
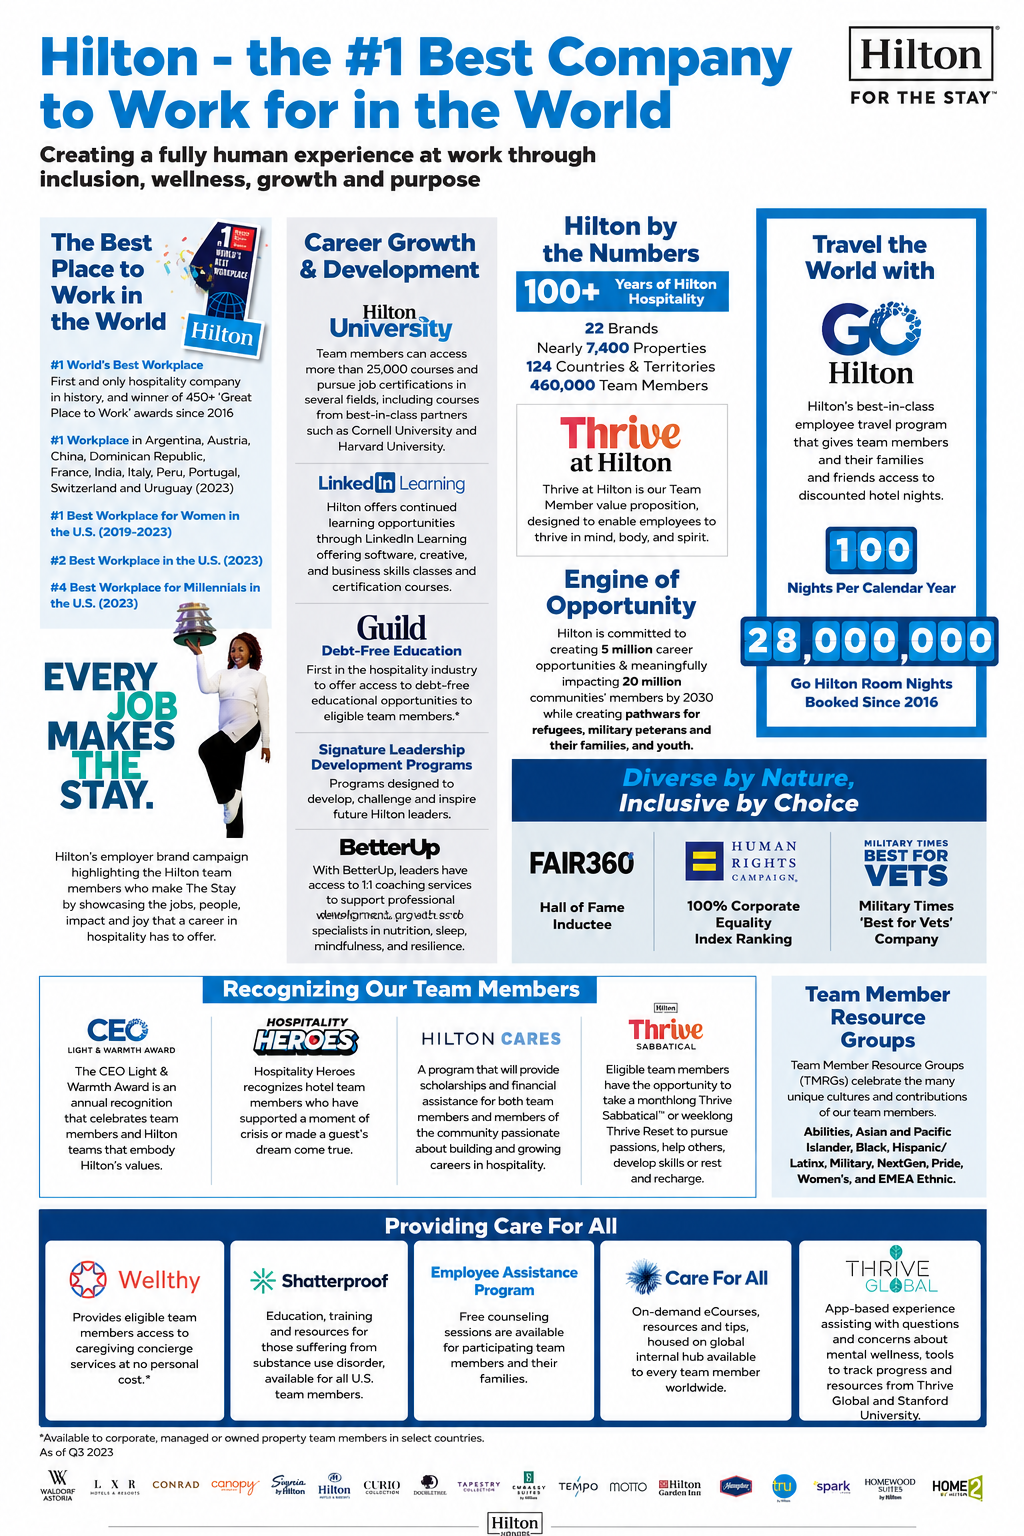
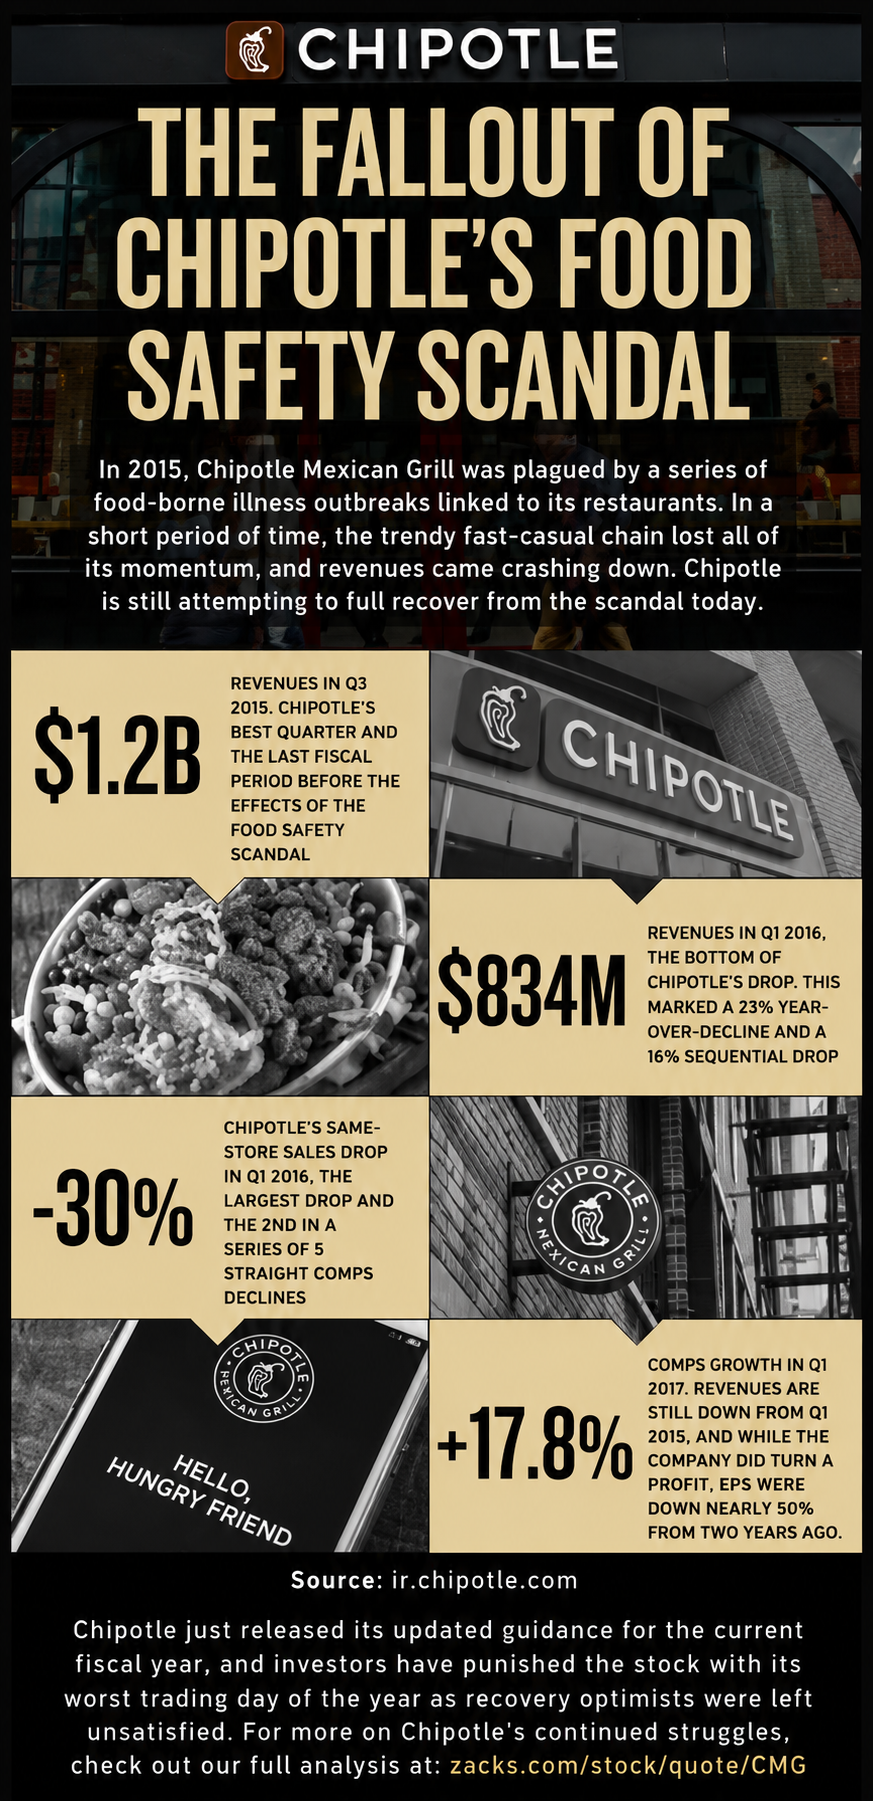
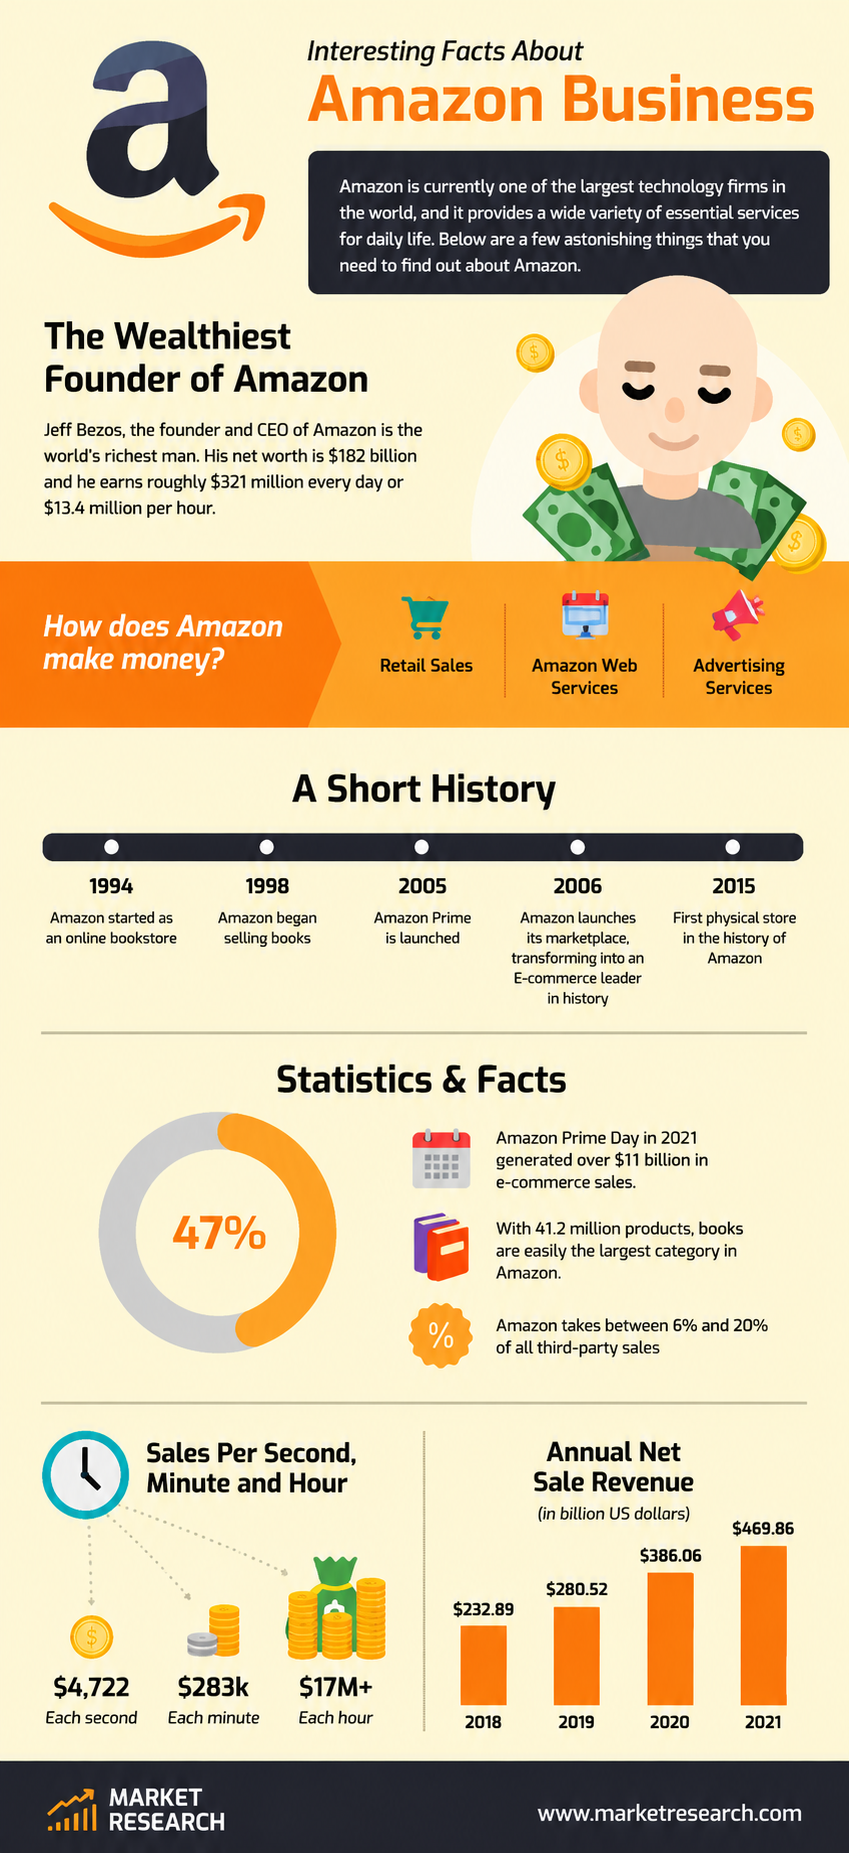
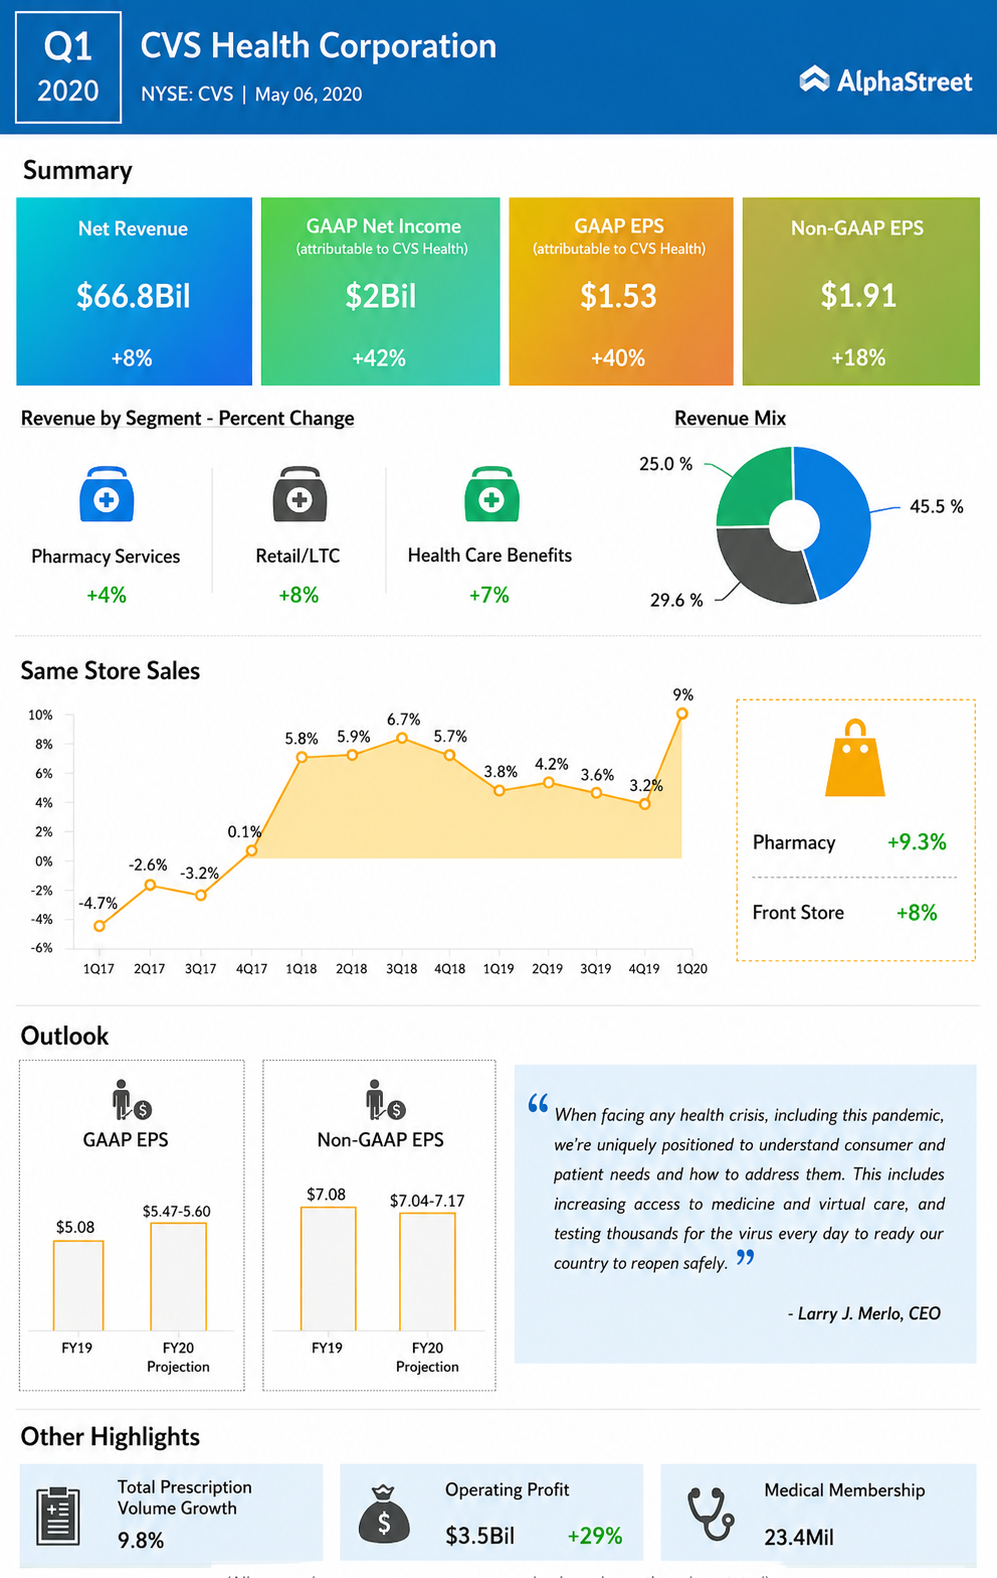
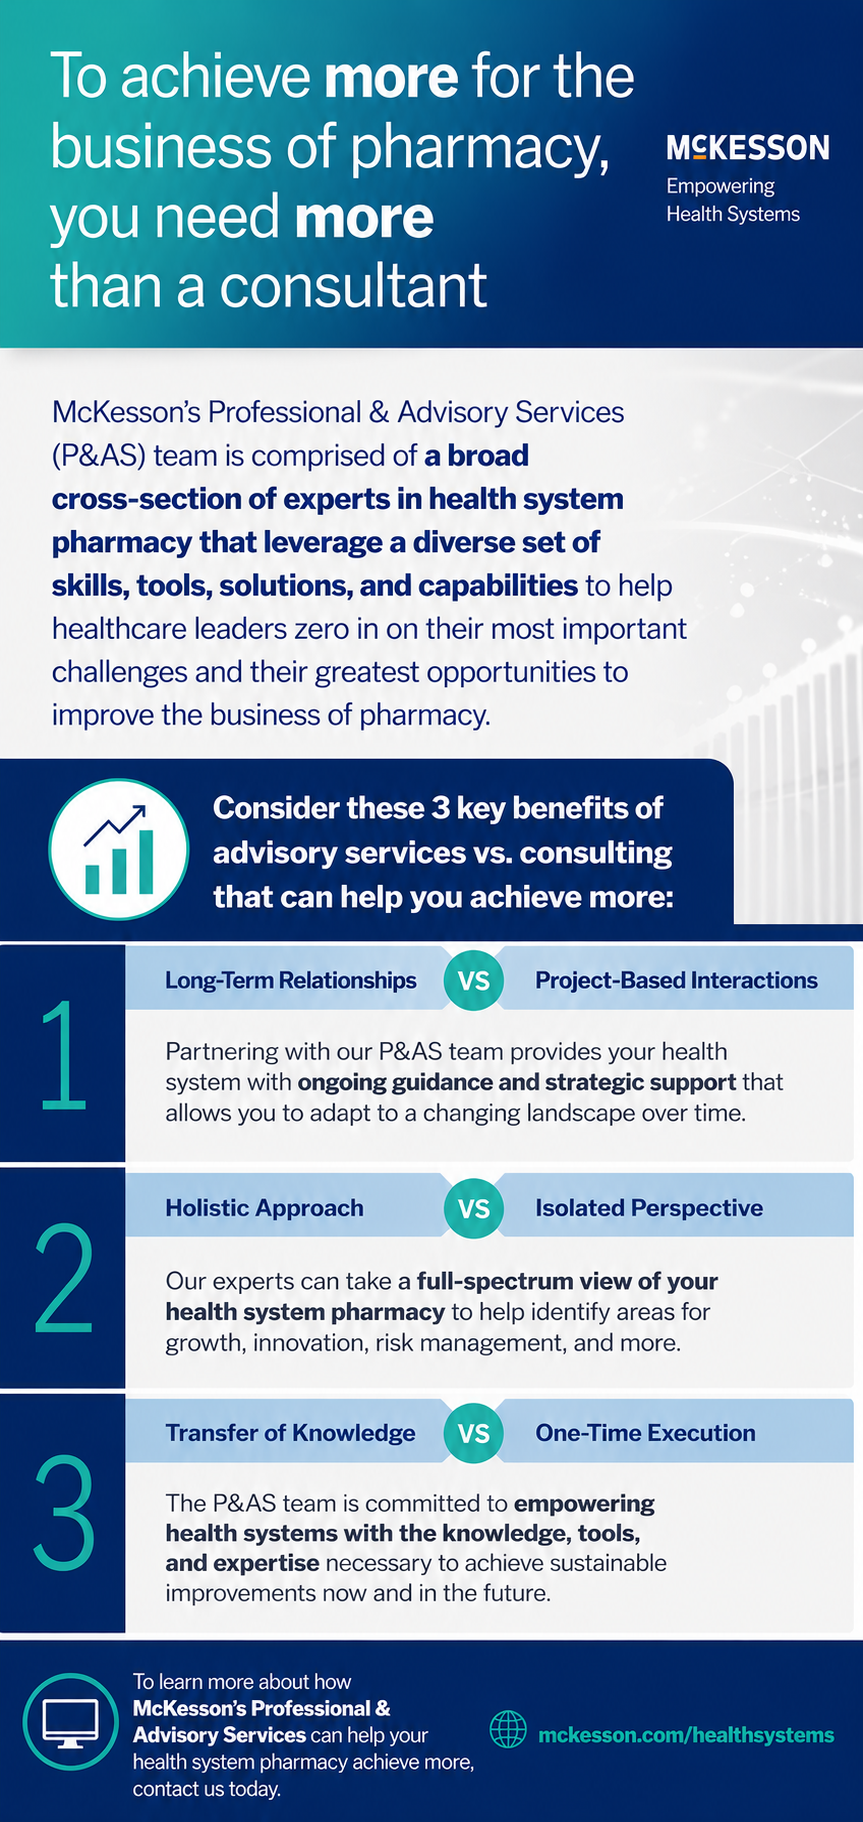
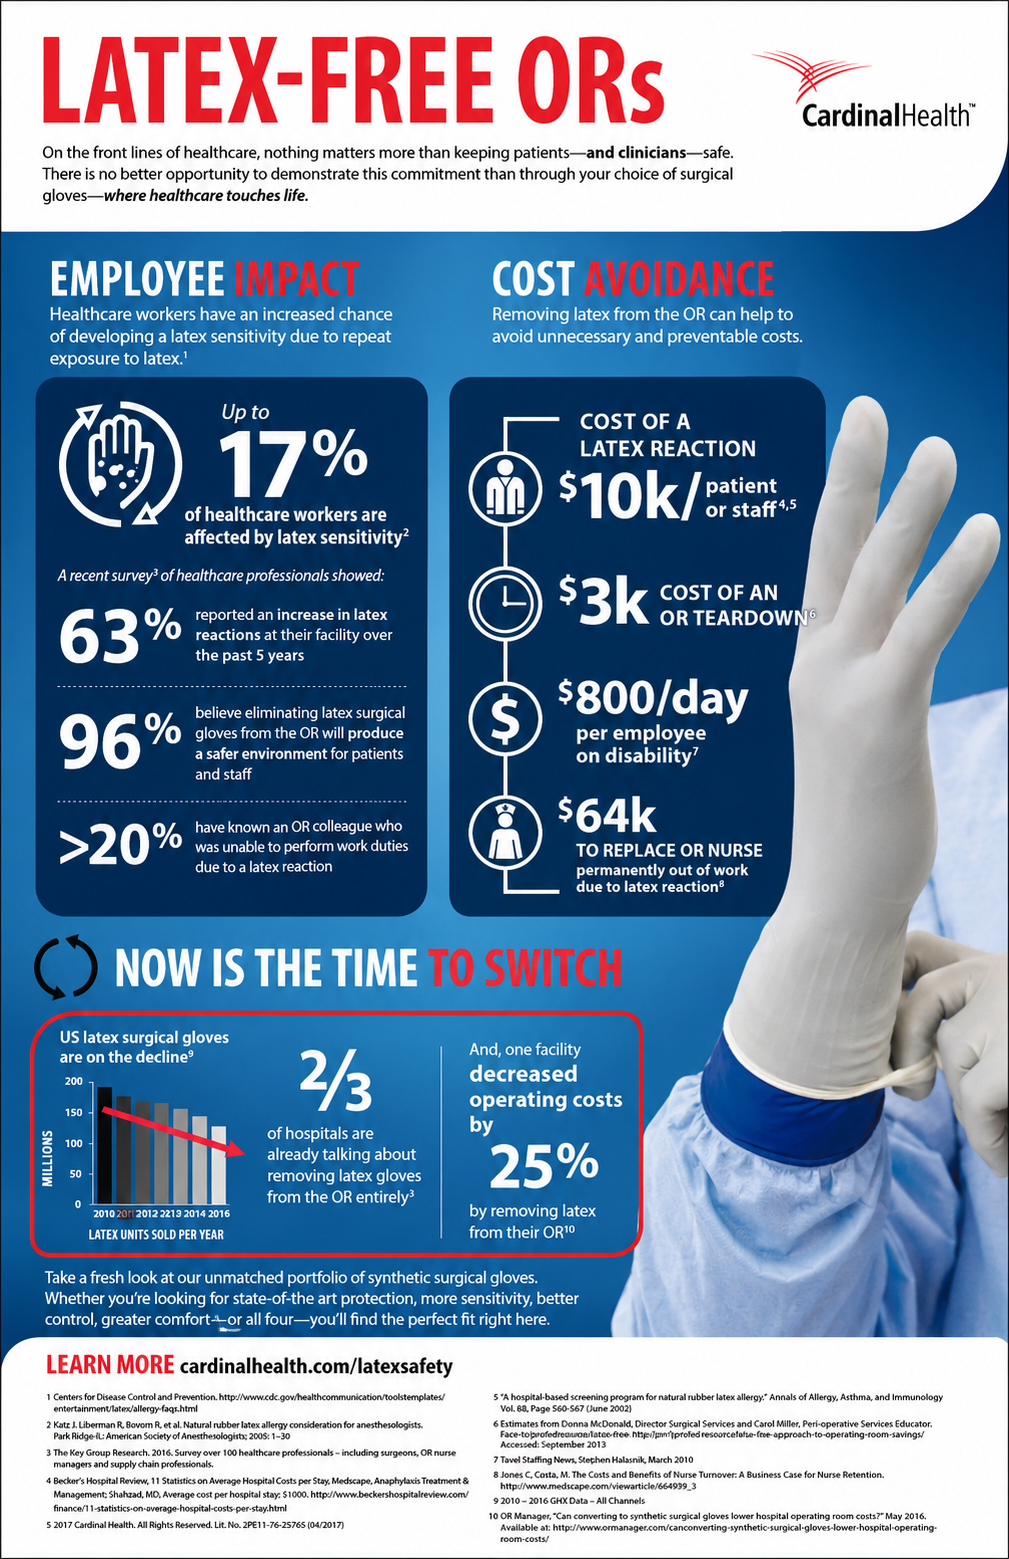
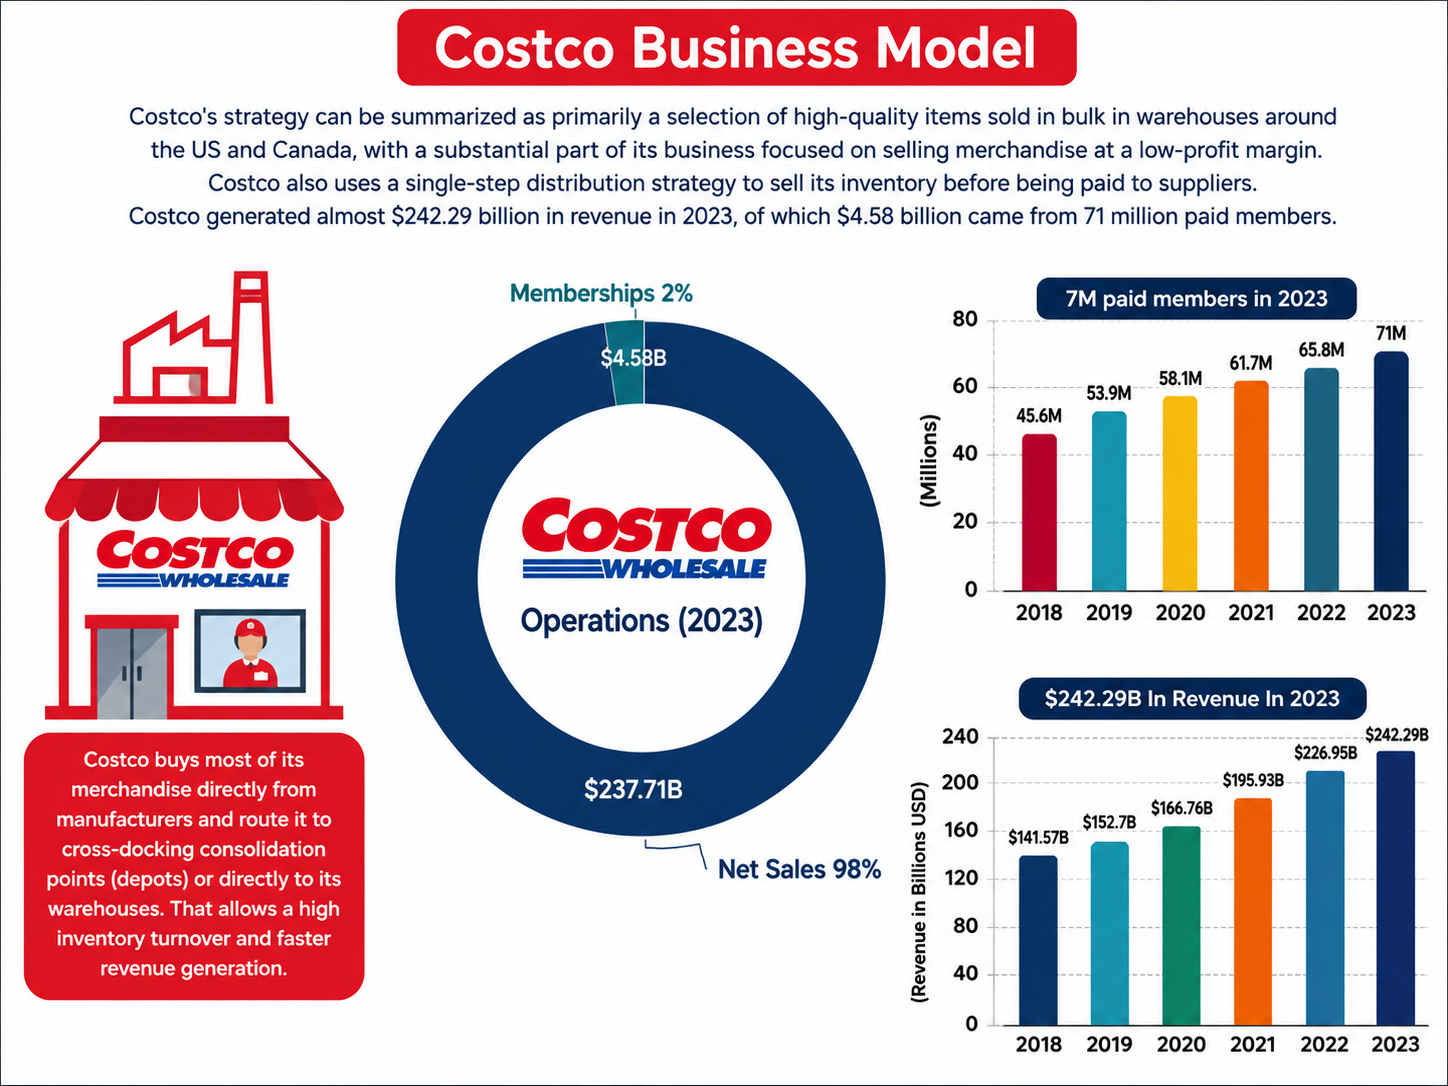
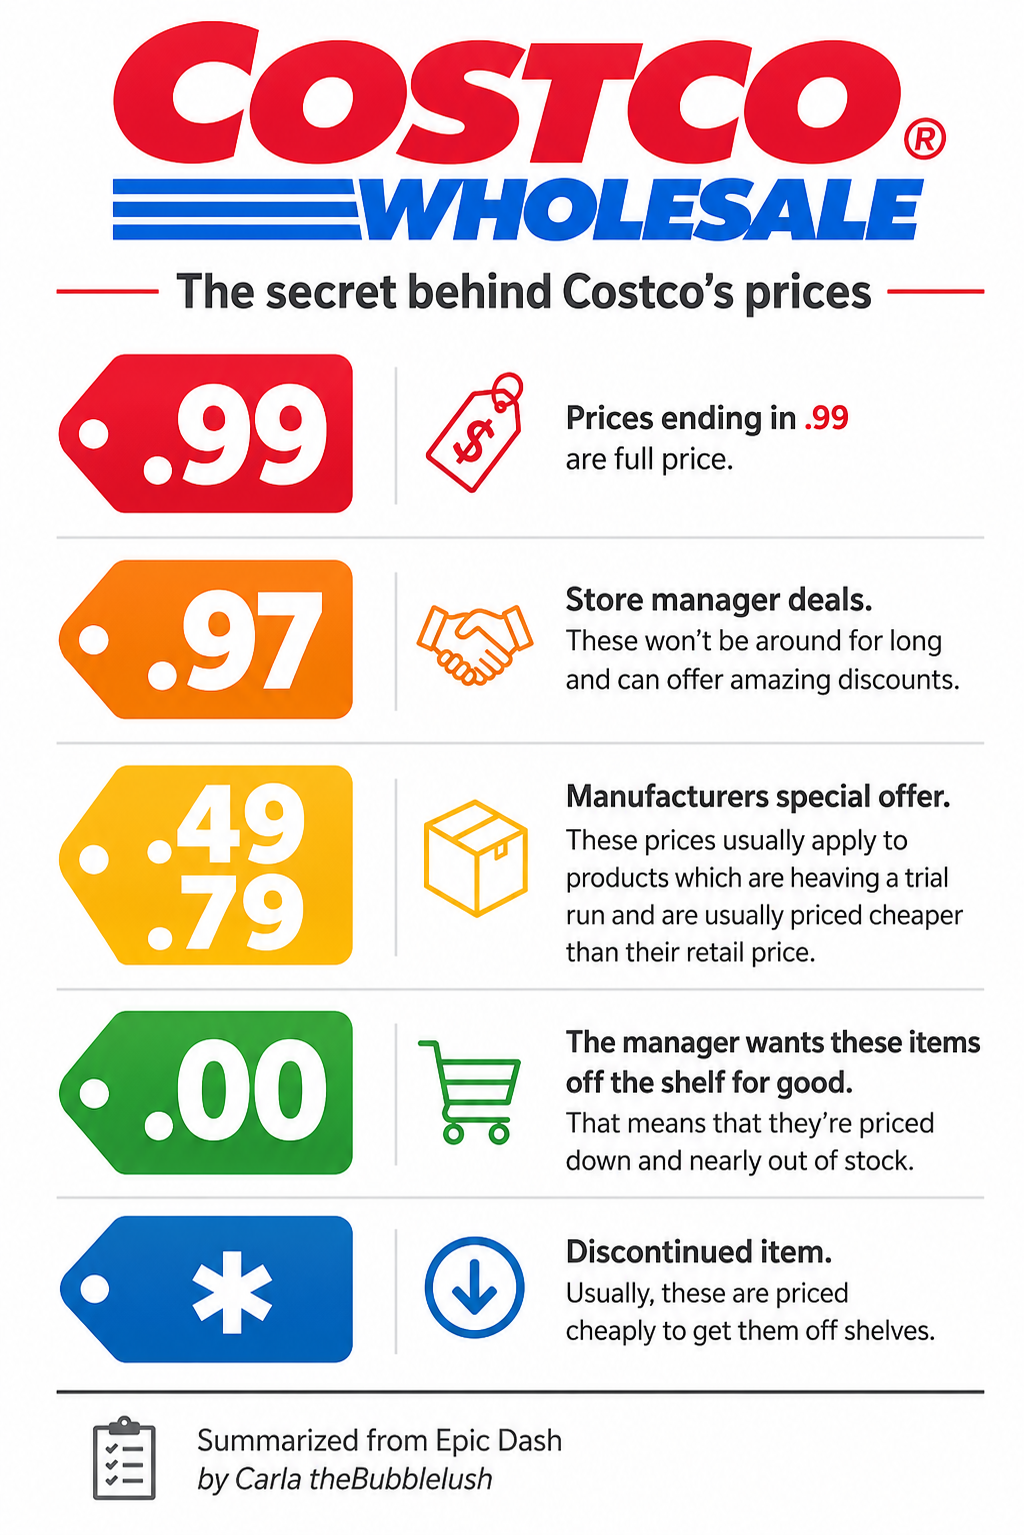
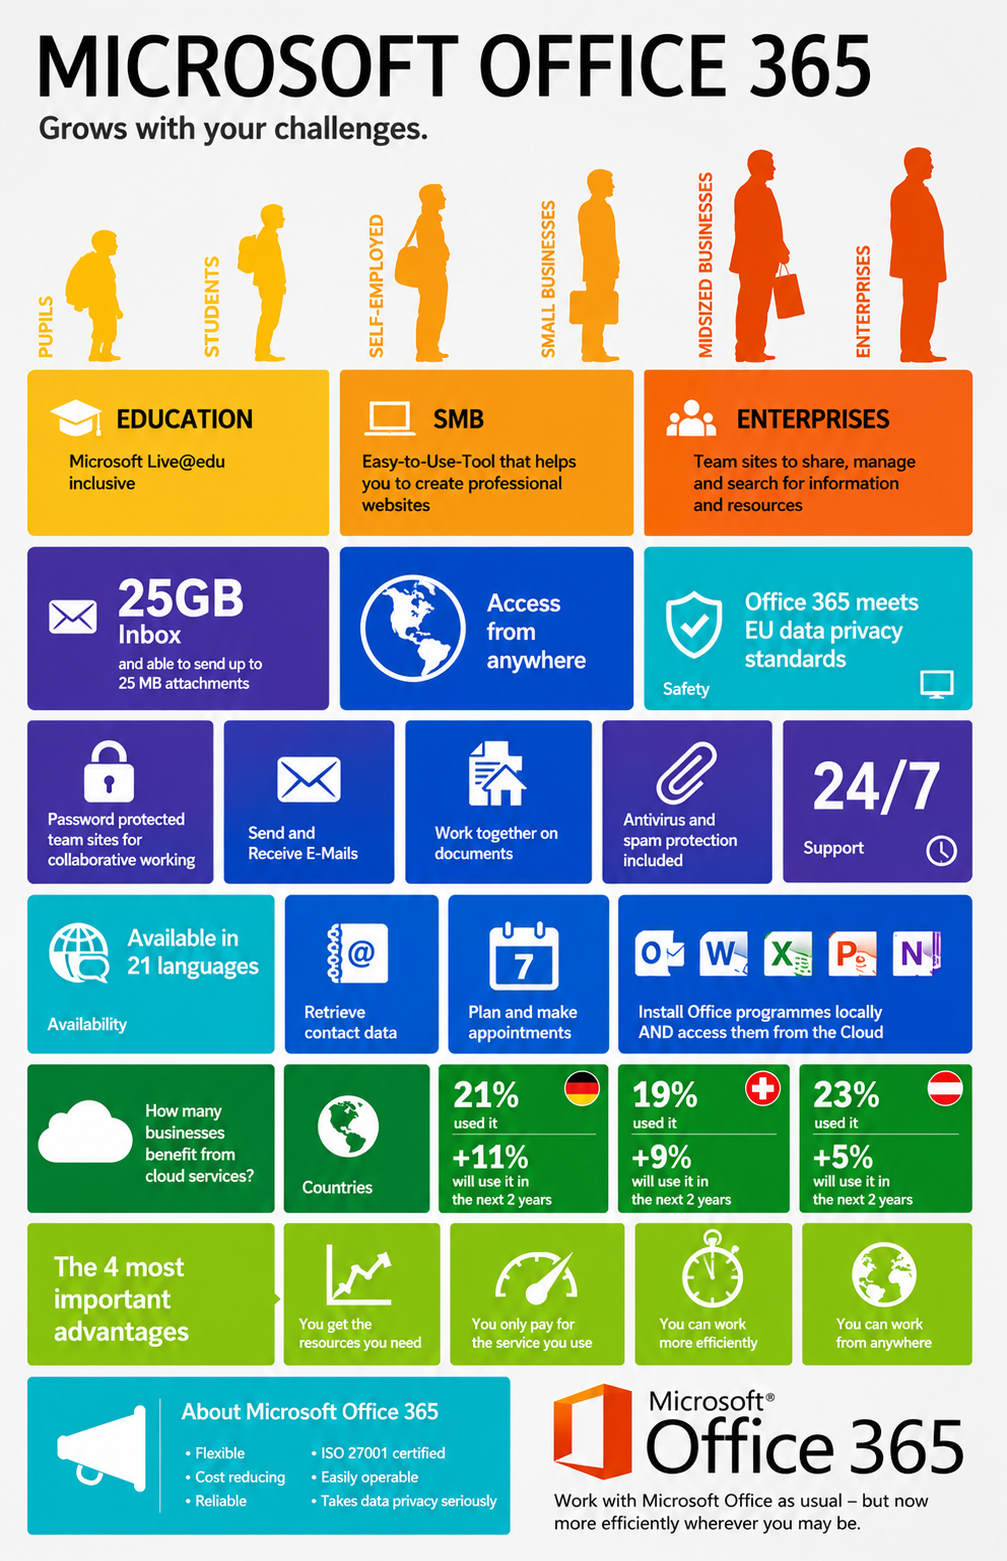
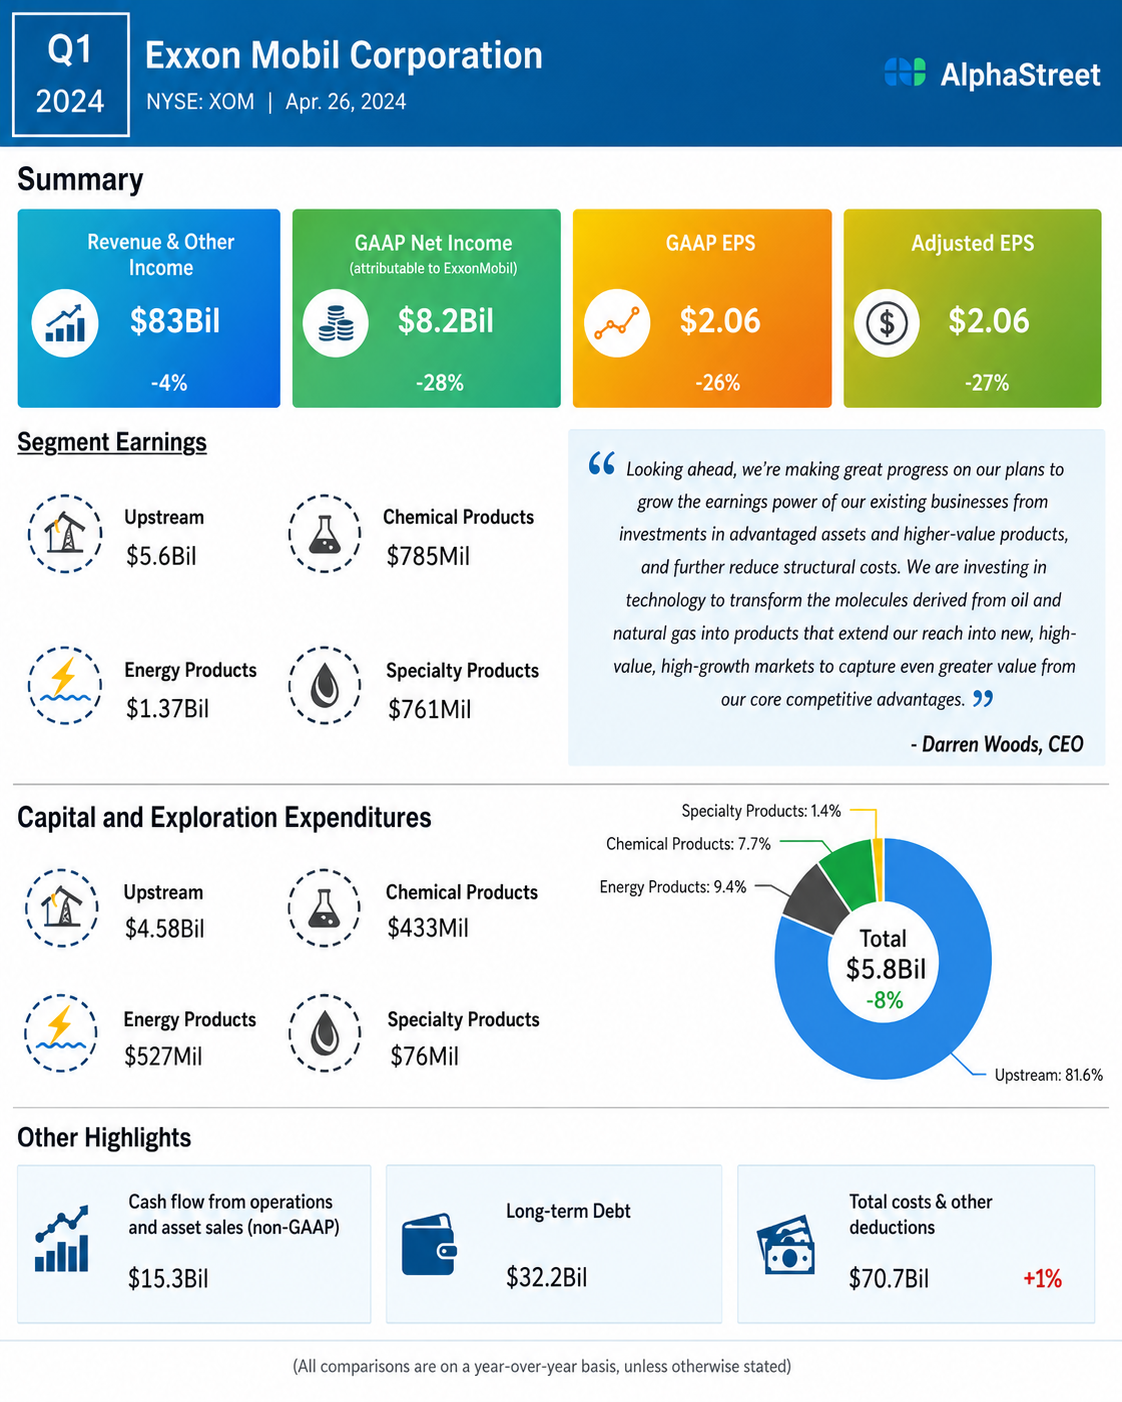
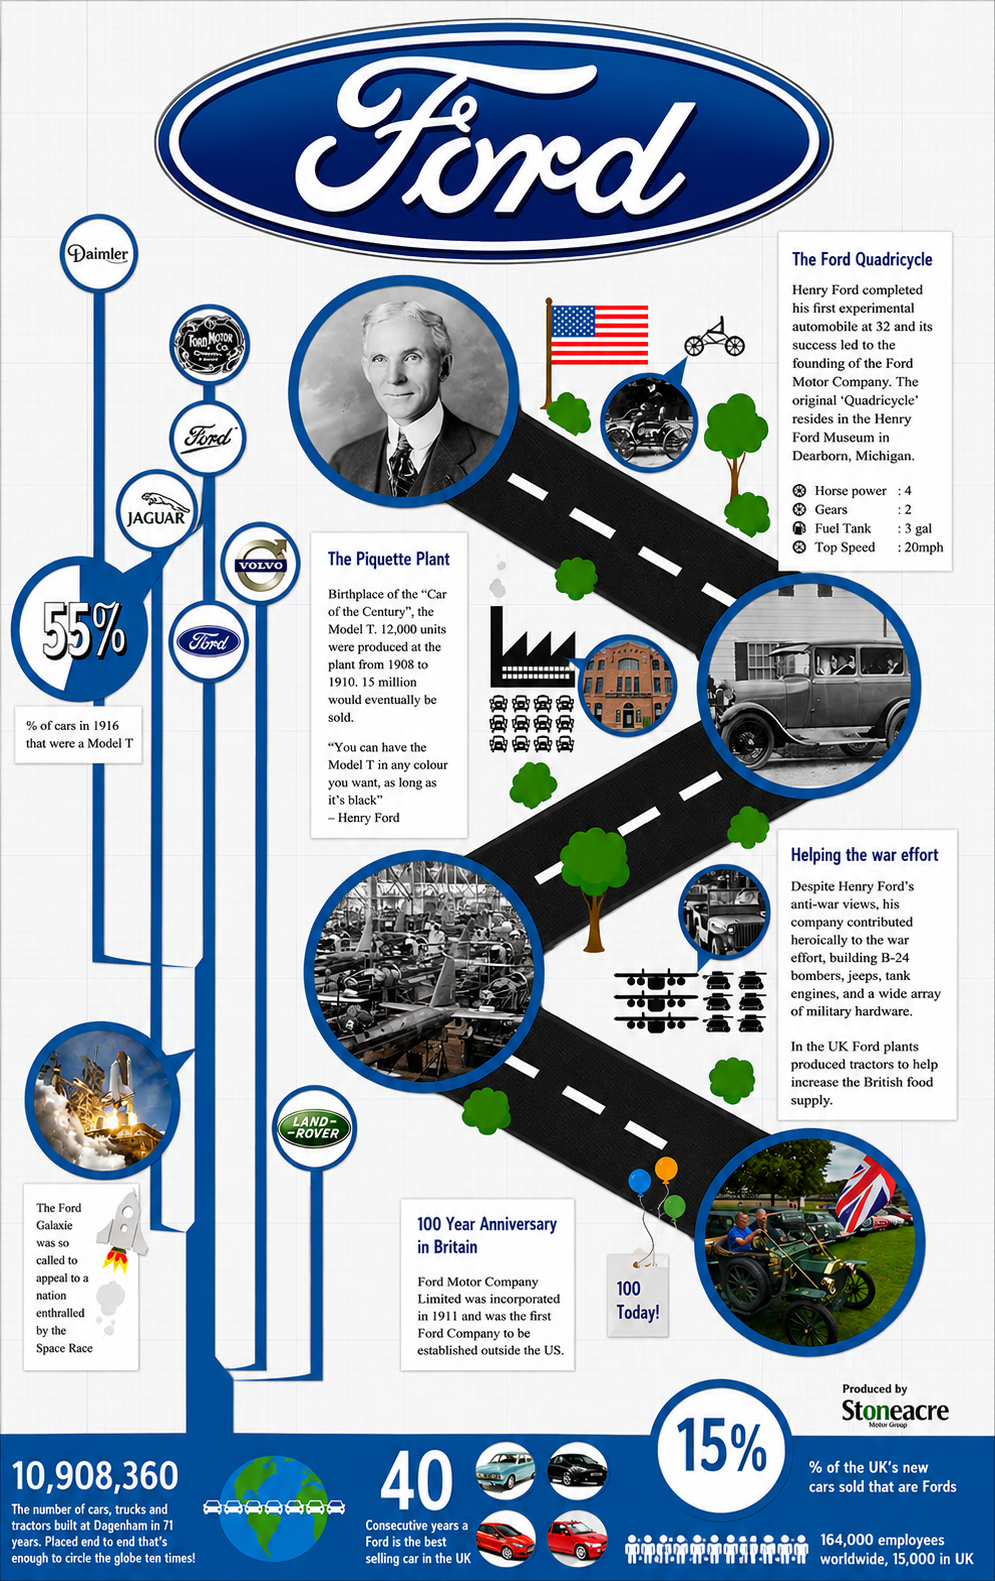
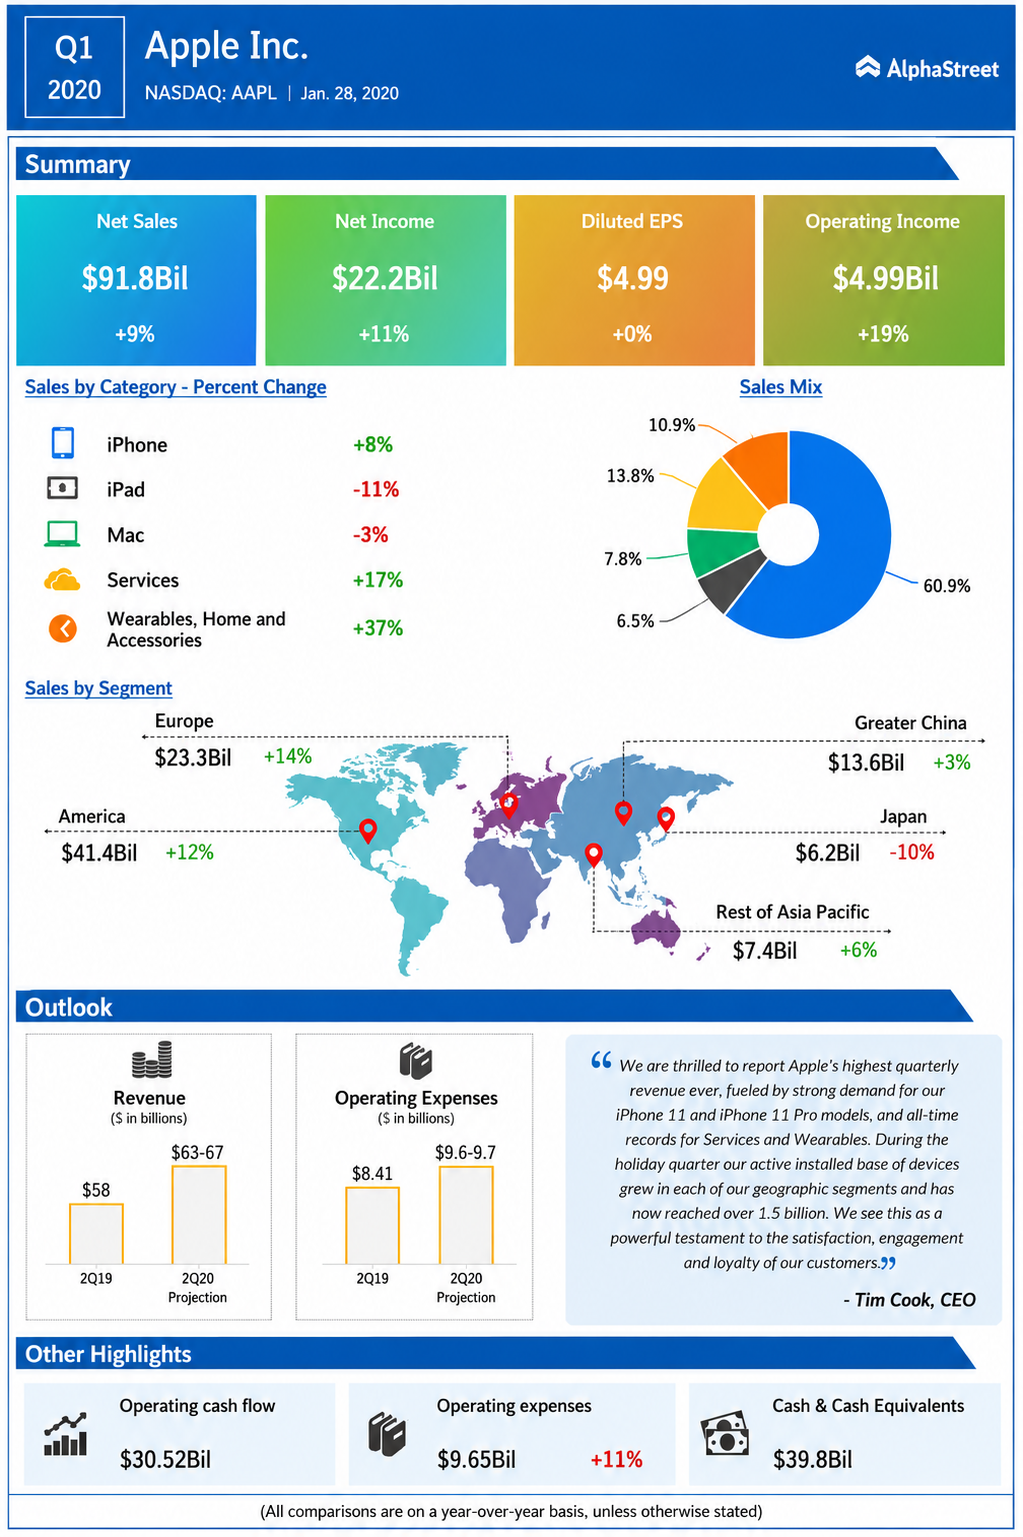
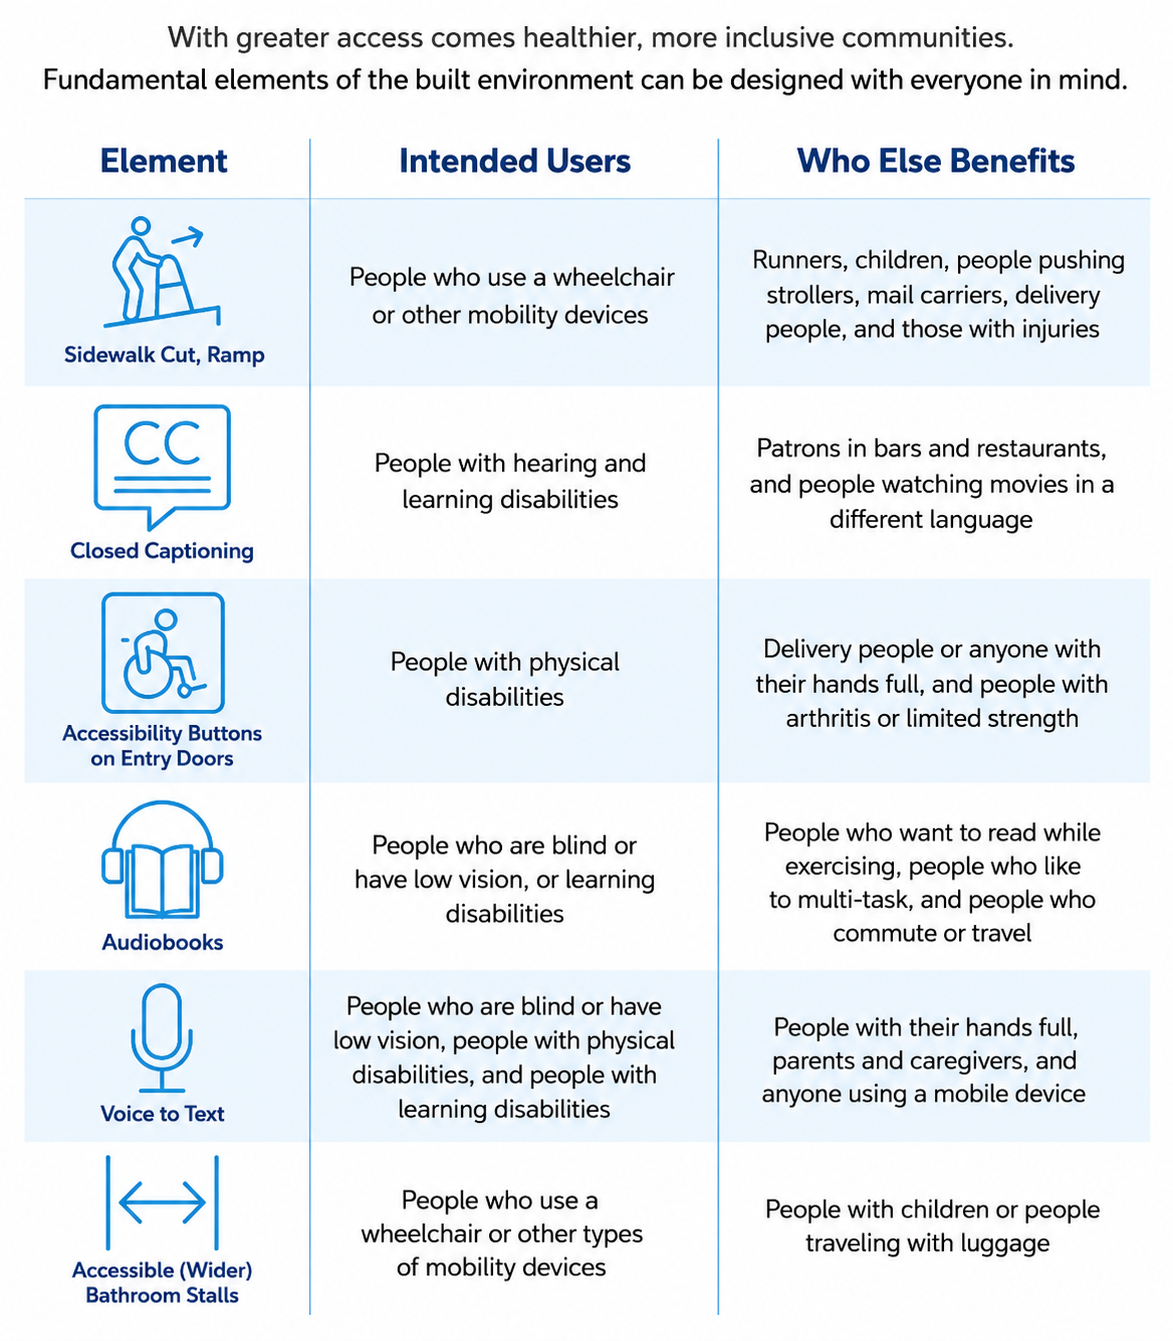
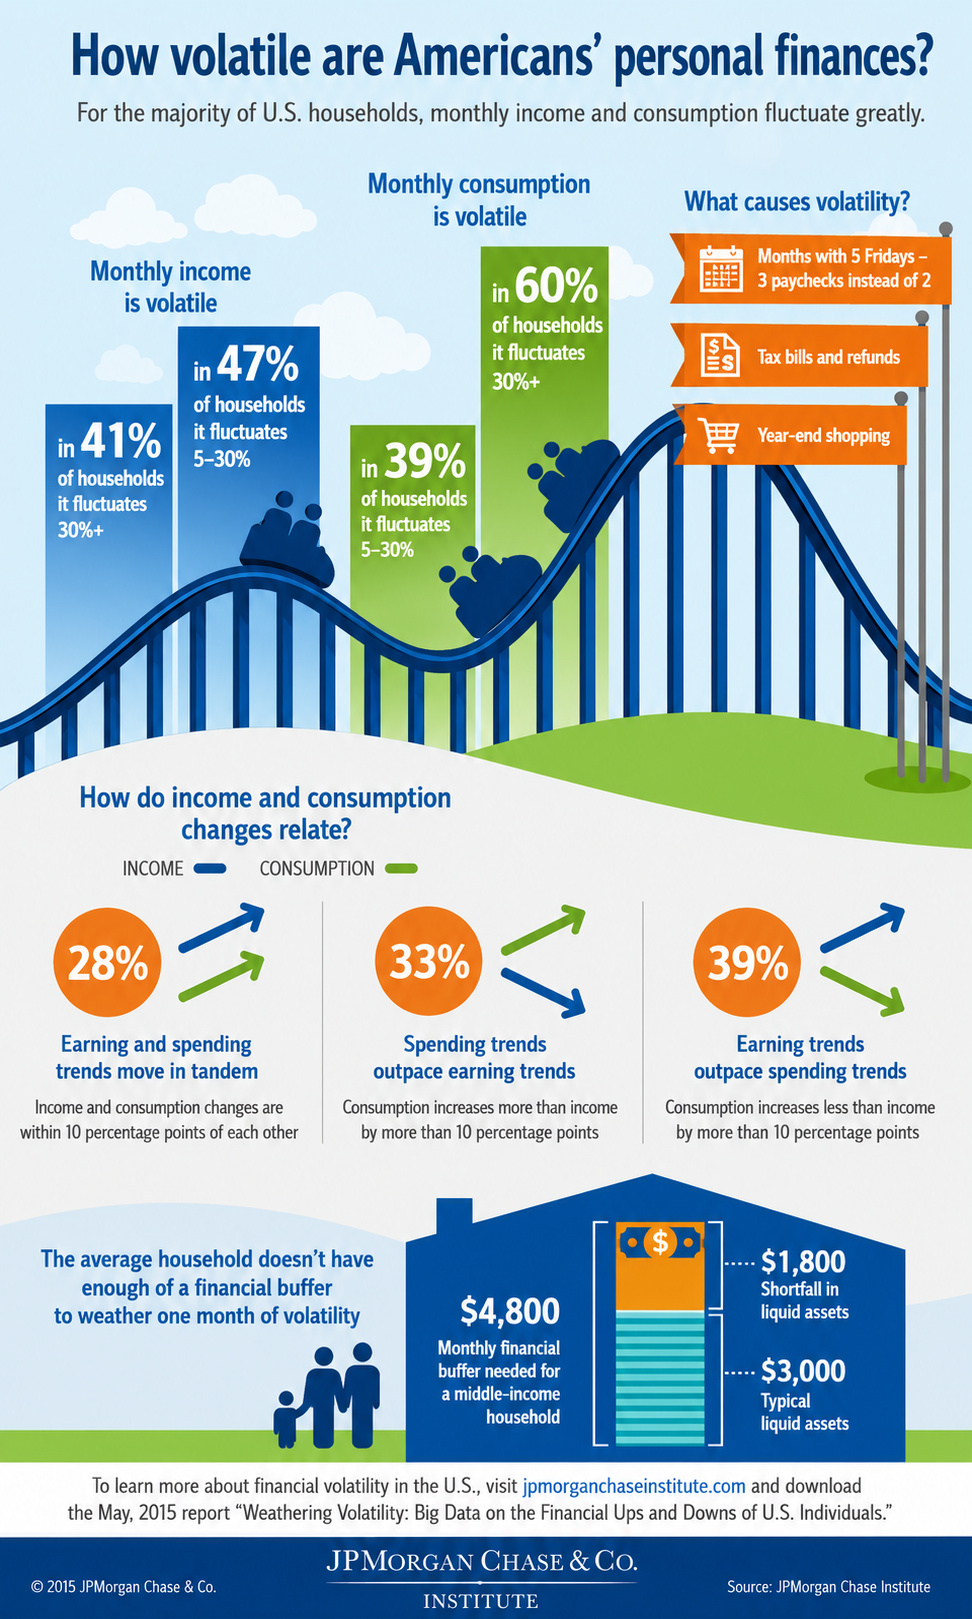
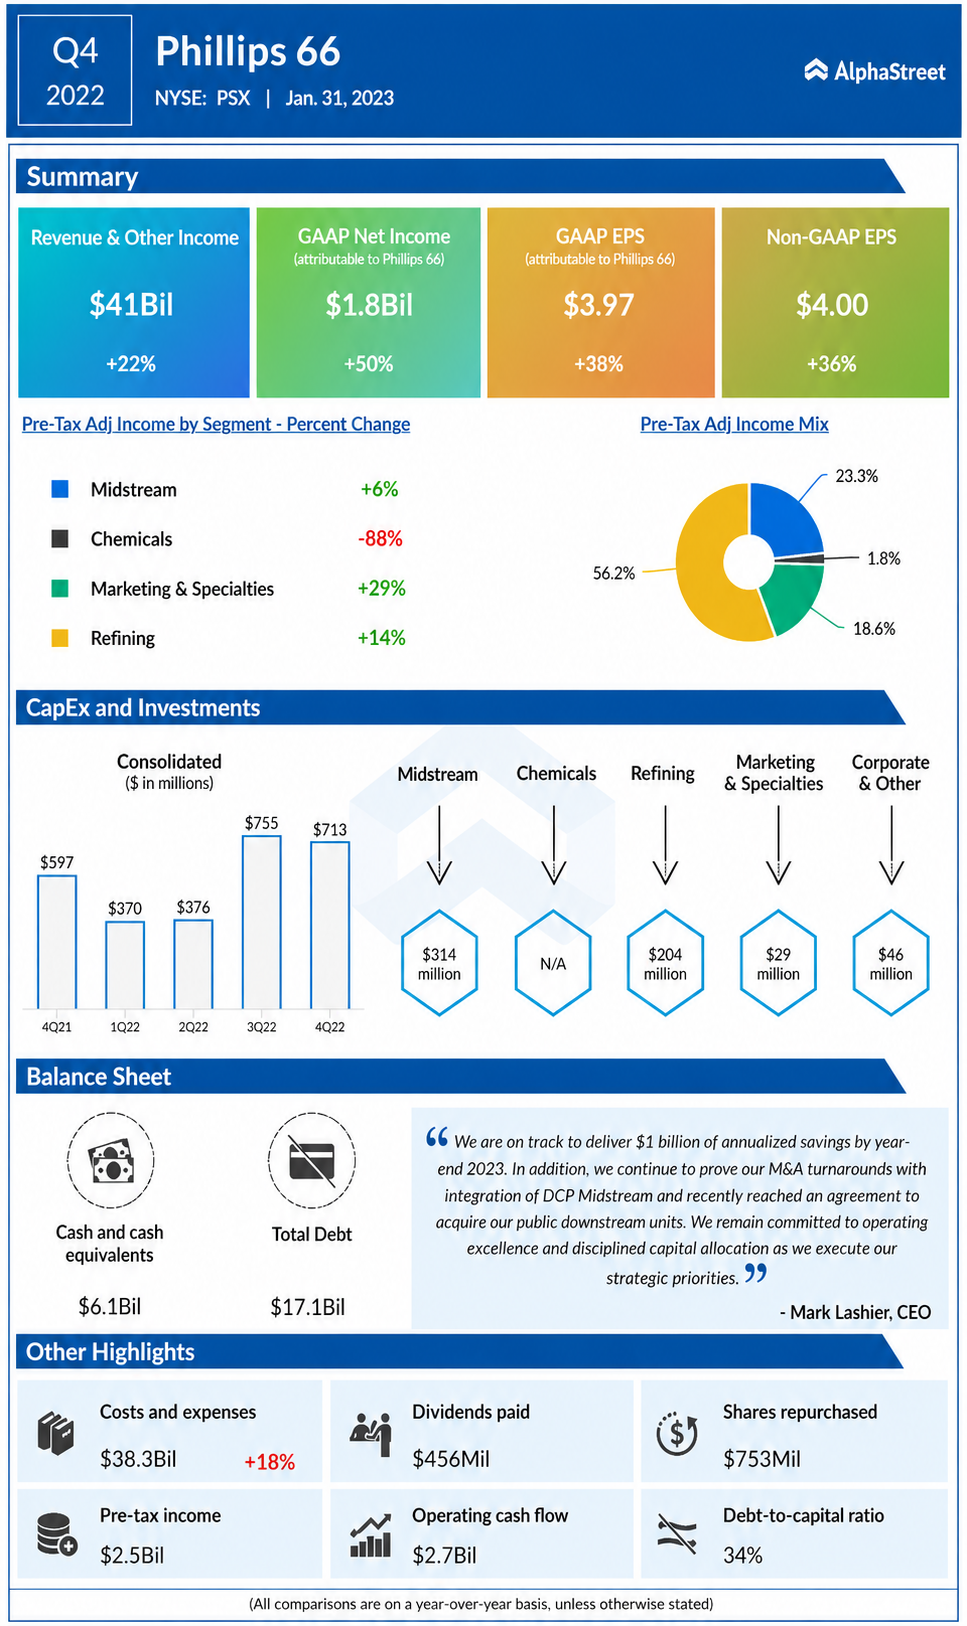
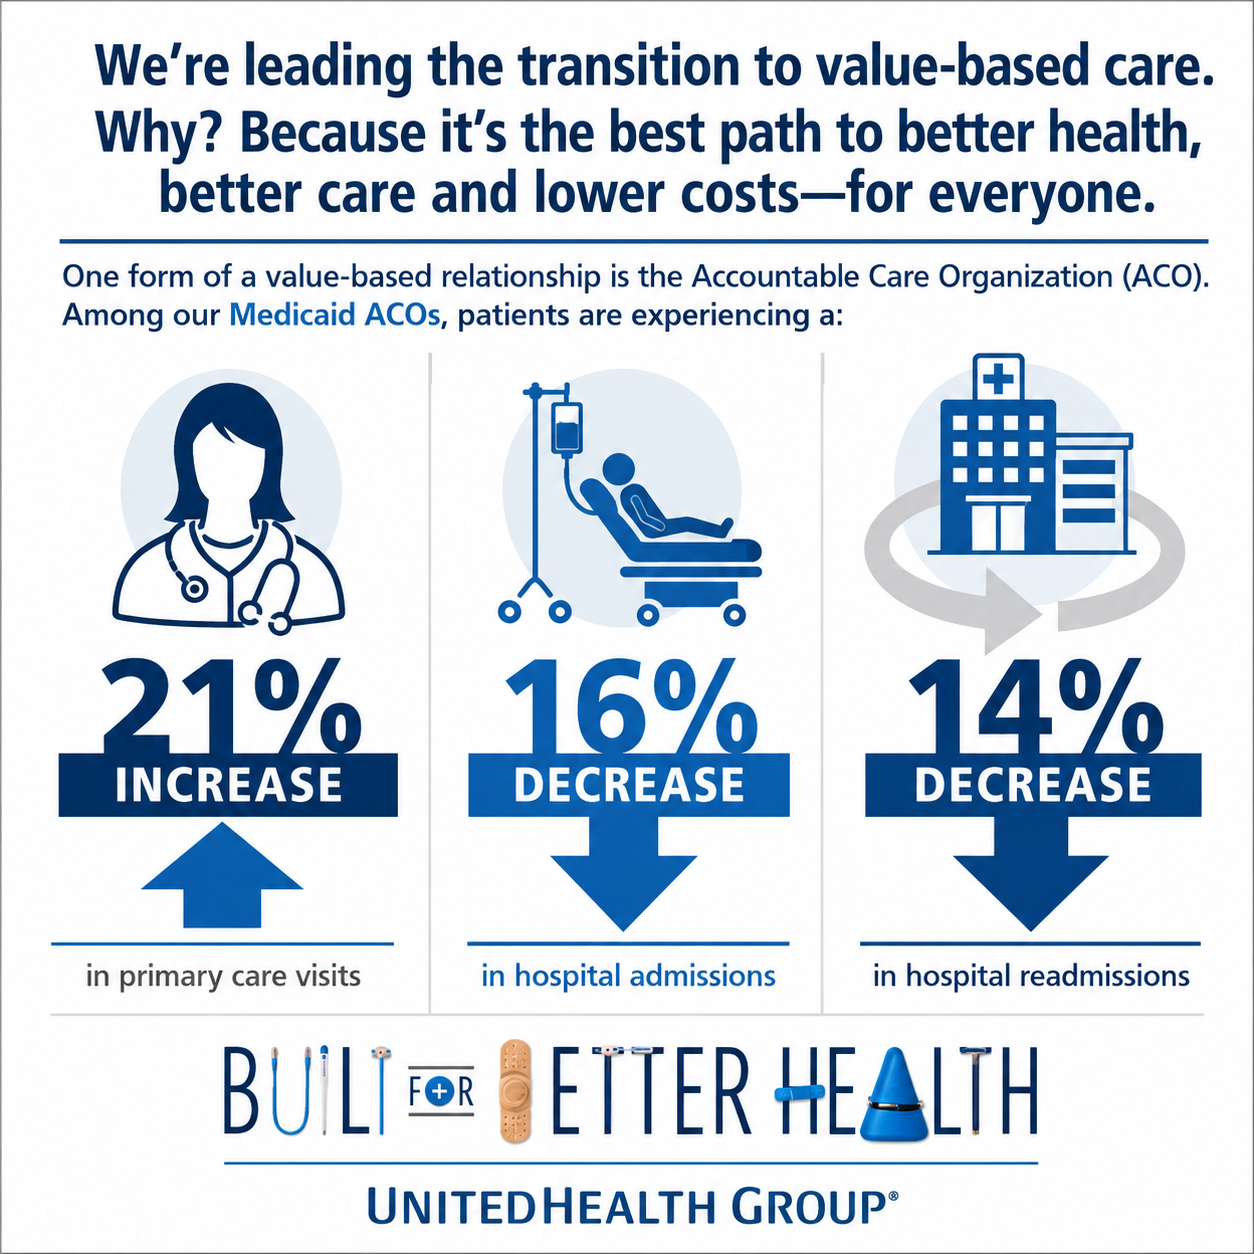
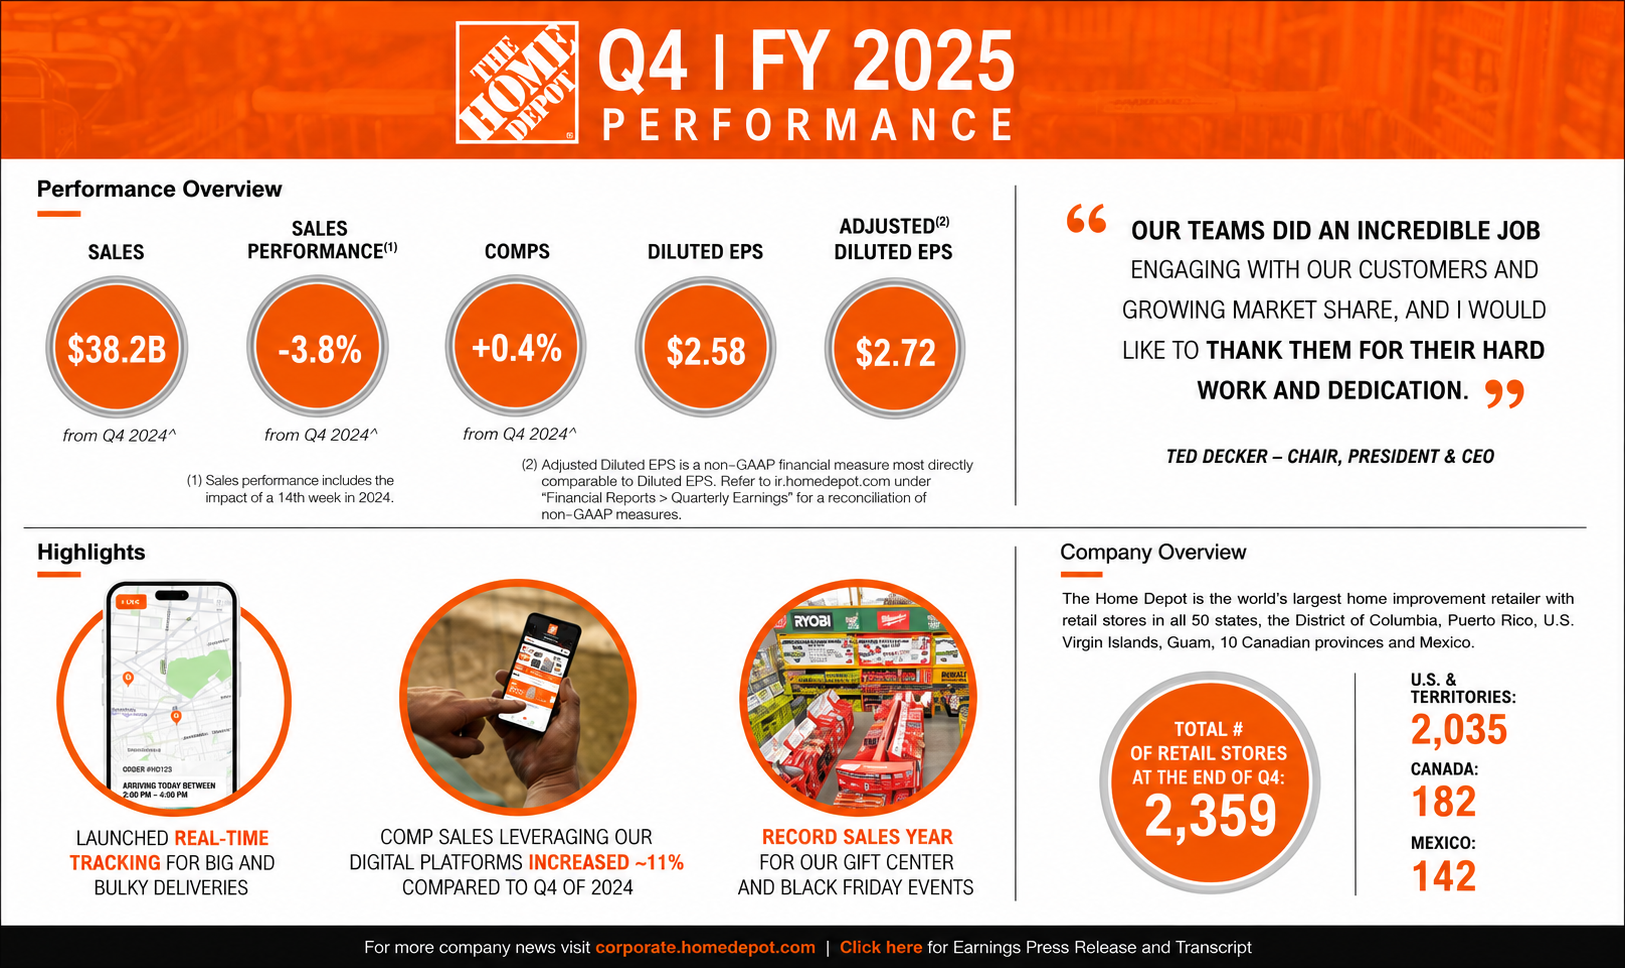
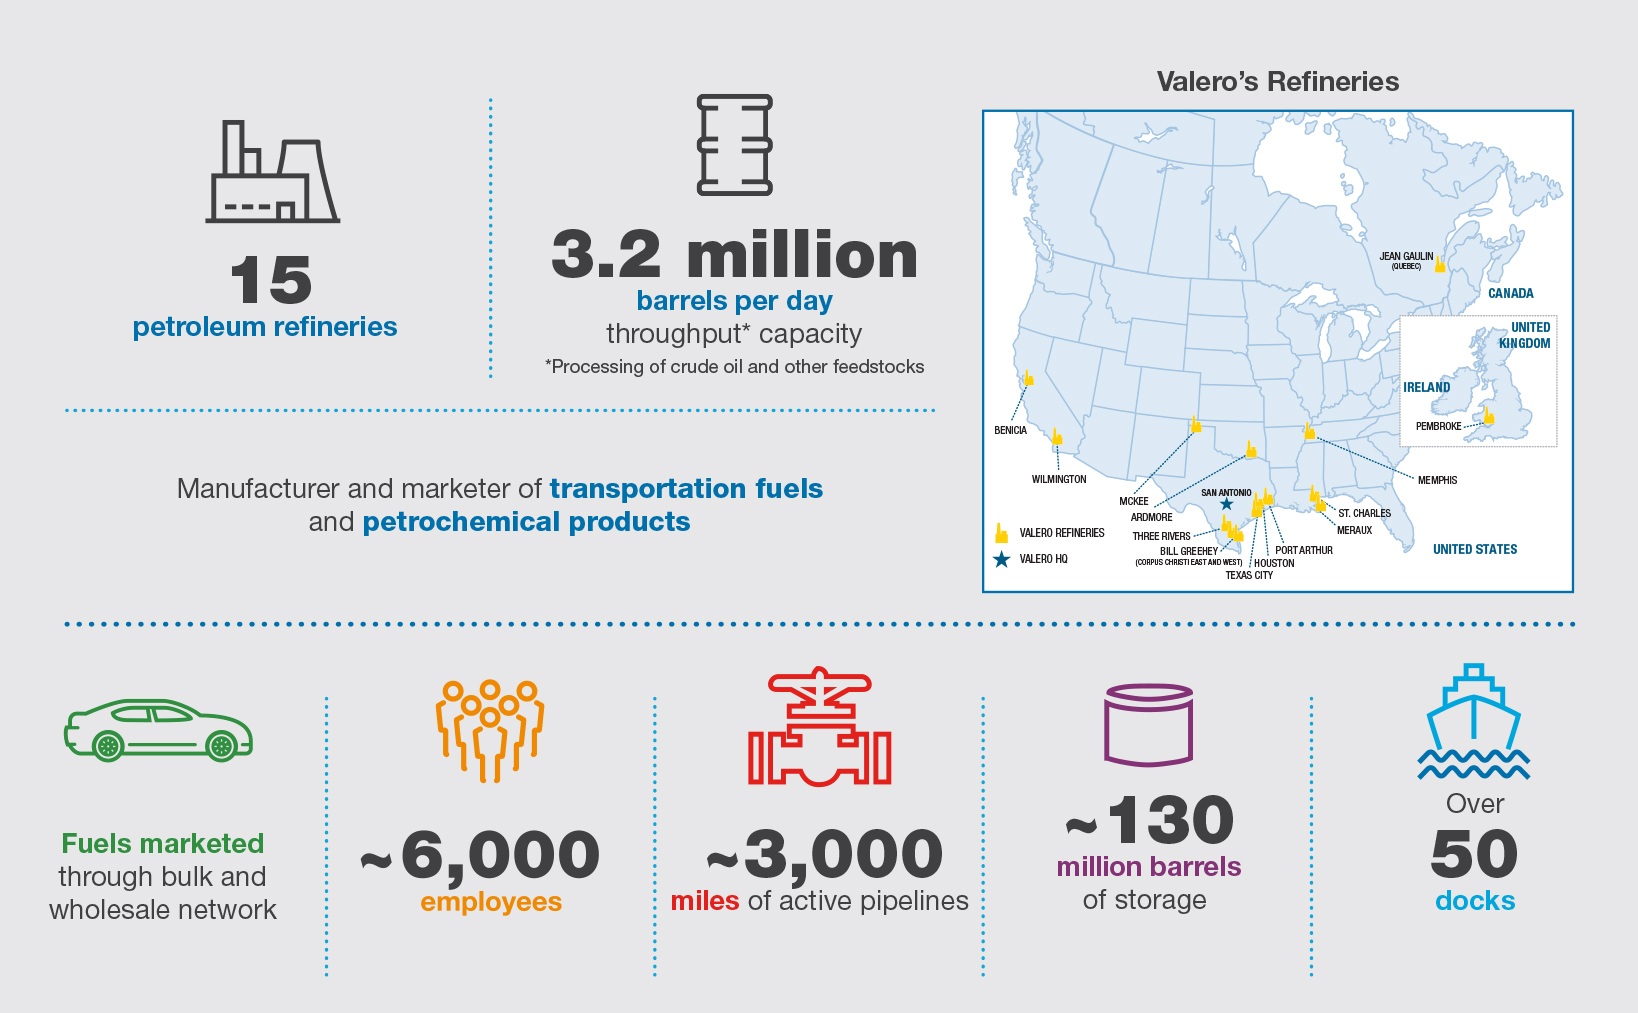
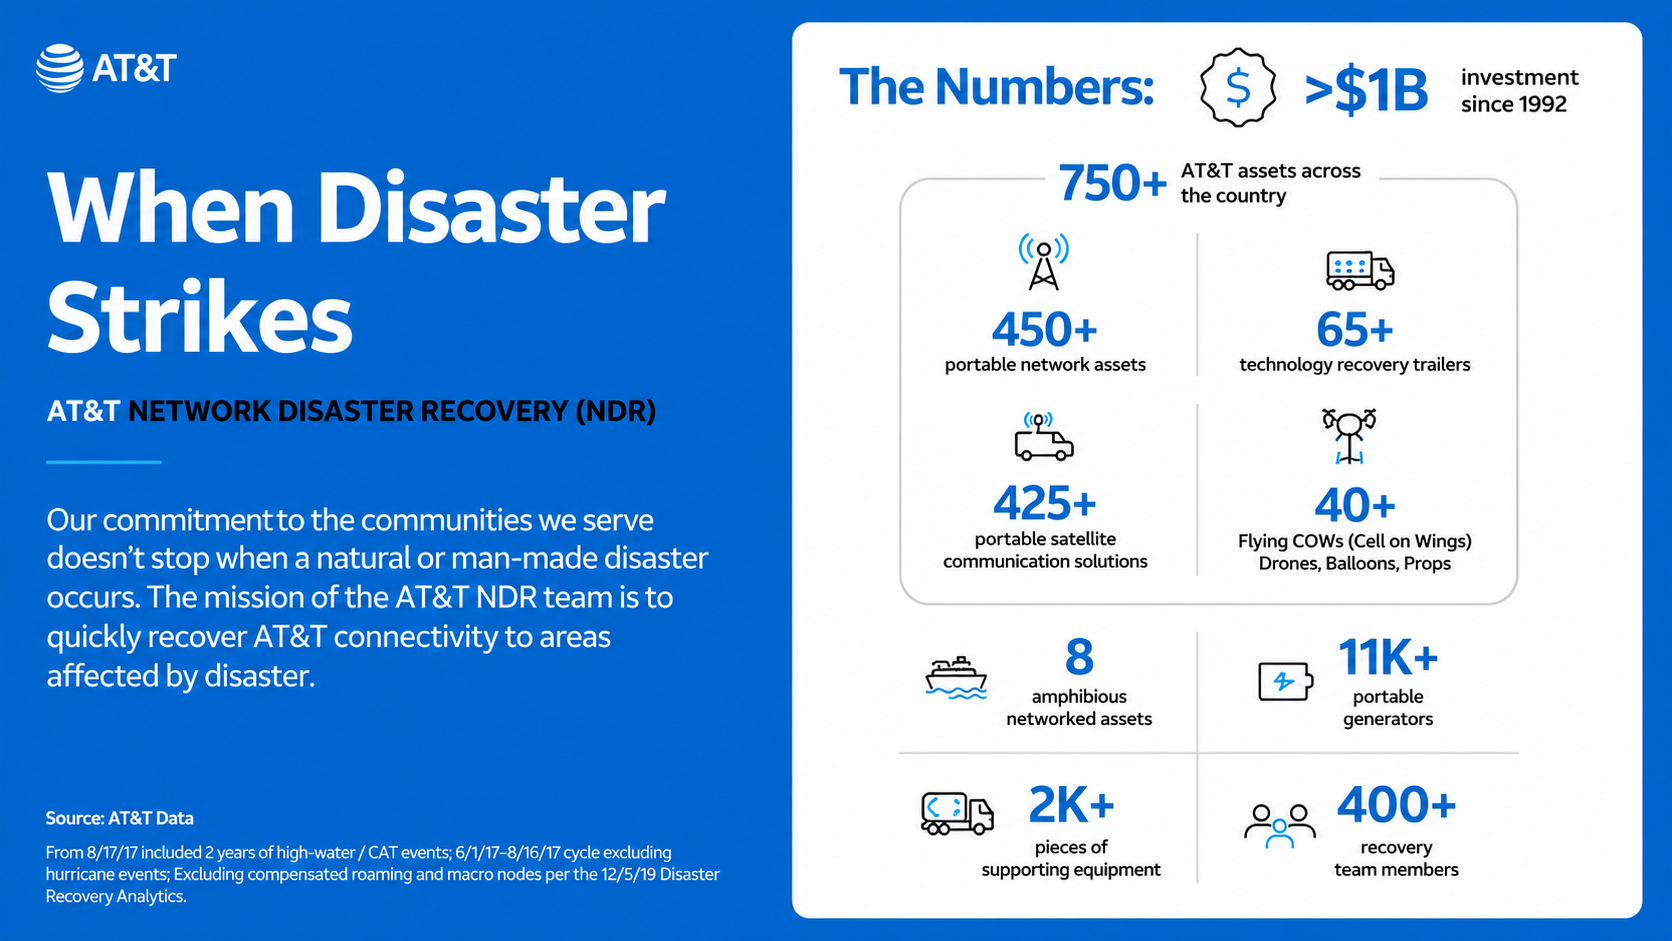
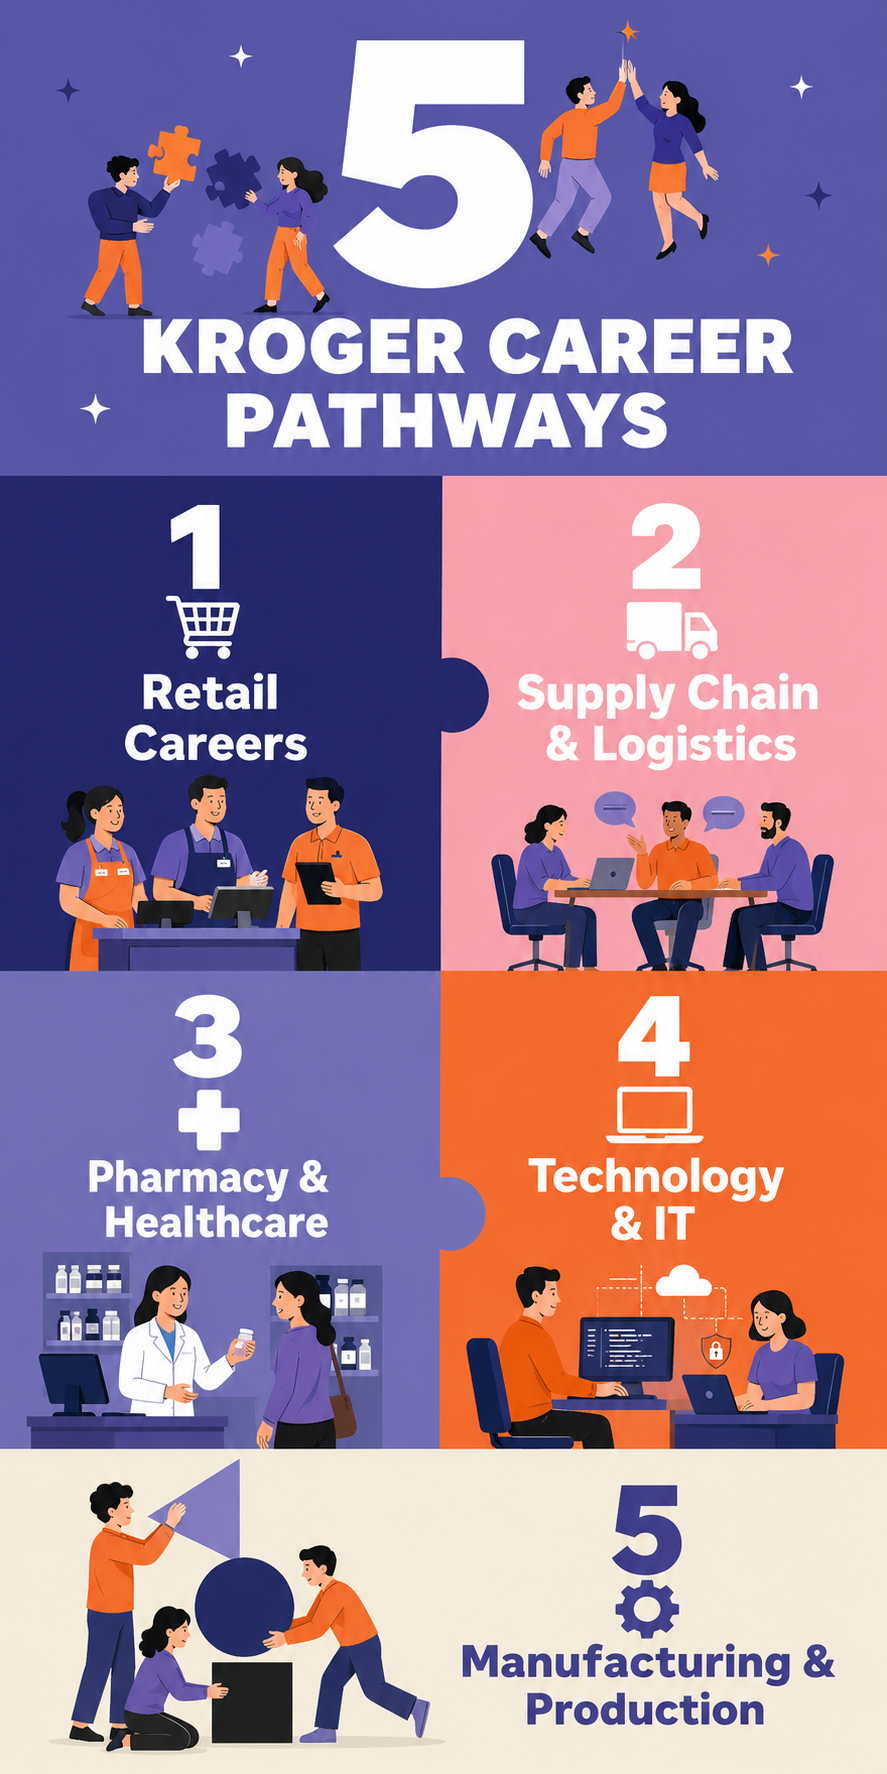
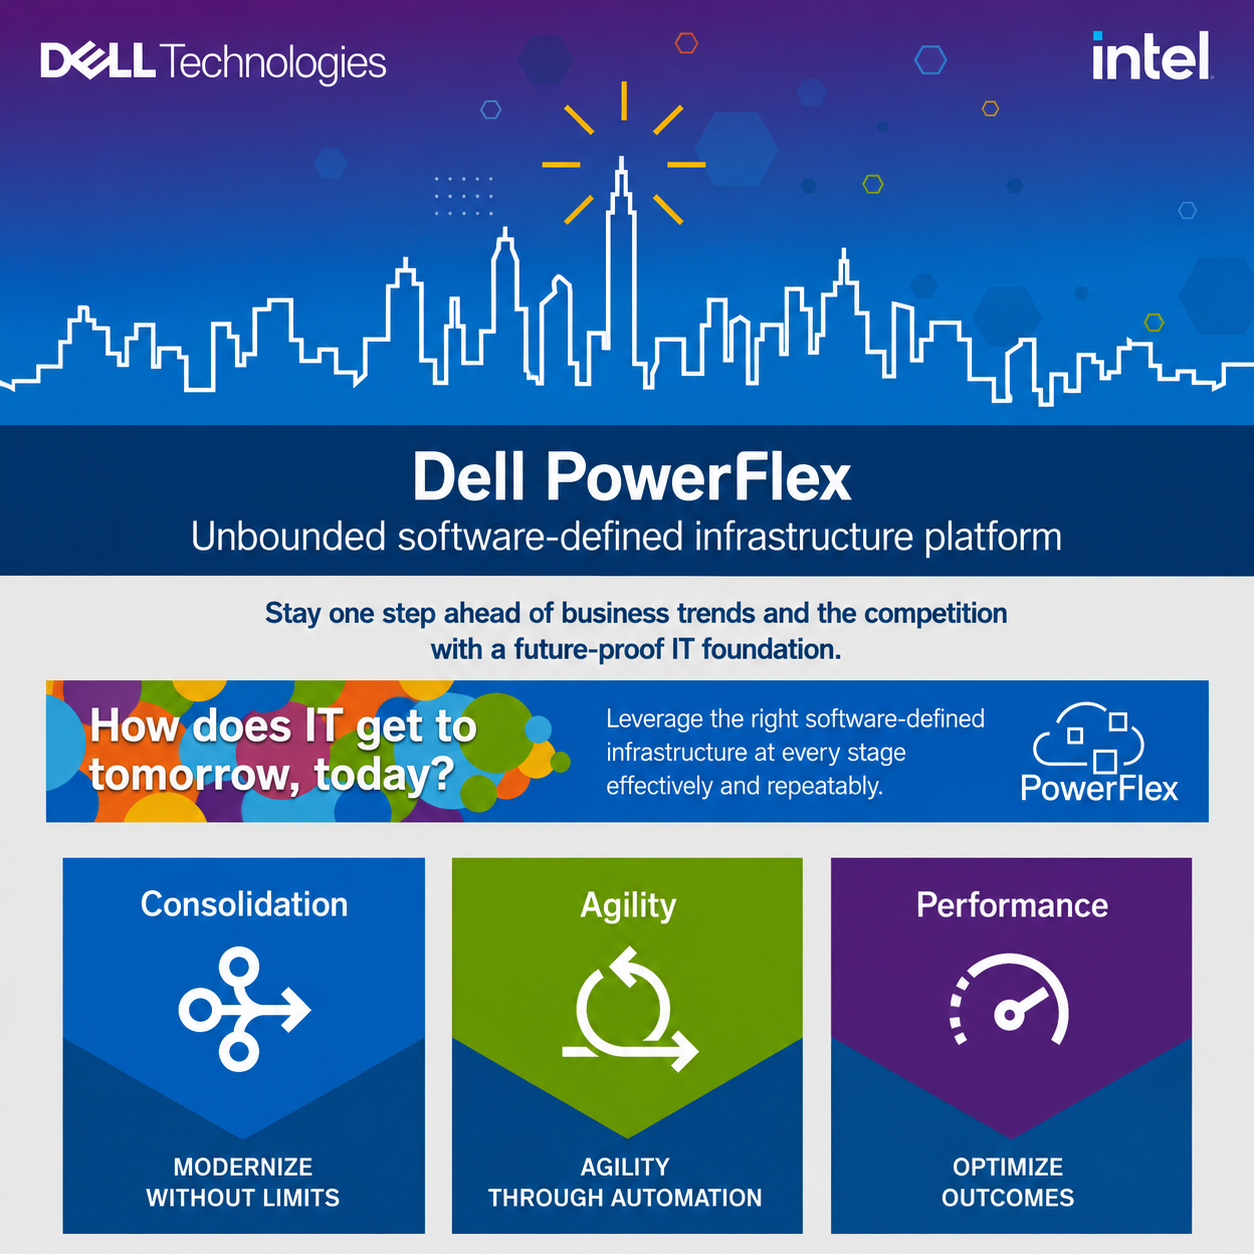
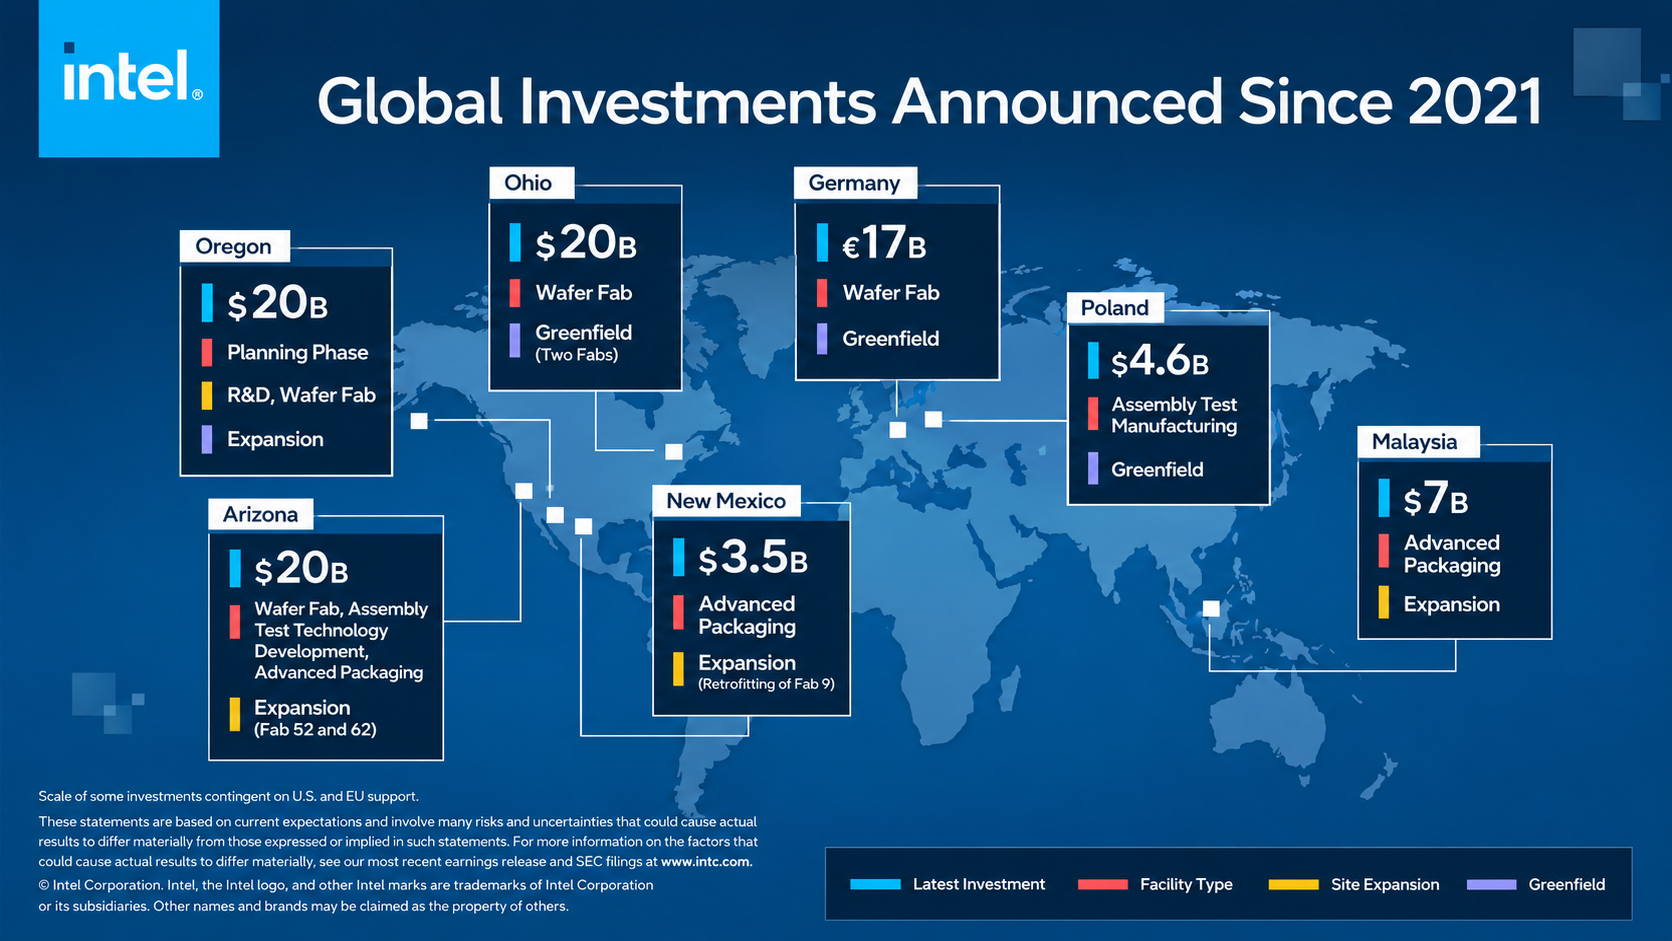
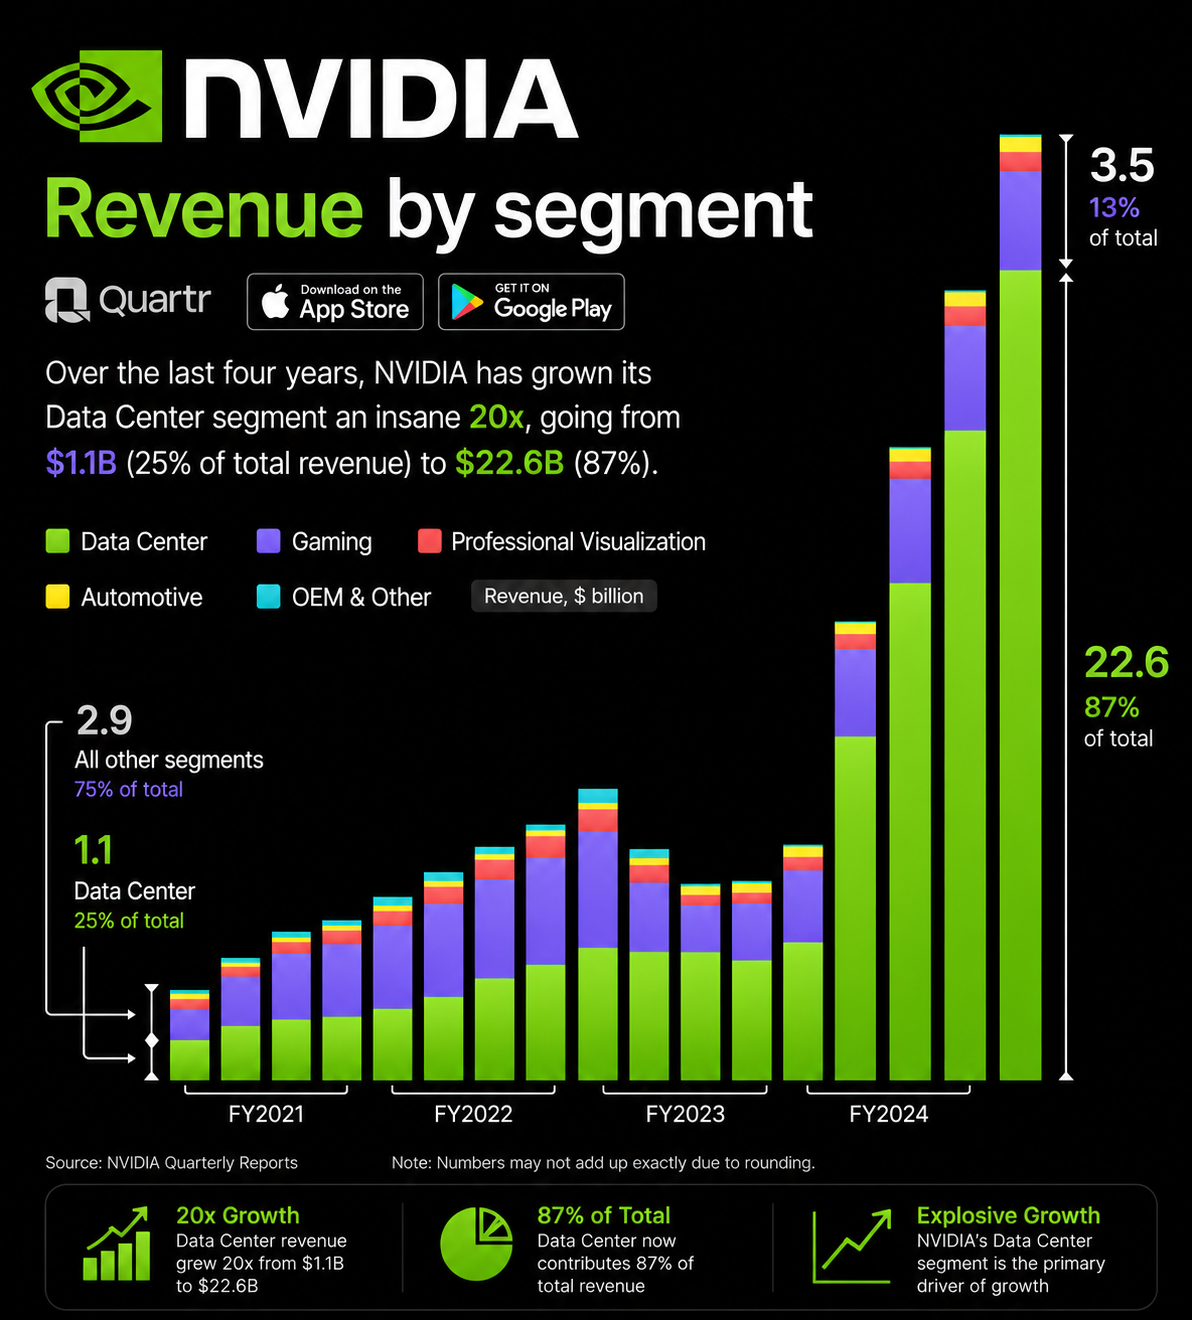
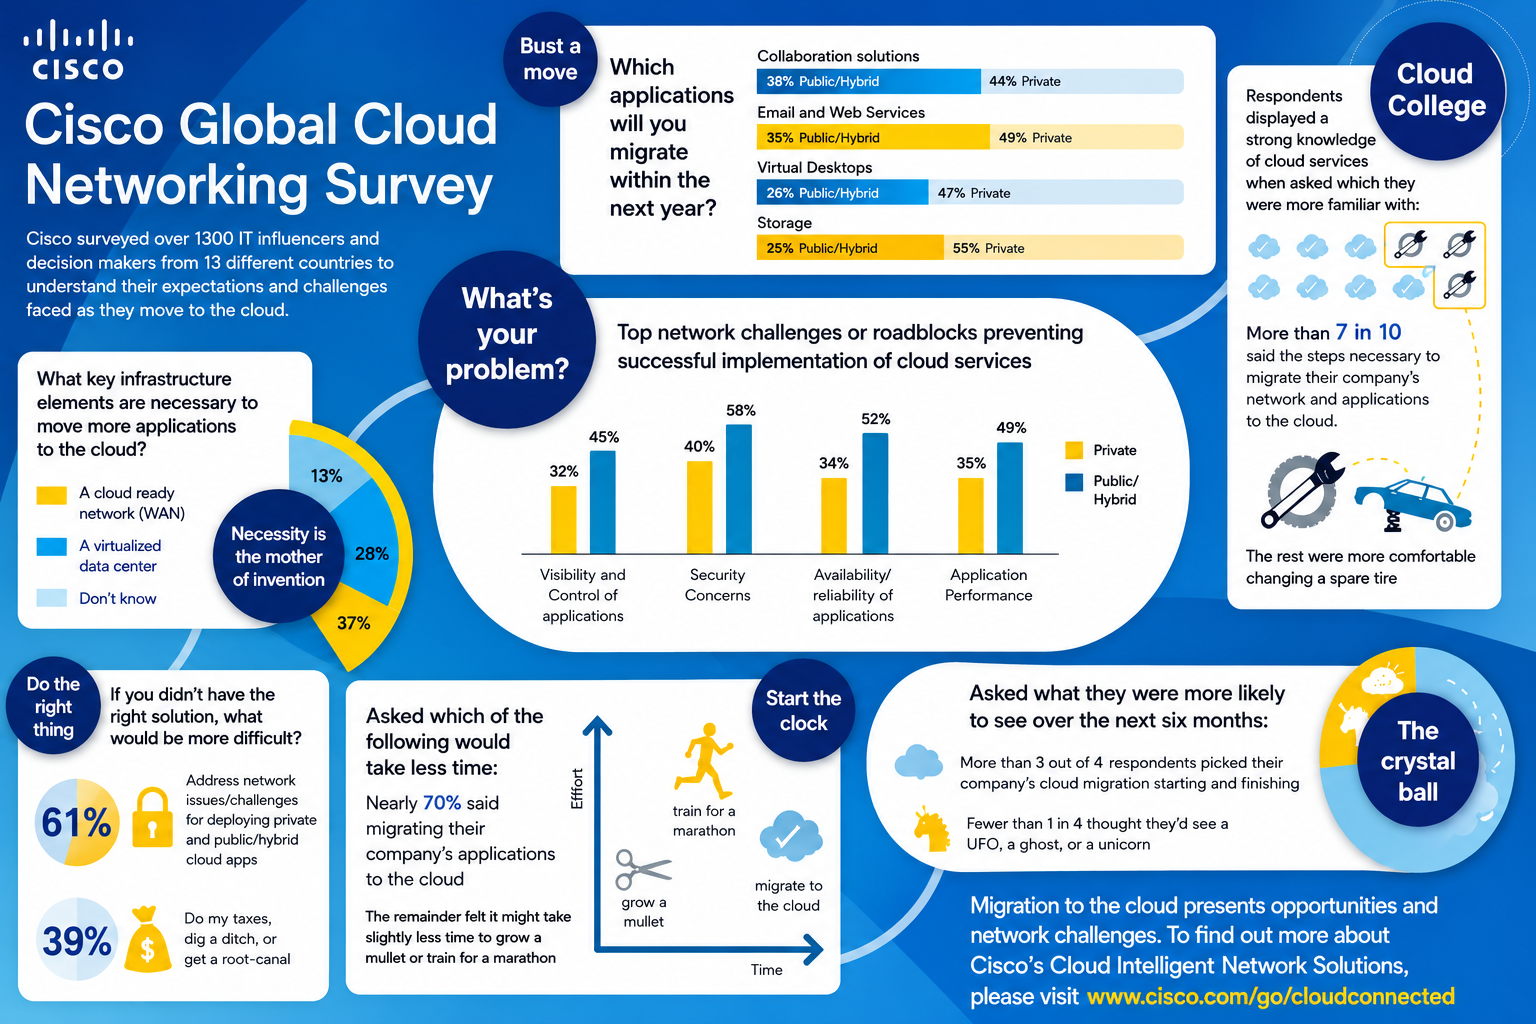
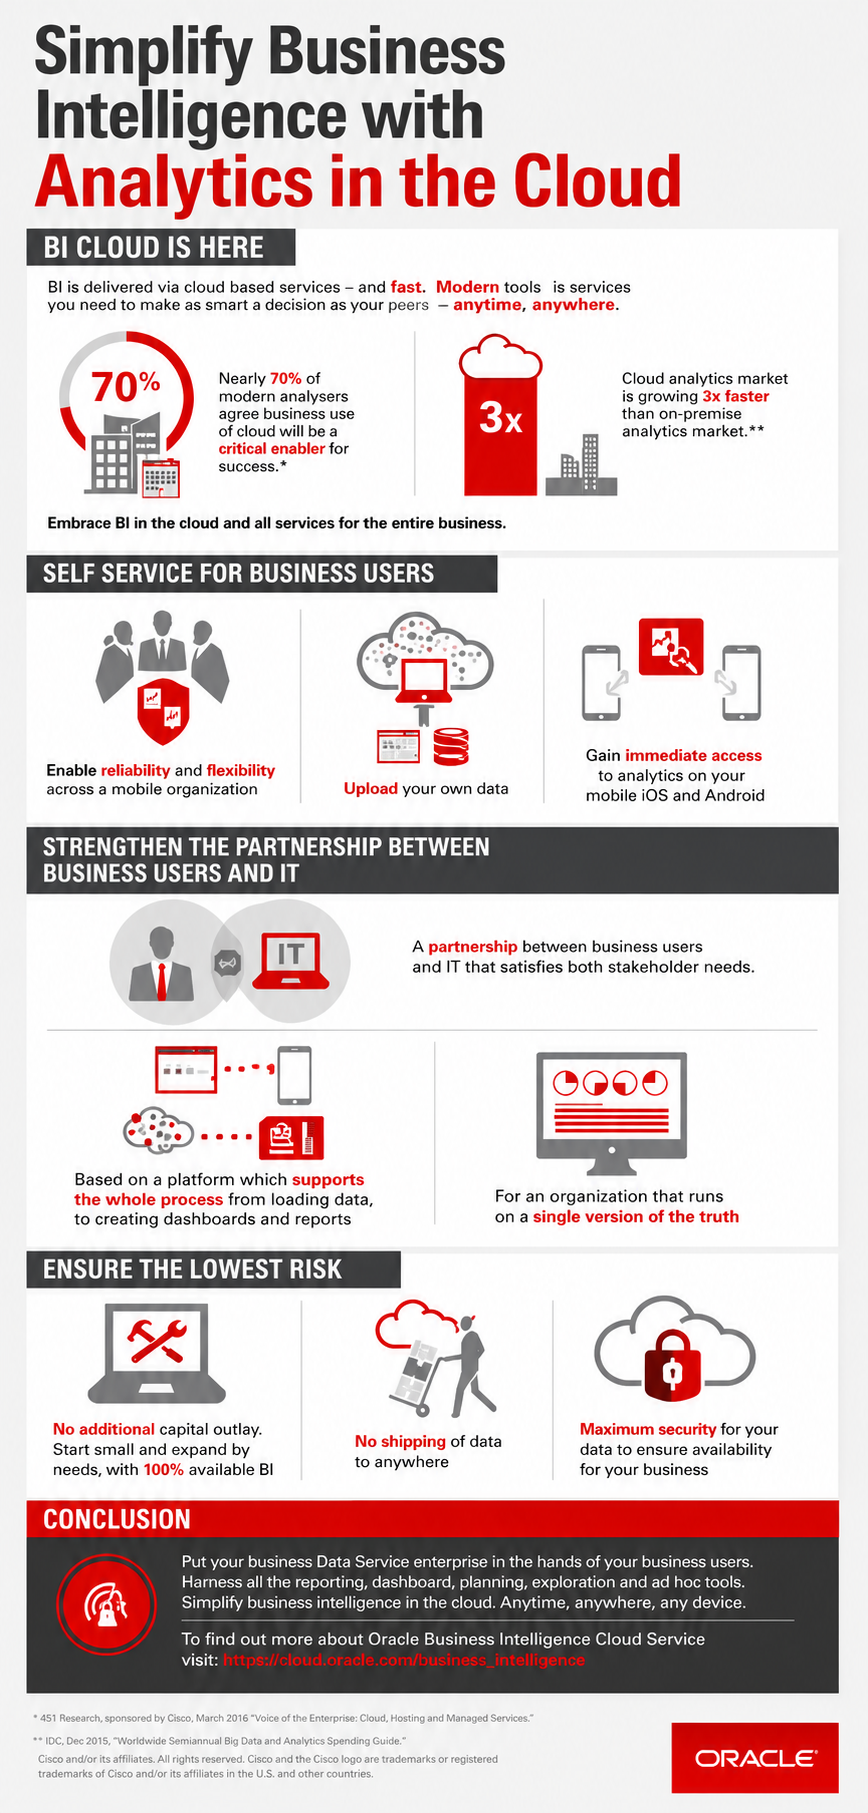
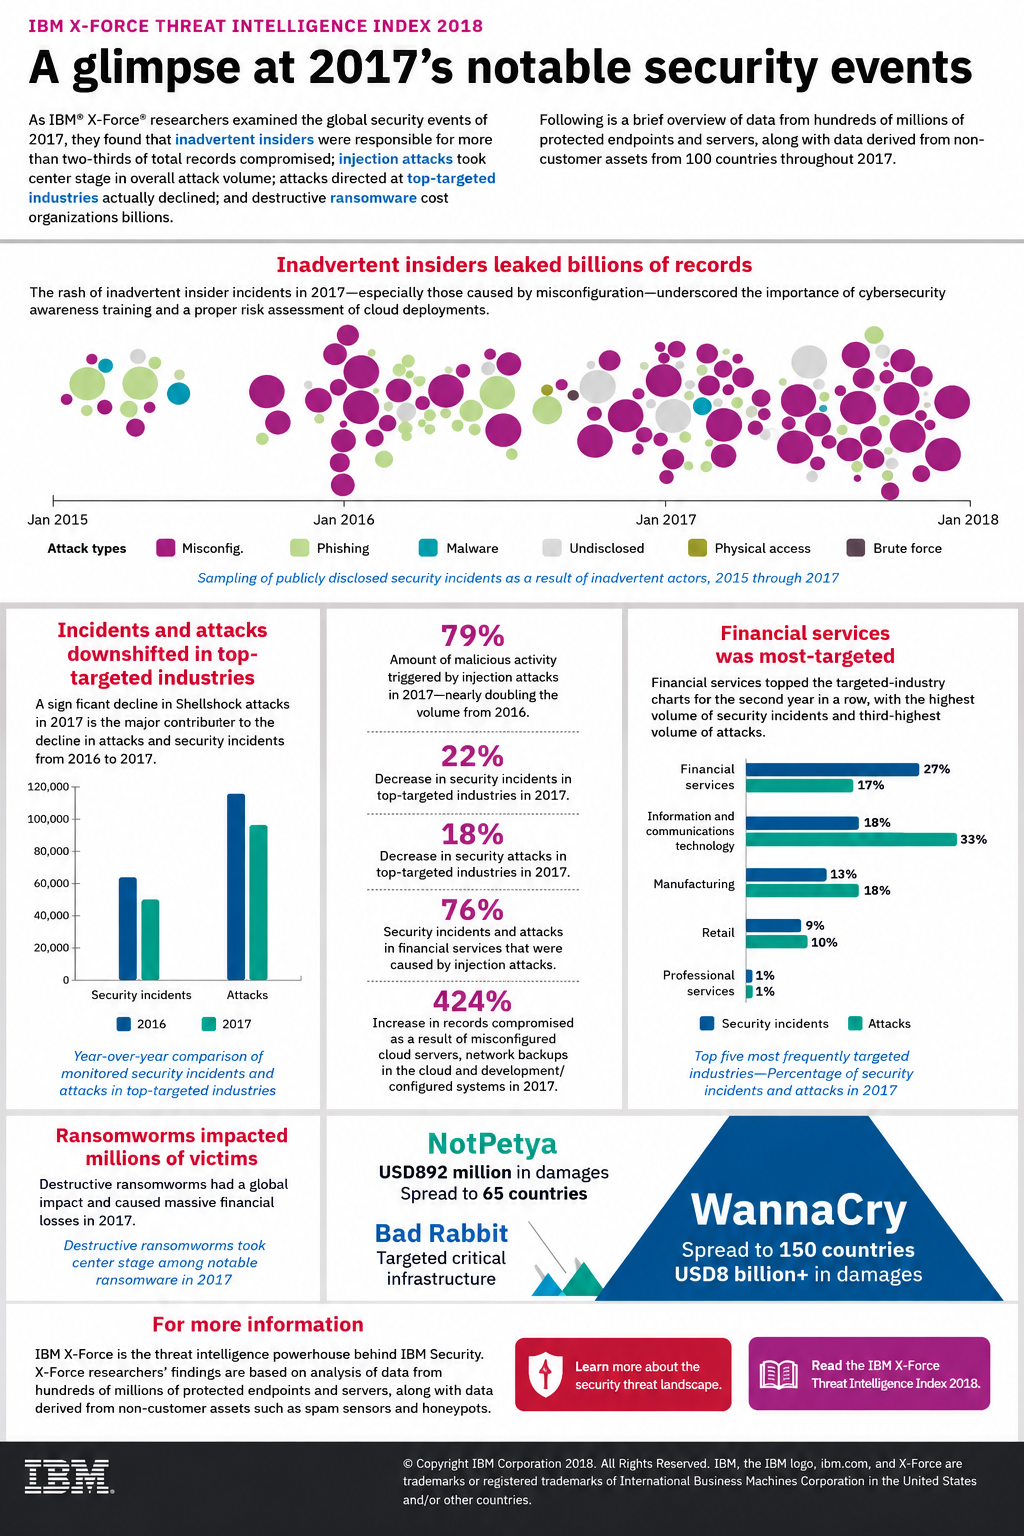
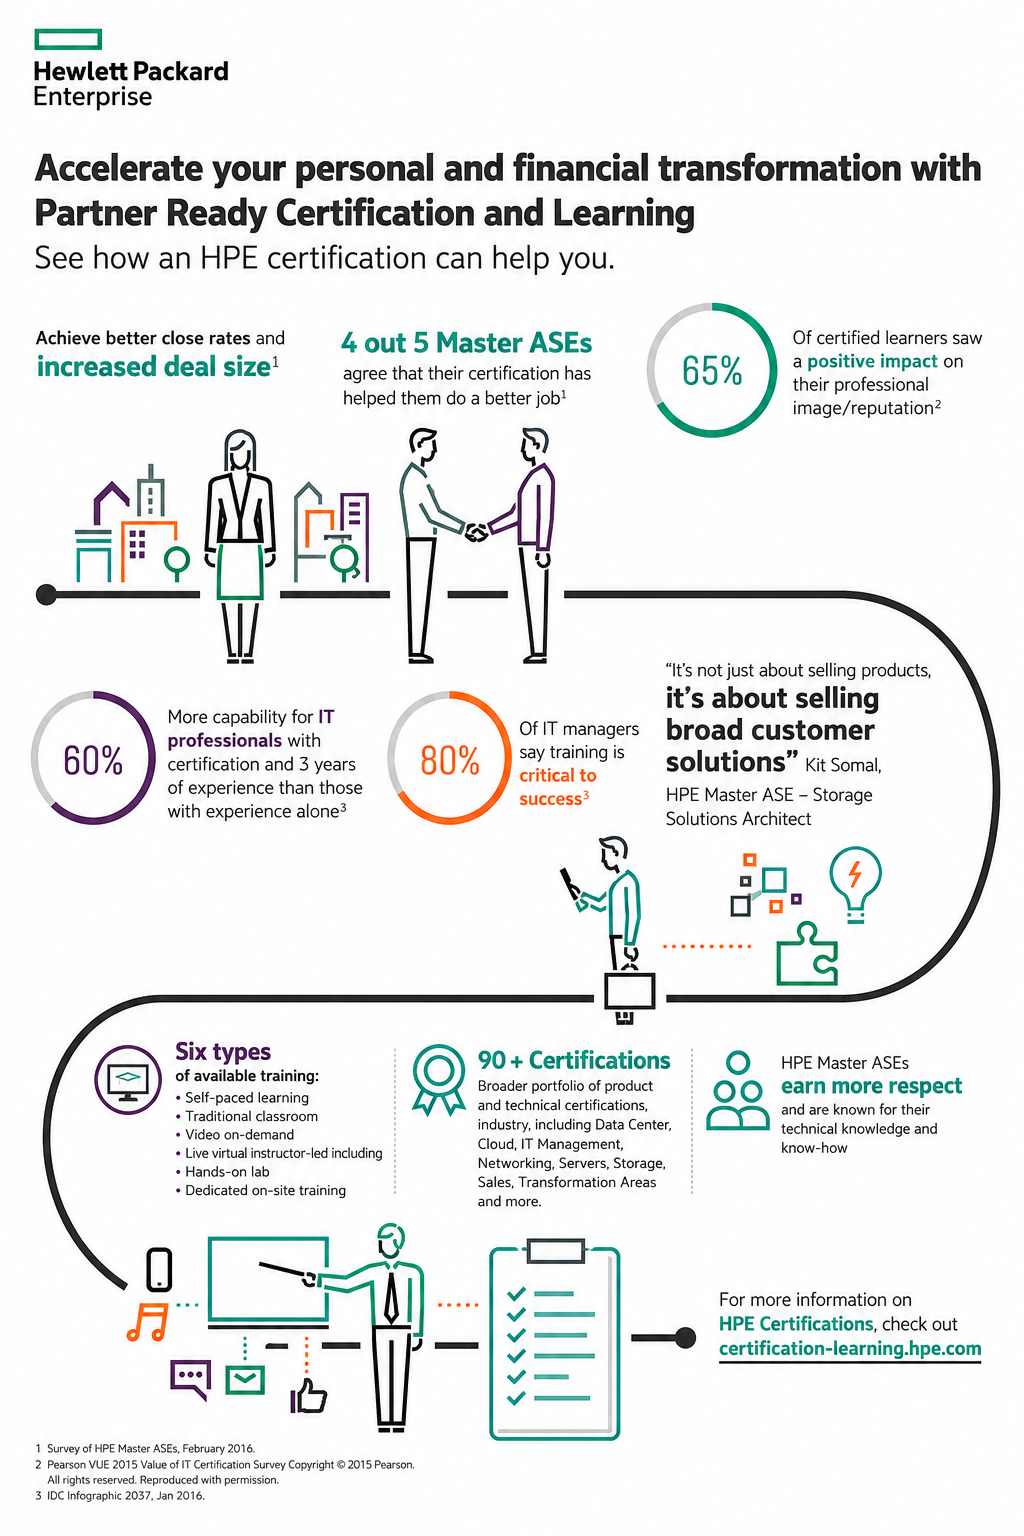
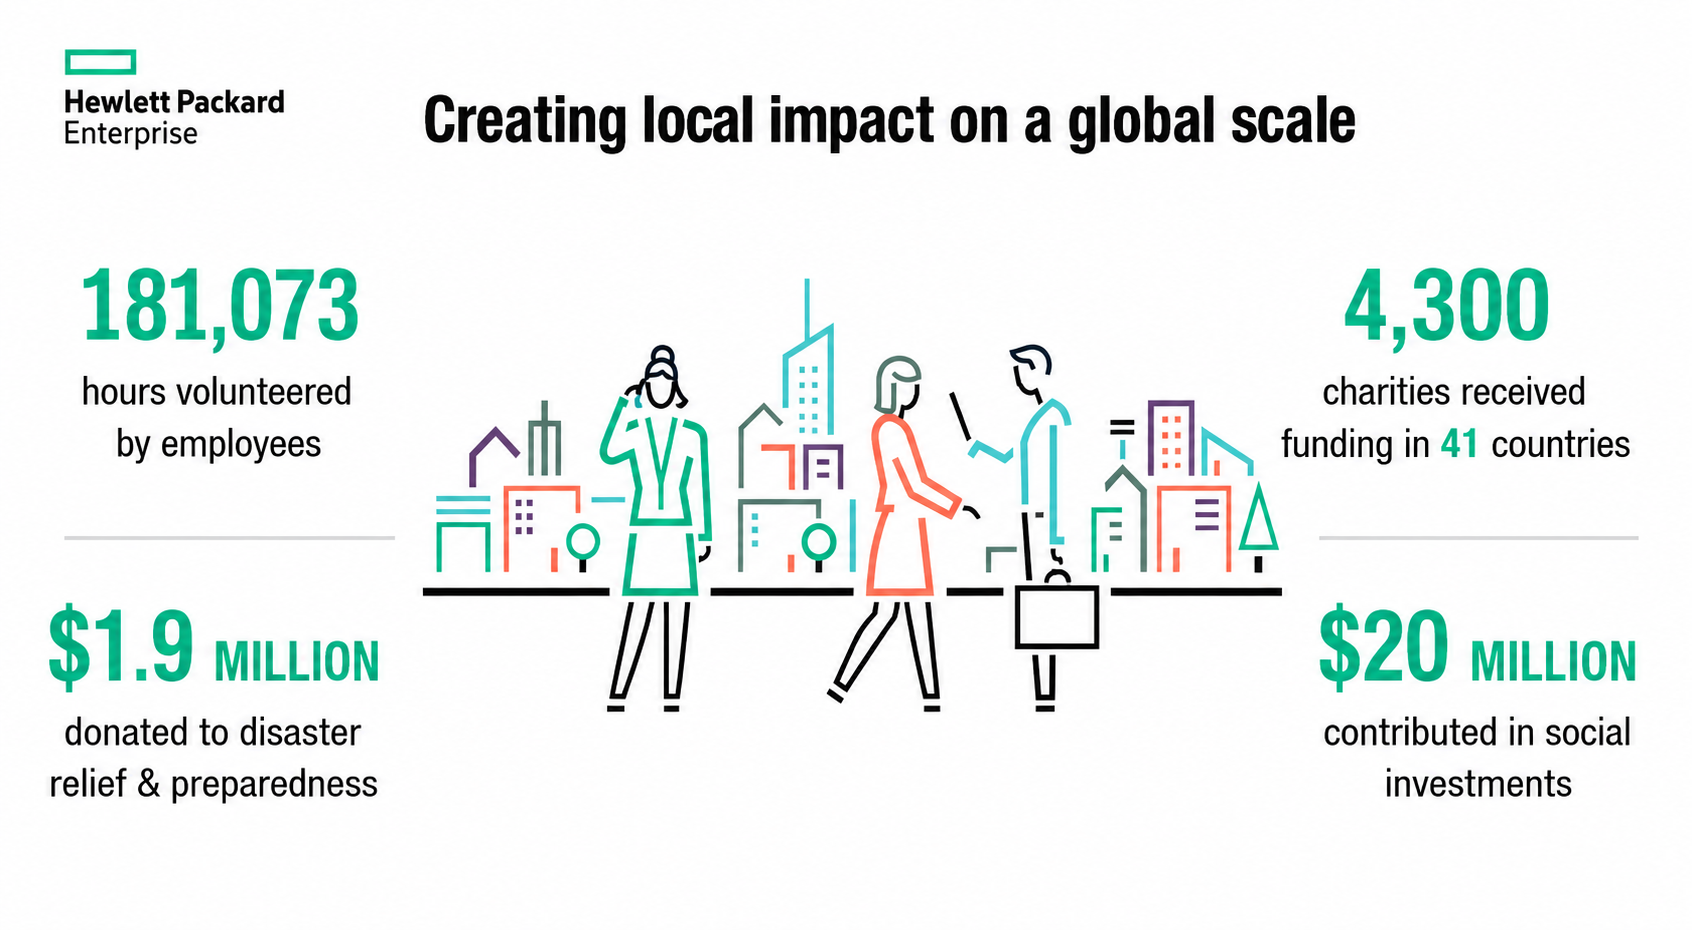
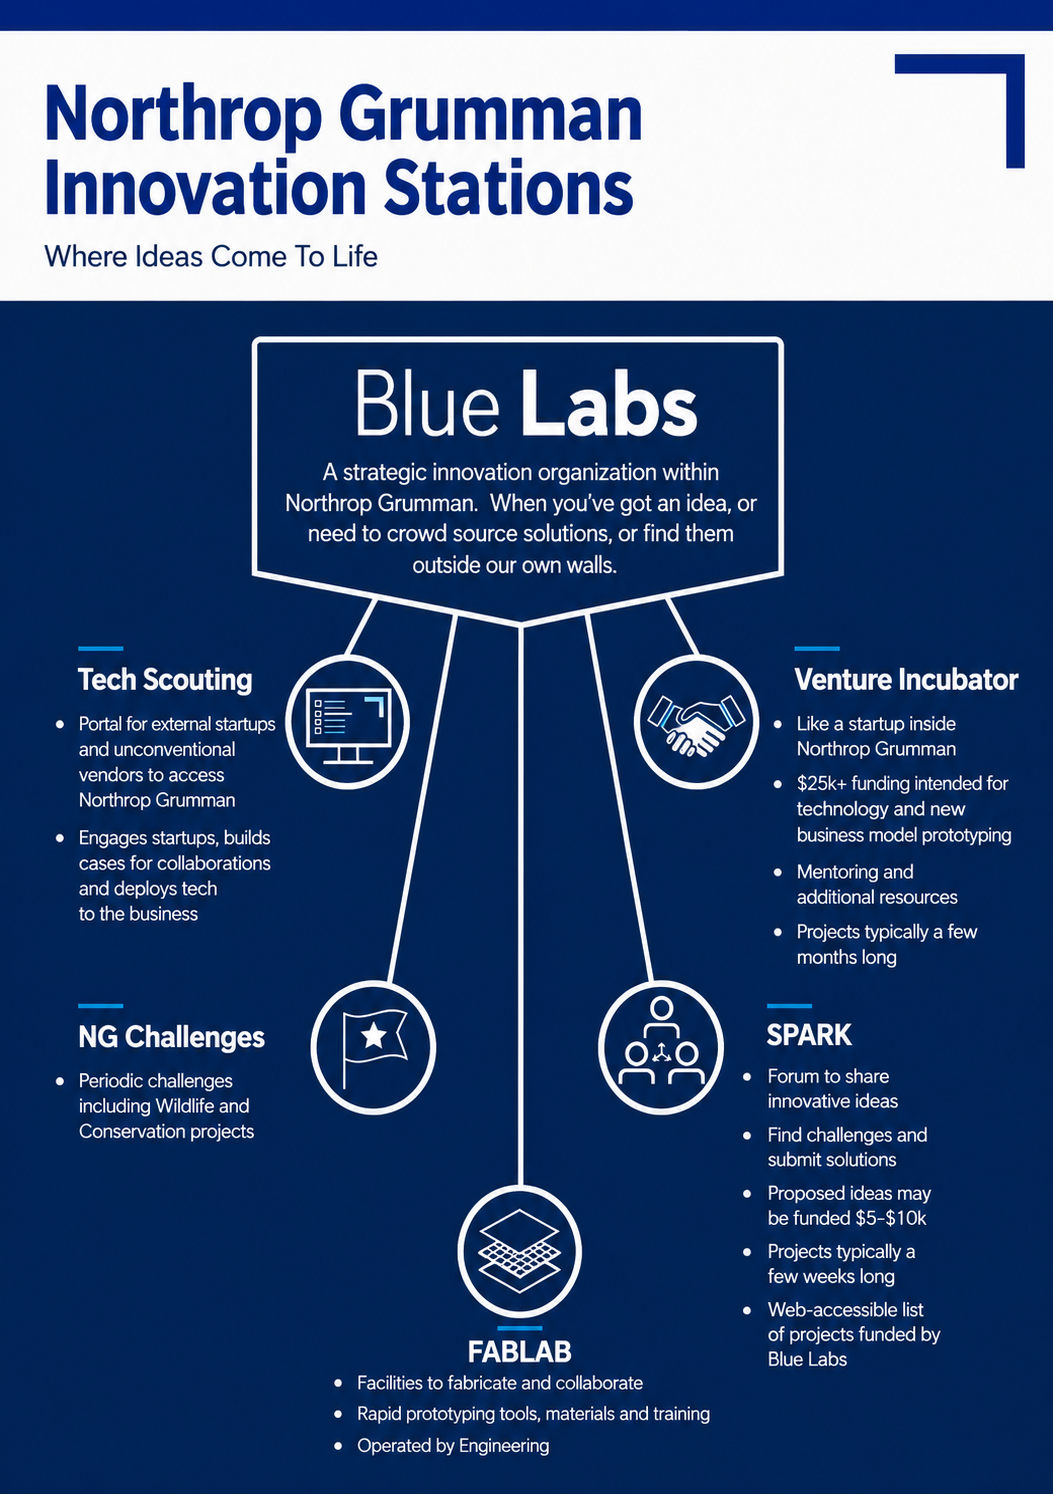
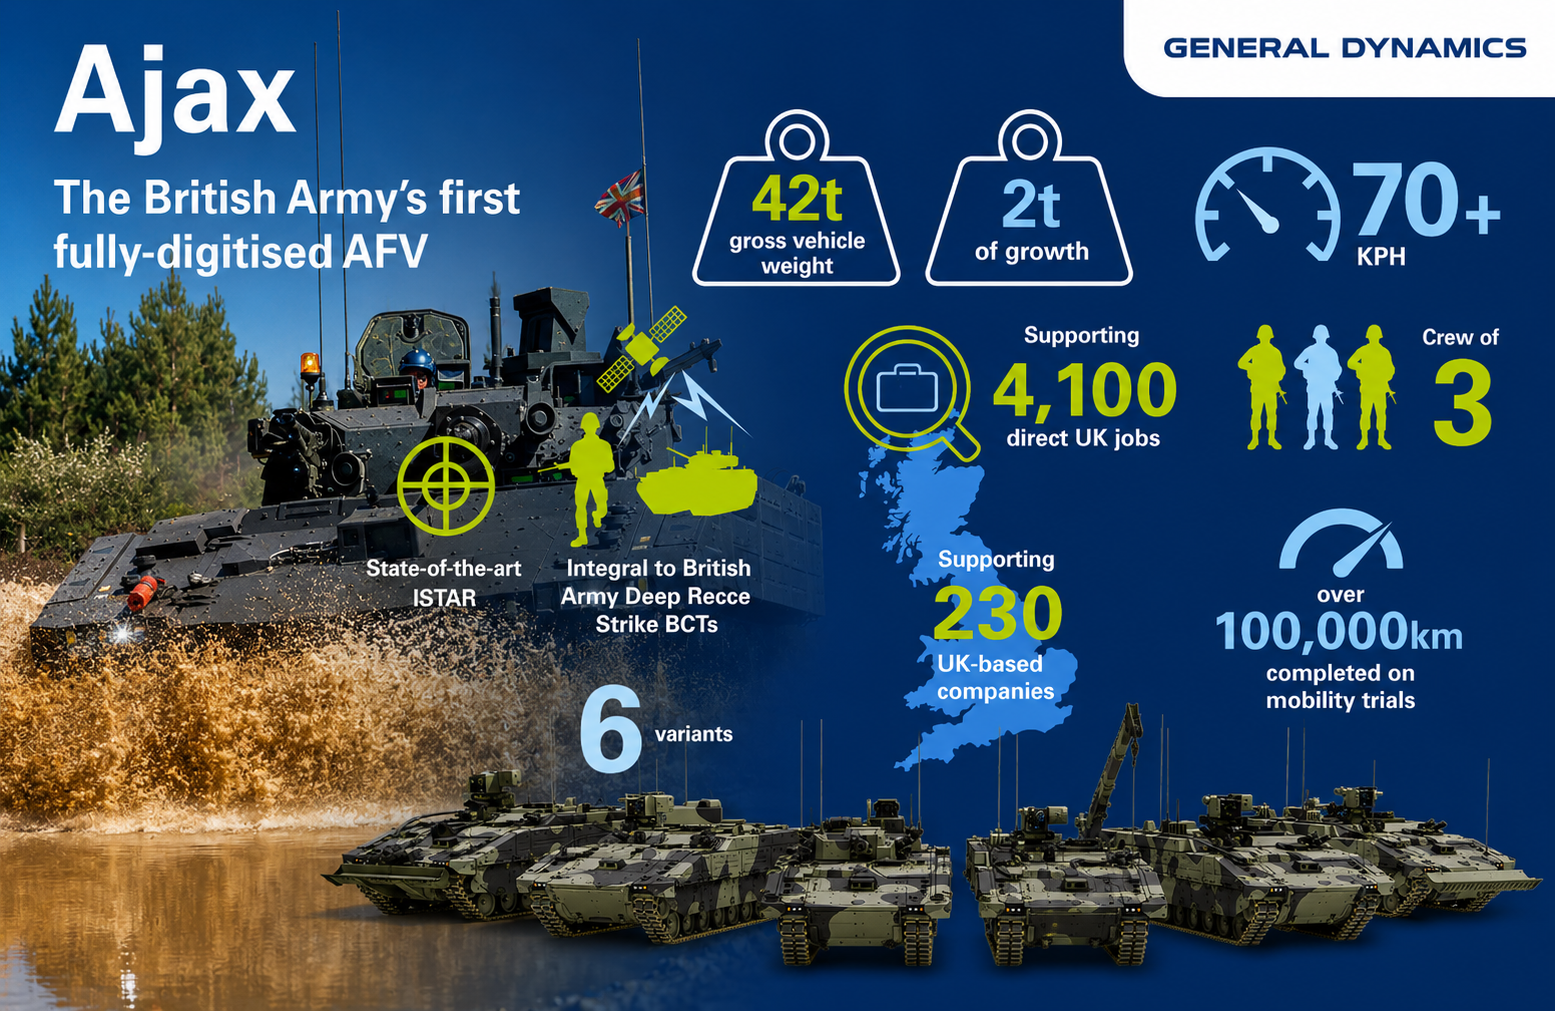
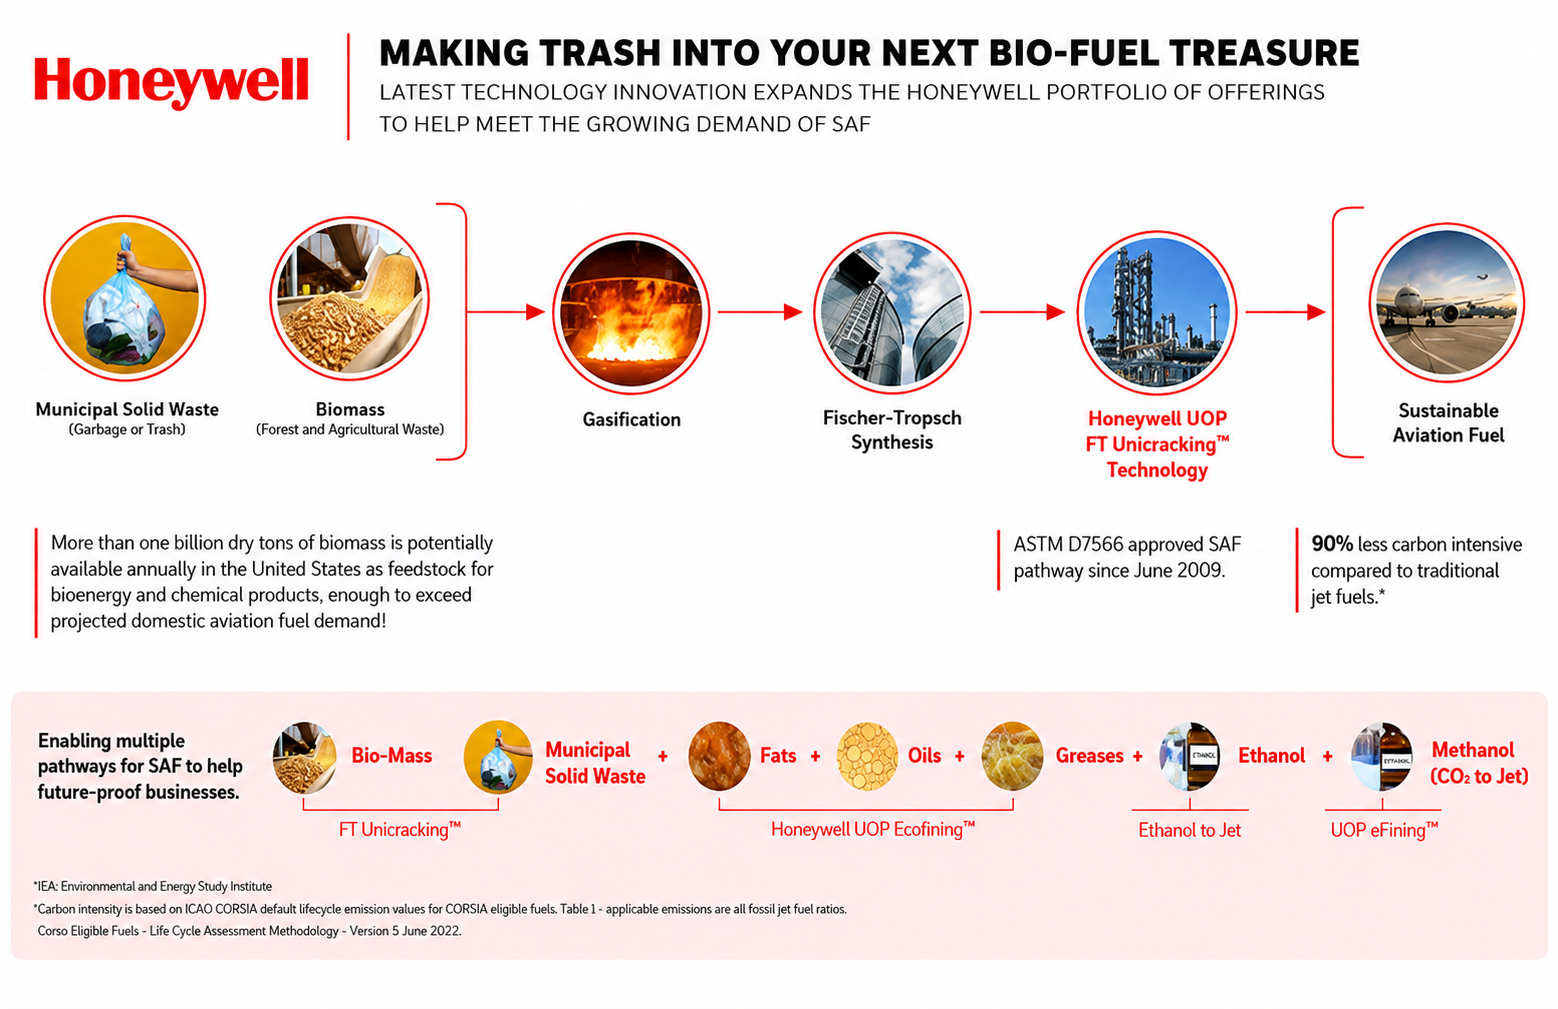
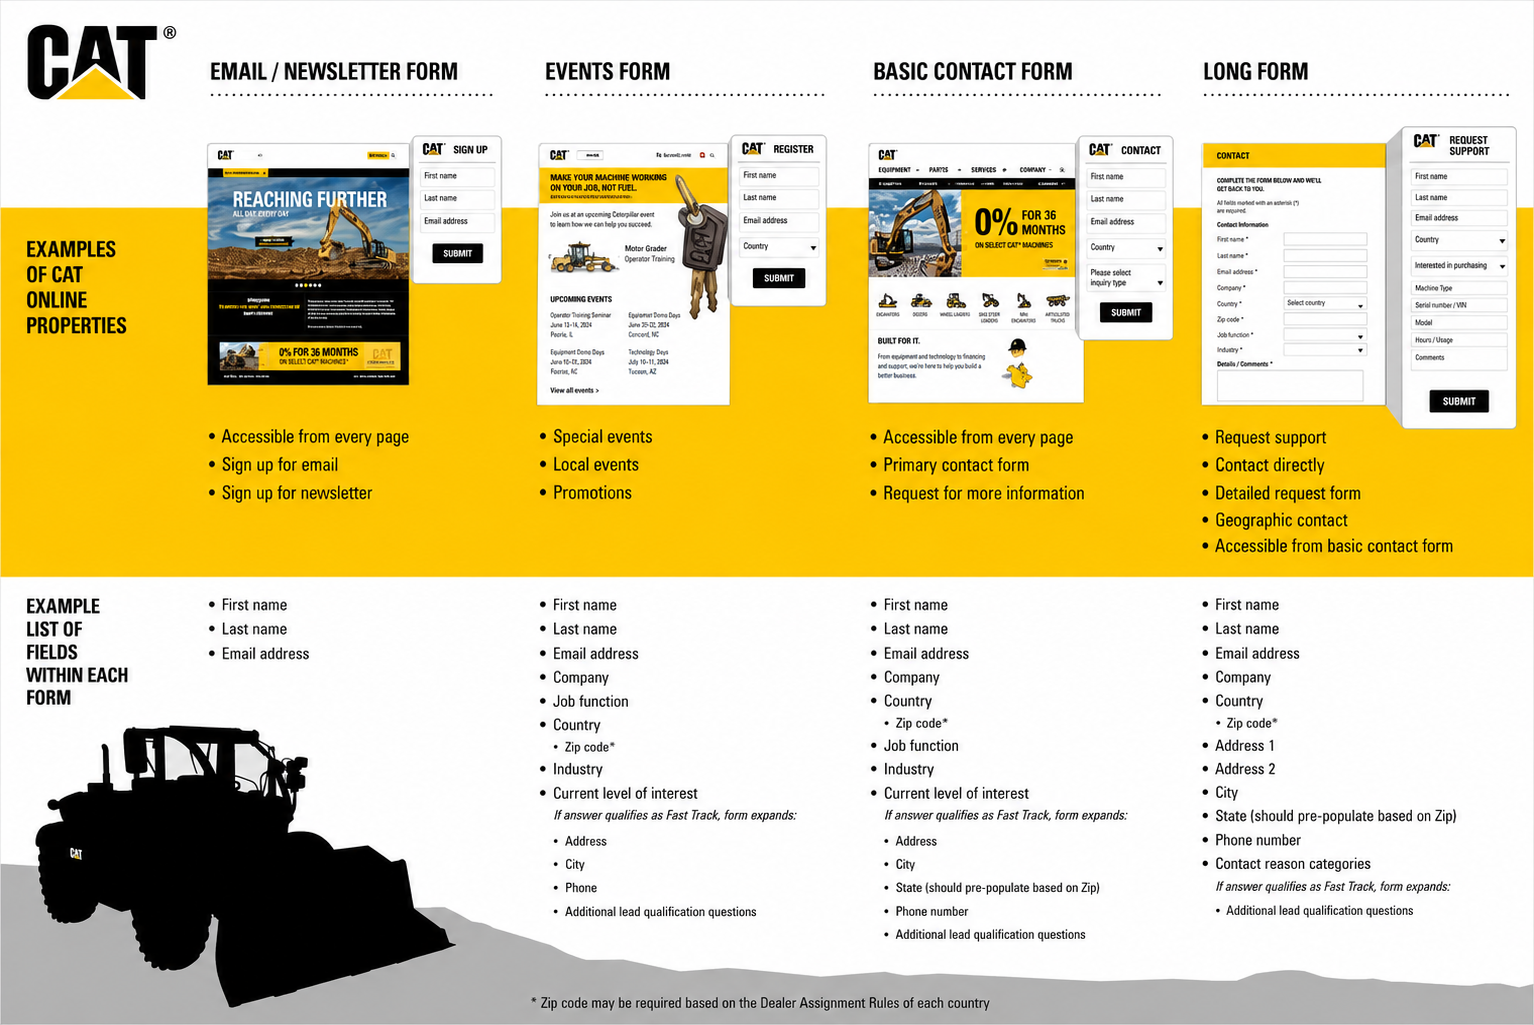
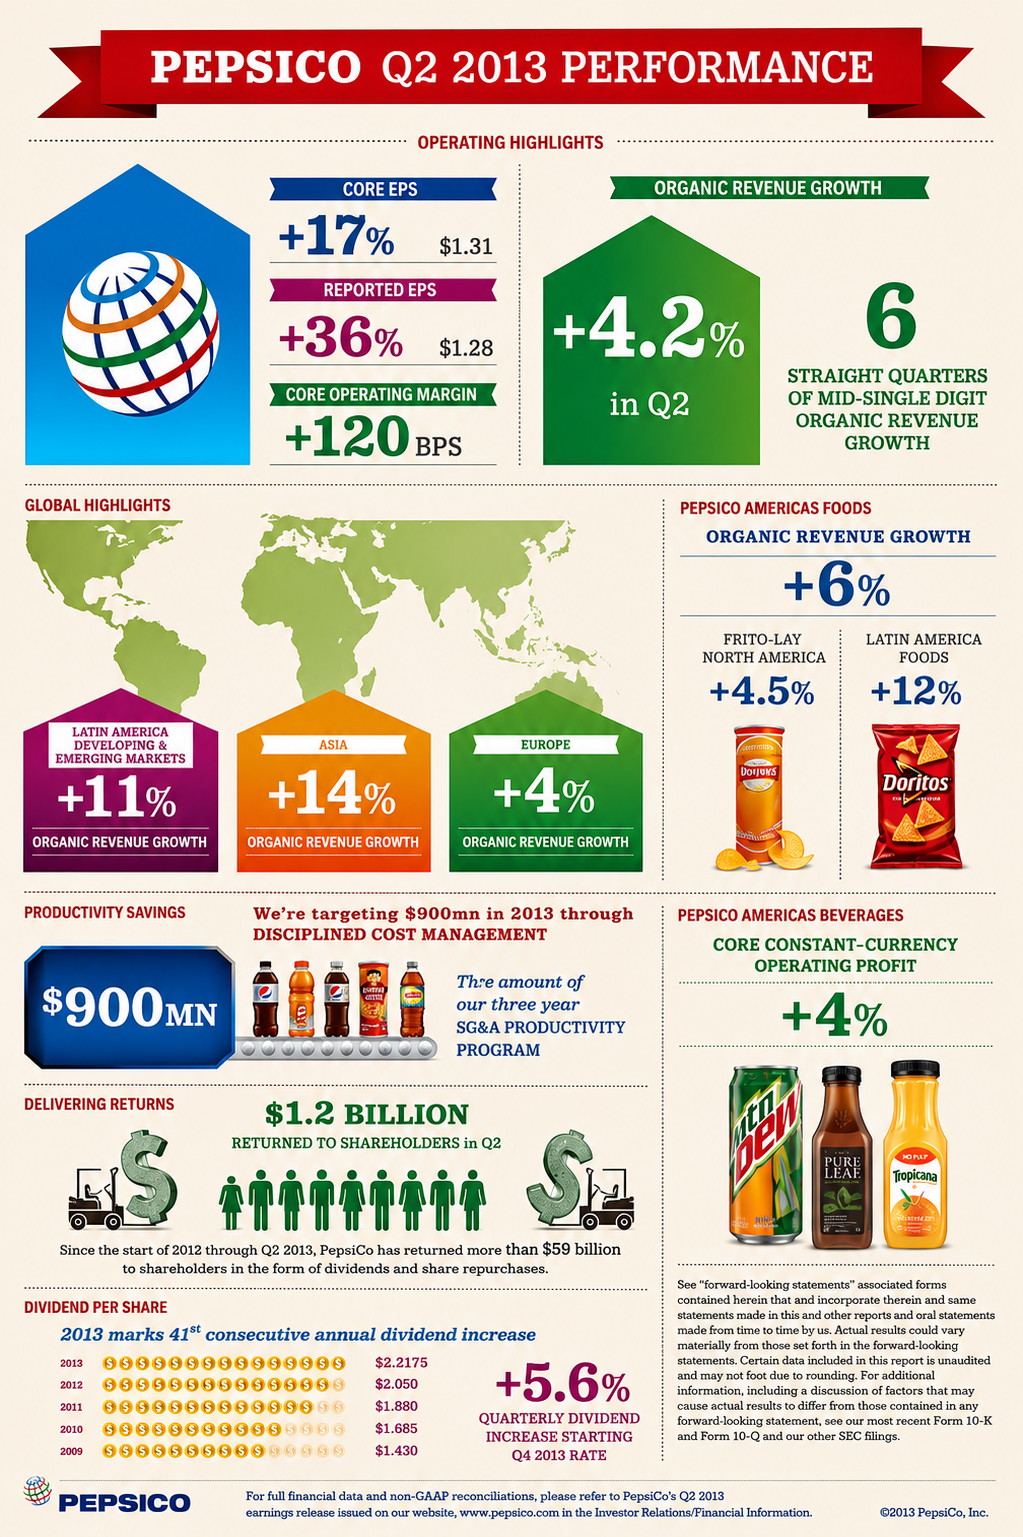
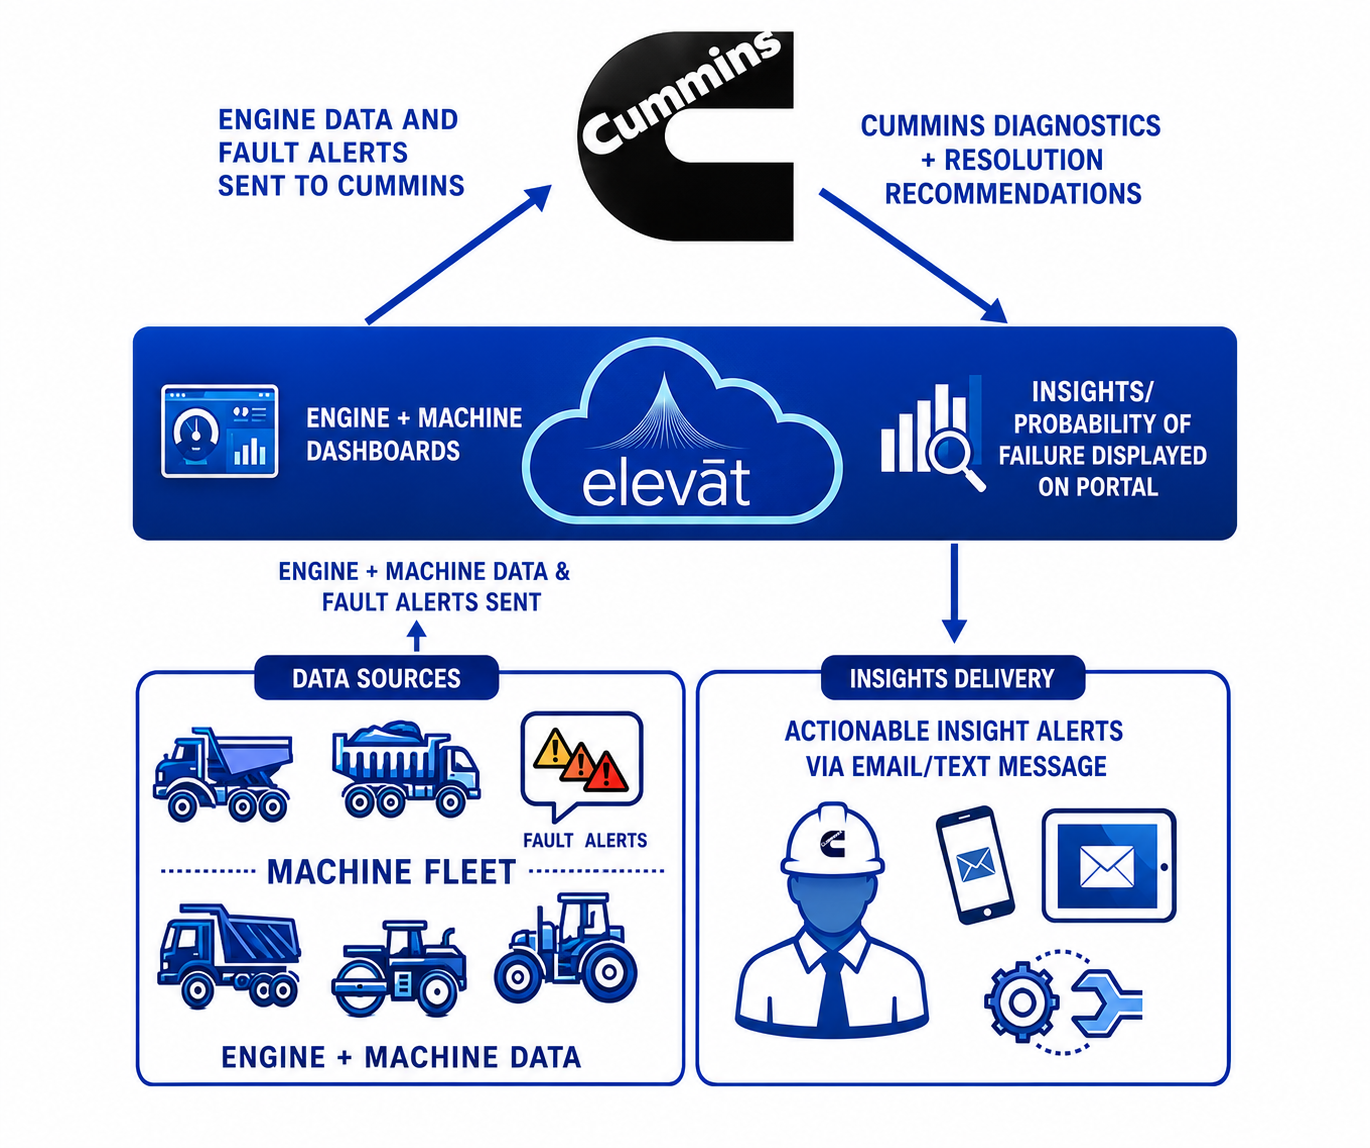
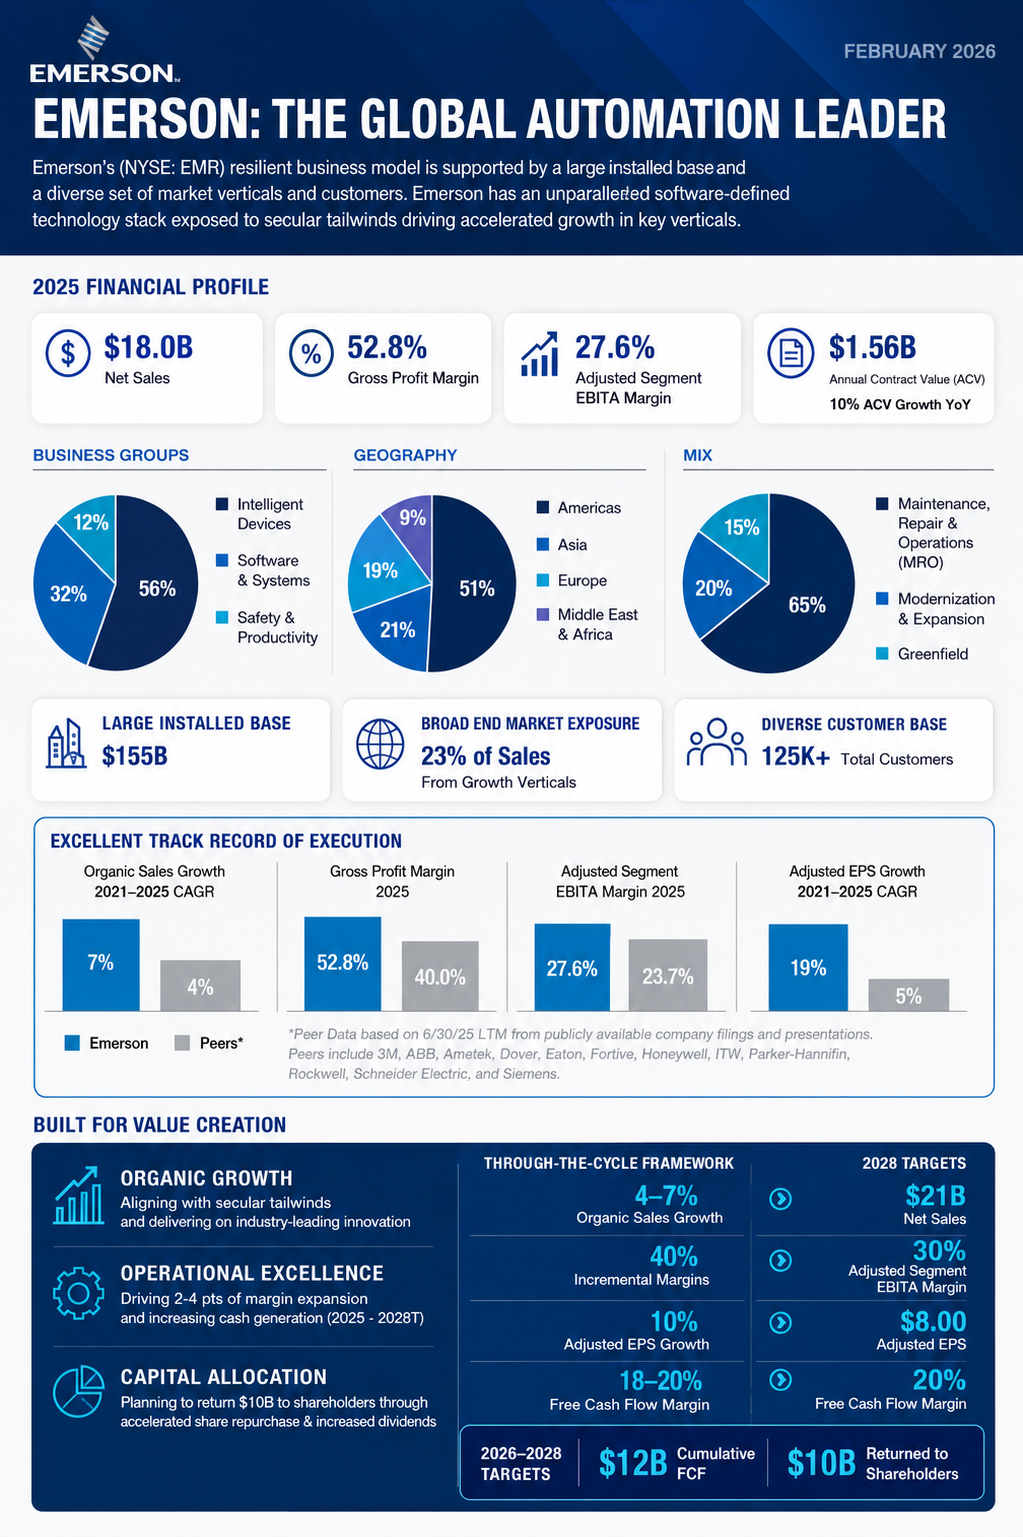
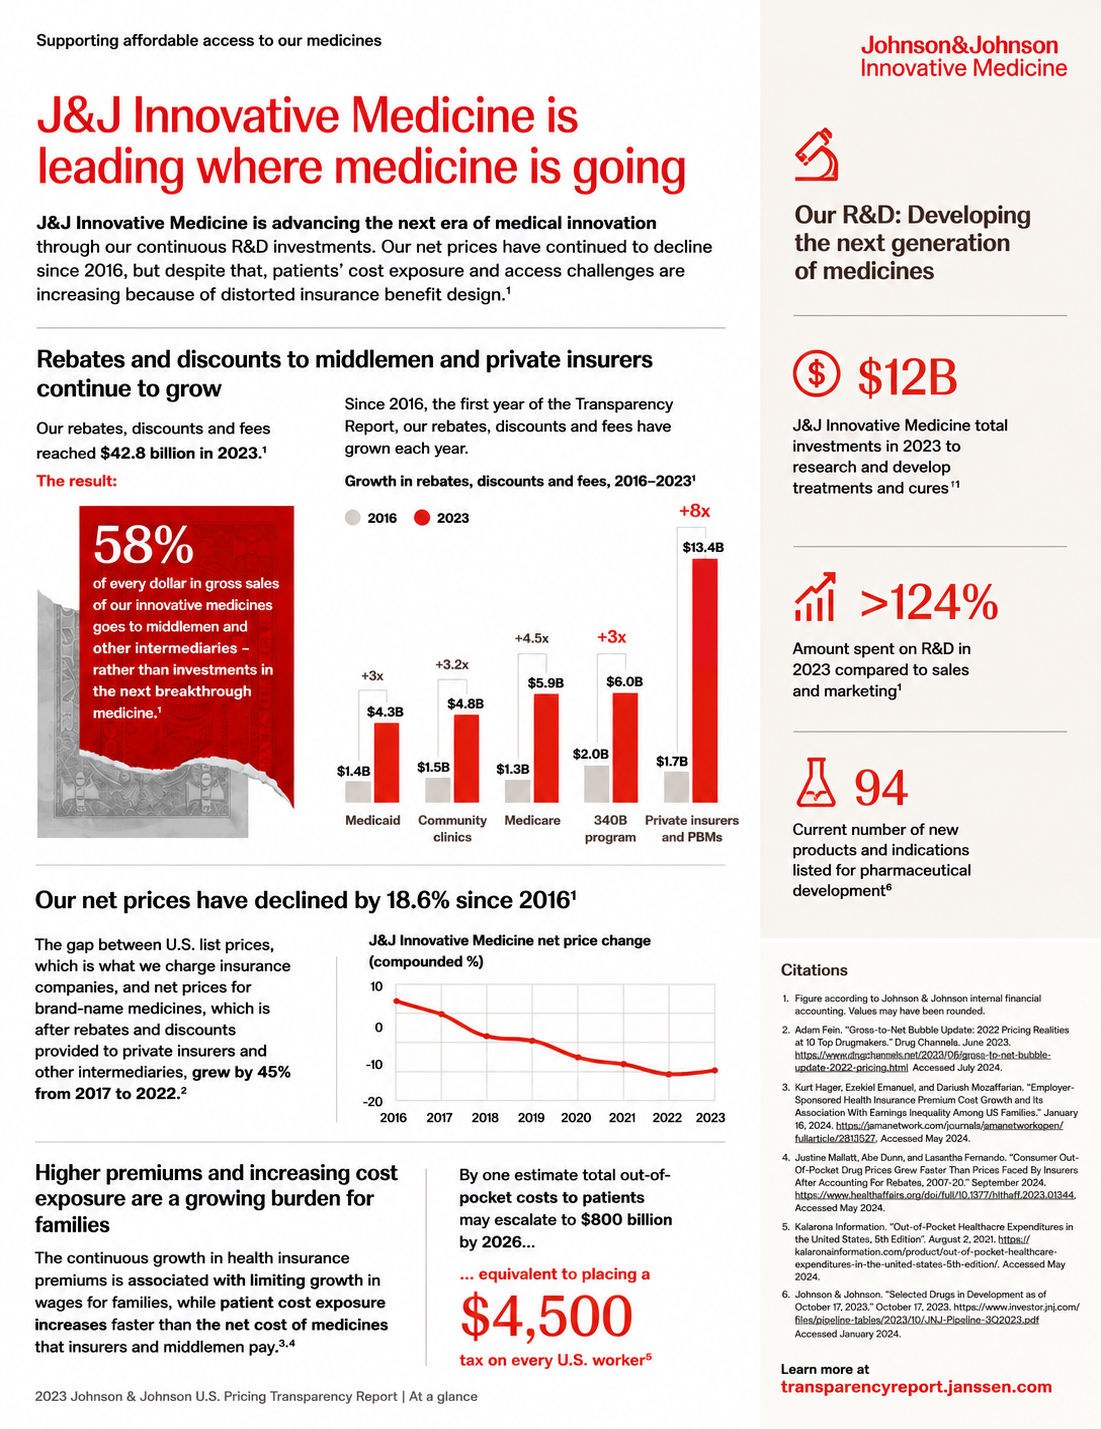
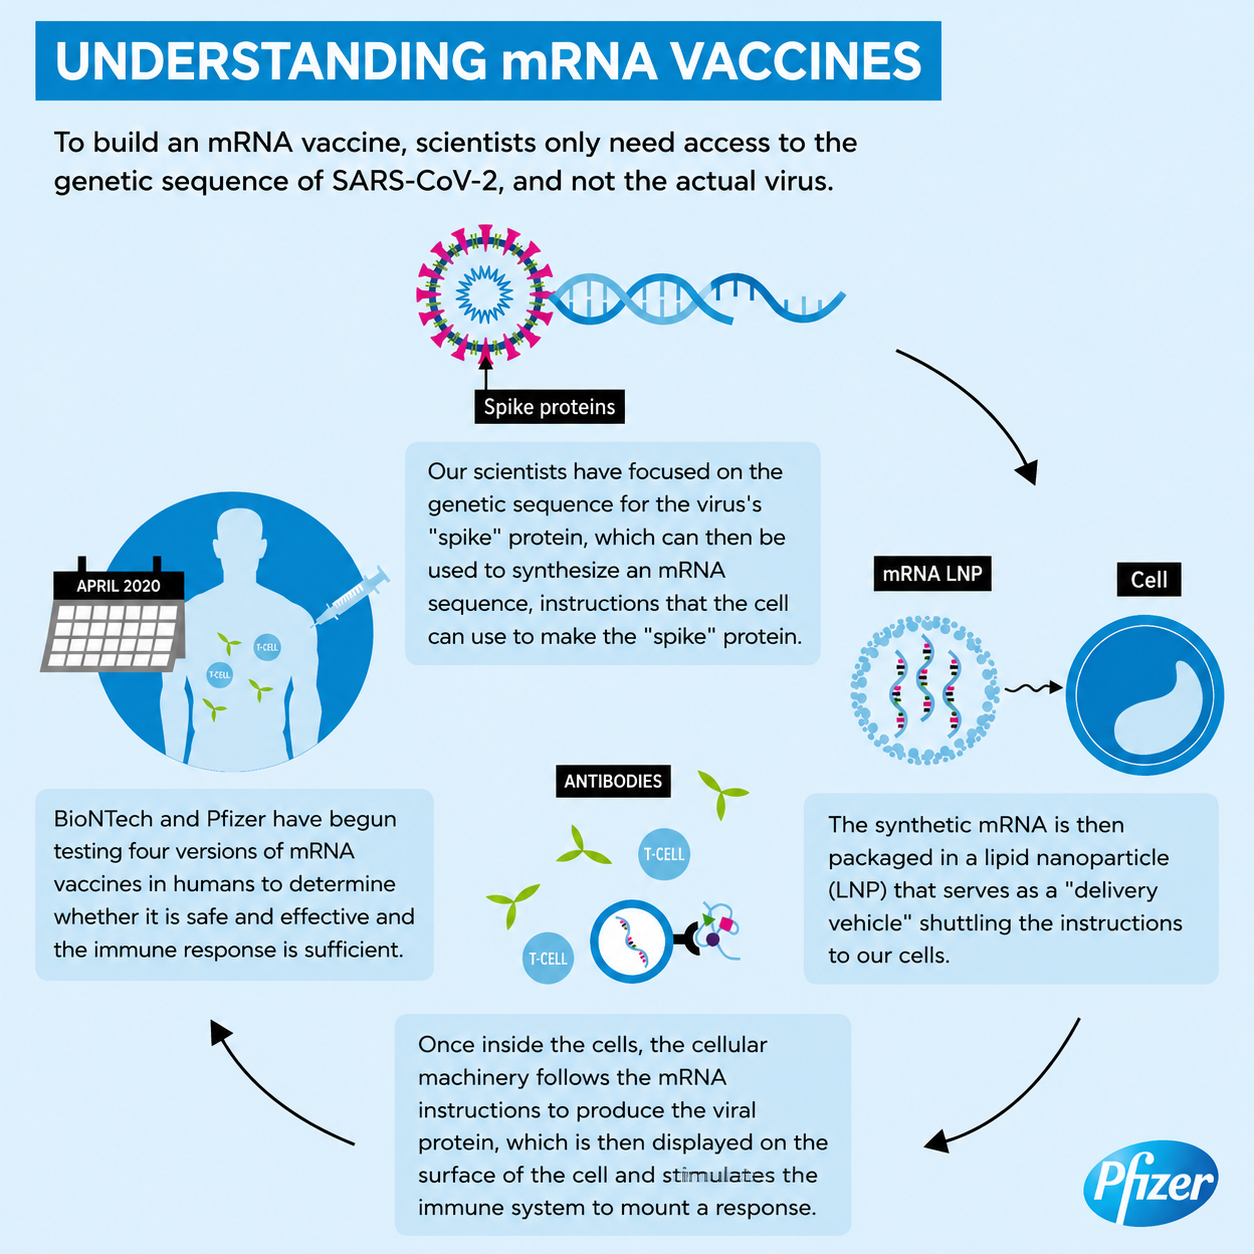
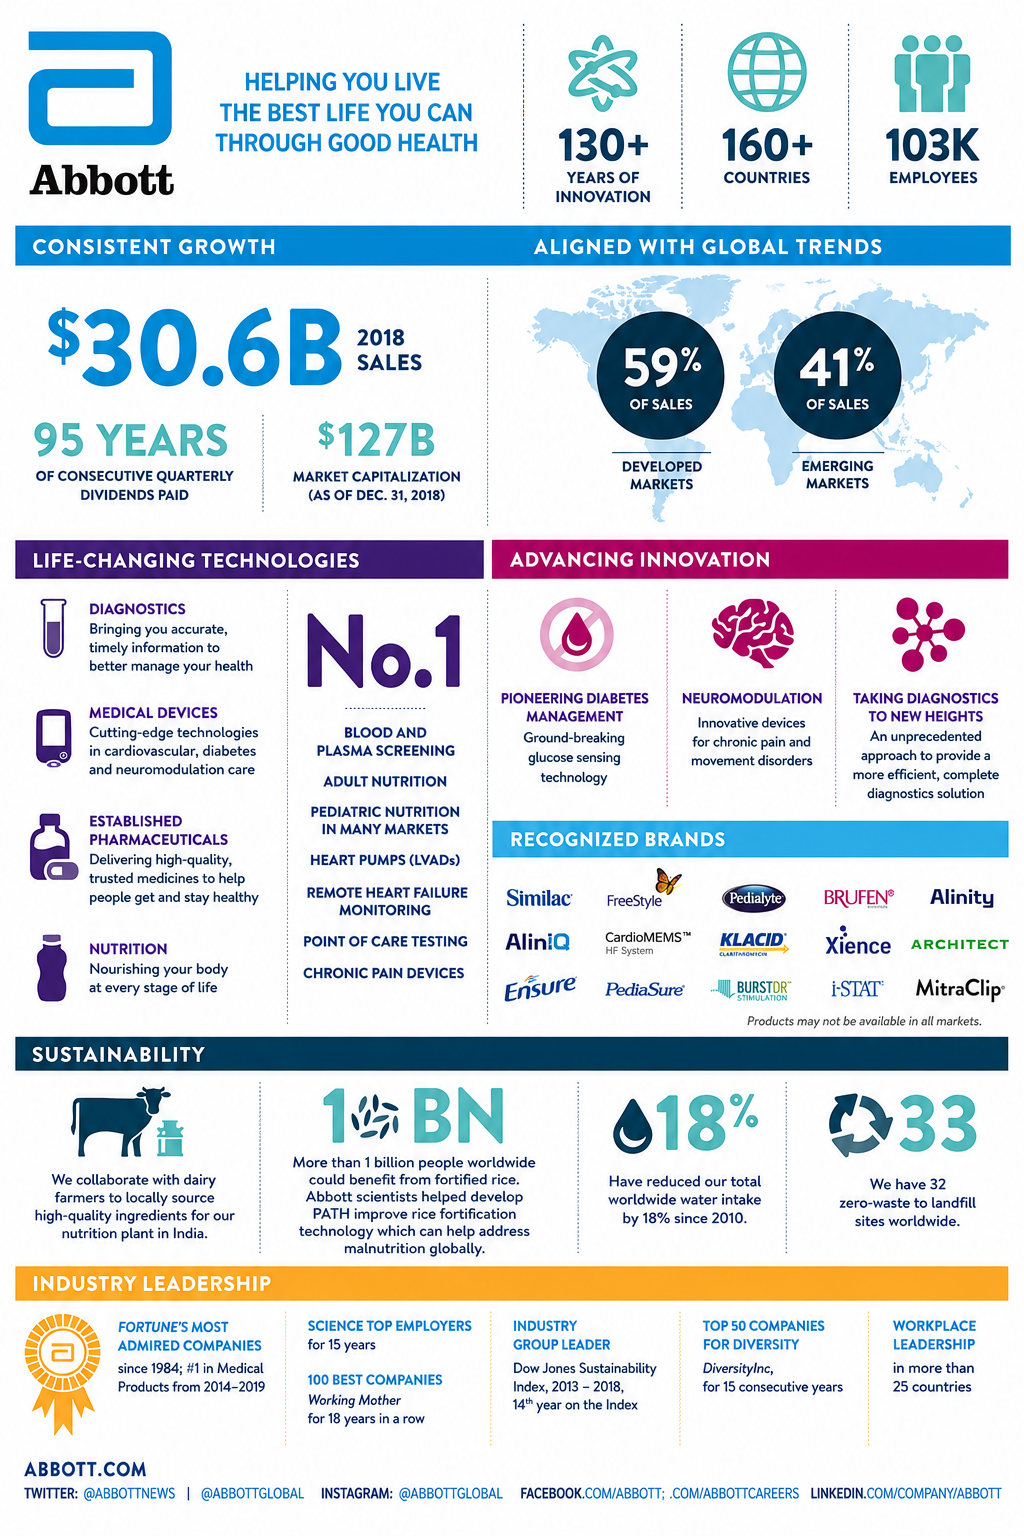
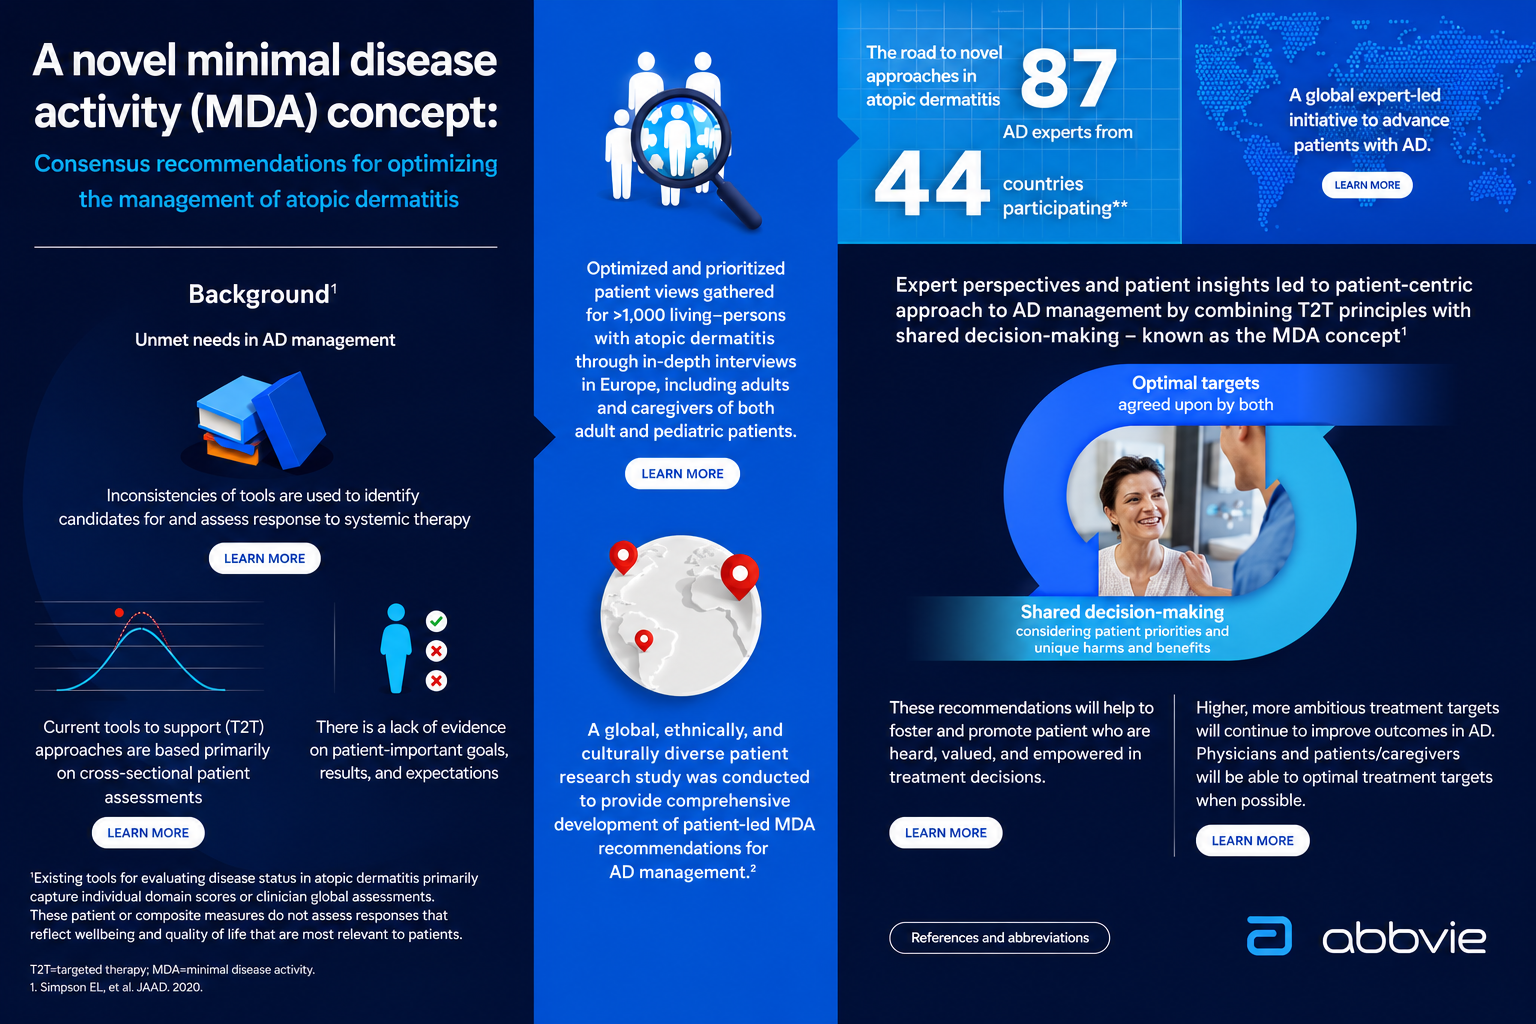
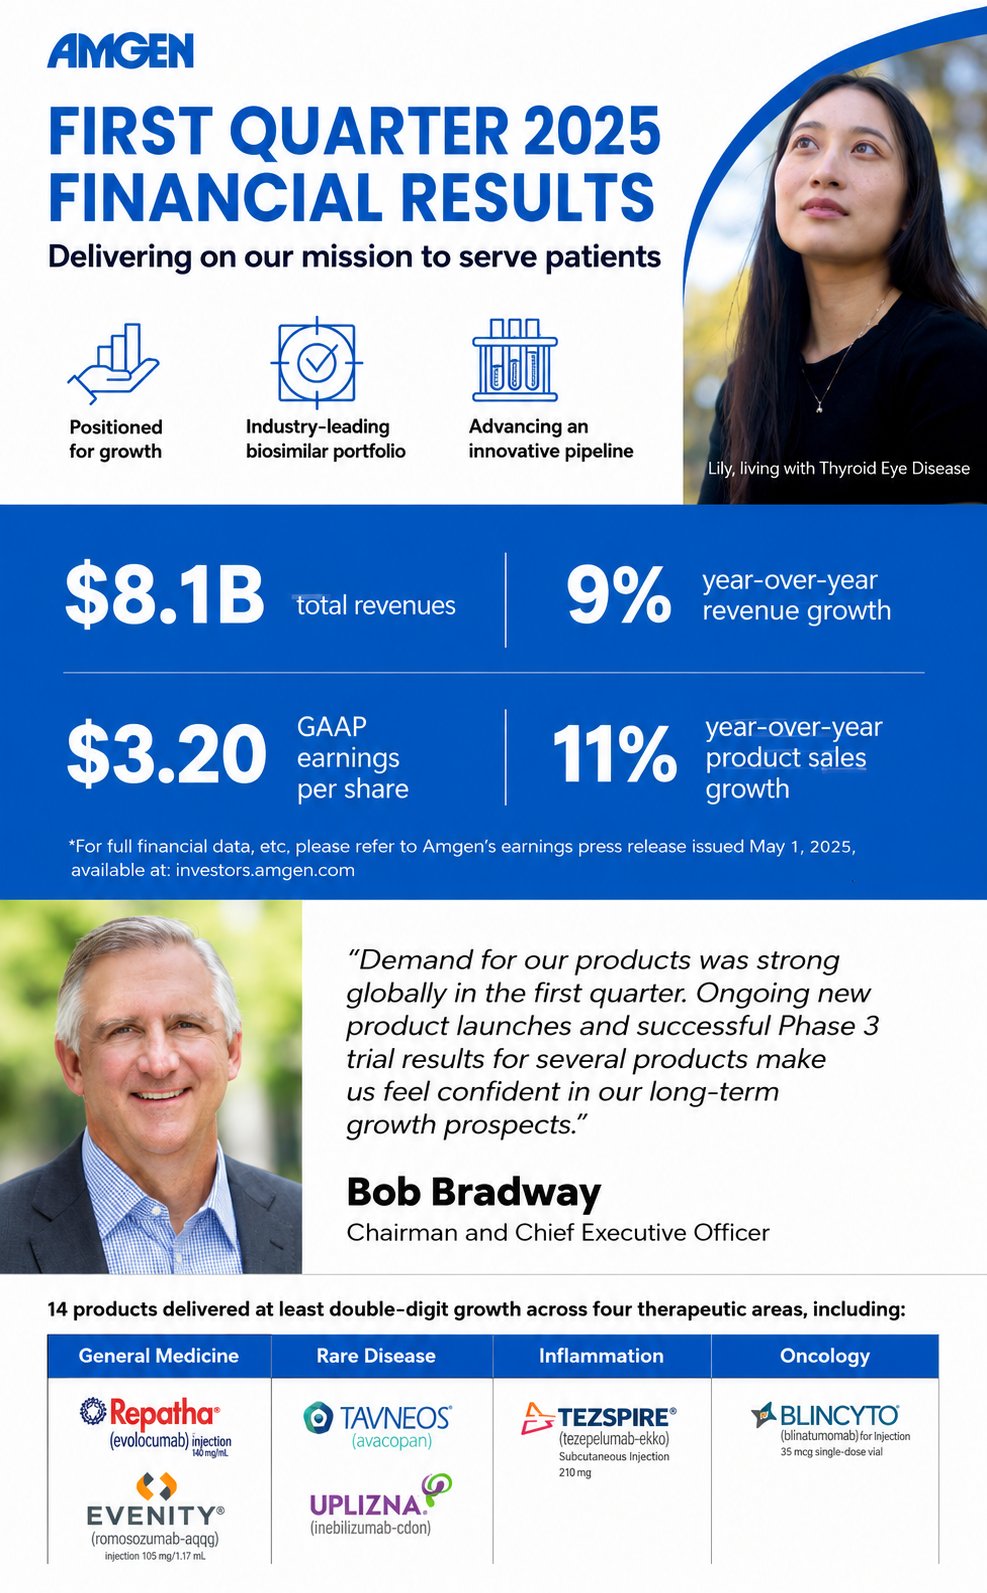
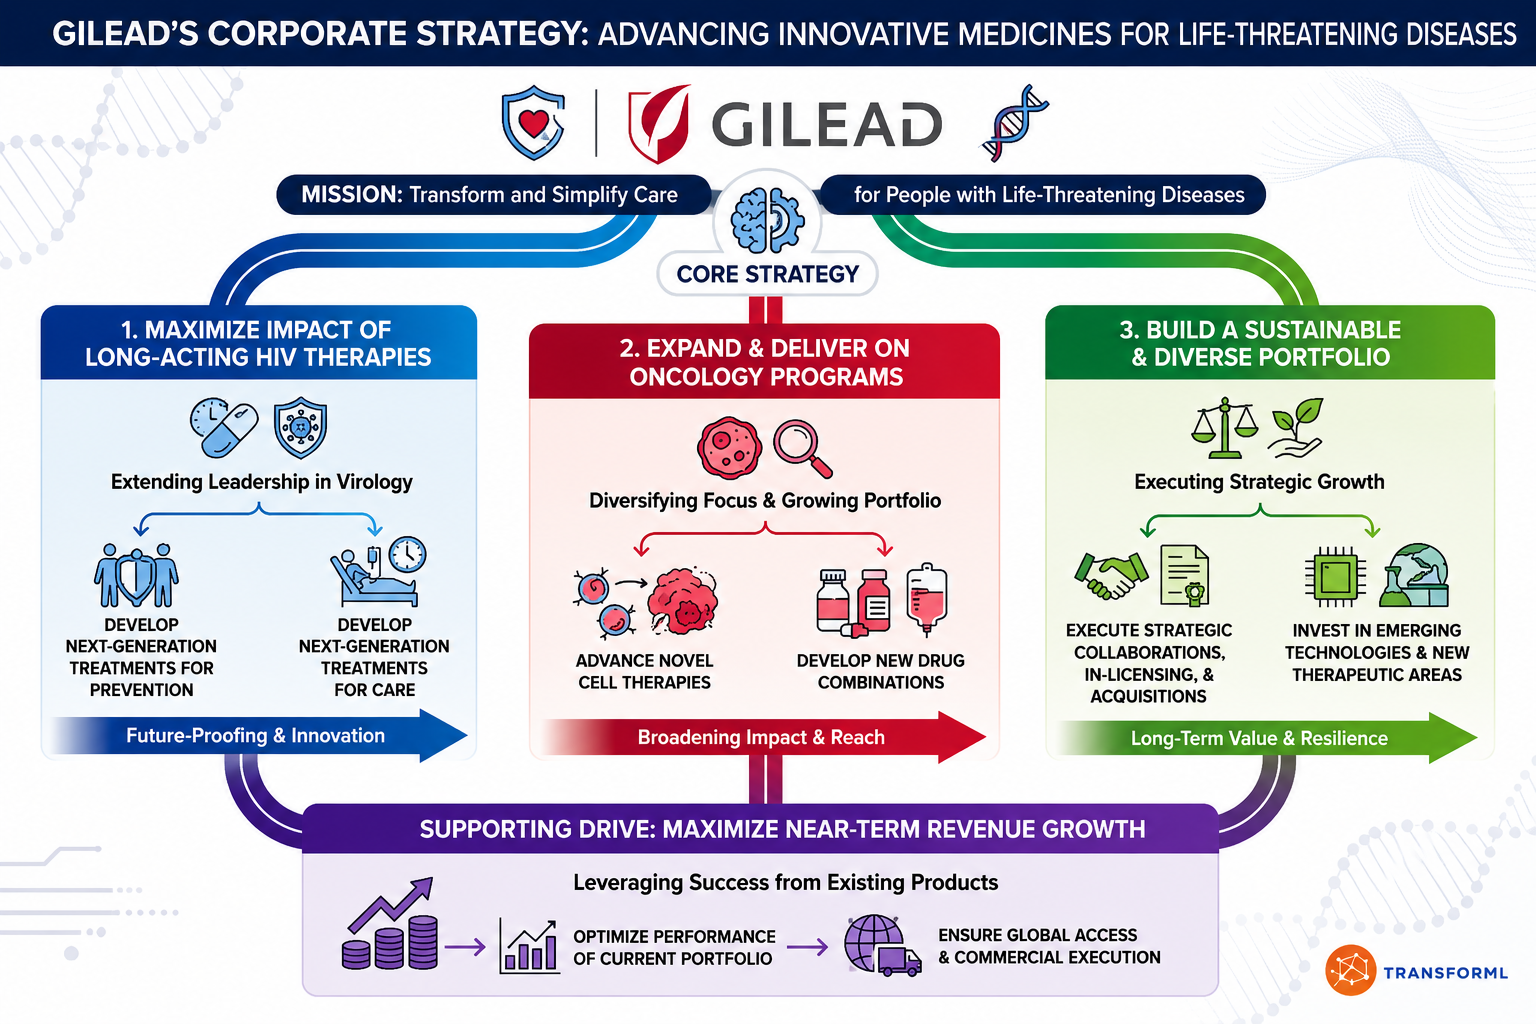
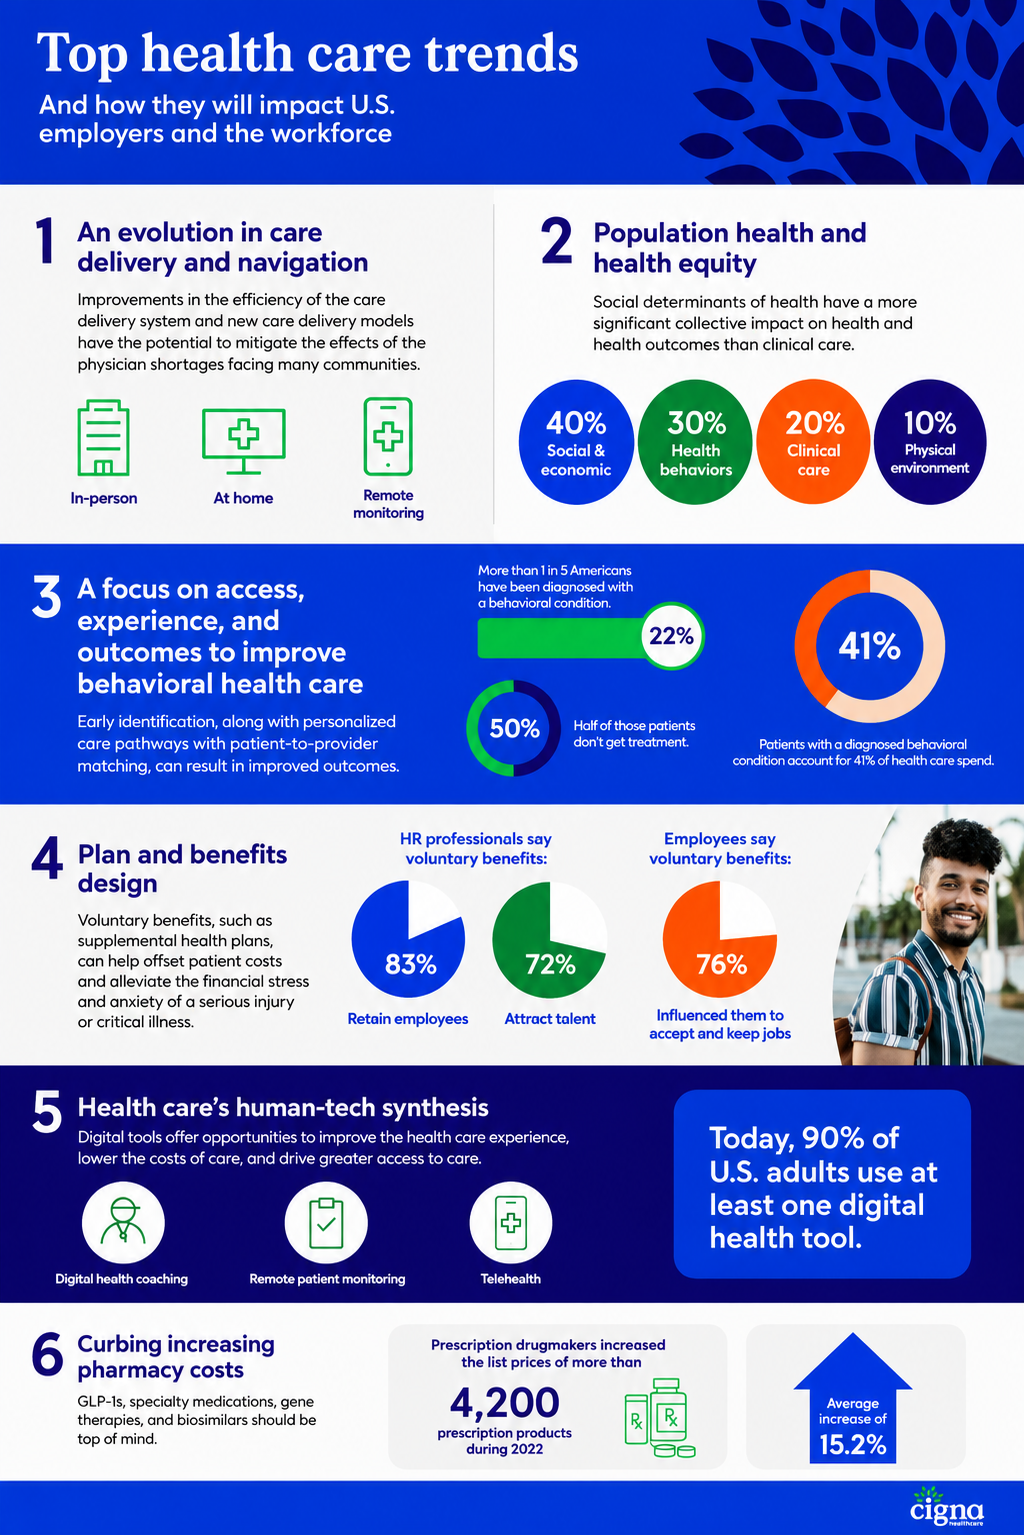
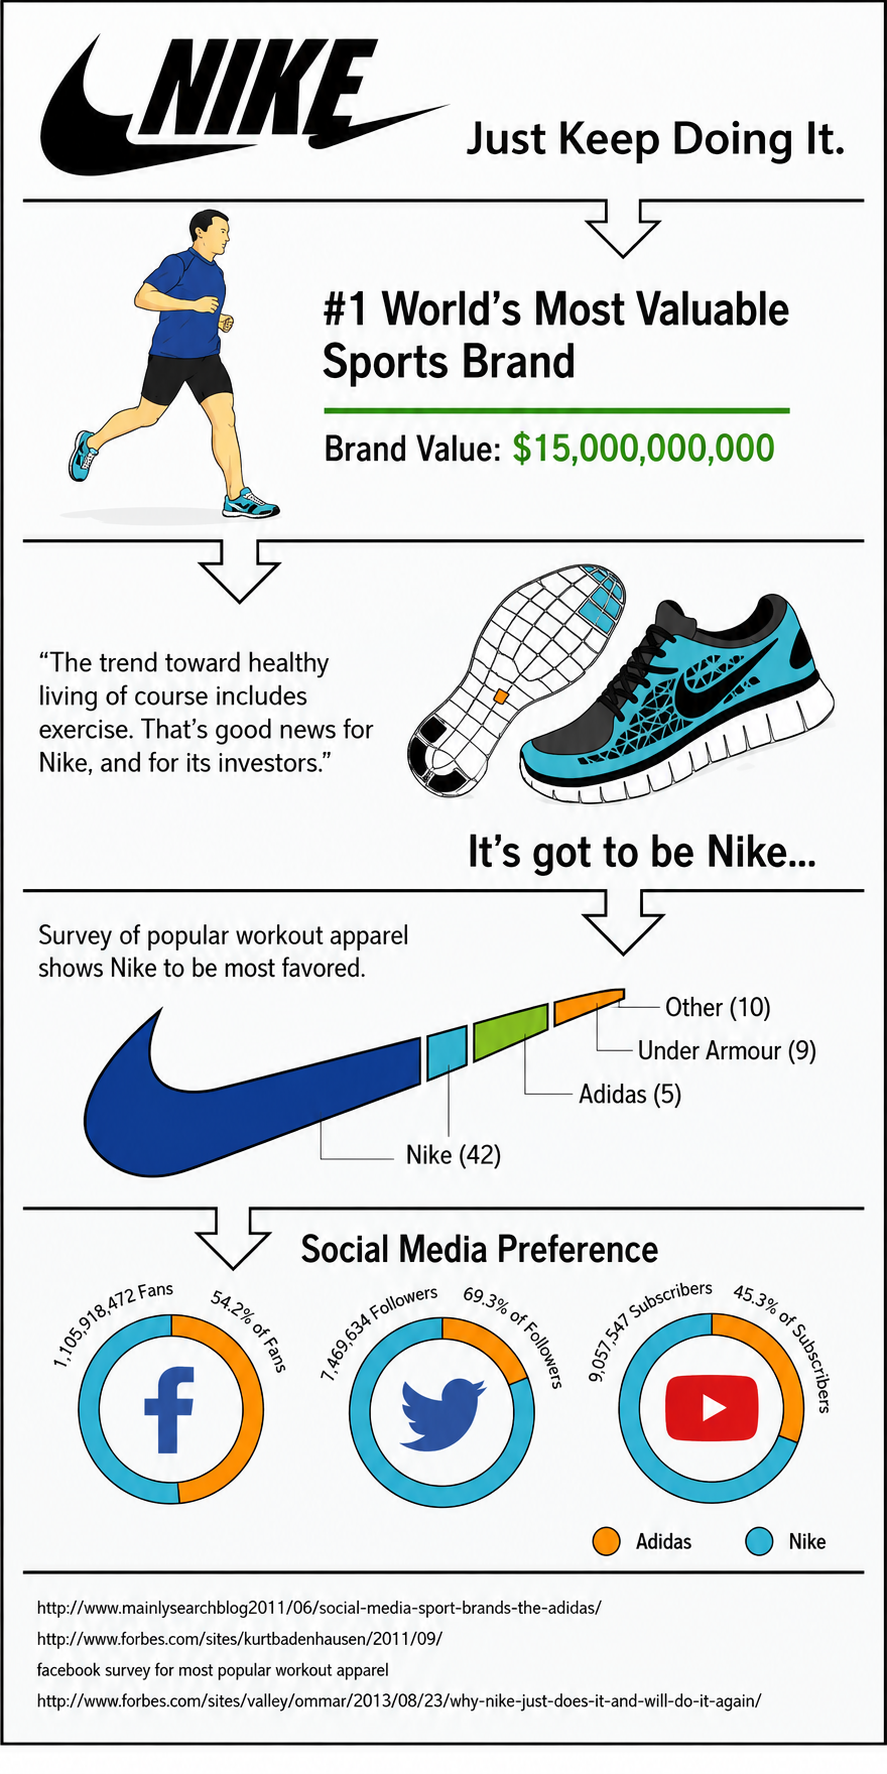
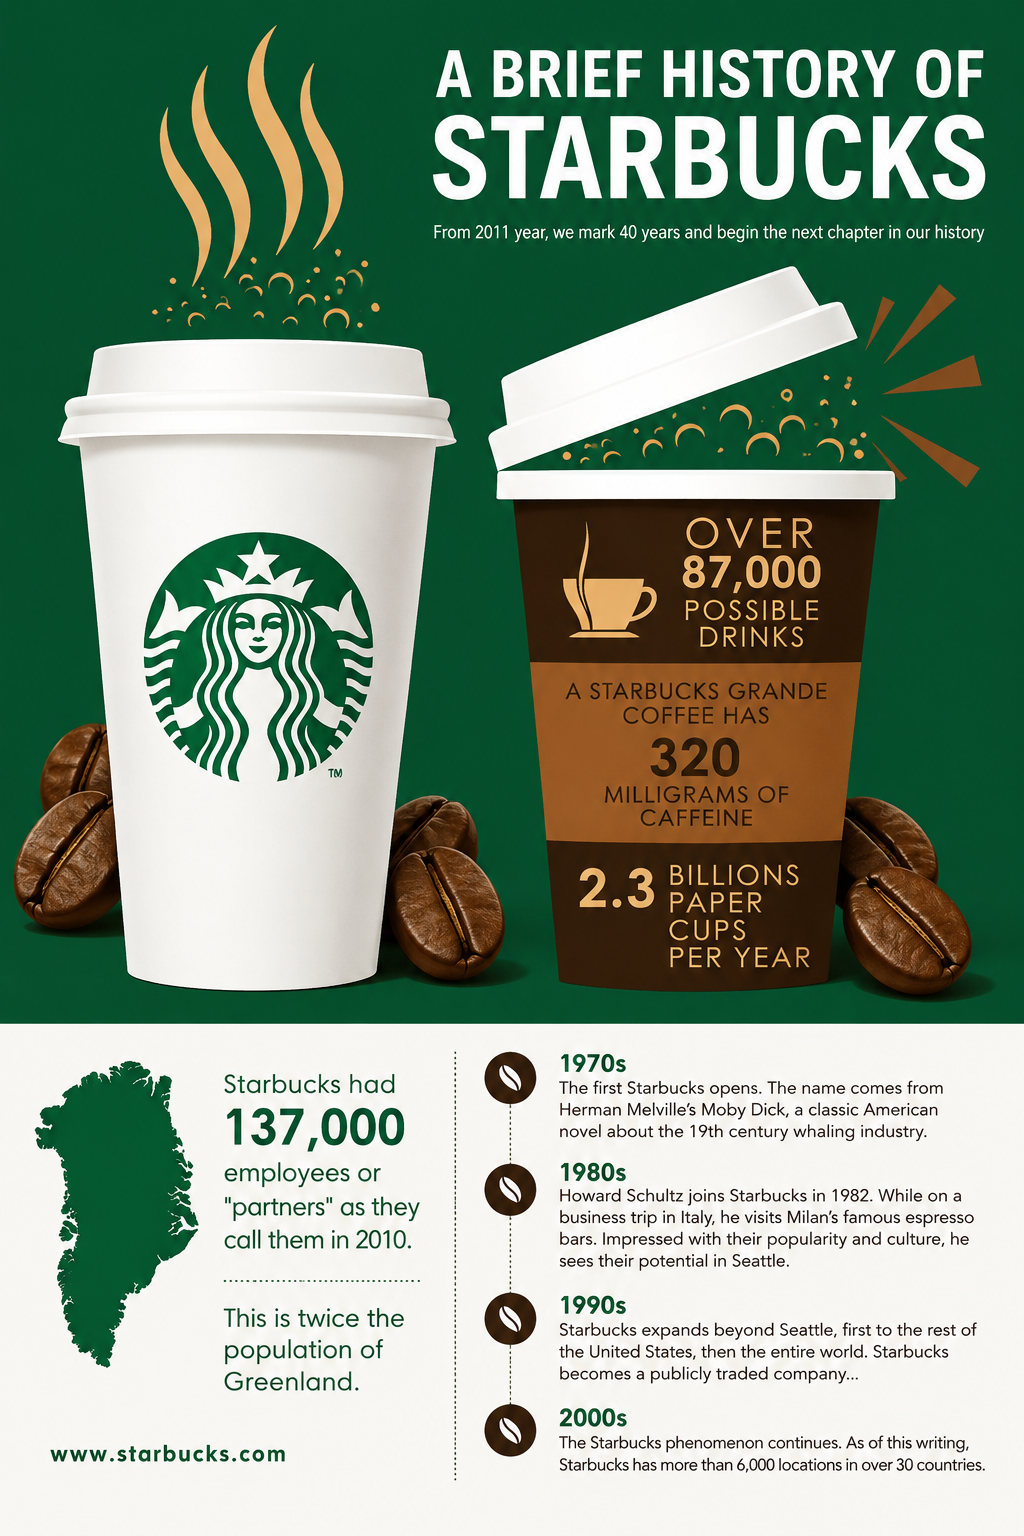
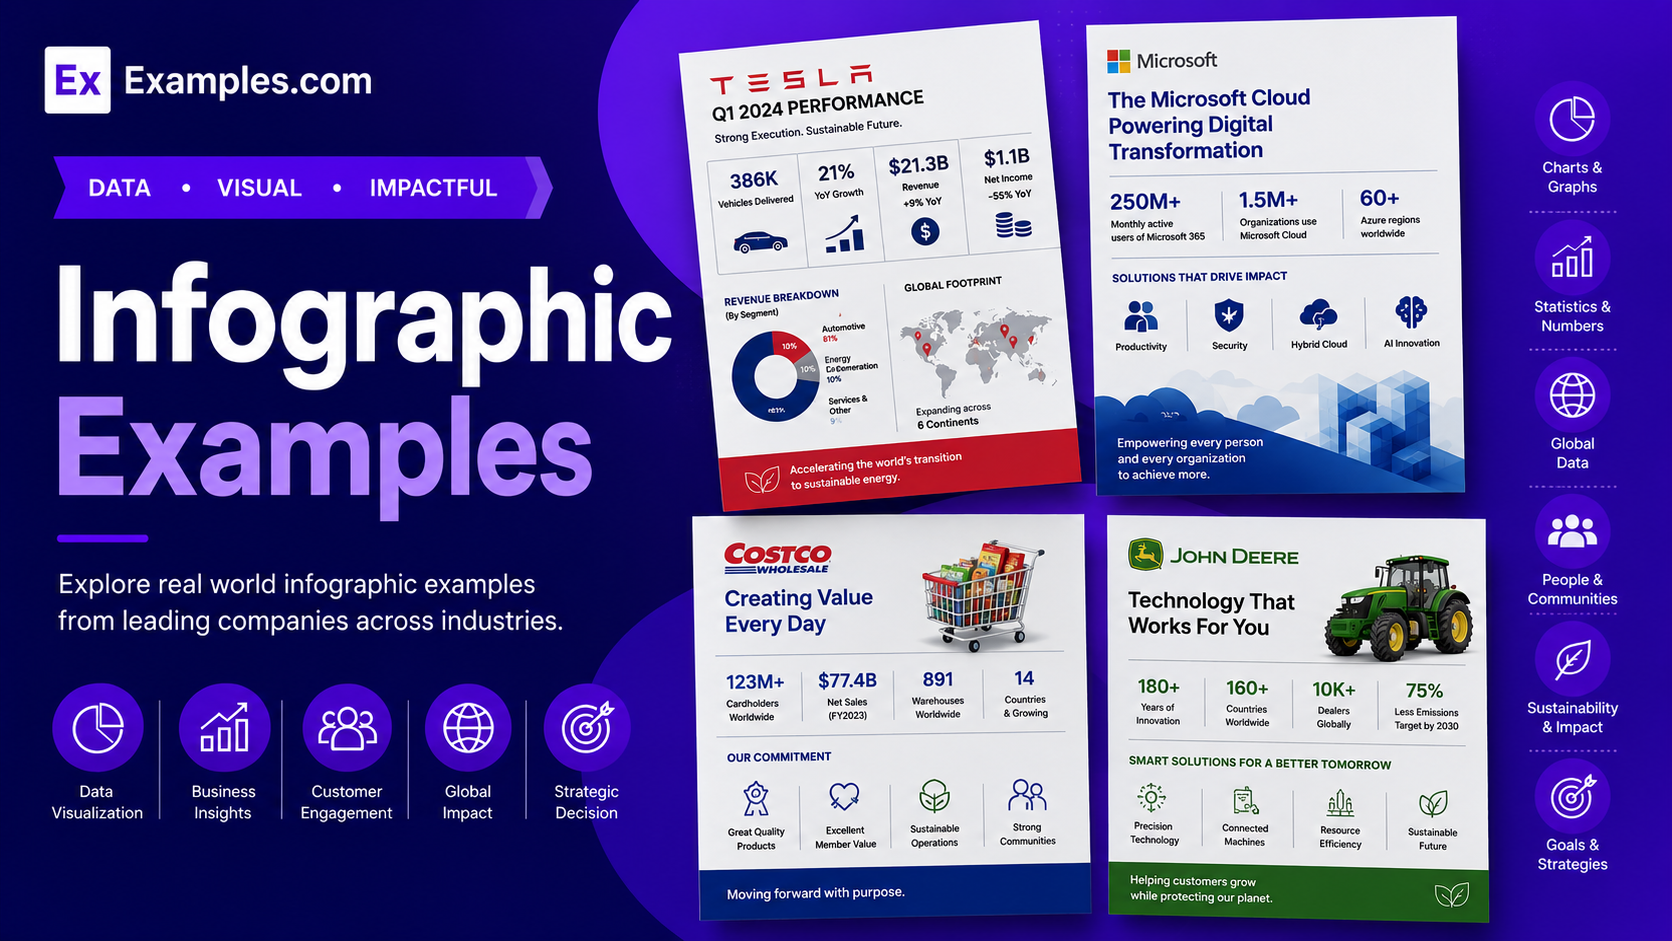
Turn ideas, data, and complex information into engaging visuals using AI-powered infographic generation inspired by real-world infographic examples. Browse professional infographic designs from business reports, marketing campaigns, education, healthcare, finance, technology, and research publications, select a visual style, enter your prompt, generate a completely new infographic, customize every element in the online editor, and download the final PNG. Examples.com helps users create informative and visually appealing infographics for presentations, websites, social media, reports, and marketing.
What Is An Infographic?
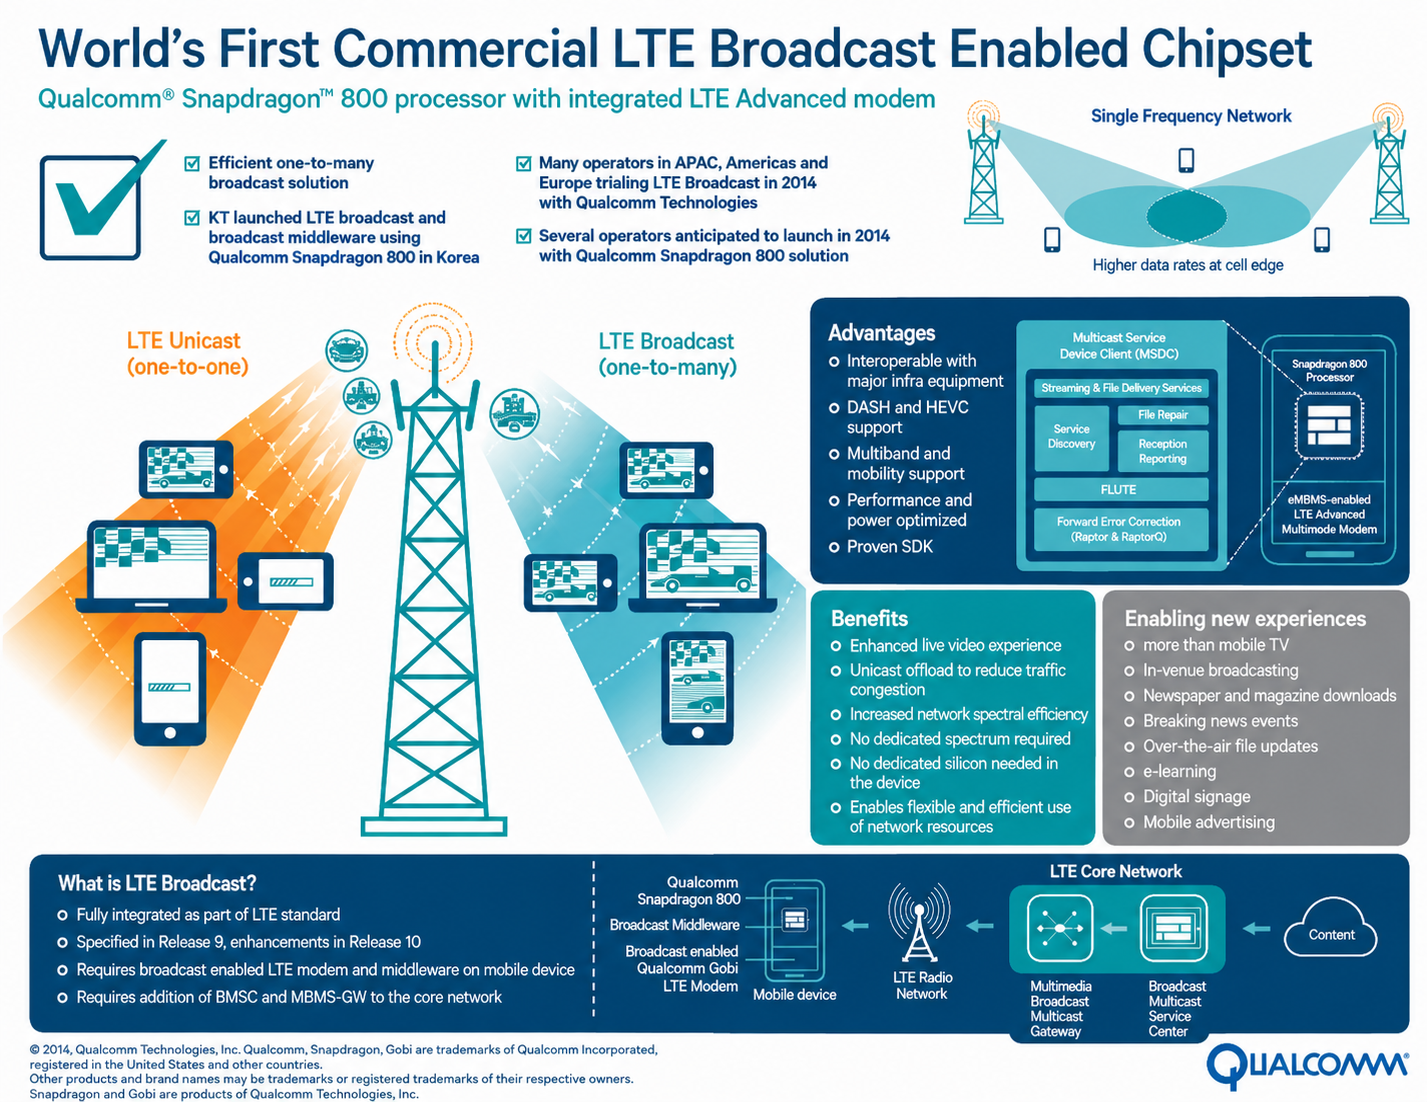
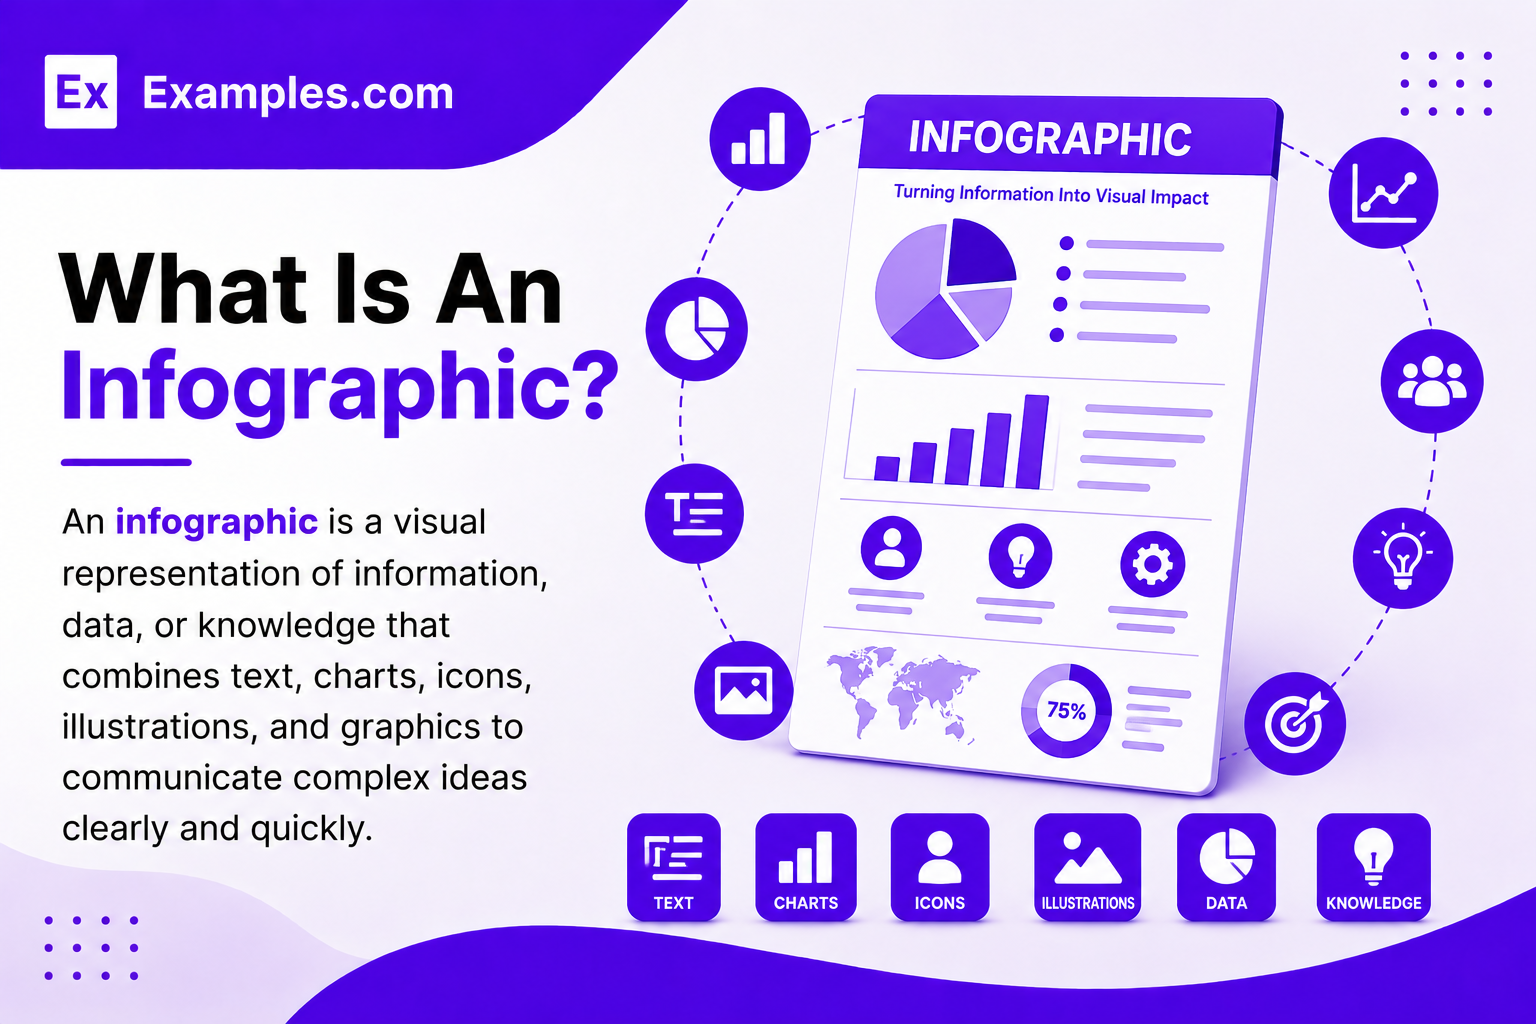
An infographic is a visual representation of information, data, or knowledge that combines text, charts, icons, illustrations, and graphics to communicate complex ideas clearly and quickly. Infographics help explain concepts, visualize statistics, present processes, compare information, and simplify reports using AI-powered design generation and online editing tools.
Popular Types Of Infographics
Infographics are designed for different communication goals, industries, and audiences. Each infographic type presents information using a unique visual structure and storytelling approach.
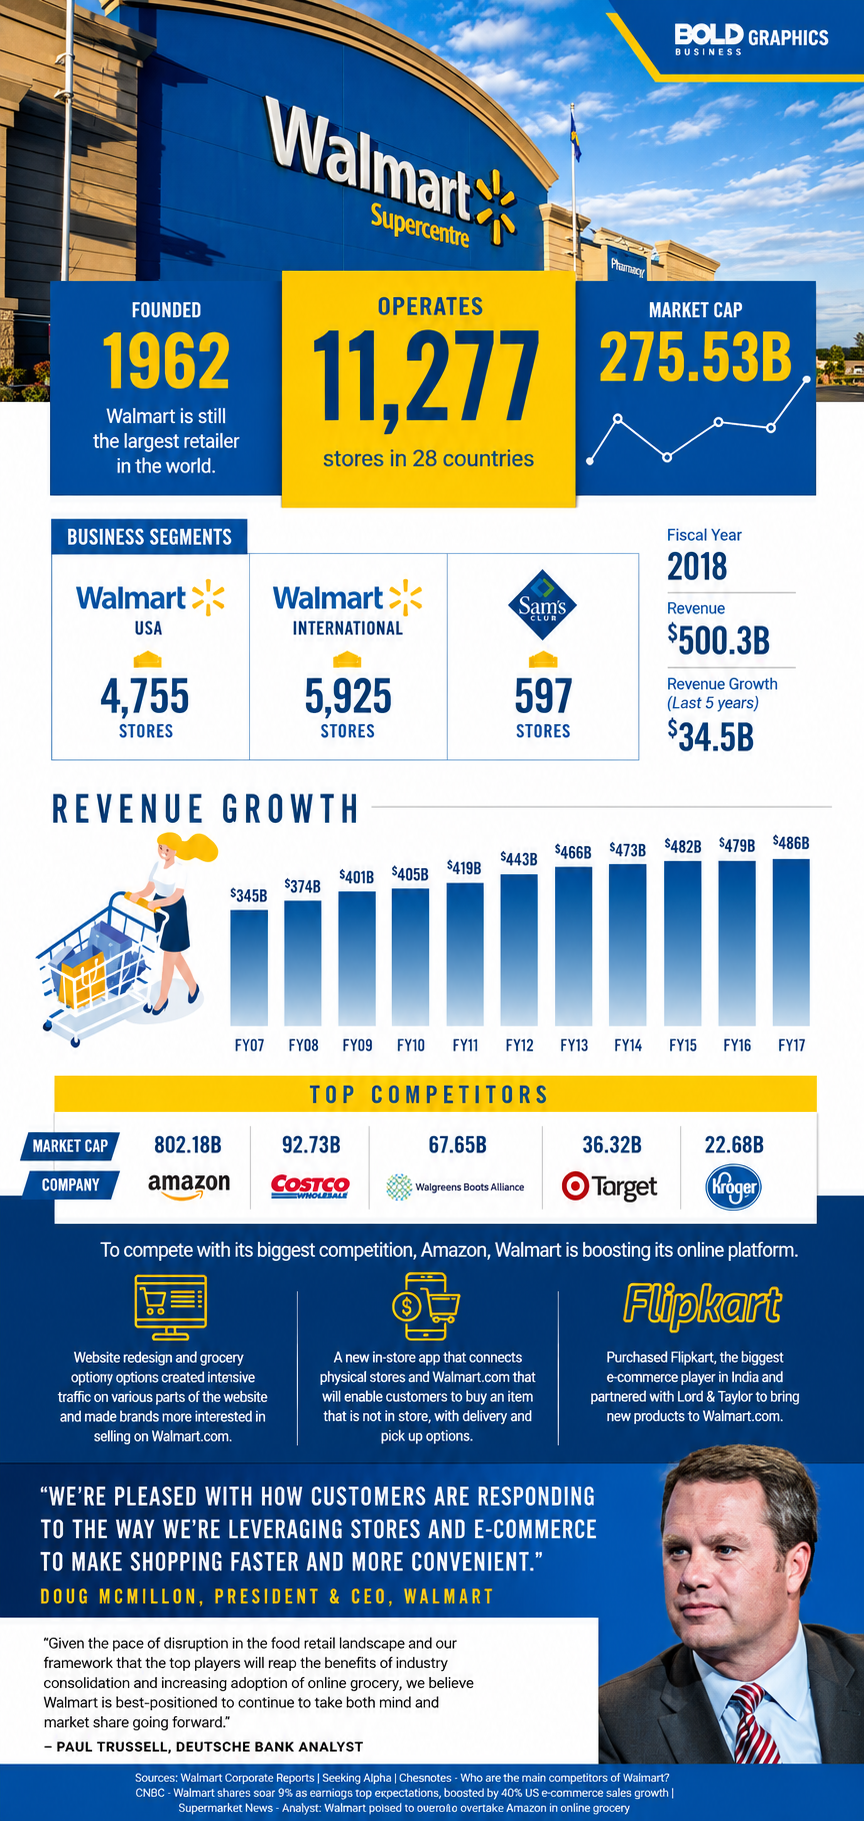
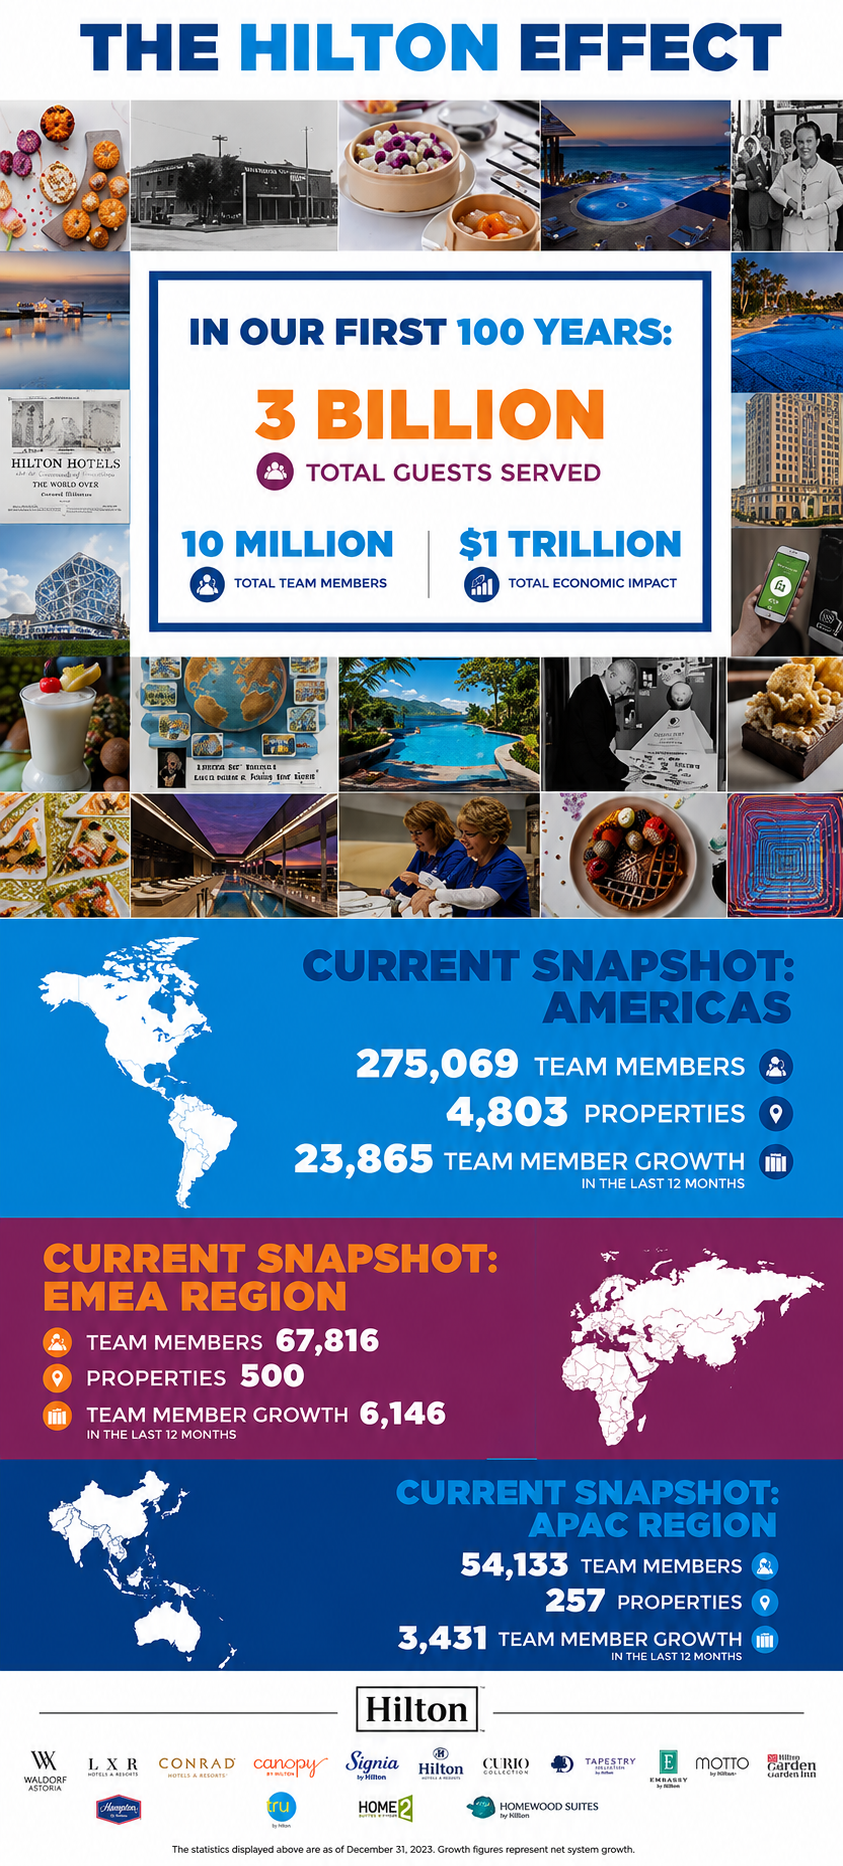
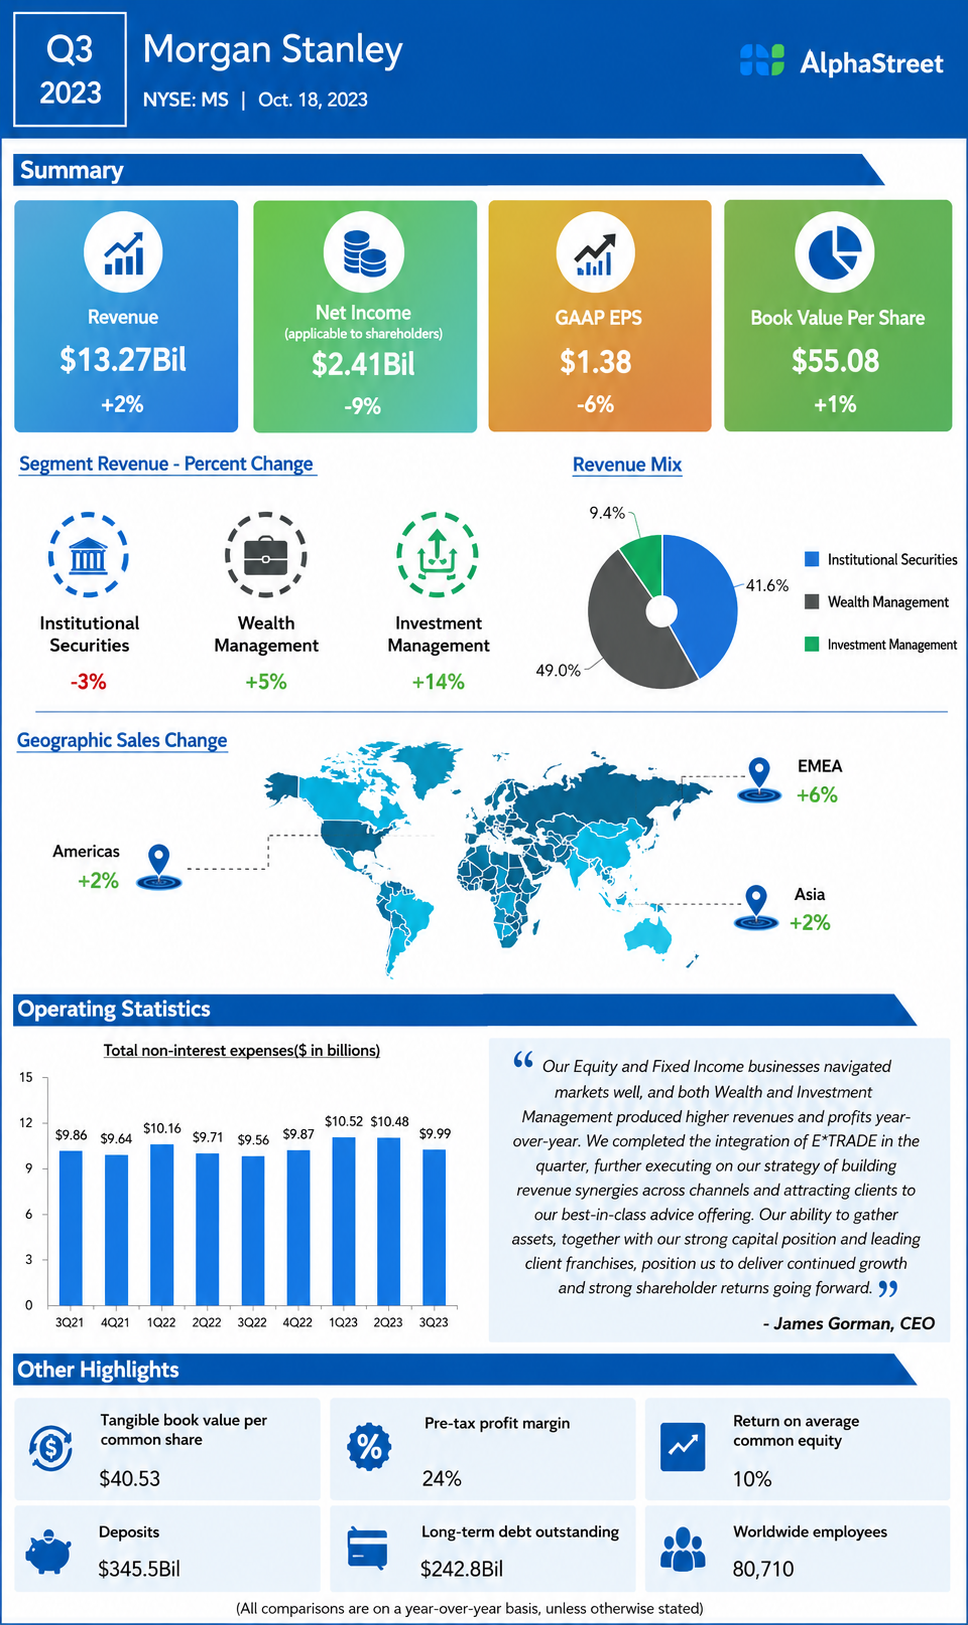
Statistical Infographics
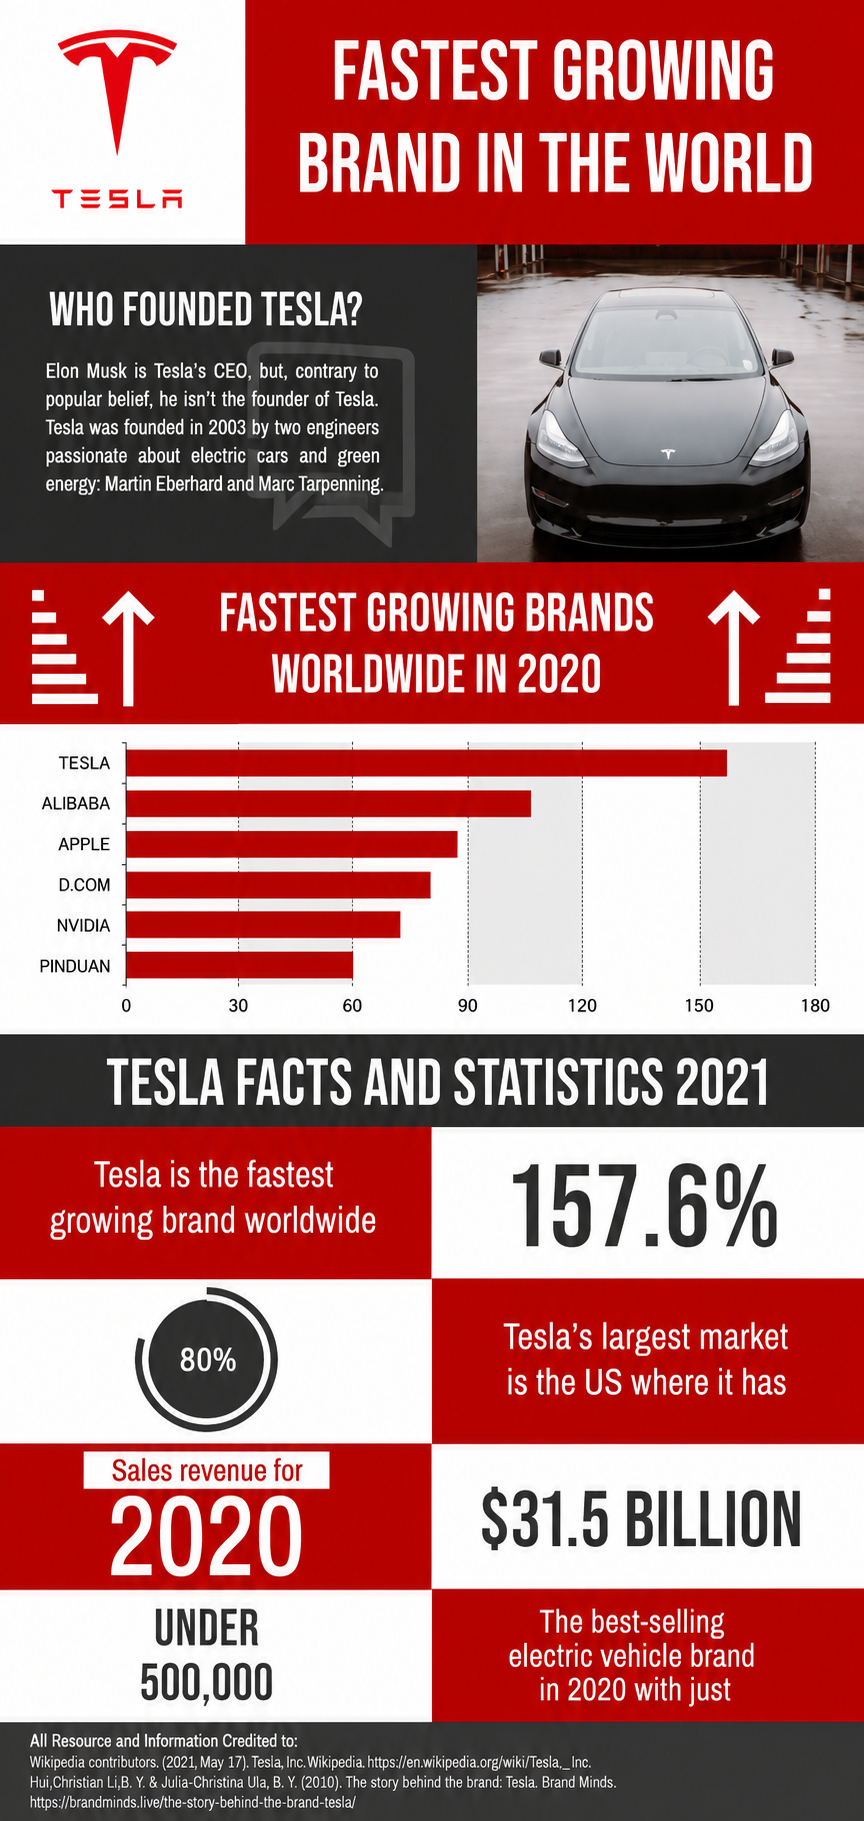
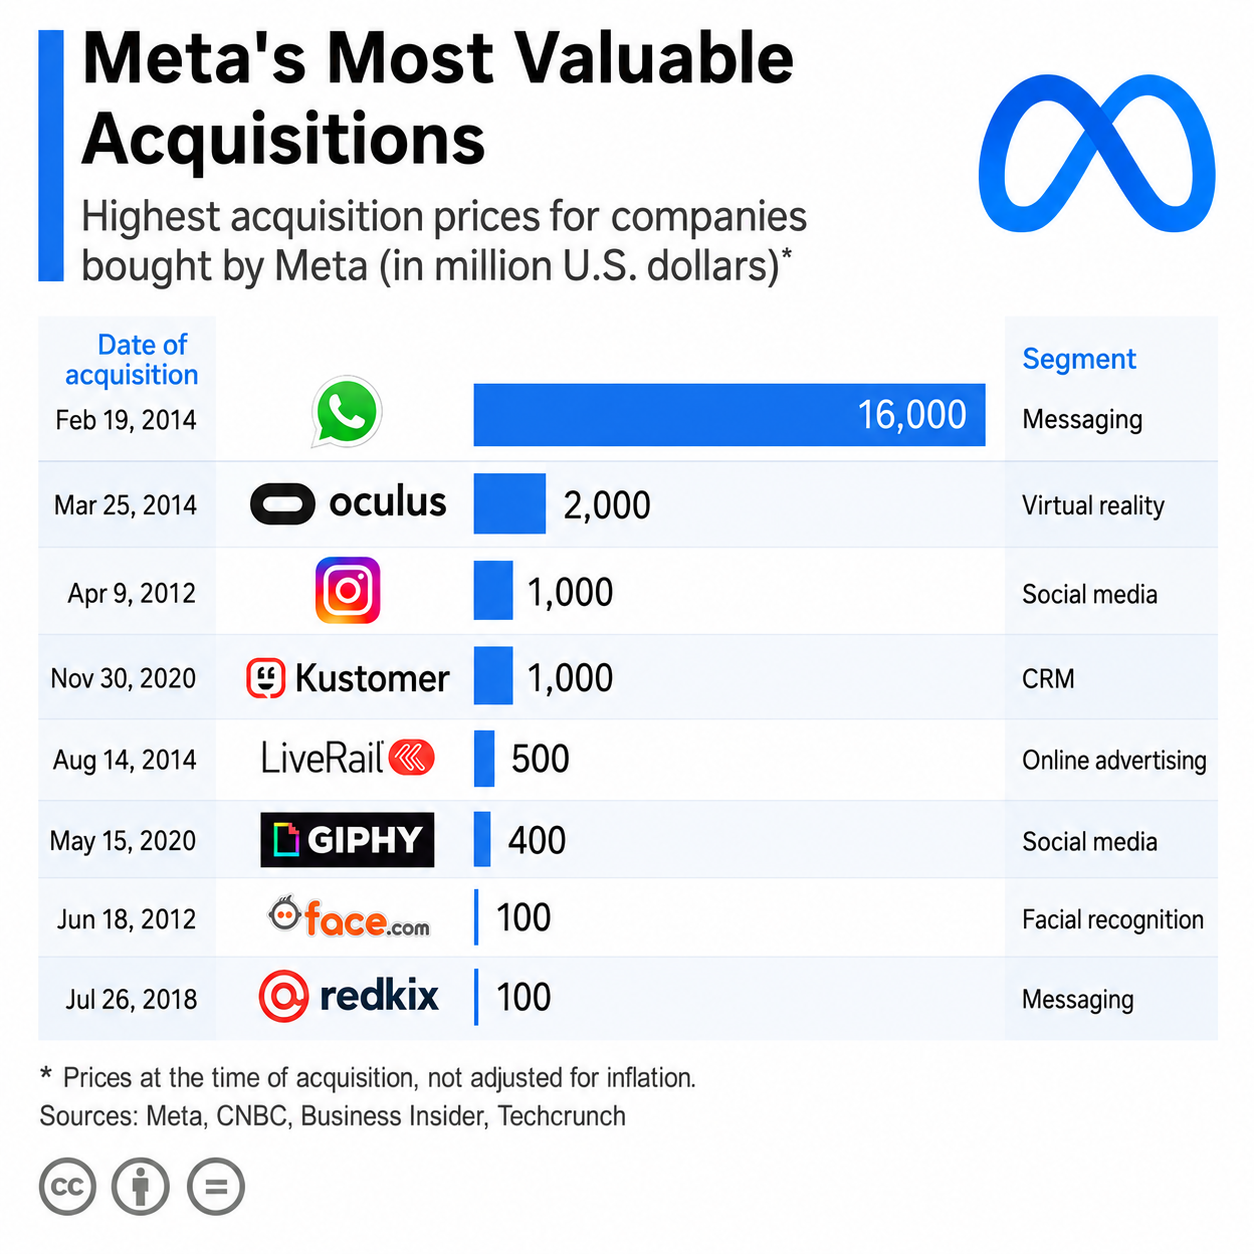
Present survey results, percentages, charts, graphs, and numerical insights through visually engaging data storytelling.
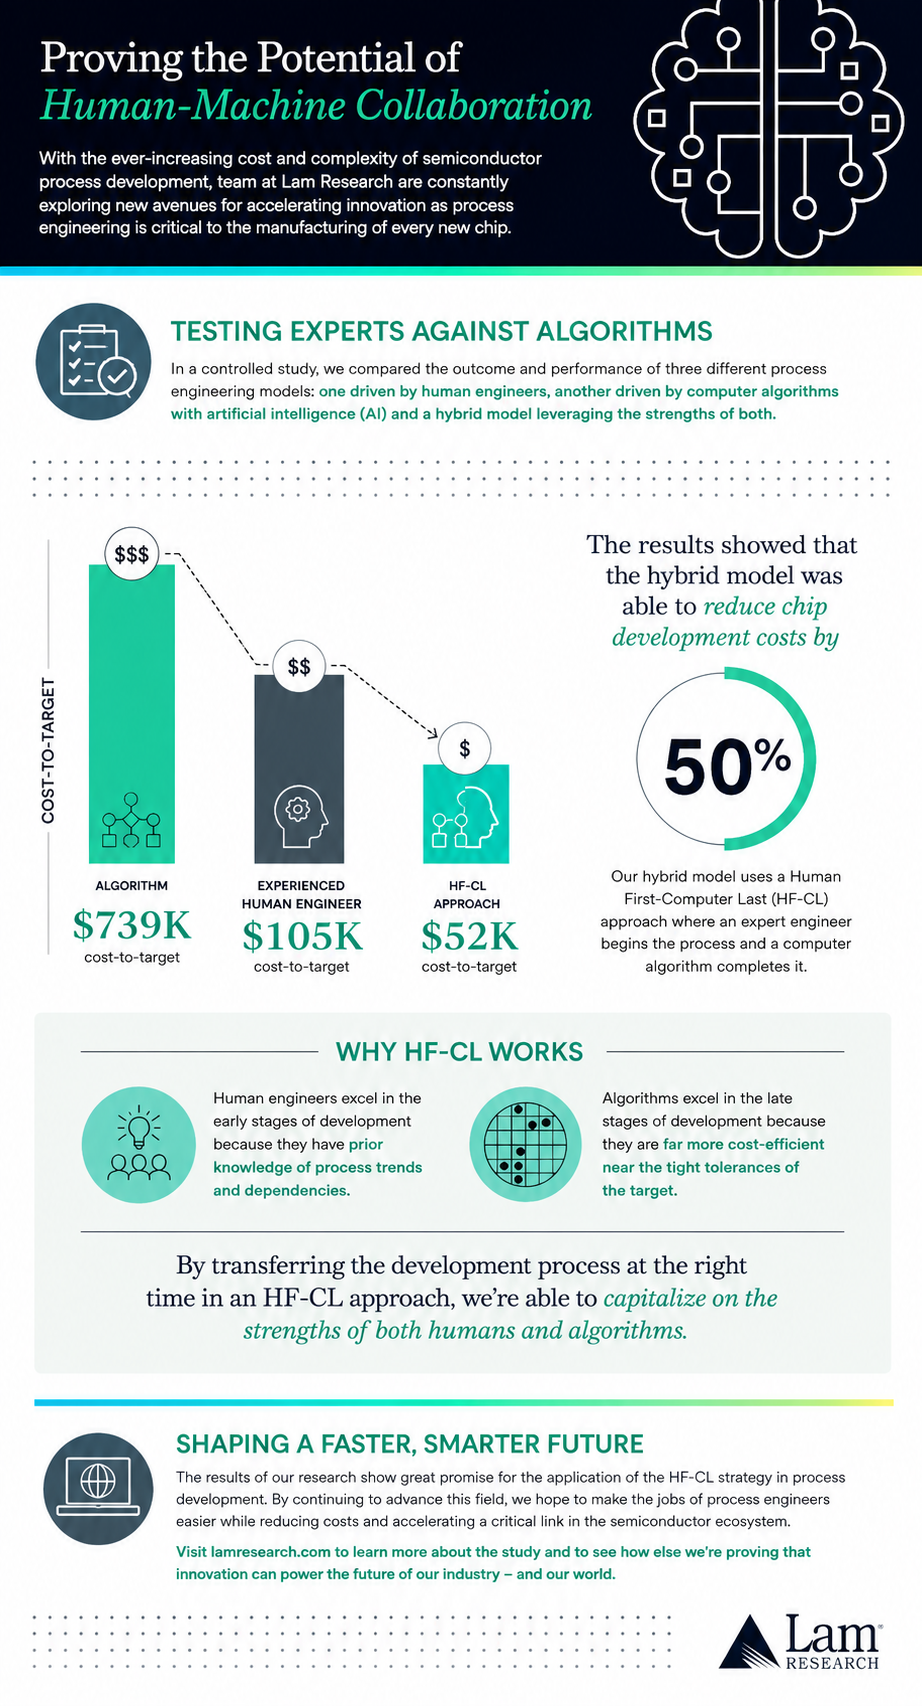
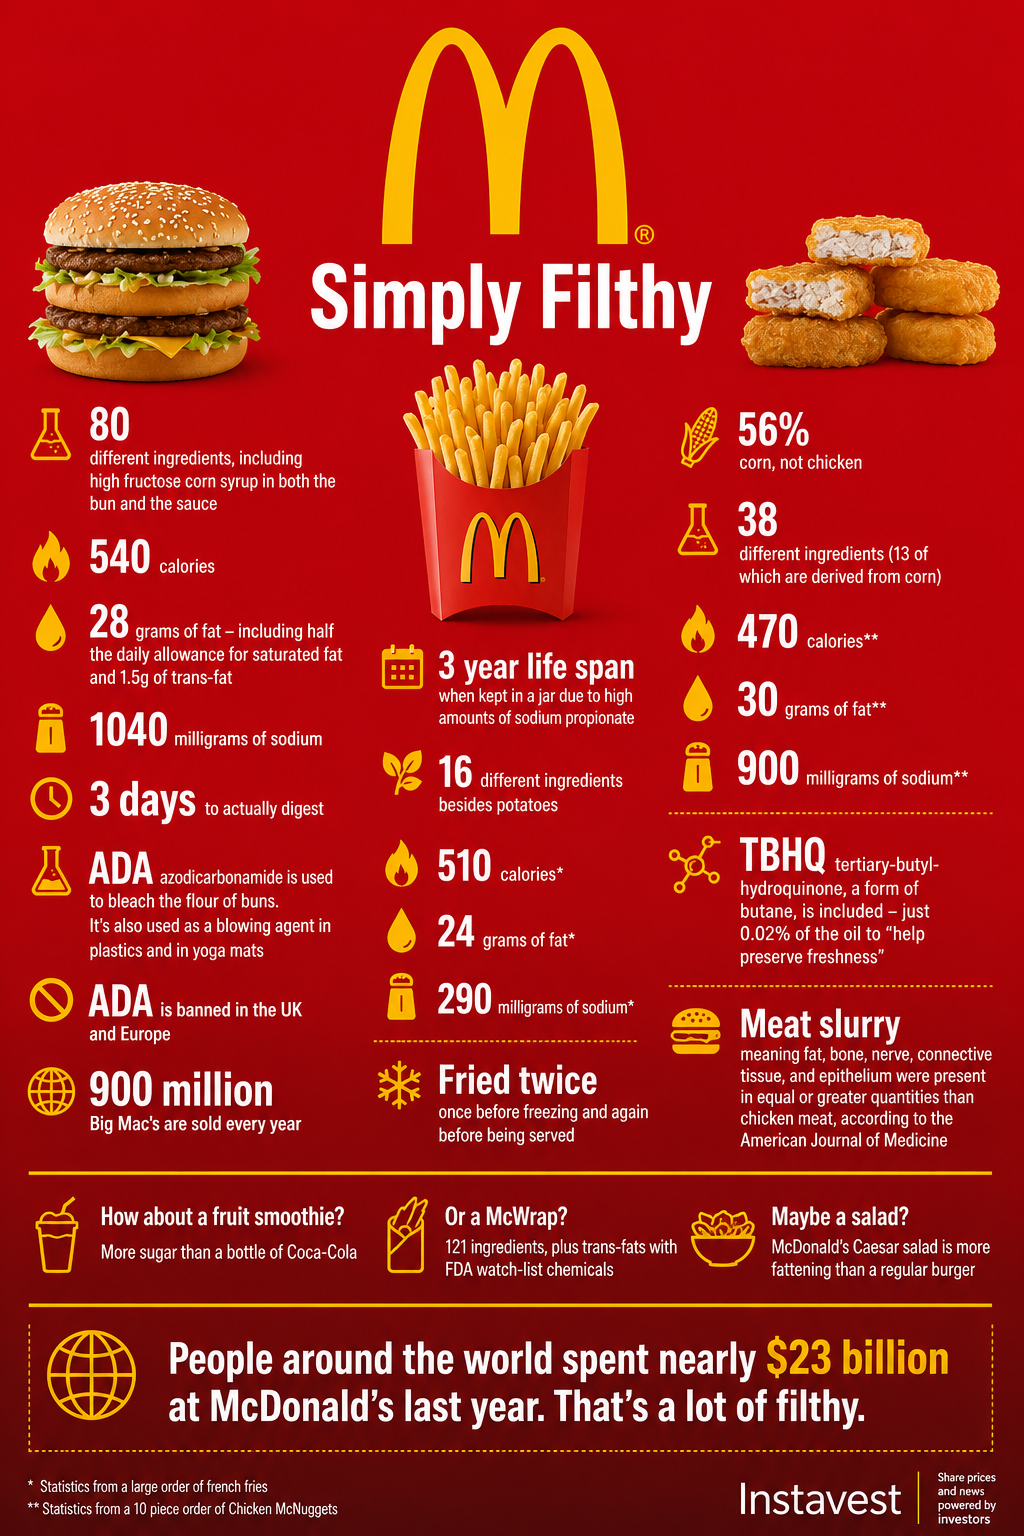
Informational Infographics
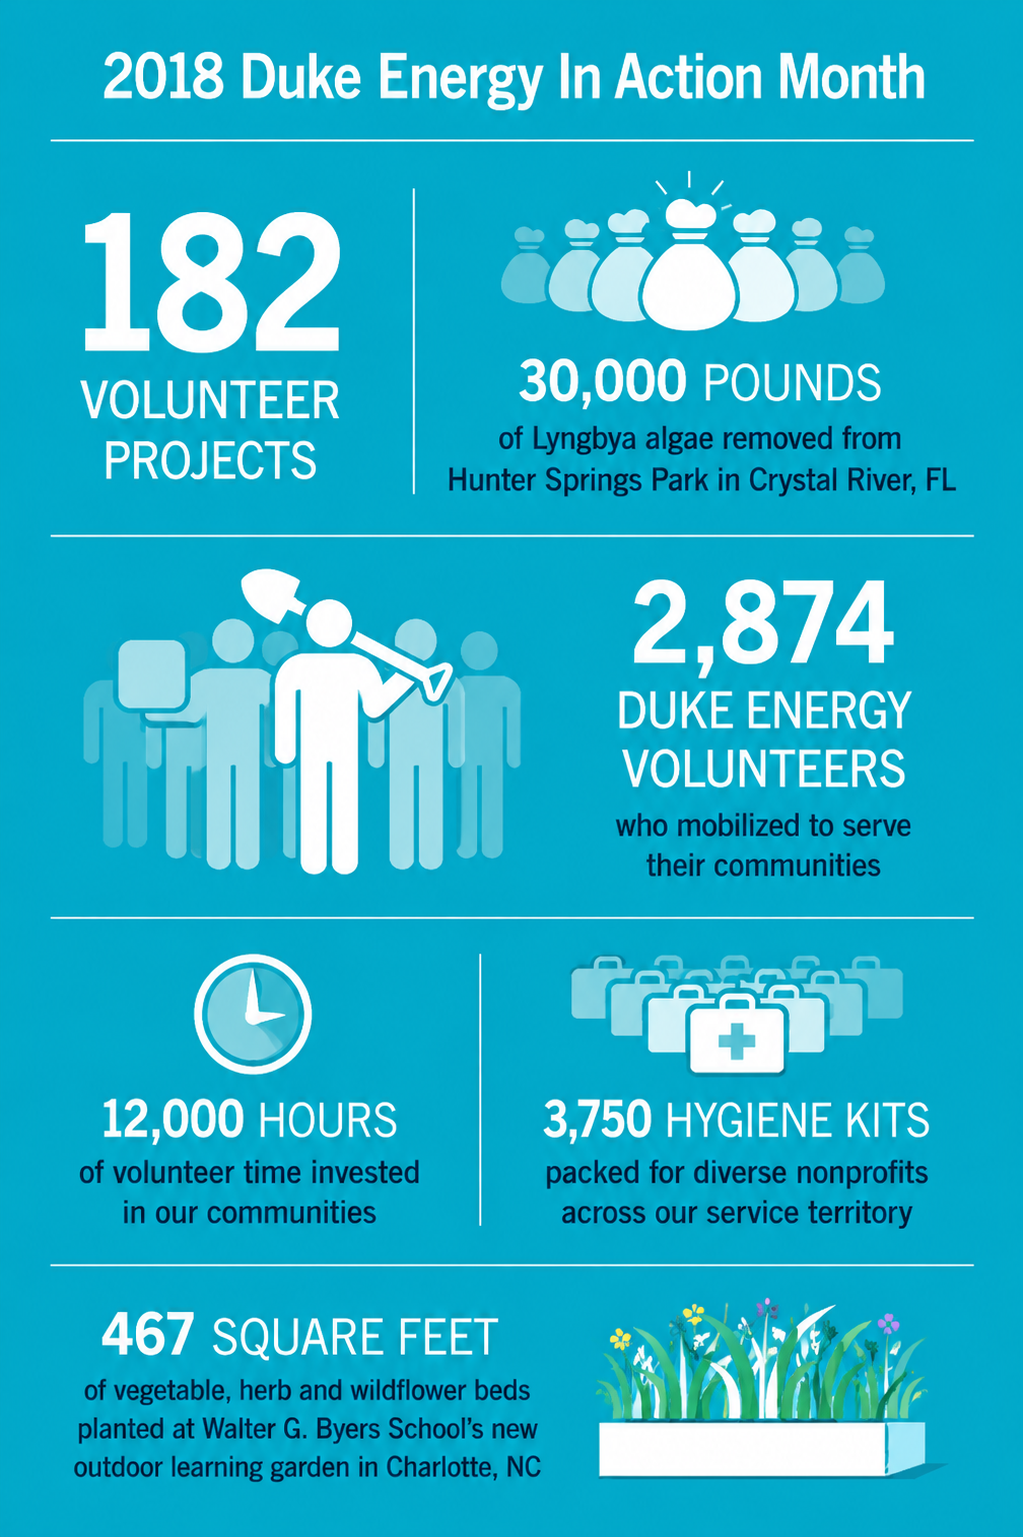
Explain concepts, summarize articles, share educational content, and simplify complex topics using organized sections.
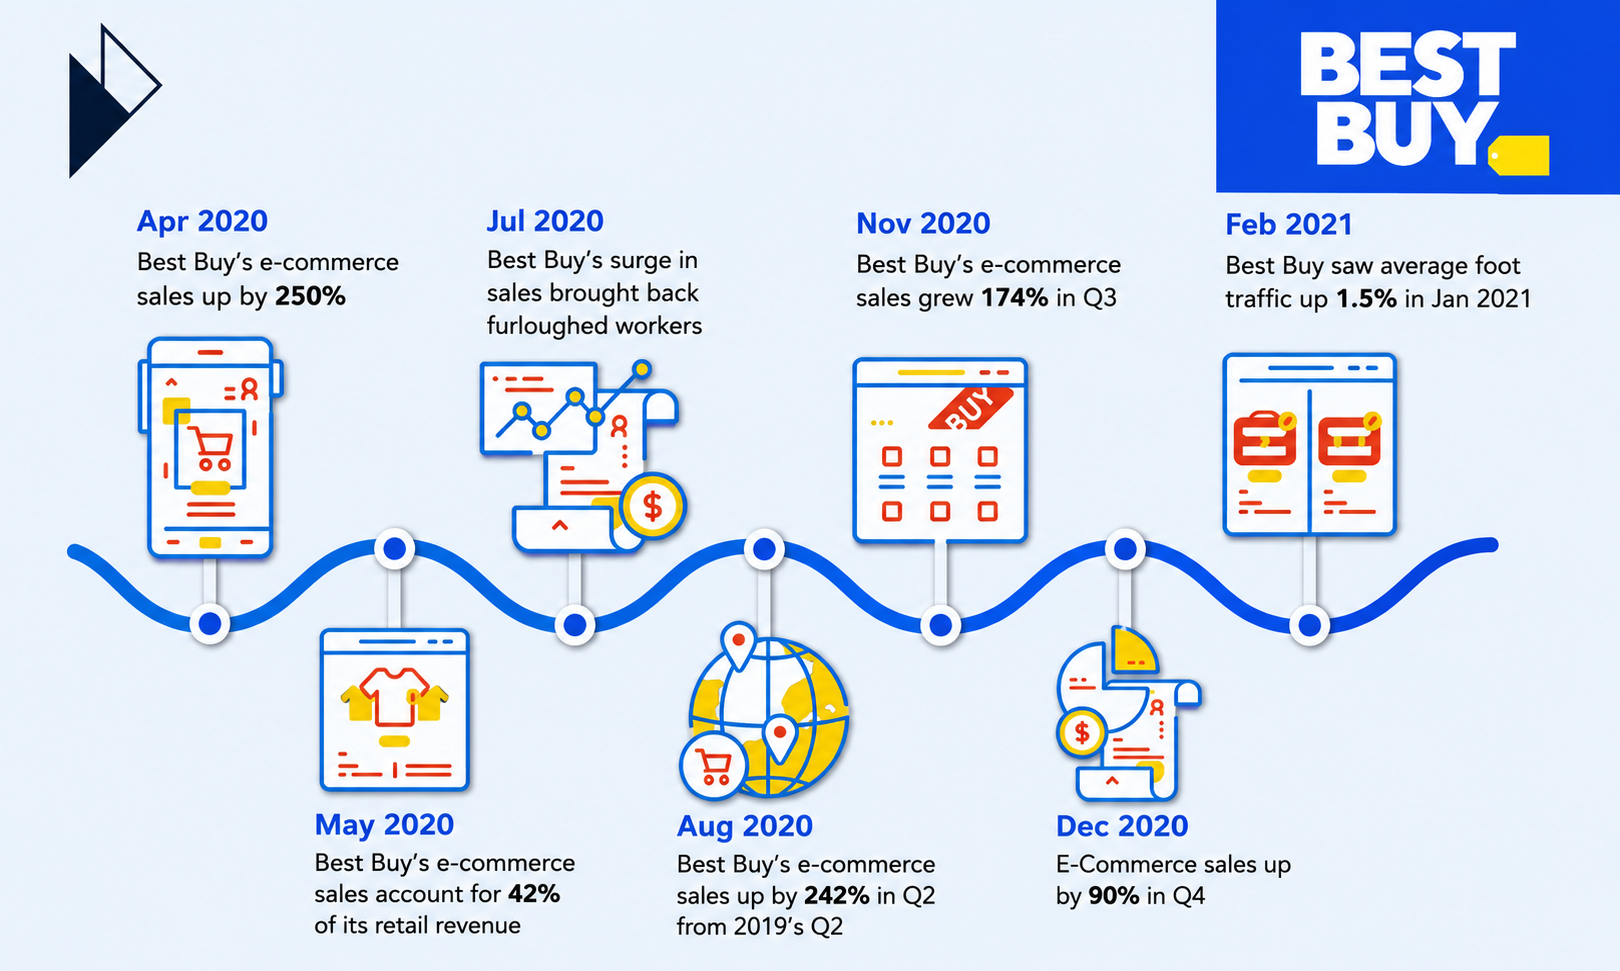
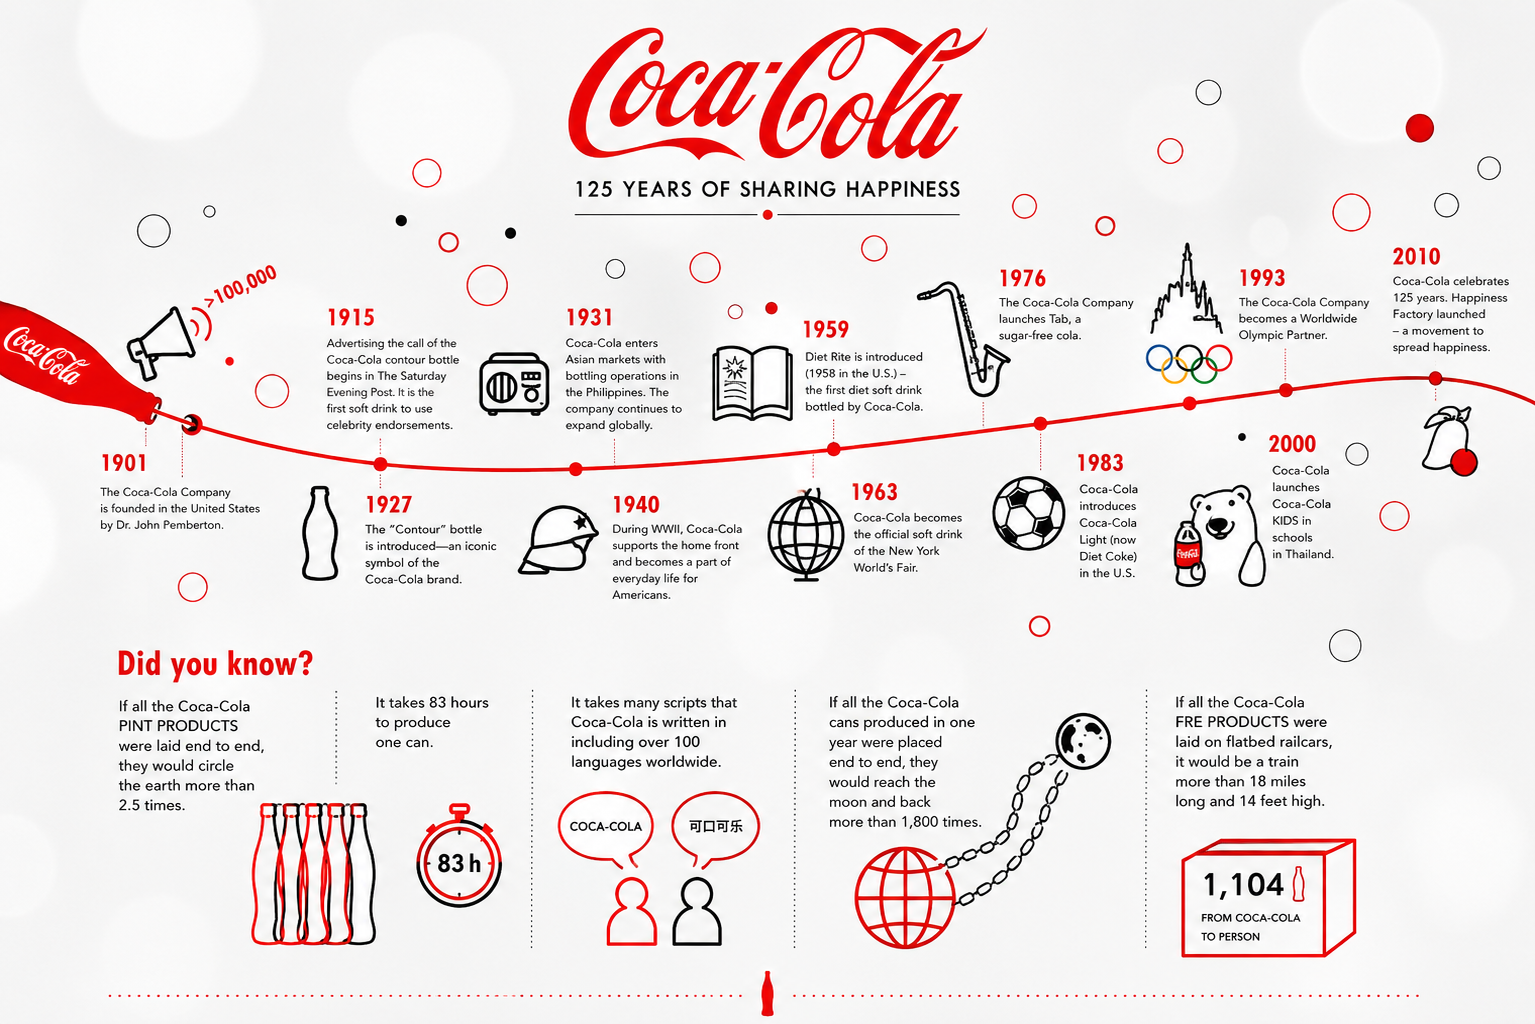
Timeline Infographics
Display historical events, company milestones, product evolution, or chronological information using structured visual layouts.
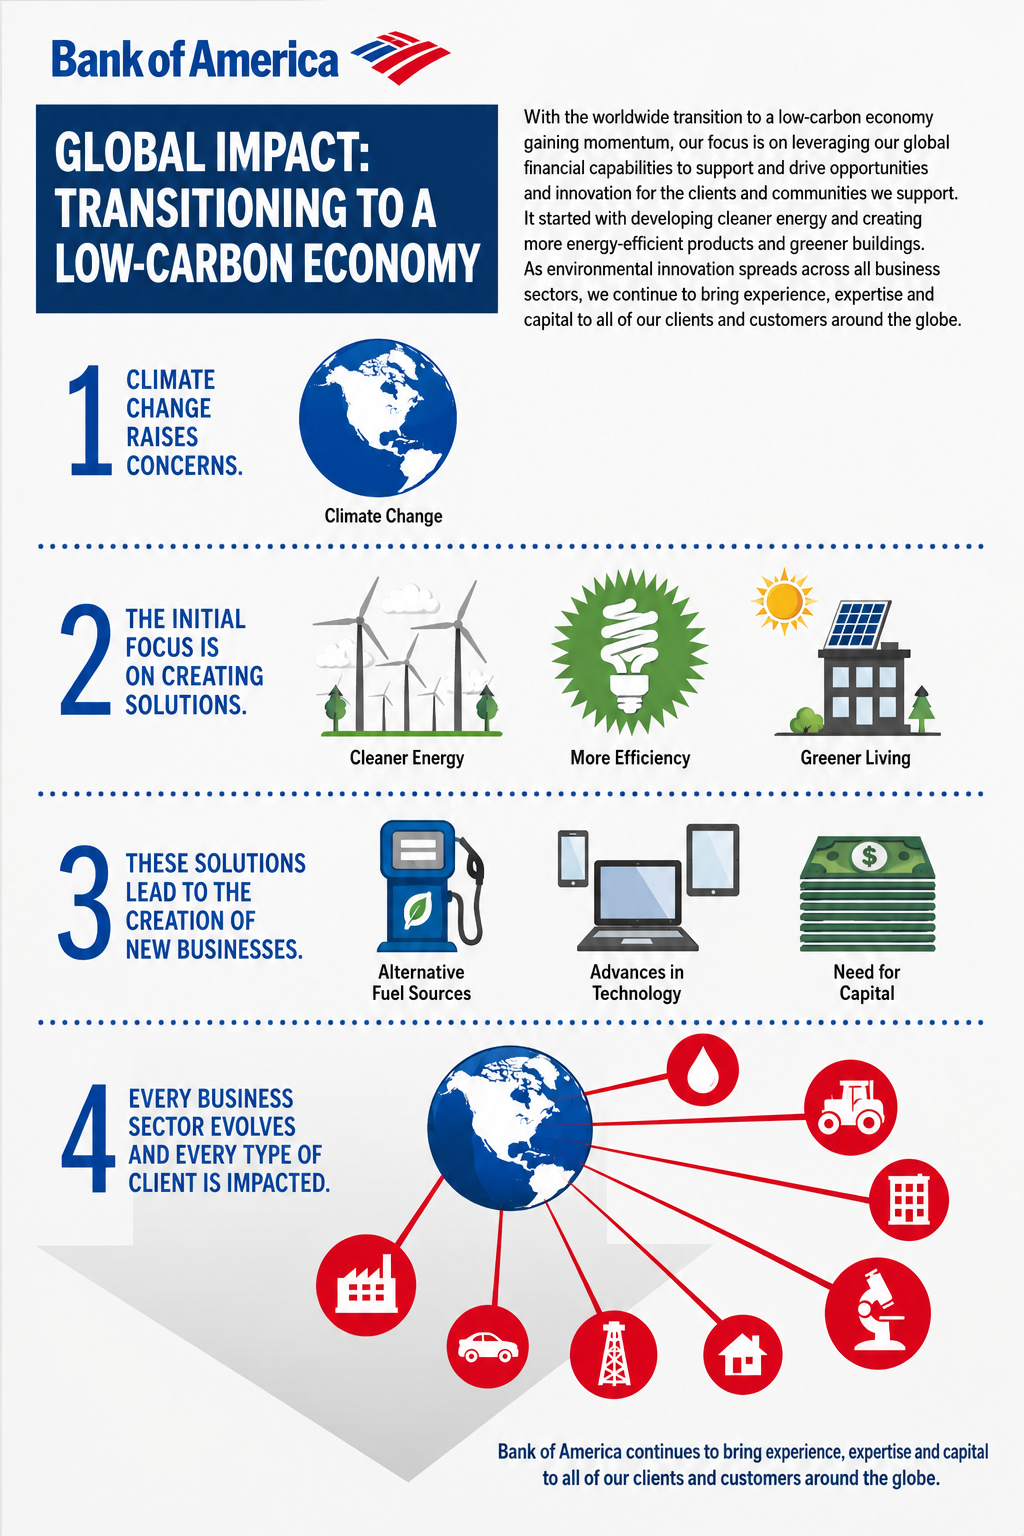
Process Infographics
Illustrate workflows, instructions, procedures, and step-by-step guides through connected visual sequences and icons.
Comparison Infographics
Compare products, services, ideas, or features using side-by-side layouts with clear visual differences.
Geographic Infographics
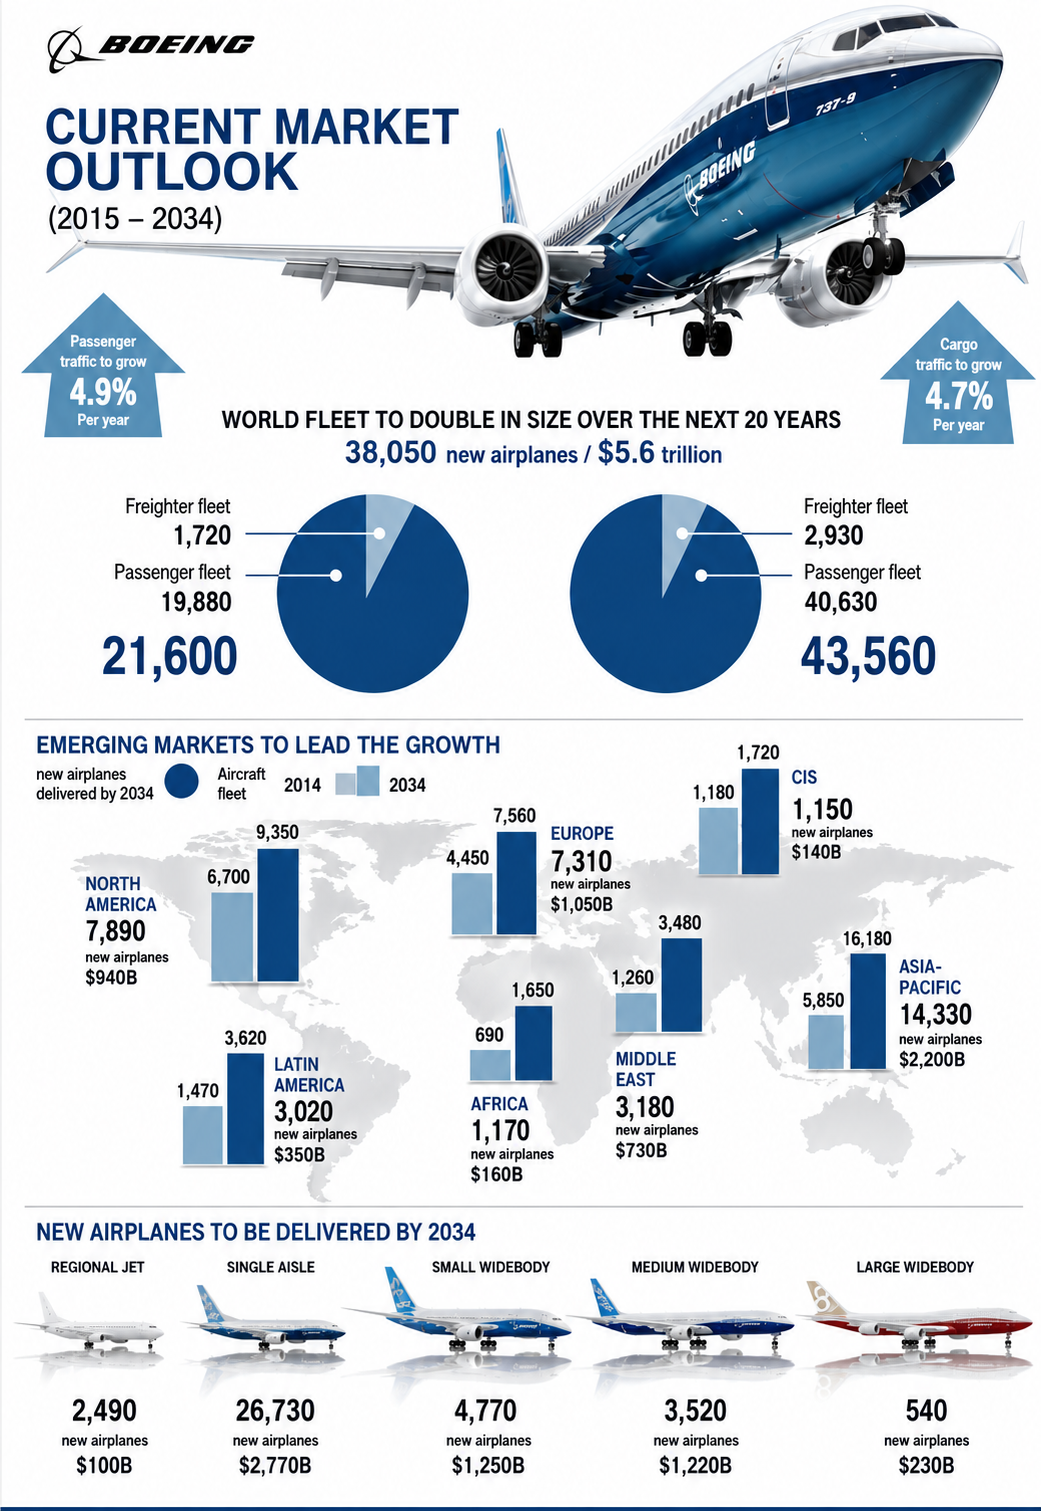
Visualize location-based information, regional statistics, demographic insights, and market distribution using maps.
Why Should I Use Real Infographic Examples To Create My Own Infographic?
Real infographic examples help users understand visual hierarchy, layout organization, icon placement, color balance, chart presentation, and storytelling techniques before creating their own design. Instead of starting with a blank canvas, users can explore professionally designed infographics that communicate information clearly and effectively.
Using real-world infographic examples also makes the design process faster and more efficient. Users can choose a reference style, enter an AI prompt, generate a completely new infographic, and personalize every section. This approach improves visual consistency, information flow, and overall presentation quality while making infographic creation accessible for beginners and professionals.
How Do I Generate An Infographic With AI?
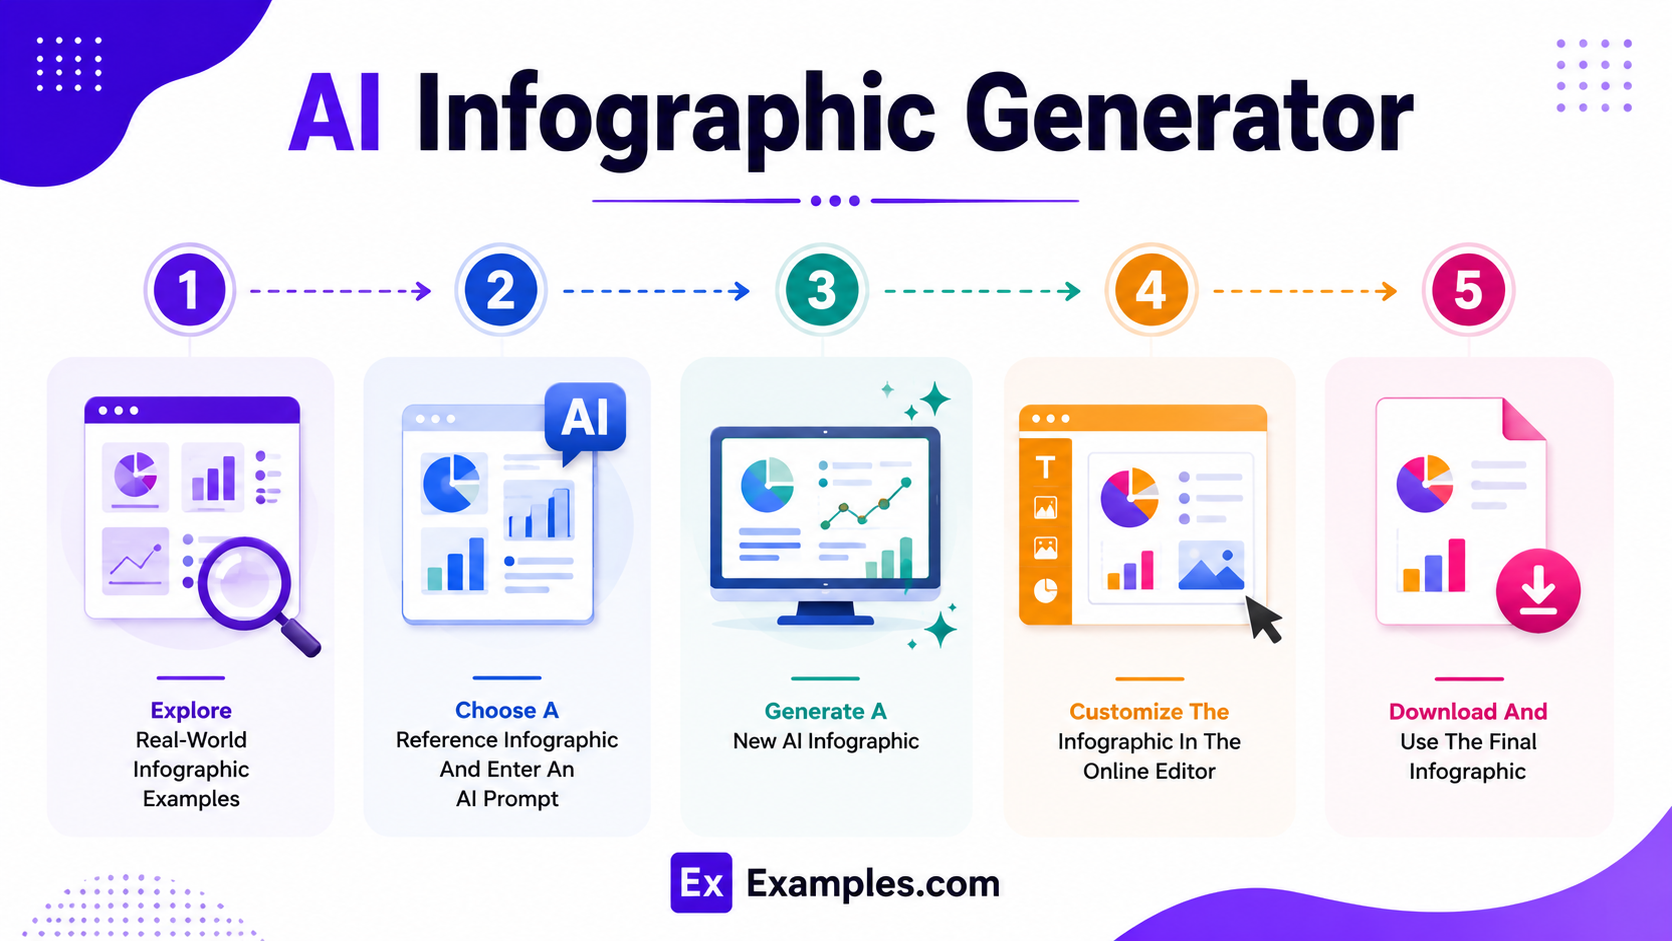
Creating an infographic with AI combines professional visual inspiration, intelligent content generation, and flexible online editing tools to simplify the design process.
Explore Real-World Infographic Examples
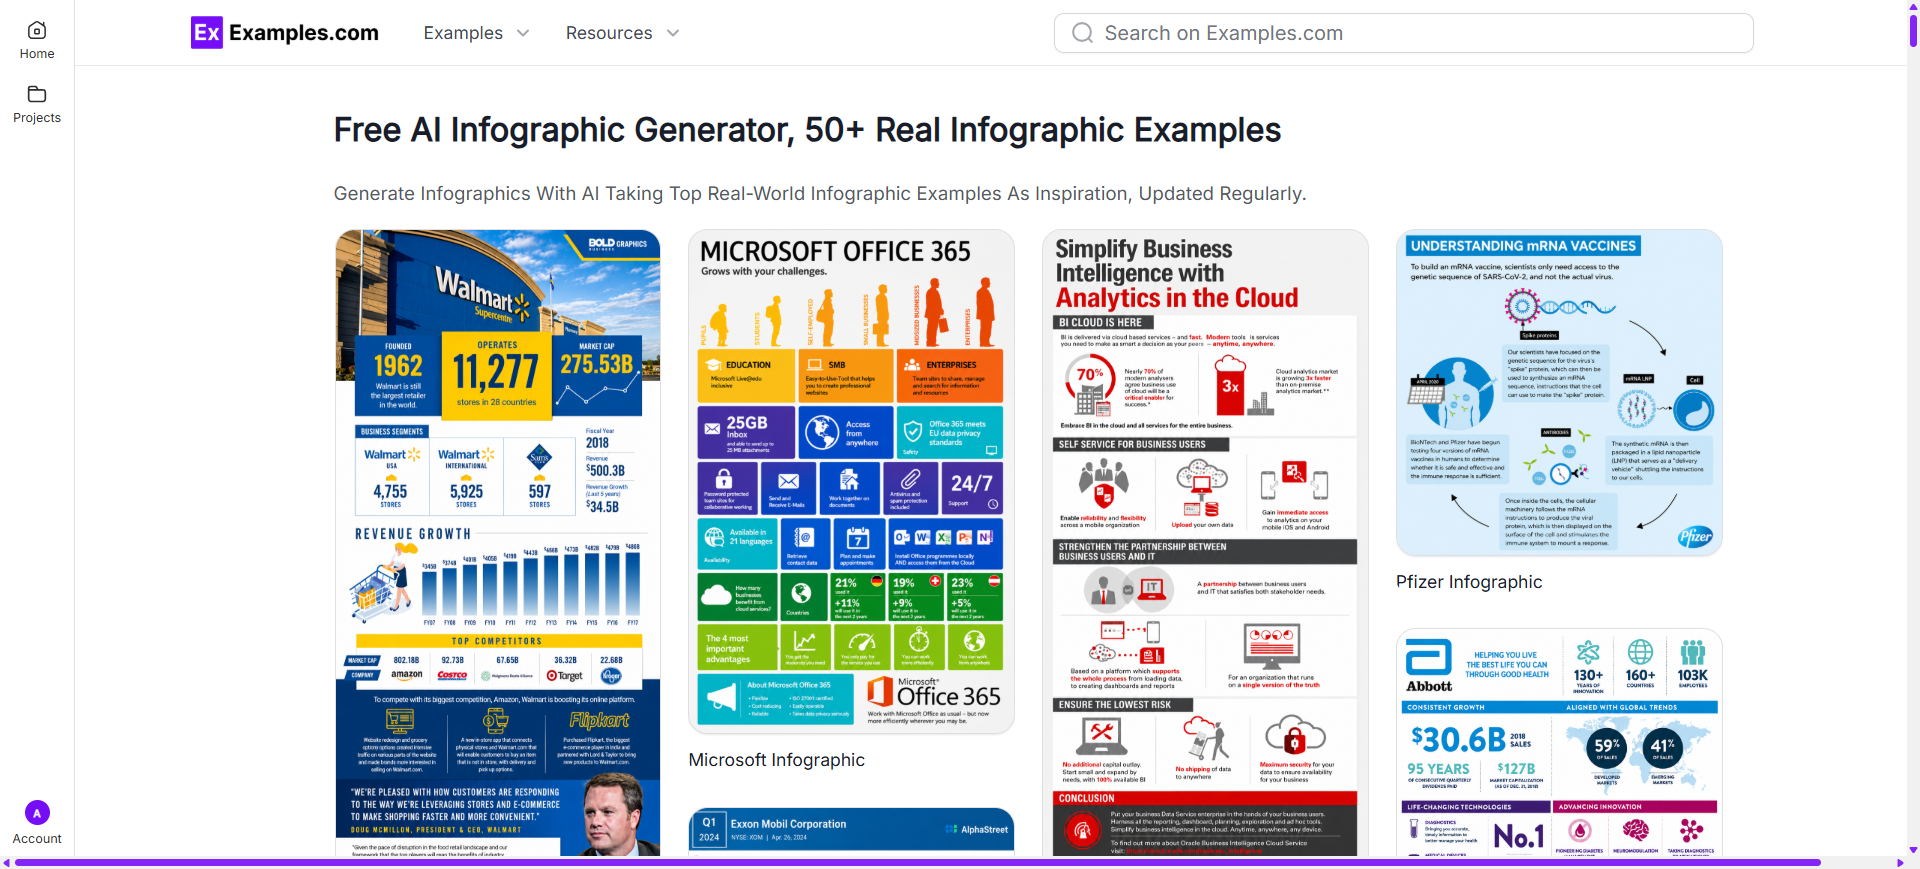
Browse infographic examples covering business, education, healthcare, finance, technology, marketing, research, and social media. These examples help users discover layouts, charts, icons, color schemes, and visual storytelling techniques before creating a new infographic.
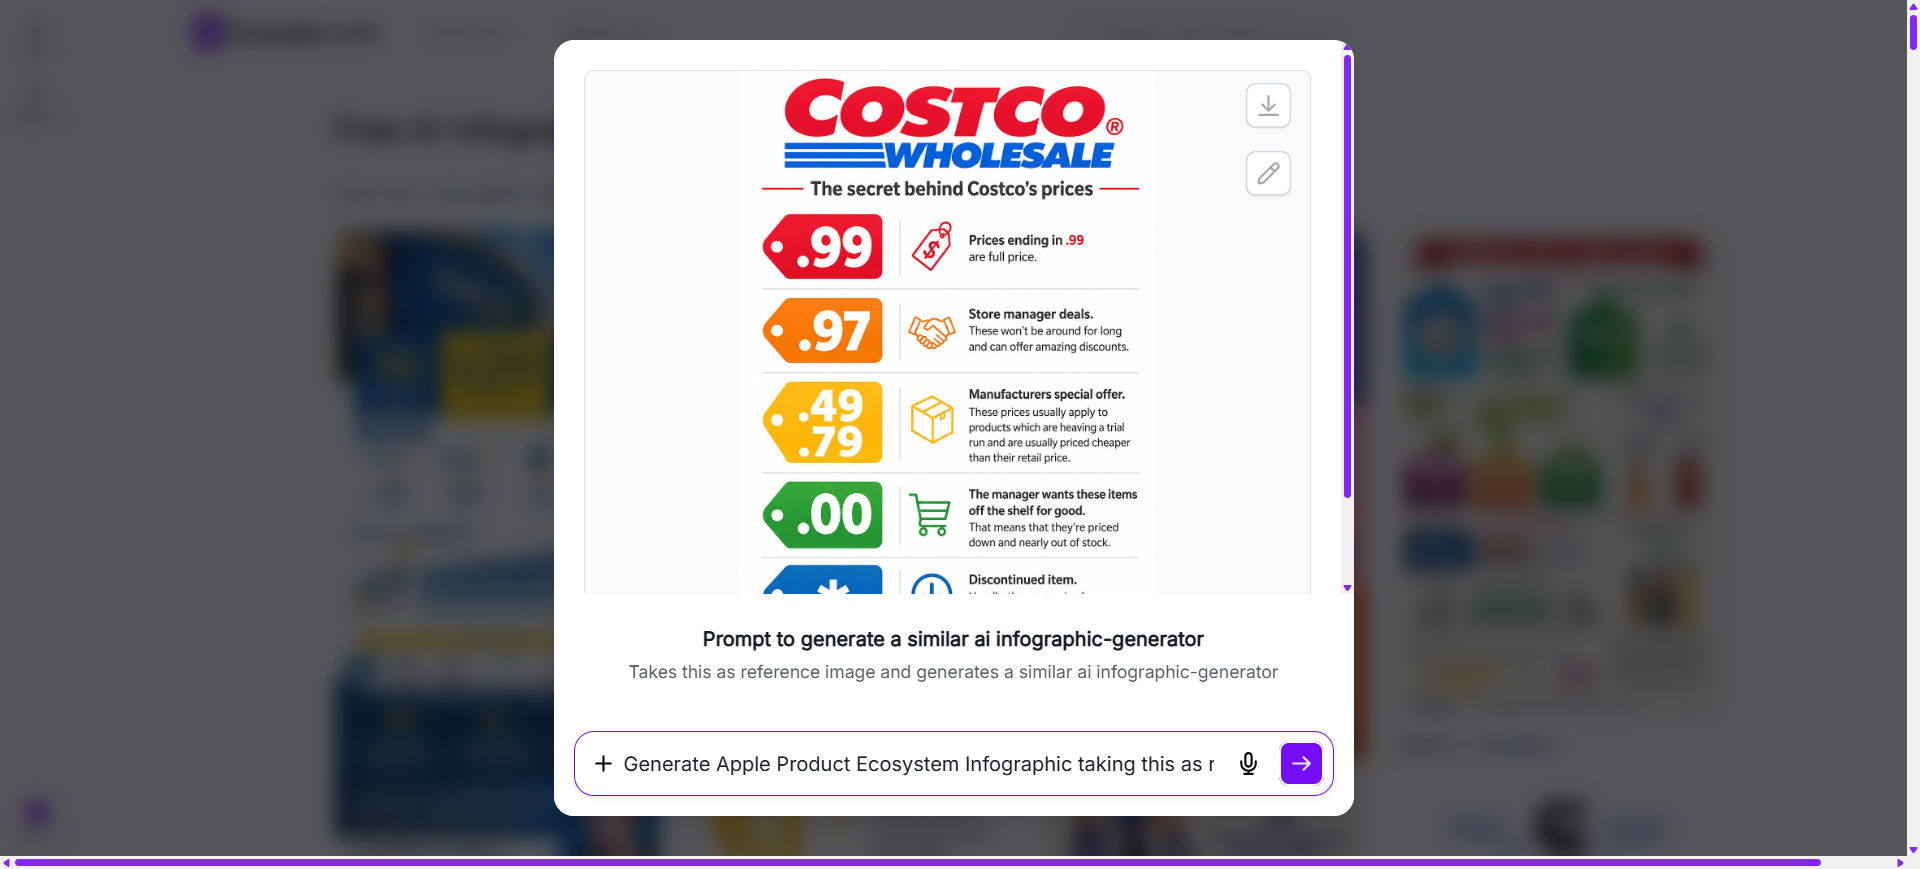
Choose A Reference Infographic And Enter An AI Prompt
Select an infographic example that matches your preferred visual style. Then enter an AI prompt describing your topic, audience, charts, icons, colors, layout, and information hierarchy to generate a personalized infographic.
Generate A New AI Infographic
The AI generates a completely new infographic inspired by the selected example and your prompt. Users can create original layouts, charts, illustrations, icons, visual sections, and data presentations without modifying the original reference design.
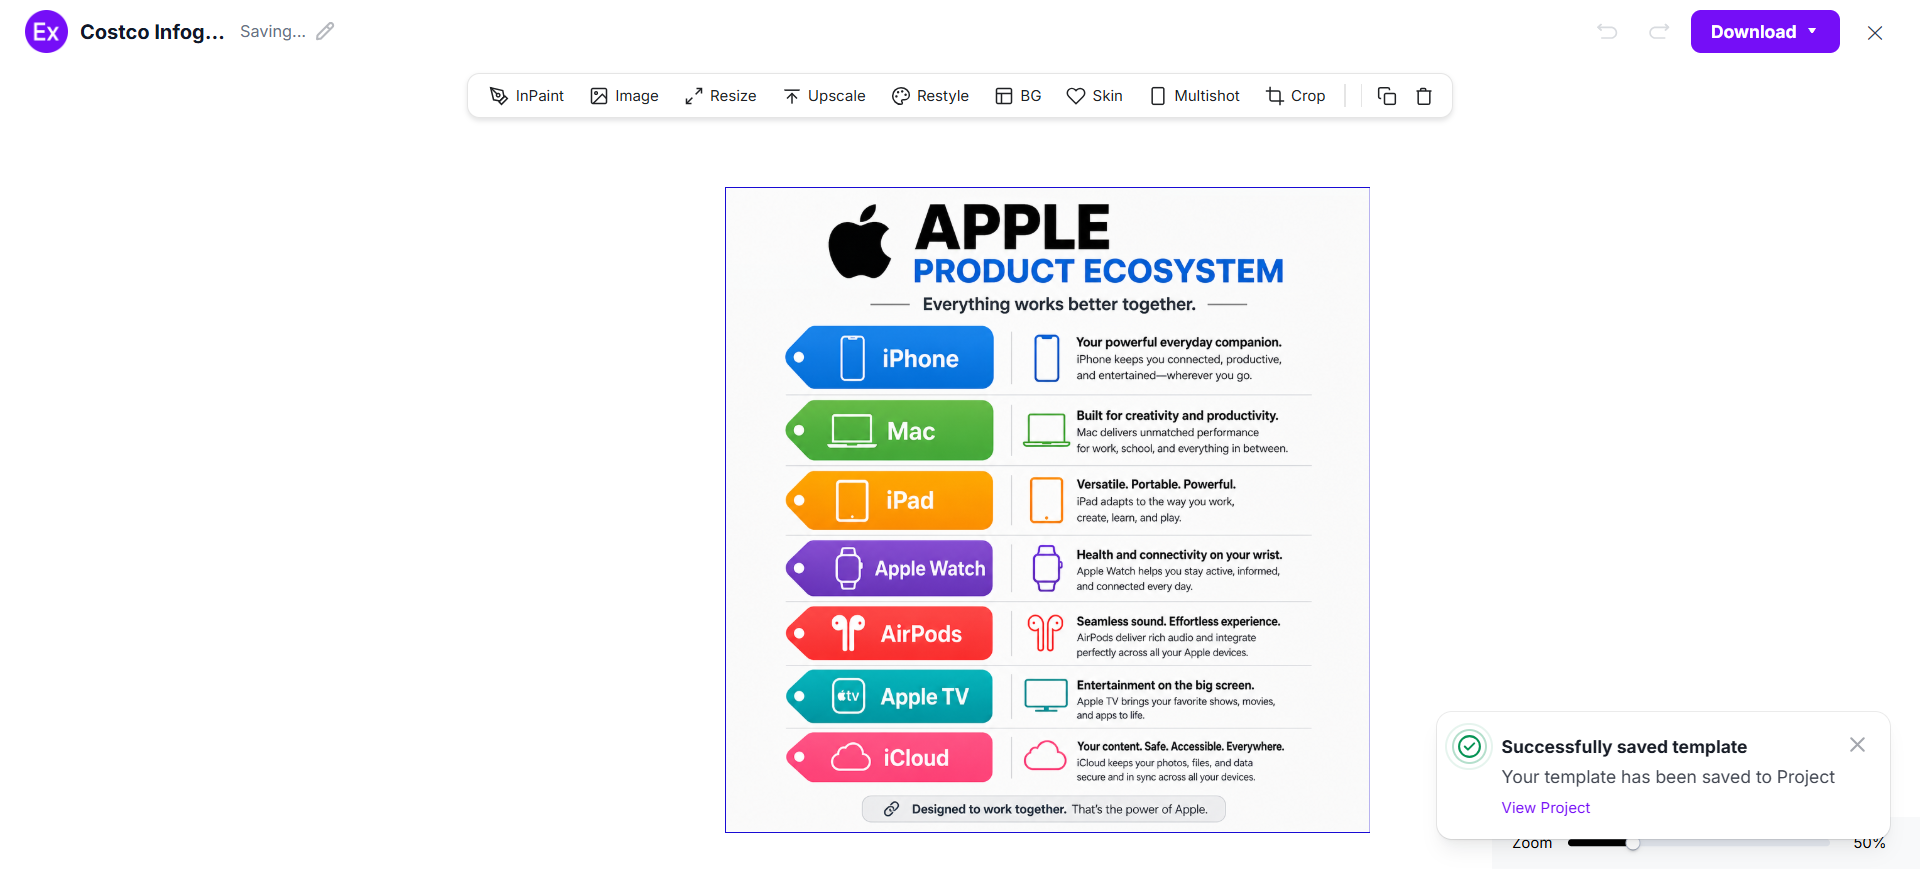
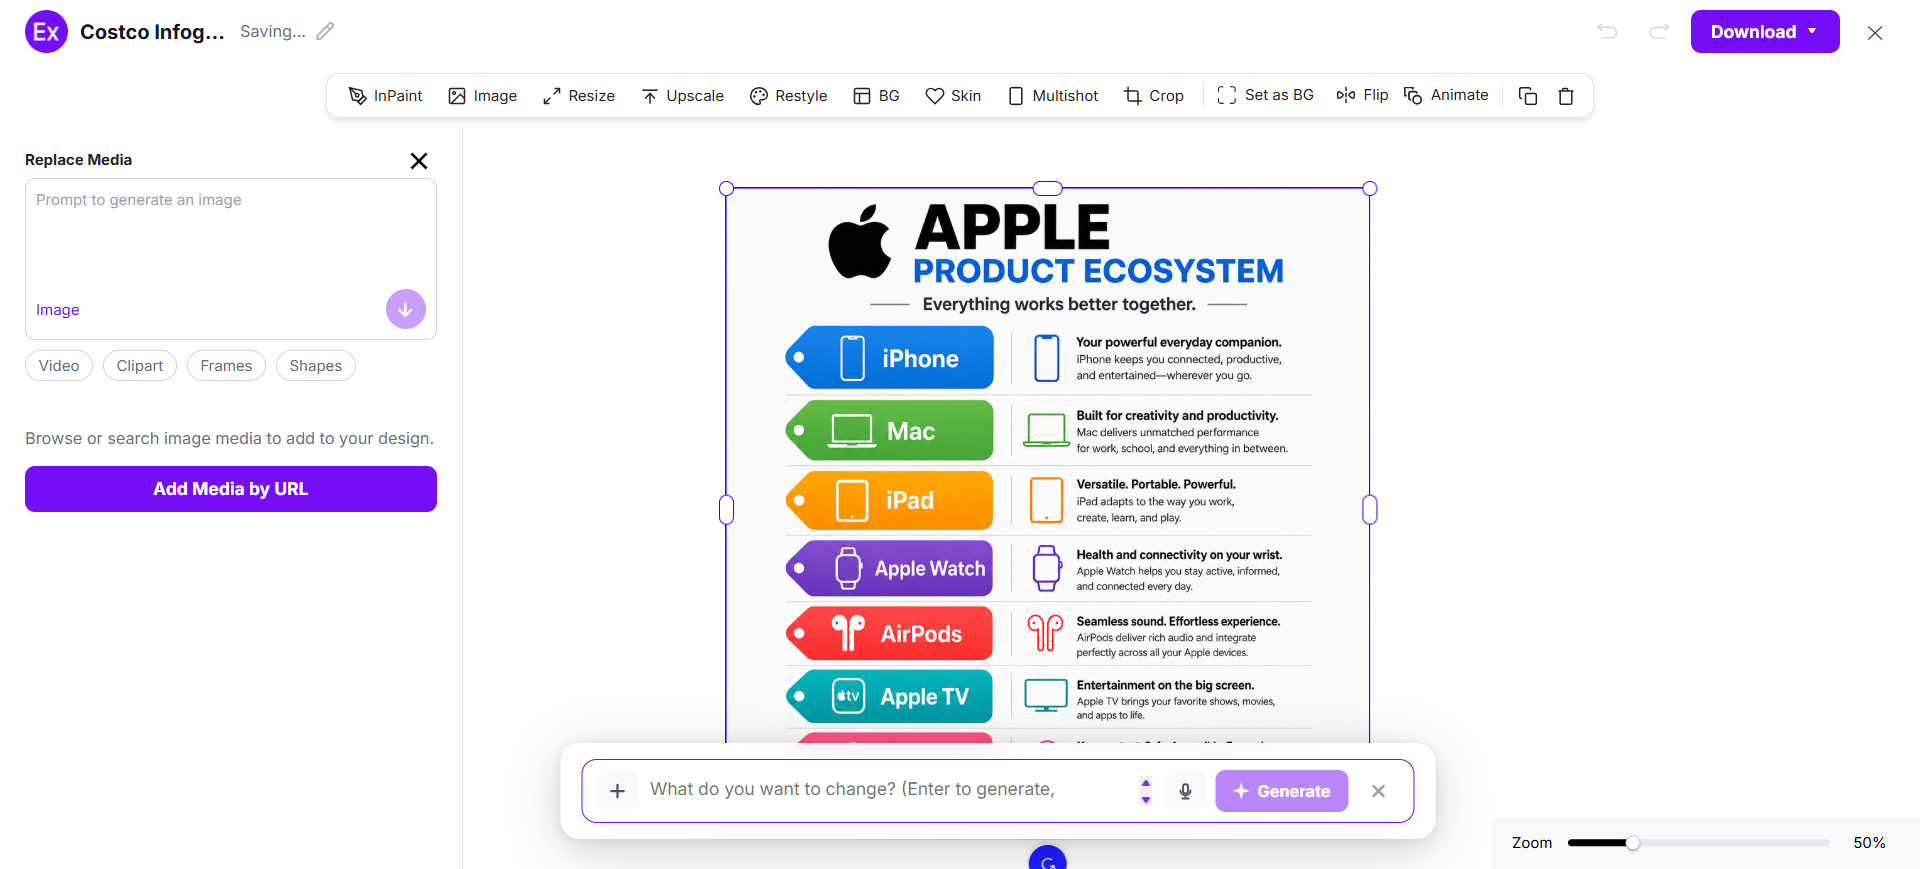
Customize The Infographic In The Online Editor
Open the generated infographic inside the online editor to customize charts, edit text, change colors, upload graphics, replace icons, reorganize layouts, and refine every visual element using AI-powered editing tools.
Download And Use The Final Infographic
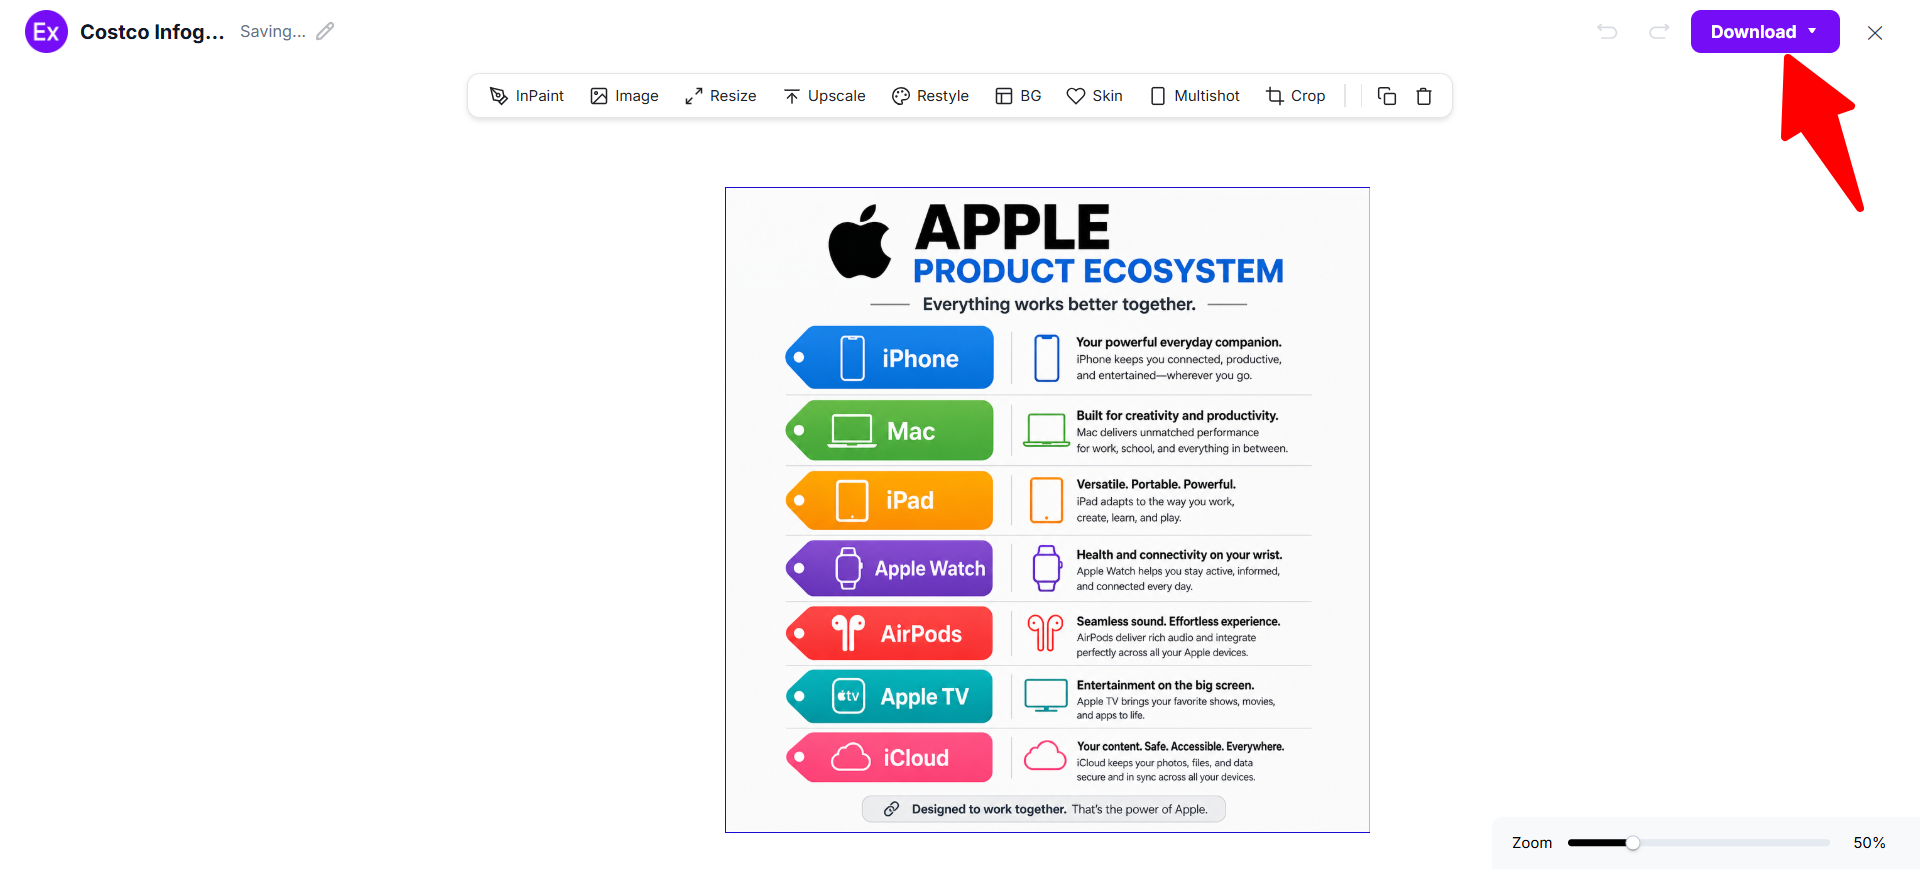
After customization is complete, download the finished infographic as a PNG image. The final design can be used for presentations, reports, websites, blogs, marketing campaigns, educational materials, social media, and professional communication.
Customize Infographic Designs Online
Infographic customization allows users to personalize every section based on their data, audience, and communication goals. Examples.com provides an online editor where users can modify layouts, replace charts, edit headings, update text, change colors, insert icons, upload images, and organize visual elements without requiring professional design software.
Users can also generate new graphics with AI prompts, improve image quality, resize infographic layouts, edit backgrounds, and create multiple design variations. This flexible workflow helps businesses, educators, marketers, researchers, and creators produce engaging infographics for presentations, reports, websites, blogs, social media, and business communication.
AI Infographic Editing Features
Examples.com includes multiple AI-powered editing tools that help users improve and customize infographic designs online.
InPaint
Edit or remove specific infographic elements without affecting surrounding graphics or layouts.
Resize
Adjust infographic dimensions for websites, presentations, social media, reports, or print materials.
Upscale
Enhance image quality and sharpen icons, illustrations, and charts for professional-looking visuals.
Restyle
Generate alternative infographic styles, color palettes, and visual themes with AI assistance.
Background Editing
Remove, replace, or customize backgrounds to create cleaner and more focused infographic designs.
Crop
Refine layouts and improve visual composition by adjusting the infographic framing.
Flip
Mirror selected graphics or design elements to create balanced visual arrangements.
Animate
Convert infographic visuals into engaging animated content for digital presentations and social media.
Multishot
Generate multiple infographic design variations from a single prompt for easier comparison.
Standard Infographic Sizes And Formats
Choosing the right infographic size helps improve readability, platform compatibility, and visual presentation. Different formats work better depending on where the infographic will be published or shared.
| Infographic Size | Common Dimensions | Best Use Case |
|---|---|---|
| Vertical Infographic | 800 × 2000 px | Blog posts, educational content, and reports |
| Square Infographic | 1080 × 1080 px | Social media posts and promotions |
| Presentation Infographic | 1920 × 1080 px | Slides, meetings, and business presentations |
| Printable Infographic | A4 (210 × 297 mm) | Reports, handouts, and educational materials |
| Poster Infographic | A3 (297 × 420 mm) | Events, classrooms, offices, and exhibitions |
| Website Infographic | 1000 × 3000 px | Long-form articles and online publishing |
Vertical infographic layouts are widely used because they provide enough space to organize information into clear visual sections. Square formats perform well on social media, while presentation and printable sizes are ideal for business communication, education, and professional reports.
PNG format is commonly preferred because it preserves image quality while supporting websites, blogs, presentations, social media publishing, and digital marketing workflows.
Essential Elements Every Infographic Should Include
An effective infographic combines organized information with engaging visuals. Including the right elements helps improve readability, communication, and audience understanding.
- Clear Title – Use a descriptive heading that immediately explains what the infographic covers.
- Organized Sections – Divide information into logical sections so readers can follow the content easily.
- Meaningful Icons – Add relevant icons that simplify concepts and improve visual communication.
- Easy-To-Read Charts – Use charts and graphs to present statistics, comparisons, and trends clearly.
- High-Quality Graphics – Include professional illustrations and visuals that strengthen the infographic.
- Consistent Color Palette – Apply coordinated colors to improve readability and maintain visual harmony.
- Readable Typography – Choose simple fonts that remain clear across headings, labels, and supporting text.
- Data Accuracy – Use reliable information to improve credibility and reader trust.
- Clear Call To Action – Encourage readers to explore more information, visit a website, or take the next step.
How Do I Design A Better Infographic?
A well-designed infographic organizes information into a clear visual story that readers can understand quickly. Following a few design principles helps improve readability, engagement, and information retention.
- Define One Clear Message – Focus the infographic on a single topic so readers can understand the main idea immediately.
- Use Accurate Information – Verify statistics, facts, and data before presenting them visually.
- Choose The Right Layout – Select a structure that matches the type of content, such as a process, comparison, timeline, or statistical infographic.
- Use Charts And Icons Effectively – Replace long paragraphs with charts, icons, and illustrations that simplify complex information.
- Organize Content Into Sections – Break information into logical groups using headings and balanced spacing.
- Maintain Consistent Colors – Apply a coordinated color palette that improves readability and visual harmony.
- Keep Text Concise – Use short descriptions so visuals remain the primary communication tool.
- Leave Enough White Space – Balanced spacing prevents clutter and makes information easier to scan.
- Highlight Key Information – Use larger text, bold numbers, or visual emphasis to draw attention to the most important insights.
Common Infographic Design Mistakes To Avoid
Avoiding common infographic design mistakes helps improve readability, visual clarity, and the effectiveness of information delivery.
- Too Much Text – Large blocks of text reduce readability. Summarize information using concise text supported by visuals.
- Poor Data Organization – Arrange information in a logical sequence so readers can easily follow the visual story.
- Using Inaccurate Data – Verify facts, statistics, and figures before including them in the infographic.
- Weak Visual Hierarchy – Organize headings, numbers, and graphics clearly to guide readers through the content.
- Too Many Colors – Limit the color palette to maintain consistency and improve visual balance.
- Unreadable Fonts – Choose clean typography that remains easy to read across digital and print formats.
- Cluttered Layouts – Leave enough white space between charts, icons, and sections to improve readability.
- Using Irrelevant Visuals – Select icons, charts, and illustrations that directly support the information being presented.
How Can I Market My Product Using An Infographic?
Infographics help businesses simplify information while making products, services, and marketing messages more engaging. They improve understanding, attract attention, and encourage audiences to explore brands further.
Product Features
Present product features, specifications, and customer benefits using charts, icons, and organized visual sections.
Business Reports
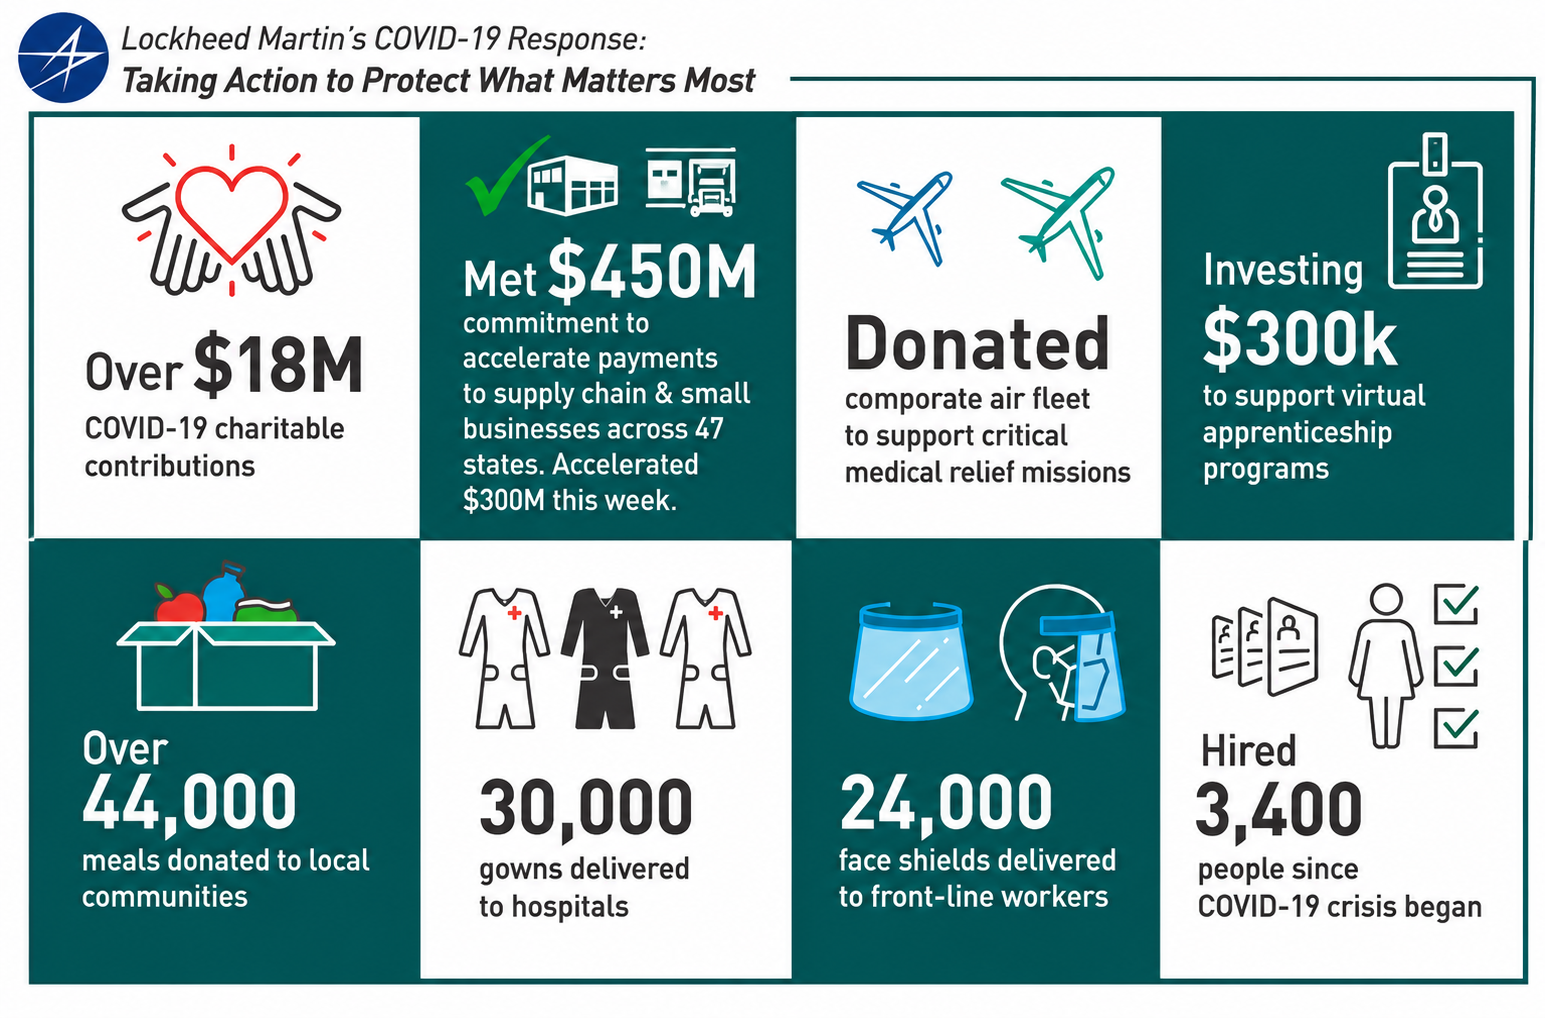
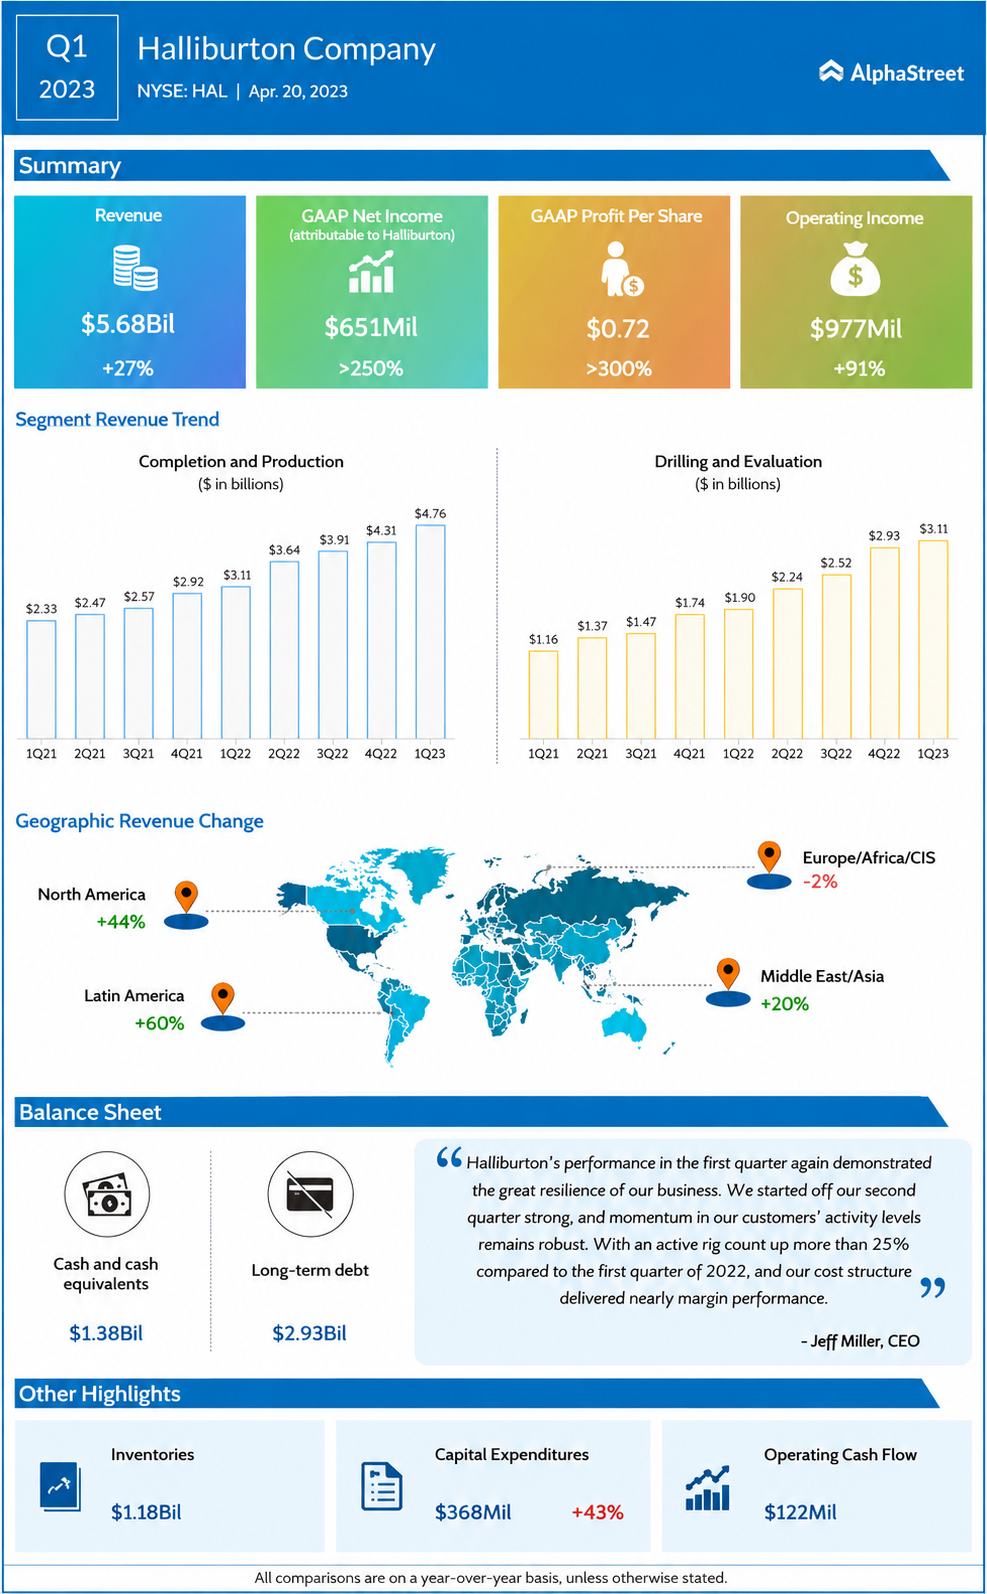
Transform company statistics, financial summaries, performance metrics, and research findings into easy-to-understand visual reports.
Educational Content
Explain concepts, tutorials, guides, and industry knowledge using informative visual storytelling.
Social Media Campaigns
Create engaging infographic posts that increase visibility, encourage sharing, and improve audience engagement.
Marketing Presentations
Summarize business strategies, customer insights, campaign performance, and promotional messages using visual layouts.
Product Comparisons
Compare products, pricing, services, or features side by side to help customers make informed purchasing decisions.
Which Infographic Sizes Perform Best?
The best-performing infographic size depends on where the content will be published and how the audience will consume the information.
| Infographic Size | Best For | Advantages |
|---|---|---|
| Vertical (800 × 2000 px) | Blogs, articles, and educational content | Easy scrolling and organized storytelling |
| Square (1080 × 1080 px) | Social media platforms | Optimized for sharing and audience engagement |
| Presentation (1920 × 1080 px) | Meetings and business presentations | Perfect for widescreen displays |
| A4 (210 × 297 mm) | Reports and printable documents | Professional print-friendly format |
| A3 (297 × 420 mm) | Posters and classroom displays | Large space for visual communication |
| Website Long Format (1000 × 3000 px) | Landing pages and online publishing | Supports detailed information with excellent readability |
Vertical infographics remain the most popular because they support long-form storytelling while maintaining clear organization. Square formats work well for social media, and presentation sizes are ideal for business meetings and educational content.
Infographic Ideas For Different Industries
Different industries use infographics to simplify information, explain processes, and communicate valuable insights through engaging visual content.
- Business And Finance – Visualize financial reports, company growth, investment trends, and business performance using charts and statistics.
- Healthcare – Explain medical procedures, wellness tips, healthcare statistics, patient education, and treatment processes through clear visuals.
- Education – Present lessons, study guides, historical timelines, scientific concepts, and classroom resources in an engaging format.
- Technology – Illustrate software features, product comparisons, cybersecurity practices, digital trends, and emerging innovations.
- Marketing – Show campaign performance, customer journeys, marketing funnels, and audience insights using visual storytelling.
- Human Resources – Explain onboarding processes, company policies, employee benefits, recruitment workflows, and workplace guidelines.
- Ecommerce – Display product comparisons, buying guides, customer reviews, order processes, and shopping statistics.
- Real Estate – Present market trends, buying processes, neighborhood insights, investment opportunities, and property comparisons.
- Travel And Tourism – Highlight travel guides, destination comparisons, itineraries, cultural facts, and tourism statistics.
- Environmental And Sustainability – Visualize climate data, recycling processes, renewable energy facts, conservation efforts, and sustainability initiatives.
FAQs
What Makes An Infographic Effective?
An effective infographic combines accurate information, organized layouts, readable typography, meaningful visuals, and clear data presentation to communicate ideas quickly and clearly.
When Should I Use An Infographic Instead Of A Presentation?
Infographics work best for summarizing information on a single visual, while presentations are better suited for detailed discussions across multiple slides.
Can I Create An Infographic Without Design Experience?
Yes. AI-powered tools help users generate layouts, organize information, and customize visuals, making infographic creation simple for beginners.
What Information Works Best In An Infographic?
Statistics, comparisons, timelines, processes, educational concepts, research findings, surveys, and business insights are commonly presented through infographics.
How Can I Make My Infographic Easier To Read?
Use clear headings, concise text, organized sections, readable fonts, consistent colors, and visuals that naturally support the information.
Can I Customize Every Element After AI Generates An Infographic?
Yes. Users can edit charts, icons, graphics, colors, text, layouts, and other visual elements using the online editor.
What Is The Difference Between A Statistical And An Informational Infographic?
Statistical infographics focus on presenting numbers and data visually, while informational infographics explain concepts or educational topics using organized visual sections.
Where Can I Use An Infographic?
Infographics can be used for websites, blogs, presentations, business reports, classrooms, marketing campaigns, research publications, social media, and professional communication.