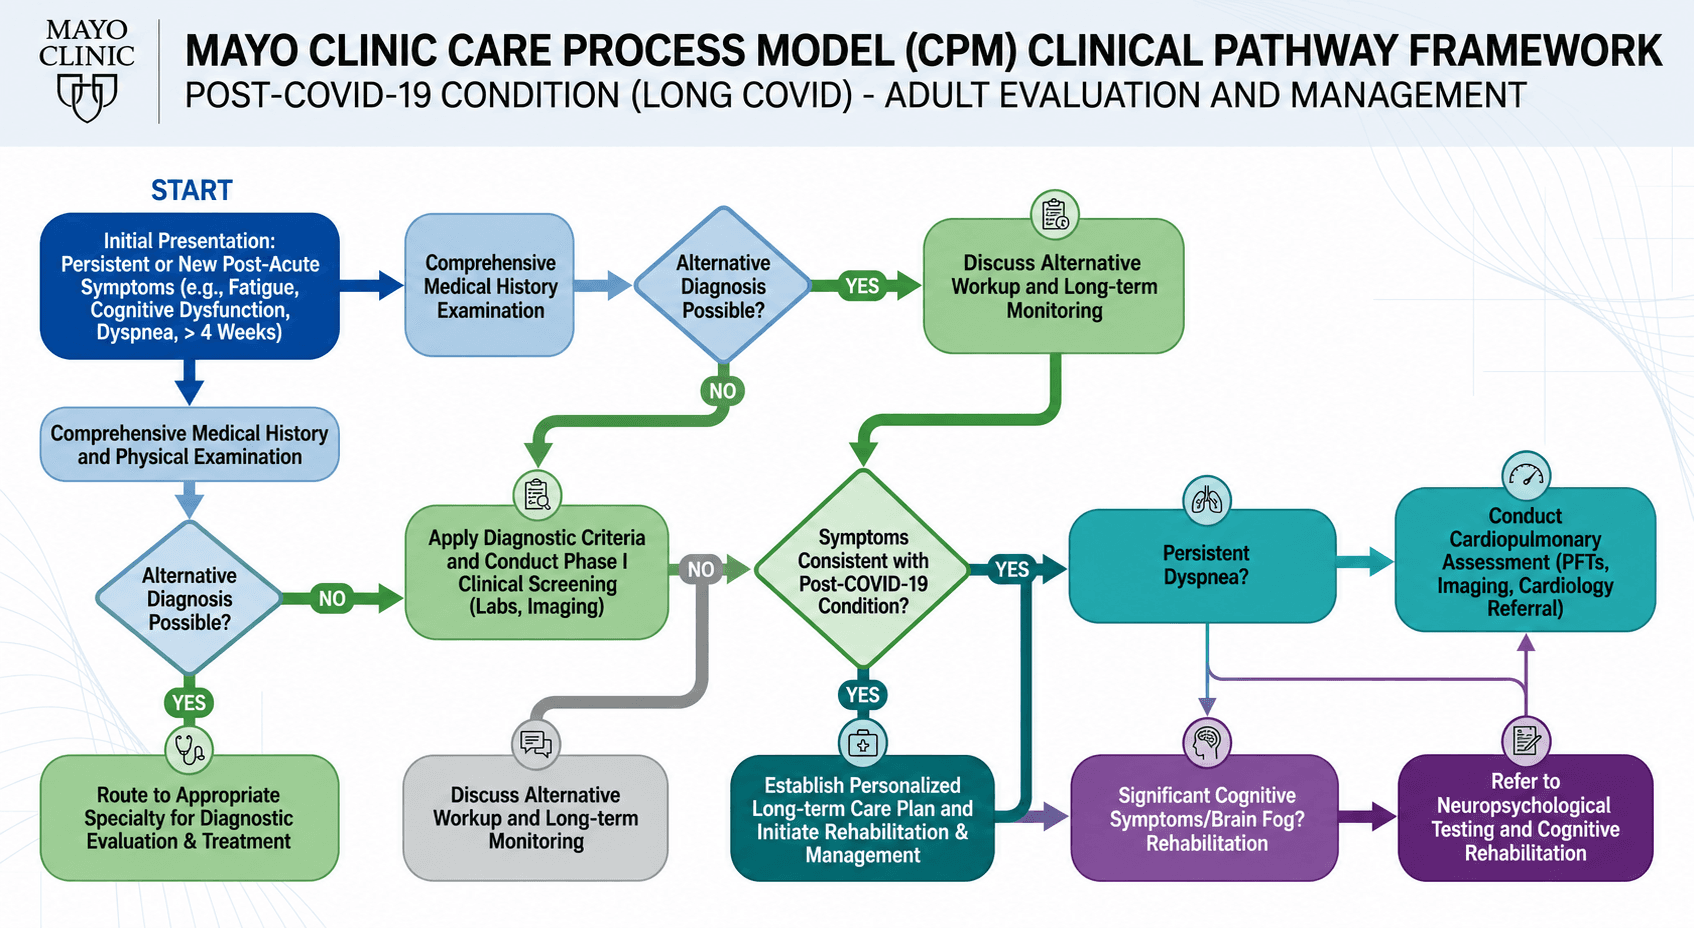
Mayo Clinic Care Process Model (CPM) Clinical Pathway Framework Flowchart
product shot
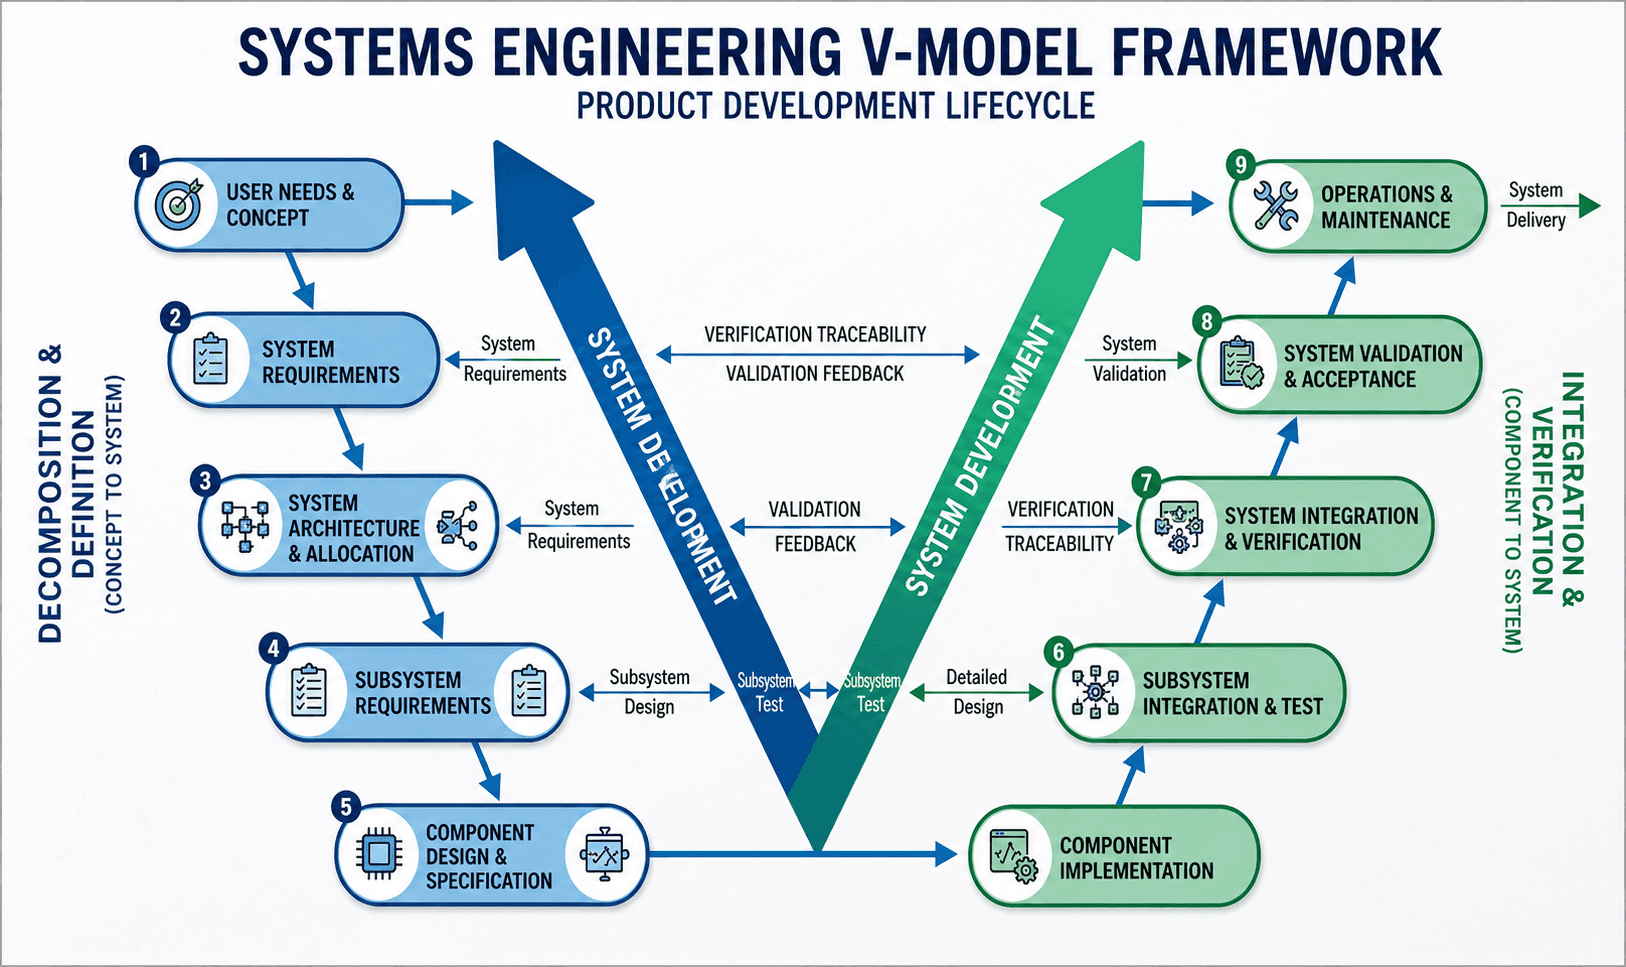
Systems Engineering V-Model Flowchart
product shot
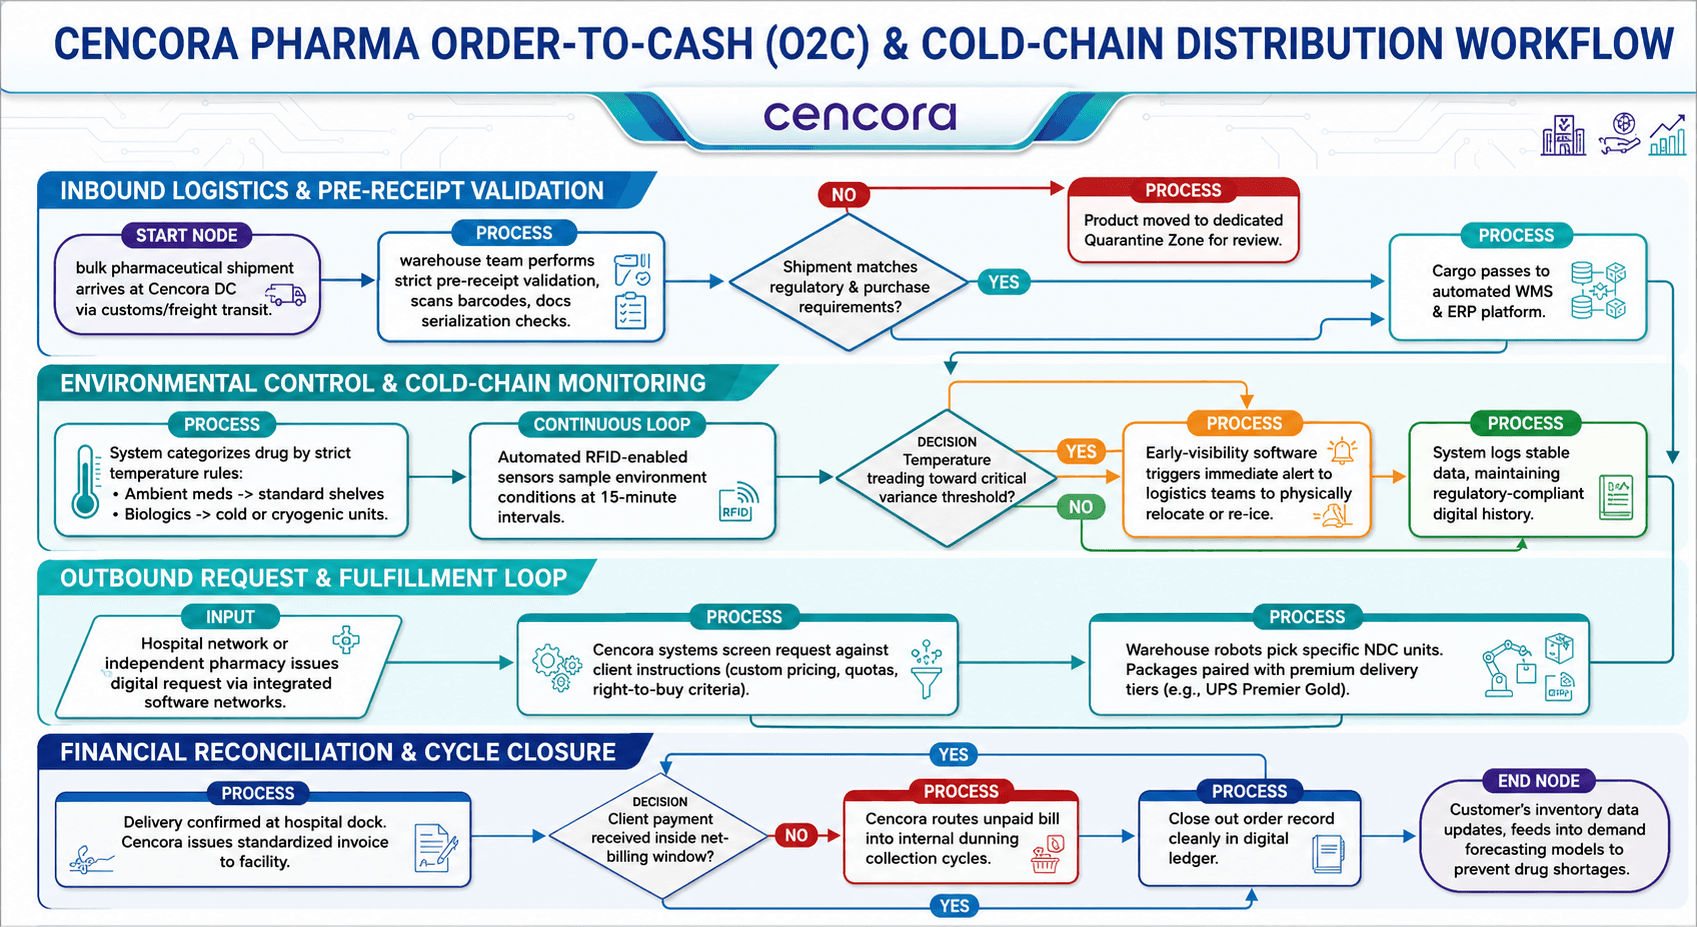
Cencora Pharma Order-to-Cash (O2C) Inbound & Outbound Distribution Flowchart
product shot
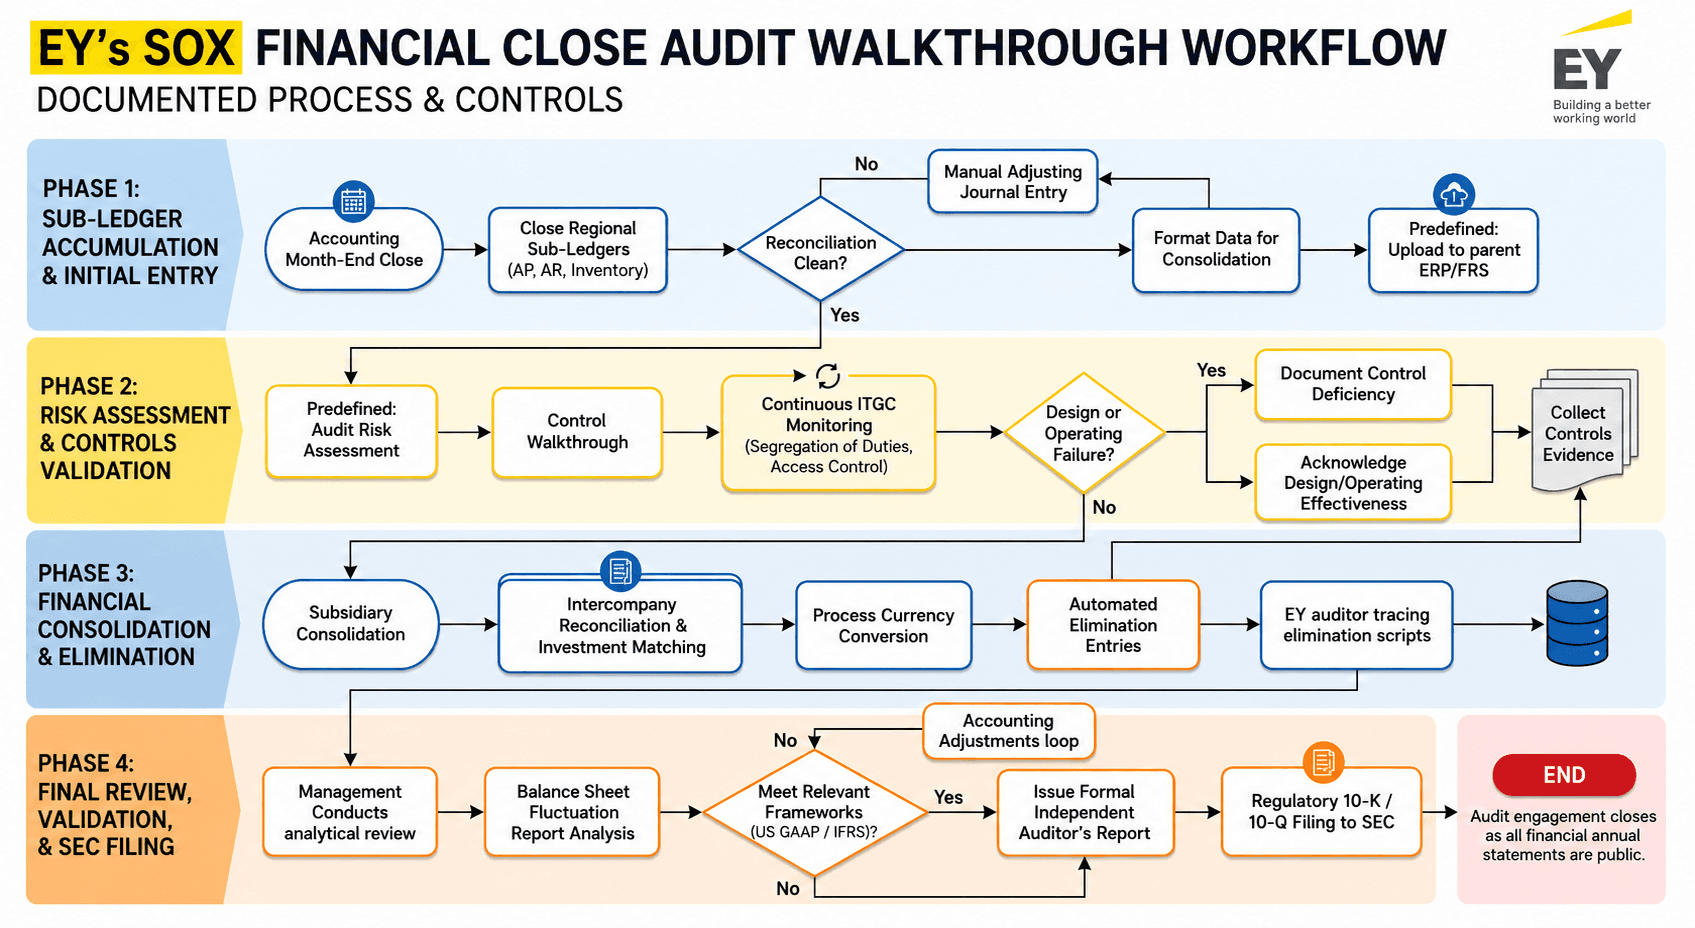
EY’s SOX Financial Close Audit Walkthrough Workflow Flowchart
product shot
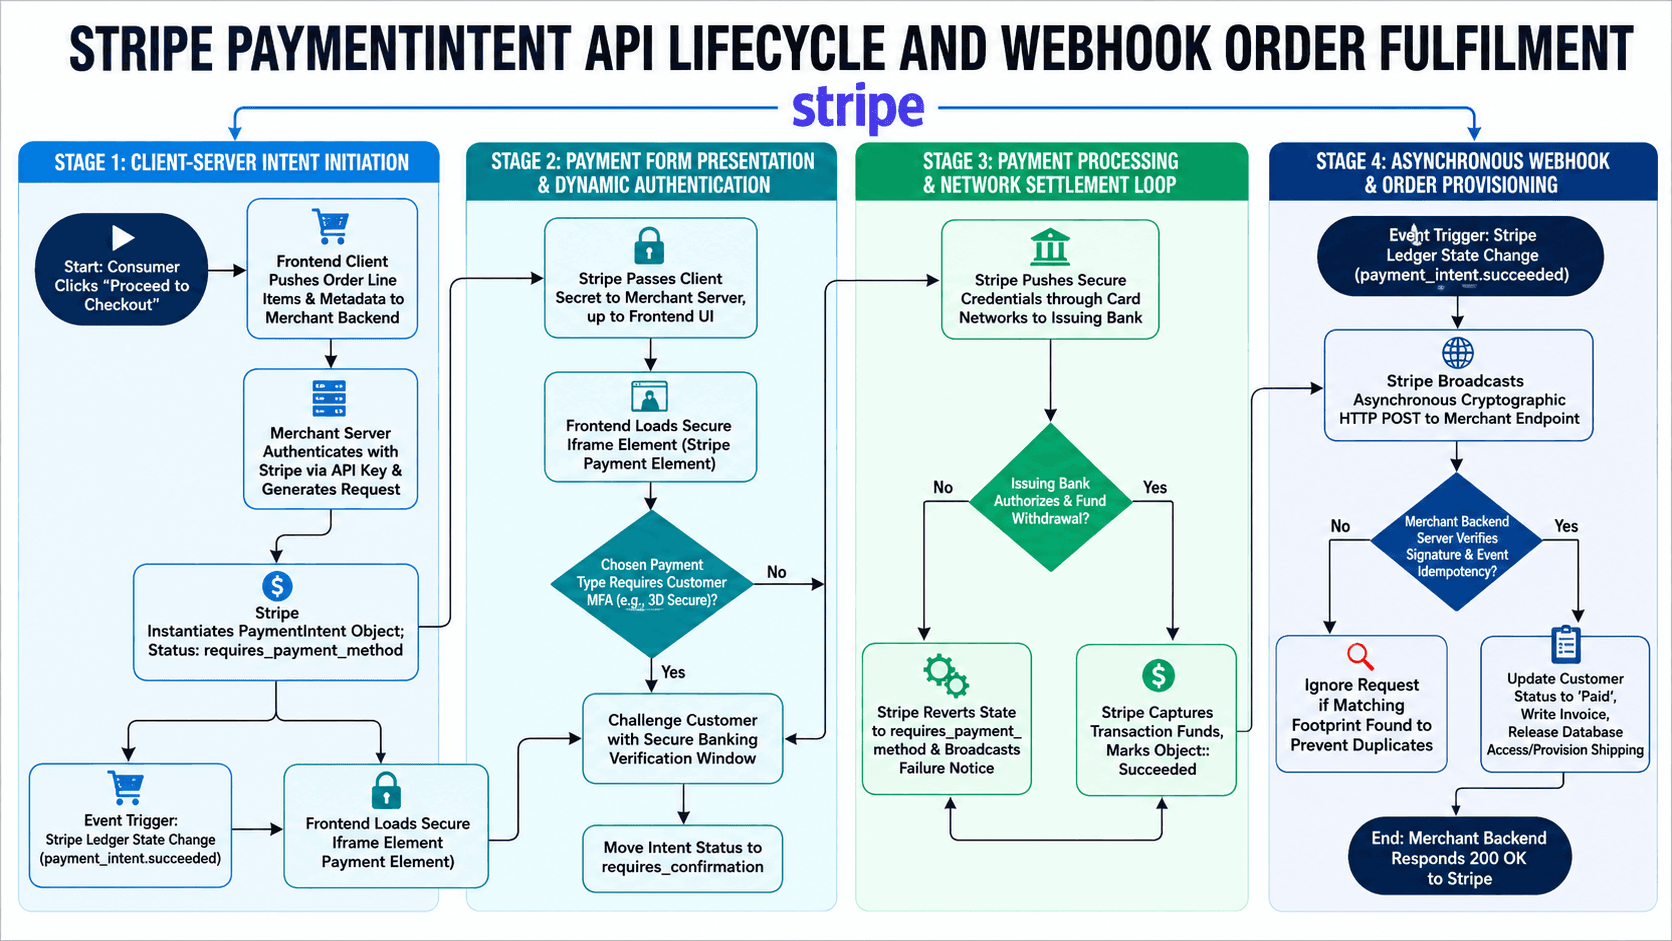
Stripe Payment Intent API Lifecycle and Webhook Order Fulfillment Flowchart
product shot
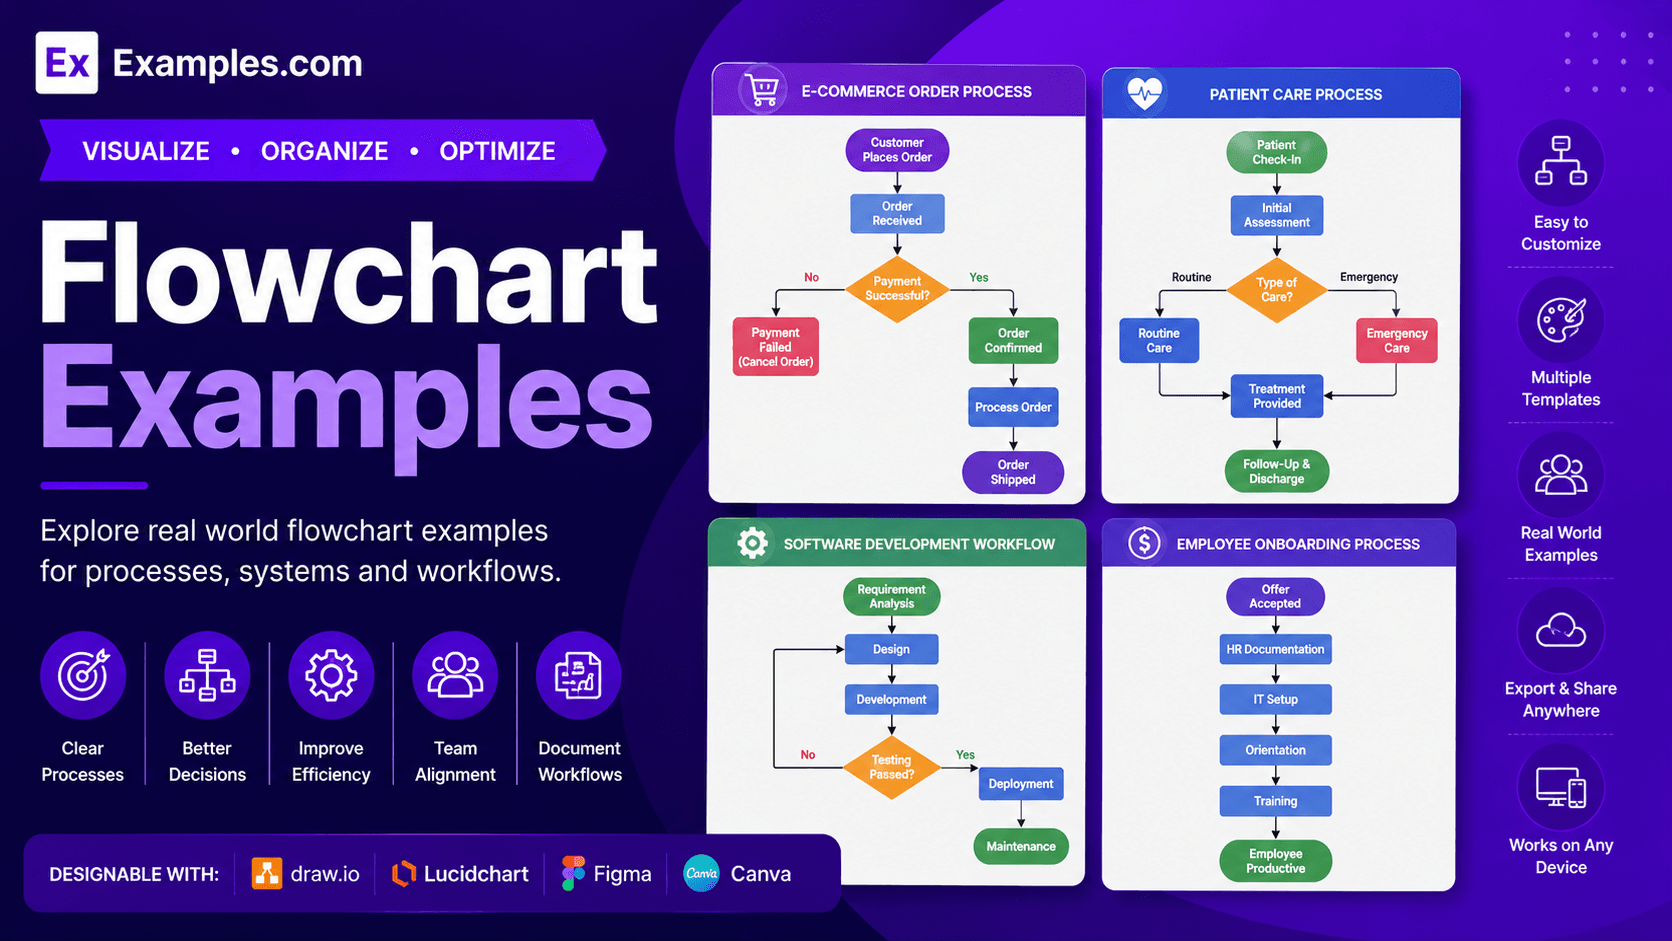
Visualize processes, workflows, and decision-making using AI-powered flowchart generation inspired by real-world flowchart examples. I can explore flowcharts created for business operations, software development, project management, healthcare, education, manufacturing, customer support, and process improvement, choose a layout that matches my objective, enter an AI prompt, generate a completely new flowchart, customize every symbol in the online editor, and download the final PNG. With Examples.com, I can transform complex workflows into clear visual diagrams that improve communication, planning, and problem-solving.
What Is A Flowchart?
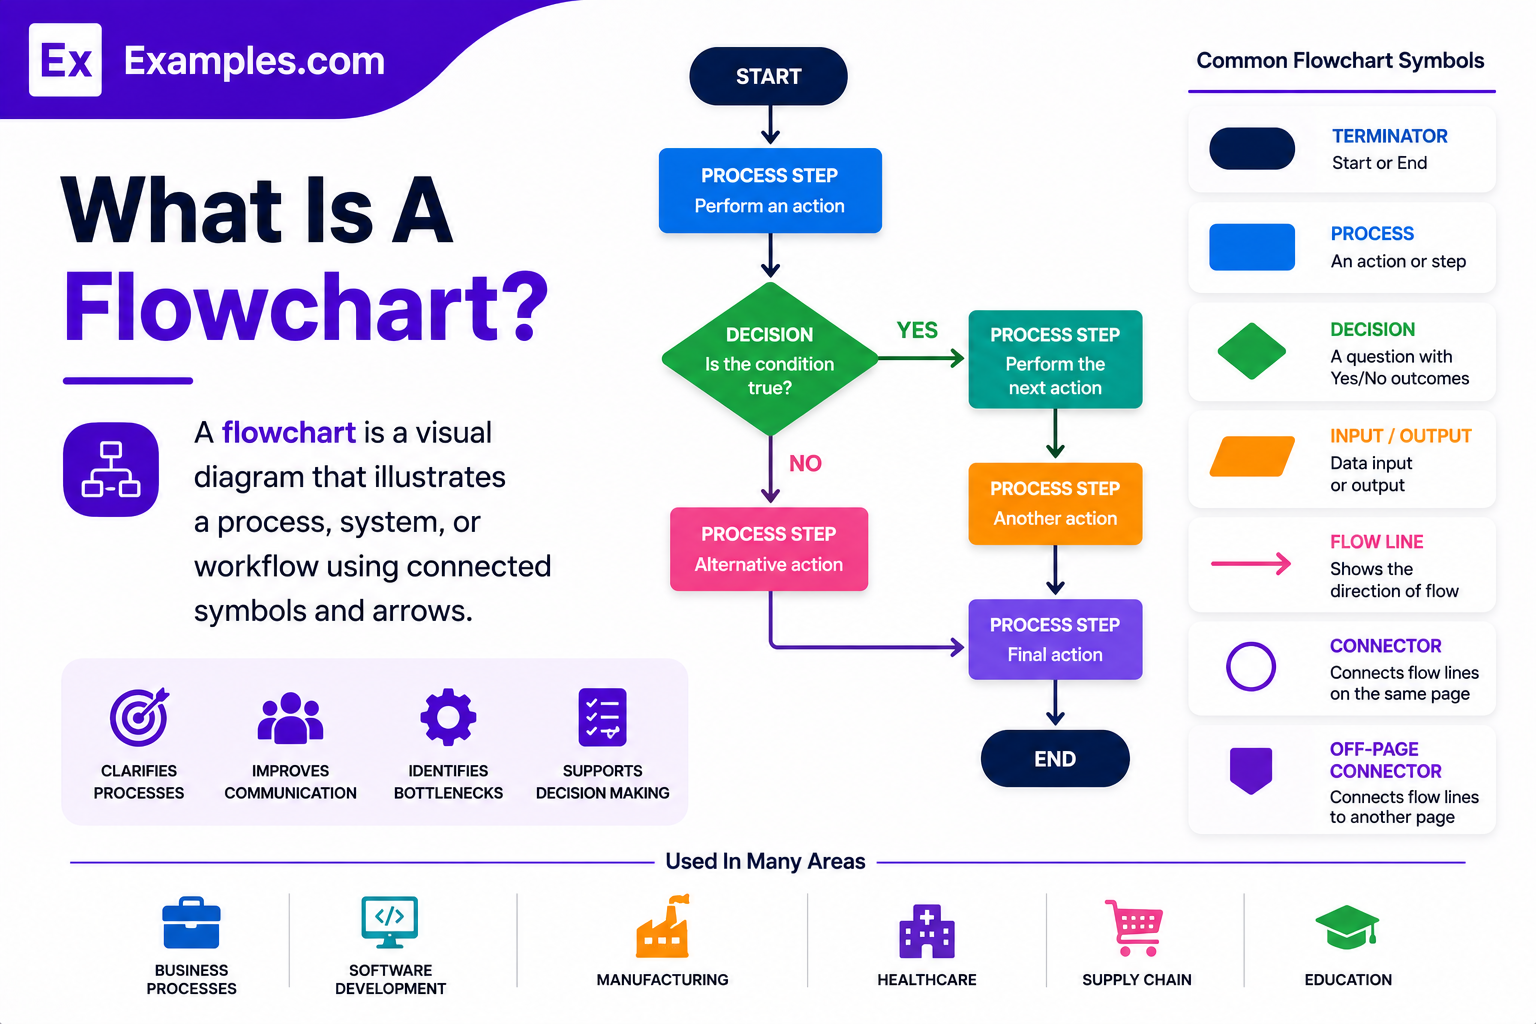
A flowchart is a visual diagram that illustrates a process, system, or workflow using connected symbols and arrows. It organizes steps, decisions, and outcomes in a logical sequence, making complex procedures easier to understand. I can create flowcharts for planning, problem-solving, training, business processes, algorithms, and project workflows using AI-powered design and customization tools.
Popular Types Of Flowcharts
Different flowchart styles help organize workflows, systems, and decision-making across various industries.
⚙️
Process Flowcharts
Illustrate sequential business processes, operational workflows, and standard procedures using connected process symbols.
🔄
Workflow Flowcharts
Visualize task movement, approvals, responsibilities, and work progression across teams and departments.
🔀
Decision Flowcharts
Guide users through yes-or-no decisions using branches that lead to different outcomes.
🖥️
System Flowcharts
Represent system architecture, data movement, software components, and technical process interactions visually.
🏢
Business Process Flowcharts
Document organizational procedures, customer journeys, service delivery, and operational improvements clearly.
💻
Algorithm Flowcharts
Explain logical programming sequences, calculations, conditions, and software algorithms before development begins.
Why Should I Use Real Flowchart Examples To Create My Own Flowchart?
Real flowchart examples help me understand how processes, decisions, symbols, and workflows connect in a logical sequence. They provide inspiration while making it easier to visualize complex systems, improve communication, identify problems, and organize information into a structured diagram.
Instead of modifying an existing flowchart, I can use professional flowcharts as visual references. On Examples.com, I simply choose a flowchart style, enter an AI prompt, generate a completely new flowchart, and customize every symbol, connector, and decision path to match my own workflow or process.
How Do I Generate Flowcharts Using Proven Examples From The World's Best Brands?
Creating a professional flowchart becomes easier when I use successful process diagrams as inspiration. The workflow combines real-world flowchart references, AI-powered generation, online editing, and personalized customization to transform complex processes into organized visual diagrams.
Explore Real-World Flowchart Examples
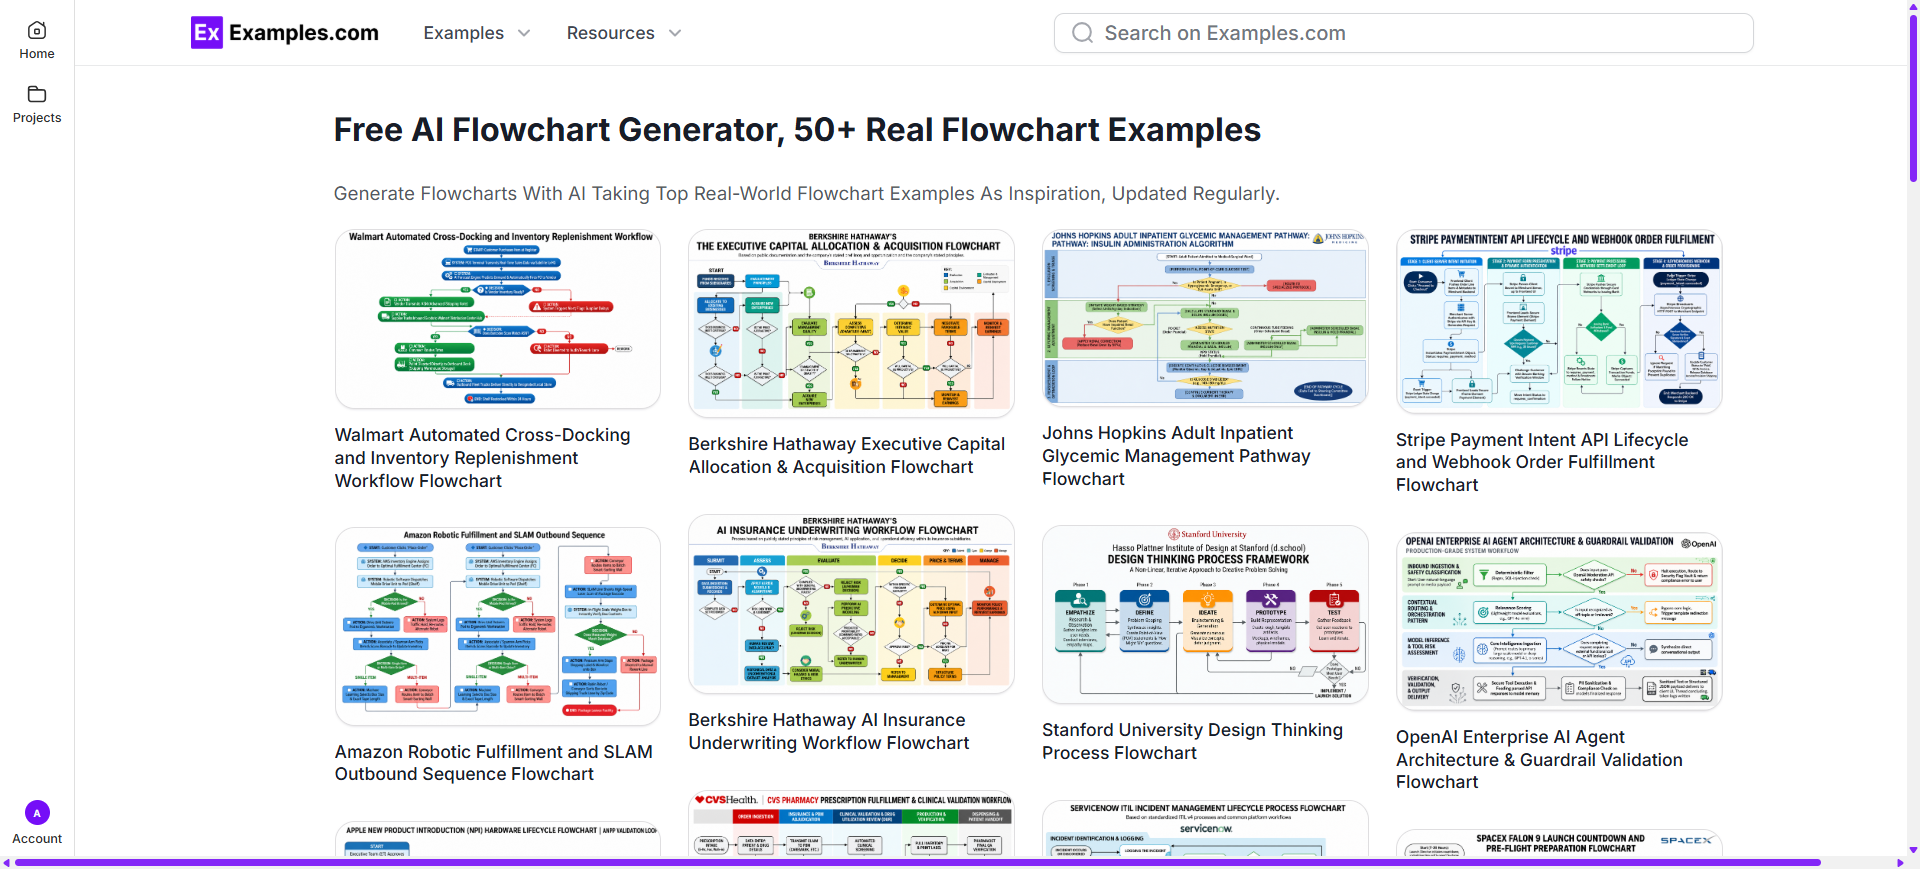
I can browse flowchart examples covering business operations, software development, healthcare, manufacturing, education, project management, customer service, algorithms, and organizational workflows to discover layouts, symbols, decision paths, and process structures.
Choose A Reference Flowchart And Enter An AI Prompt
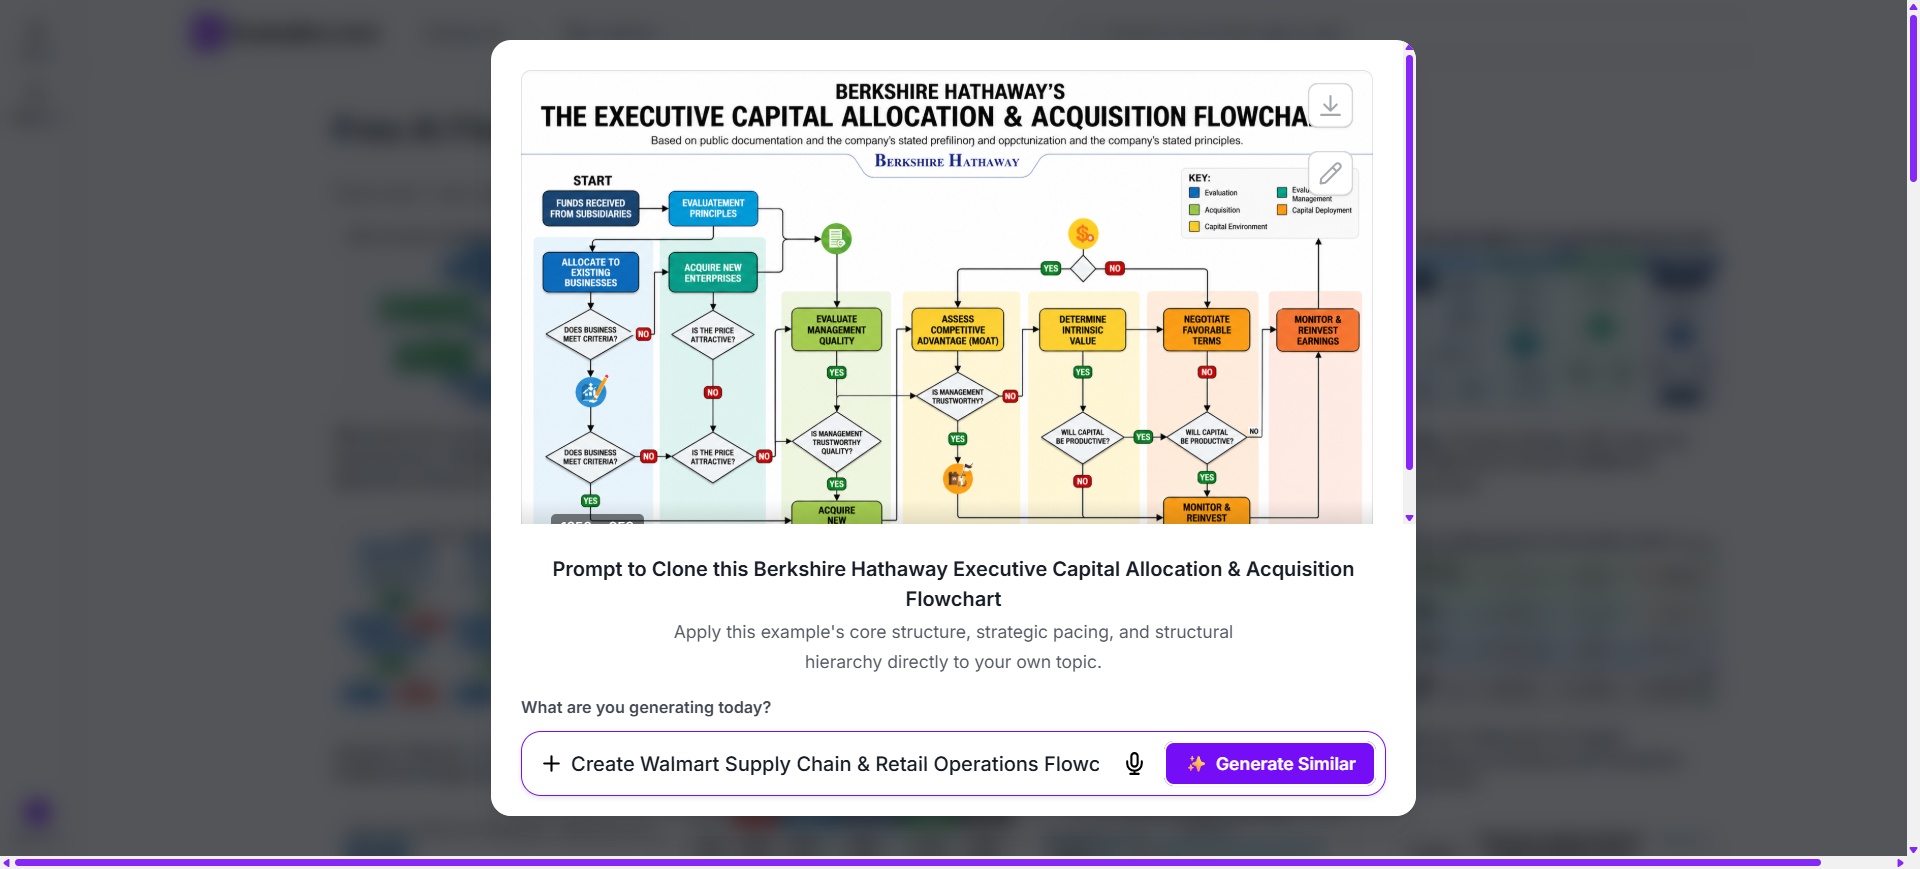
After selecting a flowchart style, I can describe my workflow, process steps, decisions, symbols, connectors, colors, labels, and objectives through an AI prompt to generate a completely original flowchart.
Generate A New AI Flowchart
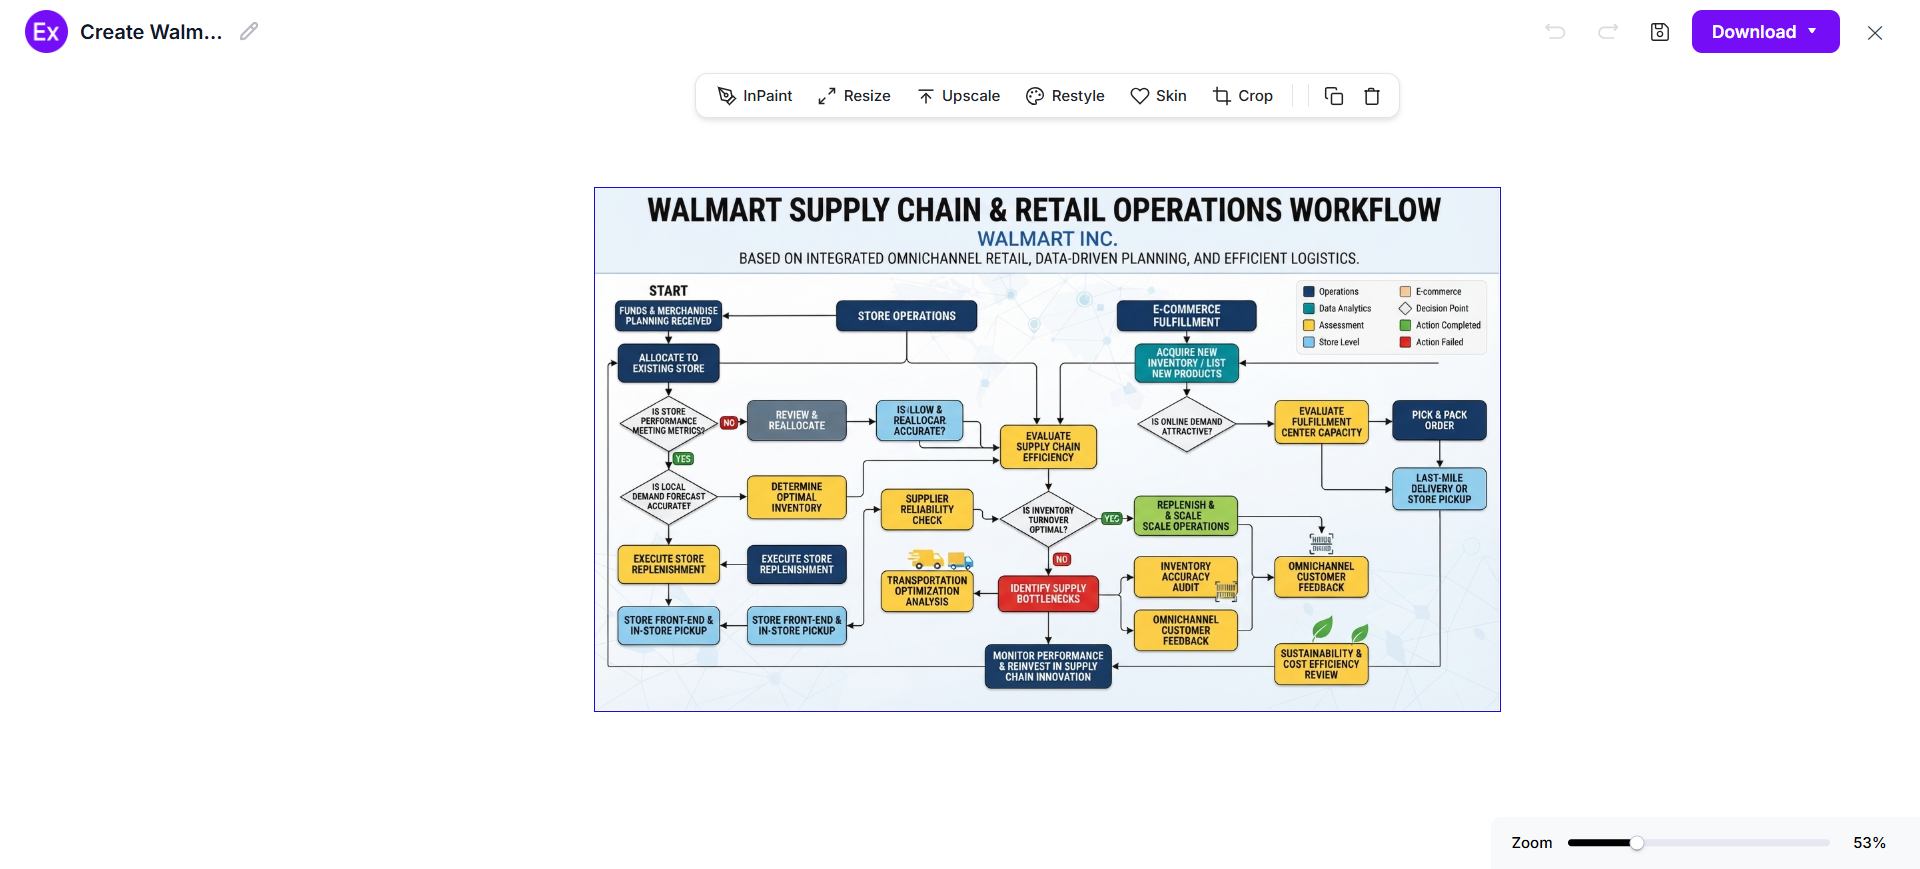
The AI creates a brand-new flowchart inspired by the selected example and my prompt. It generates original process symbols, decision branches, flowlines, labels, and workflow structures without modifying the original reference flowchart.
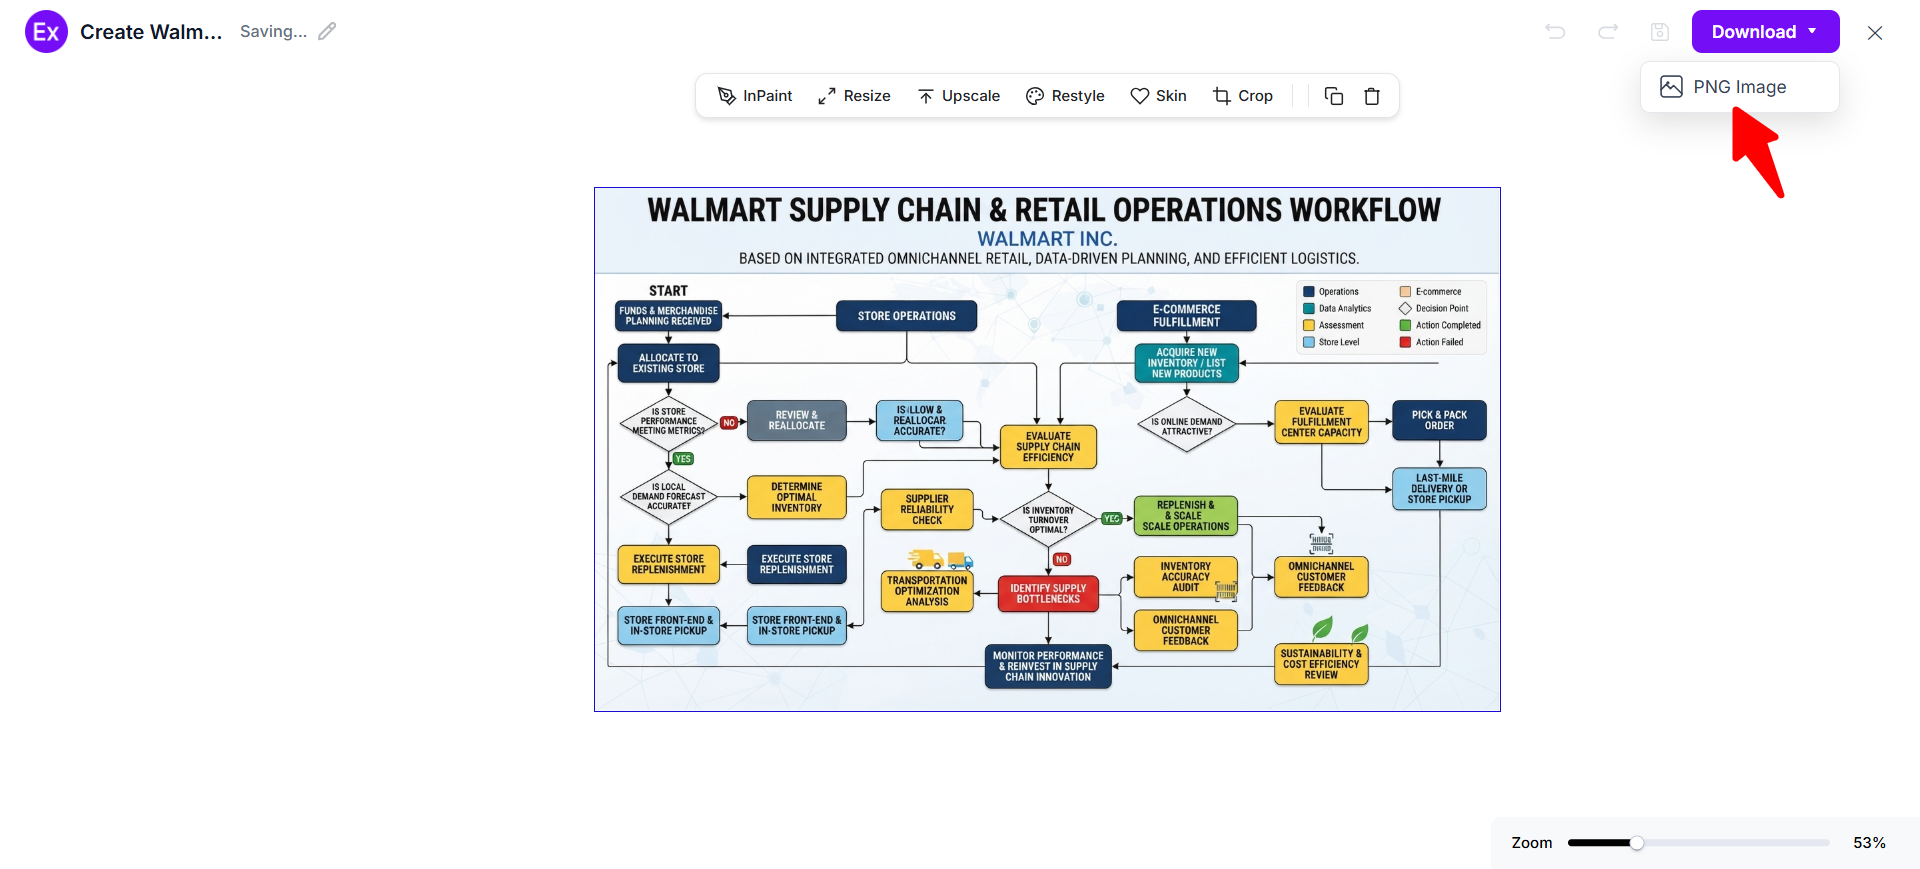
Customize The Flowchart In The Online Editor
I can personalize every process step by editing symbols, updating labels, changing colors, adding connectors, rearranging workflows, inserting icons, uploading graphics, and refining the complete diagram using AI-powered editing tools.
Download And Use The Final Flowchart
Once my flowchart is complete, I can download the finished design as a PNG image and use it for business planning, software development, training materials, process documentation, project management, presentations, education, or operational improvement.
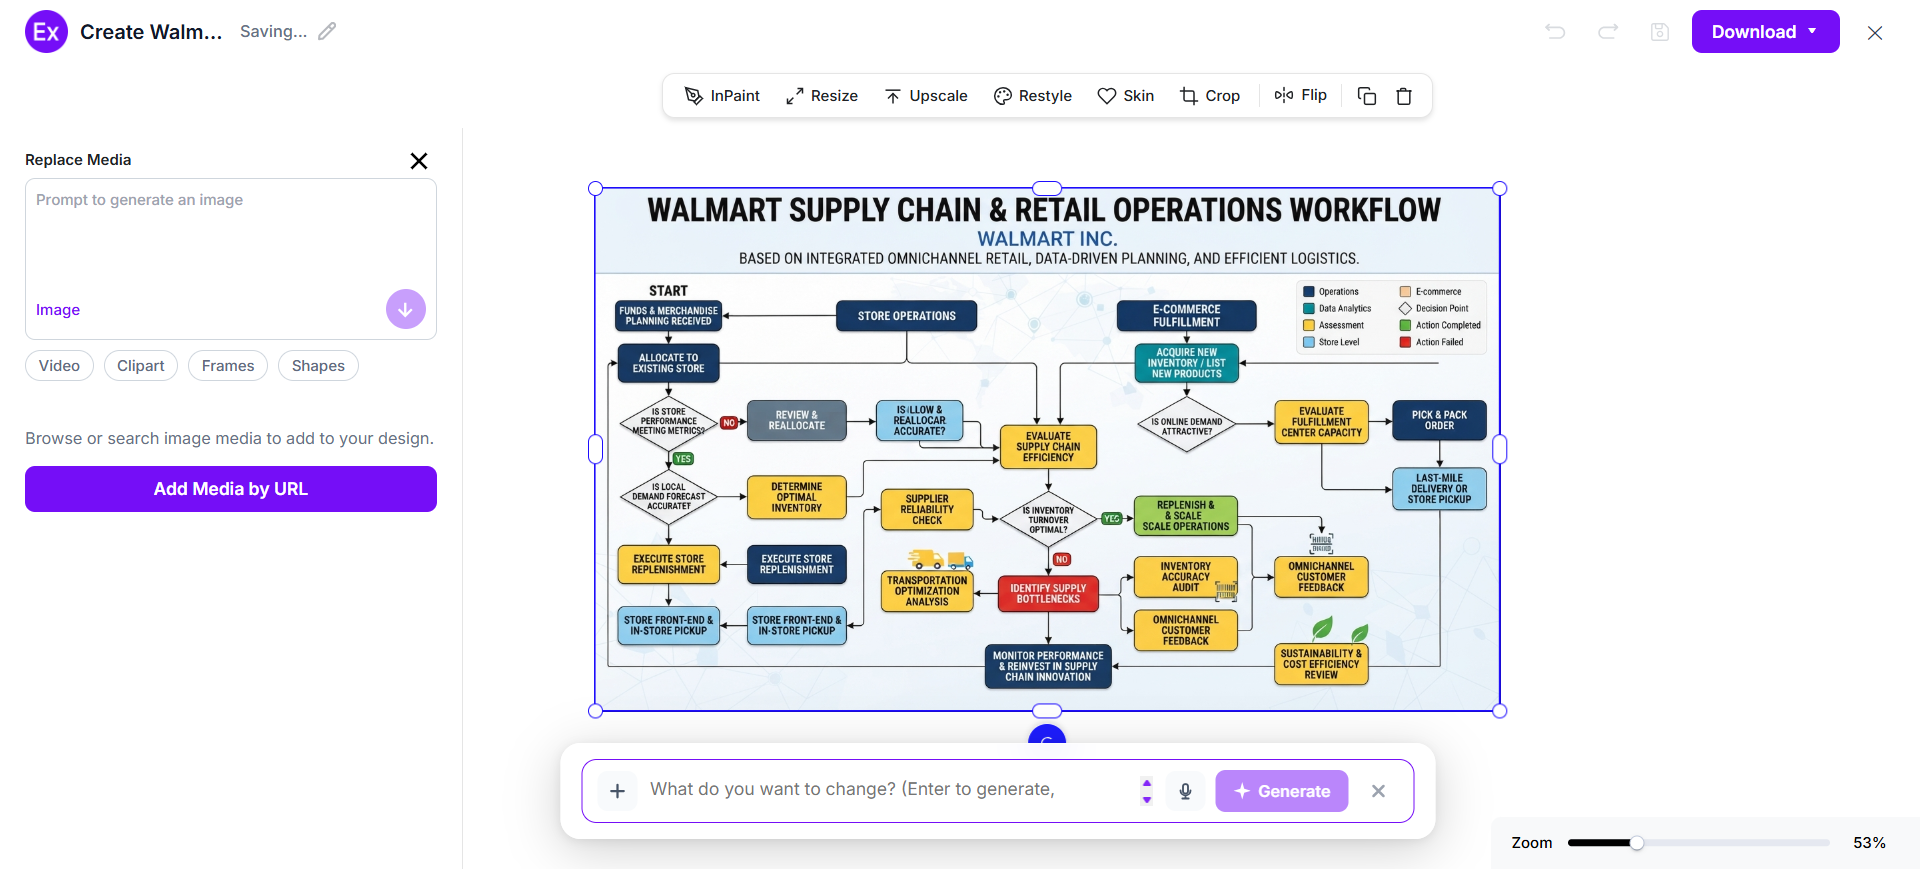
After generating a new flowchart, I can open it in the online editor to customize every process step, symbol, connector, and decision point. I can edit labels, add new process boxes, update decision paths, change colors, upload icons, rearrange workflows, and organize every step into a clear and easy-to-follow visual diagram.
The editor also includes AI-powered tools that help improve graphics, generate new visual elements, resize layouts, remove backgrounds, and create multiple flowchart variations. On Examples.com, I can transform an AI-generated flowchart into a polished process diagram without requiring advanced diagramming or design experience.
AI Flowchart Editing Features
AI-powered editing features make flowchart customization faster, more accurate, and easier to manage.
1
InPaint
Edit or remove selected process symbols, connectors, or workflow elements without affecting the remaining diagram.
2
Resize
Adjust flowchart dimensions for presentations, reports, websites, documentation, or print-ready layouts.
3
Upscale
Enhance image quality and sharpen symbols, connectors, and graphics for professional-looking flowcharts.
4
Restyle
Generate alternative flowchart layouts, color themes, typography, and visual styles using AI.
5
BG
Remove or replace backgrounds to create clean and distraction-free process diagrams.
6
Crop
Refine the overall composition by removing unnecessary space while preserving the complete workflow.
7
Flip
Mirror the flowchart horizontally or vertically to explore different layout arrangements.
8
Animate
Transform static flowcharts into animated process presentations for training and demonstrations.
9
Multishot
Generate multiple flowchart variations from one prompt to compare different workflow structures.
Standard Flowchart Sizes And Formats
Selecting the right flowchart size improves readability, collaboration, and process visualization. The ideal format depends on the complexity of the workflow and where the flowchart will be presented.
Flowchart Format
Common Size
Best Use Case
Landscape Flowchart
1920 × 1080 px
Business processes and workflow presentations
Portrait Flowchart
1080 × 1920 px
Training guides and educational process documentation
Square Flowchart
1080 × 1080 px
Social media, quick process overviews, and digital sharing
A4 Flowchart
210 × 297 mm
Reports, documentation, and classroom handouts
A3 Flowchart
297 × 420 mm
Large workflows, system diagrams, and operational planning
Digital Flowchart
Custom Screen Size
Online collaboration, remote meetings, and interactive documentation
Landscape flowcharts are ideal for displaying long workflows with multiple process steps, while portrait layouts support vertical procedures. Larger formats provide more space for detailed decision branches, annotations, and process symbols.
Essential Elements Every Flowchart Should Include
A well-designed flowchart combines standardized symbols with logical sequencing to make processes easier to understand and follow.
Start And End Symbols – Use oval terminators to clearly identify where the workflow begins and finishes.
Process Steps – Represent each task or action using rectangle process symbols arranged in logical order.
Decision Points – Use diamond symbols to display yes-or-no questions or conditional branching paths.
Flowlines – Connect every symbol with arrows that clearly indicate the direction of the process.
Clear Labels – Write concise descriptions inside each symbol to explain every action or decision.
Logical Sequence – Arrange process steps in chronological order so the workflow remains easy to follow.
Consistent Symbols – Apply standardized flowchart symbols throughout the diagram for better understanding.
Balanced Layout – Maintain proper spacing between symbols to improve readability and reduce visual clutter.
Color Coding – Use consistent colors to distinguish departments, process phases, decision paths, or workflow categories.
How Do I Design A Better Flowchart?
A clear flowchart helps simplify complex workflows while improving communication, planning, and decision-making.
Define the process objective – Define the process objective before creating the first flowchart symbol.
Begin with one clear start point – Begin with one clear start point and end with a defined outcome.
Arrange every process step – Arrange every process step in a logical chronological sequence.
Use standard flowchart symbols – Use standard flowchart symbols for consistency and easy recognition.
Keep labels short – Keep labels short, direct, and easy to understand.
Minimize crossing lines – Minimize crossing lines to improve readability and visual organization.
Use decision symbols only – Use decision symbols only when multiple outcomes exist.
Apply consistent spacing – Apply consistent spacing to maintain a clean and balanced layout.
Review the complete workflow – Review the complete workflow to identify missing steps or incorrect connections.
Refine the final diagram – Refine the final diagram so every process is accurate, organized, and easy to follow.
Common Flowchart Design Mistakes To Avoid
A flowchart should present a process in a clear and logical sequence. Avoiding these common mistakes helps improve understanding, reduce confusion, and create more effective process documentation.
Skipping The Start And End Symbols – Every flowchart should begin and end with clearly defined terminator symbols.
Using Incorrect Symbols – Use standard symbols such as ovals for start and end points, rectangles for processes, diamonds for decisions, and arrows for flow direction.
Overcomplicating The Workflow – Break large processes into smaller, manageable sections to improve readability.
Crossing Too Many Flowlines – Excessive crossing arrows make diagrams difficult to follow. Keep connections simple and organized.
Writing Long Process Descriptions – Use short, meaningful labels instead of lengthy sentences inside process boxes.
Missing Decision Outcomes – Every decision symbol should clearly show each possible path, such as Yes or No.
Inconsistent Process Direction – Maintain one primary reading direction, such as top to bottom or left to right, throughout the flowchart.
Not Testing The Workflow – Review every step to ensure the process is accurate, complete, and logically connected before sharing.
How Can I Market My Product Using A Flowchart?
Flowcharts help explain products, services, and business processes through clear visual workflows. They improve customer understanding while making presentations, training, and marketing materials easier to follow.
1
Product Demonstrations
Illustrate how a product works using simple step-by-step process diagrams and decision paths.
2
Customer Onboarding
Visualize onboarding workflows that guide customers through registration, setup, and product usage.
3
Sales Process
Present lead generation, qualification, proposal, negotiation, and conversion stages through organized process flows.
4
Business Operations
Explain internal workflows, approval processes, service delivery, and operational procedures to employees and stakeholders.
5
Training Programs
Teach employees standardized work procedures, troubleshooting methods, and safety processes using structured flowcharts.
6
Technical Documentation
Document software algorithms, system workflows, troubleshooting procedures, and support processes through visual diagrams.
Which Flowchart Sizes Perform Best?
The best flowchart size depends on the complexity of the workflow, presentation format, and intended audience.
Flowchart Format
Best For
Advantages
Landscape (1920 × 1080 px)
Business workflows and presentations
Wide layout for displaying complex process flows clearly
Portrait (1080 × 1920 px)
Training guides and instructional procedures
Ideal for sequential step-by-step documentation
Square (1080 × 1080 px)
Social media and quick workflow overviews
Compact layout with balanced visual organization
A4 (210 × 297 mm)
Documentation, reports, and educational materials
Easy to print, distribute, and review
A3 (297 × 420 mm)
Large operational workflows and system diagrams
Provides extra space for detailed process mapping
Digital Flowchart
Online collaboration and process management
Supports easy editing, sharing, and remote teamwork
Choosing the appropriate flowchart size improves readability, enhances collaboration, and ensures every workflow remains clear across digital and printed formats.
Flowchart Ideas For Different Industries
Flowcharts help professionals simplify workflows, document processes, and improve communication across many industries.
Business Management – Visualize approval workflows, operational procedures, organizational processes, and decision-making systems.
Software Development – Map algorithms, programming logic, application workflows, debugging processes, and software architecture.
Healthcare – Document patient care workflows, treatment procedures, diagnosis paths, and hospital operational processes.
Education – Explain learning processes, classroom activities, lesson planning, and educational workflows through visual diagrams.
Manufacturing – Illustrate production lines, quality control procedures, equipment maintenance, and supply chain operations.
Human Resources – Visualize recruitment workflows, onboarding processes, employee evaluations, and training procedures.
Customer Service – Organize support processes, complaint resolution workflows, ticket handling, and customer communication procedures.
Logistics And Supply Chain – Display inventory management, shipping procedures, warehouse operations, and delivery workflows.
Information Technology – Document network processes, cybersecurity procedures, infrastructure management, troubleshooting, and system administration workflows.
FAQs
What Is The Main Purpose Of A Flowchart?
A flowchart visually represents a process using standardized symbols and connecting arrows, making workflows easier to understand, communicate, and improve.
Can I Create A Flowchart Without Technical Knowledge?
Yes. AI-powered tools help generate structured process diagrams, organize workflows, and customize flowcharts without requiring technical or programming experience.
What Symbols Are Commonly Used In A Flowchart?
Flowcharts commonly use oval symbols for start and end points, rectangles for process steps, diamonds for decisions, and arrows to indicate workflow direction.
How Does A Flowchart Improve Business Processes?
Flowcharts simplify complex procedures, improve communication, identify inefficiencies, support training, and help teams follow standardized workflows.
Can I Edit Every Process Step After AI Generates A Flowchart?
Yes. After generating a flowchart, I can edit symbols, labels, colors, connectors, layouts, and workflow paths using the online editor available on Examples.com.
What Is The Difference Between A Flowchart And A Mind Map?
A flowchart shows a step-by-step process with sequential decisions, while a mind map organizes related ideas around one central topic using branching structures.
Which Industries Commonly Use Flowcharts?
Flowcharts are widely used in business, software development, healthcare, education, manufacturing, finance, human resources, logistics, customer service, and information technology.
Where Can I Use A Flowchart?
Flowcharts can be used for business planning, project management, employee training, software design, troubleshooting, process documentation, quality improvement, presentations, and operational workflow analysis.
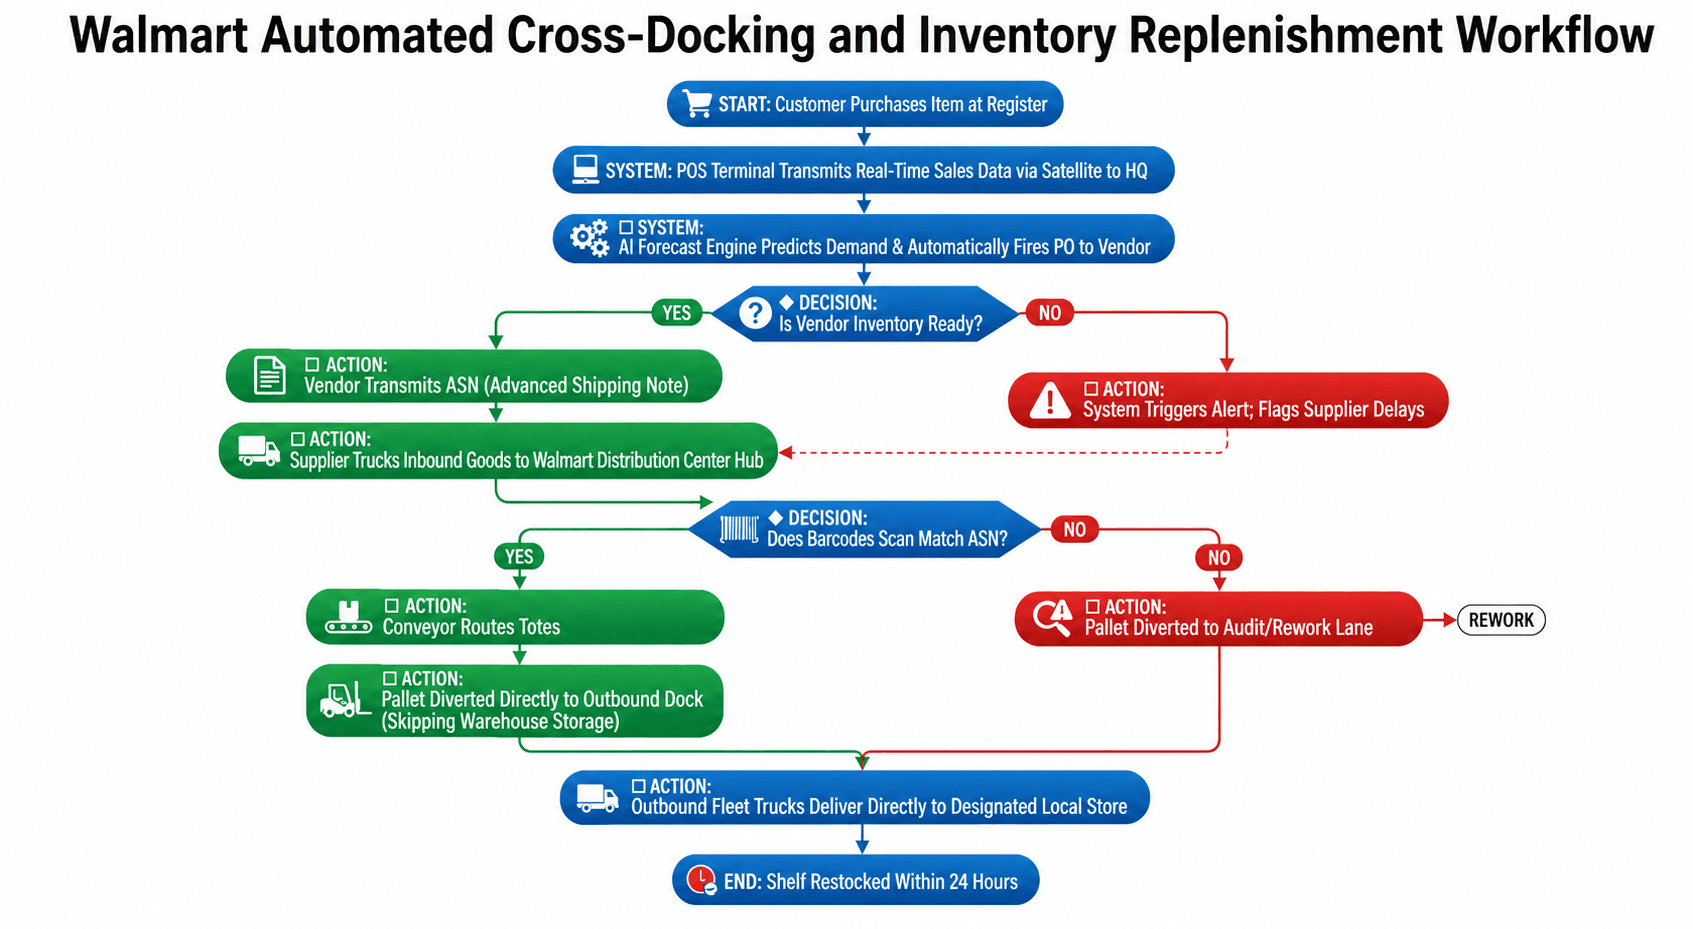
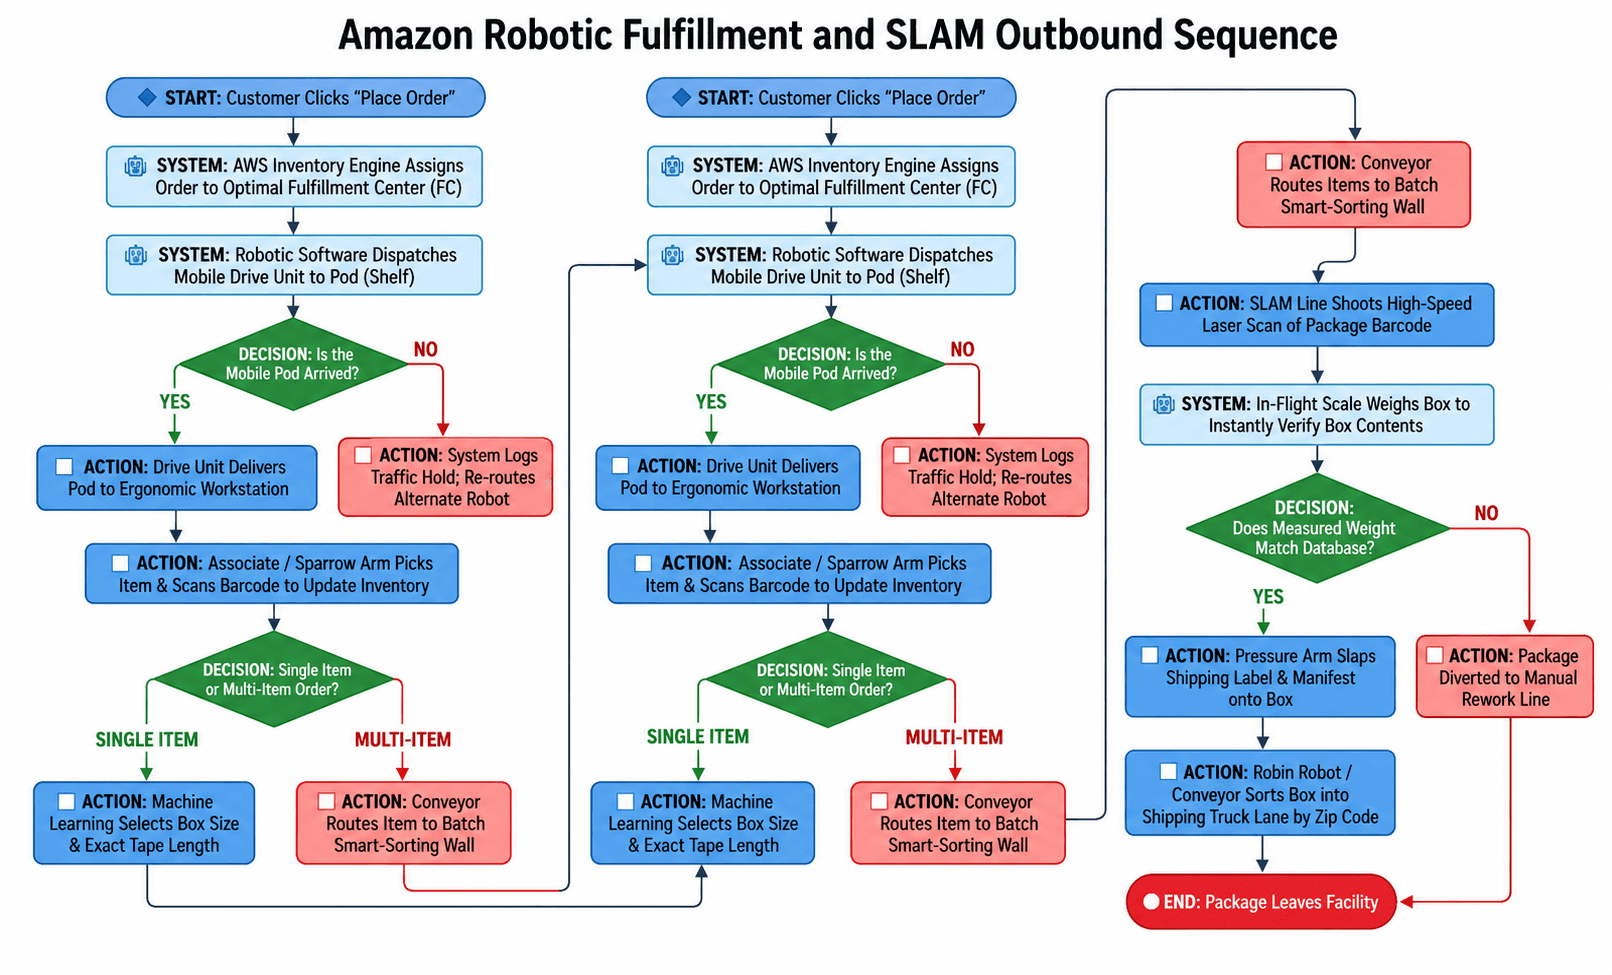
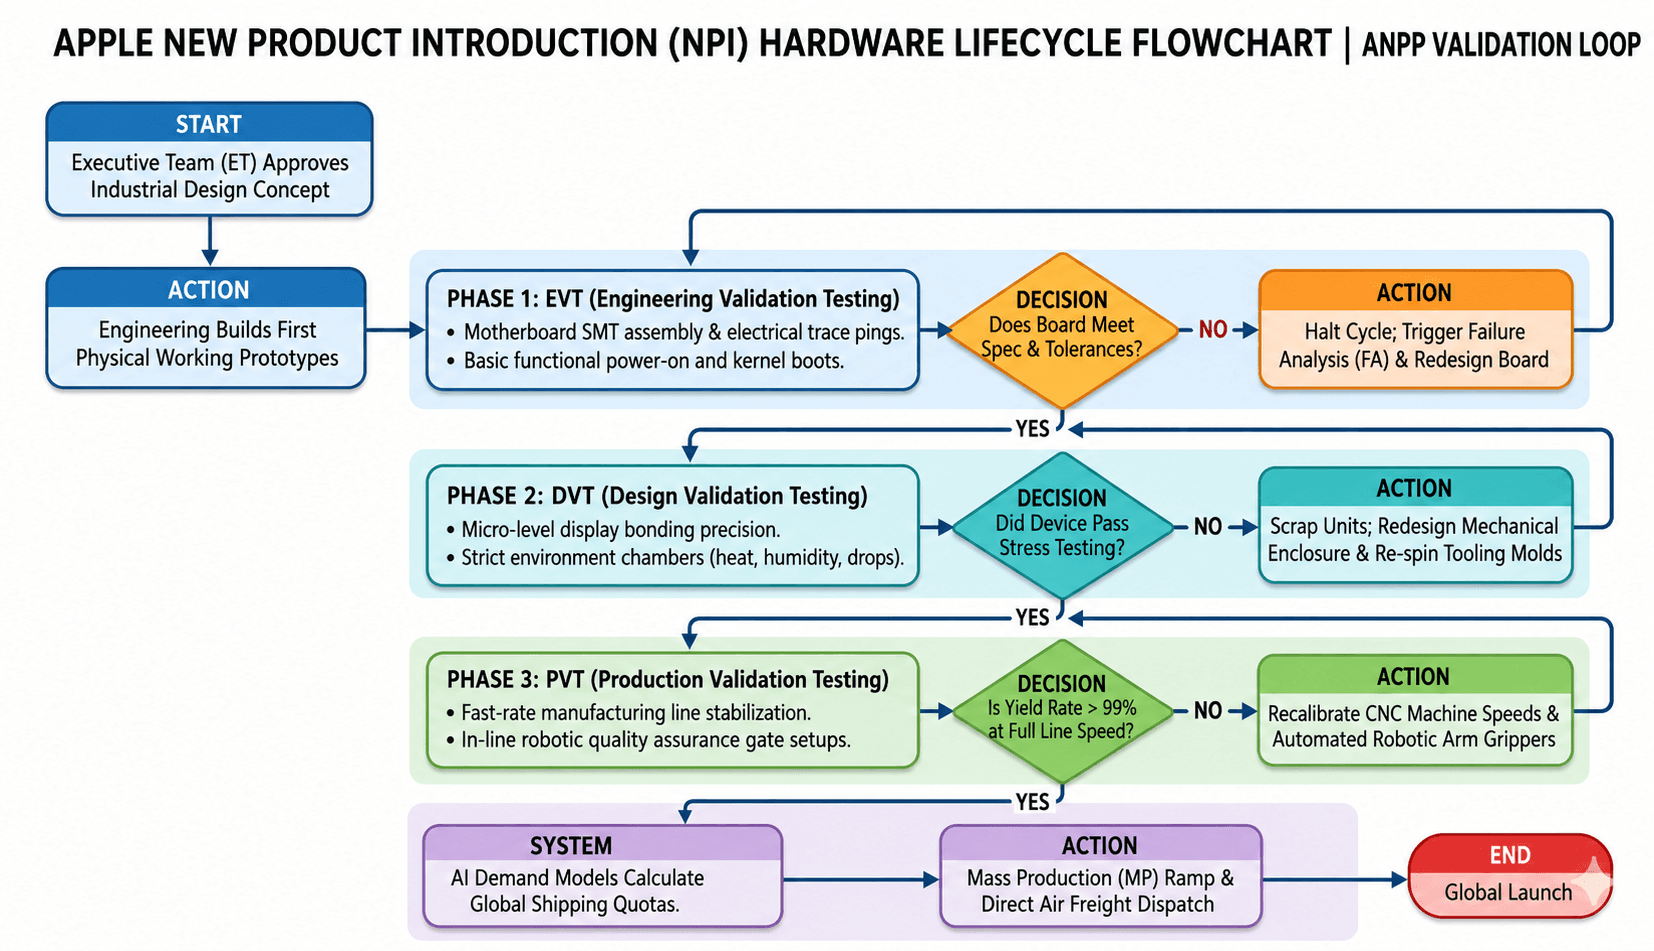
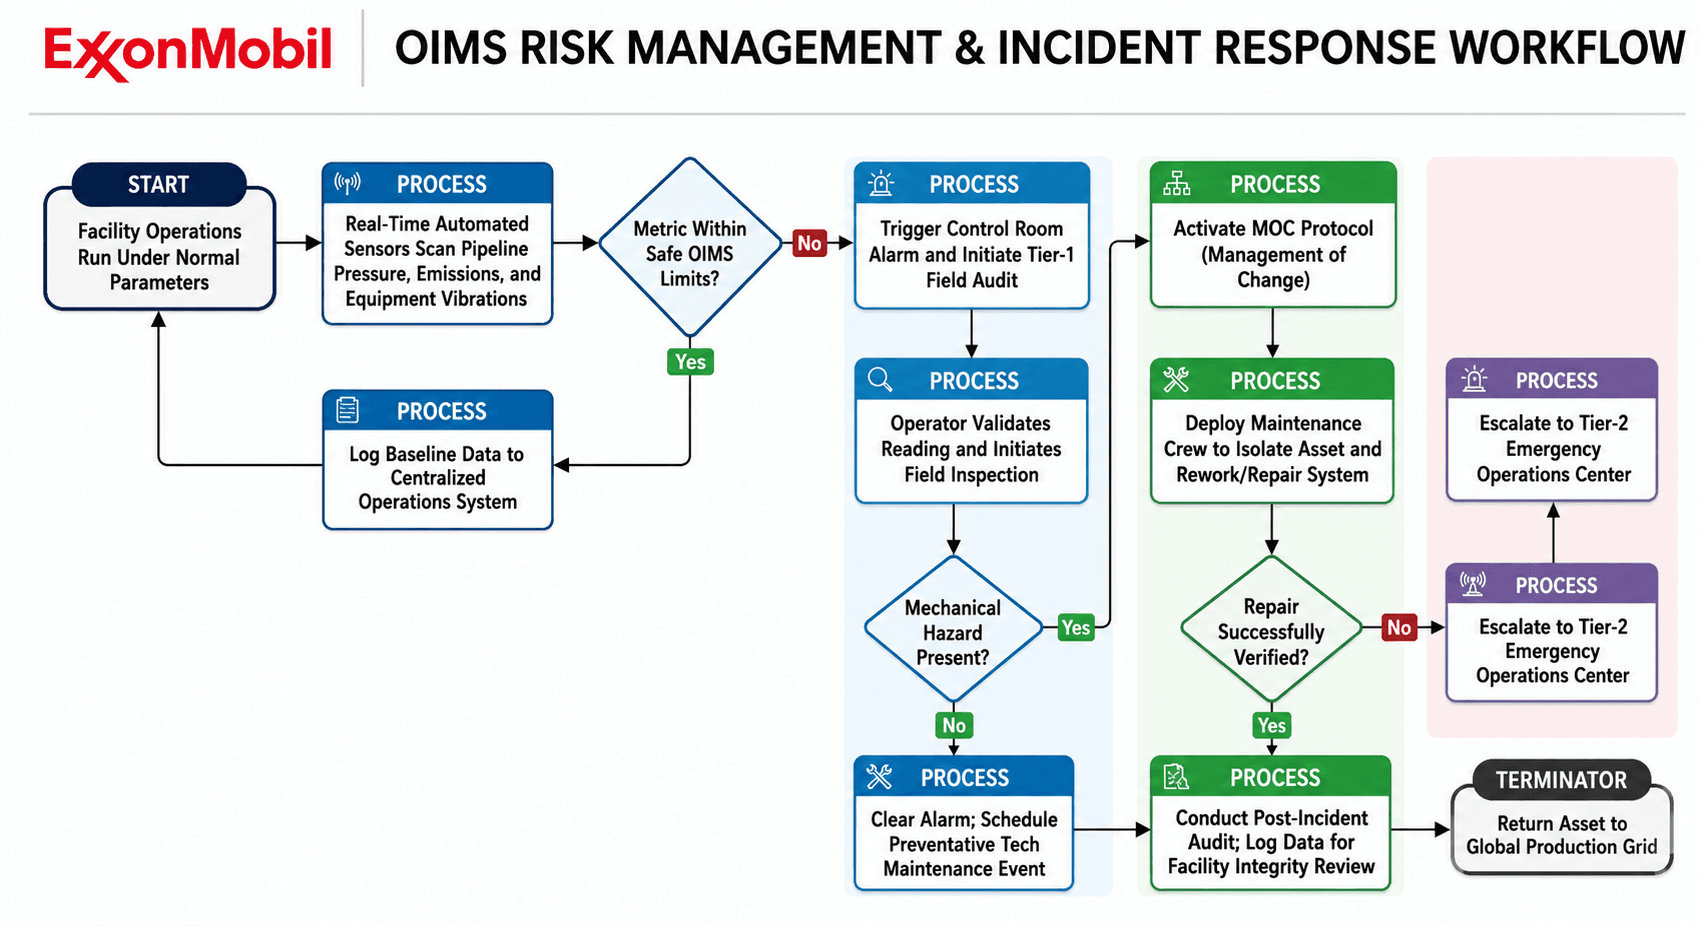
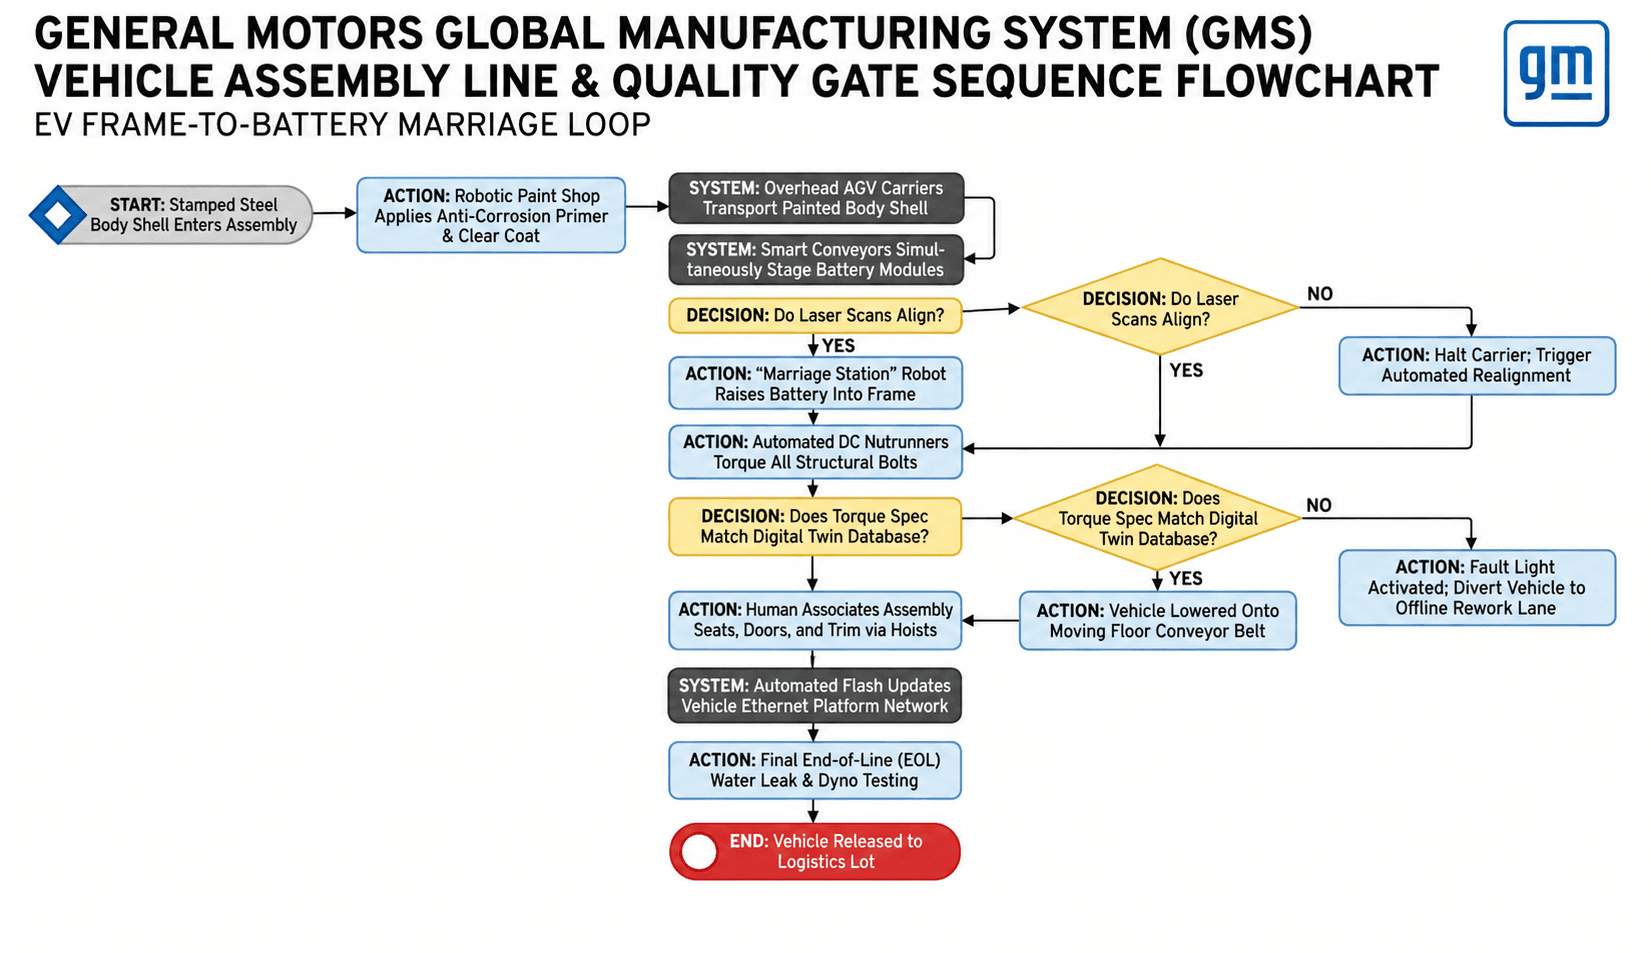
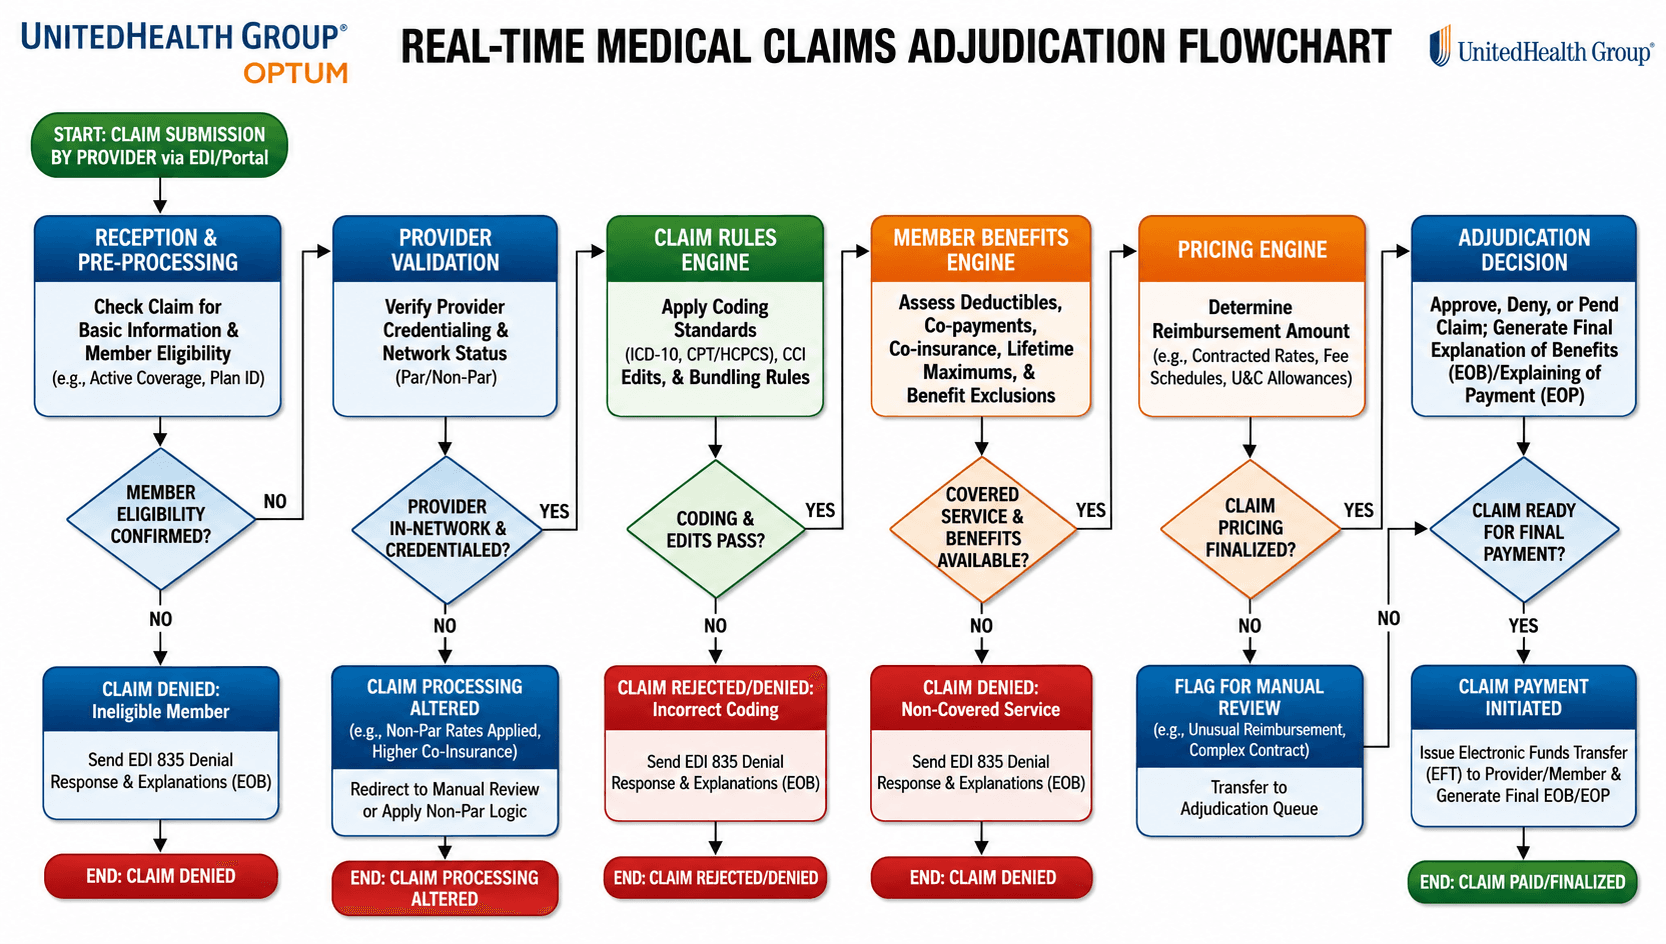
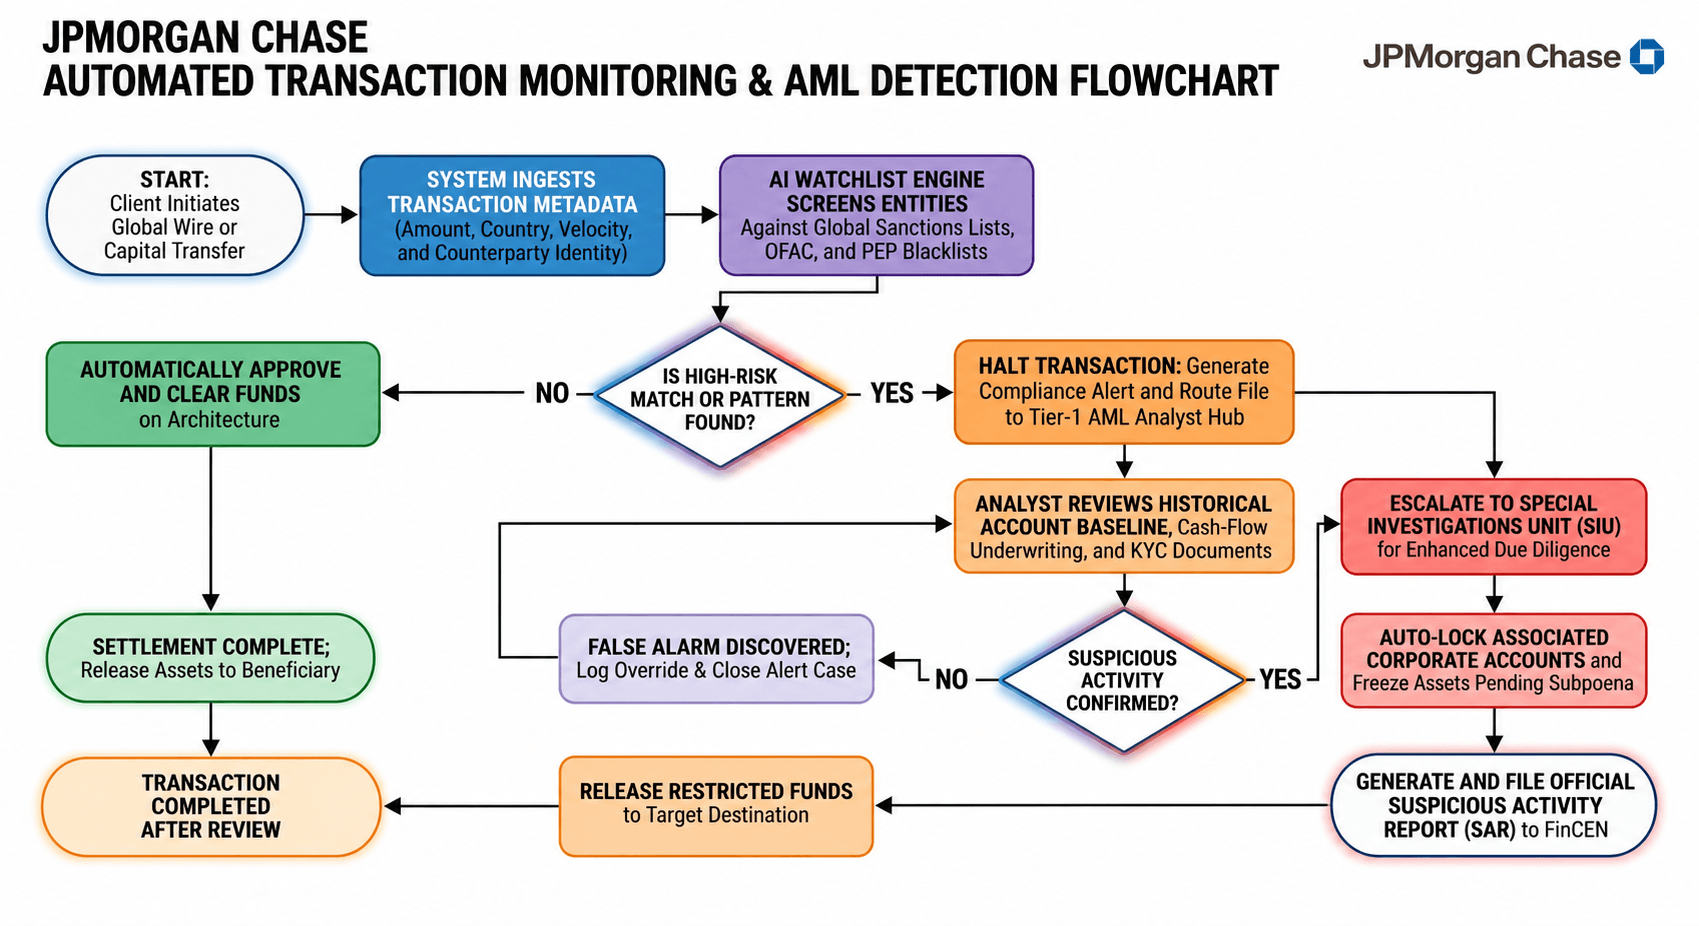
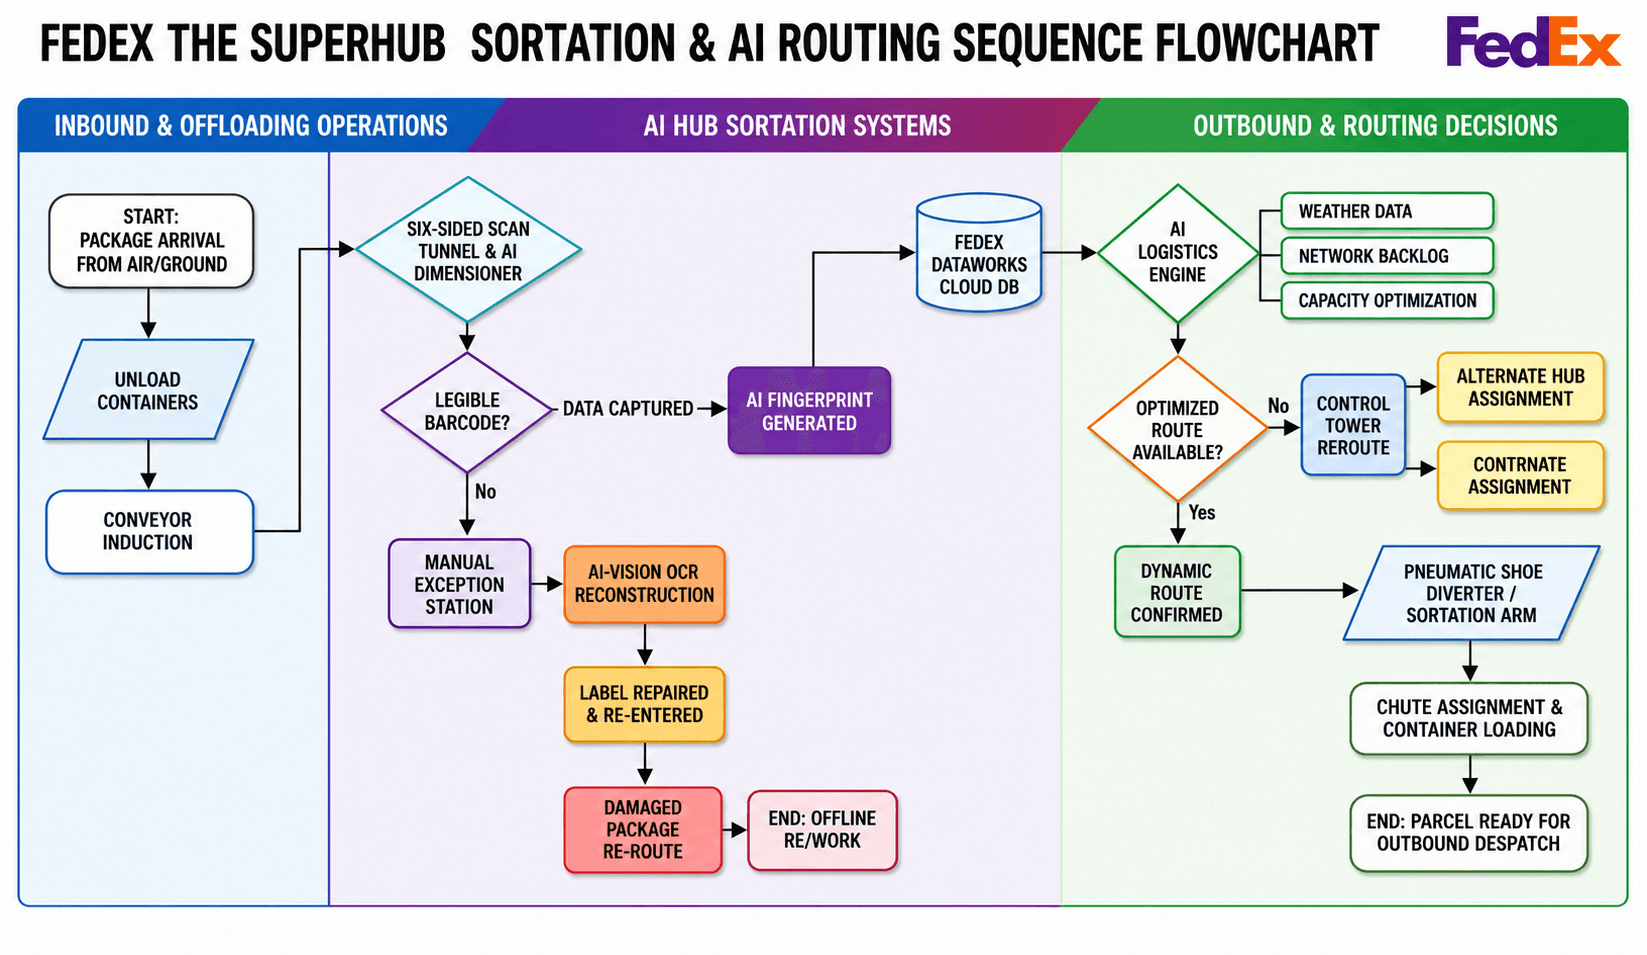
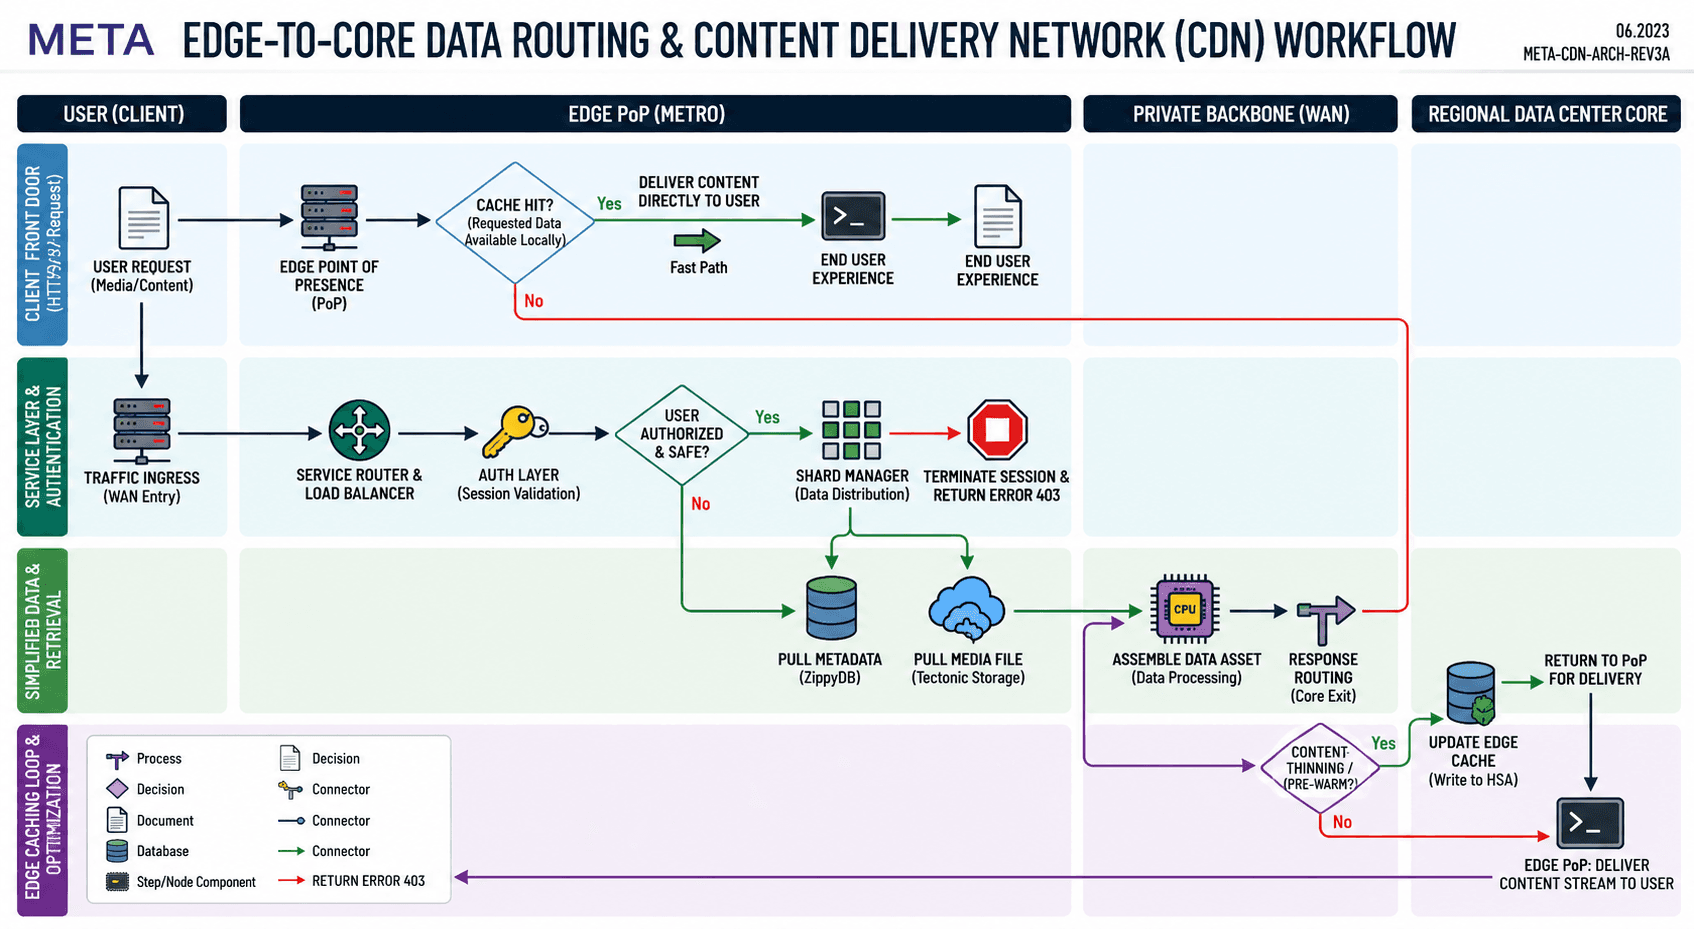
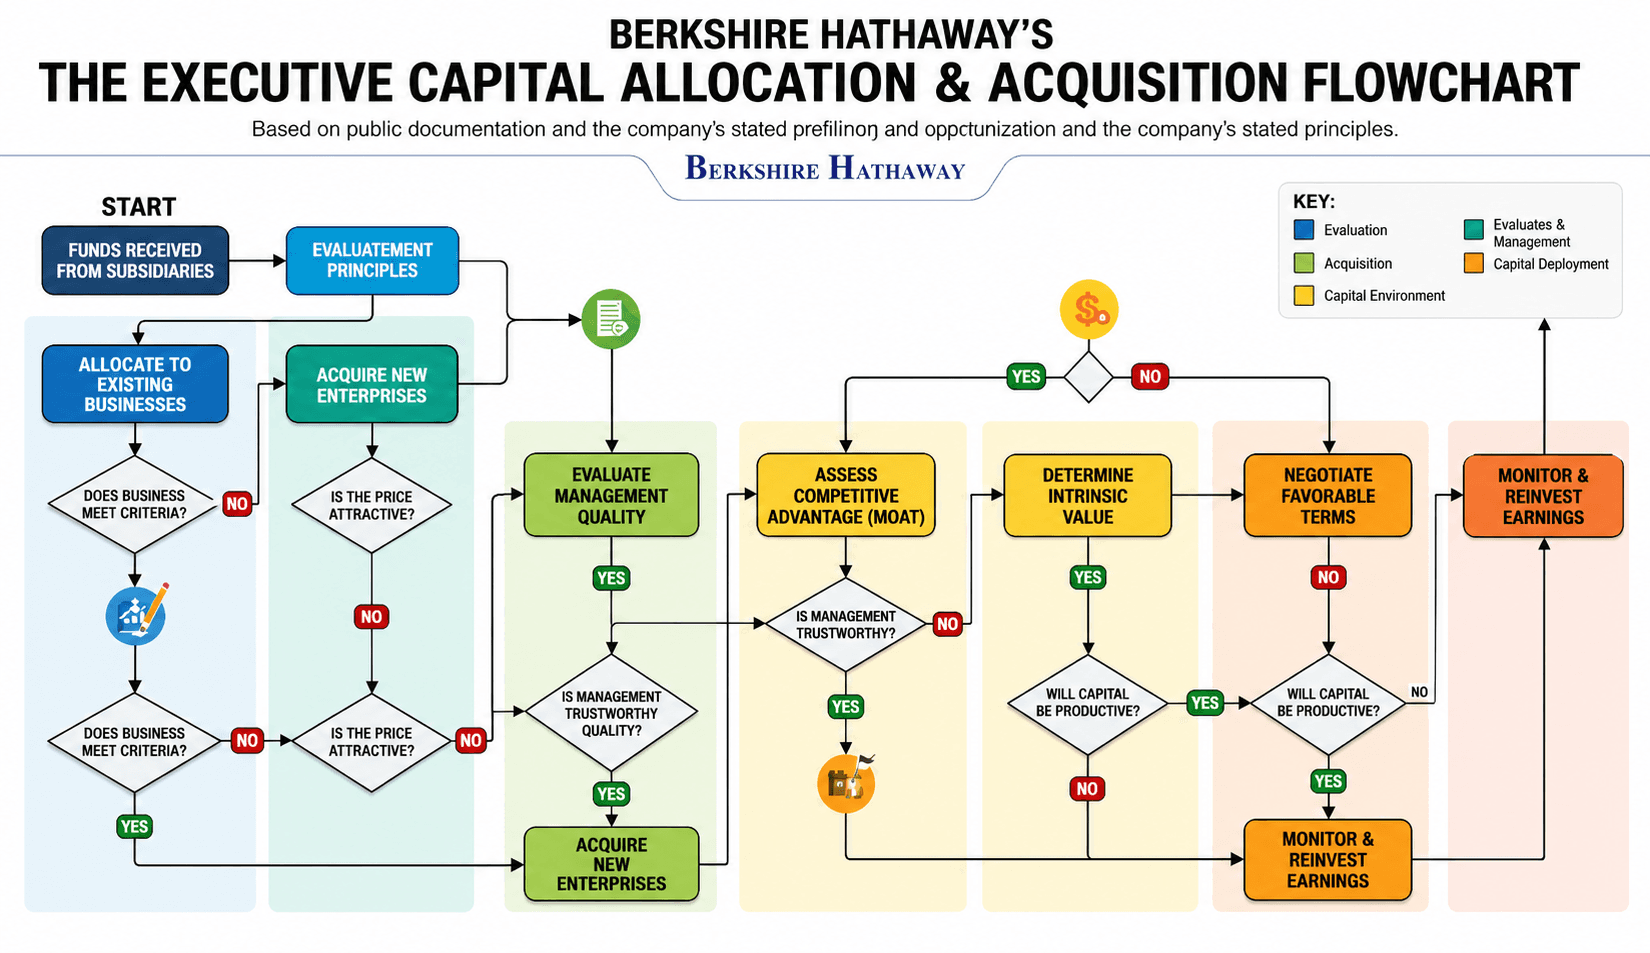
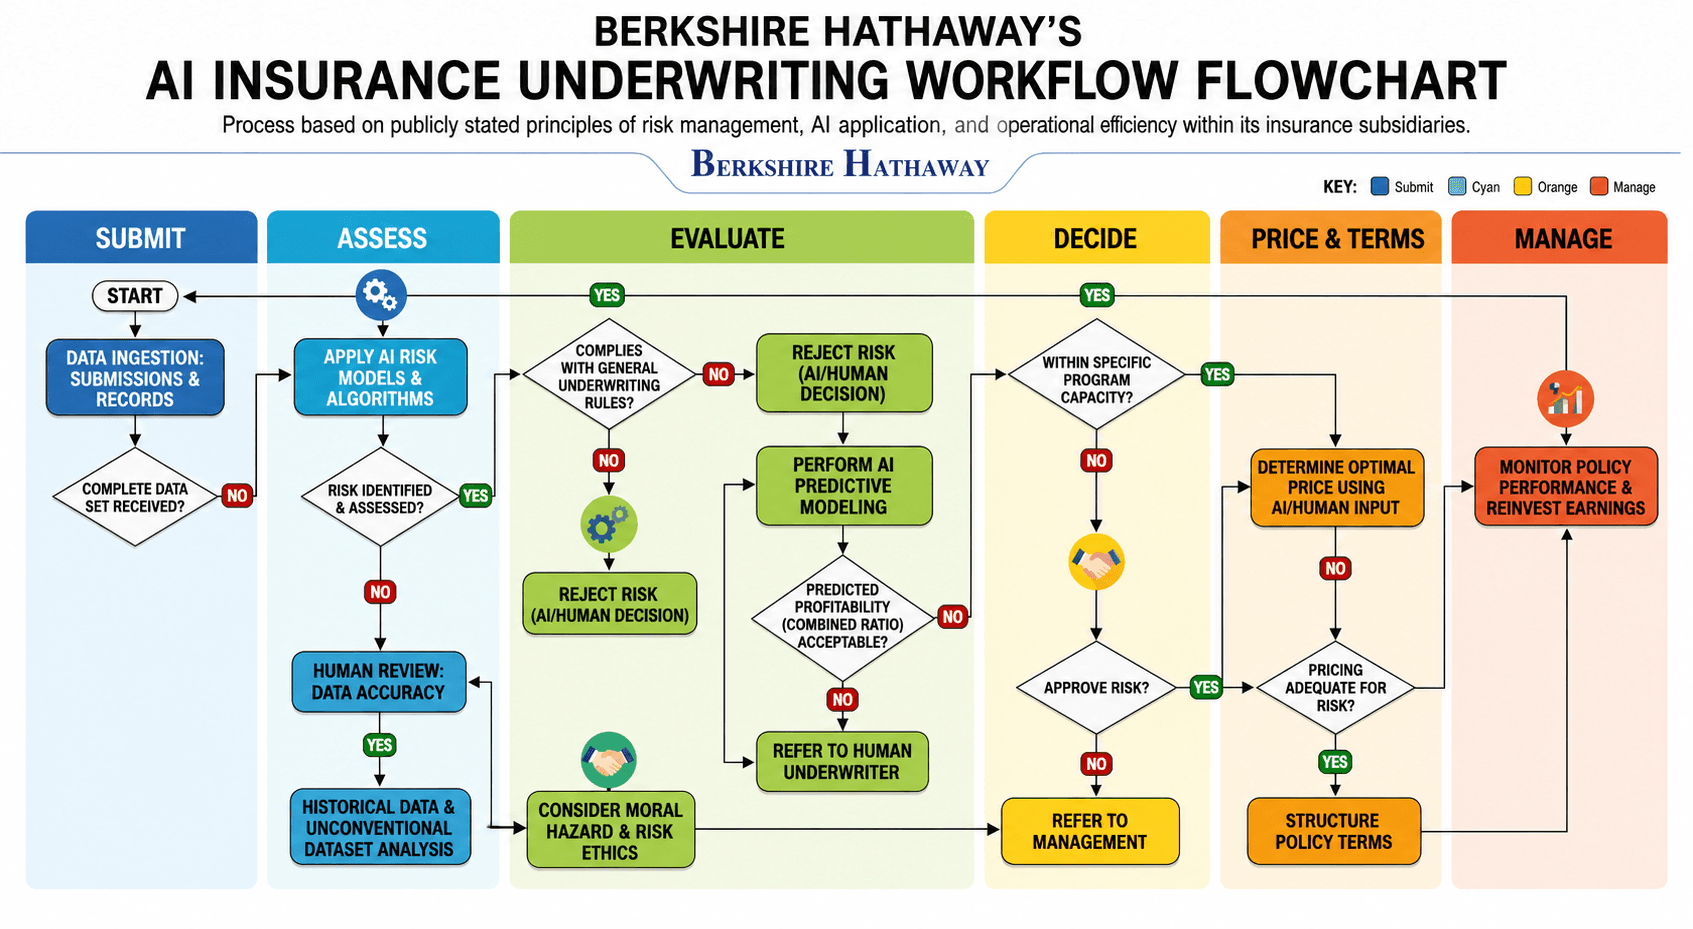
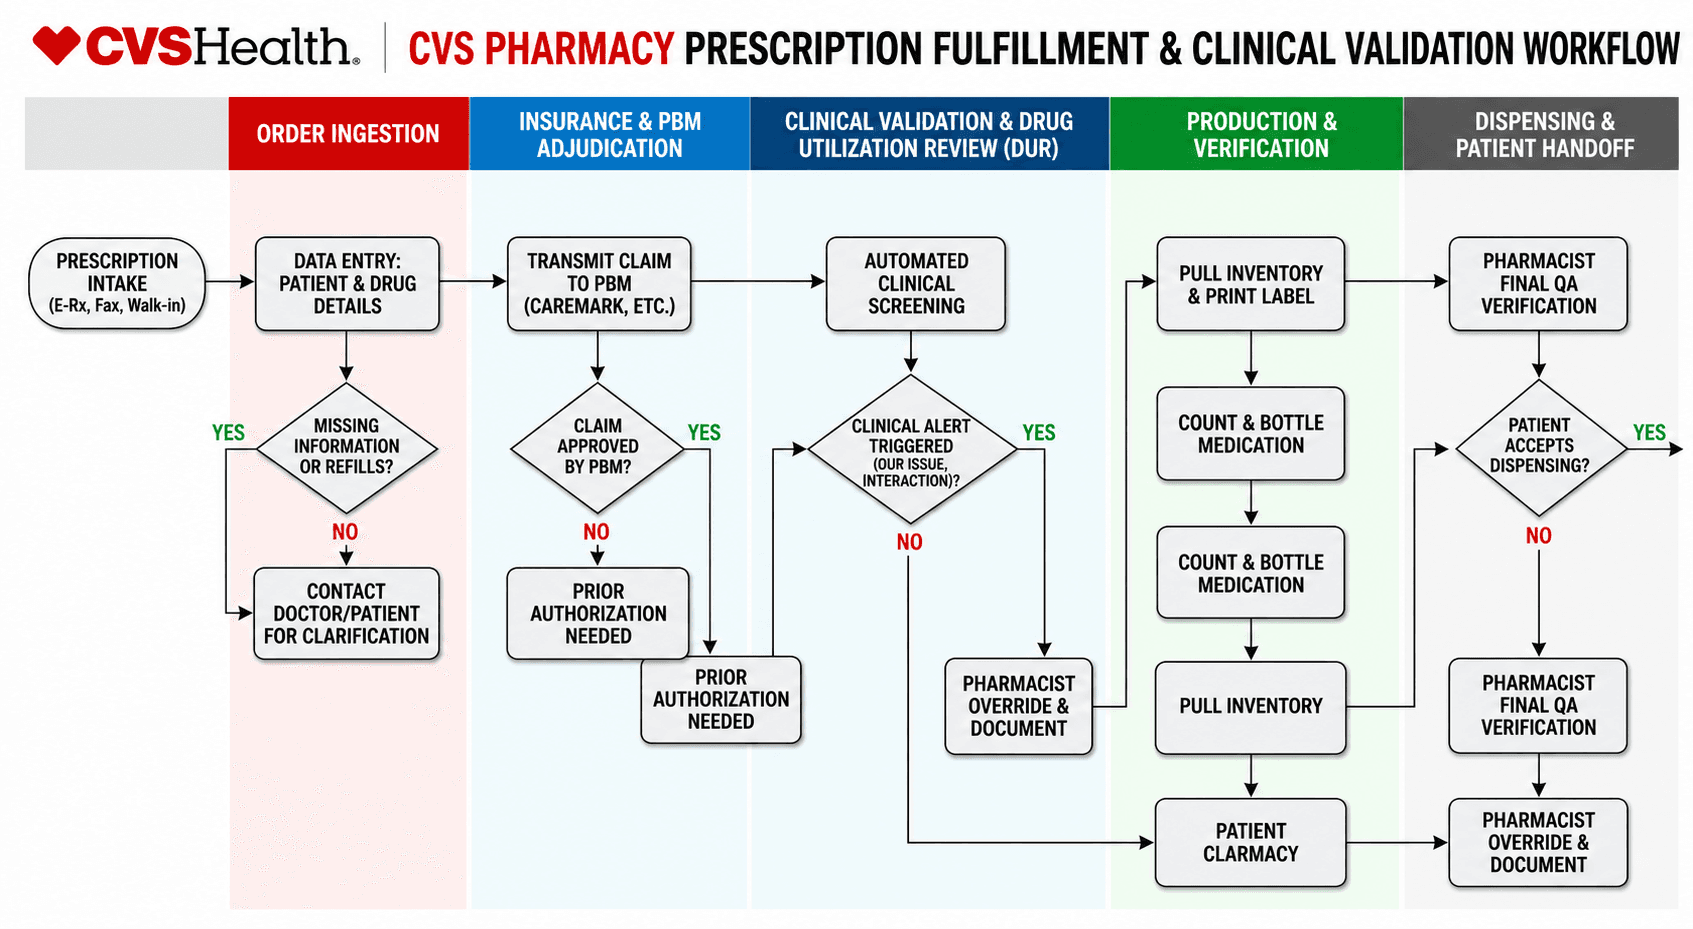
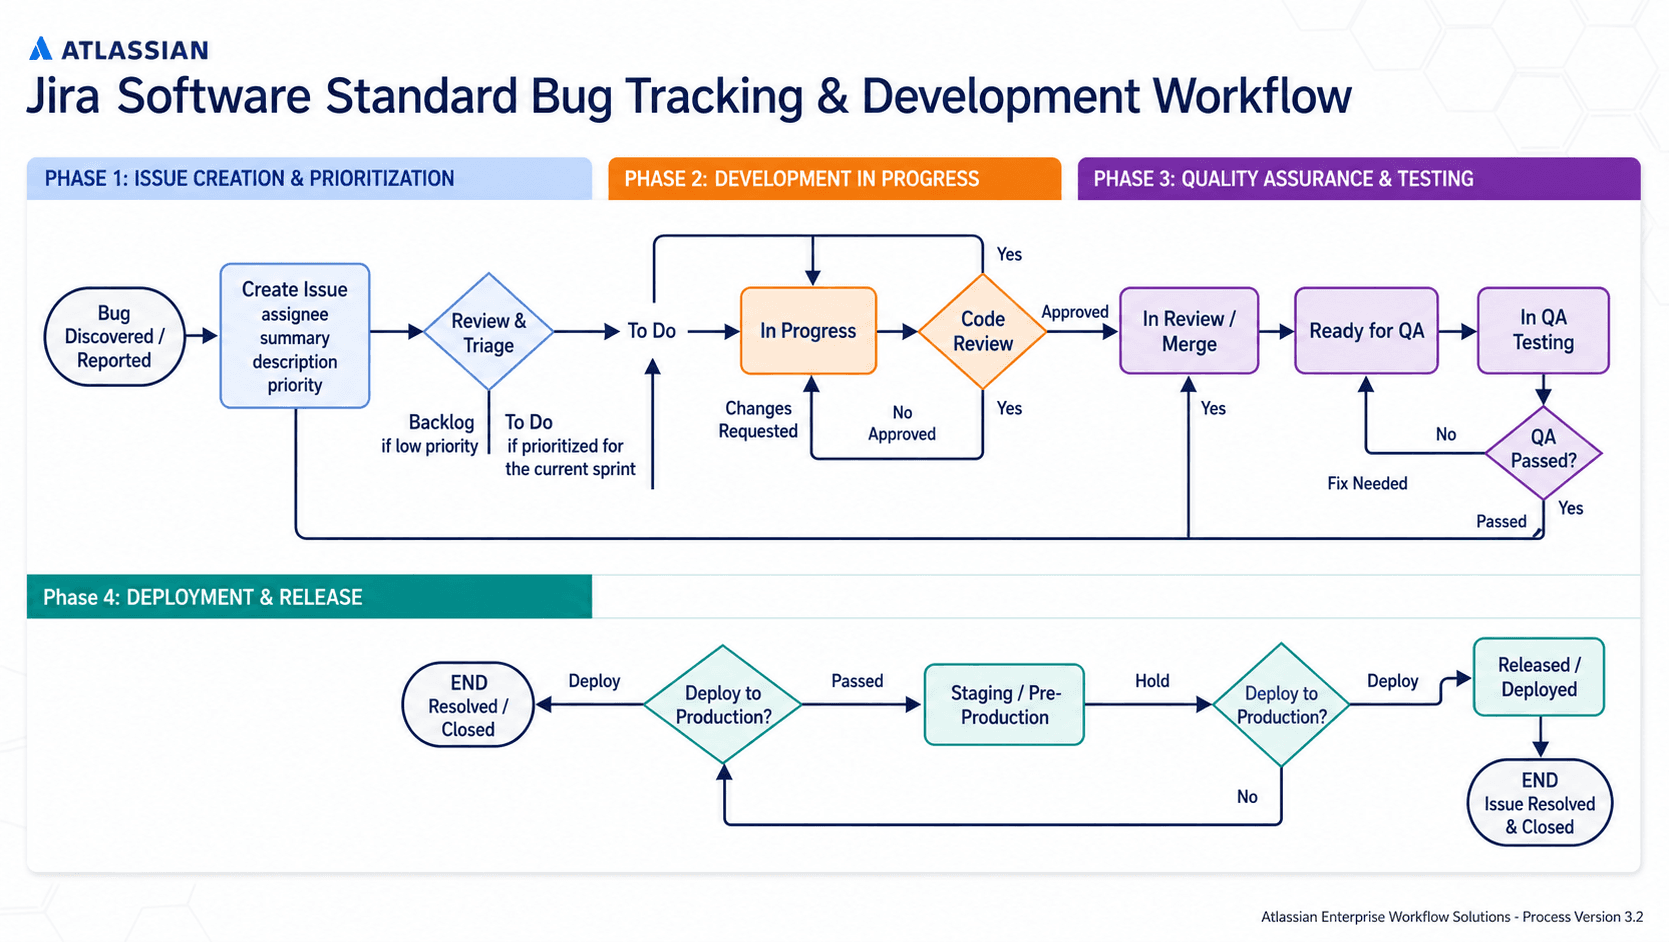
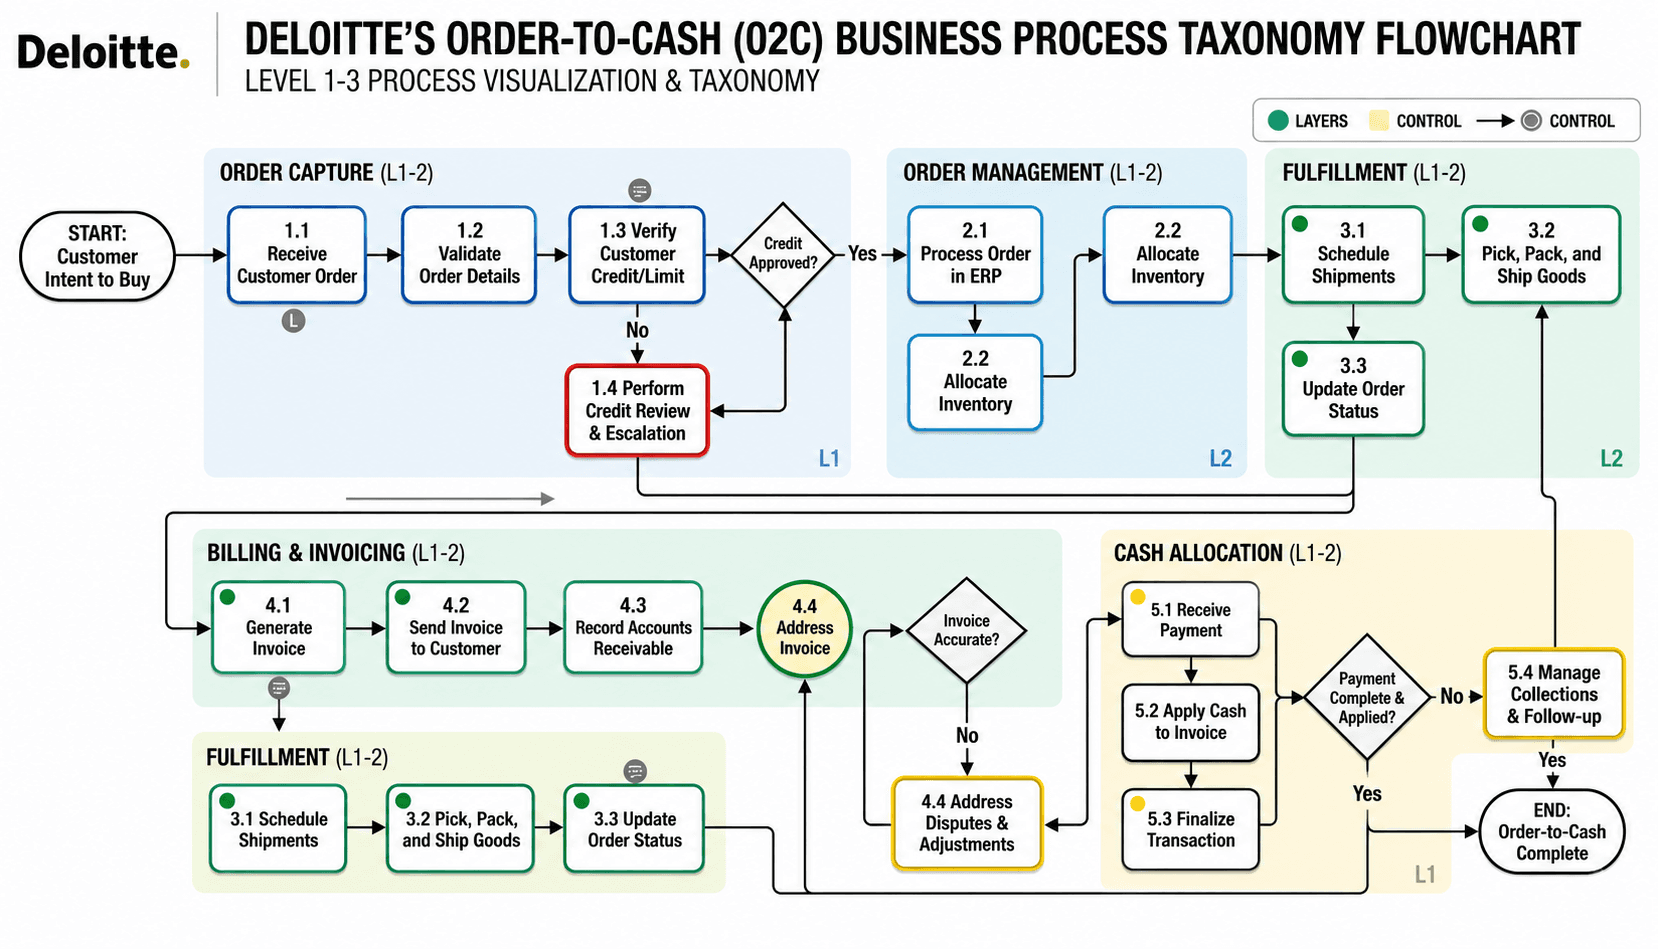
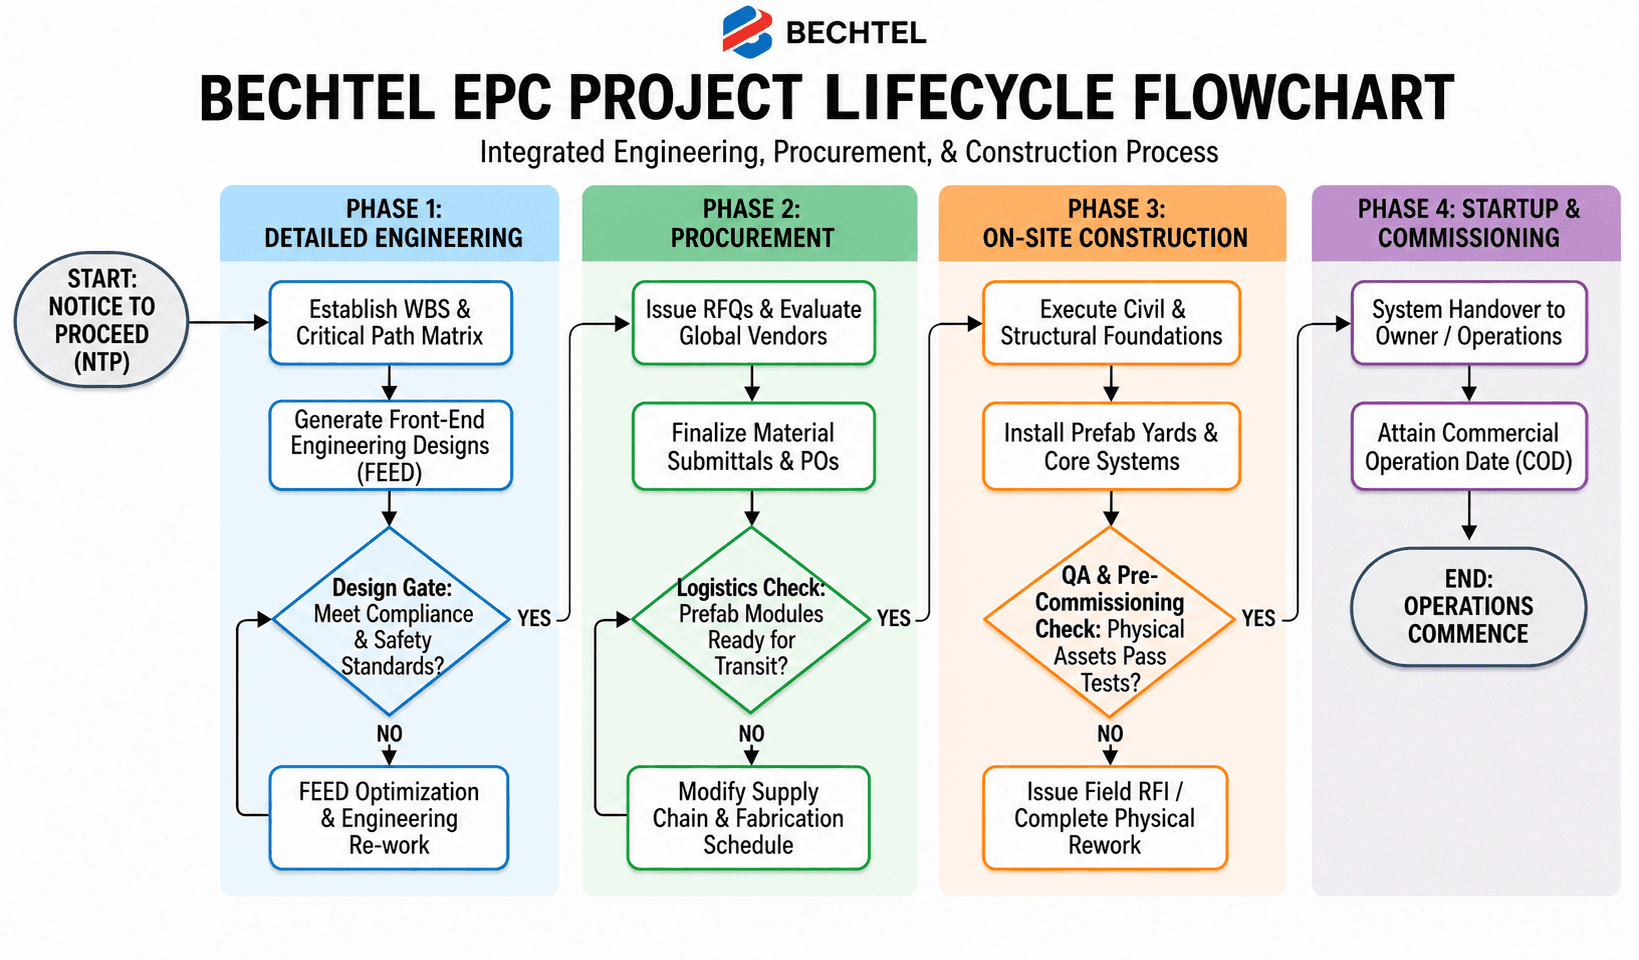
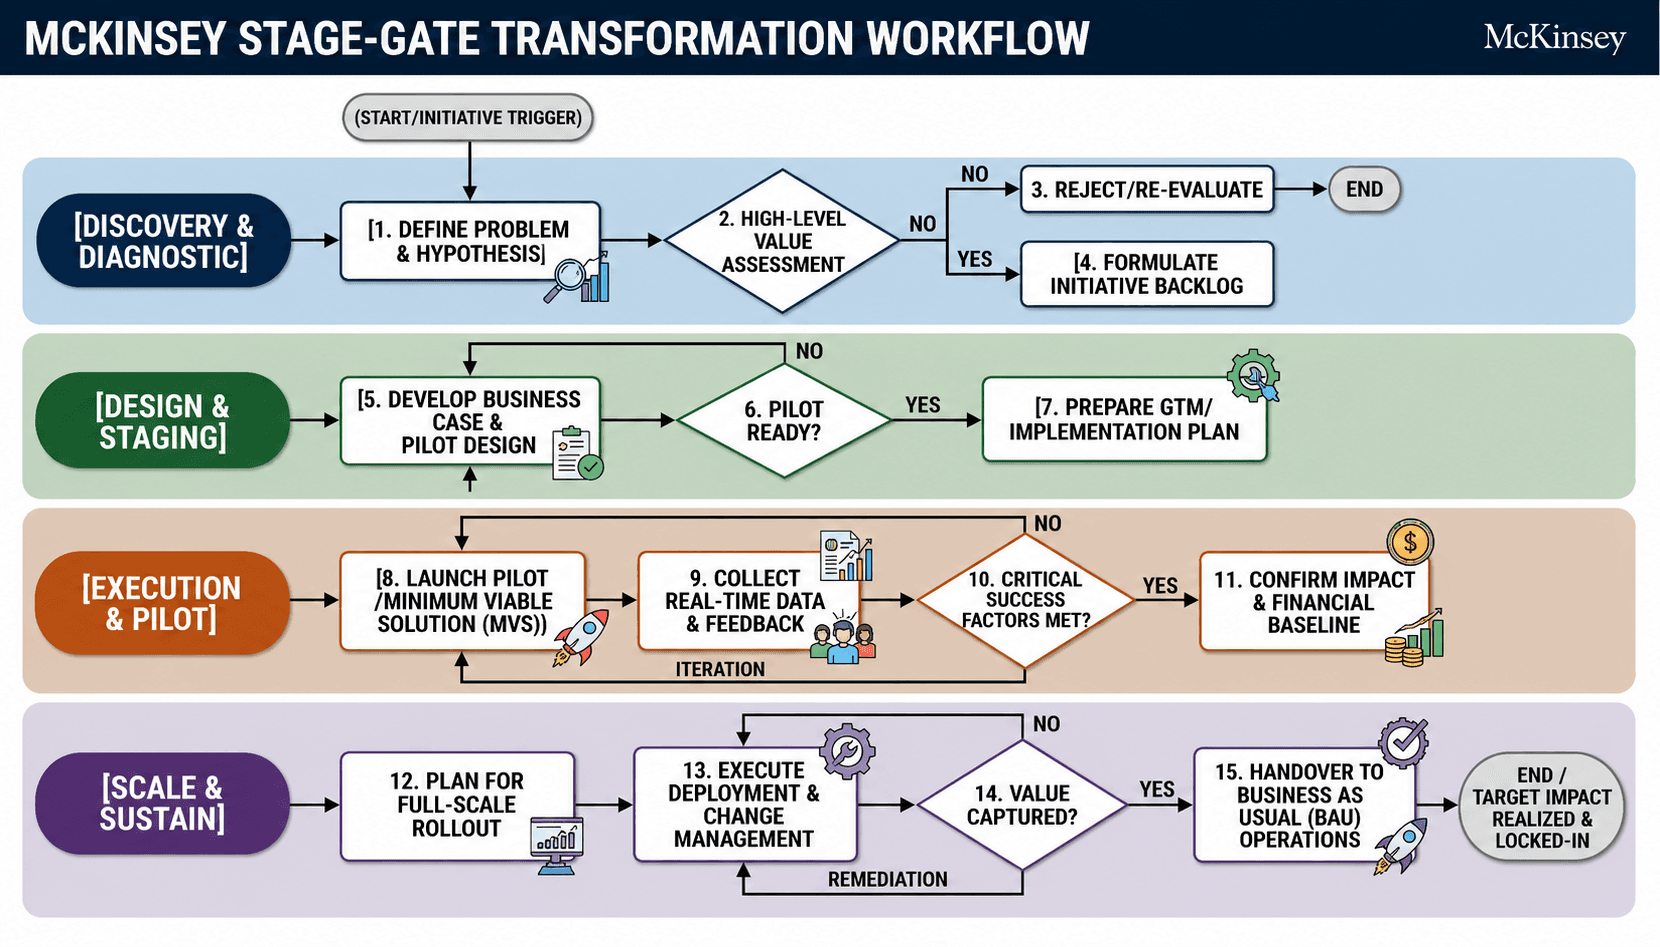
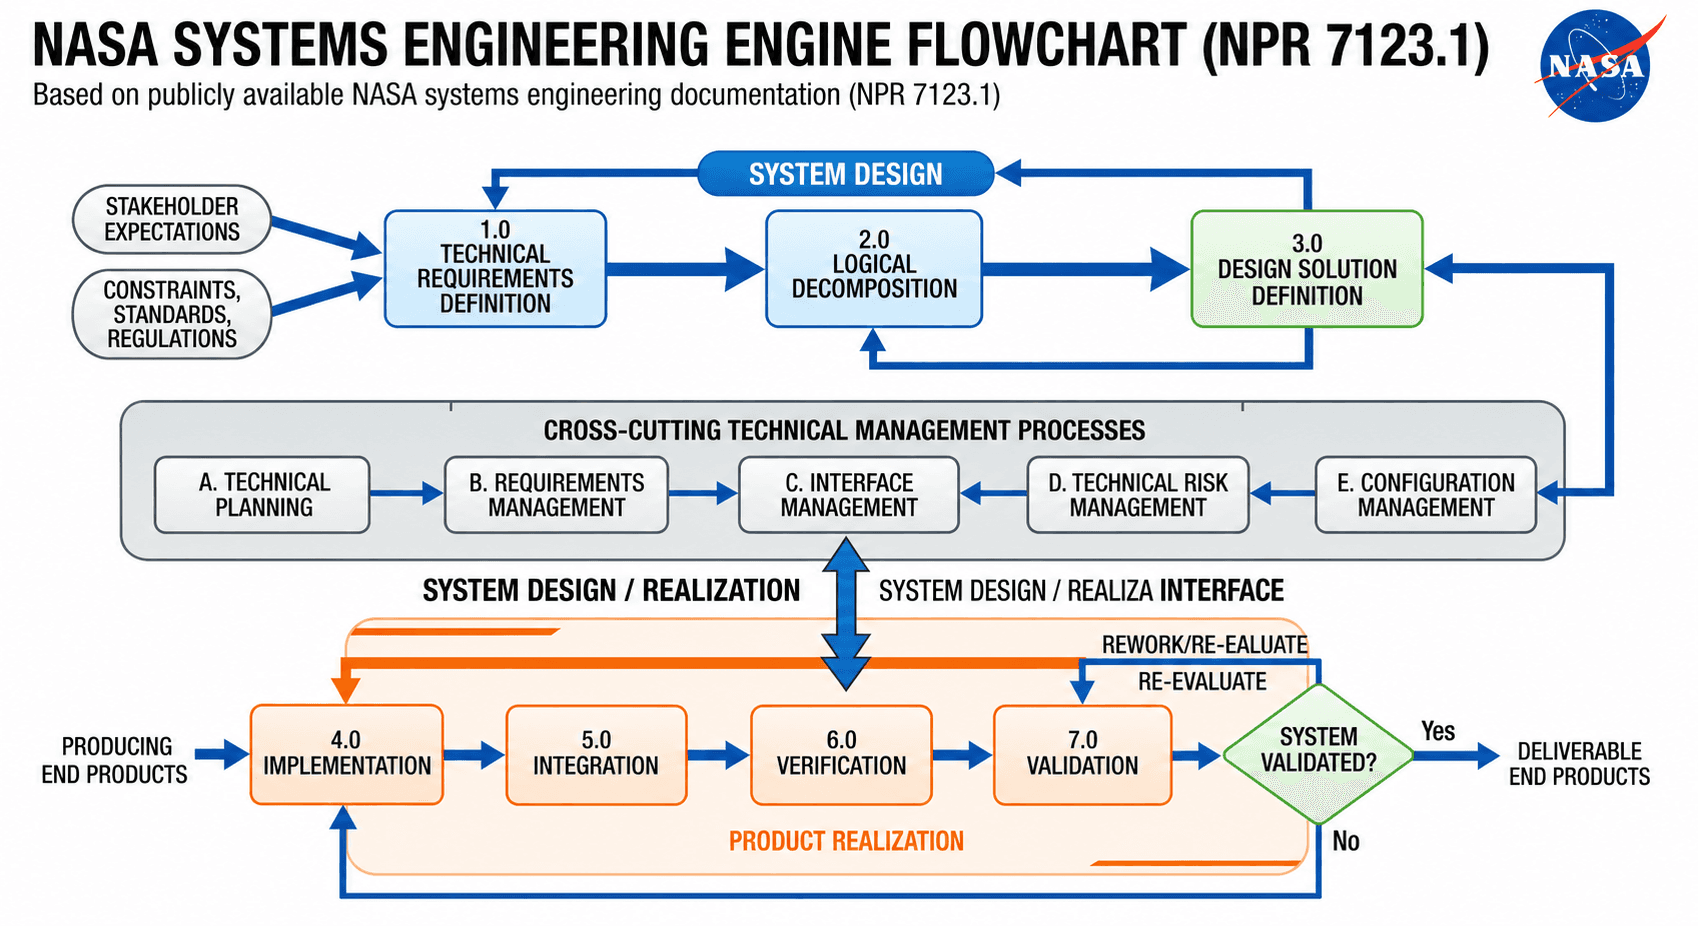
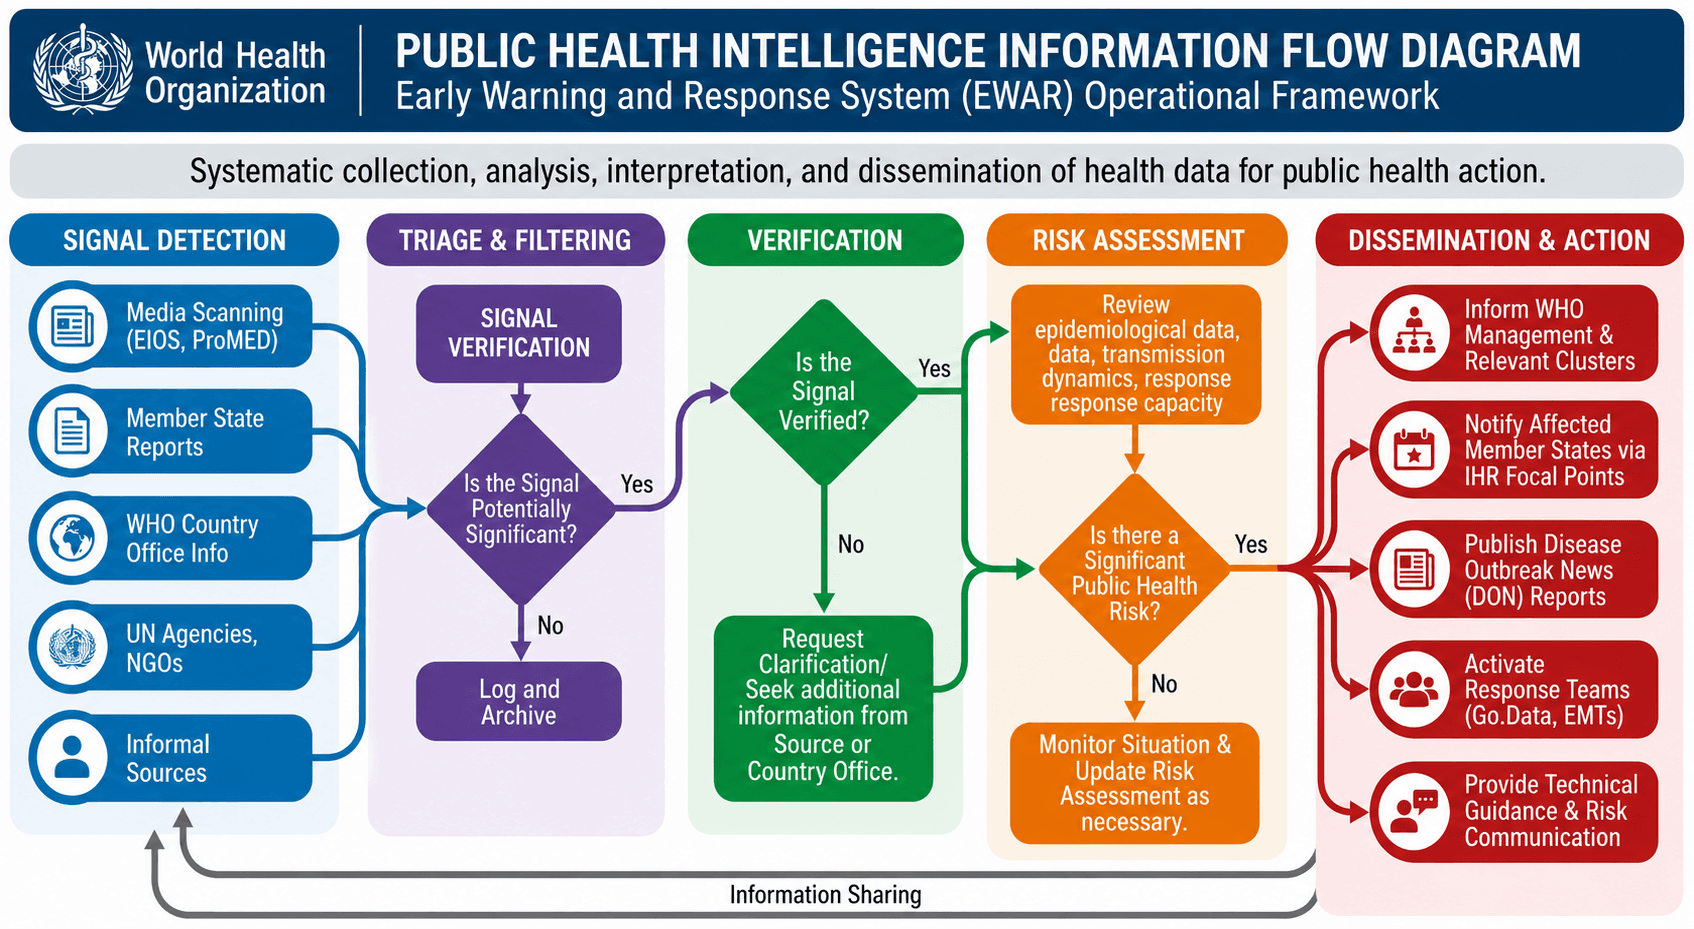
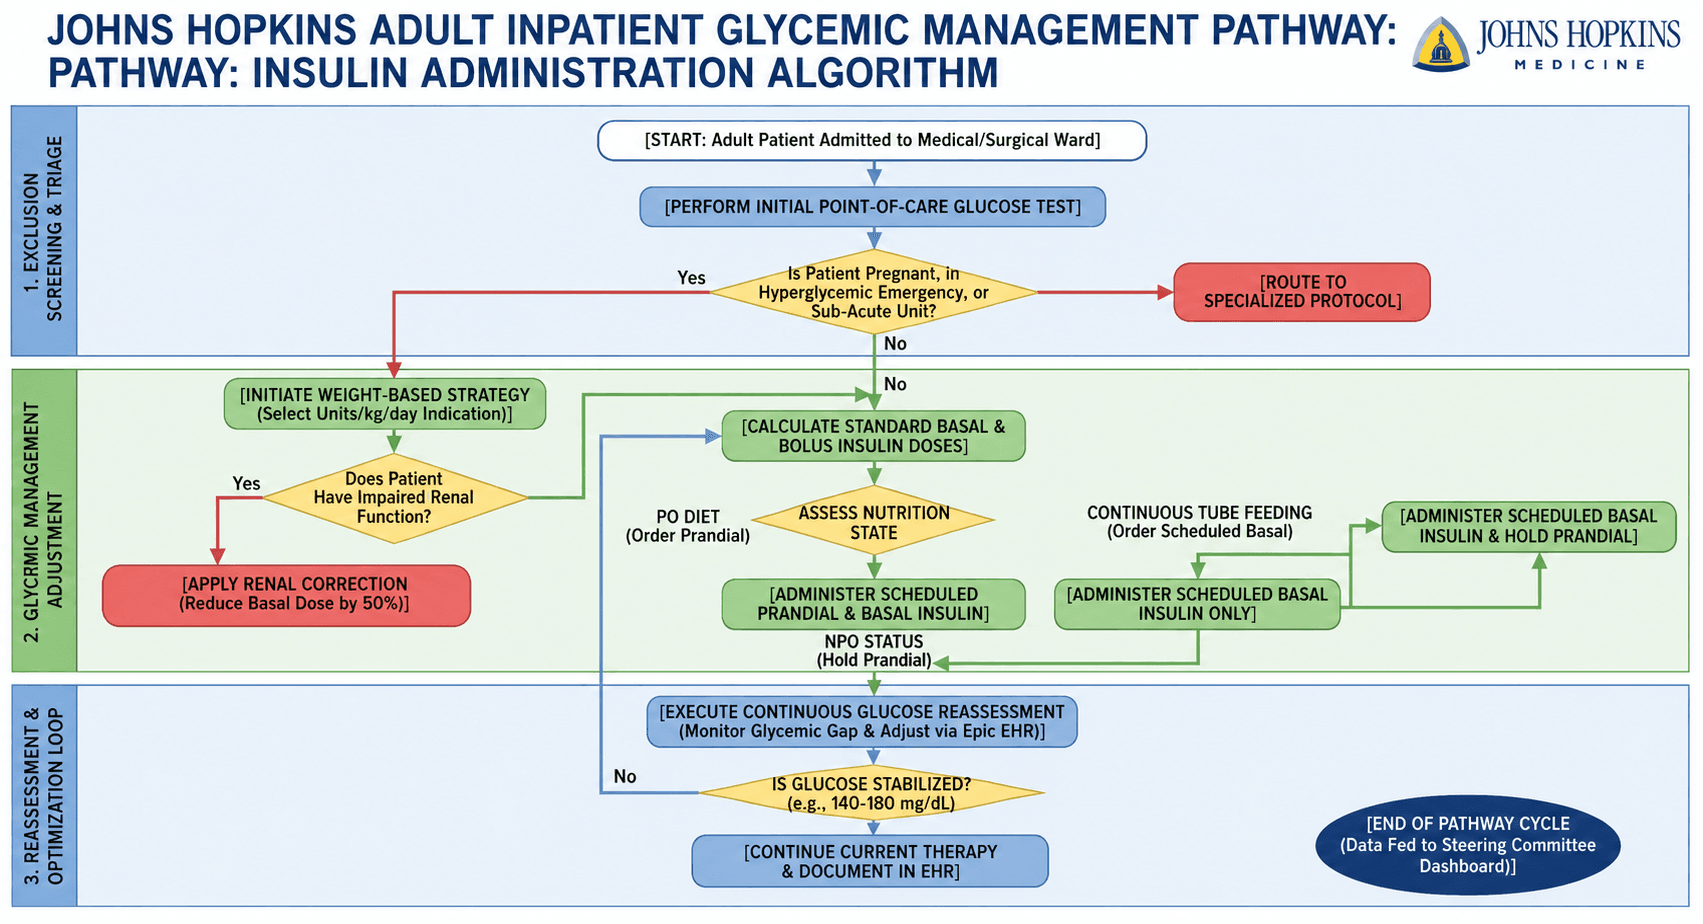
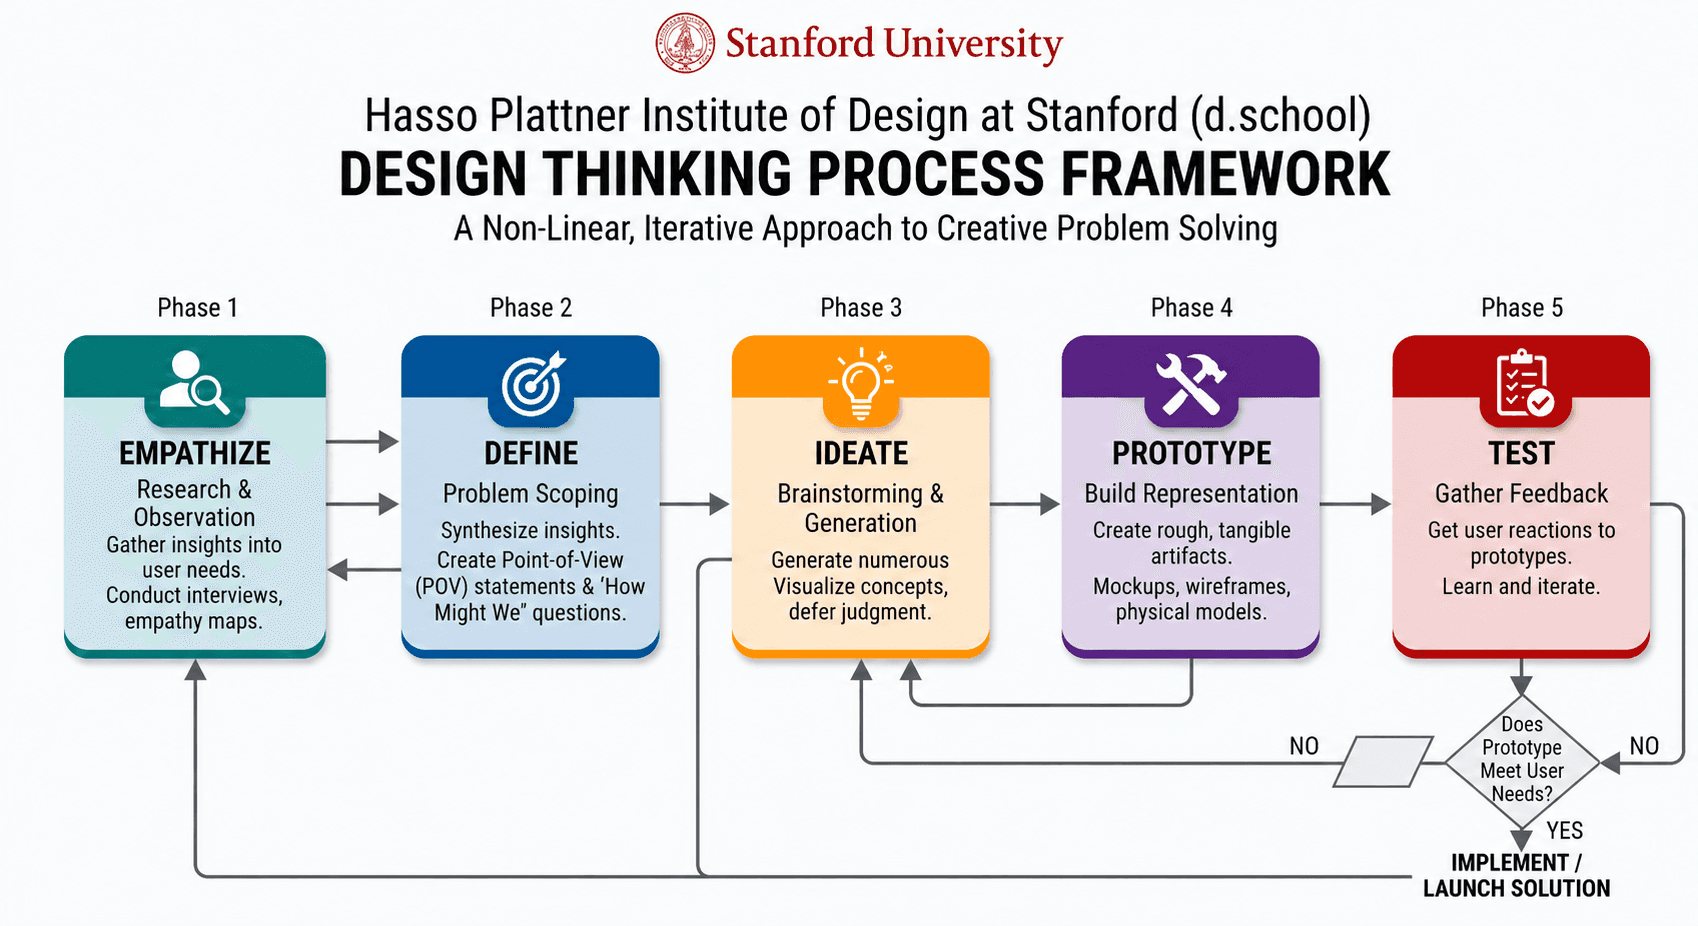
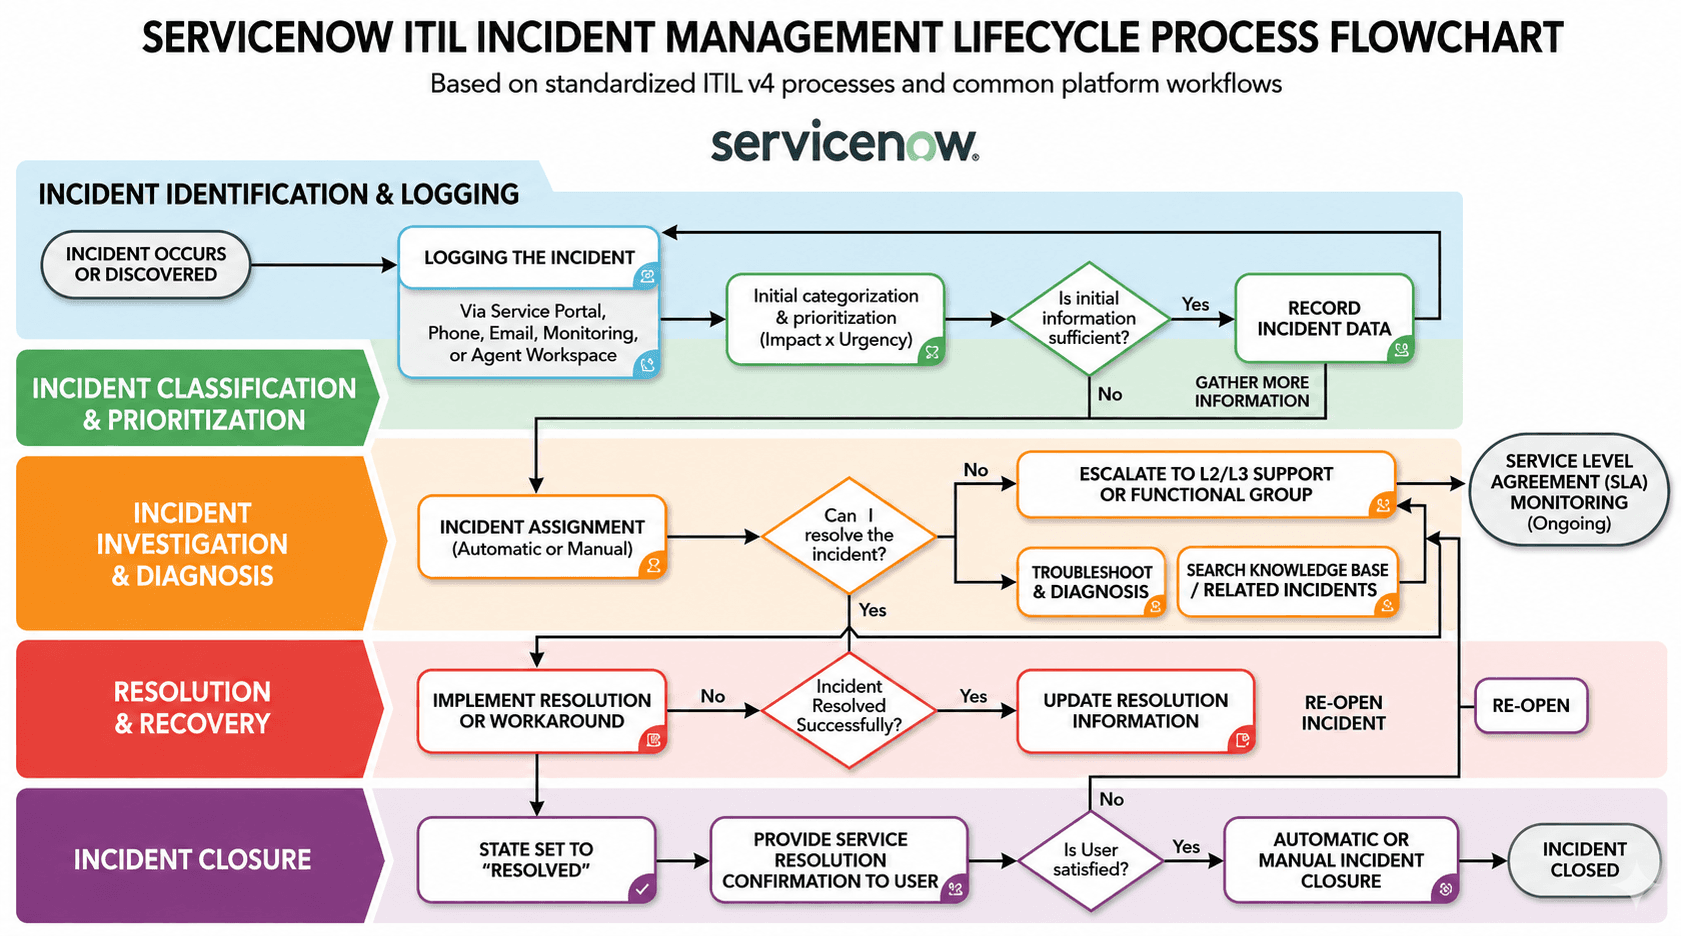
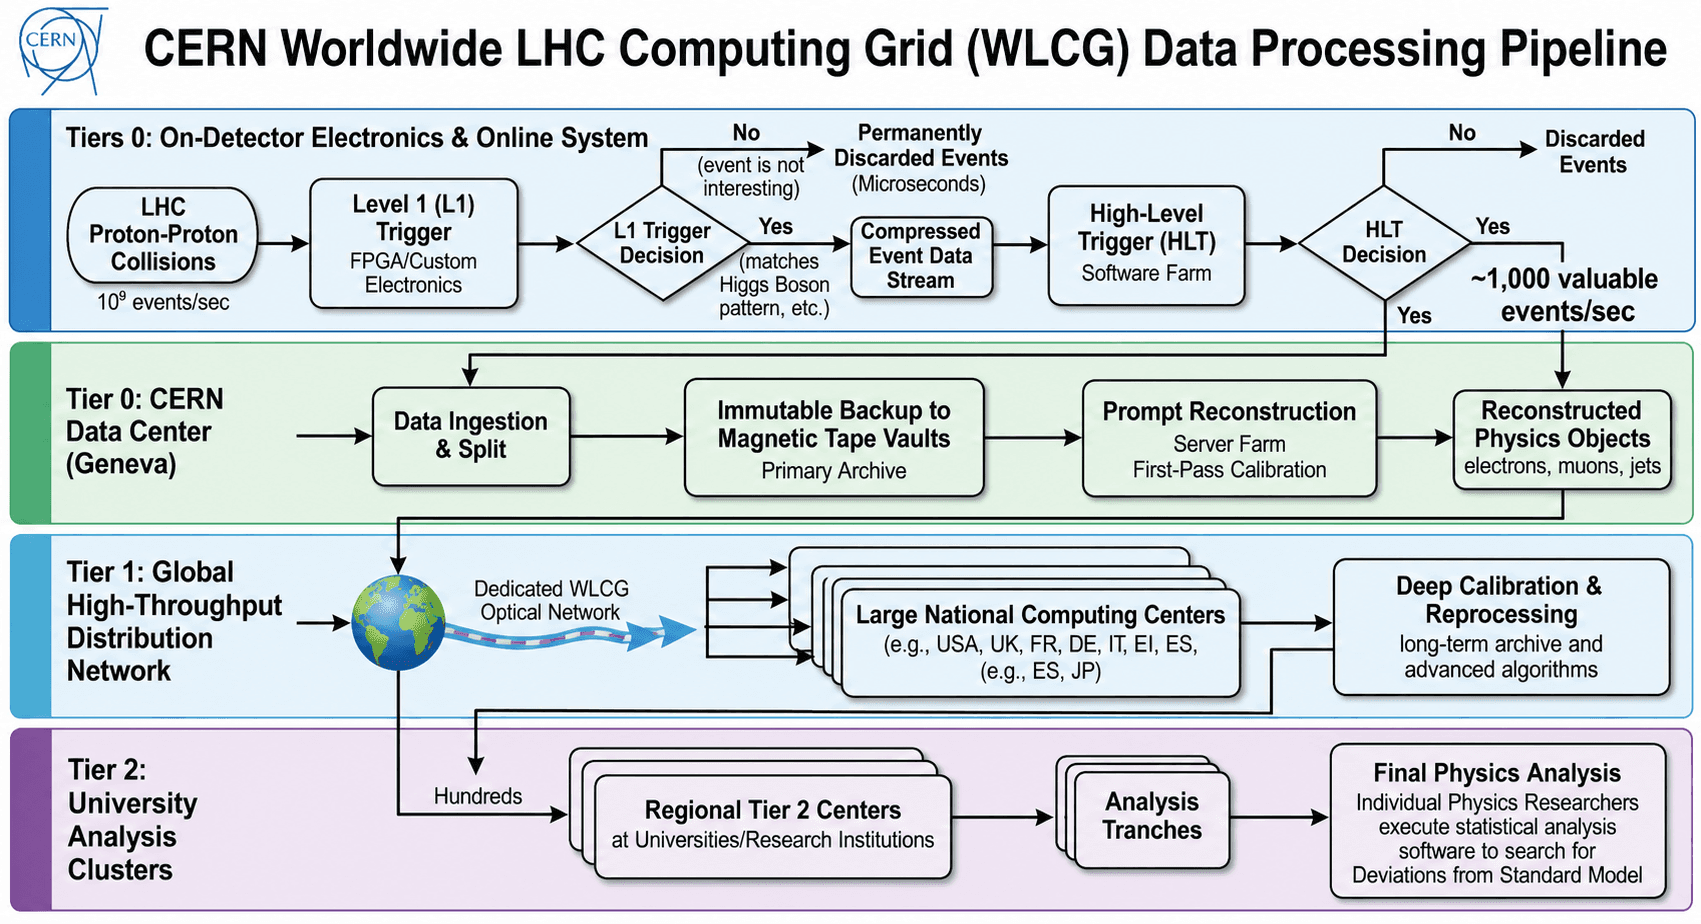
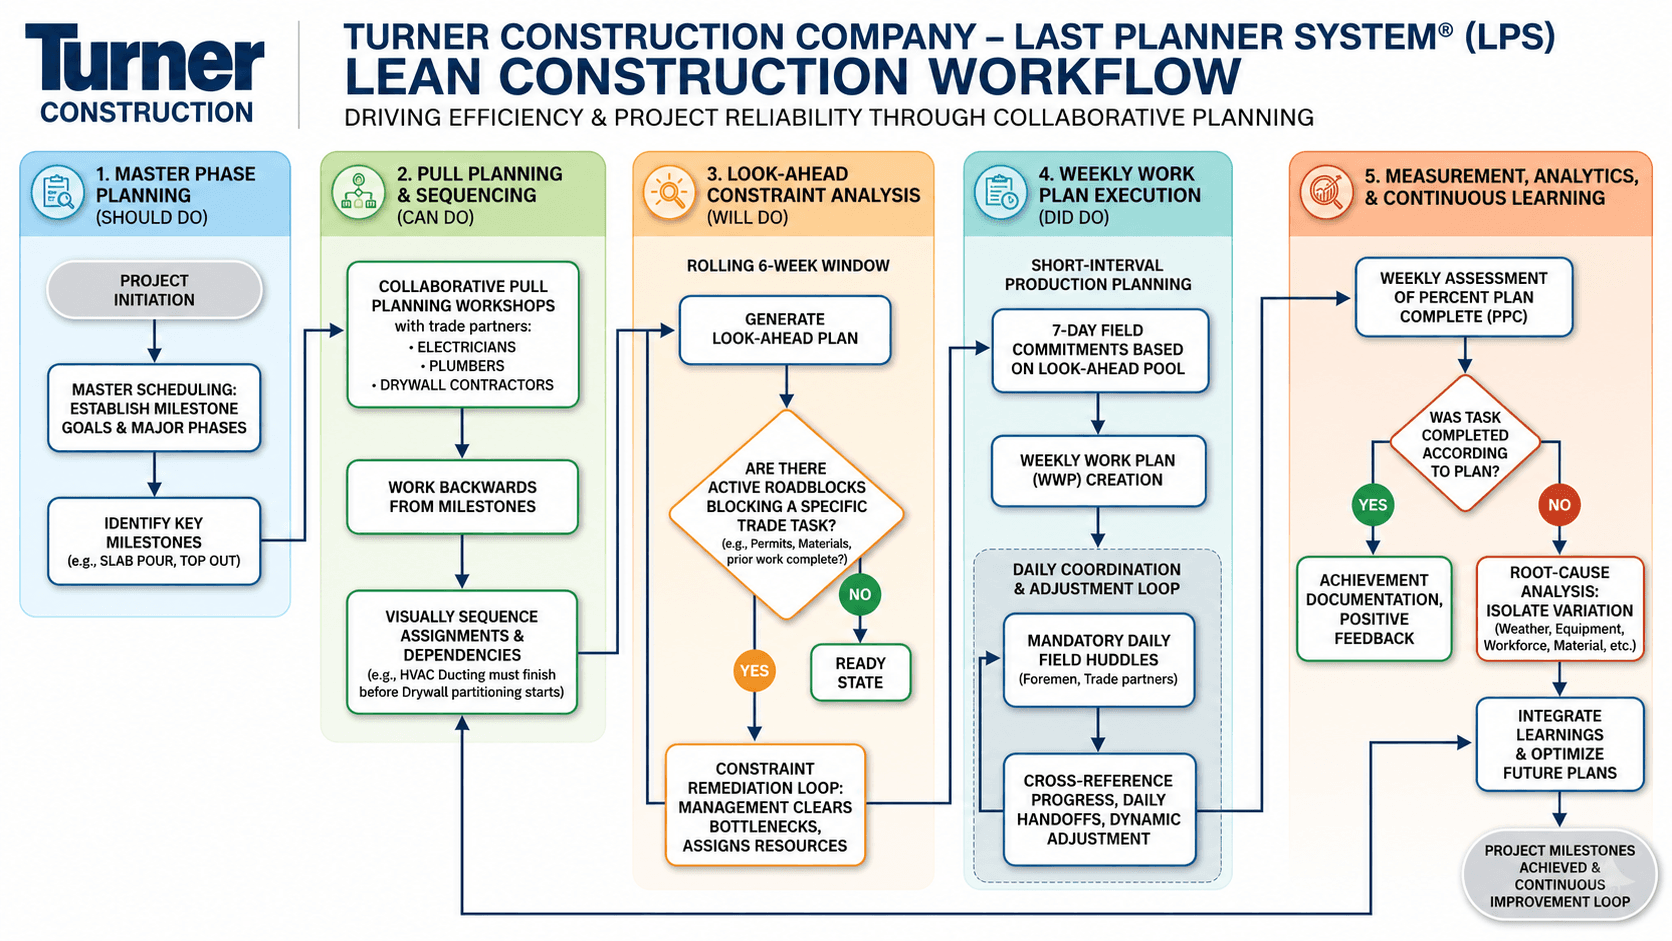
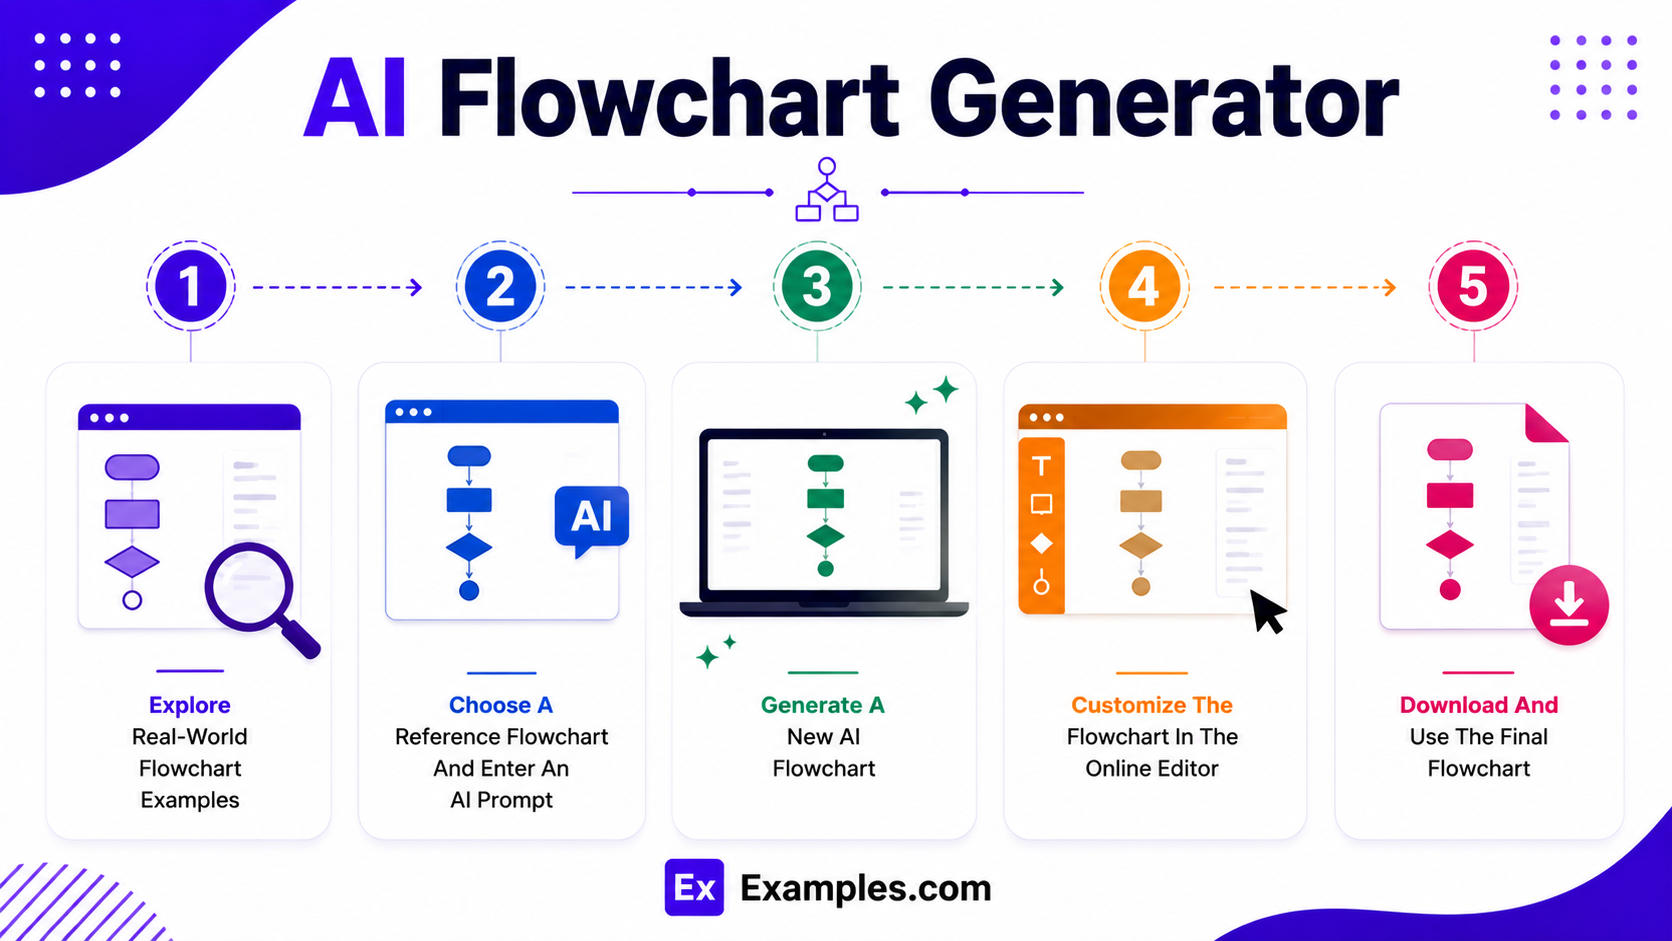 Creating a professional flowchart becomes easier when I use successful process diagrams as inspiration. The workflow combines real-world flowchart references, AI-powered generation, online editing, and personalized customization to transform complex processes into organized visual diagrams.