Venn Diagrams with our comprehensive guide, tailored for educators and students striving for clarity in mathematics and logic. This guide demystifies the concept of Venn Diagrams, showcasing their utility in representing logical relationships visually. With the help of a venn diagram maker, users can easily build custom diagrams to suit any lesson or study need. Through practical examples and simplified explanations, we aim to enhance analytical thinking and problem-solving skills using ready-to-use venn diagram templates that streamline visual learning. Whether it’s for classroom instruction or self-study, this resource is your go-to for mastering the intricacies of Venn Diagrams.
What are Venn Diagrams?
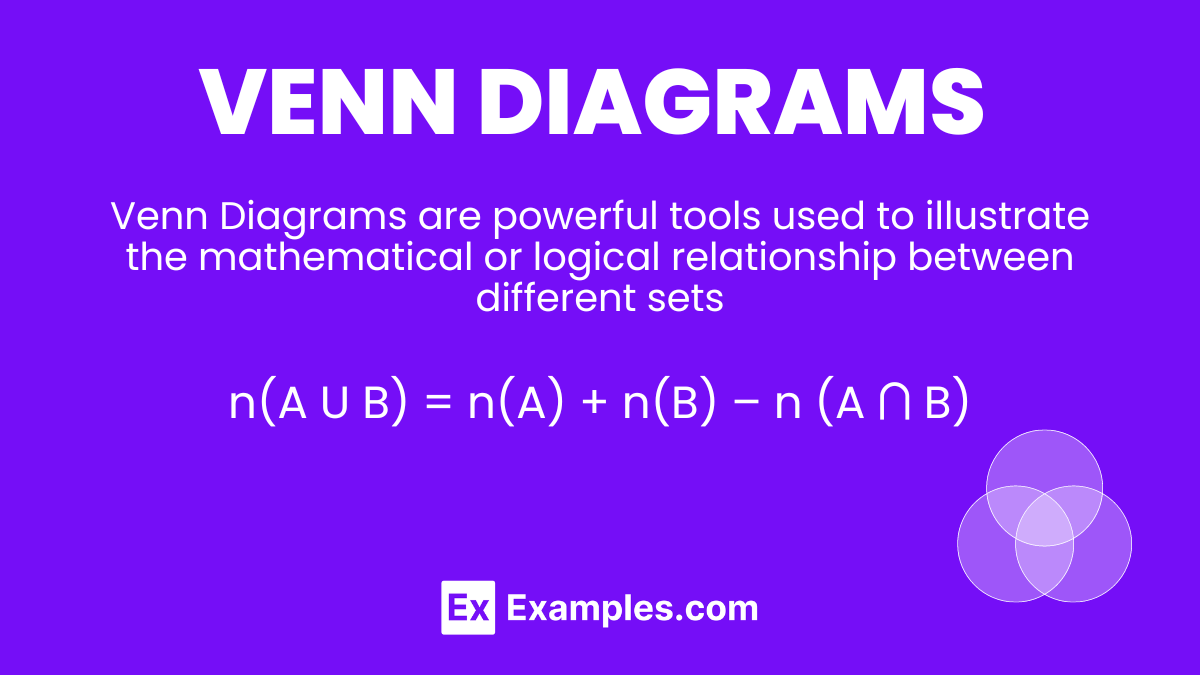
Venn Diagrams are powerful tools used to illustrate the mathematical or logical relationship between different sets. By drawing circles that overlap, they visually represent how items or groups share common traits or differ, making complex relationships easier to understand. This method is invaluable in various fields, including statistics, logic, and education, helping students and teachers alike to dissect and comprehend the interconnectedness of concepts.
What is the Best Example of a Venn Diagram?
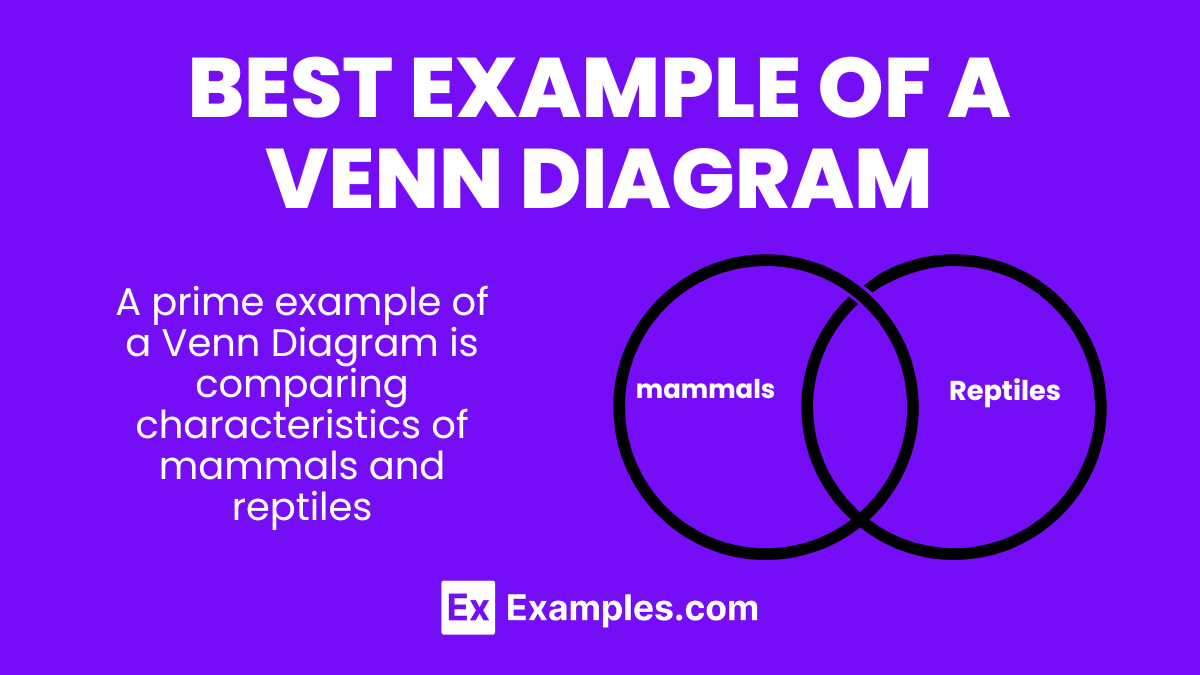
A prime example of a Venn Diagram is comparing characteristics of mammals and reptiles. By placing unique traits in separate circles and shared traits in the overlapping area, students can visually discern the similarities and differences between the two classes. This not only aids in grasping biological classifications but also in developing critical thinking skills by analyzing how groups relate to each other.
Venn Diagram Formula
Delve into the Venn Diagram formula with this succinct guide, designed to make mathematical concepts accessible for educators and students. The formula, helps quantify the elements in union and intersection of two sets, A and B. This formula is a cornerstone for understanding set theory, providing a mathematical framework to solve problems involving elements from multiple sets. Through clear examples and applications, this description empowers users to apply the Venn Diagram formula effectively in various scenarios.
n(A U B) = n(A) + n(B) – n (A ⋂ B)
Venn Diagram Example
Unlock the potential of Venn Diagrams with this insightful guide, crafted to aid educators and students in visualizing complex relationships between sets. Venn Diagrams serve as a versatile tool in mathematics, logic, and beyond, illustrating intersections, unions, and differences with clarity. By providing a visual representation of how sets overlap, these diagrams facilitate a deeper understanding of concepts, enhancing analytical and critical thinking skills.
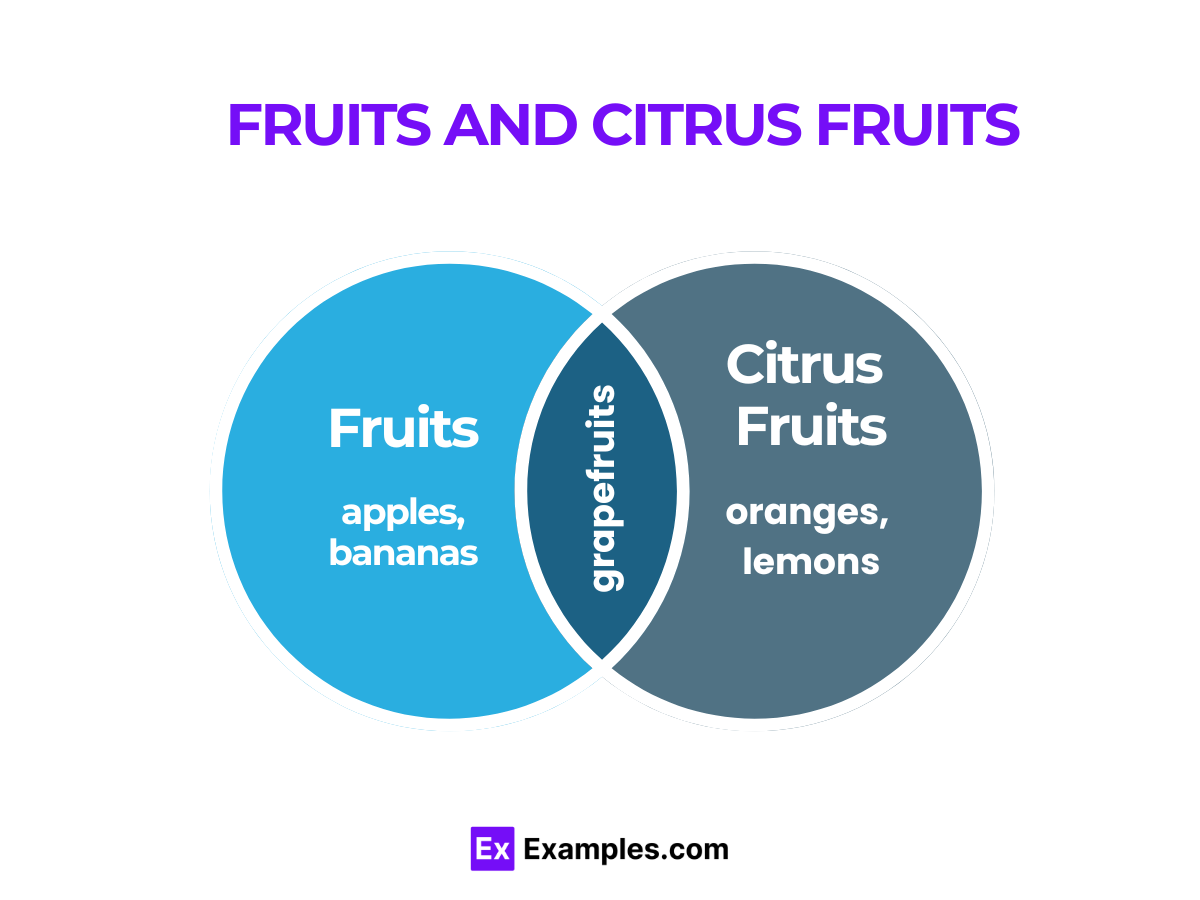
Example 1: Fruits and Citrus Fruits
A Venn Diagram showcasing the relationship between fruits in general and citrus fruits specifically. The circle for fruits includes apples, bananas, while the citrus circle includes oranges, lemons, with grapefruits appearing in the overlap, indicating it’s both a fruit and a citrus.
Example 2: Students in Sports Clubs
Illustrates students participating in basketball, football, and those who play both. Basketball and football circles overlap on students who play both, demonstrating the diagram’s ability to depict shared membership in two sets.
Example 3: Vegetarians and Vegans
This Venn Diagram differentiates between vegetarians and vegans. Vegetarians are represented in one circle, including eggs and cheese, while vegans are in another, focusing on plant-based foods. The overlap highlights foods both groups consume, like vegetables and fruits.
Example 4: Fiction and Science Fiction Books in a Library
Depicts the categorization of fiction and science fiction books. The fiction circle includes romance and historical novels, science fiction includes space operas, with dystopian novels in the overlap, indicating their dual categorization.
Example 5: Water-Soluble and Fat-Soluble Vitamins
A Venn Diagram to classify water-soluble (C and B vitamins) and fat-soluble vitamins (A, D, E, K). The diagram clearly separates them, with no overlap, indicating distinct absorption pathways in the body.
These examples underscore the Venn Diagram’s utility in teaching and learning, offering a visual method to compare and contrast various concepts across disciplines.
Terms Related to Venn Diagram
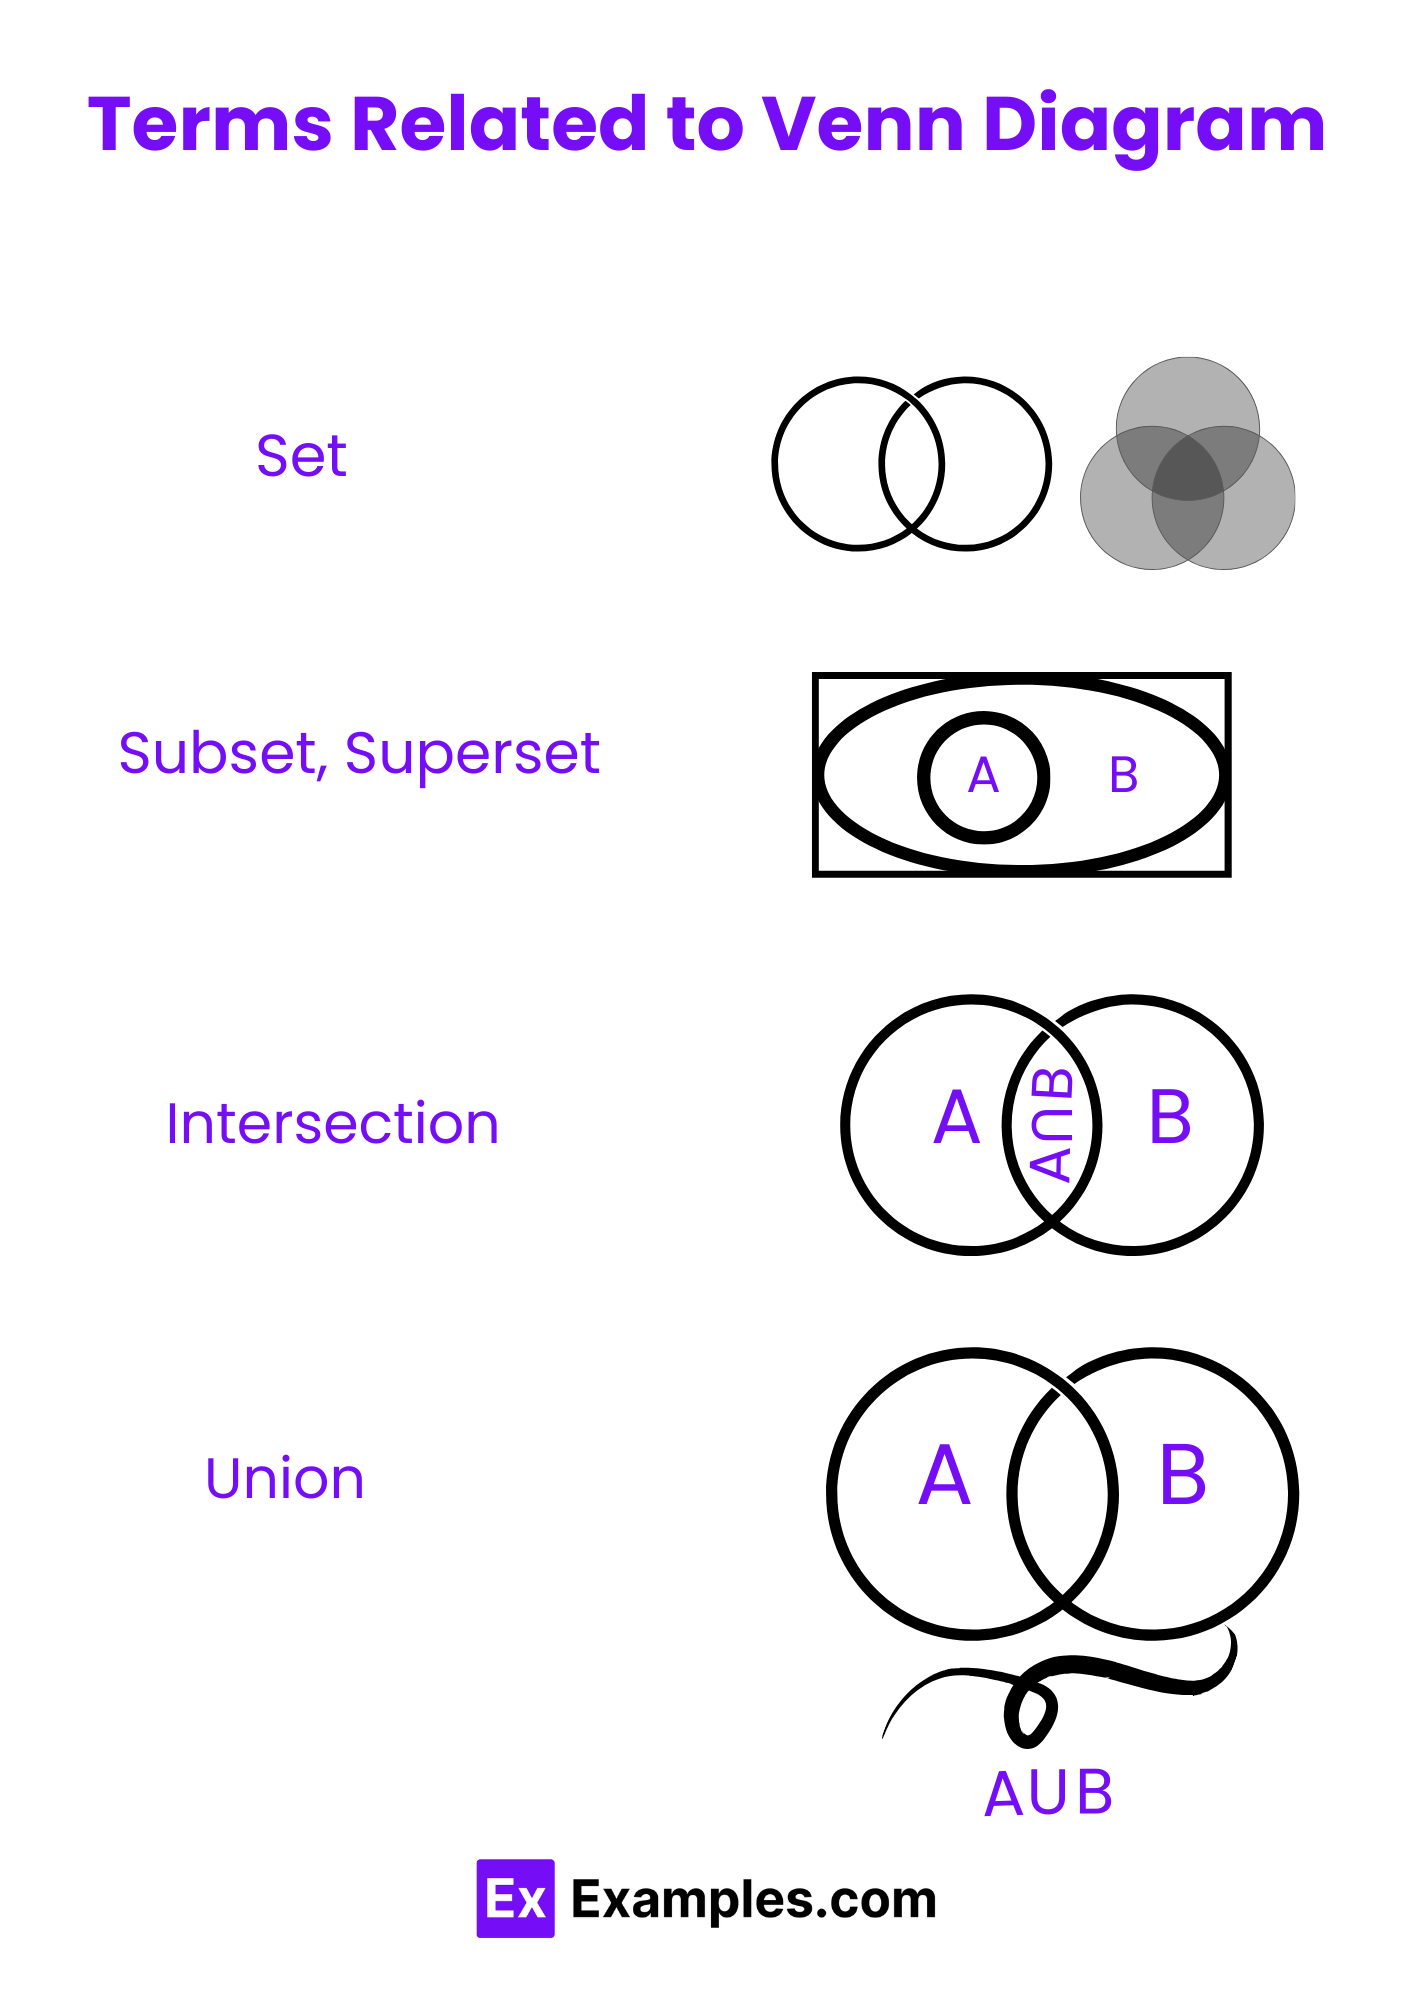
Dive into the world of Venn Diagrams with this essential terminology guide. Perfect for educators and students, it covers key terms necessary for understanding and applying Venn Diagrams in logical, mathematical, and statistical contexts. From “sets” to “intersections,” this guide enriches your vocabulary, enabling clearer communication and comprehension of complex relationships between groups.
Examples:
- Set: A collection of distinct objects or elements.
- Explanation: In a Venn Diagram, a set is represented by a circle, encompassing its elements to visualize groupings in a problem or scenario.
- Subset: A set entirely contained within another set.
- Explanation: Indicates when all elements of one set (subset) are also elements of another, shown by one circle entirely within another in a Venn Diagram.
- Intersection (𝐴 ∩ 𝐵): The common elements between sets A and B.
- Explanation: The overlapping area of circles in a Venn Diagram, representing elements shared by sets A and B.
- Union (𝐴 ∪ 𝐵): All elements that are in set A, set B, or both.
- Explanation: In Venn Diagrams, the union is depicted by the total area covered by both sets’ circles, including the intersection.
- Complement: The elements not in the set.
- Explanation: Represented in Venn Diagrams by the area outside a set’s circle but within the universal set boundary, indicating elements excluded from the set.
Venn Diagram Symbols
Master Venn Diagram symbols with this concise guide, tailored for educational use. These symbols form the visual language of Venn Diagrams, facilitating the representation of mathematical and logical relationships between sets. Understanding these symbols is crucial for teachers and students to effectively analyze and convey information through Venn Diagrams.
Examples:
- Circle: Represents a set.
- Explanation: Each circle in a Venn Diagram encapsulates the elements of a set, serving as a visual boundary for group identification.
- Overlap (Intersecting Area): Shared elements between sets.
- Explanation: The area where circles intersect illustrates the common elements between sets, crucial for understanding their relationships.
- Rectangle (Universal Set): The larger area containing all possible elements.
- Explanation: Surrounding the circles, the rectangle defines the universe of discourse, including all elements considered in the scenario.
- Element Dot: An individual element within a set.
- Explanation: Dots placed inside circles signify individual members of sets, making it easy to count and identify specific elements.
- Complement Shading: Indicates elements not in a specific set.
- Explanation: Shaded areas outside a set but within the universal set boundary show the complement, or elements not included in the set under consideration.
Venn Diagram for Sets Operations
Explore set operations through Venn Diagrams with this insightful guide. Ideal for educational purposes, it simplifies complex set theories, making them accessible for teachers and students. Venn Diagrams visually represent set operations like unions, intersections, and complements, providing a clear method to understand and teach mathematical relationships between sets.
Examples:
- Union Operation (𝐴 ∪ 𝐵): Combines all elements of sets A and B.
- Explanation: The Venn Diagram for a union showcases the total area covered by sets A and B, emphasizing inclusivity of elements.
- Intersection Operation (𝐴 ∩ 𝐵): Identifies common elements of sets A and B.
- Explanation: Highlighted by the overlap between sets, the intersection focuses on elements shared by A and B.
- Complement Operation (𝐴’): Elements not in set A.
- Explanation: Illustrated by shading outside A but within the universal set, this operation reveals elements excluded from set A.
- Difference Operation (𝐴 – 𝐵): Elements in A but not in B.
- Explanation: This operation is visualized by shading parts of A’s circle that do not overlap with B, showing elements unique to A.
- Symmetric Difference (𝐴 Δ 𝐵): Elements in A or B but not in both.
- Explanation: The Venn Diagram highlights the non-overlapping parts of A and B, focusing on elements exclusive to each set, excluding their intersection.
Difference of Set Venn Diagram
Discover the essence of set differences with Venn Diagrams in this concise guide. Ideal for teachers and students, it illustrates how to visually represent the difference between two sets, A and B, by highlighting the elements that belong exclusively to set A. This concept is pivotal in understanding complex relationships in mathematics, fostering a deeper comprehension of how sets interact with each other.
Examples:
- Set A (Prime Numbers) and Set B (Even Numbers):
- The difference shows prime numbers that are not even, like 3 and 5, visually excluding even primes like 2.
- Set A (Fruits) and Set B (Citrus Fruits):
- Illustrates fruits that are not citrus, such as apples and bananas, by highlighting them outside the citrus section.
- Set A (Books) and Set B (Novels):
- Demonstrates that non-novel books (e.g., dictionaries) belong to set A but not to set B.
- Set A (Animals) and Set B (Mammals):
- Showcases animals that are not mammals, like birds and fish, separated visually.
- Set A (Vehicles) and Set B (Electric Vehicles):
- Highlights vehicles that are not electric, indicating the broader category excludes the subset of electric vehicles.
Venn Diagram of Three Sets
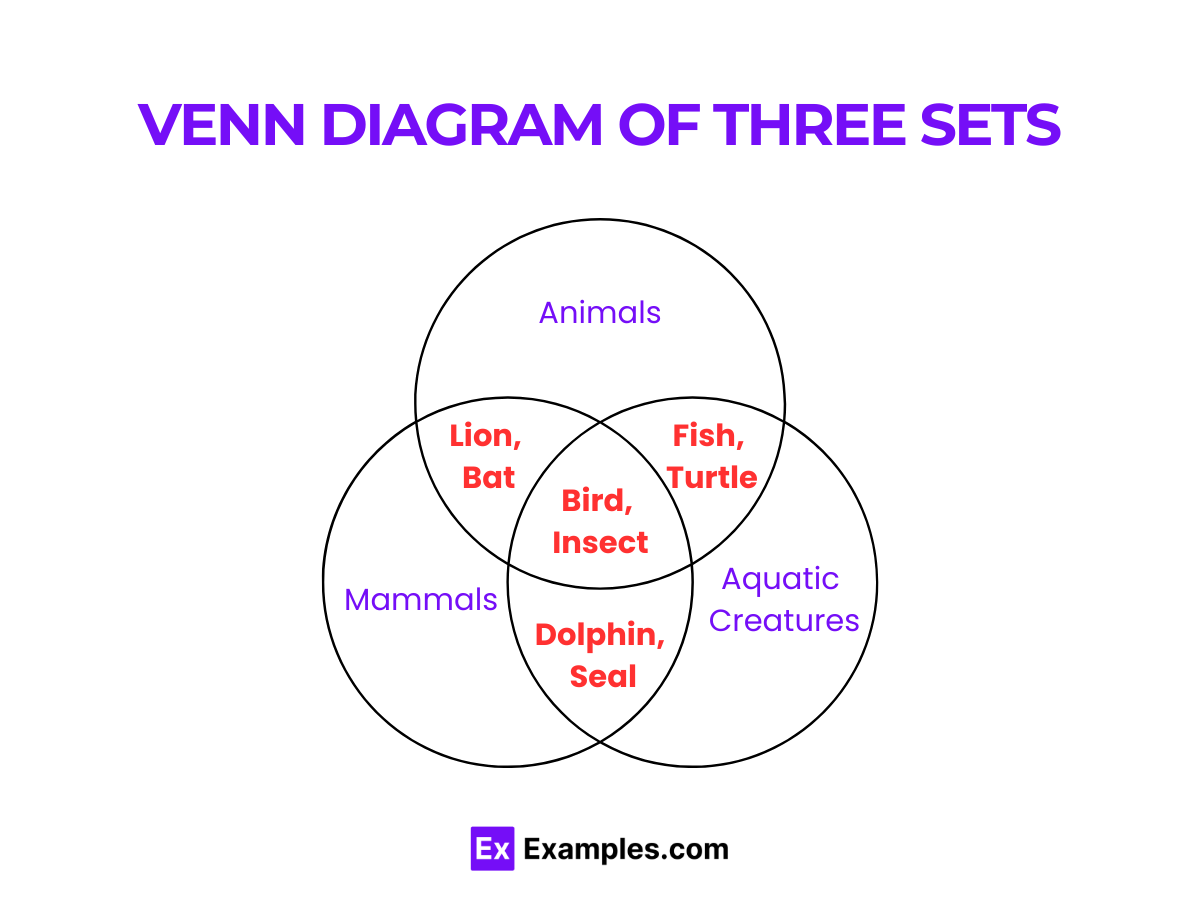
Explore the dynamics of three-set Venn Diagrams with our guide, perfect for educators looking to depict the complex relationships between three distinct sets. This visualization tool sheds light on how sets intersect, combine, and differ, offering a comprehensive understanding of shared and unique elements. It’s an invaluable resource for enhancing analytical thinking and problem-solving skills in mathematics and logic.
Examples:
- Sets: Animals, Mammals, Aquatic Creatures:
- Reveals animals that are mammals, aquatic, both, or neither, providing insight into biological classifications.
- Sets: English, Math, Science Students:
- Depicts students who are exclusively in one subject or intersect in two or all, highlighting academic preferences.
- Sets: Fiction, Mystery, Bestsellers:
- Shows how books can be categorized into fiction, mystery, both, and those that are bestsellers, revealing market trends.
- Sets: Vegetables, Green Foods, Fiber-Rich Foods:
- Illustrates the overlap between vegetables, foods that are green, and those high in fiber, offering dietary insights.
- Sets: European Countries, EU Members, Eurozone Countries:
- Clarifies countries that are in Europe, part of the EU, the Eurozone, or a combination, enhancing geographical understanding.
How to Draw a Venn Diagram?
Master the art of drawing Venn Diagrams with our straightforward guide. Tailored for both teachers and students, this resource simplifies the process into manageable steps, from conceptualizing set relationships to visualizing intersections and differences. Whether for mathematical equations, logical reasoning, or categorizing information, learning to draw Venn Diagrams is an essential skill for effective problem-solving and communication.
Examples:
- Identifying Sets:
- Begin by defining the sets you want to compare or contrast to understand their relationships.
- Drawing Circles:
- Draw circles to represent each set, ensuring they overlap for common elements.
- Labeling:
- Clearly label each circle with the corresponding set name for easy identification.
- Filling in Values:
- Place elements in the respective areas: unique in non-overlapping and common in overlapping sections.
- Analyzing Relationships:
- Use the completed diagram to analyze and explain the relationships between the sets, such as intersections and differences.
These guides and examples are crafted to enhance the understanding and application of Venn Diagrams in educational settings, fostering a deeper comprehension of set theory and logical analysis among students.
Applications of Venn Diagram
Venn Diagrams serve as versatile tools in education, data analysis, and problem-solving. By visually mapping out relationships between sets, they facilitate understanding of complex concepts through overlap and distinction. Ideal for both classroom learning and professional data presentation, Venn Diagrams enhance comprehension in subjects ranging from mathematics to social sciences, making them indispensable in analytical reasoning and decision-making processes.
Examples:
- Mathematics Class: Illustrating prime vs. composite numbers.
- Explanation: Students can visualize numbers that are exclusively prime or composite and those that share attributes with a Venn Diagram, enhancing number theory comprehension.
- Literature Analysis: Comparing themes across novels.
- Explanation: By using Venn Diagrams, teachers can help students identify common themes and unique elements in different works, promoting deeper literary analysis.
- Scientific Classification: Showcasing characteristics of living organisms.
- Explanation: Venn Diagrams simplify the comparison of taxonomic groups, helping students grasp similarities and differences in traits among species.
- Market Analysis: Identifying target audience overlap.
- Explanation: Businesses utilize Venn Diagrams to understand shared characteristics among different customer segments, optimizing marketing strategies.
- Problem Solving: Facilitating conflict resolution.
- Explanation: In conflict resolution, Venn Diagrams can highlight common ground and differing points, aiding in finding mutually acceptable solutions.
Venn Diagram Purpose and Benefits
Venn Diagrams are pivotal in simplifying the visualization of complex relationships, offering clarity in educational, analytical, and strategic contexts. They enable users to compare and contrast sets, highlighting similarities, differences, and intersections with ease. This visualization aids in fostering critical thinking, enhancing memory retention, and supporting effective communication, making Venn Diagrams a powerful tool for learners and professionals alike.
Examples:
- Enhancing Memory Retention: Visual learning through Venn Diagrams.
- Explanation: The visual representation in Venn Diagrams aids in memory retention by simplifying abstract concepts into tangible comparisons.
- Improving Critical Thinking: Analyzing logical relations.
- Explanation: Venn Diagrams challenge students to think critically about how sets relate, enhancing logical reasoning skills.
- Facilitating Discussion: Encouraging collaborative learning.
- Explanation: In group settings, Venn Diagrams serve as focal points for discussion, promoting collaborative learning and idea exchange.
- Data Presentation: Simplifying complex data sets.
- Explanation: Venn Diagrams make it easier to present and interpret complex data, improving audience understanding in presentations.
- Decision Making: Aiding in pros and cons evaluation.
- Explanation: By visually comparing options, Venn Diagrams help in weighing the pros and cons, facilitating more informed decision-making.
Venn Diagram Use Cases
Venn Diagrams are employed across various fields to visually organize information, facilitating understanding and analysis of relationships between sets. From educational settings to business strategy and scientific research, they provide a clear and intuitive method to display intersections, differences, and similarities, enhancing decision-making, learning, and data interpretation.
Examples:
- Educational Tools: Simplifying grammar concepts.
- Explanation: Teachers use Venn Diagrams to compare and contrast grammatical elements, helping students understand language rules.
- Business Strategies: Analyzing competitor offerings.
- Explanation: Companies employ Venn Diagrams to compare their products with competitors’, identifying unique selling points and areas for improvement.
- Healthcare Research: Comparing disease symptoms.
- Explanation: Researchers use Venn Diagrams to visualize similarities and differences in symptoms among diseases, aiding in differential diagnosis.
- Environmental Studies: Exploring ecosystems’ overlaps.
- Explanation: Venn Diagrams help students understand the shared and unique characteristics of different ecosystems, promoting environmental awareness.
- Technology Development: Identifying feature sets in software.
- Explanation: Developers use Venn Diagrams to compare features across different software versions or competitors, guiding development priorities.
Intersection of Two Sets in Venn Diagram
Explore the concept of the intersection of two sets in Venn Diagrams, a crucial element for teachers and students in understanding shared characteristics between groups. This visualization technique marks the common elements of sets within the overlapping regions of circles, simplifying complex relationships and enhancing analytical reasoning. Perfect for classroom discussions, it facilitates a deeper comprehension of how sets interact in mathematics and logic.
Examples:
- Students Who Play Both Basketball and Football:
- The intersection shows students involved in both sports, highlighting shared participants in the overlapping area.
- People Who Like Both Tea and Coffee:
- This intersection identifies individuals who enjoy both beverages, represented by the shared space between two circles.
- Animals That Are Both Mammals and Carnivores:
- The overlapping section illustrates animals sharing traits of mammals and carnivores, aiding in biological classification.
- Books That Are Both Fiction and Mystery:
- In the intersection, books categorized as fiction and mystery are shown, demonstrating how genres can overlap.
- Countries in Both Europe and the Schengen Area:
- This example uses the intersection to show countries that are part of Europe and the Schengen Agreement, facilitating a geographic and political understanding.
Union of Two Sets in Venn Diagram
The union of two sets in Venn Diagrams represents the combination of all elements from both sets, including the shared and unique elements. This concept is vital for students and teachers, offering a visual method to comprehend the totality of distinct and overlapping characteristics within groups. By enhancing visualization skills, it aids in grasping the breadth of set relationships, making it a fundamental tool in mathematical education.
Examples:
- Books in Either the Science Fiction or Fantasy Genre:
- The union includes all books from both genres, emphasizing the extensive range of literature available.
- Students Enrolled in Art or Music Classes:
- This union displays students taking either or both subjects, showcasing the diverse interests within the school population.
- Countries in Asia or Africa:
- The combined set includes all countries from both continents, highlighting the vast geographical coverage.
- People Who Speak English or Spanish:
- By uniting the two sets, it shows individuals speaking either or both languages, reflecting linguistic diversity.
- Pets That Are Cats or Dogs:
- The union encompasses all pets falling into either category, illustrating the variety of household animals.
Complement of Union of Sets in Venn Diagram
The complement of the union of sets in Venn Diagrams refers to elements not included in the union of specified sets, offering a unique perspective on set relationships. This concept is essential for educators teaching logical complementation, as it visually separates the universal set from the combined sets. By identifying elements outside the union, students gain insight into exclusion within set theory, enriching their understanding of mathematical and logical boundaries.
Examples:
- Students Not Involved in Sports or Music:
- The complement shows students who participate in neither activity, highlighting diverse interests outside these areas.
- Foods That Are Neither Fruits Nor Vegetables:
- This example identifies foods categorized outside of fruits and vegetables, emphasizing the variety in dietary choices.
- Books Not in the Romance or Horror Genres:
- The complement includes books outside these genres, showcasing the wide range of literature beyond specific categories.
- Countries Not in North America or Europe:
- By focusing on the complement, it reveals countries situated outside these continents, expanding geographic knowledge.
- Animals Not Classified as Birds or Fish:
- This complement helps in understanding the diversity of animal kingdoms beyond avian and aquatic life forms.
Complement of Intersection of Sets in Venn Diagram
Discover the concept of the complement of the intersection of sets in Venn Diagrams, a crucial element for students and teachers in understanding set theory. This principle highlights the elements that are not part of the intersection of two sets, offering a visual and intuitive method to grasp set relationships. By learning this concept, educators can enhance their teaching strategies, enabling students to better understand complex set operations through visual representation.
Examples:
- Complement of Intersection in a Two-Set Venn Diagram:
- In a diagram of sets A and B, the complement of includes all elements outside the overlapping area. This illustrates elements not shared by A and B.
- Using Universal Set U:
- With the universal set U containing all possible elements, the complement of is represented by all areas in U not in , showcasing non-common elements.
- Complement in Three-Set Diagram:
- In a Venn Diagram with sets A, B, and C, the complement of shows elements in U excluding those common to all three sets, emphasizing unique elements outside these intersections.
- Practical Classroom Example:
- Considering sets of ‘red items’ and ’round items’, the complement of their intersection excludes items that are both red and round, helping students identify items that do not possess both properties simultaneously.
- Application in Probability:
- This concept is used in probability to determine the likelihood of events not occurring together, enhancing students’ understanding of probability theory through visual aids.
What Is a Venn Diagram in Math?
A Venn Diagram is a visual tool used in math to show the relationships between different sets through overlapping circles.
How Do You Read a Venn Diagram?
To read a Venn Diagram, identify each circle as a set and where they overlap, indicating shared elements or characteristics.
Why Are They Called Venn Diagrams?
They are named after John Venn, a mathematician who popularized these diagrams in the 1880s to illustrate logical relationships.
What Is the Middle of a Venn Diagram Called?
The middle, where two or more circles overlap, is called the intersection, representing elements common to all overlapping sets.
Does a Venn Diagram Always Use 2 or 3 Circles?
No, a Venn Diagram can use any number of circles, though 2 or 3 are most common for simplicity and clarity in representation.
Venn Diagrams are indispensable tools in education, offering a visual representation of set relationships that enhance comprehension and analytical skills. By simplifying complex concepts, they become accessible, engaging, and insightful for students, making them a favored resource among educators dedicated to fostering a deeper understanding of mathematics and logic.