



ScienceDirect
Available online at
www.sciencedirect.com
Procedia Computer Science 124 (2017) 100–107
1877-0509
©
2018 The Authors. Published by Elsevier B.V.
Peer-review under responsibility of the scientific committee of the 4th Information Systems International Conference 2017
10.1016/j.procs.2017.12.135
4th Information Systems International Conference 2017, ISICO 2017, 6-8 November 2017, Bali,
Indonesia
Teenstagram TimeFrame
: A Visualization for Instagram Time Dataset
from Teen Users (Case Study in Surabaya, Indonesia)
Irmasari Hafidz*, Alvin Rahman Kautsar, Tetha Valianta, Nur Aini Rakhmawati
Department of Information Systems, Institut Teknologi Sepuluh Nopember, Kampus ITS, Surabaya, 60111, Indonesia
Abstract
The aim of this study is to create Teenstagram, a visualization for online pattern activity using Instagram dataset from teen users (junior
high school, 7
th
- 9
th
grade) in Surabaya, Indonesia. First, an offline workshop about ethics using Internet and social media for 18 junior
high schools in Surabaya were conducted about three weeks, from 3
rd
until 26
th
October 2016. Second, we create Teenstagram, by
building a web application to visualize and analyze the pattern activity from teen users using Instagram. We get the 290 Instagram
users account from 579 students who fill in the survey from the first stage of the research. We employ K-Modes using R to cluster the
dataset with six categorical features; online type activity (like, comment follow), days in the week (Monday – Sunday), hour (00-23),
student activity (study time, rest time, school time), type of school (public and private activity), and sex (male, female). We propose a
tool for analyzing Instagram dataset for online time activity, this result reveals the time pattern from the teen users using social media
(e.g. Instagram) and what are the characteristics of each pattern has.
© 2018 The Authors. Published by Elsevier B.V.
Peer-review under responsibility of the scientific committee of the 4th Information Systems International Conference 2017.
Keywords:
Instagram; K-Modes; R; Teen; Online Behavior; Social Media; Visualization; Categorical Attributes
1.
Introduction
The internet and social media are now an inseparable way of life from human being, from six month old-baby [1] until
senior users age 65 years old and older [2]. An article from TIME reported that baby as early as 6-month year old now
mostly have access to mobile devices; 65% their parents uses these mobile devices to calm their kids and 29% put their
children to sleep. The American Association of Pediatrics (AAP) stated in the article that the excessive used of Internet
* Corresponding author. Tel.:+6231-5999-944; Fax.: +62-31-5964-965.
E-mail address:
irma@is.its.ac.id
Irmasari HafIDz et al. / Procedia Computer Science 124 (2017) 100–107
101
later could contribute to school trouble, attention problems and obesity [3]. AAP also warns that Internet and cell-phone
use can be a platform that lead to risky behavior.
According to survey conducted by APJII (Association of Indonesian Internet Service Providers), from 132.7 million
user of internet in Indonesia, 18.4 percent or 24.4 million are teen users [4]. According to this survey, there are two
platforms in social media which popular among the users (all age), Facebook (71,6 million users) and Instagram (19,9
million users). Even though Mark Zuckerberg still has its charm, teen users are now swifting from Facebook to Snapchat
and Instagram, one article stated that “
Teenagers really do think Facebook is less cool than Instagram and Snapchat
” [5].
This paper study about how teen users use Instagram in their daily life. We create a web application called
Teenstagram. For this paper, we propose a framework for online pattern activity using Instagram dataset from teen users.
We visit 18 junior high school in Surabaya, Indonesia and deliver questionnaires, which later become the main input for
the analysis for clustering and visualization for the Instagram time and online activity.
2.
Literature Review
In this section, we describe Instagram and related literature about social media and Internet usage. Then, we explain
the K-Modes algorithm that is used to cluster the dataset and create pattern analysis from online time activity of Instagram
users.
2.1.
Instagram
Instagram is an online social media platform founded by Kevin Systrom (CEO, co-founder) and Mike Krieger (CTO,
co-founder), that allows its users to capture and share variety moments into photos or video easily [6]. By using Instagram
APIs, we need to understand and read the company legal terms that available on Instagram sites [7]. Right now, there are
36 General Terms (as per July 2017), this statement can be renewable any time in the future.
Studies shown many benefit for Internet usage among life-learning ability [8], for example greater skills to do Math.
But there are consequences that could damage health risk in children and pre-school [9, 10] as well as teen users [11].
Not only increase health problem, but the excessive media usage could also damage personal and create more
psychological problems [12]. For example, deficient social skills and loneliness are important factors that could lead to
impulsive and high or strong Internet behaviors, which resulted in negatives life outcomes, such as: less activity in direct
significant relationship and distract the school activity [12].
2.2.
K-Modes Algorithm
K-Modes algorithm is the modification of K-Means clustering from MacQueen in 1967 [13], the algorithm replaces
the means (average of points on a cluster) with the modes. K-Modes simply records or count which characteristic or
values mostly found (the modes) on a specific feature or attribute. Similar with K-means, the algorithm will ask the initial
number of K (number of cluster defined) and will record the distance between instances and the center of a cluster K.
A study from Huang [14] used K-Modes for 34 categorical features from half million Soybean dataset (500000 records)
resulted in higher scalability because the algorithm needs many less iterations to converge. We employ the package from
R, using packages called
kmodes
and calculate the number of
withindiff
or the distance calculated by simple-matching
algorithm within cluster for each cluster [15]. The similarity measurement defined as the calculation of the distance point.
The K-Modes algorithm is frequency based and update the centroid of cluster K based on iterative object cluster
assignment [16].
3.
Research Methodologies
We conduct two research stages. First, we conduct an offline survey and workshop about ethics using Internet and
social media for 18 junior high school in Surabaya. During the workshop we also delivered questionnaires through the
student or participants. The offline survey to 18 junior high school had been conducted in three weeks from October 3
rd
– 26
th
, 2016. We delivered questionnaires during this workshop and consent form about how many social media account
they have, how much time do they spent online on a day, etc. We successfully delivered 590 offline questionnaires




102
Irmasari HafIDz et al. / Procedia Computer Science 124 (2017) 100–107
through the students and validated 290 Instagram account from the feedback. We validate the student names with each
Instagram account manually, and add sex features (annotated to each account whether she/he is female/ male). This is
important for the second stage of research since sex is an important feature for the analysis. Secondly, we create a website
application to show the pattern and statistical distribution from Instagram dataset. We use Instagram API and crawl the
account for about one month from April, 23
rd
to May 18
th
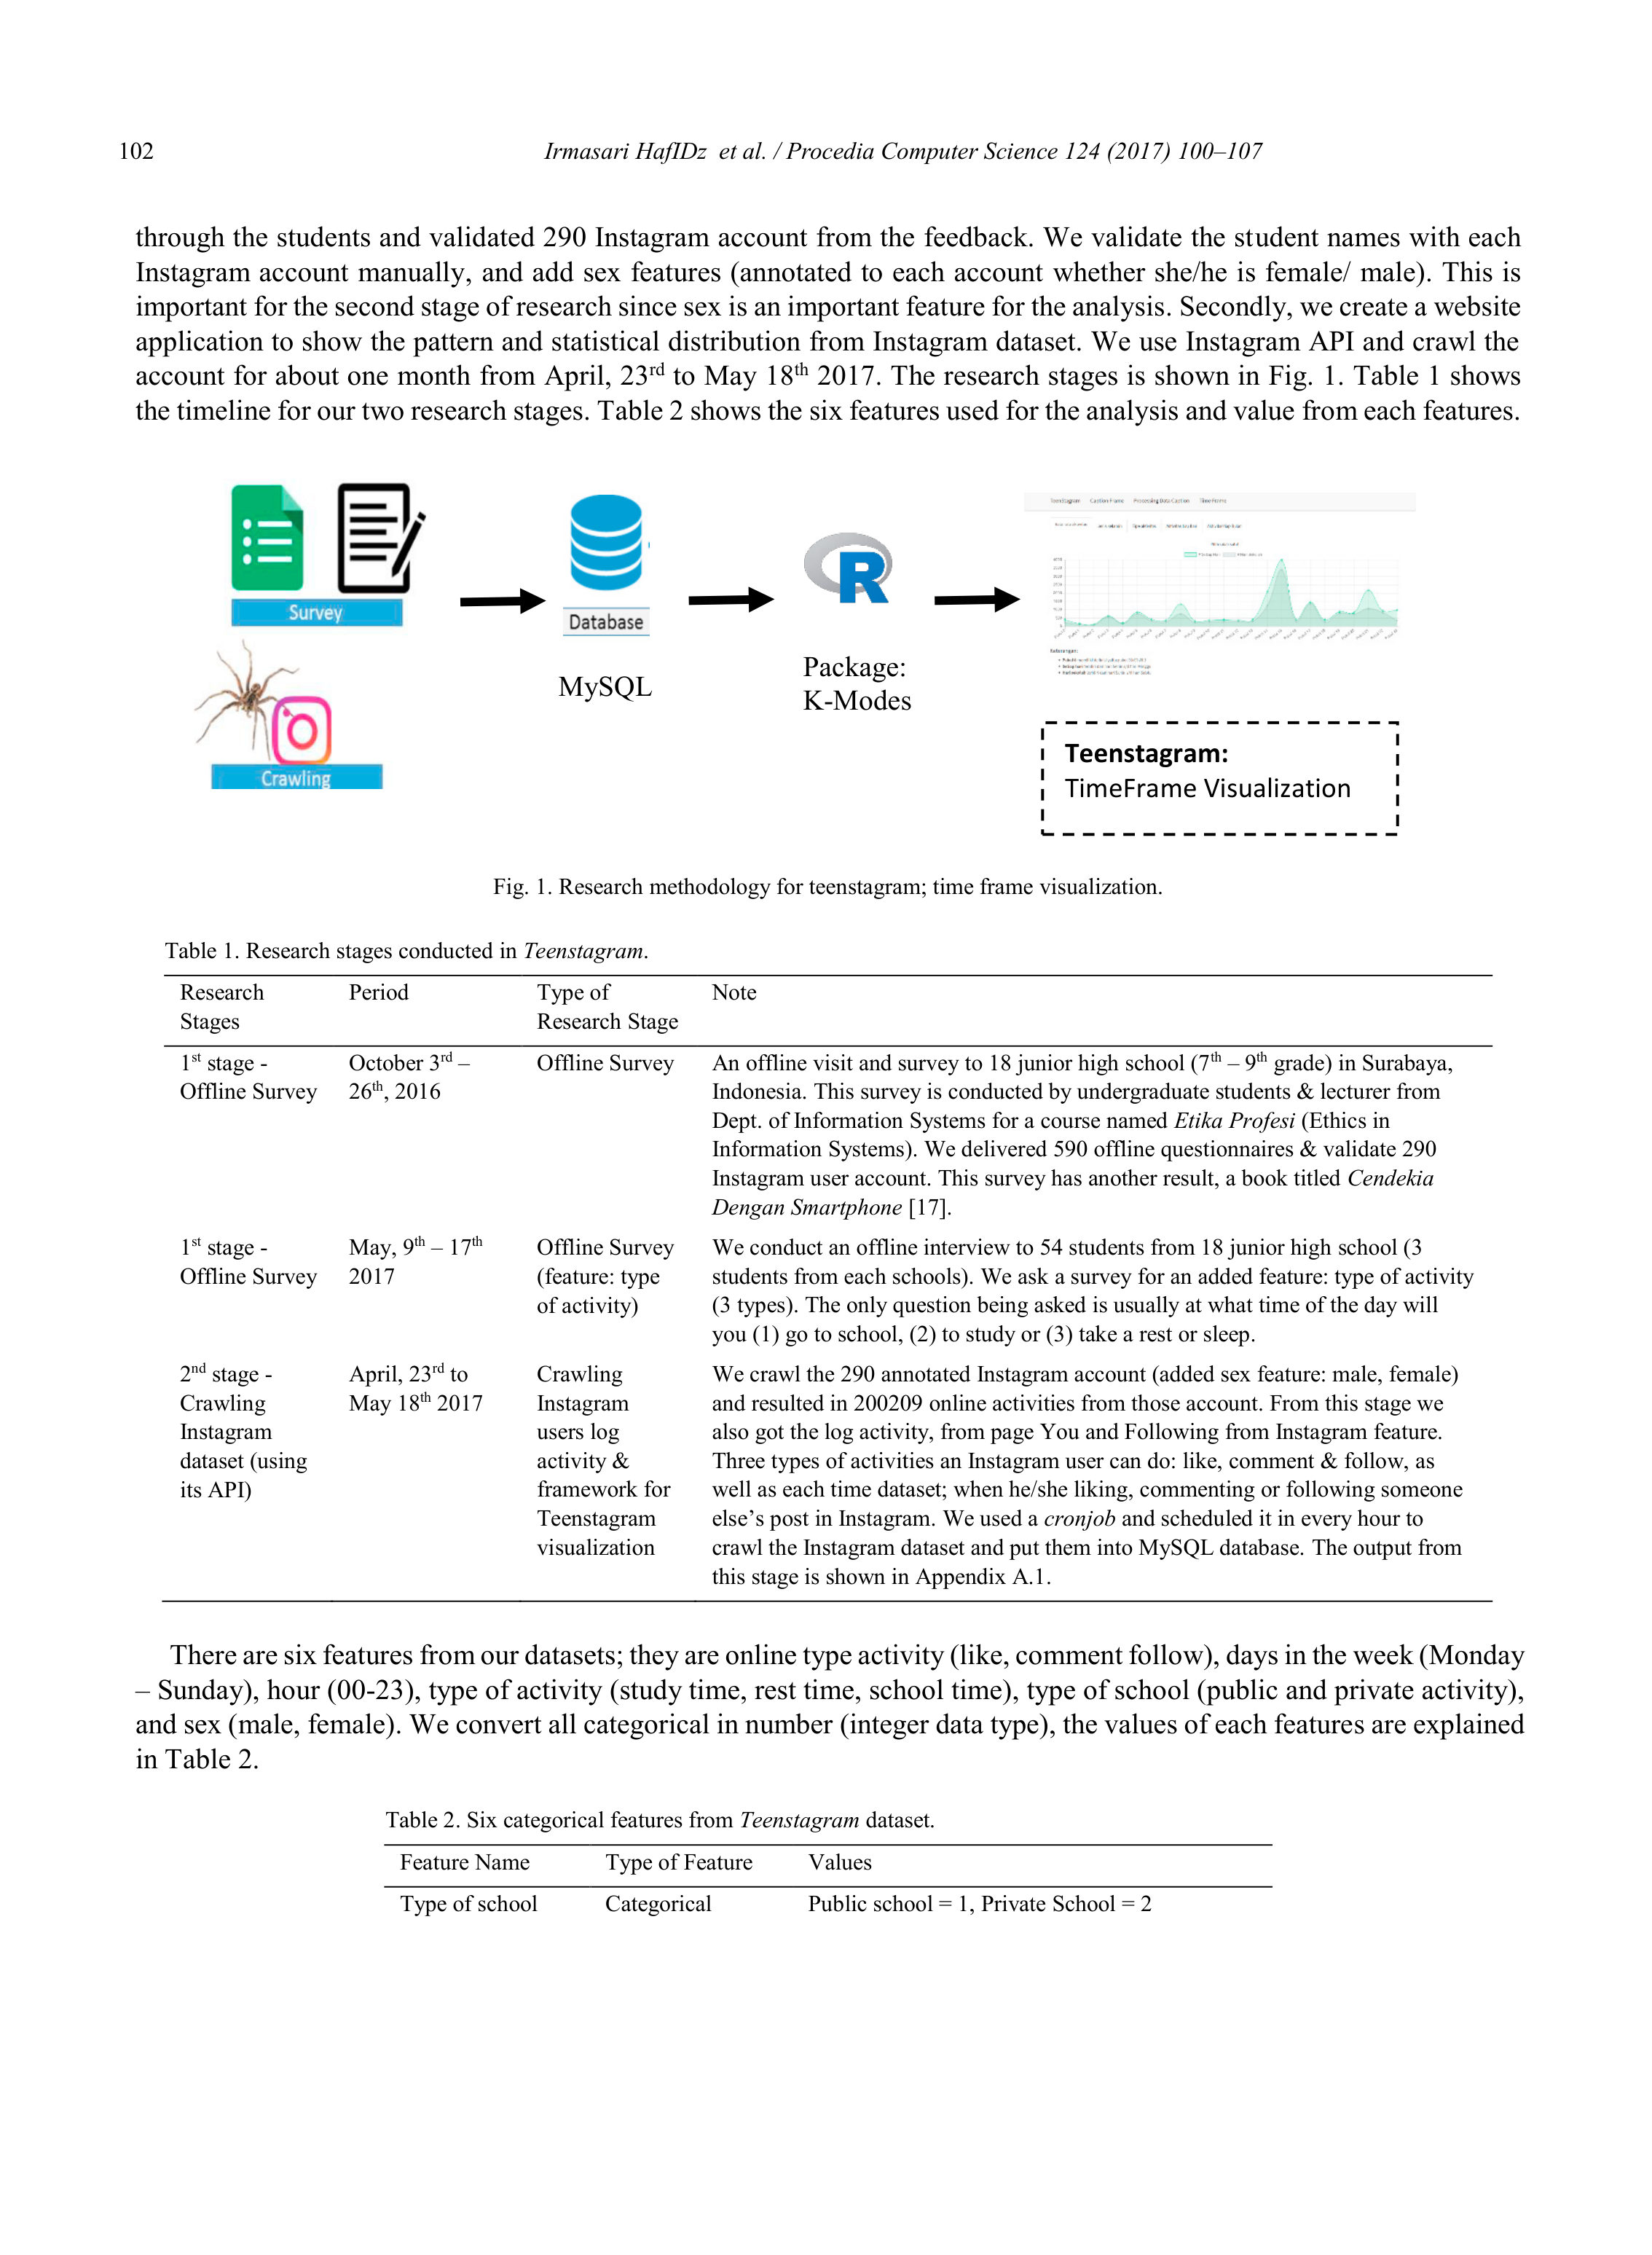
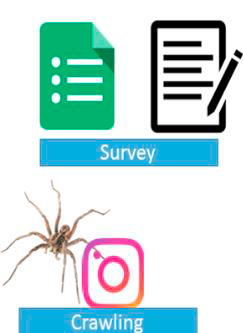
2017. The research stages is shown in Fig. 1. Table 1 shows
the timeline for our two research stages. Table 2 shows the six features used for the analysis and value from each features.
Fig. 1. Research methodology for teenstagram; time frame visualization.
Table 1. Research stages conducted in
Teenstagram
.
Research
Stages
Period
Type of
Research Stage
Note
1
st
stage -
Offline Survey
October 3
rd
–
26
th
, 2016
Offline Survey
An offline visit and survey to 18 junior high school (7
th
– 9
th
grade) in Surabaya,
Indonesia. This survey is conducted by undergraduate students & lecturer from
Dept. of Information Systems for a course named
Etika Profesi
(Ethics in
Information Systems). We delivered 590 offline questionnaires & validate 290
Instagram user account. This survey has another result, a book titled
Cendekia
Dengan Smartphone
[17].
1
st
stage -
Offline Survey
May, 9
th
– 17
th
2017
Offline Survey
(feature: type
of activity)
We conduct an offline interview to 54 students from 18 junior high school (3
students from each schools). We ask a survey for an added feature: type of activity
(3 types). The only question being asked is usually at what time of the day will
you (1) go to school, (2) to study or (3) take a rest or sleep.
2
nd
stage -
Crawling
Instagram
dataset (using
its API)
April, 23
rd
to
May 18
th
2017
Crawling
Instagram
users log
activity &
framework for
Teenstagram
visualization
We crawl the 290 annotated Instagram account (added sex feature: male, female)
and resulted in 200209 online activities from those account. From this stage we
also got the log activity, from page You and Following from Instagram feature.
Three types of activities an Instagram user can do: like, comment & follow, as
well as each time dataset; when he/she liking, commenting or following someone
else’s post in Instagram. We used a
cronjob
and scheduled it in every hour to
crawl the Instagram dataset and put them into MySQL database. The output from
this stage is shown in Appendix A.1.
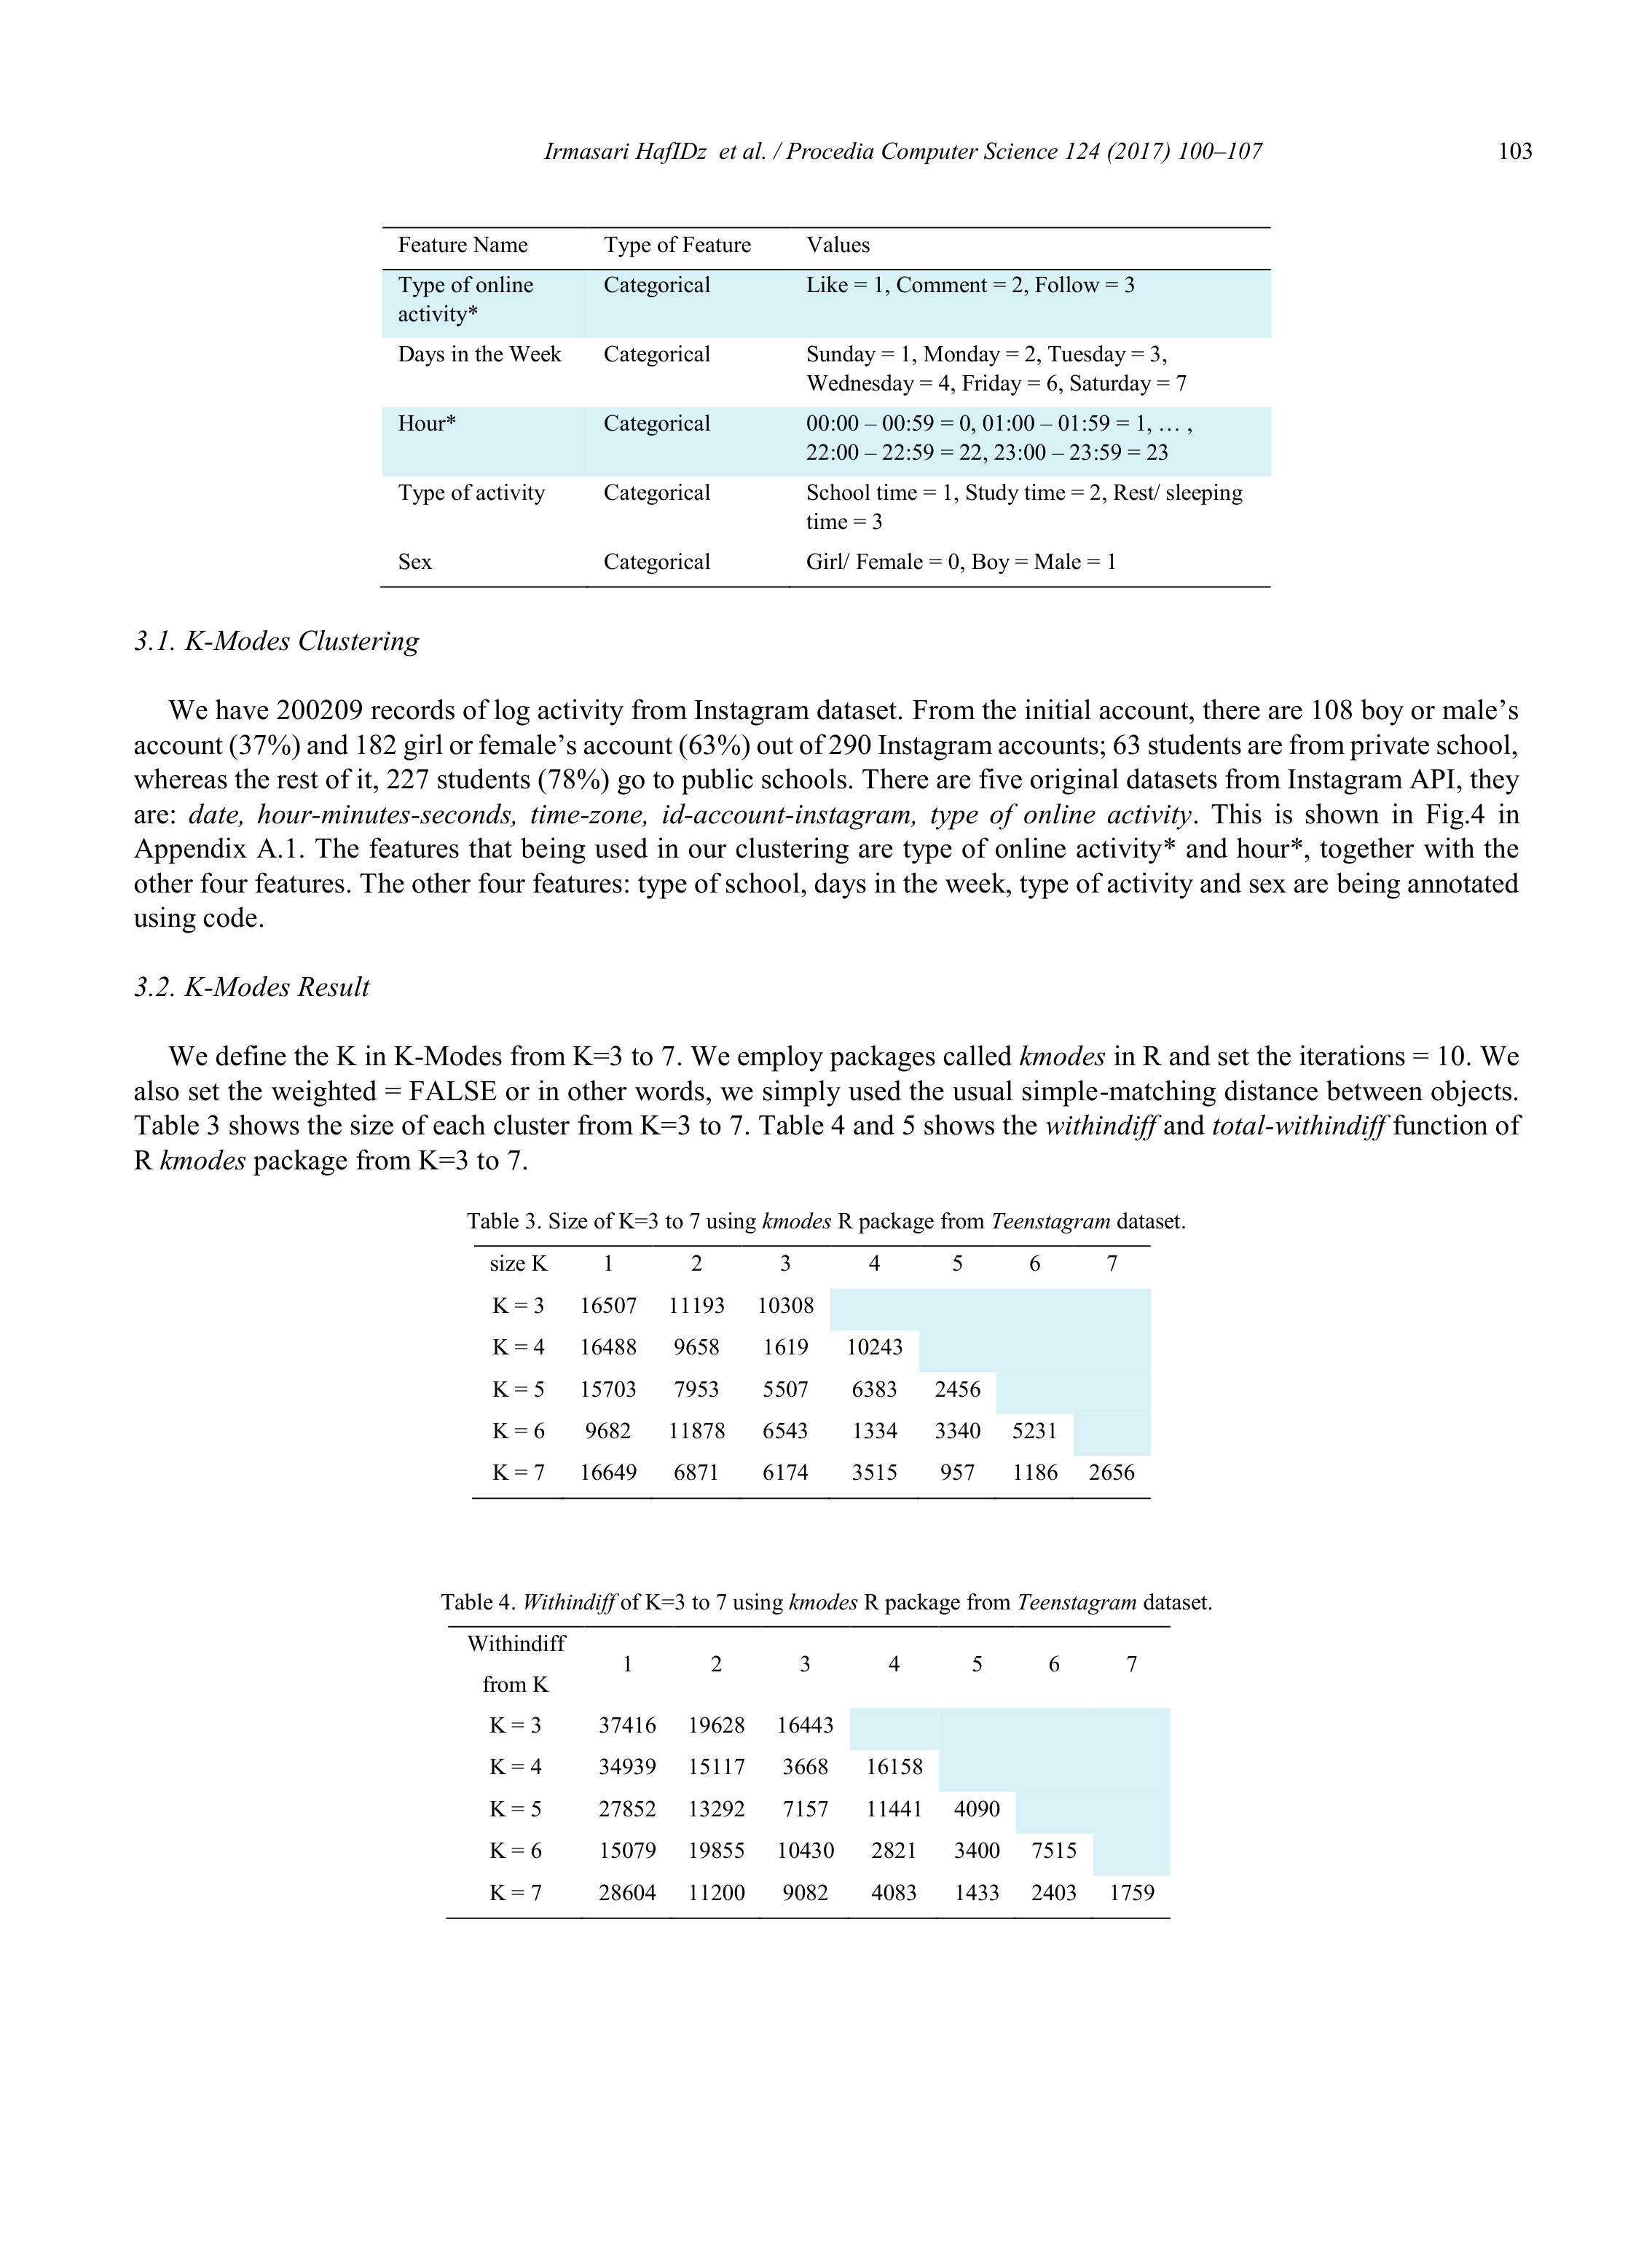
There are six features from our datasets; they are online type activity (like, comment follow), days in the week (Monday
– Sunday), hour (00-23), type of activity (study time, rest time, school time), type of school (public and private activity),
and sex (male, female). We convert all categorical in number (integer data type), the values of each features are explained
in Table 2.
Table 2. Six categorical features from
Teenstagram
dataset.
Feature Name
Type of Feature
Values
Type of school
Categorical
Public school = 1, Private School = 2
MySQL
Teenstagram:
TimeFrame Visualization
Package:
K-Modes
Irmasari HafIDz et al. / Procedia Computer Science 124 (2017) 100–107
103
Feature Name
Type of Feature
Values
Type of online
activity*
Categorical
Like = 1, Comment = 2, Follow = 3
Days in the Week
Categorical
Sunday = 1, Monday = 2, Tuesday = 3,
Wednesday = 4, Friday = 6, Saturday = 7
Hour*
Categorical
00:00 – 00:59 = 0, 01:00 – 01:59 = 1, … ,
22:00 – 22:59 = 22, 23:00 – 23:59 = 23
Type of activity
Categorical
School time = 1, Study time = 2, Rest/ sleeping
time = 3
Sex
Categorical
Girl/ Female = 0, Boy = Male = 1
3.1.
K-Modes Clustering
We have 200209 records of log activity from Instagram dataset. From the initial account, there are 108 boy or male’s
account (37%) and 182 girl or female’s account (63%) out of 290 Instagram accounts; 63 students are from private school,
whereas the rest of it, 227 students (78%) go to public schools. There are five original datasets from Instagram API, they
are:
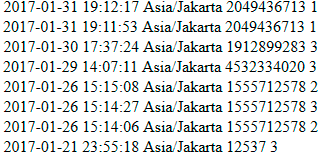
date, hour-minutes-seconds, time-zone, id-account-instagram, type of online activity
. This is shown in Fig.4 in
Appendix A.1. The features that being used in our clustering are type of online activity* and hour*, together with the
other four features. The other four features: type of school, days in the week, type of activity and sex are being annotated
using code.
3.2.
K-Modes Result
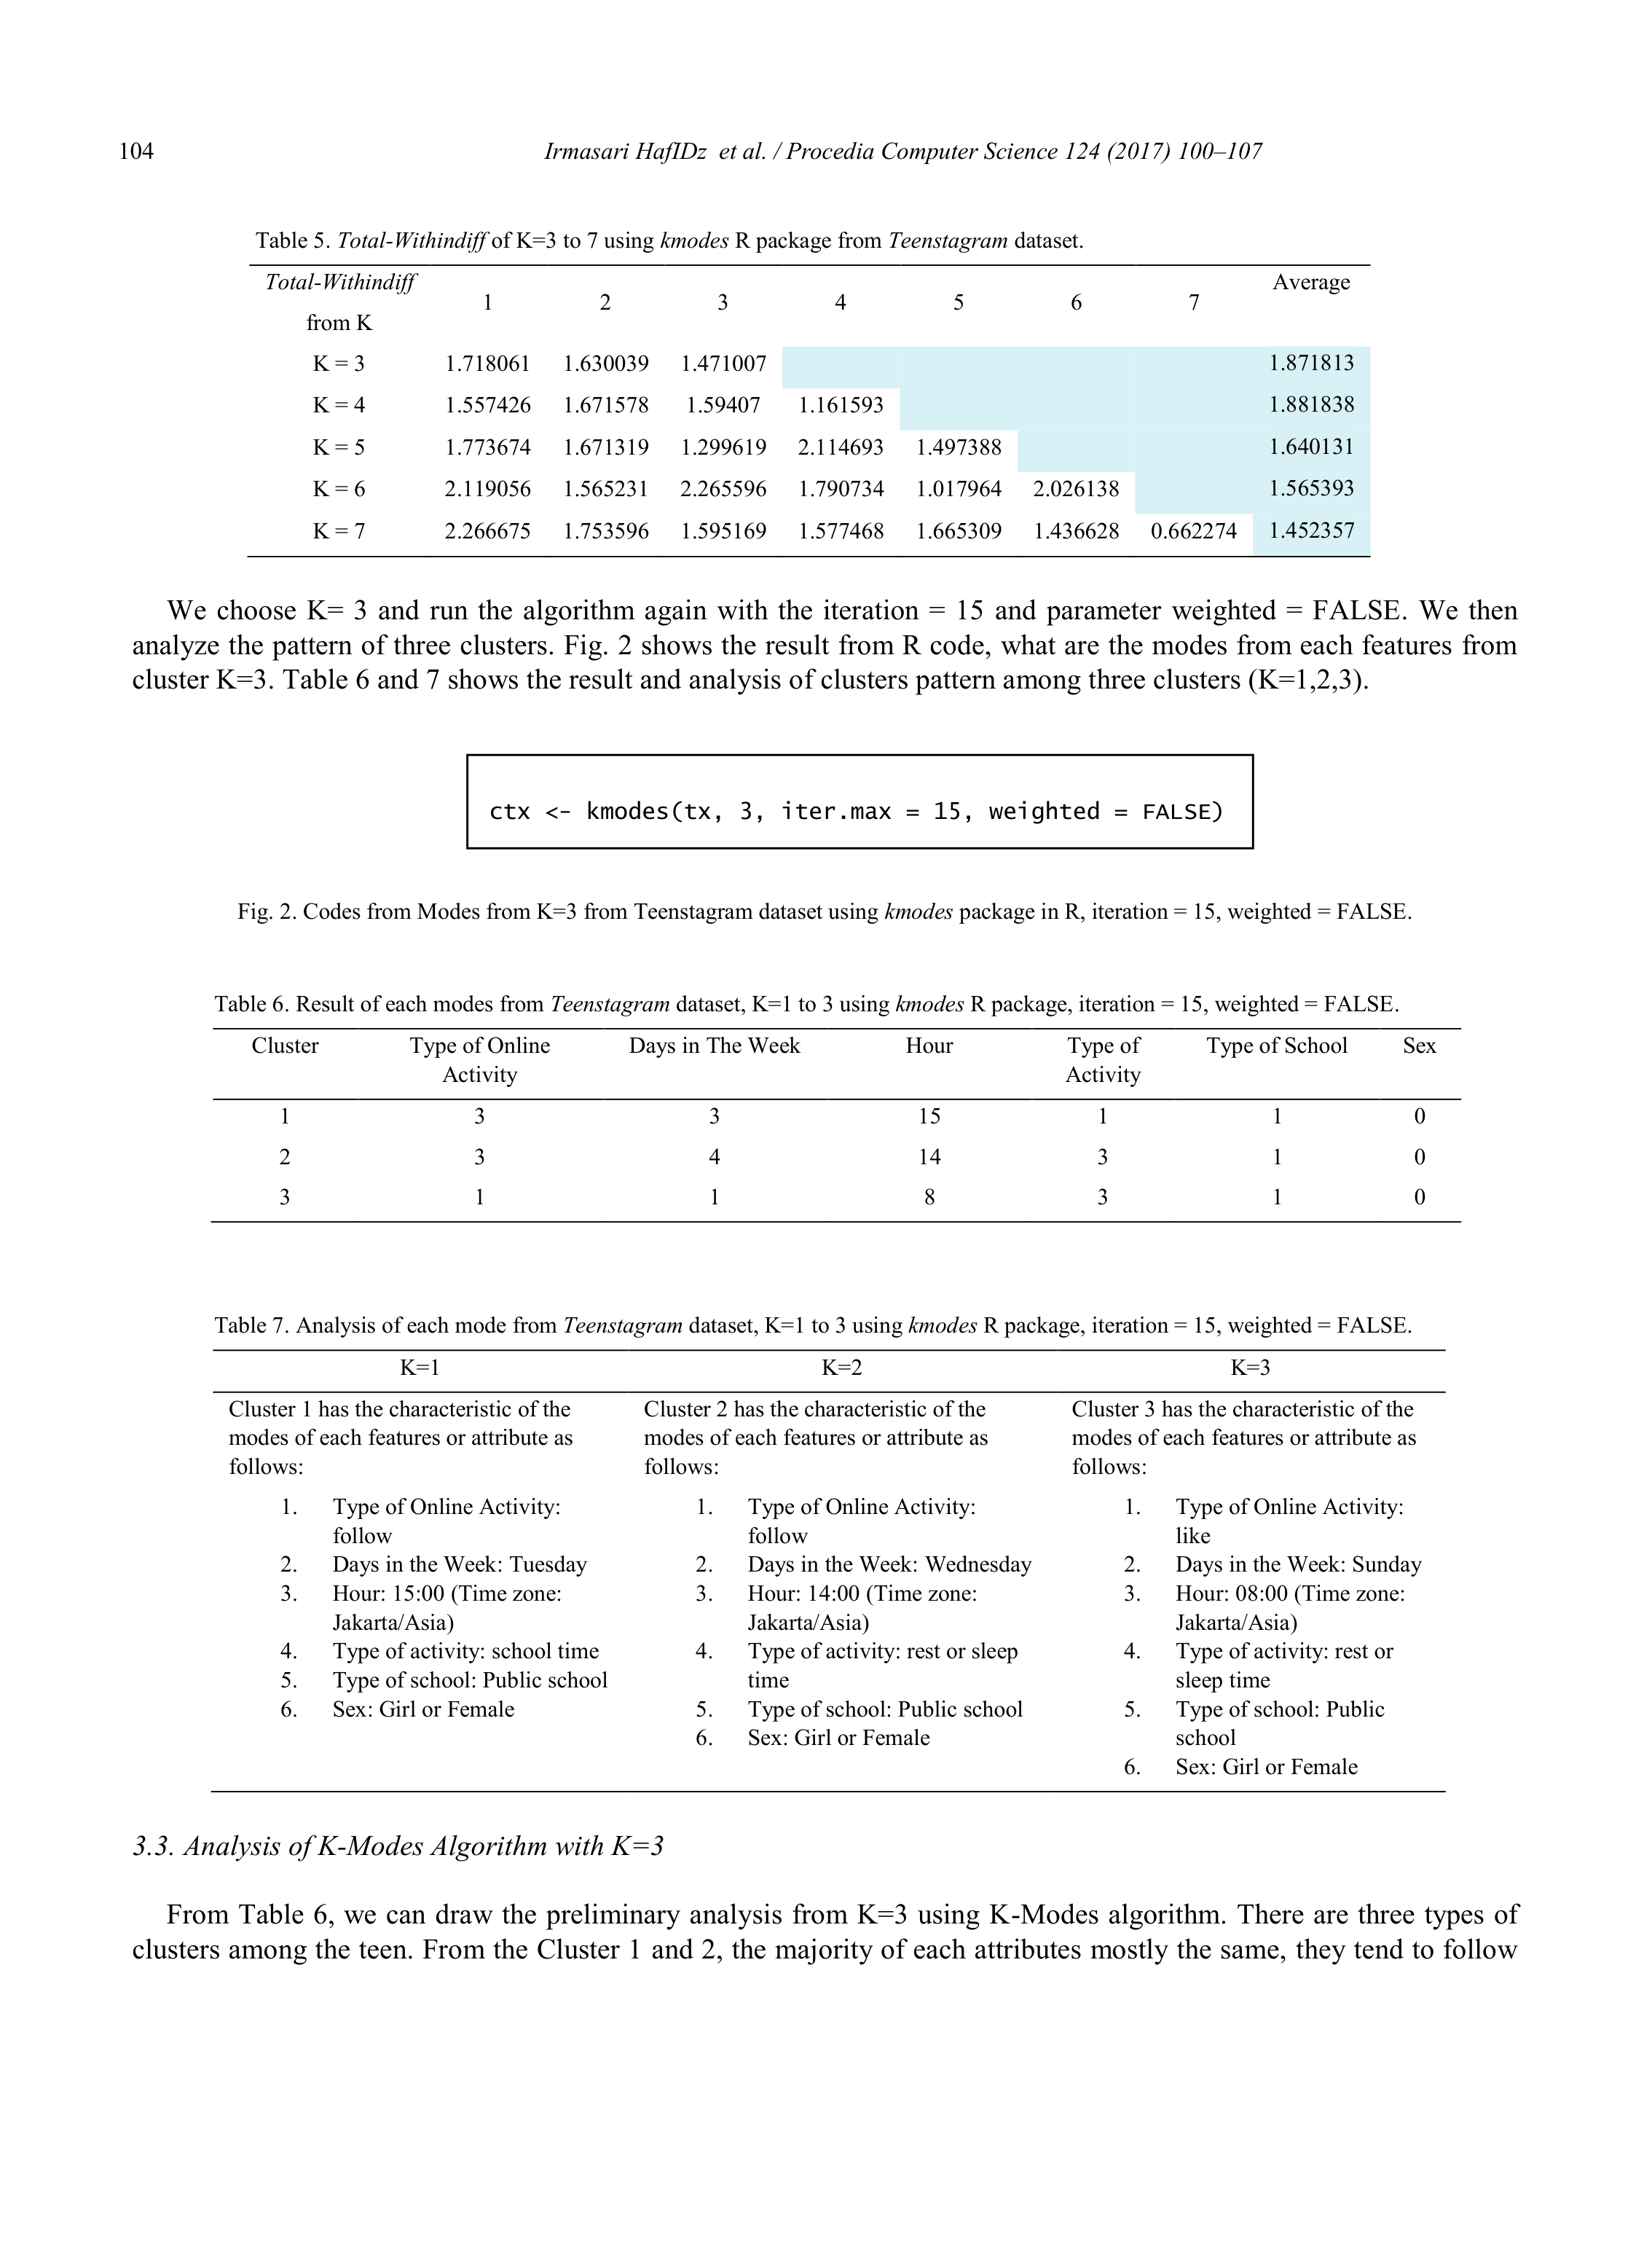
We define the K in K-Modes from K=3 to 7. We employ packages called
kmodes
in R and set the iterations = 10. We
also set the weighted = FALSE or in other words, we simply used the usual simple-matching distance between objects.
Table 3 shows the size of each cluster from K=3 to 7. Table 4 and 5 shows the
withindiff
and
total-withindiff
function of
R
kmodes
package from K=3 to 7.
Table 3. Size of K=3 to 7 using
kmodes
R package from
Teenstagram
dataset.
size K
1
2
3
4
5
6
7
K = 3
16507
11193
10308
K = 4
16488
9658
1619
10243
K = 5
15703
7953
5507
6383
2456
K = 6
9682
11878
6543
1334
3340
5231
K = 7
16649
6871
6174
3515
957
1186
2656
Table 4.
Withindiff
of K=3 to 7 using
kmodes
R package from
Teenstagram
dataset.
Withindiff
from K
1
2
3
4
5
6
7
K = 3
37416
19628
16443
K = 4
34939
15117
3668
16158
K = 5
27852
13292
7157
11441
4090
K = 6
15079
19855
10430
2821
3400
7515
K = 7
28604
11200
9082
4083
1433
2403
1759
104
Irmasari HafIDz et al. / Procedia Computer Science 124 (2017) 100–107
Table 5.
Total-Withindiff
of K=3 to 7 using
kmodes
R package from
Teenstagram
dataset.
Total-Withindiff
from K
1
2
3
4
5
6
7
Average
K = 3
1.718061
1.630039
1.471007
1.871813
K = 4
1.557426
1.671578
1.59407
1.161593
1.881838
K = 5
1.773674
1.671319
1.299619
2.114693
1.497388
1.640131
K = 6
2.119056
1.565231
2.265596
1.790734
1.017964
2.026138
1.565393
K = 7
2.266675
1.753596
1.595169
1.577468
1.665309
1.436628
0.662274
1.452357
We choose K= 3 and run the algorithm again with the iteration = 15 and parameter weighted = FALSE. We then
analyze the pattern of three clusters. Fig. 2 shows the result from R code, what are the modes from each features from
cluster K=3. Table 6 and 7 shows the result and analysis of clusters pattern among three clusters (K=1,2,3).
Fig. 2. Codes from Modes from K=3 from Teenstagram dataset using
kmodes
package in R, iteration = 15, weighted = FALSE.
Table 6. Result of each modes from
Teenstagram
dataset, K=1 to 3 using
kmodes
R package, iteration = 15, weighted = FALSE.
Cluster
Type of Online
Activity
Days in The Week
Hour
Type of
Activity
Type of School
Sex
1
3
3
15
1
1
0
2
3
4
14
3
1
0
3
1
1
8
3
1
0
Table 7. Analysis of each mode from
Teenstagram
dataset, K=1 to 3 using
kmodes
R package, iteration = 15, weighted = FALSE.
K=1
K=2
K=3
Cluster 1 has the characteristic of the
modes of each features or attribute as
follows:
1.
Type of Online Activity:
follow
2.
Days in the Week: Tuesday
3.
Hour: 15:00 (Time zone:
Jakarta/Asia)
4.
Type of activity: school time
5.
Type of school: Public school
6.
Sex: Girl or Female
Cluster 2 has the characteristic of the
modes of each features or attribute as
follows:
1.
Type of Online Activity:
follow
2.
Days in the Week: Wednesday
3.
Hour: 14:00 (Time zone:
Jakarta/Asia)
4.
Type of activity: rest or sleep
time
5.
Type of school: Public school
6.
Sex: Girl or Female
Cluster 3 has the characteristic of the
modes of each features or attribute as
follows:
1.
Type of Online Activity:
like
2.
Days in the Week: Sunday
3.
Hour: 08:00 (Time zone:
Jakarta/Asia)
4.
Type of activity: rest or
sleep time
5.
Type of school: Public
school
6.
Sex: Girl or Female
3.3.
Analysis of K-Modes Algorithm with K=3
From Table 6, we can draw the preliminary analysis from K=3 using K-Modes algorithm. There are three types of
clusters among the teen. From the Cluster 1 and 2, the majority of each attributes mostly the same, they tend to follow
ctx <- kmodes(tx, 3, iter.max = 15, weighted = FALSE)

Irmasari HafIDz et al. / Procedia Computer Science 124 (2017) 100–107
105
people and they are from Public schools. The different values are for attribute the Days in the Week (Cluster 1= Tuesday,
Cluster 2=Wednesday), Type of activity (Cluster 1= school time, Cluster 2=rest or sleep time). The hour in the day from
both Cluster 1 and Cluster 2 are almost the same, it is during 14:00 – 15:00. Surprisingly from all the clusters, the girls
or females have the highest number of engagement compare to the boys or males. In Cluster 3, the type of activity that
has the highest modes are like and it is on Sunday, which is clearly a rest time for all students and it is mostly happen
during 8:00 in the morning.
3.4.
Visualization for Teenstagram TimeFrame
We build a web application using Xampp 3.2.2 and PHP 5.6.28. The database being used is MySQL. The web page
of the Teenstagram TimeFrame Visualization is available at http://bit.ly/2xKv5l1. We visualize the distribution of
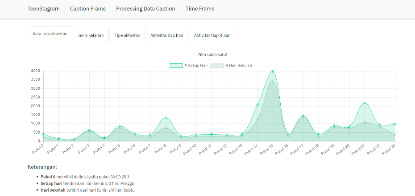
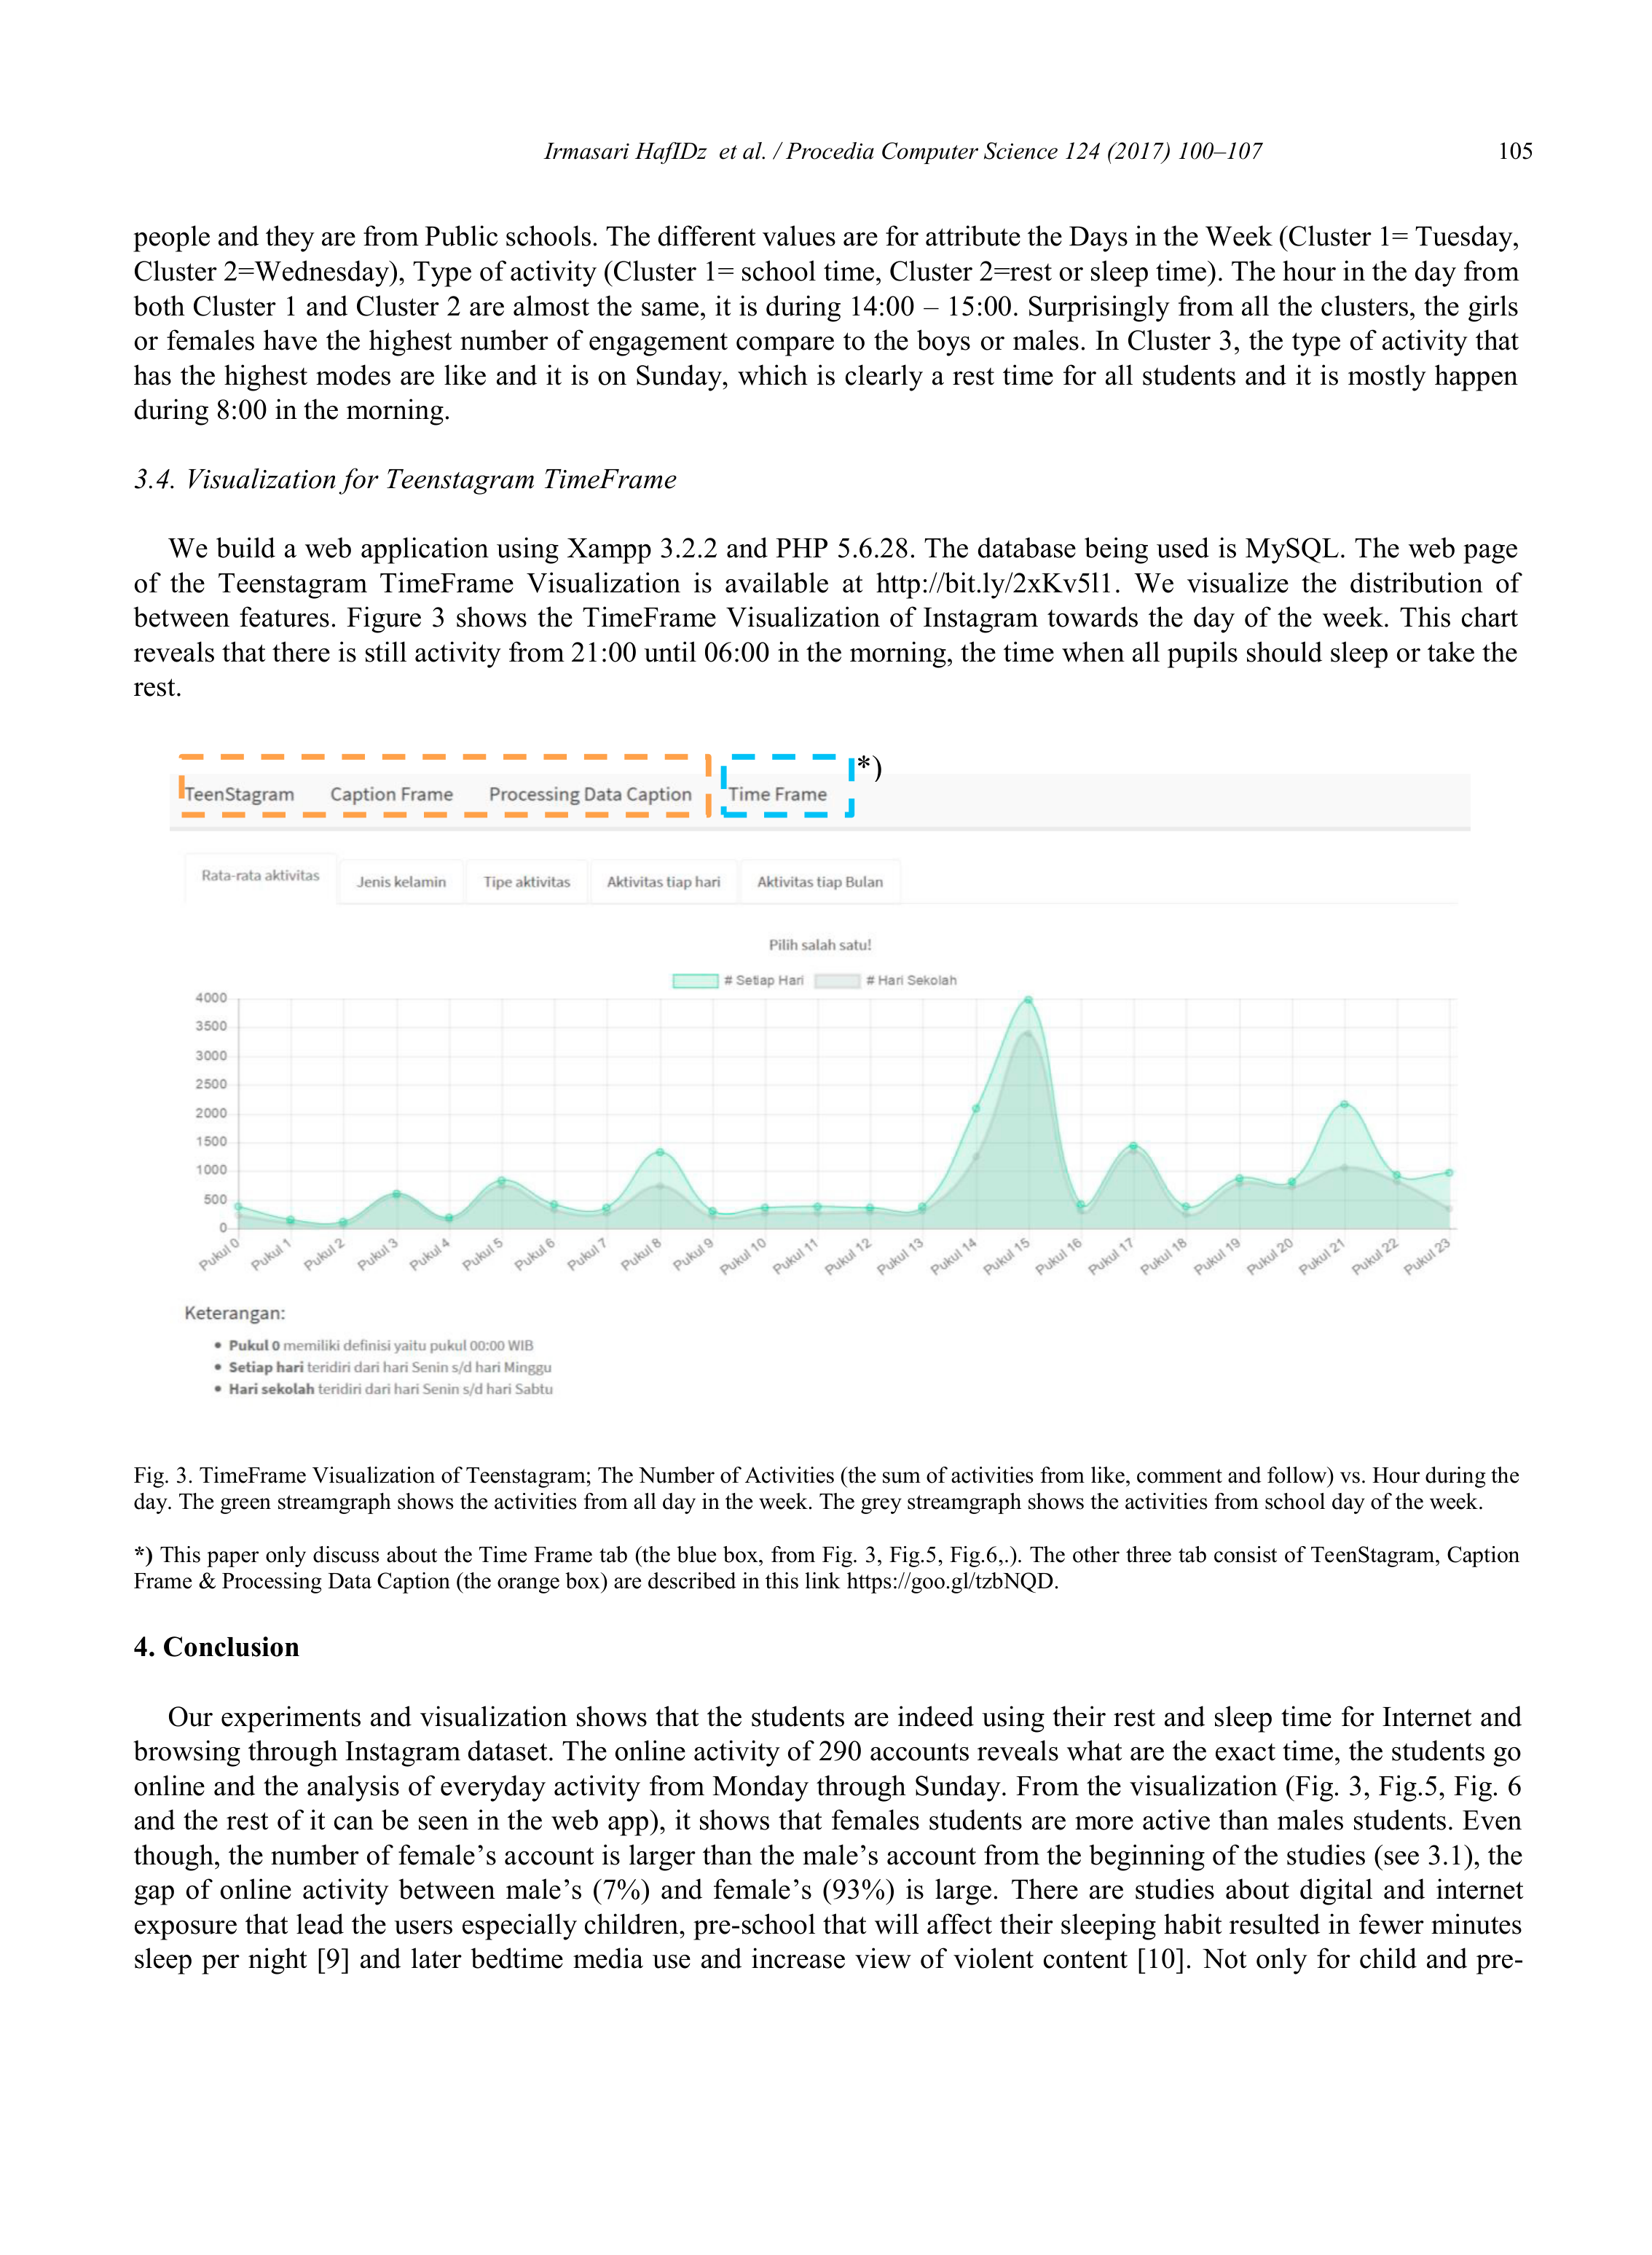
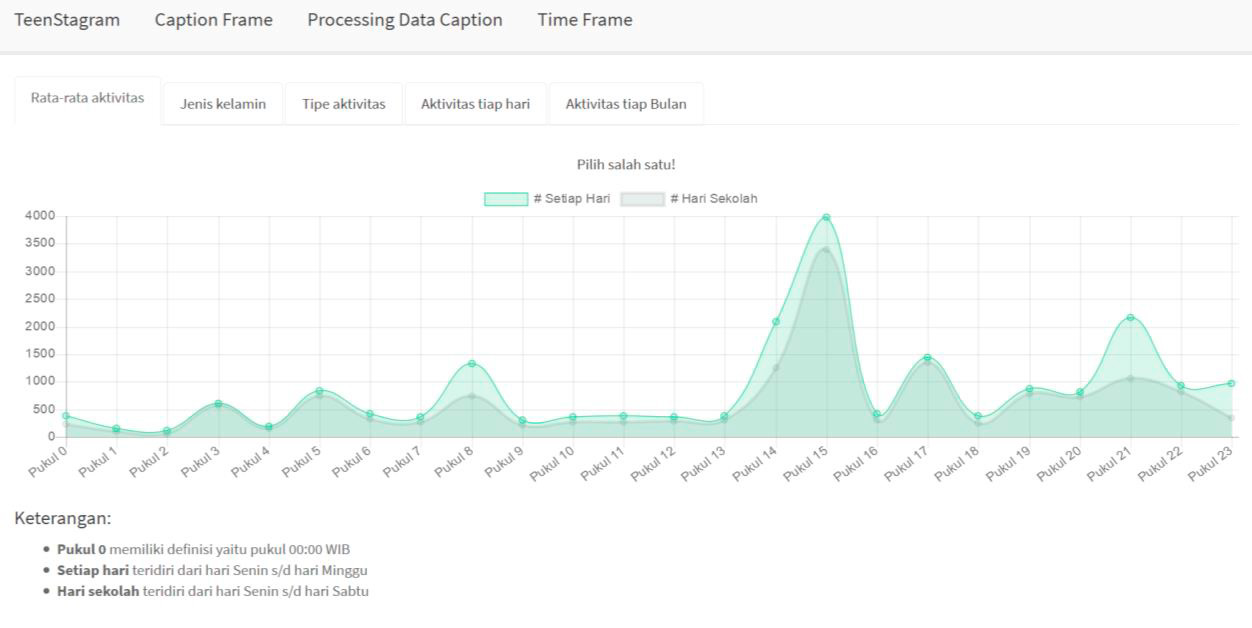
between features. Figure 3 shows the TimeFrame Visualization of Instagram towards the day of the week. This chart
reveals that there is still activity from 21:00 until 06:00 in the morning, the time when all pupils should sleep or take the
rest.
Fig. 3. TimeFrame Visualization of Teenstagram; The Number of Activities (the sum of activities from like, comment and follow) vs. Hour during the
day. The green streamgraph shows the activities from all day in the week. The grey streamgraph shows the activities from school day of the week.
*)
This paper only discuss about the Time Frame tab (the blue box, from Fig. 3, Fig.5, Fig.6,.). The other three tab consist of TeenStagram, Caption
Frame & Processing Data Caption (the orange box) are described in this link https://goo.gl/tzbNQD.
4. Conclusion
Our experiments and visualization shows that the students are indeed using their rest and sleep time for Internet and
browsing through Instagram dataset. The online activity of 290 accounts reveals what are the exact time, the students go
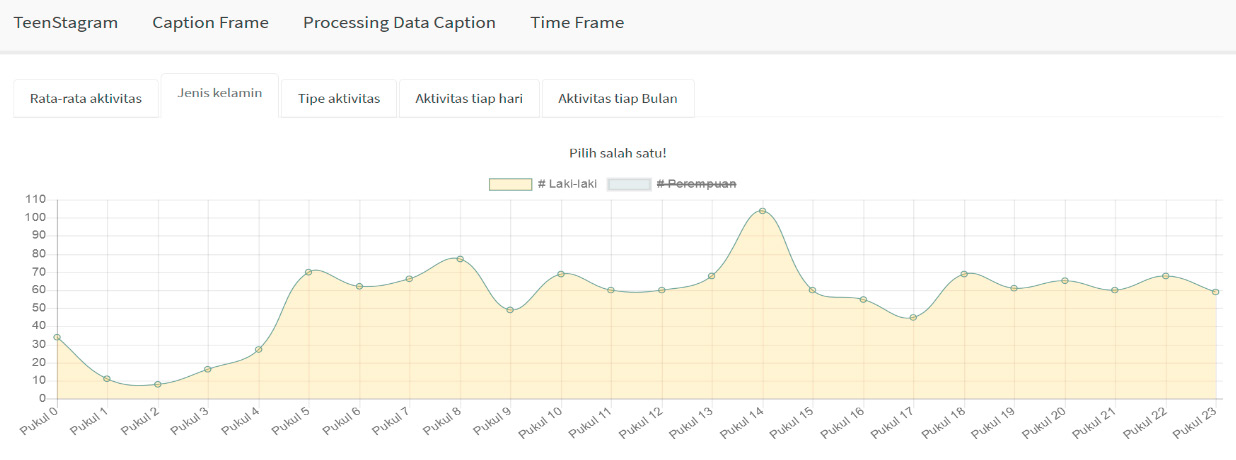
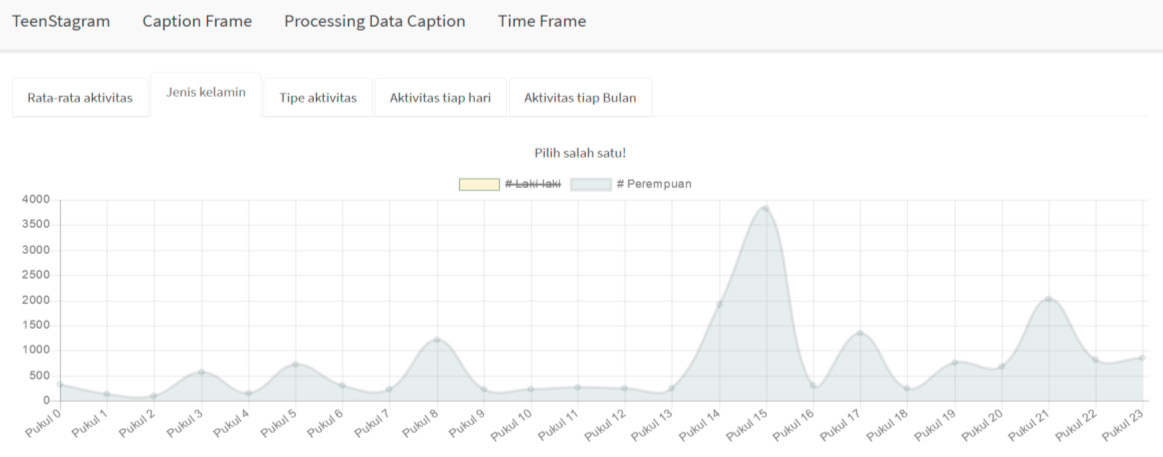
online and the analysis of everyday activity from Monday through Sunday. From the visualization (Fig. 3, Fig.5, Fig. 6
and the rest of it can be seen in the web app), it shows that females students are more active than males students. Even
though, the number of female’s account is larger than the male’s account from the beginning of the studies (see 3.1), the
gap of online activity between male’s (7%) and female’s (93%) is large. There are studies about digital and internet
exposure that lead the users especially children, pre-school that will affect their sleeping habit resulted in fewer minutes
sleep per night [9] and later bedtime media use and increase view of violent content [10]. Not only for child and pre-
*)

106
Irmasari HafIDz et al. / Procedia Computer Science 124 (2017) 100–107
school students, this phenomenon is also happening to the young adults or adolescents people; studies found that these
young adults with higher social media use will have greater risks of sleep disturbances [11]. Although other study stated
that Internet promotes greater ability to learn, for example in Math [12] by using an app and increase creativity in children,
the Internet and social media usage shows an alarming pattern that should be taken into account, especially for parents
and teachers in school. There are lots of improvements for future research such as the validation from the number of K
being chosen in K-Modes algorithm. Other algorithms can be taken into account, for example: Fuzzy K-Modes or K-
Prototype to compare and seek what parameters need to be change in order to increase the performance of the chosen
algorithm.
Acknowledgements
This research is being conducted and was supported by funding from Lembaga Penelitian dan Pengabdian kepada
Masyarakat, Institut Teknologi Sepuluh Nopember (LPPM - ITS) and Kementrian Riset, Teknologi, dan Pendidikan
Tinggi (or Ministry of Higher Education Indonesia) with the scheme of
Penelitian Dosen Pemula
and the grant number
or
Surat Perjanjian Penelitian No: 817/PKS/ITS/2017
.
Appendix A. Teenstagram TimeFrame Visualization
The Appendix A has many section and figures which provides graphs and tables from Teenstagram TimeFrame
Visualization study. The other data and graph from this study is available at: https://goo.gl/tzbNQD.
A.1. Instagram dataset - Crawling Output
Fig. 4. Crawling output of time dataset from Teenstagram.
A.2. Teenstagram Visualization: Boy and Girl vs. Hour during the Day
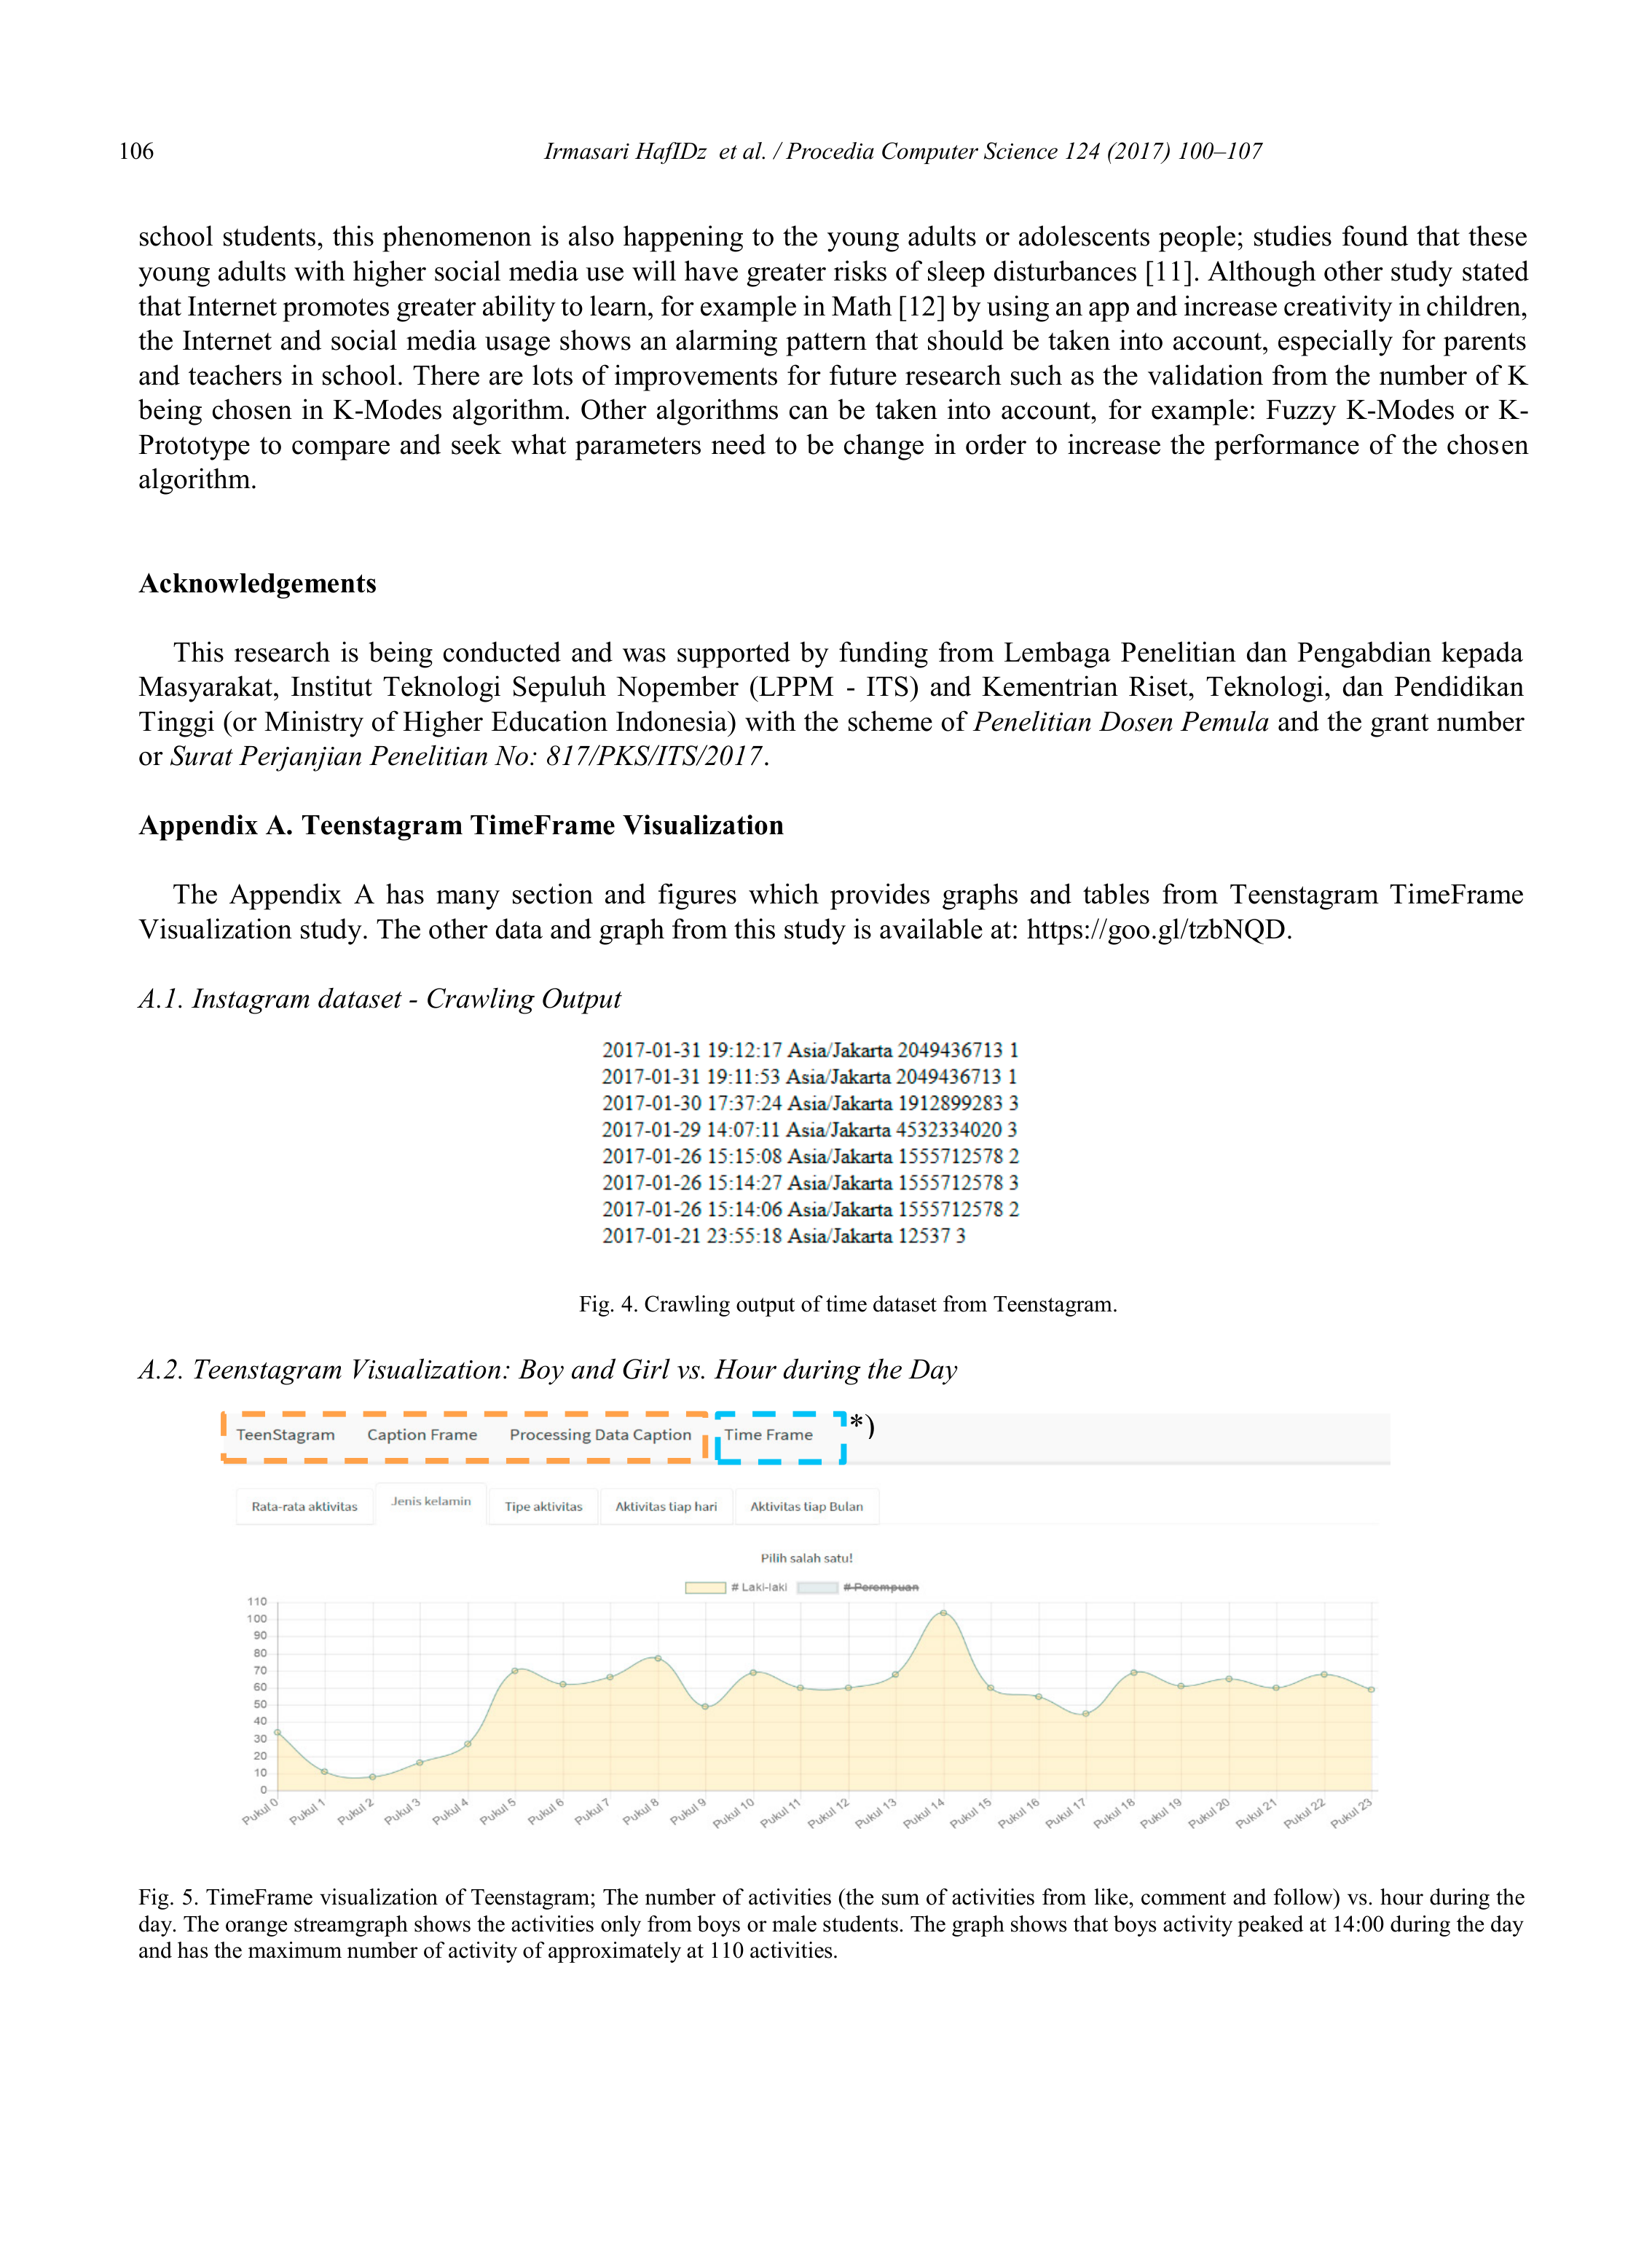
Fig. 5. TimeFrame visualization of Teenstagram; The number of activities (the sum of activities from like, comment and follow) vs. hour during the
day. The orange streamgraph shows the activities only from boys or male students. The graph shows that boys activity peaked at 14:00 during the day
and has the maximum number of activity of approximately at 110 activities.
*)

Irmasari HafIDz et al. / Procedia Computer Science 124 (2017) 100–107
107
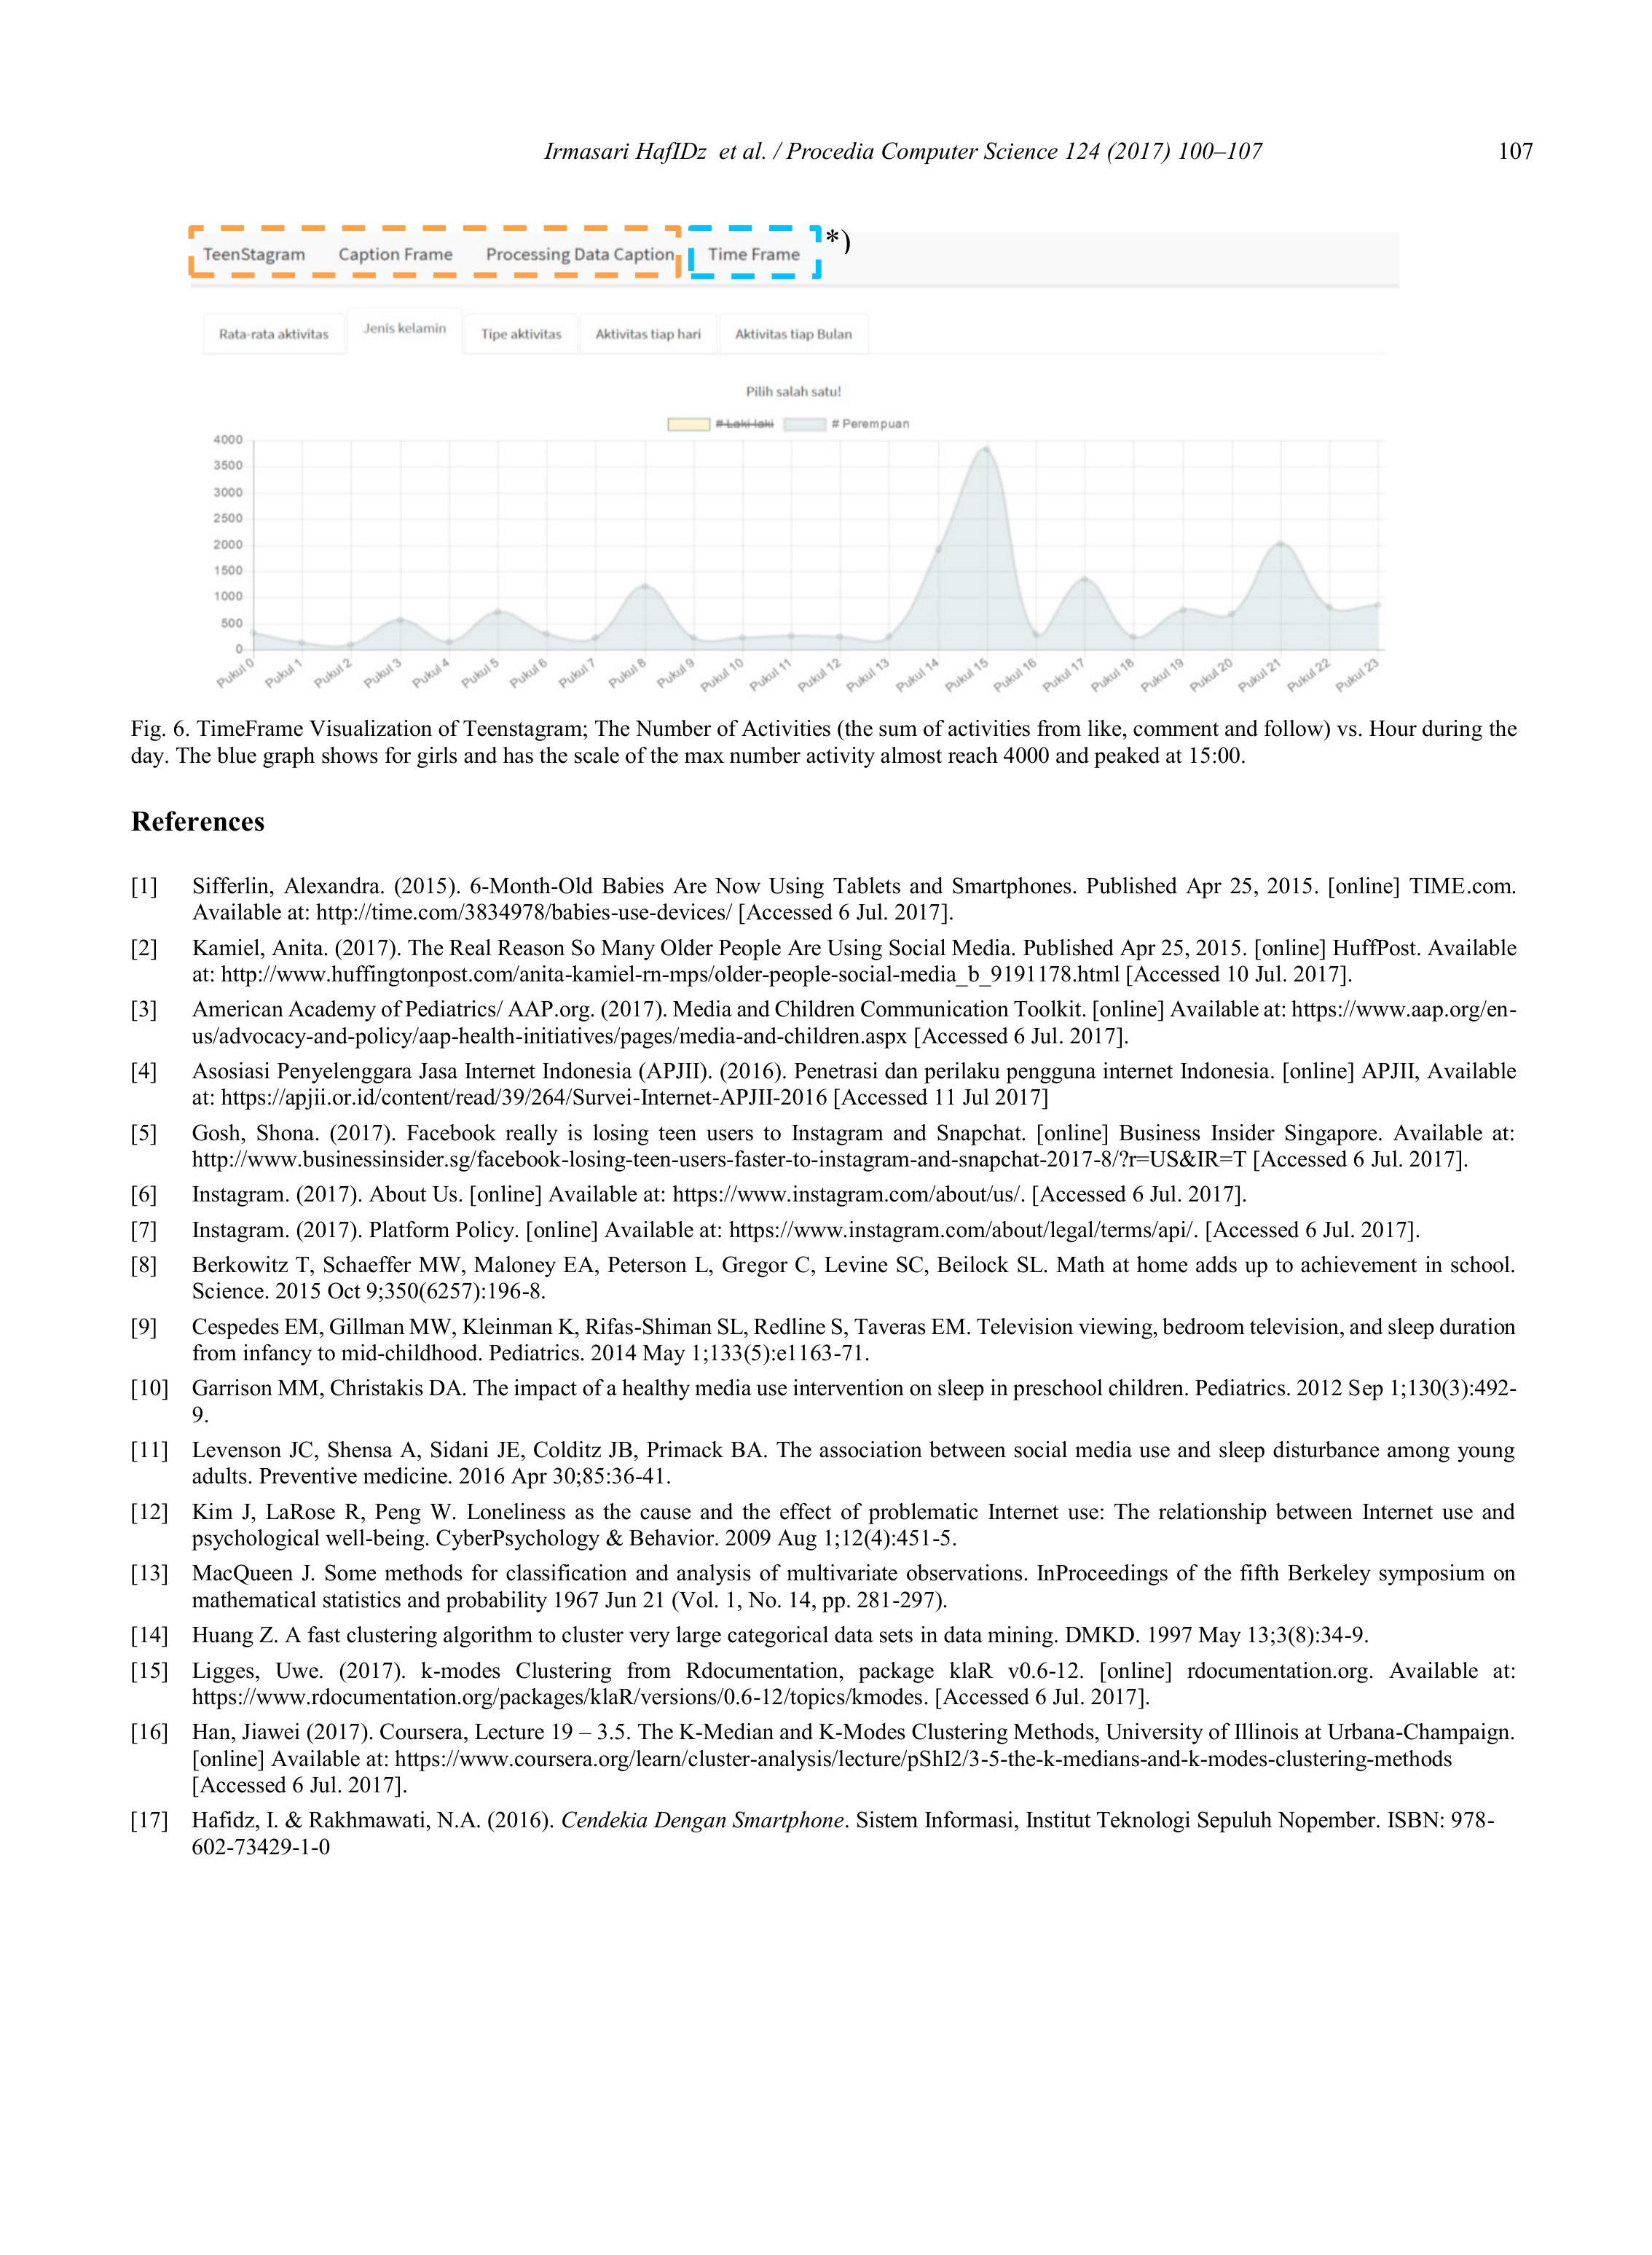
Fig. 6. TimeFrame Visualization of Teenstagram; The Number of Activities (the sum of activities from like, comment and follow) vs. Hour during the
day. The blue graph shows for girls and has the scale of the max number activity almost reach 4000 and peaked at 15:00.
References
[1]
Sifferlin, Alexandra. (2015). 6-Month-Old Babies Are Now Using Tablets and Smartphones. Published Apr 25, 2015. [online] TIME.com.
Available at: http://time.com/3834978/babies-use-devices/ [Accessed 6 Jul. 2017].
[2]
Kamiel, Anita. (2017). The Real Reason So Many Older People Are Using Social Media. Published Apr 25, 2015. [online] HuffPost. Available
at: http://www.huffingtonpost.com/anita-kamiel-rn-mps/older-people-social-media_b_9191178.html [Accessed 10 Jul. 2017].
[3]
American Academy of Pediatrics/ AAP.org. (2017). Media and Children Communication Toolkit. [online] Available at: https://www.aap.org/en-
us/advocacy-and-policy/aap-health-initiatives/pages/media-and-children.aspx [Accessed 6 Jul. 2017].
[4]
Asosiasi Penyelenggara Jasa Internet Indonesia (APJII). (2016). Penetrasi dan perilaku pengguna internet Indonesia. [online] APJII, Available
at: https://apjii.or.id/content/read/39/264/Survei-Internet-APJII-2016 [Accessed 11 Jul 2017]
[5]
Gosh, Shona. (2017). Facebook really is losing teen users to Instagram and Snapchat. [online] Business Insider Singapore. Available at:
http://www.businessinsider.sg/facebook-losing-teen-users-faster-to-instagram-and-snapchat-2017-8/?r=US&IR=T [Accessed 6 Jul. 2017].
[6]
Instagram. (2017). About Us. [online] Available at: https://www.instagram.com/about/us/. [Accessed 6 Jul. 2017].
[7]
Instagram. (2017). Platform Policy. [online] Available at: https://www.instagram.com/about/legal/terms/api/. [Accessed 6 Jul. 2017].
[8]
Berkowitz T, Schaeffer MW, Maloney EA, Peterson L, Gregor C, Levine SC, Beilock SL. Math at home adds up to achievement in school.
Science. 2015 Oct 9;350(6257):196-8.
[9]
Cespedes EM, Gillman MW, Kleinman K, Rifas-Shiman SL, Redline S, Taveras EM. Television viewing, bedroom television, and sleep duration
from infancy to mid-childhood. Pediatrics. 2014 May 1;133(5):e1163-71.
[10] Garrison MM, Christakis DA. The impact of a healthy media use intervention on sleep in preschool children. Pediatrics. 2012 Sep 1;130(3):492-
9.
[11] Levenson JC, Shensa A, Sidani JE, Colditz JB, Primack BA. The association between social media use and sleep disturbance among young
adults. Preventive medicine. 2016 Apr 30;85:36-41.
[12] Kim J, LaRose R, Peng W. Loneliness as the cause and the effect of problematic Internet use: The relationship between Internet use and
psychological well-being. CyberPsychology & Behavior. 2009 Aug 1;12(4):451-5.
[13] MacQueen J. Some methods for classification and analysis of multivariate observations. InProceedings of the fifth Berkeley symposium on
mathematical statistics and probability 1967 Jun 21 (Vol. 1, No. 14, pp. 281-297).
[14] Huang Z. A fast clustering algorithm to cluster very large categorical data sets in data mining. DMKD. 1997 May 13;3(8):34-9.
[15] Ligges, Uwe. (2017). k-modes Clustering from Rdocumentation, package klaR v0.6-12. [online] rdocumentation.org. Available at:
https://www.rdocumentation.org/packages/klaR/versions/0.6-12/topics/kmodes. [Accessed 6 Jul. 2017].
[16] Han, Jiawei (2017). Coursera, Lecture 19 – 3.5. The K-Median and K-Modes Clustering Methods, University of Illinois at Urbana-Champaign.
[online] Available at: https://www.coursera.org/learn/cluster-analysis/lecture/pShI2/3-5-the-k-medians-and-k-modes-clustering-methods
[Accessed 6 Jul. 2017].
[17] Hafidz, I. & Rakhmawati, N.A. (2016).
Cendekia Dengan Smartphone
. Sistem Informasi, Institut Teknologi Sepuluh Nopember. ISBN: 978-
602-73429-1-0
*)