
CSRID Journal
e-ISSN: 2460-870X | p-ISSN: 2085-1367
Vol. 17 No. 3 October 2025 Pg.354-371
354
DOI: https://www.doi.org/10.22303/csrid-.17.3.2025.354-371
Data Visualization to Analyze Consumer Behavior for
Strategic Business Decision Making in the Retail Industry:
Walmart Case Study
Akhmad Bakhrun
a,1
, Yasyfa Maghfyra
b,2*
, Rintan Nurhayati Putri
c,3
, Dewi Ayu Larassati
d,4
a,b,c,d
Politeknik Negeri Bandung, Jl. Gegerkalong Hilir, Ciwaruga, Kec. Parongpong, Kabupaten Bandung Barat,
Jawa Barat 40559, Indonesia
abakhrun@polban.ac.id
1
, *yasyfamaghfyra16@gmail.com
2
, rintanurhayatiputri@gmail.com
3
,
dewiayras744@gmail.com
4
ABSTRACT
This research focuses on data visualization to analyze consumer behavior in an effort to make strategic business
decisions in the retail industry, taking the Walmart Case Study. The main objective of this study is to explore
customer consumption patterns and generate data-based insights that can be utilized in formulating marketing
strategies and managing retail operations. A quantitative approach is applied through systematic stages,
including problem identification, literature study, data collection, Extract, Transform, Load (ETL) process,
analysis, visualization, and data interpretation. The dataset used includes 50,000 Walmart customer
transactions during the period January 2024 to February 2025. The use of interactive data visualization using
Microsoft Power BI successfully transformed raw data into strategic insights. Key findings from the analysis
indicated that the majority of transactions came from loyal customers at $6.46 million (50.58%), emphasizing
the importance of customer retention strategies. In addition, customer purchasing activity was much more
dominant on weekdays, with weekday purchases totaling $9.07 million compared to weekend purchases totaling
$3.70 million. The data also shows that Generation X dominates the overall purchase value compared to other
age groups, with purchases totaling $5.04 million. In addition, in-depth analysis of the most popular product
categories, segmentation by gender, and payment method preferences provided comprehensive insights. These
visualization results significantly support fast and evidence-based business decision-making. This research
contributes to retail business practice through an applicable data visualization approach, and opens up
opportunities for further development such as the integration of machine learning for predictive analysis and
wider exploration of BI tools to improve the accuracy and scope of business analysis in the future.
Keywords :Power BI, Walmart, Business Intelligence, Consumer Behavior, Retail Industry, Data Visualization.
Article Info :
Submitted:
Reviewed:
Accepted :
Copyright © 2025 – CSRID Journal. All rights reserved.
1.
INTRODUCTION
Understanding consumer behavior is a crucial element in the modern retail sector, especially in the
midst of increasingly fierce and fast-changing industry competition. Shifting preferences and
consumption patterns require retailers to continuously innovate and adapt in order to maintain their
business sustainability and growth. This condition emphasizes the importance of in-depth analysis of
consumer behavior as a foundation in formulating targeted business strategies.
Along with the advancement of the digital era, data has become one of the most strategic assets for
retail companies. By collecting and analyzing consumer data, companies are able to identify trends,
understand preferences, and classify customers more precisely. Data analytics not only helps determine
what products consumers are purchasing, but also reveals when, where, and why those purchases are
made supporting evidence-based decision-making and enhancing competitive advantage (Zahra &
Akhmad, Data Visualization to Analyze … 355
https://csridjournal.potensi-utama.org/index.php/CSRIDjournal/index | redaksijurnalupu@gmail.com
Triayudi, 2025). However, one of the major challenges in utilizing data lies in how to simplify complex
information so that it can be easily understood and used by decision-makers. Data visualization emerges
as a solution to present insights in a clear and intuitive manner. In the retail sector, data visualization
plays a key role in monitoring sales performance, evaluating promotion effectiveness, and identifying
market growth opportunities (Zahra & Triayudi, 2025).
In line with the need for accurate and accessible information, Business Intelligence (BI) offers a
comprehensive solution by enabling users to access, process, and analyze data deeply transforming raw
data into high-quality insights that support operational continuity and strategic decisions. Microsoft
Power BI, one of the leading BI platforms, provides advanced features to organize and visualize data
effectively. It empowers users to explore data interactively, draw meaningful conclusions, and generate
data-driven business insights (Nisa’ & Rusdianto, 2024).
In Indonesia, several studies have examined the implementation of Power BI in analyzing sales data
and consumer behavior within the retail industry. Power BI’s interactive dashboards can present real-
time insights, such as customer reviews, product ratings, and purchasing trends, helping companies make
timely and accurate decisions (Najib & Stefany, 2024). However, previous studies tend to focus on
descriptive visualization and general data presentation without integrating behavioral theory to explore
deeper insights into consumer motivations and loyalty patterns.
This study aims to address that gap by using Power BI not only as a visualization tool, but also as an
analytical platform that incorporates consumer behavior theory. Using a publicly available Walmart
dataset from Kaggle, this research seeks to identify customer segmentation, purchasing patterns, and
factors influencing consumer loyalty. By combining real-world retail data with advanced visualization
and behavioral analysis, the study contributes to more targeted, data-driven marketing strategies and
enhances decision-making processes in retail.
Understanding consumer behavior is essential for developing effective marketing strategies. It
includes all stages of the decision-making process from information search, selection, purchase, to post-
purchase evaluation and is influenced by cultural, social, and personal factors (Irwansyah et al., 2021;
Nugraha et al., 2021). By identifying what, where, when, how, and why consumers make purchasing
decisions, companies can better tailor their marketing efforts.
To support such analysis, Business Intelligence (BI) provides a systematic approach for converting
raw data into actionable insights. Among various BI tools, Microsoft Power BI stands out for its ability
to process large datasets and generate interactive dashboards that support real-time data exploration
(Steven et al., 2021). Its integration capabilities, user-friendly interface, and advanced visualization
features make it suitable for retail data analytics.
The integration of Big Data with BI tools like Power BI further enhances a company’s ability to
respond to market trends efficiently. Retailers today generate real-time data from multiple sources,
enabling them to understand customer preferences, forecast demand, and personalize marketing
campaigns (Halawa, Bangun, & Sihombing, 2024). However, the key challenge lies in translating this
large volume of data into understandable and actionable insights. Visual dashboards play a crucial role
in this process by presenting key performance indicators (KPIs), sales trends, and product metrics in a
visual format (Sabrina, Aswarulloh, & Shiddieq, 2024).
Several studies have highlighted the effectiveness of Power BI in analyzing retail sales data. Wanda
(2024), for example, used Power BI to monitor daily sales and seasonal trends, while Najib & Stefany
(2024) focused on visualizing customer preferences through product reviews and ratings. Although these
studies demonstrate the practical utility of Power BI, they primarily emphasize descriptive analysis and
dashboard creation without integrating a theoretical framework of consumer behavior.
CSRID Journal
e-ISSN: 2460-870X | p-ISSN: 2085-1367
Vol. 17 No. 3 October 2025 Pg.354-371
356
DOI: https://www.doi.org/10.22303/csrid-.17.3.2025.354-371
This study distinguishes itself by combining the technological capabilities of Power BI with
theoretical foundations from consumer behavior research. It does not only visualize data, but also
interprets patterns within a structured behavioral context such as identifying loyalty drivers and
purchasing behavior segments. While previous studies explored general visualization features, this
research presents a more analytical approach that applies behavioral theory to enhance insight generation.
This integration of BI tools and behavioral analysis represents a significant contribution to the evolving
landscape of retail analytics and constitutes the novelty of this research.
2.
METHOD
This research adopts a quantitative approach supported by a systematic flow to explore how Power BI
can be used for visualizing and analyzing customer behavior in the retail industry. The method combines
standard data analytics procedures with theory-driven insights into consumer segmentation and behavior.
Unlike previous studies that primarily focused on static sales visualization, this research incorporates
both demographic and behavioral segmentation, delivering a more comprehensive understanding of
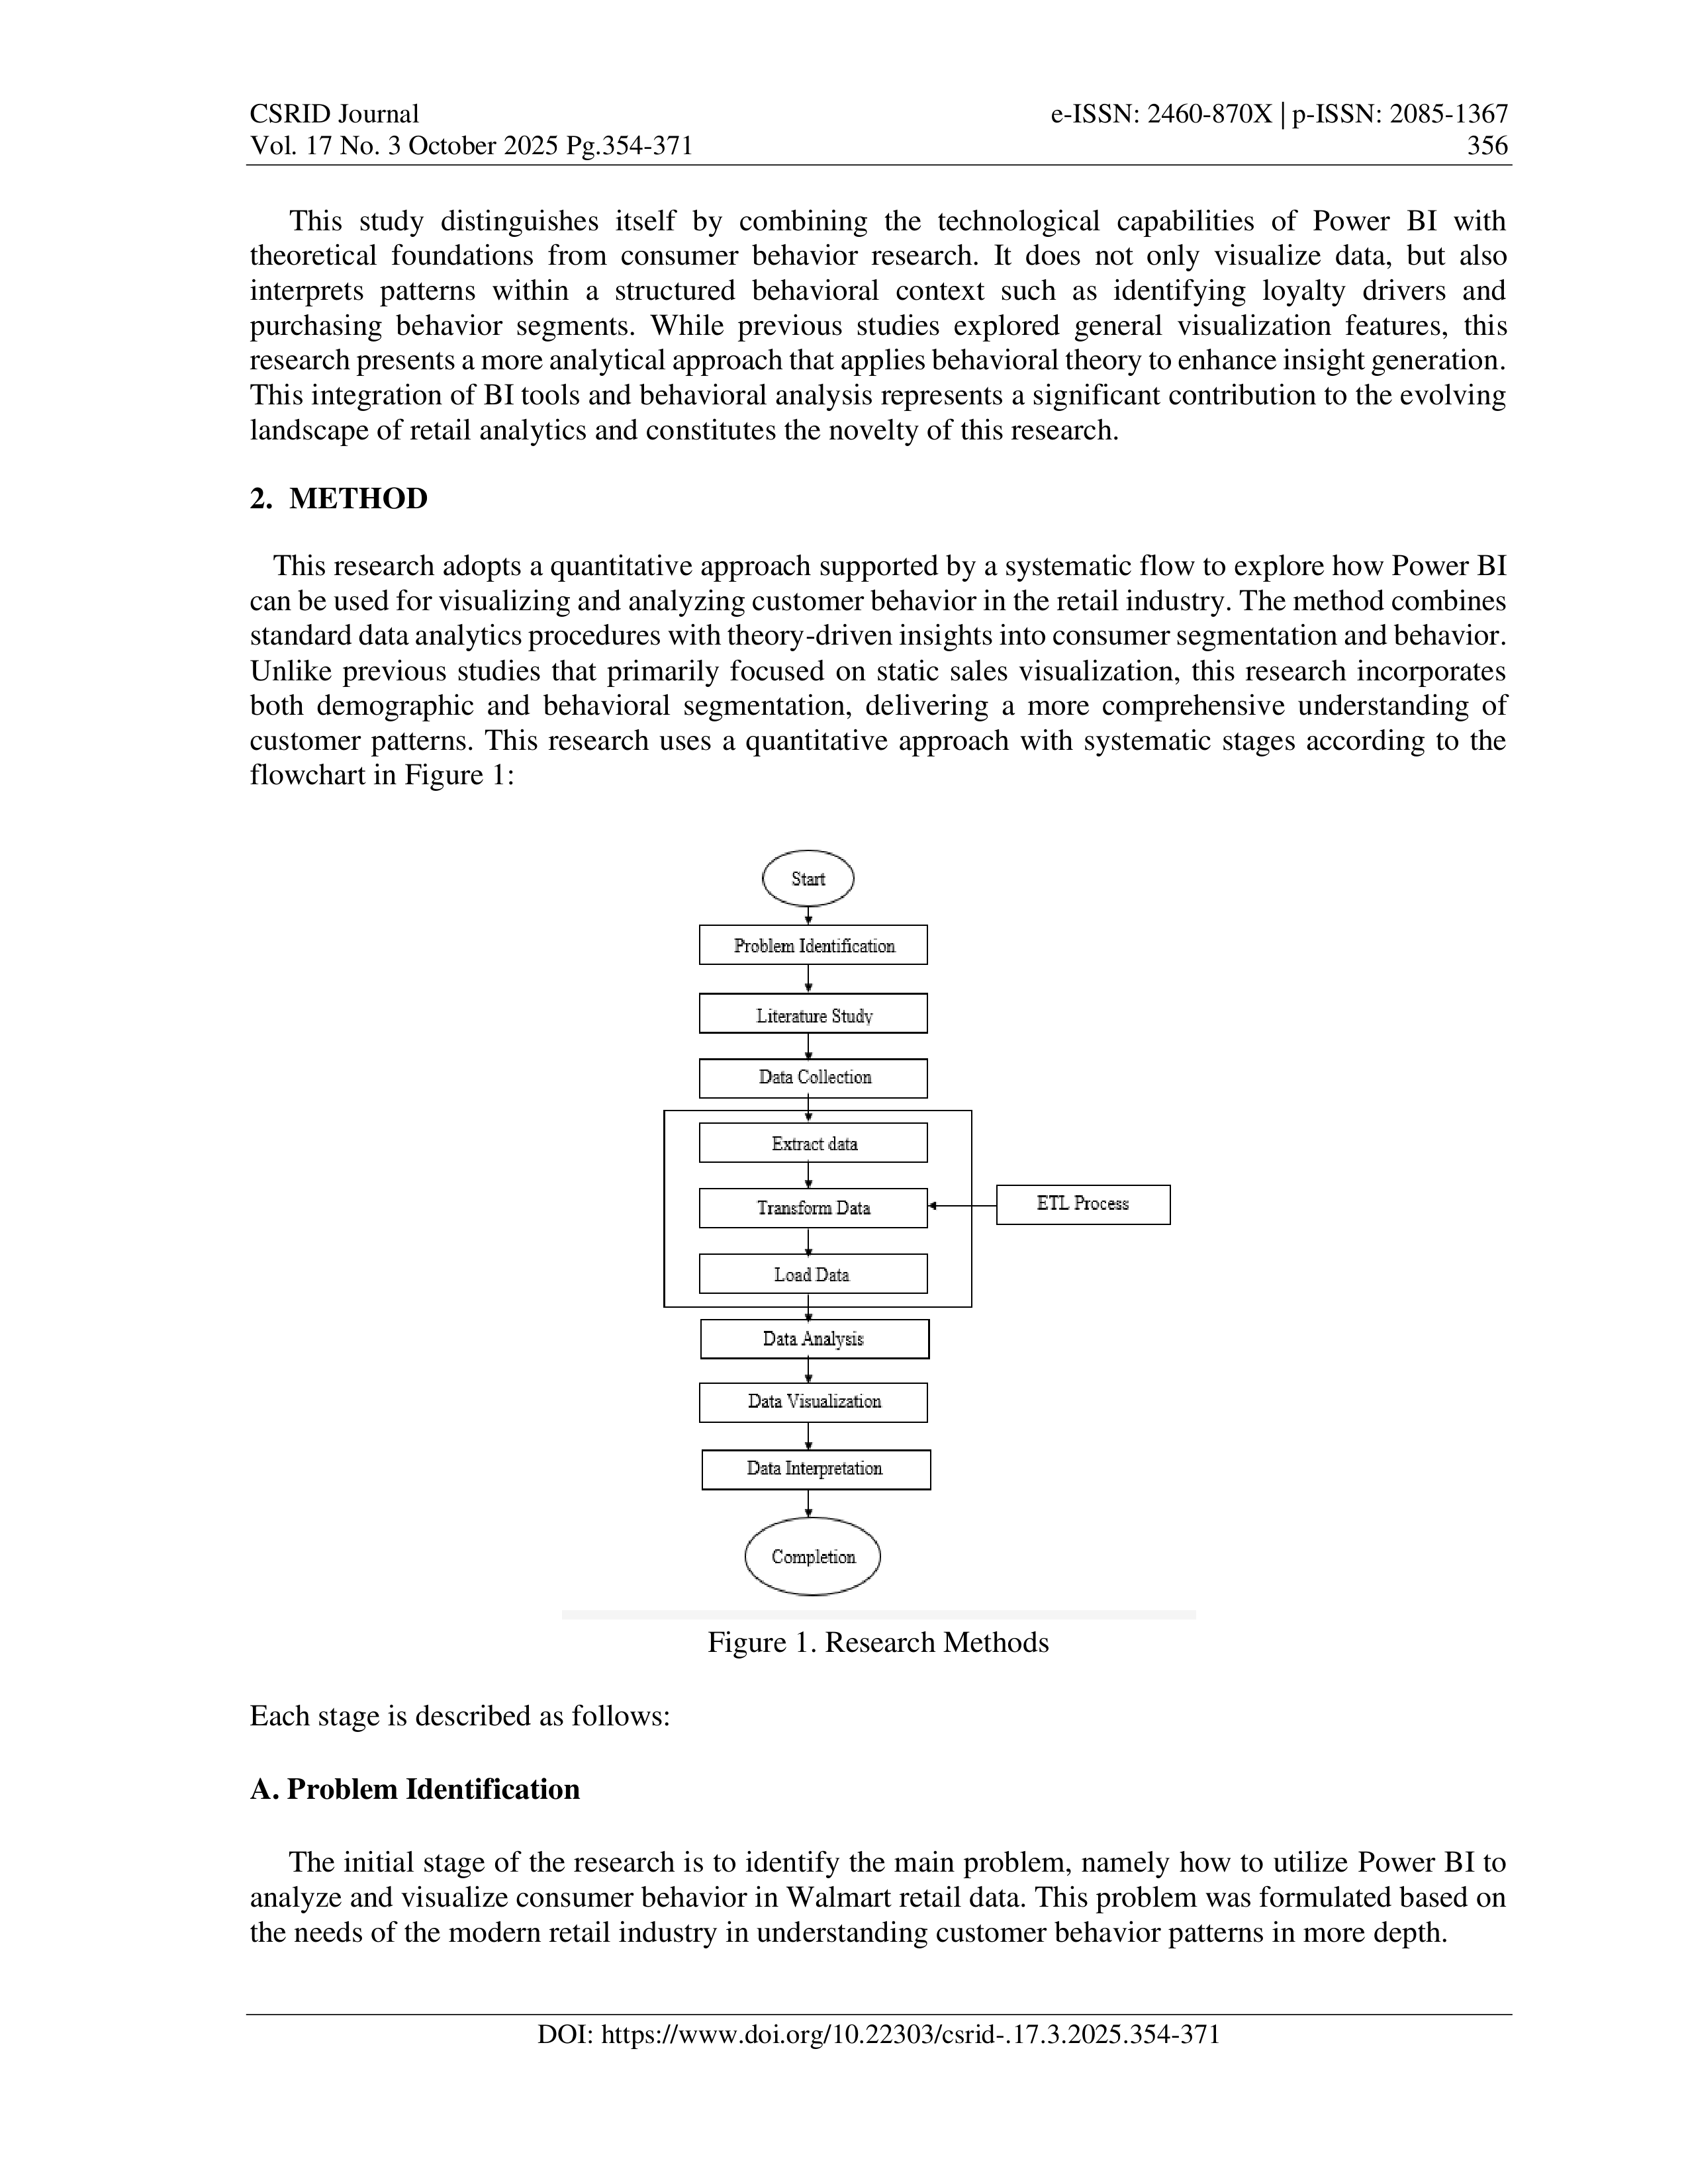
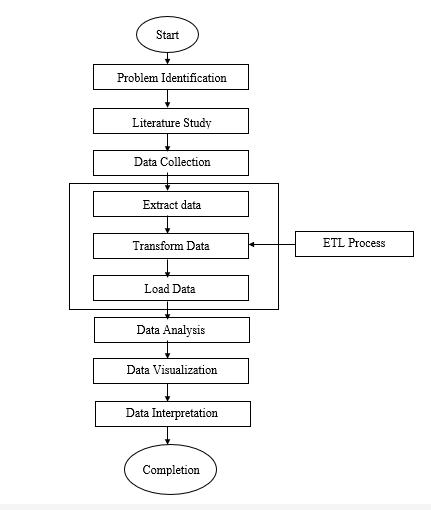
customer patterns. This research uses a quantitative approach with systematic stages according to the
flowchart in Figure 1:
Figure 1. Research Methods
Each stage is described as follows:
A. Problem Identification
The initial stage of the research is to identify the main problem, namely how to utilize Power BI to
analyze and visualize consumer behavior in Walmart retail data. This problem was formulated based on
the needs of the modern retail industry in understanding customer behavior patterns in more depth.
Akhmad, Data Visualization to Analyze … 357
https://csridjournal.potensi-utama.org/index.php/CSRIDjournal/index | redaksijurnalupu@gmail.com
B. Literature Study
Researchers conducted a literature study to obtain a theoretical basis related to consumer behavior,
business intelligence concepts, big data, and the use of Power BI in data visualization. The literature used
comes from national journals and trusted sources that are relevant to the research topic.
C. Data Collection
The data in this study was obtained from the Kaggle site, which provides a dataset on Walmart
consumer behavior. The dataset used is titled "Walmart Customer Purchase Behavior Dataset" and can
be accessed via the link:
https://www.kaggle.com/datasets/logiccraftbyhimanshi/walmart-customer-
purchase-behavior-dataset
. This dataset was downloaded on April 20, 2025 for the purpose of this
research. This data was originally a CSV (Comma Separated Values) file. Specifically, this dataset
contains important information related to Walmart customer transactions that includes 50,000 rows of
data and 12 different columns. The dataset contains important information related to customer
transactions, such as customer ID, age, gender, city, product category, product name, purchase date,
purchase amount, payment method, discount usage, customer rating, and customer status whether they
are repeat customers or not.
In addition to transaction data, the dataset also provides demographic variables such as age, gender
(male, female, other), and loyalty status (existing and new customers). This information is important for
segmentation, as it allows the identification of buying patterns based on demographics and loyalty
levels.With complete data coverage, including the distribution of customers by age and gender, as well
as the transaction period from January 2024 to February 2025, this research can analyze consumer
behavior in a more targeted manner. The results are expected to provide relevant insights for marketing
strategies and retail management.
D. ETL Process (Extract, Transform, Load)
The ETL process consists of three stages, namely extract data, transform data, and load data.
a) Extract Data
The research data was downloaded from the Kaggle website in a publicly available CSV format. After
the download process, the data was extracted to identify the table structure and variables. Each column
and row was examined to ensure completeness and suitability for analysis. This step is important to
understand the initial characteristics of the data before entering the transformation stage.
b) Transform Data
The extracted data was then cleaned from duplicates, missing values, and outliers to maintain data
quality. The transformation process is carried out by changing the data format according to the needs of
the analysis, such as grouping age into age categories (Generation X, Y, Z) and calculating total
purchases, total transactions, and total discounts. In addition, the data is also processed to identify top
product categories, top selling products, and segment customers based on purchasing behavior. This
transformation aims to make the data ready to be analyzed in a more in-depth and structured manner.
CSRID Journal
e-ISSN: 2460-870X | p-ISSN: 2085-1367
Vol. 17 No. 3 October 2025 Pg.354-371
358
DOI: https://www.doi.org/10.22303/csrid-.17.3.2025.354-371
c) Load Data
After the transformation is complete, the data is loaded into Power BI for further analysis. The load
process includes setting up relationships between tables and converting data types. Validation is
performed to ensure all data is correctly entered into the system. This stage marks that the data is ready
to be used in the visual and statistical analysis process.
E. Data Analysis
Analysis was conducted using descriptive statistics and customer segmentation techniques in Power
BI. Descriptive statistics were used to look at average purchases, number of transactions, and
demographic distribution. Segmentation helps group customers based on purchasing patterns and
preferences. The results of this analysis were used to gain insight into Walmart's customer behavior. This
study advances previous research by implementing a dual-layered segmentation demographic (e.g., age,
gender, loyalty) and behavioral (e.g., purchase frequency, product preferences) within Power BI. Unlike
prior approaches that applied segmentation externally or via static tools, Power BI's DAX (Data Analysis
Expressions) was utilized to create dynamic calculated measures. These provide more refined insights
into patterns such as high-value repeat customers or seasonal buying behaviors.
F. Data Visualization
The results of the data analysis were visualized in the form of interactive dashboards using Power BI.
The visualization includes graphs of sales trends, customer segmentation, demographic distribution, and
other key metrics that support managerial needs. Each visualization element is designed to be easy to
understand and can be used as a basis for decision-making. The dashboard also allows dynamic
exploration of data according to user needs. In contrast to earlier visualizations found in related studies,
this research emphasizes interpretative visual storytelling where dashboards are not only interactive but
also structured to reflect theoretical consumer behavior constructs. This includes mapping decision-
making patterns across segments and highlighting loyalty triggers through trend analytics.
G. Data Interpretation
The data interpretation stage is carried out by giving meaning to the analysis results that have been
obtained. This process includes explaining relationships between variables, as well as identifying
important patterns in the data. Appropriate interpretation allows researchers to understand the
significance of the findings and their implications for business strategy. Thus, the research results can
make a real contribution to the development of retail management.
H. Completion
In the final stage, the researcher draws conclusions based on the results of the data analysis and
visualization that has been done. Strategic recommendations are given to retail managers as a follow-up
to the research findings. The suggestions provided are expected to help optimize marketing strategies
and customer management. This entire process is designed to ensure the research provides practical and
academic benefits in a comprehensive manner.
This research method is expected to provide a comprehensive overview of the stages of retail
consumer behavior data analysis using Power BI, from data collection to visualization of analysis results.
Akhmad, Data Visualization to Analyze … 359
https://csridjournal.potensi-utama.org/index.php/CSRIDjournal/index | redaksijurnalupu@gmail.com
Overall, the adopted method combines robust data processing with theory-driven interpretation,
providing a methodological contribution that bridges the gap between operational dashboards and
strategic consumer insights in retail analytics.
3.
RESULT AND DISCUSSION
A. Walmart's Customer Data Model
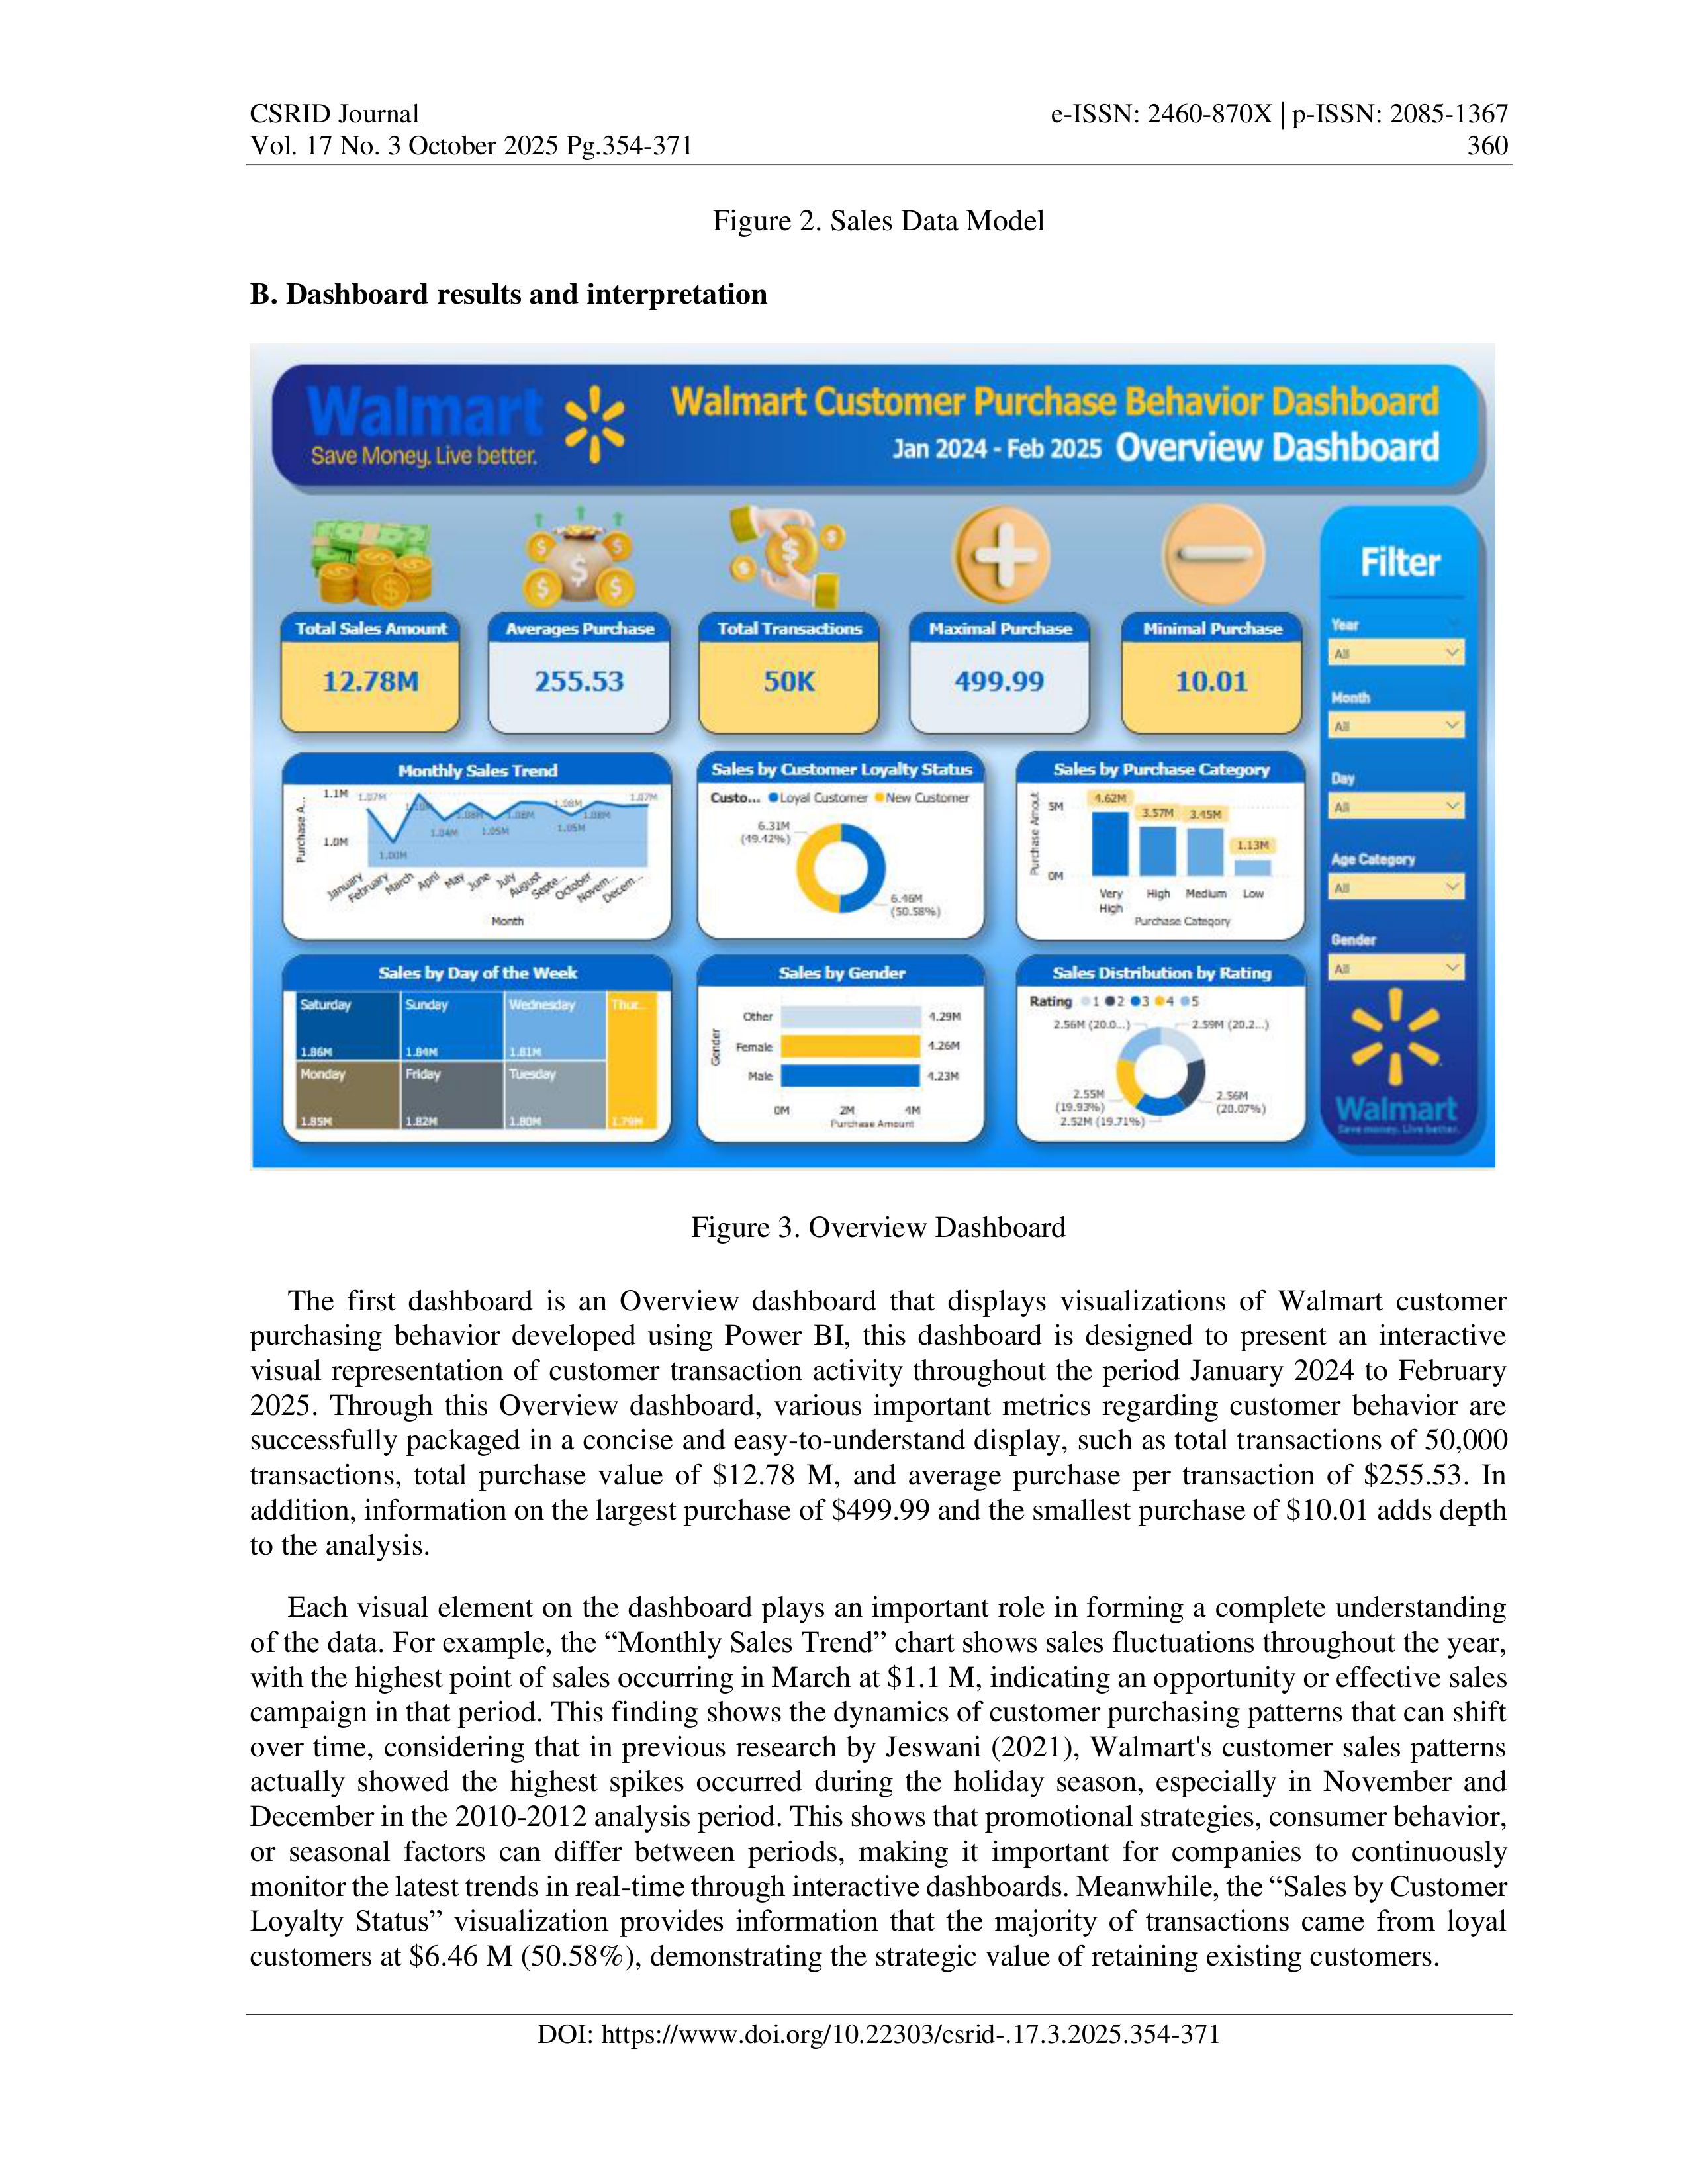
The Walmart customer transaction data model that was originally in the form of a single table was
processed into a star schema model to improve the efficiency of the analysis and visualization process in
Power BI. This modeling was chosen because it can simplify the relationship between data and improve
analysis performance. According to Amin et al. (2021), star schema is a recommended approach in Power
BI because it simplifies complex relationships, optimizes performance, and facilitates reporting.
Referring to this, this research adopts a similar concept but with further development, namely by using
six dimension tables instead of the five tables used by Amin et al. (2021), to support the need for more
in-depth analysis according to the context of the data used.
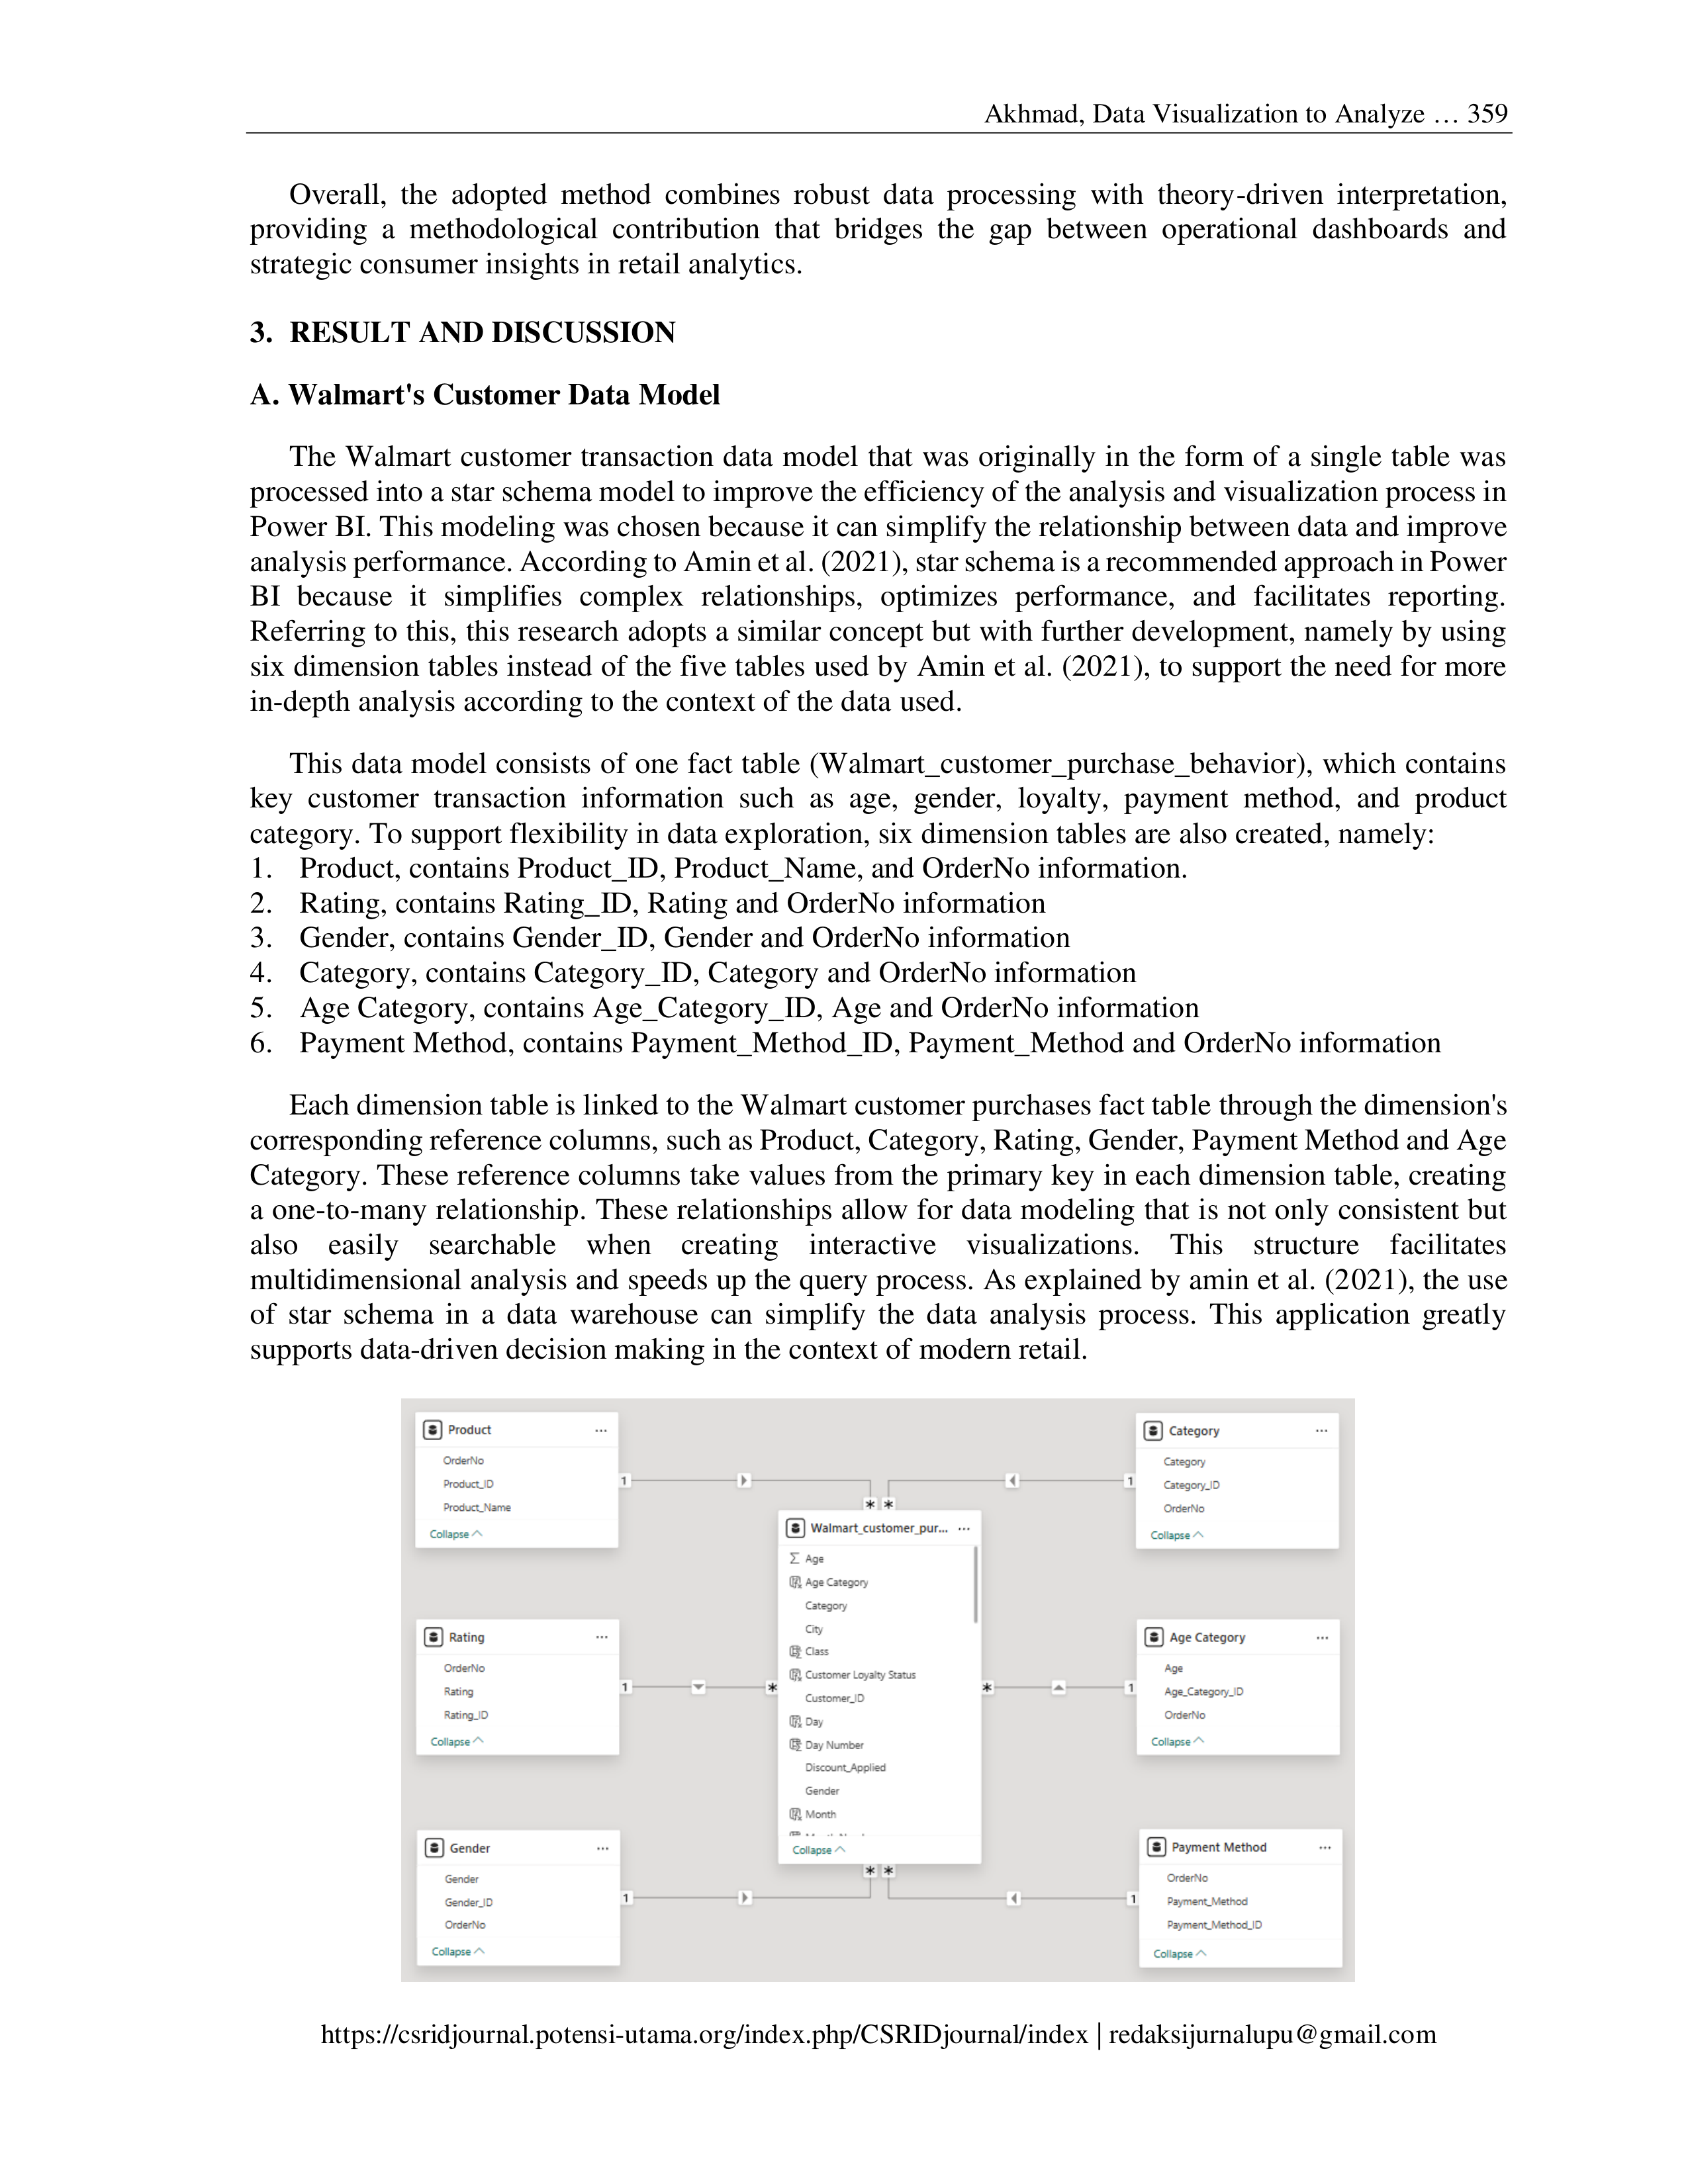
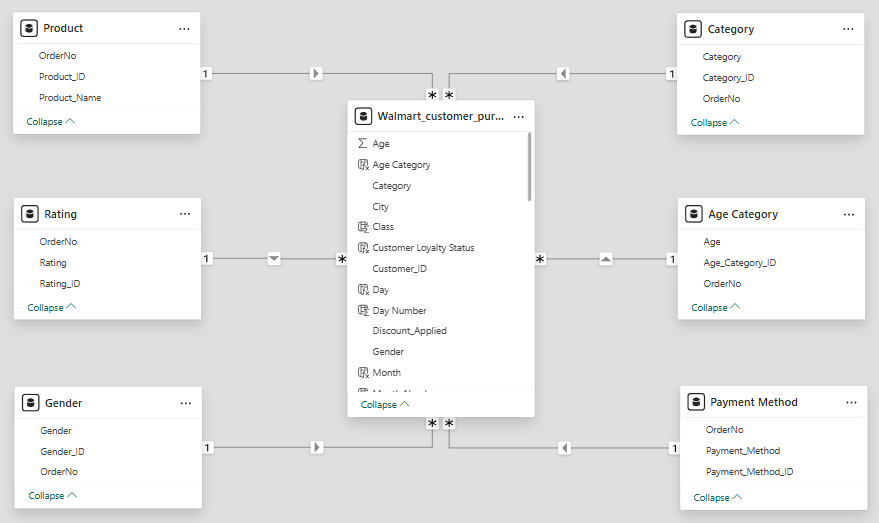
This data model consists of one fact table (Walmart_customer_purchase_behavior), which contains
key customer transaction information such as age, gender, loyalty, payment method, and product
category. To support flexibility in data exploration, six dimension tables are also created, namely:
1.
Product, contains Product_ID, Product_Name, and OrderNo information.
2.
Rating, contains Rating_ID, Rating and OrderNo information
3.
Gender, contains Gender_ID, Gender and OrderNo information
4.
Category, contains Category_ID, Category and OrderNo information
5.
Age Category, contains Age_Category_ID, Age and OrderNo information
6.
Payment Method, contains Payment_Method_ID, Payment_Method and OrderNo information
Each dimension table is linked to the Walmart customer purchases fact table through the dimension's
corresponding reference columns, such as Product, Category, Rating, Gender, Payment Method and Age
Category. These reference columns take values from the primary key in each dimension table, creating
a one-to-many relationship. These relationships allow for data modeling that is not only consistent but
also easily searchable when creating interactive visualizations. This structure facilitates
multidimensional analysis and speeds up the query process. As explained by amin et al. (2021), the use
of star schema in a data warehouse can simplify the data analysis process. This application greatly
supports data-driven decision making in the context of modern retail.
CSRID Journal
e-ISSN: 2460-870X | p-ISSN: 2085-1367
Vol. 17 No. 3 October 2025 Pg.354-371
360
DOI: https://www.doi.org/10.22303/csrid-.17.3.2025.354-371
Figure 2. Sales Data Model
B. Dashboard results and interpretation
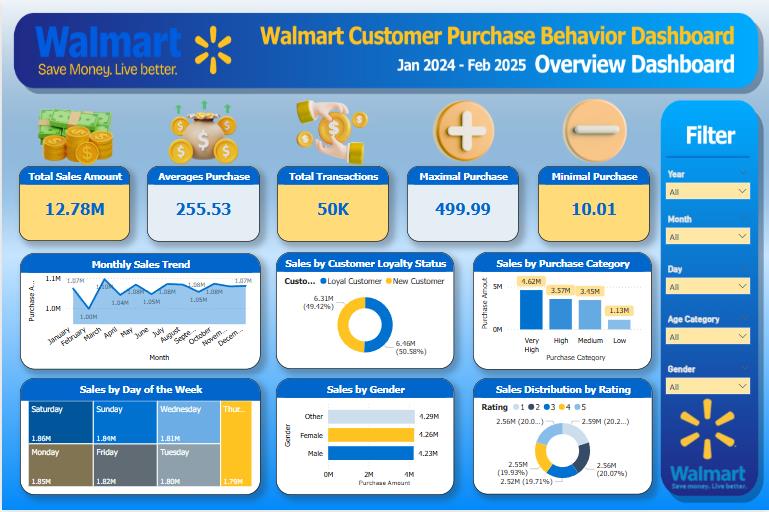
Figure 3. Overview Dashboard
The first dashboard is an Overview dashboard that displays visualizations of Walmart customer
purchasing behavior developed using Power BI, this dashboard is designed to present an interactive
visual representation of customer transaction activity throughout the period January 2024 to February
2025. Through this Overview dashboard, various important metrics regarding customer behavior are
successfully packaged in a concise and easy-to-understand display, such as total transactions of 50,000
transactions, total purchase value of $12.78 M, and average purchase per transaction of $255.53. In
addition, information on the largest purchase of $499.99 and the smallest purchase of $10.01 adds depth
to the analysis.
Each visual element on the dashboard plays an important role in forming a complete understanding
of the data. For example, the “Monthly Sales Trend” chart shows sales fluctuations throughout the year,
with the highest point of sales occurring in March at $1.1 M, indicating an opportunity or effective sales
campaign in that period. This finding shows the dynamics of customer purchasing patterns that can shift
over time, considering that in previous research by Jeswani (2021), Walmart's customer sales patterns
actually showed the highest spikes occurred during the holiday season, especially in November and
December in the 2010-2012 analysis period. This shows that promotional strategies, consumer behavior,
or seasonal factors can differ between periods, making it important for companies to continuously
monitor the latest trends in real-time through interactive dashboards. Meanwhile, the “Sales by Customer
Loyalty Status” visualization provides information that the majority of transactions came from loyal
customers at $6.46 M (50.58%), demonstrating the strategic value of retaining existing customers.
Akhmad, Data Visualization to Analyze … 361
https://csridjournal.potensi-utama.org/index.php/CSRIDjournal/index | redaksijurnalupu@gmail.com
The “Sales by Purchase Category” visualization classifies total purchases by transaction value, which
is divided into four categories: “Low” (<= $150), “Medium” (<= $300), “High” (<= $400), and “Very
High” (> $400). Given that the average purchase per transaction is $255.53, this visualization is
particularly relevant in understanding the distribution of transaction value. From this chart, it can be seen
that the majority of sales came from the “Very High” category at $4.6 M, indicating that most customers
made purchases with values that were above the average purchase. The “Low” category accounts for
$1.1 M, indicating that there is a segment of customers who tend to make smaller value purchases.
Furthermore, the “High” category accounted for $3.6 M and “Medium” for $3.5 M.
The “Sales by Day of the Week” chart displays the total sales accumulated each day, providing insight
into customers' buying patterns during the week. From this visualization, it is clear that Saturday was the
peak sales day with a total of $1.86 M, confirming the hypothesis that customers tend to shop more
actively on weekends. Interestingly, Monday took second place with $1.85 M in sales, suggesting that
the beginning of the week is also an important period for purchasing activity. On the other hand, the
lowest sales were recorded on Thursday with $1.79 M. This pattern suggests that there are significant
fluctuations in purchasing behavior throughout the week. This information can be leveraged to optimize
staff deployment, promotion schedules, and product availability, with more focus on weekends and early
weeks to maximize sales potential.
The dashboard also displays the distribution of purchases by gender, with customers of the other
gender dominating sales at approximately $4.29 M, compared to men at $4.23 M. This visualization
reinforces the importance of market segmentation based on demographics. Meanwhile, the distribution
of purchases by rating shows that the majority of sales value came from products with low ratings,
namely ratings 1 and 2, accounting for 20.20% and 20.07% of total sales, respectively. This can be
interpreted as an indication that high sales volume does not always correlate with a positive assessment
of the product. It could be that the low-rated products are competitively priced or belong to the staple
category that remains in demand despite the less-than-satisfactory reviews.
All of this information can be further analyzed using the filter feature found on the right side of the
dashboard. These filters include year, month, day, age category, and gender variables that allow users to
conduct deeper data exploration based on specific needs. The use of these filters becomes very important
in the data-driven decision-making process, as stated by Hafeez (2023), Power BI's ability to present up-
to-date data visualizations is very beneficial for decision makers, as it helps them monitor key
performance indicators (KPIs) and respond quickly to new trends or changing situations. Interactive
filters further support this process by allowing managers or data analysts to focus their analysis on
specific customer segments for a more accurate understanding of behavior.
The utilization of Microsoft Power BI in the development of this dashboard overview also reflects the
real implementation of Business Intelligence (BI) principles, which is to transform raw data into
meaningful information. This is in line with the findings of Gokulpriya (2024) who stated that through
the use of data visualization features in Microsoft Power BI, raw sales data can be processed into
informative dashboards and interactive reports. Thus, this dashboard is not just a visualization tool, but
a decision support system that facilitates contextual understanding of Walmart's customer behavior. This
approach reflects the synergy between the theory of data processing and the practice of business
analytics, which plays an important role in supporting data-driven marketing strategies, inventory
management, and improving customer satisfaction.
CSRID Journal
e-ISSN: 2460-870X | p-ISSN: 2085-1367
Vol. 17 No. 3 October 2025 Pg.354-371
362
DOI: https://www.doi.org/10.22303/csrid-.17.3.2025.354-371
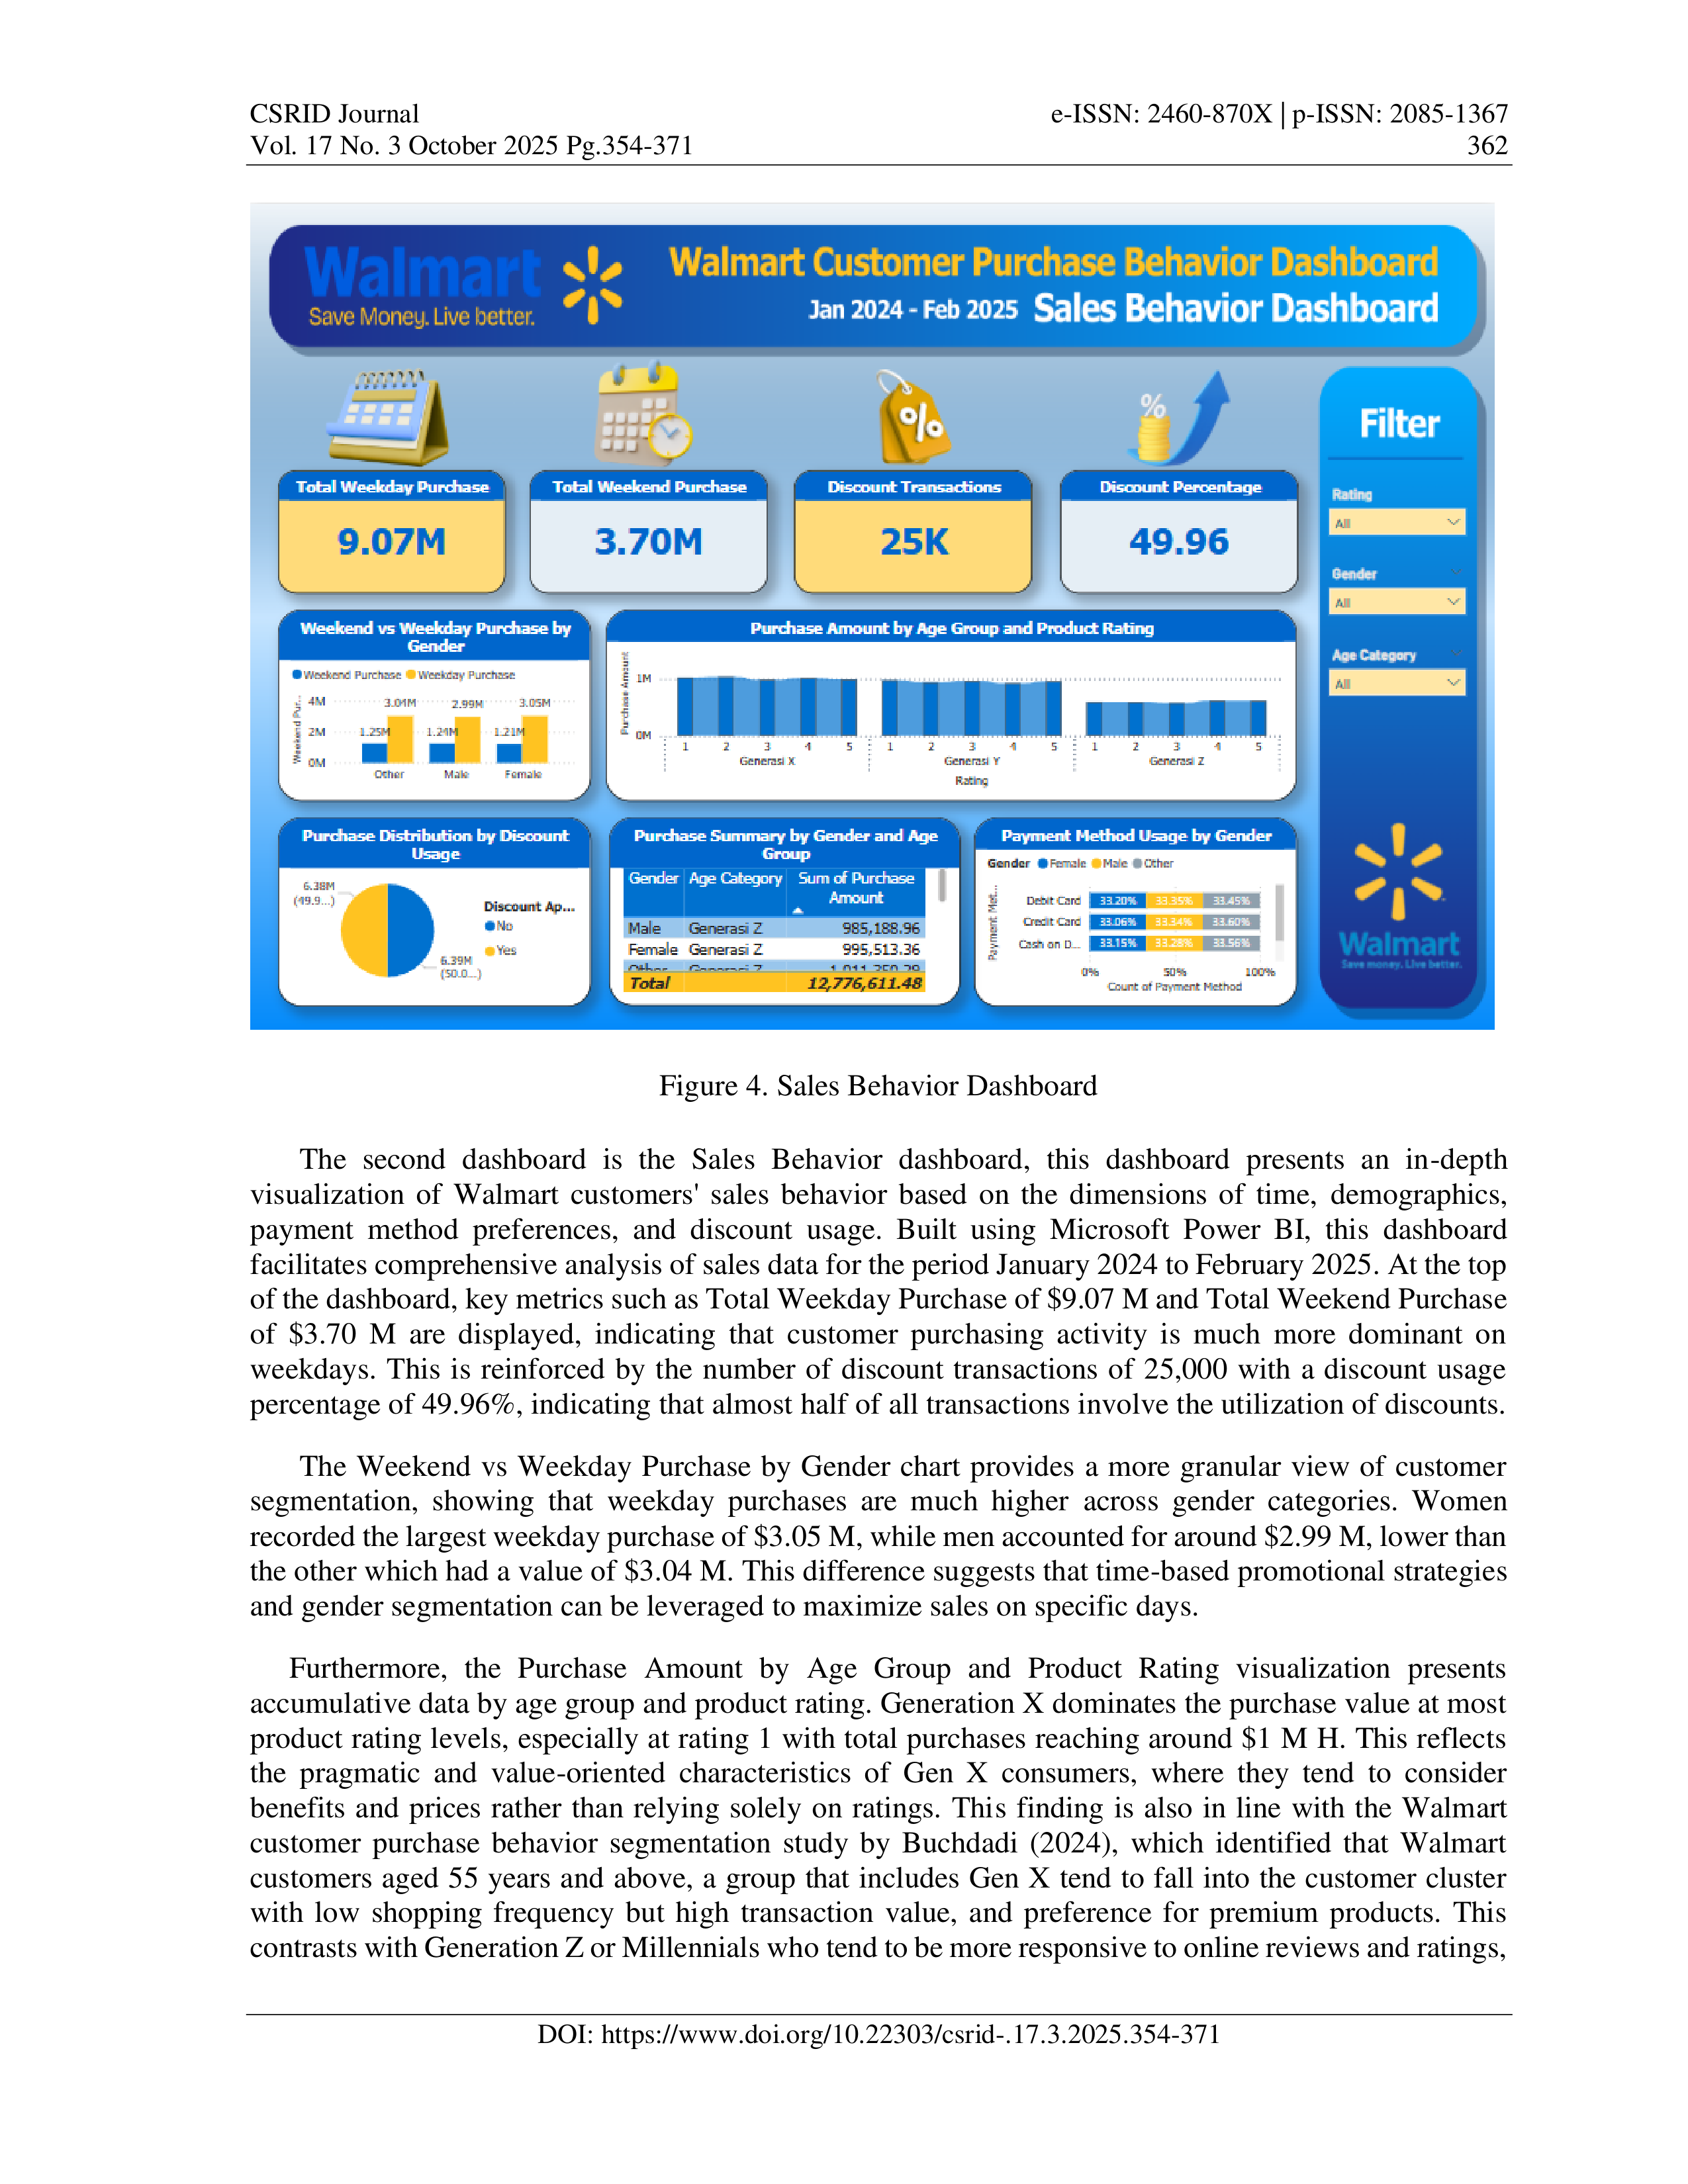
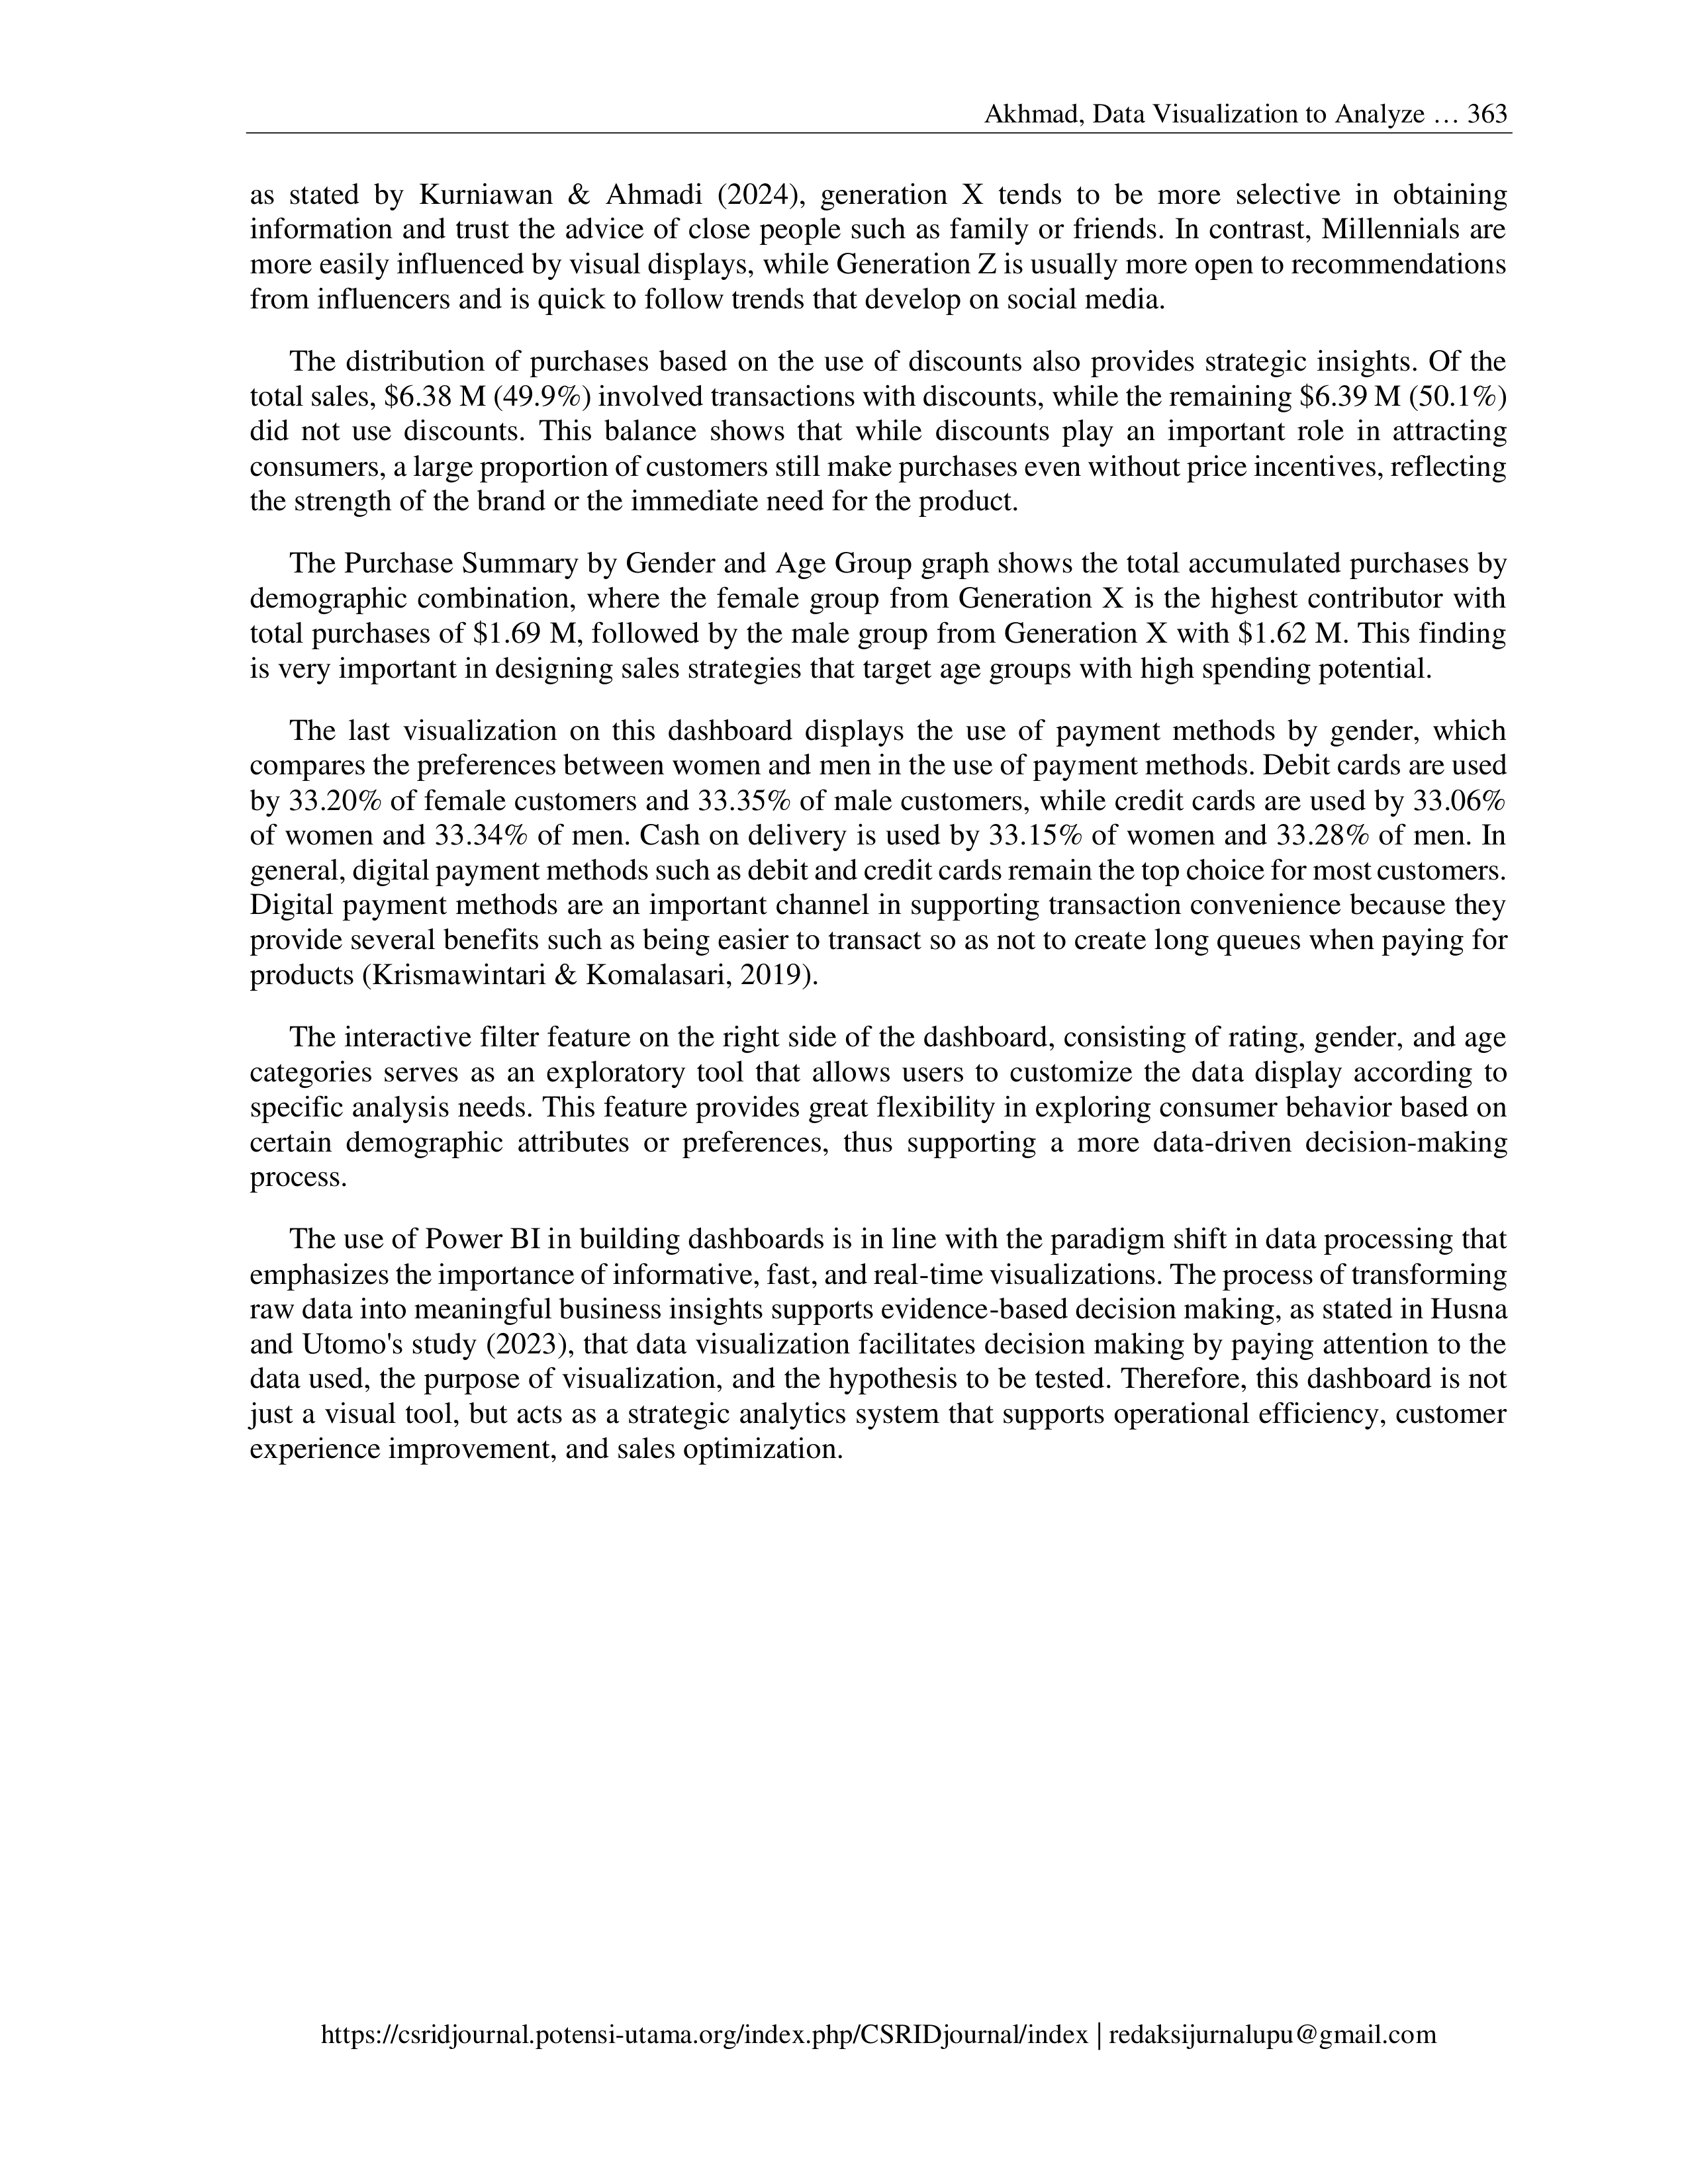
Figure 4. Sales Behavior Dashboard
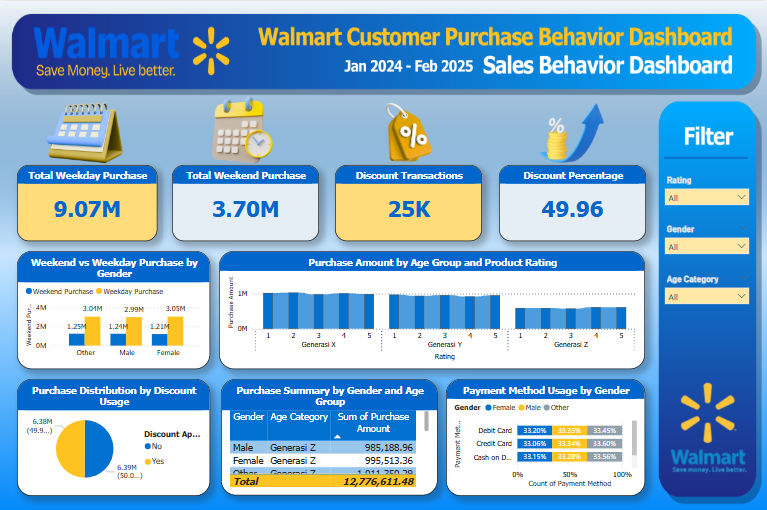
The second dashboard is the Sales Behavior dashboard, this dashboard presents an in-depth
visualization of Walmart customers' sales behavior based on the dimensions of time, demographics,
payment method preferences, and discount usage. Built using Microsoft Power BI, this dashboard
facilitates comprehensive analysis of sales data for the period January 2024 to February 2025. At the top
of the dashboard, key metrics such as Total Weekday Purchase of $9.07 M and Total Weekend Purchase
of $3.70 M are displayed, indicating that customer purchasing activity is much more dominant on
weekdays. This is reinforced by the number of discount transactions of 25,000 with a discount usage
percentage of 49.96%, indicating that almost half of all transactions involve the utilization of discounts.
The Weekend vs Weekday Purchase by Gender chart provides a more granular view of customer
segmentation, showing that weekday purchases are much higher across gender categories. Women
recorded the largest weekday purchase of $3.05 M, while men accounted for around $2.99 M, lower than
the other which had a value of $3.04 M. This difference suggests that time-based promotional strategies
and gender segmentation can be leveraged to maximize sales on specific days.
Furthermore, the Purchase Amount by Age Group and Product Rating visualization presents
accumulative data by age group and product rating. Generation X dominates the purchase value at most
product rating levels, especially at rating 1 with total purchases reaching around $1 M H. This reflects
the pragmatic and value-oriented characteristics of Gen X consumers, where they tend to consider
benefits and prices rather than relying solely on ratings. This finding is also in line with the Walmart
customer purchase behavior segmentation study by Buchdadi (2024), which identified that Walmart
customers aged 55 years and above, a group that includes Gen X tend to fall into the customer cluster
with low shopping frequency but high transaction value, and preference for premium products. This
contrasts with Generation Z or Millennials who tend to be more responsive to online reviews and ratings,
Akhmad, Data Visualization to Analyze … 363
https://csridjournal.potensi-utama.org/index.php/CSRIDjournal/index | redaksijurnalupu@gmail.com
as stated by Kurniawan & Ahmadi (2024), generation X tends to be more selective in obtaining
information and trust the advice of close people such as family or friends. In contrast, Millennials are
more easily influenced by visual displays, while Generation Z is usually more open to recommendations
from influencers and is quick to follow trends that develop on social media.
The distribution of purchases based on the use of discounts also provides strategic insights. Of the
total sales, $6.38 M (49.9%) involved transactions with discounts, while the remaining $6.39 M (50.1%)
did not use discounts. This balance shows that while discounts play an important role in attracting
consumers, a large proportion of customers still make purchases even without price incentives, reflecting
the strength of the brand or the immediate need for the product.
The Purchase Summary by Gender and Age Group graph shows the total accumulated purchases by
demographic combination, where the female group from Generation X is the highest contributor with
total purchases of $1.69 M, followed by the male group from Generation X with $1.62 M. This finding
is very important in designing sales strategies that target age groups with high spending potential.
The last visualization on this dashboard displays the use of payment methods by gender, which
compares the preferences between women and men in the use of payment methods. Debit cards are used
by 33.20% of female customers and 33.35% of male customers, while credit cards are used by 33.06%
of women and 33.34% of men. Cash on delivery is used by 33.15% of women and 33.28% of men. In
general, digital payment methods such as debit and credit cards remain the top choice for most customers.
Digital payment methods are an important channel in supporting transaction convenience because they
provide several benefits such as being easier to transact so as not to create long queues when paying for
products (Krismawintari & Komalasari, 2019).
The interactive filter feature on the right side of the dashboard, consisting of rating, gender, and age
categories serves as an exploratory tool that allows users to customize the data display according to
specific analysis needs. This feature provides great flexibility in exploring consumer behavior based on
certain demographic attributes or preferences, thus supporting a more data-driven decision-making
process.
The use of Power BI in building dashboards is in line with the paradigm shift in data processing that
emphasizes the importance of informative, fast, and real-time visualizations. The process of transforming
raw data into meaningful business insights supports evidence-based decision making, as stated in Husna
and Utomo's study (2023), that data visualization facilitates decision making by paying attention to the
data used, the purpose of visualization, and the hypothesis to be tested. Therefore, this dashboard is not
just a visual tool, but acts as a strategic analytics system that supports operational efficiency, customer
experience improvement, and sales optimization.
CSRID Journal
e-ISSN: 2460-870X | p-ISSN: 2085-1367
Vol. 17 No. 3 October 2025 Pg.354-371
364
DOI: https://www.doi.org/10.22303/csrid-.17.3.2025.354-371
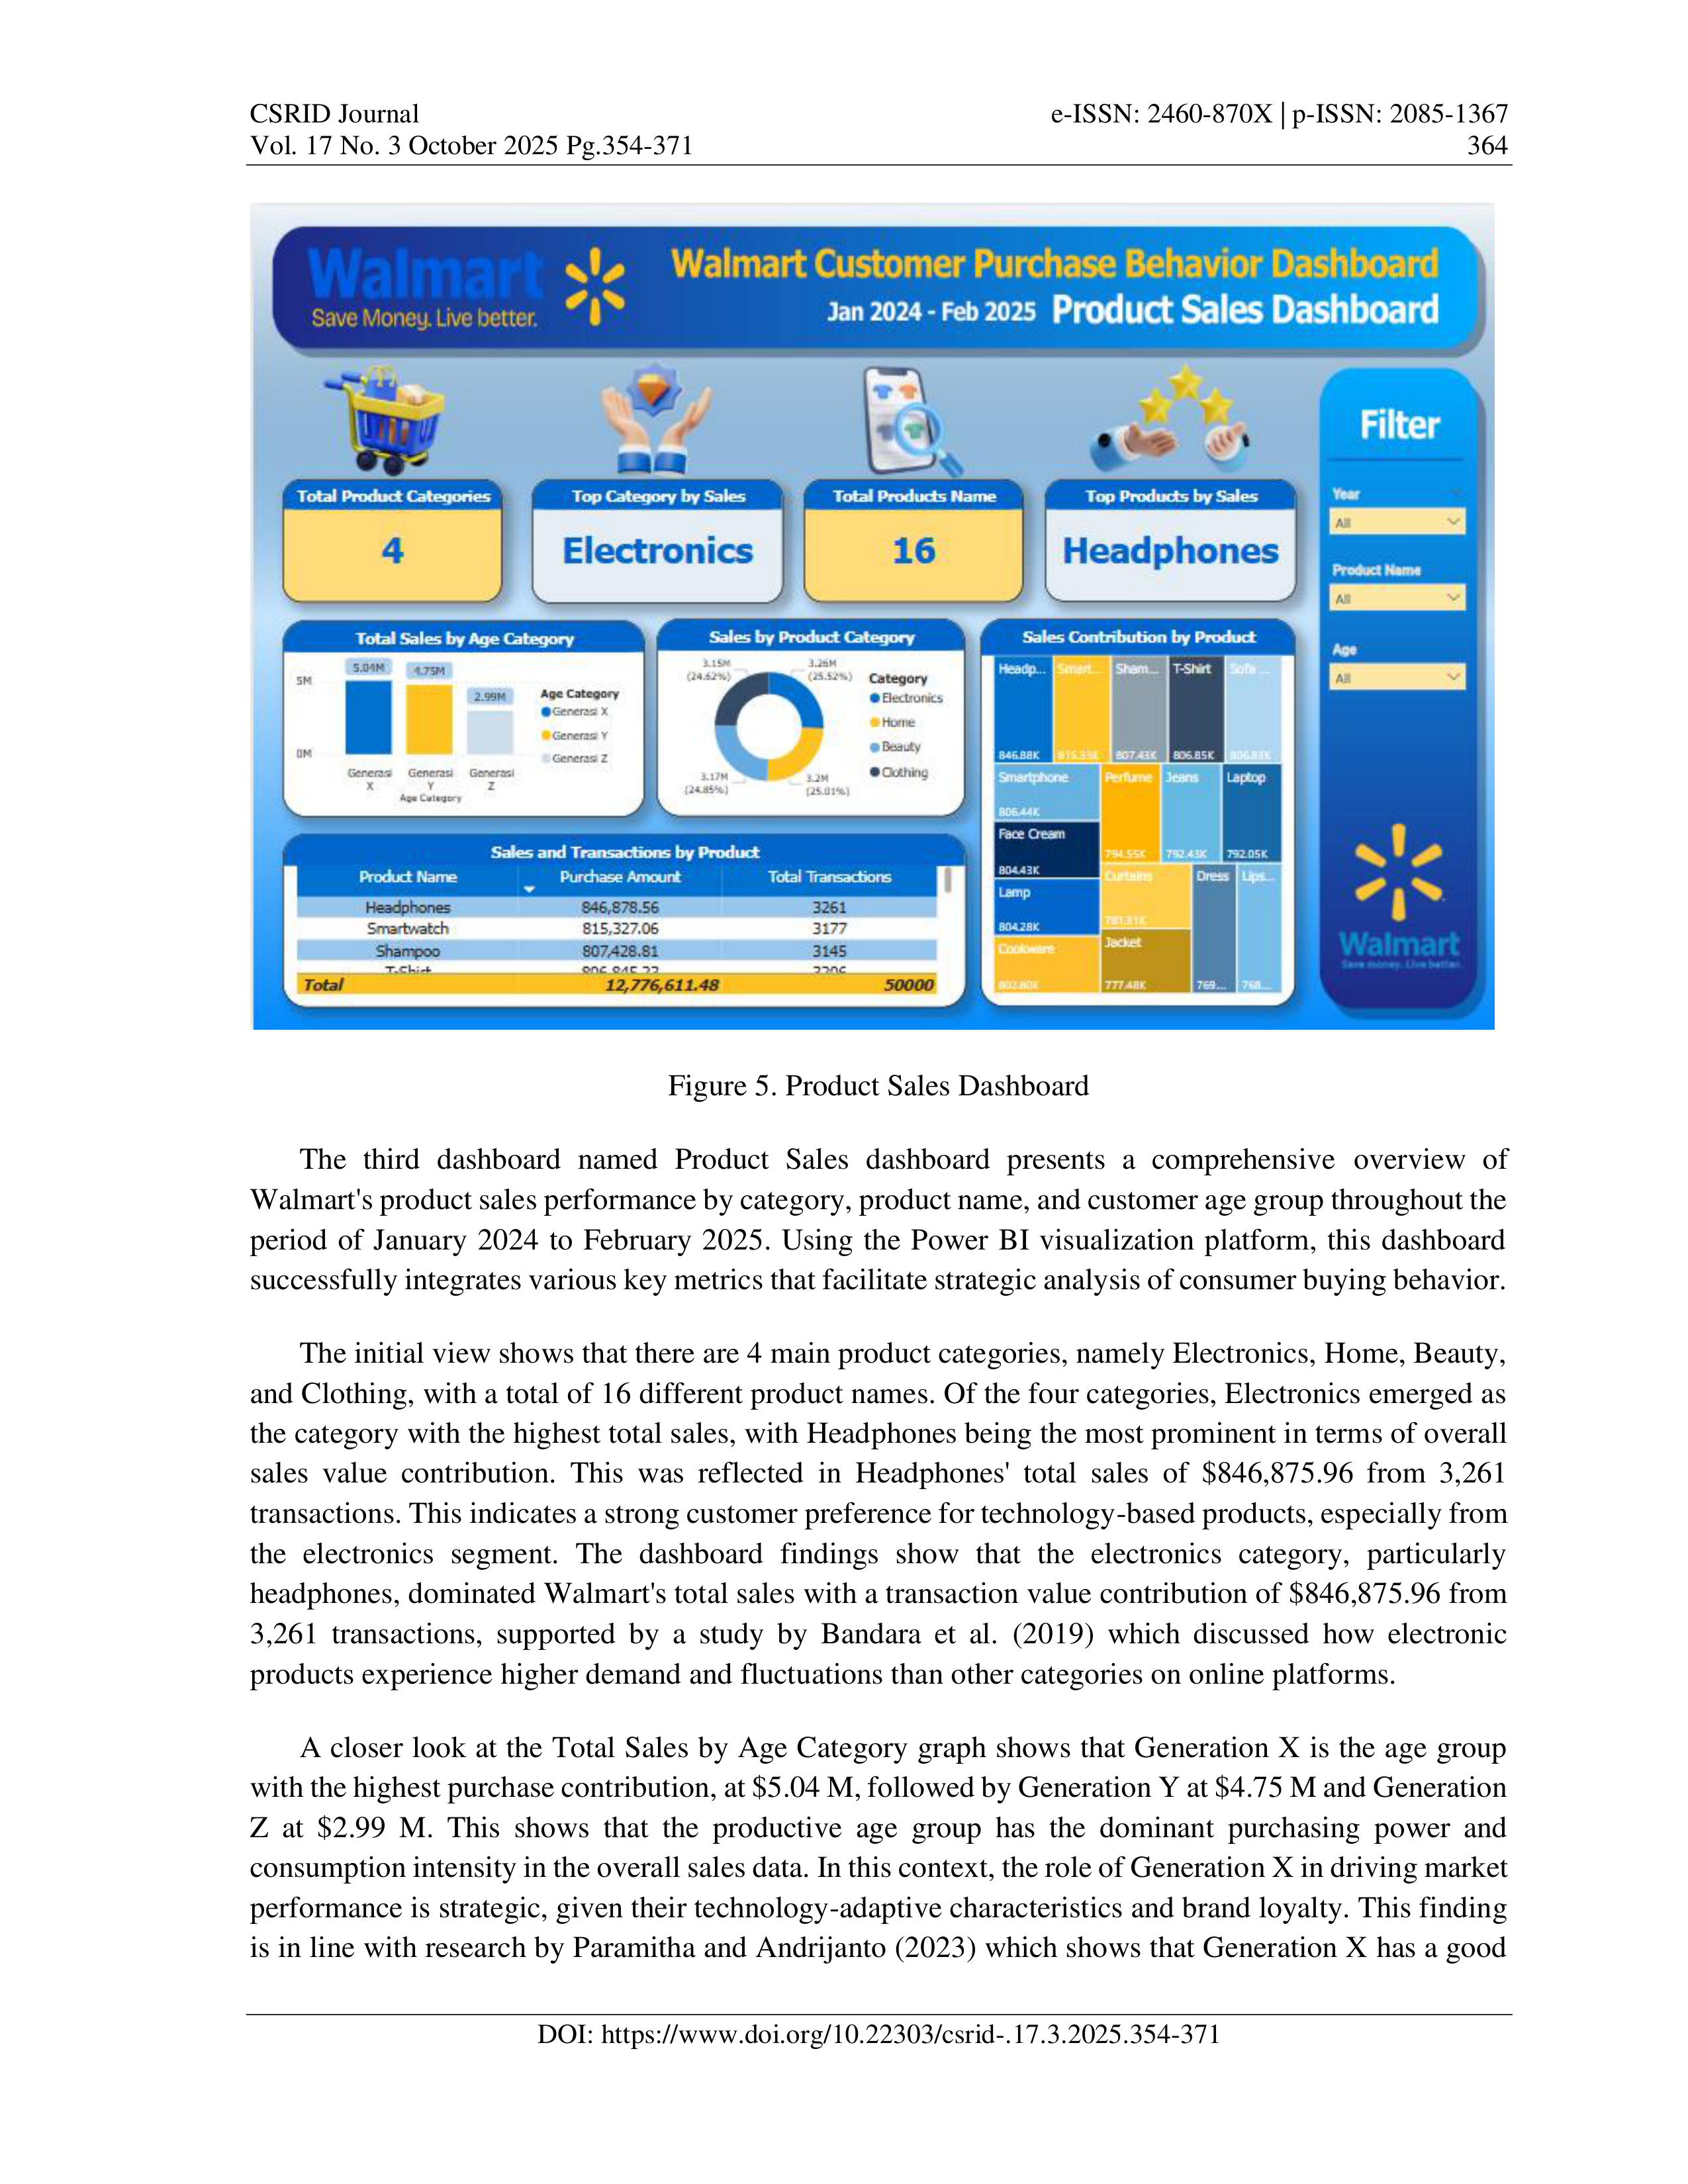
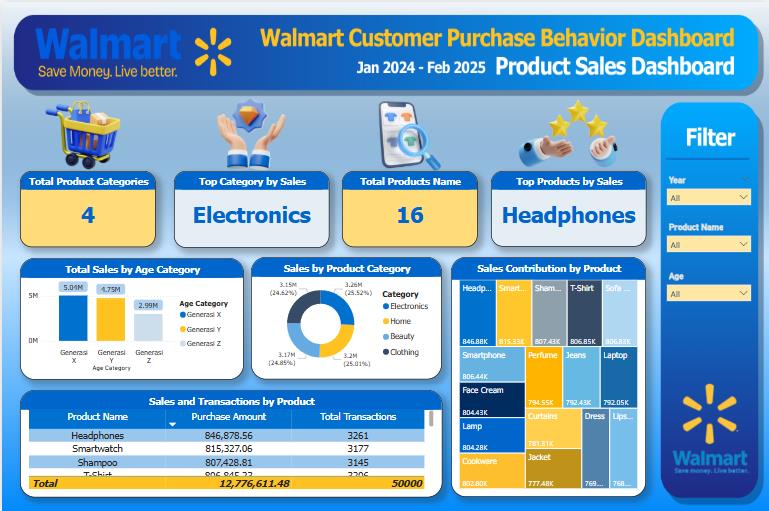
Figure 5. Product Sales Dashboard
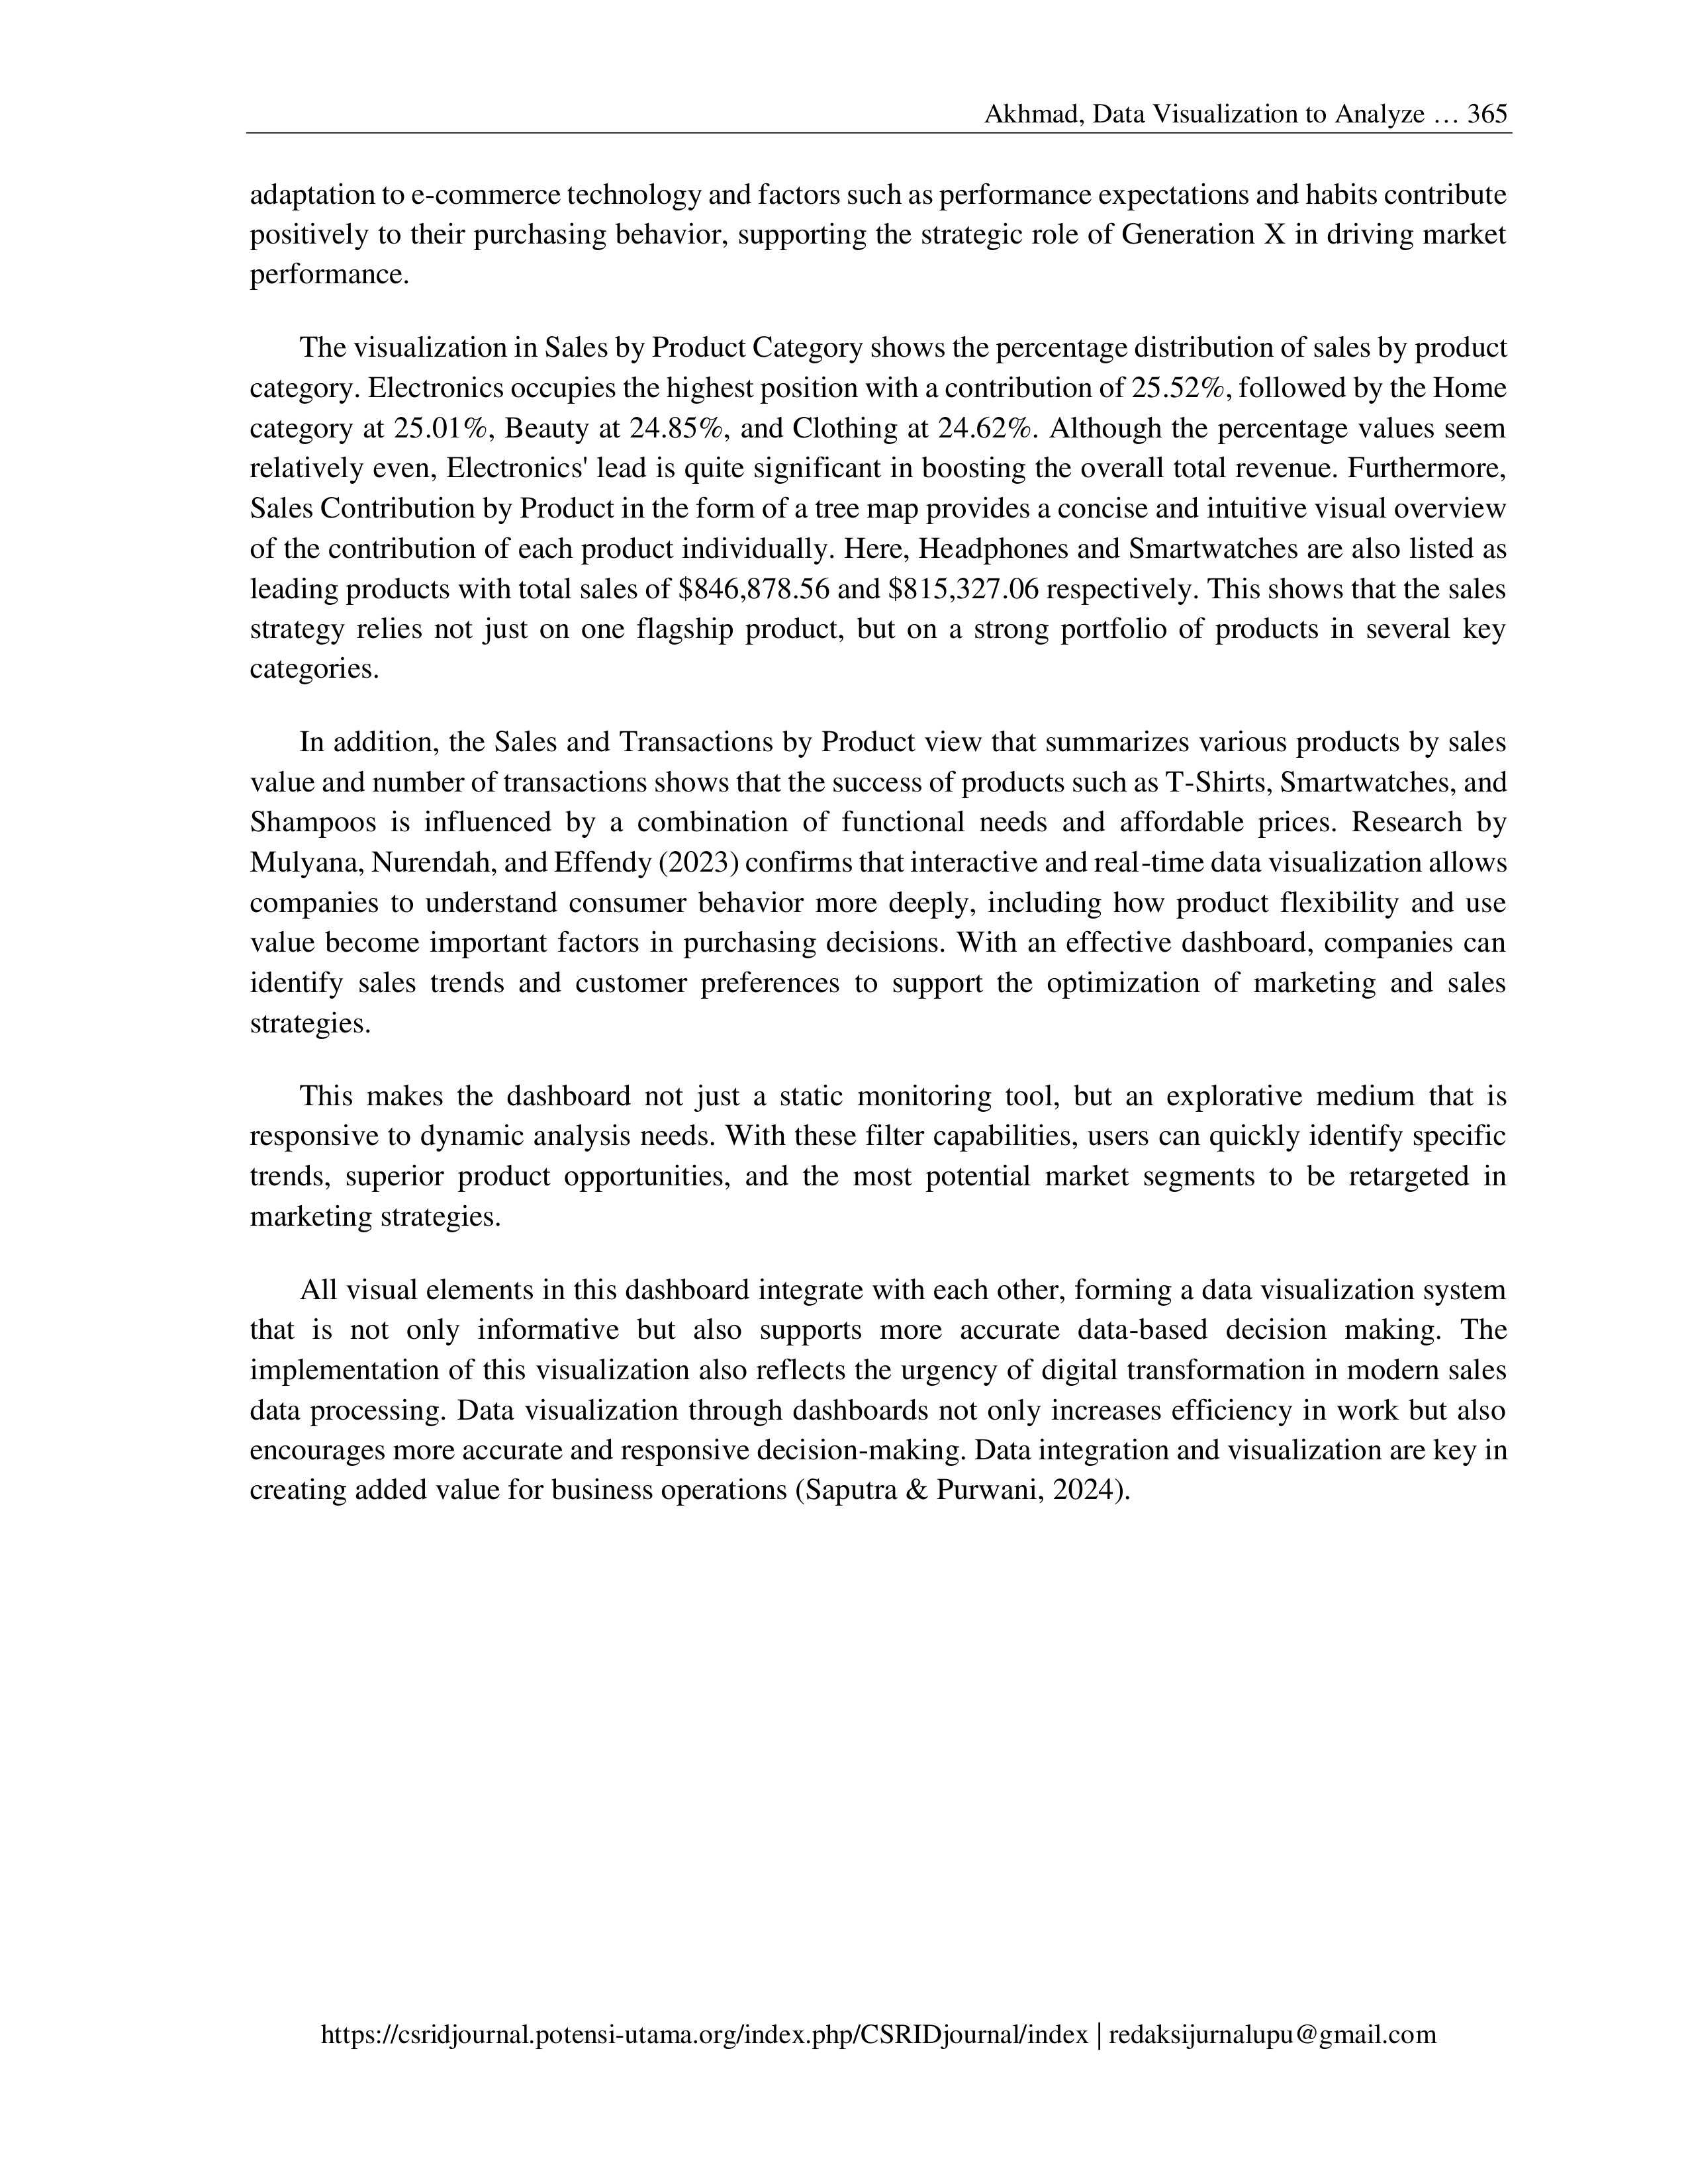
The third dashboard named Product Sales dashboard presents a comprehensive overview of
Walmart's product sales performance by category, product name, and customer age group throughout the
period of January 2024 to February 2025. Using the Power BI visualization platform, this dashboard
successfully integrates various key metrics that facilitate strategic analysis of consumer buying behavior.
The initial view shows that there are 4 main product categories, namely Electronics, Home, Beauty,
and Clothing, with a total of 16 different product names. Of the four categories, Electronics emerged as
the category with the highest total sales, with Headphones being the most prominent in terms of overall
sales value contribution. This was reflected in Headphones' total sales of $846,875.96 from 3,261
transactions. This indicates a strong customer preference for technology-based products, especially from
the electronics segment. The dashboard findings show that the electronics category, particularly
headphones, dominated Walmart's total sales with a transaction value contribution of $846,875.96 from
3,261 transactions, supported by a study by Bandara et al. (2019) which discussed how electronic
products experience higher demand and fluctuations than other categories on online platforms.
A closer look at the Total Sales by Age Category graph shows that Generation X is the age group
with the highest purchase contribution, at $5.04 M, followed by Generation Y at $4.75 M and Generation
Z at $2.99 M. This shows that the productive age group has the dominant purchasing power and
consumption intensity in the overall sales data. In this context, the role of Generation X in driving market
performance is strategic, given their technology-adaptive characteristics and brand loyalty. This finding
is in line with research by Paramitha and Andrijanto (2023) which shows that Generation X has a good
Akhmad, Data Visualization to Analyze … 365
https://csridjournal.potensi-utama.org/index.php/CSRIDjournal/index | redaksijurnalupu@gmail.com
adaptation to e-commerce technology and factors such as performance expectations and habits contribute
positively to their purchasing behavior, supporting the strategic role of Generation X in driving market
performance.
The visualization in Sales by Product Category shows the percentage distribution of sales by product
category. Electronics occupies the highest position with a contribution of 25.52%, followed by the Home
category at 25.01%, Beauty at 24.85%, and Clothing at 24.62%. Although the percentage values seem
relatively even, Electronics' lead is quite significant in boosting the overall total revenue. Furthermore,
Sales Contribution by Product in the form of a tree map provides a concise and intuitive visual overview
of the contribution of each product individually. Here, Headphones and Smartwatches are also listed as
leading products with total sales of $846,878.56 and $815,327.06 respectively. This shows that the sales
strategy relies not just on one flagship product, but on a strong portfolio of products in several key
categories.
In addition, the Sales and Transactions by Product view that summarizes various products by sales
value and number of transactions shows that the success of products such as T-Shirts, Smartwatches, and
Shampoos is influenced by a combination of functional needs and affordable prices. Research by
Mulyana, Nurendah, and Effendy (2023) confirms that interactive and real-time data visualization allows
companies to understand consumer behavior more deeply, including how product flexibility and use
value become important factors in purchasing decisions. With an effective dashboard, companies can
identify sales trends and customer preferences to support the optimization of marketing and sales
strategies.
This makes the dashboard not just a static monitoring tool, but an explorative medium that is
responsive to dynamic analysis needs. With these filter capabilities, users can quickly identify specific
trends, superior product opportunities, and the most potential market segments to be retargeted in
marketing strategies.
All visual elements in this dashboard integrate with each other, forming a data visualization system
that is not only informative but also supports more accurate data-based decision making. The
implementation of this visualization also reflects the urgency of digital transformation in modern sales
data processing. Data visualization through dashboards not only increases efficiency in work but also
encourages more accurate and responsive decision-making. Data integration and visualization are key in
creating added value for business operations (Saputra & Purwani, 2024).
CSRID Journal
e-ISSN: 2460-870X | p-ISSN: 2085-1367
Vol. 17 No. 3 October 2025 Pg.354-371
366
DOI: https://www.doi.org/10.22303/csrid-.17.3.2025.354-371
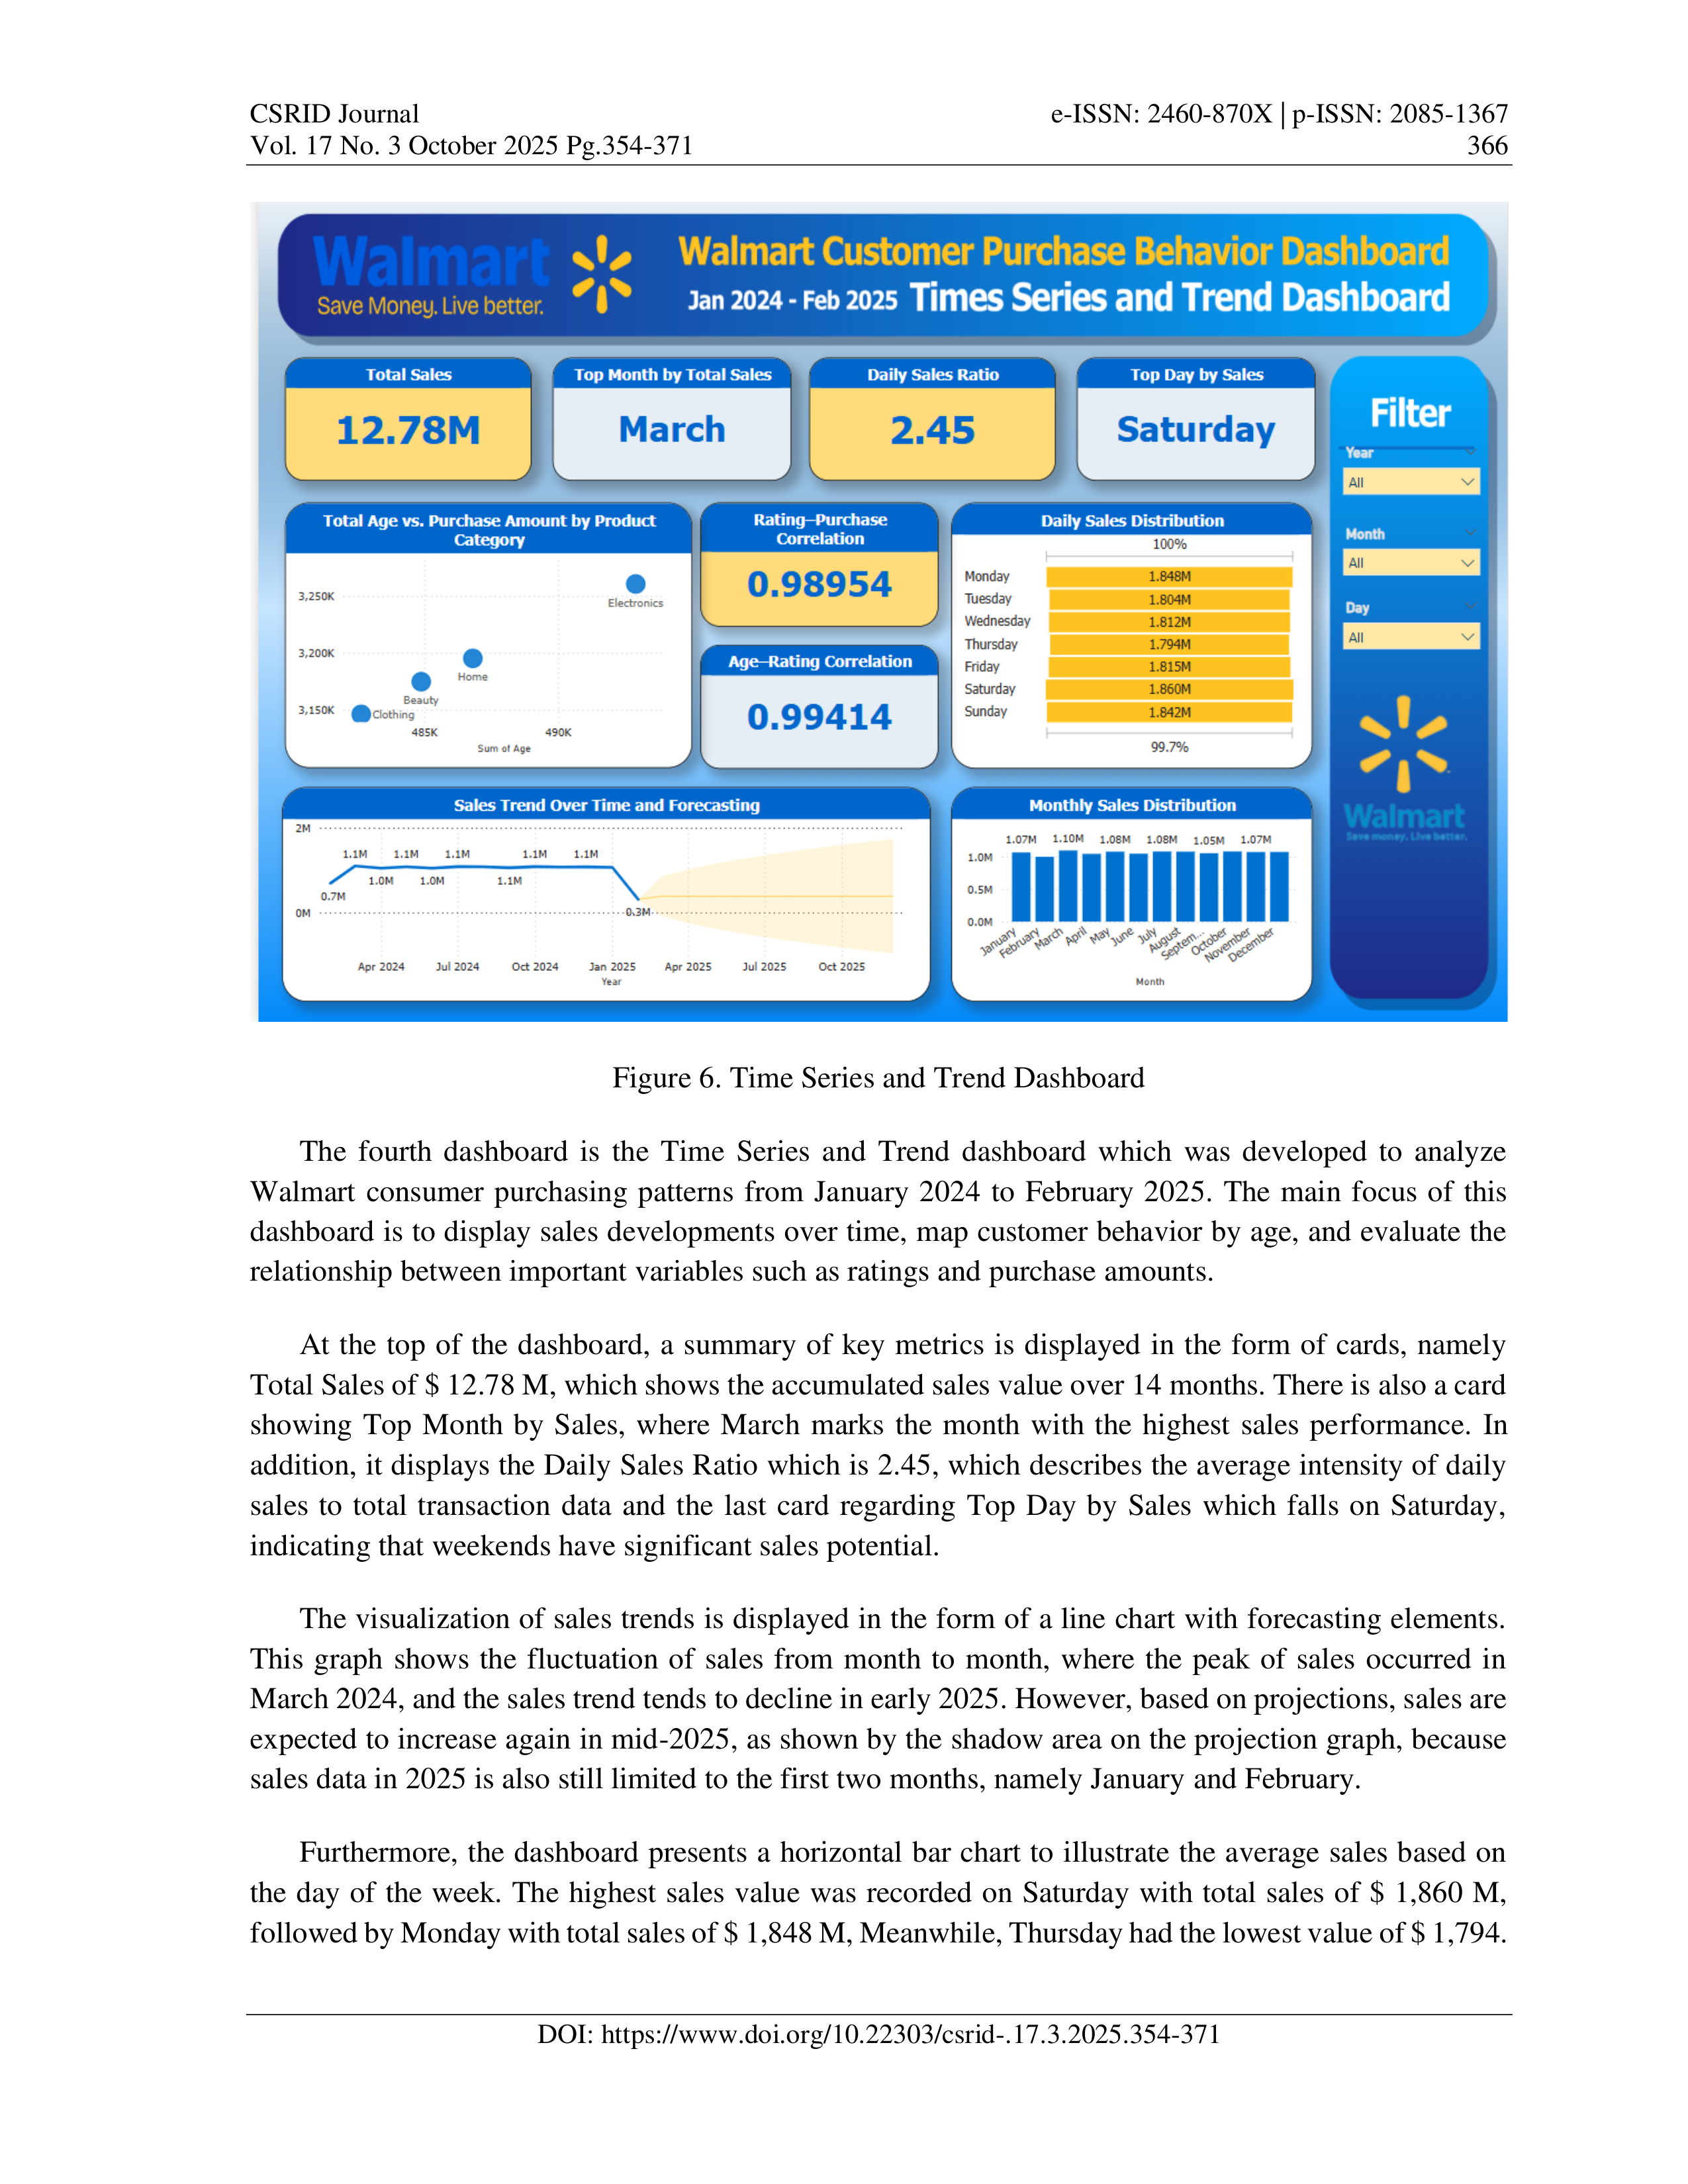
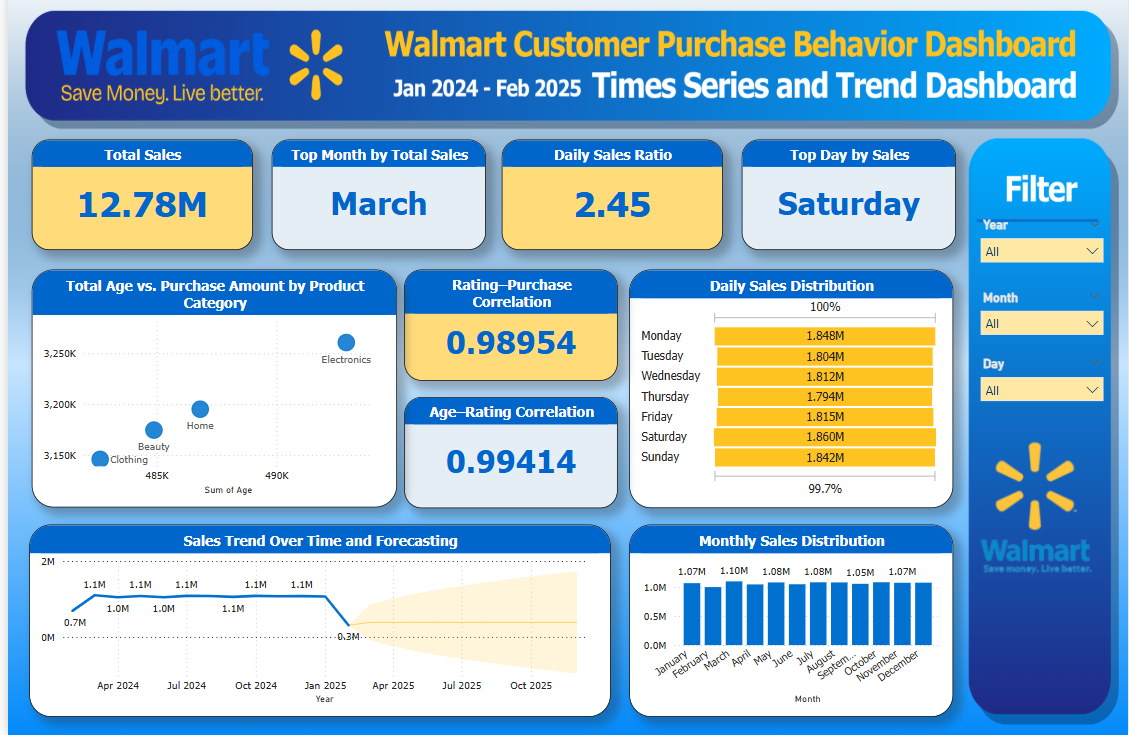
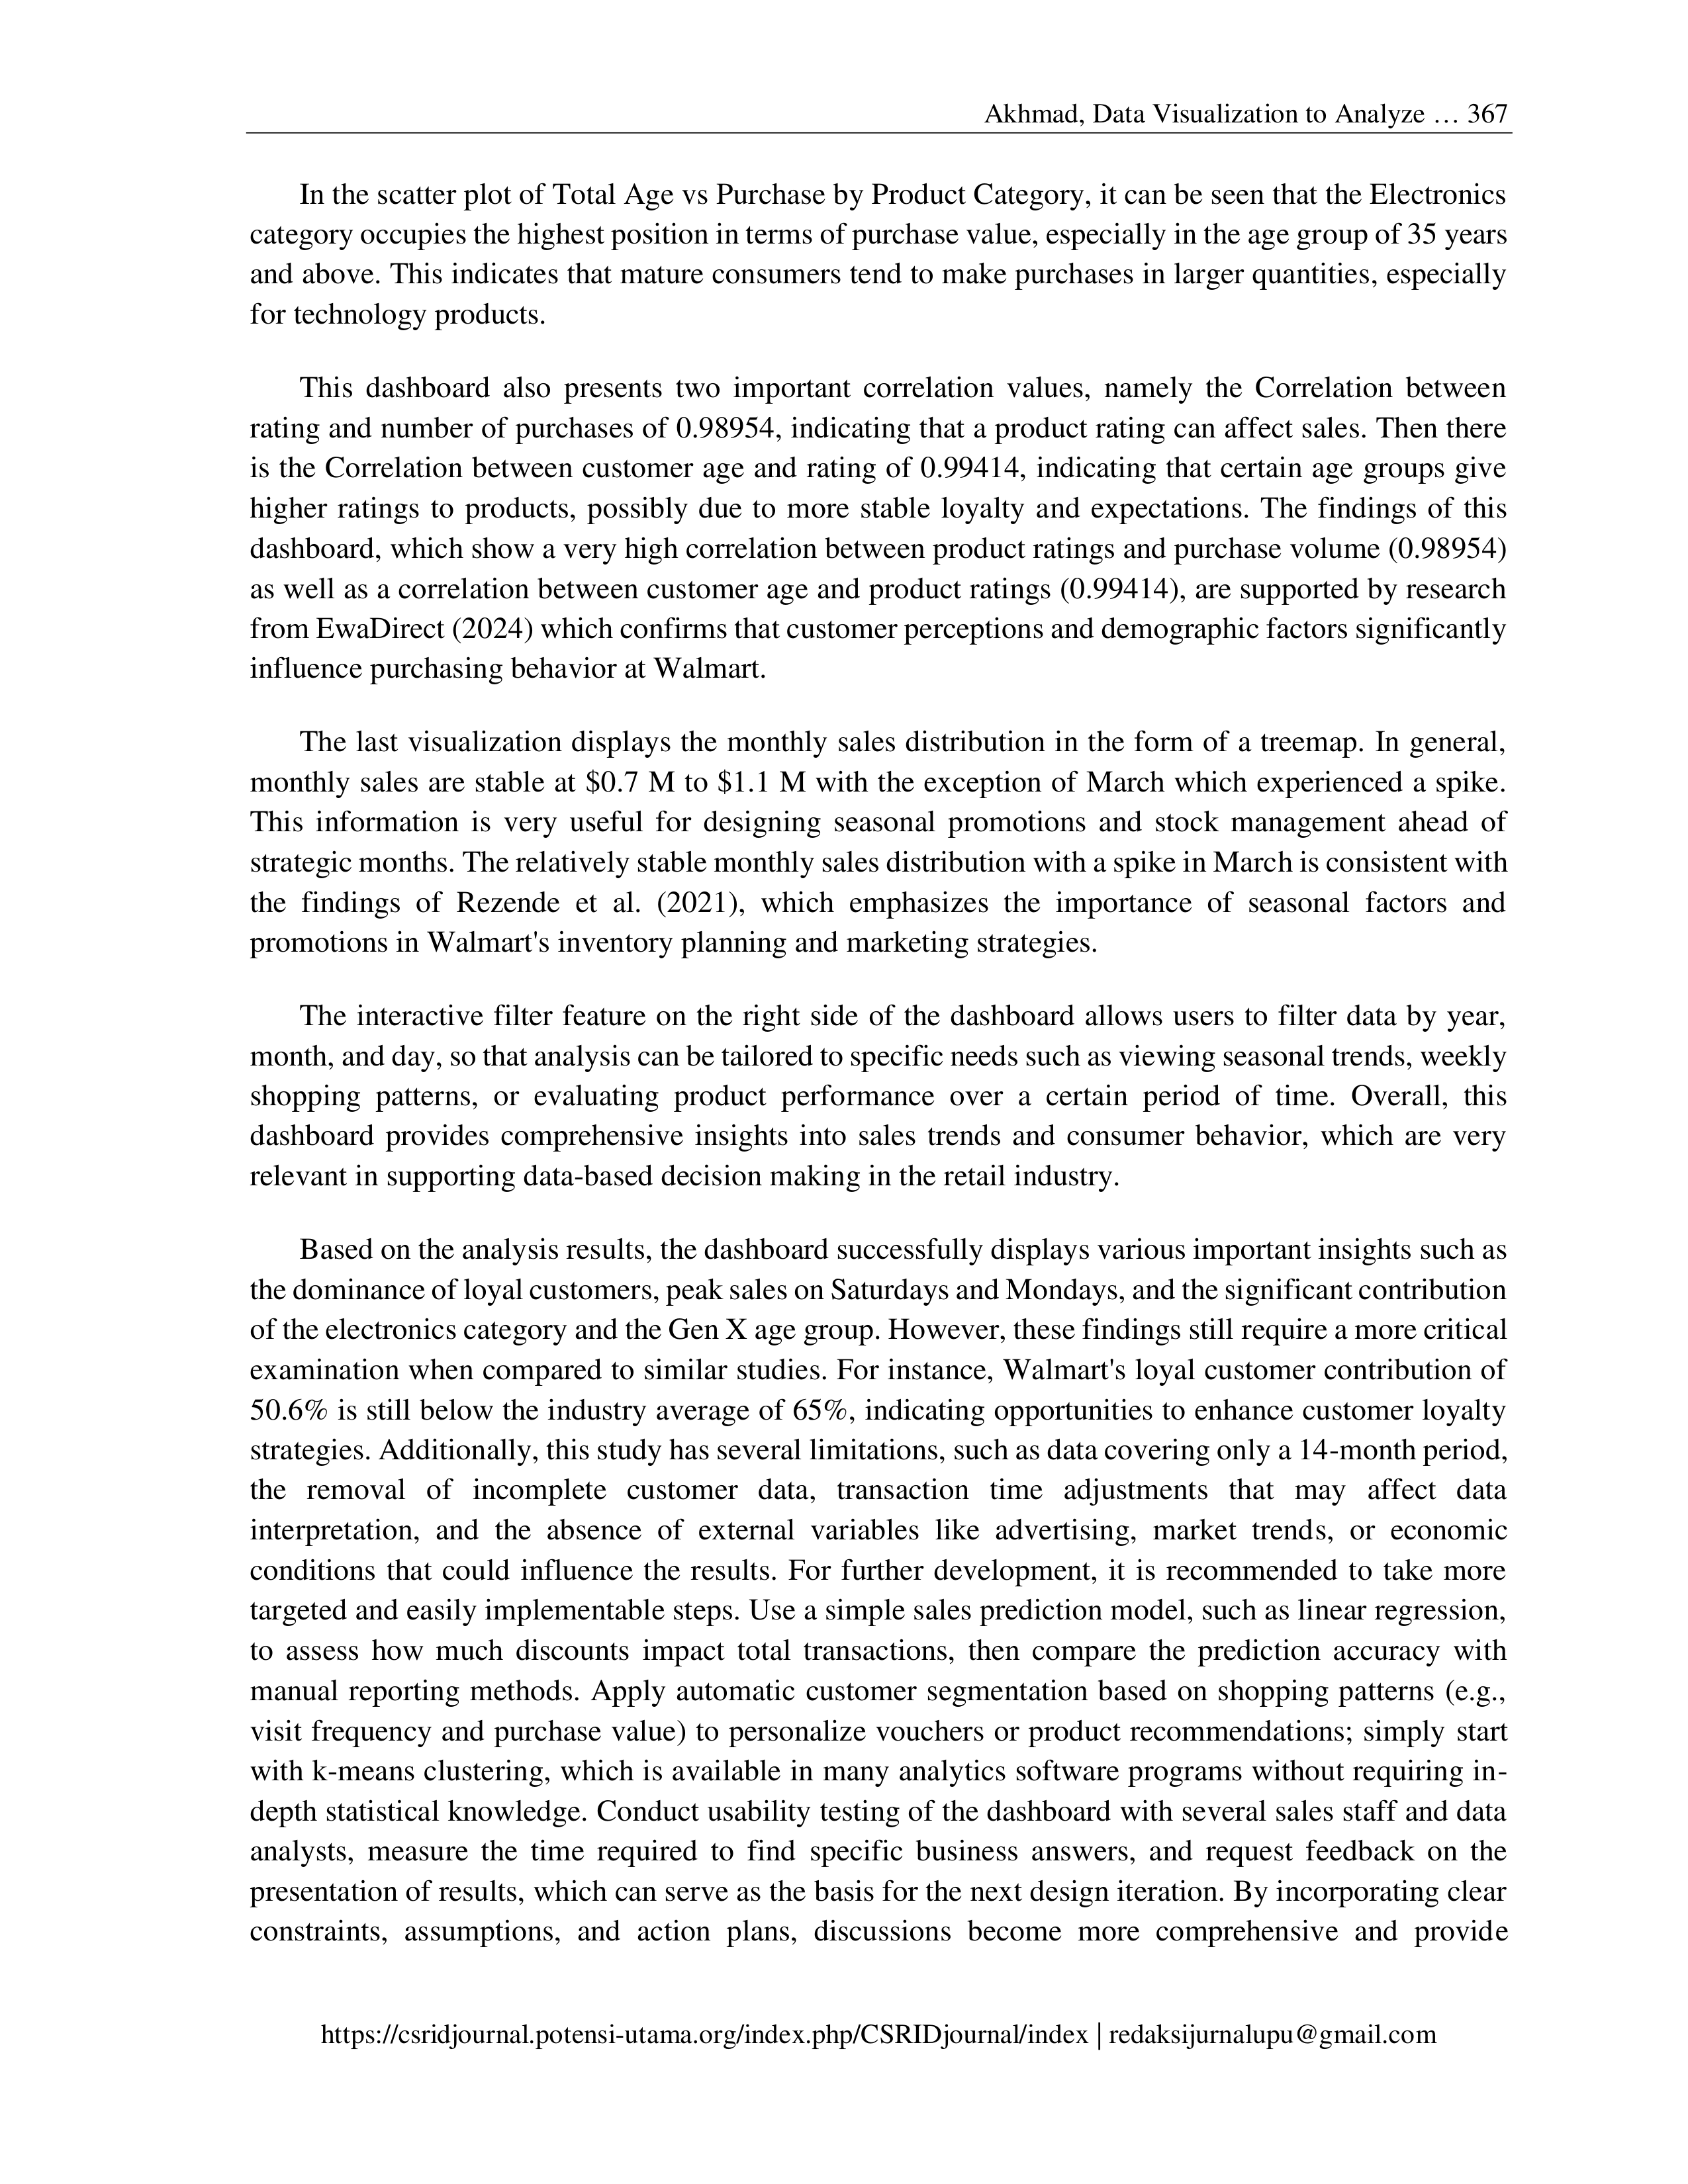
Figure 6. Time Series and Trend Dashboard
The fourth dashboard is the Time Series and Trend dashboard which was developed to analyze
Walmart consumer purchasing patterns from January 2024 to February 2025. The main focus of this
dashboard is to display sales developments over time, map customer behavior by age, and evaluate the
relationship between important variables such as ratings and purchase amounts.
At the top of the dashboard, a summary of key metrics is displayed in the form of cards, namely
Total Sales of $ 12.78 M, which shows the accumulated sales value over 14 months. There is also a card
showing Top Month by Sales, where March marks the month with the highest sales performance. In
addition, it displays the Daily Sales Ratio which is 2.45, which describes the average intensity of daily
sales to total transaction data and the last card regarding Top Day by Sales which falls on Saturday,
indicating that weekends have significant sales potential.
The visualization of sales trends is displayed in the form of a line chart with forecasting elements.
This graph shows the fluctuation of sales from month to month, where the peak of sales occurred in
March 2024, and the sales trend tends to decline in early 2025. However, based on projections, sales are
expected to increase again in mid-2025, as shown by the shadow area on the projection graph, because
sales data in 2025 is also still limited to the first two months, namely January and February.
Furthermore, the dashboard presents a horizontal bar chart to illustrate the average sales based on
the day of the week. The highest sales value was recorded on Saturday with total sales of $ 1,860 M,
followed by Monday with total sales of $ 1,848 M, Meanwhile, Thursday had the lowest value of $ 1,794.
Akhmad, Data Visualization to Analyze … 367
https://csridjournal.potensi-utama.org/index.php/CSRIDjournal/index | redaksijurnalupu@gmail.com
In the scatter plot of Total Age vs Purchase by Product Category, it can be seen that the Electronics
category occupies the highest position in terms of purchase value, especially in the age group of 35 years
and above. This indicates that mature consumers tend to make purchases in larger quantities, especially
for technology products.
This dashboard also presents two important correlation values, namely the Correlation between
rating and number of purchases of 0.98954, indicating that a product rating can affect sales. Then there
is the Correlation between customer age and rating of 0.99414, indicating that certain age groups give
higher ratings to products, possibly due to more stable loyalty and expectations. The findings of this
dashboard, which show a very high correlation between product ratings and purchase volume (0.98954)
as well as a correlation between customer age and product ratings (0.99414), are supported by research
from EwaDirect (2024) which confirms that customer perceptions and demographic factors significantly
influence purchasing behavior at Walmart.
The last visualization displays the monthly sales distribution in the form of a treemap. In general,
monthly sales are stable at $0.7 M to $1.1 M with the exception of March which experienced a spike.
This information is very useful for designing seasonal promotions and stock management ahead of
strategic months. The relatively stable monthly sales distribution with a spike in March is consistent with
the findings of Rezende et al. (2021), which emphasizes the importance of seasonal factors and
promotions in Walmart's inventory planning and marketing strategies.
The interactive filter feature on the right side of the dashboard allows users to filter data by year,
month, and day, so that analysis can be tailored to specific needs such as viewing seasonal trends, weekly
shopping patterns, or evaluating product performance over a certain period of time. Overall, this
dashboard provides comprehensive insights into sales trends and consumer behavior, which are very
relevant in supporting data-based decision making in the retail industry.
Based on the analysis results, the dashboard successfully displays various important insights such as
the dominance of loyal customers, peak sales on Saturdays and Mondays, and the significant contribution
of the electronics category and the Gen X age group. However, these findings still require a more critical
examination when compared to similar studies. For instance, Walmart's loyal customer contribution of
50.6% is still below the industry average of 65%, indicating opportunities to enhance customer loyalty
strategies. Additionally, this study has several limitations, such as data covering only a 14-month period,
the removal of incomplete customer data, transaction time adjustments that may affect data
interpretation, and the absence of external variables like advertising, market trends, or economic
conditions that could influence the results. For further development, it is recommended to take more
targeted and easily implementable steps. Use a simple sales prediction model, such as linear regression,
to assess how much discounts impact total transactions, then compare the prediction accuracy with
manual reporting methods. Apply automatic customer segmentation based on shopping patterns (e.g.,
visit frequency and purchase value) to personalize vouchers or product recommendations; simply start
with k-means clustering, which is available in many analytics software programs without requiring in-
depth statistical knowledge. Conduct usability testing of the dashboard with several sales staff and data
analysts, measure the time required to find specific business answers, and request feedback on the
presentation of results, which can serve as the basis for the next design iteration. By incorporating clear
constraints, assumptions, and action plans, discussions become more comprehensive and provide
CSRID Journal
e-ISSN: 2460-870X | p-ISSN: 2085-1367
Vol. 17 No. 3 October 2025 Pg.354-371
368
DOI: https://www.doi.org/10.22303/csrid-.17.3.2025.354-371
concrete direction on how data-driven improvements (including the implementation of simple machine
learning) can be implemented and evaluated.
3.3 Strategic Analysis of the Retail Industry Based on Walmart Consumer Behavior through
Interactive Data Visualization
The use of interactive data visualization in analyzing consumer behavior has become a strategic
approach that provides significant added value for retail companies. In this study, the interactive
dashboard developed to analyze Walmart customer transaction data not only provides descriptive
information but also generates predictive and prescriptive business insights. By exploring variables such
as customer loyalty, product categories, purchase timing, payment methods, and consumer
demographics, several key findings were identified that can be used to develop more effective and
adaptive strategies in response to the dynamics of the retail industry.
3.3.1 Optimizing Customer Loyalty: Focusing on High-Value Segments
The dashboard shows that customers in the “Loyal” category contribute the most significantly to total
transaction value. This highlights the importance of managing long-term relationships with existing
customers who have high purchase value. In this context, retail businesses need to strengthen data-driven
Customer Relationship Management (CRM) strategies, such as implementing reward point-based loyalty
programs, personalized product recommendations, and exclusive offers for customers in the loyal
category. Customer retention is not only more cost-effective than acquiring new customers but also
creates revenue stability. This insight also emphasizes the importance of identifying high-value customer
characteristics early on to focus on more targeted marketing efforts.
3.3.2 Seasonal Management and Sales Calendar: Designing Timely Sales Strategies
Transaction data shows that March is the peak sales month. This seasonal pattern provides a strong
signal for management to develop adaptive sales calendar and promotional strategies. For example,
increasing stock procurement, seasonal promotions, and marketing campaigns ahead of high-traffic
months can optimize revenue. Meanwhile, in months with low sales, cost-efficiency strategies, clearance
discounts, or bundle campaigns can be solutions to maintain performance. By leveraging this insight,
retail businesses can improve inventory planning and reduce the risk of overstocking or stockouts.
3.3.3 Mapping Top Product Categories: More Accurate Resource Allocation
Another important insight comes from analyzing product category contributions, where “Electronics”
and “Home” rank highest in total sales. This information is highly strategic in determining resource
allocation, product portfolio development, and thematic promotion planning. Retailers can increase
investment in top-performing categories, such as expanding product variety, deepening inventory, and
bundling to enhance purchase value. Additionally, categories with low performance can be evaluated for
repositioning, diversification, or even elimination. These insights drive product management efficiency
and overall profit margin improvement.
3.3.4 Daily Operational Strategy: Optimizing Sales Days
The dashboard shows that customer purchases are significantly higher on weekdays compared to
weekends. This finding serves as a crucial basis for developing more efficient and responsive daily
operational strategies aligned with customer behavior. Increased activity on weekdays can be leveraged
by allocating additional staff, extending operating hours, and optimizing services during these busy days.
Meanwhile, the potential for increased traffic on weekends can be achieved through special discounts,
Akhmad, Data Visualization to Analyze … 369
https://csridjournal.potensi-utama.org/index.php/CSRIDjournal/index | redaksijurnalupu@gmail.com
flash sales, or thematic events that appeal to more passive segments. With this data-driven approach,
operational efficiency and customer satisfaction can be improved simultaneously.
3.3.5
Demographic Segmentation: Personalizing Marketing Strategies
Data shows that the majority of customers come from the Generation X female segment. This
provides valuable insight that marketing strategies need to focus on the characteristics of this segment in
terms of communication media, visual style, and promotional language. For example, the use of
communication channels such as email marketing, social media platforms like Facebook, and product
narratives that emphasize convenience and quality can be more appealing to this segment. With data-
driven demographic segmentation strategies, retailers can optimize their marketing budgets and enhance
campaign effectiveness.
3.3.6 Payment Method Analysis: Developing Strategic Collaborations
The analysis shows that the dominant payment methods are debit and credit. This insight can
encourage strategic collaborations between retailers and financial institutions, such as banks and digital
payment platforms. Installment programs, cashback, or special discounts for certain card users can
encourage transaction frequency and volume. Additionally, diversifying payment methods, such as
integrating e-wallets or BNPL (buy now, pay later), can also enhance consumer transaction inclusion
and convenience.
3.3.7 The Impact of Discounts on Purchasing Behavior: Emphasis on Product Value
Interestingly, more than half of customers make purchases without using discounts. This indicates
that price is not the sole determinant in Walmart consumers' purchasing decisions. Factors such as
product quality, shopping experience, brand trust, and service convenience play a significant role.
Therefore, long-term strategies should not focus solely on price cuts but also on creating product and
service value. Positioning the brand as a provider of high-quality solutions will be more sustainable than
aggressive discount strategies.
4.
CONCLUSION
The interactive dashboard project developed using Microsoft Power BI successfully presented in-
depth visualizations of Walmart consumer behavior from January 2024 to February 2025. The dashboard
revealed several key insights that are critical for data-driven decision-making in retail. First, loyal
customers contributed the highest sales value, amounting to $6.46 million (50.58%), emphasizing the
strategic importance of maintaining long-term customer relationships. Second, transactions during
weekdays were significantly higher than on weekends, with $9.07 million in purchases compared to
$3.70 million, indicating consumer behavior patterns based on shopping timing. In terms of product
preferences, the Electronics category particularly Headphones dominated, generating $846,875.96 in
sales from 3,261 transactions. Segmentation by age group showed that Generation X consistently led in
purchase value across most product rating levels, especially at rating 1, contributing nearly $1 million.
The analysis also indicated that debit card payments were the most commonly used method across both
genders, with nearly equal distribution. These findings enriched by both demographic and behavioral
segmentation offer a comprehensive view of Walmart customer purchasing patterns, and provide
actionable insights for marketing, inventory, and customer relationship strategies. Unlike previous
studies that focused solely on descriptive analysis, this research integrates consumer behavior theory
with interactive business intelligence dashboards, providing structured interpretations of loyalty drivers
and segmentation insights. This methodological integration marks a notable contribution to the field of
retail analytics.
CSRID Journal
e-ISSN: 2460-870X | p-ISSN: 2085-1367
Vol. 17 No. 3 October 2025 Pg.354-371
370
DOI: https://www.doi.org/10.22303/csrid-.17.3.2025.354-371
For future researchers, it is recommended to incorporate machine learning techniques such as
clustering, predictive modeling, or recommendation systems to uncover deeper behavioral patterns and
forecast future trends. Exploring other BI platforms (e.g., Tableau, Looker Studio) and integrating with
real-time data pipelines can also enhance visualization quality and analytical flexibility.
For retail practitioners, the adoption of interactive dashboards should be considered essential as part
of strategic and operational decision-support systems. Dashboards enable real-time monitoring of critical
metrics such as customer loyalty, sales trends, and promotion effectiveness supporting faster, evidence-
based decision-making. In today’s dynamic retail environment, this approach can significantly enhance
efficiency, customer engagement, and business competitiveness.
REFERENCES
[1]
Amin, M. M., Sutrisman, A., & Dwitayanti, Y. (2021). Development of Star-Schema Model for Lecturer
Performance in Research Activities. International Journal of Advanced Computer Science and
Applications (IJACSA), 12(9), 74–80.
https://doi.org/10.14569/IJACSA.2021.0120910
[2]
Bandara, K., Shi, P., Bergmeir, C., Hewamalage, H., Tran, Q., & Seaman, B. (2019). Sales demand forecast
in e-commerce using a long short-term memory neural network methodology. In X. Y. Editor & Z. W.
Editor (Eds.), Neural information processing (Lecture Notes in Computer Science, Vol. 11727, pp. 462–
474).
[3]
Buchdadi, A. D. (2024). Segmenting Walmart Customers for Personalized Marketing Strategies Using
MiniBatchKMeans Clustering and Decision Trees: An Analysis of Purchasing Behavior.
Journal of
Digital Market and Digital Currency
,
1
(3), 204-224.
[4]
Chen, D. (2024). Walmart sales prediction based on random forest model and application of feature
importance. Applied and Computational Engineering, 53.
[5]
Gokulpriya, R. (2024). E-Commerce Sales Analysis Dashboard using Business Intelligence Tool - Microsoft
Power BI. International Journal of Innovative Research in Multidisciplinary Physical Sciences (IJIRMPS),
12(4), 1-12. https://www.ijirmps.org/papers/2024/4/230837.pdf
[6]
Hafeez, J. (2023). Effectiveness of Power BI in Transforming Business Intelligence Processes.
https://www.theseus.fi/bitstream/10024/813012/2/Hafeez_Jawad.pdf
[7]
Halawa, P., Bangun, B., & Sihombing, V. (2024). Penggunaan Big Data untuk prediksi tren pasar dalam
industri retail. Jurnal Sistem Informasi, Teknik Komputer dan Teknologi Pendidikan, 4(1), 32–36.
https://loddosinstitute.org/journal/index.php/JUSTIKPEN/article/view/136/112
[8]
Husna, L., & Utomo, P. E. P. (2023). Analisis Dan Visualisasi Data Body Performance Menggunakan Tiga
Tools Visualisasi. Jurnal Ilmiah Intech: Information Technology Journal of UMUS, 5(1), 32-40.
[9]
Irwansyah, R., Listya, K., Setiorini, A., Hanika, I. M., Hasan, M., Utomo, K. P., Bairizki, A., Lestari, A. S.,
Rahayu, D. W. S., Butarbutar, M., Nupus, H., Hasbi, I., Elvera, & Triwardhani, D. (2021). Perilaku
konsumen. Penerbit Widina Bhakti Persada Bandung.
[10]
Jeswani, R. (2021). Predicting Walmart Sales, Exploratory Data Analysis, and Walmart Sales Dashboard.
PhD thesis
.
[11]
Krismawintari, N. P. D., & Komalasari, Y. (2019, November). Perilaku Pembelian Melalui Cashless Payment
Pada Gerai Retail (Studi Pada Masyarakat Kabupaten Badung Bali). In Seminar Ilmiah Nasional
Teknologi, Sains, dan Sosial Humaniora (SINTESA) (Vol. 2).
[12]
Kurniawan, R., & Ahmadi, M. A. (2024). Pengaruh media sosial terhadap kebiasaan belanja konsumen bagi
generasi X, Y, Z. Jurnal Media Akademik, 2(12), 1–14.
Akhmad, Data Visualization to Analyze … 371
https://csridjournal.potensi-utama.org/index.php/CSRIDjournal/index | redaksijurnalupu@gmail.com
[13]
Lizana, H. I., & Ridho, F. (2021). Implementasi dan Evaluasi Visualisasi Data Interaktif pada Publikasi
Laporan Bulanan Data Sosial Ekonomi Indonesia. Seminar Nasional Official Statistics, 2021(1), 947-957.
[14]
Mulyana, M., Nurendah, Y., & Effendy, M. (2023). Business Intelligence: Pemanfaatan Dashboard dan
Visualisasi Data untuk Mendukung Pengambilan Keputusan. Jurnal IBIK, 23(1), 23-40.
[15]
Najib, M. K., & Stefany, E. M. (2024). Visualisasi data penjualan supermarket dengan Microsoft Power BI
untuk menghasilkan insight dan rekomendasi. Jurnal Sistem Informasi (TEKNOFILE), 2(12), 921–928.
https://jurnal.nawansa.com/index.php/teknofile/article/view/488/234
[16]
Nisa', S. H. K., & Rusdianto, R. Y. (2024). Pemanfaatan Visualisasi Data dalam Meningkatkan Pengambilan
Keputusan
Bisnis.
Jurnal
Informasi,
Sains
dan
Teknologi,
7(2),
200-204.
https://doi.org/10.55606/jisamtek.v7i2.290
[17]
Nugraha, J. P., Alfiah, D., Sihulingga, G., Rojiati, U., Saloom, G., Rosmawati, Fatihani, S. E., Johannes, R.,
Krisita, Batin, M. H., Lestari, W. J., Khathimah, H., & Beribe, M. F. B. (2021). Teori perilaku konsumen.
PT
Nasya
Expanding
Management.
https://repository.usd.ac.id/43512/1/7750_Ebook+Teori+Perilaku+Konsumen.pdf
[18]
Nurhakim, I., & Voutama, A. (2024). Analisis Efisiensi Pelayanan Kesehatan dengan Visualisasi Data
Interaktif di Power BI. JITET (Jurnal Informatika dan Teknik Elektro Terapan), 13(2), 904.
[19]
Paramitha, F., & Adrijanto, P. E. (2023). Adaptasi perilaku berbelanja daring Generasi X di masa pandemi.
Jurnal Impresi Indonesia, 2(7), 622–635.
https://doi.org/10.58344/jii.v2i7.3185
[20]
Rezende, R. de, Egert, K., Marin, I., & Thompson, G. (2022). A white-boxed ISSM approach to estimate
uncertainty distributions of Walmart sales. International Journal of Forecasting, 38(4), 1460–1467.
[21]
Sabrina, S. S., Aswarulloh, H., & Shiddieq, D. F. (2024). Visualisasi data penyebab kematian di Indonesia
rentang tahun 2000–2022 dengan Power BI. Jurnal Informatika dan Teknik Elektro Terapan (JITET),
12(2), 1–8. https://doi.org/10.23960/jitet.v12i2.4071
[22]
Saputra, M. A., & Purwani, F. (2024). Perancangan dashboard analytic untuk visualisasi data progres proyek
IIIB PT. Pupuk Sriwidjaja Palembang dengan Microsoft Power BI. Seminar Nasional Pembelajaran
Matematika,
Sains
Dan
Teknologi,
4(1),
184–190.
http://e-
jurnal.fkip.unila.ac.id/index.php/SINAPMASAGI/article/view/807
[23]
Steven, K., Hariyanto, S., Arijanto, R., & Wijaya, A. H. (2021). Penerapan business intelligence untuk
menganalisis data pada PT. Suryaplas Intitama menggunakan Microsoft Power BI. Jurnal Algor, 2(2), 1–
10. https://jurnal.buddhidharma.ac.id/index.php/algor/article/view/550/346
[24]
Wanda, Anika Sukma. 2024. "Analisis dan Visualisasi Data Penjualan Sembako Toko Jaya Abadi
Menggunakan
Power
BI."
Jurnal
Sistem
Informasi
(TEKNOFILE)
2
(10):
731–737.
https://jurnal.nawansa.com/index.php/teknofile/article/view/321
[25]
Zahra, H. F., & Triayudi, A. (2025). Implementasi business intelligence untuk memprediksi penjualan ritel
pada PT Chelatama Perkasa menggunakan regresi linear. JATI, 9(3), 4806–4815.