




Citation:
Qian, D.; Dargusch, P.; Hill,
G. Carbon Management behind the
Ambitious Pledge of Net Zero
Carbon Emission—A Case Study of
PepsiCo.
Sustainability
2022
,
14
, 2171.
https://doi.org/10.3390/su14042171
Academic Editor:
Baojie He
Received:
12 January 2022
Accepted:
10 February 2022
Published:
14 February 2022
Publisher’s Note:
MDPI stays neutral
with regard to jurisdictional claims in
published maps and institutional affil-
iations.
Copyright:
©
2022
by
the
authors.
Licensee
MDPI,
Basel,
Switzerland.
This
article
is
an
open
access
article
distributed
under
the
terms
and
conditions
of
the
Creative
Commons
Attribution
(CC
BY)
license
(https://
creativecommons.org/licenses/by/
4.0/).
sustainability
Article
Carbon Management behind the Ambitious Pledge of Net Zero
Carbon Emission—A Case Study of PepsiCo
Duan Qian, Paul Dargusch
and Genia Hill *
School of Earth and Environmental Sciences, The University of Queensland, St Lucia, QLD 4072, Australia;
d.qian@uqconnect.edu.au (D.Q.); p.dargusch@uq.edu.au (P.D.)
*
Correspondence:
genia.hill@uq.edu.au
Abstract:
Since
the
industrial
revolution,
greenhouse
gas
emissions
caused
by
human
activities
have posed an unprecedented global challenge to social development and impact on the natural
environment.
With
the
growing
awareness
of
environmental
protection
and
the
promotion
of
international
cooperation
mechanisms,
there
is
a
global
consensus
to
control
greenhouse
gases.
In
order
to
avoid
irreversible
and
catastrophic
climate
change,
there
is
an
urgent
need
for
more
companies
to
take
action
and
make
credible
commitments
to
combat
climate
change
and
carbon
reduction goals aligned with the Paris Agreement and the UN Sustainable Development Goals.
As
one
of
the
largest
and
most
influential
international
food
and
beverage
companies
with
a
range
of well-known brands, PepsiCo has made ambitious commitments to science-based climate goals,
including reducing GHG emissions from its direct operations by 75% against the 2015 baseline and
reducing GHG emissions across its indirect value chain by 40% by 2030, as well as setting an ambitious
new target to achieve net-zero emissions by 2040.
PepsiCo has incorporated carbon reduction and
climate strategies in all focus areas across its value chain, accelerating its work on broadening the
scale of sustainable agriculture and regenerative farming practice; reducing plastic use and increasing
the use of recycle and renewable materials as well as adopting low-carbon alternatives; developing
efficient and alternative solutions in transportation and distribution; shifting to renewable electricity
and
fuels
in
manufacturing
and
fleet.
Up
to
2021,
PepsiCo
has
achieved
a
23%
of
the
absolute
emissions
target
of
reducing
Scope
1
and
Scope
2
emissions
and
7.9%
of
the
absolute
emissions
target of reducing Scope 3 emissions.
This research aims to evaluate the performance of PepsiCo on
achieving their carbon reduction targets based on the analysis of the reported carbon estimates and
reduction strategies, and also provides future strategic suggestions and guidance by adopting case
study analysis.
Although PepsiCo has reported great progress in reducing carbon emissions, further
efforts are needed to achieve these goals.
Keywords:
net zero; corporate sustainability; climate change mitigation; environmental, social, and
corporate governance (ESG)
1.
Introduction
Anthropogenic activity, especially the large-scale consumption of fossil fuels in the
process of industrialization in developed countries, has led to a dramatic rise in the con-
centration of greenhouse gases in the atmosphere.
According to an IPCC report, global
warming is likely to reach 1.5
◦
C between 2030 and 2052 if it continues to increase at the
current rate (high confidence) [
1
].
The significant effects of global warming on natural sys-
tems and social development have been detected in varying degrees in the last 50 years [
1
],
which poses an unprecedented challenge to the ecological environment and development
of human society.
International cooperation on climate change has made significant progress through
the introduction and improvement of a series of international climate policies [
2
].
The Paris
Agreement 2015 provides a global framework with an explicit long-term goal to limit global
Sustainability
2022
,
14
, 2171.
https://doi.org/10.3390/su14042171
https://www.mdpi.com/journal/sustainability
Sustainability
2022
,
14
, 2171
2 of 12
warming to well below pre-industrial levels of 2 degrees Celsius, preferably 1.5 degrees
Celsius [
2
].
Most countries have put effort into international climate change cooperation
and enhanced their capacity to implement the Agreement.
A range of ambitious actions
and strategies have been carried out to address climate issues and enhance adaptation and
resilience to related adverse impacts [
2
,
3
].
The Paris Agreement 2015 incorporates the emission reduction actions committed to
by all parties into a unified and legally binding framework, prompting more and more
countries, cities, and firms to establish and achieve net zero emission targets [
3
].
One of the
prioritised actions indicated by the Paris Agreement 2015 is the science-based economic
and
social
transformation
[
4
].
Enormous
firms
and
organisations
pay
more
attention
to their carbon footprint and to gradually transforming and adjusting their energy and
industrial processes in response to the goal of international or national climate policies
and increasing public environmental awareness [
5
].
Carbon footprints are used to quantify
the
environmental
impact
of
carbon
emissions
at
organisation-level
from
daily
energy
consumption,
accounting
for
all
direct
emissions
(Scope
1),
indirect
energy
emissions
(Scope
2)
and
other
indirect
emissions
(Scope
3)
within
the
set
system
boundaries
and
limits of the assessment.
After assessing the carbon emissions of the entire value chain,
enterprises can formulate corresponding emission reduction targets and strategies [
6
].
As interest in greenhouse gas emissions continues to rise among customers, govern-
ment agencies and other stakeholders, many leading companies are motivated to improve
the capacity of understanding their carbon footprint across the value chain by engaging
their suppliers, customers, and other partners to incorporate the reduction of GHG emis-
sions into their own business system practices and seek feasible and effective methods to
reduce emissions [
5
,
7
].
As a multinational company known for its consumer-facing brands, PepsiCo is dedi-
cated to establishing a more sustainable food system through strengthening their capacity
on
tackling
climate-related
issues
and
carbon
emission
reduction.
They
recognise
that
committing to the environmental sustainability of their products and promoting this func-
tion
to
consumers
can
be
a
great
contributor
to
their
success
in
the
marketplace,
with
a
significant
advantage
over
their
competitors
[
8
].
PepsiCo
incorporates
sustainability
goals and strategies into the implementation of a range of initiatives.
They target focus
areas of the complex value chain to improve the energy efficiency of operations to reduce
greenhouse
gas
emissions,
achieve
sustainable
water
security,
innovate
products,
and
recycle packaging materials.
PepsiCo discloses their carbon emission estimates by scope
and source, demonstrating their progress and outcomes.
Meanwhile, they ensure that the
company is adapting sustainability strategy in alignment with stakeholder expectations,
legislation, and marketplace conditions [
7
,
9
].
2.
Overview of the Firm
More than one billion consumers in more than 200 countries and territories around the
world enjoy PepsiCo products every day.
More than 290,000 employees work in the firm.
PepsiCo’s portfolio of brands includes a range of popular food and beverage products,
23 of which have estimated annual retail sales of more than $1 billion.
The net revenues for
PepsiCo in 2020 exceeded $70 billion [
9
].
PepsiCo
is
committed
to
establishing
a
sustainable
food
system.
They
aim
to
take
advantage of their scale, influence, and expertise to change the way the world produces,
distributes, consumes, and handles food and drink to meet the global challenges brought
by climate change, soil erosion, water scarcity, and population growth.
The sustainability
agenda of PepsiCo indicates six prioritised focus areas and goals in their sustainable food
system, which include (1) agriculture (further expand the scale of sustainable agriculture
and regenerative practices to improve agricultural resilience and reduce emissions); (2) wa-
ter (promote water safety,
ensure business continuity and make a positive contribution
to
the
community);
(3)
packaging
(promote
“a
world
where
packaging
never
becomes
waste”); (4) products (optimize the product by reducing the addition of sugar, sodium and
Sustainability
2022
,
14
, 2171
3 of 12
saturated fat); (5) climate (reduce greenhouse gas (GHG) emissions throughout the value
chain; dedicate to the containment of climate change); (6) people (promote the provision
of fair and safe working conditions and the establishment of an equitable and inclusive
workplace) [
9
].
3.
Pledges and Targets
PepsiCo
announced
the
goal
to
reduce
their
absolute
emissions
across
their
entire
value chain by 20% by 2030 (against a 2015 baseline) in 2016.
This goal has been approved
by the Science-Based Targets Initiative (SBTi) and is aligned to a 2
◦
C pathway.
In early 2020,
PepsiCo announced the new ambition to reduce greenhouse gas emissions from its direct
value chain (Scope 1 and 2) by 75% from the 2015 benchmark and reduce greenhouse gas
emissions from its indirect value chain (Scope 3) by 40% [
10
].
As one of the 115 signatories
of The Climate Pledge 2021, PepsiCo also pledged to achieve carbon neutrality by 2040,
which is 10 years earlier than called for in the Paris Agreement [
10
].
PepsiCo committed
to
(1)
regularly
provide
reports
of
greenhouse
gas
emission
estimates;
(2)
develop
and
undertake low-carbon strategies consistent with the Paris Agreement through practical
business change and innovation; (3) neutralize any remaining carbon emissions through
additional, quantifiable, real, permanent, and socially beneficial offsets to achieve the goal
of net-zero carbon emission by 2040 [
11
].
They are monitoring the guidance currently being
developed by the SBTi and will align the target accordingly [
12
].
4.
Emissions Estimates
PepsiCo discloses comprehensive financial information and carbon emission estimates
and publishes them in their response to the CDP (Customer Data Platform) climate ques-
tionnaire annually (Table
1
).
The standard, protocol, or methodology have been applied to
access activity data and calculated emissions are clearly stated [
12
].
4.1.
Scope 1 and Scope 2
Region-specific emissions factors were applied to estimate the Scope 1 emissions from
manufacturing operations and company-owned fleet fuel use in 2019 and 2020.
Default
emissions factors were applied in 2018.
The 2017 report did not include emissions related
to commercial activities in direct operations as part of the global total Scope 1 figure [
12
].
Table 1.
Global gross Scope 1 emission categorised by business activities [
12
].
Activity
2017 Emissions
(Metric Tons CO
2
e)
2018 Emissions
(Metric Tons CO
2
e)
2019 Emissions
(Metric Tons CO
2
e)
2020 Emissions
(Metric Tons CO
2
e)
Processing/manufacturing
2,170,323
2,167,540
2,239,964
Distribution of
commodity
1,406,944
1,384,874
1,312,742
Total
3,734,520
3,577,267
3,552,415
3,552,706
PepsiCo
disclosed
the
breakdowns
of
gross
global
Scope
2
emissions
by
business
division
(Table
2
).
PepsiCo
stated
the
electricity
supplier
emissions
factors
or
residual
emissions factors for some divisions are not accessible currently.
They have applied and
reported all available data (e.g., in Europe) to market-based Scope 2 emissions estimates.
PepsiCo has in addition applied location-based methodology to estimate Scope 2 emissions.
Therefore, they can evaluate and monitor the impact of the abatement efforts across different
business activities and operational areas based on these two methodologies [
12
].
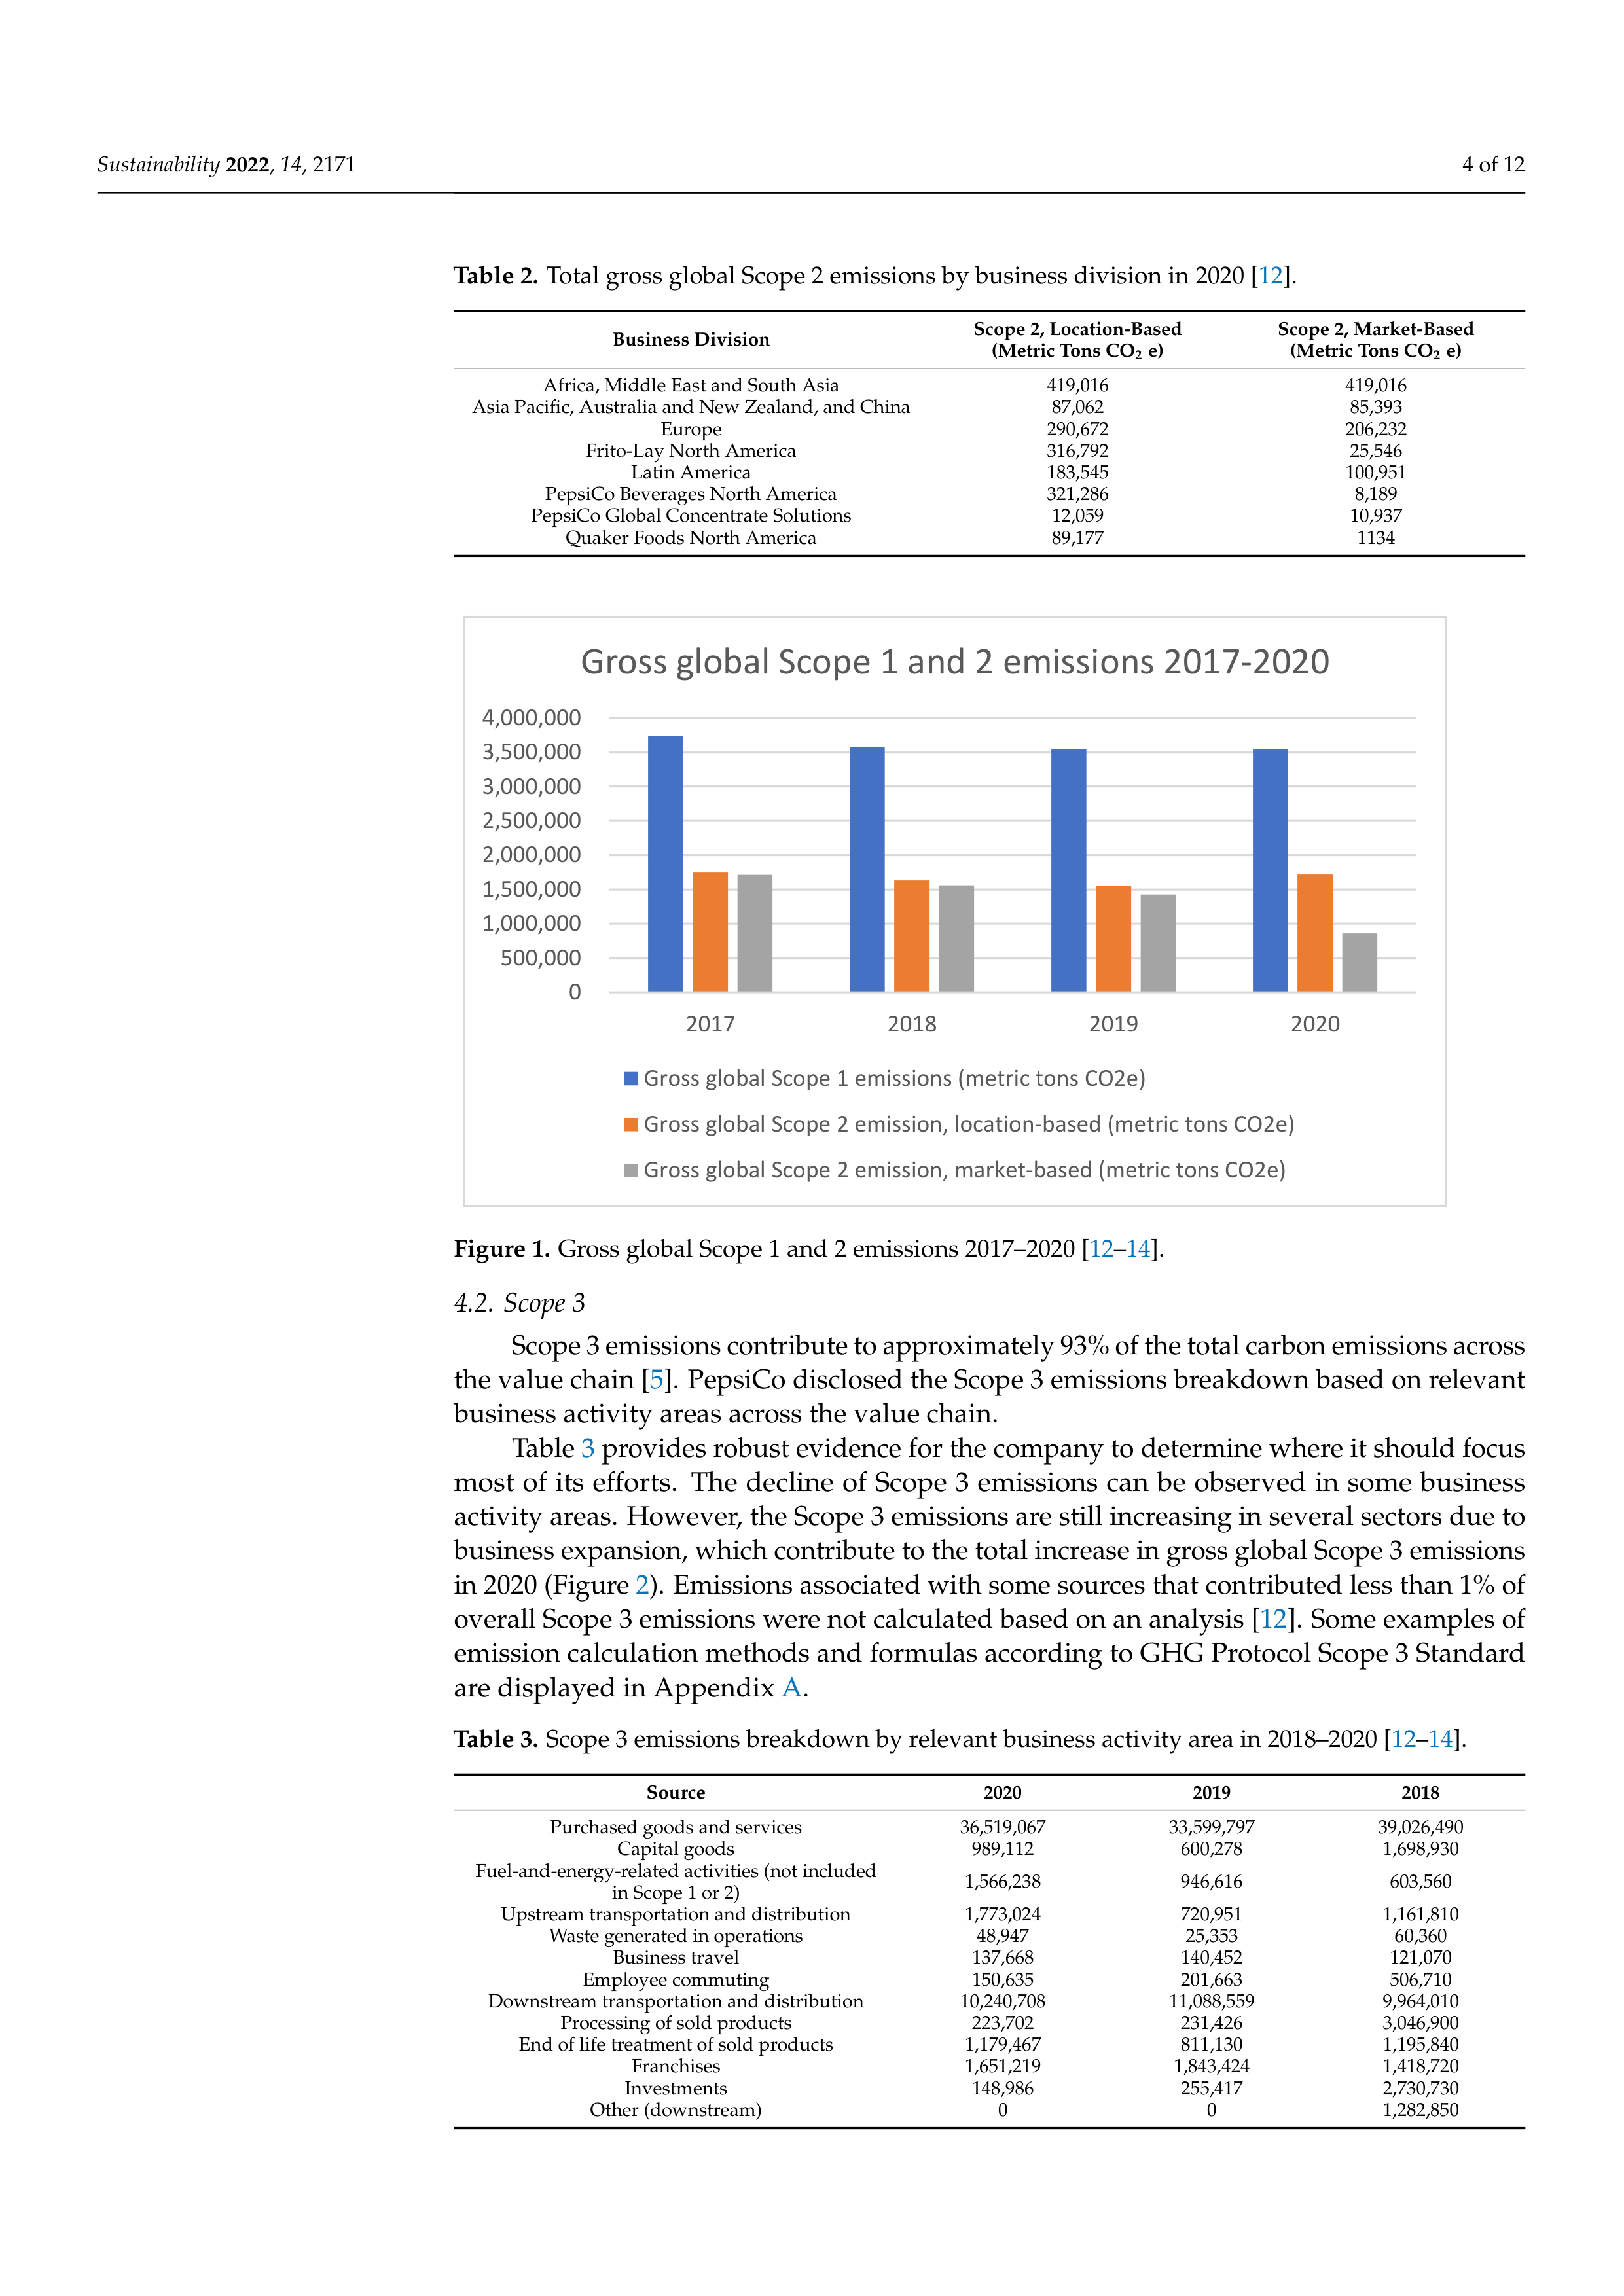
From Figure
1
above, a steady decline in Scope 1 and Scope 2 (market-based) can be
observed over the past 4 years.
There was a slight increase in Scope 2 emissions (located-
based) in 2020, however, the total gross global Scope 2 emissions are on a downward trend.
Sustainability
2022
,
14
, 2171
4 of 12
Table 2.
Total gross global Scope 2 emissions by business division in 2020 [
12
].
Business Division
Scope 2, Location-Based
(Metric Tons CO
2
e)
Scope 2, Market-Based
(Metric Tons CO
2
e)
Africa, Middle East and South Asia
419,016
419,016
Asia Pacific, Australia and New Zealand, and China
87,062
85,393
Europe
290,672
206,232
Frito-Lay North America
316,792
25,546
Latin America
183,545
100,951
PepsiCo Beverages North America
321,286
8,189
PepsiCo Global Concentrate Solutions
12,059
10,937
Quaker Foods North America
89,177
1134
0
500,000
1,000,000
1,500,000
2,000,000
2,500,000
3,000,000
3,500,000
4,000,000
2017
2018
2019
2020
Gross global Scope 1 and 2 emissions 2017-2020
Gross global Scope 1 emissions (metric tons CO2e)
Gross global Scope 2 emission, location-based (metric tons CO2e)
Gross global Scope 2 emission, market-based (metric tons CO2e)
Figure 1.
Gross global Scope 1 and 2 emissions 2017–2020 [
12
–
14
].
4.2.
Scope 3
Scope 3 emissions contribute to approximately 93% of the total carbon emissions across
the value chain [
5
].
PepsiCo disclosed the Scope 3 emissions breakdown based on relevant
business activity areas across the value chain.
Table
3
provides robust evidence for the company to determine where it should focus
most
of
its
efforts.
The
decline
of
Scope
3
emissions
can
be
observed
in
some
business
activity areas.
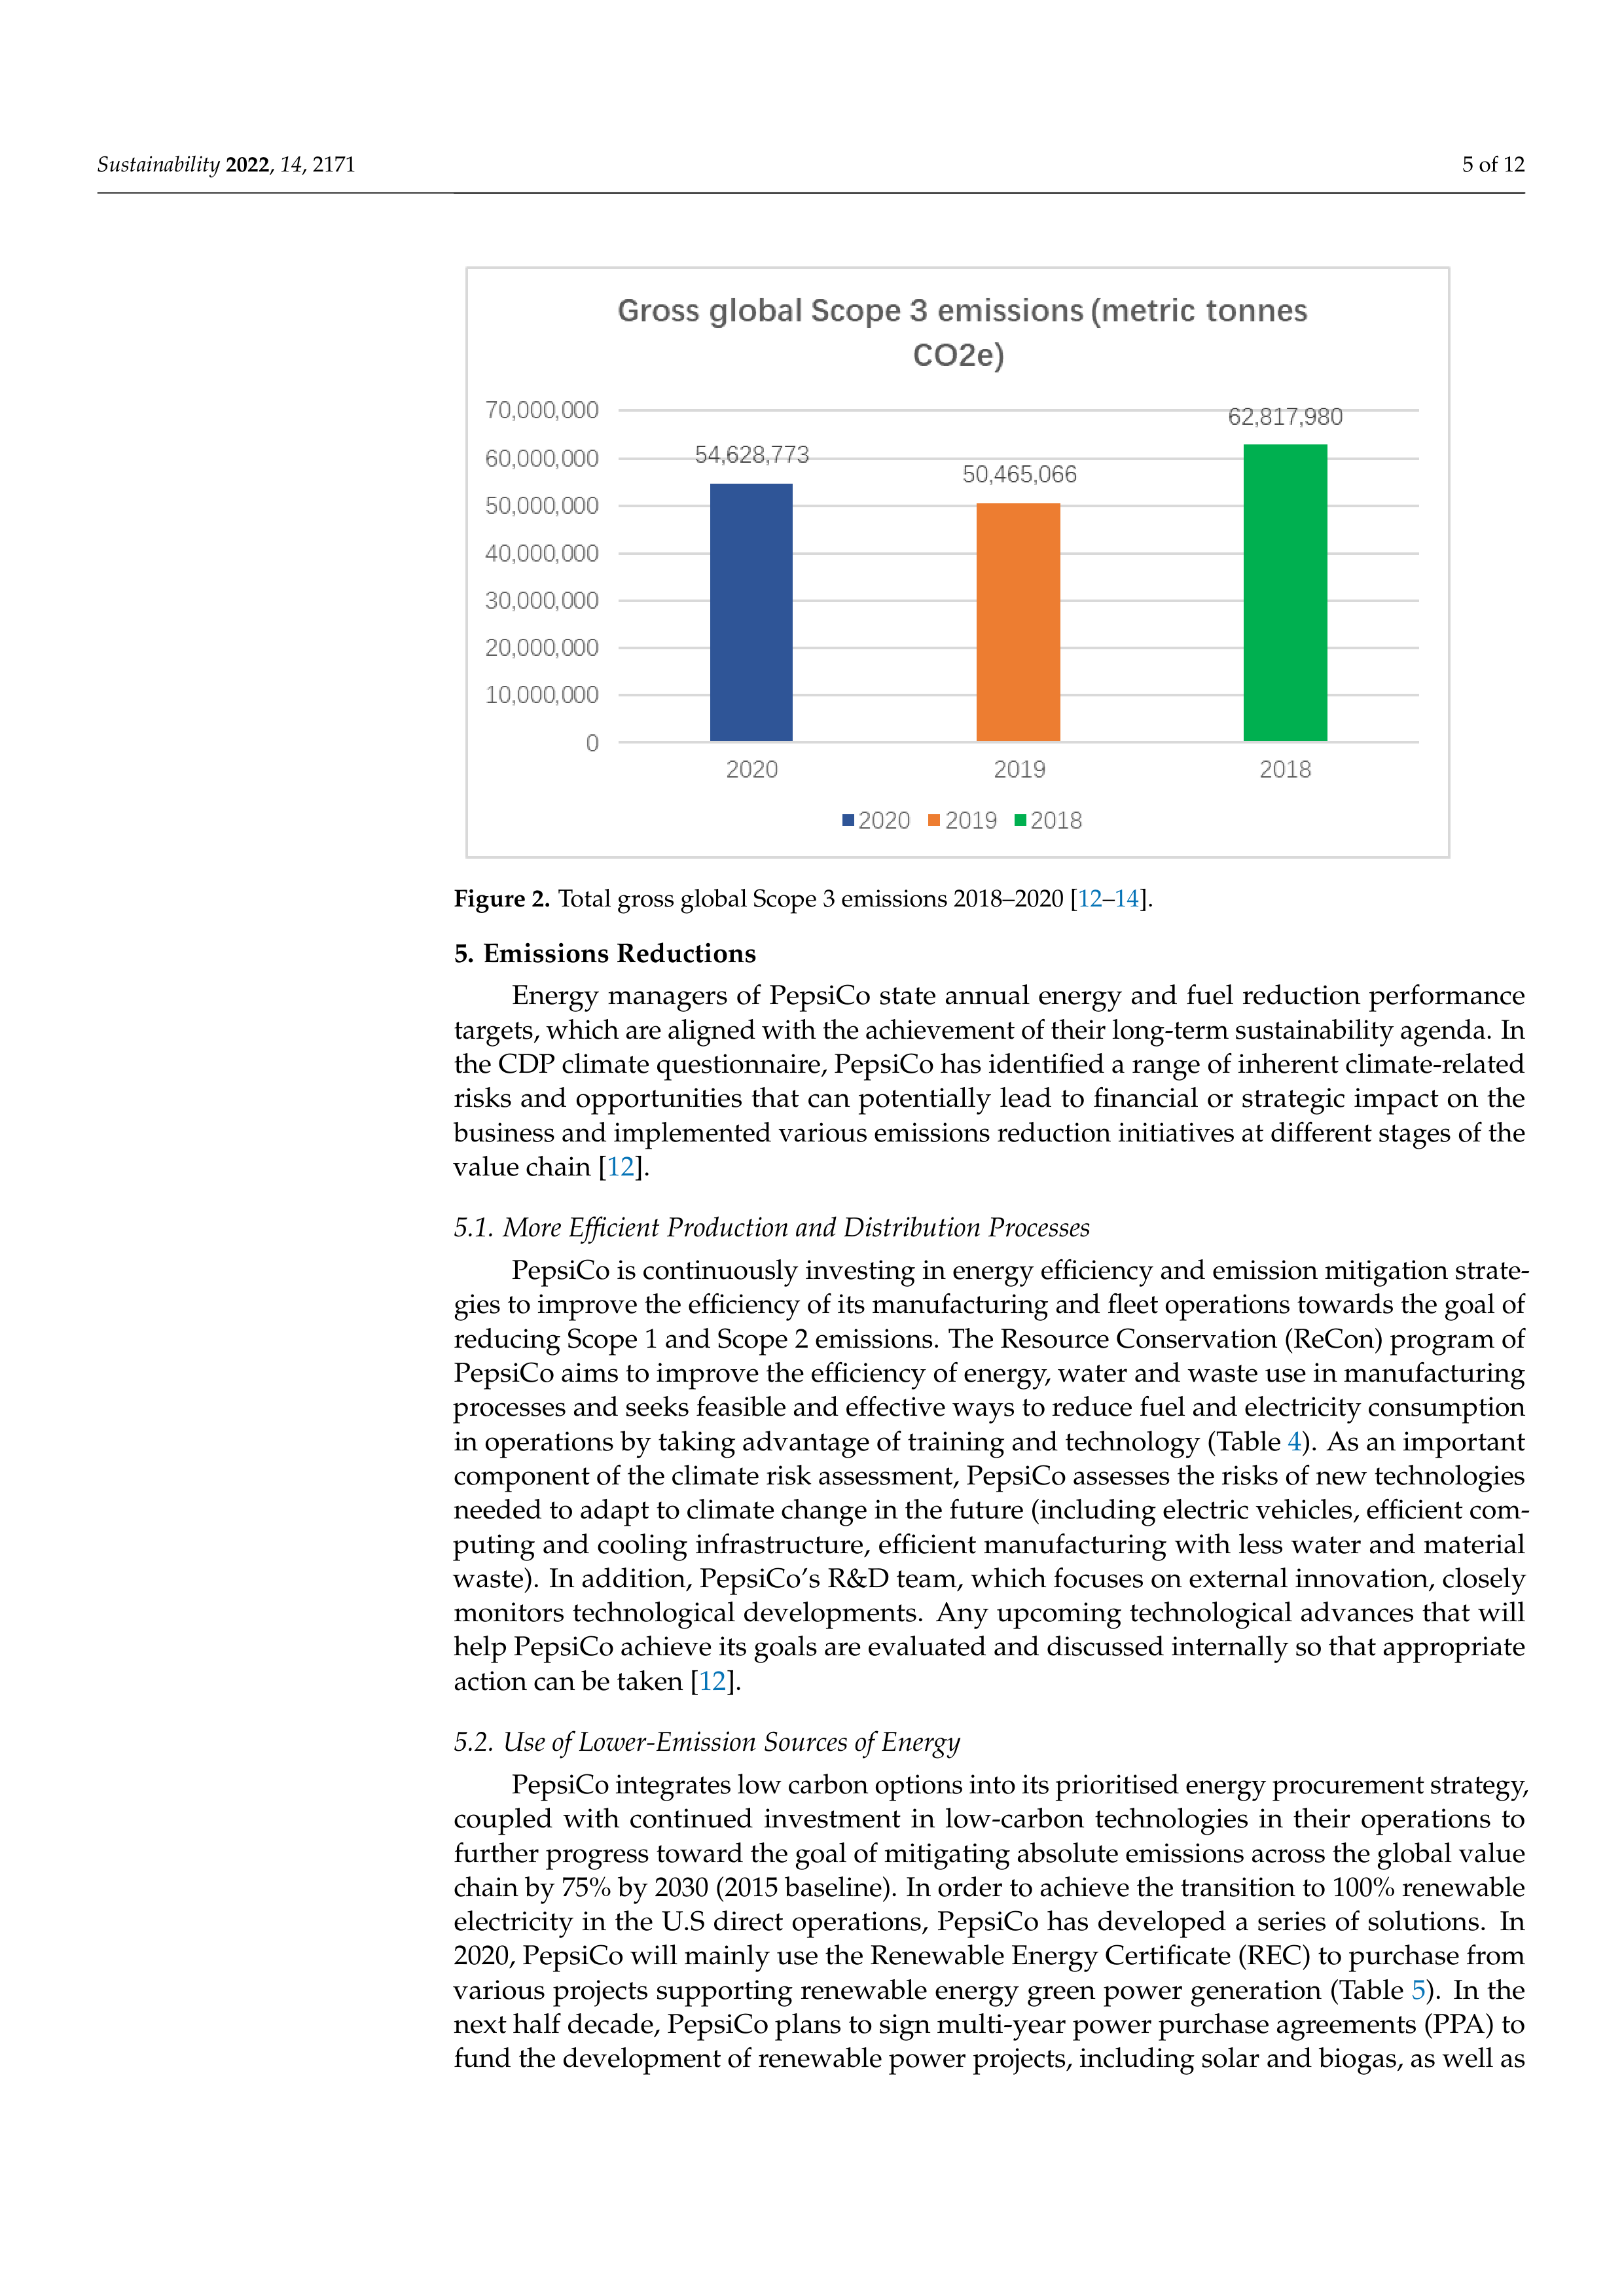
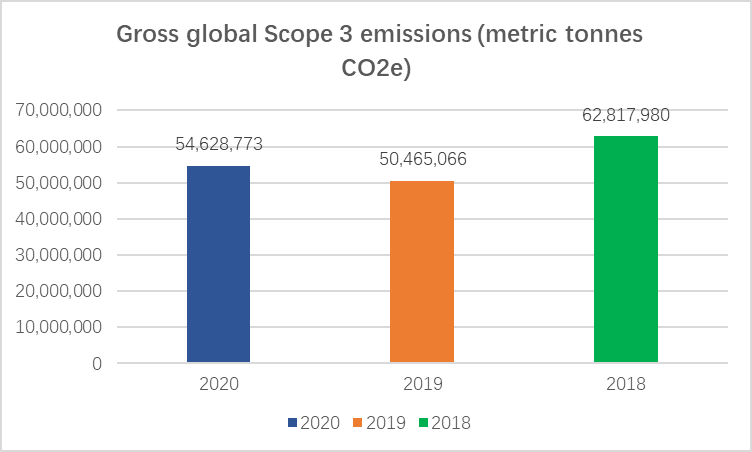
However, the Scope 3 emissions are still increasing in several sectors due to
business expansion, which contribute to the total increase in gross global Scope 3 emissions
in 2020 (Figure
2
).
Emissions associated with some sources that contributed less than 1% of
overall Scope 3 emissions were not calculated based on an analysis [
12
].
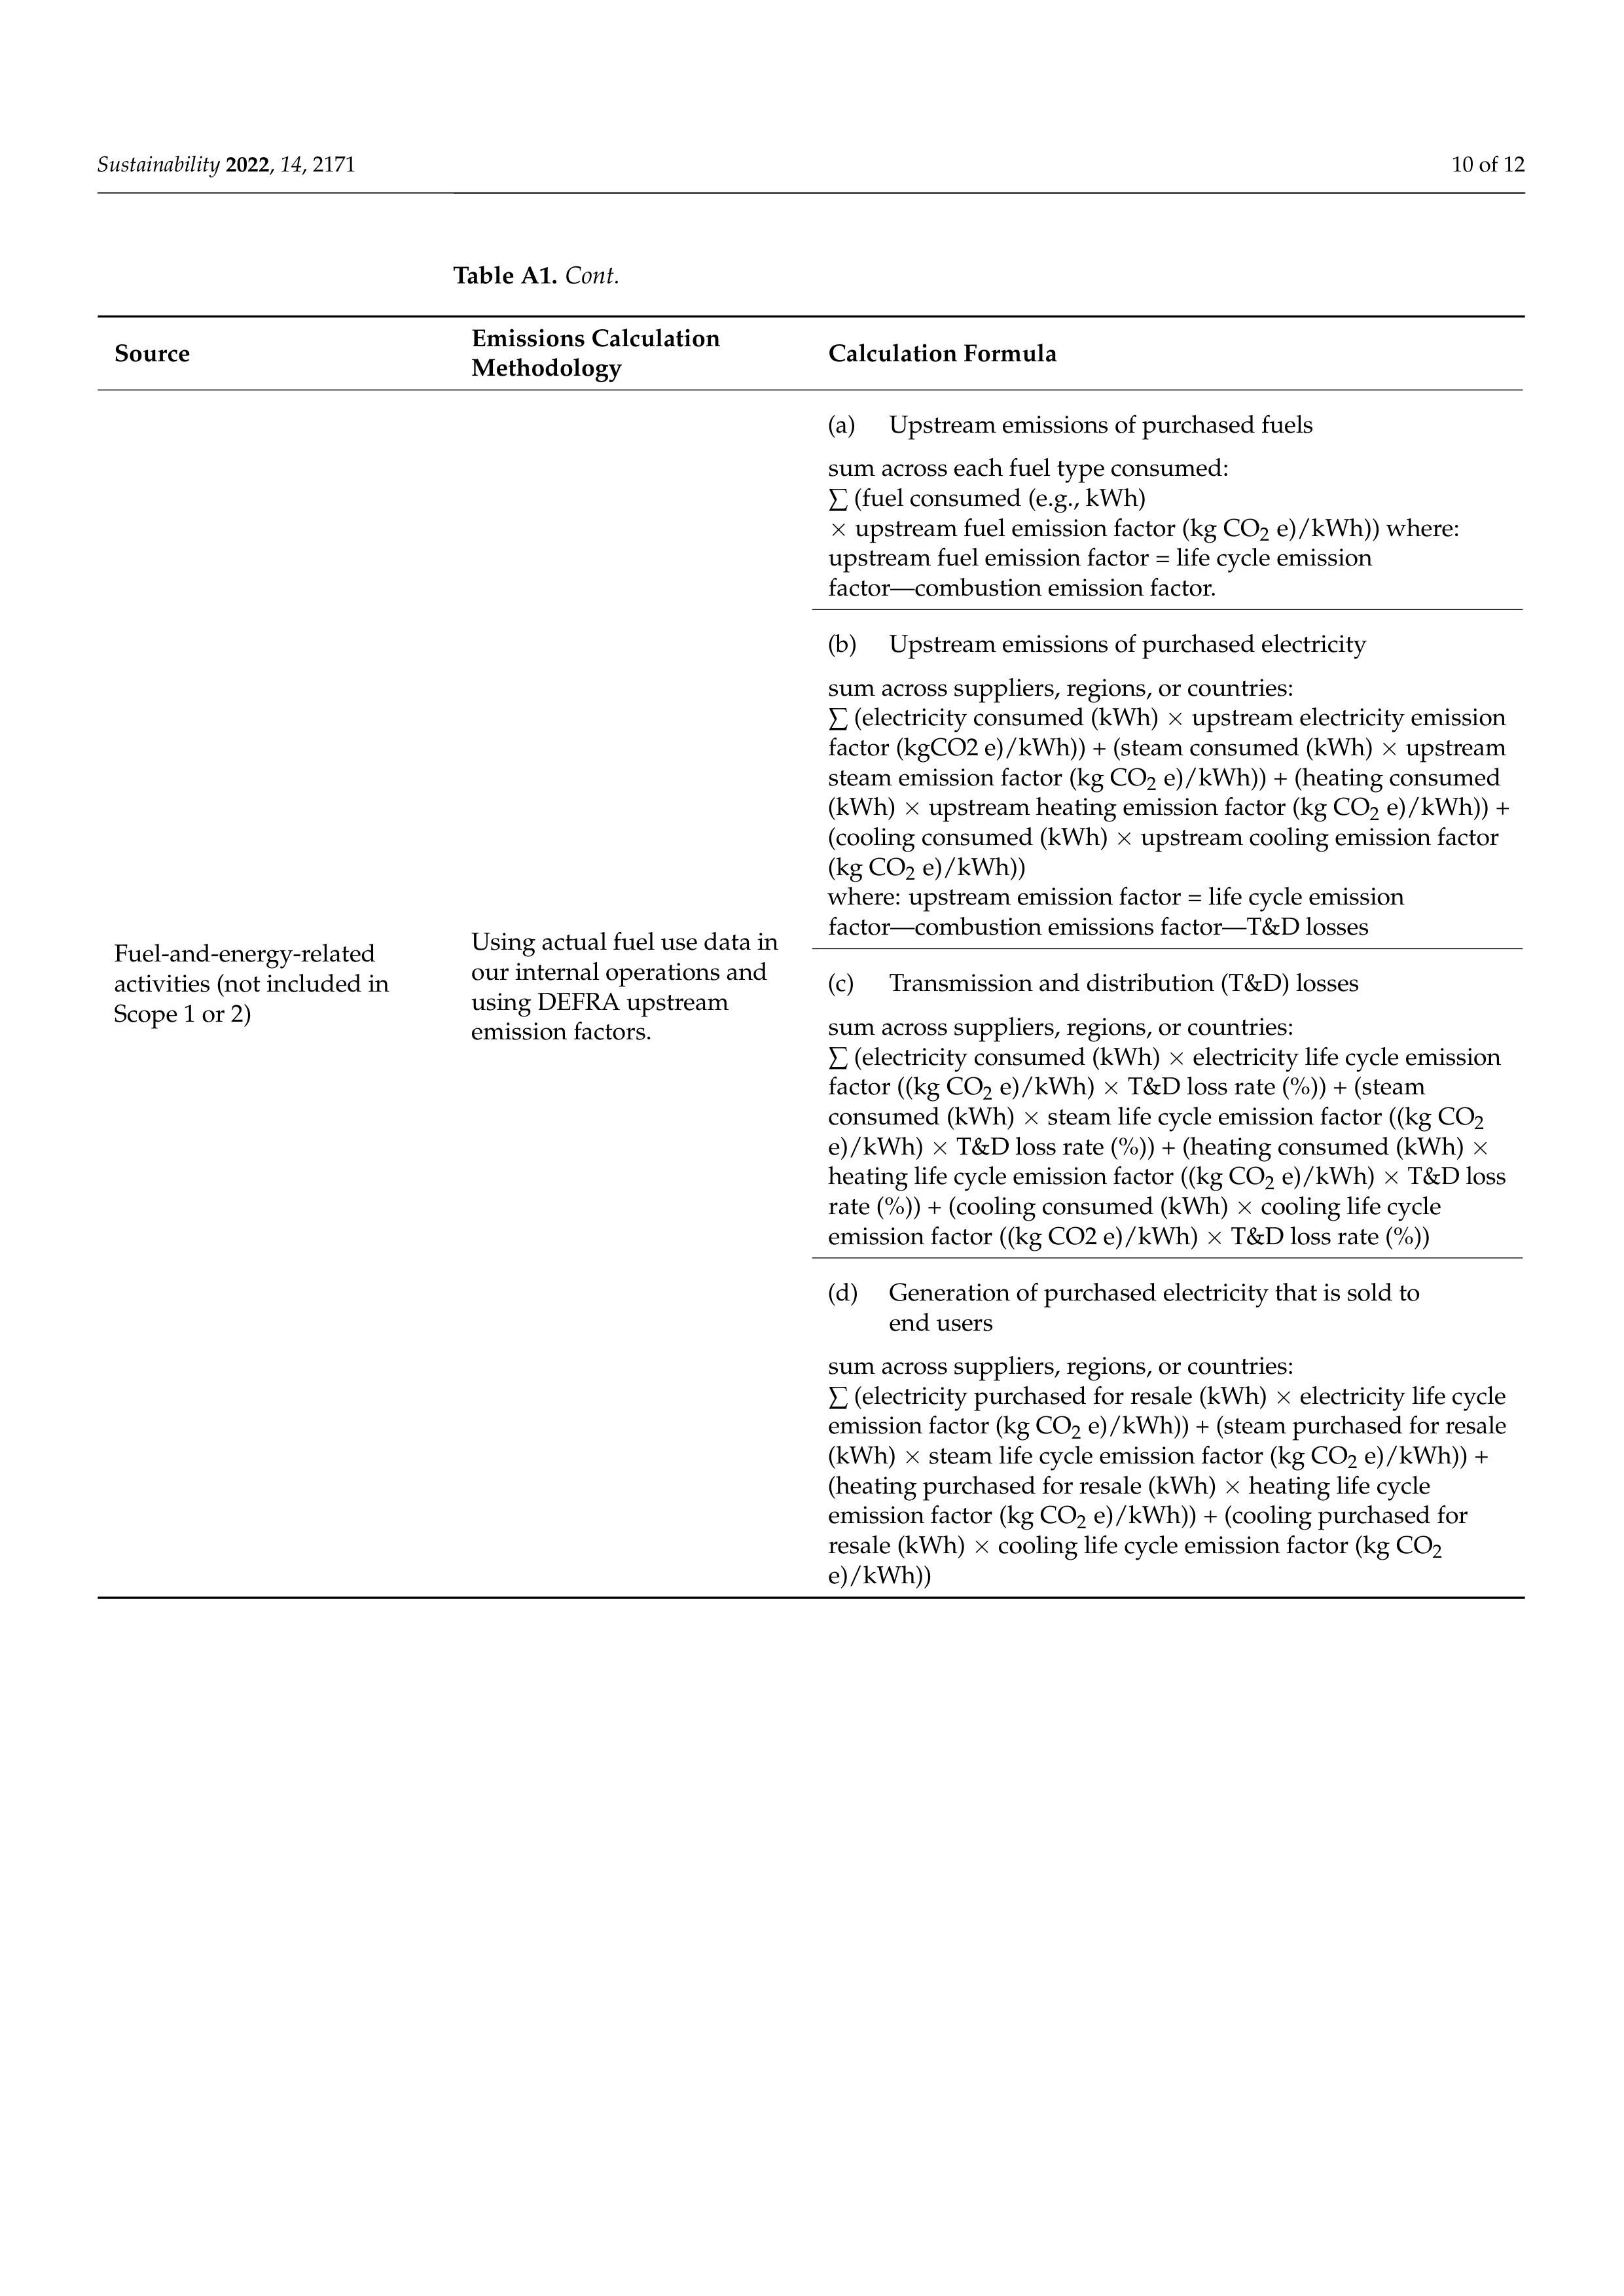
Some examples of
emission calculation methods and formulas according to GHG Protocol Scope 3 Standard
are displayed in Appendix
A
.
Table 3.
Scope 3 emissions breakdown by relevant business activity area in 2018–2020 [
12
–
14
].
Source
2020
2019
2018
Purchased goods and services
36,519,067
33,599,797
39,026,490
Capital goods
989,112
600,278
1,698,930
Fuel-and-energy-related activities (not included
in Scope 1 or 2)
1,566,238
946,616
603,560
Upstream transportation and distribution
1,773,024
720,951
1,161,810
Waste generated in operations
48,947
25,353
60,360
Business travel
137,668
140,452
121,070
Employee commuting
150,635
201,663
506,710
Downstream transportation and distribution
10,240,708
11,088,559
9,964,010
Processing of sold products
223,702
231,426
3,046,900
End of life treatment of sold products
1,179,467
811,130
1,195,840
Franchises
1,651,219
1,843,424
1,418,720
Investments
148,986
255,417
2,730,730
Other (downstream)
0
0
1,282,850
Sustainability
2022
,
14
, 2171
5 of 12
Figure 2.
Total gross global Scope 3 emissions 2018–2020 [
12
–
14
].
5.
Emissions Reductions
Energy
managers
of
PepsiCo
state
annual
energy
and
fuel
reduction
performance
targets, which are aligned with the achievement of their long-term sustainability agenda.
In
the CDP climate questionnaire, PepsiCo has identified a range of inherent climate-related
risks
and
opportunities
that
can
potentially
lead
to
financial
or
strategic
impact
on
the
business and implemented various emissions reduction initiatives at different stages of the
value chain [
12
].
5.1.
More Efficient Production and Distribution Processes
PepsiCo is continuously investing in energy efficiency and emission mitigation strate-
gies to improve the efficiency of its manufacturing and fleet operations towards the goal of
reducing Scope 1 and Scope 2 emissions.
The Resource Conservation (ReCon) program of
PepsiCo aims to improve the efficiency of energy, water and waste use in manufacturing
processes and seeks feasible and effective ways to reduce fuel and electricity consumption
in operations by taking advantage of training and technology (Table
4
).
As an important
component of the climate risk assessment, PepsiCo assesses the risks of new technologies
needed to adapt to climate change in the future (including electric vehicles, efficient com-
puting and cooling infrastructure, efficient manufacturing with less water and material
waste).
In addition, PepsiCo’s R&D team, which focuses on external innovation, closely
monitors technological developments.
Any upcoming technological advances that will
help PepsiCo achieve its goals are evaluated and discussed internally so that appropriate
action can be taken [
12
].
5.2.
Use of Lower-Emission Sources of Energy
PepsiCo integrates low carbon options into its prioritised energy procurement strategy,
coupled
with
continued
investment
in
low-carbon
technologies
in
their
operations
to
further progress toward the goal of mitigating absolute emissions across the global value
chain by 75% by 2030 (2015 baseline).
In order to achieve the transition to 100% renewable
electricity
in
the
U.S
direct
operations,
PepsiCo
has
developed
a
series
of
solutions.
In
2020, PepsiCo will mainly use the Renewable Energy Certificate (REC) to purchase from
various projects supporting renewable energy green power generation (Table
5
).
In the
next half decade, PepsiCo plans to sign multi-year power purchase agreements (PPA) to
fund the development of renewable power projects, including solar and biogas, as well as
Sustainability
2022
,
14
, 2171
6 of 12
wind power plants [
15
].
In 2020, PepsiCo signed several power purchase agreements with
renewable power projects as the first step to establish a renewable energy portfolio [
12
].
Table 4.
The financial and emission estimates of improving resource efficiency in 2020 [
12
].
Initiative Category and
Initiative Type
Estimated Annual
CO
2
e Savings
(Metric Tonnes
CO
2
e)
Scope(s)
Annual Monetary
Savings (US $)
Investment
Required (US $)
Energy efficiency in buildings
Combined heat and
power (cogeneration)
7810
Scope 1
Scope 2
(market-based)
2,268,598
11,791,772
Energy efficiency in buildings
Heating, Ventilation and Air
Conditioning (HVAC)
2128
Scope 1
Scope 2
(market-based)
421,567
2,149,012
Energy efficiency in buildings
Insulation
1948
Scope 1
Scope 2
(market-based)
166,485
790,151
Energy efficiency in buildings
Lighting
1023
Scope 2
(market-based)
169,534
990,453
Energy efficiency in production
processes Compressed air
2633
Scope 2
(market-based)
262,631
1,356,136
Energy efficiency in production
processes Cooling technology
2223
Scope 1
Scope 2
(market-based)
252,610
1,343,917
Energy efficiency in production
processes Fuel switch
583
Scope 1
33,617
167,436
Energy efficiency in production
processes Machine/equipment
replacement
6305
Scope 1
907,884
5,397,549
Energy efficiency in production
processes Process optimization
18,106
Scope 1
Scope 2
(market-based)
Scope 3
2,862,834
12,139,619
Energy efficiency in production
processes Smart control system
7903
Scope 1
Scope 2
(market-based)
292,924
1,918,890
Energy efficiency in production
processes Waste heat recovery
4333
Scope 1
577,112
2,841,703
Total
54,995
8,215,796
40,886,638
Table 5.
The financial and emission estimates of using low-carbon energy in 2020 [
12
].
Initiative Category and
Initiative Type
Estimated Annual
CO
2
e Savings
(Metric Tonnes
CO
2
e)
Scope(s)
Annual
Monetary
Savings (US $)
Investment
Required (US $)
Low-carbon energy
consumption
Biogas
484
Scope 1
377,830
1,698,000
Low-carbon energy
generation
Solar heating and cooling
120
Scope 1
Scope 2
(market-based)
14,104
65,706
Low-carbon energy
generation
Solar PV
10,873
Scope 2
(market-based)
2,252,856
12,811,075
Total
11,477
2,644,790
14,574,781
5.3.
Development of New Products or Services through R&D and Innovation
In 2019, PepsiCo preliminarily introduced a climate strategy into their product inno-
vation process.
In 2020, PepsiCo completed the global rollout of the program and began
business integration with its cross-functional partners.
The program incorporating a toolkit
and
business
processes
aims
to
improve
the
capacity
within
each
function
of
product
innovation (e.g., R&D, marketing, and insights) to identify the potential impacts of product
design and production on environmental and climate and adopt sustainable alternatives
(Table
6
).
Sustainable packaging objectives include researching recyclability solutions and
incorporating
recyclable
content
into
product
packaging;
improving
product
specifica-
tions to move towards increasingly energy efficient vending and cooling machines being
deployed in the marketplace [
15
].
PepsiCo has joined the NaturAll Bottle Alliance with
peer companies to promote the development of renewable bio-based materials for plastic
bottles [
7
].
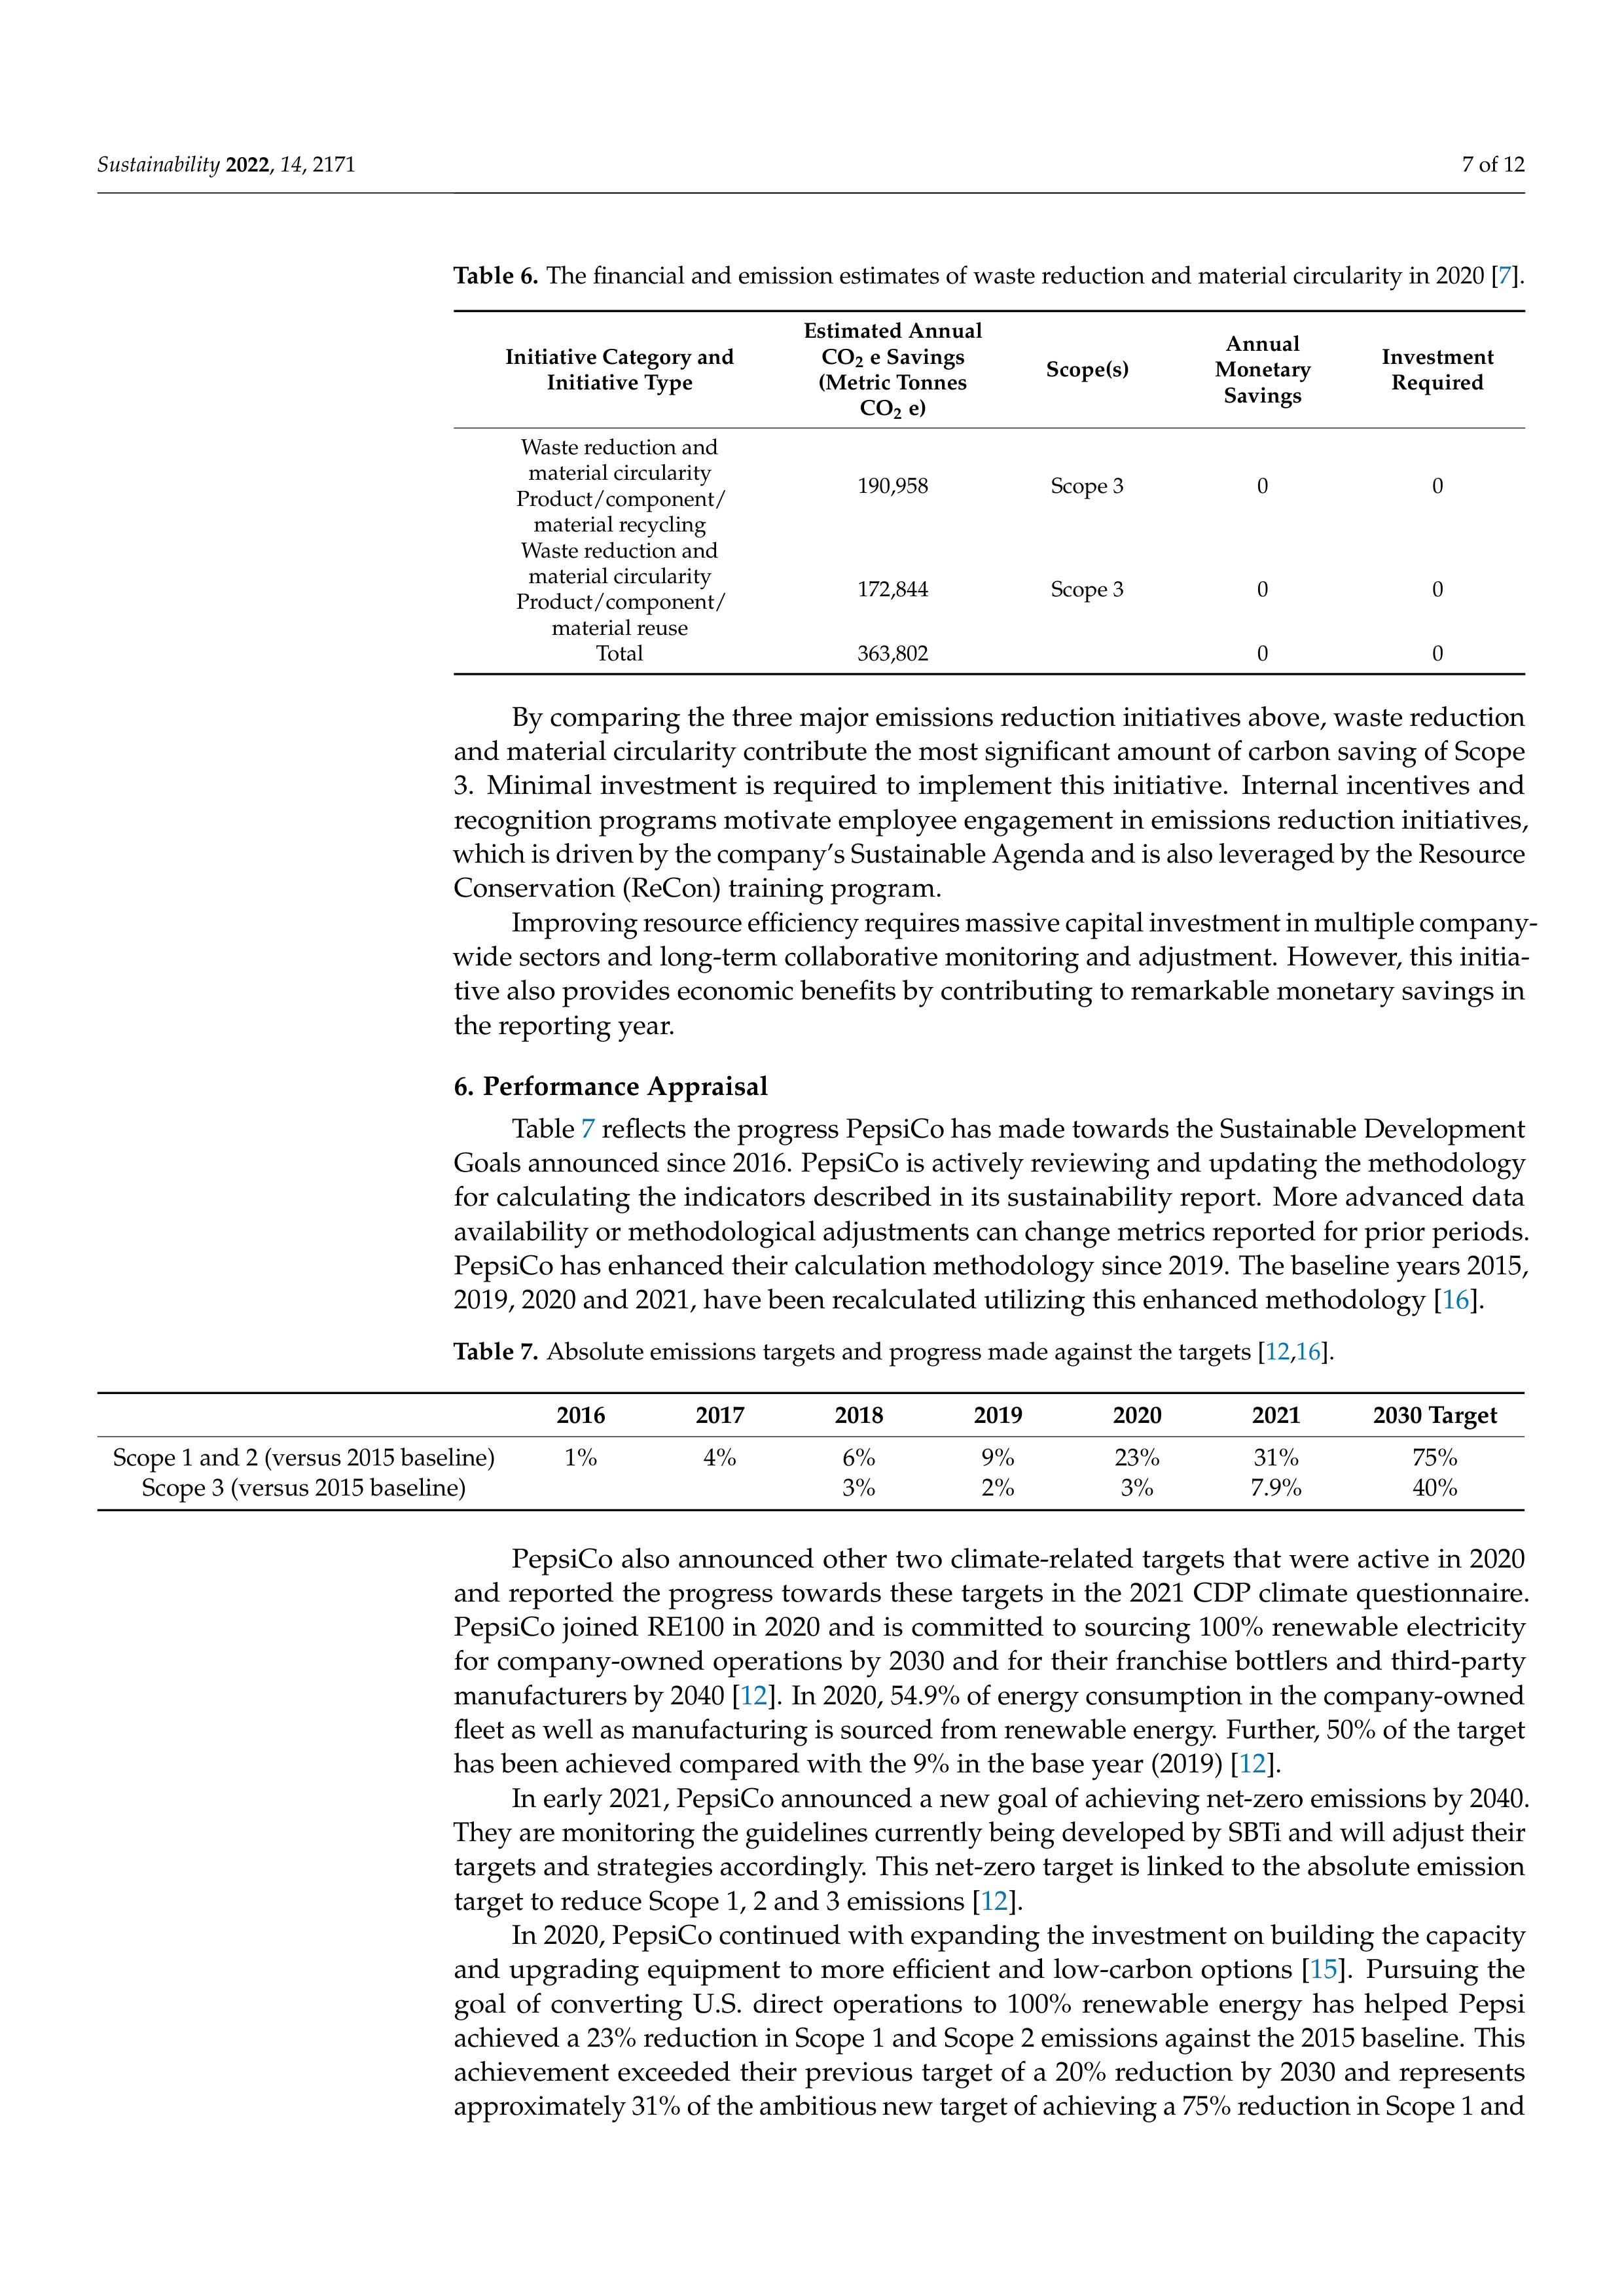
Sustainability
2022
,
14
, 2171
7 of 12
Table 6.
The financial and emission estimates of waste reduction and material circularity in 2020 [
7
].
Initiative Category and
Initiative Type
Estimated Annual
CO
2
e Savings
(Metric Tonnes
CO
2
e)
Scope(s)
Annual
Monetary
Savings
Investment
Required
Waste reduction and
material circularity
Product/component/
material recycling
190,958
Scope 3
0
0
Waste reduction and
material circularity
Product/component/
material reuse
172,844
Scope 3
0
0
Total
363,802
0
0
By comparing the three major emissions reduction initiatives above, waste reduction
and material circularity contribute the most significant amount of carbon saving of Scope
3.
Minimal investment is required to implement this initiative.
Internal incentives and
recognition programs motivate employee engagement in emissions reduction initiatives,
which is driven by the company’s Sustainable Agenda and is also leveraged by the Resource
Conservation (ReCon) training program.
Improving resource efficiency requires massive capital investment in multiple company-
wide sectors and long-term collaborative monitoring and adjustment.
However, this initia-
tive also provides economic benefits by contributing to remarkable monetary savings in
the reporting year.
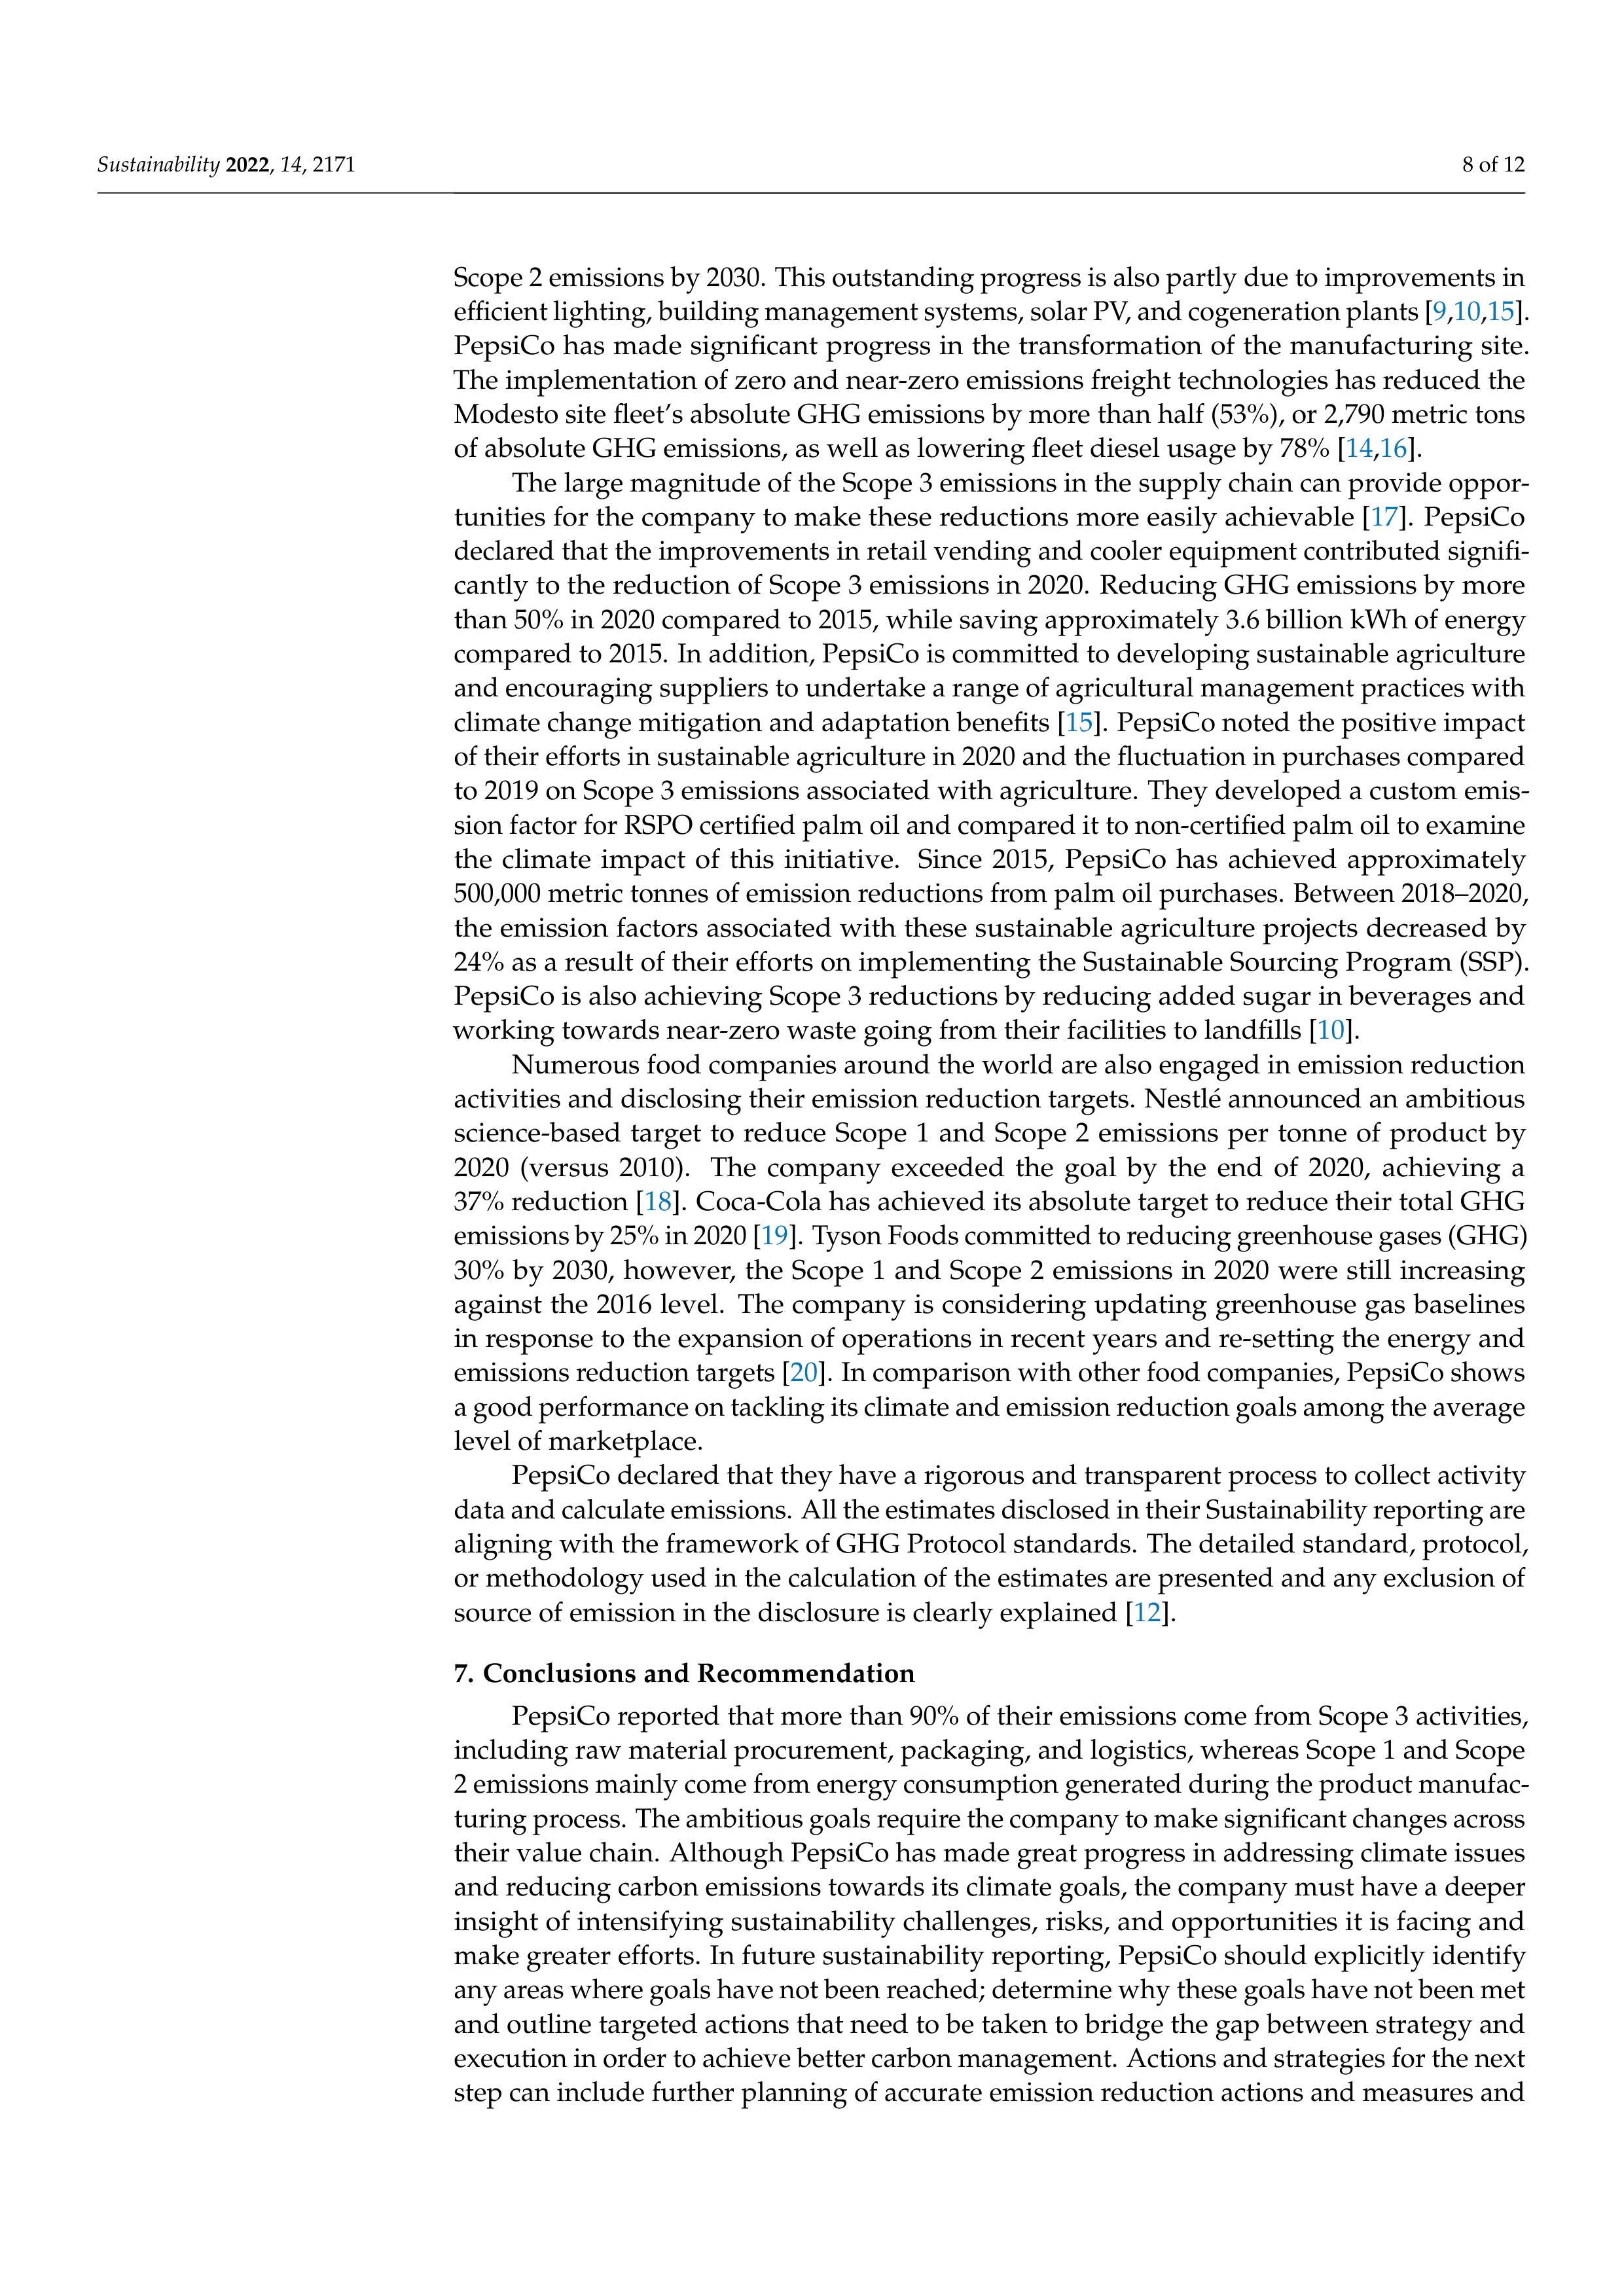
6.
Performance Appraisal
Table
7
reflects the progress PepsiCo has made towards the Sustainable Development
Goals announced since 2016.
PepsiCo is actively reviewing and updating the methodology
for calculating the indicators described in its sustainability report.
More advanced data
availability or methodological adjustments can change metrics reported for prior periods.
PepsiCo has enhanced their calculation methodology since 2019.
The baseline years 2015,
2019, 2020 and 2021, have been recalculated utilizing this enhanced methodology [
16
].
Table 7.
Absolute emissions targets and progress made against the targets [
12
,
16
].
2016
2017
2018
2019
2020
2021
2030 Target
Scope 1 and 2 (versus 2015 baseline)
1%
4%
6%
9%
23%
31%
75%
Scope 3 (versus 2015 baseline)
3%
2%
3%
7.9%
40%
PepsiCo also announced other two climate-related targets that were active in 2020
and reported the progress towards these targets in the 2021 CDP climate questionnaire.
PepsiCo joined RE100 in 2020 and is committed to sourcing 100% renewable electricity
for company-owned operations by 2030 and for their franchise bottlers and third-party
manufacturers by 2040 [
12
].
In 2020, 54.9% of energy consumption in the company-owned
fleet as well as manufacturing is sourced from renewable energy.
Further, 50% of the target
has been achieved compared with the 9% in the base year (2019) [
12
].
In early 2021, PepsiCo announced a new goal of achieving net-zero emissions by 2040.
They are monitoring the guidelines currently being developed by SBTi and will adjust their
targets and strategies accordingly.
This net-zero target is linked to the absolute emission
target to reduce Scope 1, 2 and 3 emissions [
12
].
In 2020, PepsiCo continued with expanding the investment on building the capacity
and upgrading equipment to more efficient and low-carbon options [
15
].
Pursuing the
goal
of
converting
U.S.
direct
operations
to
100%
renewable
energy
has
helped
Pepsi
achieved a 23% reduction in Scope 1 and Scope 2 emissions against the 2015 baseline.
This
achievement
exceeded
their
previous
target
of
a
20%
reduction
by
2030
and
represents
approximately 31% of the ambitious new target of achieving a 75% reduction in Scope 1 and
Sustainability
2022
,
14
, 2171
8 of 12
Scope 2 emissions by 2030.
This outstanding progress is also partly due to improvements in
efficient lighting, building management systems, solar PV, and cogeneration plants [
9
,
10
,
15
].
PepsiCo
has
made
significant
progress
in
the
transformation
of
the
manufacturing
site.
The implementation of zero and near-zero emissions freight technologies has reduced the
Modesto site fleet’s absolute GHG emissions by more than half (53%), or 2,790 metric tons
of absolute GHG emissions, as well as lowering fleet diesel usage by 78% [
14
,
16
].
The large magnitude of the Scope 3 emissions in the supply chain can provide oppor-
tunities for the company to make these reductions more easily achievable [
17
].
PepsiCo
declared that the improvements in retail vending and cooler equipment contributed signifi-
cantly to the reduction of Scope 3 emissions in 2020.
Reducing GHG emissions by more
than 50% in 2020 compared to 2015, while saving approximately 3.6 billion kWh of energy
compared to 2015.
In addition, PepsiCo is committed to developing sustainable agriculture
and encouraging suppliers to undertake a range of agricultural management practices with
climate change mitigation and adaptation benefits [
15
].
PepsiCo noted the positive impact
of their efforts in sustainable agriculture in 2020 and the fluctuation in purchases compared
to 2019 on Scope 3 emissions associated with agriculture.
They developed a custom emis-
sion factor for RSPO certified palm oil and compared it to non-certified palm oil to examine
the
climate
impact
of
this
initiative.
Since
2015,
PepsiCo
has
achieved
approximately
500,000 metric tonnes of emission reductions from palm oil purchases.
Between 2018–2020,
the emission factors associated with these sustainable agriculture projects decreased by
24% as a result of their efforts on implementing the Sustainable Sourcing Program (SSP).
PepsiCo is also achieving Scope 3 reductions by reducing added sugar in beverages and
working towards near-zero waste going from their facilities to landfills [
10
].
Numerous food companies around the world are also engaged in emission reduction
activities and disclosing their emission reduction targets.
Nestl
é
announced an ambitious
science-based
target
to
reduce
Scope
1
and
Scope
2
emissions
per
tonne
of
product
by
2020
(versus
2010).
The
company
exceeded
the
goal
by
the
end
of
2020,
achieving
a
37% reduction [
18
].
Coca-Cola has achieved its absolute target to reduce their total GHG
emissions by 25% in 2020 [
19
]. Tyson Foods committed to reducing greenhouse gases (GHG)
30%
by
2030,
however,
the
Scope
1
and
Scope
2
emissions
in
2020
were
still
increasing
against the 2016 level.
The company is considering updating greenhouse gas baselines
in response to the expansion of operations in recent years and re-setting the energy and
emissions reduction targets [
20
].
In comparison with other food companies, PepsiCo shows
a good performance on tackling its climate and emission reduction goals among the average
level of marketplace.
PepsiCo declared that they have a rigorous and transparent process to collect activity
data and calculate emissions. All the estimates disclosed in their Sustainability reporting are
aligning with the framework of GHG Protocol standards.
The detailed standard, protocol,
or methodology used in the calculation of the estimates are presented and any exclusion of
source of emission in the disclosure is clearly explained [
12
].
7.
Conclusions and Recommendation
PepsiCo reported that more than 90% of their emissions come from Scope 3 activities,
including raw material procurement, packaging, and logistics, whereas Scope 1 and Scope
2 emissions mainly come from energy consumption generated during the product manufac-
turing process.
The ambitious goals require the company to make significant changes across
their value chain.
Although PepsiCo has made great progress in addressing climate issues
and reducing carbon emissions towards its climate goals, the company must have a deeper
insight of intensifying sustainability challenges, risks, and opportunities it is facing and
make greater efforts.
In future sustainability reporting, PepsiCo should explicitly identify
any areas where goals have not been reached; determine why these goals have not been met
and outline targeted actions that need to be taken to bridge the gap between strategy and
execution in order to achieve better carbon management.
Actions and strategies for the next
step can include further planning of accurate emission reduction actions and measures and
Sustainability
2022
,
14
, 2171
9 of 12
timely adjustment of strategies based on relevant progress, incorporating the establishment
of short-term and long-term climate-related targets; improving the risk and opportunity
assessment framework to enhance the adaptivity and resilience of various sectors to re-
spond to future climate risk; improve and adopt more advanced science-based research
and analysis methodologies; intensify the training of professional and management talents
in
all
fields
related
to
the
business;
maximise
the
transparency
and
quality
of
financial
and emission estimates; launch a feasible supply chain climate programme to expand the
engagement of stakeholders, suppliers and consumers and improve decision-making and
coordination mechanisms.
This case study also has the potential to be used by stakeholders and peers to evaluate
the
performance
of
carbon
management
of
other
firms
committed
to
achieving
carbon
reduction targets.
Different firms should set scientific carbon emission reduction targets
by
incorporating
their
characteristics.
The
company’s
emission
reduction
targets
and
roadmap
should
be
refined
into
those
of
each
department;
improving
the
enthusiasm
for emission reduction in each internal operational section by developing environmental
key performance indicators; incorporating the carbon emission indicators for upstream
materials of the supply chain into the assessment and evaluation of suppliers and providing
a decision-making basis for the selection of the suppliers. In terms of information disclosure,
firms should establish a reasonable information disclosure system, which should comply
with the reporting disclosure requirements stipulated by the government or the market
and refer to relevant international standards.
Firms can also respond to the concerns of the
market and relevant stakeholders by utilising a variety of disclosure forms to present a
comprehensive picture of their financial and reduction estimates.
Author Contributions:
Conceptualization, D.Q.; writing—original draft preparation, D.Q.; supervision—
P.D.; writing—drafting and editing; project administration—G.H. All authors have read and agreed
to the published version of the manuscript.
Funding:
This research received no external funding.
Institutional Review Board Statement:
Not applicable.
Informed Consent Statement:
Not applicable.
Data Availability Statement:
Not applicable.
Conflicts of Interest:
The authors declare no conflict of interest.
Appendix A
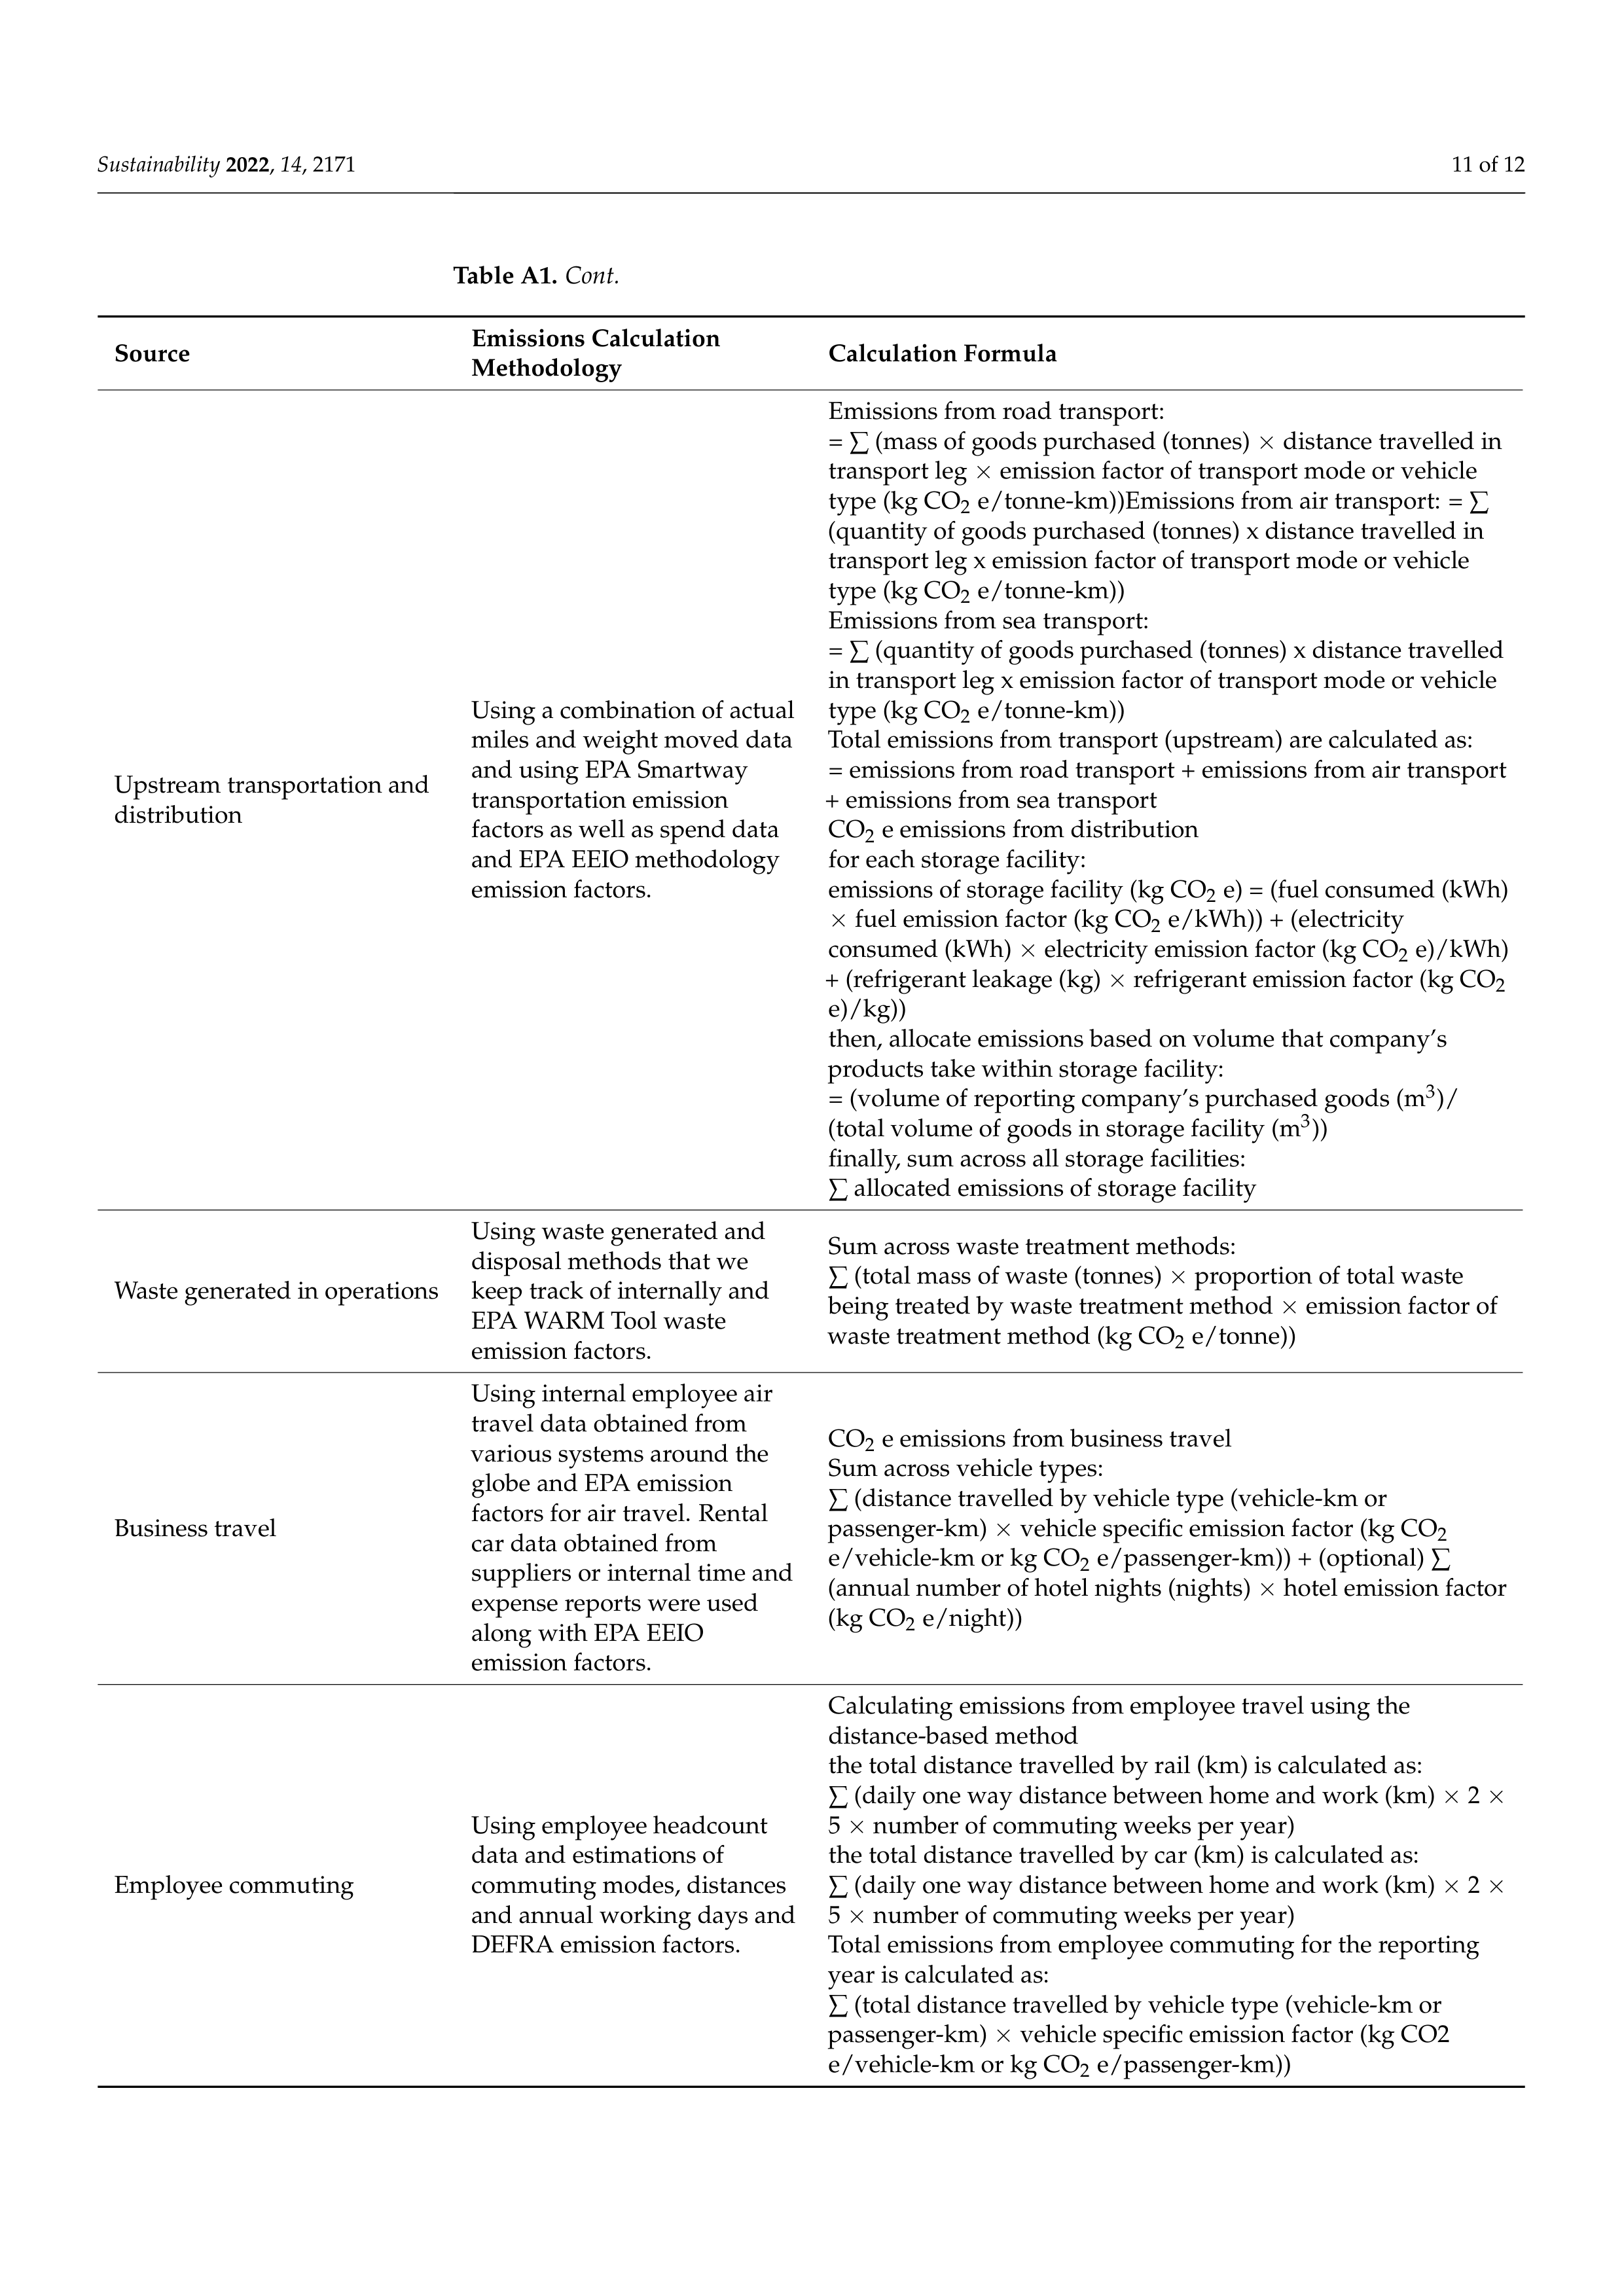
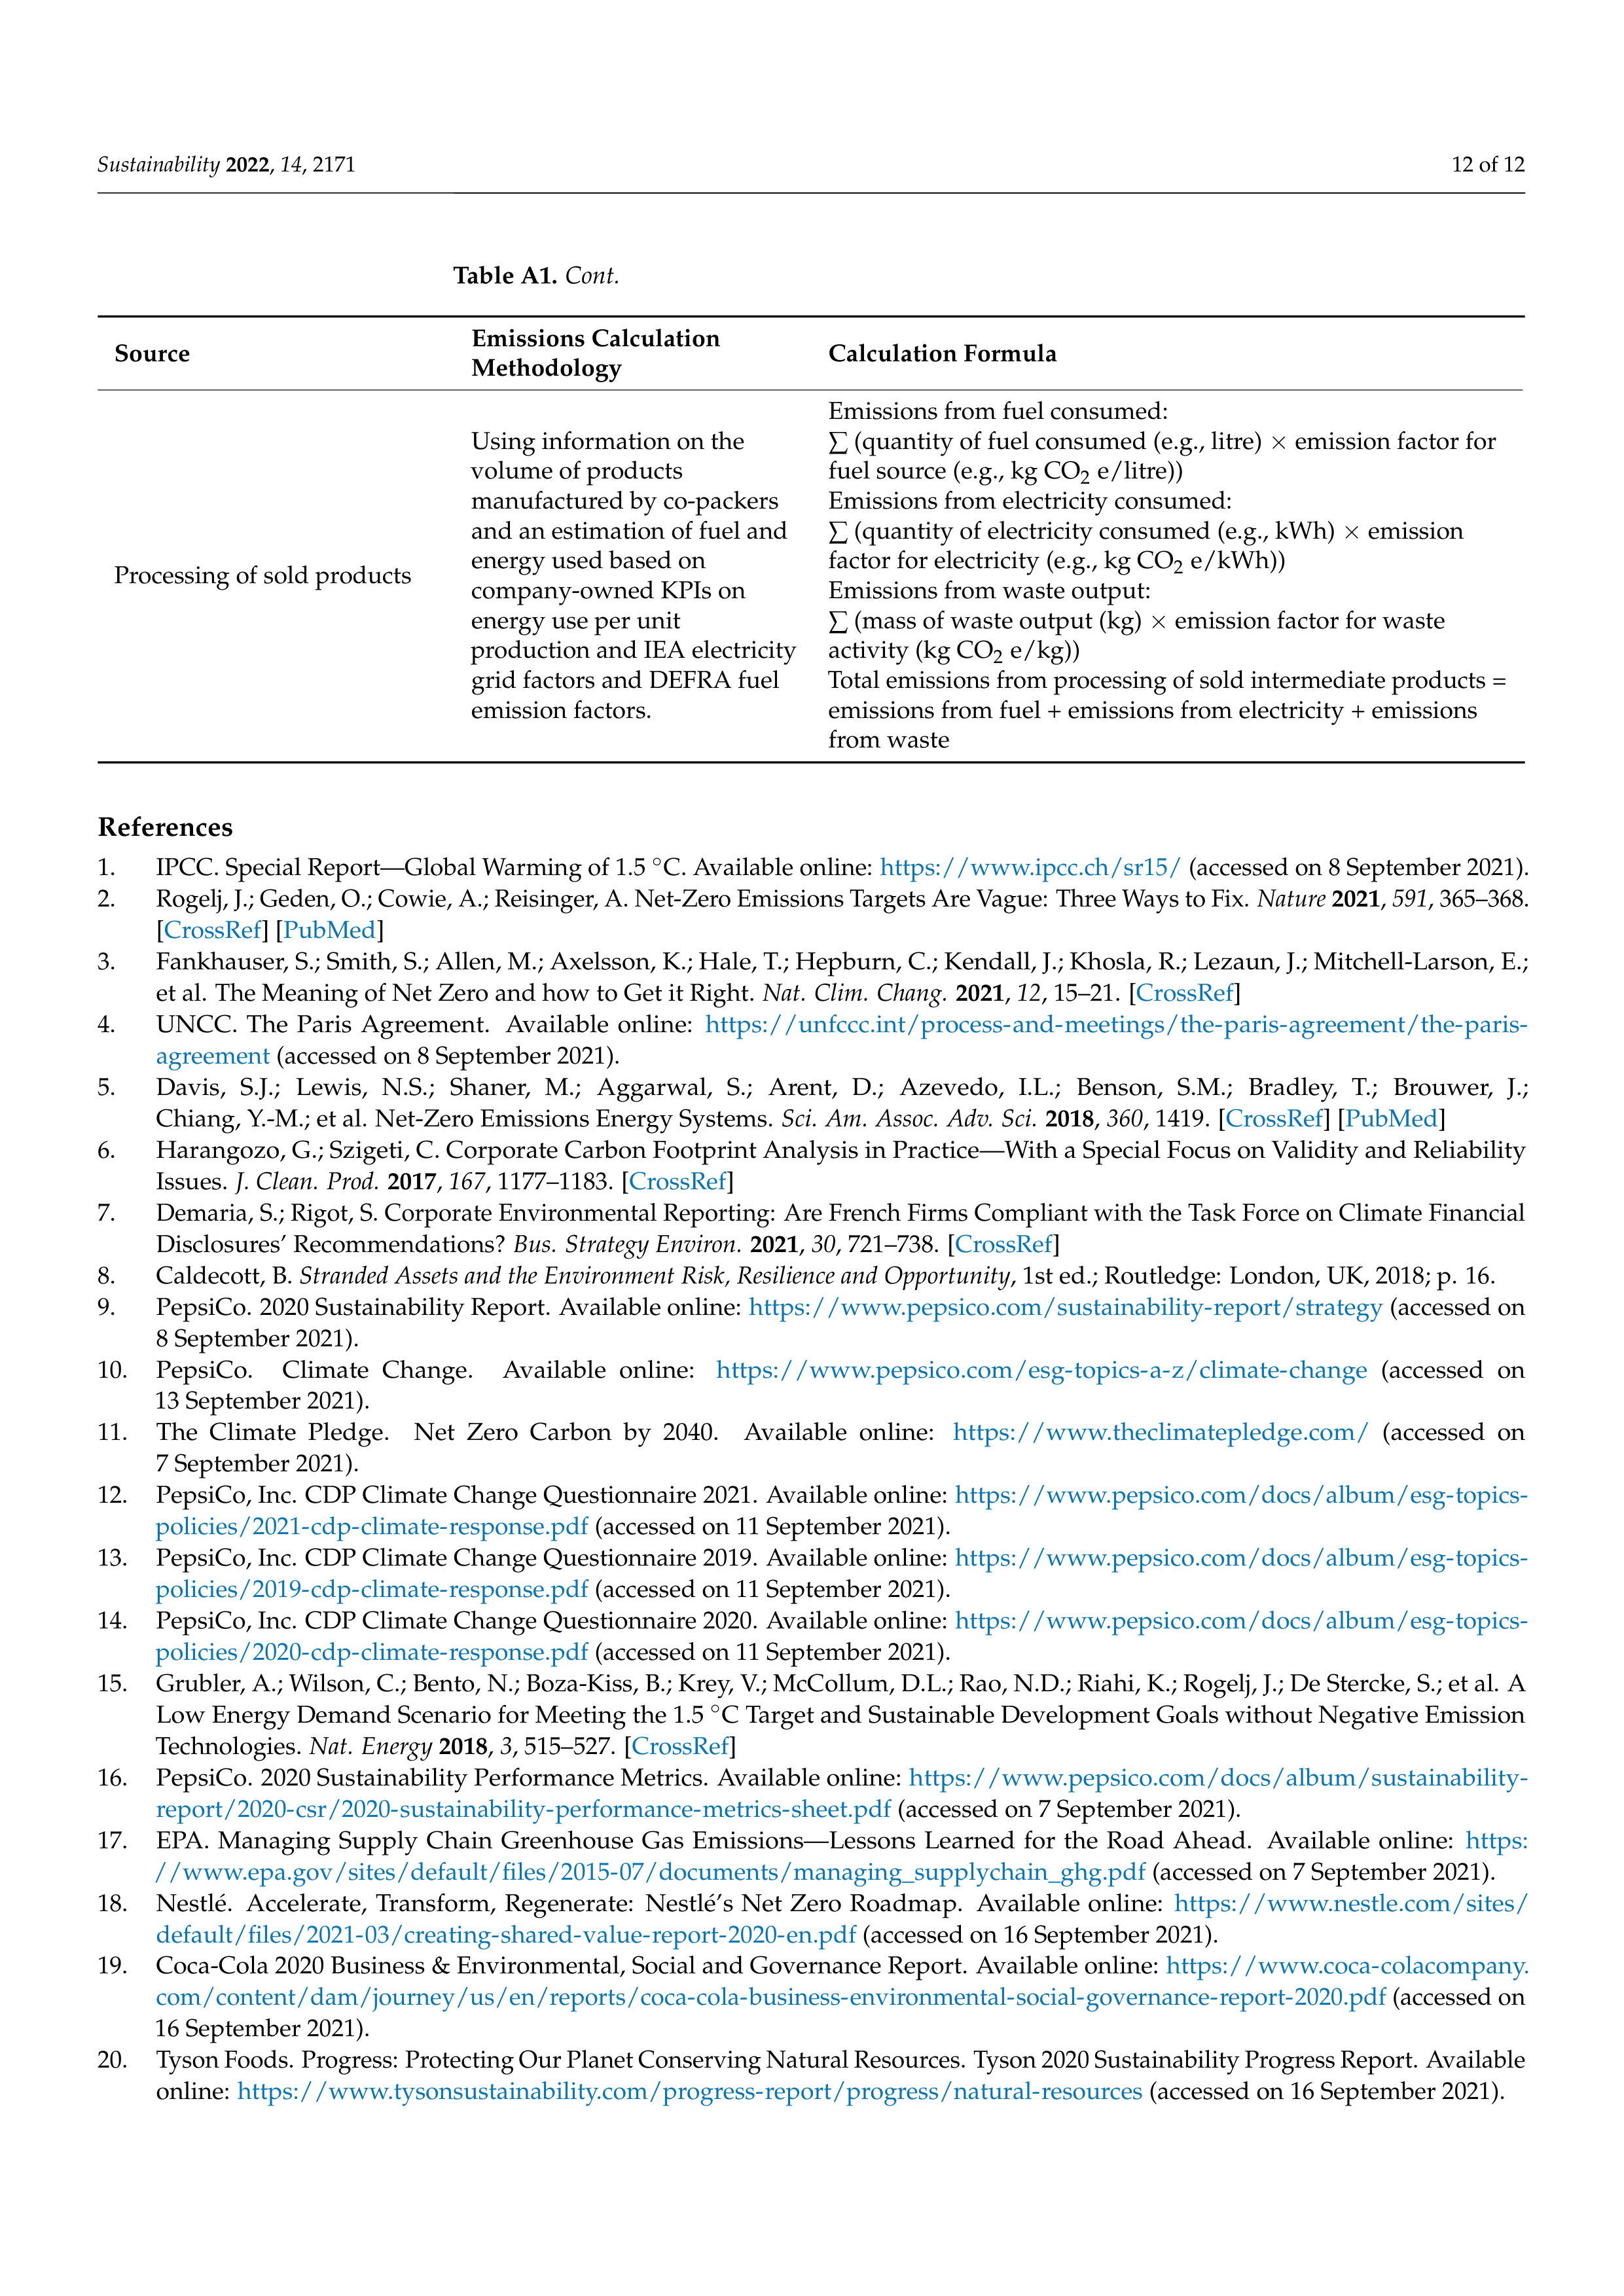
Table A1.
Example of methods and formulas for calculating Scope 3 emissions.
Source
Emissions Calculation
Methodology
Calculation Formula
Purchased goods and services
Using procurement data and
material-specific
emission factors.
Total emissions of purchased goods are calculated as follows:
∑
(quantities of good purchased (e.g., kg)
×
supplier-specific
emission factor of purchased good or service (e.g., kg
CO
2
e/kg))
Capital goods
Using spend data on capital
goods and EPA’s Extended
Economic Input Output
(EEIO) methodology
emission factors.
Total emissions of capital goods are calculated as follows:
∑
(value of capital goods ($)
×
emission factor of capital goods
per unit of economic value (kg CO
2
e/$))
Sustainability
2022
,
14
, 2171
10 of 12
Table A1.
Cont.
Source
Emissions Calculation
Methodology
Calculation Formula
Fuel-and-energy-related
activities (not included in
Scope 1 or 2)
Using actual fuel use data in
our internal operations and
using DEFRA upstream
emission factors.
(a)
Upstream emissions of purchased fuels
sum across each fuel type consumed:
∑
(fuel consumed (e.g., kWh)
×
upstream fuel emission factor (kg CO
2
e)/kWh)) where:
upstream fuel emission factor = life cycle emission
factor—combustion emission factor.
(b)
Upstream emissions of purchased electricity
sum across suppliers, regions, or countries:
∑
(electricity consumed (kWh)
×
upstream electricity emission
factor (kgCO2 e)/kWh)) + (steam consumed (kWh)
×
upstream
steam emission factor (kg CO
2
e)/kWh)) + (heating consumed
(kWh)
×
upstream heating emission factor (kg CO
2
e)/kWh)) +
(cooling consumed (kWh)
×
upstream cooling emission factor
(kg CO
2
e)/kWh))
where:
upstream emission factor = life cycle emission
factor—combustion emissions factor—T&D losses
(c)
Transmission and distribution (T&D) losses
sum across suppliers, regions, or countries:
∑
(electricity consumed (kWh)
×
electricity life cycle emission
factor ((kg CO
2
e)/kWh)
×
T&D loss rate (%)) + (steam
consumed (kWh)
×
steam life cycle emission factor ((kg CO
2
e)/kWh)
×
T&D loss rate (%)) + (heating consumed (kWh)
×
heating life cycle emission factor ((kg CO
2
e)/kWh)
×
T&D loss
rate (%)) + (cooling consumed (kWh)
×
cooling life cycle
emission factor ((kg CO2 e)/kWh)
×
T&D loss rate (%))
(d)
Generation of purchased electricity that is sold to
end users
sum across suppliers, regions, or countries:
∑
(electricity purchased for resale (kWh)
×
electricity life cycle
emission factor (kg CO
2
e)/kWh)) + (steam purchased for resale
(kWh)
×
steam life cycle emission factor (kg CO
2
e)/kWh)) +
(heating purchased for resale (kWh)
×
heating life cycle
emission factor (kg CO
2
e)/kWh)) + (cooling purchased for
resale (kWh)
×
cooling life cycle emission factor (kg CO
2
e)/kWh))
Sustainability
2022
,
14
, 2171
11 of 12
Table A1.
Cont.
Source
Emissions Calculation
Methodology
Calculation Formula
Upstream transportation and
distribution
Using a combination of actual
miles and weight moved data
and using EPA Smartway
transportation emission
factors as well as spend data
and EPA EEIO methodology
emission factors.
Emissions from road transport:
=
∑
(mass of goods purchased (tonnes)
×
distance travelled in
transport leg
×
emission factor of transport mode or vehicle
type (kg CO
2
e/tonne-km))Emissions from air transport:
=
∑
(quantity of goods purchased (tonnes) x distance travelled in
transport leg x emission factor of transport mode or vehicle
type (kg CO
2
e/tonne-km))
Emissions from sea transport:
=
∑
(quantity of goods purchased (tonnes) x distance travelled
in transport leg x emission factor of transport mode or vehicle
type (kg CO
2
e/tonne-km))
Total emissions from transport (upstream) are calculated as:
= emissions from road transport + emissions from air transport
+ emissions from sea transport
CO
2
e emissions from distribution
for each storage facility:
emissions of storage facility (kg CO
2
e) = (fuel consumed (kWh)
×
fuel emission factor (kg CO
2
e/kWh)) + (electricity
consumed (kWh)
×
electricity emission factor (kg CO
2
e)/kWh)
+ (refrigerant leakage (kg)
×
refrigerant emission factor (kg CO
2
e)/kg))
then, allocate emissions based on volume that company’s
products take within storage facility:
= (volume of reporting company’s purchased goods (m
3
)/
(total volume of goods in storage facility (m
3
))
finally, sum across all storage facilities:
∑
allocated emissions of storage facility
Waste generated in operations
Using waste generated and
disposal methods that we
keep track of internally and
EPA WARM Tool waste
emission factors.
Sum across waste treatment methods:
∑
(total mass of waste (tonnes)
×
proportion of total waste
being treated by waste treatment method
×
emission factor of
waste treatment method (kg CO
2
e/tonne))
Business travel
Using internal employee air
travel data obtained from
various systems around the
globe and EPA emission
factors for air travel.
Rental
car data obtained from
suppliers or internal time and
expense reports were used
along with EPA EEIO
emission factors.
CO
2
e emissions from business travel
Sum across vehicle types:
∑
(distance travelled by vehicle type (vehicle-km or
passenger-km)
×
vehicle specific emission factor (kg CO
2
e/vehicle-km or kg CO
2
e/passenger-km)) + (optional)
∑
(annual number of hotel nights (nights)
×
hotel emission factor
(kg CO
2
e/night))
Employee commuting
Using employee headcount
data and estimations of
commuting modes, distances
and annual working days and
DEFRA emission factors.
Calculating emissions from employee travel using the
distance-based method
the total distance travelled by rail (km) is calculated as:
∑
(daily one way distance between home and work (km)
×
2
×
5
×
number of commuting weeks per year)
the total distance travelled by car (km) is calculated as:
∑
(daily one way distance between home and work (km)
×
2
×
5
×
number of commuting weeks per year)
Total emissions from employee commuting for the reporting
year is calculated as:
∑
(total distance travelled by vehicle type (vehicle-km or
passenger-km)
×
vehicle specific emission factor (kg CO2
e/vehicle-km or kg CO
2
e/passenger-km))
Sustainability
2022
,
14
, 2171
12 of 12
Table A1.
Cont.
Source
Emissions Calculation
Methodology
Calculation Formula
Processing of sold products
Using information on the
volume of products
manufactured by co-packers
and an estimation of fuel and
energy used based on
company-owned KPIs on
energy use per unit
production and IEA electricity
grid factors and DEFRA fuel
emission factors.
Emissions from fuel consumed:
∑
(quantity of fuel consumed (e.g., litre)
×
emission factor for
fuel source (e.g., kg CO
2
e/litre))
Emissions from electricity consumed:
∑
(quantity of electricity consumed (e.g., kWh)
×
emission
factor for electricity (e.g., kg CO
2
e/kWh))
Emissions from waste output:
∑
(mass of waste output (kg)
×
emission factor for waste
activity (kg CO
2
e/kg))
Total emissions from processing of sold intermediate products =
emissions from fuel + emissions from electricity + emissions
from waste
References
1.
IPCC. Special Report—Global Warming of 1.5
◦
C. Available online:
https://www.ipcc.ch/sr15/
(accessed on 8 September 2021).
2.
Rogelj, J.; Geden, O.; Cowie, A.; Reisinger, A. Net-Zero Emissions Targets Are Vague:
Three Ways to Fix.
Nature
2021
,
591
, 365–368.
[
CrossRef
] [
PubMed
]
3.
Fankhauser, S.; Smith, S.; Allen, M.; Axelsson, K.; Hale, T.; Hepburn, C.; Kendall, J.; Khosla, R.; Lezaun, J.; Mitchell-Larson, E.;
et al.
The Meaning of Net Zero and how to Get it Right.
Nat.
Clim.
Chang.
2021
,
12
, 15–21.
[
CrossRef
]
4.
UNCC.
The
Paris
Agreement.
Available
online:
https://unfccc.int/process-and-meetings/the-paris-agreement/the-paris-
agreement
(accessed on 8 September 2021).
5.
Davis,
S.J.;
Lewis,
N.S.;
Shaner,
M.;
Aggarwal,
S.;
Arent,
D.;
Azevedo,
I.L.;
Benson,
S.M.;
Bradley,
T.;
Brouwer,
J.;
Chiang, Y.-M.; et al.
Net-Zero Emissions Energy Systems.
Sci.
Am.
Assoc.
Adv.
Sci.
2018
,
360
, 1419.
[
CrossRef
] [
PubMed
]
6.
Harangozo, G.; Szigeti, C. Corporate Carbon Footprint Analysis in Practice—With a Special Focus on Validity and Reliability
Issues.
J. Clean.
Prod.
2017
,
167
, 1177–1183.
[
CrossRef
]
7.
Demaria, S.; Rigot, S. Corporate Environmental Reporting:
Are French Firms Compliant with the Task Force on Climate Financial
Disclosures’ Recommendations?
Bus.
Strategy Environ.
2021
,
30
, 721–738.
[
CrossRef
]
8.
Caldecott, B.
Stranded Assets and the Environment Risk, Resilience and Opportunity
, 1st ed.; Routledge:
London, UK, 2018; p.
16.
9.
PepsiCo.
2020 Sustainability Report.
Available online:
https://www.pepsico.com/sustainability-report/strategy
(accessed on
8 September 2021).
10.
PepsiCo.
Climate
Change.
Available
online:
https://www.pepsico.com/esg-topics-a-z/climate-change
(accessed
on
13 September 2021).
11.
The
Climate
Pledge.
Net
Zero
Carbon
by
2040.
Available
online:
https://www.theclimatepledge.com/
(accessed
on
7 September 2021).
12.
PepsiCo, Inc.
CDP Climate Change Questionnaire 2021.
Available online:
https://www.pepsico.com/docs/album/esg-topics-
policies/2021-cdp-climate-response.pdf
(accessed on 11 September 2021).
13.
PepsiCo, Inc.
CDP Climate Change Questionnaire 2019.
Available online:
https://www.pepsico.com/docs/album/esg-topics-
policies/2019-cdp-climate-response.pdf
(accessed on 11 September 2021).
14.
PepsiCo, Inc.
CDP Climate Change Questionnaire 2020.
Available online:
https://www.pepsico.com/docs/album/esg-topics-
policies/2020-cdp-climate-response.pdf
(accessed on 11 September 2021).
15.
Grubler, A.; Wilson, C.; Bento, N.; Boza-Kiss, B.; Krey, V.; McCollum, D.L.; Rao, N.D.; Riahi, K.; Rogelj, J.; De Stercke, S.; et al.
A
Low Energy Demand Scenario for Meeting the 1.5
◦
C Target and Sustainable Development Goals without Negative Emission
Technologies.
Nat.
Energy
2018
,
3
, 515–527.
[
CrossRef
]
16.
PepsiCo.
2020 Sustainability Performance Metrics.
Available online:
https://www.pepsico.com/docs/album/sustainability-
report/2020-csr/2020-sustainability-performance-metrics-sheet.pdf
(accessed on 7 September 2021).
17.
EPA.
Managing
Supply
Chain
Greenhouse
Gas
Emissions—Lessons
Learned
for
the
Road
Ahead.
Available
online:
https:
//www.epa.gov/sites/default/files/2015-07/documents/managing_supplychain_ghg.pdf
(accessed on 7 September 2021).
18.
Nestl
é
.
Accelerate,
Transform,
Regenerate:
Nestl
é
’s
Net
Zero
Roadmap.
Available
online:
https://www.nestle.com/sites/
default/files/2021-03/creating-shared-value-report-2020-en.pdf
(accessed on 16 September 2021).
19.
Coca-Cola 2020 Business & Environmental, Social and Governance Report.
Available online:
https://www.coca-colacompany.
com/content/dam/journey/us/en/reports/coca-cola-business-environmental-social-governance-report-2020.pdf
(accessed on
16 September 2021).
20.
Tyson Foods. Progress: Protecting Our Planet Conserving Natural Resources. Tyson 2020 Sustainability Progress Report. Available
online:
https://www.tysonsustainability.com/progress-report/progress/natural-resources
(accessed on 16 September 2021).