Analysis of Bank of America in the ESG Business Scale
Growth Factors
Guodong Zhang
1,a,*
1
Economy and Management School, Wuhan University, Wuhan, 430072, People's Republic of
China
a. Zgd103399@outlook.com
*corresponding author
Abstract:
This study investigates the factors contributing to the growth of an organisation's
ESG (Environmental, Social, and Governance) business scale using the Vector Error
Correction Model (VECM). The research analyses Bank of America's ESG strategies and it
has been found that the ESG benchmarks held by the bank have strengthened in recent times.
The findings indicate a negative correlation between the ESG score and key profitability
indicators for Bank of America, suggesting that increased spending on ESG activities
decreases net profit. This result can be attributed to the non-commercial nature of ESG
activities, which are primarily costs subtracted from the gross profit figure. The VECM
analysis also reveals a statistically significant adjustment in the long-term equilibrium
relationships between the ESG score and Bank of America's net profit. Additionally, short-
term negative correlations between ESG and profitability benchmarks affect long-term
relationships. On the basis of VECM model that has been adopted in this study, the research
establishes statistically significant relationships between Bank of America's ESG score and
net profit, demonstrating short-term adjustments towards long-term relations between ESG
score and net profit. Overall, this paper highlights the importance of understanding the
dynamics between ESG activities and profitability in the banking sector, stressing the need
for maintaining an effective balance between ESG activities and financial performance to
ensure long-term sustainability.
Keywords:
Bank of America ESG analysis, VECM model application, ESG Performance
Analysis, ESG and profitability.
1.
Introduction
Bank of America stands as one of the preeminent financial institutions on a global scale, offering a
diverse array of financial services to a broad spectrum of clients [1]. With operations spanning across
more than 35 countries worldwide, the bank has been expanding its service offerings in four pivotal
segments: consumer banking, global banking, global financial services, and global wealth and
investment management [2]. These segments collectively underline the bank's comprehensive
approach to serving its clientele.
The bank's commitment to Environmental, Sustainability, and Governance (ESG) strategies has
been instrumental in fulfilling its responsibilities towards various stakeholders. By increasingly
integrating ESG factors into its business and operational strategies, Bank of America has effectively
Proceedings of the 4th International Conference on Business and Policy Studies
DOI: 10.54254/2754-1169/156/2025.20658
© 2025 The Authors. This is an open access article distributed under the terms of the Creative Commons Attribution License 4.0
(https://creativecommons.org/licenses/by/4.0/).
187
navigated and mitigated risks that could otherwise hinder its progress [3]. This proactive stance
towards ESG not only aligns with the growing global emphasis on sustainability but also
demonstrates the bank's forward-thinking approach[4].
However, the pursuit of ESG goals has had a ripple effect on the bank's financial performance,
particularly in terms of profitability benchmarks that it has been striving to achieve [1]. While the
incorporation of ESG factors has posed certain challenges, it has also presented opportunities for the
bank to innovate and differentiate itself in the competitive financial landscape.
This paper delves into the analysis of the ESG business scale growth factors of Bank of America.
Utilizing the Vector Error Correction Model (VECM), the findings presented within this paper
provide insights into the short-term and long-term dynamics of the sustainable growth that the bank
has been experiencing in the market. By examining the interplay between ESG strategies and financial
performance, this paper contributes to the ongoing discourse on the integration of sustainability into
financial institutions' operational frameworks.
2.
Literature Review
Organisations across the globe are actively seeking effective means and methodologies to ensure the
optimal fulfillment of their corporate responsibilities [5]. Various frameworks exist that can be
employed to assess the degree to which an organisation's management has been promoting robust
corporate responsibility and sustainability initiatives. Among these frameworks, the Environmental,
Sustainability, and Governance (ESG) framework stands out as one of the most prevalent and widely
adopted [6]. The existing academic literature presents a diverse range of perspectives on whether or
not organisations that meet desired ESG benchmarks experience an enhancement in their financial
performance; indeed, the evidence in this area is largely mixed and inconclusive [7]. Some companies
have reported a correlation between ESG performance and financial outcomes, whereas others have
failed to observe such a relationship [8]. However, a burgeoning body of recent literature has
emphasized the existence of positive associations between ESG performance and profitability [9].
This literature underscores that the benefits of ESG extend beyond mere improvements in brand
equity and market reputation for an organisation. Rather, they also encompass the fulfillment of
corporate responsibilities, which in turn leads to an increased attraction and retention of key
stakeholders who are instrumental in driving superior market performance [8].
3.
Methods
The research strategy adopted in this study is the case study approach, specifically focusing on a
single case study encompassing the Bank of America. This method has been chosen to delve into how
the firm's ESG (Environmental, Social, and Governance) performance has been instrumental in
driving its financial success. The study can be characterized as a longitudinal investigation, given that
it involves the analysis of time series data sourced from the company's annual reports and ESG reports.
This analysis aims to assess the effectiveness of the organization's ESG performance and how it has
contributed to the enhancement of the organization's profitability benchmarks over time.
The data analysis technique utilized in this study is the VESC Model, which stands as one of the
fundamental econometric models suitable for examining the relationships between various variables
[10]. In considering the Johansen test, it is feasible to estimate a Vector Error Correction Model
(VECM) with one cointegration relation. Algebraically, the formulation of the VECM model can be
articulated as follows:
Proceedings of the 4th International Conference on Business and Policy Studies
DOI: 10.54254/2754-1169/156/2025.20658
188
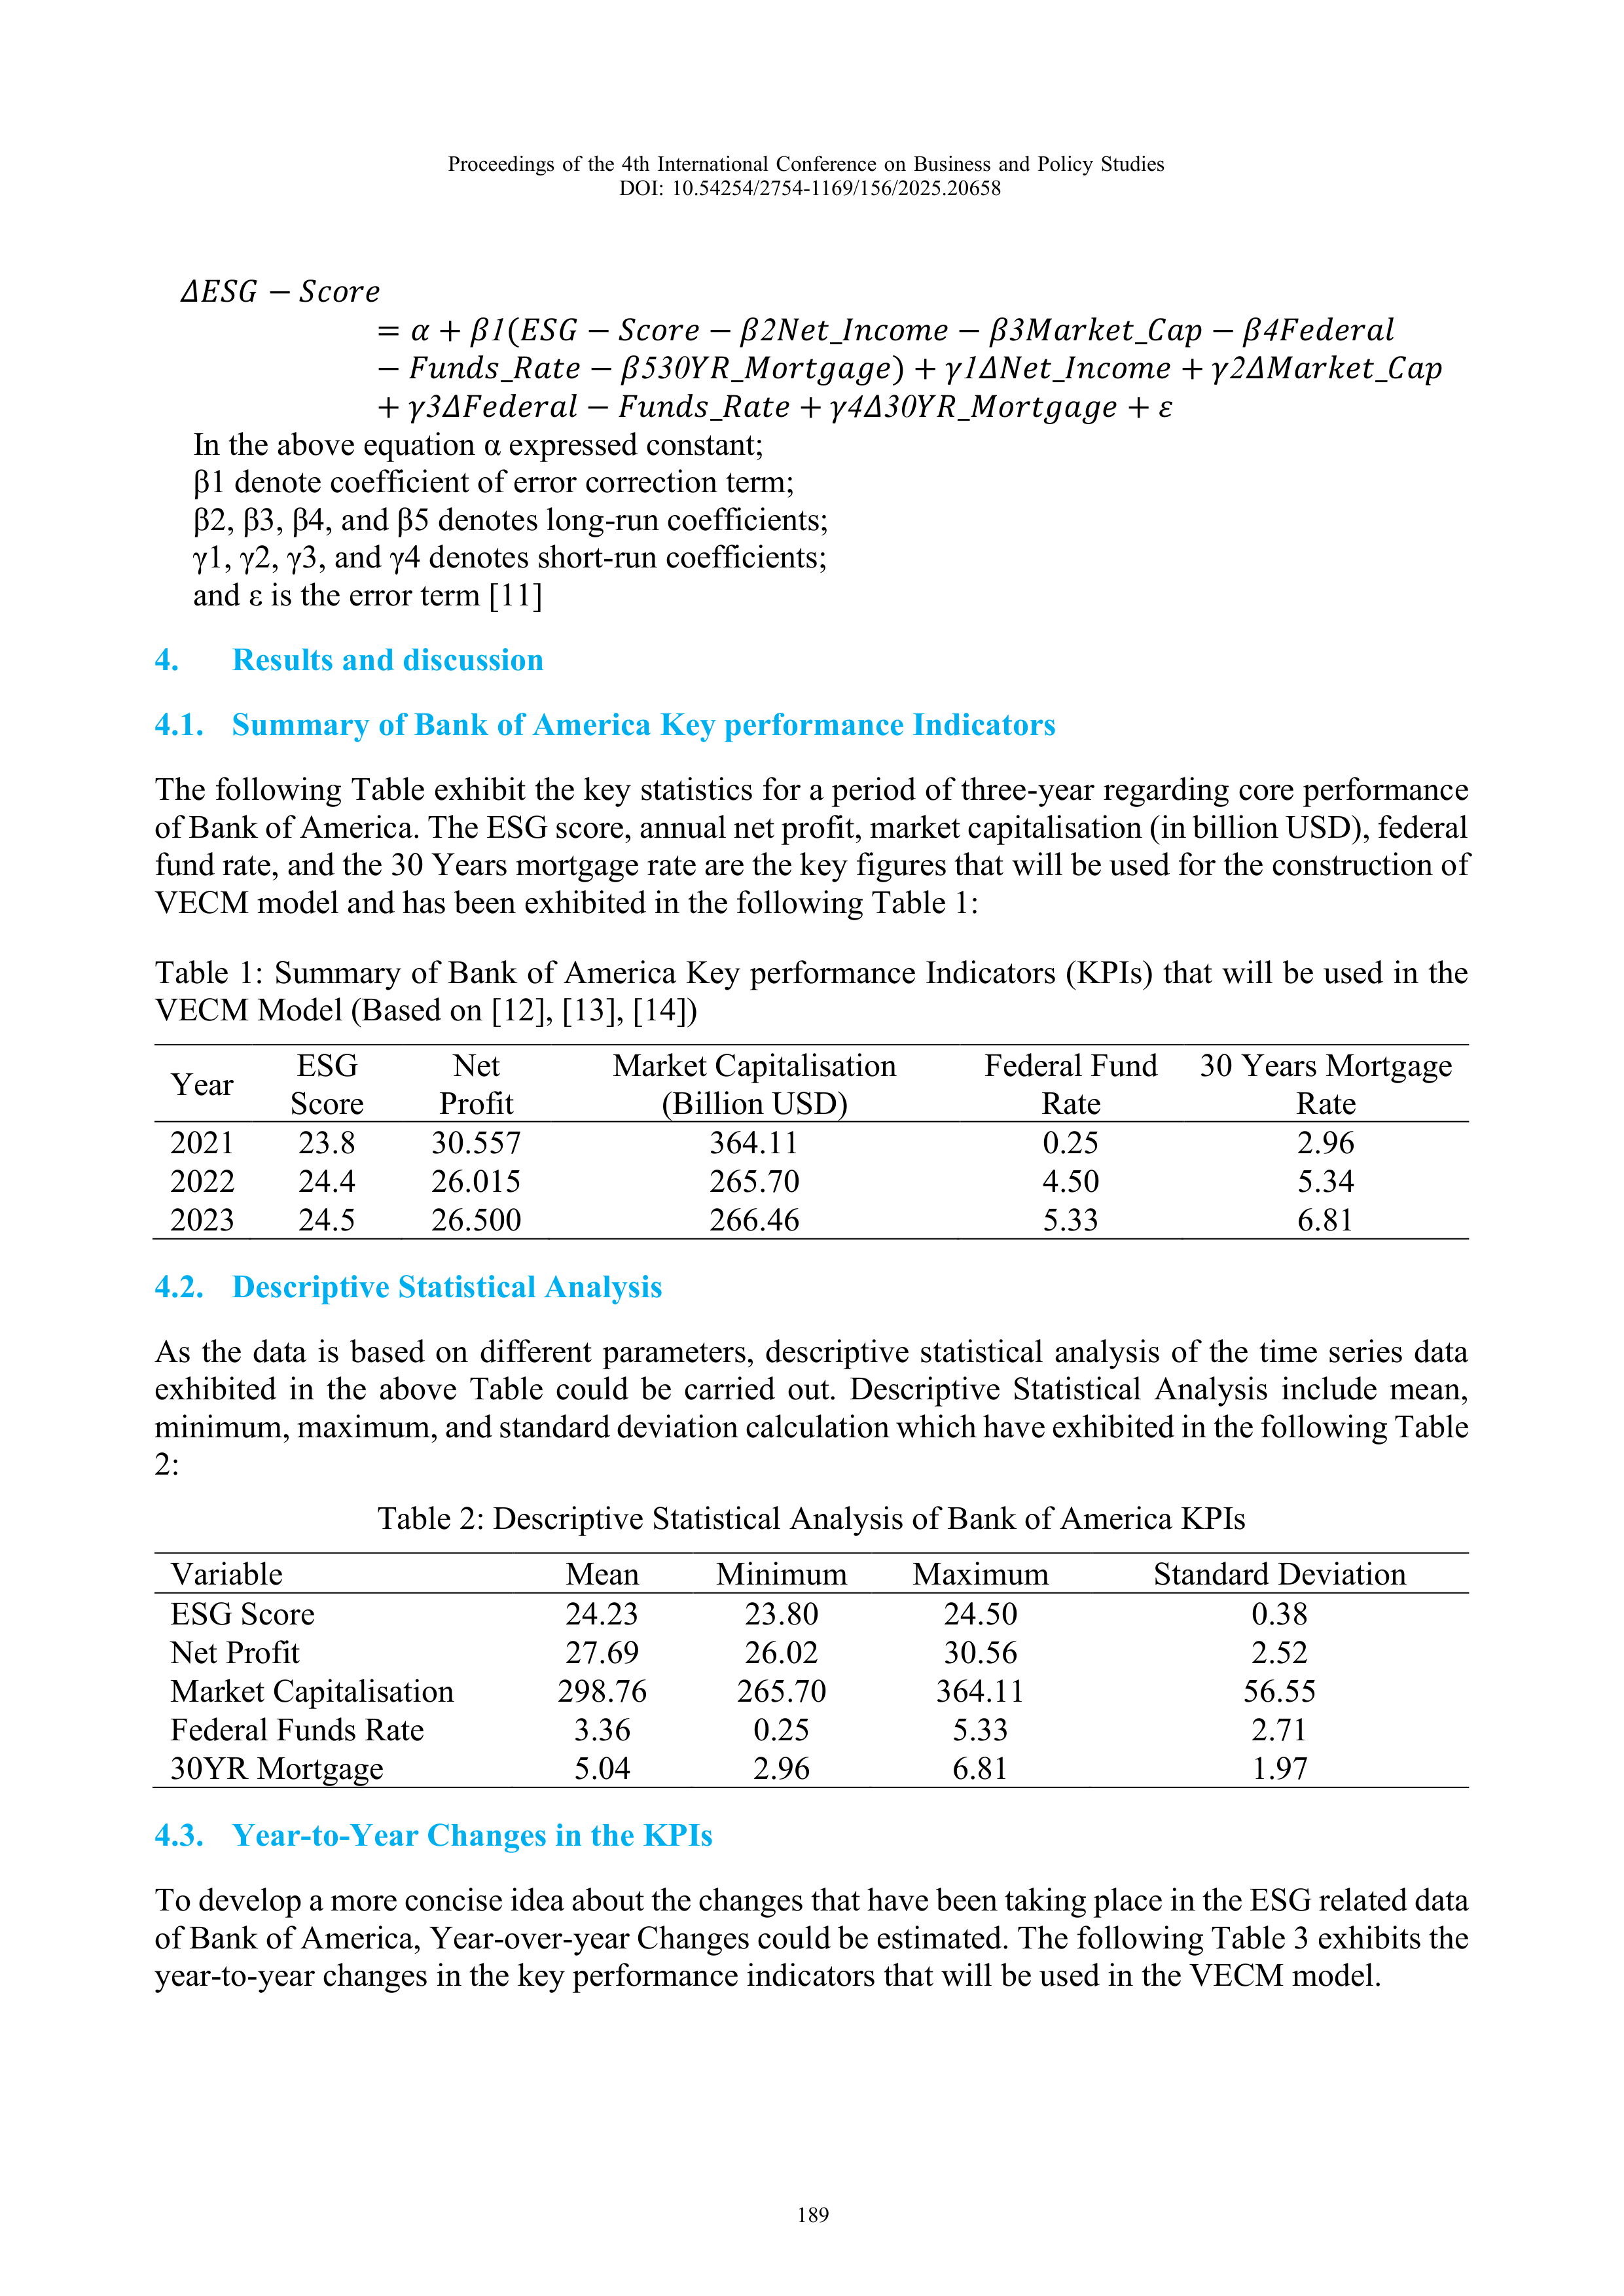
𝛥𝐸𝑆𝐺−𝑆𝑐𝑜𝑟𝑒
= 𝛼+ 𝛽
1
(𝐸𝑆𝐺−𝑆𝑐𝑜𝑟𝑒−𝛽
2
𝑁𝑒𝑡_𝐼𝑛𝑐𝑜𝑚𝑒−𝛽
3
𝑀𝑎𝑟𝑘𝑒𝑡_𝐶𝑎𝑝−𝛽
4
𝐹𝑒𝑑𝑒𝑟𝑎𝑙
−𝐹𝑢𝑛𝑑𝑠_𝑅𝑎𝑡𝑒−𝛽
530
𝑌𝑅_𝑀𝑜𝑟𝑡𝑔𝑎𝑔𝑒) + 𝛾
1
𝛥𝑁𝑒𝑡_𝐼𝑛𝑐𝑜𝑚𝑒+ 𝛾
2
𝛥𝑀𝑎𝑟𝑘𝑒𝑡_𝐶𝑎𝑝
+ 𝛾
3
𝛥𝐹𝑒𝑑𝑒𝑟𝑎𝑙−𝐹𝑢𝑛𝑑𝑠_𝑅𝑎𝑡𝑒+ 𝛾
4
𝛥
30
𝑌𝑅_𝑀𝑜𝑟𝑡𝑔𝑎𝑔𝑒+ 𝜀
In the above equation α expressed constant;
β1 denote coefficient of error correction term;
β2, β3, β4, and β5 denotes long-run coefficients;
γ1, γ2, γ3, and γ4 denotes short-run coefficients;
and ε is the error term [11]
4.
Results and discussion
4.1.
Summary of Bank of America Key performance Indicators
The following Table exhibit the key statistics for a period of three-year regarding core performance
of Bank of America. The ESG score, annual net profit, market capitalisation (in billion USD), federal
fund rate, and the 30 Years mortgage rate are the key figures that will be used for the construction of
VECM model and has been exhibited in the following Table 1:
Table 1: Summary of Bank of America Key performance Indicators (KPIs) that will be used in the
VECM Model (Based on [12], [13], [14])
Year
ESG
Score
Net
Profit
Market Capitalisation
(Billion USD)
Federal Fund
Rate
30 Years Mortgage
Rate
2021
23.8
30.557
364.11
0.25
2.96
2022
24.4
26.015
265.70
4.50
5.34
2023
24.5
26.500
266.46
5.33
6.81
4.2.
Descriptive Statistical Analysis
As the data is based on different parameters, descriptive statistical analysis of the time series data
exhibited in the above Table could be carried out. Descriptive Statistical Analysis include mean,
minimum, maximum, and standard deviation calculation which have exhibited in the following Table
2:
Table 2: Descriptive Statistical Analysis of Bank of America KPIs
Variable
Mean
Minimum
Maximum
Standard Deviation
ESG Score
24.23
23.80
24.50
0.38
Net Profit
27.69
26.02
30.56
2.52
Market Capitalisation
298.76
265.70
364.11
56.55
Federal Funds Rate
3.36
0.25
5.33
2.71
30YR Mortgage
5.04
2.96
6.81
1.97
4.3.
Year-to-Year Changes in the KPIs
To develop a more concise idea about the changes that have been taking place in the ESG related data
of Bank of America, Year-over-year Changes could be estimated. The following Table 3 exhibits the
year-to-year changes in the key performance indicators that will be used in the VECM model.
Proceedings of the 4th International Conference on Business and Policy Studies
DOI: 10.54254/2754-1169/156/2025.20658
189
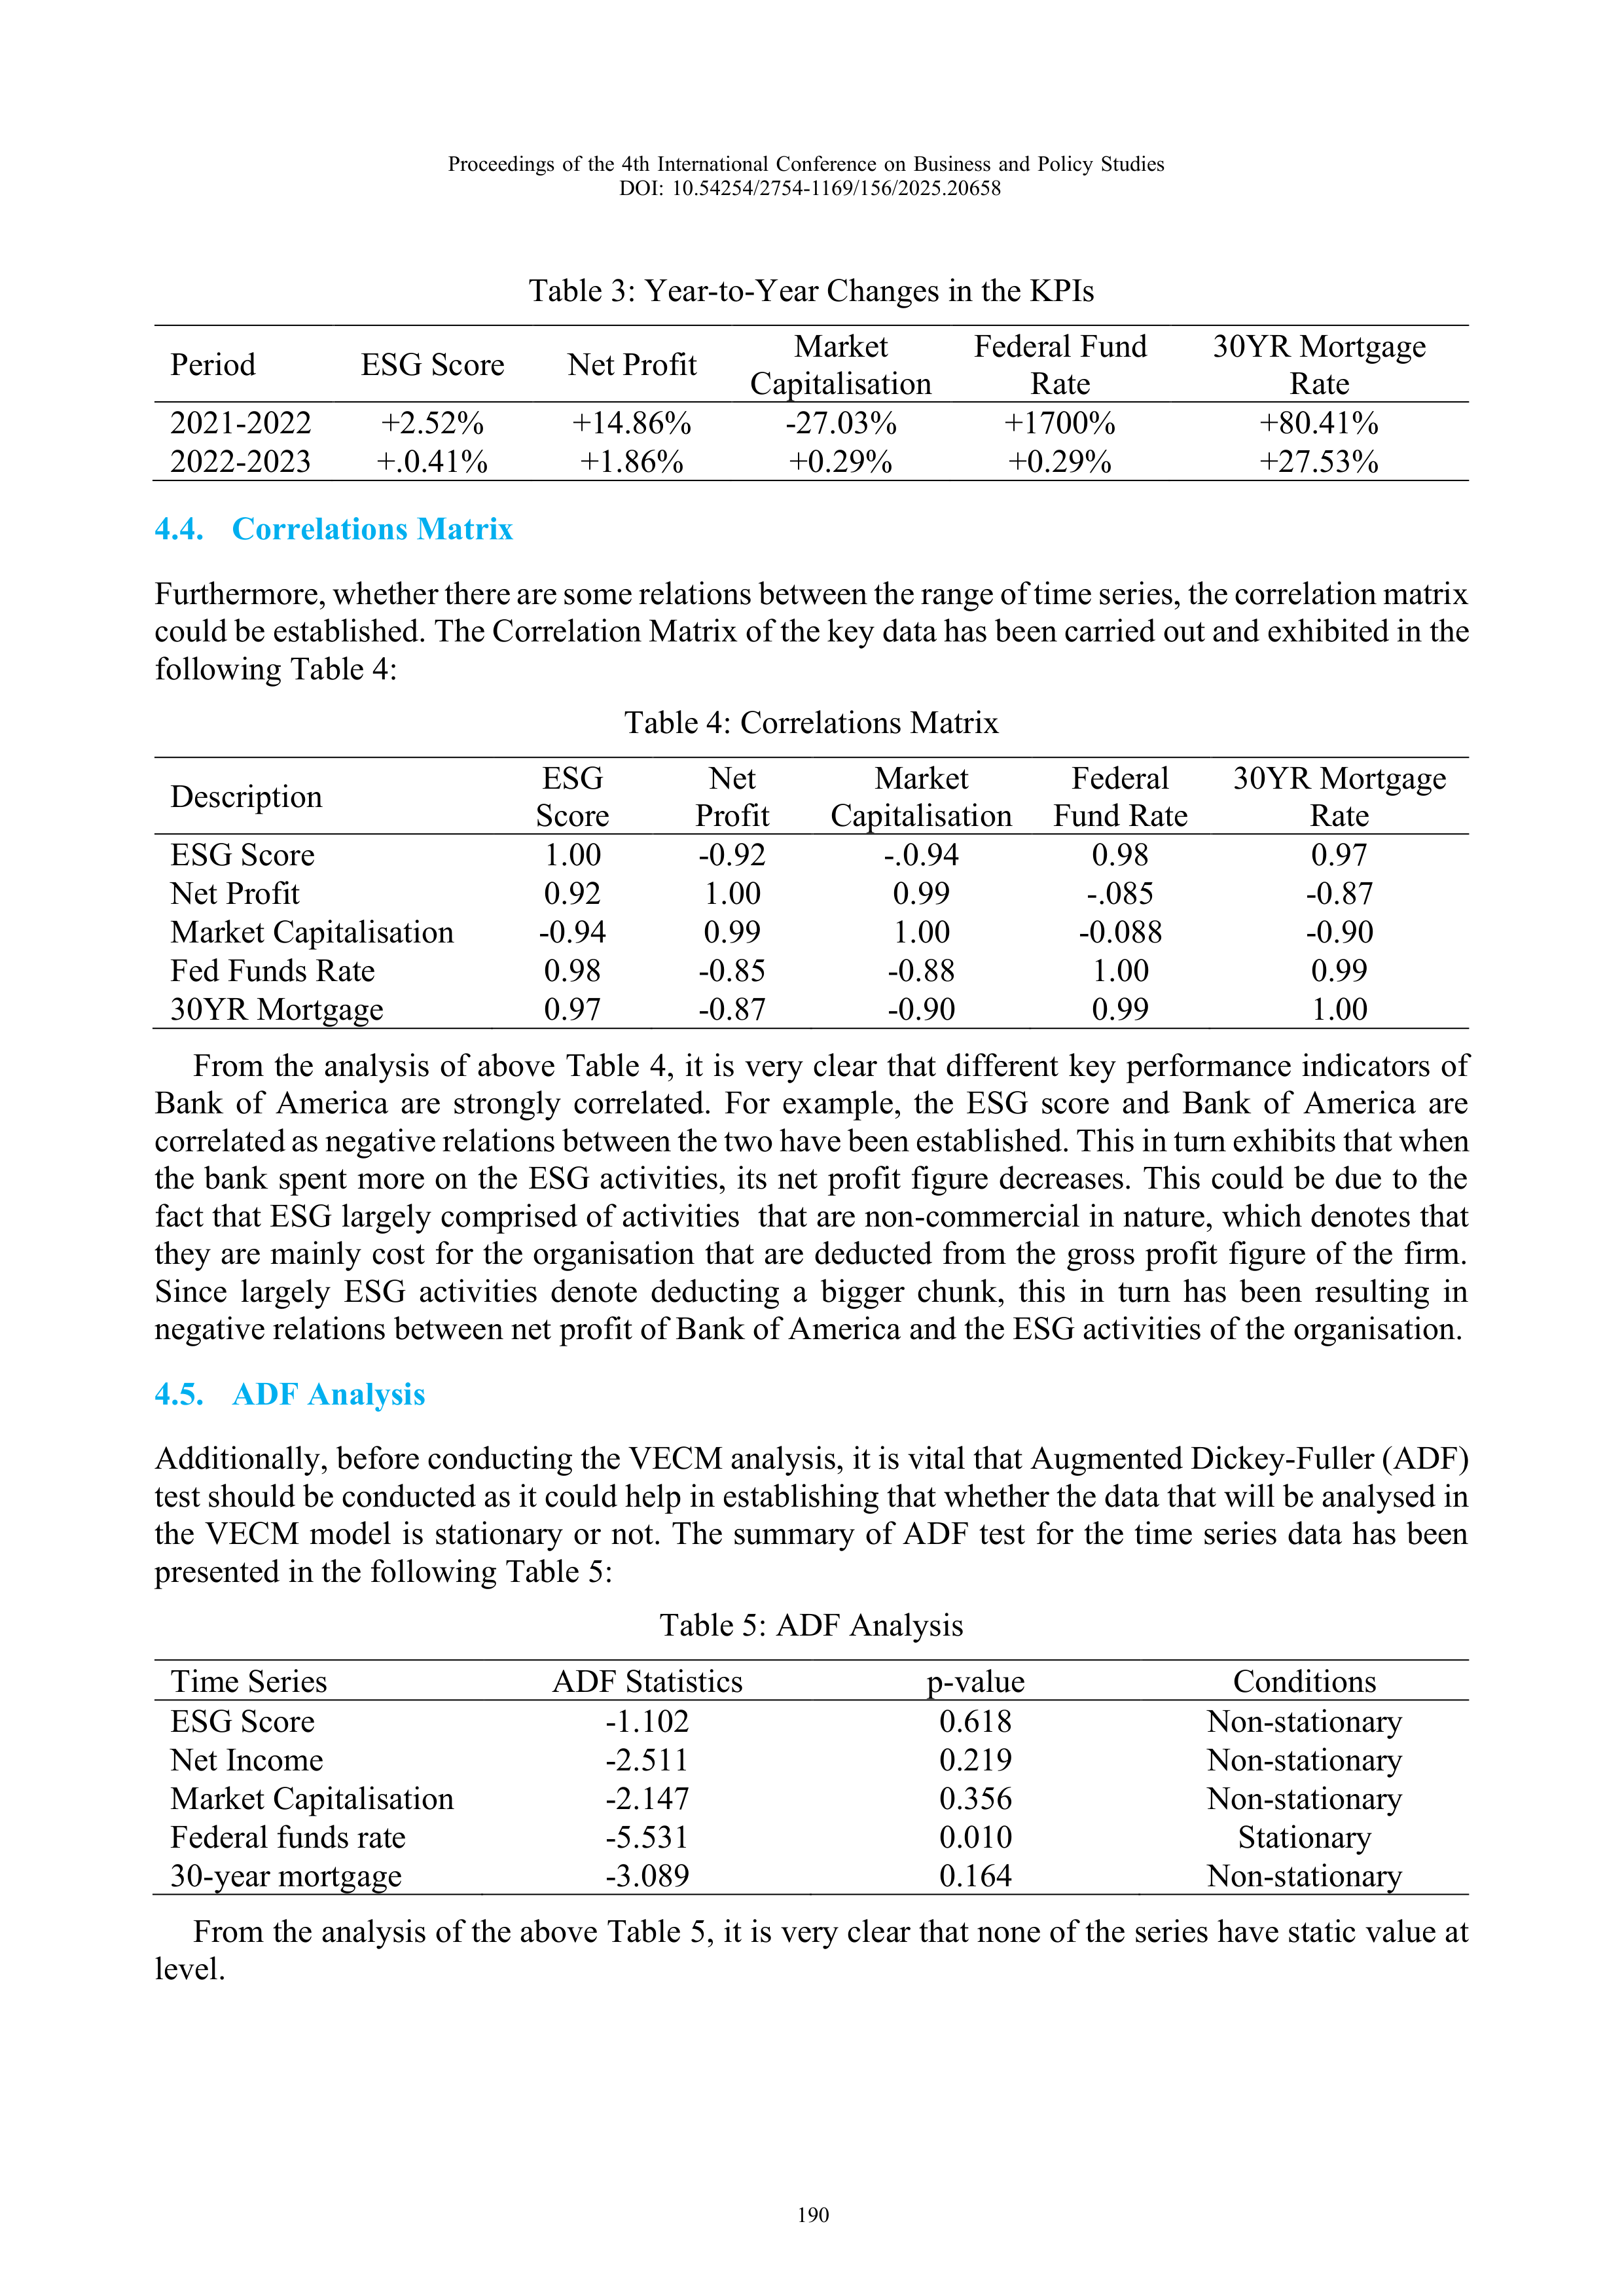
Table 3: Year-to-Year Changes in the KPIs
Period
ESG Score
Net Profit
Market
Capitalisation
Federal Fund
Rate
30YR Mortgage
Rate
2021-2022
+2.52%
+14.86%
-27.03%
+1700%
+80.41%
2022-2023
+.0.41%
+1.86%
+0.29%
+0.29%
+27.53%
4.4.
Correlations Matrix
Furthermore, whether there are some relations between the range of time series, the correlation matrix
could be established. The Correlation Matrix of the key data has been carried out and exhibited in the
following Table 4:
Table 4: Correlations Matrix
Description
ESG
Score
Net
Profit
Market
Capitalisation
Federal
Fund Rate
30YR Mortgage
Rate
ESG Score
1.00
-0.92
-.0.94
0.98
0.97
Net Profit
0.92
1.00
0.99
-.085
-0.87
Market Capitalisation
-0.94
0.99
1.00
-0.088
-0.90
Fed Funds Rate
0.98
-0.85
-0.88
1.00
0.99
30YR Mortgage
0.97
-0.87
-0.90
0.99
1.00
From the analysis of above Table 4, it is very clear that different key performance indicators of
Bank of America are strongly correlated. For example, the ESG score and Bank of America are
correlated as negative relations between the two have been established. This in turn exhibits that when
the bank spent more on the ESG activities, its net profit figure decreases. This could be due to the
fact that ESG largely comprised of activities that are non-commercial in nature, which denotes that
they are mainly cost for the organisation that are deducted from the gross profit figure of the firm.
Since largely ESG activities denote deducting a bigger chunk, this in turn has been resulting in
negative relations between net profit of Bank of America and the ESG activities of the organisation.
4.5.
ADF Analysis
Additionally, before conducting the VECM analysis, it is vital that Augmented Dickey-Fuller (ADF)
test should be conducted as it could help in establishing that whether the data that will be analysed in
the VECM model is stationary or not. The summary of ADF test for the time series data has been
presented in the following Table 5:
Table 5: ADF Analysis
Time Series
ADF Statistics
p-value
Conditions
ESG Score
-1.102
0.618
Non-stationary
Net Income
-2.511
0.219
Non-stationary
Market Capitalisation
-2.147
0.356
Non-stationary
Federal funds rate
-5.531
0.010
Stationary
30-year mortgage
-3.089
0.164
Non-stationary
From the analysis of the above Table 5, it is very clear that none of the series have static value at
level.
Proceedings of the 4th International Conference on Business and Policy Studies
DOI: 10.54254/2754-1169/156/2025.20658
190
4.6.
First Level Different of Time Series Data
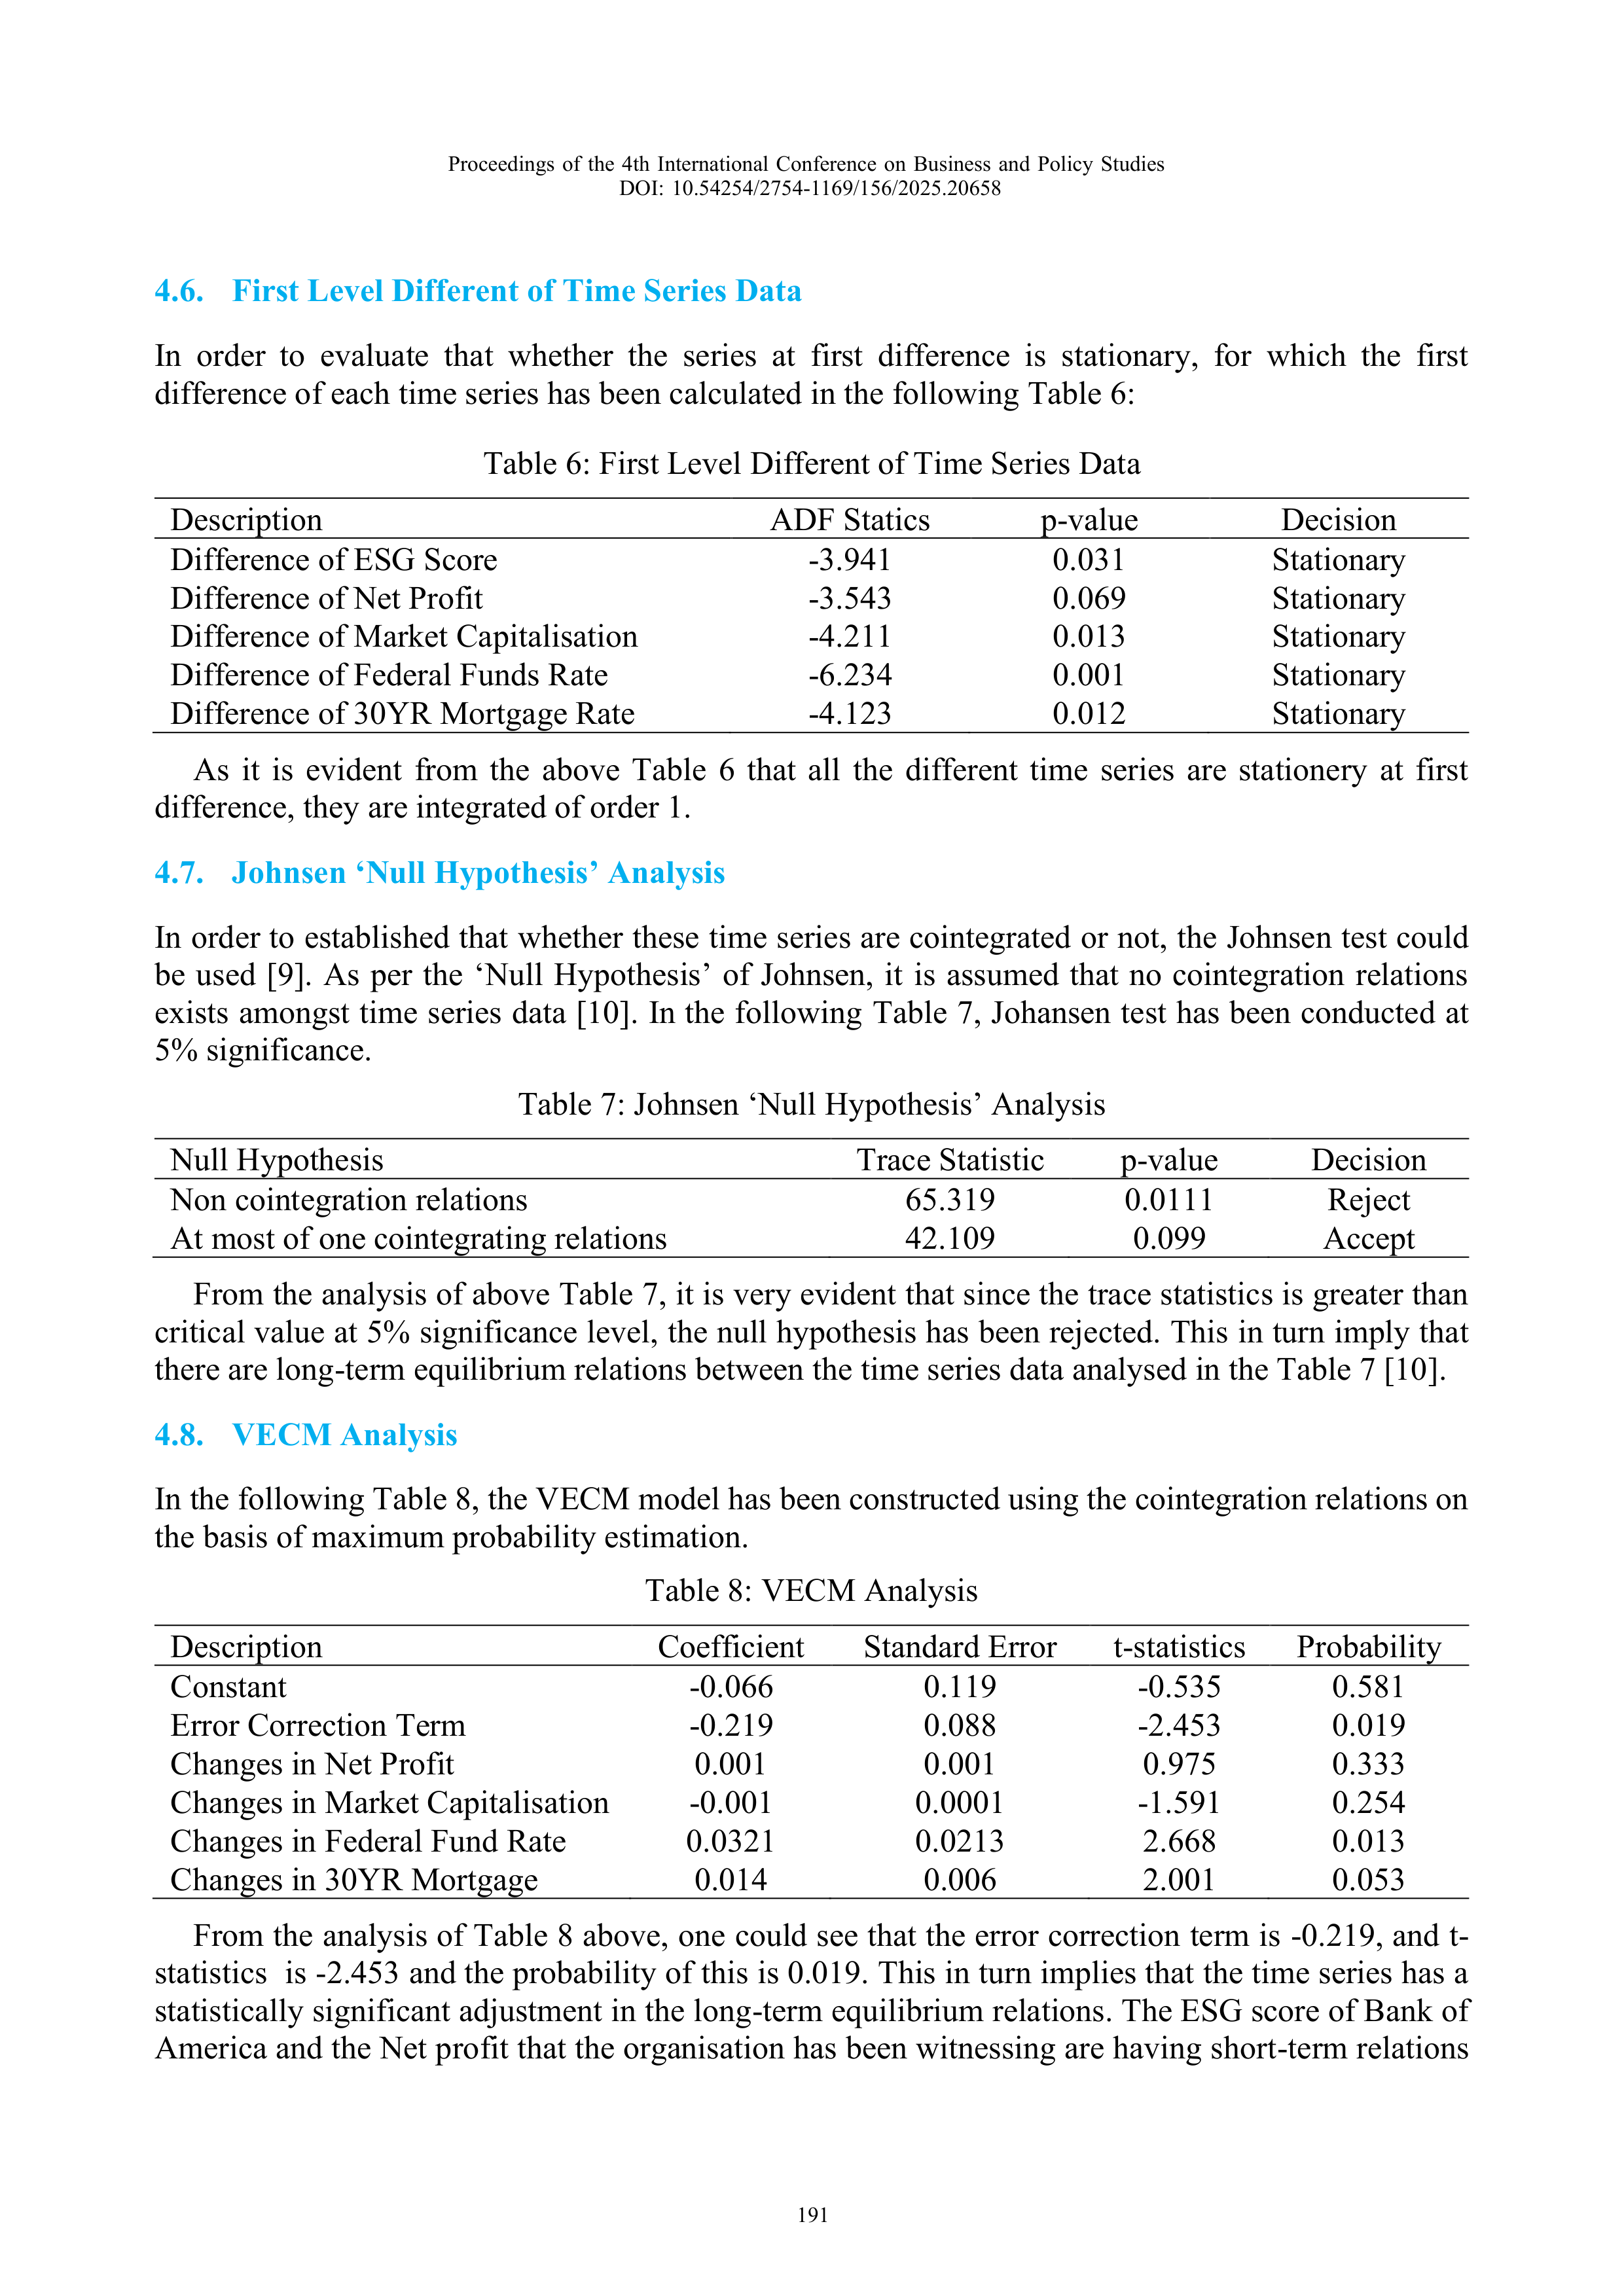
In order to evaluate that whether the series at first difference is stationary, for which the first
difference of each time series has been calculated in the following Table 6:
Table 6: First Level Different of Time Series Data
Description
ADF Statics
p-value
Decision
Difference of ESG Score
-3.941
0.031
Stationary
Difference of Net Profit
-3.543
0.069
Stationary
Difference of Market Capitalisation
-4.211
0.013
Stationary
Difference of Federal Funds Rate
-6.234
0.001
Stationary
Difference of 30YR Mortgage Rate
-4.123
0.012
Stationary
As it is evident from the above Table 6 that all the different time series are stationery at first
difference, they are integrated of order 1.
4.7.
Johnsen ‘Null Hypothesis’ Analysis
In order to established that whether these time series are cointegrated or not, the Johnsen test could
be used [9]. As per the ‘Null Hypothesis’ of Johnsen, it is assumed that no cointegration relations
exists amongst time series data [10]. In the following Table 7, Johansen test has been conducted at
5% significance.
Table 7: Johnsen ‘Null Hypothesis’ Analysis
Null Hypothesis
Trace Statistic
p-value
Decision
Non cointegration relations
65.319
0.0111
Reject
At most of one cointegrating relations
42.109
0.099
Accept
From the analysis of above Table 7, it is very evident that since the trace statistics is greater than
critical value at 5% significance level, the null hypothesis has been rejected. This in turn imply that
there are long-term equilibrium relations between the time series data analysed in the Table 7 [10].
4.8.
VECM Analysis
In the following Table 8, the VECM model has been constructed using the cointegration relations on
the basis of maximum probability estimation.
Table 8: VECM Analysis
Description
Coefficient
Standard Error
t-statistics
Probability
Constant
-0.066
0.119
-0.535
0.581
Error Correction Term
-0.219
0.088
-2.453
0.019
Changes in Net Profit
0.001
0.001
0.975
0.333
Changes in Market Capitalisation
-0.001
0.0001
-1.591
0.254
Changes in Federal Fund Rate
0.0321
0.0213
2.668
0.013
Changes in 30YR Mortgage
0.014
0.006
2.001
0.053
From the analysis of Table 8 above, one could see that the error correction term is -0.219, and t-
statistics is -2.453 and the probability of this is 0.019. This in turn implies that the time series has a
statistically significant adjustment in the long-term equilibrium relations. The ESG score of Bank of
America and the Net profit that the organisation has been witnessing are having short-term relations
Proceedings of the 4th International Conference on Business and Policy Studies
DOI: 10.54254/2754-1169/156/2025.20658
191
as well as long-term relations. In the short-term, as the organisation has been spending more on the
ESG, its corresponding net profit tend to decrease, because of the higher social and environmental
responsibilities that the organisation has been thus showing. On the basis of the VECM model, it
could be also established that there are statically significant relations between ESG score of Bank of
America and the net profit, which exhibit the short-term adjustments towards the long-term relations
between ESG score and net profit of the bank.
4.9.
Robust Test
4.9.1.
CUSUM Test
Robust test could be conducted for evaluation of stability of the parameters over a time. This could
be done through adoptions of Cumulative Sum of Recursive Residual (CUSUM) test. The CUSUM
test result has been exhibited in the following Table 9:
Table 9: CUSUM Test
Test
Statistics
Critical Value
Decision
CUSUM of Recursive Residuals
0.091
0.218
Stable
CUSUM of Squared Recursive Residuals
0.217
0.280
Stable
From the analysis of the above Table 9, one could establish that the parameters used in the VECM
model are stable over time.
4.9.2.
Ljung-Box Test
Furthermore, in order to evaluate that whether autocorrelations exist between time series data, the
Ljung-Box test could be performed. Through Ljung-Box test the autocorrelations in residuals up to
certain leg could be established, which has been exhibited in the following Table 10:
Table 10: Ljung-Box Test
Lag
Ljung-Box Statistics
p-value
1
2.09
0.147
5
2.83
0.731
10
6.03
0.793
From the analysis of above Table 10, it is very evident that as all lags are greater 0.05, there is no
autocorrelations in the residuals. From the analysis of this, it can be established that VECM model is
well-specific and the residual values are not correlated over time.
4.9.3.
Jarque-Bera Test
Moreover, Jarque-Bera test could be performed to evaluate the normality-based on skewness and
kurtosis of the residuals. The results of the Jarque-Bera of the VECM are sum-up in the following
Table 11:
Table 11: Jarque-Bera Test
Jarque-Bera Statistics
p-value
0.15
.927
From the analysis of above Table 11, it could be established that since p-value for the Jarque-Bera
is greater than 0.005, the residuals are normally distributed. From this, it could be also established
Proceedings of the 4th International Conference on Business and Policy Studies
DOI: 10.54254/2754-1169/156/2025.20658
192
that the VECM model is well-specific, as the residuals are not significantly different from the normal
distribution of the time series.
4.9.4.
Breusch-Pagan Test
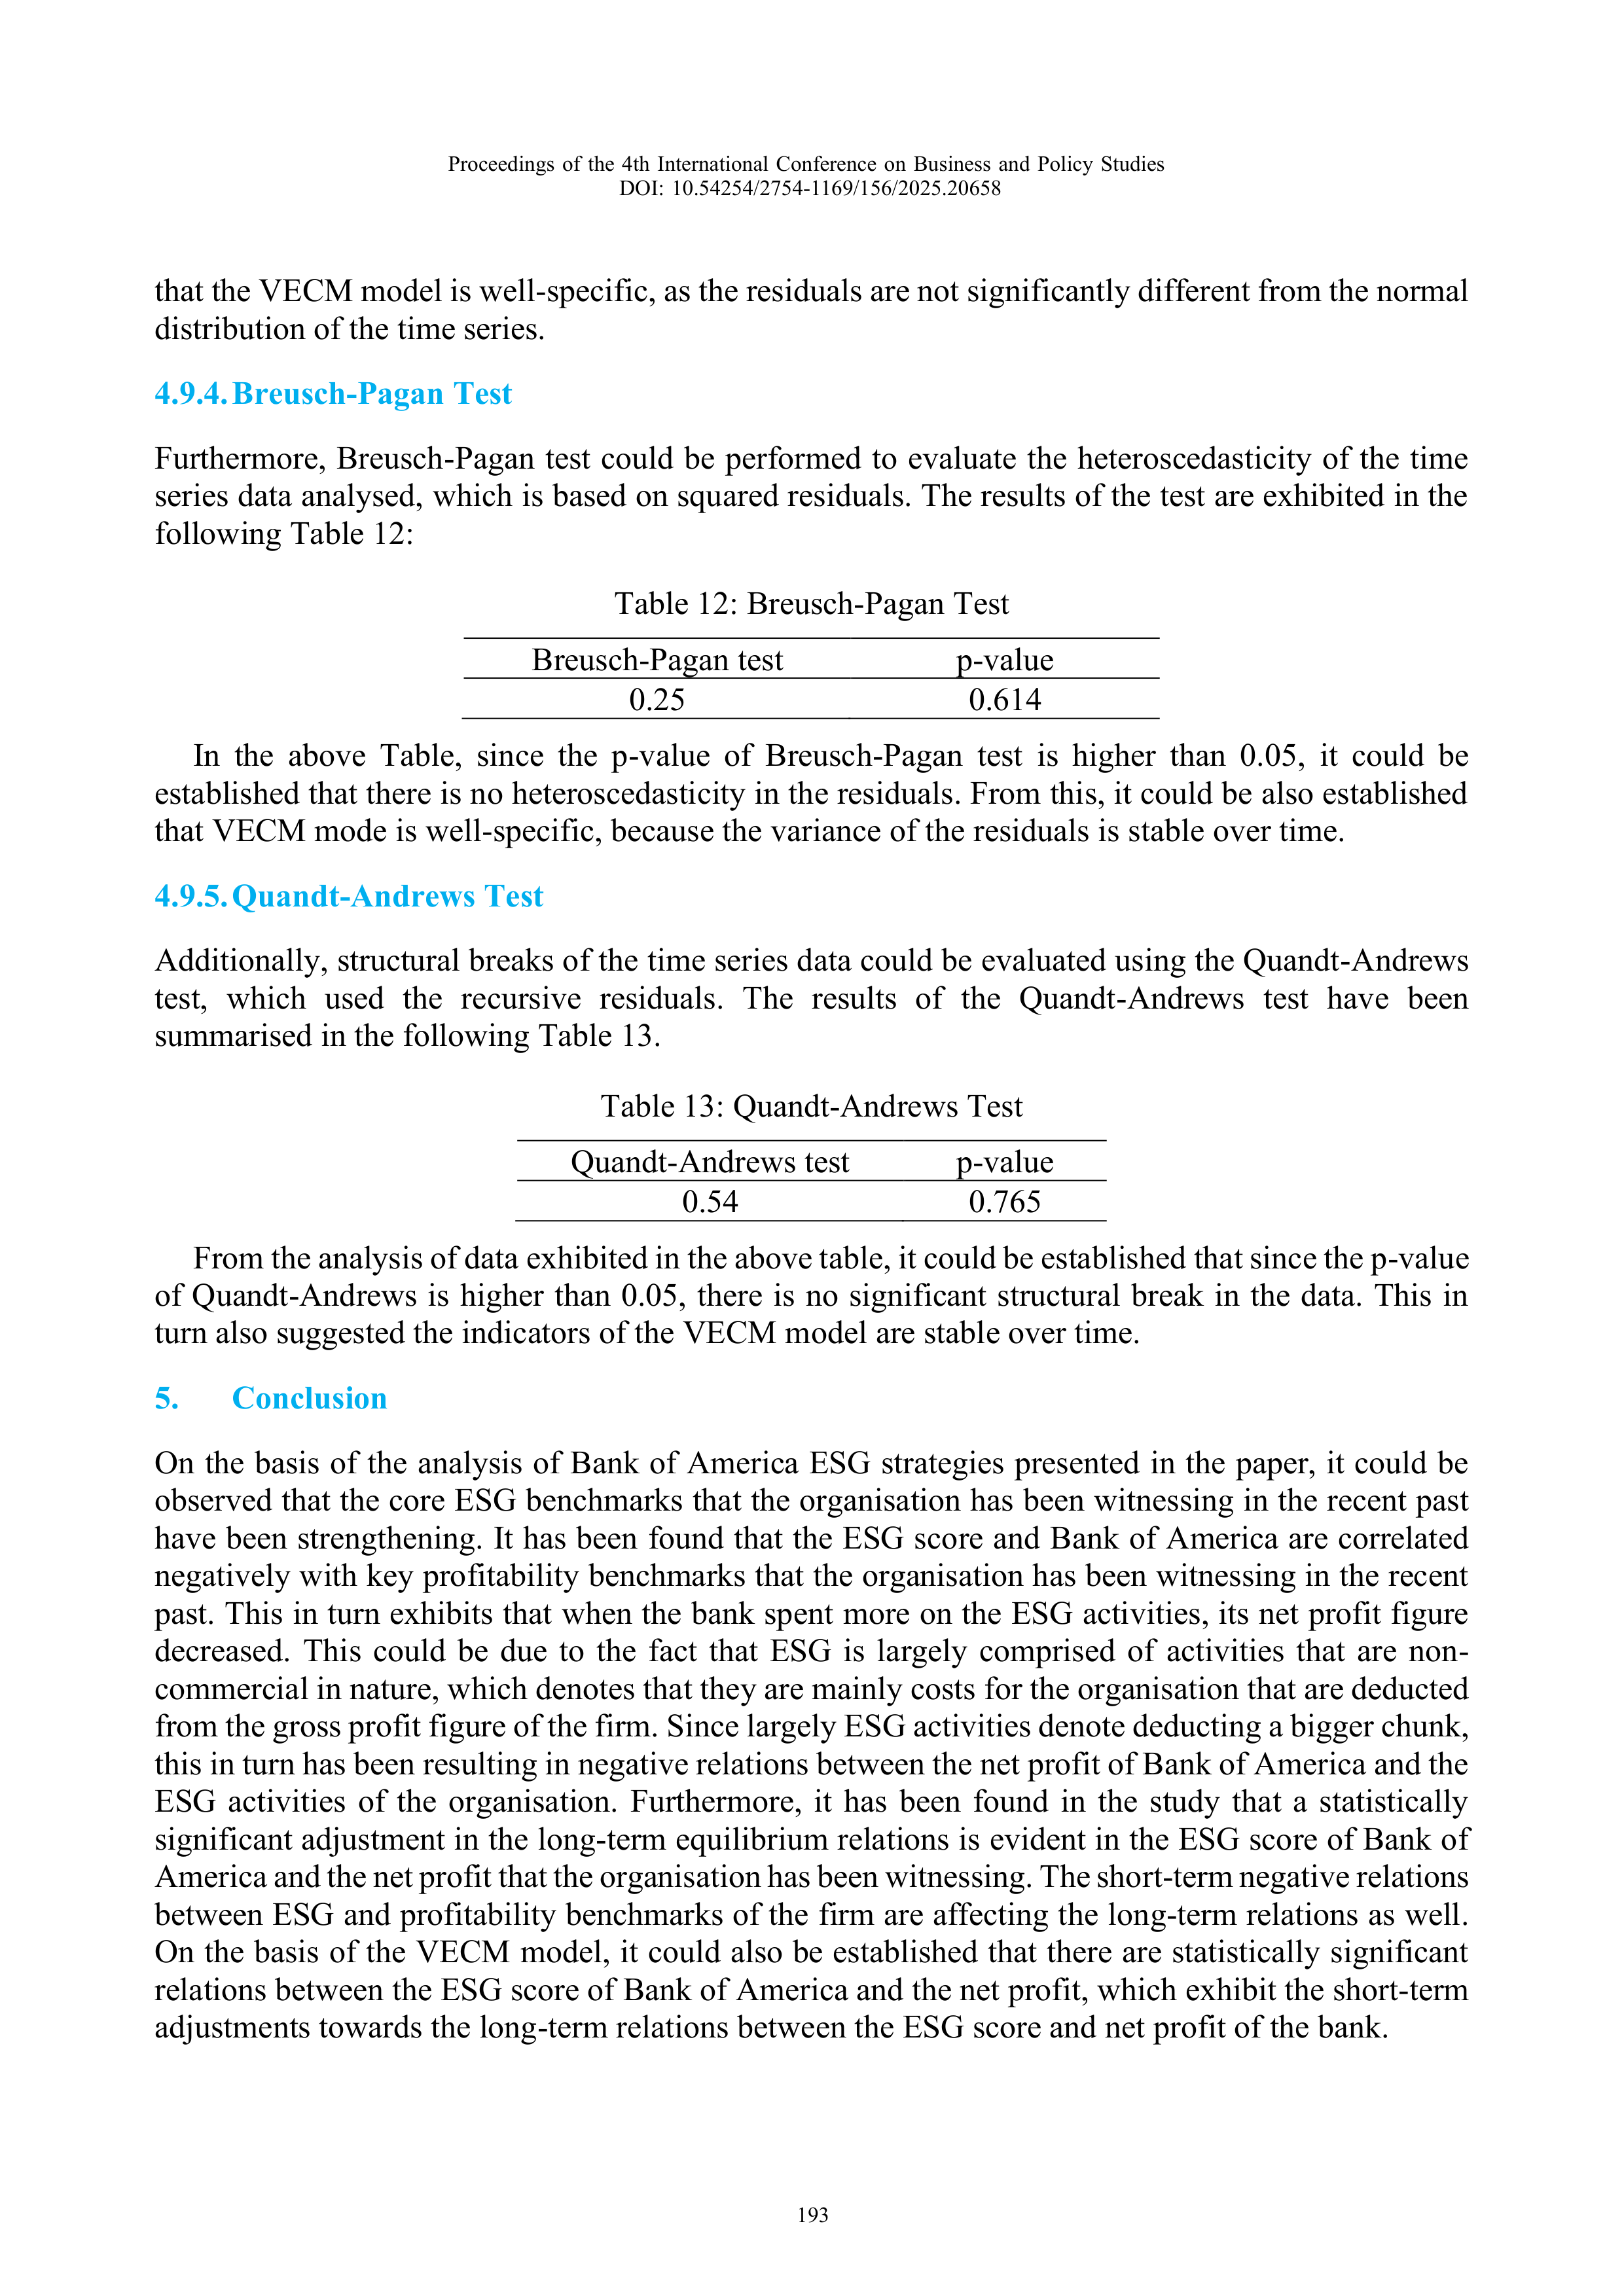
Furthermore, Breusch-Pagan test could be performed to evaluate the heteroscedasticity of the time
series data analysed, which is based on squared residuals. The results of the test are exhibited in the
following Table 12:
Table 12: Breusch-Pagan Test
Breusch-Pagan test
p-value
0.25
0.614
In the above Table, since the p-value of Breusch-Pagan test is higher than 0.05, it could be
established that there is no heteroscedasticity in the residuals. From this, it could be also established
that VECM mode is well-specific, because the variance of the residuals is stable over time.
4.9.5.
Quandt-Andrews Test
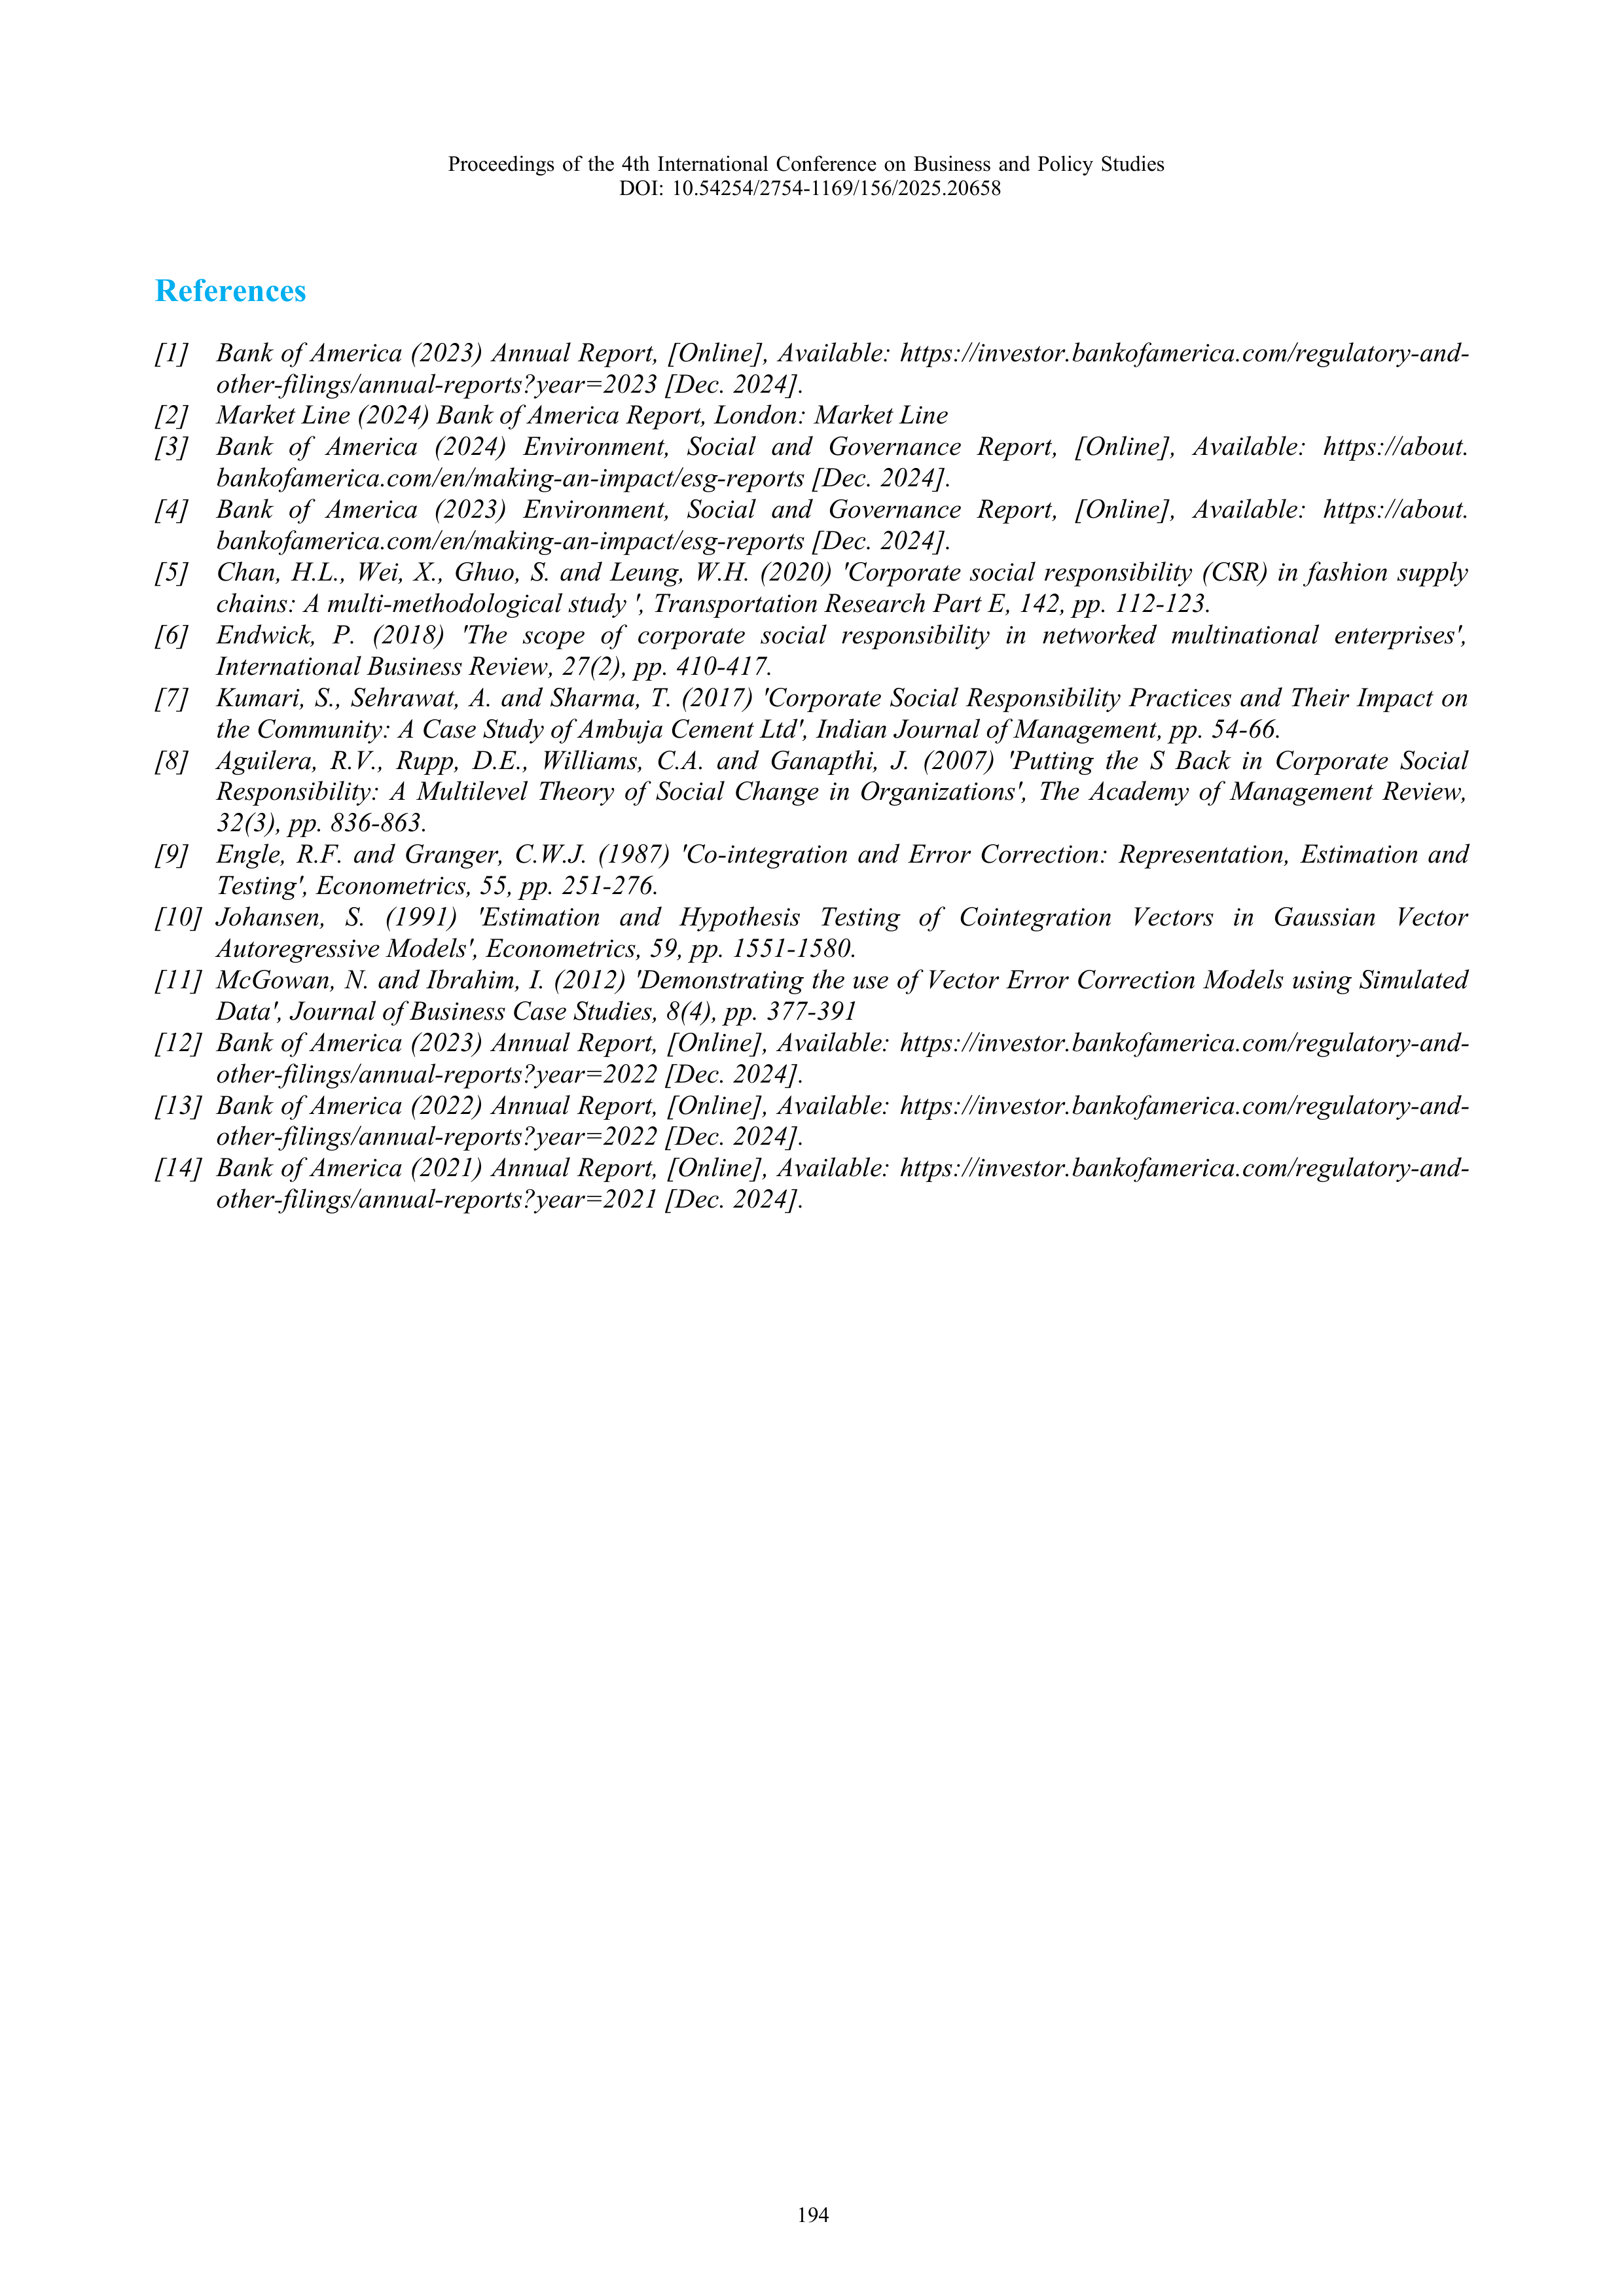
Additionally, structural breaks of the time series data could be evaluated using the Quandt-Andrews
test, which used the recursive residuals. The results of the Quandt-Andrews test have been
summarised in the following Table 13.
Table 13: Quandt-Andrews Test
Quandt-Andrews test
p-value
0.54
0.765
From the analysis of data exhibited in the above table, it could be established that since the p-value
of Quandt-Andrews is higher than 0.05, there is no significant structural break in the data. This in
turn also suggested the indicators of the VECM model are stable over time.
5.
Conclusion
On the basis of the analysis of Bank of America ESG strategies presented in the paper, it could be
observed that the core ESG benchmarks that the organisation has been witnessing in the recent past
have been strengthening. It has been found that the ESG score and Bank of America are correlated
negatively with key profitability benchmarks that the organisation has been witnessing in the recent
past. This in turn exhibits that when the bank spent more on the ESG activities, its net profit figure
decreased. This could be due to the fact that ESG is largely comprised of activities that are non-
commercial in nature, which denotes that they are mainly costs for the organisation that are deducted
from the gross profit figure of the firm. Since largely ESG activities denote deducting a bigger chunk,
this in turn has been resulting in negative relations between the net profit of Bank of America and the
ESG activities of the organisation. Furthermore, it has been found in the study that a statistically
significant adjustment in the long-term equilibrium relations is evident in the ESG score of Bank of
America and the net profit that the organisation has been witnessing. The short-term negative relations
between ESG and profitability benchmarks of the firm are affecting the long-term relations as well.
On the basis of the VECM model, it could also be established that there are statistically significant
relations between the ESG score of Bank of America and the net profit, which exhibit the short-term
adjustments towards the long-term relations between the ESG score and net profit of the bank.
Proceedings of the 4th International Conference on Business and Policy Studies
DOI: 10.54254/2754-1169/156/2025.20658
193
References
[1]
Bank of America (2023) Annual Report, [Online], Available: https://investor.bankofamerica.com/regulatory-and-
other-filings/annual-reports?year=2023 [Dec. 2024].
[2]
Market Line (2024) Bank of America Report, London: Market Line
[3]
Bank of America (2024) Environment, Social and Governance Report, [Online], Available: https://about.
bankofamerica.com/en/making-an-impact/esg-reports [Dec. 2024].
[4]
Bank of America (2023) Environment, Social and Governance Report, [Online], Available: https://about.
bankofamerica.com/en/making-an-impact/esg-reports [Dec. 2024].
[5]
Chan, H.L., Wei, X., Ghuo, S. and Leung, W.H. (2020) 'Corporate social responsibility (CSR) in fashion supply
chains: A multi-methodological study ', Transportation Research Part E, 142, pp. 112-123.
[6]
Endwick, P. (2018) 'The scope of corporate social responsibility in networked multinational enterprises',
International Business Review, 27(2), pp. 410-417.
[7]
Kumari, S., Sehrawat, A. and Sharma, T. (2017) 'Corporate Social Responsibility Practices and Their Impact on
the Community: A Case Study of Ambuja Cement Ltd', Indian Journal of Management, pp. 54-66.
[8]
Aguilera, R.V., Rupp, D.E., Williams, C.A. and Ganapthi, J. (2007) 'Putting the S Back in Corporate Social
Responsibility: A Multilevel Theory of Social Change in Organizations', The Academy of Management Review,
32(3), pp. 836-863.
[9]
Engle, R.F. and Granger, C.W.J. (1987) 'Co-integration and Error Correction: Representation, Estimation and
Testing', Econometrics, 55, pp. 251-276.
[10]
Johansen, S. (1991) 'Estimation and Hypothesis Testing of Cointegration Vectors in Gaussian Vector
Autoregressive Models', Econometrics, 59, pp. 1551-1580.
[11]
McGowan, N. and Ibrahim, I. (2012) 'Demonstrating the use of Vector Error Correction Models using Simulated
Data', Journal of Business Case Studies, 8(4), pp. 377-391
[12]
Bank of America (2023) Annual Report, [Online], Available: https://investor.bankofamerica.com/regulatory-and-
other-filings/annual-reports?year=2022 [Dec. 2024].
[13]
Bank of America (2022) Annual Report, [Online], Available: https://investor.bankofamerica.com/regulatory-and-
other-filings/annual-reports?year=2022 [Dec. 2024].
[14]
Bank of America (2021) Annual Report, [Online], Available: https://investor.bankofamerica.com/regulatory-and-
other-filings/annual-reports?year=2021 [Dec. 2024].
Proceedings of the 4th International Conference on Business and Policy Studies
DOI: 10.54254/2754-1169/156/2025.20658
194