2024 Environmental Social Governance Report







OUR
APPROACH
Our Environmental, Social and
Governance (ESG) framework
is informed by relevant
reporting frameworks –
including the Sustainability
Accounting Standards Board
(SASB), Global Reporting
Initiative (GRI) and Task
Force on Climate-Related
Financial Disclosures (TCFD).
INTRODUCTION
Introduction
3
About Netflix
3
ENVIRONMENT
Sustainability Strategy
5
Industry Collaboration
17
Climate Risk
18
OUTER BANKS
MR. PLANKTON
SOCIAL
The Netflix Culture
20
Investing in Our
Communities
27
Privacy, Security and
Accessibility on Our Service
28
GOVERNANCE
Corporate Governance
31
Enterprise Risk
33
Ethics and Compliance
33
IP Protection & Piracy
33
THE LINCOLN LAWYER
SWEET TOOTH
APPENDIX
About This Report
35
ESG Data Table
36
SASB Index
39
TCFD Index
40
Resources
42
GHG Emissions
Inventory Methodology
43
Carbon Credit Project
Screening Criteria
44
CONTENTS
Introduction
Environment
Social
Governance
Appendix
2







Introduction
At Netflix, we’re on a mission to entertain
the world with amazing films, series and
games that inspire and thrill audiences
everywhere. It’s an ambitious goal and
why we work hard to manage our business
responsibly and for the long term.
Our latest ESG Report reflects our work
and progress in support of our mission. In
this report, you’ll find that we continue to:
Decarbonize
our operations,
including the productions
of our films and series
Environment
Invest in
our people
around
the world and develop the
next generation of talent
Social
Maintain our
corporate governance
structure to support healthy growth
and create long-term shareholder value
Governance
Our progress in these areas, combined
with a strong slate of high quality
shows and movies, help us on our
journey to build the most loved and
valued entertainment company for our
members, creators and shareholders.
About
Netflix
founded in
1997
public in
2002
first slate of original
programming released
2013
Today
approximate employees
1
14k
estimated audience
700m
+
languages
streamed
50
+
countries
streamed
190
+
countries where films
and series are created
50
+
1
As of December 31, 2024
Contents
INTRODUCTION
Environment
Social
Governance
Appendix
3




OUTER BANKS
ENVIRONMENT
We are working to modernize our operations and
productions to be more efficient and sustainable, engaging
with business partners and vendors to decarbonize
our value chain, managing climate risks and supporting
creators who want to highlight sustainability on screen.
Sustainability Strategy
5
Industry Collaboration
17
Climate Risk
18
Contents
Introduction
ENVIRONMENT
Social
Governance
Appendix
4

Sustainability
Strategy
Sustainability in Our
Operations and Value Chain
Netflix established climate targets in 2021 to align our
business with the global transition to a clean economy.
These targets are measured in years, not decades.
Our Climate Targets
We continue to make progress against our targets:
1
Reduce our emissions
by roughly half by 2030
2
2
Match our remaining emissions from
2022 onwards
through investments in
verified natural climate solutions and super
pollutant (e.g., methane) destruction, in
support of global net zero goals
Beyond 2030, Netflix will continue to reduce
our emissions in line with the latest climate
science until global net zero is achieved.
3
2
Refer to the “Decarbonization Target” table for our specific
emissions reduction targets, which have been validated
by the Science Based Targets Initiative (SBTi).
3
There is currently a lack of alignment, clarity, and harmonization
around the universal definition of organizational net
zero. We are monitoring the development of standards
and frameworks and expect to align future targets.
Decarbonization Target
Netflix
Emissions
Reduction
Actions
Fuel
Energy Efficiency
Electric Vehicles
Clean Mobile Power
Renewable Fuels
Electricity
Energy Efficiency
Renewable
Energy
Provider
Engagement
Target
SBTi-
Validated
46
%
Absolute Reduction in
Scopes 1 and 2 Emissions
(from a 2019 baseline)
Terminology
Our
“Sphere of Control”
Absolute Reduction Goal
Value Chain
Demand Signaling
Technology
Accelerators
Educational
Offerings
55
%
Intensity Reduction
in Scope 3 Emissions
(per million $ value added
4
from a 2019 baseline)
Our
“Sphere
of Influence”
Intensity
Reduction Goal
4
“Value Added” is a term used by SBTi. For Netflix, this is derived by subtracting “Cost of Revenues”
from “Revenues”, both of which are reported in our public financial statements.
We achieve these targets
through measuring, reducing
and matching our emissions:
Measuring Our Emissions:
We calculate our
greenhouse gas (GHG) emissions (“Carbon
Footprint”) annually in accordance with the
Greenhouse Gas Protocol, and receive third party
assurance from Ernst & Young LLP (EY). This helps
us track progress and prioritize our actions.
Reducing Our Emissions:
We work to reduce our
Scopes 1 (fuel), 2 (electricity) and 3 (value chain)
emissions in line with our science-based targets, and
report our progress along the way. We continuously
measure our progress through specific emissions
avoidance tracking and our annual emissions
accounting.
5
Learn about our specific efforts in our
operations and value chain sections of the report.
Matching Our Remaining Emissions:
In
addition to reducing emissions, each year
(starting in 2022) we match a) non-renewable
electricity use with renewable energy credits,
where possible, and b) all remaining emissions
across Scopes 1-3 by purchasing and retiring
third-party verified carbon credits.
To help guide us, in 2021 we created
an independent Advisory Group made
up of scientists and other experts.
Full List
5
Emissions reductions noted throughout the
report are based on a comparison of actual
annual emissions between years as noted.
Climate Risk
Industry
Collaboration
Contents
Introduction
ENVIRONMENT
Social
Governance
Appendix
Sustainability
Strategy
5




Our Carbon Footprint
We measure our carbon footprint by collecting, validating, and calculating data from across the business.
These annual emissions totals inform our strategy and serve as a measure of progress against our reduction
targets. Our independent accountants, EY, have provided limited assurance over our 2020-2024 Scopes
1, 2 and 3 GHG inventories
6
and our retirement of carbon credits (refer to the assurance letter here).
2019
2020
2021
2022
2023
2024
MARKET-BASED
(Metric Tons CO
2
e)
Market-based reporting reflects emissions
from the specific electricity Netflix purchases. It
takes into account direct energy contracts with
suppliers and/or energy attribute certificates
such as renewable energy certificates (RECs).
Scope 1
51,487
30,883
62,815
59,388
25,790
50,488
Scope 2
565
141
0
0
0
0
Scope 3
1,192,659
1,020,541
1,466,497
1,086,833
817,317
986,738
TOTAL
1,244,711
1,051,565
1,529,312
1,146,221
843,107
1,037,226
LOCATION-BASED
(Metric Tons CO
2
e)
Location-based reporting calculates emissions
based on the average emission intensity of
the power grid Netflix locations are physically
connected to. It does not take into account
electricity contracts that may be in place.
Scope 1
51,487
30,883
62,815
59,388
25,790
50,488
Scope 2
26,594
28,585
42,291
41,411
30,303
40,684
Scope 3
1,234,936
1,067,778
1,471,243
1,110,989
840,778
1,037,952
TOTAL
1,313,017
1,127,246
1,576,349
1,211,788
896,871
1,129,124
TARGET-BASED
(Metric Tons CO
2
e)
Target-based reporting, specific to Netflix,
uses EY assured emissions data and
accounting methodologies, excluding the
application of retail RECs in our Scopes
2 and 3 emissions and incorporating the
emissions reductions associated with
sustainable aviation fuel certificates (SAFc)
in our Scopes 1 and 3 emissions. Refer
to the appendix for further details.
Scope 1
51,487
30,883
62,815
59,388
25,790
49,647
Scope 2
26,317
29,356
31,937
23,622
15,281
25,353
TOTAL
(Scopes 1 and 2)
77,804
60,239
94,752
83,010
41,071
75,000
Scope 3
SBTi Boundary
7
(Metric Tons CO
2
e)
867,804
745,436
1,043,612
805,704
646,848
862,884
Value Added
($ millions,
refer to footnote 4)
7,716
9,720
12,365
12,447
14,008
17,963
Scope 3
Target-Based Intensity
(Metric Tons CO
2
e
per $ value added)
112
77
84
65
46
48
6
Refer to the appendix for details about our emissions inventory methodology, footprint boundaries and data management process.
7
The SBTi standard requires companies to include approximately two-thirds of their baseline emissions in their Scope 3
emissions reduction target, so this line represents the Scope 3 categories within the boundaries of our SBTi-validated target.
Sustainability in our Operations and Value Chain
GRISELDA
THE ROAST OF TOM BRADY
We measure and report
progress against our
emissions reduction
target using the “target-
based” method.
Refer to the appendix
data tables for a
complete view of our
GHG emissions inventory
and a breakdown by
emissions Scopes.
ESG Data Table
Climate Risk
Industry
Collaboration
Contents
Introduction
ENVIRONMENT
Social
Governance
Appendix
Sustainability
Strategy
6






Carbon Footprint by
Business Activity
On average, our principal source of emissions
comes from the production of films, series and
games (“production”), but we see variability in
production volumes from year to year that can shift
the emissions breakdown. In 2024, our largest
source of emissions (Scopes 1-3) came from
corporate operations & procurement (“corporate”),
followed by production, and lastly a small percentage
from our streaming delivery infrastructure and
data center providers (“streaming”). For Netflix’s
direct operations (i.e., Scopes 1 & 2), emissions
from the making of films, series and games
remain the clear majority of annual emissions.
2024 Emissions
8
by Business
Activity
(%)
Sustainability in our Operations and Value Chain
Our Carbon Footprint
SCOPES 1 & 2
12%
69%
19%
ALL SCOPES
4%
41%
55%
Streaming
Production
Corporate
8
Target-Based Emissions, as defined in the appendix
GHG Emissions Inventory Methodology.
A MAN ON THE INSIDE
LA DOLCE VILLA
Climate Risk
Industry
Collaboration
Contents
Introduction
ENVIRONMENT
Social
Governance
Appendix
Sustainability
Strategy
7
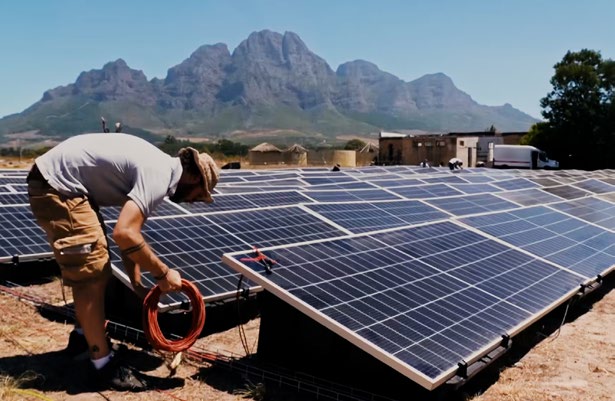

Our Operations
As a global entertainment company, we operate
across the world. The vast majority of the properties
where we have our operations are leased facilities
(approximately 90% by floor space), including
most of our corporate offices. For the sites we
own or where we have long term leases, including
some of our production studios, we have more
operational control and can seek more opportunities
to optimize and decarbonize the facilities.
This strategy allows us to leverage the solutions
available today while helping to accelerate the supply
of solutions tomorrow. For example, while energy
efficiency and renewable energy remain mature and
cost-effective in many markets, and can be deployed
at scale now, clean mobile power and electric vans/
trucks remain less available technologies. That means
they will deliver most of their emissions reductions
for Netflix in the latter half of this decade as we scale
these solutions. Watch the video below to see our
recent decarbonization efforts across our four key
levers come to life in our studios and productions.
Watch Sustainable Productions at Netflix
Tracking progress against our Science-Based Target for Scopes 1 and 2 emissions
Emissions Reductions Plan
To meet our emissions reduction objectives in our
operations, we continue to focus on four key levers:
Energy Efficiency
Identifying the efficiency improvements
with the highest return on investment for
energy used in our offices and studios
Vehicle Electrification
Transitioning from vehicles that
use fossil fuels to electric and/
or low-carbon alternatives
Clean Mobile Power
Using alternatives to diesel
generators on productions
Renewable Energy
Using renewable sources
of electricity and fuels
We approach these four levers using a framework in which we first
optimize energy use, then electrify it and decarbonize the rest (OED).
Optimize
We conduct energy efficiency audits, optimize vehicle
fleet operations, right-size vehicles and mobile power
and give preference to more efficient equipment.
Electrify
We are working to electrify the equipment that uses the
most fuel, such as vehicles, buildings and generators.
Where available, we use electric motors, which are more
efficient, quieter, produce fewer fumes and are more
sustainable because electricity is more easily decarbonized
than liquid fuels. Across our productions, we’ve increased
the use of mobile batteries and hydrogen-battery powered
generators in place of fossil-fuel powered generators.
And we are also replacing internal combustion engine
vehicles with electric, plug-in hybrid and hybrid vehicles.
Decarbonize
When electrification isn’t possible, we decarbonize
the remaining emissions by installing and purchasing
renewable electricity and procuring sustainable fuels.
Sustainability in our Operations and Value Chain
Climate Risk
Industry
Collaboration
Contents
Introduction
ENVIRONMENT
Social
Governance
Appendix
Sustainability
Strategy
8

2024 Progress
Each year, we develop and further refine our plan
to meet our Scopes 1 and 2 emissions targets, and
the decarbonization levers that will get us there.
•
Emissions Reductions
– While absolute 2024 Scopes
1 and 2 target-based emissions were higher
9
year
over year, they were 4% lower than our baseline year
of 2019, despite significant growth of the business
during that time. As previously noted, the unevenness
year over year is directly related to the work stoppages
in 2023 stemming from the WGA and SAG-AFTRA
strikes, leading to abnormally low emissions totals
that year, followed by a return to work in 2024.
•
Avoided Emissions
– The combined impact of our
emissions reductions initiatives across our four
decarbonization levers in 2024 was significant.
Absent these actions, the Scopes 1 and 2 emissions
totals would have been approximately 35% higher.
•
Progress
– Despite the majority of our emission
reductions coming from renewable energy and
sustainable fuels, we also made year-over-year
progress integrating electric and low-carbon vehicles
and clean mobile power in productions, which helped
us to avoid over 200,000 gallons in fuel use.
9
In addition to emissions reductions
from our decarbonization efforts,
external factors also influence the
calculated emissions total, including
data improvements (e.g., improved
data quality, updated emissions
factors) and changes in core business
activities from year to year (e.g., number
of directly managed vs. partner-
managed productions which can shift
the emissions between Scopes).
Netflix Climate Transition Plan
Target-Based Scope 1 & 2 GHG Emissions (mtCO
2
e)
Annual Emissions
/
Business As Usual
/
Renewable Energy: Electricity & Fuels
/
Electric Vehicles
/
Clean Mobile Power
/
Energy Efficiency
2019
20
21
22
23
2024
25
26
27
28
29
2030
50K
0
100K
150K
Forecasted
Actuals
78K
75K
DECLINE IN
EMISSIONS DUE
TO PRODUCTION-
RELATED STRIKES
DECLINE IN
EMISSIONS DUE
TO THE COVID-19
PANDEMIC
SCIENCE-
BASED TARGET
42k
Sustainability in our Operations and Value Chain
Our Operations
Climate Risk
Industry
Collaboration
Contents
Introduction
ENVIRONMENT
Social
Governance
Appendix
Sustainability
Strategy
9



2024 Scopes 1 and 2 Avoided Emissions Summary Table
EMISSION REDUCTION LEVERS
AVOIDED EMISSIONS
10
(mtCO
2
e)
ACTION
2021
2022
2023
2024
Energy Efficiency
0
213
173
838
Vehicle Electrification
29
158
47
558
Clean Mobile Power
107
1,178
417
1,325
Renewable Energy
(electricity & fuels)
14,074
23,954
21,980
25,780
TOTAL
14,210
25,503
22,617
28,501
10
For all interventions that are implemented in an effort to reduce carbon emissions, compared to what would have happened
absent any intervention, we conduct detailed internal analysis to estimate the emissions impact (“Avoided Emissions”).
Powering Operations
with Renewable Energy
Renewable Electricity
In 2024, we continued to supply our global operations
with renewable electricity through a range of approaches
that include onsite generation, as well as utility- and
landlord-supplied clean electricity. As part of our public
climate target to match remaining emissions annually, we
matched 100% of our global electricity use
11
through the
retirement of Renewable Energy Credits, such as RECs.
In keeping with the target-based method we use to
track our progress, we do not count retail RECs against
our Scope 2 climate targets because we recognize
that not all renewable energy supply is the same in
terms of its impact when it comes to driving emissions
reductions. By not counting annual retail REC purchases
towards our target, it incentivizes us to increase the
proportion of onsite generation, utility- and landlord-
supplied clean electricity and direct sourcing from
offsite projects. We continue to evaluate opportunities
to expand these forms of renewable electricity supply
where our operational control or influence allows.
Renewable Fuels
To address Netflix business aviation emissions in
2024, we secured more than 440,000 gallons of
Sustainable Aviation Fuel (SAF) blend (a 30/70 SAF to
Jet-A blend replacement fuel that incorporates lower
emissions alternatives). We also helped to accelerate
the market supply for SAF as a founding member of
the Sustainable Aviation Buyers Alliance (SABA).
While we strive to implement zero-emissions
solutions where possible, we can also achieve
meaningful near-term reductions by utilizing fuels
that have significantly lower life cycle emissions
compared to fossil fuels. In 2024, we fueled both
production vehicles and mobile generators with
nearly 200,000 gallons of renewable diesel and
heated our facilities with over 60,000 therms
of renewable natural gas as we worked toward
longer-term decarbonization of our productions.
11
Refer to the appendix for our global electricity consumption data.
Sustainability in our Operations and Value Chain
Our Operations
CARRY ON
FOREVER
Climate Risk
Industry
Collaboration
Contents
Introduction
ENVIRONMENT
Social
Governance
Appendix
Sustainability
Strategy
10
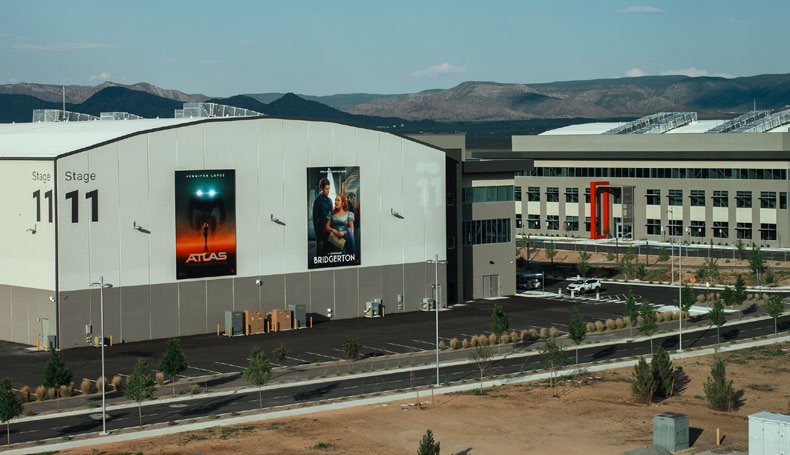


Reducing Studio Emissions through Energy Efficiency and Electrification
NETFLIX STUDIOS ALBUQUERQUE
ALBUQUERQUE, NM
Optimize
GEOTHERMAL
HEATING & COOLING
An onsite geothermal system
utilizes the natural constant
temperature deep underground
for highly efficient heating and
cooling of the campus.
12
The
entire system is powered by
electricity, which when supplied
by 100% clean electricity
(refer to the Decarbonize
column), makes the heating
and cooling of the studio
expansion zero emissions.
Electrify
EV CHARGING
50+ electric vehicle (EV)
chargers are available on the
campus, including 10 DC
fast chargers, making Netflix
Albuquerque one of the first
major studio campuses to
include onsite fast charging
available to productions.
Decarbonize
SOLAR & STORAGE
The entire Albuquerque campus
(both existing and expansion
lots) will soon be powered by
100% solar energy generated
and stored onsite. A 5MW
solar and 3MW battery energy
storage system is currently
under construction, and is
anticipated to come online
later in 2025. Together, these
features will help us reduce the
studio's carbon footprint, all
while lowering operating costs.
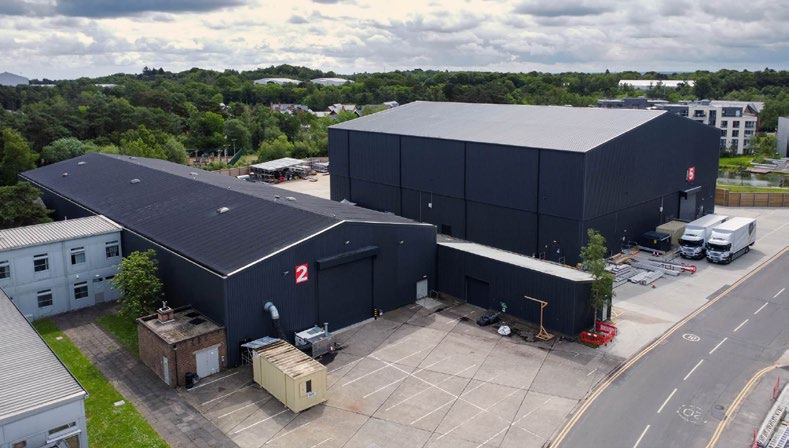
NETFLIX LONGCROSS STUDIO
LONGCROSS, UK
ENERGY EFFICIENCY
MEASURES
Buildings have been fully
renovated with a newly
constructed stage that includes
energy efficient building
envelopes and lighting.
CLEAN POWER &
EV CHARGING
Increased availability of
electrical power to many stages
and workshops, allowing
productions to eliminate their
previous reliance on diesel
generators for power needs.
Electric heating and cooling to
reduce onsite fossil fuel usage.
EV charging stations, including
6 Ultra Rapid Charging ports
(up to 300kW) and 6 Rapid
Charging ports (up to 50 kW).
RENEWABLE ELECTRICITY
We signed a multiyear
agreement to source
100% renewable electricity
for the studio.
12
Traditionally, studio campus
heating and cooling is
powered by natural gas
or propane combustion in
the winter, and electricity
intensive air conditioning
in the warmer months.
Sustainability in our Operations and Value Chain
Our Operations
Climate Risk
Industry
Collaboration
Contents
Introduction
ENVIRONMENT
Social
Governance
Appendix
Sustainability
Strategy
11


Reducing Emissions on Set
through Clean Mobile Power
and Vehicle Electrification
As previously noted, emissions stemming from the
physical production of directly-managed Netflix
productions make up over two-thirds of our Scopes
1 and 2 emissions. To reduce emissions on set,
we are focusing our efforts on: (1)
clean mobile
power
, replacing diesel generators and (2)
vehicle
electrification
, replacing diesel and gasoline-powered
vehicles with EVs and other low emissions vehicles.
13
In 2024, we continued to use clean technologies on all
of the scripted productions Netflix directly manages.
We employ global, regional and local production
sustainability experts who work with the production
teams to identify opportunities that take advantage of
the cleaner technologies, power and fuels available in
that region. We also maintain a website to introduce
our direct and partner-managed productions to the
latest clean technologies available in their regions.
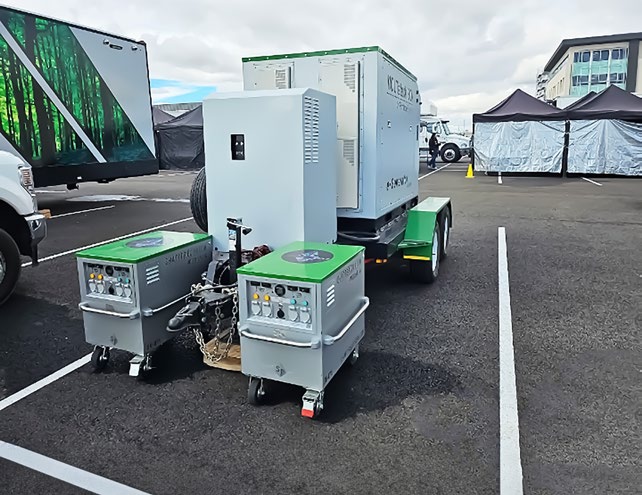
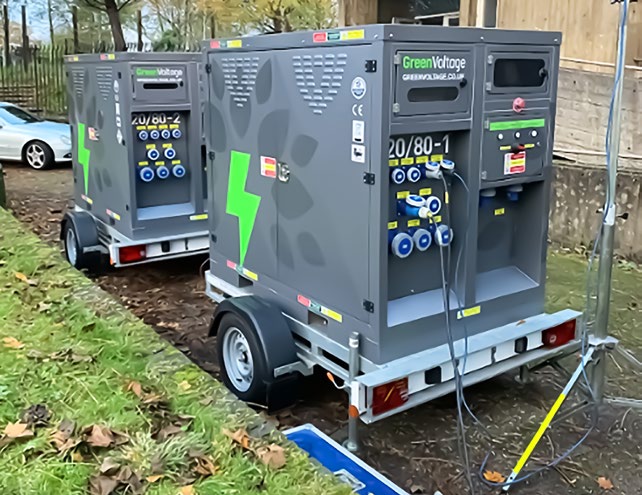
Clean Mobile Power
Using diesel generators for temporary or
supplemental power has long been an entertainment
industry default. Clean technology solutions are
now coming to market — reducing costly diesel
generator use, while saving fuel and reducing air
and noise pollution on set. By co-founding the
Clean Mobile Power Initiative, we collaborate
with the industry to help scale these solutions.
In 2024, all
14
of the scripted productions that Netflix
directly managed incorporated clean mobile power
solutions. We are beginning to see meaningful fuel
reductions from diesel generators through the use of
clean mobile power – almost half of the productions
we directly managed reduced their generator fuel
use by more than 20%, with 15% of all productions
cutting their generator fuel use by more than half.
13
Our production vehicle fleets and mobile power equipment
are rented, meaning we have to partner with local equipment
suppliers to make sustainable alternatives to fossil-fuel
powered equipment available to our productions.
14
Excluding multiple camera productions which are
100% studio based and don't require generators.
Vehicle Electrification
Thousands of vehicles are rented for productions
directly managed by Netflix and those we partner
with others to produce, and the default has been
fossil fuel vehicles based on availability. We recognize
our industry is in the early days of EV deployment.
However, by engaging with transportation vendors
and production teams in each region, 98% of the
scripted productions Netflix directly managed in 2024
incorporated low carbon vehicles, with 88% using
at least one all-electric vehicle. In 2024, we began
piloting medium duty electric trucks in productions,
including: 5-ton EV box trucks in Vancouver, BC; EV
Shorty 40 box trucks in Albuquerque, NM and Los
Angeles, CA; and flatbed EV trucks in the United
Kingdom. We also continued to install EV charging
infrastructure, bringing DC fast charging to studios in
Los Angeles, Albuquerque, and the United Kingdom.
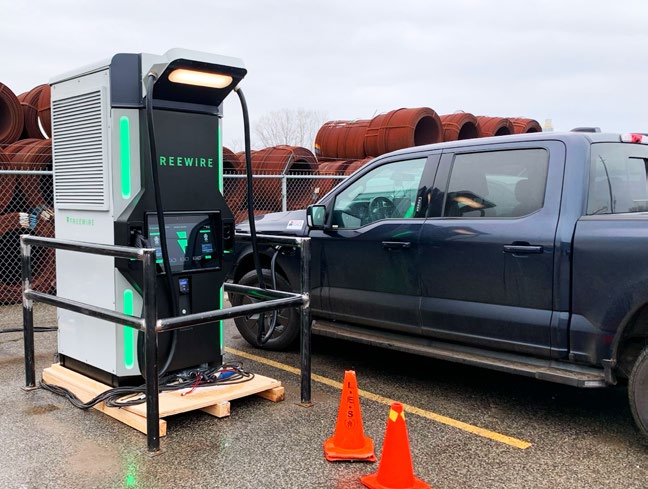
To supplement these permanent charging solutions,
we deploy temporary DC fast charging equipment for
studios without adequate EV charging infrastructure.
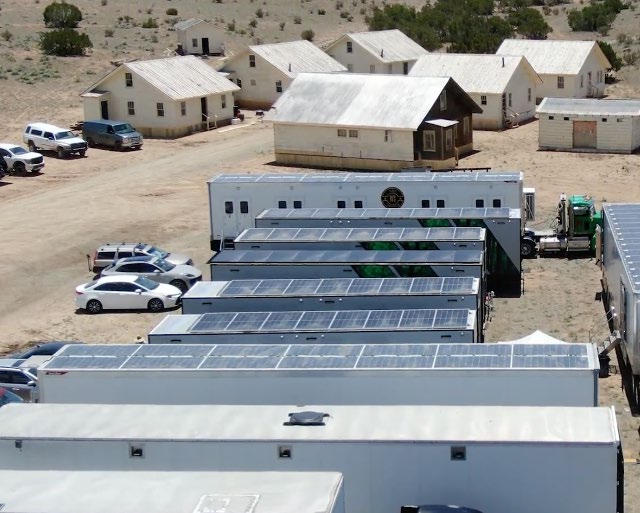
RANSOM CANYON
Ransom Canyon
is a modern-day western
saga starring Josh Duhamel and Minka
Kelly. On screen, land and legacy go hand-
in-hand throughout the story. Off screen, the
crew embraced innovative and sustainable
production technologies to help preserve
the land and leave behind a cleaner, safer
legacy. Filmed in New Mexico, the series
became the first Netflix production to
fully power its base camp by the sun. The
production reduced its diesel generator fuel
usage across all equipment by over 50%
by using a mix of large mobile batteries,
solar trailers, and solar battery systems.
Watch Ransom Canyon: Sustainability on Set
Sustainability in our Operations and Value Chain
Our Operations
RANSOM CANYON
CLEAN MOBILE POWER ON SET
CLEAN MOBILE POWER ON SET
EVs ON SET
Climate Risk
Industry
Collaboration
Contents
Introduction
ENVIRONMENT
Social
Governance
Appendix
Sustainability
Strategy
12


Sustainability in our Operations and Value Chain
Our Value Chain
Tracking progress against
our Science-Based Target
for Scope 3 emissions
Our Scope 3 science-based target is to reduce
emissions intensity by 55% per USD of value
added
15
by 2030. A decrease in emissions intensity
per dollar value added reflects Netflix’s decoupling
of emissions growth and business growth.
Our market-based Scope 3 emissions increased
about 21% compared to last year. This unevenness
is largely related to the work stoppages in 2023
stemming from the WGA and SAG-AFTRA strikes,
which led to abnormally low emissions totals
that year, followed by a return to work in 2024.
However, we are still on track to meet our Scope
3 emissions intensity reduction target in 2030.
Scope 3 Emissions Breakdown
Scope 3 emissions make up over 90% of the
GHG emissions in our footprint. Our largest
sources of emissions come from the
goods and services we buy from others
(a combined ~80% from Purchased
Goods & Services and Capital Goods,
including films and series made
for us by other studios), as well
as Business Travel (~14%).
16
15
"Value Added” is a term used by SBTi. For Netflix, this is
derived by subtracting “Cost of Revenues” from “Revenues”,
both of which are reported in our public financial statements.
16
Scope 3 Categories as defined by the Greenhouse Gas Protocol.
69.8%
Purchased Goods
and Services
9.4%
Capital Goods
2.2%
Upstream Energy Losses
2.6%
Upstream Transportation
and Distribution
0.5%
Waste from Operations
13.8%
Business Travel
1.4%
Employee Commuting
and Work From Home
0.2%
Use of Sold Products
Emissions breakdown is based on
market-based Scope 3 emissions.
Emissions categories that make up
less than 0.2% are not represented
in this chart, refer to the appendix
data table for the full breakdown.
Climate Risk
Industry
Collaboration
Contents
Introduction
ENVIRONMENT
Social
Governance
Appendix
Sustainability
Strategy
13


Sustainability in our Operations and Value Chain
Our Value Chain
Reducing Scope 3 Emissions
While addressing Scope 3 emissions requires collaboration and systemic change, our near-term priority remains targeting high impact areas of our business:
FUEL REDUCTIONS AND CLEANTECH
ADOPTION FOR PARTNER
MANAGED PRODUCTIONS
Many of the titles that our members watch on
Netflix are produced by other studios and third
party production companies. We continuously
apply learnings from the productions we manage
to our partner productions to further cleantech
adoption. In 2024, we continued to see adoption of
these technologies across many partner-managed
productions, including electrical grid tie-ins,
batteries, renewable energy and the use of EVs.
RENEWABLE ENERGY FOR
DIGITAL SERVICES
Netflix value chain emissions are made up in
large part by electricity usage, so we’re leaning
into digital services to help “dematerialize”
parts of our supply chain. In 2024, Netflix
deployed a cloud-based suite of tools,
Media Production Suite (MPS), allowing
us to digitalize and streamline production
processes. Both AWS and Netflix buy renewable
electricity for all of the energy needed to
power the infrastructure behind MPS.
SUSTAINABLE MATERIALS
MANAGEMENT
We work to promote efficiency and reuse
within our productions and corporate
operations and collaborate with industry
groups to support long-term systemic
change. In 2024, we sourced lower-carbon
materials in office retrofits and supported
material reuse on productions, recycling
assets within Netflix productions and
upcycling assets to non-Netflix productions.
Sustainable Transportation
in our Value Chain
We also recognize the importance of supporting
emerging opportunities that, at scale, will help
us reduce our Scope 3 emissions in future
years. These include sustainable aviation fuel
certificates via the Sustainable Aviation Buyers
Alliance, and clean trucking via the Center for
Green Market Activation’s trucking alliance.
Cloud Services and Content
Distribution Network
(CDN)
Carbon Trust’s white paper on the Carbon
Impacts of Video Streaming determined that the
use-phase emissions associated with data center
and CDN operations are small (<1%) compared
to the rest of the video streaming value chain.
End user devices represent 89% of the total
emissions, and the rest is network transmission,
which is broadly independent of streaming usage.
CLOUD SERVICES
For our product’s data storage and cloud computation
needs, Netflix partners with AWS. AWS reported
via their customer carbon footprint tool that due
to their renewable energy sourcing and energy
efficiency initiatives, the electricity powering Netflix
computing needs in 2024 was 99% renewable.
CONTENT DISTRIBUTION
When it comes to distributing content to our members,
it is an ongoing effort to make the process as efficient as
possible with our Open Connect program. We localize,
encode and adapt our stream based on how our members
are watching. We make servers available for free to Internet
Service Providers who operate them in their data centers
across over 6,000 locations in over 175 countries. We
develop encoding technology to reduce file sizes and
optimize bandwidth use while maintaining high video
quality for consumers. We also encode multiple versions
of the same video file, customized to the capabilities of
different devices (including legacy ones) to maximize
efficiency. That way, when our members press play, instead
of streaming their film or series from halfway around the
world, they’re streaming it much more locally with optimized
quality — increasing efficiency for operators while also
ensuring a high-quality, smooth viewing experience.
For members who want to further optimize
their streaming carbon footprint, we provide
information on actionable steps they can take.
Digital Emissions
Because internet infrastructure
(including data centers) is shared by
such a vast number of consumers
across so many services, the associated
energy consumption for individual
video streams is relatively efficient (i.e.,
~10% of total use-phase streaming
emissions).
17
By contrast, the physical
devices our members use (wifi routers,
streaming sticks, set top boxes and
displays) drive the majority of energy
consumption and emissions (~89%).
Based on globally accepted greenhouse
gas accounting standards,
18
“indirect use
phase emissions” fall outside of the carbon
footprint boundary for Netflix. Even so,
we think it is important for us to contribute
to the decarbonization of the digital product
lifecycle so we work in collaboration with
DIMPACT. Beyond decarbonization, efficient
digital infrastructure is aligned with our
business goals — it costs less and offers a
better quality experience for our members.
17
What the Latest
Research on Streaming
Emissions Tells Us
18
Per the Greenhouse
Gas Protocol, indirect
use-phase emissions
are optional to include.
Climate Risk
Industry
Collaboration
Contents
Introduction
ENVIRONMENT
Social
Governance
Appendix
Sustainability
Strategy
14



Matching Remaining
Emissions
In parallel with our operational decarbonization
efforts, each year we match our remaining emissions
(across all three Scopes) to help meet our climate
commitments and in support of global net zero
goals, through investments in verified carbon
credits. Netflix investments in carbon projects
finance solutions that both slow the rate and curb the
impact of climate change, by financing innovation
in resource management and supporting projects
that drive forward systems change. In alignment
with climate science,
19
our purchase of carbon
credits is done now, not later, and in addition
to, not in lieu of, our decarbonization efforts.
In 2024, carbon credits were retired from projects that
span four continents and six countries. Our projects
are chosen carefully through a five step vetting
process, which includes requirements for third-
party verification for climate impact and issuance by
carbon standards with governance in place to ensure
climate additionality and durability. In addition to their
environmental benefits, projects in the Netflix carbon
portfolio also help to bring jobs to local economies.
20
1
Natural Climate Solutions (NCS)
include verified
protection of old growth forests, restoration of
degraded agricultural lands, and partnerships with
local communities to steward mangrove forests
for livelihood, biodiversity, and climate outcomes.
21
They also help to prevent the breakdown of the
natural systems that power our global economy,
while meeting the needs of those who depend on
them for their livelihoods, including indigenous
or lower-income communities. In 2024, we made
investments in reforestation projects that harness
advancements in earth observation data. Our
early funding and long-term commitment make it
easier and less risky for landowners and farmers
to participate in these reforestation programs and
make the switch to more sustainable practices.
~
70
%
of carbon credits
retired to match
remaining emissions
in 2024 consisted of
nature-based projects
2
Addressing
Super Pollutants
can produce rapid
climate benefits.
22
Super pollutants are potent
greenhouse gases such as methane, ozone-
depleting substances (ODS), hydrofluorocarbons
(HFCs), and nitrous oxide (N
2
O) that can have up
to 80 times the global warming potential of carbon
dioxide. Cutting methane emissions from waste,
collecting and destroying ODS from old appliances,
and installing N
2
O abatement technology help
slow the rate of global warming near-term, giving
society more time to transition to a low-carbon
economy. They also bring public health benefits
by reducing local air pollutants linked to cancer.
~
30
%
of carbon credits
retired to match
remaining emissions
in 2024 came from
a municipal landfill
methane destruction
project in Brazil
19
AR6 Climate Change 2022: Mitigation of Climate Change — IPCC.
20
Based on third party verified data
21
Natural climate solutions | PNAS
22
The methane imperative l Frontiers
Sustainability in our Operations and Value Chain
DAUGHTERS
LOVE ON THE SPECTRUM U.S.
Climate Risk
Industry
Collaboration
Contents
Introduction
ENVIRONMENT
Social
Governance
Appendix
Sustainability
Strategy
15


2024 Carbon Credit Retirements
PROJECT NAME AND ID
23
LOCATION
CREDIT TYPE
REGISTRY AND PROTOCOL
PROJECT BENEFITS
SUPPLIER
METRIC TONS
Acapa - Bajo Mira Y Frontera
REDD+ Project (VCS1389)
Colombia, Nariño
department
Avoidance
Verified Carbon Standard:
VM0006
Supports sustainable livelihoods
development, biodiversity
protection, local jobs
Everland
140,435
Reforesting Degraded Lands
through the use of Mycorrhizal
Inoculation (VCS1055)
Chile, Regions
RM, V, VI, VII, VIII
Removal
Verified Carbon Standard:
AR-ACM0003
Advances biotechnology,
biodiversity, local skilled
jobs, soil rehabilitation
Mikro-Tek
197,329
Chyulu Hills REDD+
Project (VCS1408)
Kenya, Makueni,
Taita Taveta and
Kajiado Counties
Avoidance
Verified Carbon Standard:
VM0009 v3
Climate Community Biodiversity
Standard: 2nd Edition
CCB Gold
Biodiversity protection, drought
prevention, education, local jobs
and alternative livelihoods
Conservation
International
259,199
Salvador da Bahia Landfill Gas
Management Project (CDM0052)
Brazil, Bahia
Avoidance
Clean Development Mechanism:
ACM0001 v19
Reduced air pollution, local skilled
jobs, increased public health
ClimatePartner
GmBH
233,700
Scott River - Whiskey IFM
project (ACR733)
U.S., California
Avoidance &
Removals
American Carbon Registry: Improved
Forest Management on Non-
Federal U.S. Forestlands v1.3
Fire prevention, biochar production,
watershed restoration
EFM
110,444
Scott River - Whiskey
IFM projec (ACR734)
U.S., California
Avoidance &
Removals
American Carbon Registry: Improved
Forest Management on Non-
Federal U.S. Forestlands v1.3
Fire prevention, biochar production,
watershed restoration
EFM
13,169
Indigo US Project No. 1
(CAR1459)
U.S., multiple
states
Removals
Climate Action Reserve Soil
Enrichment Protocol v1.1
Improved soil health, increased
crop productivity and yield,
improved habitat and biodiversity
Cool Effect
1,900
Delta Blue Carbon - 1
(VCS2250)
Pakistan
Removals
VM0033 Methodology for Tidal Wetland
and Seagrass Restoration, v2.0
Improved coastal protection,
increased livelihood opportunities,
ecosystem restoration
Rubicon
Carbon
80,000
Total
24
1,036,176
23
Exact project names and IDs as listed in the relevant carbon registry.
24
The total volume of carbon credits listed in the table, combined with an additional 1,050 mtCO
2
e from purchased SAF certificates (SAFc), were retired on behalf
of Netflix to match our 2024 market-based emissions of 1,037,226 mtCO
2
e. These retirements have been subject to limited assurance by EY.
Renewable Energy Credits
For all remaining non-renewable electricity and a portion of value chain electricity, we retired renewable energy credits
25
to:
a) match 100% of the electricity consumption in our operations and b) match a portion of the electricity-driven emissions
in our value chain. These credits come from renewable energy projects located in the same region as where the power is
consumed in over 124 countries. In total, 251,333 MWh of renewable energy credits were used to match 85,539 mtCO
2
e.
25
Renewable energy credits vary in name depending on the jurisdiction (e.g., RECs) in the U.S., Guarantees of Origin (GOs) in Europe).
Sustainability in our Operations and Value Chain
Matching Remaining Emissions
SPELLBOUND
Climate Risk
Industry
Collaboration
Contents
Introduction
ENVIRONMENT
Social
Governance
Appendix
Sustainability
Strategy
16



Industry
Collaboration
We partner with other studios and organizations to
help ensure progress made by one benefits all — and
because we believe collective actions will yield positive
and faster outcomes for Netflix. We do this through:
SUSTAINABLE PRODUCTION
INDUSTRY GROUPS
Netflix is a member of several industry groups
such as the Sustainable Entertainment Alliance
(global), BAFTA’s Albert (UK and global),
Reel Green/On Tourne Vert/Ontario Green
Screen (Canada), Green Motion (Germany),
EcoProd (France), and Sustainable Screens
Australia to help bring more transparency
and support for sector decarbonization.
Netflix co-founded the Sustainable Aviation
Buyers Alliance (SABA) to send market signals to
producers of Sustainable Aviation Fuel (SAF) to
grow supply, facilitate coordinated procurement
activity and help ensure the environmental integrity
of their claims. In 2024, Netflix participated in the
largest ever collection of deals to purchase high-
integrity SAF certificates (SAFc). Over the span
of five years, members have committed nearly
$200 million into the purchasing of the equivalent
of 50 million gallons of high integrity SAF, which
equates to 500,000 tons of abated CO
2
e.
Beyond is an alliance of companies, NGOs, and
technical experts driving market-based climate
solutions, including growing the pipeline of
high quality natural climate solutions projects.
Netflix founded the Clean Mobile Power
Initiative (CMPI) together with The Walt
Disney Company to identify and deliver
cost-competitive zero emissions mobile
power at scale for the entertainment industry.
The long term goal is to eliminate diesel
generators in top production markets.
Through our participation in DIMPACT,
Netflix collaborates with other entertainment
streamers across the value chain – Internet
Service Providers (ISPs), device manufacturers,
and academic and industry experts to
identify best practices, implement cutting
edge solutions, and support smart policy
that will help decarbonize video streaming
and other digital emissions globally.
We also actively partner with other
key cross-sector consortia to: (1)
most effectively support creators,
including through BAFTA and
the Sustainable Entertainment
Alliance and industry sustainability
salons organized by the Television
Academy, Academy of Motion
Picture Arts & Sciences , Creative
Artists Agency, Producers
Guild of America (PGA), and
regional Writers Guilds; and
(2) monitor public policy that
creates enabling environments
for our work, including through
CERES, Center for Climate
and Energy Solutions (C2ES),
Clean Energy Buyers Alliance
(CEBA), Business Roundtable,
Aldersgate Group, and the Motion
Picture Association (MPA).
OUR OCEANS
Sustainability
Strategy
Climate Risk
Contents
Introduction
ENVIRONMENT
Social
Governance
Appendix
Industry
Collaboration
17




Climate Risk
Governance
The Netflix Board oversees the Company’s ESG
efforts with the assistance of the Nominating and
Governance Committee. They receive updates on
sustainability and enterprise risk management at
Board meetings. Executive Management oversees
decisions related to climate risk with expert input
from internal teams. An annual company-wide
enterprise risk management (ERM) assessment is
performed, in which climate risks are considered,
and the findings of this assessment are shared
with our Board annually. Our sustainability
program, which includes our climate-related
work, is led by our Netflix Sustainability Officer.
Strategy and Risk
Management
In 2024, aligned to the investor-driven Task Force
on Climate-Related Disclosures framework, we
performed a climate risk and opportunity assessment
using scenario analysis
26
to identify climate-related
physical and transition risks and opportunities for
Netflix. Climate-related physical risk scenario analysis
was conducted for locations that are the most integral
to corporate and production operations across a
diverse set of geographic locations and operation
types. The analysis assessed both chronic and acute
physical risks such as extreme temperatures, sea-
level rise, drought, flood, wildfire, tornadoes and
tropical cyclones, and impacts of extreme weather
events. Transition risks and opportunities associated
with a transition to a low-carbon economy were also
assessed, including: emerging policies and regulations;
development and implementation of new technologies,
products and services; market transitions and
trends; risks to reputation and public perception; and
decarbonization of operations and resource efficiency.
Risks and Opportunities
Refer to details of our risks and opportunities
identified during our most recent climate risk
assessment in the TCFD Index in the report
appendix. While the assessment was a useful
exercise, the climate risks we identified were all
mapped to risk mitigation strategies already in
place or underway. The results of this climate risk
assessment were also used as an input into our
ERM assessment. When evaluated using our ERM
methodology, no standalone climate-related risks
were identified as significant for the company.
Metrics & Targets
Refer to our climate targets and Scopes 1, 2
and 3 GHG emissions data above. Measuring
our performance against these targets over
time helps to inform our climate risk assessment
process, in particular our transition risks.
26
This analysis leveraged the Intergovernmental Panel on Climate Change (IPCC)’s SSP1-2.6 (1.5-
2°C) and SSP5-8.5 (4-5°C) climate scenarios with projections through 2050.
SOCIETY OF THE SNOW
UNDER PARIS
Refer to the TCFD
Index in the appendix
for more information
TCFD Index
Sustainability
Strategy
Industry
Collaboration
Contents
Introduction
ENVIRONMENT
Social
Governance
Appendix
Climate Risk
18




MR. PLANKTON
SOCIAL
Our business is to entertain the world, which includes an estimated
audience of over 700 million people across different countries,
cultures, languages and tastes. To entertain an audience this
global, our company needs to reflect the world and the variety of
stories we tell. To help ensure our workforce is representative of
the members we serve, we employ people in multiple countries
around the world and work to maintain a global culture of inclusion.
The Netflix Culture
20
Investing in Our Communities
27
Privacy, Security and
Accessibility on Our Service
28
Contents
Introduction
Environment
SOCIAL
Governance
Appendix
19





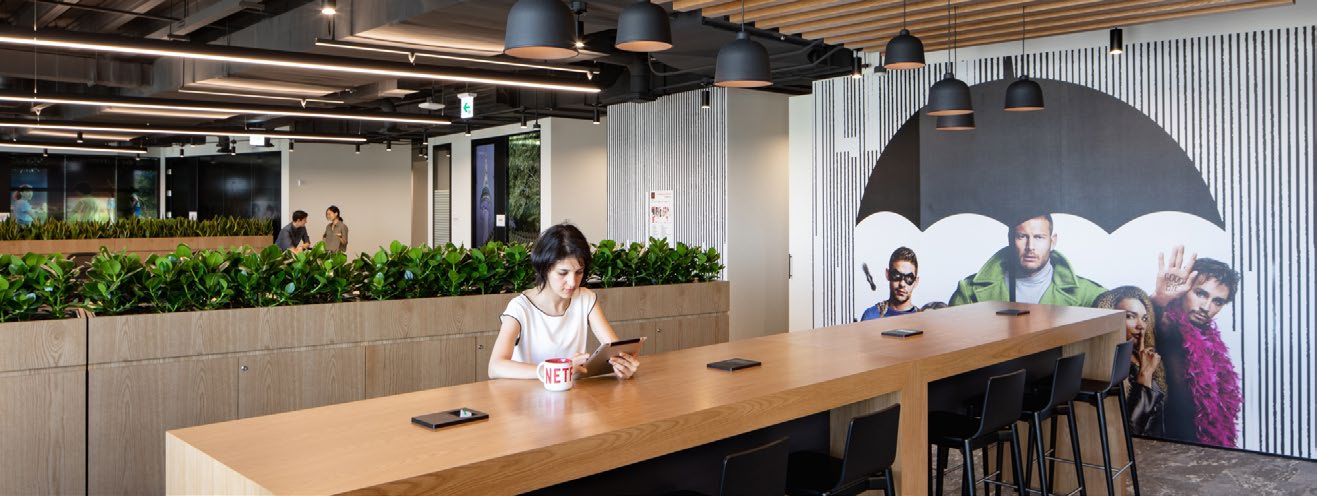

The Netflix
Culture
We believe an important component of our
success is our company culture as detailed in
the “Netflix Culture Memo”, which was updated in
2024. Our culture is focused on excellence, and
creating an environment where talented people
can thrive — lifting ourselves, each other and our
audiences higher and higher. We engage employees
and seek feedback through regular town halls,
surveys, business reviews and memos — which
we often share broadly, inviting comments.
Inclusion is one of our values in the Netflix culture
memo. We aim to attract and retain great people —
representing a broad array of perspectives and
skills — to work together as a dream team. For
more people and cultures to see themselves
reflected on screen, it’s important that our employee
base represents the communities we serve.
NETFLIX TOKYO
NETFLIX LONDON
NETFLIX AMSTERDAM
NETFLIX SEOUL
NETFLIX LOS GATOS
Privacy, Security
and Accessibility
on Our Service
Investing in Our
Communities
Contents
Introduction
Environment
SOCIAL
Governance
Appendix
The Netflix
Culture
20

Identity (Who We Are)
Identity
(Who we are)
Netflix uses a Self-ID survey to allow employees to
self-identify voluntarily across various dimensions
of identity. The data presented in this section
are drawn from that self-reported data.
Gender Identity
(Global)
27
SENIOR LEADERSHIP
Of our
23
senior leaders
28
34.8%
(
8
) are women.
Gender
Identity
29
(Global)
ALL JOB LEVELS
1.4%
Additional Gender Identities
1.7%
Undeclared
30
46.0%
46.5%
Men
51.5%
51.0%
Women
2024
2023
0.2%
DIRECTOR+ JOB LEVELS
46.2%
46.8%
Men
52.4%
51.7%
Women
1.3%
1.4%
Undeclared
30
Additional Gender Identities
2024
2023
27
The data for gender identity represents approximately 86%
of our global full-time employees as reported in our 2024
10-K, (an increase from last year’s reporting levels of 78%).
Employees who are not represented in this data include: those
who did not complete the Self-ID survey and/or those who are
located in a country where we cannot legally collect this data.
28
Data represents our leadership team as of 12/31/24. Our
current leadership team, which has evolved since the end
of 2024, can be found on our About Netflix website.
29
Employees can self-identify from categories
outside of man or woman.
30
Undeclared means that an employee selected the option “I
choose not to disclose” when completing their Self-ID survey.
Privacy, Security
and Accessibility
on Our Service
Investing in Our
Communities
Contents
Introduction
Environment
SOCIAL
Governance
Appendix
The Netflix
Culture
21

Identity (Who We Are)
Race/Ethnicity
(U.S.)
31
SENIOR LEADERSHIP
Of the
19
U.S.-based leaders on
our senior leadership team
32
in
2024,
47.4%
(
8
) self-identified
as belonging to one or more
underrepresented communities.
Refer also to our annual EEO-1 reports
EEO-1 Reports
Race/
Ethnicity
33
ALL JOB LEVELS
0.7%
0.6%
Native American/
Alaskan Native
2024
2023
0.9%
0.8%
Native Hawaiian/
Other Pacifi c Islander
2.8%
2.6%
Middle Eastern/
North African
10.6%
10.2%
Black
12.2%
Hispanic/Latnio/a/x
28.7%
29.8%
Asian
5.1%
Undeclared
47.7%
47.6%
White
DIRECTOR+ JOB LEVELS
2024
2023
Native Hawaiian/
Other Pacifi c Islander
1.1%
1.0%
Middle Eastern/
North African
2.7%
2.3%
Black
12.5%
11.7%
Asian
19.2%
19.5%
Undeclared
4.7%
4.4%
Hispanic/Latnio/a/x
7.5%
7.3%
Native American/
Alaskan Native
0.7%
White
59.7%
61.1%
31
The data for race/ethnicity represents approximately 96% of
our U.S. full-time employees as reported in our 2024 10-K
(which is flat from last year’s reporting levels). Employees
who are not represented in this data include: those who did
not complete the Self-ID survey and/or those who are located
in a country where we cannot legally collect this data.
32
Data represents our leadership team as of 12/31/24. Our
current leadership team, which has evolved since the end
of 2024, can be found on our About Netflix website.
33
Our data collection methods allow employees to share multiple
self-identities (e.g., Black and Asian compared to only “multi-
race”); therefore, percentages can add up to more than 100%.
Privacy, Security
and Accessibility
on Our Service
Investing in Our
Communities
Contents
Introduction
Environment
SOCIAL
Governance
Appendix
The Netflix
Culture
22

Recruitment and Retention
For Netflix, a big part of our focus on excellence is hiring people who are great at what they do and creating an environment
where talent can thrive. Once someone accepts a job at Netflix, we offer benefits that prioritize the well-being of our employees.
Gender
(Global, All Job Levels)
2024
2023
HIRING
34
1.5%
1.6%
1.7%
1.8%
47.6%
49.4%
49.7%
47.9%
Exits
Workforce
2024 Representation
ATTRITION REPRESENTATION
35
1.6%
1.7%
Undeclared
2.0%
1.4%
Additional
Gender Identities
46.5%
48.0%
Men
48.9%
Women
51.0%
Recruitment and Retention
Race/Ethnicity
(U.S., All Job Levels)
2024
2023
HIRING
34
0.7%
0.6%
3.2%
2.4%
12.1%
9.4%
35.3%
33.3%
4.2%
4.8%
12.7%
11.0%
0.5%
0.3%
41.8%
43.7%
Exits
Workforce
2024 Representation
ATTRITION REPRESENTATION
35
0.8%
1.1%
Native Hawaiian/
Other Pacifi c Islander
2.6%
3.6%
Middle Eastern/
North African
10.2%
12.3%
Black
29.8%
27.5%
Asian
5.1%
4.8%
Undeclared
12.2%
10.4%
Hispanic/Latnio/a/x
0.6%
Native American/
Alaskan Native
47.6%
41.7%
White
34
Data excludes employees
from acquisitions &
internal transfers.
35
This data reflects exits (both
voluntary and involuntary)
by employees of a particular
group as a percentage of
total employee exits within
the respective year.
Privacy, Security
and Accessibility
on Our Service
Investing in Our
Communities
Contents
Introduction
Environment
SOCIAL
Governance
Appendix
The Netflix
Culture
23


Pay Equity
We are committed to paying our employees
equitably. We leverage formal pay equity analyses
to help ensure that employees are not being
underpaid based on gender (globally) and race
(U.S.) relative to others doing the same or similar
work under comparable circumstances. We aim
to fix any gaps we find through this analysis —
and the results of this analysis are shared below.
Every component of compensation
36
is used
in the analysis. The pay equity data for gender
represents an analysis of approximately 82% of
our global full-time employees
37
(an increase from
last year’s reporting levels of 78%) and for race/
ethnicity represents an analysis of approximately
94% of our U.S. full-time employees
37
(an
increase from last year’s reporting levels of 78%).
Adjusted Pay Equity
Our adjusted pay equity data represents the
difference in pay between two groups (e.g.,
between two different gender identities),
statistically adjusted for factors such as job, level
and geography. We believe this methodology is
the best way to measure whether we are paying
our employees equitably on a like-for-like basis.
Adjusted Pay Equity Data
MEN COMPARED TO
WOMEN AND ADDITIONAL
GENDER IDENTITIES
(global)
Women and additional
gender identities earn
99
¢
for every
$
1
earned by men
WHITE EMPLOYEES
COMPARED TO EMPLOYEES
FROM ONE OR MORE NON-
WHITE RACIAL AND ETHNIC
BACKGROUNDS
(U.S.)
Employees from one or
more non-White racial and
ethnic backgrounds earn
$
1
for every
$
1
earned by white employees
Visit the Netflix
Inclusion webpage
for more
Inclusion
Unadjusted Pay Equity
Our unadjusted pay equity data is based on median
pay without applied controls. When comparing two
groups (e.g., between two different gender identities),
the analysis lines up all the salaries from lowest to
highest and compares the median salary of each group.
Gender
Based on median pay without adjusting for factors such
as job, level and geography, women and additional gender
identities earn 66¢ for every $1 earned by men. Netflix
effectively operates across two different business industries
(entertainment and technology), each with different
market pay. Market pay for tech roles is traditionally
higher than for non-tech roles. To better represent these
distinct employee populations, we’ve also broken out
unadjusted pay equity between our tech and non-tech
employees.
38
Women and additional gender identities in
tech roles earn 82¢ for every $1 earned by men in tech
roles. Women and additional gender identities in non-tech
roles earn 84¢ for every $1 earned by men in non-tech
roles. Within Netflix, we have a higher representation
of women and additional gender identities in non-tech
roles than in tech roles. As a result, the unadjusted
pay gap, when the tech and non-tech populations are
combined, is much lower than when they are separated.
Race/Ethnicity
Based on median pay without adjusting for factors
such as job, level and geography, employees from
one or more non-White racial and ethnic backgrounds
earn 92¢ for every $1 earned by White employees. As
explained above, we are also including the unadjusted
pay equity data broken out for our tech and non-
tech employees to better represent these distinct
employee populations. For our employee population
in tech roles, employees from one or more non-White
racial and ethnic backgrounds earn 97¢ for every
$1 earned by White employees. For our employee
population in non-tech roles, employees from one
or more non-White racial and ethnic backgrounds
earn 85¢ for every $1 earned by White employees.
36
Including base salary, equity awards and bonus
(applicable only to our Executive Officers in 2024).
37
As reported in our 2024 10-K. The data does not include
employees who have not completed the Self-ID survey, those
living in countries with legal restrictions on data collection
and/or those for whom our job definition framework has
not yet been integrated. We are committed to expanding
the coverage of employees included in the pay equity
analyses in an effort to include all global employees, where
collection of data is allowed, and increase transparency.
38
Each employee is classified as either tech or non-tech
based on their actual role vs. their organization.
Privacy, Security
and Accessibility
on Our Service
Investing in Our
Communities
Contents
Introduction
Environment
SOCIAL
Governance
Appendix
The Netflix
Culture
24





Employee
Giving Program
Philanthropy at Netflix is driven by employees through
our Employee Giving Program, where we allow
employees to donate to causes that are meaningful
to them. When an employee donates to a charitable
organization (from over 2 million eligible organizations
in 200 countries), Netflix matches it with two times
the donation amount, up to $20,000 per employee
per year for all donations and matches. We also offer
a volunteer match program, encouraging Netflix
employees to donate time by volunteering. For every
hour an employee volunteers with an eligible cause,
Netflix donates $50 to the same cause as part of
each employee’s annual match maximum. This allows
employees to support causes they’re passionate
about. In 2024, total giving as part of the Netflix
Employee Giving Program was approximately $40M,
supporting over 5,000 charities in over 50 countries.
Nearly 30% of our employees participated in the
Employee Giving Program, including by performing
more than 20,000 hours of volunteer work.
Employee Giving
Impact Spotlight
~
30
%
of employees
gave to
charities
20k
+
hours
volunteered
= $725k Netflix
match
$
40M
donated
5k
+
nonprofits in
50+ countries
received gifts
Privacy, Security
and Accessibility
on Our Service
Investing in Our
Communities
Contents
Introduction
Environment
SOCIAL
Governance
Appendix
The Netflix
Culture
25

Developing Talent
Across Our Films
and Series
Research shows that including more
perspectives behind the camera creates better
representation in front of the camera. That's
why Netflix invests in programs that identify
and support new voices and perspectives.
USC Annenberg
Inclusion Report
Since 2021, we have partnered with the USC
Annenberg Inclusion Initiative to release a biennial
study of several inclusion metrics (e.g., gender,
race/ ethnicity, LGBTQ+, disability) in our U.S.-
commissioned films and series. This year, we
published the latest round of research focused
on Netflix U.S. films and series from 2022 to
2023. The latest study showed that women and
people of color continue to be depicted in leading
roles, and that underrepresented characters
significantly increased between 2018 to 2023.
More detailed findings are available in the
executive summary and full report.
Executive Summary
Full Report
Key
Findings
56
%
of films & series
had girls/women as
the lead or co lead
between 2018–2023
42
%
of films & series
featured people of
color in leading roles
between 2018–2023
The percentage of
underrepresented
characters has
significantly
increased from
34
%
in 2018, to
42
%
in 2023
Privacy, Security
and Accessibility
on Our Service
Investing in Our
Communities
Contents
Introduction
Environment
SOCIAL
Governance
Appendix
The Netflix
Culture
26





Developing Talent Across Our Films and Series
Fund for Creative Equity
In 2021, we established the Netflix Fund for
Creative Equity, a commitment of $100 million
over five years aimed at creating new opportunities
in entertainment for people around the world.
Through the Fund, Netflix supports external
organizations that are committed to creating more
opportunities in the entertainment industry, as well
as bespoke Netflix programs designed to help us
to identify, train and provide opportunities and
access to jobs for up-and-coming talent globally.
As of the end of 2024, we’ve committed
approximately $57 million towards these initiatives,
supporting over 25,000 people through nearly 300
programs, reaching people in 60 countries around
the world. Over 500 people from our programs
have gone on to work on Netflix productions in a
variety of roles, ranging from line producers and
associate editors to casting assistants and grips.
~
$
57m
invested in
programs
~
300
programs
supported in
60
countries
around
the world
25k
+
people supported
500
+
people from our
programs have
gone on to work on
Netflix productions
100 YEARS OF SOLITUDE
CLOSING DYNASTY
QUINCEAÑERO
Investing in Our
Communities
Supplier Diversity
We strive to work with the best suppliers and
vendors. To achieve this, we source broadly,
including from small businesses and those owned
by individuals from a wide range of backgrounds.
In 2024, we spent approximately $570M globally
with suppliers considered small and suppliers
from underrepresented communities.
Community Impact
Investments
Our financial commitment to community impact
investing has grown and as of December 31, 2024,
we have allocated approximately $150 million of
our cash and short-term investments to the cause.
Privacy, Security
and Accessibility
on Our Service
Contents
Introduction
Environment
SOCIAL
Governance
Appendix
The Netflix
Culture
Investing in Our
Communities
27



Privacy, Security
and Accessibility
on Our Service
Privacy
When members sign up for any plan we ask for
very limited information— email, name and method
of payment. In some countries, Netflix also offers
an ad-supported plan which allows members to
enjoy our service at a lower price with limited ads.
When someone signs up for our ad-supported
plan, we also ask for date of birth and gender.
Our Personal Information Handling Principles help
ensure our engineering and business teams are aligned
on our approach to privacy. And our Privacy Statement
provides members with a detailed explanation of our
privacy practices, including: the information Netflix
collects or receives from each member; information
from our partners; how we use and disclose it
(including advertising that we conduct off Netflix to
promote our service); and the controls each member
has in relation to their personal information.
For our ad-supported plans, members have the ability
to opt-out of the selection of ads based on third party
behavioral advertising (i.e., ads selected based on
use and/or interactions with unaffiliated third party
websites and apps over time). We offer members the
ability to exercise these opt-outs through a simple
in-service control — and we do not share information
about what individual members watch with advertisers.
Information and
Cybersecurity
We have an enterprise-wide information security
program designed to identify, protect, detect and
respond to and manage reasonably foreseeable
cybersecurity risks and threats. To protect our
information systems from cybersecurity threats, we
use various security tools that help prevent, identify,
escalate, investigate, resolve and recover from
identified vulnerabilities and security incidents in a
timely manner. We also maintain a third party security
program to identify, prioritize, assess, mitigate and
remediate third party risks; however, we rely on the
third parties we use to implement security programs
commensurate with their risk, and we cannot ensure in
all circumstances that their efforts will be successful.
We regularly assess risks from cybersecurity and
technology threats and monitor our information
systems for potential vulnerabilities. We use a widely
adopted risk quantification model to identify, measure
and prioritize cybersecurity and technology risks and
develop related security controls and safeguards. We
conduct regular reviews and tests of our information
security program and also leverage audits by our
internal audit team, tabletop exercises, penetration and
vulnerability testing, red team exercises, simulations,
and other exercises to evaluate the effectiveness of
our information security program and improve our
security measures and planning. We also engage an
external auditor to conduct an annual payment card
industry data security standard review of our security
controls protecting payment information, as well as
third-party penetration testing of our cardholder
environment and related systems. The results of these
assessments are reported to the Audit Committee.
Our Global Information Security Organization is
responsible for overseeing the Netflix information
security program. The teams provide regular reports
to senior management and other relevant teams
on various cybersecurity threats, assessments and
findings. The Board oversees our annual enterprise
risk assessment, where we assess key risks within the
company, including security and technology risks and
cybersecurity threats. The Audit Committee of the
Board oversees our cybersecurity risk and receives
regular reports on various cybersecurity matters.
Government Requests
Related to Content
We give creators the opportunity to reach audiences
around the world, but our catalog varies from country
to country. In some cases, this is due to the fact
that we don’t have the rights to every title in every
country where we operate. In a few cases, we’ve
had to remove specific titles or episodes of titles
in specific countries to comply with government
demands and we report these annually. Below
are the requests we complied with in 2024.
1.
In January 2024, we complied with a written
demand from the Turkish Radio and TV Supreme
Council to remove the series
Pieles
in Turkey.
2.
In April 2024, we removed the title
Thanksgiving
because it was denied certification by the Ministry
of Culture Sports and Tourism in Vietnam.
3.
In July 2024, we removed
Trinil
and
The Corpse
Washer
as they were banned by the Ministry
of Culture Sports and Tourism in Vietnam.
4.
In August 2024, we complied with written
demands from Turkish Radio and TV Supreme
Council to remove
Sausage Party
in Turkey.
5.
In November 2024, we complied with written
demands from the Ministry of Culture Sports and
Tourism in Vietnam to remove the following titles:
Obliterated
(episode 2),
Naked Director
(season
1),
A Girl and a Guy
,
Love on the Spectrum
and
Love on the Spectrum Australia
in Vietnam.
BEVERLY HILLS COP: AXEL F
CHICKEN RUN: DAWN OF THE NUGGET
The Netflix
Culture
Investing in Our
Communities
Contents
Introduction
Environment
SOCIAL
Governance
Appendix
Privacy, Security
and Accessibility
on Our Service
28



Accessibility on
our Service
We believe all of our members should be able to
enjoy our series, films and games, regardless of
language, device, connectivity, or ability. That’s
why we conduct research, which we are expanding
globally, with current and prospective members
who are deaf, disabled and/or neurodivergent. The
research is aimed at identifying barriers to perceiving,
navigating and interacting with Netflix, then designing
solutions to remove those barriers. In 2024, we
launched our most extensive global accessibility
feedback initiative yet — connecting directly with
members to better understand who they are and
where we can improve, all with the goal of driving
the next wave of innovation. Read more here.
We build compatibility with assistive listening
systems, brightness controls, keyboard shortcuts,
screen readers, larger font size and voice commands
into our products. Our mobile apps take advantage
of device-specific assistive technologies (e.g.,
native features on Apple iOS and Android platforms)
as much as possible. And we create our own
accessibility options to give members more choice,
including customizing the font, size, shadow and
background color of closed captions and subtitles
on TV and adjusting playback speed on mobile.
We include badge icons for our films and series that
have Audio Descriptions (AD) and Subtitles for the
Deaf and Hard of Hearing (SDH) so members can
more easily discover stories suited to their needs,
eliminating the inconvenient need to play a title first.
We’re working to increase the total number of films
and series that support AD and SDH, and are building
new capabilities to deliver industry leading quality
SDH during live shows. All Netflix-branded films and
series support SDH for the language in which they
were originally produced, and we’ve expanded the
language availability in AD and SDH to 13 languages.
We partner with vendors around the world who
are dedicated to working with the blind and low
vision community in many different capacities —
from hiring blind or low vision narrators, quality
controllers and co-author/editors, to working
with local disability organizations to gather
feedback through focus groups. Guidelines for
the creation of Audio Descriptions, timed text
style guides, gaming accessibility and minimizing
photosensitivity issues (flashes or patterns that
could negatively affect our audiences) are also
publicly available to share best practices.
Amplifying Accessibility
Awareness is our global
collection of series and
films with characters
or stories about people
living with disabilities.
Watch
ALEX AMEZCUA
ARTIST
Visit the Netflix
Accessibility web
page for more
Accessibility
The Netflix
Culture
Investing in Our
Communities
Contents
Introduction
Environment
SOCIAL
Governance
Appendix
Privacy, Security
and Accessibility
on Our Service
29



THE LINCOLN LAWYER
GOVERNANCE
Corporate Governance
31
Enterprise Risk
33
Ethics and Compliance
33
IP Protection & Piracy
33
Contents
Introduction
Environment
Social
GOVERNANCE
Appendix
30













Corporate
Governance
Board Composition
and Structure
In 2024, our Board was composed of 13 highly
experienced and strategic directors
39
who have
served as Board members and executives at some
of the world’s most successful companies. We
believe that the Board
is well situated to navigate
the changing competitive environment we operate
in, and that a diverse mix of skills, experience,
perspectives and backgrounds contribute to an
effective Board.
40
The composition of our Board
has evolved over the past several years, and when
looking to fill Board positions, we will continue
to evaluate potential candidates who we believe
complement and augment our current Board.
Netflix Board
41
Comittee Chair
/
Nominating & Governance Committee
/
Audit Committee
/
Compensation Committee
Reed Hastings
Executive Chairman
42
Ted Sarandos
co-Chief Executive Officer and
President of the Company
Greg Peters
co-Chief Executive Officer and
President of the Company
Jay C. Hoag
/
Lead Independent Director
Timothy Haley
43
/
Ann Mather
/
Brad Smith
/
Anne Sweeney
/
Richard Barton
/
Strive Masiyiwa
/
Mathias Döpfner
/
Leslie Kilgore
44
/
Ambassador Susan Rice
/
39
Changes to the Board since the end of 2024 are noted in
the table below. In addition, Ellie Mertz was appointed to
the Netflix Board of Directors on June 24, 2025. Mertz
will also serve on the Audit Committee of the Board.
40
Self-identified demographic diversity characteristics
of our directors include race/ethnicity (2
directors) and/or gender (4 directors).
41
As of the end of 2024.
42
Effective April 17, 2025, Mr. Hastings transitioned
from Executive Chairman to Chairman of the
Board and a non-executive director.
43
Mr. Haley did not stand for re-election at the 2025 Annual
Meeting and is no longer serving as a member of the Board.
44
As of June 24, 2025, Leslie Kilgore moved from the
Audit Committee to the Compensation Committee of the
Board, where she will serve as the Committee Chair.
Enterprise Risk
Ethics and
Compliance
IP Protection &
Piracy
Contents
Introduction
Environment
Social
GOVERNANCE
Appendix
Corporate
Governance
31


Board Oversight
The Board’s role in our risk oversight process includes reviewing and discussing with members of management areas
of material risk to the Company, including overall enterprise, strategic, operational, financial and legal risks. The Board
oversees the Company’s ESG efforts. The Board also oversees succession planning. The Board receives regular
updates from management, typically in the form of an interactive memo, where directors ask questions to management
and further discuss matters at meetings. Each of the committees oversee various ESG matters, depending on
the specific issues. Committees report to the full Board regarding their respective considerations and actions.
Board
The Board’s role in our risk oversight process includes reviewing and discussing with members of
management areas of material risk to the Company, including overall enterprise, strategic, operational,
financial and legal risks. The Board receives regular updates from management, typically in the form
of an interactive memo, where directors ask questions to management and further discuss matters at
meetings. Committees report to the full Board regarding their respective considerations and actions.
NOMINATING AND
GOVERNANCE
COMMITTEE
Primary committee
responsible for
Board structure,
governance and director
independence, as well
as assisting the Board in
overseeing ESG matters
AUDIT COMMITTEE
Oversees matters
of financial and
legal risk, including
cybersecurity risk
COMPENSATION
COMMITTEE
Oversees risks
related to
compensation
issues
Company management
The executive team, led by our co-Chief Executive Officers, supervises day-to-day
risk management processes, including identifying, assessing, monitoring, managing
and mitigating significant business risks. Company management reports to the
Board on an annual basis, or more frequently if needed, the top areas of risk.
Governance Structure
Our goal is to align our corporate
governance practices with the long-
term interests of shareholders. To that
end, we’ve adopted the following:
One share, one vote
We have a single class of shares with
each share entitled to one vote.
Voting
We have a majority voting standard in uncontested
director elections, and we eliminated supermajority
voting provisions in our Charter and Bylaws.
Annual director elections
The entire Board stands for annual elections.
Proxy Access
A group of up to 20 stockholders, owning at
least 3% of shares continuously for at least
three years, may nominate up to two directors
or 20% of the Board (whichever is greater)
for inclusion in our proxy statement.
Stockholder right to call
a special meeting
Stockholders holding a not less than 20% net-
long position in the Company continuously for
at least one year may call a special meeting.
Director resignation policy
Any incumbent director who fails to receive a majority
of votes cast in an uncontested election must tender
their resignation to the Board. The Nominating
and Governance Committee must then make a
recommendation to the Board regarding whether
to accept or reject the resignation or take other
action, act on the recommendation and publicly
disclose its decision and the rationale within 90 days
from the date the election results are certified.
Policy on directors’ service on
other public company boards
We have a policy that the Netflix co-CEOs may
not serve on more than two boards of other public
companies in addition to the Netflix Board, and
that directors other than the co-CEOs, may not
serve on more than four boards of other public
companies in addition to the Netflix Board.
BRIDGERTON
Enterprise Risk
Ethics and
Compliance
IP Protection &
Piracy
Contents
Introduction
Environment
Social
GOVERNANCE
Appendix
Corporate
Governance
32


Shareholder
Engagement
We proactively engage with our shareholders
throughout the year, and directors regularly
participate in these discussions. Since the
2024 annual meeting, we invited shareholders
representing approximately
50% of ownership
45
to engage and provide feedback. We met with
18 shareholders, collectively representing
approximately 30% of our shares outstanding
and directors participated in approximately half
of our engagements. Over the past several years,
in response to shareholder feedback, and as
part of our ongoing evaluation of best practices,
the Board has incorporated enhancements
to our disclosures and corporate governance
practices. A few highlights are below.
EXECUTIVE COMPENSATION
PROGRAM CHANGES
The Compensation Committee has
significantly evolved the compensation
program for our Executive Officers to: (1)
eliminate the ability to allocate compensation
between cash salary and stock options; (2)
limit guaranteed cash compensation by
setting base salaries; (3) include an annual
performance-based cash bonus program;
(4) grant performance-based restricted
stock unit awards and time-based restricted
stock unit awards; (5) evolve our change-
in-control severance arrangements to
include “double-trigger” provisions; and
(6) adopt stock ownership guidelines.
46
ADOPTION OF CORPORATE
GOVERNANCE GUIDELINES
We adopted corporate governance guidelines,
which in conjunction with our charter and
bylaws, provide the framework pursuant to
which the Board oversees the Company’s
business in accordance with its fiduciary
responsibilities. The corporate governance
guidelines address various issues such as
board composition, director qualifications,
board terms, board responsibilities and
procedures, among other items.
45
Ownership data presented in this section is based
on shares outstanding as of 12/31/24.
46
Refer to the Netflix 2025 Proxy Statement for further details.
Enterprise Risk
Our approach to enterprise risk management
(ERM) is consistent with the COSO framework.
On an annual basis, an enterprise risk assessment
is performed. We gather insights from several
internal and external sources, including
discussions with executives for their views on
enterprise risks that the company is facing,
and compile an inventory of risks across the
business. The findings of this assessment,
including mitigation approaches, are presented
to the Board for their input and oversight.
Ethics and
Compliance
Cultivating a culture where all employees are expected to
act ethically and with integrity is important to our long-
term success. The Netflix Code of Ethics supports this
goal and applies to members of the Board, officers and
employees of Netflix and subsidiaries around the world.
We encourage anyone to report a breach of our
Code or any unethical or inappropriate conduct to
our Chief Legal Officer or, in the case of misconduct
by a senior financial officer, to the Chair of our Audit
Committee. We also provide access to a third-party
operated service
47
where reports of misconduct can
be made confidentially or anonymously,
48
24 hours
a day, seven days a week, 365 days a year in local
languages. Reports made through this service are
elevated and investigated until they are resolved, and
updates are provided annually to the Audit Committee.
Our Global Anti-Corruption Policy requires our
employees and contractors to abide by global
anti-corruption and anti-bribery laws. We provide
regular training on compliance with this policy, in
addition to conducting regular and ongoing risk
assessments. In 2024, we adopted a Human Rights
Statement that sets forth a commitment to respecting
internationally recognized human rights as defined
by the International Bill of Human Rights. We also
comply with applicable government mandated
sanctions regimes (with leadership provided by a
designated Sanctions Compliance Officer) as well as
compliance with human rights legislation (e.g., UK
Modern Slavery Act, Australian Modern Slavery Act).
47
netflix.ethicspoint.com
48
Where permitted under local law.
IP Protection
&
Piracy
We use a combination of patent, trademark,
copyright, trade secret laws and confidentiality
agreements to protect our proprietary intellectual
property. We also use a variety of methods to
monitor potential infringement of our intellectual
property, including searches conducted internally
and by external vendors. We work closely with
our industry organizations to identify and shut
down major piracy infrastructure and protect
consumers from illegal and harmful services.
Contents
Introduction
Environment
Social
GOVERNANCE
Appendix
Corporate
Governance
Enterprise Risk
Ethics and
Compliance
IP Protection &
Piracy
33



SWEET TOOTH
APPENDIX
About This Report
35
ESG Data Table
36
SASB Index
39
TCFD Index
40
Resources
42
GHG Emissions
Inventory Methodology
43
Carbon Credit Project
Screening Criteria
44
Contents
Introduction
Environment
Social
Governance
APPENDIX
34

About This
Report
This report covers the calendar year 2024 and
all data included in the report is from that time
period unless otherwise noted. Refer to data tables
below for a summary of ESG data for 2024 as
well as published data from previous years. This
report is also reflective of global Netflix operations
unless otherwise noted. This report is informed
by external ESG reporting frameworks including
the Sustainability Accounting and Standard Board
(SASB)’s “Internet Media & Services” and “Media &
Entertainment” standards, as well as the Task Force
on Climate-related Financial Disclosures (TCFD).
SASB and TCFD indices are provided below.
Forward-Looking
Statements
The information covered by the report contains
forward-looking statements within the meaning of
the Private Securities Litigation Reform Act of 1995
including, but not limited to, statements regarding
our ESG programs, activities, plans, policies, goals,
targets, objectives, commitments, projections,
expectations and strategies that are not historical
in nature. These forward-looking statements are
subject to risks and uncertainties that could cause
actual results and events to differ, including any failure
to meet stated ESG goals and commitments, and
execute our strategies in the time frame expected
or at all, as a result of many factors, including
changing government regulations or stakeholder
expectations, and our expansion into new products,
services, technologies and geographic regions.
More information on risks, uncertainties and other
potential factors that could affect our business
and performance is included in our filings with
the SEC, including in Item 1A: “Risk Factors”
section of the company’s most recently filed
periodic reports on Form 10-K, Form 10-Q and
subsequent filings. All forward-looking statements
included in this document are based on information
available to us on the date hereof, and we assume
no obligation to revise or publicly release any
revision to any such forward-looking statement,
except as may otherwise be required by law.
NETFLIX TOKYO
Carbon Credit
Project Screening
Criteria
ESG Data Table
GHG Emissions
Inventory
Methodology
SASB Index
Resources
TCFD Index
Contents
Introduction
Environment
Social
Governance
APPENDIX
About This Report
35

ESG Data Table
General
DATA POINT
2019
2020
2021
2022
2023
2024
Members (as of the end of the calendar year) (millions)
167
204
222
231
260
302
Employees
8,600
9,400
11,300
12,800
13,000
14,000
Revenue (millions, USD)
20,156
24,996
29,698
31,616
33,723
39,001
Value Added
49
(millions, USD)
7,716
9,720
12,365
12,447
14,008
17,963
49
“Value Added” is a term used by SBTi. For Netflix, this is derived by subtracting “Cost of Revenues” from “Revenues”, both of which are reported in our public financial statements.
Environment
DATA POINT
2019
2020
2021
2022
2023
2024
Purchased Grid Electricity (MWh)
81,136
94,285
156,555
156,967
113,754
158,039
Global Renewable Electricity (%)
100
100
100
100
100
100
Scope 1 Emissions (Metrics Tons CO
2
e)
51,487
30,883
62,815
59,388
25,790
50,488
Scope 1 Emissions, Target-Based (Metrics Tons CO
2
e)
51,487
30,883
62,815
59,388
25,790
49,647
Scope 2 Emissions, Market-Based (Metrics Tons CO
2
e)
565
141
0
0
0
0
Scope 2 Emissions, Location-Based (Metrics Tons CO
2
e)
26,594
28,585
42,291
41,411
30,303
40,684
Scope 2 Emissions, Target-Based (Metrics Tons CO
2
e)
26,317
29,356
31,937
23,622
15,281
25,353
Scope 3 Emissions, Market-Based (Metrics Tons CO
2
e)
1,192,659
1,020,541
1,466,497
1,086,833
817,317
986,738
Category 1: Purchased Goods & Services
—
—
—
841,060
618,537
689,044
Category 2: Capital Goods
—
—
—
64,229
58,048
92,339
Category 3: Upstream Energy Losses
—
—
—
—
—
22,137
Category 4: Upstream Transportation and Distribution
—
—
—
—
—
25,718
Category 5: Waste from Operations
—
—
—
—
—
4,864
Category 6: Business Travel
—
—
—
105,756
94,259
136,259
Category 7: Employee Commuting and WFH
—
—
—
—
—
13,827
Category 8: Upstream Leased Assets
—
—
—
—
—
85
Category 11: Use of Sold Products
—
—
—
—
—
2,386
Category 13: Downstream Leased Assets
—
—
—
—
—
79
— Did not report
About This Report
Carbon Credit
Project Screening
Criteria
GHG Emissions
Inventory
Methodology
SASB Index
Resources
TCFD Index
Contents
Introduction
Environment
Social
Governance
APPENDIX
ESG Data Table
36


Environment
DATA POINT
2019
2020
2021
2022
2023
2024
Scope 3 Emissions, Location-Based (Metrics Tons CO
2
e)
1,234,936
1,067,778
1,471,243
1,110,989
840,778
1,037,952
Scope 3 emissions, Target-Based (Metrics Tons CO
2
e) (SBTi Boundary)
867,804
745,436
1,043,612
805,704
646,848
862,884
Scope 3 Target-Based Intensity (Metric Tons CO
2
e per $ value added)
112
77
84
65
46
48
Total GHG Emissions, Market-Based (Metric Tons CO
2
e)
1,244,711
1,051,565
1,529,312
1,146,221
843,107
1,037,226
Total GHG Emissions, Location-Based (Metric Tons CO
2
e)
1,313,017
1,127,246
1,576,349
1,211,788
896,871
1,129,124
Carbon Credits (Metric Tons CO
2
e)
(36,506)
(54,107)
(1,529,312)
(1,146,221)
(843,107)
(1,036,176)
Sustainable Aviation Fuel Certificates (SAFc) (Metric Tons CO
2
e)
0
0
0
0
0
(1,050)
Biogenic Emissions (Metric tons CO
2
e)
0
0
1,007
2,033
1,647
2,222
Social
DATA POINT
2020
2021
2022
50
2023
2024
Representation Data: All Job Levels
Global Gender Identity, % Women
48.7
51.7
49.6
51.5
51.0
Global Gender Identity, % Men
51.3
45.7
45.0
46.0
46.5
Global Gender Identity, % Additional Gender Identities
Gender Identity options that allow employees to self-identify from non-binary categories were added in 2021.
1.3
1.3
1.4
1.4
US Race Ethnicity, % Asian
24.0
25.8
27.2
28.7
29.8
US Race Ethnicity, % Black
8.6
11.7
10.8
10.6
10.2
US Race Ethnicity, % Hispanic/Latino/A/X
7.9
11.2
11.9
12.2
12.2
US Race Ethnicity, % Middle Eastern/North African
0.8
2.2
2.6
2.8
2.6
US Race Ethnicity, % Native American/Alaskan Native
0.3
0.6
0.7
0.7
0.6
US Race Ethnicity, % Native Hawaiian/Other Pacific Islander
0.5
0.8
0.9
0.9
0.8
US Race Ethnicity, % White
44.3
46.6
48.2
47.7
47.6
US Race Ethnicity, % 2 or more races/ethnicities
4.8
Did not report. Starting in 2021, data collection methods were implemented to allow employees to
share multiple self-identities (e.g., Black and Asian compared to “2 or more races/ethnicities”)
Representation Data: Director + Job Levels
Global Gender Identity, % Women
47.8
51.2
51.4
52.4
51.7
Global Gender Identity, % Men
52.2
47.8
45.6
46.2
46.8
Global Gender Identity, % Additional Gender Identities
Did not report. Gender Identity options that allow employees to self-identify from non-binary categories were added in 2021.
0.3
0.2
0.2
0.2
50
2022 data represented in this table may vary slightly from 2022 data included in the 2022 ESG Report, in an effort to maintain a consistent employee population represented in the date for year-over-year comparisons (due an increased % of employees with selfID survey data available).
About This Report
Carbon Credit
Project Screening
Criteria
GHG Emissions
Inventory
Methodology
SASB Index
Resources
TCFD Index
Contents
Introduction
Environment
Social
Governance
APPENDIX
ESG Data Table
37


Social
DATA POINT
2020
2021
2022
2023
2024
US Race Ethnicity, % Asian
15.3
18.6
19.4
19.2
19.5
US Race Ethnicity, % Black
10.9
13.6
12.8
12.5
11.7
US Race Ethnicity, % Hispanic/Latino/A/X
4.3
6.8
7.6
7.5
7.3
US Race Ethnicity, % Middle Eastern/North African
0.3
2.0
2.6
2.7
2.3
US Race Ethnicity, % Native American/Alaskan Native
0.0
0.4
0.7
0.7
0.7
US Race Ethnicity, % Native Hawaiian/Other Pacific Islander
0.6
0.8
0.9
1.1
1.0
US Race Ethnicity, % White
56.6
59.0
59.3
59.7
61.1
US Race Ethnicity, % 2 or more races/ethnicities
4.2
Did not report. Starting in 2021, data collection methods were implemented to allow employees to
share multiple self-identities (e.g., Black and Asian compared to “2 or more races/ethnicities”)
Pay Equity Data
Pay Equity, Gender (Women and Additional Gender Earnings [USD] per $1 earned my Men)
—
—
—
0.99
0.99
Pay Equity, Race Ethnicity (Employees from historically underrepresented ethnic and/or racial background earnings [USD] per $1 earned by White employees)
—
—
—
0.99
1.0
Other Social Data
Number of Employee Resource Groups (ERGs)
—
—
—
—
18
Number of ERG Chapters
—
60
84
83
82
Employee Giving Program Total Donations (millions, USD)
—
~$31
~$34
~$35.7
~$40
Number of Government Requests to Remove Content
4
7
3
3
5
Supplier diversity spend (millions, USD)
—
—
~$700
~$600
~$570
— Did not report
Governance
51
DATA POINT
2020
2021
2022
2023
2024
Board of Directors (number of Directors)
11
12
12
13
13
Board of Directors (number of Independent Directors)
10
10
10
10
10
Gender representation on Board of Directors
(number of women directors)
Self-reported demographic data was not
collected from our Board before 2022
3
4
4
Race/Ethnicity representation on Board of Directors
(number of directors from historically excluded ethnic and/or racial background)
Self-reported demographic data was not
collected from our Board before 2022
1
2
2
51
Data is based on the information included in each year's annual proxy statement.
About This Report
Carbon Credit
Project Screening
Criteria
GHG Emissions
Inventory
Methodology
SASB Index
Resources
TCFD Index
Contents
Introduction
Environment
Social
Governance
APPENDIX
ESG Data Table
38

SASB Index
Internet Media & Services
SASB STANDARD
TOPIC
SASB CODE
ACCOUNTING METRIC
2020
2021
2022
2023
2024
INTERNET
MEDIA &
SERVICES
Sustainability
Accounting
Standard
Entity-defined measure
of user activity
TC-IM-000.A
Paid Memberships (millions)
204
222
231
260+
300+
Environmental Footprint of
Hardware Infrastructure
52
TC-IM-130a.1
Total energy consumed (MWH)
29,196
33,407
36,110
41,827
55,817
Percentage grid electricity
100%
100%
100%
100%
100%
Percentage renewable
100%
100%
100%
100%
100%
Environmental Footprint
of Remaining Scope 2
53
TC-IM-130a.1
Total energy consumed (MWH)
68,089
123,148
120,857
71,926
102,222
Percentage grid electricity
100%
100%
100%
100%
100%
Percentage renewable
100%
100%
100%
100%
100%
Environmental Footprint of
Hardware Infrastructure
TC-IM-130a.3
Discussion of the integration of environmental considerations into strategic planning for data center needs
Refer to the Sustainability in Our Operations and Value Chain section of the report.
Data Privacy, Advertising
Standards & Freedom
of Expression
TC-IM-220a.1
Description of policies and practices relating to behavioral advertising and user privacy
Refer to the Privacy, Security and Accessibility on Our Service section of the report and the Netflix Privacy Statement.
TC-IM-220a.2
Number of users whose information is used for secondary purposes
Refer to the Privacy, Security and Accessibility on Our Service section of the report and the Netflix Privacy Statement.
TC-IM-220a.6
Number of government requests to remove content, percentage compliance with requests
4 / 100%
7 / 100%
3 / 100%
3 / 100%
5 / 100%
Data Security
TC-IM-230a.2
Description of approach to identifying and addressing data security risks, including use of third-party cybersecurity standards
Refer to the Information and Cybersecurity section of the report
Employee Recruitment,
Inclusion & Performance
TC-IM-330a.3
Percentage of gender and racial/ethnic group representation for
(1) management, (2) technical staff, and (3) all other employees
Refer to Netflix employee representation data in the Identity (Who we are)
section of the report as well as in the ESG Data Table in this appendix.
Media & Entertainment
SASB STANDARD
TOPIC
SASB CODE
ACCOUNTING METRIC
2020
2021
2022
2023
2024
MEDIA &
ENTERTAINMENT
Sustainability
Accounting
Standard
Actvity Metric
SV-ME-000.A
(1) Total recipients of media and the number of (2) households reached by broadcast
TV, (3) subscribers to cable networks, and (4) circulation for magazines and newspapers
As noted in the entity-
defined measure of user
activity above, there
were 204 million paid
Netflix memberships
at the end of 2020.
As noted in the entity-
defined measure of
user activity above,
there were 222 million
paid memberships at
the end of 2021.
As noted in the entity-
defined measure of
user activity above,
there were 231 million
paid memberships at
the end of 2022.
As noted in the entity-
defined measure of user
activity above, there
were over 260 million
paid memberships at
the end of 2023.
As noted in the entity-
defined measure of user
activity above, there
were over 300 million
paid memberships at
the end of 2024.
Media Pluralism
SV-ME-260a.1
Percentage of gender and racial/ethnic group representation for (1)
management, (2) professionals, and (3) all other employees
Refer to Netflix employee representation data in the Identity (Who we are)
section of the report as well as in the ESG Data Table in this appendix.
Intellectual Property
Protection & Media Piracy
SV-ME-520a.1
Description of approach to ensuring intellectual property (IP) protection
Refer to the IP Protection & Piracy section of the report
52
Only includes Scope 2 hardware infrastructure, i.e. Netflix-operated Open Connect Appliances in colocation data centers, which represent approximately 1/10th of Scope 2 and 3 data center electricity use (all Open Connect and AWS combined).
53
While SASB only requires reporting for the “Environmental Footprint of Hardware Infrastructure,” Netflix has opted to report on its other Scope 2 energy consumption as well, which includes electricity use in corporate offices, production studios, and billboards, in addition to colocation data center infrastructure.
About This Report
Carbon Credit
Project Screening
Criteria
ESG Data Table
GHG Emissions
Inventory
Methodology
Resources
TCFD Index
Contents
Introduction
Environment
Social
Governance
APPENDIX
SASB Index
39

TCFD Index
TCFD DISCLOSURE REQUIREMENT
NETFLIX DISCLOSURES
Governance
Disclose the organization’s governance around climate-related risks and opportunities
Describe the board’s oversight of
climate-related risks and opportunities
The Netflix Board oversees the Company’s ESG efforts, which includes sustainability,
with the assistance of the Nominating and Governance Committee. They receive
updates on sustainability and enterprise risk management at Board meetings.
An annual company-wide enterprise risk assessment is performed, in which
climate risks are considered, and the findings of this assessment are shared with
our Board annually. Refer to the Climate Risk section of the ESG report.
Describe management’s role in
assessing and managing climate
related risks and opportunities
Executive Management oversees decisions related to climate risk with expert input from
internal teams. Our sustainability program, which includes our climate strategy, is led by
our Netflix Sustainability Officer. Refer to the Climate Risk section of the ESG report.
Strategy
Disclose the actual and potential impacts of climate-related risks and opportunities on the organization’s
businesses, strategy, and financial planning where such information is material
Describe the climate-related risks and
opportunities the organization has identified
over the short, medium, and long term
Refer to the table on the following page for a summary of our climate-related risks
and opportunities. The results of our climate risk assessment were also used as an
input into our ERM assessment. When evaluated using our ERM methodology, no
standalone climate-related risks were identified as significant for the company.
Describe the impact of climate-related risks
and opportunities on the organization’s
businesses, strategy, and financial planning
Describe the resilience of the organization’s
strategy, taking into consideration
different climate-related scenarios,
including a 2°C or lower scenario
TCFD DISCLOSURE REQUIREMENT
NETFLIX DISCLOSURES
Risk Management
Disclose how the organization identifies, assesses, and manages climate-related risks
Describe the organization’s processes for
identifying and assessing climate-related risk
In 2024, aligned to the investor-driven Task Force on Climate-Related Disclosures
framework, we performed a climate risk and opportunity assessment using scenario
analysis to identify climate-related physical and transition risks and opportunities for Netflix.
This analysis leveraged the Intergovernmental Panel on Climate Change (IPCC)’s SSP1-
2.6 (1.5-2°C) and SSP5-8.5 (4-5°C) climate scenarios with projections through 2050.
Climate-related physical risk scenario analysis was conducted for locations that are the
most integral to corporate and production operations across a diverse set of geographic
locations and operation types. The analysis assessed both chronic and acute physical
risks such as extreme temperatures, sea-level rise, drought, flood, wildfire, tornadoes
and tropical cyclones, and impacts of extreme weather events. Transition risks and
opportunities associated with a transition to a low-carbon economy were also assessed,
including: emerging policies and regulations; development and implementation of new
technologies, products and services; market transitions and trends; risks to reputation
and public perception; and decarbonization of operations and resource efficiency.
Describe the organization’s processes
for managing climate-related risks
Describe how processes for identifying,
assessing, and managing climate-
related risks are integrated into the
organization’s overall risk management
Metrics & Targets
Disclose the metrics and targets used to assess and manage relevant climate-related risks and opportunities where such information is material
Disclose the metrics used by the
organization to assess climate related
risks and opportunities in line with its
strategy and risk management process
Refer to the Our Climate Targets and Our Carbon Footprint sections of the
ESG report for information on our metrics, emissions and targets. Measuring
our performance against our climate targets over time helps to inform our
climate risk assessment process, in particular our transition risks.
Disclose Scope 1, Scope 2, and, if
appropriate, Scope 3 greenhouse gas
(GHG) emissions, and the related risks
Describe the targets used by the organization to
manage climaterelated risks and opportunities
and performance against targets
About This Report
Carbon Credit
Project Screening
Criteria
ESG Data Table
GHG Emissions
Inventory
Methodology
SASB Index
Resources
Contents
Introduction
Environment
Social
Governance
APPENDIX
TCFD Index
40


Short term (0–1 years)
/
Medium term (1–5 years)
/
Long term (5–10 years)
Risks
RISK
TYPE
DESCRIPTION
TIME
HORIZON
MITIGATION
STRATEGY
Acute
Physical
Acute physical risks caused
by disruption from wildfires,
wind gusts, drought, and
flooding could pose a threat to
business continuity and disrupt
productions in areas impacted
by such natural disasters.
We produce content all around the world and can be
somewhat resilient to issues affecting a particular
studio or filming location. As part of our planning for
productions, we conduct risk assessments and develop
emergency response plans for each potential scenario.
During production, we track adverse weather events
and other situations that may impact the continuity of
our productions and implement plans as needed (e.g.,
halting production, moving locations, etc.). We will also
continue to monitor global physical risks as a part of our
enterprise wide risk management and business continuity
programs, which inform additional mitigation strategies.
Chronic
Physical
Rising temperatures and
changing precipitation patterns
could increase cooling costs
and affect water availability,
impacting outsourced data
centers and productions.
While most of these impacts pose a bigger risk to our
partners in the value chain, we work closely with our cloud
services partners to ensure that we are informed and
aligned on their climate mitigation actions to help ensure
resilience to these potential chronic physical risks. And as
noted above, we produce content all around the world and
can be somewhat resilient to issues affecting a particular
studio or filming location in our planning processes.
Policy &
Legal Risks
Regulatory changes may
necessitate operational shifts,
new technology installations, and
additional permitting, imposing
additional costs and limitations
on how we produce content
and operate our service.
Enhanced emissions reporting
requirements could increase
compliance costs and require
operational changes.
We partner closely with players across the industry
to evaluate, develop and deploy new sustainable
technologies as well as seek to operate as efficiently
as possible with traditional energy sources. Refer
to our Industry Collaboration section above
for more details on these partnerships.
We have developed systems for carbon accounting,
assurance and disclosures to help us prepare for additional
emissions and climate-related reporting requirements.
Opportunities
OPPORTUNITY
TYPE
DESCRIPTION
TIME
HORIZON
BUSINESS
STRATEGY
Resource
Efficiency
Decarbonization of production
operations and increased
resource efficiency in the supply
chain can help to reduce costs
and emissions and increase
resilience. Reuse, recycling
and responsible disposal
initiatives can reduce emissions
and production costs.
To meet our emissions reduction objectives in our
operations, we continue to focus on four key levers:
Energy Efficiency, Vehicle Electrification, Clean Mobile
Power and Renewable Energy. We approach these four
levers using a framework in which we first optimize energy
use, then electrify it and decarbonize the rest (OED).
Learn more in the Our Operations and
Our Value Chain sections.
Energy
Source
Renewable energy procurement
and the use of new technologies
can lower emissions and
operational costs, while
participation in carbon
markets and supportive policy
structures can provide financial
and reputational benefits.
In addition to reducing emissions through the
implementation of new technologies, we match remaining
non-renewable electricity use with renewable energy
credits and non-electricity emissions across Scopes 1-3 by
purchasing and retiring third-party verified carbon credits.
We also partner with external organizations
and industry groups to support sustainable
technologies and policy solutions.
Learn more in our Matching Remaining Emissions
and Industry Collaboration sections.
About This Report
Carbon Credit
Project Screening
Criteria
ESG Data Table
GHG Emissions
Inventory
Methodology
SASB Index
Resources
Contents
Introduction
Environment
Social
Governance
APPENDIX
TCFD Index
41






Resources
Reports Archive
2023 ESG Report
2022 ESG Report
2021 ESG Report
2020 ESG Report
2019 ESG Report
Environmental
About Netflix – Sustainability
Our Progress on Sustainability:
Three Years In
Energy Efficiency in Streaming
Carbon Impact of Video Streaming
Earth Week 2024
2024 GHG Emissions
Inventory Assurance Letter
Social
About Netflix – Inclusion
Netflix Fund for Creative Equity
Inclusion in Netflix Original
Films & Series – Executive Summary
Inclusion in Netflix Original
Films & Series – Full Report
Netflix EEO-1 Reports
Political Activity Disclosures
Governance
FY2024 10-K
2025 Proxy Statement
Netflix Governance Documents
Leadership & Directors
Netflix Code of Ethics
Netflix Human Rights Statement
Netflix Supplier Code of Conduct
OUR GREAT NATIONAL PARKS
DAMSEL
About This Report
Carbon Credit
Project Screening
Criteria
ESG Data Table
GHG Emissions
Inventory
Methodology
SASB Index
TCFD Index
Contents
Introduction
Environment
Social
Governance
APPENDIX
Resources
42
GHG Emissions
Inventory
Methodology
Netflix reports its emissions following the World
Resources Institute (WRI) / World Business Council
for Sustainable Development’s (WBCSD) Greenhouse
Gas Protocol Corporate Standard, as amended by
the GHG Protocol Scope 2 Guidance, as well as WRI
/ WBCSD’s Greenhouse Gas Protocol Corporate
Value Chain (Scope 3) Accounting and Reporting
Standard and Technical Guidance for Calculating
Scope 3 Emissions (collectively, the GHG Protocol).
Netflix GHG emissions reporting follows the
operational control approach set out by the GHGP.
Our reported emissions account for all GHGs covered
by the UNFCCC Kyoto Protocol (Annex A) relevant
to Netflix activities and are converted into metric
tons of carbon dioxide equivalents (mtCO
2
e) as
specified by the GHG Protocol. All emission factors
are applied to the data and updated annually to reflect
the latest guidance and factors published by US EPA
Emission Factors for Greenhouse Gas Inventories
(2024), US EPA eGRID2022 Electricity Grid Emission
Factors (2025) and UK DEFRA Greenhouse Gas
Reporting Conversion Factors (2024). Additionally,
where data is not available or of sufficient quality,
Netflix uses proxy data, industry-average figures,
or expert assumptions. In such instances, we use
third-party sources for reliability and completeness.
Some of these data sets, such as average building
energy consumption, use intensity values from the
U.S. Energy Information Administration Commercial
Building Energy Consumption Survey (2018).
Netflix greenhouse gas (GHG) emissions reporting is
consistent with the “operational control” approach as
set out by the GHG Protocol Corporate Accounting
and Reporting Standard: Revised Edition. The
organizational and operational boundary applies to the
global company including its subsidiaries, the office
and studio facilities we own and operate (e.g., Netflix
Albuquerque Studios, US) as well as facilities we
lease from others but over which we have operational
control (e.g., corporate and studio offices and stages).
Location-Based
Emissions
Location-based emissions reflect the average
emissions intensity of the grid on which energy
consumption occurs. This method uses regional or
national grid averages to calculate the GHG emissions
resulting from the electricity consumed. The emission
factor is generally provided by government agencies
or grid operators and reflects the mix of different
energy sources (like coal, natural gas, renewables,
etc.) used to produce electricity in that region.
Market-Based
Emissions
Market-based emissions accounting takes
into account contractual instruments, such as
RECs, guarantees of origin, or Power Purchase
Agreements (PPAs), which the reporting entity has
purchased. This method reflects the emissions
from the electricity that Netflix has specifically
chosen to buy or has contractual rights to claim.
Target-Based Emissions
We use a target-based emissions accounting
method relative to our science-based targets,
which is custom to Netflix. This method builds off
of the market-based method and utilizes the same
emission factors hierarchy as outlined in the GHGP,
including for direct renewable energy supply (e.g.,
onsite generation, utility & landlord supply, PPAs, or
direct investments). However, it does not account
for the reductions of emissions stemming from
electricity usage that is covered by retail purchases
of RECs and their geographical equivalents.
Our Footprint
Boundary
Scopes 1 and 2
Our emissions include all Scope 1 (direct) and
Scope 2 (indirect emissions) from the following:
our corporate operations (e.g., offices, etc); the
production of our films, series and games; and
the storage and delivery of our content. Scope 2
emissions are calculated using market-based and
location-based emissions accounting methods
defined by the GHG Protocol Scope 2 Guidance.
Location-based estimates are calculated based
on the emissions intensity of the locations where
the electricity consumption occurs. The market-
based method incorporates electricity procurement
decisions that are chosen within the local electricity
market, including zero-carbon electricity supply
from utilities (i.e., opt-in “green tariff” rates)
and contractual instruments such as RECs.
Scope 3
Netflix also estimates and reports relevant Scope
3 categories, which therefore includes activities
outside of our operational control. Our Scope 3
boundary was established in alignment with the
GHG Protocol Corporate and Scope 3 Standards.
Netflix includes all relevant and material sources
of emissions including categories 1–8, and 11.
Scope 3 emissions use location-based emissions
factors except where individual suppliers provided
supplier specific emissions that are market-based
(e.g., AWS) or through application of RECs to Scope
3 emissions where information on the specific
energy consumption by location was available
(e.g., for the Open Connect network) in order to
match the contractual instrument to known energy
consumption in accordance with GHG Protocol
Scope 2 Guidance. Netflix works with individual
suppliers, wherever possible, to determine that
any renewable contractual instruments applied
to their emissions are appropriately attributed.
We include all Netflix-branded content productions,
whether we manage the production directly (like
The Sea Beast
,
Spirit Rangers
,
Don’t Look Up
,
Our Great National Parks
), or through a third-party
production company (like
Glass Onion: A Knives
Out Mystery
,
The Elephant Whisperers
) as well as
all content that we license that is Netflix-branded
(like
Octonauts: Above and Beyond
,
Captain Nova
,
Down to Earth with Zac Efron
). Activities outside
of our operational control present challenges to
measuring and reducing emissions, but because
so much of production infrastructure, crew and
equipment are shared across studios, we believe
that holding ourselves accountable for all emissions
from Netflix-branded content (wherever it is
produced) will create a positive ripple effect across
our own emissions as well as the entire industry.
Data Management
We maintain a Greenhouse Gas Inventory Management
plan to help ensure consistency of calculating and
estimating emissions from year to year, and to provide
to our 3rd party assurance providers as a basis for their
audit of our emissions. We maintain documentation
as evidence to support our emissions inventory and
follow Netflix retention policies for these records.
About This Report
Carbon Credit
Project Screening
Criteria
ESG Data Table
SASB Index
Resources
TCFD Index
Contents
Introduction
Environment
Social
Governance
APPENDIX
GHG Emissions
Inventory
Methodology
43
Carbon Credit Project
Screening Criteria
SCREEN 1
Competitive selection
Our competitive requests for proposals (RFPs) are
issued widely, to over 75 project developers, non-profits,
brokers and credit retailers across many project types and
geographies. This is done periodically to help ensure we
evaluate new proposals for investment on a rolling basis.
SCREEN 2
Meet core quality criteria
Any credits that we purchase must meet globally
recognized core quality criteria and be:
•
Additional
•
Verified by a 3rd party
•
Based on a conservative and realistic
54
baseline
•
Not double counted
•
Durable
•
Issued by a credible standard
55
with robust provisions
for reversal risk, and accounts for leakage (the risk of
displacing emissions from one location to another)
These criteria align with the 2024 Core Carbon Principles (CCPs)
defined by the Integrity Council for the Voluntary Carbon Market
(ICVCM), as well as with foundational project accounting standards, such
as the GHG Protocol for Project Accounting and ISO 14064 Part 2.
SCREEN 3
Deep project-level
diligence and
impact screening
Our team conducts due diligence on the projects and holds live
interviews directly with the project developers and/or trusted
project partners. This includes research on the projects, their
proponents and other local stakeholders. Engaging directly
with the project hosts enables a deeper understanding of the
unique circumstances and conditions that surround a particular
carbon credit project and how and why it came to be.
In addition, we make use of The Nature Conservancy’s
(TNC) 2024 Principles of Natural Climate Solutions and the
International Union for Conservation of Nature’s (IUCN) 2020
Global Standard for Nature Based Solutions
56
as guiding
frameworks for the assessment of project design quality.
We also conduct additional screens for local community
ownership and direct benefit sharing; job creation and
training; women and girls empowerment; biodiversity and
habitat restoration and protection (e.g., Verra Climate,
Community & Biodiversity certified projects); and climate
resilience impacts. In this way, we align with the Sustainable
Development principles of ICVCM’s CCPs, which
includes requirements for ensuring social safeguards and
alignment with the transition to a global net zero state.
SCREEN 4
Use digital tools and
resources to improve visibility
Where feasible, we use technology to enhance project validation and
verification, such as AI-powered satellite imagery, machine learning
and remote sensing analysis. We actively seek opportunities to connect
projects with geospatial data and tools providers to unlock higher
frequency monitoring of project progress, as well as to augment impact
visualization to support communication and ongoing transparency.
SCREEN 5
Seek additional
expert advice
Netflix relies on its expert Advisory Group and other expert
authors of the various standards in order to provide additional
insight and guidance on an ongoing basis across a range
of key issues, including our carbon credit investment plan.
This helps us identify things we may have missed.
54
Periodically updated, or where appropriate, employ a dynamic baseline
55
We only purchase credits that have been third-party verified and
registered on a trusted registry, including – Verra, Gold Standard,
Climate Action Reserve and American Carbon Registry – or have
demonstrated an equivalent level of rigor, including programmatic
rules to address reversal risks such as buffer pool mechanisms.
56
As Netflix increases its investments to support new project development, we
leverage IUCN's project design-focused guidance to support our diligence.
About This Report
ESG Data Table
GHG Emissions
Inventory
Methodology
SASB Index
Resources
TCFD Index
Contents
Introduction
Environment
Social
Governance
APPENDIX
Carbon Credit
Project Screening
Criteria
44

Learn More
about.netflix.com
ir.netflix.net/ESG