


Annual Report 2025
Life, Liberty
and
the Pursuit of
Happiness
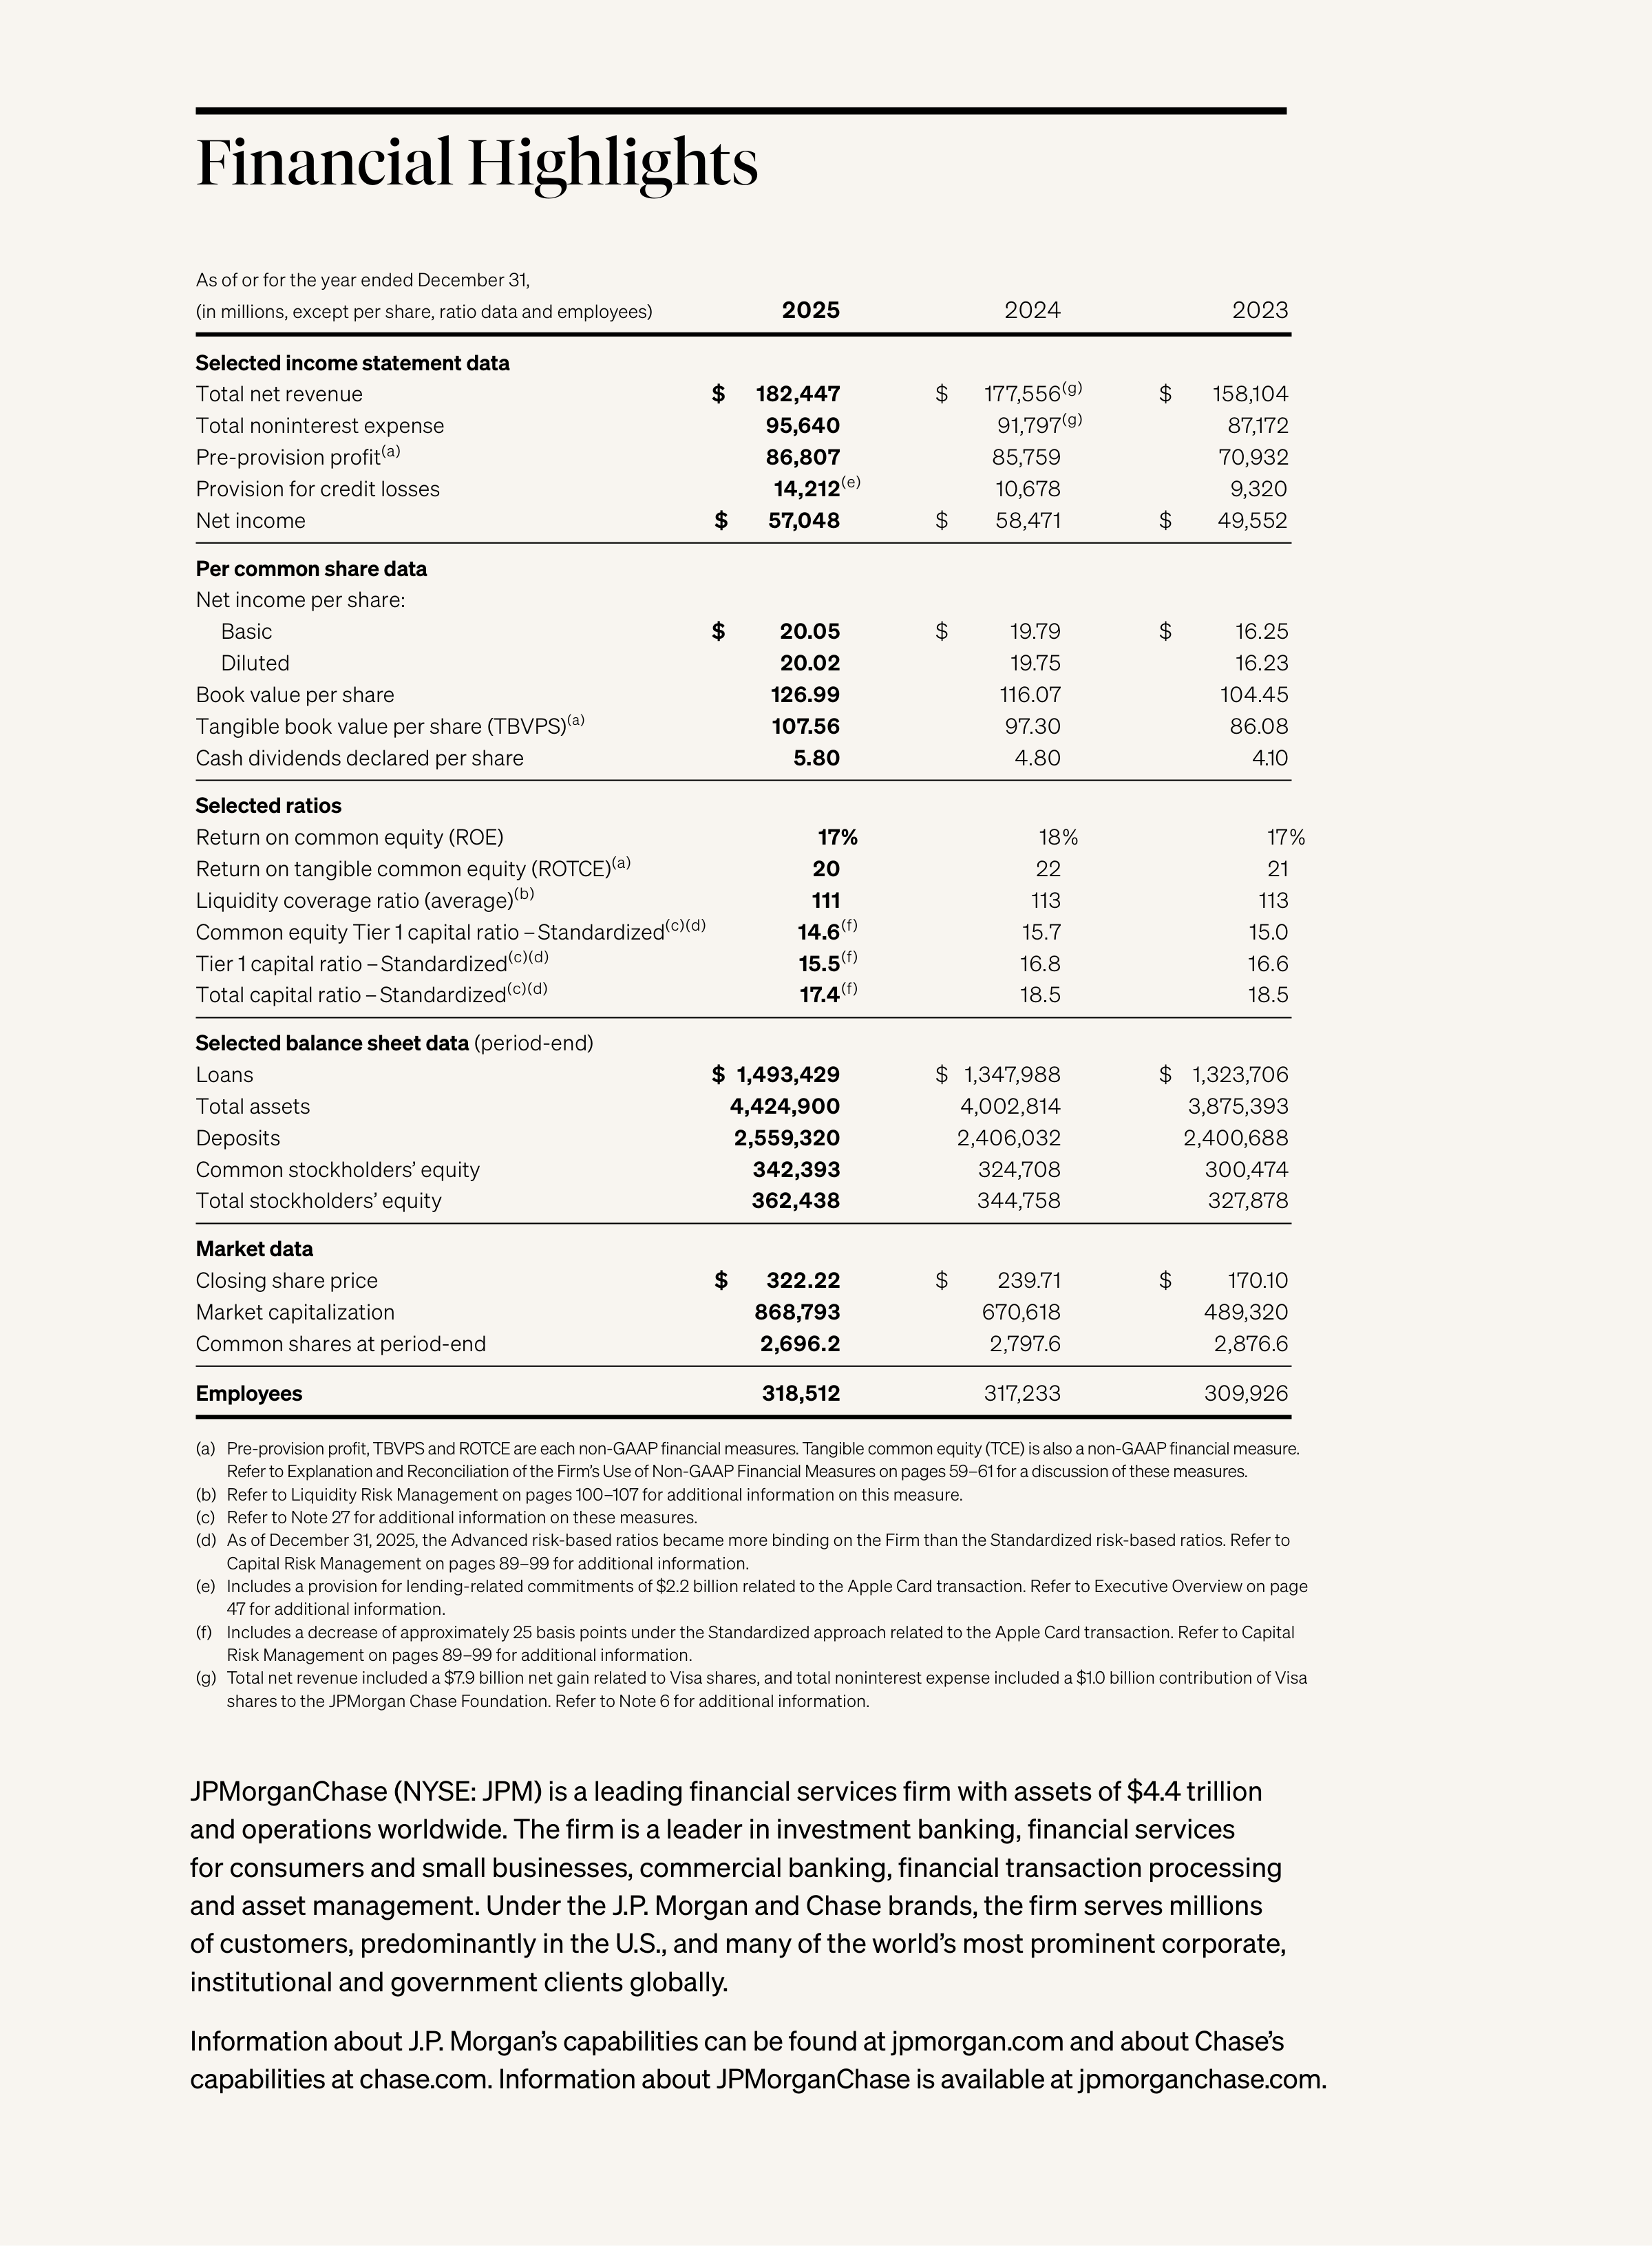
Financial Highlights
As of or for the year ended December 31,
(in millions, except per share, ratio data and employees)
2025
2024
2023
Selected income statement data
Total net revenue
$
182,447
$
177,556
(g)
$
158,104
Total noninterest expense
95,640
91,797
(g)
87,172
Pre-provision profit
(a)
86,807
85,759
70,932
Provision for credit losses
14,212
(e)
10,678
9,320
Net income
$
57,048
$
58,471
$
49,552
Per common share data
Net income per share:
Basic
$
20.05
$
19.79
$
16.25
Diluted
20.02
19.75
16.23
Book value per share
126.99
116.07
104.45
Tangible book value per share (TBVPS)
(a)
107.56
97.30
86.08
Cash dividends declared per share
5.80
4.80
4.10
Selected ratios
Return on common equity (ROE)
17 %
18 %
17 %
Return on tangible common equity (ROTCE)
(a)
20
22
21
Liquidity coverage ratio (average)
(b)
111
113
113
Common equity Tier 1 capital ratio – Standardized
(c)(d)
14.6
(f)
15.7
15.0
Tier 1 capital ratio – Standardized
(c)(d)
15.5
(f)
16.8
16.6
Total capital ratio – Standardized
(c)(d)
17.4
(f)
18.5
18.5
Selected balance sheet data
(period-end)
Loans
$
1,493,429
$
1,347,988
$
1,323,706
Total assets
4,424,900
4,002,814
3,875,393
Deposits
2,559,320
2,406,032
2,400,688
Common stockholders’ equity
342,393
324,708
300,474
Total stockholders’ equity
362,438
344,758
327,878
Market data
Closing share price
$
322.22
$
239.71
$
170.10
Market capitalization
868,793
670,618
489,320
Common shares at period-end
2,696.2
2,797.6
2,876.6
Employees
318,512
317,233
309,926
(a) Pre-provision profit, TBVPS and ROTCE are each non-GAAP financial measures. Tangible common equity (TCE) is also a non-GAAP financial measure.
Refer to Explanation and Reconciliation of the Firm’s Use of Non-GAAP Financial Measures on pages 59–61 for a discussion of these measures.
(b) Refer to Liquidity Risk Management on pages 100–107 for additional information on this measure.
(c) Refer to Note 27 for additional information on these measures.
(d) As of December 31, 2025, the Advanced risk-based ratios became more binding on the Firm than the Standardized risk-based ratios. Refer to
Capital Risk Management on pages 89–99 for additional information.
(e) Includes a provision for lending-related commitments of $2.2 billion related to the Apple Card transaction. Refer to Executive Overview on page
47 for additional information.
(f)
Includes a decrease of approximately 25 basis points under the Standardized approach related to the Apple Card transaction. Refer to Capital
Risk Management on pages 89–99 for additional information.
(g) Total net revenue included a $7.9 billion net gain related to Visa shares, and total noninterest expense included a $1.0 billion contribution of Visa
shares to the JPMorgan Chase Foundation. Refer to Note 6 for additional information.
JPMorganChase (NYSE: JPM) is a leading financial services firm with assets of $4.4 trillion
and operations worldwide. The firm is a leader in investment banking, financial services
for consumers and small businesses, commercial banking, financial transaction processing
and asset management. Under the J.P. Morgan and Chase brands, the firm serves millions
of customers, predominantly in the U.S., and many of the world’s most prominent corporate,
institutional and government clients globally.
Information about J.P. Morgan’s capabilities can be found at jpmorgan.com and about Chase’s
capabilities at chase.com. Information about JPMorganChase is available at jpmorganchase.com.

2025
Another Year of Firsts
COMMERCIAL & INVESTMENT BANK
Generated $28 billion of net income
on revenue of $78 billion
#
1
#
1
IN DEPOSITS AND FOR SMALL BUSINESSES
Named #1 in retail deposit market share
and #1 primary bank for U.S. small businesses
TRADITIONAL MIDDLE MARKET BOOKRUNNER
Ranked #1
Traditional Middle Market Bookrunner in the U.S.
#
1
IN ARTIFICIAL INTELLIGENCE
Ranked #1 for overall artificial intelligence
capabilities on the Evident AI Index
for the fourth year in a row
#
1
IN CREDIT CARDS
#1 credit card issuer
in the U.S. by sales
#
1
MOST ADMIRED COMPANIES
Ranked in the top 10 on
Fortune
magazine’s Most Admired Companies list
for the ninth year in a row
TOP 10
TOP COMPANIES FOR CAREER GROWTH
Ranked in the top 10 on LinkedIn’s 2025
Top Companies list, which ranks the 50 best large
U.S. companies for career growth
TOP 10
PRIVATE BANK AND ASSET MANAGER
Named Best Private Bank in the World
by
Global Finance
magazine
and #1 asset manager by active flows
#
1
1


In 2026, America is celebrating its 250
th
anniversary. Also this year, we are
celebrating the 227
th
anniversary of JPMorganChase, which was founded in April
1799. This is the perfect time to rededicate ourselves to the values that made this
great nation of ours — freedom, liberty and opportunity — and to recognize that
we all stand on our country’s shoulders.
The challenges we all face are significant. The list is long but at the top are the
terrible ongoing war and violence in Ukraine, the current war in Iran and the
broader hostilities in the Middle East, terrorist activity and growing geopolitical
tensions, importantly with China. Our hearts go out to those whose lives are
profoundly affected by these crises. We sincerely hope these global conflicts are
properly resolved and that one day all of Europe and the Middle East will attain
long-term stability and prosperity. Even in troubled times, we have confidence
that America will do what it has always done — look to the values that have
defined our singular nation and sustained our leadership of the free world.
Despite the unsettling landscape, the U.S. economy continues to be resilient, with
consumers still earning and spending (though with some recent weakening) and
businesses still healthy. It is important to note that our economy has been fueled
Dear Fellow Shareholders,
2
INTRODUCTION
Jamie Dimon,
Chairman and
Chief Executive Officer

by large amounts of government deficit spending and past stimulus and that
increased expenditure on infrastructure remains a growing need. Now, because
of the war in Iran, we additionally face the potential for significant ongoing oil and
commodity price shocks, along with the reshaping of global supply chains, which
may lead to stickier inflation and ultimately higher interest rates than markets
currently expect. Continual trade negotiations exacerbate the tense geopolitical
issues. And high asset prices, which certainly feel good in the short run, create
additional risk if anything goes wrong. In Section III of this letter, I describe in
greater detail how we are dealing with these risks.
JPMorganChase, a company that historically has worked across borders and
boundaries, will do its part to ensure that the global economy is safe and secure,
but we cannot confidently predict the outcome of current events, and our
company is not immune to their ultimate effects. As we have for more than two
centuries, we will continue to work through all of the complexities that confront us
and continue to help our clients, including governments, always defending our
values, even when challenged.
Remember the poem “If—” by Rudyard Kipling that begins “If you can keep your
head when all about you are losing theirs”? We will stay true to this. We must deal
with the world we have — and strive for the one we want.
Two things are absolutely foundational to our long-term success: The first is
that we run a great company, and the second, which is maybe more important,
is that the vitality of America domestically and the future of the free and
democratic world are strong. In the first part of this letter, I talk about issues
unique to JPMorganChase and how we are addressing them, including constantly
surmounting complexity, bureaucracy and complacency. And in the last two
sections, I focus on the perils before us, both nationally and internationally, that
require urgent, effective solutions.
Throughout 2025, JPMorganChase demonstrated the power of its investment
philosophy and guiding principles, as well as the value of being there for clients —
as we always are — in both good times and bad times. The result was continued
broad healthy growth across all our franchises, with the firm generating record
revenue for the eighth consecutive year and setting numerous records in each of
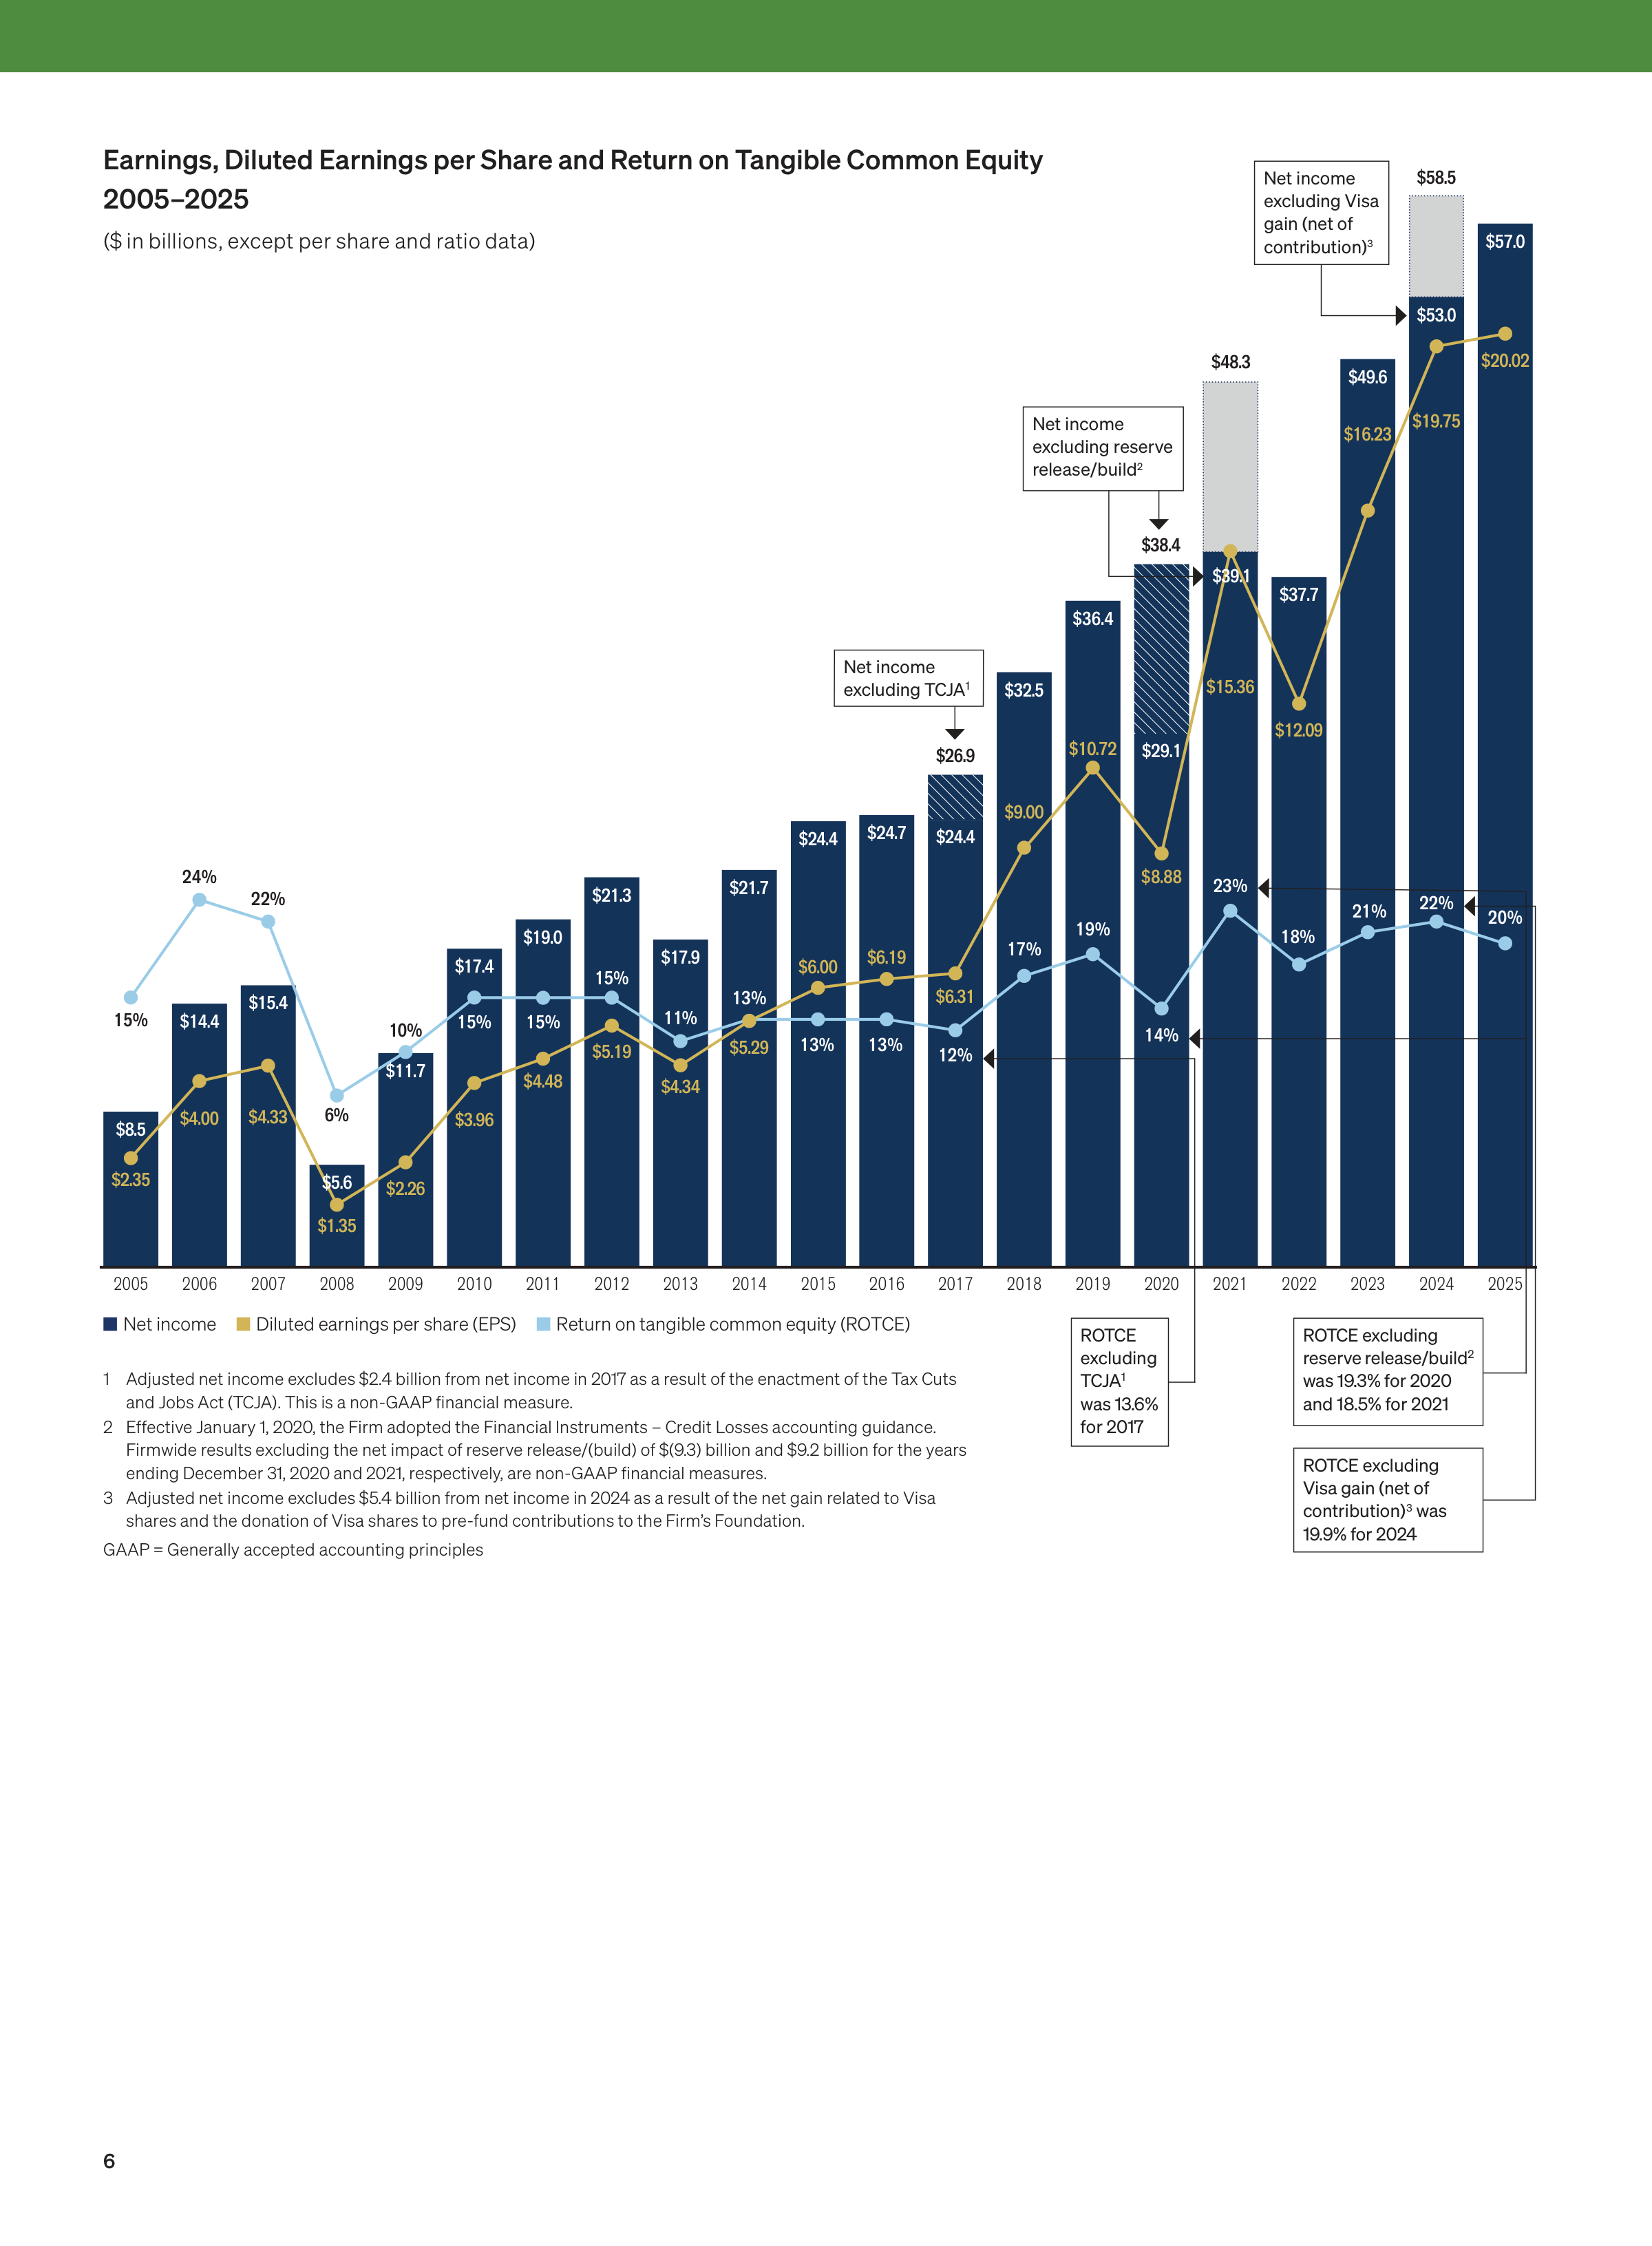
our lines of business. We earned revenue in 2025 of $185.6 billion
1
and net income
of $57.0 billion, with return on tangible common equity (ROTCE) of 20%, reflecting
a strong underlying performance across all of our businesses.
We also increased our quarterly common dividend from $1.25 per share to
$1.40 per share in the first quarter of 2025 — and again to $1.50 per share in the
third quarter of 2025 — while continuing to reinforce our fortress balance sheet.
We grew market share in several of our businesses and continued to make
1
Represents managed
revenue.
3
INTRODUCTION
significant investments in products, people and technologies while exercising
strict risk disciplines. We have achieved our decades-long consistency by
adhering to our key principles and strategies (see the sidebar on our steadfast
principles on page 5), which allow us to drive good organic growth and promote
proper management of our capital (including dividends and stock buybacks).
The charts on pages 6–12 show our performance results and illustrate how we
have grown our franchises, how we compare with our competitors and how we
look at our fortress balance sheet. Please peruse them and the CEO and COO
letters in this Annual Report, all of which provide specific details about our
businesses and our plans for the future.
In 2025, we continued to play a forceful and essential role in advancing economic
growth. In total, we extended credit and raised capital amounting to $3.3 trillion
for our consumer and institutional clients around the world. On a daily basis, we
move nearly $12 trillion in 120+ currencies and more than 160 countries, as well
as safeguard over $41 trillion in assets. Bank deregulation will make it easier for
financial institutions to support our growing economy, and, I believe, if properly
done, it can actually make the banking system safer. More on this in Section I.
Amidst the extreme challenges of the last two decades, we have never stopped
doing all the things we should be doing to serve our clients and our communities.
As you know, we are champions of banking’s essential role in a community — its
potential for bringing people together, for enabling companies and individuals to
attain their goals, and for being a source of strength in difficult times. We remain
as committed as ever to reaching out to all communities in an effort to create a
stronger, more inclusive economy.
We recently launched two ambitious initiatives, the Security and Resiliency
Initiative (described in detail in Sections I and IV) and the American Dream
Initiative (highlighted in Section I), both inspired by our resolve to offer our
expertise to help address the needs of our country and what’s best for all
Americans. We hope these commitments also demonstrate how business and
government leaders can work together to solve seemingly intractable problems.
These efforts are also commercial in nature — and they are no different from
what most businesses large and small are trying to do in towns across America.
I often remind our employees that the work we do matters and has impact. United
by our principles and purpose, we help people and institutions finance and
achieve their aspirations, lifting up individuals, homeowners, small businesses,
larger corporations, schools, hospitals, cities and countries in all regions of the
world. I remain proud of our company’s resiliency and of what our hundreds of
thousands of employees around the world have achieved, collectively and
individually. We owe them a great debt of gratitude.
4
INTRODUCTION
Steadfast principles worth repeating
Looking back on the past two+ decades
— starting from my time as Chairman
and CEO of Bank One in 2000 — there is
one common theme: our unwavering
dedication to help clients, communities
and countries throughout the world.
Clearly our financial discipline, constant
investment in innovation and ongoing
development of our people have
enabled us to achieve this consistency
and commitment. In addition, across the
firm, we uphold certain steadfast tenets
that are worth repeating.
First, our work has very real human
impact. While JPMorganChase stock is
owned by large institutions, pension
plans, mutual funds and directly by sin
gle investors, the ultimate beneficiaries,
in almost all cases, are individuals in our
communities. More than 100 million
people in the United States own stocks;
many, in one way or another, own
JPMorganChase stock. Frequently,
these shareholders are veterans, teach
ers, police officers, firefighters, health
care workers, retirees, or those saving
for a home, education or retirement.
Often our employees also bank these
shareholders, as well as their families
and their companies. Our management
team goes to work every day recogniz
ing the enormous responsibility that we
have to all of our shareholders.
Second, shareholder value can be built
only
if you maintain a healthy and
vibrant company, which means doing a
good job of taking care of your custom
ers, employees and communities.
Conversely, how can you have a healthy
company if you neglect any of these
stakeholders? As we have learned over
the past few years, there are myriad
ways an institution can demonstrate
compassion for its employees and its
communities while still strengthening
shareholder value.
Third, while we don’t run the company
worrying about the stock price in the
short run, in the
long run
we consider
our stock price a measure of our prog
ress over time. This progress is a func
tion of continual investments in our
people, systems and products, in good
and bad times, to build our capabilities.
These important investments also
drive our company’s future prospects
and position it to grow and prosper for
decades. Measured by stock perfor
mance, our progress is exceptional.
For example, whether looking back 10
years or even further to 2004, when the
JPMorganChase/Bank One merger
took place, we have outperformed the
Standard & Poor’s 500 Index and the
Standard & Poor’s Financials Index.
Fourth, we are united behind basic
principles and strategies (you can see
the principles for How We Do Business
on our website and our Purpose state
ment in
my letter from 2022
) that have
helped build this company and made
it thrive. These allow us to maintain a
fortress balance sheet, constantly
invest and nurture talent, fully satisfy
regulators, continually improve risk,
governance and controls, and serve
customers and clients while lifting up
communities worldwide. This philoso
phy is embedded in our company cul
ture and influences nearly every role in
the firm.
Fifth, we strive to build enduring busi
nesses, which rely on and benefit from
one another, but we are not a conglom
erate. This structure helps generate
our superior returns. Nonetheless,
despite our best efforts, the walls that
protect this company are not particu
larly high — and we face extraordinary
competition. I have written about this
reality extensively in the past and cover
it again in this letter. We recognize our
strengths and vulnerabilities, and we
play our hand as best we can.
Sixth, we must be a source of strength,
particularly in tough times, for our
clients and the countries in which we
operate. We must take seriously our
role as one of the guardians of the
world’s financial systems.
Seventh, we operate with a very
important silent partner — the U.S. gov
ernment — noting, as my friend Warren
Buffett points out, that his company’s
success is predicated upon the extraor
dinary conditions our country creates.
He is right to have said to his sharehold
ers that when they see the American
flag, they all should say thank you. We
should, too. JPMorganChase is a healthy
and thriving company, and we always
want to give back and pay our fair share.
We do pay our fair share — and we want
it to be spent well and have the greatest
impact.
To give you an idea of where our
taxes and fees go: In the last 10 years,
we paid more than $44 billion in federal,
state and local taxes in the United
States and over $30 billion in taxes out
side of the United States. Additionally,
we paid the Federal Deposit Insurance
Corporation (FDIC) over $13 billion so
that it has the resources to cover fail
ures in the American banking sector.
Our partner — the federal government
— also imposes significant regulations
upon us, and it is imperative that we
meet all legal and regulatory require
ments imposed on our company.
Eighth and finally, we know the founda
tion of our success rests with our
people. They are the front line, both
individually and as teams, serving our
customers and communities, building
the technology, making the strategic
decisions, managing the risks, deter
mining our investments and driving
innovation. However you view the world
— its complexity, risks and opportuni
ties — a company’s prosperity requires
a great team of people with guts,
brains, integrity, enormous capabilities
and high standards of professional
excellence to ensure its ongoing
success.
5
INTRODUCTION
6
Net income
Diluted earnings per share (EPS)
Return on tangible common equity (ROTCE)
2025
2024
2023
2022
2021
2020
2019
2018
2017
2016
2015
2014
2013
2012
2011
2010
2009
2008
2007
2006
2005
$8.5
$15.4
$17.4
$19.0
$21.3
$17.9
$24.4
$21.7
$24.7
$14.4
$24.4
$32.5
$26.9
$38.4
$49.6
$53.0
$57.0
$48.3
$58.5
$36.4
15%
24%
22%
6%
10%
15%
15%
15%
11%
13%
13%
13%
17%
19%
14%
23%
18%
21%
22%
20%
12%
$4.00
$4.33
$1.35
$2.26
$3.96
$4.48
$5.19
$4.34
$5.29
$6.00
$6.31
$10.72
$15.36
$12.09
$16.23
$20.02
$19.75
$8.88
$9.00
$6.19
$2.35
$5.6
$11.7
$37.7
$39.1
$29.1
Net income
excluding TCJA
1
Net income
excluding reserve
release/build
2
ROTCE
excluding
TCJA
1
was 13.6%
for 2017
ROTCE excluding
reserve release/build
2
was 19.3% for 2020
and 18.5% for 2021
ROTCE excluding
Visa gain (net of
contribution)
3
was
19.9% for 2024
Net income
excluding Visa
gain (net of
contribution)
3
1
Adjusted net income excludes $2.4 billion from net income in 2017 as a result of the enactment of the Tax Cuts
and Jobs Act (TCJA). This is a non-GAAP financial measure.
2
Effective January 1, 2020, the Firm adopted the Financial Instruments – Credit Losses accounting guidance.
Firmwide results excluding the net impact of reserve release/(build) of $(9.3) billion and $9.2 billion for the years
ending December 31, 2020 and 2021, respectively, are non-GAAP financial measures.
3
Adjusted net income excludes $5.4 billion from net income in 2024 as a result of the net gain related to Visa
shares and the donation of Visa shares to pre-fund contributions to the Firm’s Foundation.
GAAP = Generally accepted accounting principles
Earnings, Diluted Earnings per Share and Return on Tangible Common Equity
2005–2025
($ in billions, except per share and ratio data)
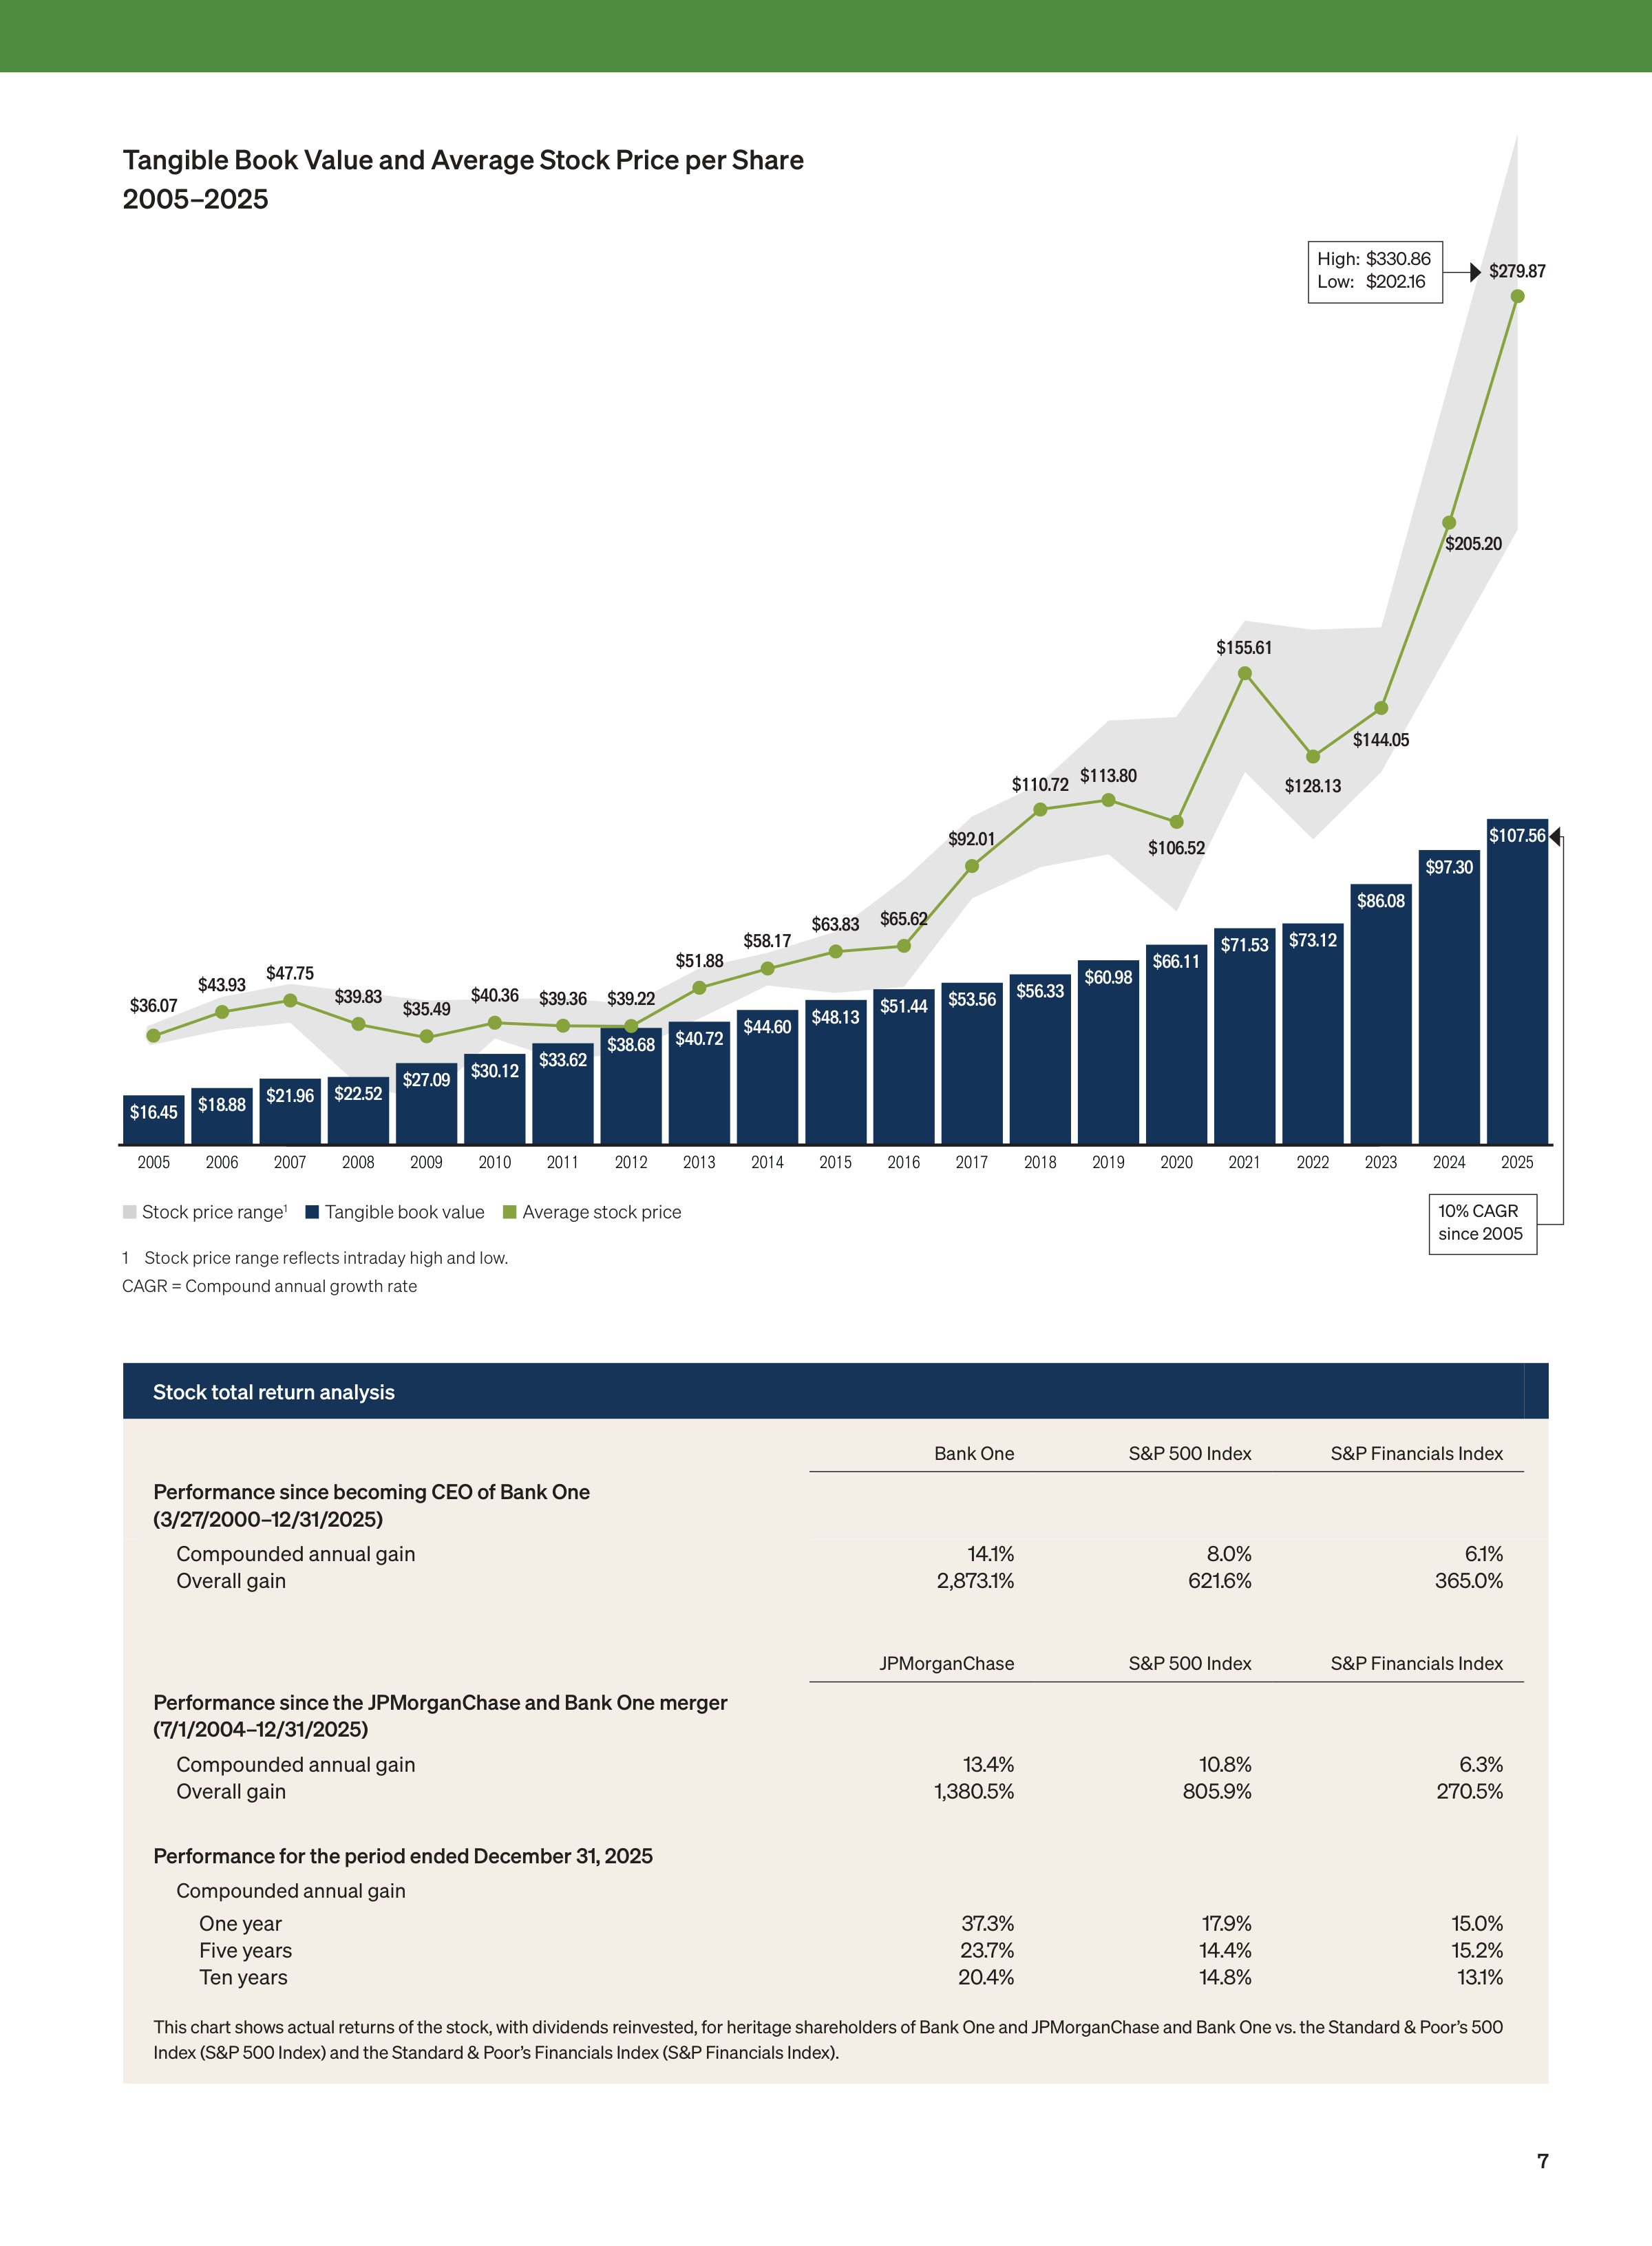
7
Stock price range
1
Tangible book value
Average stock price
2025
2024
2023
2022
2021
2020
2019
2018
2017
2016
2015
2014
2013
2012
2011
2010
2009
2008
2007
2006
2005
$60.98
$66.11
$71.53
$73.12
$86.08
$97.30
$107.56
$56.33
$16.45
$18.88
$21.96
$22.52
$27.09
$30.12
$33.62
$38.68
$40.72
$44.60
$48.13
$51.44
$53.56
$36.07
$43.93
$47.75
$39.83
$35.49
$40.36 $39.36
$39.22
$51.88
$58.17
$63.83
$65.62
$106.52
$155.61
$128.13
$144.05
$279.87
$110.72
$92.01
$113.80
$205.20
1 Stock price range reflects intraday high and low.
CAGR = Compound annual growth rate
10% CAGR
since 2005
High: $330.86
Low: $202.16
Stock total return analysis
Bank One
S&P 500 Index
S&P Financials Index
Performance since becoming CEO of Bank One
(3/27/2000–12/31/2025)
Compounded annual gain
14.1%
8.0%
6.1%
Overall gain
2,873.1%
621.6%
365.0%
JPMorganChase
S&P 500 Index
S&P Financials Index
Performance since the JPMorganChase and Bank One merger
(7/1/2004–12/31/2025)
Compounded annual gain
13.4%
10.8%
6.3%
Overall gain
1,380.5%
805.9%
270.5%
Performance for the period ended December 31, 2025
Compounded annual gain
One year
37.3%
17.9%
15.0%
Five years
23.7%
14.4%
15.2%
Ten years
20.4%
14.8%
13.1%
This chart shows actual returns of the stock, with dividends reinvested, for heritage shareholders of Bank One and JPMorganChase and Bank One vs. the Standard & Poor’s 500
Index (S&P 500 Index) and the Standard & Poor’s Financials Index (S&P Financials Index).
Tangible Book Value and Average Stock Price per Share
2005–2025
8
AUM = Assets under management
ETF = Exchange-traded funds
MSA = Metropolitan statistical area
USD = U.S. dollar
CB = Commercial Banking
FICC = Fixed income, currencies and commodities
NA = Not available
K = Thousands
DCM = Debt capital markets
GCB = Global Corporate Banking
NM = Not meaningful
M = Millions
ECM = Equity capital markets
GIB = Global Investment Banking
Swift = Society for Worldwide Interbank
B = Billions
EMEA = Europe, Middle East and Africa
JPMAM = J.P. Morgan Asset Management
Financial Telecommunications
T = Trillions
EOP = End of period
LT = Long-Term
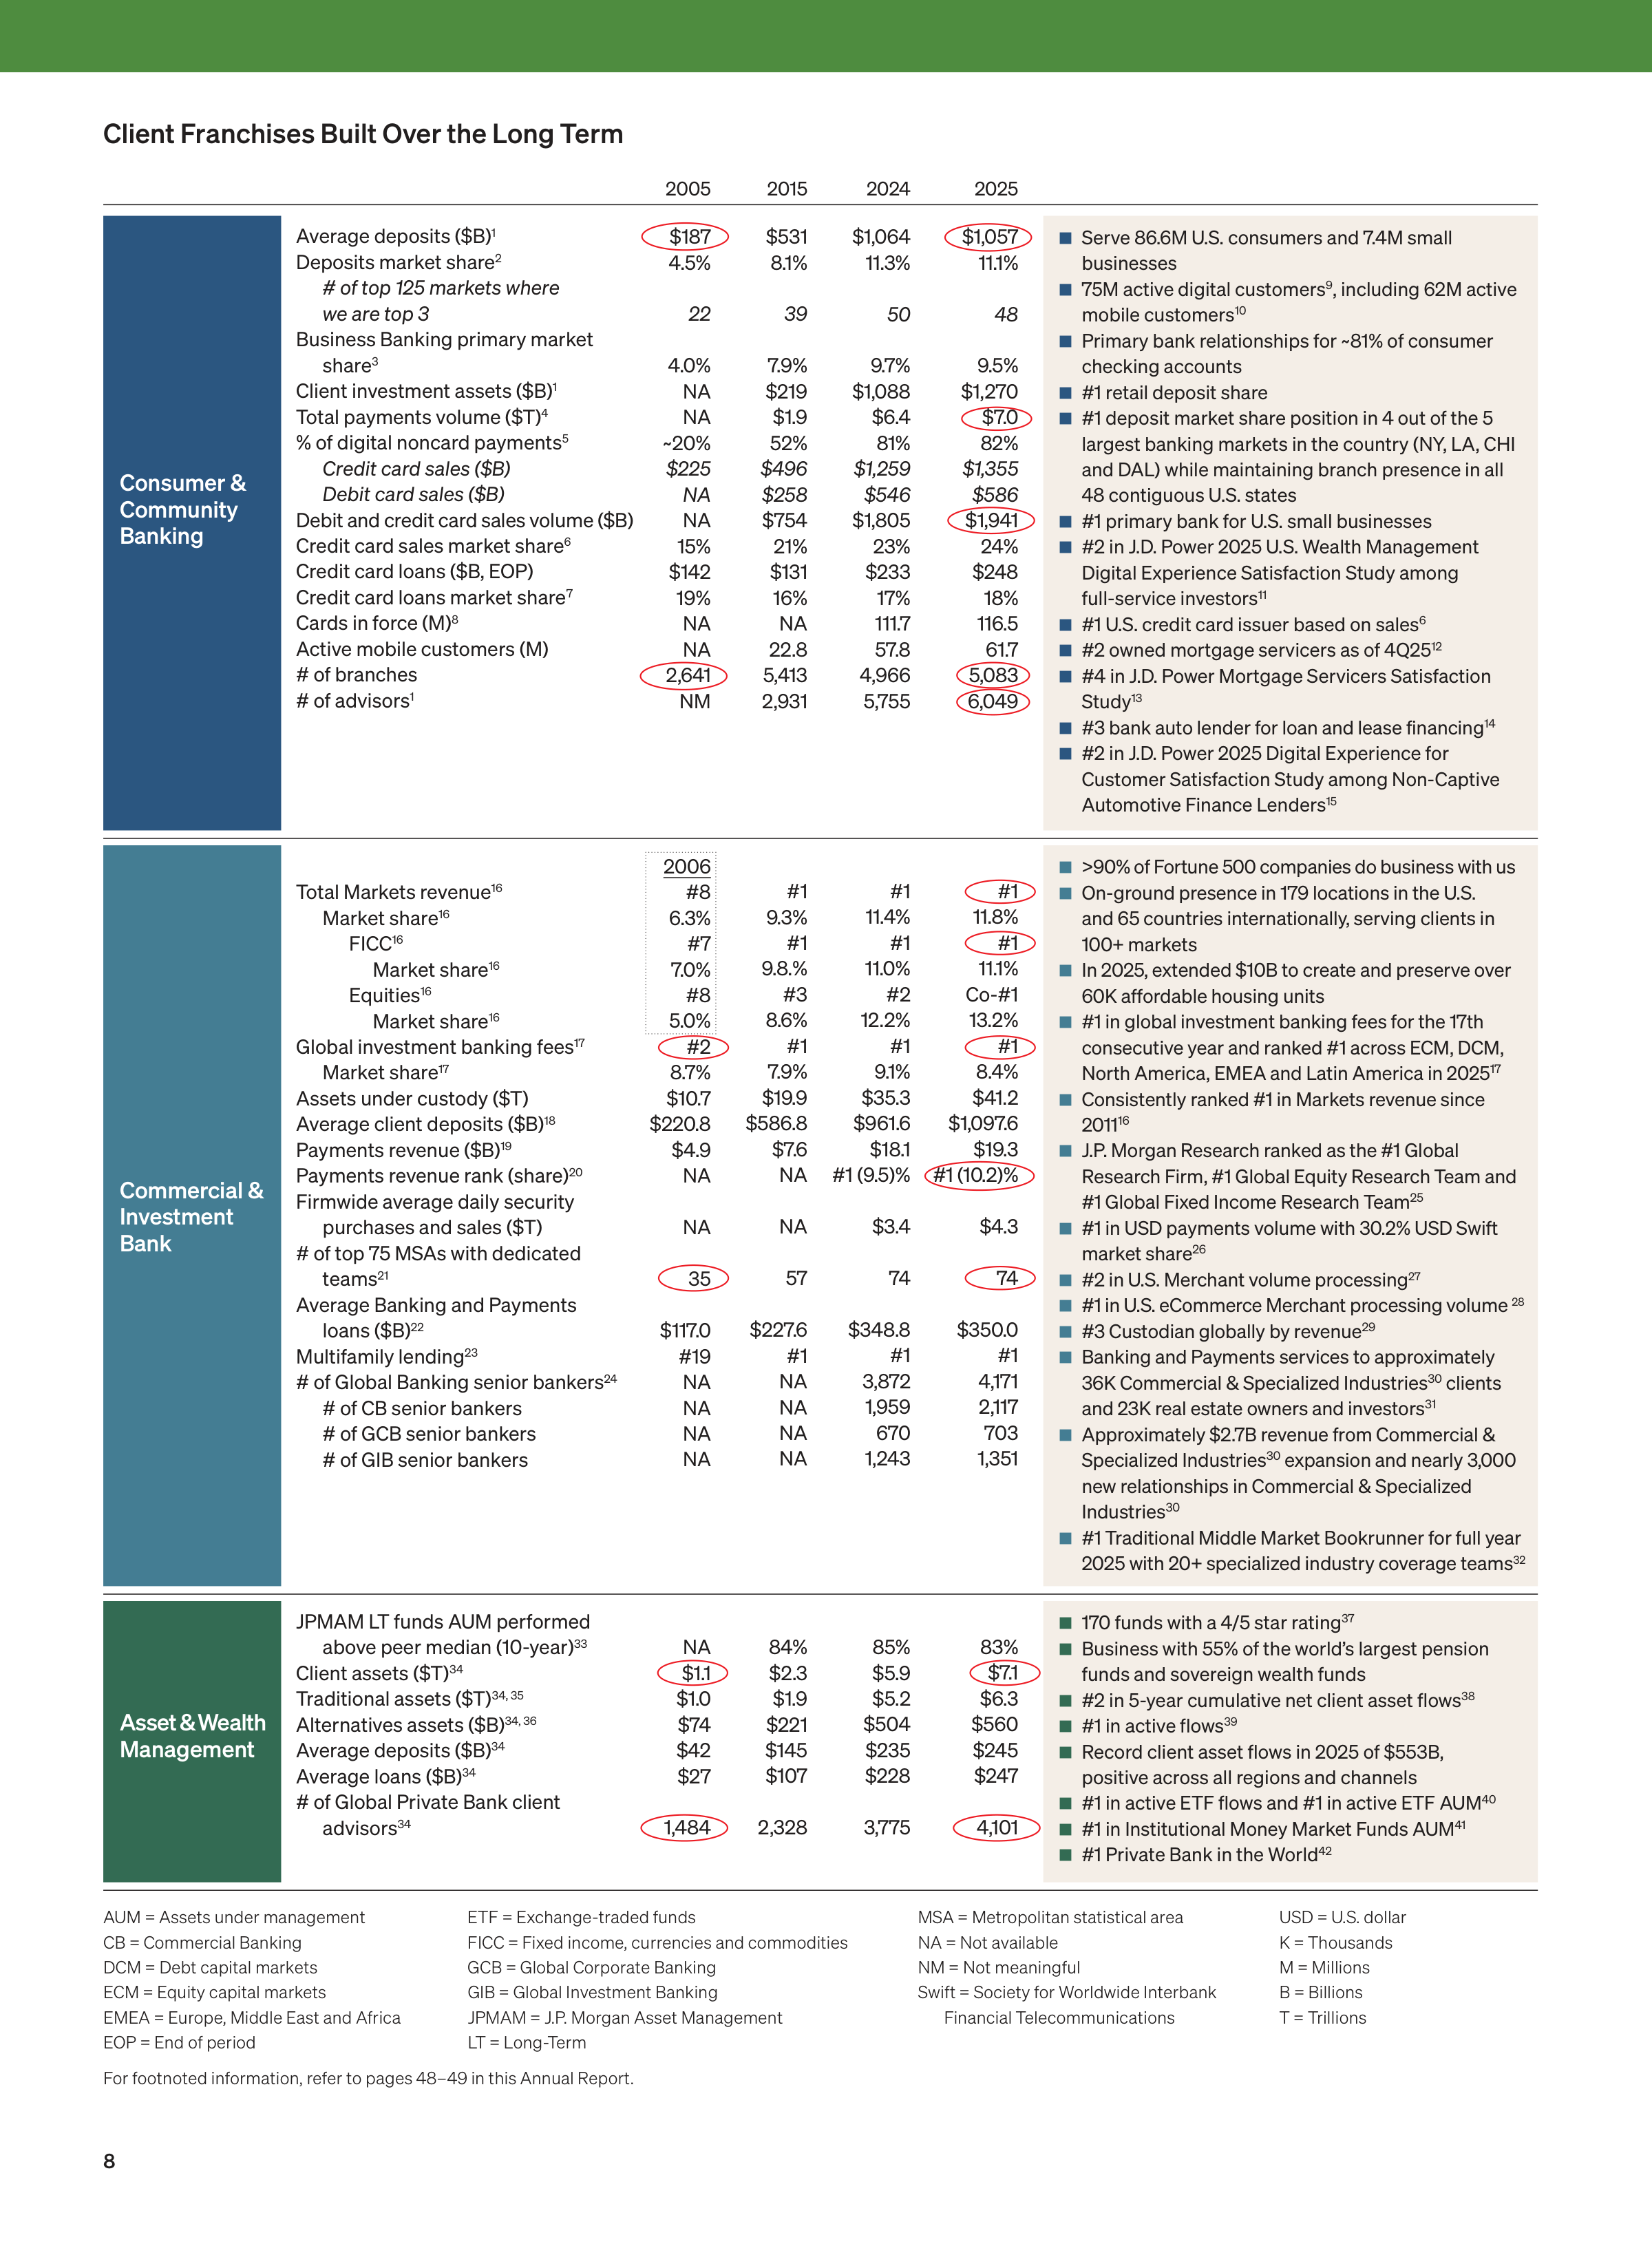
For footnoted information, refer to pages 48–49 in this Annual Report.
2005
2015
2024
2025
Consumer &
Community
Banking
Average deposits ($B)
1
Deposits market share
2
# of top 125 markets where
we are top 3
Business Banking primary market
share
3
Client investment assets ($B)
1
Total payments volume ($T)
4
% of digital noncard payments
5
Credit card sales ($B)
Debit card sales ($B)
Debit and credit card sales volume ($B)
Credit card sales market share
6
Credit card loans ($B, EOP)
Credit card loans market share
7
Cards in force (M)
8
Active mobile customers (M)
# of branches
# of advisors
1
$187
4.5%
22
4.0%
NA
NA
~20%
$225
NA
NA
15%
$142
19%
NA
NA
2,641
NM
$531
8.1%
39
7.9%
$219
$1.9
52%
$496
$258
$754
21%
$131
16%
NA
22.8
5,413
2,931
$1,064
11.3%
50
9.7%
$1,088
$6.4
81%
$1,259
$546
$1,805
23%
$233
17%
111.7
57.8
4,966
5,755
$1,057
11.1%
48
9.5%
$1,270
$7.0
82%
$1,355
$586
$1,941
24%
$248
18%
116.5
61.7
5,083
6,049
Serve 86.6M U.S. consumers and 7.4M small
businesses
75M active digital customers
9
, including 62M active
mobile customers
10
Primary bank relationships for ~81% of consumer
checking accounts
#1 retail deposit share
#1 deposit market share position in 4 out of the 5
largest banking markets in the country (NY, LA, CHI
and DAL) while maintaining branch presence in all
48 contiguous U.S. states
#1 primary bank for U.S. small businesses
#2 in J.D. Power 2025 U.S. Wealth Management
Digital Experience Satisfaction Study among
full-service investors
11
#1 U.S. credit card issuer based on sales
6
#2 owned mortgage servicers as of 4Q25
12
#4 in J.D. Power Mortgage Servicers Satisfaction
Study
13
#3 bank auto lender for loan and lease financing
14
#2 in J.D. Power 2025 Digital Experience for
Customer Satisfaction Study among Non-Captive
Automotive Finance Lenders
15
Commercial &
Investment
Bank
Total Markets revenue
16
Market share
16
FICC
16
Market share
16
Equities
16
Market share
16
Global investment banking fees
17
Market share
17
Assets under custody ($T)
Average client deposits ($B)
18
Payments revenue ($B)
19
Payments revenue rank (share)
20
Firmwide average daily security
purchases and sales ($T)
# of top 75 MSAs with dedicated
teams
21
Average Banking and Payments
loans ($B)
22
Multifamily lending
23
# of Global Banking senior bankers
24
# of CB senior bankers
# of GCB senior bankers
# of GIB senior bankers
2006
#8
6.3%
#7
7.0%
#8
5.0%
#2
8.7%
$10.7
$220.8
$4.9
NA
NA
35
$117.0
#19
NA
NA
NA
NA
#1
9.3%
#1
9.8.%
#3
8.6%
#1
7.9%
$19.9
$586.8
$7.6
NA
NA
57
$227.6
#1
NA
NA
NA
NA
#1
11.4%
#1
11.0%
#2
12.2%
#1
9.1%
$35.3
$961.6
$18.1
#1 (9.5)%
$3.4
74
$348.8
#1
3,872
1,959
670
1,243
#1
11.8%
#1
11.1%
Co-#1
13.2%
#1
8.4%
$41.2
$1,097.6
$19.3
#1 (10.2)%
$4.3
74
$350.0
#1
4,171
2,117
703
1,351
>90% of Fortune 500 companies do business with us
On-ground presence in 179 locations in the U.S.
and 65 countries internationally, serving clients in
100+ markets
In 2025, extended $10B to create and preserve over
60K affordable housing units
#1 in global investment banking fees for the 17th
consecutive year and ranked #1 across ECM, DCM,
North America, EMEA and Latin America in 2025
17
Consistently ranked #1 in Markets revenue since
2011
16
J.P. Morgan Research ranked as the #1 Global
Research Firm, #1 Global Equity Research Team and
#1 Global Fixed Income Research Team
25
#1 in USD payments volume with 30.2% USD Swift
market share
26
#2 in U.S. Merchant volume processing
27
#1 in U.S. eCommerce Merchant processing volume
28
#3 Custodian globally by revenue
29
Banking and Payments services to approximately
36K Commercial & Specialized Industries
30
clients
and 23K real estate owners and investors
31
Approximately $2.7B revenue from Commercial &
Specialized Industries
30
expansion and nearly 3,000
new relationships in Commercial & Specialized
Industries
30
#1 Traditional Middle Market Bookrunner for full year
2025 with 20+ specialized industry coverage teams
32
Asset & Wealth
Management
JPMAM LT funds AUM performed
above peer median (10-year)
33
Client assets ($T)
34
Traditional assets ($T)
34, 35
Alternatives assets ($B)
34, 36
Average deposits ($B)
34
Average loans ($B)
34
# of Global Private Bank client
advisors
34
NA
$1.1
$1.0
$74
$42
$27
1,484
84%
$2.3
$1.9
$221
$145
$107
2,328
85%
$5.9
$5.2
$504
$235
$228
3,775
83%
$7.1
$6.3
$560
$245
$247
4,101
170 funds with a 4/5 star rating
37
Business with 55% of the world’s largest pension
funds and sovereign wealth funds
#2 in 5-year cumulative net client asset flows
38
#1 in active flows
39
Record client asset flows in 2025 of $553B,
positive across all regions and channels
#1 in active ETF flows and #1 in active ETF AUM
40
#1 in Institutional Money Market Funds AUM
41
#1 Private Bank in the World
42
Client Franchises Built Over the Long Term
9
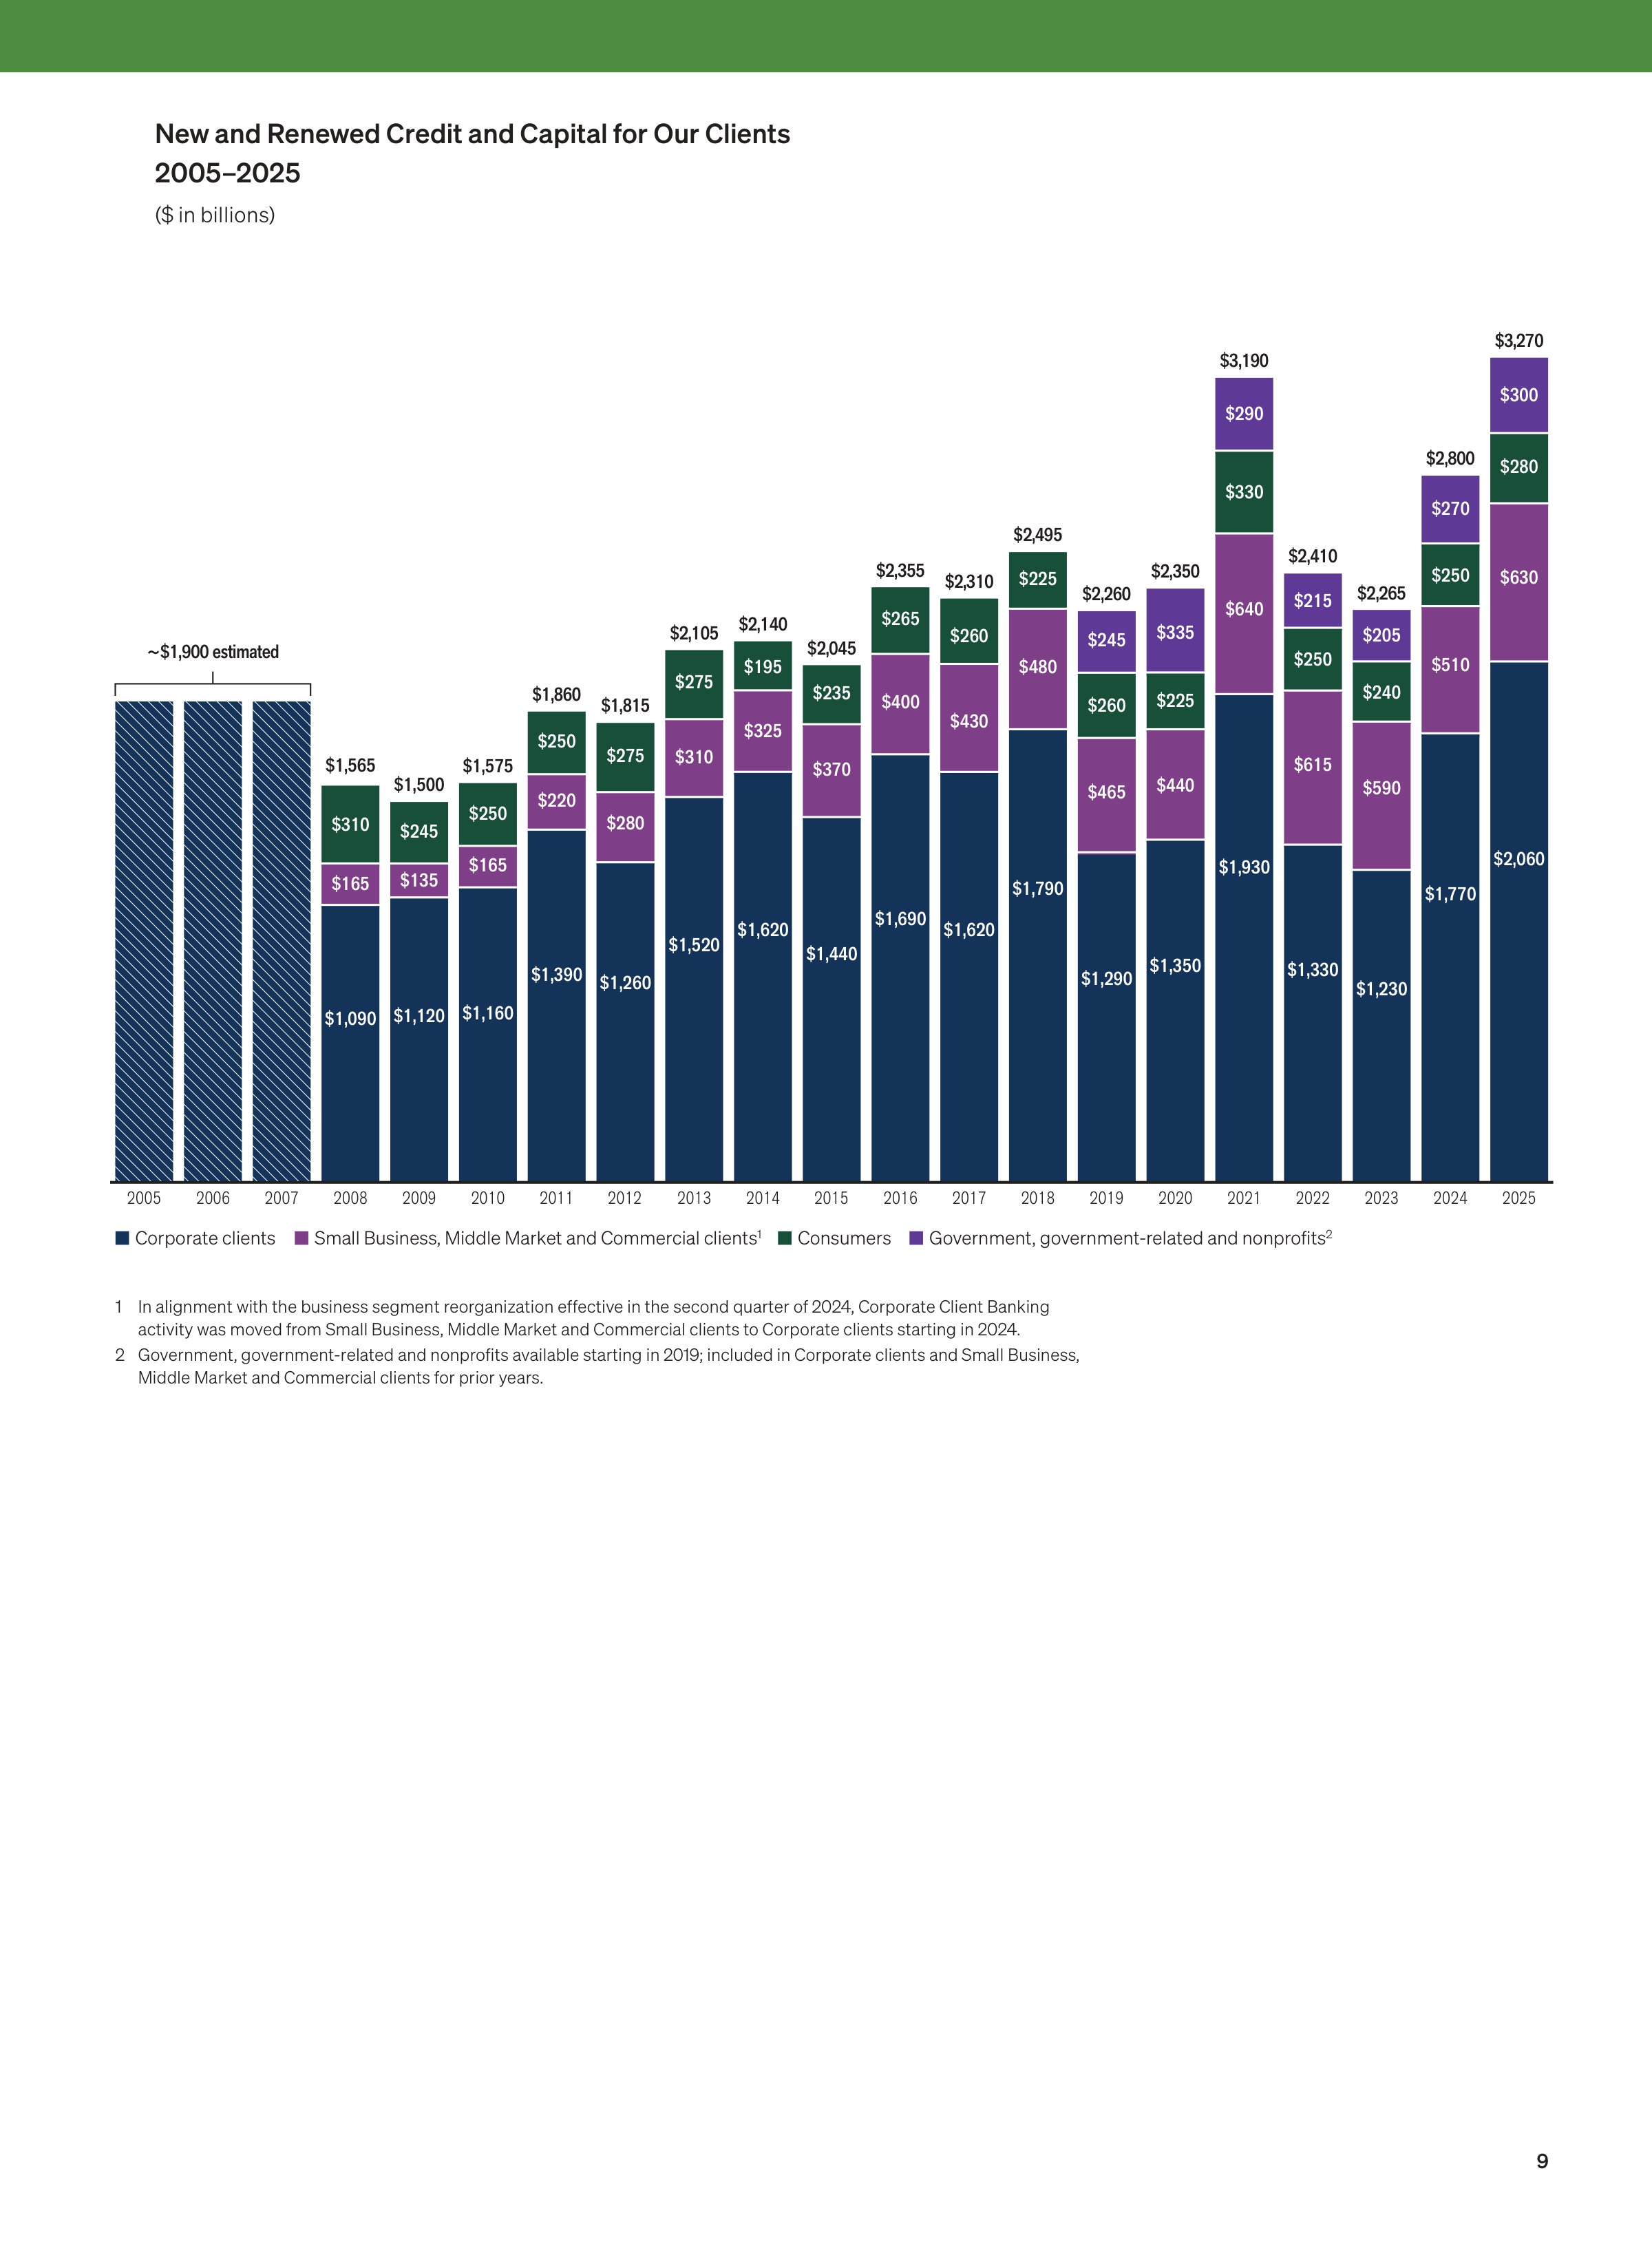
1 In alignment with the business segment reorganization effective in the second quarter of 2024, Corporate Client Banking
activity was moved from Small Business, Middle Market and Commercial clients to Corporate clients starting in 2024.
2 Government, government-related and nonprofits available starting in 2019; included in Corporate clients and Small Business,
Middle Market and Commercial clients for prior years.
Corporate clients
Small Business, Middle Market and Commercial clients
1
Consumers
Government, government-related and nonprofits
2
2025
2024
2023
2022
2021
2020
2019
2018
2017
2016
2015
2014
2013
2012
2011
2010
2009
2008
2007
2006
2005
$1,090
$165
$310
$1,120
$135
$245
$1,160
$165
$250
$1,390
$220
$250
$1,260
$1,520
$280
$310
$275
$275
$1,690
$400
$265
$1,620
$430
$260
$1,790
$480
$225
$1,350
$440
$225
$335
$290
$215
$250
$615
$590
$1,290
$465
$245
$260
$640
$1,930
$1,330
$205
$240
$270
$250
$510
$1,230
$1,770
$330
$1,440
$370
$235
$1,620
$325
$195
$1,500
$1,575
$1,860
$1,815
$2,105
$2,355
$2,310
$2,495
$2,350
$3,190
$2,410
$2,265
$2,800
$300
$280
$630
$2,060
$3,270
$2,260
$2,045
$2,140
$1,565
~$1,900 estimated
New and Renewed Credit and Capital for Our Clients
2005–2025
($ in billions)
10
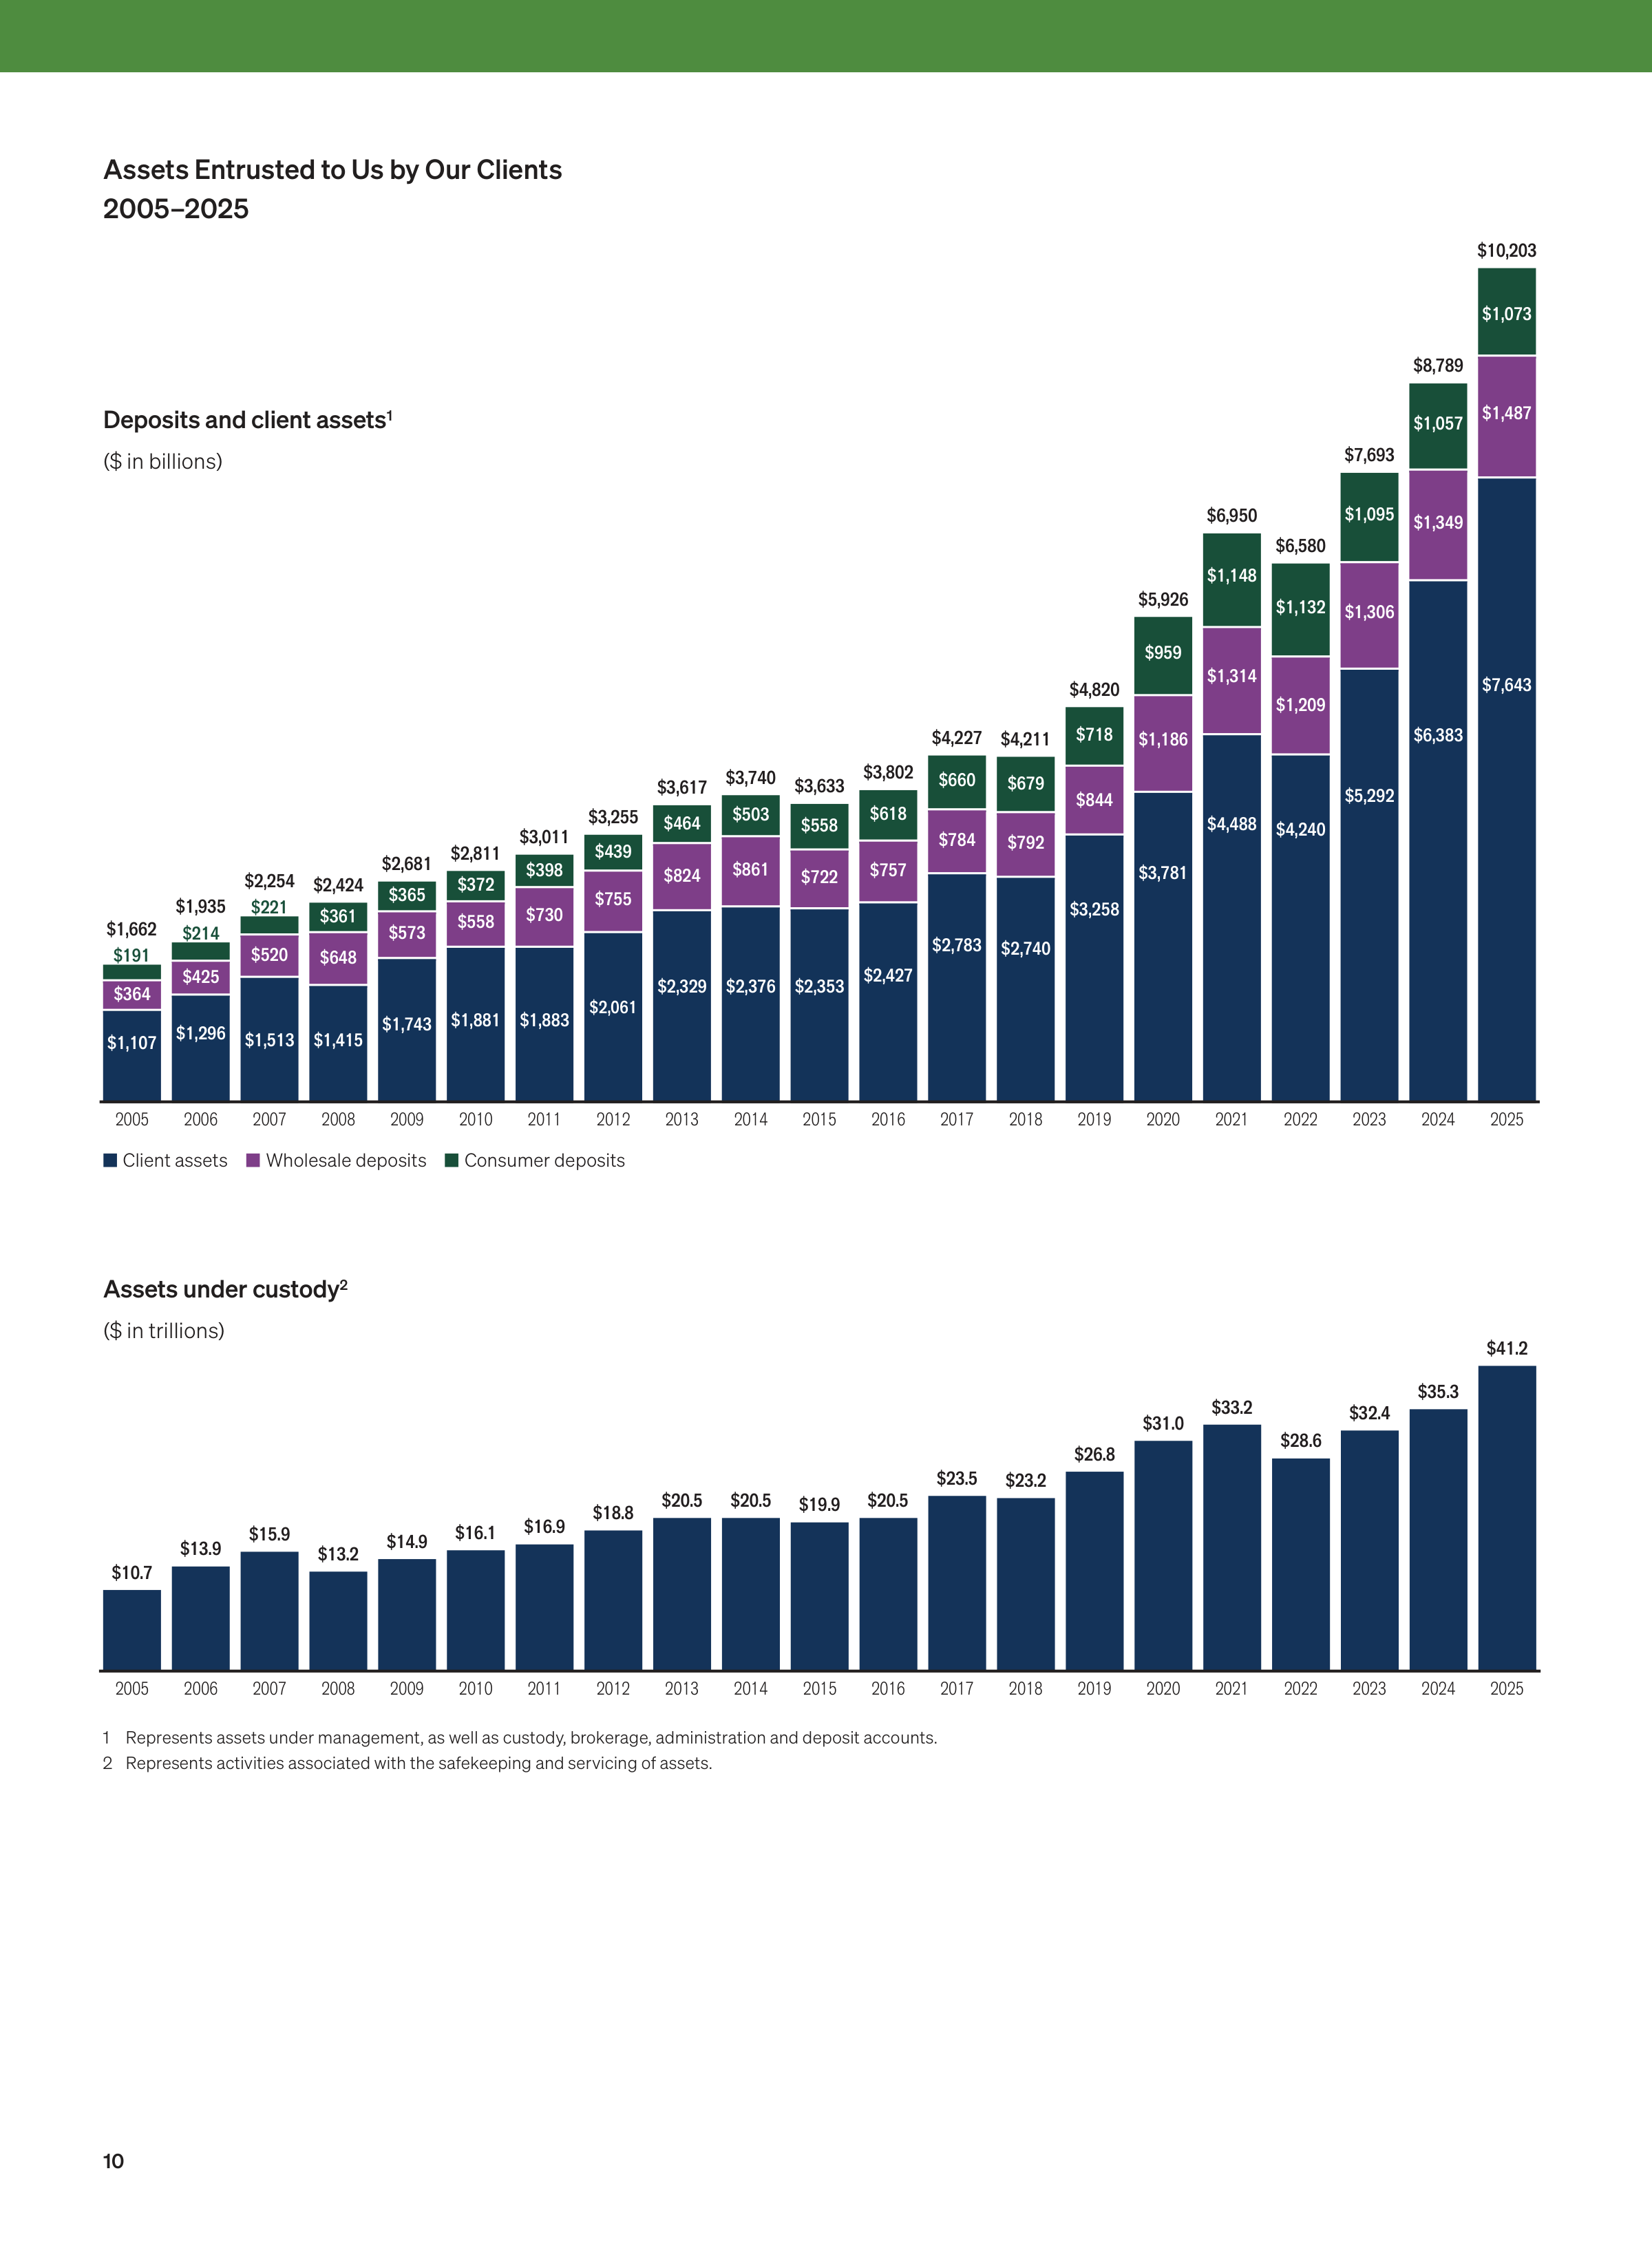
1 Represents assets under management, as well as custody, brokerage, administration and deposit accounts.
2 Represents activities associated with the safekeeping and servicing of assets.
Client assets
Wholesale deposits
Consumer deposits
2025
2024
2023
2022
2021
2020
2019
2018
2017
2016
2015
2014
2013
2012
2011
2010
2009
2008
2007
2006
2005
$1,883
$730
$398
$2,061
$755
$439
$2,329
$824
$464
$2,376
$861
$503
$2,353
$2,427
$722
$757
$558
$618
$3,255
$3,617
$3,740 $3,633
$3,802
$3,781
$4,240
$1,186
$1,209
$959
$1,132
$5,926
$6,580
$7,643
$1,487
$1,073
$10,203
$6,383
$1,349
$1,057
$8,789
$5,292
$1,306
$1,095
$7,693
$4,488
$1,314
$1,148
$6,950
$3,258
$844
$718
$4,820
$2,740
$792
$679
$4,211
$2,783
$784
$660
$4,227
$3,011
$1,881
$558
$372
$2,811
$1,743
$573
$365
$2,681
$1,415
$648
$361
$2,424
$1,513
$520
$221
$2,254
$1,296
$425
$214
$1,935
$1,107
$364
$191
$1,662
2025
2024
2023
2022
2021
2020
2019
2018
2017
2016
2015
2014
2013
2012
2011
2010
2009
2008
2007
2006
2005
$16.9
$18.8
$20.5
$13.2
$10.7
$13.9
$15.9
$14.9
$16.1
$20.5
$19.9
$20.5
$23.5
$23.2
$26.8
$33.2
$32.4
$41.2
$35.3
$31.0
$28.6
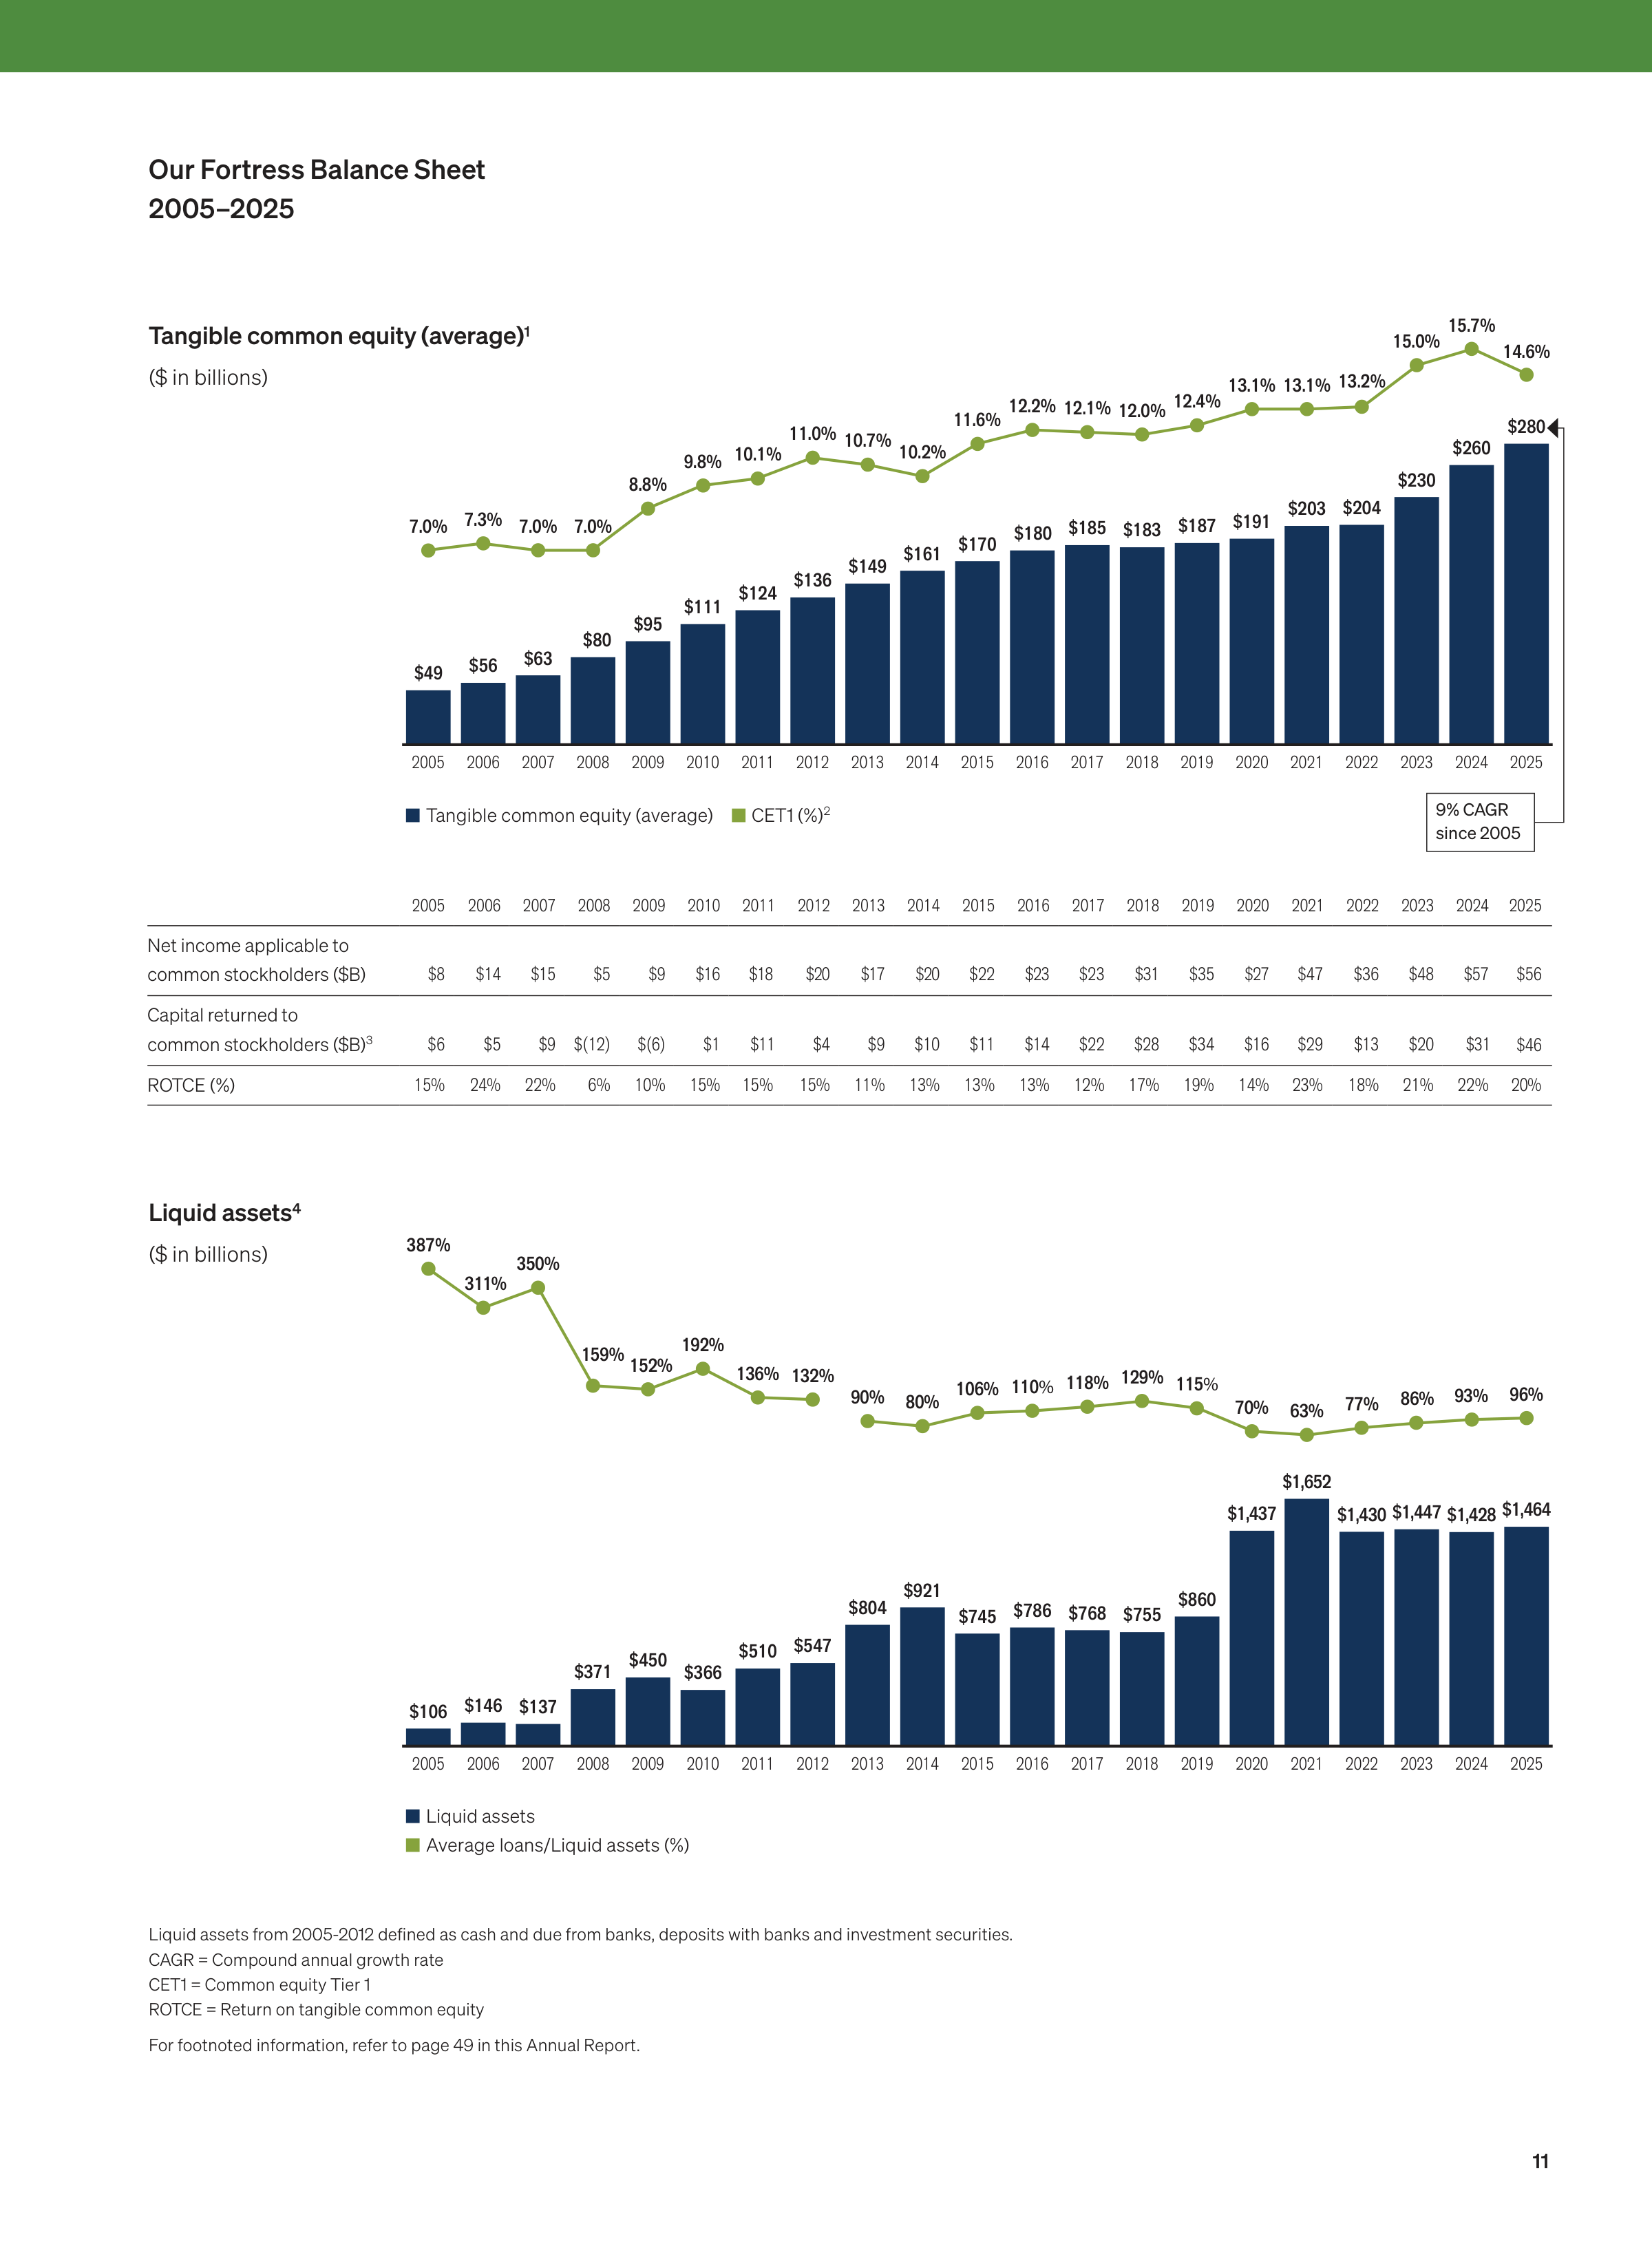
Assets Entrusted to Us by Our Clients
2005–2025
Deposits and client assets
1
($ in billions)
Assets under custody
2
($ in trillions)
11
2025
2024
2023
2022
2021
2020
2019
2018
2017
2016
2015
2014
2013
2012
2011
2010
2009
2008
2007
2006
2005
$124
$136
$149
$80
$56
$49
$63
$95
$111
$161
$170
$180
$185
$183
$187
$203
$230
$260
$280
$191
$204
10.1%
11.0%
10.7%
7.3%
7.0%
7.0%
7.0%
8.8%
9.8%
10.2%
11.6%
12.2%
12.1%
12.0%
12.4%
15.0%
15.7%
14.6%
13.1%
13.1%
13.2%
Tangible common equity (average)
CET1 (%)
2
Liquid assets
Average loans/Liquid assets (%)
2025
2024
2023
2022
2021
2020
2019
2018
2017
2016
2015
2014
2013
2012
2011
2010
2009
2008
2007
2006
2005
90%
132%
136%
192%
152%
159%
350%
387%
80%
106%
129%
86%
93%
96%
70%
63%
77%
311%
110
%
118%
115
%
$804
$547
$510
$366
$450
$371
$137
$146
$106
$921
$745
$786
$768
$755
$860
$1,652
$1,447 $1,428
$1,464
$1,437
$1,430
9% CAGR
since 2005
2005
2006
2007
2008
2009
2010
2011
2012
2013
2014
2015
2016
2017
2018
2019
2020
2021
2022
2023
2024
2025
Net income applicable to
common stockholders ($B)
$8
$14
$15
$5
$9
$16
$18
$20
$17
$20
$22
$23
$23
$31
$35
$27
$47
$36
$48
$57
$56
Capital returned to
common stockholders ($B)
3
$6
$5
$9
$(12)
$(6)
$1
$11
$4
$9
$10
$11
$14
$22
$28
$34
$16
$29
$13
$20
$31
$46
ROTCE (%)
15%
24%
22%
6%
10%
15%
15%
15%
11%
13%
13%
13%
12%
17%
19%
14%
23%
18%
21%
22%
20%
Liquid assets from 2005-2012 defined as cash and due from banks, deposits with banks and investment securities.
CAGR = Compound annual growth rate
CET1 = Common equity Tier 1
ROTCE = Return on tangible common equity
For footnoted information, refer to page 49 in this Annual Report.
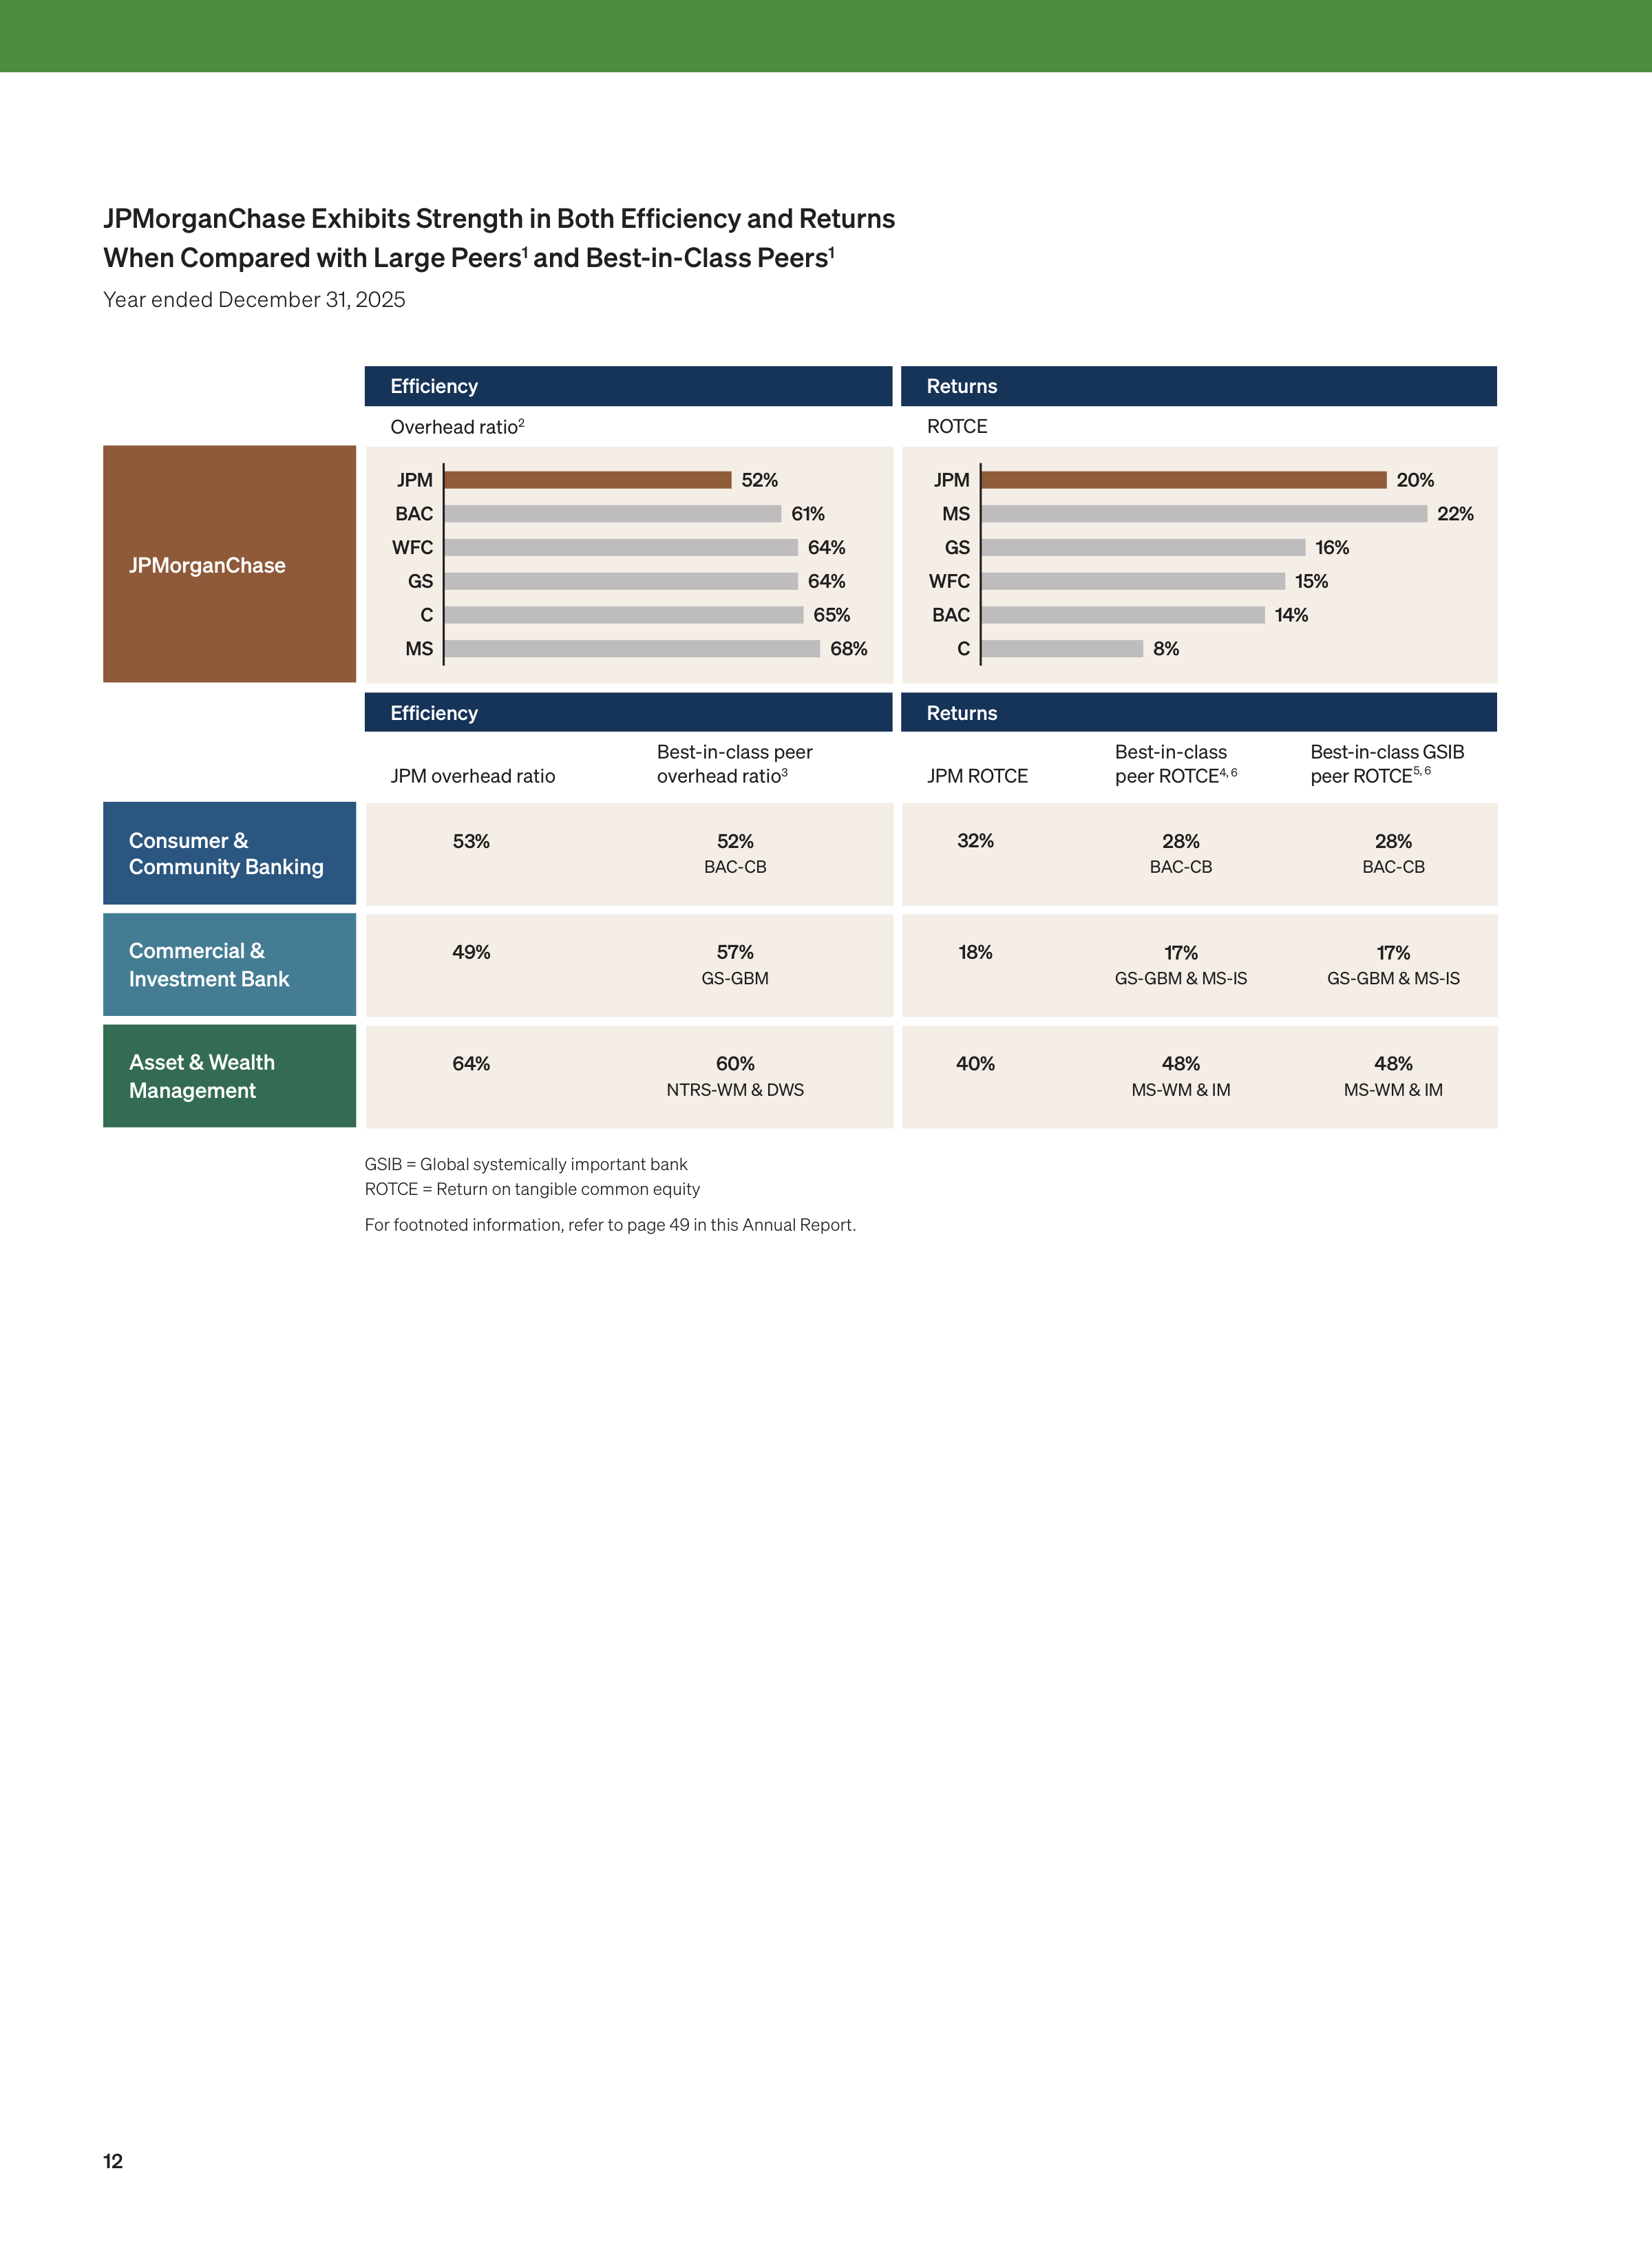
Our Fortress Balance Sheet
2005–2025
Tangible common equity (average)
1
($ in billions)
Liquid assets
4
($ in billions)
12
Efficiency
Returns
Overhead ratio
2
ROTCE
JPMorganChase
Efficiency
Returns
JPM overhead ratio
Best-in-class peer
overhead ratio
3
JPM ROTCE
Best-in-class
peer ROTCE
4, 6
Best-in-class GSIB
peer ROTCE
5, 6
Consumer &
Community Banking
53%
52%
BAC-CB
32%
28%
BAC-CB
28%
BAC-CB
Commercial &
Investment Bank
49%
57%
GS-GBM
18%
17%
GS-GBM & MS-IS
17%
GS-GBM & MS-IS
Asset & Wealth
Management
64%
60%
NTRS-WM & DWS
40%
48%
MS-WM & IM
48%
MS-WM & IM
GSIB = Global systemically important bank
ROTCE = Return on tangible common equity
For footnoted information, refer to page 49 in this Annual Report.
68%
65%
64%
64%
61%
52%
MS
C
GS
WFC
BAC
JPM
8%
14%
15%
16%
22%
20%
C
BAC
WFC
GS
MS
JPM
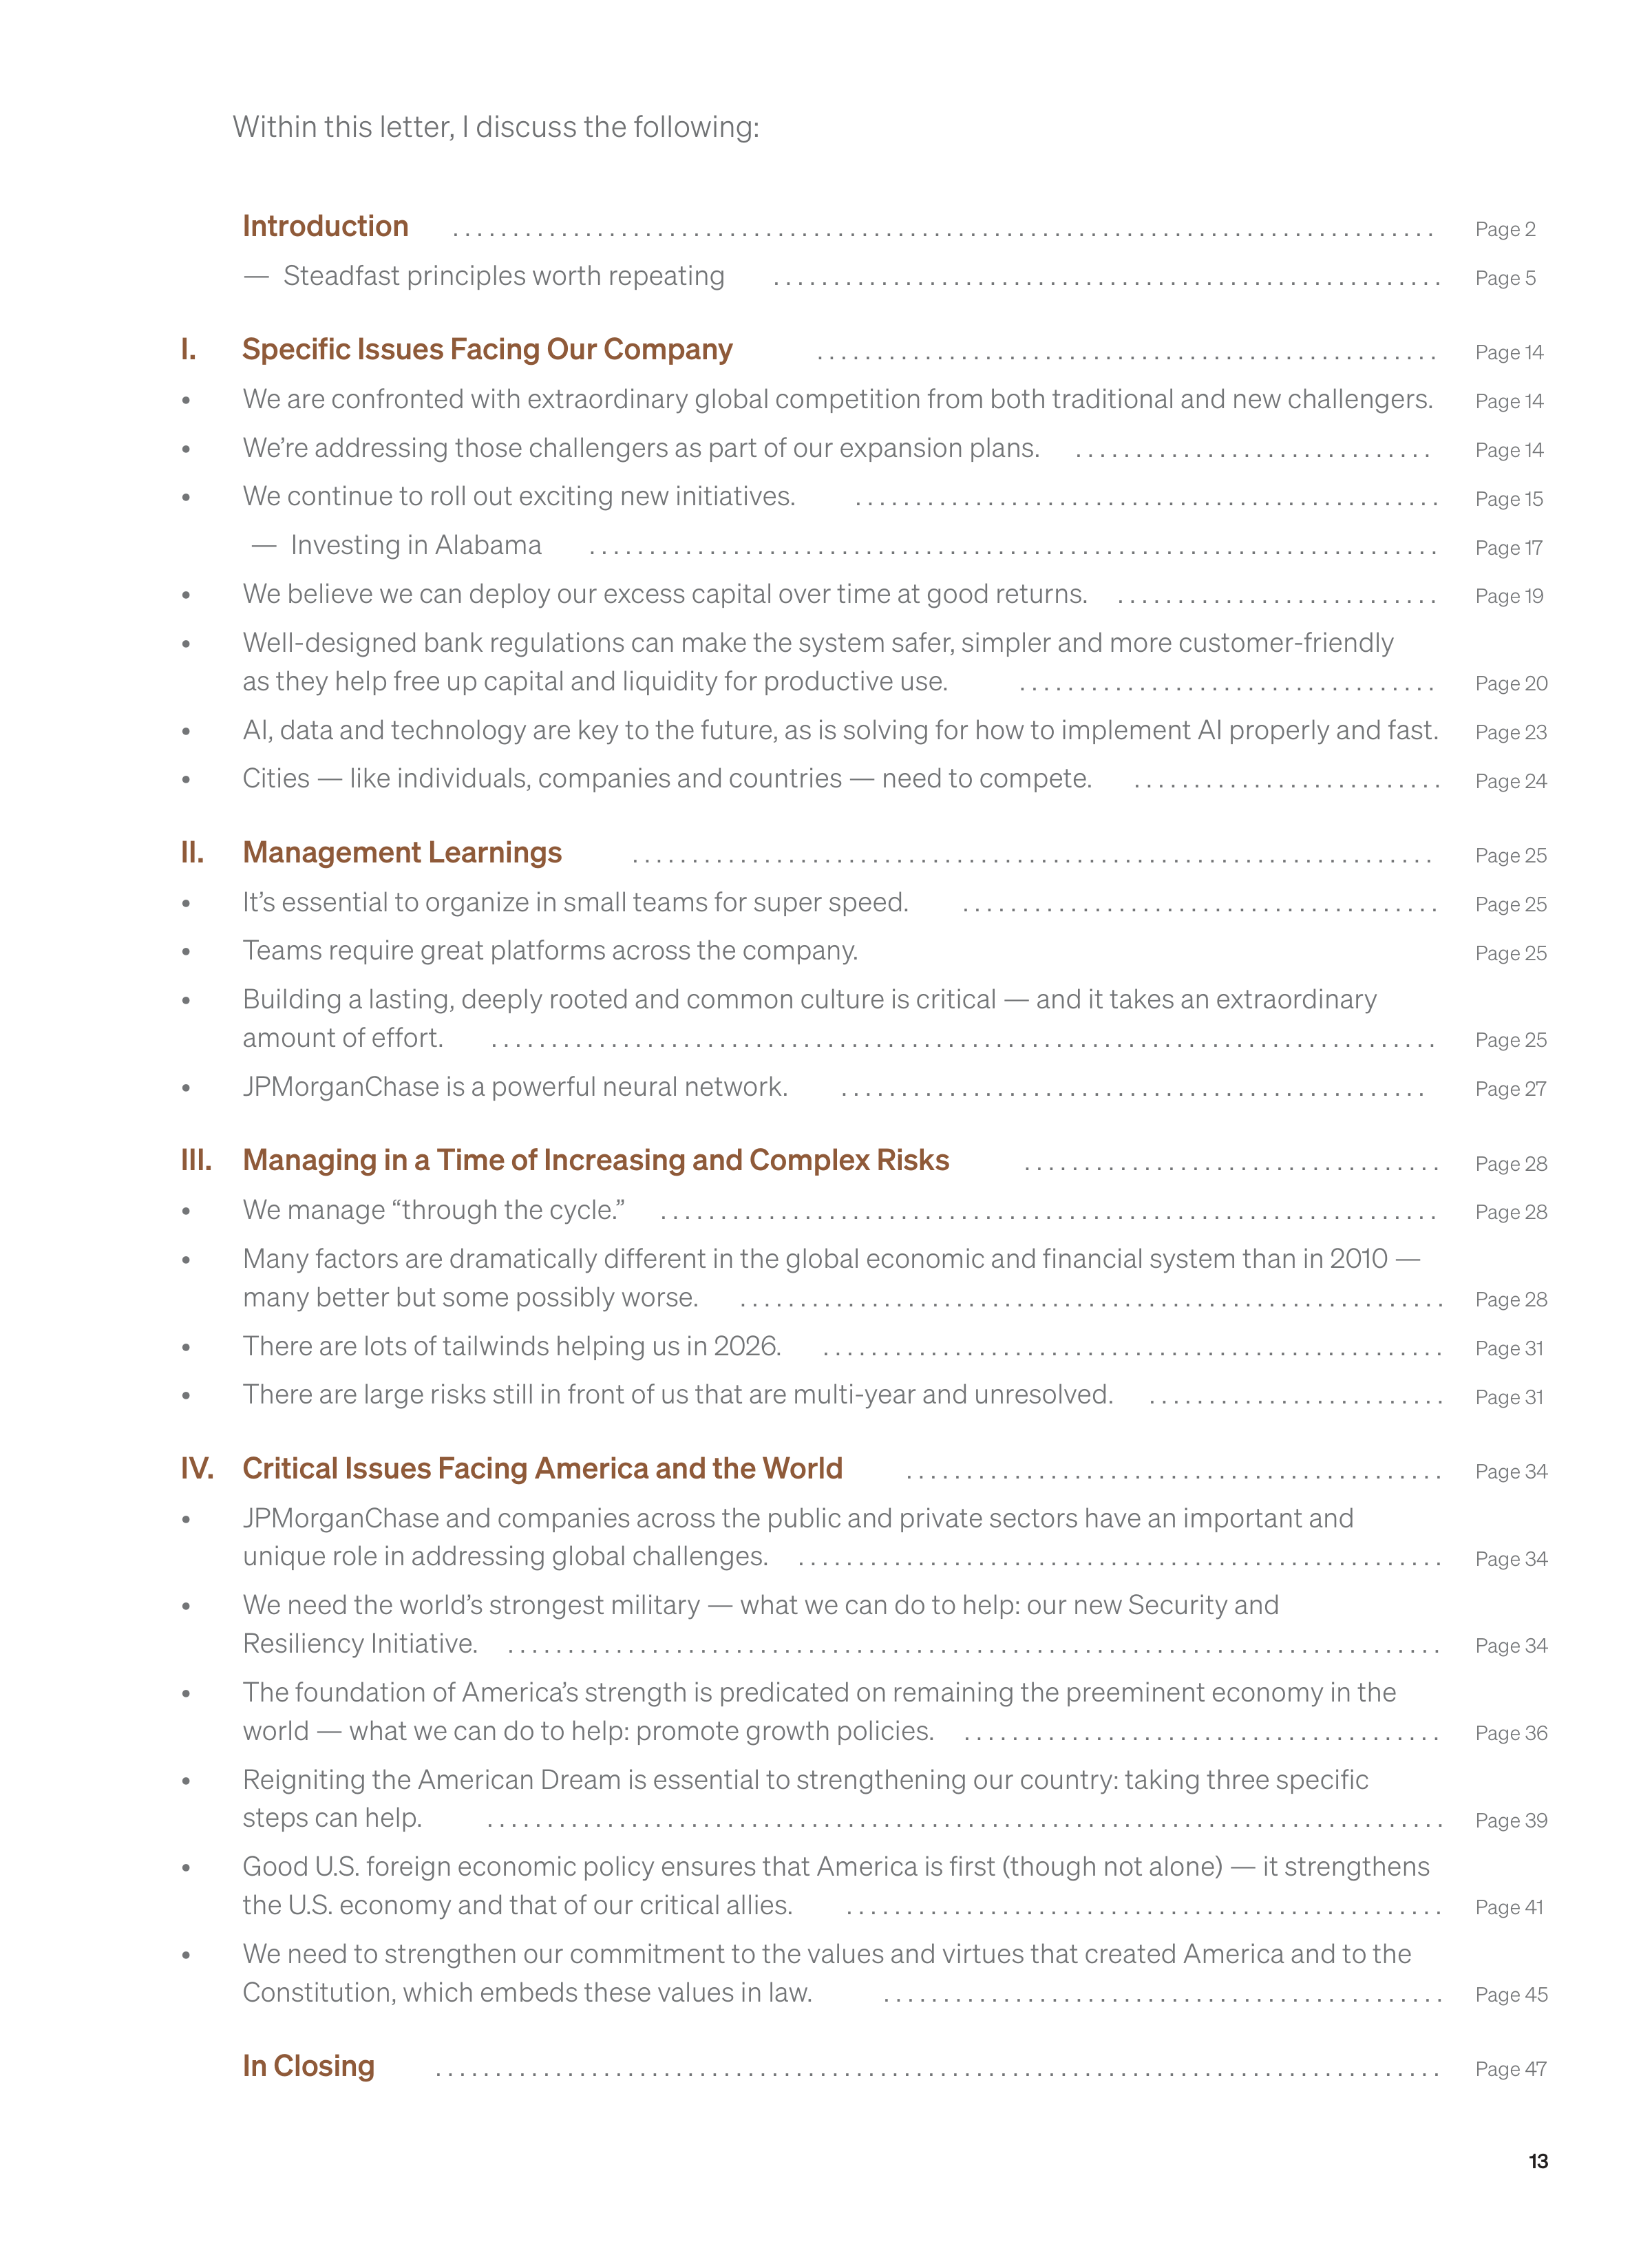
JPMorganChase Exhibits Strength in Both Efficiency and Returns
When Compared with Large Peers
1
and Best-in-Class Peers
1
Year ended December 31, 2025
Page 2
Page 5
Page 14
Page 14
Page 14
Page 15
Page 17
Page 19
Page 20
Page 23
Page 24
Page 25
Page 25
Page 25
Page 25
Page 27
Page 28
Page 28
Page 28
Page 31
Page 31
Page 34
Page 34
Page 34
Page 36
Page 39
Page 41
Page 45
Page 47
Introduction
. . .
. .
.
. . . . . . . . . . . . . . . . . . . . . . . . . . . . . . . . . . . . . . . .
. . . . . . . . . . . . . . . . . . . . . . . . . . . . . . . . . . . .
— Steadfast principles worth repeating . . . . . . . . . . . . . . . . . . . . . . . . . . . . . . . . . . . . . . . . . . . . . . . . . . . . . . . .
I.
Specific Issues Facing Our Company
. . . . . . . . . . . . . . . . . . . . . . . . . . . . . . . . . . . . . . . . . . . . . . . . . . . .
•
We are confronted with extraordinary global competition from both traditional and new challengers.
•
We’re addressing those challengers as part of our expansion plans.
. .
. . . . . . . . . . . . . . . . . . . . . . . . . . . .
•
We continue to roll out exciting new initiatives.
. . . . . . . . . . . . . . . . . . . . . . . . . . . . . . . . . . . . . . . . . . . . . . . . .
—
Investing in Alabama
. . . . . . . . . . . . . . . . . . . . . . . . . . . . . . . . . . . . . . . . . . . . . . . . . . . . . . . . . . . . . . . . . . . . . . .
•
We believe we can deploy our excess capital over time at good returns.
. . . . . . . . . . . . . . . . . . . . . . . . . . .
•
Well-designed bank regulations can make the system safer, simpler and more customer-friendly
as they help free up capital and liquidity for productive use.
. . . . . . . . . . . . . . . . . . . . . . . . . . . . . . . . . . .
•
AI, data and technology are key to the future, as is solving for how to implement AI properly and fast.
•
Cities — like individuals, companies and countries — need to compete.
. . . . . . . . . . . . . . . . . . . . . . . . . .
II.
Management Learnings
. . . . . . . . . . . . . . . . . . . . . . . . . . . . . . . . . . . . . . . . . . . . . . . . . . . . . . . . . . . . . . . . . . .
•
It’s essential to organize in small teams for super speed.
. . . . . . . . . . . . . . . . . . . . . . . . . . . . . . . . . . . . . . . .
•
Teams require great platforms across the company.
•
Building a lasting, deeply rooted and common culture is critical — and it takes an extraordinary
amount of effort.
. . . . . . . . . . . . . . . . . . . . . . . . . . . . . . . . . . . . . . . . . . . . . . . . . . . . . . . . . . . . . . . . . . . . . . . . . . . . . . .
•
JPMorganChase is a powerful neural network.
. . . . . . . . . . . . . . . . . . . . . . . . . . . . . . . . . . . . . . . . . . . . . . . . .
III.
Managing in a Time of Increasing and Complex Risks
. . . . . . . . . . . . . . . . . . . . . . . . . . . . . . . . . . .
•
We manage “through the cycle.”
. . . . . . . . . . . . . . . . . . . . . . . . . . . . . . . . . . . . . . . . . . . . . . . . . . . . . . . . . . . . . . . . .
•
Many factors are dramatically different in the global economic and financial system than in 2010 —
many better but some possibly worse.
. . . . . . . . . . . . . . . . . . . . . . . . . . . . . . . . . . . . . . . . . . . . . . . . . . . . . . . . . . .
•
There are lots of tailwinds helping us in 2026.
. . . . . . . . . . . . . . . . . . . . . . . . . . . . . . . . . . . . . . . . . . . . . . . . . . . .
•
There are large risks still in front of us that are multi-year and unresolved.
. . . . . . . . . . . . . . . . . . . . . . . . .
IV.
Critical Issues Facing America and the World
. . . . . . . . . . . . . . . . . . . . . . . . . . . . . . . . . . . . . . . . . . . . .
•
JPMorganChase and companies across the public and private sectors have an important and
unique role in addressing global challenges.
. . . . . . . . . . . . . . . . . . . . . . . . . . . . . . . . . . . . . . . . . . . . . . . . . . . . . .
•
We need the world’s strongest military — what we can do to help: our new Security and
Resiliency Initiative.
. . . . . . . . . . . . . . . . . . . . . . . . . . . . . . . . . . . . . . . . . . . . . . . . . . . . . . . . . . . . . . . . . . . . . . . . . . . . . .
•
The foundation of America’s strength is predicated on remaining the preeminent economy in the
world — what we can do to help: promote growth policies.
. . . . . . . . . . . . . . . . . . . . . . . . . . . . . . . . . . . . . . . .
•
Reigniting the American Dream is essential to strengthening our country: taking three specific
steps can help.
. . . . . . . . . . . . . . . . . . . . . . . . . . . . . . . . . . . . . . . . . . . . . . . . . . . . . . . . . . . . . . . . . . . . . . . . . . . . . . . .
•
Good U.S. foreign economic policy ensures that America is first (though not alone) — it strengthens
the U.S. economy and that of our critical allies.
. . . . . . . . . . . . . . . . . . . . . . . . . . . . . . . . . . . . . . . . . . . . . . . . . .
•
We need to strengthen our commitment to the values and virtues that created America and to the
Constitution, which embeds these values in law.
. . . . . . . . . . . . . . . . . . . . . . . . . . . . . . . . . . . . . . . . . . . . . . .
In Closing
. . . . . . . . . . . . . . . . . . . . . . . . . . . . . . . . . . . . . . . . . . . . . . . . . . . . . . . . . . . . . . . . . . . . . . . . . . . . . . . . . . . .
Within this letter, I discuss the following:
13

serving people and businesses needing to hold
money, move money, invest money, raise money
and manage their investments — new competi
tors and new technologies may change the
fundamental nature of
how
all this is done.
We’re addressing those challengers as
part of our expansion plans.
While the competition is fierce, we do believe
in most cases we will be able to sustain our
top-ranking performance. In the section on
management learnings, I discuss what we need
to do as a management team to ensure our
ongoing success.
We continue to see growth opportunities in
almost all our businesses.
Some of our growth opportunities are basic
and exist in every detailed segment level. In
Consumer & Community Banking (CCB), we
continue to add, train and enable bankers and
advisors to serve more clients. We’re expanding
our branch network to capture share in under
penetrated markets, including more
rural
markets
across the country. And we’re investing
in marketing and product refreshes to drive card
account growth, as well as scaling natural adja
cencies in wealth management and commerce
to address more of our customers’ needs. In the
Commercial & Investment Bank (CIB), we’re
expanding to more countries and regions, secur
ing growth in private markets and building upon
our capabilities in global payments and digital
assets. And in Asset & Wealth Management
(AWM), we are continuing to invest in our active
management capabilities, enhancing our alter
natives and exchange-traded fund platforms,
expanding our international footprint and adding
Global Private Bank advisors.
You can read about these plans more specifi
cally in the CEO letters.
14
14
SPECIFIC ISSUES FACING OUR COMPANY
I. Specific Issues Facing Our
Company
The last five years have been a period of signifi
cant growth for us — as evidence, we added
more than 60,000 people to our workforce, we
opened over 900 branches across the United
States, and we launched multiple new products
and services. In the following section and in the
letter by our Chief Operating Officer, we share
various ways we seek to keep our company
healthy, including specific efforts designed to
maintain our grit, our leading position and our
efficiency. We are keenly aware that our compe
tition around the world is always gaining.
We are confronted with extraordinary
global competition from both
traditional and new challengers.
Our shareholders should recognize, as we do,
that our company faces strengthened tradi
tional competitors, including large banks in the
United States, regional banks, strong interna
tional banks, large and successful money man
agers, and strong investment banks.
As I’ve detailed in previous letters, our rivals
increasingly include a large and growing set of
nontraditional and fintech competitors globally
in areas such as payments, digital banking and
investing, and global market making. I’m not
going to mention all their names, but you can
imagine that we study and track over a hundred
of them.
While we have been able to grow, many but not
all of the new players have been quite success
ful and continue to raise both money and their
ambitions. In addition, a whole new set of
competitors is emerging based on blockchain,
which includes stablecoins, smart contracts
and other forms of tokenization.
Our ongoing success will be based on our
ability to wisely invest and move very quickly
and nimbly, especially around product design
and rollout, including incorporating artificial
intelligence (AI) in everything we do. While
much of what we do will remain the same —
Our ongoing success will require us to up
our game — and in multiple ways.
We need to do a better job of utilizing our data
to help the customer. We must develop prod
ucts quicker and always look at the adjacencies
that can make a customer’s life easier. We need
to roll out our own blockchain technology and
continually focus on what our customers want in
a very detailed way.
We need to maximize the benefits of our
scale and scope, which are necessary to our
largest institutional and government clients,
while minimizing their considerable
negatives.
Size can often be a tremendous business disad
vantage because it frequently comes with the
baggage of complexity, bureaucracy and com
placency. It can slow down decision making,
generate arrogance and cloud the essential
focus on seeing the world through the custom
er’s eyes. Being a company of sizable magni
tude makes it easier to ignore new competitors
since they often start small in one product but
move rapidly to expand. The most successful
examples of these are Block, Citadel Securities,
Revolut and Stripe.
However, scale, capital and capabilities are
going to matter
more
with the enormous invest
ments that need to be made in global infra
structure — technology, new supply chains,
AI and enhancements that meet government
needs. In some of these cases, our size, capital
and capabilities can be a relatively good com
petitive advantage.
We continue to roll out exciting new
initiatives.
They are outlined as follows:
Our Security and Resiliency Initiative is
critical to national and global security.
Our Security and Resiliency Initiative (SRI) is
already well underway and, in fact, will help us
grow. It is explained in greater detail in the last
section of this letter but, broadly speaking,
describes our deployment of capital and exper
tise to support industries critical to the military
and economic security of the United States and
its partners. We have a lot to catch up on and
not much time
.
Reigniting the American Dream is also
essential — and it drives growth as well.
I continue to believe the American Dream is
alive, but it’s slipping out of reach for too many
people — and it’s now affecting generations of
families. This slows economic growth, hurts
communities and prevents many people from
getting ahead. Further, it deeply damages
Americans’ faith and confidence in their country.
That is why JPMorganChase recently
announced the American Dream Initiative (ADI)
— a firmwide multi-year effort to expand
opportunity to millions of Americans through
targeted investments in local communities
across the United States. It builds on our firm’s
years of experience of investing in local solu
tions that work.
We will focus on six areas where we have deep
expertise that helps drive meaningful impact:
Business growth and entrepreneurship:
Increase access to capital, advice, training
or tools for 10 million small businesses.
Housing access and affordability:
Improve
affordability for hundreds of thousands of
renters and buyers through increased hous
ing supply and homeownership opportunities.
15
15
SPECIFIC ISSUES FACING OUR COMPANY
Financial health and wealth creation:
Expand
access to financial education, banking prod
ucts, services and digital financial health
tools — scaling financial education efforts to
reach approximately 5 million cumulative
customers, students and small businesses,
up from 1 million served over the past five
years.
Careers and skills:
Broaden access to skills-
based training through policy and hiring
opportunities, including for JPMorganChase
employees.
Healthcare:
Support efforts that offer better
access to healthcare, as well as promote
better health outcomes, affordability and
transparency for all Americans.
Local institutions:
Provide more financing
and support for thousands of schools, hospi
tals, nonprofits and local governments
critical to community success across the
United States.
We are starting by supporting 10 million small
businesses — up from 7 million served today —
over the next several years. As the nation’s
leading small business bank, we intend to scale
support for small businesses by deploying
increased capital and providing more financial
coaching, advice, training and tools.
We’re also taking the American Dream to the
local level — and our presence in Detroit proves
that point. When we went there in 2014, we
looked at what the city needed and how invest
ments from our firm could make a meaningful
difference, targeting areas where we could
make the greatest impact. We must continue
these efforts, learning from successes like
Detroit. That city spawned many initiatives
at our company (think our Service Corps and
Advancing
Cities), but most important, it
showed how proper
collaboration
between
business and government can help to tackle
some of our biggest problems.
Now we want to replicate and scale what works.
ADI will be nationwide with a particular focus on
amplifying impactful work already happening
in certain markets, such as Alabama, Atlanta,
Los Angeles, Philadelphia and San Francisco.
Please read the sidebar, which shows how we’re
going deep and local in Alabama.
We need to support policies that create jobs,
foster upward mobility and ensure everyone
has a fair shot. This could go a long way to solv
ing affordability challenges, too. Jobs create
dignity and self-worth — and attaining that first
rung almost always leads to the second, which,
in turn, fosters many positive social outcomes.
The dream of enjoying freedom, taking care
of your family, experiencing good health and
making the most of opportunity is not just an
American aspiration, it’s a global one.
16
16
SPECIFIC ISSUES FACING OUR COMPANY
For over 50 years, JPMorganChase has helped drive
economic and job growth, support businesses of all
sizes and put the American Dream within reach for
more Alabamians. It’s clear that Alabama’s future is
bright, and we are excited for what’s next.
We’ve been working hand in hand with local govern
ments, businesses and community partners to under
stand how we can best use JPMorganChase’s full range
of resources to complement their efforts. I was hon
ored to meet with many of these leaders during our bus
tour through Alabama last summer. The state’s expan
sive economic growth has opened up immense oppor
tunity for the residents and businesses of Alabama.
We proudly serve more than 590,000 Consumer
Banking customers, helping them buy homes and save
for the future. We bank over 29,000 small businesses
statewide, as well as key institutions like Auburn
University, the University of Alabama, Children’s Hospi
tal of Alabama and Infirmary Health System, among
others. We also finance critical infrastructure, including
a recent $730 million Alabama Highway Authority bond
for the West Alabama Corridor project.
This year we are deepening our efforts in Alabama as
part of our recently announced American Dream Initia
tive. This includes new programs and ideas that you’ll
hear more about in the coming weeks and months,
such as:
Strengthening small businesses by expanding
access to capital and providing expert advice,
helping them compete for supply chain contracts
and other opportunities.
Equipping individuals to secure in-demand jobs in
Alabama’s growing sectors, working with employers,
colleges and other local partners to accomplish this.
Helping families achieve their financial goals with
new digital tools and education programs.
Many of these efforts align with our Security and
Resiliency Initiative, a $1.5 trillion, 10-year plan to
facilitate, finance and invest in industries critical to
national economic security and resiliency. We expect
this to benefit companies, workers and communities
in Alabama, a leader in advanced manufacturing,
aerospace and defense.
Supporting local businesses
Small and midsized businesses are the backbone of the
state’s economy — the former alone employ nearly half
of Alabama’s private sector workers. JPMorganChase
will continue to help local entrepreneurs and busi
nesses, like Astrion, headquartered in Huntsville, at
every stage of their growth secure access to capital,
supply chain opportunities and other essential
resources to thrive.
This includes a recent $2 million philanthropic invest
ment to launch the Alabama Capital Access Collabora
tive aimed to help small businesses gain improved
access to capital and achieve greater efficiencies, as
well as assist local community development finance
institutions and other community lenders in improving
their lending, investing and operational capacity.
Moving forward, we’re helping local small businesses
overcome barriers to serving as suppliers in Alabama’s
growing aerospace, defense and government indus
tries by providing mentorship, capital and upskilling to
compete for supply chain contracts. It can be costly
and difficult for smaller companies to meet the require
ments, including cyber readiness.
Additionally, we’re expanding our team of senior busi
ness consultants in branches across Alabama and pro
viding more coaching and expert guidance on business
planning, financial management and marketing.
Connecting Alabama workers to high-growth
industries
A prosperous job market is the foundation of a strong
economy — and in Alabama, demand is high for skilled
workers, especially those who can perform technical
work in the industries that are vital for America’s secu
rity and local economic growth.
With our support, the nonprofit Alabama Possible is
working with community colleges to expand eight
career advancement programs for adult learners in
aviation, steel and aerospace. They’re also partnering
with Alabama Power to support two accelerated
training programs for HVAC technicians and utility
line workers.
Investing in Alabama
17
17
SPECIFIC ISSUES FACING OUR COMPANY
As we do more in Alabama, we intend to partner with
additional community colleges and universities, busi
ness leaders, and groups that serve communities large
and small to better connect local workers and employ
ers. This includes expanding access to skills and job
opportunities for veterans and strengthening appren
ticeship pathways.
Expanding access to banking services
We’re working to help more Alabamians save money,
build credit and achieve their financial dreams.
We are opening new branches in Decatur, Foley and
Trussville this year as part of our plan to triple the num
ber of Chase branches to 35 by 2030. We will also open
our first Community Center in the state, which is
designed with extra space for community events,
financial health workshops, skills training and small
business pop-ups.
This effort will create more than
170 new jobs and help over 50% of the state’s citizens
reside within an accessible drive of a Chase branch.
Through Chase Money Skills, Chase Secure Banking
SM
and Chase First Banking
SM
, we’re also helping people
access digital financial tools and affordable banking
products. Through our Birmingham-based Community
Manager, we’re offering additional financial education
and expanding our partnerships with community orga
nizations and colleges. These collective efforts help
with ways to boost credit scores and put residents on
a pathway to homeownership.
By doing more in Alabama, we’re not just investing in
the state’s economic future — we’re helping to secure
America’s long-term economic resilience and security,
with Alabama’s people and industries leading the way.
Serving Alabama since 1973
Our footprint includes:
Serving our clients and customers
~280 medium and large clients
$15+ billion in credit and capital provided to medium
and large clients since 2021
590,000+ customers supported with mortgages,
auto loans, and savings, checking and credit card
accounts
29,000+ small business customers
14 branches across the state, growing to 35 by 2030
Serving local institutions
17 government, higher education, healthcare and
nonprofit clients throughout the state
$5.1 billion in credit and capital provided to govern
ment, higher education, healthcare and nonprofit
clients throughout the state since 2021
30+ regional, midsized and community banks
provided services, helping them serve local
communities
$155 million in credit and capital extended to finan
cial institutions, such as local and regional banks,
since 2021
$55+ million in financing for affordable housing con
struction and preservation in Alabama since 2020
$730 million Alabama Highway Authority bond
to advance the West Alabama Corridor project,
widening the highway to four lanes and creating
better access to services like healthcare, education
and jobs
Serving the local economy and communities
150 company employees throughout the state, pro
viding full-time employees with a minimum annual
pay of $41,600 (plus an average annual benefits
package worth over $21,000), compared with the
statewide per capita income of nearly $36,100
$9.5+ million contributed to the Alabama economy
through goods and services purchased by the firm
in 2025
$6.5 million in philanthropic support provided since
2019
18
18
SPECIFIC ISSUES FACING OUR COMPANY
We will be building new products to make
us an even greater trusted partner.
We are an extremely trusted partner in a world
of growing distrust, particularly in the spheres
of social media, commerce and use of data and
where these intersect. There are a lot of risks
associated with the misuse of customer data
and commerce, which is likely to get far worse
with AI and agentic commerce. We think there
are large opportunities for us to act on behalf of
our customers and in the way they want — as a
truly trusted partner. We are continually improv
ing our already strong capabilities to combat
scams and fraud. We expect to roll out some
products over the next two years that will build
on what we already offer, particularly around
control of personal data, safe commerce and
customer-friendly algorithms. We also believe
that some of our identity and fraud prevention
capabilities can be extended to more third
parties.
We continue to bring all our clients,
regardless of size, best-in-class money
management tools.
We have continued to grow our Wealth Manage
ment business through our branch bank model,
J.P. Morgan advisors and Self-Directed Investing.
In total, client investment assets in this area
rose 17% in 2025 to $1.3 trillion. In 2026, we
intend to make it much easier for clients to
automatically
move money from their regular
checking account to higher-yielding brokerage
products and vice versa so they can maximize
yield while managing day-to-day cash flow. It
won’t require multiple steps to trade, clear and
transfer cash between accounts — our Smart
Cash capability will do it for them. Eventually,
AI will allow clients to predict cash flow needs
and anticipate upcoming bills, doing their
budgeting for them.
In 2026, we have also rolled out what we
believe is
best-in-class retail trade execution
— basically giving consumers access to the
same execution capability that the largest,
most sophisticated investors in the world
enjoy, which saves them money. We believe
this is better than the execution provided
when a broker is paid for order flow.
We now offer Special Advisory Services
to our key clients.
With clients facing unprecedented change,
uncertainty and opportunity, we recognize that
the traditional role of a banker is changing. In
navigating complex challenges, clients are often
seeking guidance far beyond typical financial
advice. We’re commonly asked, “How does
JPMorganChase approach this? How are you
preparing for that? How do you protect the firm?
How do you ensure operational resiliency?”
Special Advisory Services allows us to formally
connect clients with our in-house experts leading
critical areas such as AI, cybersecurity, digital
assets, geopolitics, government affairs, real
estate, risk strategy, supply chain and talent man
agement. This means our clients can draw on the
same expertise and insights that guide our own
firm through today’s most complex challenges.
Whether a client is preparing for a major IPO,
planning a transformational deal or looking to
grow their business with us as their primary
bank, our commitment is to be there every step
of the way. Sharing insights and best practices
with them across so many aspects of their com
pany can help them run a better business. It’s
also one more way we can demonstrate our
dedication to the client, understanding their
challenges and strengthening our value as their
partner for years to come.
We used to offer these services on an ad hoc
basis, often by request. Now we intend to
extend these extraordinary services further to
companies that have a long-term relationship
with us; i.e., we are one of their lead banks and
have trusted relationships with their C-suite and
board members.
We believe we can deploy our excess
capital over time at good returns.
Our excess capital, making many assumptions
around regulatory reform, is approximately $40
billion. This $40 billion is effectively earning a
4% after-tax return. We now believe that over
time we can deploy it at excellent returns. We
will do this with our normal careful building of
important customer relationships, which also
means that it may take several years or so to
deploy this capital.
19
19
SPECIFIC ISSUES FACING OUR COMPANY
In the meantime, we continue to pay healthy and
increasing dividends. And we also continue to
buy back enough stock so as not to increase
total excess capital, though we have a number
of options on how to deploy our capital and are
clear-eyed that many asset prices, including
bank stocks, are fully valued. We always prefer
to deploy capital, if possible, and when we do
that through share repurchases, we want it at
prices that enhance the value for our ongoing
shareholders.
Some of our excess capital is effectively
deployed when we build new branches or hire
new bankers, even though it is treated as an
expense. We believe that the initiatives listed
above and outlined in the CEO letters are
effective uses of our deployable capital.
Well-designed bank regulations
can make the system safer, simpler
and more customer-friendly as they
help free up capital and liquidity for
productive use.
A properly regulated banking system helps
reduce risk to the financial system, protect
customers, and maximize productive use of
capital and lending. The Dodd-Frank Wall Street
Reform and Consumer Protection Act and some
of the rules that followed that legislation accom
plished some good things. At the same time,
they also created a fragmented, slow-moving
system with expensive, overlapping and exces
sive rules and regulations — some of which
made the financial system weaker and reduced
productive lending. Those regulations also
created many rules and requirements that had
nothing to do with safety and soundness, and in
fact often took the regulators’ eyes off the real
risk. The real risks almost always end up being
credit, liquidity, interest rate or operational risk.
Many of the financial rules that were put in place
did not originate from a clear idea about what
they should be or what they should accomplish,
which led to unintended consequences. Addi
tionally, rules were often inconsistent from reg
ulating body to regulating body — and many
regulators were independently involved in so
many regulations that they lacked an ability to
make rapid or coordinated changes as needed.
Of course, this was also very difficult for them.
I am going to talk further about some of the
negative consequences of bad bank regula
tions, but I also hope to provide some real
solutions.
One other flaw of the banking regulations is that
they were legislated in a way that made them
open to completely different interpretations
depending on your political point of view. As
agency leadership changes, this has the effect
of creating ping-pong regulations. It would be
very helpful if legislators wrote more clearly
crafted regulations across the board that mini
mized the risk of dramatically different political
interpretations.
Here are some of the negative consequences
partially due to poor bank regulations.
Because capital requirements on banks are
much higher than the market gives to private
entities, insurance companies or even foreign
banks, huge arbitrage is created. This is
often a sign of potential risk.
Regulators wrongly incorporated an
accounting concept called “held to maturity”
(HTM) into the capital rules, thereby giving
Treasury and mortgage securities better
capital treatment because the holder has
promised not to sell them. This had many
negative consequences — it allowed banks
to not recognize mark-to-market losses on
those securities in their regulatory capital,
and in some cases, it falsely increased
returns on those securities (because the
amount of regulatory capital needed to be
held against them was significantly smaller).
This inadvertently encouraged banks to take
on more interest rate risk, which was the ulti
mate trigger for the failure of Silicon Valley
Bank (SVB) and First Republic Bank (FRB).
The Fed’s Comprehensive Capital Analysis
and Review (CCAR) stress test, as currently
constructed, produces results that are far
worse, in our strongly held opinion, than what
our actual results would be under those
severely adverse conditions. The process
is flawed, including reliance on inaccurate
models and assumptions and the fact that it
tests only one type of crisis, so other scenar
ios are overlooked (e.g., rapid rises in interest
rates, as in the case of SVB and FRB). Testing
20
20
SPECIFIC ISSUES FACING OUR COMPANY
should use accurate numbers and assump
tions — then the results are what they are —
rather than being driven by predetermined
“what-ifs.” More transparency and sound
methodology would lead to continuous
improvement, not gaming the system. Essen
tially, we do not use CCAR to manage risk —
we look at far more scenarios and need to be
prepared for all of them. We also look at these
risks every week, not just once a year.
The calculation for a global systemically
important bank (GSIB) remains one of the
most convoluted and distorted calculations
I have ever seen (it was a typical over-
architected academic modeling exercise
that has very little to do with real risk) —
and it should be gotten rid of and replaced
with something reasonable. I understand
the concept that the failure of a large bank
would be more damaging in general than the
failure of a smaller bank. This is the same
concept as loss given default, however the
probability of default may be considerably
less. At the very least, the methodology
should be simplified and made to focus on
risk more than it does today.
Operational risk capital calculations are also
intensely inaccurate and should
actually
measure
risk in a way that helps banks man
age operational risk. The framework does
not offer credit for anything that was done to
dramatically reduce such risk. And it does
not measure factors that cause
actual
opera
tional risk, such as excessive margining,
low-quality collateral, actual operational fail
ures, lower-quality lending and others. In an
ironic twist, most of the operational risk capi
tal borne by banks is related to litigation plus
fines and fees charged by regulators, which
were excessive and punitive (and impossible
to dispute).
The Federal Reserve never fully disclosed
what they believed the changes in capital
rules and liquidity requirements would do to
bank lending and market liquidity. Nor has
the Fed ever accurately provided an analysis
of the effects that result from the intercon
nectivity between liquidity requirements and
quantitative easing (QE).
Liquidity requirement regulations perma
nently locked up (in a very rigid way) an
extraordinary amount of liquidity in the bank
ing system, which could have gone to more
productive use. JPMorganChase alone will
have over $1 trillion in usable liquidity but will
be unable to deploy it because of the inflexi
bility of the calculations. More to come on
this point.
All these financial rules dramatically reduced
lending by banks and contributed to lend
ing’s shift into the nonbank sector, which is
often more expensive and less reliable.
The FDIC process was badly handled. Its
mismanagement of SVB, Signature Bank and
FRB probably cost the FDIC many billions
more than it should have. And since the FDIC
is effectively a mutual insurance company,
these losses are always charged back to the
banks —
the taxpayer has never paid
.
Not all bank regulations are all good or all bad
— we should just try to get it right. I have a few
suggestions.
Here are some examples of smart, rigorous
regulations and new ideas that could make
the system safer and better.
One of the huge risks for a bank has always
been a “run on the bank,” which occurs when
people think that their uninsured deposits are
at risk. The FDIC only covers insured deposits,
and the run risk is driven by uninsured depos
its, particularly nonoperating uninsured depos
its. In recent bank failures, regulators have had
to invoke the systemic risk exception (SRE) to
protect uninsured deposits at the point of fail
ure. That is a problem — no one should want
this as an emergency mechanism. It creates
moral hazard, and the process to invoke the
SRE is chaotic and involves multiple agencies,
including approval by the Treasury Secretary in
consultation with the President. Bank runs can
happen quickly, and relying on that type of
action to avoid contagion is simply not a good
idea. Here are some ideas that I believe would
not only significantly reduce the chances
that the SRE would need to be invoked but
would also make the system safer and avoid
moral hazard.
21
21
SPECIFIC ISSUES FACING OUR COMPANY
I would limit the amount of HTM securities
in a way that links to the total long-term debt
that the bank must have available to absorb
losses upon its failure. And while this is a
judgment call, banks need to realize that
when available-for-sale and HTM security
losses start to exceed 50% of tangible equity,
investors will get worried.
Through some simple tests, I would limit the
extent of interest rate exposure that banks
can take.
Capital has not been an issue for banks.
However, I would establish clear capital
thresholds. If banks go below a certain
amount, they cannot raise their dividend or
buy back stock. At a level below that, they
would have to cut their dividend. And at a
level below that, they would be forced to
raise capital. This would impose real disci
pline. Although current Fed rules already
achieve some of that, I think the rules could
be tougher, clearer and simpler.
The liquidity component of loans and securi
ties should be equal to what the Fed discount
window would lend against those securities.
We should eliminate duplicative or unneces
sary liquidity buffers. These actions would
create an enormous amount of lendable
liquidity and also allow banks to use their
capital far more flexibly in a crisis. They
would also reduce the need for the Fed to
step in every time there is a kerfuffle in the
market. Credit for the Fed discount window
alone would increase JPMorganChase’s
lendable liquidity by almost $500 billion.
Prior to failure — between the Fed window
and the rather quick sale or financing of
securities or other assets — banks should be
in a position where they have enough liquid
ity to
pay off more than 50% of uninsured,
nonoperating deposits. Regulators floated
a similar idea in 2024, and I agree with them.
This plan, plus the fact that equity and
long-term debt will absorb losses before
uninsured deposits are at risk, would give
customers far greater peace of mind.
We should also consider simply setting,
upfront, a statutory cap on the percentage
loss on uninsured deposits in the event of
failure — say, at 5%. This would reduce moral
hazard and create an additional buffer for the
FDIC to achieve a smooth resolution without
using the SRE. With this plan, a small portion
of the uninsured deposits would be immedi
ately available to cover losses and communi
cated to depositors in “peacetime” while
the bulk of uninsured deposits would be pro
tected in a resolution. Although some might
argue that a mechanism like this might
increase the risk of a bank run, I think if the
percentage is well-chosen, it might actually
be stabilizing by eliminating the uninsured
depositor’s nightmare scenario of losing all
their money. In the end, all debates about
the best way to proceed revolve around how
much shareholders, creditors and uninsured
depositors of the failing bank should pay and
how much healthy banks should pay. As I
already said, it has never been the taxpayer.
And perhaps capping the maximum loss on
uninsured deposits upfront would put an end
to ad hoc involvement by the government
once and for all.
On highly leveraged repo or derivative-type
positions, there should be standard conser
vative margin requirements, as appropriate,
for each type of collateral and maturity.
Banks should be allowed to require less mar
gin, which often happens because of com
petitive markets; but if banks take this step,
they should report that action to the Fed. The
Fed ought to reserve the right to charge cap
ital if it thinks margin requirements are too
low or the aggregate size of these positions
is causing risk to the system. This would give
the Fed a very powerful tool to deleverage
and derisk the system.
Our initial reactions to the revised Basel 3
Endgame and GSIB proposals are mixed.
While it was good to see that the recent propos
als for the Basel 3 Endgame (B3E) and GSIB
attempted to reduce the increase in required
capital from the 2023 proposals, there are still
some aspects that are frankly nonsensical.
22
22
SPECIFIC ISSUES FACING OUR COMPANY
The GSIB surcharge is still broken. The original
Basel rule, known as Method 1, was a grab bag of
overlapping metrics — many of which had noth
ing to do with risk or resolvability — that solved
for a number that international regulators thought
was right. Then the United States decided that
wasn’t high enough and created Method 2, which
basically was double Method 1. In the meantime,
banks, including JPMorganChase, have made
enormous progress addressing resolvability con
cerns while remaining profitable and becoming
more resilient. Due to its methodological flaws,
the bulk of the increase of our Method 2 sur
charge has been driven by growth in the overall
economy. Under the GSIB re-proposal, our sur
charge would only decrease very modestly, to
about 5.0%. This is absurd when we compare it
with our 2015 Method 2 surcharge of 3.5%, and
even more absurd when compared with our
Method 1 surcharge of 2.5%, which has been flat
versus inception.
A properly designed framework should reward
the resilience and strength of our diverse
income streams and strong risk management.
With a surcharge of approximately 5.0%,
JPMorganChase will have to hold as much as
50% more capital across the vast majority of
loans to U.S. consumers and businesses when
compared with a large non-GSIB bank for the
same set of loans. While we can accept that
some level of surcharge is appropriate, given
our position in the market, the proposed
level just seems to punish our success, our
strength, our consistency and our balanced
business model. Frankly, it’s not right, and it’s
un-American.
As I mentioned earlier, there are numerous
flaws in the operational risk framework. Since
the current proposal still retains this operational
risk and hasn’t addressed all the duplication
and flaws, we could show you some additional
capital metrics that are a fairer representation
of the strength of our balance sheet.
We support a timely finalization of the B3E and
GSIB re-proposals: Everyone wants to move on,
and there are new important areas that require
focus, like liquidity regulation. But, unfortu
nately, the latest proposals are still very flawed
in a few specific areas, so we will be pointing
that out in our comment letters.
AI, data and technology are key to
the future, as is solving for how to
implement AI properly and fast.
The importance of AI is real — and while I hesi
tate to use the word transformational — it is.
The pace of adoption will likely be far faster
than prior technological transformations, like
electricity or the internet. Those took decades
to roll out, but this implementation looks likely
to accelerate over the next few years. Our Chief
Operating Officer describes our efforts in more
detail, but I want to make some key points here.
We will not put our heads in the sand. We
will deploy AI, as we deploy all technology,
to do a better job for our customers (and
employees).
AI will affect virtually every function, applica
tion and process in the company. And in the
long run, it will have a huge positive impact
on productivity. I do not think it is an exag
geration to say that AI will cure some can
cers, create new composites and reduce
accidental deaths, among other positive
outcomes. It will eventually reduce the work
week in the developed world. And people
will live longer and safer.
We do not yet know exactly how AI will
unfold. The landscape will change rapidly,
with shifting assumptions about power con
sumption, costs, chip technologies and the
speed at which data centers are deployed.
There will be a wide variety of AI models —
open and closed, large and small — and no
single tool will dominate. Overall, the invest
ment in AI is not a speculative bubble; rather,
it will deliver significant benefits. However,
at this time, we cannot predict the ultimate
winners and losers in AI-related industries.
AI is a genuine technological shift that will
impact many sectors, including physical
industries and scientific research. AI is only
beginning to be applied broadly in science,
and its influence will continue to expand.
23
23
SPECIFIC ISSUES FACING OUR COMPANY
AI will also introduce serious new risks —
from deepfakes and misinformation to
cybersecurity vulnerabilities. These risks are
real, but they are manageable if companies,
regulators and governments prepare. The
worst mistakes we can make are predictable:
overreact at the first serious incident and
regulate out important innovation or under
react and fail to learn from what went wrong.
The right approach requires rigorous prepa
ration in advance, an honest assessment
when things go wrong — and they will —
and discipline to fix what’s broken without
destroying what works.
AI will definitely eliminate some jobs, while it
enhances others. Our firm will have definitive
plans on how we can support and redeploy
our affected workforce.
AI will create many jobs — some we can see
today in cybersecurity and AI itself, and
some we can’t see. But we do know that there
is a huge workforce shortage for many
well-paying white- and blue-collar jobs.
There is a possibility that AI deployment will
move faster than workforce adaptation to
new job creation. In prior technological trans
formations, labor had time to adjust and
retrain. We do believe that business and
government can do many things to properly
incent retraining, income assistance, reskill
ing, early retirement and relocation for those
whose job might be adversely impacted by AI
(I talk about some of these ideas in Section IV
around work skills training and the Earned
Income Tax Credit).
One last but important point: We have focused
on some of the “known and predictable” and
some of the “known unknown” events. But huge
technological shifts like AI always have second-
and third-order effects as well that can deeply
impact society. Some of these are, for example,
cars bringing about the development of sub
urbs and shopping malls; agriculture enabling
cities; and the original internet (invented back in
1969) leading to mobile phones, apps and social
media. We should be monitoring for this kind of
transformation, too.
Cities — like individuals, companies
and countries — need to compete.
No matter who you are, you need to deal with
reality and the truth. The truth is that while New
York City has much going for it, particularly for
financial companies (because of extraordinary
local talent), it also has the highest city and
state corporate taxes and the highest individual
income and state taxes. People often make this
a moral or loyalty issue, but it is not. Companies
need to remain competitive in this very tough,
fast-moving world. And higher taxes mean
lower returns on capital and less competitive
ness by their nature.
Additionally, individuals vote with their feet —
you can already see a fairly large exodus of peo
ple and jobs out of some states with high taxes
and high expenses (often due to high taxes and
regulatory burdens). Sometimes you see com
panies leaving states, but migration also shows
up in shifts of employees out of certain states.
For example, while New York City is still our
company’s global headquarters, we have shrunk
our headcount in the city, from 30,000 a decade
ago to 24,000 today, and increased our head
count in Texas, from 26,000 in 2015 to 32,000
today. This trend will likely continue.
Sometimes this can be a disaster for a city. I am
reminded that in the 1970s, nearly half of the 125
Fortune 500 companies based in New York City
left. While mergers accounted for some depar
tures, the price of doing business in New York
City accounted for most: cost of taxes, office
rents, labor and so on. No city — or company or
country — has a divine right to success.
24
24
SPECIFIC ISSUES FACING OUR COMPANY
We need to keep everything in motion, break
down bureaucracy, and leverage our trusted
brand and technological edge to win in every
market where opportunity exists. I do believe
that we have everything in motion for continu
ous progress.
Teams require great platforms across
the company.
While there is an unbelievable need for speed,
these teams can’t all build their own systems.
They need to rely on a common language,
common tools and interoperability. Therefore,
certain platforms (e.g., for data, AI, coding,
financial and CRM systems) need to be compa
nywide and easily deployed, which may mean
they are necessarily large. Before they are
deployed, it may require consensus that they
are the best platform to use. This makes them
reusable and highly efficient. The trick is to have
great platforms without creating bureaucracy
and to build great teams for speed.
Building a lasting, deeply rooted and
common culture is critical — and it
takes an extraordinary amount of effort.
It has been an immense pleasure and honor
running this company. It has also been an
extraordinary amount of hard work, long days
and lots of travel. And I have often wondered
if all of that effort was worthwhile. I have seen
management teams that don’t work as hard or
travel as much and still run a successful com
pany. And I have seen companies that have
multiple cultures and still seem to get by — at
least in the short run. But I do not believe this
company, with its complexity and extraordinary
risk and global reach, could have survived or
thrived that way. When I look back, I do believe
the exceptional effort that we all made really
made a huge difference.
We always enjoy every year musing about man
agement lessons learned — and sometimes
relearned. Sometimes we also discover that we
need to change how we function because the
world (technology, competitors, products,
among other factors) has changed.
It’s essential to organize in small teams
for super speed.
The real competitive battles are fought at the
detailed segment level: It’s not just investment
banking or the investment banking healthcare
sector; it’s having the right team to win in
healthcare pharma or medical devices. It’s not
just credit card or even affluent brands; it’s the
Chase Sapphire® card. It’s not small business
clients in branches; it’s restaurateurs or law
firms. It’s not digital payments; it’s 24/7 digital
payments with automatic currency conversions.
It’s hundreds of small teams (including technol
ogy, AI, marketing, subject matter experts and
others) attacking specific problems. The teams
needed to tackle these challenges should be
small and authorized with the decision-making
ability to move and act like Navy SEALs or the
Army’s Delta Force. Finally, they need to be
dedicated to the task at hand. Very often when
a management team wants to accomplish
something new, like create a digital account
opening process that cuts across virtually every
area, everyone on the team says, “We’ll get it
done,” meaning they will add it to the long list of
tasks already on their plate. But when efforts
are 1% of a lot of people’s jobs, it will never get
done. You need a team 100% dedicated to the
mission — and everyone else supports them.
Success requires speed, agility and relentless
execution. This is trench warfare; it’s about fight
ing for every inch, moving quickly and getting
things done. Growth comes from out-working
and out-innovating the competition, deploying
our resources strategically and fine-tuning our
initiatives to maximize impact.
II. Management Learnings
MANAGEMENT LEARNINGS
25
Given the breadth of our company, these efforts
take many forms. In addition to constant busi
ness reviews, management meetings, workout
sessions, deep dives, client and employee
lunches, and leadership offsites, our commit
ments are considerable, a sampling of which
may help our shareholders better understand
how we maintain our culture. Here are a few
examples from the
past 10 years
:
The letter to shareholders
, published each
year in the Annual Report, is very clarifying
not just to shareholders but to me, the man
agement team, our employees and the
communities in which we operate. While the
annual letter is a lot of work — both for me
and for many people in the company — it
makes us analyze and answer complex ques
tions, and articulate clearly and concisely
what we are trying to accomplish.
Attending leadership training sessions, of
which we do hundreds, and employee town
halls, of which I
personally hosted more than
60 last year
, has been a significant commit
ment over the last 10 years.
In my travels, I’ve made a total of over
230
international visits
to
46 countries
.
Meetings that our leadership has held with
management, employees, clients, regulators
and government leaders have involved
6,887
flights, 9 million miles
and
372 cities
, again
with extensive meetings in each place.
Wherever I go, I also meet with community
leaders and partners, traveling on average
145 days
a year.
Over the course of each year, JPMorganChase
hosts more than
2,900 global client events
for over
440,000 attendees
. Of those, I
typically host approximately
250
of these
large events around the world. And I always
try to stand out front shaking the hands of
clients as they enter.
This year we will host our
16
th
bus tour, where
we travel off the beaten path to visit branches
and operations centers to see our employees
in action and to meet with clients in their local
communities. Over our first 15 bus tours span
ning 14 years, we have stopped in
39 states
,
with California, Illinois, Minnesota and Wash
ington hosting three tours each. North Dakota
was a first. Last year we hit Mississippi,
Alabama and the Carolinas, the backyard of
some of our biggest competitors. And the bus
has made stops in approximately
75 cities
in the United States. Approximately
24,000
clients
and
30,000 employees
have attended
a bus tour event. Approximately
100 branches
have been visited by bus over the 15 tours.
Each year, one of my other favorite things to
do is travel to our annual
National Achievers
event
—
1,400 strong
— where we recognize
and thank our top branch tellers and personal
bankers for the great job they are doing in
serving our customers. We present awards to
the winners that takes hours — and we all find
it inspiring. It always motivates me to do a
better job for all of them.
Importantly, our travels have included
396
trips to Washington, D.C.,
over the last
decade, visiting regulators, administration
officials and members of Congress approxi
mately 300 times — providing insights,
research, data and, where necessary, a coun
tervailing view, testifying and receiving input,
handling customer complaints and helping
to resolve issues (including big ones like the
failure of First Republic). Not every conversa
tion resulted in agreement or alignment, but
we are committed to being part of the solu
tion. During this time, JPMorganChase has
played a central role, across party lines and
administrations, to support American resil
ience and global safety in moments of stress.
Every year,
350 of our senior leaders
from
around the world gather together to educate
and network with one another, hear from
expert external speakers and internal
colleagues about business segments and
innovations, and prepare with a common
purpose for the year ahead.
MANAGEMENT LEARNINGS
26

This hard work is also fun as we celebrate our
successes, and it is extremely informative as
we learn from employees and customers about
what we could do better. These extensive efforts
and travel drive continuous improvement and
inform how we educate our people to treat one
another and our clients and deal with problems.
One last note: Wherever I go, I get to observe
our employees around the world getting to know
our people in other parts of the firm and seam
lessly collaborate with one another for the ben
efit of JPMorganChase and our clients. It’s
gratifying to see this exceptional company in
action.
One of the most rewarding parts of the bus trip
for us is riding alongside some of our front-line
employees — our bankers and advisors. Their
perspective and advice on how we can do a
better job are invaluable. And, boy, do we get a
lot of advice — over the years, there have been
hundreds of specific recommendations, which
we implement as appropriate.
We want to make this drive toward continuous
improvement a part of the fiber of every person
at our firm.
JPMorganChase is a powerful neural
network.
Recently, I was blown away by the presentations
of several of our executives (at a senior leaders’
meeting) and by the level of collaboration across
every segment — consumer, private bank,
investment bank, commercial bank and others.
There’s a sense of momentum: I feel like we’ve
got everything in motion and that we’re attack
ing our problems in multiple ways. If the senior
leaders ever feel we’re too bureaucratic or slow,
they speak up. Our challenge to them is: “Don’t
wait. Get stuff done; get it fixed.” We need to
make it an “always-on” process of streamlining
and bureaucracy-busting.
In effect, with all of this “culture building,”
JPMorganChase is its own strong “neural
network”— powerful and healthy connections
between
our people. People usually look at
investment as capital expenditures, but in many
ways, our investment is in the intelligence of our
people and their healthy connections. They
need to perform like a well-functioning sports
team. This network and the knowledge, talents
and brainpower of our people, dedicated to the
purpose of serving clients, create the capabili
ties that we have today, which would be very
difficult to replicate.
A good culture is hard to create and easy to
lose so you have to fight for it every day — with
a little bit of grit, courage and an open mind.
MANAGEMENT LEARNINGS
27
We must remain clear-eyed: As good — or bad
— as things feel now, we must necessarily
always be prepared for all possibilities, including
the possibility of some really tough times ahead.
We do this so that our company is prepared to
serve all of our clients, including governments
around the world, regardless of the turn of
events.
To do this, we look at many increasingly large
and complex factors — such as geopolitics and
wars, energy prices, trade and economic rela
tions, political polarization, large global deficits
and high asset prices, among others. We look
at both short-term factors that will likely affect
us in the ensuing 12 months and the complex
factors that may affect us in the current year
and in
future
years.
We manage “through the cycle.”
On Investor Day, our Chief Financial Officer
showed what our returns would look like under
various scenarios. Some of these examples
reflect historical economic events. For instance,
the worst-case scenario (a very bad recession)
assumes front-end rates cutting to floor levels,
the stock market dropping 40%, credit losses
doubling and volumes dropping significantly.
Even then, our return on tangible common
equity would still be approximately 10%. It’s also
worth remembering that the firm didn’t lose
money in any single quarter during the great
financial crisis — a period whose stresses are
similar to those modeled for the Fed’s annual
CCAR test. We are very disciplined in using both
actual historical scenarios and very detailed
economic models, but we know they do not
and cannot accurately predict the future.
We often talk about our “through-the-cycle”
target returns of 17% return on tangible common
equity. By through the cycle, we mean that there
will be times when returns will be better than
that, and there will be times when they will be
worse. We are often asked why we don’t raise
that target since we have exceeded it for
numerous years. It’s good to put this number
in context. Compared with the returns of our
10 major competitors, this return has been
exceeded only 9% of the time over the last
10 years.
Many factors are dramatically different
in the global economic and financial
system than in 2010 — many better but
some possibly worse.
Before I talk about risks specifically, it’s helpful
to recognize that the world’s economy is far
larger and more diversified and far less reliant
on energy as an input versus 20 years ago.
Global energy consumption to the global gross
domestic product (GDP) is only about 40% of
what it was around 45 years ago, say in the early
1980s, and the United States, instead of being
a major importer on a net basis, is now a major
exporter. All of this may very well mean that the
economy is more resilient and less vulnerable
to some of the factors I am going to discuss. It
is also good to remember that the United States
remains the world’s best investment destina
tion, particularly when things are going badly.
If you look at the table on the next page, there
are a few items that are truly different now from
what they were in 2010, and these may well lead
to different and unexpected outcomes. To name
a few: The global debt and equity markets are
far bigger than before (as are global deficits).
Many nonbank financial institutions and inves
tors are dramatically bigger than they were
in the past (think hedge funds, private equity
funds, sovereign wealth funds, among others).
Global foreign portfolio investments are far
bigger than before, and a large stock of U.S.
Treasuries owned by foreigners is not held by
III. Managing in a Time of
Increasing and Complex Risks
MANAGING IN A TIME OF INCREASING AND COMPLEX RISKS
28
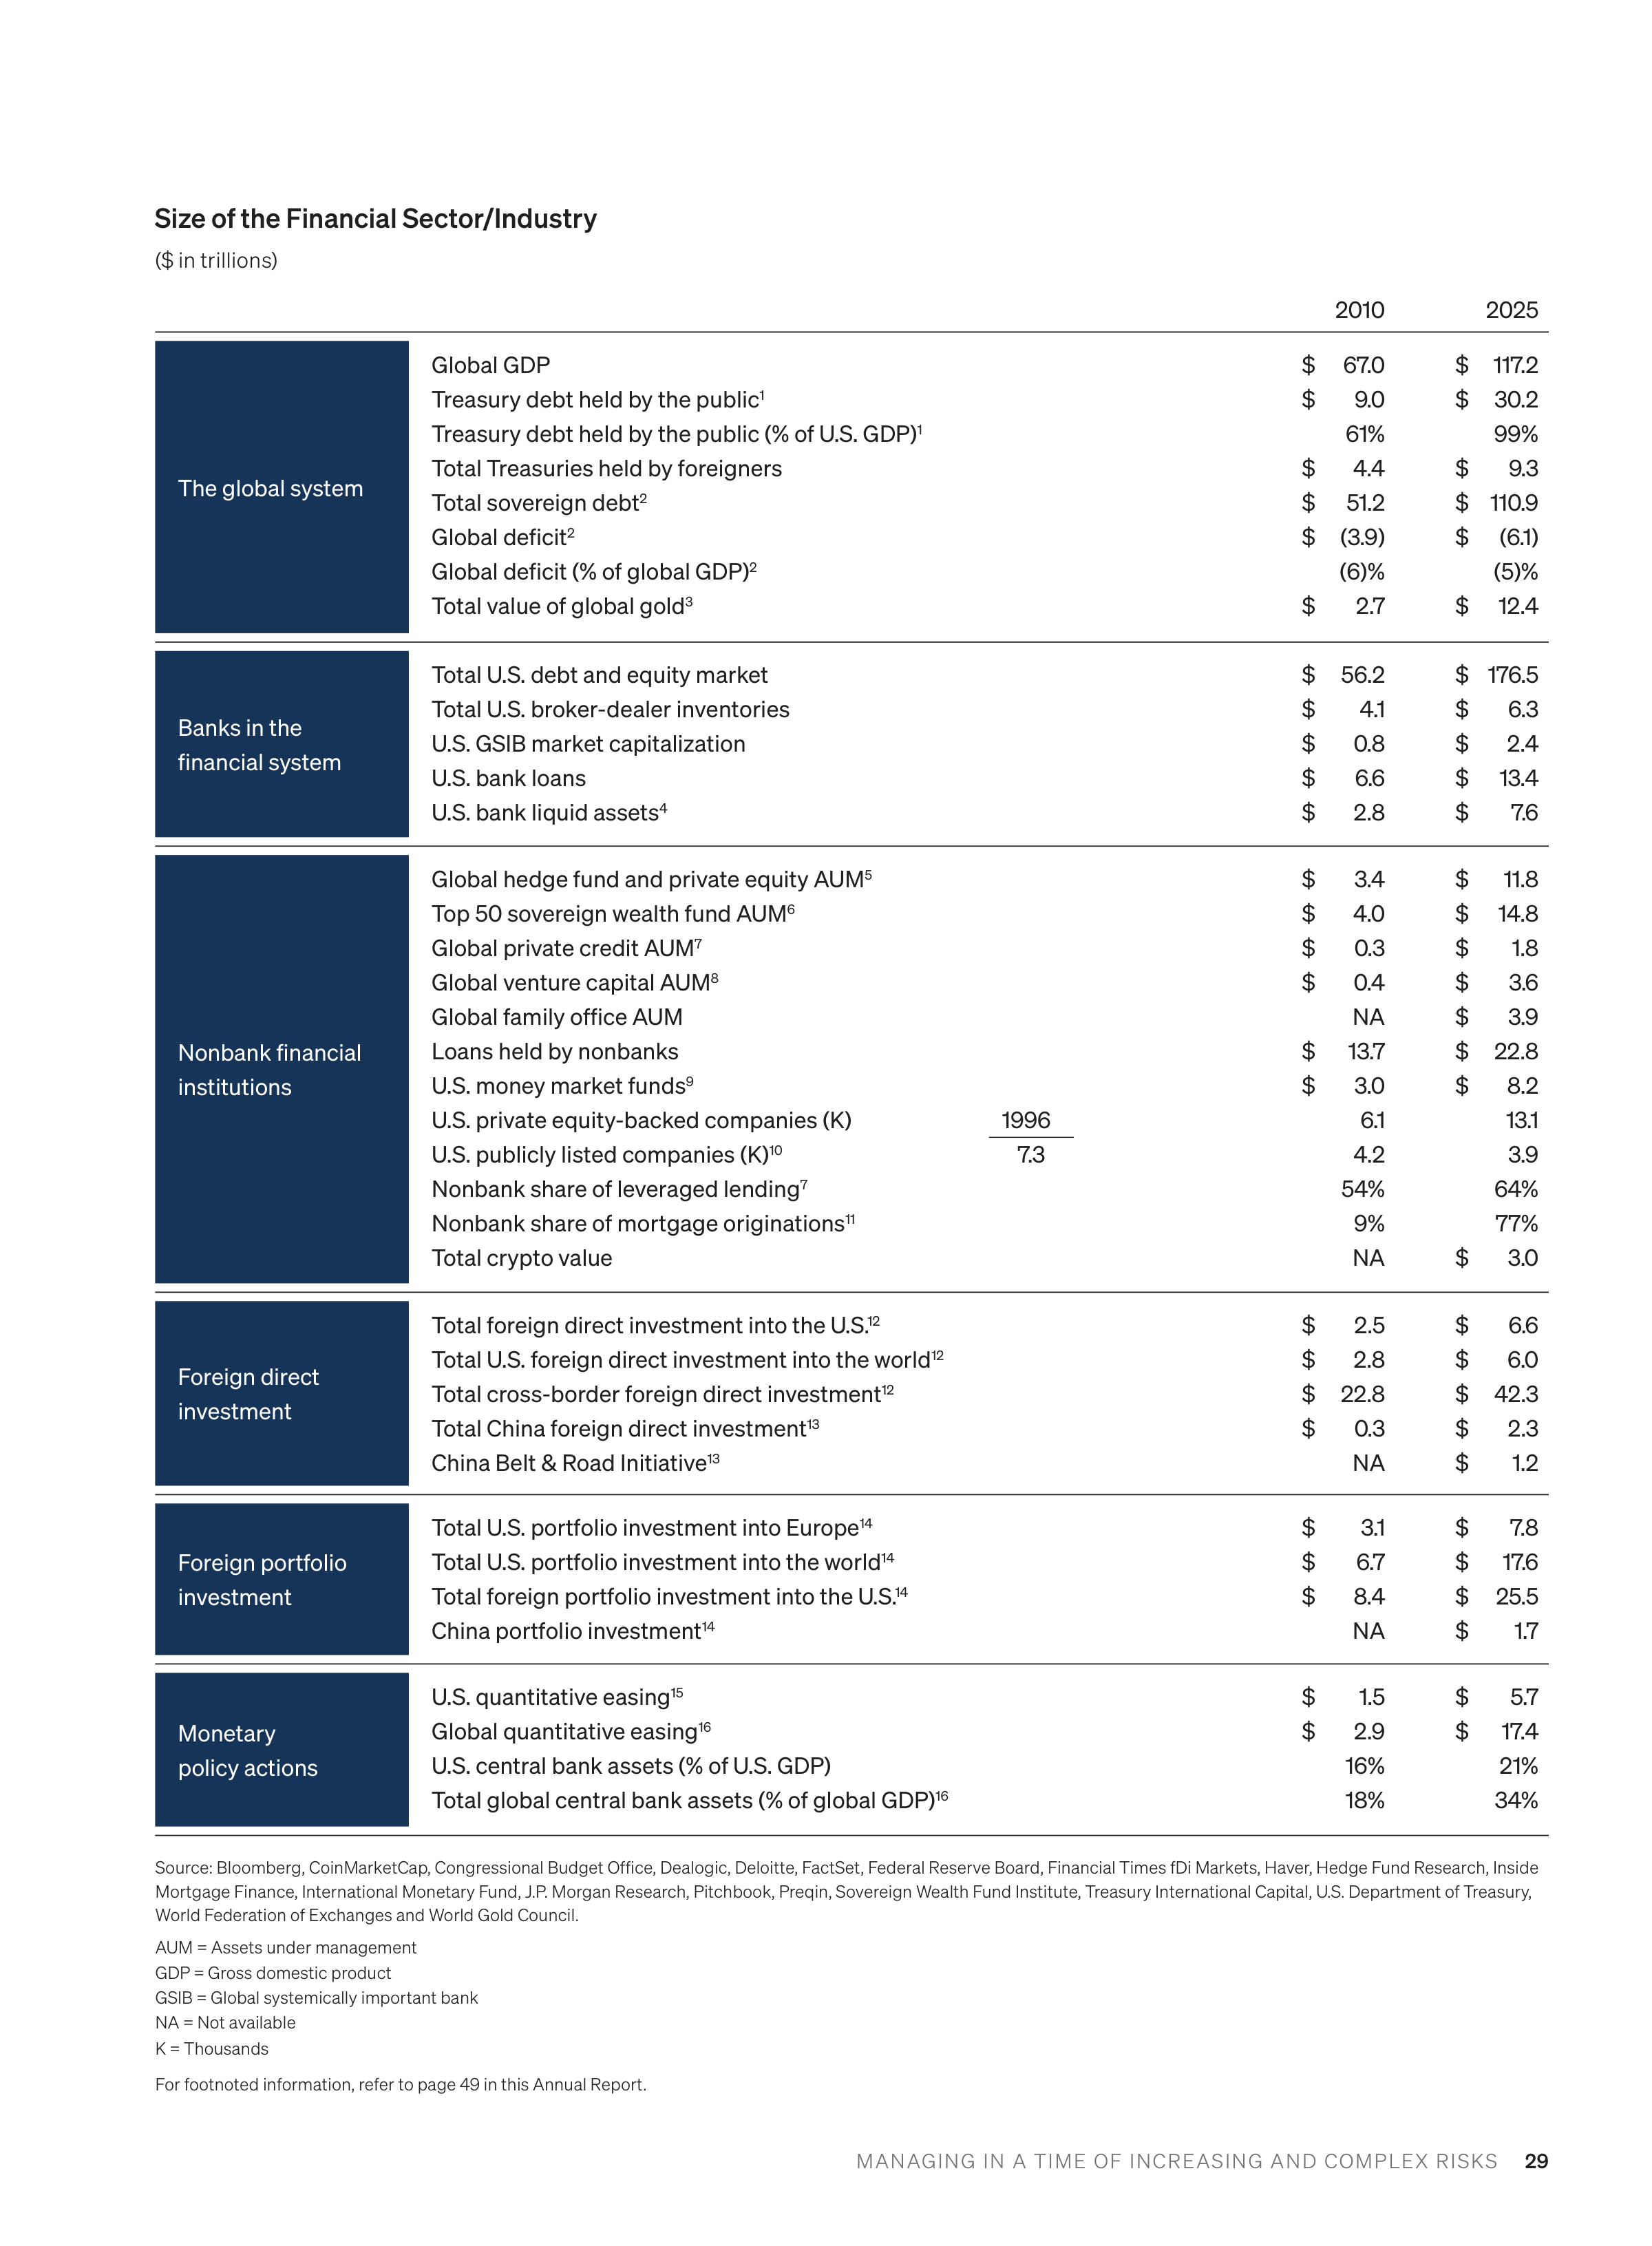
MANAGING IN A TIME OF INCREASING AND COMPLEX RISKS
29
2010
2025
The global system
Global GDP
Treasury debt held by the public
1
Treasury debt held by the public (% of U.S. GDP)
1
Total Treasuries held by foreigners
Total sovereign debt
2
Global deficit
2
Global deficit (% of global GDP)
2
Total value of global gold
3
$
67.0
$
9.0
61%
$
4.4
$
51.2
$
(3.9)
(6)%
$
2.7
$
117.2
$
30.2
99%
$
9.3
$ 110.9
$
(6.1)
(5)%
$
12.4
Banks in the
financial system
Total U.S. debt and equity market
Total U.S. broker-dealer inventories
U.S. GSIB market capitalization
U.S. bank loans
U.S. bank liquid assets
4
$
56.2
$
4.1
$
0.8
$
6.6
$
2.8
$ 176.5
$
6.3
$
2.4
$
13.4
$
7.6
Nonbank financial
institutions
Global hedge fund and private equity AUM
5
Top 50 sovereign wealth fund AUM
6
Global private credit AUM
7
Global venture capital AUM
8
Global family office AUM
Loans held by nonbanks
U.S. money market funds
9
U.S. private equity-backed companies (K)
U.S. publicly listed companies (K)
10
Nonbank share of leveraged lending
7
Nonbank share of mortgage originations
11
Total crypto value
1996
7.3
$
3.4
$
4.0
$
0.3
$
0.4
NA
$
13.7
$
3.0
6.1
4.2
54%
9%
NA
$
11.8
$
14.8
$
1.8
$
3.6
$
3.9
$
22.8
$
8.2
13.1
3.9
64%
77%
$
3.0
Foreign direct
investment
Total foreign direct investment into the U.S.
12
Total U.S. foreign direct investment into the world
12
Total cross-border foreign direct investment
12
Total China foreign direct investment
13
China Belt & Road Initiative
13
$
2.5
$
2.8
$
22.8
$
0.3
NA
$
6.6
$
6.0
$
42.3
$
2.3
$
1.2
Foreign portfolio
investment
Total U.S. portfolio investment into Europe
14
Total U.S. portfolio investment into the world
14
Total foreign portfolio investment into the U.S.
14
China portfolio investment
14
$
3.1
$
6.7
$
8.4
NA
$
7.8
$
17.6
$
25.5
$
1.7
Monetary
policy actions
U.S. quantitative easing
15
Global quantitative easing
16
U.S. central bank assets (% of U.S. GDP)
Total global central bank assets (% of global GDP)
16
$
1.5
$
2.9
16%
18%
$
5.7
$
17.4
21%
34%
Source: Bloomberg, CoinMarketCap, Congressional Budget Office, Dealogic, Deloitte, FactSet, Federal Reserve Board, Financial Times fDi Markets, Haver, Hedge Fund Research, Inside
Mortgage Finance, International Monetary Fund, J.P. Morgan Research, Pitchbook, Preqin, Sovereign Wealth Fund Institute, Treasury International Capital, U.S. Department of Treasury,
World Federation of Exchanges and World Gold Council.
AUM = Assets under management
GDP = Gross domestic product
GSIB = Global systemically important bank
NA = Not available
K = Thousands
For footnoted information, refer to page 49 in this Annual Report.
Size of the Financial Sector/Industry
($ in trillions)
central banks (central banks are less likely to
make dramatic changes in their holdings of U.S.
Treasuries). In addition, global QE is far bigger
than it ever was before. A change in sentiment
could easily affect the global flow of investments
into securities, including U.S. Treasuries. You
can also see that brokerage inventories are far
smaller as a percentage of investments than
ever before and, as a result, market makers are
less able to intermediate in extremely volatile
markets.
More broadly, as we think about how these new
conditions relate to one another, it’s good to
keep three things in mind: 1) It seems to me
that while people frequently overreact to often-
inaccurate short-term weekly and monthly data,
their forecasts are generally small modifications
versus current conditions, 2) while the economy
may be less fragile than in the past, this alone
does not mean there is no “tipping point” — it
just may mean it could take more straws on the
camel’s back to get there and 3) often it is an
unexpected confluence of events that causes
a “tipping point.” The convergence of rapidly
increasing oil prices and inflation is frequently
viewed as among the main causes of the very
large 1974 and 1982 recessions. Also, human
nature has
not
changed — sentiment and
confidence can change rapidly and drive
the markets.
Liquidity itself is a complex concept and can
also change with sentiment. Often when people
talk about liquidity, they are talking about the
ability to readily buy or sell in the marketplace,
e.g., when spreads are high and volumes are
low, this would be considered low liquidity.
Sometimes people are referring to the money
supply. Money can be created by the central
bank when it buys securities or by banks when
they expand their balance sheets. In both cases,
they create deposits (more liquid assets) in the
short run. But all investors, from individuals to
companies to major asset managers and banks,
have their own liquidity needs and require
ments, usually driven by their policy or regula
tory policy, working capital requirements, col
lateral needs and sentiment (for example, the
desire to be more conservative). When asset
prices drop and all of these other factors
change, the “need for liquidity” can change
dramatically, too. When people get scared, they
generally sell risky assets to buy safe ones,
e.g., essentially T-bills or deposits at safe banks.
And when they sell risky assets, they usually
start with their most liquid positions.
While the most important outcome we should
all hope for now is proper resolution of the cur
rent wars and, ultimately, peace on Earth, we
do need to understand and track the economic
effects of all the risks we mentioned. A bad
confluence of events generally causes various
degrees of a recession, which is accompanied
by high credit losses and volatile markets, lower
asset prices and higher unemployment rates,
though recession would happen in different
ways in different places. What might vary is
inflation. There are some scenarios that would
result in a recession, which generally reduces
inflation, and other scenarios that would lead to
a recession with inflation (stagflation — where
inflationary forces overcome deflationary ones).
The skunk at the party — and it could happen in
2026 — would be inflation slowly going up, as
opposed to slowly going down. This alone could
cause interest rates to rise and asset prices to
drop. Interest rates are like gravity to almost all
asset prices. And falling asset prices at one
point can change sentiment rapidly and cause
a flight to cash.
MANAGING IN A TIME OF INCREASING AND COMPLEX RISKS
30
There are lots of tailwinds helping us
in 2026.
While there are many larger risks, as discussed
in the next section, that may or may not impact
the economy in 2026, we do know several
things that will have a positive impact on the
economy in the remainder of this year. They are:
Increasing fiscal stimulus from the One Big
Beautiful Bill. Our economists believe this will
inject another $300 billion (effectively 1% of
GDP) into the economy. This has to be very
modestly inflationary this year.
Benefits from the Fed’s purchase of $40
billion of additional securities each month,
which is supposed to be reduced to $20
billion–$25 billion this April. At a minimum,
this supports asset prices and helps ensure
there is no liquidity squeeze in the financial
system.
Positive effects of comprehensive deregula
tory policies. This was badly needed and
long overdue. Change is clearly evident in
bank regulations that will free up capital and
liquidity, which can be lent out (and we
already see this happening), and in deregula
tion across many other industries, from
energy to home building. It is fair to say that
actions taken have clearly increased confi
dence and animal spirits. This should add to
productivity and be modestly deflationary
this year.
Huge increase in AI-driven capital spending
and construction by the five hyperscalers.
In 2025, this number was $450 billion, and in
2026, it will be approximately $725 billion.
While AI will clearly drive productivity, which
is generally good for inflation in the long run,
all of this spending is probably inflationary in
the short run.
Some of the items above have mild inflationary
effects, while others probably have some defla
tionary effects.
There are large risks still in front of us
that are multi-year and unresolved.
I think some of the larger risks are much like
tectonic plates, always moving and periodically
causing earthquakes and volcanoes when they
crash into each other. Some of the larger risks
we should keep our eyes on are:
First and foremost, geopolitics.
Russia’s
war in Ukraine and its ongoing sabotage in
Europe and now the war in Iran and its poten
tial effects on energy prices can cause
events that are unpredictable. We all hope
these wars get properly resolved. But war is
the realm of uncertainty, as each side in a war
determines what it wants to do (as is often
said, “the enemy gets a vote”), and these
conflicts involve many countries. Not only do
they have a major impact on the nations at
war, but they also have an impact on coun
tries and economies across the globe that
are not directly involved in war. Nations that
are heavily dependent upon imported energy
are already seeing the effects. And it’s not
just energy, it’s commodity products that are
byproducts of oil and gas, like fertilizer and
helium. And given our complex global supply
chains, countries are experiencing disrup
tions in shipbuilding, food and farming,
among others. The outcome of current geo
political events may very well be the defining
factor in how the future global economic
order unfolds — then again, it may not.
High global sovereign deficits and debt.
Global deficits are significantly elevated,
particularly during what has been a relatively
healthy global economy and, until recently,
a time of peace — the deficit globally is at an
extremely high 5%, while global sovereign
debt is at all-time highs. The current forecast
from the Congressional Budget Office has
our debt-to-GDP ratio going from 100% today
to 120% in 2036. High government debt is
somewhat offset by low consumer debt,
which was nearly 100% of GDP in 2007 and is
now below 70%. Similarly, corporate debt is
at a fairly normal healthy level of 45%. High
and increasing government debt will eventu
ally have to be dealt with — the right way
would be to deal with it now before it
becomes a problem; the wrong way would
MANAGING IN A TIME OF INCREASING AND COMPLEX RISKS
31
be to let it become a crisis, which, in my
opinion, is probably the likely outcome.
Importantly, almost 60% of government
spending is for entitlements and is not
discretionary. This makes the job that much
harder. A crucial note on the
importance of
growth
: If interest rates went down 100 basis
points and GDP grew at 3%, the debt-to-GDP
ratio could actually start to go down instead
of going up.
High asset prices and very low credit
spreads.
In and of itself, this is not a bad
thing. Household net worth as a percentage
of GDP is now 560%. The high during the
housing peak in 2006 was 460%. But this
also means that anything less than positive
outcomes could have a dramatic impact on
global markets. Rapidly decreasing asset
prices can sometimes create a self-reinforc
ing loop. It’s always good to remember that
prices are set by the
marginal
buyers and
sellers — which, on the average day, is only
a small fraction of asset owners. And it’s also
good to remember that foreigners own
almost $30 trillion of U.S. equities and bonds.
While U.S. investments and the U.S. dollar
are generally havens of security in a troubled
world, that didn’t stop recessions and bad
markets in prior times.
Trade 2.0.
The U.S. tariffs themselves had
only minor effects on inflation or growth, and
were only one straw on the camel’s back. But
the trade battles are clearly not over, and it
should be expected that many nations are
analyzing how and with whom they should
create trade arrangements. This is causing
a realignment of economic relations in the
world. While some of this is necessary for
national security and resiliency, which are
paramount, it is hard to figure out what the
long-term effects will be.
U.S. and China relations.
This relationship
is critical to the whole world and is also
impacted by the events mentioned above.
The United States and China clearly have dif
ferent systems, values, goals and objectives,
and while both sides are currently engaging,
we have to expect that there will be some
bumps in the road — maybe even some large
ones. We should all hope that ongoing proper
engagement continues to lead to what may
be a competitive but peaceful future.
Private credit and credit in general.
The lever
aged private credit market totals $1.8 trillion.
As a comparison, the U.S. high yield bond
market totals $1.5 trillion, and the bank syndi
cated leveraged loan market totals $1.7 trillion.
Taking a wider view, the total market size of
investment grade bonds is $13 trillion. And the
total market value of all residential mortgage
securities and loans is also $13 trillion. In the
great scheme of things, private credit proba
bly does not present a systemic risk.
I do believe that when we have a credit cycle,
which will happen one day, losses on all lev
eraged lending in general will be higher than
expected, relative to the environment. This
is because credit standards have been mod
estly weakening pretty much across the
board; i.e., more aggressive and positive
assumptions about future performance
(called add-backs), weaker covenants, more
use of PIK (payment-in-kind; not paying inter
est in cash but accruing it), more aggressive
private ratings (particularly in insurance
companies) and more arbitrage (not always a
great sign). Also, by and large, private credit
does not tend to have great transparency or
rigorous valuation “marks” of their loans —
this increases the chance that people will sell
if they think the environment will get worse
— even if actual realized losses barely
change.
MANAGING IN A TIME OF INCREASING AND COMPLEX RISKS
32

Additionally, actual losses right now are
already a little higher than they should be,
relative to the environment. Finally, if rates or
credit spreads ever go up, the companies
that borrowed will have to borrow at even
higher rates, putting them under even
greater stress. However this plays out, it
should be expected that at some point insur
ance regulators will insist on more rigorous
ratings or markdowns, which will likely lead
to demands for more capital.
It has always been true that not everyone
providing credit is necessarily good at it.
There are many players who are late to this
game, and it should be expected that some
credit providers will do a far worse job than
others. We have not had a credit recession in
a long time, and it seems that some people
assume it will never happen.
Additionally, anything that gets sold to retail
investors as opposed to institutional inves
tors requires greater transparency, higher
standards and fewer potential conflicts.
If anything ever goes wrong, you should
assume that retail investors, even though
they were told about some of the risks, will
seek remedy in the courts. Also, some of
these loans go into various funds run by the
asset management company. Generally,
each of these funds has its own objectives
and its own fiduciary responsibility to make
sure that the loans are suitable for that spe
cific fund. Those who do not do this properly
are likely to get into trouble.
Private markets.
With stock markets at all-
time highs in recent months, it is a little sur
prising that private equity firms, which own
close to 13,000 companies, have not taken
greater advantage of healthy markets to take
their companies public. Private equity invest
ments are now held for an average of seven
years — this is virtually double what it used
to be. And some are sold, not to another
company or taken public, and put in a new
fund called a continuation fund. We have
generally had nothing but a bull market since
the great financial crisis — it’s hard to imagine
what will happen if and when we have an
extended bear market.
Cyber risk.
I have to mention this because it
remains one of our biggest risks, and this is
probably true for many other major indus
tries and corporations. AI will almost surely
make this risk worse. We invest significantly
to protect ourselves and stay vigilant.
All in all, there are lots of moving parts and
potential straws that might be added to the
poor camel’s back. We are watching closely and
hoping for the best. We always try to be pre
pared and vigilant and also recognize that
tough times can create good opportunities.
MANAGING IN A TIME OF INCREASING AND COMPLEX RISKS
33

leaders, community stakeholders and govern
ment officials worked together to successfully
address the city’s economic decline. We see
this same need for collaboration to help address
challenges related to our national education
system, job creation, skills development and
virtually anything related to realizing the
American Dream. America will be far stronger
if more Americans prosper.
The scale, brain
power and resources that institutions like
ours can bring to bear on these challenges
can be extraordinary.
We at JPMorganChase feel an enormous
responsibility to our nation and many others —
and we remind ourselves that many companies
will only thrive if their countries thrive. With the
right policies and committed actions, the United
States will maintain the strongest military and
strongest economy, and will remain the bastion
of freedom and the arsenal of democracy. (An
important side note: This is also essential to
maintaining the U.S. dollar as the world’s
reserve currency.) In spite of all our extraordi
nary blessings, the United States needs to get
stronger and tougher to make this true — no
country has a divine right to success.
We have met big challenges before. At one
point in 1940, only one nation, the United King
dom, stood against the Nazi war machine, which
had already conquered most of Western
Europe. The United States was unprepared for
what was going to happen but rose to the chal
lenge. You may find it uplifting to read the book
Freedom’s Forge
, which shows how the United
States came together to build the arsenal
of freedom and to keep the world safe for
democracy.
We need the world’s strongest military
— what we can do to help: our new
Security and Resiliency Initiative.
The ongoing war in Ukraine, the conflict
between Iran and both the United States and
Israel, and other major hostilities across the
globe should permanently dispel the illusion
There are three critical issues that will ultimately
determine the health and safety of the United
States and possibly determine the future direc
tion and strength of the free and democratic
world. JPMorganChase and its employees —
like all other businesses and individuals — will
be deeply affected over time by how the United
States succeeds in these areas:
1.
The United States must maintain the premier
military force in the world.
2. The United States must maintain its preemi
nent economic position in the world, which
also requires reigniting the American Dream.
3. The United States must manage its foreign
economic affairs to strengthen the U.S. econ
omy and that of our critical allies
so that the
first two points remain true.
Foundational to accomplishing the three goals
above is that the core strength of the United
States — its deeply held values and principles,
including our commitment to the Constitution
— is constantly nourished and strengthened.
In this section, we also ask and answer the
question: What can we as a company offer in
order to do our part?
JPMorganChase and companies
across the public and private sectors
have an important and unique role in
addressing global challenges.
Many public and private companies and insti
tutions play a vital role in addressing various
critical policy issues. The world is increasingly
complex and polarized, and we need to remain
completely clear-headed. It has become obvi
ous, for example, that many of our largest pol
icy issues cannot be solved by government or
business alone. Our national security clearly
depends not only on the U.S. military but also
on the civilians and companies responsible for
developing equipment and tools critical to our
country’s defense, from ships and planes to
chips and AI. JPMorganChase saw the benefit
of collaboration in Detroit, where business
IV. Critical Issues Facing America
and the World
CRITICAL ISSUES FACING AMERICA AND THE WORLD
34
that the world is safe. Having the world’s best
military is expensive, but it will always be a huge
deterrent to war. Fighting wars is even more
expensive. And losing wars even more so.
I firmly hope that the United States provides
sufficient military and economic support to
help Ukraine prevail in what has become an
extended and bloody war for democracy and
against autocracy. Time will tell whether the
current war in Iran achieves our short-term and
long-term objectives in the region and at what
cost. We should not turn a blind eye to the role
the current regime in Iran has played in foster
ing terrorism and killing thousands of people,
including Americans and many of its own citi
zens, over many years. And that threat must be
addressed in an appropriate manner (by those
who have more intel and knowledge than I do)
— and urgently if Iran ever acquires a nuclear
ballistic missile. Nuclear proliferation remains
the gravest threat to the future of mankind.
The U.S. military umbrella has not only provided
security for our allies and partner countries
since World War II, but it has also provided
safety and stability for non-allied states, includ
ing major countries like India.
We have much to do to ensure we remain the
world’s best military.
While we have the world’s best military and while
congressional oversight is a constitutional
responsibility, the military is often stretched and
hampered by congressional rules, interference,
legislation and short-term budgeting, as well as
by over-consolidation and under-investment in
our defense industrial base. We need to spend
more (and we hope smarter and more efficiently)
on our military and give it the ability to move
faster, unimpeded by politics and bureaucracy.
The United States has also allowed itself to
become too dependent on unreliable sources for
items that are essential to our national security,
such as critical minerals, semiconductors and
advanced manufacturing output, among others.
We have maintained insufficient productive
capabilities to be ready to quickly increase pro
duction if necessary. And our military needs to
be able to rapidly develop new and often cheaper
weapons, like drones. The Pentagon, and in fact
the whole government, is now actively address
ing this problem, but it needs lots of private
sector help.
JPMorganChase is well-positioned to do its part.
That’s why JPMorganChase has launched
the Security and Resiliency Initiative.
This initiative is a $1.5 trillion, 10-year plan to
facilitate, finance and invest in industries critical
to national economic security and resiliency.
As part of this endeavor, we will make direct
equity and venture capital investments, with an
initial amount of $10 billion, to help companies
enhance their growth, spur innovation and
accelerate strategic manufacturing.
We are focusing our efforts on the following
five key areas, supporting companies across
all sizes and development stages by offering
advice, providing financing and, in some cases,
investing capital:
Supply chain and advanced manufacturing
,
including critical minerals, shipbuilding and
robotics, helping ensure access to essential
minerals and gaining dominance in advanced
manufacturing
Defense and aerospace
, including defense
technology, autonomous systems, drones,
next-generation connectivity and secure
communications, helping defend our nation
Energy independence and resilience
,
including battery storage, grid resilience
and distributed energy, helping build energy
systems to meet the increased demand of
technologies like AI and data centers
Frontier and strategic technologies
, including
AI, cybersecurity and quantum computing
Pharmaceuticals and health technologies
,
including medicines, essential medical
supplies, devices and technology
CRITICAL ISSUES FACING AMERICA AND THE WORLD
35
The initiative will also include special, thematic
research focused on private industries and
supply chain weaknesses like rare earths, AI
and technology. It will be complemented by
the firm’s recently launched JPMorganChase
Center for Geopolitics, which provides us and
clients with timely analysis and insights on top
global trends.
Policy is essential, too. So our objectives will
include designing practices that can accelerate
these efforts, including research and develop
ment (R&D), permitting reform, rapid and multi-
year procurement, and regulations conducive to
growth. As our firm intensifies its focus on those
industries essential to our nation’s security and
resiliency, we will also continue to work closely
with our community and business partners to
champion these enterprises, foster talent and
support skills training to ensure companies can
fill critical jobs.
Since the launch of our Security and Resiliency
Initiative at the end of 2025, the response has
been nothing short of remarkable. We have
received more than 750 business opportunities
from company leaders and government officials
across critical sectors. To handle this momen
tum, we are assembling a dedicated 30+ person
SRI global banking and investment team (sup
ported by much of the rest of the company) with
the experience and vision necessary to drive
meaningful impact.
In addition, we announced the formation of an
external advisory council composed of experi
enced leaders and exceptional thinkers from
both the public and private sectors (from mili
tary generals to former secretaries of state and
defense to business executives and CEOs) to
help guide the SRI’s direction and strategy.
I have the privilege of chairing this council,
which recently convened in person in Washing
ton, D.C., alongside many of JPMorganChase’s
top leaders.
Building on advice from the advisory council, we
are hosting our inaugural Defense Action Forum
this month. Unlike typical industry conferences,
our forum is designed to foster collaboration
and generate practical solutions that drive
meaningful change. The sessions will bring
together leading experts to explore the pivotal
role that the private sector can play in ensuring
our nation’s enduring strength and security. We
hope to make some real progress, which will be
shared broadly.
Our SRI work is more comprehensive than
American security alone. This initiative will
continue to be extended, as appropriate, to
other allied nations. The SRI can help allied and
partner countries and companies as they make
the investments and reforms necessary to play
a more active role in our nations’ common
defense needs.
The foundation of America’s strength
is predicated on remaining the
preeminent economy in the world —
what we can do to help: promote
growth policies.
Over the last 20 years or so, U.S. GDP has
averaged about 2% annually — I believe we
could have easily achieved at least 3% growth.
The reason we were able to grow 2% is that
America’s businesses and entrepreneurial spirit
allowed us to overcome a lot of the roadblocks
mentioned later in this section. That 1% differ
ence would have had an enormous impact,
providing Americans with an extra $20,000
GDP per person annually, giving us resources
to take care of nearly all our problems and
jump-starting deficit reduction. Growth is part
of the solution to almost all of our problems.
Achieving such growth also would help restore
trust in our government.
Good policy drives growth, helps all citizens
and has the virtue of being fundamentally
free.
Good policy matters and is at the heart of
sustainable progress. It’s policy, policy,
policy. We’re committed to engaging with
policymakers, supporting sound regulation,
and advocating for growth and security.
CRITICAL ISSUES FACING AMERICA AND THE WORLD
36
We’re investing in strong policy teams and
backing our positions with rigorous analysis.
We have a responsibility to help shape the right
policies, not just for our company but for the
country and the world.
In the
Sturm und Drang
of today’s politics, you
mostly hear about simplistic solutions like rais
ing taxes, taxing the rich and cutting expenses,
but as any businessperson knows, you should
always be asking, “How are you doing with what
you have?” Our inefficiencies, red (and blue)
tape and lack of analysis stifle our growth and
almost always hurt the poor the most. But there
are so many things that could be done that
could make everything better — for all citizens.
And these things would be virtually free.
There are some very basic things that
hamper our growth and really need to
be fixed.
I am going to mention a few damaging policies,
not in detail because I’ve written about them in
the past, but if they aren’t corrected, real prog
ress may be impossible.
Fraud, waste and abuse.
These areas likely
cost U.S. taxpayers many hundreds of bil
lions of dollars annually (according to the
Government Accountability Office). In many
cases, the government does not even have
basic controls in place to manage this waste,
like any good company would. It offends
people and causes them to lose trust in
their government.
Inefficiencies within the federal government
(and within state and local governments,
too).
Every government department should
have detailed budgeting, planning and
analytics; for example, every agency should
be answering this question: “What is the
output of all the money you gave me?” And
writing clearer, more effective legislation
would lessen regulatory overreach and
reduce the ability of political parties to inter
pret the law the way they see fit. Technology
and AI should begin to make this kind of
waste of taxpayers’ money inexcusable,
and the government will have to adapt to
embrace these new technologies.
Mortgage and regulatory policies and local
housing requirements.
Excessive rules
around mortgages (servicing, origination
and securitization) have pushed most of the
mortgage business out of banks and have
increased the cost of mortgages by 20–30
basis points. Mortgage regulatory reform
alone would make the mortgage business far
safer and generate an additional 500,000
mortgages a year.
Local zoning requirements often limit afford
able housing and make it much more expen
sive. In addition, there are many examples of
excellent public/private affordable housing
programs, which only need to be replicated.
Fixing these regulations would go a long way
to helping people achieve this part of the
American Dream.
Red and “blue” tape, permitting reforms and
a little litigation reform.
Some politicians
think that all regulations are good — the more
the better. Given that many of these politicians
come from the blue side of America’s red-blue
divide, I think it’s more appropriate to call
excessive regulation “blue tape.” We should
aim for “good” regulations, continuously
improved, to both protect the public and
reduce costs. You probably need to have
real-life experience in dealing with regulations
to understand this.
Permitting and many associated regulations
take too long and not only extend the dura
tion of a project but also increase the cost
and sometimes stop projects from beginning.
Many countries, including Canada and
Singapore, have successfully introduced pol
icies to dramatically reduce permitting time.
Proper federal, state and local regulations,
along with permitting reform, are necessary
to reduce delays and legal bottlenecks. Mini
mizing “blue” tape — excessive regulatory
and related litigation costs — would make it
easier, cheaper and faster to build infrastruc
ture such as roads, schools, bridges, energy
facilities and housing. A little common sense
would go a long way.
CRITICAL ISSUES FACING AMERICA AND THE WORLD
37
One last point: Excessive regulations make
it much harder to start a new business, and
they often reduce competition. And they
almost always hurt smaller companies more
than larger ones.
Policy uncertainty.
Legal, regulatory and tax
policies swing dramatically with changes in
administrations. This definitely reduces the
propensity for companies to invest and hire
employees.
Unreliable R&D policies.
We also need policy
certainty around research and development.
Government, businesses and universities are
all essential to our country’s R&D. On the
government side, this includes the Defense
Advanced Research Projects Agency, the
National Aeronautics and Space Administra
tion, and the National Institutes of Health,
among others. Businesses need consistent
tax policy for R&D; universities need consis
tent funding policy. The government is
directly responsible for R&D that no one else
can afford and that has been fundamental to
the country’s success. Government funding
of universities has made possible extraordi
nary discoveries, including many of our new
technologies. Businesses, in turn, use these
new technologies and perform their own
research to create new products and ser
vices. This system has been critical to the
incredible innovation machine of America.
Failure to recognize that capital formation
drives growth.
Central to growth in a country
and growth of its GDP are capital formation
and disciplined capital allocation. Countries
that do not promote capital formation,
including those that tolerate policies inhibit
ing capital formation, fail to thrive. Globally
competitive taxes and policy certainly are
critical for capital formation. Other good
policies include strengthening active capital
markets, tax incentives for capital expendi
tures and R&D, and savings and pension
plans (we support the new “Trump Accounts”
that, over time, will give all Americans an
economic stake in America) that incent
investment in equities, venture capital and
other investments.
CRITICAL ISSUES FACING AMERICA AND THE WORLD
38
2025 estimate
1
Businesses (K)
# of small businesses
2
# of large businesses
3
38,000
22
Employment (M)
# of employees working at small businesses
2
# of employees working at large businesses
3
64
78
R&D (T)
Total spend by businesses
% by large businesses
3
$0.8
80%
CapEx (T)
Total CapEx
% by 1,000 largest U.S. public companies
4
$2.2
70%
1 2025 is projected based on published surveys for prior years, internal JPMorganChase estimates and proprietary
assumptions. Actual results may differ materially.
2 Small businesses defined as companies with fewer than 500 employees, including nonemployers.
3 Large businesses defined as companies with 500 employees or more.
4 Based on companies included in the Russell 1000 Index.
Source: Bloomberg, Annual Capital Expenditures Survey (ACES), U.S. Census Bureau; Business Enterprise Research and
Development (BERD) Survey, National Center for Science and Engineering Statistics and U.S. Census Bureau; FactSet;
Nonemployer Statistics (NES), U.S. Census Bureau; and Statistics of U.S. Businesses (SUSB), U.S. Census Bureau.
CapEx = Capital expenditures
K = Thousands
R&D = Research and development
M = Millions
T = Trillions
Capital Expenditures, Employment and R&D for Small and Large Businesses
There are also some good examples found
in other countries. In Sweden, an investment
savings account is available that simplifies
the investing process with favorable tax
treatment. Account holders can deposit and
withdraw funds at any time, and there is no
capital gains tax — just an annual tax of 1%
on the balance. This has dramatically
increased investment by retail investors into
the Swedish stock market. It may surprise
some of our readers that Sweden’s policies
have created a growing and innovative stock
market and that Sweden has more unicorns
and billionaires per person than America
does. Another example is Australia, which
has a wonderful retirement policy based on
superannuation, a savings account funded
by both employer and employee
contributions.
We must recognize that capital formation
drives capital expenditures and R&D, and
large companies lead the way: 80% of R&D is
done by large companies; and 70% of capital
expenditure comes from the largest 1,000
public companies. This is what drives pro
ductivity and GDP-per-person growth. And
small business and big business are symbi
otic. When a bigger company builds a bil
lion-dollar plant that creates 5,000 jobs, it
may also generate 25,000 jobs surrounding
the facility. These jobs are often small busi
nesses that are developed to support the
plant and those who live nearby.
People often refer to financialization of the
economy as a bad thing — and if they mean
pure speculation, then I understand. But a
country that is a barter economy effectively
has no financial assets. As capital formation
takes place, financial assets, including
stocks, bonds and loans, are created, which
represent all the investment. And as a coun
try grows and continually reinvests in higher
productivity, there will be more financial
assets per person. While the market value
of those assets may fluctuate, the growth in
financial assets is very good.
Reigniting the American Dream is
essential to strengthening our country:
taking three specific steps can help.
The American Dream itself rests upon our pro
viding, as best we can, equal opportunity to all
our citizens. Education and jobs are still the
best way to achieve this. Much of our education
system no longer truly meets our country’s
promise that its students graduate with the
skills they need to attain a good job.
In a number of our inner city and rural high
schools, under 50% of the students graduate,
and those who do often don’t have the skills
they need to hold a well-paying job. Increas
ingly, poverty has become intergenerational.
High schools and colleges should be judged
by their outcomes — do the students
graduate with job offers, and what do they
pay?
The growth of America was always driven by
productivity that matched capital investment
with skills, which is also the driver of individual
income. Fortunately, to fix our problems, all we
need to do is reorient what we do today. No
investment is required. It is essentially free; we
just need to redirect existing resources (the
United States spends almost $1 trillion a year
on K–12 education) into better outcomes.
We know exactly what to do, though systems
change is hard. There are millions of jobs avail
able for which training could be done in high
school, community college or special programs
outside of school. For example, there are train
ing programs lasting 12–24 weeks in computer
science, advanced manufacturing, cyber, data
science, program management, and nursing
and healthcare-related areas, among others.
These trainings should be certified and counted
as credits for an undergraduate or graduate
education. Many unions run excellent appren
ticeship and training programs that certify
workers for badly needed high-skilled jobs like
welding, electrical work, plumbing and others.
These jobs can pay well in excess of $100,000
a year.
CRITICAL ISSUES FACING AMERICA AND THE WORLD
39
The federal government should use its consid
erable power to ask every school to report on
the jobs and income levels that their students
achieve when they leave school. This alone
would put tremendous pressure on schools
to become accountable — everyone would be
seeking out best practices so as not to be left
behind. I would even consider tying teacher
and administrator compensation to these goals.
We should double the Earned Income Tax
Credit, which raises the income of our
lowest-paid citizens, creates better social
outcomes and has the virtue of incenting
employment.
It is clear that, over the decades, the income
levels of low-wage workers have not kept up
with general growth and overall salaries despite
the fact that their work is still essential. It is also
clear that in any economy, there are groups of
people who are struggling to get ahead.
Approximately 23% of American workers make
less than $17 an hour. And close to 10% have
an income of $20,000 a year or less, partially
because they only have part-time jobs. Some
surveys show that over 60% of workers today
are living paycheck to paycheck, that hourly
workers have less predictable incomes and
that 35% of households with incomes below
$50,000 spend 95% on necessities — these
conditions are likely very stressful for many
families. We need to fix this.
Dramatically expanding the Earned Income
Tax Credit (EITC) does not help everyone, but it
would go a long way in helping those who need
it most. The tax code could play an important
role in easing the stress of individuals and fami
lies at the bottom of the economic ladder. One
way the code could incentivize labor force par
ticipation is to expand and reform the EITC. The
EITC gives an individual earning $18,000 a year
with two children a maximum tax credit of
$7,152 (and with no children a maximum tax
credit of $649). The average EITC across all
recipients is approximately $2,900, and close to
20% of eligible taxpayers don’t apply. I would
double this tax credit and remove the child
requirement. I would effectively make it a nega
tive monthly income tax as opposed to a year-
end credit. (It’s also important that any tax
credit and social benefits program be properly
phased in so it is both fair and it doesn’t dis-
incent work.)
While this would cost a lot of money, it has many
excellent virtues. It would give those with lower
income far more money to spend, without
government interference, on what they and
their families need — education, food, better
housing and so on. And much of it would be
spent locally, in lower-income neighborhoods.
This plan has the benefit of both rewarding work
and bringing more people into the workforce,
which would grow GDP. Jobs not only bring dig
nity but better social outcomes in terms of less
homelessness and crime, improved health out
comes and more household formation, among
other upsides. For many people, that first job
is just the first rung on the ladder of a career.
I have little doubt that this plan would more than
pay for itself over time. Many Republicans and
Democrats support this proposal as it helps to
create the American Dream for many people.
Now that we have strong border control,
we should finish proper immigration reform.
Uncontrolled immigration is highly disturbing
to affected populations around the world and
reduces the ability to manage legal and needed
immigration. In the United States, the number of
immigrants has increased by more than 60%
over the last 25 years. Since we have finally
gained control of our borders, I believe most
Americans would support the following:
increasing merit-based immigration, allowing
anyone who earns a degree here to stay, ensur
ing there are proper visas for seasonal workers,
enabling children born in this country to remain
and providing a rigorous path to citizenship for
law-abiding, undocumented immigrants.
Healthy and proper immigration would bring
great talent to our country and has been shown
to actually help grow the economy. There are
over 150,000 foreign students who receive a
degree annually in science, technology, engi
neering or math but have no guaranteed way of
staying here for the long term, although many
would choose to do so. Most students from
CRITICAL ISSUES FACING AMERICA AND THE WORLD
40
countries outside the United States pay full
freight to attend our universities, but many are
forced to take the skills they learned here back
home. From my vantage point, that means one
of our largest exports is brainpower.
The last time we had major immigration reform
was in 1986 under President Reagan. There
have been two times in the last 20 years when
Congress almost passed an immigration reform
bill that looks a lot like what I outlined above.
Let’s just get it done this time.
The Congressional Budget Office estimated
that the failure to pass immigration reform is
costing us 0.3% of GDP a year. Immigration has
been one of the great strengths of this country
— we should never forget that.
Good U.S. foreign economic policy
ensures that America is first (though
not alone) — it strengthens the U.S.
economy and that of our critical allies.
The goal of U.S. economic foreign policy should
be twofold (after protecting national security):
1.
Maximize the growth and competitiveness
of America — both in the United States and
for our companies doing business
internationally.
2. Simultaneously strengthen our allies
economically and bind them closer to the
United States and like-minded Western
democracies.
Economic weakening of the world’s democra
cies or a fragmentation of their economic bonds
could lead to truly adverse consequences. This is
precisely what some of our adversaries and many
autocratic nations want — it is their stated objec
tive. They would like to see all of our allies far less
dependent on the United States and therefore far
more dependent on them. In this scenario, many
countries would be compelled to seek deeper
economic bonds with some possible bad actors
— over time, they could become vassals of these
countries and unable to avoid coercion from
them. The following are a few ideas on how we
can promote healthy economic engagement
(and combat unfair trade) while strengthening
both our own and our allies’ economies. And I will
leave you with one big, bold idea.
There are many ways to promote good U.S.
foreign economic policy.
America’s ties with the rest of the world are
already extensive (see U.S. global foreign direct
investment and portfolio investment), and the
levers to accomplish our foreign policy goals
extend to tax policy (and our international com
petitiveness), investment policy and trade pol
icy, which encompass tariffs, quotas, regulatory
barriers, immigration policies and so on. While
tariffs have certainly “brought people to the
table” and have allowed us to start to correct
some of our past bad trade practices, we need
to look at U.S. foreign economic policy compre
hensively. The ultimate goal should be to create
a system with our allies of stability and consis
tency, in addition to fairness and mutual benefit.
Not only should our foreign economic policy
help us grow as a nation, but it should also help
other countries grow. For example, the United
States has the best capital markets in the world,
large and small, public and private, and we have
already described how proper capital formation
and allocation are key to America’s vibrant
economic system. Another goal of our foreign
economic policy should be to help other coun
tries develop their capital markets. In addition,
there are excellent economic policies found
elsewhere in the world, and we should emulate
them to help more countries thrive.
Even the proper use of strategic communica
tions can foster entrepreneurship and the
universal principles of freedom, which will also
drive growth and prosperity.
The United States does not do enough to foster
American business expansion overseas, partic
ularly in complex parts of the world. Most other
nations, China in particular, encourage the
growth of their companies overseas. China,
through their Belt & Road Initiative and basic
foreign direct investment (see Size of the
Financial Sector/Industry chart on page 29),
has massively invested, particularly in emerg
ing and developing countries around the world.
America has recently begun to expand its
development finance institution and its
Export-Import Bank to help U.S. businesses
grow overseas. This should be encouraged.
CRITICAL ISSUES FACING AMERICA AND THE WORLD
41
However, the worst outcome to trade’s evolution
over the past several decades is that Americans
have become too dependent on some non
aligned foreign countries for many things
essential to our national security and resiliency.
This extends, as mentioned previously, from
rare earths to the manufacturing of semicon
ductors. Unfortunately, we need industrial
policy to remedy this.
America already trades with more than 200
countries and territories. We should strike the
best — and, of course, the most fair — trade
agreements that we can. We can do this while
maintaining our close economic relations with
our allies.
Industrial policy has become a necessary
tool now, but it should be done right. It
should be limited and market-based.
Unfortunately, we need industrial policy to guar
antee our national security and resiliency. And it
also could be used to combat unfair mercantilist
policies around critical industries. These policies
uniquely could be completely
unilateral
.
Industrial policy mechanisms, when used,
should be as targeted and as simple as possi
ble. They come in many guises: grants, cheap
loans, equity investing, purchase agreements
and others. The cleanest of these is tax credits
in various forms. Whatever the policy, two rules
should not be violated: (1) there should be no
social engineering — this is not a jobs program
(the Jones Act meant to preserve jobs in the
Merchant Marine has basically destroyed our
Merchant Marine and merchant ship building
business) and (2) for the most part, the market
should allocate capital, not the government.
Industrial policy can easily devolve into a
buffet where corporate America gorges at the
expense of the taxpayer. While there are certain
circumstances that require the government
to allocate capital (think infrastructure and
national security), generally the government is
simply not good at allocating capital in a free
market. America does best not with central
planning but with consistent and clear policies
that are conducive to growth.
We need to combat unfair trade — and
strive for free and fair trade.
For hundreds of years, countries have used
trade practices to get a leg up on other coun
tries. This economic competition is often exer
cised through industrial and trade policy, and it
comes in many forms: banning or limiting trade
(quotas), tariffs, subsidies, grants, tax credits
or accelerated depreciation, loan guarantees,
long-term purchase agreements and capital
controls. There are also other unfair trade prac
tices that need to be mentioned; e.g., nontrade
barriers, such as regulations that effectively
stop specific types of trade and various unfair
tax policies that range from value-added taxes
to a particular country’s tax schemes. Practices
such as permitting countries to circumvent
trade restrictions imposed on them — for exam
ple, allowing any country to use agreements it
has with other nations to bypass tariffs on their
goods — can and should be stopped.
All of these trade practices are generally used
as tools to give a company or an industry an
unfair competitive advantage, and when used
together, they can create unbeatable econo
mies of scale. In their harshest form, trade prac
tices can be used by countries as a tactic to try
to unfairly dominate whole industries. This
should not be allowed.
Trade agreements have many flaws and need to
be carefully negotiated. Had the World Trade
Organization done its job well, we would not
have such serious trade issues — it is in need
of serious reform. Obviously, where the United
States is treated unfairly, we should demand
that those agreements be fixed. It would also be
good to acknowledge that we have sometimes
treated others unfairly (for example, parts of the
Inflation Reduction Act unfairly favor American
business).
We also need to acknowledge that there have
been real negative job impacts as a result of
trade (in 1990, there were 18 million jobs in
manufacturing in this country versus 13 million
today), which are usually concentrated around
certain geographic areas and businesses. The
loss of these jobs also had a serious negative
effect on social outcomes, including depres
sion, divorce and others.
CRITICAL ISSUES FACING AMERICA AND THE WORLD
42
The reason we need industrial policy is because
many of the things we need to do for national
security would fail without government support.
It just needs to be designed wisely. The ques
tion, however, is: What conditions require indus
trial policy and what guardrails are needed so
the policy does not grow unchecked and distort
the free market?
Trade is increasingly complex, and the
United States needs to stay deeply
engaged.
Trade is very complex and constantly changing.
I have no doubt that other nations will be thinking
about their future trade policies as they try to
adjust to demands from both the United States
and China, as well as weigh their own national
security needs. It is in our country’s interest that
our allies remain economically tied to the United
States. Many nations have joined, or are negoti
ating to join, large transregional free trade
groups. Europe, for goods, is already essentially
one, and the European Union (EU) signed a free
trade agreement with India and the EU-Mercosur
Partnership Agreement, a large free trade agree
ment with Argentina, Brazil, Paraguay and
Uruguay. The Comprehensive and Progressive
Agreement for Trans-Pacific Partnership is
another large free trade agreement between
12 countries in the West and Indo-Pacific. Being
excluded from an increasing number of these
free trade agreements will, over time, weaken
America’s competitiveness and companies. It
will also mean that America will not have a seat
at the table when policies, strategies and proc
esses are being established. Therefore, I believe
formulating trade agreements should be drawn
up
alongside
our allies if possible.
America needs Europe to succeed — and
it’s currently on a bad path.
It is very hard to predict the future, and even
when we analyze history, hindsight is not 20/20.
We still analyze the disintegration of the Roman
Empire, the British Empire, the Chinese Empire
and the failures after World War I that led to
Nazi Germany. However, there are major trends
that we should study — they are like shifting
tectonic plates that can determine the future
course of history.
I believe we are staring one in the face: the slow
but constant decline and fragmentation of
Europe. Europe is entering a decisive decade,
and it is unable to act. The EU was an extraordi
nary accomplishment — nations coming
together and using political and peaceful
means to settle differences. And this after
a millennium of terrible wars. It worked, but it
only went halfway. Europe never finished the
economic union (see the Draghi report), which
meant that European countries constantly
underperformed economically. This has led to
their GDP relative to the United States going
from 90% in the year 2000 to approximately
70% today. This fragmentation remains a
structural drag on competitiveness. As former
European Central Bank President Mario Draghi
has noted, internal EU market barriers function
like “hard tariffs” of approximately 45% for
manufacturing and 110% for services. Those
barriers reflect not a failure of ambition but
rather a failure of integration. This has led to
a lack of scale for their major businesses and
a lack of mobility for both capital and people.
EU nations also created whole new layers of
bureaucracy that reduced innovation, growth
and investment among other things. This will
continue unless European leaders dramatically
change course. If they don’t, they will eventually
be unable to afford their social safety nets,
restrengthen their nations’ militaries and grow
their economies. The EU is currently home to
world-class companies, deep pools of savings
and a talented workforce. But without new EU
direction, their major global companies will
weaken, faced with very strong American and
Chinese competition. The ultimate loser in all
this will be Europe and all its citizens — and it
will hurt the United States as well.
Europe and America are each other’s largest
trade partners at $2 trillion a year. The United
States and Europe remain the twin engines of
the world economy, with the transatlantic rela
tionship reaching a record $9.8 trillion in 2025.
While America and Europe do have real differ
ences, we believe that a stronger Europe,
militarily and economically, is in America’s
self-interest.
CRITICAL ISSUES FACING AMERICA AND THE WORLD
43
Europe needs to rebuild its military and its
defense industrial base.
Almost all European countries have dramati
cally increased their budgets to strengthen
their militaries — all allies now meet or exceed
their current North Atlantic Treaty Organization
(NATO) commitments. We can and should clarify
and reaffirm NATO’s goals and mission. The
goal should be to end up with a far stronger
NATO and fit for purpose.
Yet Europe’s defense industrial base is still not
fit for purpose. This is as much an economic
and industrial challenge as a military one. The
continent needs enduring production capacity,
coordinated procurement and dual-use manu
facturing that serves both commercial and
defense sectors.
Europe’s defense will also benefit from main
taining the deep interconnectedness with the
United States that has anchored Euro-Atlantic
security for decades. Efforts to grow Europe’s
defense industrial base should avoid measures
— such as strict “Buy European” content
requirements — designed to favor EU suppliers
but that end up shutting out U.S. firms and, with
them, the small- and medium-sized suppliers
that many European defense manufacturers still
rely upon.
Europe will have a hard time competing with the
United States on the large-scale production of
certain very advanced military capabilities, like
nuclear submarines, advanced airplanes, mili
tary intelligence and satellites among others.
They should rely on our country for this, which
means we need to be totally reliable. European
nations should focus on the types of things they
can build very effectively, like drones, tanks,
armaments and others. They do, however, need
to do this efficiently — not inefficiently. They do
this now by, for example, building 14 different
types of tanks all over the continent. The military
equipment of NATO needs to be interoperable.
While they need several manufacturers to
compete to build most types of equipment,
they should not have so many that it’s highly
inefficient. And while the successful manufac
turers can have plants in different countries,
this should not be treated as a jobs creation
program.
Finally, a transatlantic approach to some
defense production — such as RTX’s partner
ship with Germany’s Diehl Defence on air
defense systems — will deliver more scale,
more interchangeability and more capability
than any go-it-alone model.
We need one big, beautiful trade deal for
Europe.
The United States should do whatever it can
to help — or even push — Europe to take all
necessary steps to reverse its decline and
strengthen its economy. We should support
them to act on what is in their own self-interest:
adopting the reforms in the Draghi report. For
example, strengthening the EU’s internal mar
ket structure — through completion of the Capi
tal Markets Union and Banking Union — would
be transformative for Europe’s ability to scale
and compete. A more integrated financial
system would unlock investment for strategic
industries; enhance stability and reduce frag
mentation costs; enable more European banks
to compete globally; and make the continent a
more attractive environment for foreign firms.
For companies like ours, it would create tougher
competition (which in the long run is good), but
it would also enable us to serve clients more
efficiently across borders — lowering complex
ity, improving capital allocation and, ultimately,
increasing growth.
I know this is a long shot, but we could offer
Europe one unbelievable inducement: If it
commits to economic and military reforms, the
United States would negotiate
one big, beautiful
free trade agreement with all of Europe
. If I
could, I would throw in similar action with
Australia, Japan, the Philippines, South Korea
and other nations. This would be an economic
and geopolitical home run for the United States
and for Europe, allowing us to set the global
rules around trade (if you want to access to over
40% of the world’s market), and it would bind
Western allies together in the face of autocratic
pressure.
We tried this before in the so-called T-TIP
(Transatlantic Trade and Investment Partner
ship) proposal a decade ago. Clearly, it would be
hard to do because we would need to resolve
existing tax and regulatory issues around digi
tal services, as well as extraterritorial regula
CRITICAL ISSUES FACING AMERICA AND THE WORLD
44

“We hold these truths to be self-evident, that all men
are created equal.”
“That they are endowed by their Creator with certain
unalienable Rights, that among these are Life, Liberty
and the pursuit of Happiness.”
“With liberty and justice for all.”
tions around climate reporting (the highly mis
guided Corporate Sustainability Due Diligence
Directive disclosure rules). And of course, we
are all going to have to be a little flexible about
one of the most challenging issues — agricul
ture — but with hard work, all of these concerns
could be resolved. And the benefits would be
enormous. Doing big things is never easy.
Strong American leadership is required —
there is no real alternative.
Some political leaders have said that there is a
“rupture” between America and the Western
world —that the red lines have been crossed
and there is no return to the prior system. I com
pletely disagree. There is no practical replace
ment to the prior system. It has not ruptured,
but it needs reform. The middle-sized nations
do not have real alternatives in terms of building
a unified military or a unified economy that can
compete effectively with the United States and
China. If these middle nations did, the result
would look a lot like what Europe is today:
dysfunctional. The only practical alternative
is to fix the current situation.
The United States and Europe have an extraordi
nary number of commonalities, including values
deeply held. For more than 75 years since the
end of World War II, the United States and Europe
have worked together to resolve most major
global economic or military challenges and in
fighting terrorism and nuclear proliferation. We
need this cooperation for the next 75 years.
I do not want to contemplate the opposite. With
out American leadership, there would be a huge
vacuum. If not us, who? We are the only country
that has the capability to do it. Fragmented
relationships with and among our extensive
allies could lead to an “every nation for them
selves” mentality. America would become more
isolated, the U.S. dollar would no longer be the
world’s reserve currency and autocratic nations
would rejoice. Need I say more?
We need to strengthen our commitment
to the values and virtues that created
America and to the Constitution, which
embeds these values in law.
The Constitution is the legal embodiment of
the values and principles that define America.
We pledge allegiance to the Constitution, but
it’s the values that are the true foundation of
America’s success.
The values we uphold unite us.
Our country’s values transcend any political
stance — libertarian, conservative, progressive,
Democrat or Republican. These values reach
deep into American life: to provide justice and
equal opportunity to all, to try to lift up all of
our citizens, to dedicate to a strong national
defense, to promote free enterprise, to have
freedom of religion, and to respect family,
country, self-reliance, labor and laborers, and
common sense. These values are not mutually
exclusive and should be embraced and upheld
by all of us.
CRITICAL ISSUES FACING AMERICA AND THE WORLD
45

We need to be stronger.
These principles allow individuals to pursue
life as they lawfully see fit. These extraordinary
legal rights come with important civic responsi
bilities. To be able to address our problems at
home and abroad, we must be strong. And our
core strength is based upon our commitment to
our values. If the soul of America is not strong,
then the rest will be weak.
While we should acknowledge America’s flaws,
they should not be used to pull apart our coun
try. We need to believe in ourselves and get
back to work, not tear each other down. Many
of the blind ideologies being bandied about
run counter to our fundamental principles.
Ideologues often adhere to rigid beliefs and,
when extreme, seek to impose those beliefs on
others; in radical forms of fanaticism, there is
no room for individual differences. While we
should listen to all people and all viewpoints,
we should not allow ourselves to become wea
ponized. We should fight blind ideologies, like
anti-Semitism, and any form of racism however
and whenever it rears its ugly head.
I believe we have gotten a little too soft.
Working hard, having ambition, demonstrating
self-responsibility and loving your nation
(particularly this nation) are wonderful qualities.
We need to rededicate ourselves to these
values. Proper civic engagement should better
reflect President Kennedy’s statement, “Ask
not what your country can do for you, but what
you can do for your country.”
We also cannot forget that we have to deal
with the world we have — not the one we want.
Directly related to our values should be our
strong commitment to defending them, includ
ing militarily. Tough minds and realpolitik are
absolutely required in our complex world and
in our global relationships.
It is incumbent on us to educate ourselves,
our fellow citizens and future generations —
starting in grammar school — about American
values, our history and our ongoing pursuit of
a more perfect democracy.
CRITICAL ISSUES FACING AMERICA AND THE WORLD
46


Jamie Dimon
Chairman and Chief Executive Officer
April 6, 2026
In Closing
I hope you are as proud of what we all have achieved — as a business, as a
bank and as a community investor — as I am. I can’t even begin to express
my heartfelt appreciation and respect for the tremendous character and
capabilities of the management team that guided us through the good times
and the bad times to where we stand today. And I recognize that we are
enormously indebted to the achievements of many others who came before
us in building this exceptional company of ours.
We are delighted to have opened our new headquarters in New York City,
which is a beautiful physical manifestation of our company. It is a great example
of how we treat our people with wonderful places to work — in New York City,
across the country and around the world. Our new headquarters also shows
how you can deconstruct something and rebuild it in a powerful way — that’s
good for our colleagues, our clients and our community.
I would also like to express my deep gratitude to the 320,000+ employees,
and their families, of JPMorganChase. Through these annual letters, I hope
shareholders and all readers have gained a deeper understanding of what
it takes to keep your company strong in a rapidly changing world.
Finally, we sincerely hope to see the world on the path to peace and prosperity.
47
Client Franchises Built Over the Long Term
(page 8)
Note: Figures may not sum due to rounding.
1
Certain wealth management clients were realigned from Asset &
Wealth Management (AWM) to Consumer & Community Banking
(CCB) in 4Q20. 2005 and 2015 amounts were not revised in
connection with this realignment.
2
Federal Deposit Insurance Corporation (FDIC) Summary of Deposits
survey per S&P Global Market Intelligence applies a $1 billion
deposit cap to Chase and industry branches for market share. While
many of our branches have more than $1 billion in retail deposits,
applying a cap consistently to ourselves and the industry is critical
to the integrity of this measurement. Includes all commercial banks,
savings banks and savings institutions as defined by the FDIC.
Deposit market share and rankings are calculated with historical
institutional ownership for each year stated.
3
Barlow Research Associates, Primary Bank Market Share Database.
Rolling eight-quarter average of small businesses with revenue
of more than $100,000 and less than $25 million. Barlow’s 2005
Primary Bank Market Share is based on companies with revenue of
more than $100,000 and less than $10 million.
4
Total payments transaction volume includes debit and credit card
sales volume and gross outflows of ACH, ATM, teller, wires, BillPay,
PayChase, Zelle, person-to-person and checks.
5
Digital noncard payment transactions include outflows for ACH,
BillPay, PayChase, Zelle, real-time-payments (RTP), external
transfers and digital wires, excluding credit and debit card sales.
2005 is based on internal JPMorganChase estimates.
6
Sales share based on 2025 sales peer disclosures, JPMorganChase
estimates, and excludes private label and Commercial Card.
7
Outstandings share based on 2025 loans outstanding peer
disclosures, JPMorganChase estimates, and excludes private label,
Citi Retail Cards and Commercial Card.
8
Represents the total number of open credit cards, inclusive of
primary cardholders and authorized users.
9
Represents users of all web and/or mobile platforms who have
logged in within the past 90 days.
10 Represents users of all mobile platforms who have logged in within
the past 90 days.
11
Measures satisfaction with wealth management websites and
apps. Learn more: jdpower.com/awards.
12
Inside Mortgage Finance, Top Owned Mortgage Servicers as of
4Q25.
13
Measures customer satisfaction with the mortgage servicing
experience. Learn more: jdpower.com/awards.
14 Experian Velocity data as of full year 2025. Reflects financing
market share for new and used loan and lease units at franchised
and independent dealers.
15
Measures satisfaction with automotive finance websites and apps.
Learn more: jdpower.com/awards.
16
Coalition Greenwich Competitor Analytics (preliminary for full year
2025). Market share is based on JPMorganChase’s internal
business structure, footprint and revenue. Ranks are based on
Coalition Index Banks for Markets. 2006 rank is based on
JPMorganChase analysis.
17
Dealogic as of January 2, 2026, excludes the impact of the UBS/
Credit Suisse merger prior to the year of acquisition (2023).
18 Client deposits and other third-party liabilities pertain to the
Payments and Securities Services businesses.
19
2005 data represents Treasury Services firmwide revenue only. All
other periods include Merchant Services revenue.
20 Coalition Greenwich Competitor Analytics (preliminary for full year
2025) reflects global firmwide Treasury Services business
(Commercial & Investment Bank and Commercial Banking (CB)).
Market share is based on JPMorganChase’s internal business
structure, footprint and revenue. Ranks are based on Coalition
Index Banks for Treasury Services.
21
Data in 2005 column is as of 12/31/2006.
22 Balances represented for 2005 include certain loans in the Markets
business.
Footnotes
23 Prior year rankings based on current active banks – excludes
banks that have been acquired. S&P Global Market Intelligence as
of December 31, 2025.
24 Global Banking is a client coverage view within the Banking &
Payments business and is comprised of the Global Corporate
Banking (GCB), Global Investment Banking (GIB) and CB client
coverage segments. Senior banker includes Vice President and
higher. CB includes bankers and Treasury Management Officers;
GCB and GIB include bankers only.
25 Extel.
26 Represents U.S. dollar payment instructions for direct payments
and credit transfers processed over Society for Worldwide
Interbank Financial Telecommunications (Swift) in the countries
where J.P. Morgan has sales coverage. Market share is based on
internal JPMorganChase estimates as of December 2025.
27 Nilson, full year 2025.
28 Nilson, card-not-present acquiring, full year 2025.
29 Coalition Greenwich Competitor Analytics (preliminary for full year
2025). Rank is based on JPMorganChase’s internal business
structure, footprint and revenue and Coalition Index Banks for
Securities Services (excluding Corporate Trust, Escrow Services
and Clearing & Settlement).
30 In the second quarter of 2025, the Middle Market Banking client
coverage segment was renamed Commercial & Specialized
Industries.
31
There was a change in methodology during 2025 in terms of how
to count Commercial Term Lending clients within Commercial Real
Estate (“CRE”). Client count is now based on Ultimate Parent,
thereby reducing CRE’s overall client count from 38,000 in 2024 to
23,000 for 2025.
32 London Stock Exchange Group – U.S. Traditional Middle Market
Bookrunner, 2025.
33 Percentage of long-term active mutual fund and active
exchange-traded funds (ETF) assets under management (AUM)
in funds ranked in the 1st or 2nd quartile (one, three and five years):
All quartile rankings, the assigned peer categories and the asset
values used to derive these rankings are sourced from the fund
rating providers. Quartile rankings are based on the net-of-fee
absolute return of each fund. Where applicable, the fund rating
providers redenominate asset values into U.S. dollars. The
percentage of AUM is based on fund performance and associated
peer rankings at the share class level for U.S.-domiciled funds, at a
“primary share class” level to represent the quartile ranking for
U.K., Luxembourg and Hong Kong Special Administrative Regional
(SAR) funds and at the fund level for all other funds. The
performance data may have been different if all share classes had
been included. Past performance is not indicative of future results.
“Primary share class” means the C share class for European funds
and Acc share class for Hong Kong SAR and Taiwan funds. If these
share classes are not available, the oldest share class is used as the
“primary share class.” Due to a methodology change effective
September 30, 2023, prior results include all long-term mutual
fund assets and exclude active ETF assets.
34 In the fourth quarter of 2020, the Firm realigned certain wealth
management clients from AWM to CCB. Prior period amounts have
been revised to conform with the current presentation.
35 Traditional assets include Equity, Fixed Income, Multi-Asset and
Liquidity AUM; Brokerage, Administration and Custody assets
under supervision.
36 Alternatives assets include Private Equity, Private Credit, Real
Assets, Hedge Funds, Liquid Alternatives and other nontraditional
assets. Assets calculated using net asset value of investments
(except for certain Real Asset strategies, which use gross asset
value) plus undrawn, committed capital. AUM only for 2005.
48
37 Morningstar, as of December 31, 2025. Count of active mutual
funds and active ETFs rated 4- or 5-stars: Mutual fund rating
services rank funds based on their risk-adjusted performance over
various periods. A 5-star rating is the best rating and represents
the top 10% of industry-wide ranked funds. A 4-star rating
represents the next 22.5% of industry-wide ranked funds. A 3-star
rating represents the next 35% of industry-wide ranked funds.
A 2-star rating represents the next 22.5% of industry-wide ranked
funds. A 1-star rating is the worst rating and represents the bottom
10% of industry-wide ranked funds. An overall Morningstar rating is
derived from a weighted average of the performance associated
with a fund’s three-, five and 10-year (if applicable) Morningstar
Rating metrics. For U.S.-domiciled funds, separate star ratings
are provided at the individual share class level. The Nomura “star
rating” is based on three-year risk-adjusted performance only.
Funds with fewer than three years of history are not rated and
hence excluded from these rankings. All ratings, the assigned peer
categories and the asset values used to derive these rankings are
sourced from the applicable fund rating provider. Where
applicable, the fund rating providers redenominate asset values
into U.S. dollars. The count of funds is based on star ratings at the
share class level for U.S.-domiciled funds and at a “primary share
class” level to represent the star rating of all other funds except for
Japan, for which Nomura provides ratings at the fund level. The
performance data may have been different if all share classes had
been included. Past performance is not indicative of future results.
38 Company filings and JPMorganChase estimates. Rankings reflect
publicly traded peer group as follows: Allianz, Bank of America,
Bank of New York Mellon, BlackRock, Charles Schwab, DWS,
Franklin Templeton, Goldman Sachs, Invesco, Morgan Stanley,
State Street, T. Rowe Price and UBS. JPMorganChase ranking
reflects Asset & Wealth Management client assets, U.S. Wealth
Management investments and new-to-firm Chase Private Client
deposits.
39 Public filings, Morningstar, J.P. Morgan estimates.
40 Bloomberg and FactSet December 31, 2025.
41
iMoneyNet.
42 Global Finance magazine.
Our Fortress Balance Sheet
(page 11)
1
Tangible common equity (TCE) 2005-2007 reflects common
stockholders’ equity less goodwill and other intangibles assets.
2
Basel III Transitional rules became effective on January 1, 2014;
prior-period common equity Tier 1 (CET1) data is based on Basel I
rules. As of December 31, 2014, the ratios represent the more
binding of the Standardized or Advanced approach calculated
under the Basel III Fully Phased-in basis. Capital results reflect the
current expected credit loss (CECL) capital transition provisions
starting in 2020. The 2025 binding capital ratio reflects an
$80 billion downward adjustment for the temporarily elevated
Advanced RWA related to the Apple Card transaction as disclosed
in Capital Risk Management in the Form 10-K.
3
Capital returned to common shareholders includes common
dividends and net repurchases.
4
Includes eligible high quality liquid assets (HQLA) as defined in the
liquidity coverage ratio (LCR) rule and unencumbered marketable
securities, such as equity and debt securities, that the Firm
believes would be available to raise liquidity, including excess
eligible HQLA securities at JPMorgan Chase Bank, N.A. that are not
transferable to nonbank affiliates. For December 31, 2022-2025,
the balance includes eligible end-of-period HQLA as defined in the
LCR rule issued December 19, 2016. For December 31, 2017-2021,
the balance includes average eligible HQLA. Periods prior to 2017
represent period-end balances. December 31, 2016 and 2015
balances are under the initial U.S. rule approved on September 3,
2014. The December 31, 2014 amount is estimated prior to the
effective date of the initial rule and under the Basel III liquidity
coverage ratio (Basel III LCR) for December 31, 2013. Amounts for
December 31, 2005-2012 reflect cash and due from banks,
deposits with banks and investment securities.
JPMorganChase Exhibits Strength in Both Efficiency
and Returns When Compared with Large Peers and
Best-in-Class Peers
(page 12)
1
Bank of America Corporation (BAC), Citigroup Inc. (C), The
Goldman Sachs Group, Inc. (GS), Morgan Stanley (MS) and Wells
Fargo & Company (WFC).
2
Managed overhead ratio = total noninterest expense/managed
revenue; revenue for GS and MS is reflected on a reported basis.
3
Best-in-class overhead ratio of comparable peer business
segments and firms: Bank of America Consumer Banking
(BAC-CB), Goldman Sachs Global Banking & Markets (GS-GBM)
and Northern Trust Wealth Management & Data Warehouse
Solutions (NTRS-WM & DWS). Peer segment overhead ratio is
estimated based on public disclosure, where unavailable.
4
Best-in-class ROTCE of comparable peer business segments and
firms: Bank of America Consumer Banking (BAC-CB), Goldman
Sachs Global Banking & Markets (GS-GBM), Morgan Stanley
Institutional Securities (MS-IS) and Morgan Stanley Wealth
Management & Investment Management (MS-WM & IM). Peer
segment ROTCE is estimated based on public disclosure, where
unavailable.
5
Best-in-class ROTCE of comparable GSIB peer business segments:
Bank of America Consumer Banking (BAC-CB), Goldman Sachs
Global Banking & Markets (GS-GBM), Morgan Stanley Institutional
Securities (MS-IS) and Morgan Stanley Wealth Management &
Investment Management (MS-WM & IM). Peer segment ROTCE is
estimated based on public disclosure, where unavailable.
6
Given comparisons are at the business segment level, where
available; allocation methodologies across peers may be
inconsistent with JPM’s.
Size of the Financial Sector/Industry
(page 29)
1
Congressional Budget Office; reflects end of fiscal year
(September 30).
2
International Monetary Fund (IMF) estimates for general
government as of October 2025 edition of Fiscal Monitor.
3
World Gold Council, Bloomberg and internal JPMorganChase
estimates.
4
Consists of cash assets and Treasury and agency securities.
5
Private Equity assets under management (AUM) includes Balanced,
Buyout, Co-Investment, Co-Investment Multi-Manager, Direct
Secondaries, Growth, Hybrid, private investment in public equity
(PIPE) and Turnaround in closed-end funds only. Excludes Fund of
Funds, Secondaries and venture capital (VC) to avoid the double
counting of funds.
6
Top 50 fund AUM data per Sovereign Wealth Fund Institute (SWFI).
2010 AUM for entities in the top 50 in 2025.
7
Preqin, Dealogic and JPMorganChase Credit Research.
8
Venture Capital AUM includes Early Stage, Venture and Expansion/
Late-Stage Capital in closed-end funds only. Excludes Fund of Funds
and Secondaries to avoid the double counting of funds.
9
U.S. money market fund investment holdings of securities issued by
entities worldwide.
10
NYSE + NASDAQ; excludes investment funds, exchange-traded fund
(ETF) unit trusts and companies whose business goal is to hold
shares of other listed companies; a company with several classes of
shares is only counted once.
11
Inside Mortgage Finance and JPMorganChase internal data; consists
of Top 50 Originators.
12
2025 based on flow data up to 3Q25. Global data preliminary based
on 80 country sub-sample.
13
Financial Times fDi Markets, Dealogic.
14
Data up to 2Q25.
15
Reflects the growth in central bank assets during subsequent
quantitative easing (QE) phases, net of the decline observed during
the balance sheet reduction phase.
16
Global quantitative easing (QE) and global central bank assets are
proxied by the changes and outstanding values of central bank
assets as % of gross domestic product in the following economies:
Australia, Canada, Denmark, Euro Area, Iceland, Japan, New Zealand,
Norway, Sweden, Switzerland, the U.K. and the United States.
49
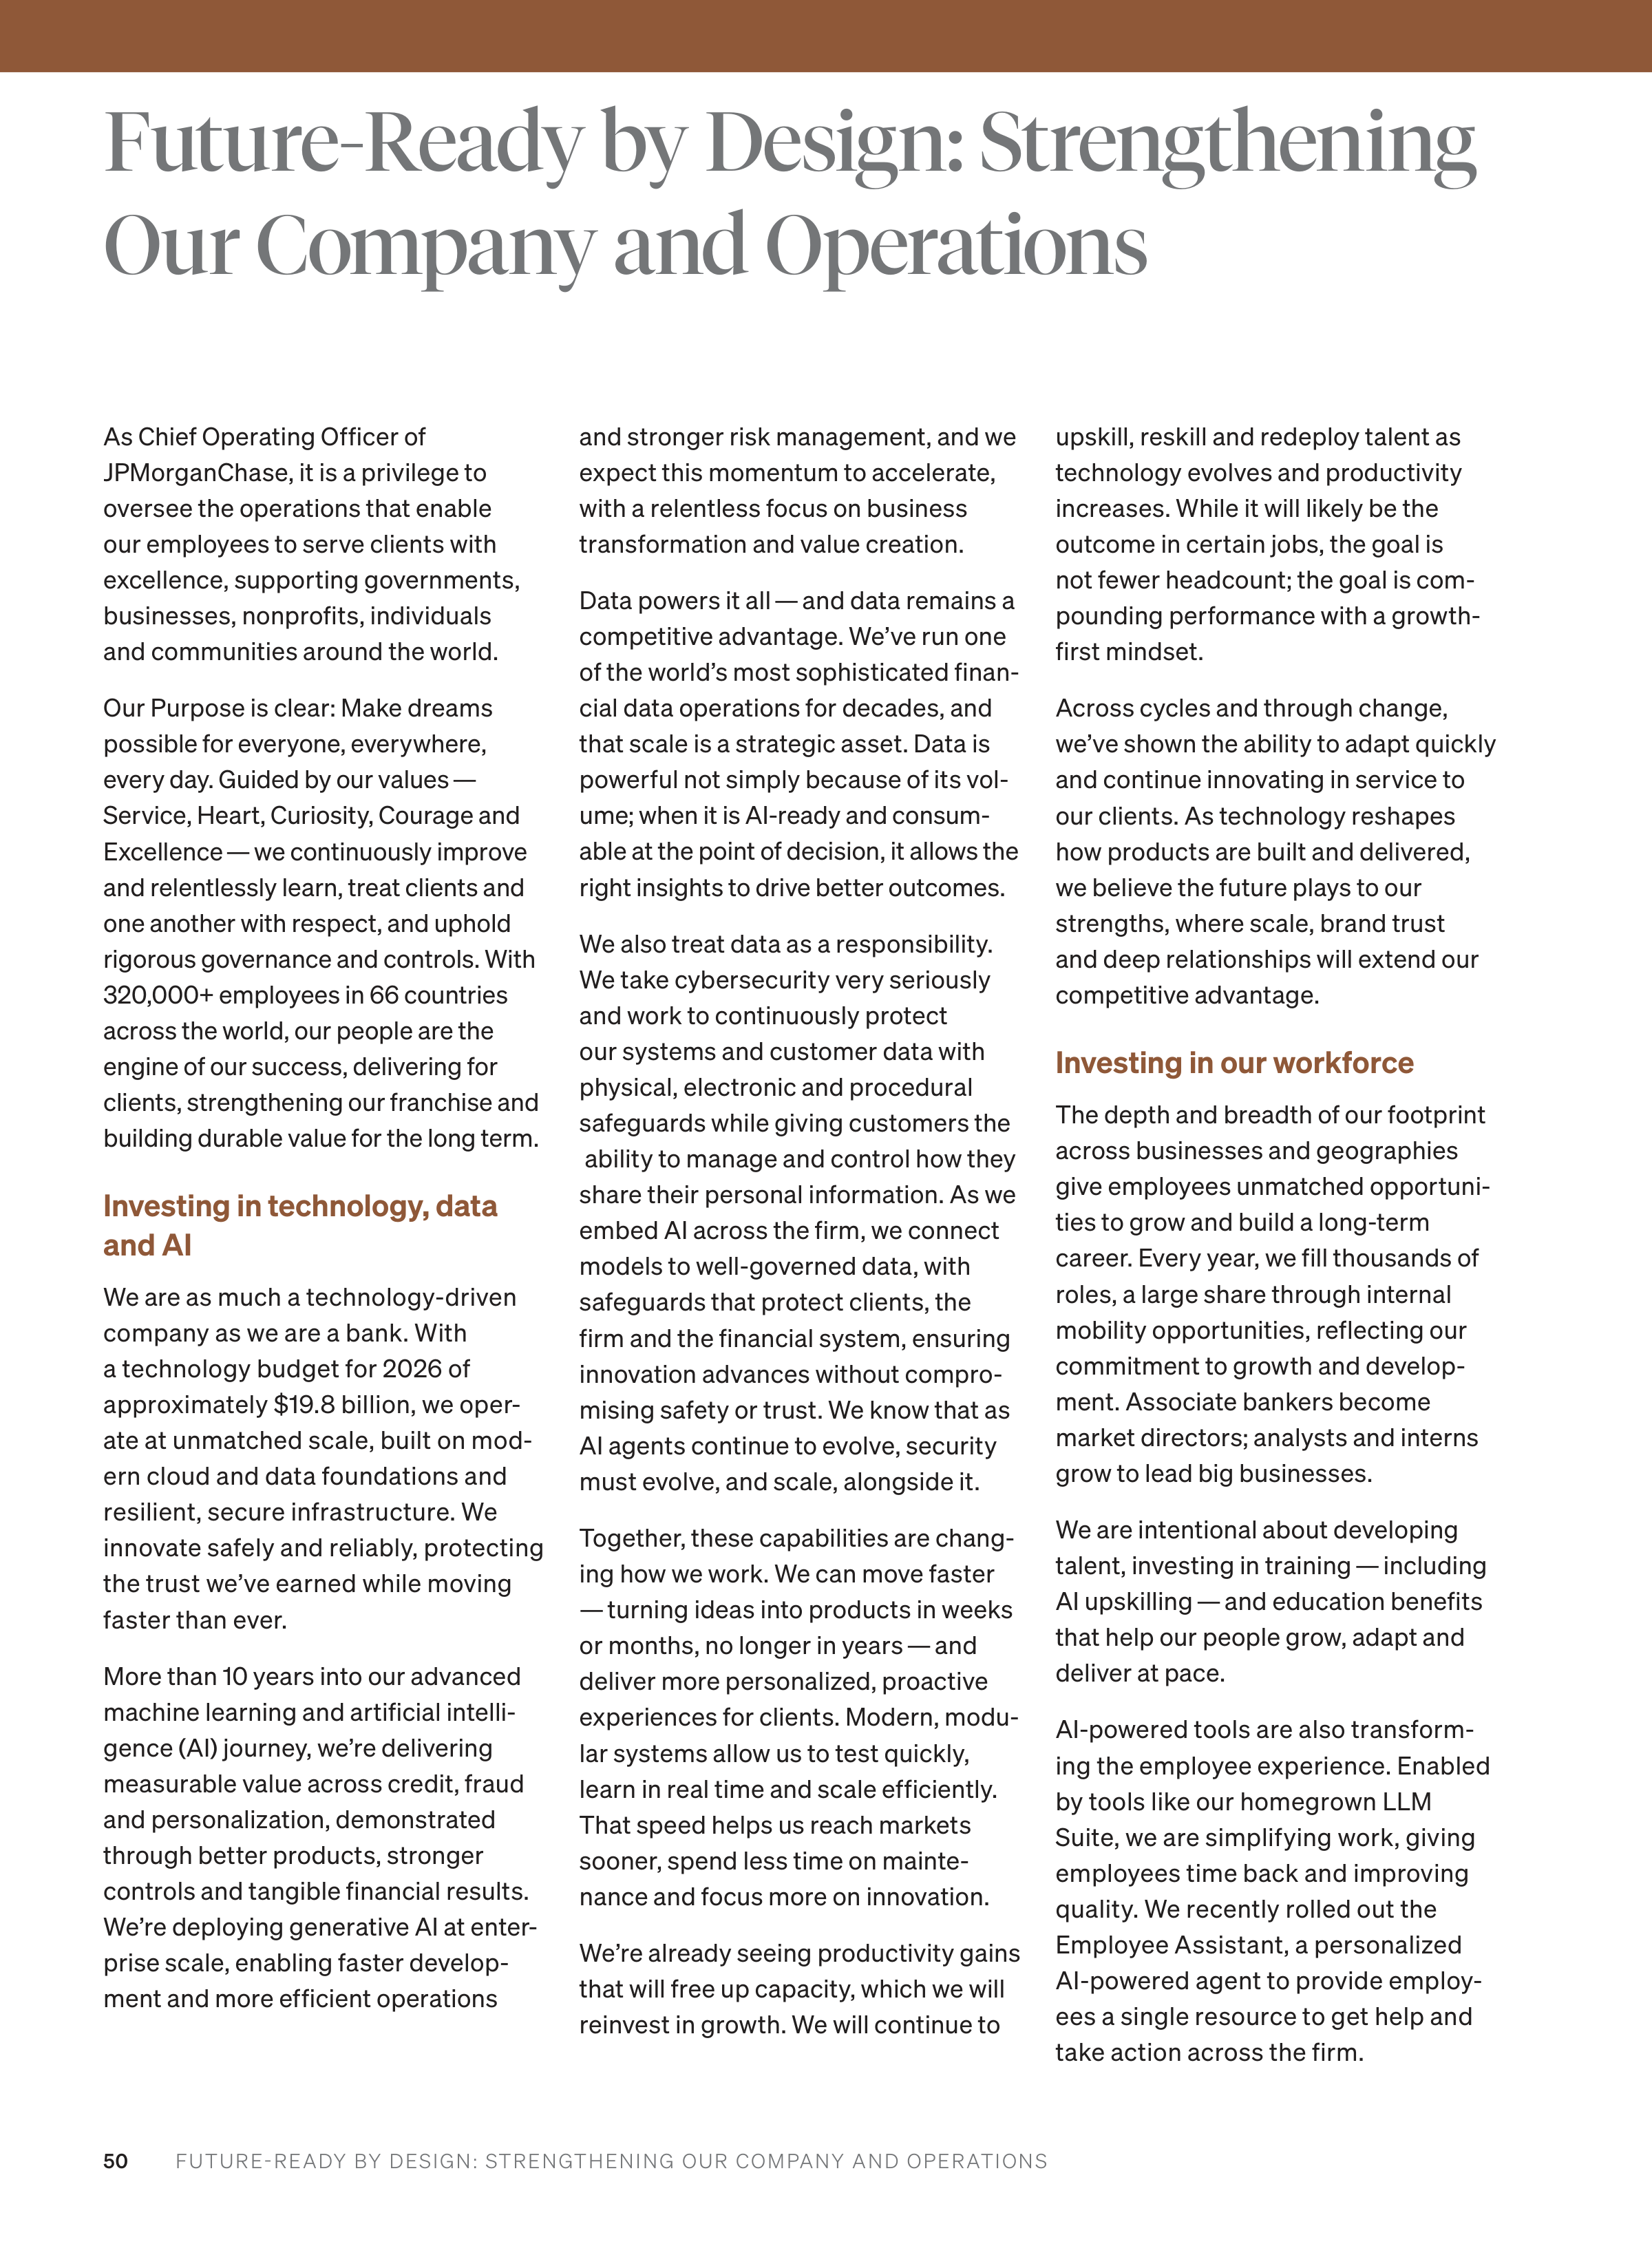
FUTURE-READY BY DESIGN: STRENGTHENING OUR COMPANY AND OPERATIONS
50
Future-Ready by Design: Strengthening
Our Company and Operations
As Chief Operating Officer of
JPMorganChase, it is a privilege to
oversee the operations that enable
our employees to serve clients with
excellence, supporting governments,
businesses, nonprofits, individuals
and communities around the world.
Our Purpose is clear: Make dreams
possible for everyone, everywhere,
every day. Guided by our values —
Service, Heart, Curiosity, Courage and
Excellence — we continuously improve
and relentlessly learn, treat clients and
one another with respect, and uphold
rigorous governance and controls. With
320,000+ employees in 66 countries
across the world, our people are the
engine of our success, delivering for
clients, strengthening our franchise and
building durable value for the long term.
Investing in technology, data
and AI
We are as much a technology-driven
company as we are a bank. With
a technology budget for 2026 of
approximately $19.8 billion, we oper
ate at unmatched scale, built on mod
ern cloud and data foundations and
resilient, secure infrastructure. We
innovate safely and reliably, protecting
the trust we’ve earned while moving
faster than ever.
More than 10 years into our advanced
machine learning and artificial intelli
gence (AI) journey, we’re delivering
measurable value across credit, fraud
and personalization, demonstrated
through better products, stronger
controls and tangible financial results.
We’re deploying generative AI at enter
prise scale, enabling faster develop
ment and more efficient operations
and stronger risk management, and we
expect this momentum to accelerate,
with a relentless focus on business
transformation and value creation.
Data powers it all — and data remains a
competitive advantage. We’ve run one
of the world’s most sophisticated finan
cial data operations for decades, and
that scale is a strategic asset. Data is
powerful not simply because of its vol
ume; when it is AI‑ready and consum
able at the point of decision, it allows the
right insights to drive better outcomes.
We also treat data as a responsibility.
We take cybersecurity very seriously
and work to continuously protect
our systems and customer data with
physical, electronic and procedural
safeguards while giving customers the
ability to manage and control how they
share their personal information. As we
embed AI across the firm, we connect
models to well‑governed data, with
safeguards that protect clients, the
firm and the financial system, ensuring
innovation advances without compro
mising safety or trust. We know that as
AI agents continue to evolve, security
must evolve, and scale, alongside it.
Together, these capabilities are chang
ing how we work. We can move faster
— turning ideas into products in weeks
or months, no longer in years — and
deliver more personalized, proactive
experiences for clients. Modern, modu
lar systems allow us to test quickly,
learn in real time and scale efficiently.
That speed helps us reach markets
sooner, spend less time on mainte
nance and focus more on innovation.
We’re already seeing productivity gains
that will free up capacity, which we will
reinvest in growth. We will continue to
upskill, reskill and redeploy talent as
technology evolves and productivity
increases. While it will likely be the
outcome in certain jobs, the goal is
not fewer headcount; the goal is com
pounding performance with a growth-
first mindset.
Across cycles and through change,
we’ve shown the ability to adapt quickly
and continue innovating in service to
our clients. As technology reshapes
how products are built and delivered,
we believe the future plays to our
strengths, where scale, brand trust
and deep relationships will extend our
competitive advantage.
Investing in our workforce
The depth and breadth of our footprint
across businesses and geographies
give employees unmatched opportuni
ties to grow and build a long-term
career. Every year, we fill thousands of
roles, a large share through internal
mobility opportunities, reflecting our
commitment to growth and develop
ment. Associate bankers become
market directors; analysts and interns
grow to lead big businesses.
We are intentional about developing
talent, investing in training — including
AI upskilling — and education benefits
that help our people grow, adapt and
deliver at pace.
AI‑powered tools are also transform
ing the employee experience. Enabled
by tools like our homegrown LLM
Suite, we are simplifying work, giving
employees time back and improving
quality. We recently rolled out the
Employee Assistant, a personalized
AI-powered agent to provide employ
ees a single resource to get help and
take action across the firm.



FUTURE-READY BY DESIGN: STRENGTHENING OUR COMPANY AND OPERATIONS
51
We invest in our people through com
petitive compensation and comprehen
sive, best-in-class benefits that support
employees and their families across life
stages. These benefits include health
care, retirement, wellness and mental
health resources, paid time away, child
care and family building support (e.g.,
adoption, surrogacy, fertility, parental
leave), tuition assistance and financial
coaching, where applicable.
Through Morgan Health, we are work
ing to improve the quality and afford
ability of healthcare for our employees
while helping scale new care models
more broadly for employer-sponsored
healthcare. We do this by piloting inno
vative approaches, such as onsite
primary care within our U.S. Benefits
program and incentives that steer our
employees to high quality providers,
and by investing in healthcare compa
nies that are improving outcomes and
lowering costs.
We stand by our people in their most
challenging moments. Our crisis
response and duty of care show opera
tional excellence in action: During
natural disasters, conflicts and other
emergencies, we protect our people
through payroll continuity, benefits
protection and targeted emergency
assistance. Cyclones in the Philippines,
wildfires in California and the war in the
Middle East are recent examples of
times when we activated to support our
employees and their families through
flexible work arrangements, temporary
housing and financial assistance.
Supporting our people also means
investing in where they work every day.
We recently completed — or soon will
— major office renovations in Boston,
Manila, Mumbai, Newark, Paris and
Tampa and are expanding in Bour
nemouth and London, including our
newly announced Riverside develop
ment in London.
In 2025, we opened our iconic 270 Park
Avenue headquarters in New York City,
designed to support collaboration,
sustainability and a better day‑to‑day
experience for our employees — a true
physical manifestation of our values.
We invest in real estate that is func
tional, beautiful and flexible enough to
support a range of future needs.
Our operational capabilities are com
petitive differentiators, not back-office
utilities. Security, procurement, real
estate and amenities enable trust, effi
ciency and a superior employee experi
ence at scale — and we manage them
as investments in our people and
culture, not expenses to be minimized.
Our winning culture
Our culture is our secret sauce.
We hold ourselves to the highest stan
dards because our clients rely on us in
good times and bad. We have a shared
commitment to inclusion, respect and
opportunity — bringing the best from
every background — and to doing
what’s right, not just what’s required.
Our culture informs our efforts to widen
access to opportunity and strengthen
communities. One year ago, we sharp
ened our focus from DEI to DOI —
Diversity, Opportunity and Inclusion —
while staying true to a core belief:
Talent is evenly distributed, but access
and opportunity often are not. Our
focus is to lower barriers to opportunity
— never to lower standards of
excellence.
The purpose is to be inclusive, not
unintentionally exclusive. We hold our
people to consistently high expecta
tions, and we get the best out of them
as a result.
Our responsibility to help lift communi
ties applies outside of our walls as well.
We’re scaling local solutions with
national impact to help more people
realize the American Dream. That’s why
we recently announced a major initia
tive to expand opportunity to millions
of Americans and future generations
through targeted investments in local
communities across the United States.
We will do that by accelerating and scal
ing proven local solutions that advance
small business growth, increase hous
ing supply to make homes more afford
able, improve financial health, create
good jobs, expand access to quality
healthcare and strengthen local institu
tions. We’re also focused on expanding
advocacy for sound public policies that
unlock local investment so that busi
ness, government and community
leaders can remove roadblocks to
opportunity.
We deploy capital where it’s most effec
tive, measure outcomes, iterate and
partner locally to strengthen commu
nity ecosystems because successful
companies require thriving communi
ties — and investing in the broader
ecosystem makes good business sense.
We’ll continue to deliver best-in-class
products and services in a first-class
way with the trust, security, scale and
excellence that have defined our brand
for the past 227 years.
Jennifer Piepszak
Chief Operating Officer
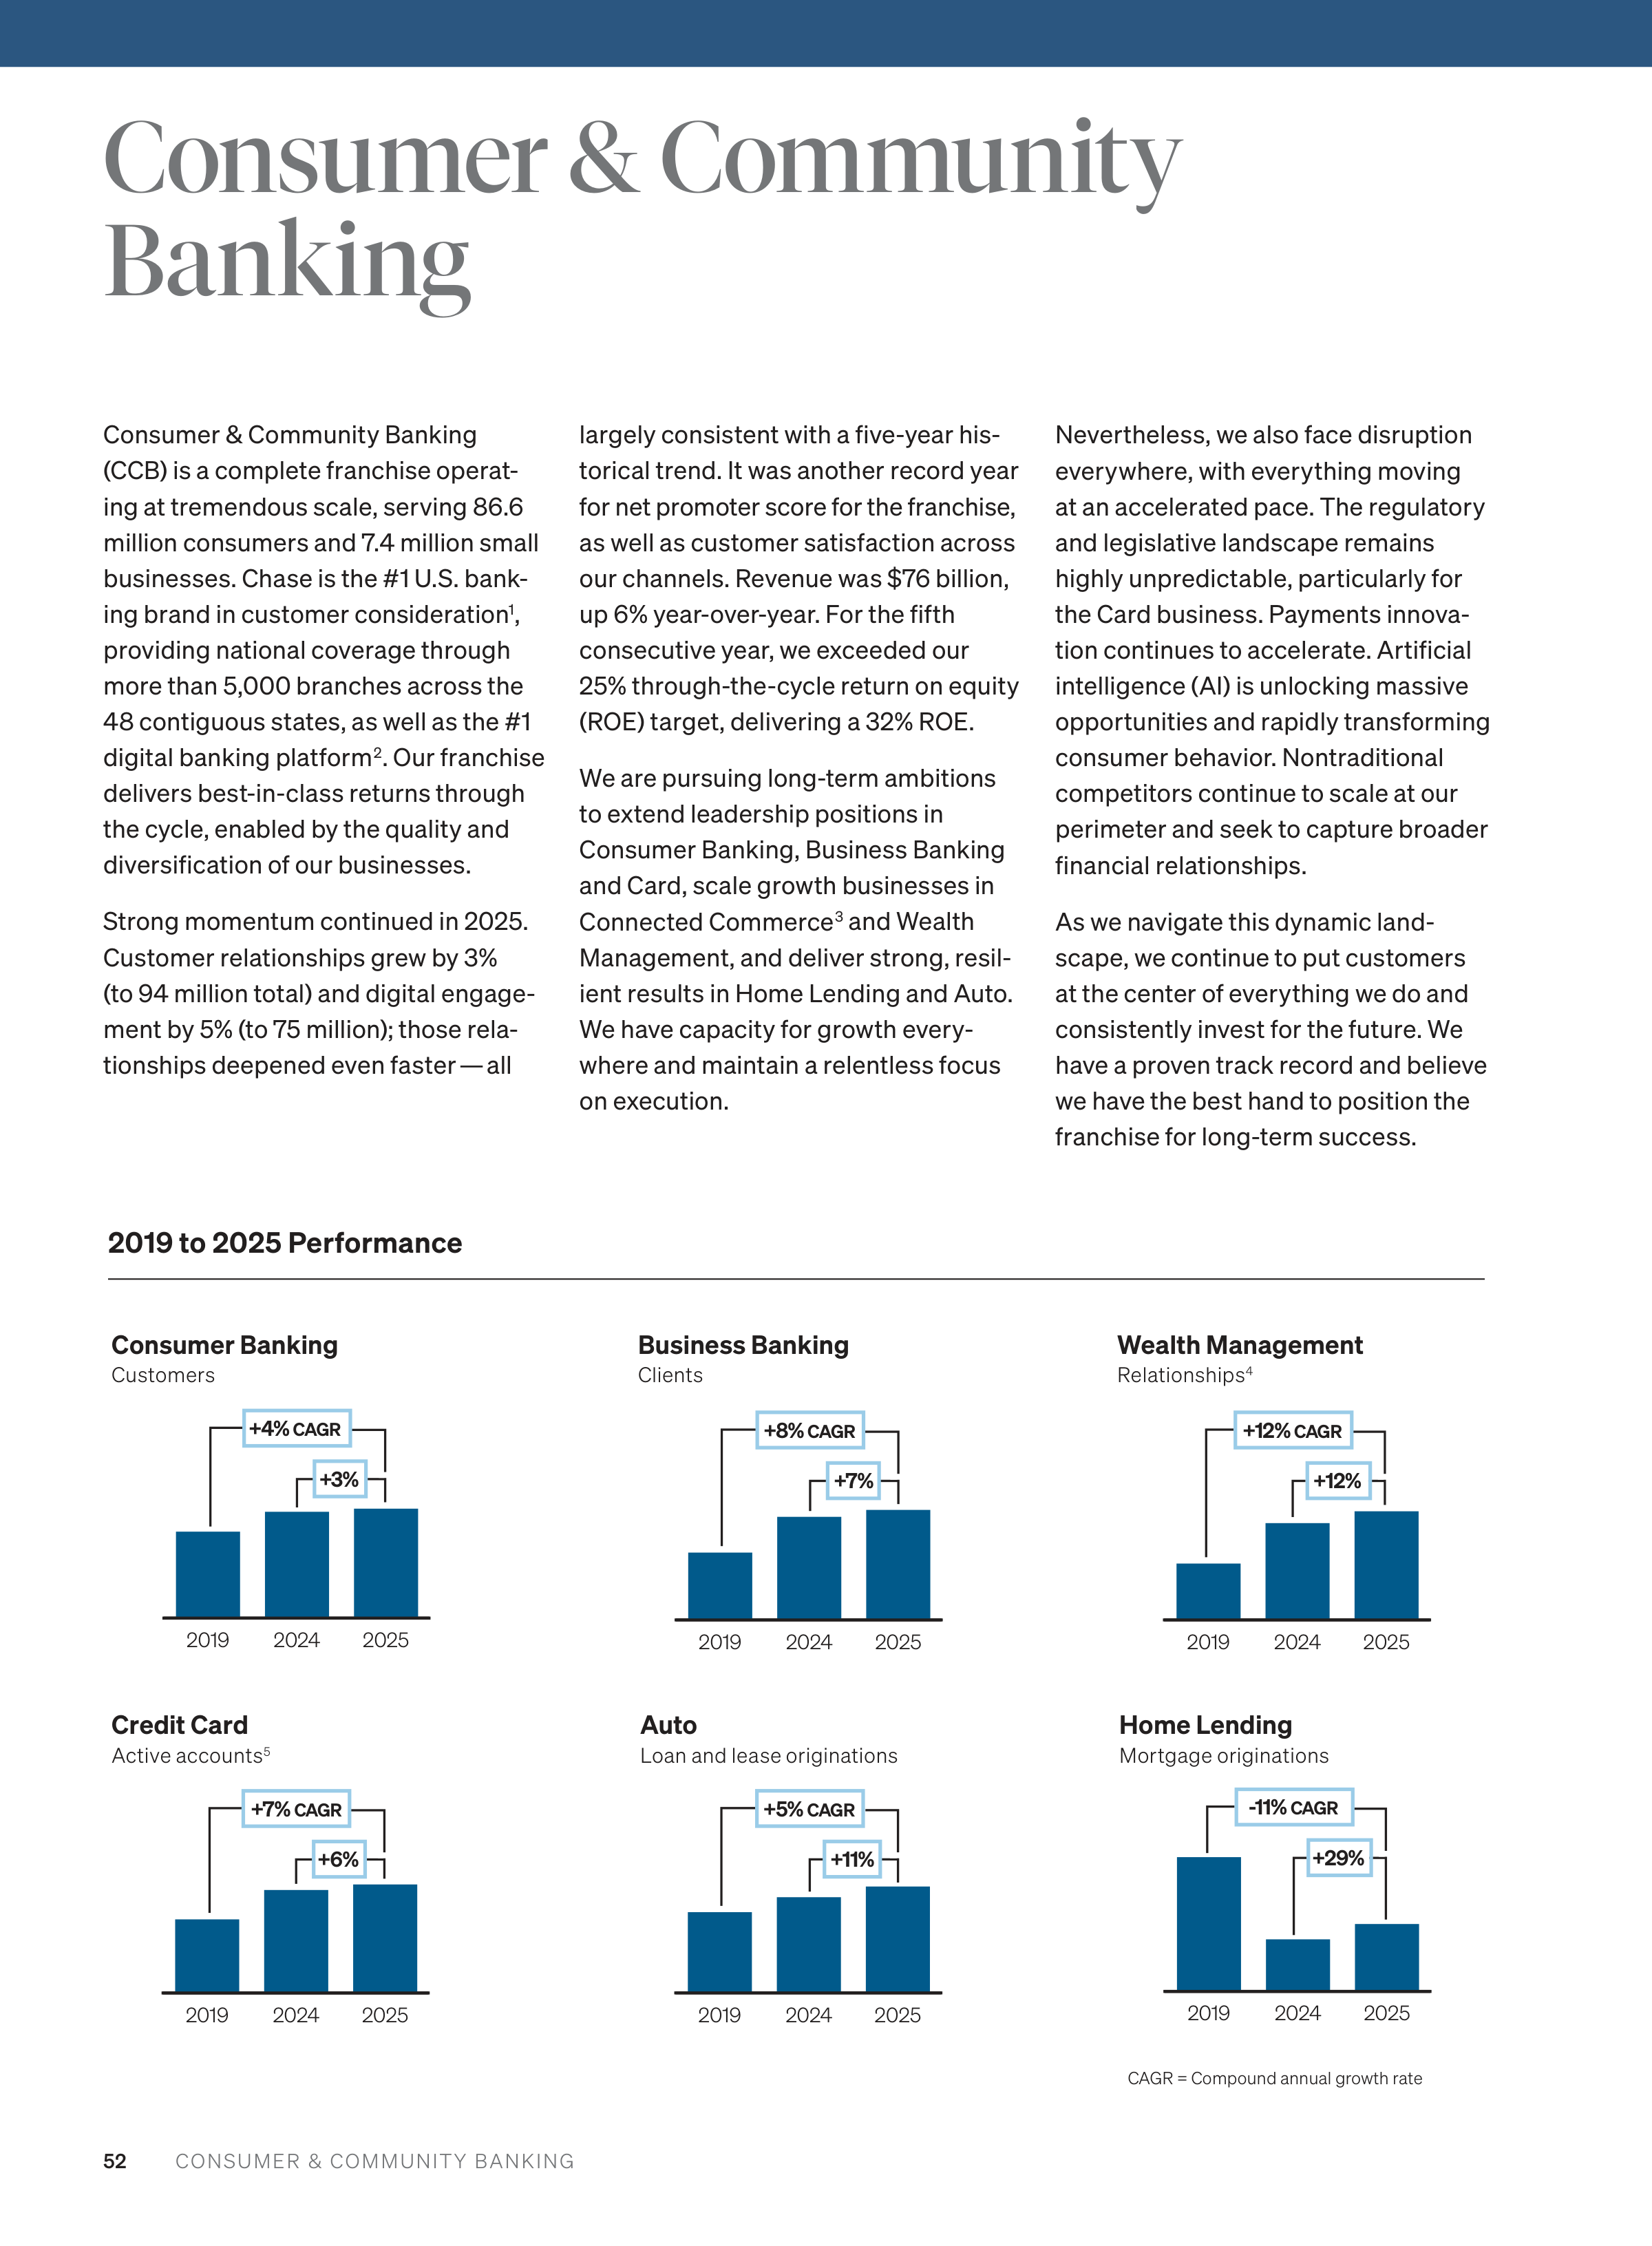
CONSUMER & COMMUNITY BANKING
52
Consumer & Community Banking
(CCB) is a complete franchise operat
ing at tremendous scale, serving 86.6
million consumers and 7.4 million small
businesses. Chase is the #1 U.S. bank
ing brand in customer consideration
1
,
providing national coverage through
more than 5,000 branches across the
48 contiguous states, as well as the #1
digital banking platform
2
. Our franchise
delivers best-in-class returns through
the cycle, enabled by the quality and
diversification of our businesses.
Strong momentum continued in 2025.
Customer relationships grew by 3%
(to 94 million total) and digital engage
ment by 5% (to 75 million); those rela
tionships deepened even faster — all
Consumer & Community
Banking
largely consistent with a five-year his
torical trend. It was another record year
for net promoter score for the franchise,
as well as customer satisfaction across
our channels. Revenue was $76 billion,
up 6% year-over-year. For the fifth
consecutive year, we exceeded our
25% through-the-cycle return on equity
(ROE) target, delivering a 32% ROE.
We are pursuing long-term ambitions
to extend leadership positions in
Consumer Banking, Business Banking
and Card, scale growth businesses in
Connected Commerce
3
and Wealth
Management, and deliver strong, resil
ient results in Home Lending and Auto.
We have capacity for growth every
where and maintain a relentless focus
on execution.
Nevertheless, we also face disruption
everywhere, with everything moving
at an accelerated pace. The regulatory
and legislative landscape remains
highly unpredictable, particularly for
the Card business. Payments innova
tion continues to accelerate. Artificial
intelligence (AI) is unlocking massive
opportunities and rapidly transforming
consumer behavior. Nontraditional
competitors continue to scale at our
perimeter and seek to capture broader
financial relationships.
As we navigate this dynamic land
scape, we continue to put customers
at the center of everything we do and
consistently invest for the future. We
have a proven track record and believe
we have the best hand to position the
franchise for long-term success.
2025
2024
2019
+3%
+4%
CAGR
2025
2024
2019
+7%
+8%
CAGR
2025
2024
2019
+12%
+12%
CAGR
Consumer Banking
Customers
Credit Card
Active accounts
5
Auto
Loan and lease originations
Home Lending
Mortgage originations
Business Banking
Clients
Wealth Management
Relationships
4
2019 to 2025 Performance
2025
2024
2019
+6%
+7%
CAGR
2025
2024
2019
+11%
+5%
CAGR
2025
2024
2019
+29%
-11%
CAGR
CAGR = Compound annual growth rate
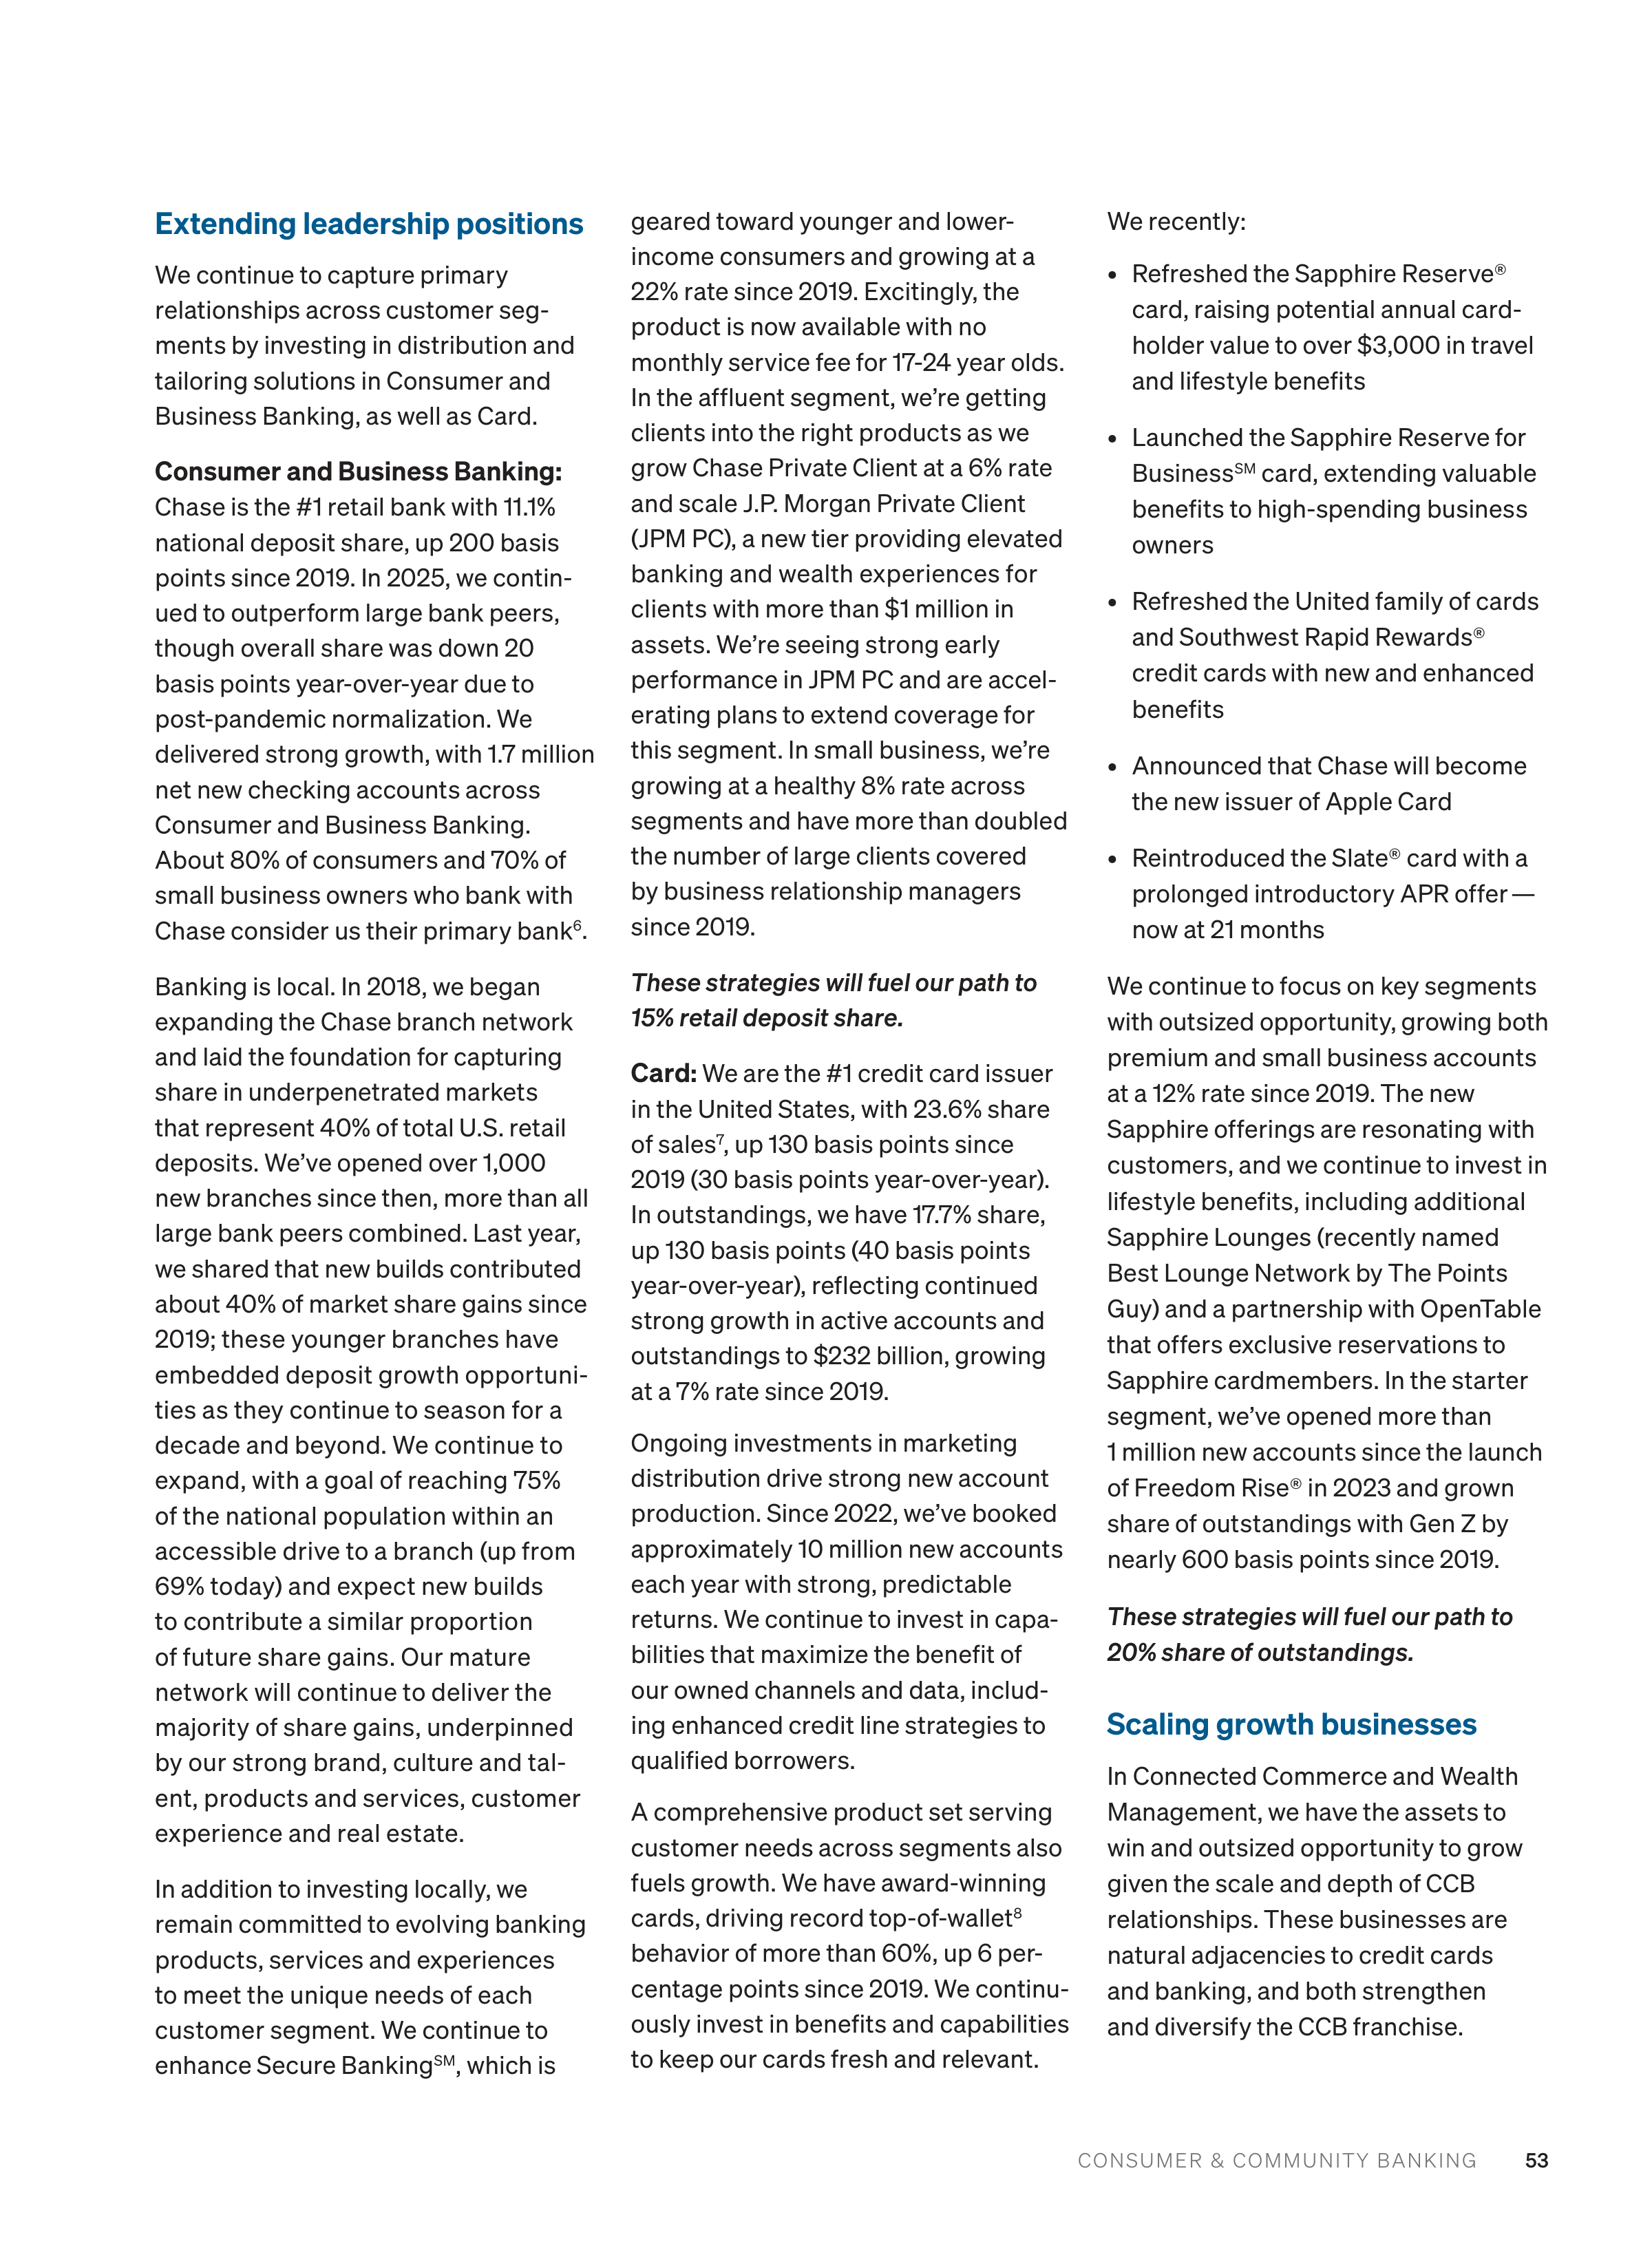
CONSUMER & COMMUNITY BANKING
53
Extending leadership positions
We continue to capture primary
relationships across customer seg
ments by investing in distribution and
tailoring solutions in Consumer and
Business Banking, as well as Card.
Consumer and Business Banking:
Chase is the #1 retail bank with 11.1%
national deposit share, up 200 basis
points since 2019. In 2025, we contin
ued to outperform large bank peers,
though overall share was down 20
basis points year-over-year due to
post-pandemic normalization. We
delivered strong growth, with 1.7 million
net new checking accounts across
Consumer and Business Banking.
About 80% of consumers and 70% of
small business owners who bank with
Chase consider us their primary bank
6
.
Banking is local. In 2018, we began
expanding the Chase branch network
and laid the foundation for capturing
share in underpenetrated markets
that represent 40% of total U.S. retail
deposits. We’ve opened over 1,000
new branches since then, more than all
large bank peers combined. Last year,
we shared that new builds contributed
about 40% of market share gains since
2019; these younger branches have
embedded deposit growth opportuni
ties as they continue to season for a
decade and beyond. We continue to
expand, with a goal of reaching 75%
of the national population within an
accessible drive to a branch (up from
69% today) and expect new builds
to contribute a similar proportion
of future share gains. Our mature
network will continue to deliver the
majority of share gains, underpinned
by our strong brand, culture and tal
ent, products and services, customer
experience and real estate.
In addition to investing locally, we
remain committed to evolving banking
products, services and experiences
to meet the unique needs of each
customer segment. We continue to
enhance Secure Banking
SM
, which is
geared toward younger and lower-
income consumers and growing at a
22% rate since 2019. Excitingly, the
product is now available with no
monthly service fee for 17-24 year olds.
In the affluent segment, we’re getting
clients into the right products as we
grow Chase Private Client at a 6% rate
and scale J.P. Morgan Private Client
(JPM PC), a new tier providing elevated
banking and wealth experiences for
clients with more than $1 million in
assets. We’re seeing strong early
performance in JPM PC and are accel
erating plans to extend coverage for
this segment. In small business, we’re
growing at a healthy 8% rate across
segments and have more than doubled
the number of large clients covered
by business relationship managers
since 2019.
These strategies will fuel our path to
15% retail deposit share.
Card
:
We are the #1 credit card issuer
in the United States, with 23.6% share
of sales
7
, up 130 basis points since
2019 (30 basis points year-over-year).
In outstandings, we have 17.7% share,
up 130 basis points (40 basis points
year-over-year), reflecting continued
strong growth in active accounts and
outstandings to $232 billion, growing
at a 7% rate since 2019.
Ongoing investments in marketing
distribution drive strong new account
production. Since 2022, we’ve booked
approximately 10 million new accounts
each year with strong, predictable
returns. We continue to invest in capa
bilities that maximize the benefit of
our owned channels and data, includ
ing enhanced credit line strategies to
qualified borrowers.
A comprehensive product set serving
customer needs across segments also
fuels growth. We have award-winning
cards, driving record top-of-wallet
8
behavior of more than 60%, up 6 per
centage points since 2019. We continu
ously invest in benefits and capabilities
to keep our cards fresh and relevant.
We recently:
•
Refreshed the Sapphire Reserve®
card, raising potential annual card
holder value to over $3,000 in travel
and lifestyle benefits
•
Launched the Sapphire Reserve for
Business
SM
card, extending valuable
benefits to high-spending business
owners
•
Refreshed the United family of cards
and Southwest Rapid Rewards®
credit cards with new and enhanced
benefits
•
Announced that Chase will become
the new issuer of Apple Card
•
Reintroduced the Slate® card with a
prolonged introductory APR offer —
now at 21 months
We continue to focus on key segments
with outsized opportunity, growing both
premium and small business accounts
at a 12% rate since 2019. The new
Sapphire offerings are resonating with
customers, and we continue to invest in
lifestyle benefits, including additional
Sapphire Lounges (recently named
Best Lounge Network by The Points
Guy) and a partnership with OpenTable
that offers exclusive reservations to
Sapphire cardmembers. In the starter
segment, we’ve opened more than
1 million new accounts since the launch
of Freedom Rise® in 2023 and grown
share of outstandings with Gen Z by
nearly 600 basis points since 2019.
These strategies will fuel our path to
20% share of outstandings.
Scaling growth businesses
In Connected Commerce and Wealth
Management, we have the assets to
win and outsized opportunity to grow
given the scale and depth of CCB
relationships. These businesses are
natural adjacencies to credit cards
and banking, and both strengthen
and diversify the CCB franchise.
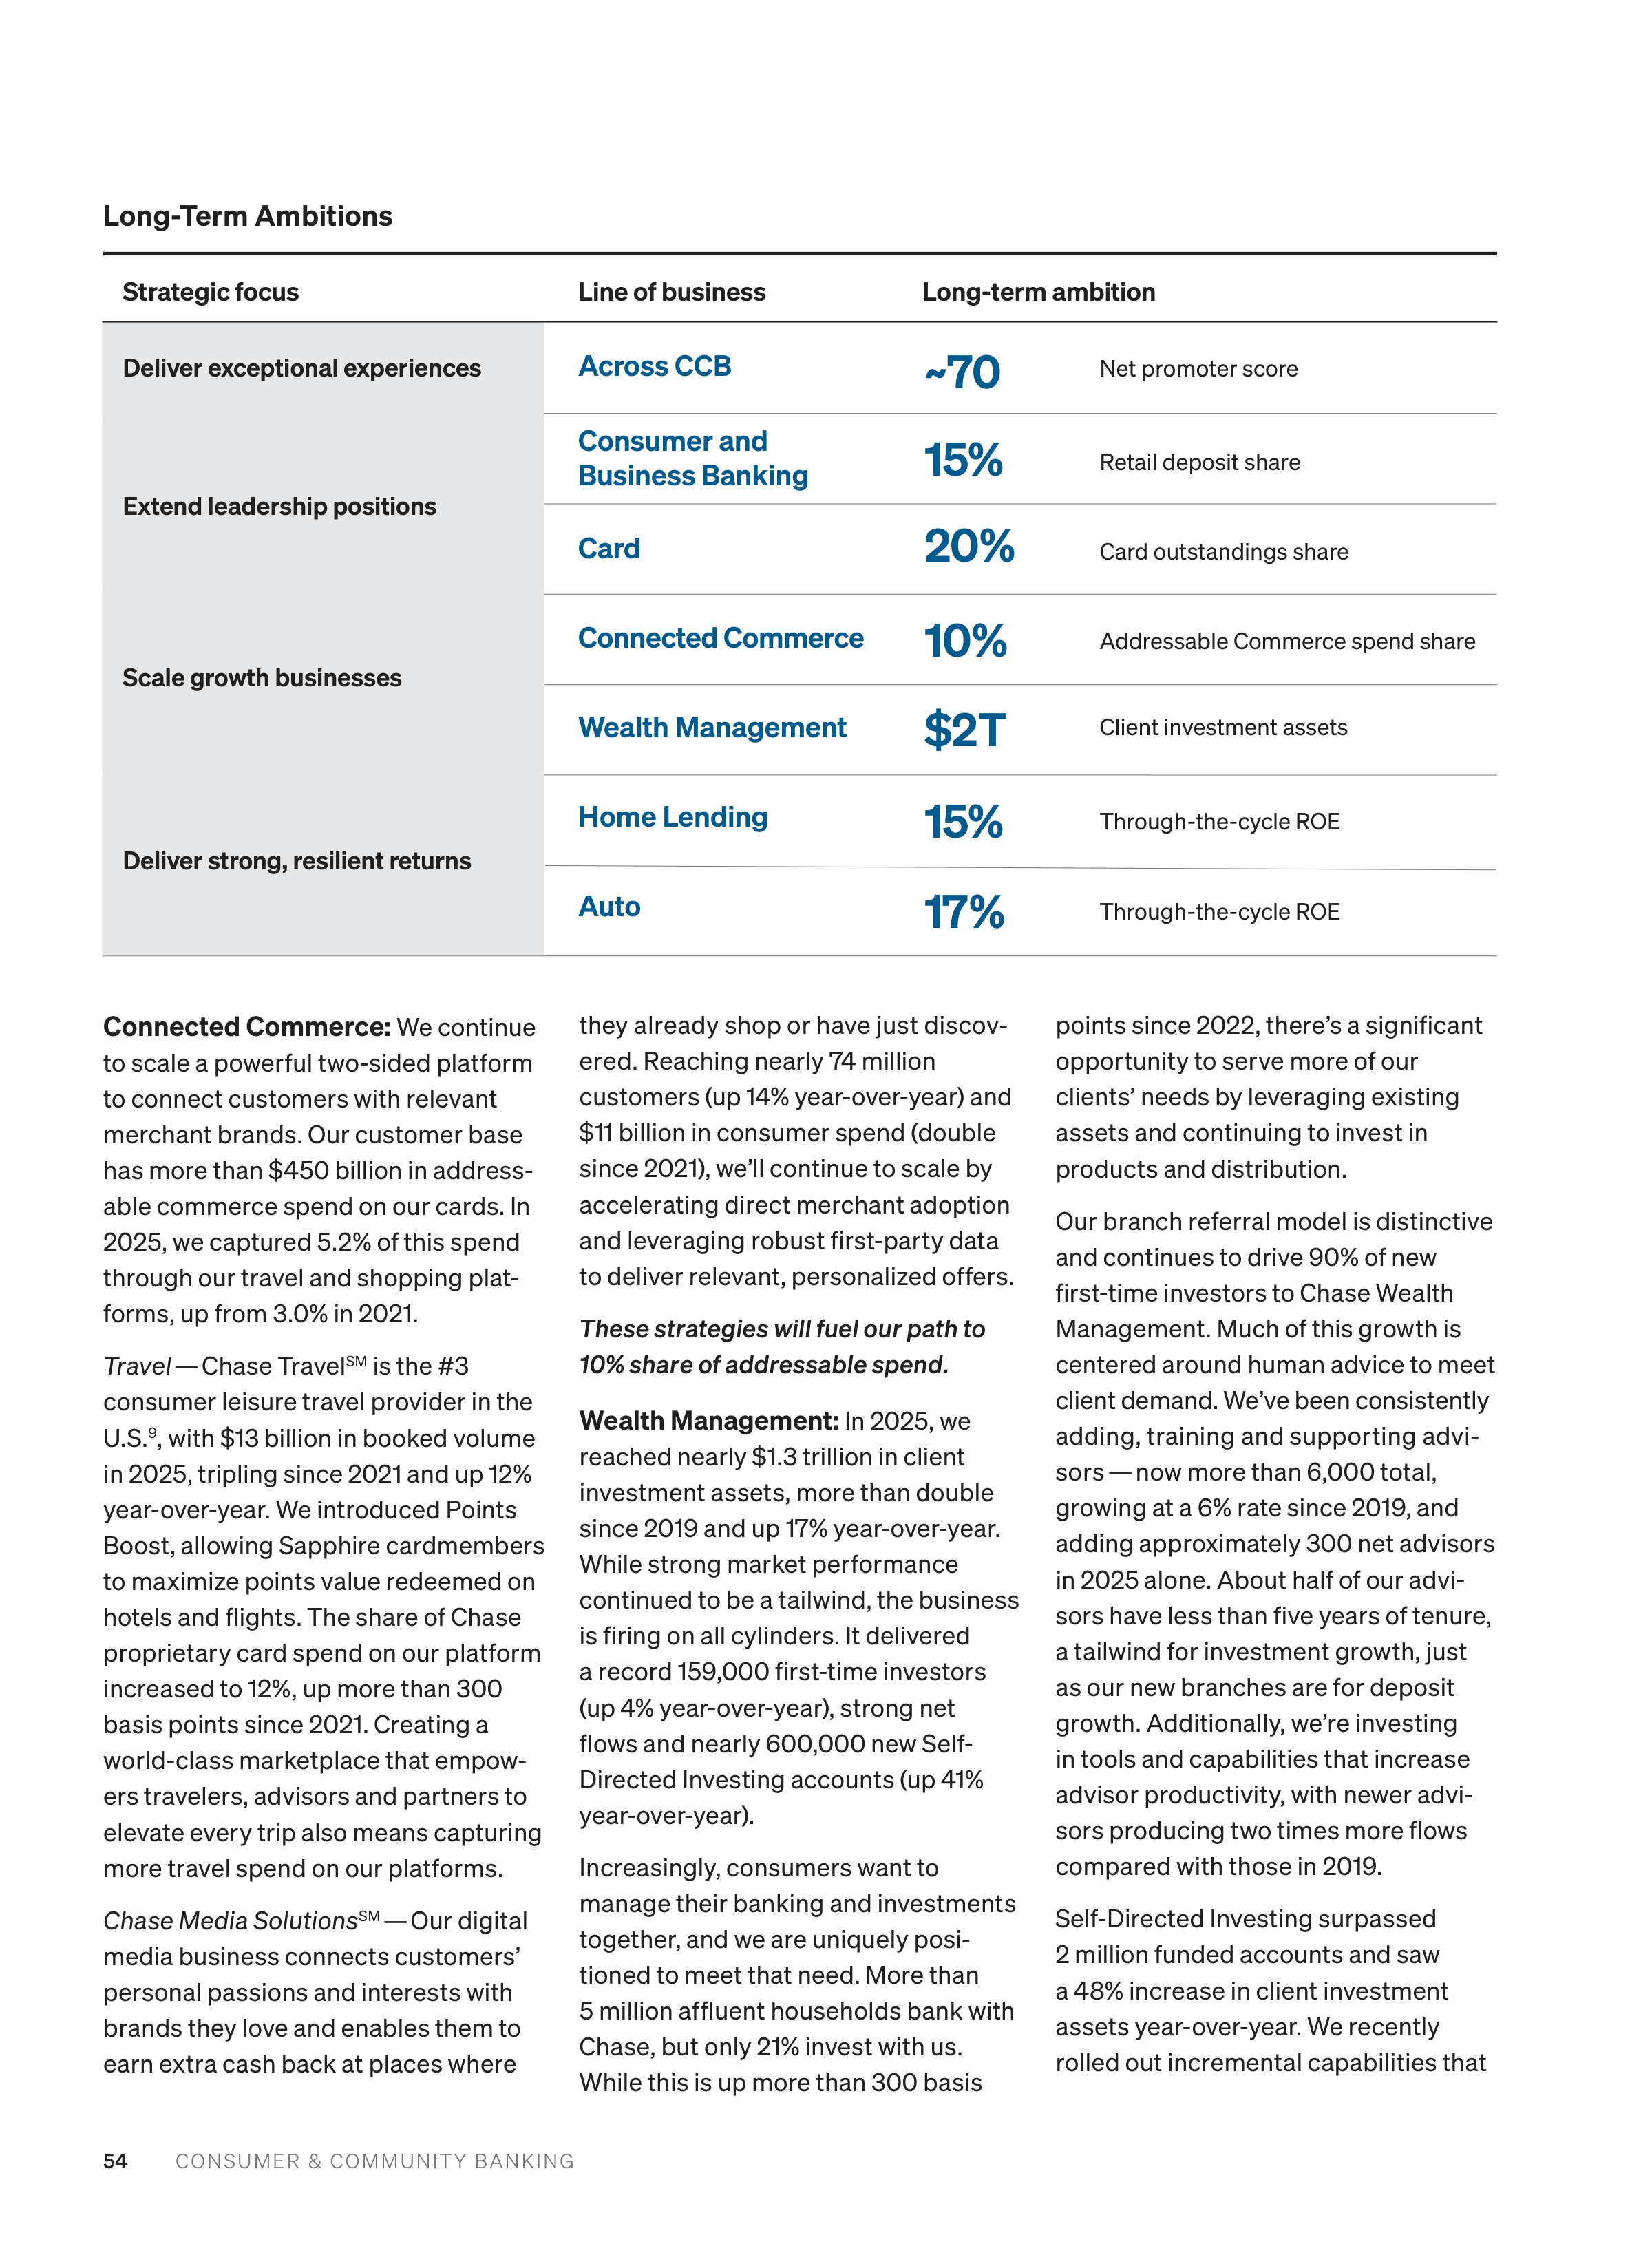
CONSUMER & COMMUNITY BANKING
54
Connected Commerce:
We continue
to scale a powerful two-sided platform
to connect customers with relevant
merchant brands. Our customer base
has more than $450 billion in address
able commerce spend on our cards. In
2025, we captured 5.2% of this spend
through our travel and shopping plat
forms, up from 3.0% in 2021.
Travel
— Chase Travel
SM
is the #3
consumer leisure travel provider in the
U.S.
9
, with $13 billion in booked volume
in 2025, tripling since 2021 and up 12%
year-over-year. We introduced Points
Boost, allowing Sapphire cardmembers
to maximize points value redeemed on
hotels and flights. The share of Chase
proprietary card spend on our platform
increased to 12%, up more than 300
basis points since 2021. Creating a
world-class marketplace that empow
ers travelers, advisors and partners to
elevate every trip also means capturing
more travel spend on our platforms.
Chase Media Solutions
SM
— Our digital
media business connects customers’
personal passions and interests with
brands they love and enables them to
earn extra cash back at places where
they already shop or have just discov
ered. Reaching nearly 74 million
customers (up 14% year-over-year) and
$11 billion in consumer spend (double
since 2021), we’ll continue to scale by
accelerating direct merchant adoption
and leveraging robust first-party data
to deliver relevant, personalized offers.
These strategies will fuel our path to
10% share of addressable spend.
Wealth Management
:
In 2025, we
reached nearly $1.3 trillion in client
investment assets, more than double
since 2019 and up 17% year-over-year.
While strong market performance
continued to be a tailwind, the business
is firing on all cylinders. It delivered
a record 159,000 first-time investors
(up 4% year-over-year), strong net
flows and nearly 600,000 new Self-
Directed Investing accounts (up 41%
year-over-year).
Increasingly, consumers want to
manage their banking and investments
together, and we are uniquely posi
tioned to meet that need. More than
5 million affluent households bank with
Chase, but only 21% invest with us.
While this is up more than 300 basis
points since 2022, there’s a significant
opportunity to serve more of our
clients’ needs by leveraging existing
assets and continuing to invest in
products and distribution.
Our branch referral model is distinctive
and continues to drive 90% of new
first-time investors to Chase Wealth
Management. Much of this growth is
centered around human advice to meet
client demand. We’ve been consistently
adding, training and supporting advi
sors — now more than 6,000 total,
growing at a 6% rate since 2019, and
adding approximately 300 net advisors
in 2025 alone. About half of our advi
sors have less than five years of tenure,
a tailwind for investment growth, just
as our new branches are for deposit
growth. Additionally, we’re investing
in tools and capabilities that increase
advisor productivity, with newer advi
sors producing two times more flows
compared with those in 2019.
Self-Directed Investing surpassed
2 million funded accounts and saw
a 48% increase in client investment
assets year-over-year. We recently
rolled out incremental capabilities that
Strategic focus
Line of business
Long-term ambition
Across CCB
Consumer and
Business Banking
Card
Connected Commerce
Wealth Management
Home Lending
Auto
~70
15%
20%
10%
$2T
15%
17%
Net promoter score
Retail deposit share
Card outstandings share
Addressable Commerce spend share
Client investment assets
Through-the-cycle ROE
Through-the-cycle ROE
Deliver exceptional experiences
Extend leadership positions
Scale growth businesses
Deliver strong, resilient returns
Long-Term Ambitions
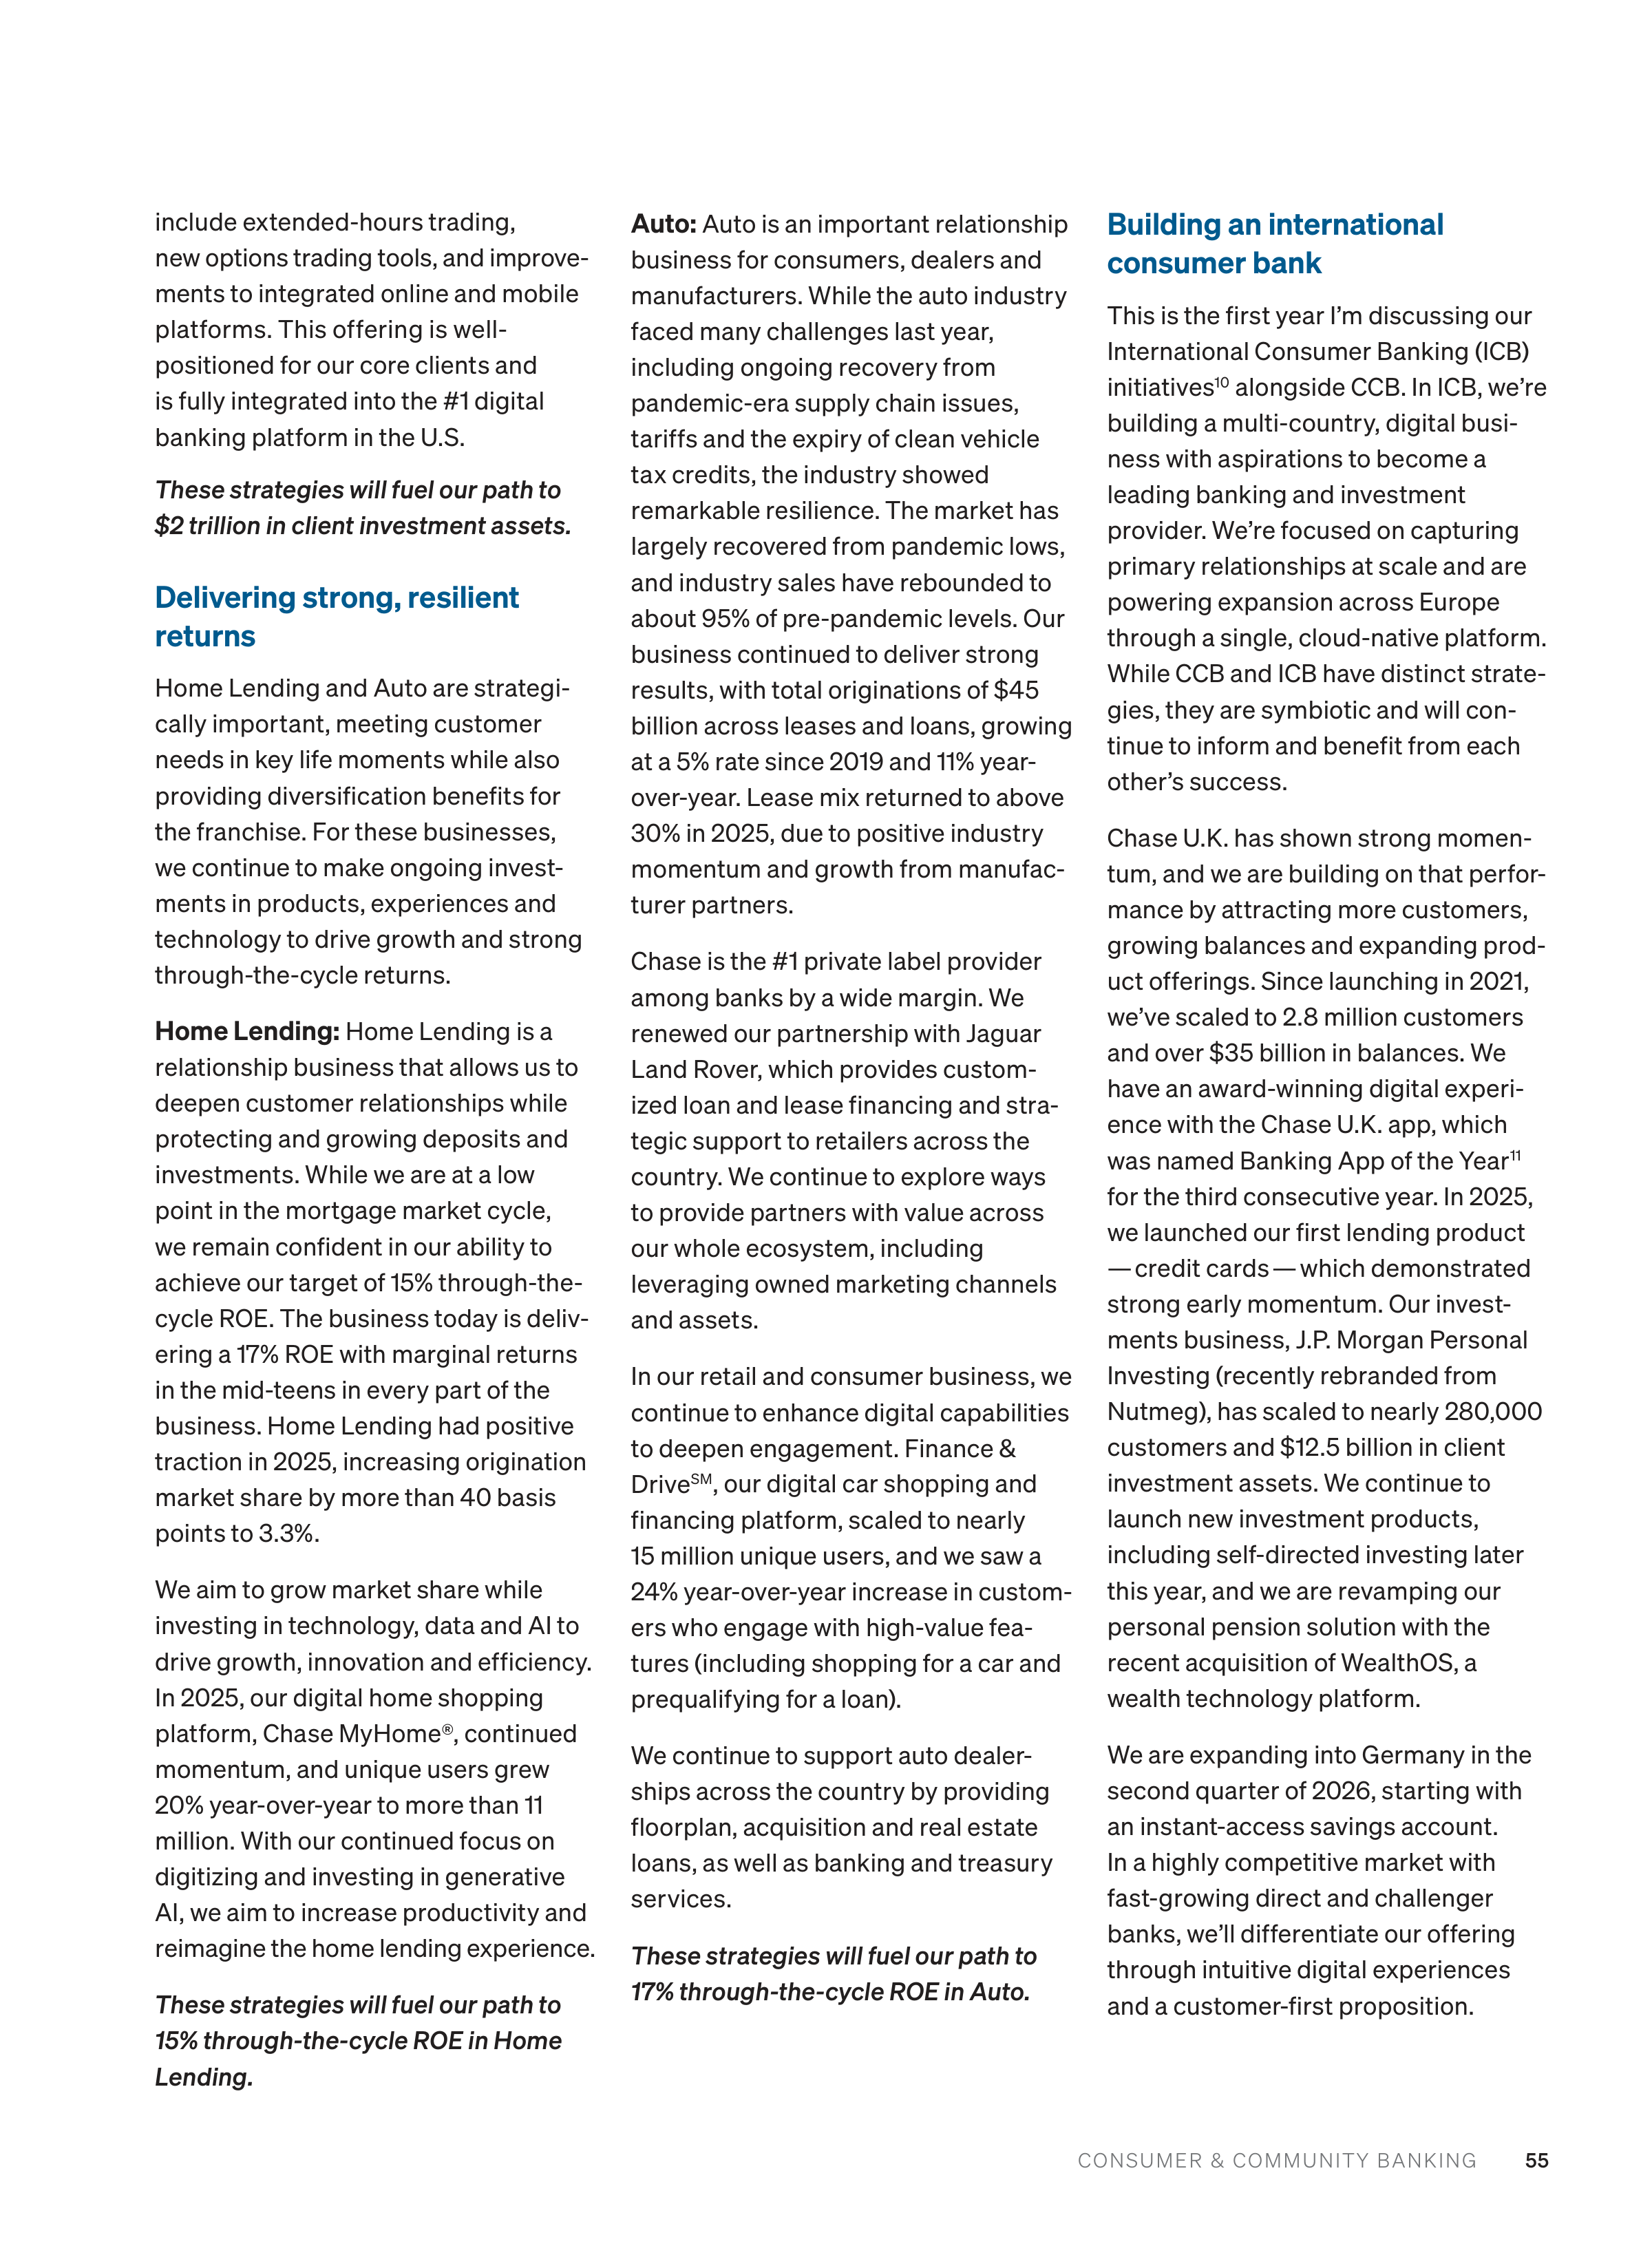
CONSUMER & COMMUNITY BANKING
55
include extended-hours trading,
new options trading tools, and improve
ments to integrated online and mobile
platforms. This offering is well-
positioned for our core clients and
is fully integrated into the #1 digital
banking platform in the U.S.
These strategies will fuel our path to
$2 trillion in client investment assets.
Delivering strong, resilient
returns
Home Lending and Auto are strategi
cally important, meeting customer
needs in key life moments while also
providing diversification benefits for
the franchise. For these businesses,
we continue to make ongoing invest
ments in products, experiences and
technology to drive growth and strong
through-the-cycle returns.
Home Lending:
Home Lending is a
relationship business that allows us to
deepen customer relationships while
protecting and growing deposits and
investments. While we are at a low
point in the mortgage market cycle,
we remain confident in our ability to
achieve our target of 15% through-the-
cycle ROE. The business today is deliv
ering a 17% ROE with marginal returns
in the mid-teens in every part of the
business. Home Lending had positive
traction in 2025, increasing origination
market share by more than 40 basis
points to 3.3%.
We aim to grow market share while
investing in technology, data and AI to
drive growth, innovation and efficiency.
In 2025, our digital home shopping
platform, Chase MyHome®, continued
momentum, and unique users grew
20% year-over-year to more than 11
million. With our continued focus on
digitizing and investing in generative
AI, we aim to increase productivity and
reimagine the home lending experience.
These strategies will fuel our path to
15% through-the-cycle ROE in Home
Lending.
Auto:
Auto is an important relationship
business for consumers, dealers and
manufacturers. While the auto industry
faced many challenges last year,
including ongoing recovery from
pandemic-era supply chain issues,
tariffs and the expiry of clean vehicle
tax credits, the industry showed
remarkable resilience. The market has
largely recovered from pandemic lows,
and industry sales have rebounded to
about 95% of pre-pandemic levels. Our
business continued to deliver strong
results, with total originations of $45
billion across leases and loans, growing
at a 5% rate since 2019 and 11% year-
over-year. Lease mix returned to above
30% in 2025, due to positive industry
momentum and growth from manufac
turer partners.
Chase is the #1 private label provider
among banks by a wide margin. We
renewed our partnership with Jaguar
Land Rover, which provides custom
ized loan and lease financing and stra
tegic support to retailers across the
country. We continue to explore ways
to provide partners with value across
our whole ecosystem, including
leveraging owned marketing channels
and assets.
In our retail and consumer business, we
continue to enhance digital capabilities
to deepen engagement. Finance &
Drive
SM
, our digital car shopping and
financing platform, scaled to nearly
15 million unique users, and we saw a
24% year-over-year increase in custom
ers who engage with high-value fea
tures (including shopping for a car and
prequalifying for a loan).
We continue to support auto dealer
ships across the country by providing
floorplan, acquisition and real estate
loans, as well as banking and treasury
services.
These strategies will fuel our path to
17% through-the-cycle ROE in Auto.
Building an international
consumer bank
This is the first year I’m discussing our
International Consumer Banking (ICB)
initiatives
10
alongside CCB. In ICB, we’re
building a multi-country, digital busi
ness with aspirations to become a
leading banking and investment
provider. We’re focused on capturing
primary relationships at scale and are
powering expansion across Europe
through a single, cloud-native platform.
While CCB and ICB have distinct strate
gies, they are symbiotic and will con
tinue to inform and benefit from each
other’s success.
Chase U.K. has shown strong momen
tum, and we are building on that perfor
mance by attracting more customers,
growing balances and expanding prod
uct offerings. Since launching in 2021,
we’ve scaled to 2.8 million customers
and over $35 billion in balances
.
We
have an award-winning digital experi
ence with the Chase U.K. app, which
was named Banking App of the Year
11
for the third consecutive year. In 2025,
we launched our first lending product
— credit cards — which demonstrated
strong early momentum. Our invest
ments business, J.P. Morgan Personal
Investing (recently rebranded from
Nutmeg), has scaled to nearly 280,000
customers and $12.5 billion in client
investment assets. We continue to
launch new investment products,
including self-directed investing later
this year, and we are revamping our
personal pension solution with the
recent acquisition of WealthOS, a
wealth technology platform.
We are expanding into Germany in the
second quarter of 2026, starting with
an instant-access savings account.
In a highly competitive market with
fast-growing direct and challenger
banks, we’ll differentiate our offering
through intuitive digital experiences
and a customer-first proposition.
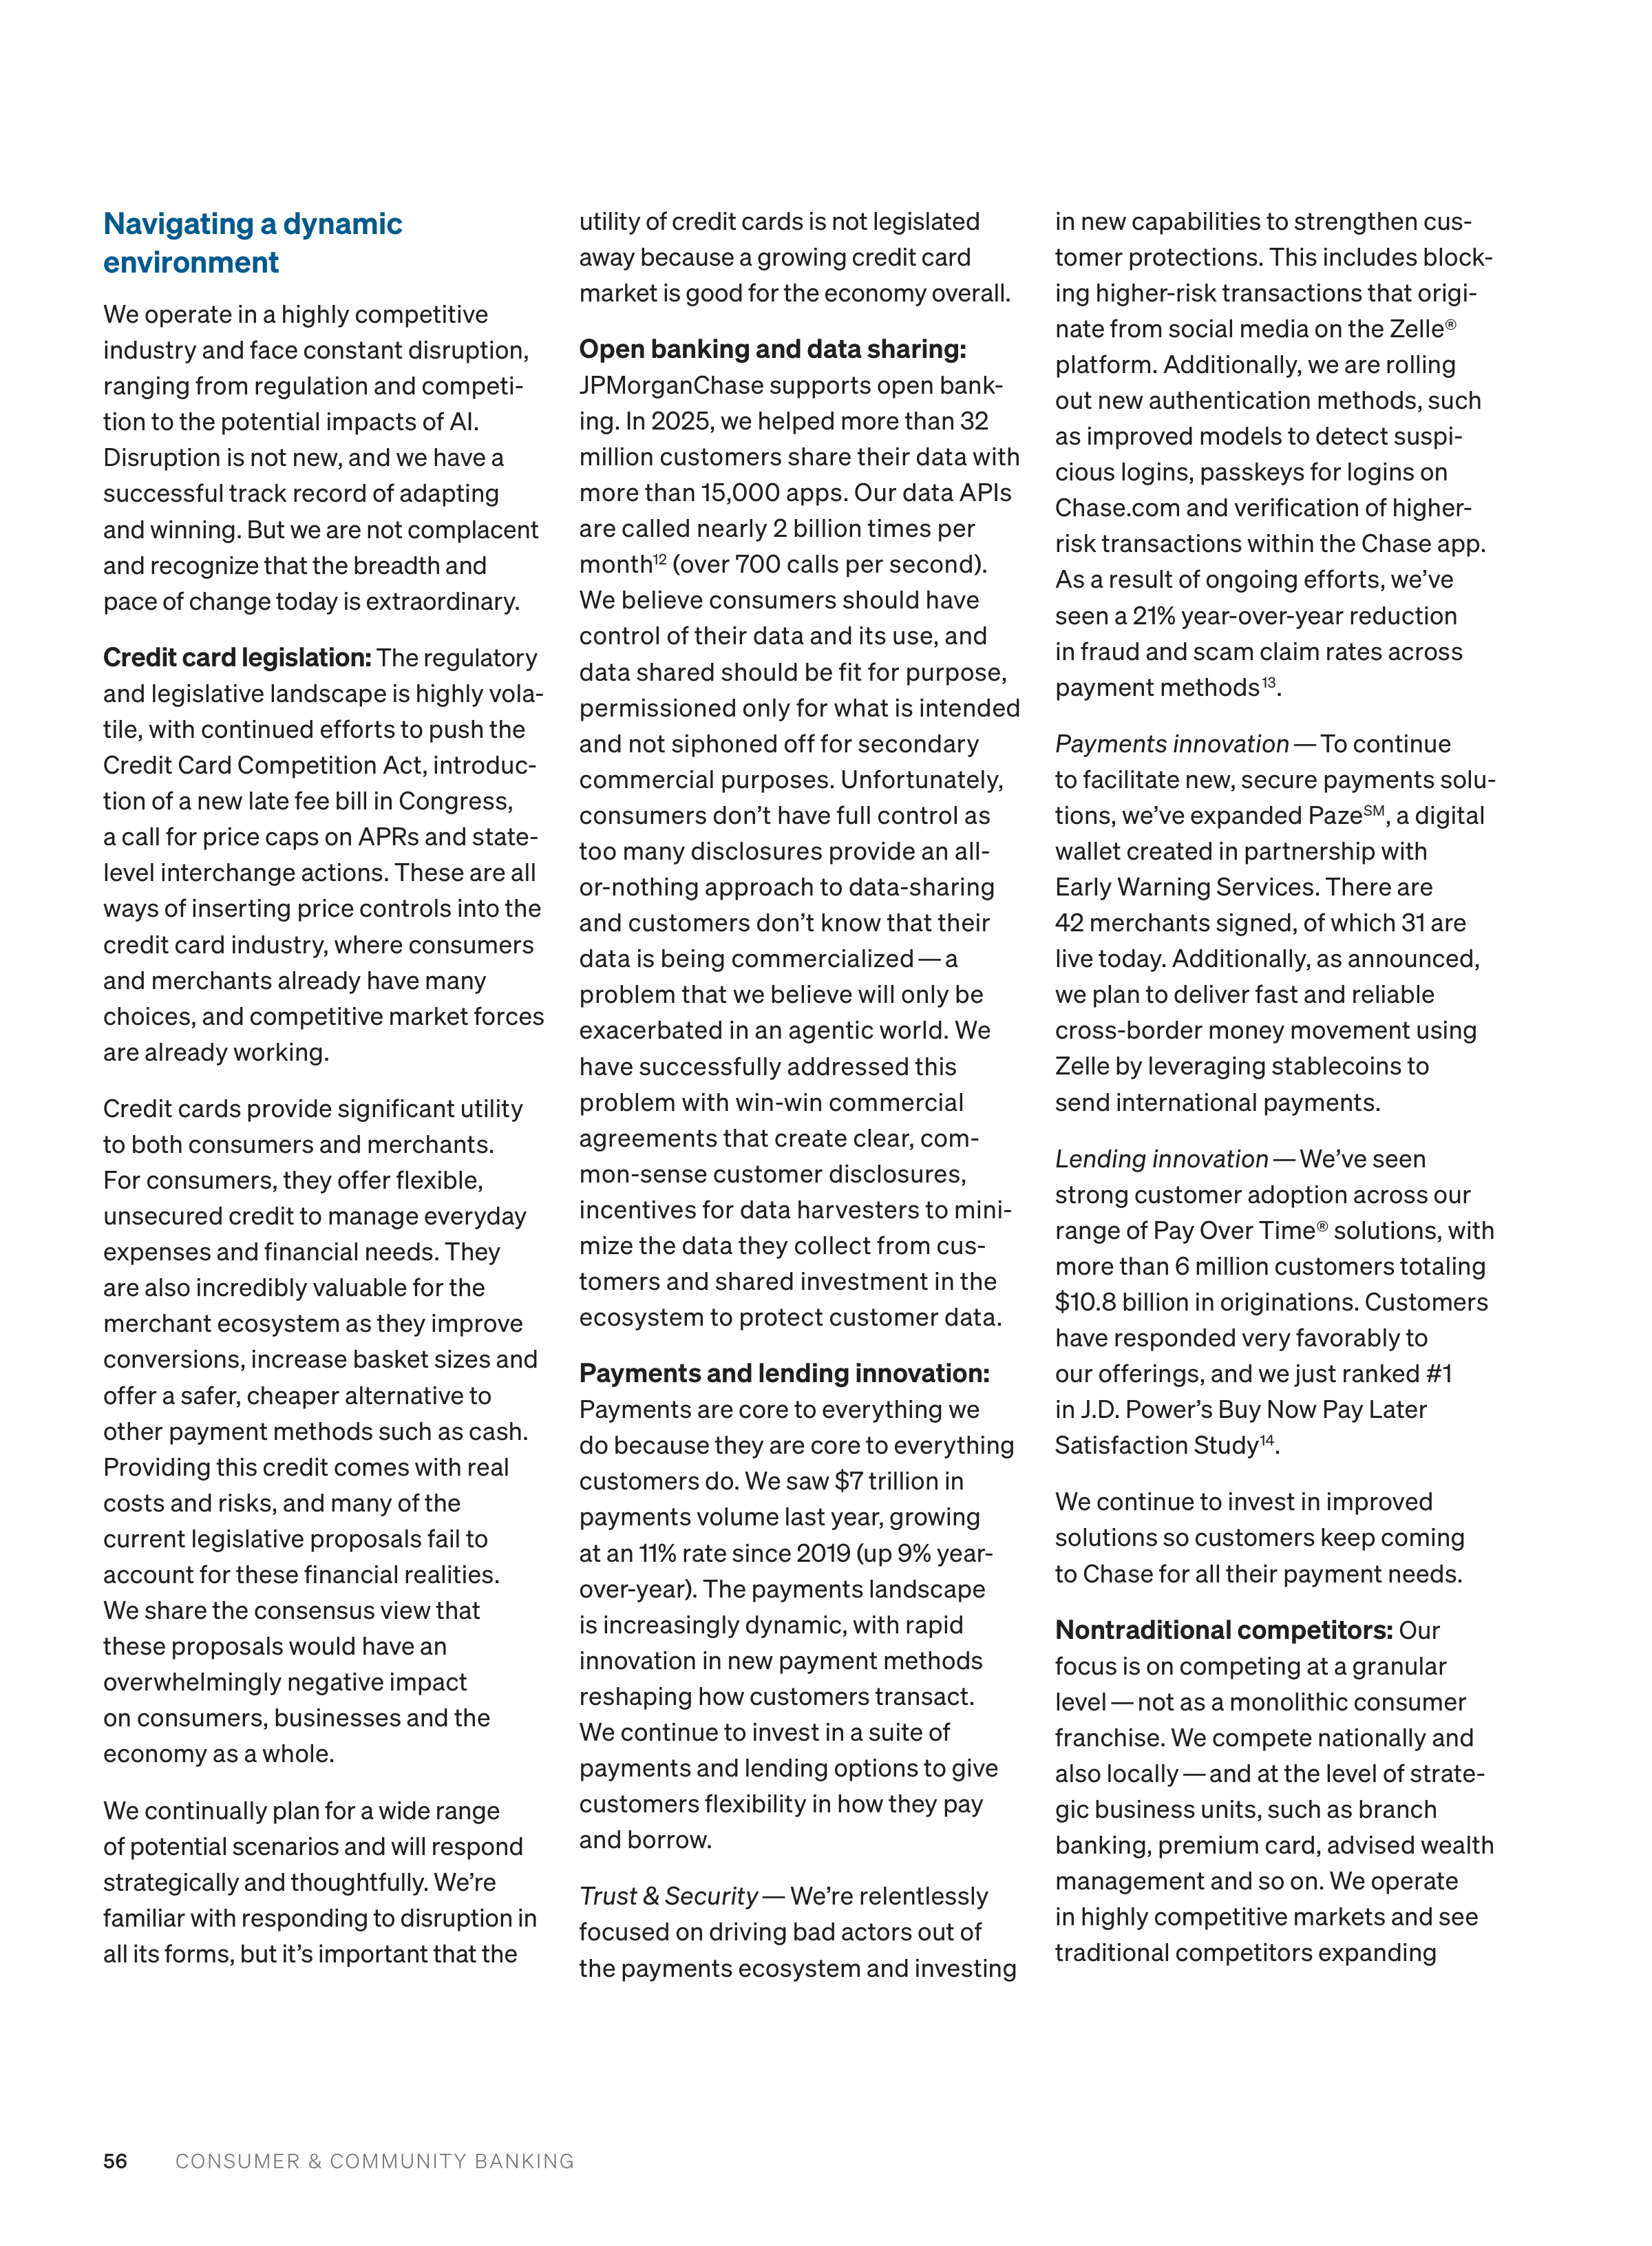
CONSUMER & COMMUNITY BANKING
56
Navigating a dynamic
environment
We operate in a highly competitive
industry and face constant disruption,
ranging from regulation and competi
tion to the potential impacts of AI.
Disruption is not new, and we have a
successful track record of adapting
and winning. But we are not complacent
and recognize that the breadth and
pace of change today is extraordinary.
Credit card legislation:
The regulatory
and legislative landscape is highly vola
tile, with continued efforts to push the
Credit Card Competition Act, introduc
tion of a new late fee bill in Congress,
a call for price caps on APRs and state-
level interchange actions. These are all
ways of inserting price controls into the
credit card industry, where consumers
and merchants already have many
choices, and competitive market forces
are already working.
Credit cards provide significant utility
to both consumers and merchants.
For consumers, they offer flexible,
unsecured credit to manage everyday
expenses and financial needs. They
are also incredibly valuable for the
merchant ecosystem as they improve
conversions, increase basket sizes and
offer a safer, cheaper alternative to
other payment methods such as cash.
Providing this credit comes with real
costs and risks, and many of the
current legislative proposals fail to
account for these financial realities.
We share the consensus view that
these proposals would have an
overwhelmingly negative impact
on consumers, businesses and the
economy as a whole.
We continually plan for a wide range
of potential scenarios and will respond
strategically and thoughtfully. We’re
familiar with responding to disruption in
all its forms, but it’s important that the
utility of credit cards is not legislated
away because a growing credit card
market is good for the economy overall.
Open banking and data sharing:
JPMorganChase supports open bank
ing. In 2025, we helped more than 32
million customers share their data with
more than 15,000 apps. Our data APIs
are called nearly 2 billion times per
month
12
(over 700 calls per second).
We believe consumers should have
control of their data and its use, and
data shared should be fit for purpose,
permissioned only for what is intended
and not siphoned off for secondary
commercial purposes. Unfortunately,
consumers don’t have full control as
too many disclosures provide an all-
or-nothing approach to data-sharing
and customers don’t know that their
data is being commercialized — a
problem that we believe will only be
exacerbated in an agentic world. We
have successfully addressed this
problem with win-win commercial
agreements that create clear, com
mon-sense customer disclosures,
incentives for data harvesters to mini
mize the data they collect from cus
tomers and shared investment in the
ecosystem to protect customer data.
Payments and lending innovation:
Payments are core to everything we
do because they are core to everything
customers do. We saw $7 trillion in
payments volume last year, growing
at an 11% rate since 2019 (up 9% year-
over-year). The payments landscape
is increasingly dynamic, with rapid
innovation in new payment methods
reshaping how customers transact.
We continue to invest in a suite of
payments and lending options to give
customers flexibility in how they pay
and borrow.
Trust & Security
— We’re relentlessly
focused on driving bad actors out of
the payments ecosystem and investing
in new capabilities to strengthen cus
tomer protections. This includes block
ing higher-risk transactions that origi
nate from social media on the Zelle®
platform. Additionally, we are rolling
out new authentication methods, such
as improved models to detect suspi
cious logins, passkeys for logins on
Chase.com and verification of higher-
risk transactions within the Chase app.
As a result of ongoing efforts, we’ve
seen a 21% year-over-year reduction
in fraud and scam claim rates across
payment methods
13
.
Payments innovation
— To continue
to facilitate new, secure payments solu
tions, we’ve expanded Paze
SM
, a digital
wallet created in partnership with
Early Warning Services. There are
42 merchants signed, of which 31 are
live today. Additionally, as announced,
we plan to deliver fast and reliable
cross-border money movement using
Zelle by leveraging stablecoins to
send international payments.
Lending innovation
— We’ve seen
strong customer adoption across our
range of Pay Over Time® solutions, with
more than 6 million customers totaling
$10.8 billion in originations. Customers
have responded very favorably to
our offerings, and we just ranked #1
in J.D. Power’s Buy Now Pay Later
Satisfaction Study
14
.
We continue to invest in improved
solutions so customers keep coming
to Chase for all their payment needs.
Nontraditional competitors:
Our
focus is on competing at a granular
level — not as a monolithic consumer
franchise. We compete nationally and
also locally — and at the level of strate
gic business units, such as branch
banking, premium card, advised wealth
management and so on. We operate
in highly competitive markets and see
traditional competitors expanding



CONSUMER & COMMUNITY BANKING
57
their branch networks and reach, fight
ing harder to capture relationships
and spend among affluent clients,
and integrating AI to elevate offerings
and experiences.
In addition, big tech and fintech com
petitors have continued to scale across
domains such as payments and invest
ments, which they use as a wedge to
expand into core financial services
relationships. This isn’t a new playbook,
but as time progresses, nontraditional
competitors are building deeper rela
tionships, predominantly with younger
and lower-income segments.
Chase continues to be a top choice
across products and customer demo
graphics, including with these cus
tomer segments. To date, we’ve been
successful in our ability to generate
outperformance, and we’ll keep doing
what we know works, like building
branches, deepening into investments,
and driving payments and lending
innovation. But we recognize that what
made us successful in the past may not
be sufficient in the future, and so we’re
leaning into disruption by reimagining
customer experiences and delivering
on segmented propositions — all with
greater speed.
AI transformation
:
AI adoption is
growing rapidly. This is a massive
opportunity, and we see benefits
everywhere. We delivered a nearly 60%
increase in value from AI and machine
learning (ML) year-over-year and are
supercharging teams’ productivity.
Operations is at the tip of the spear,
where we announced an objective to
achieve more than 40% gross produc
tivity efficiency by 2030, and we’re
already on track to outperform. There
are similar opportunities across CCB.
We have mature use cases leveraging
predictive AI/ML in credit, operations
and fraud, and we are expanding this
with an increased focus on agentic
capabilities in coding, marketing, sales
optimization, pricing and personaliza
tion. Enabling this, our data is in the
cloud, already fit for purpose and read
able by humans and predictive AI —
and more of our important data is
streaming real-time for consumption
by generative AI.
AI is also transforming consumer
behavior. People are switching from
clicks to conversations, changing how
they discover brands and products,
how they shop and how they pay. We’re
leveraging our valuable data assets to
personalize experiences across all our
channels — based not only on the rela
tionships customers have with us but
also what is contextually relevant to
them in the moment. Going forward,
we’re embedding generative and agen
tic AI capabilities to further elevate
these interactions.
2026 look ahead
CCB is a growth-oriented franchise
that operates from a position of
strength. We focus on building durable
customer relationships across seg
ments and in communities across the
U.S., and we’re excited about the inter
national growth opportunity with the
International Consumer Bank. We earn
customers’ trust by providing safe
and secure access to banking, and
we protect the firm and shareholders
through a rigorous commitment to a
fortress balance sheet and through-
the-cycle decision making. Our more
than 140,000 global employees — and
the culture and values they exemplify
— continue to be a great asset and a
competitive advantage.
The overall U.S. economy — and
consumers and small businesses —
remain resilient despite geopolitical
uncertainty and emerging signs of
softness in the labor market and
sentiment. Though we face a dynamic
environment across regulation, com
petition and AI, our clear strategies
and momentum position us for ongo
ing success.
1
#1 banking brand based on Brand Health
Masterbrand Q4 2025 Report.
2
#1 in U.S. mobile monthly active users (2025) among
incumbent U.S. banking mobile apps based on
Sensor Tower. Sensor Tower supplies modelled
data through proprietary panels and apps.
3
Connected Commerce is part of Card Services
and includes payment solutions, travel services,
merchant offers and lifestyle benefits.
4
Unique families with primary and joint account
owners for open and funded accounts.
5
Defined as average sales debit active accounts.
6
Primary Consumer Bank customers meet one of
the following conditions:
≥
15 withdrawals from a
checking account or
≥
5 withdrawals from a
checking account and
≥
$500 of inflows in a given
month. Primary Business Banking clients represent
clients with these account indicators:
≥
$100,000
annual revenue and
≥
4 months on book.
7
2019 and 2024 sales market shares have been
revised to conform with the current presentation.
8
Defined as the percentage of monthly active
customers who have 10 or more transactions or
$10,000 or more annualized spend.
9
Skift research.
10
International Consumer initiatives are currently
reflected in Corporate.
11
Moneyfactscompare.co.uk Awards, 2024-2026.
12
Based on average monthly calls from June–
December 2025.
13
Includes Credit, Debit, Digital and Checks, and
Internal Funds Transfer volumes from September
2024 only and ACH Credit volumes from April 2024.
14
Measures satisfaction with buy now pay later
providers. Learn more: jdpower.com/awards.
Marianne Lake
CEO, Consumer & Community Banking
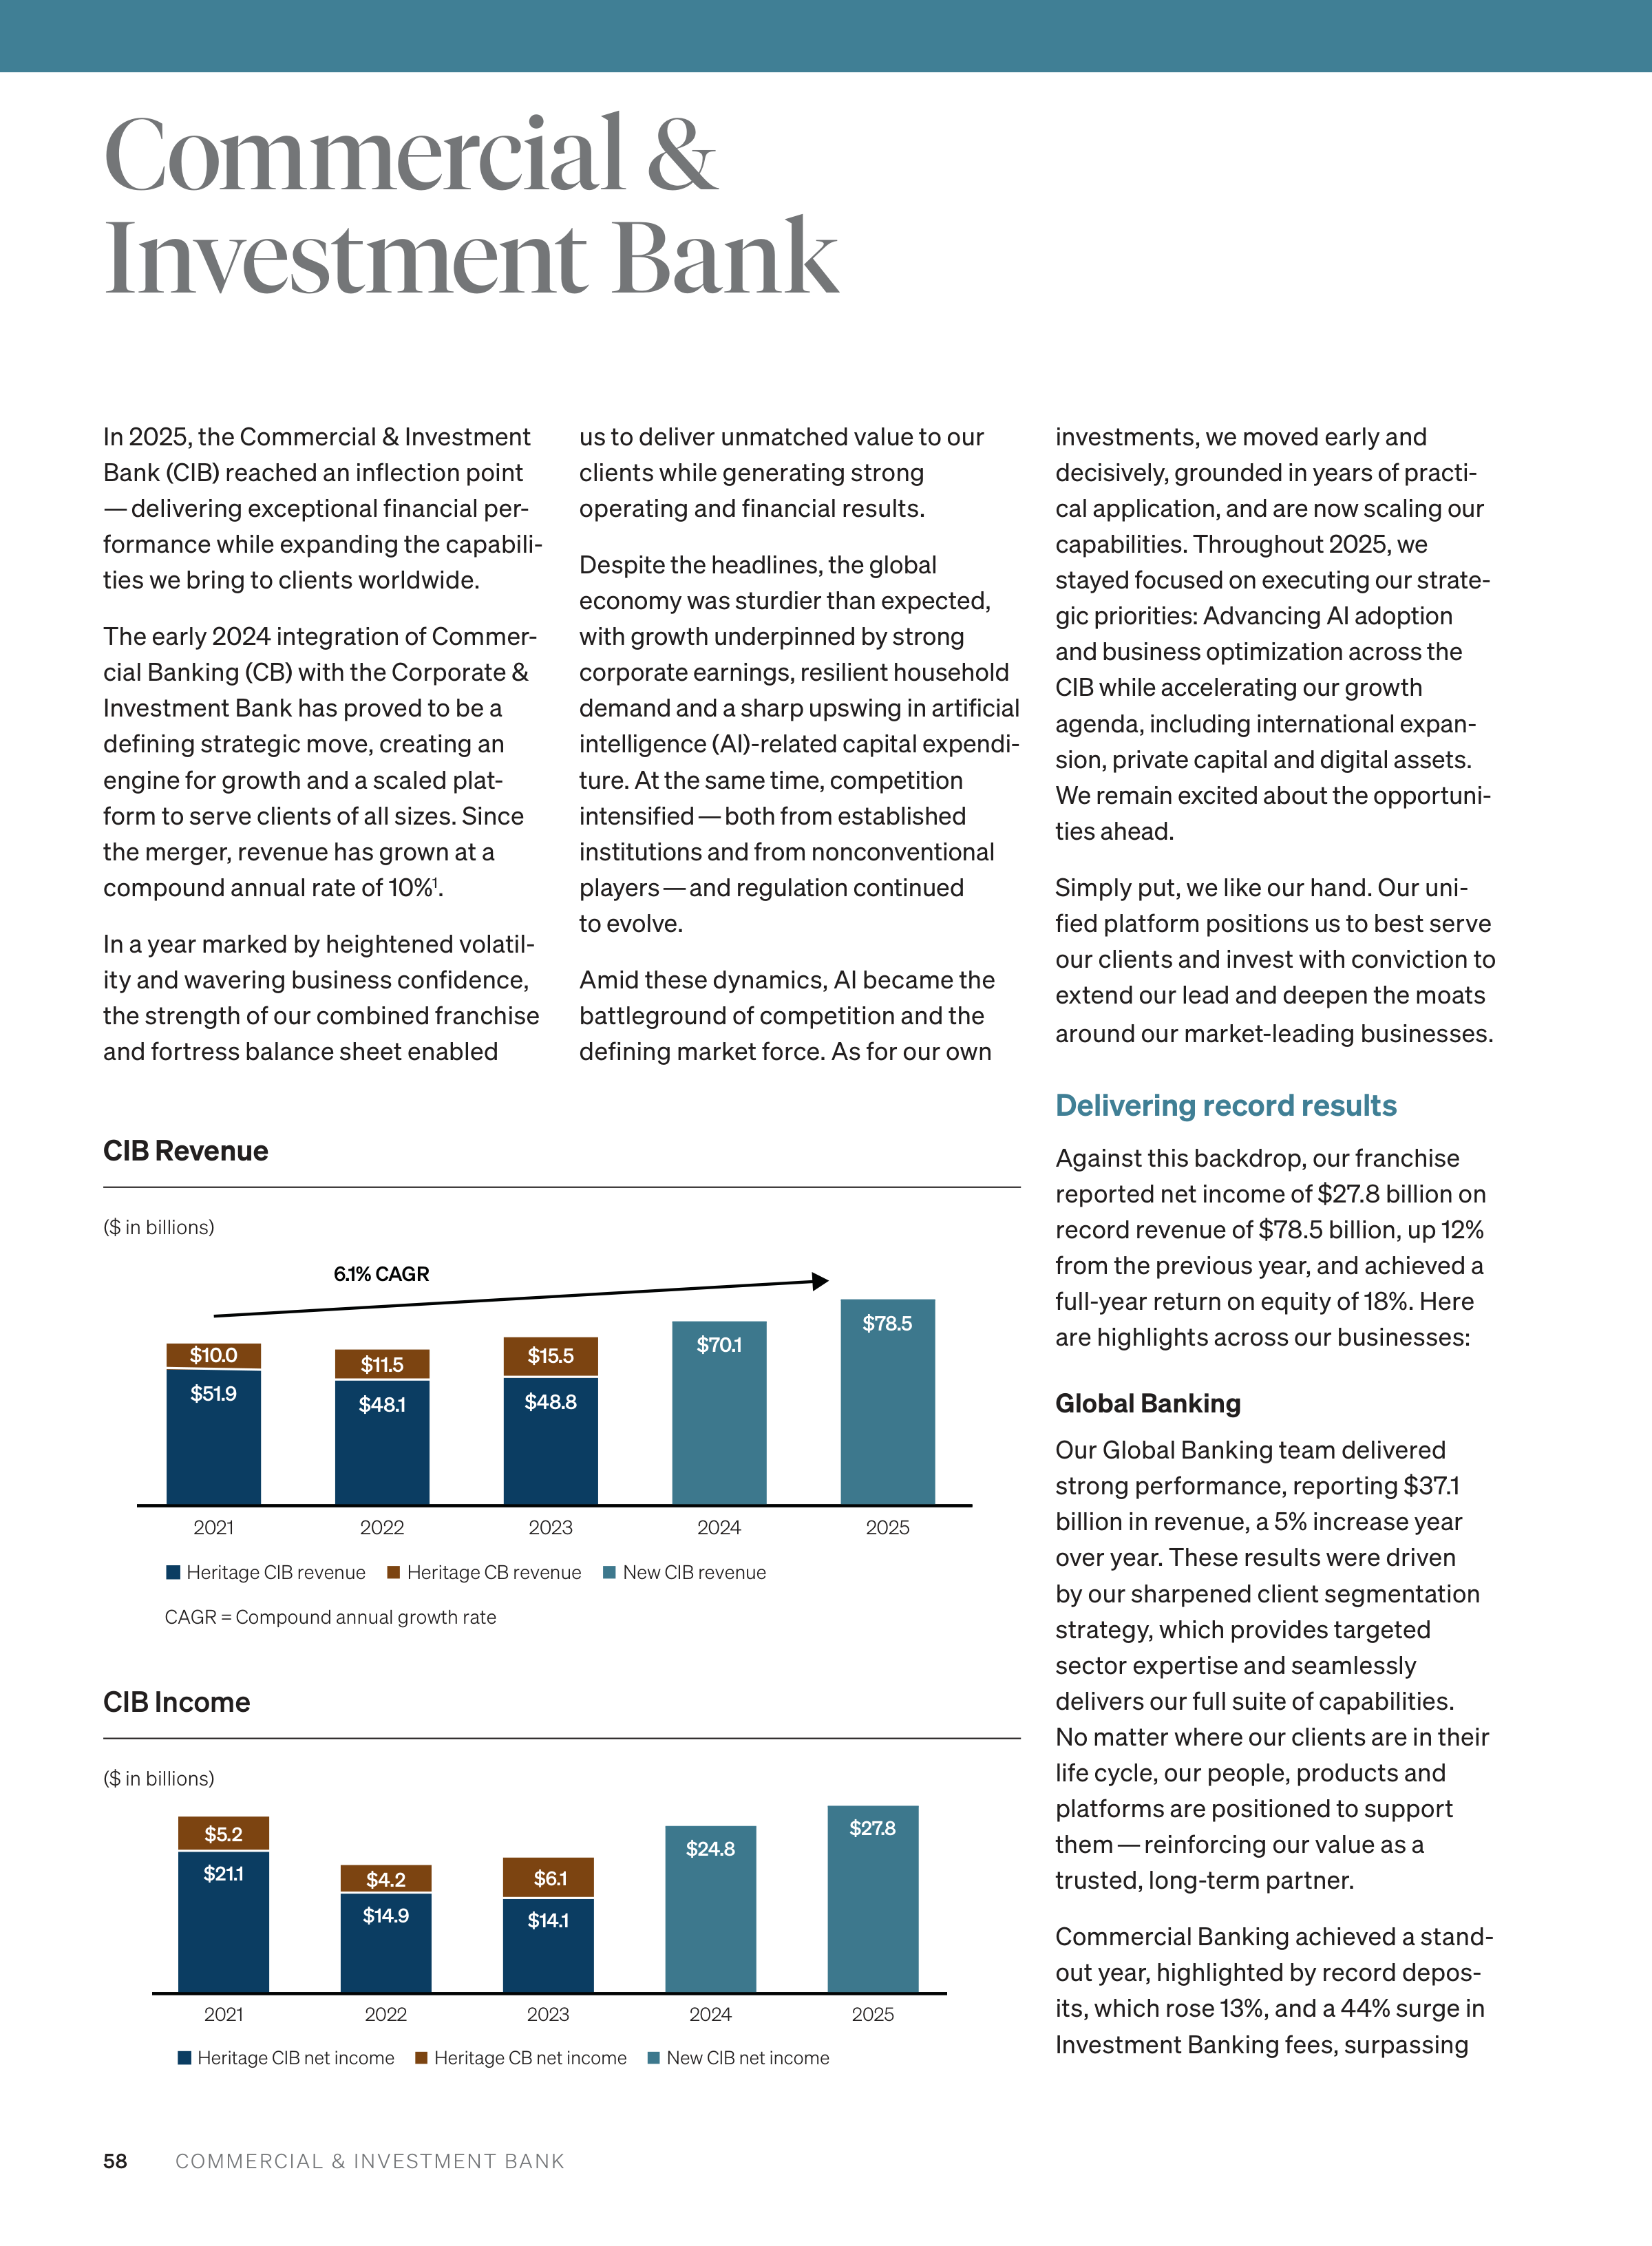
58
COMMERCIAL & INVESTMENT BANK
us to deliver unmatched value to our
clients while generating strong
operating and financial results.
Despite the headlines, the global
economy was sturdier than expected,
with growth underpinned by strong
corporate earnings, resilient household
demand and a sharp upswing in artificial
intelligence (AI)-related capital expendi
ture. At the same time, competition
intensified — both from established
institutions and from nonconventional
players — and regulation continued
to evolve.
Amid these dynamics, AI became the
battleground of competition and the
defining market force. As for our own
investments, we moved early and
decisively, grounded in years of practi
cal application, and are now scaling our
capabilities. Throughout 2025, we
stayed focused on executing our strate
gic priorities: Advancing AI adoption
and business optimization across the
CIB while accelerating our growth
agenda, including international expan
sion, private capital and digital assets.
We remain excited about the opportuni
ties ahead.
Simply put, we like our hand. Our uni
fied platform positions us to best serve
our clients and invest with conviction to
extend our lead and deepen the moats
around our market-leading businesses.
Delivering record results
Against this backdrop, our franchise
reported net income of $27.8 billion on
record revenue of $78.5 billion, up 12%
from the previous year, and achieved a
full-year return on equity of 18%. Here
are highlights across our businesses:
Global Banking
Our Global Banking team delivered
strong performance, reporting $37.1
billion in revenue, a 5% increase year
over year. These results were driven
by our sharpened client segmentation
strategy, which provides targeted
sector expertise and seamlessly
delivers our full suite of capabilities.
No matter where our clients are in their
life cycle, our people, products and
platforms are positioned to support
them — reinforcing our value as a
trusted, long-term partner.
Commercial Banking achieved a stand
out year, highlighted by record depos
its, which rose 13%, and a 44% surge in
Investment Banking fees, surpassing
Commercial &
Investment Bank
In 2025, the Commercial & Investment
Bank (CIB) reached an inflection point
— delivering exceptional financial per
formance while expanding the capabili
ties we bring to clients worldwide.
The early 2024 integration of Commer
cial Banking (CB) with the Corporate &
Investment Bank has proved to be a
defining strategic move, creating an
engine for growth and a scaled plat
form to serve clients of all sizes. Since
the merger, revenue has grown at a
compound annual rate of 10%
1
.
In a year marked by heightened volatil
ity and wavering business confidence,
the strength of our combined franchise
and fortress balance sheet enabled
CIB Revenue
($ in billions)
CIB Income
($ in billions)
Heritage CIB revenue
Heritage CB revenue
New CIB revenue
2025
2024
2023
2022
2021
$51.9
$10.0
$48.1
$11.5
6.1% CAGR
$48.8
$15.5
$70.1
$78.5
CAGR = Compound annual growth rate
Heritage CIB net income
Heritage CB net income
New CIB net income
2025
2024
2023
2022
2021
$21.1
$5.2
$14.9
$4.2
$14.1
$6.1
$24.8
$27.8
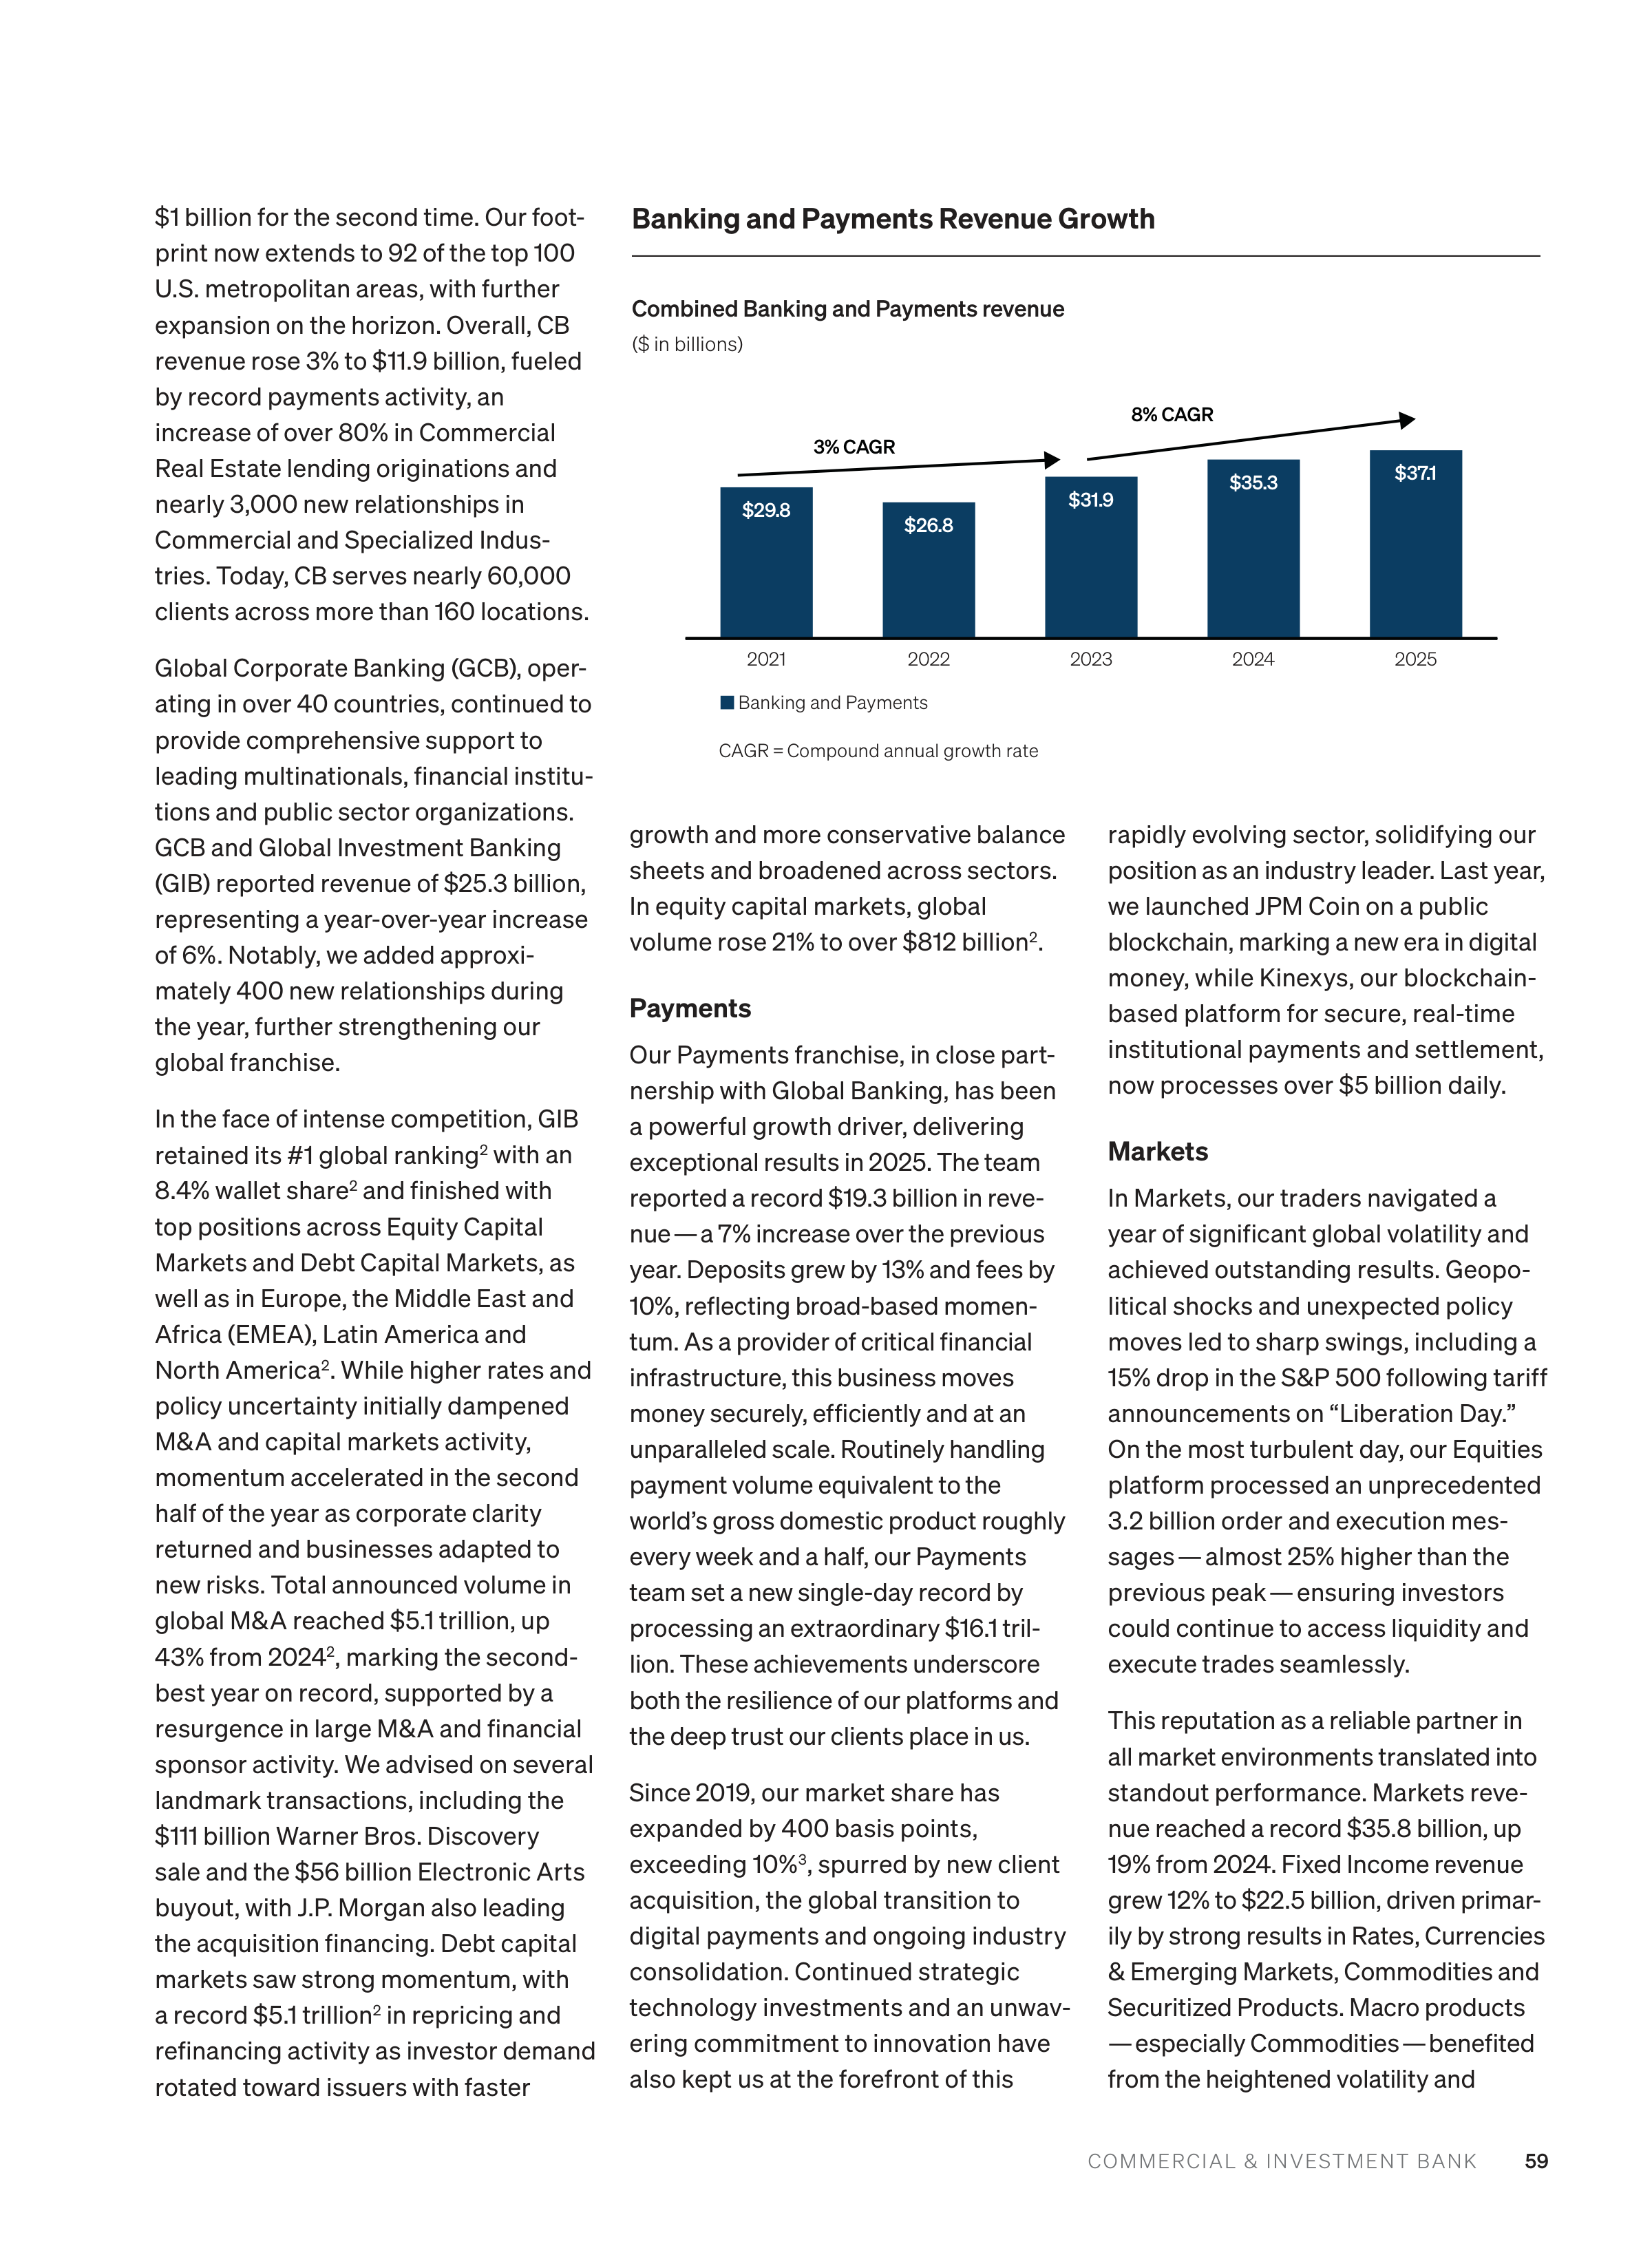
59
COMMERCIAL & INVESTMENT BANK
$1 billion for the second time. Our foot
print now extends to 92 of the top 100
U.S. metropolitan areas, with further
expansion on the horizon. Overall, CB
revenue rose 3% to $11.9 billion, fueled
by record payments activity, an
increase of over 80% in Commercial
Real Estate lending originations and
nearly 3,000 new relationships in
Commercial and Specialized Indus
tries. Today, CB serves nearly 60,000
clients across more than 160 locations.
Global Corporate Banking (GCB), oper
ating in over 40 countries, continued to
provide comprehensive support to
leading multinationals, financial institu
tions and public sector organizations.
GCB and Global Investment Banking
(GIB) reported revenue of $25.3 billion,
representing a year-over-year increase
of 6%. Notably, we added approxi
mately 400 new relationships during
the year, further strengthening our
global franchise.
In the face of intense competition, GIB
retained its #1 global ranking
2
with an
8.4% wallet share
2
and finished with
top positions across Equity Capital
Markets and Debt Capital Markets, as
well as in Europe, the Middle East and
Africa (EMEA), Latin America and
North America
2
. While higher rates and
policy uncertainty initially dampened
M&A and capital markets activity,
momentum accelerated in the second
half of the year as corporate clarity
returned and businesses adapted to
new risks. Total announced volume in
global M&A reached $5.1 trillion, up
43% from 2024
2
, marking the second-
best year on record, supported by a
resurgence in large M&A and financial
sponsor activity. We advised on several
landmark transactions, including the
$111 billion Warner Bros. Discovery
sale and the $56 billion Electronic Arts
buyout, with J.P. Morgan also leading
the acquisition financing. Debt capital
markets saw strong momentum, with
a record $5.1 trillion
2
in repricing and
refinancing activity as investor demand
rotated toward issuers with faster
growth and more conservative balance
sheets and broadened across sectors.
In equity capital markets, global
volume rose 21% to over $812 billion
2
.
Payments
Our Payments franchise, in close part
nership with Global Banking, has been
a powerful growth driver, delivering
exceptional results in 2025. The team
reported a record $19.3 billion in reve
nue — a 7% increase over the previous
year. Deposits grew by 13% and fees by
10%, reflecting broad-based momen
tum. As a provider of critical financial
infrastructure, this business moves
money securely, efficiently and at an
unparalleled scale. Routinely handling
payment volume equivalent to the
world’s gross domestic product roughly
every week and a half, our Payments
team set a new single-day record by
processing an extraordinary $16.1 tril
lion. These achievements underscore
both the resilience of our platforms and
the deep trust our clients place in us.
Since 2019, our market share has
expanded by 400 basis points,
exceeding 10%
3
, spurred by new client
acquisition, the global transition to
digital payments and ongoing industry
consolidation. Continued strategic
technology investments and an unwav
ering commitment to innovation have
also kept us at the forefront of this
rapidly evolving sector, solidifying our
position as an industry leader. Last year,
we launched JPM Coin on a public
blockchain, marking a new era in digital
money, while Kinexys, our blockchain-
based platform for secure, real-time
institutional payments and settlement,
now processes over $5 billion daily.
Markets
In Markets, our traders navigated a
year of significant global volatility and
achieved outstanding results. Geopo
litical shocks and unexpected policy
moves led to sharp swings, including a
15% drop in the S&P 500 following tariff
announcements on “Liberation Day.”
On the most turbulent day, our Equities
platform processed an unprecedented
3.2 billion order and execution mes
sages — almost 25% higher than the
previous peak — ensuring investors
could continue to access liquidity and
execute trades seamlessly.
This reputation as a reliable partner in
all market environments translated into
standout performance. Markets reve
nue reached a record $35.8 billion, up
19% from 2024. Fixed Income revenue
grew 12% to $22.5 billion, driven primar
ily by strong results in Rates, Currencies
& Emerging Markets, Commodities and
Securitized Products. Macro products
— especially Commodities — benefited
from the heightened volatility and
Banking and Payments Revenue Growth
Combined Banking and Payments revenue
($ in billions)
Banking and Payments
CAGR = Compound annual growth rate
2025
2024
2023
2022
2021
$29.8
$26.8
$31.9
$35.3
$37.1
3% CAGR
8% CAGR
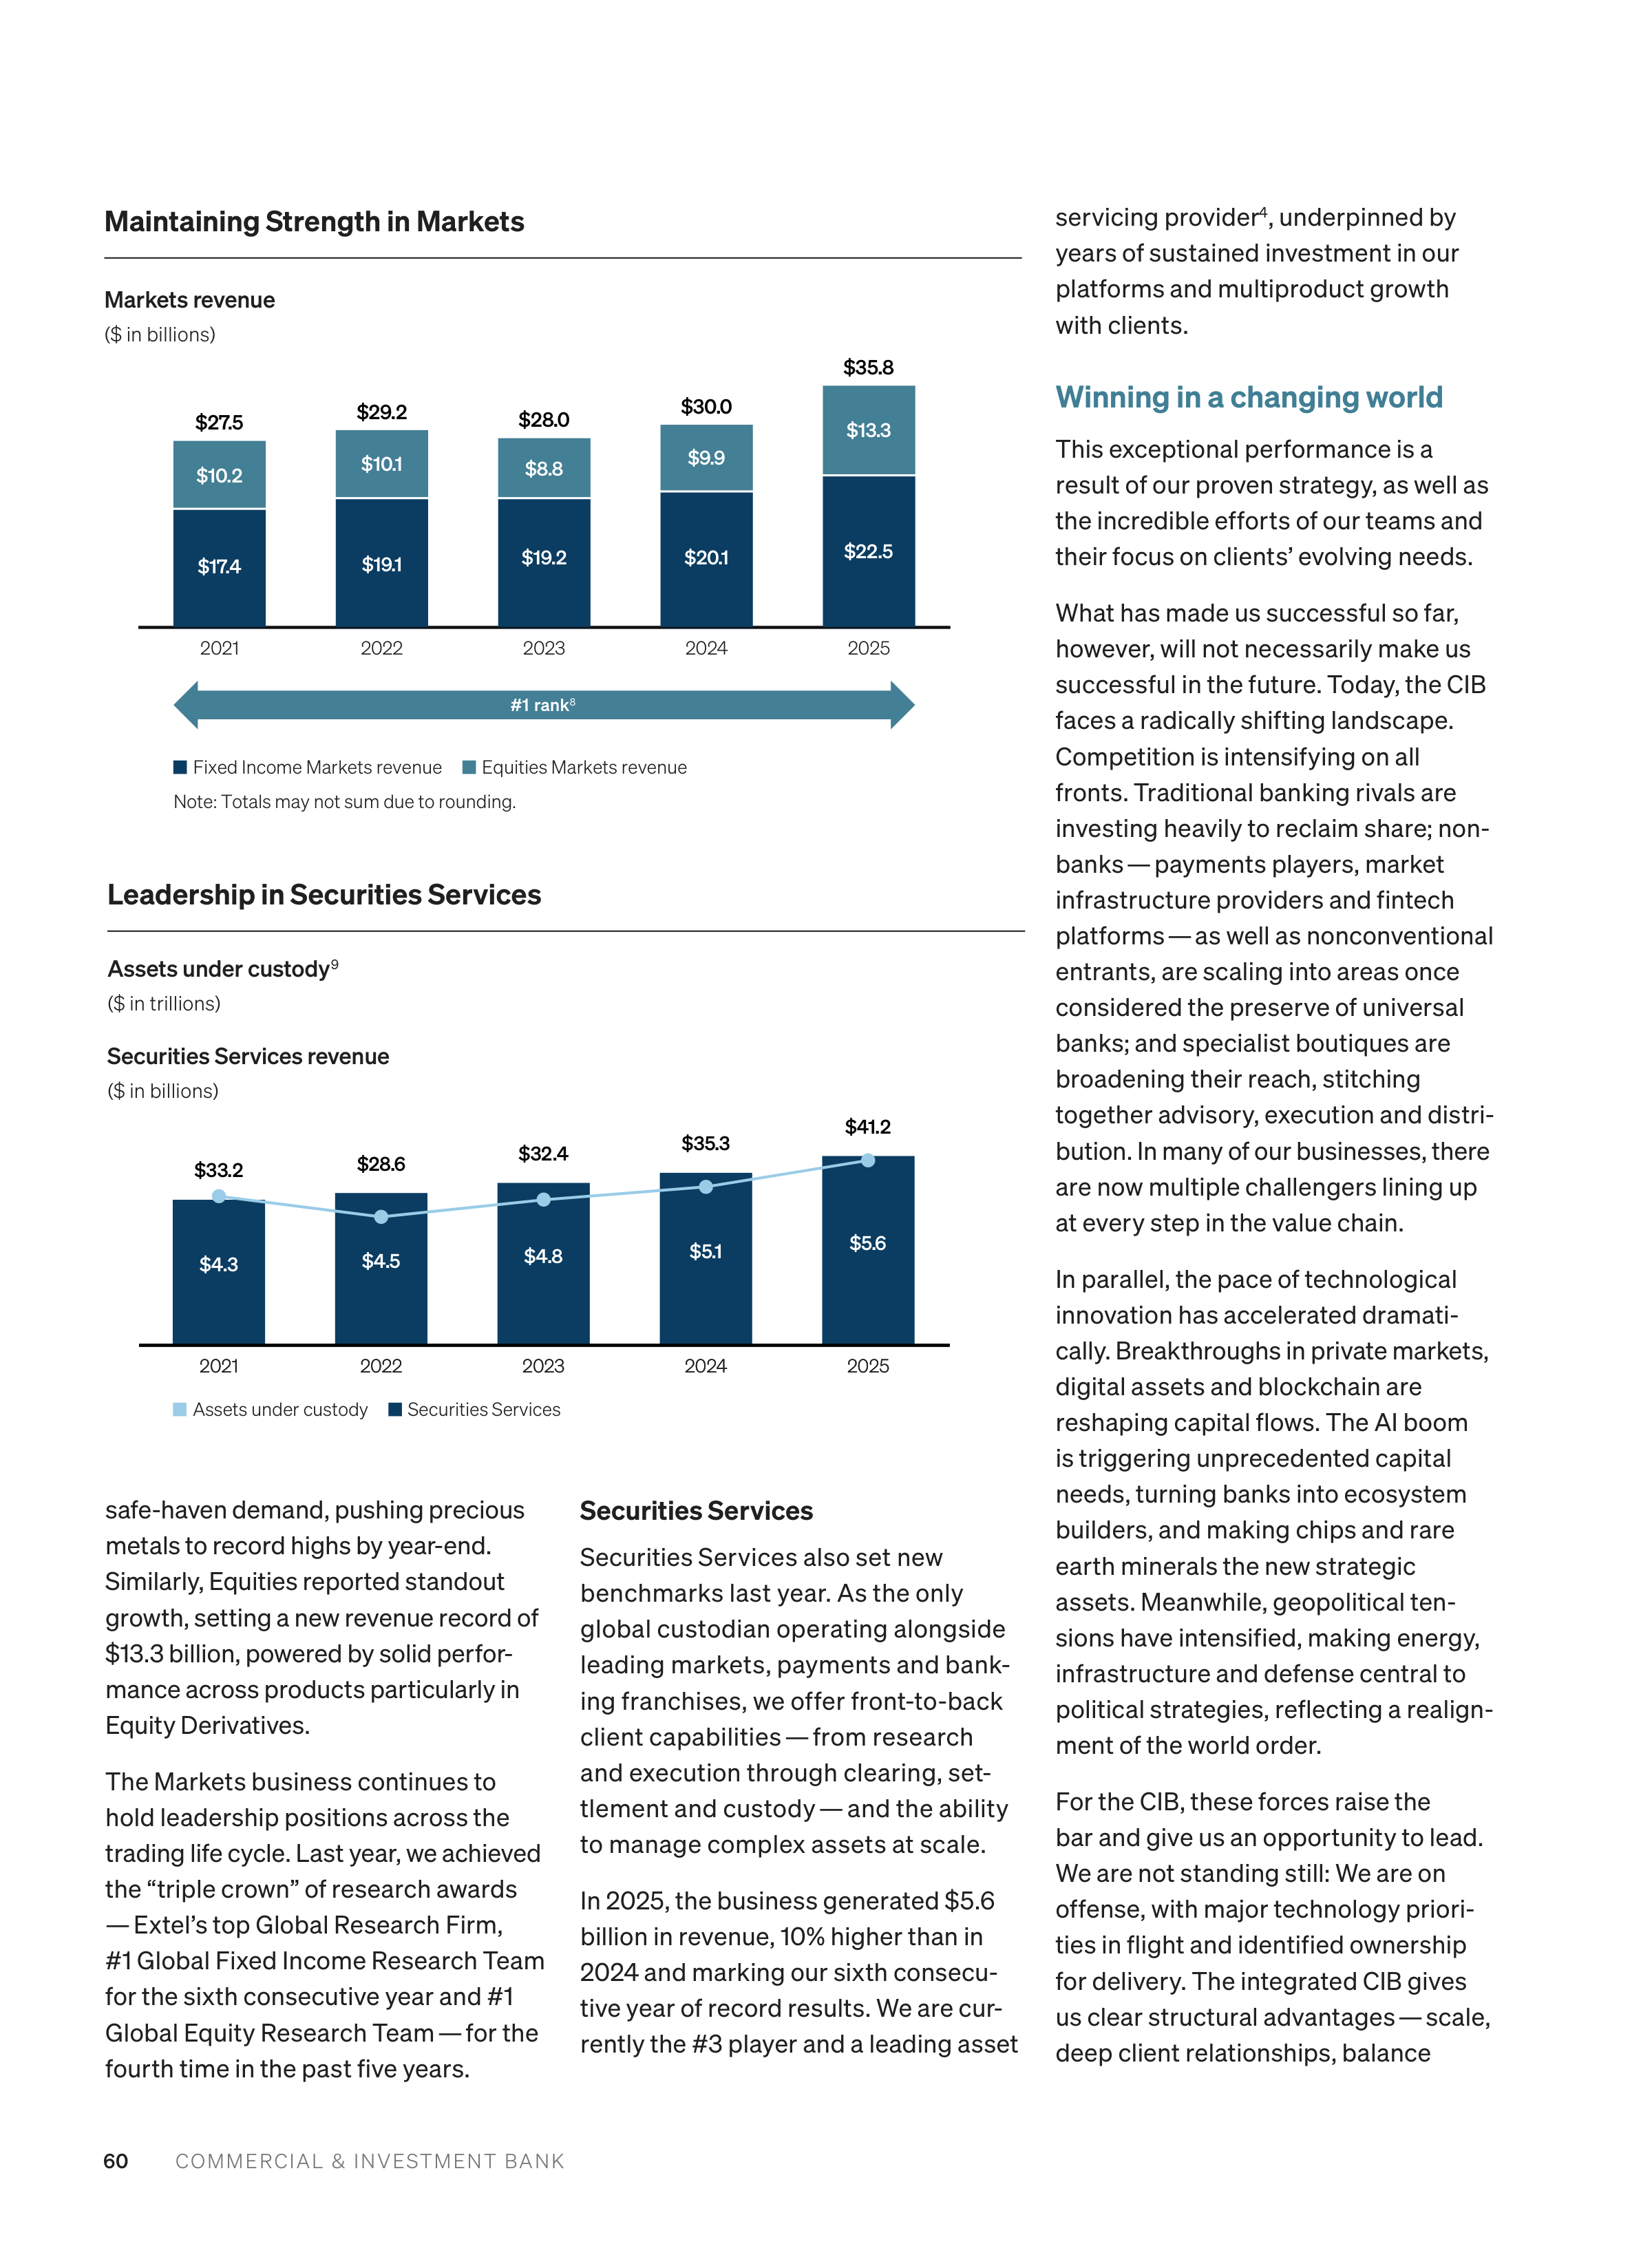
60
COMMERCIAL & INVESTMENT BANK
safe-haven demand, pushing precious
metals to record highs by year-end.
Similarly, Equities reported standout
growth, setting a new revenue record of
$13.3 billion, powered by solid perfor
mance across products particularly in
Equity Derivatives.
The Markets business continues to
hold leadership positions across the
trading life cycle. Last year, we achieved
the “triple crown” of research awards
— Extel’s top Global Research Firm,
#1 Global Fixed Income Research Team
for the sixth consecutive year and #1
Global Equity Research Team — for the
fourth time in the past five years.
Securities Services
Securities Services also set new
benchmarks last year. As the only
global custodian operating alongside
leading markets, payments and bank
ing franchises, we offer front-to-back
client capabilities — from research
and execution through clearing, set
tlement and custody — and the ability
to manage complex assets at scale.
In 2025, the business generated $5.6
billion in revenue, 10% higher than in
2024 and marking our sixth consecu
tive year of record results. We are cur
rently the #3 player and a leading asset
servicing provider
4
, underpinned by
years of sustained investment in our
platforms and multiproduct growth
with clients.
Winning in a changing world
This exceptional performance is a
result of our proven strategy, as well as
the incredible efforts of our teams and
their focus on clients’ evolving needs.
What has made us successful so far,
however, will not necessarily make us
successful in the future. Today, the CIB
faces a radically shifting landscape.
Competition is intensifying on all
fronts. Traditional banking rivals are
investing heavily to reclaim share; non
banks — payments players, market
infrastructure providers and fintech
platforms — as well as nonconventional
entrants, are scaling into areas once
considered the preserve of universal
banks; and specialist boutiques are
broadening their reach, stitching
together advisory, execution and distri
bution. In many of our businesses, there
are now multiple challengers lining up
at every step in the value chain.
In parallel, the pace of technological
innovation has accelerated dramati
cally. Breakthroughs in private markets,
digital assets and blockchain are
reshaping capital flows. The AI boom
is triggering unprecedented capital
needs, turning banks into ecosystem
builders, and making chips and rare
earth minerals the new strategic
assets. Meanwhile, geopolitical ten
sions have intensified, making energy,
infrastructure and defense central to
political strategies, reflecting a realign
ment of the world order.
For the CIB, these forces raise the
bar and give us an opportunity to lead.
We are not standing still: We are on
offense, with major technology priori
ties in flight and identified ownership
for delivery. The integrated CIB gives
us clear structural advantages — scale,
deep client relationships, balance
Maintaining Strength in Markets
Markets revenue
($ in billions)
Leadership in Securities Services
Assets under custody
9
($ in trillions)
Securities Services revenue
($ in billions)
Fixed Income Markets revenue
Equities Markets revenue
Note: Totals may not sum due to rounding.
#1 rank
8
2025
2024
2023
2022
2021
$17.4
$10.2
$27.5
$19.1
$10.1
$29.2
$19.2
$8.8
$20.1
$9.9
$22.5
$13.3
$28.0
$30.0
$35.8
Assets under custody
Securities Services
2025
2024
2023
2022
2021
2025
2024
2023
2022
2021
$4.3
$33.2
$4.5
$4.8
$5.1
$5.6
$28.6
$32.4
$35.3
$41.2
61
COMMERCIAL & INVESTMENT BANK
sheet capacity, global reach, AI capa
bilities and a vast data set. Our task
now is to convert those strengths into
simpler, more seamless client experi
ences and higher return growth.
Here’s how we’re positioning to stay
ahead:
1. Igniting growth through our
integration
The integration of our businesses
has created a powerful “combustion
effect” — igniting growth and unlock
ing new opportunities across our
expanded organization. Uniting our
teams has amplified our collective
impact, making the whole greater
than the sum of its parts.
For example, in Global Banking, by
combining our leading U.S. Commer
cial and Specialized Industries fran
chise with the deep sector expertise
of our investment bankers, we are sup
porting clients with high-value oppor
tunities, including sell-side mandates
and capital raising. This drives deeper
client engagement and expands our
share of wallet.
Our industry coverage is also comple
mented by a targeted focus on high-
growth subsectors, such as enterprise
and cloud, applied technology, biotech
and healthcare services, where our
bankers’ expertise delivers differenti
ated value and positions us to capture
outsized growth.
At the same time, our larger business
footprint creates more scope to broaden
client engagement with macro solu
tions, especially foreign exchange.
While we have long been strong in the
U.S. dollar and other major currencies,
the integrated platform is accelerating
our expansion into new markets,
offering clients a more comprehensive
suite of solutions and deepening our
relationships.
2. Powering private markets
Despite increased scrutiny of private
credit in recent months, we believe
private markets will remain an import
ant part of the financial system over
the long term.
Today, private companies far outnum
ber public ones, with many choosing to
remain private longer due to the high
costs and complexities of public list
ings. Simultaneously, surging investor
appetite for private assets is reshaping
capital flows and creating new oppor
tunities for growth. Assets under man
agement in private markets have grown
at an annual rate of 14% since 2013
5
and
are projected to nearly double — from
around $17 trillion in 2024 to $32 trillion
in 2030
6
.
Clients in these markets are increas
ingly interconnected, forming a network
where limited partners, general
partners and portfolio companies
collaborate and influence each other’s
banking, financing and advisory needs.
To best serve this ecosystem, the CIB
has launched several initiatives. We
have reorganized our coverage model
to serve the private capital markets in
a more integrated way, creating a joint
venture between the CIB and the
Private Bank to deliver seamless solu
tions — from frictionless access to
liquidity to creative monetization strat
egies — at every stage of the private
capital life cycle. Meanwhile, our new
Private Capital Advisory & Solutions
team provides clients with comprehen
sive advice across the private capital
spectrum, connecting investors and
companies well before any IPO or sale.
On the financing side, we remain
a reliable provider of credit to well-
established direct lenders. In addition,
last year, we launched the Strategic
Financing Solutions group, combining
Global Banking and Markets structur
ing expertise to offer clients a compre
hensive suite of financing options —
from direct lending to syndicated loans
and high yield. Our direct lending
platform has expanded as well, with
$14 billion total exposure
7
from our
$50 billion commitment to private
credit, alongside over $25 billion of
partner capital available.
Finally, in an industry first, we intro
duced private company sell-side
research last year, providing in-depth
analysis on influential companies such
as OpenAI, Anthropic and Stripe —
businesses driving innovation in their
sectors.
3. Expanding in international
markets
Today, nearly 40% of the CIB’s revenue
originates from outside the United
States with broad-based growth across
Asia Pacific, EMEA and Latin America.
Our scale, deep local expertise and
ability to navigate complex regulatory
and geopolitical landscapes have
enabled us to deliver effective solu
tions to clients worldwide.
The opportunity ahead is significant:
International markets are poised to
outpace domestic growth, fueled
by economic diversification, rising
cross-border trade and a new wave of
investment — particularly in the Middle
East, North Africa and Turkey. Amid
evolving regional dynamics, we are
advancing with a measured, phased
approach designed to protect continu
ity of service and client outcomes.
To capture this regional growth, we are
investing in our capabilities in Bahrain,
Saudi Arabia and the United Arab
Emirates, as well as expanding our
franchise in Turkey. In addition, we’re
increasing critical infrastructure in
Africa, including a new onshore pres
ence on the Ivory Coast and Kenya. Our
focus extends beyond serving large
multinationals to include international
mid-cap and institutional clients, as
well as subsidiaries of U.S.-based firms.
62
COMMERCIAL & INVESTMENT BANK
A key driver of our expansion is extend
ing our Payments solutions in new
geographies. Today, the firm processes
around 65 million transactions daily
and moves nearly $12 trillion across
120 currencies. But the ambition is
broader — to expand coverage and
products across venture capital, the
Innovation Economy and mid-cap
corporates while deepening our offer
ings in equities and fixed income.
4. Building an AI-powered business
Across the CIB, we’re rewiring our
business to embed AI in every process,
maintain modern data architecture and
drive measurable business outcomes.
AI is already creating material effi
ciency gains. In transaction screening,
AI has enabled us to review more than
double the volume while halving the
number of manual operator checks.
That means quicker turnaround for
clients and fewer delays. AI is also
elevating how we work — cutting man
ual tasks, accelerating innovation and
improving client outcomes. Over 90%
of our engineers now use AI code
assistants, and more than 65,000
CIB colleagues actively use LLM Suite,
our generative AI platform.
We’re deploying AI proactively for
clients, too — corporate treasury
clients now have a cash-flow-
forecasting tool that supports smarter
liquidity management. In Markets,
Prime Finance applies AI to manage
our inventory of securities, sharpen
pricing, strengthen risk management
and optimize capital efficiency.
Rather than a one-size-fits-all
approach, each of our businesses has
its own AI strategy aligned to the end-
to-end client journey, ensuring AI is
applied where it creates the most value
— all underpinned by a large, well-
organized data estate.
5. Transforming the client
experience
Likewise, we’re continuing to invest
significantly in our digital capabilities,
focusing on improving every aspect of
the client experience, reducing unnec
essary hurdles and giving clients a uni
fied view of their financial information.
Our leading digital platforms now sup
port more than 400,000 users, ranging
from small businesses to large global
companies. These platforms bring
together account management, pay
ments and cash flow tools so clients
can handle their finances more easily
and efficiently in one place.
We’re also investing in new solutions
tailored to the needs of unique client
segments. For example, U.S. technol
ogy startups benefit from a full digital
onboarding and banking experience
built for founders, plus dedicated Inno
vation Economy coverage supported
by 550 bankers, so they can expand
from seed to IPO. Midsized companies
get access to automated payment
solutions and real-time financial
insights, making it easier for them
to scale their businesses.
By combining these efforts, we’re com
mitted to delivering a faster, smarter
and more seamless digital experience
for all our clients.
6. Leading the way in digital assets
Once a niche innovation, digital assets
have developed into a significant eco
system, changing how value is stored,
transferred and accessed. Crypto
assets, formerly on the fringe, have
also experienced notable growth, and
stablecoins are increasingly being
used for transactions. As adoption
expands among corporations and
financial institutions, tokenized assets
— digital tokens representing real-
world assets — are expected to see
continued growth, with some projec
tions estimating the market could
reach $13 trillion by 2030, highlighting
the ongoing evolution of digital finance.
The CIB has been at the forefront of
this shift with its Kinexys platform,
launched in 2019, which enables busi
nesses to make fast, secure payments
using blockchain technology. We have
also developed new blockchain-based
products, such as deposit tokens and
tokenized money market funds, that
deliver faster settlement, greater
transparency and improved efficiency
compared with traditional banking.
Since 2023, the number of transactions
on these platforms has grown thirty
fold. By investing early in digital pay
ments, financing and crypto solutions,
we are well-positioned to compete with
emerging digital-native financial firms
while capitalizing on the trust and reli
ability that J.P. Morgan is known for.
2025 marked the first U.S. commercial
paper issuance on the Solana public
blockchain for Galaxy Digital Holdings,
settled using stablecoin and digital
custody. This milestone demonstrates
that public blockchains can support
institutional-grade transactions, offer
ing lower costs and access to new
sources of liquidity.
Broader adoption hinges on regulatory
clarity. Ultimately, the firm supports
regulation that encourages innovation
but also includes clear frameworks
and safeguards so that tokenized
assets are treated consistently with
traditional ones.
7. Banking for impact
As we continue to innovate and grow
our business, we remain equally
committed to harnessing our scale and
resources to drive positive change in
society — deploying capital and exper
tise to strengthen resilience and
expand economic opportunity in the
United States and key international
markets. Our work reflects a core
belief: Commercial success and social
impact are mutually reinforcing.
Central to this mission is the firm’s $1.5
trillion Security & Resiliency Initiative, a
decade-long effort to facilitate, finance
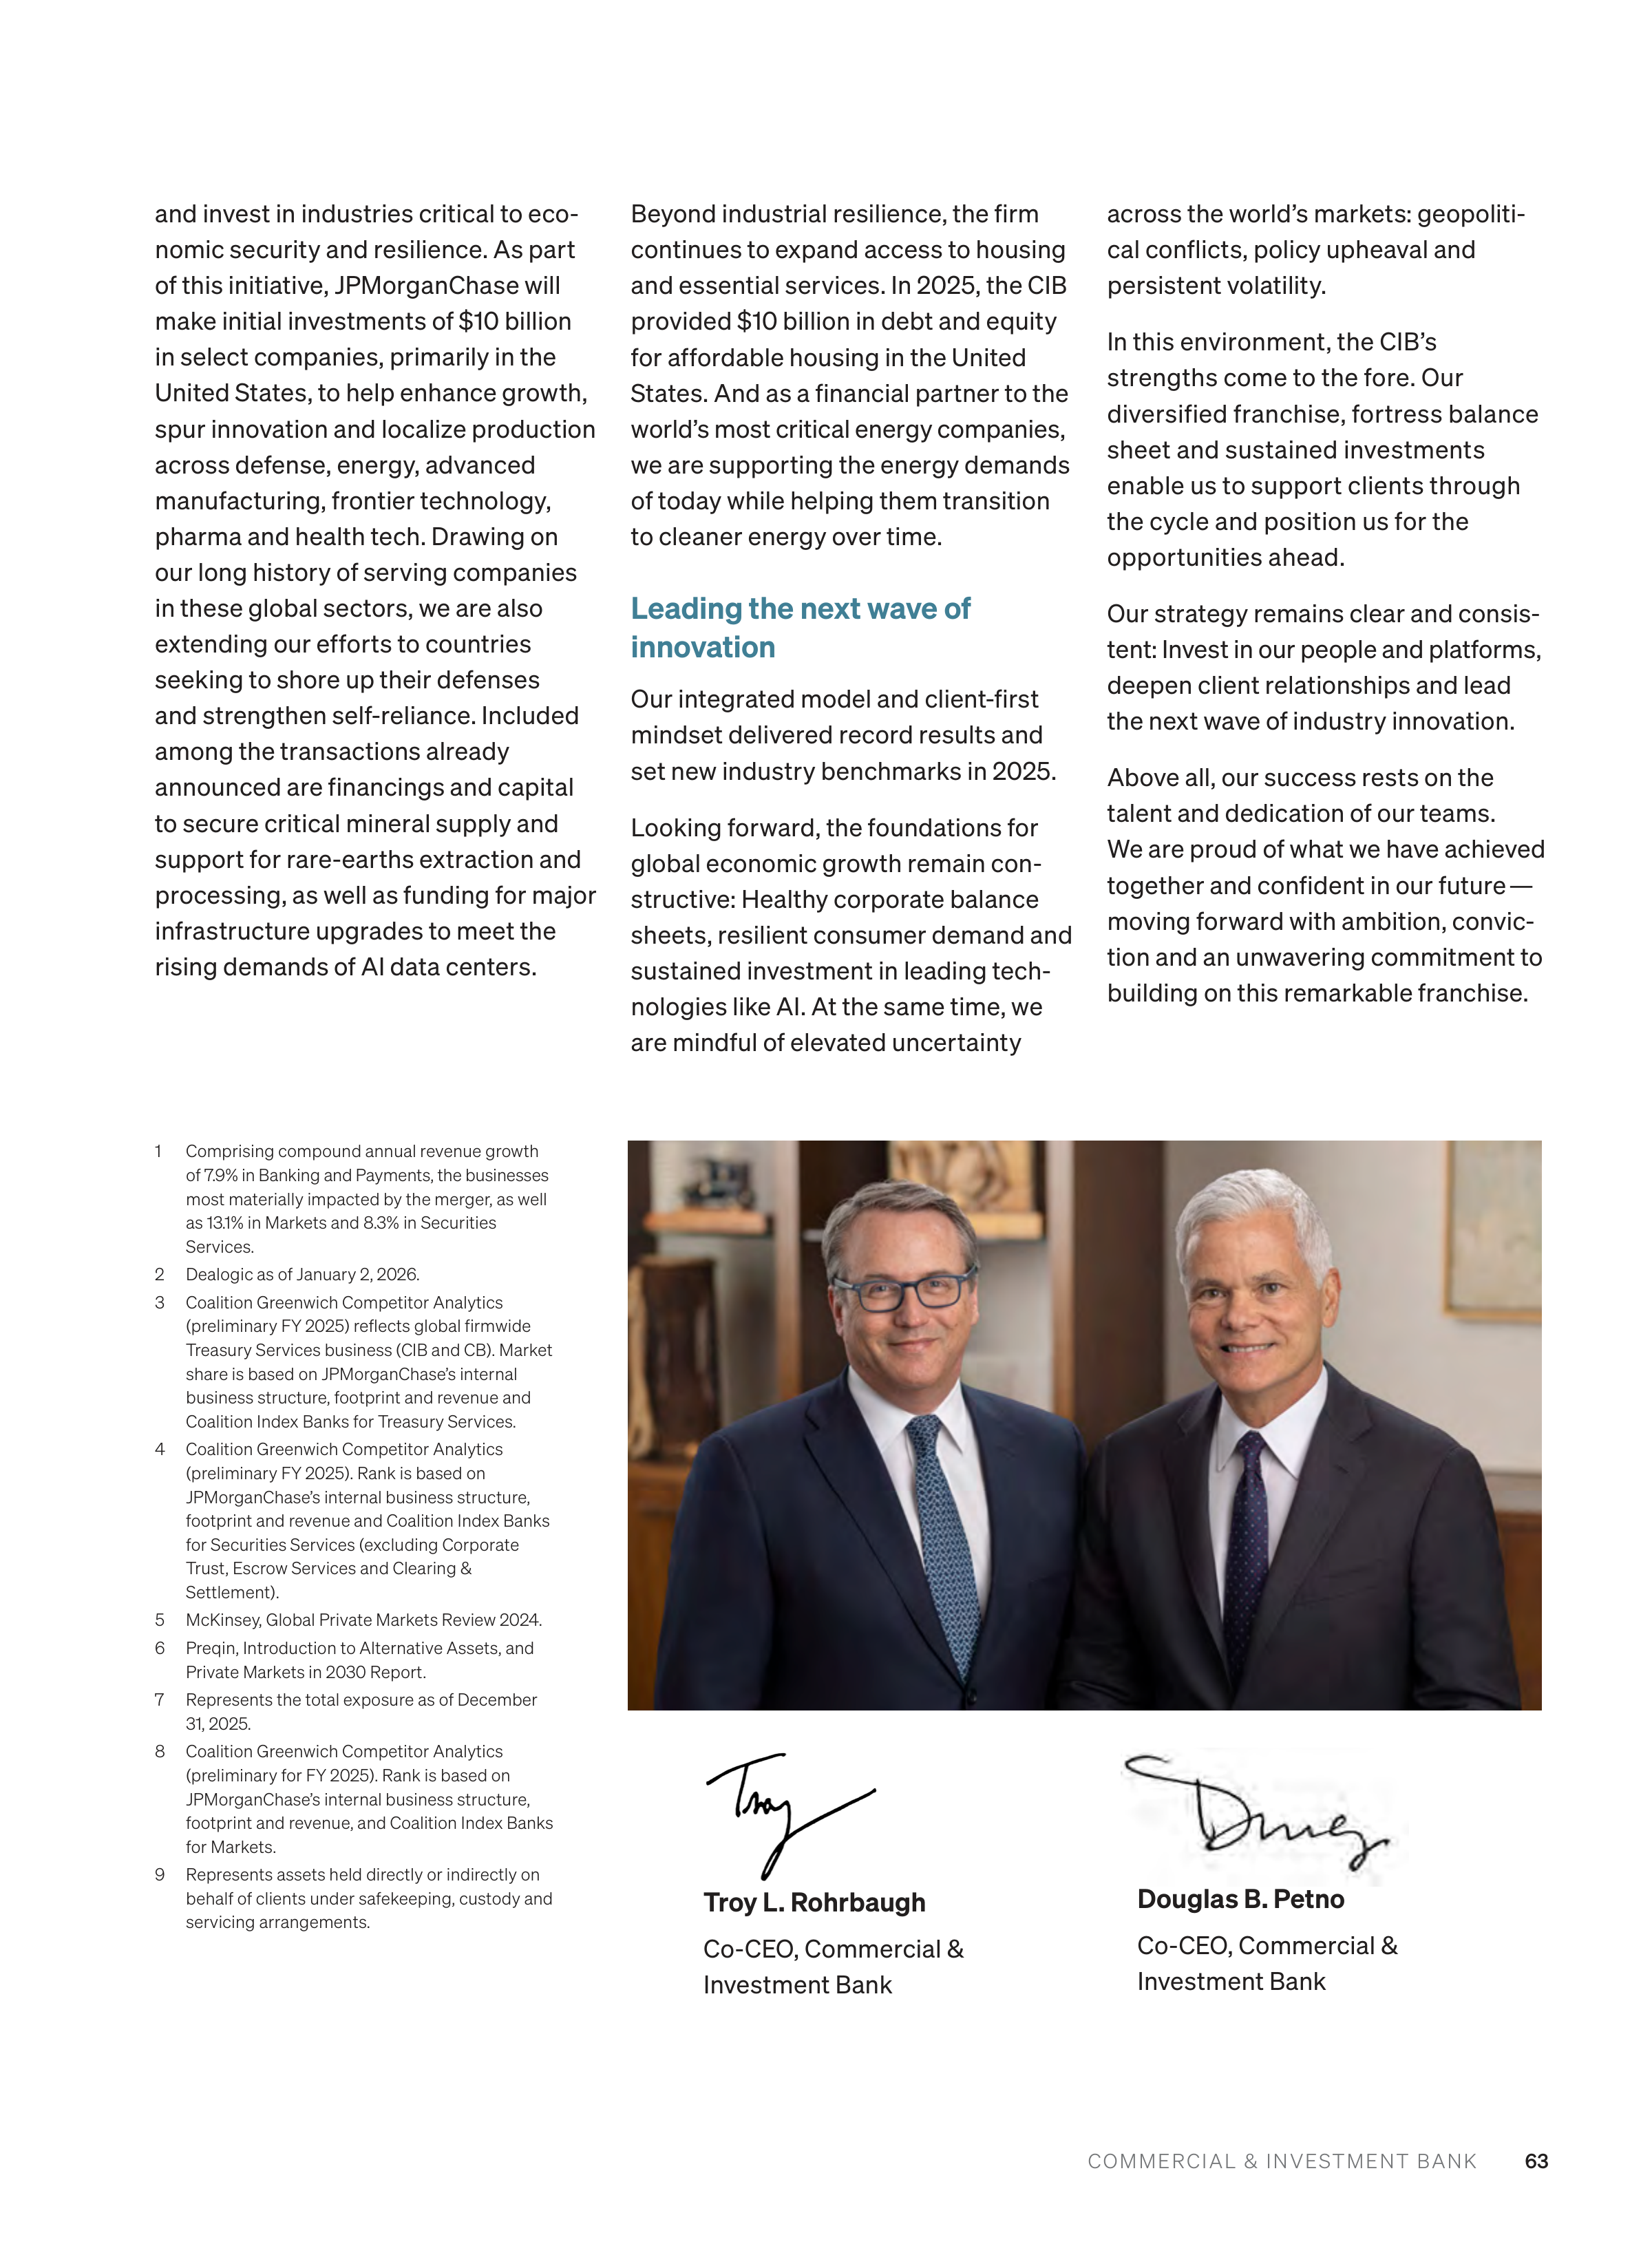



63
COMMERCIAL & INVESTMENT BANK
and invest in industries critical to eco
nomic security and resilience. As part
of this initiative, JPMorganChase will
make initial investments of $10 billion
in select companies, primarily in the
United States, to help enhance growth,
spur innovation and localize production
across defense, energy, advanced
manufacturing, frontier technology,
pharma and health tech. Drawing on
our long history of serving companies
in these global sectors, we are also
extending our efforts to countries
seeking to shore up their defenses
and strengthen self-reliance. Included
among the transactions already
announced are financings and capital
to secure critical mineral supply and
support for rare-earths extraction and
processing, as well as funding for major
infrastructure upgrades to meet the
rising demands of AI data centers.
Beyond industrial resilience, the firm
continues to expand access to housing
and essential services. In 2025, the CIB
provided $10 billion in debt and equity
for affordable housing in the United
States. And as a financial partner to the
world’s most critical energy companies,
we are supporting the energy demands
of today while helping them transition
to cleaner energy over time.
Leading the next wave of
innovation
Our integrated model and client-first
mindset delivered record results and
set new industry benchmarks in 2025.
Looking forward, the foundations for
global economic growth remain con
structive: Healthy corporate balance
sheets, resilient consumer demand and
sustained investment in leading tech
nologies like AI. At the same time, we
are mindful of elevated uncertainty
across the world’s markets: geopoliti
cal conflicts, policy upheaval and
persistent volatility.
In this environment, the CIB’s
strengths come to the fore. Our
diversified franchise, fortress balance
sheet and sustained investments
enable us to support clients through
the cycle and position us for the
opportunities ahead.
Our strategy remains clear and consis
tent: Invest in our people and platforms,
deepen client relationships and lead
the next wave of industry innovation.
Above all, our success rests on the
talent and dedication of our teams.
We are proud of what we have achieved
together and confident in our future —
moving forward with ambition, convic
tion and an unwavering commitment to
building on this remarkable franchise.
1
Comprising compound annual revenue growth
of 7.9% in Banking and Payments, the businesses
most materially impacted by the merger, as well
as 13.1% in Markets and 8.3% in Securities
Services.
2
Dealogic as of January 2, 2026.
3
Coalition Greenwich Competitor Analytics
(preliminary FY 2025) reflects global firmwide
Treasury Services business (CIB and CB). Market
share is based on JPMorganChase’s internal
business structure, footprint and revenue and
Coalition Index Banks for Treasury Services.
4
Coalition Greenwich Competitor Analytics
(preliminary FY 2025). Rank is based on
JPMorganChase’s internal business structure,
footprint and revenue and Coalition Index Banks
for Securities Services (excluding Corporate
Trust, Escrow Services and Clearing &
Settlement).
5
McKinsey, Global Private Markets Review 2024.
6
Preqin, Introduction to Alternative Assets, and
Private Markets in 2030 Report.
7
Represents the total exposure as of December
31, 2025.
8
Coalition Greenwich Competitor Analytics
(preliminary for FY 2025). Rank is based on
JPMorganChase’s internal business structure,
footprint and revenue, and Coalition Index Banks
for Markets.
9
Represents assets held directly or indirectly on
behalf of clients under safekeeping, custody and
servicing arrangements.
Troy L. Rohrbaugh
Co-CEO, Commercial &
Investment Bank
Douglas B. Petno
Co-CEO, Commercial &
Investment Bank
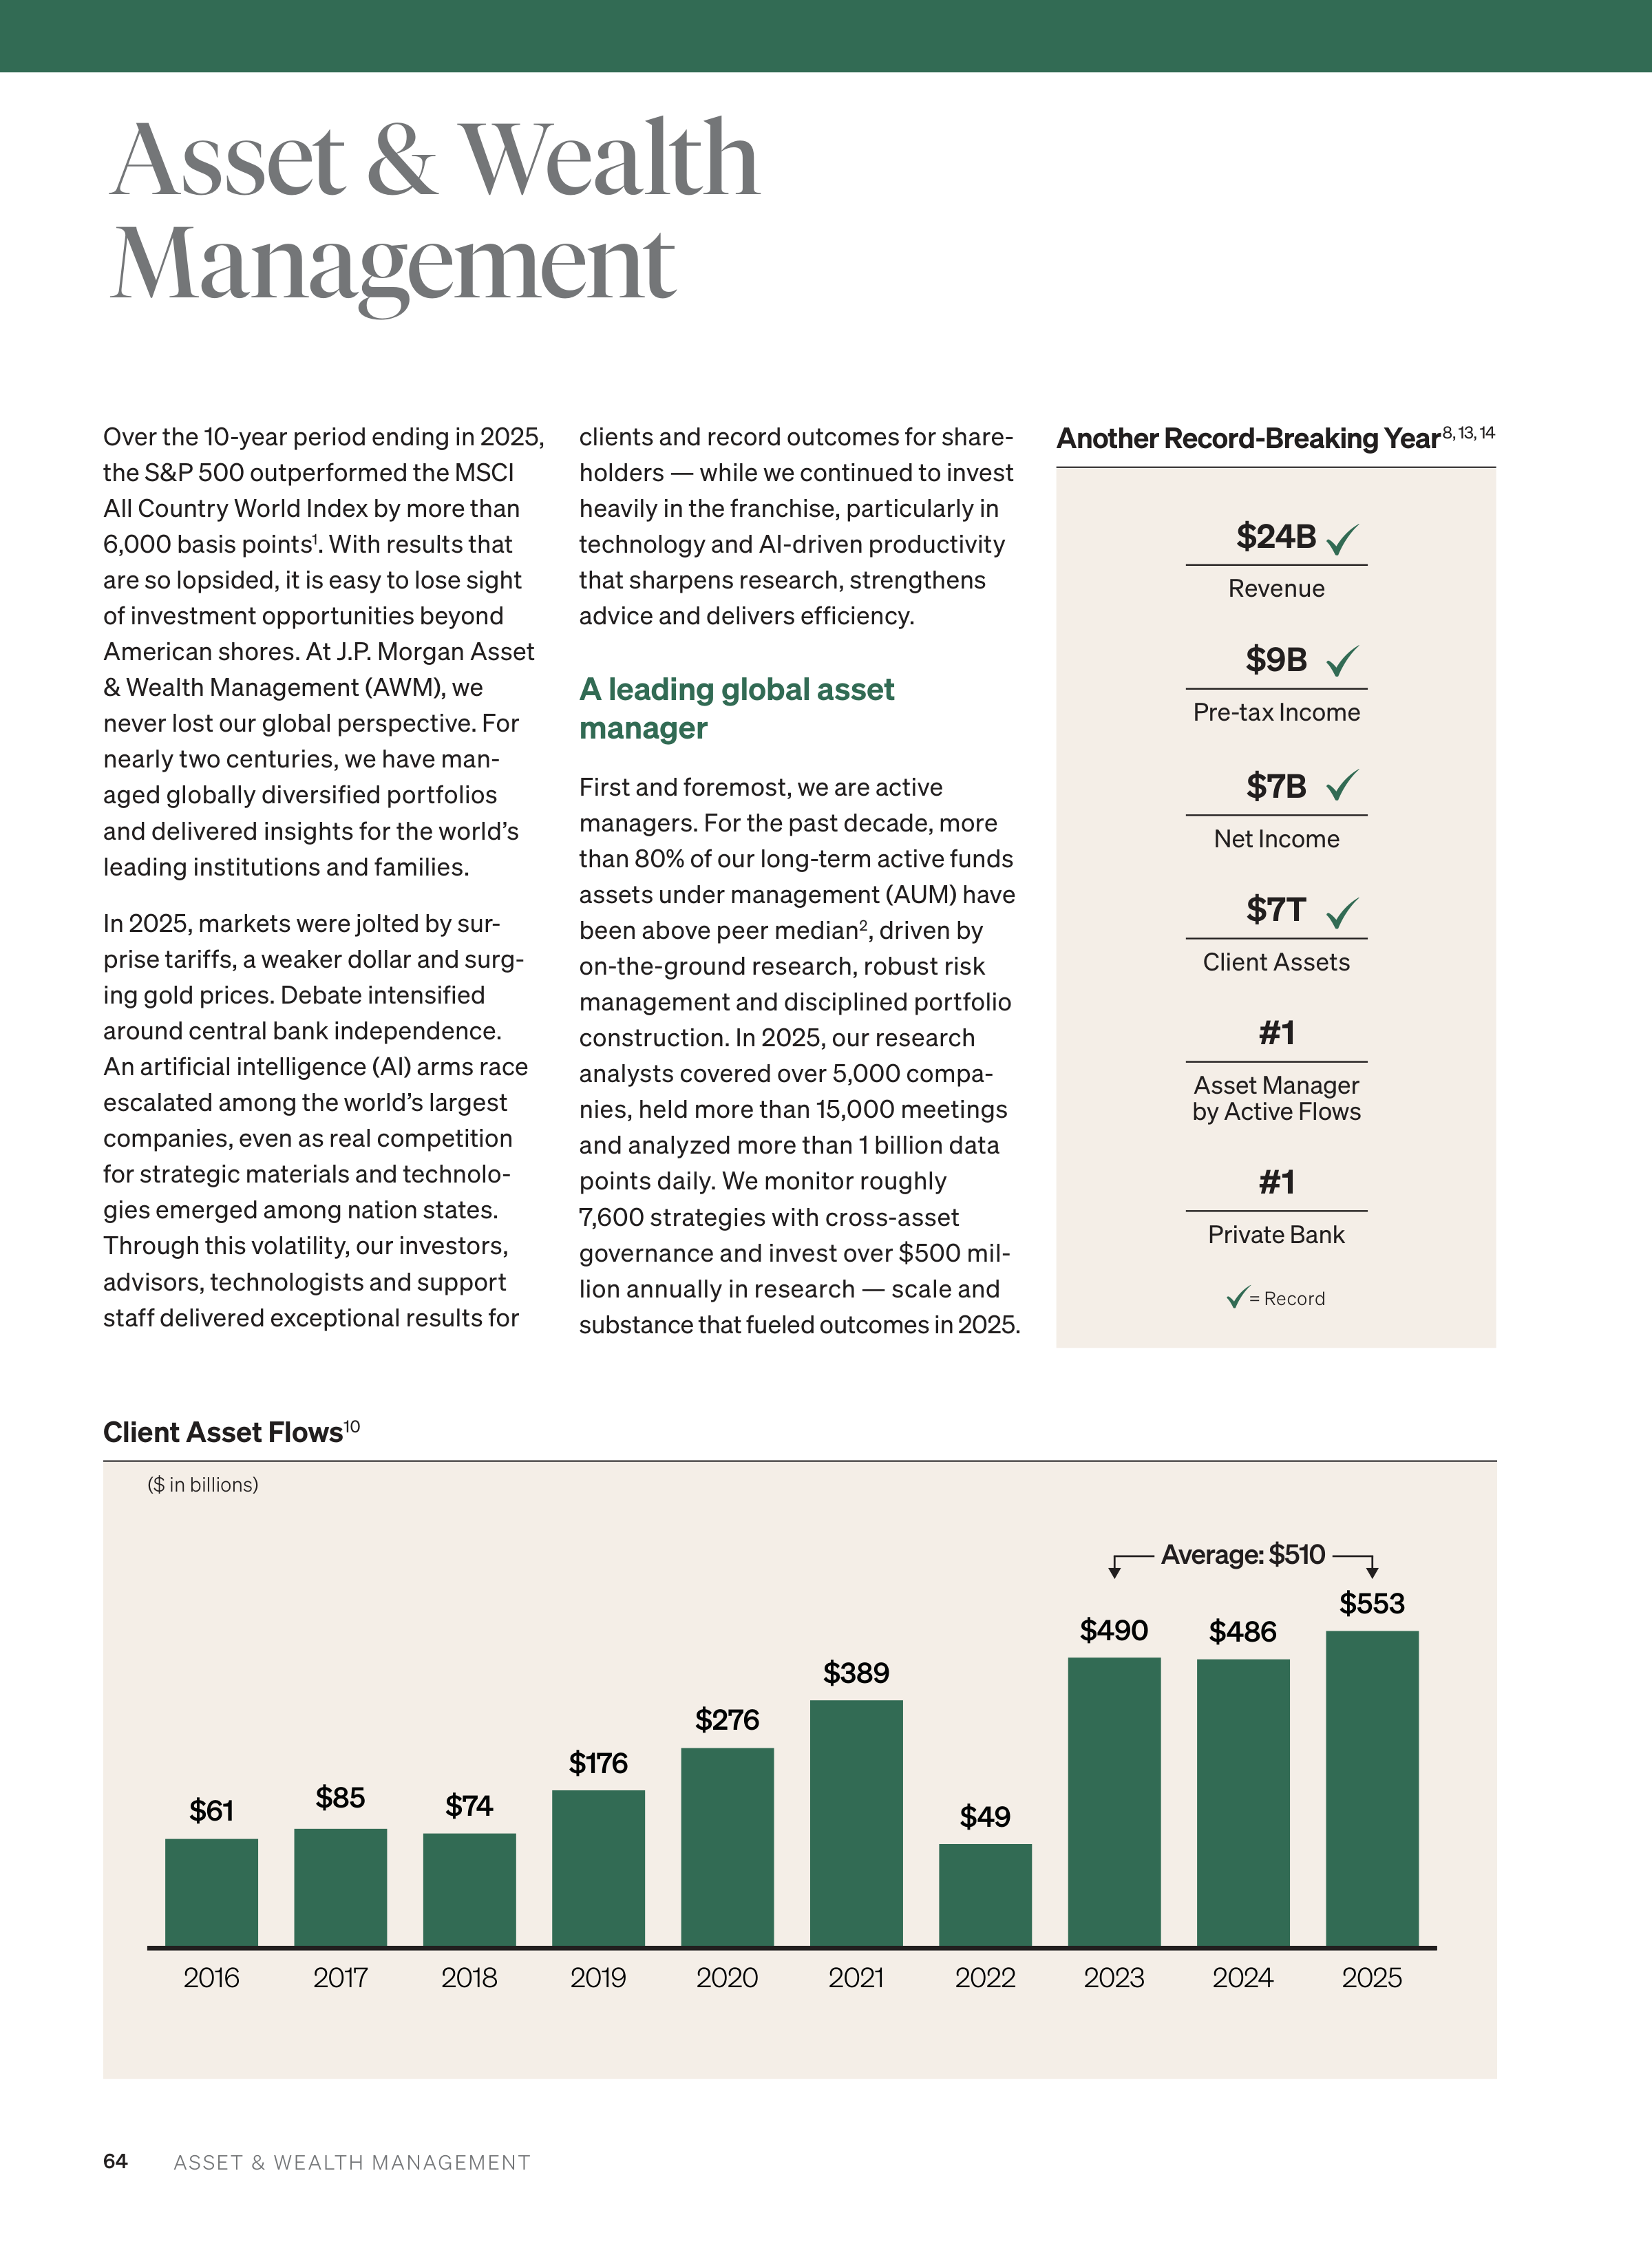
64
ASSET & WEALTH MANAGEMENT
Over the 10-year period ending in 2025,
the S&P 500 outperformed the MSCI
All Country World Index by more than
6,000 basis points
1
. With results that
are so lopsided, it is easy to lose sight
of investment opportunities beyond
American shores. At J.P. Morgan Asset
& Wealth Management (AWM), we
never lost our global perspective. For
nearly two centuries, we have man
aged globally diversified portfolios
and delivered insights for the world’s
leading institutions and families.
In 2025, markets were jolted by sur
prise tariffs, a weaker dollar and surg
ing gold prices. Debate intensified
around central bank independence.
An artificial intelligence (AI) arms race
escalated among the world’s largest
companies, even as real competition
for strategic materials and technolo
gies emerged among nation states.
Through this volatility, our investors,
advisors, technologists and support
staff delivered exceptional results for
clients and record outcomes for share
holders — while we continued to invest
heavily in the franchise, particularly in
technology and AI-driven productivity
that sharpens research, strengthens
advice and delivers efficiency.
A leading global asset
manager
First and foremost, we are active
managers. For the past decade, more
than 80% of our long-term active funds
assets under management (AUM) have
been above peer median
2
, driven by
on-the-ground research, robust risk
management and disciplined portfolio
construction. In 2025, our research
analysts covered over 5,000 compa
nies, held more than 15,000 meetings
and analyzed more than 1 billion data
points daily. We monitor roughly
7,600 strategies with cross-asset
governance and invest over $500 mil
lion annually in research — scale and
substance that fueled outcomes in 2025.
Asset & Wealth
Management
Another Record-Breaking Year
8, 13, 14
$24B
Revenue
$7T
Client Assets
$9B
Pre-tax Income
$7B
Net Income
#1
Asset Manager
by Active Flows
#1
Private Bank
= Record
($ in billions)
Client Asset Flows
10
2025
2024
2023
2022
2021
2020
2019
2018
2017
2016
$61
$85
$74
$176
$276
$389
$49
$486
$490
$553
Average: $510
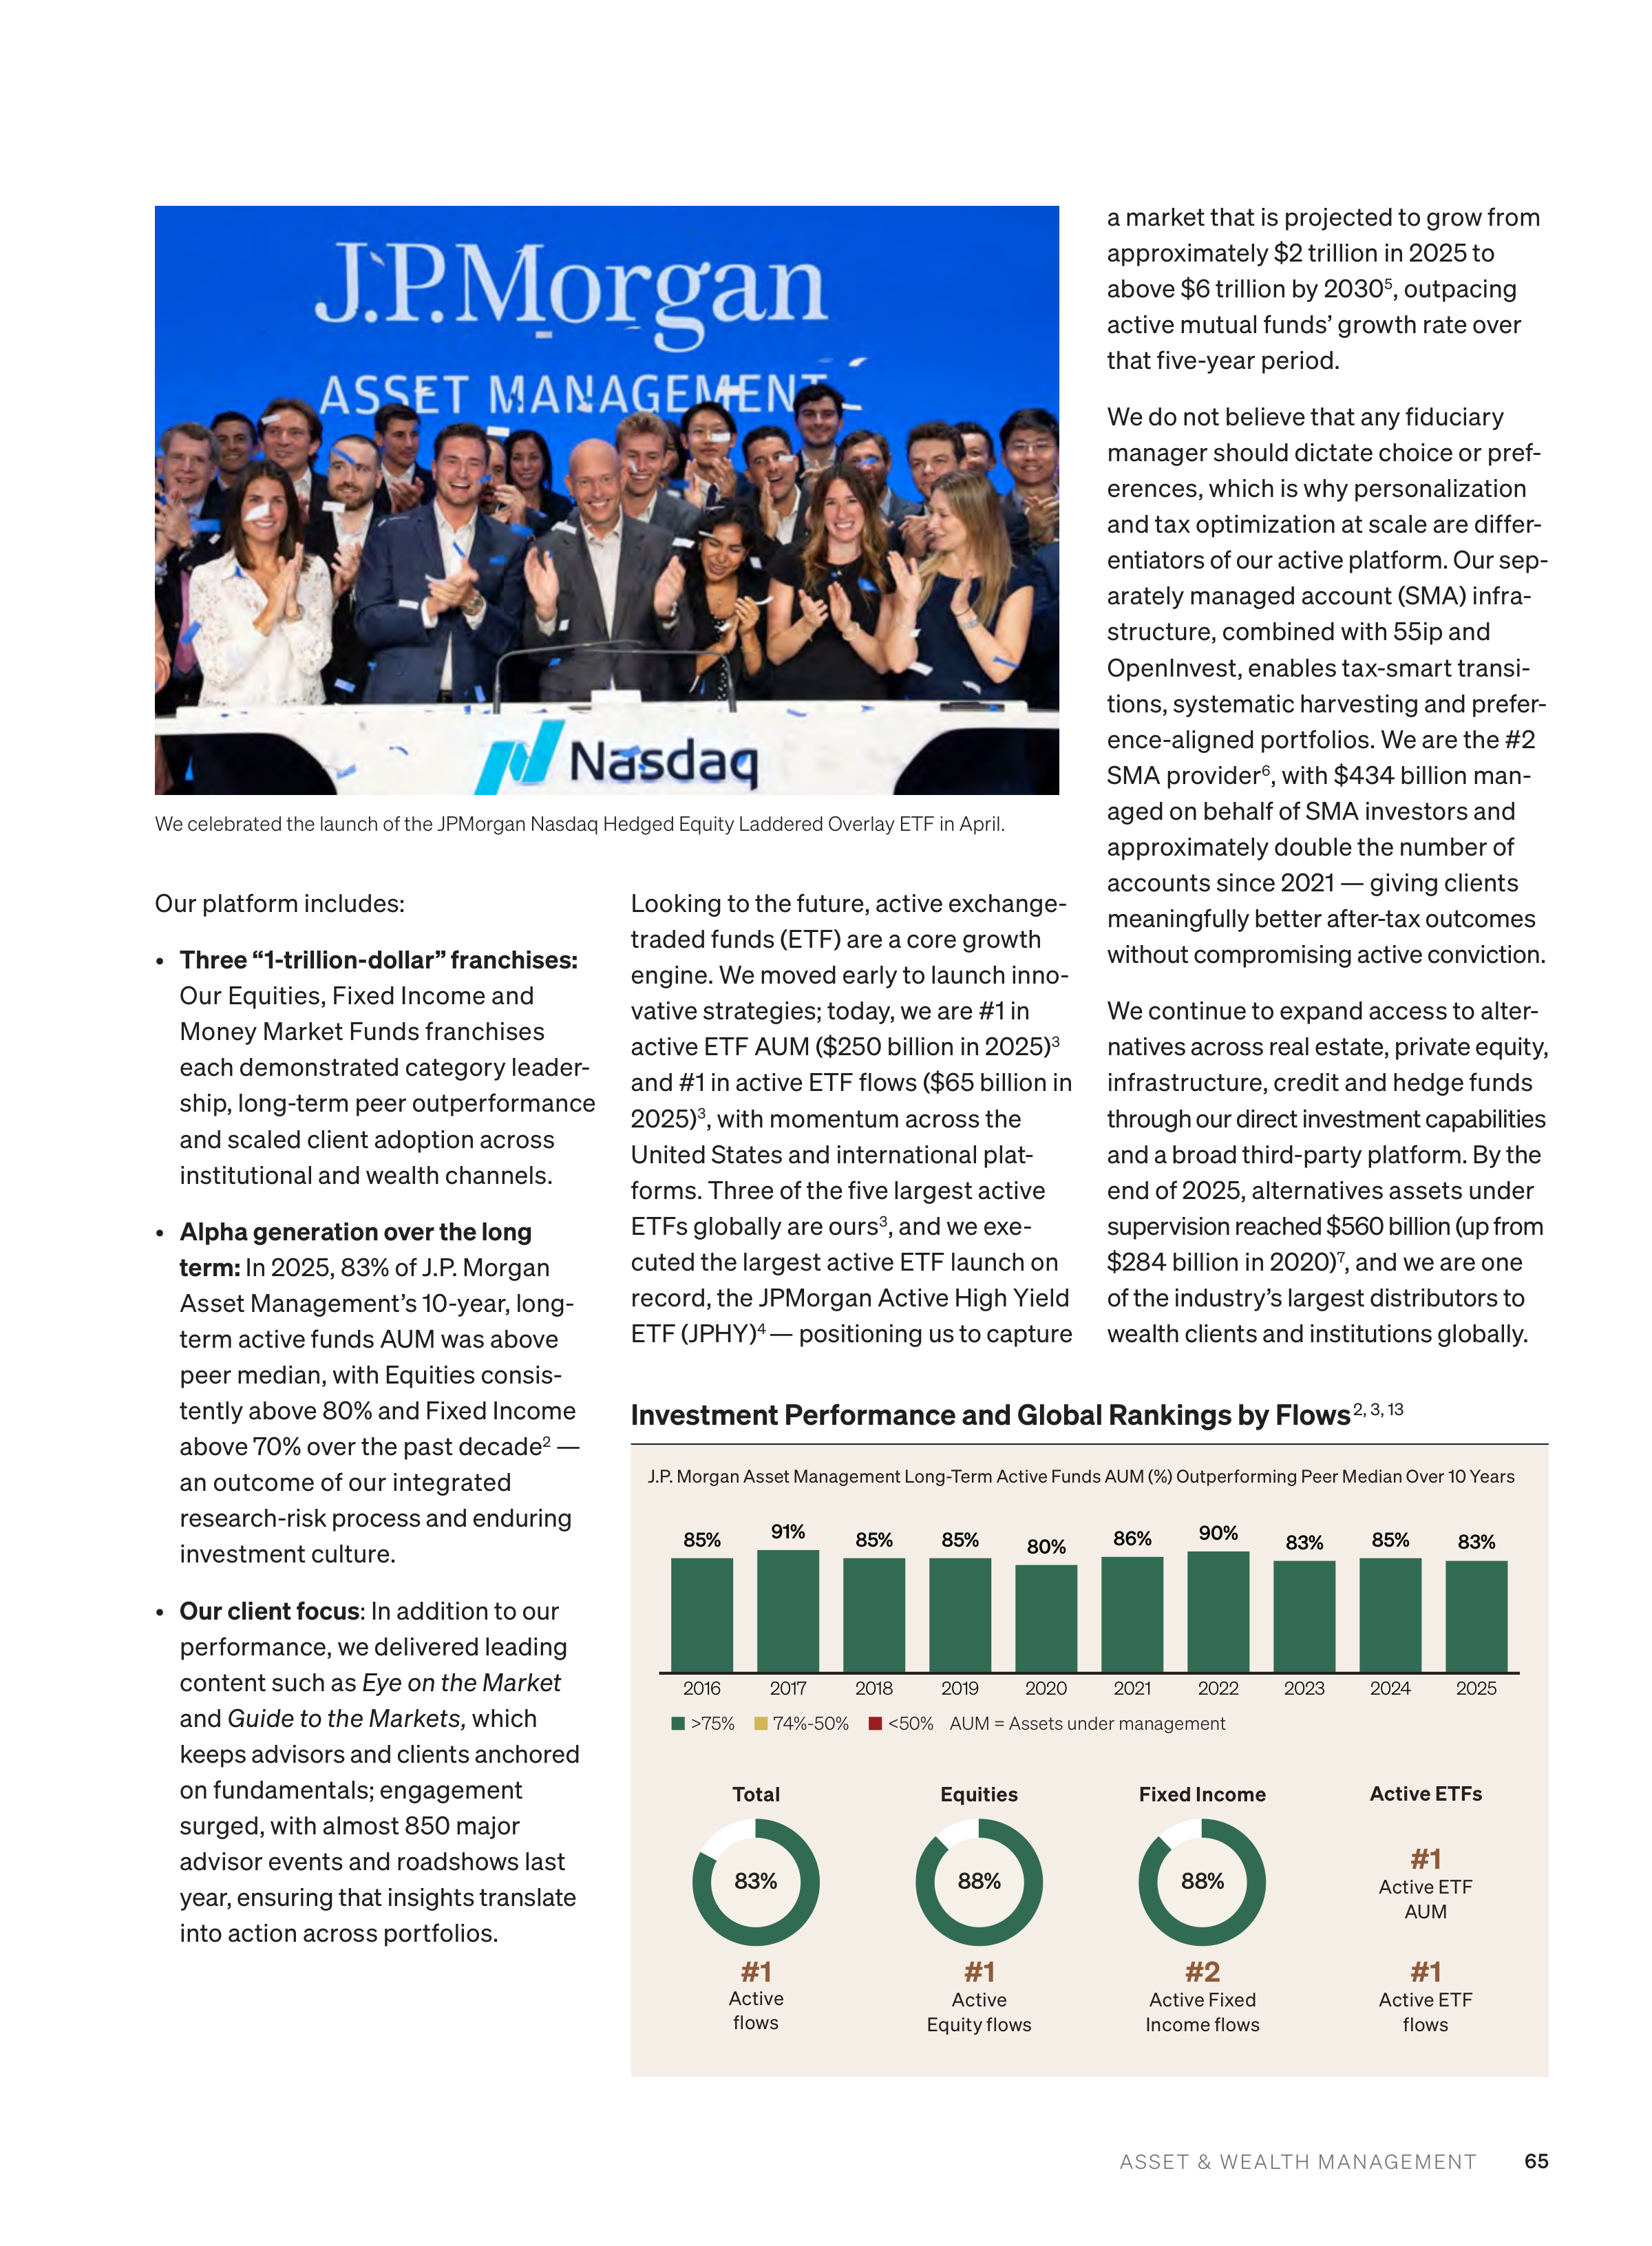

65
ASSET & WEALTH MANAGEMENT
Our platform includes:
•
Three “1-trillion-dollar” franchises:
Our Equities, Fixed Income and
Money Market Funds franchises
each demonstrated category leader
ship, long-term peer outperformance
and scaled client adoption across
institutional and wealth channels.
•
Alpha generation over the long
term:
In 2025, 83% of J.P. Morgan
Asset Management’s 10-year, long-
term active funds AUM was above
peer median, with Equities consis
tently above 80% and Fixed Income
above 70% over the past decade
2
—
an outcome of our integrated
research-risk process and enduring
investment culture.
•
Our client focus
: In addition to our
performance, we delivered leading
content such as
Eye on the Market
and
Guide to the Markets,
which
keeps advisors and clients anchored
on fundamentals; engagement
surged, with almost 850 major
advisor events and roadshows last
year, ensuring that insights translate
into action across portfolios.
Looking to the future, active exchange-
traded funds (ETF) are a core growth
engine. We moved early to launch inno
vative strategies; today, we are #1 in
active ETF AUM ($250 billion in 2025)
3
and #1 in active ETF flows ($65 billion in
2025)
3
, with momentum across the
United States and international plat
forms. Three of the five largest active
ETFs globally are ours
3
, and we exe
cuted the largest active ETF launch on
record, the JPMorgan Active High Yield
ETF (JPHY)
4
— positioning us to capture
a market that is projected to grow from
approximately $2 trillion in 2025 to
above $6 trillion by 2030
5
, outpacing
active mutual funds’ growth rate over
that five-year period.
We do not believe that any fiduciary
manager should dictate choice or pref
erences, which is why personalization
and tax optimization at scale are differ
entiators of our active platform. Our sep
arately managed account (SMA) infra
structure, combined with 55ip and
OpenInvest, enables tax-smart transi
tions, systematic harvesting and prefer
ence-aligned portfolios. We are the #2
SMA provider
6
, with $434 billion man
aged on behalf of SMA investors and
approximately double the number of
accounts since 2021 — giving clients
meaningfully better after-tax outcomes
without compromising active conviction.
We continue to expand access to alter
natives across real estate, private equity,
infrastructure, credit and hedge funds
through our direct investment capabilities
and a broad third-party platform. By the
end of 2025, alternatives assets under
supervision reached $560 billion (up from
$284 billion in 2020)
7
, and we are one
of the industry’s largest distributors to
wealth clients and institutions globally.
We celebrated the launch of the JPMorgan Nasdaq Hedged Equity Laddered Overlay ETF in April.
#1
Active ETF
AUM
#1
Active ETF
flows
#1
Active
flows
Total
83%
#1
Active
Equity flows
Equities
88%
Active ETFs
#2
Active Fixed
Income flows
Fixed Income
88%
Investment Performance and Global Rankings by Flows
2, 3, 13
J.P. Morgan Asset Management Long-Term Active Funds AUM (%) Outperforming Peer Median Over 10 Years
>75%
74%-50%
<50%
AUM = Assets under management
2025
2024
2023
2022
2021
2020
2019
2018
2017
2016
85%
91%
85%
85%
80%
86%
90%
83%
85%
83%
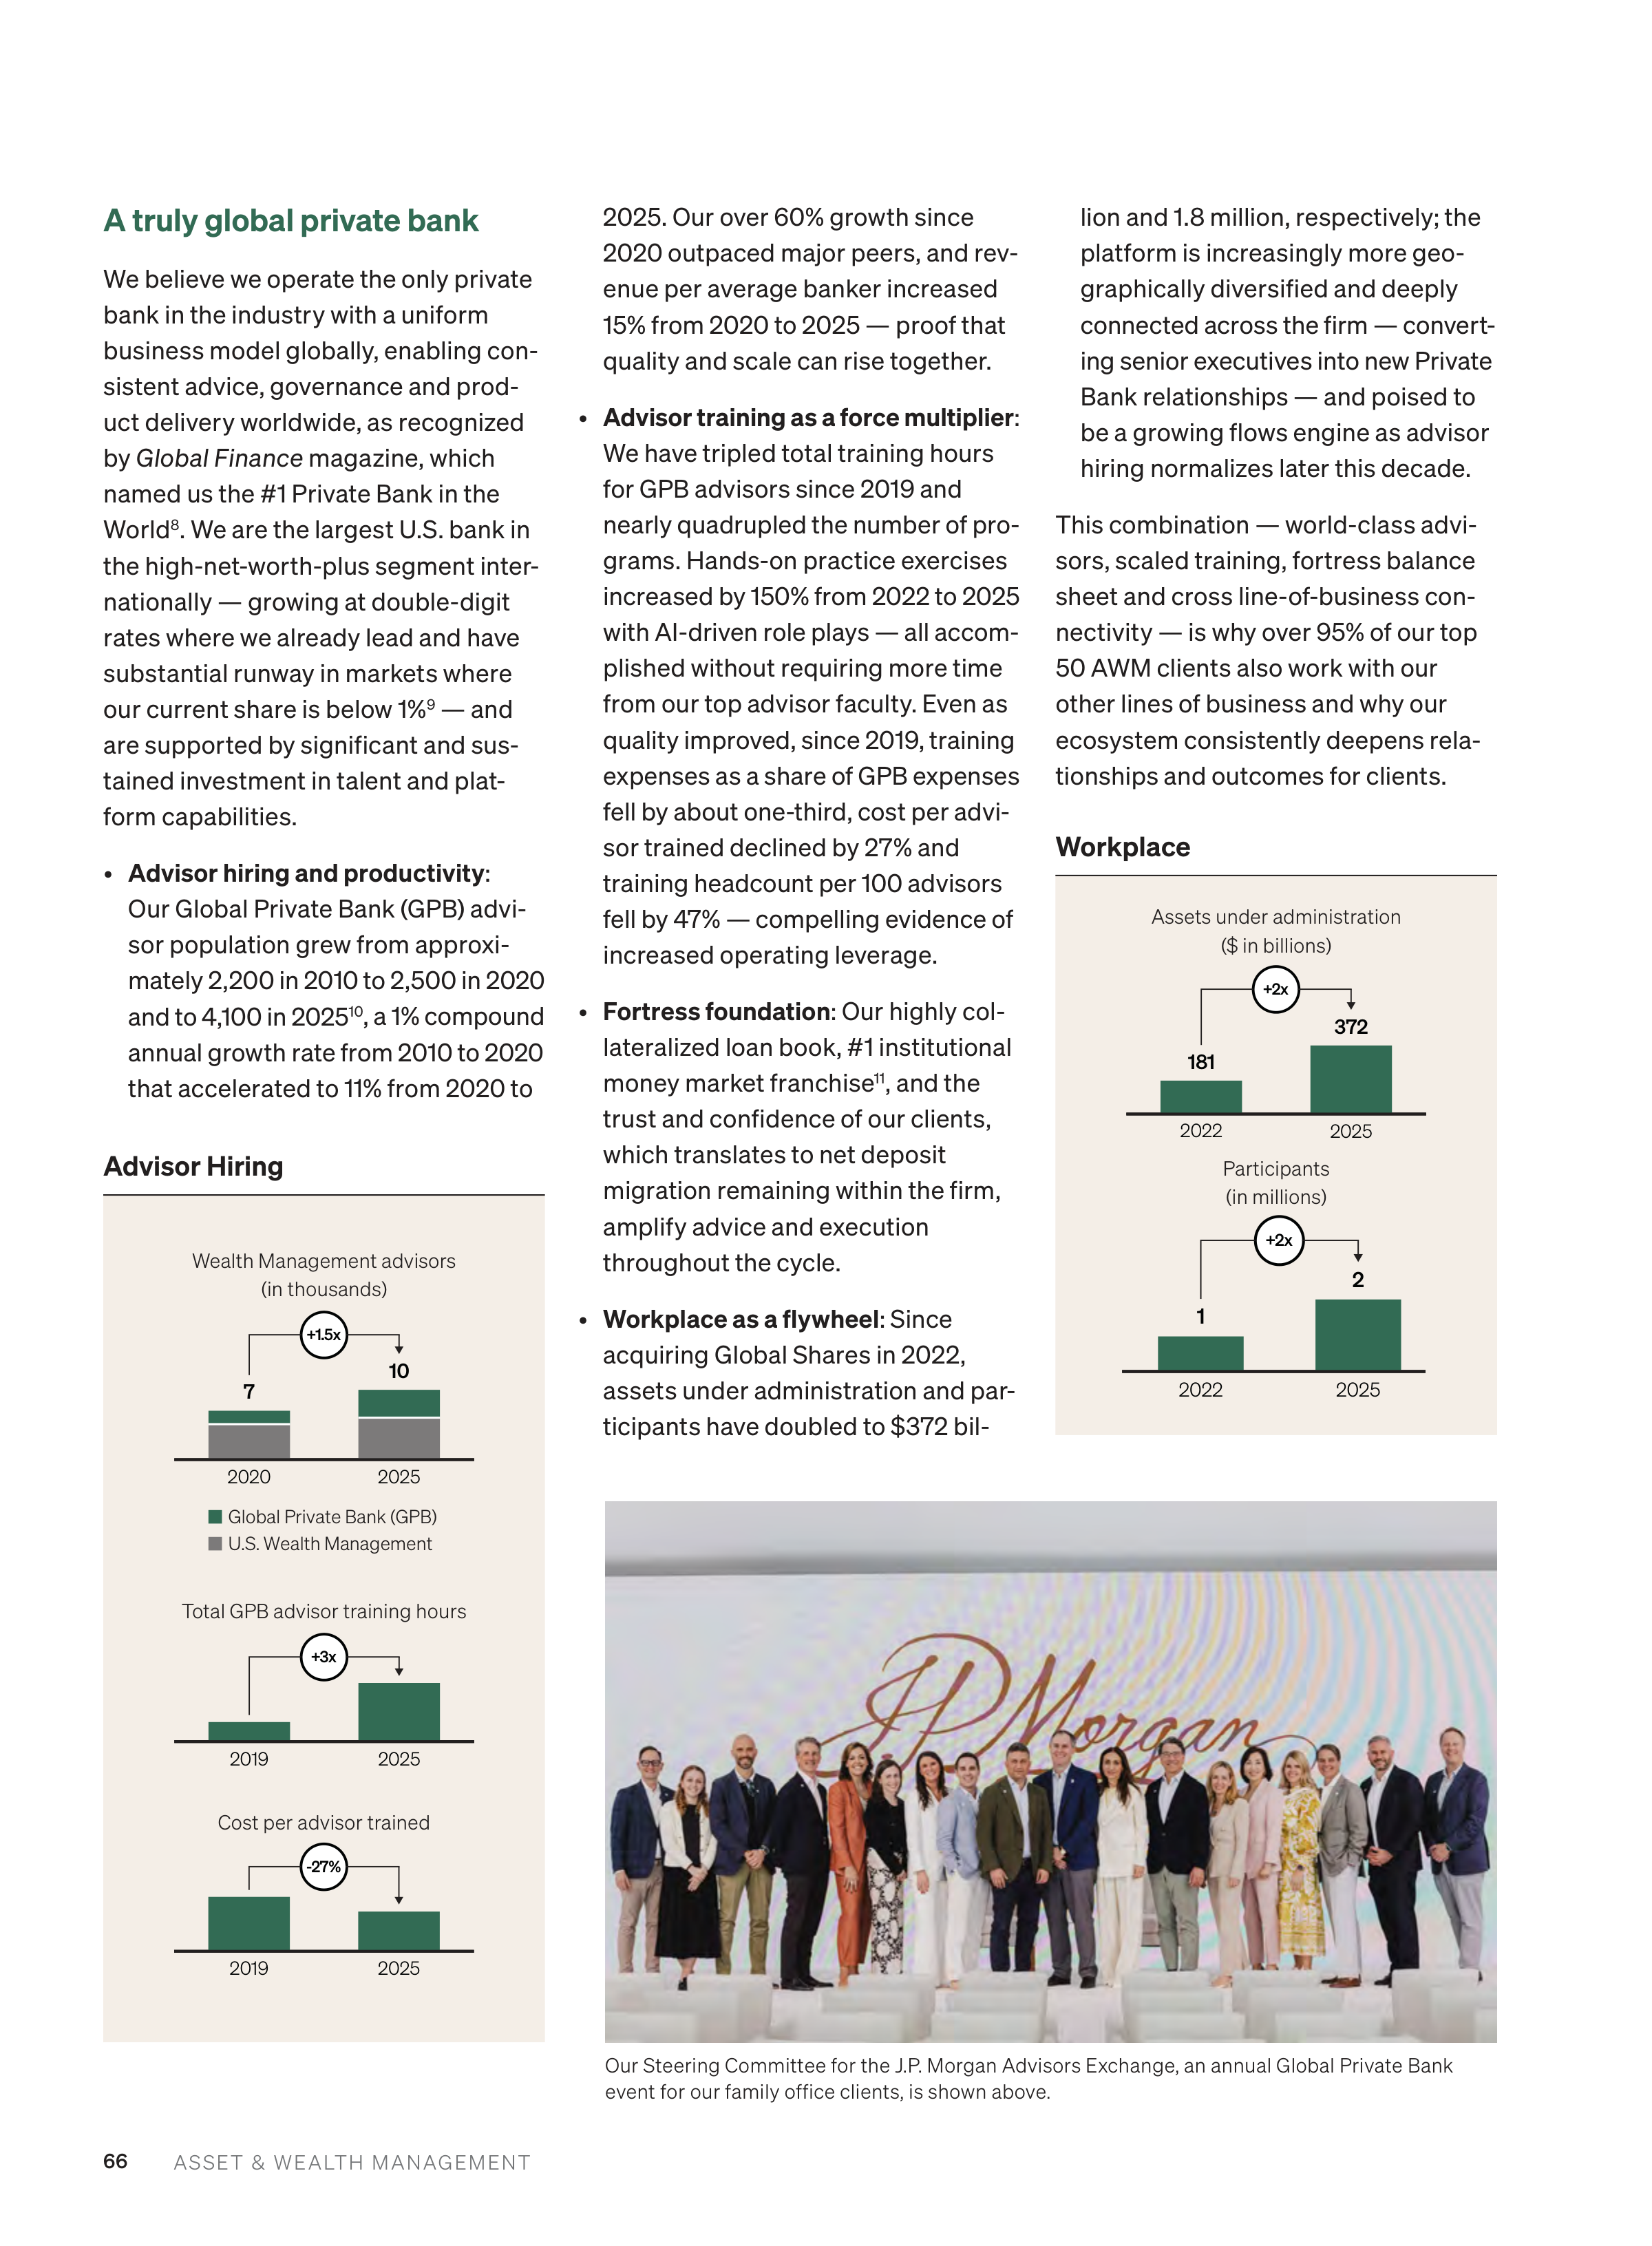

66
ASSET & WEALTH MANAGEMENT
A truly global private bank
We believe we operate the only private
bank in the industry with a uniform
business model globally, enabling con
sistent advice, governance and prod
uct delivery worldwide, as recognized
by
Global Finance
magazine, which
named us the #1 Private Bank in the
World
8
. We are the largest U.S. bank in
the high-net-worth-plus segment inter
nationally — growing at double-digit
rates where we already lead and have
substantial runway in markets where
our current share is below 1%
9
— and
are supported by significant and sus
tained investment in talent and plat
form capabilities.
•
Advisor hiring and productivity
:
Our Global Private Bank (GPB) advi
sor population grew from approxi
mately 2,200 in 2010 to 2,500 in 2020
and to 4,100 in 2025
10
, a 1% compound
annual growth rate from 2010 to 2020
that accelerated to 11% from 2020 to
2025. Our over 60% growth since
2020 outpaced major peers, and rev
enue per average banker increased
15% from 2020 to 2025 — proof that
quality and scale can rise together.
•
Advisor training as a force multiplier
:
We have tripled total training hours
for GPB advisors since 2019 and
nearly quadrupled the number of pro
grams. Hands-on practice exercises
increased by 150% from 2022 to 2025
with AI-driven role plays — all accom
plished without requiring more time
from our top advisor faculty. Even as
quality improved, since 2019, training
expenses as a share of GPB expenses
fell by about one-third, cost per advi
sor trained declined by 27% and
training headcount per 100 advisors
fell by 47% — compelling evidence of
increased operating leverage.
•
Fortress foundation
: Our highly col
lateralized loan book, #1 institutional
money market franchise
11
, and the
trust and confidence of our clients,
which translates to net deposit
migration remaining within the firm,
amplify advice and execution
throughout the cycle.
•
Workplace as a flywheel
: Since
acquiring Global Shares in 2022,
assets under administration and par
ticipants have doubled to $372 bil
lion and 1.8 million, respectively; the
platform is increasingly more geo
graphically diversified and deeply
connected across the firm — convert
ing senior executives into new Private
Bank relationships — and poised to
be a growing flows engine as advisor
hiring normalizes later this decade.
This combination — world-class advi
sors, scaled training, fortress balance
sheet and cross line-of-business con
nectivity — is why over 95% of our top
50 AWM clients also work with our
other lines of business and why our
ecosystem consistently deepens rela
tionships and outcomes for clients.
2025
2022
372
181
+2x
Assets under administration
($ in billions)
2025
2022
2
1
+2x
Participants
(in millions)
Workplace
Global Private Bank (GPB)
U.S. Wealth Management
2025
2020
10
7
+1.5x
Wealth Management advisors
(in thousands)
2025
2019
+3x
Total GPB advisor training hours
2025
2019
-27%
Cost per advisor trained
Advisor Hiring
Our Steering Committee for the J.P. Morgan Advisors Exchange, an annual Global Private Bank
event for our family office clients, is shown above.




67
ASSET & WEALTH MANAGEMENT
Investing in our people,
platforms and AI
We invest through the cycle to
improve performance, strengthen
advice and achieve operational excel
lence — relentlessly driving out ineffi
ciency so every dollar of investment
translates into better outcomes for cli
ents and shareholders. In 2025, we
increased investment across active
management, ETFs, alternatives, our
Workplace platform, GPB advisors,
personalization and AI — while main
taining discipline on overall headcount
growth and efficiency.
There are three AI investment examples
I would like to highlight:
•
SpectrumIQ
: Our proprietary suite of
AI capabilities embedded directly in
Spectrum ties together research,
data and risk. We have automated
nearly 75% of equity trading (saving
clients about $4 billion in trading
costs since inception) and almost
85% of foreign exchange trading, and
now rebalance trades for more than
2,500 clients each month. Data cov
erage has expanded from 8,000 to
90,000 securities and 22 million
documents, and we ingest about
7,000 broker research reports daily.
Smart Monitor, our investor AI assis
tant, learns investor preferences
and pushes prioritized, explainable
insights in real time, reducing hours
of manual research to a click and
compressing time-to-insight by 80%.
•
Connect Coach
: Launched just over a
year ago, Connect Coach now serves
12,000 users across the Private Bank
and U.S. Wealth Management and
includes 25 specialized AI agents.
The platform proactively pushes
1 million personalized AI-driven
insights straight to our front-office
users, unlocking prospecting and
relationship-deepening opportunities
with our clients. Advisors use Con
nect Coach to accelerate meeting
preparation, support portfolio analy
sis and generate call summaries, cre
ating valuable capacity for advisors
to spend more time with clients — a
practical step toward having every
advisor operate like our very best and
every client feel like our only one.
•
Proxy Voting powered by
SpectrumIQ
: Our independent stew
ardship workflow aggregates and
analyzes proprietary data from more
than 3,000 annual company meet
ings across the U.S. equity markets.
Our NextGen employee participants at our Global Innovation Summit presented technological
solutions they created to improve the client and advisor experience.
AI Use Case Examples
Our suite of AI capabilities that ties
together research, data and risk,
covering about 90,000 securities
and 22 million documents
Our stewardship workflow aggre
gates and analyzes proprietary
data from 3,000+ company
meetings in U.S. equity markets
Our tool with 25 specialized AI
agents proactively delivering per
sonalized outreach ideas so advi
sors can focus on clients
80%
Reduction in time from manual
research to insight
1 million
Custom AI-driven insights straight
to our 5,000 GPB users in real time
1st
Major asset manager to fully
disengage from external proxy
advisors in U.S. voting
Proxy Voting powered by



68
ASSET & WEALTH MANAGEMENT
1
Bloomberg.
2
For footnote, refer to page 48 footnote 33 in this
Annual Report.
3
Bloomberg and FactSet as of December 31, 2025.
4
J.P. Morgan Asset Management, Bloomberg and
Morningstar. U.S. Active ETF launches. Does not
include mutual fund conversions (as of May 31, 2025).
5
Morningstar, J.P. Morgan estimates.
6
Cerulli 2025 U.S. Managed Accounts Report.
7
JPM alternative assets includes private equity, private
credit, real assets, hedge funds, liquid alternatives
and other nontraditional assets which may be
presented using net asset value (NAV) of investments.
In quarterly filings, assets are predominantly
presented using NAV and certain of these assets are
reflected in other asset classes or categories
comprising total Client Assets.
8
Global Finance magazine 2025.
9
Company filings, J.P. Morgan estimates.
10
For footnote, refer to page 48 footnote 34 in this
Annual Report.
11
iMoneyNet.
12
Wall Street Journal.
13
Public filings, Morningstar, J.P. Morgan estimates.
14
In the fourth quarter of 2020, the Firm realigned
certain Wealth Management clients from Asset &
Wealth Management to Consumer & Community
Banking. Prior-period amounts have been revised to
conform with the current presentation. Historical
revenue revised as a result of the adoption of the new
accounting guidance for revenue recognition,
effective January 1, 2018.
15
Company filings and websites, J.P. Morgan estimates.
Transition to exclusive use for U.S.
proxy votes began in the first quar
ter of 2026 with full implementation
as of April 1, 2026, making us the
first major asset manager to fully
disengage from external proxy advi
sors in U.S. voting
12
. Integrating
investor insights with voting deci
sions at the scale of more than $7
trillion in client assets reinforces
independent stewardship aligned
with long-term value creation.
We have made significant investments
in our tools and resources, many of
which have been developed and
enhanced by our employees. Their
creativity and ingenuity have driven
innovative solutions that directly ben
efit our clients. We have also heavily
invested in our teams that provide
seamless, around-the-clock support
to clients, ensuring exceptional ser
vice and responsiveness at all times.
A leading industry position
In 2025, we were recognized as the
#1 Asset Manager by active flows
13
and the #1 Private Bank in the World
8
,
reflecting the strength of our invest
ment engine and advice platform.
Our clients continue to vote with their
flows, driving record total client asset
flows of $553 billion — our 22nd
consecutive year of positive net new
inflows — record client assets of
$7 trillion and record revenue for the
ninth consecutive year at $24 billion
14
.
Total client asset flows exceeded
$1 trillion over the last two years; that
amount by itself would rank among
the top 30 asset managers
15
. Culmi
nating a year of strong execution, we
delivered a
40% return on equity
in
the 2025 fiscal year (up from 34% in
2024), reflecting expense and capital
discipline and highly selective
headcount growth, with the latter
primarily consisting of GPB advisors.
These extraordinary results belong to
our more than 29,000 AWM profes
sionals across 48 countries who show
up every day to earn our clients’ trust. I
am especially grateful to my Operating
Committee partners in AWM, whose
leadership across our investment, advi
sory, technology and operations teams
makes this performance possible — and
whose unwavering ambition for what
comes next continues to raise the bar.
Thank you for your trust in us. Our North
Star has never changed: to be the best
in the industry for our clients, not the
biggest — and our fiduciary commit
ment to deliver investment perfor
mance remains the way we prove it
every day. We will keep investing in our
people, research and platforms; extend
leadership in active management and
active ETFs; expand our leading global
private bank; broaden access to alter
natives and personalization; and embed
AI across the franchise to elevate advice
and outcomes — leveraging the unpar
alleled strength of JPMorganChase for
our clients and shareholders.
Our clients continue to vote with
their flows, driving record total client
asset flows of $553 billion — our
22nd consecutive year of positive net
new inflows — record client assets of
$7 trillion and record revenue for the
ninth consecutive year at $24 billion.
Total client asset flows exceeded
$1 trillion over the last two years; that
amount by itself would rank among
the top 30 asset managers.”
“
Mary Callahan Erdoes
CEO, Asset & Wealth Management
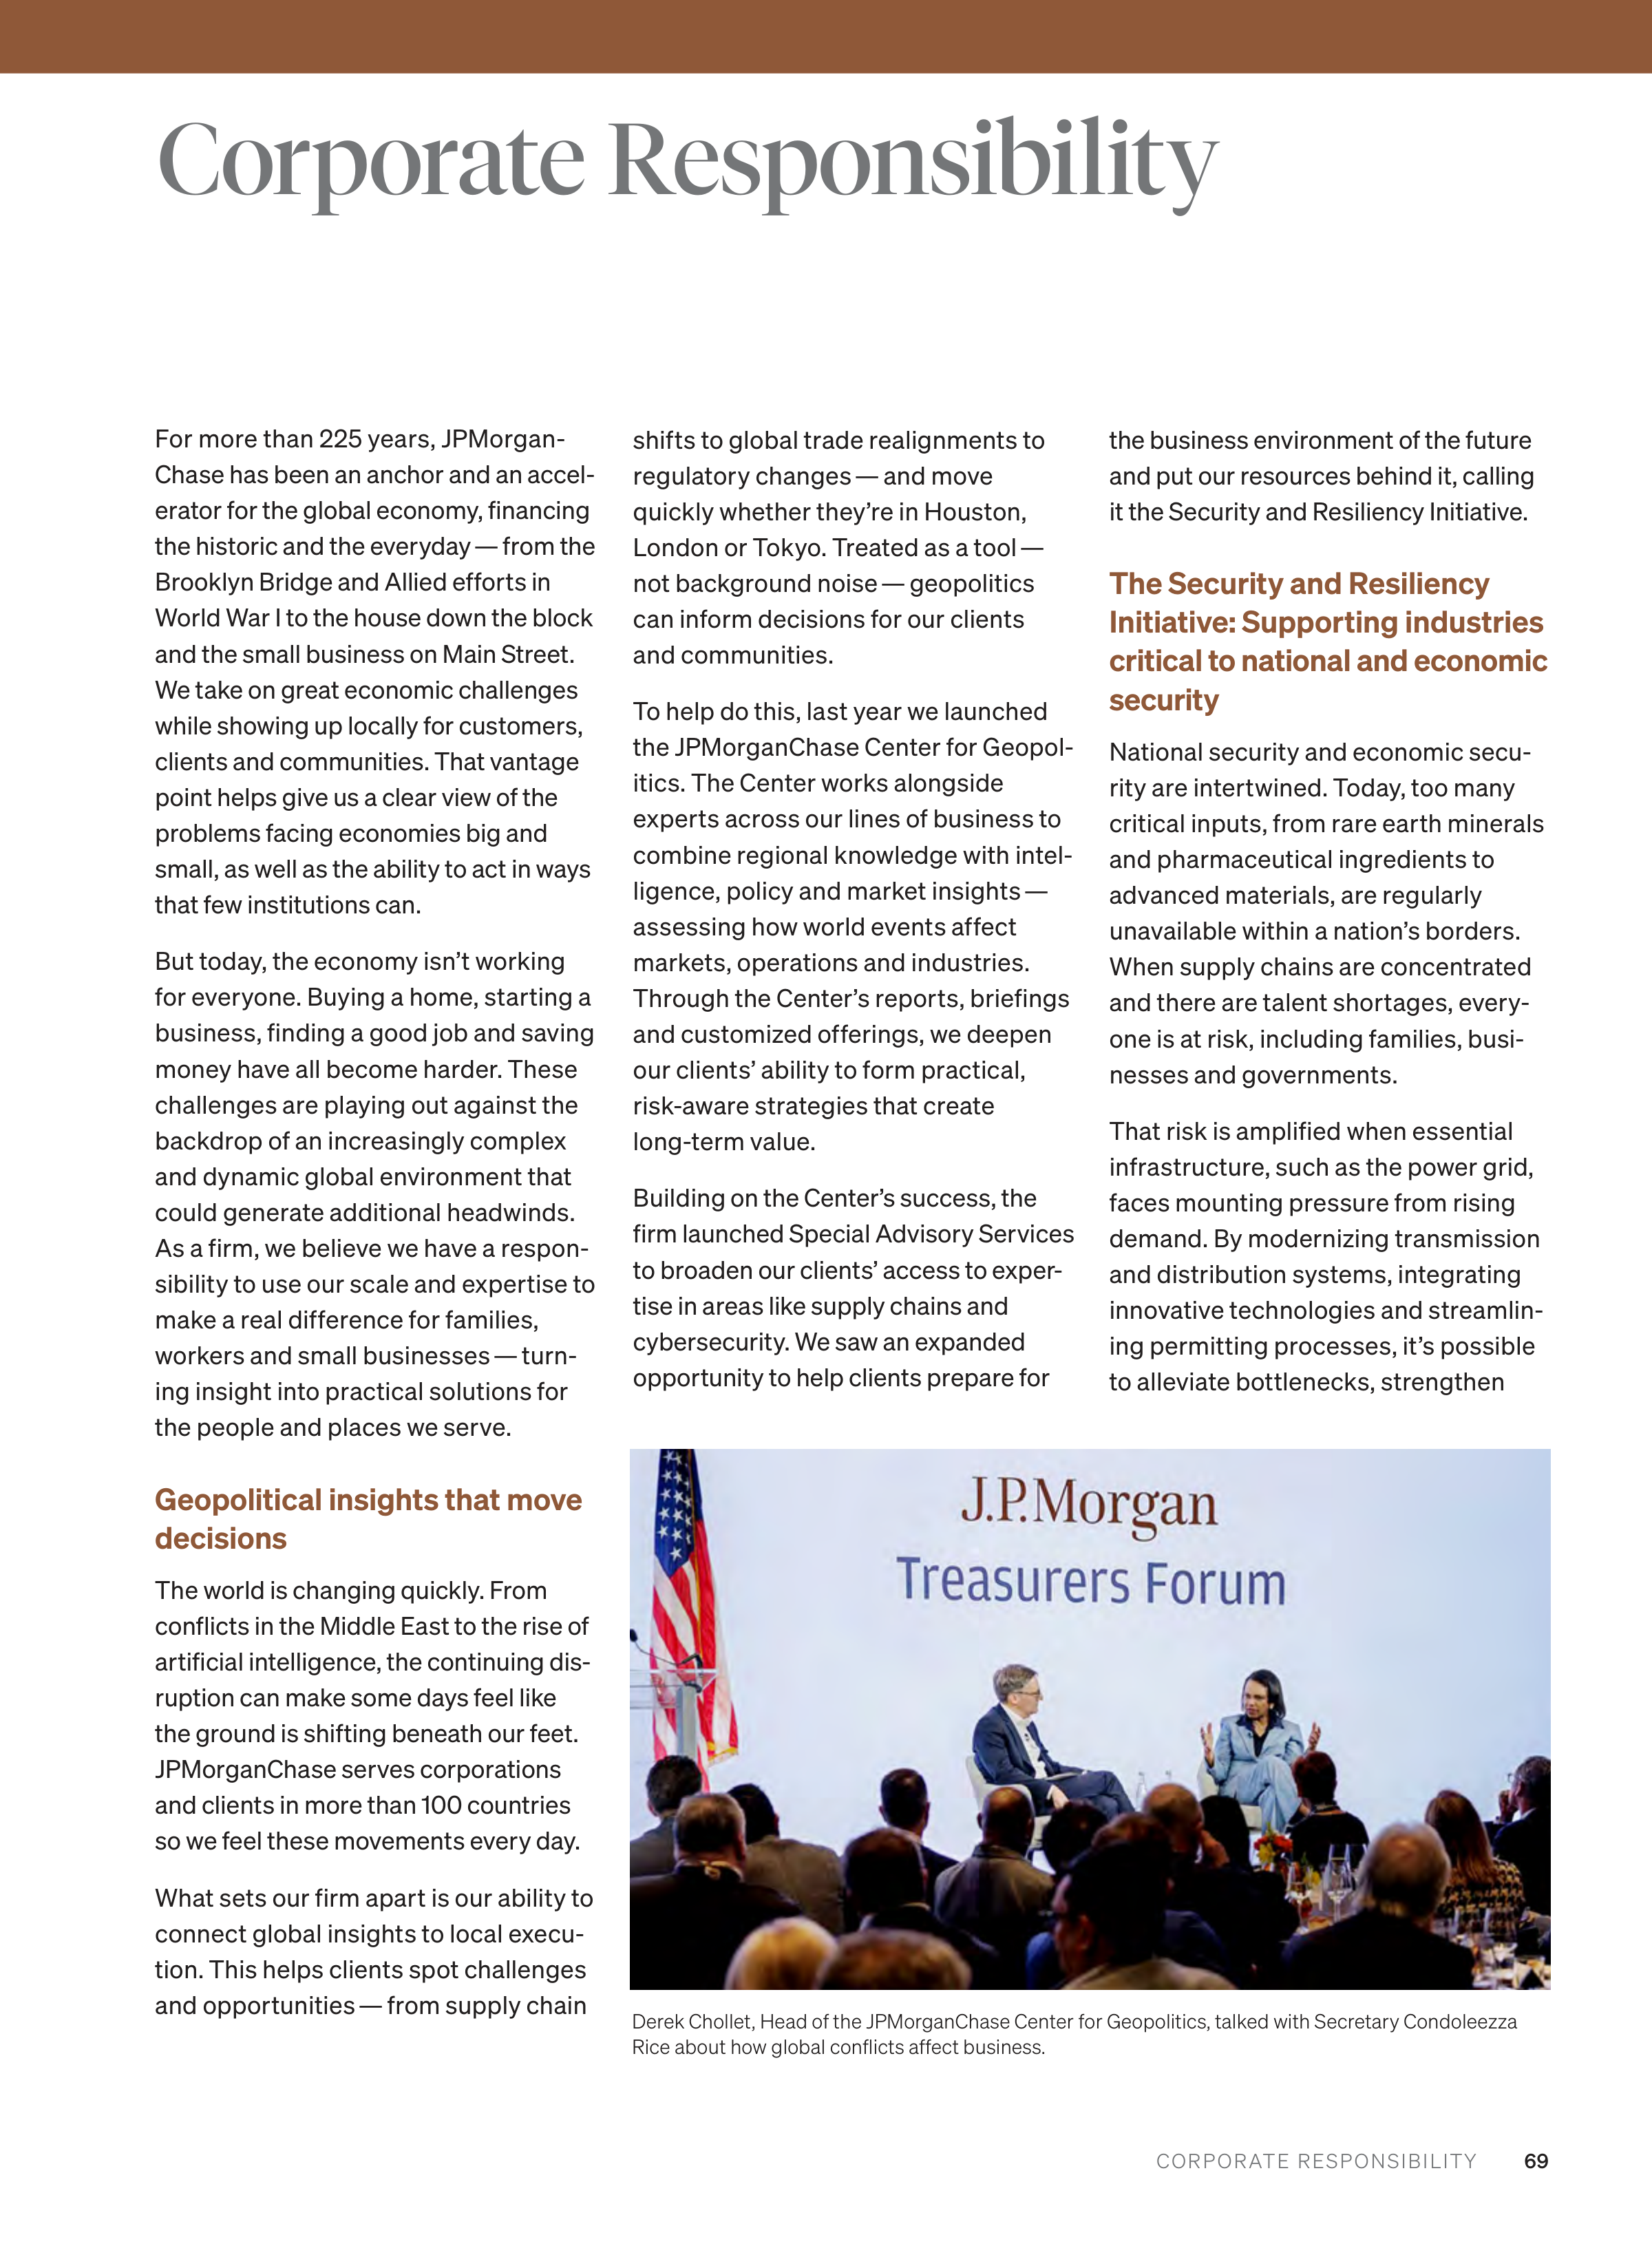

69
CORPORATE RESPONSIBILITY
For more than 225 years, JPMorgan
Chase has been an anchor and an accel
erator for the global economy, financing
the historic and the everyday — from the
Brooklyn Bridge and Allied efforts in
World War I to the house down the block
and the small business on Main Street.
We take on great economic challenges
while showing up locally for customers,
clients and communities. That vantage
point helps give us a clear view of the
problems facing economies big and
small, as well as the ability to act in ways
that few institutions can.
But today, the economy isn’t working
for everyone. Buying a home, starting a
business, finding a good job and saving
money have all become harder. These
challenges are playing out against the
backdrop of an increasingly complex
and dynamic global environment that
could generate additional headwinds.
As a firm, we believe we have a respon
sibility to use our scale and expertise to
make a real difference for families,
workers and small businesses — turn
ing insight into practical solutions for
the people and places we serve.
Geopolitical insights that move
decisions
The world is changing quickly. From
conflicts in the Middle East to the rise of
artificial intelligence, the continuing dis
ruption can make some days feel like
the ground is shifting beneath our feet.
JPMorganChase serves corporations
and clients in more than 100 countries
so we feel these movements every day.
What sets our firm apart is our ability to
connect global insights to local execu
tion. This helps clients spot challenges
and opportunities — from supply chain
shifts to global trade realignments to
regulatory changes — and move
quickly whether they’re in Houston,
London or Tokyo. Treated as a tool —
not background noise — geopolitics
can inform decisions for our clients
and communities.
To help do this, last year we launched
the JPMorganChase Center for Geopol
itics. The Center works alongside
experts across our lines of business to
combine regional knowledge with intel
ligence, policy and market insights —
assessing how world events affect
markets, operations and industries.
Through the Center’s reports, briefings
and customized offerings, we deepen
our clients’ ability to form practical,
risk‑aware strategies that create
long‑term value.
Building on the Center’s success, the
firm launched Special Advisory Services
to broaden our clients’ access to exper
tise in areas like supply chains and
cybersecurity. We saw an expanded
opportunity to help clients prepare for
the business environment of the future
and put our resources behind it, calling
it the Security and Resiliency Initiative.
The Security and Resiliency
Initiative: Supporting industries
critical to national and economic
security
National security and economic secu
rity are intertwined. Today, too many
critical inputs, from rare earth minerals
and pharmaceutical ingredients to
advanced materials, are regularly
unavailable within a nation’s borders.
When supply chains are concentrated
and there are talent shortages, every
one is at risk, including families, busi
nesses and governments.
That risk is amplified when essential
infrastructure, such as the power grid,
faces mounting pressure from rising
demand. By modernizing transmission
and distribution systems, integrating
innovative technologies and streamlin
ing permitting processes, it’s possible
to alleviate bottlenecks, strengthen
Corporate Responsibility
Derek Chollet, Head of the JPMorganChase Center for Geopolitics, talked with Secretary Condoleezza
Rice about how global conflicts affect business.


70
CORPORATE RESPONSIBILITY
resilience against storms and cyber
threats, and help keep prices stable for
families and small businesses.
That’s why we launched the Security
and Resiliency Initiative (SRI), a $1.5 tril
lion, 10‑year plan to facilitate, finance
and invest in industries that are critical
to our national and economic security.
We announced SRI in the United States
in October 2025, and we have already
expanded it to the United Kingdom.
Private investment works best along
side smart public policy so capital is
only part of our broader plan. The firm
will also advocate for policy changes
that accelerate progress and help proj
ects move from ideas to real results.
Our advocacy is paired with data and
action. For example, a joint report from
the JPMorganChase
Policy
Center and
Center for Geopolitics outlined solu
tions that combine policy and philan
thropy to close talent gaps, including
the digital skills gap. Ninety‑two
percent of jobs in the United States,
including those in sectors critical to
security and resiliency, require digital
skills. Yet one‑third of manufacturing
workers and one-half of all construc
tion, transportation and storage work
ers don’t have these skills. We believe
all levels of the U.S. government should
work together to make job training
more accessible and effective, tailored
to the needs of future roles.
The federal government, for instance,
can expand apprenticeships to help
close the digital skills gap. Similarly,
states can create programs that con
nect education directly to real jobs and
align funding to reward student out
comes, simultaneously driving their
own economic growth. In Texas, House
Bill 8 established a blueprint for coordi
nating education and career opportuni
ties, shifting from a funding model
based on courses and credit hours to
one focused on tangible results:
good-paying jobs. Community colleges
in Texas now earn funding by educating
more students with credentials that
match the state’s workforce needs. We
advocated for this legislation because
it makes a real difference for people,
businesses and local economies.
Our SRI investments cannot translate
into production without workers ready
to step into skilled roles, so policies like
these are critical. Across the United
States and around the world, communi
ties face a growing skills mismatch:
There are jobs available but too few
workers with the training to fill them.
Clients tell us every day that talent is a
constraint, whether they need welders,
electricians, engineers or technicians.
This is not only an economic concern
but also a strategic issue that affects
long‑term competitiveness.
To tackle these challenges and drive
meaningful change, public-private
partnerships are essential. JPMorgan
Chase has a proven track record of
investing in regional talent collabora
tives across the country that connect
education and training directly to real
workforce needs. With support from
our firm, The Commit Partnership and
the Dallas County Promise initiative
have assisted over 115,000 students by
bringing together businesses, educa
tors and community organizations to
link career education with local
employer needs. When each of these
stakeholders has a seat at the table,
students can be guided to skills train
ing needed for local job opportunities.
We consistently support similar part
nerships across the country that estab
lish clear school-to-career pathways,
preparing students for the high-paying,
in-demand jobs of the future, and we
plan to build on this success to help
people secure good jobs and expand
the talent pool for sectors essential to
local and national resilience.
We’re doing this because we see a com
munity’s workforce as part of its infra
structure, no less important than
access to power, roads and bridges. A
strong workforce is critical to attract
investment, grow business and
strengthen competitiveness. These
strategies are rooted in communities
because resilience is ultimately realized
in neighborhoods: power that stays on
during storms, secure networks for
businesses, and products made closer
to where consumers live and shop.
Public‑private partnership is crucial to
SRI’s success — and, as noted above, it
is already underway. In January 2026,
Members of the Corporate Sustainability team met with clients in London alongside Heather Zichal,
JPMorganChase Global Head of Sustainability, and Dr. Sarah Kapnick, Global Head of Climate Advisory,
J.P. Morgan Commercial & Investment Bank.
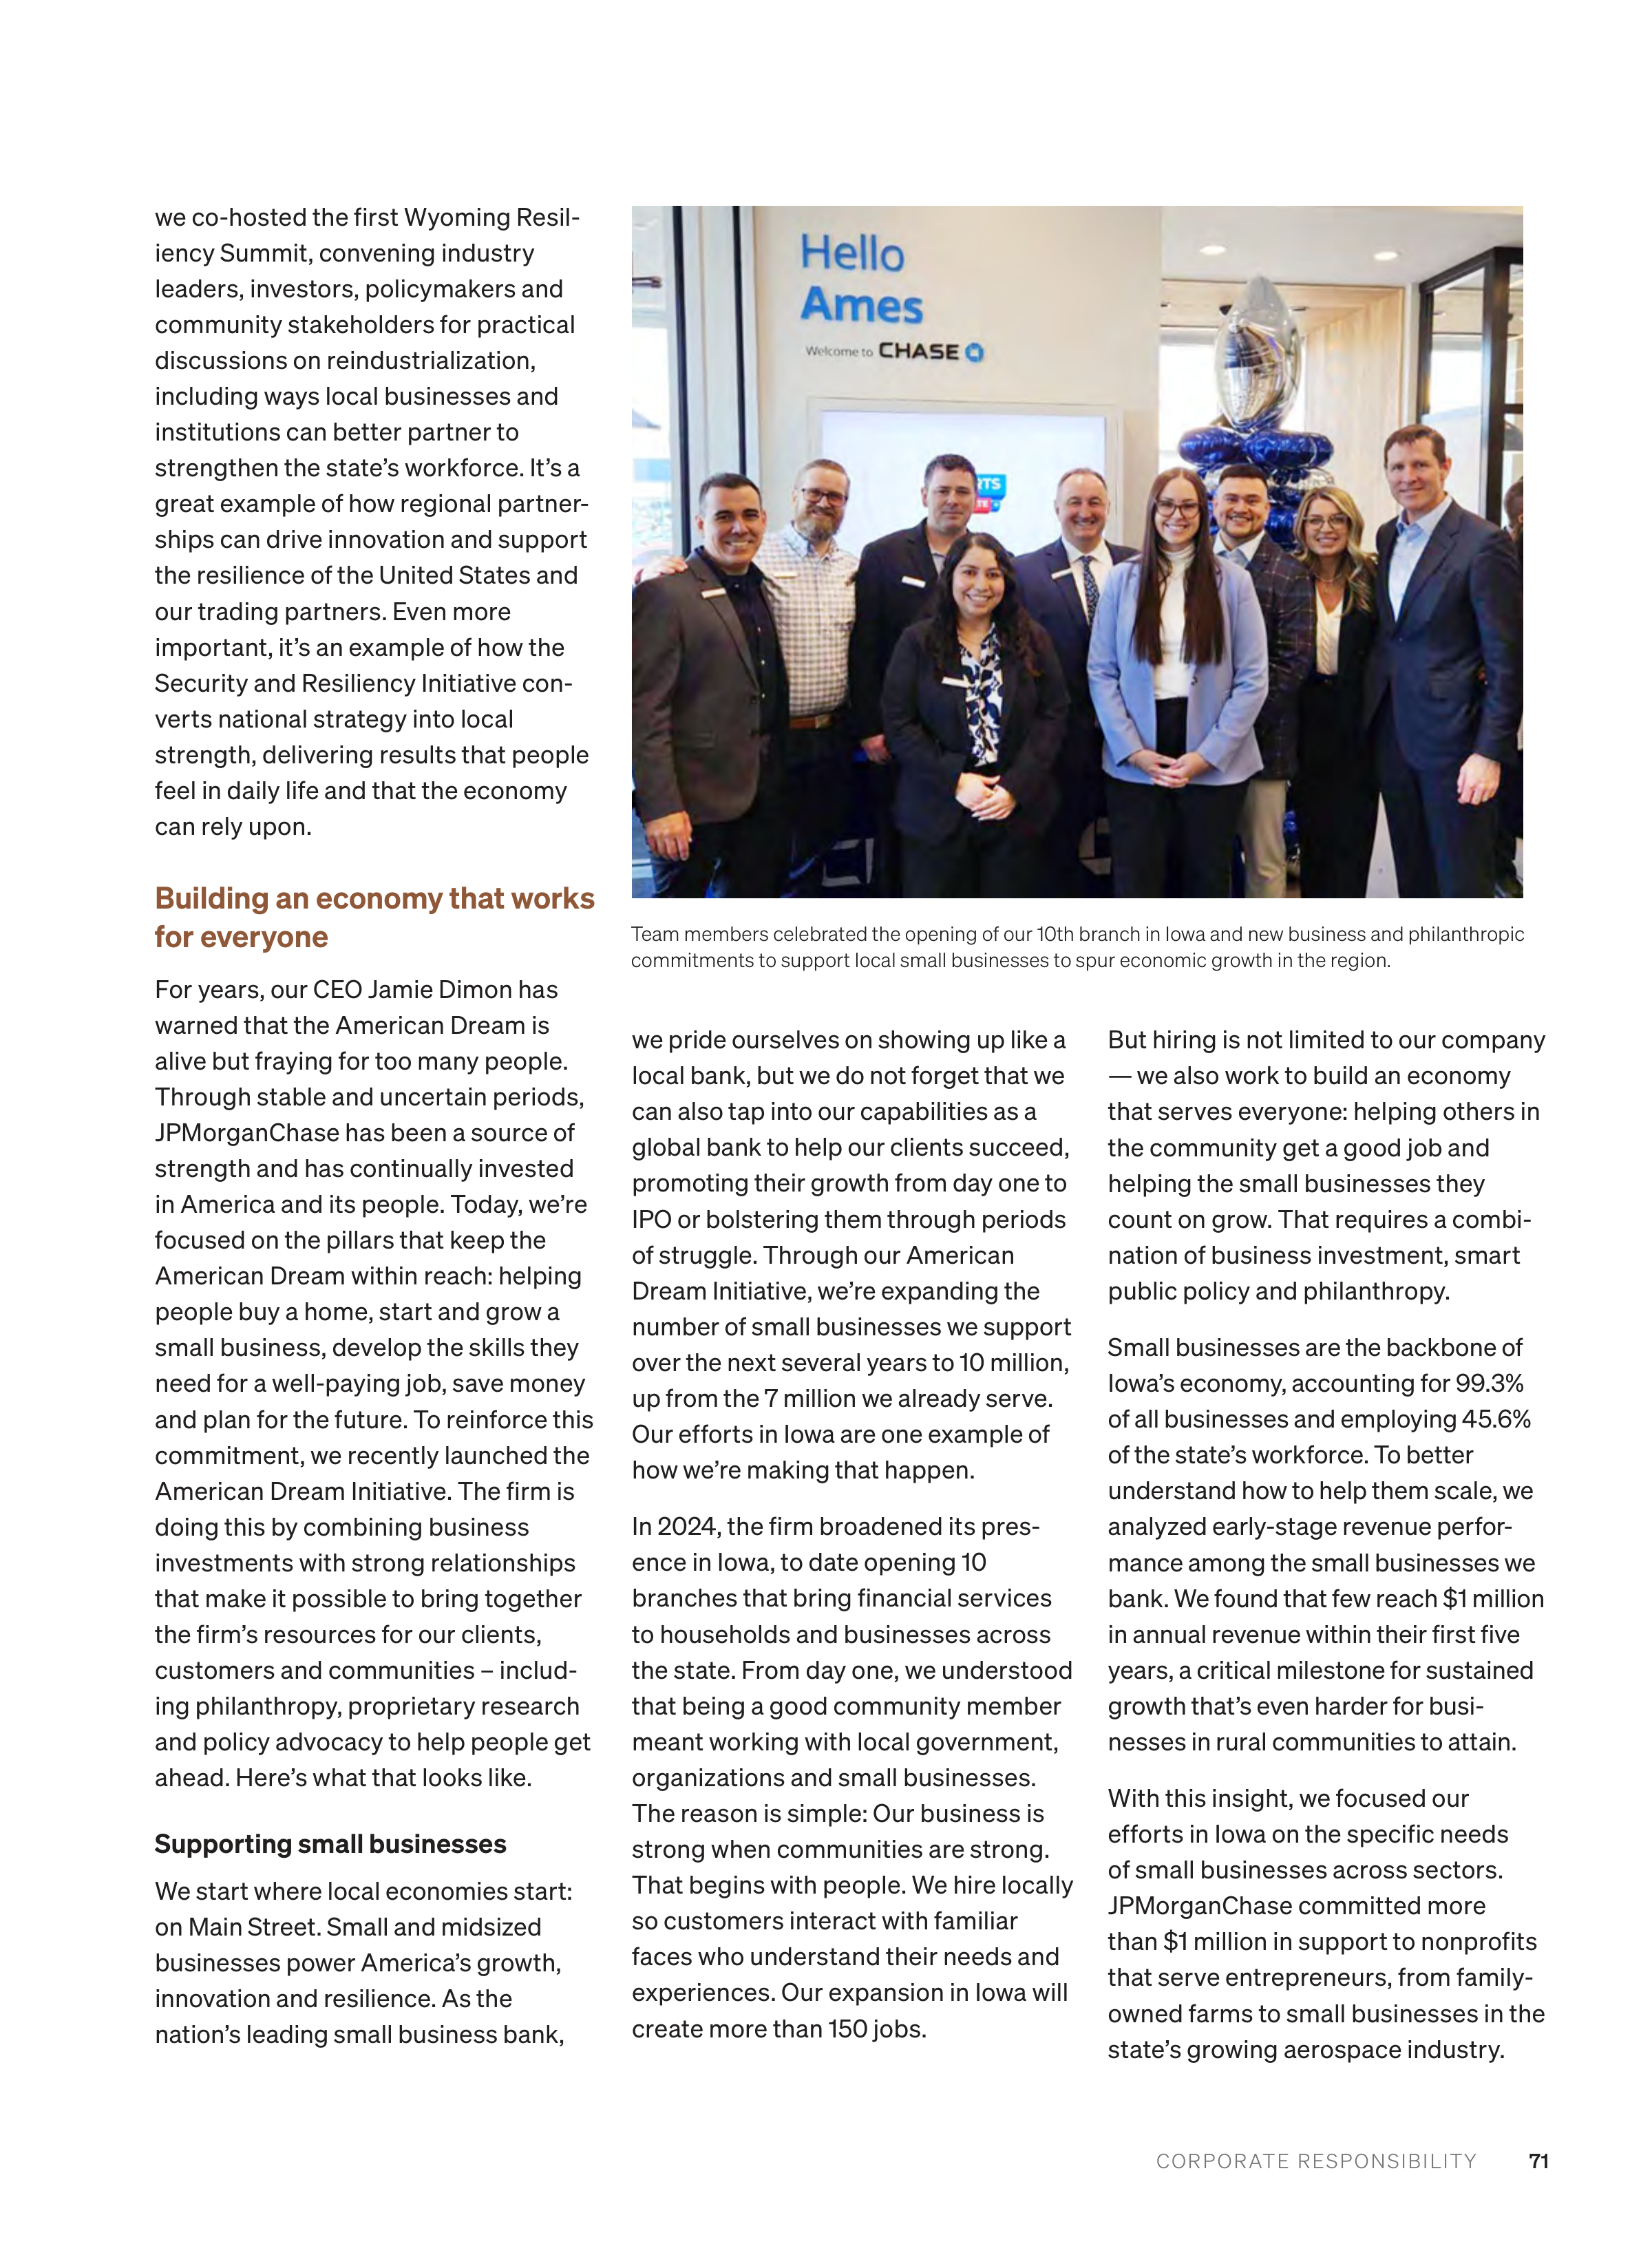

71
CORPORATE RESPONSIBILITY
we co-hosted the first Wyoming Resil
iency Summit, convening industry
leaders, investors, policymakers and
community stakeholders for practical
discussions on reindustrialization,
including ways local businesses and
institutions can better partner to
strengthen the state’s workforce. It’s a
great example of how regional partner
ships can drive innovation and support
the resilience of the United States and
our trading partners. Even more
important, it’s an example of how the
Security and Resiliency Initiative con
verts national strategy into local
strength, delivering results that people
feel in daily life and that the economy
can rely upon.
Building an economy that works
for everyone
For years, our CEO Jamie Dimon has
warned that the American Dream is
alive but fraying for too many people.
Through stable and uncertain periods,
JPMorganChase has been a source of
strength and has continually invested
in America and its people. Today, we’re
focused on the pillars that keep the
American Dream within reach: helping
people buy a home, start and grow a
small business, develop the skills they
need for a well-paying job, save money
and plan for the future. To reinforce this
commitment, we recently launched the
American Dream Initiative. The firm is
doing this by combining business
investments with strong relationships
that make it possible to bring together
the firm’s resources for our clients,
customers and communities – includ
ing philanthropy, proprietary research
and policy advocacy to help people get
ahead. Here’s what that looks like.
Supporting small businesses
We start where local economies start:
on Main Street. Small and midsized
businesses power America’s growth,
innovation and resilience. As the
nation’s leading small business bank,
we pride ourselves on showing up like a
local bank, but we do not forget that we
can also tap into our capabilities as a
global bank to help our clients succeed,
promoting their growth from day one to
IPO or bolstering them through periods
of struggle. Through our American
Dream Initiative, we’re expanding the
number of small businesses we support
over the next several years to 10 million,
up from the 7 million we already serve.
Our efforts in Iowa are one example of
how we’re making that happen.
In 2024, the firm broadened its pres
ence in Iowa, to date opening 10
branches that bring financial services
to households and businesses across
the state. From day one, we understood
that being a good community member
meant working with local government,
organizations and small businesses.
The reason is simple: Our business is
strong when communities are strong.
That begins with people. We hire locally
so customers interact with familiar
faces who understand their needs and
experiences. Our expansion in Iowa will
create more than 150 jobs.
But hiring is not limited to our company
— we also work to build an economy
that serves everyone: helping others in
the community get a good job and
helping the small businesses they
count on grow. That requires a combi
nation of business investment, smart
public policy and philanthropy.
Small businesses are the backbone of
Iowa’s economy, accounting for 99.3%
of all businesses and employing 45.6%
of the state’s workforce. To better
understand how to help them scale, we
analyzed early‑stage revenue perfor
mance among the small businesses we
bank. We found that few reach $1 million
in annual revenue within their first five
years, a critical milestone for sustained
growth that’s even harder for busi
nesses in rural communities to attain.
With this insight, we focused our
efforts in Iowa on the specific needs
of small businesses across sectors.
JPMorganChase committed more
than $1 million in support to nonprofits
that serve entrepreneurs, from family‑
owned farms to small businesses in the
state’s growing aerospace industry.
Team members celebrated the opening of our 10th branch in Iowa and new business and philanthropic
commitments to support local small businesses to spur economic growth in the region.



72
CORPORATE RESPONSIBILITY
This investment will help strengthen
Iowa’s economy and builds on our
strong track record of lending to more
than 20,000 Iowa businesses. Policy
matters, too. We will continue to advo
cate for a stronger small business eco
system at the federal, state and local
levels by removing unnecessary barri
ers and expanding access to capital.
Increasing access to stable,
affordable housing
Homeownership is a core pillar of the
American Dream. As a major lender and
investor in affordable housing across
the United States, we have seen first
hand that families are facing historic
housing challenges. The list is long:
Construction costs are high, regula
tions hinder the pace of building and
gaps in funding inhibit innovation.
These issues limit the number of avail
able homes and raise prices. The ripple
effects are real: People live farther from
work, local businesses are under pres
sure and households are spending less.
Federal, state and local policymakers
see the opportunity to act and are
working to address these problems.
We’re working alongside them.
Last year in Atlanta, we convened poli
cymakers, community advocates and
business leaders to find practical ways
to improve housing affordability and to
share lessons that may be helpful to
other cities. It’s one way we mobilize the
full breadth of the firm to help people
and their communities.
To ground the discussion, we analyzed
data on housing challenges across the
Atlanta metro area and looked at strat
egies that have worked in locations
with similar conditions, including Texas
and Montana. This underscores what
sets JPMorganChase apart: our ability
to leverage our presence around the
world to spot trends, learn what works,
make policy recommendations and
scale effective approaches from other
communities.
We focused on solutions that increase
supply and speed delivery: building
and preserving affordable homes,
updating zoning and permitting where
appropriate, and using new financing
tools to close funding gaps. To support
the construction of affordable housing,
we dedicated $40 million in new phil
anthropic funding to help address
the shortage. This builds on the more
than $5 billion in debt and equity that
JPMorganChase provided in 2025
across the country to help create and
preserve affordable housing.
Our housing work demonstrates our
approach: Use data to identify gaps,
partner locally to act and carry what
works to other communities. It is the
same advantage we bring to tables of
all kinds.
The JPMorganChase advantage
From small towns to big cities,
JPMorganChase helps power the global
economy. Our scale, networks and
resources let us take on big problems.
We are uniquely positioned to bring
people together and get things done
with the resources and know-how to
open doors to opportunity. In a world
where partisanship and polarization
can stall progress, we move the needle
by authentically earning the trust of
those we serve.
One of the many ways we do this is
through our Market Leadership Team
program. Organized to help leaders
from across the firm develop and imple
ment holistic business strategies that
address key community priorities, the
Market Leadership Team program
opens doors to opportunity.
We work across the public, private and
nonprofit sectors to solve complex
issues with practical solutions. Our
global network and data help us spot
patterns early, and our local partner
ships help us execute quickly and tailor
our approach to communities. We com
bine research, policy and investment to
turn ideas into outcomes, and we show
up in schools, neighborhoods, city halls
and on shop floors to make progress
you can feel.
The American Dream endures when
opportunity is within reach. JPMorgan
Chase will continue to pair data with
action, capital with creative thinking and
ambition with local execution — so fami
lies can buy a home, small businesses
can hire and grow, and workers can gain
the skills that lead to good jobs. We will
leverage our balance sheet, talent and
expertise; champion policies that
strengthen our economy and security;
and work across sectors to turn smart
strategies into measurable wins.
Our responsibility is to focus on what
matters most to families, workers and
businesses because when communi
ties thrive, our firm thrives. If we stay
focused on what matters most and
scale what works, we can help power
the next chapter of growth — building
resilience at home, expanding opportu
nity with our partners around the world
and leaving future generations better
off than those before them.
Tim Berry
Global Head of Corporate Responsibility,
Chairman of the Mid-Atlantic Region
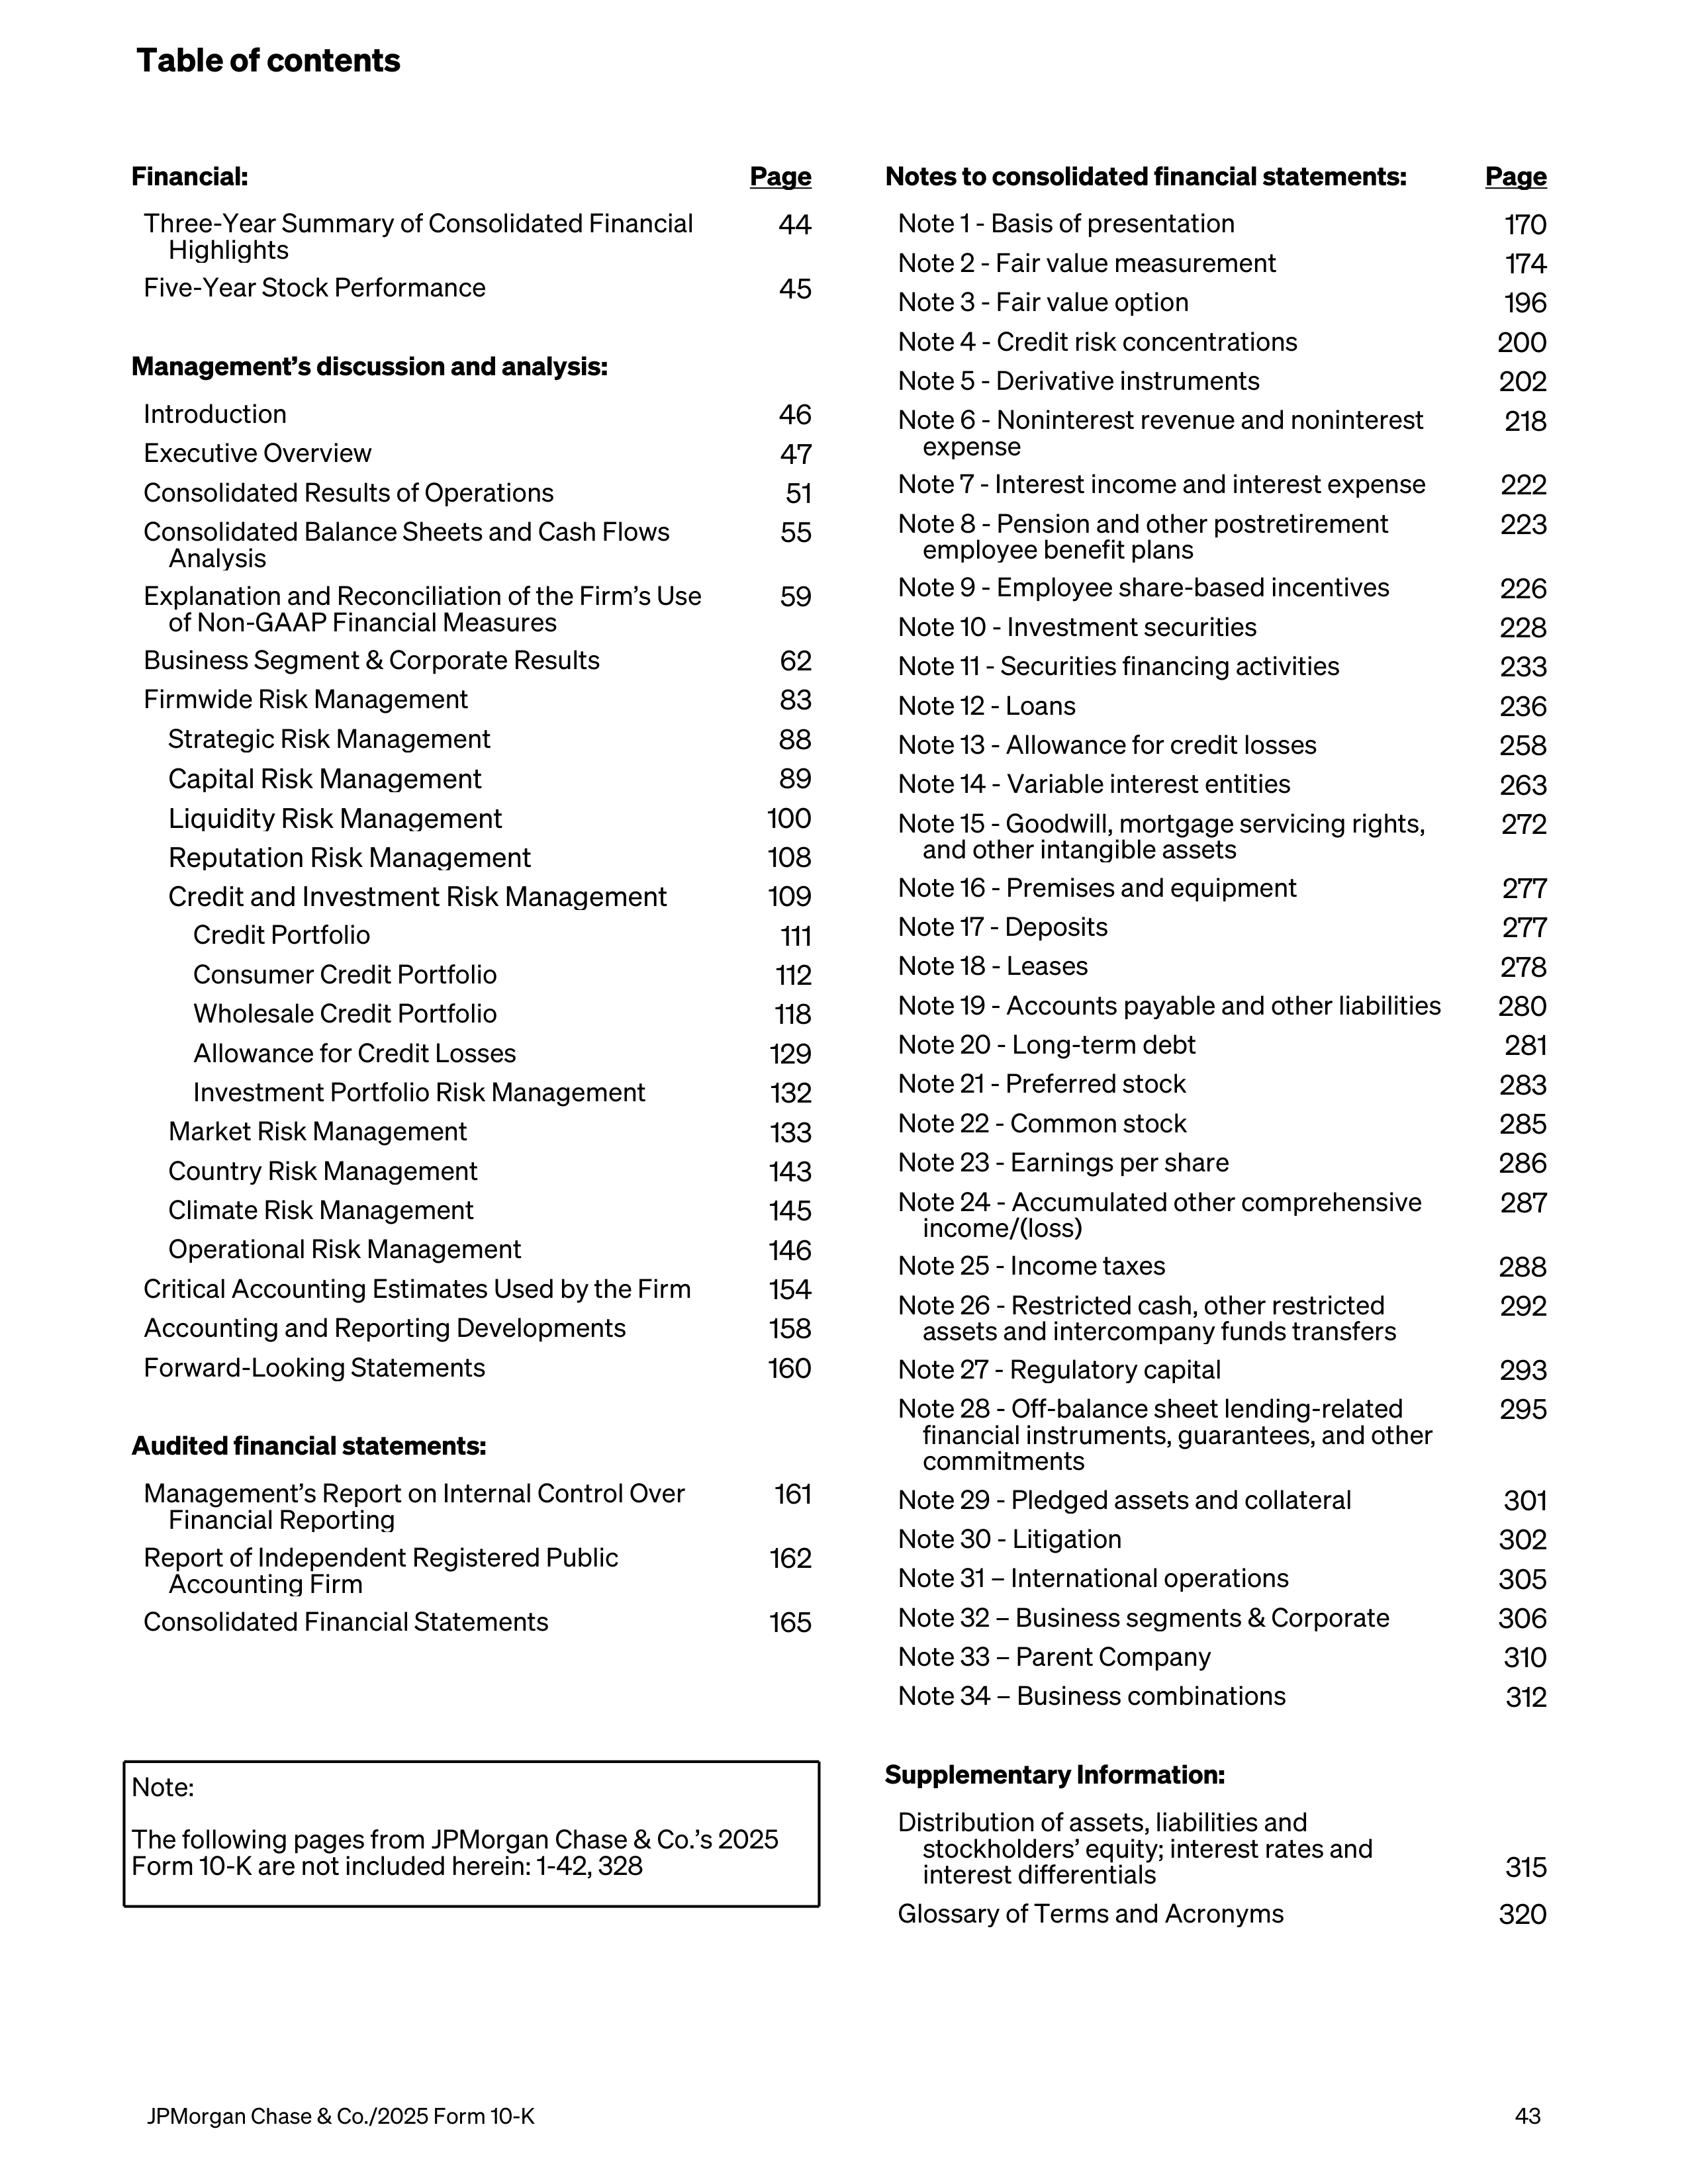
Financial:
Page
Three-Year Summary of Consolidated Financial
Highlights
44
Five-Year Stock Performance
45
Management’s discussion and analysis:
Introduction
46
Executive Overview
47
Consolidated Results of Operations
51
Consolidated Balance Sheets and Cash Flows
Analysis
55
Explanation and Reconciliation of the Firm’s Use
of Non-GAAP Financial Measures
59
Business Segment & Corporate Results
62
Firmwide Risk Management
83
Strategic Risk Management
88
Capital Risk Management
89
Liquidity Risk Management
100
Reputation Risk Management
108
Credit and Investment Risk Management
109
Credit Portfolio
111
Consumer Credit Portfolio
112
Wholesale Credit Portfolio
118
Allowance for Credit Losses
129
Investment Portfolio Risk Management
132
Market Risk Management
133
Country Risk Management
143
Climate Risk Management
145
Operational Risk Management
146
Critical Accounting Estimates Used by the Firm
154
Accounting and Reporting Developments
158
Forward-Looking Statements
160
Audited financial statements:
Management’s Report on Internal Control Over
Financial Reporting
161
Report of Independent Registered Public
Accounting Firm
162
Consolidated Financial Statements
165
Note:
The following pages from JPMorgan Chase & Co.’s 2025
Form 10-K are not included herein: 1-42, 328
Notes to consolidated financial statements:
Page
Note 1 - Basis of presentation
170
Note 2 - Fair value measurement
174
Note 3 - Fair value option
196
Note 4 - Credit risk concentrations
200
Note 5 - Derivative instruments
202
Note 6 - Noninterest revenue and noninterest
expense
218
Note 7 - Interest income and interest expense
222
Note 8 - Pension and other postretirement
employee benefit plans
223
Note 9 - Employee share-based incentives
226
Note 10 - Investment securities
228
Note 11 - Securities financing activities
233
Note 12 - Loans
236
Note 13 - Allowance for credit losses
258
Note 14 - Variable interest entities
263
Note 15 - Goodwill, mortgage servicing rights,
and other intangible assets
272
Note 16 - Premises and equipment
277
Note 17 - Deposits
277
Note 18 - Leases
278
Note 19 - Accounts payable and other liabilities
280
Note 20 - Long-term debt
281
Note 21 - Preferred stock
283
Note 22 - Common stock
285
Note 23 - Earnings per share
286
Note 24 - Accumulated other comprehensive
income/(loss)
287
Note 25 - Income taxes
288
Note 26 - Restricted cash, other restricted
assets and intercompany funds transfers
292
Note 27 - Regulatory capital
293
Note 28 - Off-balance sheet lending-related
financial instruments, guarantees, and other
commitments
295
Note 29 - Pledged assets and collateral
301
Note 30 - Litigation
302
Note 31 – International operations
305
Note 32 – Business segments & Corporate
306
Note 33 – Parent Company
310
Note 34 – Business combinations
312
Supplementary Information:
Distribution of assets, liabilities and
stockholders’ equity; interest rates and
interest differentials
315
Glossary of Terms and Acronyms
320
Table of contents
JPMorgan Chase & Co./2025 Form 10-K
43
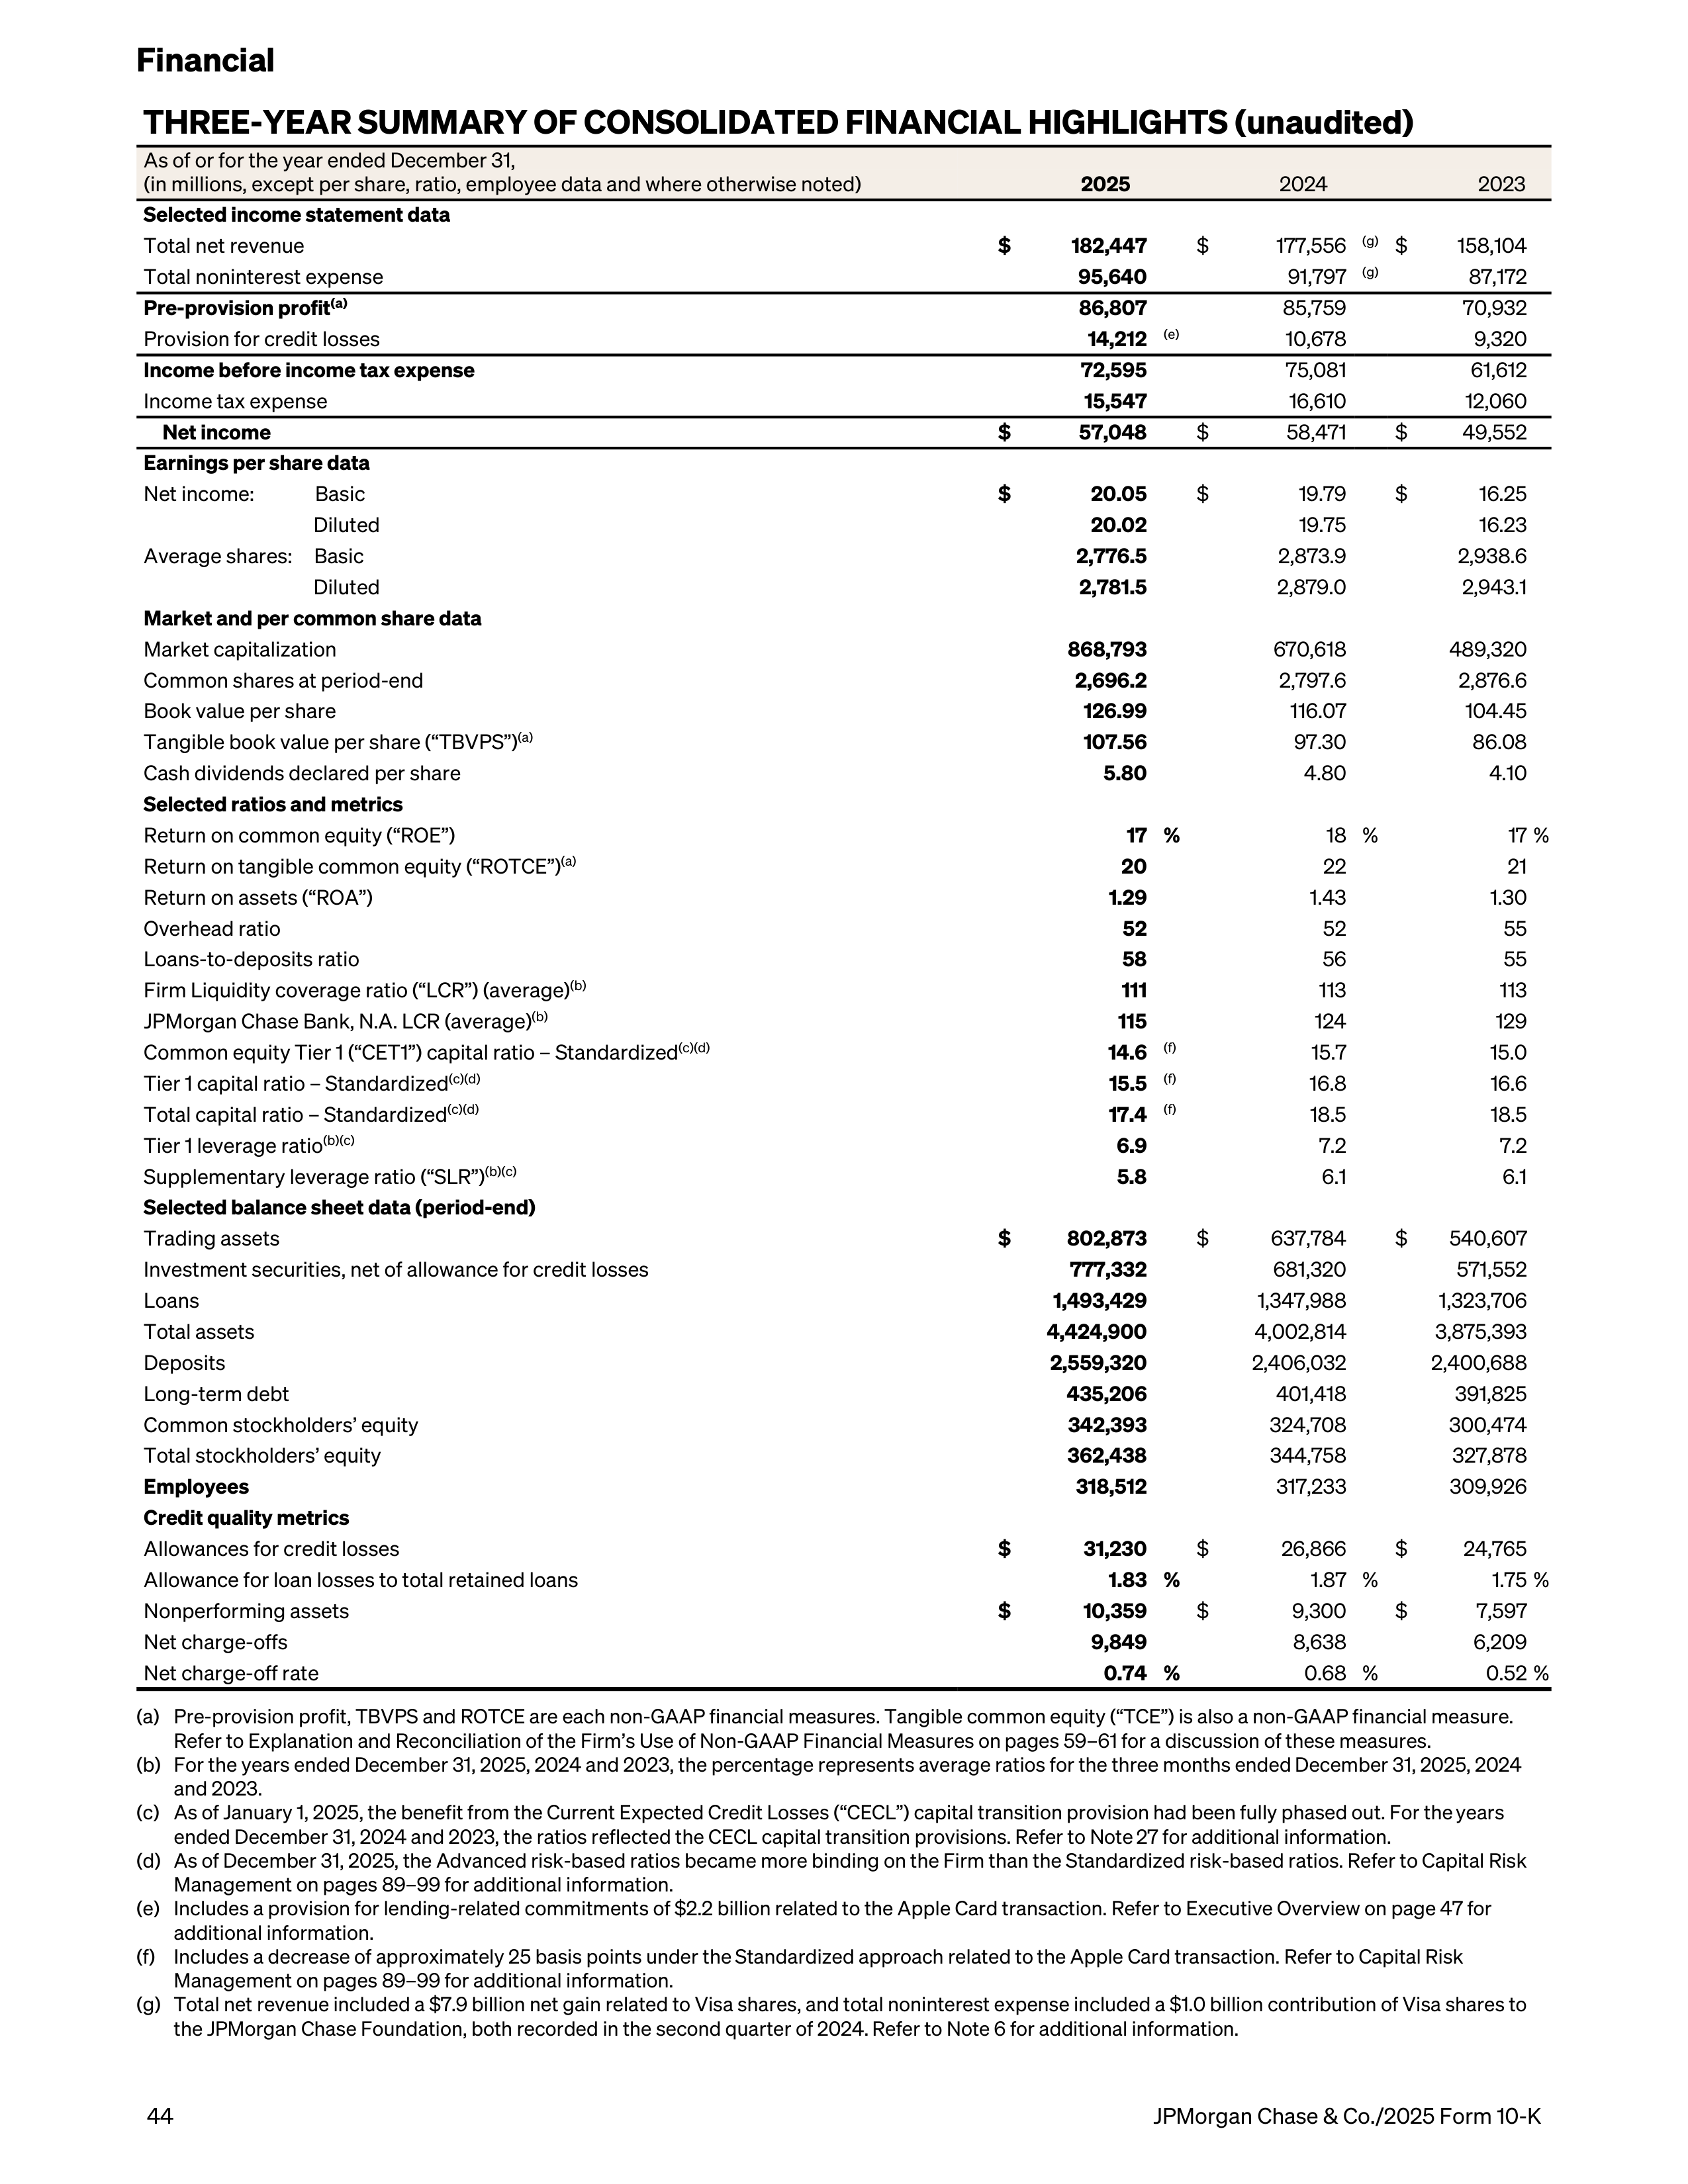
THREE-YEAR SUMMARY OF CONSOLIDATED FINANCIAL HIGHLIGHTS (unaudited)
2025
2024
2023
Selected income statement data
Total net revenue
$
182,447
$
177,556
(g)
$
158,104
Total noninterest expense
95,640
91,797
(g)
87,172
Pre-provision profit
(a)
86,807
85,759
70,932
Provision for credit losses
14,212
(e)
10,678
9,320
Income before income tax expense
72,595
75,081
61,612
Income tax expense
15,547
16,610
12,060
Net income
$
57,048
$
58,471
$
49,552
Earnings per share data
Net income: Basic
$
20.05
$
19.79
$
16.25
Diluted
20.02
19.75
16.23
Average shares: Basic
2,776.5
2,873.9
2,938.6
Diluted
2,781.5
2,879.0
2,943.1
Market and per common share data
Market capitalization
868,793
670,618
489,320
Common shares at period-end
2,696.2
2,797.6
2,876.6
Book value per share
126.99
116.07
104.45
Tangible book value per share (“TBVPS”)
(a)
107.56
97.30
86.08
Cash dividends declared per share
5.80
4.80
4.10
Selected ratios and metrics
Return on common equity (“ROE”)
17 %
18 %
17 %
Return on tangible common equity (“ROTCE”)
(a)
20
22
21
Return on assets (“ROA”)
1.29
1.43
1.30
Overhead ratio
52
52
55
Loans-to-deposits ratio
58
56
55
Firm Liquidity coverage ratio (“LCR”) (average)
(b)
111
113
113
JPMorgan Chase Bank, N.A. LCR (average)
(b)
115
124
129
Common equity Tier 1 (“CET1”) capital ratio – Standardized
(c)(d)
14.6
(f)
15.7
15.0
Tier 1 capital ratio – Standardized
(c)(d)
15.5
(f)
16.8
16.6
Total capital ratio – Standardized
(c)(d)
17.4
(f)
18.5
18.5
Tier 1 leverage ratio
(b)(c)
6.9
7.2
7.2
Supplementary leverage ratio (“SLR”)
(b)(c)
5.8
6.1
6.1
Selected balance sheet data (period-end)
Trading assets
$
802,873
$
637,784
$
540,607
Investment securities, net of allowance for credit losses
777,332
681,320
571,552
Loans
1,493,429
1,347,988
1,323,706
Total assets
4,424,900
4,002,814
3,875,393
Deposits
2,559,320
2,406,032
2,400,688
Long-term debt
435,206
401,418
391,825
Common stockholders’ equity
342,393
324,708
300,474
Total stockholders’ equity
362,438
344,758
327,878
Employees
318,512
317,233
309,926
Credit quality metrics
Allowances for credit losses
$
31,230
$
26,866
$
24,765
Allowance for loan losses to total retained loans
1.83 %
1.87 %
1.75 %
Nonperforming assets
$
10,359
$
9,300
$
7,597
Net charge-offs
9,849
8,638
6,209
Net charge-off rate
0.74 %
0.68 %
0.52 %
As of or for the year ended December 31,
(in millions, except per share, ratio, employee data and where otherwise noted)
(a)
Pre-provision profit, TBVPS and ROTCE are each non-GAAP financial measures. Tangible common equity (“TCE”) is also a non-GAAP financial measure.
Refer to Explanation and Reconciliation of the Firm’s Use of Non-GAAP Financial Measures on pages 59–61 for a discussion of these measures.
(b)
For the years ended December 31, 2025, 2024 and 2023, the percentage represents average ratios for the three months ended December 31, 2025, 2024
and 2023.
(c)
As of January 1, 2025, the benefit from the Current Expected Credit Losses (“CECL”) capital transition provision had been fully phased out. For the years
ended December 31, 2024 and 2023, the ratios reflected the CECL capital transition provisions. Refer to Note 27 for additional information.
(d)
As of December 31, 2025, the Advanced risk-based ratios became more binding on the Firm than the Standardized risk-based ratios. Refer to Capital Risk
Management on pages 89–99 for additional information.
(e)
Includes a provision for lending-related commitments of $2.2 billion related to the Apple Card transaction. Refer to Executive Overview on page 47 for
additional information.
(f)
Includes a decrease of approximately 25 basis points under the Standardized approach related to the Apple Card transaction. Refer to Capital Risk
Management on pages 89–99 for additional information.
(g)
Total net revenue included a $7.9 billion net gain related to Visa shares, and total noninterest expense included a $1.0 billion contribution of Visa shares to
the JPMorgan Chase Foundation, both recorded in the second quarter of 2024. Refer to Note 6 for additional information.
Financial
44
JPMorgan Chase & Co./2025 Form 10-K
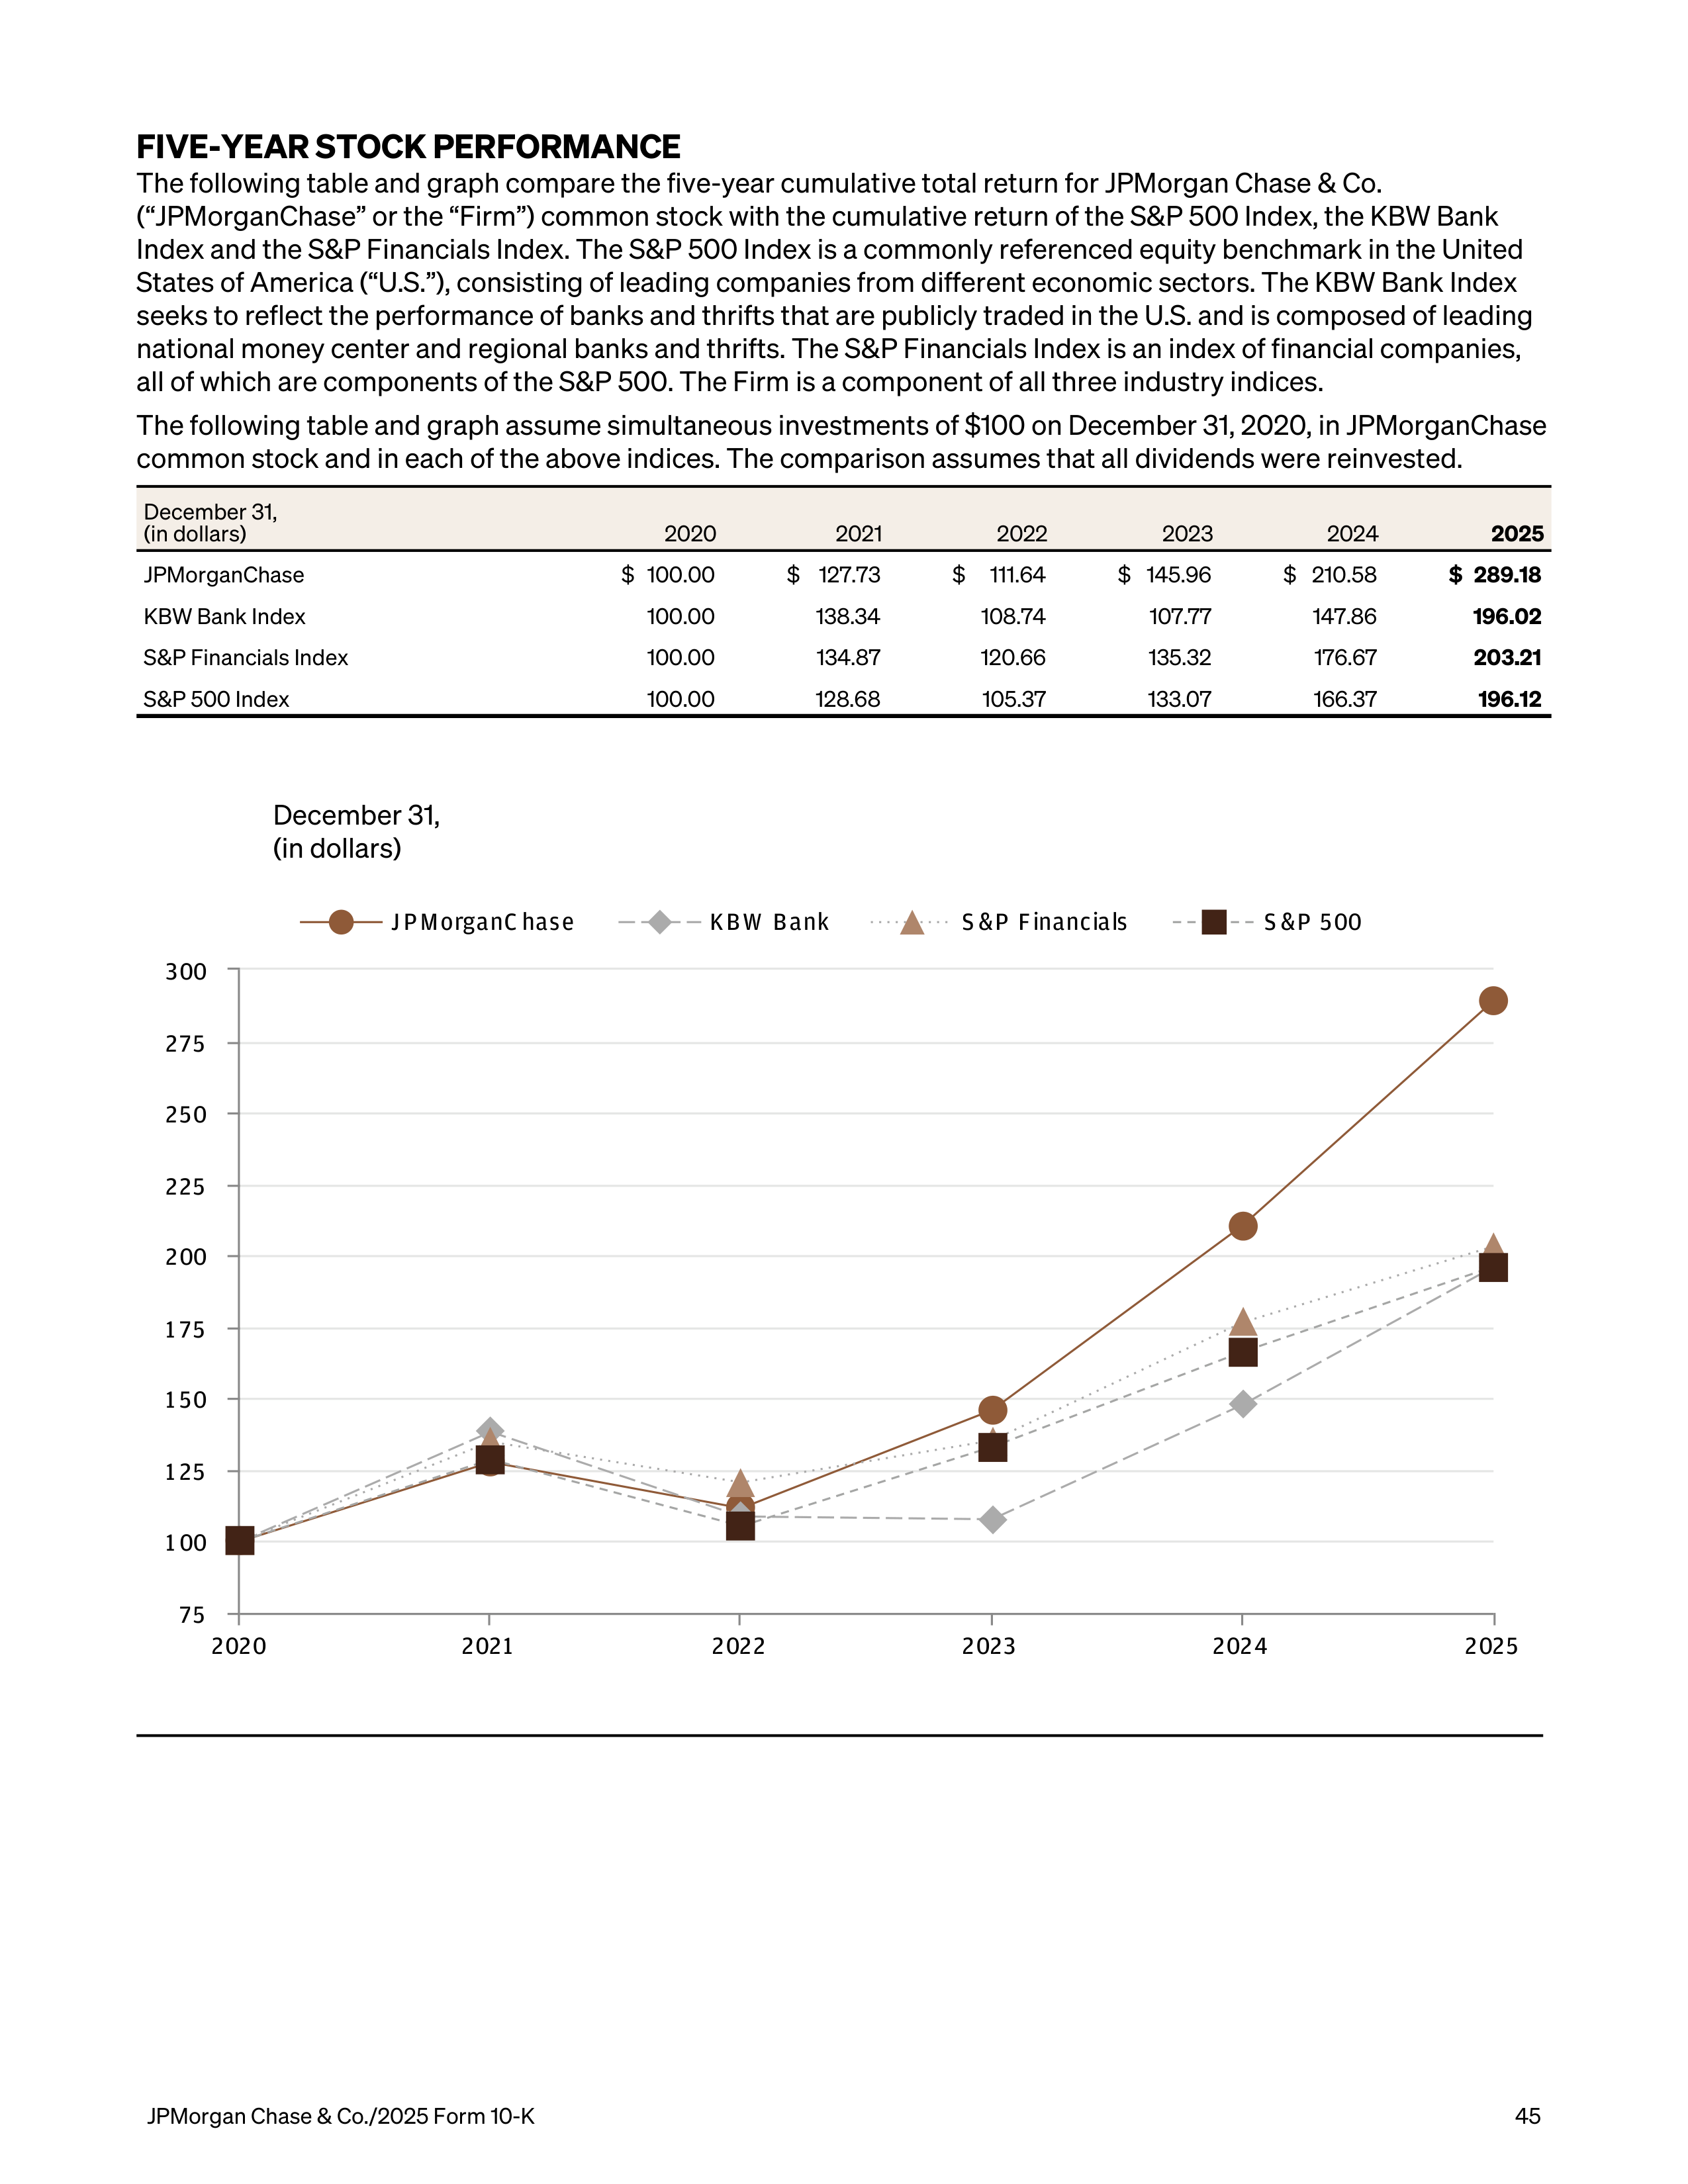
FIVE-YEAR STOCK PERFORMANCE
The following table and graph compare the five-year cumulative total return for JPMorgan Chase & Co.
(“JPMorganChase” or the “Firm”) common stock with the cumulative return of the S&P 500 Index, the KBW Bank
Index and the S&P Financials Index. The S&P 500 Index is a commonly referenced equity benchmark in the United
States of America (“U.S.”), consisting of leading companies from different economic sectors. The KBW Bank Index
seeks to reflect the performance of banks and thrifts that are publicly traded in the U.S. and is composed of leading
national money center and regional banks and thrifts. The S&P Financials Index is an index of financial companies,
all of which are components of the S&P 500. The Firm is a component of all three industry indices.
The following table and graph assume simultaneous investments of $100 on December 31, 2020, in JPMorganChase
common stock and in each of the above indices. The comparison assumes that all dividends were reinvested.
December 31,
(in dollars)
2020
2021
2022
2023
2024
2025
JPMorganChase
$ 100.00
$ 127.73
$
111.64
$ 145.96
$ 210.58
$ 289.18
KBW Bank Index
100.00
138.34
108.74
107.77
147.86
196.02
S&P Financials Index
100.00
134.87
120.66
135.32
176.67
203.21
S&P 500 Index
100.00
128.68
105.37
133.07
166.37
196.12
December 31,
(in dollars)
JPMorganC hase
KBW Bank
S &P Financials
S &P 500
2020
2021
2022
2023
2024
2025
75
1 00
1 25
1 50
1 75
200
225
250
275
300
JPMorgan Chase & Co./2025 Form 10-K
45
The following is Management’s discussion and analysis of the financial condition and results of operations (“MD&A”)
of JPMorganChase for the year ended December 31, 2025. The MD&A is included in both JPMorganChase’s Annual
Report for the year ended December 31, 2025 (“Annual Report”) and its Annual Report on Form 10-K for the year
ended December 31, 2025 (“2025 Form 10-K” or “Form 10-K”) filed with the Securities and Exchange Commission
(“SEC”). Refer to the Glossary of terms and acronyms on pages 320–327 for definitions of terms and acronyms used
throughout the Annual Report and the 2025 Form 10-K.
This Form 10-K contains forward-looking statements within the meaning of the Private Securities Litigation Reform
Act of 1995. These forward-looking statements are based on the current beliefs and expectations of
JPMorganChase’s management, speak only as of the date of this Form 10-K and are subject to significant risks and
uncertainties. Refer to Forward-looking Statements on page 160 and Part 1, Item 1A: Risk Factors in this Form 10-K
on pages 9–31 for a discussion of certain of those risks and uncertainties and the factors that could cause
JPMorganChase’s actual results to differ materially because of those risks and uncertainties. There is no assurance
that actual results will be in line with any outlook information set forth herein, and the Firm does not undertake to
update any forward-looking statements.
INTRODUCTION
JPMorgan Chase & Co. (NYSE: JPM), a financial holding
company incorporated under Delaware law in 1968, is
a leading financial services firm based in the United
States of America (“U.S.”), with operations worldwide.
JPMorganChase had $4.4 trillion in assets and $362.4
billion in stockholders’ equity as of December 31, 2025.
The Firm is a leader in investment banking, financial
services for consumers and small businesses,
commercial banking, financial transaction processing
and asset management. Under the J.P. Morgan and
Chase brands, the Firm serves millions of customers,
predominantly in the U.S., and many of the world’s
most prominent corporate, institutional and
government clients globally.
JPMorganChase’s principal bank subsidiary is
JPMorgan Chase Bank, National Association
(“JPMorgan Chase Bank, N.A.”), a national banking
association with U.S. branches in 48 states and
Washington, D.C. JPMorganChase’s principal non-
bank subsidiary is J.P. Morgan Securities LLC (“J.P.
Morgan Securities”), a U.S. broker-dealer. The bank
and non-bank subsidiaries of JPMorganChase operate
nationally as well as through overseas branches and
subsidiaries, representative offices and subsidiary
foreign banks. The Firm’s principal operating
subsidiaries outside the U.S. are J.P. Morgan Securities
plc and J.P. Morgan SE (“JPMSE”), which are
subsidiaries of JPMorgan Chase Bank, N.A. and are
based in the United Kingdom (“U.K.”) and Germany,
respectively.
For management reporting purposes, the Firm has
three reportable business segments – Consumer &
Community Banking (“CCB”), Commercial &
Investment Bank (“CIB”) and Asset & Wealth
Management (“AWM”) – with the remaining activities
in Corporate. The Firm's consumer business segment
is CCB, and the Firm's wholesale business segments
are CIB and AWM. Refer to Business Segment &
Corporate Results on pages 62–82 and Note 32 for a
description of the Firm’s reportable business
segments and the products and services that they
provide to their respective client bases, as well as a
description of Corporate activities.
The Firm’s website is www.jpmorganchase.com.
JPMorganChase makes available on its website, free of
charge, annual reports on Form 10-K, quarterly reports
on Form 10-Q and current reports on Form 8-K
pursuant to Section 13(a) or Section 15(d) of the
Securities Exchange Act of 1934, as soon as
reasonably practicable after it electronically files or
furnishes such material to the U.S. Securities and
Exchange Commission (the “SEC”) at www.sec.gov.
JPMorganChase makes new and important
information about the Firm available on its website at
https://www.jpmorganchase.com, including on the
Investor Relations section of its website at https://
www.jpmorganchase.com/ir. Information on the Firm's
website, including documents on the website that are
referenced in this Form 10-K, is not incorporated by
reference into this 2025 Form 10-K or the Firm’s other
filings with the SEC.
Management’s discussion and analysis
46
JPMorgan Chase & Co./2025 Form 10-K
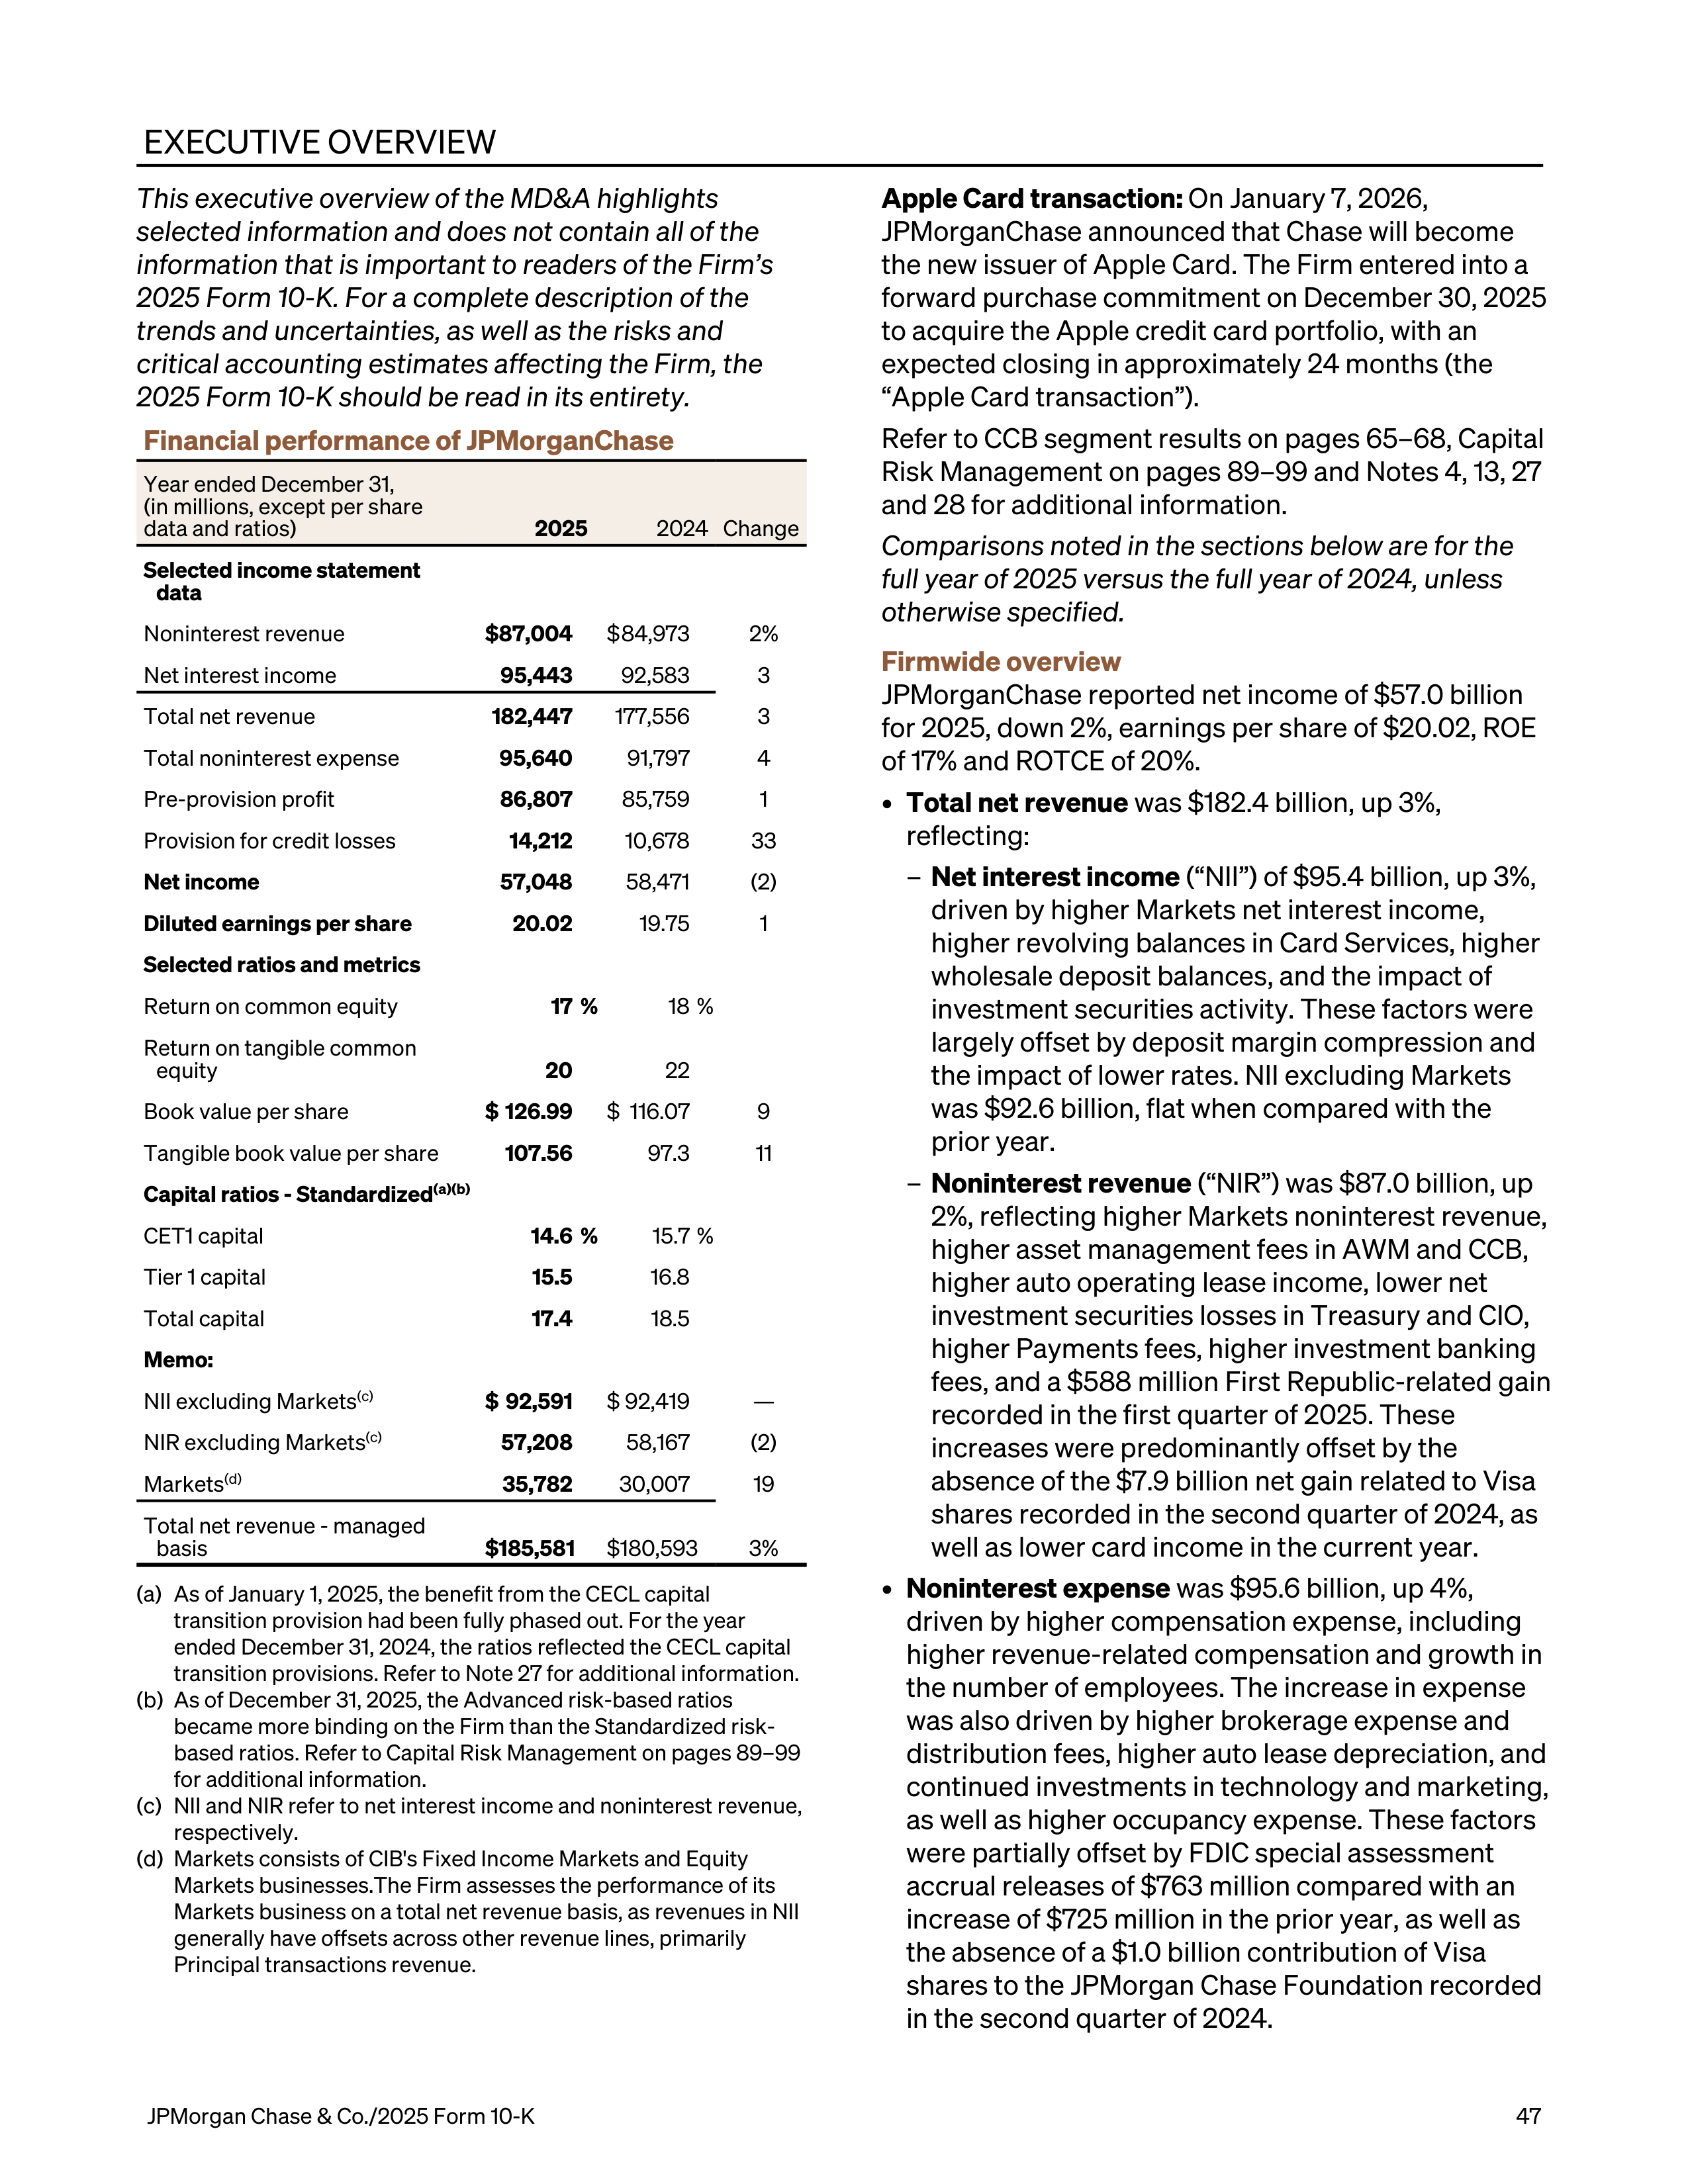
EXECUTIVE OVERVIEW
This executive overview of the MD&A highlights
selected information and does not contain all of the
information that is important to readers of the Firm’s
2025 Form 10-K. For a complete description of the
trends and uncertainties, as well as the risks and
critical accounting estimates affecting the Firm, the
2025 Form 10-K should be read in its entirety.
Financial performance of JPMorganChase
Year ended December 31,
(in millions, except per share
data and ratios)
2025
2024
Change
Selected income statement
data
Noninterest revenue
$ 87,004
$ 84,973
2%
Net interest income
95,443
92,583
3
Total net revenue
182,447
177,556
3
Total noninterest expense
95,640
91,797
4
Pre-provision profit
86,807
85,759
1
Provision for credit losses
14,212
10,678
33
Net income
57,048
58,471
(2)
Diluted earnings per share
20.02
19.75
1
Selected ratios and metrics
Return on common equity
17 %
18 %
Return on tangible common
equity
20
22
Book value per share
$ 126.99
$ 116.07
9
Tangible book value per share
107.56
97.3
11
Capital ratios - Standardized
(a)(b)
CET1 capital
14.6 %
15.7 %
Tier 1 capital
15.5
16.8
Total capital
17.4
18.5
Memo:
NII excluding Markets
(c)
$ 92,591
$ 92,419
—
NIR excluding Markets
(c)
57,208
58,167
(2)
Markets
(d)
35,782
30,007
19
Total net revenue - managed
basis
$ 185,581
$ 180,593
3%
(a) As of January 1, 2025, the benefit from the CECL capital
transition provision had been fully phased out. For the year
ended December 31, 2024, the ratios reflected the CECL capital
transition provisions. Refer to Note 27 for additional information.
(b) As of December 31, 2025, the Advanced risk-based ratios
became more binding on the Firm than the Standardized risk-
based ratios. Refer to Capital Risk Management on pages 89–99
for additional information.
(c) NII and NIR refer to net interest income and noninterest revenue,
respectively.
(d) Markets consists of CIB's Fixed Income Markets and Equity
Markets businesses.The Firm assesses the performance of its
Markets business on a total net revenue basis, as revenues in NII
generally have offsets across other revenue lines, primarily
Principal transactions revenue.
Apple Card transaction:
On January 7, 2026,
JPMorganChase announced that Chase will become
the new issuer of Apple Card. The Firm entered into a
forward purchase commitment on December 30, 2025
to acquire the Apple credit card portfolio, with an
expected closing in approximately 24 months (the
“Apple Card transaction”).
Refer to CCB segment results on pages 65–68, Capital
Risk Management on pages 89–99 and Notes 4, 13, 27
and 28 for additional information.
Comparisons noted in the sections below are for the
full year of 2025 versus the full year of 2024, unless
otherwise specified.
Firmwide overview
JPMorganChase reported net income of $57.0 billion
for 2025, down 2%, earnings per share of $20.02, ROE
of 17% and ROTCE of 20%.
•
Total net revenue
was $182.4 billion, up 3%,
reflecting:
–
Net interest income
(“NII”) of $95.4 billion, up 3%,
driven by higher Markets net interest income,
higher revolving balances in Card Services, higher
wholesale deposit balances, and the impact of
investment securities activity. These factors were
largely offset by deposit margin compression and
the impact of lower rates. NII excluding Markets
was $92.6 billion, flat when compared with the
prior year.
–
Noninterest revenue
(“NIR”) was $87.0 billion, up
2%, reflecting higher Markets noninterest revenue,
higher asset management fees in AWM and CCB,
higher auto operating lease income, lower net
investment securities losses in Treasury and CIO,
higher Payments fees, higher investment banking
fees, and a $588 million First Republic-related gain
recorded in the first quarter of 2025. These
increases were predominantly offset by the
absence of the $7.9 billion net gain related to Visa
shares recorded in the second quarter of 2024, as
well as lower card income in the current year.
•
Noninterest expense
was $95.6 billion, up 4%,
driven by higher compensation expense, including
higher revenue-related compensation and growth in
the number of employees. The increase in expense
was also driven by higher brokerage expense and
distribution fees, higher auto lease depreciation, and
continued investments in technology and marketing,
as well as higher occupancy expense. These factors
were partially offset by FDIC special assessment
accrual releases of $763 million compared with an
increase of $725 million in the prior year, as well as
the absence of a $1.0 billion contribution of Visa
shares to the JPMorgan Chase Foundation recorded
in the second quarter of 2024.
JPMorgan Chase & Co./2025 Form 10-K
47
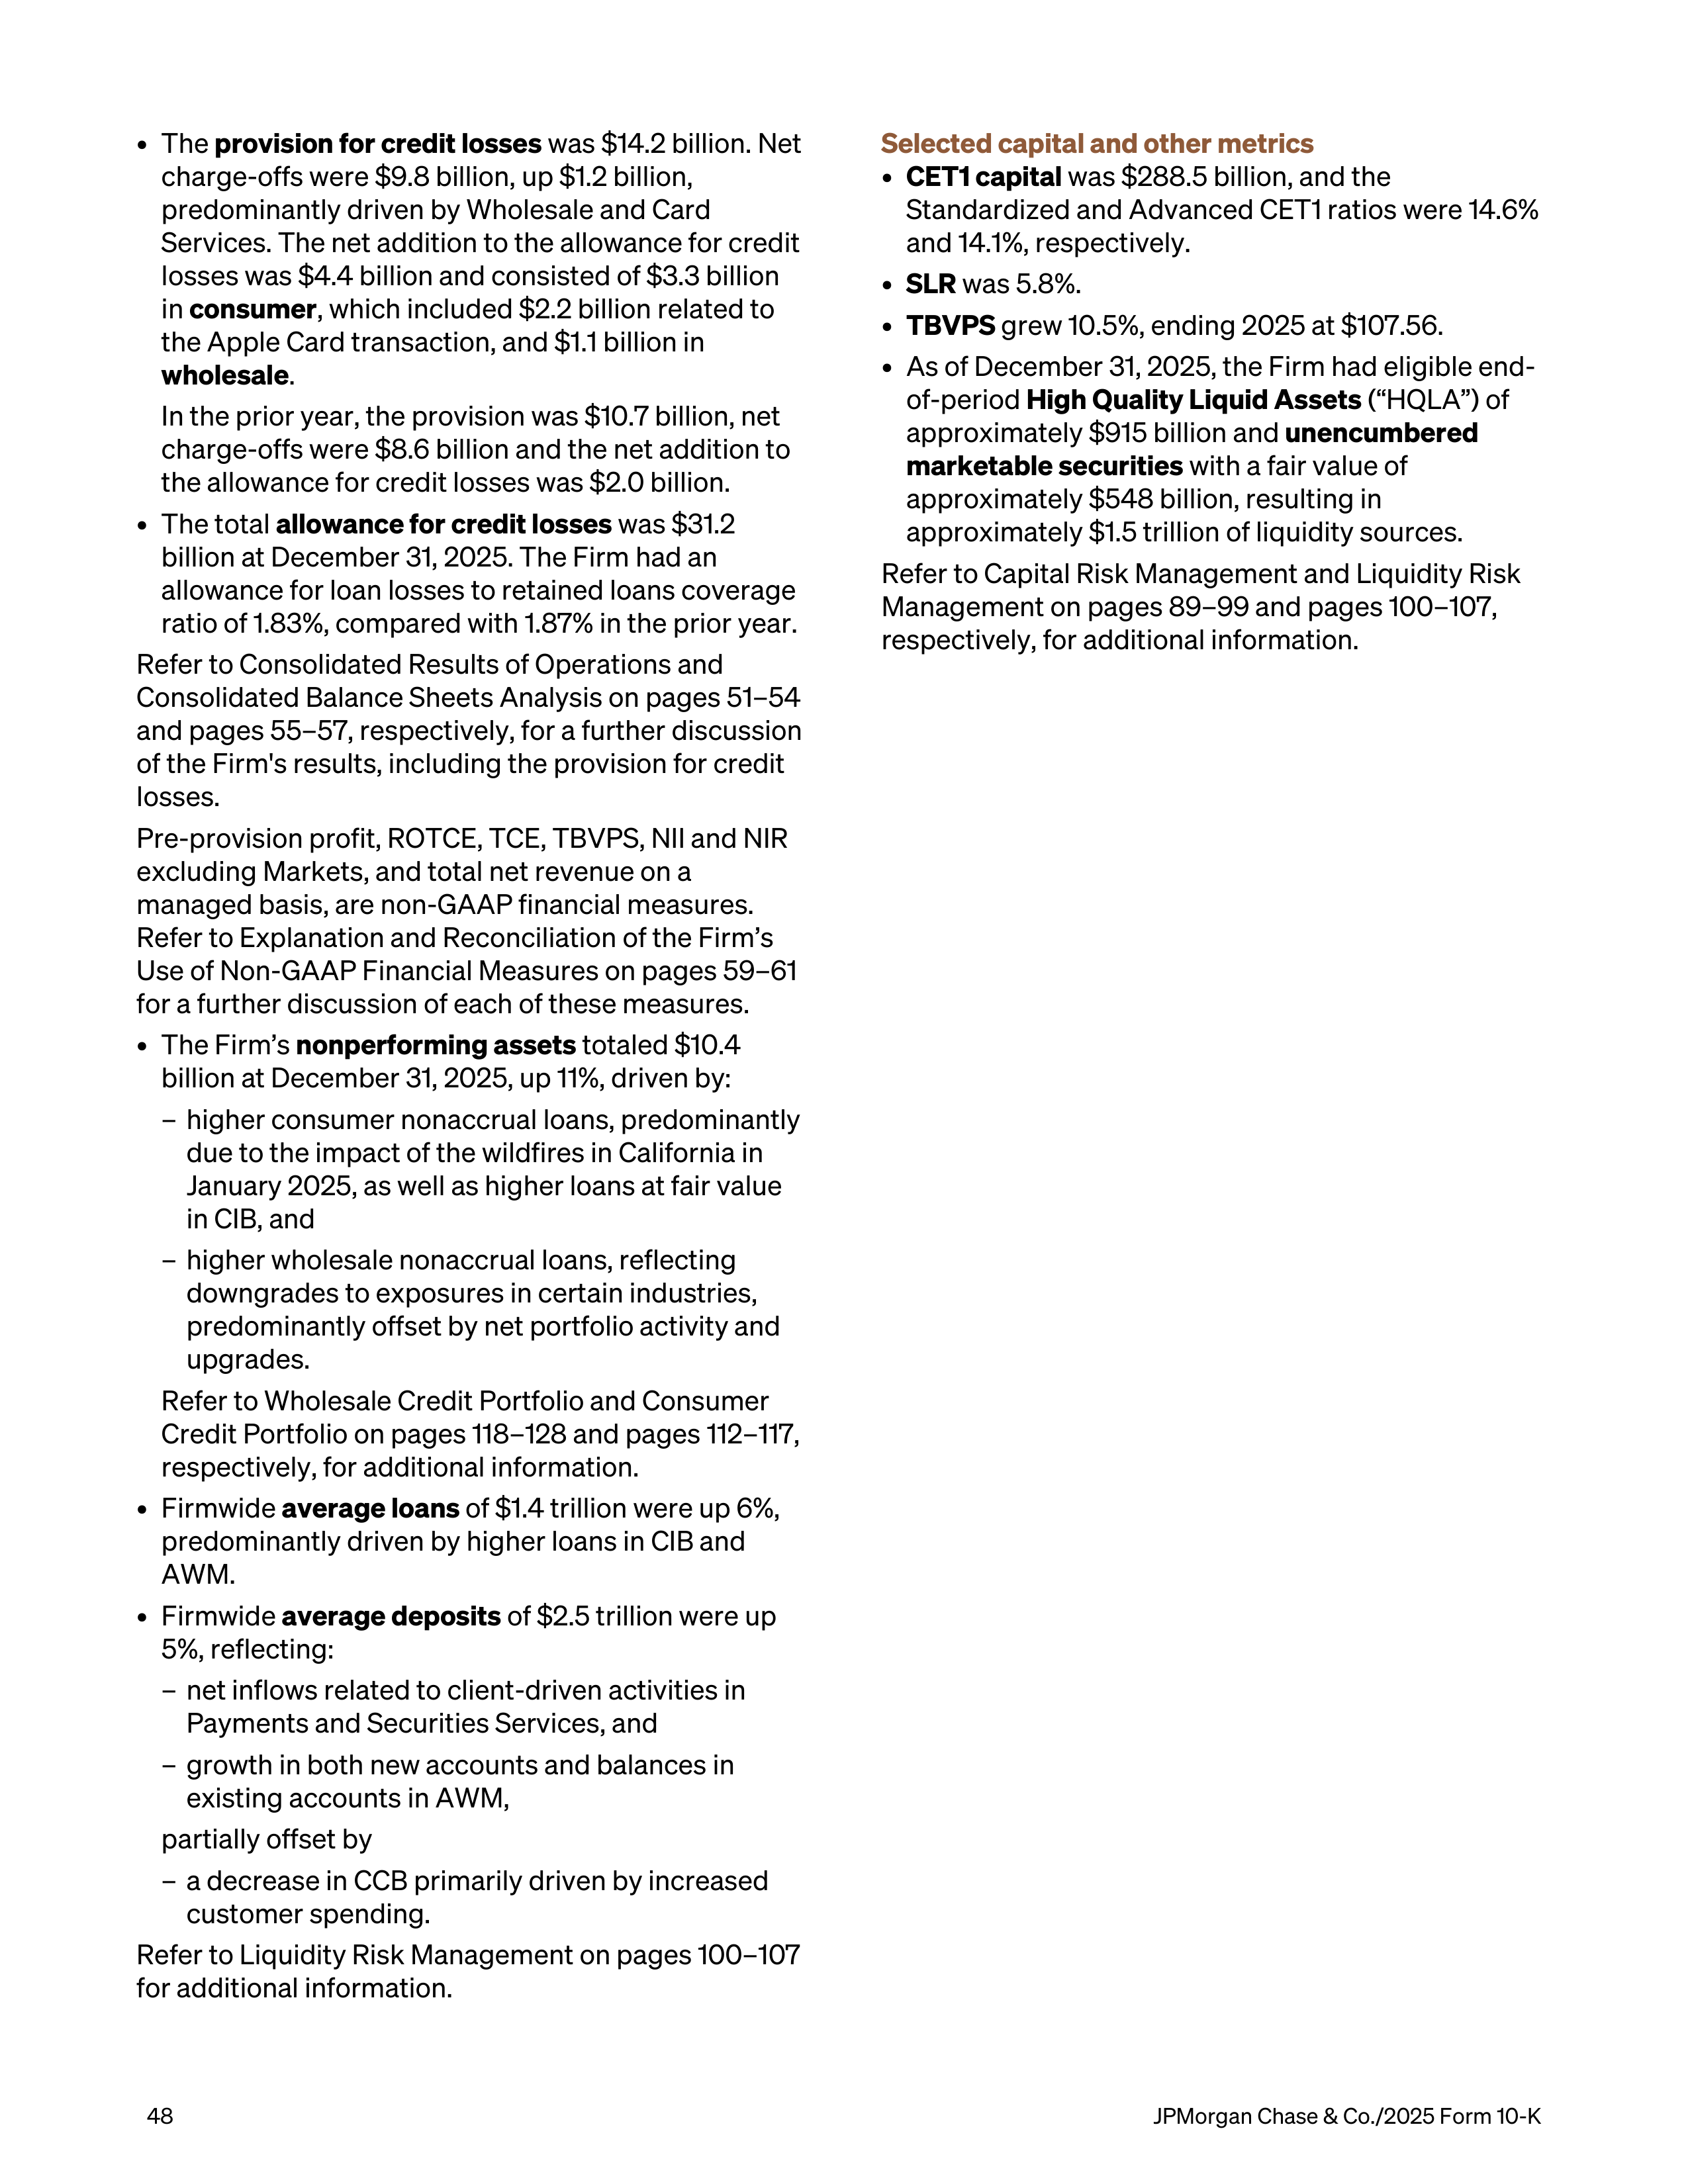
•
The
provision for credit losses
was $14.2 billion. Net
charge-offs were $9.8 billion, up $1.2 billion,
predominantly driven by Wholesale and Card
Services. The net addition to the allowance for credit
losses was $4.4 billion and consisted of $3.3 billion
in
consumer
, which included $2.2 billion related to
the Apple Card transaction, and $1.1 billion in
wholesale
.
In the prior year, the provision was $10.7 billion, net
charge-offs were $8.6 billion and the net addition to
the allowance for credit losses was $2.0 billion.
•
The total
allowance for credit losses
was $31.2
billion at December 31, 2025. The Firm had an
allowance for loan losses to retained loans coverage
ratio of 1.83%, compared with 1.87% in the prior year.
Refer to Consolidated Results of Operations and
Consolidated Balance Sheets Analysis on pages 51–54
and pages 55–57, respectively, for a further discussion
of the Firm's results, including the provision for credit
losses.
Pre-provision profit, ROTCE, TCE, TBVPS, NII and NIR
excluding Markets, and total net revenue on a
managed basis, are non-GAAP financial measures.
Refer to Explanation and Reconciliation of the Firm’s
Use of Non-GAAP Financial Measures on pages 59–61
for a further discussion of each of these measures.
•
The Firm’s
nonperforming assets
totaled $10.4
billion at December 31, 2025, up 11%, driven by:
–
higher consumer nonaccrual loans, predominantly
due to the impact of the wildfires in California in
January 2025, as well as higher loans at fair value
in CIB, and
–
higher wholesale nonaccrual loans, reflecting
downgrades to exposures in certain industries,
predominantly offset by net portfolio activity and
upgrades.
Refer to Wholesale Credit Portfolio and Consumer
Credit Portfolio on pages 118–128 and pages 112–117,
respectively, for additional information.
•
Firmwide
average loans
of $1.4 trillion were up 6%,
predominantly driven by higher loans in CIB and
AWM.
•
Firmwide
average deposits
of $2.5 trillion were up
5%, reflecting:
–
net inflows related to client-driven activities in
Payments and Securities Services, and
–
growth in both new accounts and balances in
existing accounts in AWM,
partially offset by
–
a decrease in CCB primarily driven by increased
customer spending.
Refer to Liquidity Risk Management on pages 100–107
for additional information.
Selected capital and other metrics
•
CET1 capital
was $288.5 billion, and the
Standardized and Advanced CET1 ratios were 14.6%
and 14.1%, respectively.
•
SLR
was 5.8%.
•
TBVPS
grew 10.5%, ending 2025 at $107.56.
•
As of December 31, 2025, the Firm had eligible end-
of-period
High Quality Liquid Assets
(“HQLA”) of
approximately $915 billion and
unencumbered
marketable securities
with a fair value of
approximately $548 billion, resulting in
approximately $1.5 trillion of liquidity sources.
Refer to Capital Risk Management and Liquidity Risk
Management on pages 89–99 and pages 100–107,
respectively, for additional information.
48
JPMorgan Chase & Co./2025 Form 10-K
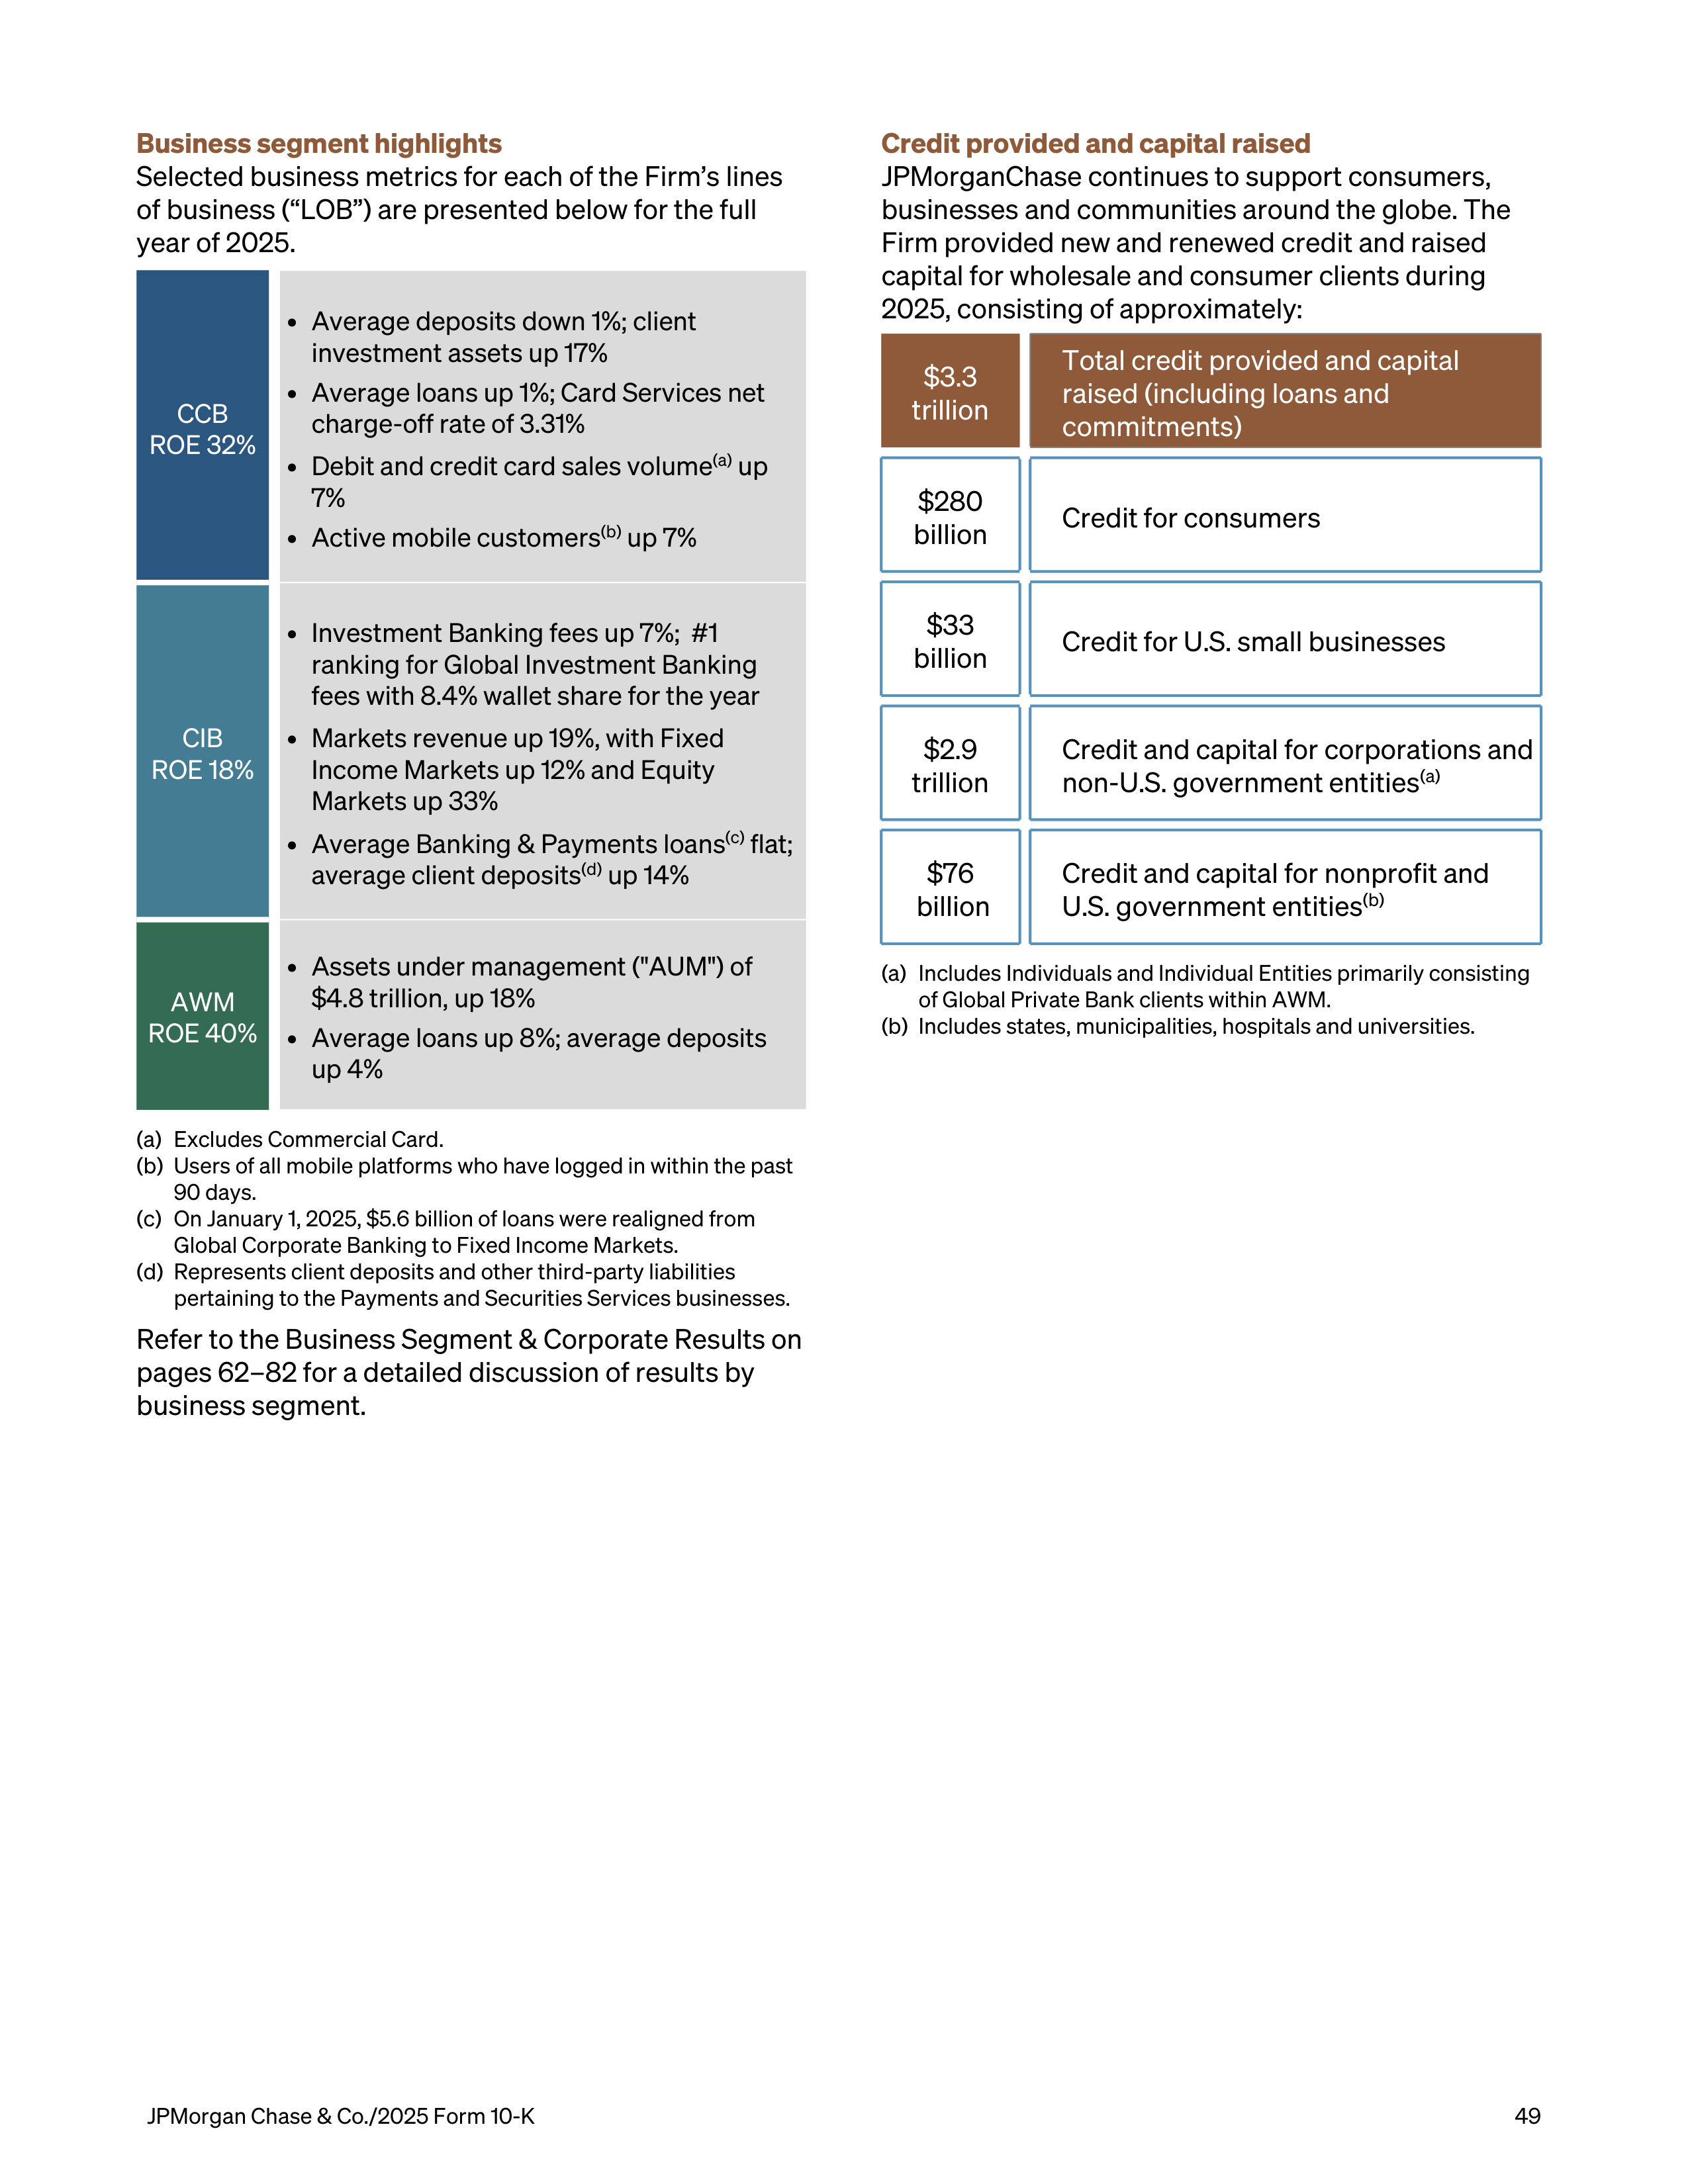
Business segment highlights
Selected business metrics for each of the Firm’s lines
of business (“LOB”) are presented below for the full
year of 2025.
CCB
ROE 32%
•
Average deposits down 1%; client
investment assets up 17%
•
Average loans up 1%; Card Services net
charge-off rate of 3.31%
•
Debit and credit card sales volume
(a)
up
7%
•
Active mobile customers
(b)
up 7%
CIB
ROE 18%
•
Investment Banking fees up 7%; #1
ranking for Global Investment Banking
fees with 8.4% wallet share for the year
•
Markets revenue up 19%, with Fixed
Income Markets up 12% and Equity
Markets up 33%
•
Average Banking & Payments loans
(c)
flat;
average client deposits
(d)
up 14%
AWM
ROE 40%
•
Assets under management ("AUM") of
$4.8 trillion, up 18%
•
Average loans up 8%; average deposits
up 4%
(a)
Excludes Commercial Card.
(b)
Users of all mobile platforms who have logged in within the past
90 days.
(c)
On January 1, 2025, $5.6 billion of loans were realigned from
Global Corporate Banking to Fixed Income Markets.
(d)
Represents client deposits and other third-party liabilities
pertaining to the Payments and Securities Services businesses.
Refer to the Business Segment & Corporate Results on
pages 62–82 for a detailed discussion of results by
business segment.
Credit provided and capital raised
JPMorganChase continues to support consumers,
businesses and communities around the globe. The
Firm provided new and renewed credit and raised
capital for wholesale and consumer clients during
2025, consisting of approximately:
$3.3
trillion
Total credit provided and capital
raised (including loans and
commitments)
$280
billion
Credit for consumers
$33
billion
Credit for U.S. small businesses
$2.9
trillion
Credit and capital for corporations and
non-U.S. government entities
(a)
$76
billion
Credit and capital for nonprofit and
U.S. government entities
(b)
(a)
Includes Individuals and Individual Entities primarily consisting
of Global Private Bank clients within AWM.
(b)
Includes states, municipalities, hospitals and universities.
JPMorgan Chase & Co./2025 Form 10-K
49
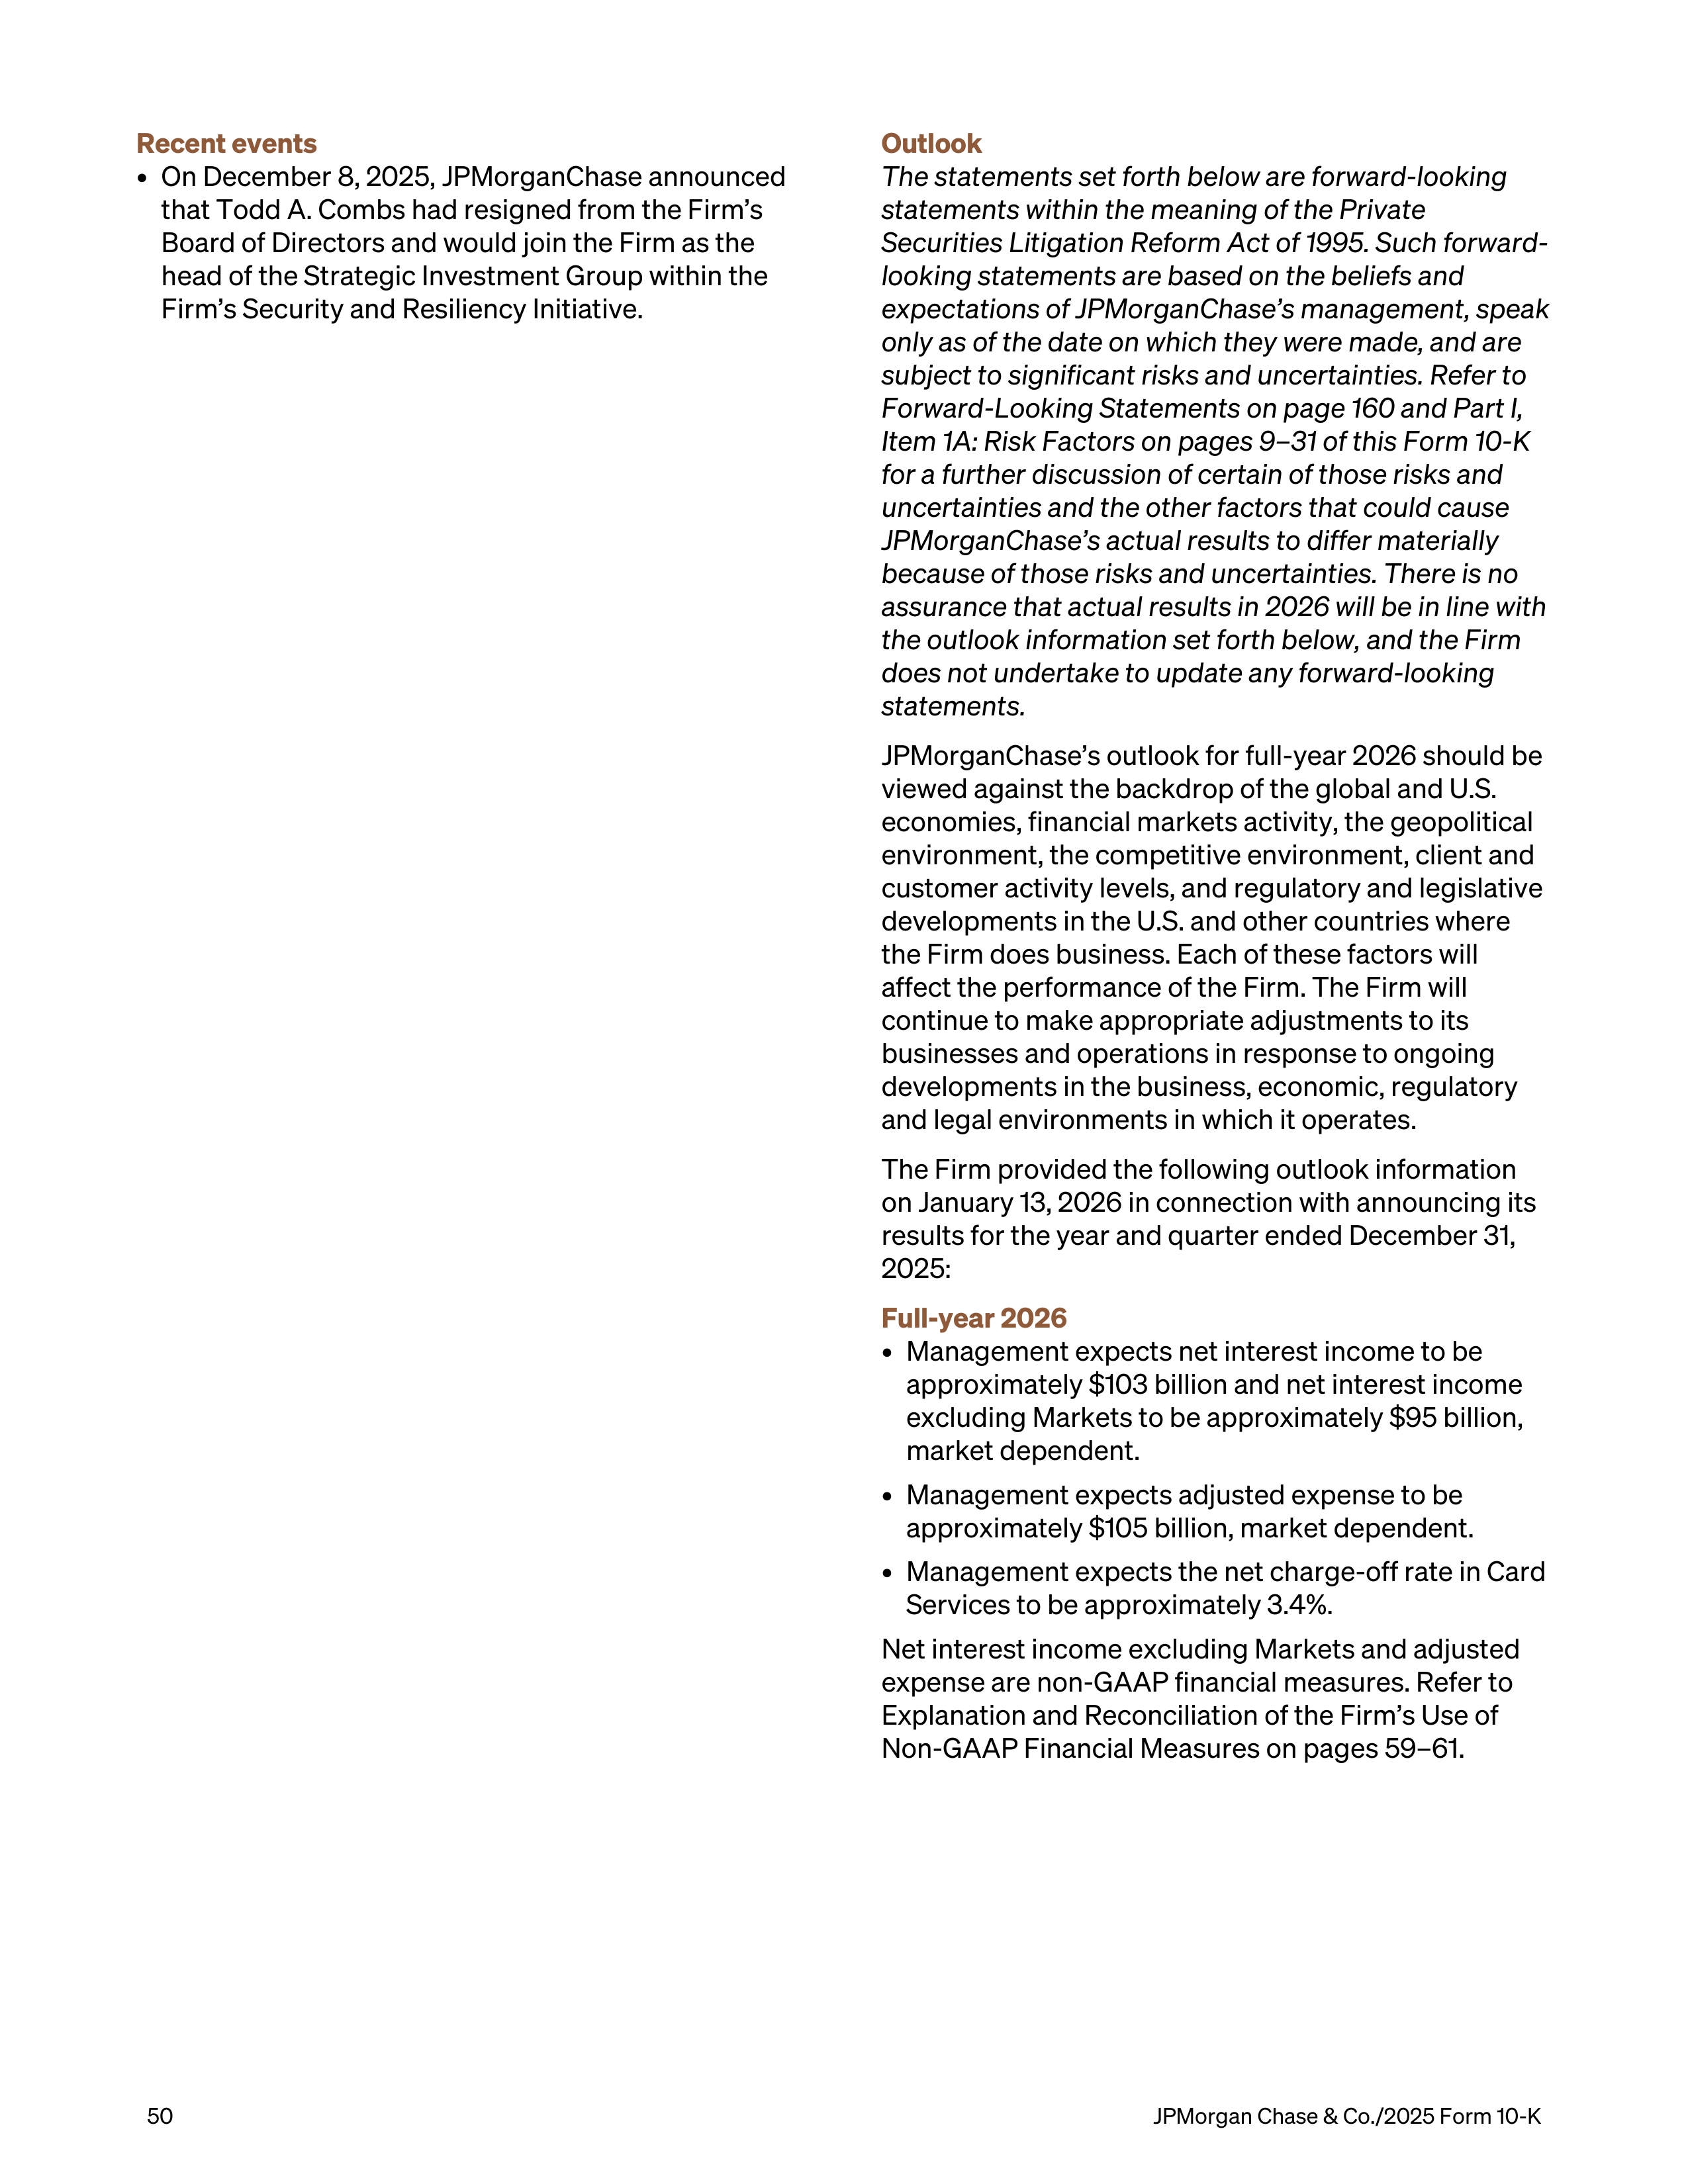
Recent events
•
On December 8, 2025, JPMorganChase announced
that Todd A. Combs had resigned from the Firm’s
Board of Directors and would join the Firm as the
head of the Strategic Investment Group within the
Firm’s Security and Resiliency Initiative.
Outlook
The statements set forth below are forward-looking
statements within the meaning of the Private
Securities Litigation Reform Act of 1995. Such forward-
looking statements are based on the beliefs and
expectations of JPMorganChase’s management, speak
only as of the date on which they were made, and are
subject to significant risks and uncertainties. Refer to
Forward-Looking Statements on page 160 and Part I,
Item 1A: Risk Factors on pages 9–31 of this Form 10-K
for a further discussion of certain of those risks and
uncertainties and the other factors that could cause
JPMorganChase’s actual results to differ materially
because of those risks and uncertainties. There is no
assurance that actual results in 2026 will be in line with
the outlook information set forth below, and the Firm
does not undertake to update any forward-looking
statements.
JPMorganChase’s outlook for full-year 2026 should be
viewed against the backdrop of the global and U.S.
economies, financial markets activity, the geopolitical
environment, the competitive environment, client and
customer activity levels, and regulatory and legislative
developments in the U.S. and other countries where
the Firm does business. Each of these factors will
affect the performance of the Firm. The Firm will
continue to make appropriate adjustments to its
businesses and operations in response to ongoing
developments in the business, economic, regulatory
and legal environments in which it operates.
The Firm provided the following outlook information
on January 13, 2026 in connection with announcing its
results for the year and quarter ended December 31,
2025:
Full-year 2026
•
Management expects net interest income to be
approximately $103 billion and net interest income
excluding Markets to be approximately $95 billion,
market dependent.
•
Management expects adjusted expense to be
approximately $105 billion, market dependent.
•
Management expects the net charge-off rate in Card
Services to be approximately 3.4%.
Net interest income excluding Markets and adjusted
expense are non-GAAP financial measures. Refer to
Explanation and Reconciliation of the Firm’s Use of
Non-GAAP Financial Measures on pages 59–61.
50
JPMorgan Chase & Co./2025 Form 10-K
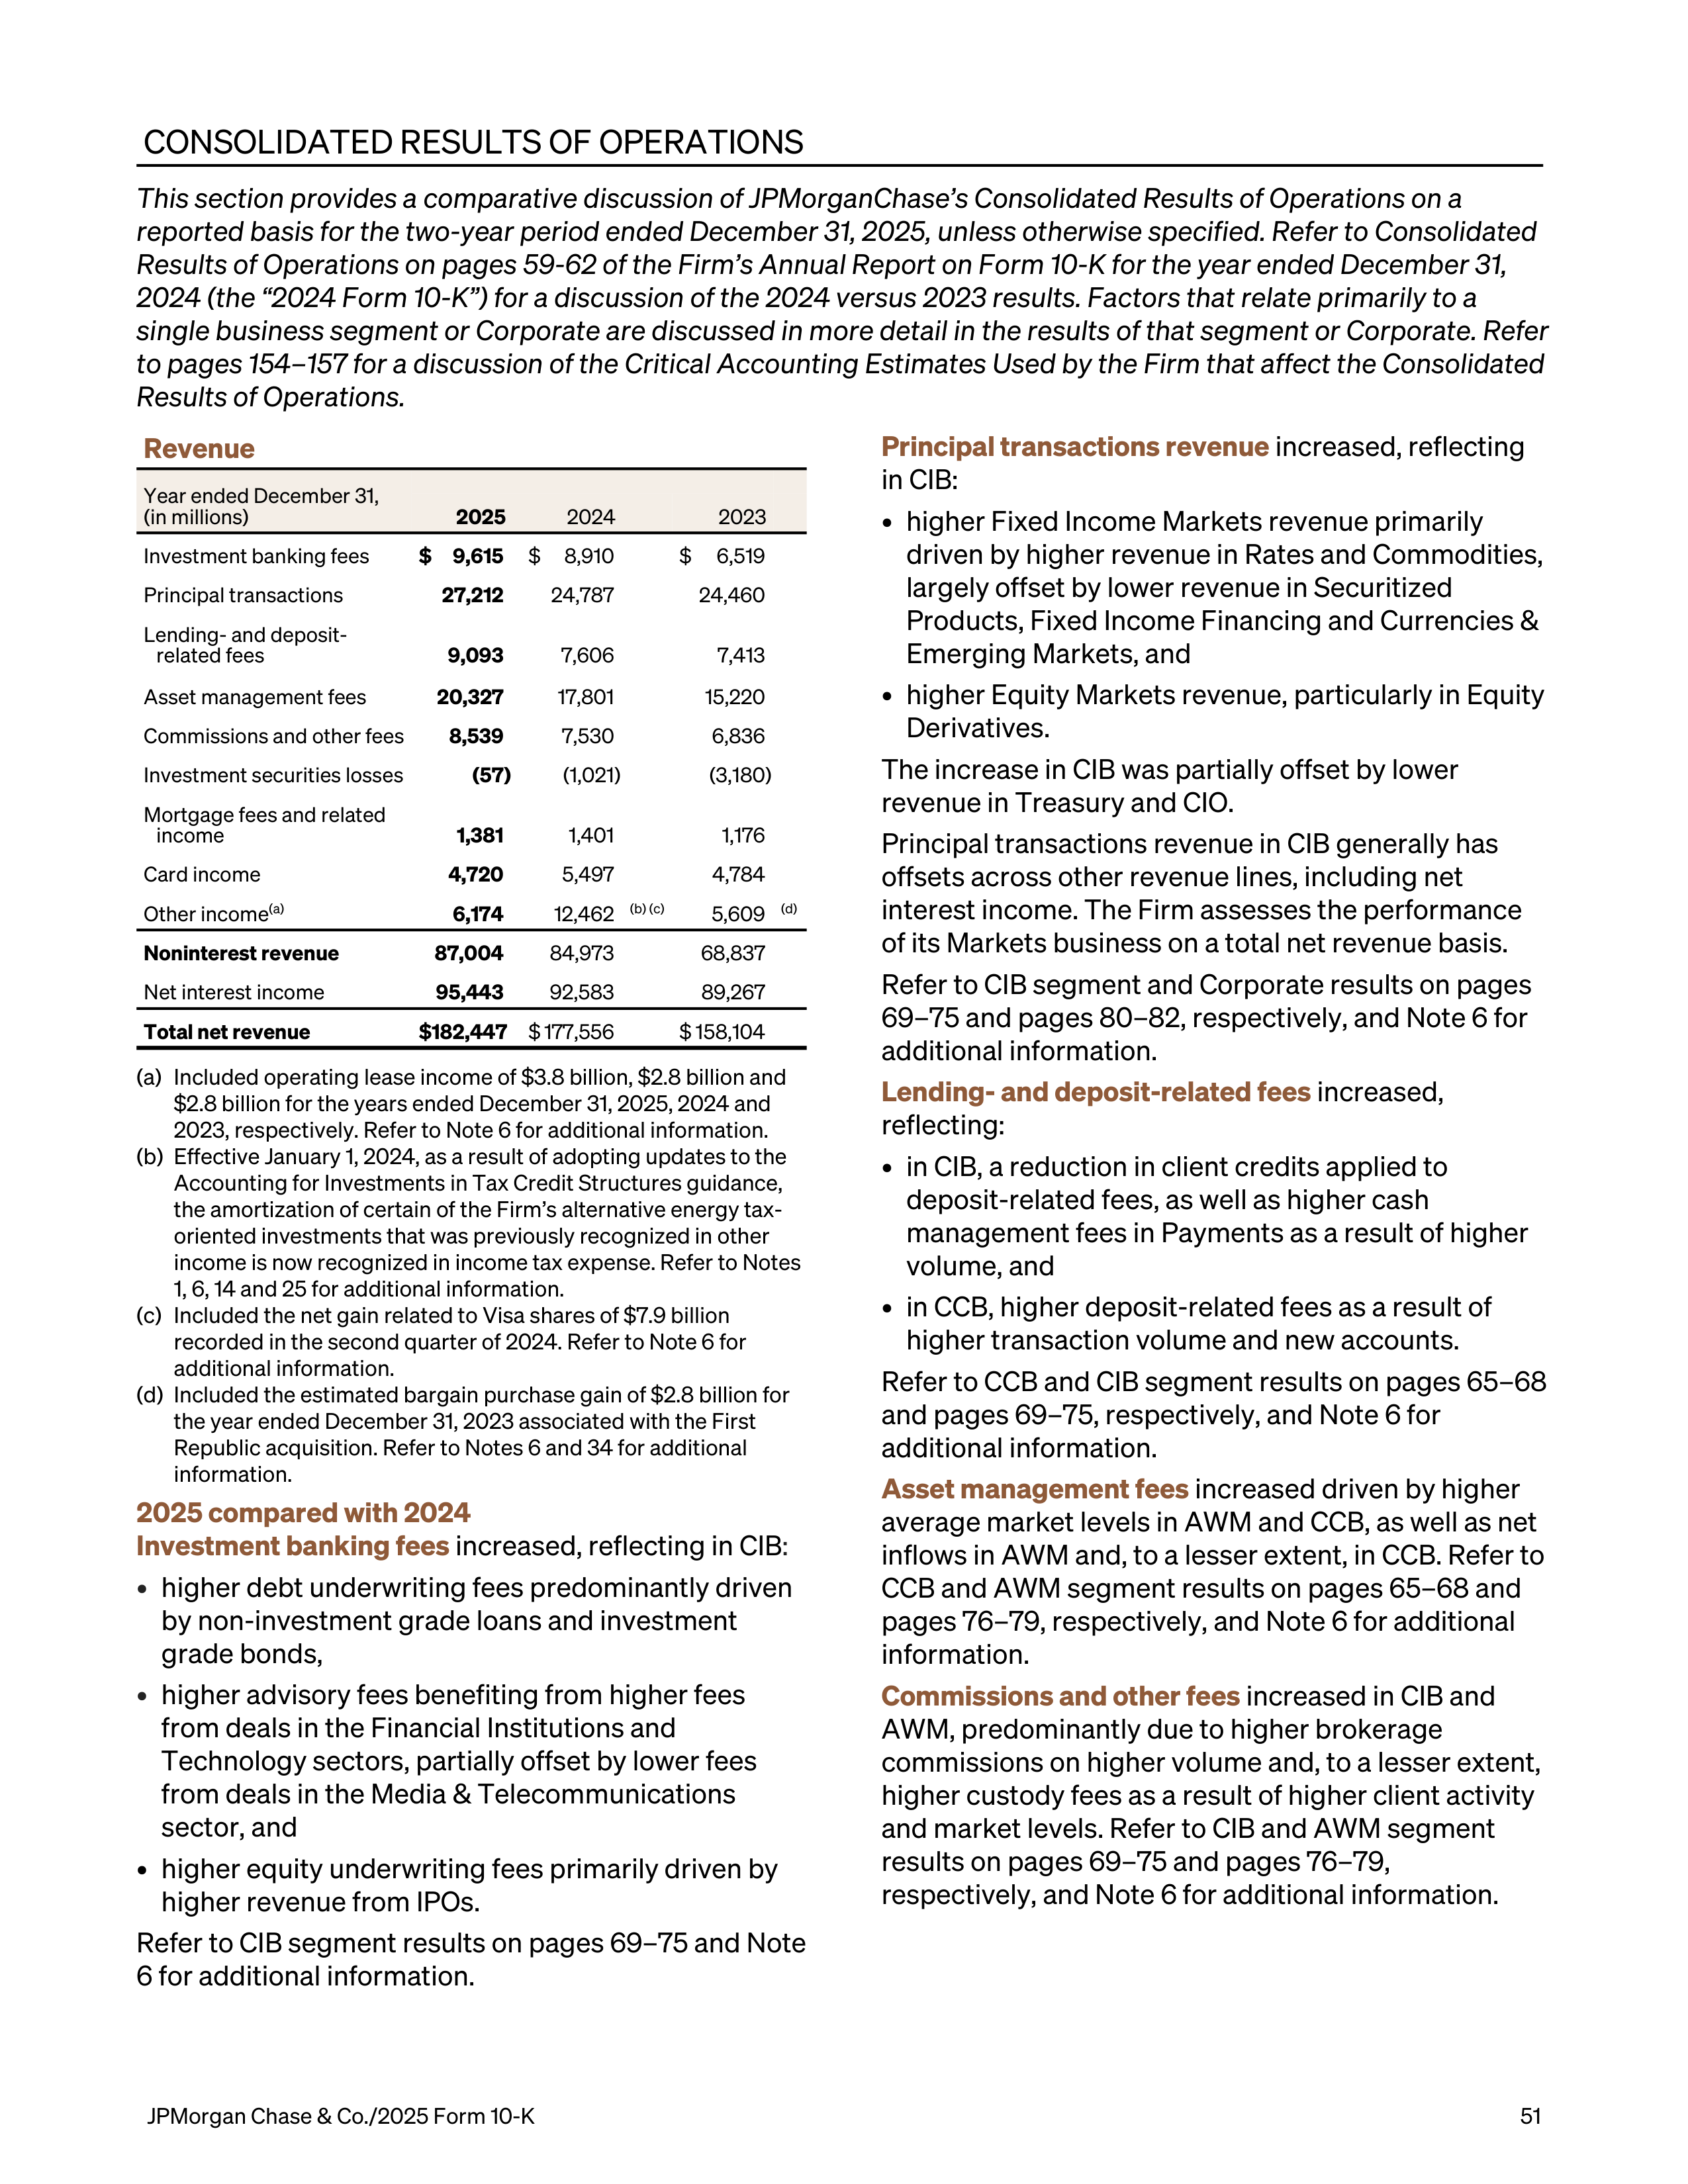
CONSOLIDATED RESULTS OF OPERATIONS
This section provides a comparative discussion of JPMorganChase’s Consolidated Results of Operations on a
reported basis for the two-year period ended December 31, 2025, unless otherwise specified. Refer to Consolidated
Results of Operations on pages 59-62 of the Firm’s Annual Report on Form 10-K for the year ended December 31,
2024 (the “2024 Form 10-K”) for a discussion of the 2024 versus 2023 results. Factors that relate primarily to a
single business segment or Corporate are discussed in more detail in the results of that segment or Corporate. Refer
to pages 154–157 for a discussion of the Critical Accounting Estimates Used by the Firm that affect the Consolidated
Results of Operations.
Revenue
Year ended December 31,
(in millions)
2025
2024
2023
Investment banking fees
$
9,615
$
8,910
$
6,519
Principal transactions
27,212
24,787
24,460
Lending- and deposit-
related fees
9,093
7,606
7,413
Asset management fees
20,327
17,801
15,220
Commissions and other fees
8,539
7,530
6,836
Investment securities losses
(57)
(1,021)
(3,180)
Mortgage fees and related
income
1,381
1,401
1,176
Card income
4,720
5,497
4,784
Other income
(a)
6,174
12,462
(b) (c)
5,609
(d)
Noninterest revenue
87,004
84,973
68,837
Net interest income
95,443
92,583
89,267
Total net revenue
$ 182,447
$ 177,556
$ 158,104
(a)
Included operating lease income of $3.8 billion, $2.8 billion and
$2.8 billion for the years ended December 31, 2025, 2024 and
2023, respectively. Refer to Note 6 for additional information.
(b)
Effective January 1, 2024, as a result of adopting updates to the
Accounting for Investments in Tax Credit Structures guidance,
the amortization of certain of the Firm’s alternative energy tax-
oriented investments that was previously recognized in other
income is now recognized in income tax expense. Refer to Notes
1, 6, 14 and 25 for additional information.
(c)
Included the net gain related to Visa shares of $7.9 billion
recorded in the second quarter of 2024. Refer to Note 6 for
additional information.
(d)
Included the estimated bargain purchase gain of $2.8 billion for
the year ended December 31, 2023 associated with the First
Republic acquisition. Refer to Notes 6 and 34 for additional
information.
2025 compared with 2024
Investment banking fees
increased, reflecting in CIB
:
•
higher debt underwriting fees predominantly driven
by non-investment grade loans and investment
grade bonds,
•
higher advisory fees benefiting from higher fees
from deals in the Financial Institutions and
Technology sectors, partially offset by lower fees
from deals in the Media & Telecommunications
sector, and
•
higher equity underwriting fees primarily driven by
higher revenue from IPOs.
Refer to CIB segment results on pages 69–75 and Note
6 for additional information.
Principal transactions revenue
increased, reflecting
in CIB:
•
higher Fixed Income Markets revenue primarily
driven by higher revenue in Rates and Commodities,
largely offset by lower revenue in Securitized
Products, Fixed Income Financing and Currencies &
Emerging Markets, and
•
higher Equity Markets revenue, particularly in Equity
Derivatives.
The increase in CIB was partially offset by lower
revenue in Treasury and CIO.
Principal transactions revenue in CIB generally has
offsets across other revenue lines, including net
interest income. The Firm assesses the performance
of its Markets business on a total net revenue basis.
Refer to CIB segment and Corporate results on pages
69–75 and pages 80–82, respectively, and Note 6 for
additional information.
Lending- and deposit-related fees
increased,
reflecting:
•
in CIB, a reduction in client credits applied to
deposit-related fees, as well as higher cash
management fees in Payments as a result of higher
volume, and
•
in CCB, higher deposit-related fees as a result of
higher transaction volume and new accounts.
Refer to CCB and CIB segment results on pages 65–68
and pages 69–75, respectively, and Note 6 for
additional information.
Asset management fees
increased driven by higher
average market levels in AWM and CCB, as well as net
inflows in AWM and, to a lesser extent, in CCB. Refer to
CCB and AWM segment results on pages 65–68 and
pages 76–79, respectively, and Note 6 for additional
information.
Commissions and other fees
increased in CIB and
AWM, predominantly due to higher brokerage
commissions on higher volume and, to a lesser extent,
higher custody fees as a result of higher client activity
and market levels. Refer to CIB and AWM segment
results on pages 69–75 and pages 76–79,
respectively, and Note 6 for additional information.
JPMorgan Chase & Co./2025 Form 10-K
51
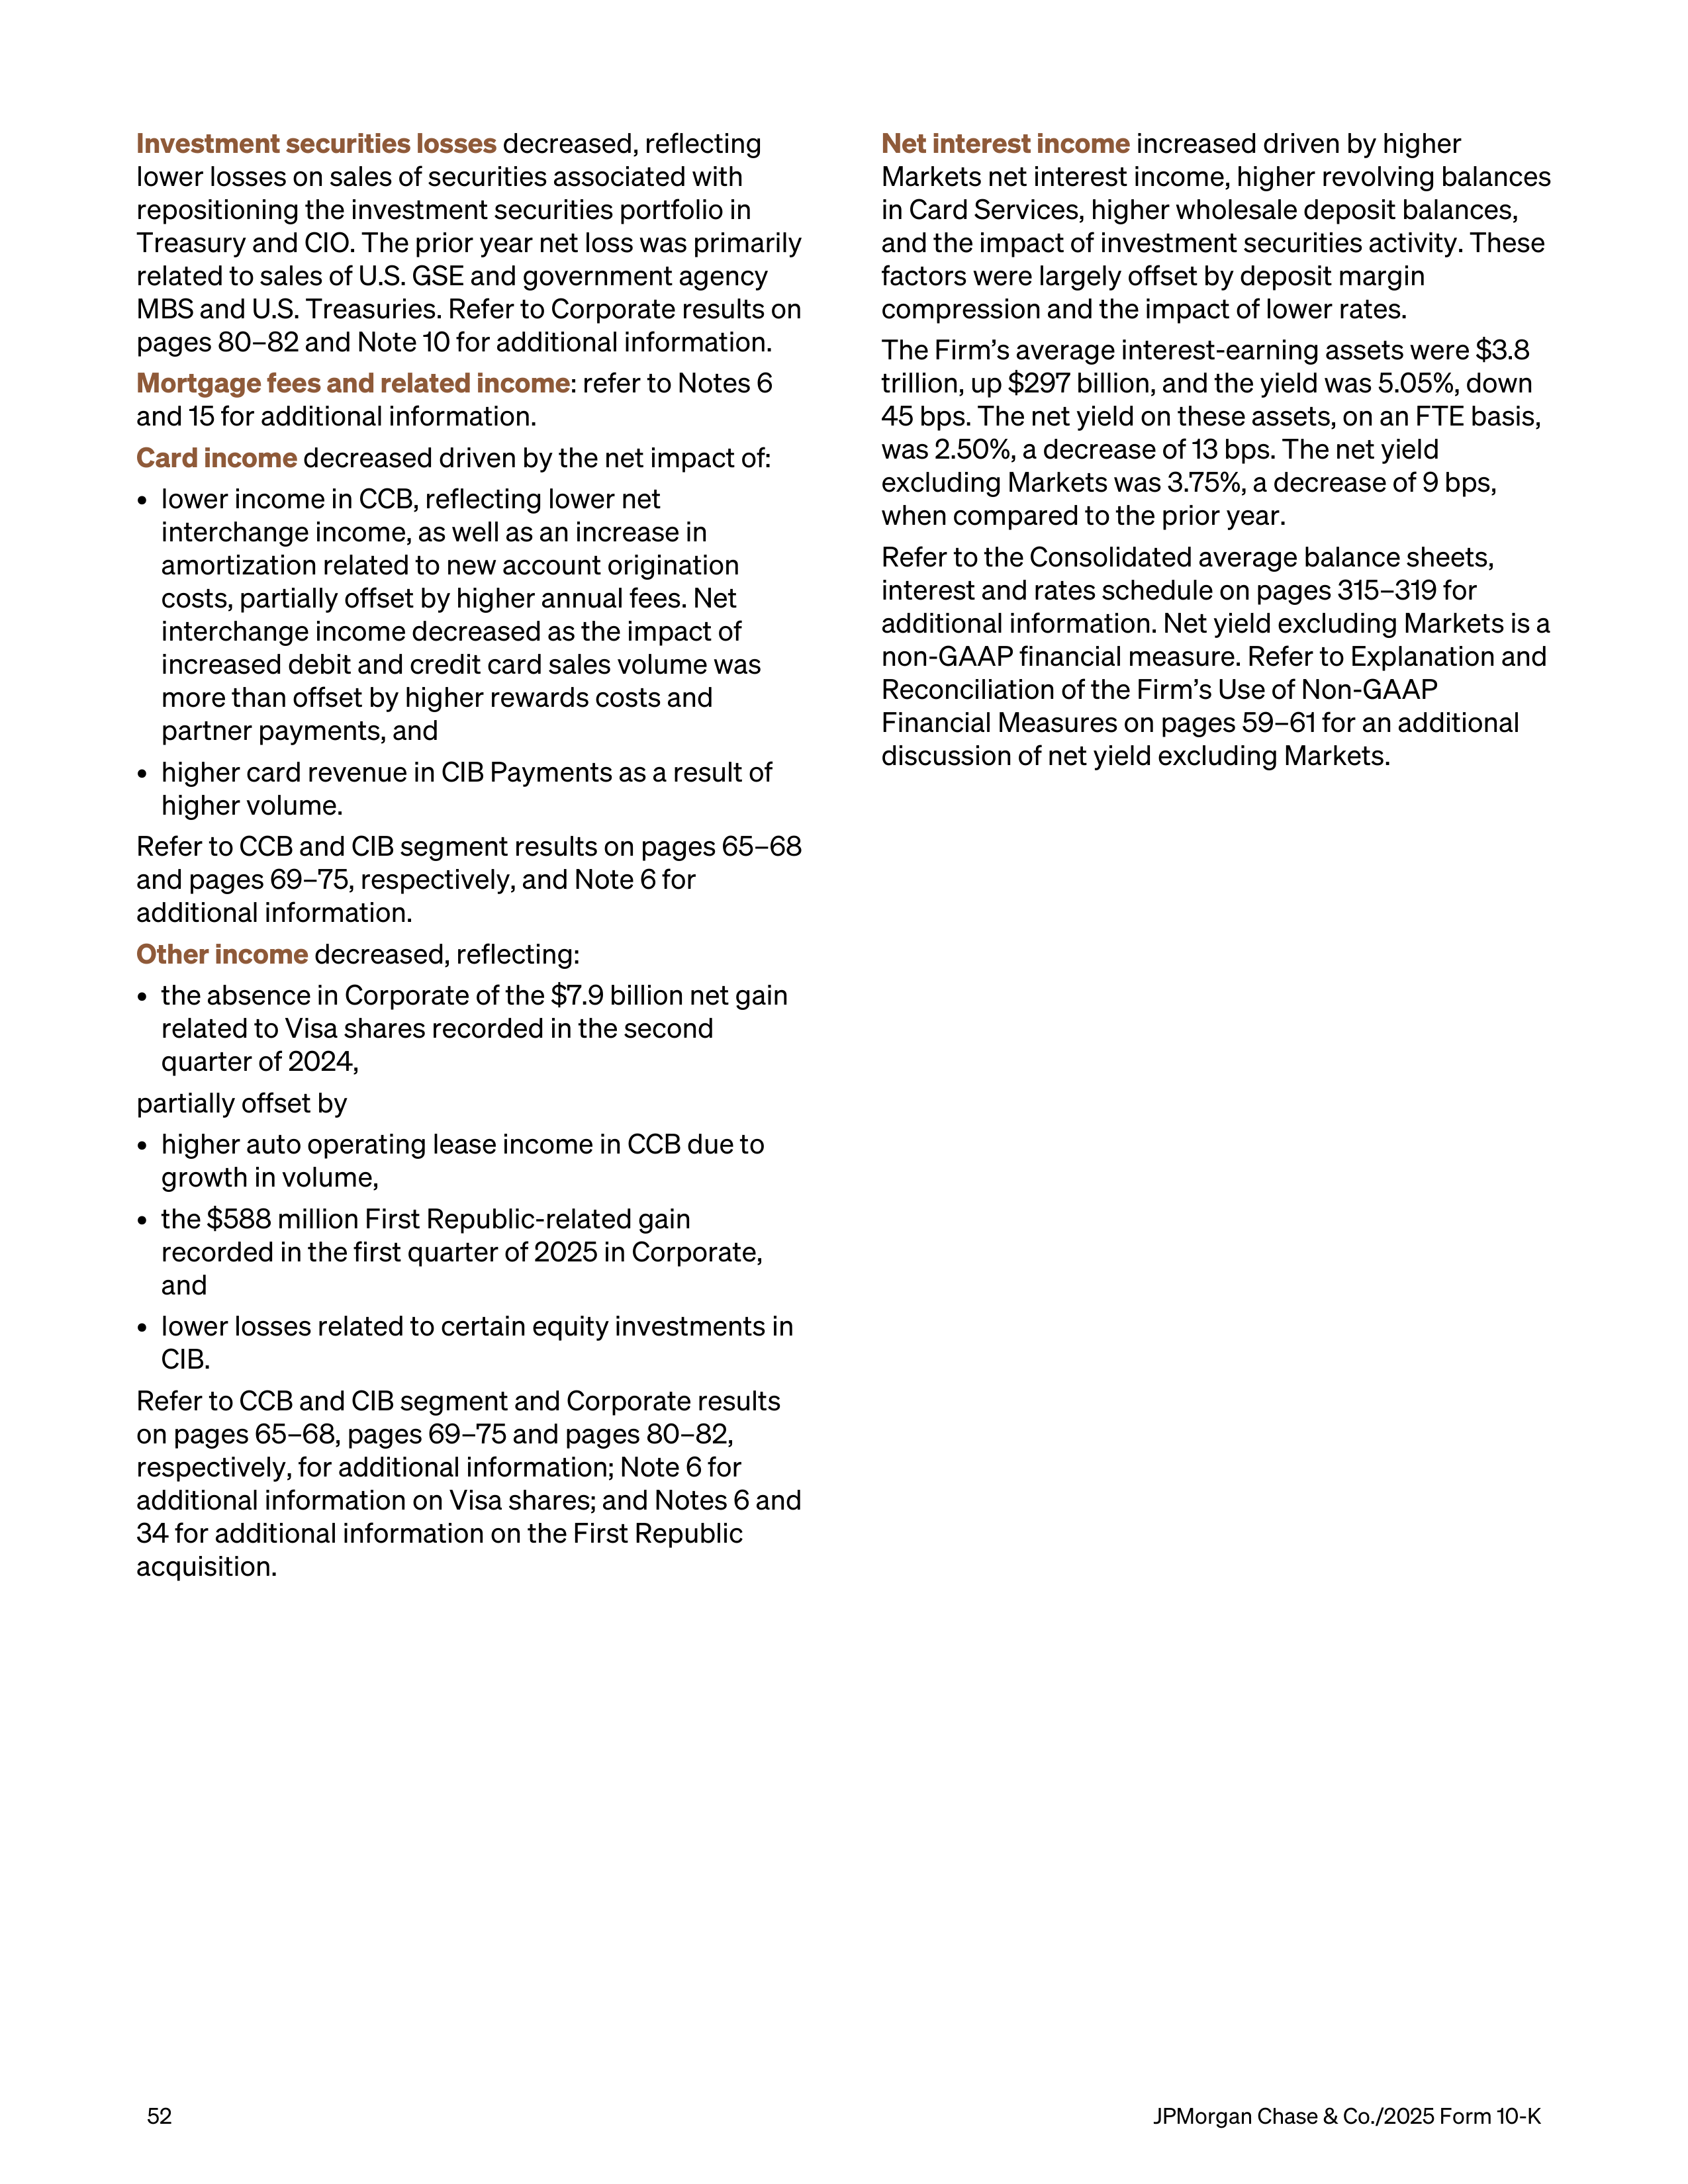
Investment securities losses
decreased, reflecting
lower losses on sales of securities associated with
repositioning the investment securities portfolio in
Treasury and CIO. The prior year net loss was primarily
related to sales of U.S. GSE and government agency
MBS and U.S. Treasuries. Refer to Corporate results on
pages 80–82 and Note 10 for additional information.
Mortgage fees and related income
: refer to Notes 6
and 15 for additional information.
Card income
decreased driven by the net impact of:
•
lower income in CCB, reflecting lower net
interchange income, as well as an increase in
amortization related to new account origination
costs, partially offset by higher annual fees. Net
interchange income decreased as the impact of
increased debit and credit card sales volume was
more than offset by higher rewards costs and
partner payments, and
•
higher card revenue in CIB Payments as a result of
higher volume.
Refer to CCB and CIB segment results on pages 65–68
and pages 69–75, respectively, and Note 6 for
additional information.
Other income
decreased, reflecting:
•
the absence in Corporate of the $7.9 billion net gain
related to Visa shares recorded in the second
quarter of 2024,
partially offset by
•
higher auto operating lease income in CCB due to
growth in volume,
•
the $588 million First Republic-related gain
recorded in the first quarter of 2025 in Corporate,
and
•
lower losses related to certain equity investments in
CIB.
Refer to CCB and CIB segment and Corporate results
on pages 65–68, pages 69–75 and pages 80–82,
respectively, for additional information; Note 6 for
additional information on Visa shares; and Notes 6 and
34 for additional information on the First Republic
acquisition.
Net interest income
increased driven by higher
Markets net interest income, higher revolving balances
in Card Services, higher wholesale deposit balances,
and the impact of investment securities activity. These
factors were largely offset by deposit margin
compression and the impact of lower rates.
The Firm’s average interest-earning assets were $3.8
trillion, up $297 billion, and the yield was 5.05%, down
45 bps. The net yield on these assets, on an FTE basis,
was 2.50%, a decrease of 13 bps. The net yield
excluding Markets was 3.75%, a decrease of 9 bps,
when compared to the prior year.
Refer to the Consolidated average balance sheets,
interest and rates schedule on pages 315–319 for
additional information. Net yield excluding Markets is a
non-GAAP financial measure. Refer to Explanation and
Reconciliation of the Firm’s Use of Non-GAAP
Financial Measures on pages 59–61 for an additional
discussion of net yield excluding Markets.
52
JPMorgan Chase & Co./2025 Form 10-K
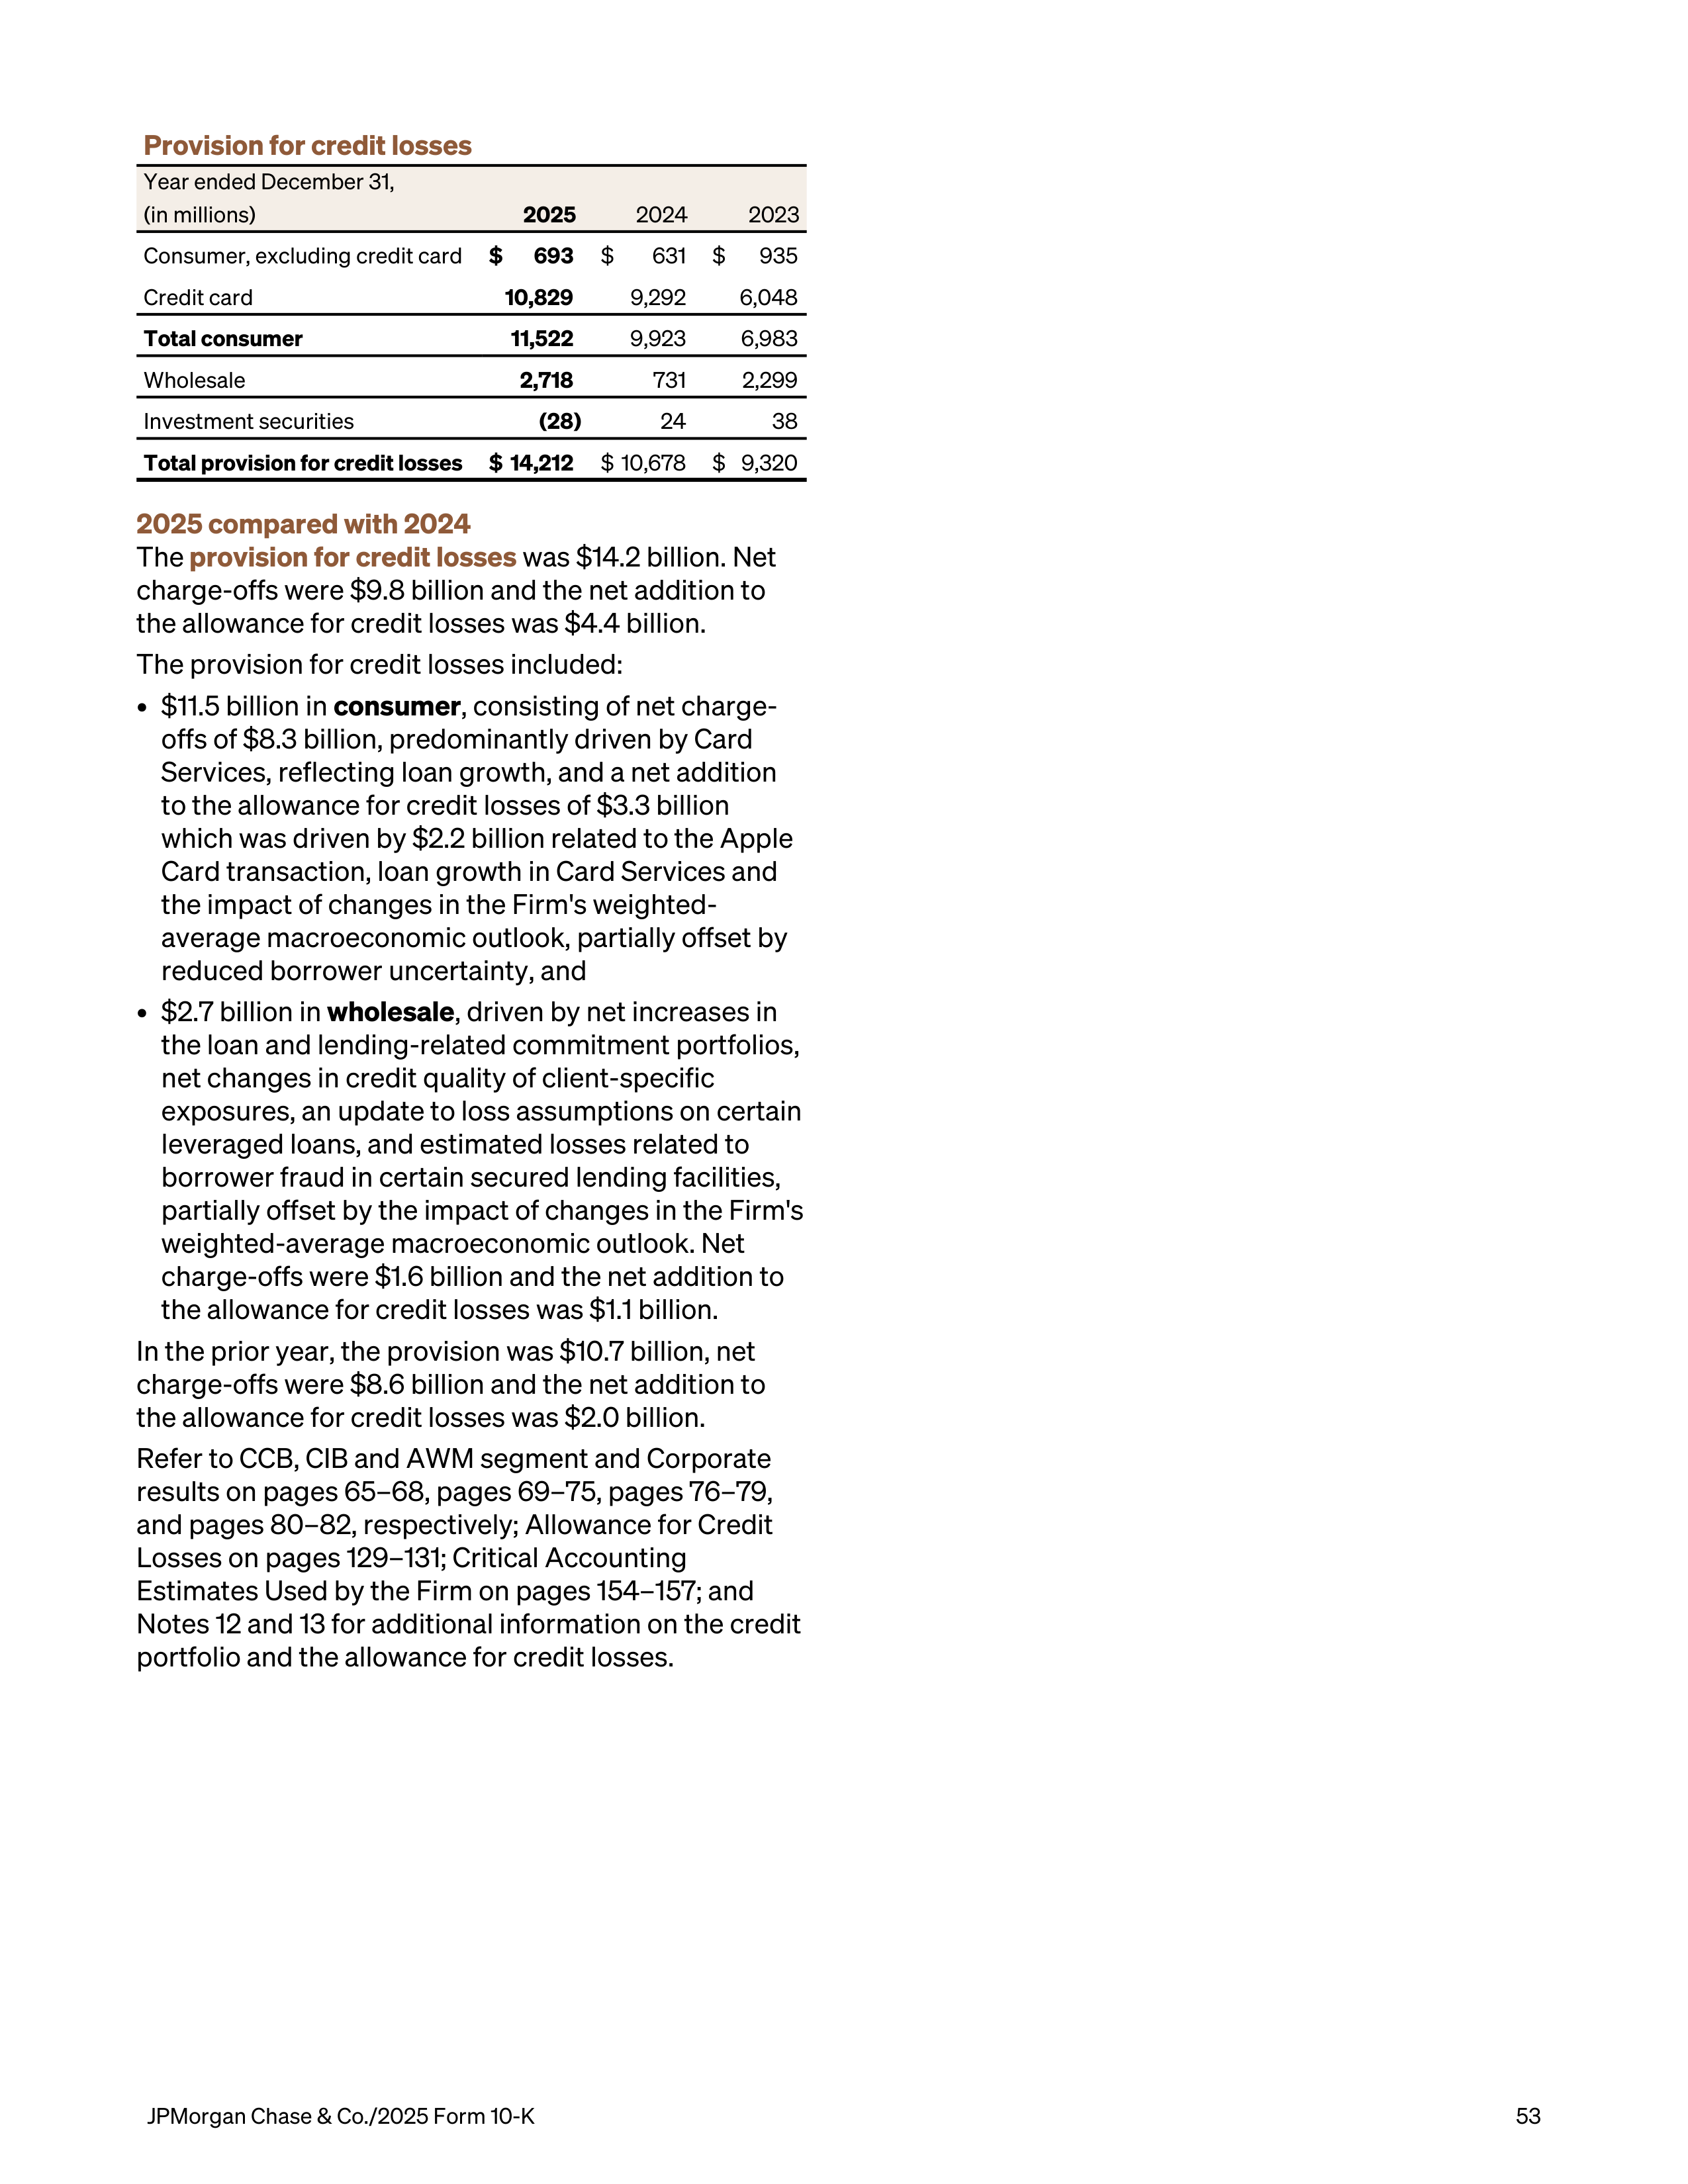
Provision for credit losses
Year ended December 31,
(in millions)
2025
2024
2023
Consumer, excluding credit card
$
693
$
631
$
935
Credit card
10,829
9,292
6,048
Total consumer
11,522
9,923
6,983
Wholesale
2,718
731
2,299
Investment securities
(28)
24
38
Total provision for credit losses
$ 14,212
$ 10,678
$ 9,320
2025 compared with 2024
The
provision for credit losses
was $14.2 billion. Net
charge-offs were $9.8 billion and the net addition to
the allowance for credit losses was $4.4 billion.
The provision for credit losses included:
•
$11.5 billion in
consumer
, consisting of net charge-
offs of $8.3 billion, predominantly driven by Card
Services, reflecting loan growth, and a net addition
to the allowance for credit losses of $3.3 billion
which was driven by $2.2 billion related to the Apple
Card transaction, loan growth in Card Services and
the impact of changes in the Firm's weighted-
average macroeconomic outlook, partially offset by
reduced borrower uncertainty, and
•
$2.7 billion in
wholesale
, driven by net increases in
the loan and lending-related commitment portfolios,
net changes in credit quality of client-specific
exposures, an update to loss assumptions on certain
leveraged loans, and estimated losses related to
borrower fraud in certain secured lending facilities,
partially offset by the impact of changes in the Firm's
weighted-average macroeconomic outlook. Net
charge-offs were $1.6 billion and the net addition to
the allowance for credit losses was $1.1 billion.
In the prior year, the provision was $10.7 billion, net
charge-offs were $8.6 billion and the net addition to
the allowance for credit losses was $2.0 billion.
Refer to CCB, CIB and AWM segment and Corporate
results on pages 65–68, pages 69–75, pages 76–79,
and pages 80–82, respectively; Allowance for Credit
Losses on pages 129–131; Critical Accounting
Estimates Used by the Firm on pages 154–157; and
Notes 12 and 13 for additional information on the credit
portfolio and the allowance for credit losses.
JPMorgan Chase & Co./2025 Form 10-K
53
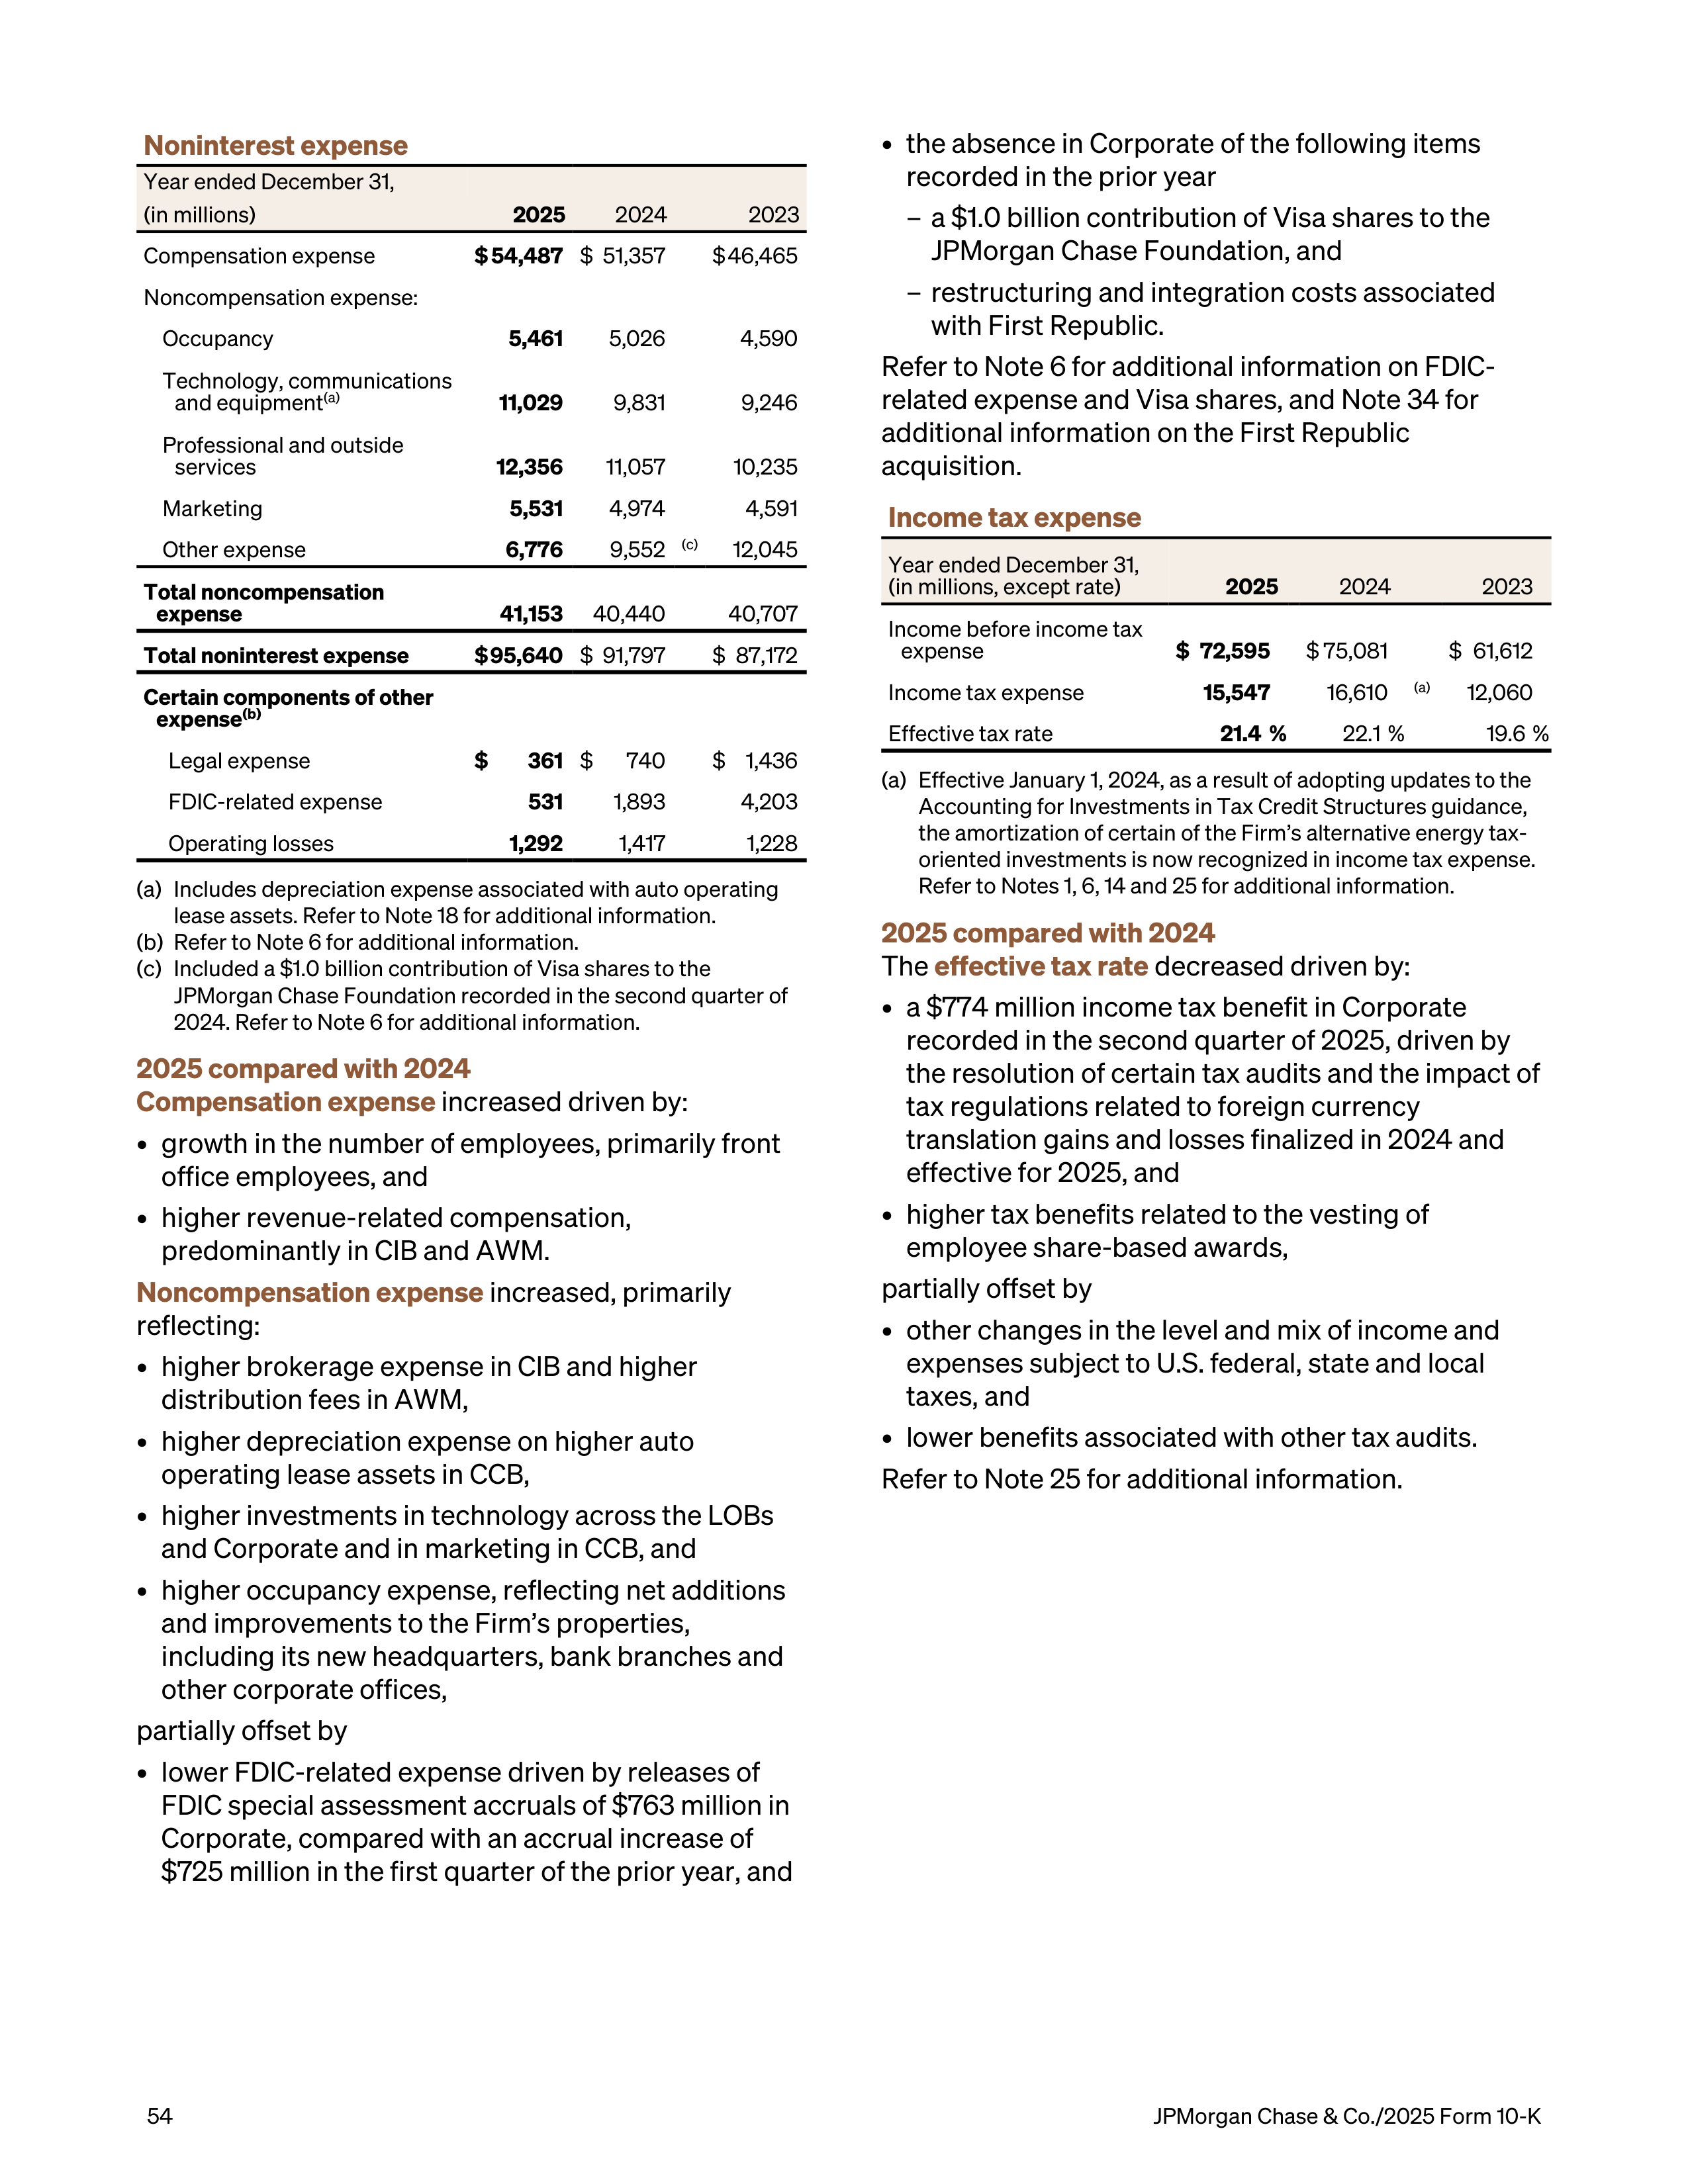
Noninterest expense
Year ended December 31,
(in millions)
2025
2024
2023
Compensation expense
$ 54,487
$ 51,357
$ 46,465
Noncompensation expense:
Occupancy
5,461
5,026
4,590
Technology, communications
and equipment
(a)
11,029
9,831
9,246
Professional and outside
services
12,356
11,057
10,235
Marketing
5,531
4,974
4,591
Other expense
6,776
9,552
(c)
12,045
Total noncompensation
expense
41,153
40,440
40,707
Total noninterest expense
$ 95,640
$ 91,797
$ 87,172
Certain components of other
expense
(b)
Legal expense
$
361
$
740
$ 1,436
FDIC-related expense
531
1,893
4,203
Operating losses
1,292
1,417
1,228
(a)
Includes depreciation expense associated with auto operating
lease assets. Refer to Note 18 for additional information.
(b)
Refer to Note 6 for additional information.
(c)
Included a $1.0 billion contribution of Visa shares to the
JPMorgan Chase Foundation recorded in the second quarter of
2024. Refer to Note 6 for additional information.
2025 compared with 2024
Compensation expense
increased driven by:
•
growth in the number of employees, primarily front
office employees, and
•
higher revenue-related compensation,
predominantly in CIB and AWM.
Noncompensation expense
increased, primarily
reflecting:
•
higher brokerage expense in CIB and higher
distribution fees in AWM,
•
higher depreciation expense on higher auto
operating lease assets in CCB,
•
higher investments in technology across the LOBs
and Corporate and in marketing in CCB, and
•
higher occupancy expense, reflecting net additions
and improvements to the Firm’s properties,
including its new headquarters, bank branches and
other corporate offices,
partially offset by
•
lower FDIC-related expense driven by releases of
FDIC special assessment accruals of $763 million in
Corporate, compared with an accrual increase of
$725 million in the first quarter of the prior year, and
•
the absence in Corporate of the following items
recorded in the prior year
–
a $1.0 billion contribution of Visa shares to the
JPMorgan Chase Foundation, and
–
restructuring and integration costs associated
with First Republic.
Refer to Note 6 for additional information on FDIC-
related expense and Visa shares, and Note 34 for
additional information on the First Republic
acquisition.
Income tax expense
Year ended December 31,
(in millions, except rate)
2025
2024
2023
Income before income tax
expense
$ 72,595
$ 75,081
$ 61,612
Income tax expense
15,547
16,610
(a)
12,060
Effective tax rate
21.4 %
22.1 %
19.6 %
(a)
Effective January 1, 2024, as a result of adopting updates to the
Accounting for Investments in Tax Credit Structures guidance,
the amortization of certain of the Firm’s alternative energy tax-
oriented investments is now recognized in income tax expense.
Refer to Notes 1, 6, 14 and 25 for additional information.
2025 compared with 2024
The
effective tax rate
decreased driven by:
•
a $774 million income tax benefit in Corporate
recorded in the second quarter of 2025, driven by
the resolution of certain tax audits and the impact of
tax regulations related to foreign currency
translation gains and losses finalized in 2024 and
effective for 2025, and
•
higher tax benefits related to the vesting of
employee share-based awards,
partially offset by
•
other changes in the level and mix of income and
expenses subject to U.S. federal, state and local
taxes, and
•
lower benefits associated with other tax audits.
Refer to Note 25 for additional information.
54
JPMorgan Chase & Co./2025 Form 10-K
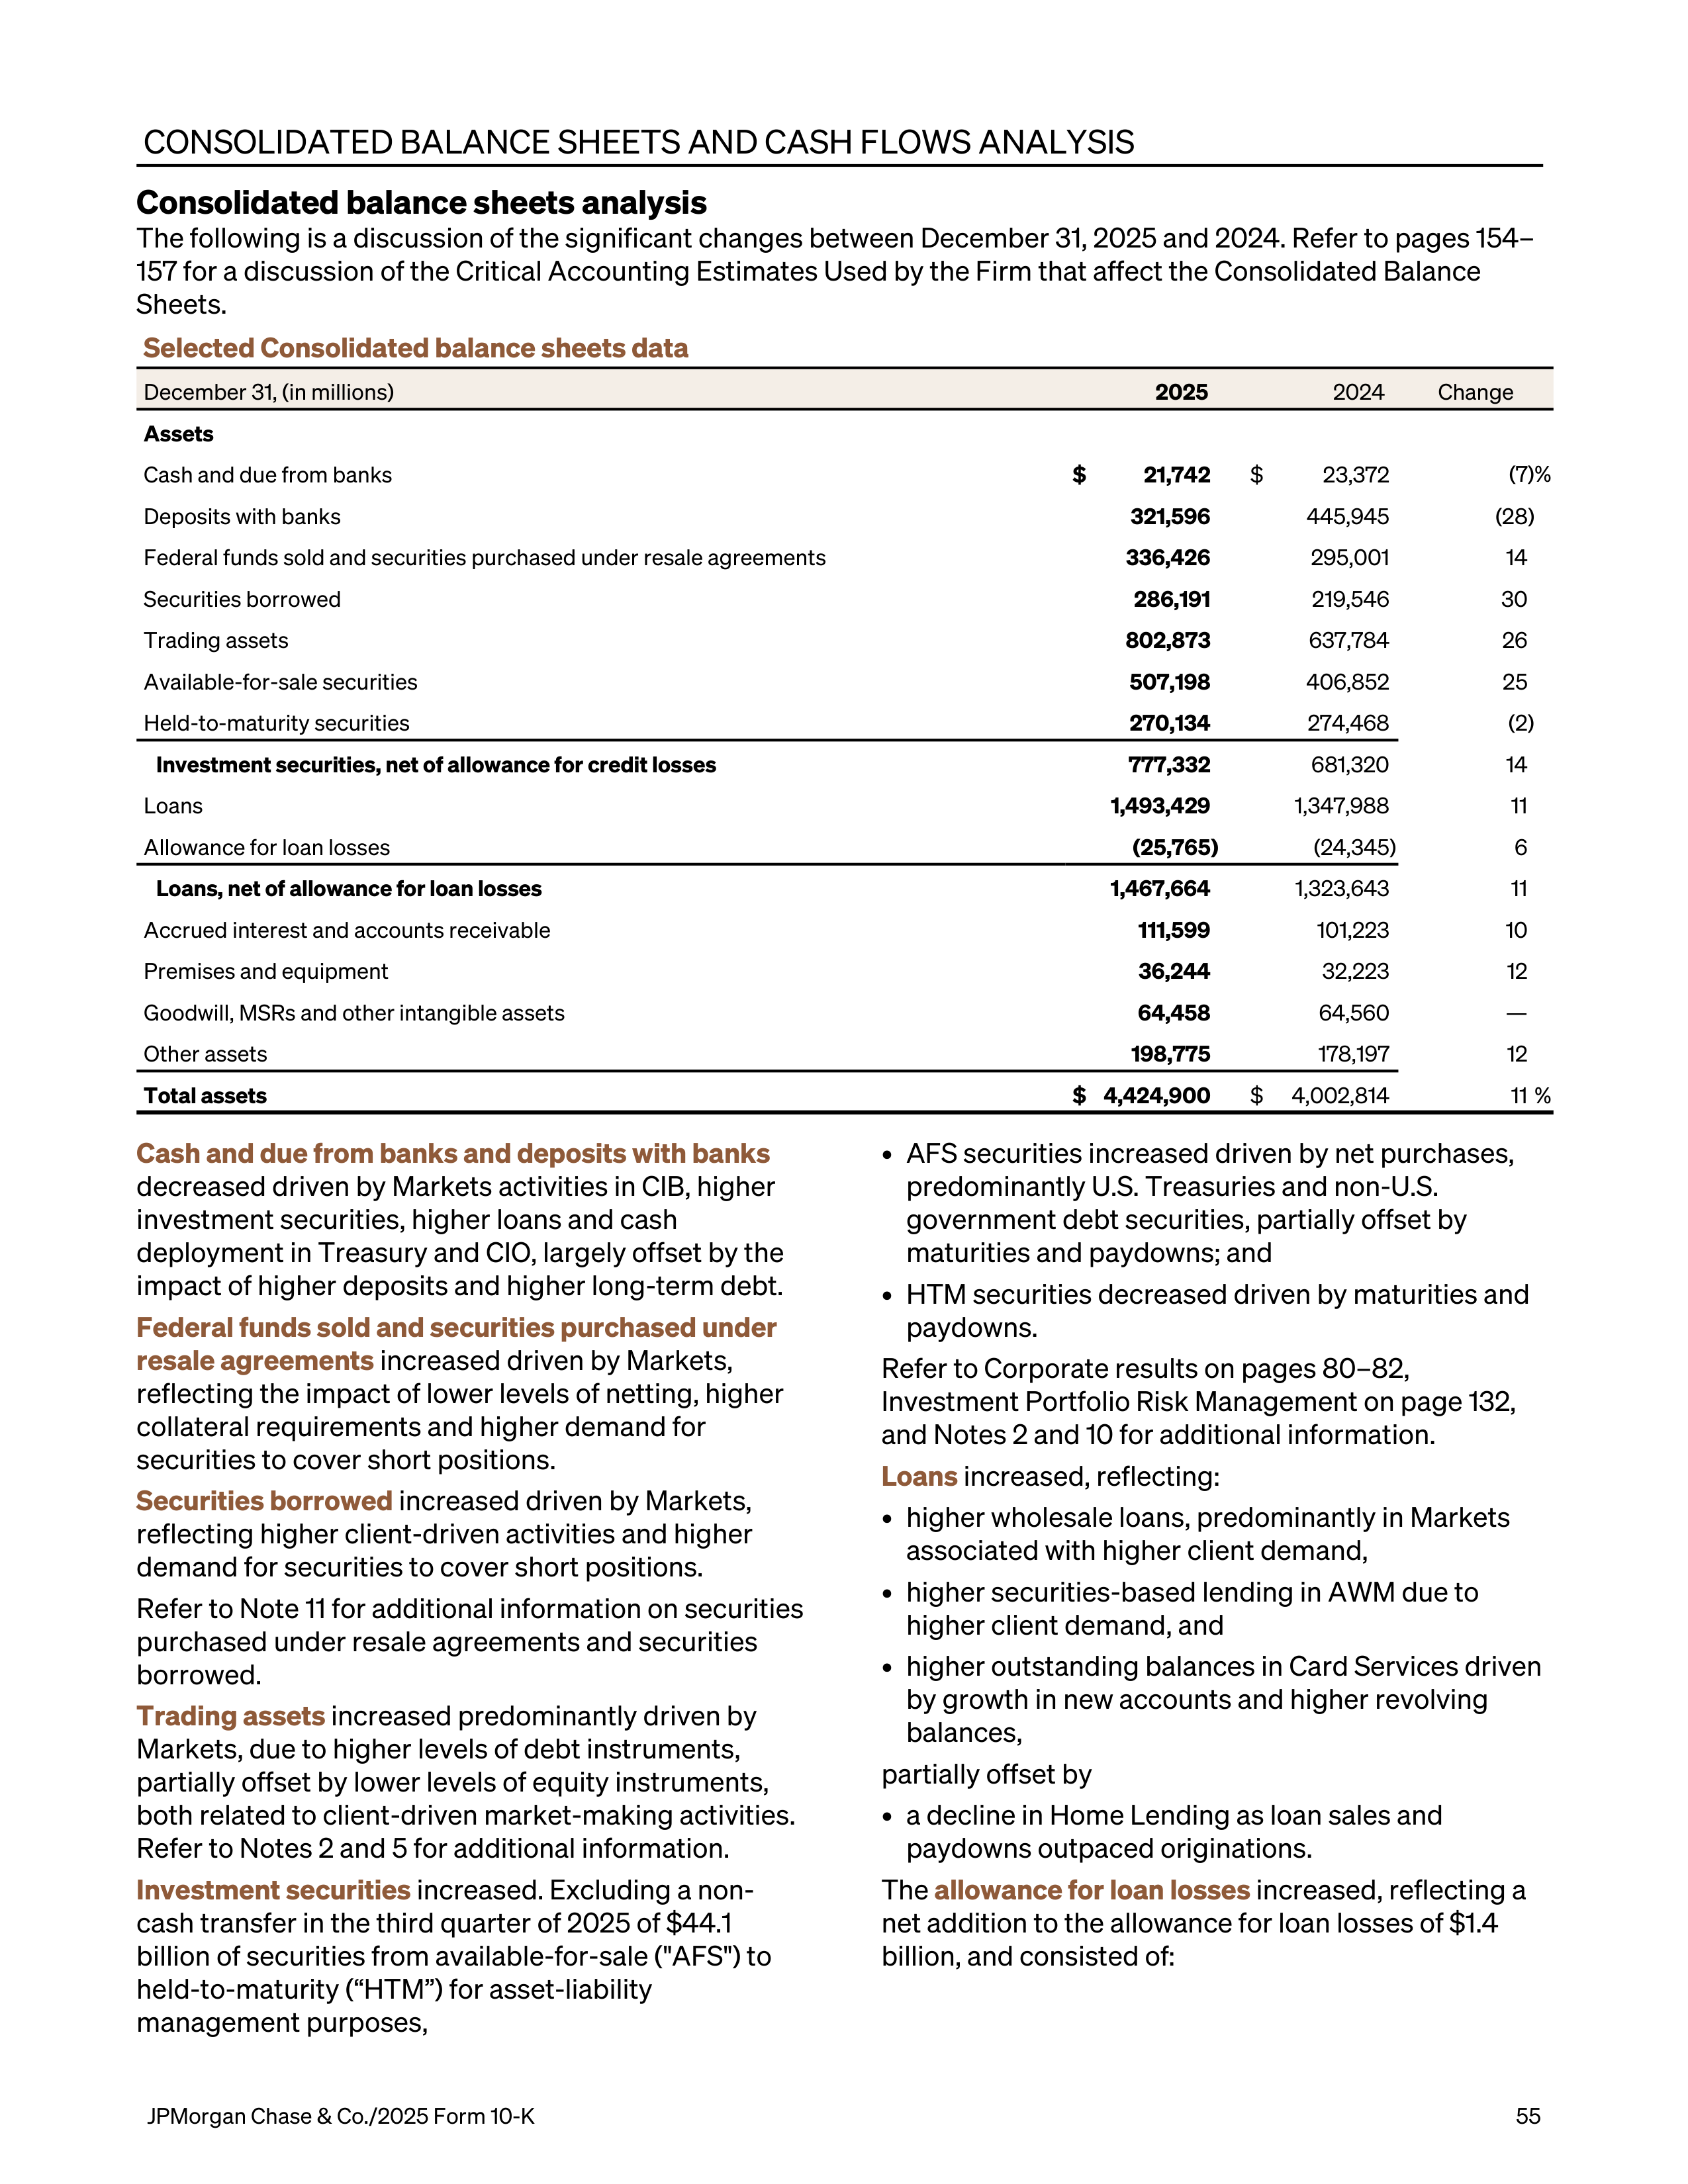
CONSOLIDATED BALANCE SHEETS AND CASH FLOWS ANALYSIS
Consolidated balance sheets analysis
The following is a discussion of the significant changes between December 31, 2025 and 2024. Refer to pages 154–
157 for a discussion of the Critical Accounting Estimates Used by the Firm that affect the Consolidated Balance
Sheets.
Selected Consolidated balance sheets data
December 31, (in millions)
2025
2024
Change
Assets
Cash and due from banks
$
21,742
$
23,372
(7) %
Deposits with banks
321,596
445,945
(28)
Federal funds sold and securities purchased under resale agreements
336,426
295,001
14
Securities borrowed
286,191
219,546
30
Trading assets
802,873
637,784
26
Available-for-sale securities
507,198
406,852
25
Held-to-maturity securities
270,134
274,468
(2)
Investment securities, net of allowance for credit losses
777,332
681,320
14
Loans
1,493,429
1,347,988
11
Allowance for loan losses
(25,765)
(24,345)
6
Loans, net of allowance for loan losses
1,467,664
1,323,643
11
Accrued interest and accounts receivable
111,599
101,223
10
Premises and equipment
36,244
32,223
12
Goodwill, MSRs and other intangible assets
64,458
64,560
—
Other assets
198,775
178,197
12
Total assets
$ 4,424,900
$
4,002,814
11 %
Cash and due from banks and deposits with banks
decreased driven by Markets activities in CIB, higher
investment securities, higher loans and cash
deployment in Treasury and CIO, largely offset by the
impact of higher deposits and higher long-term debt.
Federal funds sold and securities purchased under
resale agreements
increased driven by Markets,
reflecting the impact of lower levels of netting, higher
collateral requirements and higher demand for
securities to cover short positions.
Securities borrowed
increased driven by Markets,
reflecting higher client-driven activities and higher
demand for securities to cover short positions.
Refer to Note 11 for additional information on securities
purchased under resale agreements and securities
borrowed.
Trading assets
increased predominantly driven by
Markets, due to higher levels of debt instruments,
partially offset by lower levels of equity instruments,
both related to client-driven market-making activities.
Refer to Notes 2 and 5 for additional information.
Investment securities
increased. Excluding a non-
cash transfer in the third quarter of 2025 of $44.1
billion of securities from available-for-sale ("AFS") to
held-to-maturity (“HTM”) for asset-liability
management purposes,
•
AFS securities increased driven by net purchases,
predominantly U.S. Treasuries and non-U.S.
government debt securities, partially offset by
maturities and paydowns; and
•
HTM securities decreased driven by maturities and
paydowns.
Refer to Corporate results on pages 80–82,
Investment Portfolio Risk Management on page 132,
and Notes 2 and 10 for additional information.
Loans
increased, reflecting:
•
higher wholesale loans, predominantly in Markets
associated with higher client demand,
•
higher securities-based lending in AWM due to
higher client demand, and
•
higher outstanding balances in Card Services driven
by growth in new accounts and higher revolving
balances,
partially offset by
•
a decline in Home Lending as loan sales and
paydowns outpaced originations.
The
allowance for loan losses
increased, reflecting a
net addition to the allowance for loan losses of $1.4
billion, and consisted of:
JPMorgan Chase & Co./2025 Form 10-K
55
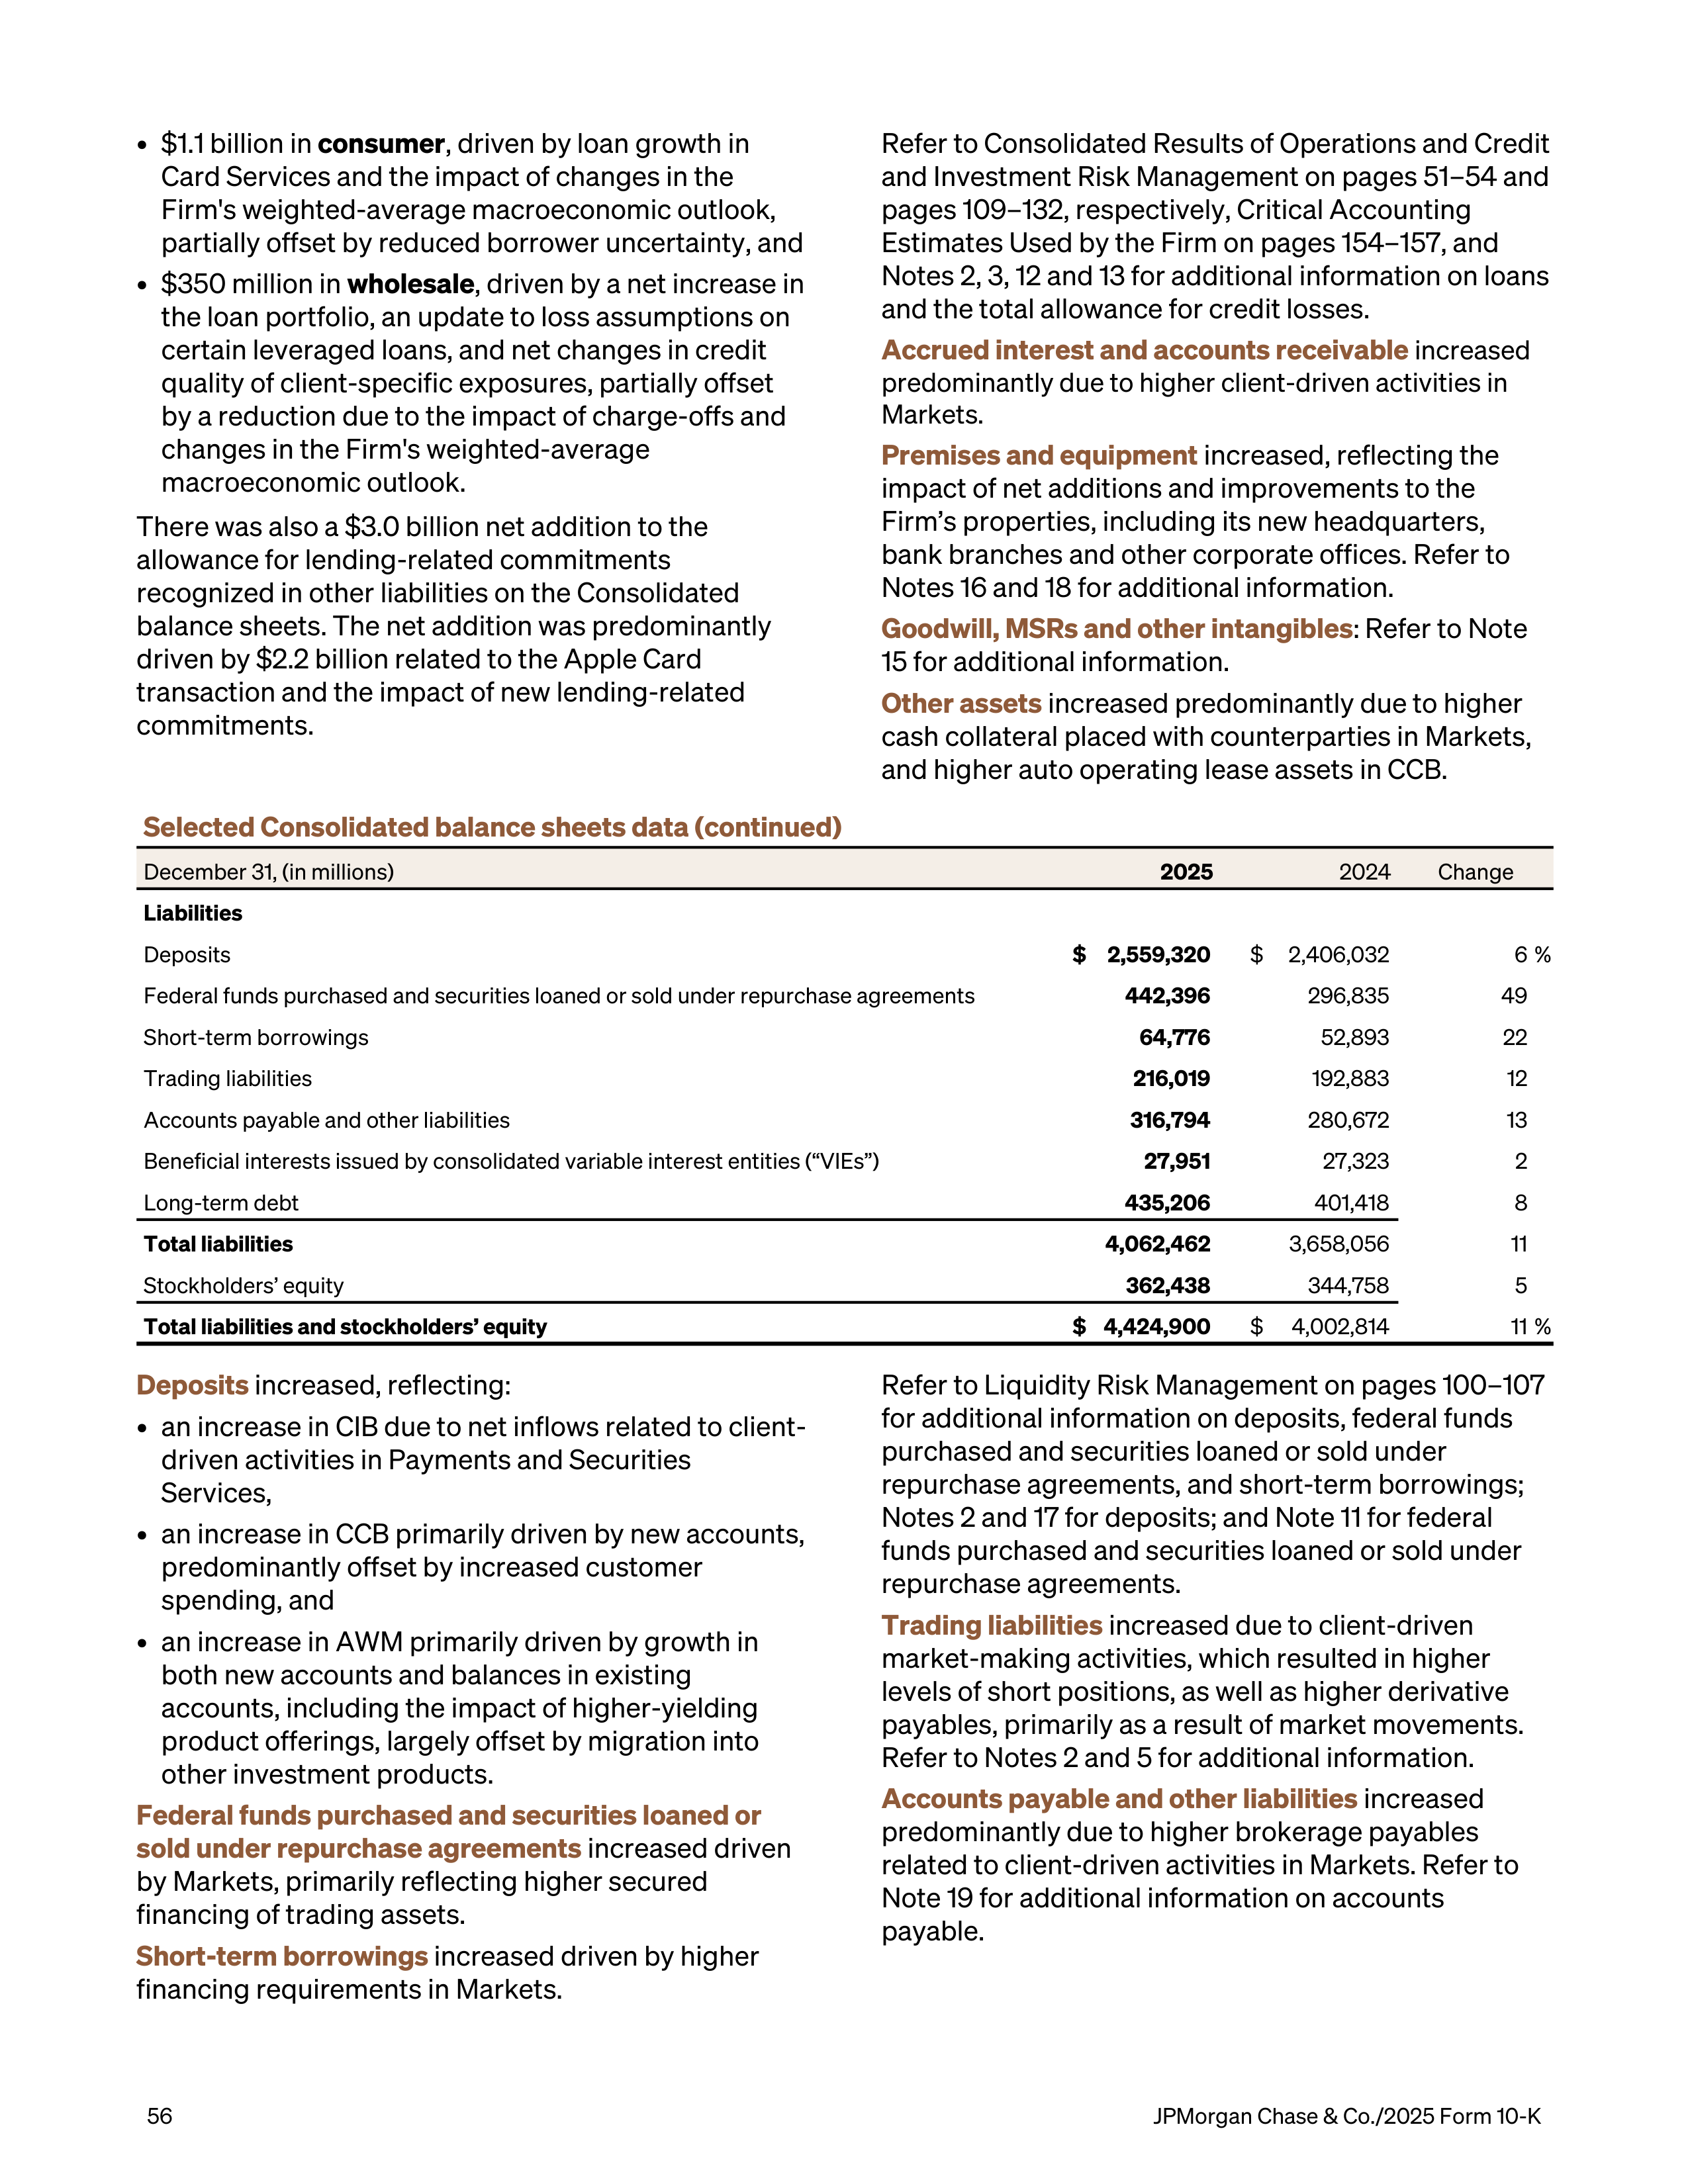
•
$1.1 billion in
consumer
, driven by loan growth in
Card Services and the impact of changes in the
Firm's weighted-average macroeconomic outlook,
partially offset by reduced borrower uncertainty, and
•
$350 million in
wholesale
, driven by a net increase in
the loan portfolio, an update to loss assumptions on
certain leveraged loans, and net changes in credit
quality of client-specific exposures, partially offset
by a reduction due to the impact of charge-offs and
changes in the Firm's weighted-average
macroeconomic outlook.
There was also a $3.0 billion net addition to the
allowance for lending-related commitments
recognized in other liabilities on the Consolidated
balance sheets. The net addition was predominantly
driven by $2.2 billion related to the Apple Card
transaction and the impact of new lending-related
commitments.
Refer to Consolidated Results of Operations and Credit
and Investment Risk Management on pages 51–54 and
pages 109–132, respectively, Critical Accounting
Estimates Used by the Firm on pages 154–157, and
Notes 2, 3, 12 and 13 for additional information on loans
and the total allowance for credit losses.
Accrued interest and accounts receivable
increased
predominantly due to higher client-driven activities in
Markets.
Premises and equipment
increased, reflecting the
impact of net additions and improvements to the
Firm’s properties, including its new headquarters,
bank branches and other corporate offices. Refer to
Notes 16 and 18 for additional information.
Goodwill, MSRs and other intangibles
:
Refer to Note
15 for additional information.
Other assets
increased predominantly due to higher
cash collateral placed with counterparties in Markets,
and higher auto operating lease assets in CCB.
Selected Consolidated balance sheets data (continued)
December 31, (in millions)
2025
2024
Change
Liabilities
Deposits
$ 2,559,320
$
2,406,032
6 %
Federal funds purchased and securities loaned or sold under repurchase agreements
442,396
296,835
49
Short-term borrowings
64,776
52,893
22
Trading liabilities
216,019
192,883
12
Accounts payable and other liabilities
316,794
280,672
13
Beneficial interests issued by consolidated variable interest entities (“VIEs”)
27,951
27,323
2
Long-term debt
435,206
401,418
8
Total liabilities
4,062,462
3,658,056
11
Stockholders’ equity
362,438
344,758
5
Total liabilities and stockholders’ equity
$ 4,424,900
$
4,002,814
11 %
Deposits
increased, reflecting:
•
an increase in CIB due to net inflows related to client-
driven activities in Payments and Securities
Services,
•
an increase in CCB primarily driven by new accounts,
predominantly offset by increased customer
spending, and
•
an increase in AWM primarily driven by growth in
both new accounts and balances in existing
accounts, including the impact of higher-yielding
product offerings, largely offset by migration into
other investment products.
Federal funds purchased and securities loaned or
sold under repurchase agreements
increased driven
by Markets, primarily reflecting higher secured
financing of trading assets.
Short-term borrowings
increased driven by higher
financing requirements in Markets.
Refer to Liquidity Risk Management on pages 100–107
for additional information on deposits, federal funds
purchased and securities loaned or sold under
repurchase agreements, and short-term borrowings;
Notes 2 and 17 for deposits; and Note 11 for federal
funds purchased and securities loaned or sold under
repurchase agreements.
Trading liabilities
increased due to client-driven
market-making activities, which resulted in higher
levels of short positions, as well as higher derivative
payables, primarily as a result of market movements.
Refer to Notes 2 and 5 for additional information.
Accounts payable and other liabilities
increased
predominantly
due to higher brokerage payables
related to client-driven activities in Markets. Refer to
Note 19 for additional information on accounts
payable.
56
JPMorgan Chase & Co./2025 Form 10-K
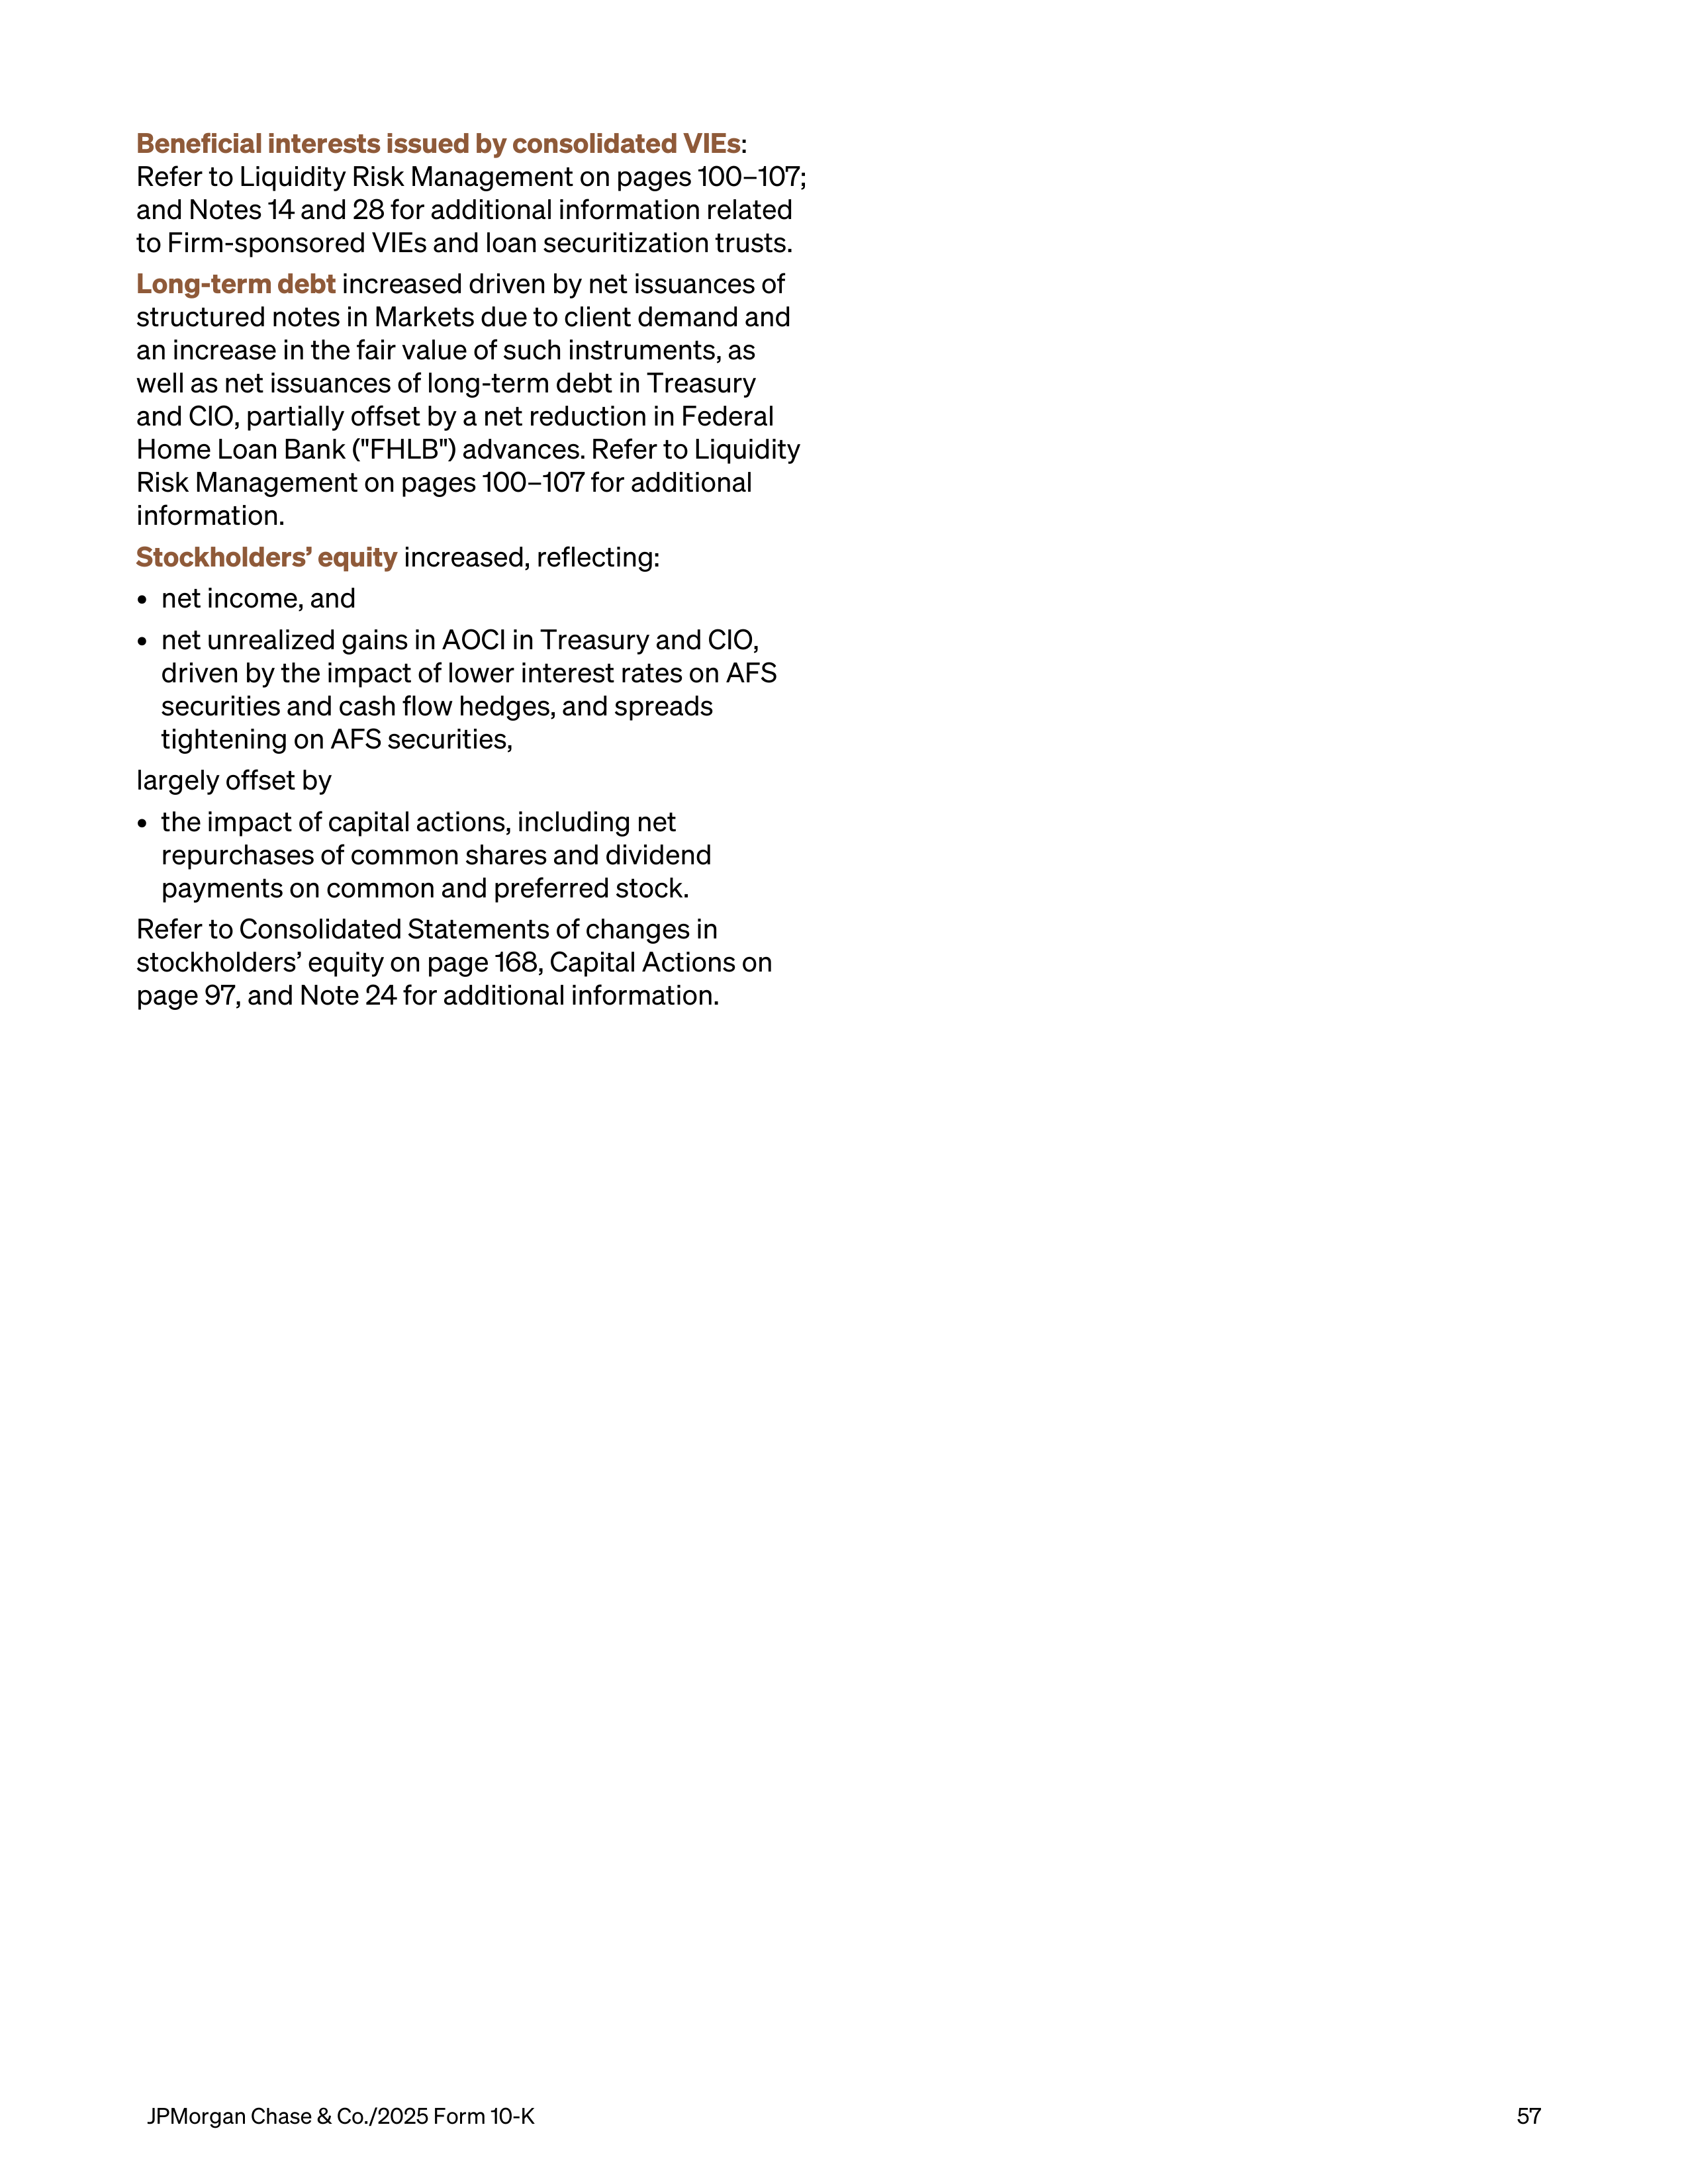
Beneficial interests issued by consolidated VIEs
:
Refer to Liquidity Risk Management on pages 100–107;
and Notes 14 and 28 for additional information related
to Firm-sponsored VIEs and loan securitization trusts.
Long-term debt
increased driven by net issuances of
structured notes in Markets due to client demand and
an increase in the fair value of such instruments, as
well as net issuances of long-term debt in Treasury
and CIO, partially offset by a net reduction in Federal
Home Loan Bank ("FHLB") advances
.
Refer to Liquidity
Risk Management on pages 100–107 for additional
information.
Stockholders’ equity
increased, reflecting:
•
net income, and
•
net unrealized gains in AOCI in Treasury and CIO,
driven by the impact of lower interest rates on AFS
securities and cash flow hedges, and spreads
tightening on AFS securities,
largely offset by
•
the impact of capital actions, including net
repurchases of common shares and dividend
payments on common and preferred stock.
Refer to Consolidated Statements of changes in
stockholders’ equity
on page 168, Capital Actions on
page 97, and Note 24 for additional information.
JPMorgan Chase & Co./2025 Form 10-K
57
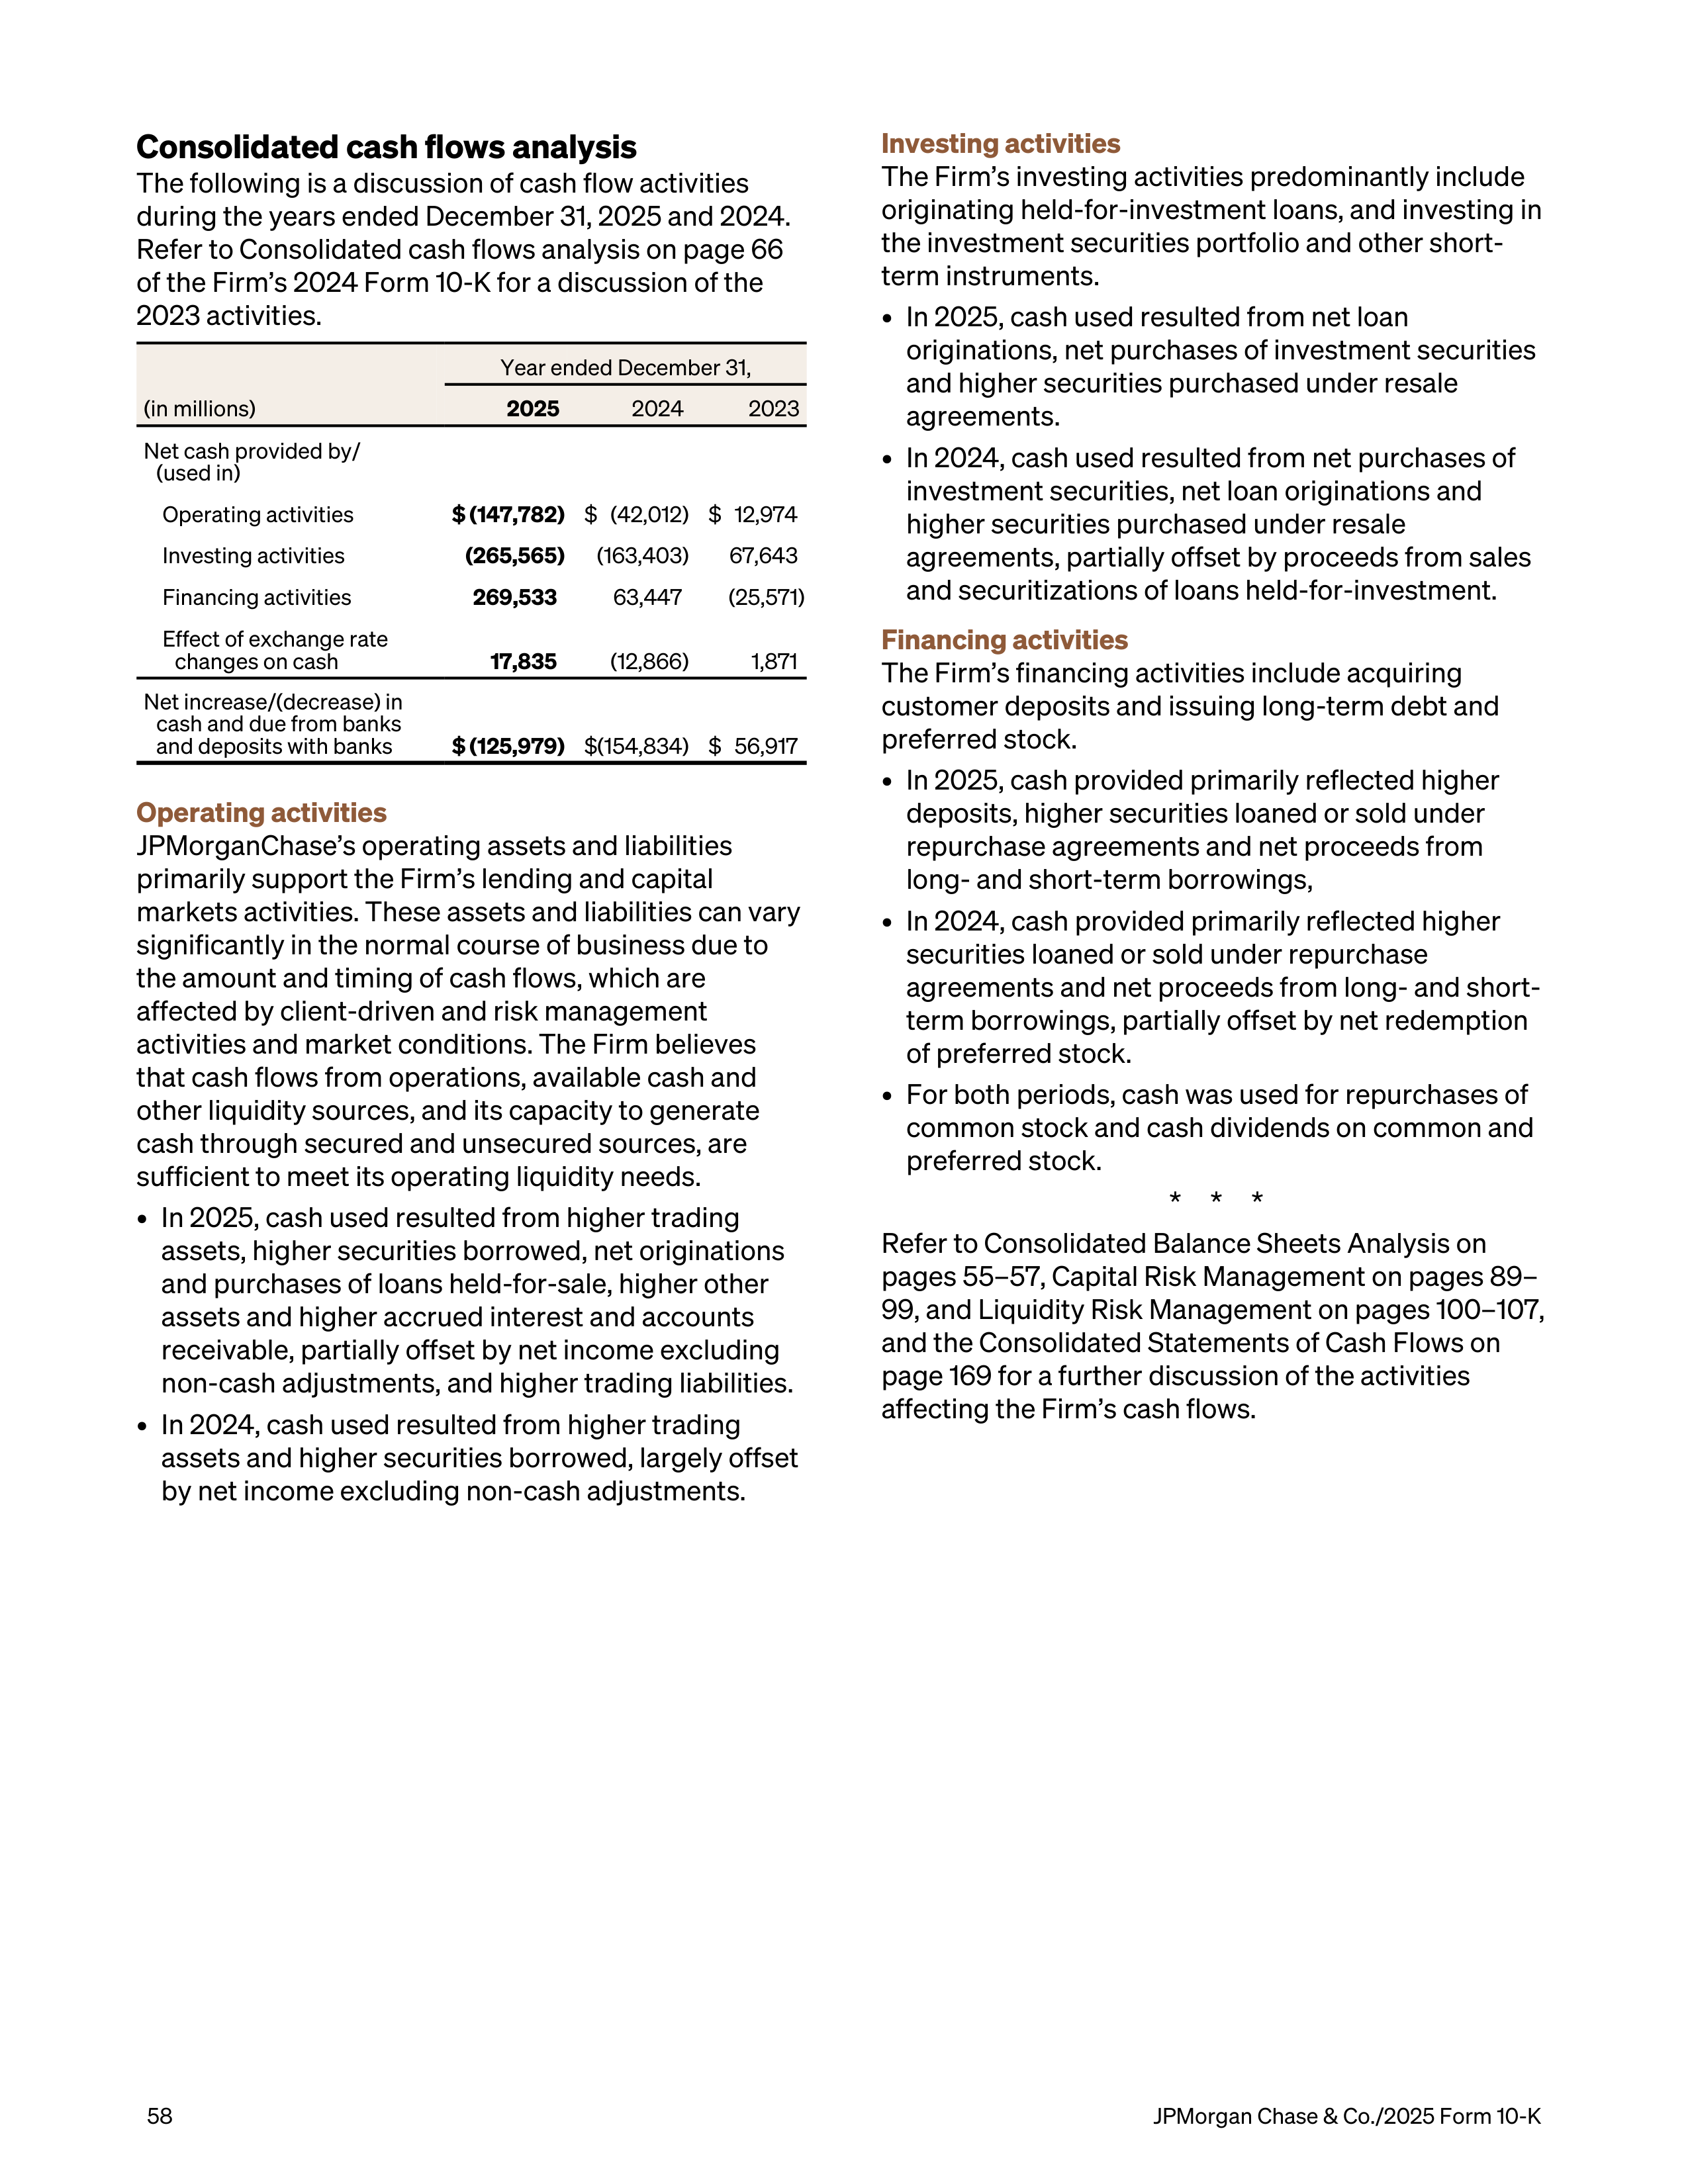
Consolidated cash flows analysis
The following is a discussion of cash flow activities
during the years ended December 31, 2025 and 2024.
Refer to Consolidated cash flows analysis on page 66
of the Firm’s 2024 Form 10-K for a discussion of the
2023 activities.
(in millions)
Year ended December 31,
2025
2024
2023
Net cash provided by/
(used in)
Operating activities
$ (147,782)
$ (42,012) $ 12,974
Investing activities
(265,565)
(163,403) 67,643
Financing activities
269,533
63,447
(25,571)
Effect of exchange rate
changes on cash
17,835
(12,866)
1,871
Net increase/(decrease) in
cash and due from banks
and deposits with banks
$ (125,979)
$ (154,834) $ 56,917
Operating activities
JPMorganChase’s operating assets and liabilities
primarily support the Firm’s lending and capital
markets activities. These assets and liabilities can vary
significantly in the normal course of business due to
the amount and timing of cash flows, which are
affected by client-driven and risk management
activities and market conditions. The Firm believes
that cash flows from operations, available cash and
other liquidity sources, and its capacity to generate
cash through secured and unsecured sources, are
sufficient to meet its operating liquidity needs.
•
In 2025, cash used resulted from higher trading
assets, higher securities borrowed, net originations
and purchases of loans held-for-sale, higher other
assets and higher accrued interest and accounts
receivable, partially offset by net income excluding
non-cash adjustments, and higher trading liabilities.
•
In 2024, cash used resulted from higher trading
assets and higher securities borrowed, largely offset
by net income excluding non-cash adjustments.
Investing activities
The Firm’s investing activities predominantly include
originating held-for-investment loans, and investing in
the investment securities portfolio and other short-
term instruments.
•
In 2025, cash used resulted from net loan
originations, net purchases of investment securities
and higher securities purchased under resale
agreements.
•
In 2024, cash used resulted from net purchases of
investment securities, net loan originations and
higher securities purchased under resale
agreements, partially offset by proceeds from sales
and securitizations of loans held-for-investment.
Financing activities
The Firm’s financing activities include acquiring
customer deposits and issuing long-term debt and
preferred stock.
•
In 2025, cash provided primarily reflected higher
deposits, higher securities loaned or sold under
repurchase agreements and net proceeds from
long- and short-term borrowings,
•
In 2024, cash provided primarily reflected higher
securities loaned or sold under repurchase
agreements and net proceeds from long- and short-
term borrowings, partially offset by net redemption
of preferred stock.
•
For both periods, cash was used for repurchases of
common stock and cash dividends on common and
preferred stock.
* * *
Refer to Consolidated Balance Sheets Analysis on
pages 55–57, Capital Risk Management on pages 89–
99, and Liquidity Risk Management on pages 100–107,
and the Consolidated Statements of Cash Flows on
page 169 for a further discussion of the activities
affecting the Firm’s cash flows.
58
JPMorgan Chase & Co./2025 Form 10-K
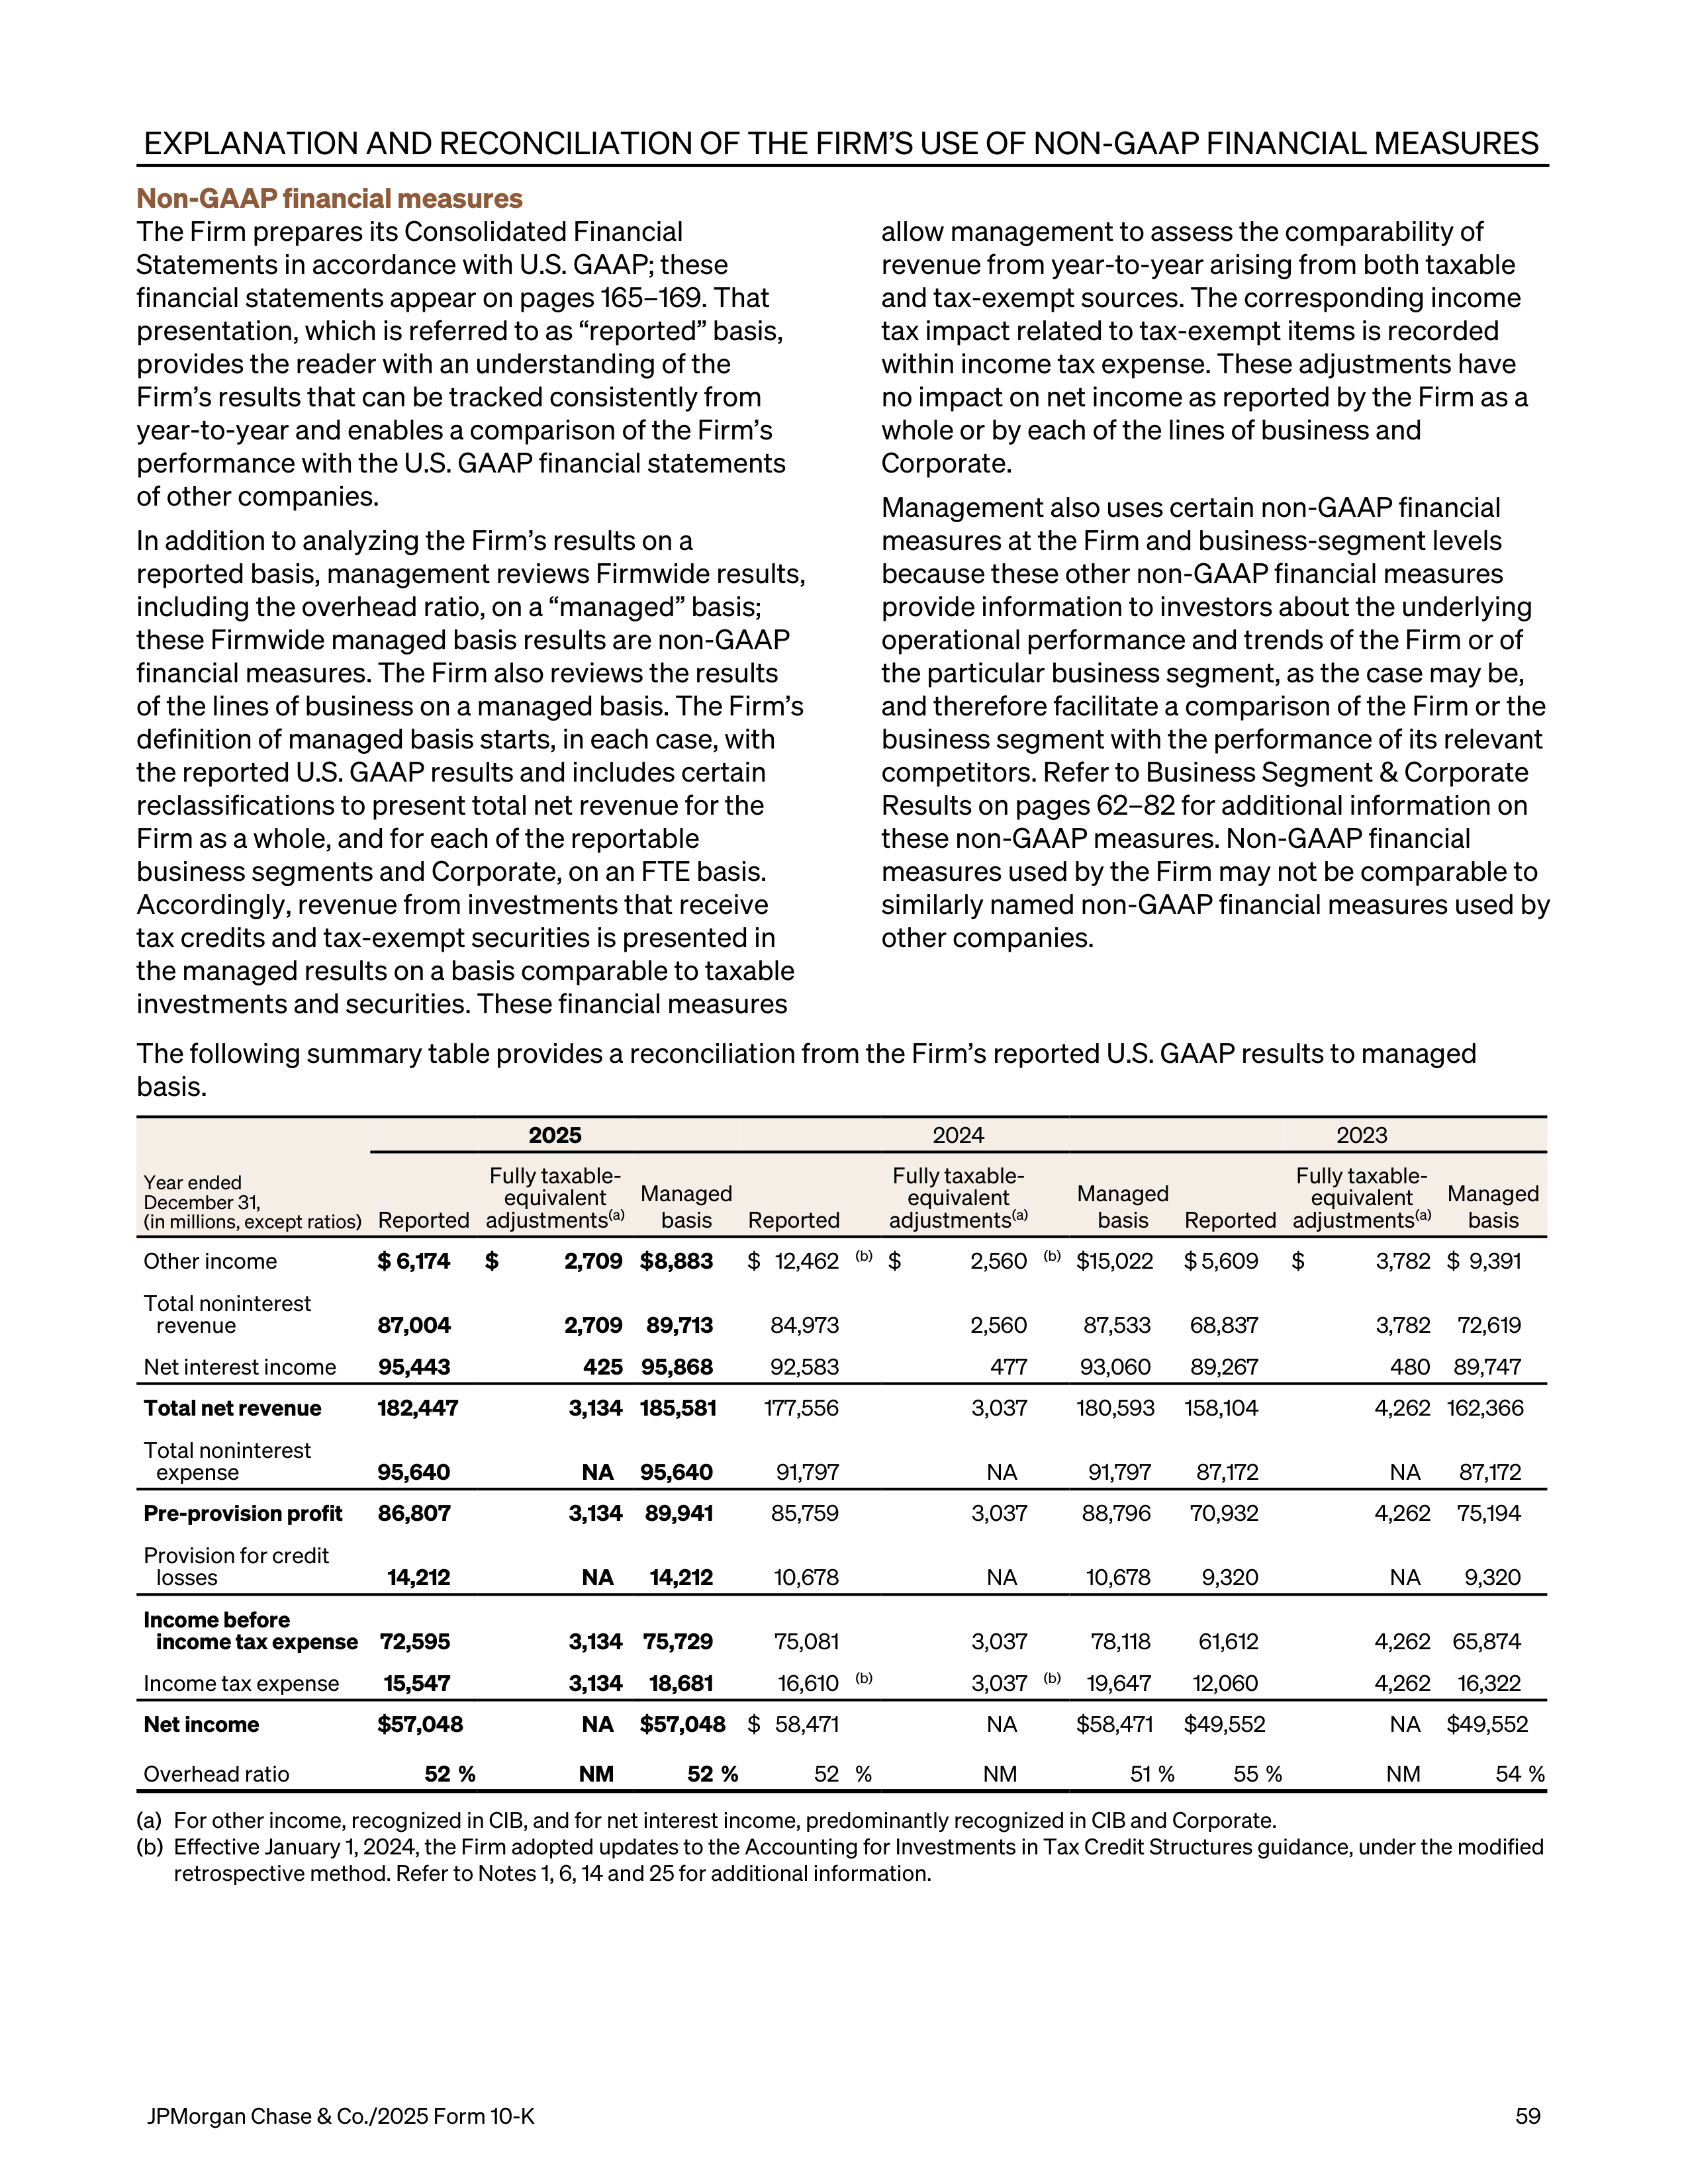
EXPLANATION AND RECONCILIATION OF THE FIRM’S USE OF NON-GAAP FINANCIAL MEASURES
Non-GAAP financial measures
The Firm prepares its Consolidated Financial
Statements in accordance with U.S. GAAP; these
financial statements appear on pages 165–169. That
presentation, which is referred to as “reported” basis,
provides the reader with an understanding of the
Firm’s results that can be tracked consistently from
year-to-year and enables a comparison of the Firm’s
performance with the U.S. GAAP financial statements
of other companies.
In addition to analyzing the Firm’s results on a
reported basis, management reviews Firmwide results,
including the overhead ratio, on a “managed” basis;
these Firmwide managed basis results are non-GAAP
financial measures. The Firm also reviews the results
of the lines of business on a managed basis. The Firm’s
definition of managed basis starts, in each case, with
the reported U.S. GAAP results and includes certain
reclassifications to present total net revenue for the
Firm as a whole, and for each of the reportable
business segments and Corporate, on an FTE basis.
Accordingly, revenue from investments that receive
tax credits and tax-exempt securities is presented in
the managed results on a basis comparable to taxable
investments and securities. These financial measures
allow management to assess the comparability of
revenue from year-to-year arising from both taxable
and tax-exempt sources. The corresponding income
tax impact related to tax-exempt items is recorded
within income tax expense. These adjustments have
no impact on net income as reported by the Firm as a
whole or by each of the lines of business and
Corporate.
Management also uses certain non-GAAP financial
measures at the Firm and business-segment levels
because these other non-GAAP financial measures
provide information to investors about the underlying
operational performance and trends of the Firm or of
the particular business segment, as the case may be,
and therefore facilitate a comparison of the Firm or the
business segment with the performance of its relevant
competitors. Refer to Business Segment & Corporate
Results on pages 62–82 for additional information on
these non-GAAP measures. Non-GAAP financial
measures used by the Firm may not be comparable to
similarly named non-GAAP financial measures used by
other companies.
The following summary table provides a reconciliation from the Firm’s reported U.S. GAAP results to managed
basis.
2025
2024
2023
Year ended
December 31,
(in millions, except ratios)
Reported
Fully taxable-
equivalent
adjustments
(a)
Managed
basis
Reported
Fully taxable-
equivalent
adjustments
(a)
Managed
basis
Reported
Fully taxable-
equivalent
adjustments
(a)
Managed
basis
Other income
$ 6,174
$
2,709 $ 8,883
$ 12,462
(b)
$
2,560
(b)
$ 15,022
$ 5,609
$
3,782 $ 9,391
Total noninterest
revenue
87,004
2,709 89,713
84,973
2,560
87,533
68,837
3,782 72,619
Net interest income
95,443
425 95,868
92,583
477
93,060
89,267
480 89,747
Total net revenue
182,447
3,134 185,581
177,556
3,037
180,593
158,104
4,262 162,366
Total noninterest
expense
95,640
NA
95,640
91,797
NA
91,797
87,172
NA
87,172
Pre-provision profit
86,807
3,134 89,941
85,759
3,037
88,796
70,932
4,262 75,194
Provision for credit
losses
14,212
NA
14,212
10,678
NA
10,678
9,320
NA
9,320
Income before
income tax expense
72,595
3,134 75,729
75,081
3,037
78,118
61,612
4,262 65,874
Income tax expense
15,547
3,134 18,681
16,610
(b)
3,037
(b)
19,647
12,060
4,262 16,322
Net income
$ 57,048
NA
$ 57,048
$ 58,471
NA
$ 58,471
$ 49,552
NA
$ 49,552
Overhead ratio
52 %
NM
52 %
52 %
NM
51 %
55 %
NM
54 %
(a)
For other income, recognized in CIB, and for net interest income, predominantly recognized in CIB and Corporate.
(b)
Effective January 1, 2024, the Firm adopted updates to the Accounting for Investments in Tax Credit Structures guidance, under the modified
retrospective method. Refer to Notes 1, 6, 14 and 25 for additional information.
JPMorgan Chase & Co./2025 Form 10-K
59
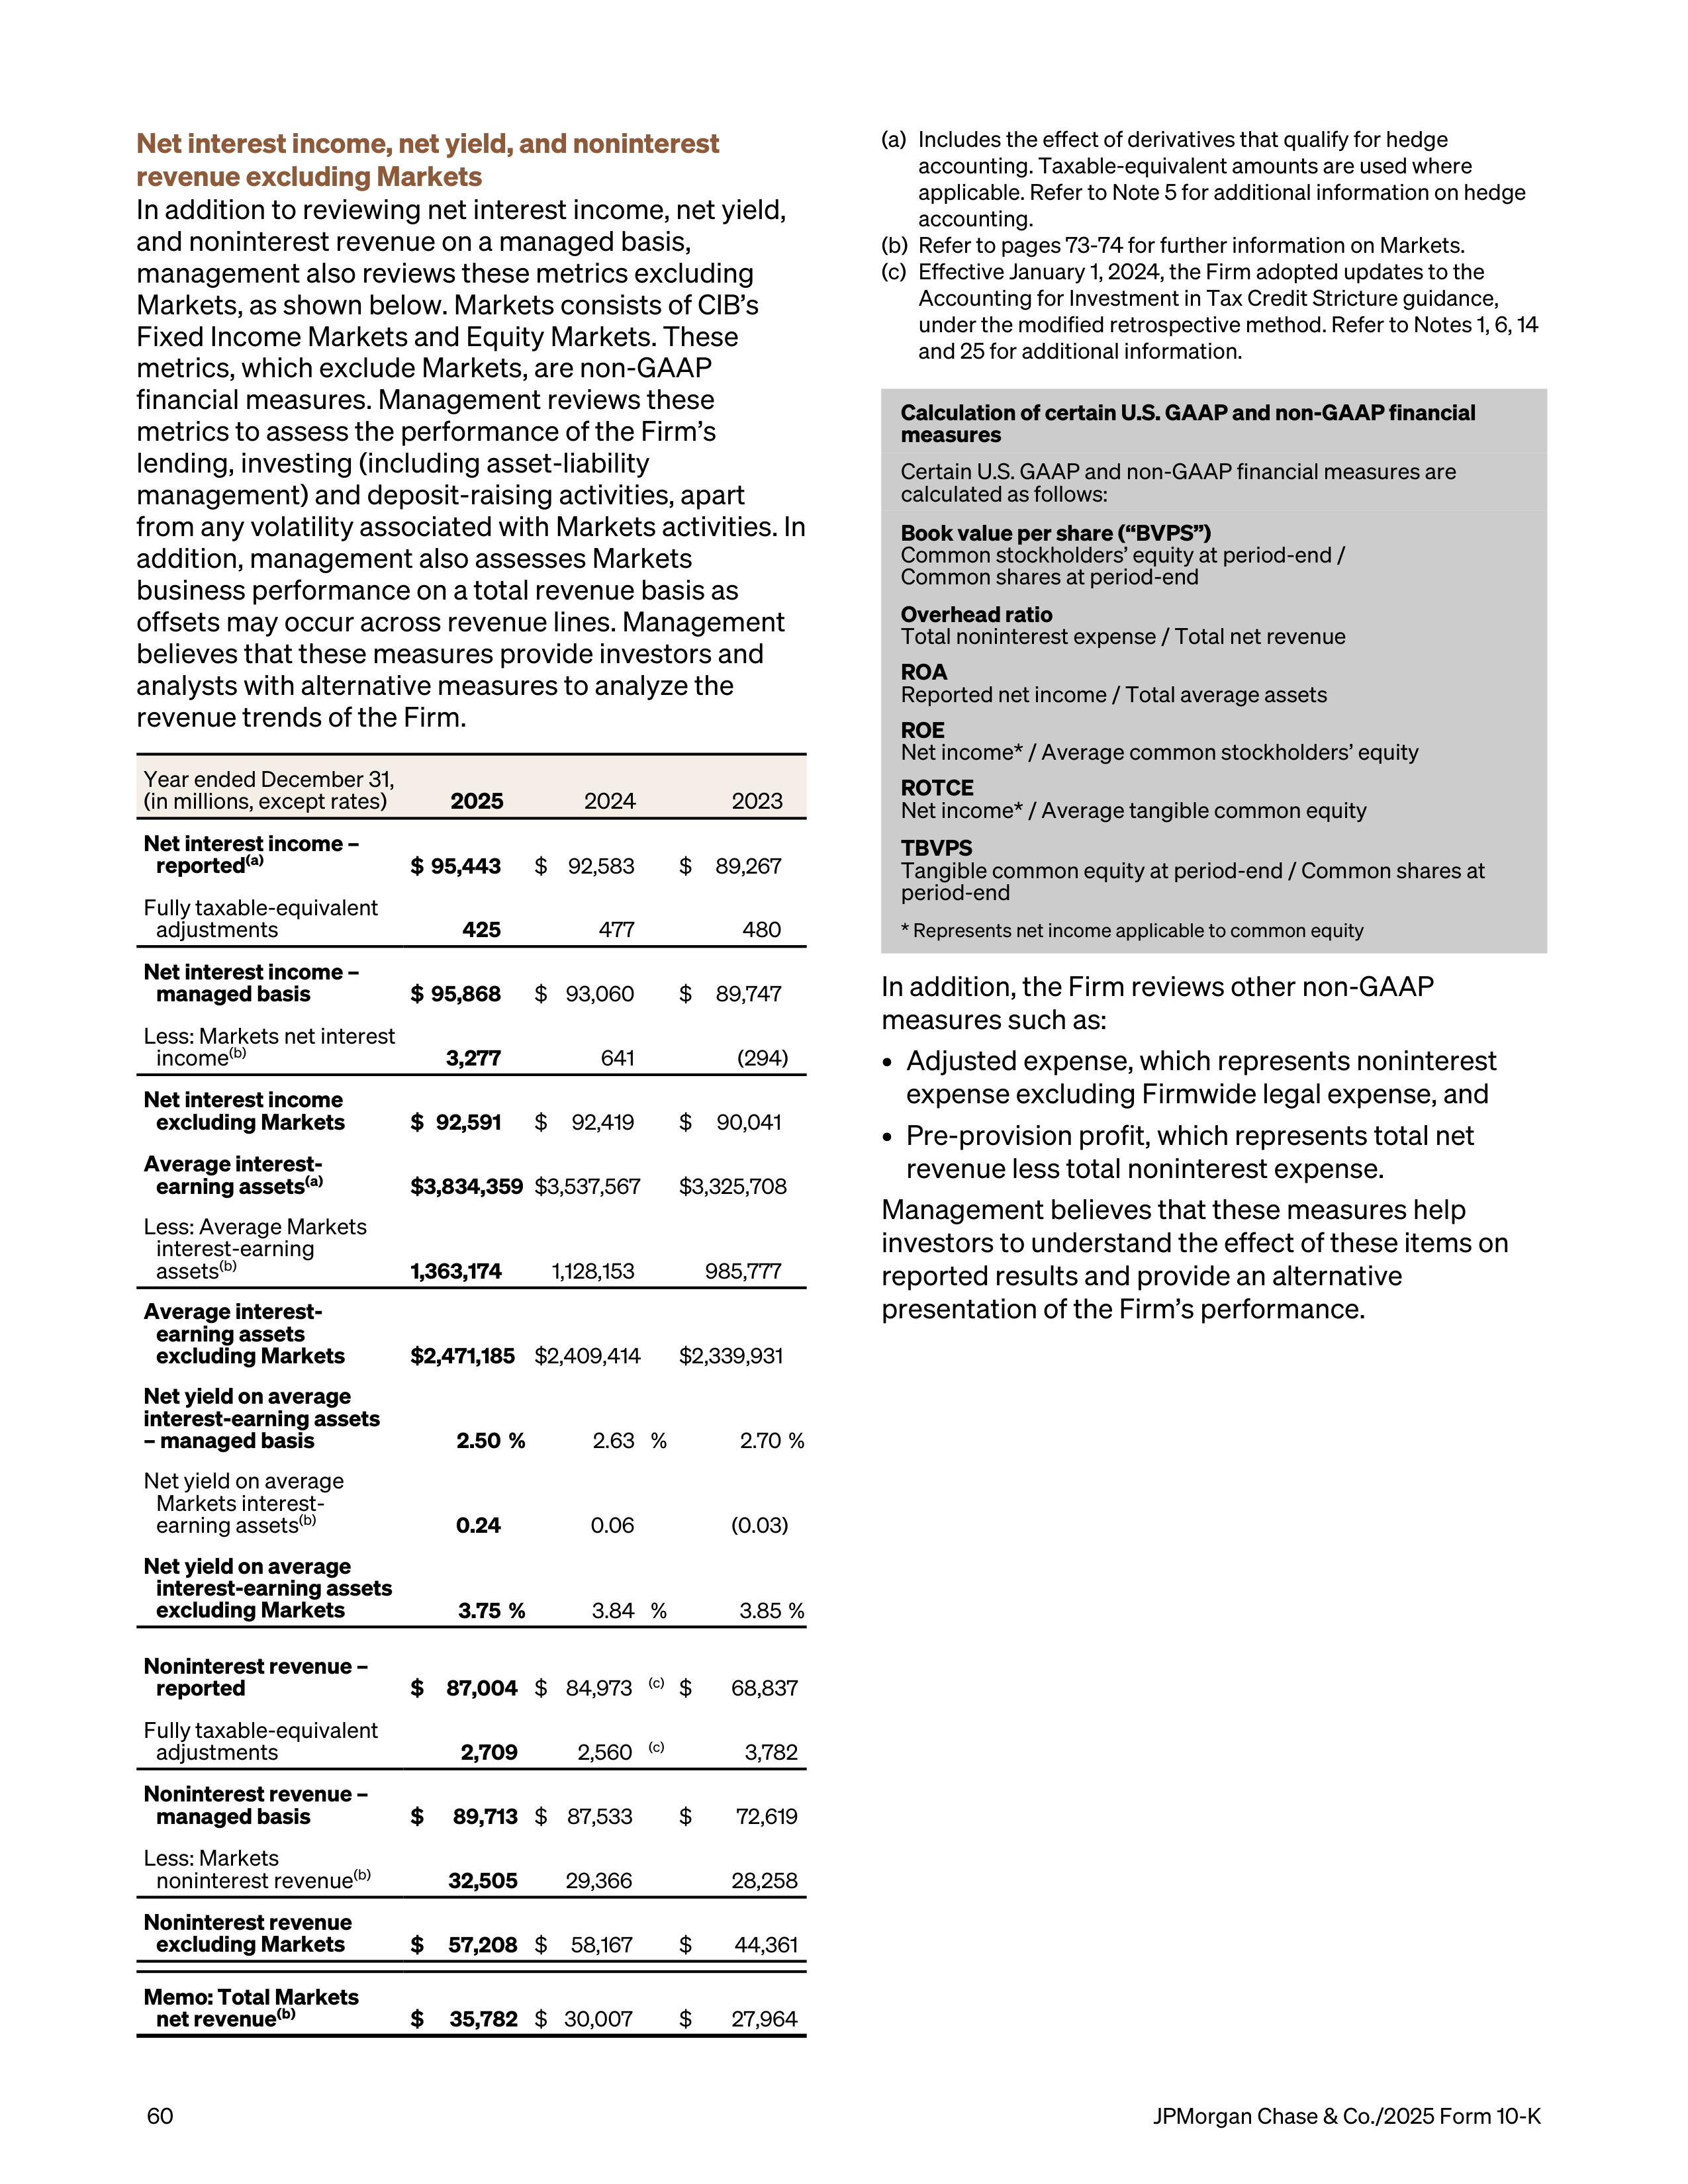
Net interest income, net yield, and noninterest
revenue excluding Markets
In addition to reviewing net interest income, net yield,
and noninterest revenue on a managed basis,
management also reviews these metrics excluding
Markets, as shown below. Markets consists of CIB’s
Fixed Income Markets and Equity Markets. These
metrics, which exclude Markets, are non-GAAP
financial measures. Management reviews these
metrics to assess the performance of the Firm’s
lending, investing (including asset-liability
management) and deposit-raising activities, apart
from any volatility associated with Markets activities. In
addition, management also assesses Markets
business performance on a total revenue basis as
offsets may occur across revenue lines. Management
believes that these measures provide investors and
analysts with alternative measures to analyze the
revenue trends of the Firm.
Year ended December 31,
(in millions, except rates)
2025
2024
2023
Net interest income –
reported
(a)
$ 95,443
$ 92,583
$
89,267
Fully taxable-equivalent
adjustments
425
477
480
Net interest income –
managed basis
$ 95,868
$ 93,060
$
89,747
Less: Markets net interest
income
(b)
3,277
641
(294)
Net interest income
excluding Markets
$ 92,591
$
92,419
$
90,041
Average interest-
earning assets
(a)
$ 3,834,359
$ 3,537,567
$ 3,325,708
Less: Average Markets
interest-earning
assets
(b)
1,363,174
1,128,153
985,777
Average interest-
earning assets
excluding Markets
$ 2,471,185
$ 2,409,414
$ 2,339,931
Net yield on average
interest-earning assets
– managed basis
2.50 %
2.63 %
2.70 %
Net yield on average
Markets interest-
earning assets
(b)
0.24
0.06
(0.03)
Net yield on average
interest-earning assets
excluding Markets
3.75 %
3.84 %
3.85 %
Noninterest revenue –
reported
$
87,004
$ 84,973
(c)
$
68,837
Fully taxable-equivalent
adjustments
2,709
2,560
(c)
3,782
Noninterest revenue –
managed basis
$
89,713
$ 87,533
$
72,619
Less: Markets
noninterest revenue
(b)
32,505
29,366
28,258
Noninterest revenue
excluding Markets
$
57,208
$
58,167
$
44,361
Memo: Total Markets
net revenue
(b)
$
35,782
$ 30,007
$
27,964
(a)
Includes the effect of derivatives that qualify for hedge
accounting. Taxable-equivalent amounts are used where
applicable. Refer to Note 5 for additional information on hedge
accounting.
(b)
Refer to pages 73-74 for further information on Markets.
(c)
Effective January 1, 2024, the Firm adopted updates to the
Accounting for Investment in Tax Credit Stricture guidance,
under the modified retrospective method. Refer to Notes 1, 6, 14
and 25 for additional information.
Calculation of certain U.S. GAAP and non-GAAP financial
measures
Certain U.S. GAAP and non-GAAP financial measures are
calculated as follows:
Book value per share (“BVPS”)
Common stockholders’ equity at period-end /
Common shares at period-end
Overhead ratio
Total noninterest expense / Total net revenue
ROA
Reported net income / Total average assets
ROE
Net income* / Average common stockholders’ equity
ROTCE
Net income* / Average tangible common equity
TBVPS
Tangible common equity at period-end / Common shares at
period-end
* Represents net income applicable to common equity
In addition, the Firm reviews other non-GAAP
measures such as:
•
Adjusted expense, which represents noninterest
expense excluding Firmwide legal expense, and
•
Pre-provision profit, which represents total net
revenue less total noninterest expense.
Management believes that these measures help
investors to understand the effect of these items on
reported results and provide an alternative
presentation of the Firm’s performance.
60
JPMorgan Chase & Co./2025 Form 10-K
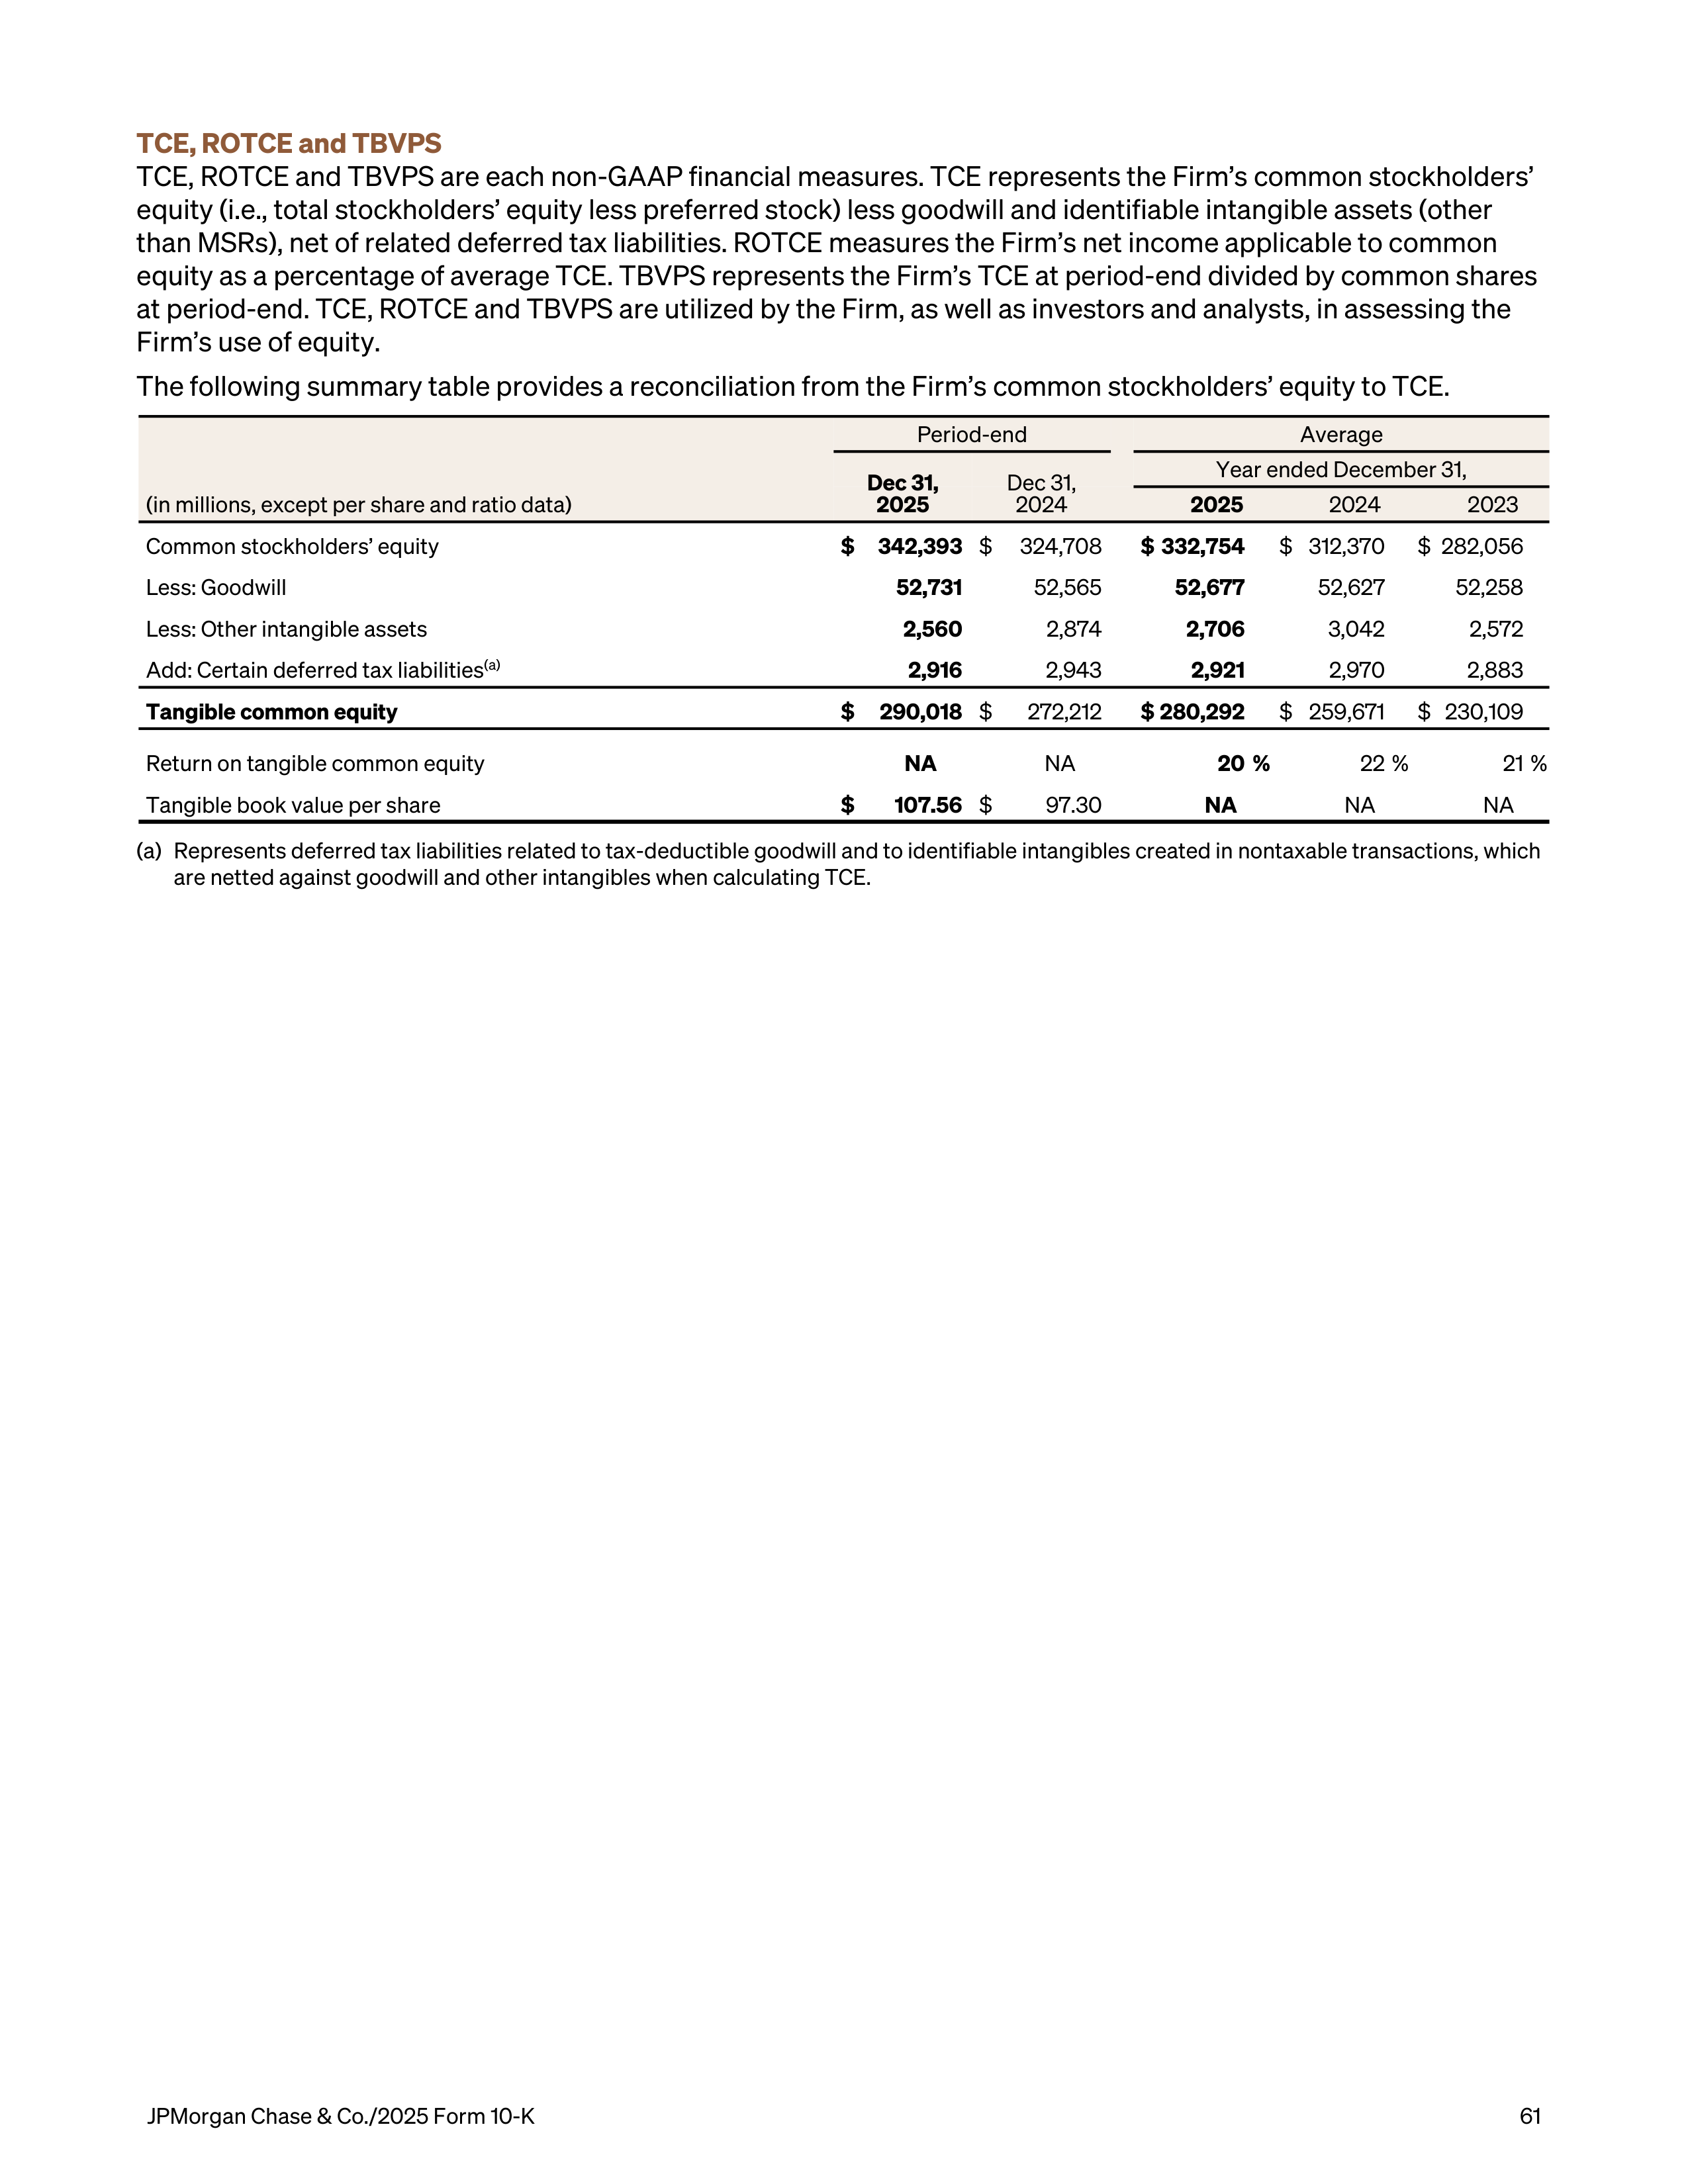
TCE, ROTCE and TBVPS
TCE, ROTCE and TBVPS are each non-GAAP financial measures. TCE represents the Firm’s common stockholders’
equity (i.e., total stockholders’ equity less preferred stock) less goodwill and identifiable intangible assets (other
than MSRs), net of related deferred tax liabilities. ROTCE measures the Firm’s net income applicable to common
equity as a percentage of average TCE. TBVPS represents the Firm’s TCE at period-end divided by common shares
at period-end. TCE, ROTCE and TBVPS are utilized by the Firm, as well as investors and analysts, in assessing the
Firm’s use of equity.
The following summary table provides a reconciliation from the Firm’s common stockholders’ equity to TCE.
Period-end
Average
Dec 31,
2025
Dec 31,
2024
Year ended December 31,
(in millions, except per share and ratio data)
2025
2024
2023
Common stockholders’ equity
$
342,393
$
324,708
$ 332,754
$ 312,370
$ 282,056
Less: Goodwill
52,731
52,565
52,677
52,627
52,258
Less: Other intangible assets
2,560
2,874
2,706
3,042
2,572
Add: Certain deferred tax liabilities
(a)
2,916
2,943
2,921
2,970
2,883
Tangible common equity
$
290,018
$
272,212
$ 280,292
$ 259,671
$ 230,109
Return on tangible common equity
NA
NA
20 %
22 %
21 %
Tangible book value per share
$
107.56
$
97.30
NA
NA
NA
(a)
Represents deferred tax liabilities related to tax-deductible goodwill and to identifiable intangibles created in nontaxable transactions, which
are netted against goodwill and other intangibles when calculating TCE.
JPMorgan Chase & Co./2025 Form 10-K
61
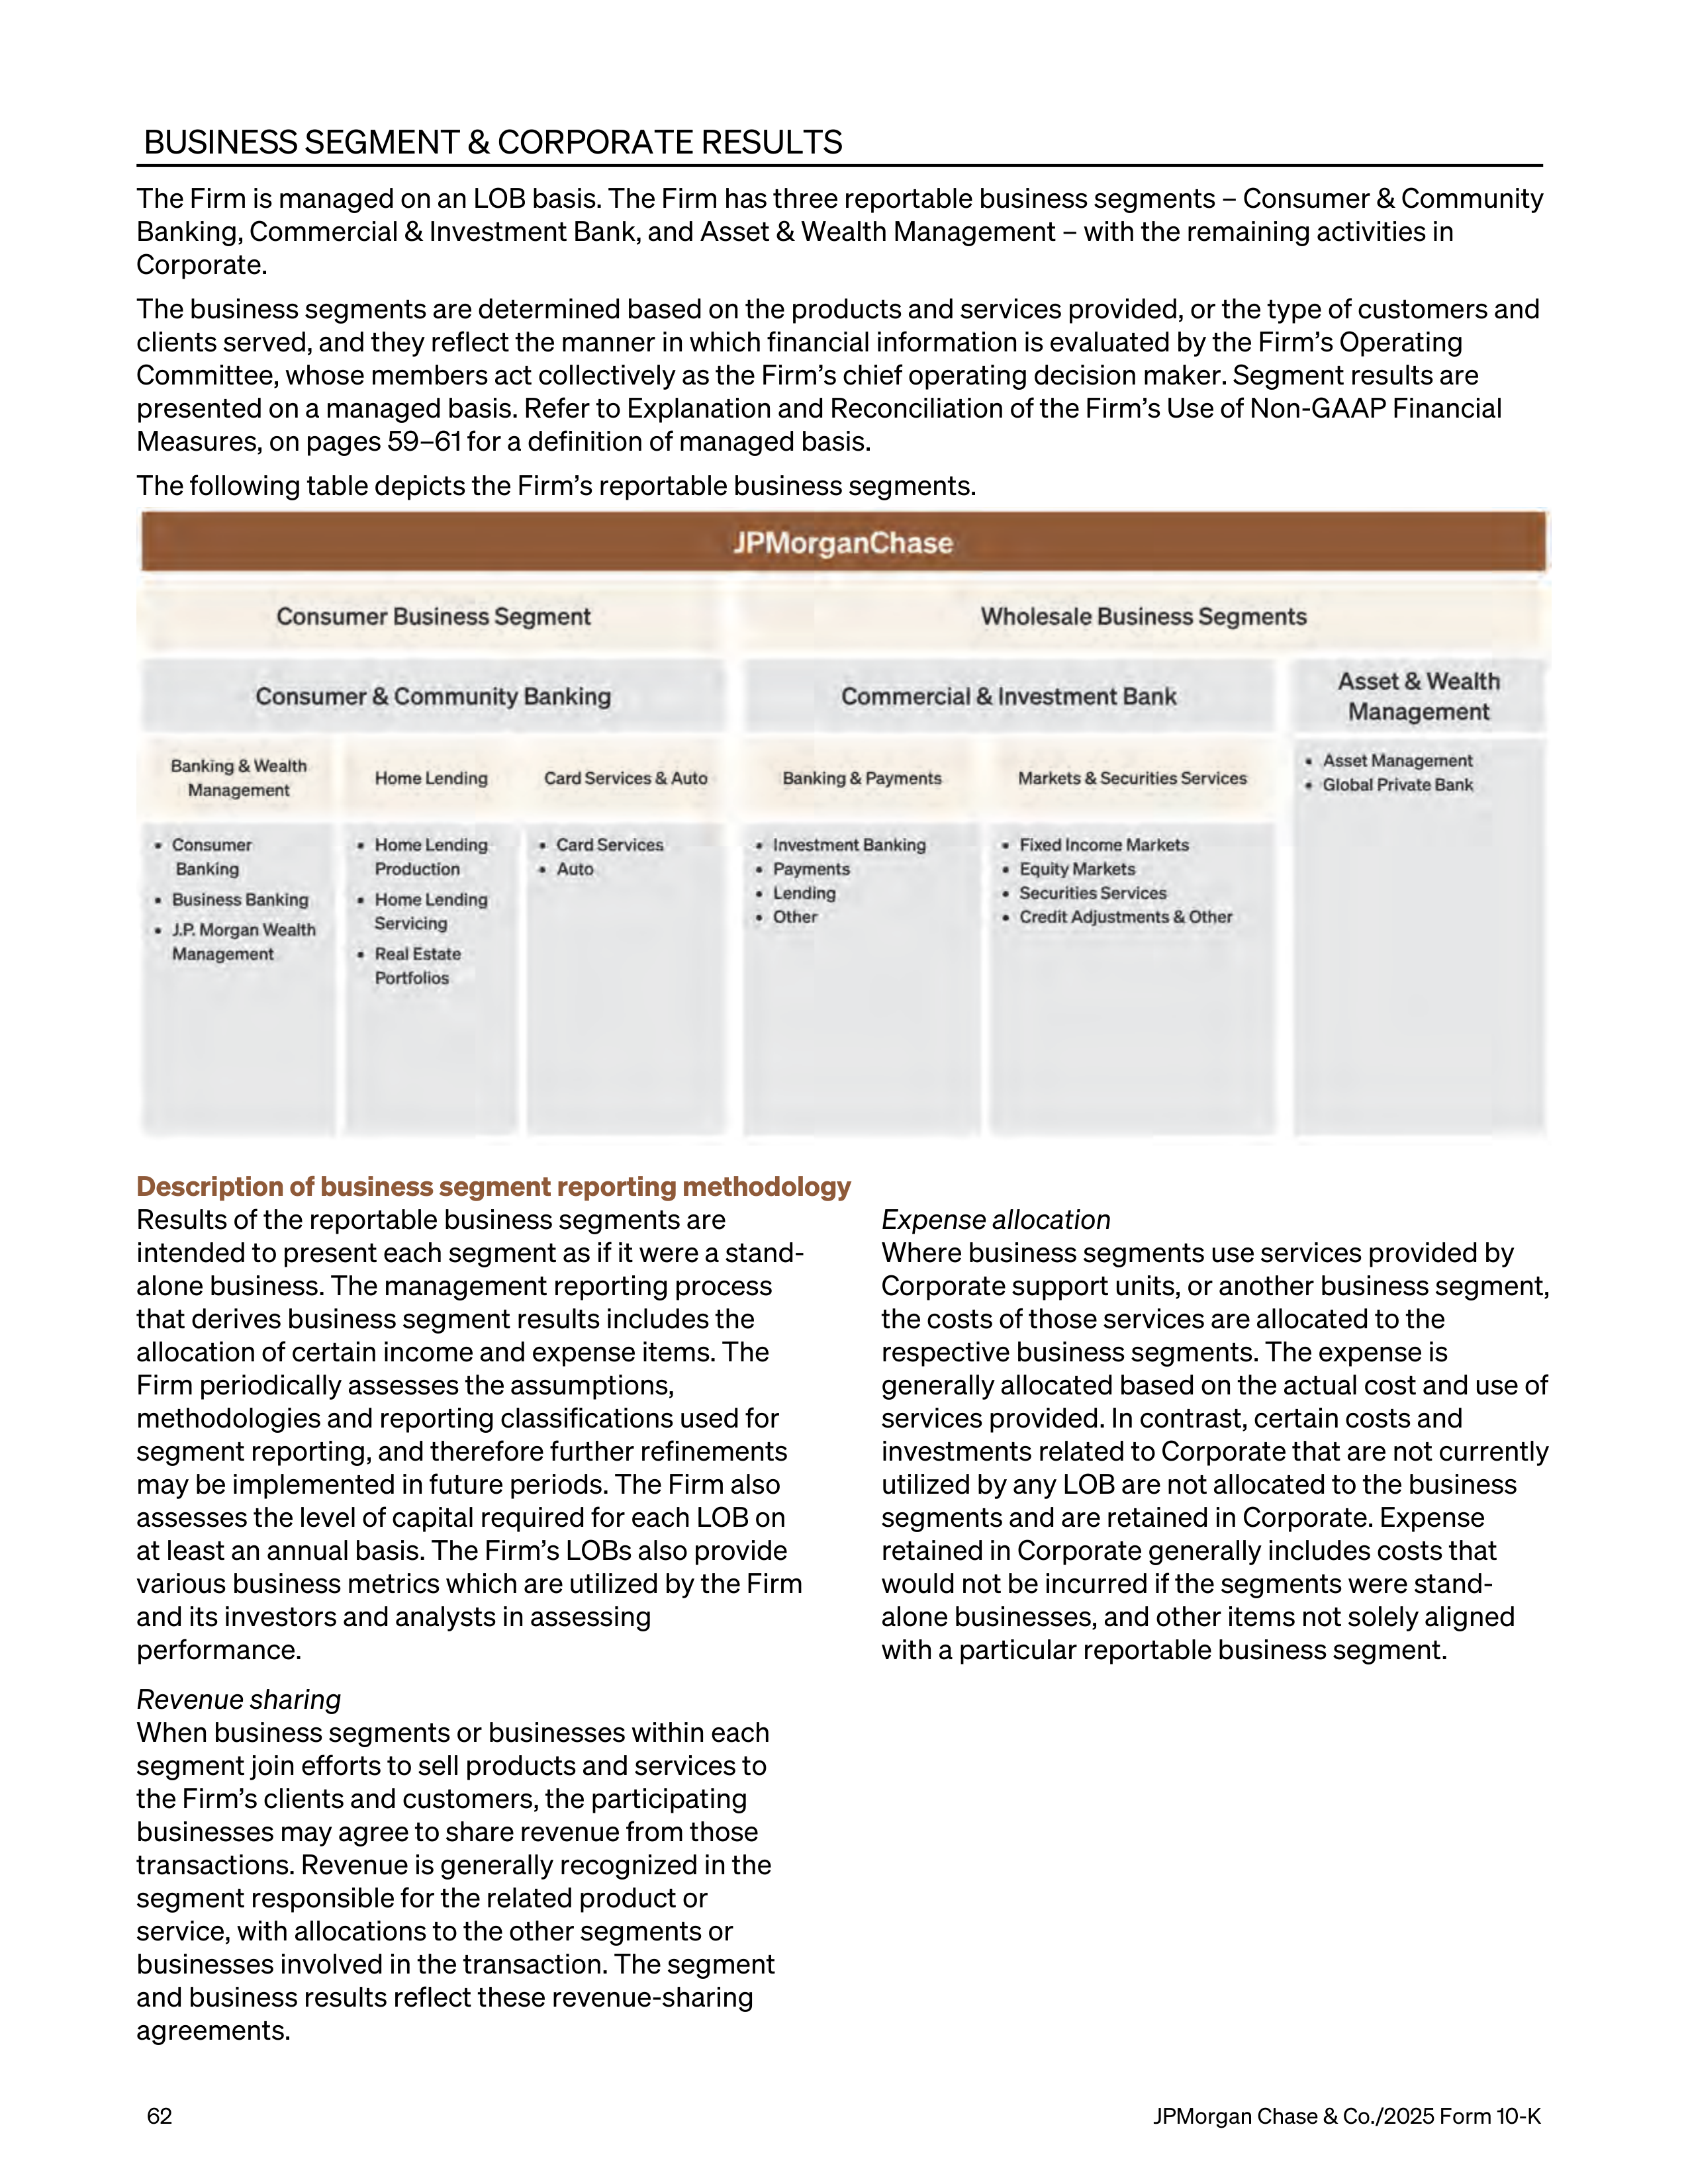

BUSINESS SEGMENT & CORPORATE RESULTS
The Firm is managed on an LOB basis. The Firm has three reportable business segments – Consumer & Community
Banking, Commercial & Investment Bank, and Asset & Wealth Management – with the remaining activities in
Corporate.
The business segments are determined based on the products and services provided, or the type of customers and
clients served, and they reflect the manner in which financial information is evaluated by the Firm’s Operating
Committee, whose members act collectively as the Firm’s chief operating decision maker. Segment results are
presented on a managed basis. Refer to Explanation and Reconciliation of the Firm’s Use of Non-GAAP Financial
Measures, on pages 59–61 for a definition of managed basis.
The following table depicts the Firm’s reportable business segments.
Description of business segment reporting methodology
Results of the reportable business segments are
intended to present each segment as if it were a stand-
alone business. The management reporting process
that derives business segment results includes the
allocation of certain income and expense items. The
Firm periodically assesses the assumptions,
methodologies and reporting classifications used for
segment reporting, and therefore further refinements
may be implemented in future periods. The Firm also
assesses the level of capital required for each LOB on
at least an annual basis. The Firm’s LOBs also provide
various business metrics which are utilized by the Firm
and its investors and analysts in assessing
performance.
Revenue sharing
When business segments or businesses within each
segment join efforts to sell products and services to
the Firm’s clients and customers, the participating
businesses may agree to share revenue from those
transactions. Revenue is generally recognized in the
segment responsible for the related product or
service, with allocations to the other segments or
businesses involved in the transaction. The segment
and business results reflect these revenue-sharing
agreements.
Expense allocation
Where business segments use services provided by
Corporate support units, or another business segment,
the costs of those services are allocated to the
respective business segments. The expense is
generally allocated based on the actual cost and use of
services provided. In contrast, certain costs and
investments related to Corporate that are not currently
utilized by any LOB are not allocated to the business
segments and are retained in Corporate. Expense
retained in Corporate generally includes costs that
would not be incurred if the segments were stand-
alone businesses, and other items not solely aligned
with a particular reportable business segment.
62
JPMorgan Chase & Co./2025 Form 10-K
Funds transfer pricing
Funds transfer pricing (“FTP”) is the process by which
the Firm allocates interest income and expense to the
LOBs and Other Corporate and transfers the primary
interest rate risk and liquidity risk to Treasury and CIO.
The funds transfer pricing process considers the
interest rate and liquidity risk characteristics of assets
and liabilities and off-balance sheet products.
Periodically, the methodology and assumptions
utilized in the FTP process are adjusted to reflect
economic conditions and other factors, which may
impact the allocation of net interest income to the
segments. Effective in the fourth quarter of 2024, the
Firm updated its FTP with respect to consumer
deposits, which resulted in an increase in the funding
benefit reflected within CCB’s net interest income that
is fully offset in Corporate, with no effect on the Firm’s
net interest income.
As a result of lower average interest rates in the
current year, the cost of funding for assets and the
funding benefit earned for liabilities generally
decreased compared with the prior year. During the
period ended December 31, 2025, this resulted in a
lower cost of funds for loans and Markets activities. In
addition, the FTP benefit for deposits generally
decreased more than the decrease in rates paid to
deposit holders during the year, resulting in an overall
deposit margin compression.
Foreign exchange risk
Foreign exchange risk is transferred from the LOBs
and Other Corporate to Treasury and CIO for certain
revenues and expenses. Treasury and CIO manages
these risks centrally and reports the impact of foreign
exchange rate movements related to the transferred
risk in its results. Refer to Market Risk Management on
page 142 for additional information.
Debt expense and preferred stock dividend allocation
As part of the FTP process, almost all of the cost of the
credit spread component of outstanding unsecured
long-term debt and preferred stock dividends is
allocated to the reportable business segments, while
the balance of the cost is retained in Corporate. The
methodology to allocate the cost of unsecured long-
term debt and preferred stock dividends to the
business segments is aligned with the relevant
regulatory capital requirements and funding needs of
the LOBs, as applicable. The allocated cost of
unsecured long-term debt is included in a business
segment’s net interest income, and net income is
reduced by preferred stock dividends, to arrive at a
business segment’s net income applicable to common
equity. Refer to Capital Risk Management on pages
89–99 for additional information.
Capital allocation
The amount of capital assigned to each LOB and
Corporate is referred to as equity. The Firm’s current
equity allocation methodology incorporates Basel III
Standardized risk-weighted assets (“RWA”) and the
global systemically important banks (“GSIB”)
surcharge, both under rules currently in effect, as well
as a simulation of capital depletion in a severe stress
environment. At least annually, the assumptions,
judgments and methodologies used to allocate capital
are reassessed and, as a result, the capital allocated to
the LOBs and Corporate may change. Refer to Line of
business and Corporate equity on page 96 for
additional information on capital allocation.
JPMorgan Chase & Co./2025 Form 10-K
63
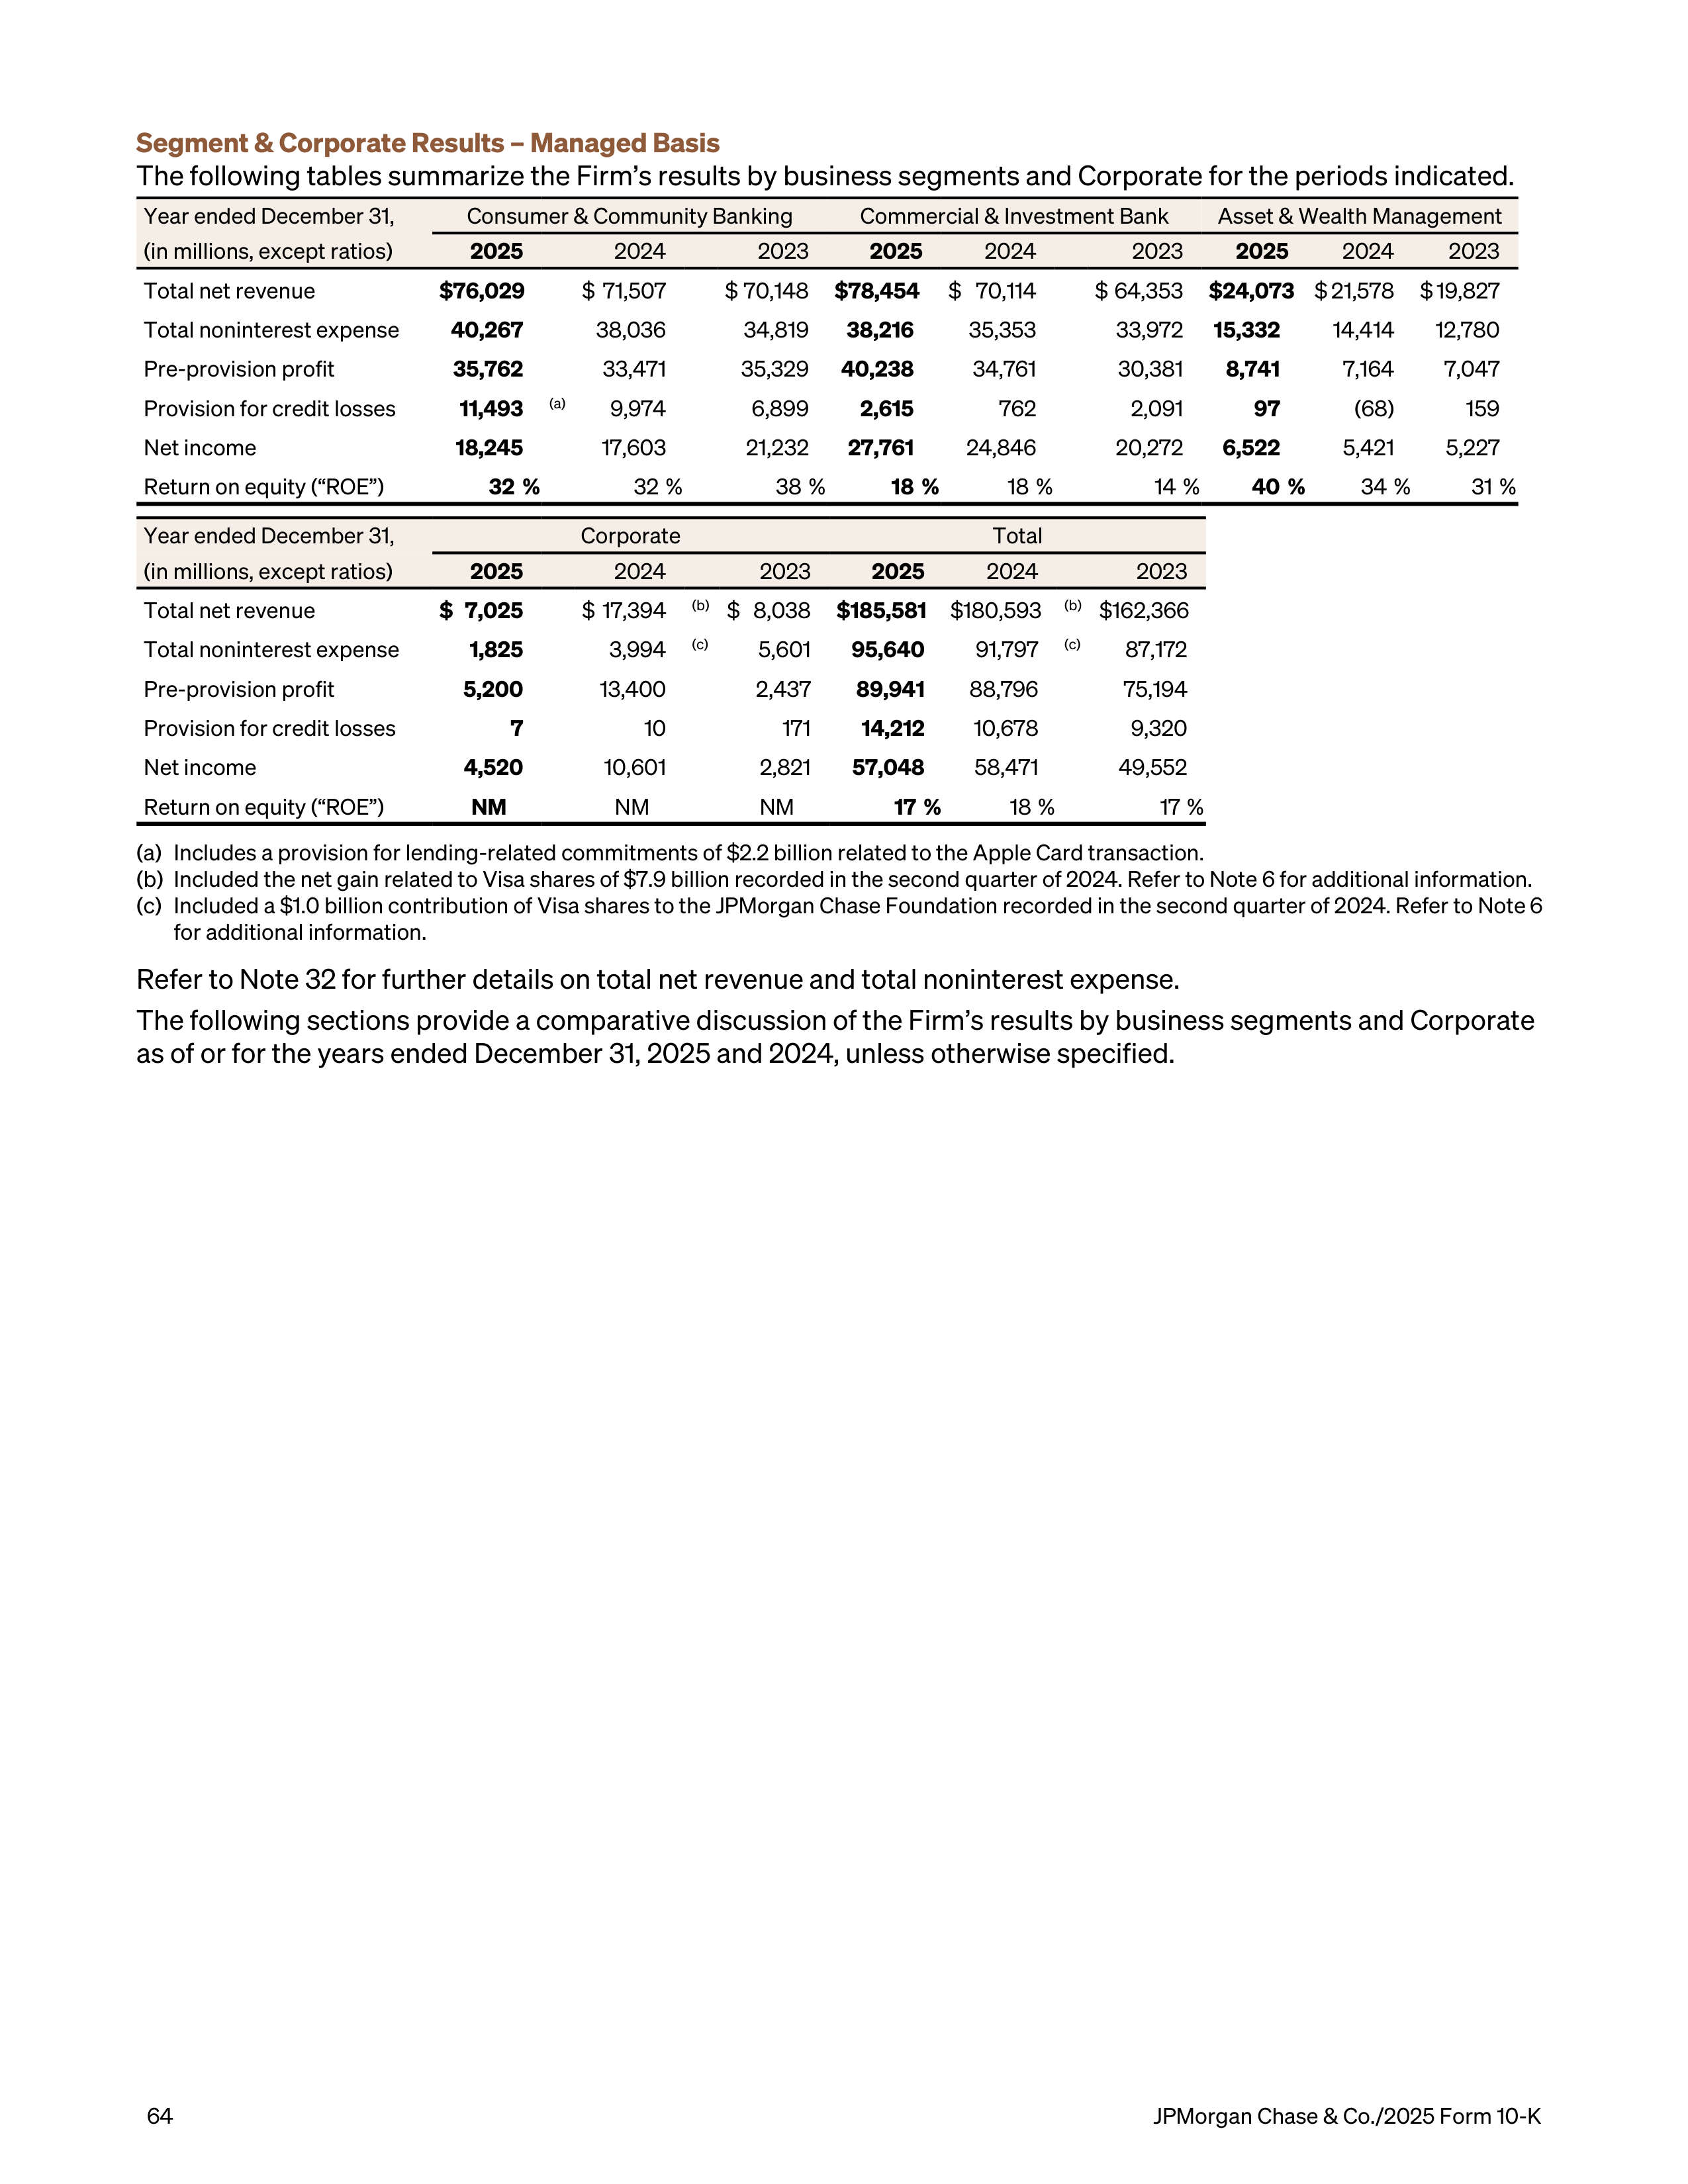
Segment & Corporate Results – Managed Basis
The following tables summarize the Firm’s results by business segments and Corporate for the periods indicated.
Year ended December 31,
Consumer & Community Banking
Commercial & Investment Bank
Asset & Wealth Management
(in millions, except ratios)
2025
2024
2023
2025
2024
2023
2025
2024
2023
Total net revenue
$ 76,029
$ 71,507
$ 70,148
$ 78,454
$ 70,114
$ 64,353
$ 24,073
$ 21,578
$ 19,827
Total noninterest expense
40,267
38,036
34,819
38,216
35,353
33,972
15,332
14,414
12,780
Pre-provision profit
35,762
33,471
35,329
40,238
34,761
30,381
8,741
7,164
7,047
Provision for credit losses
11,493
(a)
9,974
6,899
2,615
762
2,091
97
(68)
159
Net income
18,245
17,603
21,232
27,761
24,846
20,272
6,522
5,421
5,227
Return on equity (“ROE”)
32 %
32 %
38 %
18 %
18 %
14 %
40 %
34 %
31 %
Year ended December 31,
Corporate
Total
(in millions, except ratios)
2025
2024
2023
2025
2024
2023
Total net revenue
$ 7,025
$ 17,394
(b)
$ 8,038
$ 185,581
$ 180,593
(b)
$ 162,366
Total noninterest expense
1,825
3,994
(c)
5,601
95,640
91,797
(c)
87,172
Pre-provision profit
5,200
13,400
2,437
89,941
88,796
75,194
Provision for credit losses
7
10
171
14,212
10,678
9,320
Net income
4,520
10,601
2,821
57,048
58,471
49,552
Return on equity (“ROE”)
NM
NM
NM
17 %
18 %
17 %
(a)
Includes a provision for lending-related commitments of $2.2 billion related to the Apple Card transaction.
(b)
Included the net gain related to Visa shares of $7.9 billion recorded in the second quarter of 2024. Refer to Note 6 for additional information.
(c)
Included a $1.0 billion contribution of Visa shares to the JPMorgan Chase Foundation recorded in the second quarter of 2024. Refer to Note 6
for additional information.
Refer to Note 32 for further details on total net revenue and total noninterest expense.
The following sections provide a comparative discussion of the Firm’s results by business segments and Corporate
as of or for the years ended December 31, 2025 and 2024, unless otherwise specified.
64
JPMorgan Chase & Co./2025 Form 10-K
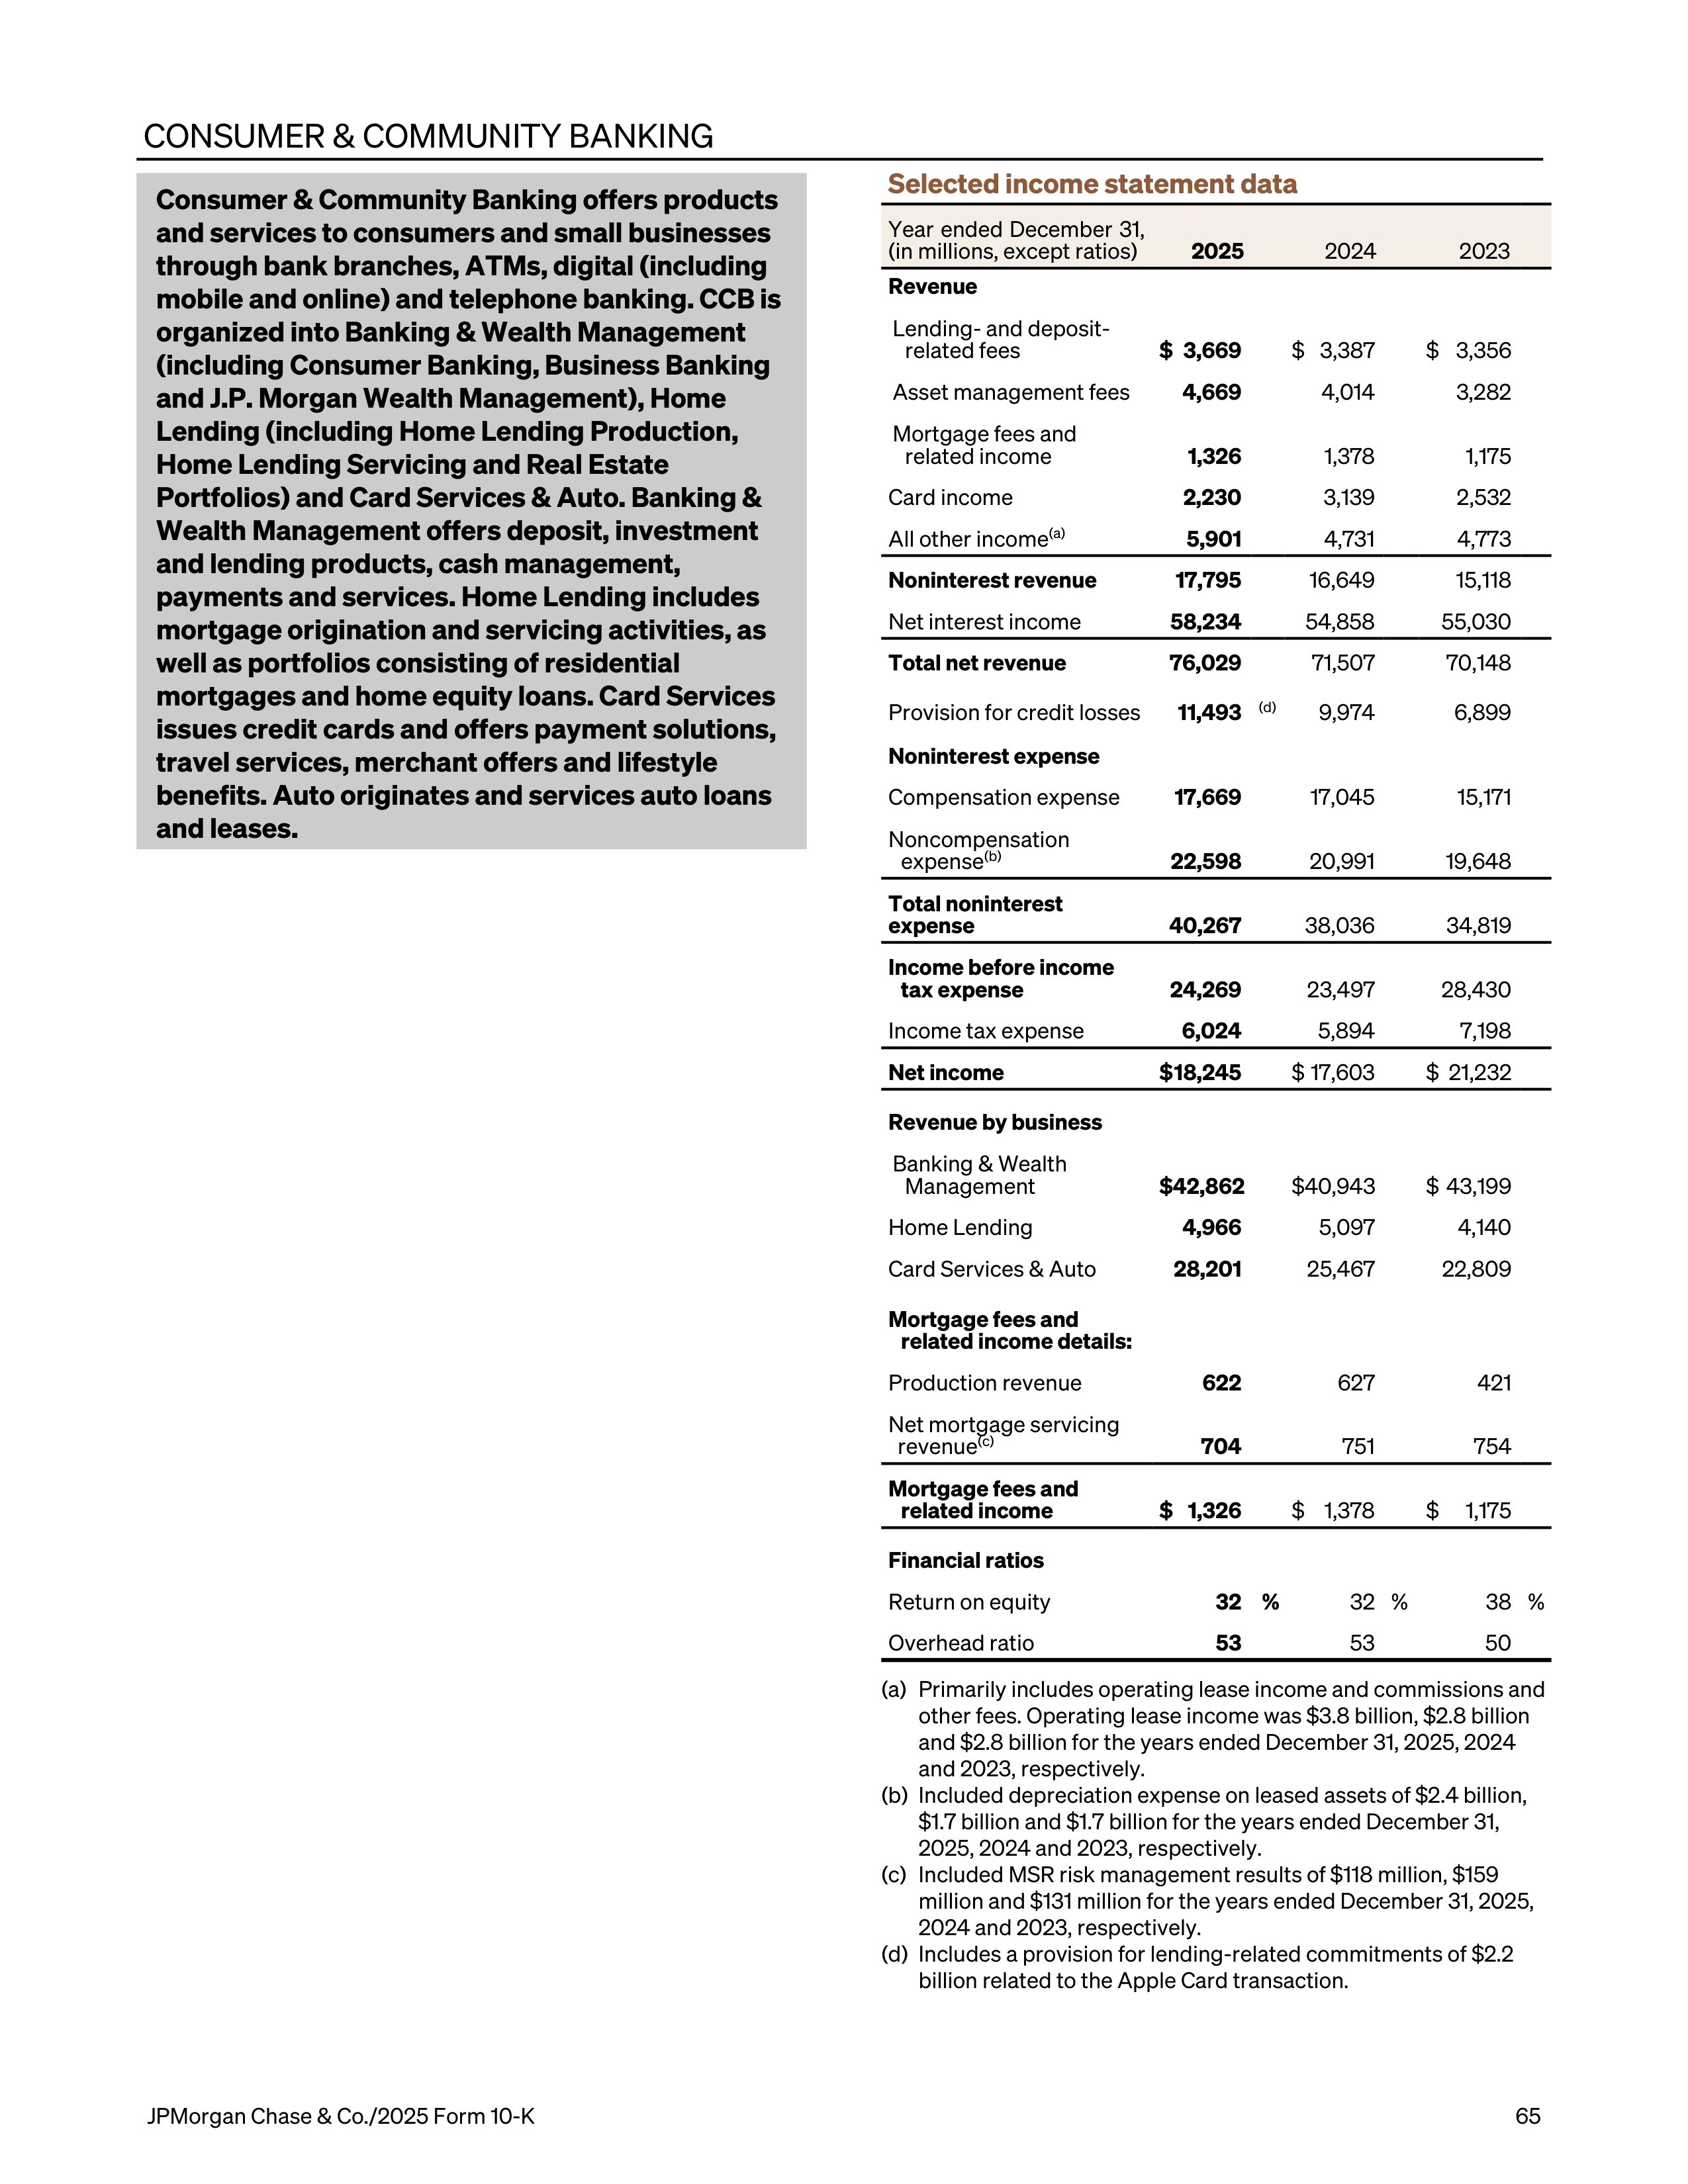
CONSUMER & COMMUNITY BANKING
Consumer & Community Banking offers products
and services to consumers and small businesses
through bank branches, ATMs, digital (including
mobile and online) and telephone banking. CCB is
organized into Banking & Wealth Management
(including Consumer Banking, Business Banking
and J.P. Morgan Wealth Management), Home
Lending (including Home Lending Production,
Home Lending Servicing and Real Estate
Portfolios) and Card Services & Auto. Banking &
Wealth Management offers deposit, investment
and lending products, cash management,
payments and services. Home Lending includes
mortgage origination and servicing activities, as
well as portfolios consisting of residential
mortgages and home equity loans. Card Services
issues credit cards and offers payment solutions,
travel services, merchant offers and lifestyle
benefits. Auto originates and services auto loans
and leases.
Selected income statement data
Year ended December 31,
(in millions, except ratios)
2025
2024
2023
Revenue
Lending- and deposit-
related fees
$ 3,669
$ 3,387
$ 3,356
Asset management fees
4,669
4,014
3,282
Mortgage fees and
related income
1,326
1,378
1,175
Card income
2,230
3,139
2,532
All other income
(a)
5,901
4,731
4,773
Noninterest revenue
17,795
16,649
15,118
Net interest income
58,234
54,858
55,030
Total net revenue
76,029
71,507
70,148
Provision for credit losses
11,493
(d)
9,974
6,899
Noninterest expense
Compensation expense
17,669
17,045
15,171
Noncompensation
expense
(b)
22,598
20,991
19,648
Total noninterest
expense
40,267
38,036
34,819
Income before income
tax expense
24,269
23,497
28,430
Income tax expense
6,024
5,894
7,198
Net income
$ 18,245
$ 17,603
$ 21,232
Revenue by business
Banking & Wealth
Management
$ 42,862
$ 40,943
$ 43,199
Home Lending
4,966
5,097
4,140
Card Services & Auto
28,201
25,467
22,809
Mortgage fees and
related income details:
Production revenue
622
627
421
Net mortgage servicing
revenue
(c)
704
751
754
Mortgage fees and
related income
$ 1,326
$ 1,378
$
1,175
Financial ratios
Return on equity
32 %
32 %
38 %
Overhead ratio
53
53
50
(a)
Primarily includes operating lease income and commissions and
other fees. Operating lease income was $3.8 billion, $2.8 billion
and $2.8 billion for the years ended December 31, 2025, 2024
and 2023, respectively.
(b)
Included depreciation expense on leased assets of $2.4 billion,
$1.7 billion and $1.7 billion for the years ended December 31,
2025, 2024 and 2023, respectively.
(c)
Included MSR risk management results of $118 million, $159
million and $131 million for the years ended December 31, 2025,
2024 and 2023, respectively.
(d)
Includes a provision for lending-related commitments of $2.2
billion related to the Apple Card transaction.
JPMorgan Chase & Co./2025 Form 10-K
65
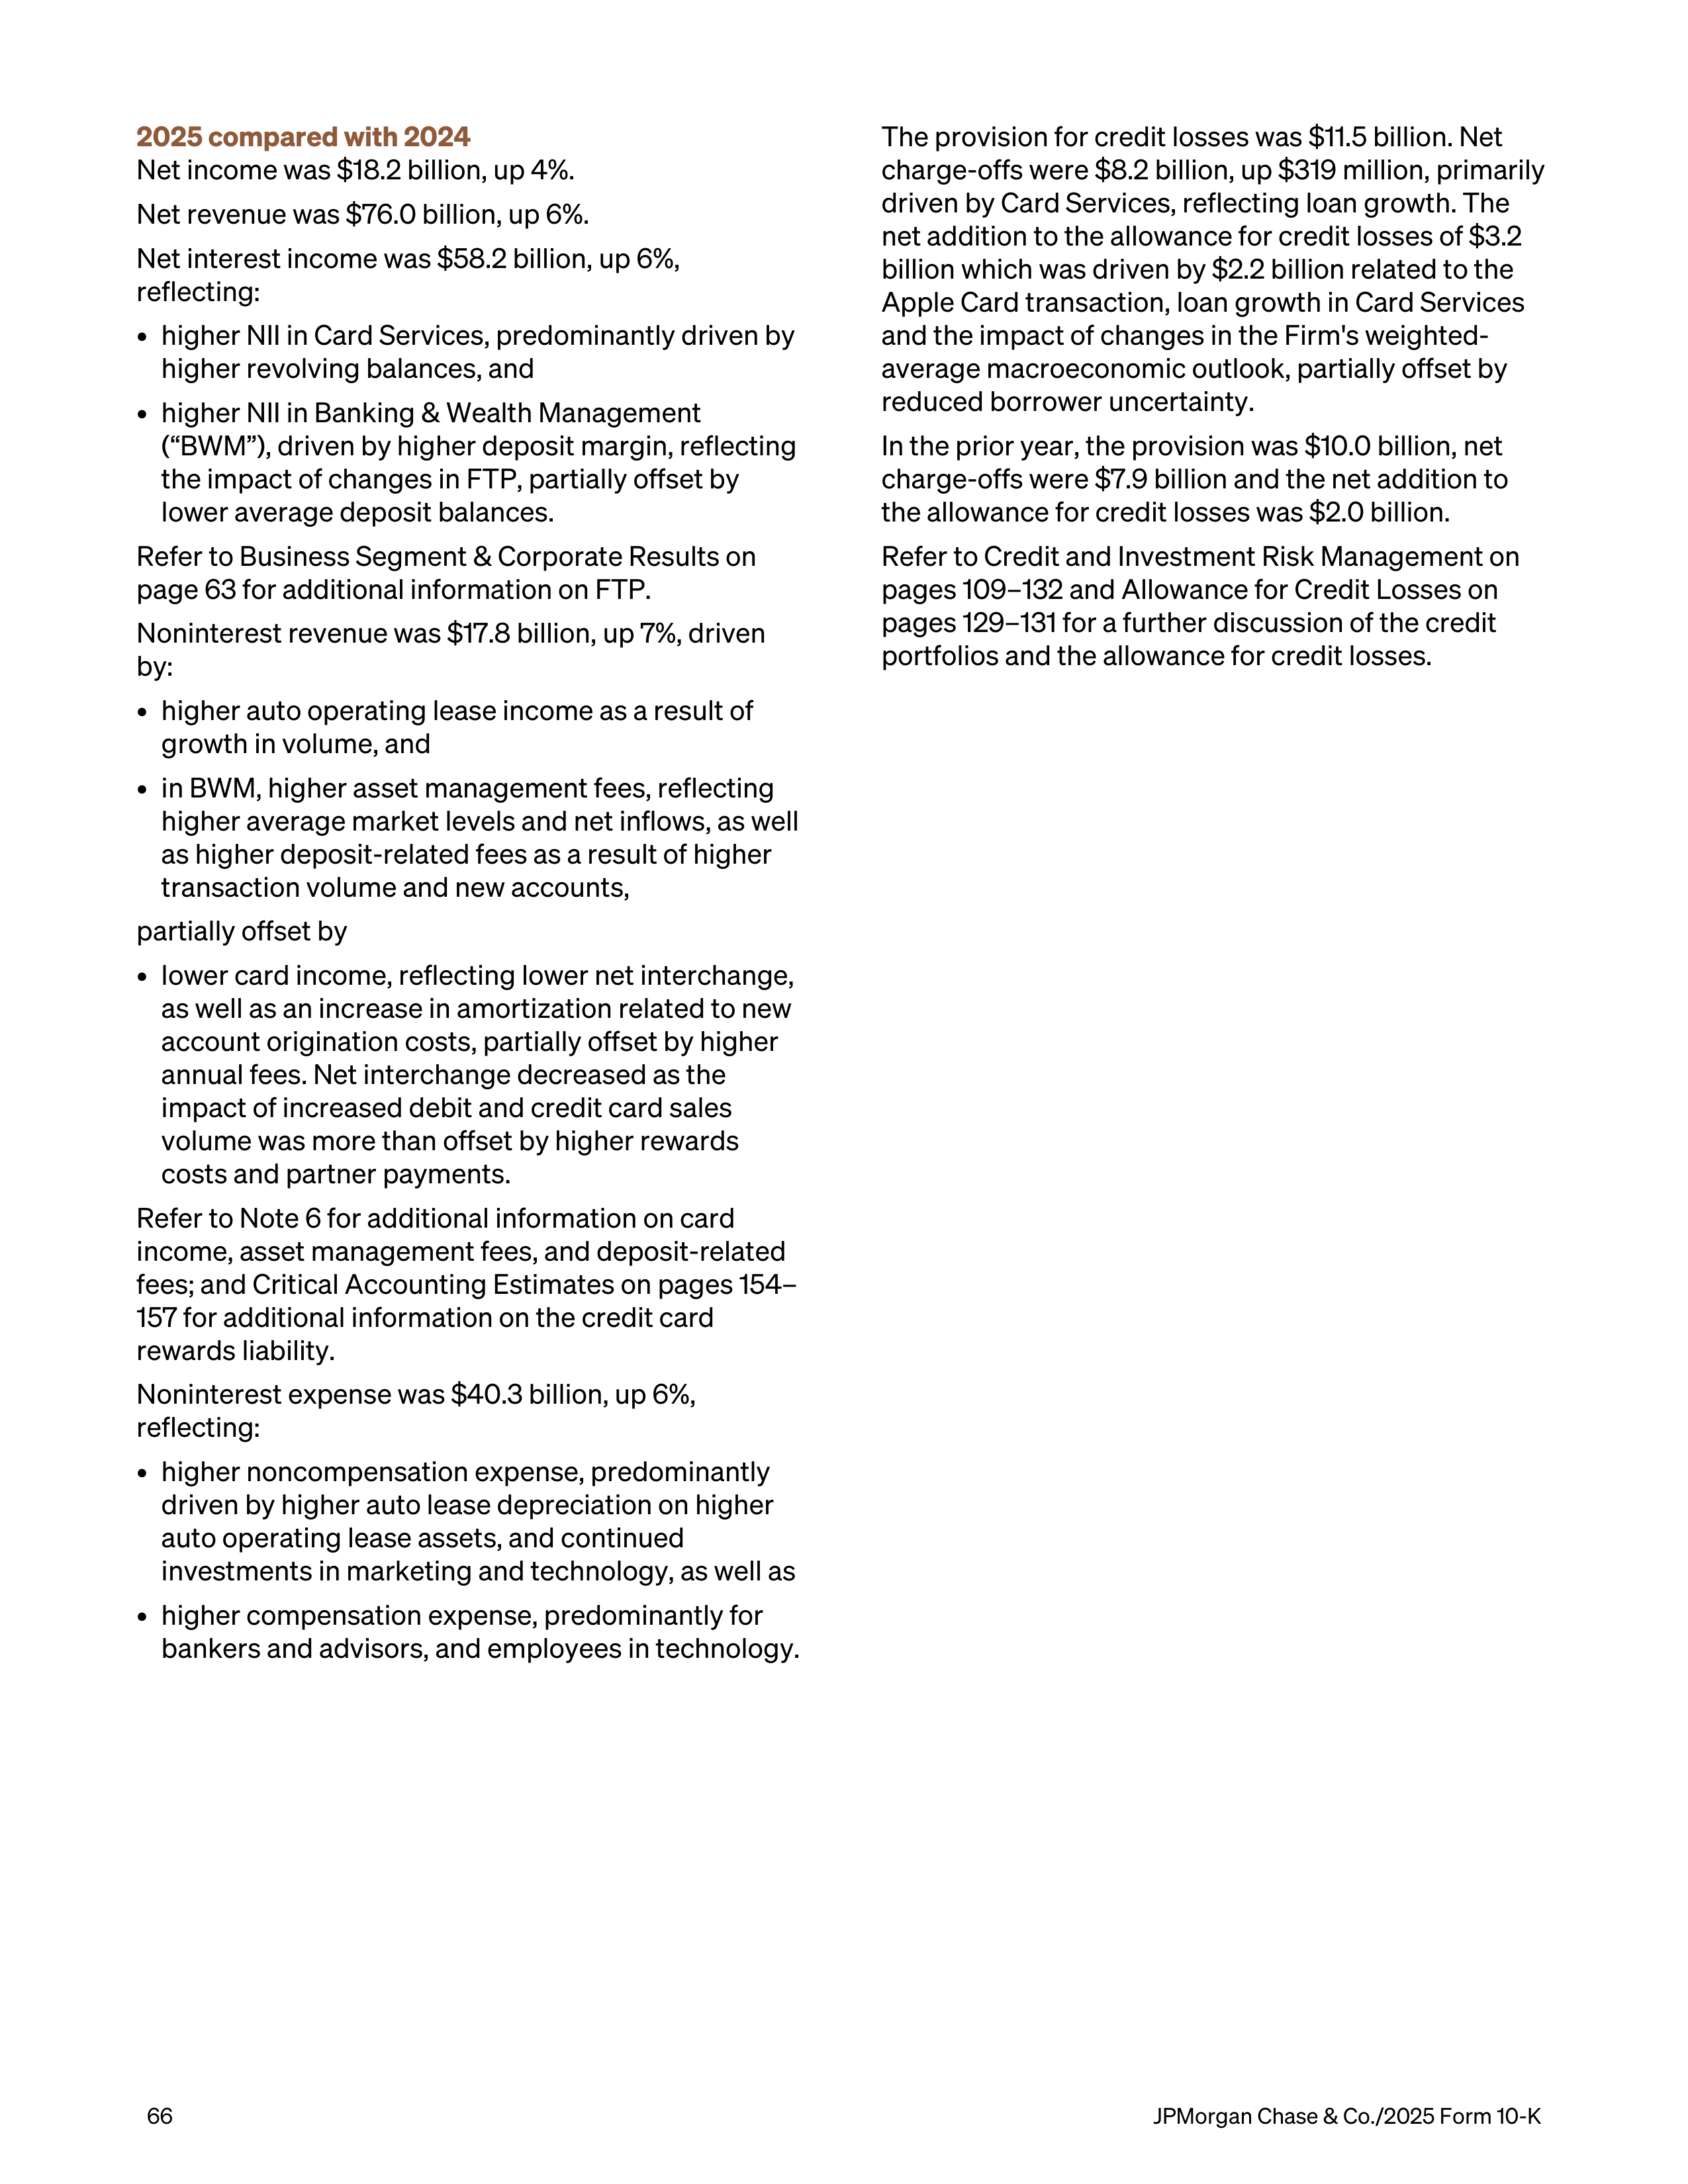
2025 compared with 2024
Net income was $18.2 billion, up 4%.
Net revenue was $76.0 billion, up 6%.
Net interest income was $58.2 billion, up 6%,
reflecting:
•
higher NII in Card Services, predominantly driven by
higher revolving balances, and
•
higher NII in Banking & Wealth Management
(“BWM”), driven by higher deposit margin, reflecting
the impact of changes in FTP, partially offset by
lower average deposit balances.
Refer to Business Segment & Corporate Results on
page 63 for additional information on FTP.
Noninterest revenue was $17.8 billion, up 7%, driven
by:
•
higher auto operating lease income as a result of
growth in volume, and
•
in BWM, higher asset management fees, reflecting
higher average market levels and net inflows, as well
as higher deposit-related fees as a result of higher
transaction volume and new accounts,
partially offset by
•
lower card income, reflecting lower net interchange,
as well as an increase in amortization related to new
account origination costs, partially offset by higher
annual fees. Net interchange decreased as the
impact of increased debit and credit card sales
volume was more than offset by higher rewards
costs and partner payments.
Refer to Note 6 for additional information on card
income, asset management fees, and deposit-related
fees; and Critical Accounting Estimates on pages 154–
157 for additional information on the credit card
rewards liability.
Noninterest expense was $40.3 billion, up 6%,
reflecting:
•
higher noncompensation expense, predominantly
driven by higher auto lease depreciation on higher
auto operating lease assets, and continued
investments in marketing and technology, as well as
•
higher compensation expense, predominantly for
bankers and advisors, and employees in technology.
The provision for credit losses was $11.5 billion. Net
charge-offs were $8.2 billion, up $319 million, primarily
driven by Card Services, reflecting loan growth. The
net addition to the allowance for credit losses of $3.2
billion which was driven by $2.2 billion related to the
Apple Card transaction, loan growth in Card Services
and the impact of changes in the Firm's weighted-
average macroeconomic outlook, partially offset by
reduced borrower uncertainty.
In the prior year, the provision was $10.0 billion, net
charge-offs were $7.9 billion and the net addition to
the allowance for credit losses was $2.0 billion.
Refer to Credit and Investment Risk Management on
pages 109–132 and Allowance for Credit Losses on
pages 129–131 for a further discussion of the credit
portfolios and the allowance for credit losses.
66
JPMorgan Chase & Co./2025 Form 10-K
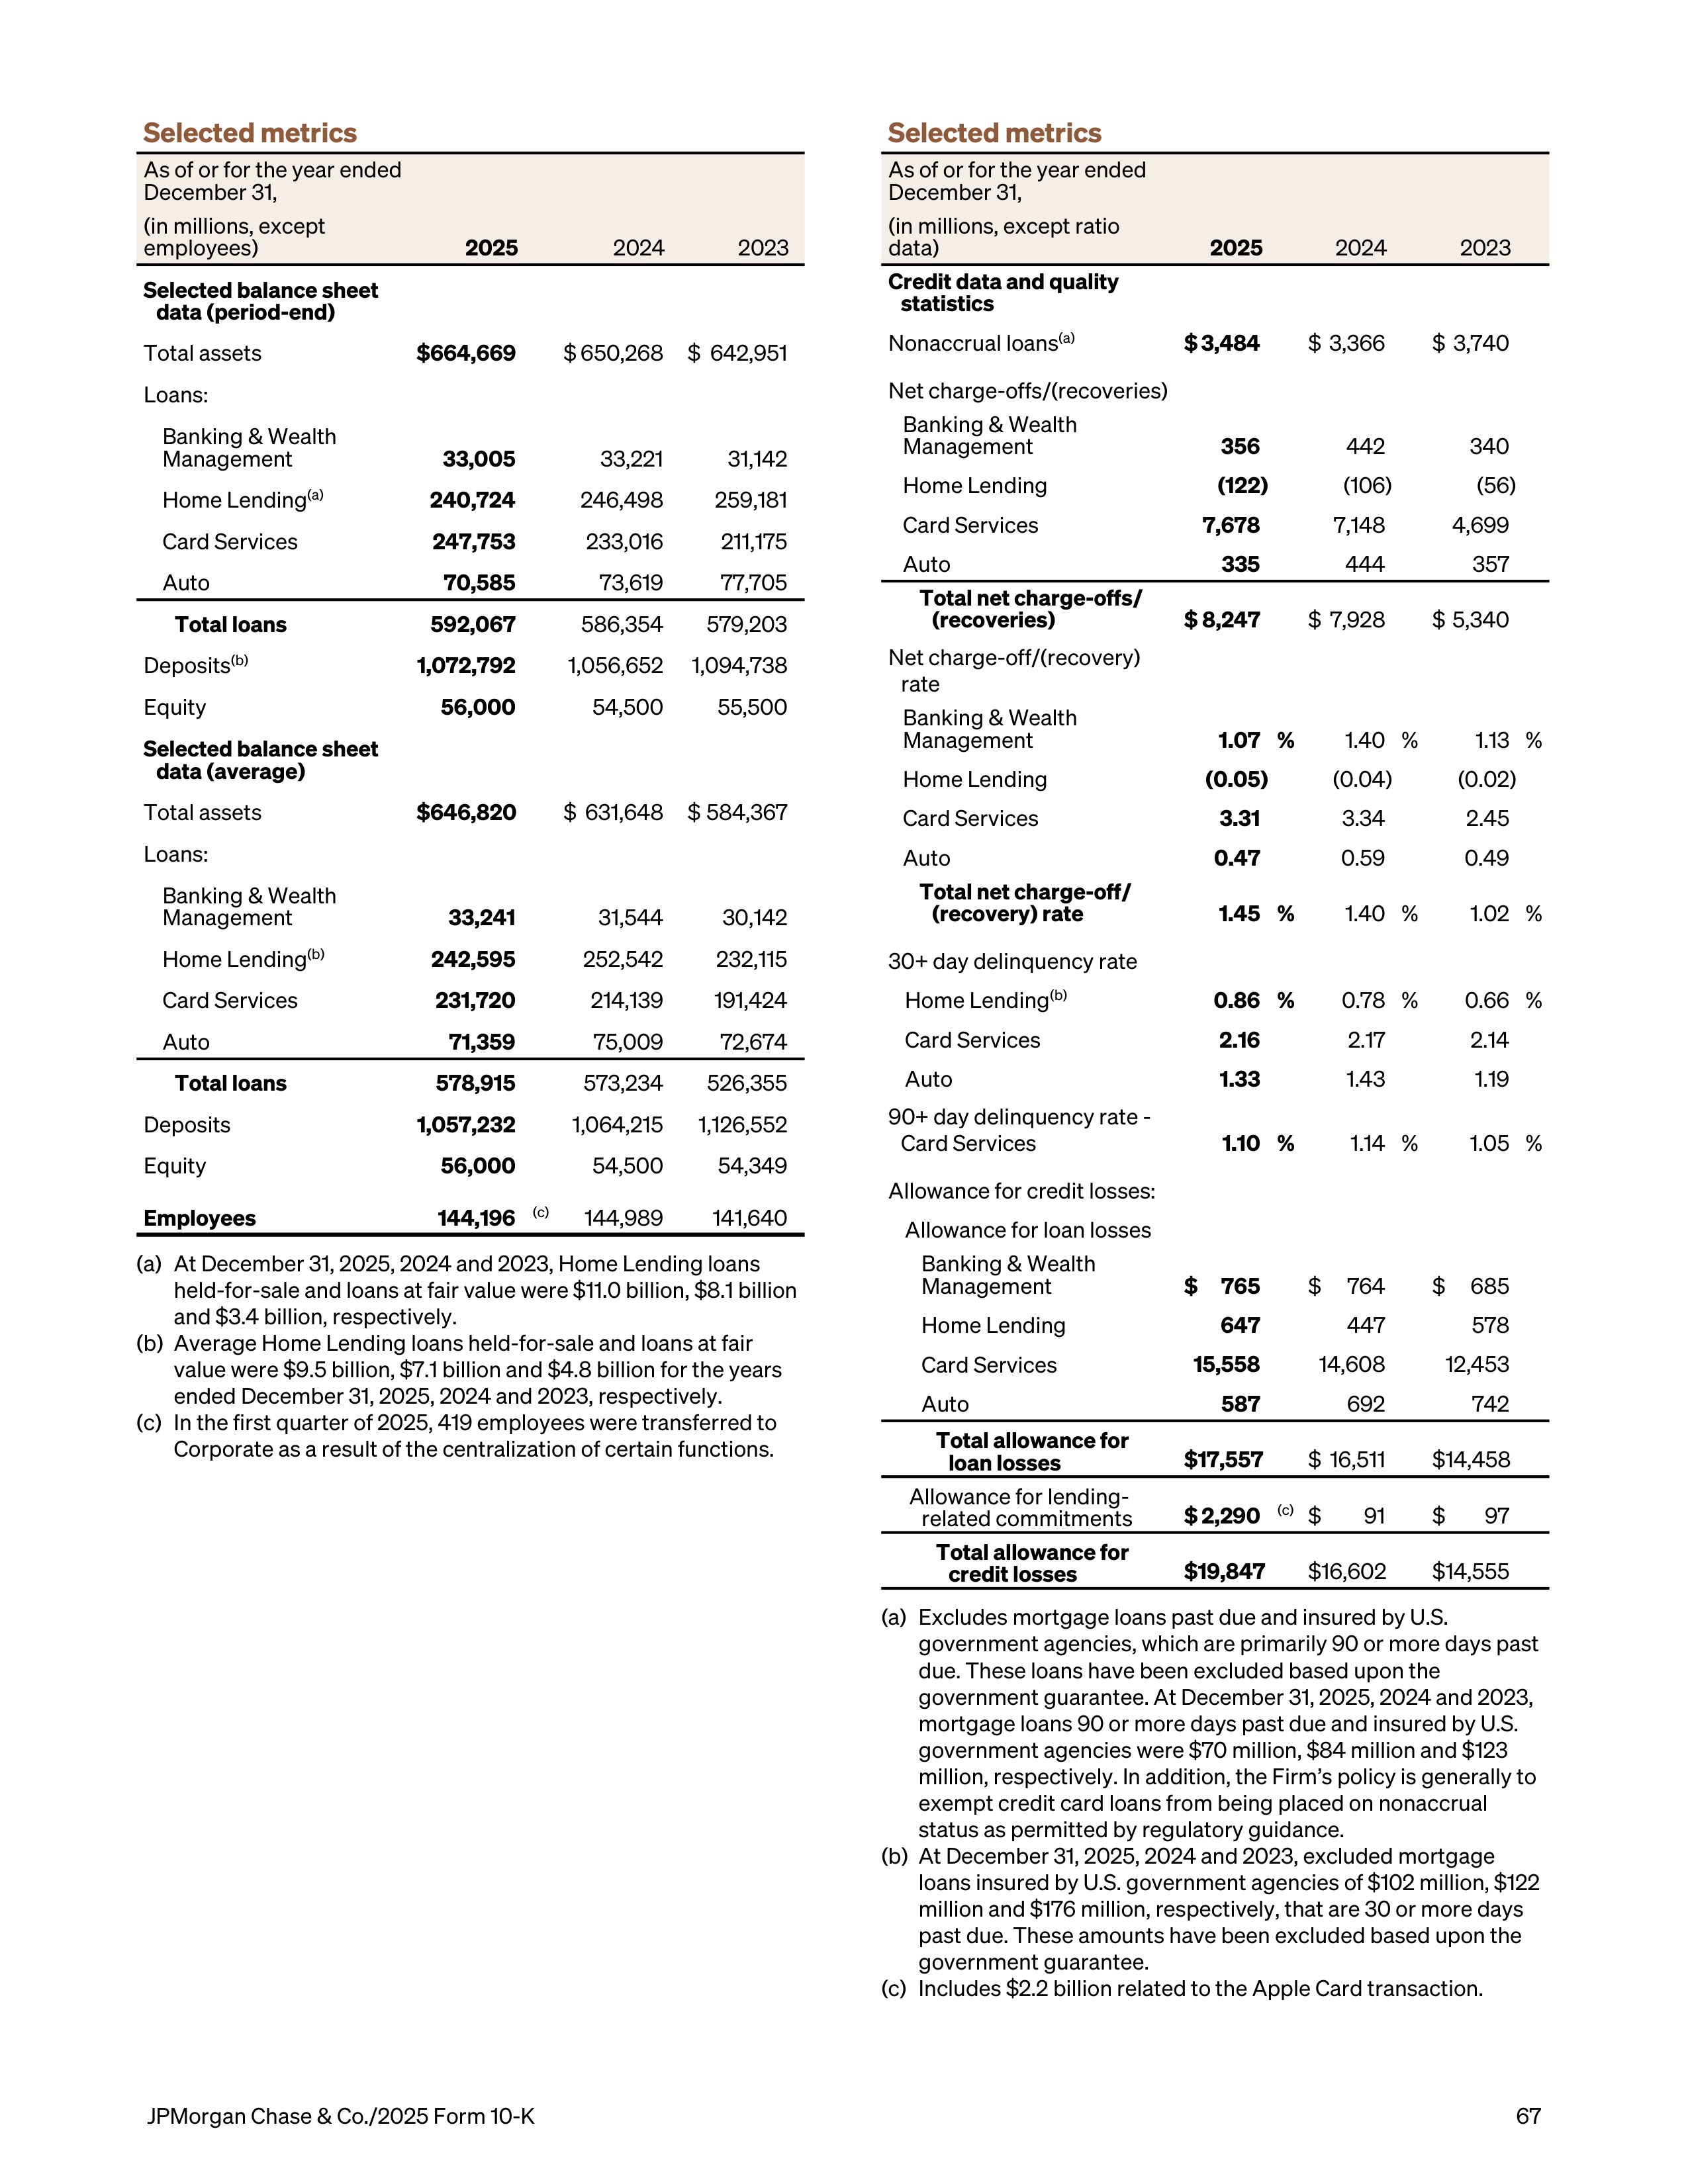
Selected metrics
As of or for the year ended
December 31,
(in millions, except
employees)
2025
2024
2023
Selected balance sheet
data (period-end)
Total assets
$ 664,669
$ 650,268
$ 642,951
Loans:
Banking & Wealth
Management
33,005
33,221
31,142
Home Lending
(a)
240,724
246,498
259,181
Card Services
247,753
233,016
211,175
Auto
70,585
73,619
77,705
Total loans
592,067
586,354
579,203
Deposits
(b)
1,072,792
1,056,652
1,094,738
Equity
56,000
54,500
55,500
Selected balance sheet
data (average)
Total assets
$ 646,820
$ 631,648
$ 584,367
Loans:
Banking & Wealth
Management
33,241
31,544
30,142
Home Lending
(b)
242,595
252,542
232,115
Card Services
231,720
214,139
191,424
Auto
71,359
75,009
72,674
Total loans
578,915
573,234
526,355
Deposits
1,057,232
1,064,215
1,126,552
Equity
56,000
54,500
54,349
Employees
144,196
(c)
144,989
141,640
(a)
At December 31, 2025, 2024 and 2023, Home Lending loans
held-for-sale and loans at fair value were $11.0 billion, $8.1 billion
and $3.4 billion, respectively.
(b)
Average Home Lending loans held-for-sale and loans at fair
value were $9.5 billion, $7.1 billion and $4.8 billion for the years
ended December 31, 2025, 2024 and 2023, respectively.
(c)
In the first quarter of 2025, 419 employees were transferred to
Corporate as a result of the centralization of certain functions.
Selected metrics
As of or for the year ended
December 31,
(in millions, except ratio
data)
2025
2024
2023
Credit data and quality
statistics
Nonaccrual loans
(a)
$ 3,484
$ 3,366
$ 3,740
Net charge-offs/(recoveries)
Banking & Wealth
Management
356
442
340
Home Lending
(122)
(106)
(56)
Card Services
7,678
7,148
4,699
Auto
335
444
357
Total net charge-offs/
(recoveries)
$ 8,247
$ 7,928
$ 5,340
Net charge-off/(recovery)
rate
Banking & Wealth
Management
1.07 %
1.40 %
1.13 %
Home Lending
(0.05)
(0.04)
(0.02)
Card Services
3.31
3.34
2.45
Auto
0.47
0.59
0.49
Total net charge-off/
(recovery) rate
1.45 %
1.40 %
1.02 %
30+ day delinquency rate
Home Lending
(b)
0.86 %
0.78 %
0.66 %
Card Services
2.16
2.17
2.14
Auto
1.33
1.43
1.19
90+ day delinquency rate -
Card Services
1.10 %
1.14 %
1.05 %
Allowance for credit losses:
Allowance for loan losses
Banking & Wealth
Management
$
765
$
764
$
685
Home Lending
647
447
578
Card Services
15,558
14,608
12,453
Auto
587
692
742
Total allowance for
loan losses
$ 17,557
$ 16,511
$ 14,458
Allowance for lending-
related commitments
$ 2,290
(c)
$
91
$
97
Total allowance for
credit losses
$ 19,847
$ 16,602
$ 14,555
(a)
Excludes mortgage loans past due and insured by U.S.
government agencies, which are primarily 90 or more days past
due. These loans have been excluded based upon the
government guarantee. At December 31, 2025, 2024 and 2023,
mortgage loans 90 or more days past due and insured by U.S.
government agencies were $70 million, $84 million and $123
million, respectively. In addition, the Firm’s policy is generally to
exempt credit card loans from being placed on nonaccrual
status as permitted by regulatory guidance.
(b)
At December 31, 2025, 2024 and 2023, excluded mortgage
loans insured by U.S. government agencies of $102 million, $122
million and $176 million, respectively, that are 30 or more days
past due. These amounts have been excluded based upon the
government guarantee.
(c)
Includes $2.2 billion related to the Apple Card transaction.
JPMorgan Chase & Co./2025 Form 10-K
67
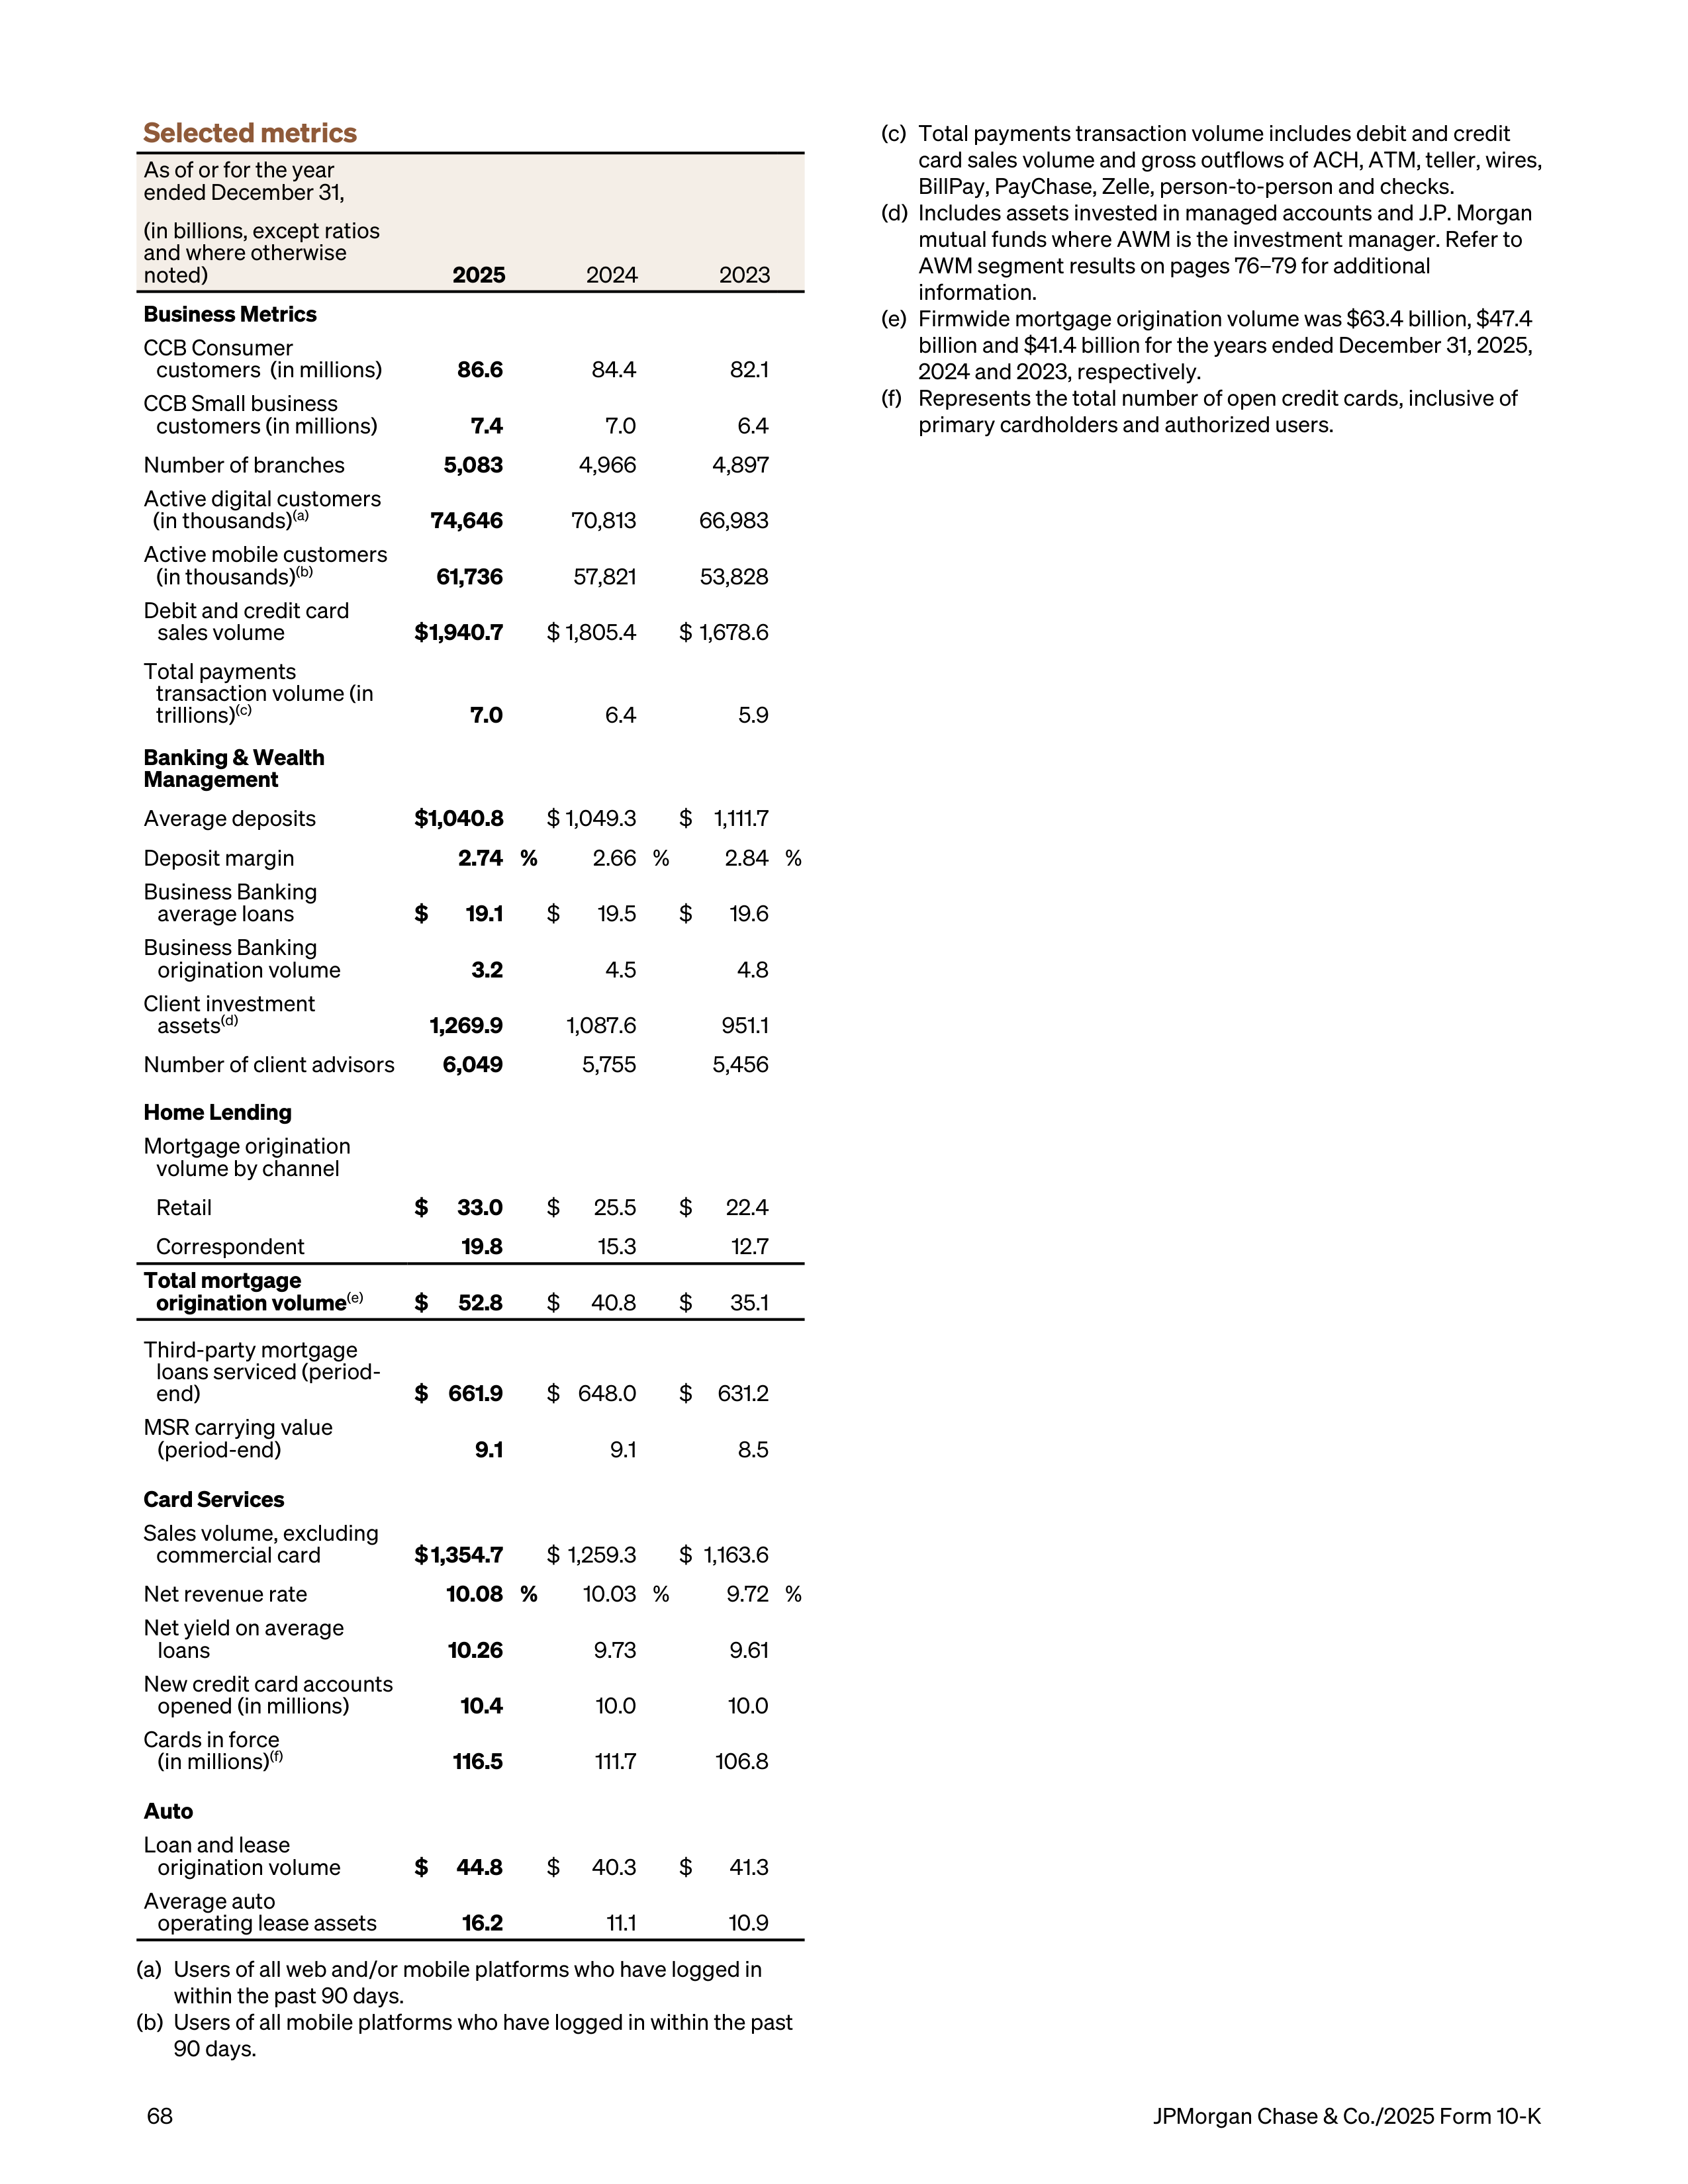
Selected metrics
As of or for the year
ended December 31,
(in billions, except ratios
and where otherwise
noted)
2025
2024
2023
Business Metrics
CCB Consumer
customers (in millions)
86.6
84.4
82.1
CCB Small business
customers (in millions)
7.4
7.0
6.4
Number of branches
5,083
4,966
4,897
Active digital customers
(in thousands)
(a)
74,646
70,813
66,983
Active mobile customers
(in thousands)
(b)
61,736
57,821
53,828
Debit and credit card
sales volume
$ 1,940.7
$ 1,805.4
$ 1,678.6
Total payments
transaction volume (in
trillions)
(c)
7.0
6.4
5.9
Banking & Wealth
Management
Average deposits
$ 1,040.8
$ 1,049.3
$ 1,111.7
Deposit margin
2.74 %
2.66 %
2.84 %
Business Banking
average loans
$
19.1
$
19.5
$
19.6
Business Banking
origination volume
3.2
4.5
4.8
Client investment
assets
(d)
1,269.9
1,087.6
951.1
Number of client advisors
6,049
5,755
5,456
Home Lending
Mortgage origination
volume by channel
Retail
$
33.0
$
25.5
$
22.4
Correspondent
19.8
15.3
12.7
Total mortgage
origination volume
(e)
$
52.8
$
40.8
$
35.1
Third-party mortgage
loans serviced (period-
end)
$ 661.9
$ 648.0
$
631.2
MSR carrying value
(period-end)
9.1
9.1
8.5
Card Services
Sales volume, excluding
commercial card
$ 1,354.7
$ 1,259.3
$ 1,163.6
Net revenue rate
10.08 %
10.03 %
9.72 %
Net yield on average
loans
10.26
9.73
9.61
New credit card accounts
opened (in millions)
10.4
10.0
10.0
Cards in force
(in millions)
(f)
116.5
111.7
106.8
Auto
Loan and lease
origination volume
$
44.8
$
40.3
$
41.3
Average auto
operating lease assets
16.2
11.1
10.9
(a)
Users of all web and/or mobile platforms who have logged in
within the past 90 days.
(b)
Users of all mobile platforms who have logged in within the past
90 days.
(c)
Total payments transaction volume includes debit and credit
card sales volume and gross outflows of ACH, ATM, teller, wires,
BillPay, PayChase, Zelle, person-to-person and checks.
(d)
Includes assets invested in managed accounts and J.P. Morgan
mutual funds where AWM is the investment manager. Refer to
AWM segment results on pages 76–79 for additional
information.
(e)
Firmwide mortgage origination volume was $63.4 billion, $47.4
billion and $41.4 billion for the years ended December 31, 2025,
2024 and 2023, respectively.
(f)
Represents the total number of open credit cards, inclusive of
primary cardholders and authorized users.
68
JPMorgan Chase & Co./2025 Form 10-K
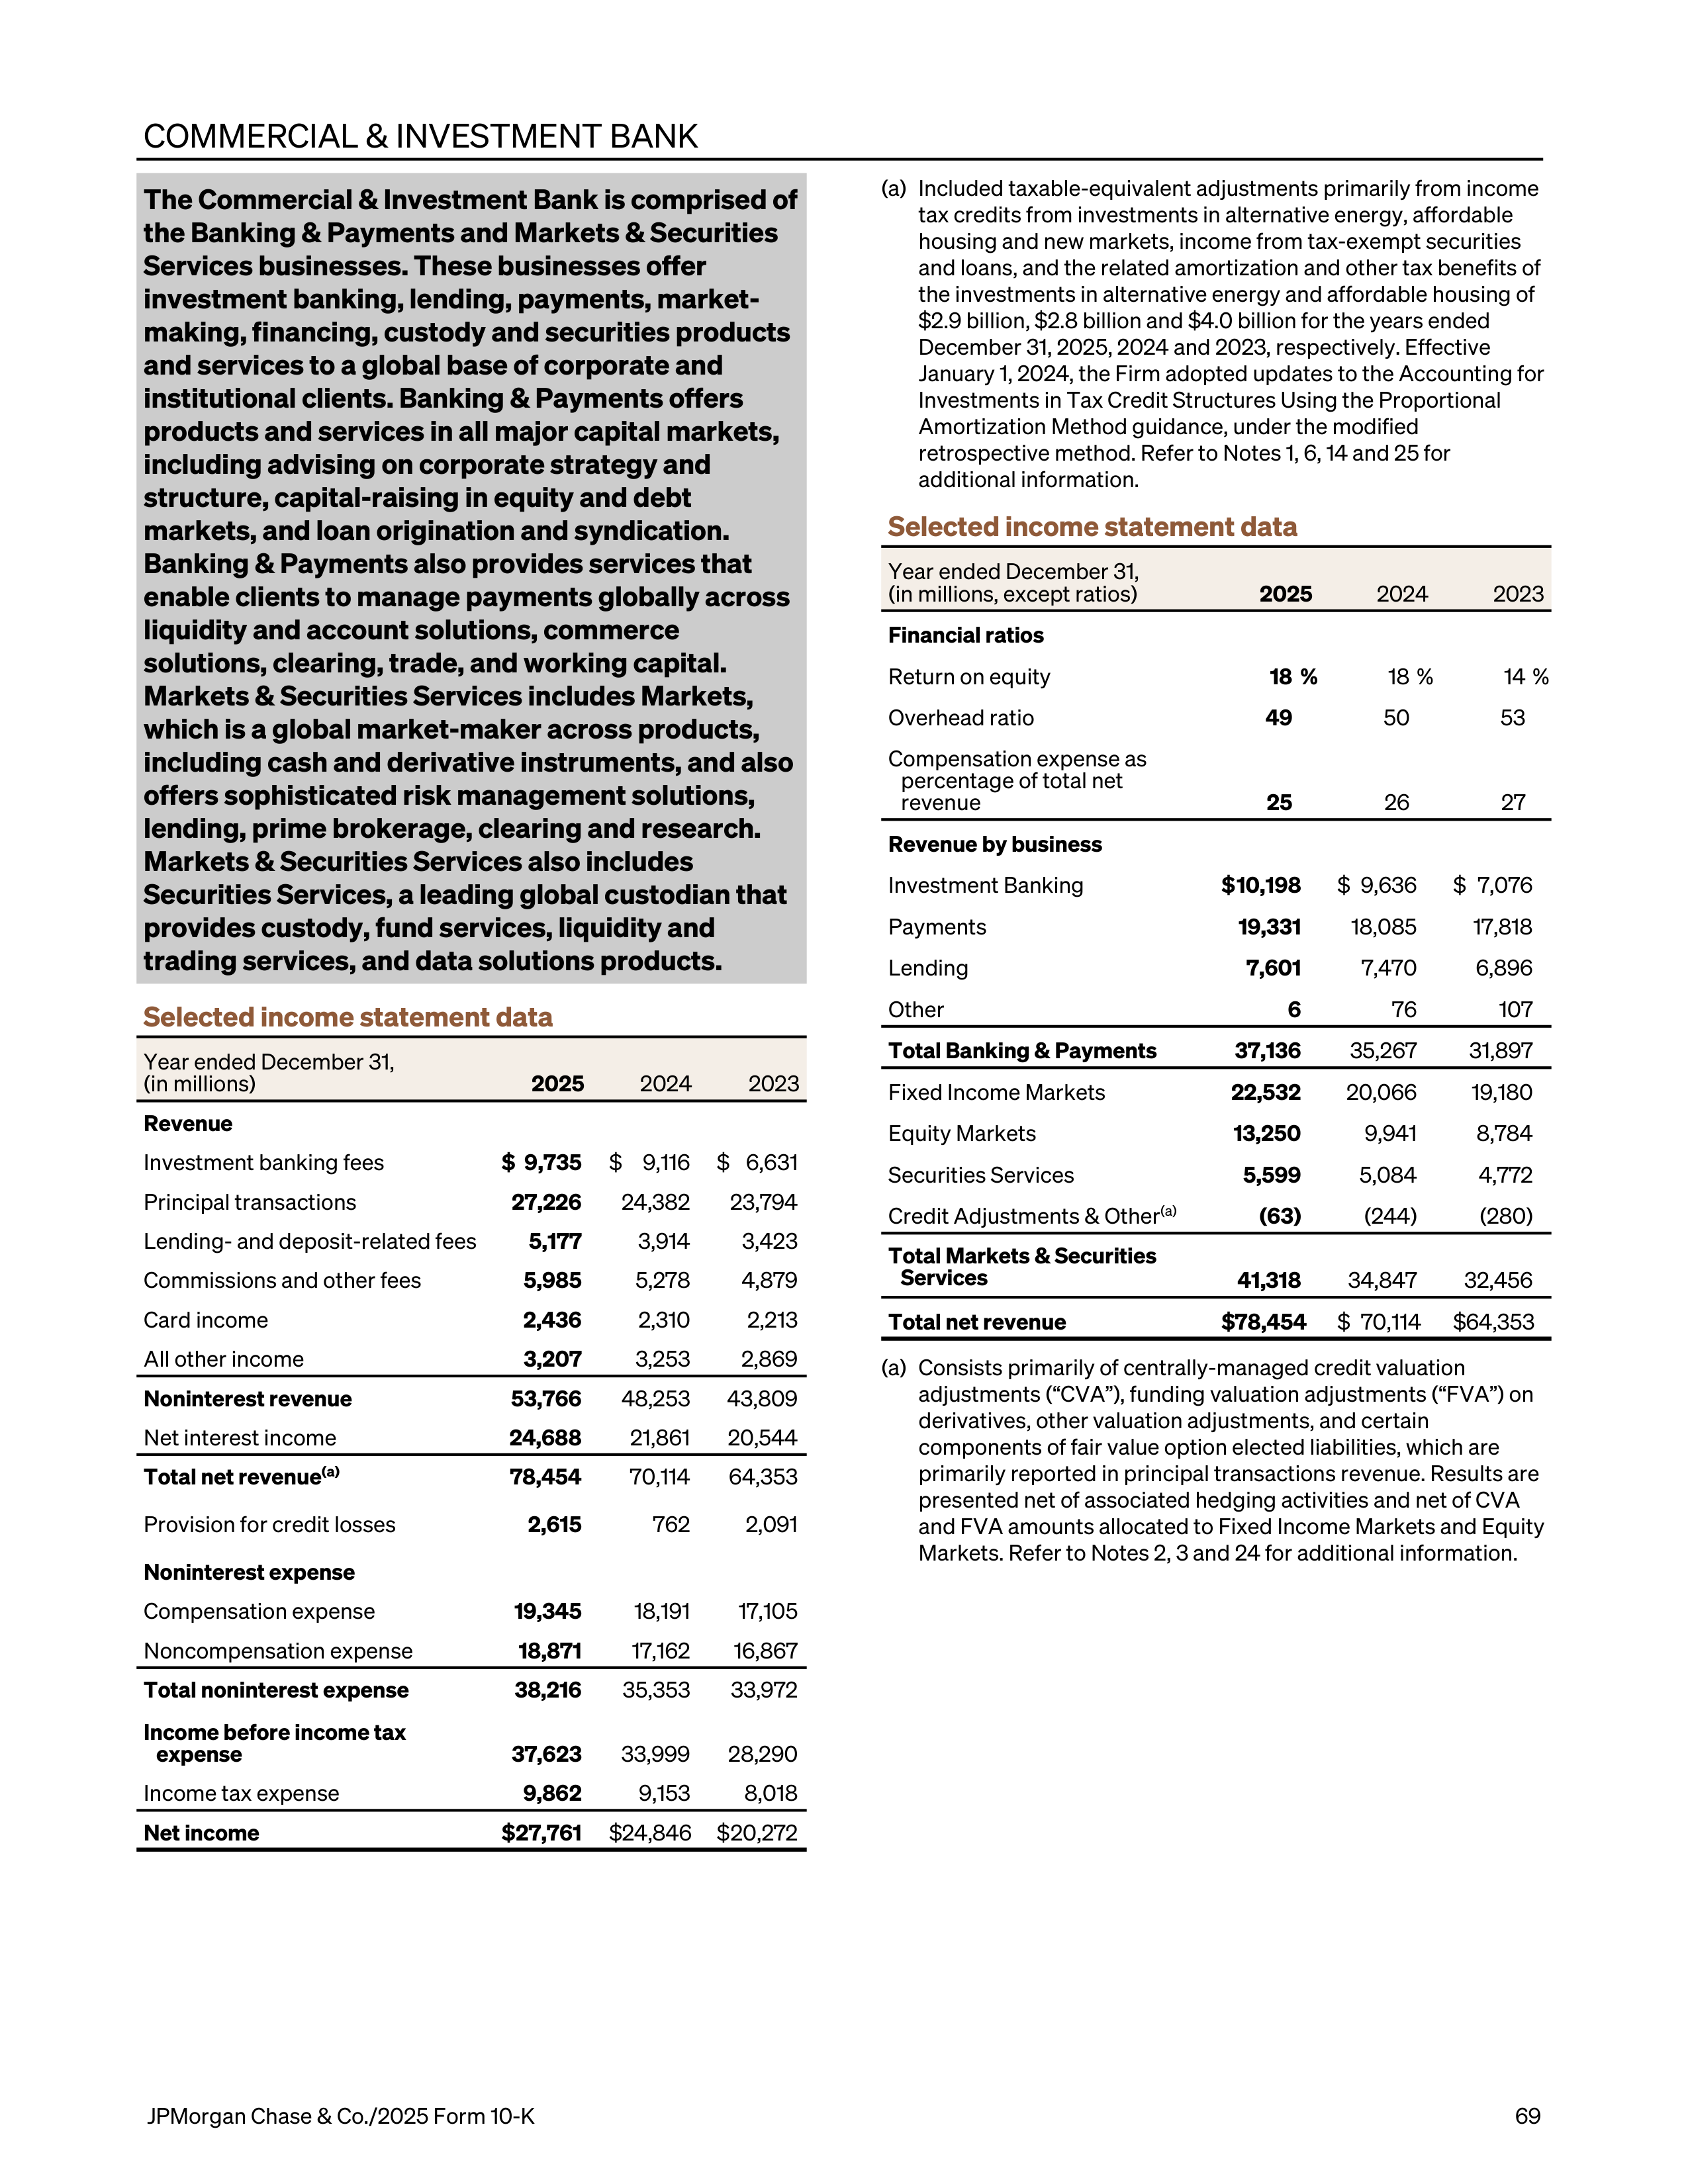
COMMERCIAL & INVESTMENT BANK
The Commercial & Investment Bank is comprised of
the Banking & Payments and Markets & Securities
Services businesses. These businesses offer
investment banking, lending, payments, market-
making, financing, custody and securities products
and services to a global base of corporate and
institutional clients. Banking & Payments offers
products and services in all major capital markets,
including advising on corporate strategy and
structure, capital-raising in equity and debt
markets, and loan origination and syndication.
Banking & Payments also provides services that
enable clients to manage payments globally across
liquidity and account solutions, commerce
solutions, clearing, trade, and working capital.
Markets & Securities Services includes Markets,
which is a global market-maker across products,
including cash and derivative instruments, and also
offers sophisticated risk management solutions,
lending, prime brokerage, clearing and research.
Markets & Securities Services also includes
Securities Services, a leading global custodian that
provides custody, fund services, liquidity and
trading services, and data solutions products.
Selected income statement data
Year ended December 31,
(in millions)
2025
2024
2023
Revenue
Investment banking fees
$ 9,735
$ 9,116
$ 6,631
Principal transactions
27,226
24,382
23,794
Lending- and deposit-related fees
5,177
3,914
3,423
Commissions and other fees
5,985
5,278
4,879
Card income
2,436
2,310
2,213
All other income
3,207
3,253
2,869
Noninterest revenue
53,766
48,253
43,809
Net interest income
24,688
21,861
20,544
Total net revenue
(a)
78,454
70,114
64,353
Provision for credit losses
2,615
762
2,091
Noninterest expense
Compensation expense
19,345
18,191
17,105
Noncompensation expense
18,871
17,162
16,867
Total noninterest expense
38,216
35,353
33,972
Income before income tax
expense
37,623
33,999
28,290
Income tax expense
9,862
9,153
8,018
Net income
$ 27,761
$ 24,846
$ 20,272
(a)
Included taxable-equivalent adjustments primarily from income
tax credits from investments in alternative energy, affordable
housing and new markets, income from tax-exempt securities
and loans, and the related amortization and other tax benefits of
the investments in alternative energy and affordable housing of
$2.9 billion, $2.8 billion and $4.0 billion for the years ended
December 31, 2025, 2024 and 2023, respectively. Effective
January 1, 2024, the Firm adopted updates to the Accounting for
Investments in Tax Credit Structures Using the Proportional
Amortization Method guidance, under the modified
retrospective method. Refer to Notes 1, 6, 14 and 25 for
additional information.
Selected income statement data
Year ended December 31,
(in millions, except ratios)
2025
2024
2023
Financial ratios
Return on equity
18 %
18 %
14 %
Overhead ratio
49
50
53
Compensation expense as
percentage of total net
revenue
25
26
27
Revenue by business
Investment Banking
$ 10,198
$ 9,636
$ 7,076
Payments
19,331
18,085
17,818
Lending
7,601
7,470
6,896
Other
6
76
107
Total Banking & Payments
37,136
35,267
31,897
Fixed Income Markets
22,532
20,066
19,180
Equity Markets
13,250
9,941
8,784
Securities Services
5,599
5,084
4,772
Credit Adjustments & Other
(a)
(63)
(244)
(280)
Total Markets & Securities
Services
41,318
34,847
32,456
Total net revenue
$ 78,454
$ 70,114
$ 64,353
(a)
Consists primarily of centrally-managed credit valuation
adjustments (“CVA”), funding valuation adjustments (“FVA”) on
derivatives, other valuation adjustments, and certain
components of fair value option elected liabilities, which are
primarily reported in principal transactions revenue. Results are
presented net of associated hedging activities and net of CVA
and FVA amounts allocated to Fixed Income Markets and Equity
Markets. Refer to Notes 2, 3 and 24 for additional information.
JPMorgan Chase & Co./2025 Form 10-K
69
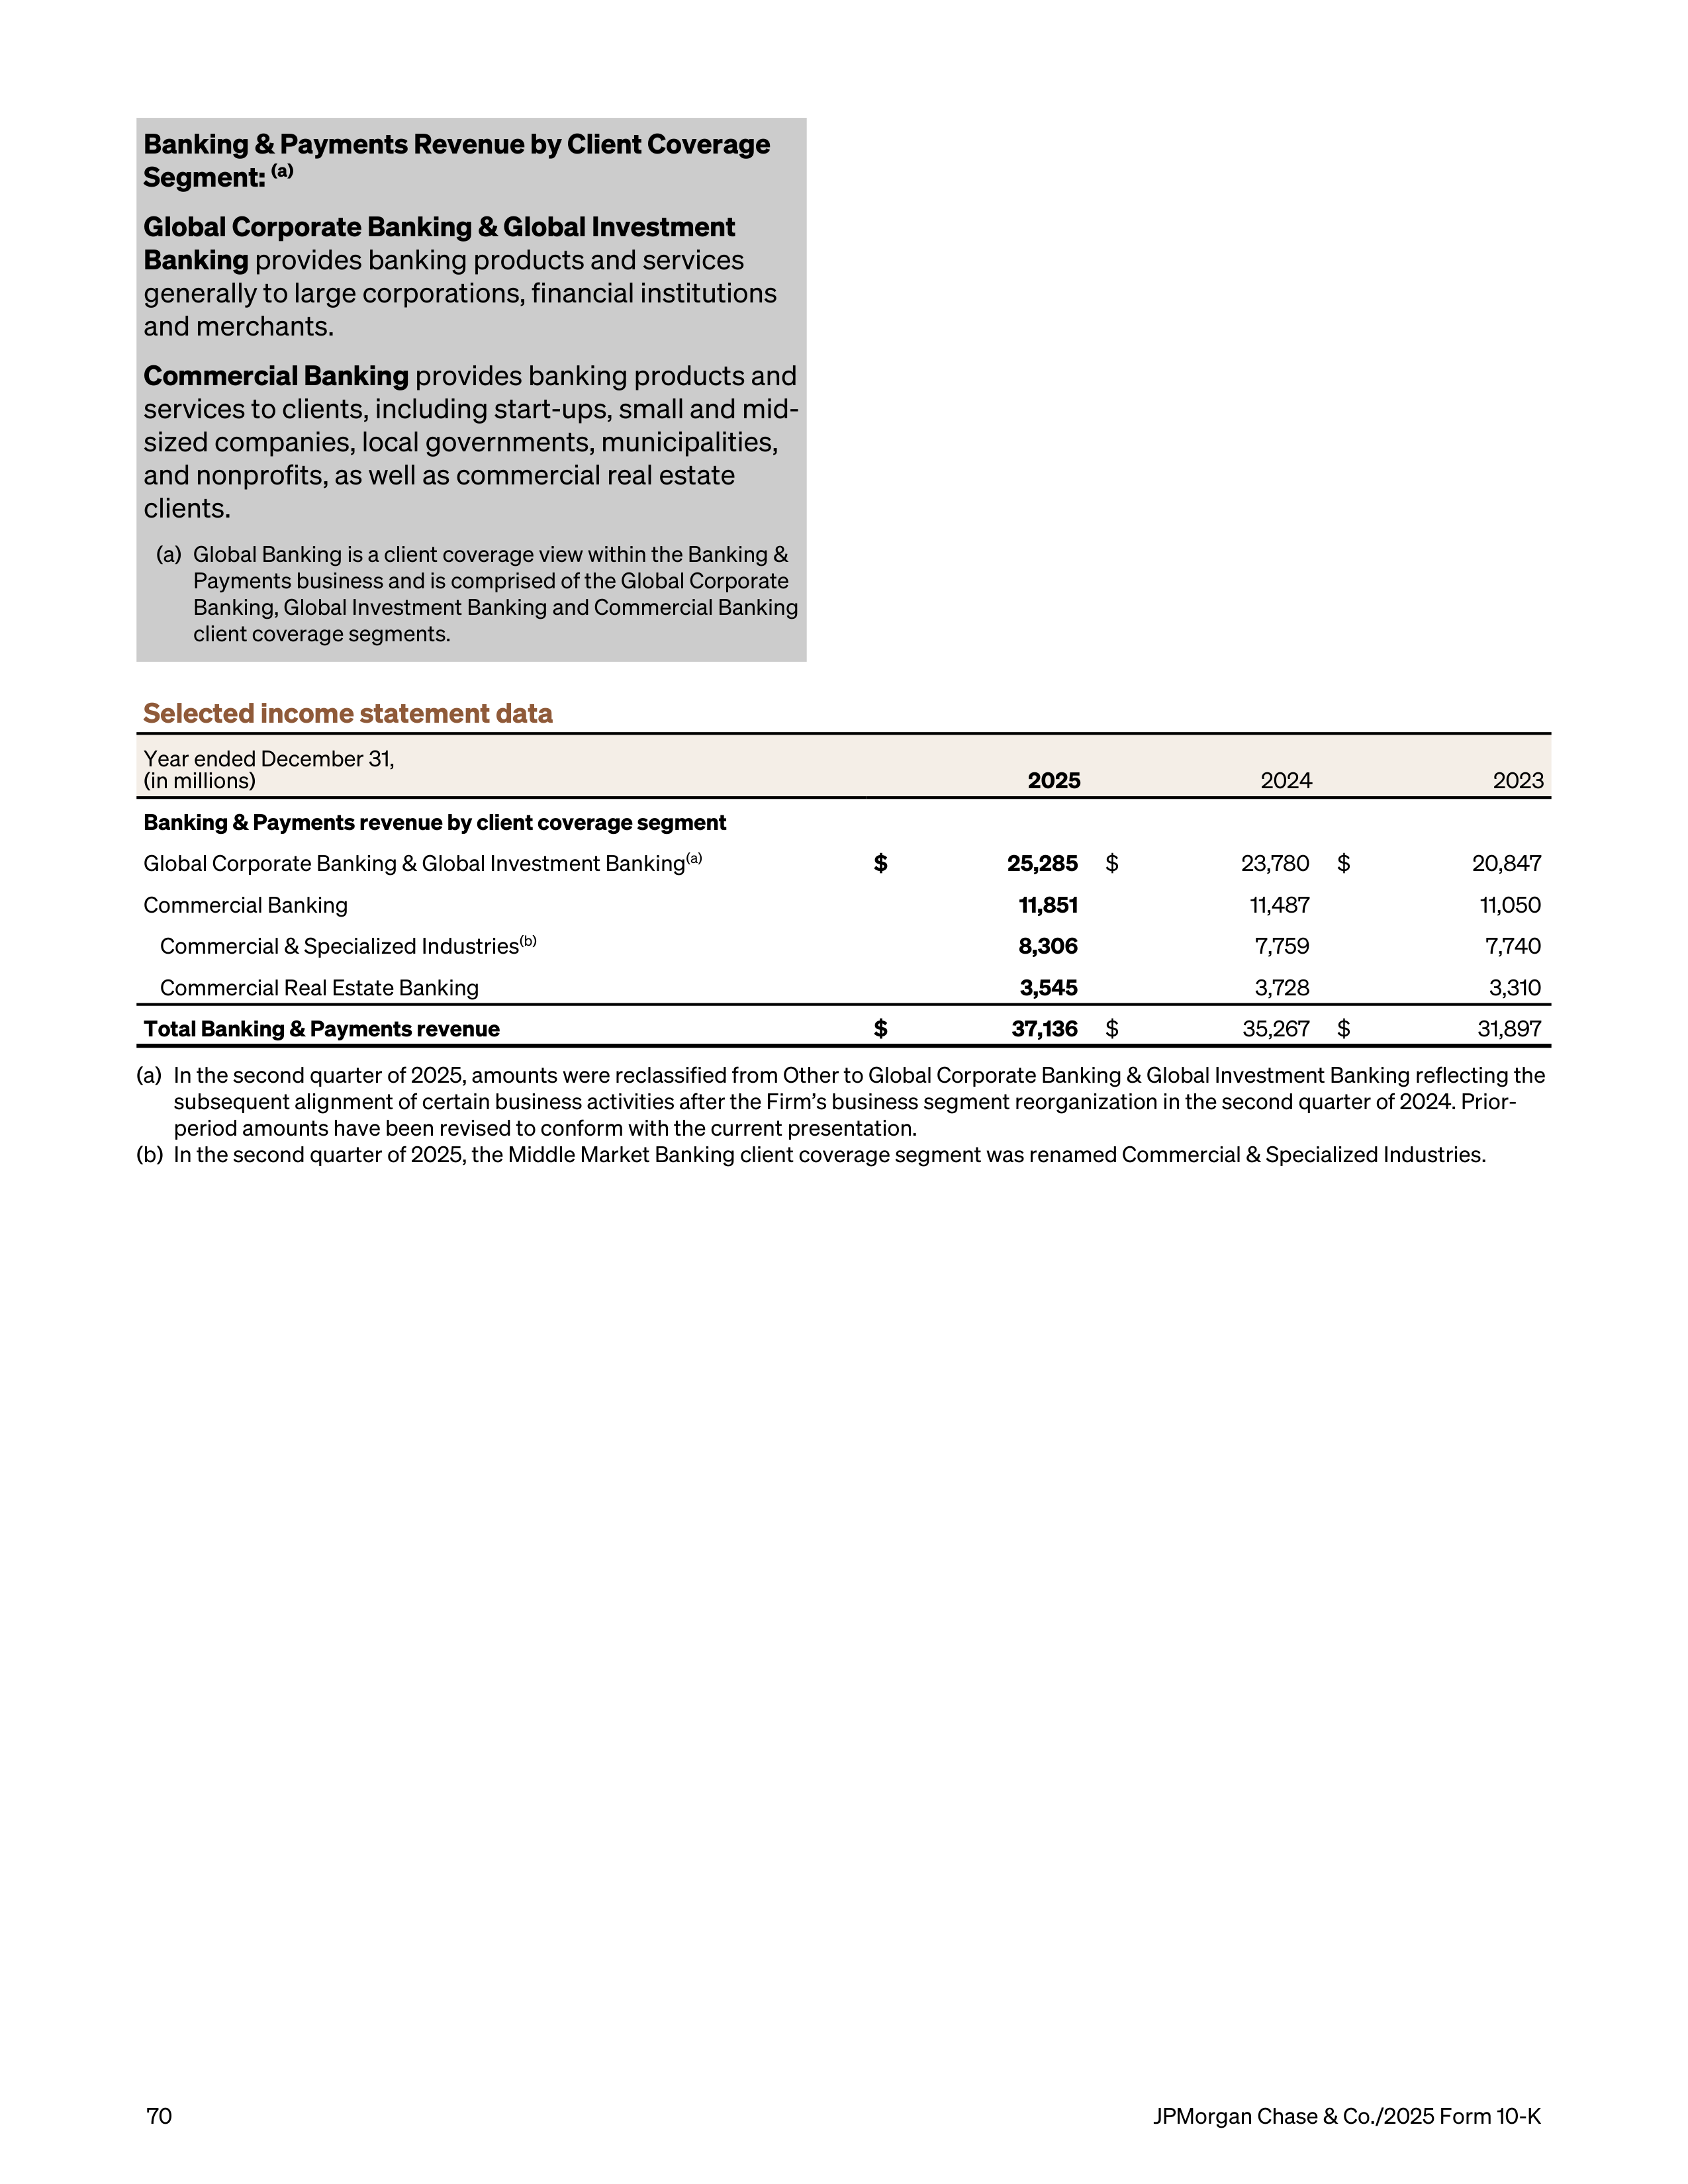
Banking & Payments Revenue by Client Coverage
Segment:
(a)
Global Corporate Banking & Global Investment
Banking
provides banking products and services
generally to large corporations, financial institutions
and merchants.
Commercial Banking
provides banking products and
services to clients, including start-ups, small and mid-
sized companies, local governments, municipalities,
and nonprofits, as well as commercial real estate
clients.
(a)
Global Banking is a client coverage view within the Banking &
Payments business and is comprised of the Global Corporate
Banking, Global Investment Banking and Commercial Banking
client coverage segments.
Selected income statement data
Year ended December 31,
(in millions)
2025
2024
2023
Banking & Payments revenue by client coverage segment
Global Corporate Banking & Global Investment Banking
(a)
$
25,285
$
23,780
$
20,847
Commercial Banking
11,851
11,487
11,050
Commercial & Specialized Industries
(b)
8,306
7,759
7,740
Commercial Real Estate Banking
3,545
3,728
3,310
Total Banking & Payments revenue
$
37,136
$
35,267
$
31,897
(a)
In the second quarter of 2025, amounts were reclassified from Other to Global Corporate Banking & Global Investment Banking reflecting the
subsequent alignment of certain business activities after the Firm’s business segment reorganization in the second quarter of 2024. Prior-
period amounts have been revised to conform with the current presentation.
(b)
In the second quarter of 2025, the Middle Market Banking client coverage segment was renamed Commercial & Specialized Industries.
70
JPMorgan Chase & Co./2025 Form 10-K
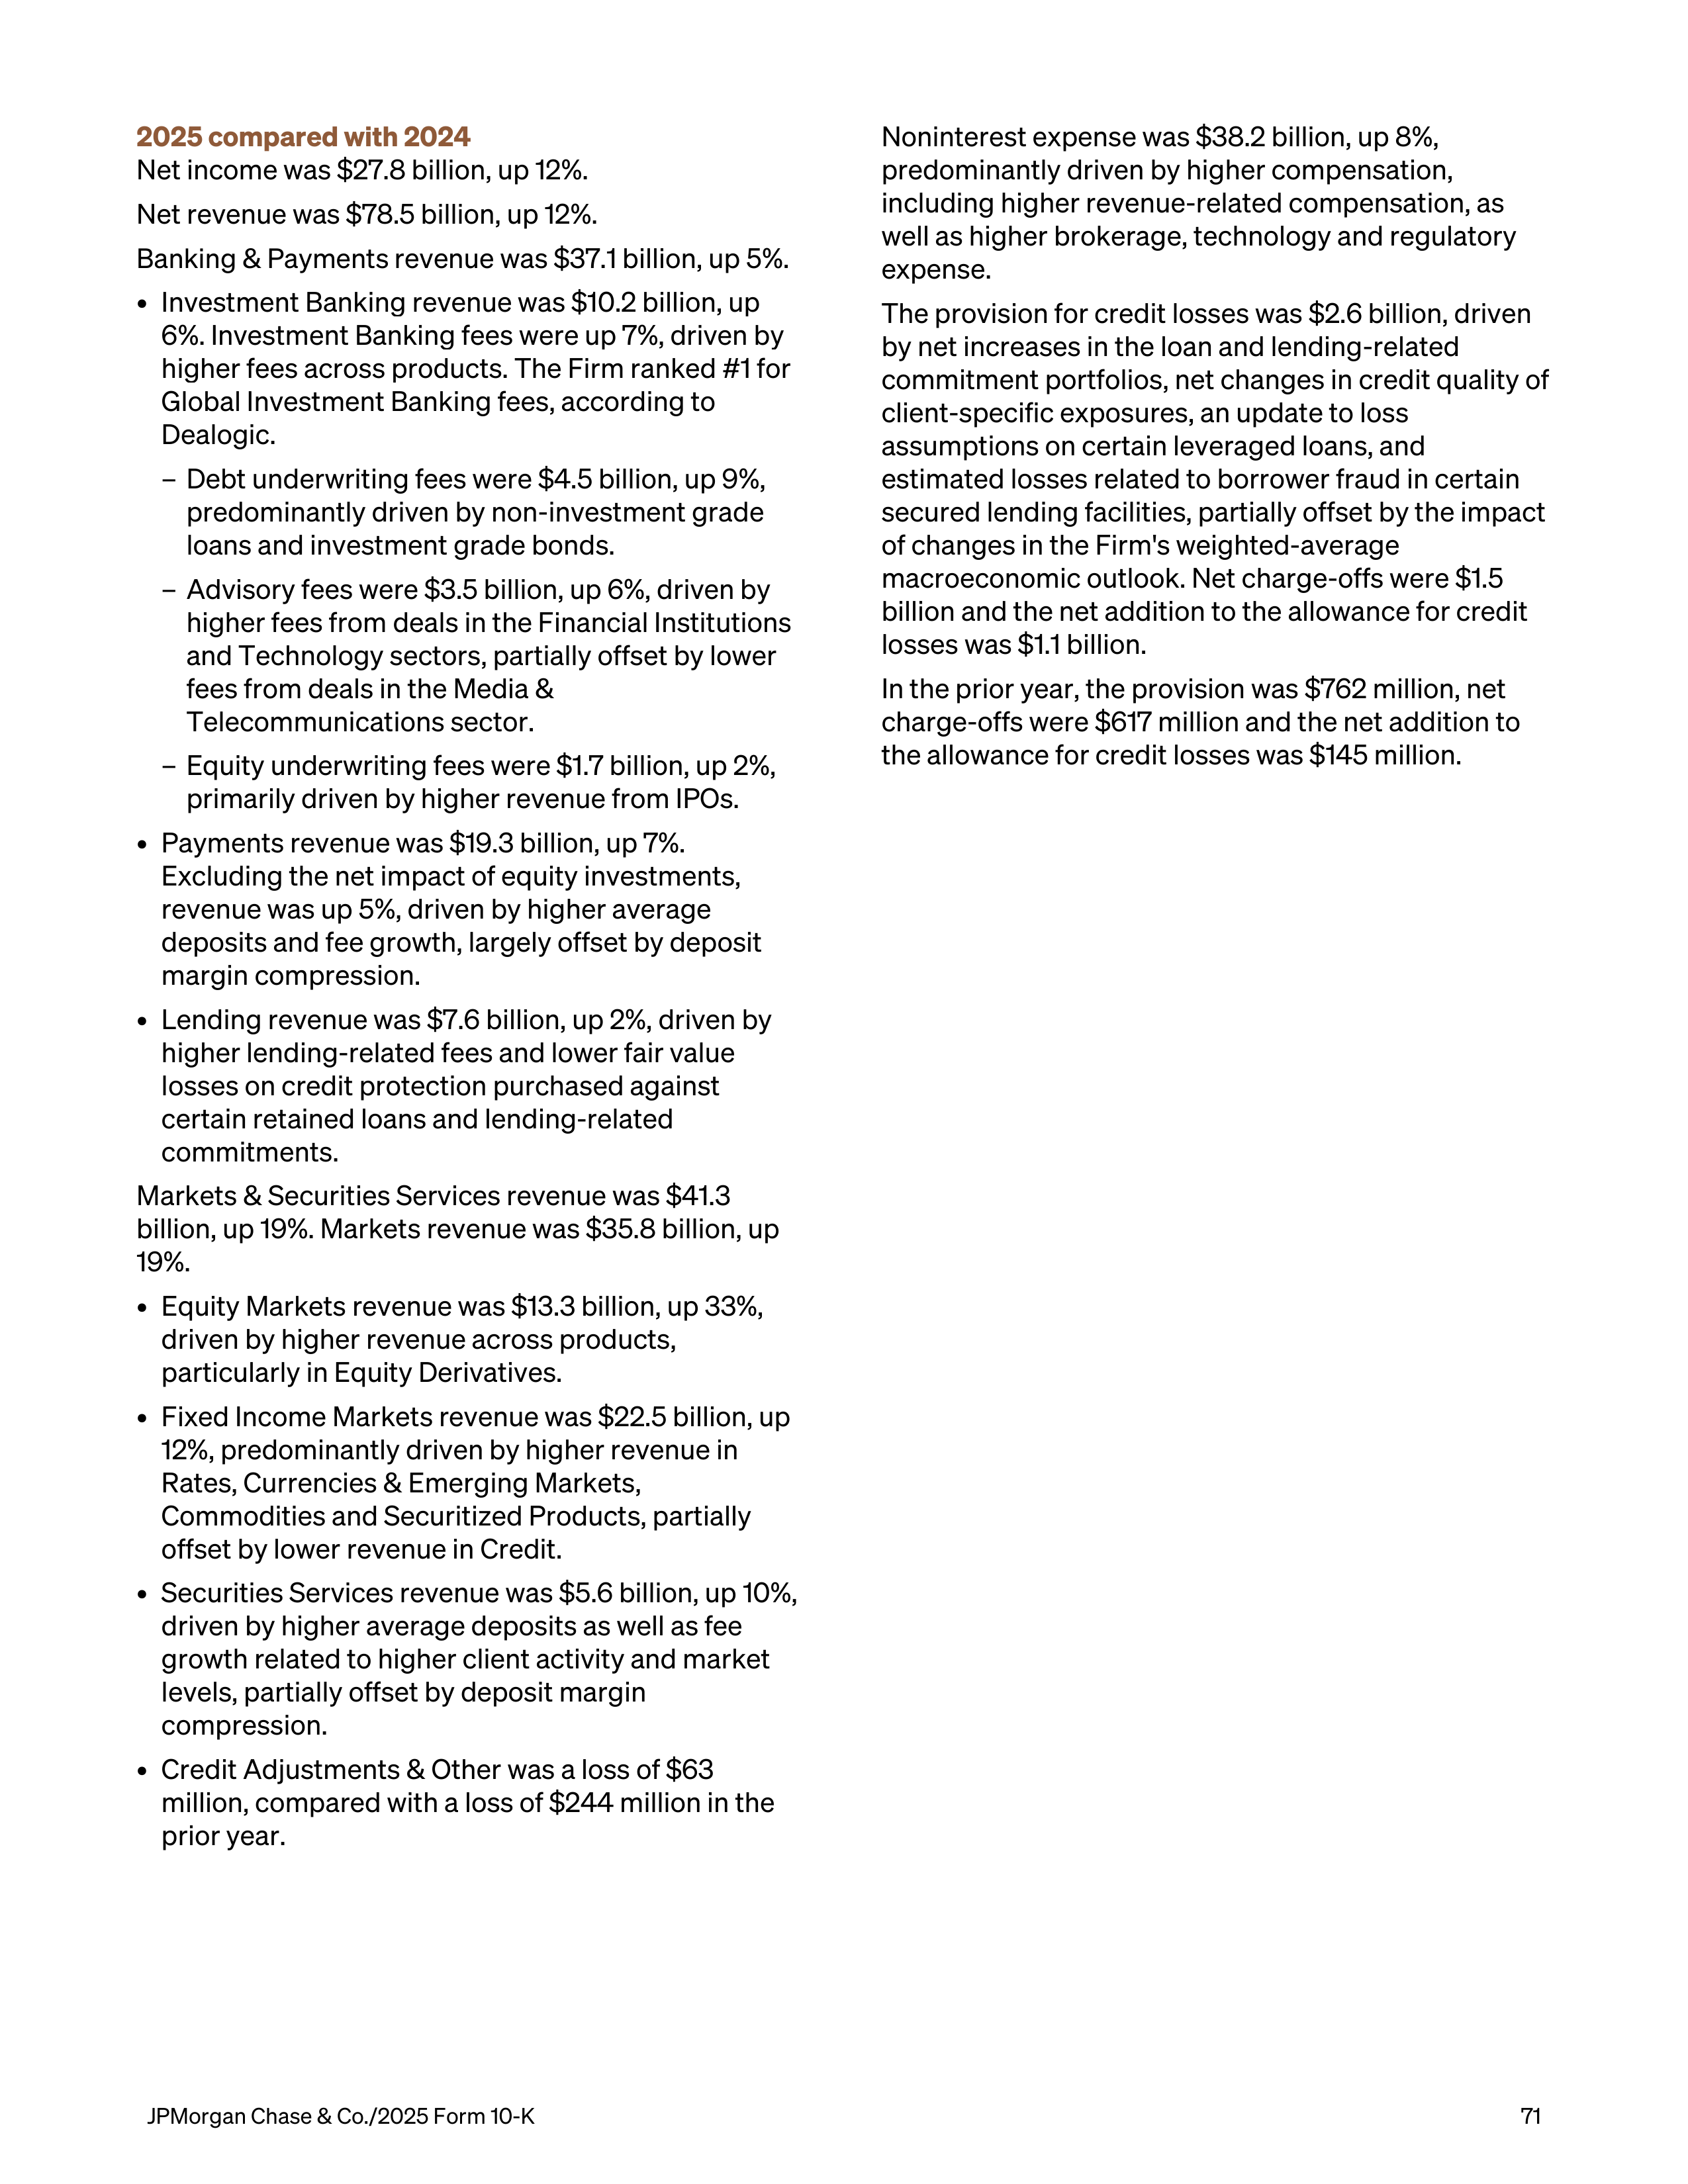
2025 compared with 2024
Net income was $27.8 billion, up 12%.
Net revenue was $78.5 billion, up 12%.
Banking & Payments
revenue was $37.1 billion, up 5%.
•
Investment Banking revenue was $10.2 billion, up
6%. Investment Banking fees were up 7%, driven by
higher fees across products. The Firm ranked #1 for
Global Investment Banking fees, according to
Dealogic.
–
Debt underwriting fees were $4.5 billion, up 9%,
predominantly driven by non-investment grade
loans and investment grade bonds.
–
Advisory fees were $3.5 billion, up 6%, driven by
higher fees from deals in the Financial Institutions
and Technology sectors, partially offset by lower
fees from deals in the Media &
Telecommunications sector.
–
Equity underwriting fees were $1.7 billion, up 2%,
primarily driven by higher revenue from IPOs.
•
Payments revenue was $19.3 billion, up 7%.
Excluding the net impact of equity investments,
revenue was up 5%, driven by higher average
deposits and fee growth, largely offset by deposit
margin compression.
•
Lending revenue was $7.6 billion, up 2%, driven by
higher lending-related fees and lower fair value
losses on credit protection purchased against
certain retained loans and lending-related
commitments.
Markets & Securities Services revenue was $41.3
billion, up 19%. Markets revenue was $35.8 billion, up
19%.
•
Equity Markets revenue was $13.3 billion, up 33%,
driven by higher revenue across products,
particularly in Equity Derivatives.
•
Fixed Income Markets revenue was $22.5 billion, up
12%, predominantly driven by higher revenue in
Rates, Currencies & Emerging Markets,
Commodities and Securitized Products, partially
offset by lower revenue in Credit.
•
Securities Services revenue was $5.6 billion, up 10%,
driven by higher average deposits as well as fee
growth related to higher client activity and market
levels, partially offset by deposit margin
compression.
•
Credit Adjustments & Other was a loss of $63
million, compared with a loss of $244 million in the
prior year.
Noninterest expense was $38.2 billion, up 8%,
predominantly driven by higher compensation,
including higher revenue-related compensation, as
well as higher brokerage, technology and regulatory
expense.
The provision for credit losses was $2.6 billion, driven
by net increases in the loan and lending-related
commitment portfolios, net changes in credit quality of
client-specific exposures, an update to loss
assumptions on certain leveraged loans, and
estimated losses related to borrower fraud in certain
secured lending facilities, partially offset by the impact
of changes in the Firm's weighted-average
macroeconomic outlook. Net charge-offs were $1.5
billion and the net addition to the allowance for credit
losses was $1.1 billion.
In the prior year, the provision was $762 million, net
charge-offs were $617 million and the net addition to
the allowance for credit losses was $145 million.
JPMorgan Chase & Co./2025 Form 10-K
71
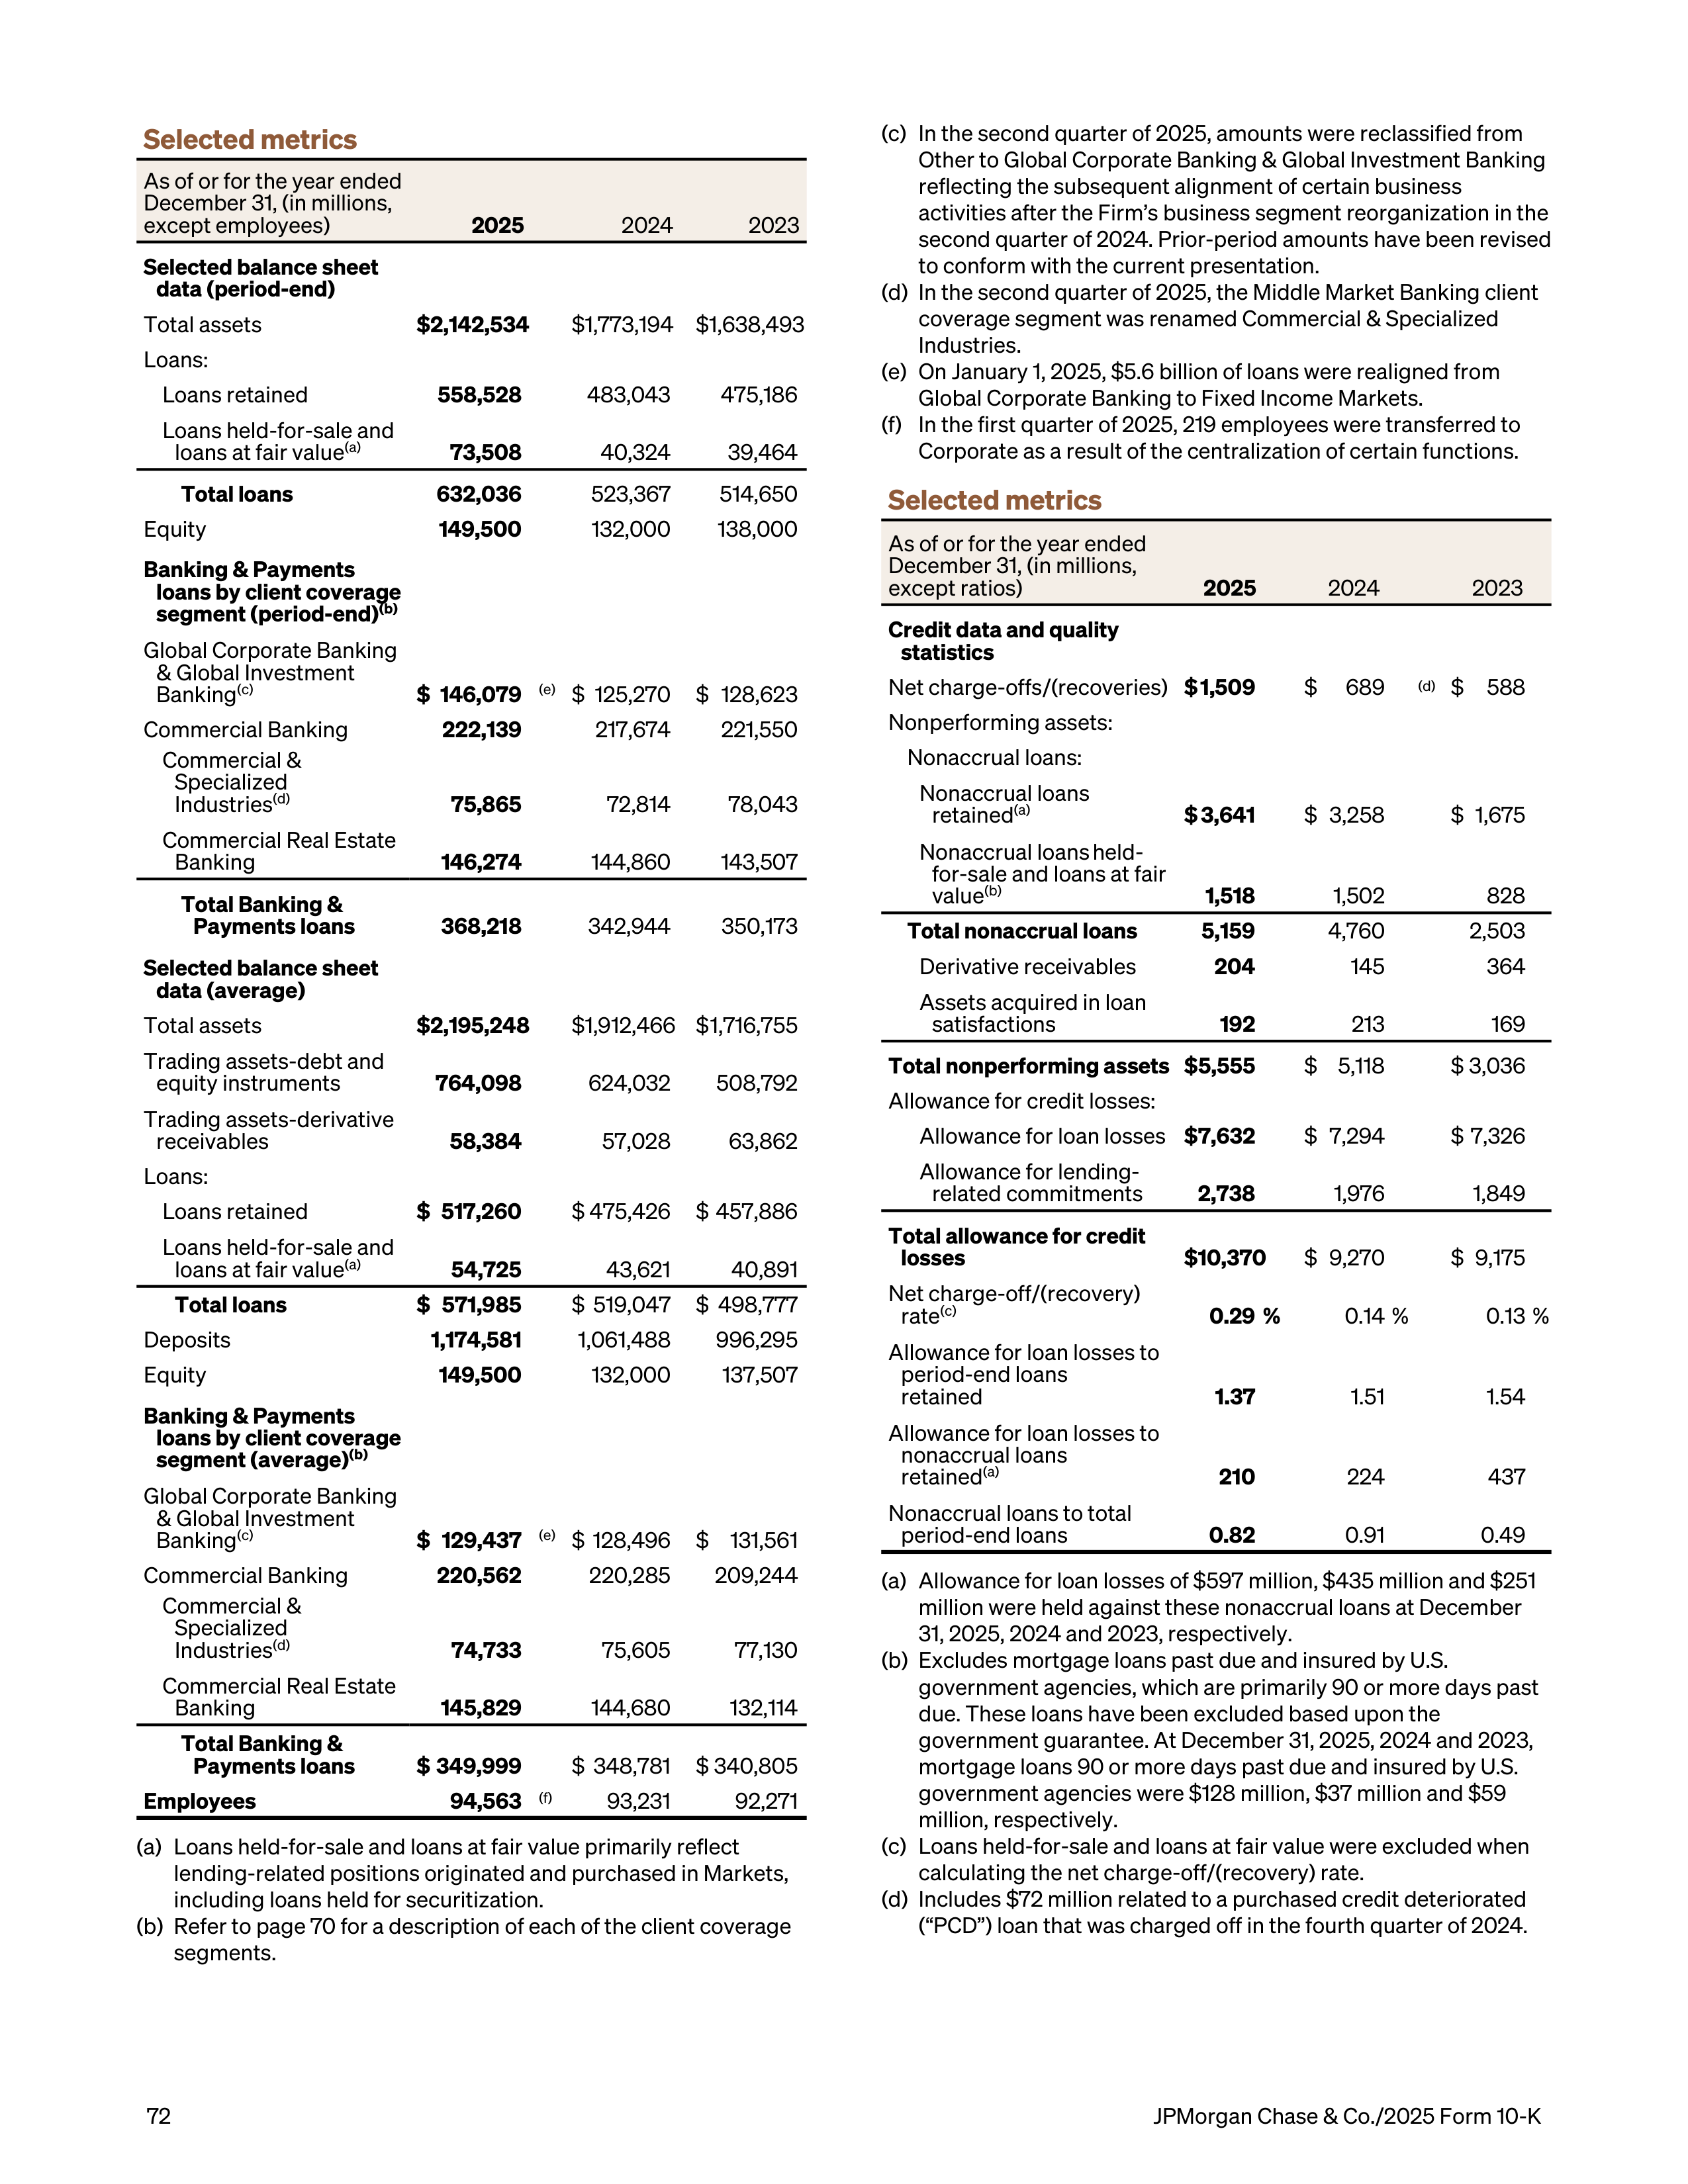
Selected metrics
As of or for the year ended
December 31, (in millions,
except employees)
2025
2024
2023
Selected balance sheet
data (period-end)
Total assets
$ 2,142,534
$ 1,773,194
$ 1,638,493
Loans:
Loans retained
558,528
483,043
475,186
Loans held-for-sale and
loans at fair value
(a)
73,508
40,324
39,464
Total loans
632,036
523,367
514,650
Equity
149,500
132,000
138,000
Banking & Payments
loans by client coverage
segment (period-end)
(b)
Global Corporate Banking
& Global Investment
Banking
(c)
$ 146,079
(e)
$ 125,270
$ 128,623
Commercial Banking
222,139
217,674
221,550
Commercial &
Specialized
Industries
(d)
75,865
72,814
78,043
Commercial Real Estate
Banking
146,274
144,860
143,507
Total Banking &
Payments loans
368,218
342,944
350,173
Selected balance sheet
data (average)
Total assets
$ 2,195,248
$ 1,912,466 $ 1,716,755
Trading assets-debt and
equity instruments
764,098
624,032
508,792
Trading assets-derivative
receivables
58,384
57,028
63,862
Loans:
Loans retained
$ 517,260
$ 475,426
$ 457,886
Loans held-for-sale and
loans at fair value
(a)
54,725
43,621
40,891
Total loans
$ 571,985
$ 519,047
$ 498,777
Deposits
1,174,581
1,061,488
996,295
Equity
149,500
132,000
137,507
Banking & Payments
loans by client coverage
segment (average)
(b)
Global Corporate Banking
& Global Investment
Banking
(c)
$ 129,437
(e)
$ 128,496
$ 131,561
Commercial Banking
220,562
220,285
209,244
Commercial &
Specialized
Industries
(d)
74,733
75,605
77,130
Commercial Real Estate
Banking
145,829
144,680
132,114
Total Banking &
Payments loans
$ 349,999
$ 348,781
$ 340,805
Employees
94,563
(f)
93,231
92,271
(a)
Loans held-for-sale and loans at fair value primarily reflect
lending-related positions originated and purchased in Markets,
including loans held for securitization.
(b)
Refer to page 70 for a description of each of the client coverage
segments.
(c)
In the second quarter of 2025, amounts were reclassified from
Other to Global Corporate Banking & Global Investment Banking
reflecting the subsequent alignment of certain business
activities after the Firm’s business segment reorganization in the
second quarter of 2024. Prior-period amounts have been revised
to conform with the current presentation.
(d)
In the second quarter of 2025, the Middle Market Banking client
coverage segment was renamed Commercial & Specialized
Industries.
(e)
On January 1, 2025, $5.6 billion of loans were realigned from
Global Corporate Banking to Fixed Income Markets.
(f)
In the first quarter of 2025, 219 employees were transferred to
Corporate as a result of the centralization of certain functions.
Selected metrics
As of or for the year ended
December 31, (in millions,
except ratios)
2025
2024
2023
Credit data and quality
statistics
Net charge-offs/(recoveries)
$ 1,509
$
689
(d)
$
588
Nonperforming assets:
Nonaccrual loans:
Nonaccrual loans
retained
(a)
$ 3,641
$ 3,258
$ 1,675
Nonaccrual loans
held-
for-sale and loans at fair
value
(b)
1,518
1,502
828
Total nonaccrual loans
5,159
4,760
2,503
Derivative receivables
204
145
364
Assets acquired in loan
satisfactions
192
213
169
Total nonperforming assets
$ 5,555
$ 5,118
$ 3,036
Allowance for credit losses:
Allowance for loan losses
$ 7,632
$ 7,294
$ 7,326
Allowance for lending-
related commitments
2,738
1,976
1,849
Total allowance for credit
losses
$ 10,370
$ 9,270
$ 9,175
Net charge-off/(recovery)
rate
(c)
0.29 %
0.14 %
0.13 %
Allowance for loan losses to
period-end loans
retained
1.37
1.51
1.54
Allowance for loan losses to
nonaccrual loans
retained
(a)
210
224
437
Nonaccrual loans to total
period-end loans
0.82
0.91
0.49
(a)
Allowance for loan losses of $597 million, $435 million and $251
million were held against these nonaccrual loans at December
31, 2025, 2024 and 2023, respectively.
(b)
Excludes mortgage loans past due and insured by U.S.
government agencies, which are primarily 90 or more days past
due. These loans have been excluded based upon the
government guarantee. At December 31, 2025, 2024 and 2023,
mortgage loans 90 or more days past due and insured by U.S.
government agencies were $128 million, $37 million and $59
million, respectively.
(c)
Loans held-for-sale and loans at fair value were excluded when
calculating the net charge-off/(recovery) rate.
(d)
Includes $72 million related to a purchased credit deteriorated
(“PCD”) loan that was charged off in the fourth quarter of 2024.
72
JPMorgan Chase & Co./2025 Form 10-K
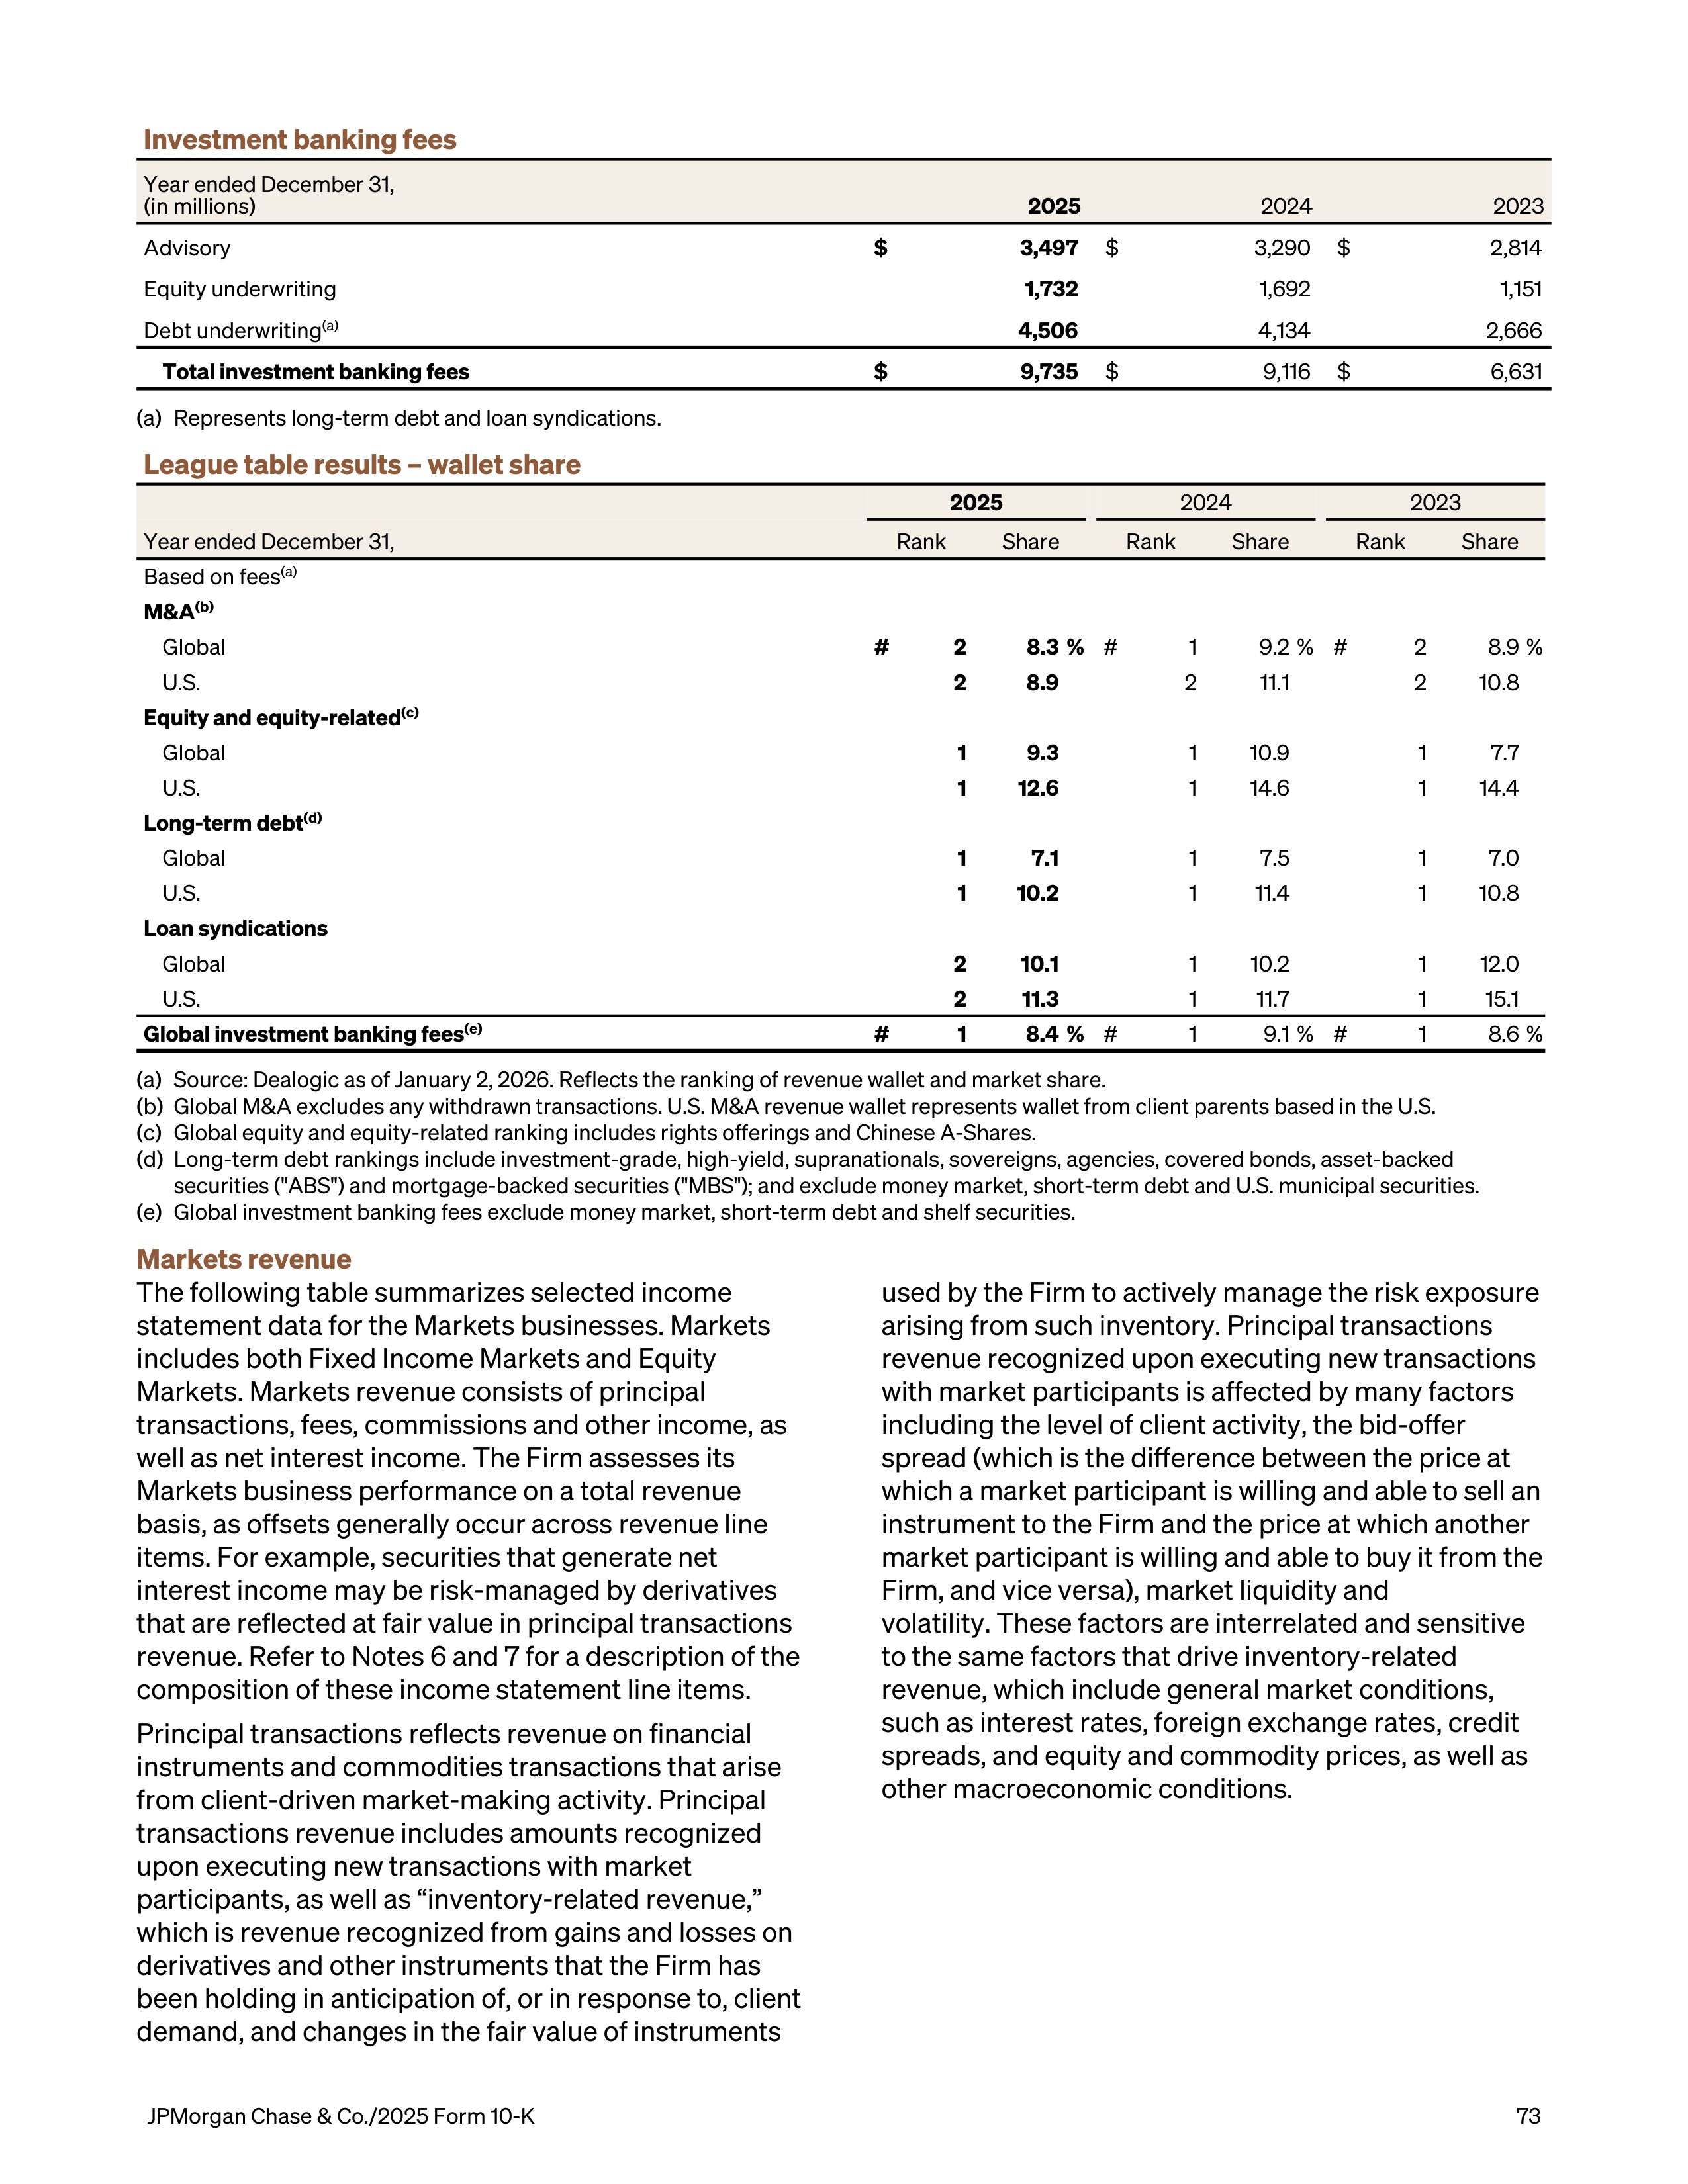
Investment banking fees
Year ended December 31,
(in millions)
2025
2024
2023
Advisory
$
3,497
$
3,290
$
2,814
Equity underwriting
1,732
1,692
1,151
Debt underwriting
(a)
4,506
4,134
2,666
Total investment banking fees
$
9,735
$
9,116
$
6,631
(a)
Represents long-term debt and loan syndications.
League table results – wallet share
2025
2024
2023
Year ended December 31,
Rank
Share
Rank
Share
Rank
Share
Based on fees
(a)
M&A
(b)
Global
#
2
8.3 %
#
1
9.2 %
#
2
8.9 %
U.S.
2
8.9
2
11.1
2
10.8
Equity and equity-related
(c)
Global
1
9.3
1
10.9
1
7.7
U.S.
1
12.6
1
14.6
1
14.4
Long-term debt
(d)
Global
1
7.1
1
7.5
1
7.0
U.S.
1
10.2
1
11.4
1
10.8
Loan syndications
Global
2
10.1
1
10.2
1
12.0
U.S.
2
11.3
1
11.7
1
15.1
Global investment banking fees
(e)
#
1
8.4 %
#
1
9.1 %
#
1
8.6 %
(a)
Source: Dealogic as of January 2, 2026. Reflects the ranking of revenue wallet and market share.
(b)
Global M&A excludes any withdrawn transactions. U.S. M&A revenue wallet represents wallet from client parents based in the U.S.
(c)
Global equity and equity-related ranking includes rights offerings and Chinese A-Shares.
(d)
Long-term debt rankings include investment-grade, high-yield, supranationals, sovereigns, agencies, covered bonds, asset-backed
securities ("ABS") and mortgage-backed securities ("MBS"); and exclude money market, short-term debt and U.S. municipal securities.
(e)
Global investment banking fees exclude money market, short-term debt and shelf securities.
Markets revenue
The following table summarizes selected income
statement data for the Markets businesses. Markets
includes both Fixed Income Markets and Equity
Markets. Markets revenue consists of principal
transactions, fees, commissions and other income, as
well as net interest income. The Firm assesses its
Markets business performance on a total revenue
basis, as offsets generally occur across revenue line
items. For example, securities that generate net
interest income may be risk-managed by derivatives
that are reflected at fair value in principal transactions
revenue. Refer to Notes 6 and 7 for a description of the
composition of these income statement line items.
Principal transactions reflects revenue on financial
instruments and commodities transactions that arise
from client-driven market-making activity. Principal
transactions revenue includes amounts recognized
upon executing new transactions with market
participants, as well as “inventory-related revenue,”
which is revenue recognized from gains and losses on
derivatives and other instruments that the Firm has
been holding in anticipation of, or in response to, client
demand, and changes in the fair value of instruments
used by the Firm to actively manage the risk exposure
arising from such inventory. Principal transactions
revenue recognized upon executing new transactions
with market participants is affected by many factors
including the level of client activity, the bid-offer
spread (which is the difference between the price at
which a market participant is willing and able to sell an
instrument to the Firm and the price at which another
market participant is willing and able to buy it from the
Firm, and vice versa), market liquidity and
volatility. These factors are interrelated and sensitive
to the same factors that drive inventory-related
revenue, which include general market conditions,
such as interest rates, foreign exchange rates, credit
spreads, and equity and commodity prices, as well as
other macroeconomic conditions.
JPMorgan Chase & Co./2025 Form 10-K
73
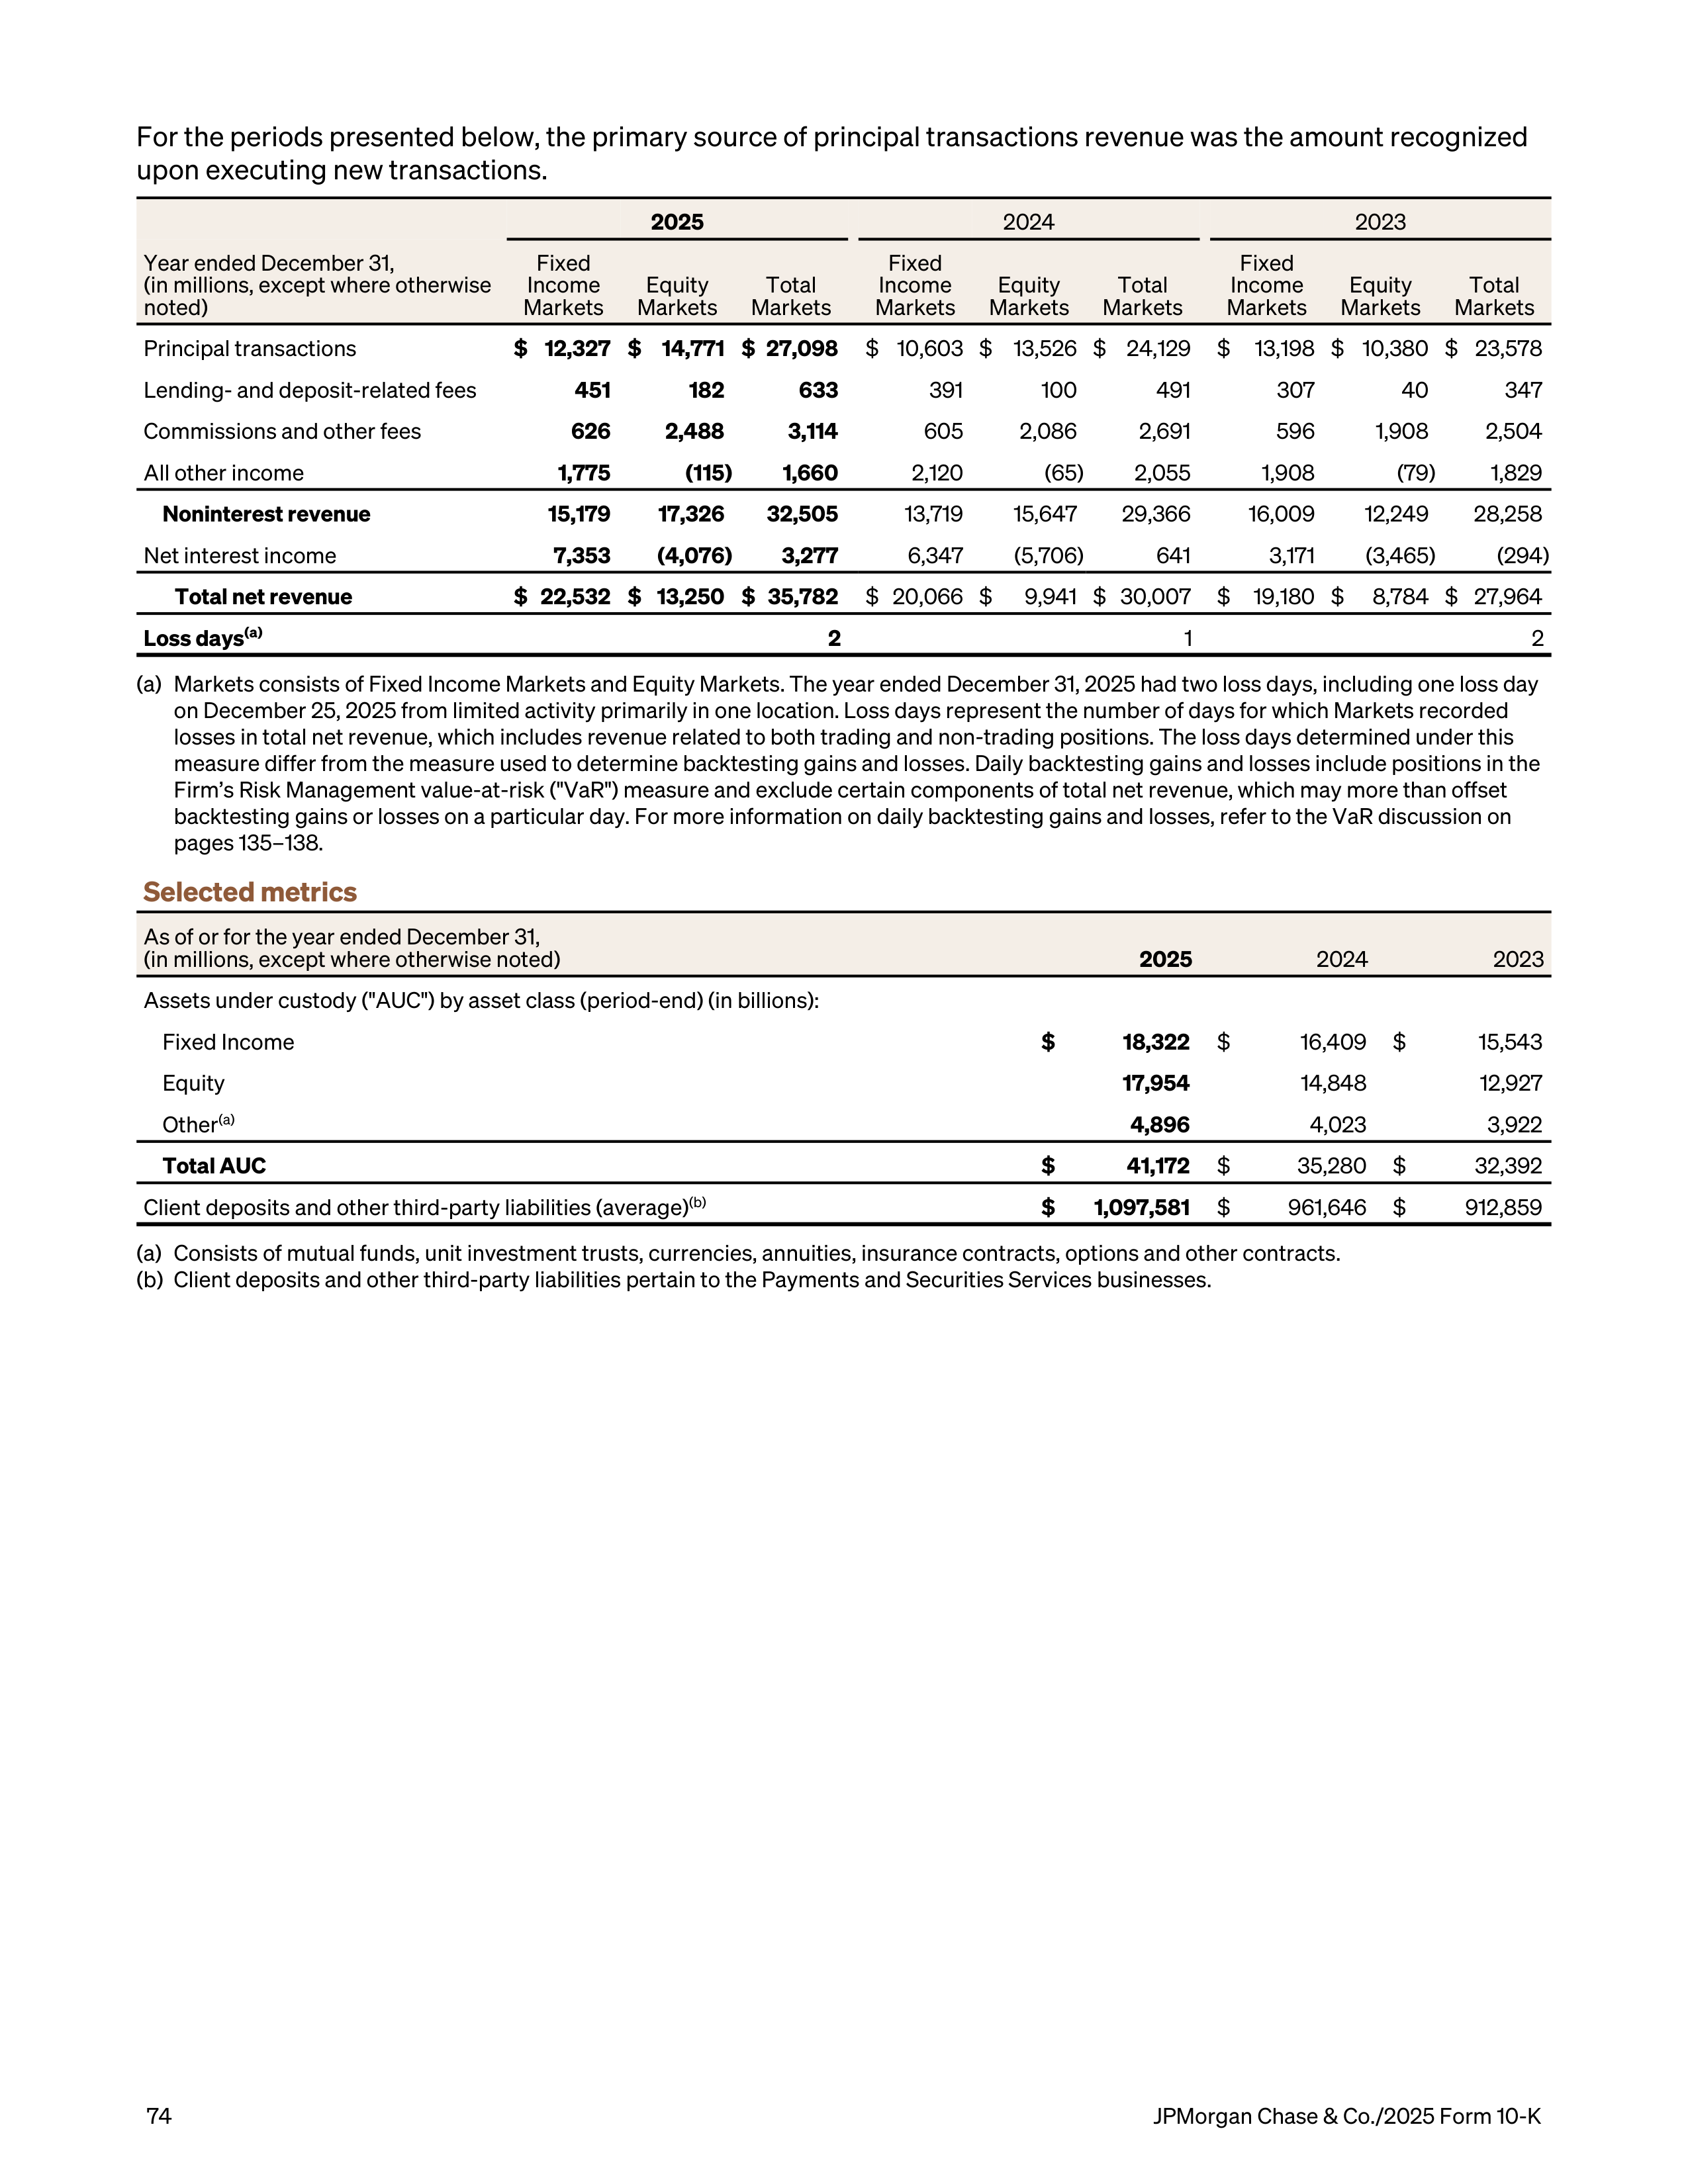
For the periods presented below, the primary source of principal transactions revenue was the amount recognized
upon executing new transactions.
2025
2024
2023
Year ended December 31,
(in millions, except where otherwise
noted)
Fixed
Income
Markets
Equity
Markets
Total
Markets
Fixed
Income
Markets
Equity
Markets
Total
Markets
Fixed
Income
Markets
Equity
Markets
Total
Markets
Principal transactions
$ 12,327 $ 14,771 $ 27,098
$ 10,603 $ 13,526 $ 24,129
$
13,198 $ 10,380 $ 23,578
Lending- and deposit-related fees
451
182
633
391
100
491
307
40
347
Commissions and other fees
626
2,488
3,114
605
2,086
2,691
596
1,908
2,504
All other income
1,775
(115)
1,660
2,120
(65)
2,055
1,908
(79)
1,829
Noninterest revenue
15,179
17,326
32,505
13,719
15,647
29,366
16,009
12,249
28,258
Net interest income
7,353
(4,076)
3,277
6,347
(5,706)
641
3,171
(3,465)
(294)
Total net revenue
$ 22,532 $ 13,250 $ 35,782
$ 20,066 $
9,941 $ 30,007
$
19,180 $
8,784 $ 27,964
Loss days
(a)
2
1
2
(a)
Markets consists of Fixed Income Markets and Equity Markets. The year ended December 31, 2025 had two loss days, including one loss day
on December 25, 2025 from limited activity primarily in one location. Loss days represent the number of days for which Markets recorded
losses in total net revenue, which includes revenue related to both trading and non-trading positions. The loss days determined under this
measure differ from the measure used to determine backtesting gains and losses. Daily backtesting gains and losses include positions in the
Firm’s Risk Management value-at-risk ("VaR") measure and exclude certain components of total net revenue, which may more than offset
backtesting gains or losses on a particular day. For more information on daily backtesting gains and losses, refer to the VaR discussion on
pages 135–138.
Selected metrics
As of or for the year ended December 31,
(in millions, except where otherwise noted)
2025
2024
2023
Assets under custody ("AUC") by asset class (period-end) (in billions):
Fixed Income
$
18,322
$
16,409
$
15,543
Equity
17,954
14,848
12,927
Other
(a)
4,896
4,023
3,922
Total AUC
$
41,172
$
35,280
$
32,392
Client deposits and other third-party liabilities (average)
(b)
$
1,097,581
$
961,646
$
912,859
(a)
Consists of mutual funds, unit investment trusts, currencies, annuities, insurance contracts, options and other contracts.
(b)
Client deposits and other third-party liabilities pertain to the Payments and Securities Services businesses.
74
JPMorgan Chase & Co./2025 Form 10-K
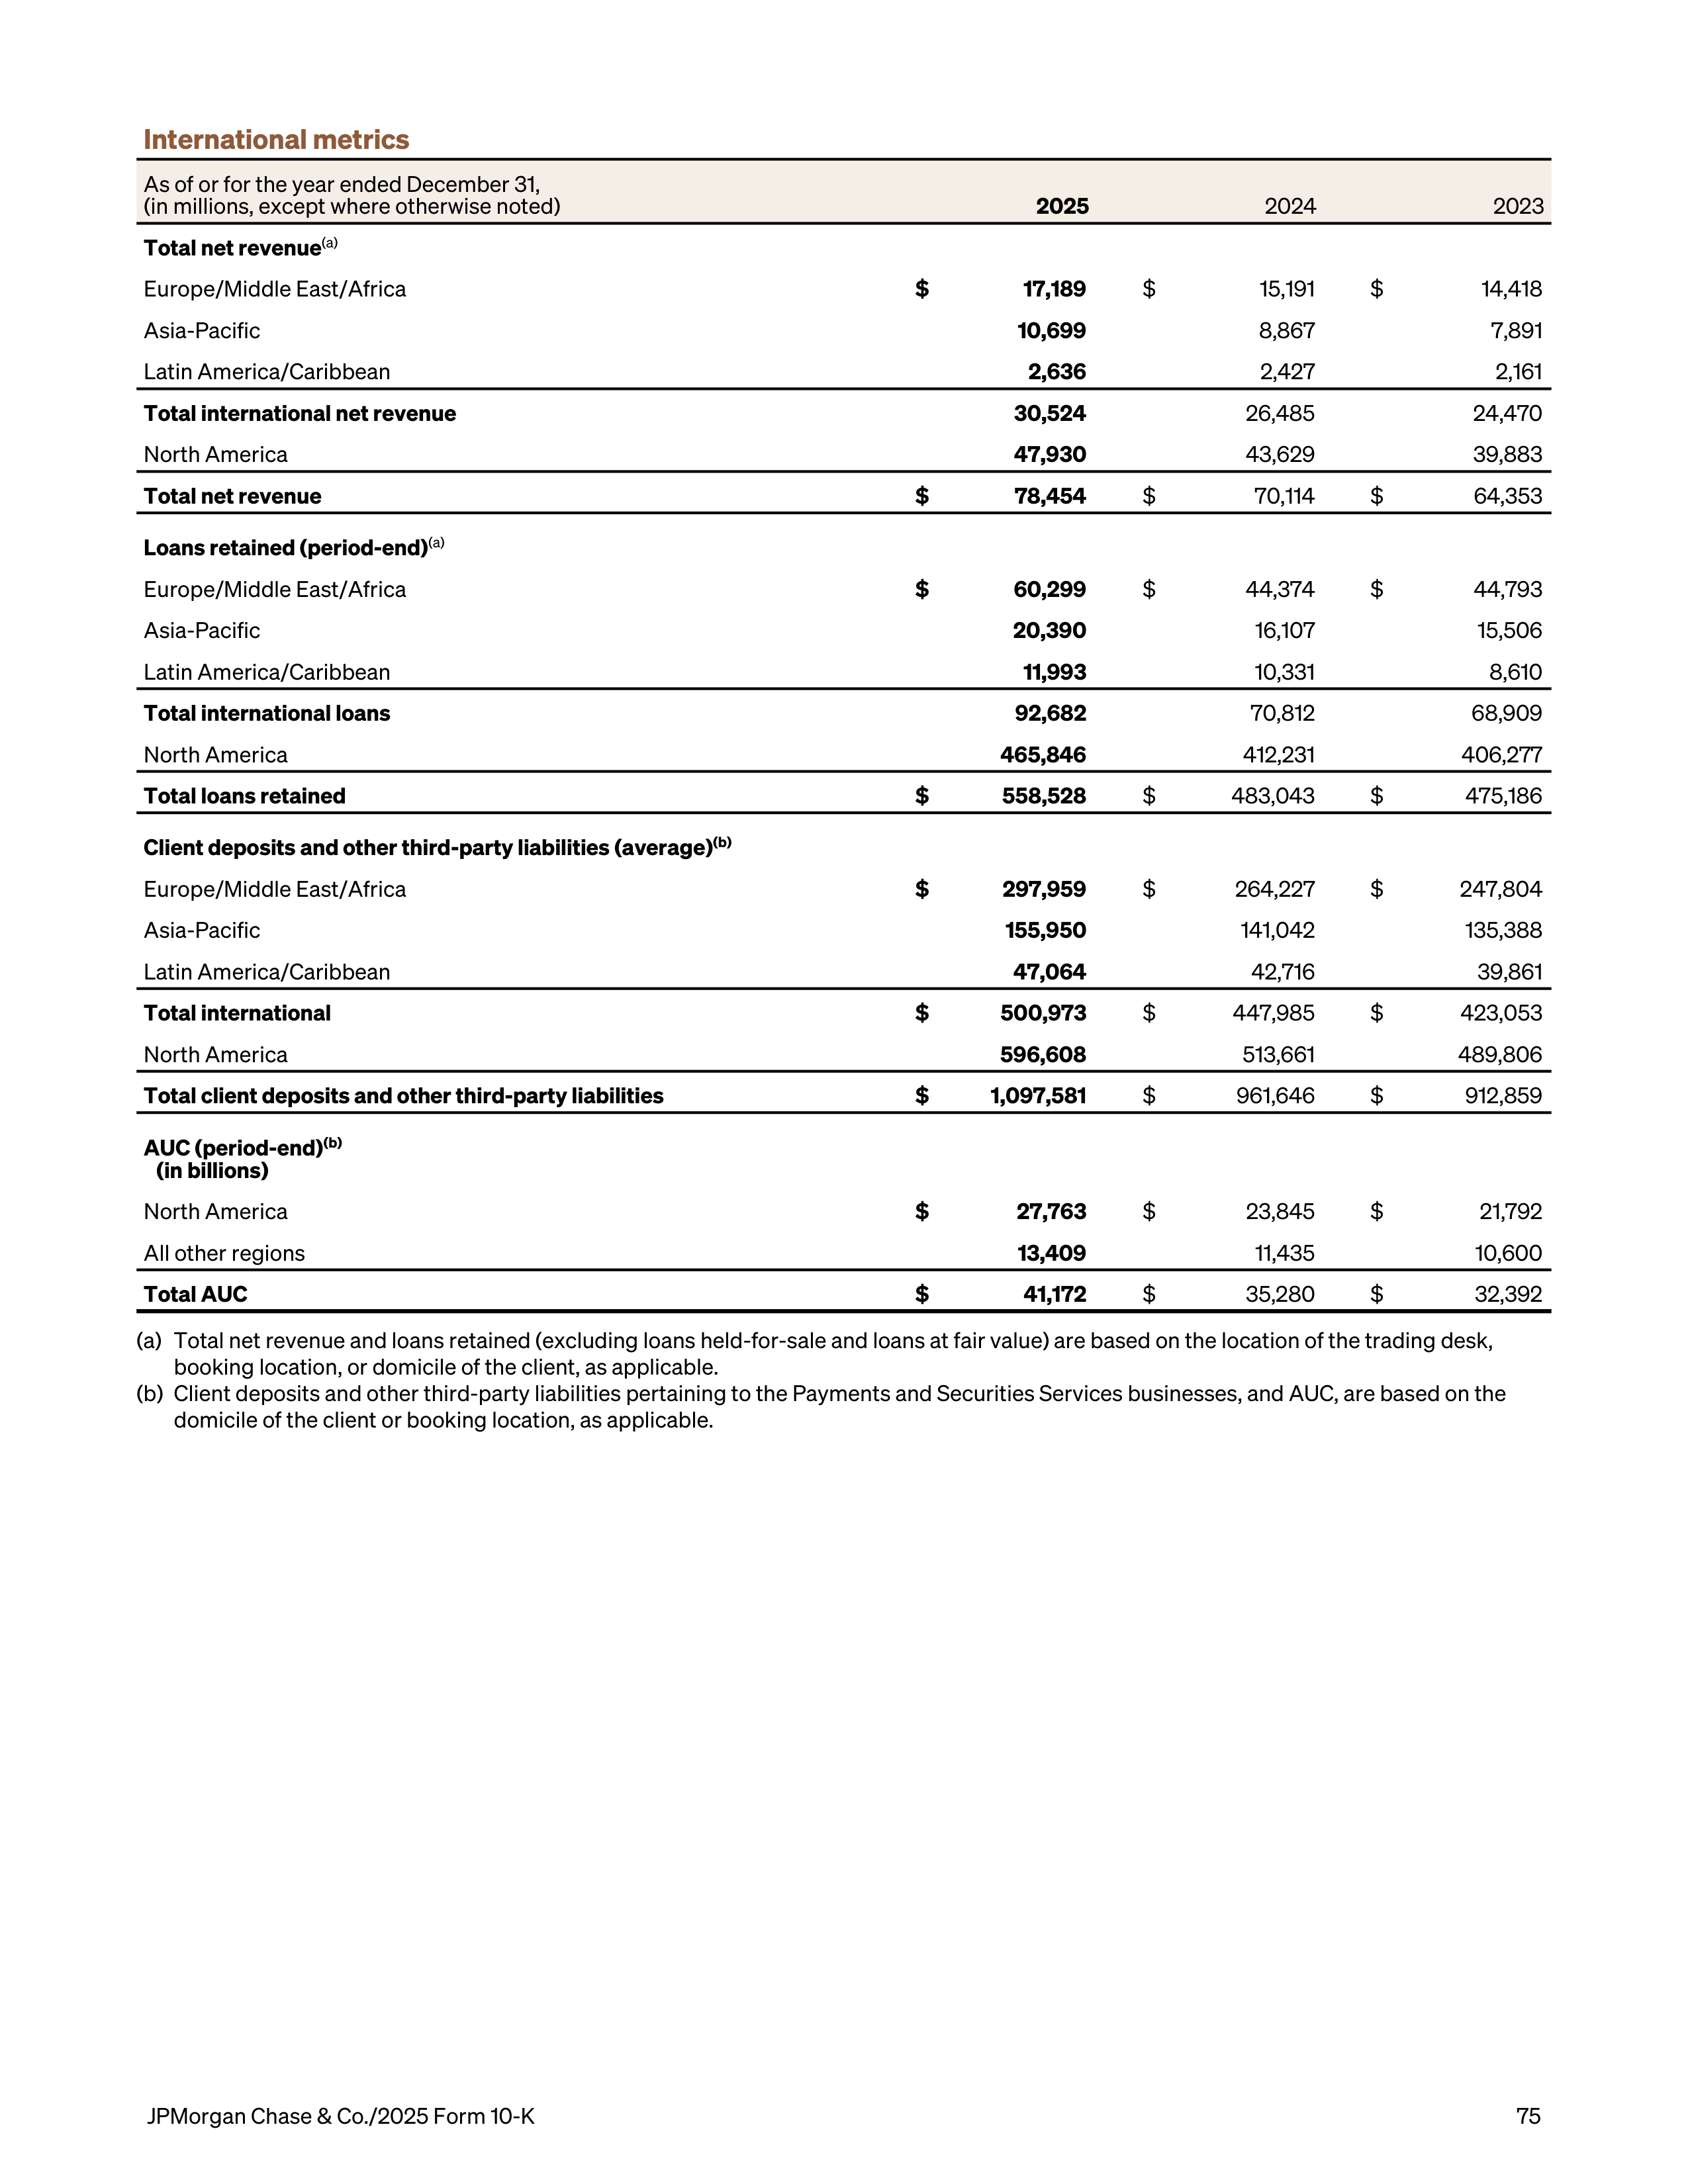
International metrics
As of or for the year ended December 31,
(in millions, except where otherwise noted)
2025
2024
2023
Total net revenue
(a)
Europe/Middle East/Africa
$
17,189
$
15,191
$
14,418
Asia-Pacific
10,699
8,867
7,891
Latin America/Caribbean
2,636
2,427
2,161
Total international net revenue
30,524
26,485
24,470
North America
47,930
43,629
39,883
Total net revenue
$
78,454
$
70,114
$
64,353
Loans retained (period-end)
(a)
Europe/Middle East/Africa
$
60,299
$
44,374
$
44,793
Asia-Pacific
20,390
16,107
15,506
Latin America/Caribbean
11,993
10,331
8,610
Total international loans
92,682
70,812
68,909
North America
465,846
412,231
406,277
Total loans retained
$
558,528
$
483,043
$
475,186
Client deposits and other third-party liabilities (average)
(b)
Europe/Middle East/Africa
$
297,959
$
264,227
$
247,804
Asia-Pacific
155,950
141,042
135,388
Latin America/Caribbean
47,064
42,716
39,861
Total international
$
500,973
$
447,985
$
423,053
North America
596,608
513,661
489,806
Total client deposits and other third-party liabilities
$
1,097,581
$
961,646
$
912,859
AUC (period-end)
(b)
(in billions)
North America
$
27,763
$
23,845
$
21,792
All other regions
13,409
11,435
10,600
Total AUC
$
41,172
$
35,280
$
32,392
(a)
Total net revenue and loans retained (excluding loans held-for-sale and loans at fair value) are based on the location of the trading desk,
booking location, or domicile of the client, as applicable.
(b)
Client deposits and other third-party liabilities pertaining to the Payments and Securities Services businesses, and AUC, are based on the
domicile of the client or booking location, as applicable.
JPMorgan Chase & Co./2025 Form 10-K
75
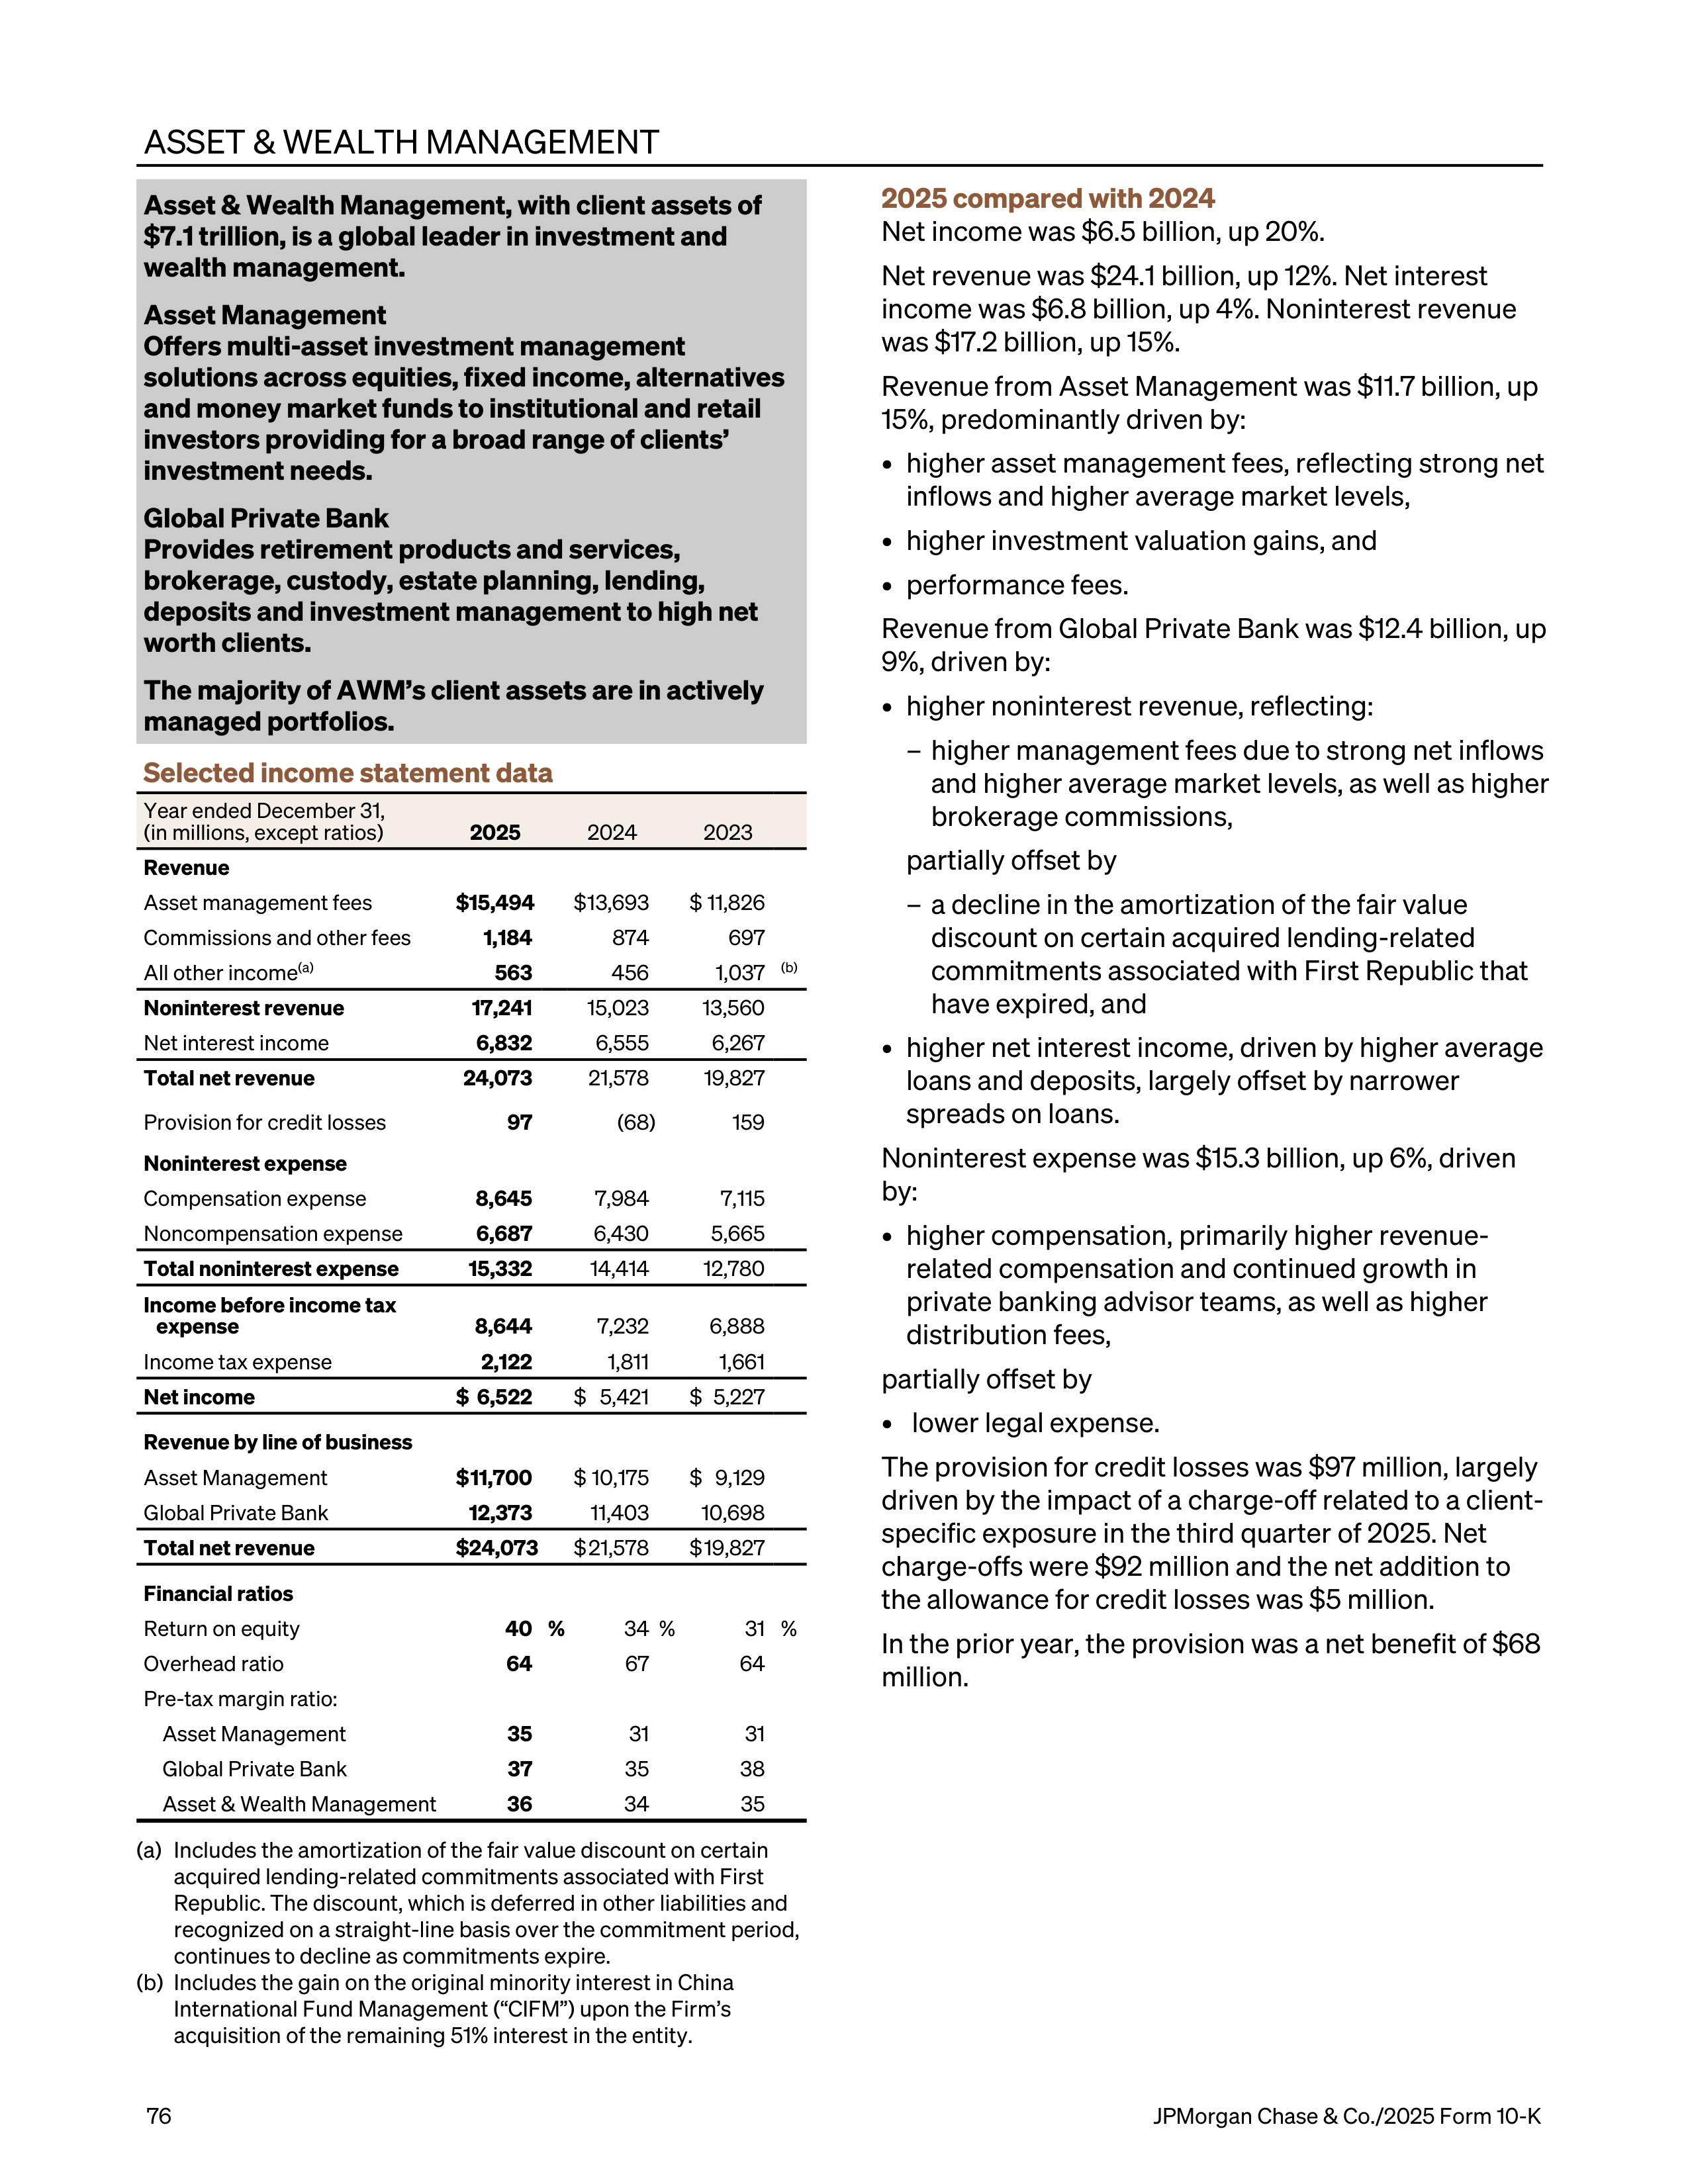
ASSET & WEALTH MANAGEMENT
Asset & Wealth Management, with client assets of
$7.1 trillion, is a global leader in investment and
wealth management.
Asset Management
Offers multi-asset investment management
solutions across equities, fixed income, alternatives
and money market funds to institutional and retail
investors providing for a broad range of clients’
investment needs.
Global Private Bank
Provides retirement products and services,
brokerage, custody, estate planning, lending,
deposits and investment management to high net
worth clients.
The majority of AWM’s client assets are in actively
managed portfolios.
Selected income statement data
Year ended December 31,
(in millions, except ratios)
2025
2024
2023
Revenue
Asset management fees
$ 15,494
$ 13,693
$ 11,826
Commissions and other fees
1,184
874
697
All other income
(a)
563
456
1,037
(b)
Noninterest revenue
17,241
15,023
13,560
Net interest income
6,832
6,555
6,267
Total net revenue
24,073
21,578
19,827
Provision for credit losses
97
(68)
159
Noninterest expense
Compensation expense
8,645
7,984
7,115
Noncompensation expense
6,687
6,430
5,665
Total noninterest expense
15,332
14,414
12,780
Income before income tax
expense
8,644
7,232
6,888
Income tax expense
2,122
1,811
1,661
Net income
$ 6,522
$ 5,421
$ 5,227
Revenue by line of business
Asset Management
$ 11,700
$ 10,175
$ 9,129
Global Private Bank
12,373
11,403
10,698
Total net revenue
$ 24,073
$ 21,578
$ 19,827
Financial ratios
Return on equity
40 %
34 %
31 %
Overhead ratio
64
67
64
Pre-tax margin ratio:
Asset Management
35
31
31
Global Private Bank
37
35
38
Asset & Wealth Management
36
34
35
(a)
Includes the amortization of the fair value discount on certain
acquired lending-related commitments associated with First
Republic. The discount, which is deferred in other liabilities and
recognized on a straight-line basis over the commitment period,
continues to decline as commitments expire.
(b)
Includes the gain on the original minority interest in China
International Fund Management (“CIFM”) upon the Firm’s
acquisition of the remaining 51% interest in the entity.
2025 compared with 2024
Net income was $6.5 billion, up 20%.
Net revenue was $24.1 billion, up 12%. Net interest
income was $6.8 billion, up 4%. Noninterest revenue
was $17.2 billion, up 15%.
Revenue from Asset Management was $11.7 billion, up
15%, predominantly driven by:
•
higher asset management fees, reflecting strong net
inflows and higher average market levels,
•
higher investment valuation gains, and
•
performance fees.
Revenue from Global Private Bank was $12.4 billion, up
9%, driven by:
•
higher noninterest revenue, reflecting:
–
higher management fees due to strong net inflows
and higher average market levels, as well as higher
brokerage commissions,
partially offset by
–
a decline in the amortization of the fair value
discount on certain acquired lending-related
commitments associated with First Republic that
have expired, and
•
higher net interest income, driven by higher average
loans and deposits, largely offset by narrower
spreads on loans.
Noninterest expense was $15.3 billion, up 6%, driven
by:
•
higher compensation, primarily higher revenue-
related compensation and continued growth in
private banking advisor teams, as well as higher
distribution fees,
partially offset by
• lower legal expense.
The provision for credit losses was $97 million, largely
driven by the impact of a charge-off related to a client-
specific exposure in the third quarter of 2025. Net
charge-offs were $92 million and the net addition to
the allowance for credit losses was $5 million.
In the prior year, the provision was a net benefit of $68
million.
76
JPMorgan Chase & Co./2025 Form 10-K
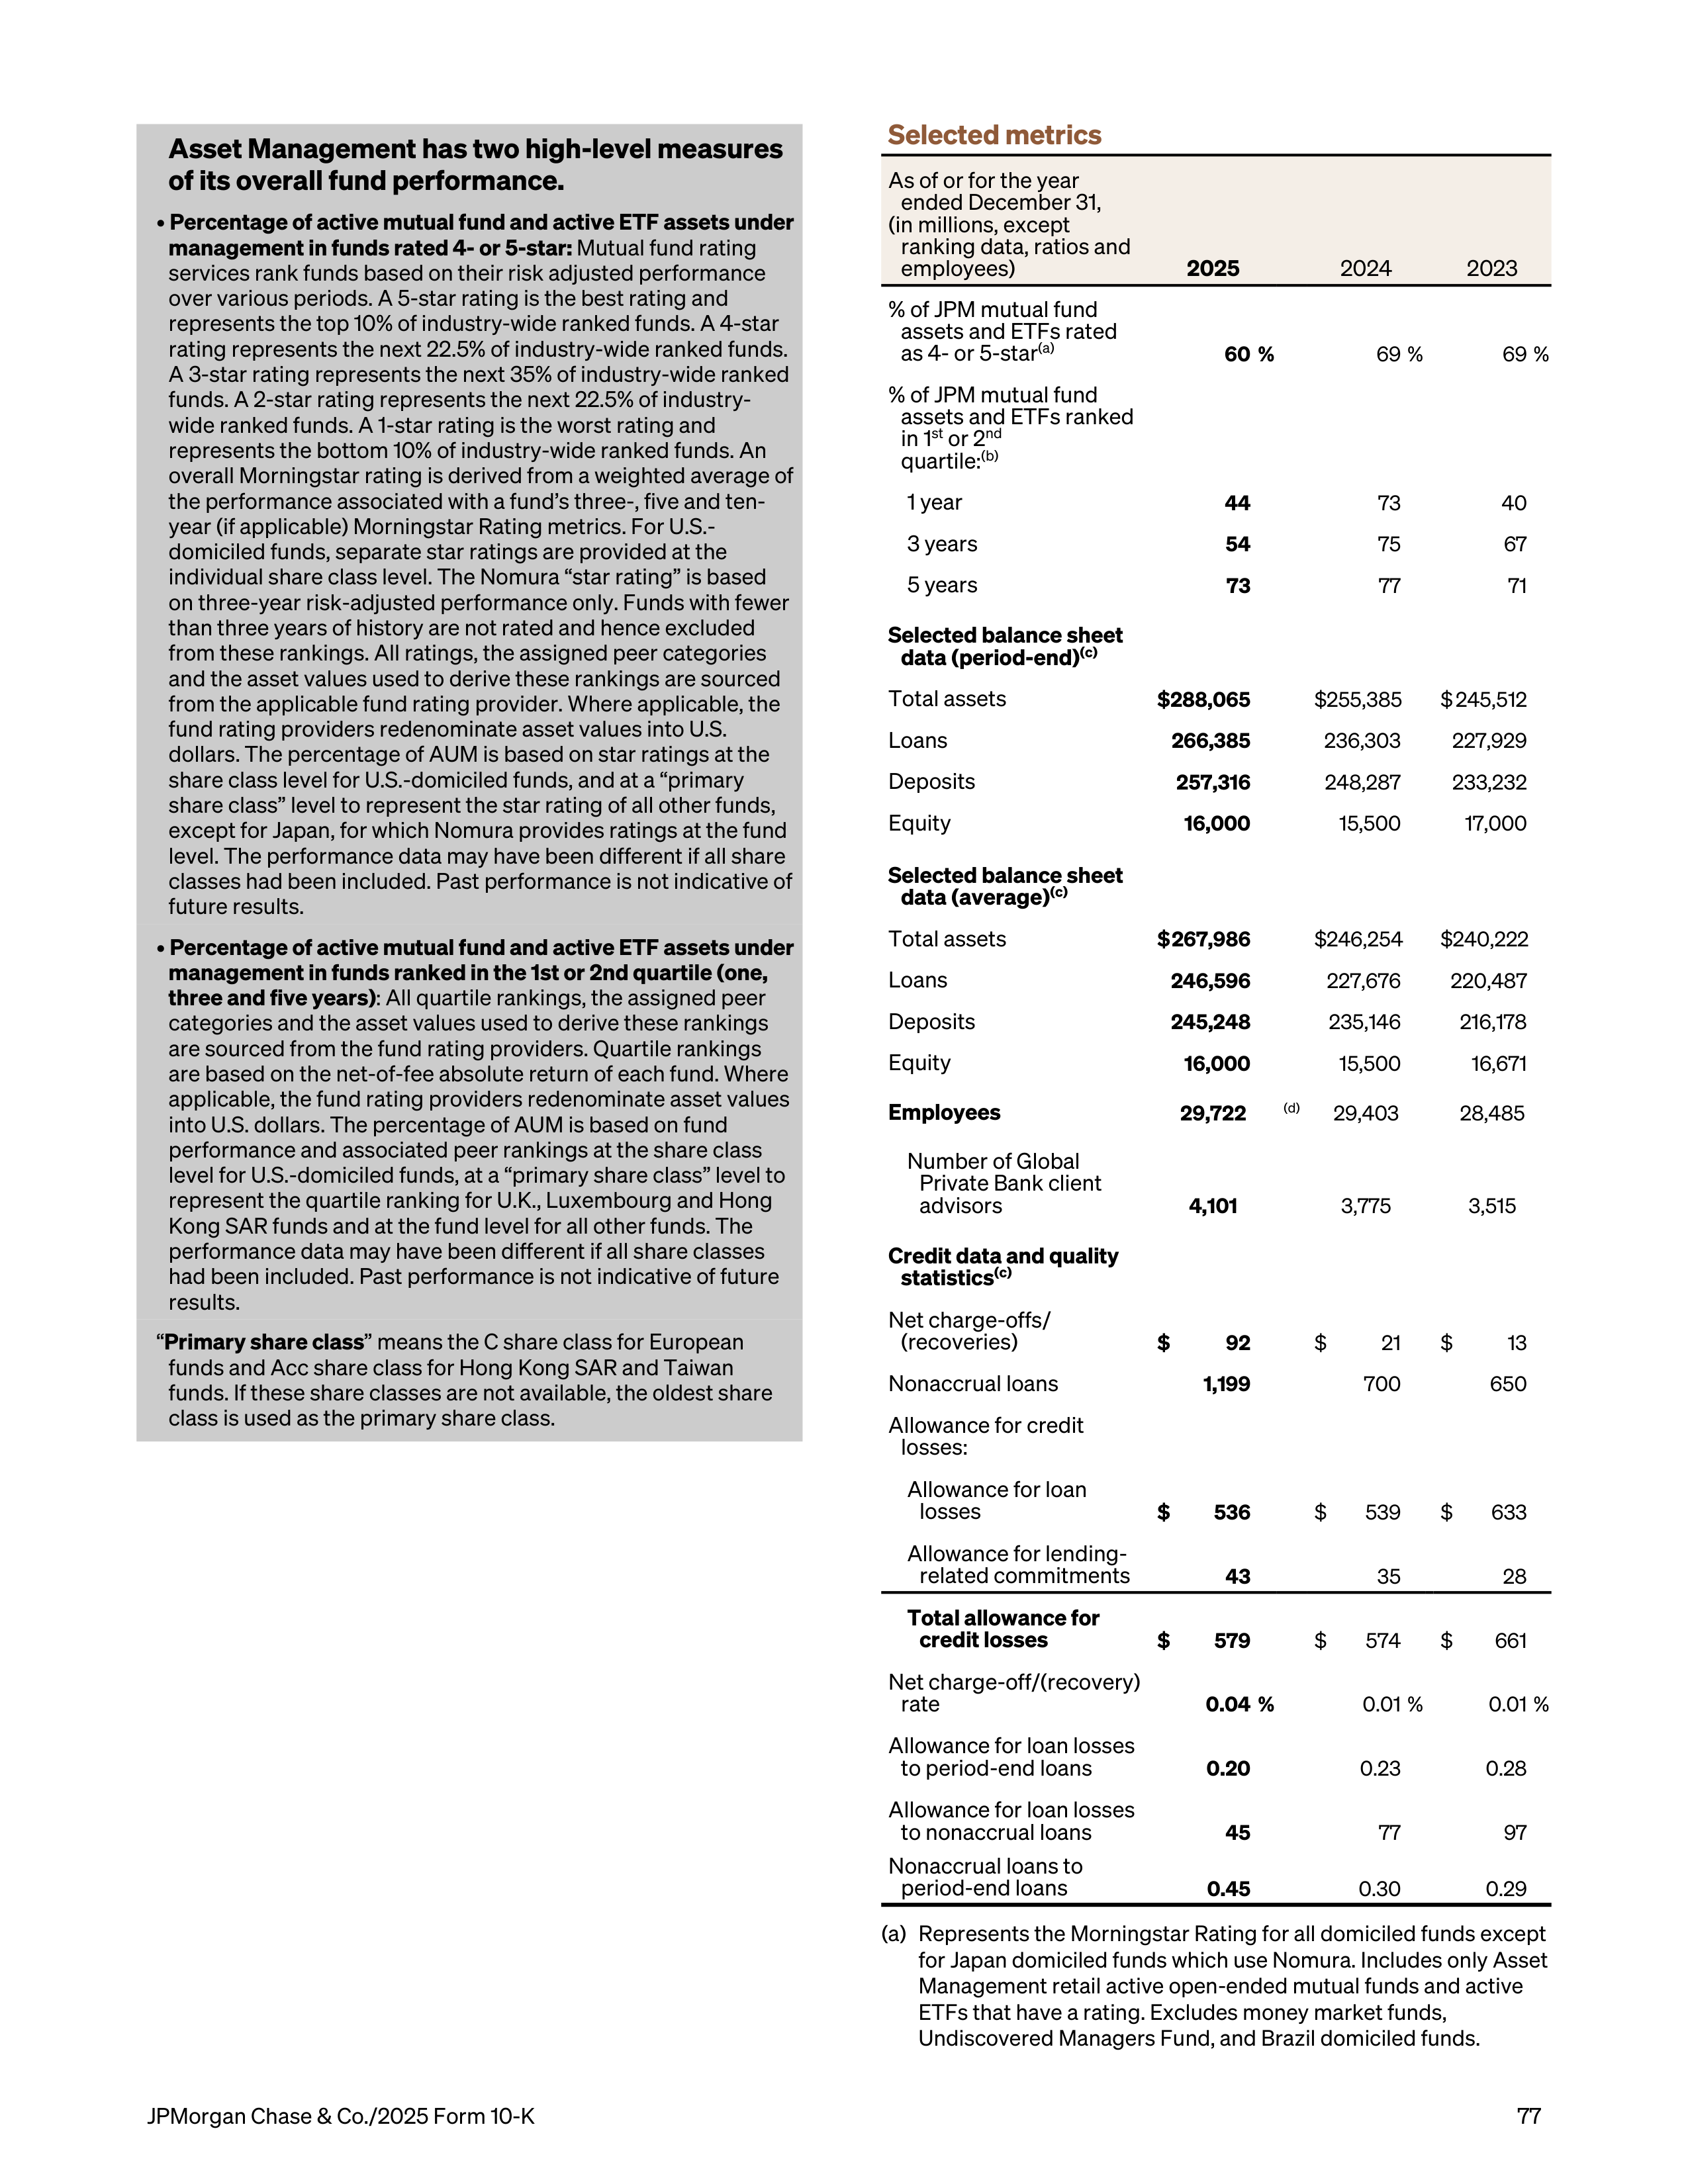
Asset Management has two high-level measures
of its overall fund performance.
•
Percentage of active mutual fund and active ETF assets under
management in funds rated 4- or 5-star:
Mutual fund rating
services rank funds based on their risk adjusted performance
over various periods. A 5-star rating is the best rating and
represents the top 10% of industry-wide ranked funds. A 4-star
rating represents the next 22.5% of industry-wide ranked funds.
A 3-star rating represents the next 35% of industry-wide ranked
funds. A 2-star rating represents the next 22.5% of industry-
wide ranked funds. A 1-star rating is the worst rating and
represents the bottom 10% of industry-wide ranked funds. An
overall Morningstar rating is derived from a weighted average of
the performance associated with a fund’s three-, five and ten-
year (if applicable) Morningstar Rating metrics. For U.S.-
domiciled funds, separate star ratings are provided at the
individual share class level. The Nomura “star rating” is based
on three-year risk-adjusted performance only. Funds with fewer
than three years of history are not rated and hence excluded
from these rankings. All ratings, the assigned peer categories
and the asset values used to derive these rankings are sourced
from the applicable fund rating provider. Where applicable, the
fund rating providers redenominate asset values into U.S.
dollars. The percentage of AUM is based on star ratings at the
share class level for U.S.-domiciled funds, and at a “primary
share class” level to represent the star rating of all other funds,
except for Japan, for which Nomura provides ratings at the fund
level. The performance data may have been different if all share
classes had been included. Past performance is not indicative of
future results.
•
Percentage of active mutual fund and active ETF assets under
management in funds ranked in the 1st or 2nd quartile (one,
three and five years)
: All quartile rankings, the assigned peer
categories and the asset values used to derive these rankings
are sourced from the fund rating providers. Quartile rankings
are based on the net-of-fee absolute return of each fund. Where
applicable, the fund rating providers redenominate asset values
into U.S. dollars. The percentage of AUM is based on fund
performance and associated peer rankings at the share class
level for U.S.-domiciled funds, at a “primary share class” level to
represent the quartile ranking for U.K., Luxembourg and Hong
Kong SAR funds and at the fund level for all other funds. The
performance data may have been different if all share classes
had been included. Past performance is not indicative of future
results.
“
Primary share class
” means the C share class for European
funds and Acc share class for Hong Kong SAR and Taiwan
funds. If these share classes are not available, the oldest share
class is used as the primary share class.
Selected metrics
As of or for the year
ended December 31,
(in millions, except
ranking data, ratios and
employees)
2025
2024
2023
% of JPM mutual fund
assets and ETFs rated
as 4- or 5-star
(a)
60 %
69 %
69 %
% of JPM mutual fund
assets and ETFs ranked
in 1
st
or 2
nd
quartile:
(b)
1 year
44
73
40
3 years
54
75
67
5 years
73
77
71
Selected balance sheet
data (period-end)
(c)
Total assets
$ 288,065
$ 255,385
$ 245,512
Loans
266,385
236,303
227,929
Deposits
257,316
248,287
233,232
Equity
16,000
15,500
17,000
Selected balance sheet
data (average)
(c)
Total assets
$ 267,986
$ 246,254
$ 240,222
Loans
246,596
227,676
220,487
Deposits
245,248
235,146
216,178
Equity
16,000
15,500
16,671
Employees
29,722
(d)
29,403
28,485
Number of Global
Private Bank client
advisors
4,101
3,775
3,515
Credit data and quality
statistics
(c)
Net charge-offs/
(recoveries)
$
92
$
21
$
13
Nonaccrual loans
1,199
700
650
Allowance for credit
losses:
Allowance for loan
losses
$
536
$
539
$
633
Allowance for lending-
related commitments
43
35
28
Total allowance for
credit losses
$
579
$
574
$
661
Net charge-off/(recovery)
rate
0.04 %
0.01 %
0.01 %
Allowance for loan losses
to period-end loans
0.20
0.23
0.28
Allowance for loan losses
to nonaccrual loans
45
77
97
Nonaccrual loans to
period-end loans
0.45
0.30
0.29
(a)
Represents the Morningstar Rating for all domiciled funds except
for Japan domiciled funds which use Nomura. Includes only Asset
Management retail active open-ended mutual funds and active
ETFs that have a rating. Excludes money market funds,
Undiscovered Managers Fund, and Brazil domiciled funds.
JPMorgan Chase & Co./2025 Form 10-K
77
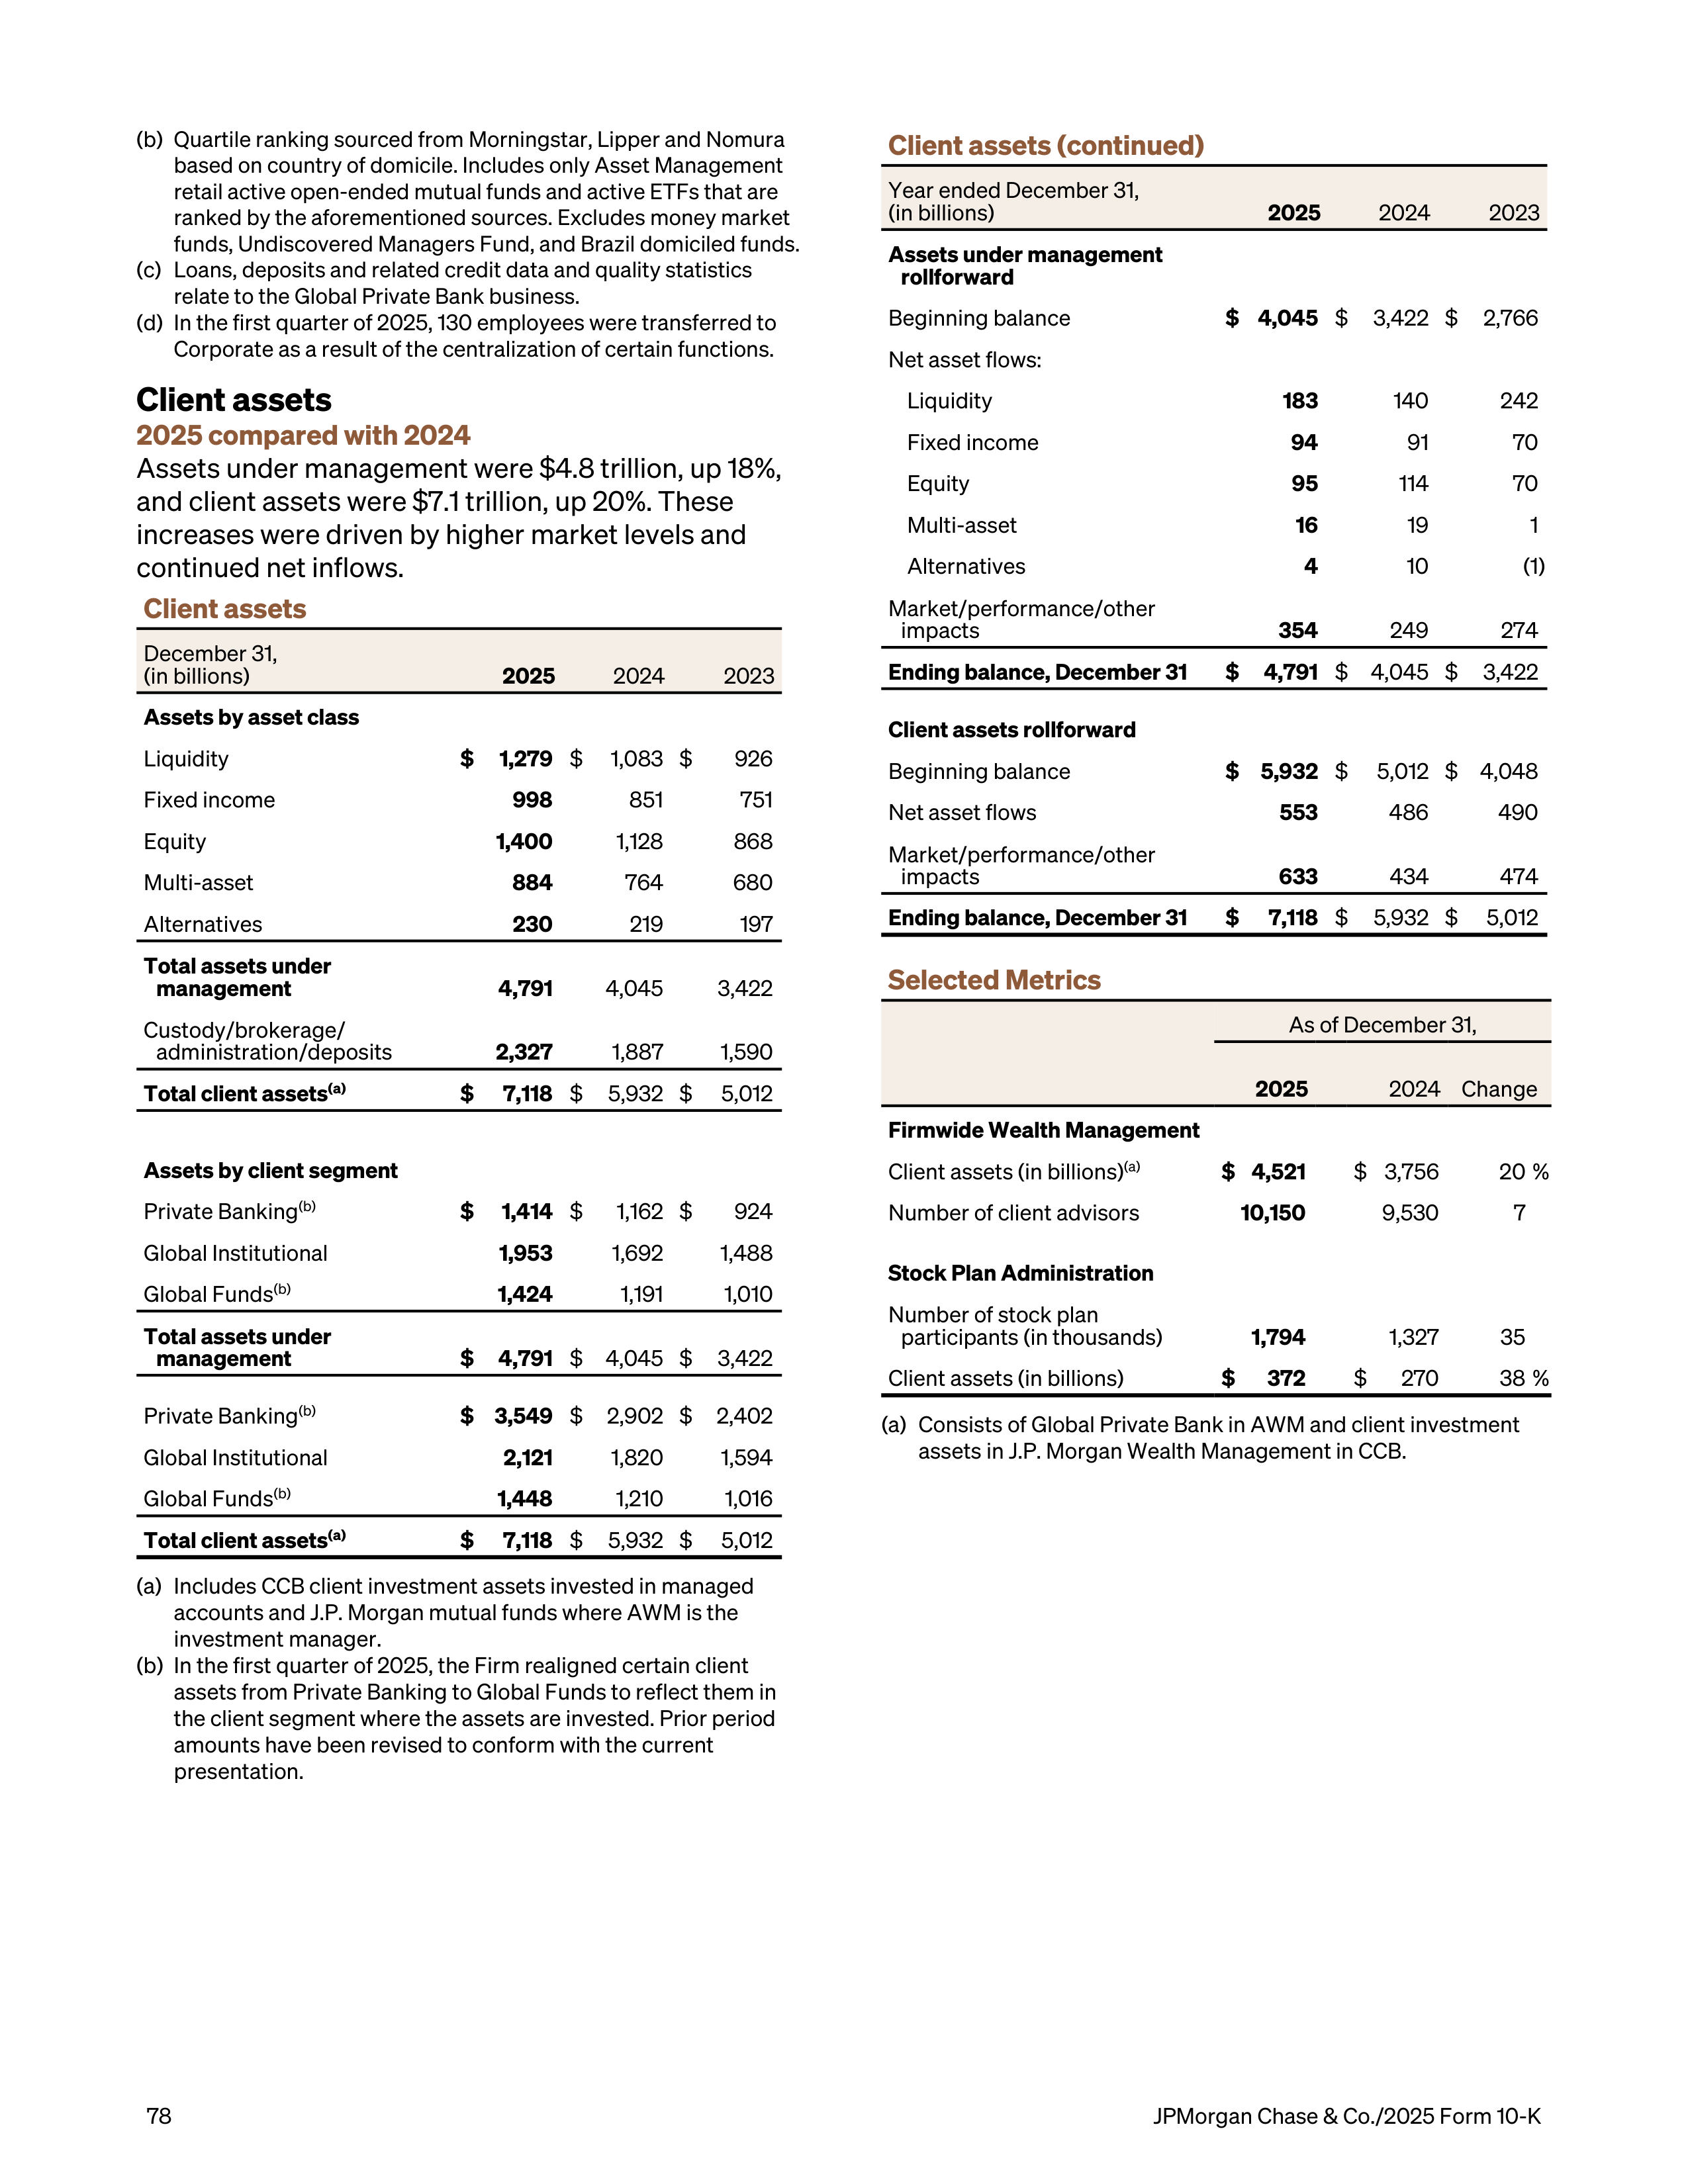
(b)
Quartile ranking sourced from Morningstar, Lipper and Nomura
based on country of domicile. Includes only Asset Management
retail active open-ended mutual funds and active ETFs that are
ranked by the aforementioned sources. Excludes money market
funds, Undiscovered Managers Fund, and Brazil domiciled funds.
(c)
Loans, deposits and related credit data and quality statistics
relate to the Global Private Bank business.
(d)
In
the first quarter of 2025, 130 employees were transferred to
Corporate as a result of the centralization of certain functions.
Client assets
2025 compared with 2024
Assets under management were $4.8 trillion, up 18%,
and client assets were $7.1 trillion, up 20%. These
increases were driven by higher market levels and
continued net inflows.
Client assets
December 31,
(in billions)
2025
2024
2023
Assets by asset class
Liquidity
$
1,279
$
1,083 $
926
Fixed income
998
851
751
Equity
1,400
1,128
868
Multi-asset
884
764
680
Alternatives
230
219
197
Total assets under
management
4,791
4,045
3,422
Custody/brokerage/
administration/deposits
2,327
1,887
1,590
Total client assets
(a)
$
7,118
$
5,932 $
5,012
Assets by client segment
Private Banking
(b)
$
1,414
$
1,162 $
924
Global Institutional
1,953
1,692
1,488
Global Funds
(b)
1,424
1,191
1,010
Total assets under
management
$
4,791
$
4,045 $
3,422
Private Banking
(b)
$ 3,549
$
2,902 $
2,402
Global Institutional
2,121
1,820
1,594
Global Funds
(b)
1,448
1,210
1,016
Total client assets
(a)
$
7,118
$
5,932 $
5,012
(a)
Includes CCB client investment assets invested in managed
accounts and J.P. Morgan mutual funds where AWM is the
investment manager.
(b)
In the first quarter of 2025, the Firm realigned certain client
assets from Private Banking to Global Funds to reflect them in
the client segment where the assets are invested. Prior period
amounts have been revised to conform with the current
presentation.
Client assets (continued)
Year ended December 31,
(in billions)
2025
2024
2023
Assets under management
rollforward
Beginning balance
$ 4,045
$
3,422 $
2,766
Net asset flows:
Liquidity
183
140
242
Fixed income
94
91
70
Equity
95
114
70
Multi-asset
16
19
1
Alternatives
4
10
(1)
Market/performance/other
impacts
354
249
274
Ending balance, December 31
$
4,791
$
4,045 $
3,422
Client assets rollforward
Beginning balance
$ 5,932
$
5,012 $
4,048
Net asset flows
553
486
490
Market/performance/other
impacts
633
434
474
Ending balance, December 31
$
7,118
$
5,932 $
5,012
Selected Metrics
As of December 31,
2025
2024
Change
Firmwide Wealth Management
Client assets (in billions)
(a)
$ 4,521
$ 3,756
20 %
Number of client advisors
10,150
9,530
7
Stock Plan Administration
Number of stock plan
participants (in thousands)
1,794
1,327
35
Client assets (in billions)
$
372
$
270
38 %
(a)
Consists of Global Private Bank in AWM and client investment
assets in J.P. Morgan Wealth Management in CCB.
78
JPMorgan Chase & Co./2025 Form 10-K
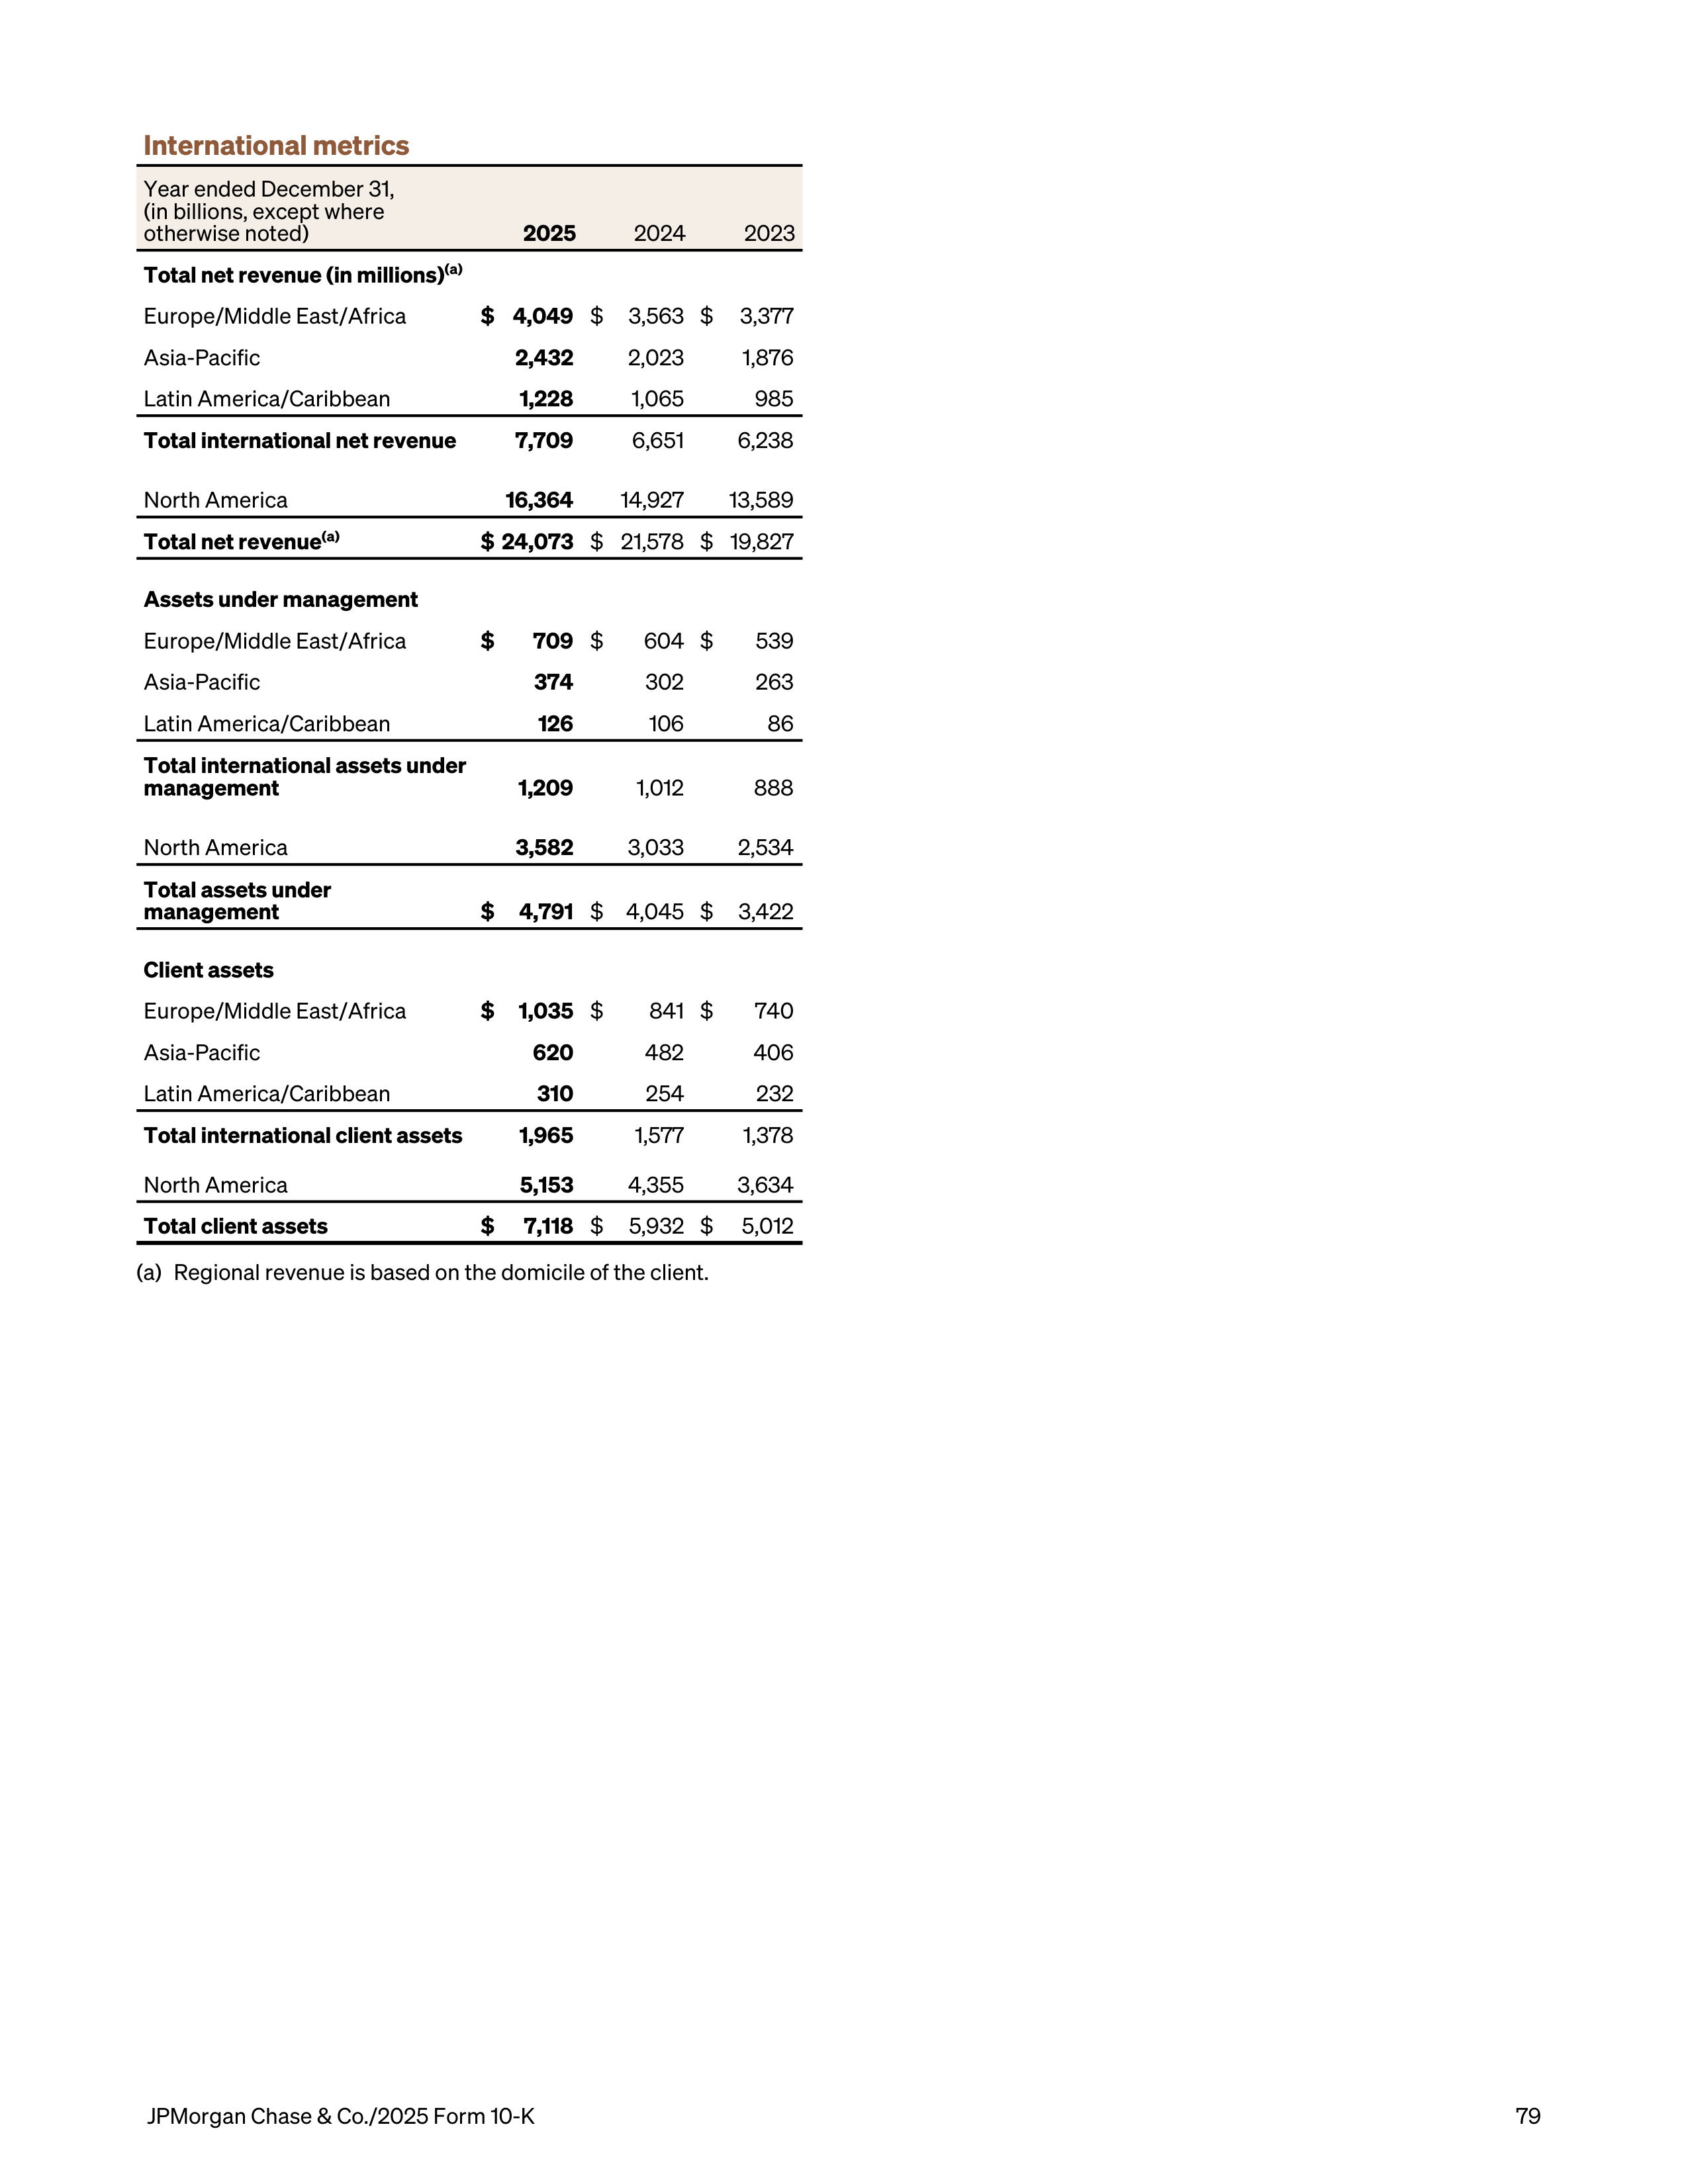
International metrics
Year ended December 31,
(in billions, except where
otherwise noted)
2025
2024
2023
Total net revenue (in millions)
(a)
Europe/Middle East/Africa
$ 4,049
$
3,563 $
3,377
Asia-Pacific
2,432
2,023
1,876
Latin America/Caribbean
1,228
1,065
985
Total international net revenue
7,709
6,651
6,238
North America
16,364
14,927
13,589
Total net revenue
(a)
$ 24,073
$ 21,578 $ 19,827
Assets under management
Europe/Middle East/Africa
$
709
$
604 $
539
Asia-Pacific
374
302
263
Latin America/Caribbean
126
106
86
Total international assets under
management
1,209
1,012
888
North America
3,582
3,033
2,534
Total assets under
management
$
4,791
$
4,045 $
3,422
Client assets
Europe/Middle East/Africa
$
1,035
$
841 $
740
Asia-Pacific
620
482
406
Latin America/Caribbean
310
254
232
Total international client assets
1,965
1,577
1,378
North America
5,153
4,355
3,634
Total client assets
$
7,118
$
5,932 $
5,012
(a)
Regional revenue is based on the domicile of the client.
JPMorgan Chase & Co./2025 Form 10-K
79
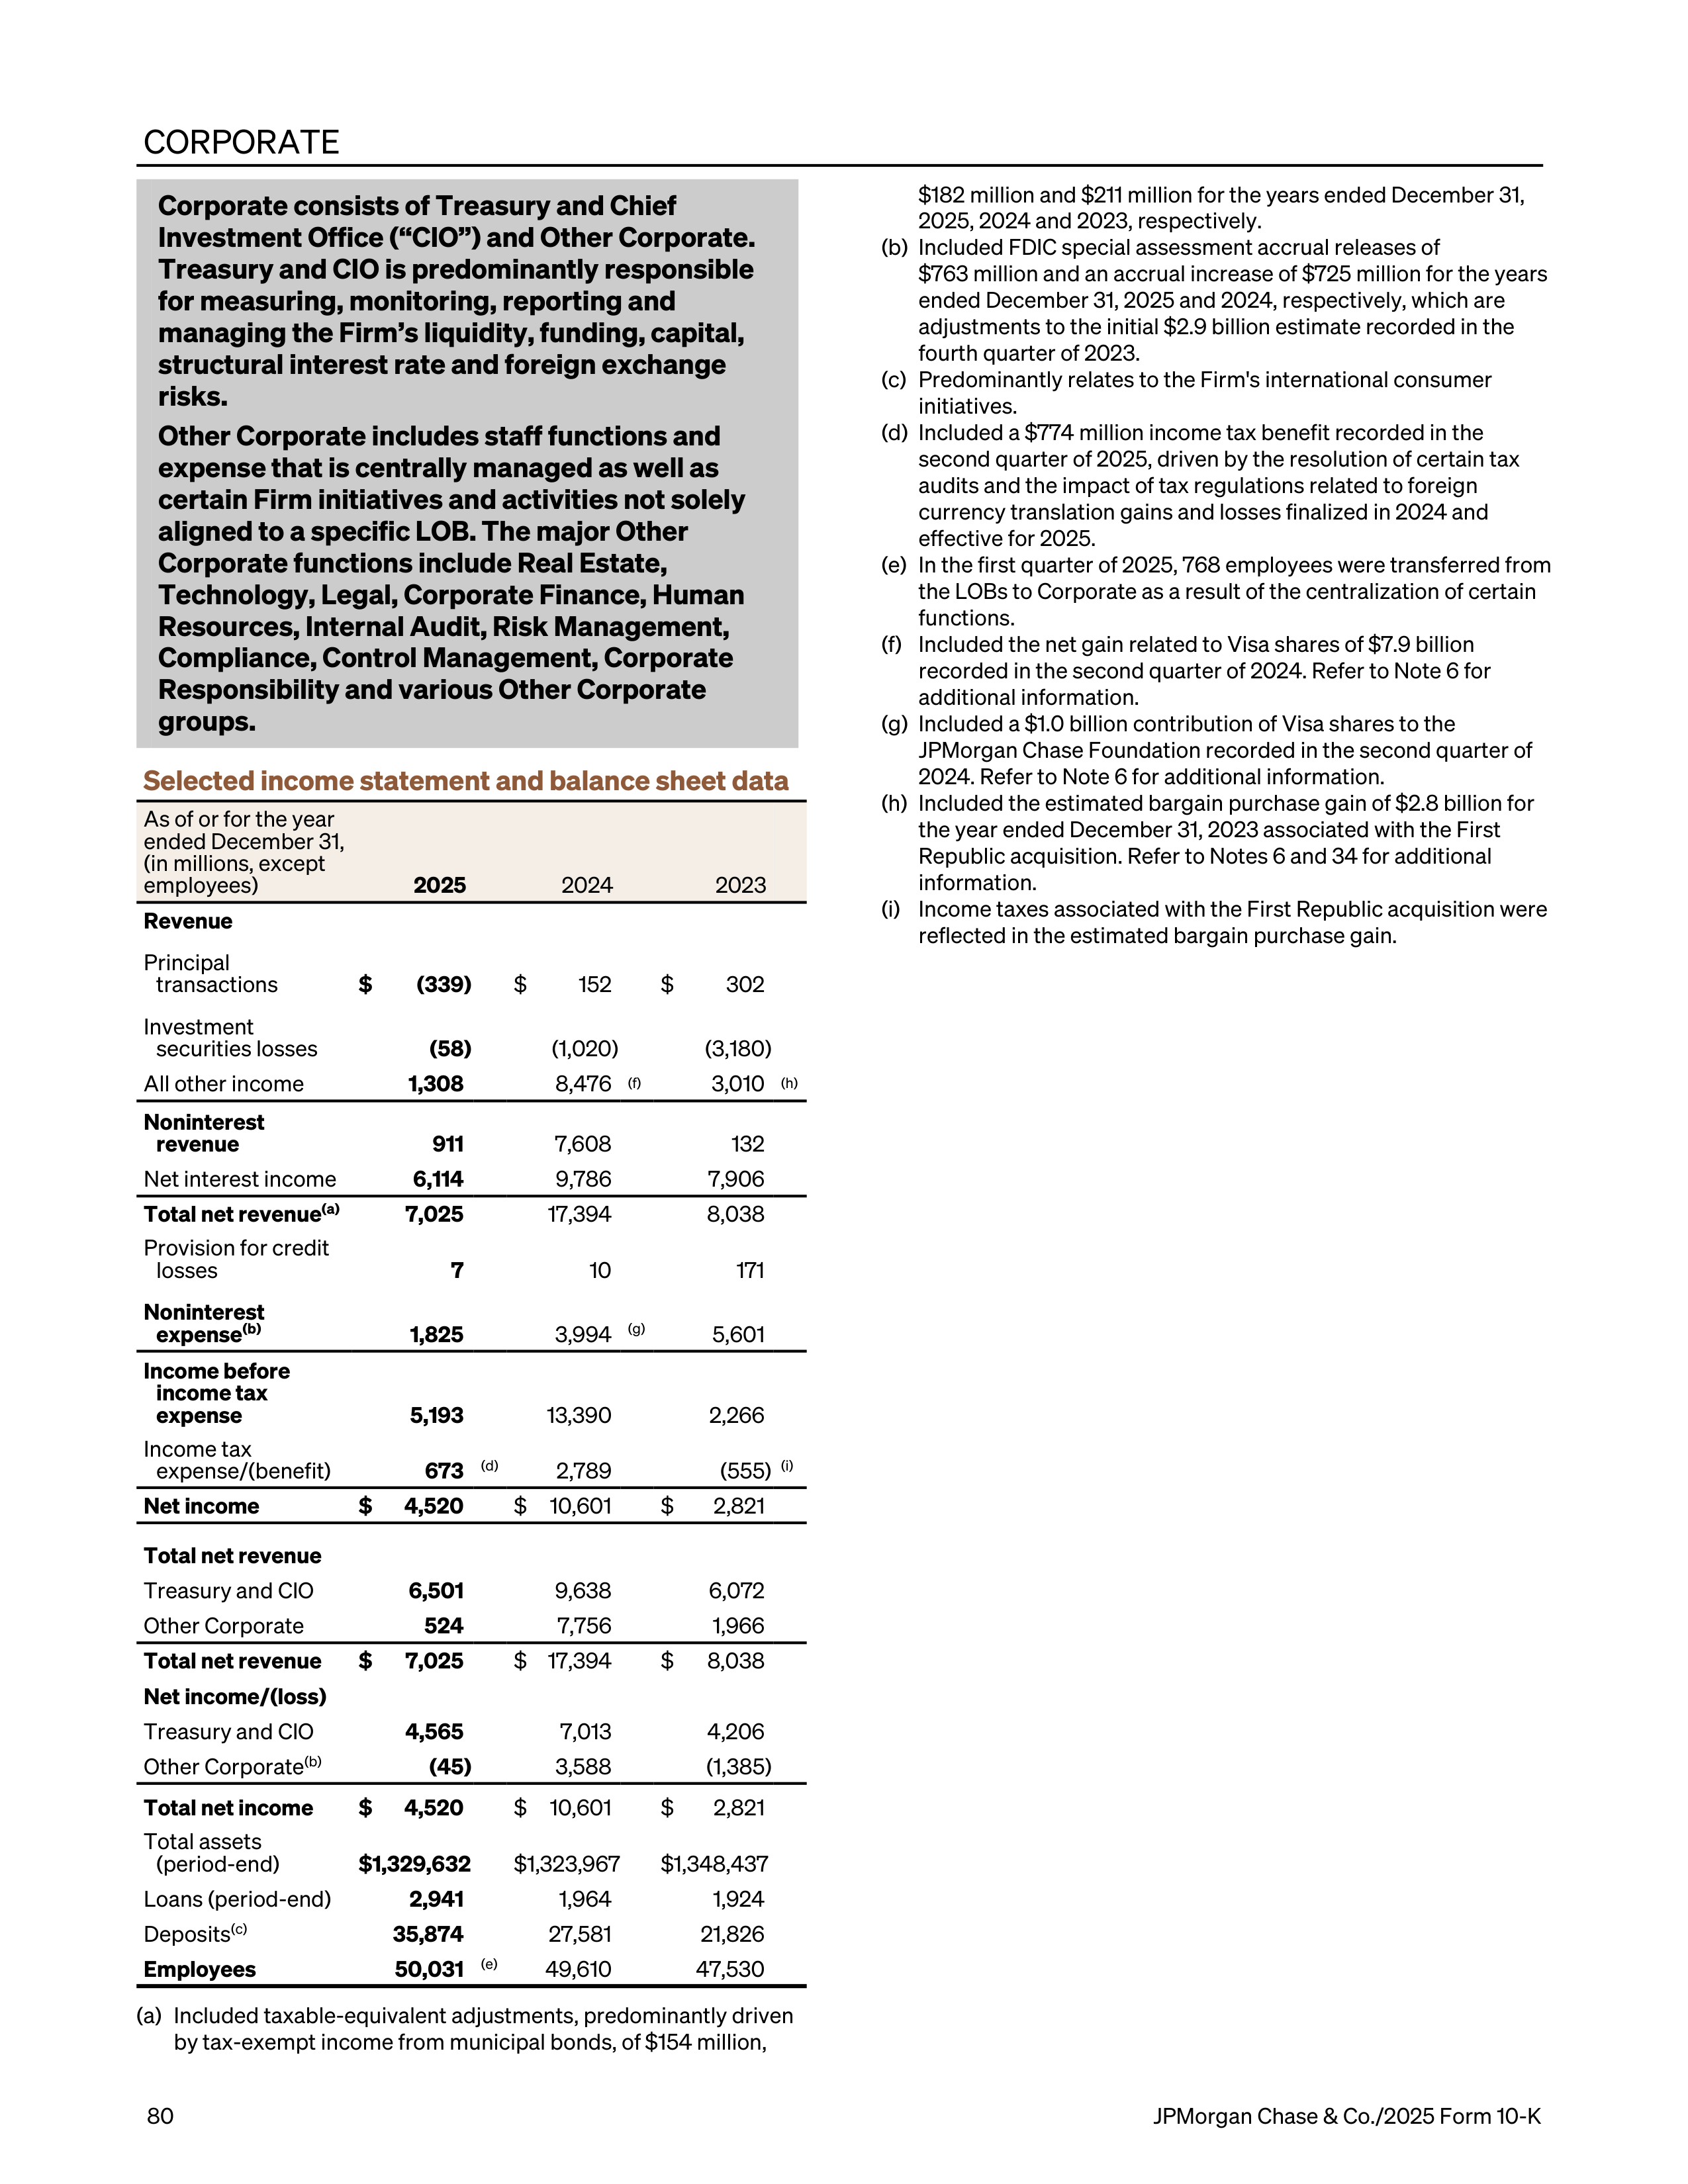
CORPORATE
Corporate consists of Treasury and Chief
Investment Office (“CIO”) and Other Corporate.
Treasury and CIO is predominantly responsible
for measuring, monitoring, reporting and
managing the Firm’s liquidity, funding, capital,
structural interest rate and foreign exchange
risks.
Other Corporate includes staff functions and
expense that is centrally managed as well as
certain Firm initiatives and activities not solely
aligned to a specific LOB. The major Other
Corporate functions include Real Estate,
Technology, Legal, Corporate Finance, Human
Resources, Internal Audit, Risk Management,
Compliance, Control Management, Corporate
Responsibility and various Other Corporate
groups.
Selected income statement and balance sheet data
As of or for the year
ended December 31,
(in millions, except
employees)
2025
2024
2023
Revenue
Principal
transactions
$
(339)
$
152
$
302
Investment
securities losses
(58)
(1,020)
(3,180)
All other income
1,308
8,476
(f)
3,010
(h)
Noninterest
revenue
911
7,608
132
Net interest income
6,114
9,786
7,906
Total net revenue
(a)
7,025
17,394
8,038
Provision for credit
losses
7
10
171
Noninterest
expense
(b)
1,825
3,994
(g)
5,601
Income before
income tax
expense
5,193
13,390
2,266
Income tax
expense/(benefit)
673
(d)
2,789
(555)
(i)
Net income
$
4,520
$
10,601
$
2,821
Total net revenue
Treasury and CIO
6,501
9,638
6,072
Other Corporate
524
7,756
1,966
Total net revenue
$
7,025
$ 17,394
$
8,038
Net income/(loss)
Treasury and CIO
4,565
7,013
4,206
Other Corporate
(b)
(45)
3,588
(1,385)
Total net income
$
4,520
$
10,601
$
2,821
Total assets
(period-end)
$ 1,329,632
$ 1,323,967
$ 1,348,437
Loans (period-end)
2,941
1,964
1,924
Deposits
(c)
35,874
27,581
21,826
Employees
50,031
(e)
49,610
47,530
(a)
Included taxable-equivalent adjustments, predominantly driven
by tax-exempt income from municipal bonds, of $154 million,
$182 million and $211 million for the years ended December 31,
2025, 2024 and 2023, respectively.
(b)
Included FDIC special assessment accrual releases of
$763 million and an accrual increase of $725 million for the years
ended December 31, 2025 and 2024, respectively, which are
adjustments to the initial $2.9 billion estimate recorded in the
fourth quarter of 2023.
(c)
Predominantly relates to the Firm's international consumer
initiatives.
(d)
Included a $774 million income tax benefit recorded in the
second quarter of 2025, driven by the resolution of certain tax
audits and the impact of tax regulations related to foreign
currency translation gains and losses finalized in 2024 and
effective for 2025.
(e)
In the first quarter of 2025, 768 employees were transferred from
the LOBs to Corporate as a result of the centralization of certain
functions.
(f)
Included the net gain related to Visa shares of $7.9 billion
recorded in the second quarter of 2024. Refer to Note 6 for
additional information.
(g)
Included a $1.0 billion contribution of Visa shares to the
JPMorgan Chase Foundation recorded in the second quarter of
2024. Refer to Note 6 for additional information.
(h)
Included the estimated bargain purchase gain of $2.8 billion for
the year ended December 31, 2023 associated with the First
Republic acquisition. Refer to Notes 6 and 34 for additional
information.
(i)
Income taxes associated with the First Republic acquisition were
reflected in the estimated bargain purchase gain.
80
JPMorgan Chase & Co./2025 Form 10-K
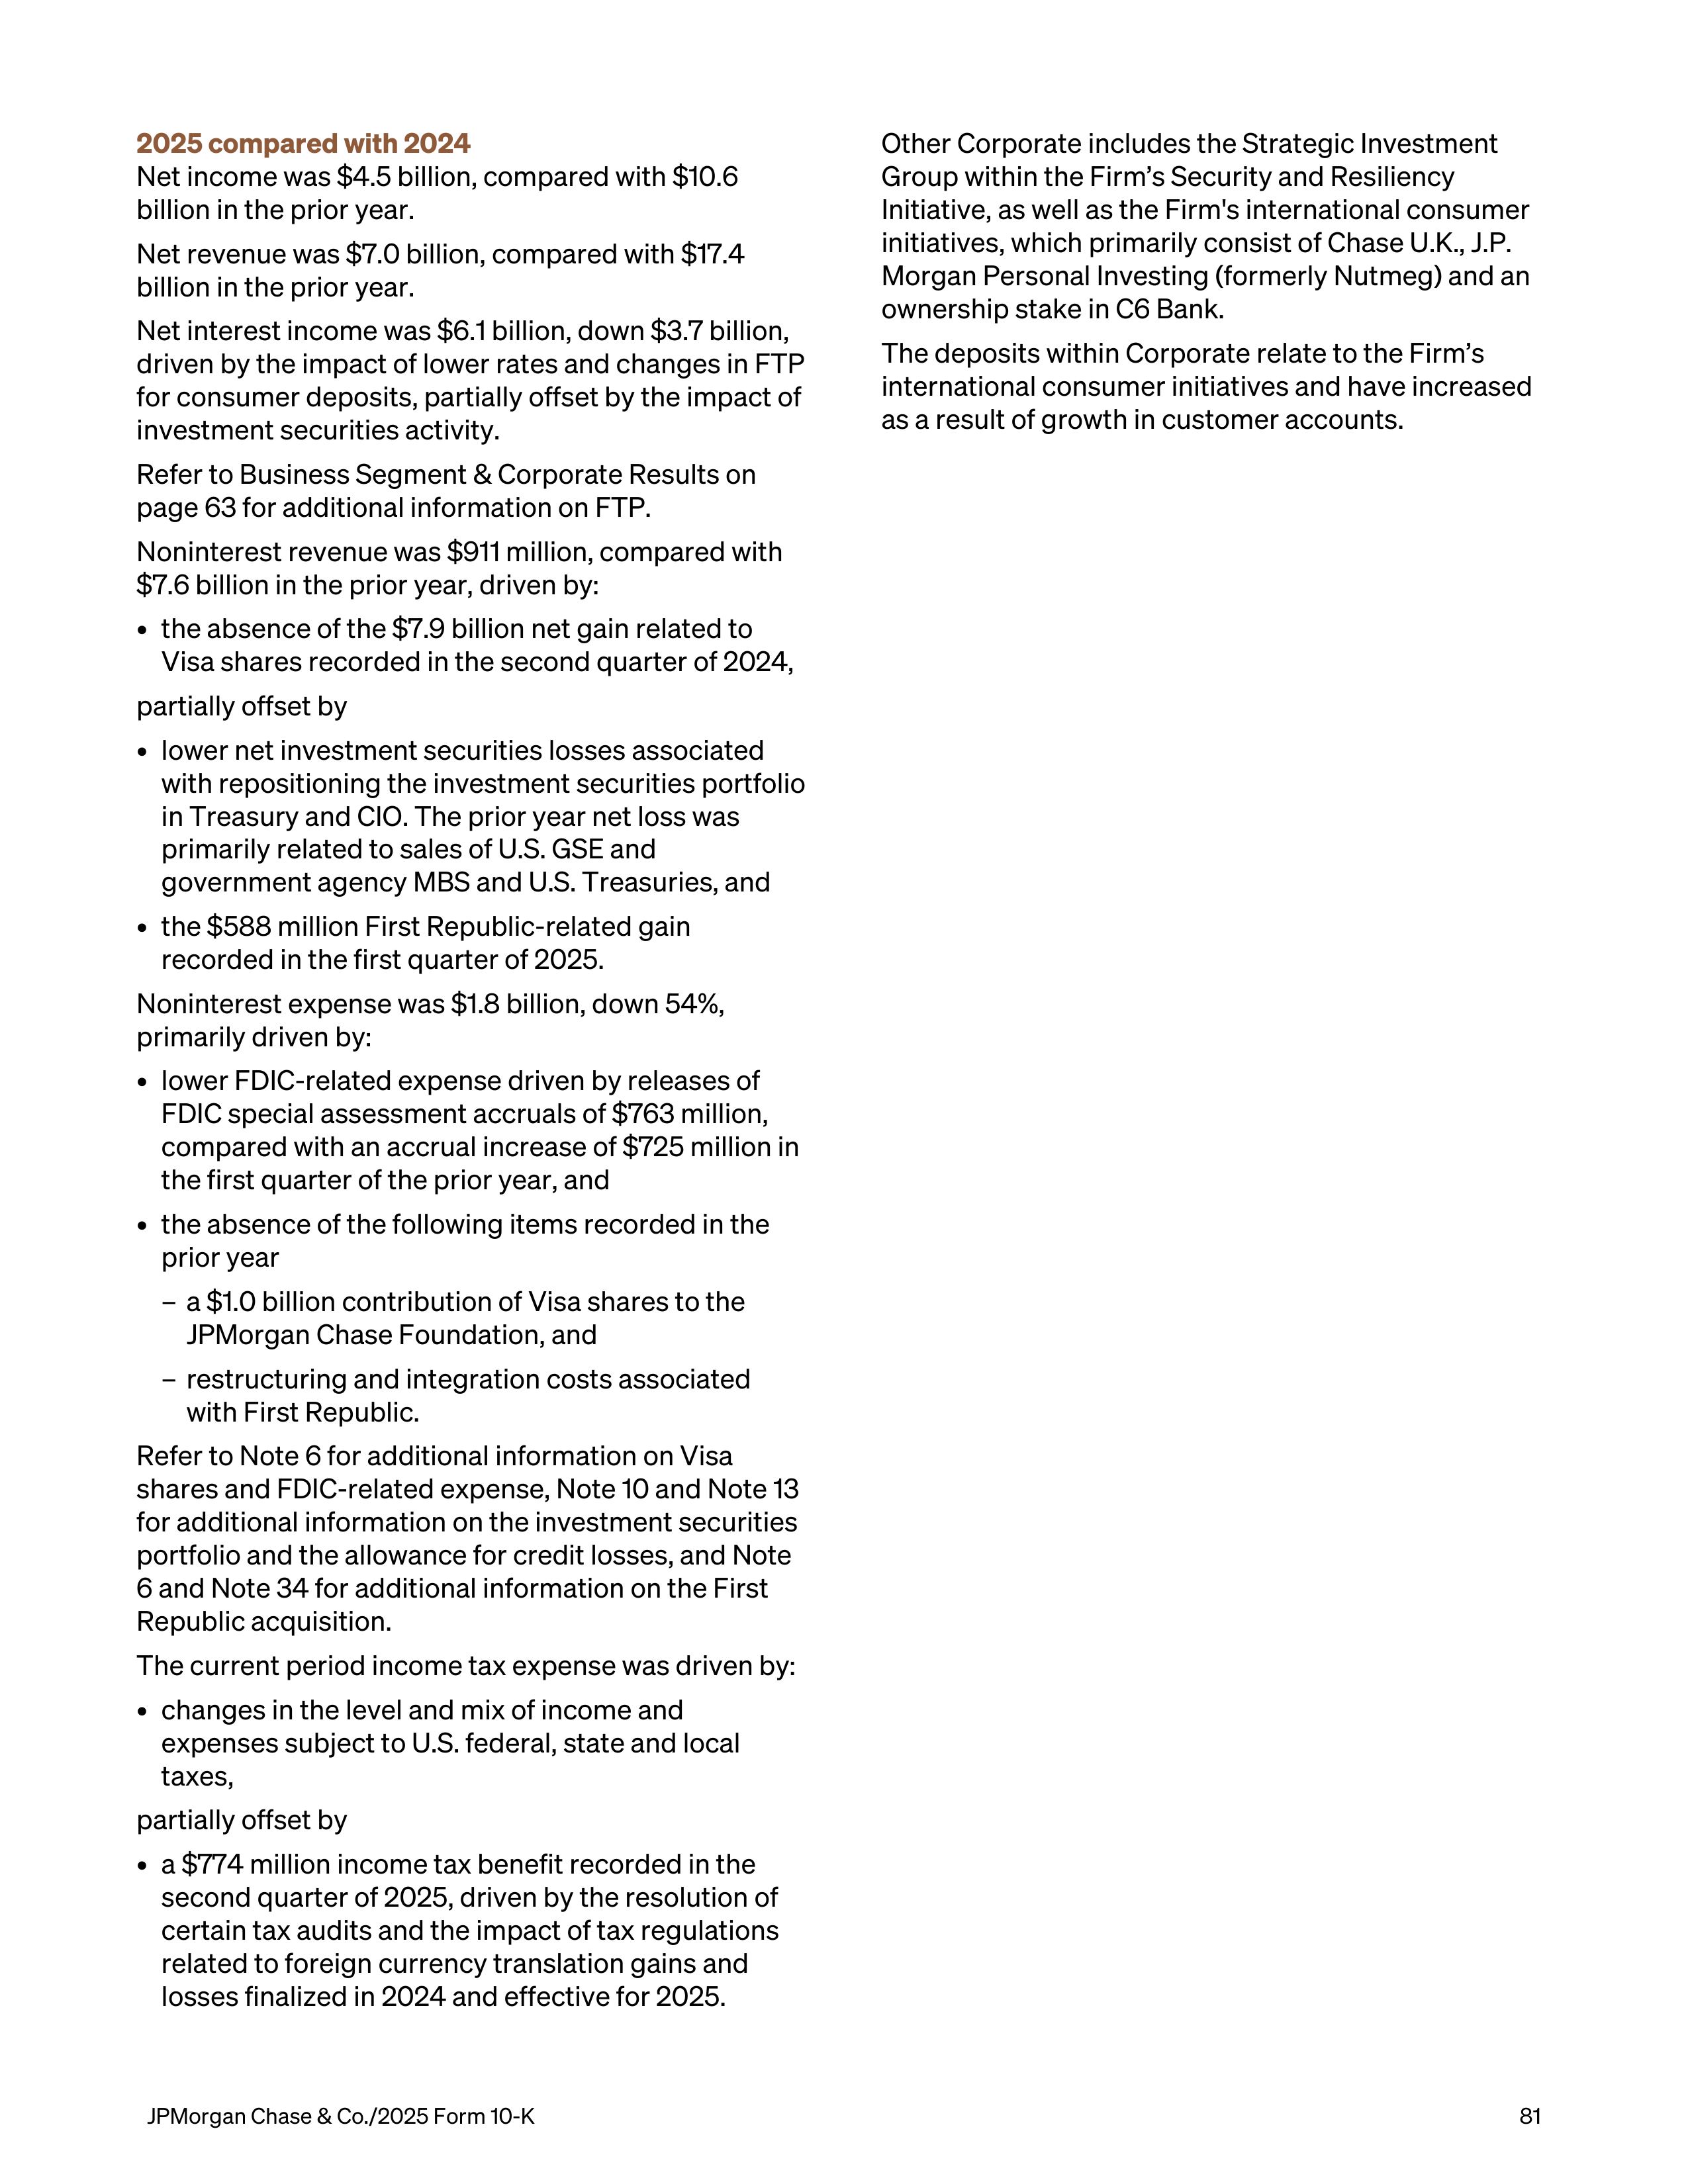
2025 compared with 2024
Net income was $4.5 billion, compared with $10.6
billion in the prior year.
Net revenue was $7.0 billion, compared with $17.4
billion in the prior year.
Net interest income was $6.1 billion, down $3.7 billion,
driven by the impact of lower rates and changes in FTP
for consumer deposits, partially offset by the impact of
investment securities activity.
Refer to Business Segment & Corporate Results on
page 63 for additional information on FTP.
Noninterest revenue was $911 million, compared with
$7.6 billion in the prior year, driven by:
•
the absence of the $7.9 billion net gain related to
Visa shares recorded in the second quarter of 2024,
partially offset by
•
lower net investment securities losses associated
with repositioning the investment securities portfolio
in Treasury and CIO. The prior year net loss was
primarily related to sales of U.S. GSE and
government agency MBS and U.S. Treasuries, and
•
the $588 million First Republic-related gain
recorded in the first quarter of 2025.
Noninterest expense was $1.8 billion, down 54%,
primarily driven by:
•
lower FDIC-related expense driven by releases of
FDIC special assessment accruals of $763 million,
compared with an accrual increase of $725 million in
the first quarter of the prior year, and
•
the absence of the following items recorded in the
prior year
–
a $1.0 billion contribution of Visa shares to the
JPMorgan Chase Foundation, and
–
restructuring and integration costs associated
with First Republic.
Refer to Note 6 for additional information on Visa
shares and FDIC-related expense, Note 10 and Note 13
for additional information on the investment securities
portfolio and the allowance for credit losses, and Note
6 and Note 34 for additional information on the First
Republic acquisition.
The current period income tax expense was driven by:
•
changes in the level and mix of income and
expenses subject to U.S. federal, state and local
taxes,
partially offset by
•
a $774 million income tax benefit recorded in the
second quarter of 2025, driven by the resolution of
certain tax audits and the impact of tax regulations
related to foreign currency translation gains and
losses finalized in 2024 and effective for 2025.
Other Corporate includes the Strategic Investment
Group within the Firm’s Security and Resiliency
Initiative, as well as the Firm's international consumer
initiatives, which primarily consist of Chase U.K., J.P.
Morgan Personal Investing (formerly Nutmeg) and an
ownership stake in C6 Bank.
The deposits within Corporate relate to the Firm’s
international consumer initiatives and have increased
as a result of growth in customer accounts.
JPMorgan Chase & Co./2025 Form 10-K
81
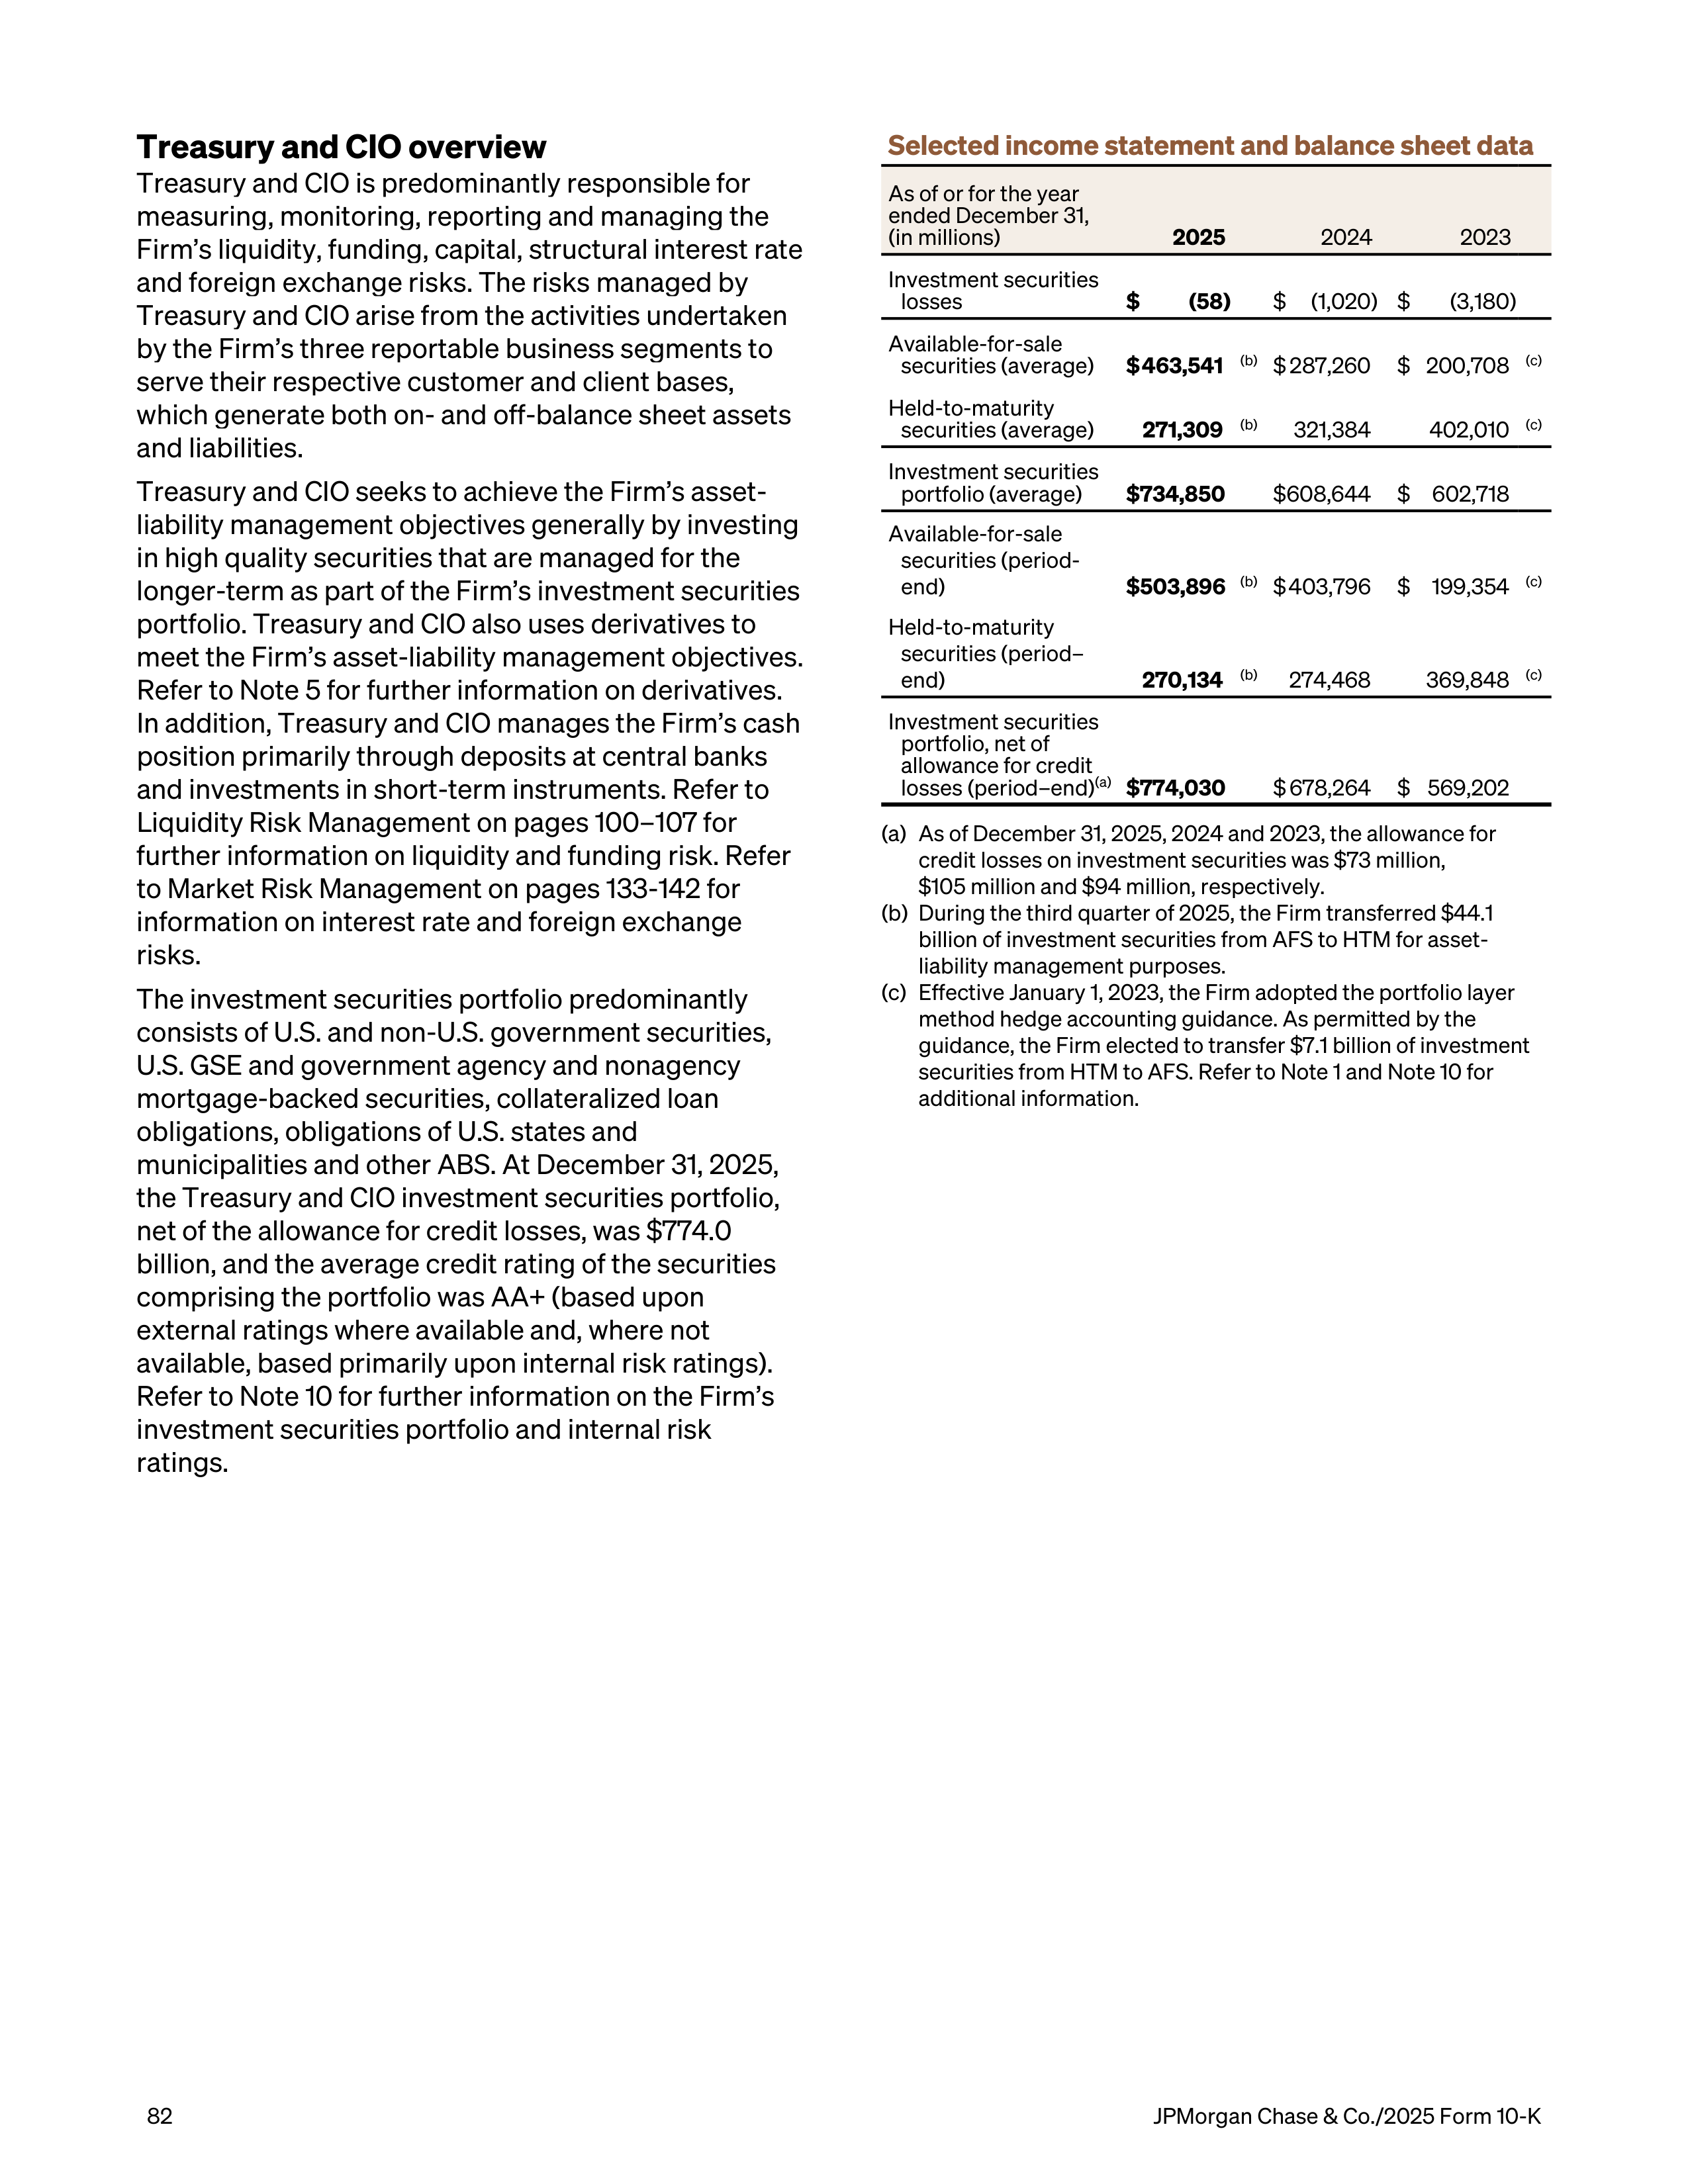
Treasury and CIO overview
Treasury and CIO is predominantly responsible for
measuring, monitoring, reporting and managing the
Firm’s liquidity, funding, capital, structural interest rate
and foreign exchange risks. The risks managed by
Treasury and CIO arise from the activities undertaken
by the Firm’s three reportable business segments to
serve their respective customer and client bases,
which generate both on- and off-balance sheet assets
and liabilities.
Treasury and CIO seeks to achieve the Firm’s asset-
liability management objectives generally by investing
in high quality securities that are managed for the
longer-term as part of the Firm’s investment securities
portfolio. Treasury and CIO also uses derivatives to
meet the Firm’s asset-liability management objectives.
Refer to Note 5 for further information on derivatives.
In addition, Treasury and CIO manages the Firm’s cash
position primarily through deposits at central banks
and investments in short-term instruments. Refer to
Liquidity Risk Management on pages 100–107 for
further information on liquidity and funding risk. Refer
to Market Risk Management on pages 133-142 for
information on interest rate and foreign exchange
risks.
The investment securities portfolio predominantly
consists of U.S. and non-U.S. government securities,
U.S. GSE and government agency and nonagency
mortgage-backed securities, collateralized loan
obligations, obligations of U.S. states and
municipalities and other ABS. At December 31, 2025,
the Treasury and CIO investment securities portfolio,
net of the allowance for credit losses, was $774.0
billion, and the average credit rating of the securities
comprising the portfolio was AA+ (based upon
external ratings where available and, where not
available, based primarily upon internal risk ratings).
Refer to Note 10 for further information on the Firm’s
investment securities portfolio and internal risk
ratings.
Selected income statement and balance sheet data
As of or for the year
ended December 31,
(in millions)
2025
2024
2023
Investment securities
losses
$
(58)
$
(1,020) $
(3,180)
Available-for-sale
securities (average)
$ 463,541
(b)
$ 287,260
$ 200,708
(c)
Held-to-maturity
securities (average)
271,309
(b)
321,384
402,010
(c)
Investment securities
portfolio (average)
$ 734,850
$ 608,644
$ 602,718
Available-for-sale
securities (period-
end)
$ 503,896
(b)
$ 403,796
$ 199,354
(c)
Held-to-maturity
securities (period–
end)
270,134
(b)
274,468
369,848
(c)
Investment securities
portfolio, net of
allowance for credit
losses (period–end)
(a)
$ 774,030
$ 678,264
$ 569,202
(a)
As of December 31, 2025, 2024 and 2023, the allowance for
credit losses on investment securities was $73 million,
$105 million and $94 million, respectively.
(b)
During the third quarter of 2025, the Firm transferred $44.1
billion of investment securities from AFS to HTM for asset-
liability management purposes.
(c)
Effective January 1, 2023, the Firm adopted the portfolio layer
method hedge accounting guidance. As permitted by the
guidance, the Firm elected to transfer $7.1 billion of investment
securities from HTM to AFS. Refer to Note 1 and Note 10 for
additional information.
82
JPMorgan Chase & Co./2025 Form 10-K
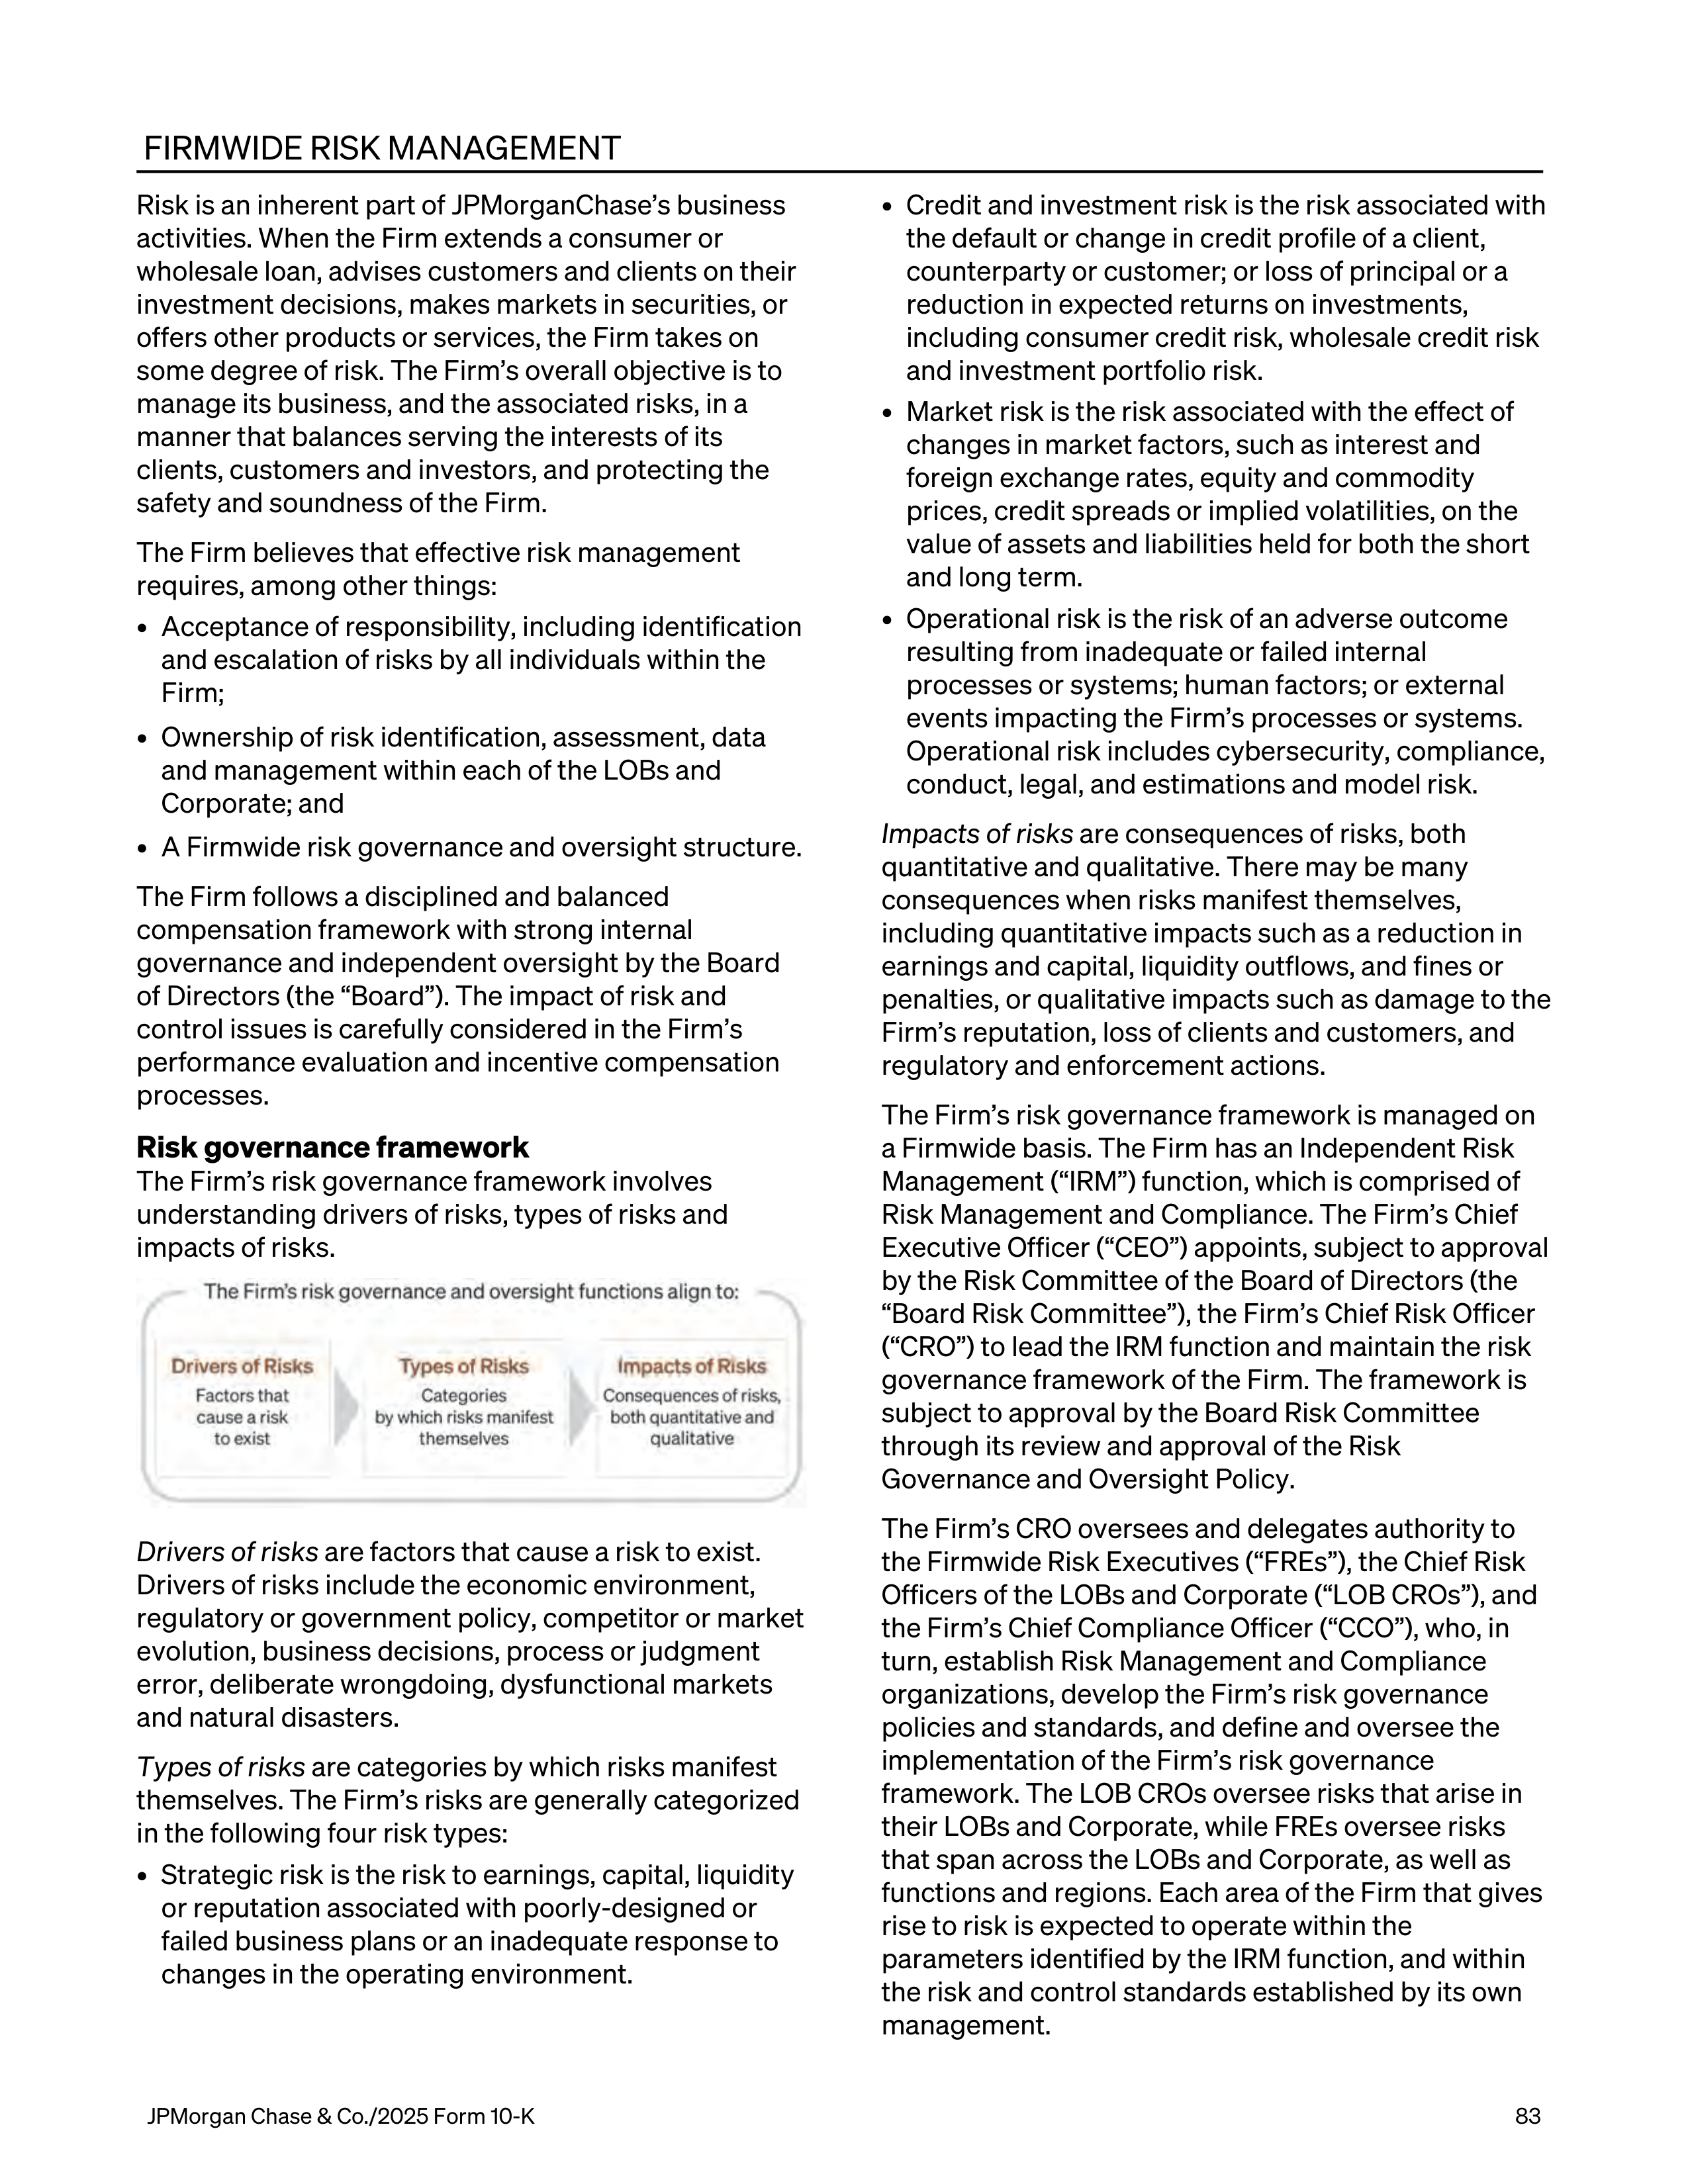

FIRMWIDE RISK MANAGEMENT
Risk is an inherent part of JPMorganChase’s business
activities. When the Firm extends a consumer or
wholesale loan, advises customers and clients on their
investment decisions, makes markets in securities, or
offers other products or services, the Firm takes on
some degree of risk. The Firm’s overall objective is to
manage its business, and the associated risks, in a
manner that balances serving the interests of its
clients, customers and investors, and protecting the
safety and soundness of the Firm.
The Firm believes that effective risk management
requires, among other things:
•
Acceptance of responsibility, including identification
and escalation of risks by all individuals within the
Firm;
•
Ownership of risk identification, assessment, data
and management within each of the LOBs and
Corporate; and
•
A Firmwide risk governance and oversight structure.
The Firm follows a disciplined and balanced
compensation framework with strong internal
governance and independent oversight by the Board
of Directors (the “Board”). The impact of risk and
control issues is carefully considered in the Firm’s
performance evaluation and incentive compensation
processes.
Risk governance framework
The Firm’s risk governance framework involves
understanding drivers of risks, types of risks and
impacts of risks.
Drivers of risks
are factors that cause a risk to exist.
Drivers of risks include the economic environment,
regulatory or government policy, competitor or market
evolution, business decisions, process or judgment
error, deliberate wrongdoing, dysfunctional markets
and natural disasters.
Types of risks
are categories by which risks manifest
themselves. The Firm’s risks are generally categorized
in the following four risk types:
•
Strategic risk is the risk to earnings, capital, liquidity
or reputation associated with poorly-designed or
failed business plans or an inadequate response to
changes in the operating environment.
•
Credit and investment risk is the risk associated with
the default or change in credit profile of a client,
counterparty or customer; or loss of principal or a
reduction in expected returns on investments,
including consumer credit risk, wholesale credit risk
and investment portfolio risk.
•
Market risk is the risk associated with the effect of
changes in market factors, such as interest and
foreign exchange rates, equity and commodity
prices, credit spreads or implied volatilities, on the
value of assets and liabilities held for both the short
and long term.
•
Operational risk is the risk of an adverse outcome
resulting from inadequate or failed internal
processes or systems; human factors; or external
events impacting the Firm’s processes or systems.
Operational risk includes cybersecurity, compliance,
conduct, legal, and estimations and model risk.
Impacts of risks
are consequences of risks, both
quantitative and qualitative. There may be many
consequences when risks manifest themselves,
including quantitative impacts such as a reduction in
earnings and capital, liquidity outflows, and fines or
penalties, or qualitative impacts such as damage to the
Firm’s reputation, loss of clients and customers, and
regulatory and enforcement actions.
The Firm’s risk governance framework is managed on
a Firmwide basis. The Firm has an Independent Risk
Management (“IRM”) function, which is comprised of
Risk Management and Compliance. The Firm’s Chief
Executive Officer (“CEO”) appoints, subject to approval
by the Risk Committee of the Board of Directors (the
“Board Risk Committee”), the Firm’s Chief Risk Officer
(“CRO”) to lead the IRM function and maintain the risk
governance framework of the Firm. The framework is
subject to approval by the Board Risk Committee
through its review and approval of the Risk
Governance and Oversight Policy.
The Firm’s CRO oversees and delegates authority to
the Firmwide Risk Executives (“FREs”), the Chief Risk
Officers of the LOBs and Corporate (“LOB CROs”), and
the Firm’s Chief Compliance Officer (“CCO”), who, in
turn, establish Risk Management and Compliance
organizations, develop the Firm’s risk governance
policies and standards, and define and oversee the
implementation of the Firm’s risk governance
framework. The LOB CROs oversee risks that arise in
their LOBs and Corporate, while FREs oversee risks
that span across the LOBs and Corporate, as well as
functions and regions. Each area of the Firm that gives
rise to risk is expected to operate within the
parameters identified by the IRM function, and within
the risk and control standards established by its own
management.
JPMorgan Chase & Co./2025 Form 10-K
83
Three lines of defense
The Firm’s “three lines of defense” are as follows:
The
first line of defense consists of each LOB, Treasury
and CIO, and certain Other Corporate initiatives,
including their aligned Operations, Technology and
Control Management. The first line of defense owns
the risks, and identification of risks, associated with
their respective activities and the design and
execution of controls to manage those risks.
Responsibilities also include adherence to applicable
laws, rules and regulations and implementation of the
risk governance framework established by IRM, which
may include policies, standards, limits, thresholds and
controls.
The second line of defense is the IRM function, which is
separate from the first line of defense and is
responsible for independently measuring risk, as well
as assessing and challenging the risk management
activities of the first line of defense. IRM is also
responsible for the identification of risks within its
organization, its own adherence to applicable laws,
rules and regulations and for the development and
implementation of policies and standards with respect
to its own processes.
The third line of defense is Internal Audit, an
independent function that provides objective
assessment of the adequacy and effectiveness of
Firmwide processes, controls, governance and risk
management. The Internal Audit function is led by the
General Auditor, who reports to the Audit Committee
and administratively to the CEO.
In addition, there are other functions that contribute to
the Firmwide control environment but are not
considered part of a particular line of defense,
including Corporate Finance, Human Resources and
Legal. These other functions are responsible for the
identification of risks within their respective
organizations, adherence to applicable laws, rules and
regulations and implementation of the risk governance
framework established by IRM.
Risk identification and ownership
The LOBs and Corporate are responsible for the
identification of risks within their respective
organizations, as well as the design and execution of
controls, including IRM-specified controls, to manage
those risks. The IRM function reviews and challenges
the material risks identified by each LOB and
Corporate, and maintains a risk identification
framework and a central risk inventory.
Risk appetite
The Firm’s overall appetite for risk is governed by Risk
Appetite frameworks for quantitative and qualitative
risks. The Firm’s risk appetite is periodically set and
approved by senior management (including the CEO
and CRO) and approved by the Board Risk Committee.
Quantitative and qualitative risks are assessed to
monitor and measure the Firm’s capacity to take risk
consistent with its stated risk appetite. Risk appetite
results are reported to the Board Risk Committee.
Management’s discussion and analysis
84
JPMorgan Chase & Co./2025 Form 10-K
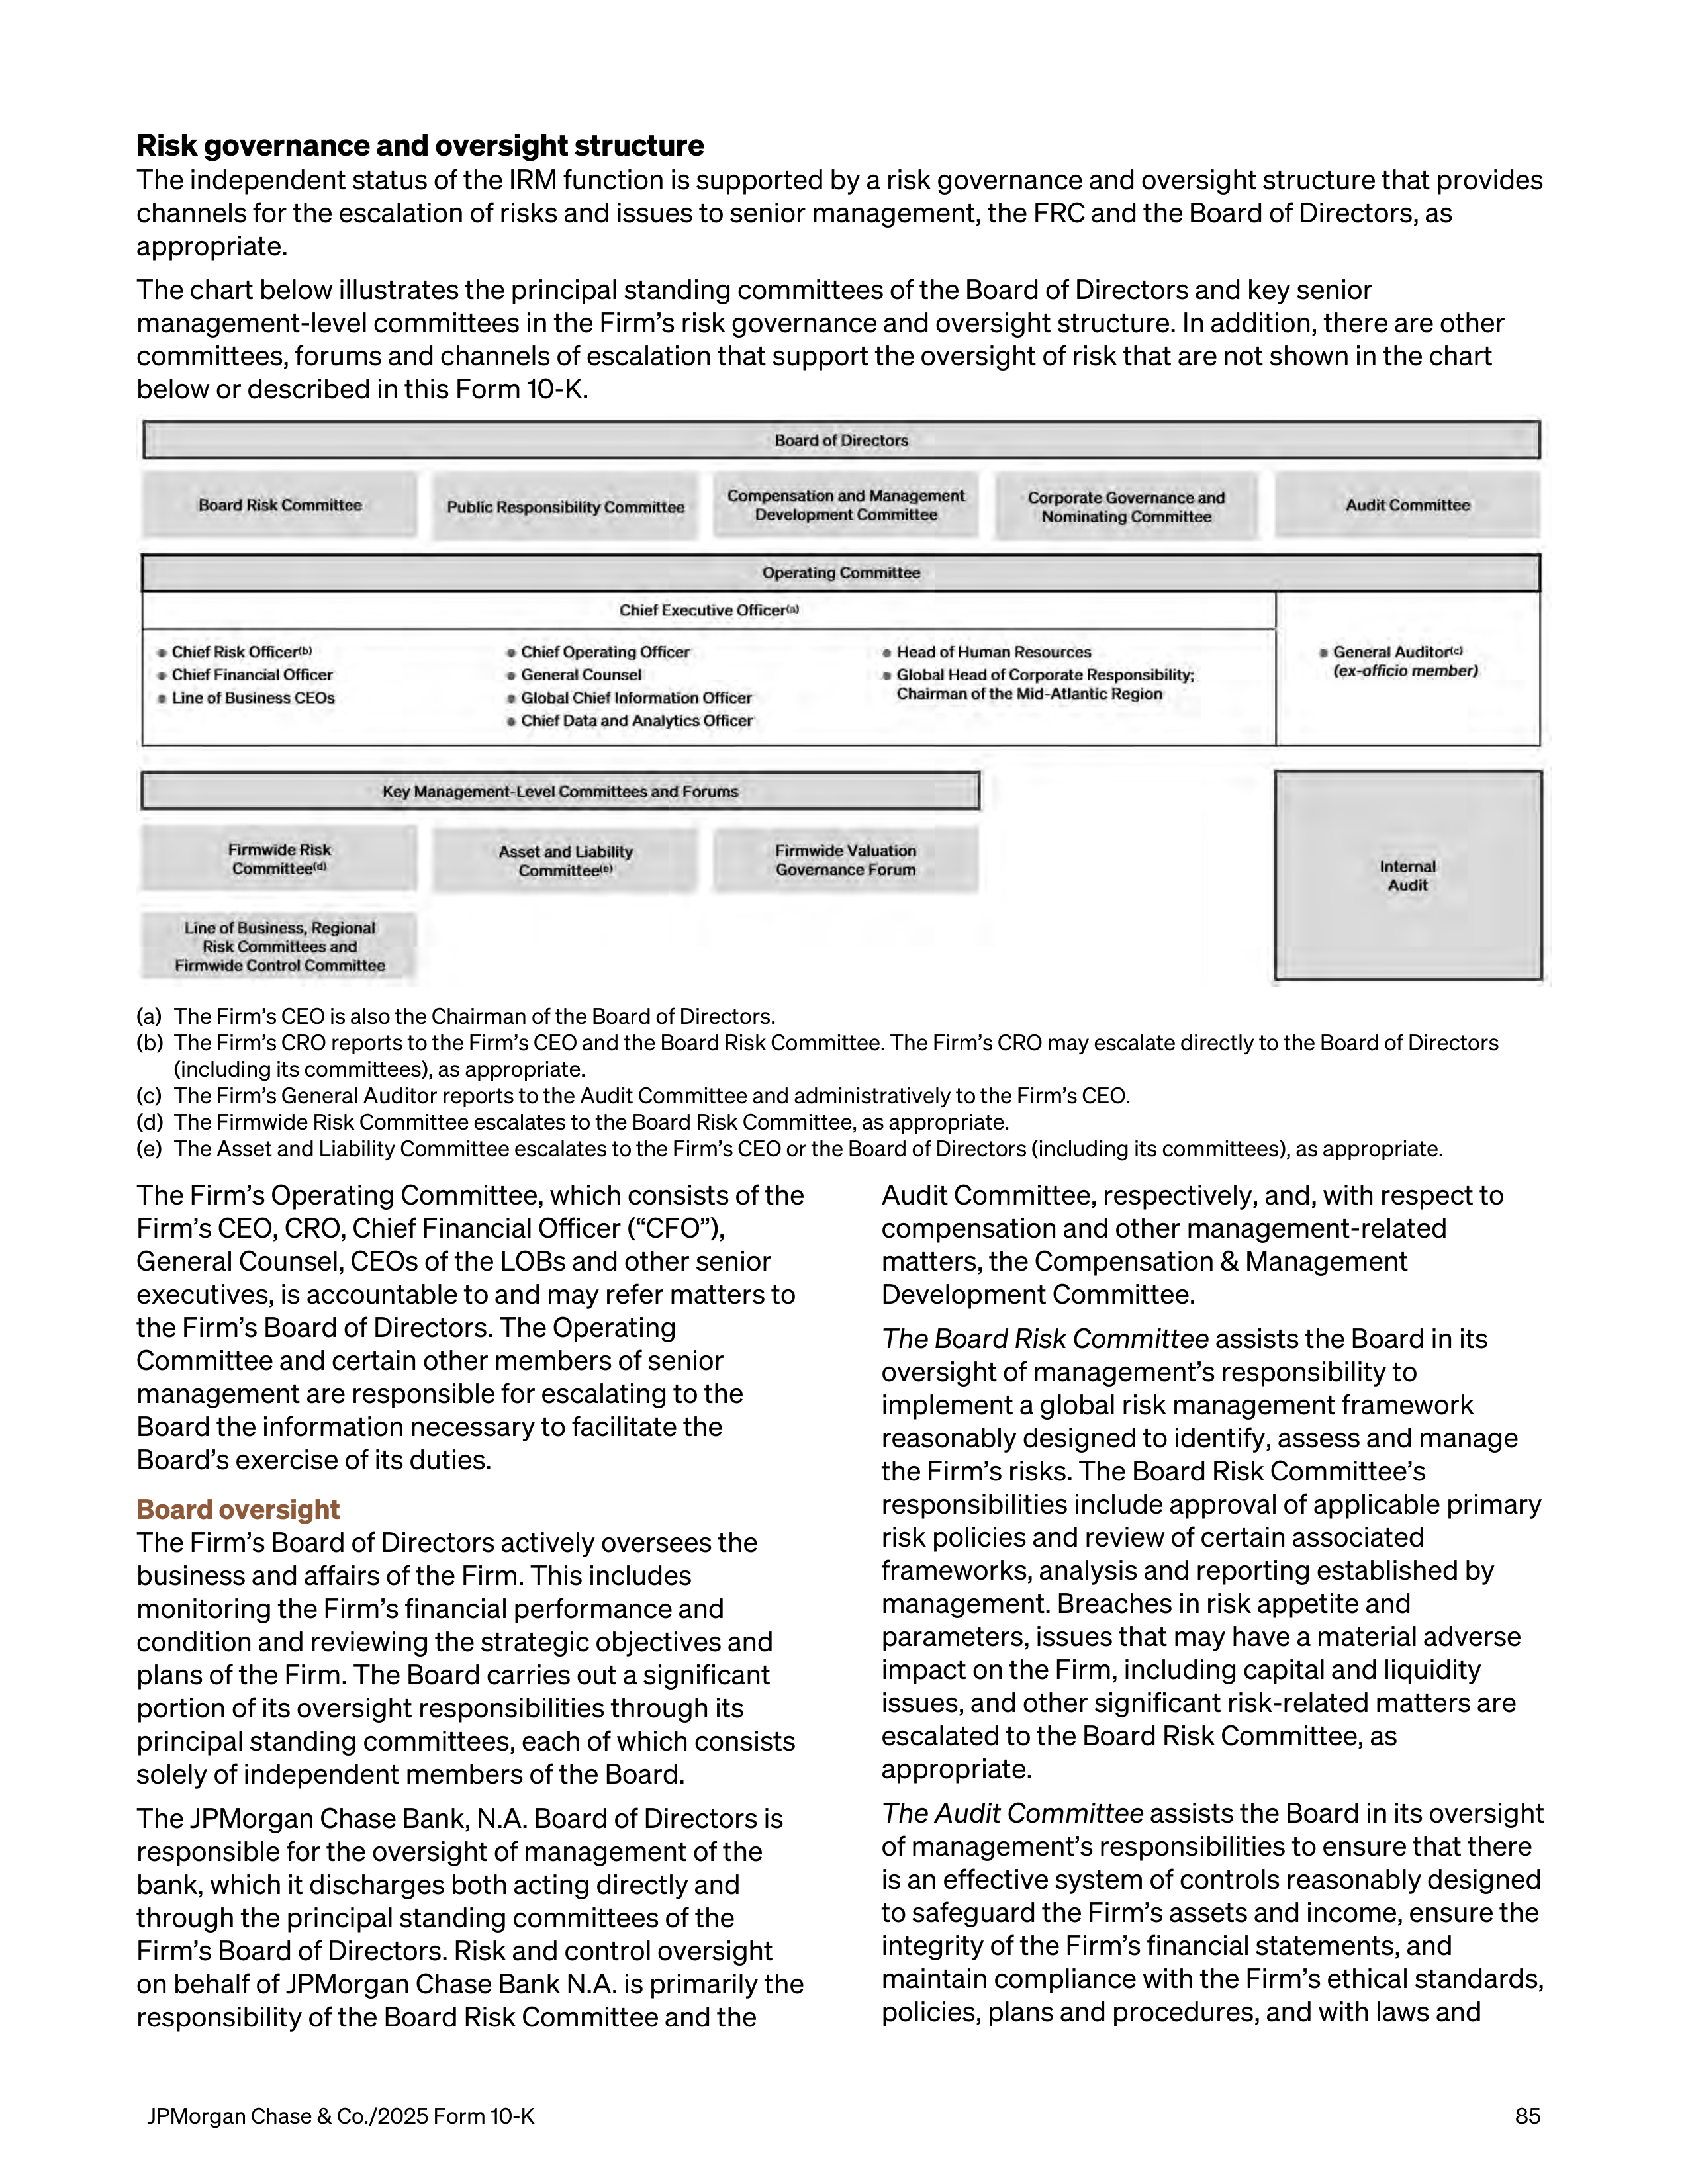
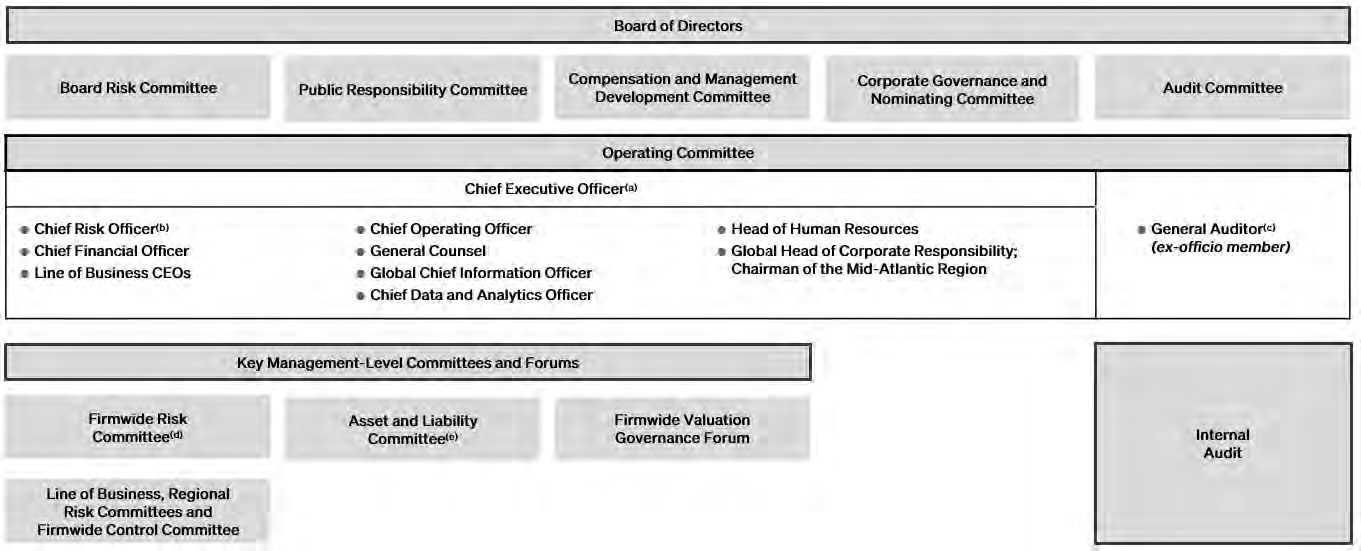
Risk governance and oversight structure
The independent status of the IRM function is supported by a risk governance and oversight structure that provides
channels for the escalation of risks and issues to senior management, the FRC and the Board of Directors, as
appropriate.
The chart below illustrates the principal standing committees of the Board of Directors and key senior
management-level committees in the Firm’s risk governance and oversight structure. In addition, there are other
committees, forums and channels of escalation that support the oversight of risk that are not shown in the chart
below or described in this Form 10-K.
(a)
The Firm’s CEO is also the Chairman of the Board of Directors.
(b)
The Firm’s CRO reports to the Firm’s CEO and the Board Risk Committee. The Firm’s CRO may escalate directly to the Board of Directors
(including its committees), as appropriate.
(c)
The Firm’s General Auditor reports to the Audit Committee and administratively to the Firm’s CEO.
(d)
The Firmwide Risk Committee escalates to the Board Risk Committee, as appropriate.
(e)
The Asset and Liability Committee escalates to the Firm’s CEO or the Board of Directors (including its committees), as appropriate.
The Firm’s Operating Committee, which consists of the
Firm’s CEO, CRO, Chief Financial Officer (“CFO”),
General Counsel, CEOs of the LOBs and other senior
executives, is accountable to and may refer matters to
the Firm’s Board of Directors. The Operating
Committee and certain other members of senior
management are responsible for escalating to the
Board the information necessary to facilitate the
Board’s exercise of its duties.
Board oversight
The Firm’s Board of Directors actively oversees the
business and affairs of the Firm. This includes
monitoring the Firm’s financial performance and
condition and reviewing the strategic objectives and
plans of the Firm. The Board carries out a significant
portion of its oversight responsibilities through its
principal standing committees, each of which consists
solely of independent members of the Board.
The JPMorgan Chase Bank, N.A. Board of Directors is
responsible for the oversight of management of the
bank, which it discharges both acting directly and
through the principal standing committees of the
Firm’s Board of Directors. Risk and control oversight
on behalf of JPMorgan Chase Bank N.A. is primarily the
responsibility of the Board Risk Committee and the
Audit Committee, respectively, and, with respect to
compensation and other management-related
matters, the Compensation & Management
Development Committee.
The Board Risk Committee
assists the Board in its
oversight of management’s responsibility to
implement a global risk management framework
reasonably designed to identify, assess and manage
the Firm’s risks. The Board Risk Committee’s
responsibilities include approval of applicable primary
risk policies and review of certain associated
frameworks, analysis and reporting established by
management. Breaches in risk appetite and
parameters, issues that may have a material adverse
impact on the Firm, including capital and liquidity
issues, and other significant risk-related matters are
escalated to the Board Risk Committee, as
appropriate.
The Audit Committee
assists the Board in its oversight
of management’s responsibilities to ensure that there
is an effective system of controls reasonably designed
to safeguard the Firm’s assets and income, ensure the
integrity of the Firm’s financial statements, and
maintain compliance with the Firm’s ethical standards,
policies, plans and procedures, and with laws and
JPMorgan Chase & Co./2025 Form 10-K
85
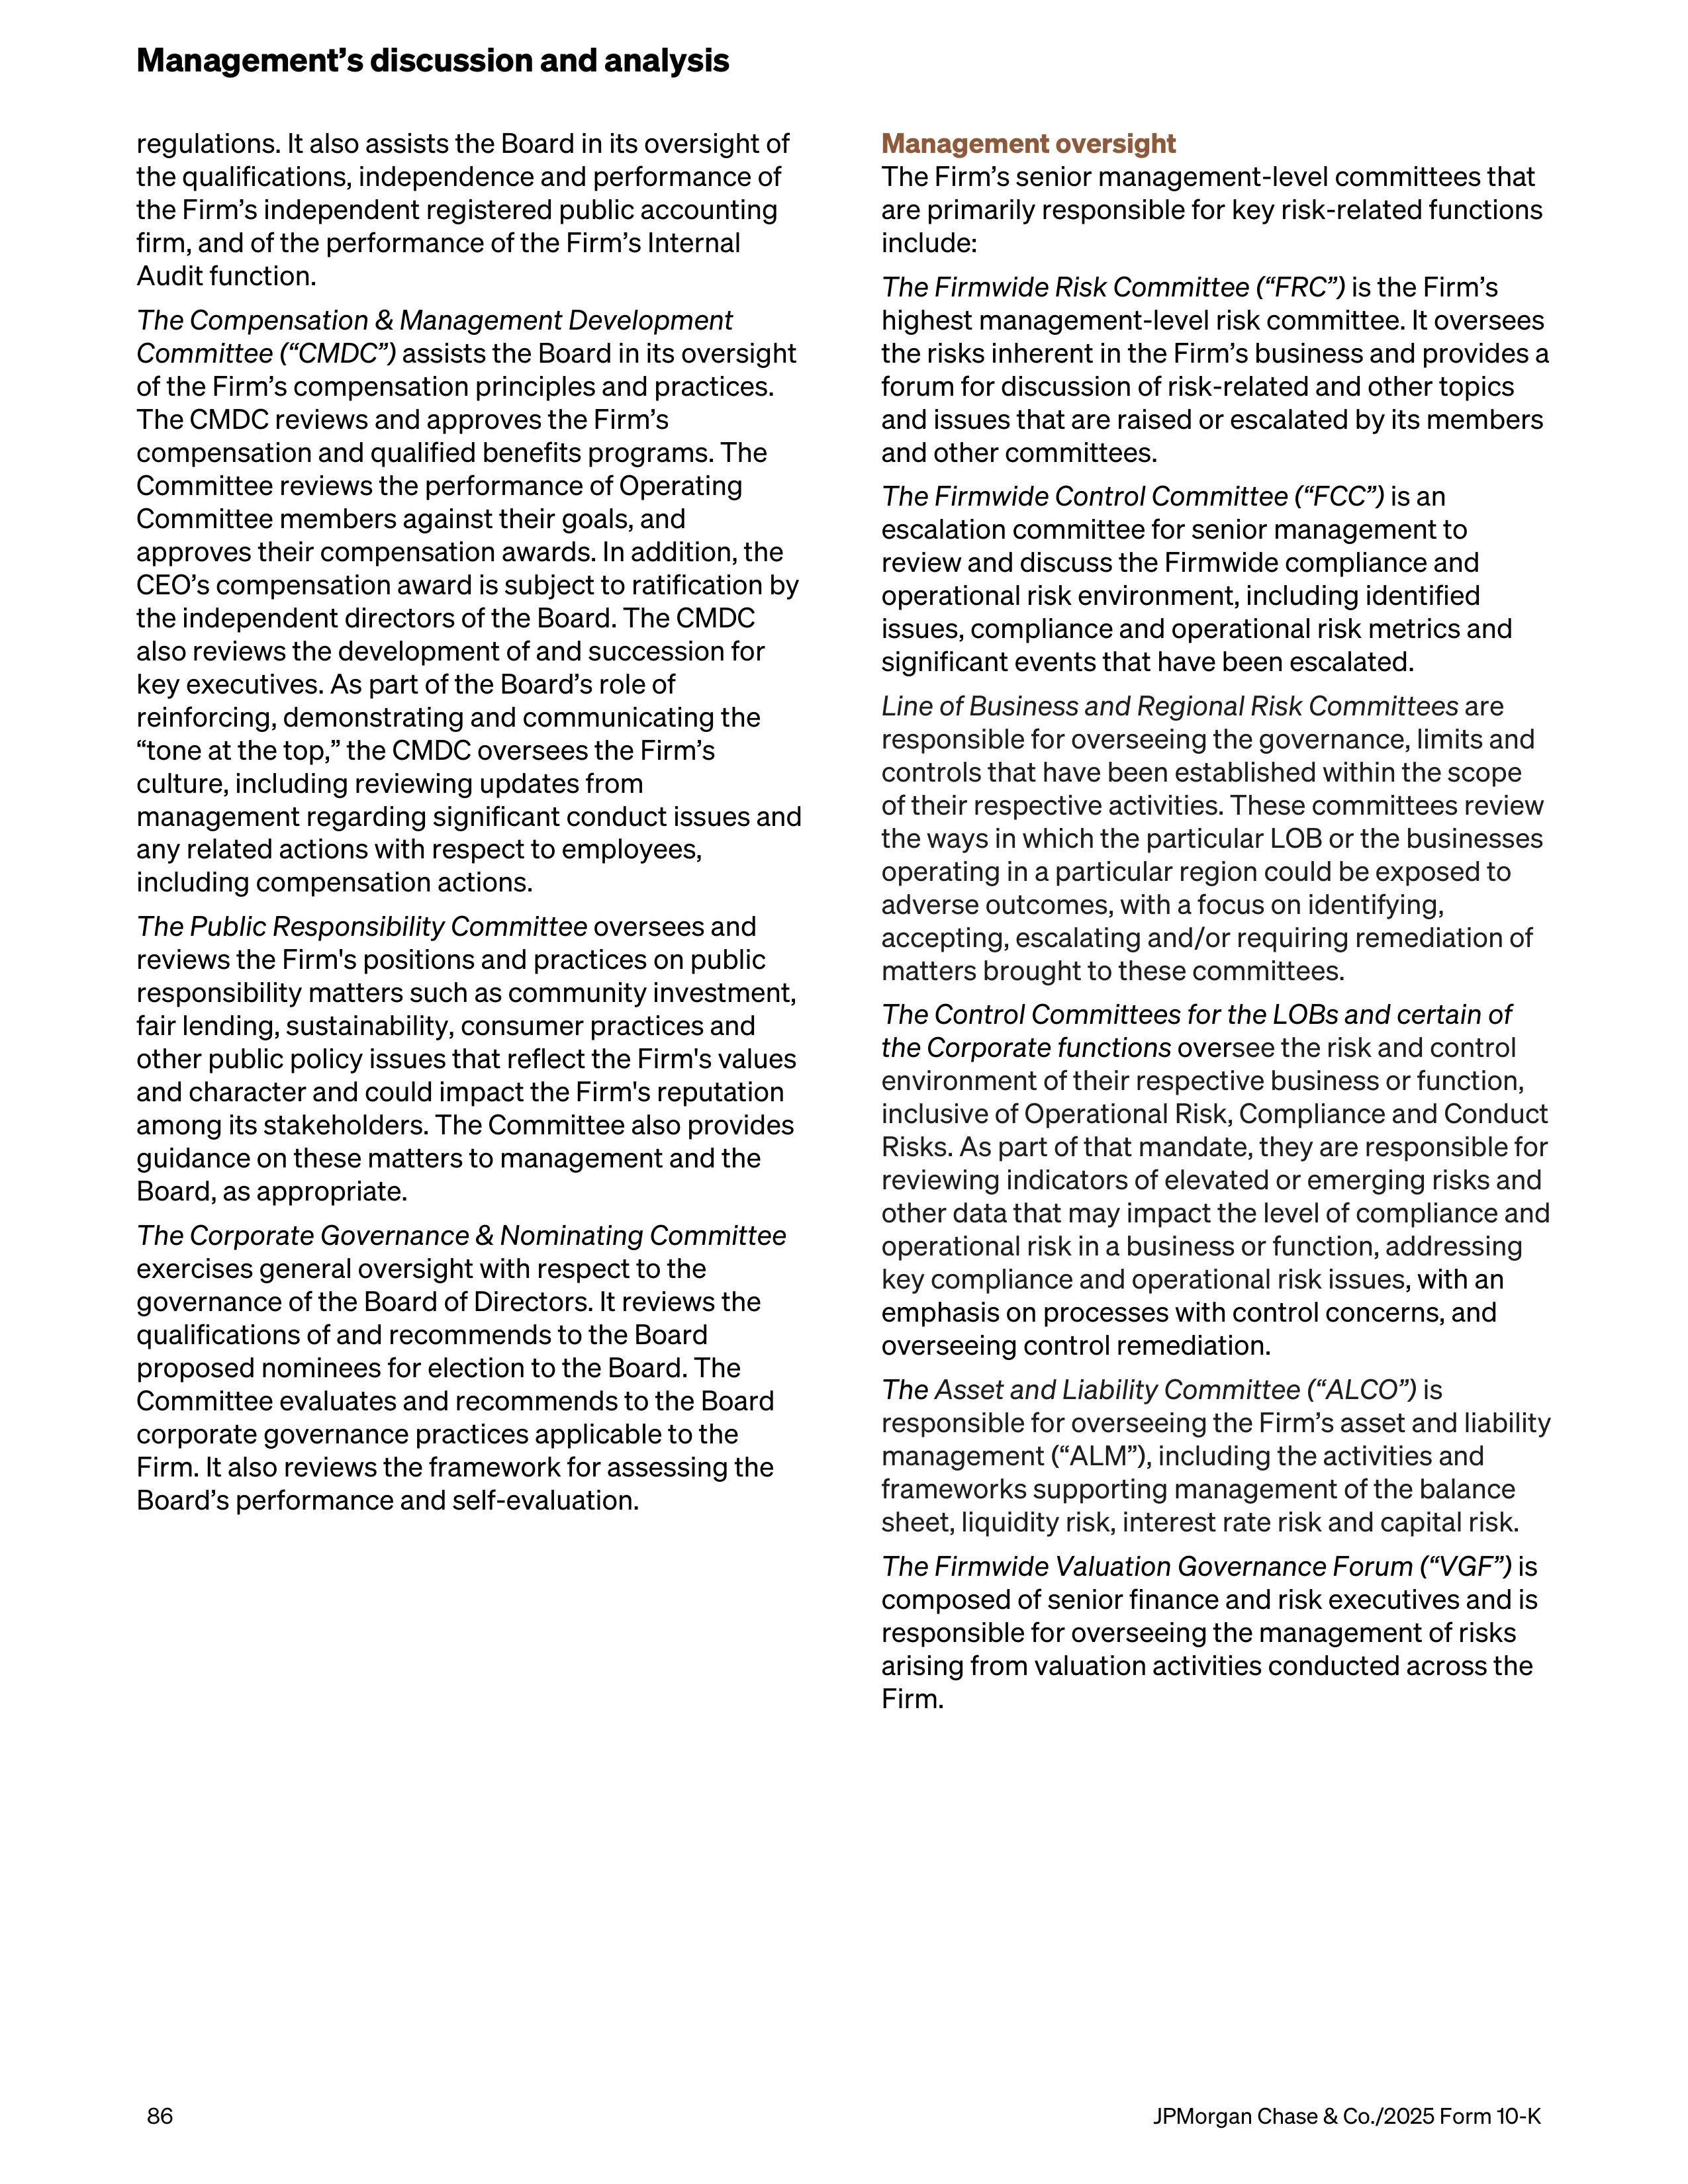
regulations. It also assists the Board in its oversight of
the qualifications, independence and performance of
the Firm’s independent registered public accounting
firm, and of the performance of the Firm’s Internal
Audit function.
The Compensation & Management Development
Committee
(“CMDC”)
assists the Board in its oversight
of the Firm’s compensation principles and practices.
The CMDC reviews and approves the Firm’s
compensation and qualified benefits programs. The
Committee reviews the performance of Operating
Committee members against their goals, and
approves their compensation awards. In addition, the
CEO’s compensation award is subject to ratification by
the independent directors of the Board. The CMDC
also reviews the development of and succession for
key executives. As part of the Board’s role of
reinforcing, demonstrating and communicating the
“tone at the top,” the CMDC oversees the Firm’s
culture, including reviewing updates from
management regarding significant conduct issues and
any related actions with respect to employees,
including compensation actions.
The Public Responsibility Committee
oversees and
reviews the Firm's positions and practices on public
responsibility matters such as community investment,
fair lending, sustainability, consumer practices and
other public policy issues that reflect the Firm's values
and character and could impact the Firm's reputation
among its stakeholders. The Committee also provides
guidance on these matters to management and the
Board, as appropriate.
The Corporate Governance & Nominating Committee
exercises general oversight with respect to the
governance of the Board of Directors. It reviews the
qualifications of and recommends to the Board
proposed nominees for election to the Board. The
Committee evaluates and recommends to the Board
corporate governance practices applicable to the
Firm. It also reviews the framework for assessing the
Board’s performance and self-evaluation.
Management oversight
The Firm’s senior management-level committees that
are primarily responsible for key risk-related functions
include:
The Firmwide Risk Committee (“FRC”)
is the Firm’s
highest management-level risk committee. It oversees
the risks inherent in the Firm’s business and provides a
forum for discussion of risk-related and other topics
and issues that are raised or escalated by its members
and other committees.
The Firmwide Control Committee (“FCC”)
is an
escalation committee for senior management to
review and discuss the Firmwide compliance and
operational risk environment, including identified
issues, compliance and operational risk metrics and
significant events that have been escalated.
Line of Business and Regional Risk Committees
are
responsible for overseeing the governance, limits and
controls that have been established within the scope
of their respective activities. These committees
review
the ways in which the particular LOB or the businesses
operating in a particular region could be exposed to
adverse outcomes, with a focus on identifying,
accepting, escalating and/or requiring remediation of
matters brought to these committees.
The Control Committees for the LOBs and certain of
the Corporate functions
over
see the risk and control
environment of their respective business or function,
inclusive of Operational Risk, Compliance and Conduct
Risks. As part of that mandate, they are responsible for
reviewing indicators of elevated or emerging risks and
other data that may impact the level of compliance and
operational risk in a business or function, addressing
key compliance and operational risk issues
, with an
emphasis on processes with control concerns, and
overseeing control remediation.
The
Asset and Liability Committee (“ALCO”)
is
responsible for overseeing the Firm’s asset and liability
management (“ALM”), including the activities and
frameworks supporting management of the balance
sheet, liquidity risk, interest rate risk and capital risk.
The Firmwide Valuation Governance Forum (“VGF”)
is
composed of senior finance and risk executives and is
responsible for overseeing the management of risks
arising from valuation activities conducted across the
Firm.
Management’s discussion and analysis
86
JPMorgan Chase & Co./2025 Form 10-K
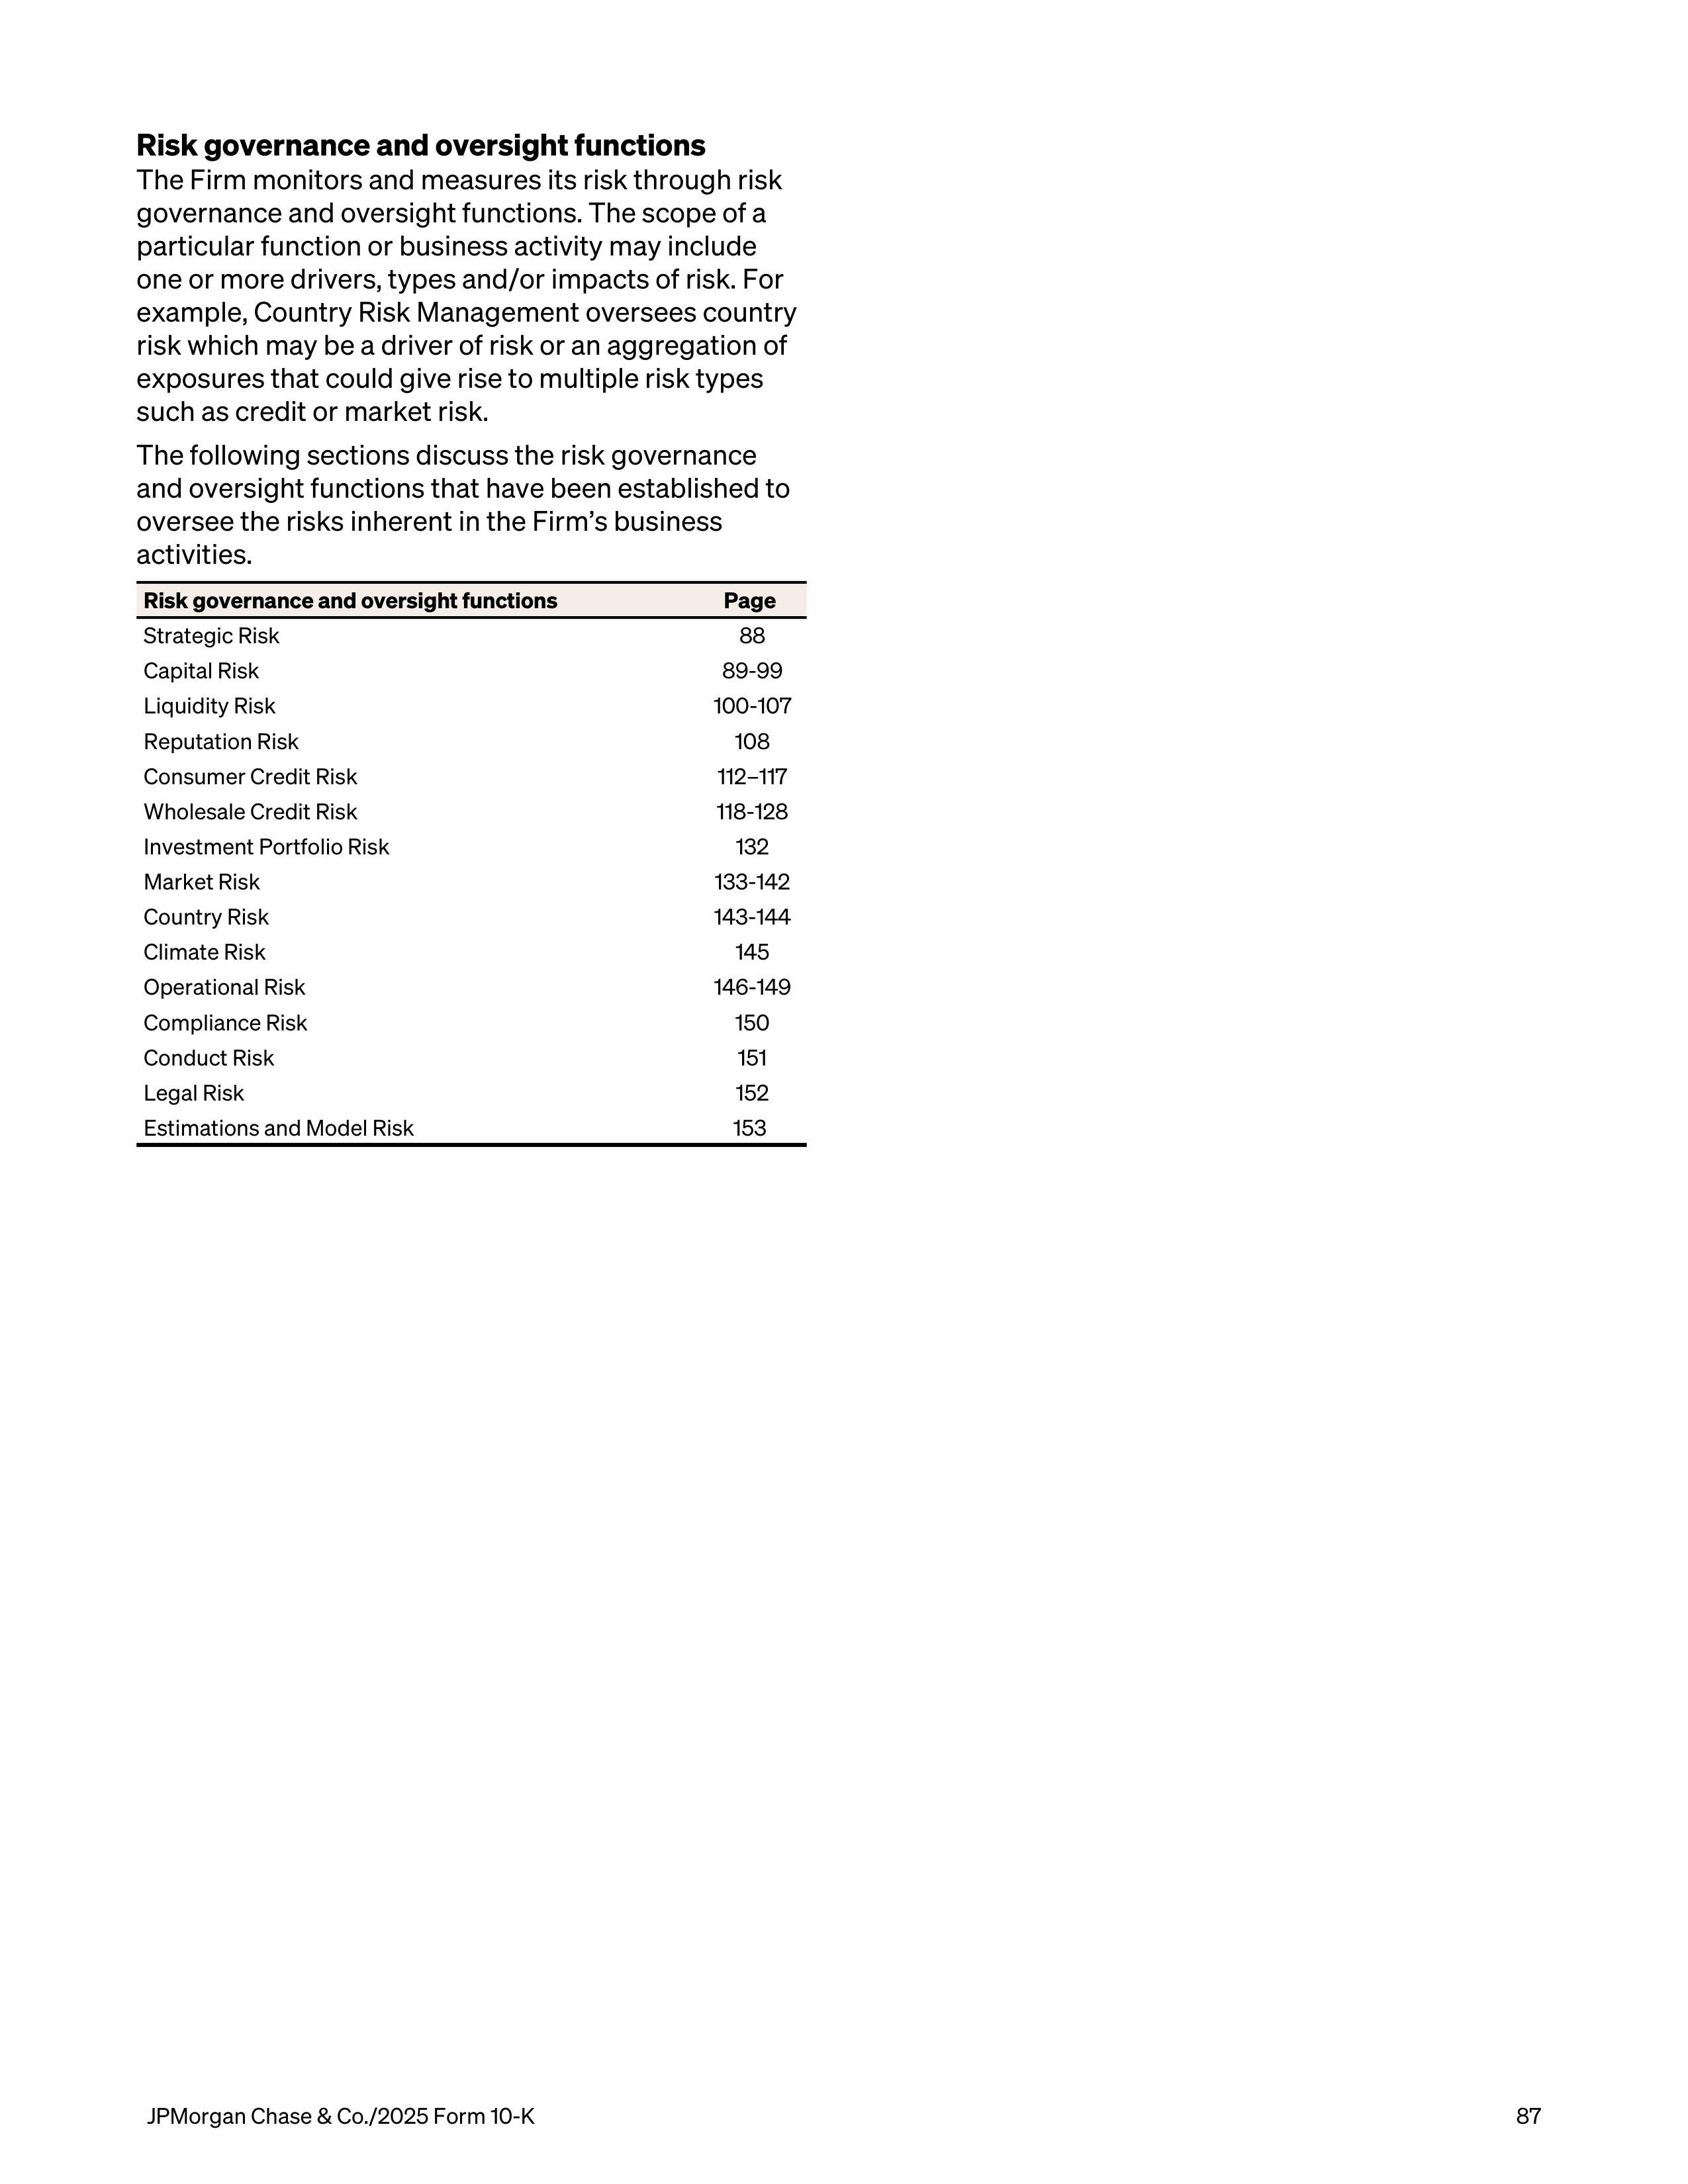
Risk governance and oversight functions
The Firm monitors and measures its risk through risk
governance and oversight functions. The scope of a
particular function or business activity may include
one or more drivers, types and/or impacts of risk. For
example, Country Risk Management oversees country
risk which may be a driver of risk or an aggregation of
exposures that could give rise to multiple risk types
such as credit or market risk.
The following sections discuss the risk governance
and oversight functions that have been established to
oversee the risks inherent in the Firm’s business
activities.
Risk governance and oversight functions
Page
Strategic Risk
88
Capital Risk
89-99
Liquidity Risk
100-107
Reputation Risk
108
Consumer Credit Risk
112–117
Wholesale Credit Risk
118-128
Investment Portfolio Risk
132
Market Risk
133-142
Country Risk
143-144
Climate Risk
145
Operational Risk
146-149
Compliance Risk
150
Conduct Risk
151
Legal Risk
152
Estimations and Model Risk
153
JPMorgan Chase & Co./2025 Form 10-K
87
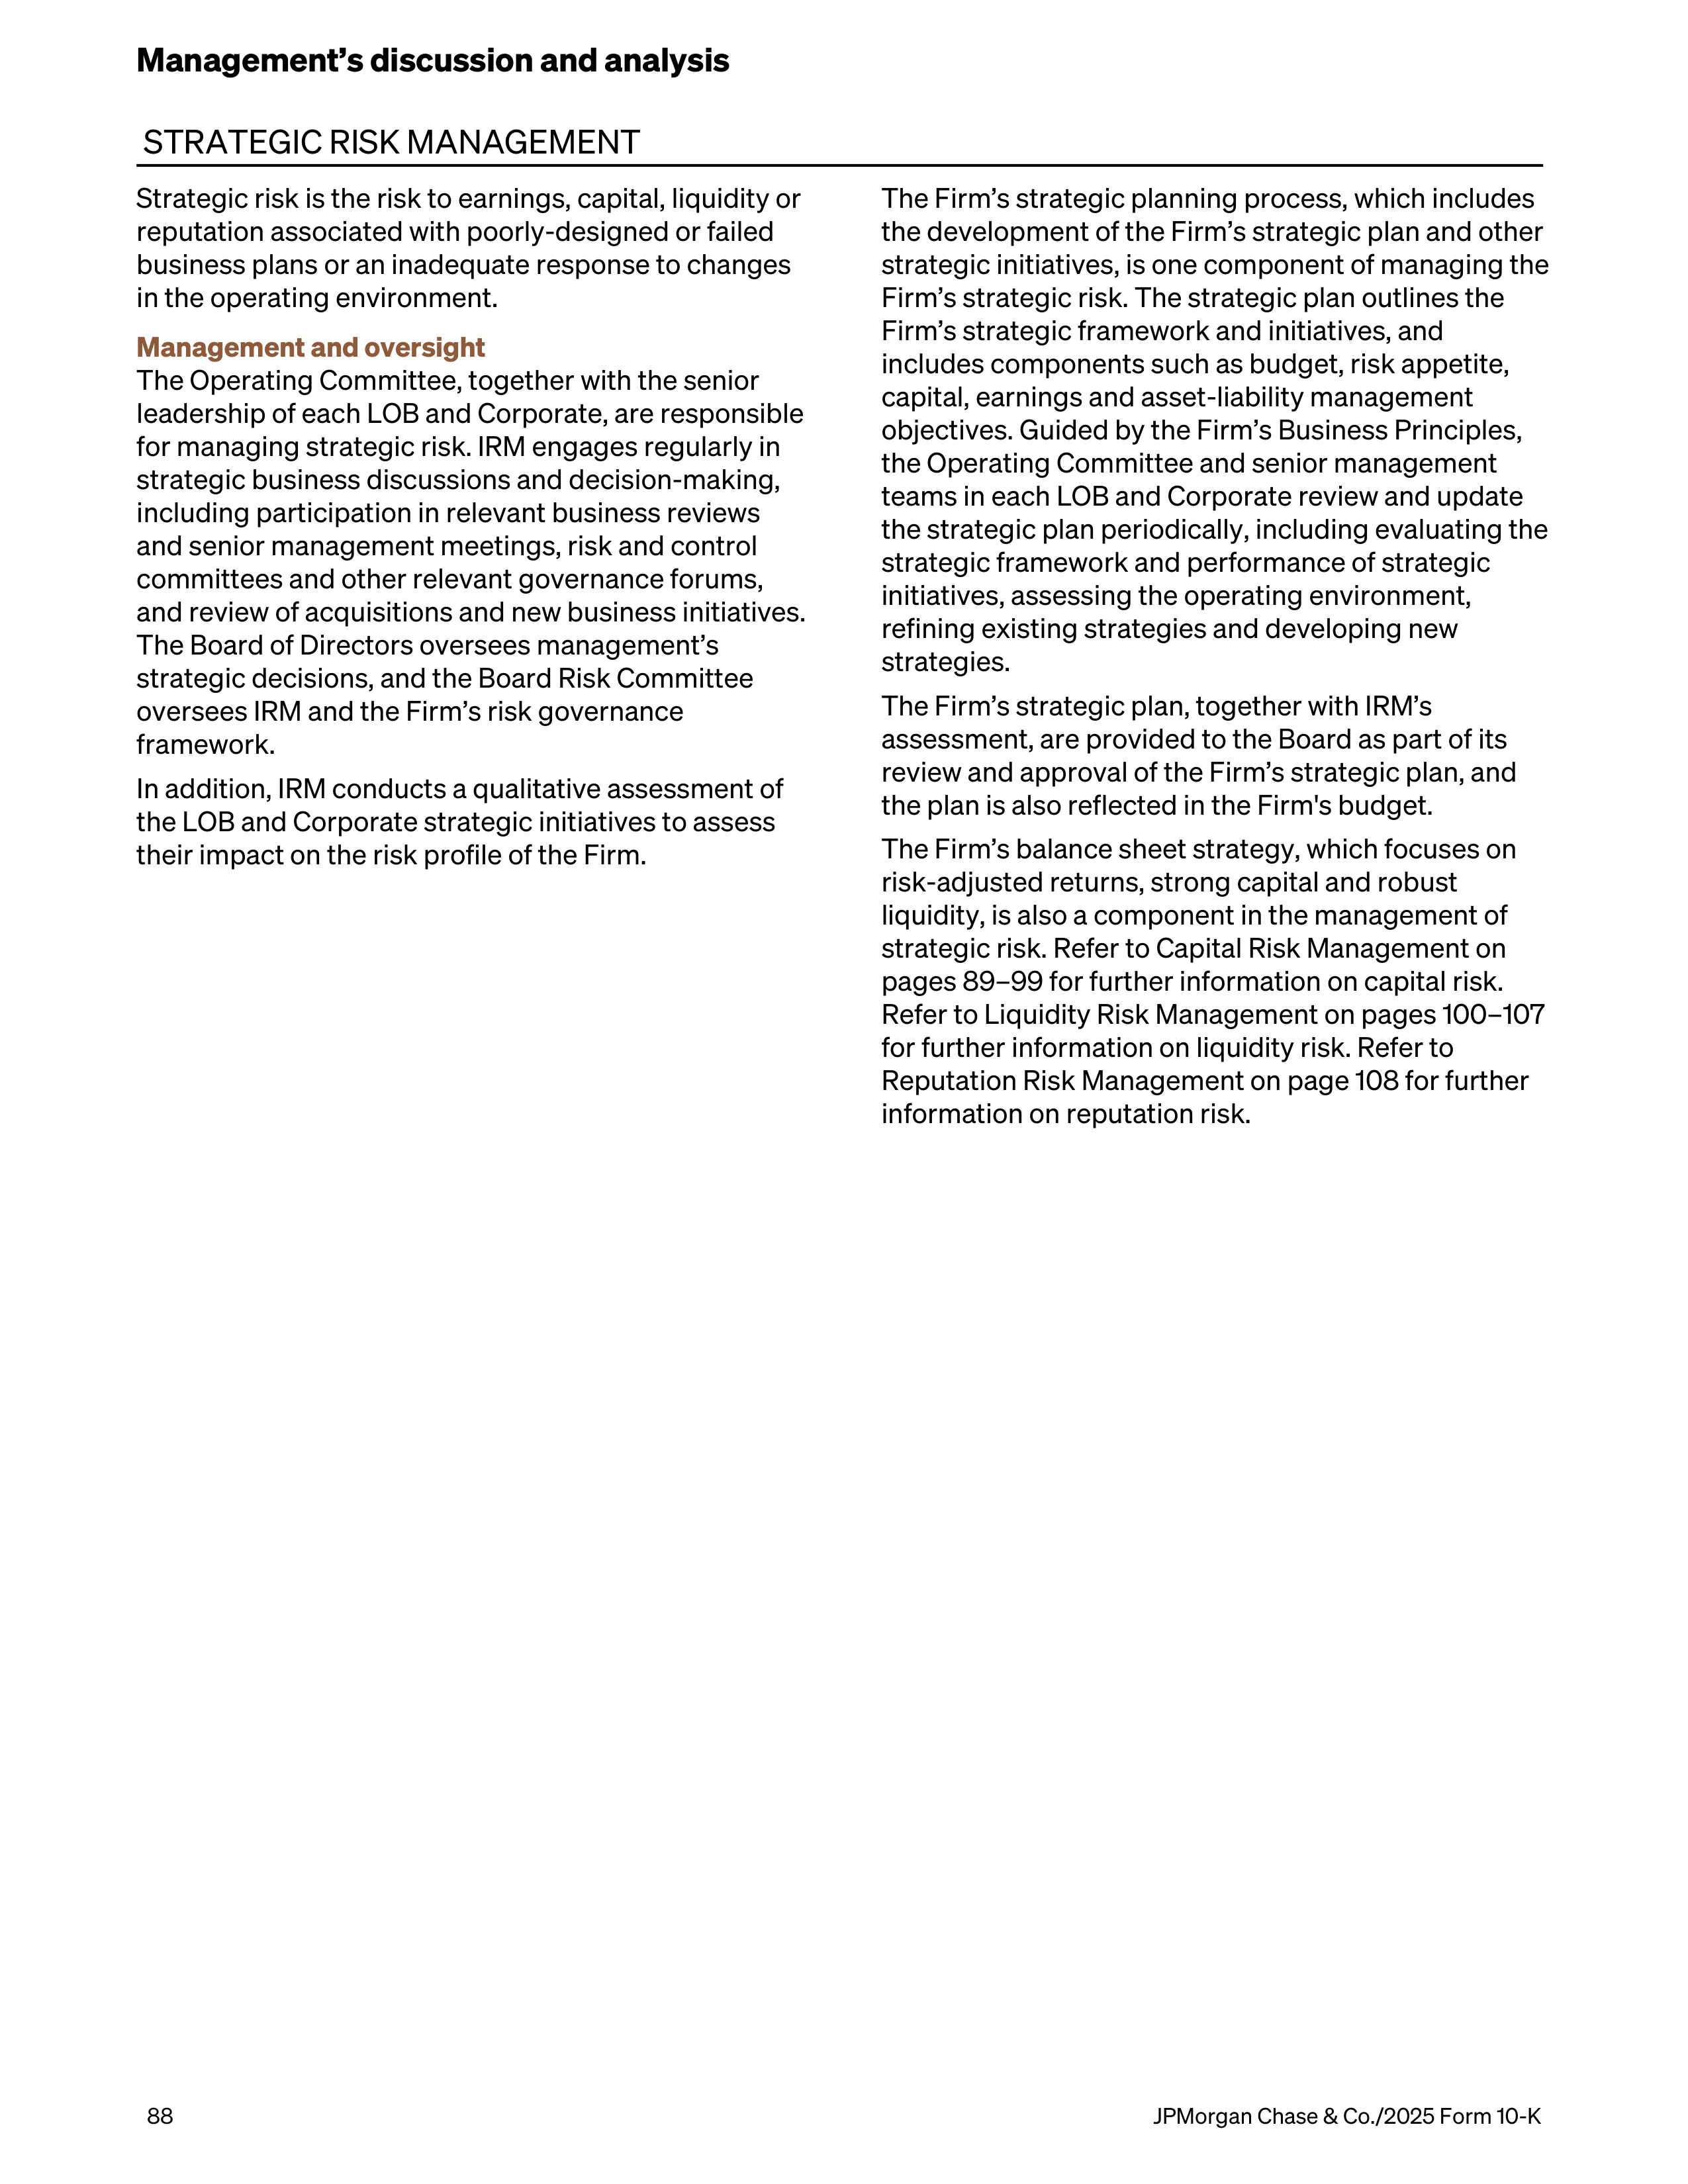
STRATEGIC RISK MANAGEMENT
Strategic risk is the risk to earnings, capital, liquidity or
reputation associated with poorly-designed or failed
business plans or an inadequate response to changes
in the operating environment.
Management and oversight
The Operating Committee, together with the senior
leadership of each LOB and Corporate, are responsible
for managing strategic risk. IRM engages regularly in
strategic business discussions and decision-making,
including participation in relevant business reviews
and senior management meetings, risk and control
committees and other relevant governance forums,
and review of acquisitions and new business initiatives.
The Board of Directors oversees management’s
strategic decisions, and the Board Risk Committee
oversees IRM and the Firm’s risk governance
framework.
In addition, IRM conducts a qualitative assessment of
the LOB and Corporate strategic initiatives to assess
their impact on the risk profile of the Firm.
The Firm’s strategic planning process, which includes
the development of the Firm’s strategic plan and other
strategic initiatives, is one component of managing the
Firm’s strategic risk. The strategic plan outlines the
Firm’s strategic framework and initiatives, and
includes components such as budget, risk appetite,
capital, earnings and asset-liability management
objectives. Guided by the Firm’s Business Principles,
the Operating Committee and senior management
teams in each LOB and Corporate review and update
the strategic plan periodically, including evaluating the
strategic framework and performance of strategic
initiatives, assessing the operating environment,
refining existing strategies and developing new
strategies.
The Firm’s strategic plan, together with IRM’s
assessment, are provided to the Board as part of its
review and approval of the Firm’s strategic plan, and
the plan is also reflected in the Firm's budget.
The Firm’s balance sheet strategy, which focuses on
risk-adjusted returns, strong capital and robust
liquidity, is also a component in the management of
strategic risk. Refer to Capital Risk Management on
pages 89–99 for further information on capital risk.
Refer to Liquidity Risk Management on pages 100–107
for further information on liquidity risk. Refer to
Reputation Risk Management on page 108 for further
information on reputation risk.
Management’s discussion and analysis
88
JPMorgan Chase & Co./2025 Form 10-K
CAPITAL RISK MANAGEMENT
Capital risk is the risk that the Firm has an insufficient
level or composition of capital to support the Firm’s
business activities and associated risks during normal
economic environments and under stressed
conditions.
A strong capital position is essential to the Firm’s
business strategy and competitive position.
Maintaining a strong balance sheet to manage through
economic volatility is a strategic imperative of the
Firm’s Board of Directors, CEO and Operating
Committee. The Firm’s “fortress balance sheet”
philosophy focuses on risk-adjusted returns, strong
capital and robust liquidity. The Firm’s capital risk
management strategy focuses on maintaining long-
term stability to enable the Firm to build and invest in
market-leading businesses, including in highly
stressed environments. Senior management considers
the implications on the Firm’s capital prior to making
significant decisions that could impact future business
activities. In addition to considering the Firm’s
earnings outlook, senior management evaluates all
sources and uses of capital with a view to ensuring the
Firm’s capital strength.
Capital risk management
The Firm has a Capital Risk Management function
whose primary objective is to provide independent
oversight of capital risk across the Firm.
Capital Risk Management’s responsibilities include:
•
Defining, monitoring and reporting capital risk
metrics;
•
Establishing, calibrating and monitoring capital risk
limits and indicators, including capital risk appetite;
•
Developing processes to classify, monitor and report
capital limit breaches;
•
Performing assessments of the Firm’s capital
management activities, including changes made to
the Contingency Capital Plan described below; and
•
Conducting independent review of the Firm's
interpretation of and compliance with the applicable
regulatory capital rules and guidance relating to the
calculation of regulatory capital.
Capital management
Treasury and CIO is responsible for capital
management.
The primary objectives of the Firm’s capital
management are to:
•
Maintain sufficient capital in order to continue to
build and invest in the Firm’s businesses through
normal economic cycles and in stressed
environments;
•
Retain flexibility to take advantage of future
investment opportunities;
•
Promote the Parent Company’s ability to serve as a
source of strength to its subsidiaries;
•
Ensure the Firm operates above the minimum
regulatory capital ratios as well as maintain “well-
capitalized” status for the Firm and its principal
insured depository institution (“IDI”) subsidiary,
JPMorgan Chase Bank, N.A., at all times under
applicable regulatory capital requirements;
•
Meet capital distribution objectives; and
•
Maintain sufficient capital resources to operate
throughout a resolution period in accordance with
the Firm’s preferred resolution strategy.
The Firm addresses these objectives through:
•
Establishing internal minimum capital requirements
and maintaining a strong capital governance
framework. The internal minimum capital levels
consider the Firm’s regulatory capital requirements
as well as an internal assessment of capital
adequacy, in normal economic cycles and in stress
events;
•
Retaining flexibility in order to react to a range of
potential events; and
•
Regularly monitoring the Firm’s capital position and
following prescribed escalation protocols, both at
the Firm and material legal entity levels.
Governance
Committees responsible for overseeing the Firm’s
capital management include the Capital Governance
Committee, the Firmwide ALCO as well as regional
ALCOs, and the CIO, Treasury and Corporate (“CTC”)
Risk Committee. In addition, the Board Risk Committee
periodically reviews the Firm’s capital risk tolerance.
Refer to Firmwide Risk Management on pages 83–87
for additional discussion of the Firmwide ALCO and
other risk-related committees.
Capital planning and stress testing
Comprehensive Capital Analysis and Review
The Federal Reserve requires the Firm, as a large Bank
Holding Company (“BHC”), to submit at least annually
a capital plan that has been reviewed and approved by
the Board of Directors. The Federal Reserve uses
Comprehensive Capital Analysis and Review (“CCAR”)
and other stress testing processes to assess whether
large BHCs, such as the Firm, have sufficient capital
during periods of economic and financial stress, and
have robust, forward-looking capital assessment and
planning processes in place that address each BHC’s
unique risks to enable it to absorb losses under certain
stress scenarios. Through CCAR, the Federal Reserve
evaluates each BHC’s capital adequacy and internal
capital adequacy assessment processes (“ICAAP”), as
well as its plans to make capital distributions, such as
dividend payments or stock repurchases. The Federal
JPMorgan Chase & Co./2025 Form 10-K
89
Reserve uses results under the severely adverse
scenario from its supervisory stress test to determine
each firm’s Stress Capital Buffer (“SCB”) requirement
for the coming year.
The Firm's current SCB requirement is 2.5% and will
remain in effect through September 30, 2027, based
on the current rules. The Firm’s Standardized CET1
capital ratio requirement, including regulatory buffers,
was 11.5% as of December 31, 2025. Refer to Key
Regulatory Developments on page 91 for information
related to proposed changes to the SCB requirement
and stress testing framework.
Refer to Capital actions on page 97 for information on
actions taken by the Firm’s Board of Directors.
Internal Capital Adequacy Assessment Process
Annually, the Firm prepares the ICAAP, which informs
the Board of Directors of the ongoing assessment of
the Firm’s processes for managing the sources and
uses of capital as well as compliance with supervisory
expectations for capital planning and capital
adequacy. The Firm’s ICAAP integrates stress testing
protocols with capital planning. The Firm’s Audit
Committee is responsible for reviewing and approving
the capital planning framework.
Stress testing assesses the potential impact of
alternative economic and business scenarios on the
Firm’s earnings and capital. Economic scenarios, and
the parameters underlying those scenarios, are
defined centrally and applied uniformly across the
businesses. These scenarios are articulated in terms of
macroeconomic factors, which are key drivers of
business results; global market shocks, which
generate short-term but severe trading losses; and
idiosyncratic operational risk events. The scenarios
are intended to capture and stress key vulnerabilities
and idiosyncratic risks facing the Firm. In addition to
CCAR and other periodic stress testing, management
also considers tailored stress scenarios and sensitivity
analyses, as necessary.
Contingency Capital Plan
The Firm’s Contingency Capital Plan establishes the
capital management framework for the Firm and
specifies the principles underlying the Firm’s approach
towards capital management in normal economic
conditions and in stressed environments. The
Contingency Capital Plan defines how the Firm
calibrates its targeted capital levels and meets
minimum capital requirements, monitors the ongoing
appropriateness of planned capital distributions, and
sets out the capital contingency actions that are
expected to be taken or considered at various levels of
capital depletion during a period of stress.
Regulatory capital
The Federal Reserve establishes capital requirements,
including well-capitalized standards, for the Firm as a
consolidated financial holding company. The Office of
the Comptroller of the Currency ("OCC") establishes
similar minimum capital requirements and standards
for the Firm’s principal IDI subsidiary, JPMorgan Chase
Bank, N.A. The U.S. capital requirements generally
follow the Capital Accord of the Basel Committee, as
amended from time to time.
Basel III Overview
The capital rules under Basel III establish minimum
capital ratios and overall capital adequacy standards
for large and internationally active U.S. BHCs and
banks, including the Firm and JPMorgan Chase Bank,
N.A. The minimum amount of regulatory capital that
must be held by BHCs and banks is determined by
calculating RWA, which are on-balance sheet assets
and off-balance sheet exposures, weighted according
to risk. Under the rules currently in effect, two
comprehensive approaches are prescribed for
calculating Basel III RWA: a standardized approach
(“Standardized”), and an advanced approach
(“Advanced”).
For each of these risk-based capital ratios, the capital
adequacy of the Firm is evaluated against the lower of
the Standardized or Advanced approaches compared
to their respective regulatory capital ratio
requirements.
The current Basel III rules establish capital
requirements for calculating credit risk RWA and
market risk RWA, and in the case of Advanced,
operational risk RWA. Key differences in the
calculation of credit risk RWA between the
Standardized and Advanced approaches are that for
Advanced, credit risk RWA is based on risk-sensitive
approaches which largely rely on the use of internal
credit models and parameters, whereas for
Standardized, credit risk RWA is generally based on
supervisory risk-weightings which vary primarily by
counterparty type and asset class. The models used in
Advanced are subject to periodic review and
calibration, which can impact RWA results. Market risk
RWA is generally calculated consistently between
Standardized and Advanced. In addition to the RWA
calculated under these approaches, the Firm may
supplement such amounts to incorporate
management judgment and feedback from its
regulators.
As of December 31, 2025, the Advanced risk-based
ratios became more binding on the Firm than the
Standardized risk-based ratios, primarily reflecting the
increase in Advanced RWA related to the Apple Card
transaction and a reduction in the Firm’s SCB
requirement which only applies to the Standardized
risk-based ratios.
Management’s discussion and analysis
90
JPMorgan Chase & Co./2025 Form 10-K
Additionally, Basel III requires that Advanced
Approaches banking organizations, including the Firm,
calculate their SLRs. Refer to page 96 for additional
information on SLR.
Key Regulatory Developments
Enhanced SLR Final Rule
In November 2025, the Federal Reserve, the OCC and
the FDIC issued the final rule amending the enhanced
Supplementary Leverage Ratio (“eSLR”) requirements
for Global Systemically Important Banks (“GSIB”) BHCs
and their IDI subsidiaries by revising the current static
leverage buffers at the BHC and IDI levels to 50% of
the BHC’s U.S. Method 1 GSIB Surcharge, which is
referred to as the “eSLR buffer.” For IDI subsidiaries,
the eSLR buffer is capped at 1%. In addition, the rule
made corresponding adjustments to the leverage-
based total loss-absorbing capacity (“TLAC”) and
eligible long-term debt (“eligible LTD”) requirements
by replacing the former TLAC leverage buffer with the
eSLR buffer and replacing the former static leverage-
based eligible LTD requirement with a requirement of
2.5% plus the eSLR buffer. Further, the rule removes
the eSLR threshold for an IDI subsidiary of a U.S. GSIB
to be considered “well capitalized” under the prompt
corrective action framework and instead applies the
eSLR as a capital buffer requirement. The final rule,
with an effective date of April 1, 2026, allows for early
adoption, which the Firm has elected, effective January
1, 2026.
Refer to page 92 for information on the U.S. Method 1
GSIB Surcharge.
Enhanced Transparency and Public Accountability
of the Supervisory Stress Test
In October 2025, the Federal Reserve issued proposals
to enhance the transparency and public accountability
of its annual stress test. The proposals would require
the Federal Reserve to publish for public comment
comprehensive documentation concerning the
supervisory stress test models and annual stress test
scenarios, including the scenarios for the upcoming
2026 stress test. The proposals also introduce an
enhanced disclosure process under which material
changes to stress test models and scenarios would be
subject to public comment prior to implementation.
Based on the Federal Reserve’s analysis, the proposed
changes to the stress test models and scenarios are
not expected to change materially the SCB for firms,
such as JPMorganChase, that are subject to the
supervisory stress test. In February 2026, the Federal
Reserve released the final 2026 supervisory stress test
scenarios, while announcing that SCB requirements for
large banks, including the Firm, will remain at current
levels through September 30, 2027 with new
requirements to be calculated in 2027 based on
revised models that incorporate public feedback.
SCB Volatility Reduction
In April 2025, the Federal Reserve proposed changes
to the calculation of the SCB for large BHCs, including
the Firm. The proposal aims to reduce SCB volatility by
using the average of supervisory stress results from
the previous two annual stress tests to calculate the
SCB. The proposal would also modify the annual
effective date of the SCB from October 1 to January 1
and make targeted changes to reporting requirements
in order to streamline data collection.
U.S. Basel III Finalization
In July 2023, the Federal Reserve, the OCC and the
FDIC released a proposal to amend the risk-based
capital framework, entitled "Regulatory capital rule:
Amendments applicable to large banking
organizations and to banking organizations with
significant trading activity", which is referred to in this
Form 10-K as the "U.S. Basel III proposal." Under this
proposal, changes to the framework would include
replacement of the Advanced approach with an
expanded risk-based approach for the calculation of
RWA. In addition, the stress capital buffer requirement
would be applicable to both the expanded risk-based
approach and the Standardized approach.
GSIB Surcharge and TLAC and Eligible LTD
Requirements
In July 2023, the Federal Reserve released a proposal
to amend the calculation of the GSIB surcharge. Under
the proposal, the annual GSIB surcharge would be
based on an average of the quarterly surcharge
calculations throughout the calendar year, with daily
averaging required for certain measures. The proposal
would also reduce surcharge increments from 50 bps
to 10 bps and includes other technical amendments to
the “Method 2” calculation. The proposed changes
would revise risk-based capital requirements for the
Firm and other U.S. GSIBs. Refer to Risk-based Capital
Regulatory Requirements on page 92 for further
information on the GSIB surcharge.
Additionally, in August 2023, the Federal Reserve, the
FDIC and the OCC released a proposal to expand the
eligible long-term debt ("eligible LTD") and clean
holding company requirements under the existing
total loss-absorbing capacity ("TLAC") rule to apply to
non-GSIB banks with $100 billion or more in total
consolidated assets. The proposal would also reduce
the amount of LTD with remaining maturities of less
than two years that count towards a U.S. GSIB's TLAC
requirement and expand the existing capital deduction
framework for LTD issued by GSIBs to include LTD
issued by non-GSIB banks subject to the LTD
requirements.
Finalization of the above proposals, including the
required implementation dates, is uncertain. The Firm
continues to monitor developments and potential
impacts.
JPMorgan Chase & Co./2025 Form 10-K
91
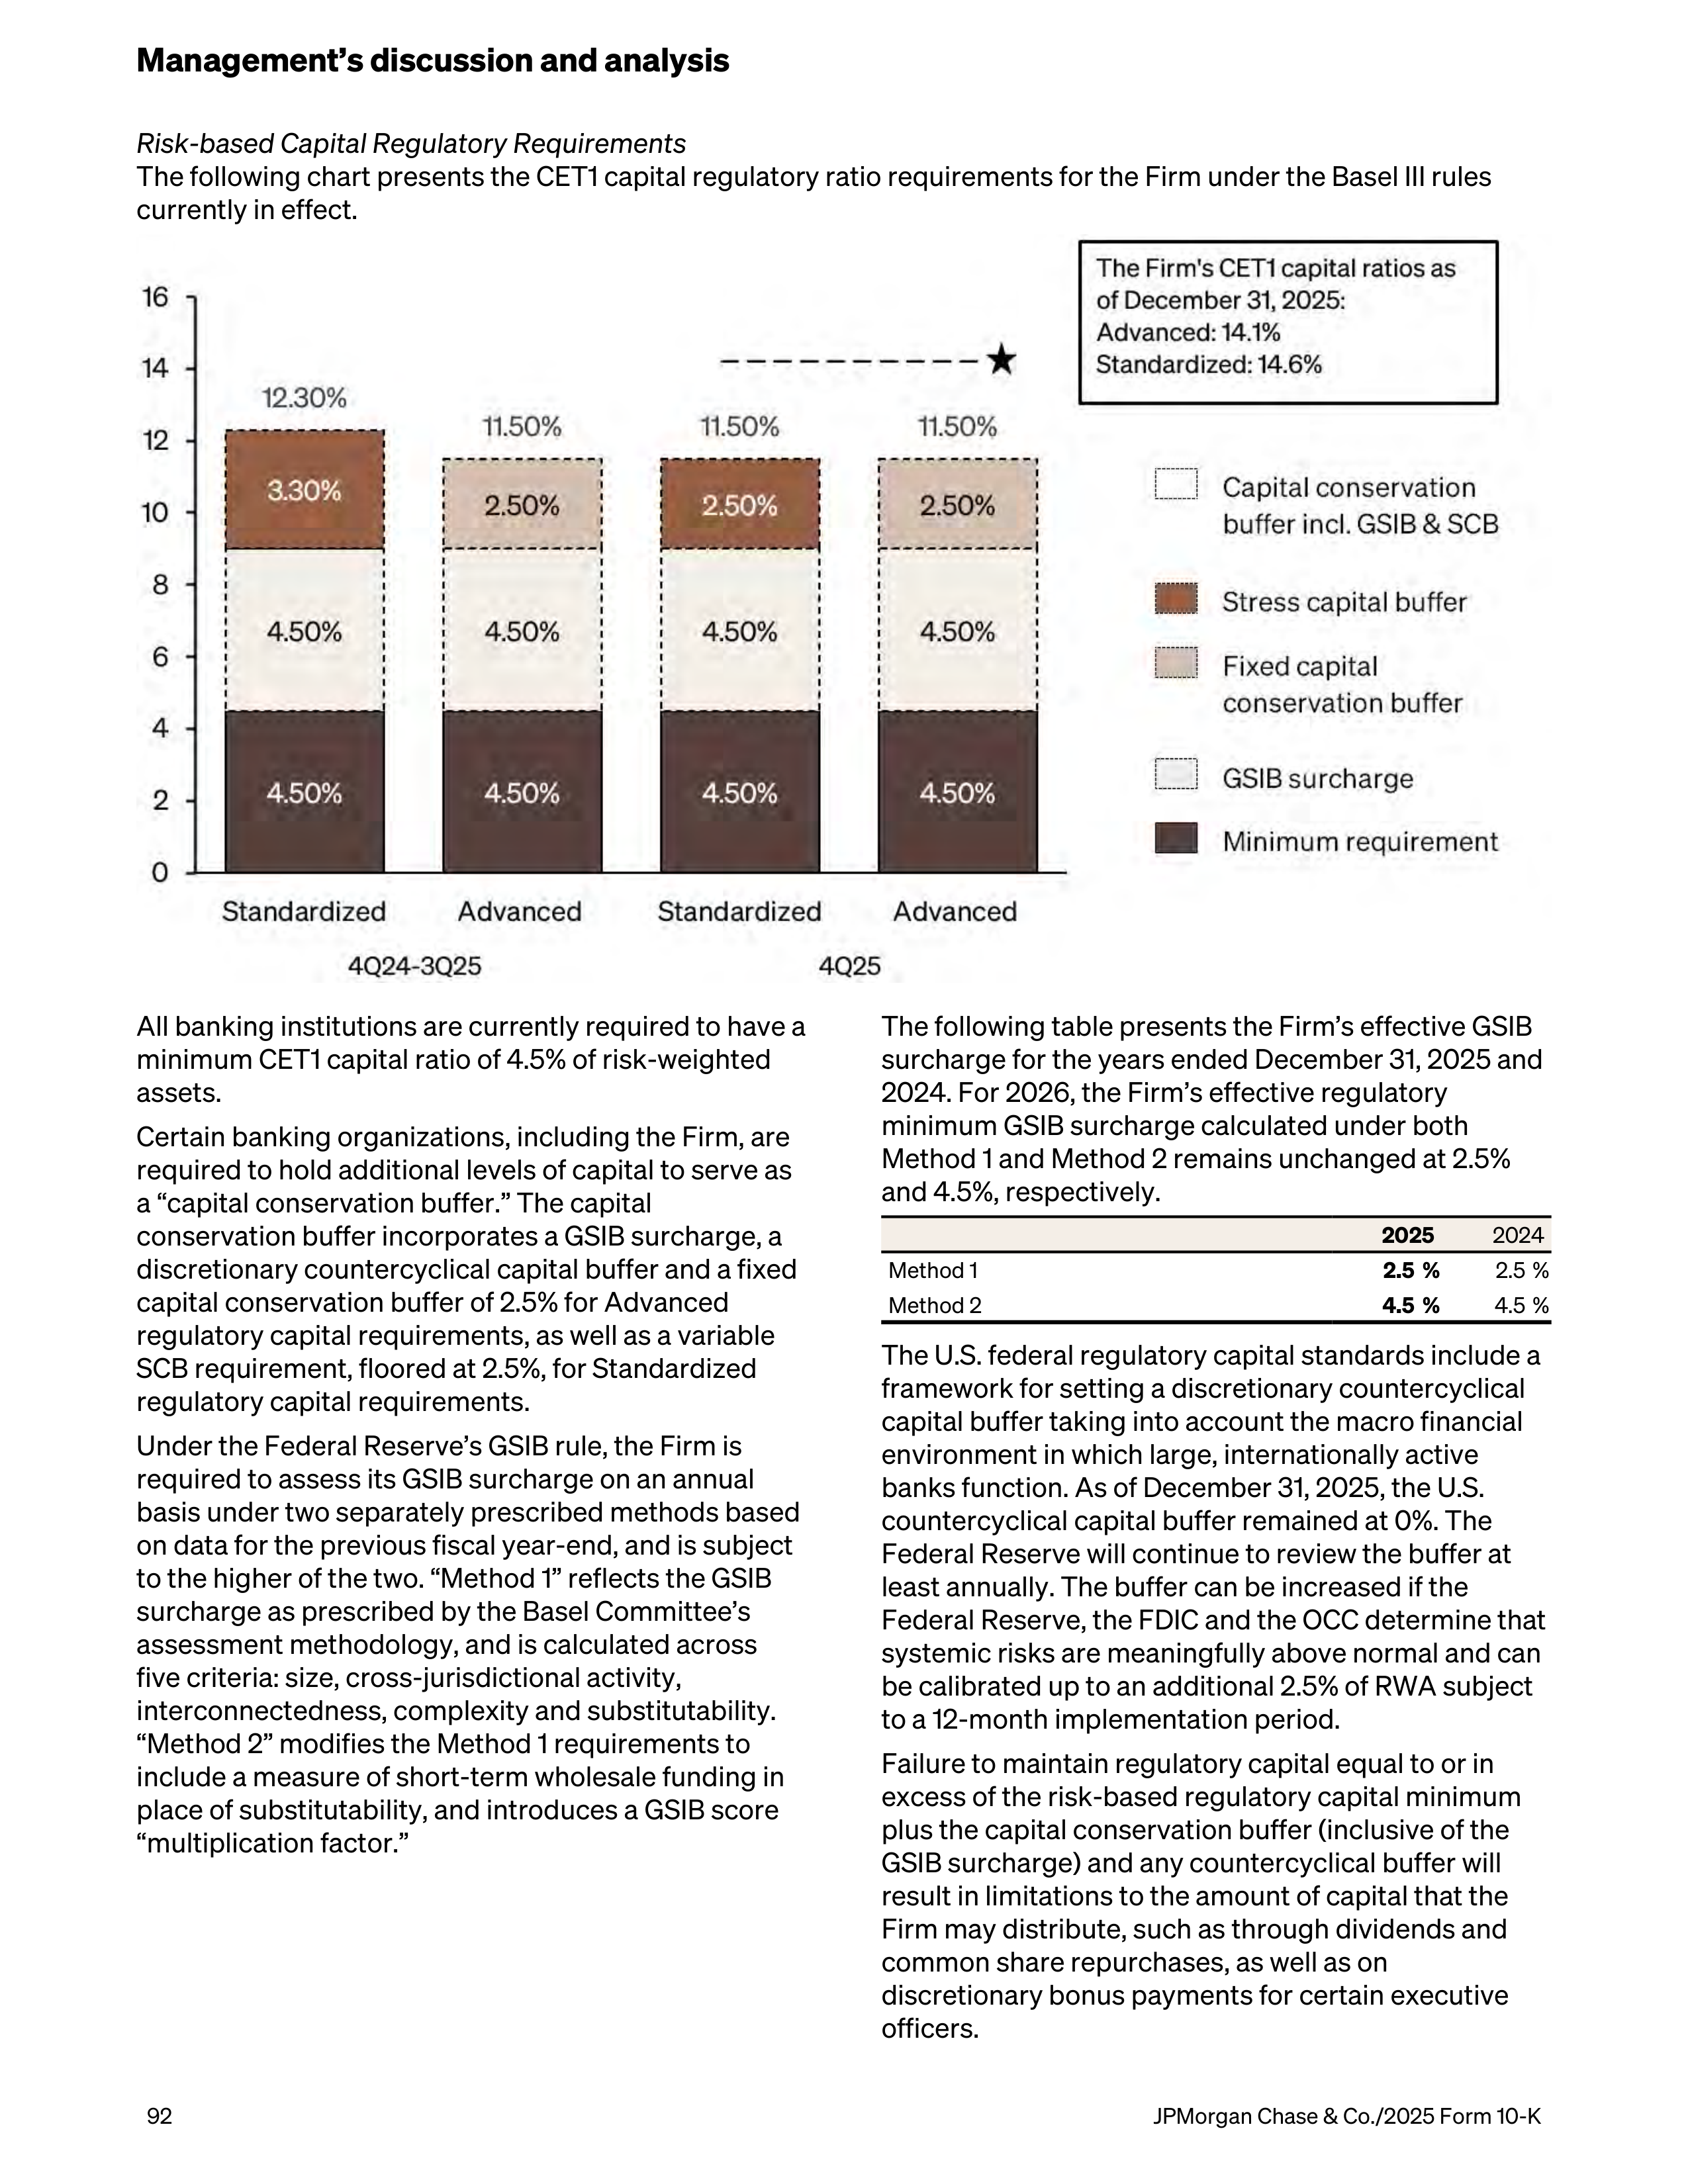
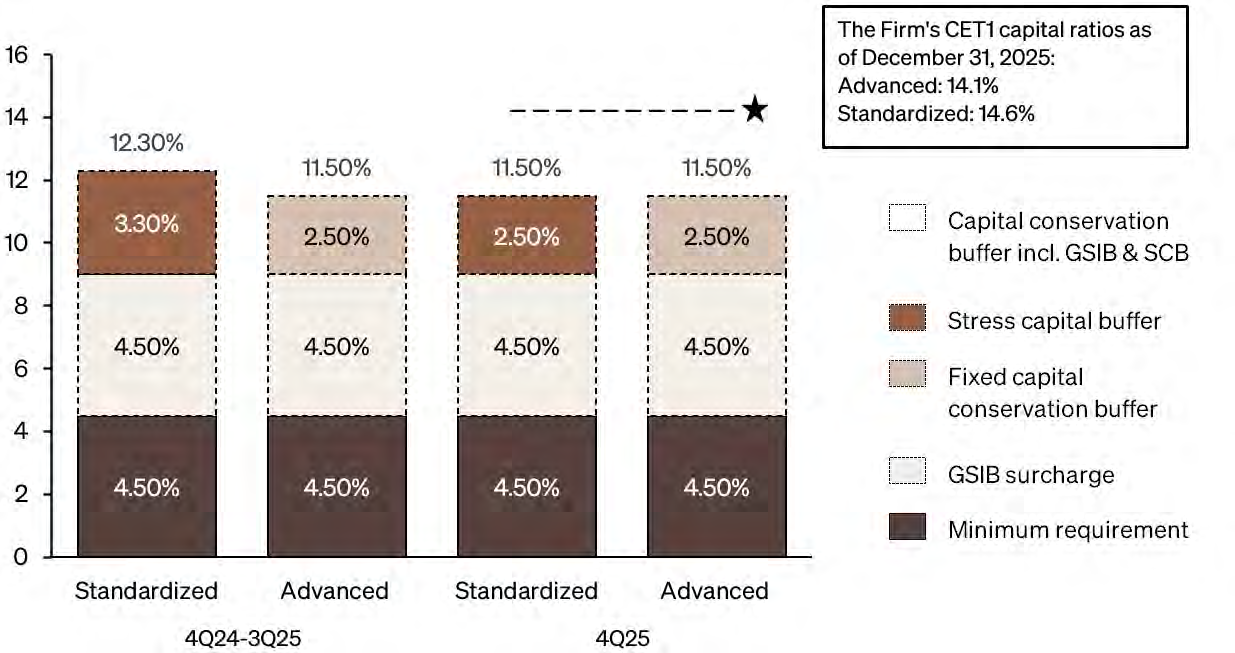
Risk-based Capital Regulatory Requirements
The following chart presents the CET1 capital regulatory ratio requirements for the Firm under the Basel III rules
currently in effect.
All banking institutions are currently required to have a
minimum CET1 capital ratio of 4.5% of risk-weighted
assets.
Certain banking organizations, including the Firm, are
required to hold additional levels of capital to serve as
a “capital conservation buffer.” The capital
conservation buffer incorporates a GSIB surcharge, a
discretionary countercyclical capital buffer and a fixed
capital conservation buffer of 2.5% for Advanced
regulatory capital requirements, as well as a variable
SCB requirement, floored at 2.5%, for Standardized
regulatory capital requirements.
Under the Federal Reserve’s GSIB rule, the Firm is
required to assess its GSIB surcharge on an annual
basis under two separately prescribed methods based
on data for the previous fiscal year-end, and is subject
to the higher of the two. “Method 1” reflects the GSIB
surcharge as prescribed by the Basel Committee’s
assessment methodology, and is calculated across
five criteria: size, cross-jurisdictional activity,
interconnectedness, complexity and substitutability.
“Method 2” modifies the Method 1 requirements to
include a measure of short-term wholesale funding in
place of substitutability, and introduces a GSIB score
“multiplication factor.”
The following table presents the Firm’s effective GSIB
surcharge for the years ended December 31, 2025 and
2024. For 2026, the Firm’s effective regulatory
minimum GSIB surcharge calculated under both
Method 1 and Method 2 remains unchanged at 2.5%
and 4.5%, respectively.
2025
2024
Method 1
2.5 %
2.5 %
Method 2
4.5 %
4.5 %
The U.S. federal regulatory capital standards include a
framework for setting a discretionary countercyclical
capital buffer taking into account the macro financial
environment in which large, internationally active
banks function. As of December 31, 2025, the U.S.
countercyclical capital buffer remained at 0%. The
Federal Reserve will continue to review the buffer at
least annually. The buffer can be increased if the
Federal Reserve, the FDIC and the OCC determine that
systemic risks are meaningfully above normal and can
be calibrated up to an additional 2.5% of RWA subject
to a 12-month implementation period.
Failure to maintain regulatory capital equal to or in
excess of the risk-based regulatory capital minimum
plus the capital conservation buffer (inclusive of the
GSIB surcharge) and any countercyclical buffer will
result in limitations to the amount of capital that the
Firm may distribute, such as through dividends and
common share repurchases, as well as on
discretionary bonus payments for certain executive
officers.
Management’s discussion and analysis
92
JPMorgan Chase & Co./2025 Form 10-K
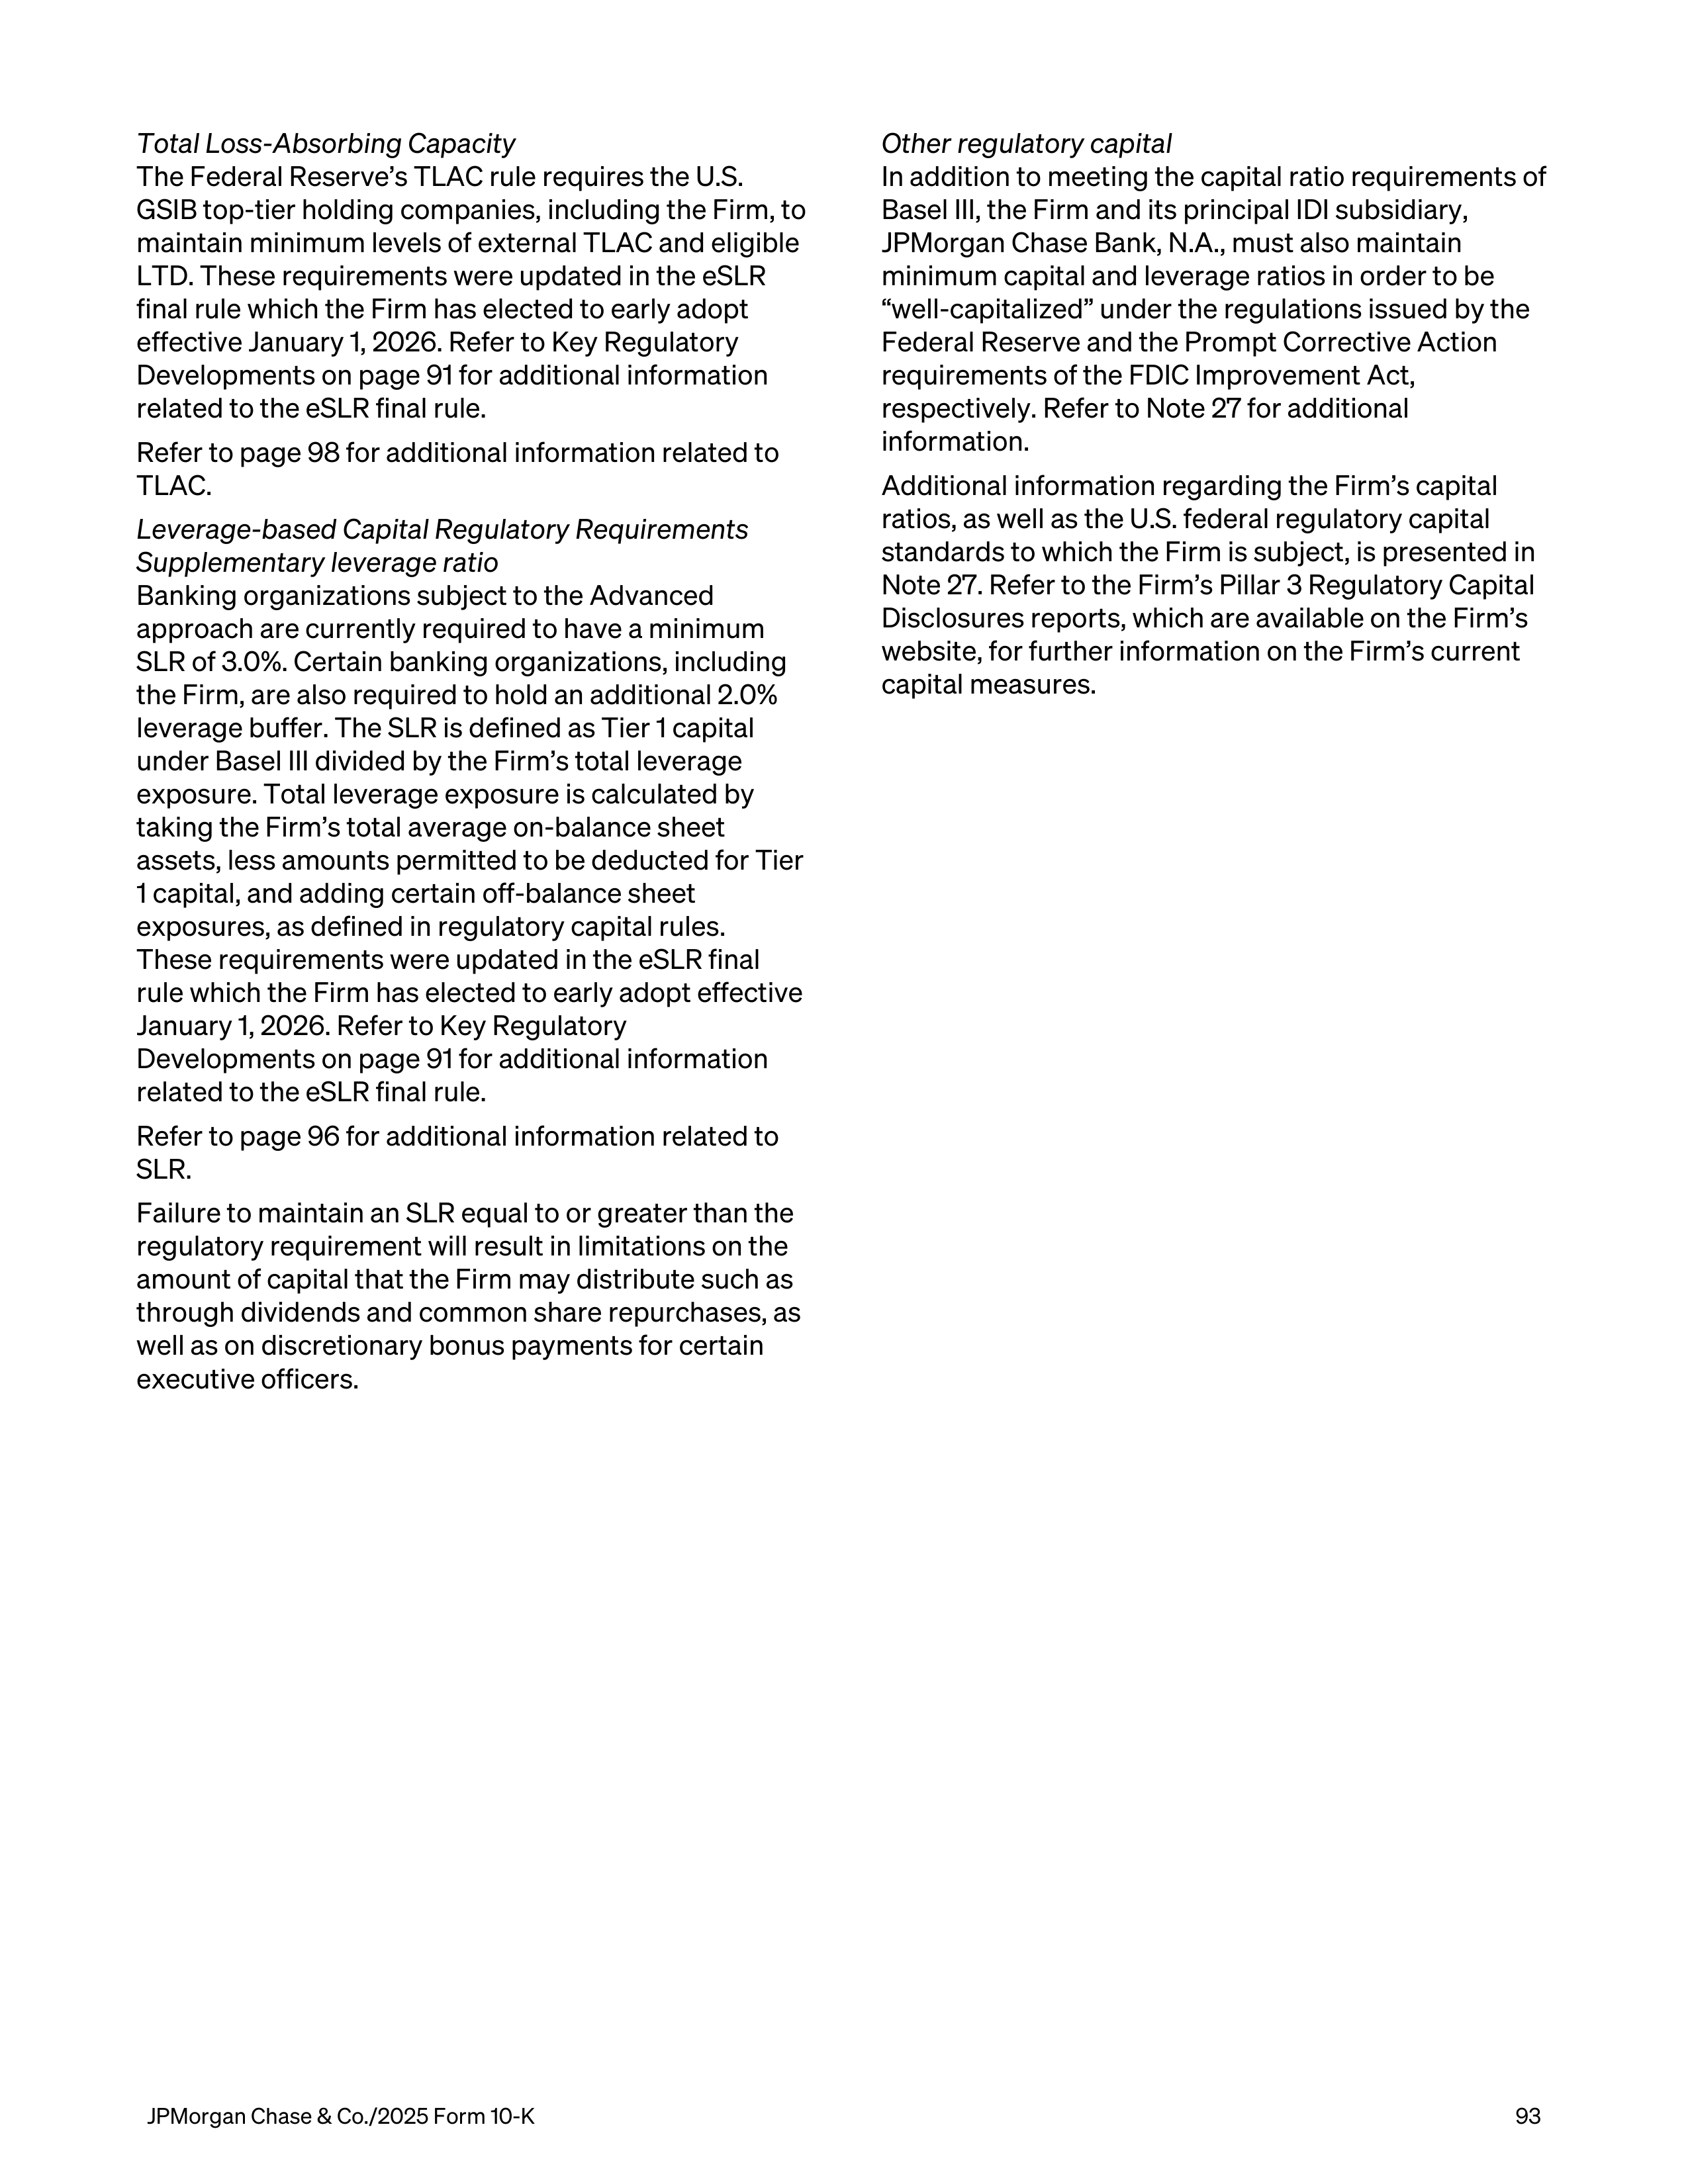
Total Loss-Absorbing Capacity
The Federal Reserve’s TLAC rule requires the U.S.
GSIB top-tier holding companies, including the Firm, to
maintain minimum levels of external TLAC and eligible
LTD. These requirements were updated in the eSLR
final rule which the Firm has elected to early adopt
effective January 1, 2026. Refer to Key Regulatory
Developments on page 91 for additional information
related to the eSLR final rule.
Refer to page 98 for additional information related to
TLAC.
Leverage-based Capital Regulatory Requirements
Supplementary leverage ratio
Banking organizations subject to the Advanced
approach are currently required to have a minimum
SLR of 3.0%. Certain banking organizations, including
the Firm, are also required to hold an additional 2.0%
leverage buffer. The SLR is defined as Tier 1 capital
under Basel III divided by the Firm’s total leverage
exposure. Total leverage exposure is calculated by
taking the Firm’s total average on-balance sheet
assets, less amounts permitted to be deducted for Tier
1 capital, and adding certain off-balance sheet
exposures, as defined in regulatory capital rules.
These requirements were updated in the eSLR final
rule which the Firm has elected to early adopt effective
January 1, 2026. Refer to Key Regulatory
Developments on page 91 for additional information
related to the eSLR final rule.
Refer to page 96 for additional information related to
SLR.
Failure to maintain an SLR equal to or greater than the
regulatory requirement will result in limitations on the
amount of capital that the Firm may distribute such as
through dividends and common share repurchases, as
well as on discretionary bonus payments for certain
executive officers.
Other regulatory capital
In addition to meeting the capital ratio requirements of
Basel III, the Firm and its principal IDI subsidiary,
JPMorgan Chase Bank, N.A., must also maintain
minimum capital and leverage ratios in order to be
“well-capitalized” under the regulations issued by the
Federal Reserve and the Prompt Corrective Action
requirements of the FDIC Improvement Act,
respectively. Refer to Note 27 for additional
information.
Additional information regarding the Firm’s capital
ratios, as well as the U.S. federal regulatory capital
standards to which the Firm is subject, is presented in
Note 27. Refer to the Firm’s Pillar 3 Regulatory Capital
Disclosures reports, which are available on the Firm’s
website, for further information on the Firm’s current
capital measures.
JPMorgan Chase & Co./2025 Form 10-K
93
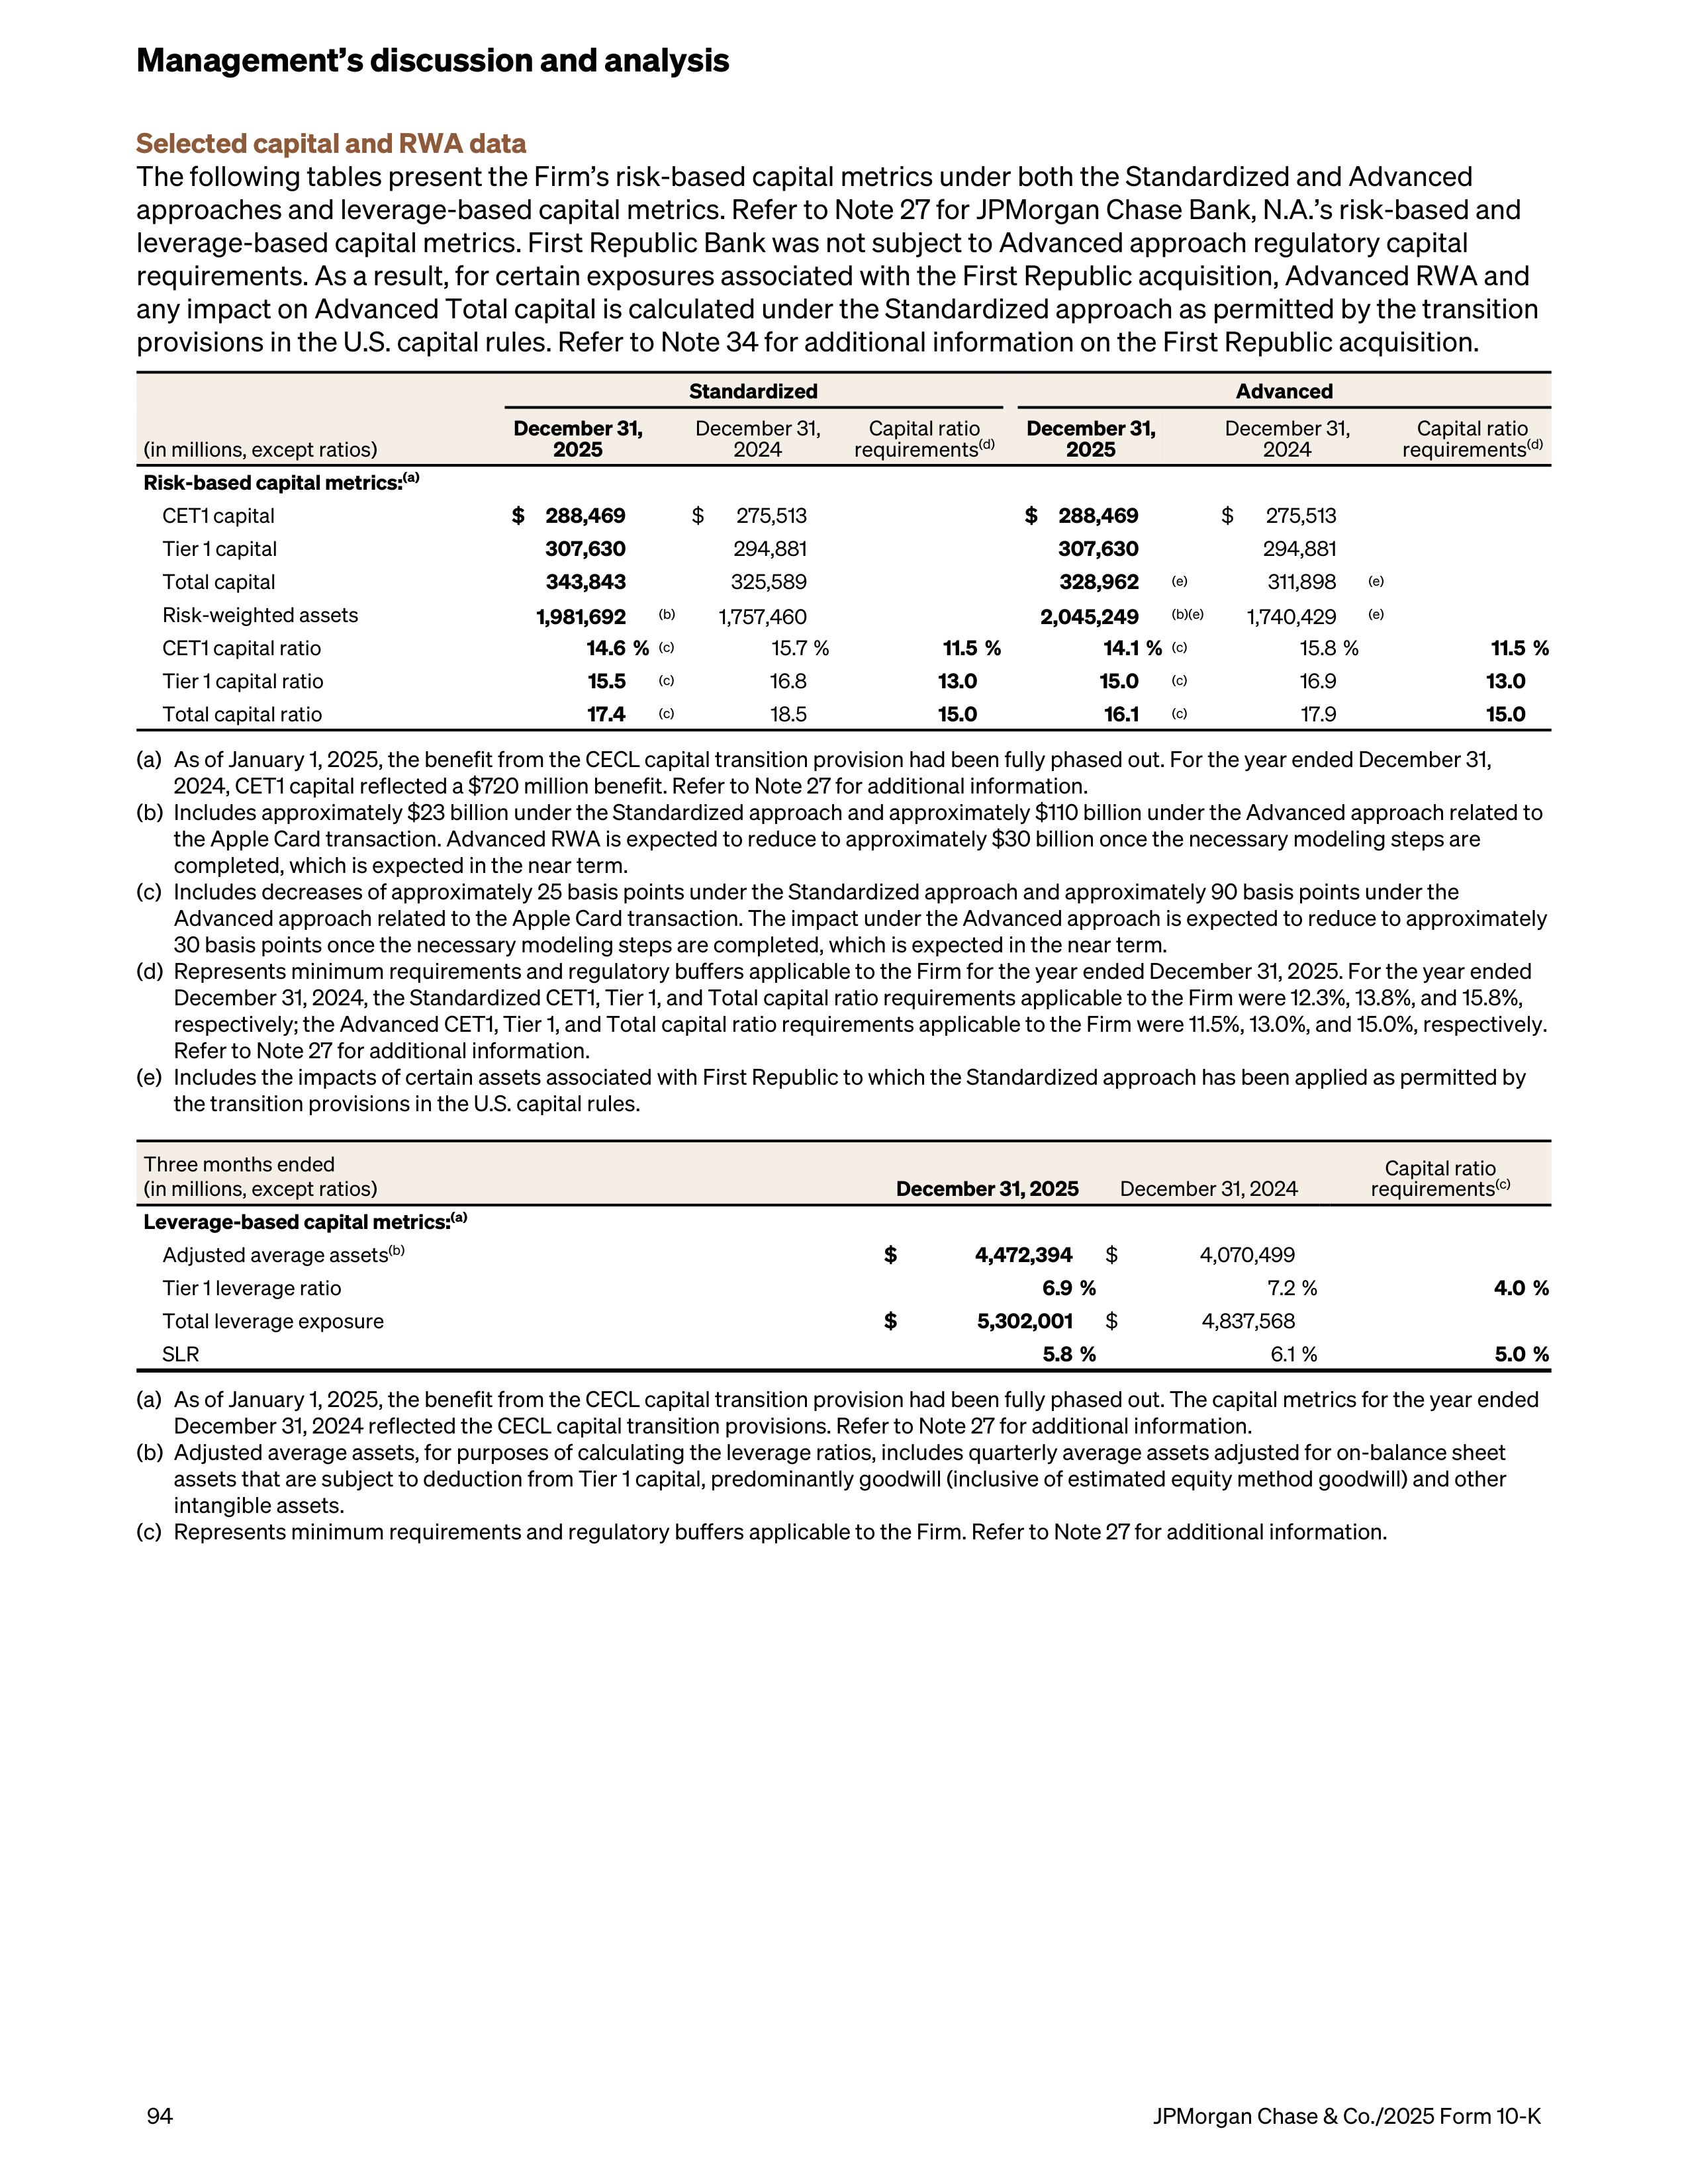
Selected capital and RWA data
The following tables present the Firm’s risk-based capital metrics under both the Standardized and Advanced
approaches and leverage-based capital metrics. Refer to Note 27 for JPMorgan Chase Bank, N.A.’s risk-based and
leverage-based capital metrics. First Republic Bank was not subject to Advanced approach regulatory capital
requirements. As a result, for certain exposures associated with the First Republic acquisition, Advanced RWA and
any impact on Advanced Total capital is calculated under the Standardized approach as permitted by the transition
provisions in the U.S. capital rules. Refer to Note 34 for additional information on the First Republic acquisition.
Standardized
Advanced
(in millions, except ratios)
December 31,
2025
December 31,
2024
Capital ratio
requirements
(d)
December 31,
2025
December 31,
2024
Capital ratio
requirements
(d)
Risk-based capital metrics:
(a)
CET1 capital
$
288,469
$
275,513
$
288,469
$
275,513
Tier 1 capital
307,630
294,881
307,630
294,881
Total capital
343,843
325,589
328,962
(e)
311,898
(e)
Risk-weighted assets
1,981,692
(b)
1,757,460
2,045,249
(b)(e)
1,740,429
(e)
CET1 capital ratio
14.6 %
(c)
15.7 %
11.5 %
14.1 %
(c)
15.8 %
11.5 %
Tier 1 capital ratio
15.5
(c)
16.8
13.0
15.0
(c)
16.9
13.0
Total capital ratio
17.4
(c)
18.5
15.0
16.1
(c)
17.9
15.0
(a)
As of January 1, 2025, the benefit from the CECL capital transition provision had been fully phased out. For the year ended December 31,
2024, CET1 capital reflected a $720 million benefit. Refer to Note 27 for additional information.
(b)
Includes approximately $23 billion under the Standardized approach and approximately $110 billion under the Advanced approach related to
the Apple Card transaction. Advanced RWA is expected to reduce to approximately $30 billion once the necessary modeling steps are
completed, which is expected in the near term.
(c)
Includes decreases of approximately 25 basis points under the Standardized approach and approximately 90 basis points under the
Advanced approach related to the Apple Card transaction. The impact under the Advanced approach is expected to reduce to approximately
30 basis points once the necessary modeling steps are completed, which is expected in the near term.
(d)
Represents minimum requirements and regulatory buffers applicable to the Firm for the year ended December 31, 2025. For the year ended
December 31, 2024, the Standardized CET1, Tier 1, and Total capital ratio requirements applicable to the Firm were 12.3%, 13.8%, and 15.8%,
respectively; the Advanced CET1, Tier 1, and Total capital ratio requirements applicable to the Firm were 11.5%, 13.0%, and 15.0%, respectively.
Refer to Note 27 for additional information.
(e)
Includes the impacts of certain assets associated with First Republic to which the Standardized approach has been applied as permitted by
the transition provisions in the U.S. capital rules.
Three months ended
(in millions, except ratios)
December 31, 2025
December 31, 2024
Capital ratio
requirements
(c)
Leverage-based capital metrics:
(a)
Adjusted average assets
(b)
$
4,472,394
$
4,070,499
Tier 1 leverage ratio
6.9 %
7.2 %
4.0 %
Total leverage exposure
$
5,302,001
$
4,837,568
SLR
5.8 %
6.1 %
5.0 %
(a)
As of January 1, 2025, the benefit from the CECL capital transition provision had been fully phased out. The capital metrics for the year ended
December 31, 2024 reflected the CECL capital transition provisions. Refer to Note 27 for additional information.
(b)
Adjusted average assets, for purposes of calculating the leverage ratios, includes quarterly average assets adjusted for on-balance sheet
assets that are subject to deduction from Tier 1 capital, predominantly goodwill (inclusive of estimated equity method goodwill) and other
intangible assets.
(c)
Represents minimum requirements and regulatory buffers applicable to the Firm. Refer to Note 27 for additional information.
Management’s discussion and analysis
94
JPMorgan Chase & Co./2025 Form 10-K
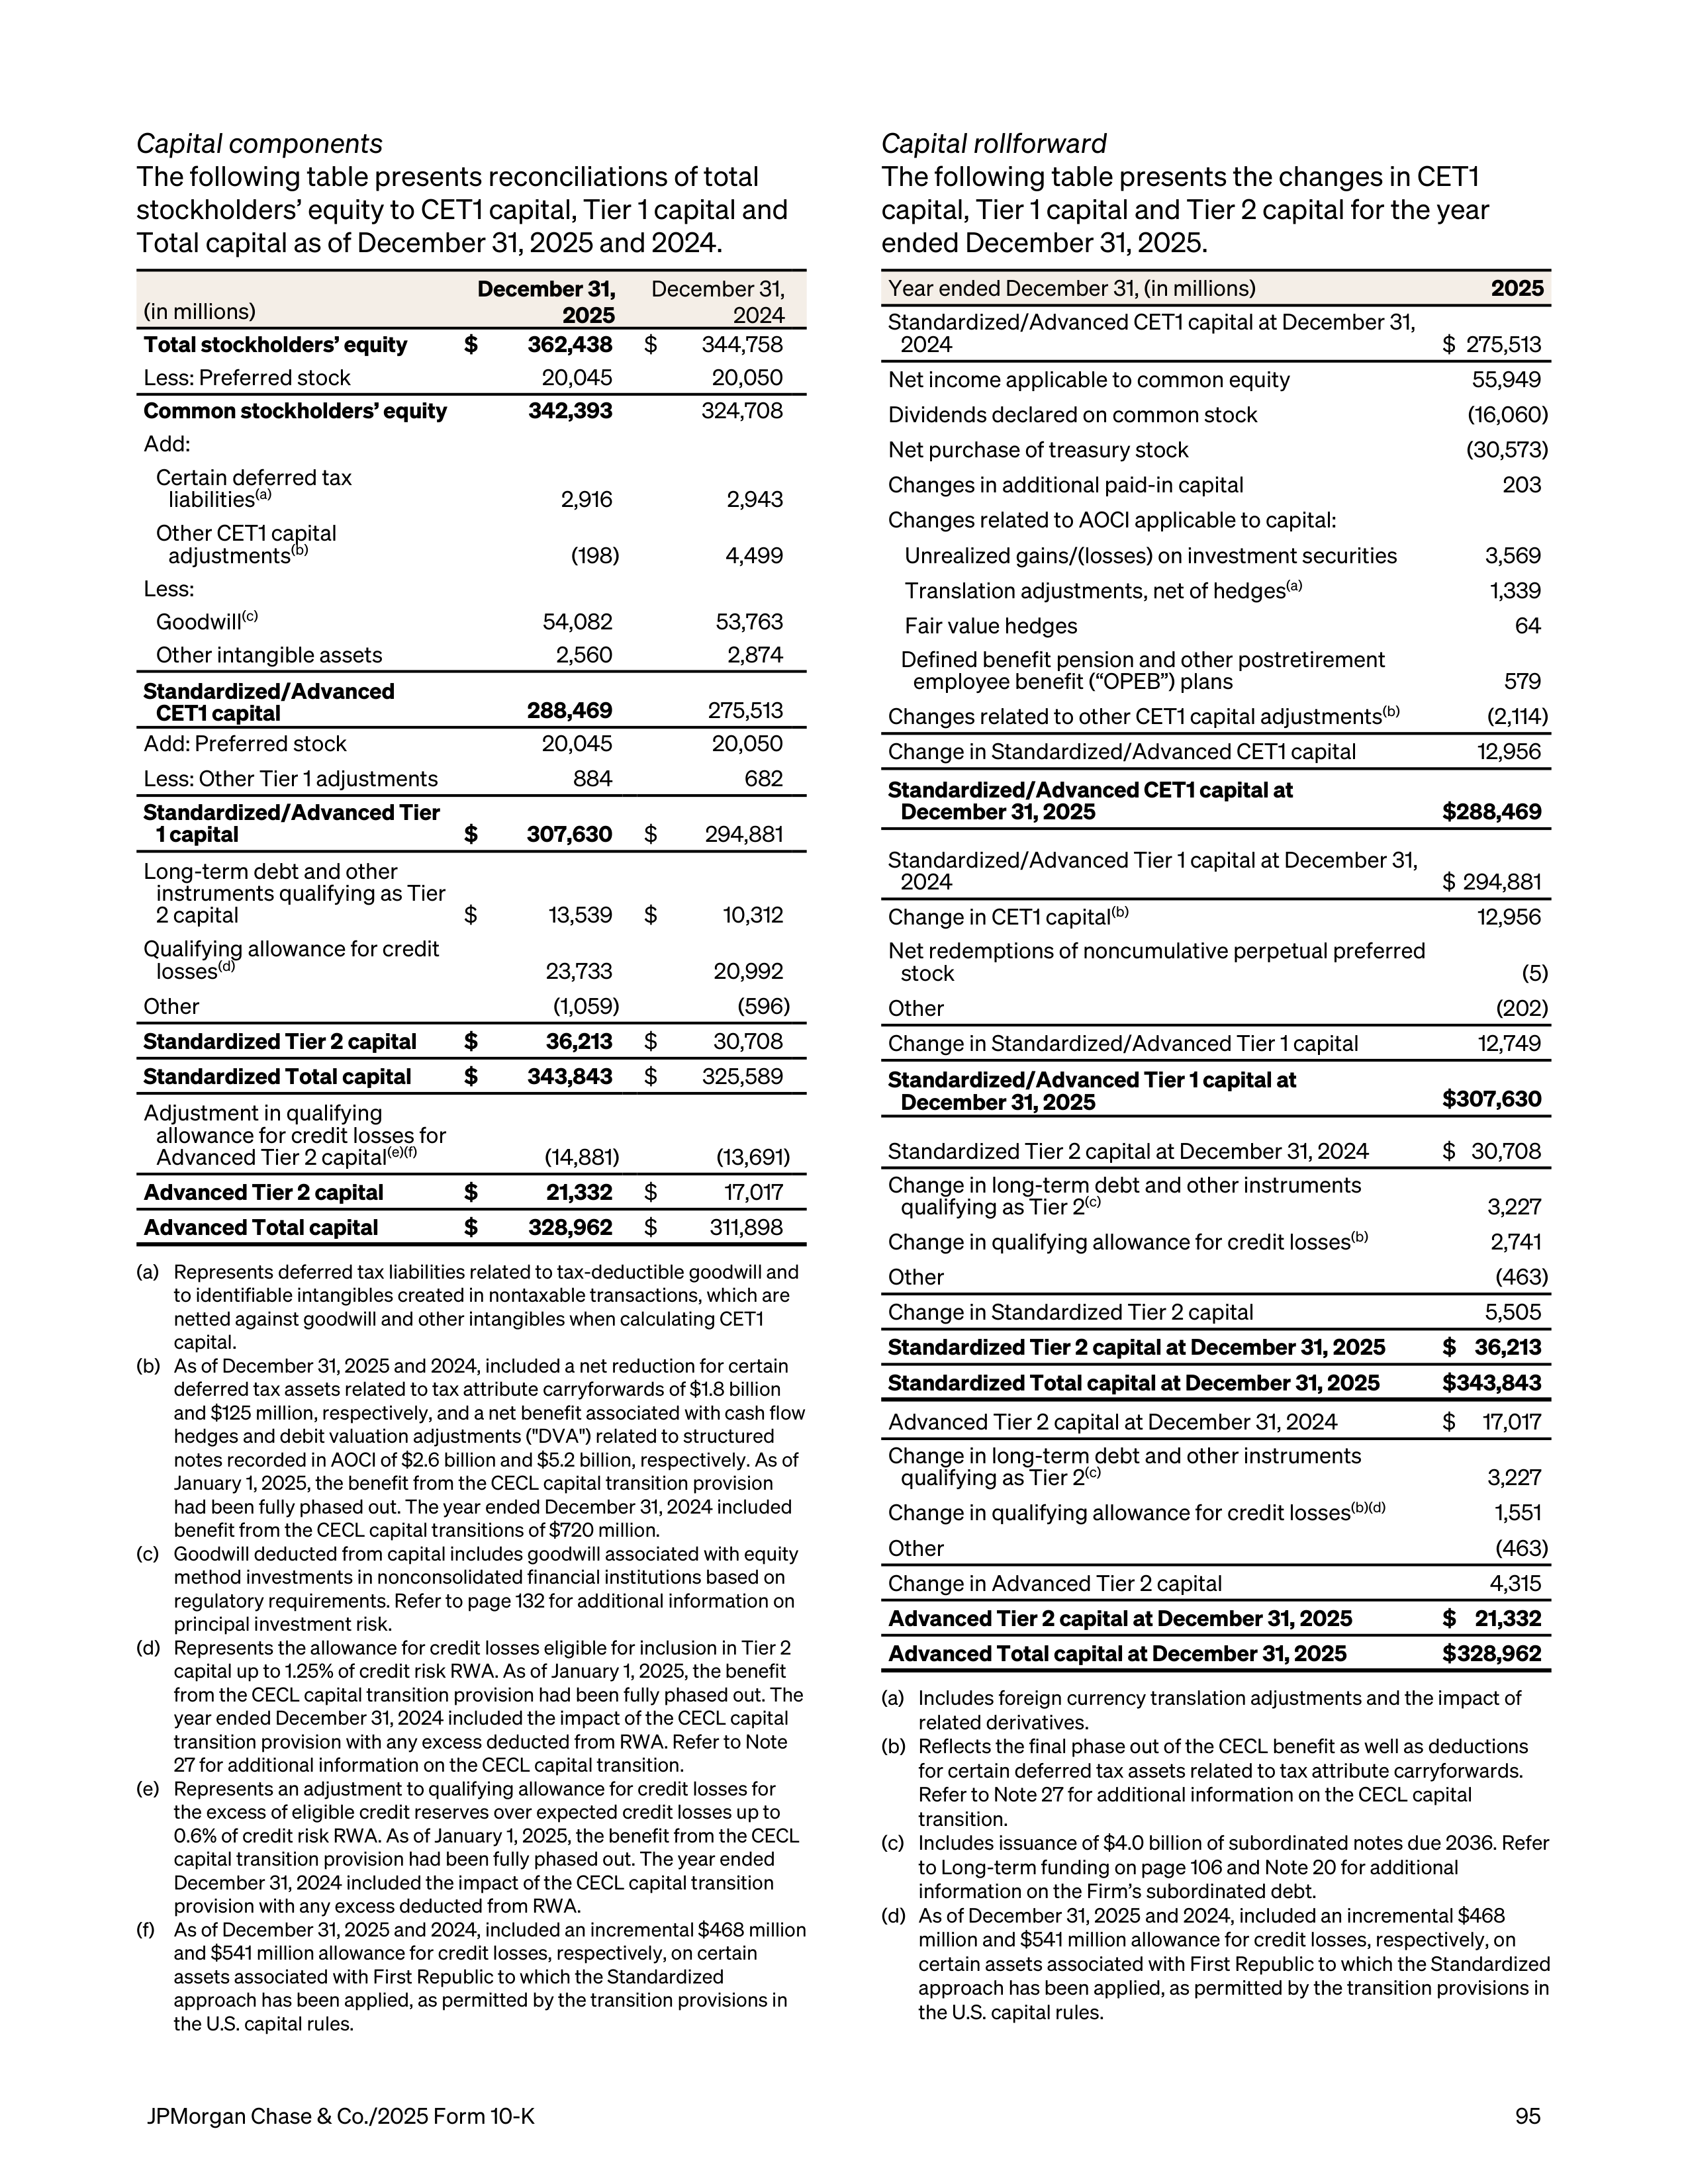
Capital components
The following table presents reconciliations of total
stockholders’ equity to CET1 capital, Tier 1 capital and
Total capital as of December 31, 2025 and 2024.
(in millions)
December 31,
2025
December 31,
2024
Total stockholders’ equity
$
362,438
$
344,758
Less: Preferred stock
20,045
20,050
Common stockholders’ equity
342,393
324,708
Add:
Certain deferred tax
liabilities
(a)
2,916
2,943
Other CET1 capital
adjustments
(b)
(198)
4,499
Less:
Goodwill
(c)
54,082
53,763
Other intangible assets
2,560
2,874
Standardized/Advanced
CET1 capital
288,469
275,513
Add: Preferred stock
20,045
20,050
Less: Other Tier 1 adjustments
884
682
Standardized/Advanced Tier
1 capital
$
307,630
$
294,881
Long-term debt and other
instruments qualifying as Tier
2 capital
$
13,539
$
10,312
Qualifying allowance for credit
losses
(d)
23,733
20,992
Other
(1,059)
(596)
Standardized Tier 2 capital
$
36,213
$
30,708
Standardized Total capital
$
343,843
$
325,589
Adjustment in qualifying
allowance for credit losses for
Advanced Tier 2 capital
(e)(f)
(14,881)
(13,691)
Advanced Tier 2 capital
$
21,332
$
17,017
Advanced Total capital
$
328,962
$
311,898
(a)
Represents deferred tax liabilities related to tax-deductible goodwill and
to identifiable intangibles created in nontaxable transactions, which are
netted against goodwill and other intangibles when calculating CET1
capital.
(b)
As of December 31, 2025 and 2024, included a net reduction for certain
deferred tax assets related to tax attribute carryforwards of $1.8 billion
and $125 million, respectively, and a net benefit associated with cash flow
hedges and debit valuation adjustments ("DVA") related to structured
notes recorded in AOCI of $2.6 billion and $5.2 billion, respectively. As of
January 1, 2025, the benefit from the CECL capital transition provision
had been fully phased out. The year ended December 31, 2024 included
benefit from the CECL capital transitions of $720 million.
(c)
Goodwill deducted from capital includes goodwill associated with equity
method investments in nonconsolidated financial institutions based on
regulatory requirements. Refer to page 132 for additional information on
principal investment risk.
(d)
Represents the allowance for credit losses eligible for inclusion in Tier 2
capital up to 1.25% of credit risk RWA. As of January 1, 2025, the benefit
from the CECL capital transition provision had been fully phased out. The
year ended December 31, 2024 included the impact of the CECL capital
transition provision with any excess deducted from RWA. Refer to Note
27 for additional information on the CECL capital transition.
(e)
Represents an adjustment to qualifying allowance for credit losses for
the excess of eligible credit reserves over expected credit losses up to
0.6% of credit risk RWA. As of January 1, 2025, the benefit from the CECL
capital transition provision had been fully phased out. The year ended
December 31, 2024 included the impact of the CECL capital transition
provision with any excess deducted from RWA.
(f)
As of December 31, 2025 and 2024, included an incremental $468 million
and $541 million allowance for credit losses, respectively, on certain
assets associated with First Republic to which the Standardized
approach has been applied, as permitted by the transition provisions in
the U.S. capital rules.
Capital rollforward
The following table presents the changes in CET1
capital, Tier 1 capital and Tier 2 capital for the year
ended December 31, 2025.
Year ended December 31, (in millions)
2025
Standardized/Advanced CET1 capital at December 31,
2024
$ 275,513
Net income applicable to common equity
55,949
Dividends declared on common stock
(16,060)
Net purchase of treasury stock
(30,573)
Changes in additional paid-in capital
203
Changes related to AOCI applicable to capital:
Unrealized gains/(losses) on investment securities
3,569
Translation adjustments, net of hedges
(a)
1,339
Fair value hedges
64
Defined benefit pension and other postretirement
employee benefit (“OPEB”) plans
579
Changes related to other CET1 capital adjustments
(b)
(2,114)
Change in Standardized/Advanced CET1 capital
12,956
Standardized/Advanced CET1 capital at
December 31, 2025
$ 288,469
Standardized/Advanced Tier 1 capital at December 31,
2024
$ 294,881
Change in CET1 capital
(b)
12,956
Net redemptions of noncumulative perpetual preferred
stock
(5)
Other
(202)
Change in Standardized/Advanced Tier 1 capital
12,749
Standardized/Advanced Tier 1 capital at
December 31, 2025
$ 307,630
Standardized Tier 2 capital at December 31, 2024
$ 30,708
Change in long-term debt and other instruments
qualifying as Tier 2
(c)
3,227
Change in qualifying allowance for credit losses
(b)
2,741
Other
(463)
Change in Standardized Tier 2 capital
5,505
Standardized Tier 2 capital at December 31, 2025
$ 36,213
Standardized Total capital at December 31, 2025
$ 343,843
Advanced Tier 2 capital at December 31, 2024
$
17,017
Change in long-term debt and other instruments
qualifying as Tier 2
(c)
3,227
Change in qualifying allowance for credit losses
(b)(d)
1,551
Other
(463)
Change in Advanced Tier 2 capital
4,315
Advanced Tier 2 capital at December 31, 2025
$ 21,332
Advanced Total capital at December 31, 2025
$ 328,962
(a)
Includes foreign currency translation adjustments and the impact of
related derivatives.
(b)
Reflects the final phase out of the CECL benefit as well as deductions
for certain deferred tax assets related to tax attribute carryforwards.
Refer to Note 27 for additional information on the CECL capital
transition.
(c)
Includes issuance of $4.0 billion of subordinated notes due 2036. Refer
to Long-term funding on page 106 and Note 20 for additional
information on the Firm’s subordinated debt.
(d)
As of December 31, 2025 and 2024, included an incremental $468
million and $541 million allowance for credit losses, respectively, on
certain assets associated with First Republic to which the Standardized
approach has been applied, as permitted by the transition provisions in
the U.S. capital rules.
JPMorgan Chase & Co./2025 Form 10-K
95
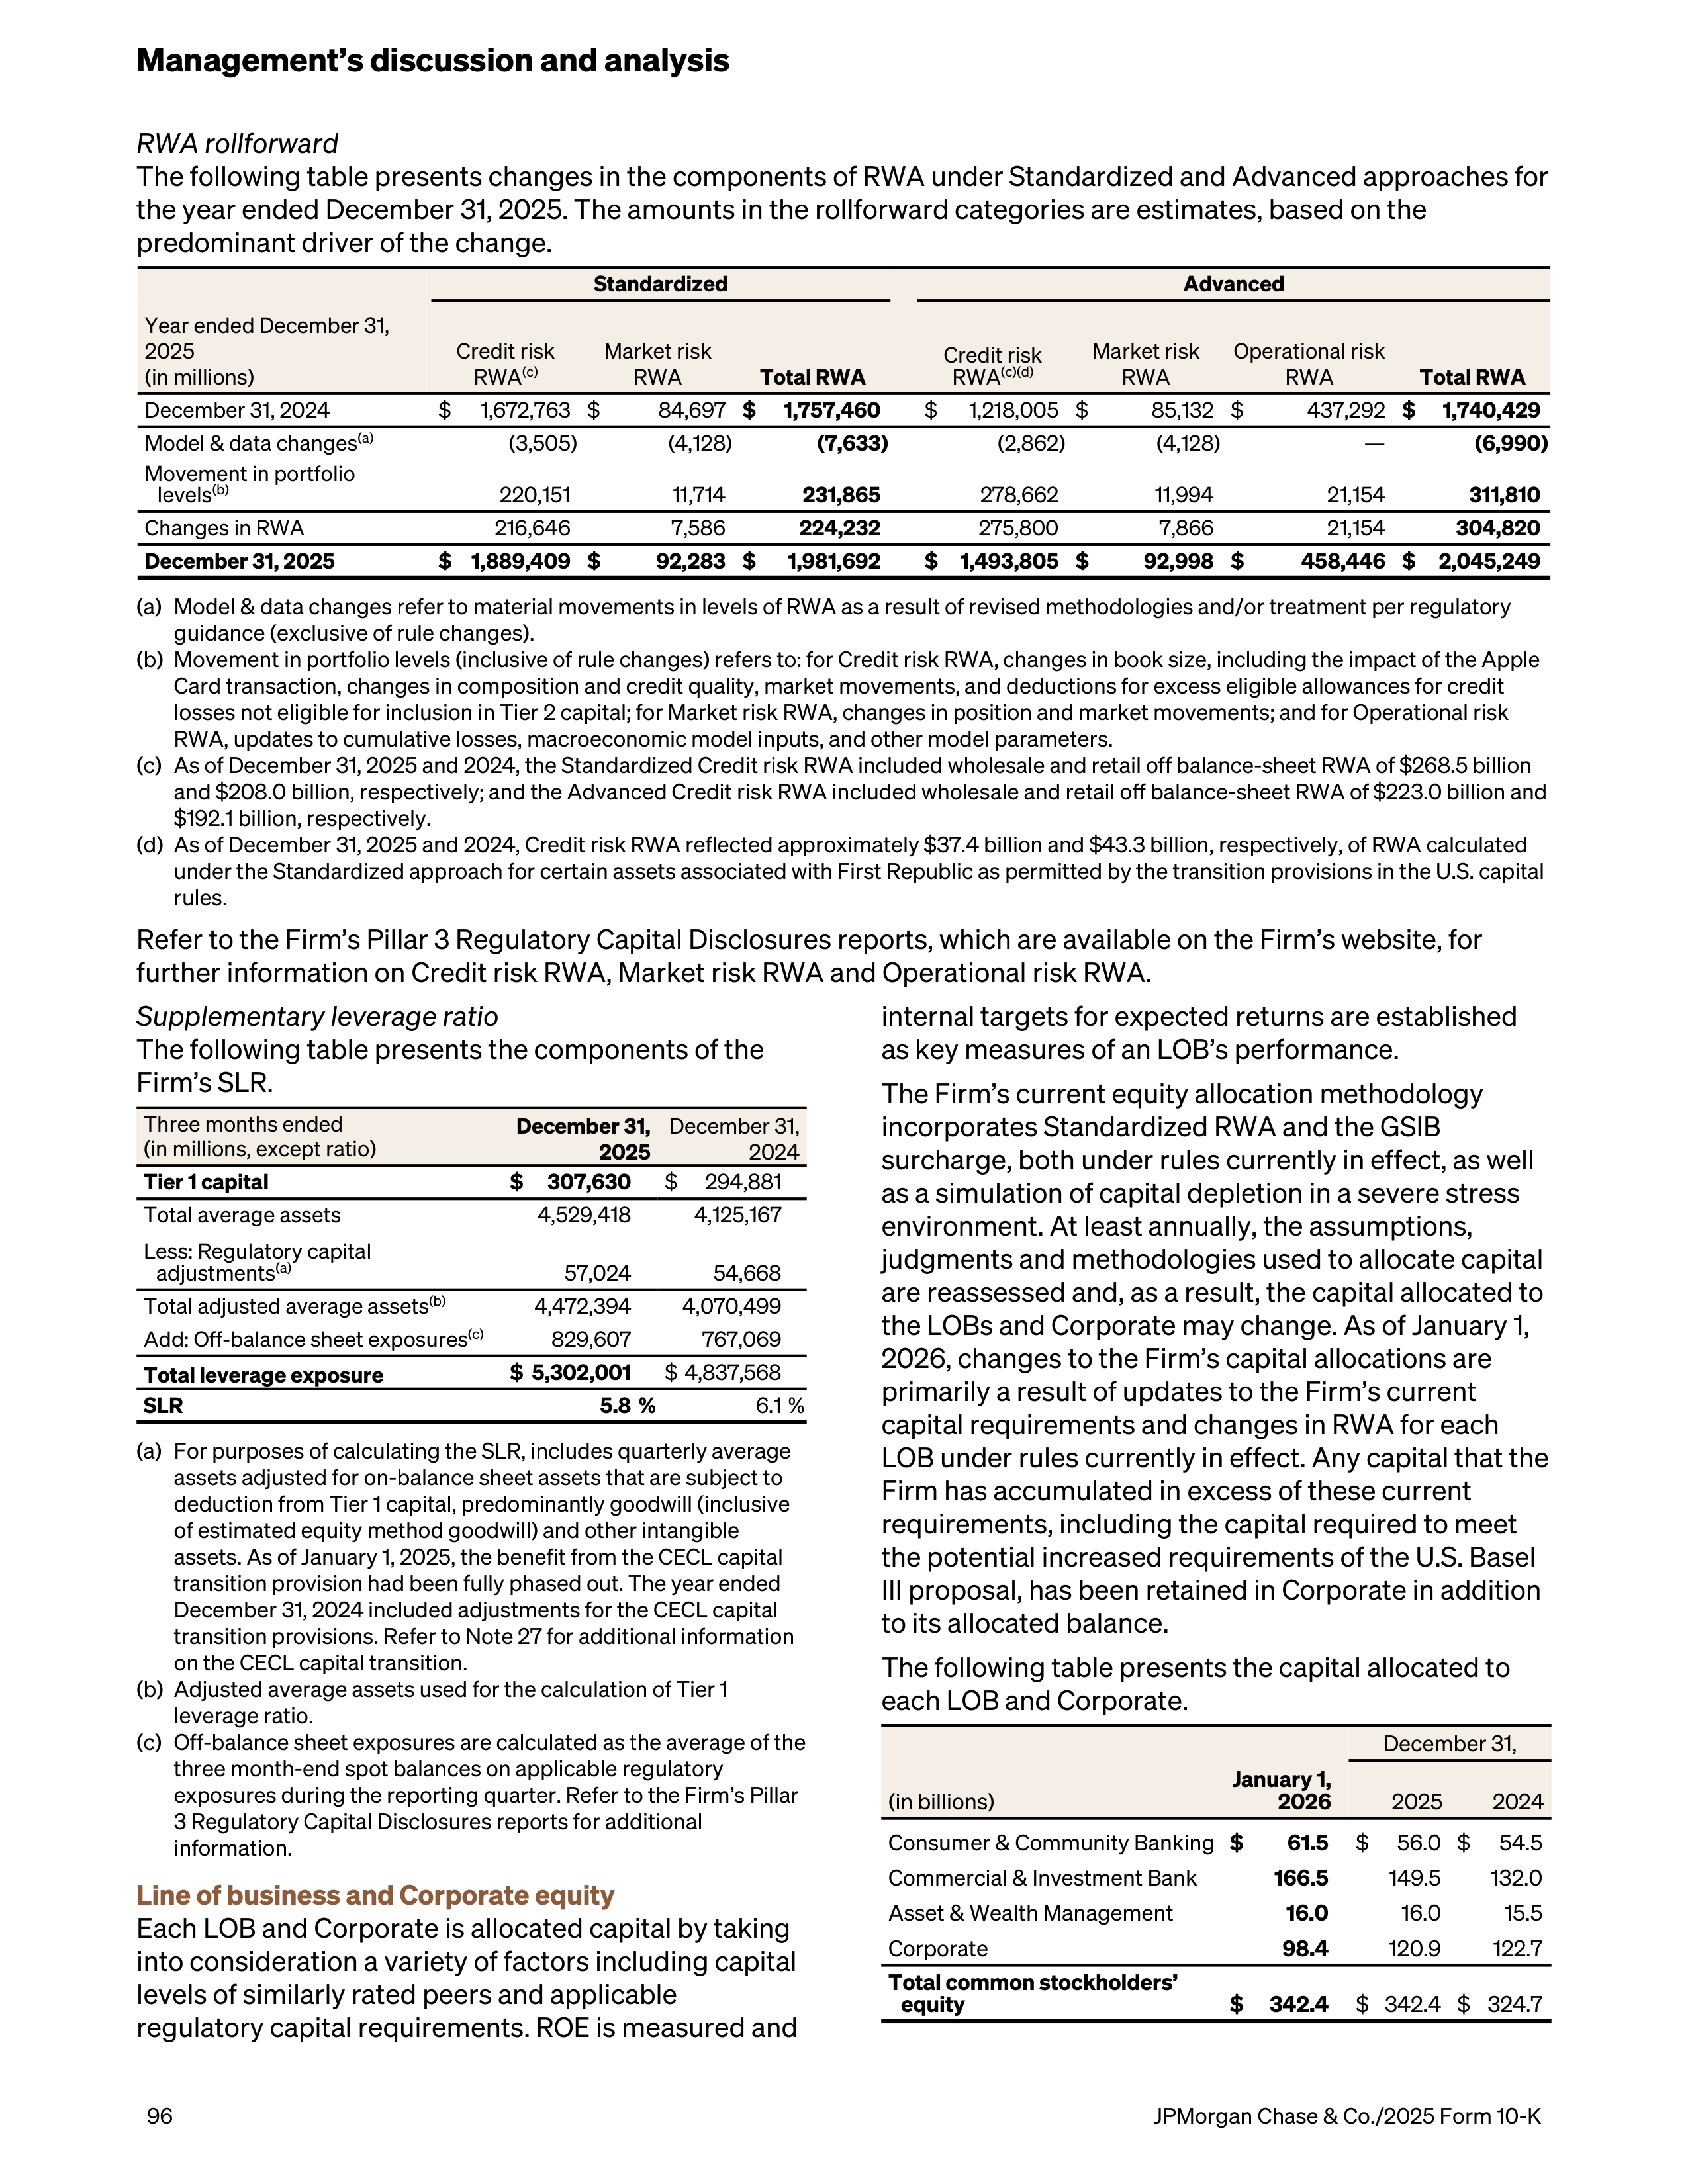
RWA rollforward
The following table presents changes in the components of RWA under Standardized and Advanced approaches for
the year ended December 31, 2025. The amounts in the rollforward categories are estimates, based on the
predominant driver of the change.
Standardized
Advanced
Year ended December 31,
2025
(in millions)
Credit risk
RWA
(c)
Market risk
RWA
Total RWA
Credit risk
RWA
(c)(d)
Market risk
RWA
Operational risk
RWA
Total RWA
December 31, 2024
$
1,672,763 $
84,697
$
1,757,460
$
1,218,005 $
85,132 $
437,292
$
1,740,429
Model & data changes
(a)
(3,505)
(4,128)
(7,633)
(2,862)
(4,128)
—
(6,990)
Movement in portfolio
levels
(b)
220,151
11,714
231,865
278,662
11,994
21,154
311,810
Changes in RWA
216,646
7,586
224,232
275,800
7,866
21,154
304,820
December 31, 2025
$ 1,889,409 $
92,283 $
1,981,692
$
1,493,805 $
92,998 $
458,446 $
2,045,249
(a)
Model & data changes refer to material movements in levels of RWA as a result of revised methodologies and/or treatment per regulatory
guidance (exclusive of rule changes).
(b)
Movement in portfolio levels (inclusive of rule changes) refers to: for Credit risk RWA, changes in book size, including the impact of the Apple
Card transaction, changes in composition and credit quality, market movements, and deductions for excess eligible allowances for credit
losses not eligible for inclusion in Tier 2 capital; for Market risk RWA, changes in position and market movements; and for Operational risk
RWA, updates to cumulative losses, macroeconomic model inputs, and other model parameters.
(c)
As of December 31, 2025 and 2024, the Standardized Credit risk RWA included wholesale and retail off balance-sheet RWA of $268.5 billion
and $208.0 billion, respectively; and the Advanced Credit risk RWA included wholesale and retail off balance-sheet RWA of $223.0 billion and
$192.1 billion, respectively.
(d)
As of December 31, 2025 and 2024, Credit risk RWA reflected approximately $37.4 billion and $43.3 billion, respectively, of RWA calculated
under the Standardized approach for certain assets associated with First Republic as permitted by the transition provisions in the U.S. capital
rules.
Refer to the Firm’s Pillar 3 Regulatory Capital Disclosures reports, which are available on the Firm’s website, for
further information on Credit risk RWA, Market risk RWA and Operational risk RWA.
Supplementary leverage ratio
The following table presents the components of the
Firm’s SLR.
Three months ended
(in millions, except ratio)
December 31,
2025
December 31,
2024
Tier 1 capital
$
307,630
$
294,881
Total average assets
4,529,418
4,125,167
Less: Regulatory capital
adjustments
(a)
57,024
54,668
Total adjusted average assets
(b)
4,472,394
4,070,499
Add: Off-balance sheet exposures
(c)
829,607
767,069
Total leverage exposure
$ 5,302,001
$ 4,837,568
SLR
5.8 %
6.1 %
(a)
For purposes of calculating the SLR, includes quarterly average
assets adjusted for on-balance sheet assets that are subject to
deduction from Tier 1 capital, predominantly goodwill (inclusive
of estimated equity method goodwill) and other intangible
assets. As of January 1, 2025, the benefit from the CECL capital
transition provision had been fully phased out. The year ended
December 31, 2024 included adjustments for the CECL capital
transition provisions. Refer to Note 27 for additional information
on the CECL capital transition.
(b)
Adjusted average assets used for the calculation of Tier 1
leverage ratio.
(c)
Off-balance sheet exposures are calculated as the average of the
three month-end spot balances on applicable regulatory
exposures during the reporting quarter. Refer to the Firm’s Pillar
3 Regulatory Capital Disclosures reports for additional
information.
Line of business and Corporate equity
Each LOB and Corporate is allocated capital by taking
into consideration a variety of factors including capital
levels of similarly rated peers and applicable
regulatory capital requirements. ROE is measured and
internal targets for expected returns are established
as key measures of an LOB’s performance.
The Firm’s current equity allocation methodology
incorporates Standardized RWA and the GSIB
surcharge, both under rules currently in effect, as well
as a simulation of capital depletion in a severe stress
environment. At least annually, the assumptions,
judgments and methodologies used to allocate capital
are reassessed and, as a result, the capital allocated to
the LOBs and Corporate may change. As of January 1,
2026, changes to the Firm’s capital allocations are
primarily a result of updates to the Firm’s current
capital requirements and changes in RWA for each
LOB under rules currently in effect. Any capital that the
Firm has accumulated in excess of these current
requirements, including the capital required to meet
the potential increased requirements of the U.S. Basel
III proposal, has been retained in Corporate in addition
to its allocated balance.
The following table presents the capital allocated to
each LOB and Corporate.
December 31,
(in billions)
January 1,
2026
2025
2024
Consumer & Community Banking
$
61.5
$
56.0 $
54.5
Commercial & Investment Bank
166.5
149.5
132.0
Asset & Wealth Management
16.0
16.0
15.5
Corporate
98.4
120.9
122.7
Total common stockholders’
equity
$
342.4
$ 342.4 $ 324.7
Management’s discussion and analysis
96
JPMorgan Chase & Co./2025 Form 10-K
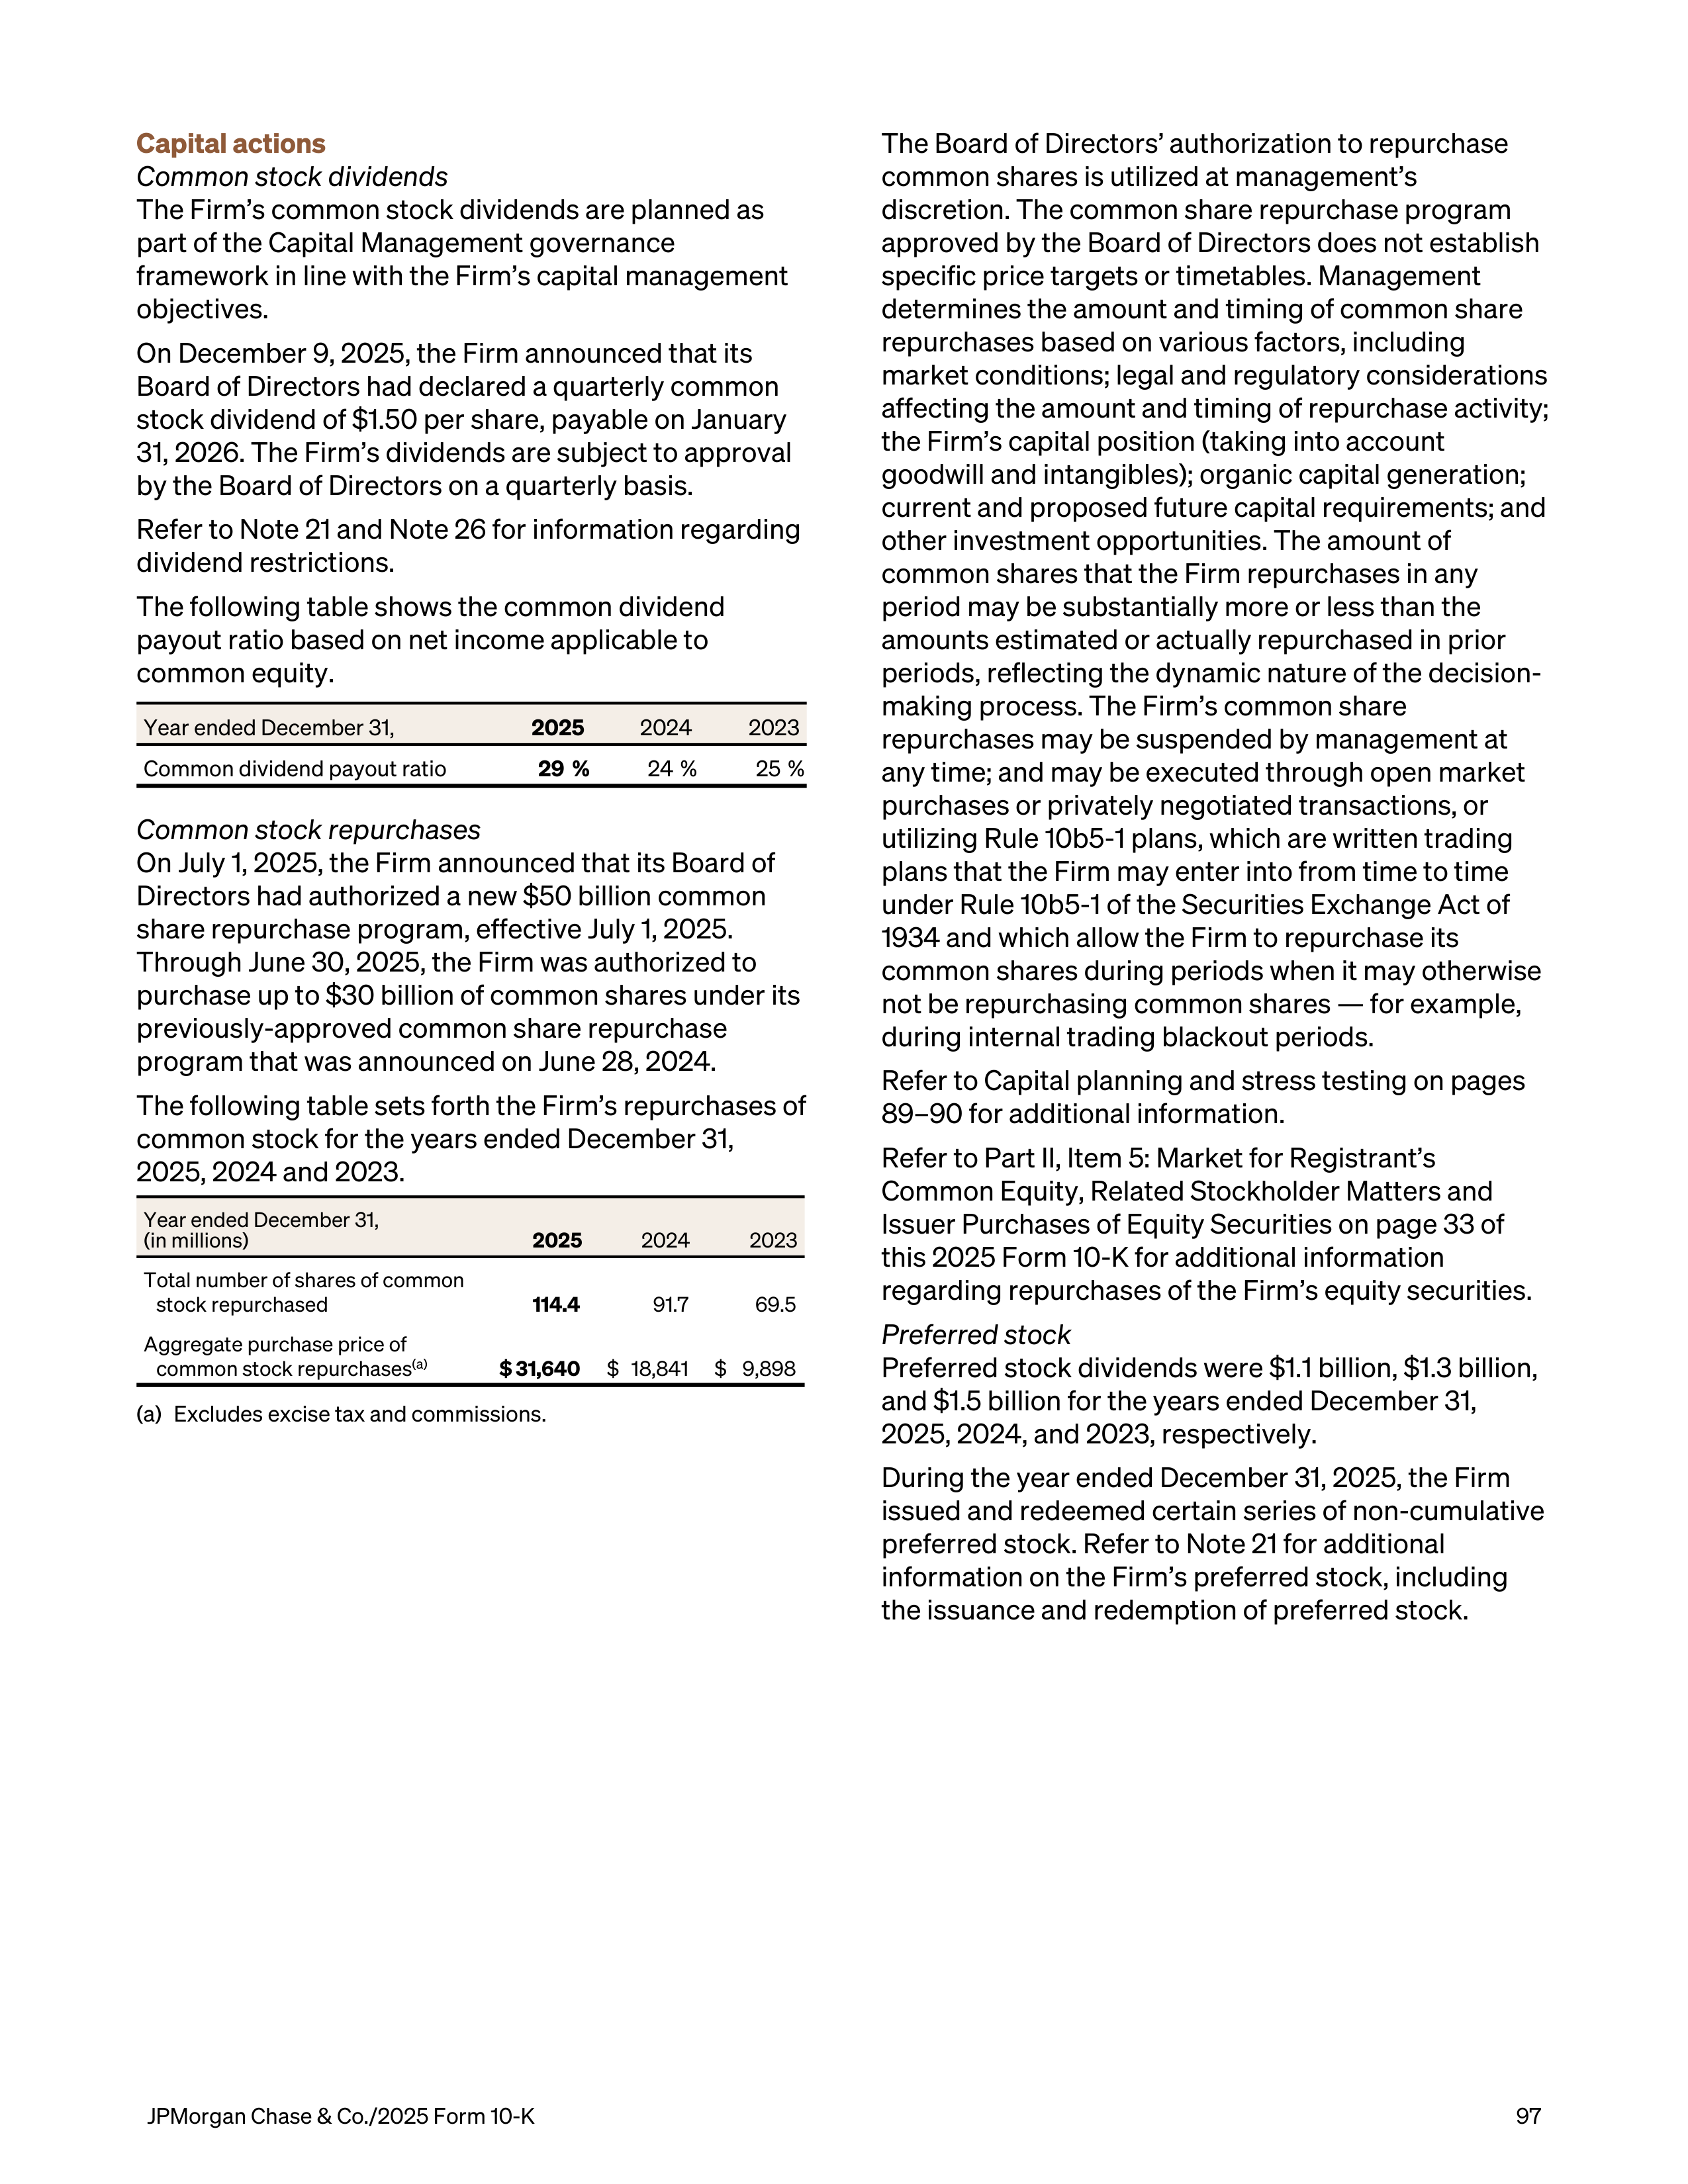
Capital actions
Common stock dividends
The Firm’s common stock dividends are planned as
part of the Capital Management governance
framework in line with the Firm’s capital management
objectives.
On December 9, 2025, the Firm announced that its
Board of Directors had declared a quarterly common
stock dividend of $1.50 per share, payable on January
31, 2026. The Firm’s dividends are subject to approval
by the Board of Directors on a quarterly basis.
Refer to Note 21 and Note 26 for information regarding
dividend restrictions.
The following table shows the common dividend
payout ratio based on net income applicable to
common equity.
Year ended December 31,
2025
2024
2023
Common dividend payout ratio
29 %
24 %
25 %
Common stock repurchases
On July 1, 2025, the Firm announced that its Board of
Directors had authorized a new $50 billion common
share repurchase program, effective July 1, 2025.
Through June 30, 2025, the Firm was authorized to
purchase up to $30 billion of common shares under its
previously-approved common share repurchase
program that was announced on June 28, 2024.
The following table sets forth the Firm’s repurchases of
common stock for the years ended December 31,
2025, 2024 and 2023.
Year ended December 31,
(in millions)
2025
2024
2023
Total number of shares of common
stock repurchased
114.4
91.7
69.5
Aggregate purchase price of
common stock repurchases
(a)
$ 31,640
$ 18,841
$ 9,898
(a)
Excludes excise tax and commissions.
The Board of Directors’ authorization to repurchase
common shares is utilized at management’s
discretion. The common share repurchase program
approved by the Board of Directors does not establish
specific price targets or timetables. Management
determines the amount and timing of common share
repurchases based on various factors, including
market conditions; legal and regulatory considerations
affecting the amount and timing of repurchase activity;
the Firm’s capital position (taking into account
goodwill and intangibles); organic capital generation;
current and proposed future capital requirements; and
other investment opportunities. The amount of
common shares that the Firm repurchases in any
period may be substantially more or less than the
amounts estimated or actually repurchased in prior
periods, reflecting the dynamic nature of the decision-
making process. The Firm’s common share
repurchases may be suspended by management at
any time; and may be executed through open market
purchases or privately negotiated transactions, or
utilizing Rule 10b5-1 plans, which are written trading
plans that the Firm may enter into from time to time
under Rule 10b5-1 of the Securities Exchange Act of
1934 and which allow the Firm to repurchase its
common shares during periods when it may otherwise
not be repurchasing common shares — for example,
during internal trading blackout periods.
Refer to Capital planning and stress testing on pages
89–90 for additional information.
Refer to Part II, Item 5: Market for Registrant’s
Common Equity, Related Stockholder Matters and
Issuer Purchases of Equity Securities on page 33 of
this 2025 Form 10-K for additional information
regarding repurchases of the Firm’s equity securities.
Preferred stock
Preferred stock dividends were $1.1 billion, $1.3 billion,
and $1.5 billion for the years ended December 31,
2025, 2024, and 2023, respectively.
During the year ended December 31, 2025, the Firm
issued and redeemed certain series of non-cumulative
preferred stock. Refer to Note 21 for additional
information on the Firm’s preferred stock, including
the issuance and redemption of preferred stock.
JPMorgan Chase & Co./2025 Form 10-K
97
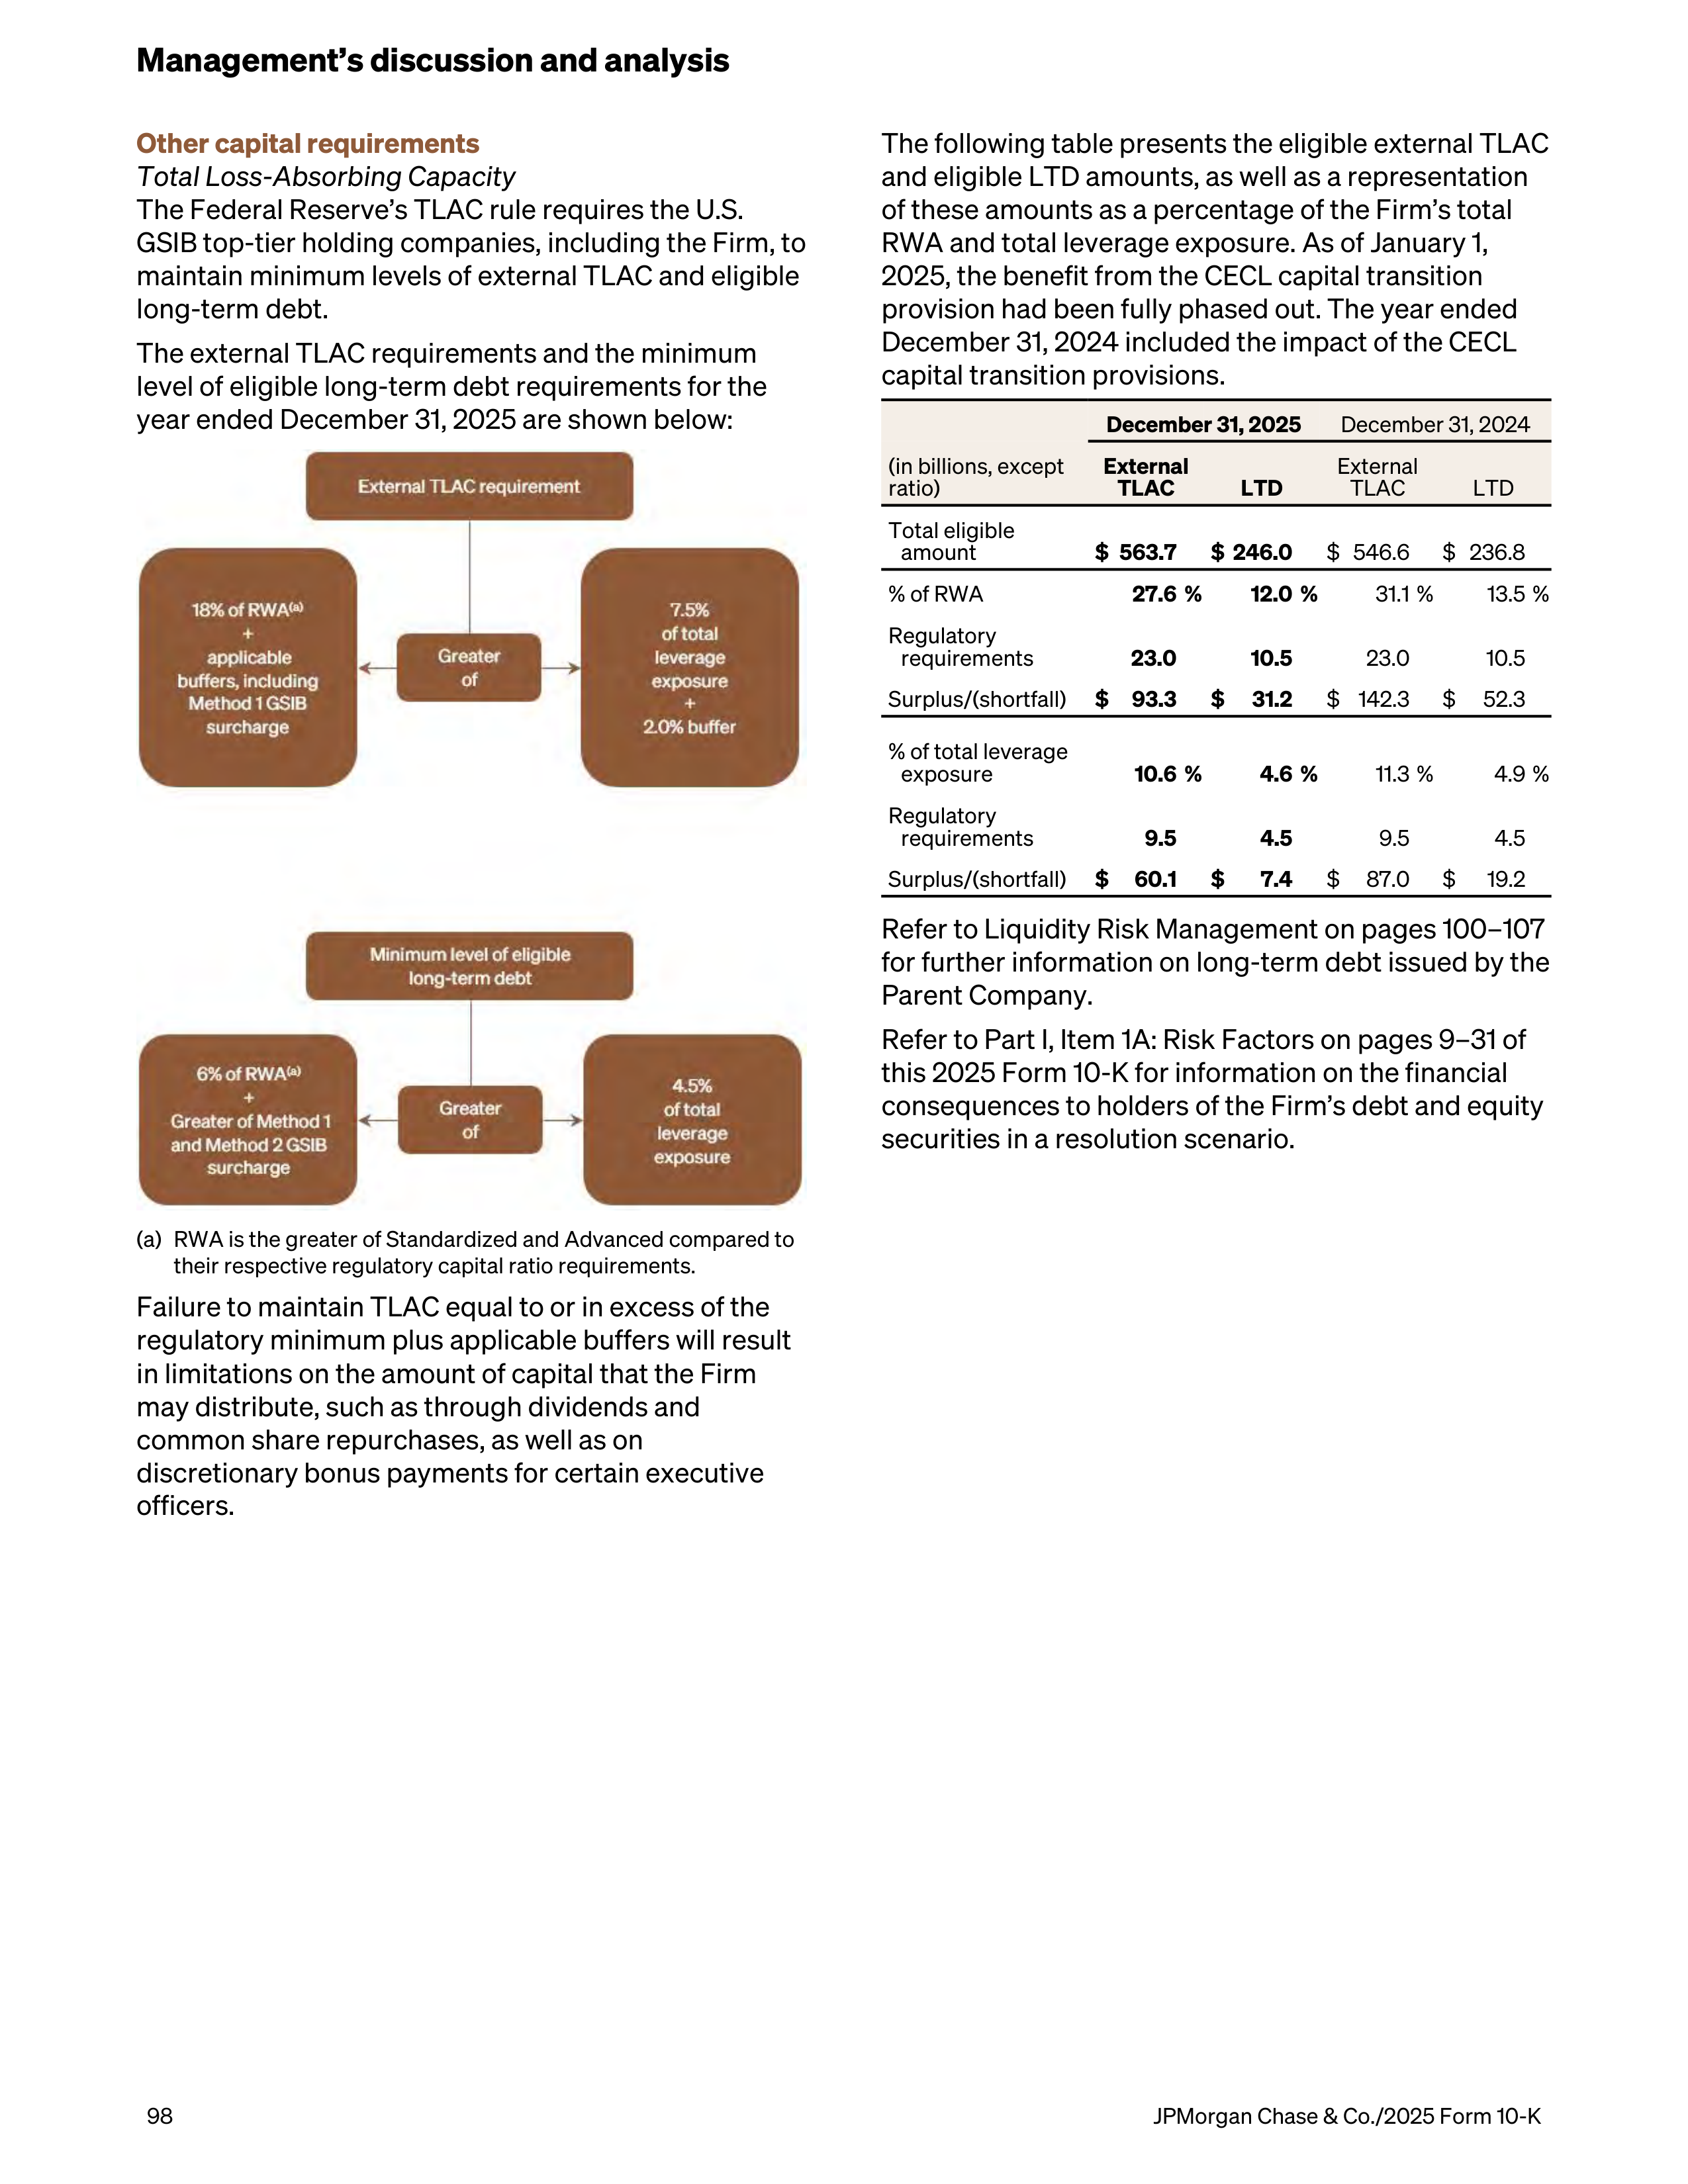
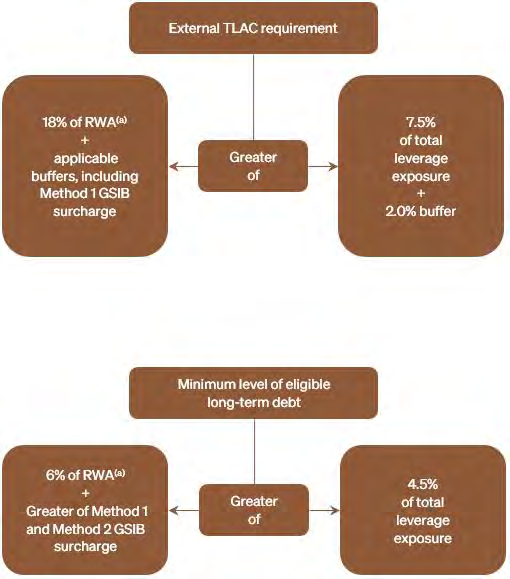
Other capital requirements
Total Loss-Absorbing Capacity
The Federal Reserve’s TLAC rule requires the U.S.
GSIB top-tier holding companies, including the Firm, to
maintain minimum levels of external TLAC and eligible
long-term debt.
The external TLAC requirements and the minimum
level of eligible long-term debt requirements for the
year ended December 31, 2025 are shown below:
(a)
RWA is the greater of Standardized and Advanced compared to
their respective regulatory capital ratio requirements.
Failure to maintain TLAC equal to or in excess of the
regulatory minimum plus applicable buffers will result
in limitations on the amount of capital that the Firm
may distribute, such as through dividends and
common share repurchases, as well as on
discretionary bonus payments for certain executive
officers.
The following table presents the eligible external TLAC
and eligible LTD amounts, as well as a representation
of these amounts as a percentage of the Firm’s total
RWA and total leverage exposure. As of January 1,
2025, the benefit from the CECL capital transition
provision had been fully phased out. The year ended
December 31, 2024 included the impact of the CECL
capital transition provisions.
December 31, 2025
December 31, 2024
(in billions, except
ratio)
External
TLAC
LTD
External
TLAC
LTD
Total eligible
amount
$ 563.7
$ 246.0
$ 546.6
$ 236.8
% of RWA
27.6 %
12.0 %
31.1 %
13.5 %
Regulatory
requirements
23.0
10.5
23.0
10.5
Surplus/(shortfall)
$
93.3
$
31.2
$ 142.3
$
52.3
% of total leverage
exposure
10.6 %
4.6 %
11.3 %
4.9 %
Regulatory
requirements
9.5
4.5
9.5
4.5
Surplus/(shortfall)
$
60.1
$
7.4
$
87.0
$
19.2
Refer to Liquidity Risk Management on pages 100–107
for further information on long-term debt issued by the
Parent Company.
Refer to Part I, Item 1A: Risk Factors on pages 9–31 of
this 2025 Form 10-K for information on the financial
consequences to holders of the Firm’s debt and equity
securities in a resolution scenario.
Management’s discussion and analysis
98
JPMorgan Chase & Co./2025 Form 10-K
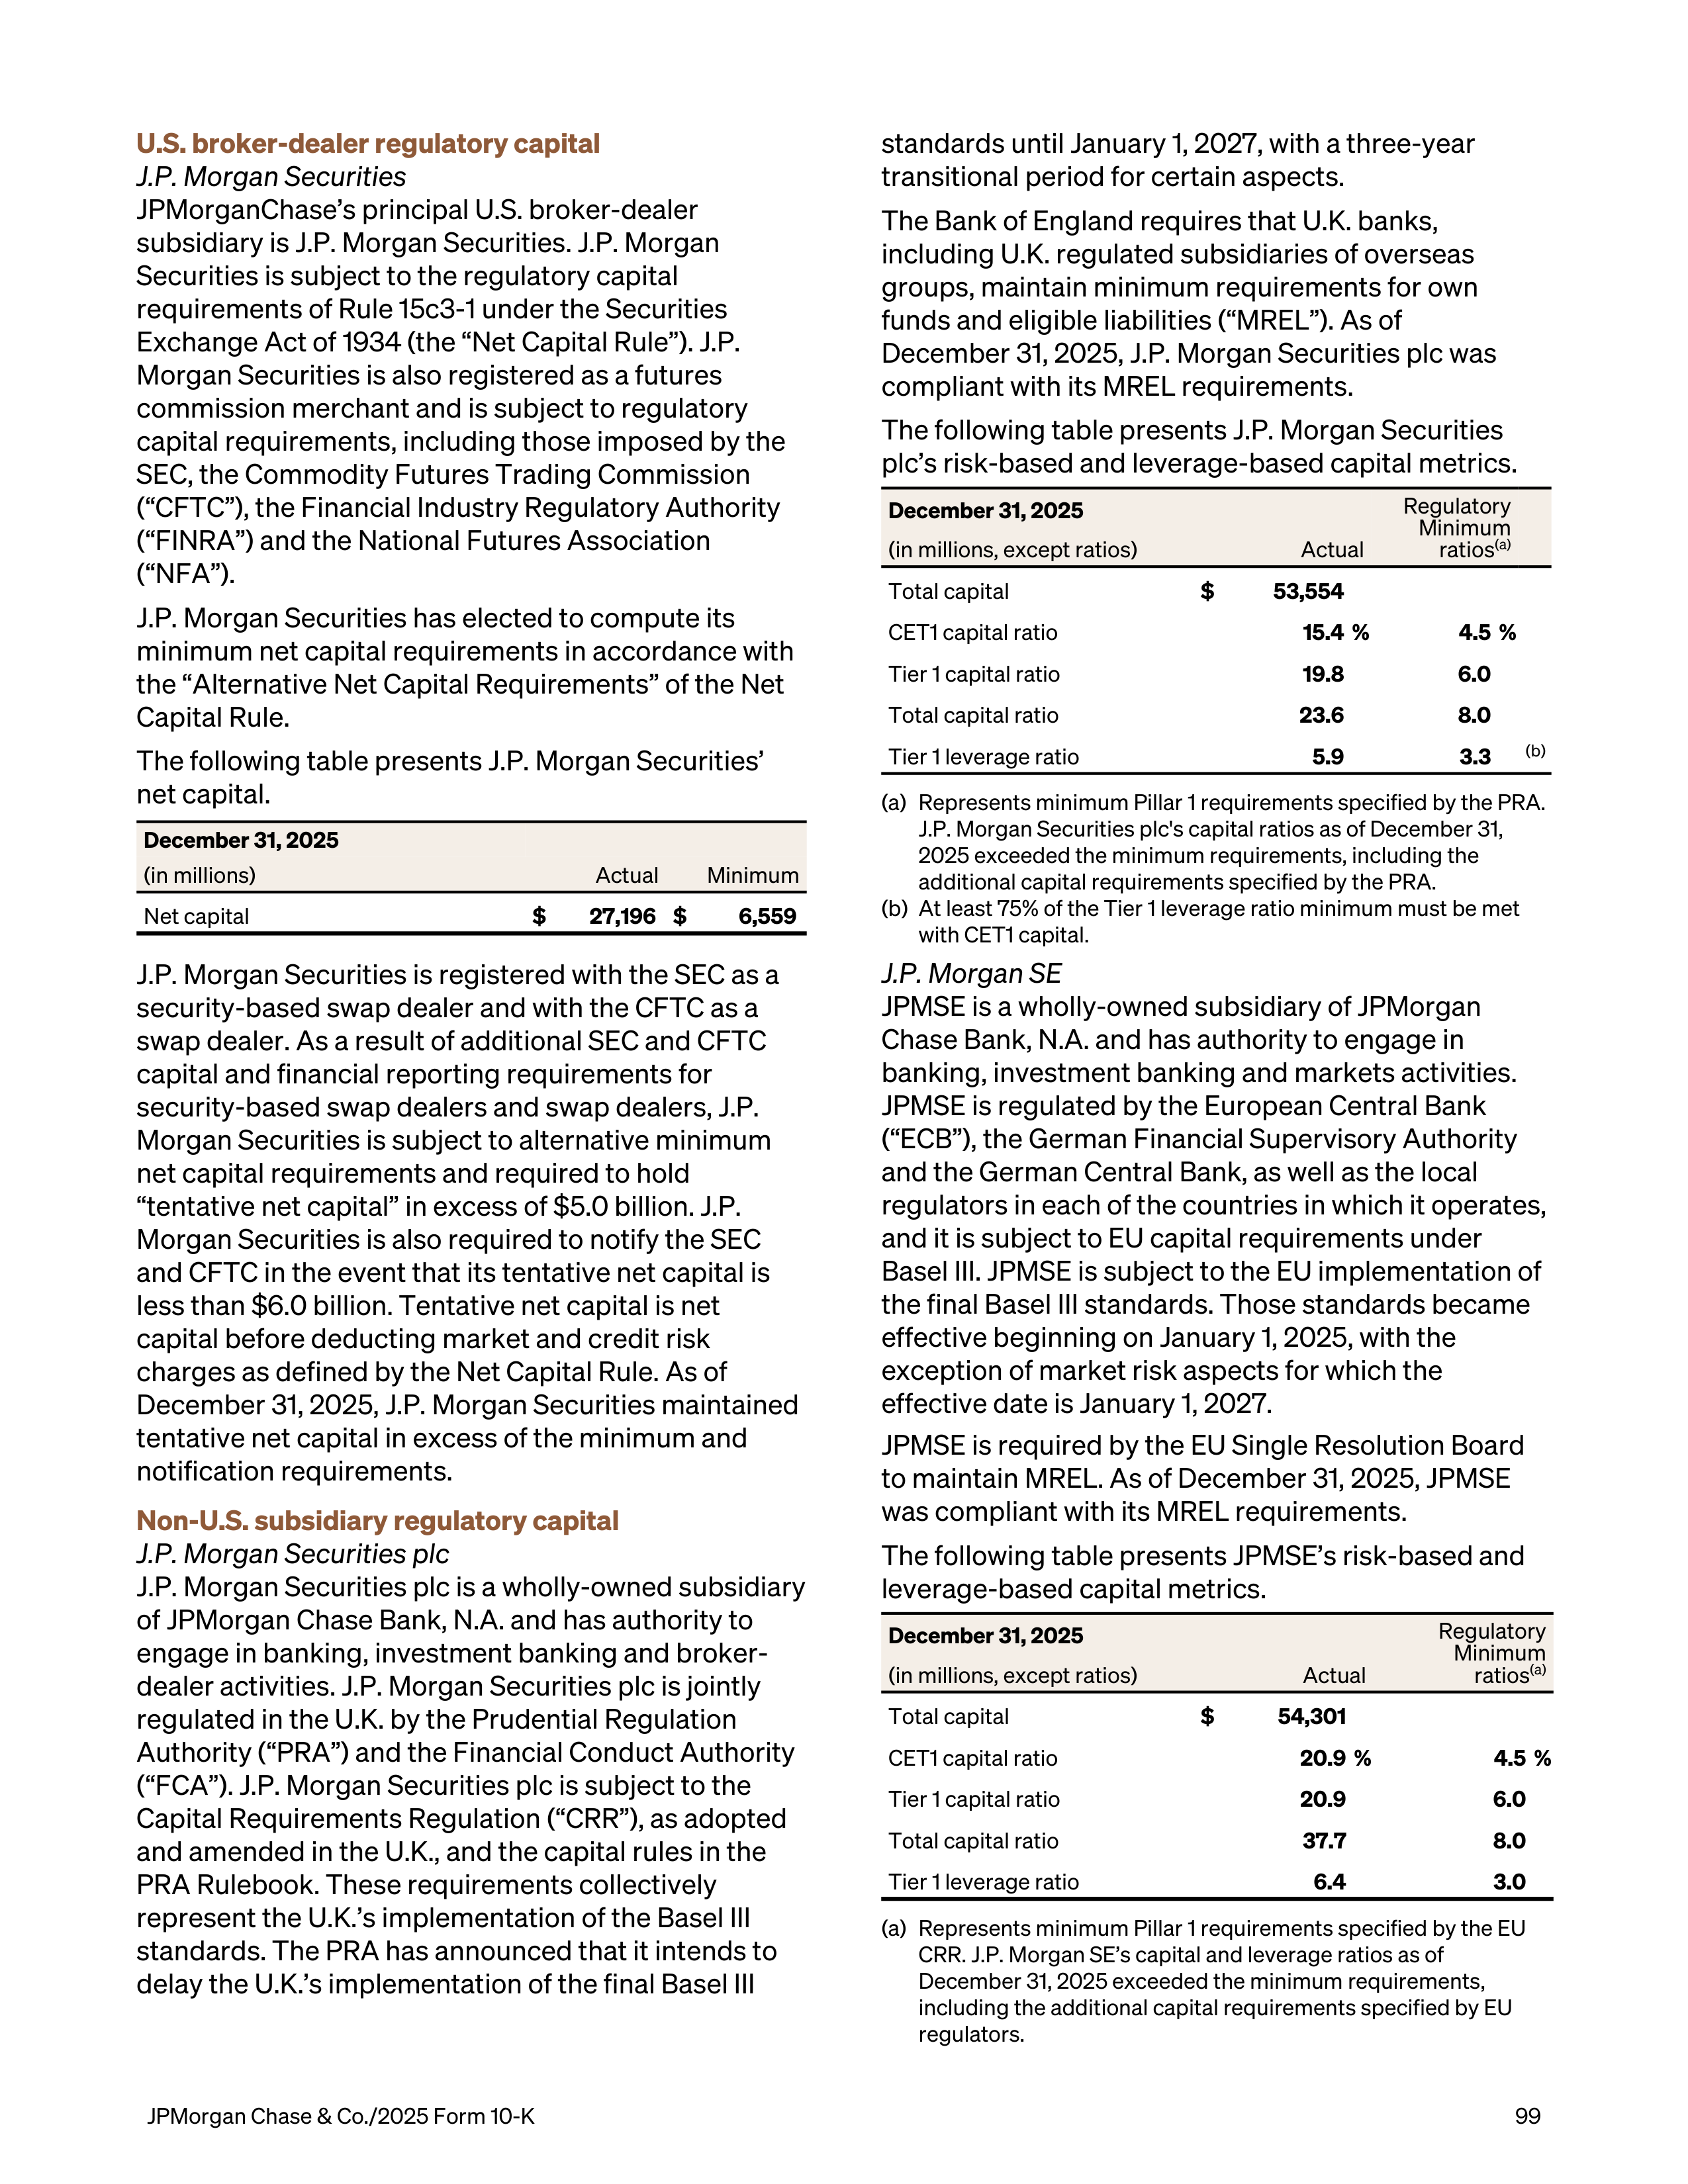
U.S. broker-dealer regulatory capital
J.P. Morgan Securities
JPMorganChase’s principal U.S. broker-dealer
subsidiary is J.P. Morgan Securities. J.P. Morgan
Securities is subject to the regulatory capital
requirements of Rule 15c3-1 under the Securities
Exchange Act of 1934 (the “Net Capital Rule”). J.P.
Morgan Securities is also registered as a futures
commission merchant and is subject to regulatory
capital requirements, including those imposed by the
SEC, the Commodity Futures Trading Commission
(“CFTC”), the Financial Industry Regulatory Authority
(“FINRA”) and the National Futures Association
(“NFA”).
J.P. Morgan Securities has elected to compute its
minimum net capital requirements in accordance with
the “Alternative Net Capital Requirements” of the Net
Capital Rule.
The following table presents J.P. Morgan Securities’
net capital.
December 31, 2025
(in millions)
Actual
Minimum
Net capital
$
27,196 $
6,559
J.P. Morgan Securities is registered with the SEC as a
security-based swap dealer and with the CFTC as a
swap dealer. As a result of additional SEC and CFTC
capital and financial reporting requirements for
security-based swap dealers and swap dealers, J.P.
Morgan Securities is subject to alternative minimum
net capital requirements and required to hold
“tentative net capital” in excess of $5.0 billion. J.P.
Morgan Securities is also required to notify the SEC
and CFTC in the event that its tentative net capital is
less than $6.0 billion. Tentative net capital is net
capital before deducting market and credit risk
charges as defined by the Net Capital Rule. As of
December 31, 2025, J.P. Morgan Securities maintained
tentative net capital in excess of the minimum and
notification requirements.
Non-U.S. subsidiary regulatory capital
J.P. Morgan Securities plc
J.P. Morgan Securities plc is a wholly-owned subsidiary
of JPMorgan Chase Bank, N.A. and has authority to
engage in banking, investment banking and broker-
dealer activities. J.P. Morgan Securities plc is jointly
regulated in the U.K. by the Prudential Regulation
Authority (“PRA”) and the Financial Conduct Authority
(“FCA”). J.P. Morgan Securities plc is subject to the
Capital Requirements Regulation (“CRR”), as adopted
and amended in the U.K., and the capital rules in the
PRA Rulebook. These requirements collectively
represent the U.K.’s implementation of the Basel III
standards. The PRA has announced that it intends to
delay the U.K.’s implementation of the final Basel III
standards until January 1, 2027, with a three-year
transitional period for certain aspects.
The Bank of England requires that U.K. banks,
including U.K. regulated subsidiaries of overseas
groups, maintain minimum requirements for own
funds and eligible liabilities (“MREL”). As of
December 31, 2025, J.P. Morgan Securities plc was
compliant with its MREL requirements.
The following table presents J.P. Morgan Securities
plc’s risk-based and leverage-based capital metrics.
December 31, 2025
Regulatory
Minimum
ratios
(a)
(in millions, except ratios)
Actual
Total capital
$
53,554
CET1 capital ratio
15.4 %
4.5 %
Tier 1 capital ratio
19.8
6.0
Total capital ratio
23.6
8.0
Tier 1 leverage ratio
5.9
3.3
(b)
(a)
Represents minimum Pillar 1 requirements specified by the PRA.
J.P. Morgan Securities plc's capital ratios as of December 31,
2025 exceeded the minimum requirements, including the
additional capital requirements specified by the PRA.
(b)
At least 75% of the Tier 1 leverage ratio minimum must be met
with CET1 capital.
J.P. Morgan SE
JPMSE is a wholly-owned subsidiary of JPMorgan
Chase Bank, N.A. and has authority to engage in
banking, investment banking and markets activities.
JPMSE is regulated by the European Central Bank
(“ECB”), the German Financial Supervisory Authority
and the German Central Bank, as well as the local
regulators in each of the countries in which it operates,
and it is subject to EU capital requirements under
Basel III. JPMSE is subject to the EU implementation of
the final Basel III standards. Those standards became
effective beginning on January 1, 2025, with the
exception of market risk aspects for which the
effective date is January 1, 2027.
JPMSE is required by the EU Single Resolution Board
to maintain MREL. As of December 31, 2025, JPMSE
was compliant with its MREL requirements.
The following table presents JPMSE’s risk-based and
leverage-based capital metrics.
December 31, 2025
Regulatory
Minimum
ratios
(a)
(in millions, except ratios)
Actual
Total capital
$
54,301
CET1 capital ratio
20.9 %
4.5 %
Tier 1 capital ratio
20.9
6.0
Total capital ratio
37.7
8.0
Tier 1 leverage ratio
6.4
3.0
(a)
Represents minimum Pillar 1 requirements specified by the EU
CRR. J.P. Morgan SE’s capital and leverage ratios as of
December 31, 2025 exceeded the minimum requirements,
including the additional capital requirements specified by EU
regulators.
JPMorgan Chase & Co./2025 Form 10-K
99

LIQUIDITY RISK MANAGEMENT
Liquidity risk is the risk that the Firm will be unable to
meet its cash and collateral needs as they arise or that
it does not have the appropriate amount, composition
and tenor of funding and liquidity to support its assets
and liabilities.
Liquidity risk management
The Firm has a Liquidity Risk Management (“LRM”)
function whose primary objective is to provide
independent oversight of liquidity risk across the Firm.
Liquidity Risk Management’s responsibilities include:
•
Defining, monitoring and reporting liquidity risk
metrics;
•
Independently establishing and monitoring limits
and indicators, including liquidity risk appetite;
•
Developing a process to classify, monitor and report
limit breaches;
•
Performing an independent review of liquidity risk
management processes to evaluate their adequacy
and effectiveness;
•
Monitoring and reporting internal Firmwide and legal
entity liquidity stress tests, regulatory defined
metrics, as well as liquidity positions, balance sheet
variances and funding activities; and
•
Approving or escalating for review new or updated
liquidity stress assumptions.
Liquidity management
Treasury and CIO is responsible for liquidity
management.
The primary objectives of the Firm’s liquidity
management are to:
•
Ensure that the Firm’s core businesses and material
legal entities are able to operate in support of client
needs and meet contractual and contingent financial
obligations through normal economic cycles as well
as during stress events, and
•
Manage an optimal funding mix and availability of
liquidity sources.
The Firm addresses these objectives through:
•
Analyzing and understanding the liquidity
characteristics of the assets and liabilities of the
Firm, LOBs, legal entities, as well as currencies,
taking into account legal, regulatory, and operational
restrictions;
•
Developing and maintaining internal liquidity stress
testing assumptions;
•
Defining and monitoring Firmwide and legal entity-
specific liquidity strategies, policies, reporting and
contingency funding plans;
•
Managing liquidity within the Firm’s approved limits
and indicators, including liquidity risk appetite
tolerances;
•
Managing compliance with regulatory requirements
related to funding and liquidity risk; and
•
Setting FTP in accordance with underlying liquidity
characteristics of balance sheet assets and liabilities
as well as certain off-balance sheet items.
As part of the Firm’s overall liquidity management
strategy, the Firm manages liquidity and funding using
a centralized, global approach designed to:
•
Optimize liquidity sources and uses;
•
Monitor exposures;
•
Identify constraints on the transfer of liquidity
between the Firm’s legal entities; and
•
Maintain the appropriate amount of surplus liquidity
at a Firmwide and legal entity level, where relevant.
Governance
Committees responsible for liquidity governance
include the Firmwide ALCO, as well as regional ALCOs,
the Treasurer Committee, and the CTC Risk
Committee. In addition, the Board Risk Committee
reviews and recommends to the Board of Directors, for
approval, the Firm’s liquidity risk tolerances, liquidity
strategy, and liquidity policy. Refer to Firmwide Risk
Management on pages 83–87 for further discussion of
ALCO and other risk-related committees.
Internal stress testing
The Firm conducts internal liquidity stress testing to
identify liquidity risks and monitor liquidity positions at
the Firm and its material legal entities under a variety
of adverse scenarios, including scenarios analyzed as
part of the Firm’s resolution and recovery planning.
Internal stress tests are produced on a daily basis, and
other stress tests are performed in response to
specific market events or concerns. Liquidity stress
tests assume all of the Firm’s contractual financial
obligations are met and take into consideration:
•
Varying levels of access to unsecured and secured
funding markets;
•
Estimated non-contractual and contingent cash
outflows;
•
Credit rating downgrades;
•
Collateral haircuts; and
•
Potential impediments to the availability and
transferability of liquidity between jurisdictions and
material legal entities such as regulatory, legal or
other restrictions.
Liquidity outflows are modeled across a range of time
horizons and currency dimensions and contemplate
both market and idiosyncratic stresses.
Results of stress tests are considered in the
formulation of the Firm’s funding plan and assessment
of its liquidity position. The Parent Company acts as a
source of funding for the Firm through equity and
Management’s discussion and analysis
100
JPMorgan Chase & Co./2025 Form 10-K
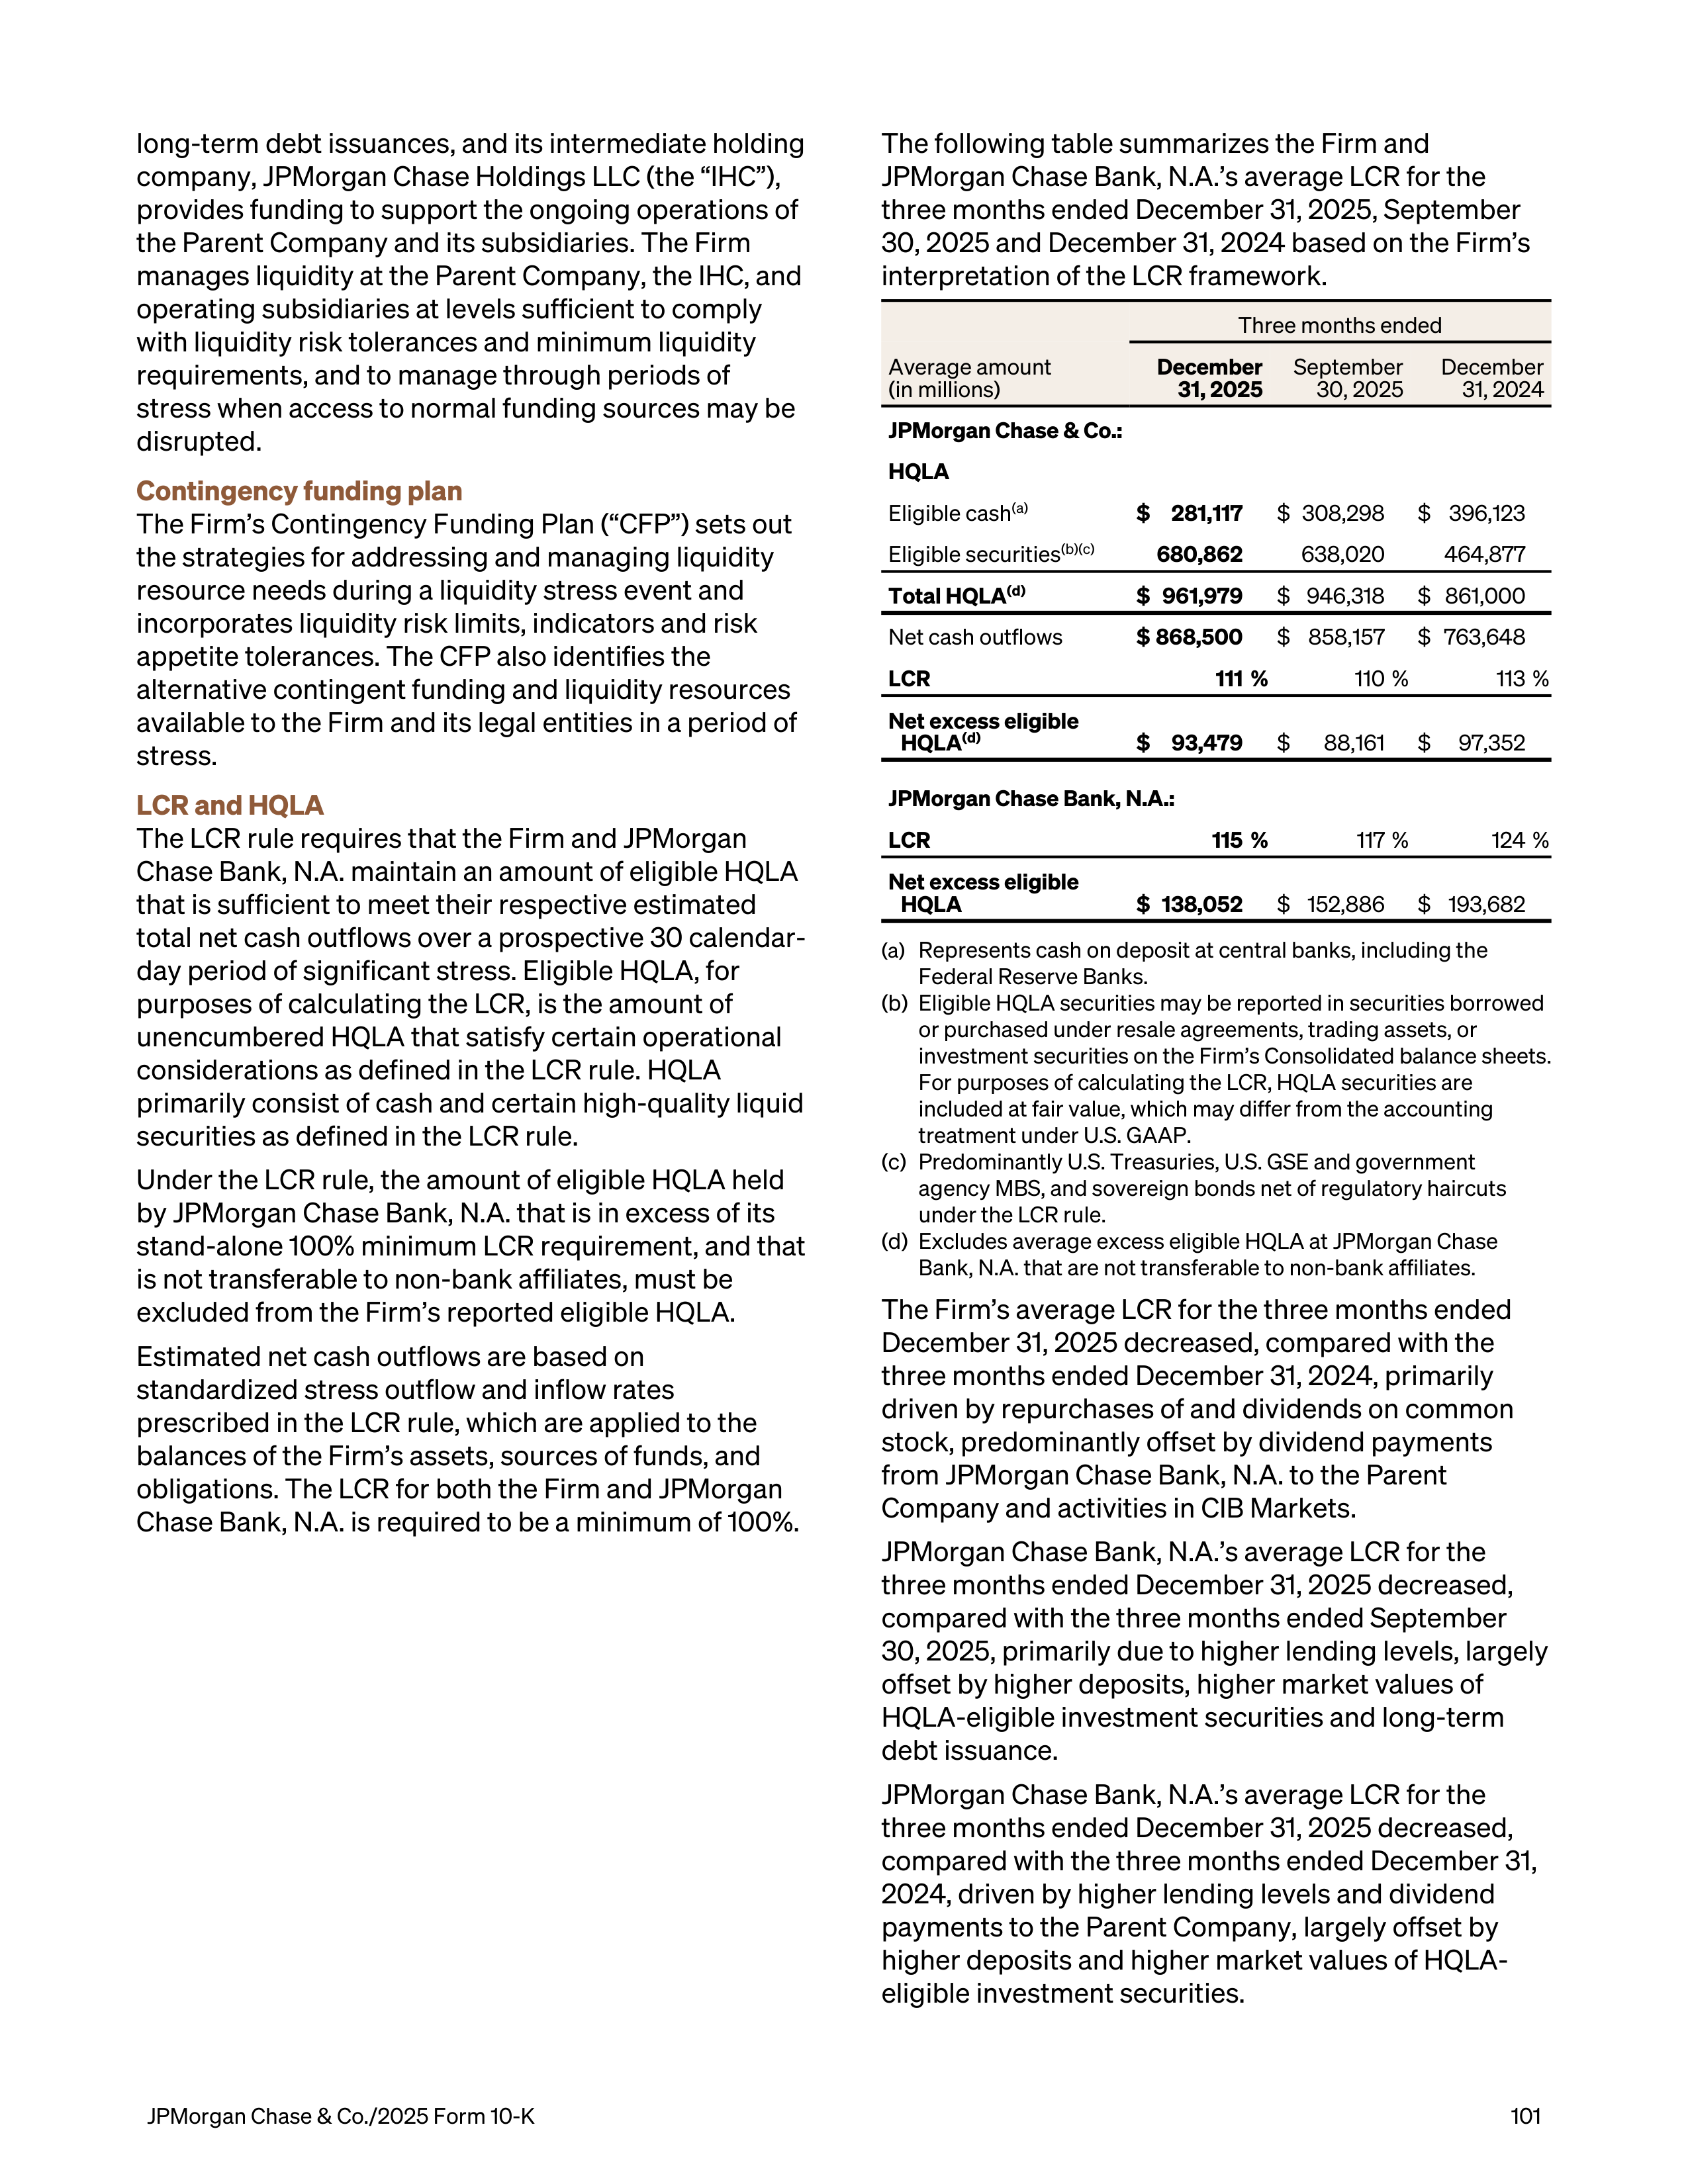
long-term debt issuances, and its intermediate holding
company, JPMorgan Chase Holdings LLC (the “IHC”),
provides funding to support the ongoing operations of
the Parent Company and its subsidiaries. The Firm
manages liquidity at the Parent Company, the IHC, and
operating subsidiaries at levels sufficient to comply
with liquidity risk tolerances and minimum liquidity
requirements, and to manage through periods of
stress when access to normal funding sources may be
disrupted.
Contingency funding plan
The Firm’s Contingency Funding Plan (“CFP”) sets out
the strategies for addressing and managing liquidity
resource needs during a liquidity stress event and
incorporates liquidity risk limits, indicators and risk
appetite tolerances. The CFP also identifies the
alternative contingent funding and liquidity resources
available to the Firm and its legal entities in a period of
stress.
LCR and HQLA
The LCR rule requires that the Firm and JPMorgan
Chase Bank, N.A. maintain an amount of eligible HQLA
that is sufficient to meet their respective estimated
total net cash outflows over a prospective 30 calendar-
day period of significant stress. Eligible HQLA, for
purposes of calculating the LCR, is the amount of
unencumbered HQLA that satisfy certain operational
considerations as defined in the LCR rule. HQLA
primarily consist of cash and certain high-quality liquid
securities as defined in the LCR rule.
Under the LCR rule, the amount of eligible HQLA held
by JPMorgan Chase Bank, N.A. that is in excess of its
stand-alone 100% minimum LCR requirement, and that
is not transferable to non-bank affiliates, must be
excluded from the Firm’s reported eligible HQLA.
Estimated net cash outflows are based on
standardized stress outflow and inflow rates
prescribed in the LCR rule, which are applied to the
balances of the Firm’s assets, sources of funds, and
obligations. The LCR for both the Firm and JPMorgan
Chase Bank, N.A. is required to be a minimum of 100%.
The following table summarizes the Firm and
JPMorgan Chase Bank, N.A.’s average LCR for the
three months ended December 31, 2025, September
30, 2025 and December 31, 2024 based on the Firm’s
interpretation of the LCR framework.
Three months ended
Average amount
(in millions)
December
31, 2025
September
30, 2025
December
31, 2024
JPMorgan Chase & Co.:
HQLA
Eligible cash
(a)
$ 281,117
$ 308,298
$ 396,123
Eligible securities
(b)(c)
680,862
638,020
464,877
Total HQLA
(d)
$ 961,979
$ 946,318
$ 861,000
Net cash outflows
$ 868,500
$ 858,157
$ 763,648
LCR
111 %
110 %
113 %
Net excess eligible
HQLA
(d)
$ 93,479
$
88,161
$
97,352
JPMorgan Chase Bank, N.A.:
LCR
115 %
117 %
124 %
Net excess eligible
HQLA
$ 138,052
$ 152,886
$ 193,682
(a)
Represents cash on deposit at central banks, including the
Federal Reserve Banks.
(b)
Eligible HQLA securities may be reported in securities borrowed
or purchased under resale agreements, trading assets, or
investment securities on the Firm’s Consolidated balance sheets.
For purposes of calculating the LCR, HQLA securities are
included at fair value, which may differ from the accounting
treatment under U.S. GAAP.
(c)
Predominantly U.S. Treasuries, U.S. GSE and government
agency MBS, and sovereign bonds net of regulatory haircuts
under the LCR rule.
(d)
Excludes average excess eligible HQLA at JPMorgan Chase
Bank, N.A. that are not transferable to non-bank affiliates.
The Firm’s average LCR for the three months ended
December 31, 2025 decreased, compared with the
three months ended December 31, 2024, primarily
driven by repurchases of and dividends on common
stock, predominantly offset by dividend payments
from JPMorgan Chase Bank, N.A. to the Parent
Company and activities in CIB Markets.
JPMorgan Chase Bank, N.A.’s average LCR for the
three months ended December 31, 2025 decreased,
compared with the three months ended September
30, 2025, primarily due to higher lending levels, largely
offset by higher deposits, higher market values of
HQLA-eligible investment securities and long-term
debt issuance.
JPMorgan Chase Bank, N.A.’s average LCR for the
three months ended December 31, 2025 decreased,
compared with the three months ended December 31,
2024, driven by higher lending levels and dividend
payments to the Parent Company, largely offset by
higher deposits and higher market values of HQLA-
eligible investment securities.
JPMorgan Chase & Co./2025 Form 10-K
101
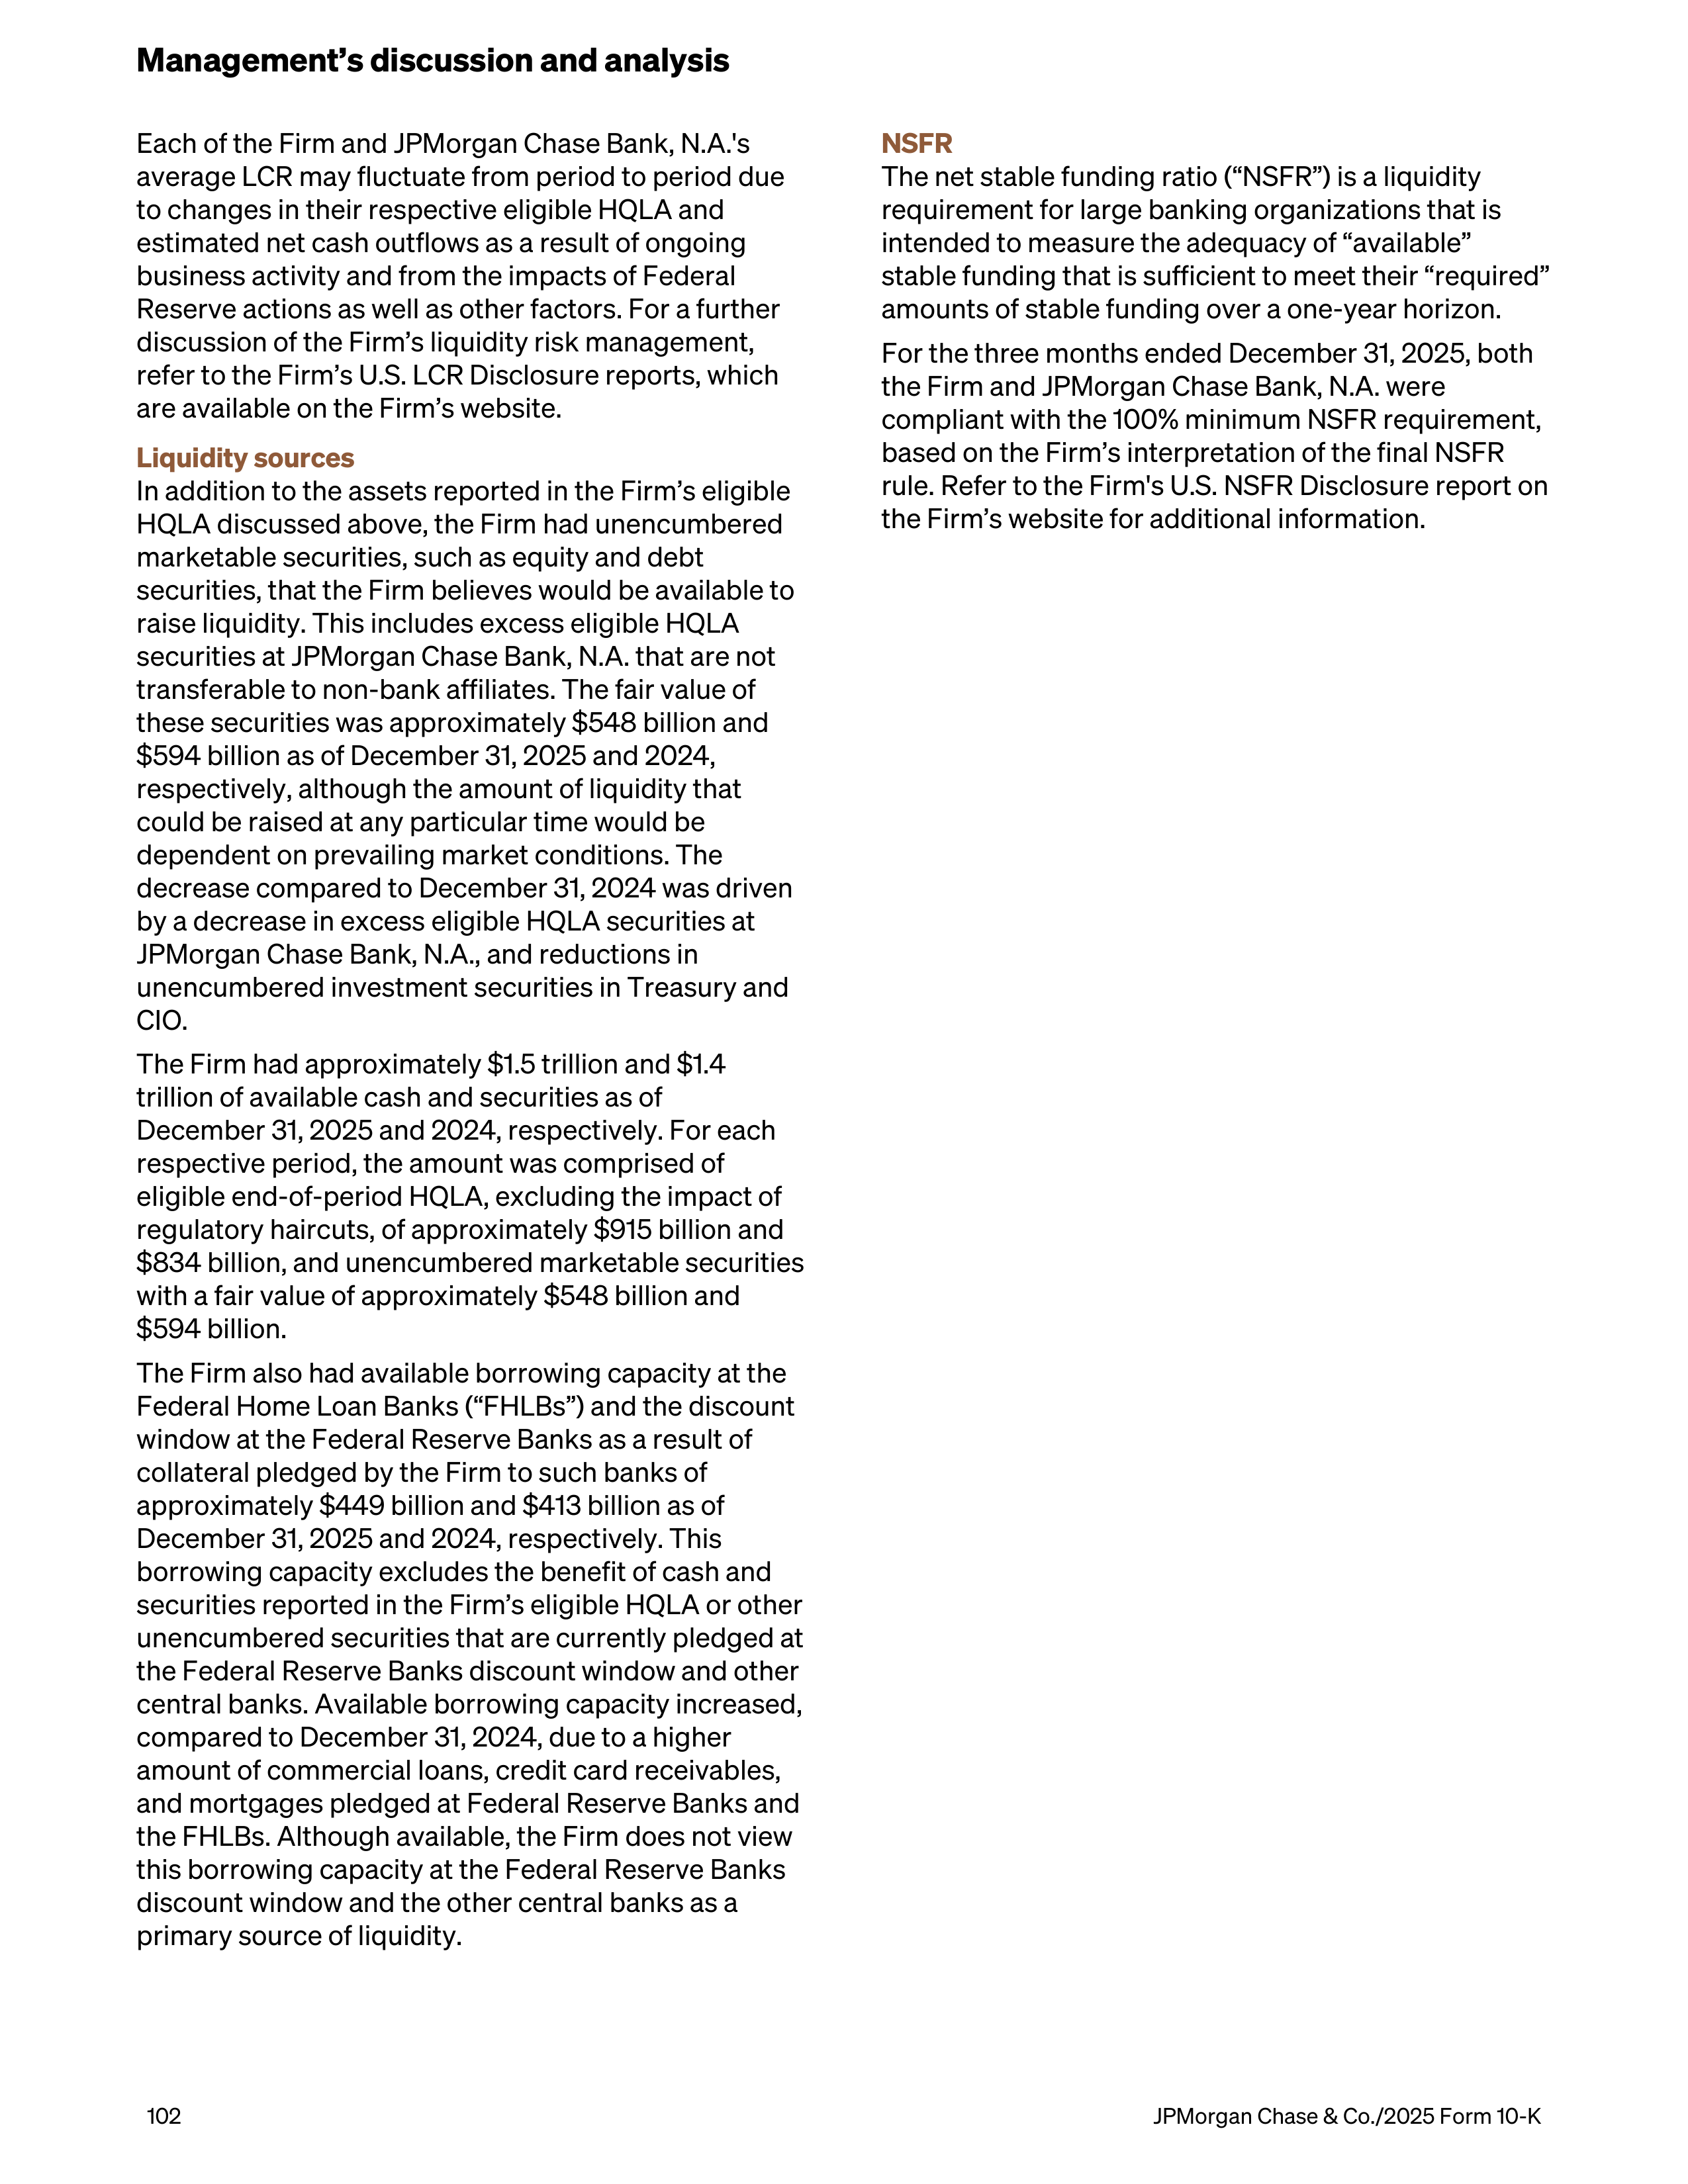
Each of the Firm and JPMorgan Chase Bank, N.A.'s
average LCR may fluctuate from period to period due
to changes in their respective eligible HQLA and
estimated net cash outflows as a result of ongoing
business activity and from the impacts of Federal
Reserve actions as well as other factors. For a further
discussion of the Firm’s liquidity risk management,
refer to the Firm’s U.S. LCR Disclosure reports, which
are available on the Firm’s website.
Liquidity sources
In addition to the assets reported in the Firm’s eligible
HQLA discussed above, the Firm had unencumbered
marketable securities, such as equity and debt
securities, that the Firm believes would be available to
raise liquidity. This includes excess eligible HQLA
securities at JPMorgan Chase Bank, N.A. that are not
transferable to non-bank affiliates. The fair value of
these securities was approximately $548 billion and
$594 billion as of December 31, 2025 and 2024,
respectively, although the amount of liquidity that
could be raised at any particular time would be
dependent on prevailing market conditions. The
decrease compared to December 31, 2024 was driven
by a decrease in excess eligible HQLA securities at
JPMorgan Chase Bank, N.A., and reductions in
unencumbered investment securities in Treasury and
CIO.
The Firm had approximately $1.5 trillion and $1.4
trillion of available cash and securities as of
December 31, 2025 and 2024, respectively. For each
respective period, the amount was comprised of
eligible end-of-period HQLA, excluding the impact of
regulatory haircuts, of approximately $915 billion and
$834 billion, and unencumbered marketable securities
with a fair value of approximately $548 billion and
$594 billion.
The Firm also had available borrowing capacity at the
Federal Home Loan Banks (“FHLBs”) and the discount
window at the Federal Reserve Banks as a result of
collateral pledged by the Firm to such banks of
approximately $449 billion and $413 billion as of
December 31, 2025 and 2024, respectively. This
borrowing capacity excludes the benefit of cash and
securities reported in the Firm’s eligible HQLA or other
unencumbered securities that are currently pledged at
the Federal Reserve Banks discount window and other
central banks. Available borrowing capacity increased,
compared to December 31, 2024, due to a higher
amount of commercial loans, credit card receivables,
and mortgages pledged at Federal Reserve Banks and
the FHLBs. Although available, the Firm does not view
this borrowing capacity at the Federal Reserve Banks
discount window and the other central banks as a
primary source of liquidity.
NSFR
The net stable funding ratio (“NSFR”) is a liquidity
requirement for large banking organizations that is
intended to measure the adequacy of “available”
stable funding that is sufficient to meet their “required”
amounts of stable funding over a one-year horizon.
For the three months ended December 31, 2025, both
the Firm and JPMorgan Chase Bank, N.A. were
compliant with the 100% minimum NSFR requirement,
based on the Firm’s interpretation of the final NSFR
rule. Refer to the Firm's U.S. NSFR Disclosure report on
the Firm’s website for additional information.
Management’s discussion and analysis
102
JPMorgan Chase & Co./2025 Form 10-K
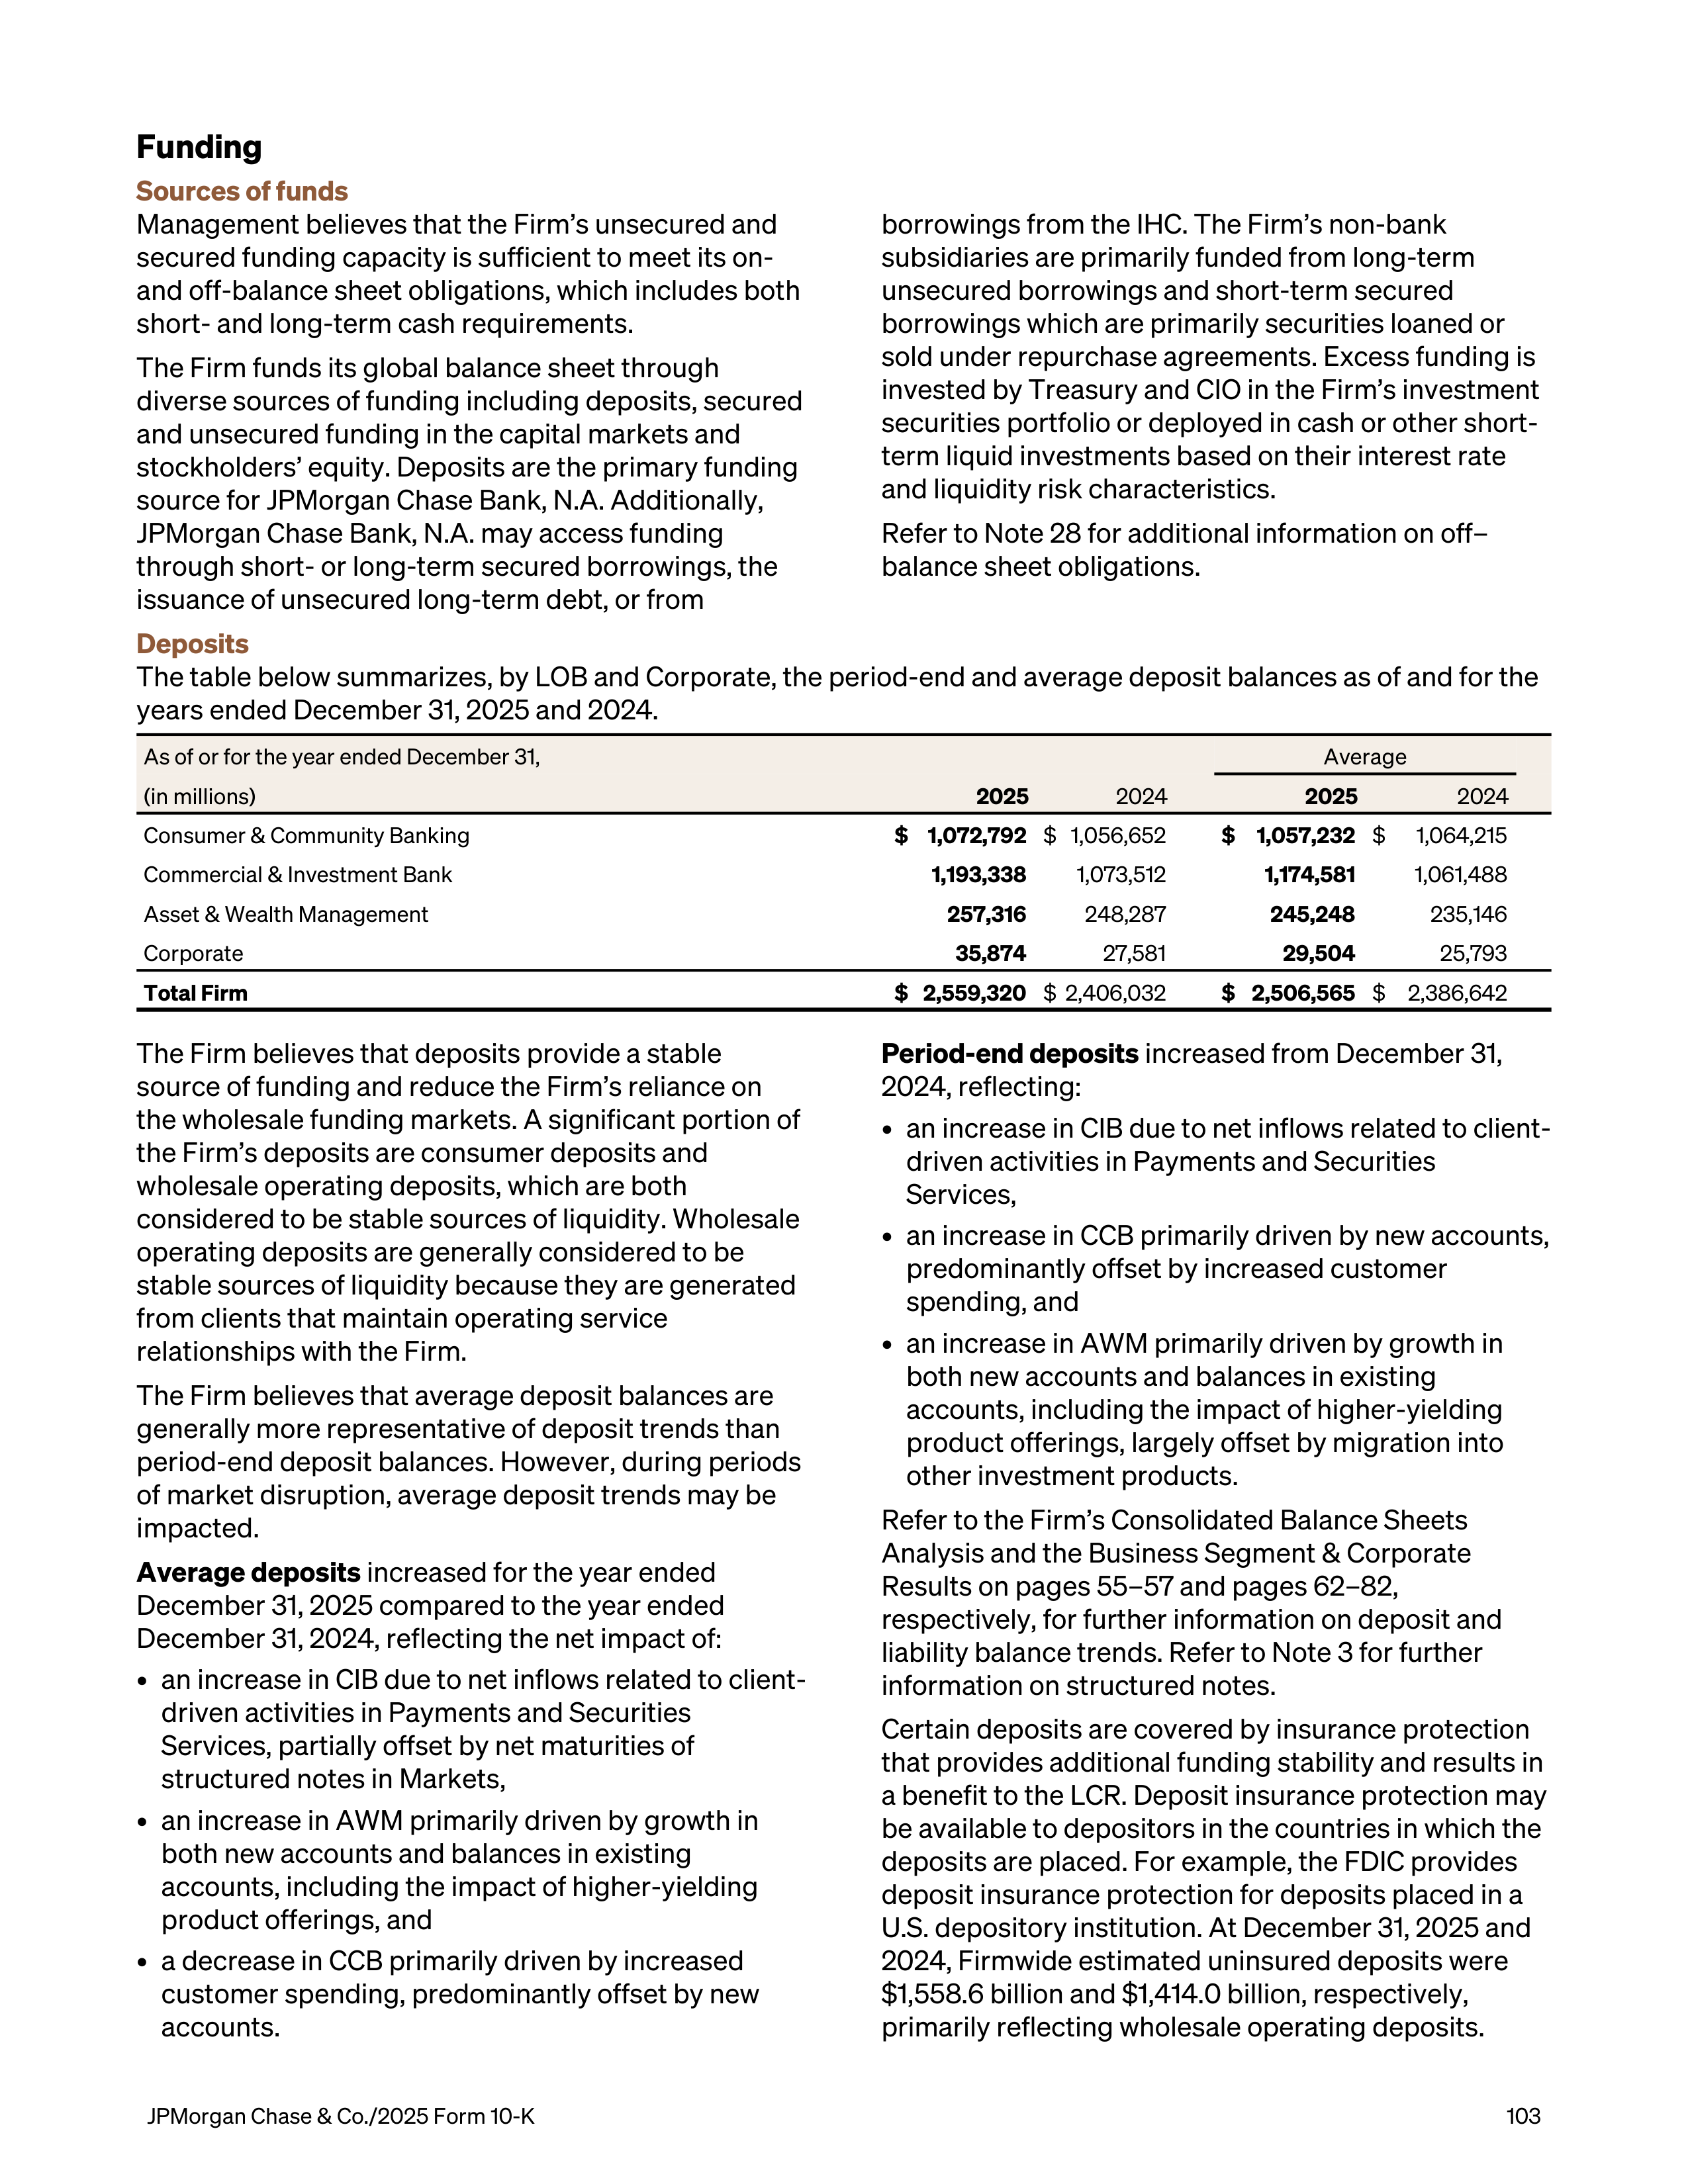
Funding
Sources of funds
Management believes that the Firm’s unsecured and
secured funding capacity is sufficient to meet its on-
and off-balance sheet obligations, which includes both
short- and long-term cash requirements.
The Firm funds its global balance sheet through
diverse sources of funding including deposits, secured
and unsecured funding in the capital markets and
stockholders’ equity. Deposits are the primary funding
source for JPMorgan Chase Bank, N.A. Additionally,
JPMorgan Chase Bank, N.A. may access funding
through short- or long-term secured borrowings, the
issuance of unsecured long-term debt, or from
borrowings from the IHC. The Firm’s non-bank
subsidiaries are primarily funded from long-term
unsecured borrowings and short-term secured
borrowings which are primarily securities loaned or
sold under repurchase agreements. Excess funding is
invested by Treasury and CIO in the Firm’s investment
securities portfolio or deployed in cash or other short-
term liquid investments based on their interest rate
and liquidity risk characteristics.
Refer to Note 28 for additional information on off–
balance sheet obligations.
Deposits
The table below summarizes, by LOB and Corporate, the period-end and average deposit balances as of and for the
years ended December 31, 2025 and 2024.
As of or for the year ended December 31,
Average
(in millions)
2025
2024
2025
2024
Consumer & Community Banking
$ 1,072,792
$ 1,056,652
$ 1,057,232
$
1,064,215
Commercial & Investment Bank
1,193,338
1,073,512
1,174,581
1,061,488
Asset & Wealth Management
257,316
248,287
245,248
235,146
Corporate
35,874
27,581
29,504
25,793
Total Firm
$ 2,559,320
$ 2,406,032
$ 2,506,565
$
2,386,642
The Firm believes that deposits provide a stable
source of funding and reduce the Firm’s reliance on
the wholesale funding markets. A significant portion of
the Firm’s deposits are consumer deposits and
wholesale operating deposits, which are both
considered to be stable sources of liquidity. Wholesale
operating deposits are generally considered to be
stable sources of liquidity because they are generated
from clients that maintain operating service
relationships with the Firm.
The Firm believes that average deposit balances are
generally more representative of deposit trends than
period-end deposit balances. However, during periods
of market disruption, average deposit trends may be
impacted.
Average deposits
increased
for the year ended
December 31, 2025 compared to the year ended
December 31, 2024, reflecting the net impact of:
•
an increase in CIB due to net inflows related to client-
driven activities in Payments
and Securities
Services, partially offset by net maturities of
structured notes in Markets,
•
an increase in AWM primarily driven by growth in
both new accounts and balances in existing
accounts, including the impact of higher-yielding
product offerings, and
•
a decrease in CCB primarily driven by increased
customer spending, predominantly offset by new
accounts.
Period-end deposits
increased from December 31,
2024, reflecting:
•
an increase in CIB due to net inflows related to client-
driven activities in Payments and Securities
Services,
•
an increase in CCB primarily driven by new accounts,
predominantly offset by increased customer
spending, and
•
an increase in AWM primarily driven by growth in
both new accounts and balances in existing
accounts, including the impact of higher-yielding
product offerings, largely offset by migration into
other investment products.
Refer to the Firm’s Consolidated Balance Sheets
Analysis and the Business Segment & Corporate
Results on pages 55–57 and pages 62–82,
respectively, for further information on deposit and
liability balance trends. Refer to Note 3 for further
information on structured notes.
Certain deposits are covered by insurance protection
that provides additional funding stability and results in
a benefit to the LCR. Deposit insurance protection may
be available to depositors in the countries in which the
deposits are placed. For example, the FDIC provides
deposit insurance protection for deposits placed in a
U.S. depository institution. At December 31, 2025 and
2024, Firmwide estimated uninsured deposits were
$1,558.6 billion and $1,414.0 billion, respectively,
primarily reflecting wholesale operating deposits.
JPMorgan Chase & Co./2025 Form 10-K
103
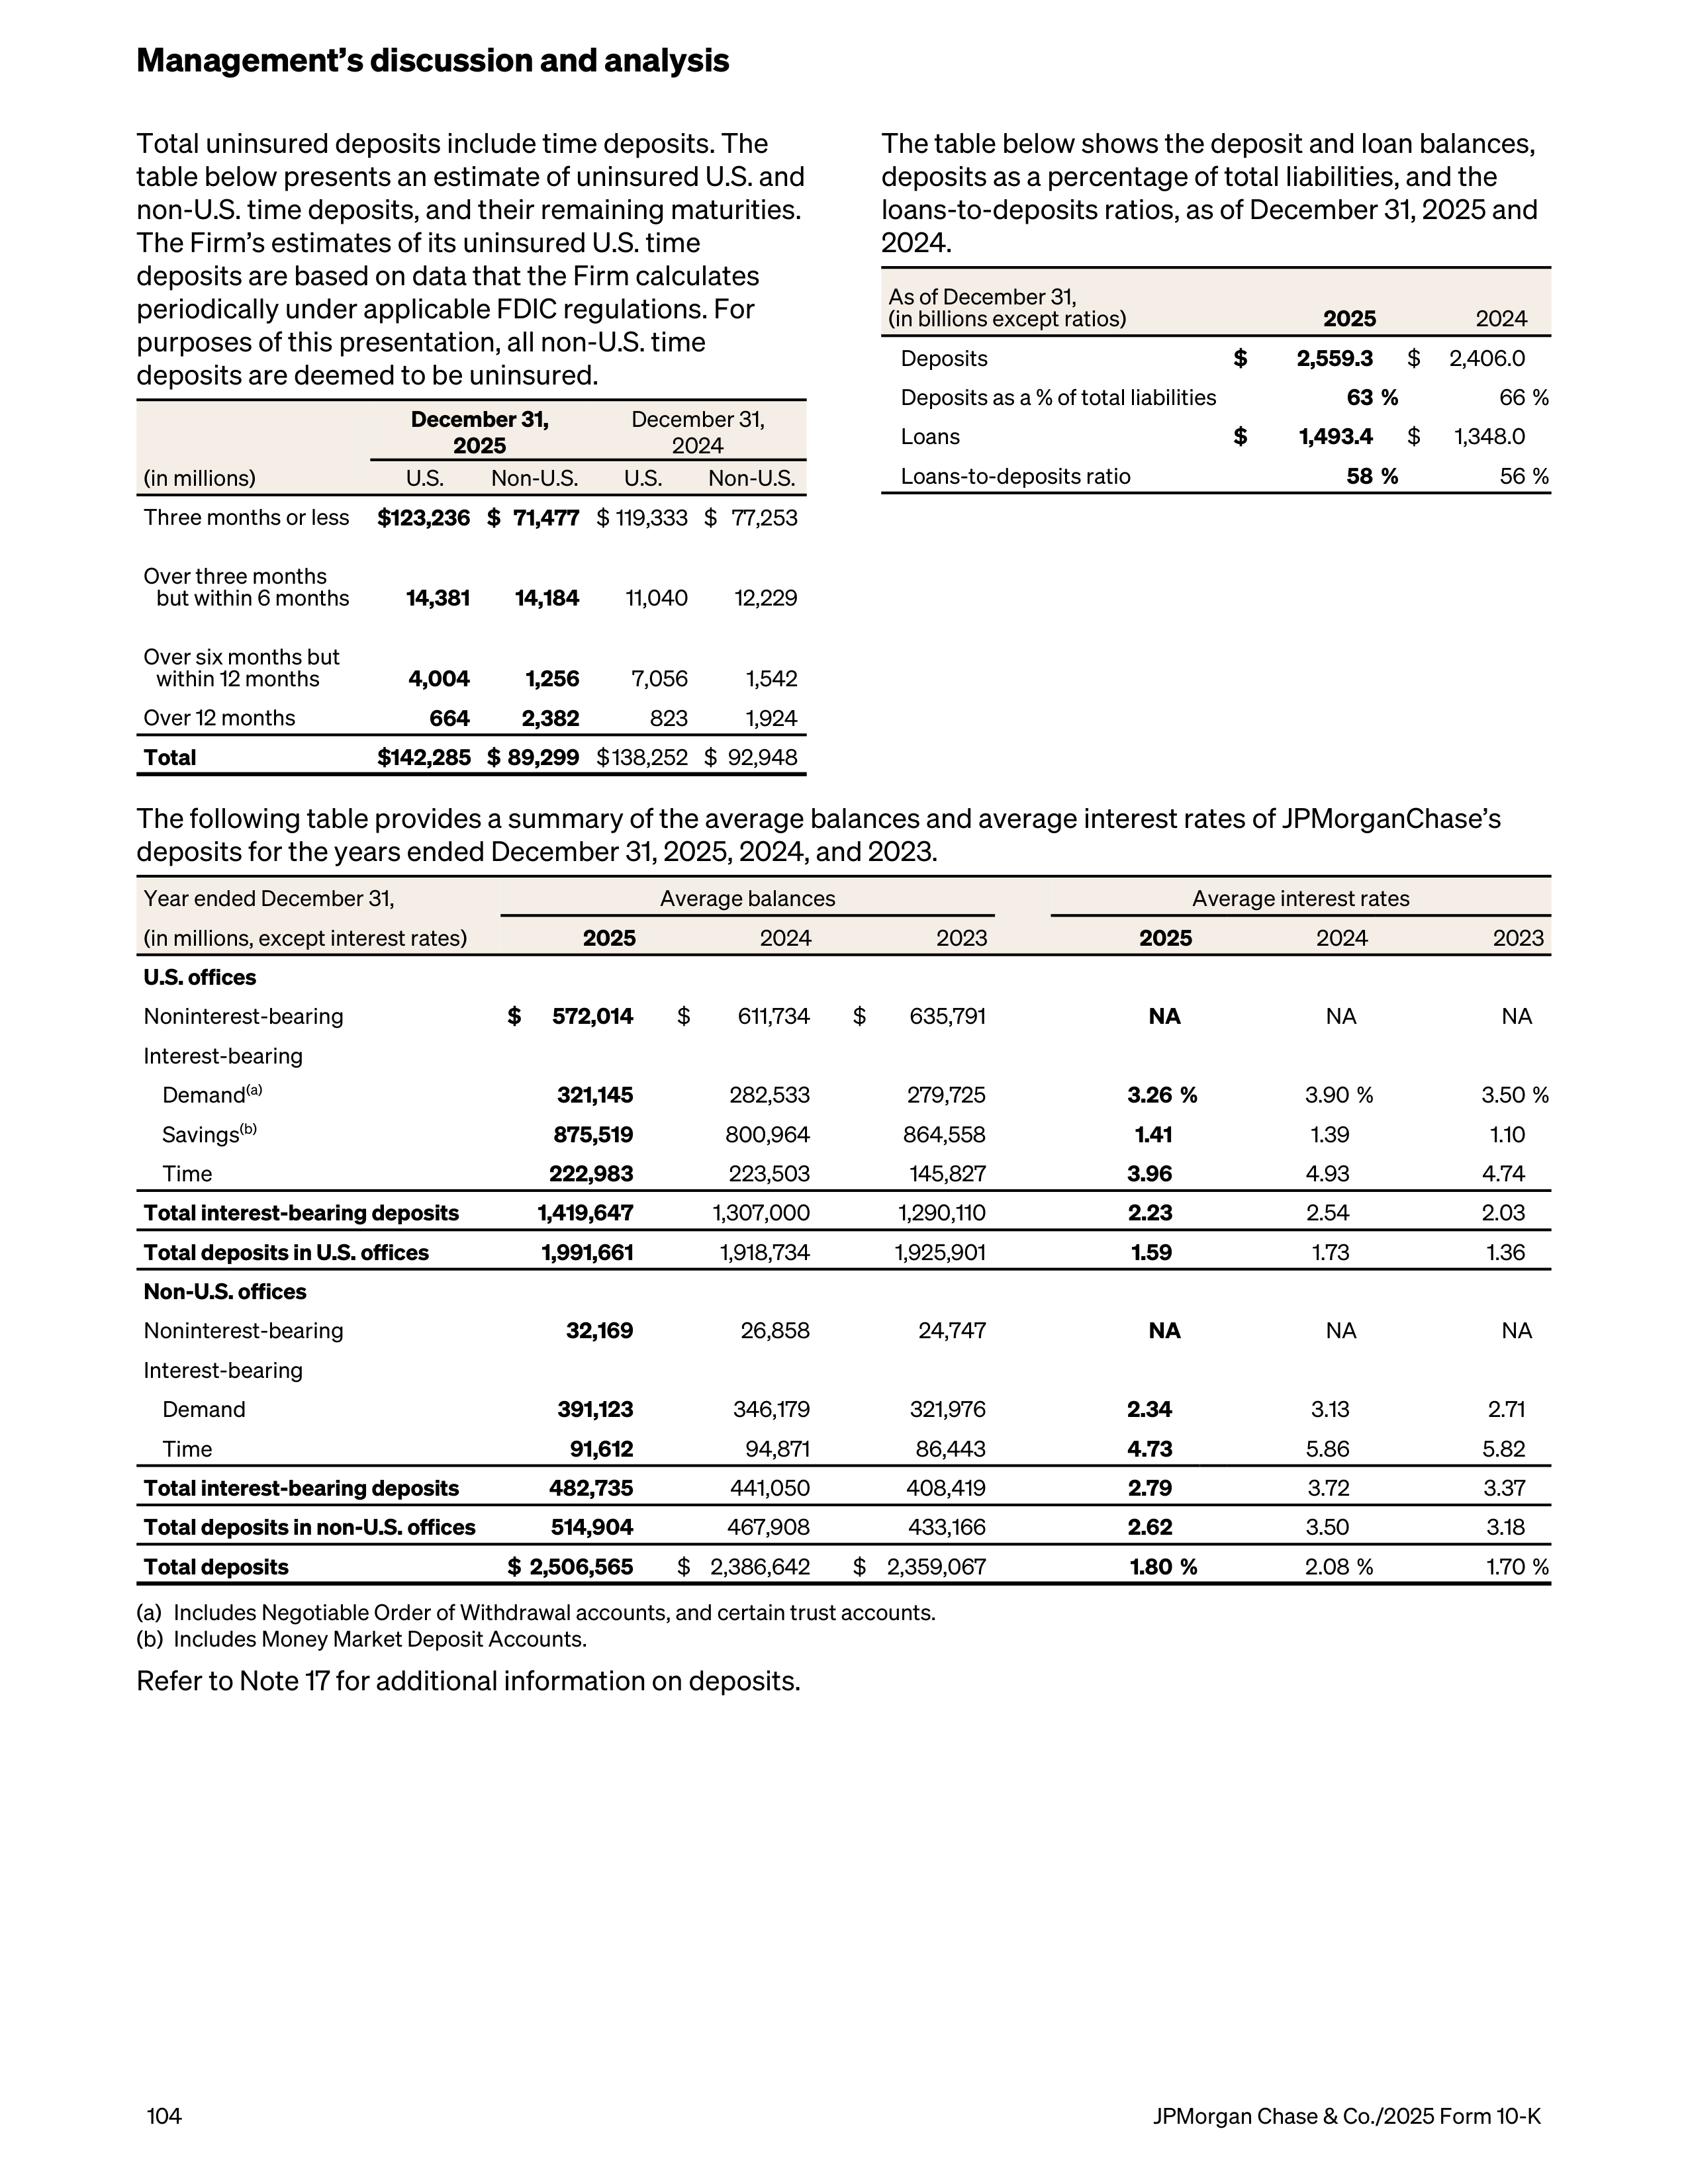
Total uninsured deposits include time deposits. The
table below presents an estimate of uninsured U.S. and
non-U.S. time deposits, and their remaining maturities.
The Firm’s estimates of its uninsured U.S. time
deposits are based on data that the Firm calculates
periodically under applicable FDIC regulations. For
purposes of this presentation, all non-U.S. time
deposits are deemed to be uninsured.
(in millions)
December 31,
2025
December 31,
2024
U.S.
Non-U.S.
U.S.
Non-U.S.
Three months or less
$ 123,236 $ 71,477
$ 119,333 $ 77,253
Over three months
but within 6 months
14,381
14,184
11,040
12,229
Over six months but
within 12 months
4,004
1,256
7,056
1,542
Over 12 months
664
2,382
823
1,924
Total
$ 142,285 $ 89,299
$ 138,252 $ 92,948
The table below shows the deposit and loan balances,
deposits as a percentage of total liabilities, and the
loans-to-deposits ratios, as of December 31, 2025 and
2024.
As of December 31,
(in billions except ratios)
2025
2024
Deposits
$
2,559.3
$
2,406.0
Deposits as a % of total liabilities
63 %
66 %
Loans
$
1,493.4
$
1,348.0
Loans-to-deposits ratio
58 %
56 %
The following table provides a summary of the average balances and average interest rates of JPMorganChase’s
deposits for the years ended December 31, 2025, 2024, and 2023.
Year ended December 31,
Average balances
Average interest rates
(in millions, except interest rates)
2025
2024
2023
2025
2024
2023
U.S. offices
Noninterest-bearing
$
572,014
$
611,734
$
635,791
NA
NA
NA
Interest-bearing
Demand
(a)
321,145
282,533
279,725
3.26 %
3.90 %
3.50 %
Savings
(b)
875,519
800,964
864,558
1.41
1.39
1.10
Time
222,983
223,503
145,827
3.96
4.93
4.74
Total interest-bearing deposits
1,419,647
1,307,000
1,290,110
2.23
2.54
2.03
Total deposits in U.S. offices
1,991,661
1,918,734
1,925,901
1.59
1.73
1.36
Non-U.S. offices
Noninterest-bearing
32,169
26,858
24,747
NA
NA
NA
Interest-bearing
Demand
391,123
346,179
321,976
2.34
3.13
2.71
Time
91,612
94,871
86,443
4.73
5.86
5.82
Total interest-bearing deposits
482,735
441,050
408,419
2.79
3.72
3.37
Total deposits in non-U.S. offices
514,904
467,908
433,166
2.62
3.50
3.18
Total deposits
$ 2,506,565
$ 2,386,642
$ 2,359,067
1.80 %
2.08 %
1.70 %
(a)
Includes Negotiable Order of Withdrawal accounts, and certain trust accounts.
(b)
Includes Money Market Deposit Accounts.
Refer to Note 17 for additional information on deposits.
Management’s discussion and analysis
104
JPMorgan Chase & Co./2025 Form 10-K
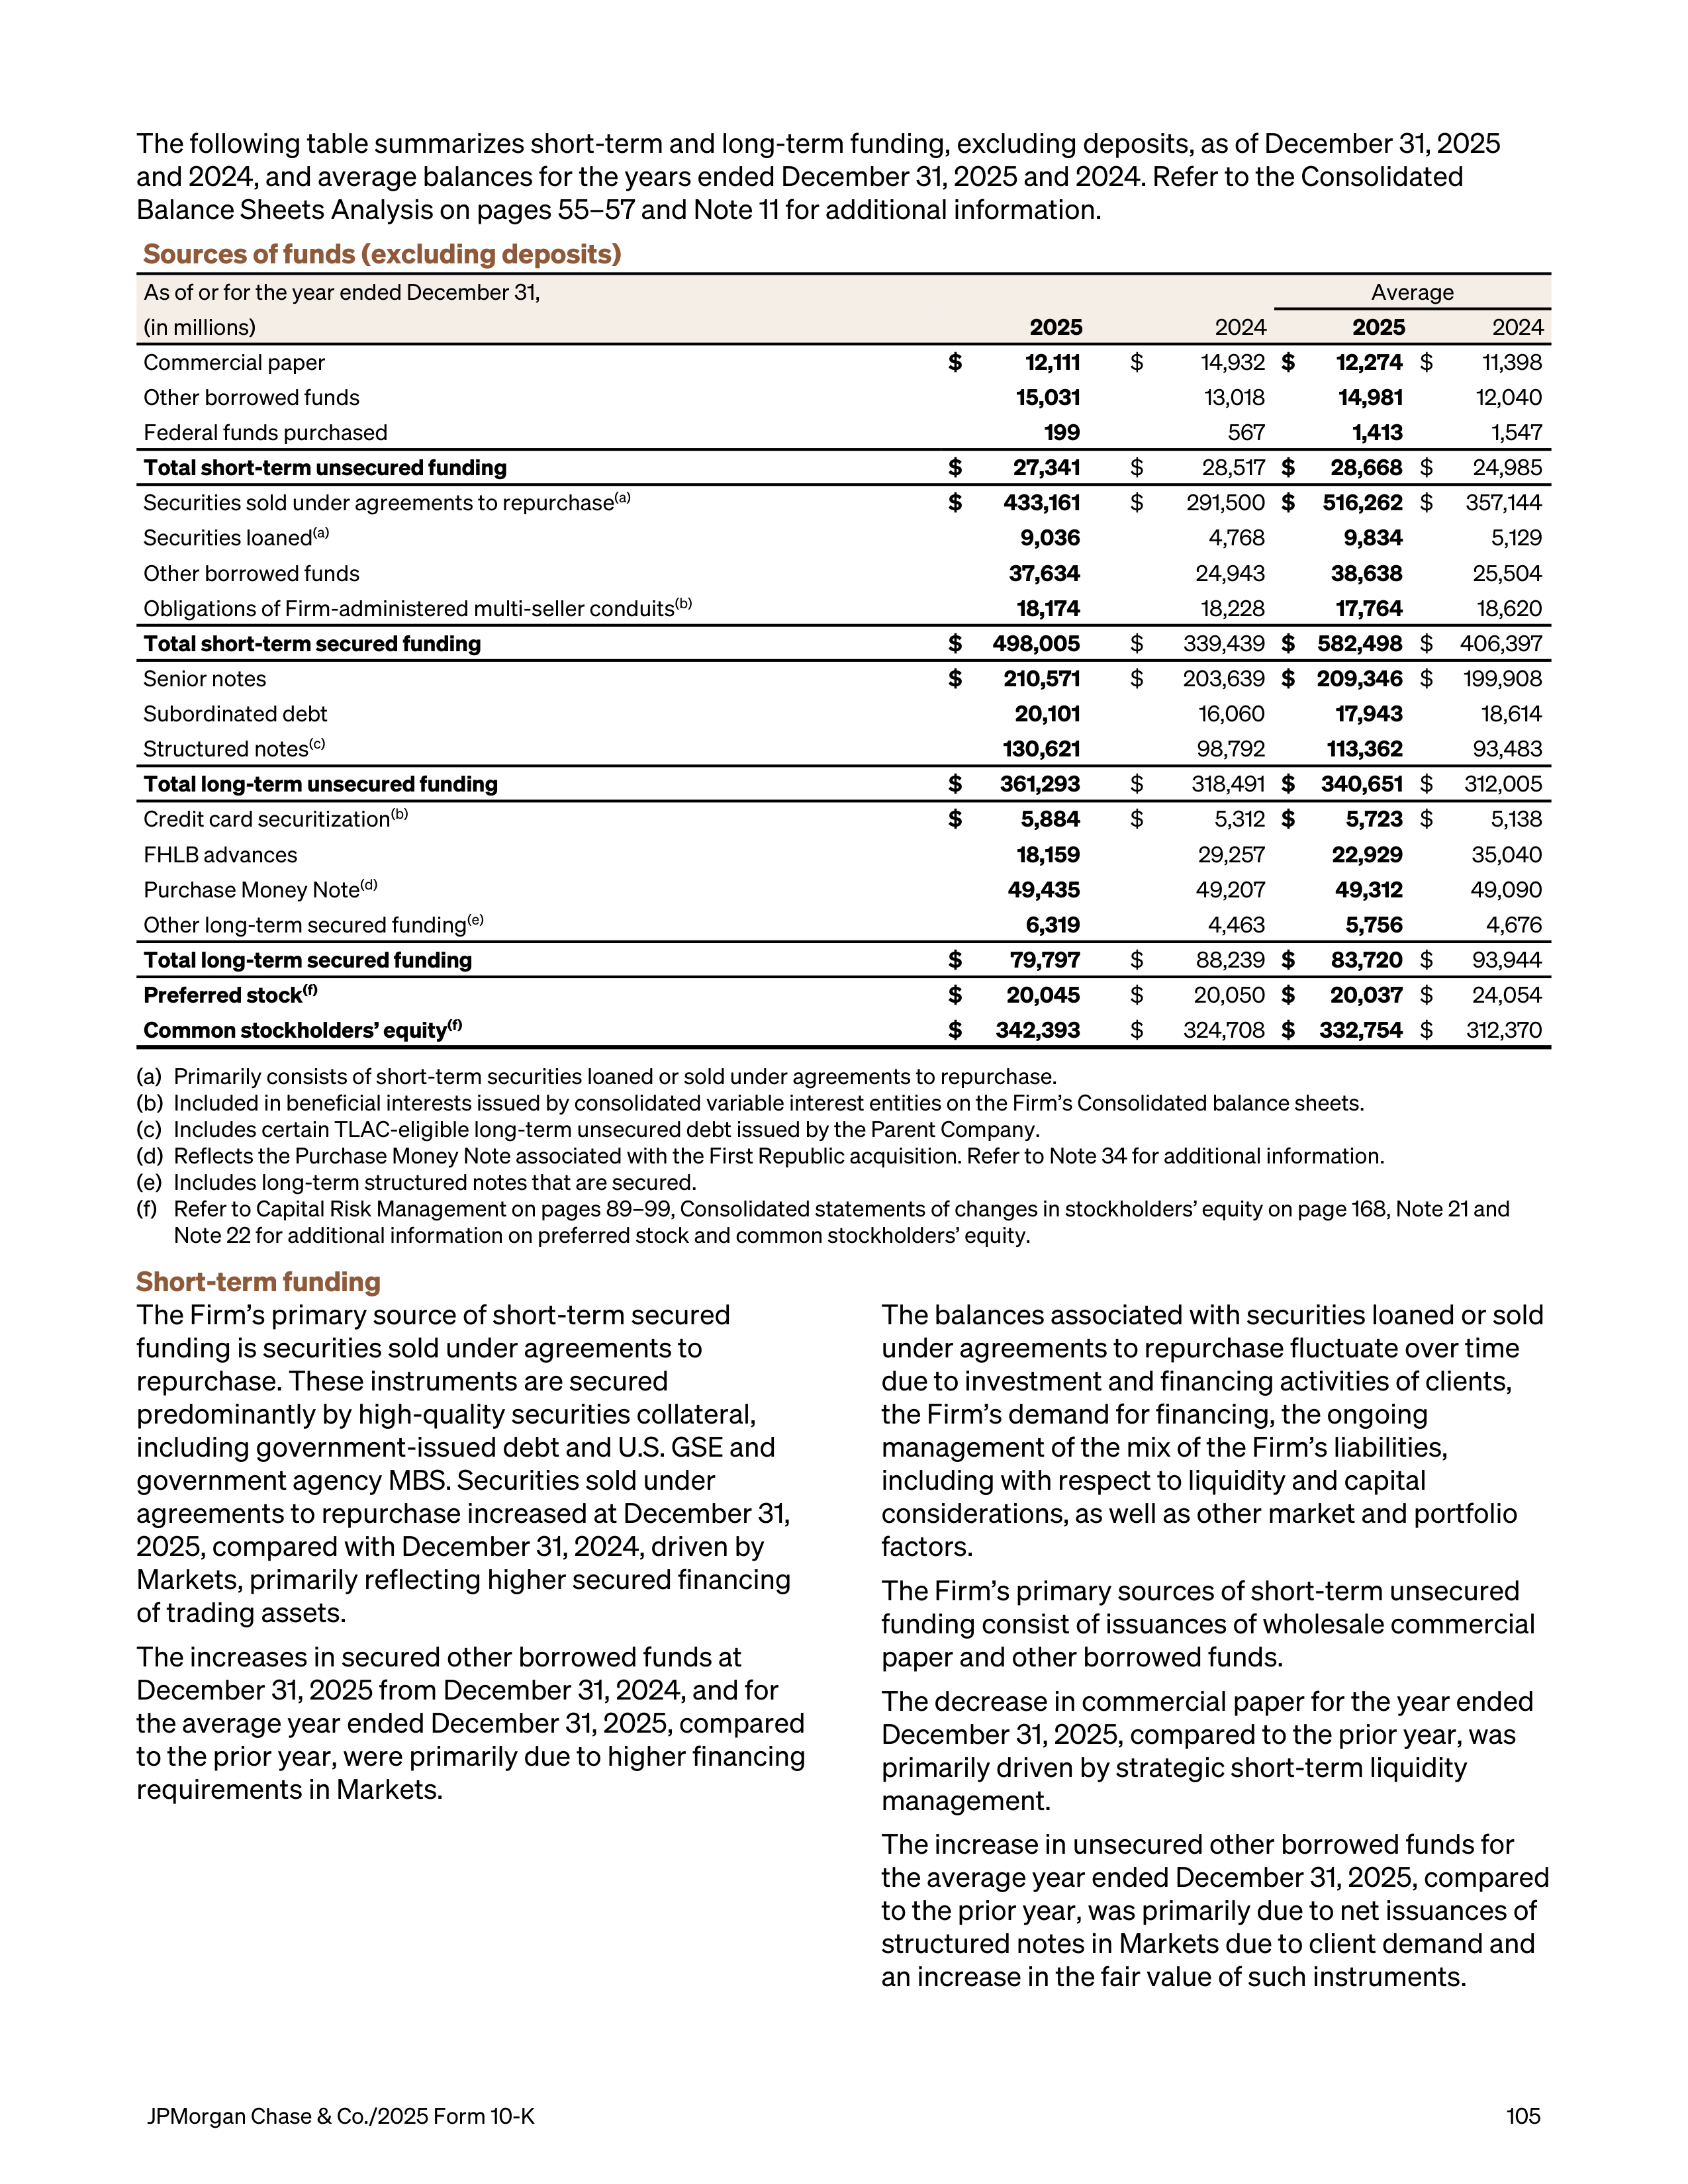
The following table summarizes short-term and long-term funding, excluding deposits, as of December 31, 2025
and 2024, and average balances for the years ended December 31, 2025 and 2024. Refer to the Consolidated
Balance Sheets Analysis on pages 55–57 and Note 11 for additional information.
Sources of funds (excluding deposits)
As of or for the year ended December 31,
Average
(in millions)
2025
2024
2025
2024
Commercial paper
$
12,111
$
14,932
$
12,274
$
11,398
Other borrowed funds
15,031
13,018
14,981
12,040
Federal funds purchased
199
567
1,413
1,547
Total short-term unsecured funding
$
27,341
$
28,517
$
28,668
$
24,985
Securities sold under agreements to repurchase
(a)
$
433,161
$
291,500
$
516,262
$
357,144
Securities loaned
(a)
9,036
4,768
9,834
5,129
Other borrowed funds
37,634
24,943
38,638
25,504
Obligations of Firm-administered multi-seller conduits
(b)
18,174
18,228
17,764
18,620
Total short-term secured funding
$
498,005
$
339,439
$
582,498
$
406,397
Senior notes
$
210,571
$
203,639
$
209,346
$
199,908
Subordinated debt
20,101
16,060
17,943
18,614
Structured notes
(c)
130,621
98,792
113,362
93,483
Total long-term unsecured funding
$
361,293
$
318,491
$
340,651
$
312,005
Credit card securitization
(b)
$
5,884
$
5,312
$
5,723
$
5,138
FHLB advances
18,159
29,257
22,929
35,040
Purchase Money Note
(d)
49,435
49,207
49,312
49,090
Other long-term secured funding
(e)
6,319
4,463
5,756
4,676
Total long-term secured funding
$
79,797
$
88,239
$
83,720
$
93,944
Preferred stock
(f)
$
20,045
$
20,050
$
20,037
$
24,054
Common stockholders’ equity
(f)
$
342,393
$
324,708
$
332,754
$
312,370
(a)
Primarily consists of short-term securities loaned or sold under agreements to repurchase.
(b)
Included in beneficial interests issued by consolidated variable interest entities on the Firm’s Consolidated balance sheets.
(c)
Includes certain TLAC-eligible long-term unsecured debt issued by the Parent Company.
(d)
Reflects the Purchase Money Note associated with the First Republic acquisition. Refer to Note 34 for additional information.
(e)
Includes long-term structured notes that are secured.
(f)
Refer to Capital Risk Management on pages 89–99, Consolidated statements of changes in stockholders’ equity on page 168, Note 21 and
Note 22 for additional information on preferred stock and common stockholders’ equity.
Short-term funding
The Firm’s primary source of short-term secured
funding is securities sold under agreements to
repurchase. These instruments are secured
predominantly by high-quality securities collateral,
including government-issued debt and U.S. GSE and
government agency MBS. Securities sold under
agreements to repurchase increased at December 31,
2025, compared with December 31, 2024, driven by
Markets, primarily reflecting higher secured financing
of trading assets.
The increases in secured other borrowed funds at
December 31, 2025 from December 31, 2024, and for
the average year ended December 31, 2025, compared
to the prior year, were primarily due to higher financing
requirements in Markets.
The balances associated with securities loaned or sold
under agreements to repurchase fluctuate over time
due to investment and financing activities of clients,
the Firm’s demand for financing, the ongoing
management of the mix of the Firm’s liabilities,
including with respect to liquidity and capital
considerations, as well as other market and portfolio
factors.
The Firm’s primary sources of short-term unsecured
funding consist of issuances of wholesale commercial
paper and other borrowed funds.
The decrease in commercial paper for the year ended
December 31, 2025, compared to the prior year, was
primarily driven by strategic short-term liquidity
management.
The increase in unsecured other borrowed funds for
the average year ended December 31, 2025, compared
to the prior year, was primarily due to net issuances of
structured notes in Markets due to client demand and
an increase in the fair value of such instruments.
JPMorgan Chase & Co./2025 Form 10-K
105
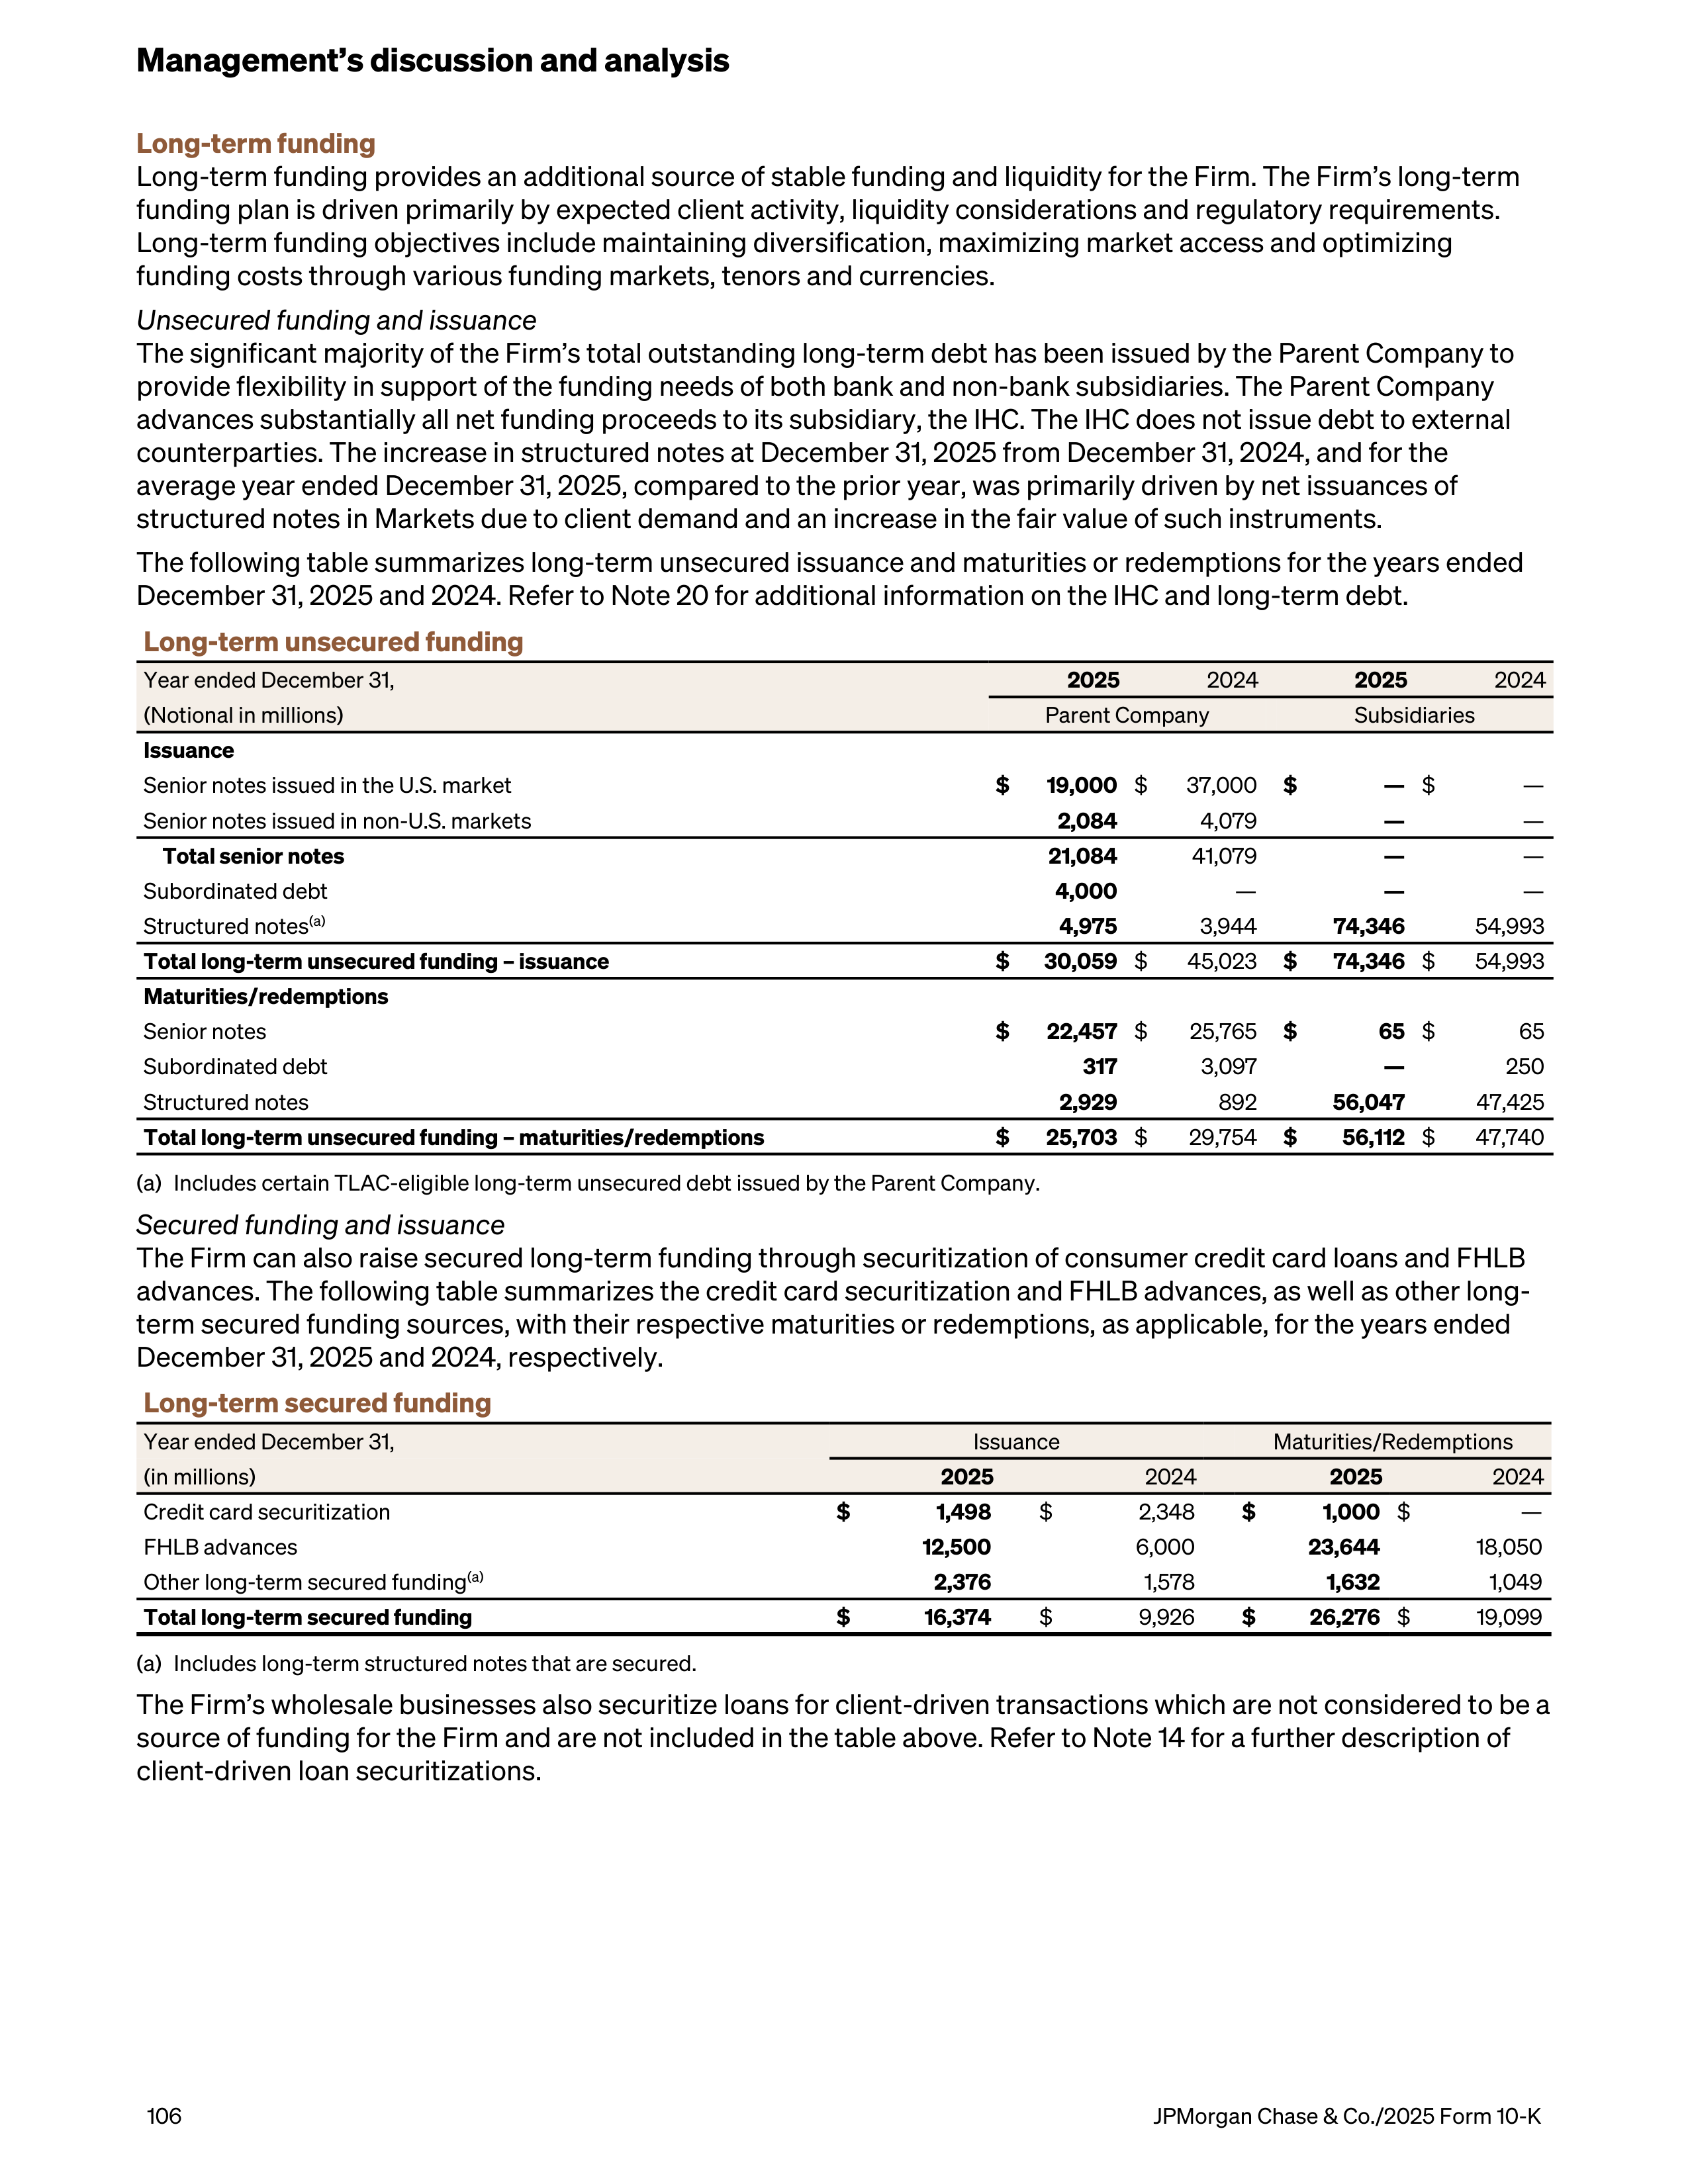
Long-term funding
Long-term funding provides an additional source of stable funding and liquidity for the Firm. The Firm’s long-term
funding plan is driven primarily by expected client activity, liquidity considerations and regulatory requirements.
Long-term funding objectives include maintaining diversification, maximizing market access and optimizing
funding costs through various funding markets, tenors and currencies.
Unsecured funding and issuance
The significant majority of the Firm’s total outstanding long-term debt has been issued by the Parent Company to
provide flexibility in support of the funding needs of both bank and non-bank subsidiaries. The Parent Company
advances substantially all net funding proceeds to its subsidiary, the IHC. The IHC does not issue debt to external
counterparties. The increase in structured notes at December 31, 2025 from December 31, 2024, and for the
average year ended December 31, 2025, compared to the prior year, was primarily driven by net issuances of
structured notes in Markets due to client demand and an increase in the fair value of such instruments.
The following table summarizes long-term unsecured issuance and maturities or redemptions for the years ended
December 31, 2025 and 2024. Refer to Note 20 for additional information on the IHC and long-term debt.
Long-term unsecured funding
Year ended December 31,
2025
2024
2025
2024
(Notional in millions)
Parent Company
Subsidiaries
Issuance
Senior notes issued in the U.S. market
$
19,000
$
37,000
$
—
$
—
Senior notes issued in non-U.S. markets
2,084
4,079
—
—
Total senior notes
21,084
41,079
—
—
Subordinated debt
4,000
—
—
—
Structured notes
(a)
4,975
3,944
74,346
54,993
Total long-term unsecured funding – issuance
$
30,059
$
45,023
$
74,346
$
54,993
Maturities/redemptions
Senior notes
$
22,457
$
25,765
$
65
$
65
Subordinated debt
317
3,097
—
250
Structured notes
2,929
892
56,047
47,425
Total long-term unsecured funding – maturities/redemptions
$
25,703
$
29,754
$
56,112
$
47,740
(a)
Includes certain TLAC-eligible long-term unsecured debt issued by the Parent Company.
Secured funding and issuance
The Firm can also raise secured long-term funding through securitization of consumer credit card loans and FHLB
advances. The following table summarizes the credit card securitization and FHLB advances, as well as other long-
term secured funding sources, with their respective maturities or redemptions, as applicable, for the years ended
December 31, 2025 and 2024, respectively.
Long-term secured funding
Year ended December 31,
Issuance
Maturities/Redemptions
(in millions)
2025
2024
2025
2024
Credit card securitization
$
1,498
$
2,348
$
1,000
$
—
FHLB advances
12,500
6,000
23,644
18,050
Other long-term secured funding
(a)
2,376
1,578
1,632
1,049
Total long-term secured funding
$
16,374
$
9,926
$
26,276
$
19,099
(a)
Includes long-term structured notes that are secured.
The Firm’s wholesale businesses also securitize loans for client-driven transactions which are not considered to be a
source of funding for the Firm and are not included in the table above. Refer to Note 14 for a further description of
client-driven loan securitizations.
Management’s discussion and analysis
106
JPMorgan Chase & Co./2025 Form 10-K
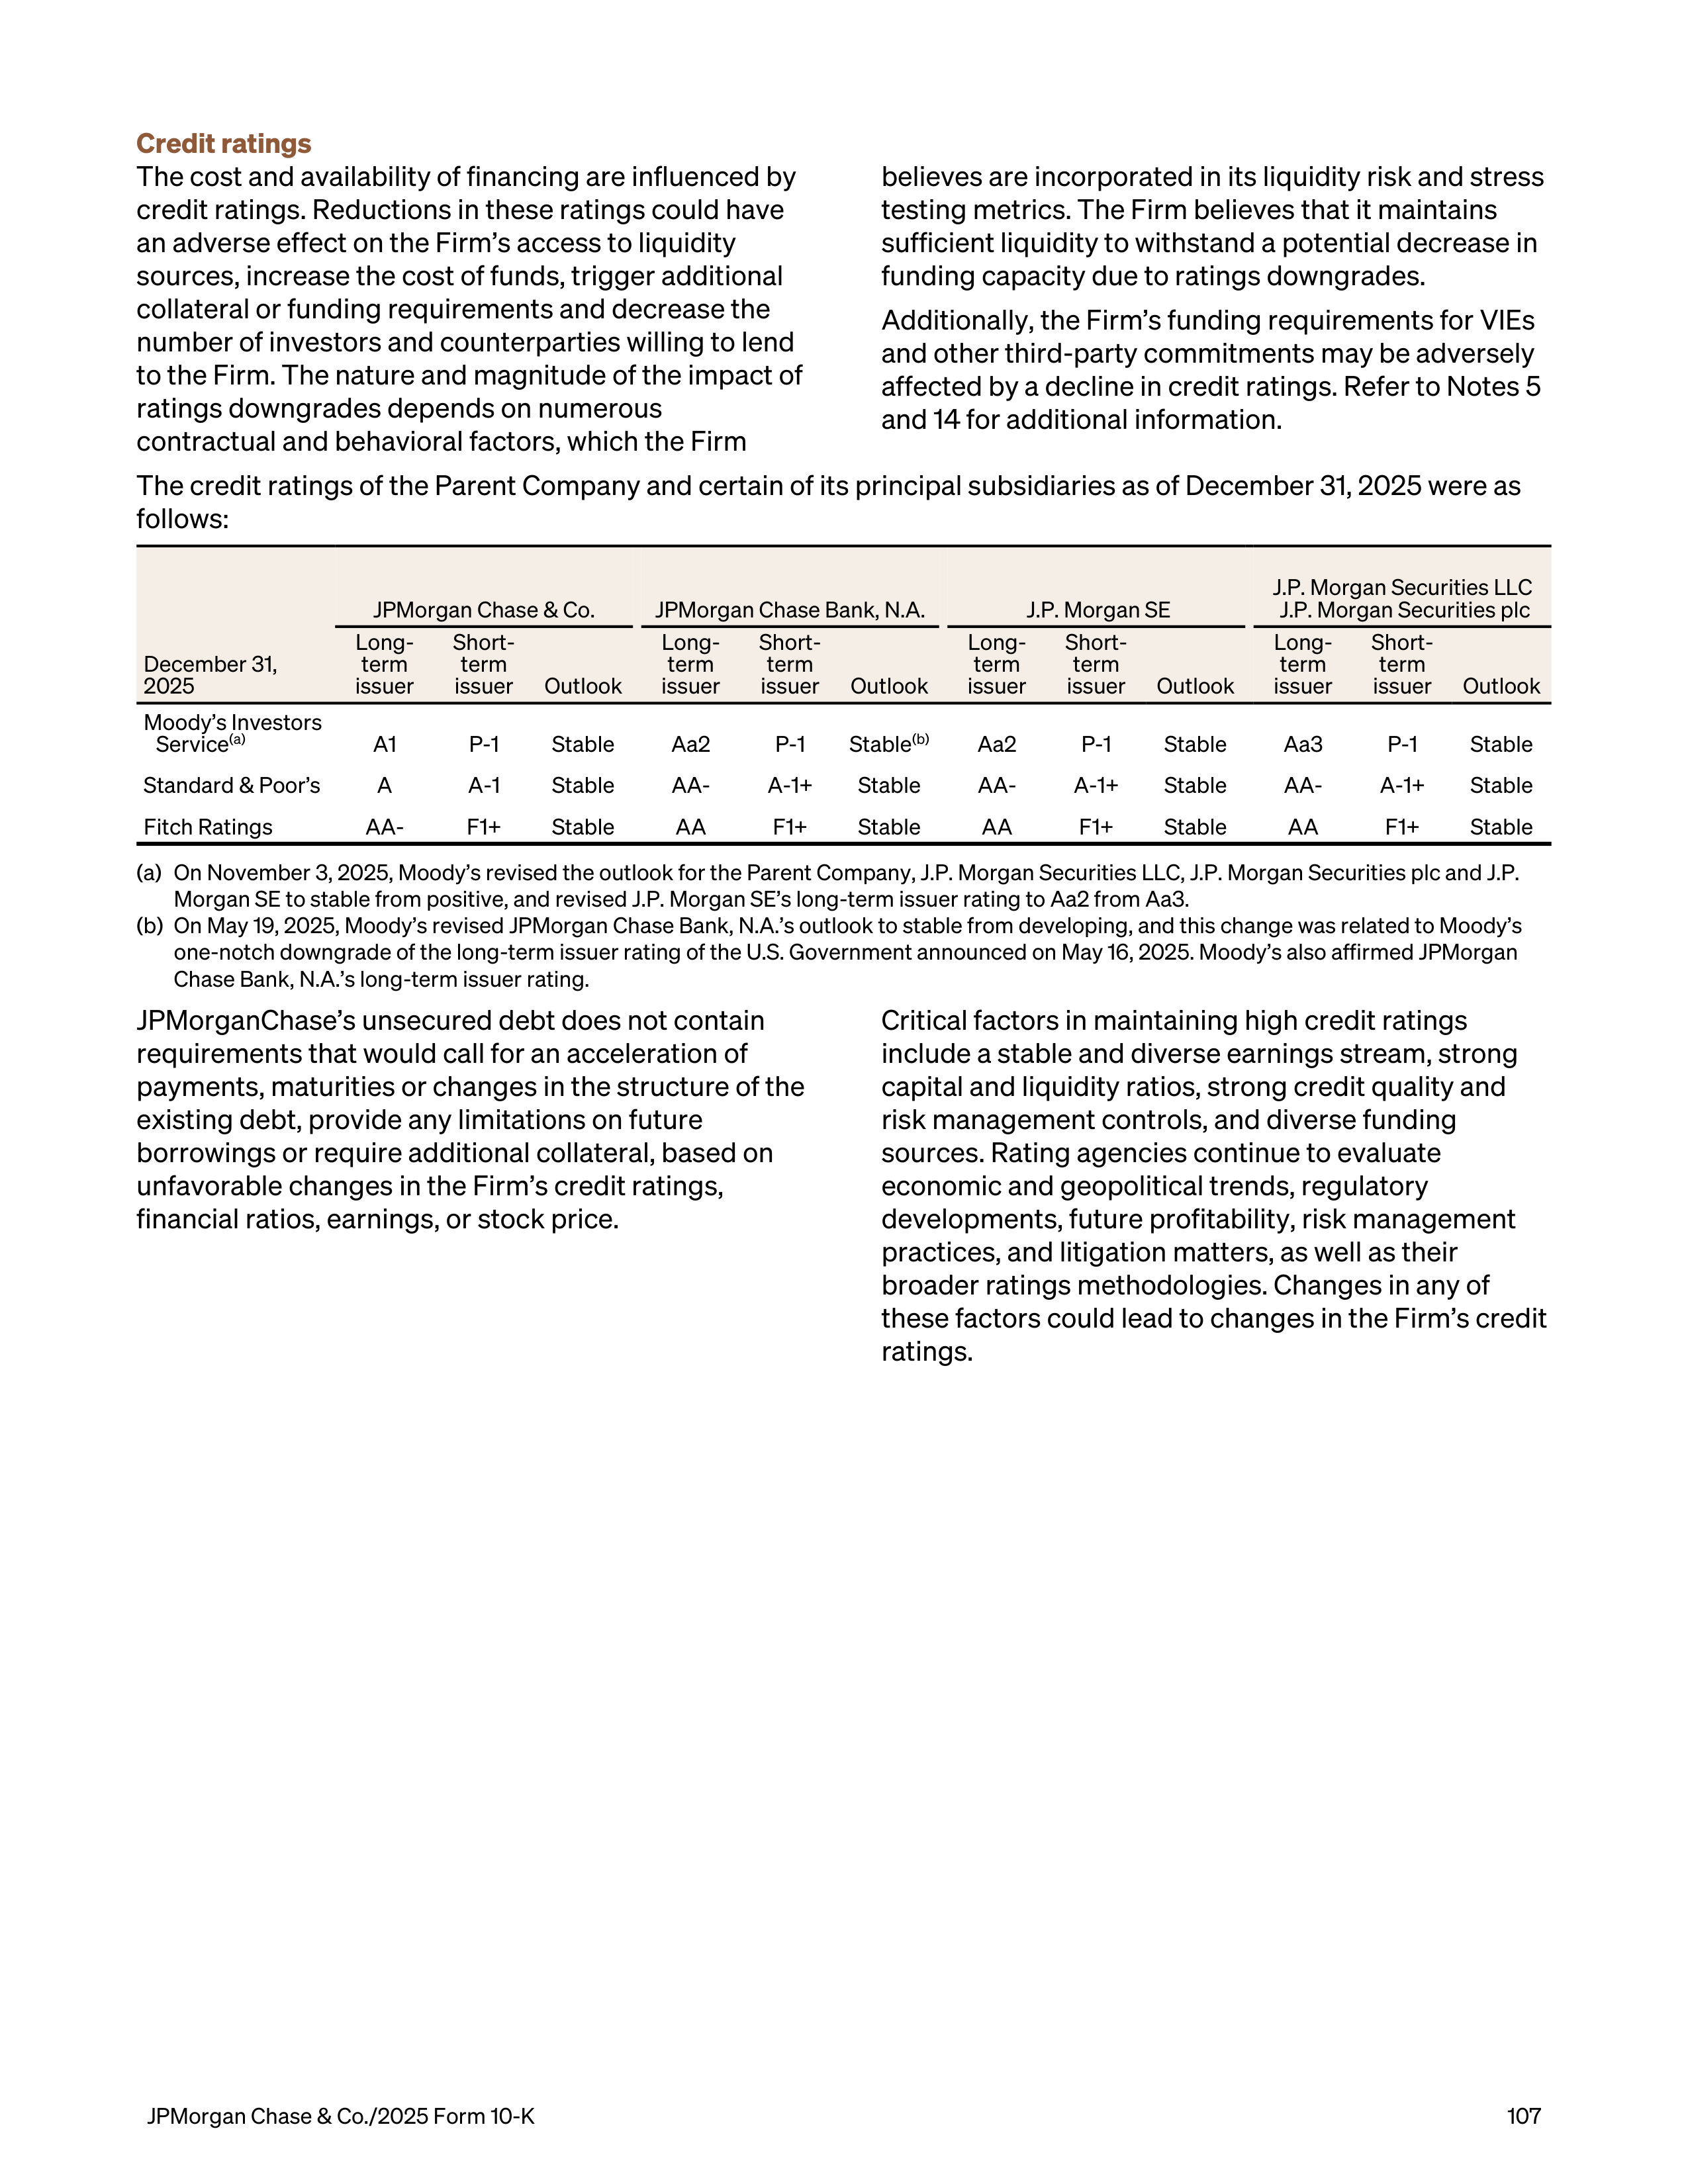
Credit ratings
The cost and availability of financing are influenced by
credit ratings. Reductions in these ratings could have
an adverse effect on the Firm’s access to liquidity
sources, increase the cost of funds, trigger additional
collateral or funding requirements and decrease the
number of investors and counterparties willing to lend
to the Firm. The nature and magnitude of the impact of
ratings downgrades depends on numerous
contractual and behavioral factors, which the Firm
believes are incorporated in its liquidity risk and stress
testing metrics. The Firm believes that it maintains
sufficient liquidity to withstand a potential decrease in
funding capacity due to ratings downgrades.
Additionally, the Firm’s funding requirements for VIEs
and other third-party commitments may be adversely
affected by a decline in credit ratings. Refer to Notes 5
and 14 for additional information.
The credit ratings of the Parent Company and certain of its principal subsidiaries as of December 31, 2025 were as
follows:
JPMorgan Chase & Co.
JPMorgan Chase Bank, N.A.
J.P. Morgan SE
J.P. Morgan Securities LLC
J.P. Morgan Securities plc
December 31,
2025
Long-
term
issuer
Short-
term
issuer
Outlook
Long-
term
issuer
Short-
term
issuer
Outlook
Long-
term
issuer
Short-
term
issuer
Outlook
Long-
term
issuer
Short-
term
issuer
Outlook
Moody’s Investors
Service
(a)
A1
P-1
Stable
Aa2
P-1
Stable
(b)
Aa2
P-1
Stable
Aa3
P-1
Stable
Standard & Poor’s
A
A-1
Stable
AA-
A-1+
Stable
AA-
A-1+
Stable
AA-
A-1+
Stable
Fitch Ratings
AA-
F1+
Stable
AA
F1+
Stable
AA
F1+
Stable
AA
F1+
Stable
(a)
On November 3, 2025, Moody’s revised the outlook for the Parent Company, J.P. Morgan Securities LLC, J.P. Morgan Securities plc and J.P.
Morgan SE to stable from positive, and revised J.P. Morgan SE’s long-term issuer rating to Aa2 from Aa3.
(b)
On May 19, 2025, Moody’s revised JPMorgan Chase Bank, N.A.’s outlook to stable from developing, and this change was related to Moody’s
one-notch downgrade of the long-term issuer rating of the U.S. Government announced on May 16, 2025. Moody’s also affirmed JPMorgan
Chase Bank, N.A.’s long-term issuer rating.
JPMorganChase’s unsecured debt does not contain
requirements that would call for an acceleration of
payments, maturities or changes in the structure of the
existing debt, provide any limitations on future
borrowings or require additional collateral, based on
unfavorable changes in the Firm’s credit ratings,
financial ratios, earnings, or stock price.
Critical factors in maintaining high credit ratings
include a stable and diverse earnings stream, strong
capital and liquidity ratios, strong credit quality and
risk management controls, and diverse funding
sources. Rating agencies continue to evaluate
economic and geopolitical trends, regulatory
developments, future profitability, risk management
practices, and litigation matters, as well as their
broader ratings methodologies. Changes in any of
these factors could lead to changes in the Firm’s credit
ratings.
JPMorgan Chase & Co./2025 Form 10-K
107
REPUTATION RISK MANAGEMENT
Reputation risk is the risk of damage to the trust,
affinity or goodwill for the Firm held by clients,
employees and investors that can result from the
Firm’s decisions to engage or not engage with a client
or in a business activity and which may lead to
negative commercial impacts. The Firm’s decisions
related to clients and business activities are made
based on a range of commercial considerations,
including operational capabilities and expertise,
servicing costs, risk relative to opportunity, the
prioritization of finite resources and, when relevant,
reputation risk considerations. The Firm manages
reputation risk through established policies, standards
and procedures that are integrated across the LOBs
and Corporate functions. Potential reputation risk
matters may be escalated to governance forums, as
appropriate, including LOB Reputation Risk
Committees. The Board Risk Committee also regularly
receives information on reputation risk matters, as
appropriate.
108
JPMorgan Chase & Co./2025 Form 10-K
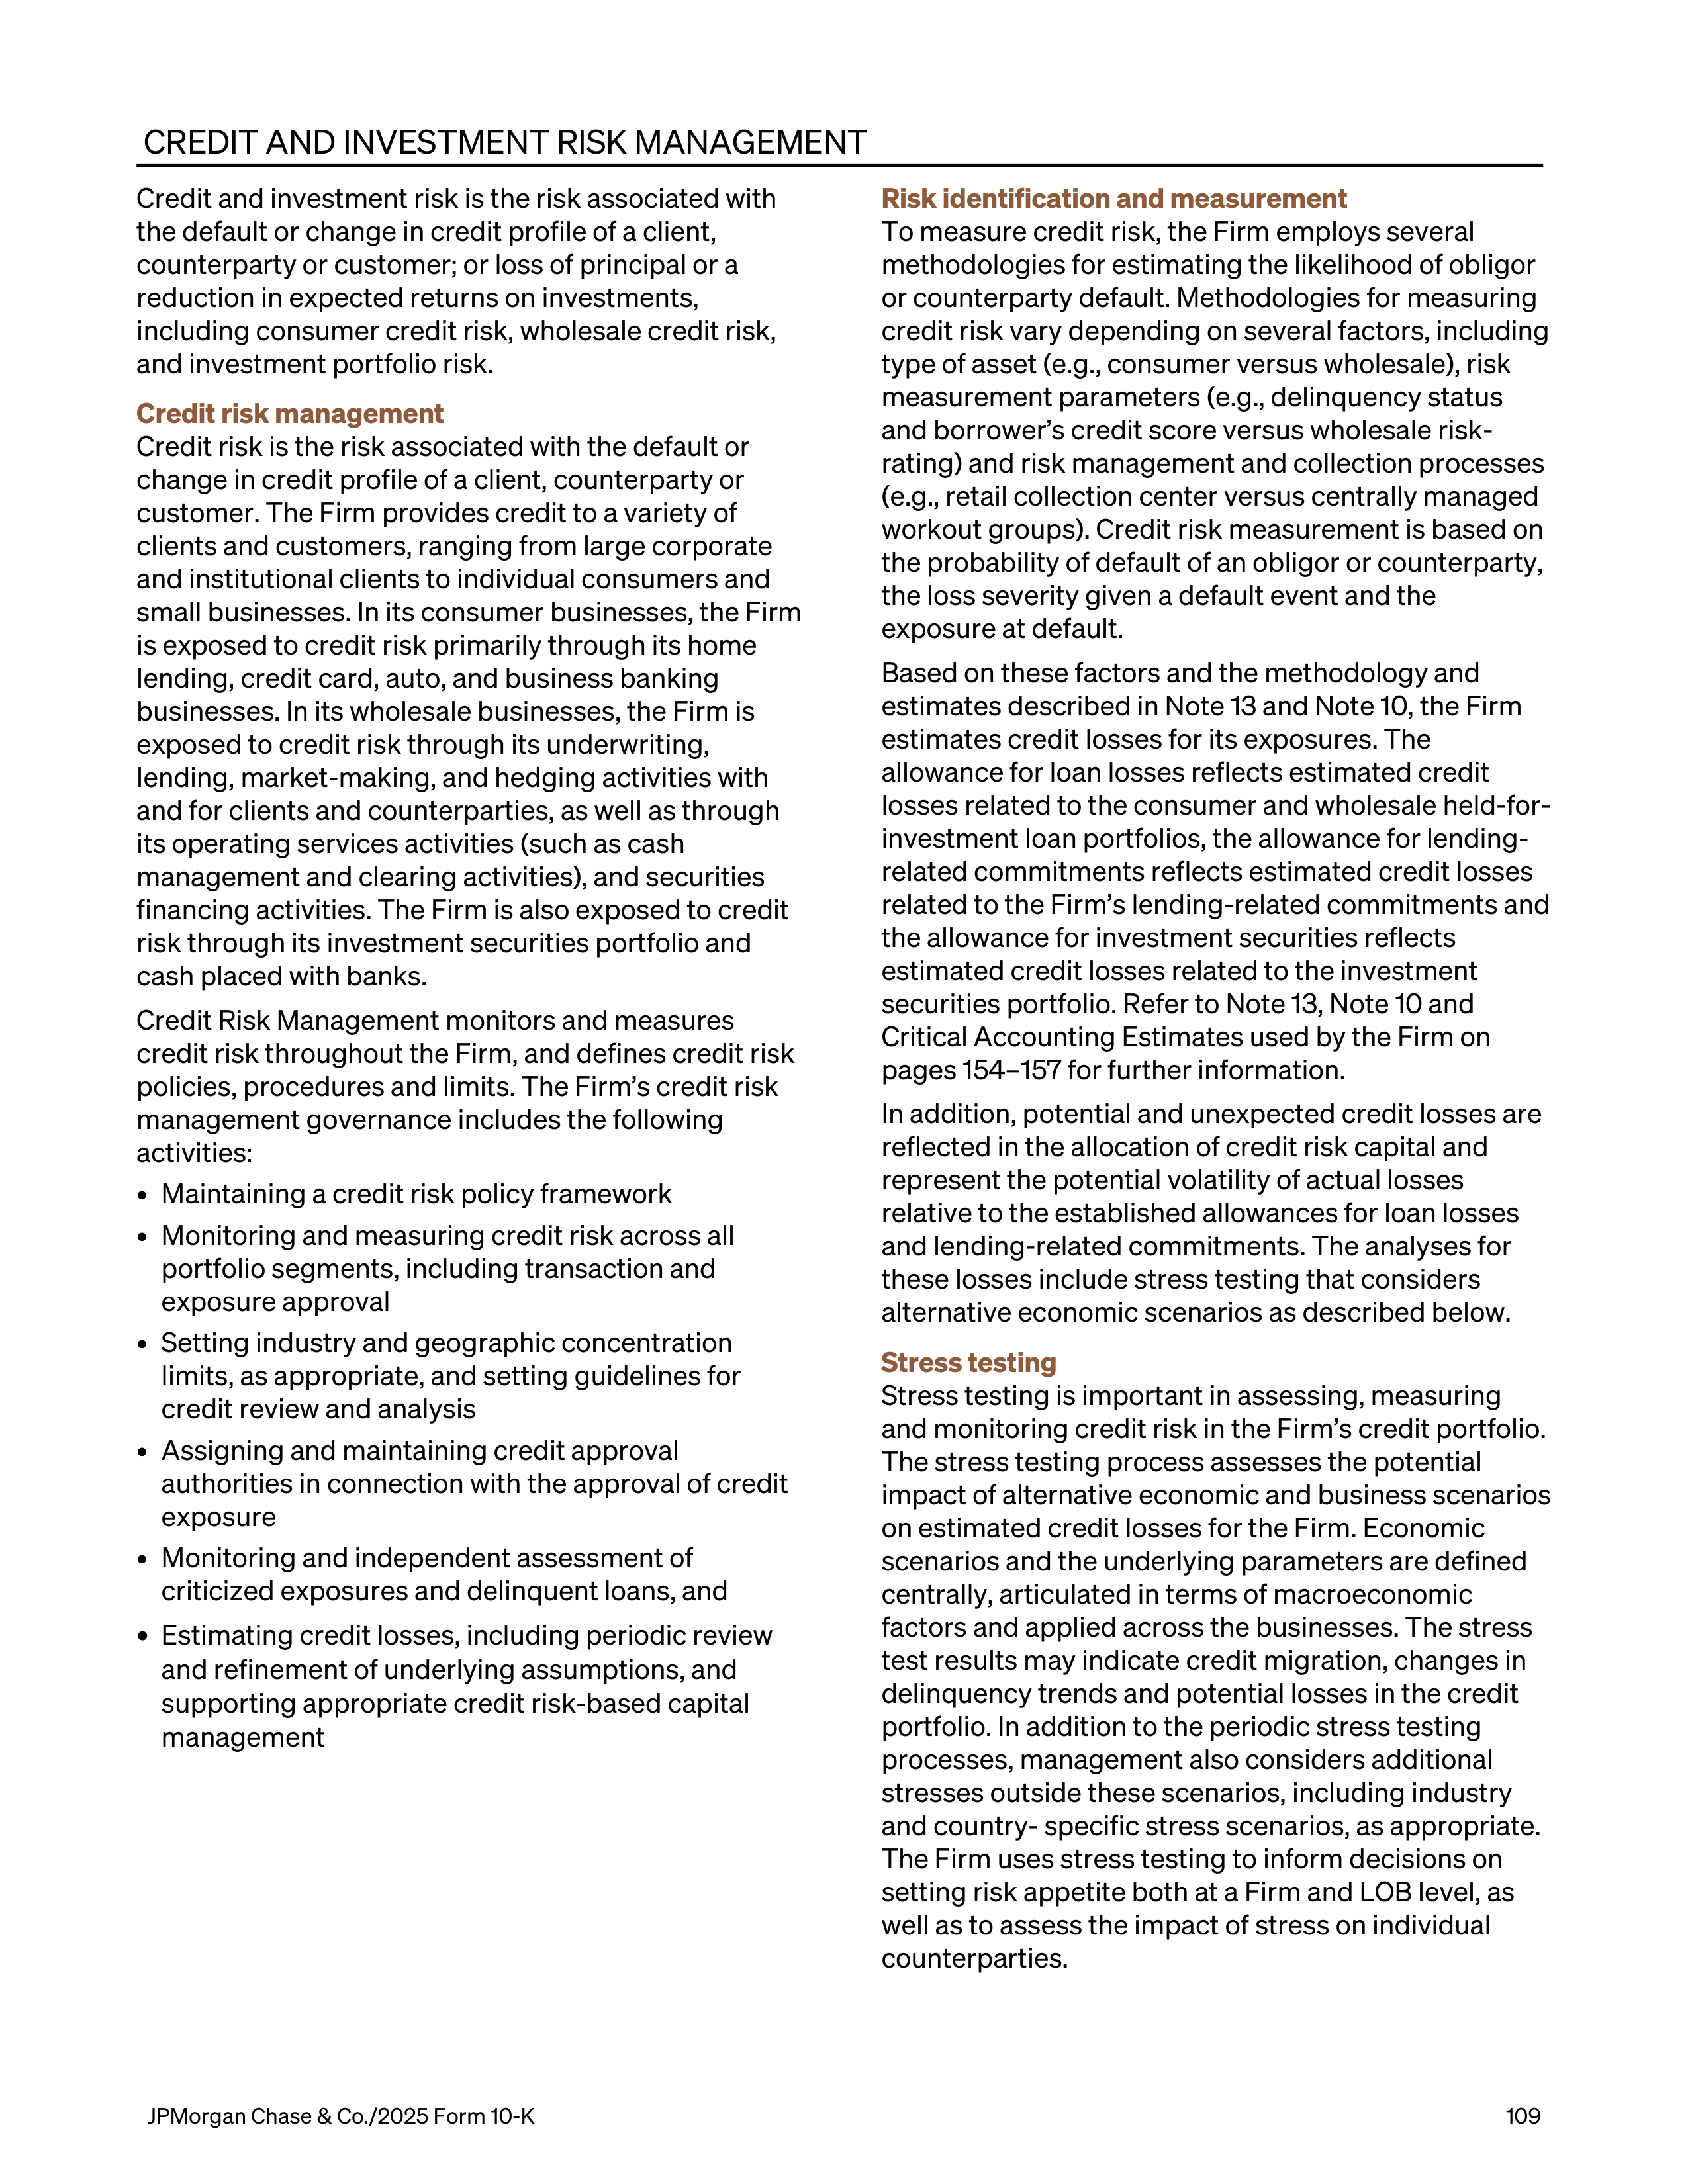
CREDIT AND INVESTMENT RISK MANAGEMENT
Credit and investment risk is the risk associated with
the default or change in credit profile of a client,
counterparty or customer; or loss of principal or a
reduction in expected returns on investments,
including consumer credit risk, wholesale credit risk,
and investment portfolio risk.
Credit risk management
Credit risk is the risk associated with the default or
change in credit profile of a client, counterparty or
customer. The Firm provides credit to a variety of
clients and customers, ranging from large corporate
and institutional clients to individual consumers and
small businesses. In its consumer businesses, the Firm
is exposed to credit risk primarily through its home
lending, credit card, auto, and business banking
businesses. In its wholesale businesses, the Firm is
exposed to credit risk through its underwriting,
lending, market-making, and hedging activities with
and for clients and counterparties, as well as through
its operating services activities (such as cash
management and clearing activities), and securities
financing activities. The Firm is also exposed to credit
risk through its investment securities portfolio and
cash placed with banks.
Credit Risk Management monitors and measures
credit risk throughout the Firm, and defines credit risk
policies, procedures and limits. The Firm’s credit risk
management governance includes the following
activities:
•
Maintaining a credit risk policy framework
•
Monitoring and measuring credit risk across all
portfolio segments, including transaction and
exposure approval
•
Setting industry and geographic concentration
limits, as appropriate, and setting guidelines for
credit review and analysis
•
Assigning and maintaining credit approval
authorities in connection with the approval of credit
exposure
•
Monitoring and independent assessment of
criticized exposures and delinquent loans, and
•
Estimating credit losses, including periodic review
and refinement of underlying assumptions, and
supporting appropriate credit risk-based capital
management
Risk identification and measurement
To measure credit risk, the Firm employs several
methodologies for estimating the likelihood of obligor
or counterparty default. Methodologies for measuring
credit risk vary depending on several factors, including
type of asset (e.g., consumer versus wholesale), risk
measurement parameters (e.g., delinquency status
and borrower’s credit score versus wholesale risk-
rating) and risk management and collection processes
(e.g., retail collection center versus centrally managed
workout groups). Credit risk measurement is based on
the probability of default of an obligor or counterparty,
the loss severity given a default event and the
exposure at default.
Based on these factors and the methodology and
estimates described in Note 13 and Note 10, the Firm
estimates credit losses for its exposures. The
allowance for loan losses reflects estimated credit
losses related to the consumer and wholesale held-for-
investment loan portfolios, the allowance for lending-
related commitments reflects estimated credit losses
related to the Firm’s lending-related commitments and
the allowance for investment securities reflects
estimated credit losses related to the investment
securities portfolio. Refer to Note 13, Note 10 and
Critical Accounting Estimates used by the Firm on
pages 154–157 for further information.
In addition, potential and unexpected credit losses are
reflected in the allocation of credit risk capital and
represent the potential volatility of actual losses
relative to the established allowances for loan losses
and lending-related commitments. The analyses for
these losses include stress testing that considers
alternative economic scenarios as described below.
Stress testing
Stress testing is important in assessing, measuring
and monitoring credit risk in the Firm’s credit portfolio.
The stress testing process assesses the potential
impact of alternative economic and business scenarios
on estimated credit losses for the Firm. Economic
scenarios and the underlying parameters are defined
centrally, articulated in terms of macroeconomic
factors and applied across the businesses. The stress
test results may indicate credit migration, changes in
delinquency trends and potential losses in the credit
portfolio. In addition to the periodic stress testing
processes, management also considers additional
stresses outside these scenarios, including industry
and country- specific stress scenarios, as appropriate.
The Firm uses stress testing to inform decisions on
setting risk appetite both at a Firm and LOB level, as
well as to assess the impact of stress on individual
counterparties.
JPMorgan Chase & Co./2025 Form 10-K
109
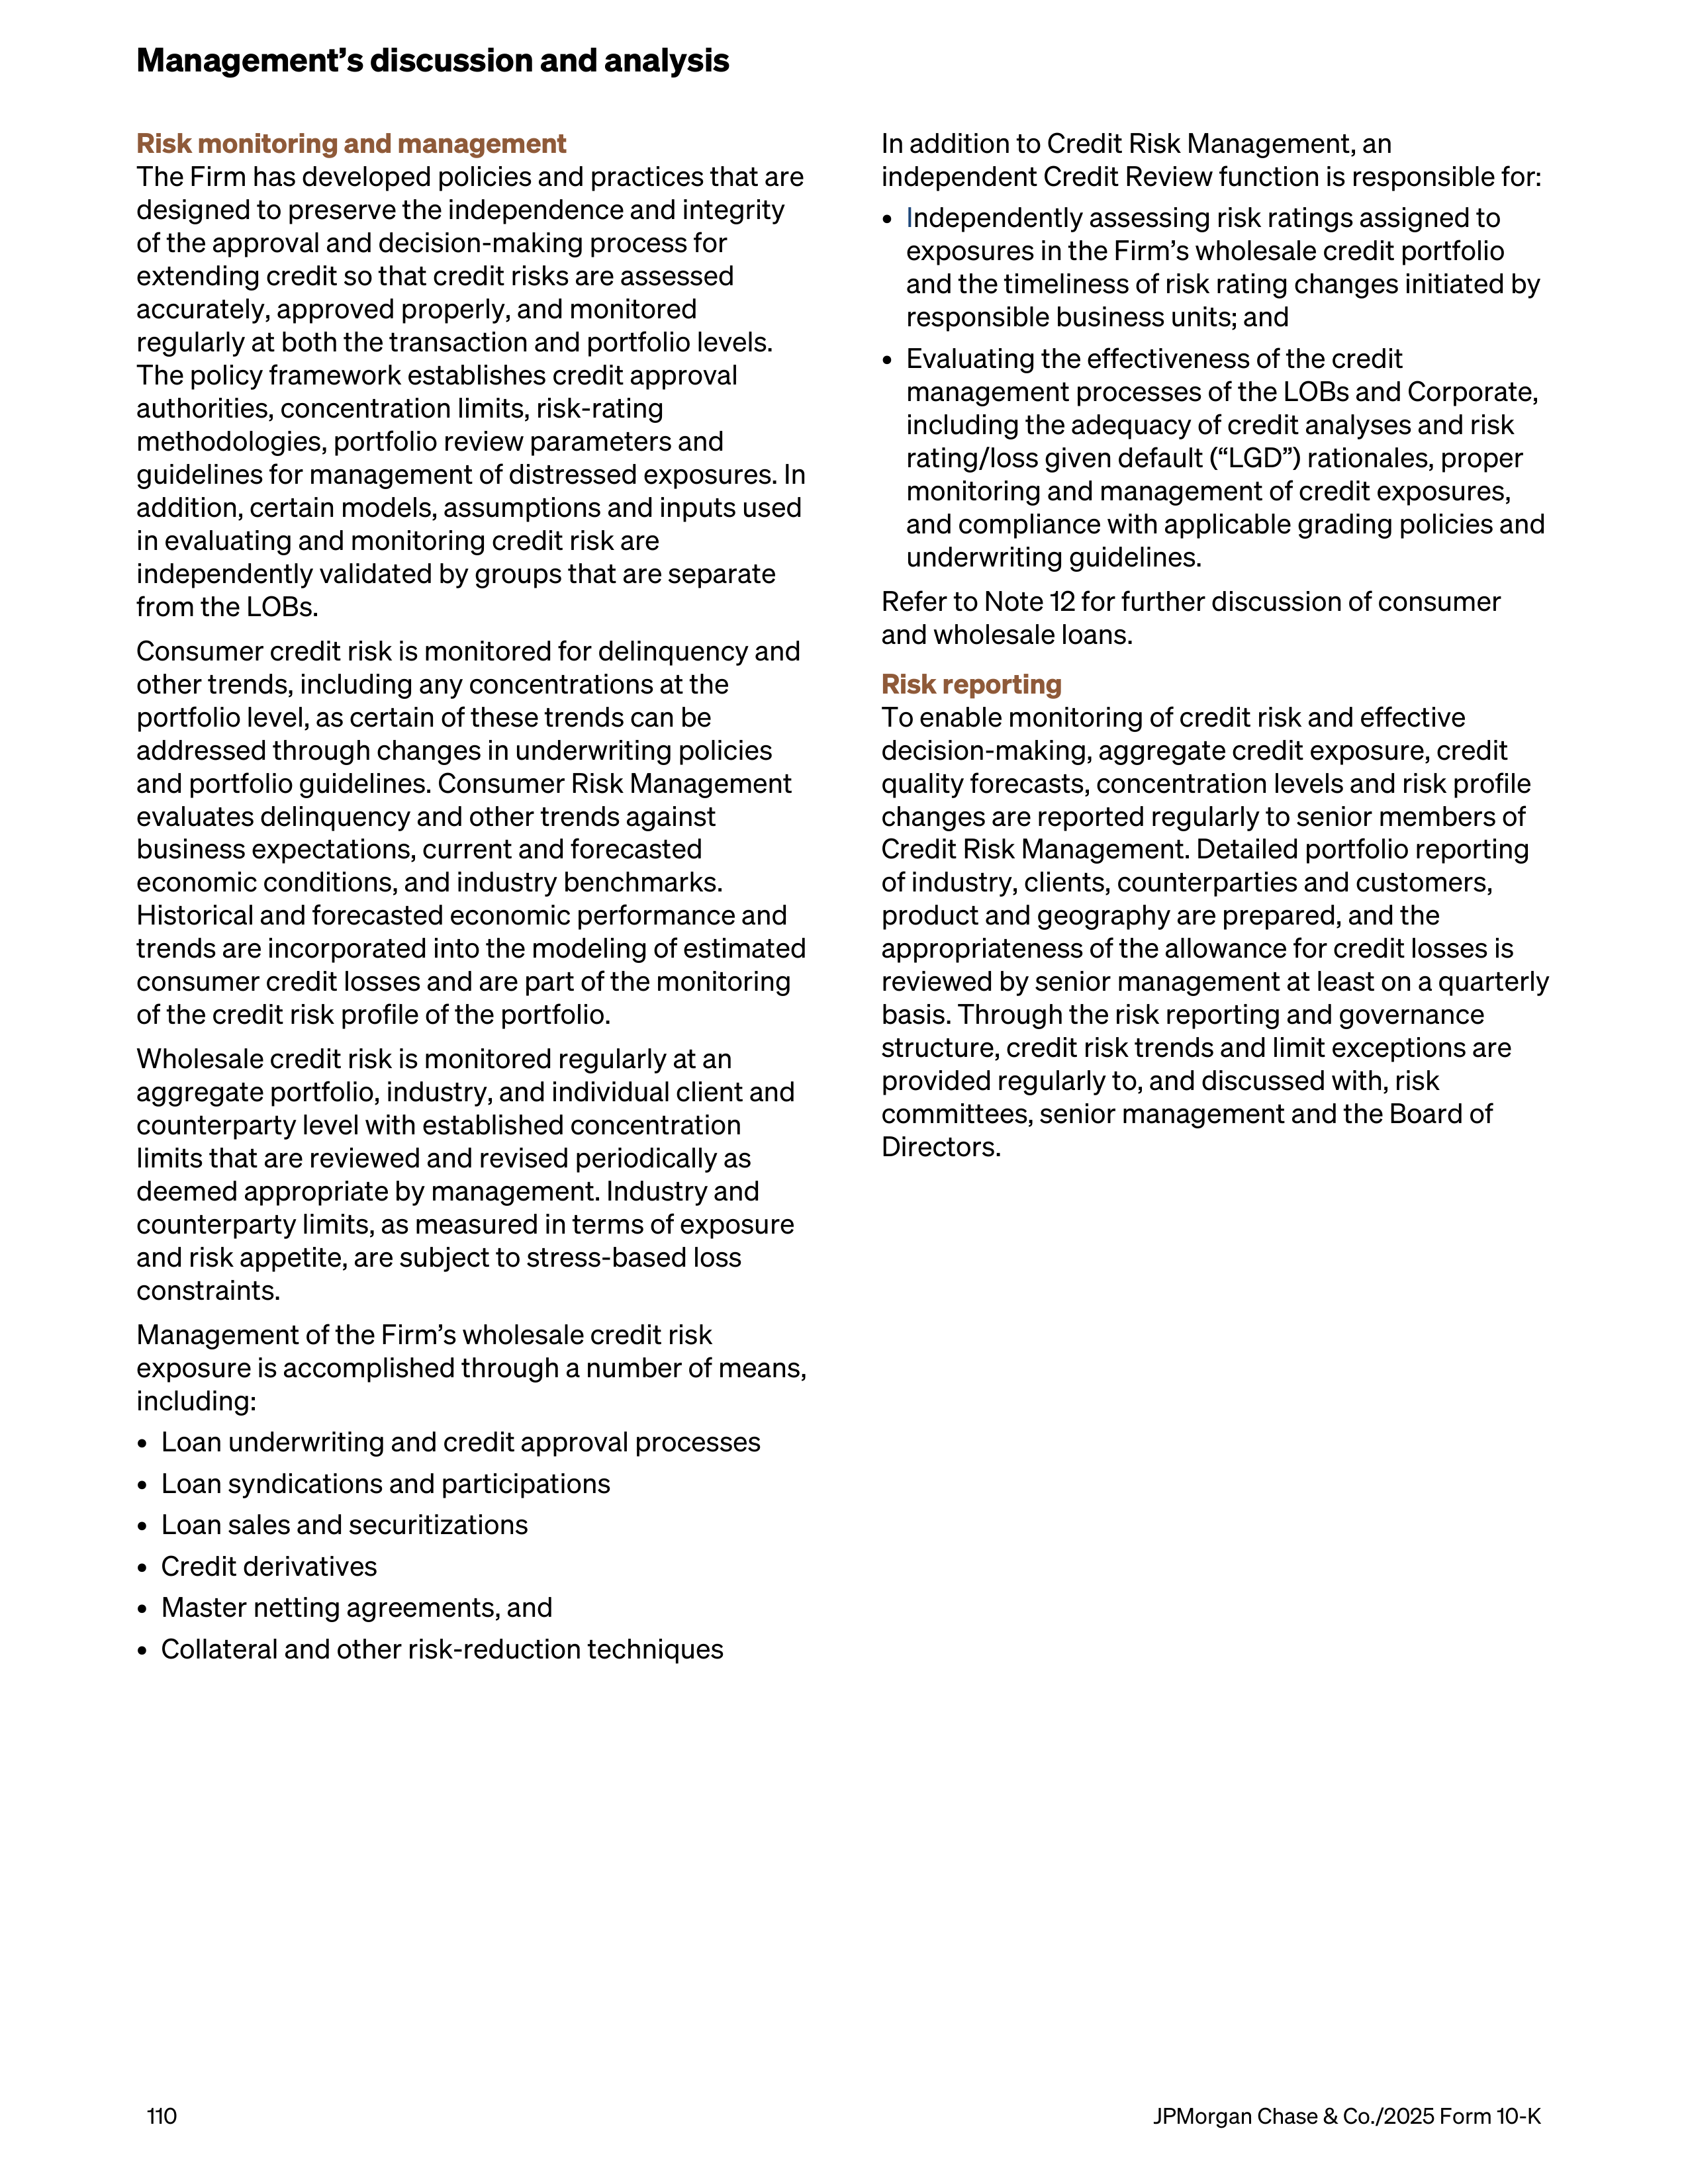
Risk monitoring and management
The Firm has developed policies and practices that are
designed to preserve the independence and integrity
of the approval and decision-making process for
extending credit so that credit risks are assessed
accurately, approved properly, and monitored
regularly at both the transaction and portfolio levels.
The policy framework establishes credit approval
authorities, concentration limits, risk-rating
methodologies, portfolio review parameters and
guidelines for management of distressed exposures. In
addition, certain models, assumptions and inputs used
in evaluating and monitoring credit risk are
independently validated by groups that are separate
from the LOBs.
Consumer credit risk is monitored for delinquency and
other trends, including any concentrations at the
portfolio level, as certain of these trends can be
addressed through changes in underwriting policies
and portfolio guidelines. Consumer Risk Management
evaluates delinquency and other trends against
business expectations, current and forecasted
economic conditions, and industry benchmarks.
Historical and forecasted economic performance and
trends are incorporated into the modeling of estimated
consumer credit losses and are part of the monitoring
of the credit risk profile of the portfolio.
Wholesale credit risk is monitored regularly at an
aggregate portfolio, industry, and individual client and
counterparty level with established concentration
limits that are reviewed and revised periodically as
deemed appropriate by management. Industry and
counterparty limits, as measured in terms of exposure
and risk appetite, are subject to stress-based loss
constraints.
Management of the Firm’s wholesale credit risk
exposure is accomplished through a number of means,
including:
•
Loan underwriting and credit approval processes
•
Loan syndications and participations
•
Loan sales and securitizations
•
Credit derivatives
•
Master netting agreements, and
•
Collateral and other risk-reduction techniques
In addition to Credit Risk Management, an
independent Credit Review function is responsible for:
•
I
ndependently assessing risk ratings assigned to
exposures in the Firm’s wholesale credit portfolio
and the timeliness of risk rating changes initiated by
responsible business units; and
•
Evaluating the effectiveness of the credit
management processes of the LOBs and Corporate,
including the adequacy of credit analyses and risk
rating/loss given default (“LGD”) rationales, proper
monitoring and management of credit exposures,
and compliance with applicable grading policies and
underwriting guidelines.
Refer to Note 12 for further discussion of consumer
and wholesale loans.
Risk reporting
To enable monitoring of credit risk and effective
decision-making, aggregate credit exposure, credit
quality forecasts, concentration levels and risk profile
changes are reported regularly to senior members of
Credit Risk Management. Detailed portfolio reporting
of industry, clients, counterparties and customers,
product and geography are prepared, and the
appropriateness of the allowance for credit losses is
reviewed by senior management at least on a quarterly
basis. Through the risk reporting and governance
structure, credit risk trends and limit exceptions are
provided regularly to, and discussed with, risk
committees, senior management and the Board of
Directors.
Management’s discussion and analysis
110
JPMorgan Chase & Co./2025 Form 10-K
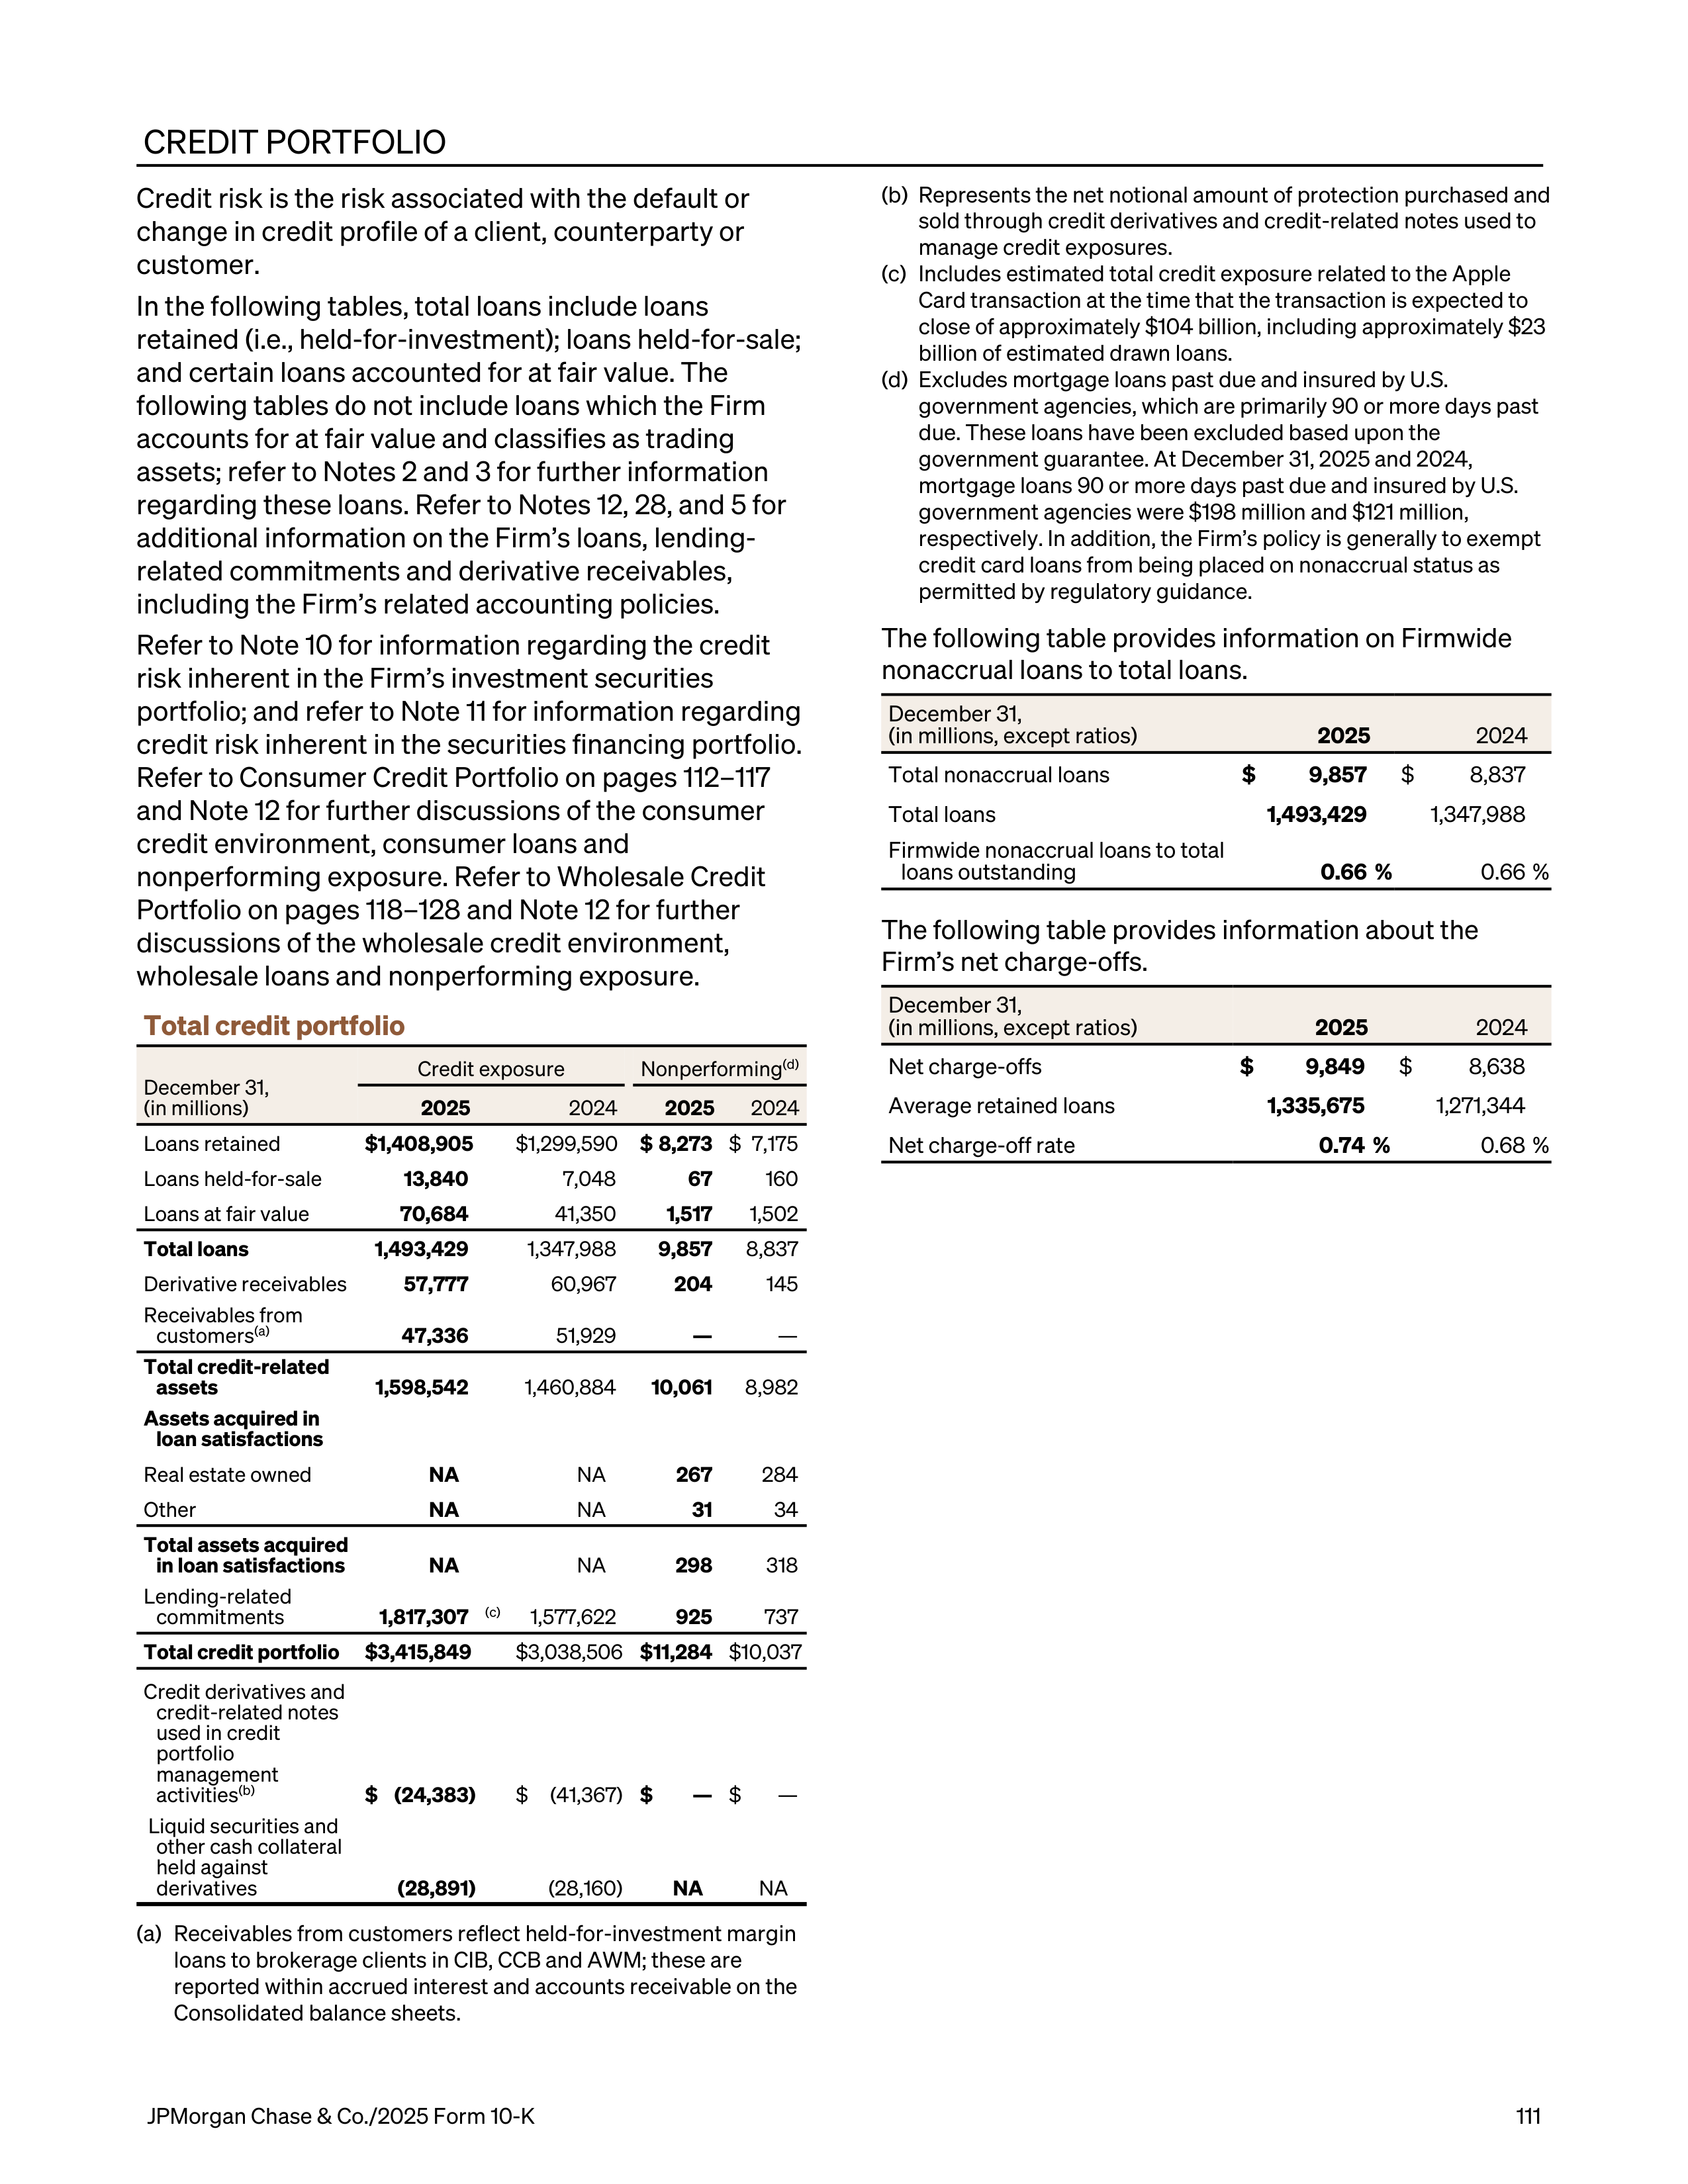
CREDIT PORTFOLIO
Credit risk is the risk associated with the default or
change in credit profile of a client, counterparty or
customer.
In the following tables, total loans include loans
retained (i.e., held-for-investment); loans held-for-sale;
and certain loans accounted for at fair value. The
following tables do not include loans which the Firm
accounts for at fair value and classifies as trading
assets; refer to Notes 2 and 3 for further information
regarding these loans. Refer to Notes 12, 28, and 5 for
additional information on the Firm’s loans, lending-
related commitments and derivative receivables,
including the Firm’s related accounting policies.
Refer to Note 10 for information regarding the credit
risk inherent in the Firm’s investment securities
portfolio; and refer to Note 11 for information regarding
credit risk inherent in the securities financing portfolio.
Refer to Consumer Credit Portfolio on pages 112–117
and Note 12 for further discussions of the consumer
credit environment, consumer loans and
nonperforming exposure. Refer to Wholesale Credit
Portfolio on pages 118–128 and Note 12 for further
discussions of the wholesale credit environment,
wholesale loans and nonperforming exposure.
Total credit portfolio
December 31,
(in millions)
Credit exposure
Nonperforming
(d)
2025
2024
2025
2024
Loans retained
$ 1,408,905
$ 1,299,590
$ 8,273
$ 7,175
Loans held-for-sale
13,840
7,048
67
160
Loans at fair value
70,684
41,350
1,517
1,502
Total loans
1,493,429
1,347,988
9,857
8,837
Derivative receivables
57,777
60,967
204
145
Receivables from
customers
(a)
47,336
51,929
—
—
Total credit-related
assets
1,598,542
1,460,884
10,061
8,982
Assets acquired in
loan satisfactions
Real estate owned
NA
NA
267
284
Other
NA
NA
31
34
Total
assets acquired
in loan satisfactions
NA
NA
298
318
Lending-related
commitments
1,817,307
(c)
1,577,622
925
737
Total credit portfolio
$ 3,415,849
$ 3,038,506
$ 11,284
$ 10,037
Credit derivatives and
credit-related notes
used in credit
portfolio
management
activities
(b)
$ (24,383)
$
(41,367)
$
—
$
—
Liquid securities and
other cash collateral
held against
derivatives
(28,891)
(28,160)
NA
NA
(a)
Receivables from customers reflect held-for-investment margin
loans to brokerage clients in CIB, CCB and AWM; these are
reported within accrued interest and accounts receivable on the
Consolidated balance sheets.
(b)
Represents the net notional amount of protection purchased and
sold through credit derivatives and credit-related notes used to
manage credit exposures.
(c)
Includes estimated total credit exposure related to the Apple
Card transaction at the time that the transaction is expected to
close of approximately $104 billion, including approximately $23
billion of estimated drawn loans.
(d)
Excludes mortgage loans past due and insured by U.S.
government agencies, which are primarily 90 or more days past
due. These loans have been excluded based upon the
government guarantee. At December 31, 2025 and 2024,
mortgage loans 90 or more days past due and insured by U.S.
government agencies were $198 million and $121 million,
respectively. In addition, the Firm’s policy is generally to exempt
credit card loans from being placed on nonaccrual status as
permitted by regulatory guidance.
The following table provides information on Firmwide
nonaccrual loans to total loans.
December 31,
(in millions, except ratios)
2025
2024
Total nonaccrual loans
$
9,857
$
8,837
Total loans
1,493,429
1,347,988
Firmwide nonaccrual loans to total
loans outstanding
0.66 %
0.66 %
The following table provides information about the
Firm’s net charge-offs.
December 31,
(in millions, except ratios)
2025
2024
Net charge-offs
$
9,849
$
8,638
Average retained loans
1,335,675
1,271,344
Net charge-off rate
0.74 %
0.68 %
JPMorgan Chase & Co./2025 Form 10-K
111
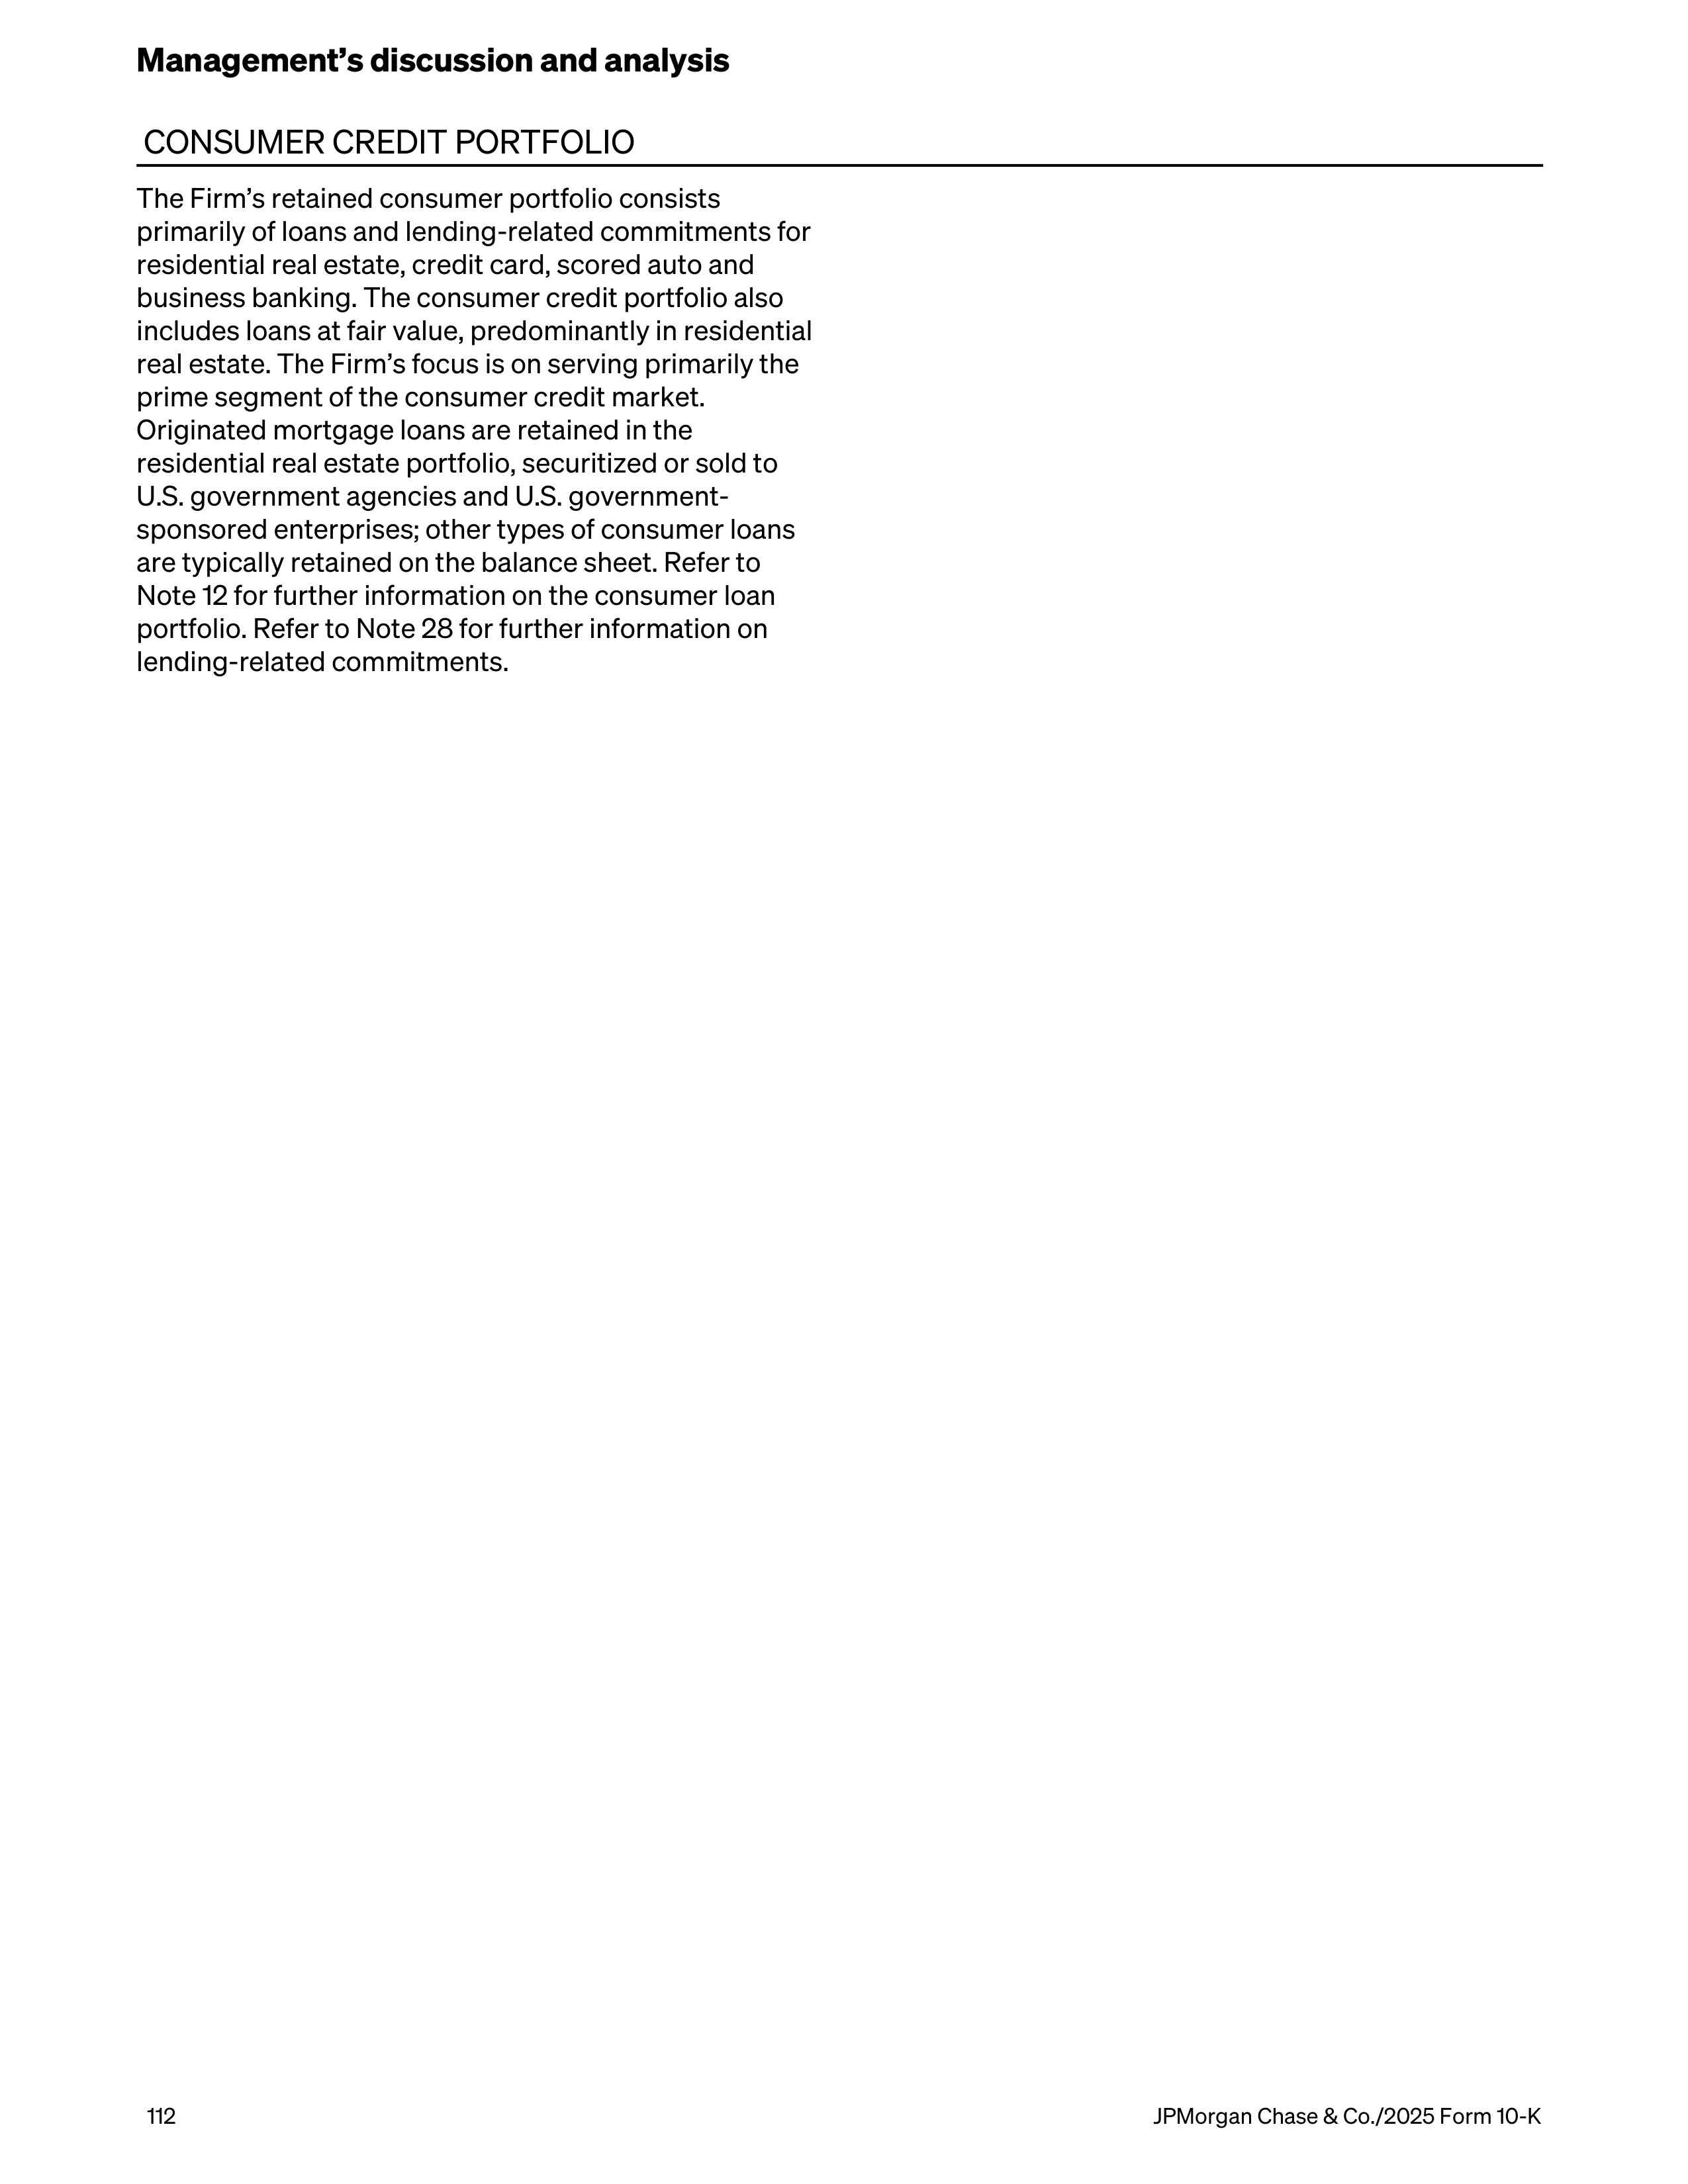
CONSUMER CREDIT PORTFOLIO
The Firm’s retained consumer portfolio consists
primarily of loans and lending-related commitments for
residential real estate, credit card, scored auto and
business banking. The consumer credit portfolio also
includes loans at fair value, predominantly in residential
real estate. The Firm’s focus is on serving primarily the
prime segment of the consumer credit market.
Originated mortgage loans are retained in the
residential real estate portfolio, securitized or sold to
U.S. government agencies and U.S. government-
sponsored enterprises; other types of consumer loans
are typically retained on the balance sheet. Refer to
Note 12 for further information on the consumer loan
portfolio. Refer to Note 28 for further information on
lending-related commitments.
Management’s discussion and analysis
112
JPMorgan Chase & Co./2025 Form 10-K
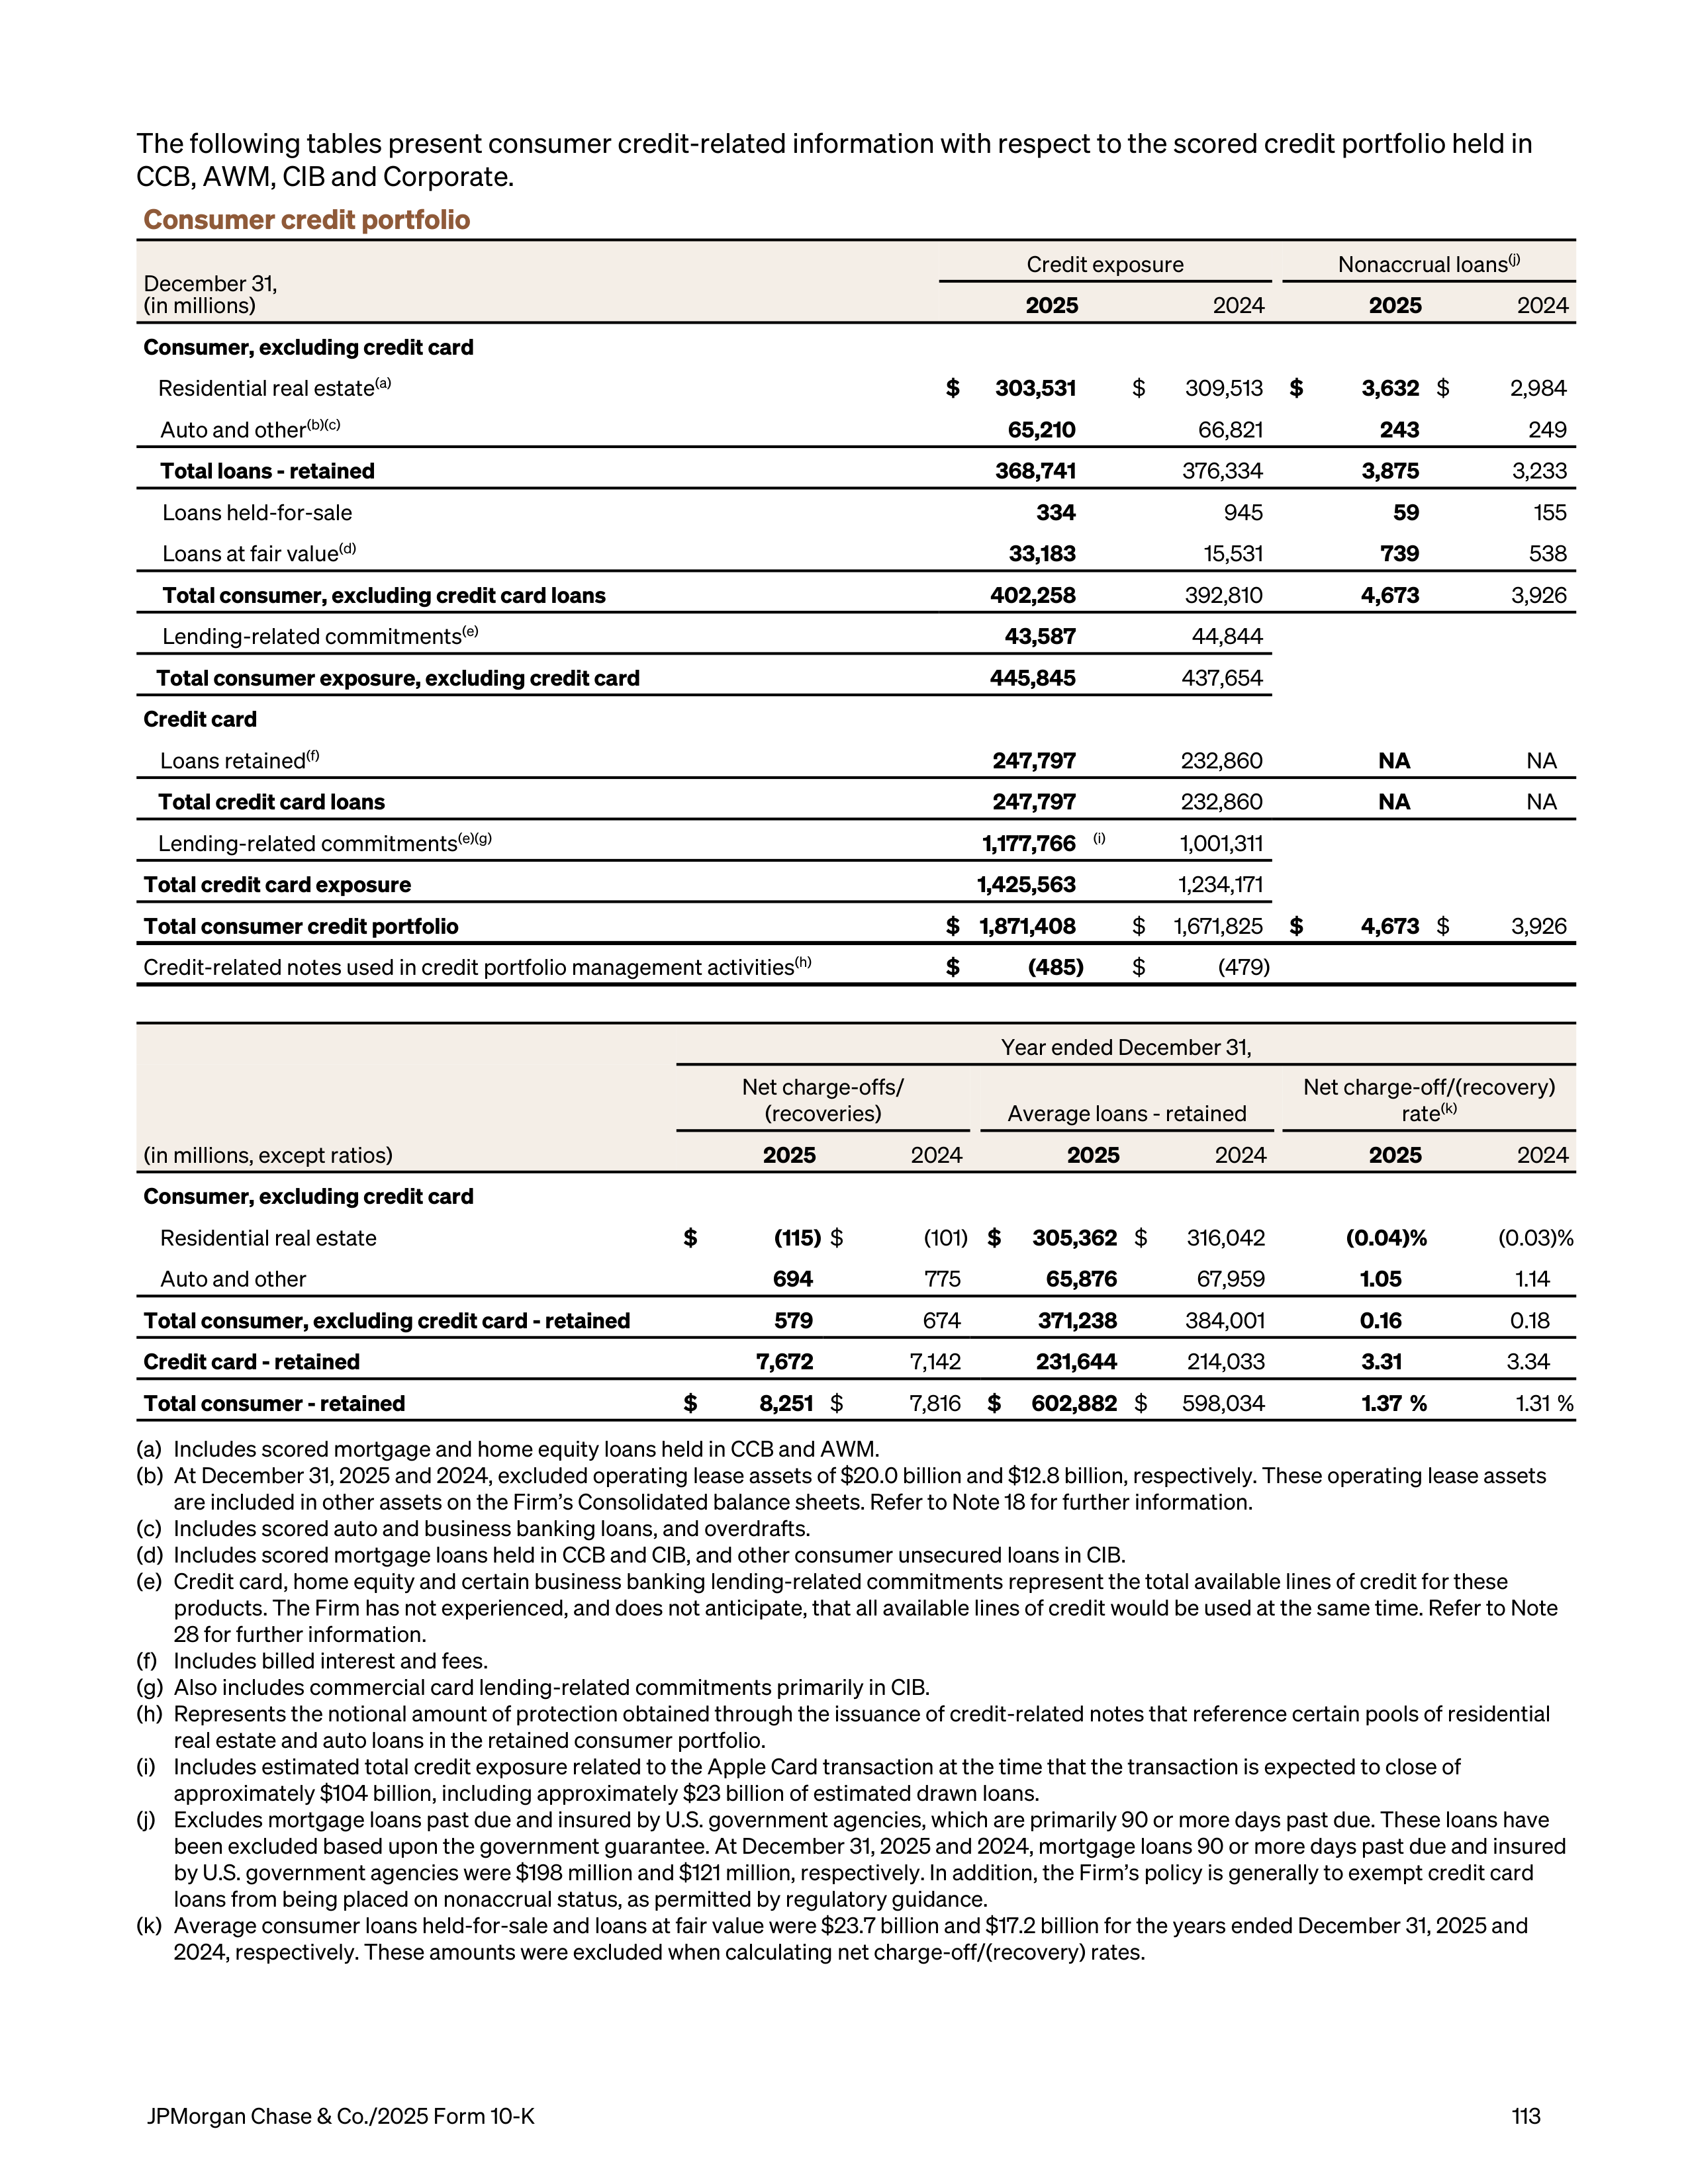
The following tables present consumer credit-related information with respect to the scored credit portfolio held in
CCB, AWM, CIB and Corporate.
Consumer credit portfolio
December 31,
(in millions)
Credit exposure
Nonaccrual loans
(j)
2025
2024
2025
2024
Consumer, excluding credit card
Residential real estate
(a)
$
303,531
$
309,513
$
3,632
$
2,984
Auto and other
(b)(c)
65,210
66,821
243
249
Total loans - retained
368,741
376,334
3,875
3,233
Loans held-for-sale
334
945
59
155
Loans at fair value
(d)
33,183
15,531
739
538
Total consumer, excluding credit card loans
402,258
392,810
4,673
3,926
Lending-related commitments
(e)
43,587
44,844
Total consumer exposure, excluding credit card
445,845
437,654
Credit card
Loans retained
(f)
247,797
232,860
NA
NA
Total credit card loans
247,797
232,860
NA
NA
Lending-related commitments
(e)(g)
1,177,766
(i)
1,001,311
Total credit card exposure
1,425,563
1,234,171
Total consumer credit portfolio
$ 1,871,408
$
1,671,825
$
4,673
$
3,926
Credit-related notes used in credit portfolio management activities
(h)
$
(485)
$
(479)
Year ended December 31,
(in millions, except ratios)
Net charge-offs/
(recoveries)
Average loans - retained
Net charge-off/(recovery)
rate
(k)
2025
2024
2025
2024
2025
2024
Consumer, excluding credit card
Residential real estate
$
(115)
$
(101)
$
305,362
$
316,042
(0.04) %
(0.03) %
Auto and other
694
775
65,876
67,959
1.05
1.14
Total consumer, excluding credit card - retained
579
674
371,238
384,001
0.16
0.18
Credit card - retained
7,672
7,142
231,644
214,033
3.31
3.34
Total consumer - retained
$
8,251
$
7,816
$
602,882
$
598,034
1.37 %
1.31 %
(a)
Includes scored mortgage and home equity loans held in CCB and AWM.
(b)
At December 31, 2025 and 2024, excluded operating lease assets of $20.0 billion and $12.8 billion, respectively. These operating lease assets
are included in other assets on the Firm’s Consolidated balance sheets. Refer to Note 18 for further information.
(c)
Includes scored auto and business banking loans, and overdrafts.
(d)
Includes scored mortgage loans held in CCB and CIB, and other consumer unsecured loans in CIB.
(e)
Credit card, home equity and certain business banking lending-related commitments represent the total available lines of credit for these
products. The Firm has not experienced, and does not anticipate, that all available lines of credit would be used at the same time. Refer to Note
28 for further information.
(f)
Includes billed interest and fees.
(g)
Also includes commercial card lending-related commitments primarily in CIB.
(h)
Represents the notional amount of protection obtained through the issuance of credit-related notes that reference certain pools of residential
real estate and auto loans in the retained consumer portfolio.
(i)
Includes estimated total credit exposure related to the Apple Card transaction at the time that the transaction is expected to close of
approximately $104 billion, including approximately $23 billion of estimated drawn loans.
(j)
Excludes mortgage loans past due and insured by U.S. government agencies, which are primarily 90 or more days past due. These loans have
been excluded based upon the government guarantee. At December 31, 2025 and 2024, mortgage loans 90 or more days past due and insured
by U.S. government agencies were $198 million and $121 million, respectively. In addition, the Firm’s policy is generally to exempt credit card
loans from being placed on nonaccrual status, as permitted by regulatory guidance.
(k)
Average consumer loans held-for-sale and loans at fair value were $23.7 billion and $17.2 billion for the years ended December 31, 2025 and
2024, respectively. These amounts were excluded when calculating net charge-off/(recovery) rates.
JPMorgan Chase & Co./2025 Form 10-K
113
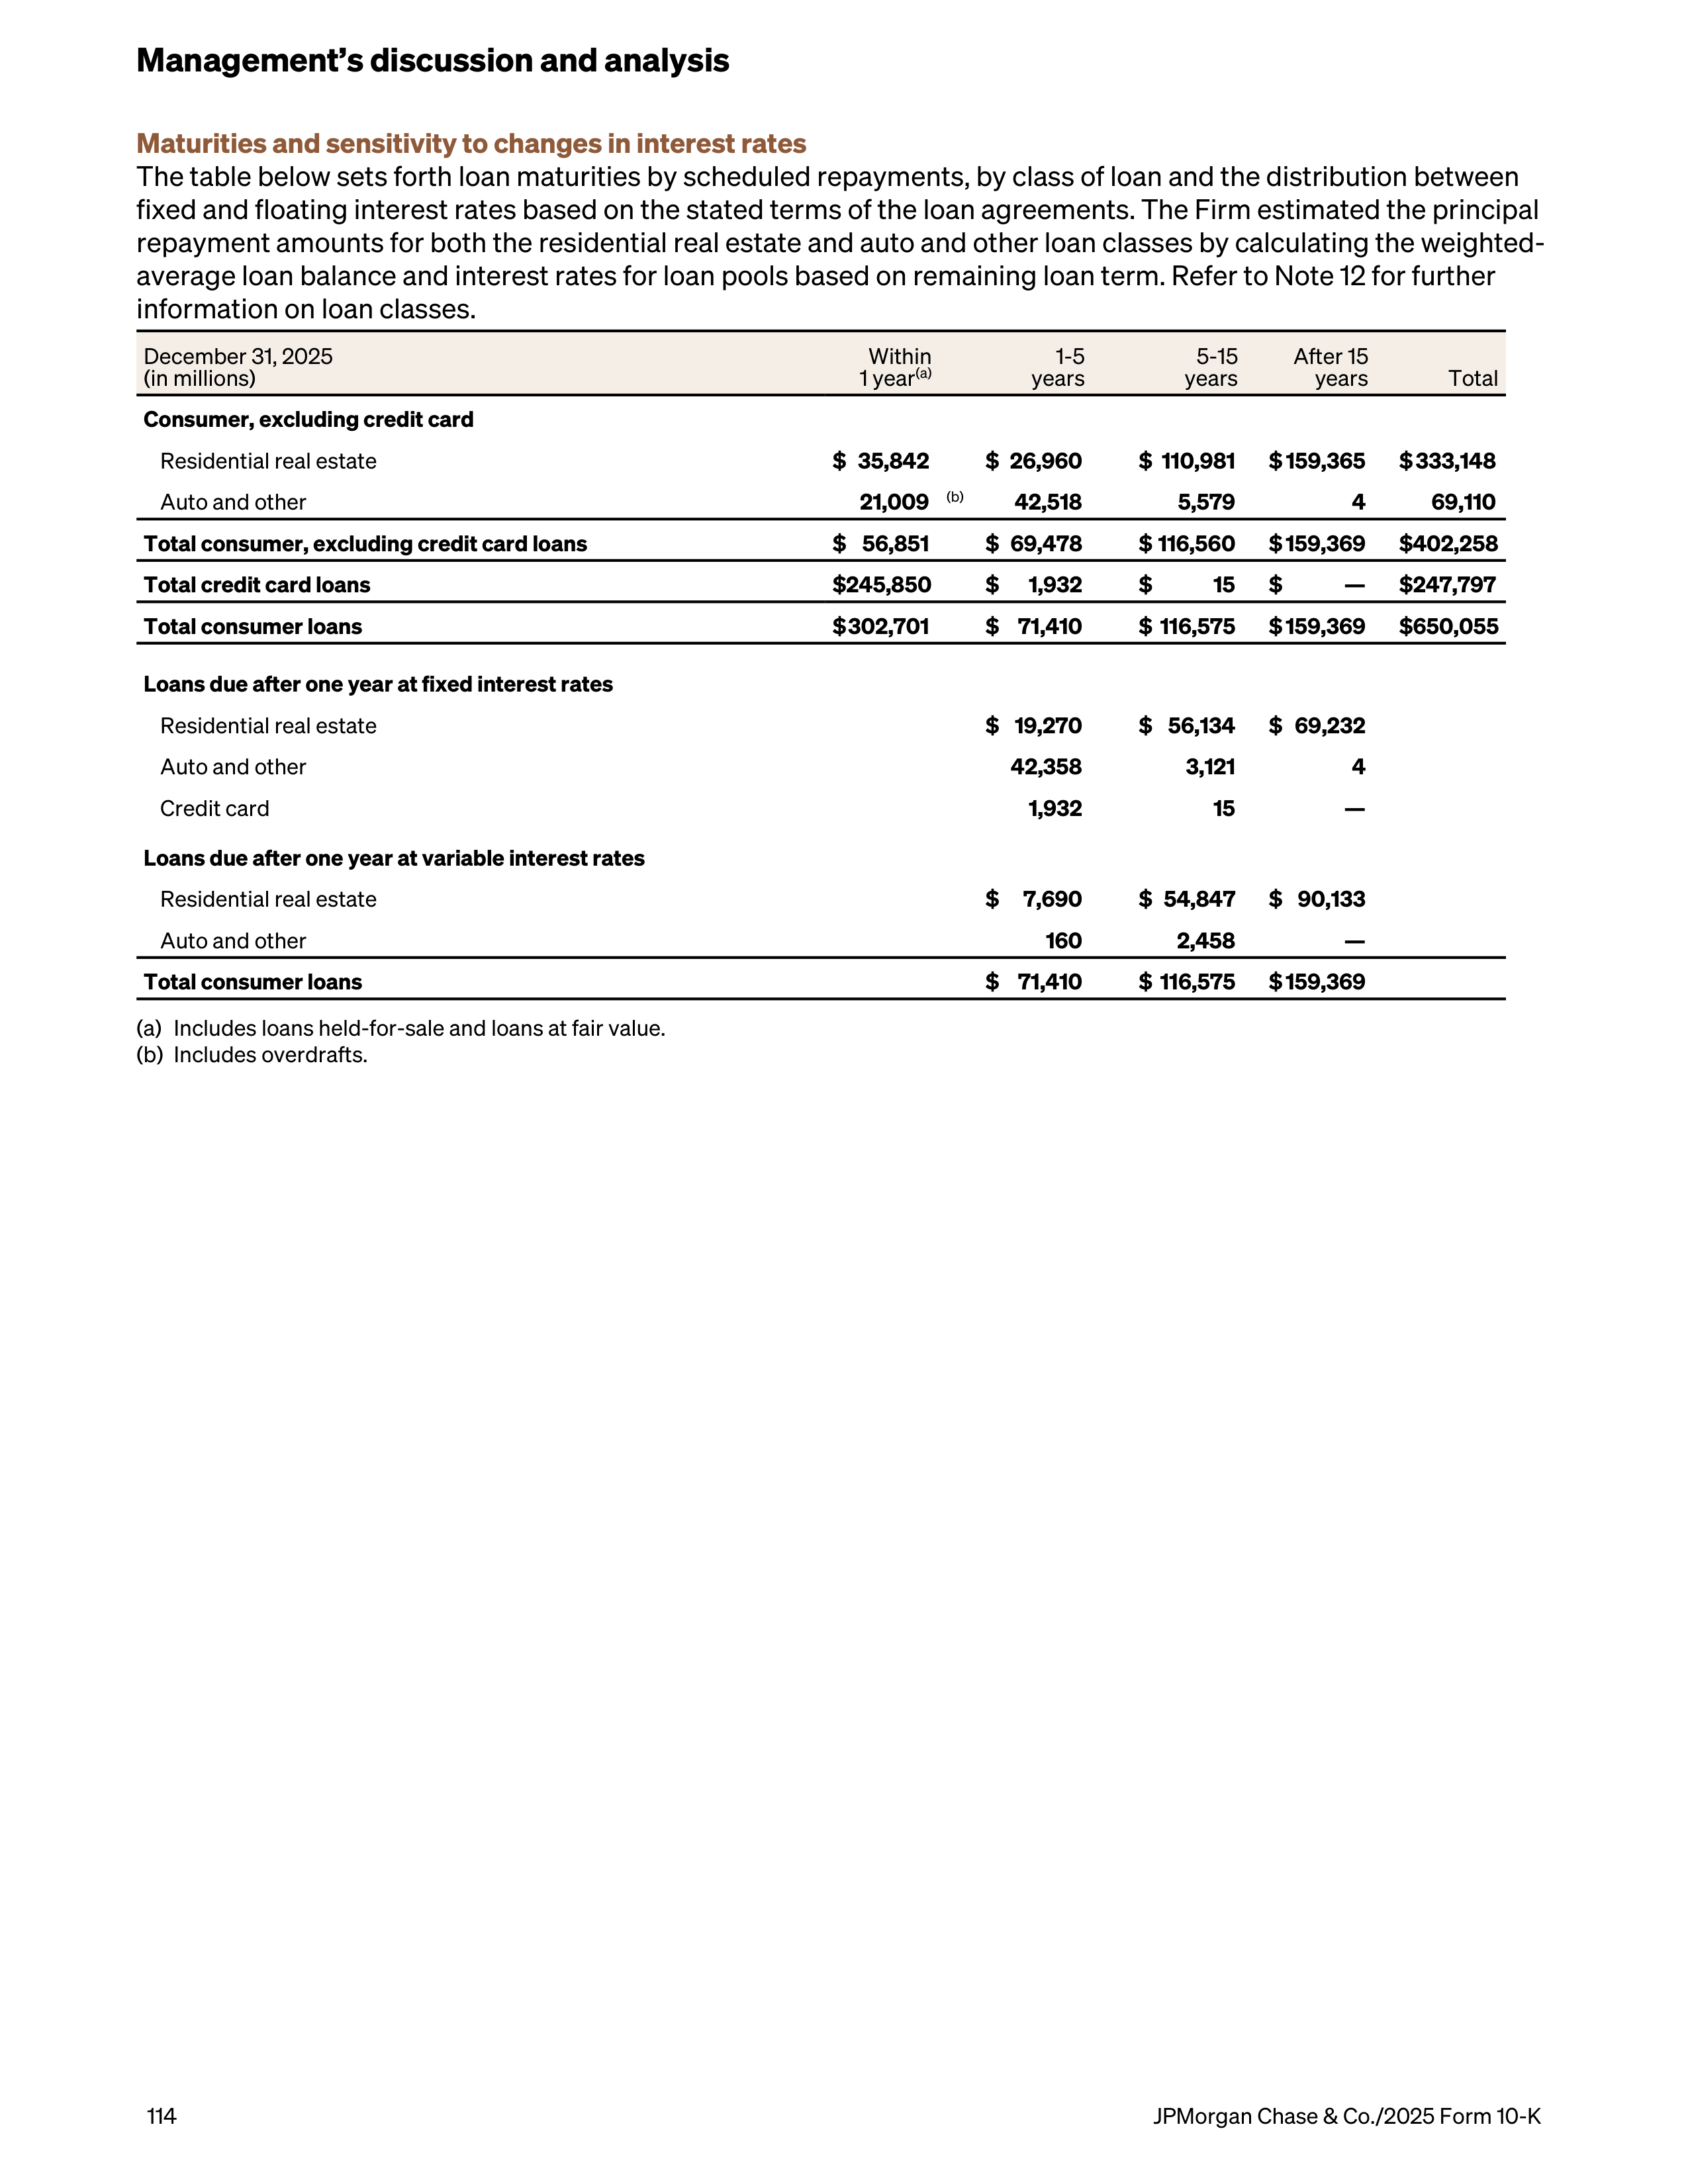
Maturities and sensitivity to changes in interest rates
The table below sets forth loan maturities by scheduled repayments, by class of loan and the distribution between
fixed and floating interest rates based on the stated terms of the loan agreements. The Firm estimated the principal
repayment amounts for both the residential real estate and auto and other loan classes by calculating the weighted-
average loan balance and interest rates for loan pools based on remaining loan term. Refer to Note 12 for further
information on loan classes.
December 31, 2025
(in millions)
Within
1 year
(a)
1-5
years
5-15
years
After 15
years
Total
Consumer, excluding credit card
Residential real estate
$ 35,842
$ 26,960
$ 110,981
$ 159,365
$ 333,148
Auto and other
21,009
(b)
42,518
5,579
4
69,110
Total consumer, excluding credit card loans
$ 56,851
$ 69,478
$ 116,560
$ 159,369
$ 402,258
Total credit card loans
$ 245,850
$
1,932
$
15
$
—
$ 247,797
Total consumer loans
$ 302,701
$ 71,410
$ 116,575
$ 159,369
$ 650,055
Loans due after one year at fixed interest rates
Residential real estate
$ 19,270
$ 56,134
$ 69,232
Auto and other
42,358
3,121
4
Credit card
1,932
15
—
Loans due after one year at variable interest rates
Residential real estate
$
7,690
$ 54,847
$ 90,133
Auto and other
160
2,458
—
Total consumer loans
$ 71,410
$ 116,575
$ 159,369
(a)
Includes loans held-for-sale and loans at fair value.
(b)
Includes overdrafts.
Management’s discussion and analysis
114
JPMorgan Chase & Co./2025 Form 10-K
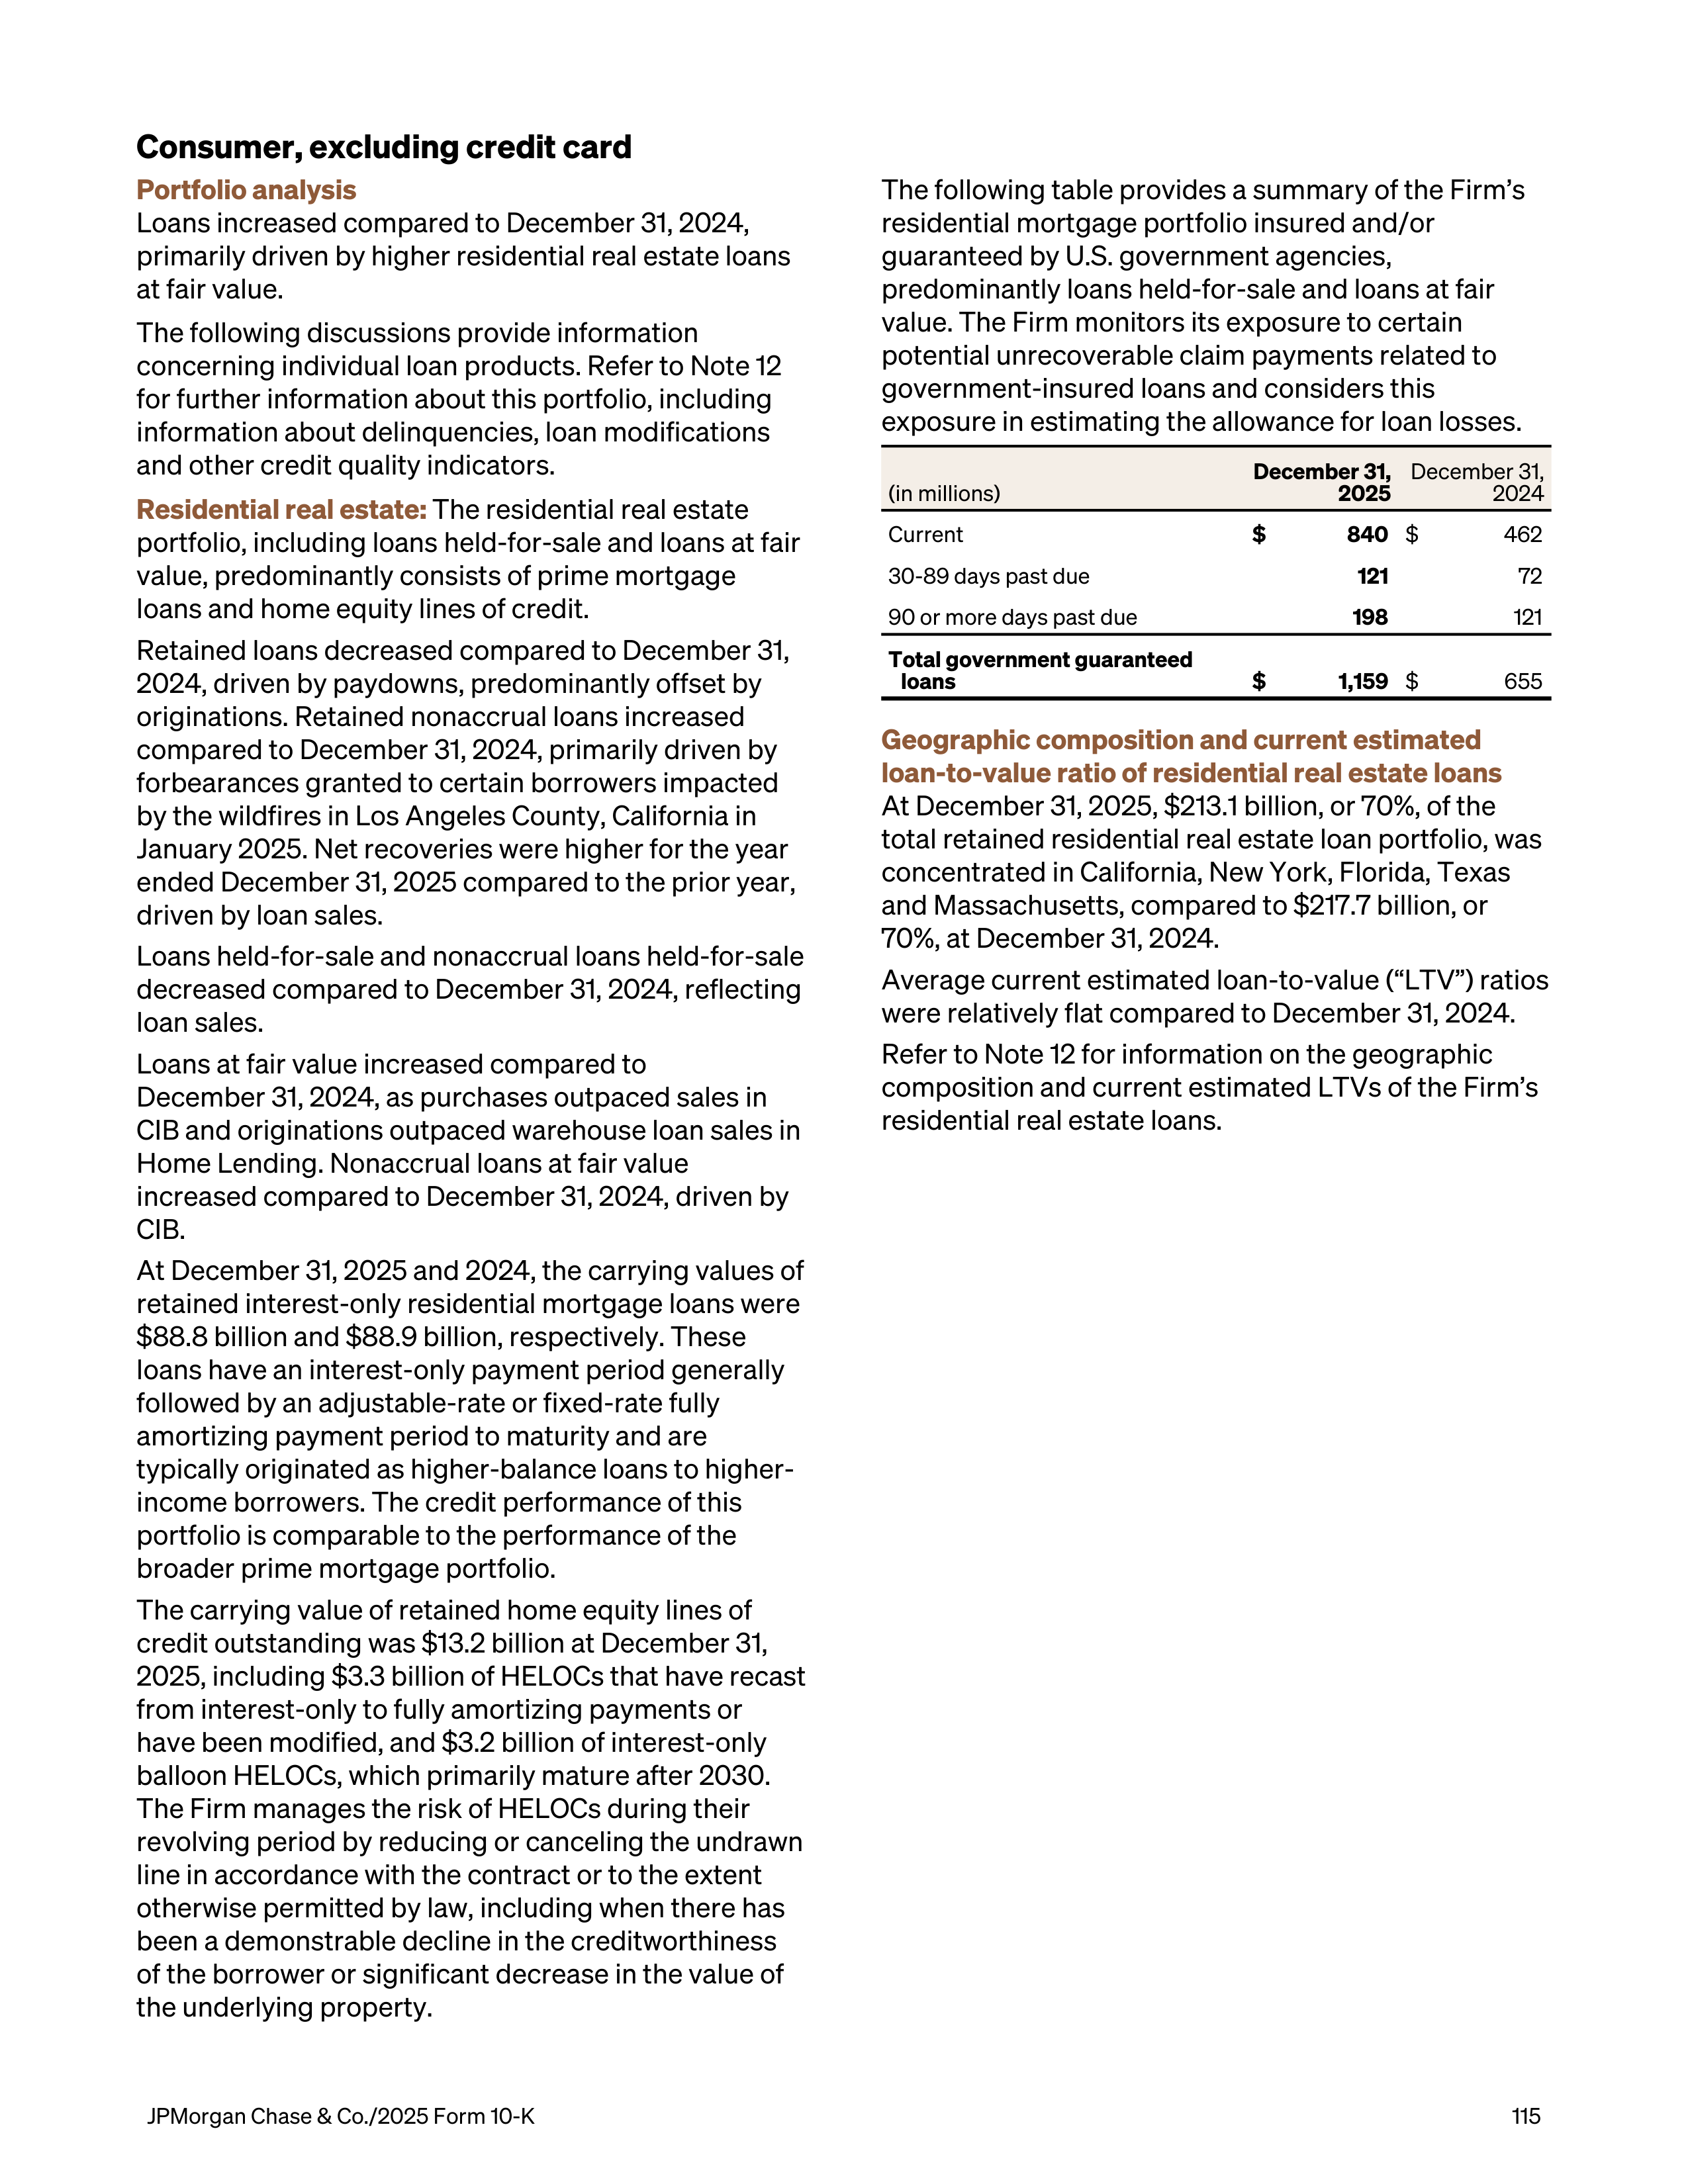
Consumer, excluding credit card
Portfolio analysis
Loans increased compared to December 31, 2024,
primarily driven by higher residential real estate loans
at fair value.
The following discussions provide information
concerning individual loan products. Refer to Note 12
for further information about this portfolio, including
information about delinquencies, loan modifications
and other credit quality indicators.
Residential real estate:
The residential real estate
portfolio, including loans held-for-sale and loans at fair
value, predominantly consists of prime mortgage
loans and home equity lines of credit.
Retained loans decreased compared to December 31,
2024, driven by paydowns, predominantly offset by
originations. Retained nonaccrual loans increased
compared to December 31, 2024, primarily driven by
forbearances granted to certain borrowers impacted
by the wildfires in Los Angeles County, California in
January 2025. Net recoveries were higher for the year
ended December 31, 2025 compared to the prior year,
driven by loan sales.
Loans held-for-sale and nonaccrual loans held-for-sale
decreased compared to December 31, 2024, reflecting
loan sales.
Loans at fair value increased compared to
December 31, 2024, as purchases outpaced sales in
CIB and originations outpaced warehouse loan sales in
Home Lending. Nonaccrual loans at fair value
increased compared to December 31, 2024, driven by
CIB.
At December 31, 2025 and 2024, the carrying values of
retained interest-only residential mortgage loans were
$88.8 billion and $88.9 billion, respectively. These
loans have an interest-only payment period generally
followed by an adjustable-rate or fixed-rate fully
amortizing payment period to maturity and are
typically originated as higher-balance loans to higher-
income borrowers. The credit performance of this
portfolio is comparable to the performance of the
broader prime mortgage portfolio.
The carrying value of retained home equity lines of
credit outstanding was $13.2 billion at December 31,
2025, including $3.3 billion of HELOCs that have recast
from interest-only to fully amortizing payments or
have been modified, and $3.2 billion of interest-only
balloon HELOCs, which primarily mature after 2030.
The Firm manages the risk of HELOCs during their
revolving period by reducing or canceling the undrawn
line in accordance with the contract or to the extent
otherwise permitted by law, including when there has
been a demonstrable decline in the creditworthiness
of the borrower or significant decrease in the value of
the underlying property.
The following table provides a summary of the Firm’s
residential mortgage portfolio insured and/or
guaranteed by U.S. government agencies,
predominantly loans held-for-sale and loans at fair
value. The Firm monitors its exposure to certain
potential unrecoverable claim payments related to
government-insured loans and considers this
exposure in estimating the allowance for loan losses.
(in millions)
December 31,
2025
December 31,
2024
Current
$
840
$
462
30-89 days past due
121
72
90 or more days past due
198
121
Total government guaranteed
loans
$
1,159
$
655
Geographic composition and current estimated
loan-to-value ratio of residential real estate loans
At December 31, 2025, $213.1 billion, or 70%, of the
total retained residential real estate loan portfolio, was
concentrated in California, New York, Florida, Texas
and Massachusetts, compared to $217.7 billion, or
70%, at December 31, 2024.
Average current estimated loan-to-value (“LTV”) ratios
were relatively flat compared to December 31, 2024.
Refer to Note 12 for information on the geographic
composition and current estimated LTVs of the Firm’s
residential real estate loans.
JPMorgan Chase & Co./2025 Form 10-K
115
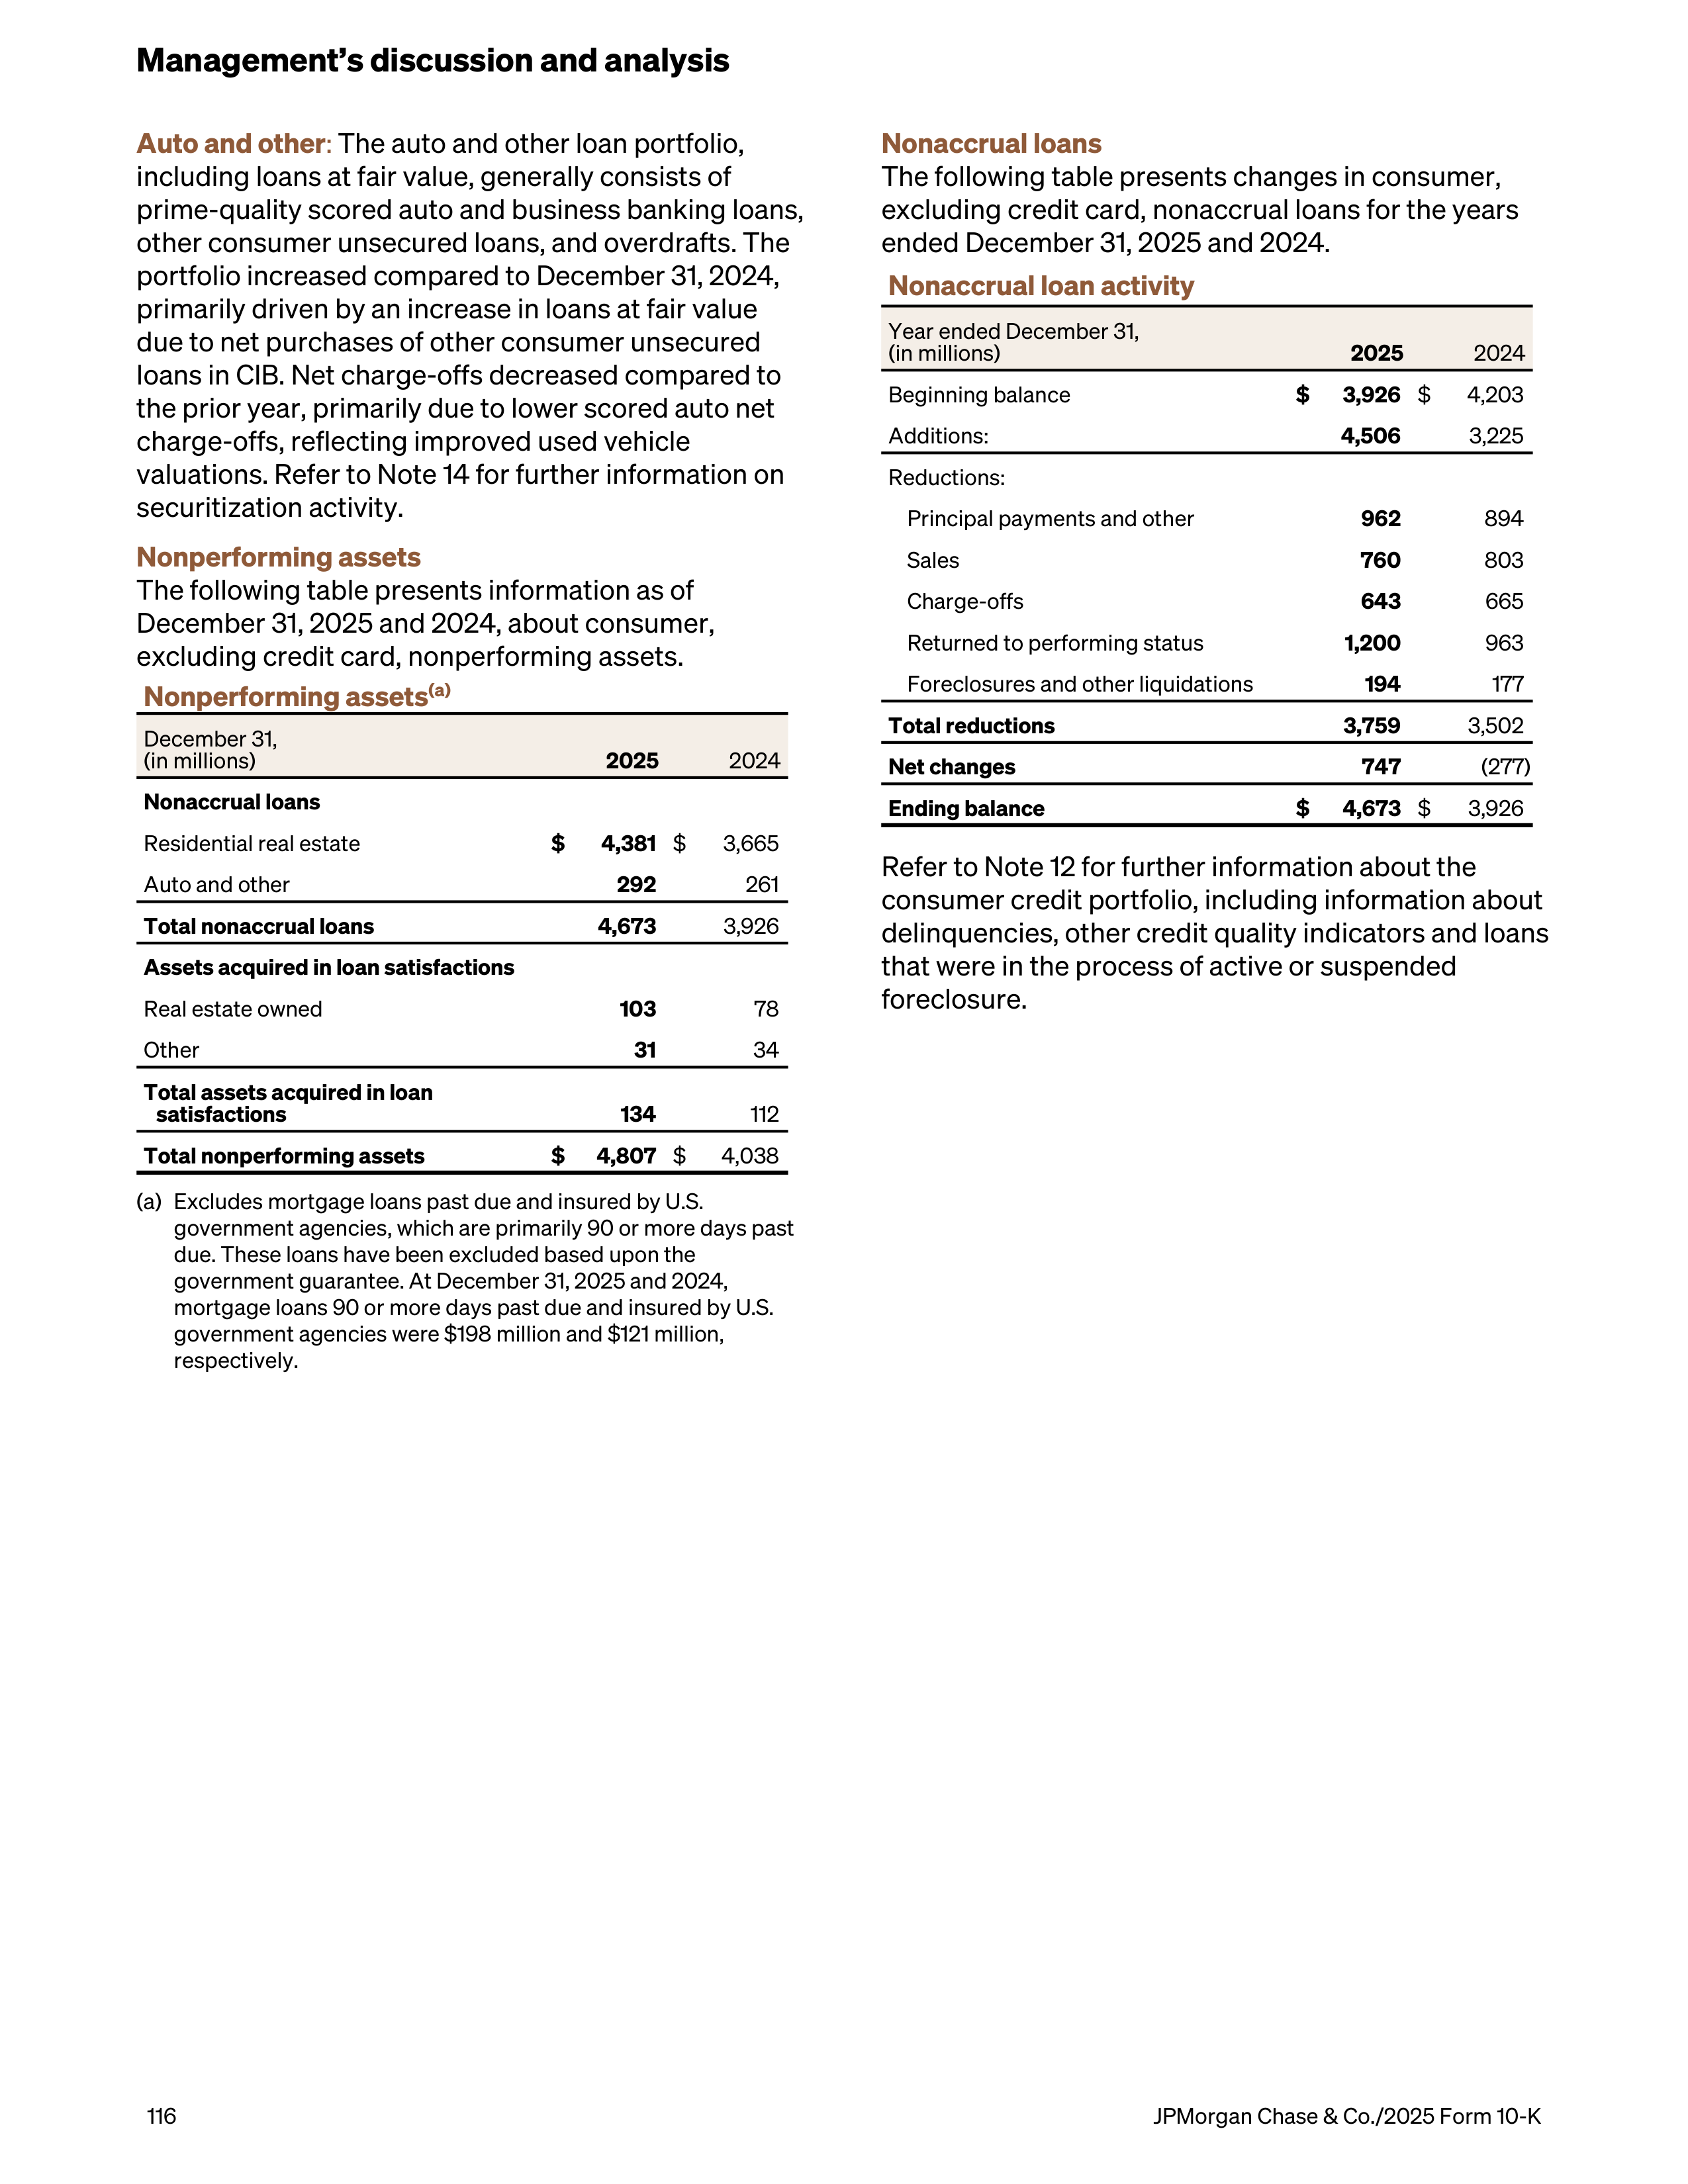
Auto and other
:
The auto and other loan portfolio,
including loans at fair value, generally consists of
prime-quality scored auto and business banking loans,
other consumer unsecured loans, and overdrafts. The
portfolio increased compared to December 31, 2024,
primarily driven by an increase in loans at fair value
due to net purchases of other consumer unsecured
loans in CIB. Net charge-offs decreased compared to
the prior year, primarily due to lower scored auto net
charge-offs, reflecting improved used vehicle
valuations. Refer to Note 14 for further information on
securitization activity.
Nonperforming assets
The following table presents information as of
December 31, 2025 and 2024, about consumer,
excluding credit card, nonperforming assets.
Nonperforming assets
(a)
December 31,
(in millions)
2025
2024
Nonaccrual loans
Residential real estate
$
4,381
$
3,665
Auto and other
292
261
Total nonaccrual loans
4,673
3,926
Assets acquired in loan satisfactions
Real estate owned
103
78
Other
31
34
Total assets acquired in loan
satisfactions
134
112
Total nonperforming assets
$
4,807
$
4,038
(a)
Excludes mortgage loans past due and insured by U.S.
government agencies, which are primarily 90 or more days past
due. These loans have been excluded based upon the
government guarantee. At December 31, 2025 and 2024,
mortgage loans 90 or more days past due and insured by U.S.
government agencies were $198 million and $121 million,
respectively.
Nonaccrual loans
The following table presents changes in consumer,
excluding credit card, nonaccrual loans for the years
ended December 31, 2025 and 2024.
Nonaccrual loan activity
Year ended December 31,
(in millions)
2025
2024
Beginning balance
$
3,926
$
4,203
Additions:
4,506
3,225
Reductions:
Principal payments and other
962
894
Sales
760
803
Charge-offs
643
665
Returned to performing status
1,200
963
Foreclosures and other liquidations
194
177
Total reductions
3,759
3,502
Net changes
747
(277)
Ending balance
$
4,673
$
3,926
Refer to Note 12 for further information about the
consumer credit portfolio, including information about
delinquencies, other credit quality indicators and loans
that were in the process of active or suspended
foreclosure.
Management’s discussion and analysis
116
JPMorgan Chase & Co./2025 Form 10-K
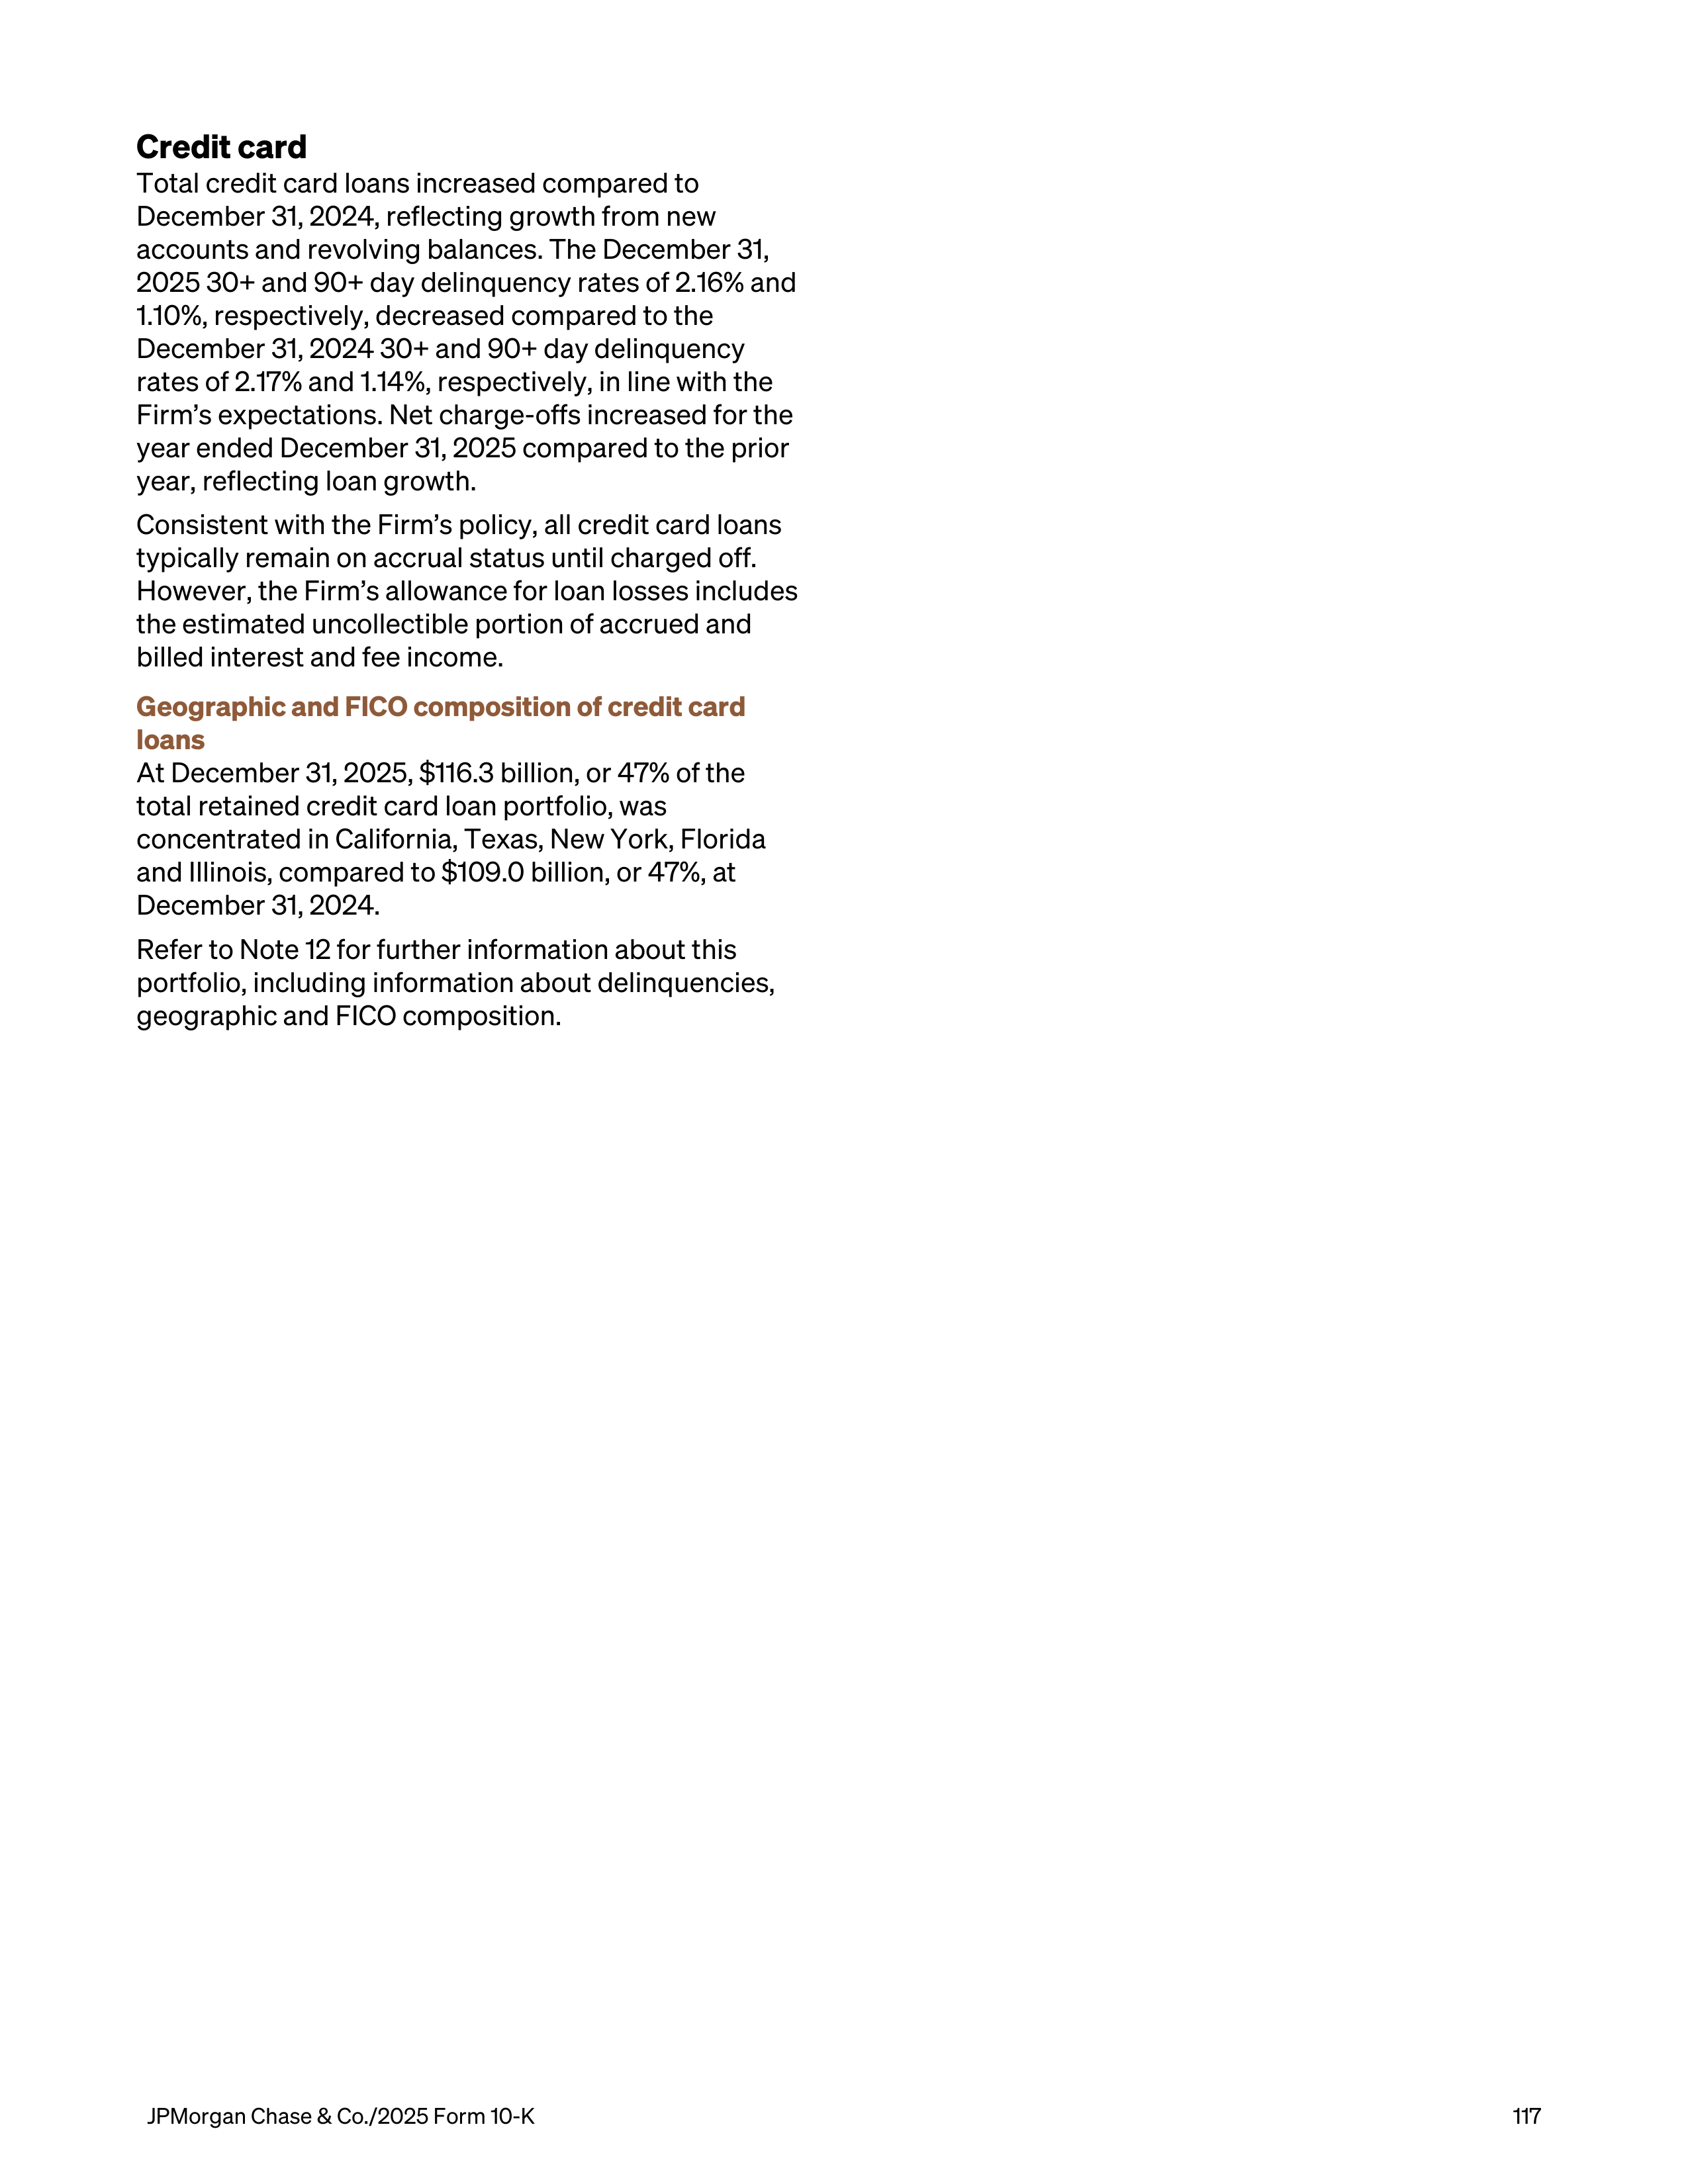
Credit card
Total credit card loans increased compared to
December 31, 2024, reflecting growth from new
accounts and revolving balances. The December 31,
2025 30+ and 90+ day delinquency rates of 2.16% and
1.10%, respectively, decreased compared to the
December 31, 2024 30+ and 90+ day delinquency
rates of 2.17% and 1.14%, respectively, in line with the
Firm’s expectations. Net charge-offs increased for the
year ended December 31, 2025 compared to the prior
year, reflecting loan growth.
Consistent with the Firm’s policy, all credit card loans
typically remain on accrual status until charged off.
However, the Firm’s allowance for loan losses includes
the estimated uncollectible portion of accrued and
billed interest and fee income.
Geographic and FICO composition of credit card
loans
At December 31, 2025, $116.3 billion, or 47% of the
total retained credit card loan portfolio, was
concentrated in California, Texas, New York, Florida
and Illinois, compared to $109.0 billion, or 47%, at
December 31, 2024.
Refer to Note 12 for further information about this
portfolio, including information about delinquencies,
geographic and FICO composition.
JPMorgan Chase & Co./2025 Form 10-K
117
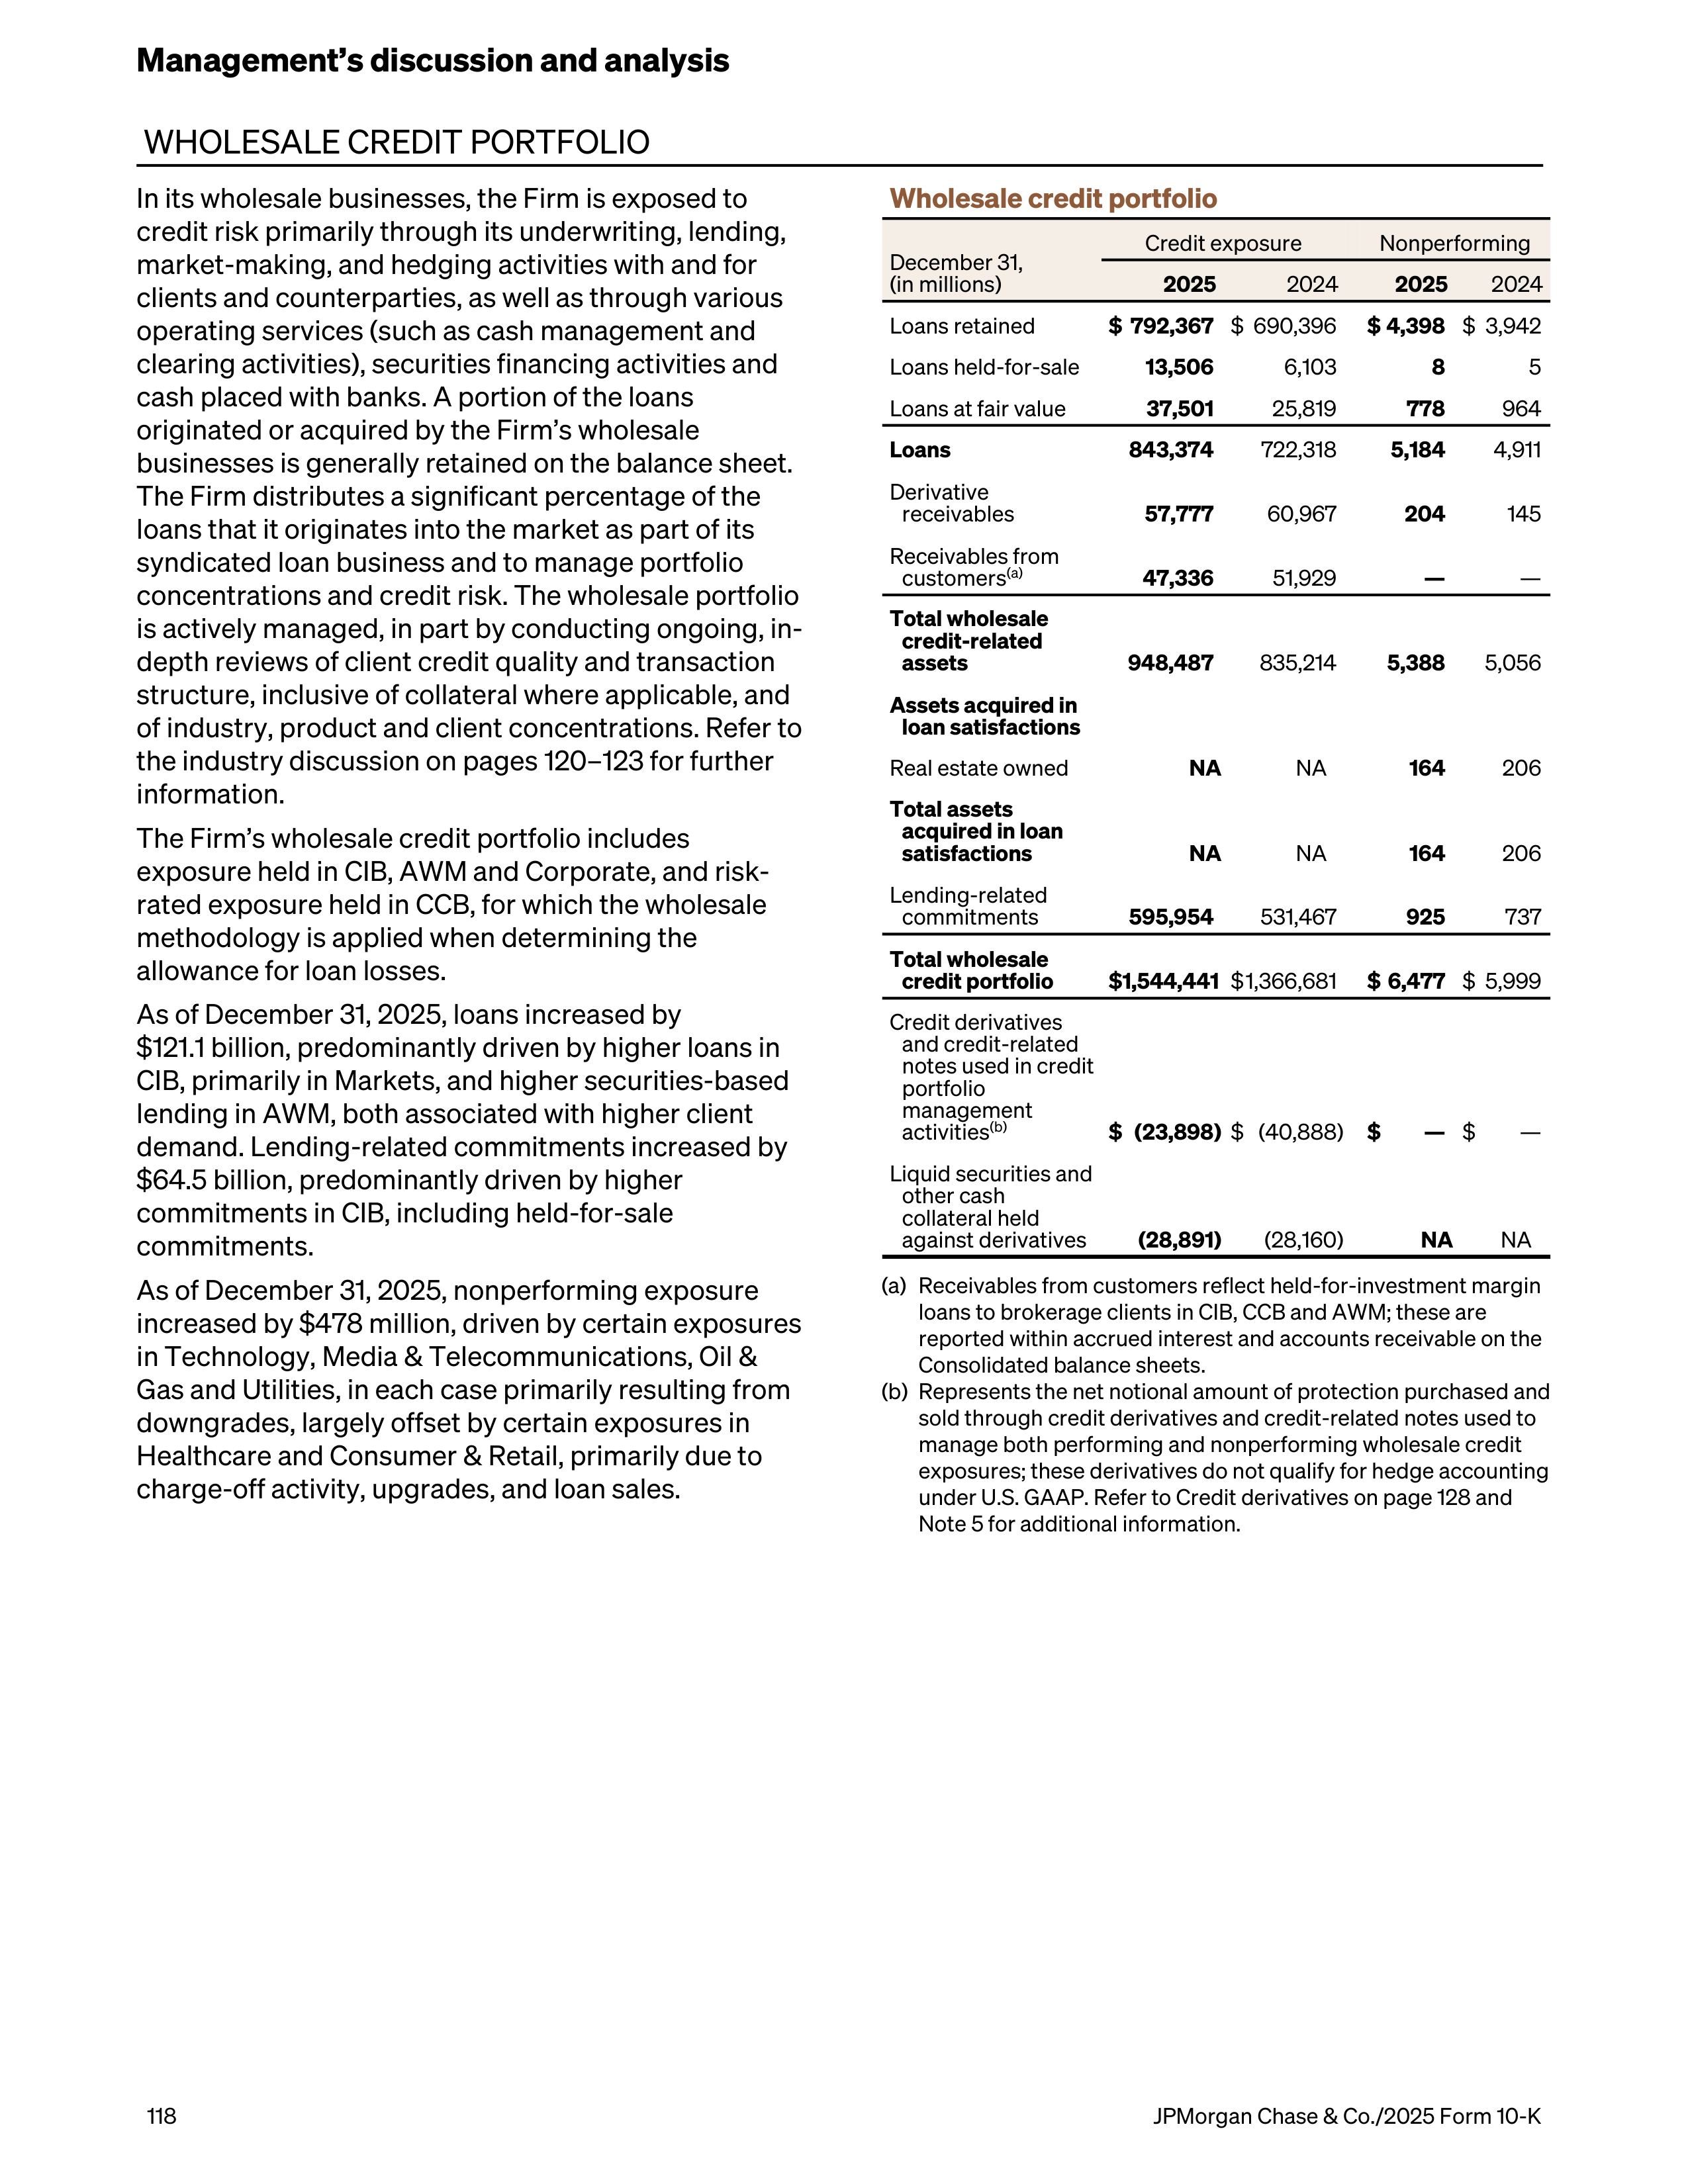
WHOLESALE CREDIT PORTFOLIO
In its wholesale businesses, the Firm is exposed to
credit risk primarily through its underwriting, lending,
market-making, and hedging activities with and for
clients and counterparties, as well as through various
operating services (such as cash management and
clearing activities), securities financing activities and
cash placed with banks. A portion of the loans
originated or acquired by the Firm’s wholesale
businesses is generally retained on the balance sheet.
The Firm distributes a significant percentage of the
loans that it originates into the market as part of its
syndicated loan business and to manage portfolio
concentrations and credit risk. The wholesale portfolio
is actively managed, in part by conducting ongoing, in-
depth reviews of client credit quality and transaction
structure, inclusive of collateral where applicable, and
of industry, product and client concentrations. Refer to
the industry discussion on pages 120–123 for further
information.
The Firm’s wholesale credit portfolio includes
exposure held in CIB, AWM and Corporate, and risk-
rated exposure held in CCB, for which the wholesale
methodology is applied when determining the
allowance for loan losses.
As of December 31, 2025, loans increased by
$121.1 billion, predominantly driven by higher loans in
CIB, primarily in Markets, and higher securities-based
lending in AWM, both associated with higher client
demand. Lending-related commitments increased by
$64.5 billion, predominantly driven by higher
commitments in CIB, including held-for-sale
commitments.
As of December 31, 2025, nonperforming exposure
increased by $478 million, driven by certain exposures
in Technology, Media & Telecommunications, Oil &
Gas and Utilities, in each case primarily resulting from
downgrades, largely offset by certain exposures in
Healthcare and Consumer & Retail, primarily due to
charge-off activity, upgrades, and loan sales.
Wholesale credit portfolio
December 31,
(in millions)
Credit exposure
Nonperforming
2025
2024
2025
2024
Loans retained
$ 792,367
$ 690,396
$ 4,398
$ 3,942
Loans held-for-sale
13,506
6,103
8
5
Loans at fair value
37,501
25,819
778
964
Loans
843,374
722,318
5,184
4,911
Derivative
receivables
57,777
60,967
204
145
Receivables from
customers
(a)
47,336
51,929
—
—
Total wholesale
credit-related
assets
948,487
835,214
5,388
5,056
Assets acquired in
loan satisfactions
Real estate owned
NA
NA
164
206
Total
assets
acquired in loan
satisfactions
NA
NA
164
206
Lending-related
commitments
595,954
531,467
925
737
Total wholesale
credit portfolio
$ 1,544,441
$ 1,366,681
$ 6,477
$ 5,999
Credit derivatives
and credit-related
notes used in credit
portfolio
management
activities
(b)
$ (23,898)
$ (40,888)
$
—
$
—
Liquid securities and
other cash
collateral held
against derivatives
(28,891)
(28,160)
NA
NA
(a)
Receivables from customers reflect held-for-investment margin
loans to brokerage clients in CIB, CCB and AWM; these are
reported within accrued interest and accounts receivable on the
Consolidated balance sheets.
(b)
Represents the net notional amount of protection purchased and
sold through credit derivatives and credit-related notes used to
manage both performing and nonperforming wholesale credit
exposures; these derivatives do not qualify for hedge accounting
under U.S. GAAP. Refer to Credit derivatives on page 128 and
Note 5 for additional information.
Management’s discussion and analysis
118
JPMorgan Chase & Co./2025 Form 10-K
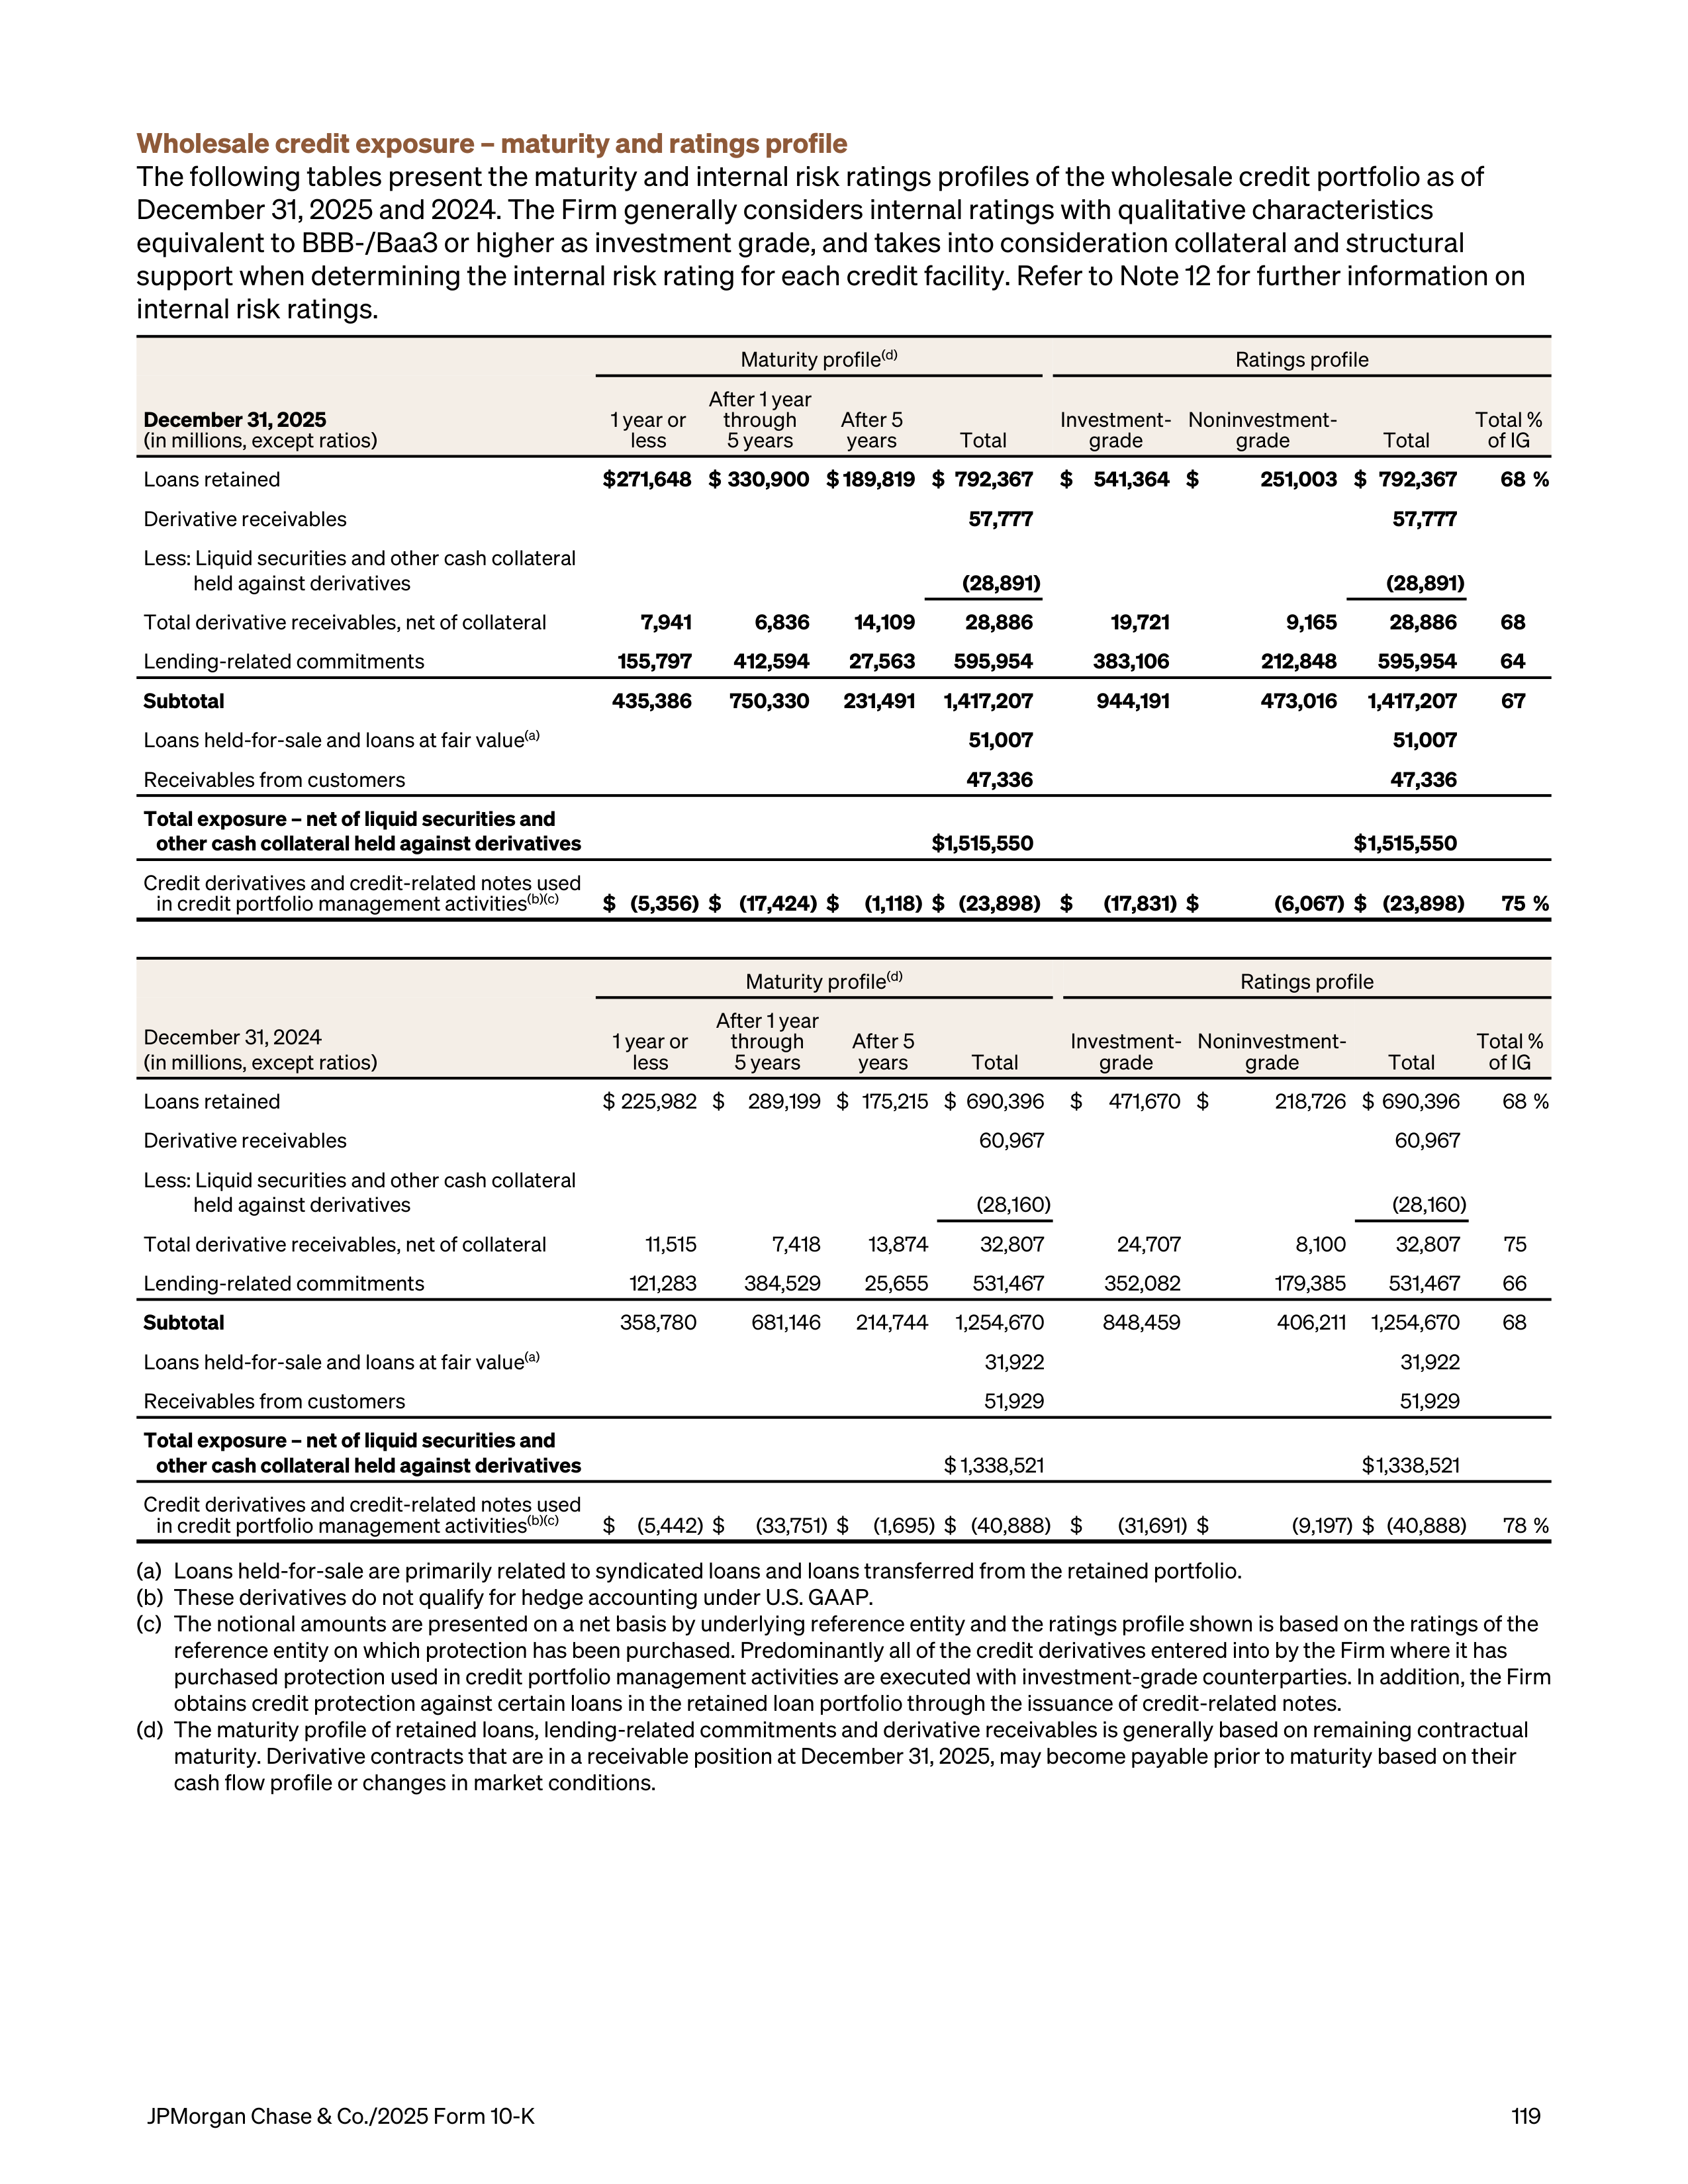
Wholesale credit exposure – maturity and ratings profile
The following tables present the maturity and internal risk ratings profiles of the wholesale credit portfolio as of
December 31, 2025 and 2024. The Firm generally considers internal ratings with qualitative characteristics
equivalent to BBB-/Baa3 or higher as investment grade, and takes into consideration collateral and structural
support when determining the internal risk rating for each credit facility. Refer to Note 12 for further information on
internal risk ratings.
Maturity profile
(d)
Ratings profile
December 31, 2025
(in millions, except ratios)
1 year or
less
After 1 year
through
5 years
After 5
years
Total
Investment-
grade
Noninvestment-
grade
Total
Total %
of IG
Loans retained
$ 271,648 $ 330,900 $ 189,819 $ 792,367
$
541,364 $
251,003 $ 792,367
68 %
Derivative receivables
57,777
57,777
Less: Liquid securities and other cash collateral
held against derivatives
(28,891)
(28,891)
Total derivative receivables, net of collateral
7,941
6,836
14,109
28,886
19,721
9,165
28,886
68
Lending-related commitments
155,797
412,594
27,563
595,954
383,106
212,848
595,954
64
Subtotal
435,386
750,330 231,491 1,417,207
944,191
473,016 1,417,207
67
Loans held-for-sale and loans at fair value
(a)
51,007
51,007
Receivables from customers
47,336
47,336
Total exposure – net of liquid securities and
other cash collateral held against derivatives
$ 1,515,550
$ 1,515,550
Credit derivatives and credit-related notes used
in credit portfolio management activities
(b)(c)
$ (5,356) $ (17,424) $
(1,118) $ (23,898) $
(17,831) $
(6,067) $ (23,898)
75 %
Maturity profile
(d)
Ratings profile
December 31, 2024
(in millions, except ratios)
1 year or
less
After 1 year
through
5 years
After 5
years
Total
Investment-
grade
Noninvestment-
grade
Total
Total %
of IG
Loans retained
$ 225,982 $
289,199 $ 175,215 $ 690,396
$
471,670 $
218,726 $ 690,396
68 %
Derivative receivables
60,967
60,967
Less: Liquid securities and other cash collateral
held against derivatives
(28,160)
(28,160)
Total derivative receivables, net of collateral
11,515
7,418
13,874
32,807
24,707
8,100
32,807
75
Lending-related commitments
121,283
384,529
25,655
531,467
352,082
179,385
531,467
66
Subtotal
358,780
681,146 214,744 1,254,670
848,459
406,211 1,254,670
68
Loans held-for-sale and loans at fair value
(a)
31,922
31,922
Receivables from customers
51,929
51,929
Total exposure – net of liquid securities and
other cash collateral held against derivatives
$ 1,338,521
$ 1,338,521
Credit derivatives and credit-related notes used
in credit portfolio management activities
(b)(c)
$
(5,442) $
(33,751) $
(1,695) $ (40,888) $
(31,691) $
(9,197) $ (40,888)
78 %
(a)
Loans held-for-sale are primarily related to syndicated loans and loans transferred from the retained portfolio.
(b)
These derivatives do not qualify for hedge accounting under U.S. GAAP.
(c)
The notional amounts are presented on a net basis by underlying reference entity and the ratings profile shown is based on the ratings of the
reference entity on which protection has been purchased. Predominantly all of the credit derivatives entered into by the Firm where it has
purchased protection used in credit portfolio management activities are executed with investment-grade counterparties. In addition, the Firm
obtains credit protection against certain loans in the retained loan portfolio through the issuance of credit-related notes.
(d)
The maturity profile of retained loans, lending-related commitments and derivative receivables is generally based on remaining contractual
maturity. Derivative contracts that are in a receivable position at December 31, 2025, may become payable prior to maturity based on their
cash flow profile or changes in market conditions.
JPMorgan Chase & Co./2025 Form 10-K
119
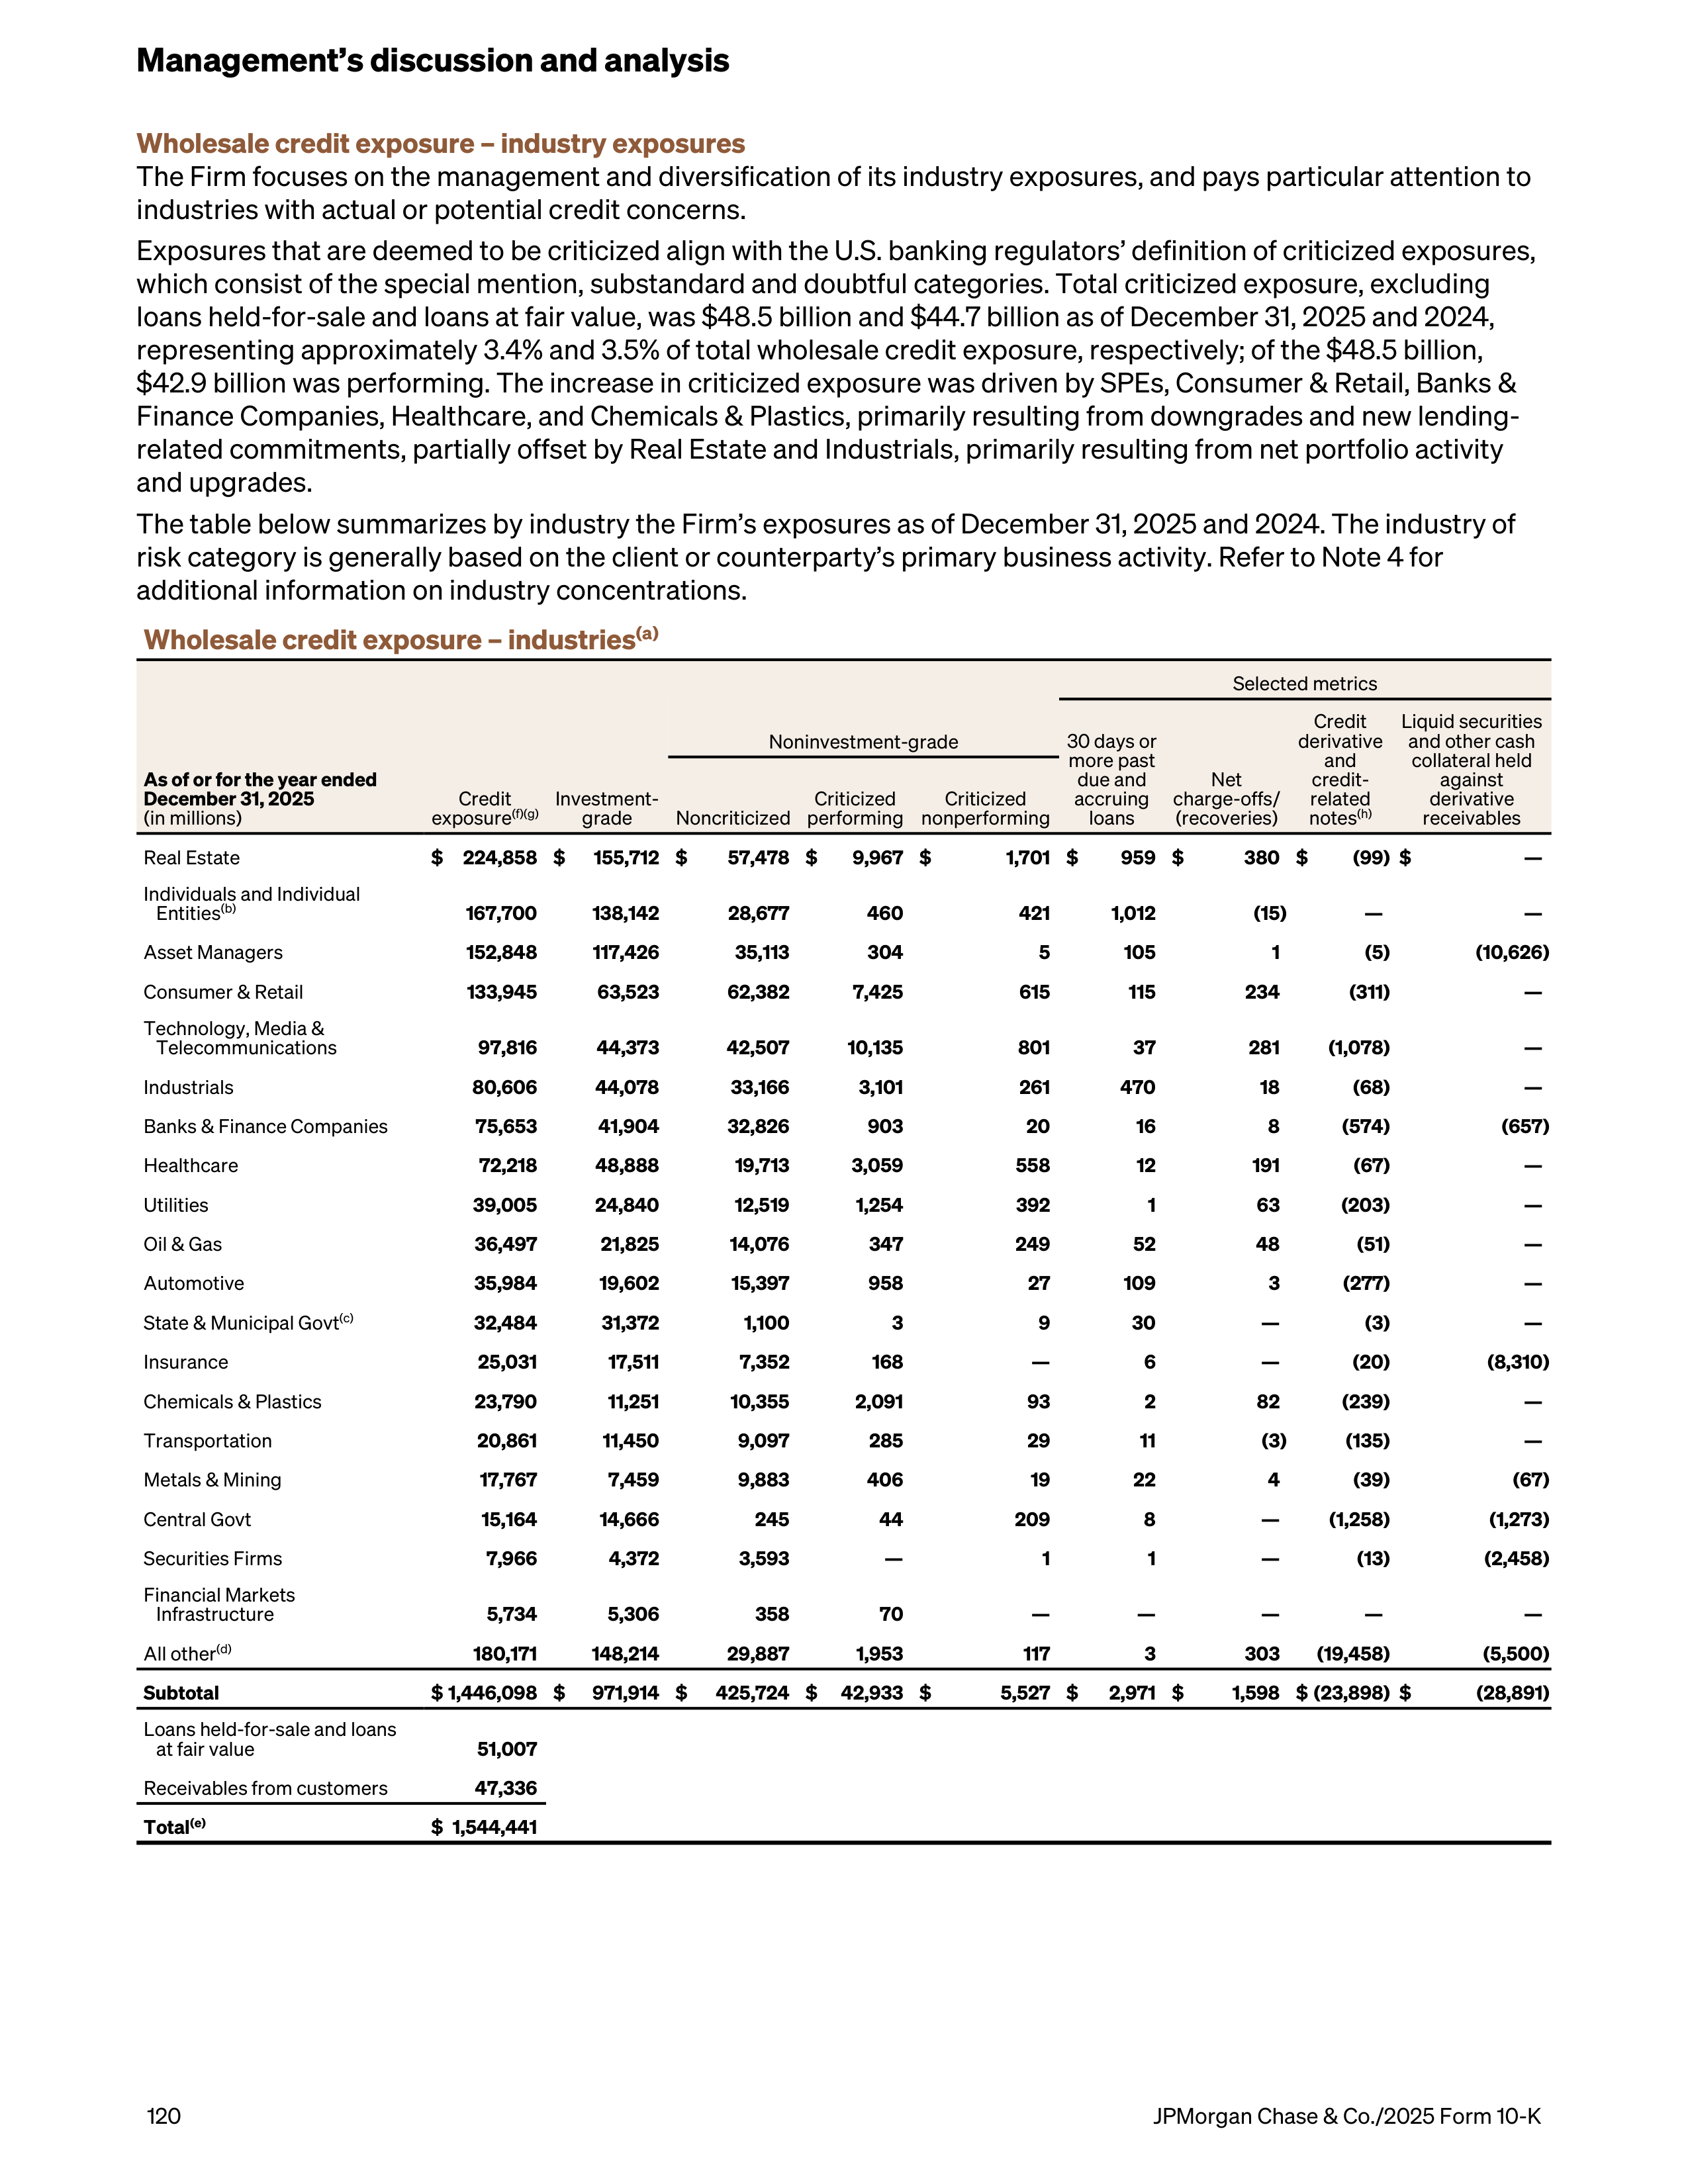
Wholesale credit exposure – industry exposures
The Firm focuses on the management and diversification of its industry exposures, and pays particular attention to
industries with actual or potential credit concerns.
Exposures that are deemed to be criticized align with the U.S. banking regulators’ definition of criticized exposures,
which consist of the special mention, substandard and doubtful categories. Total criticized exposure, excluding
loans held-for-sale and loans at fair value, was $48.5 billion and $44.7 billion as of December 31, 2025 and 2024,
representing approximately 3.4% and 3.5% of total wholesale credit exposure, respectively; of the $48.5 billion,
$42.9 billion was performing. The increase in criticized exposure was driven by SPEs, Consumer & Retail, Banks &
Finance Companies, Healthcare, and Chemicals & Plastics, primarily resulting from downgrades and new lending-
related commitments, partially offset by Real Estate and Industrials, primarily resulting from net portfolio activity
and upgrades.
The table below summarizes by industry the Firm’s exposures as of December 31, 2025 and 2024. The industry of
risk category is generally based on the client or counterparty’s primary business activity. Refer to Note 4 for
additional information on industry concentrations.
Wholesale credit exposure – industries
(a)
Selected metrics
Noninvestment-grade
30 days or
more past
due and
accruing
loans
Net
charge-offs/
(recoveries)
Credit
derivative
and
credit-
related
notes
(h)
Liquid securities
and other cash
collateral held
against
derivative
receivables
As of or for the year ended
December 31, 2025
(in millions)
Credit
exposure
(f)(g)
Investment-
grade
Noncriticized
Criticized
performing
Criticized
nonperforming
Real Estate
$
224,858 $
155,712 $
57,478 $
9,967 $
1,701 $
959 $
380 $
(99) $
—
Individuals and Individual
Entities
(b)
167,700
138,142
28,677
460
421
1,012
(15)
—
—
Asset Managers
152,848
117,426
35,113
304
5
105
1
(5)
(10,626)
Consumer & Retail
133,945
63,523
62,382
7,425
615
115
234
(311)
—
Technology, Media &
Telecommunications
97,816
44,373
42,507
10,135
801
37
281
(1,078)
—
Industrials
80,606
44,078
33,166
3,101
261
470
18
(68)
—
Banks & Finance Companies
75,653
41,904
32,826
903
20
16
8
(574)
(657)
Healthcare
72,218
48,888
19,713
3,059
558
12
191
(67)
—
Utilities
39,005
24,840
12,519
1,254
392
1
63
(203)
—
Oil & Gas
36,497
21,825
14,076
347
249
52
48
(51)
—
Automotive
35,984
19,602
15,397
958
27
109
3
(277)
—
State & Municipal Govt
(c)
32,484
31,372
1,100
3
9
30
—
(3)
—
Insurance
25,031
17,511
7,352
168
—
6
—
(20)
(8,310)
Chemicals & Plastics
23,790
11,251
10,355
2,091
93
2
82
(239)
—
Transportation
20,861
11,450
9,097
285
29
11
(3)
(135)
—
Metals & Mining
17,767
7,459
9,883
406
19
22
4
(39)
(67)
Central Govt
15,164
14,666
245
44
209
8
—
(1,258)
(1,273)
Securities Firms
7,966
4,372
3,593
—
1
1
—
(13)
(2,458)
Financial Markets
Infrastructure
5,734
5,306
358
70
—
—
—
—
—
All other
(d)
180,171
148,214
29,887
1,953
117
3
303
(19,458)
(5,500)
Subtotal
$ 1,446,098 $
971,914 $
425,724 $
42,933 $
5,527 $
2,971 $
1,598 $ (23,898) $
(28,891)
Loans held-for-sale and loans
at fair value
51,007
Receivables from customers
47,336
Total
(e)
$ 1,544,441
Management’s discussion and analysis
120
JPMorgan Chase & Co./2025 Form 10-K
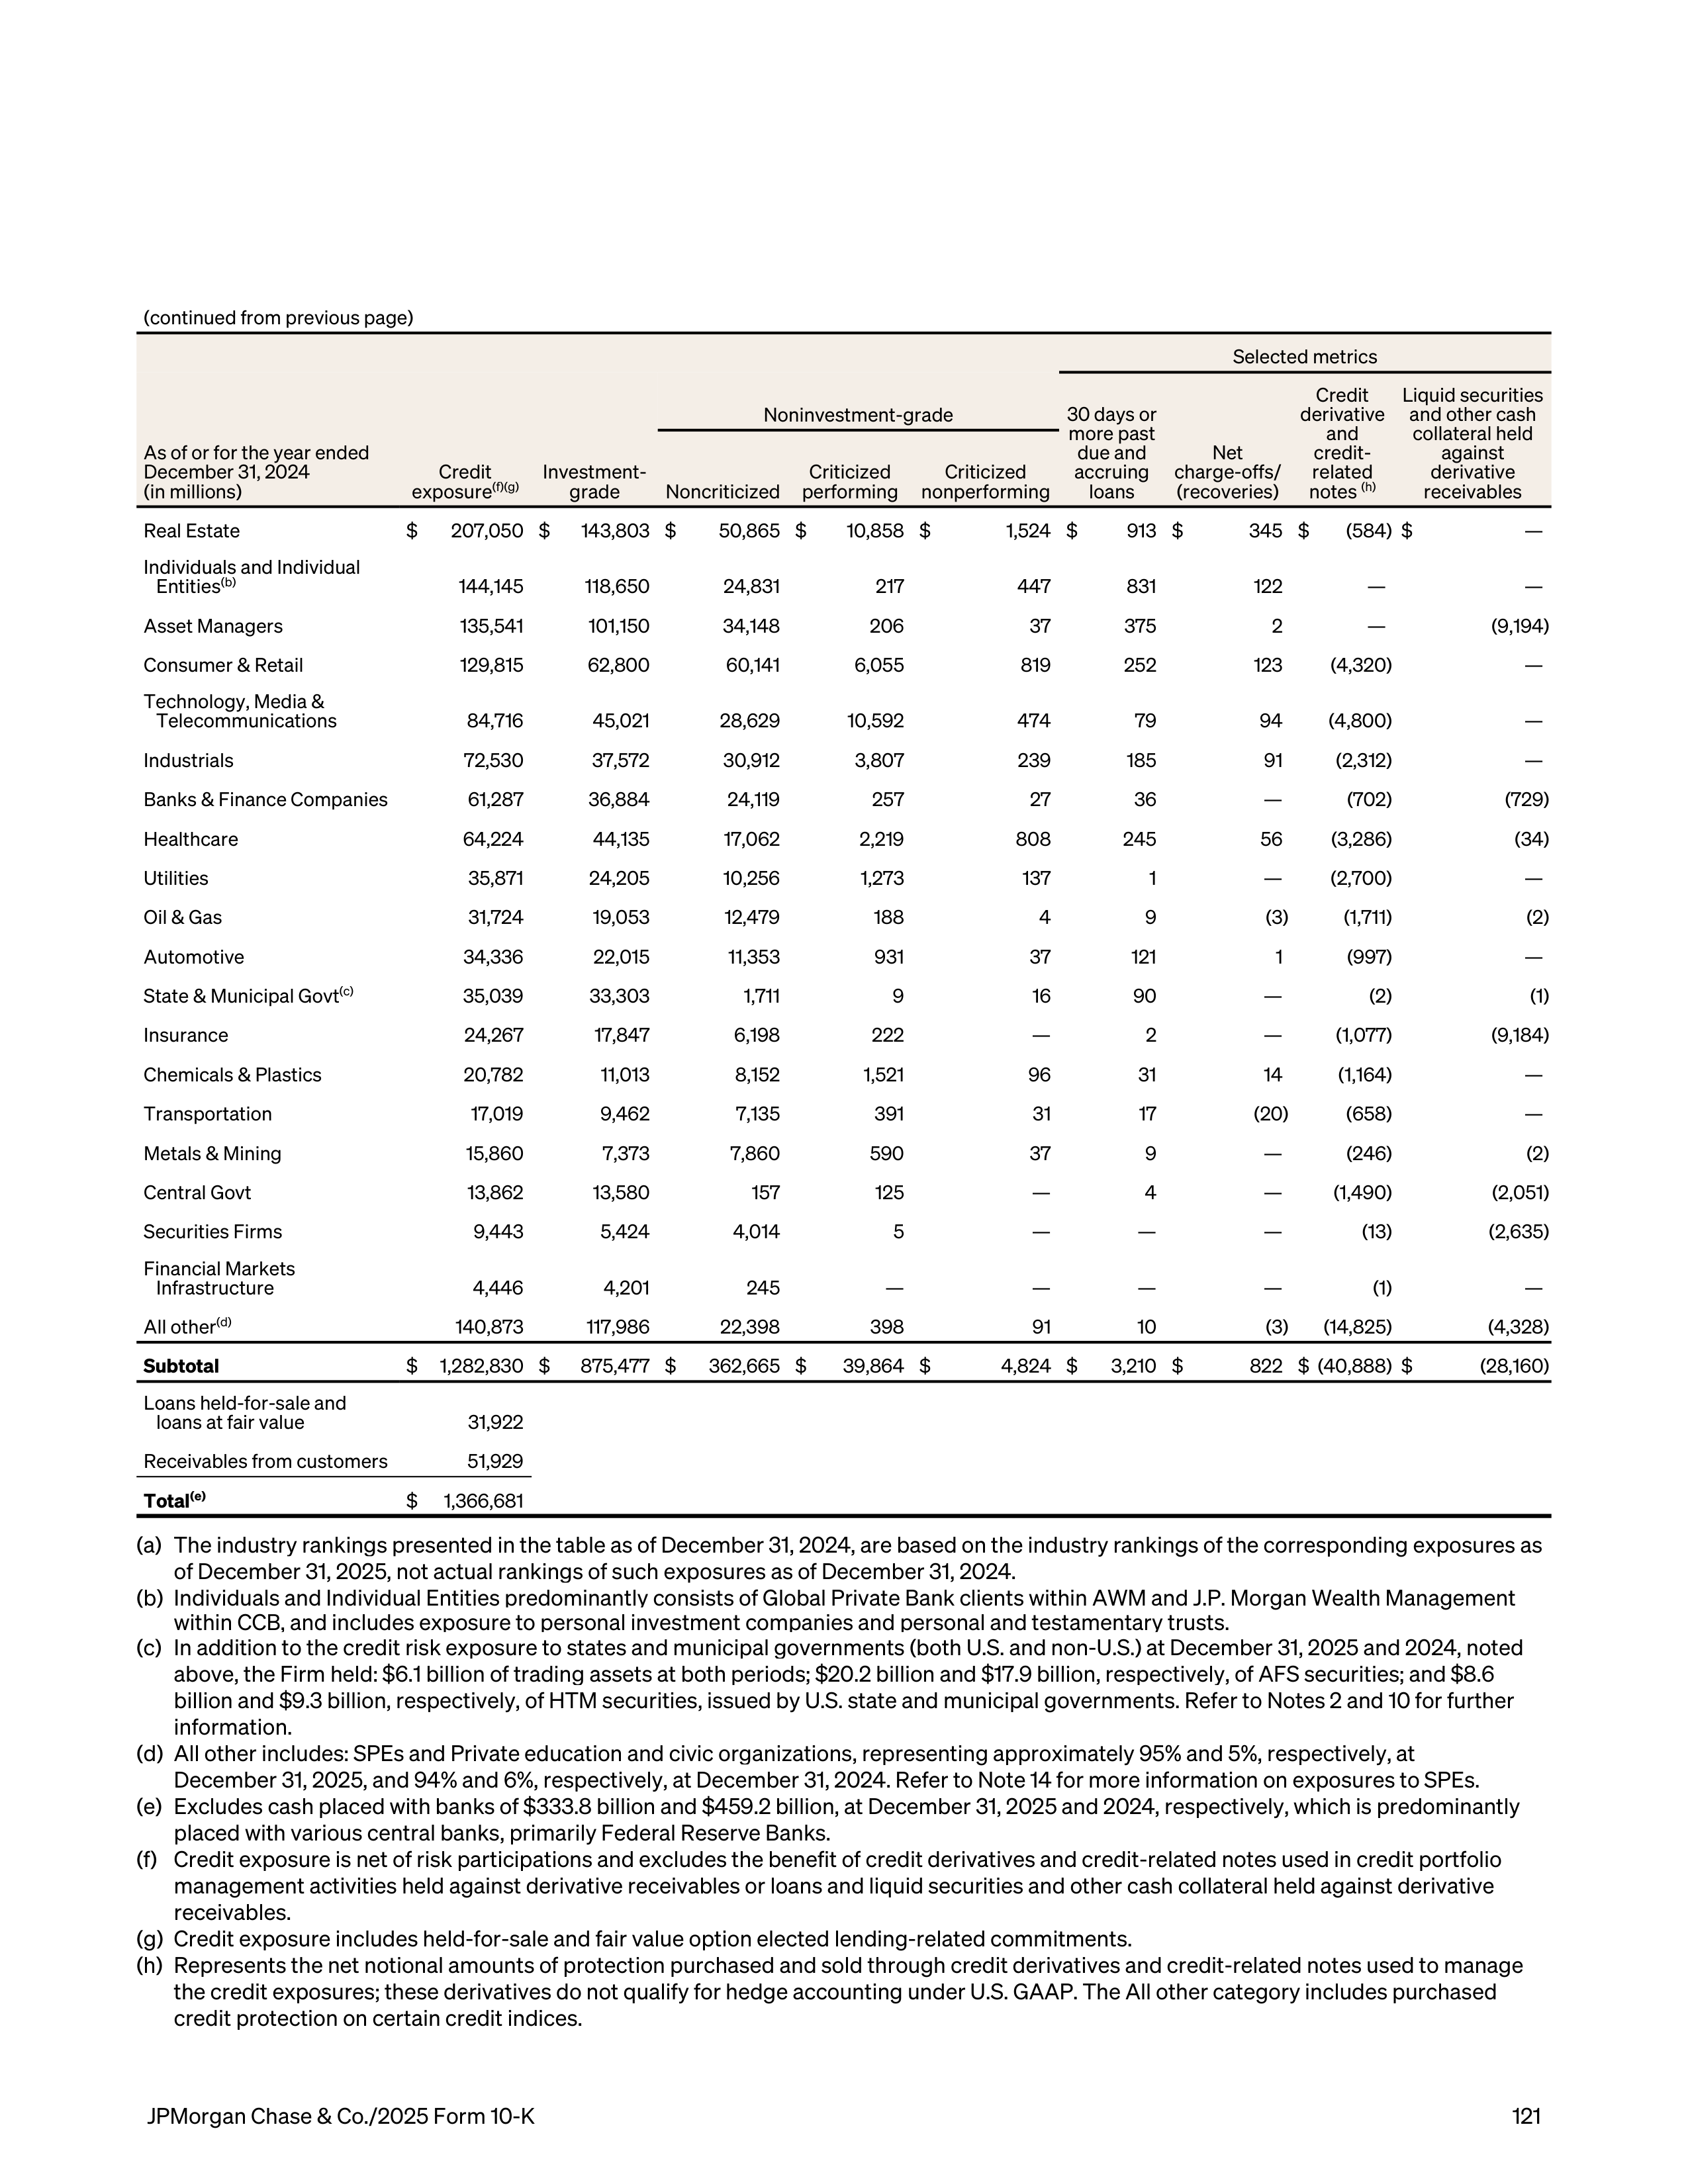
(continued from previous page)
Selected metrics
Noninvestment-grade
30 days or
more past
due and
accruing
loans
Net
charge-offs/
(recoveries)
Credit
derivative
and
credit-
related
notes
(h)
Liquid securities
and other cash
collateral held
against
derivative
receivables
As of or for the year ended
December 31, 2024
(in millions)
Credit
exposure
(f)(g)
Investment-
grade
Noncriticized
Criticized
performing
Criticized
nonperforming
Real Estate
$
207,050 $
143,803 $
50,865 $
10,858 $
1,524 $
913 $
345 $
(584) $
—
Individuals and Individual
Entities
(b)
144,145
118,650
24,831
217
447
831
122
—
—
Asset Managers
135,541
101,150
34,148
206
37
375
2
—
(9,194)
Consumer & Retail
129,815
62,800
60,141
6,055
819
252
123
(4,320)
—
Technology, Media &
Telecommunications
84,716
45,021
28,629
10,592
474
79
94
(4,800)
—
Industrials
72,530
37,572
30,912
3,807
239
185
91
(2,312)
—
Banks & Finance Companies
61,287
36,884
24,119
257
27
36
—
(702)
(729)
Healthcare
64,224
44,135
17,062
2,219
808
245
56
(3,286)
(34)
Utilities
35,871
24,205
10,256
1,273
137
1
—
(2,700)
—
Oil & Gas
31,724
19,053
12,479
188
4
9
(3)
(1,711)
(2)
Automotive
34,336
22,015
11,353
931
37
121
1
(997)
—
State & Municipal Govt
(c)
35,039
33,303
1,711
9
16
90
—
(2)
(1)
Insurance
24,267
17,847
6,198
222
—
2
—
(1,077)
(9,184)
Chemicals & Plastics
20,782
11,013
8,152
1,521
96
31
14
(1,164)
—
Transportation
17,019
9,462
7,135
391
31
17
(20)
(658)
—
Metals & Mining
15,860
7,373
7,860
590
37
9
—
(246)
(2)
Central Govt
13,862
13,580
157
125
—
4
—
(1,490)
(2,051)
Securities Firms
9,443
5,424
4,014
5
—
—
—
(13)
(2,635)
Financial Markets
Infrastructure
4,446
4,201
245
—
—
—
—
(1)
—
All other
(d)
140,873
117,986
22,398
398
91
10
(3)
(14,825)
(4,328)
Subtotal
$
1,282,830 $
875,477 $
362,665 $
39,864 $
4,824 $
3,210 $
822 $ (40,888) $
(28,160)
Loans held-for-sale and
loans at fair value
31,922
Receivables from customers
51,929
Total
(e)
$
1,366,681
(a)
The industry rankings presented in the table as of December 31, 2024, are based on the industry rankings of the corresponding exposures as
of December 31, 2025, not actual rankings of such exposures as of December 31, 2024.
(b)
Individuals and Individual Entities predominantly consists of Global Private Bank clients within AWM and J.P. Morgan Wealth Management
within CCB, and includes exposure to personal investment companies and personal and testamentary trusts.
(c)
In addition to the credit risk exposure to states and municipal governments (both U.S. and non-U.S.) at December 31, 2025 and 2024, noted
above, the Firm held: $6.1 billion of trading assets at both periods; $20.2 billion and $17.9 billion, respectively, of AFS securities; and $8.6
billion and $9.3 billion, respectively, of HTM securities, issued by U.S. state and municipal governments. Refer to Notes 2 and 10 for further
information.
(d)
All other includes: SPEs and Private education and civic organizations, representing approximately 95% and 5%, respectively, at
December 31, 2025, and 94% and 6%, respectively, at December 31, 2024. Refer to Note 14 for more information on exposures to SPEs.
(e)
Excludes cash placed with banks of $333.8 billion and $459.2 billion, at December 31, 2025 and 2024, respectively, which is predominantly
placed with various central banks, primarily Federal Reserve Banks.
(f)
Credit exposure is net of risk participations and excludes the benefit of credit derivatives and credit-related notes used in credit portfolio
management activities held against derivative receivables or loans and liquid securities and other cash collateral held against derivative
receivables.
(g)
Credit exposure includes held-for-sale and fair value option elected lending-related commitments.
(h)
Represents the net notional amounts of protection purchased and sold through credit derivatives and credit-related notes used to manage
the credit exposures; these derivatives do not qualify for hedge accounting under U.S. GAAP. The All other category includes purchased
credit protection on certain credit indices.
JPMorgan Chase & Co./2025 Form 10-K
121
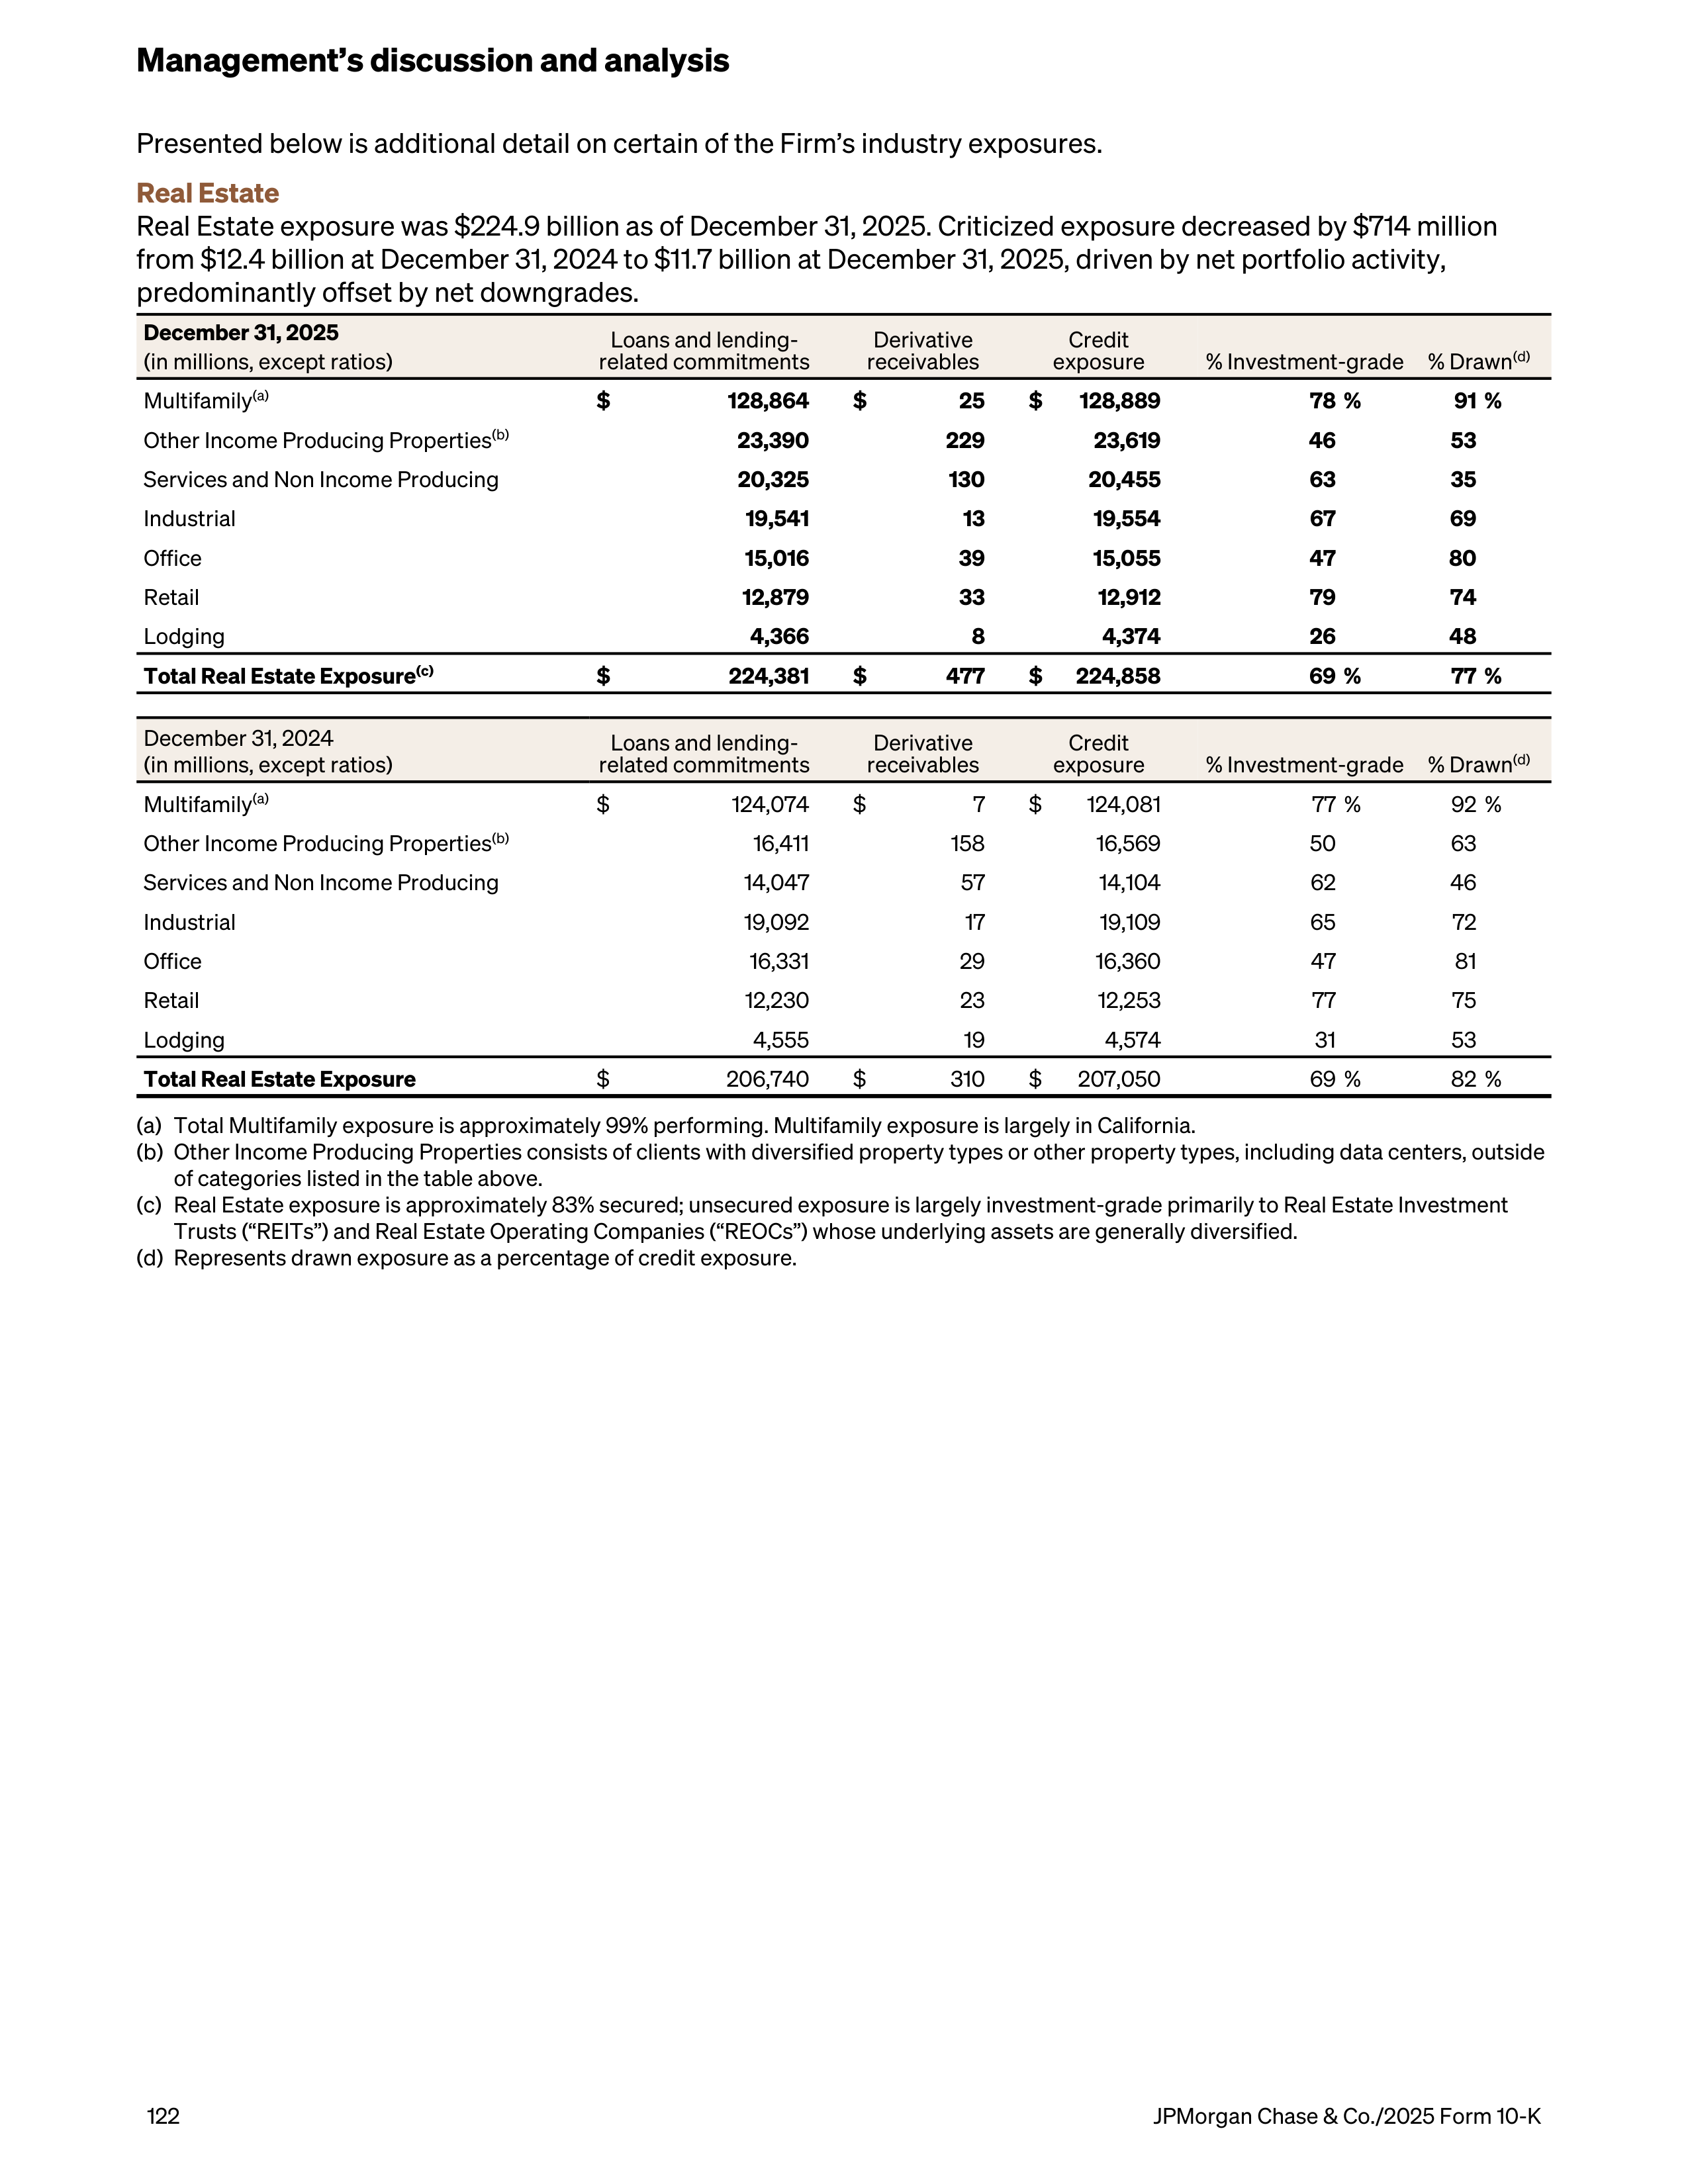
Presented below is additional detail on certain of the Firm’s industry exposures.
Real Estate
Real Estate exposure was $224.9 billion as of December 31, 2025. Criticized exposure decreased by $714 million
from $12.4 billion at December 31, 2024 to $11.7 billion at December 31, 2025, driven by net portfolio activity,
predominantly offset by net downgrades.
December 31, 2025
(in millions, except ratios)
Loans and lending-
related commitments
Derivative
receivables
Credit
exposure
% Investment-grade
% Drawn
(d)
Multifamily
(a)
$
128,864
$
25
$
128,889
78 %
91 %
Other Income Producing Properties
(b)
23,390
229
23,619
46
53
Services and Non Income Producing
20,325
130
20,455
63
35
Industrial
19,541
13
19,554
67
69
Office
15,016
39
15,055
47
80
Retail
12,879
33
12,912
79
74
Lodging
4,366
8
4,374
26
48
Total Real Estate Exposure
(c)
$
224,381
$
477
$
224,858
69 %
77 %
December 31, 2024
(in millions, except ratios)
Loans and lending-
related commitments
Derivative
receivables
Credit
exposure
% Investment-grade
% Drawn
(d)
Multifamily
(a)
$
124,074
$
7
$
124,081
77 %
92 %
Other Income Producing Properties
(b)
16,411
158
16,569
50
63
Services and Non Income Producing
14,047
57
14,104
62
46
Industrial
19,092
17
19,109
65
72
Office
16,331
29
16,360
47
81
Retail
12,230
23
12,253
77
75
Lodging
4,555
19
4,574
31
53
Total Real Estate Exposure
$
206,740
$
310
$
207,050
69 %
82 %
(a)
Total Multifamily exposure is approximately 99% performing. Multifamily exposure is largely in California.
(b)
Other Income Producing Properties consists of clients with diversified property types or other property types, including data centers, outside
of categories listed in the table above.
(c)
Real Estate exposure is approximately 83% secured; unsecured exposure is largely investment-grade primarily to Real Estate Investment
Trusts (“REITs”) and Real Estate Operating Companies (“REOCs”) whose underlying assets are generally diversified.
(d)
Represents drawn exposure as a percentage of credit exposure.
Management’s discussion and analysis
122
JPMorgan Chase & Co./2025 Form 10-K
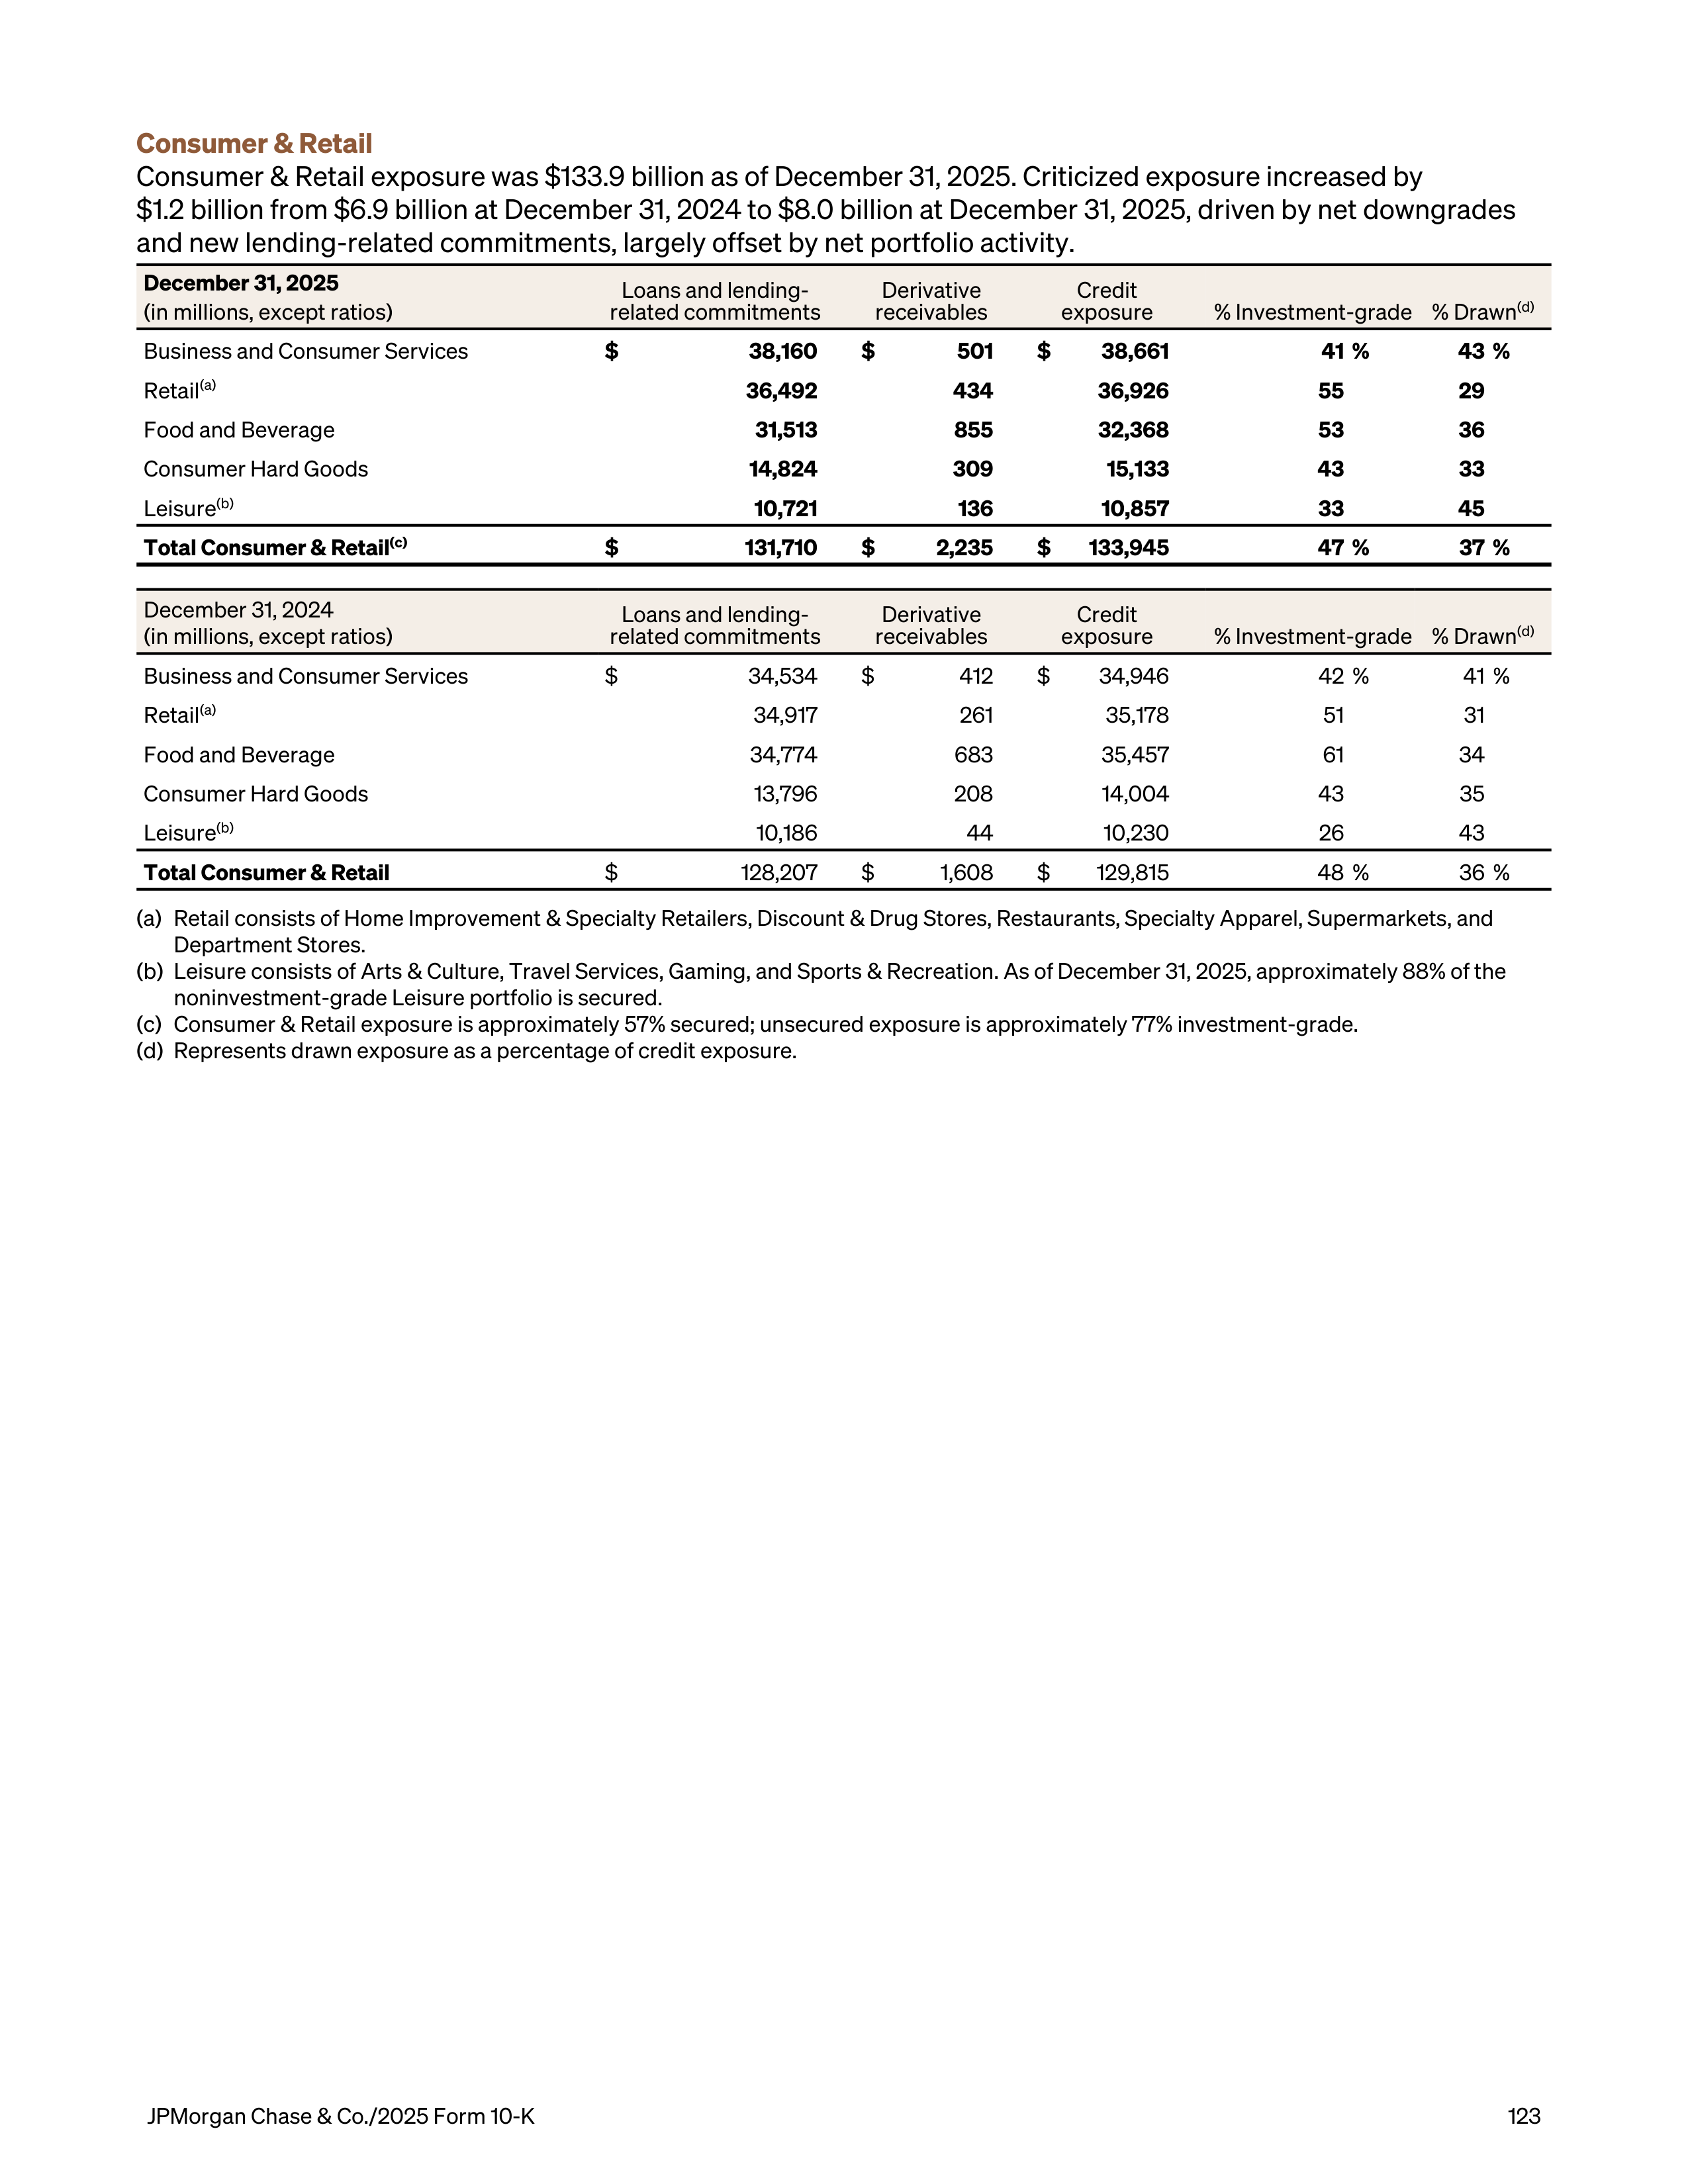
Consumer & Retail
Consumer & Retail exposure was $133.9 billion as of December 31, 2025. Criticized exposure increased by
$1.2 billion from $6.9 billion at December 31, 2024 to $8.0 billion at December 31, 2025, driven by net downgrades
and new lending-related commitments, largely offset by net portfolio activity.
December 31, 2025
(in millions, except ratios)
Loans and lending-
related commitments
Derivative
receivables
Credit
exposure
% Investment-grade
% Drawn
(d)
Business and Consumer Services
$
38,160
$
501
$
38,661
41 %
43 %
Retail
(a)
36,492
434
36,926
55
29
Food and Beverage
31,513
855
32,368
53
36
Consumer Hard Goods
14,824
309
15,133
43
33
Leisure
(b)
10,721
136
10,857
33
45
Total Consumer & Retail
(c)
$
131,710
$
2,235
$
133,945
47 %
37 %
December 31, 2024
(in millions, except ratios)
Loans and lending-
related commitments
Derivative
receivables
Credit
exposure
% Investment-grade
% Drawn
(d)
Business and Consumer Services
$
34,534
$
412
$
34,946
42 %
41 %
Retail
(a)
34,917
261
35,178
51
31
Food and Beverage
34,774
683
35,457
61
34
Consumer Hard Goods
13,796
208
14,004
43
35
Leisure
(b)
10,186
44
10,230
26
43
Total Consumer & Retail
$
128,207
$
1,608
$
129,815
48 %
36 %
(a)
Retail consists of Home Improvement & Specialty Retailers, Discount & Drug Stores, Restaurants, Specialty Apparel, Supermarkets, and
Department Stores.
(b)
Leisure consists of Arts & Culture, Travel Services, Gaming, and Sports & Recreation. As of December 31, 2025, approximately 88% of the
noninvestment-grade Leisure portfolio is secured.
(c)
Consumer & Retail exposure is approximately 57% secured; unsecured exposure is approximately 77% investment-grade.
(d)
Represents drawn exposure as a percentage of credit exposure.
JPMorgan Chase & Co./2025 Form 10-K
123
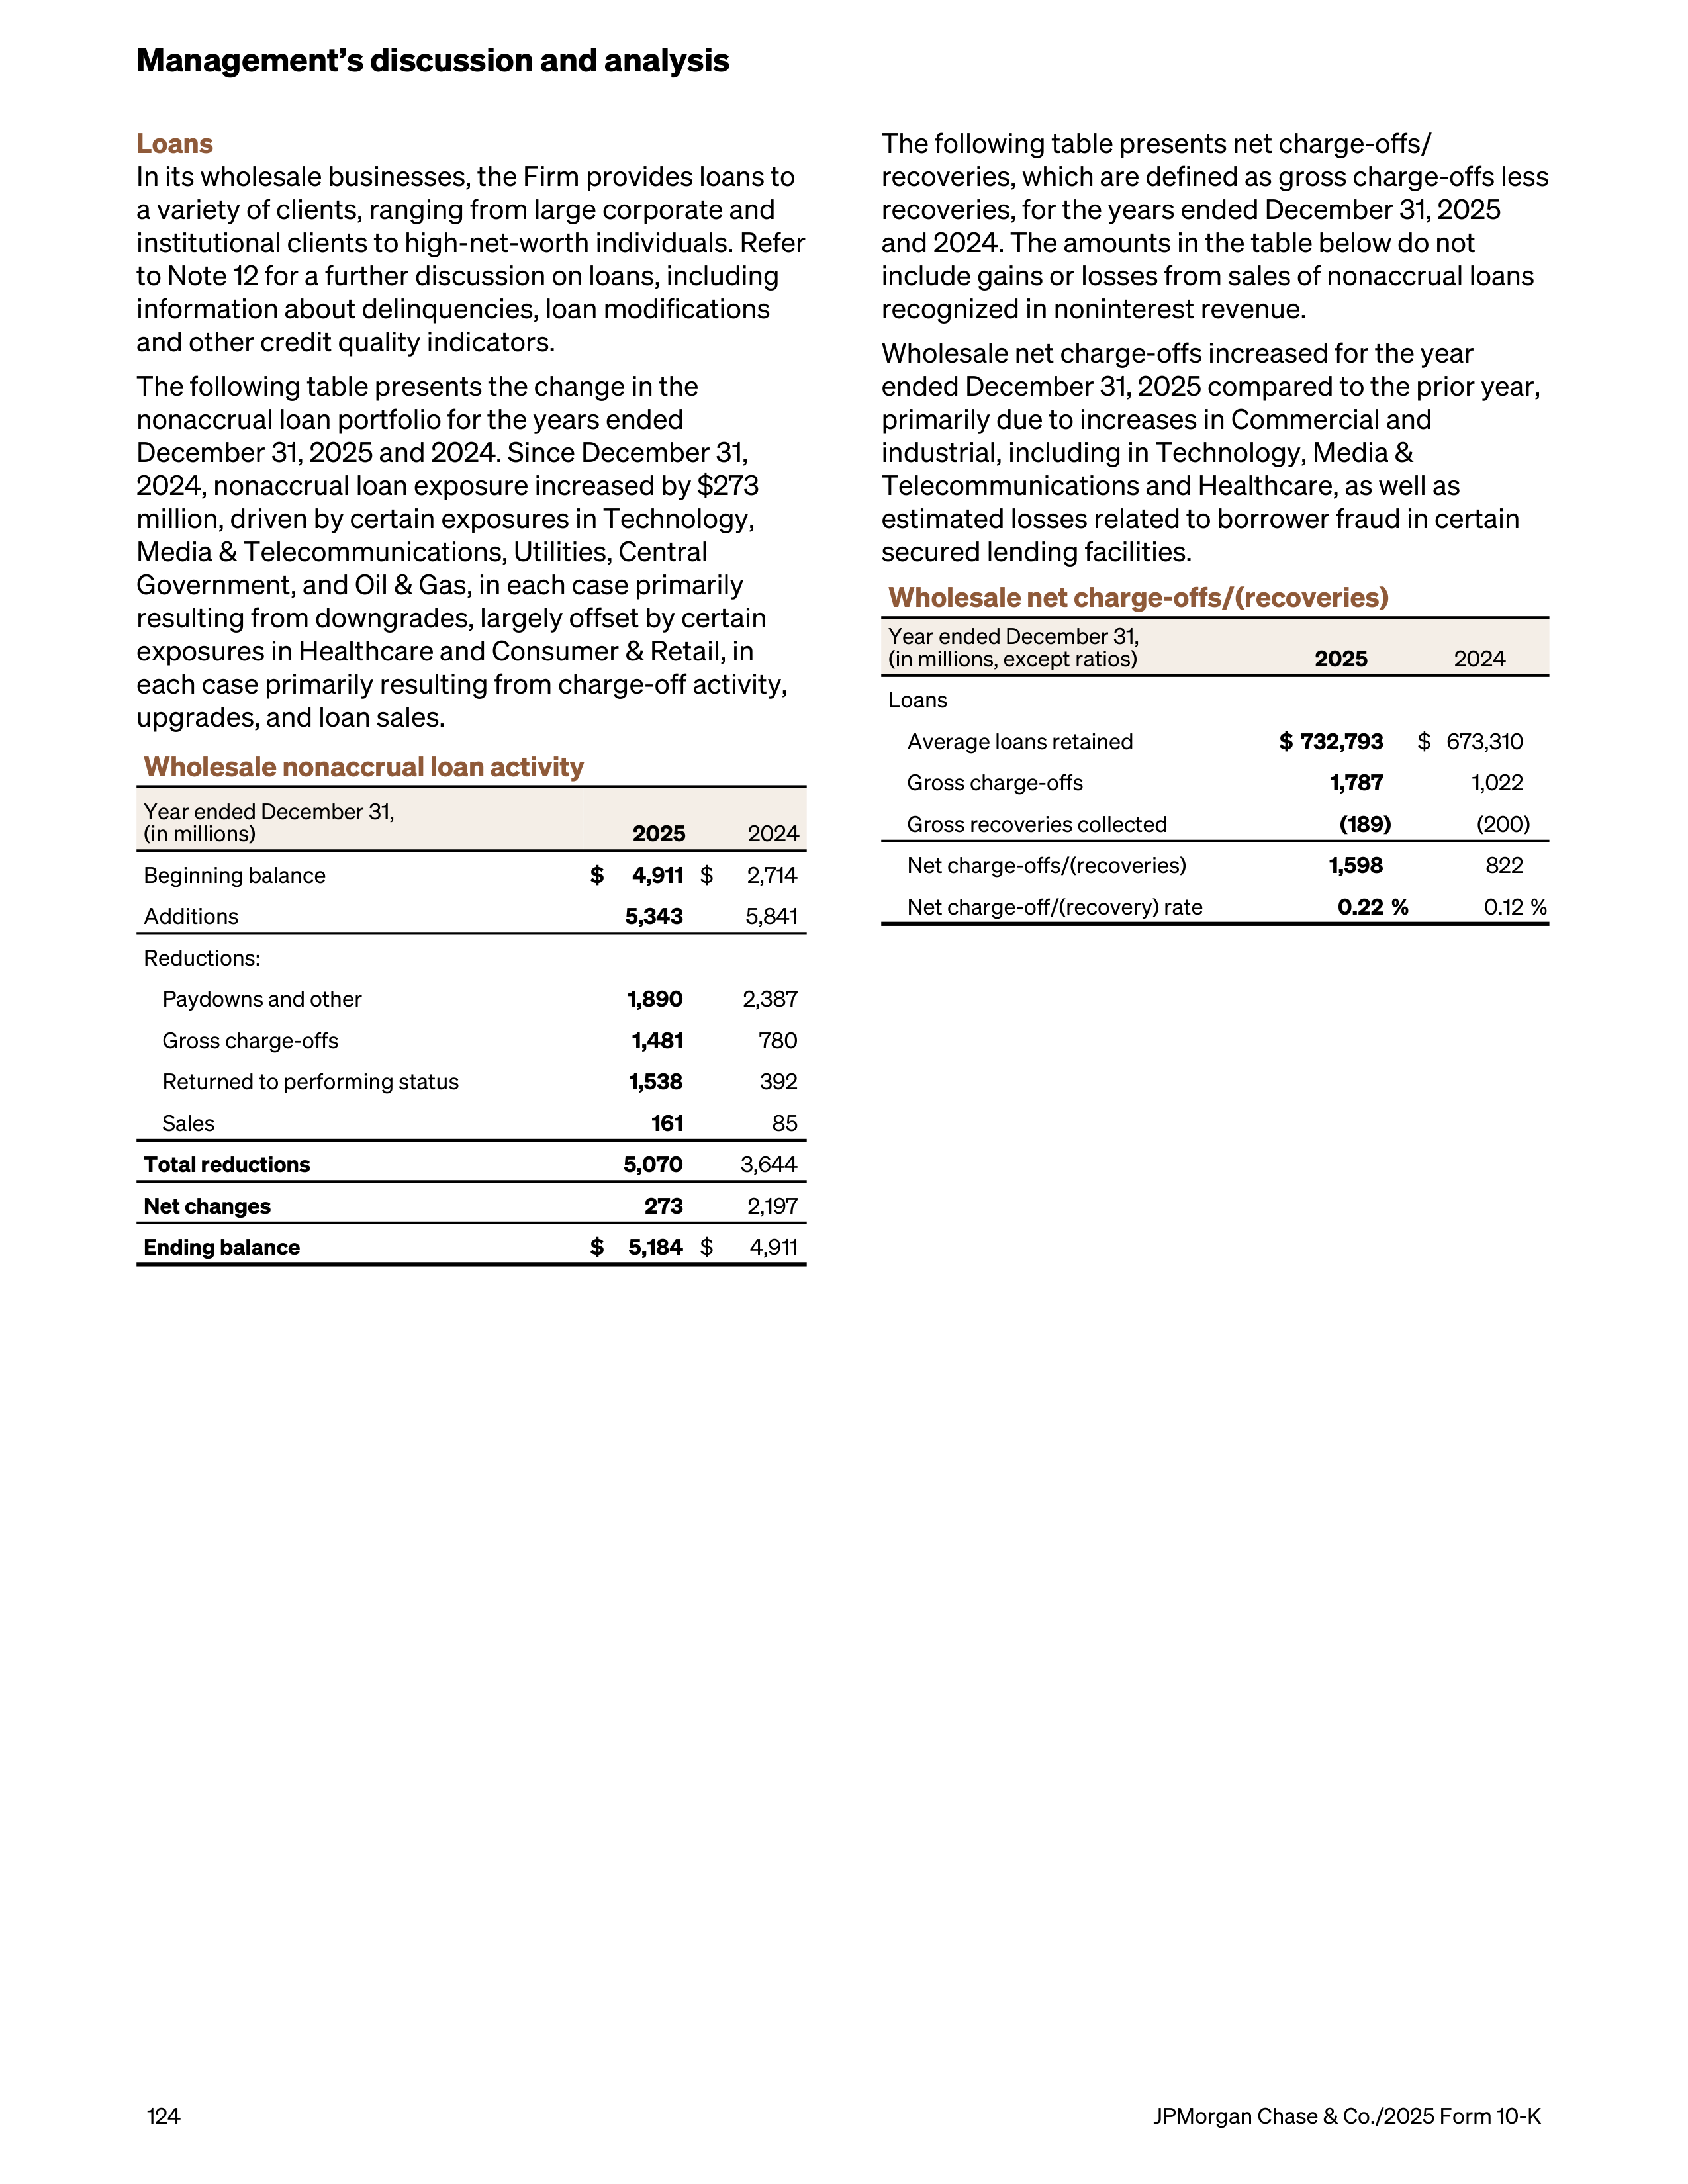
Loans
In its wholesale businesses, the Firm provides loans to
a variety of clients, ranging from large corporate and
institutional clients to high-net-worth individuals. Refer
to Note 12 for a further discussion on loans, including
information about delinquencies, loan modifications
and other credit quality indicators.
The following table presents the change in the
nonaccrual loan portfolio for the years ended
December 31, 2025 and 2024. Since December 31,
2024, nonaccrual loan exposure increased by $273
million, driven by certain exposures in Technology,
Media & Telecommunications, Utilities, Central
Government, and Oil & Gas, in each case primarily
resulting from downgrades, largely offset by certain
exposures in Healthcare and Consumer & Retail, in
each case primarily resulting from charge-off activity,
upgrades, and loan sales.
Wholesale nonaccrual loan activity
Year ended December 31,
(in millions)
2025
2024
Beginning balance
$
4,911
$
2,714
Additions
5,343
5,841
Reductions:
Paydowns and other
1,890
2,387
Gross charge-offs
1,481
780
Returned to performing status
1,538
392
Sales
161
85
Total reductions
5,070
3,644
Net changes
273
2,197
Ending balance
$
5,184
$
4,911
The following table presents net charge-offs/
recoveries, which are defined as gross charge-offs less
recoveries, for the years ended December 31, 2025
and 2024. The amounts in the table below do not
include gains or losses from sales of nonaccrual loans
recognized in noninterest revenue.
Wholesale net charge-offs increased for the year
ended December 31, 2025 compared to the prior year,
primarily due to increases in Commercial and
industrial, including in Technology, Media &
Telecommunications and Healthcare, as well as
estimated losses related to borrower fraud in certain
secured lending facilities.
Wholesale net charge-offs/(recoveries)
Year ended December 31,
(in millions, except ratios)
2025
2024
Loans
Average loans retained
$ 732,793
$ 673,310
Gross charge-offs
1,787
1,022
Gross recoveries collected
(189)
(200)
Net charge-offs/(recoveries)
1,598
822
Net charge-off/(recovery) rate
0.22 %
0.12 %
Management’s discussion and analysis
124
JPMorgan Chase & Co./2025 Form 10-K
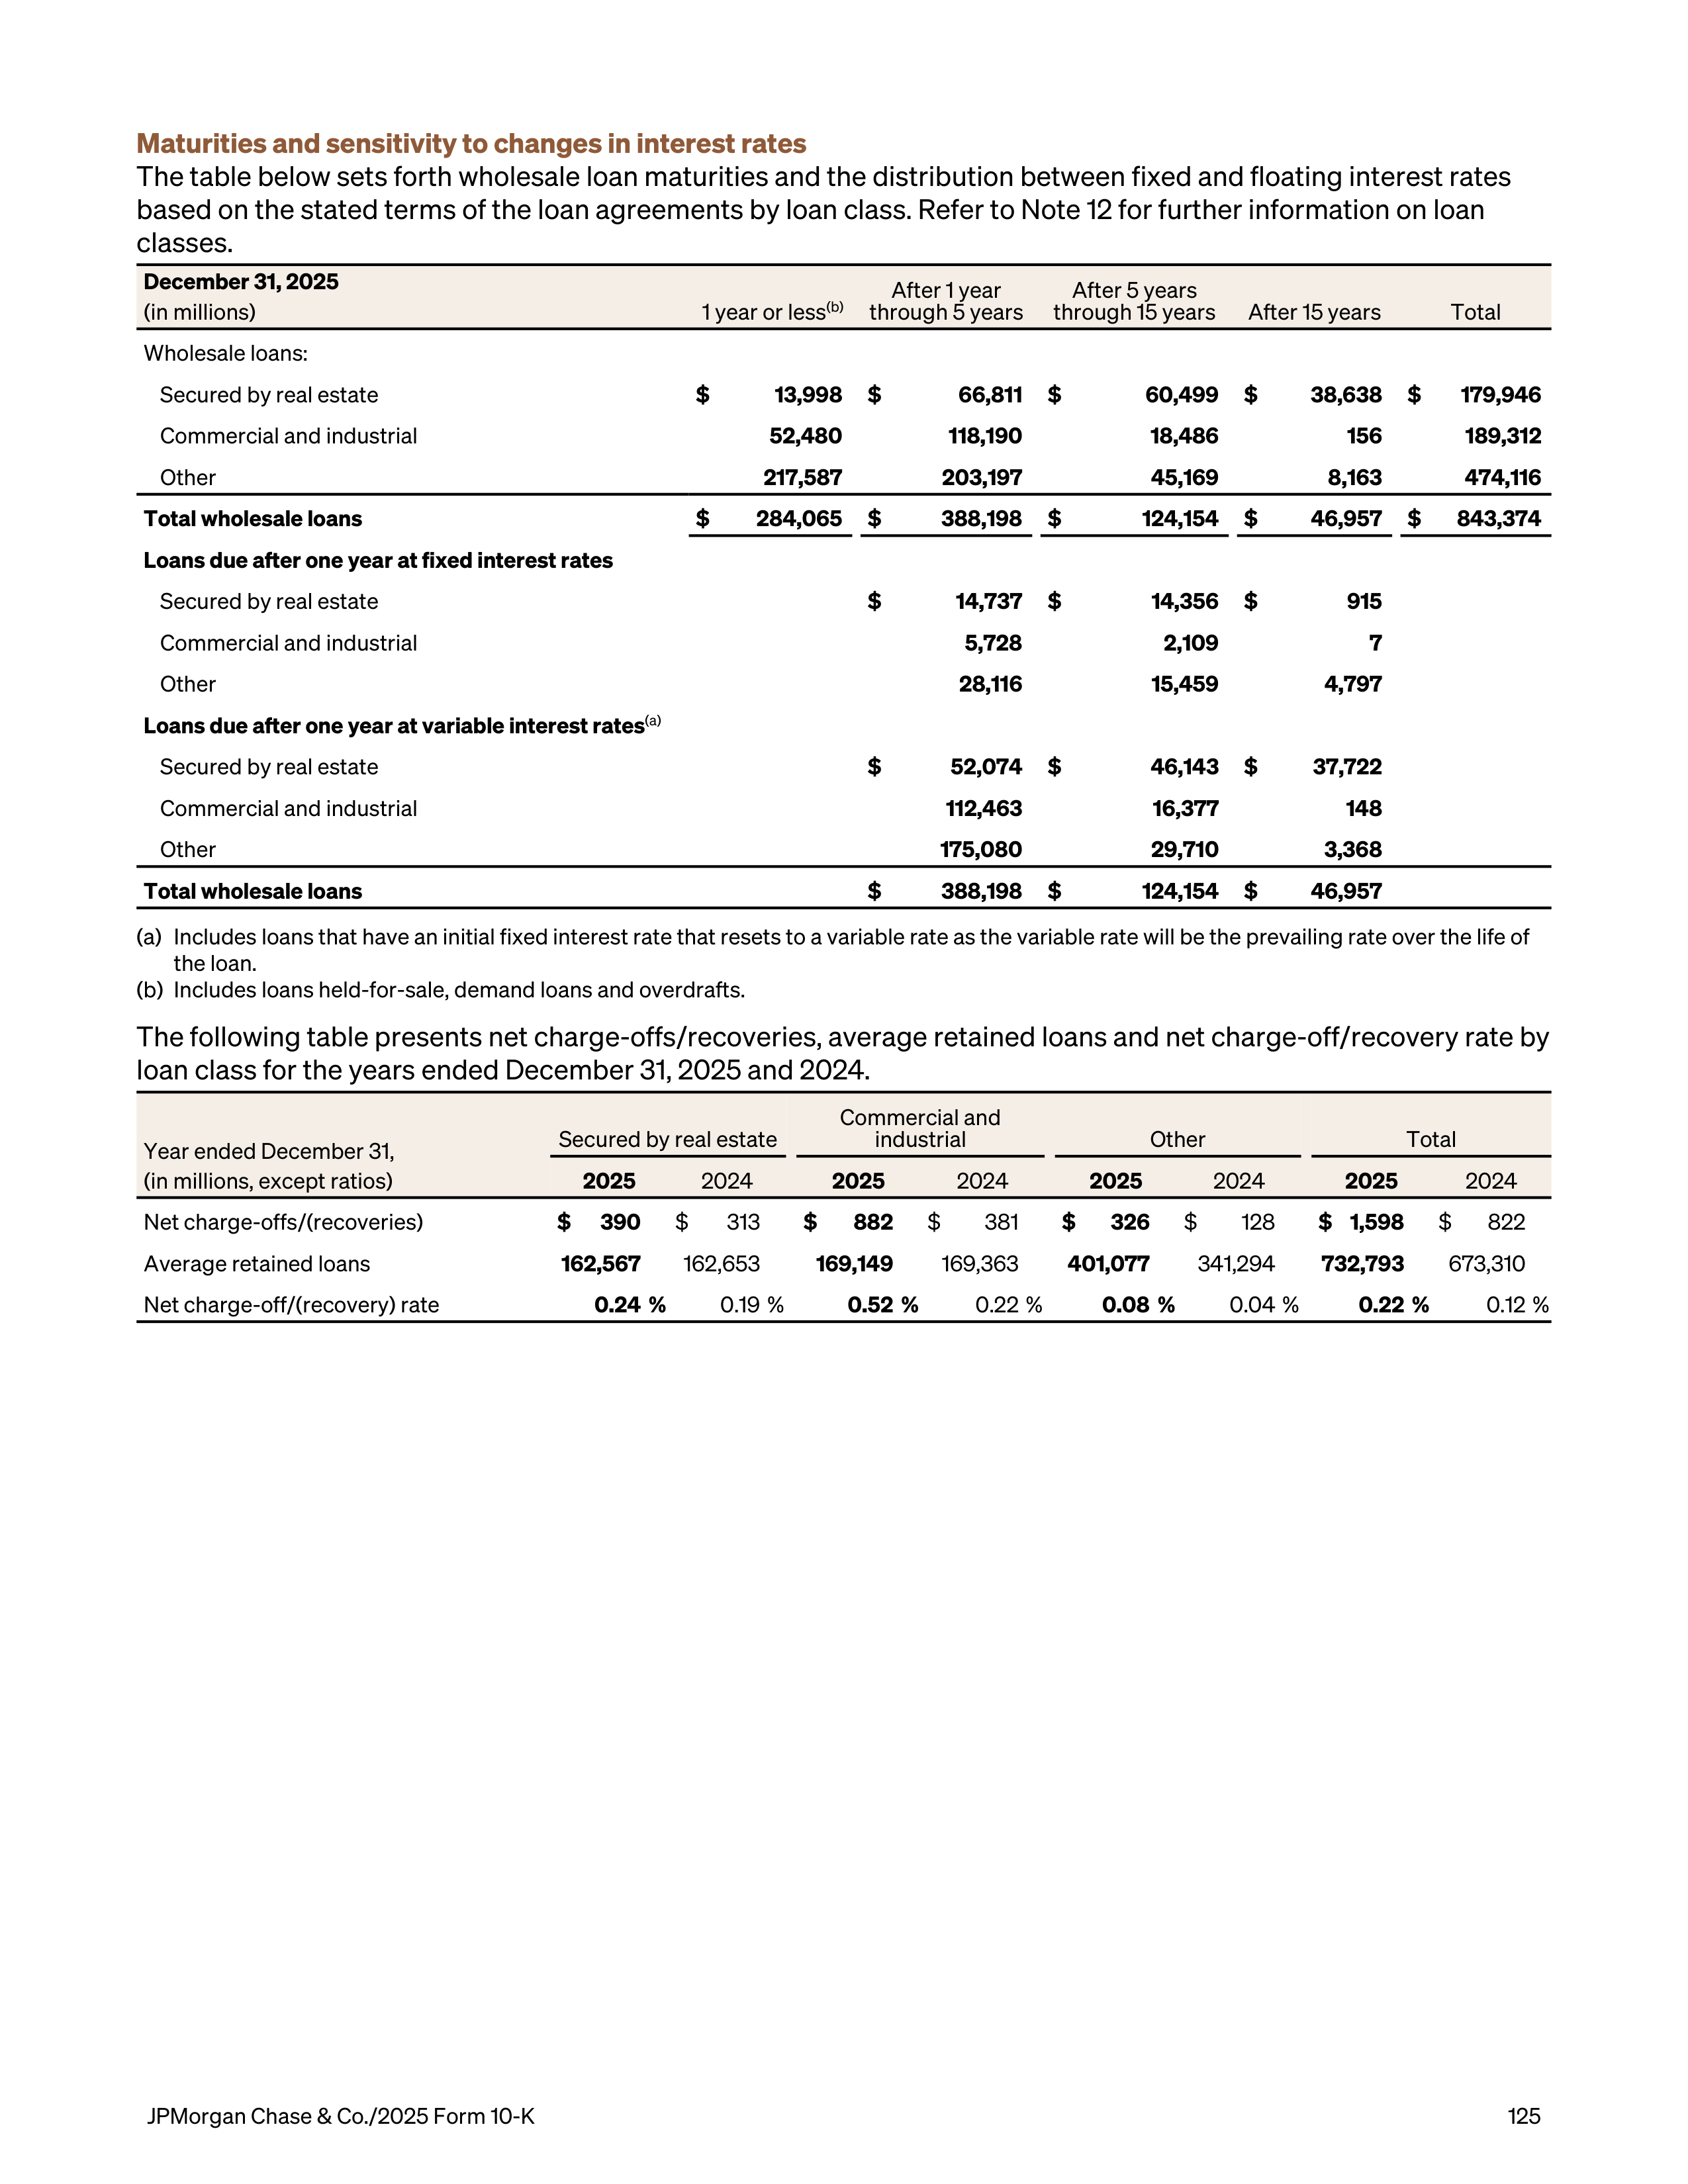
Maturities and sensitivity to changes in interest rates
The table below sets forth wholesale loan maturities and the distribution between fixed and floating interest rates
based on the stated terms of the loan agreements by loan class. Refer to Note 12 for further information on loan
classes.
December 31, 2025
(in millions)
1 year or less
(b)
After 1 year
through 5 years
After 5 years
through 15 years
After 15 years
Total
Wholesale loans:
Secured by real estate
$
13,998
$
66,811
$
60,499
$
38,638
$
179,946
Commercial and industrial
52,480
118,190
18,486
156
189,312
Other
217,587
203,197
45,169
8,163
474,116
Total wholesale loans
$
284,065
$
388,198
$
124,154
$
46,957
$
843,374
Loans due after one year at fixed interest rates
Secured by real estate
$
14,737
$
14,356
$
915
Commercial and industrial
5,728
2,109
7
Other
28,116
15,459
4,797
Loans due after one year at variable interest rates
(a)
Secured by real estate
$
52,074
$
46,143
$
37,722
Commercial and industrial
112,463
16,377
148
Other
175,080
29,710
3,368
Total wholesale loans
$
388,198
$
124,154
$
46,957
(a)
Includes loans that have an initial fixed interest rate that resets to a variable rate as the variable rate will be the prevailing rate over the life of
the loan.
(b)
Includes loans held-for-sale, demand loans and overdrafts.
The following table presents net charge-offs/recoveries, average retained loans and net charge-off/recovery rate by
loan class for the years ended December 31, 2025 and 2024.
Year ended December 31,
(in millions, except ratios)
Secured by real estate
Commercial and
industrial
Other
Total
2025
2024
2025
2024
2025
2024
2025
2024
Net charge-offs/(recoveries)
$
390
$
313
$
882
$
381
$
326
$
128
$ 1,598
$
822
Average retained loans
162,567
162,653
169,149
169,363
401,077
341,294
732,793
673,310
Net charge-off/(recovery) rate
0.24 %
0.19 %
0.52 %
0.22 %
0.08 %
0.04 %
0.22 %
0.12 %
JPMorgan Chase & Co./2025 Form 10-K
125
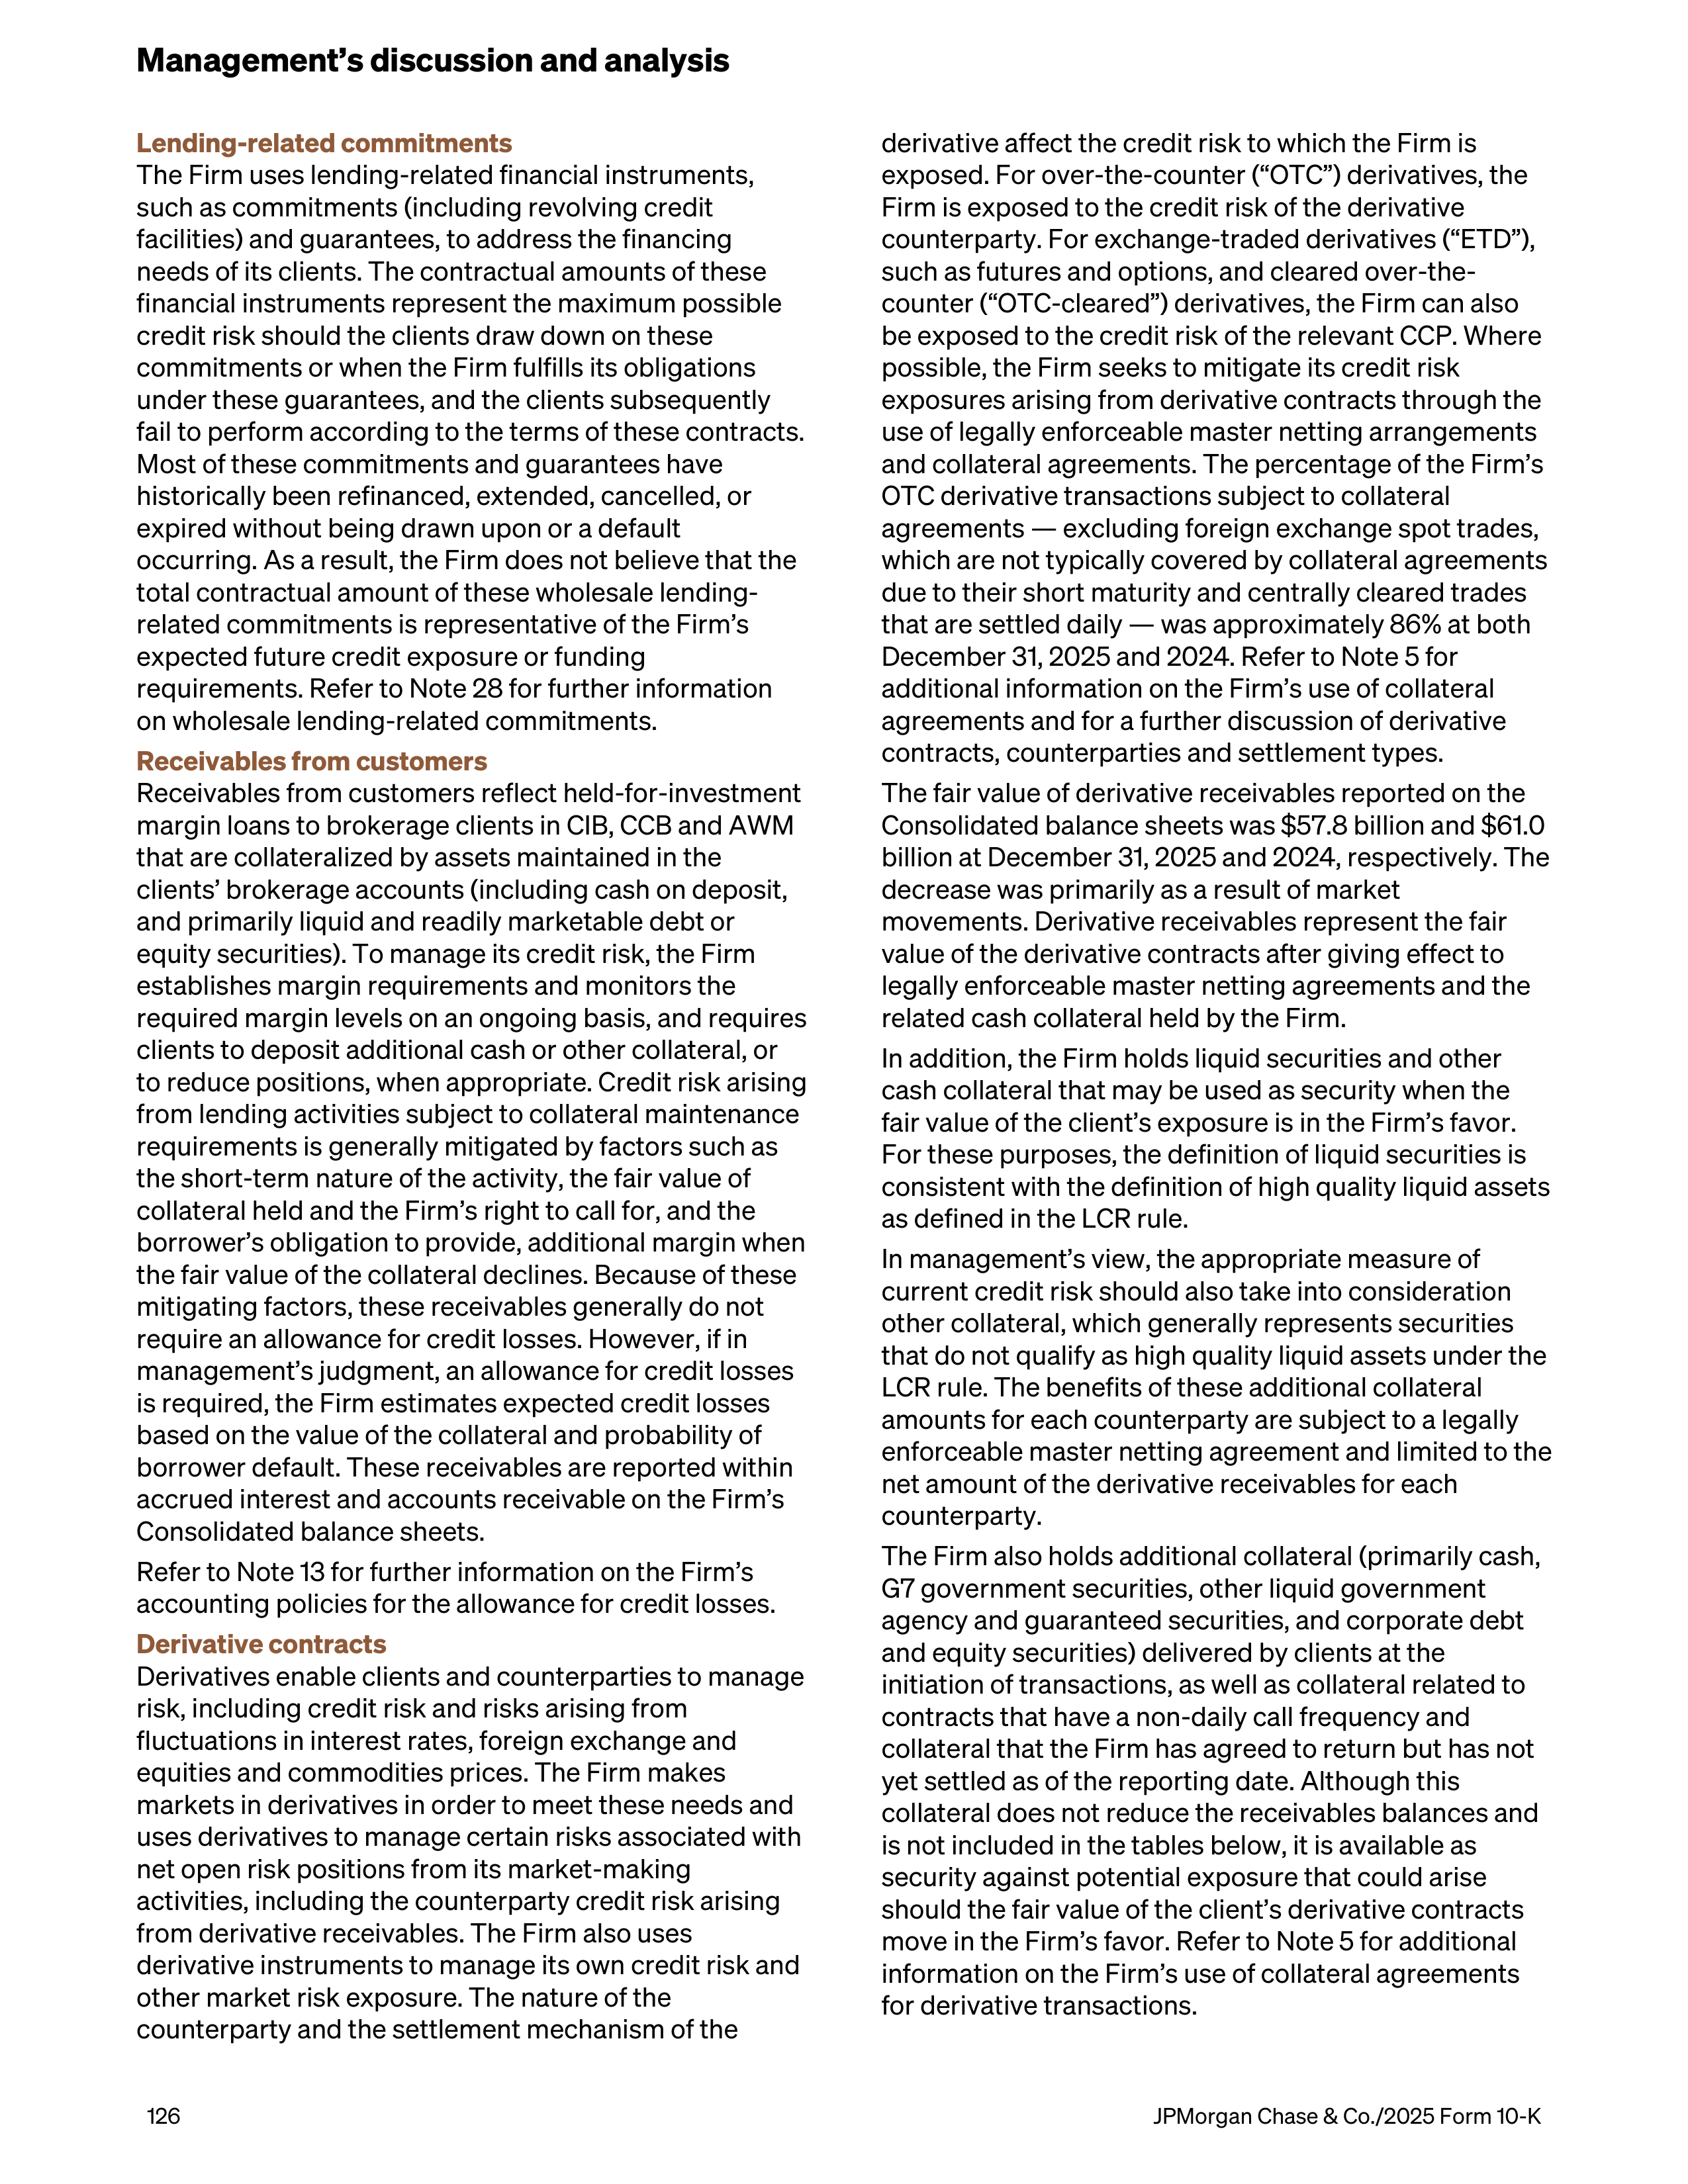
Lending-related commitments
The Firm uses lending-related financial instruments,
such as commitments (including revolving credit
facilities) and guarantees, to address the financing
needs of its clients. The contractual amounts of these
financial instruments represent the maximum possible
credit risk should the clients draw down on these
commitments or when the Firm fulfills its obligations
under these guarantees, and the clients subsequently
fail to perform according to the terms of these contracts.
Most of these commitments and guarantees have
historically been refinanced, extended, cancelled, or
expired without being drawn upon or a default
occurring. As a result, the Firm does not believe that the
total contractual amount of these wholesale lending-
related commitments is representative of the Firm’s
expected future credit exposure or funding
requirements. Refer to Note 28 for further information
on wholesale lending-related commitments.
Receivables from customers
Receivables from customers reflect held-for-investment
margin loans to brokerage clients in CIB, CCB and AWM
that are collateralized by assets maintained in the
clients’ brokerage accounts (including cash on deposit,
and primarily liquid and readily marketable debt or
equity securities). To manage its credit risk, the Firm
establishes margin requirements and monitors the
required margin levels on an ongoing basis, and requires
clients to deposit additional cash or other collateral, or
to reduce positions, when appropriate. Credit risk arising
from lending activities subject to collateral maintenance
requirements is generally mitigated by factors such as
the short-term nature of the activity, the fair value of
collateral held and the Firm’s right to call for, and the
borrower’s obligation to provide, additional margin when
the fair value of the collateral declines. Because of these
mitigating factors, these receivables generally do not
require an allowance for credit losses. However, if in
management’s judgment, an allowance for credit losses
is required, the Firm estimates expected credit losses
based on the value of the collateral and probability of
borrower default. These receivables are reported within
accrued interest and accounts receivable on the Firm’s
Consolidated balance sheets.
Refer to Note 13 for further information on the Firm’s
accounting policies for the allowance for credit losses.
Derivative contracts
Derivatives enable clients and counterparties to manage
risk, including credit risk and risks arising from
fluctuations in interest rates, foreign exchange and
equities and commodities prices. The Firm makes
markets in derivatives in order to meet these needs and
uses derivatives to manage certain risks associated with
net open risk positions from its market-making
activities, including the counterparty credit risk arising
from derivative receivables. The Firm also uses
derivative instruments to manage its own credit risk and
other market risk exposure. The nature of the
counterparty and the settlement mechanism of the
derivative affect the credit risk to which the Firm is
exposed. For over-the-counter (“OTC”) derivatives, the
Firm is exposed to the credit risk of the derivative
counterparty. For exchange-traded derivatives (“ETD”),
such as futures and options, and cleared over-the-
counter (“OTC-cleared”) derivatives, the Firm can also
be exposed to the credit risk of the relevant CCP. Where
possible, the Firm seeks to mitigate its credit risk
exposures arising from derivative contracts through the
use of legally enforceable master netting arrangements
and collateral agreements. The percentage of the Firm’s
OTC derivative transactions subject to collateral
agreements — excluding foreign exchange spot trades,
which are not typically covered by collateral agreements
due to their short maturity and centrally cleared trades
that are settled daily — was approximately 86% at both
December 31, 2025 and 2024. Refer to Note 5 for
additional information on the Firm’s use of collateral
agreements and for a further discussion of derivative
contracts, counterparties and settlement types.
The fair value of derivative receivables reported on the
Consolidated balance sheets was $57.8 billion and $61.0
billion at December 31, 2025 and 2024, respectively. The
decrease was primarily as a result of market
movements. Derivative receivables represent the fair
value of the derivative contracts after giving effect to
legally enforceable master netting agreements and the
related cash collateral held by the Firm.
In addition, the Firm holds liquid securities and other
cash collateral that may be used as security when the
fair value of the client’s exposure is in the Firm’s favor.
For these purposes, the definition of liquid securities is
consistent with the definition of high quality liquid assets
as defined in the LCR rule.
In management’s view, the appropriate measure of
current credit risk should also take into consideration
other collateral, which generally represents securities
that do not qualify as high quality liquid assets under the
LCR rule. The benefits of these additional collateral
amounts for each counterparty are subject to a legally
enforceable master netting agreement and limited to the
net amount of the derivative receivables for each
counterparty.
The Firm also holds additional collateral (primarily cash,
G7 government securities, other liquid government
agency and guaranteed securities, and corporate debt
and equity securities) delivered by clients at the
initiation of transactions, as well as collateral related to
contracts that have a non-daily call frequency and
collateral that the Firm has agreed to return but has not
yet settled as of the reporting date. Although this
collateral does not reduce the receivables balances and
is not included in the tables below, it is available as
security against potential exposure that could arise
should the fair value of the client’s derivative contracts
move in the Firm’s favor. Refer to Note 5 for additional
information on the Firm’s use of collateral agreements
for derivative transactions.
Management’s discussion and analysis
126
JPMorgan Chase & Co./2025 Form 10-K
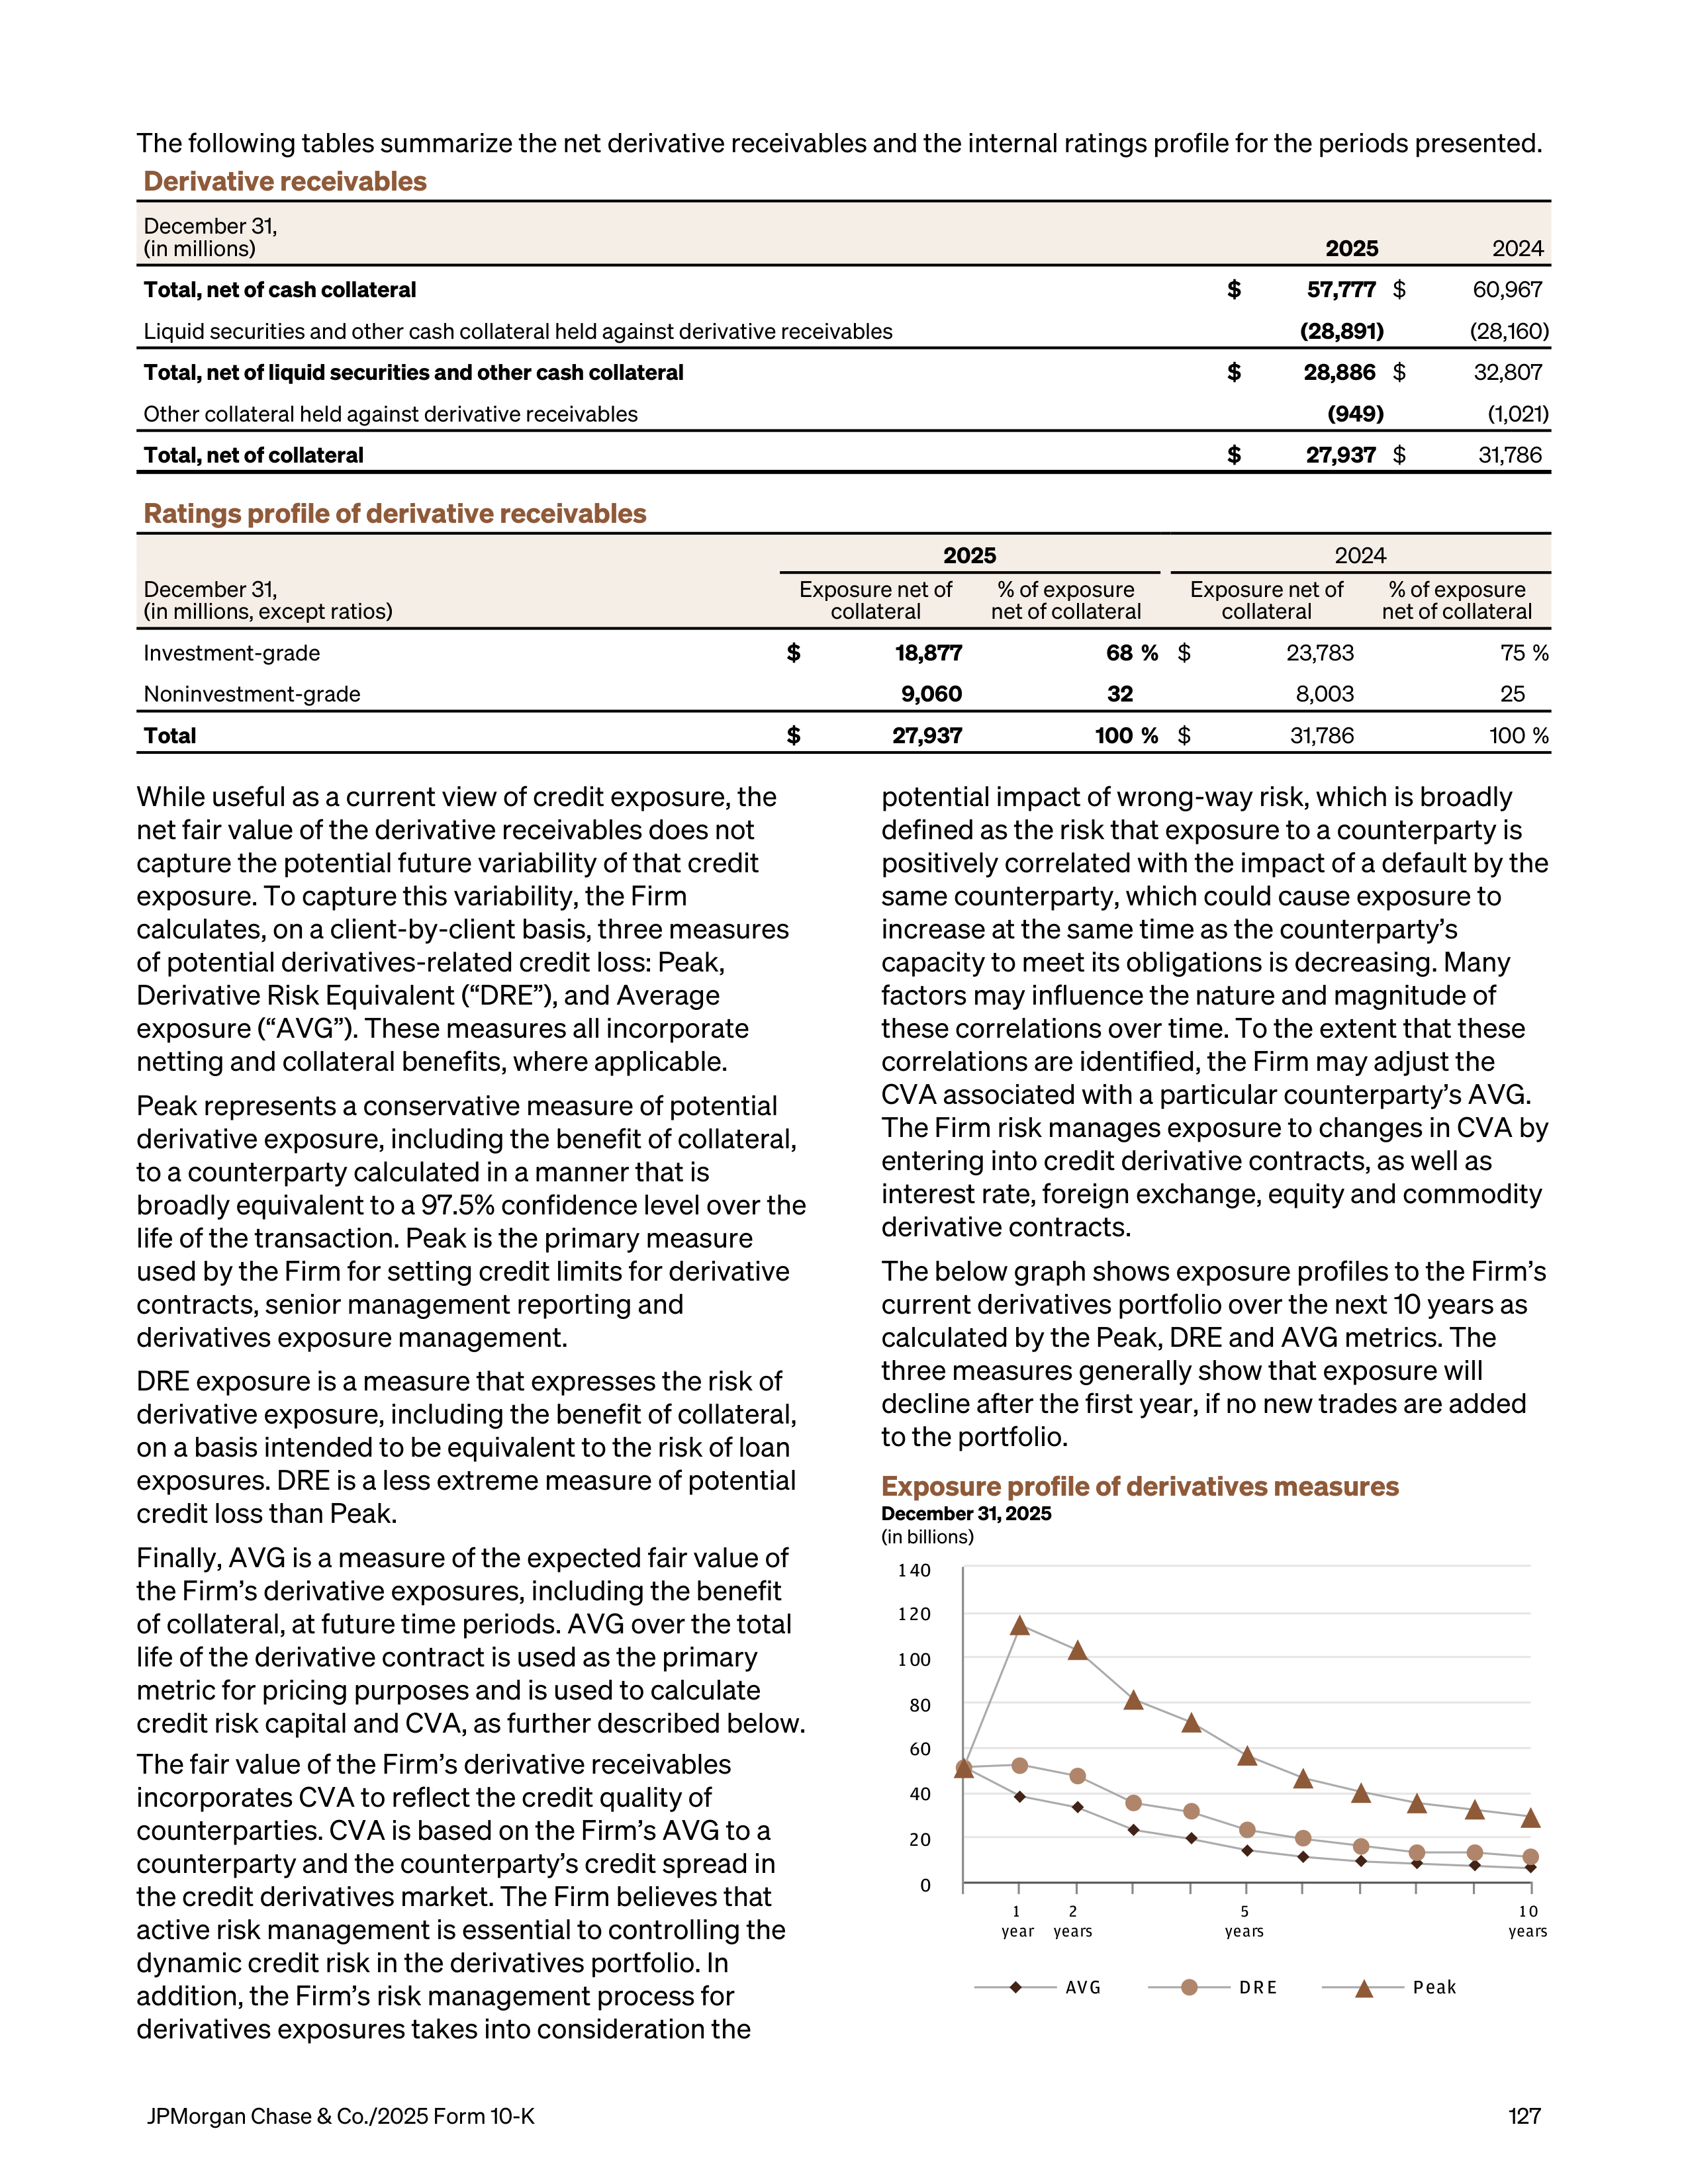
The following tables summarize the net derivative receivables and the internal ratings profile for the periods presented.
Derivative receivables
December 31,
(in millions)
2025
2024
Total, net of cash collateral
$
57,777
$
60,967
Liquid securities and other cash collateral held against derivative receivables
(28,891)
(28,160)
Total, net of liquid securities and other cash collateral
$
28,886
$
32,807
Other collateral held against derivative receivables
(949)
(1,021)
Total, net of collateral
$
27,937
$
31,786
Ratings profile of derivative receivables
2025
2024
December 31,
(in millions, except ratios)
Exposure net of
collateral
% of exposure
net of collateral
Exposure net of
collateral
% of exposure
net of collateral
Investment-grade
$
18,877
68 %
$
23,783
75 %
Noninvestment-grade
9,060
32
8,003
25
Total
$
27,937
100 %
$
31,786
100 %
While useful as a current view of credit exposure, the
net fair value of the derivative receivables does not
capture the potential future variability of that credit
exposure. To capture this variability, the Firm
calculates, on a client-by-client basis, three measures
of potential derivatives-related credit loss: Peak,
Derivative Risk Equivalent (“DRE”), and Average
exposure (“AVG”). These measures all incorporate
netting and collateral benefits, where applicable.
Peak represents a conservative measure of potential
derivative exposure, including the benefit of collateral,
to a counterparty calculated in a manner that is
broadly equivalent to a 97.5% confidence level over the
life of the transaction. Peak is the primary measure
used by the Firm for setting credit limits for derivative
contracts, senior management reporting and
derivatives exposure management.
DRE exposure is a measure that expresses the risk of
derivative exposure, including the benefit of collateral,
on a basis intended to be equivalent to the risk of loan
exposures. DRE is a less extreme measure of potential
credit loss than Peak.
Finally, AVG is a measure of the expected fair value of
the Firm’s derivative exposures, including the benefit
of collateral, at future time periods. AVG over the total
life of the derivative contract is used as the primary
metric for pricing purposes and is used to calculate
credit risk capital and CVA, as further described below.
The fair value of the Firm’s derivative receivables
incorporates CVA to reflect the credit quality of
counterparties. CVA is based on the Firm’s AVG to a
counterparty and the counterparty’s credit spread in
the credit derivatives market. The Firm believes that
active risk management is essential to controlling the
dynamic credit risk in the derivatives portfolio. In
addition, the Firm’s risk management process for
derivatives exposures takes into consideration the
potential impact of wrong-way risk, which is broadly
defined as the risk that exposure to a counterparty is
positively correlated with the impact of a default by the
same counterparty, which could cause exposure to
increase at the same time as the counterparty’s
capacity to meet its obligations is decreasing. Many
factors may influence the nature and magnitude of
these correlations over time. To the extent that these
correlations are identified, the Firm may adjust the
CVA associated with a particular counterparty’s AVG.
The Firm risk manages exposure to changes in CVA by
entering into credit derivative contracts, as well as
interest rate, foreign exchange, equity and commodity
derivative contracts.
The below graph shows exposure profiles to the Firm’s
current derivatives portfolio over the next 10 years as
calculated by the Peak, DRE and AVG metrics. The
three measures generally show that exposure will
decline after the first year, if no new trades are added
to the portfolio.
Exposure profile of derivatives measures
December 31, 2025
(in billions)
AVG
DR E
Peak
1
year
2
years
5
years
1 0
years
0
20
40
60
80
1 00
1 20
1 40
JPMorgan Chase & Co./2025 Form 10-K
127
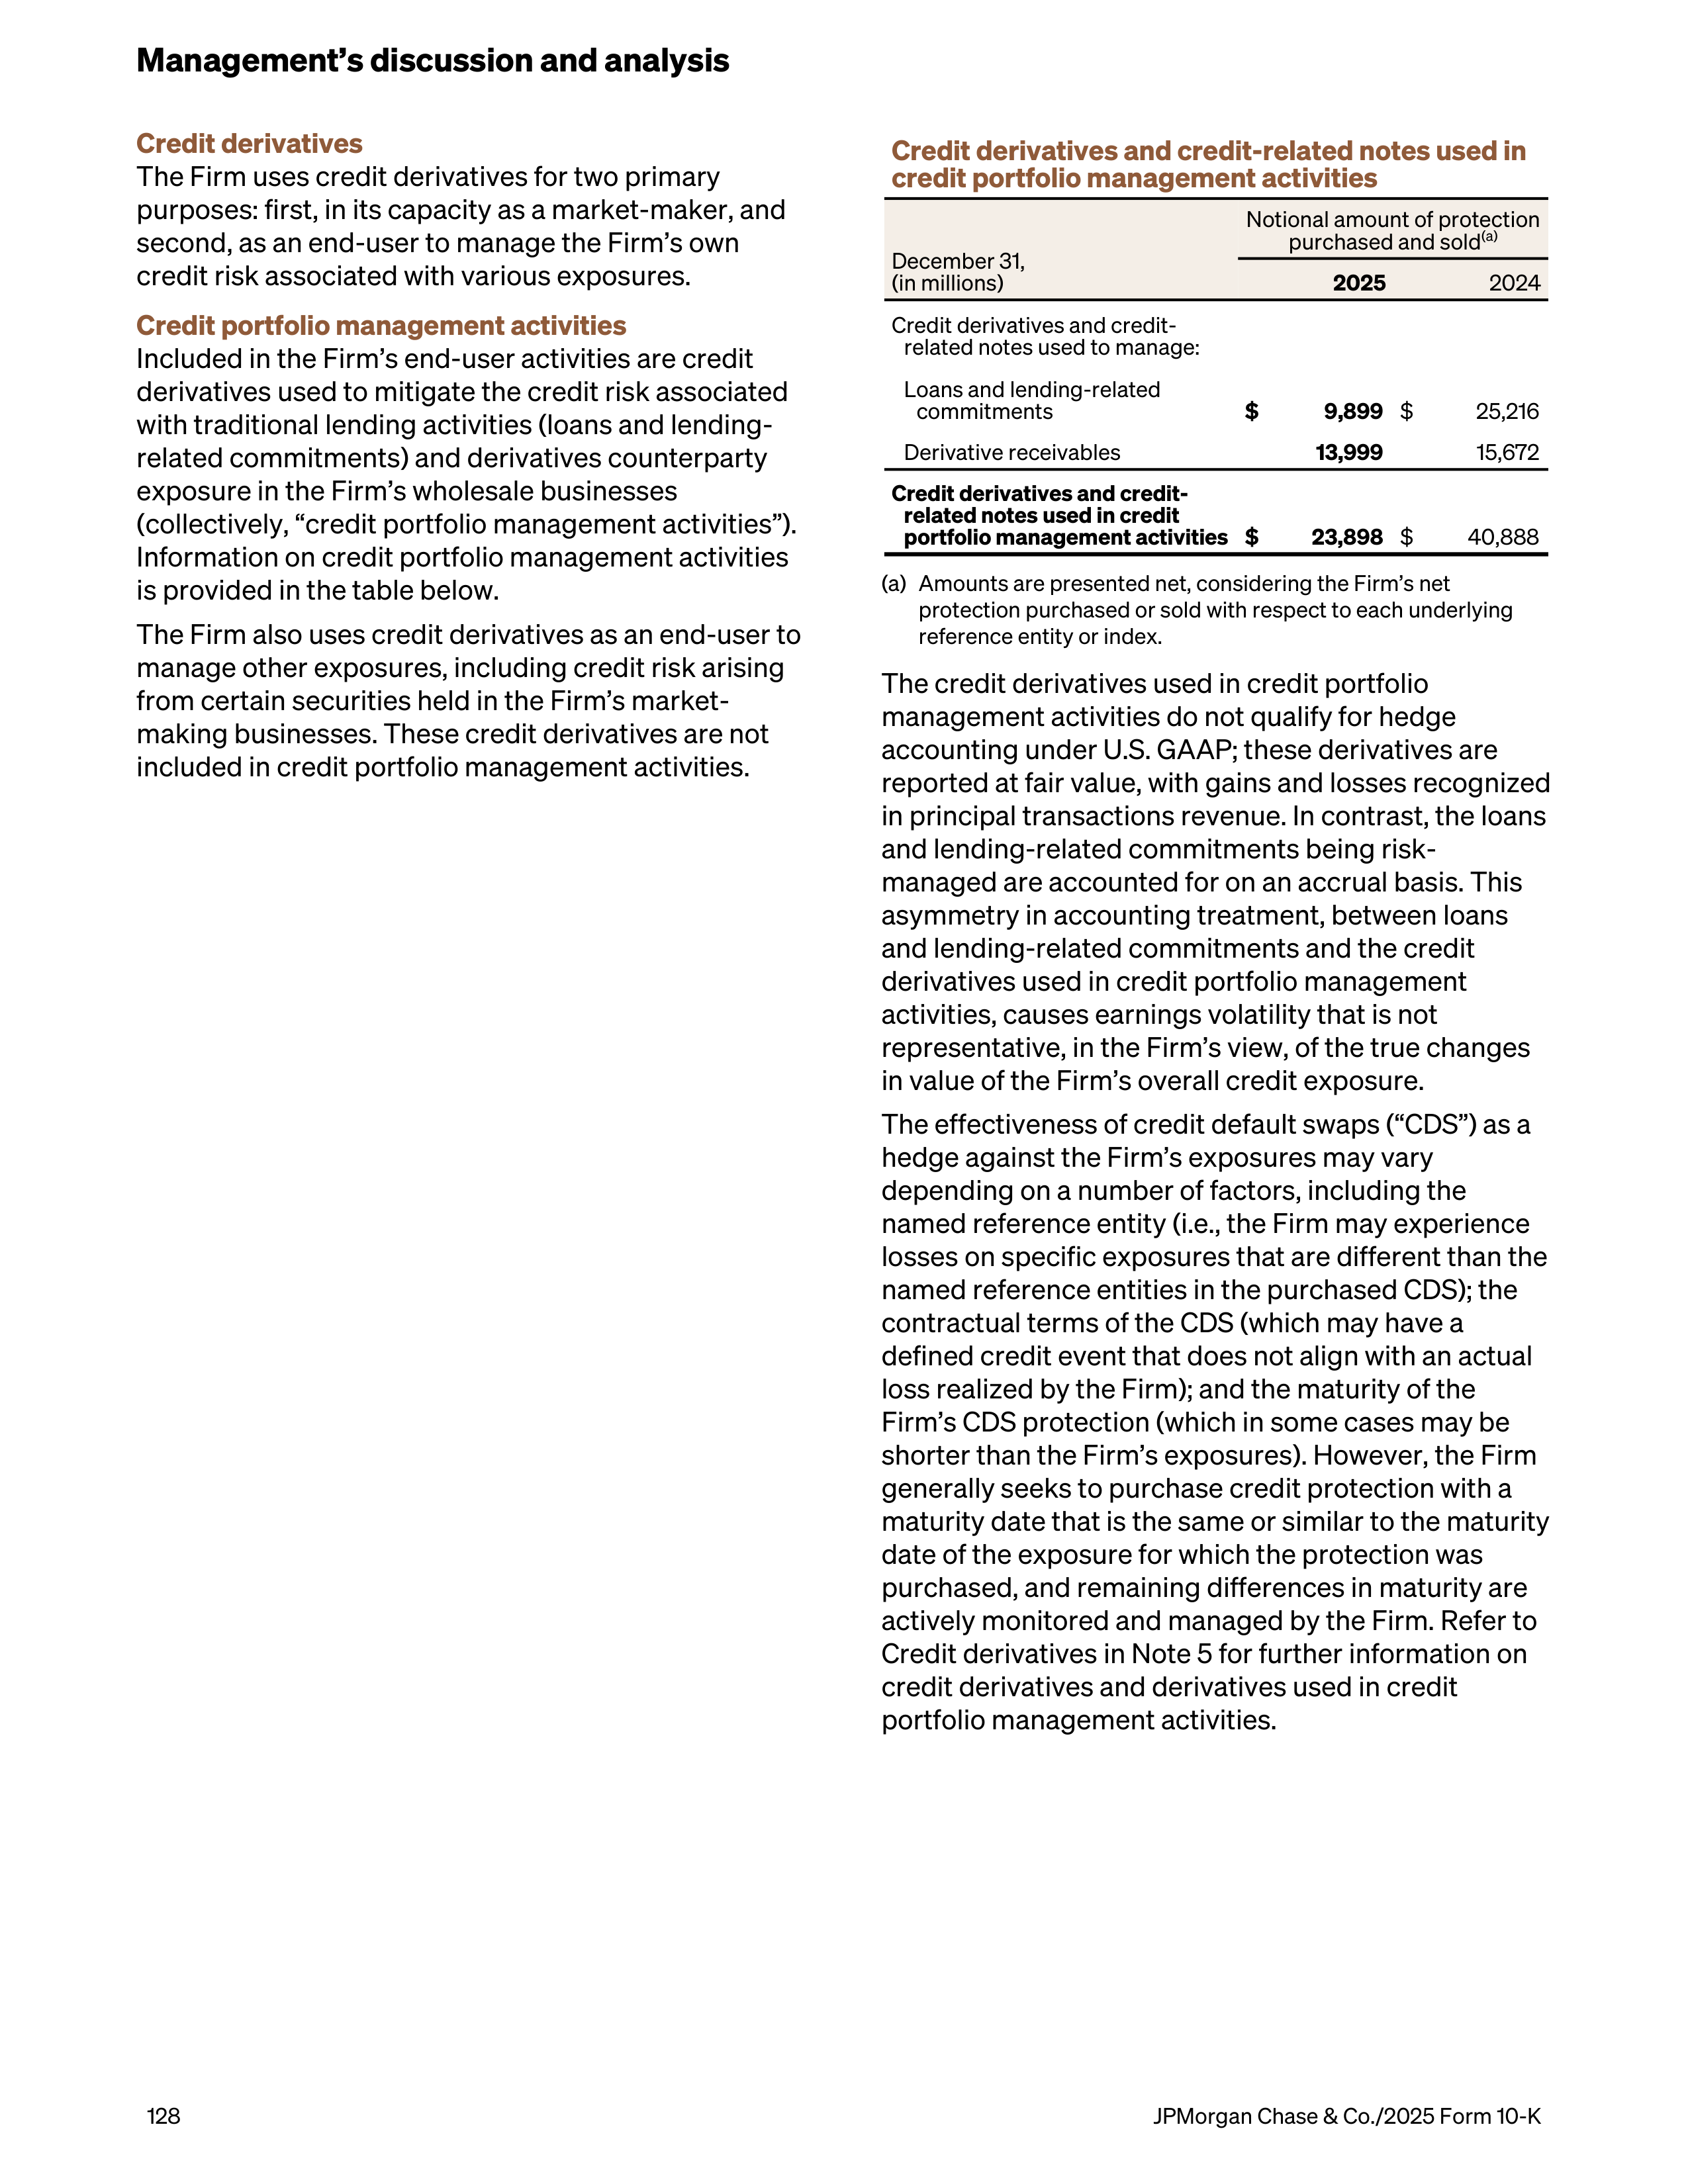
Credit derivatives
The Firm uses credit derivatives for two primary
purposes: first, in its capacity as a market-maker, and
second, as an end-user to manage the Firm’s own
credit risk associated with various exposures.
Credit portfolio management activities
Included in the Firm’s end-user activities are credit
derivatives used to mitigate the credit risk associated
with traditional lending activities (loans and lending-
related commitments) and derivatives counterparty
exposure in the Firm’s wholesale businesses
(collectively, “credit portfolio management activities”).
Information on credit portfolio management activities
is provided in the table below.
The Firm also uses credit derivatives as an end-user to
manage other exposures, including credit risk arising
from certain securities held in the Firm’s market-
making businesses. These credit derivatives are not
included in credit portfolio management activities.
Credit derivatives and credit-related notes used in
credit portfolio management activities
December 31,
(in millions)
Notional amount of protection
purchased and sold
(a)
2025
2024
Credit derivatives and credit-
related notes used to manage:
Loans and lending-related
commitments
$
9,899
$
25,216
Derivative receivables
13,999
15,672
Credit derivatives and credit-
related notes used in credit
portfolio management activities
$
23,898
$
40,888
(a)
Amounts are presented net, considering the Firm’s net
protection purchased or sold with respect to each underlying
reference entity or index.
The credit derivatives used in credit portfolio
management activities do not qualify for hedge
accounting under U.S. GAAP; these derivatives are
reported at fair value, with gains and losses recognized
in principal transactions revenue. In contrast, the loans
and lending-related commitments being risk-
managed are accounted for on an accrual basis. This
asymmetry in accounting treatment, between loans
and lending-related commitments and the credit
derivatives used in credit portfolio management
activities, causes earnings volatility that is not
representative, in the Firm’s view, of the true changes
in value of the Firm’s overall credit exposure.
The effectiveness of credit default swaps (“CDS”) as a
hedge against the Firm’s exposures may vary
depending on a number of factors, including the
named reference entity (i.e., the Firm may experience
losses on specific exposures that are different than the
named reference entities in the purchased CDS); the
contractual terms of the CDS (which may have a
defined credit event that does not align with an actual
loss realized by the Firm); and the maturity of the
Firm’s CDS protection (which in some cases may be
shorter than the Firm’s exposures). However, the Firm
generally seeks to purchase credit protection with a
maturity date that is the same or similar to the maturity
date of the exposure for which the protection was
purchased, and remaining differences in maturity are
actively monitored and managed by the Firm. Refer to
Credit derivatives in Note 5 for further information on
credit derivatives and derivatives used in credit
portfolio management activities.
Management’s discussion and analysis
128
JPMorgan Chase & Co./2025 Form 10-K
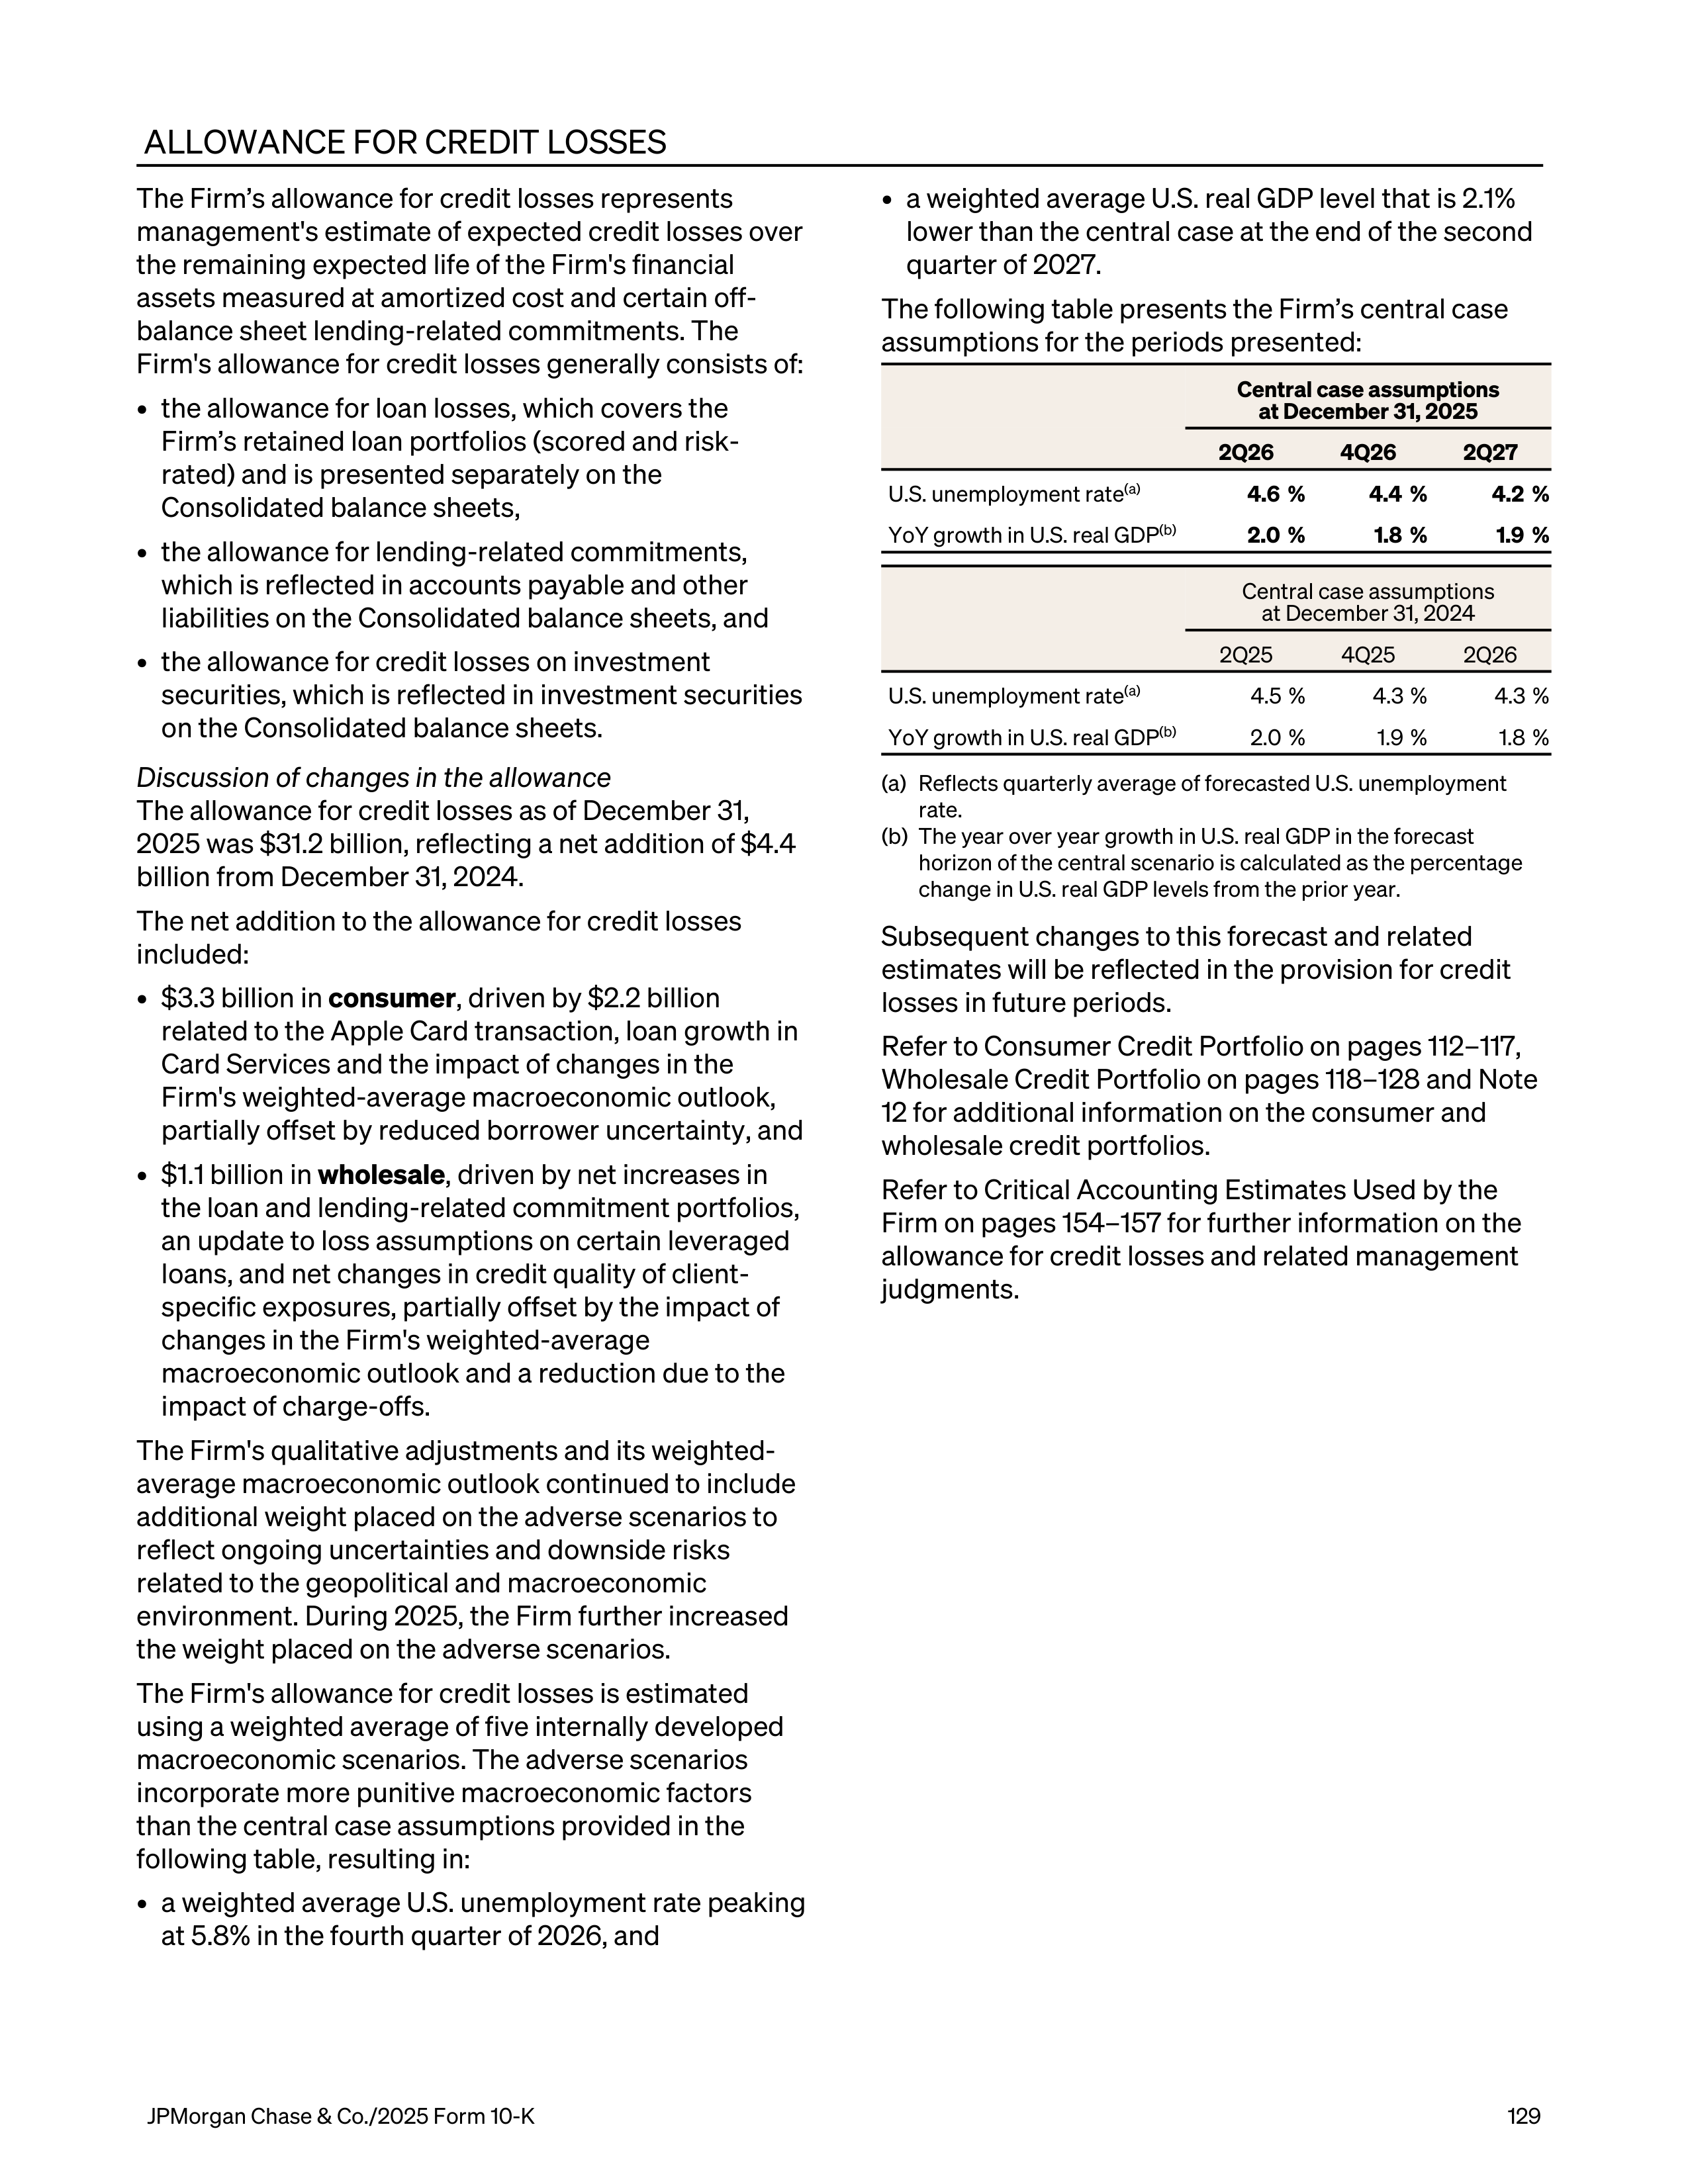
ALLOWANCE FOR CREDIT LOSSES
The Firm’s allowance for credit losses represents
management's estimate of expected credit losses over
the remaining expected life of the Firm's financial
assets measured at amortized cost and certain off-
balance sheet lending-related commitments. The
Firm's allowance for credit losses generally consists of:
•
the allowance for loan losses, which covers the
Firm’s retained loan portfolios (scored and risk-
rated) and is presented separately on the
Consolidated balance sheets,
•
the allowance for lending-related commitments,
which is reflected in accounts payable and other
liabilities on the Consolidated balance sheets, and
•
the allowance for credit losses on investment
securities, which is reflected in investment securities
on the Consolidated balance sheets.
Discussion of changes in the allowance
The allowance for credit losses as of December 31,
2025 was $31.2 billion, reflecting a net addition of $4.4
billion from December 31, 2024.
The net addition to the allowance for credit losses
included:
•
$3.3 billion in
consumer
, driven by $2.2 billion
related to the Apple Card transaction, loan growth in
Card Services and the impact of changes in the
Firm's weighted-average macroeconomic outlook,
partially offset by reduced borrower uncertainty, and
•
$1.1 billion in
wholesale
, driven by net increases in
the loan and lending-related commitment portfolios,
an update to loss assumptions on certain leveraged
loans, and net changes in credit quality of client-
specific exposures, partially offset by the impact of
changes in the Firm's weighted-average
macroeconomic outlook and a reduction due to the
impact of charge-offs.
The Firm's qualitative adjustments and its weighted-
average macroeconomic outlook continued to include
additional weight placed on the adverse scenarios to
reflect ongoing uncertainties and downside risks
related to the geopolitical and macroeconomic
environment. During 2025, the Firm further increased
the weight placed on the adverse scenarios.
The Firm's allowance for credit losses is estimated
using a weighted average of five internally developed
macroeconomic scenarios. The adverse scenarios
incorporate more punitive macroeconomic factors
than the central case assumptions provided in the
following table, resulting in:
•
a weighted average U.S. unemployment rate peaking
at 5.8% in the fourth quarter of 2026, and
•
a weighted average U.S. real GDP level that is 2.1%
lower than the central case at the end of the second
quarter of 2027.
The following table presents the Firm’s central case
assumptions for the periods presented:
Central case assumptions
at December 31, 2025
2Q26
4Q26
2Q27
U.S. unemployment rate
(a)
4.6 %
4.4 %
4.2 %
YoY growth in U.S. real GDP
(b)
2.0 %
1.8 %
1.9 %
Central case assumptions
at December 31, 2024
2Q25
4Q25
2Q26
U.S. unemployment rate
(a)
4.5 %
4.3 %
4.3 %
YoY growth in U.S. real GDP
(b)
2.0 %
1.9 %
1.8 %
(a)
Reflects quarterly average of forecasted U.S. unemployment
rate.
(b)
The year over year growth in U.S. real GDP in the forecast
horizon of the central scenario is calculated as the percentage
change in U.S. real GDP levels from the prior year.
Subsequent changes to this forecast and related
estimates will be reflected in the provision for credit
losses in future periods.
Refer to Consumer Credit Portfolio on pages 112–117,
Wholesale Credit Portfolio on pages 118–128 and Note
12 for additional information on the consumer and
wholesale credit portfolios.
Refer to Critical Accounting Estimates Used by the
Firm on pages 154–157 for further information on the
allowance for credit losses and related management
judgments.
JPMorgan Chase & Co./2025 Form 10-K
129
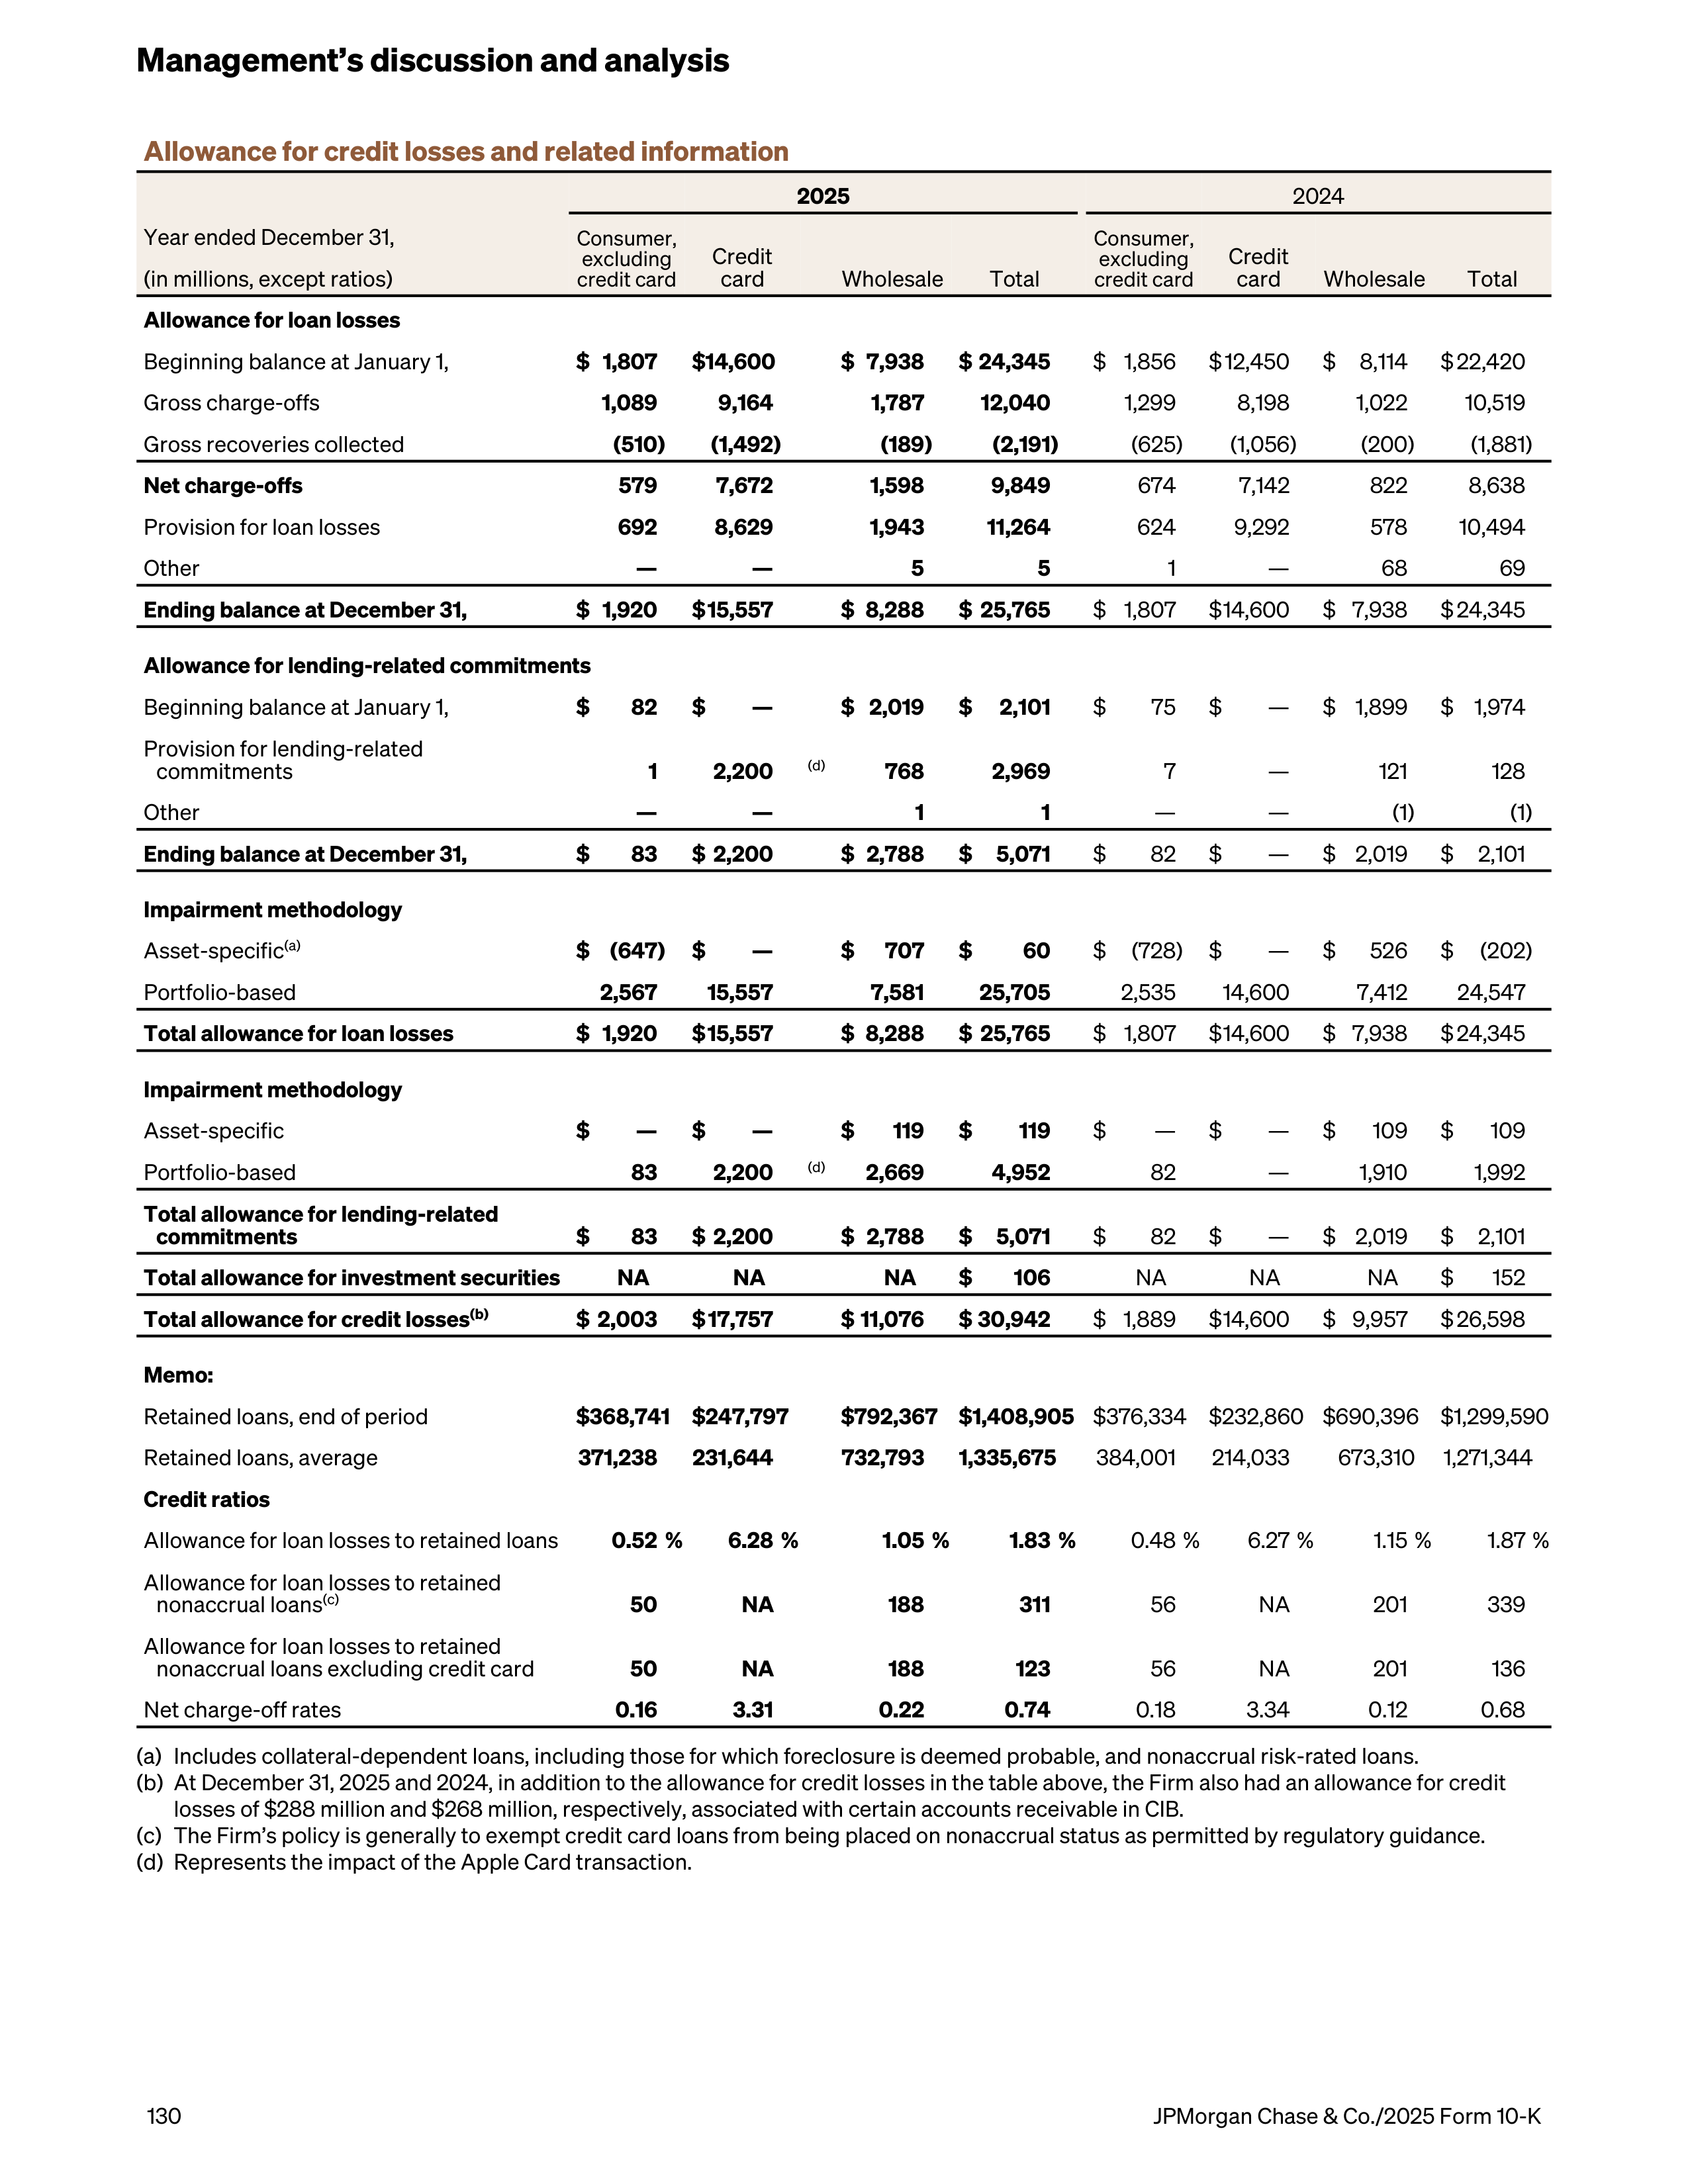
Allowance for credit losses and related information
2025
2024
Year ended December 31,
Consumer,
excluding
credit card
Credit
card
Wholesale
Total
Consumer,
excluding
credit card
Credit
card
Wholesale
Total
(in millions, except ratios)
Allowance for loan losses
Beginning balance at January 1,
$ 1,807
$ 14,600
$ 7,938
$ 24,345
$ 1,856
$ 12,450
$
8,114
$ 22,420
Gross charge-offs
1,089
9,164
1,787
12,040
1,299
8,198
1,022
10,519
Gross recoveries collected
(510)
(1,492)
(189)
(2,191)
(625)
(1,056)
(200)
(1,881)
Net charge-offs
579
7,672
1,598
9,849
674
7,142
822
8,638
Provision for loan losses
692
8,629
1,943
11,264
624
9,292
578
10,494
Other
—
—
5
5
1
—
68
69
Ending balance at December 31,
$ 1,920
$ 15,557
$ 8,288
$ 25,765
$ 1,807
$ 14,600
$ 7,938
$ 24,345
Allowance for lending-related commitments
Beginning balance at January 1,
$
82
$
—
$ 2,019
$
2,101
$
75
$
—
$ 1,899
$ 1,974
Provision for lending-related
commitments
1
2,200
(d)
768
2,969
7
—
121
128
Other
—
—
1
1
—
—
(1)
(1)
Ending balance at December 31,
$
83
$ 2,200
$ 2,788
$
5,071
$
82
$
—
$ 2,019
$
2,101
Impairment methodology
Asset-specific
(a)
$ (647)
$
—
$
707
$
60
$
(728)
$
—
$
526
$
(202)
Portfolio-based
2,567
15,557
7,581
25,705
2,535
14,600
7,412
24,547
Total allowance for loan losses
$ 1,920
$ 15,557
$ 8,288
$ 25,765
$ 1,807
$ 14,600
$ 7,938
$ 24,345
Impairment methodology
Asset-specific
$
—
$
—
$
119
$
119
$
—
$
—
$
109
$
109
Portfolio-based
83
2,200
(d)
2,669
4,952
82
—
1,910
1,992
Total allowance for lending-related
commitments
$
83
$ 2,200
$ 2,788
$
5,071
$
82
$
—
$ 2,019
$
2,101
Total allowance for investment securities
NA
NA
NA
$
106
NA
NA
NA
$
152
Total allowance for credit losses
(b)
$ 2,003
$ 17,757
$ 11,076
$ 30,942
$ 1,889
$ 14,600
$ 9,957
$ 26,598
Memo:
Retained loans, end of period
$ 368,741 $ 247,797
$ 792,367 $ 1,408,905
$ 376,334
$ 232,860 $ 690,396 $ 1,299,590
Retained loans, average
371,238
231,644
732,793
1,335,675
384,001
214,033
673,310
1,271,344
Credit ratios
Allowance for loan losses to retained loans
0.52 %
6.28 %
1.05 %
1.83 %
0.48 %
6.27 %
1.15 %
1.87 %
Allowance for loan losses to retained
nonaccrual loans
(c)
50
NA
188
311
56
NA
201
339
Allowance for loan losses to retained
nonaccrual loans excluding credit card
50
NA
188
123
56
NA
201
136
Net charge-off rates
0.16
3.31
0.22
0.74
0.18
3.34
0.12
0.68
(a)
Includes collateral-dependent loans, including those for which foreclosure is deemed probable, and nonaccrual risk-rated loans.
(b)
At December 31, 2025 and 2024, in addition to the allowance for credit losses in the table above, the Firm also had an allowance for credit
losses of $288 million and $268 million, respectively, associated with certain accounts receivable in CIB.
(c)
The Firm’s policy is generally to exempt credit card loans from being placed on nonaccrual status as permitted by regulatory guidance.
(d)
Represents the impact of the Apple Card transaction.
Management’s discussion and analysis
130
JPMorgan Chase & Co./2025 Form 10-K
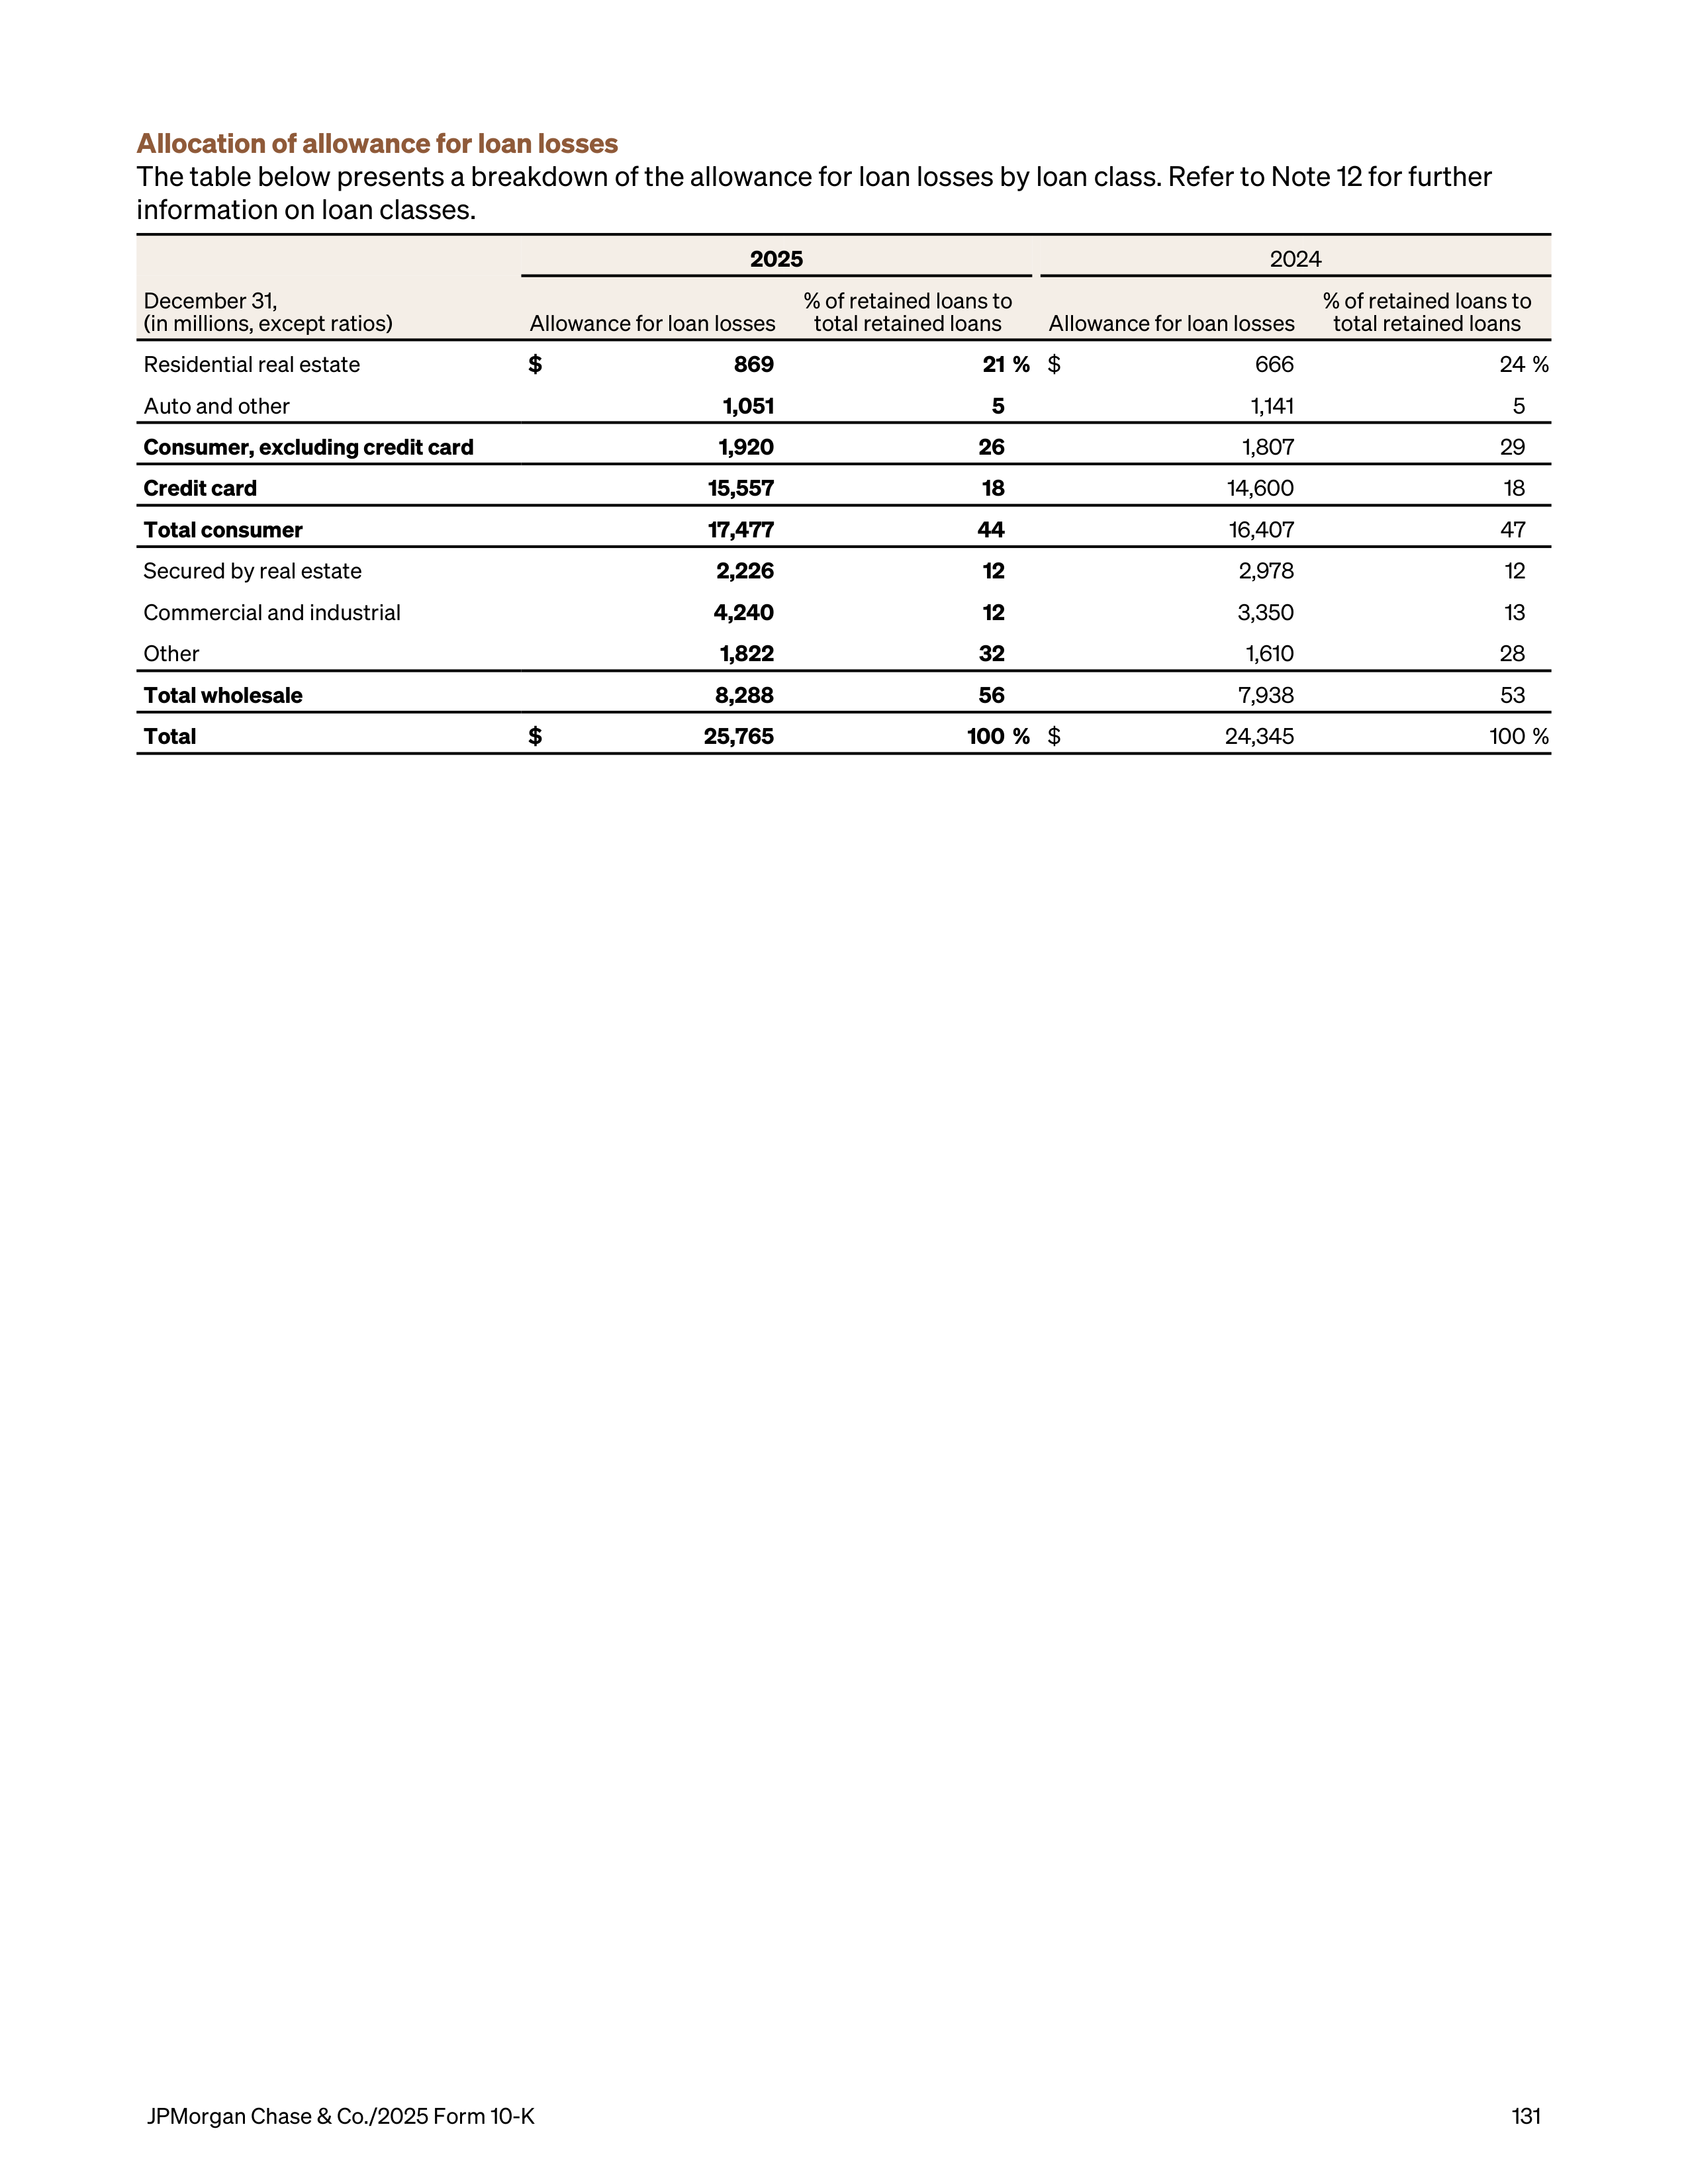
Allocation of allowance for loan losses
The table below presents a breakdown of the allowance for loan losses by loan class. Refer to Note 12 for further
information on loan classes.
2025
2024
December 31,
(in millions, except ratios)
Allowance for loan losses
% of retained loans to
total retained loans
Allowance for loan losses
% of retained loans to
total retained loans
Residential real estate
$
869
21 %
$
666
24 %
Auto and other
1,051
5
1,141
5
Consumer, excluding credit card
1,920
26
1,807
29
Credit card
15,557
18
14,600
18
Total consumer
17,477
44
16,407
47
Secured by real estate
2,226
12
2,978
12
Commercial and industrial
4,240
12
3,350
13
Other
1,822
32
1,610
28
Total wholesale
8,288
56
7,938
53
Total
$
25,765
100 %
$
24,345
100 %
JPMorgan Chase & Co./2025 Form 10-K
131
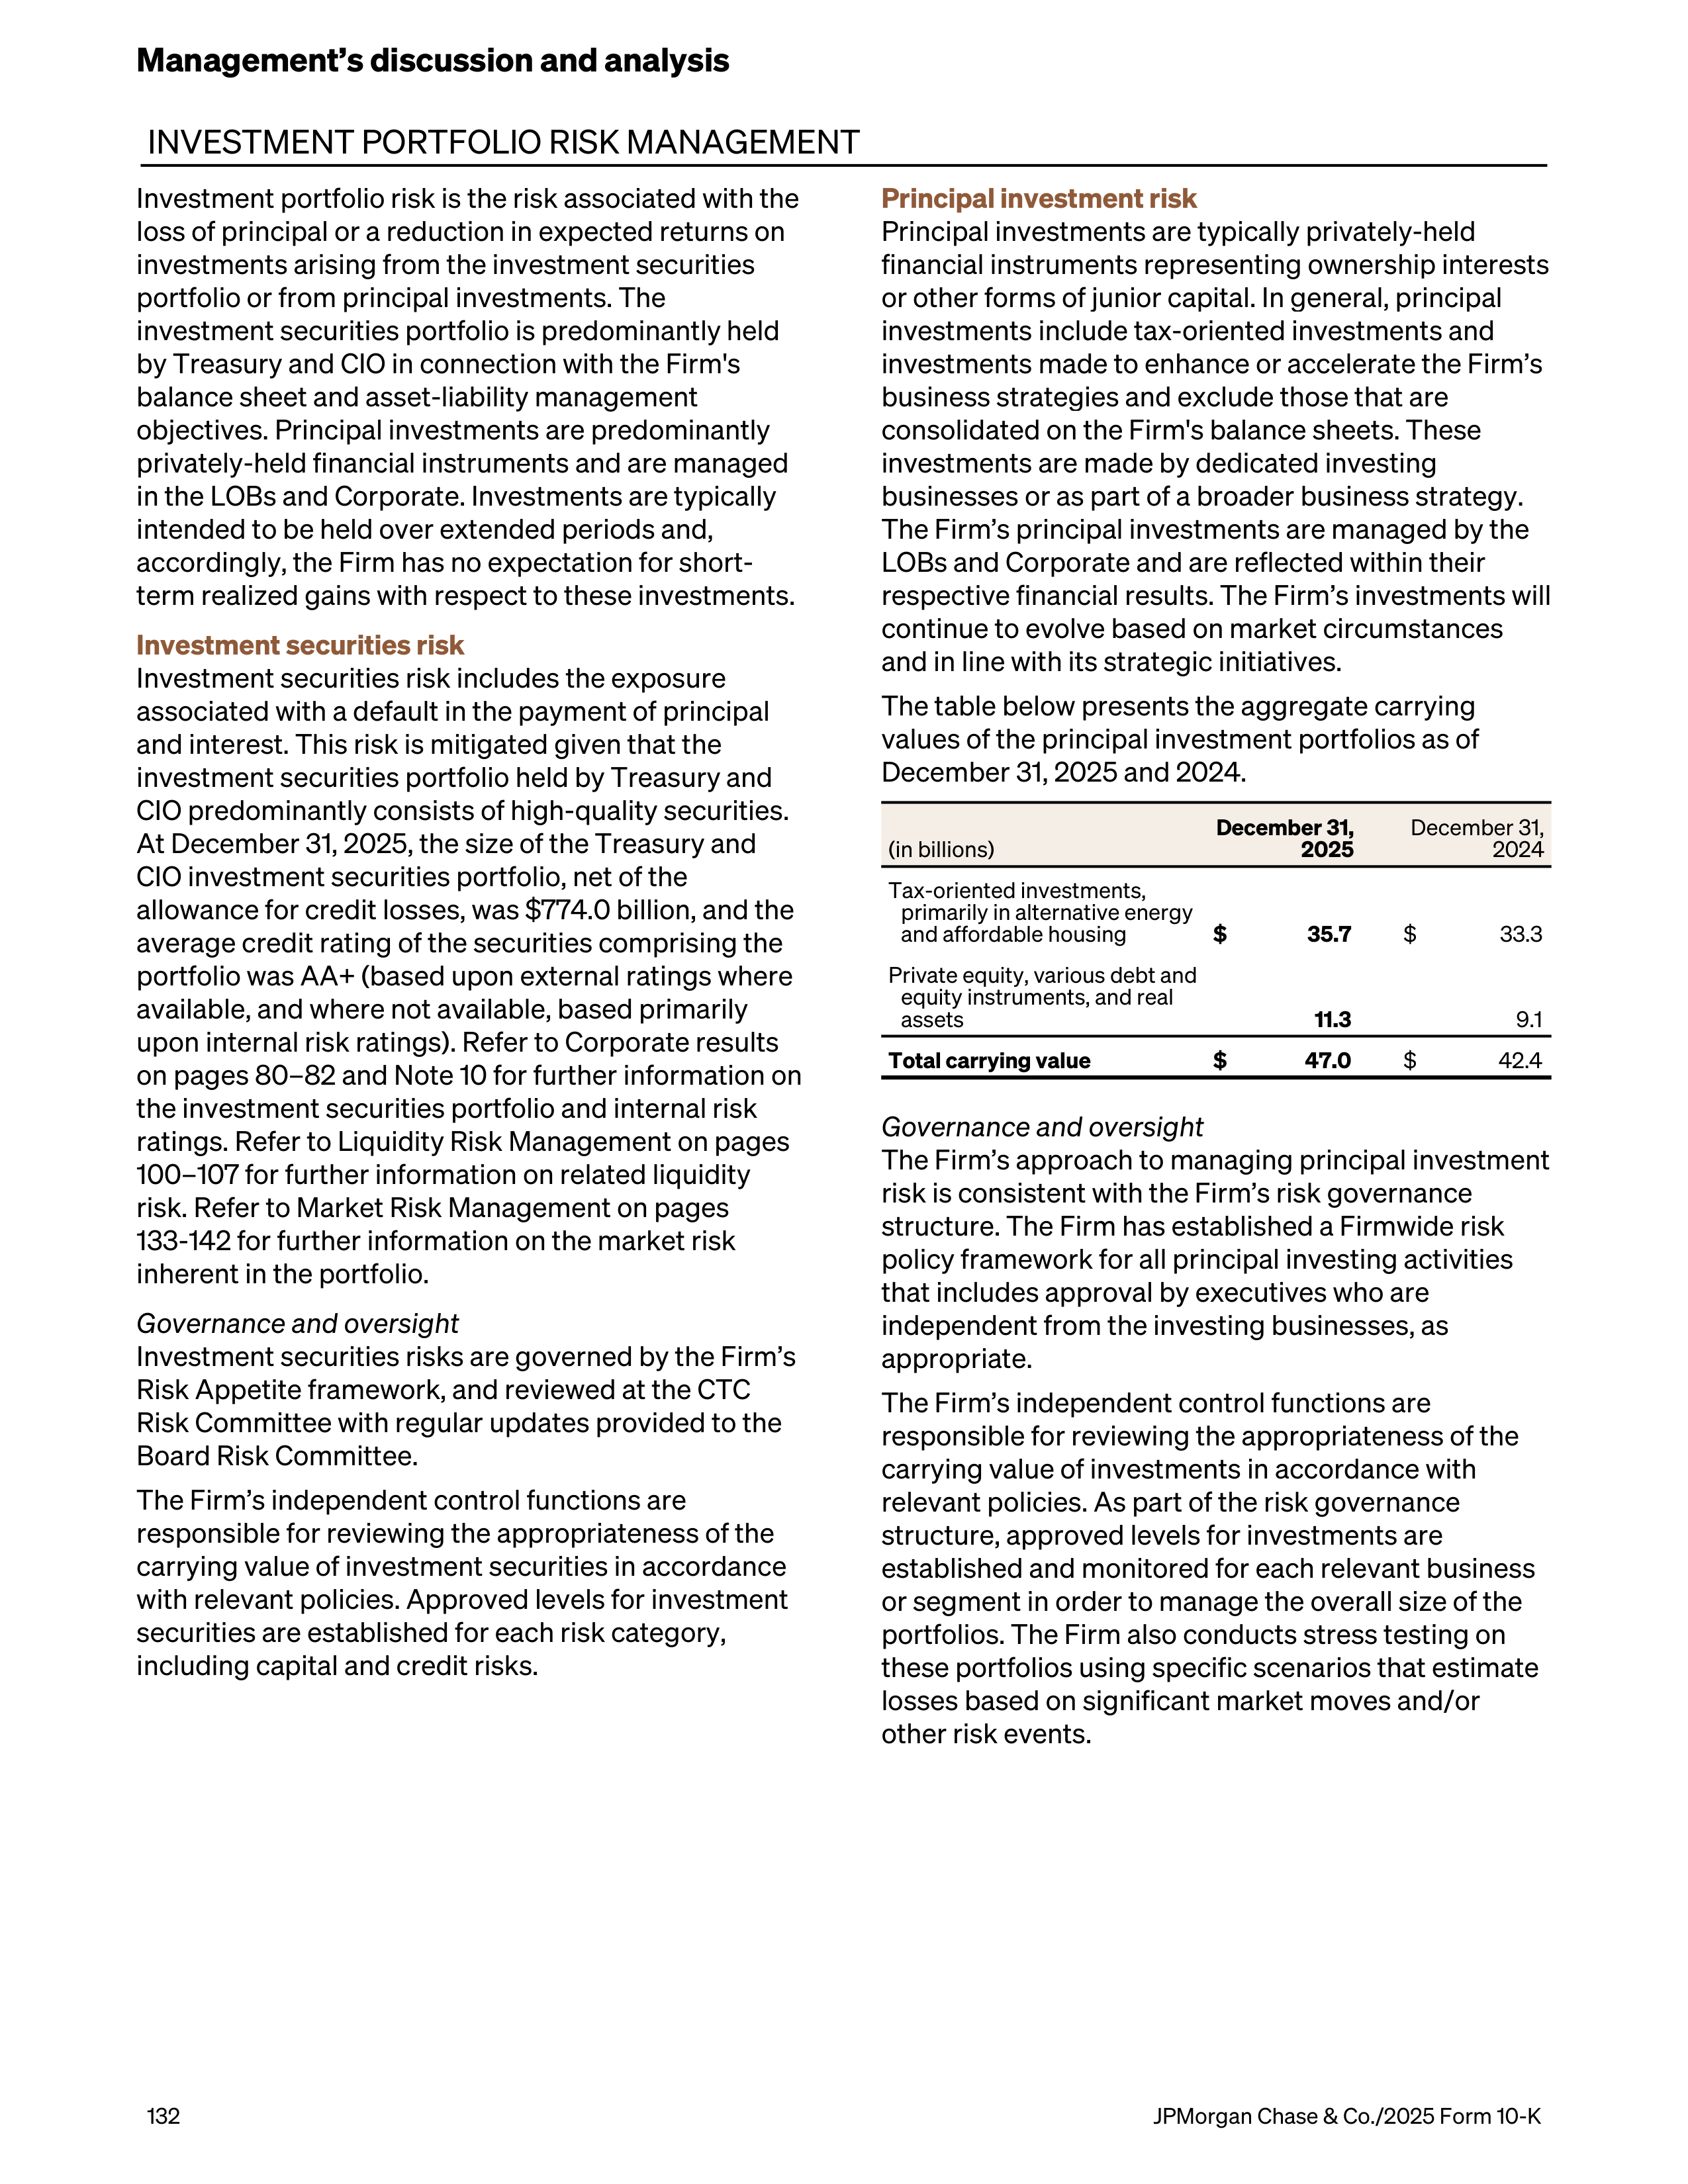
INVESTMENT PORTFOLIO RISK MANAGEMENT
Investment portfolio risk is the risk associated with the
loss of principal or a reduction in expected returns on
investments arising from the investment securities
portfolio or from principal investments. The
investment securities portfolio is predominantly held
by Treasury and CIO in connection with the Firm's
balance sheet and asset-liability management
objectives. Principal investments are predominantly
privately-held financial instruments and are managed
in the LOBs and Corporate. Investments are typically
intended to be held over extended periods and,
accordingly, the Firm has no expectation for short-
term realized gains with respect to these investments.
Investment securities risk
Investment securities risk includes the exposure
associated with a default in the payment of principal
and interest. This risk is mitigated given that the
investment securities portfolio held by Treasury and
CIO predominantly consists of high-quality securities.
At December 31, 2025, the size of the Treasury and
CIO investment securities portfolio, net of the
allowance for credit losses, was $774.0 billion, and the
average credit rating of the securities comprising the
portfolio was AA+ (based upon external ratings where
available, and where not available, based primarily
upon internal risk ratings). Refer to Corporate results
on pages 80–82 and Note 10 for further information on
the investment securities portfolio and internal risk
ratings. Refer to Liquidity Risk Management on pages
100–107 for further information on related liquidity
risk. Refer to Market Risk Management on pages
133-142 for further information on the market risk
inherent in the portfolio.
Governance and oversight
Investment securities risks are governed by the Firm’s
Risk Appetite framework, and reviewed at the CTC
Risk Committee with regular updates provided to the
Board Risk Committee.
The Firm’s independent control functions are
responsible for reviewing the appropriateness of the
carrying value of investment securities in accordance
with relevant policies. Approved levels for investment
securities are established for each risk category,
including capital and credit risks.
Principal investment risk
Principal investments are typically privately-held
financial instruments representing ownership interests
or other forms of junior capital. In general, principal
investments include tax-oriented investments and
investments made to enhance or accelerate the Firm’s
business strategies and exclude those that are
consolidated on the Firm's balance sheets. These
investments are made by dedicated investing
businesses or as part of a broader business strategy.
The Firm’s principal investments are managed by the
LOBs and Corporate and are reflected within their
respective financial results. The Firm’s investments will
continue to evolve based on market circumstances
and in line with its strategic initiatives.
The table below presents the aggregate carrying
values of the principal investment portfolios as of
December 31, 2025 and 2024.
(in billions)
December 31,
2025
December 31,
2024
Tax-oriented investments,
primarily in alternative energy
and affordable housing
$
35.7
$
33.3
Private equity, various debt and
equity instruments, and real
assets
11.3
9.1
Total carrying value
$
47.0
$
42.4
Governance and oversight
The Firm’s approach to managing principal investment
risk is consistent with the Firm’s risk governance
structure. The Firm has established a Firmwide risk
policy framework for all principal investing activities
that includes approval by executives who are
independent from the investing businesses, as
appropriate.
The Firm’s independent control functions
are
responsible for reviewing the appropriateness of the
carrying value of investments in accordance with
relevant policies. As part of the risk governance
structure, approved levels for investments are
established and monitored for each relevant business
or segment in order to manage the overall size of the
portfolios. The Firm also conducts stress testing on
these portfolios using specific scenarios that estimate
losses based on significant market moves and/or
other risk events.
Management’s discussion and analysis
132
JPMorgan Chase & Co./2025 Form 10-K
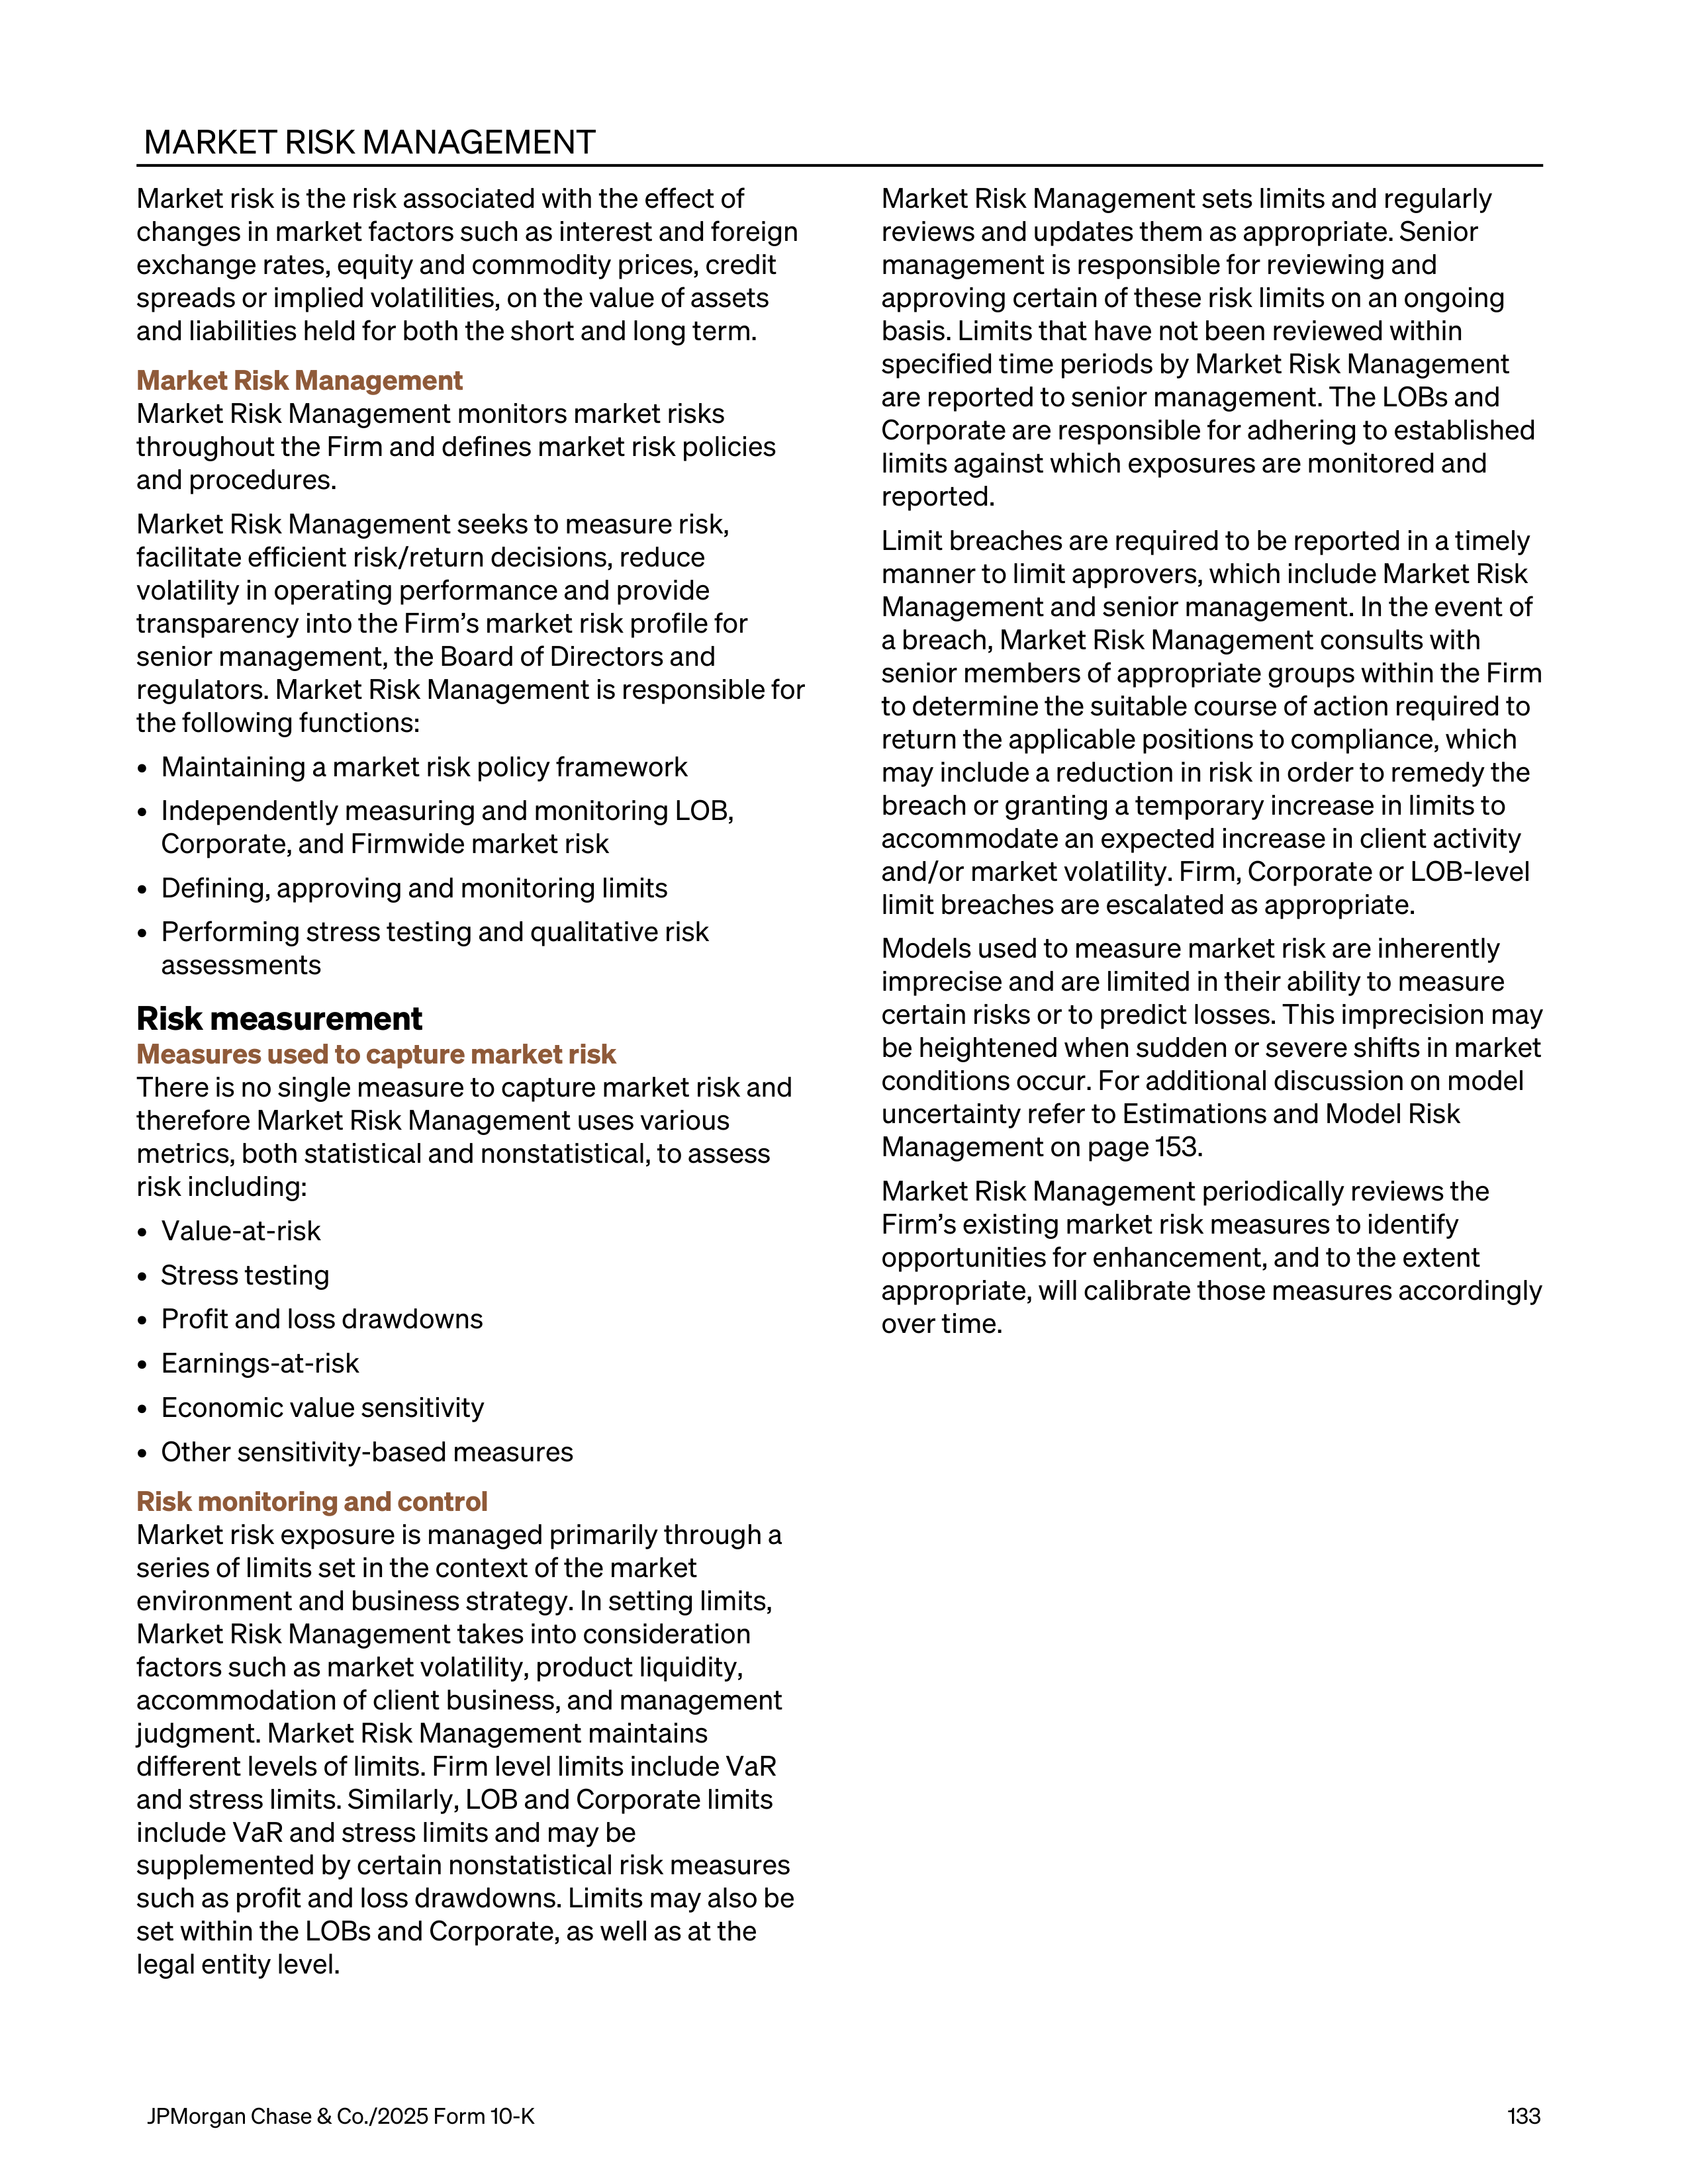
MARKET RISK MANAGEMENT
Market risk is the risk associated with the effect of
changes in market factors such as interest and foreign
exchange rates, equity and commodity prices, credit
spreads or implied volatilities, on the value of assets
and liabilities held for both the short and long term.
Market Risk Management
Market Risk Management monitors market risks
throughout the Firm and defines market risk policies
and procedures.
Market Risk Management seeks to measure risk,
facilitate efficient risk/return decisions, reduce
volatility in operating performance and provide
transparency into the Firm’s market risk profile for
senior management, the Board of Directors and
regulators. Market Risk Management is responsible for
the following functions:
•
Maintaining a market risk policy framework
•
Independently measuring and monitoring LOB,
Corporate, and Firmwide market risk
•
Defining, approving and monitoring limits
•
Performing stress testing and qualitative risk
assessments
Risk measurement
Measures used to capture market risk
There is no single measure to capture market risk and
therefore Market Risk Management uses various
metrics, both statistical and nonstatistical, to assess
risk including:
•
Value-at-risk
•
Stress testing
•
Profit and loss drawdowns
•
Earnings-at-risk
•
Economic value sensitivity
•
Other sensitivity-based measures
Risk monitoring and control
Market risk exposure is managed primarily through a
series of limits set in the context of the market
environment and business strategy. In setting limits,
Market Risk Management takes into consideration
factors such as market volatility, product liquidity,
accommodation of client business, and management
judgment. Market Risk Management maintains
different levels of limits. Firm level limits include VaR
and stress limits. Similarly, LOB and Corporate limits
include VaR and stress limits and may be
supplemented by certain nonstatistical risk measures
such as profit and loss drawdowns. Limits may also be
set within the LOBs and Corporate, as well as at the
legal entity level.
Market Risk Management sets limits and regularly
reviews and updates them as appropriate. Senior
management is responsible for reviewing and
approving certain of these risk limits on an ongoing
basis. Limits that have not been reviewed within
specified time periods by Market Risk Management
are reported to senior management. The LOBs and
Corporate are responsible for adhering to established
limits against which exposures are monitored and
reported.
Limit breaches are required to be reported in a timely
manner to limit approvers, which include Market Risk
Management and senior management. In the event of
a breach, Market Risk Management consults with
senior members of appropriate groups within the Firm
to determine the suitable course of action required to
return the applicable positions to compliance, which
may include a reduction in risk in order to remedy the
breach or granting a temporary increase in limits to
accommodate an expected increase in client activity
and/or market volatility. Firm, Corporate or LOB-level
limit breaches are escalated as appropriate.
Models used to measure market risk are inherently
imprecise and are limited in their ability to measure
certain risks or to predict losses. This imprecision may
be heightened when sudden or severe shifts in market
conditions occur. For additional discussion on model
uncertainty refer to Estimations and Model Risk
Management on page 153.
Market Risk Management periodically reviews the
Firm’s existing market risk measures to identify
opportunities for enhancement, and to the extent
appropriate, will calibrate those measures accordingly
over time.
JPMorgan Chase & Co./2025 Form 10-K
133
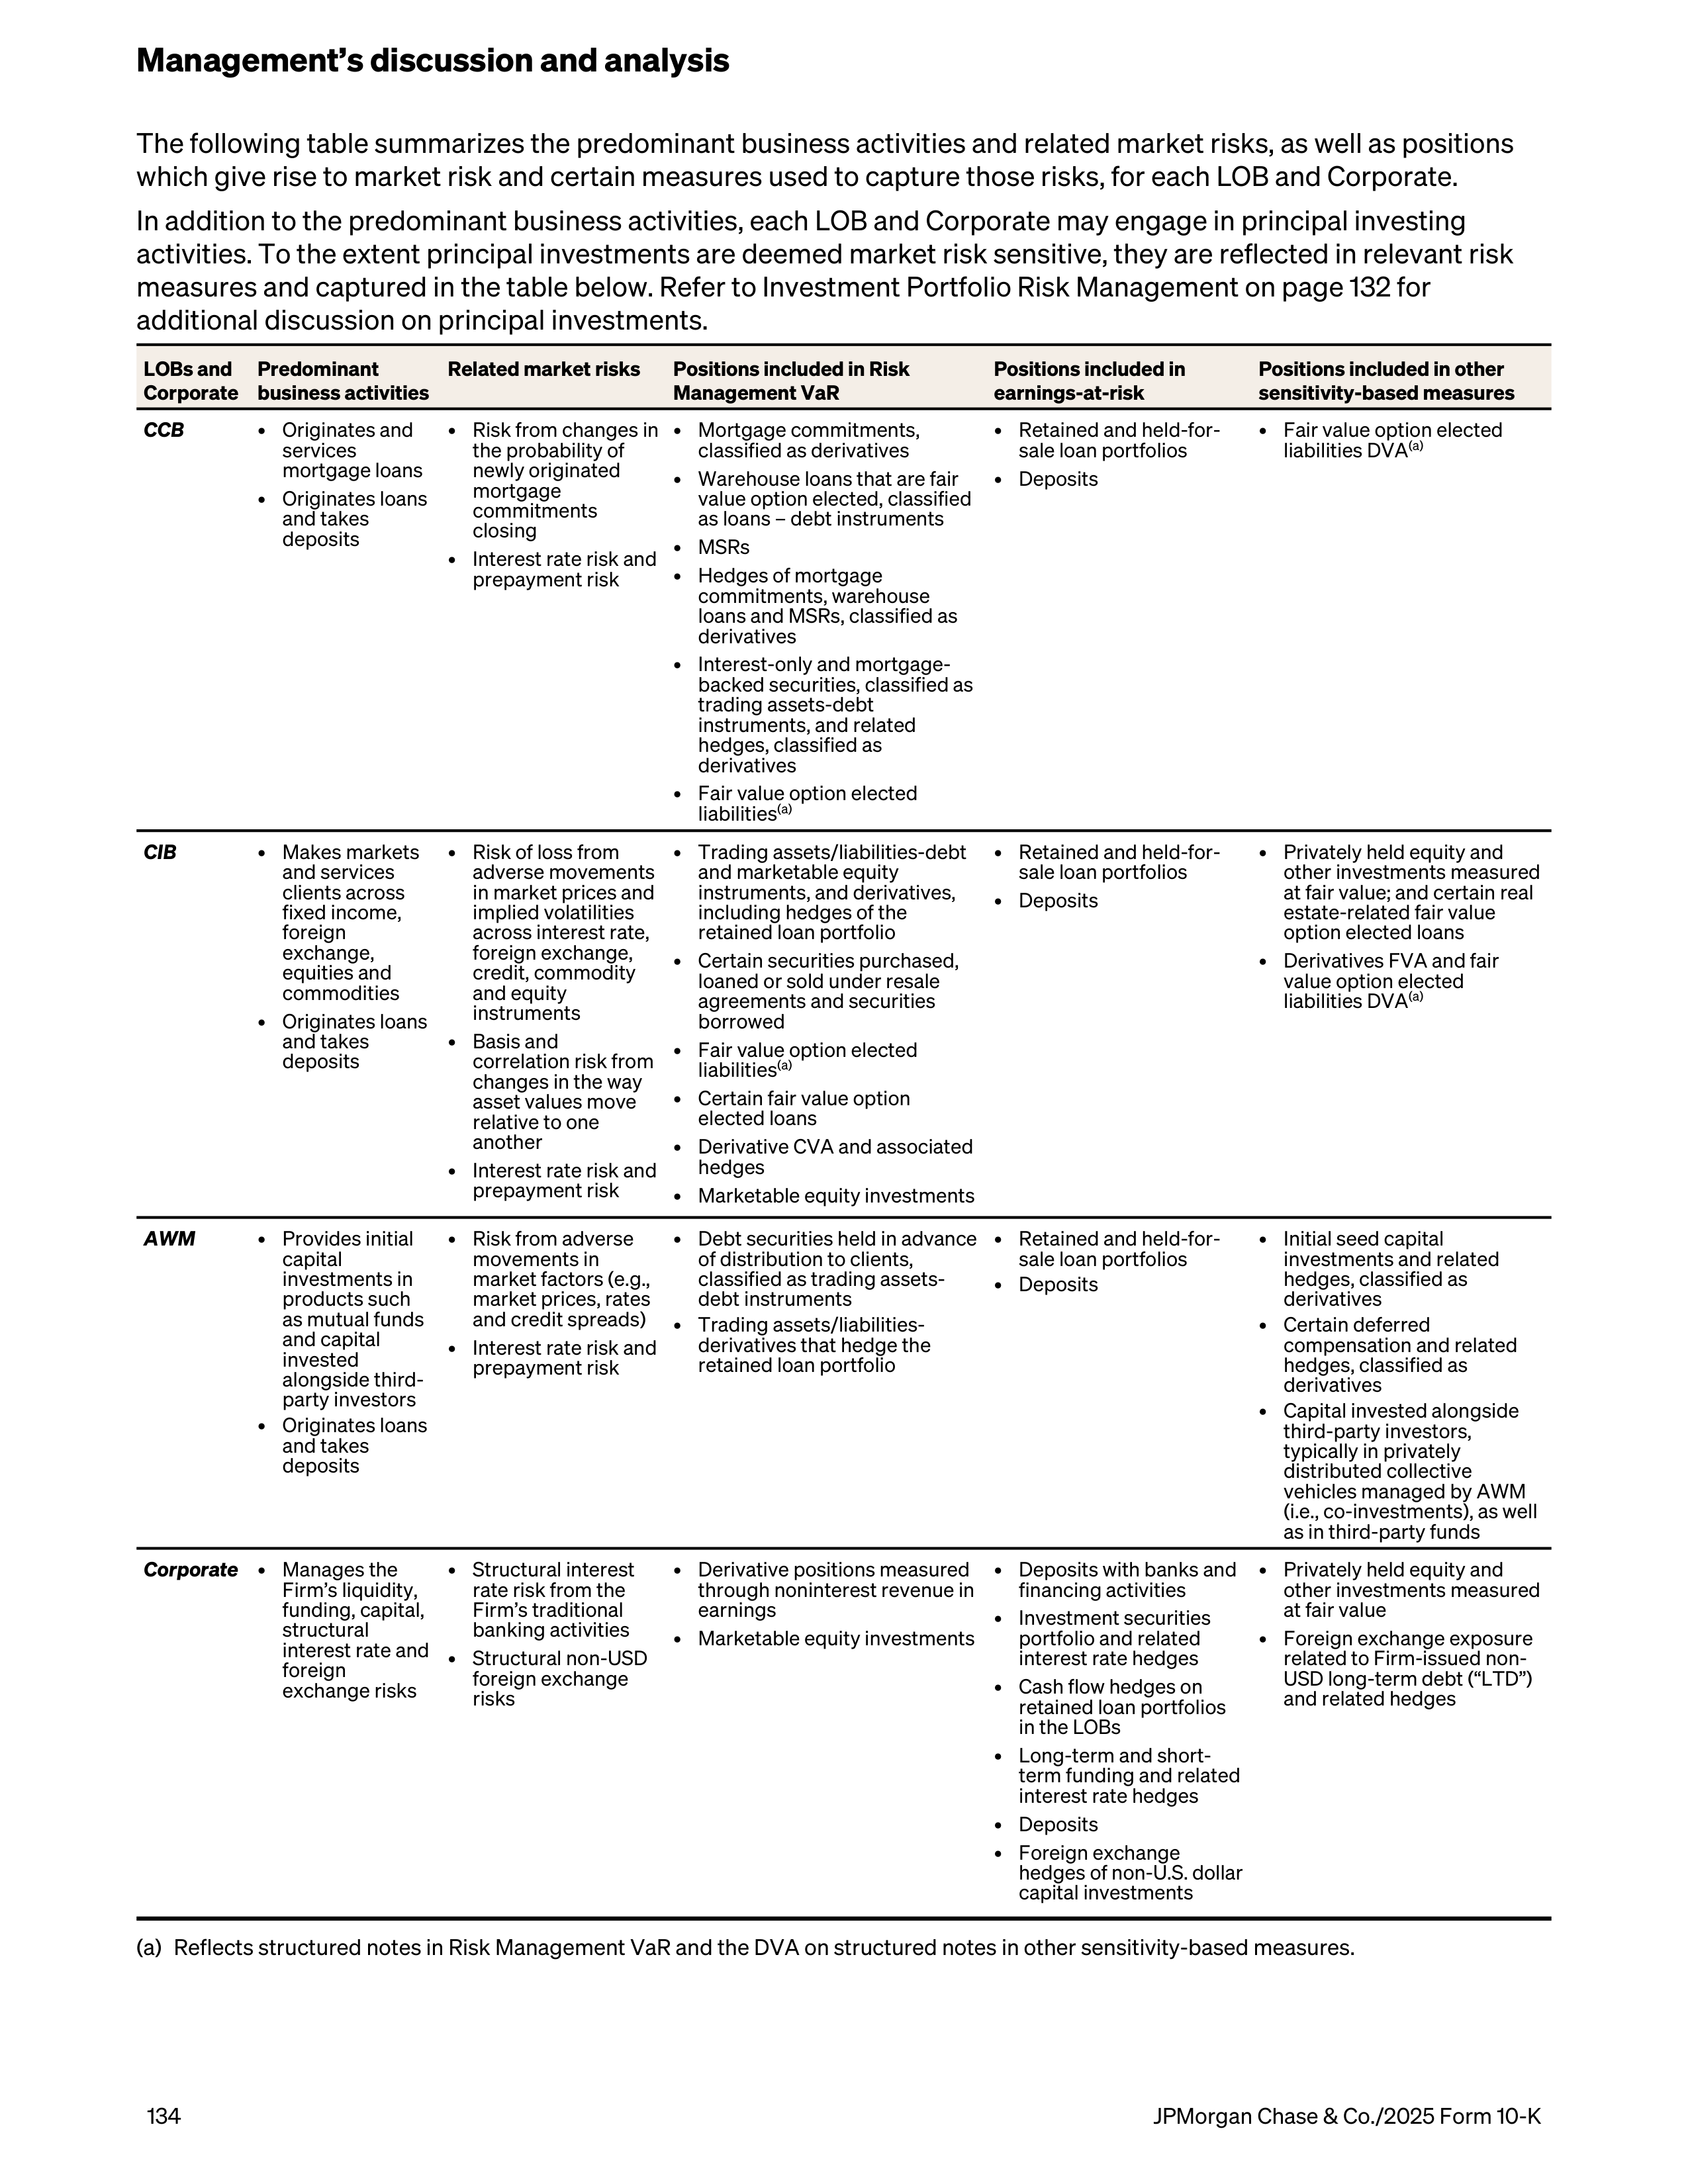
The following table summarizes the predominant business activities and related market risks, as well as positions
which give rise to market risk and certain measures used to capture those risks, for each LOB and Corporate.
In addition to the predominant business activities, each LOB and Corporate may engage in principal investing
activities. To the extent principal investments are deemed market risk sensitive, they are reflected in relevant risk
measures and captured in the table below. Refer to Investment Portfolio Risk Management on page 132 for
additional discussion on principal investments.
LOBs and
Corporate
Predominant
business activities
Related market risks
Positions included in Risk
Management VaR
Positions included in
earnings-at-risk
Positions included in other
sensitivity-based measures
CCB
•
Originates and
services
mortgage loans
•
Originates loans
and takes
deposits
•
Risk from changes in
the probability of
newly originated
mortgage
commitments
closing
•
Interest rate risk and
prepayment risk
•
Mortgage commitments,
classified as derivatives
•
Warehouse loans that are fair
value option elected, classified
as loans – debt instruments
•
MSRs
•
Hedges of mortgage
commitments, warehouse
loans and MSRs, classified as
derivatives
•
Interest-only and mortgage-
backed securities, classified as
trading assets-debt
instruments, and related
hedges, classified as
derivatives
•
Fair value option elected
liabilities
(a)
•
Retained and held-for-
sale loan portfolios
•
Deposits
•
Fair value option elected
liabilities DVA
(a)
CIB
•
Makes markets
and services
clients across
fixed income,
foreign
exchange,
equities and
commodities
•
Originates loans
and takes
deposits
•
Risk of loss from
adverse movements
in market prices and
implied volatilities
across interest rate,
foreign exchange,
credit, commodity
and equity
instruments
•
Basis and
correlation risk from
changes in the way
asset values move
relative to one
another
•
Interest rate risk and
prepayment risk
•
Trading assets/liabilities-debt
and marketable equity
instruments, and derivatives,
including hedges of the
retained loan portfolio
•
Certain securities purchased,
loaned or sold under resale
agreements and securities
borrowed
•
Fair value option elected
liabilities
(a)
•
Certain fair value option
elected loans
•
Derivative CVA and associated
hedges
•
Marketable equity investments
•
Retained and held-for-
sale loan portfolios
•
Deposits
•
Privately held equity and
other investments measured
at fair value; and certain real
estate-related fair value
option elected loans
•
Derivatives FVA and fair
value option elected
liabilities DVA
(a)
AWM
•
Provides initial
capital
investments in
products such
as mutual funds
and capital
invested
alongside third-
party investors
•
Originates loans
and takes
deposits
•
Risk from adverse
movements in
market factors (e.g.,
market prices, rates
and credit spreads)
•
Interest rate risk and
prepayment risk
•
Debt securities held in advance
of distribution to clients,
classified as trading assets-
debt instruments
•
Trading assets/liabilities-
derivatives that hedge the
retained loan portfolio
•
Retained and held-for-
sale loan portfolios
•
Deposits
•
Initial seed capital
investments and related
hedges, classified as
derivatives
•
Certain deferred
compensation and related
hedges, classified as
derivatives
•
Capital invested alongside
third-party investors,
typically in privately
distributed collective
vehicles managed by AWM
(i.e., co-investments), as well
as in third-party funds
Corporate
•
Manages the
Firm’s liquidity,
funding, capital,
structural
interest rate and
foreign
exchange risks
•
Structural interest
rate risk from the
Firm’s traditional
banking activities
•
Structural non-USD
foreign exchange
risks
•
Derivative positions measured
through noninterest revenue in
earnings
•
Marketable equity investments
•
Deposits with banks and
financing activities
•
Investment securities
portfolio and related
interest rate hedges
•
Cash flow hedges on
retained loan portfolios
in the LOBs
•
Long-term and short-
term funding and related
interest rate hedges
•
Deposits
•
Foreign exchange
hedges of non-U.S. dollar
capital investments
•
Privately held equity and
other investments measured
at fair value
•
Foreign exchange exposure
related to Firm-issued non-
USD long-term debt (“LTD”)
and related hedges
(a)
Reflects structured notes in Risk Management VaR and the DVA on structured notes in other sensitivity-based measures.
Management’s discussion and analysis
134
JPMorgan Chase & Co./2025 Form 10-K
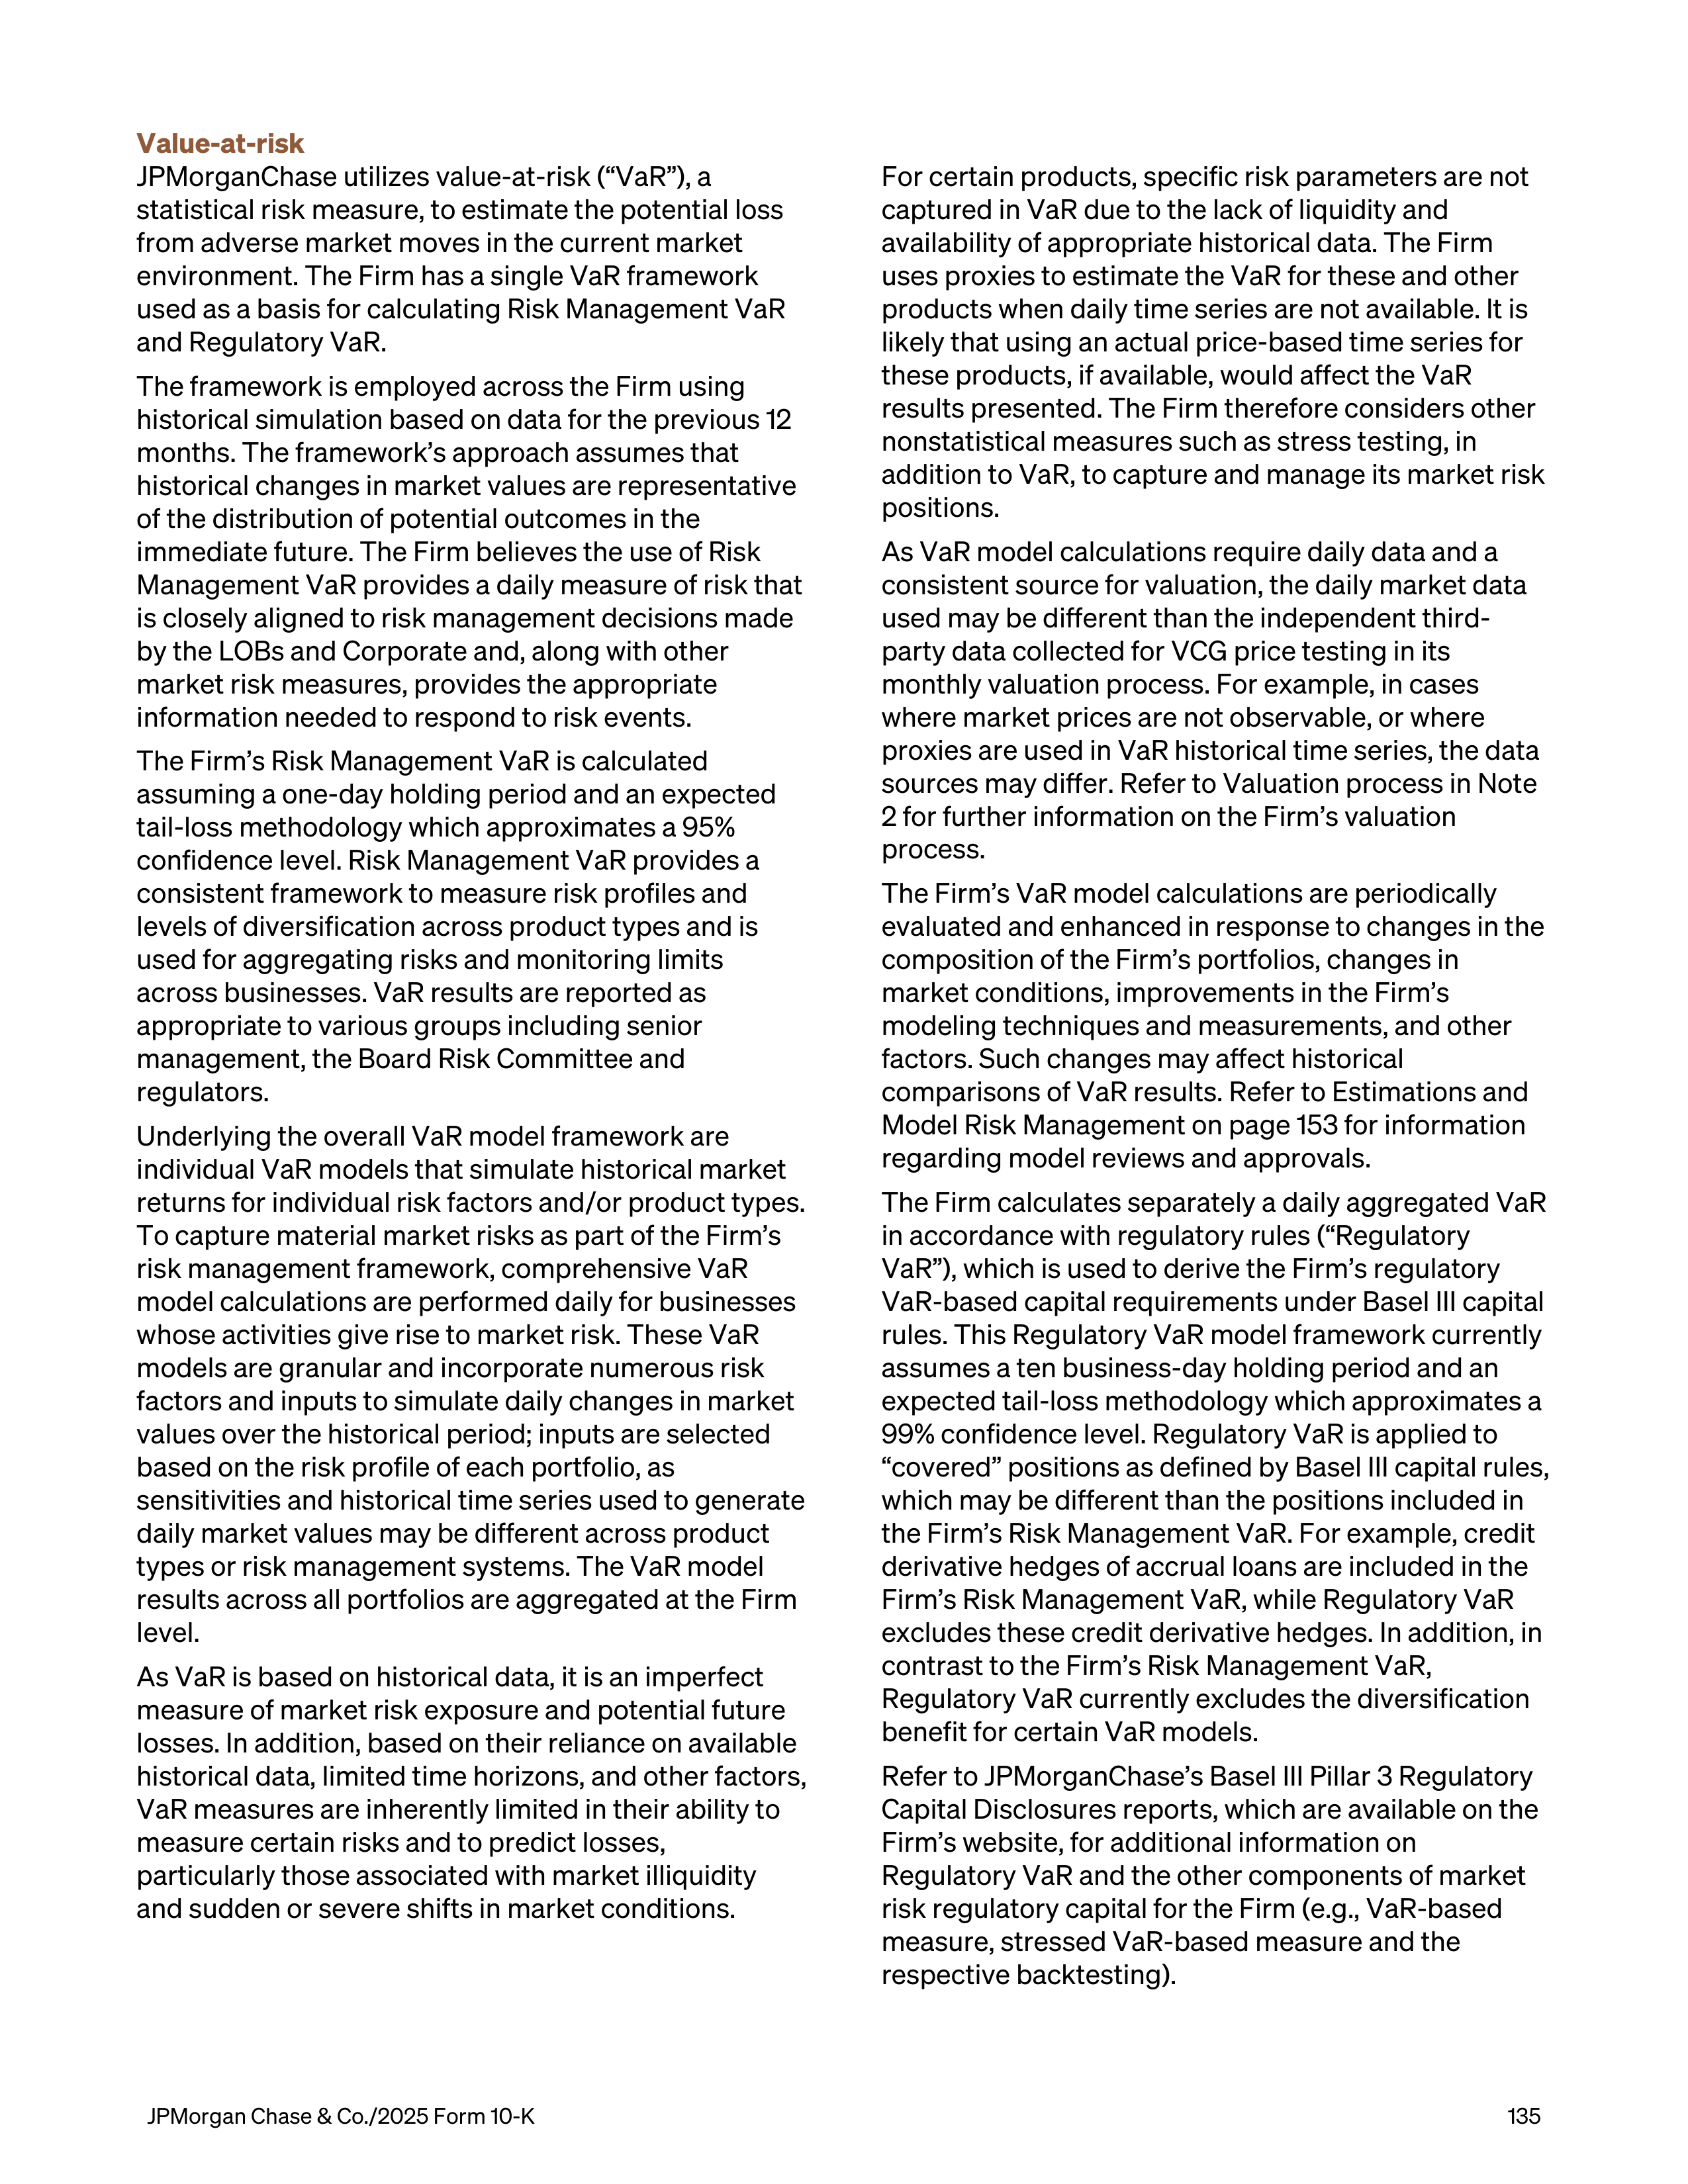
Value-at-risk
JPMorganChase utilizes value-at-risk (“VaR”), a
statistical risk measure, to estimate the potential loss
from adverse market moves in the current market
environment. The Firm has a single VaR framework
used as a basis for calculating Risk Management VaR
and Regulatory VaR.
The framework is employed across the Firm using
historical simulation based on data for the previous 12
months. The framework’s approach assumes that
historical changes in market values are representative
of the distribution of potential outcomes in the
immediate future. The Firm believes the use of Risk
Management VaR provides a daily measure of risk that
is closely aligned to risk management decisions made
by the LOBs and Corporate and, along with other
market risk measures, provides the appropriate
information needed to respond to risk events.
The Firm’s Risk Management VaR is calculated
assuming a one-day holding period and an expected
tail-loss methodology which approximates a 95%
confidence level. Risk Management VaR provides a
consistent framework to measure risk profiles and
levels of diversification across product types and is
used for aggregating risks and monitoring limits
across businesses. VaR results are reported as
appropriate to various groups including senior
management, the Board Risk Committee and
regulators.
Underlying the overall VaR model framework are
individual VaR models that simulate historical market
returns for individual risk factors and/or product types.
To capture material market risks as part of the Firm’s
risk management framework, comprehensive VaR
model calculations are performed daily for businesses
whose activities give rise to market risk. These VaR
models are granular and incorporate numerous risk
factors and inputs to simulate daily changes in market
values over the historical period; inputs are selected
based on the risk profile of each portfolio, as
sensitivities and historical time series used to generate
daily market values may be different across product
types or risk management systems. The VaR model
results across all portfolios are aggregated at the Firm
level.
As VaR is based on historical data, it is an imperfect
measure of market risk exposure and potential future
losses. In addition, based on their reliance on available
historical data, limited time horizons, and other factors,
VaR measures are inherently limited in their ability to
measure certain risks and to predict losses,
particularly those associated with market illiquidity
and sudden or severe shifts in market conditions.
For certain products, specific risk parameters are not
captured in VaR due to the lack of liquidity and
availability of appropriate historical data. The Firm
uses proxies to estimate the VaR for these and other
products when daily time series are not available. It is
likely that using an actual price-based time series for
these products, if available, would affect the VaR
results presented. The Firm therefore considers other
nonstatistical measures such as stress testing, in
addition to VaR, to capture and manage its market risk
positions.
As VaR model calculations require daily data and a
consistent source for valuation, the daily market data
used may be different than the independent third-
party data collected for VCG price testing in its
monthly valuation process. For example, in cases
where market prices are not observable, or where
proxies are used in VaR historical time series, the data
sources may differ. Refer to Valuation process in Note
2 for further information on the Firm’s valuation
process.
The Firm’s VaR model calculations are periodically
evaluated and enhanced in response to changes in the
composition of the Firm’s portfolios, changes in
market conditions, improvements in the Firm’s
modeling techniques and measurements, and other
factors. Such changes may affect historical
comparisons of VaR results. Refer to Estimations and
Model Risk Management on page 153 for information
regarding model reviews and approvals.
The Firm calculates separately a daily aggregated VaR
in accordance with regulatory rules (“Regulatory
VaR”), which is used to derive the Firm’s regulatory
VaR-based capital requirements under Basel III capital
rules. This Regulatory VaR model framework currently
assumes a ten business-day holding period and an
expected tail-loss methodology which approximates a
99% confidence level. Regulatory VaR is applied to
“covered” positions as defined by Basel III capital rules,
which may be different than the positions included in
the Firm’s Risk Management VaR. For example, credit
derivative hedges of accrual loans are included in the
Firm’s Risk Management VaR, while Regulatory VaR
excludes these credit derivative hedges. In addition, in
contrast to the Firm’s Risk Management VaR,
Regulatory VaR currently excludes the diversification
benefit for certain VaR models.
Refer to JPMorganChase’s Basel III Pillar 3 Regulatory
Capital Disclosures reports, which are available on the
Firm’s website, for additional information on
Regulatory VaR and the other components of market
risk regulatory capital for the Firm (e.g., VaR-based
measure, stressed VaR-based measure and the
respective backtesting).
JPMorgan Chase & Co./2025 Form 10-K
135
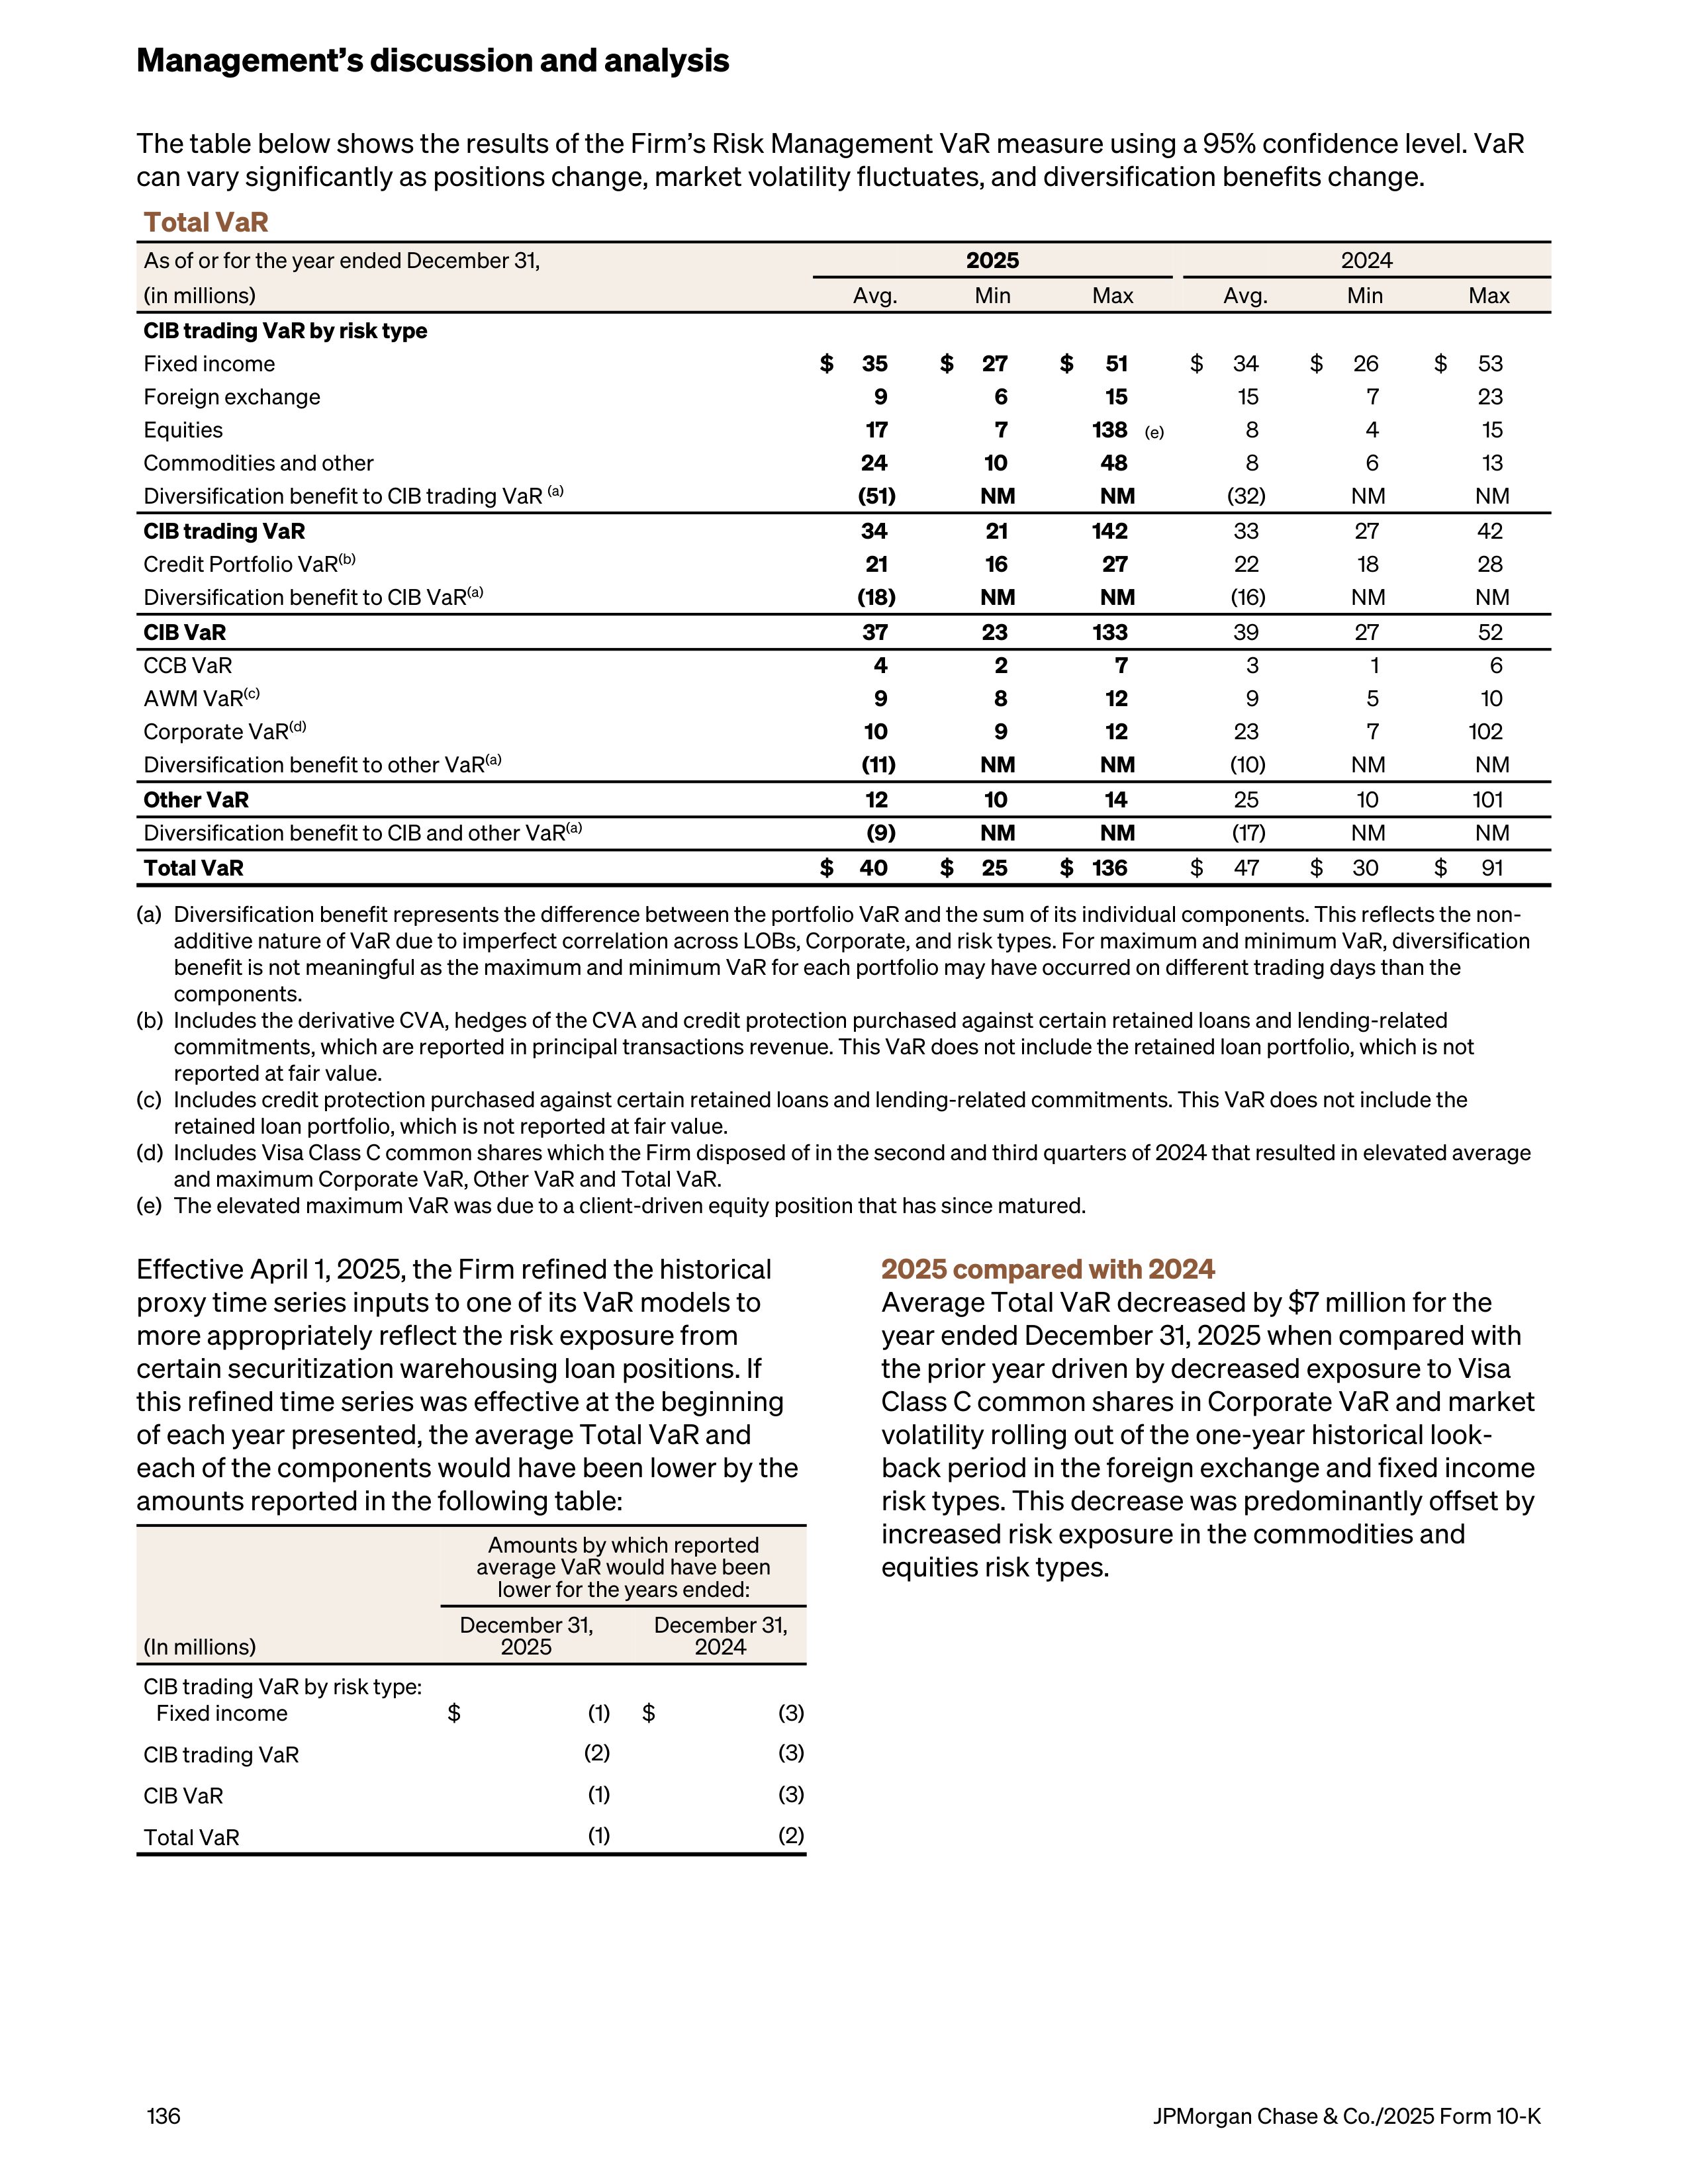
The table below shows the results of the Firm’s Risk Management VaR measure using a 95% confidence level. VaR
can vary significantly as positions change, market volatility fluctuates, and diversification benefits change.
Total VaR
As of or for the year ended December 31,
2025
2024
(in millions)
Avg.
Min
Max
Avg.
Min
Max
CIB trading VaR by risk type
Fixed income
$
35
$
27
$
51
$
34
$
26
$
53
Foreign exchange
9
6
15
15
7
23
Equities
17
7
138
(e)
8
4
15
Commodities and other
24
10
48
8
6
13
Diversification benefit to CIB trading VaR
(a)
(51)
NM
NM
(32)
NM
NM
CIB trading VaR
34
21
142
33
27
42
Credit Portfolio VaR
(b)
21
16
27
22
18
28
Diversification benefit to CIB VaR
(a)
(18)
NM
NM
(16)
NM
NM
CIB VaR
37
23
133
39
27
52
CCB VaR
4
2
7
3
1
6
AWM VaR
(c)
9
8
12
9
5
10
Corporate VaR
(d)
10
9
12
23
7
102
Diversification benefit to other VaR
(a)
(11)
NM
NM
(10)
NM
NM
Other VaR
12
10
14
25
10
101
Diversification benefit to CIB and other VaR
(a)
(9)
NM
NM
(17)
NM
NM
Total VaR
$
40
$
25
$ 136
$
47
$
30
$
91
(a)
Diversification benefit represents the difference between the portfolio VaR and the sum of its individual components. This reflects the non-
additive nature of VaR due to imperfect correlation across LOBs, Corporate, and risk types. For maximum and minimum VaR, diversification
benefit is not meaningful as the maximum and minimum VaR for each portfolio may have occurred on different trading days than the
components.
(b)
Includes the derivative CVA, hedges of the CVA and credit protection purchased against certain retained loans and lending-related
commitments, which are reported in principal transactions revenue. This VaR does not include the retained loan portfolio, which is not
reported at fair value.
(c)
Includes credit protection purchased against certain retained loans and lending-related commitments. This VaR does not include the
retained loan portfolio, which is not reported at fair value.
(d)
Includes Visa Class C common shares which the Firm disposed of in the second and third quarters of 2024 that resulted in elevated average
and maximum Corporate VaR, Other VaR and Total VaR.
(e)
The elevated maximum VaR was due to a client-driven equity position that has since matured.
Effective April 1, 2025, the Firm refined the historical
proxy time series inputs to one of its VaR models to
more appropriately reflect the risk exposure from
certain securitization warehousing loan positions. If
this refined time series was effective at the beginning
of each year presented, the average Total VaR and
each of the components would have been lower by the
amounts reported in the following table:
(In millions)
Amounts by which reported
average VaR would have been
lower for the years ended:
December 31,
2025
December 31,
2024
CIB trading VaR by risk type:
Fixed income
$
(1)
$
(3)
CIB trading VaR
(2)
(3)
CIB VaR
(1)
(3)
Total VaR
(1)
(2)
2025 compared with 2024
Average Total VaR decreased by $7 million for the
year ended December 31, 2025 when compared with
the prior year driven by decreased exposure to Visa
Class C common shares in Corporate VaR and market
volatility rolling out of the one-year historical look-
back period in the foreign exchange and fixed income
risk types. This decrease was predominantly offset by
increased risk exposure in the commodities and
equities risk types.
Management’s discussion and analysis
136
JPMorgan Chase & Co./2025 Form 10-K
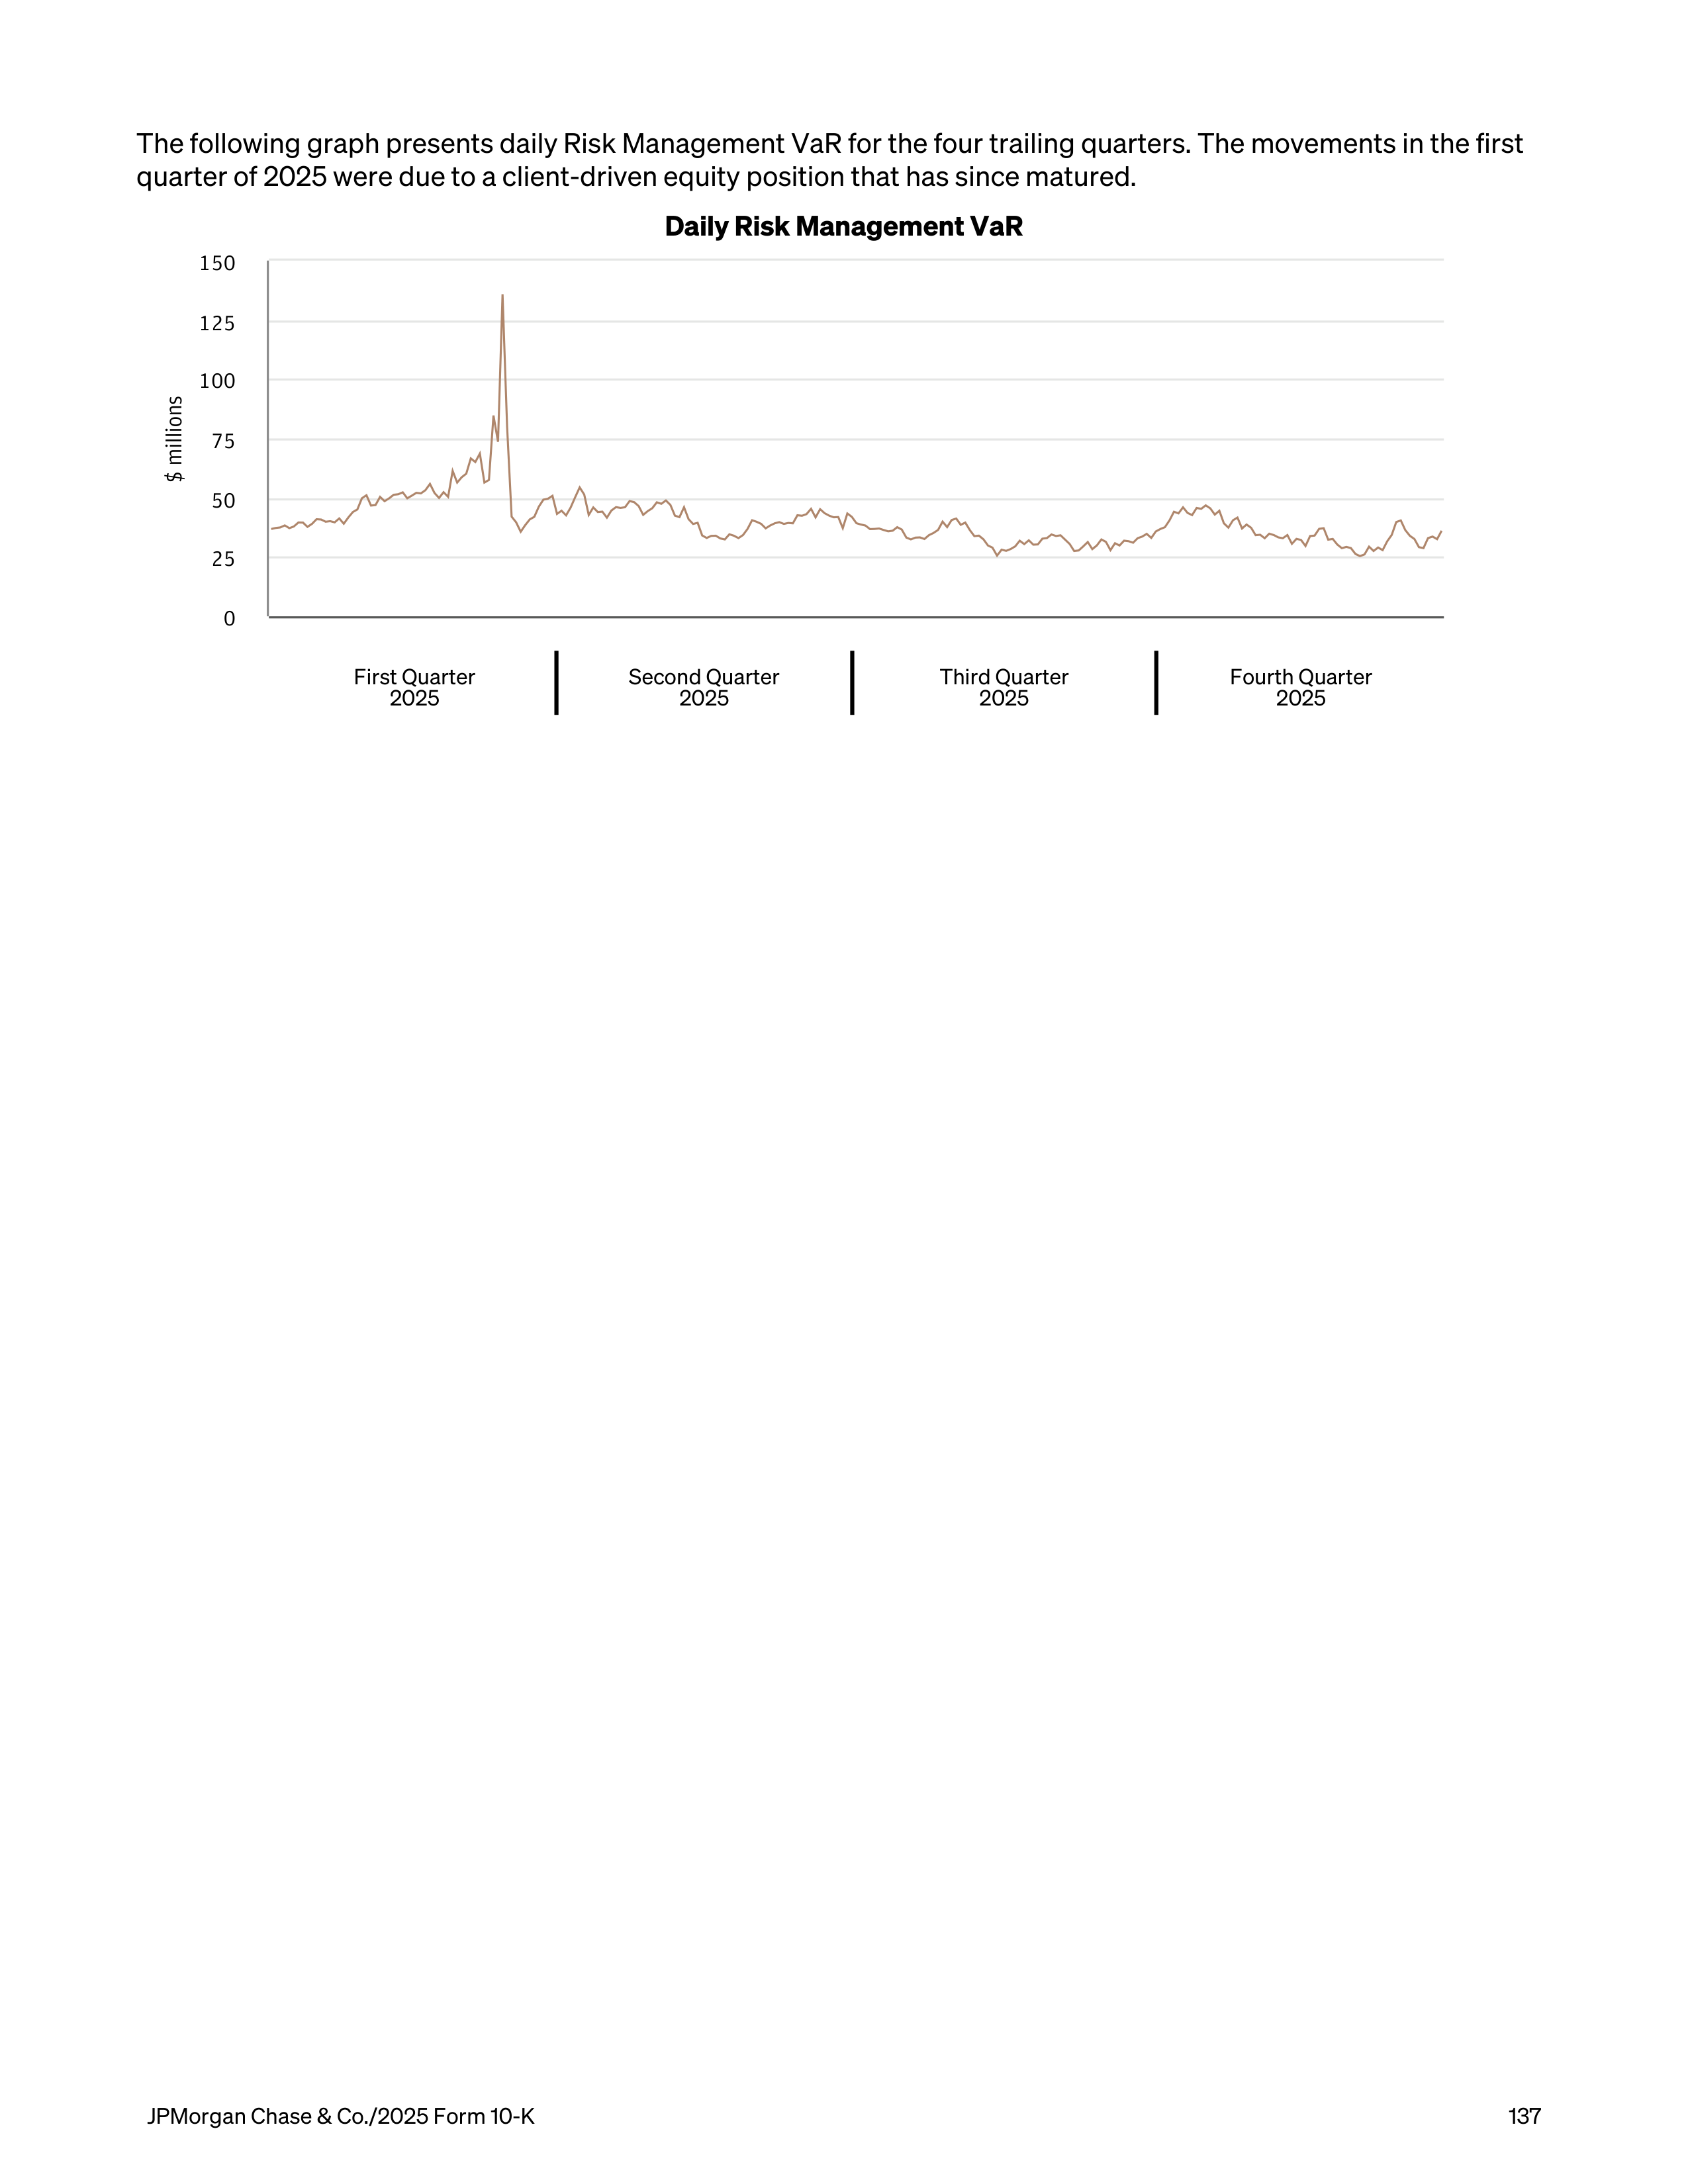
The following graph presents daily Risk Management VaR for the four trailing quarters. The movements in the first
quarter of 2025 were due to a client-driven equity position that has since matured.
Daily Risk Management VaR
$ millions
0
25
50
75
100
125
150
First Quarter
2025
Second Quarter
2025
Third Quarter
2025
Fourth Quarter
2025
JPMorgan Chase & Co./2025 Form 10-K
137
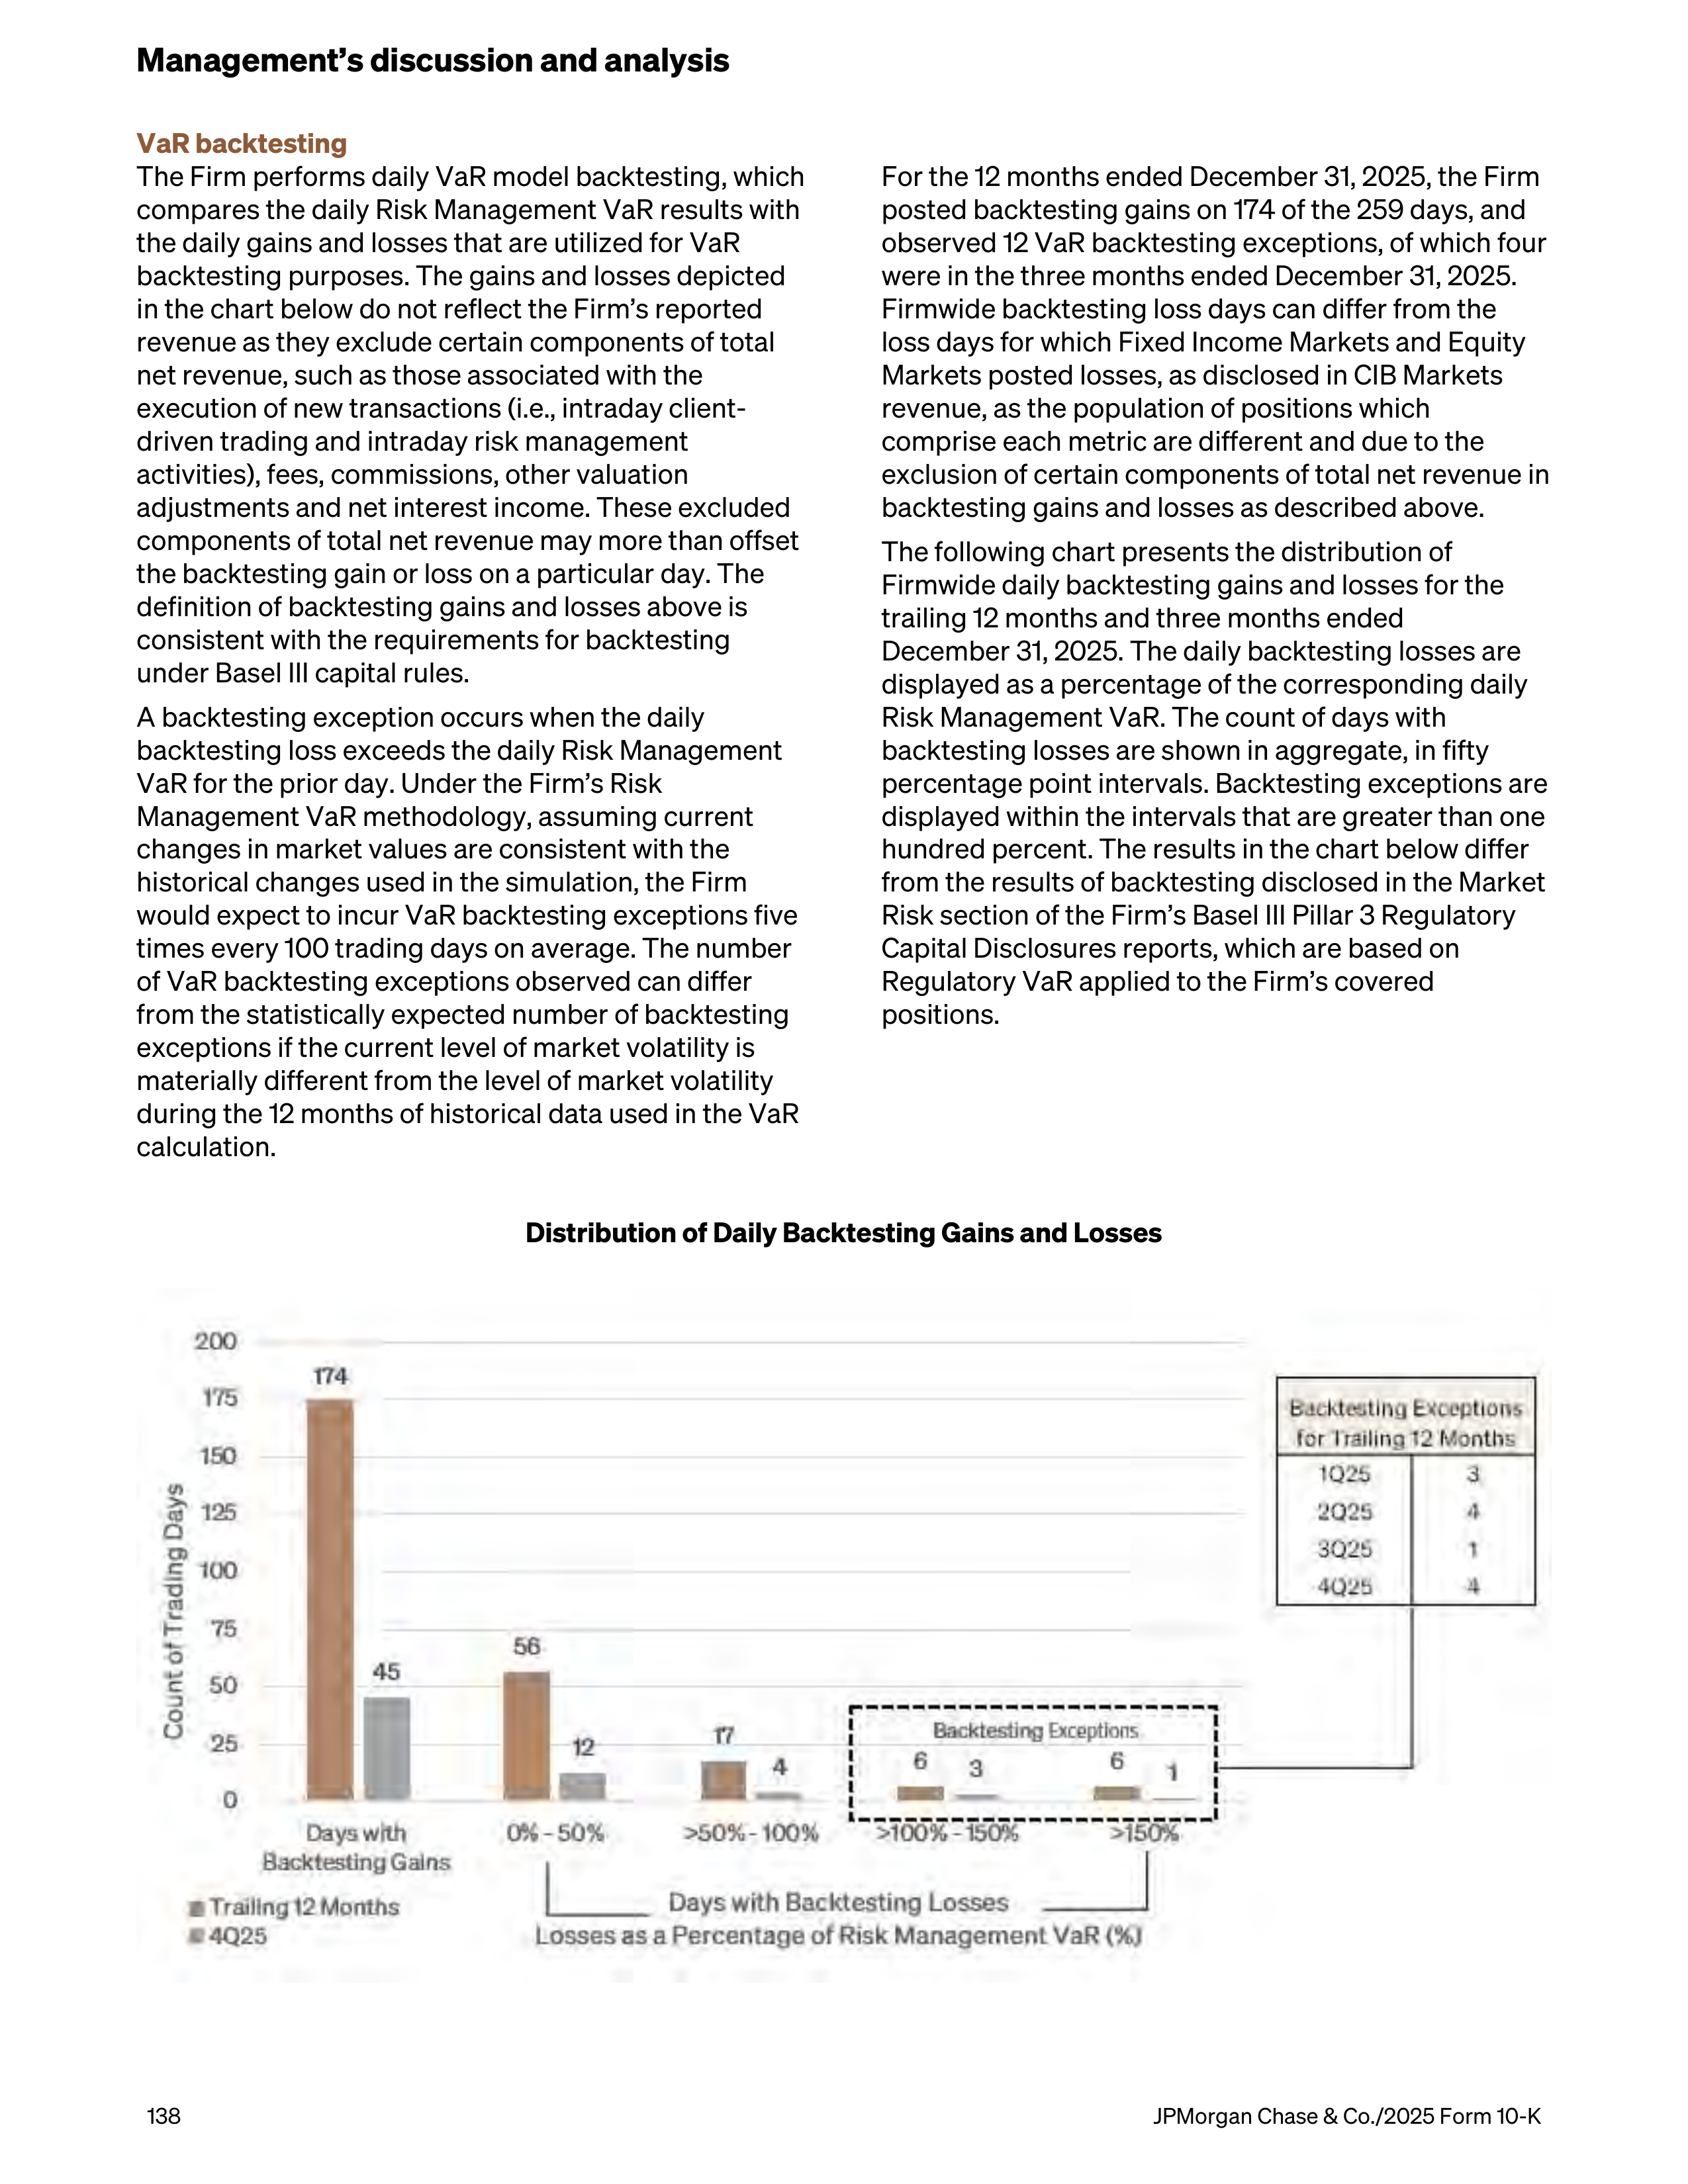
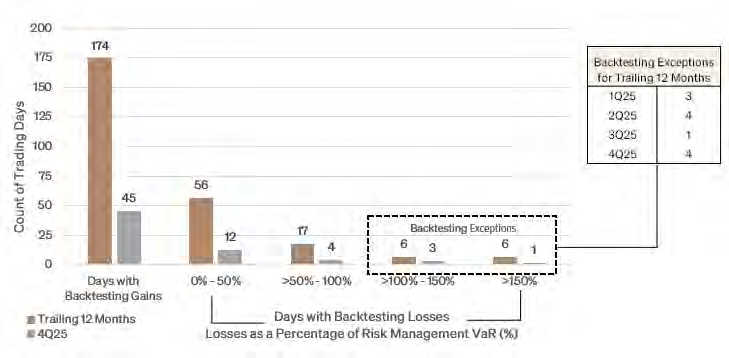
VaR backtesting
The Firm performs daily VaR model backtesting, which
compares the daily Risk Management VaR results with
the daily gains and losses that are utilized for VaR
backtesting purposes. The gains and losses depicted
in the chart below do not reflect the Firm’s reported
revenue as they exclude certain components of total
net revenue, such as those associated with the
execution of new transactions (i.e., intraday client-
driven trading and intraday risk management
activities), fees, commissions, other valuation
adjustments and net interest income. These excluded
components of total net revenue may more than offset
the backtesting gain or loss on a particular day. The
definition of backtesting gains and losses above is
consistent with the requirements for backtesting
under Basel III capital rules.
A backtesting exception occurs when the daily
backtesting loss exceeds the daily Risk Management
VaR for the prior day. Under the Firm’s Risk
Management VaR methodology, assuming current
changes in market values are consistent with the
historical changes used in the simulation, the Firm
would expect to incur VaR backtesting exceptions five
times every 100 trading days on average. The number
of VaR backtesting exceptions observed can differ
from the statistically expected number of backtesting
exceptions if the current level of market volatility is
materially different from the level of market volatility
during the 12 months of historical data used in the VaR
calculation.
For the 12 months ended December 31, 2025, the Firm
posted backtesting gains on 174 of the 259 days, and
observed 12 VaR backtesting exceptions, of which four
were in the three months ended December 31, 2025.
Firmwide backtesting loss days can differ from the
loss days for which Fixed Income Markets and Equity
Markets posted losses, as disclosed in CIB Markets
revenue, as the population of positions which
comprise each metric are different and due to the
exclusion of certain components of total net revenue in
backtesting gains and losses as described above.
The following chart presents the distribution of
Firmwide daily backtesting gains and losses for the
trailing 12 months and three months ended
December 31, 2025. The daily backtesting losses are
displayed as a percentage of the corresponding daily
Risk Management VaR. The count of days with
backtesting losses are shown in aggregate, in fifty
percentage point intervals. Backtesting exceptions are
displayed within the intervals that are greater than one
hundred percent. The results in the chart below differ
from the results of backtesting disclosed in the Market
Risk section of the Firm’s Basel III Pillar 3 Regulatory
Capital Disclosures reports, which are based on
Regulatory VaR applied to the Firm’s covered
positions.
Distribution of Daily Backtesting Gains and Losses
Management’s discussion and analysis
138
JPMorgan Chase & Co./2025 Form 10-K
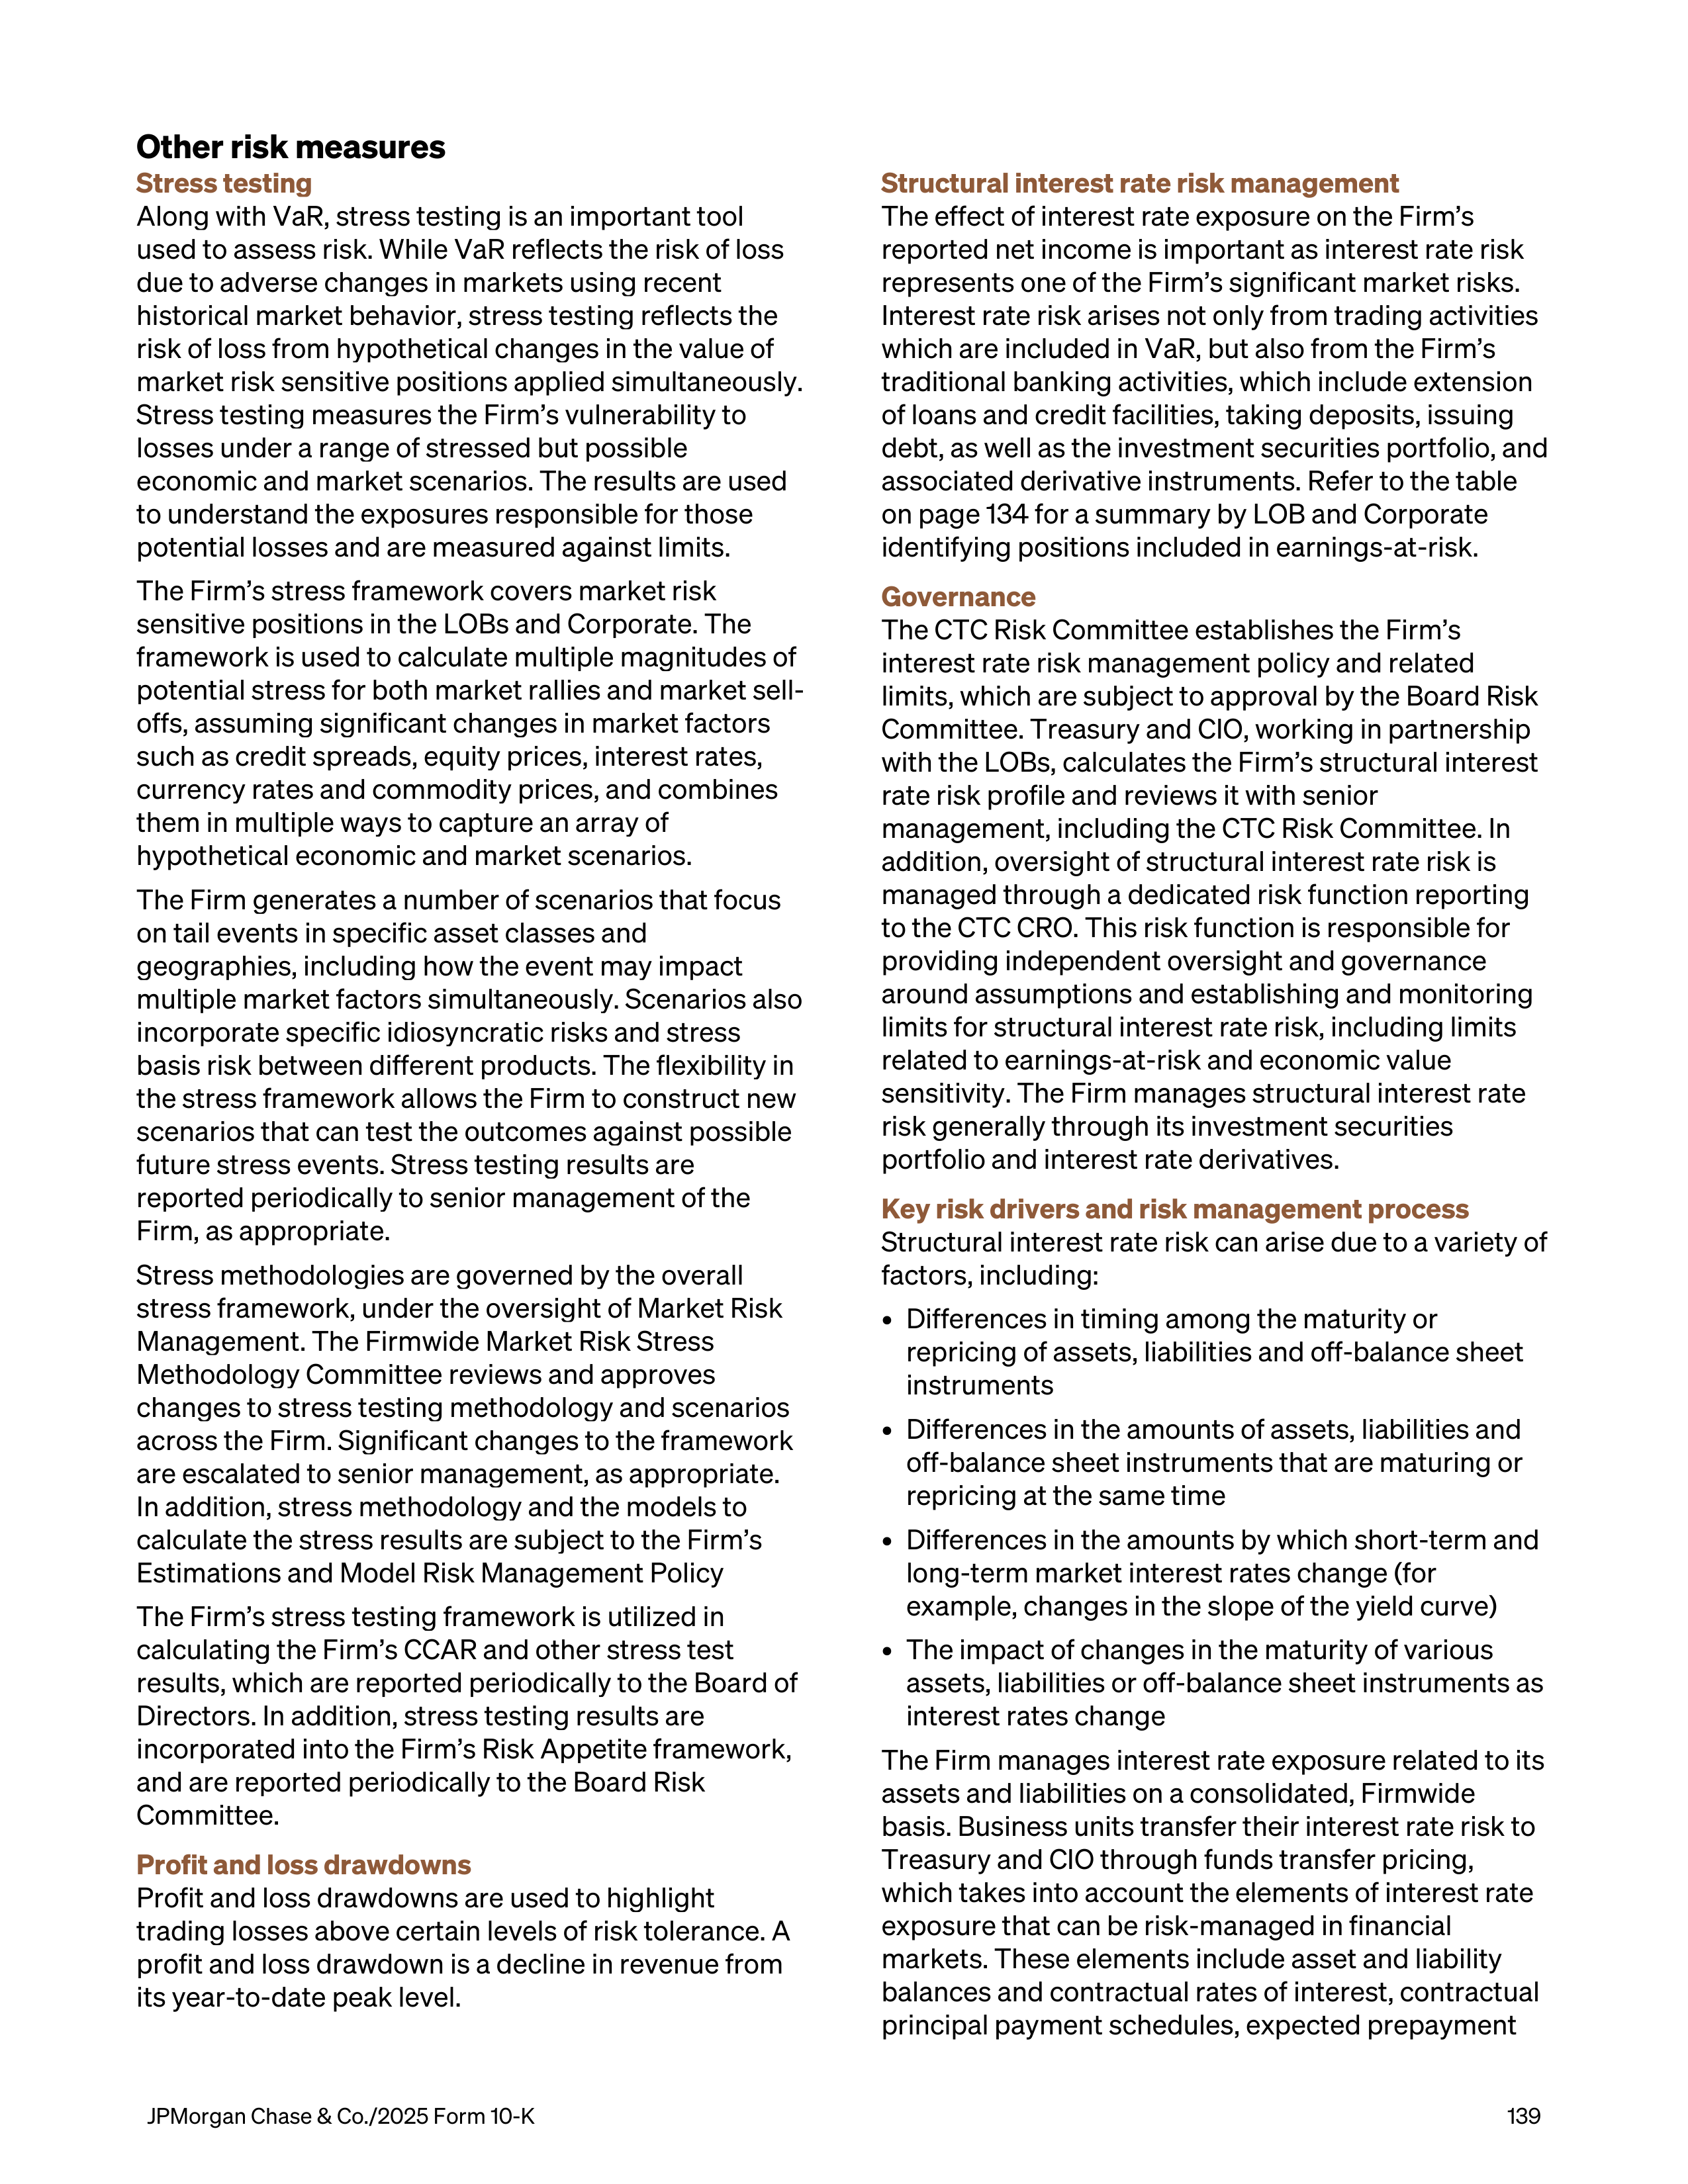
Other risk measures
Stress testing
Along with VaR, stress testing is an important tool
used to assess risk. While VaR reflects the risk of loss
due to adverse changes in markets using recent
historical market behavior, stress testing reflects the
risk of loss from hypothetical changes in the value of
market risk sensitive positions applied simultaneously.
Stress testing measures the Firm’s vulnerability to
losses under a range of stressed but possible
economic and market scenarios. The results are used
to understand the exposures responsible for those
potential losses and are measured against limits.
The Firm’s stress framework covers market risk
sensitive positions in the LOBs and Corporate. The
framework is used to calculate multiple magnitudes of
potential stress for both market rallies and market sell-
offs, assuming significant changes in market factors
such as credit spreads, equity prices, interest rates,
currency rates and commodity prices, and combines
them in multiple ways to capture an array of
hypothetical economic and market scenarios.
The Firm generates a number of scenarios that focus
on tail events in specific asset classes and
geographies, including how the event may impact
multiple market factors simultaneously. Scenarios also
incorporate specific idiosyncratic risks and stress
basis risk between different products. The flexibility in
the stress framework allows the Firm to construct new
scenarios that can test the outcomes against possible
future stress events. Stress testing results are
reported periodically to senior management of the
Firm, as appropriate.
Stress methodologies are governed by the overall
stress framework, under the oversight of Market Risk
Management. The Firmwide Market Risk Stress
Methodology Committee reviews and approves
changes to stress testing methodology and scenarios
across the Firm. Significant changes to the framework
are escalated to senior management, as appropriate.
In addition, stress methodology and the models to
calculate the stress results are subject to the Firm’s
Estimations and Model Risk Management Policy
The Firm’s stress testing framework is utilized in
calculating the Firm’s CCAR and other stress test
results, which are reported periodically to the Board of
Directors. In addition, stress testing results are
incorporated into the Firm’s Risk Appetite framework,
and are reported periodically to the Board Risk
Committee.
Profit and loss drawdowns
Profit and loss drawdowns are used to highlight
trading losses above certain levels of risk tolerance. A
profit and loss drawdown is a decline in revenue from
its year-to-date peak level.
Structural interest rate risk management
The effect of interest rate exposure on the Firm’s
reported net income is important as interest rate risk
represents one of the Firm’s significant market risks.
Interest rate risk arises not only from trading activities
which are included in VaR, but also from the Firm’s
traditional banking activities, which include extension
of loans and credit facilities, taking deposits, issuing
debt, as well as the investment securities portfolio, and
associated derivative instruments. Refer to the table
on page 134 for a summary by LOB and Corporate
identifying positions included in earnings-at-risk.
Governance
The CTC Risk Committee establishes the Firm’s
interest rate risk management policy and related
limits, which are subject to approval by the Board Risk
Committee. Treasury and CIO, working in partnership
with the LOBs, calculates the Firm’s structural interest
rate risk profile and reviews it with senior
management, including the CTC Risk Committee. In
addition, oversight of structural interest rate risk is
managed through a dedicated risk function reporting
to the CTC CRO. This risk function is responsible for
providing independent oversight and governance
around assumptions and establishing and monitoring
limits for structural interest rate risk, including limits
related to earnings-at-risk and economic value
sensitivity. The Firm manages structural interest rate
risk generally through its investment securities
portfolio and interest rate derivatives.
Key risk drivers and risk management process
Structural interest rate risk can arise due to a variety of
factors, including:
•
Differences in timing among the maturity or
repricing of assets, liabilities and off-balance sheet
instruments
•
Differences in the amounts of assets, liabilities and
off-balance sheet instruments that are maturing or
repricing at the same time
•
Differences in the amounts by which short-term and
long-term market interest rates change (for
example, changes in the slope of the yield curve)
•
The impact of changes in the maturity of various
assets, liabilities or off-balance sheet instruments as
interest rates change
The Firm manages interest rate exposure related to its
assets and liabilities on a consolidated, Firmwide
basis. Business units transfer their interest rate risk to
Treasury and CIO through funds transfer pricing,
which takes into account the elements of interest rate
exposure that can be risk-managed in financial
markets. These elements include asset and liability
balances and contractual rates of interest, contractual
principal payment schedules, expected prepayment
JPMorgan Chase & Co./2025 Form 10-K
139
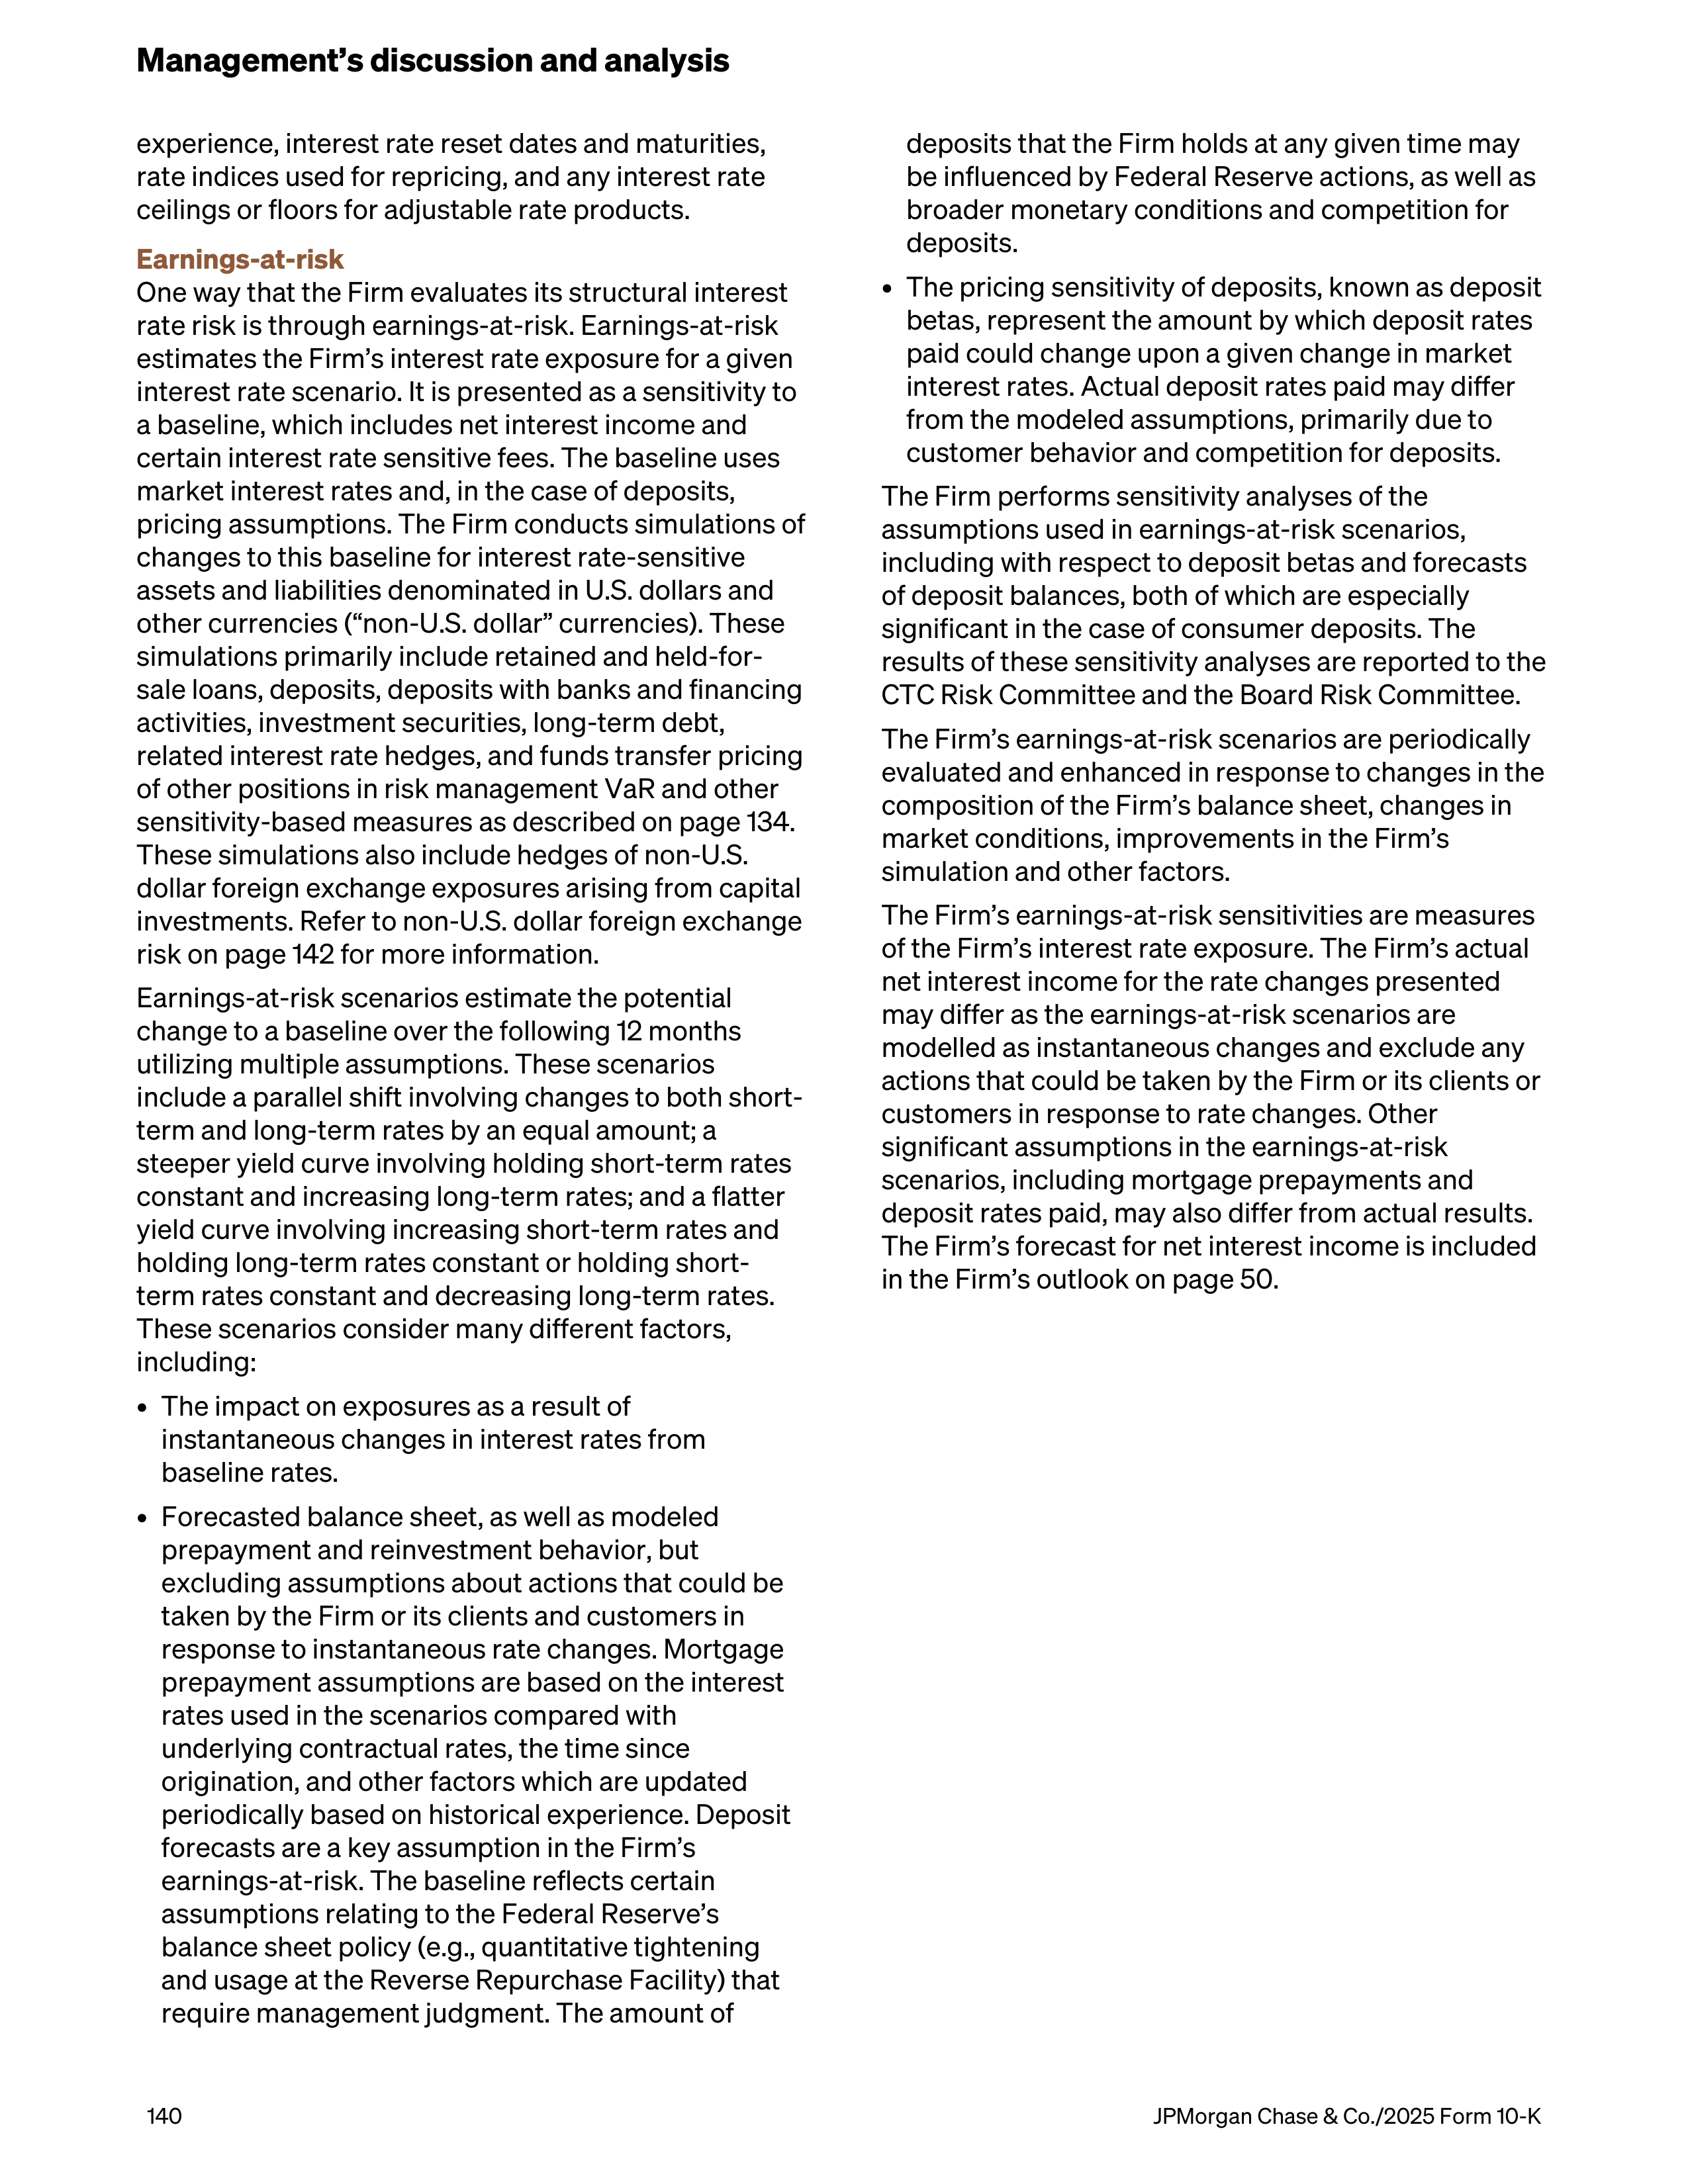
experience, interest rate reset dates and maturities,
rate indices used for repricing, and any interest rate
ceilings or floors for adjustable rate products.
Earnings-at-risk
One way that the Firm evaluates its structural interest
rate risk is through earnings-at-risk. Earnings-at-risk
estimates the Firm’s interest rate exposure for a given
interest rate scenario. It is presented as a sensitivity to
a baseline, which includes net interest income and
certain interest rate sensitive fees. The baseline uses
market interest rates and, in the case of deposits,
pricing assumptions. The Firm conducts simulations of
changes to this baseline for interest rate-sensitive
assets and liabilities denominated in U.S. dollars and
other currencies (“non-U.S. dollar” currencies). These
simulations primarily include retained and held-for-
sale loans, deposits, deposits with banks and financing
activities, investment securities, long-term debt,
related interest rate hedges, and funds transfer pricing
of other positions in risk management VaR and other
sensitivity-based measures as described on page 134.
These simulations also include hedges of non-U.S.
dollar foreign exchange exposures arising from capital
investments. Refer to non-U.S. dollar foreign exchange
risk on page 142 for more information.
Earnings-at-risk scenarios estimate the potential
change to a baseline over the following 12 months
utilizing multiple assumptions. These scenarios
include a parallel shift involving changes to both short-
term and long-term rates by an equal amount; a
steeper yield curve involving holding short-term rates
constant and increasing long-term rates; and a flatter
yield curve involving increasing short-term rates and
holding long-term rates constant or holding short-
term rates constant and decreasing long-term rates.
These scenarios consider many different factors,
including:
•
The impact on exposures as a result of
instantaneous changes in interest rates from
baseline rates.
•
Forecasted balance sheet, as well as modeled
prepayment and reinvestment behavior, but
excluding assumptions about actions that could be
taken by the Firm or its clients and customers in
response to instantaneous rate changes. Mortgage
prepayment assumptions are based on the interest
rates used in the scenarios compared with
underlying contractual rates, the time since
origination, and other factors which are updated
periodically based on historical experience. Deposit
forecasts are a key assumption in the Firm’s
earnings-at-risk. The baseline reflects certain
assumptions relating to the Federal Reserve’s
balance sheet policy (e.g., quantitative tightening
and usage at the Reverse Repurchase Facility) that
require management judgment. The amount of
deposits that the Firm holds at any given time may
be influenced by Federal Reserve actions, as well as
broader monetary conditions and competition for
deposits.
•
The pricing sensitivity of deposits, known as deposit
betas, represent the amount by which deposit rates
paid could change upon a given change in market
interest rates. Actual deposit rates paid may differ
from the modeled assumptions, primarily due to
customer behavior and competition for deposits.
The Firm performs sensitivity analyses of the
assumptions used in earnings-at-risk scenarios,
including with respect to deposit betas and forecasts
of deposit balances, both of which are especially
significant in the case of consumer deposits. The
results of these sensitivity analyses are reported to the
CTC Risk Committee and the Board Risk Committee.
The Firm’s earnings-at-risk scenarios are periodically
evaluated and enhanced in response to changes in the
composition of the Firm’s balance sheet, changes in
market conditions, improvements in the Firm’s
simulation and other factors.
The Firm’s earnings-at-risk sensitivities are measures
of the Firm’s interest rate exposure. The Firm’s actual
net interest income for the rate changes presented
may differ as the earnings-at-risk scenarios are
modelled as instantaneous changes and exclude any
actions that could be taken by the Firm or its clients or
customers in response to rate changes. Other
significant assumptions in the earnings-at-risk
scenarios, including mortgage prepayments and
deposit rates paid, may also differ from actual results.
The Firm’s forecast for net interest income is included
in the Firm’s outlook on page 50.
Management’s discussion and analysis
140
JPMorgan Chase & Co./2025 Form 10-K
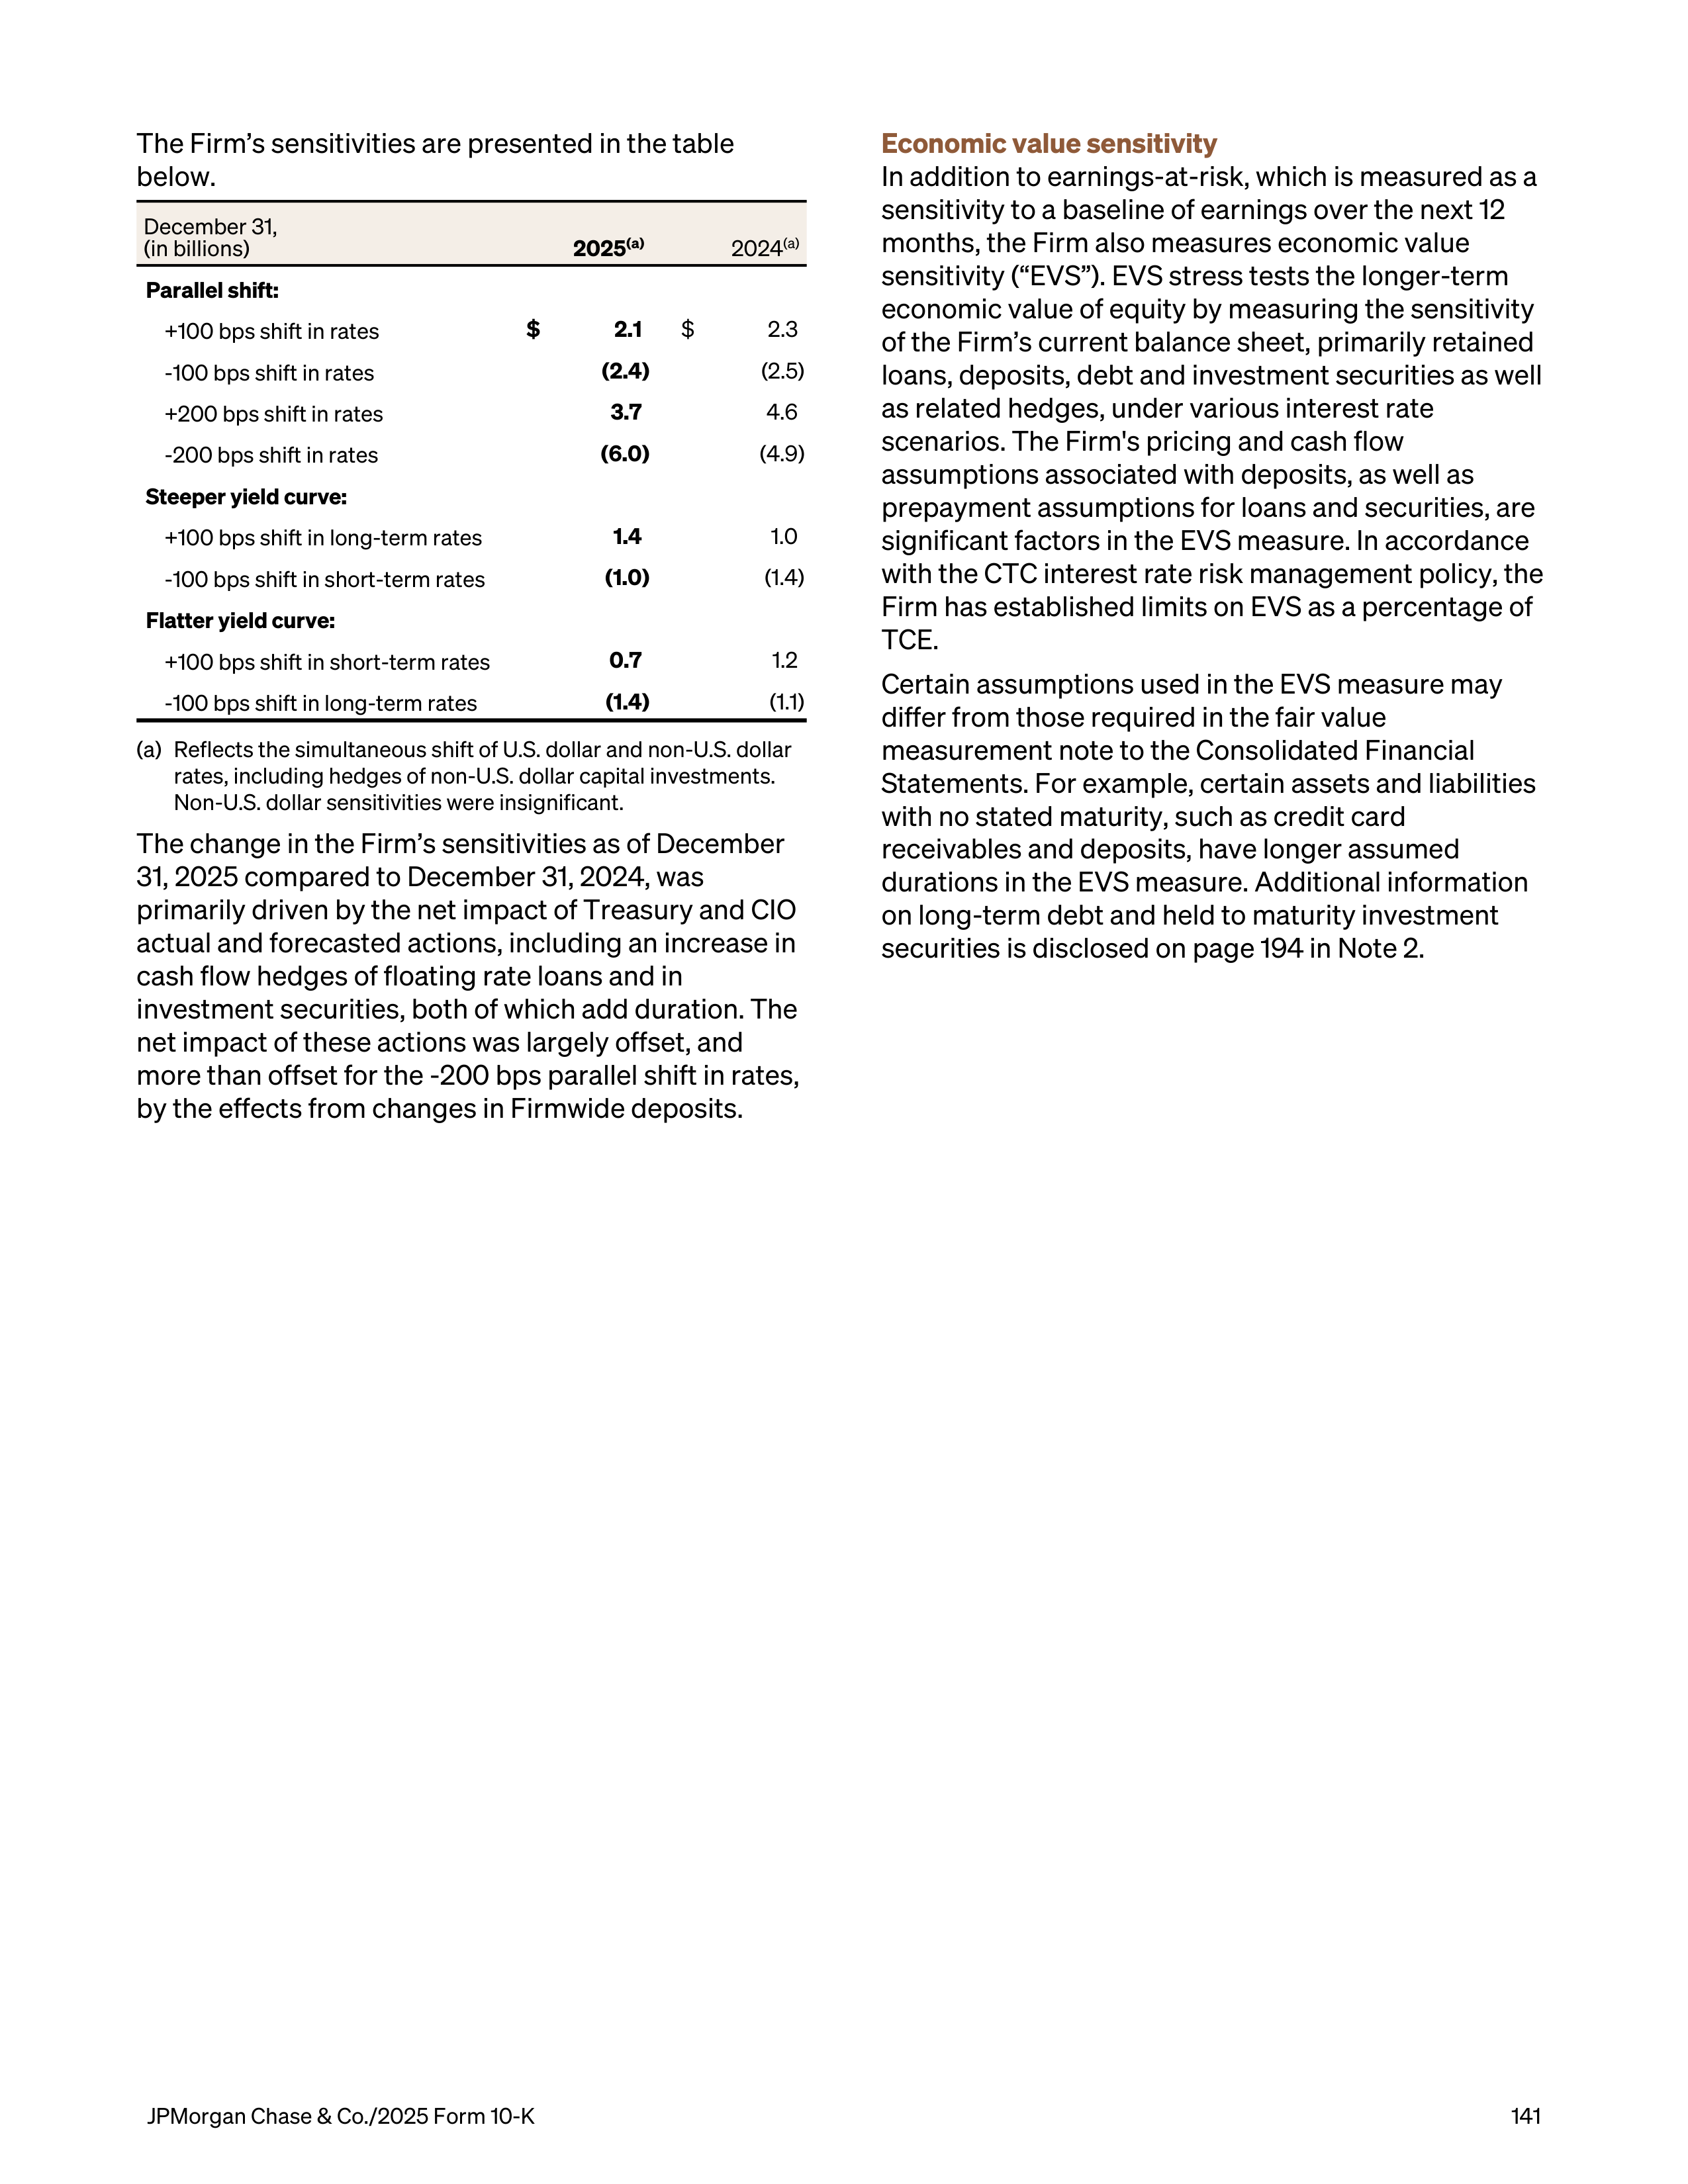
The Firm’s sensitivities are presented in the table
below.
December 31,
(in billions)
2025
(a)
2024
(a)
Parallel shift:
+100 bps shift in rates
$
2.1
$
2.3
-100 bps shift in rates
(2.4)
(2.5)
+200 bps shift in rates
3.7
4.6
-200 bps shift in rates
(6.0)
(4.9)
Steeper yield curve:
+100 bps shift in long-term rates
1.4
1.0
-100 bps shift in short-term rates
(1.0)
(1.4)
Flatter yield curve:
+100 bps shift in short-term rates
0.7
1.2
-100 bps shift in long-term rates
(1.4)
(1.1)
(a)
Reflects the simultaneous shift of U.S. dollar and non-U.S. dollar
rates, including hedges of non-U.S. dollar capital investments.
Non-U.S. dollar sensitivities were insignificant.
The change in the Firm’s sensitivities as of December
31, 2025 compared to December 31, 2024, was
primarily driven by the net impact of Treasury and CIO
actual and forecasted actions, including an increase in
cash flow hedges of floating rate loans and in
investment securities, both of which add duration. The
net impact of these actions was largely offset, and
more than offset for the -200 bps parallel shift in rates,
by the effects from changes in Firmwide deposits.
Economic value sensitivity
In addition to earnings-at-risk, which is measured as a
sensitivity to a baseline of earnings over the next 12
months, the Firm also measures economic value
sensitivity (“EVS”). EVS stress tests the longer-term
economic value of equity by measuring the sensitivity
of the Firm’s current balance sheet, primarily retained
loans, deposits, debt and investment securities as well
as related hedges, under various interest rate
scenarios. The Firm's pricing and cash flow
assumptions associated with deposits, as well as
prepayment assumptions for loans and securities, are
significant factors in the EVS measure. In accordance
with the CTC interest rate risk management policy, the
Firm has established limits on EVS as a percentage of
TCE.
Certain assumptions used in the EVS measure may
differ from those required in the fair value
measurement note to the Consolidated Financial
Statements. For example, certain assets and liabilities
with no stated maturity, such as credit card
receivables and deposits, have longer assumed
durations in the EVS measure. Additional information
on long-term debt and held to maturity investment
securities is disclosed on page 194 in Note 2.
JPMorgan Chase & Co./2025 Form 10-K
141
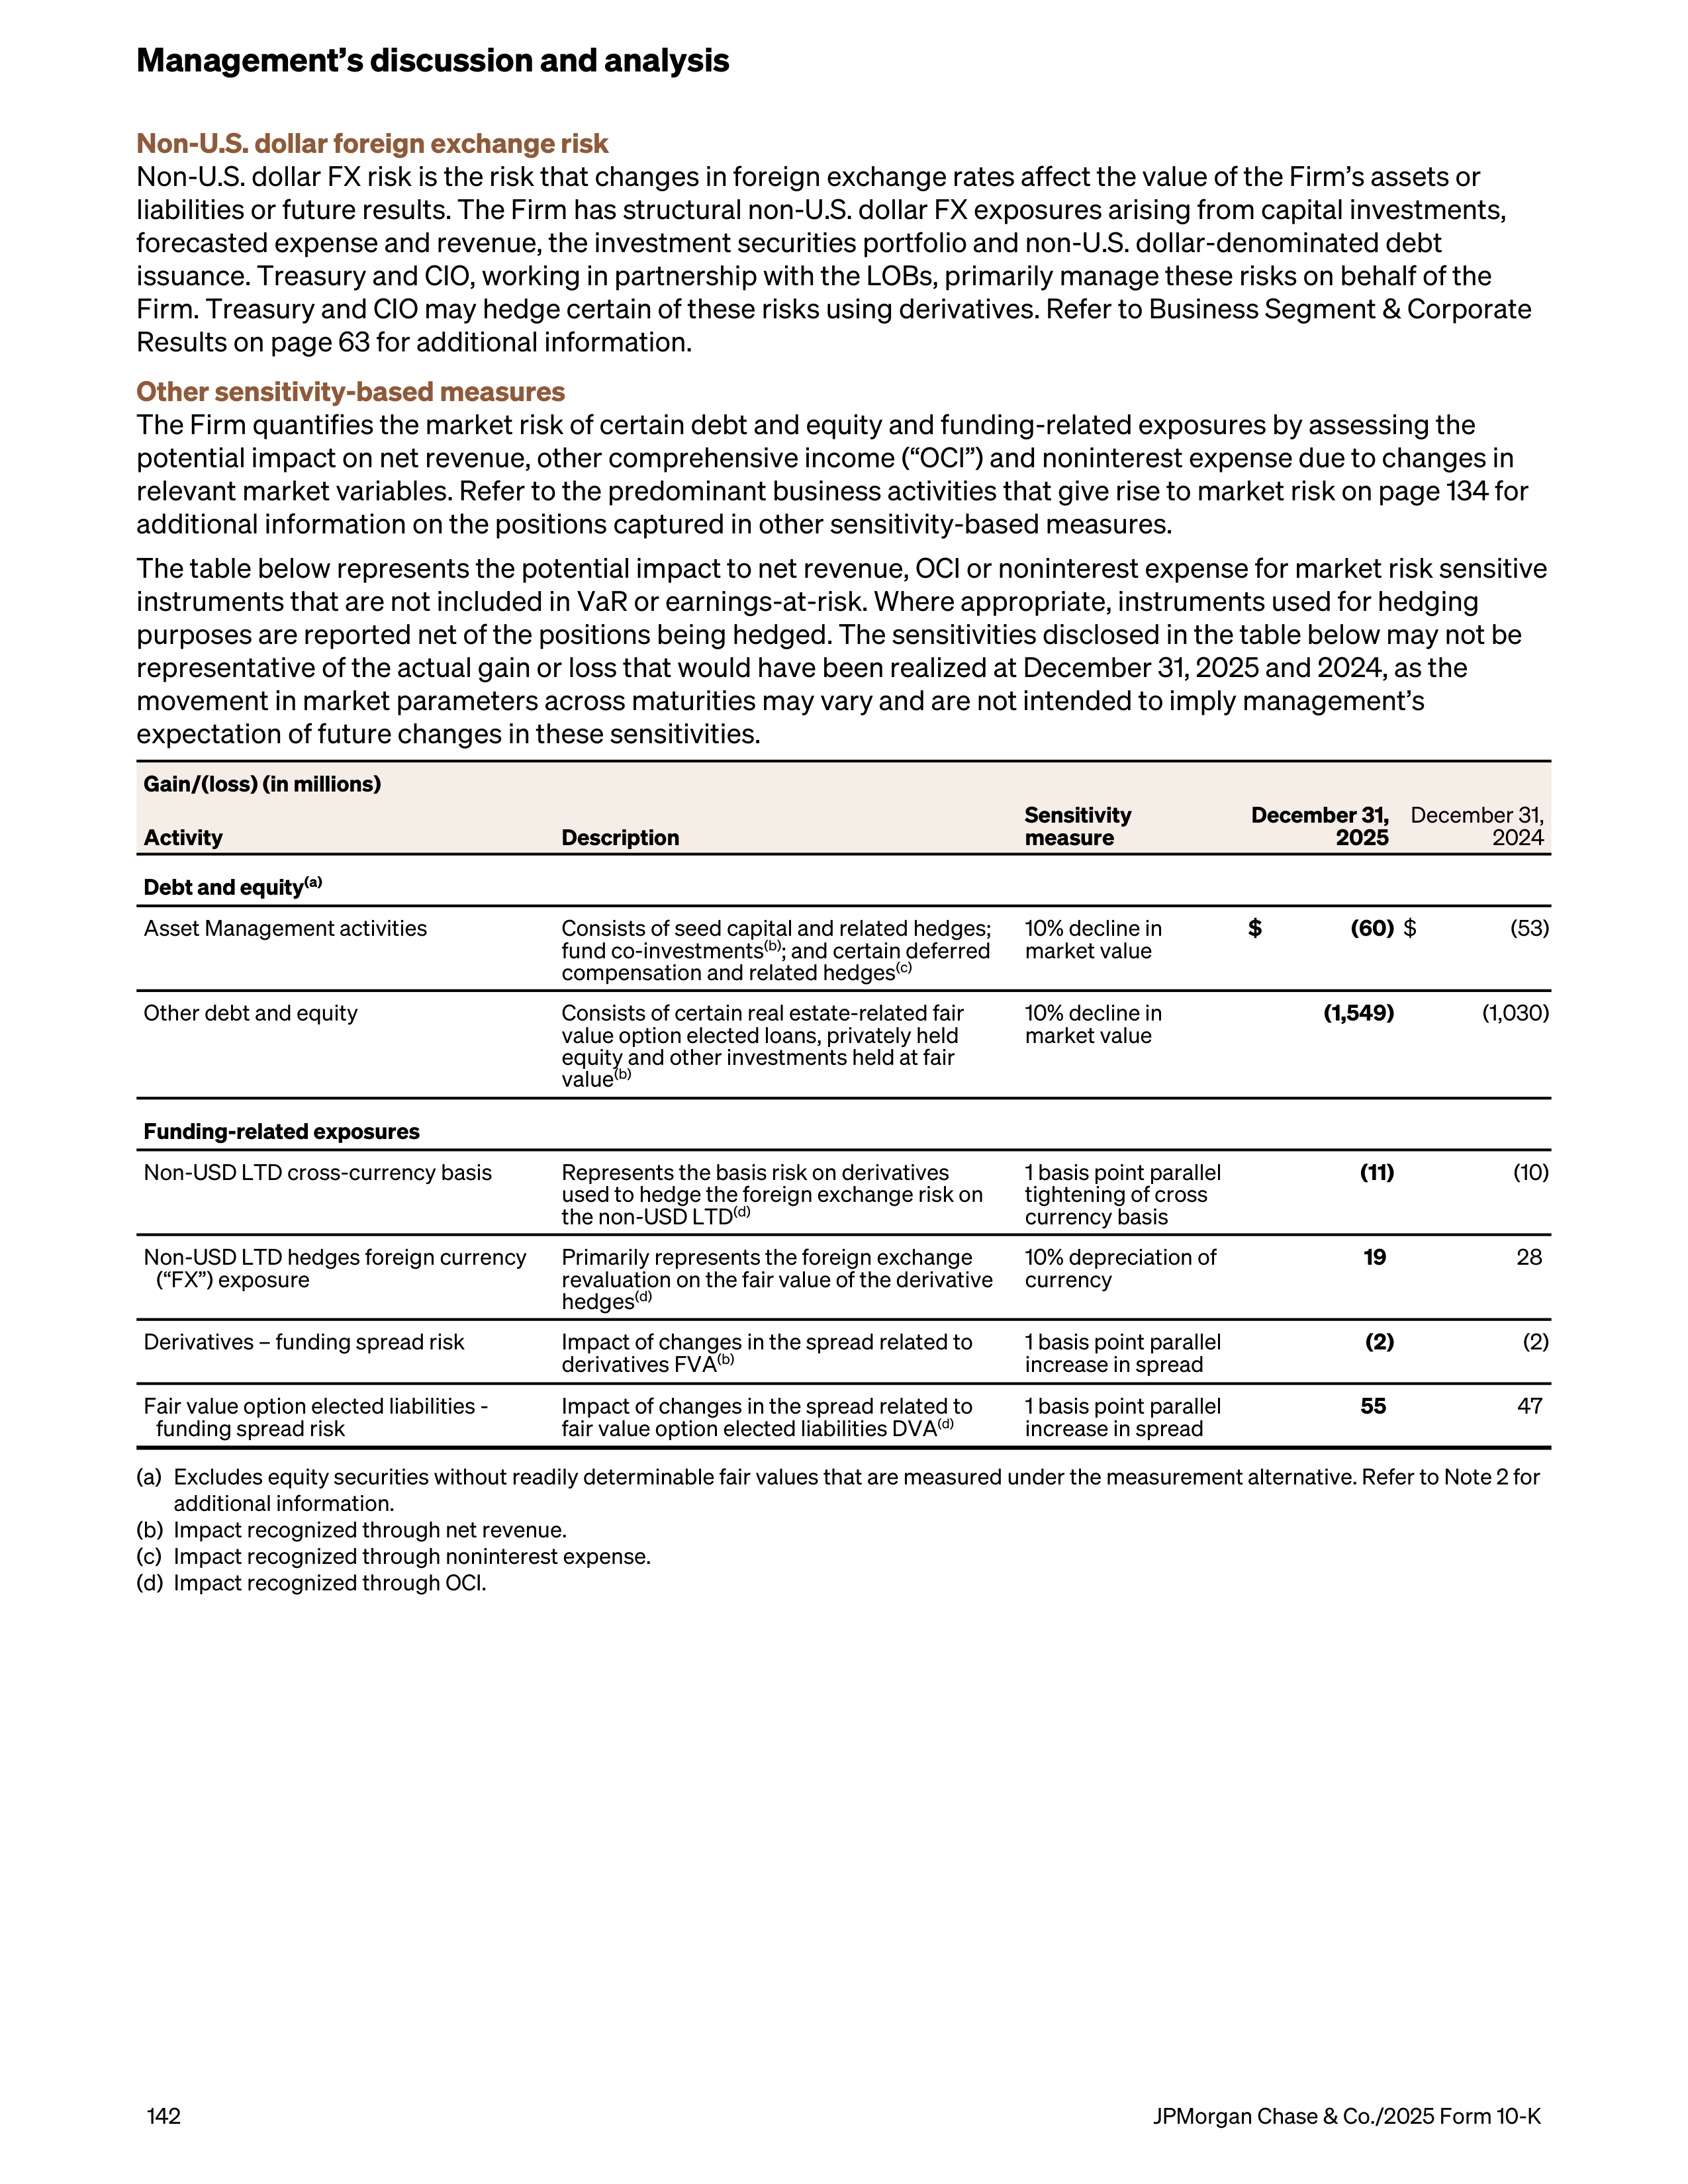
Non-U.S. dollar foreign exchange risk
Non-U.S. dollar FX risk is the risk that changes in foreign exchange rates affect the value of the Firm’s assets or
liabilities or future results. The Firm has structural non-U.S. dollar FX exposures arising from capital investments,
forecasted expense and revenue, the investment securities portfolio and non-U.S. dollar-denominated debt
issuance. Treasury and CIO, working in partnership with the LOBs, primarily manage these risks on behalf of the
Firm. Treasury and CIO may hedge certain of these risks using derivatives. Refer to Business Segment & Corporate
Results on page 63 for additional information.
Other sensitivity-based measures
The Firm quantifies the market risk of certain debt and equity and funding-related exposures by assessing the
potential impact on net revenue, other comprehensive income (“OCI”) and noninterest expense due to changes in
relevant market variables. Refer to the predominant business activities that give rise to market risk on page 134 for
additional information on the positions captured in other sensitivity-based measures.
The table below represents the potential impact to net revenue, OCI or noninterest expense for market risk sensitive
instruments that are not included in VaR or earnings-at-risk. Where appropriate, instruments used for hedging
purposes are reported net of the positions being hedged. The sensitivities disclosed in the table below may not be
representative of the actual gain or loss that would have been realized at December 31, 2025 and 2024, as the
movement in market parameters across maturities may vary and are not intended to imply management’s
expectation of future changes in these sensitivities.
Gain/(loss) (in millions)
Activity
Description
Sensitivity
measure
December 31,
2025
December 31,
2024
Debt and equity
(a)
Asset Management activities
Consists of seed capital and related hedges;
fund co-investments
(b)
; and certain deferred
compensation and related hedges
(c)
10% decline in
market value
$
(60)
$
(53)
Other debt and equity
Consists of certain real estate-related fair
value option elected loans, privately held
equity and other investments held at fair
value
(b)
10% decline in
market value
(1,549)
(1,030)
Funding-related exposures
Non-USD LTD cross-currency basis
Represents the basis risk on derivatives
used to hedge the foreign exchange risk on
the non-USD LTD
(d)
1 basis point parallel
tightening of cross
currency basis
(11)
(10)
Non-USD LTD hedges foreign currency
(“FX”) exposure
Primarily represents the foreign exchange
revaluation on the fair value of the derivative
hedges
(d)
10% depreciation of
currency
19
28
Derivatives – funding spread risk
Impact of changes in the spread related to
derivatives FVA
(b)
1 basis point parallel
increase in spread
(2)
(2)
Fair value option elected liabilities -
funding spread risk
Impact of changes in the spread related to
fair value option elected liabilities DVA
(d)
1 basis point parallel
increase in spread
55
47
(a)
Excludes equity securities without readily determinable fair values that are measured under the measurement alternative. Refer to Note 2 for
additional information.
(b)
Impact recognized through net revenue.
(c)
Impact recognized through noninterest expense.
(d)
Impact recognized through OCI.
Management’s discussion and analysis
142
JPMorgan Chase & Co./2025 Form 10-K
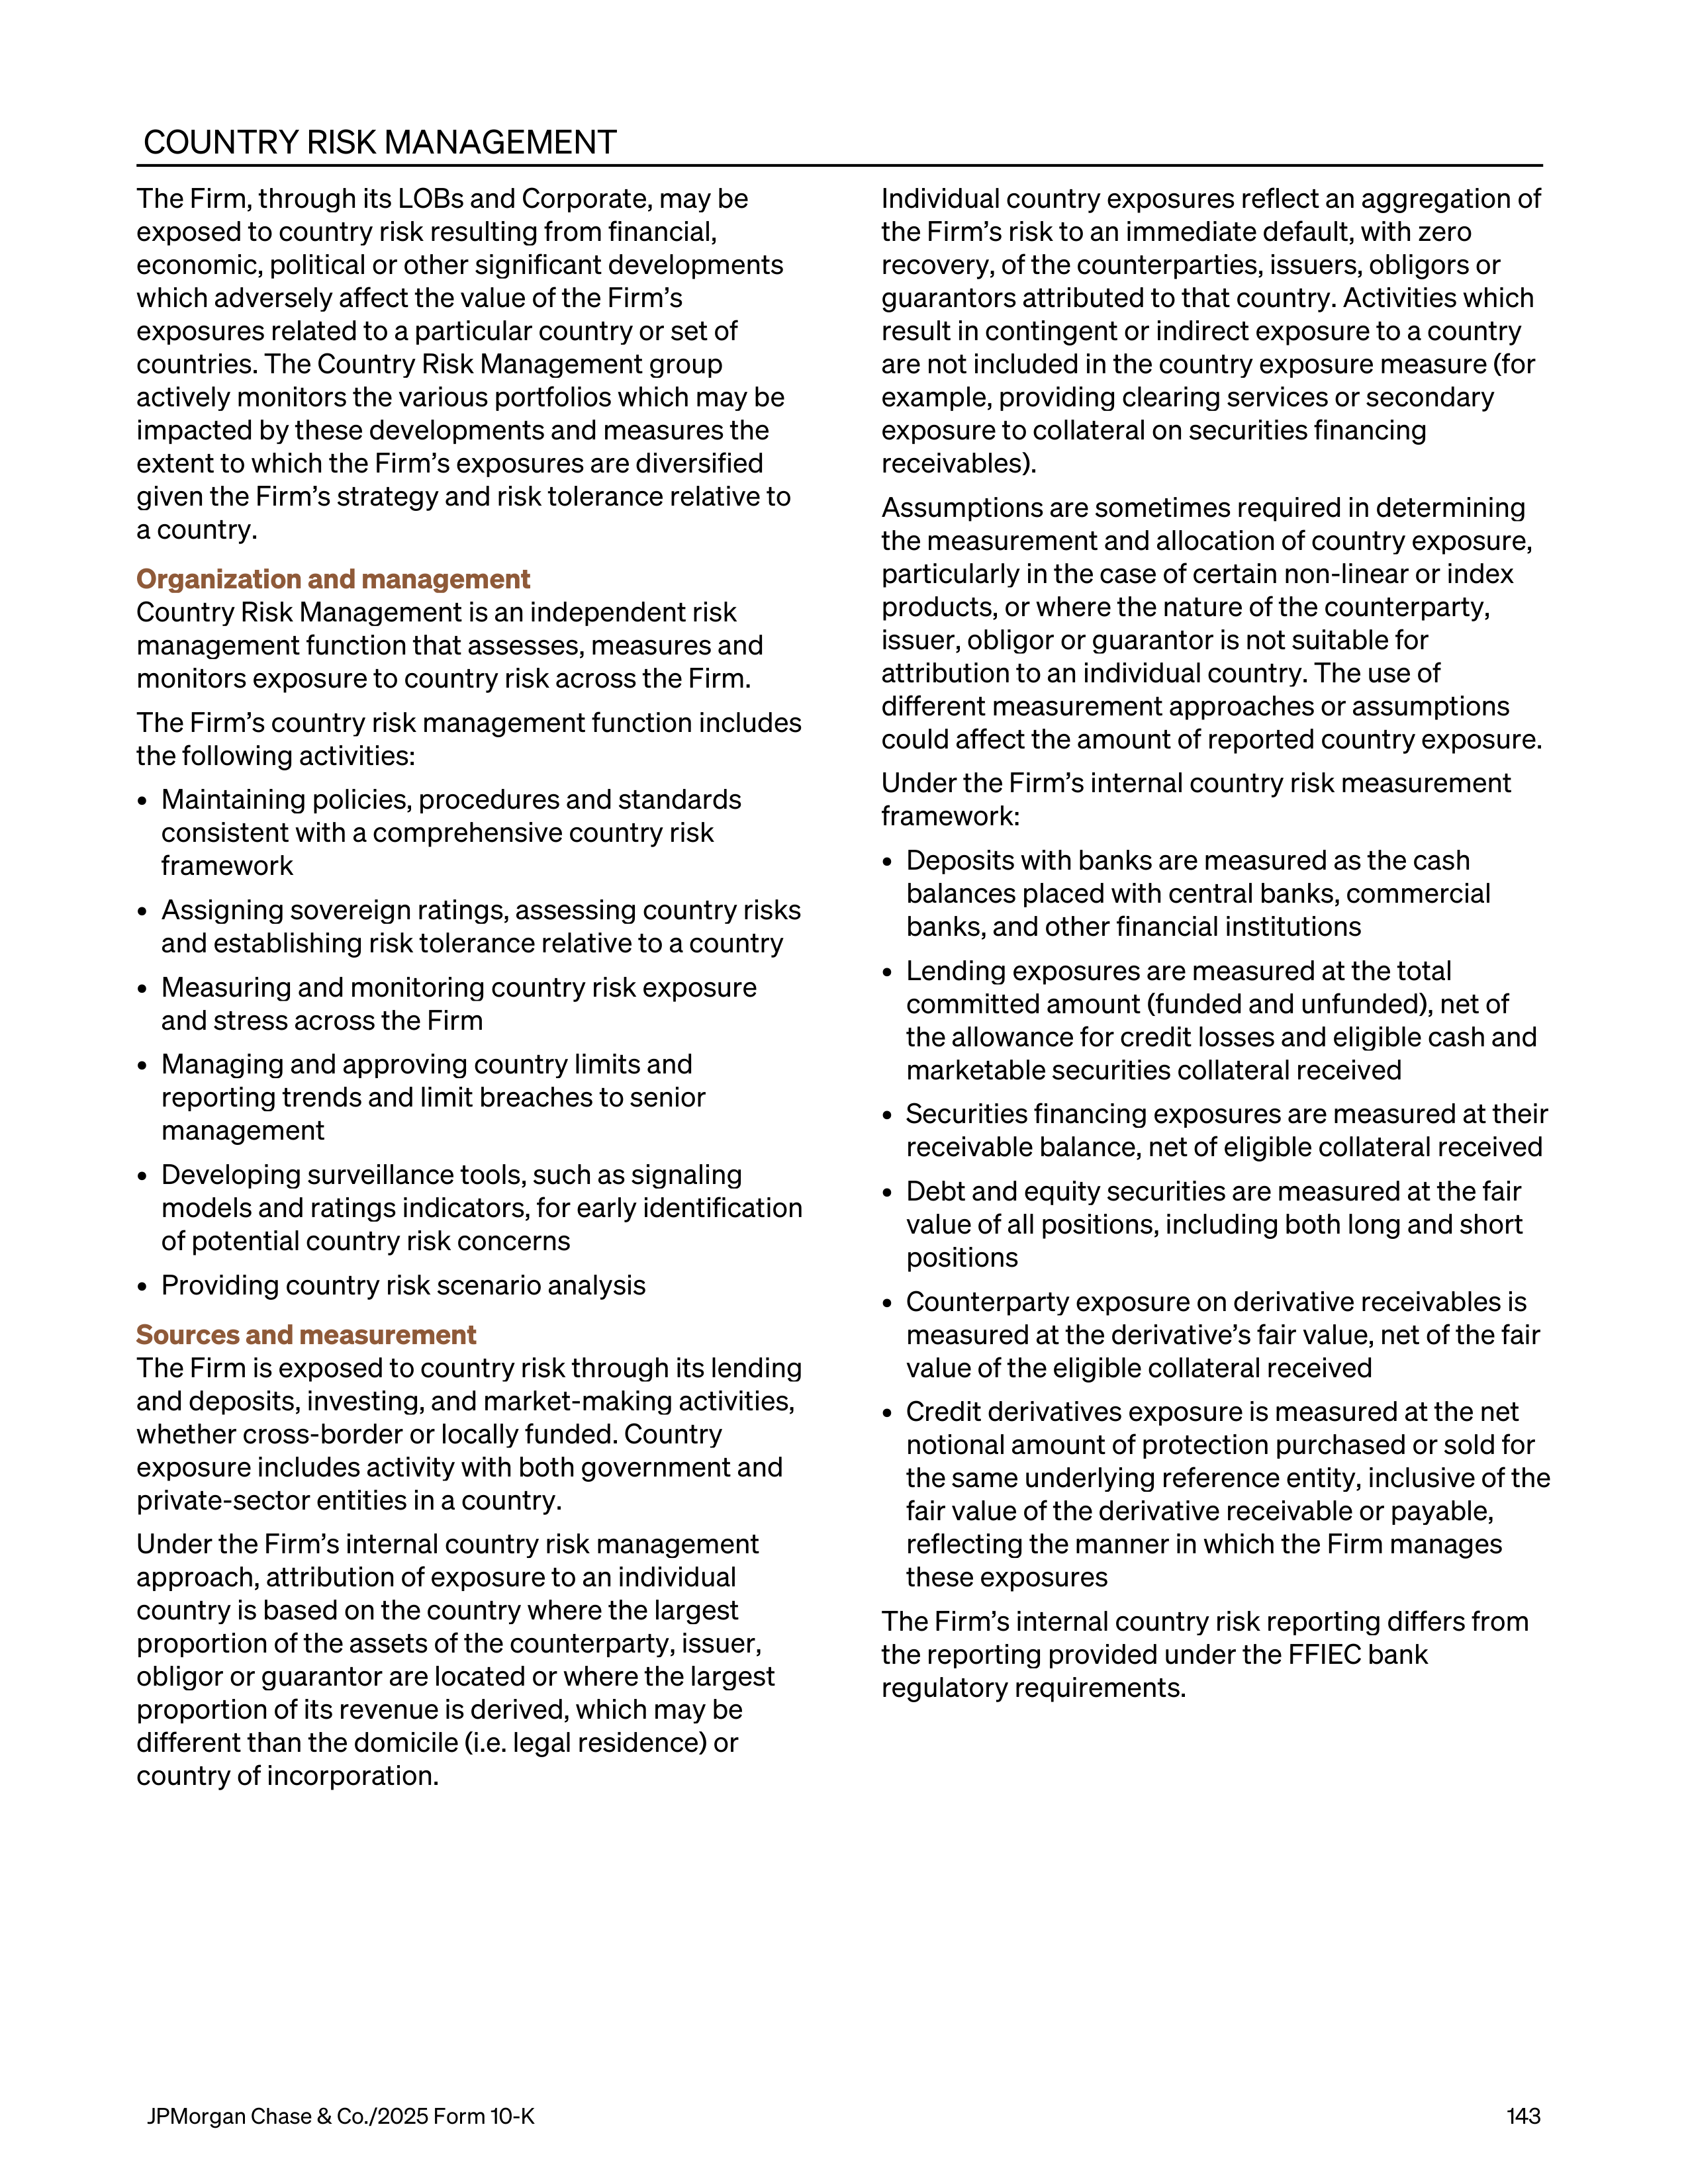
COUNTRY RISK MANAGEMENT
The Firm, through its LOBs and Corporate, may be
exposed to country risk resulting from financial,
economic, political or other significant developments
which adversely affect the value of the Firm’s
exposures related to a particular country or set of
countries. The Country Risk Management group
actively monitors the various portfolios which may be
impacted by these developments and measures the
extent to which
the Firm’s exposures are diversified
given the Firm’s strategy and risk tolerance relative to
a country.
Organization and management
Country Risk Management is an independent risk
management function that assesses, measures and
monitors exposure to country risk across the Firm.
The Firm’s country risk management function includes
the following activities:
•
Maintaining policies, procedures and standards
consistent with a comprehensive country risk
framework
•
Assigning sovereign ratings, assessing country risks
and establishing risk tolerance relative to a country
•
Measuring and monitoring country risk exposure
and stress across the Firm
•
Managing and approving country limits and
reporting trends and limit breaches to senior
management
•
Developing surveillance tools, such as signaling
models and ratings indicators, for early identification
of potential country risk concerns
•
Providing country risk scenario analysis
Sources and measurement
The Firm is exposed to country risk through its lending
and deposits, investing, and market-making activities,
whether cross-border or locally funded. Country
exposure includes activity with both government and
private-sector entities in a country.
Under the Firm’s internal country risk management
approach, attribution of exposure to an individual
country is based on the country where the largest
proportion of the assets of the
counterparty, issuer,
obligor or guarantor are located or where the largest
proportion of its revenue is derived, which may be
different than the domicile (i.e. legal residence) or
country of incorporation.
Individual country exposures reflect an aggregation of
the Firm’s risk to an immediate default, with zero
recovery, of the counterparties, issuers, obligors or
guarantors attributed to that country. Activities which
result in contingent or indirect exposure to a country
are not included in the country exposure measure (for
example, providing clearing services or secondary
exposure to collateral on securities financing
receivables).
Assumptions are sometimes required in determining
the measurement and allocation of country exposure,
particularly in the case of certain non-linear or index
products, or where the nature of the counterparty,
issuer, obligor or guarantor is not suitable for
attribution to an individual country. The use of
different measurement approaches or assumptions
could affect the amount of reported country exposure.
Under the Firm’s internal country risk measurement
framework:
•
Deposits with banks are measured as the cash
balances placed with central banks, commercial
banks, and other financial institutions
•
Lending exposures are measured at the total
committed amount (funded and unfunded), net of
the allowance for credit losses and eligible cash and
marketable securities collateral received
•
Securities financing exposures are measured at their
receivable balance, net of eligible collateral received
•
Debt and equity securities are measured at the fair
value of all positions, including both long and short
positions
•
Counterparty exposure on derivative receivables is
measured at the derivative’s fair value, net of the fair
value of the eligible collateral received
•
Credit derivatives exposure is measured at the net
notional amount of protection purchased or sold for
the same underlying reference entity, inclusive of the
fair value of the derivative receivable or payable,
reflecting the manner in which the Firm manages
these exposures
The Firm’s internal country risk reporting differs from
the reporting provided under the FFIEC bank
regulatory requirements.
JPMorgan Chase & Co./2025 Form 10-K
143
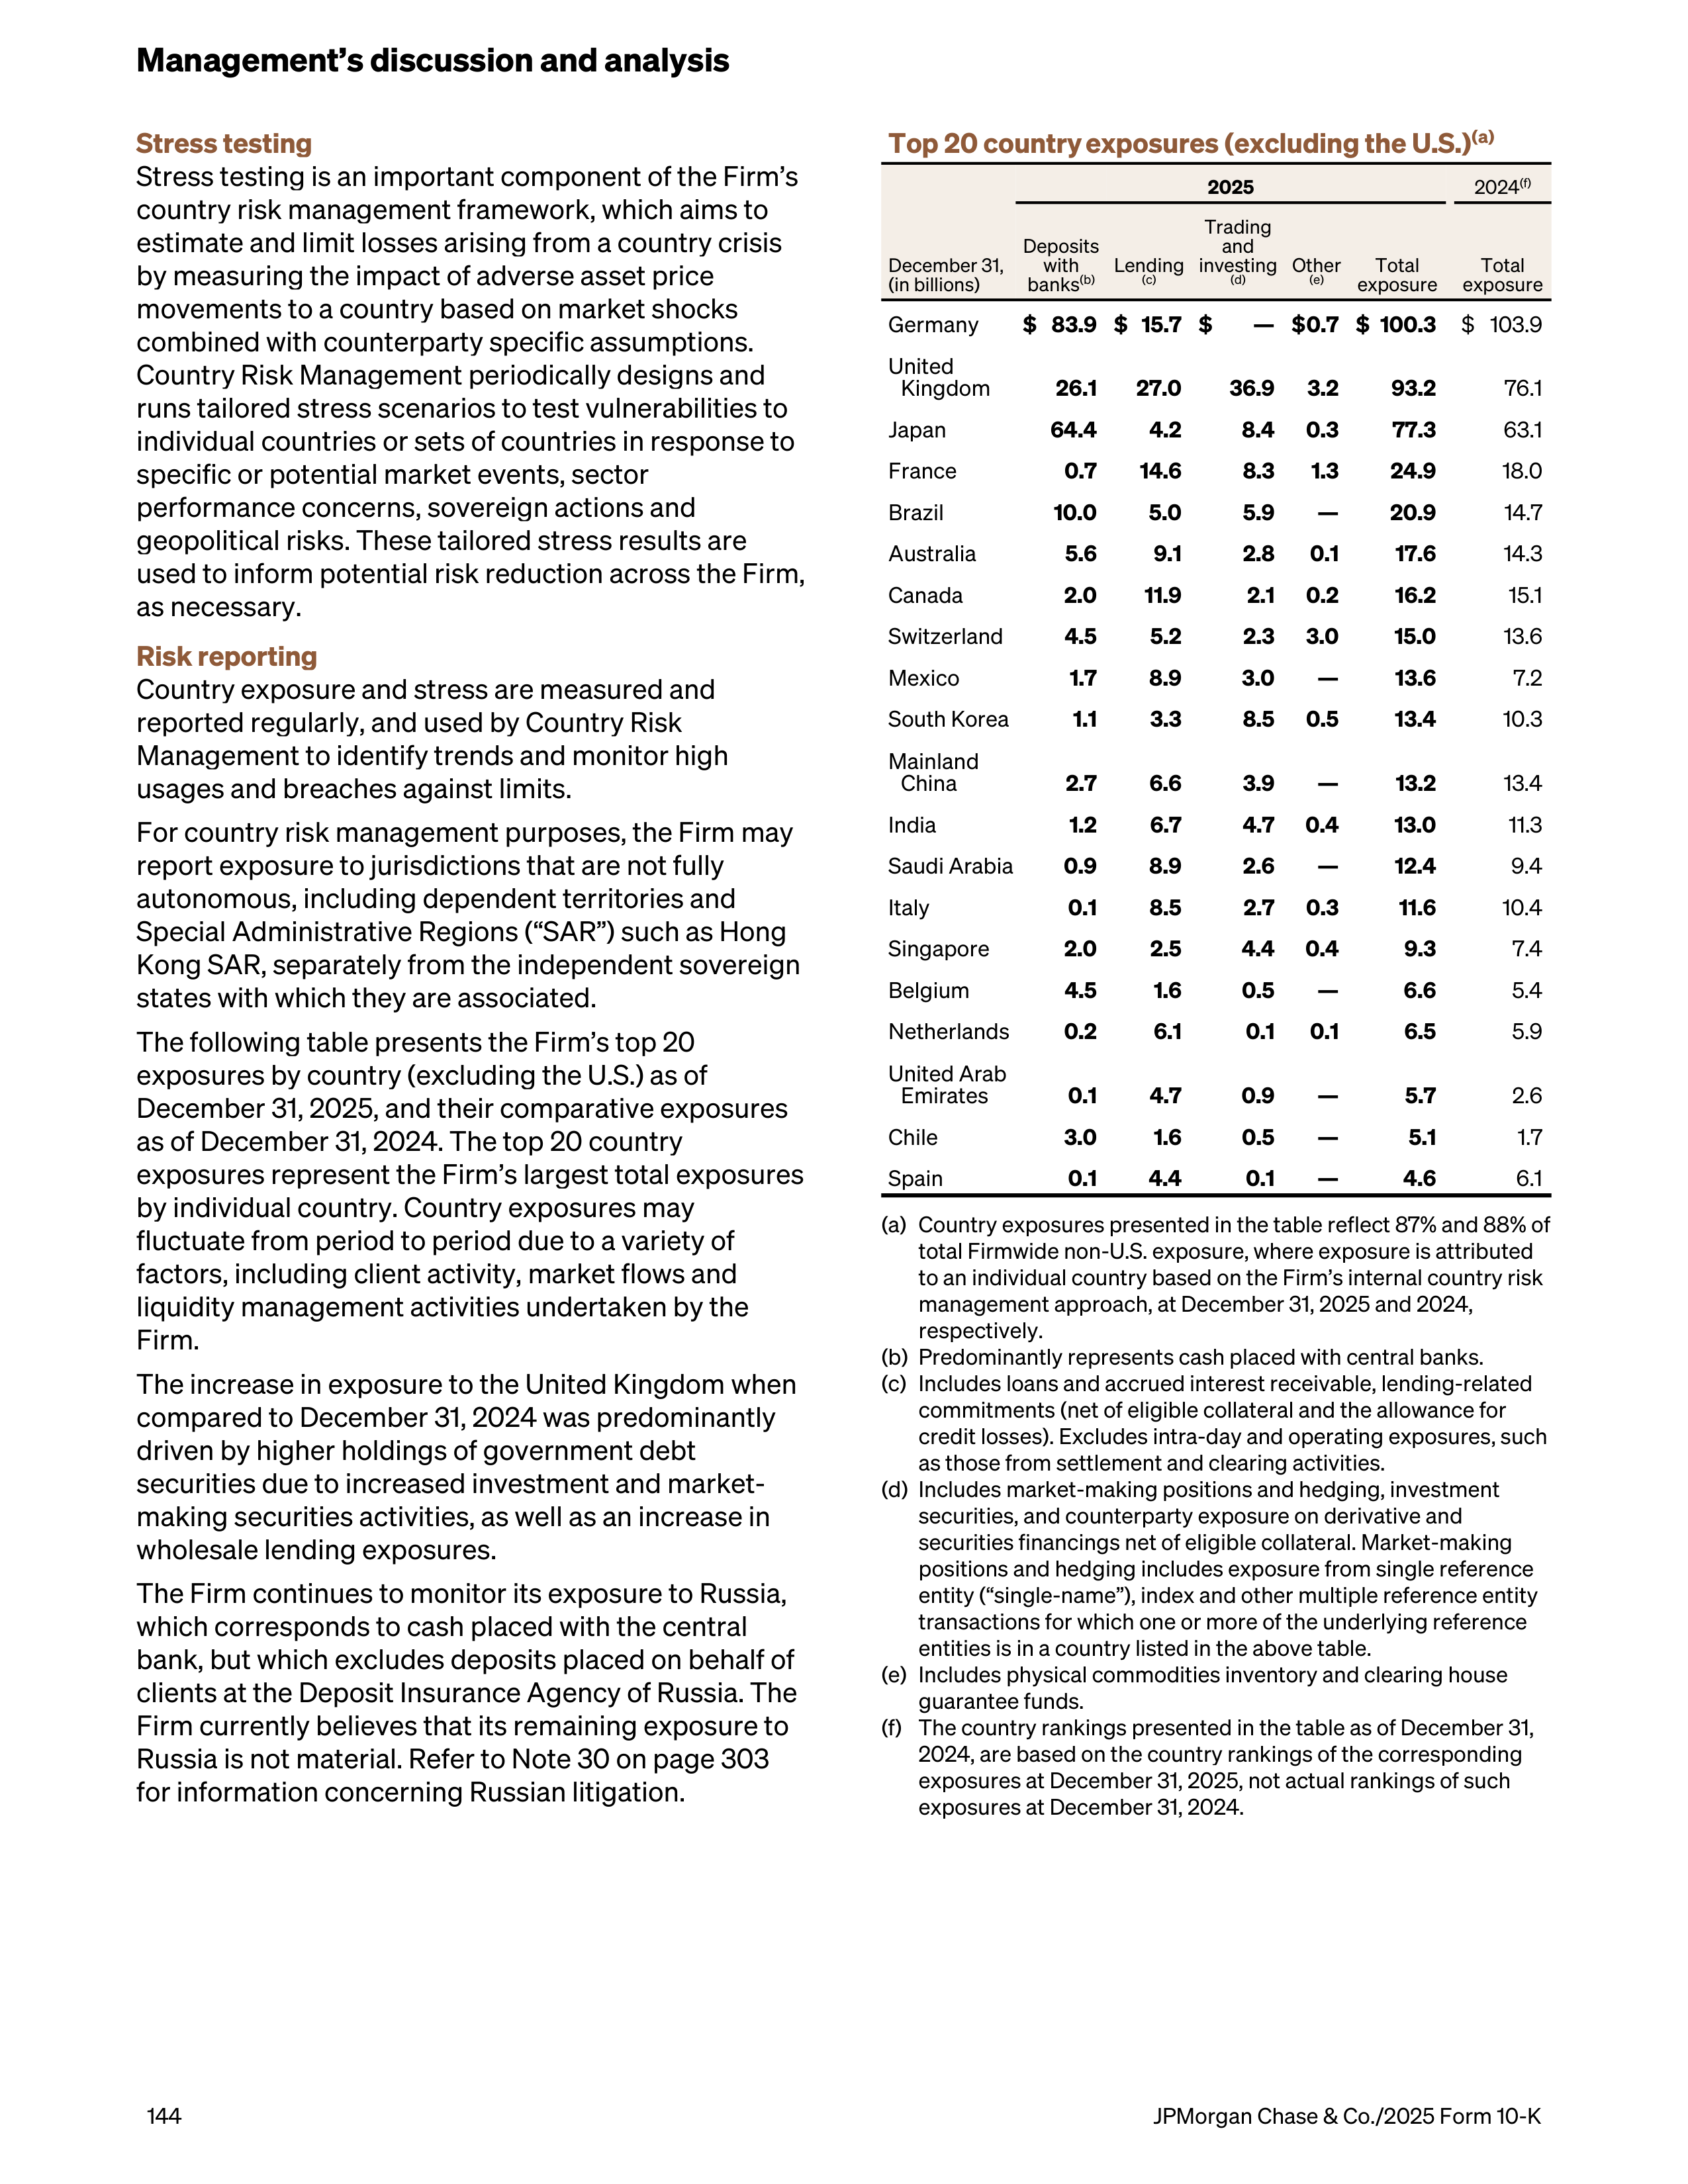
Stress testing
Stress testing is an important component of the Firm’s
country risk management framework, which aims to
estimate and limit losses arising from a country crisis
by measuring the impact of adverse asset price
movements to a country based on market shocks
combined with counterparty specific assumptions.
Country Risk Management periodically designs and
runs tailored stress scenarios to test vulnerabilities to
individual countries or sets
of countries in response to
specific or potential market events, sector
performance concerns, sovereign actions and
geopolitical risks. These tailored stress results are
used to inform potential risk reduction across the Firm,
as necessary.
Risk reporting
Country exposure and stress are measured and
reported regularly, and used by Country Risk
Management to identify trends and monitor high
usages and breaches against limits.
For country risk management purposes, the Firm may
report exposure to jurisdictions that are not fully
autonomous, including dependent territories and
Special Administrative Regions (“SAR”) such as Hong
Kong SAR, separately from the independent sovereign
states with which they are associated.
The following table presents the Firm’s top 20
exposures by country (excluding the U.S.) as of
December 31, 2025, and their comparative exposures
as of December 31, 2024. The top 20 country
exposures represent the Firm’s largest total exposures
by individual country. Country exposures may
fluctuate from period to period due to a variety of
factors, including client activity, market flows and
liquidity management activities undertaken by the
Firm.
The increase in exposure to the United Kingdom when
compared to December 31, 2024 was predominantly
driven by higher holdings of government debt
securities due to increased investment and market-
making securities activities, as well as an increase in
wholesale lending exposures.
The Firm continues to monitor its exposure to Russia,
which corresponds to cash placed with the central
bank, but which excludes deposits placed on behalf of
clients at the Deposit Insurance Agency of Russia. The
Firm currently believes that its remaining exposure to
Russia is not material. Refer to Note 30 on page 303
for information concerning Russian litigation.
Top 20 country
exposures (excluding the U.S.)
(a)
December 31,
(in billions)
2025
2024
(f)
Deposits
with
banks
(b)
Lending
(c)
Trading
and
investing
(d)
Other
(e)
Total
exposure
Total
exposure
Germany
$ 83.9 $ 15.7 $
— $ 0.7 $ 100.3
$ 103.9
United
Kingdom
26.1
27.0
36.9 3.2
93.2
76.1
Japan
64.4
4.2
8.4 0.3
77.3
63.1
France
0.7
14.6
8.3 1.3
24.9
18.0
Brazil
10.0
5.0
5.9
—
20.9
14.7
Australia
5.6
9.1
2.8 0.1
17.6
14.3
Canada
2.0
11.9
2.1 0.2
16.2
15.1
Switzerland
4.5
5.2
2.3 3.0
15.0
13.6
Mexico
1.7
8.9
3.0
—
13.6
7.2
South Korea
1.1
3.3
8.5 0.5
13.4
10.3
Mainland
China
2.7
6.6
3.9
—
13.2
13.4
India
1.2
6.7
4.7 0.4
13.0
11.3
Saudi Arabia
0.9
8.9
2.6
—
12.4
9.4
Italy
0.1
8.5
2.7 0.3
11.6
10.4
Singapore
2.0
2.5
4.4 0.4
9.3
7.4
Belgium
4.5
1.6
0.5
—
6.6
5.4
Netherlands
0.2
6.1
0.1 0.1
6.5
5.9
United Arab
Emirates
0.1
4.7
0.9
—
5.7
2.6
Chile
3.0
1.6
0.5
—
5.1
1.7
Spain
0.1
4.4
0.1
—
4.6
6.1
(a)
Country exposures presented in the table reflect 87% and 88% of
total Firmwide non-U.S. exposure,
where exposure is attributed
to an individual country based on the Firm’s internal country risk
management approach, at December 31, 2025 and 2024,
respectively.
(b)
Predominantly represents cash placed with central banks.
(c)
Includes loans and accrued interest receivable, lending-related
commitments (net of eligible collateral and the allowance for
credit losses). Excludes intra-day and operating exposures, such
as those from settlement and clearing activities.
(d)
Includes market-making positions and hedging, investment
securities, and counterparty exposure on derivative and
securities financings net of eligible collateral. Market-making
positions and hedging includes exposure from single reference
entity (“single-name”), index and other multiple reference entity
transactions for which one or more of the underlying reference
entities is in a country listed in the above table.
(e)
Includes physical commodities inventory and clearing house
guarantee funds.
(f)
The country rankings presented in the table as of December 31,
2024, are based on the country rankings of the corresponding
exposures at December 31, 2025, not actual rankings of such
exposures at December 31, 2024.
Management’s discussion and analysis
144
JPMorgan Chase & Co./2025 Form 10-K
CLIMATE RISK MANAGEMENT
Climate risk refers to the potential threats posed by
climate change to the Firm and its clients, customers,
operations and business strategy. Climate change is
viewed as a driver of risk that may impact existing
types of risks managed by the Firm. Climate risk is
categorized into physical risk and transition risk.
Physical risk involves economic costs and financial
losses due to a changing climate. Acute physical risk
drivers include the increased frequency or severity of
climate and weather events, such as floods, wildfires
and tropical cyclones. Chronic physical risk drivers
include more gradual shifts in the climate, such as sea
level rise, persistent changes in precipitation levels
and increases in average ambient temperatures.
Indirect physical risk drivers include the second-order
effects of these acute and chronic risks, such as supply
chain disruptions or changes to property valuations.
Transition risk involves the financial and economic
consequences of society’s shift toward a lower-carbon
economy. Transition risk drivers include possible
changes in public policy, adoption of new technologies
and shifts in consumer preferences. Transition risks
may also be influenced by changes in the physical
climate.
Organization and management
The Firm’s Climate, Nature and Social Risk
Management function is responsible for establishing
and maintaining the Firmwide framework and strategy
for managing climate risk.
Other responsibilities of that function include:
•
Establishing and maintaining policies, standards,
procedures and processes to support identification,
escalation, monitoring and management of climate
risk across the Firm
•
Developing metrics, scenarios and stress testing
mechanisms designed to assess the range of
potential climate-related financial and economic
impacts to the Firm
•
Establishing a Firmwide climate risk data strategy
and the supporting climate risk technology
infrastructure
The LOBs and Corporate are responsible for the
identification, assessment and management of climate
risks present in their business activities and for the
adherence to applicable climate-related laws, rules
and regulations.
Governance and oversight
The Firm’s framework and strategy for identifying,
monitoring and managing climate risk is integrated
into the Firm’s risk governance framework. This
framework allows for the escalation of significant
climate risk-related issues to LOB Risk Committees.
The Board Risk Committee also receives information
on significant climate risks and climate-related
initiatives, as appropriate.
JPMorgan Chase & Co./2025 Form 10-K
145
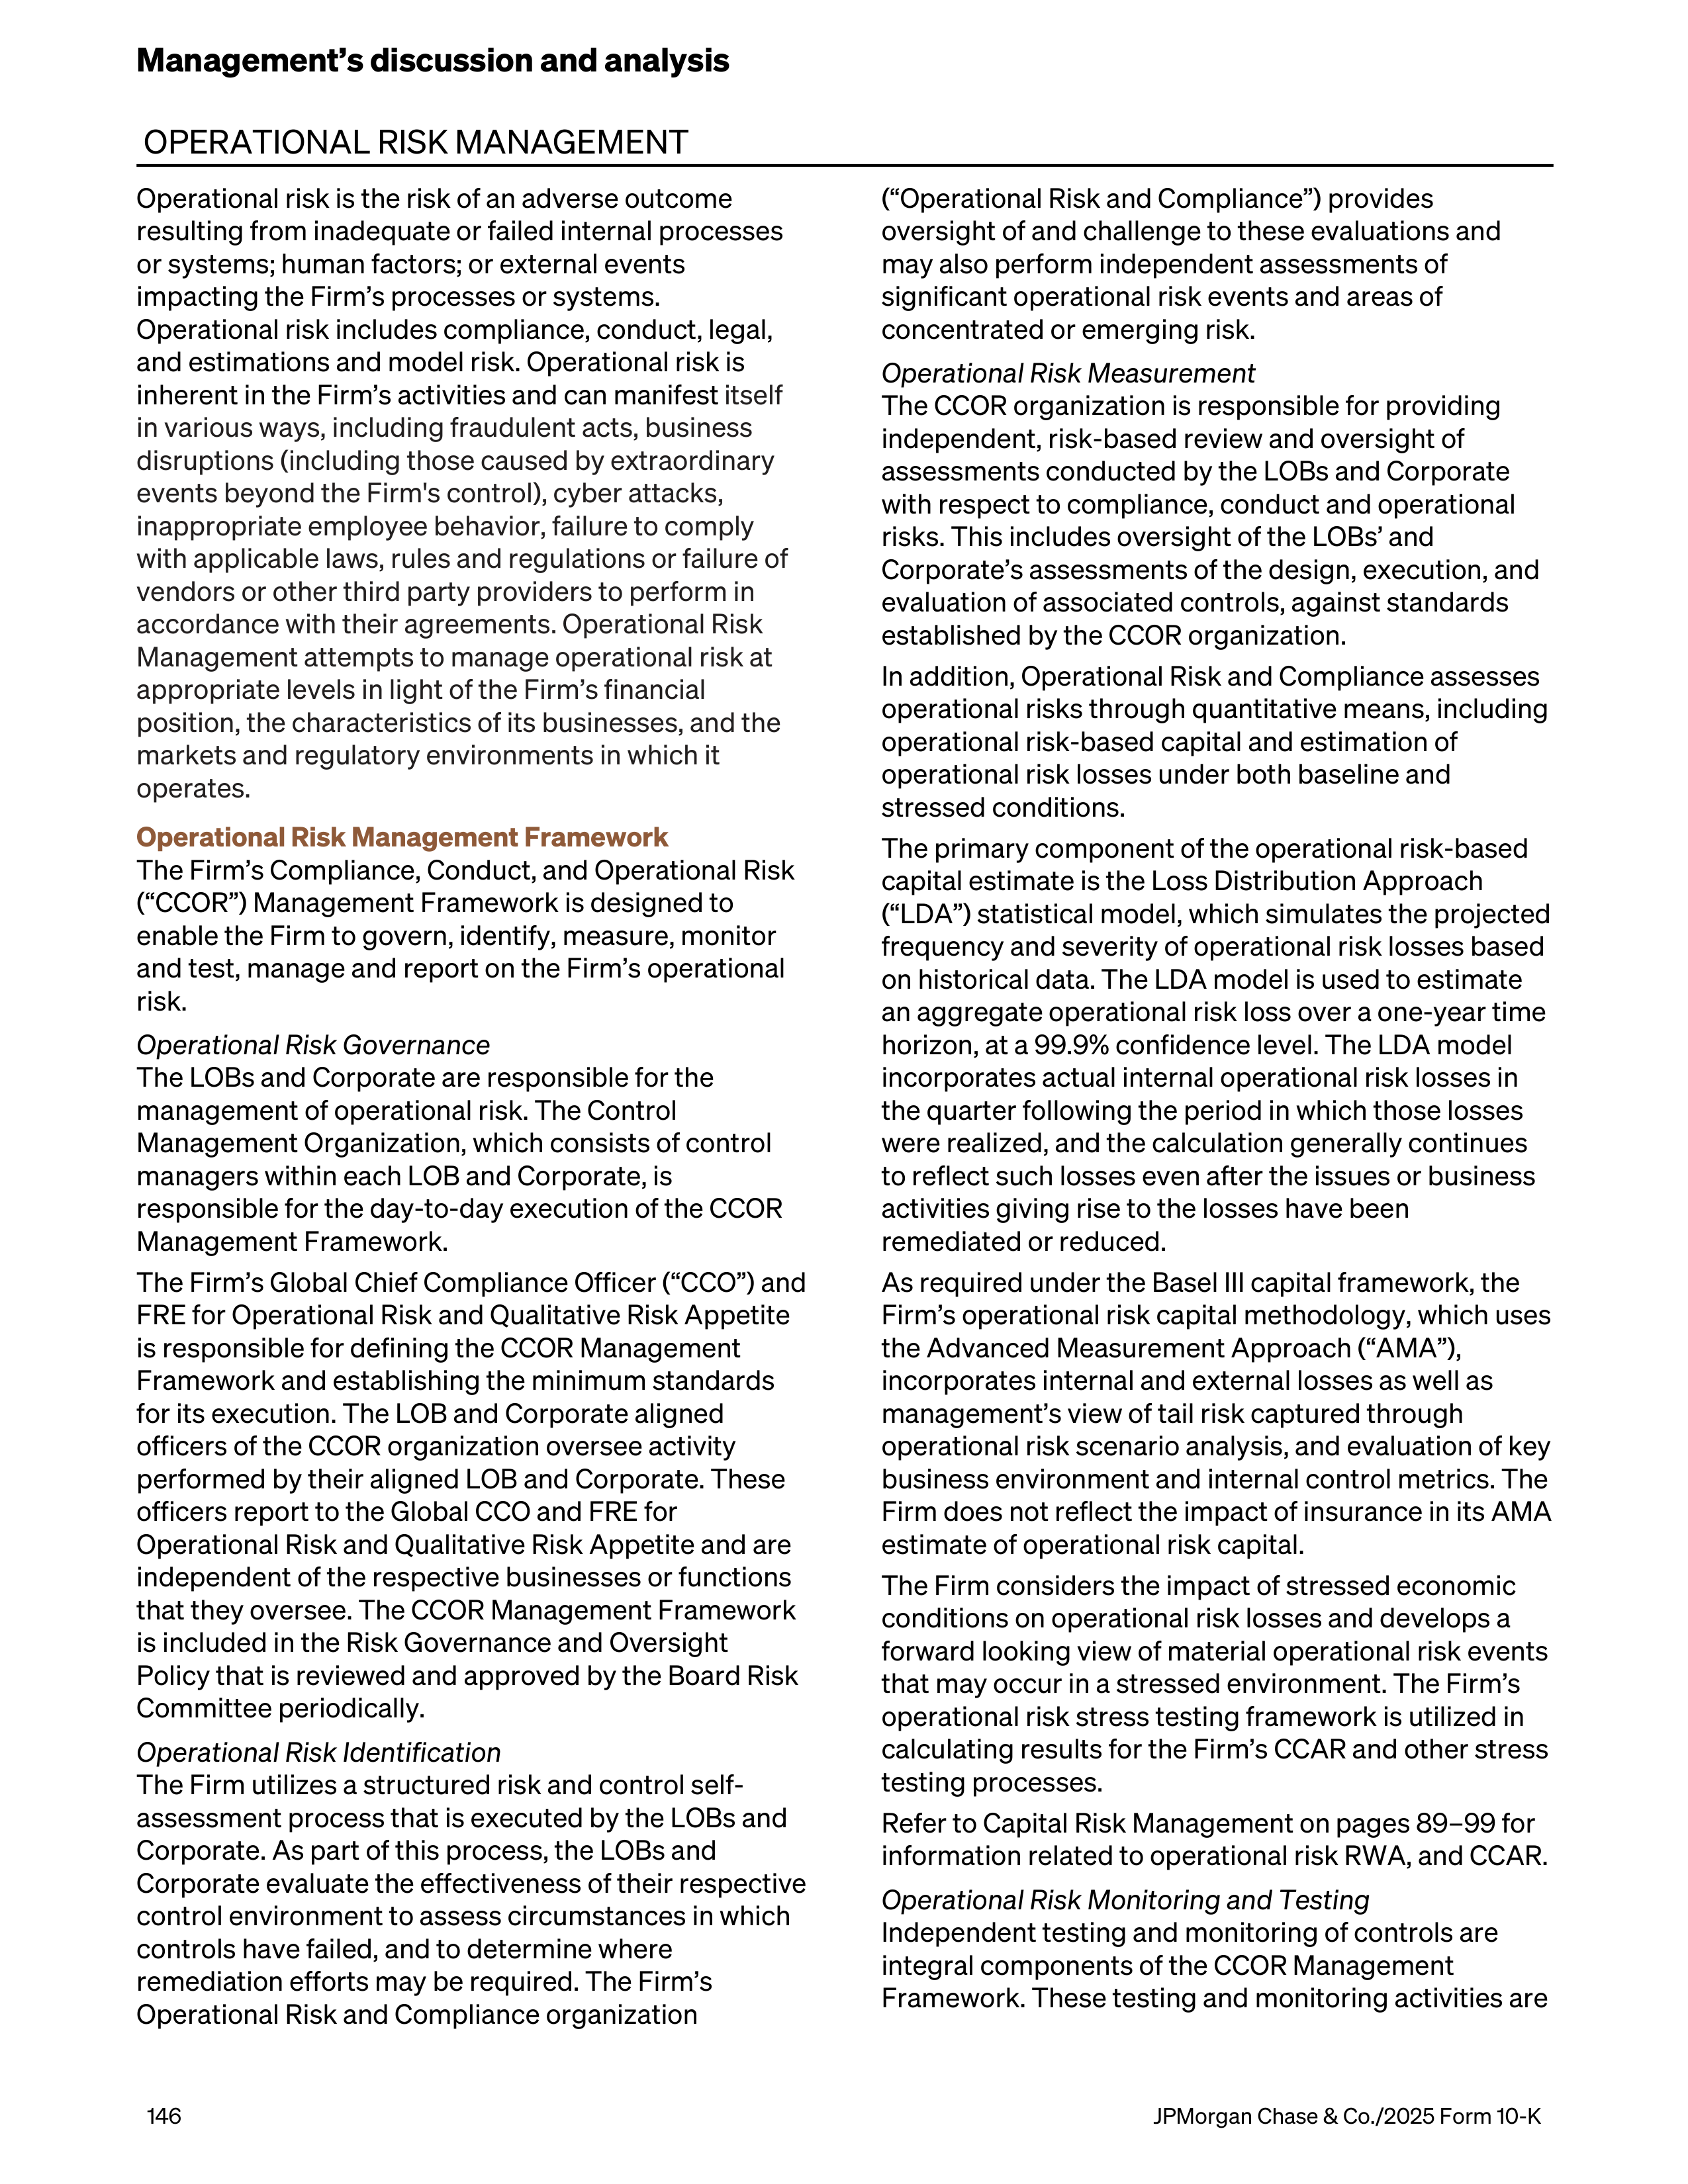
OPERATIONAL RISK MANAGEMENT
Operational risk is the risk of an adverse outcome
resulting from inadequate or failed internal processes
or systems; human factors; or external events
impacting the Firm’s processes or systems.
Operational risk includes compliance, conduct, legal,
and estimations and model risk. Operational risk is
inherent in the Firm’s activities and can manifest
itself
in various ways, including fraudulent acts, business
disruptions (including those caused by extraordinary
events beyond the Firm's control), cyber attacks,
inappropriate employee behavior, failure to comply
with applicable laws, rules and regulations or failure of
vendors or other third party providers to perform in
accordance with their agreements. Operational Risk
Management attempts to manage operational risk at
appropriate levels in light of the Firm’s financial
position, the characteristics of its businesses, and the
markets and regulatory environments in which it
operates.
Operational Risk Management Framework
The Firm’s Compliance, Conduct, and Operational Risk
(“CCOR”) Management Framework is designed to
enable the Firm to govern, identify, measure, monitor
and test, manage and report on the Firm’s operational
risk.
Operational Risk Governance
The LOBs and Corporate are responsible for the
management of operational risk. The Control
Management Organization, which consists of control
managers within each LOB and Corporate, is
responsible for the day-to-day execution of the CCOR
Management Framework.
The Firm’s Global Chief Compliance Officer (“CCO”) and
FRE for Operational Risk and Qualitative Risk Appetite
is responsible for defining the CCOR Management
Framework and establishing the minimum standards
for its execution. The LOB and Corporate aligned
officers of the CCOR organization oversee activity
performed by their aligned LOB and Corporate. These
officers report to the Global CCO and FRE for
Operational Risk and Qualitative Risk Appetite and are
independent of the respective businesses or functions
that they oversee. The CCOR Management Framework
is included in the Risk Governance and Oversight
Policy that is reviewed and approved by the Board Risk
Committee periodically.
Operational Risk Identification
The Firm utilizes a structured risk and control self-
assessment process that is executed by the LOBs and
Corporate. As part of this process, the LOBs and
Corporate evaluate the effectiveness of their respective
control environment to assess circumstances in which
controls have failed, and to determine where
remediation efforts may be required. The Firm’s
Operational Risk and Compliance organization
(“Operational Risk and Compliance”) provides
oversight of and challenge to these evaluations and
may also perform independent assessments of
significant operational risk events and areas of
concentrated or emerging risk.
Operational Risk Measurement
The CCOR organization is responsible for providing
independent, risk-based review and oversight of
assessments conducted by the LOBs and Corporate
with respect to compliance, conduct and operational
risks. This includes oversight of the LOBs’ and
Corporate’s assessments of the design, execution, and
evaluation of associated controls, against standards
established by the CCOR organization.
In addition, Operational Risk and Compliance assesses
operational risks through quantitative means, including
operational risk-based capital and estimation of
operational risk losses under both baseline and
stressed conditions.
The primary component of the operational risk-based
capital estimate is the Loss Distribution Approach
(“LDA”) statistical model, which simulates the projected
frequency and severity of operational risk losses based
on historical data. The LDA model is used to estimate
an aggregate operational risk loss over a one-year time
horizon, at a 99.9% confidence level. The LDA model
incorporates actual internal operational risk losses in
the quarter following the period in which those losses
were realized, and the calculation generally continues
to reflect such losses even after the issues or business
activities giving rise to the losses have been
remediated or reduced.
As required under the Basel III capital framework, the
Firm’s operational risk capital methodology, which uses
the Advanced Measurement Approach (“AMA”),
incorporates internal and external losses as well as
management’s view of tail risk captured through
operational risk scenario analysis, and evaluation of key
business environment and internal control metrics. The
Firm does not reflect the impact of insurance in its AMA
estimate of operational risk capital.
The Firm considers the impact of stressed economic
conditions on operational risk losses and develops a
forward looking view of material operational risk events
that may occur in a stressed environment. The Firm’s
operational risk stress testing framework is utilized in
calculating results for the Firm’s CCAR and other stress
testing processes.
Refer to Capital Risk Management on pages 89–99 for
information related to operational risk RWA, and CCAR.
Operational Risk Monitoring and Testing
Independent testing and monitoring of controls are
integral components of the CCOR Management
Framework. These testing and monitoring activities are
Management’s discussion and analysis
146
JPMorgan Chase & Co./2025 Form 10-K
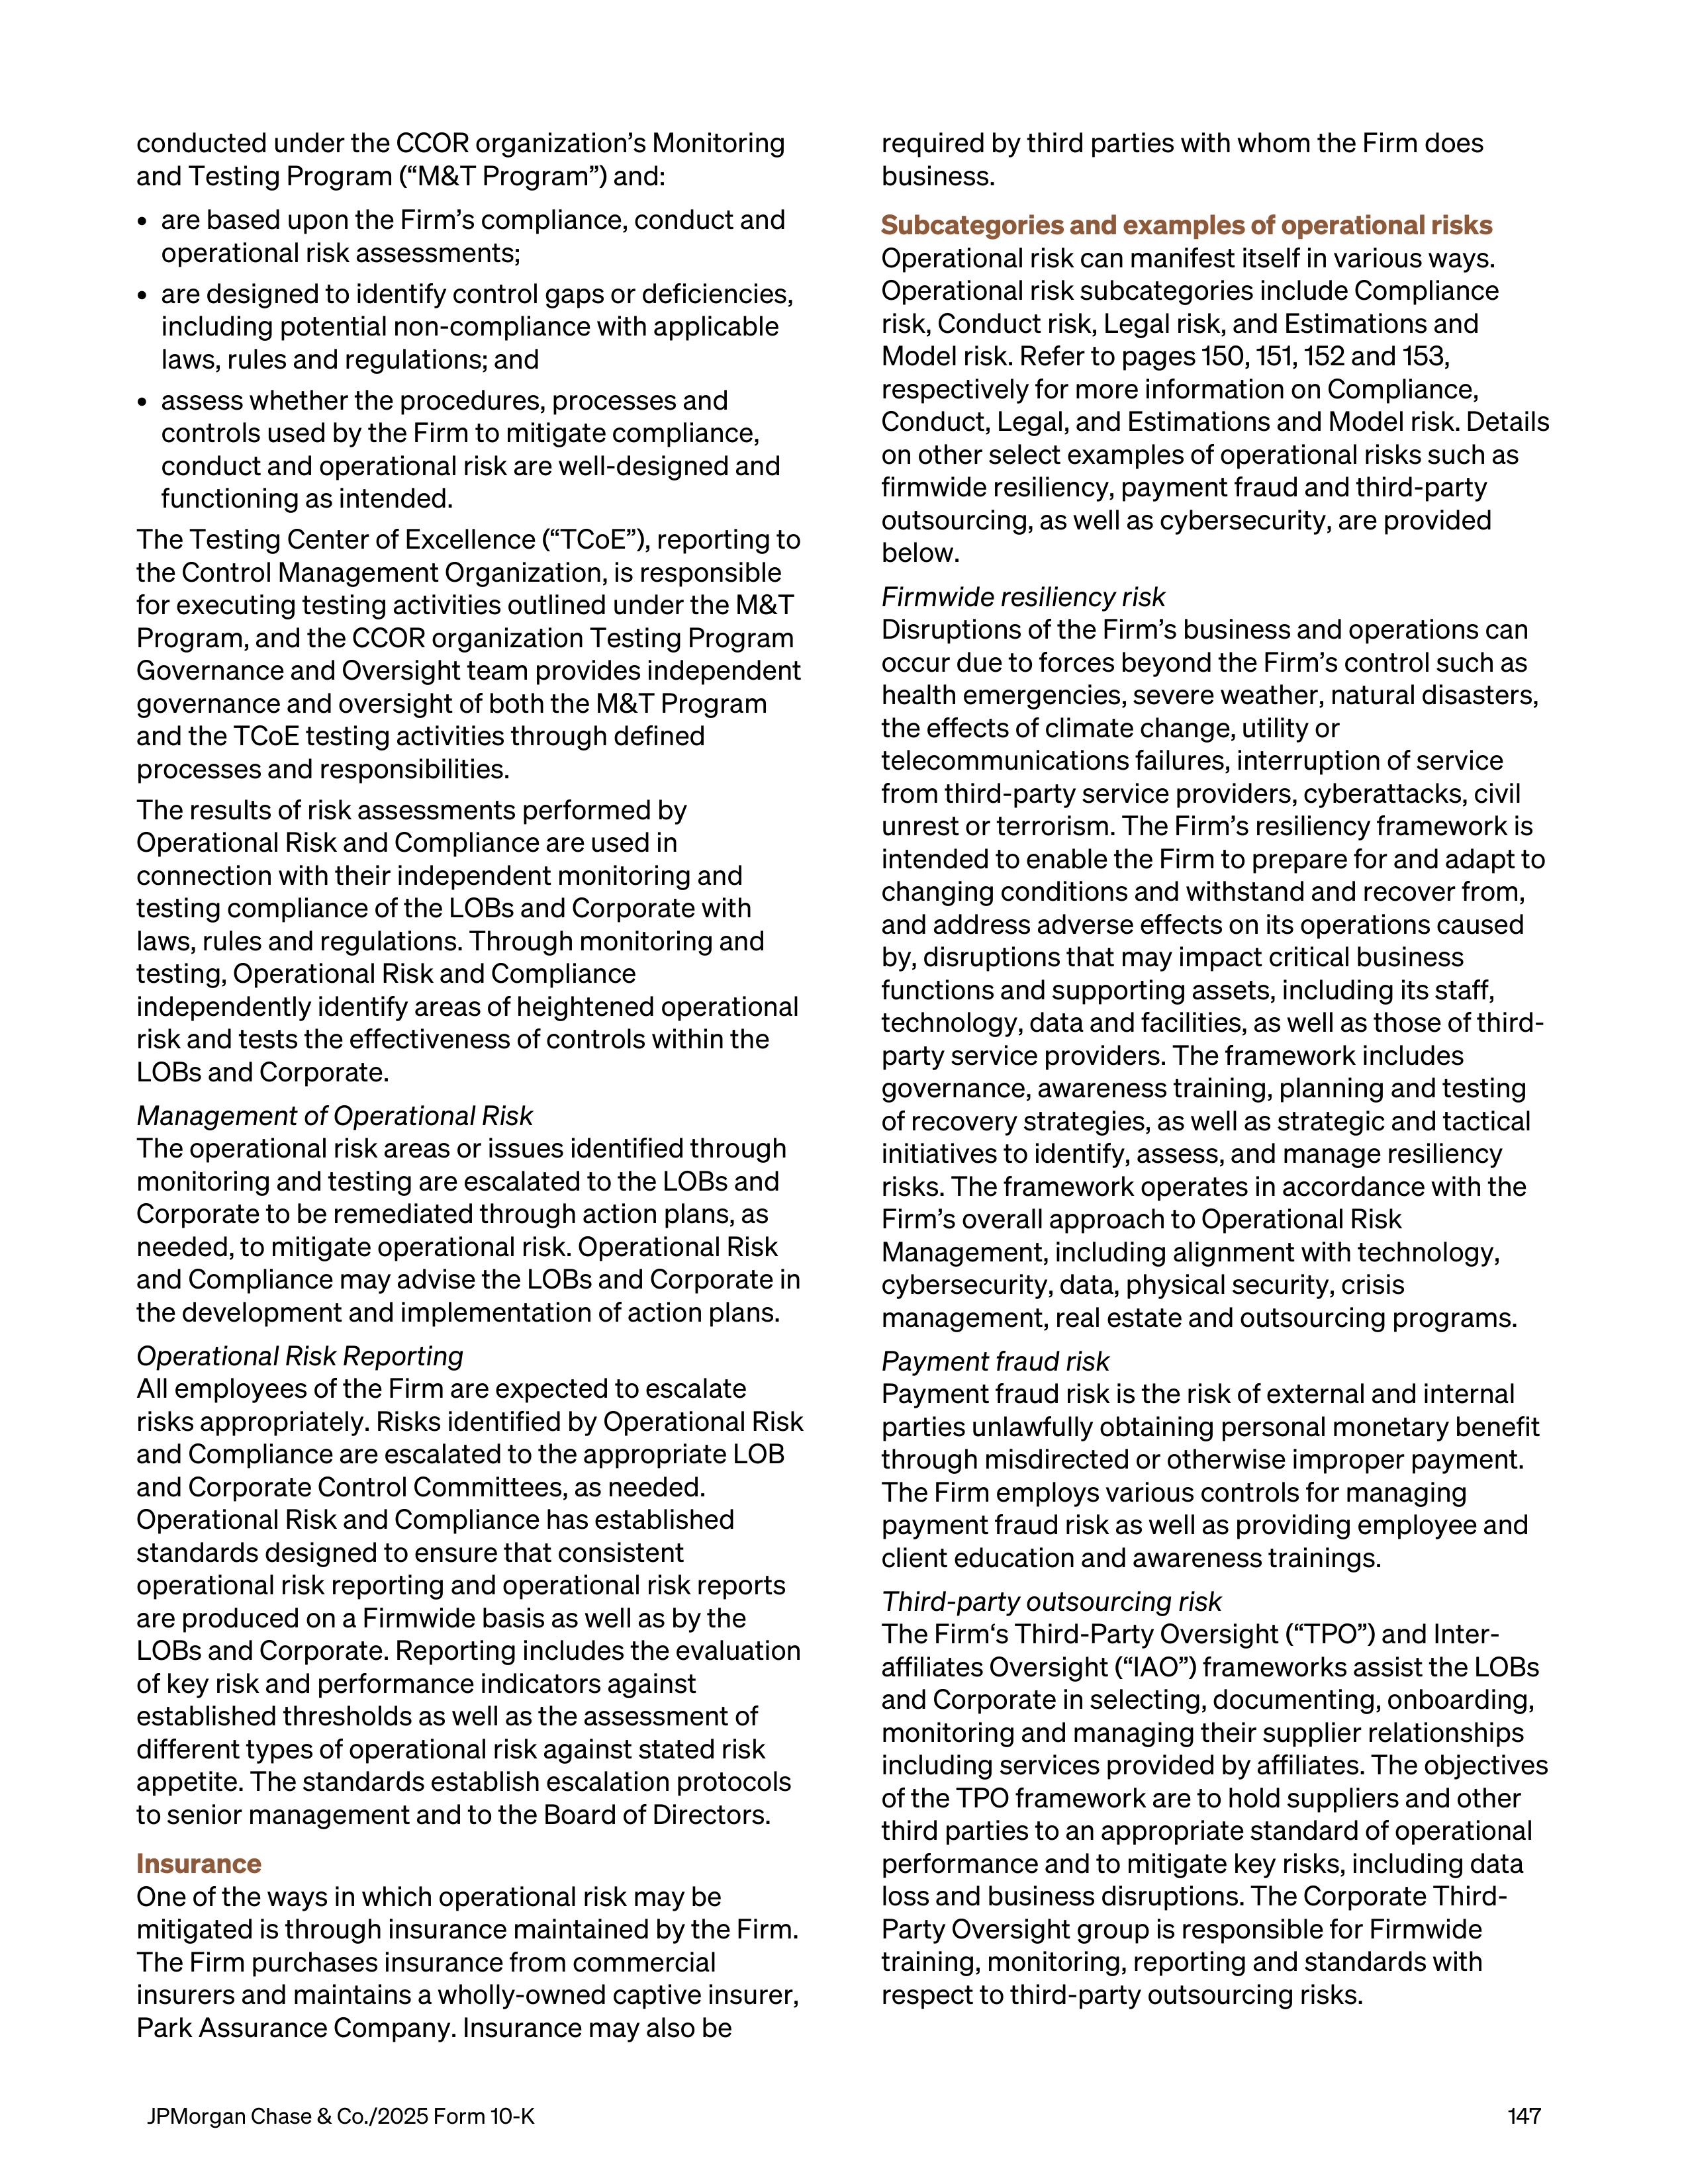
conducted under the CCOR organization’s Monitoring
and Testing Program (“M&T Program”) and:
•
are based upon the Firm’s compliance, conduct and
operational risk assessments;
•
are designed to identify control gaps or deficiencies,
including potential non-compliance with applicable
laws, rules and regulations; and
•
assess whether the procedures, processes and
controls used by the Firm to mitigate compliance,
conduct and operational risk are well-designed and
functioning as intended.
The Testing Center of Excellence (“TCoE”), reporting to
the Control Management Organization, is responsible
for executing testing activities outlined under the M&T
Program, and the CCOR organization Testing Program
Governance and Oversight team provides independent
governance and oversight of both the M&T Program
and the TCoE testing activities through defined
processes and responsibilities.
The results of risk assessments performed by
Operational Risk and Compliance are used in
connection with their independent monitoring and
testing compliance of the LOBs and Corporate with
laws, rules and regulations. Through monitoring and
testing, Operational Risk and Compliance
independently identify areas of heightened operational
risk and tests the effectiveness of controls within the
LOBs and Corporate.
Management of Operational Risk
The operational risk areas or issues identified through
monitoring and testing are escalated to the LOBs and
Corporate to be remediated through action plans, as
needed, to mitigate operational risk. Operational Risk
and Compliance may advise the LOBs and Corporate in
the development and implementation of action plans.
Operational Risk Reporting
All employees of the Firm are expected to escalate
risks appropriately. Risks identified by Operational Risk
and Compliance are escalated to the appropriate LOB
and Corporate Control Committees, as needed.
Operational Risk and Compliance has established
standards designed to ensure that consistent
operational risk reporting and operational risk reports
are produced on a Firmwide basis as well as by the
LOBs and Corporate. Reporting includes the evaluation
of key risk and performance indicators against
established thresholds as well as the assessment of
different types of operational risk against stated risk
appetite. The standards establish escalation protocols
to senior management and to the Board of Directors.
Insurance
One of the ways in which operational risk may be
mitigated is through insurance maintained by the Firm.
The Firm purchases insurance from commercial
insurers and maintains a wholly-owned captive insurer,
Park Assurance Company. Insurance may also be
required by third parties with whom the Firm does
business.
Subcategories and examples of operational risks
Operational risk can manifest itself in various ways.
Operational risk subcategories include Compliance
risk, Conduct risk, Legal risk, and Estimations and
Model risk. Refer to pages 150, 151, 152 and 153,
respectively for more information on Compliance,
Conduct, Legal, and Estimations and Model risk. Details
on other select examples of operational risks such as
firmwide resiliency, payment fraud and third-party
outsourcing, as well as cybersecurity, are provided
below.
Firmwide resiliency risk
Disruptions of the Firm’s business and operations can
occur due to forces beyond the Firm’s control such as
health emergencies, severe weather, natural disasters,
the effects of climate change, utility or
telecommunications failures, interruption of service
from third-party service providers, cyberattacks, civil
unrest or terrorism. The Firm’s resiliency framework is
intended to enable the Firm to prepare for and adapt to
changing conditions and withstand and recover from,
and address adverse effects on its operations caused
by, disruptions that may impact critical business
functions and supporting assets, including its staff,
technology, data and facilities, as well as those of third-
party service providers. The framework includes
governance, awareness training, planning and testing
of recovery strategies, as well as strategic and tactical
initiatives to identify, assess, and manage resiliency
risks. The framework operates in accordance with the
Firm’s overall approach to Operational Risk
Management, including alignment with technology,
cybersecurity, data, physical security, crisis
management, real estate and outsourcing programs.
Payment fraud risk
Payment fraud risk is the risk of external and internal
parties unlawfully obtaining personal monetary benefit
through misdirected or otherwise improper payment.
The Firm employs various controls for managing
payment fraud risk as well as providing employee and
client education and awareness trainings.
Third-party outsourcing risk
The Firm‘s Third-Party Oversight (“TPO”) and Inter-
affiliates Oversight (“IAO”) frameworks assist the LOBs
and Corporate in selecting, documenting, onboarding,
monitoring and managing their supplier relationships
including services provided by affiliates. The objectives
of the TPO framework are to hold suppliers and other
third parties to an appropriate standard of operational
performance and to mitigate key risks, including data
loss and business disruptions. The Corporate Third-
Party Oversight group is responsible for Firmwide
training, monitoring, reporting and standards with
respect to third-party outsourcing risks.
JPMorgan Chase & Co./2025 Form 10-K
147
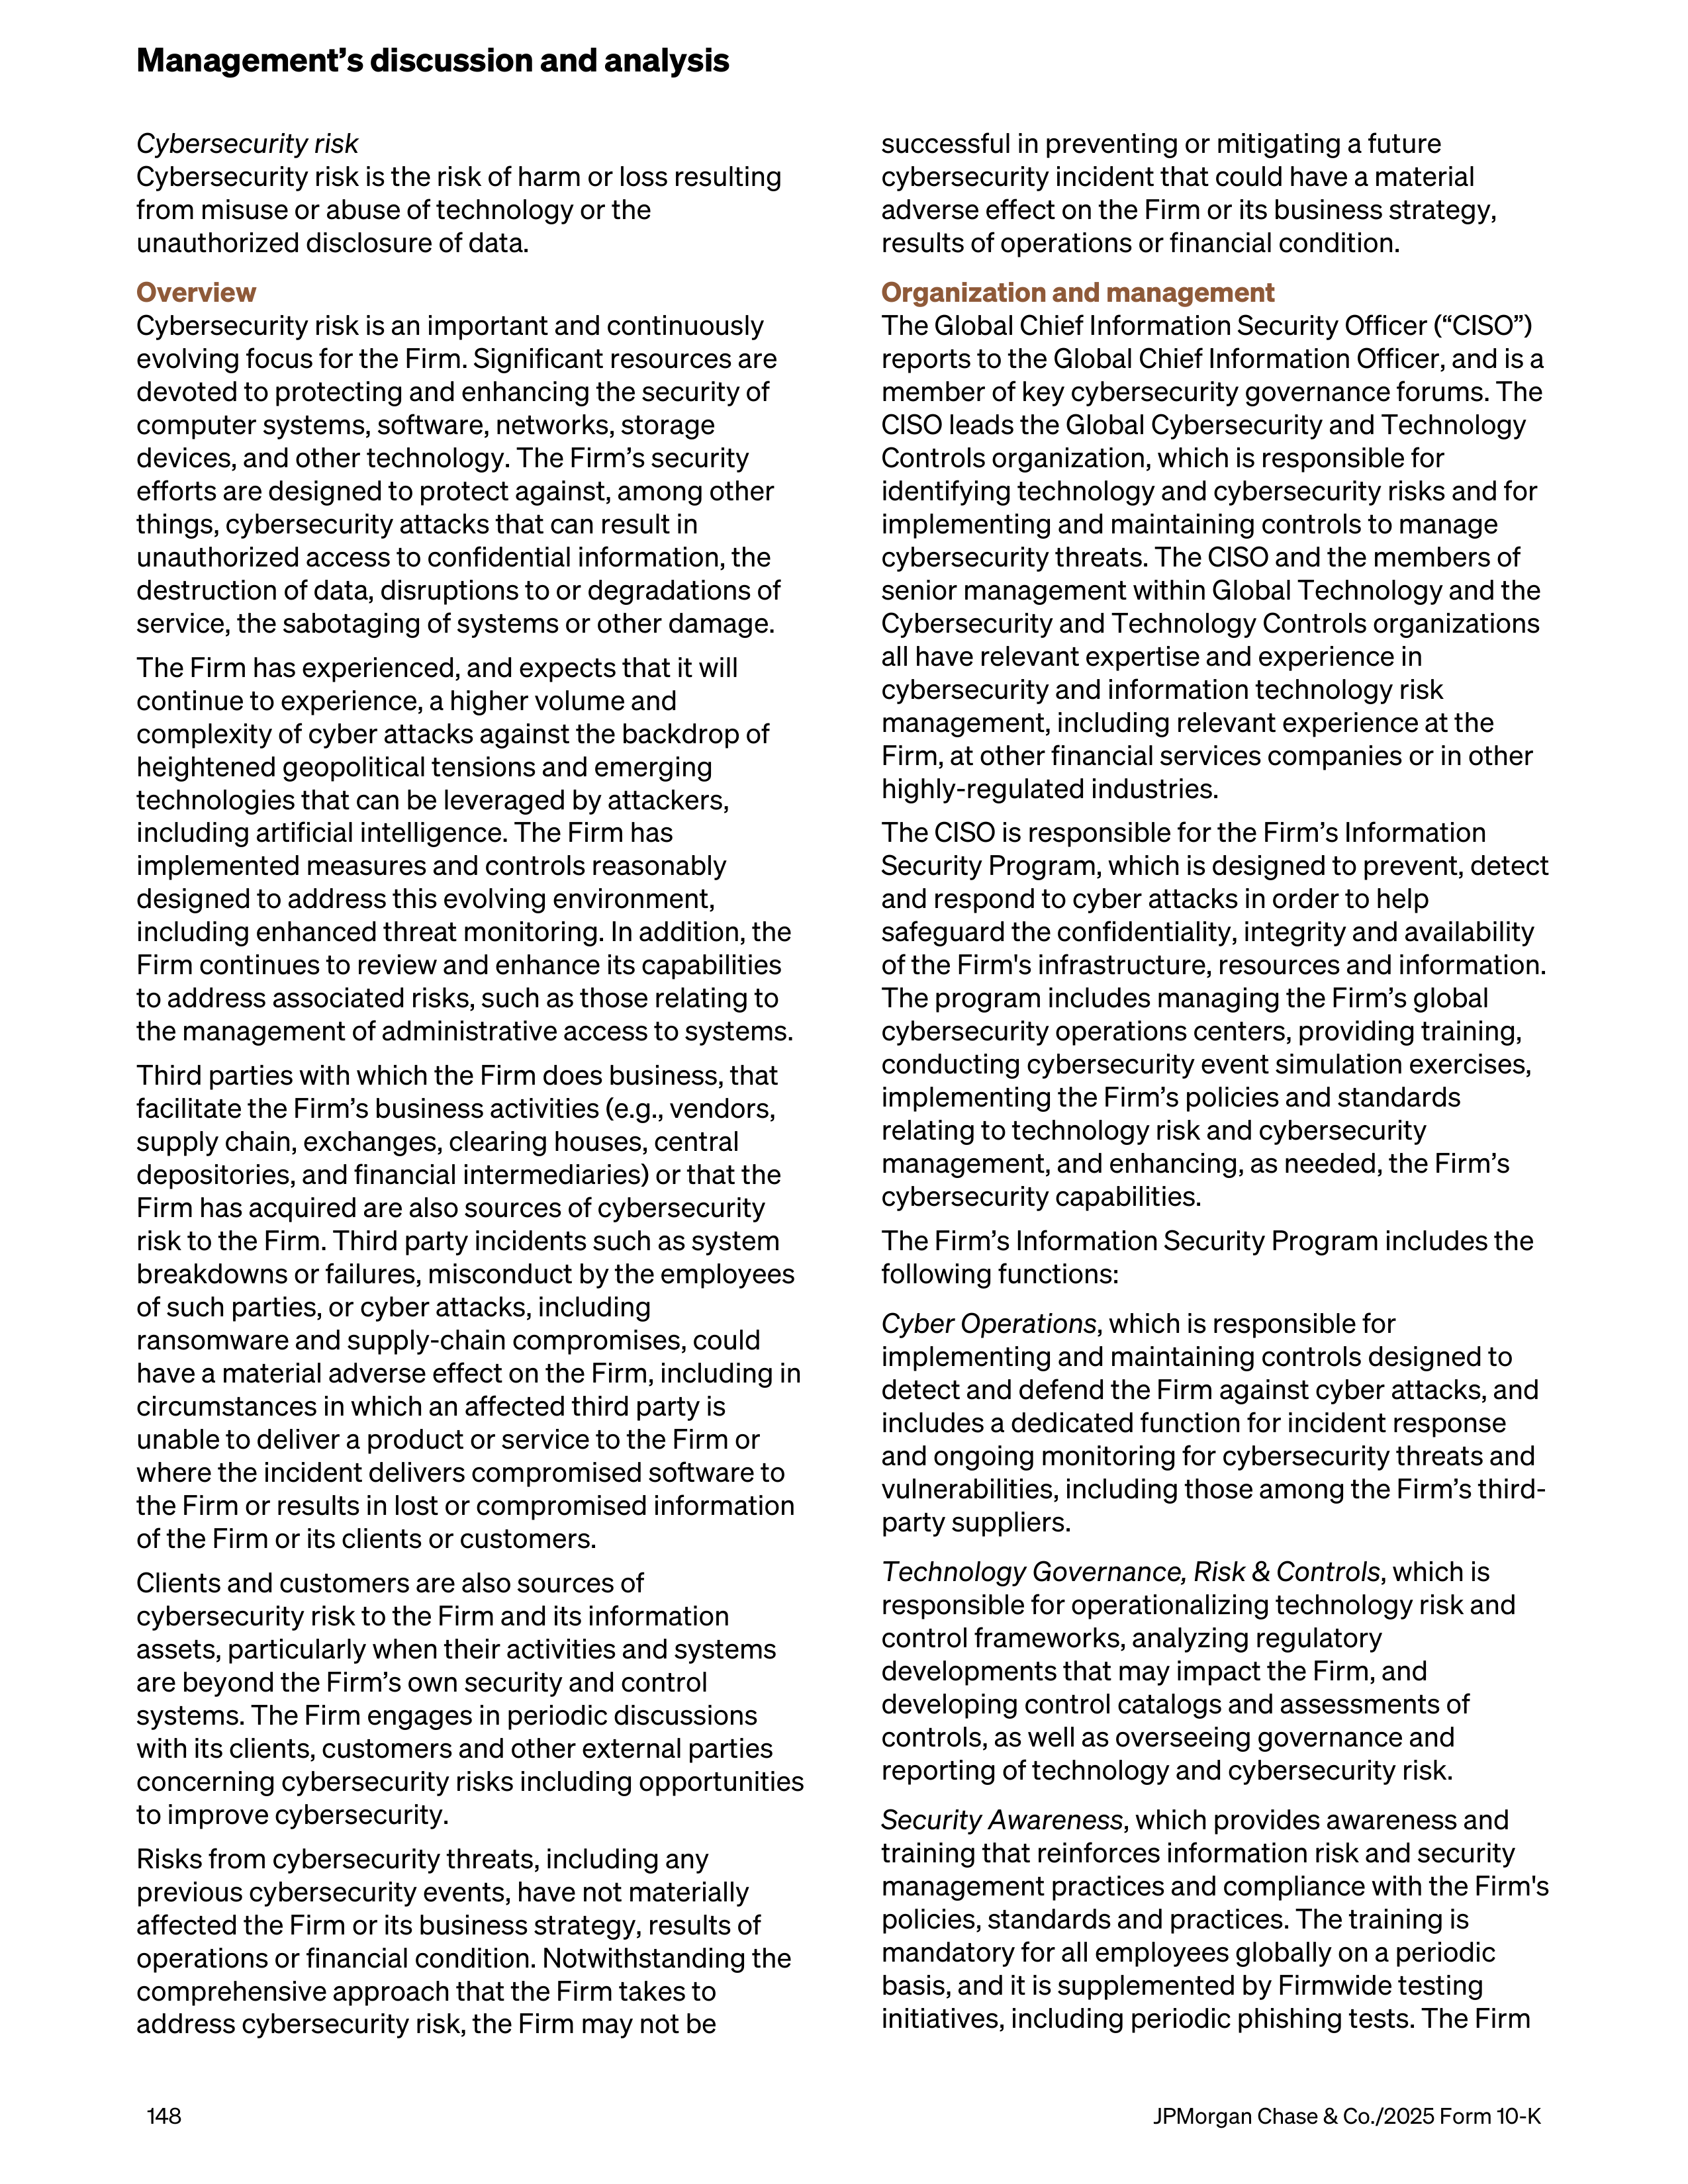
Cybersecurity risk
Cybersecurity risk is the risk of harm or loss resulting
from misuse or abuse of technology or the
unauthorized disclosure of data.
Overview
Cybersecurity risk is an important and continuously
evolving focus for the Firm. Significant resources are
devoted to protecting and enhancing the security of
computer systems, software, networks, storage
devices, and other technology. The Firm’s security
efforts are designed to protect against, among other
things, cybersecurity attacks that can result in
unauthorized access to confidential information, the
destruction of data, disruptions to or degradations of
service, the sabotaging of systems or other damage.
The Firm has experienced, and expects that it will
continue to experience, a higher volume and
complexity of cyber attacks against the backdrop of
heightened geopolitical tensions and emerging
technologies that can be leveraged by attackers,
including artificial intelligence. The Firm has
implemented measures and controls reasonably
designed to address this evolving environment,
including enhanced threat monitoring. In addition, the
Firm continues to review and enhance its capabilities
to address associated risks, such as those relating to
the management of administrative access to systems.
Third parties with which the Firm does business, that
facilitate the Firm’s business activities (e.g., vendors,
supply chain, exchanges, clearing houses, central
depositories, and financial intermediaries) or that the
Firm has acquired are also sources of cybersecurity
risk to the Firm. Third party incidents such as system
breakdowns or failures, misconduct by the employees
of such parties, or cyber attacks, including
ransomware and supply-chain compromises, could
have a material adverse effect on the Firm, including in
circumstances in which an affected third party is
unable to deliver a product or service to the Firm or
where the incident delivers compromised software to
the Firm or results in lost or compromised information
of the Firm or its clients or customers.
Clients and customers are also sources of
cybersecurity risk to the Firm and its information
assets, particularly when their activities and systems
are beyond the Firm’s own security and control
systems. The Firm engages in periodic discussions
with its clients, customers and other external parties
concerning cybersecurity risks including opportunities
to improve cybersecurity.
Risks from cybersecurity threats, including any
previous cybersecurity events, have not materially
affected the Firm or its business strategy, results of
operations or financial condition. Notwithstanding the
comprehensive approach that the Firm takes to
address cybersecurity risk, the Firm may not be
successful in preventing or mitigating a future
cybersecurity incident that could have a material
adverse effect on the Firm or its business strategy,
results of operations or financial condition.
Organization and management
The Global Chief Information Security Officer (“CISO”)
reports to the Global Chief Information Officer, and is a
member of key cybersecurity governance forums. The
CISO leads the Global Cybersecurity and Technology
Controls organization, which is responsible for
identifying technology and cybersecurity risks and for
implementing and maintaining controls to manage
cybersecurity threats. The CISO and the members of
senior management within Global Technology and the
Cybersecurity and Technology Controls organizations
all have relevant expertise and experience in
cybersecurity and information technology risk
management, including relevant experience at the
Firm, at other financial services companies or in other
highly-regulated industries.
The CISO is responsible for the Firm’s Information
Security Program, which is designed to prevent, detect
and respond to cyber attacks in order to help
safeguard the confidentiality, integrity and availability
of the Firm's infrastructure, resources and information.
The program includes managing the Firm’s global
cybersecurity operations centers, providing training,
conducting cybersecurity event simulation exercises,
implementing the Firm’s policies and standards
relating to technology risk and cybersecurity
management, and enhancing, as needed, the Firm’s
cybersecurity capabilities.
The Firm’s Information Security Program includes the
following functions:
Cyber Operations
, which is responsible for
implementing and maintaining controls designed to
detect and defend the Firm against cyber attacks, and
includes a dedicated function for incident response
and ongoing monitoring for cybersecurity threats and
vulnerabilities, including those among the Firm’s third-
party suppliers.
Technology Governance, Risk & Controls
, which is
responsible for operationalizing technology risk and
control frameworks, analyzing regulatory
developments that may impact the Firm, and
developing control catalogs and assessments of
controls, as well as overseeing governance and
reporting of technology and cybersecurity risk.
Security Awareness
, which provides awareness and
training that reinforces information risk and security
management practices and compliance with the Firm's
policies, standards and practices. The training is
mandatory for all employees globally on a periodic
basis, and it is supplemented by Firmwide testing
initiatives, including periodic phishing tests. The Firm
Management’s discussion and analysis
148
JPMorgan Chase & Co./2025 Form 10-K
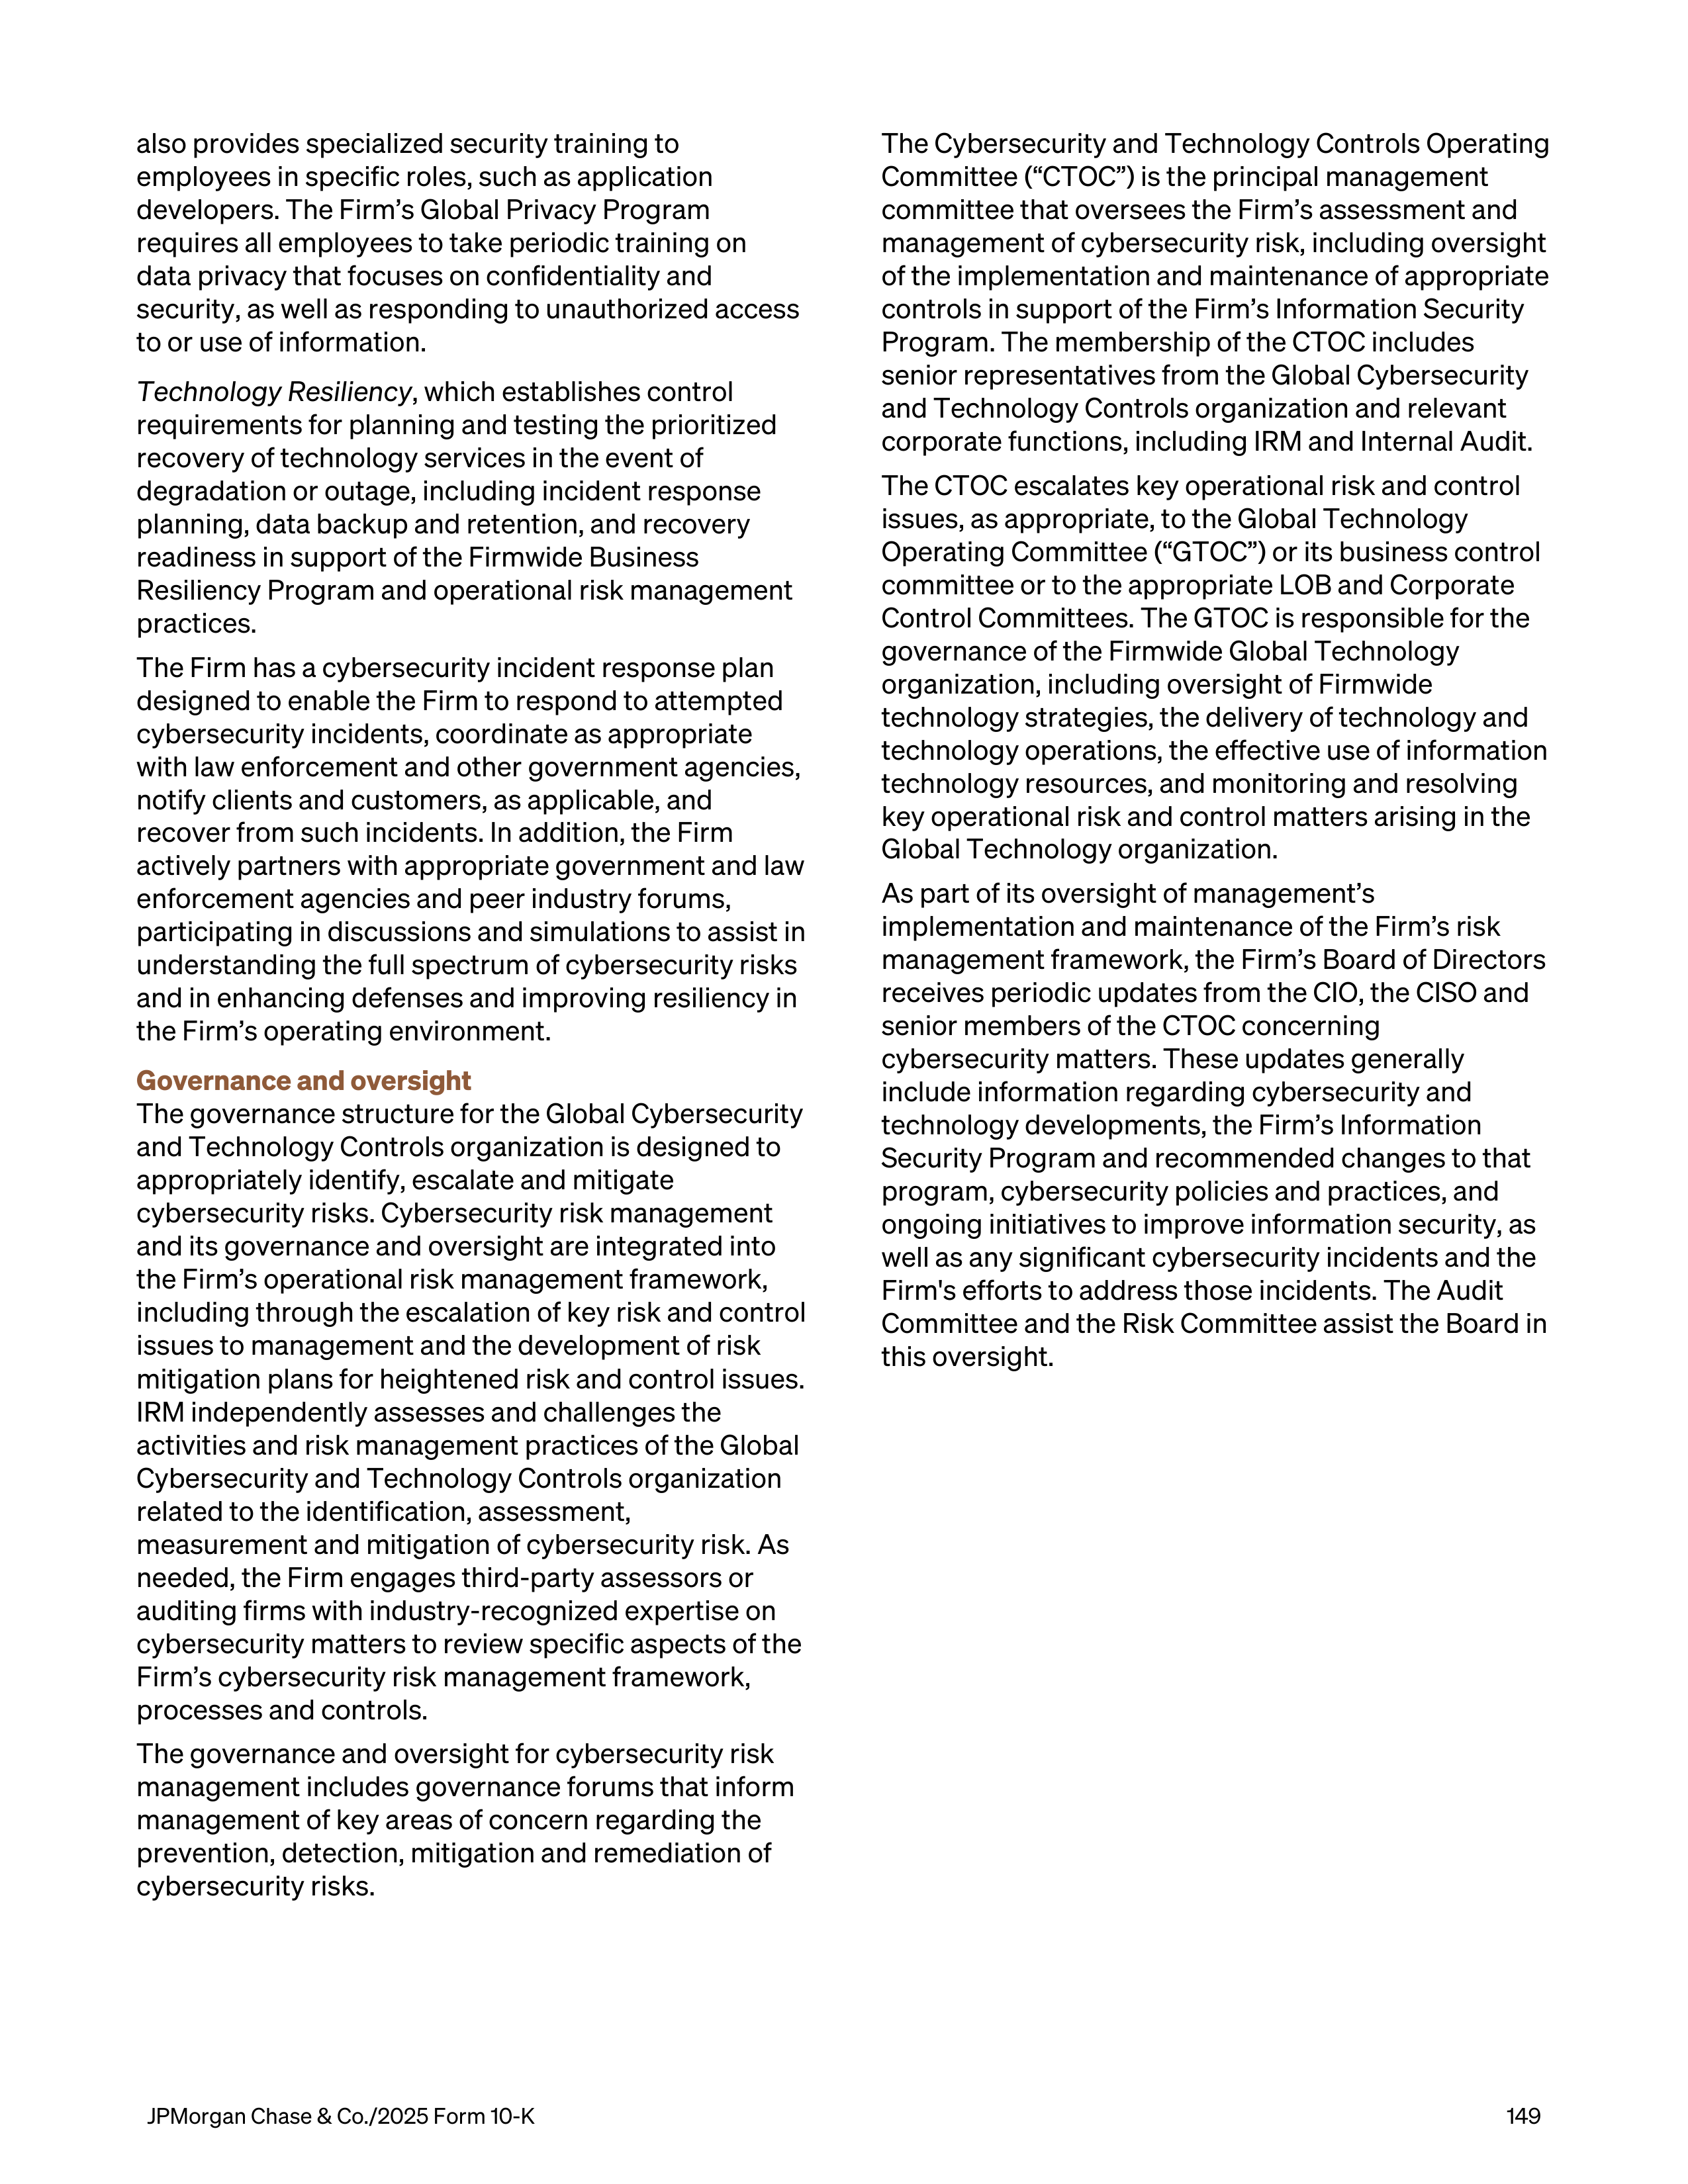
also provides specialized security training to
employees in specific roles, such as application
developers. The Firm’s Global Privacy Program
requires all employees to take periodic training on
data privacy that focuses on confidentiality and
security, as well as responding to unauthorized access
to or use of information.
Technology Resiliency
, which establishes control
requirements for planning and testing the prioritized
recovery of technology services in the event of
degradation or outage, including incident response
planning, data backup and retention, and recovery
readiness in support of the Firmwide Business
Resiliency Program and operational risk management
practices.
The Firm has a cybersecurity incident response plan
designed to enable the Firm to respond to attempted
cybersecurity incidents, coordinate as appropriate
with law enforcement and other government agencies,
notify clients and customers, as applicable, and
recover from such incidents. In addition, the Firm
actively partners with appropriate government and law
enforcement agencies and peer industry forums,
participating in discussions and simulations to assist in
understanding the full spectrum of cybersecurity risks
and in enhancing defenses and improving resiliency in
the Firm’s operating environment.
Governance and oversight
The governance structure for the Global Cybersecurity
and Technology Controls organization is designed to
appropriately identify, escalate and mitigate
cybersecurity risks. Cybersecurity risk management
and its governance and oversight are integrated into
the Firm’s operational risk management framework,
including through the escalation of key risk and control
issues to management and the development of risk
mitigation plans for heightened risk and control issues.
IRM independently assesses and challenges the
activities and risk management practices of the Global
Cybersecurity and Technology Controls organization
related to the identification, assessment,
measurement and mitigation of cybersecurity risk. As
needed, the Firm engages third-party assessors or
auditing firms with industry-recognized expertise on
cybersecurity matters to review specific aspects of the
Firm’s cybersecurity risk management framework,
processes and controls.
The governance and oversight for cybersecurity risk
management includes governance forums that inform
management of key areas of concern regarding the
prevention, detection, mitigation and remediation of
cybersecurity risks.
The Cybersecurity and Technology Controls Operating
Committee (“CTOC”) is the principal management
committee that oversees the Firm’s assessment and
management of cybersecurity risk, including oversight
of the implementation and maintenance of appropriate
controls in support of the Firm’s Information Security
Program. The membership of the CTOC includes
senior representatives from the Global Cybersecurity
and Technology Controls organization and relevant
corporate functions, including IRM and Internal Audit.
The CTOC escalates key operational risk and control
issues, as appropriate, to the Global Technology
Operating Committee (“GTOC”) or its business control
committee or to the appropriate LOB and Corporate
Control Committees. The GTOC is responsible for the
governance of the Firmwide Global Technology
organization, including oversight of Firmwide
technology strategies, the delivery of technology and
technology operations, the effective use of information
technology resources, and monitoring and resolving
key operational risk and control matters arising in the
Global Technology organization.
As part of its oversight of management’s
implementation and maintenance of the Firm’s risk
management framework, the Firm’s Board of Directors
receives periodic updates from the CIO, the CISO and
senior members of the CTOC concerning
cybersecurity matters. These updates generally
include information regarding cybersecurity and
technology developments, the Firm’s Information
Security Program and recommended changes to that
program, cybersecurity policies and practices, and
ongoing initiatives to improve information security, as
well as any significant cybersecurity incidents and the
Firm's efforts to address those incidents. The Audit
Committee and the Risk Committee assist the Board in
this oversight.
JPMorgan Chase & Co./2025 Form 10-K
149
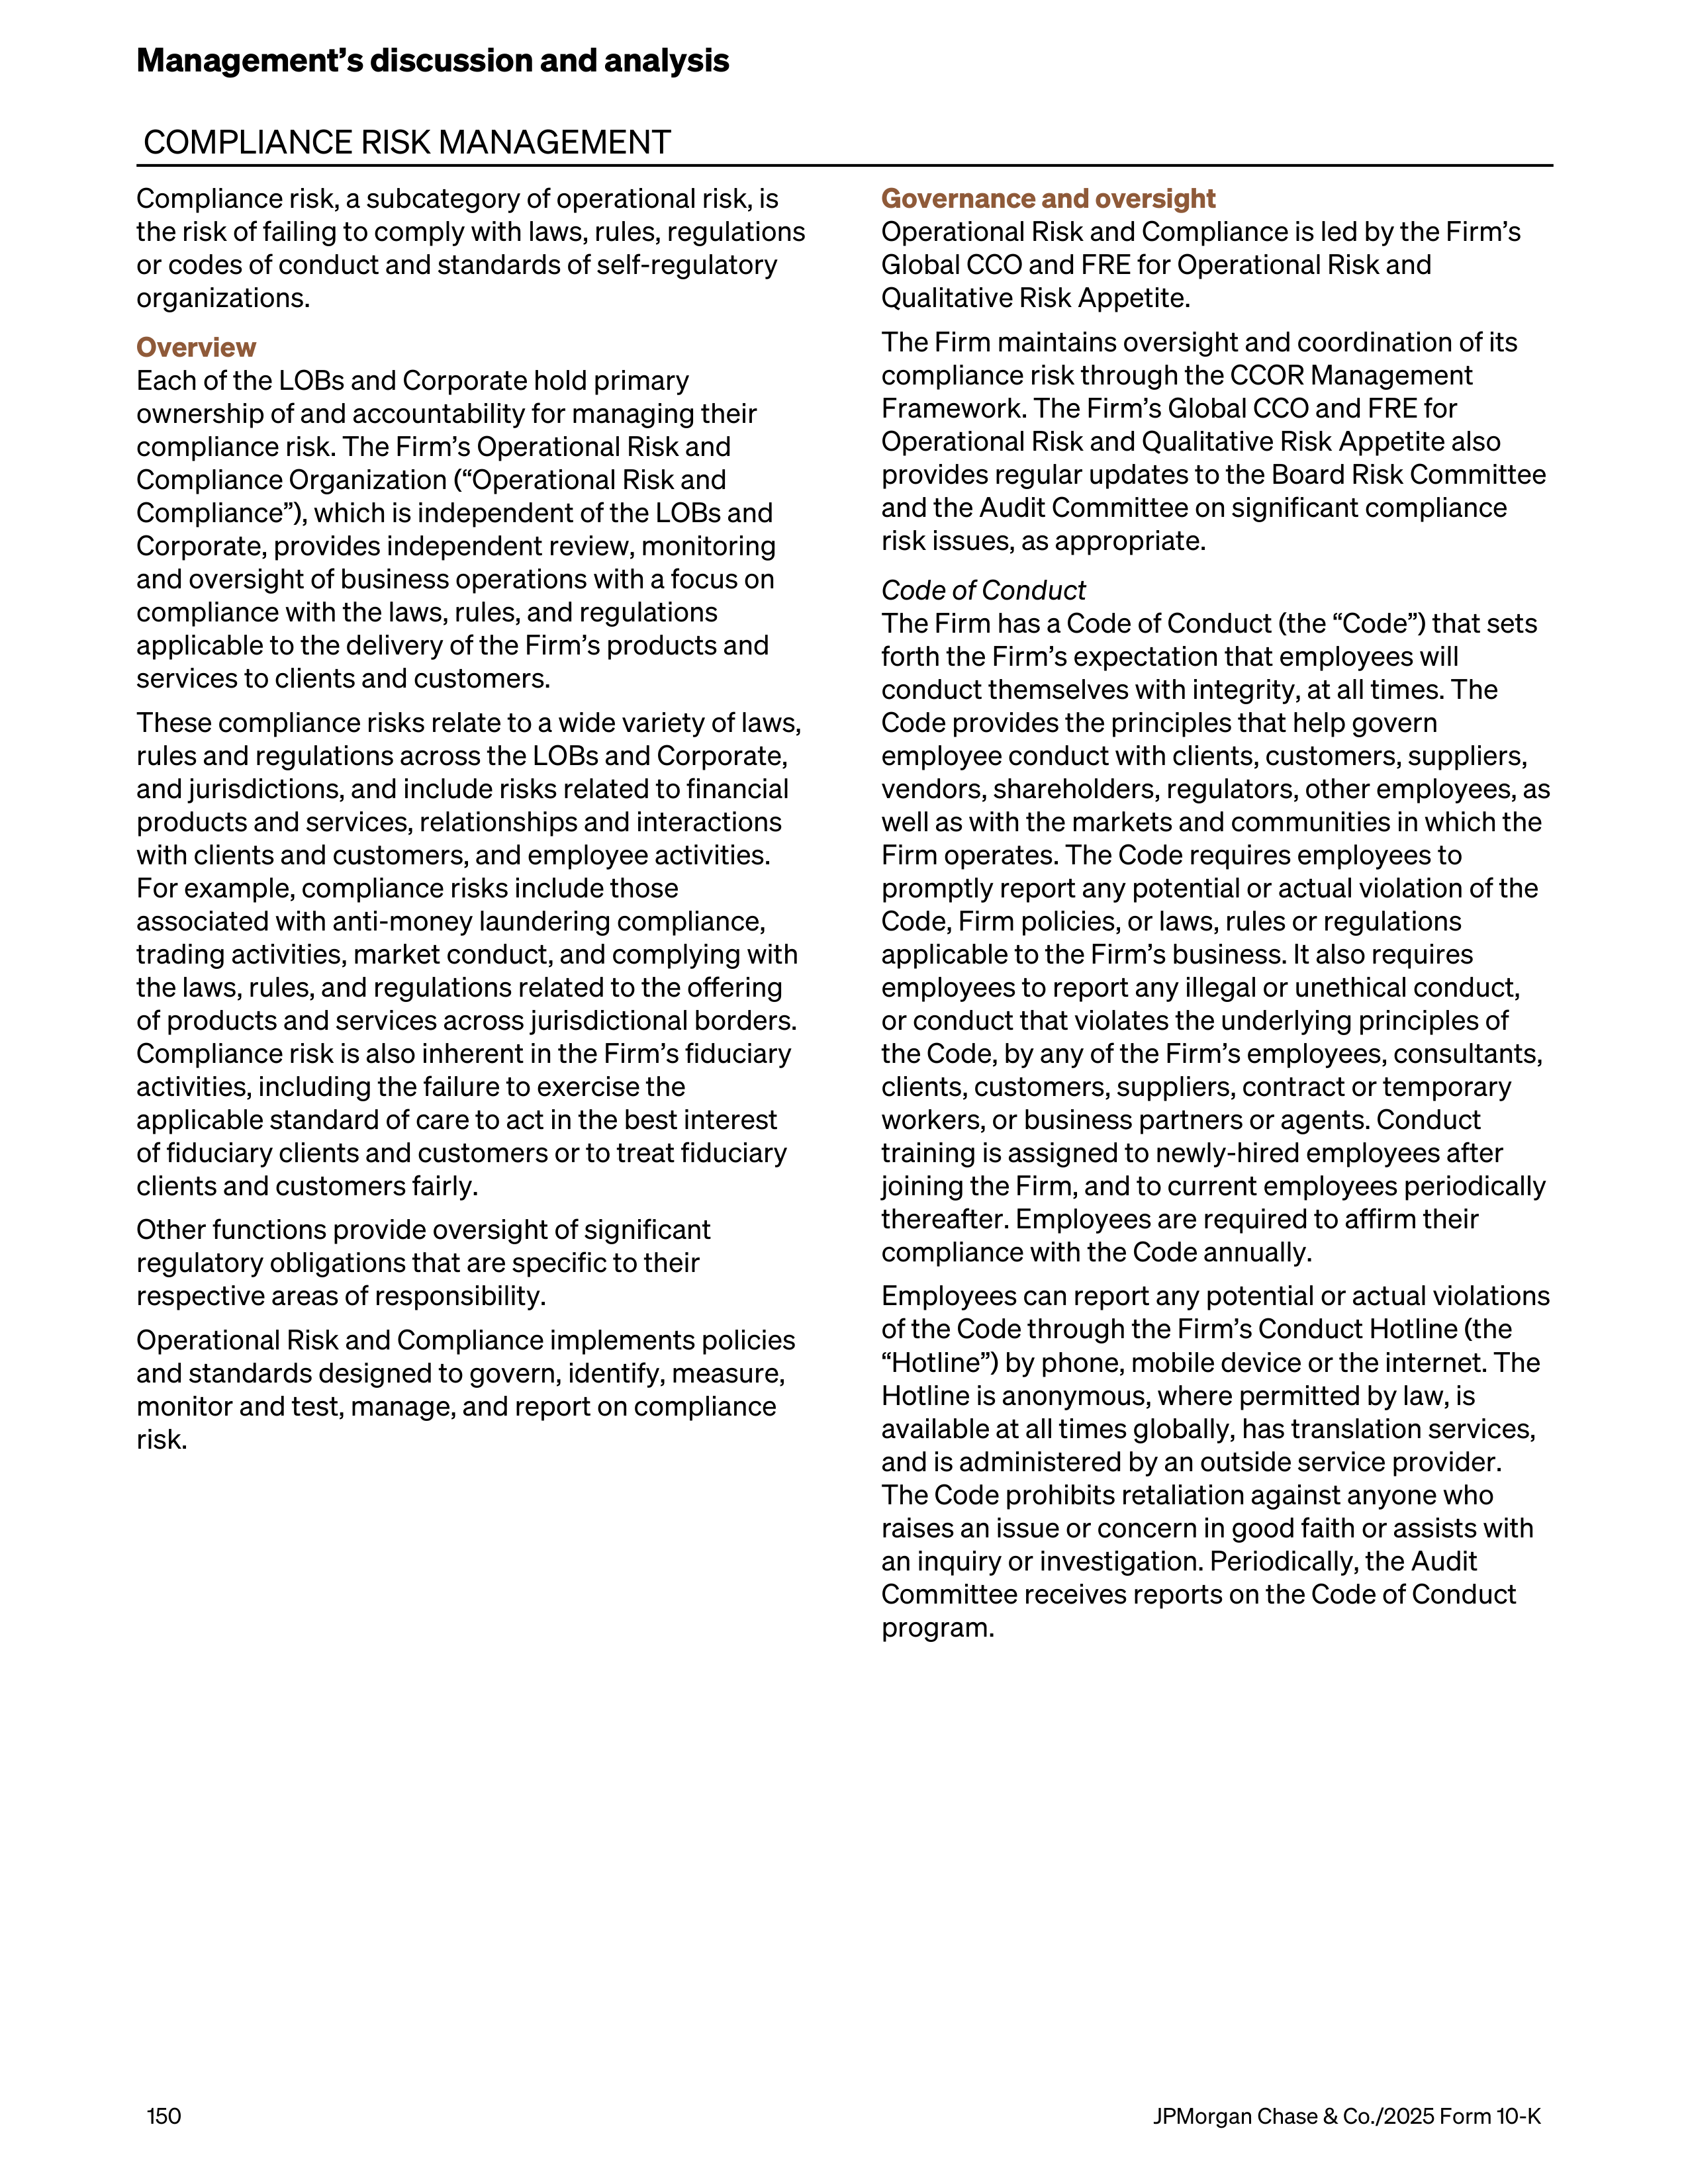
COMPLIANCE RISK MANAGEMENT
Compliance risk, a subcategory of operational risk, is
the risk of failing to comply with laws, rules, regulations
or codes of conduct and standards of self-regulatory
organizations.
Overview
Each of the LOBs and Corporate hold primary
ownership of and accountability for managing their
compliance risk. The Firm’s Operational Risk and
Compliance Organization (“Operational Risk and
Compliance”), which is independent of the LOBs and
Corporate, provides independent review, monitoring
and oversight of business operations with a focus on
compliance with the laws, rules, and regulations
applicable to the delivery of the Firm’s products and
services to clients and customers.
These compliance risks relate to a wide variety of laws,
rules and regulations across the LOBs and Corporate,
and jurisdictions, and include risks related to financial
products and services, relationships and interactions
with clients and customers, and employee activities.
For example, compliance risks include those
associated with anti-money laundering compliance,
trading activities, market conduct, and complying with
the laws, rules, and regulations related to the offering
of products and services across jurisdictional borders.
Compliance risk is also inherent in the Firm’s fiduciary
activities, including the failure to exercise the
applicable standard of care to act in the best interest
of fiduciary clients and customers or to treat fiduciary
clients and customers fairly.
Other functions provide oversight of significant
regulatory obligations that are specific to their
respective areas of responsibility.
Operational Risk and Compliance implements policies
and standards designed to govern, identify, measure,
monitor and test, manage, and report on compliance
risk.
Governance and oversight
Operational Risk and Compliance is led by the Firm’s
Global CCO and FRE for Operational Risk and
Qualitative Risk Appetite.
The Firm maintains oversight and coordination of its
compliance risk through the CCOR Management
Framework. The Firm’s Global CCO and FRE for
Operational Risk and Qualitative Risk Appetite also
provides regular updates to the Board Risk Committee
and the Audit Committee on significant compliance
risk issues, as appropriate.
Code of Conduct
The Firm has a Code of Conduct (the “Code”) that sets
forth the Firm’s expectation that employees will
conduct themselves with integrity, at all times. The
Code provides the principles that help govern
employee conduct with clients, customers, suppliers,
vendors, shareholders, regulators, other employees, as
well as with the markets and communities in which the
Firm operates. The Code requires employees to
promptly report any potential or actual violation of the
Code, Firm policies, or laws, rules or regulations
applicable to the Firm’s business. It also requires
employees to report any illegal or unethical conduct,
or conduct that violates the underlying principles of
the Code, by any of the Firm’s employees, consultants,
clients, customers, suppliers, contract or temporary
workers, or business partners or agents. Conduct
training is assigned to newly-hired employees after
joining the Firm, and to current employees periodically
thereafter. Employees are required to affirm their
compliance with the Code annually.
Employees can report any potential or actual violations
of the Code through the Firm’s Conduct Hotline (the
“Hotline”) by phone, mobile device or the internet. The
Hotline is anonymous, where permitted by law, is
available at all times globally, has translation services,
and is administered by an outside service provider.
The Code prohibits retaliation against anyone who
raises an issue or concern in good faith or assists with
an inquiry or investigation. Periodically, the Audit
Committee receives reports on the Code of Conduct
program.
Management’s discussion and analysis
150
JPMorgan Chase & Co./2025 Form 10-K
CONDUCT RISK MANAGEMENT
Conduct risk, a subcategory of operational risk, is the
risk that any action or misconduct by an employee
could lead to unfair client or customer outcomes,
impact the integrity of the markets in which the Firm
operates, harm employees or the Firm, or compromise
the Firm’s reputation.
Overview
Each LOB and Corporate is accountable for identifying
and managing its conduct risk to provide appropriate
engagement, ownership and sustainability of a culture
consistent with the Firm’s Business Principles. The
Business Principles serve as a guide for how
employees are expected to conduct themselves. With
the Business Principles serving as a guide, the Firm’s
Code sets out the Firm’s expectations for each
employee and provides information and resources to
help e
mployees conduct business ethically and in
compliance with applicable laws, rules and regulations
everywhere the Firm operates. Refer to Compliance
Risk Management on page 150 for further discussion
of the Code.
Governance and oversight
The Firm’s oversight and coordination of conduct risk
is managed in the same manner as Compliance risk.
Refer to Compliance Risk Management on
page 150
for further information.
Conduct risk management encompasses various
aspects of people management practices throughout
the employee life cycle, including recruiting,
onboarding, training and development, performance
management, promotion and compensation
processes. Each LOB, Treasury and CIO, and each
designated corporate function completes an
assessment of conduct risk periodically, reviews
metrics and issues which may involve conduct risk,
and provides conduct education as appropriate.
JPMorgan Chase & Co./2025 Form 10-K
151
LEGAL RISK MANAGEMENT
Legal risk, a subcategory of operational risk, is the risk
of loss primarily caused by the actual or alleged failure
to meet legal obligations that arise from the rule of law
in jurisdictions in which the Firm operates, agreements
with clients and customers, and products and services
offered by the Firm.
Overview
The global Legal function (“Legal”) provides legal
services and advice to the Firm. Legal is responsible
for managing the Firm’s exposure to legal risk by:
•
managing actual and potential litigation and
enforcement matters, including internal reviews and
investigations related to such matters
•
advising on products and services, including
contract negotiation and documentation
•
advising on offering and marketing documents and
new business initiatives
•
managing dispute resolution
•
interpreting existing laws, rules and regulations, and
advising on changes to them
•
advising on advocacy in connection with
contemplated and proposed laws, rules and
regulations, and
•
providing legal advice to the LOBs, Corporate and
the Board.
Legal selects, engages and manages outside counsel
for the Firm on all matters in which outside counsel is
engaged. In addition, Legal advises the Firm’s Conflicts
Office which reviews the Firm’s wholesale transactions
that may have the potential to create conflicts of
interest for the Firm.
Governance and oversight
The Firm’s General Counsel reports to the CEO and is a
member of the Operating Committee, the Firmwide
Risk Committee and the Firmwide Control Committee.
The Firm’s General Counsel and other members of
Legal report on significant legal matters to the Firm’s
Board of Directors and to the Audit Committee.
Legal serves on and advises various committees and
advises the Firm’s LOBs and Corporate on potential
reputation risk issues.
Management’s discussion and analysis
152
JPMorgan Chase & Co./2025 Form 10-K
ESTIMATIONS AND MODEL RISK MANAGEMENT
Estimations and Model risk, a subcategory of
operational risk, is the potential for adverse
consequences from decisions based on incorrect or
misused estimation outputs.
The Firm uses models and other analytical and
judgment-based estimations, including those based
upon machine learning or artificial intelligence
techniques,
across various businesses and functions.
The estimation methods are of varying levels of
sophistication and are used for many purposes, such
as the valuation of positions and measurement of risk,
assessing regulatory capital requirements, conducting
stress testing, evaluating the allowance for credit
losses and making business decisions. A dedicated
independent function, Model Risk Governance and
Review (“MRGR”), defines and governs the Firm’s
policies relating to the management of model risk and
risks associated with certain analytical and judgment-
based estimations, such as those used in risk
management, budget forecasting and capital planning
and analysis.
Model risks are owned by the users of the models
within the LOBs and Corporate based on the specific
purposes of such models. Users and developers of
models are responsible for developing, implementing
and testing their models, as well as referring models to
MRGR for review and approval. Once models have
been approved, model users and developers are
responsible for maintaining a robust operating
environment, and must monitor and evaluate the
performance of the models on an ongoing basis.
Model users and developers may seek to enhance
models in response to changes in the relevant
portfolios and in product and market developments, as
well as to capture improvements in available modeling
techniques and systems capabilities.
Models are tiered based on an internal standard
according to their complexity, the exposure associated
with the model and the Firm’s reliance on the model.
This tiering is subject to the approval of MRGR. In its
review of a model, MRGR considers whether the model
is suitable for the specific purposes for which it will be
used. When reviewing a model, MRGR analyzes and
challenges the model methodology and the
reasonableness of model assumptions, and may
perform or require additional testing, including back-
testing of model outcomes. Model reviews are
approved by the appropriate level of management
within MRGR based on the relevant model tier.
Under the Firm’s Estimations and Model Risk
Management Policy, MRGR reviews and approves new
models, as well as material changes to existing
models, prior to their use. In certain circumstances,
exceptions may be granted to the Firm’s policy to
allow a model to be used prior to review or approval.
MRGR may also require the user to take appropriate
actions to mitigate the model risk if it is to be used in
the interim. These actions will depend on the model
and may include, for example, limitation of trading
activity.
While models are inherently imprecise, the degree of
imprecision or uncertainty can be heightened by the
market or economic environment. This is particularly
true when the current and forecasted environments
are significantly different from the historical
environments upon which the models were developed.
This increased uncertainty may necessitate a greater
degree of judgment and analytics to inform any
adjustments that the Firm may make to model outputs
than would otherwise be the case. In addition, the Firm
may experience increased uncertainty in its estimates
if assets acquired differ from those used to develop
the models.
Refer to Critical Accounting Estimates Used by the
Firm on pages 154–157 and Note 2 for a summary of
model-based valuations and other valuation
techniques.
JPMorgan Chase & Co./2025 Form 10-K
153
CRITICAL ACCOUNTING ESTIMATES USED BY THE FIRM
JPMorganChase’s accounting policies and use of
estimates are integral to understanding its reported
results. The Firm’s most complex accounting
estimates require management’s judgment to
ascertain the appropriate carrying value of assets and
liabilities. The Firm has established policies and
control procedures intended to ensure that estimation
methods, including any judgments made as part of
such methods, are well-controlled, independently
reviewed and applied consistently from period to
period. The methods used and judgments made
reflect, among other factors, the nature of the assets or
liabilities and the related business and risk
management strategies, which may vary across the
Firm’s businesses and portfolios. In addition, the
policies and procedures are intended to ensure that
the process for changing methodologies occurs in an
appropriate manner. The Firm believes its estimates
for determining the carrying value of its assets and
liabilities are appropriate. The following is a brief
description of the Firm’s critical accounting estimates
involving significant judgments.
Allowance for credit losses
The Firm’s allowance for credit losses represents
management’s estimate of expected credit losses over
the remaining expected life of the Firm’s financial
assets measured at amortized cost and certain off-
balance sheet lending-related commitments. The
allowance for credit losses generally comprises:
•
The allowance for loan losses, which covers the
Firm’s retained loan portfolios (scored and risk-
rated),
•
The allowance for lending-related commitments,
and
•
The allowance for credit losses on investment
securities.
The allowance for credit losses involves significant
judgment on a number of matters including
development and weighting of macroeconomic
forecasts, incorporation of historical loss experience,
assessment of risk characteristics, assignment of risk
ratings, valuation of collateral, and the determination
of remaining expected life. Refer to Notes 10 and 13 for
further information on these judgments as well as the
Firm’s policies and methodologies used to determine
the Firm’s allowance for credit losses.
One of the most significant judgments involved in
estimating the Firm’s allowance for credit losses
relates to the macroeconomic forecasts used to
estimate credit losses over the eight-quarter forecast
period within the Firm’s methodology. The eight-
quarter forecast incorporates hundreds of
macroeconomic variables (“MEVs”) that are relevant
for exposures across the Firm, with modeled credit
losses being driven primarily by a subset of less than
twenty variables. The specific variables that have the
greatest effect on the modeled losses vary by portfolio
and geography.
•
Key MEVs for the consumer portfolio include
regional U.S. unemployment rates and U.S. HPI.
•
Key MEVs for the wholesale portfolio include U.S.
unemployment, U.S. real GDP growth rate, U.S.
equity prices, U.S. interest rates, U.S. corporate
credit spreads, oil prices, U.S. commercial real estate
prices and U.S. HPI.
Changes in the Firm’s assumptions and forecasts of
economic conditions could significantly affect its
estimate of expected credit losses in the portfolio at
the balance sheet date or lead to significant changes in
the estimate from one reporting period to the next.
It is difficult to estimate how potential changes in any
one factor or input might affect the overall allowance
for credit losses because management considers a
wide variety of factors and inputs in estimating the
allowance for credit losses. Changes in the factors and
inputs considered may not occur at the same rate and
may not be consistent across all geographies or
product types, and changes in factors and inputs may
be directionally inconsistent, such that improvement in
one factor or input may offset deterioration in others.
To consider the impact of a hypothetical alternate
macroeconomic forecast, the Firm compared the
modeled credit losses determined using its central
and relative adverse macroeconomic scenarios, which
are two of the five scenarios considered in estimating
the allowances for loan losses and lending-related
commitments. The central and relative adverse
scenarios each included a full suite of MEVs, but
differed in the levels, paths and peaks/troughs of
those variables over the eight-quarter forecast period.
For example, compared to the Firm’s central scenario
shown on page 129 and in Note 13, the Firm’s relative
adverse scenario assumes an elevated U.S.
unemployment rate, averaging approximately 2.0%
higher over the eight-quarter forecast, with a peak
difference of approximately 2.8% in the fourth quarter
of 2026.
This analysis is not intended to estimate expected
future changes in the allowance for credit losses, for a
number of reasons, including:
•
The allowance as of December 31, 2025, reflects
credit losses beyond those estimated under the
central scenario due to the weight placed on the
adverse scenarios.
•
The impacts of changes in many MEVs are both
interrelated and nonlinear, so the results of this
Management’s discussion and analysis
154
JPMorgan Chase & Co./2025 Form 10-K
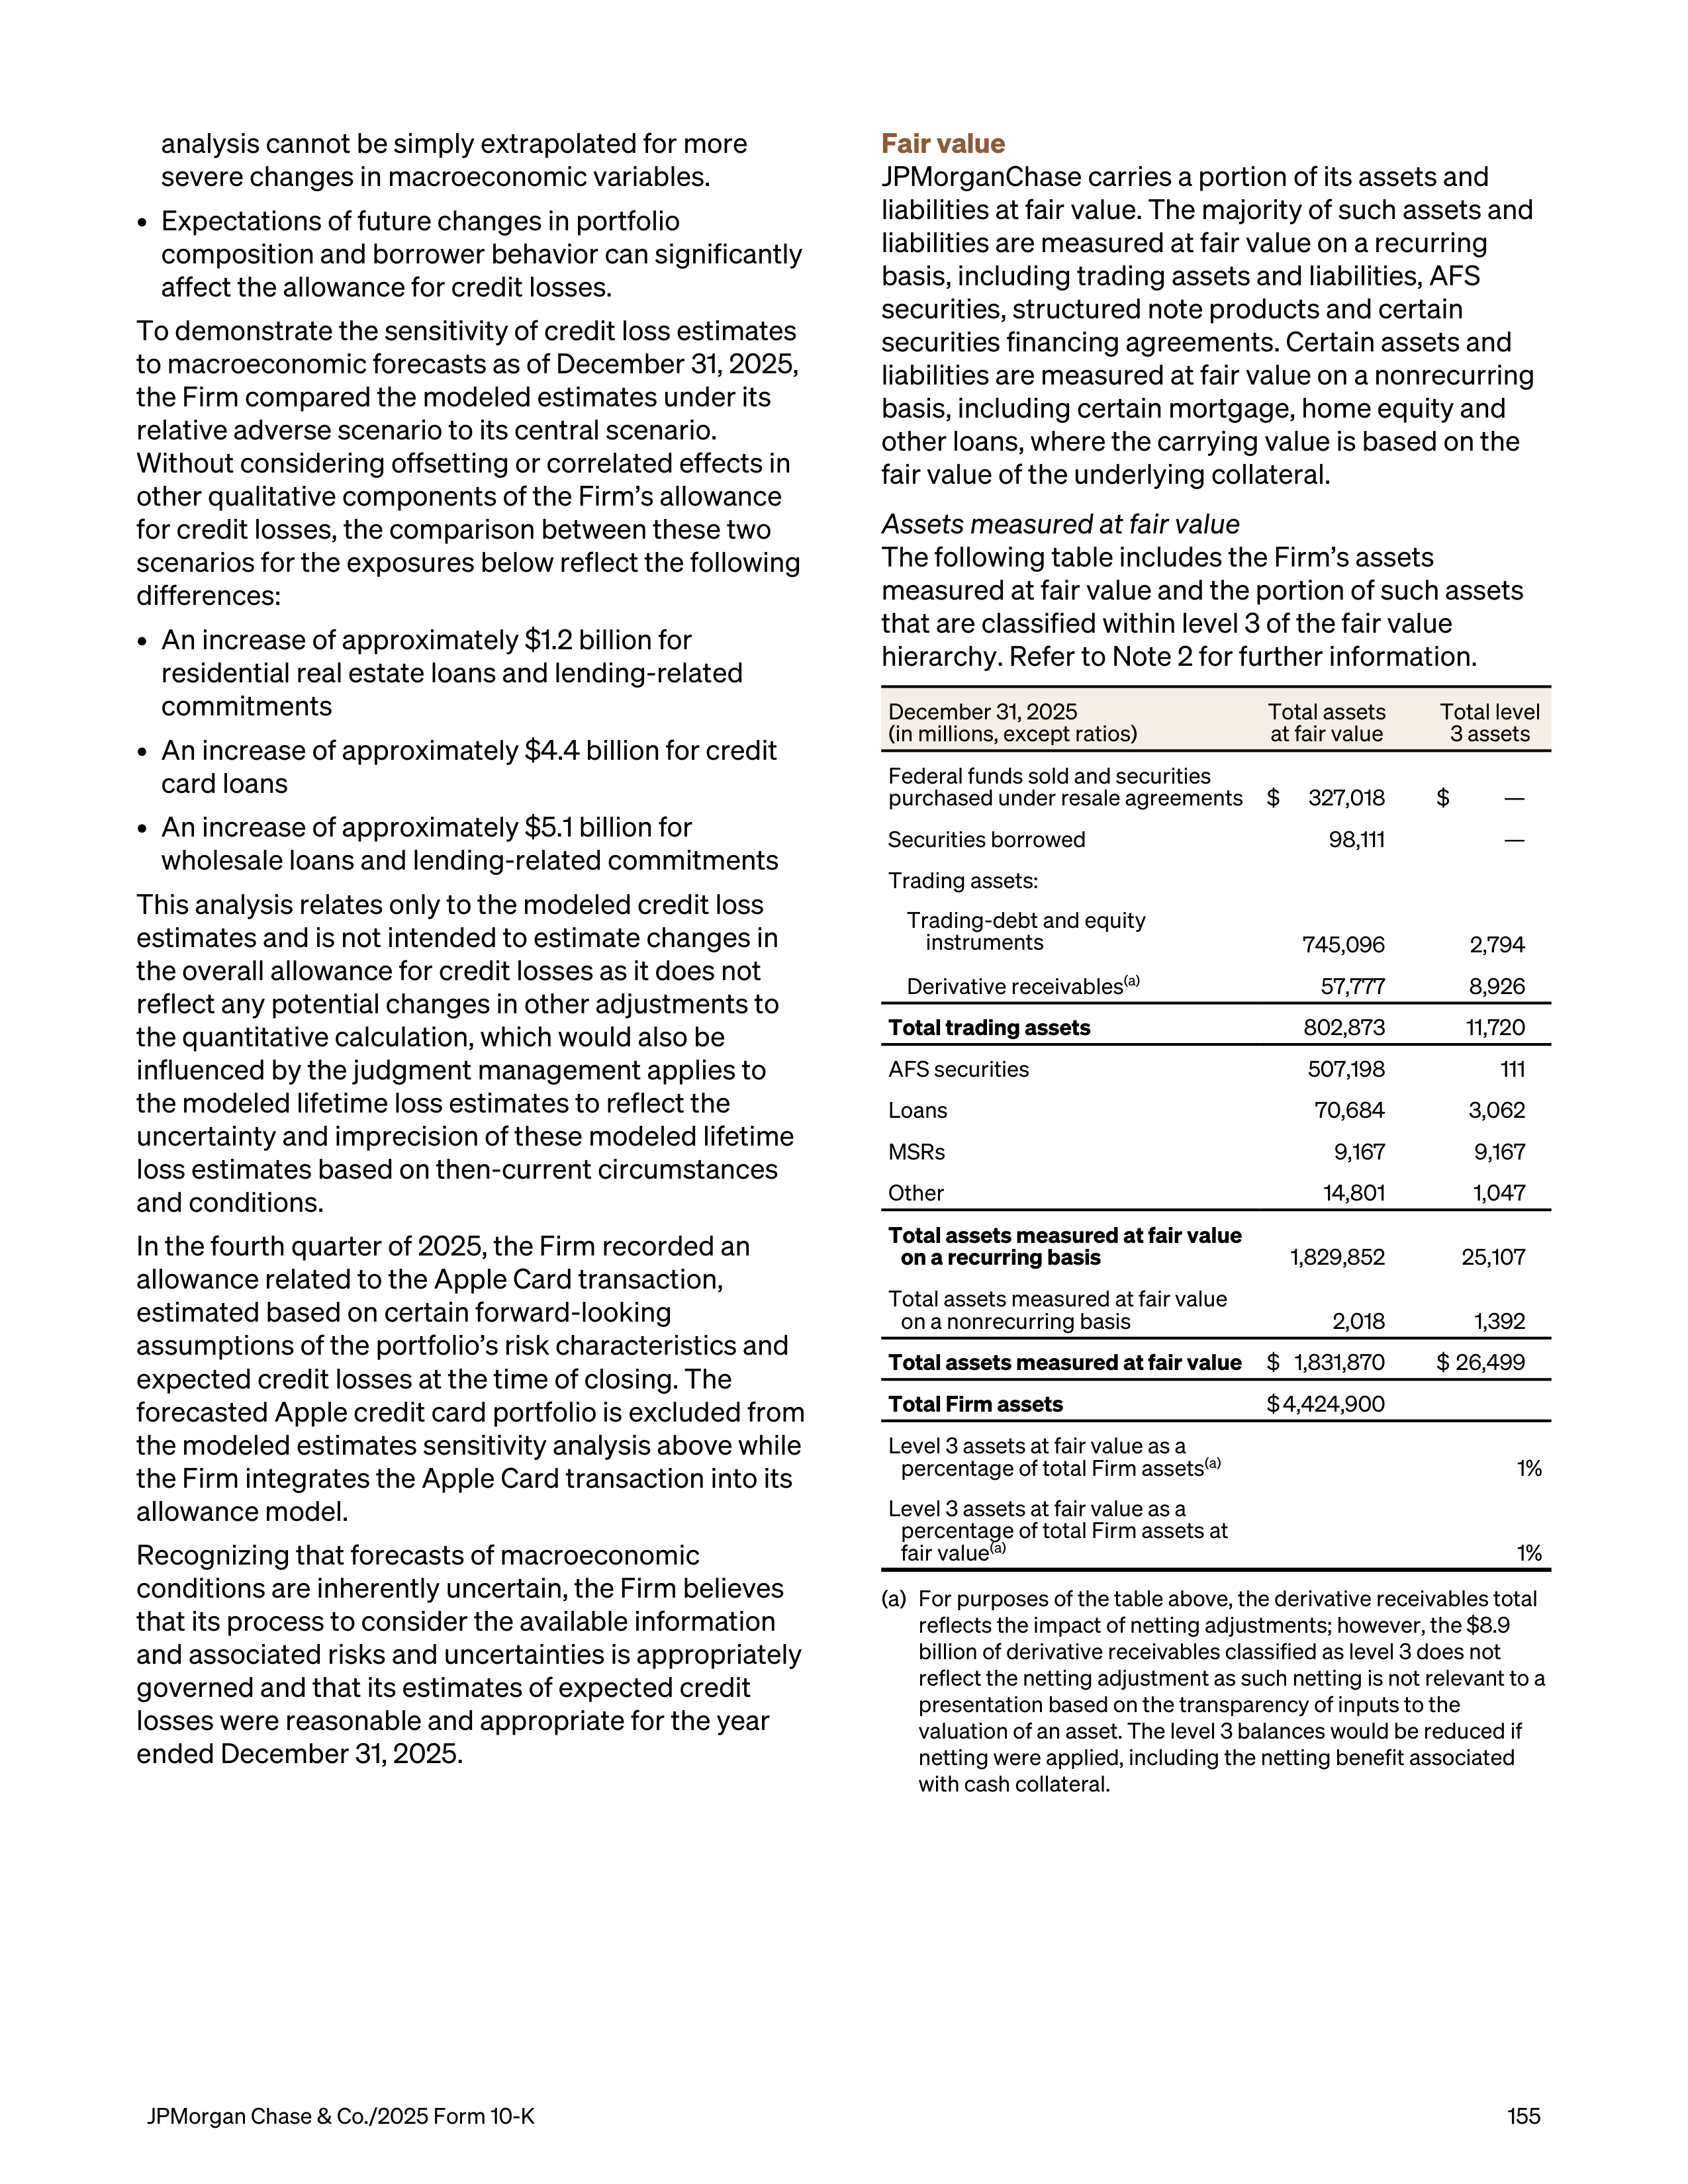
analysis cannot be simply extrapolated for more
severe changes in macroeconomic variables.
•
Expectations of future changes in portfolio
composition and borrower behavior can significantly
affect the allowance for credit losses.
To demonstrate the sensitivity of credit loss estimates
to macroeconomic forecasts as of December 31, 2025,
the Firm compared the modeled estimates under its
relative adverse scenario to its central scenario.
Without considering offsetting or correlated effects in
other qualitative components of the Firm’s allowance
for credit losses, the comparison between these two
scenarios for the exposures below reflect the following
differences:
•
An increase of approximately $1.2 billion for
residential real estate loans and lending-related
commitments
•
An increase of approximately $4.4 billion for credit
card loans
•
An increase of approximately $5.1 billion for
wholesale loans and lending-related commitments
This analysis relates only to the modeled credit loss
estimates and is not intended to estimate changes in
the overall allowance for credit losses as it does not
reflect any potential changes in other adjustments to
the quantitative calculation, which would also be
influenced by the judgment management applies to
the modeled lifetime loss estimates to reflect the
uncertainty and imprecision of these modeled lifetime
loss estimates based on then-current circumstances
and conditions.
In the fourth quarter of 2025, the Firm recorded an
allowance related to the Apple Card transaction,
estimated based on certain forward-looking
assumptions of the portfolio’s risk characteristics and
expected credit losses at the time of closing. The
forecasted Apple credit card portfolio is excluded from
the modeled estimates sensitivity analysis above while
the Firm integrates the Apple Card transaction into its
allowance model.
Recognizing that forecasts of macroeconomic
conditions are inherently uncertain, the Firm believes
that its process to consider the available information
and associated risks and uncertainties is appropriately
governed and that its estimates of expected credit
losses were reasonable and appropriate for the year
ended December 31, 2025.
Fair value
JPMorganChase carries a portion of its assets and
liabilities at fair value. The majority of such assets and
liabilities are measured at fair value on a recurring
basis, including trading assets and liabilities, AFS
securities, structured note products and certain
securities financing agreements. Certain assets and
liabilities are measured at fair value on a nonrecurring
basis, including certain mortgage, home equity and
other loans, where the carrying value is based on the
fair value of the underlying collateral.
Assets measured at fair value
The following table includes the Firm’s assets
measured at fair value and the portion of such assets
that are classified within level 3 of the fair value
hierarchy. Refer to Note 2 for further information.
December 31, 2025
(in millions, except ratios)
Total assets
at fair value
Total level
3 assets
Federal funds sold and securities
purchased under resale agreements
$
327,018
$
—
Securities borrowed
98,111
—
Trading assets:
Trading-debt and equity
instruments
745,096
2,794
Derivative receivables
(a)
57,777
8,926
Total trading assets
802,873
11,720
AFS securities
507,198
111
Loans
70,684
3,062
MSRs
9,167
9,167
Other
14,801
1,047
Total assets measured
at fair value
on a recurring basis
1,829,852
25,107
Total assets measured at fair value
on a nonrecurring basis
2,018
1,392
Total assets measured
at fair value
$ 1,831,870
$ 26,499
Total Firm assets
$ 4,424,900
Level 3 assets at fair value as a
percentage of total Firm assets
(a)
1%
Level 3 assets at fair value as a
percentage of total Firm assets at
fair value
(a)
1%
(a)
For purposes of the table above, the derivative receivables total
reflects the impact of netting adjustments; however, the $8.9
billion of derivative receivables classified as level 3 does not
reflect the netting adjustment as such netting is not relevant to a
presentation based on the transparency of inputs to the
valuation of an asset. The level 3 balances would be reduced if
netting were applied, including the netting benefit associated
with cash collateral.
JPMorgan Chase & Co./2025 Form 10-K
155
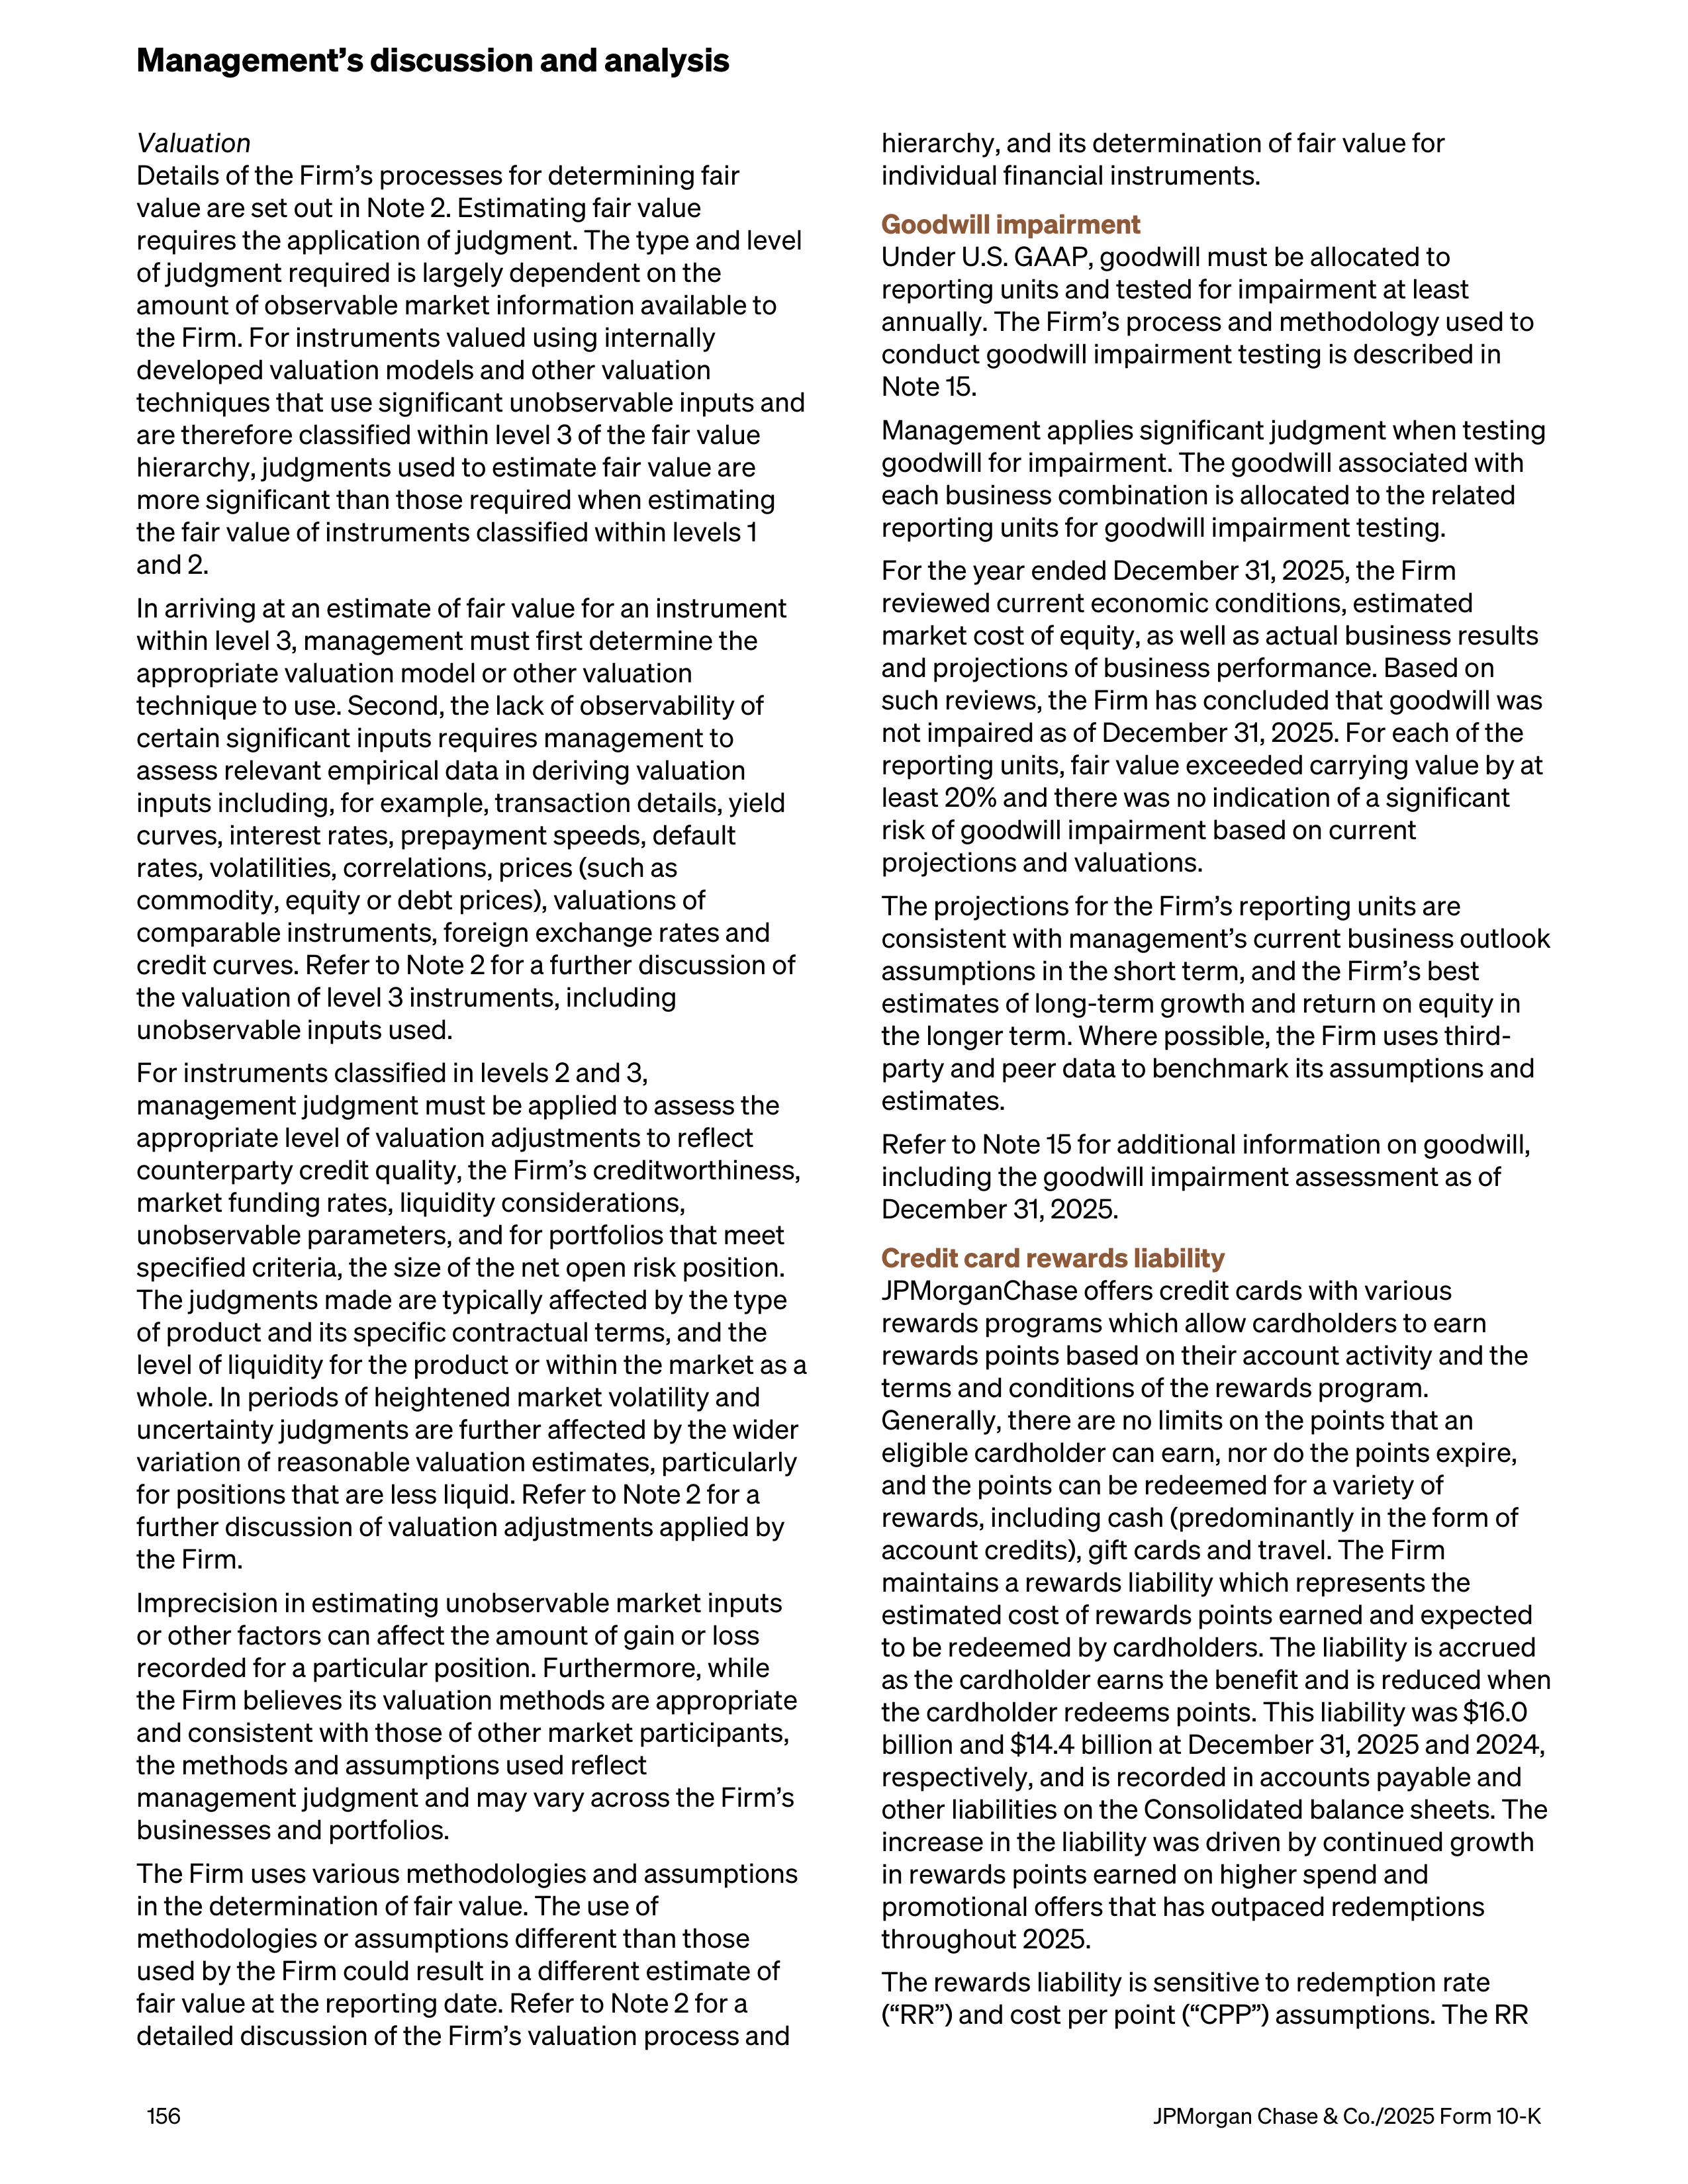
Valuation
Details of the Firm’s processes for determining fair
value are set out in Note 2. Estimating fair value
requires the application of judgment. The type and level
of judgment required is largely dependent on the
amount of observable market information available to
the Firm. For instruments valued using internally
developed valuation models and other valuation
techniques that use significant unobservable inputs and
are therefore classified within level 3 of the fair value
hierarchy, judgments used to estimate fair value are
more significant than those required when estimating
the fair value of instruments classified within levels 1
and 2.
In arriving at an estimate of fair value for an instrument
within level 3, management must first determine the
appropriate valuation model or other valuation
technique to use. Second, the lack of observability of
certain significant inputs requires management to
assess relevant empirical data in deriving valuation
inputs including, for example, transaction details, yield
curves, interest rates, prepayment speeds, default
rates, volatilities, correlations, prices (such as
commodity, equity or debt prices), valuations of
comparable instruments, foreign exchange rates and
credit curves. Refer to Note 2 for a further discussion of
the valuation of level 3 instruments, including
unobservable inputs used.
For instruments classified in levels 2 and 3,
management judgment must be applied to assess the
appropriate level of valuation adjustments to reflect
counterparty credit quality, the Firm’s creditworthiness,
market funding rates, liquidity considerations,
unobservable parameters, and for portfolios that meet
specified criteria, the size of the net open risk position.
The judgments made are typically affected by the type
of product and its specific contractual terms, and the
level of liquidity for the product or within the market as a
whole. In periods of heightened market volatility and
uncertainty judgments are further affected by the wider
variation of reasonable valuation estimates, particularly
for positions that are less liquid. Refer to Note 2 for a
further discussion of valuation adjustments applied by
the Firm.
Imprecision in estimating unobservable market inputs
or other factors can affect the amount of gain or loss
recorded for a particular position. Furthermore, while
the Firm believes its valuation methods are appropriate
and consistent with those of other market participants,
the methods and assumptions used reflect
management judgment and may vary across the Firm’s
businesses and portfolios.
The Firm uses various methodologies and assumptions
in the determination of fair value. The use of
methodologies or assumptions different than those
used by the Firm could result in a different estimate of
fair value at the reporting date. Refer to Note 2 for a
detailed discussion of the Firm’s valuation process and
hierarchy, and its determination of fair value for
individual financial instruments.
Goodwill impairment
Under U.S. GAAP, goodwill must be allocated to
reporting units and tested for impairment at least
annually. The Firm’s process and methodology used to
conduct goodwill impairment testing is described in
Note 15.
Management applies significant judgment when testing
goodwill for impairment. The goodwill associated with
each business combination is allocated to the related
reporting units for goodwill impairment testing.
For the year ended December 31, 2025, the Firm
reviewed current economic conditions, estimated
market cost of equity, as well as actual business results
and projections of business performance. Based on
such reviews, the Firm has concluded that goodwill was
not impaired as of December 31, 2025. For each of the
reporting units, fair value exceeded carrying value by at
least 20% and there was no indication of a significant
risk of goodwill impairment based on current
projections and valuations.
The projections for the Firm’s reporting units are
consistent with management’s current business outlook
assumptions in the short term, and the Firm’s best
estimates of long-term growth and return on equity in
the longer term. Where possible, the Firm uses third-
party and peer data to benchmark its assumptions and
estimates.
Refer to Note 15 for additional information on goodwill,
including the goodwill impairment assessment as of
December 31, 2025.
Credit card rewards liability
JPMorganChase offers credit cards with various
rewards programs which allow cardholders to earn
rewards points based on their account activity and the
terms and conditions of the rewards program.
Generally, there are no limits on the points that an
eligible cardholder can earn, nor do the points expire,
and the points can be redeemed for a variety of
rewards, including cash (predominantly in the form of
account credits), gift cards and travel. The Firm
maintains a rewards liability which represents the
estimated cost of rewards points earned and expected
to be redeemed by cardholders. The liability is accrued
as the cardholder earns the benefit and is reduced when
the cardholder redeems points. This liability was $16.0
billion and $14.4 billion at December 31, 2025 and 2024,
respectively, and is recorded in accounts payable and
other liabilities on the Consolidated balance sheets. The
increase in the liability was driven by continued growth
in rewards points earned on higher spend and
promotional offers that has outpaced redemptions
throughout 2025.
The rewards liability is sensitive to redemption rate
(“RR”) and cost per point (“CPP”) assumptions. The RR
Management’s discussion and analysis
156
JPMorgan Chase & Co./2025 Form 10-K
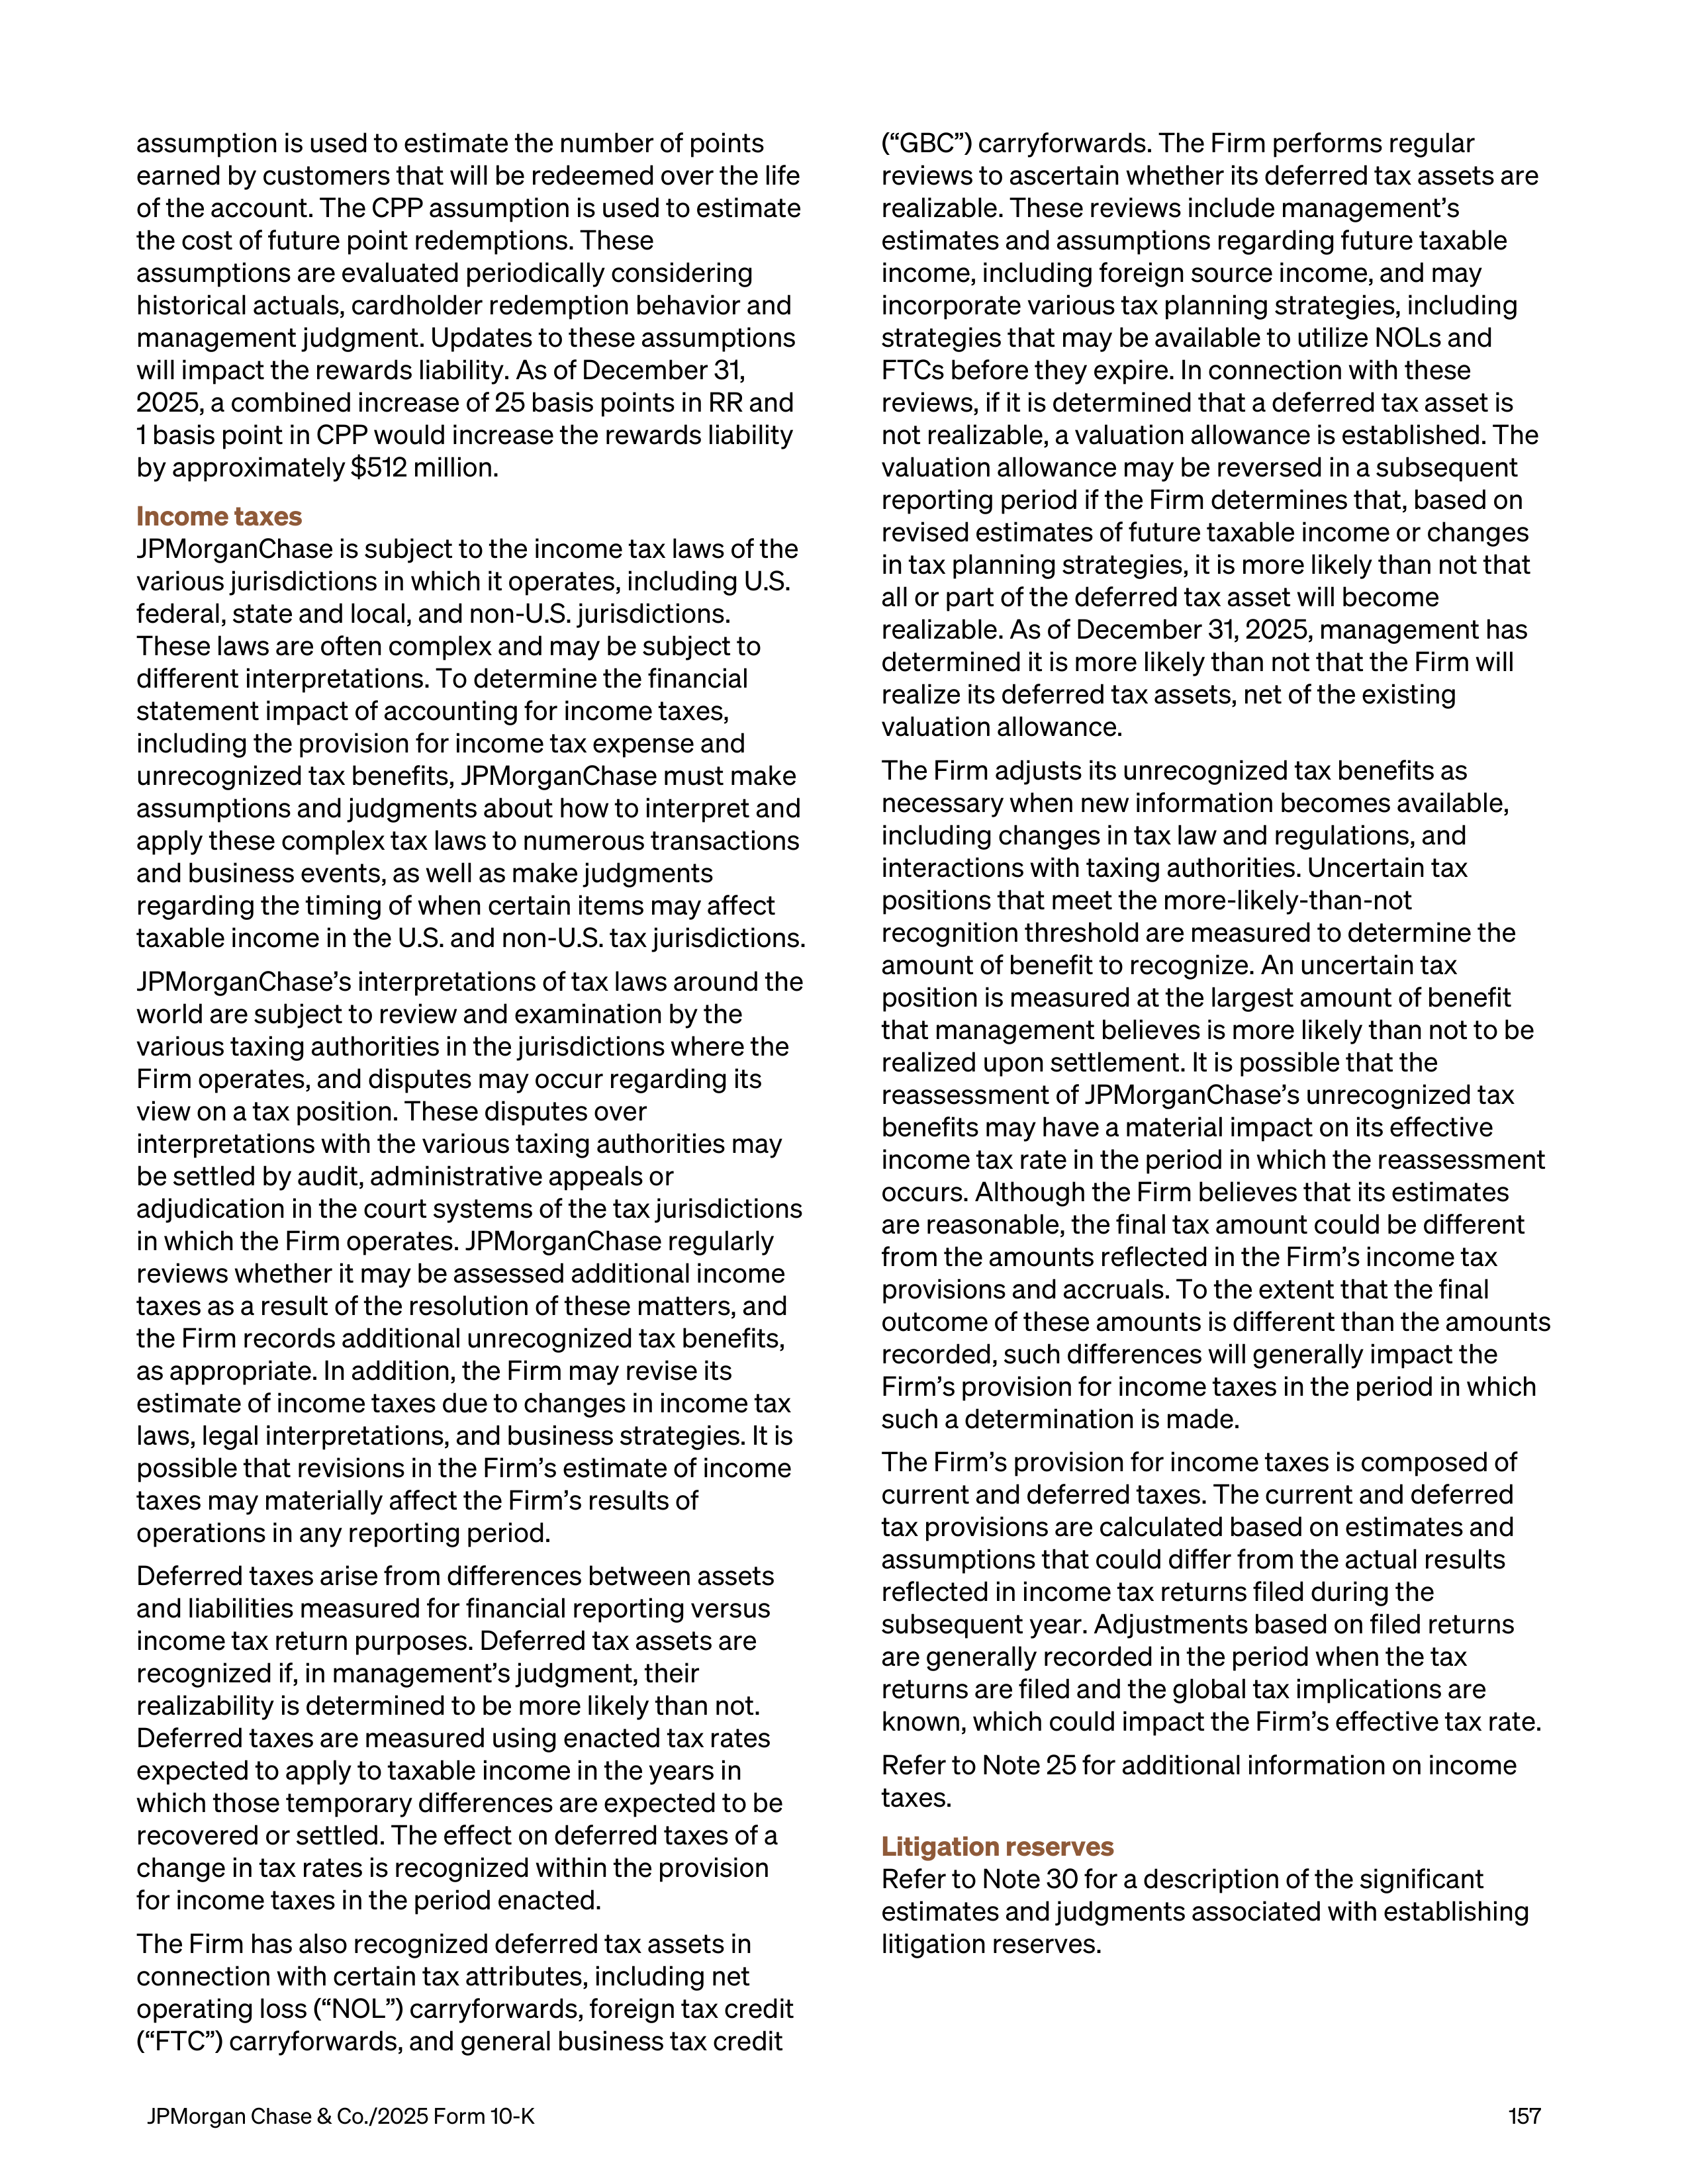
assumption is used to estimate the number of points
earned by customers that will be redeemed over the life
of the account. The CPP assumption is used to estimate
the cost of future point redemptions. These
assumptions are evaluated periodically considering
historical actuals, cardholder redemption behavior and
management judgment. Updates to these assumptions
will impact the rewards liability. As of December 31,
2025, a combined increase of 25 basis points in RR and
1 basis point in CPP would increase the rewards liability
by approximately $512 million.
Income taxes
JPMorganChase is subject to the income tax laws of the
various jurisdictions in which it operates, including U.S.
federal, state and local, and non-U.S. jurisdictions.
These laws are often complex and may be subject to
different interpretations. To determine the financial
statement impact of accounting for income taxes,
including the provision for income tax expense and
unrecognized tax benefits, JPMorganChase must make
assumptions and judgments about how to interpret and
apply these complex tax laws to numerous transactions
and business events, as well as make judgments
regarding the timing of when certain items may affect
taxable income in the U.S. and non-U.S. tax jurisdictions.
JPMorganChase’s interpretations of tax laws around the
world are subject to review and examination by the
various taxing authorities in the jurisdictions where the
Firm operates, and disputes may occur regarding its
view on a tax position. These disputes over
interpretations with the various taxing authorities may
be settled by audit, administrative appeals or
adjudication in the court systems of the tax jurisdictions
in which the Firm operates. JPMorganChase regularly
reviews whether it may be assessed additional income
taxes as a result of the resolution of these matters, and
the Firm records additional unrecognized tax benefits,
as appropriate. In addition, the Firm may revise its
estimate of income taxes due to changes in income tax
laws, legal interpretations, and business strategies. It is
possible that revisions in the Firm’s estimate of income
taxes may materially affect the Firm’s results of
operations in any reporting period.
Deferred taxes arise from differences between assets
and liabilities measured for financial reporting versus
income tax return purposes. Deferred tax assets are
recognized if, in management’s judgment, their
realizability is determined to be more likely than not.
Deferred taxes are measured using enacted tax rates
expected to apply to taxable income in the years in
which those temporary differences are expected to be
recovered or settled. The effect on deferred taxes of a
change in tax rates is recognized within the provision
for income taxes in the period enacted.
The Firm has also recognized deferred tax assets in
connection with certain tax attributes, including net
operating loss (“NOL”) carryforwards, foreign tax credit
(“FTC”) carryforwards, and general business tax credit
(“GBC”) carryforwards. The Firm performs regular
reviews to ascertain whether its deferred tax assets are
realizable. These reviews include management’s
estimates and assumptions regarding future taxable
income, including foreign source income, and may
incorporate various tax planning strategies, including
strategies that may be available to utilize NOLs and
FTCs before they expire. In connection with these
reviews, if it is determined that a deferred tax asset is
not realizable, a valuation allowance is established. The
valuation allowance may be reversed in a subsequent
reporting period if the Firm determines that, based on
revised estimates of future taxable income or changes
in tax planning strategies, it is more likely than not that
all or part of the deferred tax asset will become
realizable. As of December 31, 2025, management has
determined it is more likely than not that the Firm will
realize its deferred tax assets, net of the existing
valuation allowance.
The Firm adjusts its unrecognized tax benefits as
necessary when new information becomes available,
including changes in tax law and regulations, and
interactions with taxing authorities. Uncertain tax
positions that meet the more-likely-than-not
recognition threshold are measured to determine the
amount of benefit to recognize. An uncertain tax
position is measured at the largest amount of benefit
that management believes is more likely than not to be
realized upon settlement. It is possible that the
reassessment of JPMorganChase’s unrecognized tax
benefits may have a material impact on its effective
income tax rate in the period in which the reassessment
occurs. Although the Firm believes that its estimates
are reasonable, the final tax amount could be different
from the amounts reflected in the Firm’s income tax
provisions and accruals. To the extent that the final
outcome of these amounts is different than the amounts
recorded, such differences will generally impact the
Firm’s provision for income taxes in the period in which
such a determination is made.
The Firm’s provision for income taxes is composed of
current and deferred taxes. The current and deferred
tax provisions are calculated based on estimates and
assumptions that could differ from the actual results
reflected in income tax returns filed during the
subsequent year. Adjustments based on filed returns
are generally recorded in the period when the tax
returns are filed and the global tax implications are
known, which could impact the Firm’s effective tax rate.
Refer to Note 25 for additional information on income
taxes.
Litigation reserves
Refer to Note 30 for a description of the significant
estimates and judgments associated with establishing
litigation reserves.
JPMorgan Chase & Co./2025 Form 10-K
157
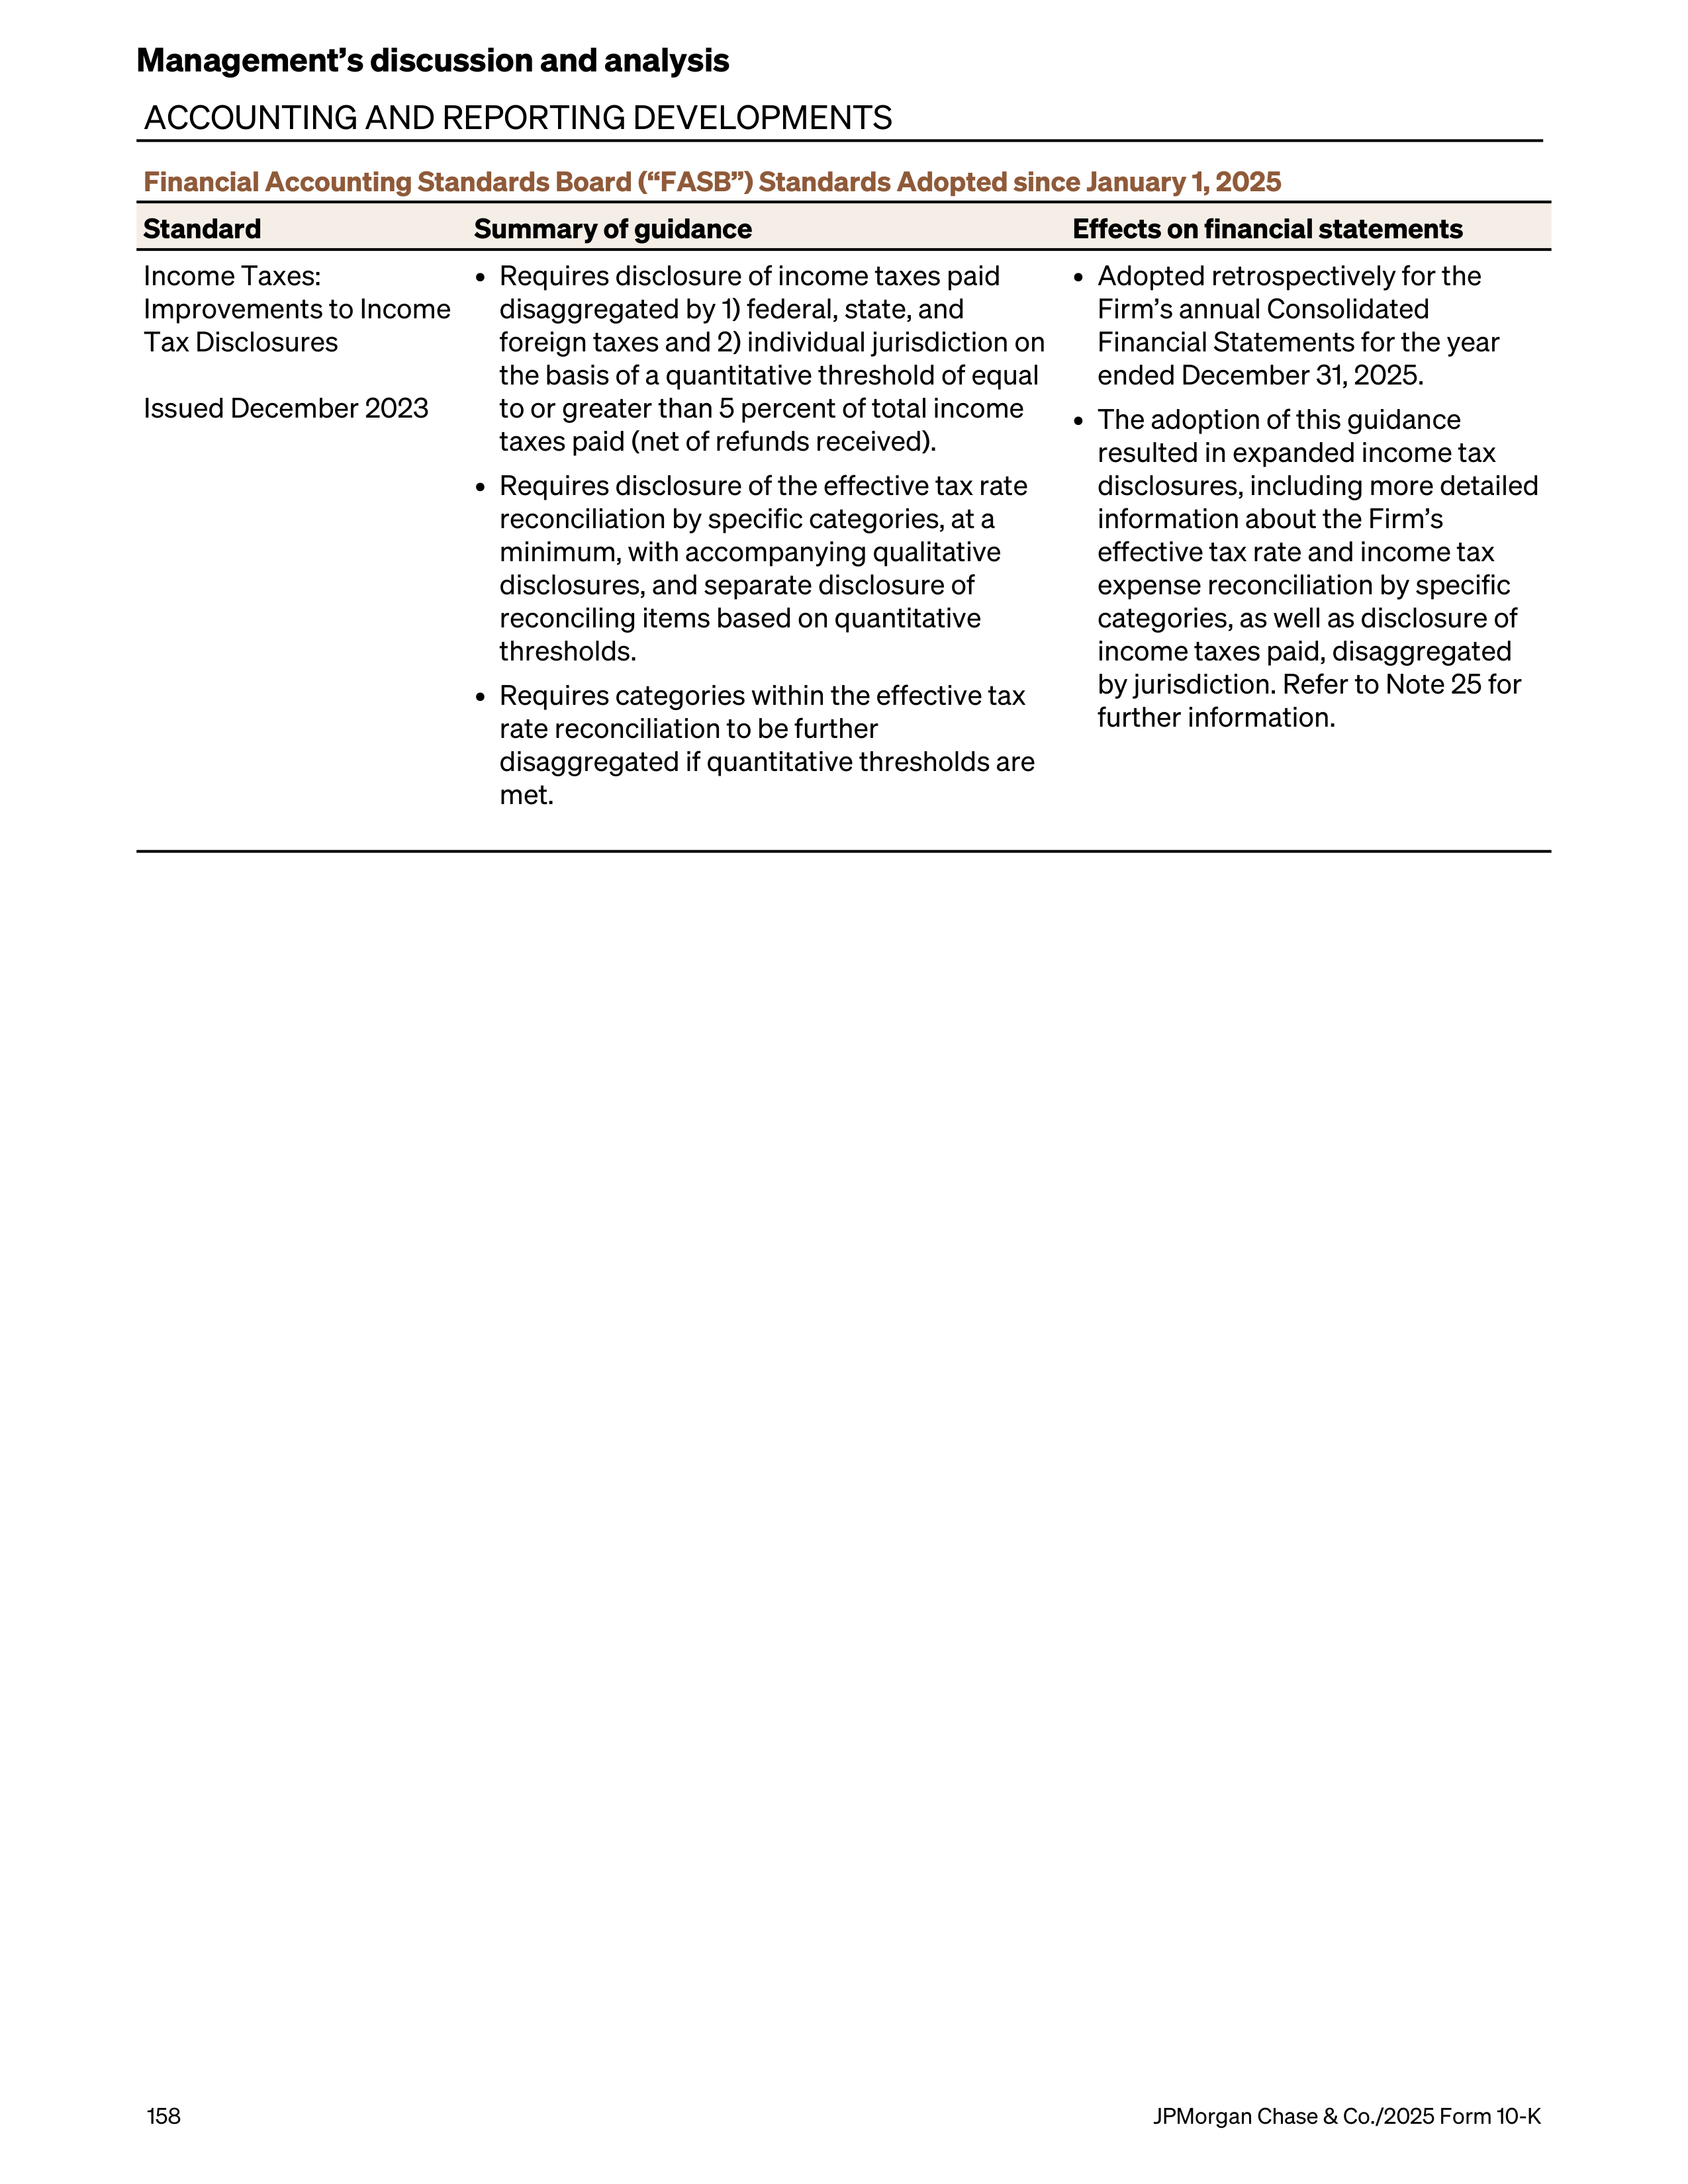
ACCOUNTING AND REPORTING DEVELOPMENTS
Financial Accounting Standards Board (“FASB”) Standards Adopted since January 1, 2025
Standard
Summary of guidance
Effects on financial statements
Income Taxes:
Improvements to Income
Tax Disclosures
Issued December 2023
•
Requires disclosure of income taxes paid
disaggregated by 1) federal, state, and
foreign taxes and 2) individual jurisdiction on
the basis of a quantitative threshold of equal
to or greater than 5 percent of total income
taxes paid (net of refunds received).
•
Requires disclosure of the effective tax rate
reconciliation by specific categories, at a
minimum, with accompanying qualitative
disclosures, and separate disclosure of
reconciling items based on quantitative
thresholds.
•
Requires categories within the effective tax
rate reconciliation to be further
disaggregated if quantitative thresholds are
met.
•
Adopted retrospectively for the
Firm’s annual Consolidated
Financial Statements for the year
ended December 31, 2025.
•
The adoption of this guidance
resulted in expanded income tax
disclosures, including more detailed
information about the Firm’s
effective tax rate and income tax
expense reconciliation by specific
categories, as well as disclosure of
income taxes paid, disaggregated
by jurisdiction. Refer to Note 25 for
further information.
Management’s discussion and analysis
158
JPMorgan Chase & Co./2025 Form 10-K
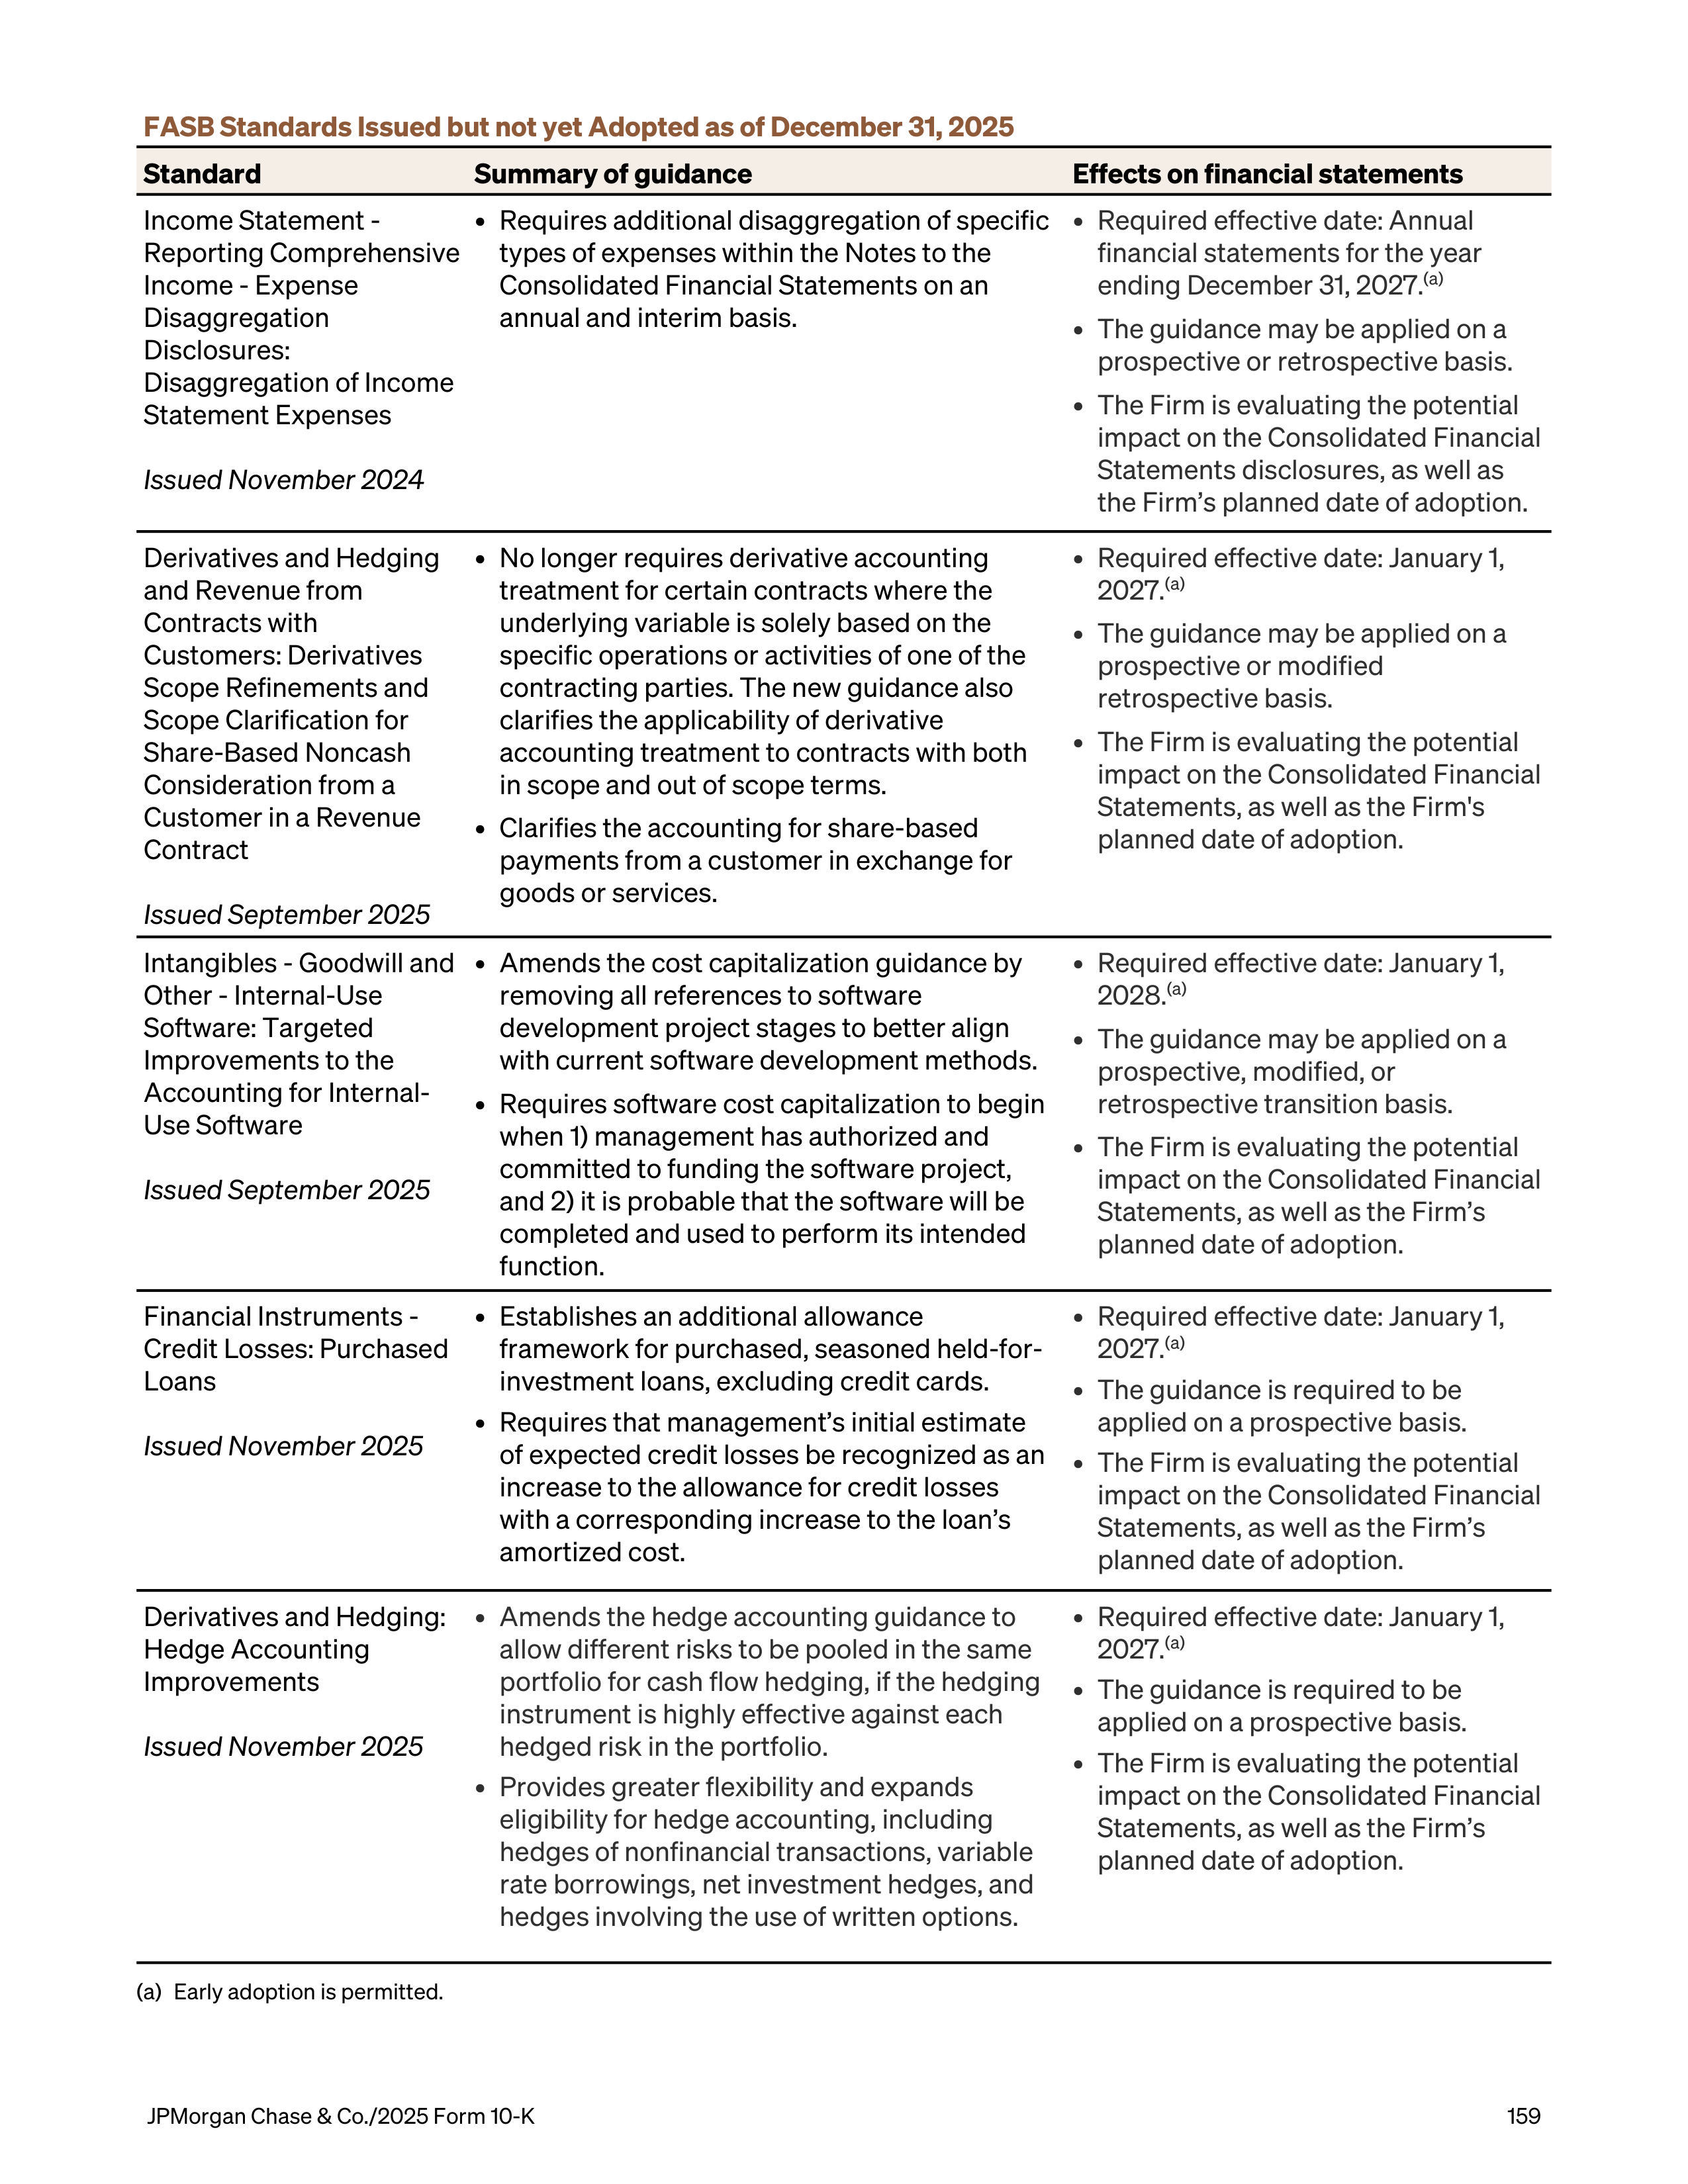
FASB Standards Issued but not yet Adopted as of December 31, 2025
Standard
Summary of guidance
Effects on financial statements
Income Statement -
Reporting Comprehensive
Income - Expense
Disaggregation
Disclosures:
Disaggregation of Income
Statement Expenses
Issued November 2024
•
Requires additional disaggregation of specific
types of expenses within the Notes to the
Consolidated Financial Statements on an
annual and interim basis.
•
Required effective date: Annual
financial statements for the year
ending December 31, 2027.
(a)
•
The guidance may be applied on a
prospective or retrospective basis.
•
The Firm is evaluating the potential
impact on the Consolidated Financial
Statements disclosures, as well as
the Firm’s planned date of adoption.
Derivatives and Hedging
and Revenue from
Contracts with
Customers: Derivatives
Scope Refinements and
Scope Clarification for
Share-Based Noncash
Consideration from a
Customer in a Revenue
Contract
Issued September 2025
•
No longer requires derivative accounting
treatment for certain contracts where the
underlying variable is solely based on the
specific operations or activities of one of the
contracting parties. The new guidance also
clarifies the applicability of derivative
accounting treatment to contracts with both
in scope and out of scope terms.
•
Clarifies the accounting for share-based
payments from a customer in exchange for
goods or services.
•
Required effective date: January 1,
2027.
(a)
•
The guidance may be applied on a
prospective or modified
retrospective basis.
•
The Firm is evaluating the potential
impact on the Consolidated Financial
Statements, as well as the Firm's
planned date of adoption.
Intangibles - Goodwill and
Other - Internal-Use
Software: Targeted
Improvements to the
Accounting for Internal-
Use Software
Issued September 2025
•
Amends the cost capitalization guidance by
removing all references to software
development project stages to better align
with current software development methods.
•
Requires software cost capitalization to begin
when 1) management has authorized and
committed to funding the software project,
and 2) it is probable that the software will be
completed and used to perform its intended
function.
•
Required effective date: January 1,
2028.
(a)
•
The guidance may be applied on a
prospective, modified, or
retrospective transition basis.
•
The Firm is evaluating the potential
impact on the Consolidated Financial
Statements, as well as the Firm’s
planned date of adoption.
Financial Instruments -
Credit Losses: Purchased
Loans
Issued November 2025
•
Establishes an additional allowance
framework for purchased, seasoned held-for-
investment loans, excluding credit cards.
•
Requires that management’s initial estimate
of expected credit losses be recognized as an
increase to the allowance for credit losses
with a corresponding increase to the loan’s
amortized cost.
•
Required effective date: January 1,
2027.
(a)
•
The guidance is required to be
applied on a prospective basis.
•
The Firm is evaluating the potential
impact on the Consolidated Financial
Statements, as well as the Firm’s
planned date of adoption.
Derivatives and Hedging:
Hedge Accounting
Improvements
Issued November 2025
•
Amends the hedge accounting guidance to
allow different risks to be pooled in the same
portfolio for cash flow hedging, if the hedging
instrument is highly effective against each
hedged risk in the portfolio.
•
Provides greater flexibility and expands
eligibility for hedge accounting, including
hedges of nonfinancial transactions, variable
rate borrowings, net investment hedges, and
hedges involving the use of written options.
•
Required effective date: January 1,
2027.
(a)
•
The guidance is required to be
applied on a prospective basis.
•
The Firm is evaluating the potential
impact on the Consolidated Financial
Statements, as well as the Firm’s
planned date of adoption.
(a)
Early adoption is permitted.
JPMorgan Chase & Co./2025 Form 10-K
159
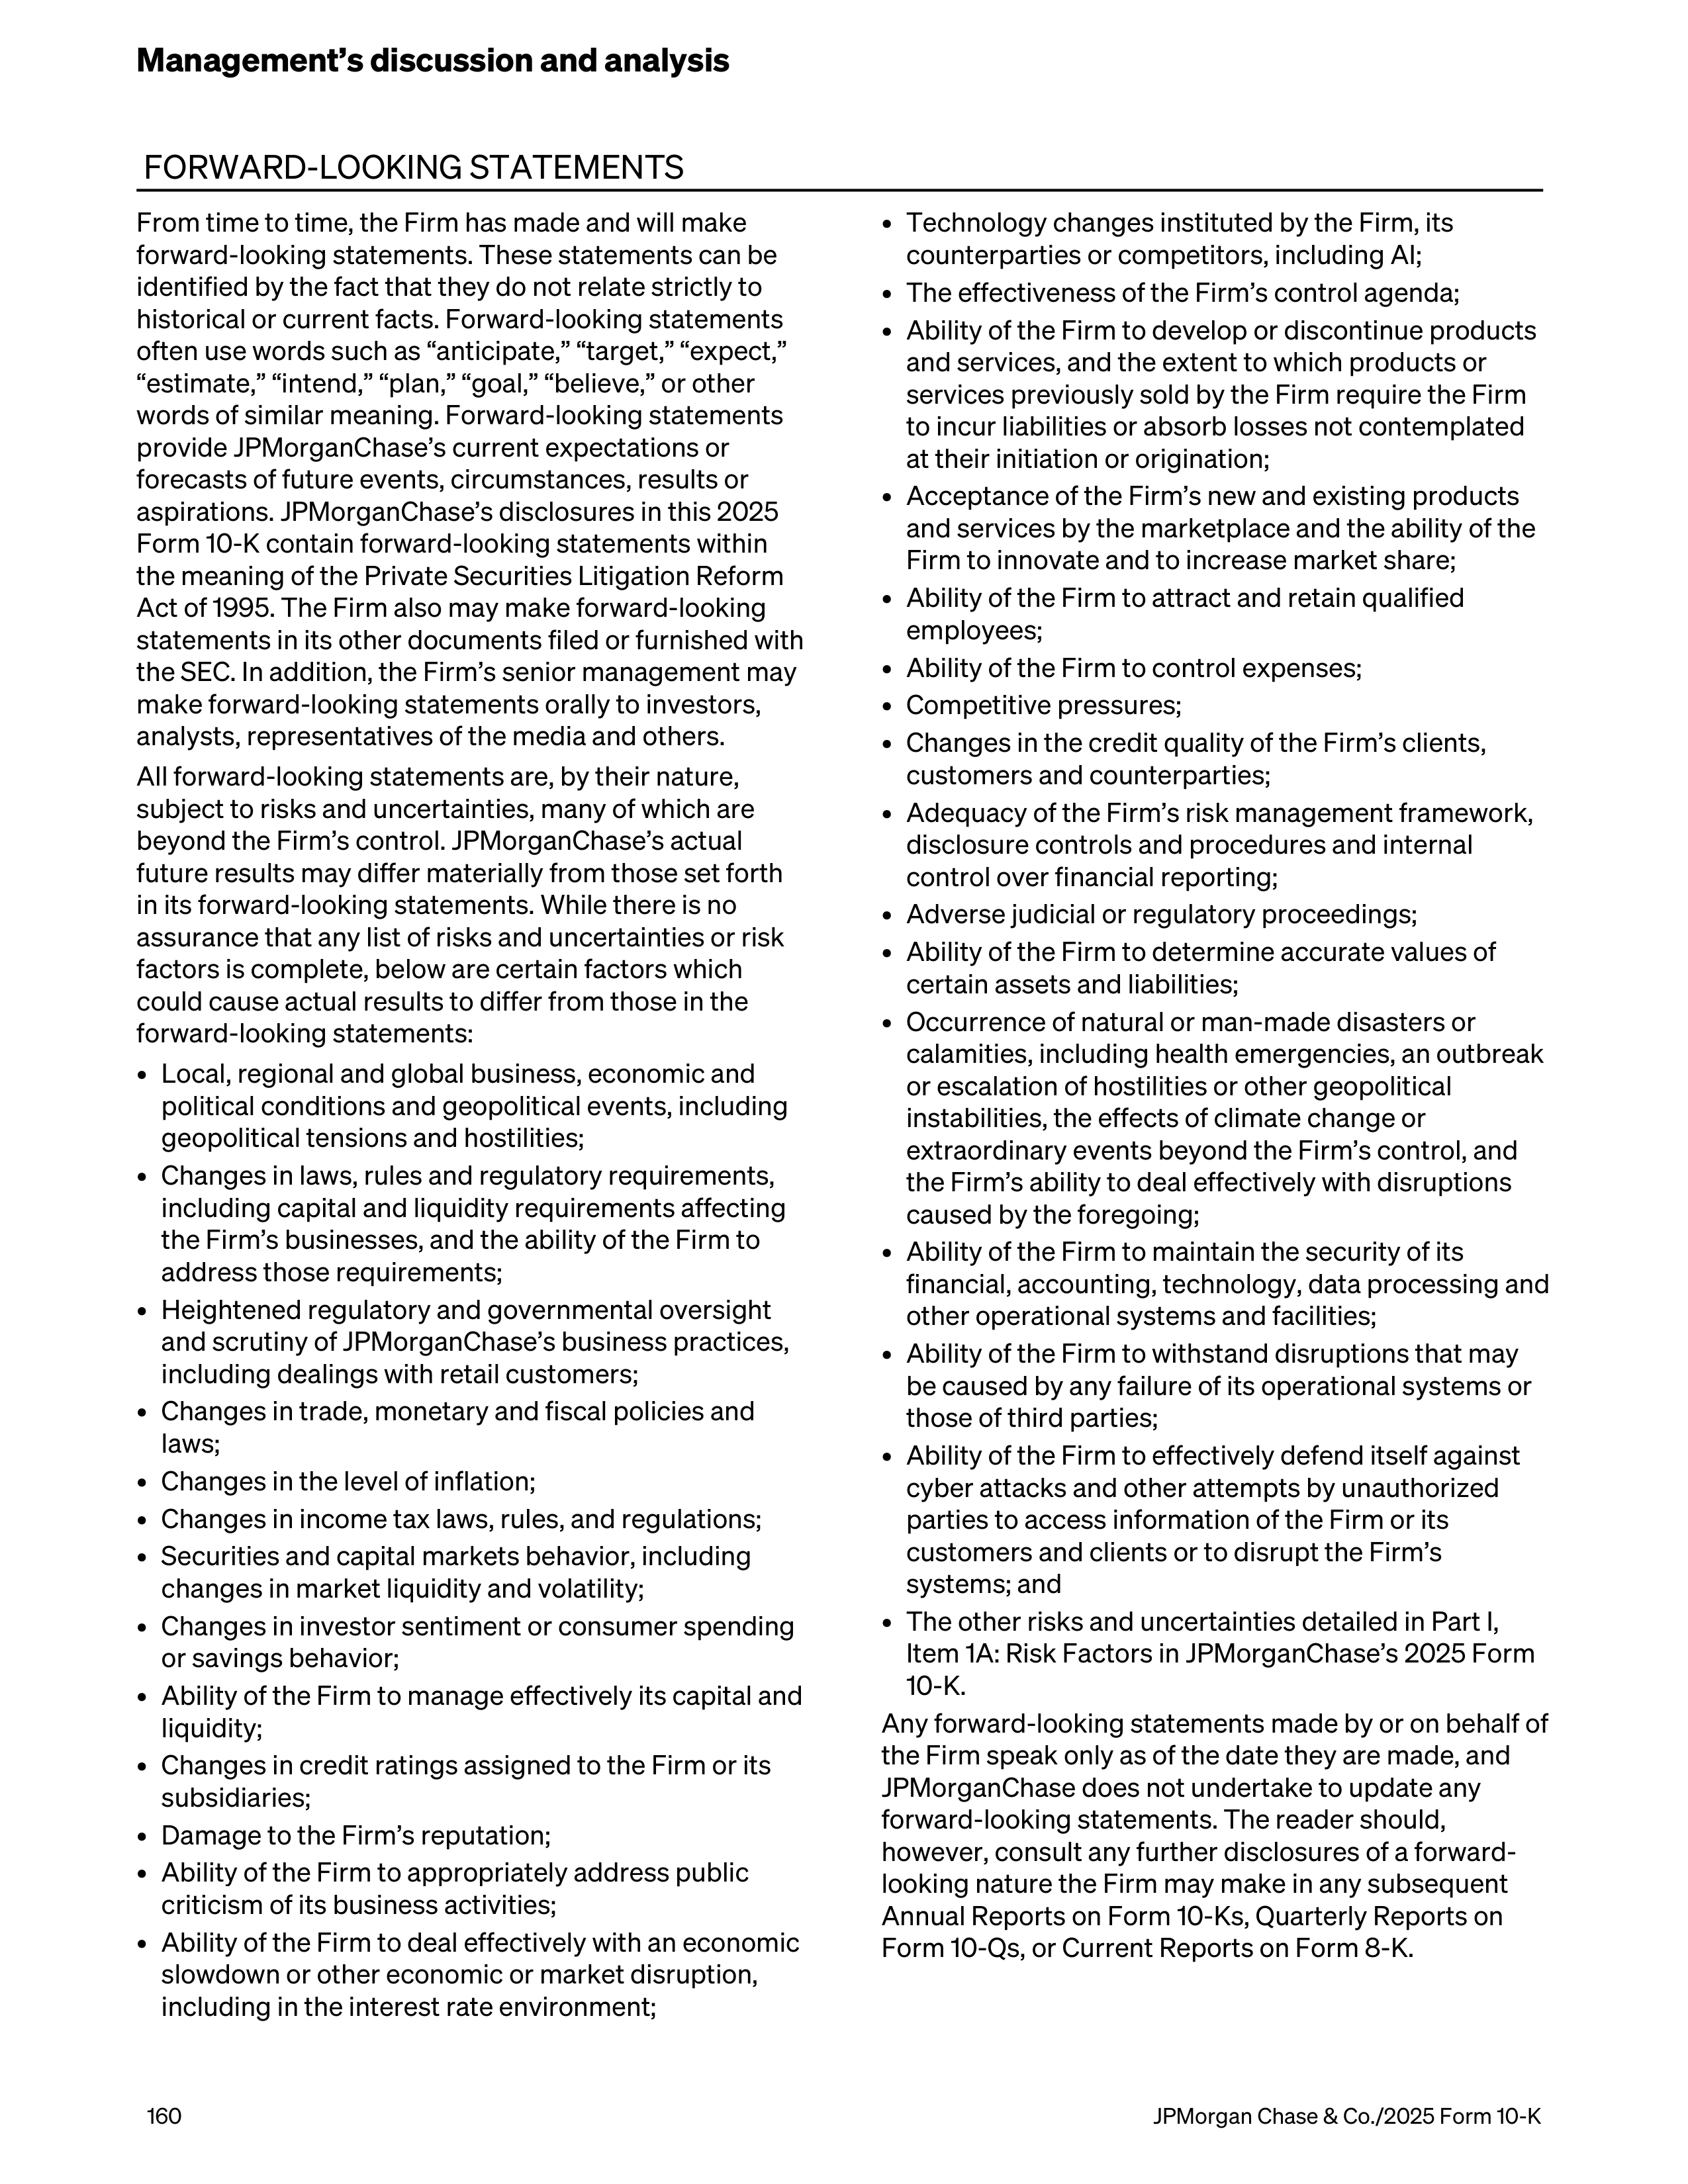
FORWARD-LOOKING STATEMENTS
From time to time, the Firm has made and will make
forward-looking statements. These statements can be
identified by the fact that they do not relate strictly to
historical or current facts. Forward-looking statements
often use words such as “anticipate,” “target,” “expect,”
“estimate,” “intend,” “plan,” “goal,” “believe,” or other
words of similar meaning. Forward-looking statements
provide JPMorganChase’s current expectations or
forecasts of future events, circumstances, results or
aspirations. JPMorganChase’s disclosures in this 2025
Form 10-K contain forward-looking statements within
the meaning of the Private Securities Litigation Reform
Act of 1995. The Firm also may make forward-looking
statements in its other documents filed or furnished with
the SEC. In addition, the Firm’s senior management may
make forward-looking statements orally to investors,
analysts, representatives of the media and others.
All forward-looking statements are, by their nature,
subject to risks and uncertainties, many of which are
beyond the Firm’s control. JPMorganChase’s actual
future results may differ materially from those set forth
in its forward-looking statements. While there is no
assurance that any list of risks and uncertainties or risk
factors is complete, below are certain factors which
could cause actual results to differ from those in the
forward-looking statements:
•
Local, regional and global business, economic and
political conditions and geopolitical events, including
geopolitical tensions and hostilities;
•
Changes in laws, rules and regulatory requirements,
including capital and liquidity requirements affecting
the Firm’s businesses, and the ability of the Firm to
address those requirements;
•
Heightened regulatory and governmental oversight
and scrutiny of JPMorganChase’s business practices,
including dealings with retail customers;
•
Changes in trade, monetary and fiscal policies and
laws;
•
Changes in the level of inflation;
•
Changes in income tax laws, rules, and regulations;
•
Securities and capital markets behavior, including
changes in market liquidity and volatility;
•
Changes in investor sentiment or consumer spending
or savings behavior;
•
Ability of the Firm to manage effectively its capital and
liquidity;
•
Changes in credit ratings assigned to the Firm or its
subsidiaries;
•
Damage to the Firm’s reputation;
•
Ability of the Firm to appropriately address public
criticism of its business activities;
•
Ability of the Firm to deal effectively with an economic
slowdown or other economic or market disruption,
including in the interest rate environment;
•
Technology changes instituted by the Firm, its
counterparties or competitors, including AI;
•
The effectiveness of the Firm’s control agenda;
•
Ability of the Firm to develop or discontinue products
and services, and the extent to which products or
services previously sold by the Firm require the Firm
to incur liabilities or absorb losses not contemplated
at their initiation or origination;
•
Acceptance of the Firm’s new and existing products
and services by the marketplace and the ability of the
Firm to innovate and to increase market share;
•
Ability of the Firm to attract and retain qualified
employees;
•
Ability of the Firm to control expenses;
•
Competitive pressures;
•
Changes in the credit quality of the Firm’s clients,
customers and counterparties;
•
Adequacy of the Firm’s risk management framework,
disclosure controls and procedures and internal
control over financial reporting;
•
Adverse judicial or regulatory proceedings;
•
Ability of the Firm to determine accurate values of
certain assets and liabilities;
•
Occurrence of natural or man-made disasters or
calamities, including health emergencies, an outbreak
or escalation of hostilities or other geopolitical
instabilities, the effects of climate change or
extraordinary events beyond the Firm’s control, and
the Firm’s ability to deal effectively with disruptions
caused by the foregoing;
•
Ability of the Firm to maintain the security of its
financial, accounting, technology, data processing and
other operational systems and facilities;
•
Ability of the Firm to withstand disruptions that may
be caused by any failure of its operational systems or
those of third parties;
•
Ability of the Firm to effectively defend itself against
cyber attacks and other attempts by unauthorized
parties to access information of the Firm or its
customers and clients or to disrupt the Firm’s
systems; and
•
The other risks and uncertainties detailed in Part I,
Item 1A: Risk Factors in JPMorganChase’s 2025 Form
10-K.
Any forward-looking statements made by or on behalf of
the Firm speak only as of the date they are made, and
JPMorganChase does not undertake to update any
forward-looking statements. The reader should,
however, consult any further disclosures of a forward-
looking nature the Firm may make in any subsequent
Annual Reports on Form 10-Ks, Quarterly Reports on
Form 10-Qs, or Current Reports on Form 8-K.
Management’s discussion and analysis
160
JPMorgan Chase & Co./2025 Form 10-K


Management of JPMorgan Chase & Co.
(“JPMorganChase” or the “Firm”) is responsible for
establishing and maintaining adequate internal control
over financial reporting. Internal control over financial
reporting is a process designed by, or under the
supervision of, the Firm’s principal executive and
principal financial officers, or persons performing
similar functions, and effected by JPMorganChase’s
Board of Directors, management and other personnel,
to provide reasonable assurance regarding the
reliability of financial reporting and the preparation of
financial statements for external purposes in
accordance with accounting principles generally
accepted in the United States of America (“U.S. GAAP”).
JPMorganChase’s internal control over financial
reporting includes those policies and procedures that
(1) pertain to the maintenance of records, that, in
reasonable detail, accurately and fairly reflect the
transactions and dispositions of the Firm’s assets; (2)
provide reasonable assurance that transactions are
recorded as necessary to permit preparation of financial
statements in accordance with U.S. GAAP, and that
receipts and expenditures of the Firm are being made
only in accordance with authorizations of
JPMorganChase’s management and directors; and (3)
provide reasonable assurance regarding prevention or
timely detection of unauthorized acquisition, use or
disposition of the Firm’s assets that could have a
material effect on the financial statements.
Because of its inherent limitations, internal control over
financial reporting may not prevent or detect
misstatements. Also, projections of any evaluation of
effectiveness to future periods are subject to the risk
that controls may become inadequate because of
changes in conditions, or that the degree of compliance
with the policies or procedures may deteriorate.
Management has completed an assessment of the
effectiveness of the Firm’s internal control over financial
reporting as of December 31, 2025. In making the
assessment, management used the “Internal Control —
Integrated Framework” (“COSO 2013”) promulgated by
the Committee of Sponsoring Organizations of the
Treadway Commission (“COSO”).
Based upon the assessment performed, management
concluded that as of December 31, 2025,
JPMorganChase’s internal control over financial
reporting was effective based upon the COSO 2013
framework. Additionally, based upon management’s
assessment, the Firm determined that there were no
material weaknesses in its internal control over financial
reporting as of December 31, 2025.
The effectiveness of the Firm’s internal control over
financial reporting as of December 31, 2025, has been
audited by PricewaterhouseCoopers LLP, an
independent registered public accounting firm, as
stated in their report which appears herein.
James Dimon
Chairman and Chief Executive Officer
Jeremy Barnum
Executive Vice President and Chief Financial Officer
February 13, 2026
Management’s report on internal control over financial reporting
JPMorgan Chase & Co./2025 Form 10-K
161

To the Board of Directors and Shareholders of
JPMorgan Chase & Co.:
Opinions on the Financial Statements and Internal
Control over Financial Reporting
We have audited the accompanying consolidated
balance sheets of JPMorgan Chase & Co. and its
subsidiaries (the “Firm”) as of December 31, 2025 and
2024, and the related consolidated statements of
income, comprehensive income, changes in
stockholders’ equity and cash flows for each of the three
years in the period ended December 31, 2025, including
the related notes (collectively referred to as the
“consolidated financial statements”). We also have
audited the Firm’s internal control over financial
reporting as of December 31, 2025, based on criteria
established in
Internal Control - Integrated Framework
(2013) issued by the Committee of Sponsoring
Organizations of the Treadway Commission (COSO).
In our opinion, the consolidated financial statements
referred to above present fairly, in all material respects,
the financial position of the Firm as of
December 31,
2025 and 2024, and the results of its operations and its
cash flows for each of the three years in the period
ended December 31, 2025
in conformity with
accounting principles generally accepted in the United
States of America. Also in our opinion, the Firm
maintained, in all material respects, effective internal
control over financial reporting as of December 31,
2025, based on criteria established in
Internal Control –
Integrated Framework
(2013) issued by the COSO.
Basis for Opinions
The Firm’s management is responsible for these
consolidated financial statements, for maintaining
effective internal control over financial reporting, and for
its assessment of the effectiveness of internal control
over financial reporting, included in the accompanying
Management’s report on internal control over financial
reporting. Our responsibility is to express opinions on
the Firm’s consolidated financial statements and on the
Firm’s internal control over financial reporting based on
our audits. We are a public accounting firm registered
with the Public Company Accounting Oversight Board
(United States) (PCAOB) and are required to be
independent with respect to the Firm in accordance with
the U.S. federal securities laws and the applicable rules
and regulations of the Securities and Exchange
Commission and the PCAOB.
We conducted our audits in accordance with the
standards of the PCAOB. Those standards require that
we plan and perform the audits to obtain reasonable
assurance about whether the consolidated financial
statements are free of material misstatement, whether
due to error or fraud, and whether effective internal
control over financial reporting was maintained in all
material respects.
Our audits of the consolidated financial statements
included performing procedures to assess the risks of
material misstatement of the consolidated financial
statements, whether due to error or fraud, and
performing procedures that respond to those risks.
Such procedures included examining, on a test basis,
evidence regarding the amounts and disclosures in the
consolidated financial statements. Our audits also
included evaluating the accounting principles used and
significant estimates made by management, as well as
evaluating the overall presentation of the consolidated
financial statements. Our audit of internal control over
financial reporting included obtaining an understanding
of internal control over financial reporting, assessing the
risk that a material weakness exists, and testing and
evaluating the design and operating effectiveness of
internal control based on the assessed risk. Our audits
also included performing such other procedures as we
considered necessary in the circumstances. We believe
that our audits provide a reasonable basis for our
opinions.
Definition and Limitations of Internal Control over
Financial Reporting
A company’s internal control over financial reporting is a
process designed to provide reasonable assurance
regarding the reliability of financial reporting and the
preparation of financial statements for external
purposes in accordance with generally accepted
accounting principles. A company’s internal control over
financial reporting includes those policies and
procedures that (i) pertain to the maintenance of
records that, in reasonable detail, accurately and fairly
reflect the transactions and dispositions of the assets of
the company; (ii) provide reasonable assurance that
transactions are recorded as necessary to permit
preparation of financial statements in accordance with
generally accepted accounting principles, and that
receipts and expenditures of the company are being
made only in accordance with authorizations of
management and directors of the company; and
(iii) provide reasonable assurance regarding prevention
or timely detection of unauthorized acquisition, use, or
disposition of the company’s assets that could have a
material effect on the financial statements.
Because of its inherent limitations, internal control over
financial reporting may not prevent or detect
misstatements. Also, projections of any evaluation of
effectiveness to future periods are subject to the risk
that controls may become inadequate because of
changes in conditions, or that the degree of compliance
with the policies or procedures may deteriorate.
PricewaterhouseCoopers LLP • 300 Madison Avenue • New York, NY 10017
Report of Independent Registered Public Accounting Firm
162
JPMorgan Chase & Co./2025 Form 10-K
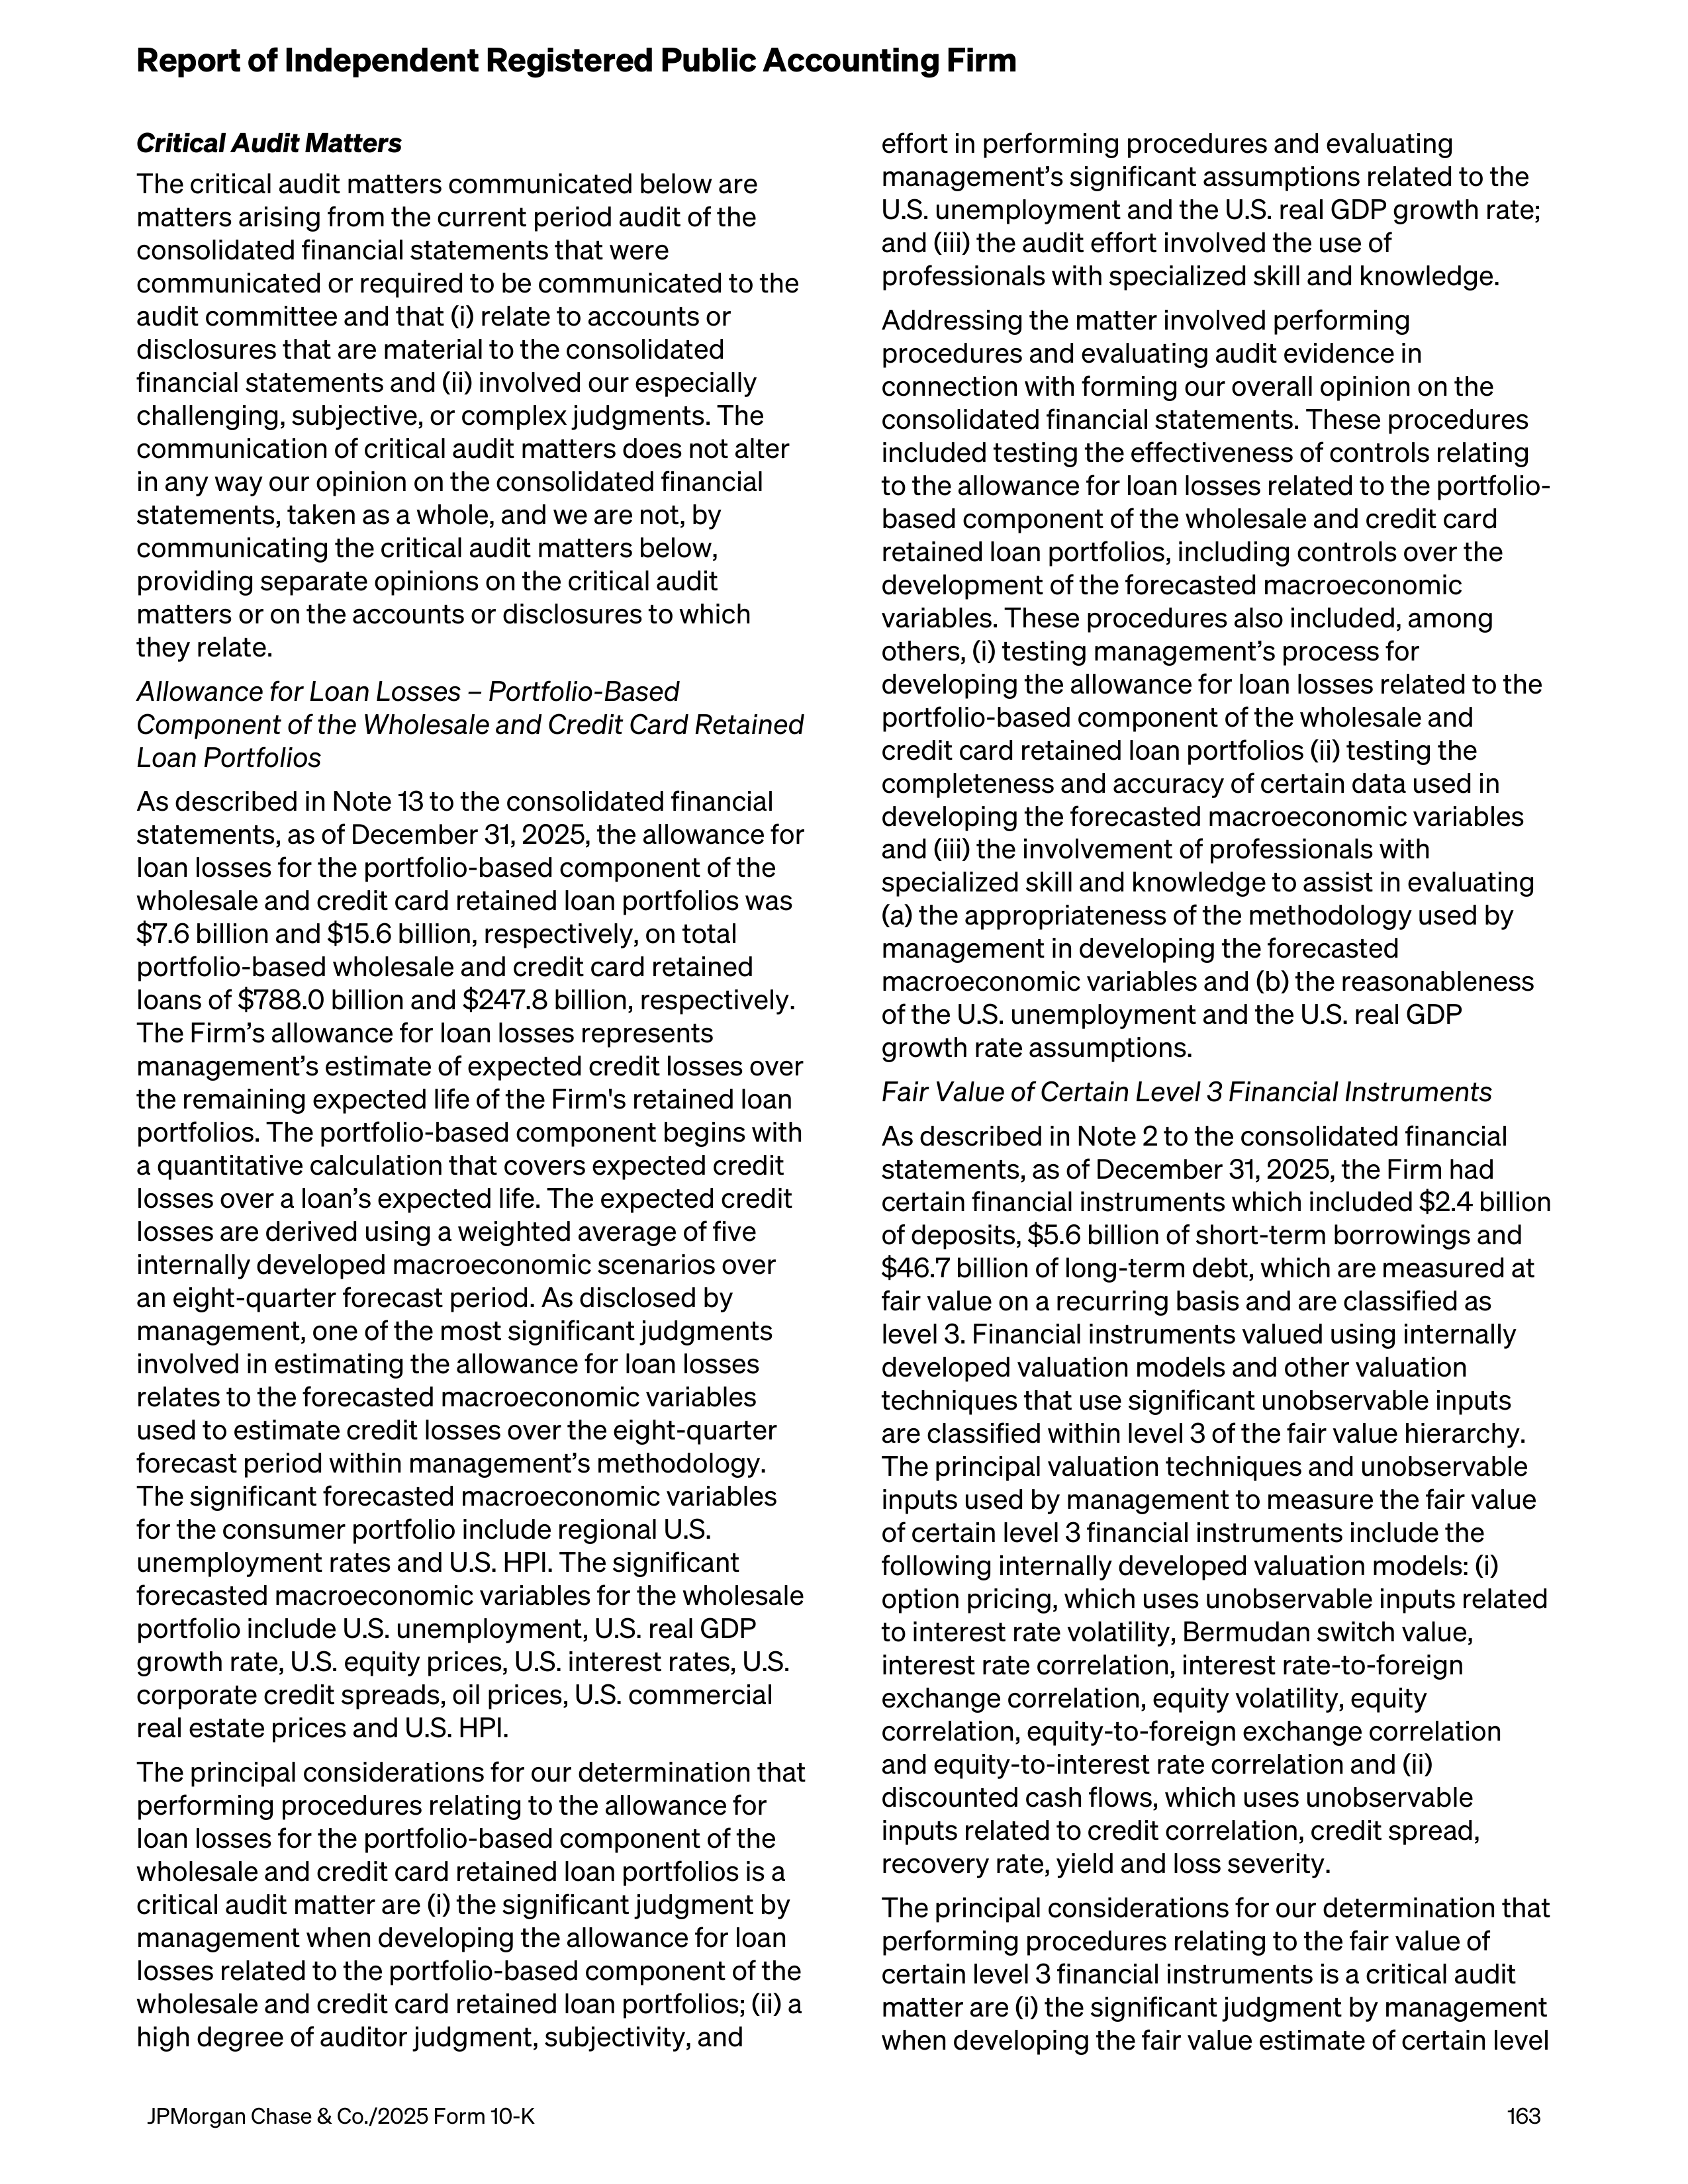
Critical Audit Matters
The critical audit matters communicated below are
matters arising from the current period audit of the
consolidated financial statements that were
communicated or required to be communicated to the
audit committee and that (i) relate to accounts or
disclosures that are material to the consolidated
financial statements and (ii) involved our especially
challenging, subjective, or complex judgments. The
communication of critical audit matters does not alter
in any way our opinion on the consolidated financial
statements, taken as a whole, and we are not, by
communicating the critical audit matters below,
providing separate opinions on the critical audit
matters or on the accounts or disclosures to which
they relate.
Allowance for Loan Losses – Portfolio-Based
Component of the Wholesale and Credit Card Retained
Loan Portfolios
As described in Note 13 to the consolidated financial
statements, as of
December 31, 2025,
the allowance for
loan losses for the portfolio-based component of the
wholesale and credit card retained loan portfolios was
$7.6 billion and $15.6 billion, respectively, on total
portfolio-based wholesale and credit card retained
loans of $788.0 billion and $247.8 billion, respectively.
The Firm’s allowance for loan losses represents
management’s estimate of expected credit losses over
the remaining expected life of the Firm's retained loan
portfolios. The portfolio-based component begins with
a quantitative calculation that covers expected credit
losses over a loan’s expected life. The expected credit
losses are derived using a weighted average of five
internally developed macroeconomic scenarios over
an eight-quarter forecast period. As disclosed by
management, one of the most significant judgments
involved in estimating the allowance for loan losses
relates to the forecasted macroeconomic variables
used to estimate credit losses over the eight-quarter
forecast period within management’s methodology.
The significant forecasted macroeconomic variables
for the consumer portfolio include regional U.S.
unemployment rates and U.S. HPI. The significant
forecasted macroeconomic variables for the wholesale
portfolio include U.S. unemployment, U.S. real GDP
growth rate, U.S. equity prices, U.S. interest rates, U.S.
corporate credit spreads, oil prices, U.S. commercial
real estate prices and U.S. HPI.
The principal considerations for our determination that
performing procedures relating to the allowance for
loan losses for the portfolio-based component of the
wholesale and credit card retained loan portfolios is a
critical audit matter are (i) the significant judgment by
management when developing the allowance for loan
losses related to the portfolio-based component of the
wholesale and credit card retained loan portfolios; (ii) a
high degree of auditor judgment, subjectivity, and
effort in performing procedures and evaluating
management’s significant assumptions related to the
U.S. unemployment and the U.S. real GDP growth rate;
and (iii) the audit effort involved the use of
professionals with specialized skill and knowledge.
Addressing the matter involved performing
procedures and evaluating audit evidence in
connection with forming our overall opinion on the
consolidated financial statements. These procedures
included testing the effectiveness of controls relating
to the allowance for loan losses related to the portfolio-
based component of the wholesale and credit card
retained loan portfolios, including controls over the
development of the forecasted macroeconomic
variables. These procedures also included, among
others, (i) testing management’s process for
developing the allowance for loan losses related to the
portfolio-based component of the wholesale and
credit card retained loan portfolios (ii) testing the
completeness and accuracy of certain data used in
developing the forecasted macroeconomic variables
and (iii) the involvement of professionals with
specialized skill and knowledge to assist in evaluating
(a) the appropriateness of the methodology used by
management in developing the forecasted
macroeconomic variables and (b) the reasonableness
of the U.S. unemployment and the U.S. real GDP
growth rate assumptions.
Fair Value of Certain Level 3 Financial Instruments
As described in Note 2 to the consolidated financial
statements, as of
December 31, 2025, the Firm had
certain financial instruments which included $2.4 billion
of deposits, $5.6 billion of short-term borrowings and
$46.7 billion of long-term debt, which are
measured at
fair value on a recurring basis and are classified as
level 3. Financial instruments valued using internally
developed valuation models and other valuation
techniques that use significant unobservable inputs
are classified within level 3 of the fair value hierarchy.
The principal valuation techniques and unobservable
inputs used by management to measure the fair value
of certain level 3 financial instruments include the
following internally developed valuation models: (i)
option pricing, which uses unobservable inputs related
to interest rate volatility, Bermudan switch value,
interest rate correlation, interest rate-to-foreign
exchange correlation, equity volatility, equity
correlation, equity-to-foreign exchange correlation
and equity-to-interest rate correlation and (ii)
discounted cash flows, which uses unobservable
inputs related to credit correlation, credit spread,
recovery rate, yield and loss severity.
The principal considerations for our determination that
performing procedures relating to the fair value of
certain level 3 financial instruments is a critical audit
matter are (i) the significant judgment by management
when developing the fair value estimate of certain level
Report of Independent Registered Public Accounting Firm
JPMorgan Chase & Co./2025 Form 10-K
163
3 financial instruments; (ii) a high degree of auditor
judgment, subjectivity, and effort in performing
procedures and evaluating audit evidence related to
the aforementioned unobservable inputs; and (iii) the
audit effort involved the use of professionals with
specialized skill and knowledge.
Addressing the matter involved performing
procedures and evaluating audit evidence in
connection with forming our overall opinion on the
consolidated financial statements. These procedures
included testing the effectiveness of controls relating
to the fair value estimate of certain level 3 financial
instruments, including controls over the
aforementioned unobservable inputs. These
procedures also included, among others, (i) testing the
completeness and accuracy of certain data provided
by management and (ii) the involvement of
professionals with specialized skill and knowledge to
assist in evaluating the reasonableness of
management’s estimate by (a) developing an
independent estimate of the fair value for a sample of
certain level 3 financial instruments using
independently developed unobservable inputs and (b)
comparing the independent estimate of the fair value
to management’s estimate.
New York, New York
February 13, 2026
We have served as the Firm’s auditor since 1965.
Report of Independent Registered Public Accounting Firm
164
JPMorgan Chase & Co./2025 Form 10-K
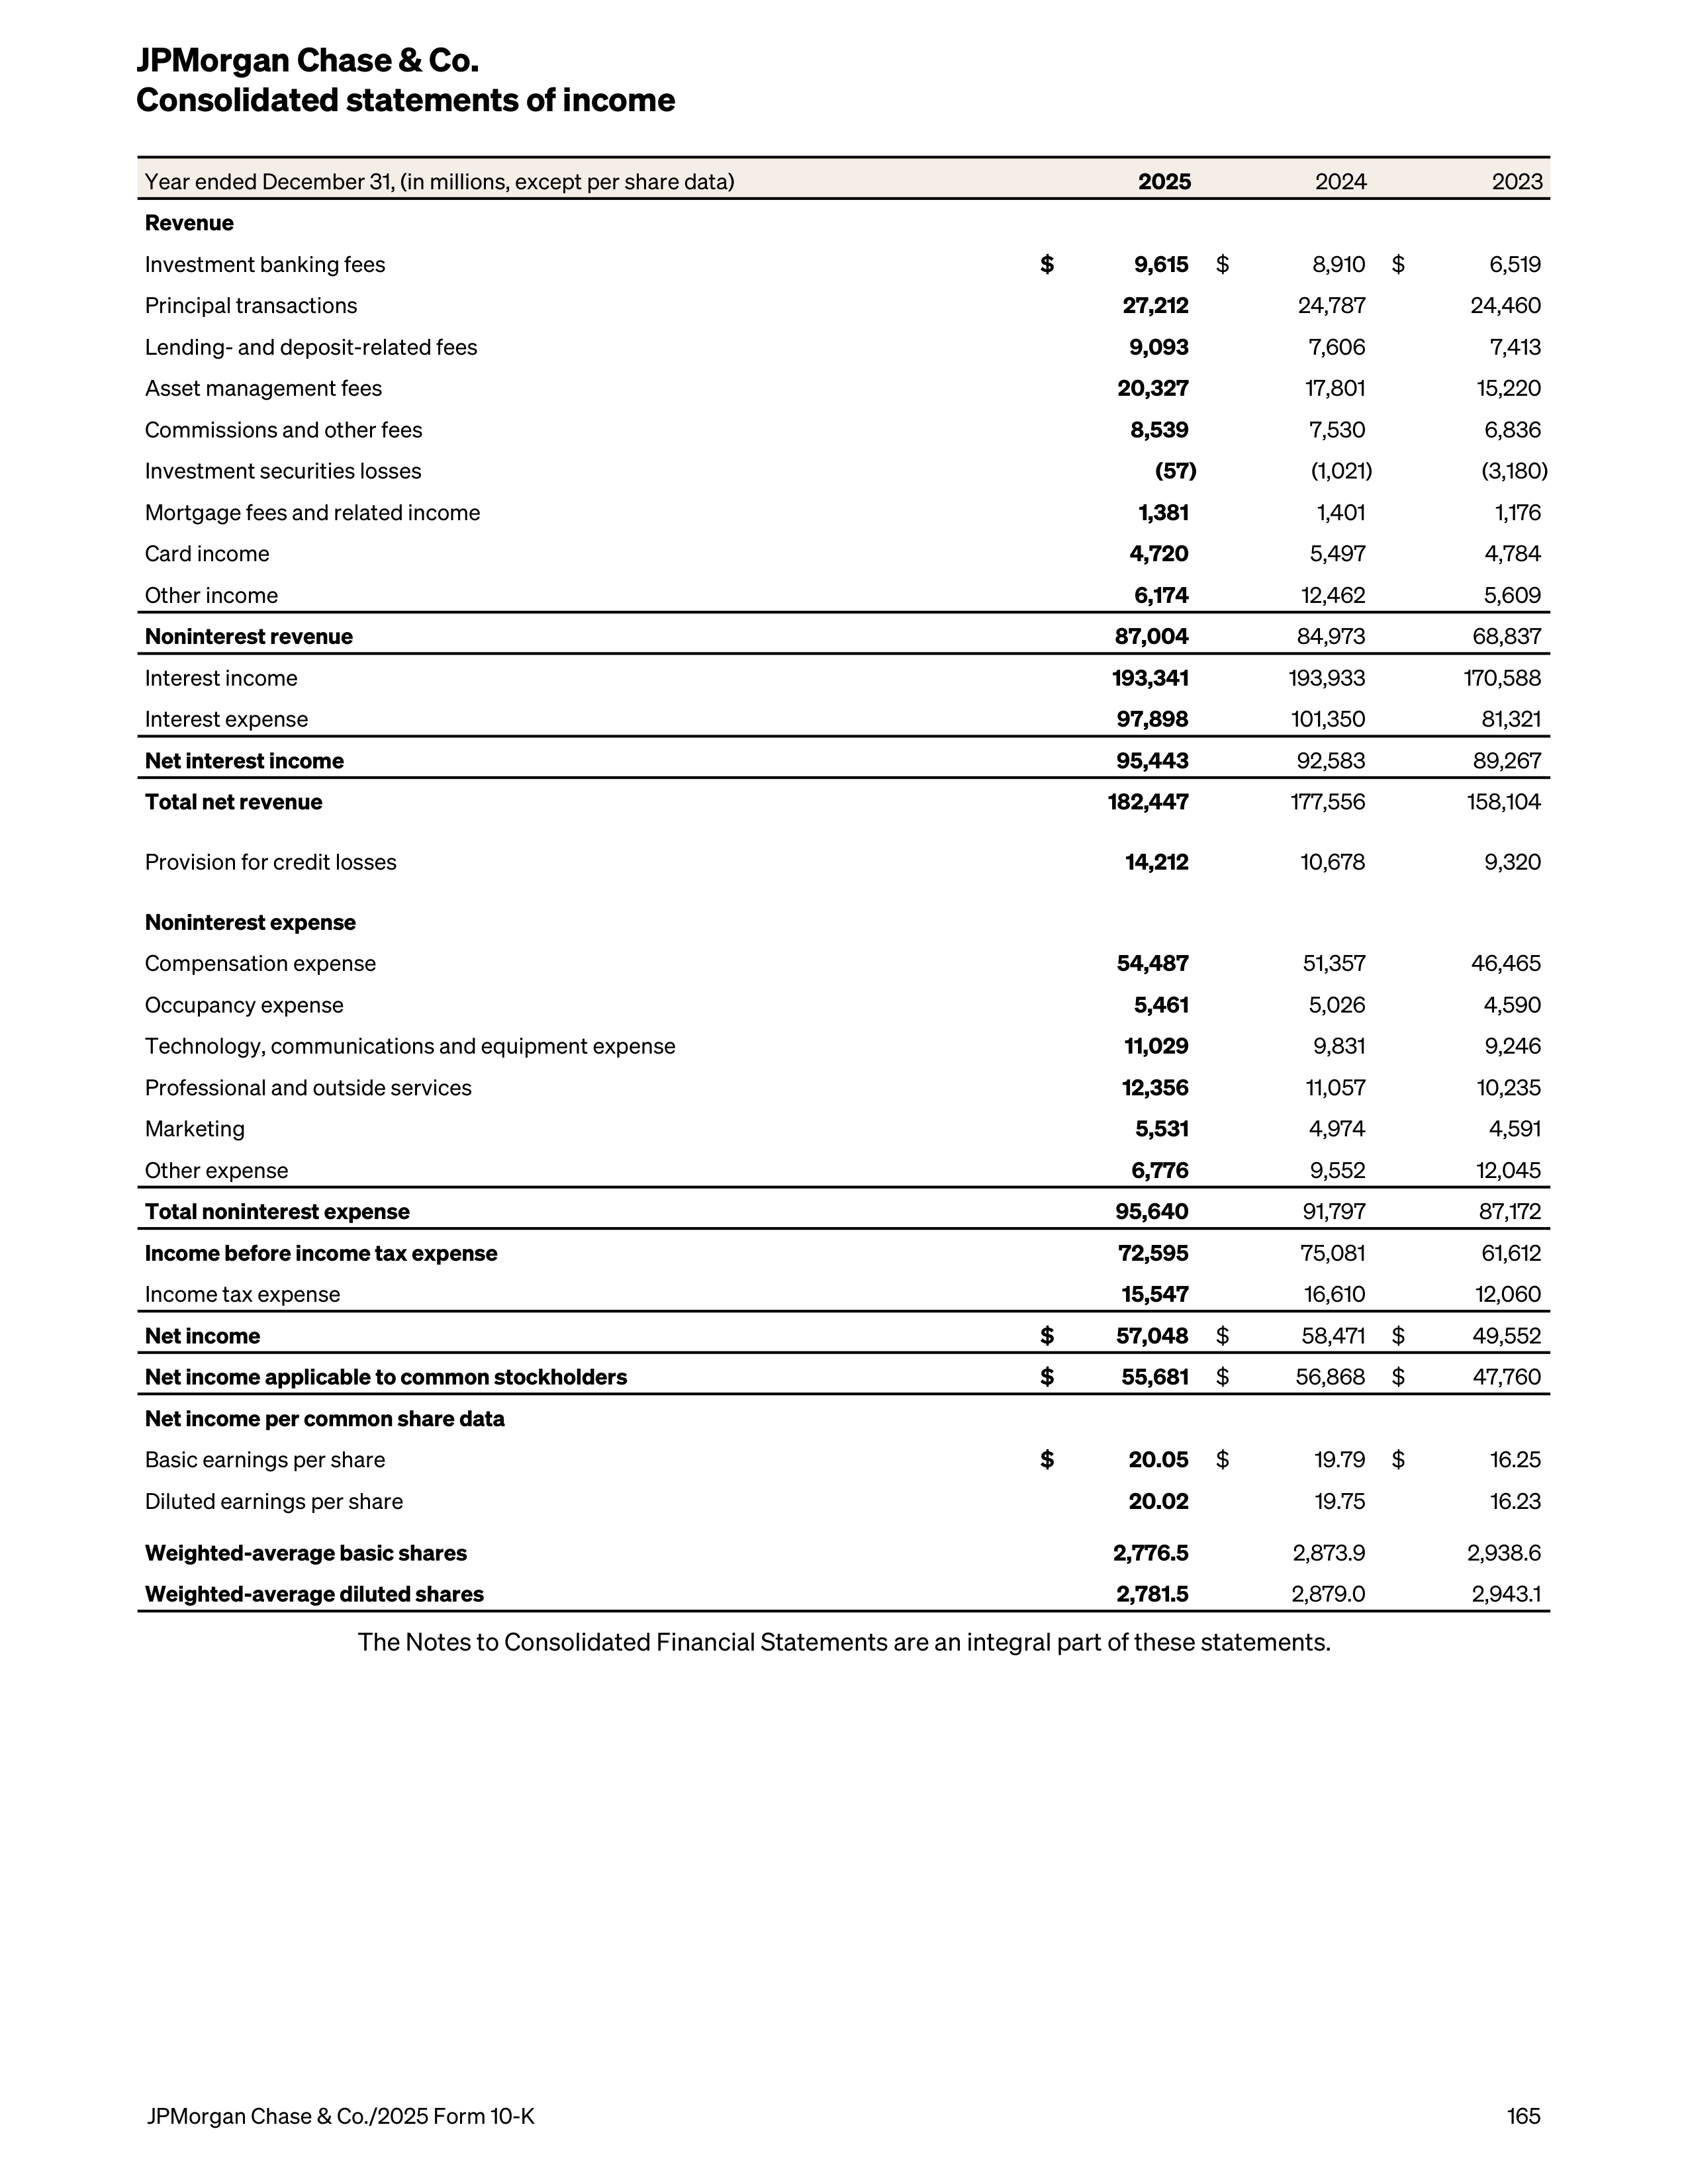
Year ended December 31, (in millions, except per share data)
2025
2024
2023
Revenue
Investment banking fees
$
9,615
$
8,910
$
6,519
Principal transactions
27,212
24,787
24,460
Lending- and deposit-related fees
9,093
7,606
7,413
Asset management fees
20,327
17,801
15,220
Commissions and other fees
8,539
7,530
6,836
Investment securities losses
(57)
(1,021)
(3,180)
Mortgage fees and related income
1,381
1,401
1,176
Card income
4,720
5,497
4,784
Other income
6,174
12,462
5,609
Noninterest revenue
87,004
84,973
68,837
Interest income
193,341
193,933
170,588
Interest expense
97,898
101,350
81,321
Net interest income
95,443
92,583
89,267
Total net revenue
182,447
177,556
158,104
Provision for credit losses
14,212
10,678
9,320
Noninterest expense
Compensation expense
54,487
51,357
46,465
Occupancy expense
5,461
5,026
4,590
Technology, communications and equipment expense
11,029
9,831
9,246
Professional and outside services
12,356
11,057
10,235
Marketing
5,531
4,974
4,591
Other expense
6,776
9,552
12,045
Total noninterest expense
95,640
91,797
87,172
Income before income tax expense
72,595
75,081
61,612
Income tax expense
15,547
16,610
12,060
Net income
$
57,048
$
58,471
$
49,552
Net income applicable to common stockholders
$
55,681
$
56,868
$
47,760
Net income per common share data
Basic earnings per share
$
20.05
$
19.79
$
16.25
Diluted earnings per share
20.02
19.75
16.23
Weighted-average basic shares
2,776.5
2,873.9
2,938.6
Weighted-average diluted shares
2,781.5
2,879.0
2,943.1
The Notes to Consolidated Financial Statements are an integral part of these statements.
JPMorgan Chase & Co.
Consolidated statements of income
JPMorgan Chase & Co./2025 Form 10-K
165
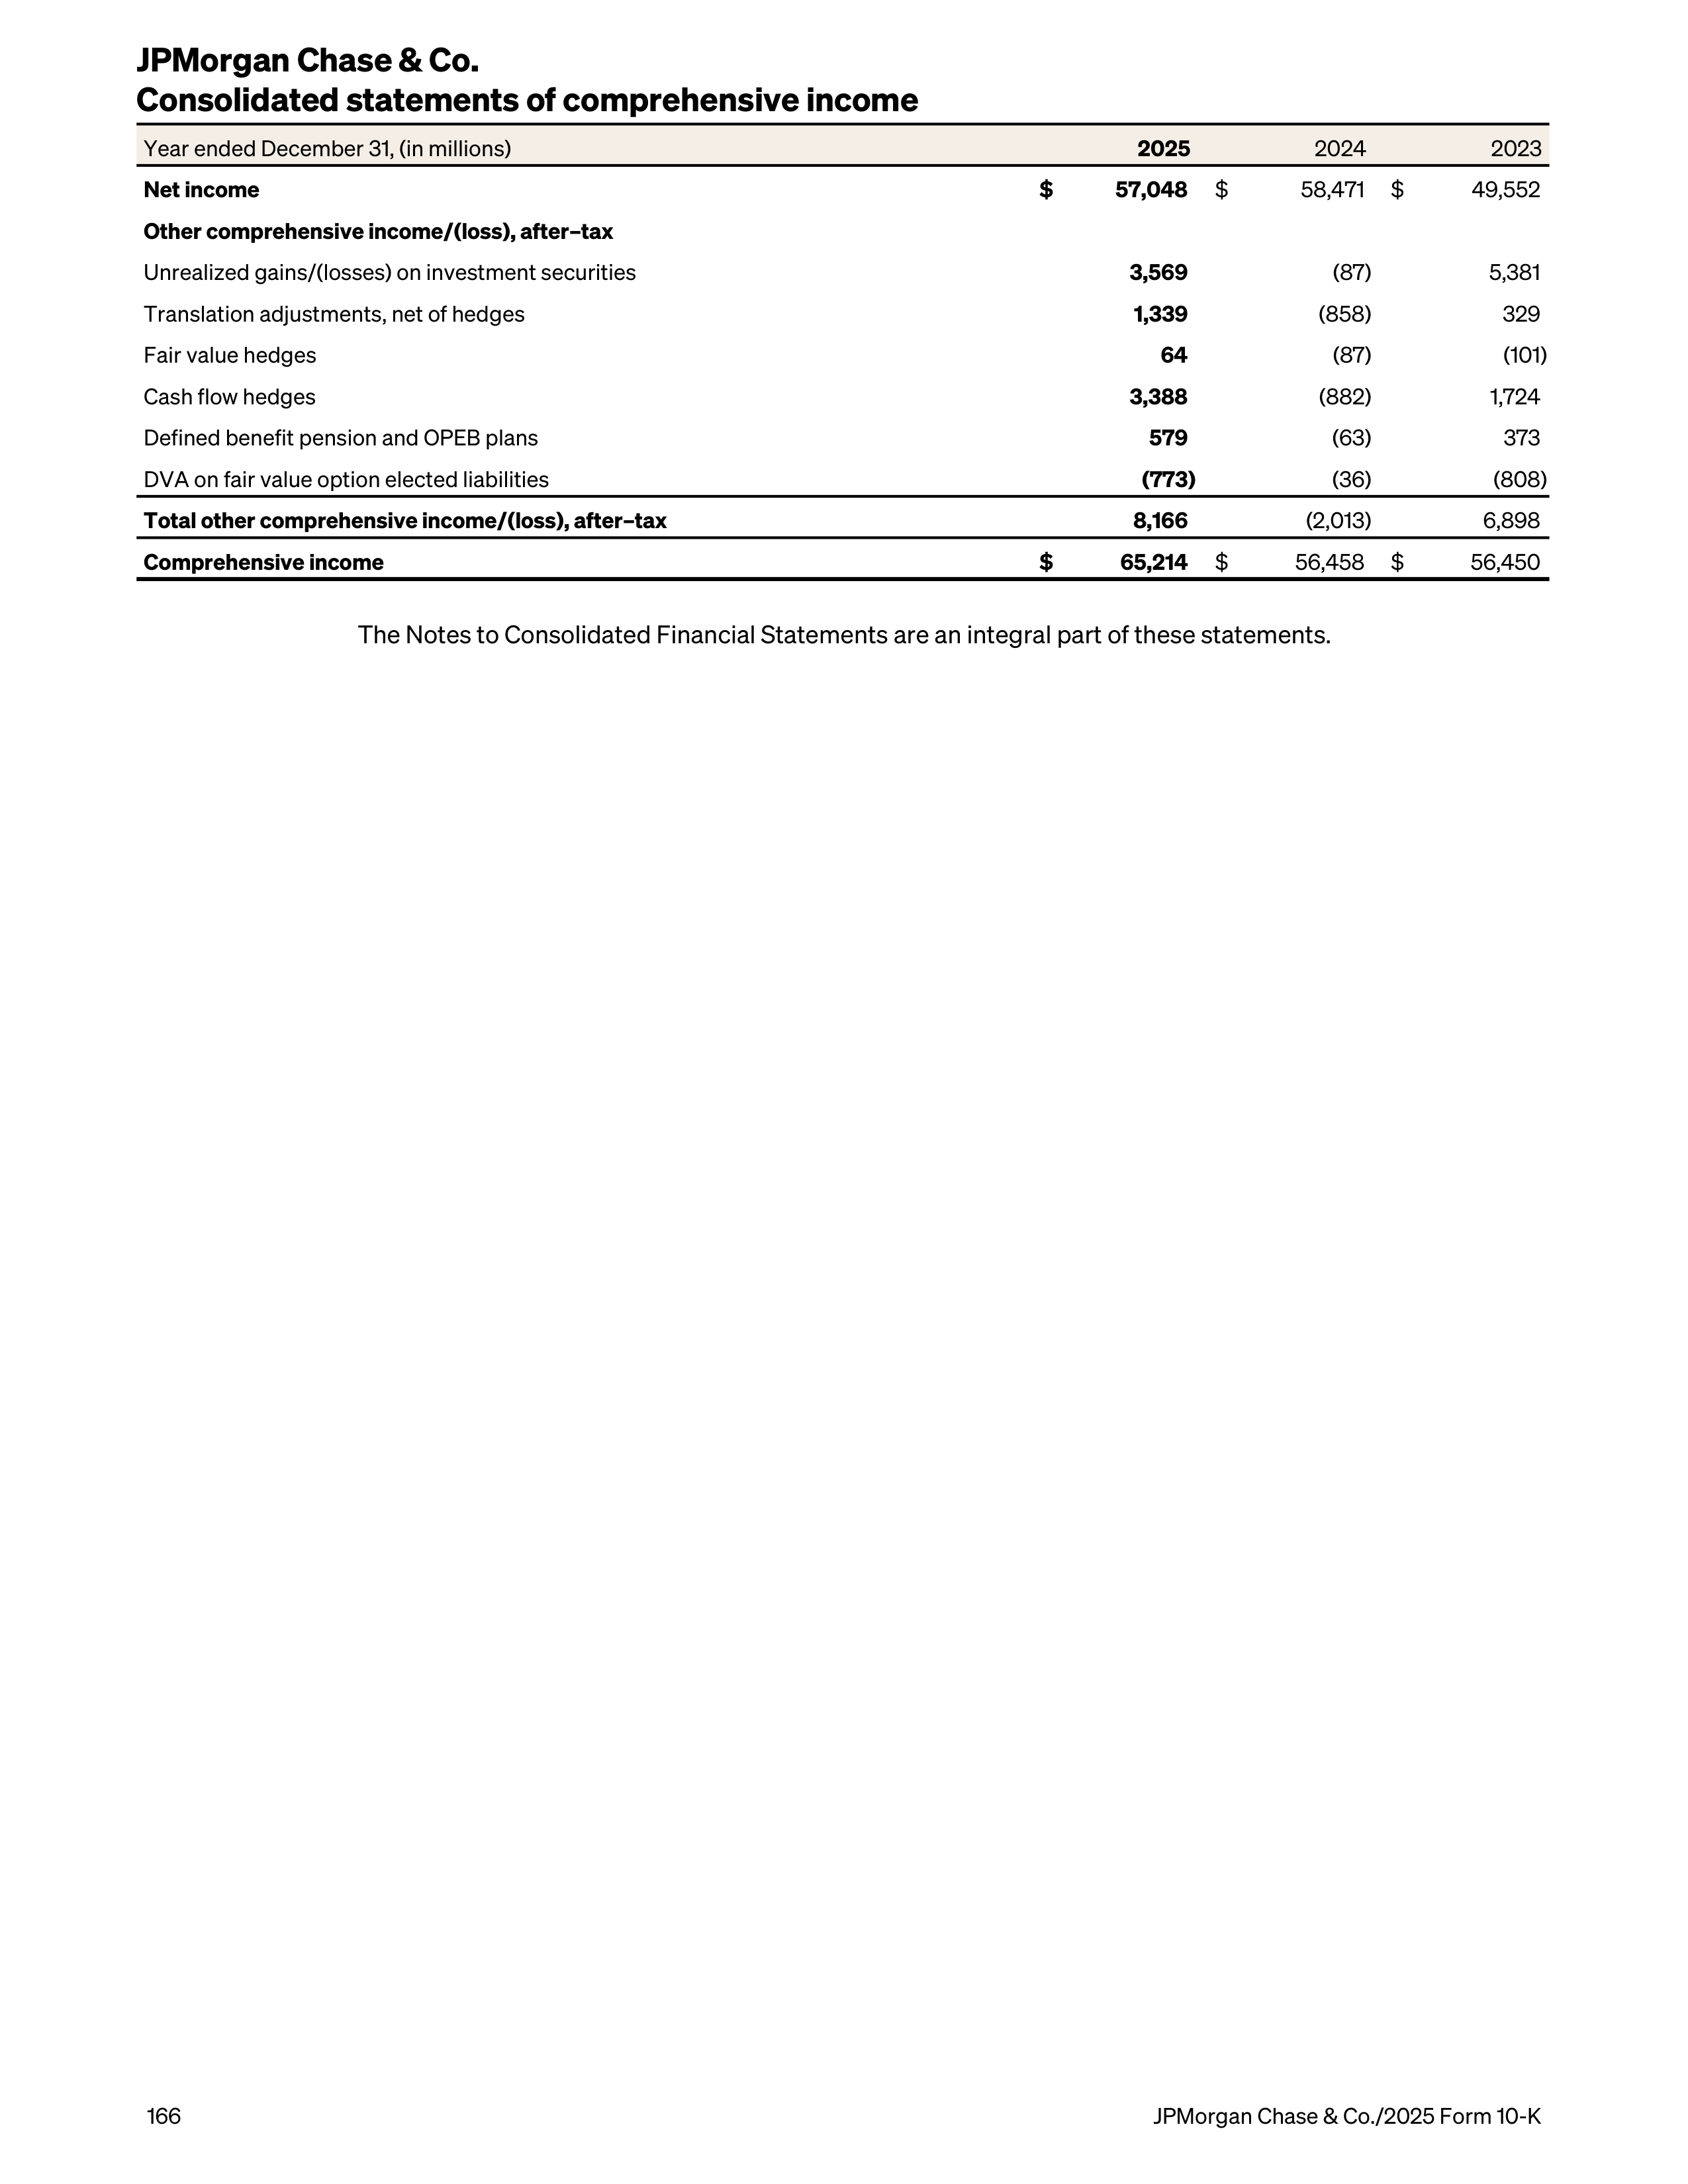
Year ended December 31, (in millions)
2025
2024
2023
Net income
$
57,048
$
58,471
$
49,552
Other comprehensive income/(loss), after–tax
Unrealized gains/(losses) on investment securities
3,569
(87)
5,381
Translation adjustments, net of hedges
1,339
(858)
329
Fair value hedges
64
(87)
(101)
Cash flow hedges
3,388
(882)
1,724
Defined benefit pension and OPEB plans
579
(63)
373
DVA on fair value option elected liabilities
(773)
(36)
(808)
Total other comprehensive income/(loss), after–tax
8,166
(2,013)
6,898
Comprehensive income
$
65,214
$
56,458
$
56,450
The Notes to Consolidated Financial Statements are an integral part of these statements.
JPMorgan Chase & Co.
Consolidated statements of comprehensive income
166
JPMorgan Chase & Co./2025 Form 10-K
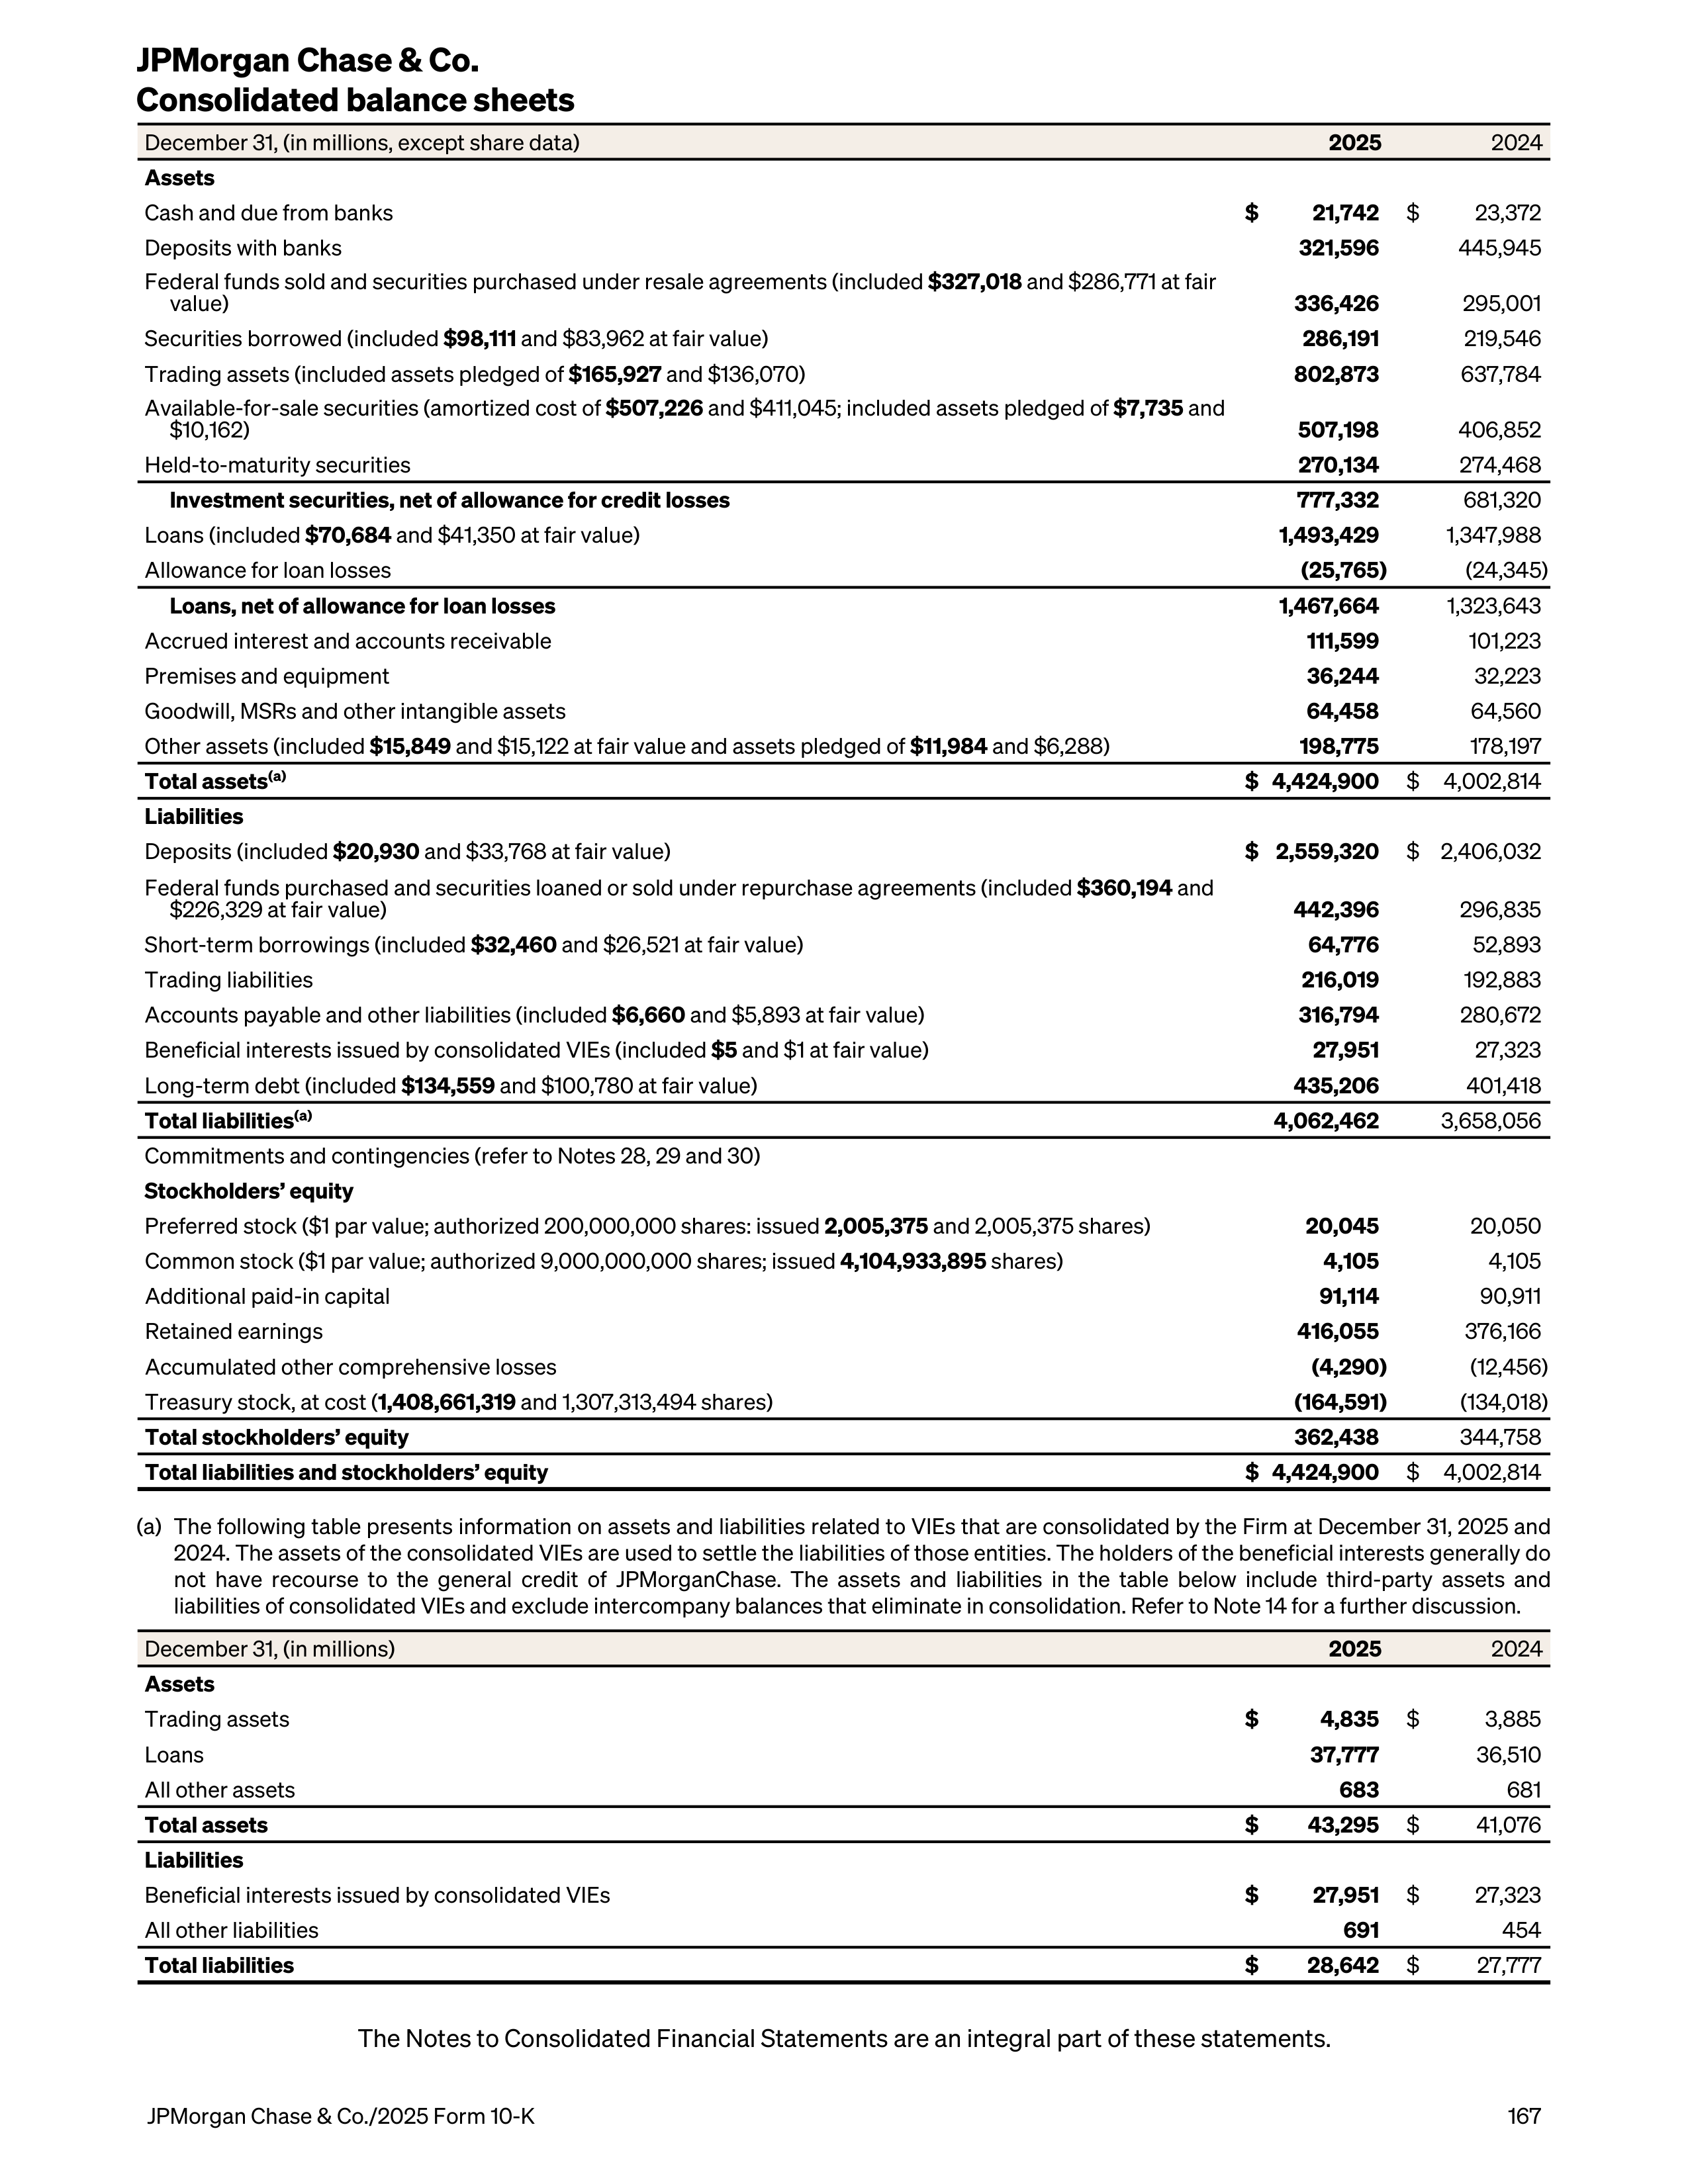
December 31, (in millions, except share data)
2025
2024
Assets
Cash and due from banks
$
21,742
$
23,372
Deposits with banks
321,596
445,945
Federal funds sold and securities purchased under resale agreements (included
$327,018
and $286,771 at fair
value)
336,426
295,001
Securities borrowed (included
$98,111
and $83,962 at fair value)
286,191
219,546
Trading assets (included assets pledged of
$165,927
and $136,070)
802,873
637,784
Available-for-sale securities (amortized cost of
$507,226
and $411,045; included assets pledged of
$7,735
and
$10,162)
507,198
406,852
Held-to-maturity securities
270,134
274,468
Investment securities, net of allowance for credit losses
777,332
681,320
Loans (included
$70,684
and $41,350 at fair value)
1,493,429
1,347,988
Allowance for loan losses
(25,765)
(24,345)
Loans, net of allowance for loan losses
1,467,664
1,323,643
Accrued interest and accounts receivable
111,599
101,223
Premises and equipment
36,244
32,223
Goodwill, MSRs and other intangible assets
64,458
64,560
Other assets (included
$15,849
and $15,122 at fair value and assets pledged of
$11,984
and $6,288)
198,775
178,197
Total assets
(a)
$ 4,424,900
$
4,002,814
Liabilities
Deposits (included
$20,930
and $33,768 at fair value)
$ 2,559,320
$ 2,406,032
Federal funds purchased and securities loaned or sold under repurchase agreements (included
$360,194
and
$226,329 at fair value)
442,396
296,835
Short-term borrowings (included
$32,460
and $26,521 at fair value)
64,776
52,893
Trading liabilities
216,019
192,883
Accounts payable and other liabilities (included
$6,660
and $5,893 at fair value)
316,794
280,672
Beneficial interests issued by consolidated VIEs (included
$5
and $1 at fair value)
27,951
27,323
Long-term debt (included
$134,559
and $100,780 at fair value)
435,206
401,418
Total liabilities
(a)
4,062,462
3,658,056
Commitments and contingencies (refer to Notes 28, 29 and 30)
Stockholders’ equity
Preferred stock ($1 par value; authorized 200,000,000 shares: issued
2,005,375
and 2,005,375 shares)
20,045
20,050
Common stock ($1 par value; authorized 9,000,000,000 shares; issued
4,104,933,895
shares)
4,105
4,105
Additional paid-in capital
91,114
90,911
Retained earnings
416,055
376,166
Accumulated other comprehensive losses
(4,290)
(12,456)
Treasury stock, at cost (
1,408,661,319
and 1,307,313,494 shares)
(164,591)
(134,018)
Total stockholders’ equity
362,438
344,758
Total liabilities and stockholders’ equity
$ 4,424,900
$
4,002,814
(a)
The following table presents information on assets and liabilities related to VIEs that are consolidated by the Firm at December 31, 2025 and
2024. The assets of the consolidated VIEs are used to settle the liabilities of those entities. The holders of the beneficial interests generally do
not have recourse to the general credit of JPMorganChase. The assets and liabilities in the table below include third-party assets and
liabilities of consolidated VIEs and exclude intercompany balances that eliminate in consolidation. Refer to Note 14 for a further discussion.
December 31, (in millions)
2025
2024
Assets
Trading assets
$
4,835
$
3,885
Loans
37,777
36,510
All other assets
683
681
Total assets
$
43,295
$
41,076
Liabilities
Beneficial interests issued by consolidated VIEs
$
27,951
$
27,323
All other liabilities
691
454
Total liabilities
$
28,642
$
27,777
The Notes to Consolidated Financial Statements are an integral part of these statements.
JPMorgan Chase & Co.
Consolidated balance sheets
JPMorgan Chase & Co./2025 Form 10-K
167
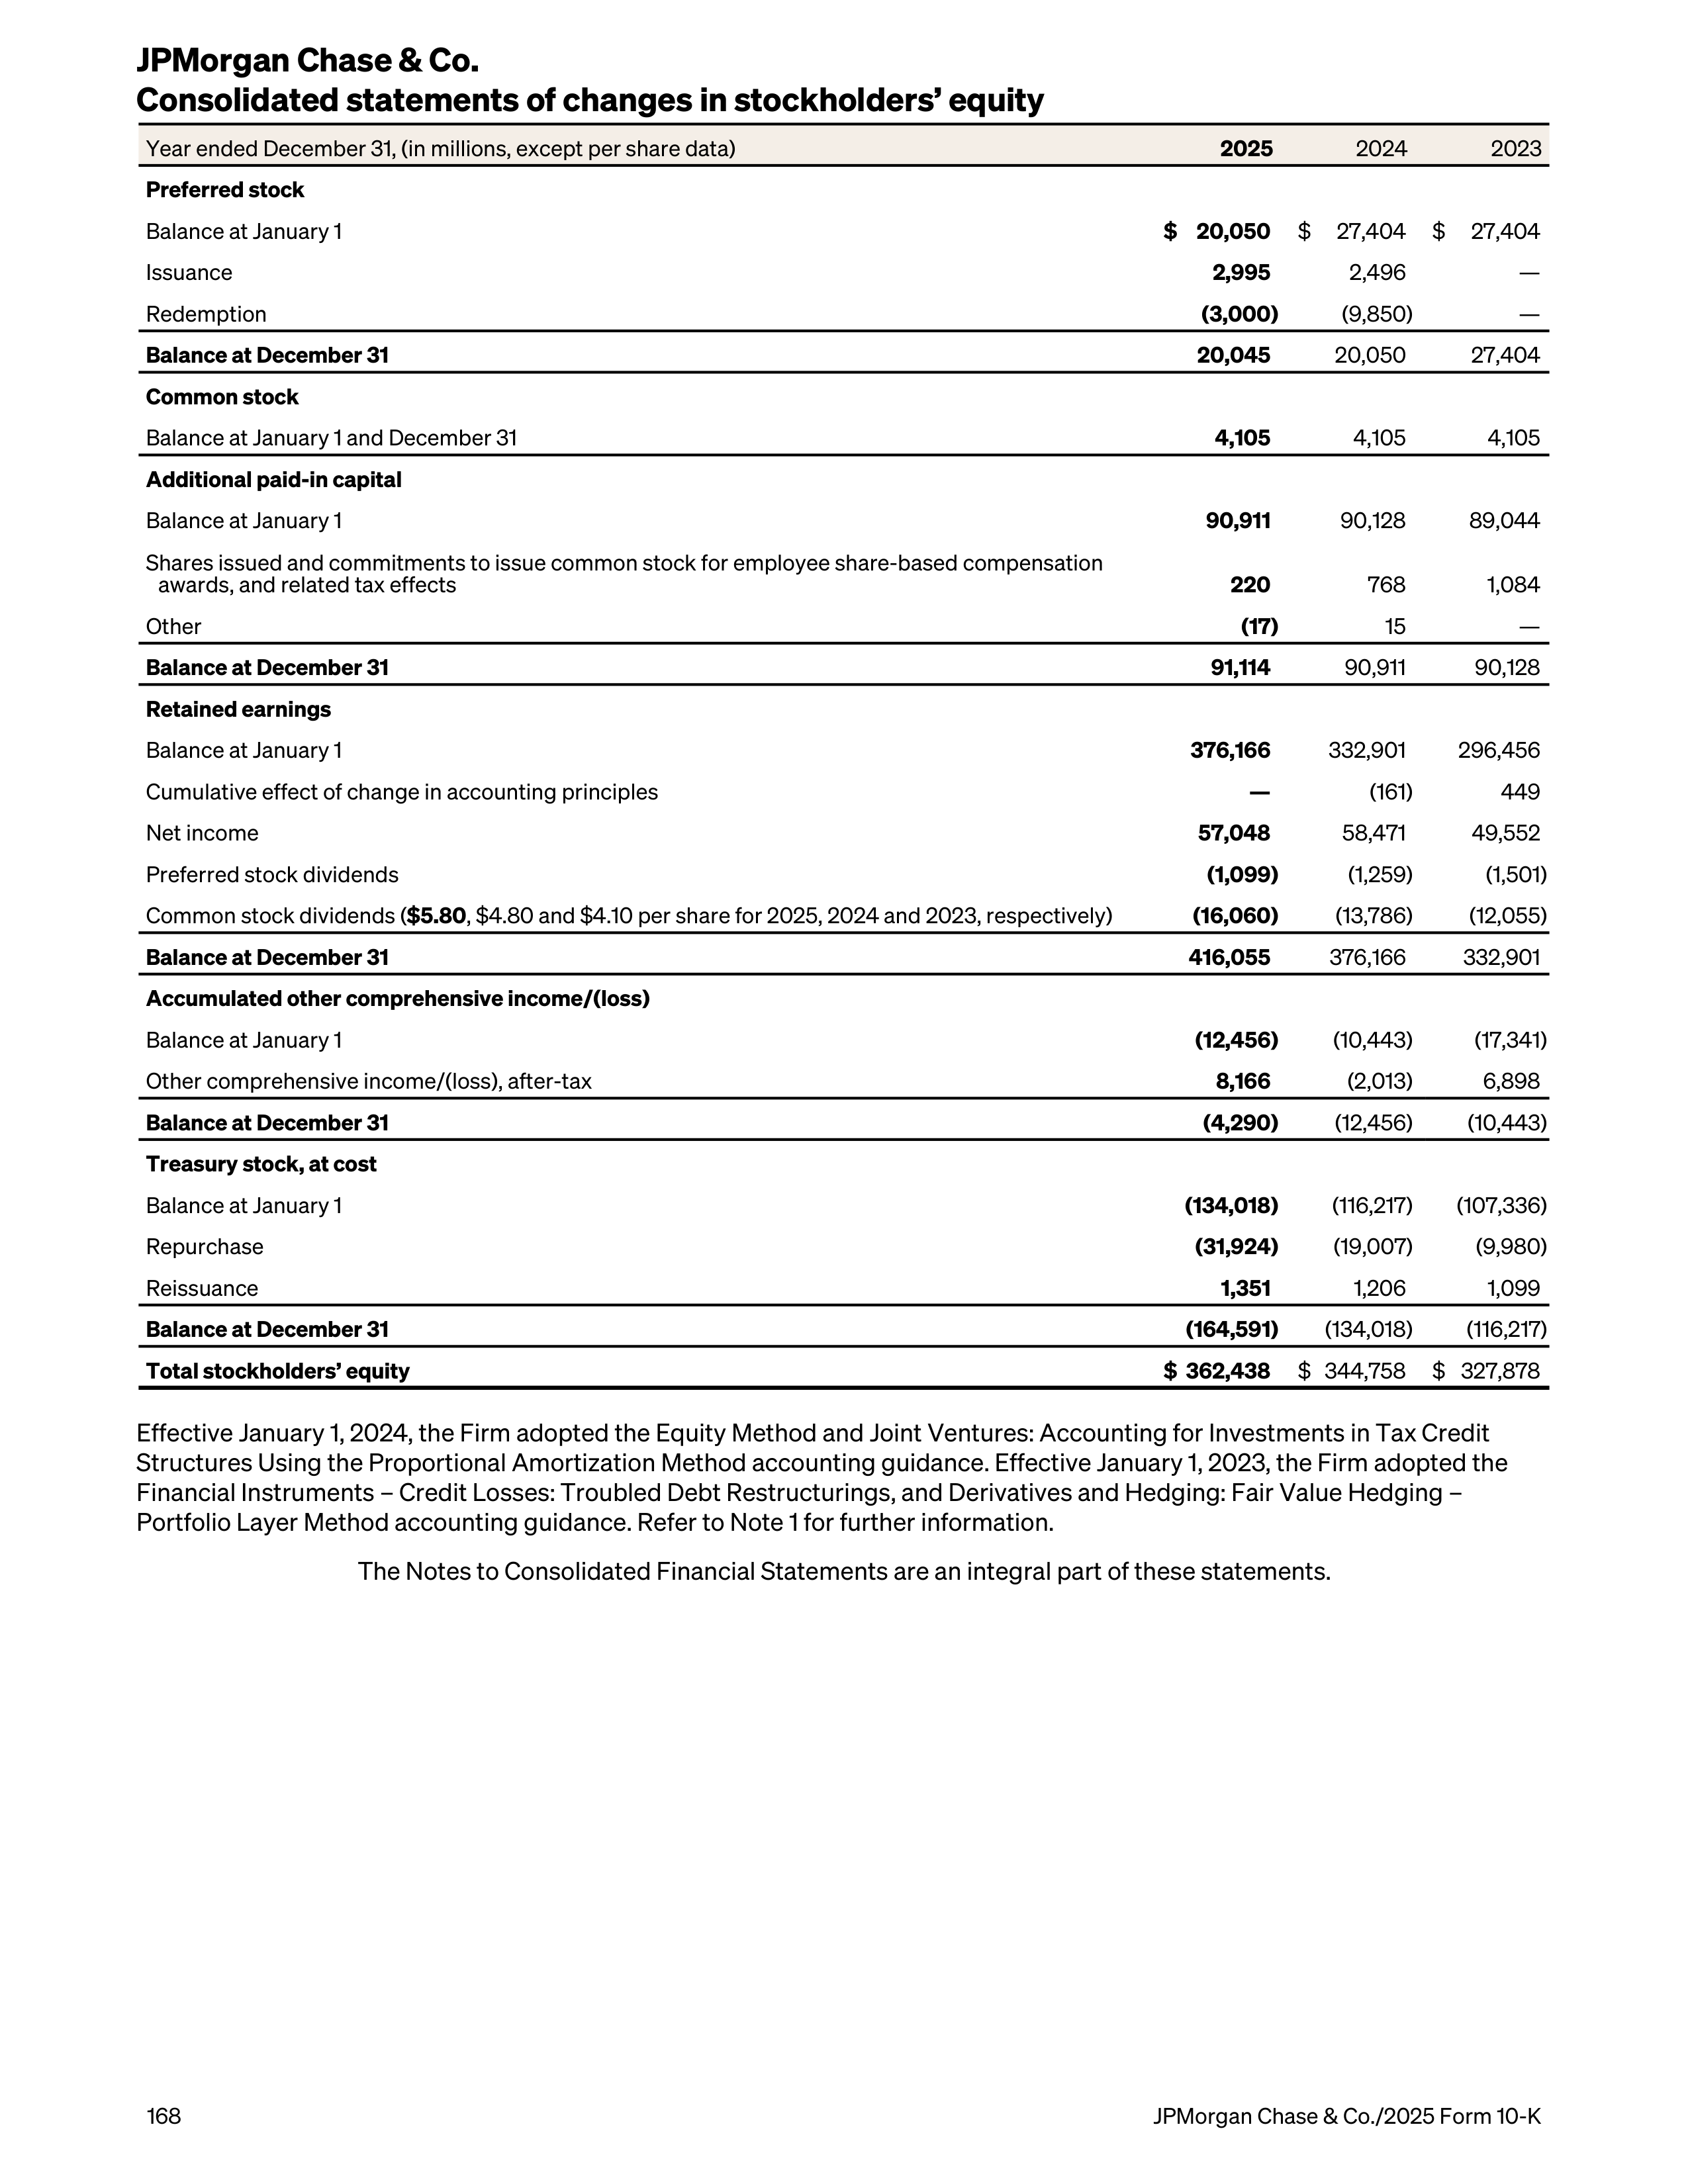
Year ended December 31, (in millions, except per share data)
2025
2024
2023
Preferred stock
Balance at January 1
$ 20,050
$
27,404
$
27,404
Issuance
2,995
2,496
—
Redemption
(3,000)
(9,850)
—
Balance at December 31
20,045
20,050
27,404
Common stock
Balance at January 1 and December 31
4,105
4,105
4,105
Additional paid-in capital
Balance at January 1
90,911
90,128
89,044
Shares issued and commitments to issue common stock for employee share-based compensation
awards, and related tax effects
220
768
1,084
Other
(17)
15
—
Balance at December 31
91,114
90,911
90,128
Retained earnings
Balance at January 1
376,166
332,901
296,456
Cumulative effect of change in accounting principles
—
(161)
449
Net income
57,048
58,471
49,552
Preferred stock dividends
(1,099)
(1,259)
(1,501)
Common stock dividends (
$5.80
, $4.80 and $4.10 per share for 2025, 2024 and 2023, respectively)
(16,060)
(13,786)
(12,055)
Balance at December 31
416,055
376,166
332,901
Accumulated other comprehensive income/(loss)
Balance at January 1
(12,456)
(10,443)
(17,341)
Other comprehensive income/(loss), after-tax
8,166
(2,013)
6,898
Balance at December 31
(4,290)
(12,456)
(10,443)
Treasury stock, at cost
Balance at January 1
(134,018)
(116,217)
(107,336)
Repurchase
(31,924)
(19,007)
(9,980)
Reissuance
1,351
1,206
1,099
Balance at December 31
(164,591)
(134,018)
(116,217)
Total stockholders’ equity
$ 362,438
$ 344,758
$ 327,878
Effective January 1, 2024, the Firm adopted the Equity Method and Joint Ventures: Accounting for Investments in Tax Credit
Structures Using the Proportional Amortization Method accounting guidance. Effective January 1, 2023, the Firm adopted the
Financial Instruments – Credit Losses: Troubled Debt Restructurings, and Derivatives and Hedging: Fair Value Hedging –
Portfolio Layer Method accounting guidance. Refer to Note 1 for further information.
The Notes to Consolidated Financial Statements are an integral part of these statements.
JPMorgan Chase & Co.
Consolidated statements of changes in stockholders’ equity
168
JPMorgan Chase & Co./2025 Form 10-K
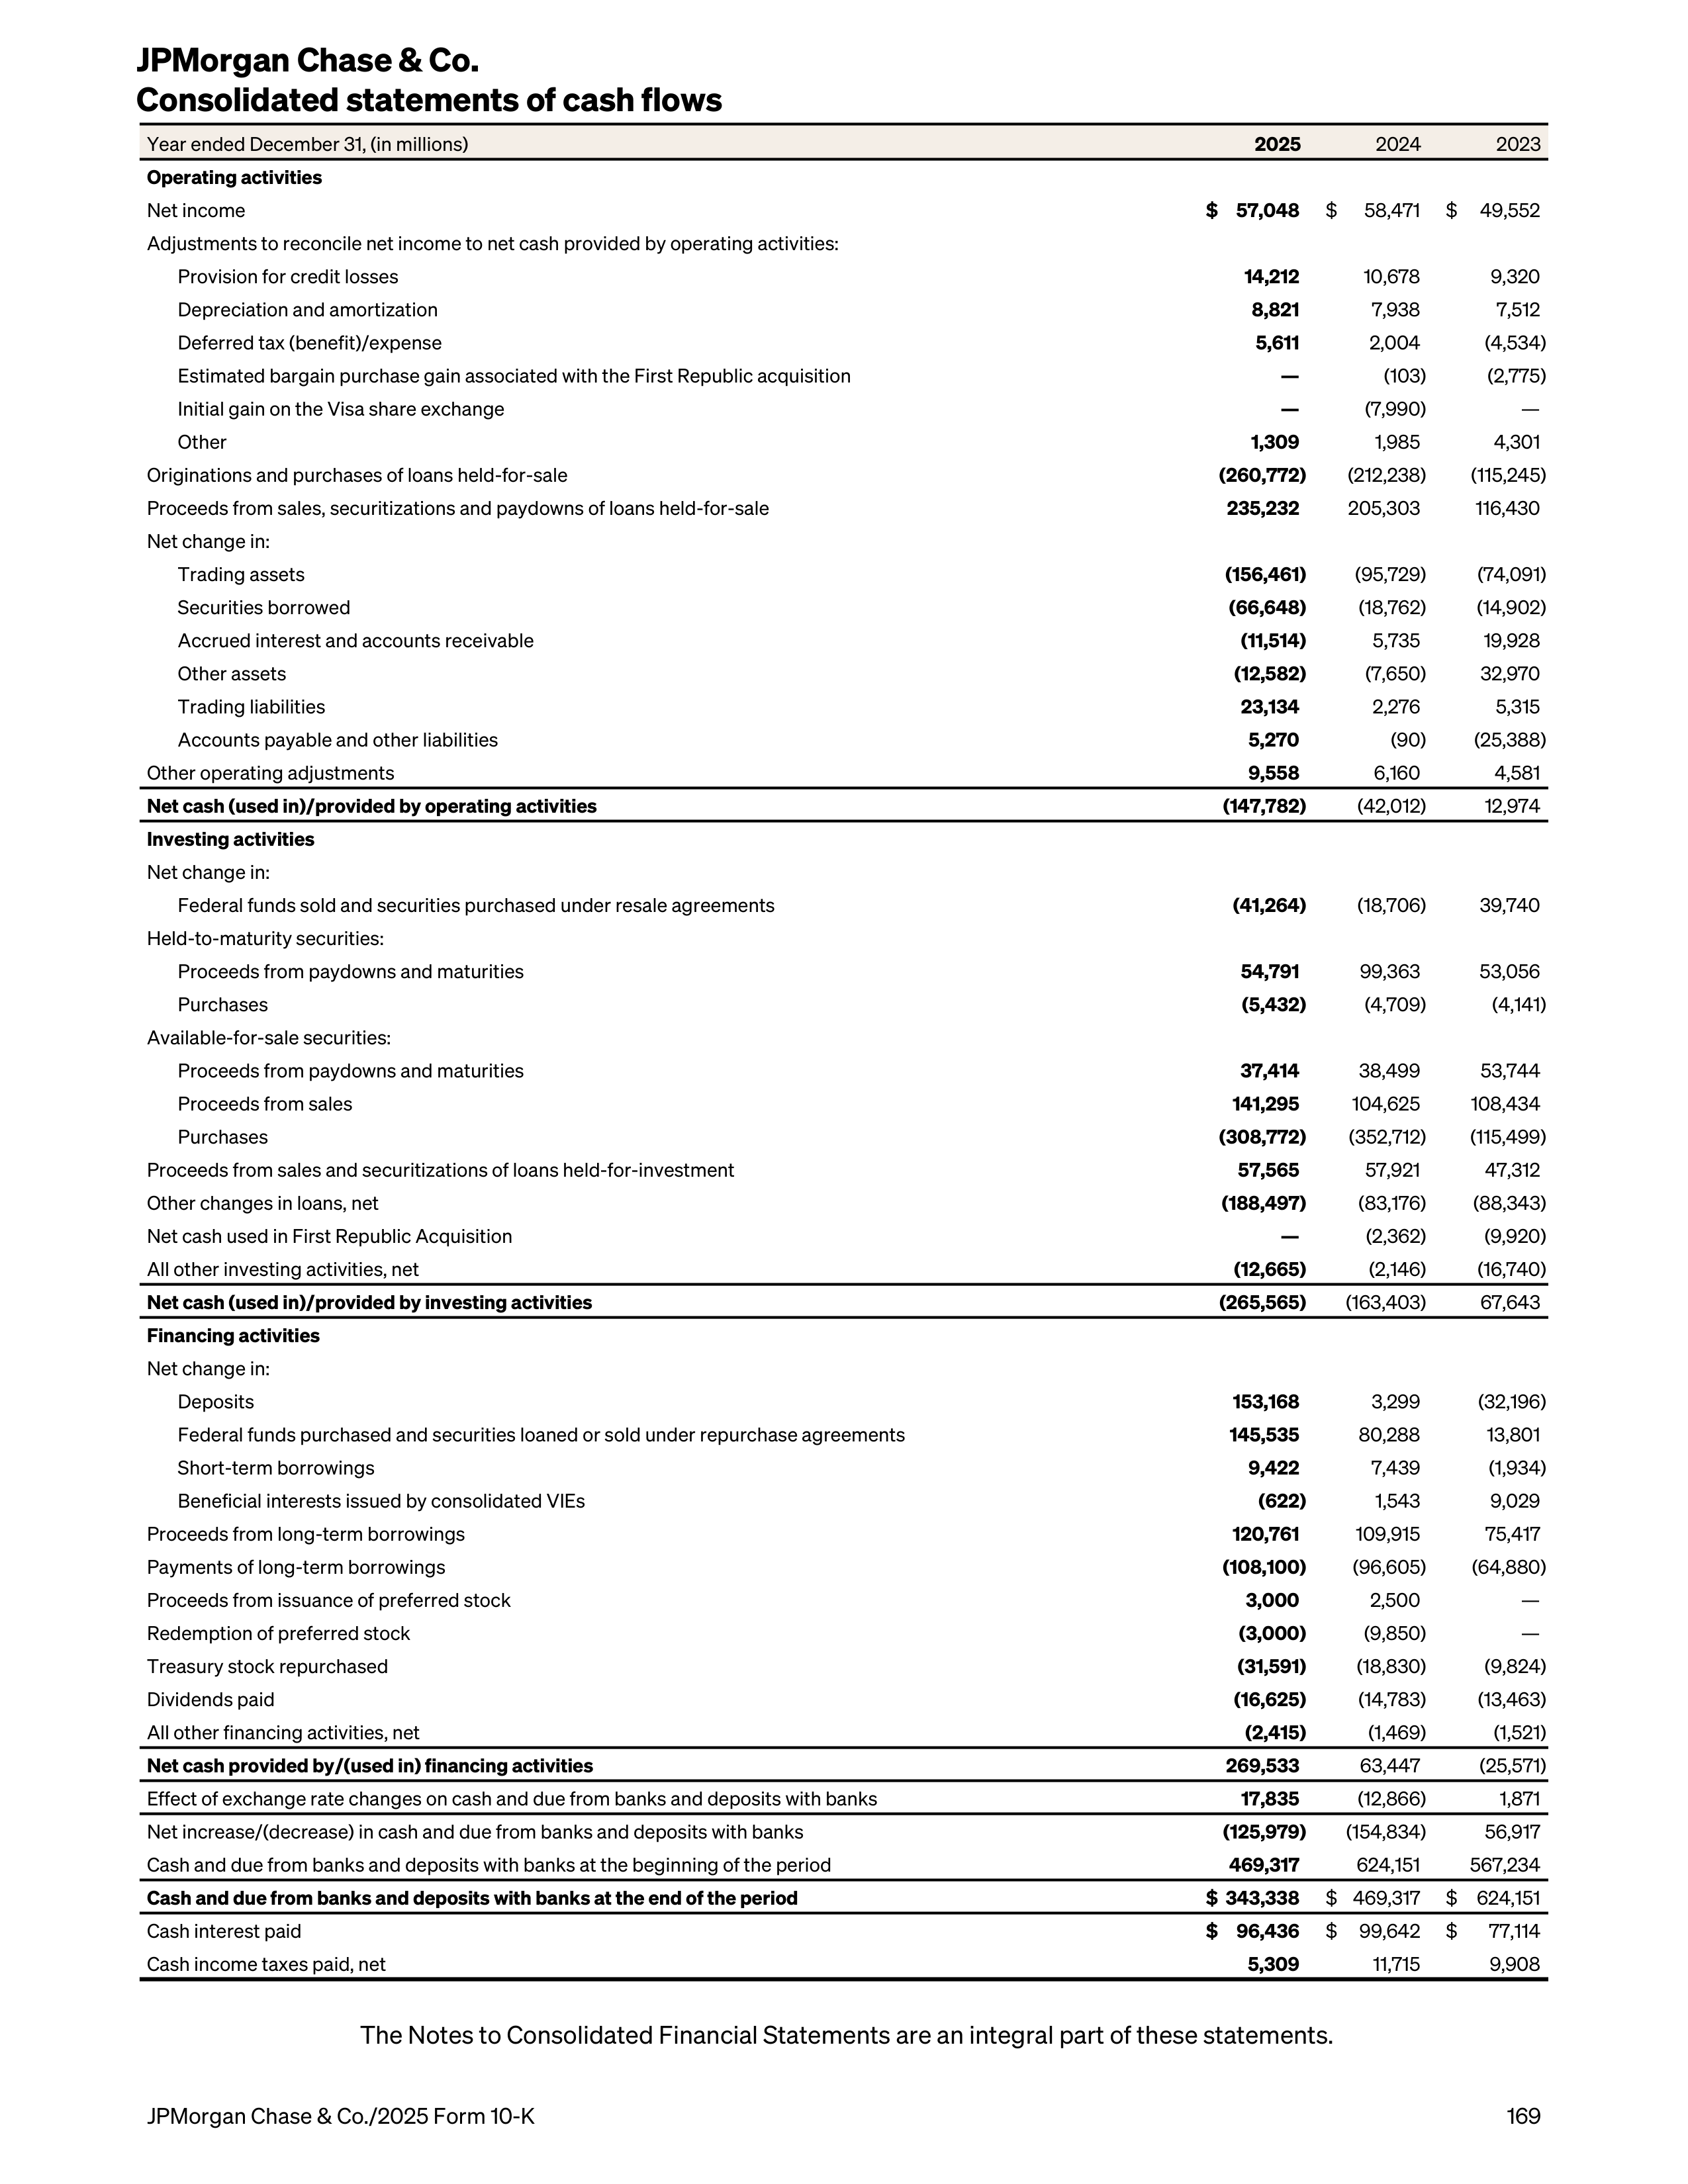
Year ended December 31, (in millions)
2025
2024
2023
Operating activities
Net income
$ 57,048
$
58,471
$
49,552
Adjustments to reconcile net income to net cash provided by operating activities:
Provision for credit losses
14,212
10,678
9,320
Depreciation and amortization
8,821
7,938
7,512
Deferred tax (benefit)/expense
5,611
2,004
(4,534)
Estimated bargain purchase gain associated with the First Republic acquisition
—
(103)
(2,775)
Initial gain on the Visa share exchange
—
(7,990)
—
Other
1,309
1,985
4,301
Originations and purchases of loans held-for-sale
(260,772)
(212,238)
(115,245)
Proceeds from sales, securitizations and paydowns of loans held-for-sale
235,232
205,303
116,430
Net change in:
Trading assets
(156,461)
(95,729)
(74,091)
Securities borrowed
(66,648)
(18,762)
(14,902)
Accrued interest and accounts receivable
(11,514)
5,735
19,928
Other assets
(12,582)
(7,650)
32,970
Trading liabilities
23,134
2,276
5,315
Accounts payable and other liabilities
5,270
(90)
(25,388)
Other operating adjustments
9,558
6,160
4,581
Net cash (used in)/provided by operating activities
(147,782)
(42,012)
12,974
Investing activities
Net change in:
Federal funds sold and securities purchased under resale agreements
(41,264)
(18,706)
39,740
Held-to-maturity securities:
Proceeds from paydowns and maturities
54,791
99,363
53,056
Purchases
(5,432)
(4,709)
(4,141)
Available-for-sale securities:
Proceeds from paydowns and maturities
37,414
38,499
53,744
Proceeds from sales
141,295
104,625
108,434
Purchases
(308,772)
(352,712)
(115,499)
Proceeds from sales and securitizations of loans held-for-investment
57,565
57,921
47,312
Other changes in loans, net
(188,497)
(83,176)
(88,343)
Net cash used in First Republic Acquisition
—
(2,362)
(9,920)
All other investing activities, net
(12,665)
(2,146)
(16,740)
Net cash (used in)/provided by investing activities
(265,565)
(163,403)
67,643
Financing activities
Net change in:
Deposits
153,168
3,299
(32,196)
Federal funds purchased and securities loaned or sold under repurchase agreements
145,535
80,288
13,801
Short-term borrowings
9,422
7,439
(1,934)
Beneficial interests issued by consolidated VIEs
(622)
1,543
9,029
Proceeds from long-term borrowings
120,761
109,915
75,417
Payments of long-term borrowings
(108,100)
(96,605)
(64,880)
Proceeds from issuance of preferred stock
3,000
2,500
—
Redemption of preferred stock
(3,000)
(9,850)
—
Treasury stock repurchased
(31,591)
(18,830)
(9,824)
Dividends paid
(16,625)
(14,783)
(13,463)
All other financing activities, net
(2,415)
(1,469)
(1,521)
Net cash provided by/(used in) financing activities
269,533
63,447
(25,571)
Effect of exchange rate changes on cash and due from banks and deposits with banks
17,835
(12,866)
1,871
Net increase/(decrease) in cash and due from banks and deposits with banks
(125,979)
(154,834)
56,917
Cash and due from banks and deposits with banks at the beginning of the period
469,317
624,151
567,234
Cash and due from banks and deposits with banks at the end of the period
$ 343,338
$ 469,317
$
624,151
Cash interest paid
$ 96,436
$
99,642
$
77,114
Cash income taxes paid, net
5,309
11,715
9,908
The Notes to Consolidated Financial Statements are an integral part of these statements.
JPMorgan Chase & Co.
Consolidated statements of cash flows
JPMorgan Chase & Co./2025 Form 10-K
169
Note 1 – Basis of presentation
JPMorgan Chase & Co. (“JPMorganChase” or the
“Firm”), a financial holding company incorporated
under Delaware law in 1968, is a leading financial
services firm based in the U.S., with operations
worldwide. The Firm is a leader in investment banking,
financial services for consumers and small businesses,
commercial banking, financial transaction processing
and asset management. Refer to Note 32 for further
discussion of the Firm's reportable business
segments.
The accounting and financial reporting policies of
JPMorganChase and its subsidiaries conform to U.S.
GAAP. Additionally, where applicable, the policies
conform to the accounting and reporting guidelines
prescribed by regulatory authorities.
Consolidation
The Consolidated Financial Statements include the
accounts of JPMorganChase and other entities in
which the Firm has a controlling financial interest. All
material intercompany balances and transactions have
been eliminated.
Assets held for clients in an agency or fiduciary
capacity by the Firm are not assets of JPMorganChase
and are not included on the Consolidated balance
sheets.
The Firm determines whether it has a controlling
financial interest in an entity by first evaluating
whether the entity is a voting interest entity or a
variable interest entity.
Voting interest entities
Voting interest entities are entities that have sufficient
equity and provide the equity investors voting rights
that enable them to make significant decisions relating
to the entity’s operations. For these types of entities,
the Firm’s determination of whether it has a controlling
interest is primarily based on the amount of voting
equity interests held. Entities in which the Firm has a
controlling financial interest, through ownership of the
majority of the entities’ voting equity interests, or
through other contractual rights that give the Firm
control, are consolidated by the Firm.
Investments in companies in which the Firm has
significant influence over operating and financing
decisions (but does not own a majority of the voting
equity interests) are accounted for (i) in accordance
with the equity method of accounting, or (ii) at fair
value if the fair value option was elected. These
investments are generally included in other assets,
with income or loss included in noninterest revenue.
Certain Firm-sponsored asset management funds are
structured as limited partnerships or limited liability
companies. For many of these entities, the Firm is the
general partner or managing member, but the non-
affiliated partners or members have the ability to
remove the Firm as the general partner or managing
member without cause (i.e., kick-out rights), based on
a simple majority vote, or the non-affiliated partners or
members have rights to participate in important
decisions. Accordingly, the Firm does not consolidate
these voting interest entities. However, in the limited
cases where the non-managing partners or members
do not have substantive kick-out or participating
rights, the Firm evaluates the funds as VIEs and
consolidates the funds if the Firm is the general
partner or managing member and has both power and
a potentially significant interest.
The Firm’s investment companies and asset
management funds have investments in both publicly-
held and privately-held entities, including investments
in buyouts, growth equity and venture opportunities.
These investments are accounted for under
investment company guidelines and, accordingly,
irrespective of the percentage of equity ownership
interests held, are carried on the Consolidated balance
sheets at fair value, and are recorded in other assets,
with income or loss included in noninterest revenue. If
consolidated, the Firm retains the accounting under
such specialized investment company guidelines.
Variable interest entities
VIEs are entities that, by design, either (1) lack
sufficient equity to permit the entity to finance its
activities without additional subordinated financial
support from other parties, or (2) have equity investors
that do not have the ability to make significant
decisions relating to the entity’s operations through
voting rights, or do not have the obligation to absorb
the expected losses, or do not have the right to receive
the residual returns of the entity.
The most common type of VIE is an SPE. SPEs are
commonly used in securitization transactions in order
to isolate certain assets and distribute the cash flows
from those assets to investors. The basic SPE
structure involves a company selling assets to the SPE;
the SPE funds the purchase of those assets by issuing
securities to investors. The legal documents that
govern the transaction specify how the cash earned on
the assets must be allocated to the SPE’s investors
and other parties that have rights to those cash flows.
SPEs are generally structured to insulate investors
from claims on the SPE’s assets by creditors of other
entities, including the creditors of the seller of the
assets.
The primary beneficiary of a VIE (i.e., the party that has
a controlling financial interest) is required to
consolidate the assets and liabilities of the VIE. The
primary beneficiary is the party that has both (1) the
power to direct the activities of the VIE that most
Notes to consolidated financial statements
170
JPMorgan Chase & Co./2025 Form 10-K
significantly impact the VIE’s economic performance;
and (2) through its interests in the VIE, the obligation
to absorb losses or the right to receive benefits from
the VIE that could potentially be significant to the VIE.
To assess whether the Firm has the power to direct the
activities of a VIE that most significantly impact the
VIE’s economic performance, the Firm considers all
the facts and circumstances, including its role in
establishing the VIE and its ongoing rights and
responsibilities. This assessment includes, first,
identifying the activities that most significantly impact
the VIE’s economic performance; and second,
identifying which party, if any, has power over those
activities. In general, the parties that make the most
significant decisions affecting the VIE (such as asset
managers, collateral managers, servicers, or owners of
call options or liquidation rights over the VIE’s assets)
or have the right to unilaterally remove those decision-
makers are deemed to have the power to direct the
activities of a VIE.
To assess whether the Firm has the obligation to
absorb losses of the VIE or the right to receive benefits
from the VIE that could potentially be significant to the
VIE, the Firm considers all of its economic interests,
including debt and equity investments, servicing fees,
and derivatives or other arrangements deemed to be
variable interests in the VIE. This assessment requires
that the Firm apply judgment in determining whether
these interests, in the aggregate, are considered
potentially significant to the VIE. Factors considered in
assessing significance include: the design of the VIE,
including its capitalization structure; subordination of
interests; payment priority; relative share of interests
held across various classes within the VIE’s capital
structure; and the reasons why the interests are held
by the Firm.
The Firm performs on-going reassessments of: (1)
whether entities previously evaluated under the
majority voting-interest framework have become VIEs,
based on certain events, and are therefore subject to
the VIE consolidation framework; and (2) whether
changes in the facts and circumstances regarding the
Firm’s involvement with a VIE cause the Firm’s
consolidation conclusion to change.
Refer to Note 14 for further discussion of Firm-
sponsored VIEs.
Revenue recognition
Interest income
The Firm recognizes interest income on loans, debt
securities, and other debt instruments, generally on a
level-yield basis, based on the underlying contractual
rate. Refer to Note 7 for further information.
Revenue from contracts with customers
JPMorganChase recognizes noninterest revenue from
certain contracts with customers
,
in investment
banking fees, deposit-related fees, asset management
fees, commissions and other fees, and components of
card income, when the Firm’s related performance
obligations are satisfied. Refer to Note 6 for further
discussion of the Firm’s revenue from contracts with
customers.
Principal transactions revenue
JPMorganChase carries a portion of its assets and
liabilities at fair value. Changes in fair value are
reported primarily in principal transactions revenue.
Refer to Notes 2 and 3 for further discussion of fair
value measurement. Refer to Note 6 for further
discussion of principal transactions revenue.
Use of estimates in the preparation of consolidated
financial statements
The preparation of the Consolidated Financial
Statements requires management to make estimates
and assumptions that affect the reported amounts of
assets and liabilities, revenue and expense, and
disclosures of contingent assets and liabilities. Actual
results could be different from these estimates.
Foreign currency translation
JPMorganChase revalues assets, liabilities, revenue
and expense denominated in non-U.S. currencies into
U.S. dollars using applicable exchange rates.
Gains and losses relating to translating functional
currency financial statements for U.S. reporting are
included in the Consolidated statements of
comprehensive income. Gains and losses relating to
nonfunctional currency transactions, including non-
U.S. operations where the functional currency is the
U.S. dollar, are reported in the Consolidated
statements of income.
Offsetting assets and liabilities
U.S. GAAP permits entities to present derivative
receivables and derivative payables with the same
counterparty and the related cash collateral
receivables and payables on a net basis on the
Consolidated balance sheets when a legally
enforceable master netting agreement exists. U.S.
GAAP also permits securities sold and purchased
under repurchase agreements and securities
borrowed or loaned under securities loan agreements
to be presented net when specified conditions are met,
including the existence of a legally enforceable master
netting agreement. The Firm has elected to net such
balances where it has determined that the specified
conditions are met.
The Firm uses master netting agreements to mitigate
counterparty credit risk in certain transactions,
including derivative contracts, resale, repurchase,
securities borrowed and securities loaned
agreements. A master netting agreement is a single
agreement with a counterparty that permits multiple
transactions governed by that agreement to be
terminated or accelerated and settled through a single
JPMorgan Chase & Co./2025 Form 10-K
171
payment in a single currency in the event of a default
(e.g., bankruptcy, failure to make a required payment
or securities transfer or deliver collateral or margin
when due). Upon the exercise of derivatives
termination rights by the non-defaulting party (i) all
transactions are terminated, (ii) all transactions are
valued and the positive values of “in the money”
transactions are netted against the negative values of
“out of the money” transactions and (iii) the only
remaining payment obligation is of one of the parties
to pay the netted termination amount. Upon exercise
of default rights under repurchase agreements and
securities loan agreements in general (i) all
transactions are terminated and accelerated, (ii) all
values of securities or cash held or to be delivered are
calculated, and all such sums are netted against each
other and (iii) the only remaining payment obligation is
of one of the parties to pay the netted termination
amount.
Typical master netting agreements for these types of
transactions also often contain a collateral/margin
agreement that provides for a security interest in, or
title transfer of, securities or cash collateral/margin to
the party that has the right to demand margin (the
“demanding party”). The collateral/margin agreement
typically requires a party to transfer collateral/margin
to the demanding party with a value equal to the
amount of the margin deficit on a net basis across all
transactions governed by the master netting
agreement, less any threshold. The collateral/margin
agreement grants to the demanding party, upon
default by the counterparty, the right to set-off any
amounts payable by the counterparty against any
posted collateral or the cash equivalent of any posted
collateral/margin. It also grants to the demanding
party the right to liquidate collateral/margin and to
apply the proceeds to an amount payable by the
counterparty.
Refer to Note 5 for further discussion of the Firm’s
derivative instruments. Refer to Note 11 for further
discussion of the Firm’s securities financing
agreements.
Statements of cash flows
For JPMorganChase’s Consolidated statements of
cash flows, cash is defined as those amounts included
in cash and due from banks and deposits with banks
on the Consolidated balance sheets.
Accounting standard adopted January 1, 2024
Equity Method and Joint Ventures: Accounting for
Investments in Tax Credit Structures Using the
Proportional Amortization Method
The guidance expanded the types of tax-oriented
investments, beyond affordable housing tax credit
investments, that the Firm can elect on a program by
program basis, to be accounted for using the
proportional amortization method.
The adoption of this guidance under the modified
retrospective method on January 1, 2024 resulted in a
change to the classification and timing of the
amortization associated with certain of the Firm's
alternative energy tax-oriented investments. As a
result of the adoption, the amortization of these
investments that was previously recognized in other
income became recognized in income tax expense.
The change in accounting resulted in a decrease to
retained earnings of $161 million and increased the
Firm’s income tax expense and the effective tax rate
by approximately $450 million and two percentage
points, respectively, in the first quarter of 2024, with no
material impact to net income.
Refer to Notes 6, 14 and 25 for additional information.
Accounting standards adopted January 1, 2023
Derivatives and Hedging: Fair Value Hedging –
Portfolio Layer Method
The adoption of this guidance expanded the ability to
hedge a portfolio of fixed-rate assets in a qualifying
hedge accounting relationship. As permitted by the
guidance, the Firm elected to transfer HTM securities
to AFS and designated those securities in a portfolio
layer method hedge upon adoption. The adoption
impact of the transfer on retained earnings was not
material.
Financial Instruments – Credit Losses: Troubled
Debt Restructurings (“TDRs”)
The adoption of this guidance eliminated the
requirement to measure the allowance for TDRs using
a discounted cash flow (“DCF”) methodology and
allowed the option of a non-DCF portfolio-based
approach for modified loans to troubled borrowers.
The Firm elected this option for all portfolios of
modified loans to troubled borrowers except
collateral-dependent loans and nonaccrual risk-rated
loans, for which the Firm elected to continue applying
a DCF methodology. The adoption of this guidance
under the modified retrospective method on January 1,
2023, resulted in a $446 million increase to retained
earnings.
Notes to consolidated financial statements
172
JPMorgan Chase & Co./2025 Form 10-K
Significant accounting policies
The following table identifies JPMorganChase’s other
significant accounting policies and the Note and page
where a detailed description of each policy can be
found.
Fair value measurement
Note 2
page 174
Fair value option
Note 3
page 196
Derivative instruments
Note 5
page 202
Noninterest revenue and noninterest
expense
Note 6
page 218
Interest income and interest expense
Note 7
page 222
Pension and other postretirement
employee benefit plans
Note 8
page 223
Employee share-based incentives
Note 9
page 226
Investment securities
Note 10
page 228
Securities financing activities
Note 11
page 233
Loans
Note 12
page 236
Allowance for credit losses
Note 13
page 258
Variable interest entities
Note 14
page 263
Goodwill, mortgage servicing rights, and
other intangible assets
Note 15
page 272
Premises and equipment
Note 16
page 277
Leases
Note 18
page 278
Accounts payable and other liabilities
Note 19
page 280
Long-term debt
Note 20
page 281
Earnings per share
Note 23
page 286
Income taxes
Note 25
page 288
Off–balance sheet lending-related
financial instruments, guarantees, and
other commitments
Note 28
page 295
Litigation
Note 30
page 302
JPMorgan Chase & Co./2025 Form 10-K
173
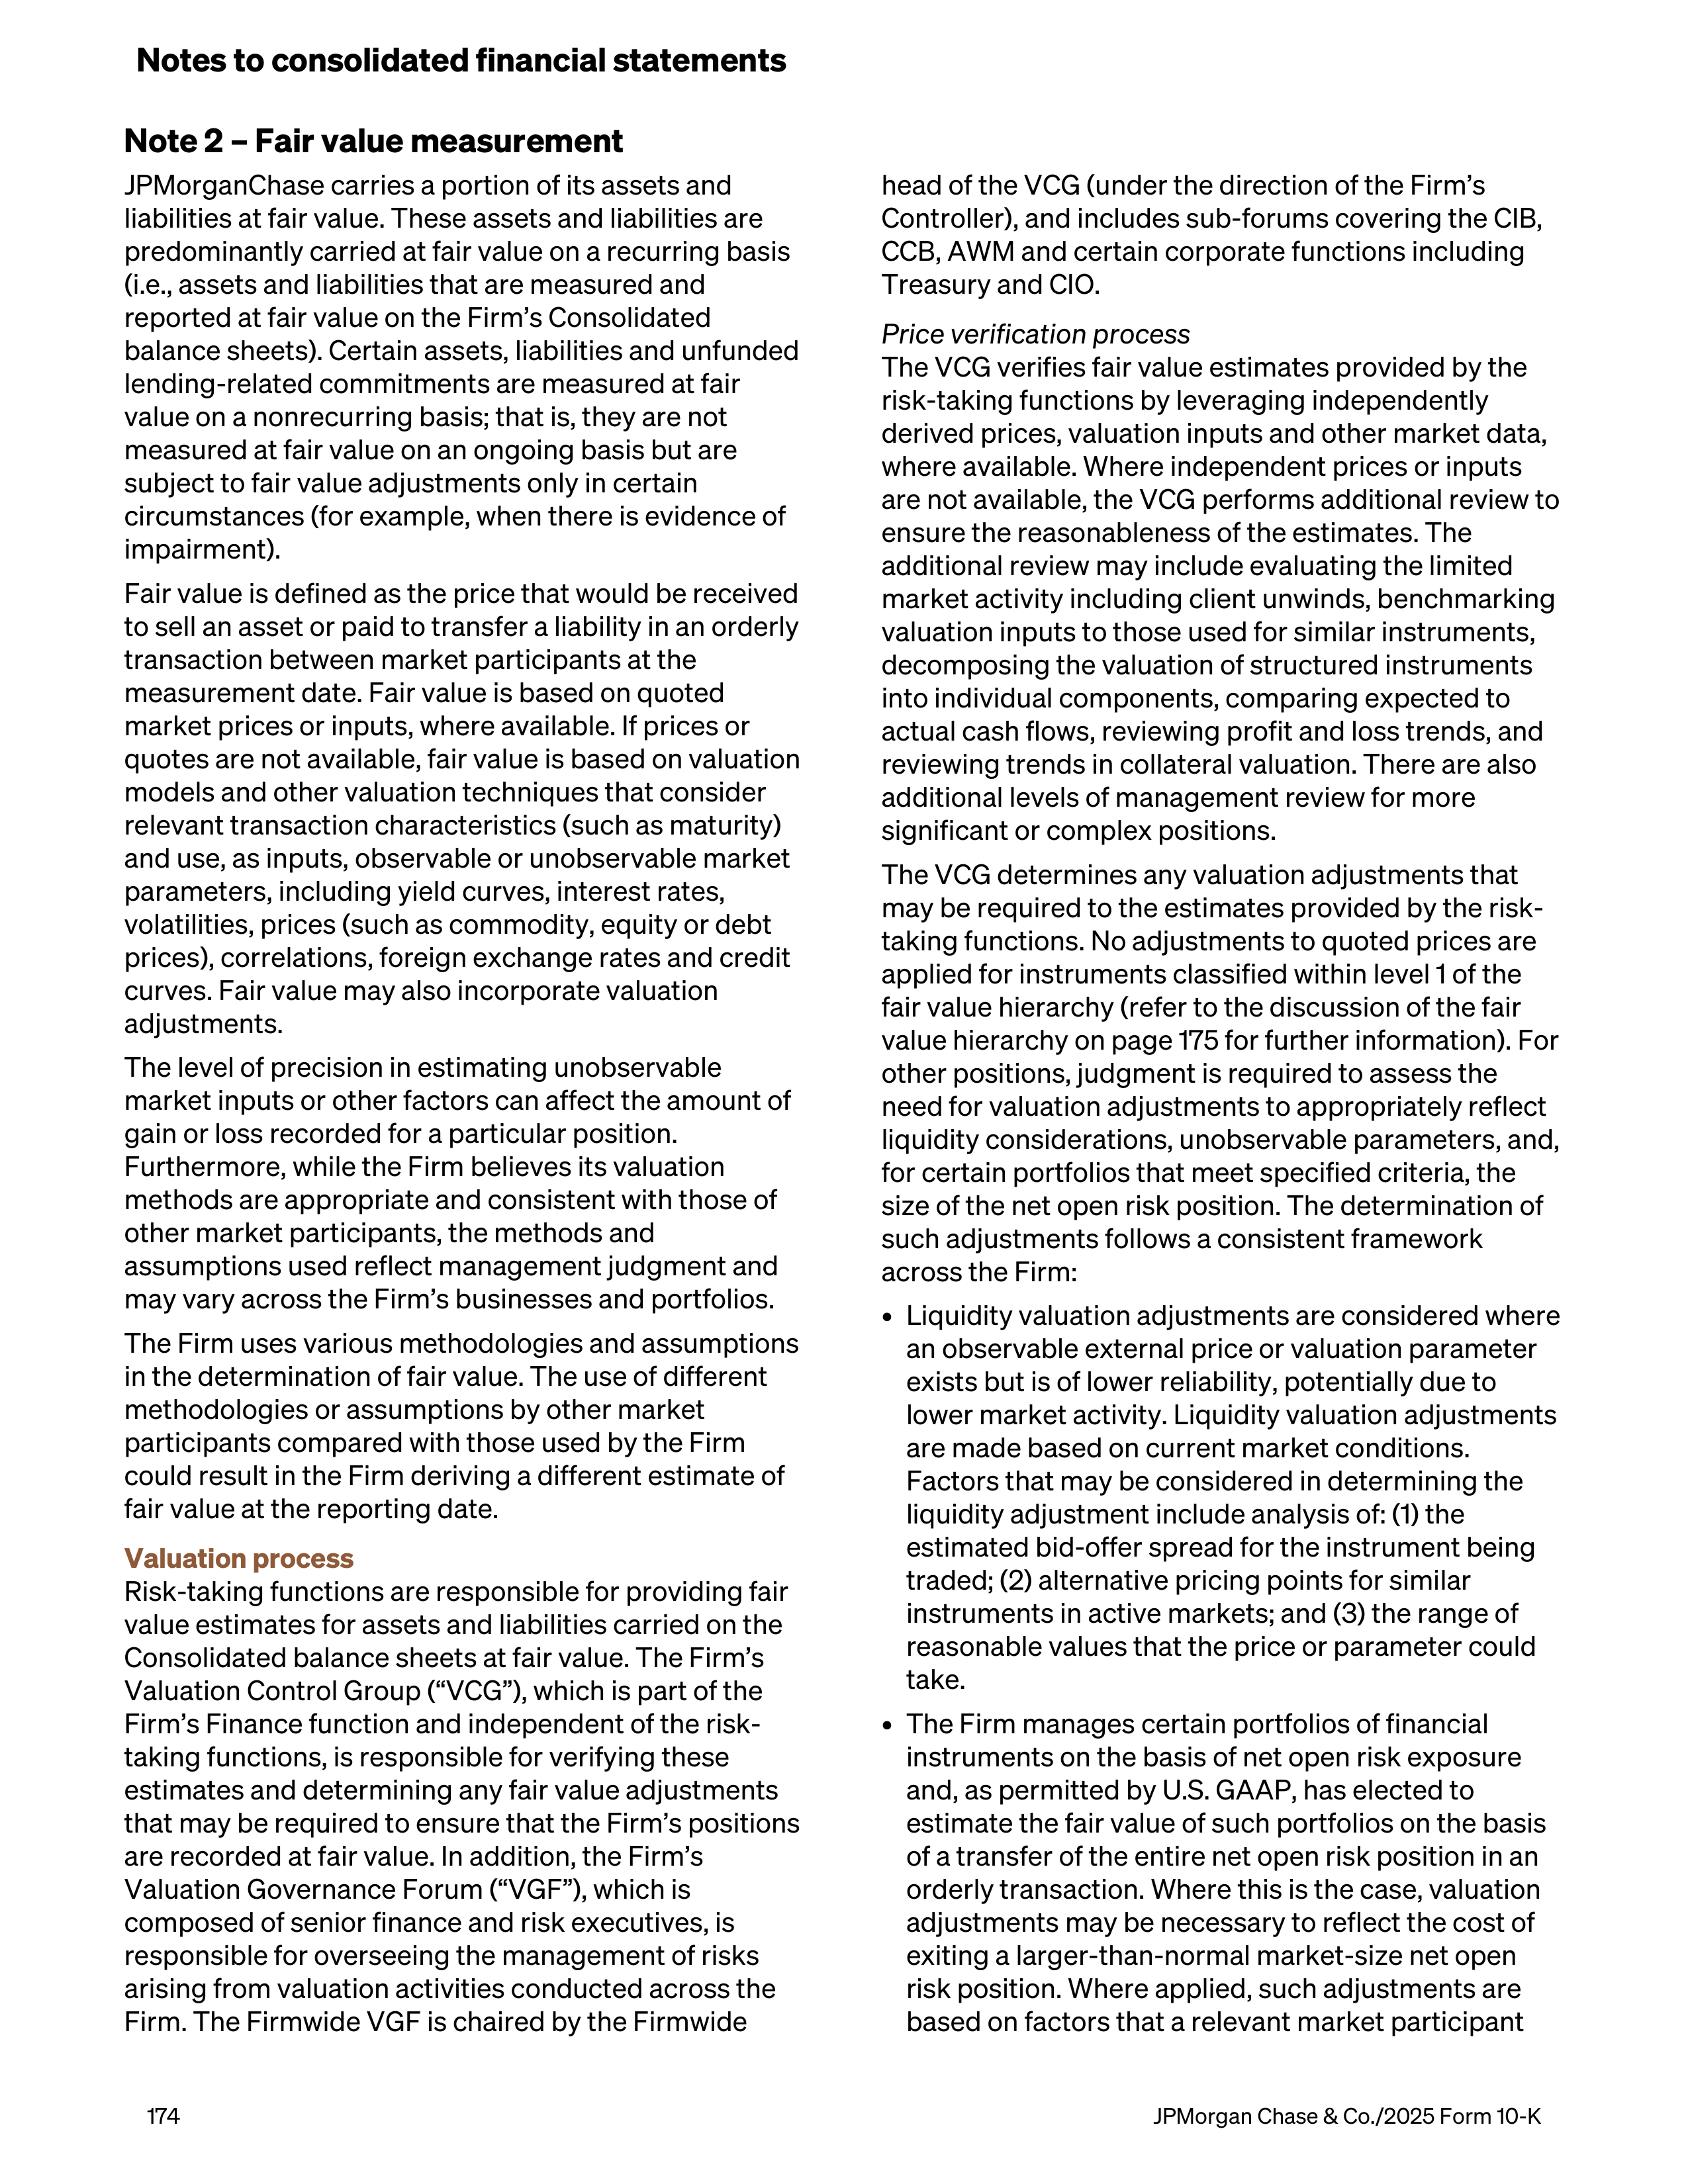
Note 2 – Fair value measurement
JPMorganChase carries a portion of its assets and
liabilities at fair value. These assets and liabilities are
predominantly carried at fair value on a recurring basis
(i.e., assets and liabilities that are measured and
reported at fair value on the Firm’s Consolidated
balance sheets). Certain assets, liabilities and unfunded
lending-related commitments are measured at fair
value on a nonrecurring basis; that is, they are not
measured at fair value on an ongoing basis but are
subject to fair value adjustments only in certain
circumstances (for example, when there is evidence of
impairment).
Fair value is defined as the price that would be received
to sell an asset or paid to transfer a liability in an orderly
transaction between market participants at the
measurement date. Fair value is based on quoted
market prices or inputs, where available. If prices or
quotes are not available, fair value is based on valuation
models and other valuation techniques that consider
relevant transaction characteristics (such as maturity)
and use, as inputs, observable or unobservable market
parameters, including yield curves, interest rates,
volatilities, prices (such as commodity, equity or debt
prices), correlations, foreign exchange rates and credit
curves. Fair value may also incorporate valuation
adjustments.
The level of precision in estimating unobservable
market inputs or other factors can affect the amount of
gain or loss recorded for a particular position.
Furthermore, while the Firm believes its valuation
methods are appropriate and consistent with those of
other market participants, the methods and
assumptions used reflect management judgment and
may vary across the Firm’s businesses and portfolios.
The Firm uses various methodologies and assumptions
in the determination of fair value. The use of different
methodologies or assumptions by other market
participants compared with those used by the Firm
could result in the Firm deriving a different estimate of
fair value at the reporting date.
Valuation process
Risk-taking functions are responsible for providing fair
value estimates for assets and liabilities carried on the
Consolidated balance sheets at fair value. The Firm’s
Valuation Control Group (“VCG”), which is part of the
Firm’s Finance function and independent of the risk-
taking functions, is responsible for verifying these
estimates and determining any fair value adjustments
that may be required to ensure that the Firm’s positions
are recorded at fair value. In addition, the Firm’s
Valuation Governance Forum (“VGF”), which is
composed of senior finance and risk executives, is
responsible for overseeing the management of risks
arising from valuation activities conducted across the
Firm. The Firmwide VGF is chaired by the Firmwide
head of the VCG (under the direction of the Firm’s
Controller), and includes sub-forums covering the CIB,
CCB, AWM and certain corporate functions including
Treasury and CIO.
Price verification process
The VCG verifies fair value estimates provided by the
risk-taking functions by leveraging independently
derived prices, valuation inputs and other market data,
where available. Where independent prices or inputs
are not available, the VCG performs additional review to
ensure the reasonableness of the estimates. The
additional review may include evaluating the limited
market activity including client unwinds, benchmarking
valuation inputs to those used for similar instruments,
decomposing the valuation of structured instruments
into individual components, comparing expected to
actual cash flows, reviewing profit and loss trends, and
reviewing trends in collateral valuation. There are also
additional levels of management review for more
significant or complex positions.
The VCG determines any valuation adjustments that
may be required to the estimates provided by the risk-
taking functions. No adjustments to quoted prices are
applied for instruments classified within level 1 of the
fair value hierarchy (refer to the discussion of the fair
value hierarchy on
page 175
for further information). For
other positions, judgment is required to assess the
need for valuation adjustments to appropriately reflect
liquidity considerations, unobservable parameters, and,
for certain portfolios that meet specified criteria, the
size of the net open risk position. The determination of
such adjustments follows a consistent framework
across the Firm:
•
Liquidity valuation adjustments are considered where
an observable external price or valuation parameter
exists but is of lower reliability, potentially due to
lower market activity. Liquidity valuation adjustments
are made based on current market conditions.
Factors that may be considered in determining the
liquidity adjustment include analysis of: (1) the
estimated bid-offer spread for the instrument being
traded; (2) alternative pricing points for similar
instruments in active markets; and (3) the range of
reasonable values that the price or parameter could
take.
•
The Firm manages certain portfolios of financial
instruments on the basis of net open risk exposure
and, as permitted by U.S. GAAP, has elected to
estimate the fair value of such portfolios on the basis
of a transfer of the entire net open risk position in an
orderly transaction. Where this is the case, valuation
adjustments may be necessary to reflect the cost of
exiting a larger-than-normal market-size net open
risk position. Where applied, such adjustments are
based on factors that a relevant market participant
Notes to consolidated financial statements
174
JPMorgan Chase & Co./2025 Form 10-K
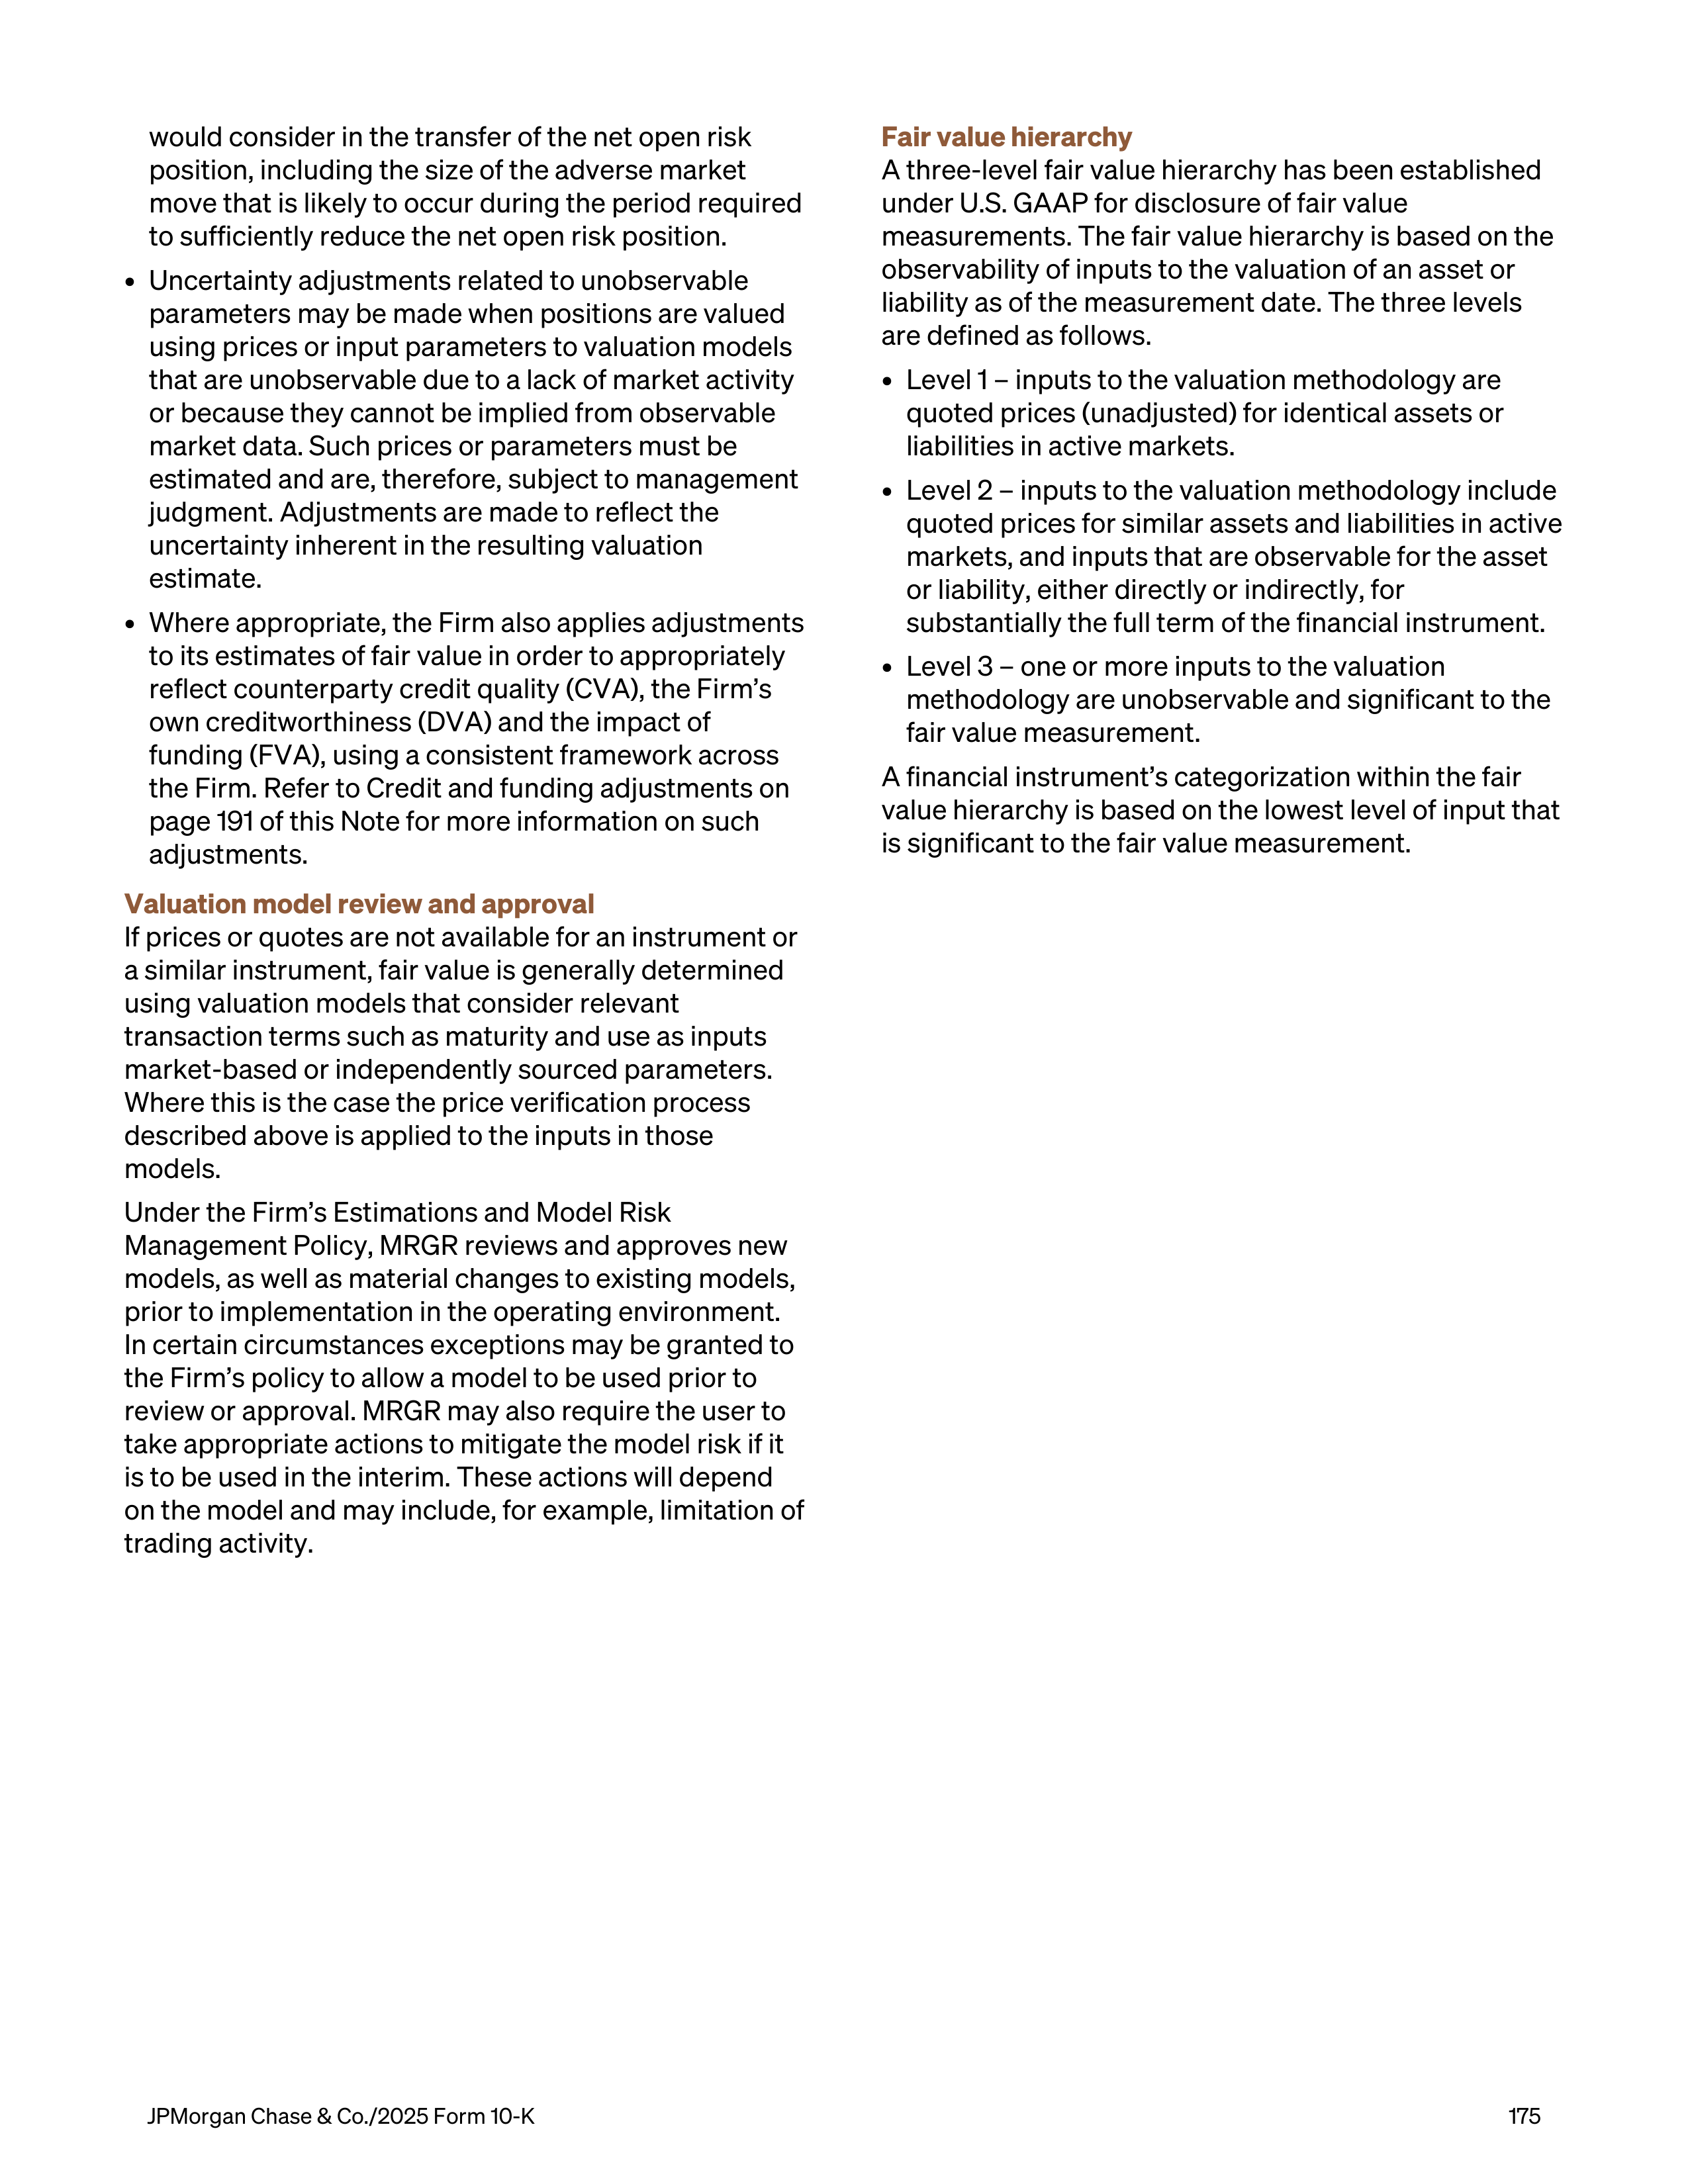
would consider in the transfer of the net open risk
position, including the size of the adverse market
move that is likely to occur during the period required
to sufficiently reduce the net open risk position.
•
Uncertainty adjustments related to unobservable
parameters may be made when positions are valued
using prices or input parameters to valuation models
that are unobservable due to a lack of market activity
or because they cannot be implied from observable
market data. Such prices or parameters must be
estimated and are, therefore, subject to management
judgment. Adjustments are made to reflect the
uncertainty inherent in the resulting valuation
estimate.
•
Where appropriate, the Firm also applies adjustments
to its estimates of fair value in order to appropriately
reflect counterparty credit quality (CVA), the Firm’s
own creditworthiness (DVA) and the impact of
funding (FVA), using a consistent framework across
the Firm. Refer to Credit and funding adjustments on
page 191 of this Note for more information on such
adjustments.
Valuation model review and approval
If prices or quotes are not available for an instrument or
a similar instrument, fair value is generally determined
using valuation models that consider relevant
transaction terms such as maturity and use as inputs
market-based or independently sourced parameters.
Where this is the case the price verification process
described above is applied to the inputs in those
models.
Under the Firm’s Estimations and Model Risk
Management Policy, MRGR reviews and approves new
models, as well as material changes to existing models,
prior to implementation in the operating environment.
In certain circumstances exceptions may be granted to
the Firm’s policy to allow a model to be used prior to
review or approval. MRGR may also require the user to
take appropriate actions to mitigate the model risk if it
is to be used in the interim. These actions will depend
on the model and may include, for example, limitation of
trading activity.
Fair value hierarchy
A three-level fair value hierarchy has been established
under U.S. GAAP for disclosure of fair value
measurements. The fair value hierarchy is based on the
observability of inputs to the valuation of an asset or
liability as of the measurement date. The three levels
are defined as follows.
•
Level 1 – inputs to the valuation methodology are
quoted prices (unadjusted) for identical assets or
liabilities in active markets.
•
Level 2 – inputs to the valuation methodology include
quoted prices for similar assets and liabilities in active
markets, and inputs that are observable for the asset
or liability, either directly or indirectly, for
substantially the full term of the financial instrument.
•
Level 3 – one or more inputs to the valuation
methodology are unobservable and significant to the
fair value measurement.
A financial instrument’s categorization within the fair
value hierarchy is based on the lowest level of input that
is significant to the fair value measurement.
JPMorgan Chase & Co./2025 Form 10-K
175
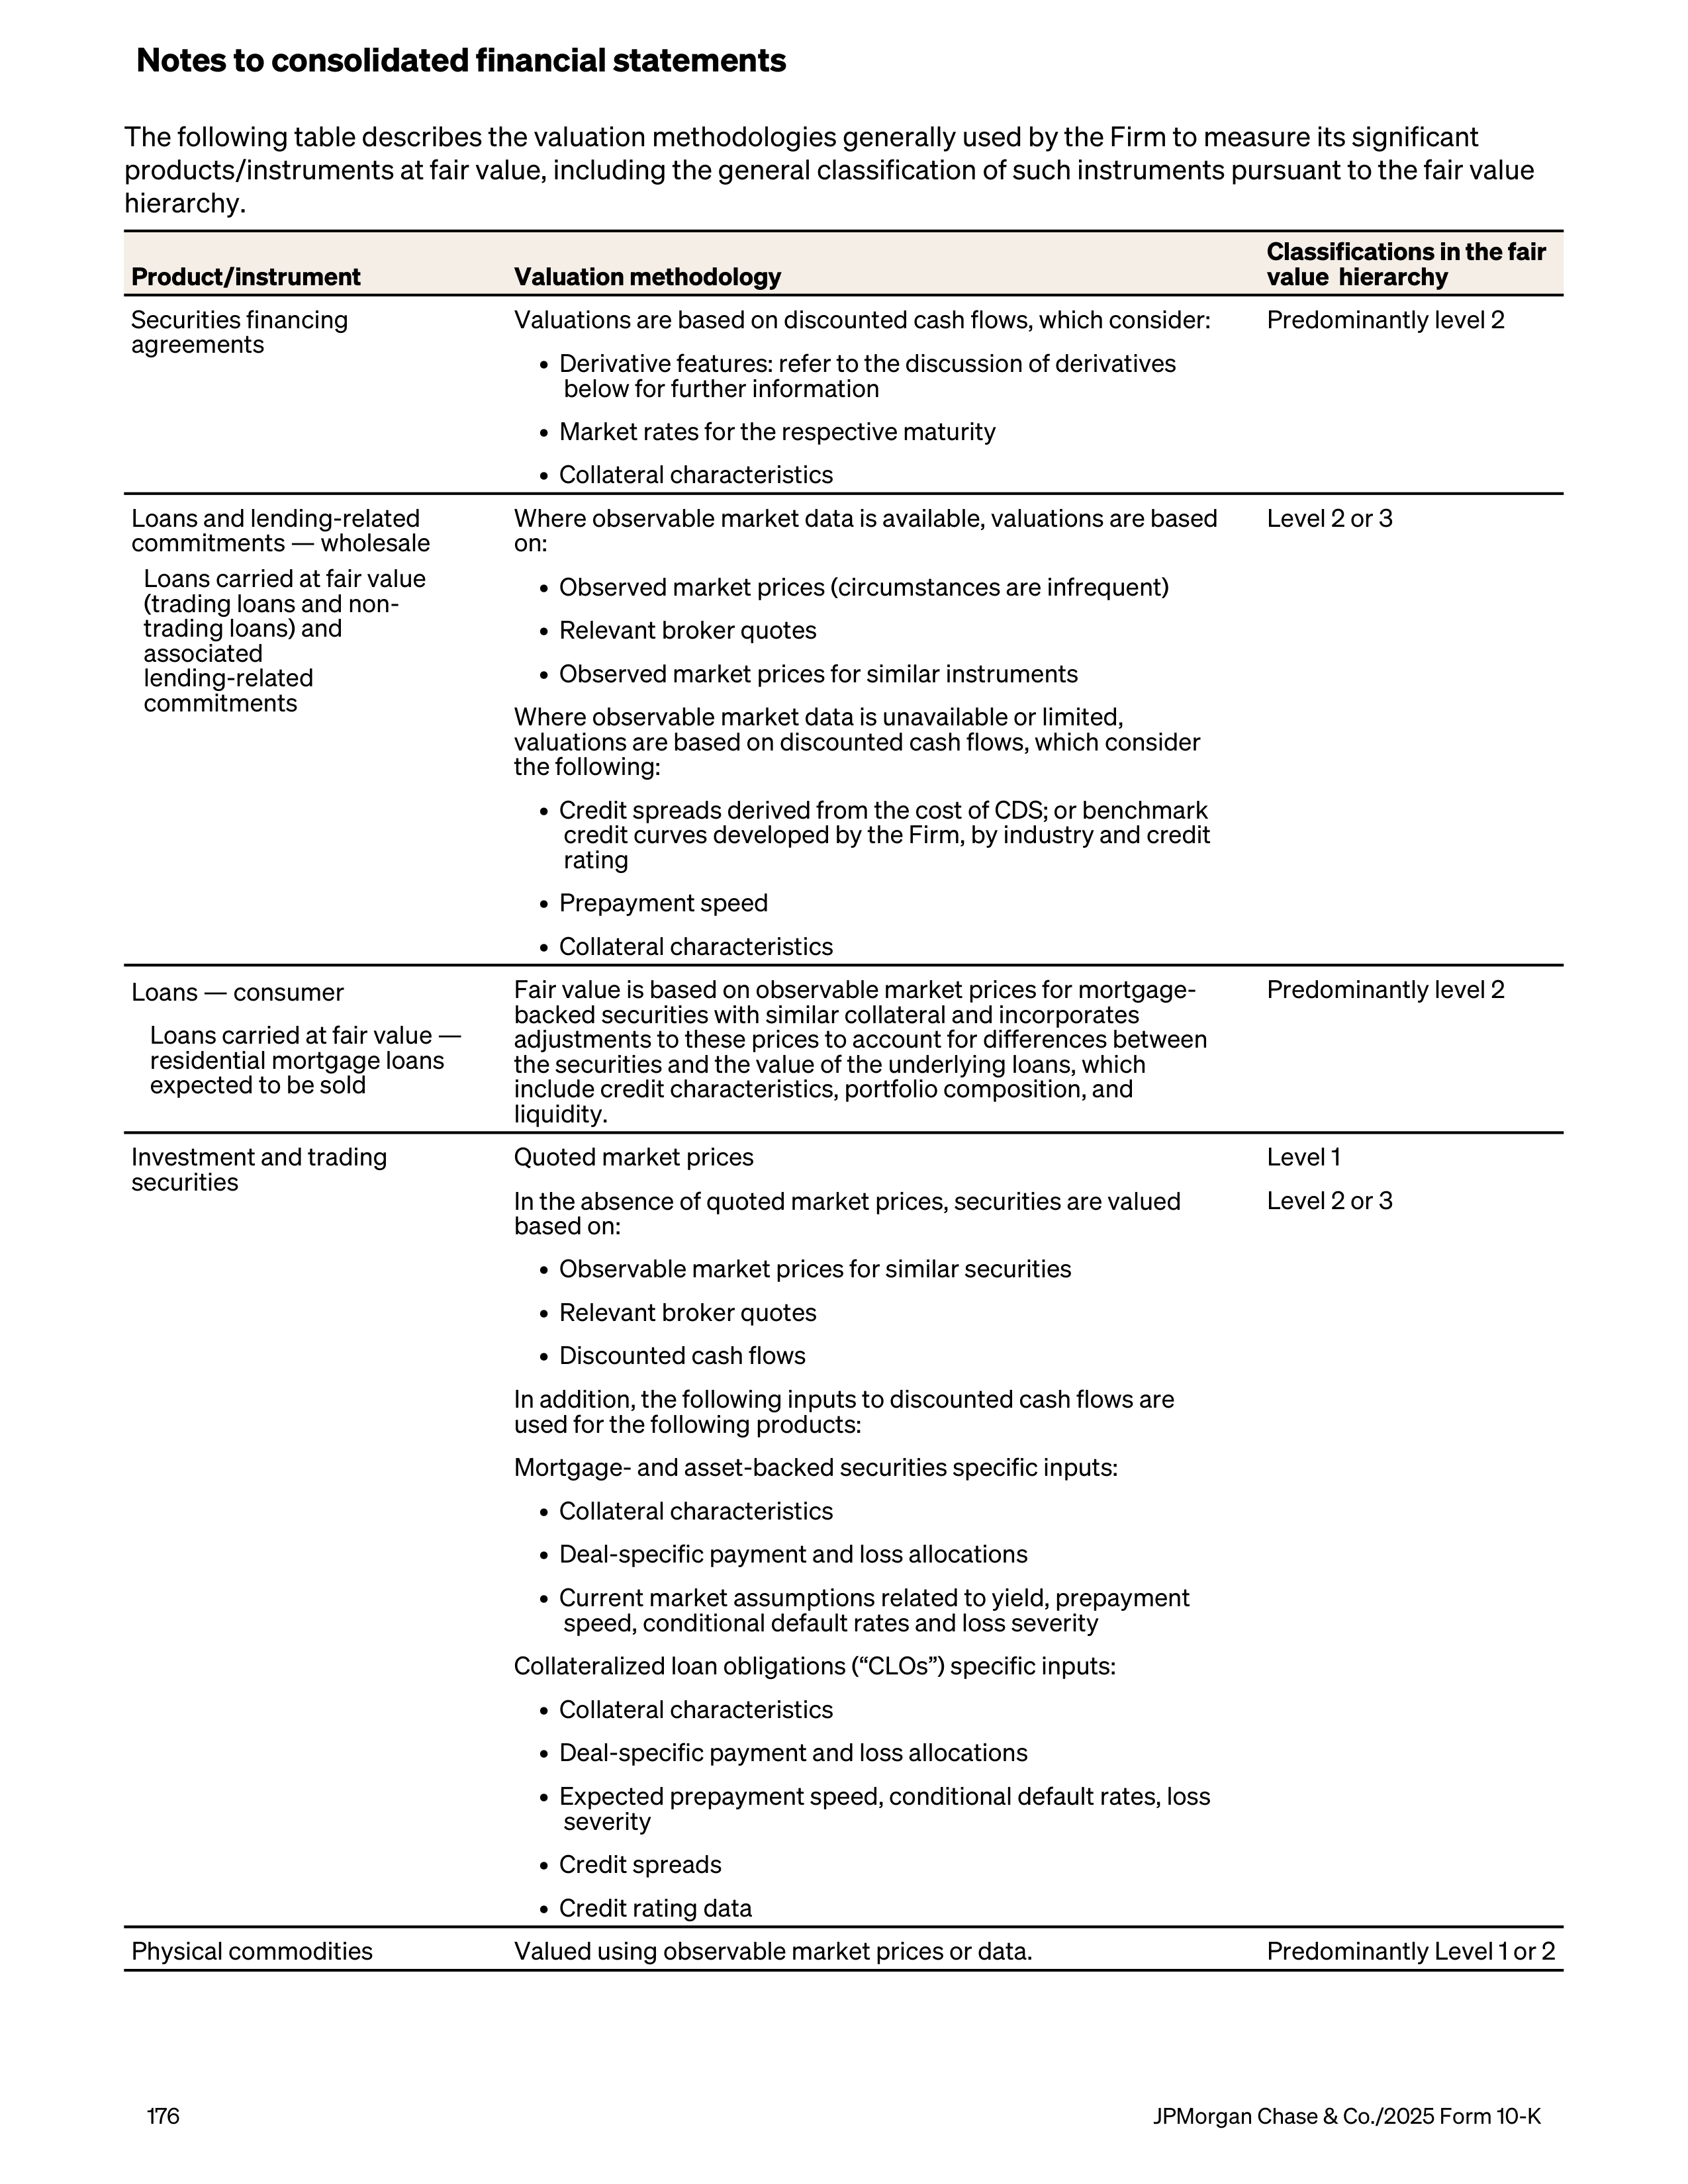
The following table describes the valuation methodologies generally used by the Firm to measure its significant
products/instruments at fair value, including the general classification of such instruments pursuant to the fair value
hierarchy.
Product/instrument
Valuation methodology
Classifications in the fair
value hierarchy
Securities financing
agreements
Valuations are based on discounted cash flows, which consider:
Predominantly level 2
• Derivative features: refer to the discussion of derivatives
below for further information
• Market rates for the respective maturity
• Collateral characteristics
Loans and lending-related
commitments — wholesale
Loans carried at fair value
(trading loans and non-
trading loans) and
associated
lending-related
commitments
Where observable market data is available, valuations are based
on:
Level 2 or 3
• Observed market prices (circumstances are infrequent)
• Relevant broker quotes
• Observed market prices for similar instruments
Where observable market data is unavailable or limited,
valuations are based on discounted cash flows, which consider
the following:
• Credit spreads derived from the cost of CDS; or benchmark
credit curves developed by the Firm, by industry and credit
rating
• Prepayment speed
• Collateral characteristics
Loans — consumer
Fair value is based on observable market prices for mortgage-
backed securities with similar collateral and incorporates
adjustments to these prices to account for differences between
the securities and the value of the underlying loans, which
include credit characteristics, portfolio composition, and
liquidity.
Predominantly level 2
Loans carried at fair value —
residential mortgage loans
expected to be sold
Investment and trading
securities
Quoted market prices
Level 1
In the absence of quoted market prices, securities are valued
based on:
Level 2 or 3
• Observable market prices for similar securities
• Relevant broker quotes
• Discounted cash flows
In addition, the following inputs to discounted cash flows are
used for the following products:
Mortgage- and asset-backed securities specific inputs:
• Collateral characteristics
• Deal-specific payment and loss allocations
• Current market assumptions related to yield, prepayment
speed, conditional default rates and loss severity
Collateralized loan obligations (“CLOs”) specific inputs:
• Collateral characteristics
• Deal-specific payment and loss allocations
• Expected prepayment speed, conditional default rates, loss
severity
• Credit spreads
• Credit rating data
Physical commodities
Valued using observable market prices or data.
Predominantly Level 1 or 2
Notes to consolidated financial statements
176
JPMorgan Chase & Co./2025 Form 10-K
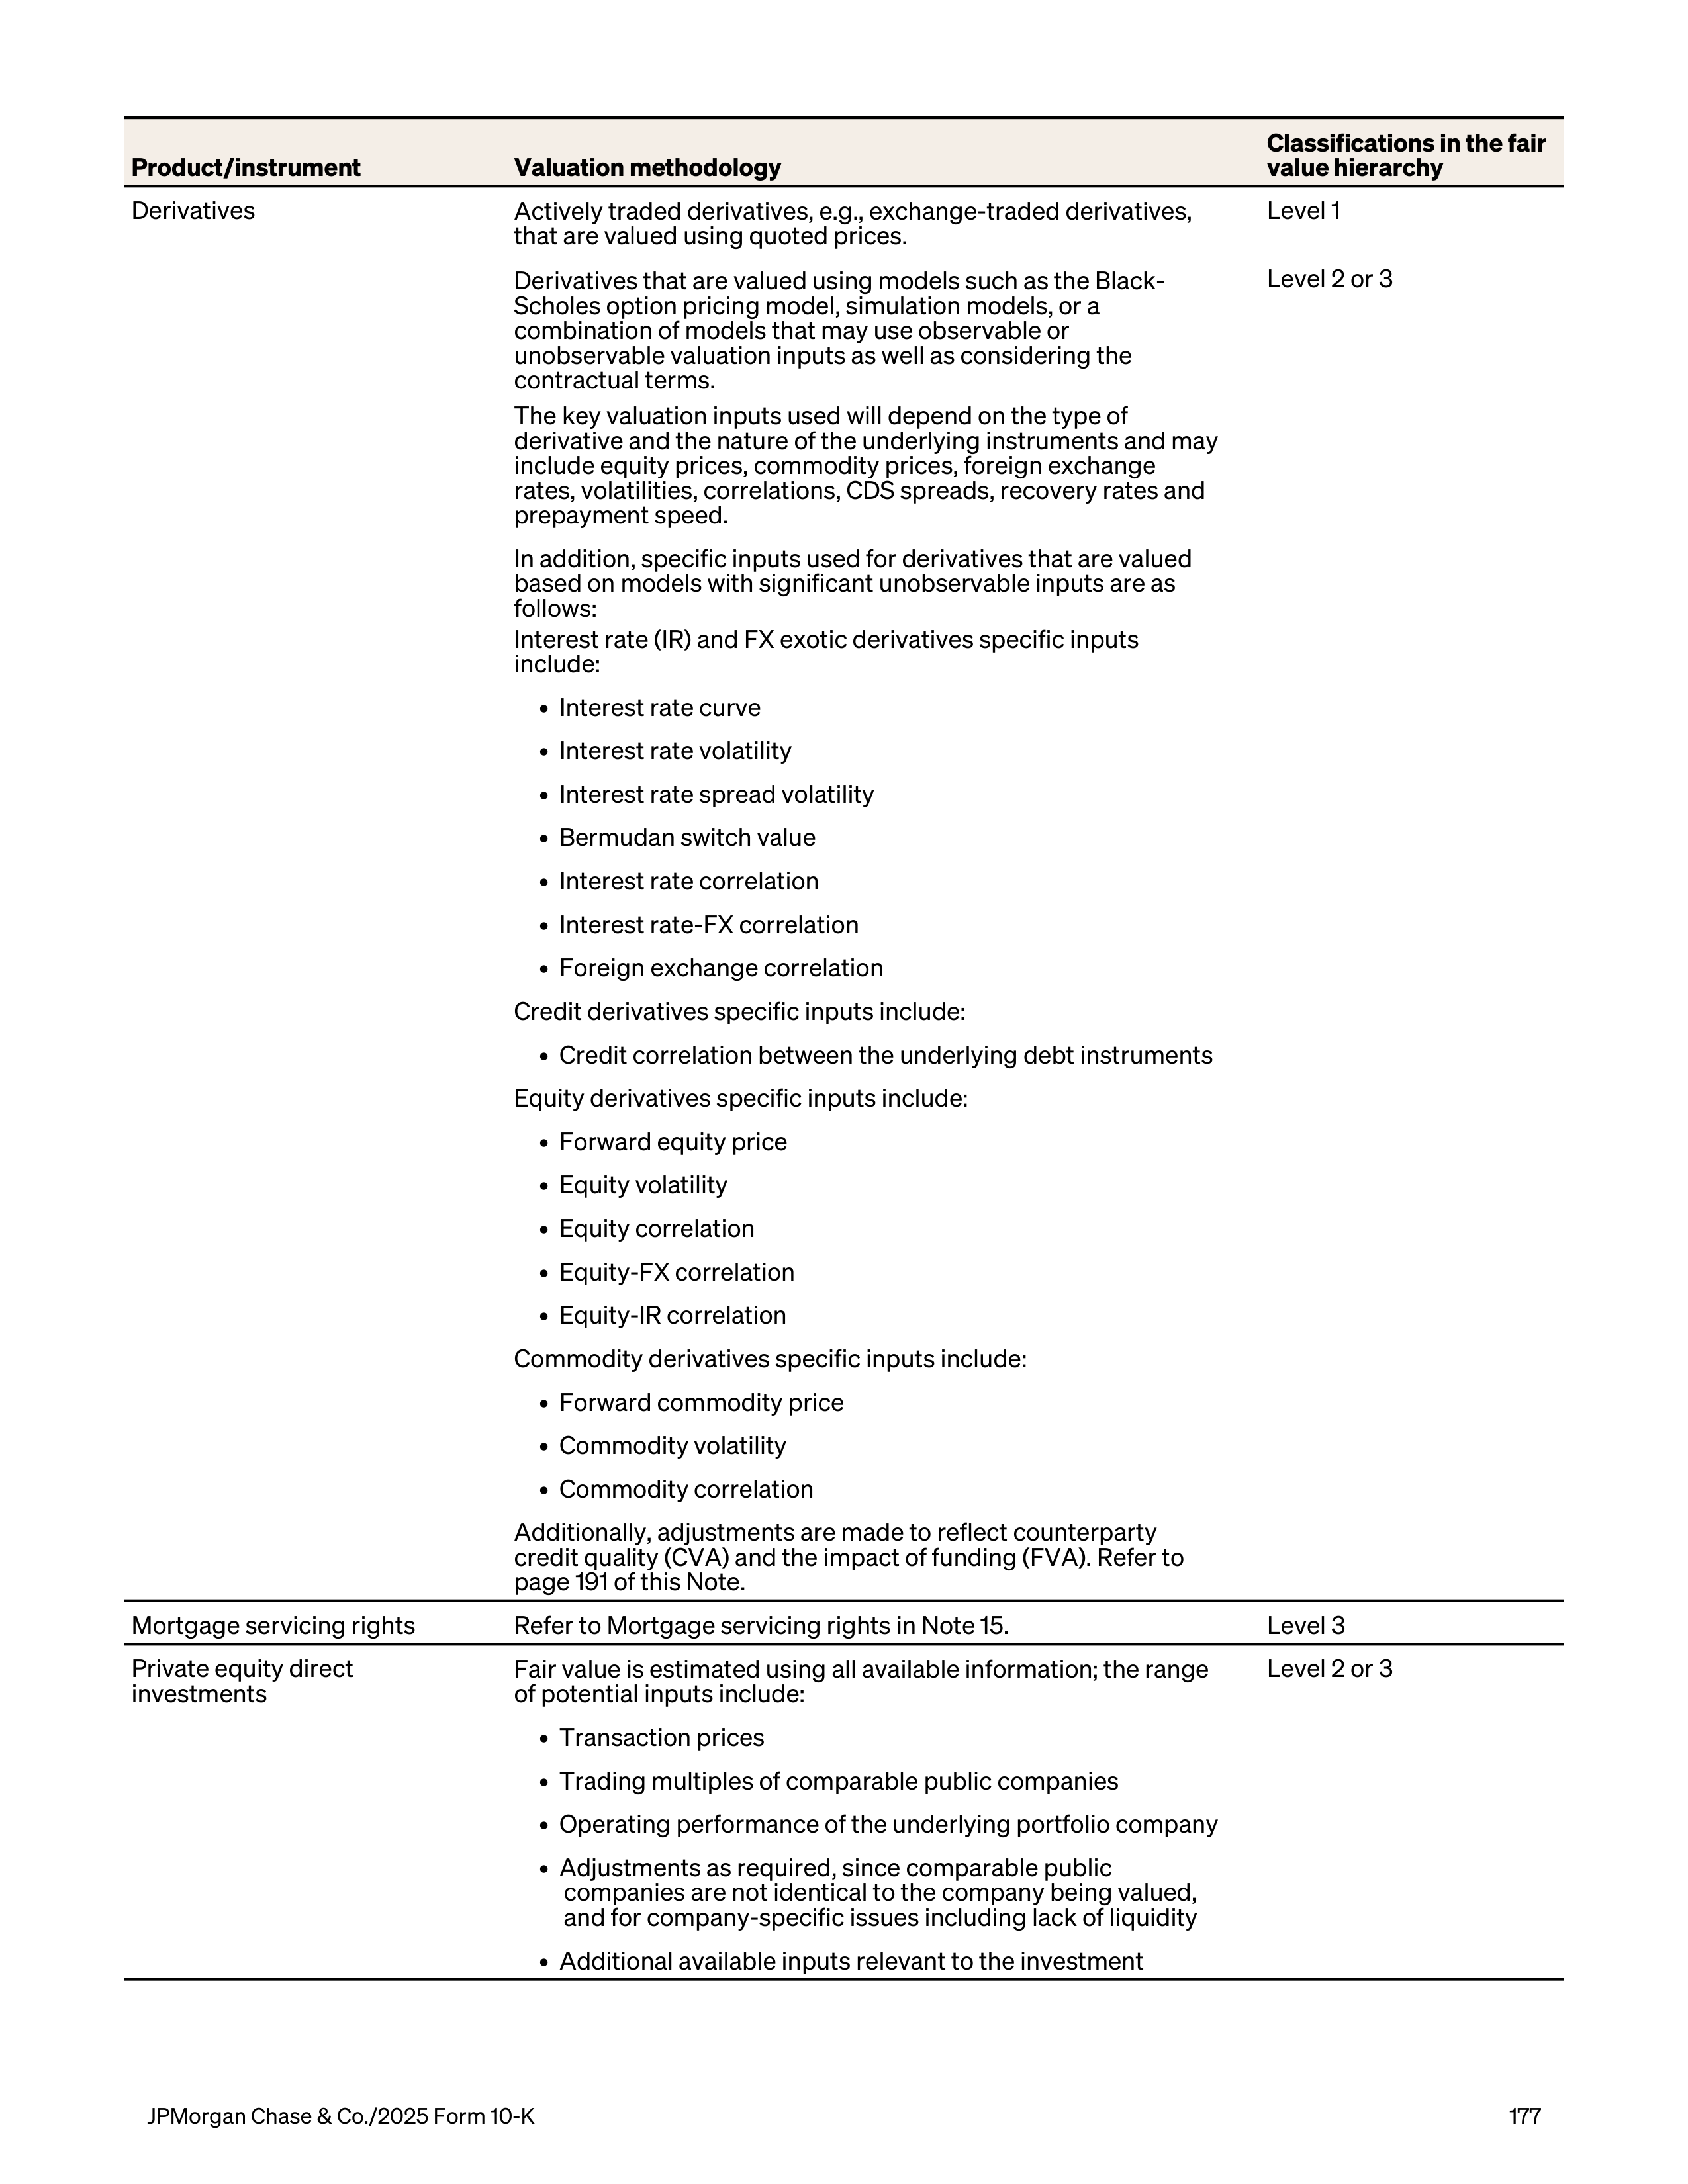
Product/instrument
Valuation methodology
Classifications in the fair
value hierarchy
Derivatives
Actively traded derivatives, e.g., exchange-traded derivatives,
that are valued using quoted prices.
Level 1
Derivatives that are valued using models such as the Black-
Scholes option pricing model, simulation models, or a
combination of models that may use observable or
unobservable valuation inputs as well as considering the
contractual terms.
The key valuation inputs used will depend on the type of
derivative and the nature of the underlying instruments and may
include equity prices, commodity prices, foreign exchange
rates, volatilities, correlations, CDS spreads, recovery rates and
prepayment speed.
Level 2 or 3
In addition, specific inputs used for derivatives that are valued
based on models with significant unobservable inputs are as
follows:
Interest rate (IR) and FX exotic derivatives specific inputs
include:
• Interest rate curve
• Interest rate volatility
• Interest rate spread volatility
• Bermudan switch value
• Interest rate correlation
• Interest rate-FX correlation
• Foreign exchange correlation
Credit derivatives specific inputs include:
• Credit correlation between the underlying debt instruments
Equity derivatives specific inputs include:
• Forward equity price
• Equity volatility
• Equity correlation
• Equity-FX correlation
• Equity-IR correlation
Commodity derivatives specific inputs include:
• Forward commodity price
• Commodity volatility
• Commodity correlation
Additionally, adjustments are made to reflect counterparty
credit quality (CVA) and the impact of funding (FVA). Refer to
page 191 of this Note.
Mortgage servicing rights
Refer to Mortgage servicing rights in Note 15.
Level 3
Private equity direct
investments
Fair value is estimated using all available information; the range
of potential inputs include:
Level 2 or 3
• Transaction prices
• Trading multiples of comparable public companies
• Operating performance of the underlying portfolio company
• Adjustments as required, since comparable public
companies are not identical to the company being valued,
and for company-specific issues including lack of liquidity
• Additional available inputs relevant to the investment
JPMorgan Chase & Co./2025 Form 10-K
177
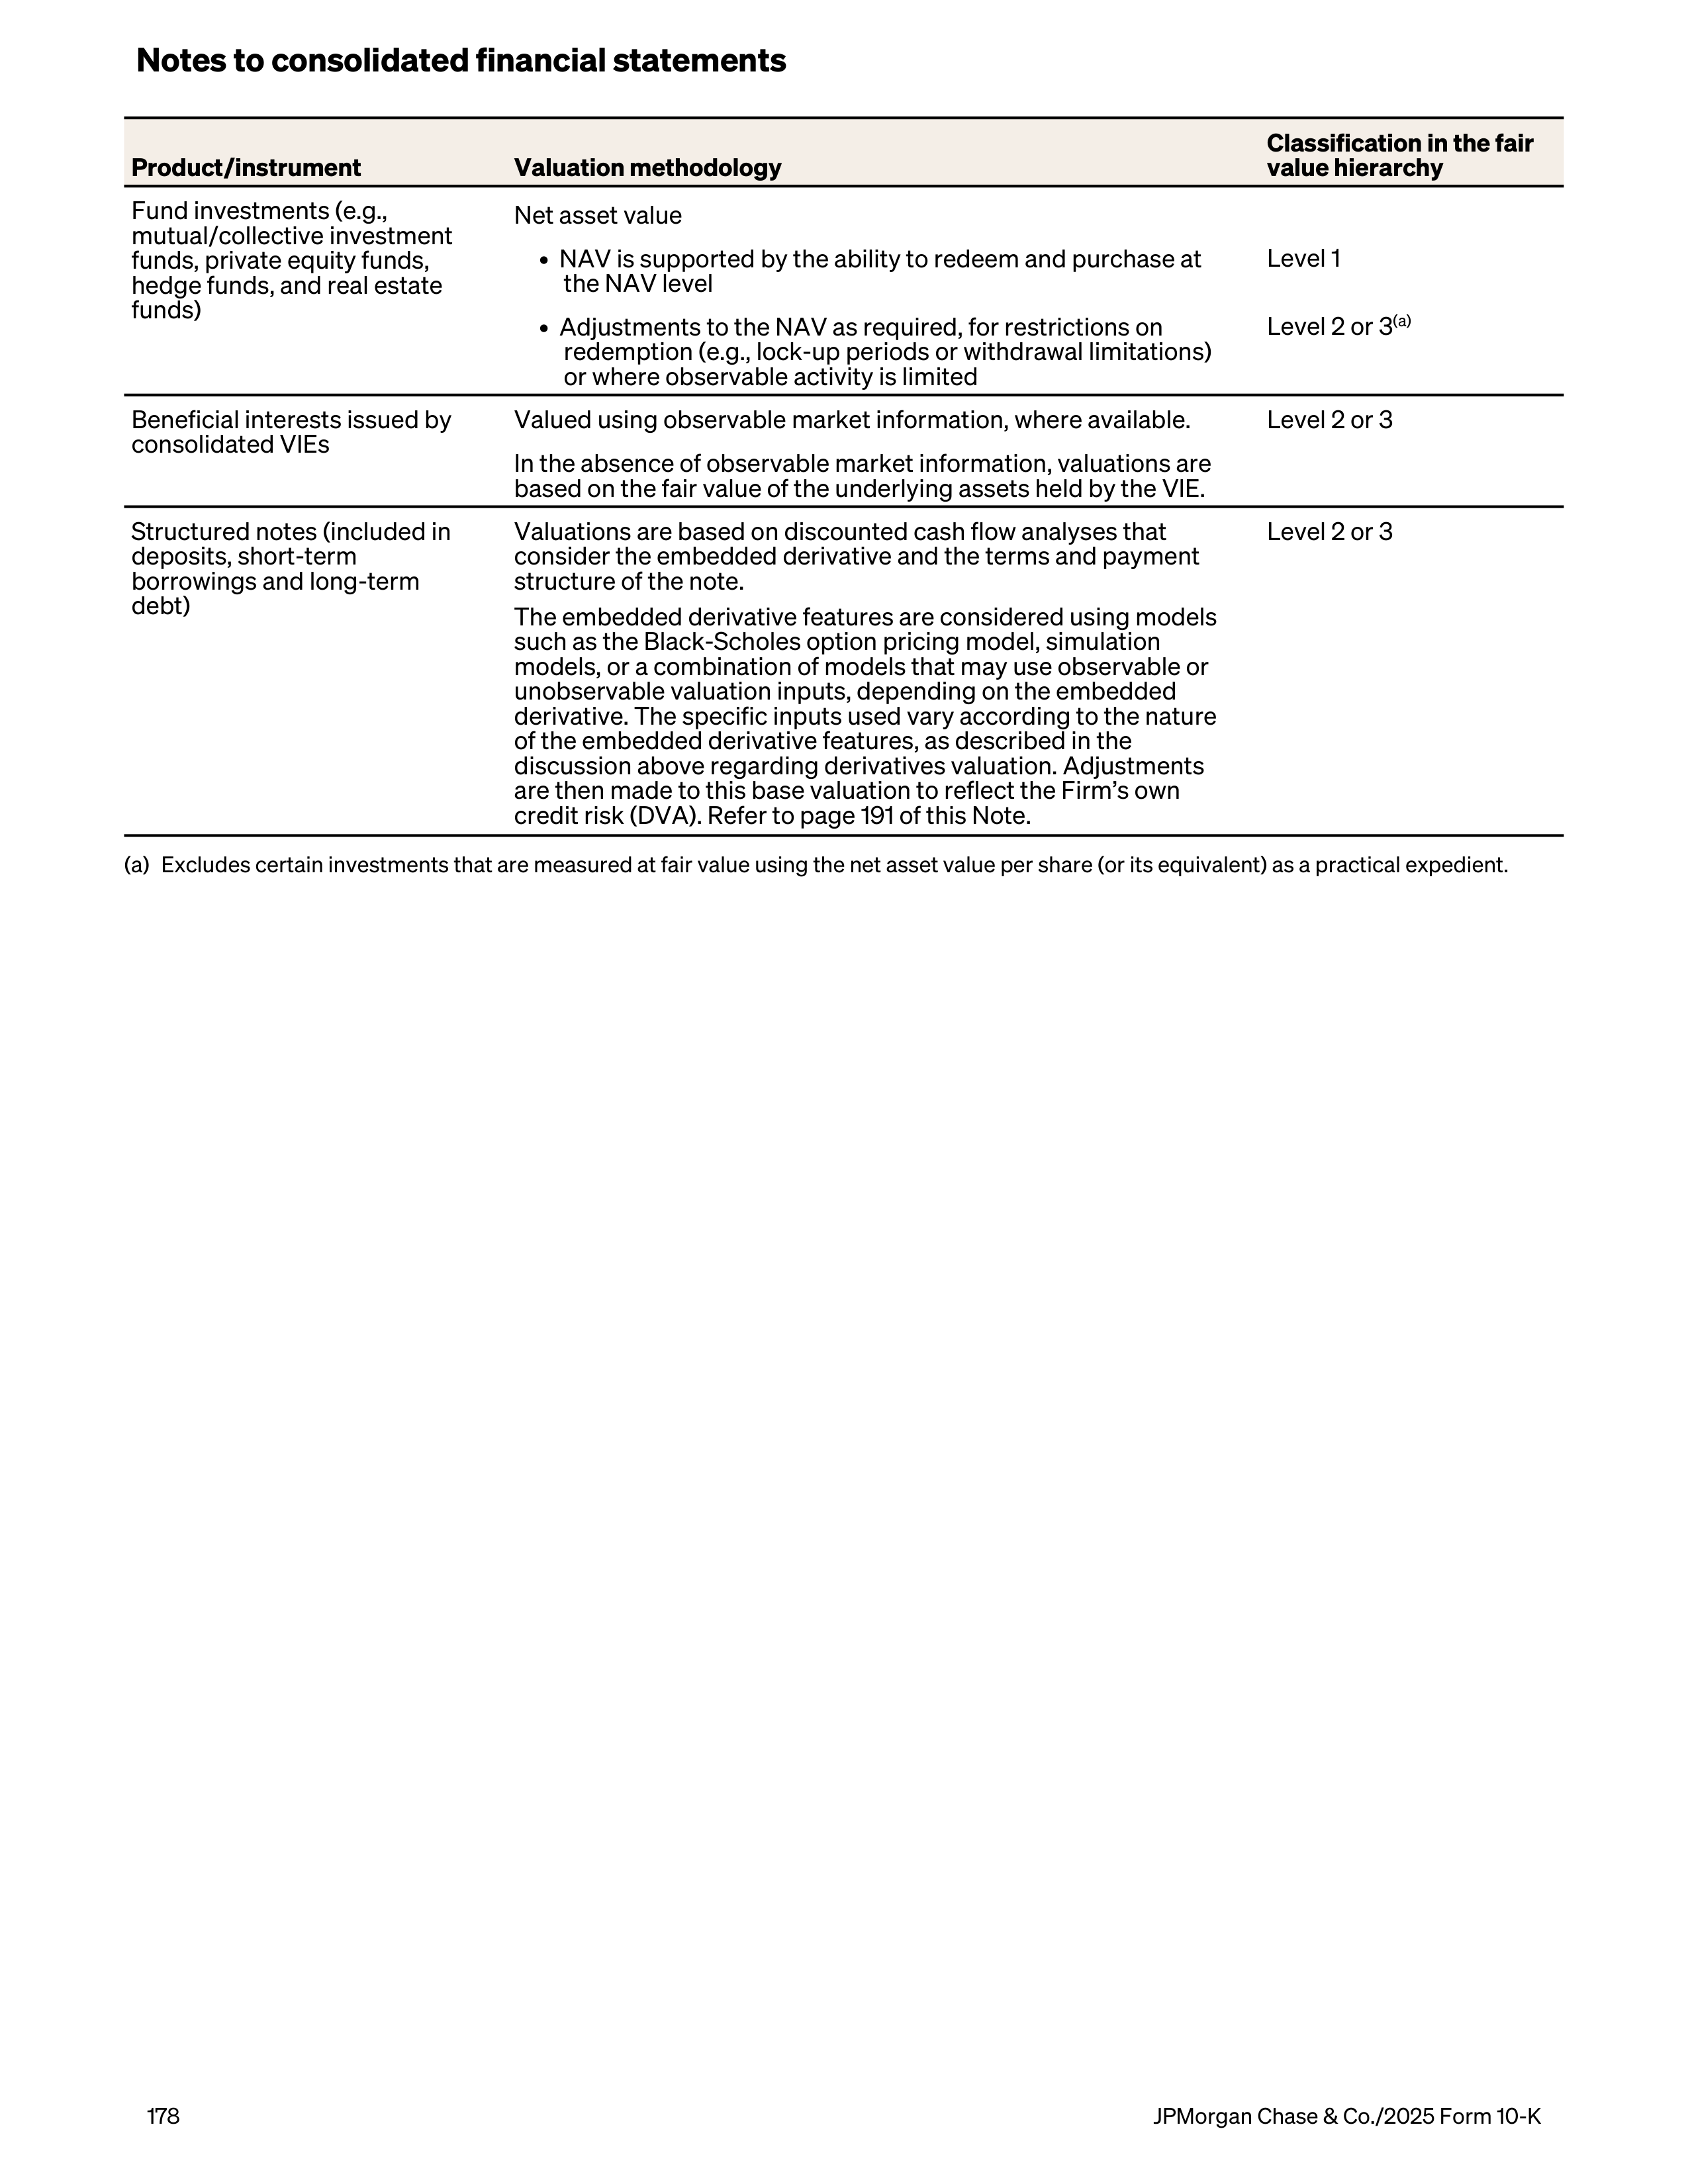
Product/instrument
Valuation methodology
Classification in the fair
value hierarchy
Fund investments (e.g.,
mutual/collective investment
funds, private equity funds,
hedge funds, and real estate
funds)
Net asset value
• NAV is supported by the ability to redeem and purchase at
the NAV level
Level 1
• Adjustments to the NAV as required, for restrictions on
redemption (e.g., lock-up periods or withdrawal limitations)
or where observable activity is limited
Level 2 or 3
(a)
Beneficial interests issued by
consolidated VIEs
Valued using observable market information, where available.
Level 2 or 3
In the absence of observable market information, valuations are
based on the fair value of the underlying assets held by the VIE.
Structured notes (included in
deposits, short-term
borrowings and long-term
debt)
Valuations are based on discounted cash flow analyses that
consider the embedded derivative and the terms and payment
structure of the note.
The embedded derivative features are considered using models
such as the Black-Scholes option pricing model, simulation
models, or a combination of models that may use observable or
unobservable valuation inputs, depending on the embedded
derivative. The specific inputs used vary according to the nature
of the embedded derivative features, as described in the
discussion above regarding derivatives valuation. Adjustments
are then made to this base valuation to reflect the Firm’s own
credit risk (DVA). Refer to page 191 of this Note.
Level 2 or 3
(a)
Excludes certain investments that are measured at fair value using the net asset value per share (or its equivalent) as a practical expedient.
Notes to consolidated financial statements
178
JPMorgan Chase & Co./2025 Form 10-K
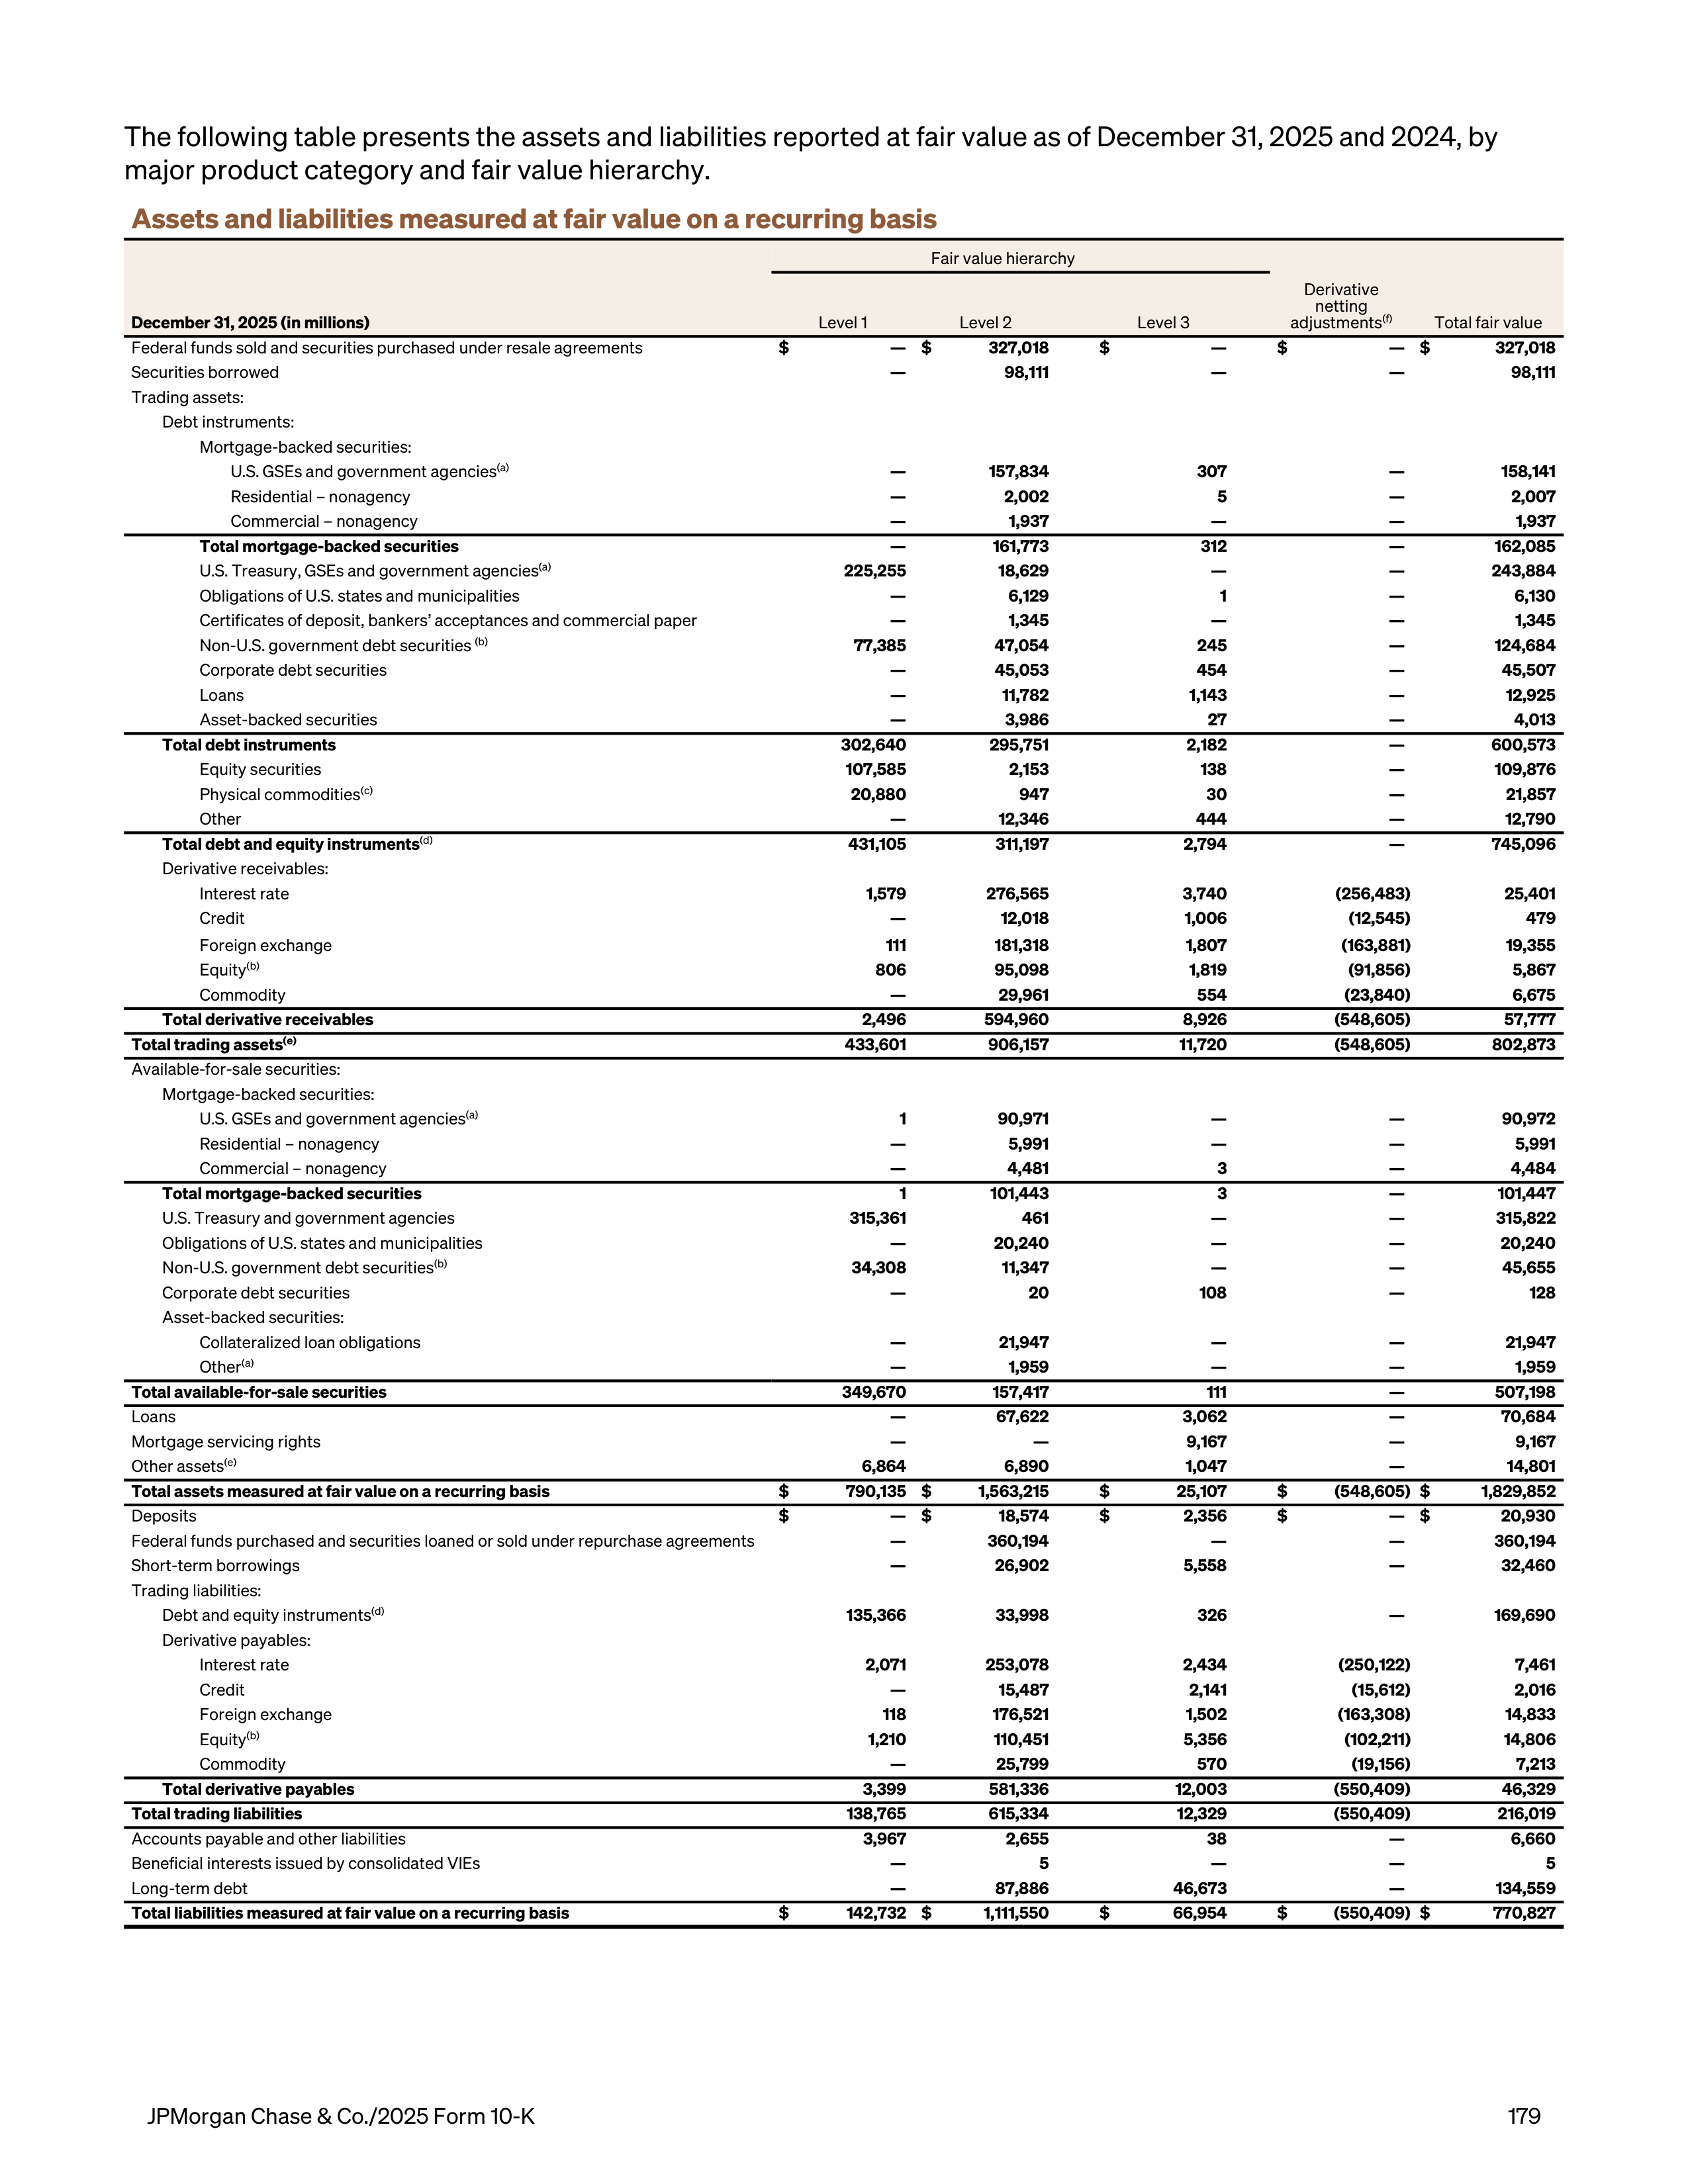
The following table presents the assets and liabilities reported at fair value as of December 31, 2025 and 2024, by
major product category and fair value hierarchy.
Assets and liabilities measured at fair value on a recurring basis
Fair value hierarchy
December 31, 2025 (in millions)
Level 1
Level 2
Level 3
Derivative
netting
adjustments
(f)
Total fair value
Federal funds sold and securities purchased under resale agreements
$
— $
327,018
$
—
$
— $
327,018
Securities borrowed
—
98,111
—
—
98,111
Trading assets:
Debt instruments:
Mortgage-backed securities:
U.S. GSEs and government agencies
(a)
—
157,834
307
—
158,141
Residential – nonagency
—
2,002
5
—
2,007
Commercial – nonagency
—
1,937
—
—
1,937
Total mortgage-backed securities
—
161,773
312
—
162,085
U.S. Treasury, GSEs and government agencies
(a)
225,255
18,629
—
—
243,884
Obligations of U.S. states and municipalities
—
6,129
1
—
6,130
Certificates of deposit, bankers’ acceptances and commercial paper
—
1,345
—
—
1,345
Non-U.S. government debt securities
(b)
77,385
47,054
245
—
124,684
Corporate debt securities
—
45,053
454
—
45,507
Loans
—
11,782
1,143
—
12,925
Asset-backed securities
—
3,986
27
—
4,013
Total debt instruments
302,640
295,751
2,182
—
600,573
Equity securities
107,585
2,153
138
—
109,876
Physical commodities
(c)
20,880
947
30
—
21,857
Other
—
12,346
444
—
12,790
Total debt and equity instruments
(d)
431,105
311,197
2,794
—
745,096
Derivative receivables:
Interest rate
1,579
276,565
3,740
(256,483)
25,401
Credit
—
12,018
1,006
(12,545)
479
Foreign exchange
111
181,318
1,807
(163,881)
19,355
Equity
(b)
806
95,098
1,819
(91,856)
5,867
Commodity
—
29,961
554
(23,840)
6,675
Total derivative receivables
2,496
594,960
8,926
(548,605)
57,777
Total trading assets
(e)
433,601
906,157
11,720
(548,605)
802,873
Available-for-sale securities:
Mortgage-backed securities:
U.S. GSEs and government agencies
(a)
1
90,971
—
—
90,972
Residential – nonagency
—
5,991
—
—
5,991
Commercial – nonagency
—
4,481
3
—
4,484
Total mortgage-backed securities
1
101,443
3
—
101,447
U.S. Treasury and government agencies
315,361
461
—
—
315,822
Obligations of U.S. states and municipalities
—
20,240
—
—
20,240
Non-U.S. government debt securities
(b)
34,308
11,347
—
—
45,655
Corporate debt securities
—
20
108
—
128
Asset-backed securities:
Collateralized loan obligations
—
21,947
—
—
21,947
Other
(a)
—
1,959
—
—
1,959
Total available-for-sale securities
349,670
157,417
111
—
507,198
Loans
—
67,622
3,062
—
70,684
Mortgage servicing rights
—
—
9,167
—
9,167
Other assets
(e)
6,864
6,890
1,047
—
14,801
Total assets measured at fair value on a recurring basis
$
790,135 $
1,563,215
$
25,107
$
(548,605) $
1,829,852
Deposits
$
— $
18,574
$
2,356
$
— $
20,930
Federal funds purchased and securities loaned or sold under repurchase agreements
—
360,194
—
—
360,194
Short-term borrowings
—
26,902
5,558
—
32,460
Trading liabilities:
Debt and equity instruments
(d)
135,366
33,998
326
—
169,690
Derivative payables:
Interest rate
2,071
253,078
2,434
(250,122)
7,461
Credit
—
15,487
2,141
(15,612)
2,016
Foreign exchange
118
176,521
1,502
(163,308)
14,833
Equity
(b)
1,210
110,451
5,356
(102,211)
14,806
Commodity
—
25,799
570
(19,156)
7,213
Total derivative payables
3,399
581,336
12,003
(550,409)
46,329
Total trading liabilities
138,765
615,334
12,329
(550,409)
216,019
Accounts payable and other liabilities
3,967
2,655
38
—
6,660
Beneficial interests issued by consolidated VIEs
—
5
—
—
5
Long-term debt
—
87,886
46,673
—
134,559
Total liabilities measured at fair value on a recurring basis
$
142,732 $
1,111,550
$
66,954
$
(550,409) $
770,827
JPMorgan Chase & Co./2025 Form 10-K
179
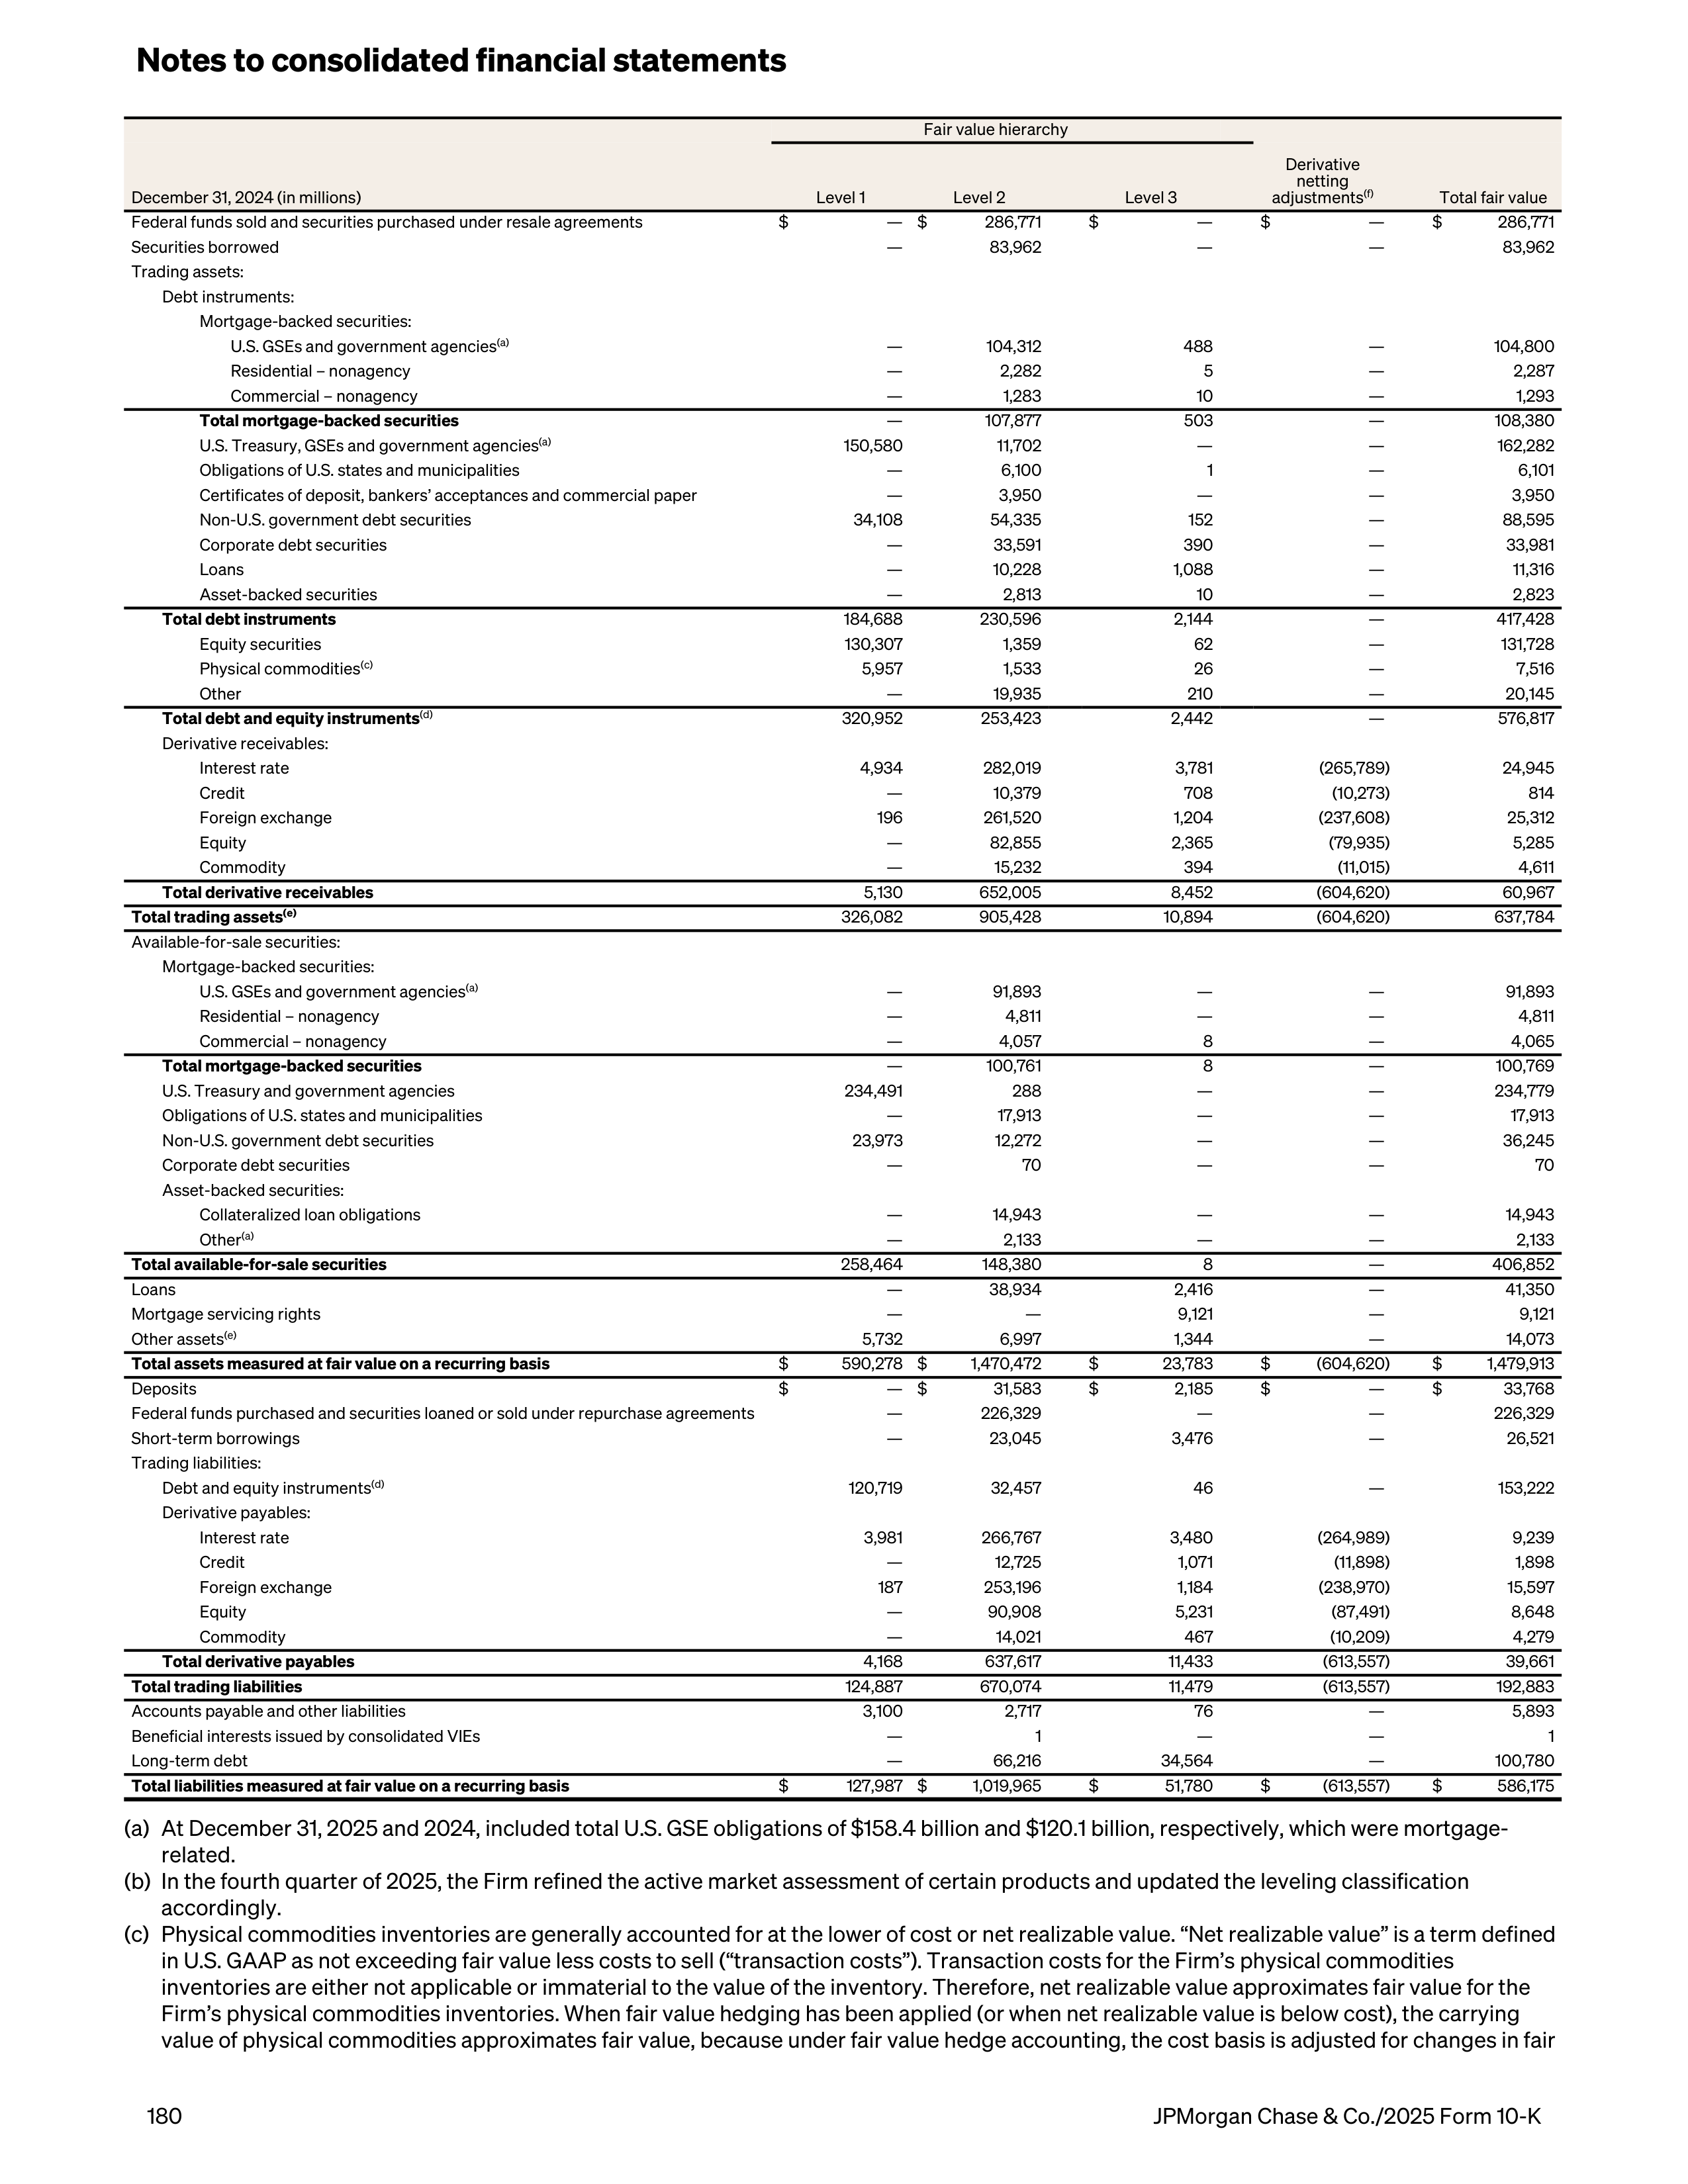
Fair value hierarchy
December 31, 2024 (in millions)
Level 1
Level 2
Level 3
Derivative
netting
adjustments
(f)
Total fair value
Federal funds sold and securities purchased under resale agreements
$
— $
286,771
$
—
$
—
$
286,771
Securities borrowed
—
83,962
—
—
83,962
Trading assets:
Debt instruments:
Mortgage-backed securities:
U.S. GSEs and government agencies
(a)
—
104,312
488
—
104,800
Residential – nonagency
—
2,282
5
—
2,287
Commercial – nonagency
—
1,283
10
—
1,293
Total mortgage-backed securities
—
107,877
503
—
108,380
U.S. Treasury, GSEs and government agencies
(a)
150,580
11,702
—
—
162,282
Obligations of U.S. states and municipalities
—
6,100
1
—
6,101
Certificates of deposit, bankers’ acceptances and commercial paper
—
3,950
—
—
3,950
Non-U.S. government debt securities
34,108
54,335
152
—
88,595
Corporate debt securities
—
33,591
390
—
33,981
Loans
—
10,228
1,088
—
11,316
Asset-backed securities
—
2,813
10
—
2,823
Total debt instruments
184,688
230,596
2,144
—
417,428
Equity securities
130,307
1,359
62
—
131,728
Physical commodities
(c)
5,957
1,533
26
—
7,516
Other
—
19,935
210
—
20,145
Total debt and equity instruments
(d)
320,952
253,423
2,442
—
576,817
Derivative receivables:
Interest rate
4,934
282,019
3,781
(265,789)
24,945
Credit
—
10,379
708
(10,273)
814
Foreign exchange
196
261,520
1,204
(237,608)
25,312
Equity
—
82,855
2,365
(79,935)
5,285
Commodity
—
15,232
394
(11,015)
4,611
Total derivative receivables
5,130
652,005
8,452
(604,620)
60,967
Total trading assets
(e)
326,082
905,428
10,894
(604,620)
637,784
Available-for-sale securities:
Mortgage-backed securities:
U.S. GSEs and government agencies
(a)
—
91,893
—
—
91,893
Residential – nonagency
—
4,811
—
—
4,811
Commercial – nonagency
—
4,057
8
—
4,065
Total mortgage-backed securities
—
100,761
8
—
100,769
U.S. Treasury and government agencies
234,491
288
—
—
234,779
Obligations of U.S. states and municipalities
—
17,913
—
—
17,913
Non-U.S. government debt securities
23,973
12,272
—
—
36,245
Corporate debt securities
—
70
—
—
70
Asset-backed securities:
Collateralized loan obligations
—
14,943
—
—
14,943
Other
(a)
—
2,133
—
—
2,133
Total available-for-sale securities
258,464
148,380
8
—
406,852
Loans
—
38,934
2,416
—
41,350
Mortgage servicing rights
—
—
9,121
—
9,121
Other assets
(e)
5,732
6,997
1,344
—
14,073
Total assets measured at fair value on a recurring basis
$
590,278 $
1,470,472
$
23,783
$
(604,620)
$
1,479,913
Deposits
$
— $
31,583
$
2,185
$
—
$
33,768
Federal funds purchased and securities loaned or sold under repurchase agreements
—
226,329
—
—
226,329
Short-term borrowings
—
23,045
3,476
—
26,521
Trading liabilities:
Debt and equity instruments
(d)
120,719
32,457
46
—
153,222
Derivative payables:
Interest rate
3,981
266,767
3,480
(264,989)
9,239
Credit
—
12,725
1,071
(11,898)
1,898
Foreign exchange
187
253,196
1,184
(238,970)
15,597
Equity
—
90,908
5,231
(87,491)
8,648
Commodity
—
14,021
467
(10,209)
4,279
Total derivative payables
4,168
637,617
11,433
(613,557)
39,661
Total trading liabilities
124,887
670,074
11,479
(613,557)
192,883
Accounts payable and other liabilities
3,100
2,717
76
—
5,893
Beneficial interests issued by consolidated VIEs
—
1
—
—
1
Long-term debt
—
66,216
34,564
—
100,780
Total liabilities measured at fair value on a recurring basis
$
127,987 $
1,019,965
$
51,780
$
(613,557)
$
586,175
(a)
At December 31, 2025 and 2024, included total U.S. GSE obligations of $158.4 billion and $120.1 billion, respectively, which were mortgage-
related.
(b)
In the fourth quarter of 2025, the Firm refined the active market assessment of certain products and updated the leveling classification
accordingly.
(c)
Physical commodities inventories are generally accounted for at the lower of cost or net realizable value. “Net realizable value” is a term defined
in U.S. GAAP as not exceeding fair value less costs to sell (“transaction costs”). Transaction costs for the Firm’s physical commodities
inventories are either not applicable or immaterial to the value of the inventory. Therefore, net realizable value approximates fair value for the
Firm’s physical commodities inventories. When fair value hedging has been applied (or when net realizable value is below cost), the carrying
value of physical commodities approximates fair value, because under fair value hedge accounting, the cost basis is adjusted for changes in fair
Notes to consolidated financial statements
180
JPMorgan Chase & Co./2025 Form 10-K

value. Refer to Note 5 for a further discussion of the Firm’s hedge accounting relationships. To provide consistent fair value disclosure
information, all physical commodities inventories have been included in each period presented.
(d)
Balances reflect the reduction of securities owned (long positions) by the amount of identical securities sold but not yet purchased (short
positions).
(e)
Certain investments that are measured at fair value using the net asset value per share (or its equivalent) as a practical expedient are not
required to be classified in the fair value hierarchy. At both December 31, 2025 and 2024, the fair values of these investments, which include
certain hedge funds, private equity funds, real estate and other funds, were $1.0 billion, primarily reported in other assets.
(f)
As permitted under U.S. GAAP, the Firm has elected to net derivative receivables and derivative payables and the related cash collateral
received and paid when a legally enforceable master netting agreement exists. The level 3 balances would be reduced if netting were applied,
including the netting benefit associated with cash collateral.
181
JPMorgan Chase & Co./2025 Form 10-K
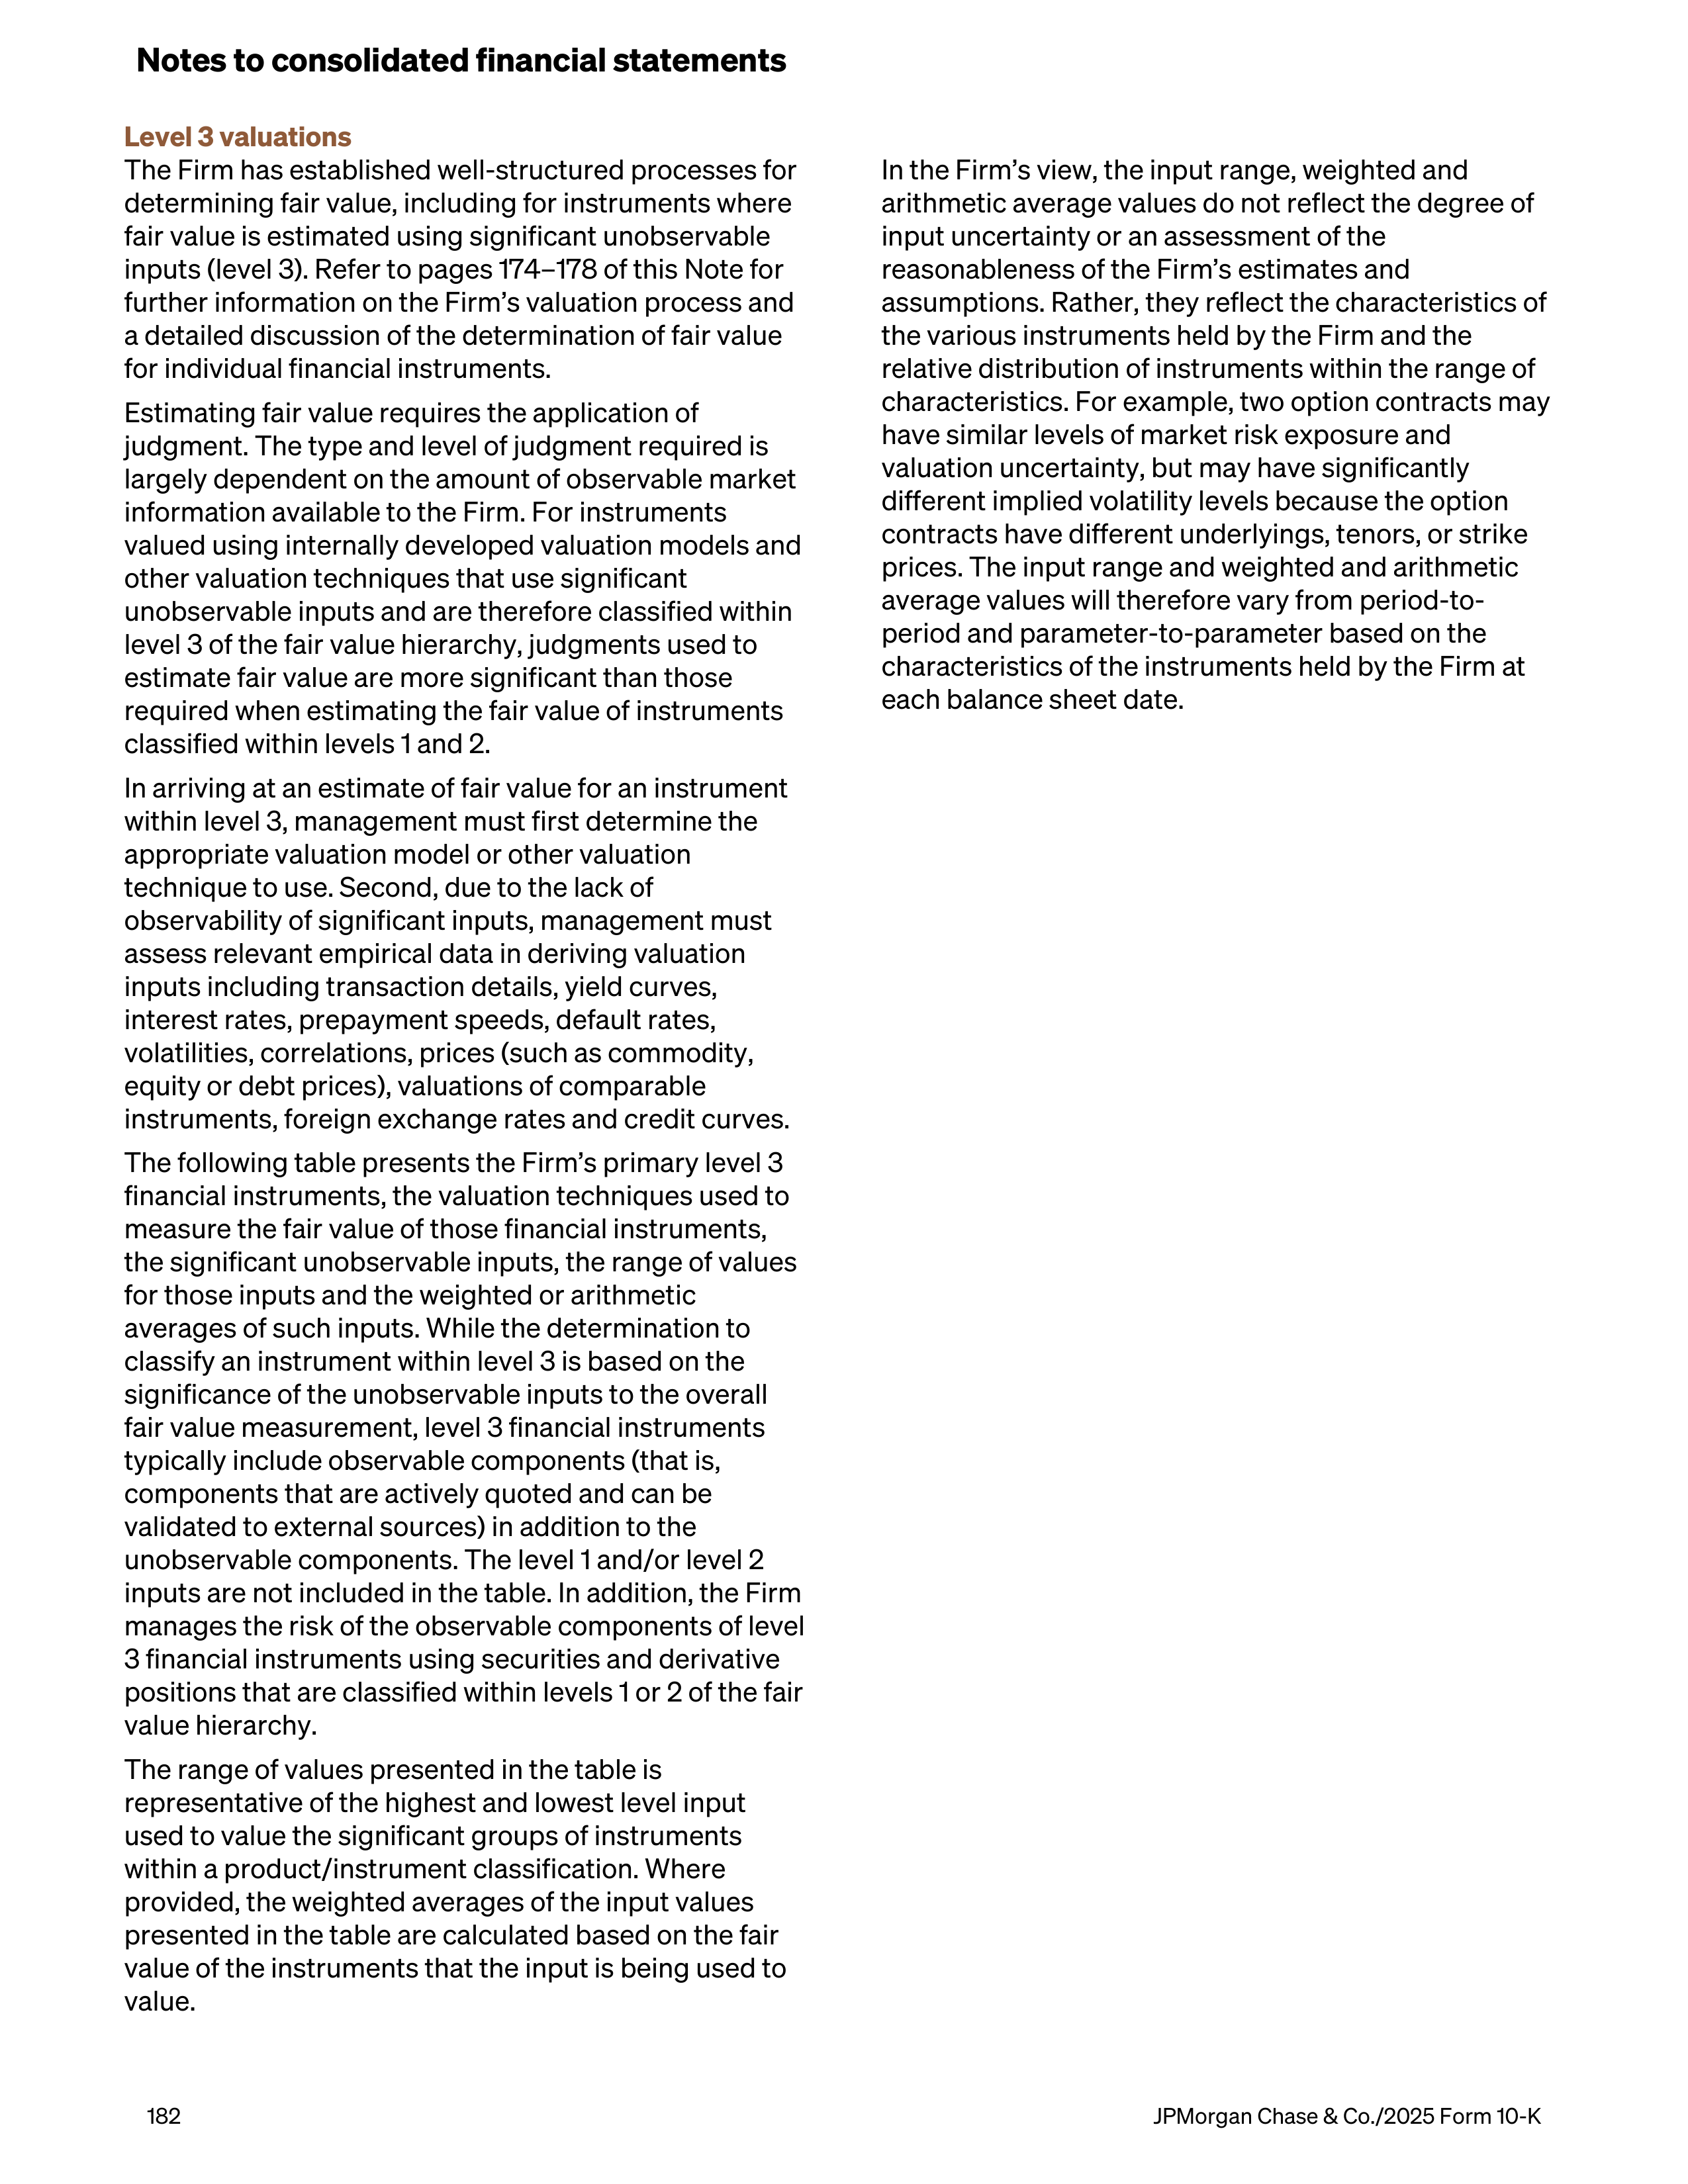
Level 3 valuations
The Firm has established well-structured processes for
determining fair value, including for instruments where
fair value is estimated using significant unobservable
inputs (level 3). Refer to pages 174–178 of this Note for
further information on the Firm’s valuation process and
a detailed discussion of the determination of fair value
for individual financial instruments.
Estimating fair value requires the application of
judgment. The type and level of judgment required is
largely dependent on the amount of observable market
information available to the Firm. For instruments
valued using internally developed valuation models and
other valuation techniques that use significant
unobservable inputs and are therefore classified within
level 3 of the fair value hierarchy, judgments used to
estimate fair value are more significant than those
required when estimating the fair value of instruments
classified within levels 1 and 2.
In arriving at an estimate of fair value for an instrument
within level 3, management must first determine the
appropriate valuation model or other valuation
technique to use. Second, due to the lack of
observability of significant inputs, management must
assess relevant empirical data in deriving valuation
inputs including transaction details, yield curves,
interest rates, prepayment speeds, default rates,
volatilities, correlations, prices (such as commodity,
equity or debt prices), valuations of comparable
instruments, foreign exchange rates and credit curves.
The following table presents the Firm’s primary level 3
financial instruments, the valuation techniques used to
measure the fair value of those financial instruments,
the significant unobservable inputs, the range of values
for those inputs and the weighted or arithmetic
averages of such inputs. While the determination to
classify an instrument within level 3 is based on the
significance of the unobservable inputs to the overall
fair value measurement, level 3 financial instruments
typically include observable components (that is,
components that are actively quoted and can be
validated to external sources) in addition to the
unobservable components. The level 1 and/or level 2
inputs are not included in the table. In addition, the Firm
manages the risk of the observable components of level
3 financial instruments using securities and derivative
positions that are classified within levels 1 or 2 of the fair
value hierarchy.
The range of values presented in the table is
representative of the highest and lowest level input
used to value the significant groups of instruments
within a product/instrument classification. Where
provided, the weighted averages of the input values
presented in the table are calculated based on the fair
value of the instruments that the input is being used to
value.
In the Firm’s view, the input range, weighted and
arithmetic average values do not reflect the degree of
input uncertainty or an assessment of the
reasonableness of the Firm’s estimates and
assumptions. Rather, they reflect the characteristics of
the various instruments held by the Firm and the
relative distribution of instruments within the range of
characteristics. For example, two option contracts may
have similar levels of market risk exposure and
valuation uncertainty, but may have significantly
different implied volatility levels because the option
contracts have different underlyings, tenors, or strike
prices. The input range and weighted and arithmetic
average values will therefore vary from period-to-
period and parameter-to-parameter based on the
characteristics of the instruments held by the Firm at
each balance sheet date.
Notes to consolidated financial statements
182
JPMorgan Chase & Co./2025 Form 10-K
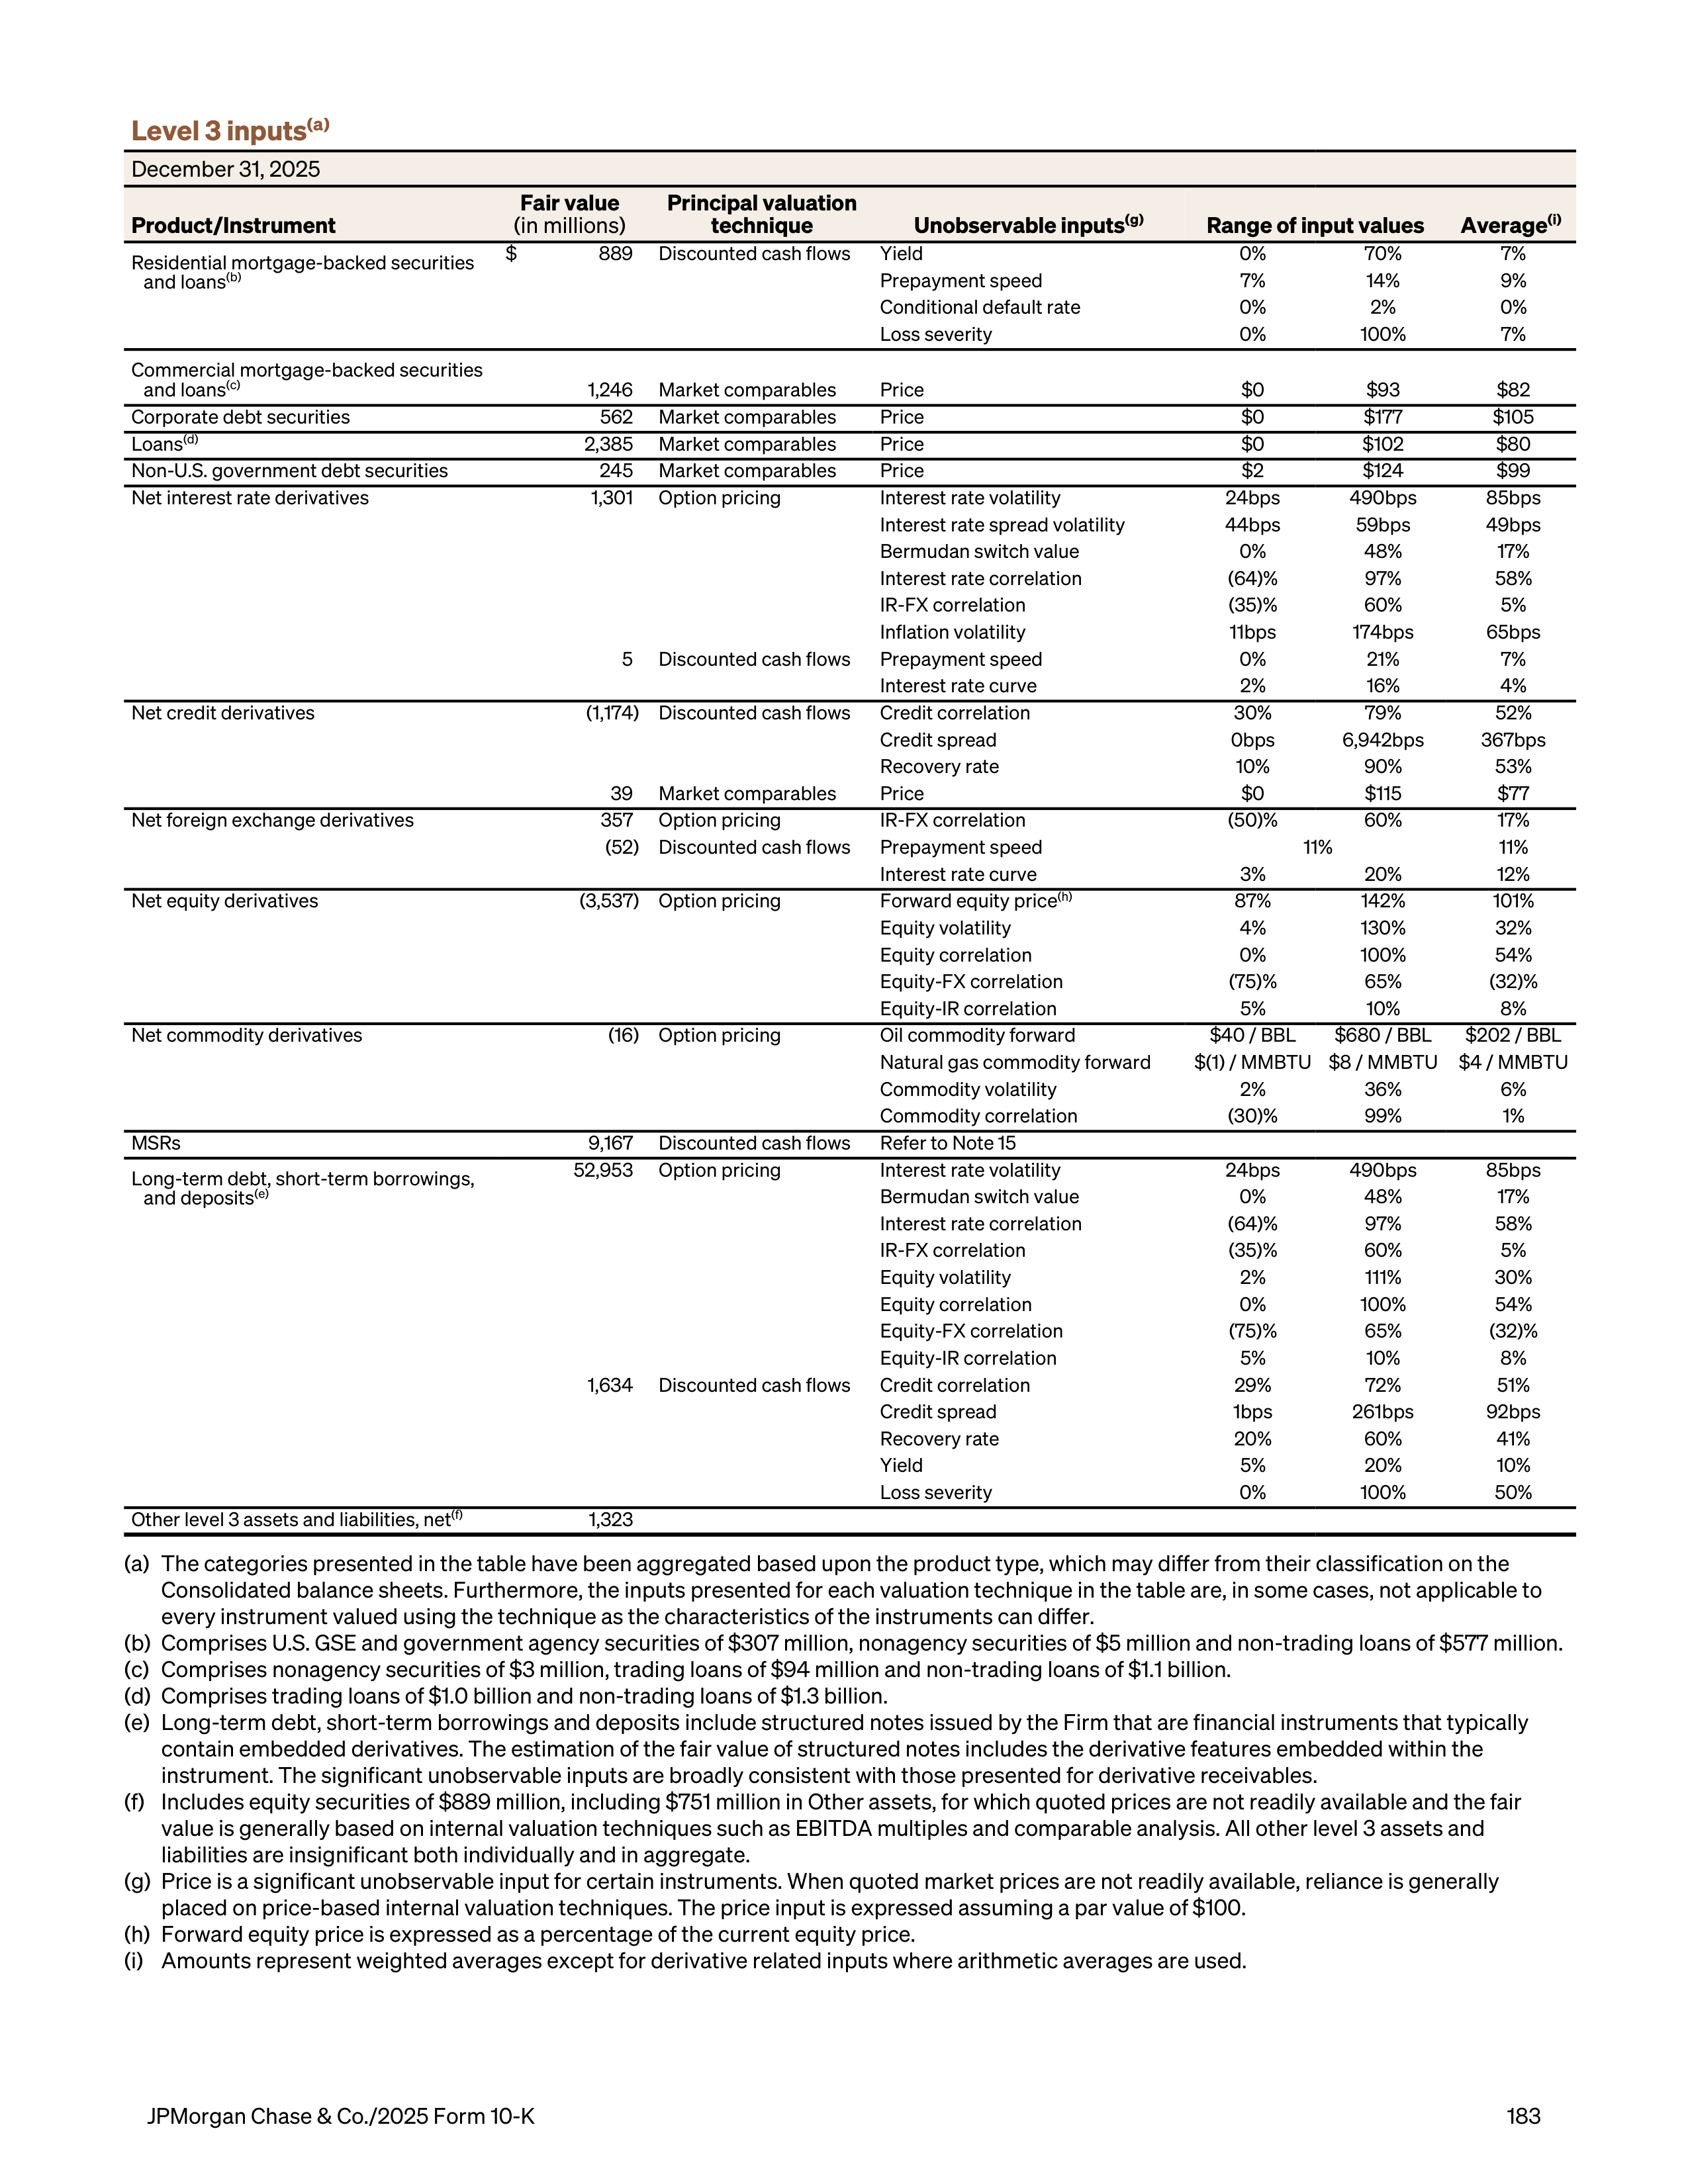
Level 3 inputs
(a)
December 31, 2025
Product/Instrument
Fair value
(in millions)
Principal valuation
technique
Unobservable inputs
(g)
Range of input values
Average
(i)
Residential mortgage-backed securities
and loans
(b)
$
889
Discounted cash flows
Yield
0%
70%
7%
Prepayment speed
7%
14%
9%
Conditional default rate
0%
2%
0%
Loss severity
0%
100%
7%
Commercial mortgage-backed securities
and loans
(c)
1,246
Market comparables
Price
$0
$93
$82
Corporate debt securities
562
Market comparables
Price
$0
$177
$105
Loans
(d)
2,385
Market comparables
Price
$0
$102
$80
Non-U.S. government debt securities
245
Market comparables
Price
$2
$124
$99
Net interest rate derivatives
1,301
Option pricing
Interest rate volatility
24bps
490bps
85bps
Interest rate spread volatility
44bps
59bps
49bps
Bermudan switch value
0%
48%
17%
Interest rate correlation
(64)%
97%
58%
IR-FX correlation
(35)%
60%
5%
Inflation volatility
11bps
174bps
65bps
5
Discounted cash flows
Prepayment speed
0%
21%
7%
Interest rate curve
2%
16%
4%
Net credit derivatives
(1,174)
Discounted cash flows
Credit correlation
30%
79%
52%
Credit spread
0bps
6,942bps
367bps
Recovery rate
10%
90%
53%
39
Market comparables
Price
$0
$115
$77
Net foreign exchange derivatives
357
Option pricing
IR-FX correlation
(50)%
60%
17%
(52)
Discounted cash flows
Prepayment speed
11%
11%
Interest rate curve
3%
20%
12%
Net equity derivatives
(3,537)
Option pricing
Forward equity price
(h)
87%
142%
101%
Equity volatility
4%
130%
32%
Equity correlation
0%
100%
54%
Equity-FX correlation
(75)%
65%
(32)%
Equity-IR correlation
5%
10%
8%
Net commodity derivatives
(16)
Option pricing
Oil commodity forward
$40 / BBL
$680 / BBL
$202 / BBL
Natural gas commodity forward
$(1) / MMBTU
$8 / MMBTU
$4 / MMBTU
Commodity volatility
2%
36%
6%
Commodity correlation
(30)%
99%
1%
MSRs
9,167
Discounted cash flows
Refer to Note 15
Long-term debt, short-term borrowings,
and deposits
(e)
52,953
Option pricing
Interest rate volatility
24bps
490bps
85bps
Bermudan switch value
0%
48%
17%
Interest rate correlation
(64)%
97%
58%
IR-FX correlation
(35)%
60%
5%
Equity volatility
2%
111%
30%
Equity correlation
0%
100%
54%
Equity-FX correlation
(75)%
65%
(32)%
Equity-IR correlation
5%
10%
8%
1,634
Discounted cash flows
Credit correlation
29%
72%
51%
Credit spread
1bps
261bps
92bps
Recovery rate
20%
60%
41%
Yield
5%
20%
10%
Loss severity
0%
100%
50%
Other level 3 assets and liabilities, net
(f)
1,323
(a)
The categories presented in the table have been aggregated based upon the product type, which may differ from their classification on the
Consolidated balance sheets. Furthermore, the inputs presented for each valuation technique in the table are, in some cases, not applicable to
every instrument valued using the technique as the characteristics of the instruments can differ.
(b)
Comprises U.S. GSE and government agency securities of $307 million, nonagency securities of $5 million and non-trading loans of $577 million.
(c)
Comprises nonagency securities of $3 million, trading loans of $94 million and non-trading loans of $1.1 billion.
(d)
Comprises trading loans of $1.0 billion and non-trading loans of $1.3 billion.
(e)
Long-term debt, short-term borrowings and deposits include structured notes issued by the Firm that are financial instruments that typically
contain embedded derivatives. The estimation of the fair value of structured notes includes the derivative features embedded within the
instrument. The significant unobservable inputs are broadly consistent with those presented for derivative receivables.
(f)
Includes equity securities of $889 million, including $751 million in Other assets, for which quoted prices are not readily available and the fair
value is generally based on internal valuation techniques such as EBITDA multiples and comparable analysis. All other level 3 assets and
liabilities are insignificant both individually and in aggregate.
(g)
Price is a significant unobservable input for certain instruments. When quoted market prices are not readily available, reliance is generally
placed on price-based internal valuation techniques. The price input is expressed assuming a par value of $100.
(h)
Forward equity price is expressed as a percentage of the current equity price.
(i)
Amounts represent weighted averages except for derivative related inputs where arithmetic averages are used.
JPMorgan Chase & Co./2025 Form 10-K
183
Changes in and ranges of unobservable inputs
The following discussion provides a description of the
impact on a fair value measurement of a change in each
unobservable input in isolation, and the
interrelationship between unobservable inputs, where
relevant and significant. The impact of changes in
inputs may not be independent, as a change in one
unobservable input may give rise to a change in another
unobservable input. Where relationships do exist
between two unobservable inputs, those relationships
are discussed below. Relationships may also exist
between observable and unobservable inputs (for
example, as observable interest rates rise,
unobservable prepayment rates decline); such
relationships have not been included in the discussion
below. In addition, for each of the individual
relationships described below, the inverse relationship
would also generally apply.
The following discussion also provides a description of
attributes of the underlying instruments and external
market factors that affect the range of inputs used in
the valuation of the Firm’s positions.
Yield – The yield of an asset is the interest rate used to
discount future cash flows in a discounted cash flow
calculation. An increase in the yield, in isolation, would
result in a decrease in a fair value measurement.
Credit spread – The credit spread is the amount of
additional annualized return over the market interest
rate that a market participant would demand for taking
exposure to the credit risk of an instrument. The credit
spread for an instrument forms part of the discount rate
used in a discounted cash flow calculation. Generally,
an increase in the credit spread would result in a
decrease in a fair value measurement.
The yield and the credit spread of a particular
mortgage-backed security primarily reflect the risk
inherent in the instrument. The yield is also impacted by
the absolute level of the coupon paid by the instrument
(which may not correspond directly to the level of
inherent risk). Therefore, the range of yield and credit
spreads reflects the range of risk inherent in various
instruments owned by the Firm. The risk inherent in
mortgage-backed securities is driven by the
subordination of the security being valued and the
characteristics of the underlying mortgages within the
collateralized pool, including borrower FICO scores,
LTV ratios for residential mortgages and the nature of
the property and/or any tenants for commercial
mortgages. For corporate debt securities, obligations of
U.S. states and municipalities and other similar
instruments, credit spreads reflect the credit quality of
the obligor and the tenor of the obligation.
Prepayment speed – The prepayment speed is a
measure of the voluntary unscheduled principal
repayments of a prepayable obligation in a
collateralized pool. Prepayment speeds generally
decline as borrower delinquencies rise. An increase in
prepayment speeds, in isolation, would result in a
decrease in a fair value measurement of assets valued
at a premium to par and an increase in a fair value
measurement of assets valued at a discount to par.
Prepayment speeds may vary from collateral pool to
collateral pool, and are driven by the type and location
of the underlying borrower, and the remaining tenor of
the obligation as well as the level and type (e.g., fixed or
floating) of interest rate being paid by the borrower.
Typically collateral pools with higher borrower credit
quality have a higher prepayment rate than those with
lower borrower credit quality, all other factors being
equal.
Conditional default rate – The conditional default rate is
a measure of the reduction in the outstanding collateral
balance underlying a collateralized obligation as a
result of defaults. While there is typically no direct
relationship between conditional default rates and
prepayment speeds, collateralized obligations for which
the underlying collateral has high prepayment speeds
will tend to have lower conditional default rates. An
increase in conditional default rates would generally be
accompanied by an increase in loss severity and an
increase in credit spreads. An increase in the
conditional default rate, in isolation, would result in a
decrease in a fair value measurement. Conditional
default rates reflect the quality of the collateral
underlying a securitization and the structure of the
securitization itself. Based on the types of securities
owned in the Firm’s market-making portfolios,
conditional default rates are most typically at the lower
end of the range presented.
Loss severity – The loss severity (the inverse concept is
the recovery rate) is the expected amount of future
realized losses resulting from the ultimate liquidation of
a particular loan, expressed as the net amount of loss
relative to the outstanding loan balance. An increase in
loss severity is generally accompanied by an increase in
conditional default rates. An increase in the loss
severity, in isolation, would result in a decrease in a fair
value measurement.
The loss severity applied in valuing a mortgage-backed
security depends on factors relating to the underlying
mortgages, including the LTV ratio, the nature of the
lender’s lien on the property and other instrument-
specific factors.
Notes to consolidated financial statements
184
JPMorgan Chase & Co./2025 Form 10-K
Correlation – Correlation is a measure of the
relationship between the movements of two variables.
Correlation is a pricing input for a derivative product
where the payoff is driven by one or more underlying
risks. Correlation inputs are related to the type of
derivative (e.g., interest rate, credit, equity, foreign
exchange and commodity) due to the nature of the
underlying risks. When parameters are positively
correlated, an increase in one parameter will result in an
increase in the other parameter. When parameters are
negatively correlated, an increase in one parameter will
result in a decrease in the other parameter. An increase
in correlation can result in an increase or a decrease in a
fair value measurement. Given a short correlation
position, an increase in correlation, in isolation, would
generally result in a decrease in a fair value
measurement.
The level of correlation used in the valuation of
derivatives with multiple underlying risks depends on a
number of factors including the nature of those risks.
For example, the correlation between two credit risk
exposures would be different than that between two
interest rate risk exposures. Similarly, the tenor of the
transaction may also impact the correlation input, as
the relationship between the underlying risks may be
different over different time periods. Furthermore,
correlation levels are dependent on market conditions
and could have a relatively wide range of levels within or
across asset classes over time, particularly in volatile
market conditions.
Volatility – Volatility is a measure of the variability in
possible returns for an instrument, parameter or market
index given how much the particular instrument,
parameter or index changes in value over time.
Volatility is a pricing input for options, including equity
options, commodity options, and interest rate options.
Given a long position in an option, an increase in
volatility, in isolation, would generally result in an
increase in a fair value measurement.
The level of volatility used in the valuation of a particular
option-based derivative depends on a number of
factors, including the nature of the risk underlying the
option (e.g., the volatility of a particular equity security
may be significantly different from that of a particular
commodity index), the tenor of the derivative as well as
the strike price of the option.
Bermudan switch value – The switch value is the
difference between the overall value of a Bermudan
swaption, which can be exercised at multiple points in
time, and its most expensive European swaption and
reflects the additional value that the multiple exercise
dates provide the holder. Switch values are dependent
on market conditions and can vary greatly depending
on a number of factors, such as the tenor of the
underlying swap as well as the strike price of the option.
An increase in switch value, in isolation, would generally
result in an increase in a fair value measurement.
Interest rate curve – The interest rate curve represents
the relationship of interest rates over differing tenors.
The interest rate curve is used to set interest rate and
foreign exchange derivative cash flows and is also a
pricing input used in the discounting of any derivative
cash flow.
Forward price – The forward price is the price at which
the buyer agrees to purchase the asset underlying a
forward contract on the predetermined future delivery
date, and is such that the value of the contract is zero at
inception.
The forward price is used as an input in the valuation of
certain derivatives and depends on a number of factors
including interest rates, the current price of the
underlying asset, and the expected income to be
received and costs to be incurred by the seller as a
result of holding that asset until the delivery date. An
increase in the forward can result in an increase or a
decrease in a fair value measurement.
Changes in level 3 recurring fair value measurements
The following tables include a rollforward of the
Consolidated balance sheets amounts (including
changes in fair value) for financial instruments classified
by the Firm within level 3 of the fair value hierarchy for
the years ended December 31, 2025, 2024 and 2023.
When a determination is made to classify a financial
instrument within level 3, the determination is based on
the significance of the unobservable inputs to the
overall fair value measurement. However, level 3
financial instruments typically include, in addition to the
unobservable or level 3 components, observable
components (that is, components that are actively
quoted and can be validated to external sources);
accordingly, the gains and losses in the table below
include changes in fair value due in part to observable
factors that are part of the valuation methodology. The
Firm risk-manages the observable components of level
3 financial instruments using securities and derivative
positions that are classified within level 1 or 2 of the fair
value hierarchy; as these level 1 and level 2 risk
management instruments are not included below, the
gains or losses in the following tables do not reflect the
effect of the Firm’s risk management activities related
to such level 3 instruments.
JPMorgan Chase & Co./2025 Form 10-K
185
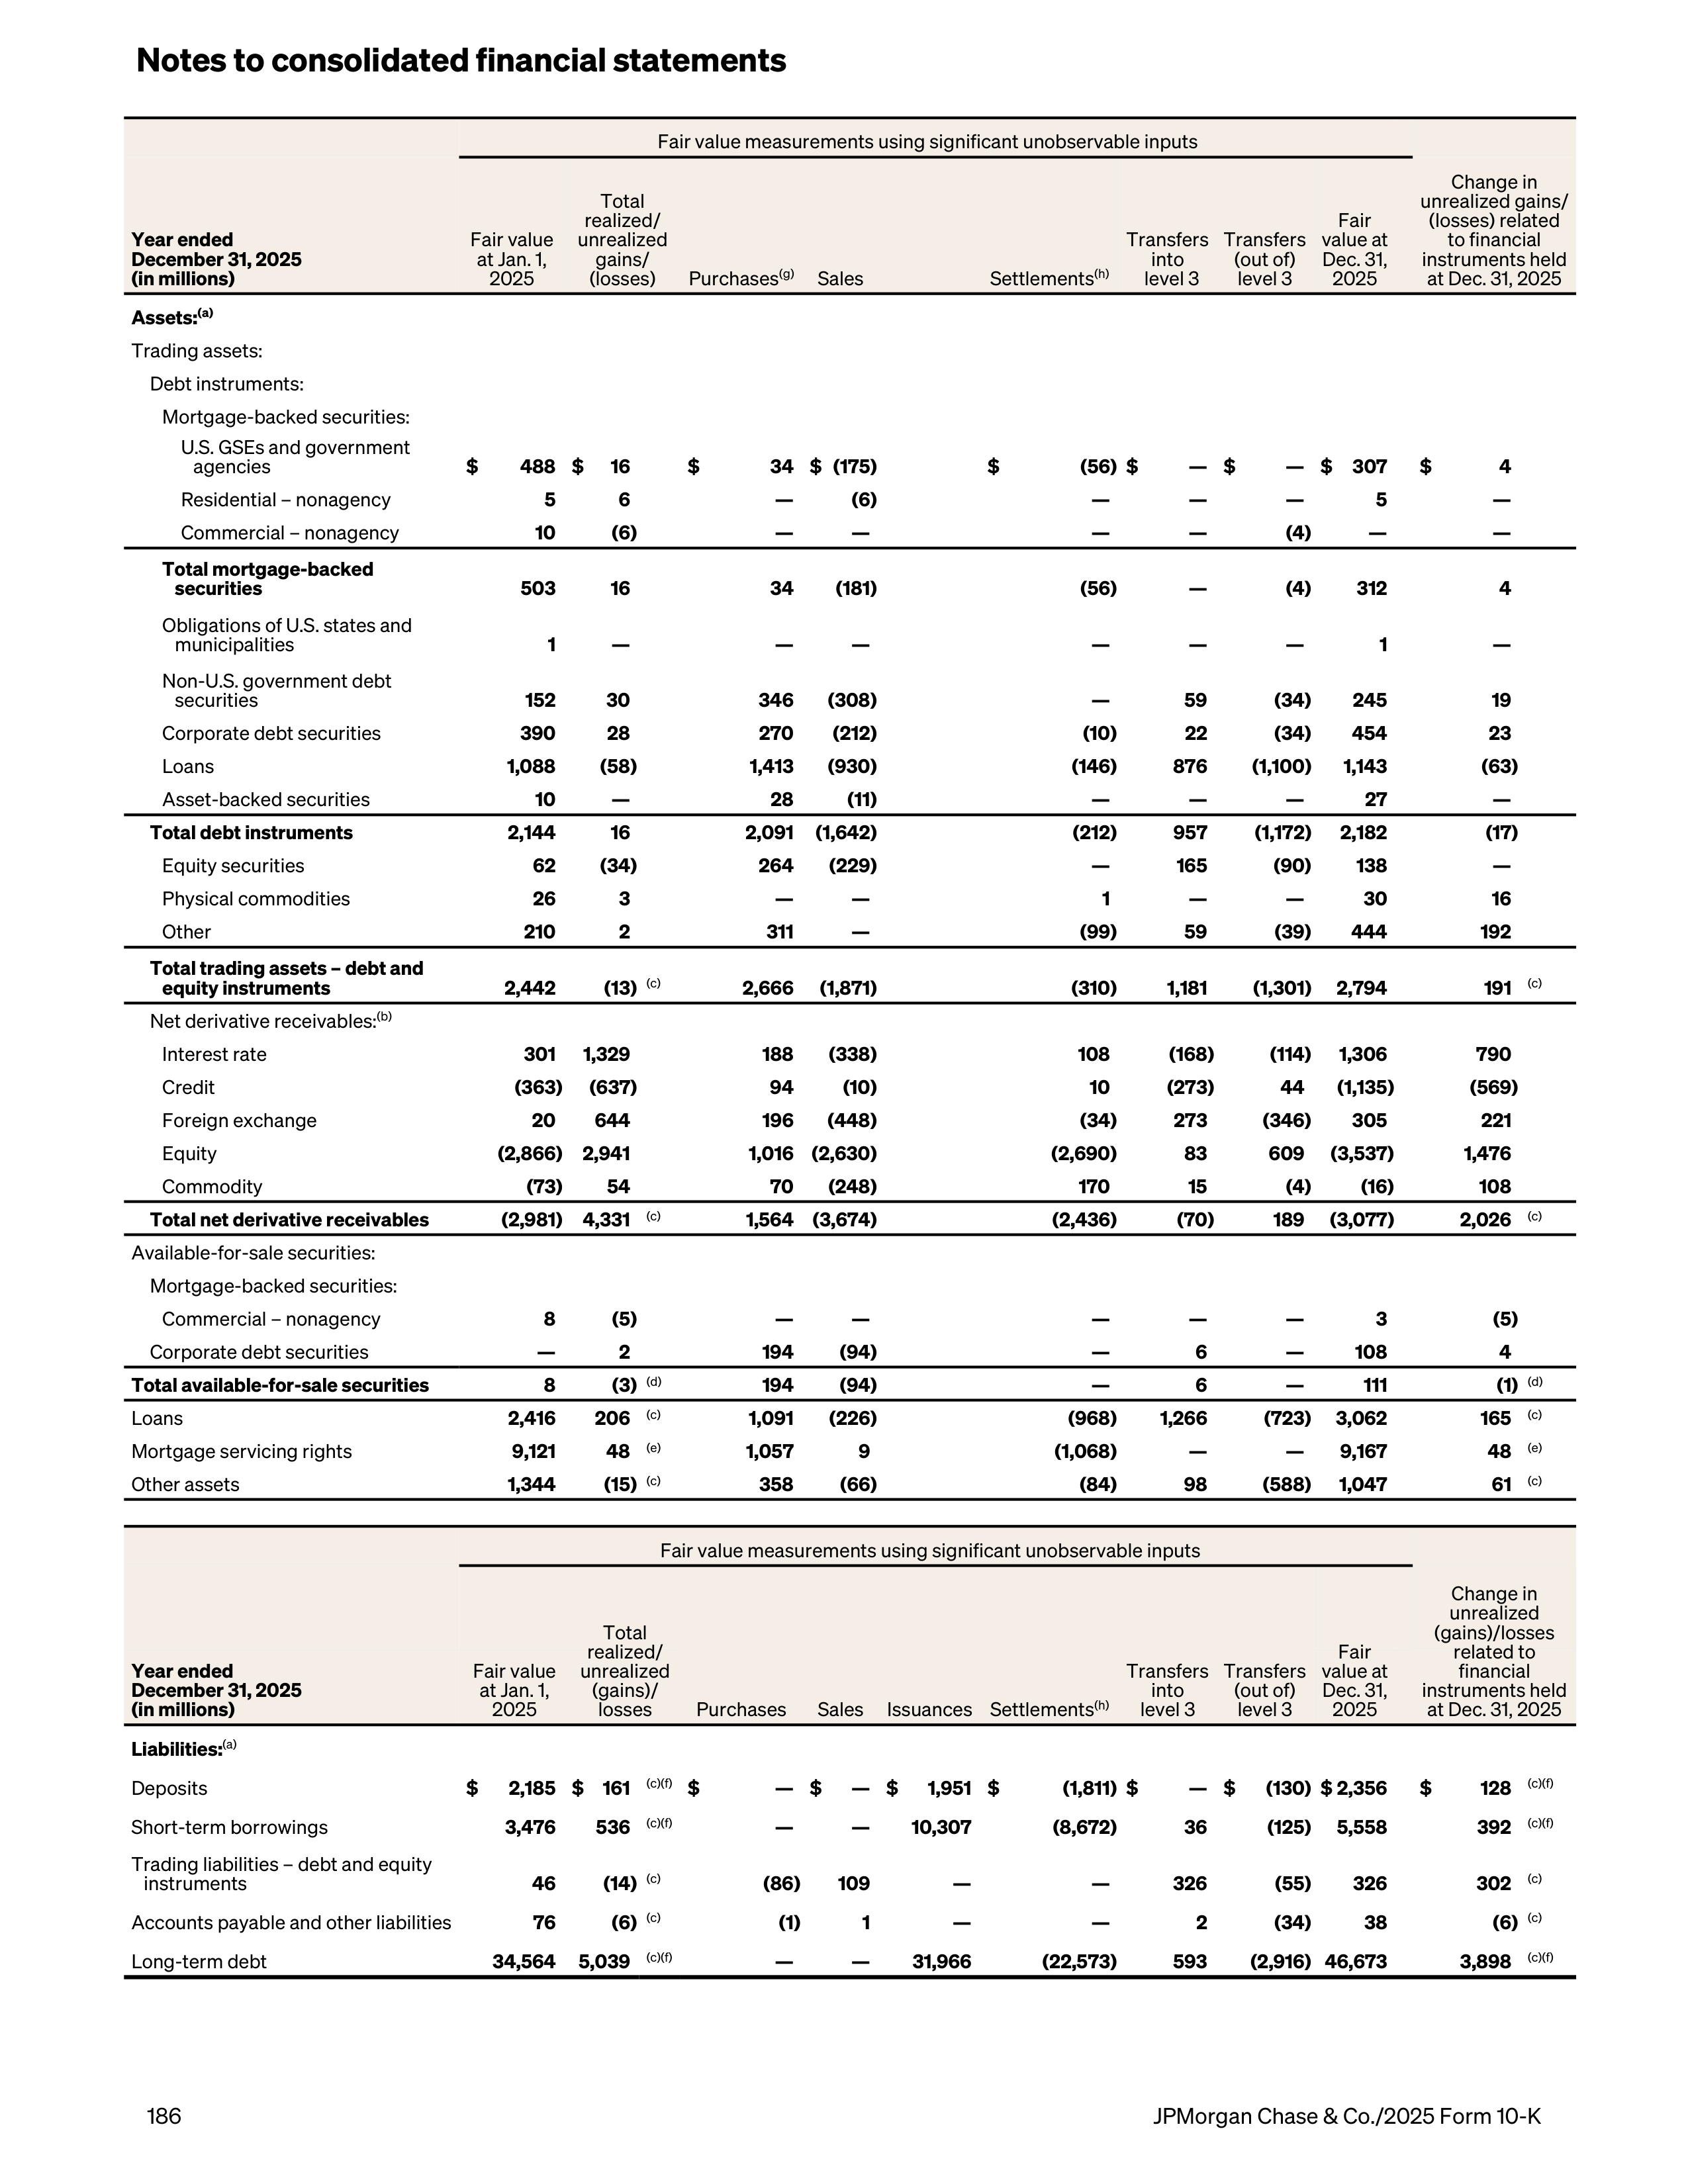
Fair value measurements using significant unobservable inputs
Year ended
December 31, 2025
(in millions)
Fair value
at Jan. 1,
2025
Total
realized/
unrealized
gains/
(losses)
Transfers
into
level 3
Transfers
(out of)
level 3
Fair
value at
Dec. 31,
2025
Change in
unrealized gains/
(losses) related
to financial
instruments held
at Dec. 31, 2025
Purchases
(g)
Sales
Settlements
(h)
Assets:
(a)
Trading assets:
Debt instruments:
Mortgage-backed securities:
U.S. GSEs and government
agencies
$
488 $
16
$
34 $ (175)
$
(56) $
— $
— $
307
$
4
Residential – nonagency
5
6
—
(6)
—
—
—
5
—
Commercial – nonagency
10
(6)
—
—
—
—
(4)
—
—
Total mortgage-backed
securities
503
16
34
(181)
(56)
—
(4)
312
4
Obligations of U.S. states and
municipalities
1
—
—
—
—
—
—
1
—
Non-U.S. government debt
securities
152
30
346 (308)
—
59
(34)
245
19
Corporate debt securities
390
28
270
(212)
(10)
22
(34)
454
23
Loans
1,088
(58)
1,413 (930)
(146)
876
(1,100)
1,143
(63)
Asset-backed securities
10
—
28
(11)
—
—
—
27
—
Total debt instruments
2,144
16
2,091 (1,642)
(212)
957
(1,172)
2,182
(17)
Equity securities
62
(34)
264
(229)
—
165
(90)
138
—
Physical commodities
26
3
—
—
1
—
—
30
16
Other
210
2
311
—
(99)
59
(39)
444
192
Total trading assets – debt and
equity instruments
2,442
(13)
(c)
2,666 (1,871)
(310)
1,181
(1,301) 2,794
191
(c)
Net derivative receivables:
(b)
Interest rate
301 1,329
188 (338)
108
(168)
(114) 1,306
790
Credit
(363) (637)
94
(10)
10
(273)
44 (1,135)
(569)
Foreign exchange
20
644
196 (448)
(34)
273
(346)
305
221
Equity
(2,866) 2,941
1,016 (2,630)
(2,690)
83
609 (3,537)
1,476
Commodity
(73)
54
70 (248)
170
15
(4)
(16)
108
Total net derivative receivables
(2,981) 4,331
(c)
1,564 (3,674)
(2,436)
(70)
189 (3,077)
2,026
(c)
Available-for-sale securities:
Mortgage-backed securities:
Commercial – nonagency
8
(5)
—
—
—
—
—
3
(5)
Corporate debt securities
—
2
194
(94)
—
6
—
108
4
Total available-for-sale securities
8
(3)
(d)
194
(94)
—
6
—
111
(1)
(d)
Loans
2,416
206
(c)
1,091
(226)
(968)
1,266
(723) 3,062
165
(c)
Mortgage servicing rights
9,121
48
(e)
1,057
9
(1,068)
—
—
9,167
48
(e)
Other assets
1,344
(15)
(c)
358
(66)
(84)
98
(588) 1,047
61
(c)
Fair value measurements using significant unobservable inputs
Year ended
December 31, 2025
(in millions)
Fair value
at Jan. 1,
2025
Total
realized/
unrealized
(gains)/
losses
Transfers
(out of)
level 3
Fair
value at
Dec. 31,
2025
Change in
unrealized
(gains)/losses
related to
financial
instruments held
at Dec. 31, 2025
Purchases
Sales
Issuances
Settlements
(h)
Transfers
into
level 3
Liabilities:
(a)
Deposits
$
2,185 $ 161
(c)(f)
$
— $
— $
1,951 $
(1,811) $
— $
(130) $ 2,356
$
128
(c)(f)
Short-term borrowings
3,476
536
(c)(f)
—
—
10,307
(8,672)
36
(125) 5,558
392
(c)(f)
Trading liabilities – debt and equity
instruments
46
(14)
(c)
(86)
109
—
—
326
(55)
326
302
(c)
Accounts payable and other liabilities
76
(6)
(c)
(1)
1
—
—
2
(34)
38
(6)
(c)
Long-term debt
34,564 5,039
(c)(f)
—
—
31,966
(22,573)
593
(2,916) 46,673
3,898
(c)(f)
Notes to consolidated financial statements
186
JPMorgan Chase & Co./2025 Form 10-K
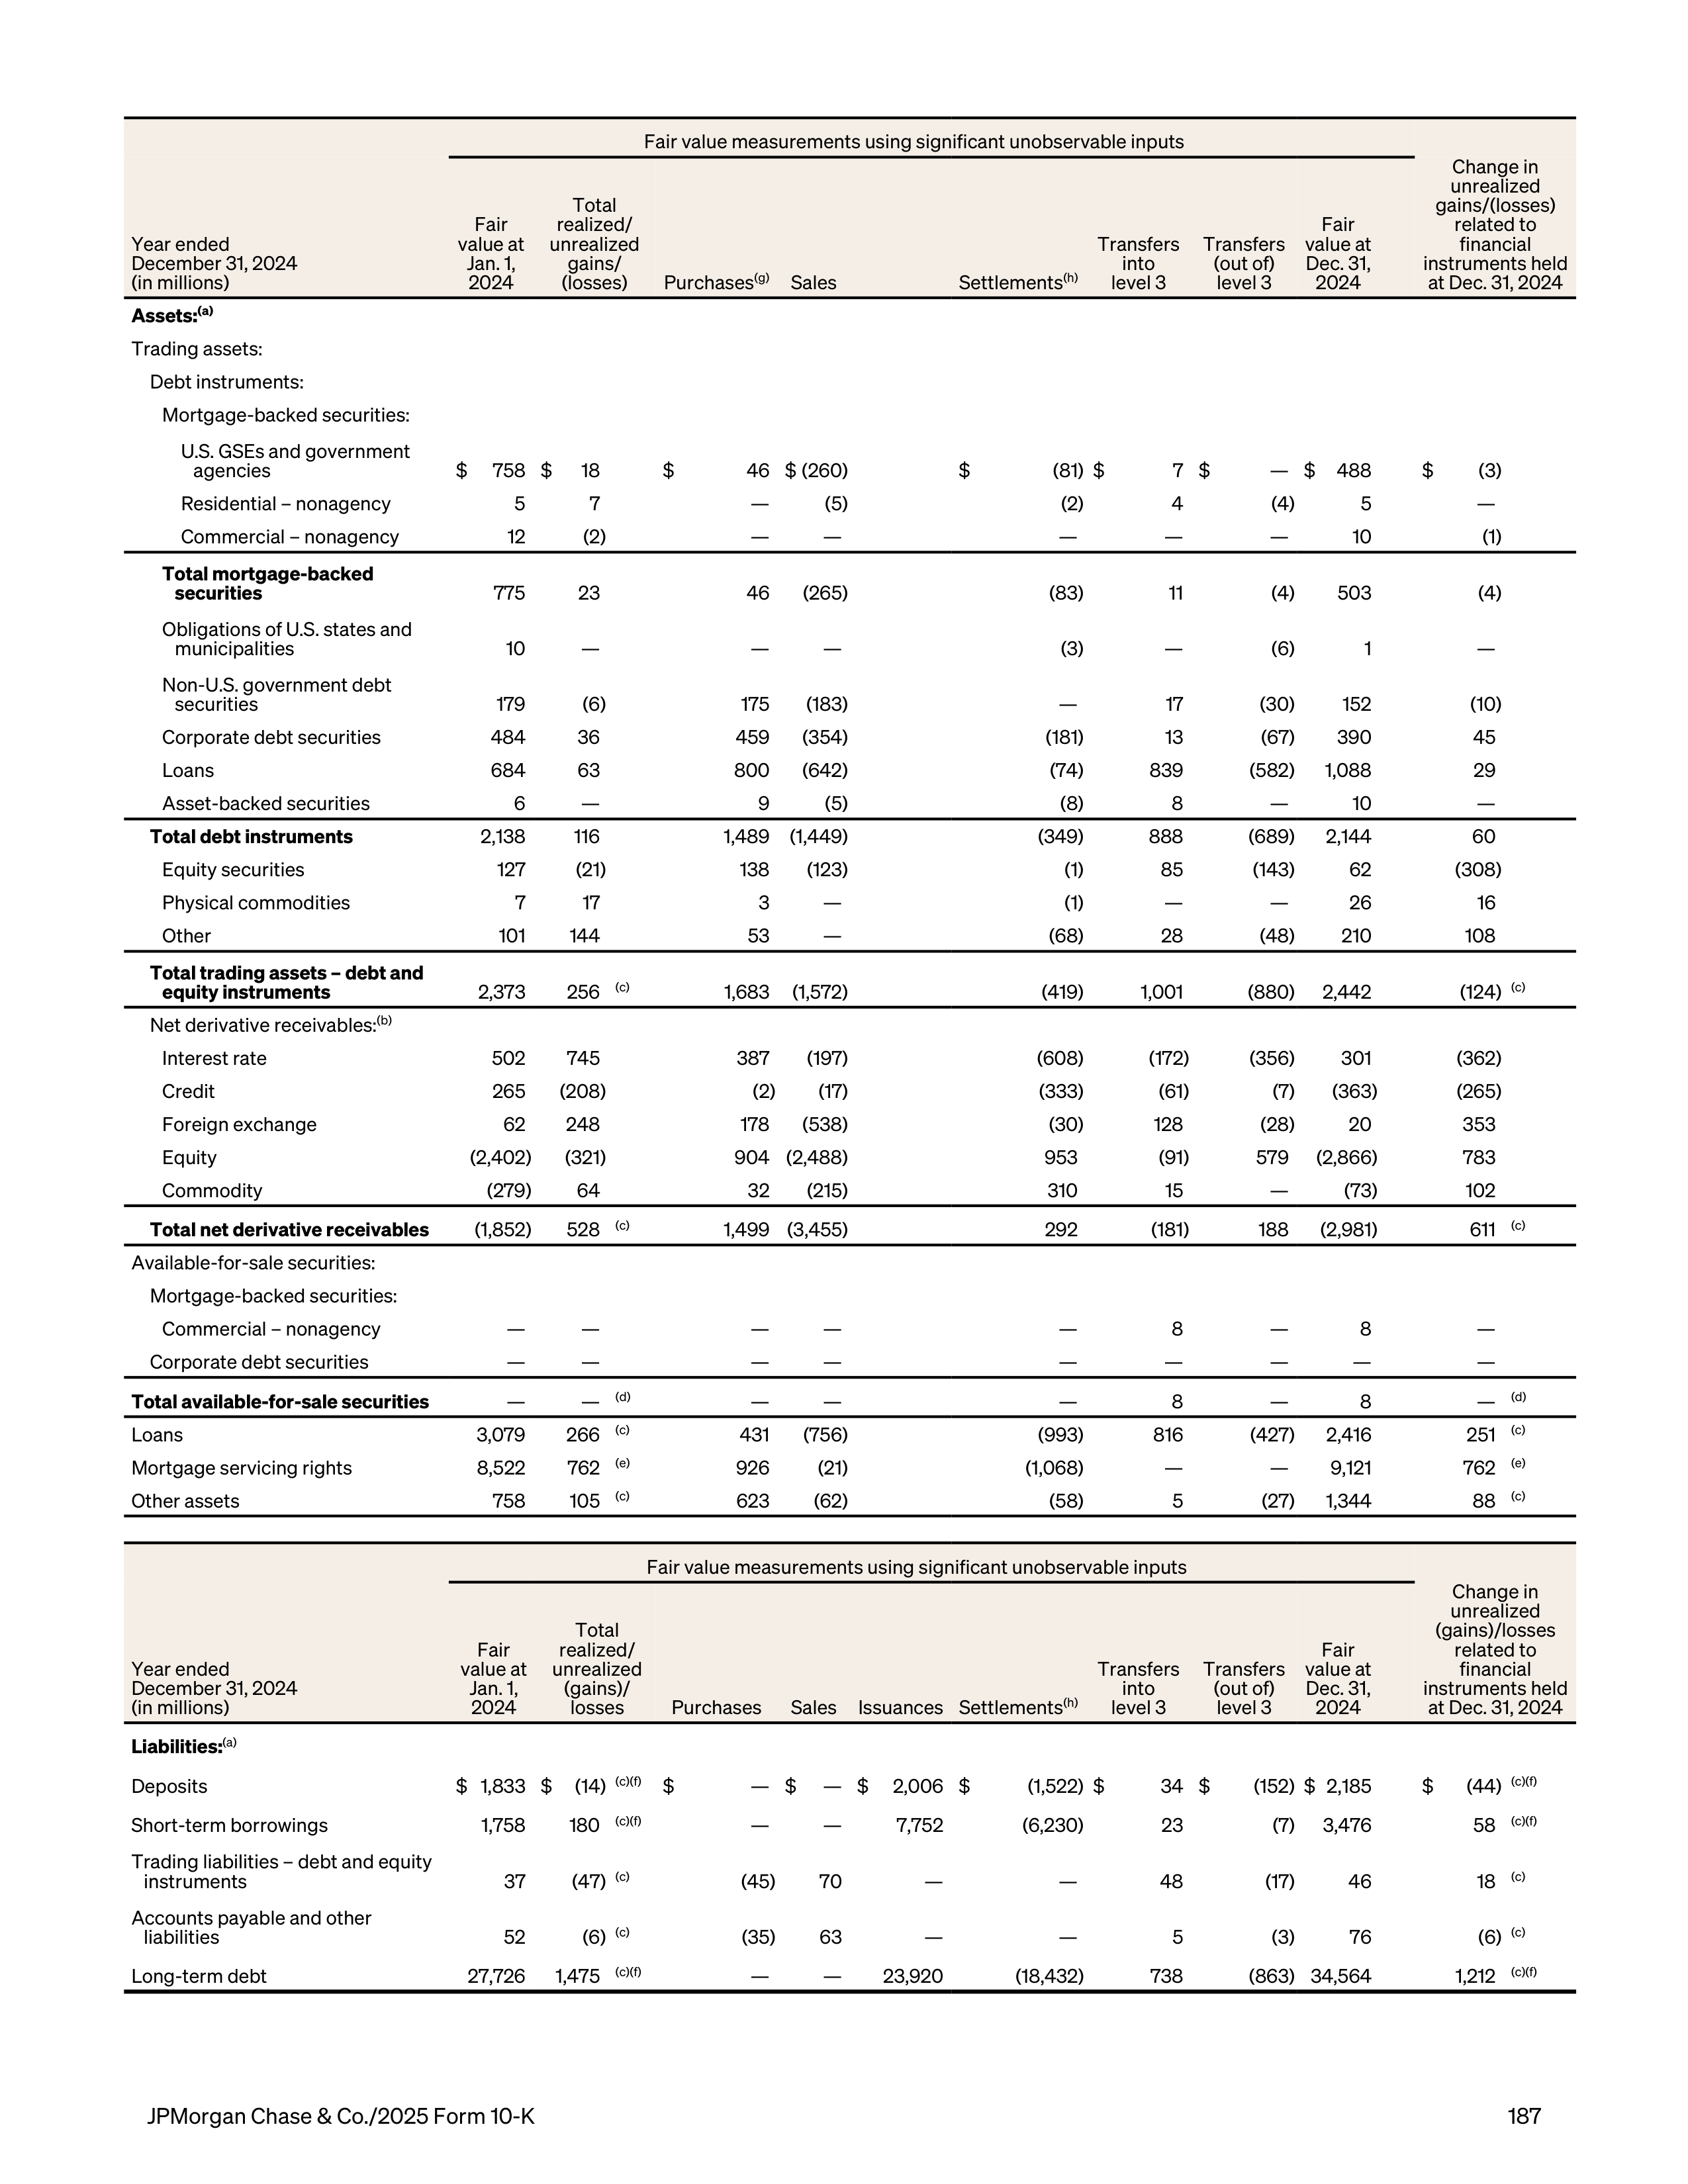
Fair value measurements using significant unobservable inputs
Year ended
December 31, 2024
(in millions)
Fair
value at
Jan. 1,
2024
Total
realized/
unrealized
gains/
(losses)
Transfers
(out of)
level 3
Fair
value at
Dec. 31,
2024
Change in
unrealized
gains/(losses)
related to
financial
instruments held
at Dec. 31, 2024
Purchases
(g)
Sales
Settlements
(h)
Transfers
into
level 3
Assets:
(a)
Trading assets:
Debt instruments:
Mortgage-backed securities:
U.S. GSEs and government
agencies
$
758 $
18
$
46 $ (260)
$
(81) $
7 $
— $
488
$
(3)
Residential – nonagency
5
7
—
(5)
(2)
4
(4)
5
—
Commercial – nonagency
12
(2)
—
—
—
—
—
10
(1)
Total mortgage-backed
securities
775
23
46 (265)
(83)
11
(4)
503
(4)
Obligations of U.S. states and
municipalities
10
—
—
—
(3)
—
(6)
1
—
Non-U.S. government debt
securities
179
(6)
175
(183)
—
17
(30)
152
(10)
Corporate debt securities
484
36
459 (354)
(181)
13
(67)
390
45
Loans
684
63
800 (642)
(74)
839
(582)
1,088
29
Asset-backed securities
6
—
9
(5)
(8)
8
—
10
—
Total debt instruments
2,138
116
1,489 (1,449)
(349)
888
(689)
2,144
60
Equity securities
127
(21)
138
(123)
(1)
85
(143)
62
(308)
Physical commodities
7
17
3
—
(1)
—
—
26
16
Other
101
144
53
—
(68)
28
(48)
210
108
Total trading assets – debt and
equity instruments
2,373
256
(c)
1,683 (1,572)
(419)
1,001
(880) 2,442
(124)
(c)
Net derivative receivables:
(b)
Interest rate
502
745
387
(197)
(608)
(172)
(356)
301
(362)
Credit
265 (208)
(2)
(17)
(333)
(61)
(7)
(363)
(265)
Foreign exchange
62
248
178 (538)
(30)
128
(28)
20
353
Equity
(2,402)
(321)
904 (2,488)
953
(91)
579 (2,866)
783
Commodity
(279)
64
32
(215)
310
15
—
(73)
102
Total net derivative receivables
(1,852)
528
(c)
1,499 (3,455)
292
(181)
188 (2,981)
611
(c)
Available-for-sale securities:
Mortgage-backed securities:
Commercial – nonagency
—
—
—
—
—
8
—
8
—
Corporate debt securities
—
—
—
—
—
—
—
—
—
Total available-for-sale securities
—
—
(d)
—
—
—
8
—
8
—
(d)
Loans
3,079
266
(c)
431 (756)
(993)
816
(427)
2,416
251
(c)
Mortgage servicing rights
8,522
762
(e)
926
(21)
(1,068)
—
—
9,121
762
(e)
Other assets
758
105
(c)
623
(62)
(58)
5
(27)
1,344
88
(c)
Fair value measurements using significant unobservable inputs
Year ended
December 31, 2024
(in millions)
Fair
value at
Jan. 1,
2024
Total
realized/
unrealized
(gains)/
losses
Transfers
(out of)
level 3
Fair
value at
Dec. 31,
2024
Change in
unrealized
(gains)/losses
related to
financial
instruments held
at Dec. 31, 2024
Purchases
Sales
Issuances
Settlements
(h)
Transfers
into
level 3
Liabilities:
(a)
Deposits
$ 1,833 $
(14)
(c)(f)
$
— $
— $
2,006 $
(1,522) $
34 $
(152) $ 2,185
$
(44)
(c)(f)
Short-term borrowings
1,758
180
(c)(f)
—
—
7,752
(6,230)
23
(7) 3,476
58
(c)(f)
Trading liabilities – debt and equity
instruments
37
(47)
(c)
(45)
70
—
—
48
(17)
46
18
(c)
Accounts payable and other
liabilities
52
(6)
(c)
(35)
63
—
—
5
(3)
76
(6)
(c)
Long-term debt
27,726 1,475
(c)(f)
—
—
23,920
(18,432)
738
(863) 34,564
1,212
(c)(f)
JPMorgan Chase & Co./2025 Form 10-K
187
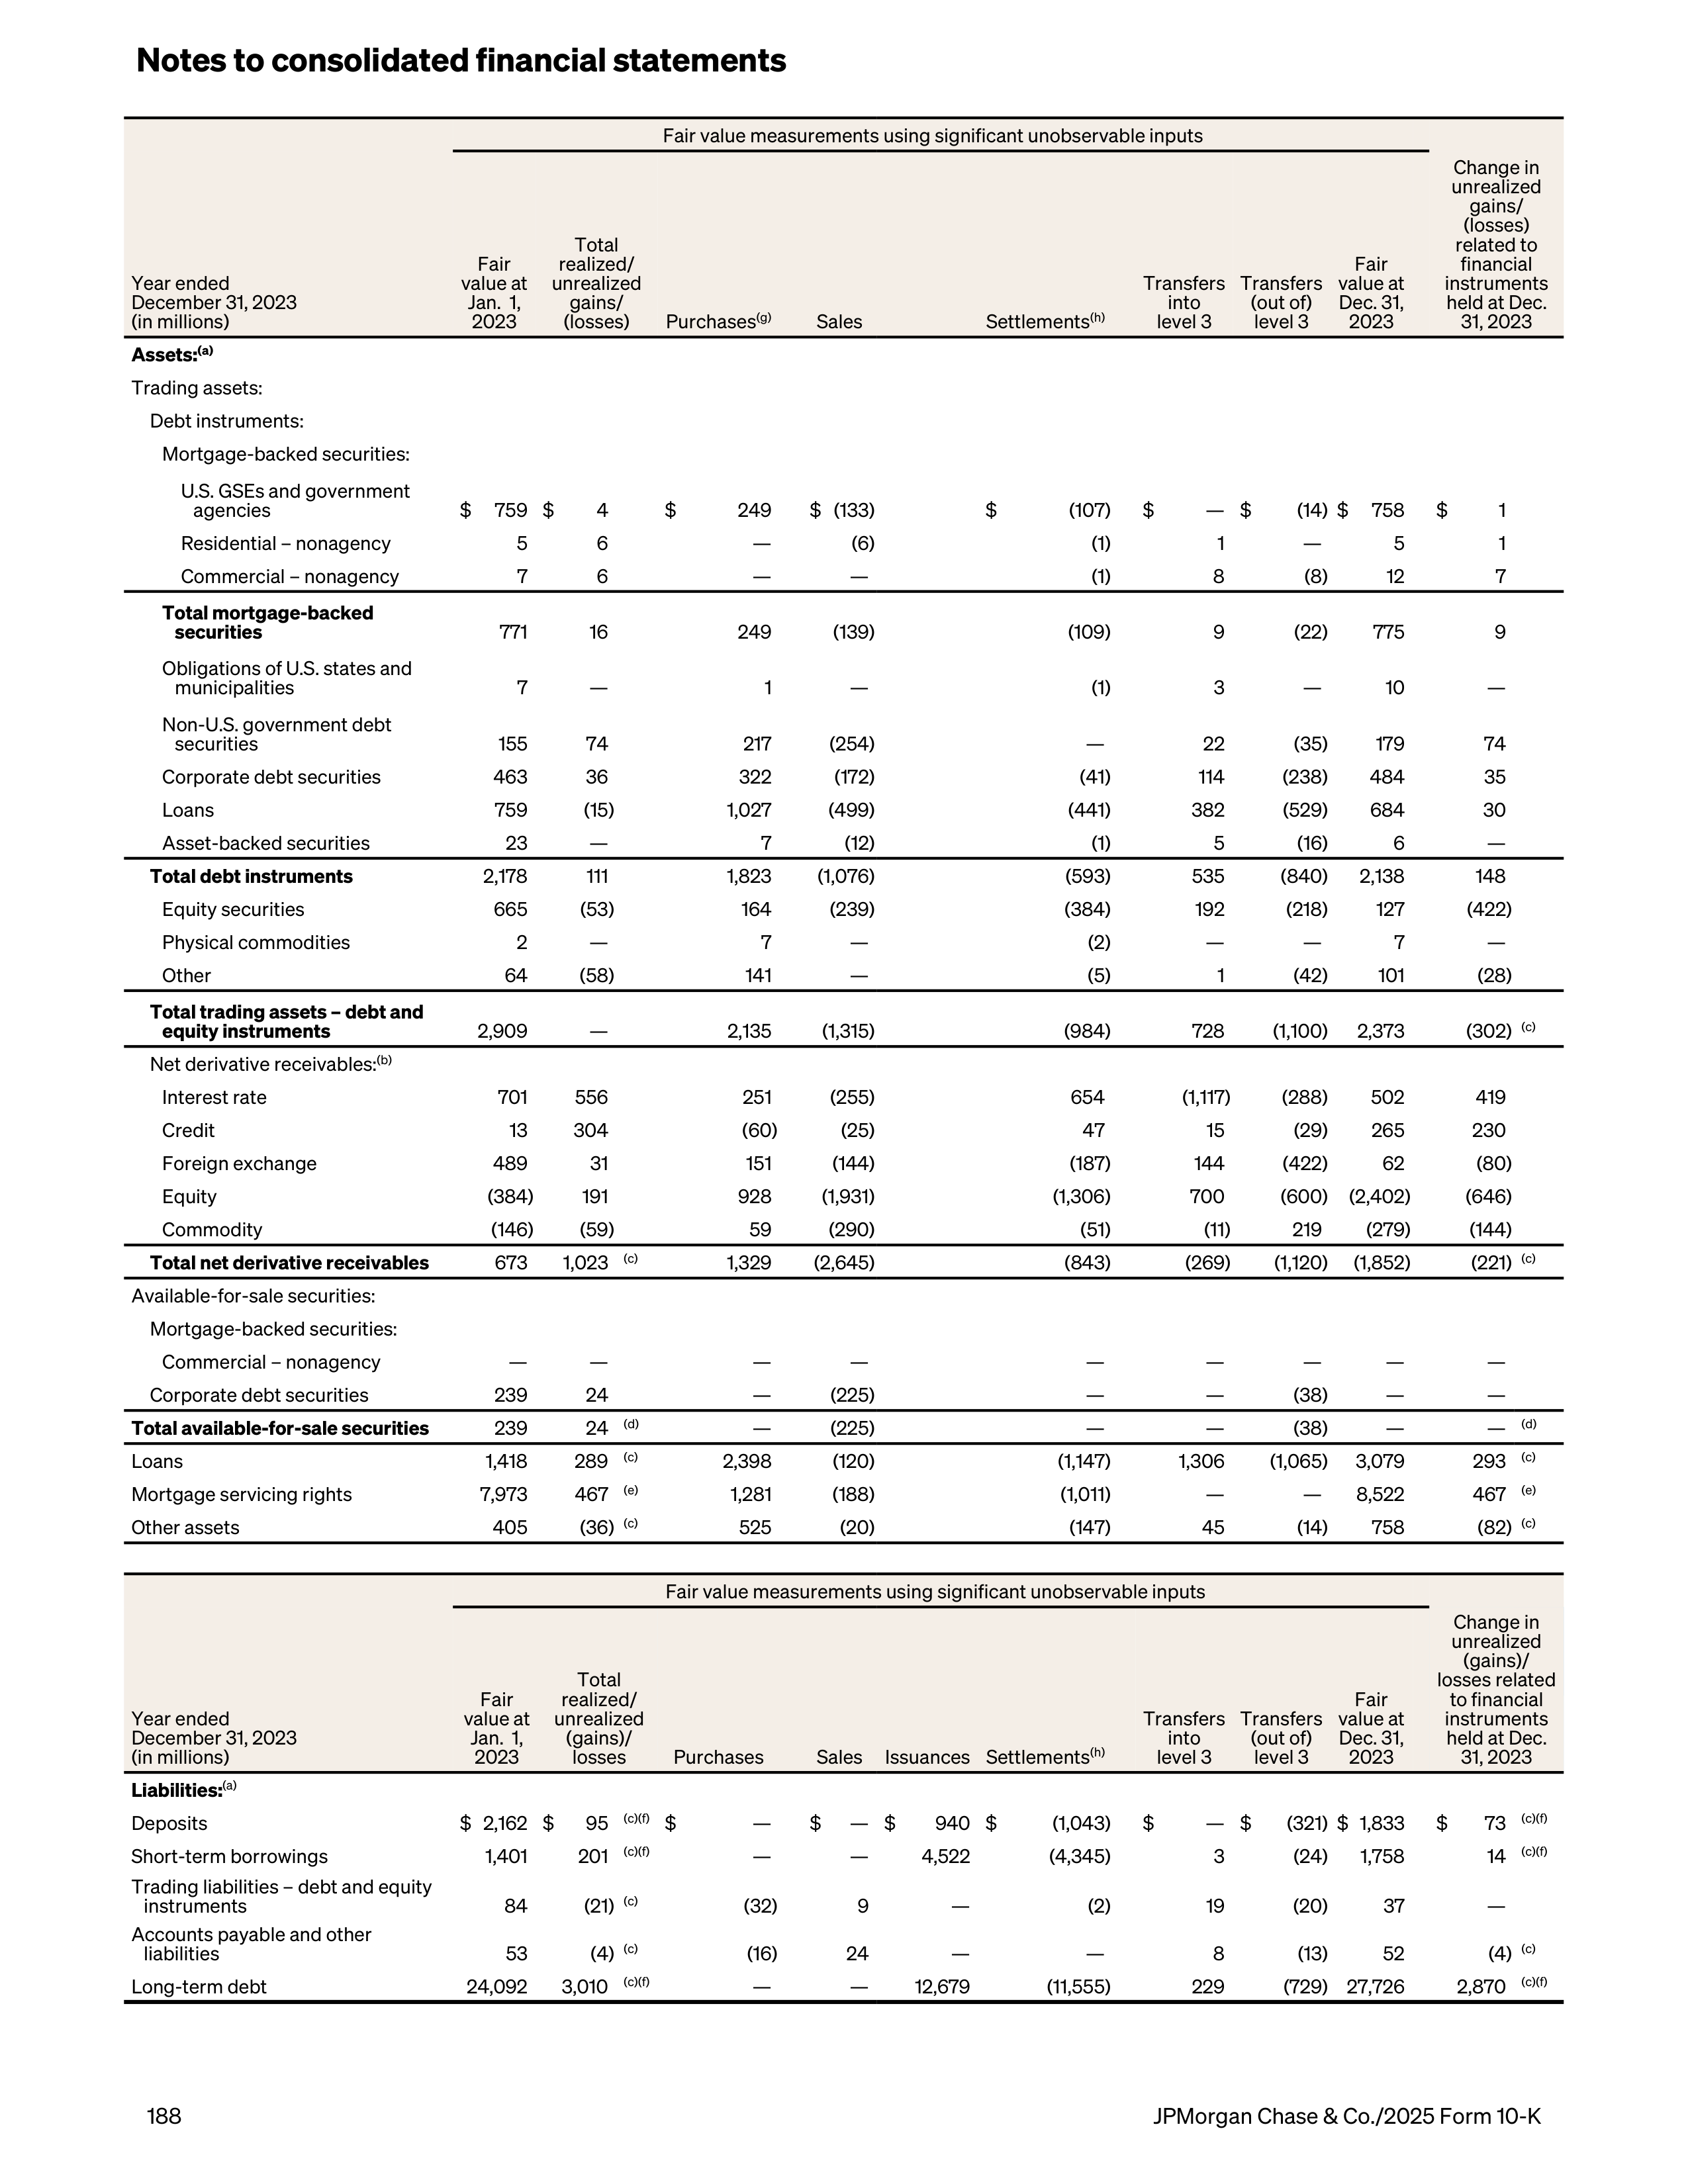
Fair value measurements using significant unobservable inputs
Year ended
December 31, 2023
(in millions)
Fair
value at
Jan. 1,
2023
Total
realized/
unrealized
gains/
(losses)
Transfers
(out of)
level 3
Fair
value at
Dec. 31,
2023
Change in
unrealized
gains/
(losses)
related to
financial
instruments
held at Dec.
31, 2023
Purchases
(g)
Sales
Settlements
(h)
Transfers
into
level 3
Assets:
(a)
Trading assets:
Debt instruments:
Mortgage-backed securities:
U.S. GSEs and government
agencies
$
759 $
4
$
249
$ (133)
$
(107)
$
— $
(14) $
758
$
1
Residential – nonagency
5
6
—
(6)
(1)
1
—
5
1
Commercial – nonagency
7
6
—
—
(1)
8
(8)
12
7
Total mortgage-backed
securities
771
16
249
(139)
(109)
9
(22)
775
9
Obligations of U.S. states and
municipalities
7
—
1
—
(1)
3
—
10
—
Non-U.S. government debt
securities
155
74
217
(254)
—
22
(35)
179
74
Corporate debt securities
463
36
322
(172)
(41)
114
(238)
484
35
Loans
759
(15)
1,027
(499)
(441)
382
(529)
684
30
Asset-backed securities
23
—
7
(12)
(1)
5
(16)
6
—
Total debt instruments
2,178
111
1,823
(1,076)
(593)
535
(840)
2,138
148
Equity securities
665
(53)
164
(239)
(384)
192
(218)
127
(422)
Physical commodities
2
—
7
—
(2)
—
—
7
—
Other
64
(58)
141
—
(5)
1
(42)
101
(28)
Total trading assets – debt and
equity instruments
2,909
—
2,135
(1,315)
(984)
728
(1,100)
2,373
(302)
(c)
Net derivative receivables:
(b)
Interest rate
701
556
251
(255)
654
(1,117)
(288)
502
419
Credit
13
304
(60)
(25)
47
15
(29)
265
230
Foreign exchange
489
31
151
(144)
(187)
144
(422)
62
(80)
Equity
(384)
191
928
(1,931)
(1,306)
700
(600) (2,402)
(646)
Commodity
(146)
(59)
59
(290)
(51)
(11)
219
(279)
(144)
Total net derivative receivables
673
1,023
(c)
1,329
(2,645)
(843)
(269)
(1,120) (1,852)
(221)
(c)
Available-for-sale securities:
Mortgage-backed securities:
Commercial – nonagency
—
—
—
—
—
—
—
—
—
Corporate debt securities
239
24
—
(225)
—
—
(38)
—
—
Total available-for-sale securities
239
24
(d)
—
(225)
—
—
(38)
—
—
(d)
Loans
1,418
289
(c)
2,398
(120)
(1,147)
1,306
(1,065) 3,079
293
(c)
Mortgage servicing rights
7,973
467
(e)
1,281
(188)
(1,011)
—
— 8,522
467
(e)
Other assets
405
(36)
(c)
525
(20)
(147)
45
(14)
758
(82)
(c)
Fair value measurements using significant unobservable inputs
Year ended
December 31, 2023
(in millions)
Fair
value at
Jan. 1,
2023
Total
realized/
unrealized
(gains)/
losses
Transfers
into
level 3
Transfers
(out of)
level 3
Fair
value at
Dec. 31,
2023
Change in
unrealized
(gains)/
losses related
to financial
instruments
held at Dec.
31, 2023
Purchases
Sales
Issuances
Settlements
(h)
Liabilities:
(a)
Deposits
$ 2,162 $
95
(c)(f)
$
—
$
— $
940 $
(1,043)
$
— $
(321) $ 1,833
$
73
(c)(f)
Short-term borrowings
1,401
201
(c)(f)
—
—
4,522
(4,345)
3
(24)
1,758
14
(c)(f)
Trading liabilities – debt and equity
instruments
84
(21)
(c)
(32)
9
—
(2)
19
(20)
37
—
Accounts payable and other
liabilities
53
(4)
(c)
(16)
24
—
—
8
(13)
52
(4)
(c)
Long-term debt
24,092 3,010
(c)(f)
—
—
12,679
(11,555)
229
(729) 27,726
2,870
(c)(f)
Notes to consolidated financial statements
188
JPMorgan Chase & Co./2025 Form 10-K
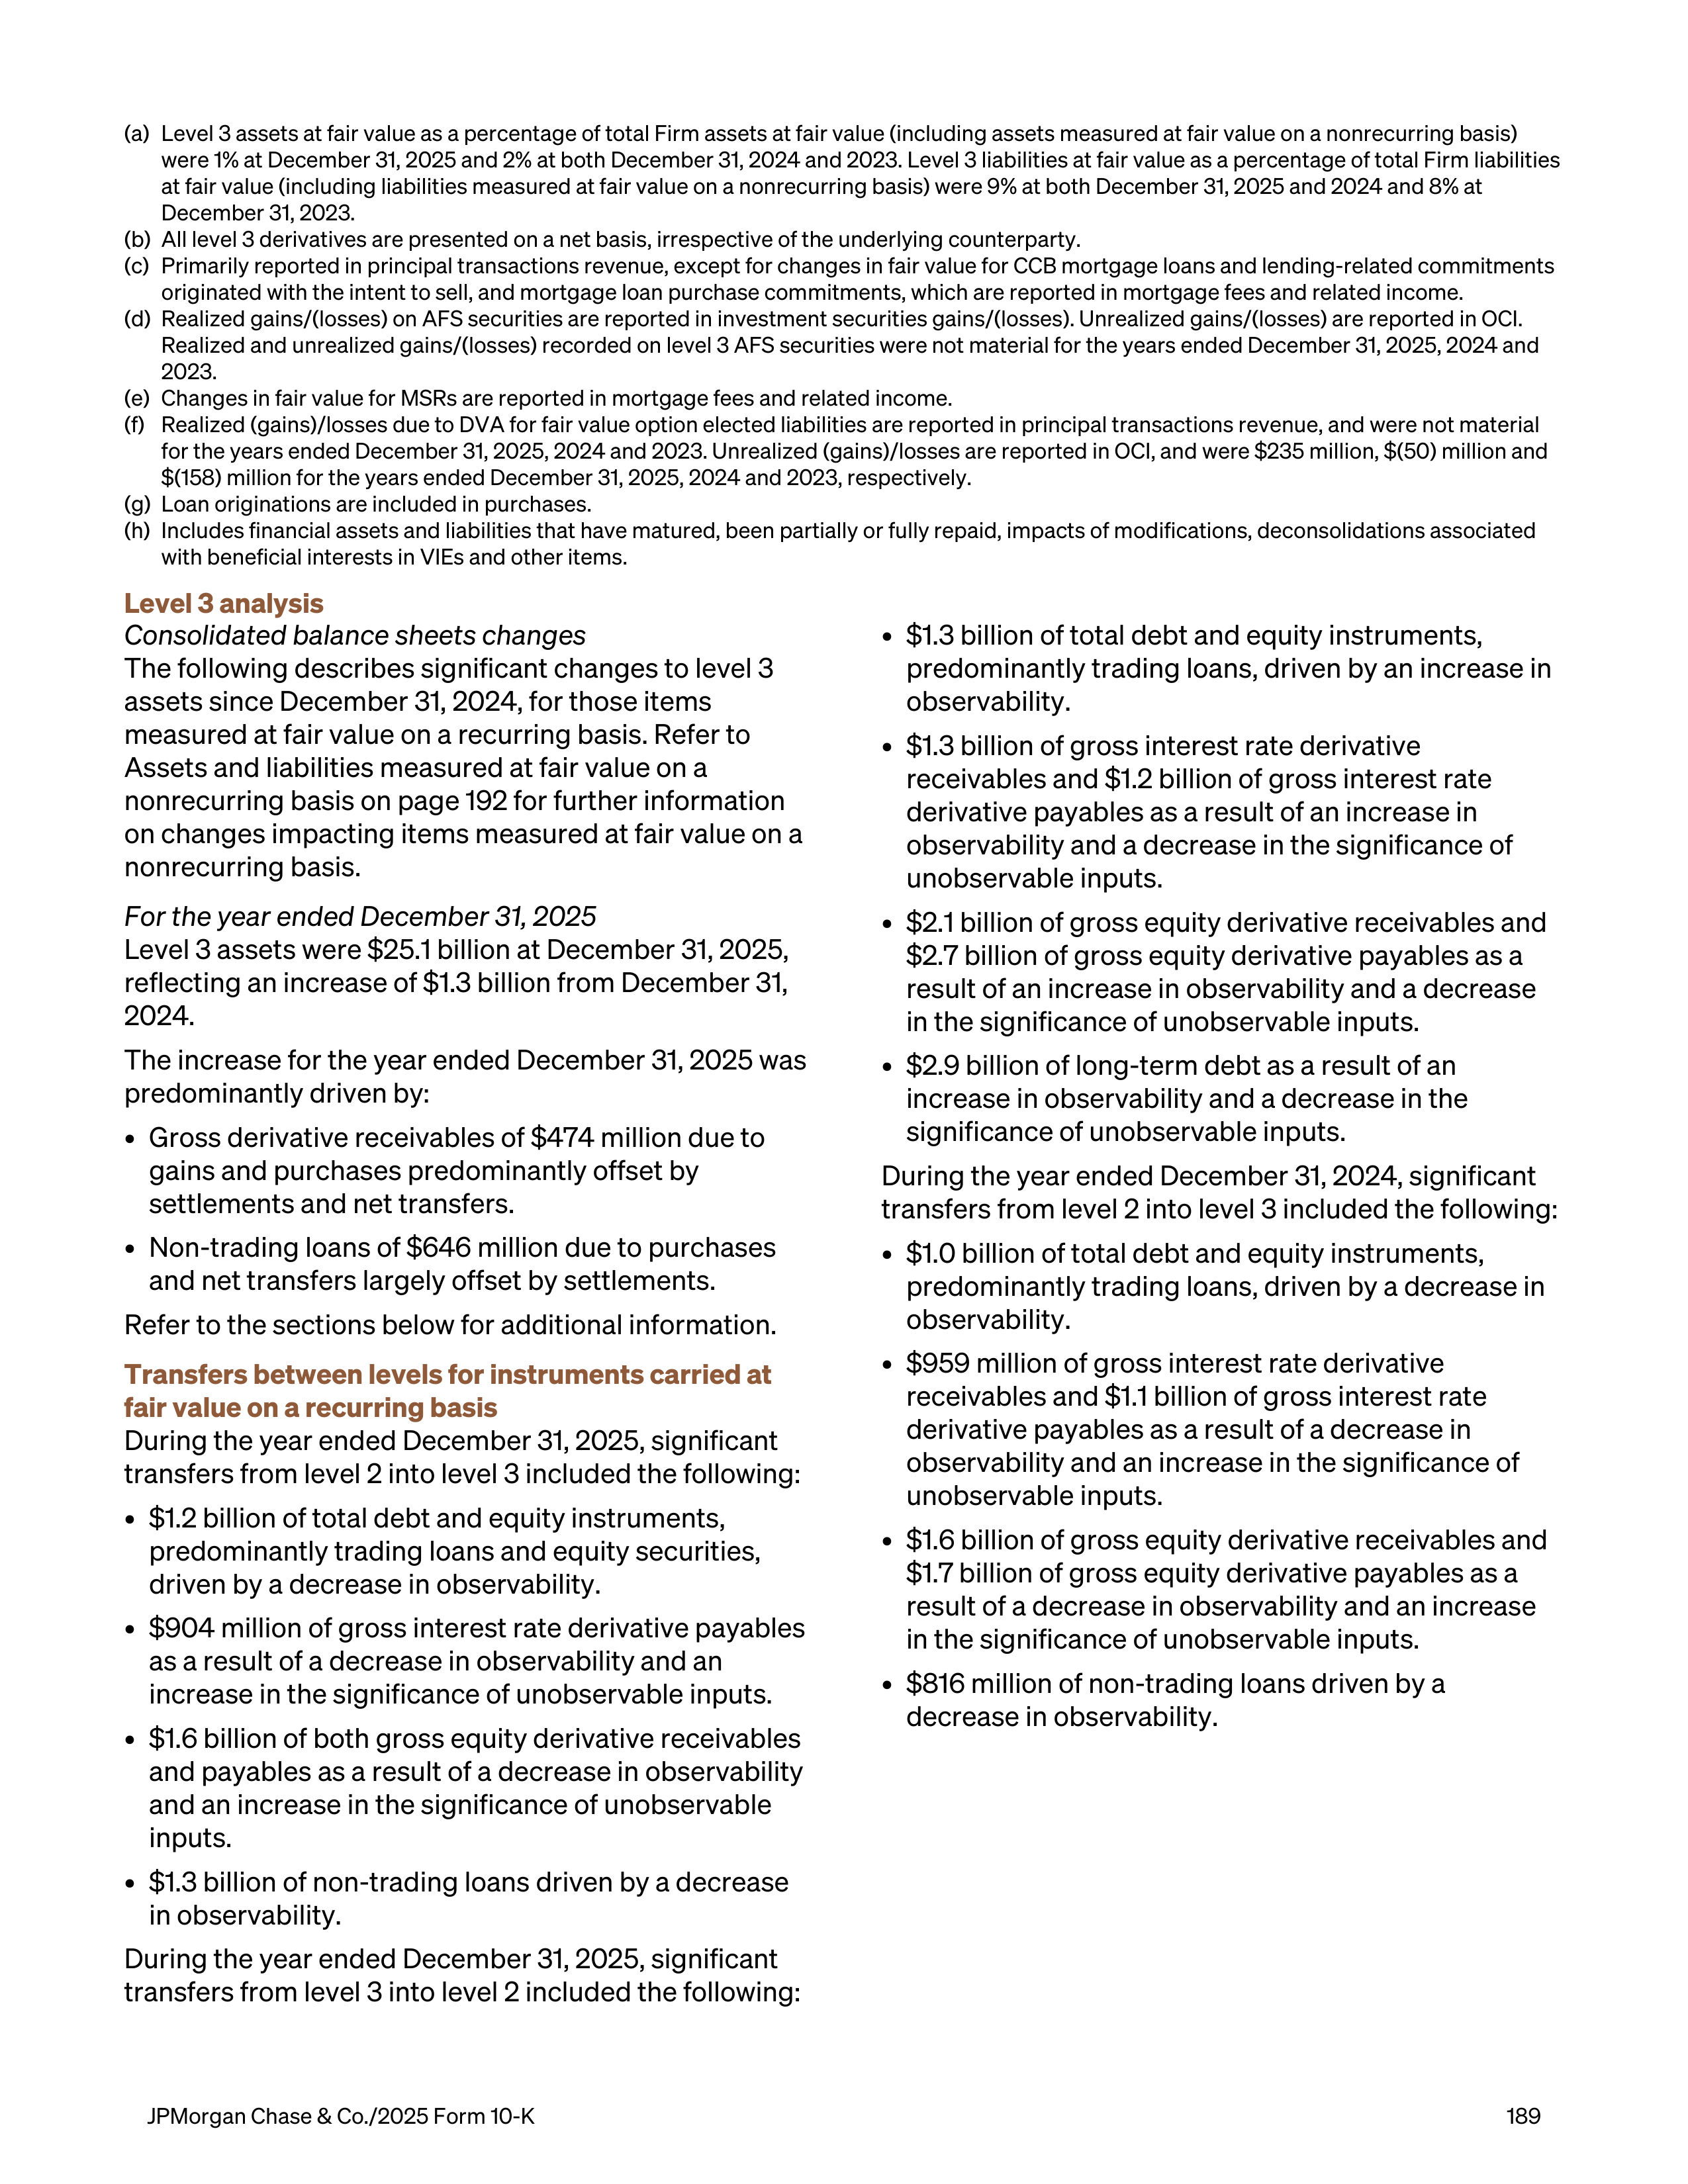
(a)
Level 3 assets at fair value as a percentage of total Firm assets at fair value (including assets measured at fair value on a nonrecurring basis)
were 1% at December 31, 2025 and 2% at both December 31, 2024 and 2023. Level 3 liabilities at fair value as a percentage of total Firm liabilities
at fair value (including liabilities measured at fair value on a nonrecurring basis) were 9% at both December 31, 2025 and 2024 and 8% at
December 31, 2023.
(b)
All level 3 derivatives are presented on a net basis, irrespective of the underlying counterparty.
(c)
Primarily reported in principal transactions revenue, except for changes in fair value for CCB mortgage loans and lending-related commitments
originated with the intent to sell, and mortgage loan purchase commitments, which are reported in mortgage fees and related income.
(d)
Realized gains/(losses) on AFS securities are reported in investment securities gains/(losses). Unrealized gains/(losses) are reported in OCI.
Realized and unrealized gains/(losses) recorded on level 3 AFS securities were not material for the years ended December 31, 2025, 2024 and
2023.
(e)
Changes in fair value for MSRs are reported in mortgage fees and related income.
(f)
Realized (gains)/losses due to DVA for fair value option elected liabilities are reported in principal transactions revenue, and were not material
for the years ended December 31, 2025, 2024 and 2023. Unrealized (gains)/losses are reported in OCI, and were $235 million, $(50) million and
$(158) million for the years ended December 31, 2025, 2024 and 2023, respectively.
(g)
Loan originations are included in purchases.
(h)
Includes financial assets and liabilities that have matured, been partially or fully repaid, impacts of modifications, deconsolidations associated
with beneficial interests in VIEs and other items.
Level 3 analysis
Consolidated balance sheets changes
The following describes significant changes to level 3
assets since December 31, 2024, for those items
measured at fair value on a recurring basis. Refer to
Assets and liabilities measured at fair value on a
nonrecurring basis on page 192 for further information
on changes impacting items measured at fair value on a
nonrecurring basis.
For the year ended December 31, 2025
Level 3 assets were $25.1 billion at December 31, 2025,
reflecting an increase of $1.3 billion from December 31,
2024.
The increase for the year ended December 31, 2025 was
predominantly driven by:
•
Gross derivative receivables of $474 million due to
gains and purchases predominantly offset by
settlements and net transfers.
•
Non-trading loans of $646 million due to purchases
and net transfers largely offset by settlements.
Refer to the sections below for additional information.
Transfers between levels for instruments carried at
fair value on a recurring basis
During the year ended December 31, 2025, significant
transfers from level 2 into level 3 included the following:
•
$1.2 billion of total debt and equity instruments,
predominantly trading loans and equity securities,
driven by a decrease in observability.
•
$904 million of gross interest rate derivative payables
as a result of a decrease in observability and an
increase in the significance of unobservable inputs.
•
$1.6 billion of both gross equity derivative receivables
and payables as a result of a decrease in observability
and an increase in the significance of unobservable
inputs.
•
$1.3 billion of non-trading loans driven by a decrease
in observability.
During the year ended December 31, 2025, significant
transfers from level 3 into level 2 included the following:
•
$1.3 billion of total debt and equity instruments,
predominantly trading loans, driven by an increase in
observability.
•
$1.3 billion of gross interest rate derivative
receivables and $1.2 billion of gross interest rate
derivative payables as a result of an increase in
observability and a decrease in the significance of
unobservable inputs.
•
$2.1 billion of gross equity derivative receivables and
$2.7 billion of gross equity derivative payables as a
result of an increase in observability and a decrease
in the significance of unobservable inputs.
•
$2.9 billion of long-term debt as a result of an
increase in observability and a decrease in the
significance of unobservable inputs.
During the year ended December 31, 2024, significant
transfers from level 2 into level 3 included the following:
•
$1.0 billion of total debt and equity instruments,
predominantly trading loans, driven by a decrease in
observability.
•
$959 million of gross interest rate derivative
receivables and $1.1 billion of gross interest rate
derivative payables as a result of a decrease in
observability and an increase in the significance of
unobservable inputs.
•
$1.6 billion of gross equity derivative receivables and
$1.7 billion of gross equity derivative payables as a
result of a decrease in observability and an increase
in the significance of unobservable inputs.
•
$816 million of non-trading loans driven by a
decrease in observability.
JPMorgan Chase & Co./2025 Form 10-K
189
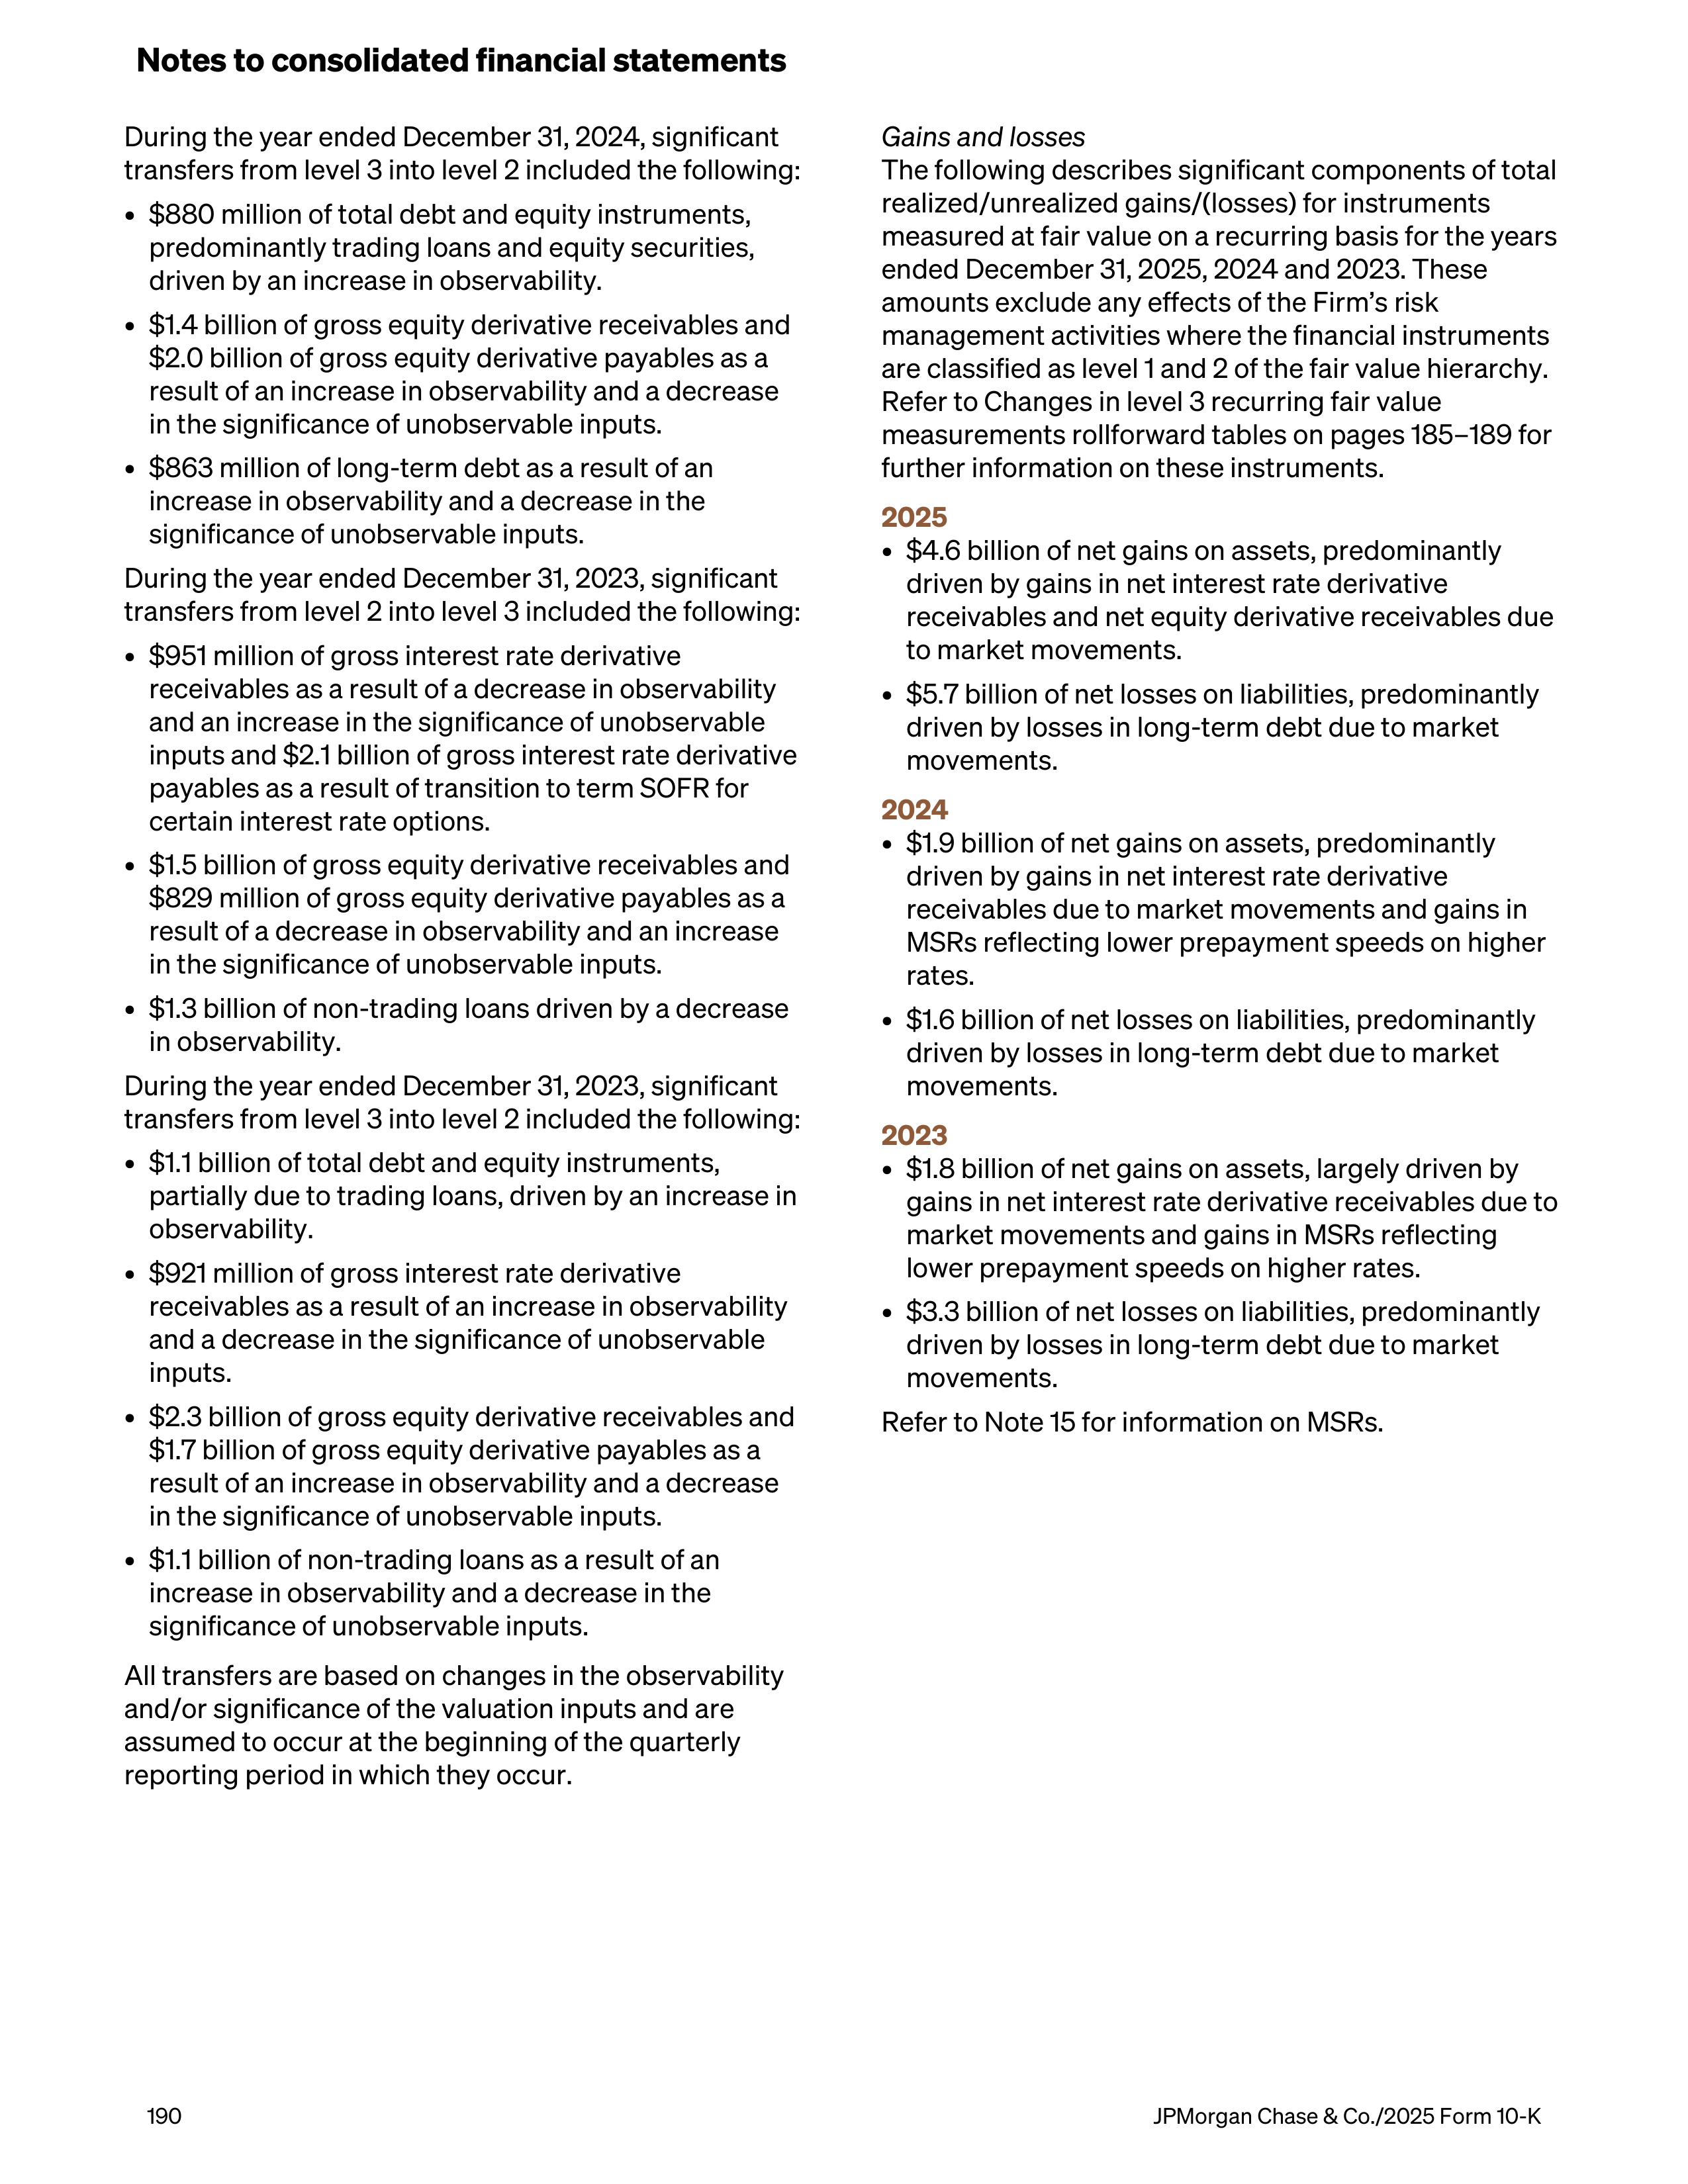
During the year ended December 31, 2024, significant
transfers from level 3 into level 2 included the following:
•
$880 million of total debt and equity instruments,
predominantly trading loans and equity securities,
driven by an increase in observability
.
•
$1.4 billion of gross equity derivative receivables and
$2.0 billion of gross equity derivative payables as a
result of an increase in observability and a decrease
in the significance of unobservable inputs.
•
$863 million of
long-term debt as a result of an
increase in observability and a decrease in the
significance of unobservable inputs.
During the year ended December 31, 2023, significant
transfers from level 2 into level 3 included the following:
•
$951 million of gross interest rate derivative
receivables
as a result of a decrease in observability
and an increase in the significance of unobservable
inputs
and $2.1 billion of gross interest rate derivative
payables as a result
of transition to term SOFR for
certain interest rate options.
•
$1.5 billion of gross equity derivative receivables and
$829 million of gross equity derivative payables as a
result of a decrease in observability and an increase
in the significance of unobservable inputs.
•
$1.3 billion of non-trading loans driven by a decrease
in observability.
During the year ended December 31, 2023, significant
transfers from level 3 into level 2 included the following:
•
$1.1 billion of total debt and equity instruments,
partially due to trading loans, driven by an increase in
observability.
•
$921 million of gross interest rate derivative
receivables as a result of an increase in observability
and a decrease in the significance of unobservable
inputs.
•
$2.3 billion of gross equity derivative receivables and
$1.7 billion of gross equity derivative payables as a
result of an increase in observability and a decrease
in the significance of unobservable inputs.
•
$1.1 billion of non-trading loans as a result of an
increase in observability and a decrease in the
significance of unobservable inputs.
All transfers are based on changes in the observability
and/or significance of the valuation inputs and are
assumed to occur at the beginning of the quarterly
reporting period in which they occur.
Gains and losses
The following describes significant components of total
realized/unrealized gains/(losses) for instruments
measured at fair value on a recurring basis for the years
ended December 31, 2025, 2024 and 2023. These
amounts exclude any effects of the Firm’s risk
management activities where the financial instruments
are classified as level 1 and 2 of the fair value hierarchy.
Refer to Changes in level 3 recurring fair value
measurements rollforward tables on pages 185–189 for
further information on these instruments.
2025
•
$4.6 billion of net gains on assets, predominantly
driven by gains in net interest rate derivative
receivables and net equity derivative receivables due
to market movements.
•
$5.7 billion of net losses on liabilities, predominantly
driven by losses in long-term debt due to market
movements.
2024
•
$1.9 billion of net gains on assets, predominantly
driven by gains in net interest rate derivative
receivables due to market movements and gains in
MSRs reflecting lower prepayment speeds on higher
rates.
•
$1.6 billion of net losses on liabilities, predominantly
driven by losses in long-term debt due to market
movements.
2023
•
$1.8 billion of net gains on assets, largely driven by
gains in net interest rate derivative receivables due to
market movements and gains in MSRs reflecting
lower prepayment speeds on higher rates.
•
$3.3 billion of net losses on liabilities, predominantly
driven by losses in long-term debt due to market
movements.
Refer to Note 15 for information on MSRs.
Notes to consolidated financial statements
190
JPMorgan Chase & Co./2025 Form 10-K
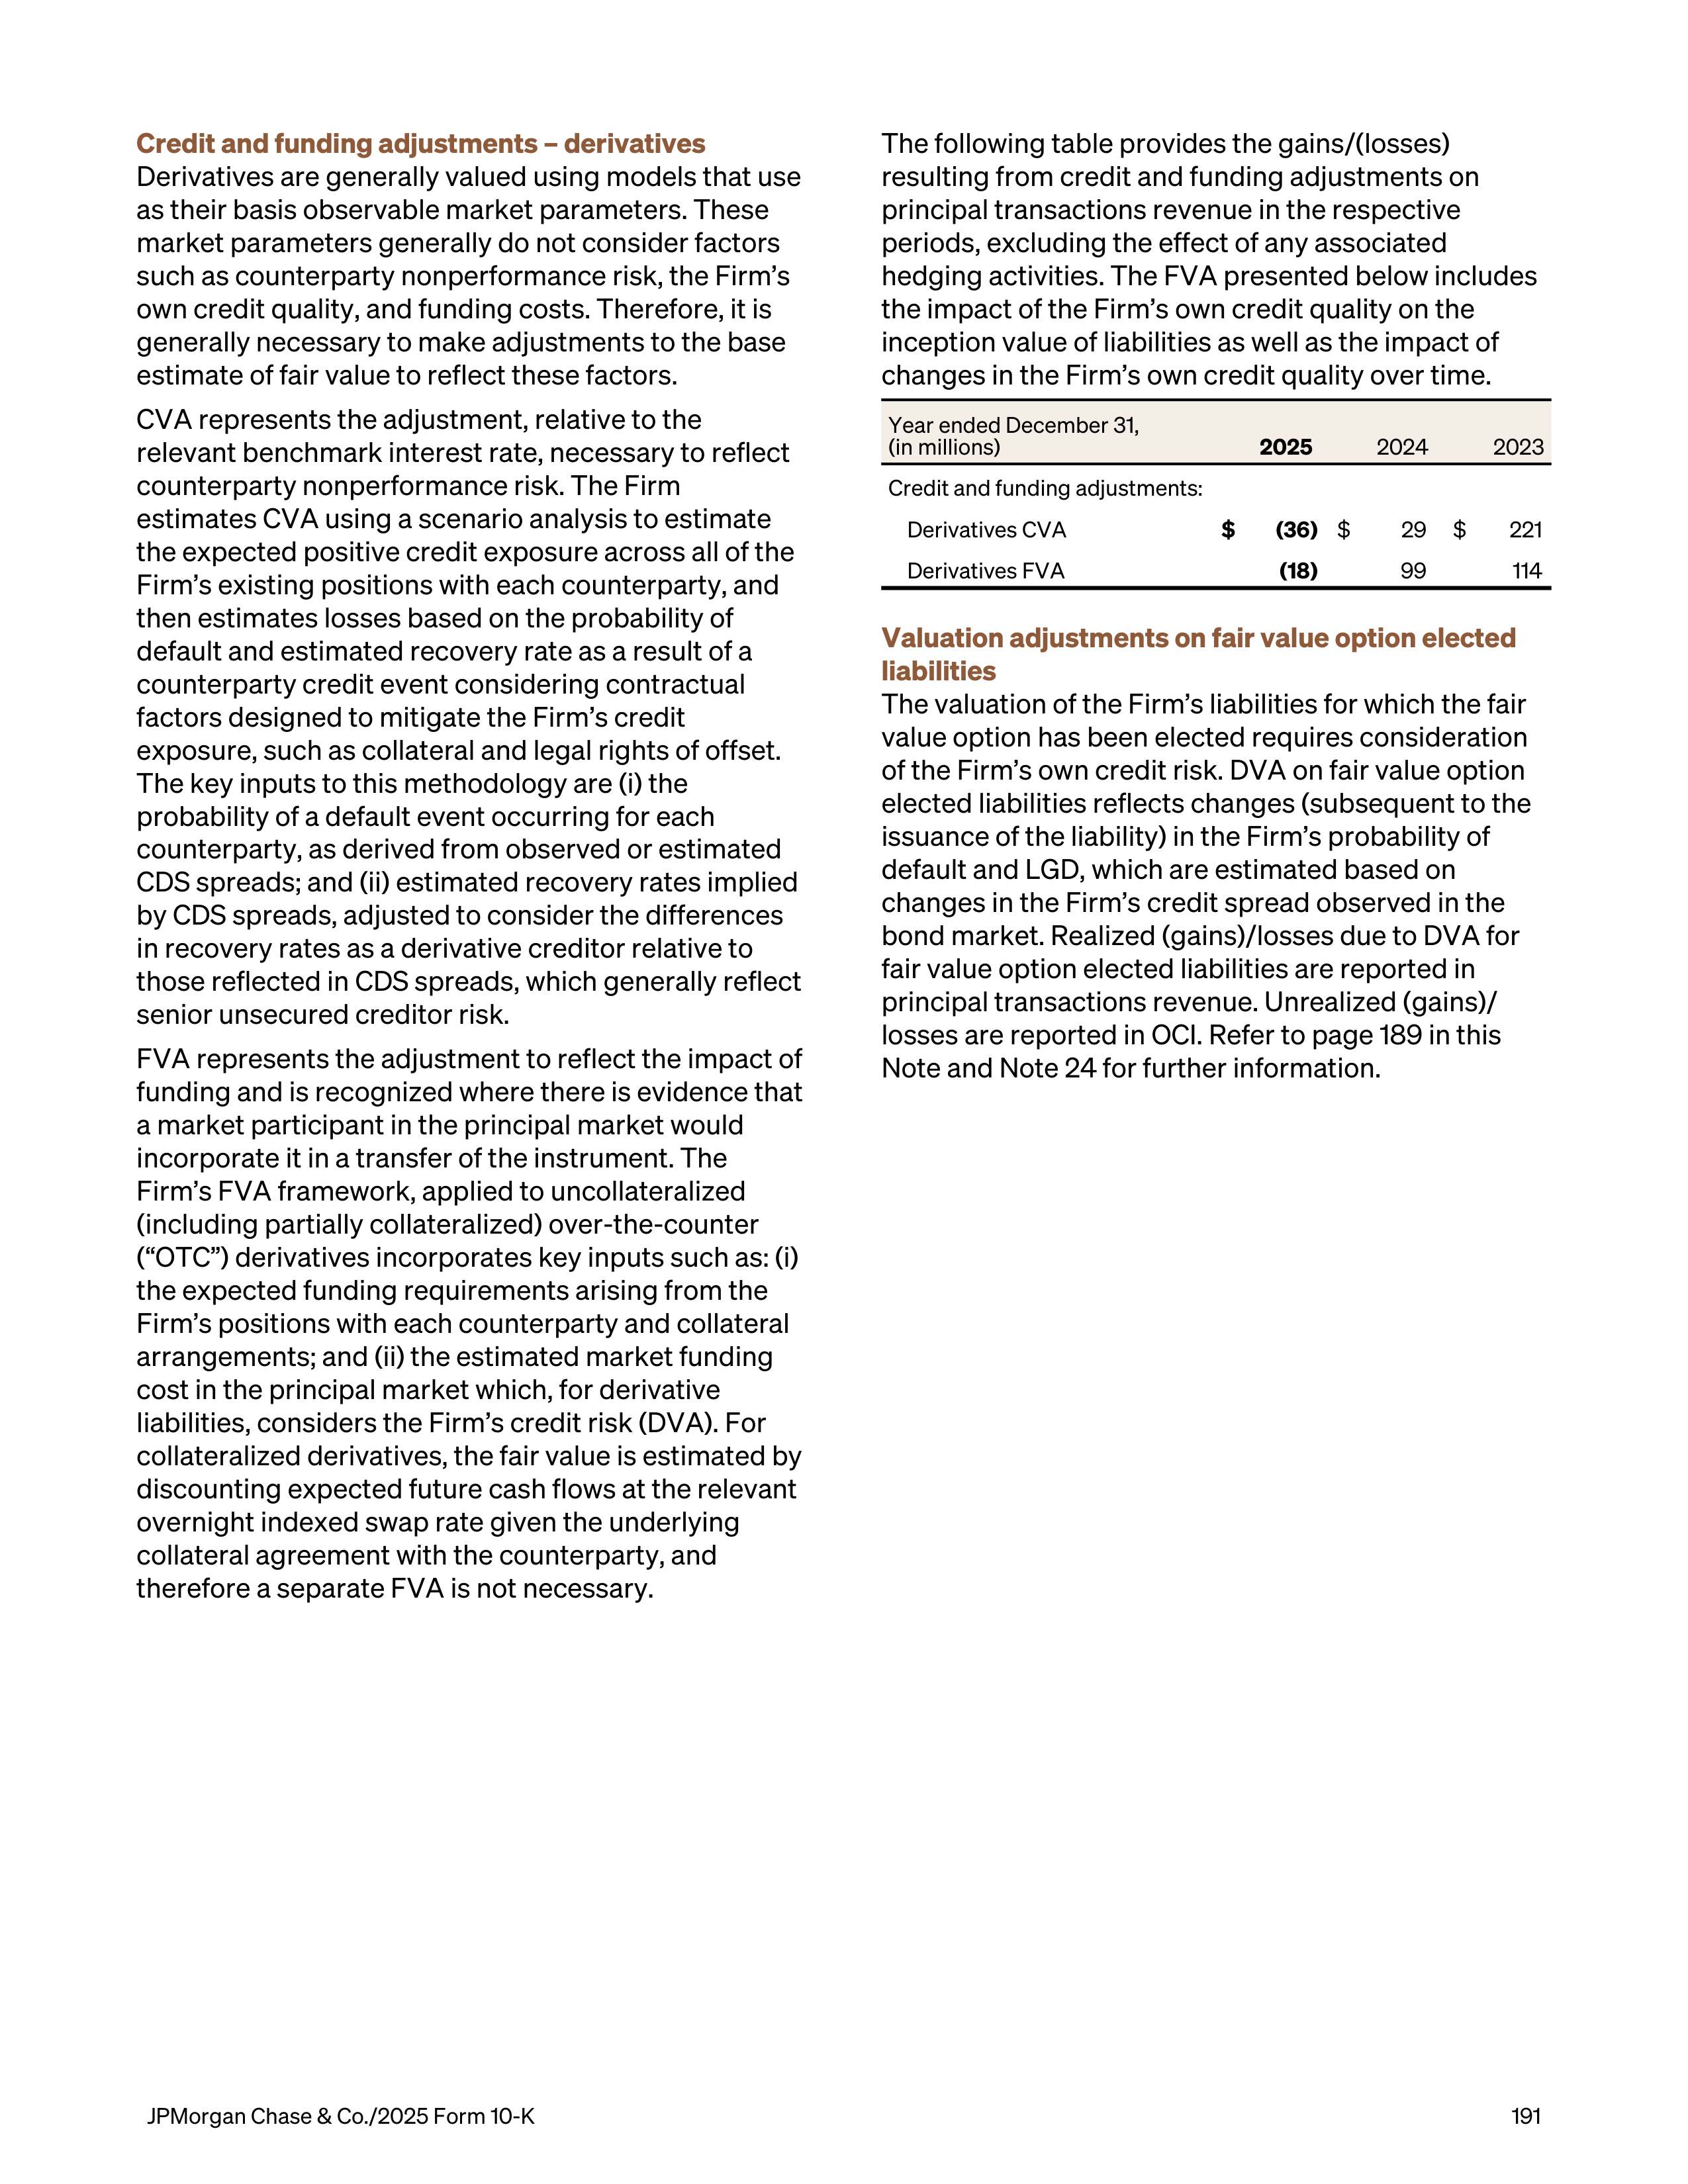
Credit and funding adjustments – derivatives
Derivatives are generally valued using models that use
as their basis observable market parameters. These
market parameters generally do not consider factors
such as counterparty nonperformance risk, the Firm’s
own credit quality, and funding costs. Therefore, it is
generally necessary to make adjustments to the base
estimate of fair value to reflect these factors.
CVA represents the adjustment, relative to the
relevant benchmark interest rate, necessary to reflect
counterparty nonperformance risk. The Firm
estimates CVA using a scenario analysis to estimate
the expected positive credit exposure across all of the
Firm’s existing positions with each counterparty, and
then estimates losses based on the probability of
default and estimated recovery rate as a result of a
counterparty credit event considering contractual
factors designed to mitigate the Firm’s credit
exposure, such as collateral and legal rights of offset.
The key inputs to this methodology are (i) the
probability of a default event occurring for each
counterparty, as derived from observed or estimated
CDS spreads; and (ii) estimated recovery rates implied
by CDS spreads, adjusted to consider the differences
in recovery rates as a derivative creditor relative to
those reflected in CDS spreads, which generally reflect
senior unsecured creditor risk.
FVA represents the adjustment to reflect the impact of
funding and is recognized where there is evidence that
a market participant in the principal market would
incorporate it in a transfer of the instrument. The
Firm’s FVA framework, applied to uncollateralized
(including partially collateralized) over-the-counter
(“OTC”) derivatives incorporates key inputs such as: (i)
the expected funding requirements arising from the
Firm’s positions with each counterparty and collateral
arrangements; and (ii) the estimated market funding
cost in the principal market which, for derivative
liabilities, considers the Firm’s credit risk (DVA). For
collateralized derivatives, the fair value is estimated by
discounting expected future cash flows at the relevant
overnight indexed swap rate given the underlying
collateral agreement with the counterparty, and
therefore a separate FVA is not necessary.
The following table provides the gains/(losses)
resulting from credit and funding adjustments on
principal transactions revenue in the respective
periods, excluding the effect of any associated
hedging activities. The FVA presented below includes
the impact of the Firm’s own credit quality on the
inception value of liabilities as well as the impact of
changes in the Firm’s own credit quality over time.
Year ended December 31,
(in millions)
2025
2024
2023
Credit and funding adjustments:
Derivatives CVA
$
(36)
$
29
$
221
Derivatives FVA
(18)
99
114
Valuation adjustments on fair value option elected
liabilities
The valuation of the Firm’s liabilities for which the fair
value option has been elected requires consideration
of the Firm’s own credit risk. DVA on fair value option
elected liabilities reflects changes (subsequent to the
issuance of the liability) in the Firm’s probability of
default and LGD, which are estimated based on
changes in the Firm’s credit spread observed in the
bond market. Realized (gains)/losses due to DVA for
fair value option elected liabilities are reported in
principal transactions revenue. Unrealized (gains)/
losses are reported in OCI. Refer to page 189 in this
Note and Note 24 for further information.
JPMorgan Chase & Co./2025 Form 10-K
191
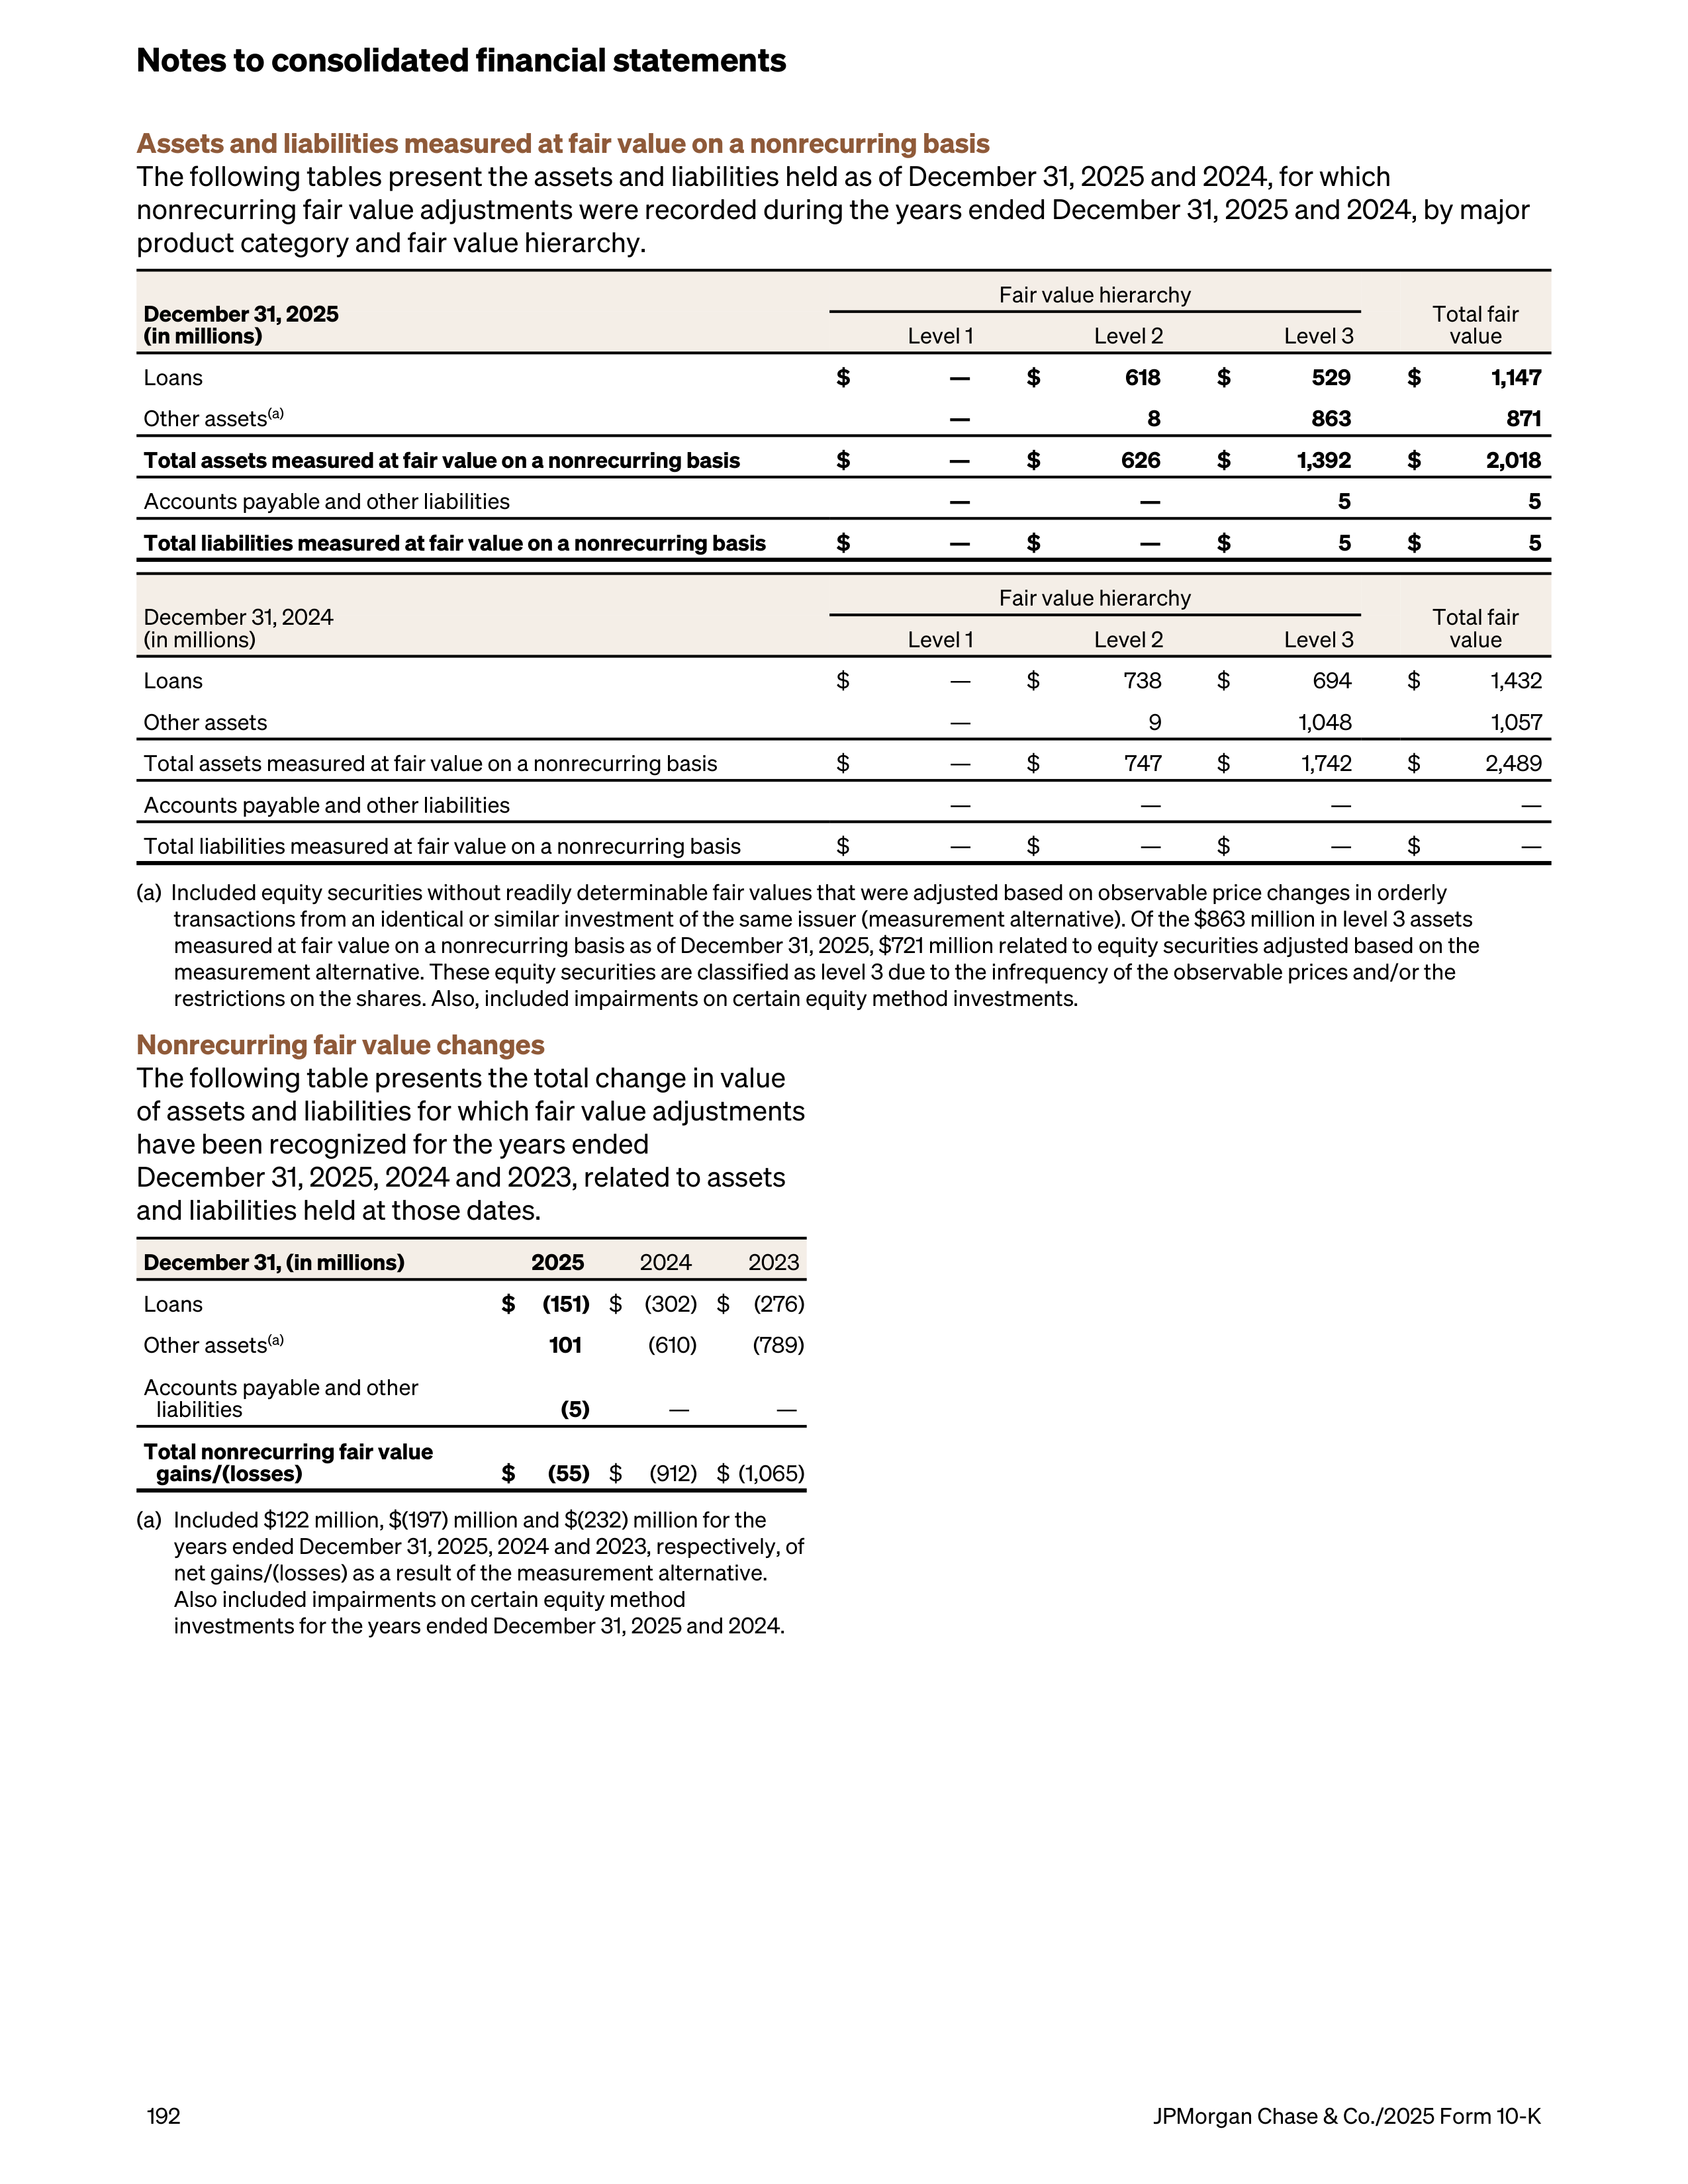
Assets and liabilities measured at fair value on a nonrecurring basis
The following tables present the assets and liabilities held as of December 31, 2025 and 2024, for which
nonrecurring fair value adjustments were recorded during the years ended December 31, 2025 and 2024, by major
product category and fair value hierarchy.
December 31, 2025
(in millions)
Fair value hierarchy
Total fair
value
Level 1
Level 2
Level 3
Loans
$
—
$
618
$
529
$
1,147
Other assets
(a)
—
8
863
871
Total assets measured at fair value on a nonrecurring basis
$
—
$
626
$
1,392
$
2,018
Accounts payable and other liabilities
—
—
5
5
Total liabilities measured at fair value on a nonrecurring basis
$
—
$
—
$
5
$
5
December 31, 2024
(in millions)
Fair value hierarchy
Total fair
value
Level 1
Level 2
Level 3
Loans
$
—
$
738
$
694
$
1,432
Other assets
—
9
1,048
1,057
Total assets measured at fair value on a nonrecurring basis
$
—
$
747
$
1,742
$
2,489
Accounts payable and other liabilities
—
—
—
—
Total liabilities measured at fair value on a nonrecurring basis
$
—
$
—
$
—
$
—
(a) Included equity securities without readily determinable fair values that were adjusted based on observable price changes in orderly
transactions from an identical or similar investment of the same issuer (measurement alternative). Of the $863 million in level 3 assets
measured at fair value on a nonrecurring basis as of December 31, 2025, $721 million related to equity securities adjusted based on the
measurement alternative. These equity securities are classified as level 3 due to the infrequency of the observable prices and/or the
restrictions on the shares. Also, included impairments on certain equity method investments.
Nonrecurring fair value changes
The following table presents the total change in value
of assets and liabilities for which fair value adjustments
have been recognized for the years ended
December 31, 2025, 2024 and 2023, related to assets
and liabilities held at those dates.
December 31, (in millions)
2025
2024
2023
Loans
$
(151)
$
(302) $
(276)
Other assets
(a)
101
(610)
(789)
Accounts payable and other
liabilities
(5)
—
—
Total nonrecurring fair value
gains/(losses)
$
(55)
$
(912) $ (1,065)
(a)
Included $122 million, $(197) million and $(232) million for the
years ended December 31, 2025, 2024 and 2023, respectively, of
net gains/(losses) as a result of the measurement alternative.
Also included impairments on certain equity method
investments for the years ended December 31, 2025 and 2024.
Notes to consolidated financial statements
192
JPMorgan Chase & Co./2025 Form 10-K
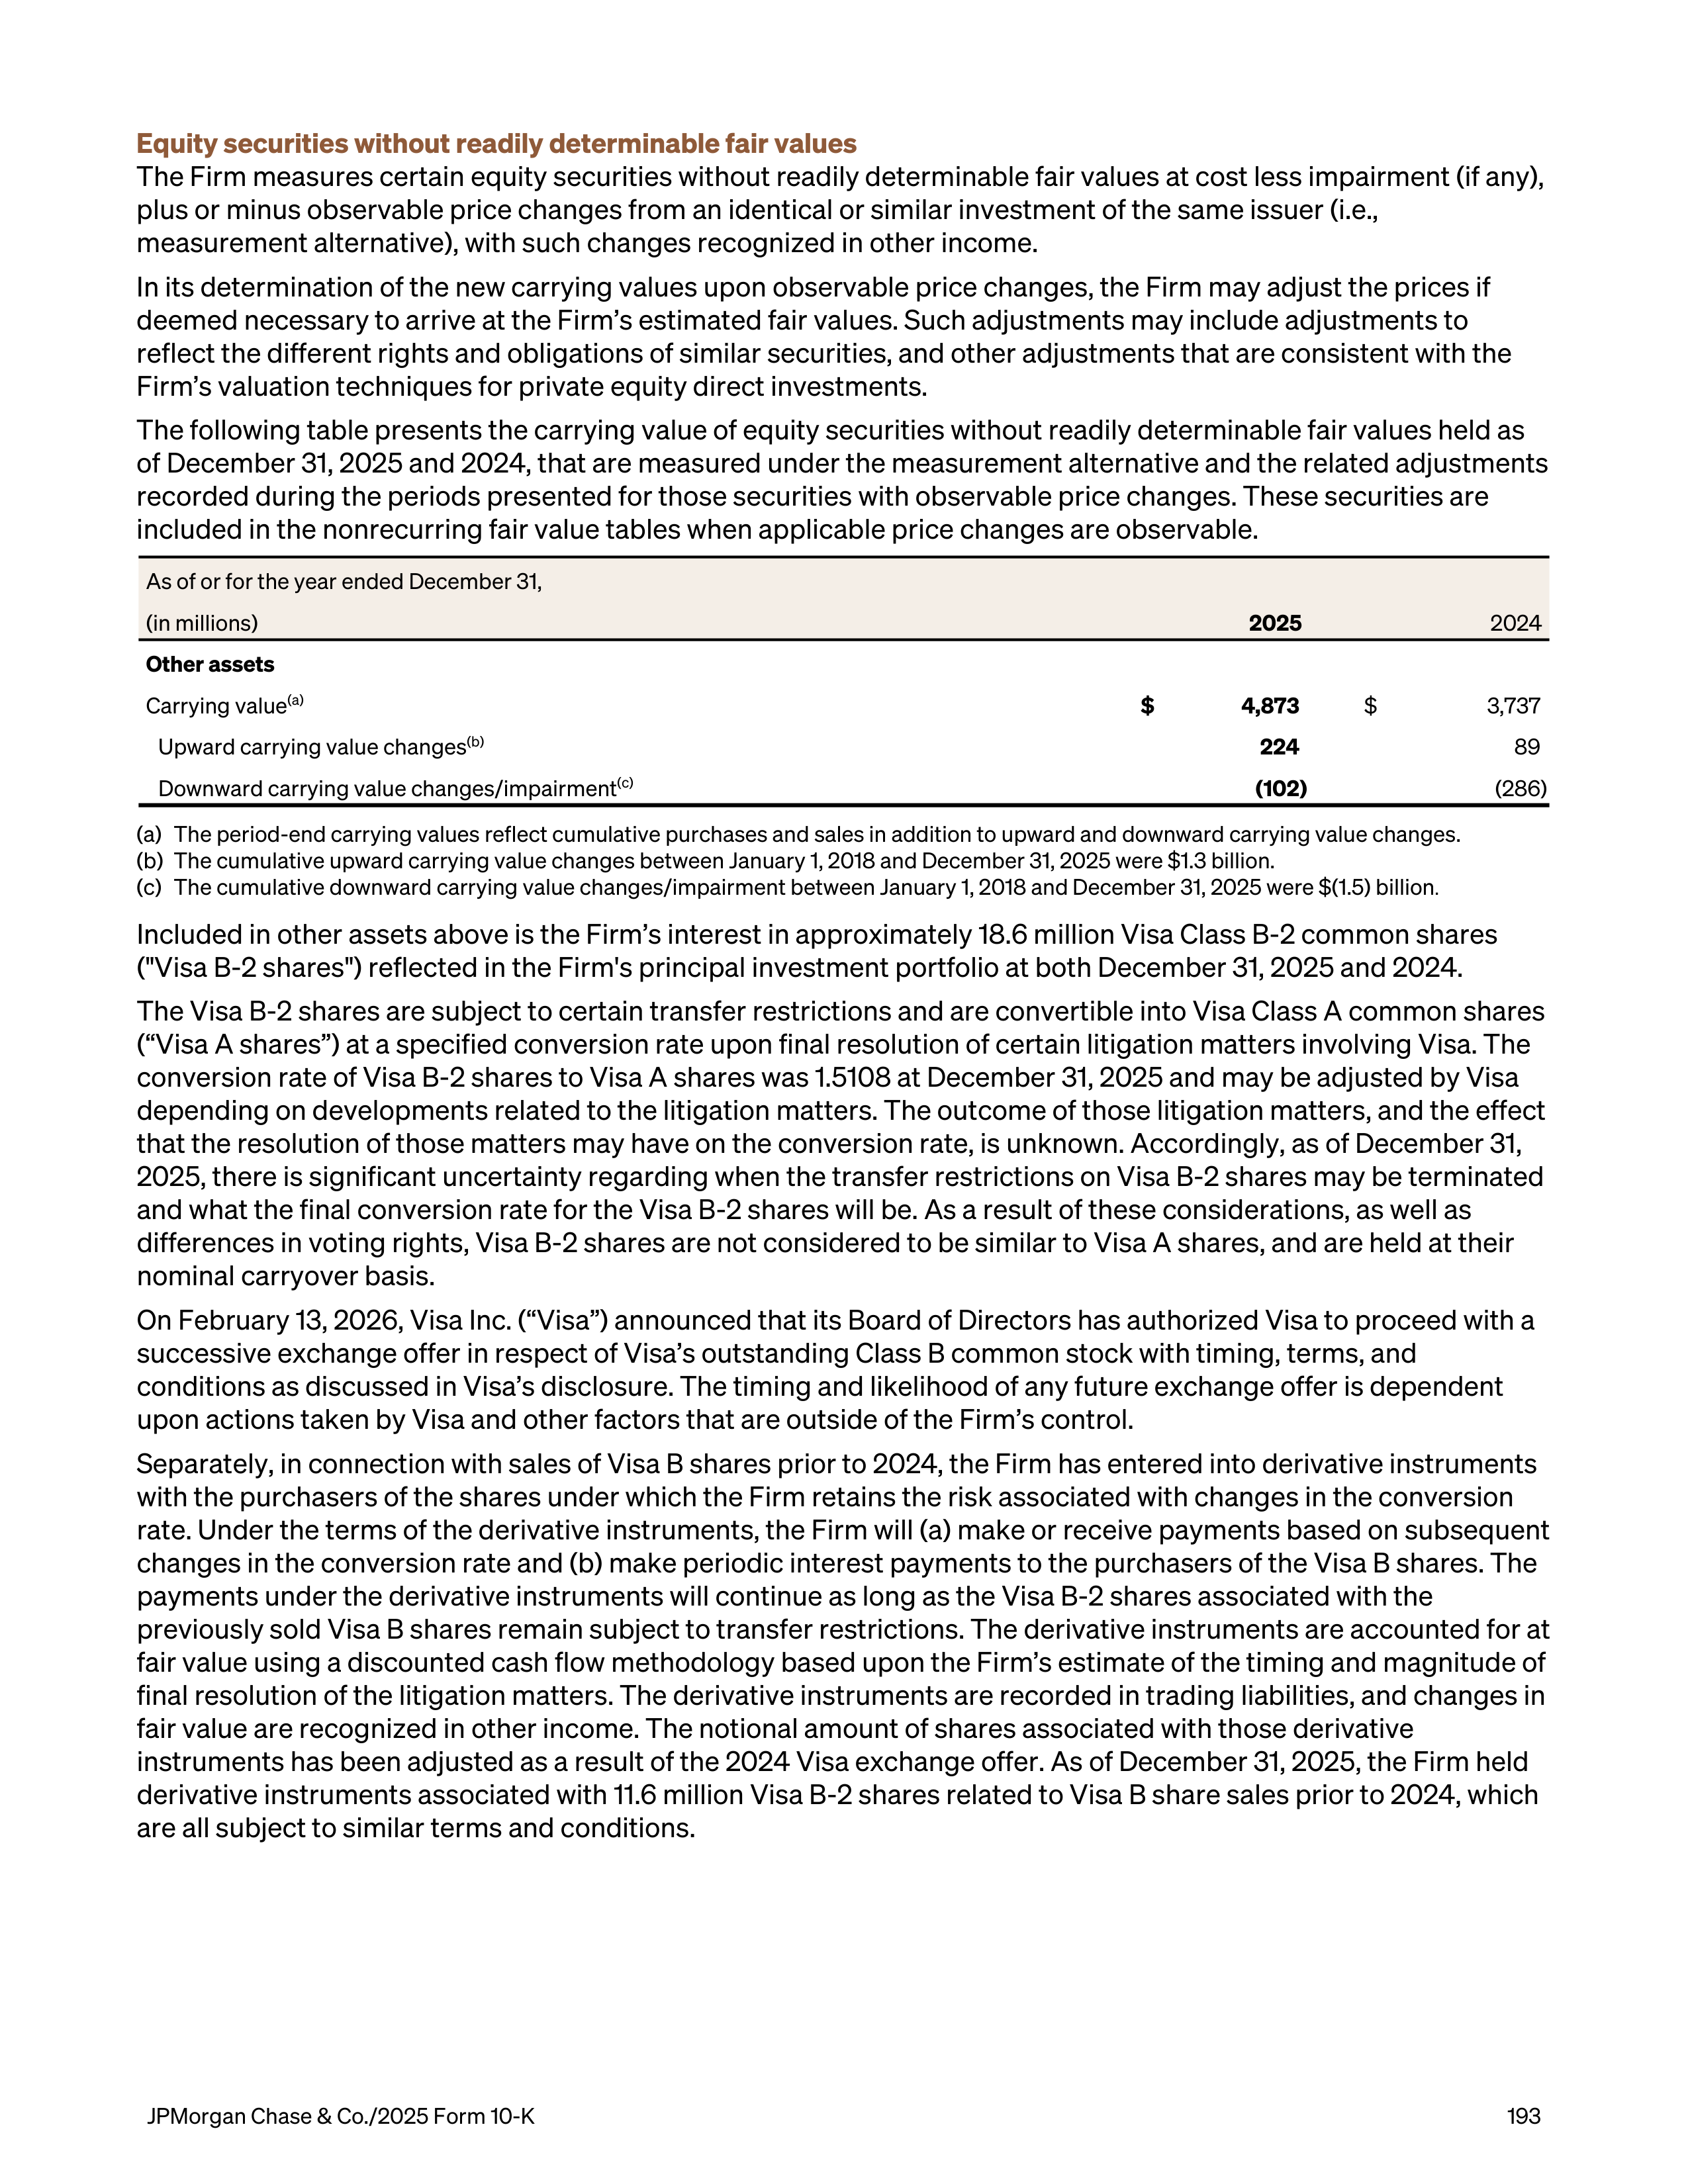
Equity securities without readily determinable fair values
The Firm measures certain equity securities without readily determinable fair values at cost less impairment (if any),
plus or minus observable price changes from an identical or similar investment of the same issuer (i.e.,
measurement alternative), with such changes recognized in other income.
In its determination of the new carrying values upon observable price changes, the Firm may adjust the prices if
deemed necessary to arrive at the Firm’s estimated fair values. Such adjustments may include adjustments to
reflect the different rights and obligations of similar securities, and other adjustments that are consistent with the
Firm’s valuation techniques for private equity direct investments.
The following table presents the carrying value of equity securities without readily determinable fair values held as
of December 31, 2025 and 2024, that are measured under the measurement alternative and the related adjustments
recorded during the periods presented for those securities with observable price changes. These securities are
included in the nonrecurring fair value tables when applicable price changes are observable.
As of or for the year ended December 31,
(in millions)
2025
2024
Other assets
Carrying value
(a)
$
4,873
$
3,737
Upward carrying value changes
(b)
224
89
Downward carrying value changes/impairment
(c)
(102)
(286)
(a)
The period-end carrying values reflect cumulative purchases and sales in addition to upward and downward carrying value changes.
(b)
The cumulative upward carrying value changes between January 1, 2018 and December 31, 2025 were $1.3 billion.
(c)
The cumulative downward carrying value changes/impairment between January 1, 2018 and December 31, 2025 were $(1.5) billion
.
Included in other assets above is the Firm’s interest in approximately 18.6 million Visa Class B-2 common shares
("Visa B-2 shares") reflected in the Firm's principal investment portfolio at both December 31, 2025 and 2024.
The Visa B-2 shares are subject to certain transfer restrictions and are convertible into Visa Class A common shares
(“Visa A shares”) at a specified conversion rate upon final resolution of certain litigation matters involving Visa. The
conversion rate of Visa B-2 shares to Visa A shares was 1.5108 at December 31, 2025 and may be adjusted by Visa
depending on developments related to the litigation matters. The outcome of those litigation matters, and the effect
that the resolution of those matters may have on the conversion rate, is unknown. Accordingly, as of December 31,
2025, there is significant uncertainty regarding when the transfer restrictions on Visa B-2 shares may be terminated
and what the final conversion rate for the Visa B-2 shares will be. As a result of these considerations, as well as
differences in voting rights, Visa B-2 shares are not considered to be similar to Visa A shares, and are held at their
nominal carryover basis.
On February 13, 2026, Visa Inc. (“Visa”) announced that its Board of Directors has authorized Visa to proceed with a
successive exchange offer in respect of Visa’s outstanding Class B common stock with timing, terms, and
conditions as discussed in Visa’s disclosure. The timing and likelihood of any future exchange offer is dependent
upon actions taken by Visa and other factors that are outside of the Firm’s control.
Separately, in connection with sales of Visa B shares prior to 2024, the Firm has entered into derivative instruments
with the purchasers of the shares under which the Firm retains the risk associated with changes in the conversion
rate. Under the terms of the derivative instruments, the Firm will (a) make or receive payments based on subsequent
changes in the conversion rate and (b) make periodic interest payments to the purchasers of the Visa B shares. The
payments under the derivative instruments will continue as long as the Visa B-2 shares associated with the
previously sold Visa B shares remain subject to transfer restrictions. The derivative instruments are accounted for at
fair value using a discounted cash flow methodology based upon the Firm’s estimate of the timing and magnitude of
final resolution of the litigation matters. The derivative instruments are recorded in trading liabilities, and changes in
fair value are recognized in other income. The notional amount of shares associated with those derivative
instruments has been adjusted as a result of the 2024 Visa exchange offer. As of December 31, 2025, the Firm held
derivative instruments associated with 11.6 million Visa B-2 shares related to Visa B share sales prior to 2024, which
are all subject to similar terms and conditions.
JPMorgan Chase & Co./2025 Form 10-K
193
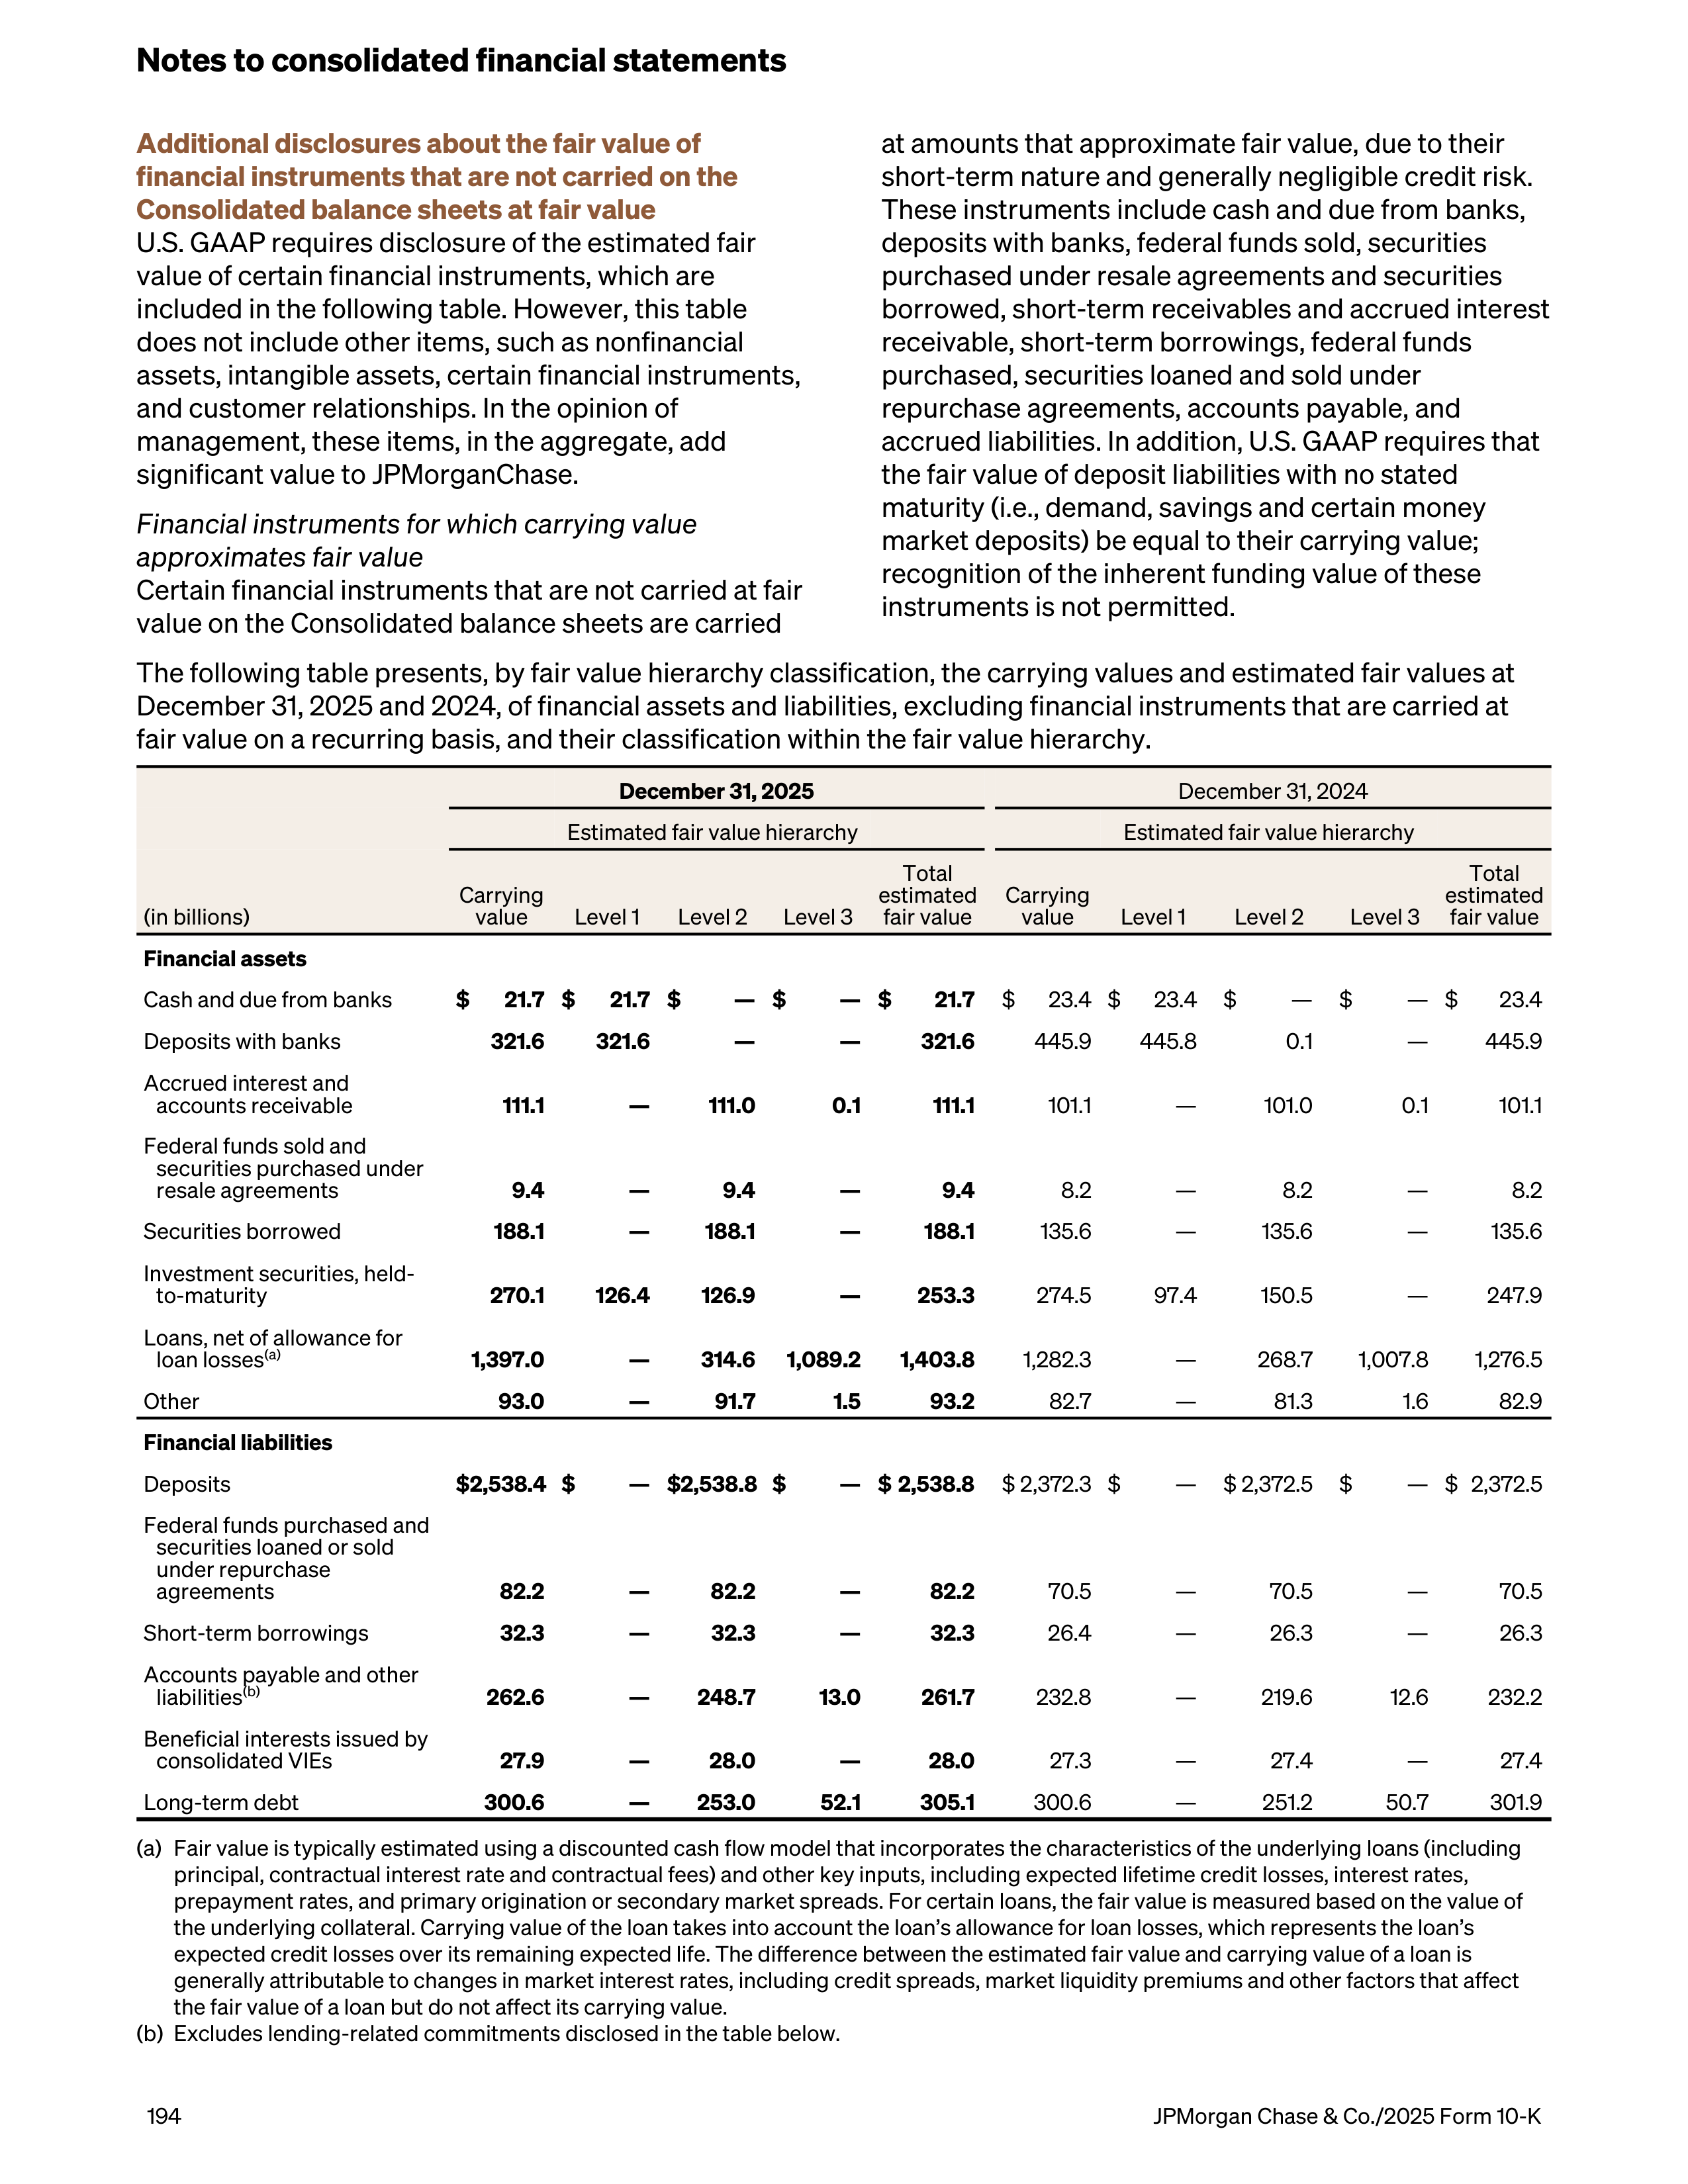
Additional disclosures about the fair value of
financial instruments that are not carried on the
Consolidated balance sheets at fair value
U.S. GAAP requires disclosure of the estimated fair
value of certain financial instruments, which are
included in the following table. However, this table
does not include other items, such as nonfinancial
assets, intangible assets, certain financial instruments,
and customer relationships. In the opinion of
management, these items, in the aggregate, add
significant value to JPMorganChase.
Financial instruments for which carrying value
approximates fair value
Certain financial instruments that are not carried at fair
value on the Consolidated balance sheets are carried
at amounts that approximate fair value, due to their
short-term nature and generally negligible credit risk.
These instruments include cash and due from banks,
deposits with banks, federal funds sold, securities
purchased under resale agreements and securities
borrowed, short-term receivables and accrued interest
receivable, short-term borrowings, federal funds
purchased, securities loaned and sold under
repurchase agreements, accounts payable, and
accrued liabilities. In addition, U.S. GAAP requires that
the fair value of deposit liabilities with no stated
maturity (i.e., demand, savings and certain money
market deposits) be equal to their carrying value;
recognition of the inherent funding value of these
instruments is not permitted.
The following table presents, by fair value hierarchy classification, the carrying values and estimated fair values at
December 31, 2025 and 2024, of financial assets and liabilities, excluding financial instruments that are carried at
fair value on a recurring basis, and their classification within the fair value hierarchy.
December 31, 2025
December 31, 2024
Estimated fair value hierarchy
Estimated fair value hierarchy
(in billions)
Carrying
value
Level 1
Level 2
Level 3
Total
estimated
fair value
Carrying
value
Level 1
Level 2
Level 3
Total
estimated
fair value
Financial assets
Cash and due from banks
$
21.7 $
21.7 $
— $
— $
21.7
$
23.4 $
23.4
$
—
$
— $
23.4
Deposits with banks
321.6
321.6
—
—
321.6
445.9
445.8
0.1
—
445.9
Accrued interest and
accounts receivable
111.1
—
111.0
0.1
111.1
101.1
—
101.0
0.1
101.1
Federal funds sold and
securities purchased under
resale agreements
9.4
—
9.4
—
9.4
8.2
—
8.2
—
8.2
Securities borrowed
188.1
—
188.1
—
188.1
135.6
—
135.6
—
135.6
Investment securities, held-
to-maturity
270.1
126.4
126.9
—
253.3
274.5
97.4
150.5
—
247.9
Loans, net of allowance for
loan losses
(a)
1,397.0
—
314.6 1,089.2
1,403.8
1,282.3
—
268.7
1,007.8
1,276.5
Other
93.0
—
91.7
1.5
93.2
82.7
—
81.3
1.6
82.9
Financial liabilities
Deposits
$ 2,538.4 $
— $ 2,538.8 $
— $ 2,538.8
$ 2,372.3 $
—
$ 2,372.5
$
— $ 2,372.5
Federal funds purchased and
securities loaned or sold
under repurchase
agreements
82.2
—
82.2
—
82.2
70.5
—
70.5
—
70.5
Short-term borrowings
32.3
—
32.3
—
32.3
26.4
—
26.3
—
26.3
Accounts payable and other
liabilities
(b)
262.6
—
248.7
13.0
261.7
232.8
—
219.6
12.6
232.2
Beneficial interests issued by
consolidated VIEs
27.9
—
28.0
—
28.0
27.3
—
27.4
—
27.4
Long-term debt
300.6
—
253.0
52.1
305.1
300.6
—
251.2
50.7
301.9
(a)
Fair value is typically estimated using a discounted cash flow model that incorporates the characteristics of the underlying loans (including
principal, contractual interest rate and contractual fees) and other key inputs, including expected lifetime credit losses, interest rates,
prepayment rates, and primary origination or secondary market spreads. For certain loans, the fair value is measured based on the value of
the underlying collateral. Carrying value of the loan takes into account the loan’s allowance for loan losses, which represents the loan’s
expected credit losses over its remaining expected life. The difference between the estimated fair value and carrying value of a loan is
generally attributable to changes in market interest rates, including credit spreads, market liquidity premiums and other factors that affect
the fair value of a loan but do not affect its carrying value.
(b)
Excludes lending-related commitments disclosed in the table below.
Notes to consolidated financial statements
194
JPMorgan Chase & Co./2025 Form 10-K
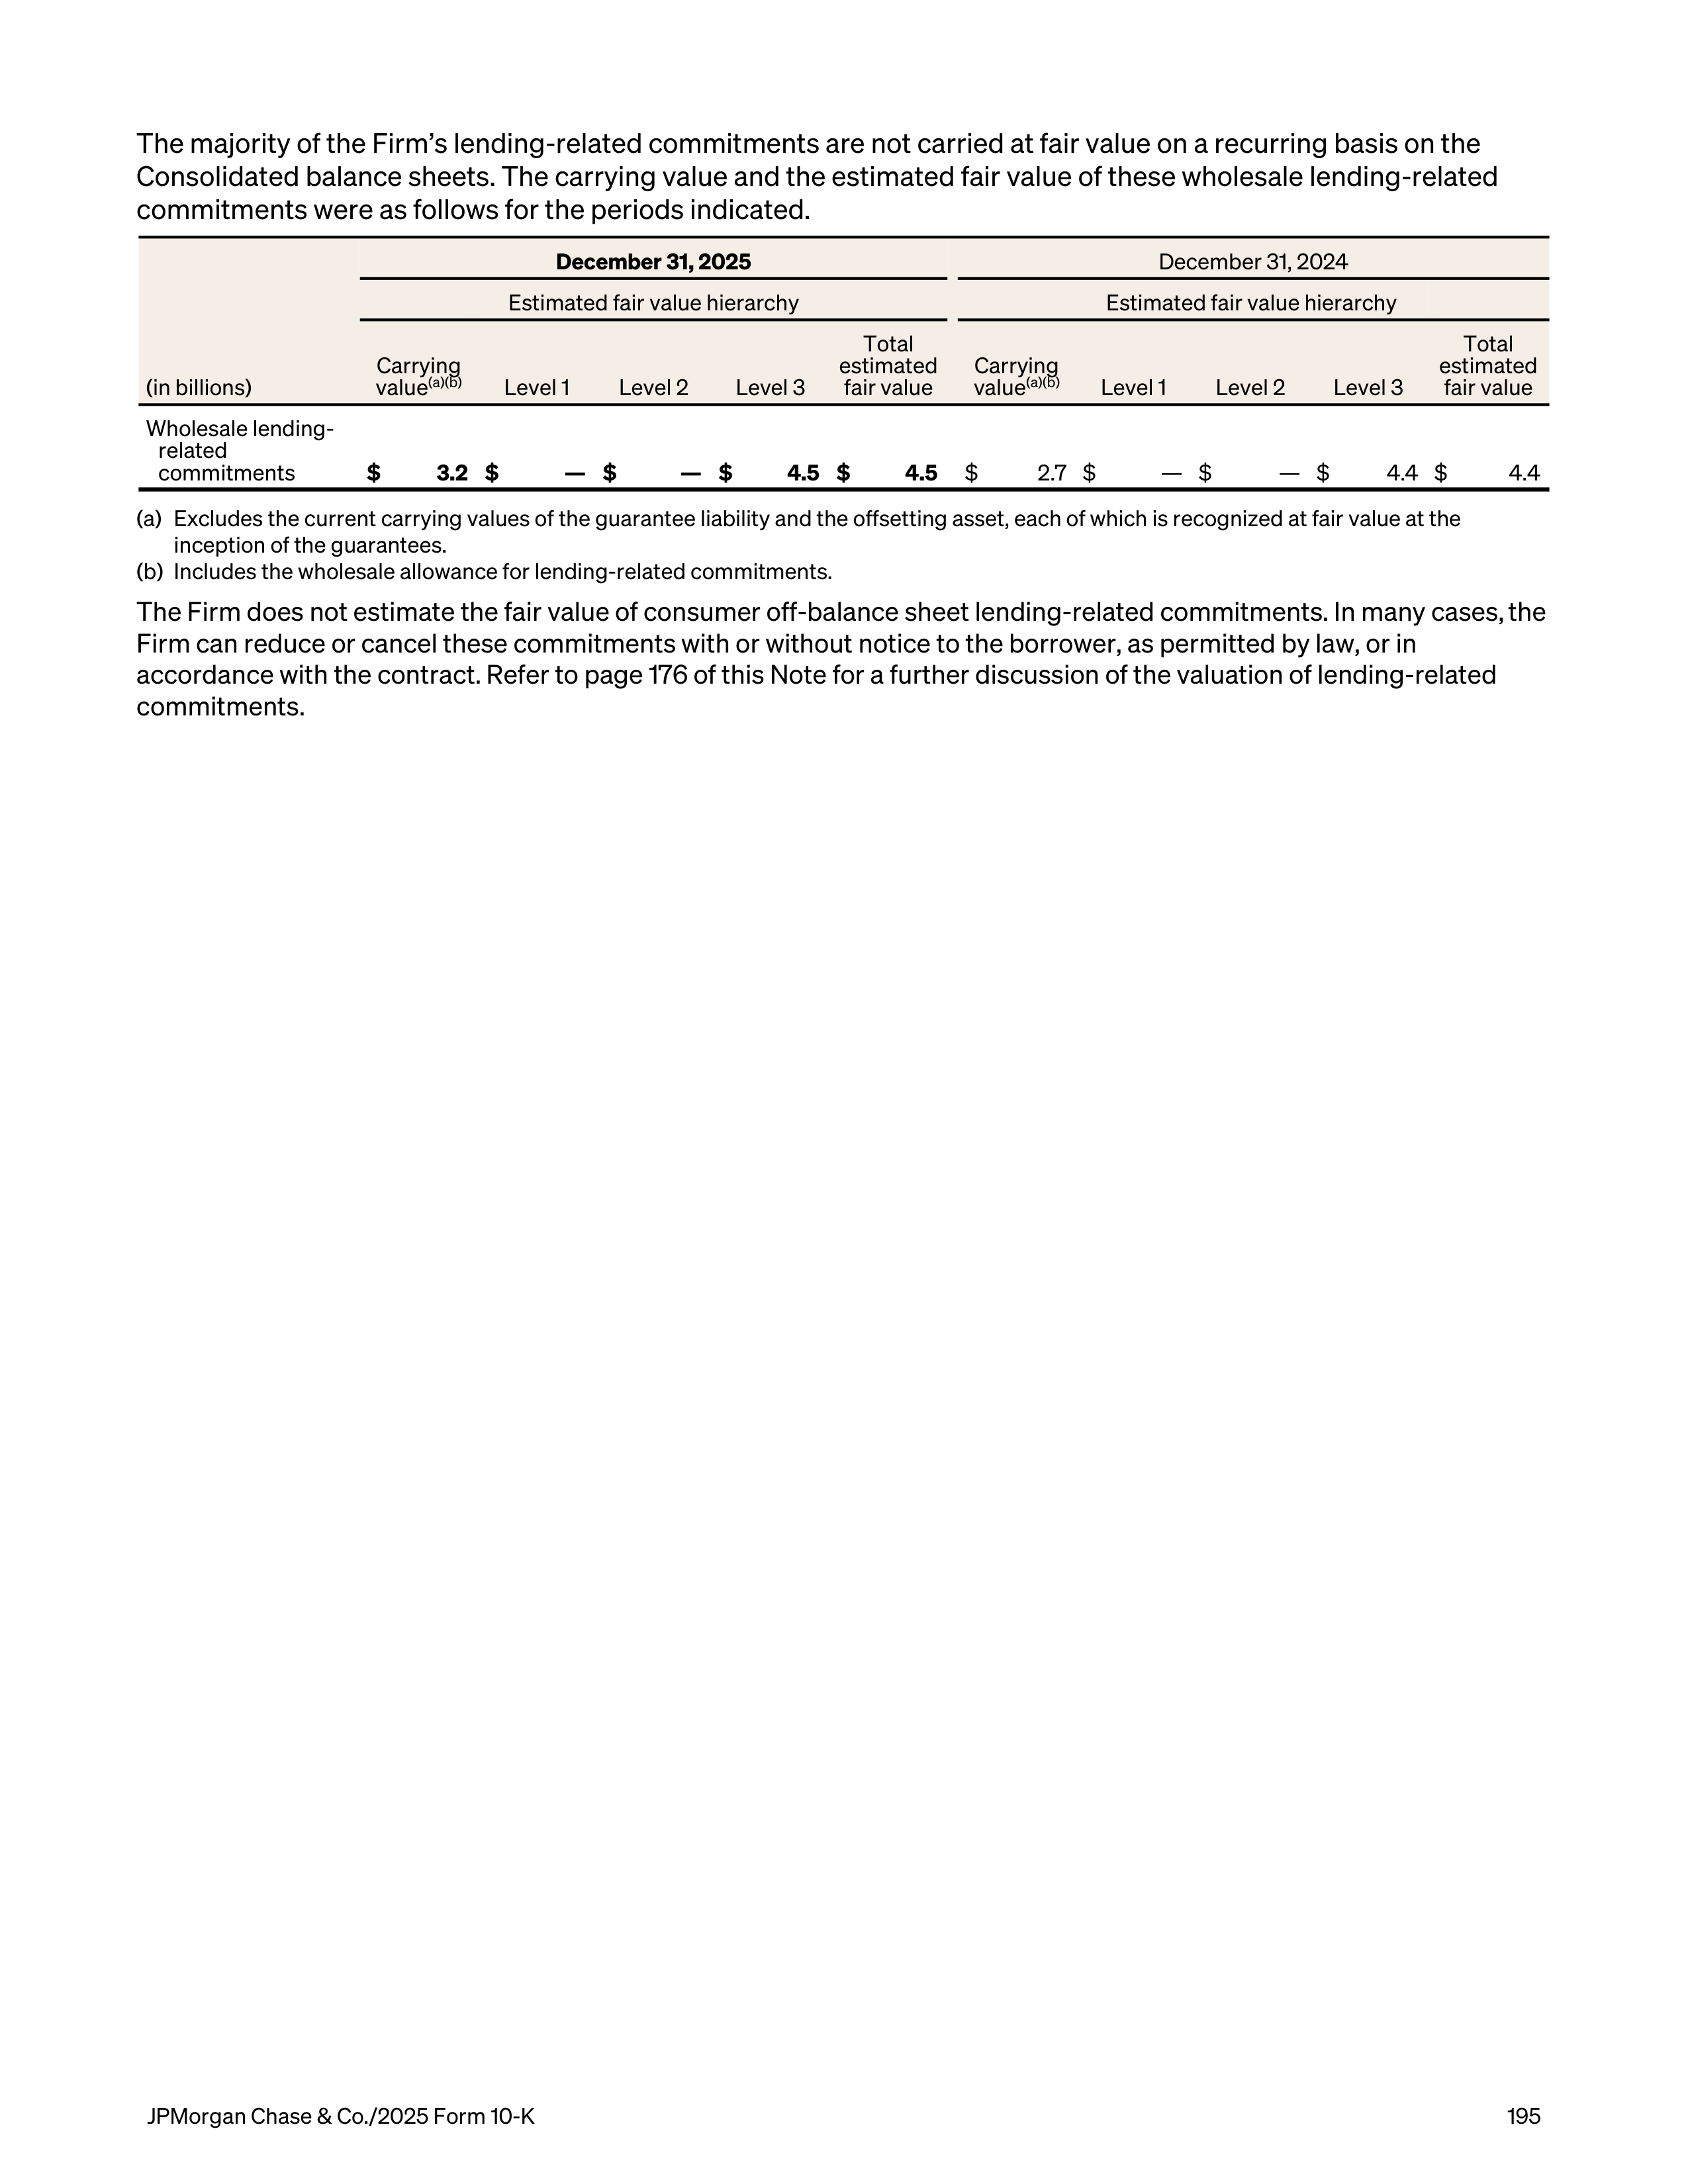
The majority of the Firm’s lending-related commitments are not carried at fair value on a recurring basis on the
Consolidated balance sheets. The carrying value and the estimated fair value of these wholesale lending-related
commitments were as follows for the periods indicated.
December 31, 2025
December 31, 2024
Estimated fair value hierarchy
Estimated fair value hierarchy
(in billions)
Carrying
value
(a)(b)
Level 1
Level 2
Level 3
Total
estimated
fair value
Carrying
value
(a)(b)
Level 1
Level 2
Level 3
Total
estimated
fair value
Wholesale lending-
related
commitments
$
3.2 $
— $
— $
4.5 $
4.5
$
2.7 $
— $
— $
4.4 $
4.4
(a)
Excludes the current carrying values of the guarantee liability and the offsetting asset, each of which is recognized at fair value at the
inception of the guarantees.
(b)
Includes the wholesale allowance for lending-related commitments.
The Firm does not estimate the fair value of consumer off-balance sheet lending-related commitments. In many cases, the
Firm can reduce or cancel these commitments with or without notice to the borrower, as permitted by law, or in
accordance with the contract. Refer to page 176 of this Note for a further discussion of the valuation of lending-related
commitments.
JPMorgan Chase & Co./2025 Form 10-K
195
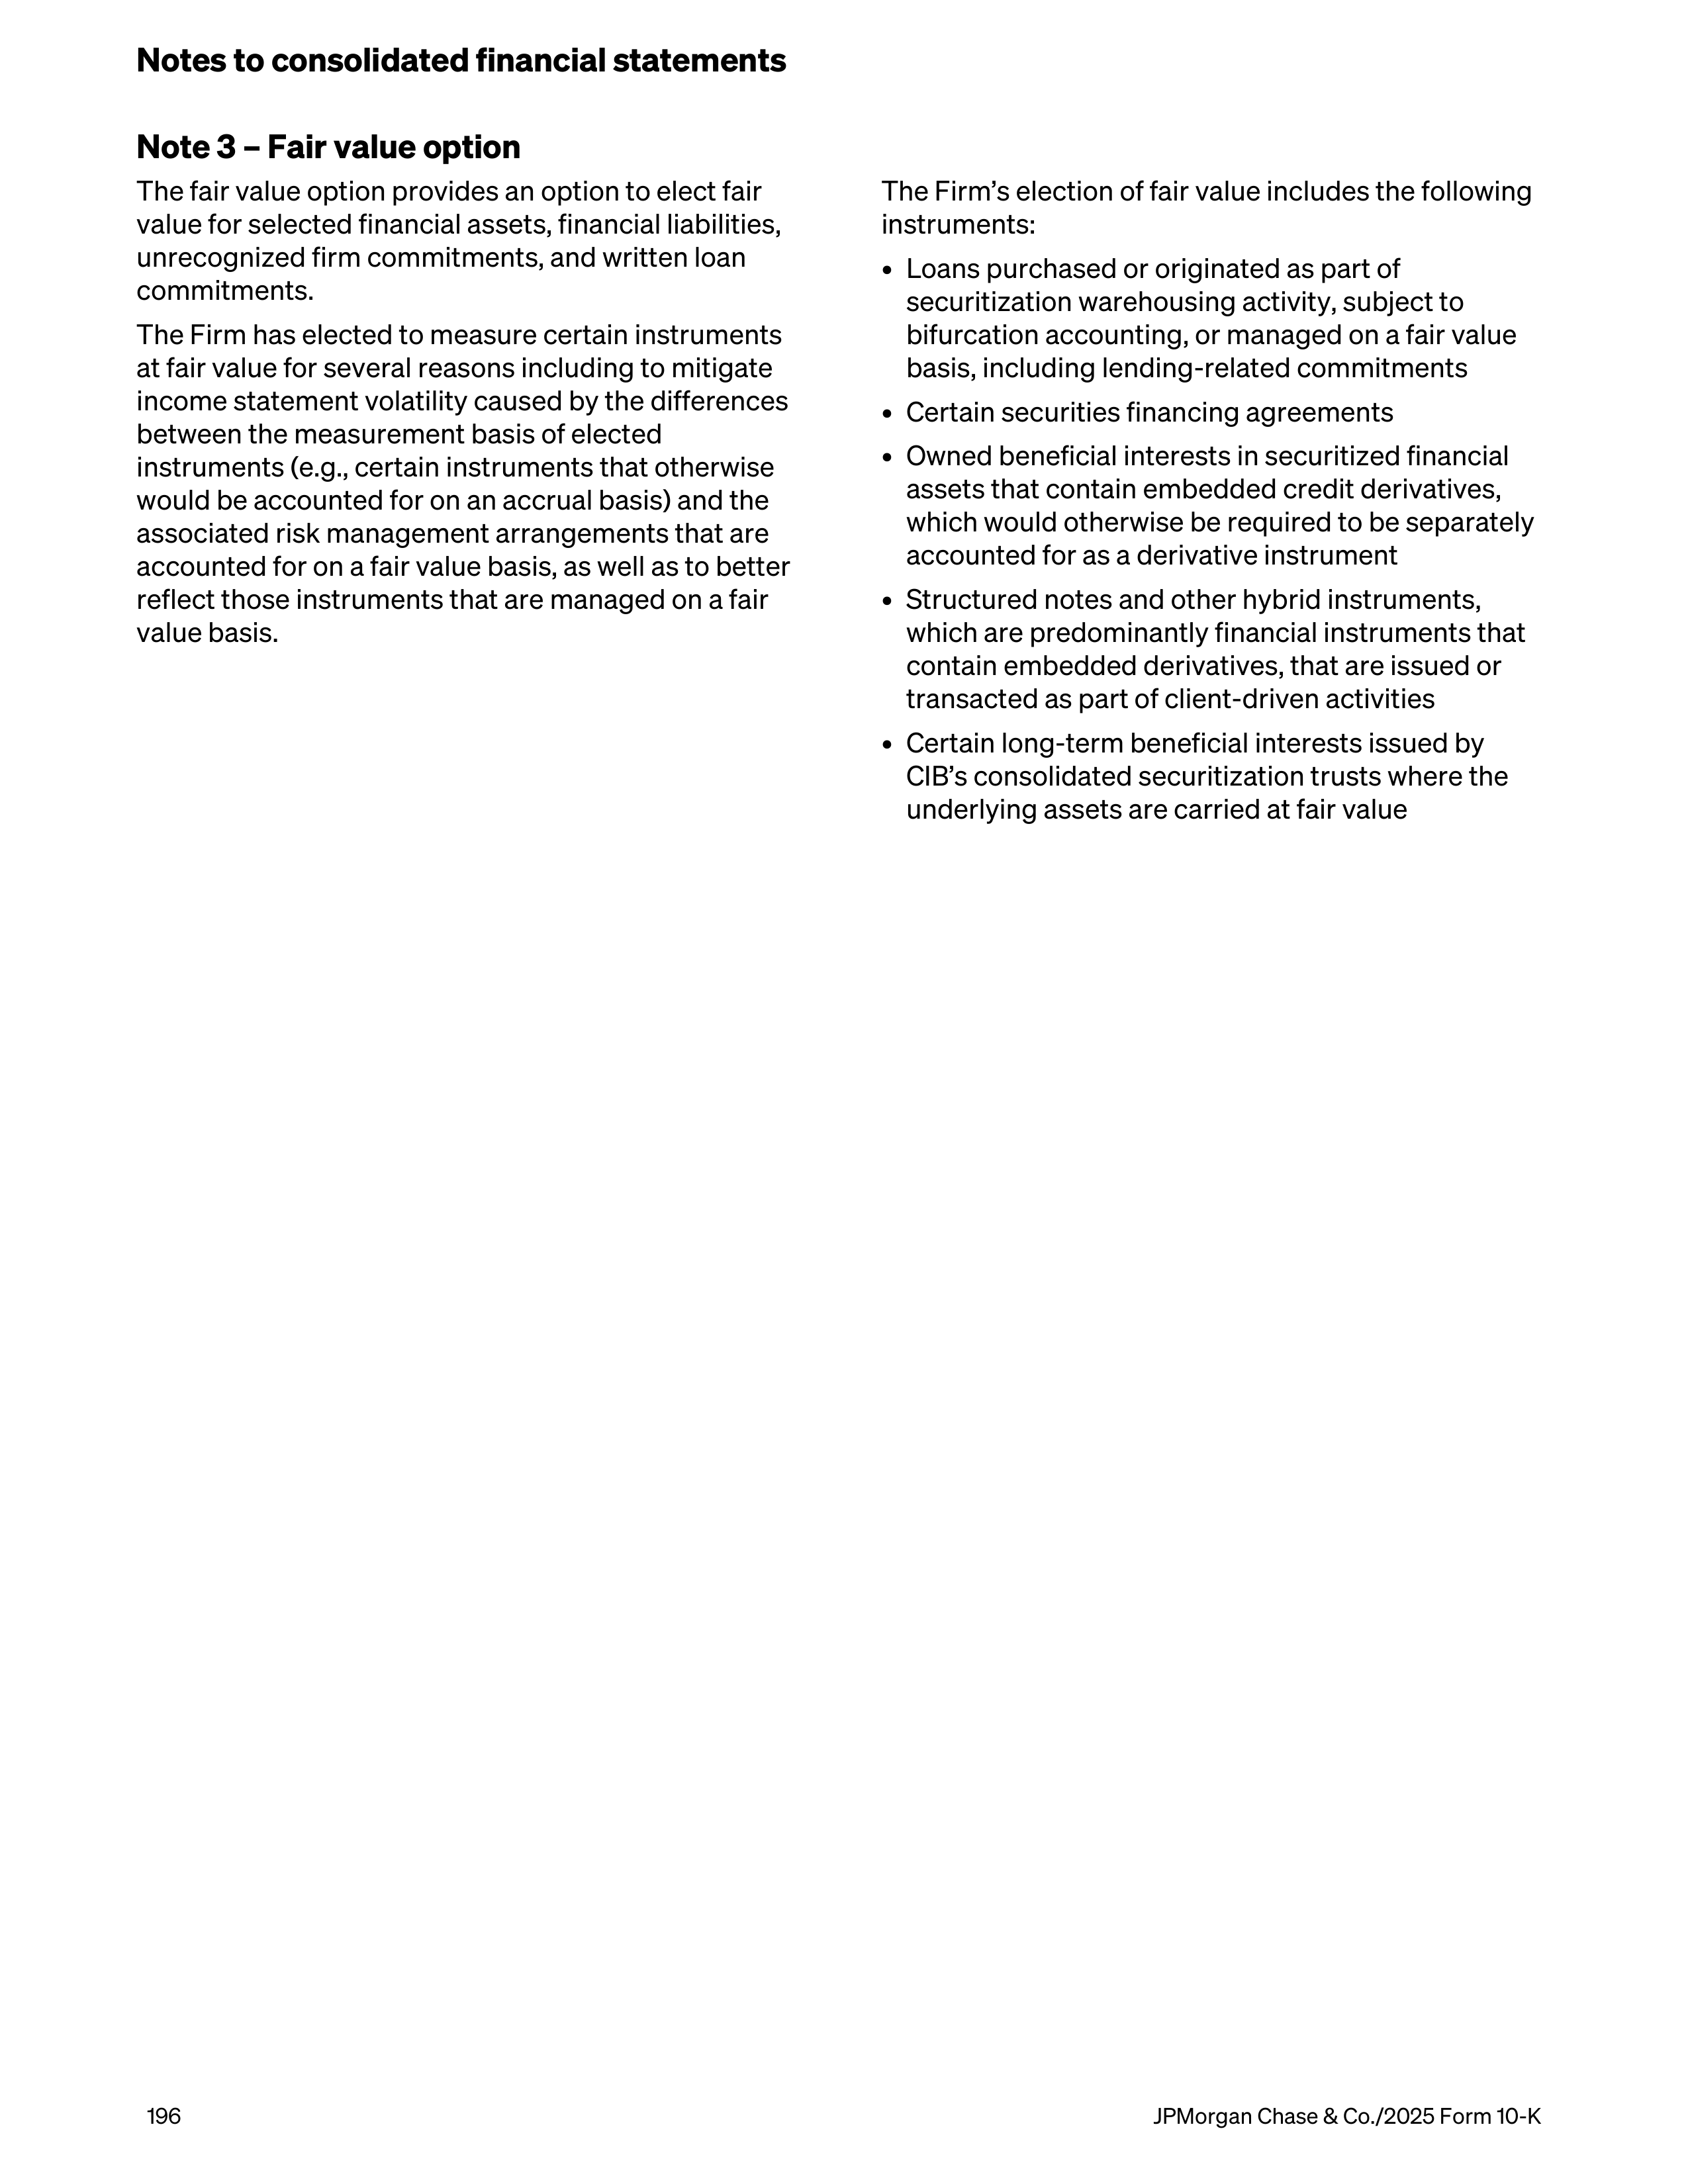
Note 3 – Fair value option
The fair value option provides an option to elect fair
value for selected financial assets, financial liabilities,
unrecognized firm commitments, and written loan
commitments.
The Firm has elected to measure certain instruments
at fair value for several reasons including to mitigate
income statement volatility caused by the differences
between the measurement basis of elected
instruments (e.g., certain instruments that otherwise
would be accounted for on an accrual basis) and the
associated risk management arrangements that are
accounted for on a fair value basis, as well as to better
reflect those instruments that are managed on a fair
value basis.
The Firm’s election of fair value includes the following
instruments:
•
Loans purchased or originated as part of
securitization warehousing activity, subject to
bifurcation accounting, or managed on a fair value
basis, including lending-related commitments
•
Certain securities financing agreements
•
Owned beneficial interests in securitized financial
assets that contain embedded credit derivatives,
which would otherwise be required to be separately
accounted for as a derivative instrument
•
Structured notes and other hybrid instruments,
which are predominantly financial instruments that
contain embedded derivatives, that are issued or
transacted as part of client-driven activities
•
Certain long-term beneficial interests issued by
CIB’s consolidated securitization trusts where the
underlying assets are carried at fair value
Notes to consolidated financial statements
196
JPMorgan Chase & Co./2025 Form 10-K
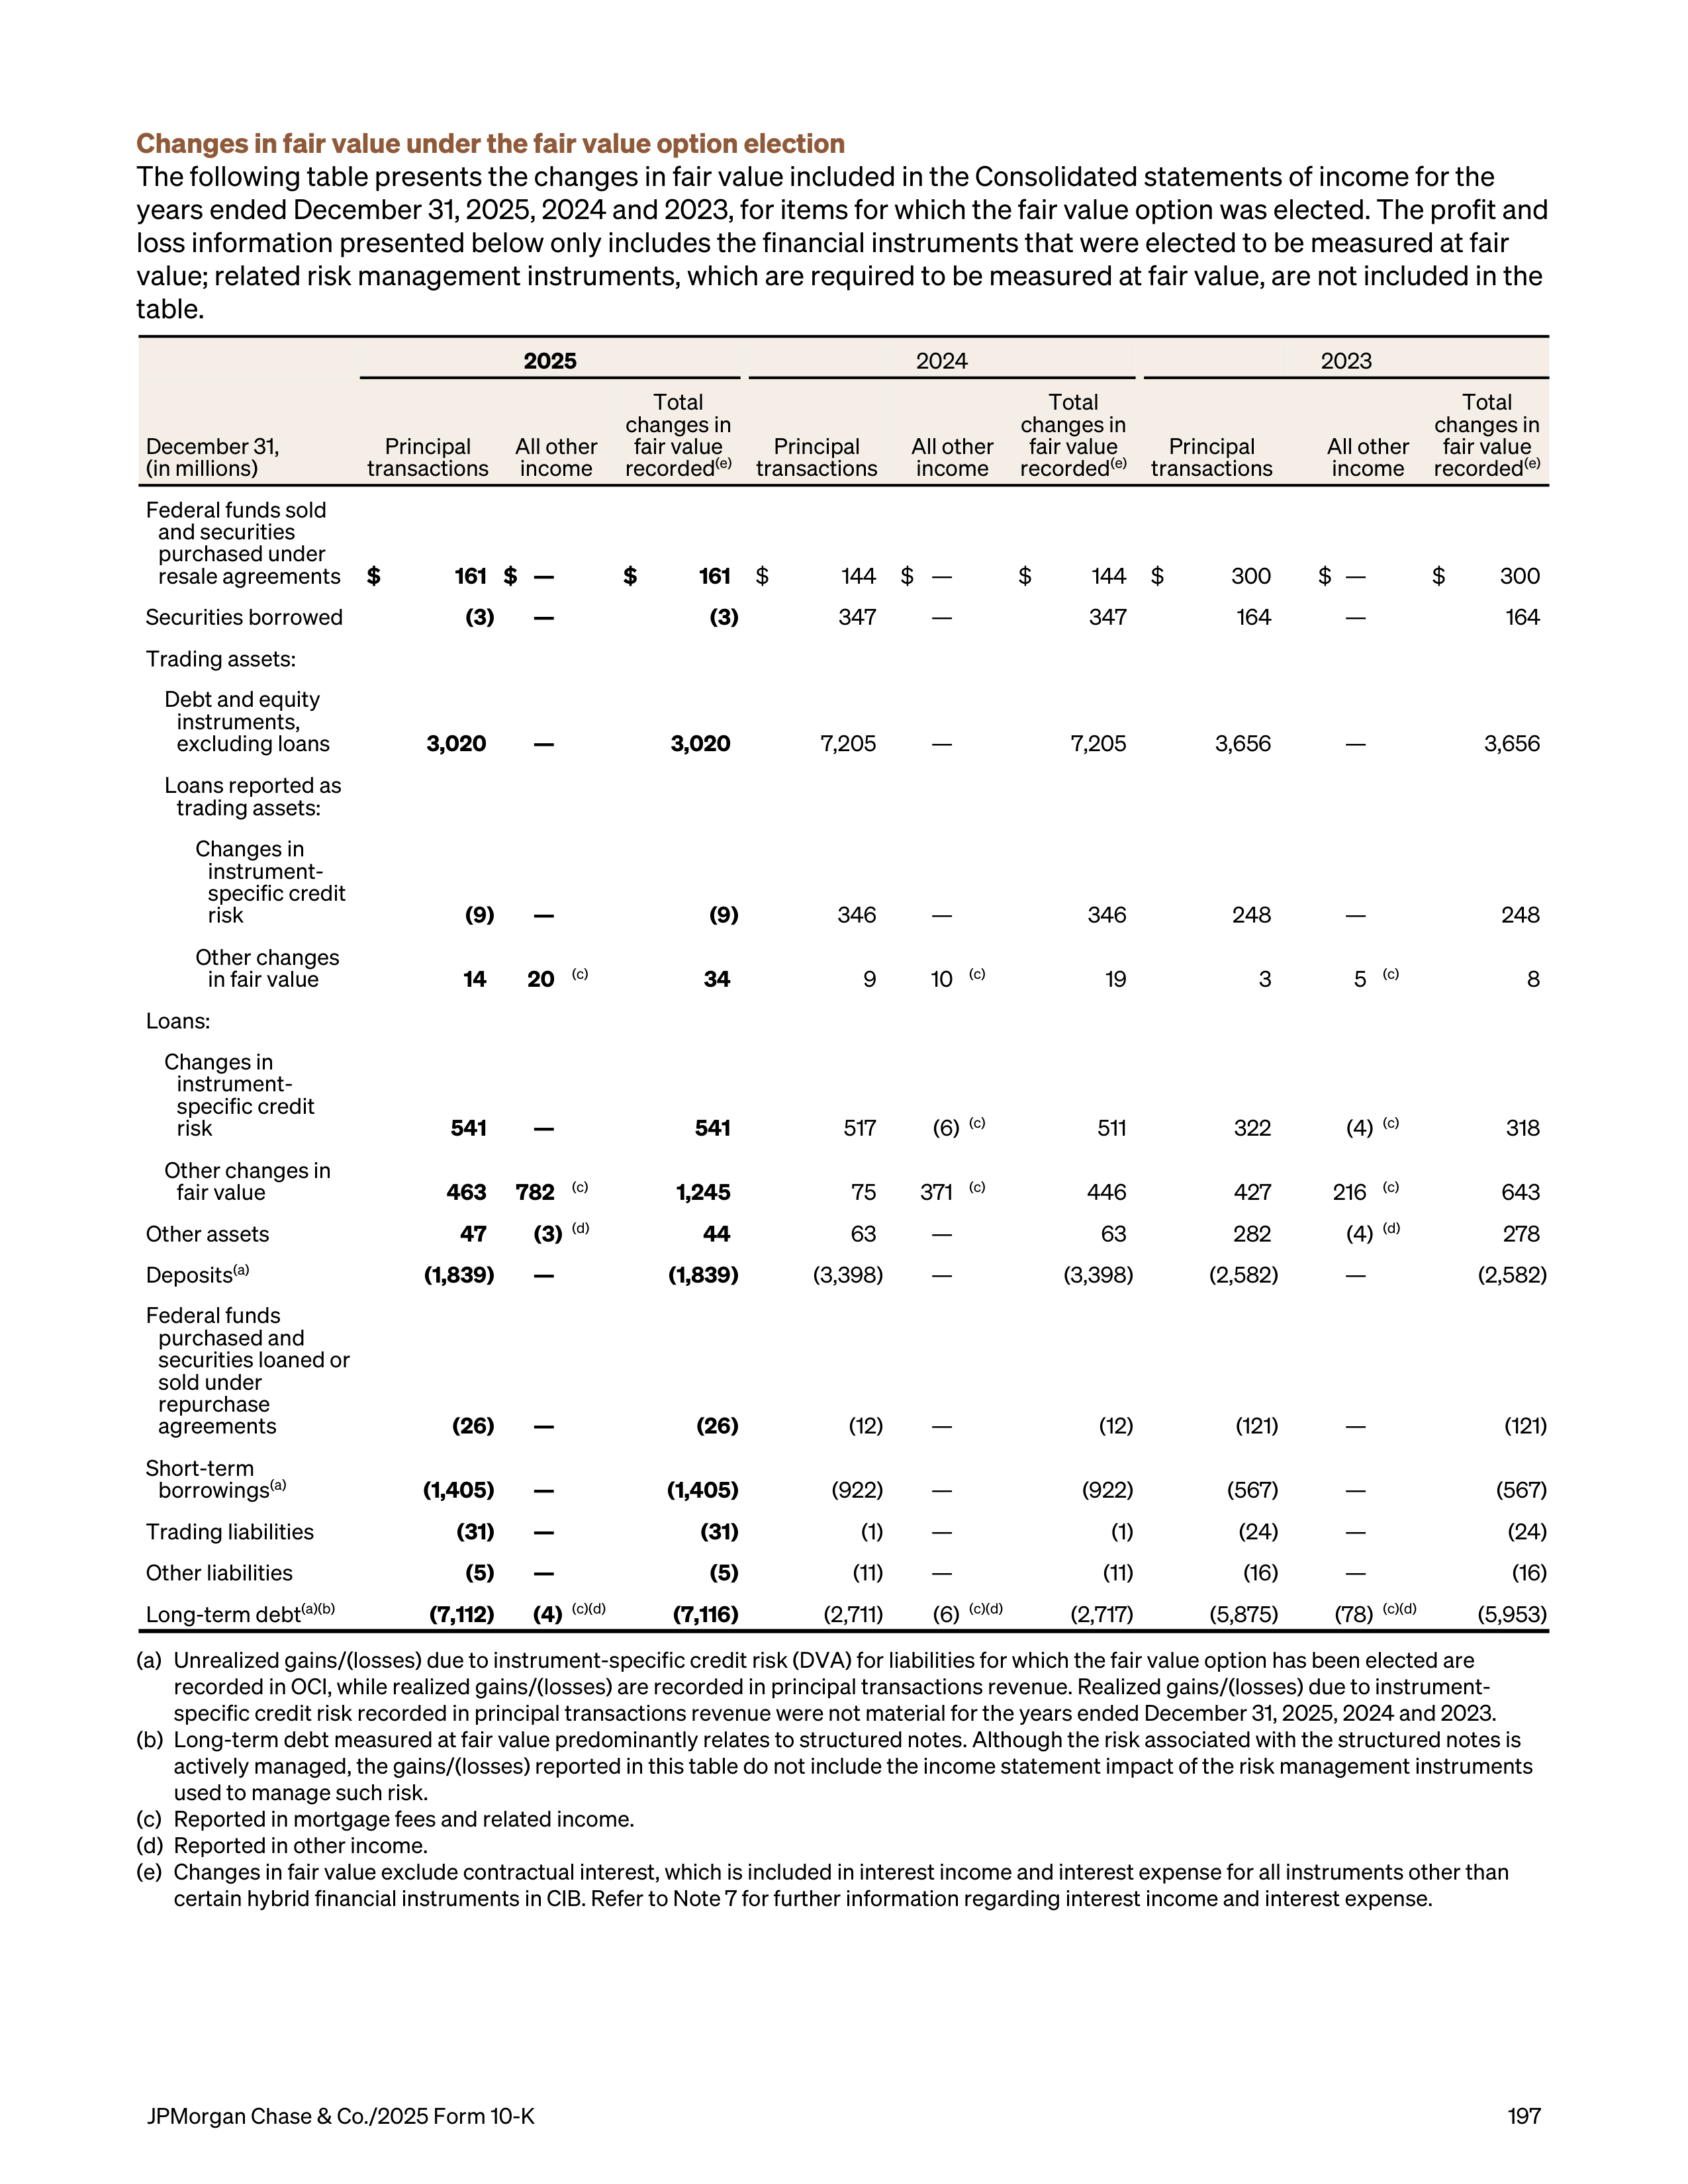
Changes in fair value under the fair value option election
The following table presents the changes in fair value included in the Consolidated statements of income for the
years ended December 31, 2025, 2024 and 2023, for items for which the fair value option was elected. The profit and
loss information presented below only includes the financial instruments that were elected to be measured at fair
value; related risk management instruments, which are required to be measured at fair value, are not included in the
table.
2025
2024
2023
December 31,
(in millions)
Principal
transactions
All other
income
Total
changes in
fair value
recorded
(e)
Principal
transactions
All other
income
Total
changes in
fair value
recorded
(e)
Principal
transactions
All other
income
Total
changes in
fair value
recorded
(e)
Federal funds sold
and securities
purchased under
resale agreements
$
161 $ —
$
161
$
144
$ —
$
144
$
300
$ —
$
300
Securities borrowed
(3)
—
(3)
347
—
347
164
—
164
Trading assets:
Debt and equity
instruments,
excluding loans
3,020
—
3,020
7,205
—
7,205
3,656
—
3,656
Loans reported as
trading assets:
Changes in
instrument-
specific credit
risk
(9)
—
(9)
346
—
346
248
—
248
Other changes
in fair value
14
20
(c)
34
9
10
(c)
19
3
5
(c)
8
Loans:
Changes in
instrument-
specific credit
risk
541
—
541
517
(6)
(c)
511
322
(4)
(c)
318
Other changes in
fair value
463 782
(c)
1,245
75
371
(c)
446
427
216
(c)
643
Other assets
47
(3)
(d)
44
63
—
63
282
(4)
(d)
278
Deposits
(a)
(1,839)
—
(1,839)
(3,398)
—
(3,398)
(2,582)
—
(2,582)
Federal funds
purchased and
securities loaned or
sold under
repurchase
agreements
(26)
—
(26)
(12)
—
(12)
(121)
—
(121)
Short-term
borrowings
(a)
(1,405)
—
(1,405)
(922)
—
(922)
(567)
—
(567)
Trading liabilities
(31)
—
(31)
(1)
—
(1)
(24)
—
(24)
Other liabilities
(5)
—
(5)
(11)
—
(11)
(16)
—
(16)
Long-term debt
(a)(b)
(7,112)
(4)
(c)(d)
(7,116)
(2,711)
(6)
(c)(d)
(2,717)
(5,875)
(78)
(c)(d)
(5,953)
(a)
Unrealized gains/(losses) due to instrument-specific credit risk (DVA) for liabilities for which the fair value option has been elected are
recorded in OCI, while realized gains/(losses) are recorded in principal transactions revenue. Realized gains/(losses) due to instrument-
specific credit risk recorded in principal transactions revenue were not material for the years ended December 31, 2025, 2024 and 2023.
(b)
Long-term debt measured at fair value predominantly relates to structured notes. Although the risk associated with the structured notes is
actively managed, the gains/(losses) reported in this table do not include the income statement impact of the risk management instruments
used to manage such risk.
(c)
Reported in mortgage fees and related income.
(d)
Reported in other income.
(e)
Changes in fair value exclude contractual interest, which is included in interest income and interest expense for all instruments other than
certain hybrid financial instruments in CIB. Refer to Note 7 for further information regarding interest income and interest expense.
JPMorgan Chase & Co./2025 Form 10-K
197
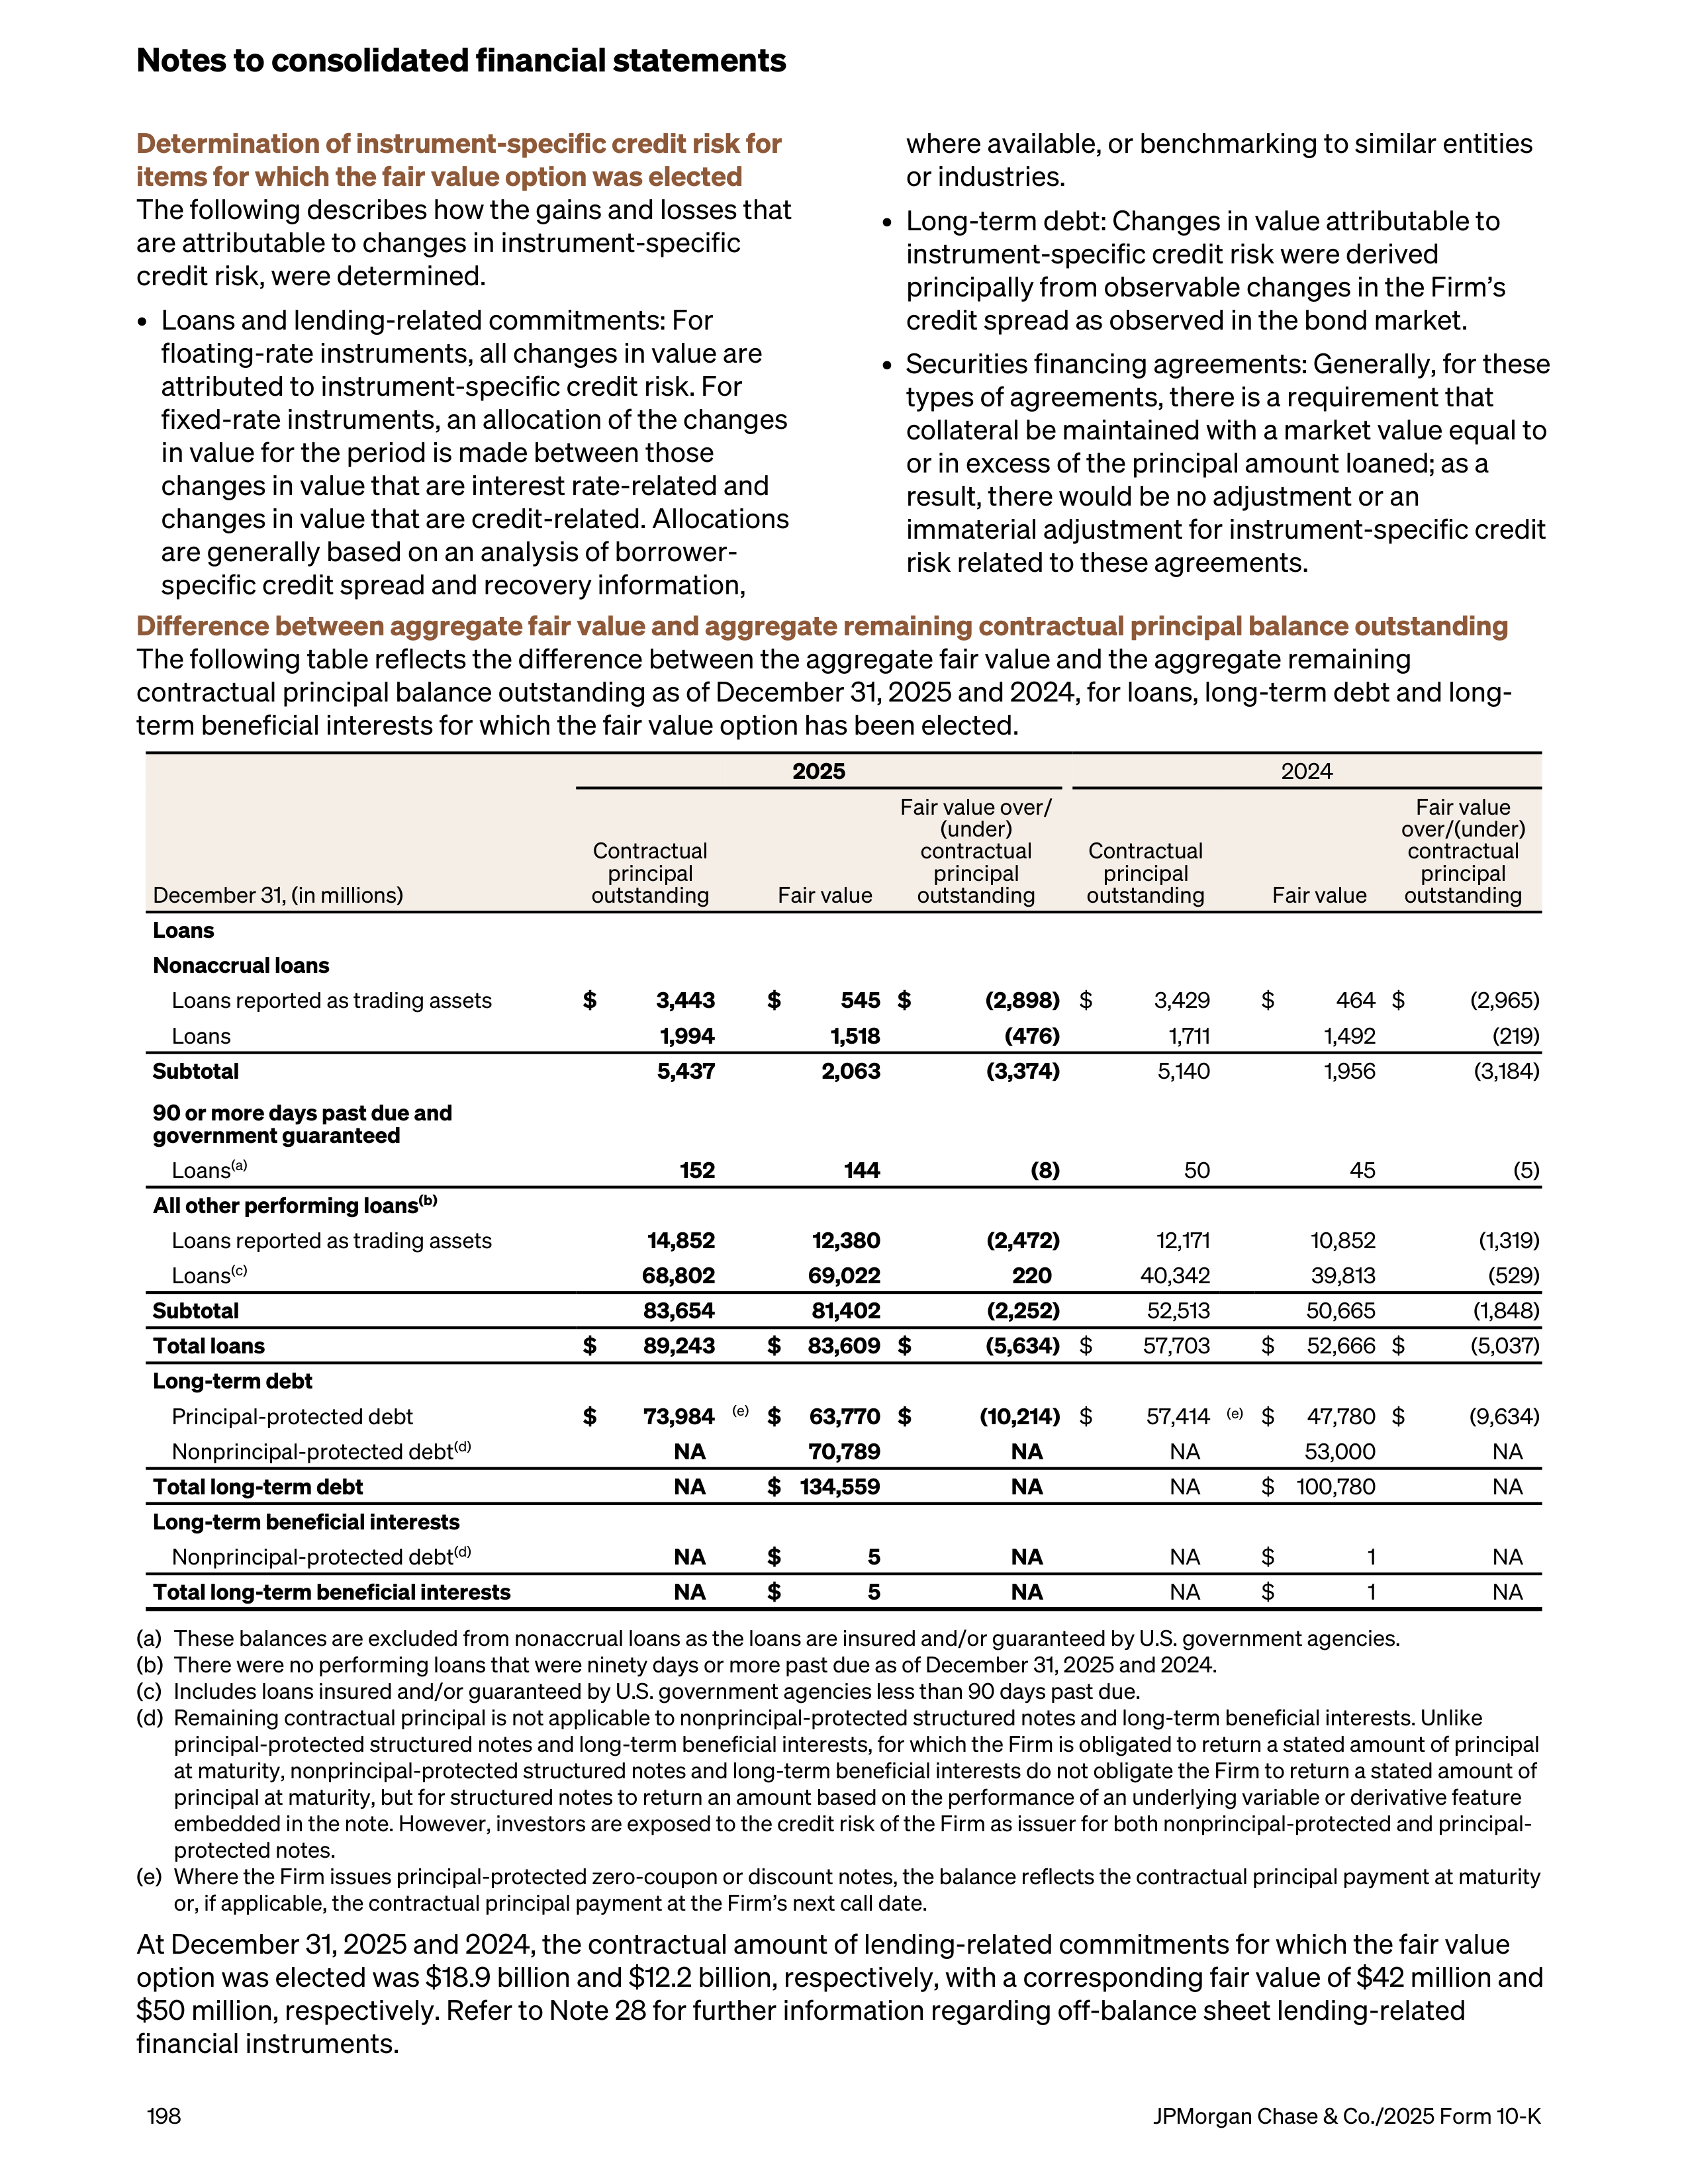
Determination of instrument-specific credit risk for
items for which the fair value option was elected
The following describes how the gains and losses that
are attributable to changes in instrument-specific
credit risk, were determined.
•
Loans and lending-related commitments: For
floating-rate instruments, all changes in value are
attributed to instrument-specific credit risk. For
fixed-rate instruments, an allocation of the changes
in value for the period is made between those
changes in value that are interest rate-related and
changes in value that are credit-related. Allocations
are generally based on an analysis of borrower-
specific credit spread and recovery information,
where available, or benchmarking to similar entities
or industries.
•
Long-term debt: Changes in value attributable to
instrument-specific credit risk were derived
principally from observable changes in the Firm’s
credit spread as observed in the bond market.
•
Securities financing agreements: Generally, for these
types of agreements, there is a requirement that
collateral be maintained with a market value equal to
or in excess of the principal amount loaned; as a
result, there would be no adjustment or an
immaterial adjustment for instrument-specific credit
risk related to these agreements.
Difference between aggregate fair value and aggregate remaining contractual principal balance outstanding
The following table reflects the difference between the aggregate fair value and the aggregate remaining
contractual principal balance outstanding as of December 31, 2025 and 2024, for loans, long-term debt and long-
term beneficial interests for which the fair value option has been elected.
2025
2024
December 31, (in millions)
Contractual
principal
outstanding
Fair value
Fair value over/
(under)
contractual
principal
outstanding
Contractual
principal
outstanding
Fair value
Fair value
over/(under)
contractual
principal
outstanding
Loans
Nonaccrual loans
Loans reported as trading assets
$
3,443
$
545 $
(2,898)
$
3,429
$
464 $
(2,965)
Loans
1,994
1,518
(476)
1,711
1,492
(219)
Subtotal
5,437
2,063
(3,374)
5,140
1,956
(3,184)
90 or more days past due and
government guaranteed
Loans
(a)
152
144
(8)
50
45
(5)
All other performing loans
(b)
Loans reported as trading assets
14,852
12,380
(2,472)
12,171
10,852
(1,319)
Loans
(c)
68,802
69,022
220
40,342
39,813
(529)
Subtotal
83,654
81,402
(2,252)
52,513
50,665
(1,848)
Total loans
$
89,243
$
83,609 $
(5,634)
$
57,703
$
52,666 $
(5,037)
Long-term debt
Principal-protected debt
$
73,984
(e)
$
63,770 $
(10,214)
$
57,414
(e)
$
47,780 $
(9,634)
Nonprincipal-protected debt
(d)
NA
70,789
NA
NA
53,000
NA
Total long-term debt
NA
$ 134,559
NA
NA
$ 100,780
NA
Long-term beneficial interests
Nonprincipal-protected debt
(d)
NA
$
5
NA
NA
$
1
NA
Total long-term beneficial interests
NA
$
5
NA
NA
$
1
NA
(a)
These balances are excluded from nonaccrual loans as the loans are insured and/or guaranteed by U.S. government agencies.
(b)
There were no performing loans that were ninety days or more past due as of December 31, 2025 and 2024.
(c)
Includes loans insured and/or guaranteed by U.S. government agencies less than 90 days past due.
(d)
Remaining contractual principal is not applicable to nonprincipal-protected structured notes and long-term beneficial interests. Unlike
principal-protected structured notes and long-term beneficial interests, for which the Firm is obligated to return a stated amount of principal
at maturity, nonprincipal-protected structured notes and long-term beneficial interests do not obligate the Firm to return a stated amount of
principal at maturity, but for structured notes to return an amount based on the performance of an underlying variable or derivative feature
embedded in the note. However, investors are exposed to the credit risk of the Firm as issuer for both nonprincipal-protected and principal-
protected notes.
(e)
Where the Firm issues principal-protected zero-coupon or discount notes, the balance reflects the contractual principal payment at maturity
or, if applicable, the contractual principal payment at the Firm’s next call date.
At December 31, 2025 and 2024, the contractual amount of lending-related commitments for which the fair value
option was elected was $18.9 billion and $12.2 billion, respectively, with a corresponding fair value of $42 million and
$50 million, respectively. Refer to Note 28 for further information regarding off-balance sheet lending-related
financial instruments.
Notes to consolidated financial statements
198
JPMorgan Chase & Co./2025 Form 10-K
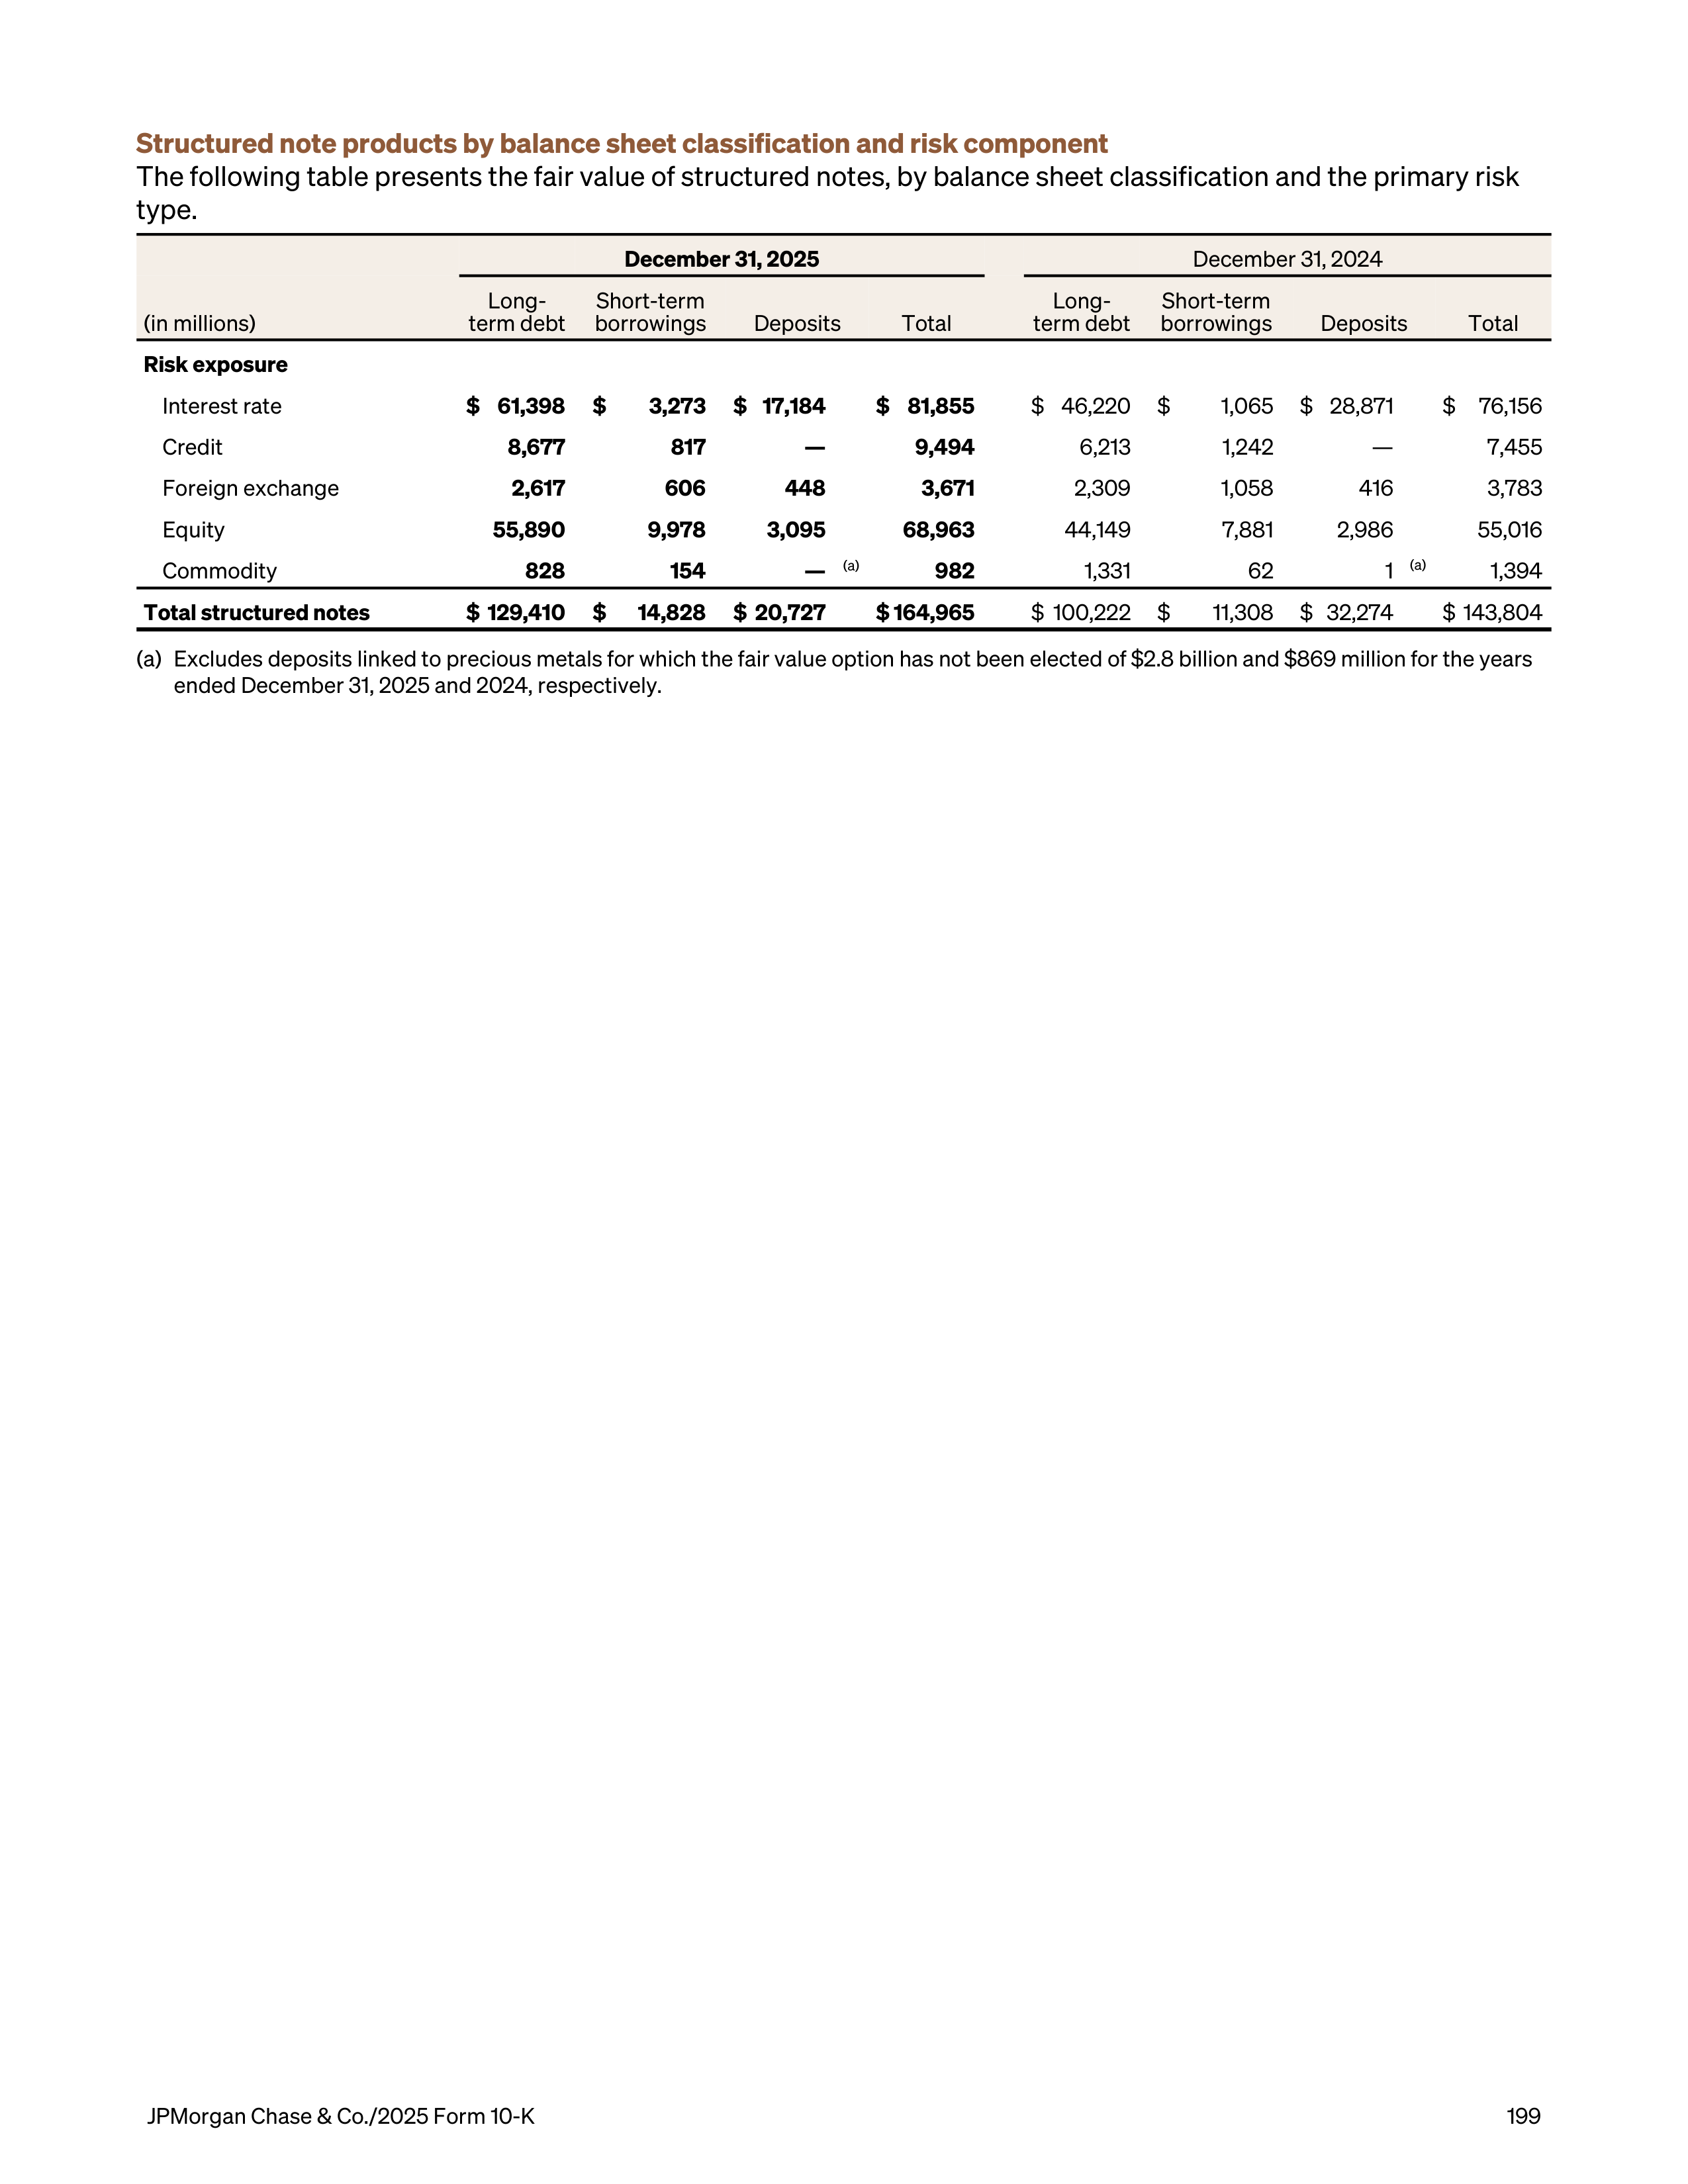
Structured note products by balance sheet classification and risk component
The following table presents the fair value of structured notes, by balance sheet classification and the primary risk
type.
December 31, 2025
December 31, 2024
(in millions)
Long-
term debt
Short-term
borrowings
Deposits
Total
Long-
term debt
Short-term
borrowings
Deposits
Total
Risk exposure
Interest rate
$ 61,398
$
3,273
$ 17,184
$ 81,855
$ 46,220
$
1,065
$ 28,871
$
76,156
Credit
8,677
817
—
9,494
6,213
1,242
—
7,455
Foreign exchange
2,617
606
448
3,671
2,309
1,058
416
3,783
Equity
55,890
9,978
3,095
68,963
44,149
7,881
2,986
55,016
Commodity
828
154
—
(a)
982
1,331
62
1
(a)
1,394
Total structured notes
$ 129,410
$
14,828
$ 20,727
$ 164,965
$ 100,222
$
11,308
$ 32,274
$ 143,804
(a)
Excludes deposits linked to precious metals for which the fair value option has not been elected of $2.8 billion and $869 million for the years
ended December 31, 2025 and 2024, respectively.
JPMorgan Chase & Co./2025 Form 10-K
199
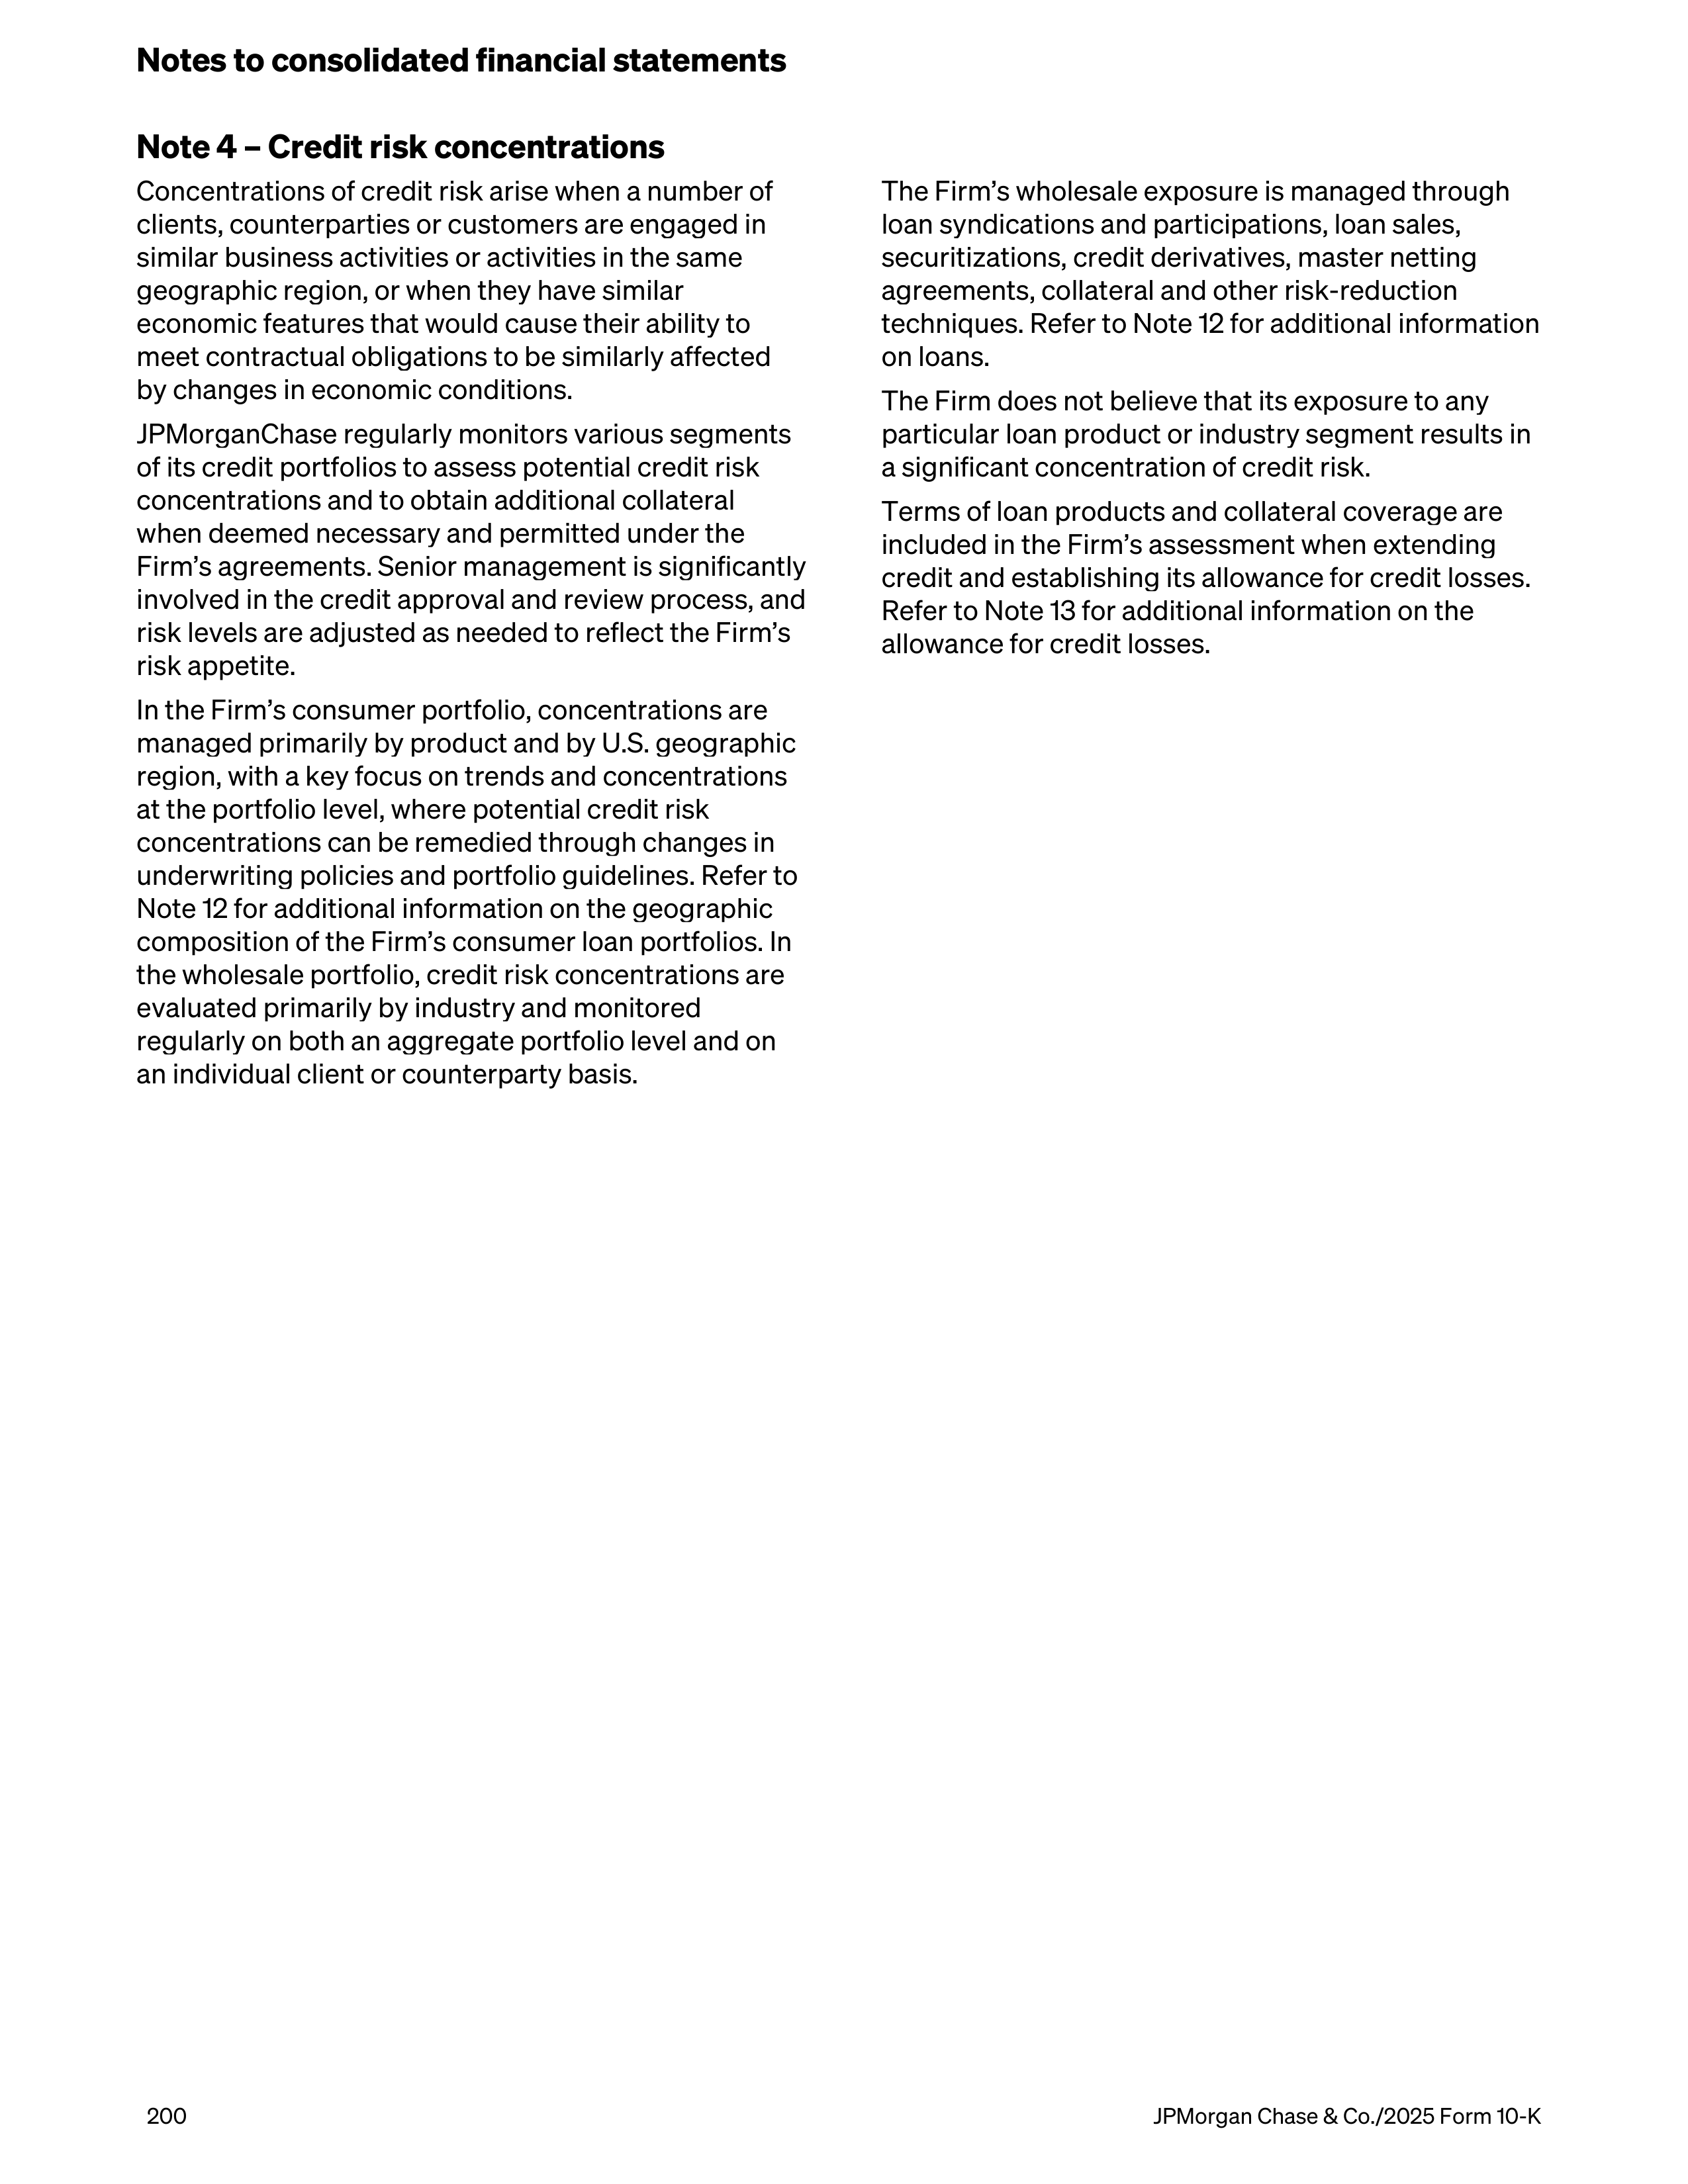
Note 4 – Credit risk concentrations
Concentrations of credit risk arise when a number of
clients, counterparties or customers are engaged in
similar business activities or activities in the same
geographic region, or when they have similar
economic features that would cause their ability to
meet contractual obligations to be similarly affected
by changes in economic conditions.
JPMorganChase regularly monitors various segments
of its credit portfolios to assess potential credit risk
concentrations and to obtain additional collateral
when deemed necessary and permitted under the
Firm’s agreements. Senior management is significantly
involved in the credit approval and review process, and
risk levels are adjusted as needed to reflect the Firm’s
risk appetite.
In the Firm’s consumer portfolio, concentrations are
managed primarily by product and by U.S. geographic
region, with a key focus on trends and concentrations
at the portfolio level, where potential credit risk
concentrations can be remedied through changes in
underwriting policies and portfolio guidelines. Refer to
Note 12 for additional information on the geographic
composition of the Firm’s consumer loan portfolios. In
the wholesale portfolio, credit risk concentrations are
evaluated primarily by industry and monitored
regularly on both an aggregate portfolio level and on
an individual client or counterparty basis.
The Firm’s wholesale exposure is managed through
loan syndications and participations, loan sales,
securitizations, credit derivatives, master netting
agreements, collateral and other risk-reduction
techniques. Refer to Note 12 for additional information
on loans.
The Firm does not believe that its exposure to any
particular loan product or industry segment results in
a significant concentration of credit risk.
Terms of loan products and collateral coverage are
included in the Firm’s assessment when extending
credit and establishing its allowance for credit losses.
Refer to Note 13 for additional information on the
allowance for credit losses.
Notes to consolidated financial statements
200
JPMorgan Chase & Co./2025 Form 10-K
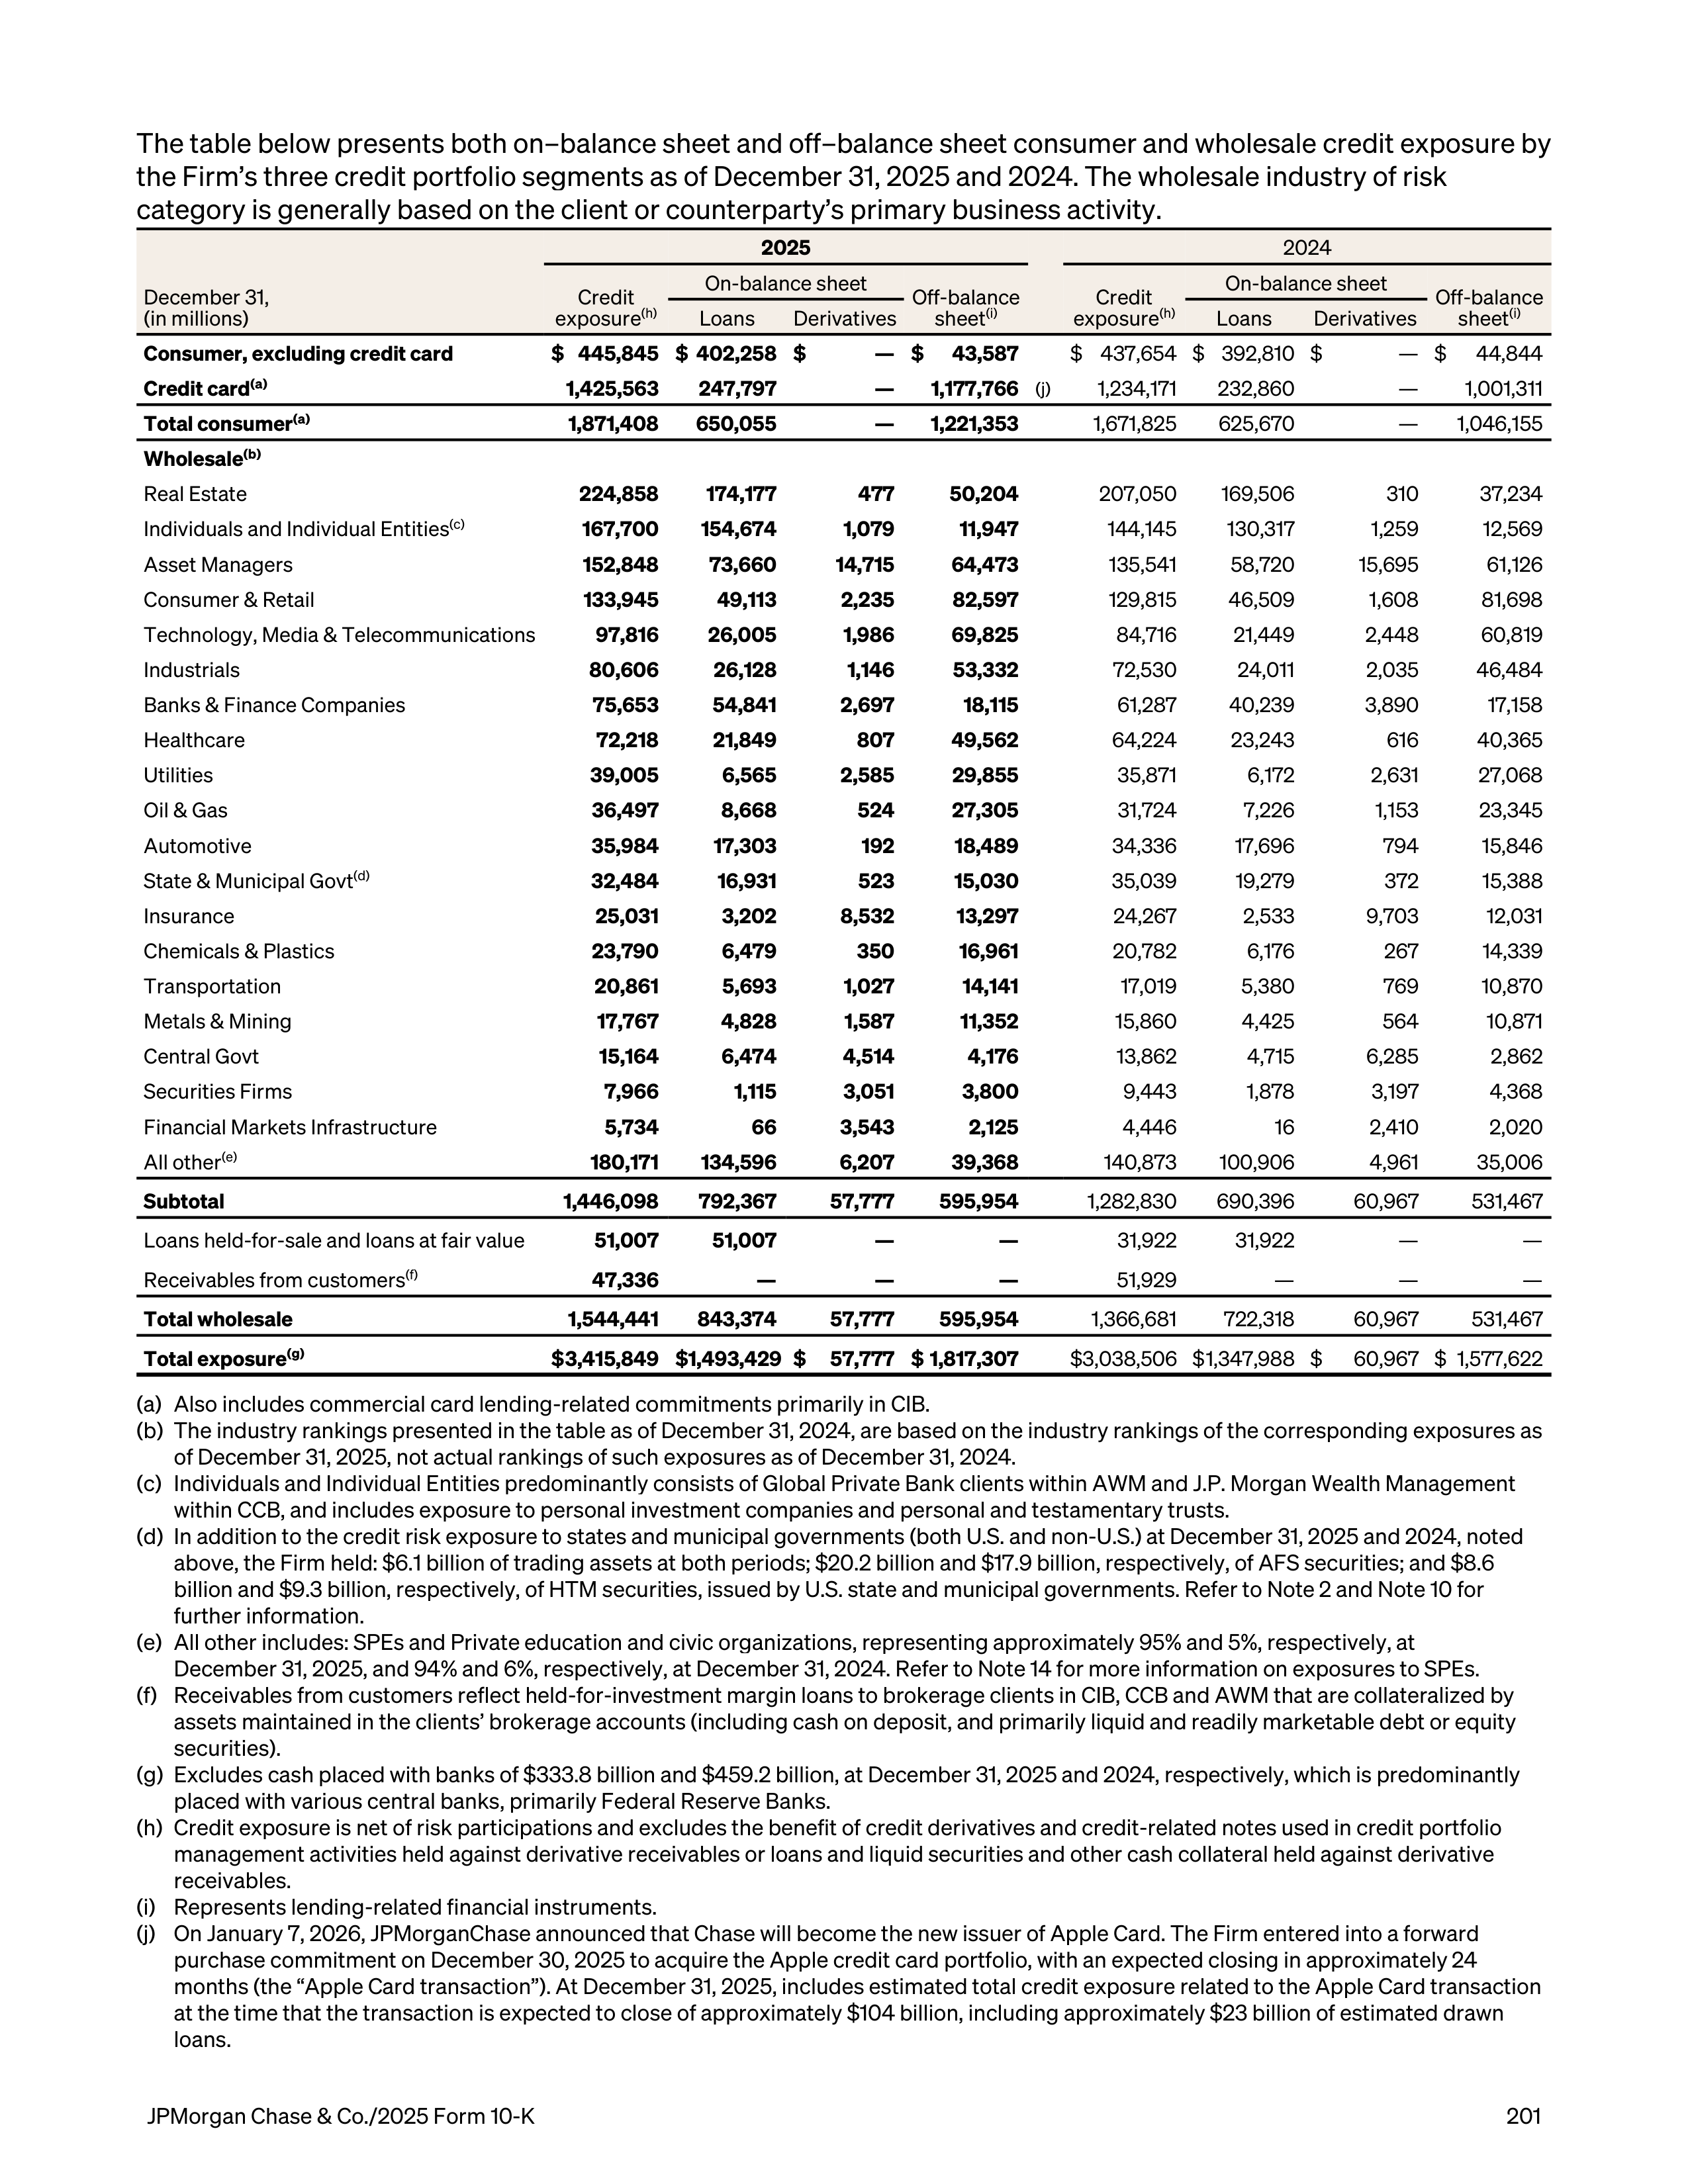
The table below presents both on–balance sheet and off–balance sheet consumer and wholesale credit exposure by
the Firm’s three credit portfolio segments as of December 31, 2025 and 2024. The wholesale industry of risk
category is generally based on the client or counterparty’s primary business activity.
2025
2024
December 31,
(in millions)
Credit
exposure
(h)
On-balance sheet
Off-balance
sheet
(i)
Credit
exposure
(h)
On-balance sheet
Off-balance
sheet
(i)
Loans
Derivatives
Loans
Derivatives
Consumer, excluding credit card
$ 445,845 $ 402,258 $
— $
43,587
$ 437,654 $ 392,810 $
— $
44,844
Credit card
(a)
1,425,563
247,797
— 1,177,766
(j)
1,234,171
232,860
—
1,001,311
Total consumer
(a)
1,871,408 650,055
— 1,221,353
1,671,825
625,670
—
1,046,155
Wholesale
(b)
Real Estate
224,858
174,177
477
50,204
207,050
169,506
310
37,234
Individuals and Individual Entities
(c)
167,700
154,674
1,079
11,947
144,145
130,317
1,259
12,569
Asset Managers
152,848
73,660
14,715
64,473
135,541
58,720
15,695
61,126
Consumer & Retail
133,945
49,113
2,235
82,597
129,815
46,509
1,608
81,698
Technology, Media & Telecommunications
97,816
26,005
1,986
69,825
84,716
21,449
2,448
60,819
Industrials
80,606
26,128
1,146
53,332
72,530
24,011
2,035
46,484
Banks & Finance Companies
75,653
54,841
2,697
18,115
61,287
40,239
3,890
17,158
Healthcare
72,218
21,849
807
49,562
64,224
23,243
616
40,365
Utilities
39,005
6,565
2,585
29,855
35,871
6,172
2,631
27,068
Oil & Gas
36,497
8,668
524
27,305
31,724
7,226
1,153
23,345
Automotive
35,984
17,303
192
18,489
34,336
17,696
794
15,846
State & Municipal Govt
(d)
32,484
16,931
523
15,030
35,039
19,279
372
15,388
Insurance
25,031
3,202
8,532
13,297
24,267
2,533
9,703
12,031
Chemicals & Plastics
23,790
6,479
350
16,961
20,782
6,176
267
14,339
Transportation
20,861
5,693
1,027
14,141
17,019
5,380
769
10,870
Metals & Mining
17,767
4,828
1,587
11,352
15,860
4,425
564
10,871
Central Govt
15,164
6,474
4,514
4,176
13,862
4,715
6,285
2,862
Securities Firms
7,966
1,115
3,051
3,800
9,443
1,878
3,197
4,368
Financial Markets Infrastructure
5,734
66
3,543
2,125
4,446
16
2,410
2,020
All other
(e)
180,171
134,596
6,207
39,368
140,873
100,906
4,961
35,006
Subtotal
1,446,098
792,367
57,777
595,954
1,282,830
690,396
60,967
531,467
Loans held-for-sale and loans at fair value
51,007
51,007
—
—
31,922
31,922
—
—
Receivables from customers
(f)
47,336
—
—
—
51,929
—
—
—
Total wholesale
1,544,441
843,374
57,777
595,954
1,366,681
722,318
60,967
531,467
Total exposure
(g)
$ 3,415,849 $ 1,493,429 $
57,777 $ 1,817,307
$ 3,038,506 $ 1,347,988 $
60,967 $ 1,577,622
(a)
Also includes commercial card lending-related commitments primarily in CIB.
(b)
The industry rankings presented in the table as of December 31, 2024, are based on the industry rankings of the corresponding exposures as
of December 31, 2025, not actual rankings of such exposures as of December 31, 2024.
(c)
Individuals and Individual Entities predominantly consists of Global Private Bank clients within AWM and J.P. Morgan Wealth Management
within CCB, and includes exposure to personal investment companies and personal and testamentary trusts.
(d)
In addition to the credit risk exposure to states and municipal governments (both U.S. and non-U.S.) at December 31, 2025 and 2024, noted
above, the Firm held: $6.1 billion of trading assets at both periods; $20.2 billion and $17.9 billion, respectively, of AFS securities; and $8.6
billion and $9.3 billion, respectively, of HTM securities, issued by U.S. state and municipal governments. Refer to Note 2 and Note 10 for
further information.
(e)
All other includes: SPEs and Private education and civic organizations, representing approximately 95% and 5%, respectively, at
December 31, 2025, and 94% and 6%, respectively, at December 31, 2024. Refer to Note 14 for more information on exposures to SPEs.
(f)
Receivables from customers reflect held-for-investment margin loans to brokerage clients in CIB, CCB and AWM that are collateralized by
assets maintained in the clients’ brokerage accounts (including cash on deposit, and primarily liquid and readily marketable debt or equity
securities).
(g)
Excludes cash placed with banks of $333.8 billion and $459.2 billion, at December 31, 2025 and 2024, respectively, which is predominantly
placed with various central banks, primarily Federal Reserve Banks.
(h)
Credit exposure is net of risk participations and excludes the benefit of credit derivatives and credit-related notes used in credit portfolio
management activities held against derivative receivables or loans and liquid securities and other cash collateral held against derivative
receivables.
(i)
Represents lending-related financial instruments.
(j)
On January 7, 2026, JPMorganChase announced that Chase will become the new issuer of Apple Card. The Firm entered into a forward
purchase commitment on December 30, 2025 to acquire the Apple credit card portfolio, with an expected closing in approximately 24
months (the “Apple Card transaction”). At December 31, 2025, includes estimated total credit exposure related to the Apple Card transaction
at the time that the transaction is expected to close of approximately $104 billion, including approximately $23 billion of estimated drawn
loans.
JPMorgan Chase & Co./2025 Form 10-K
201
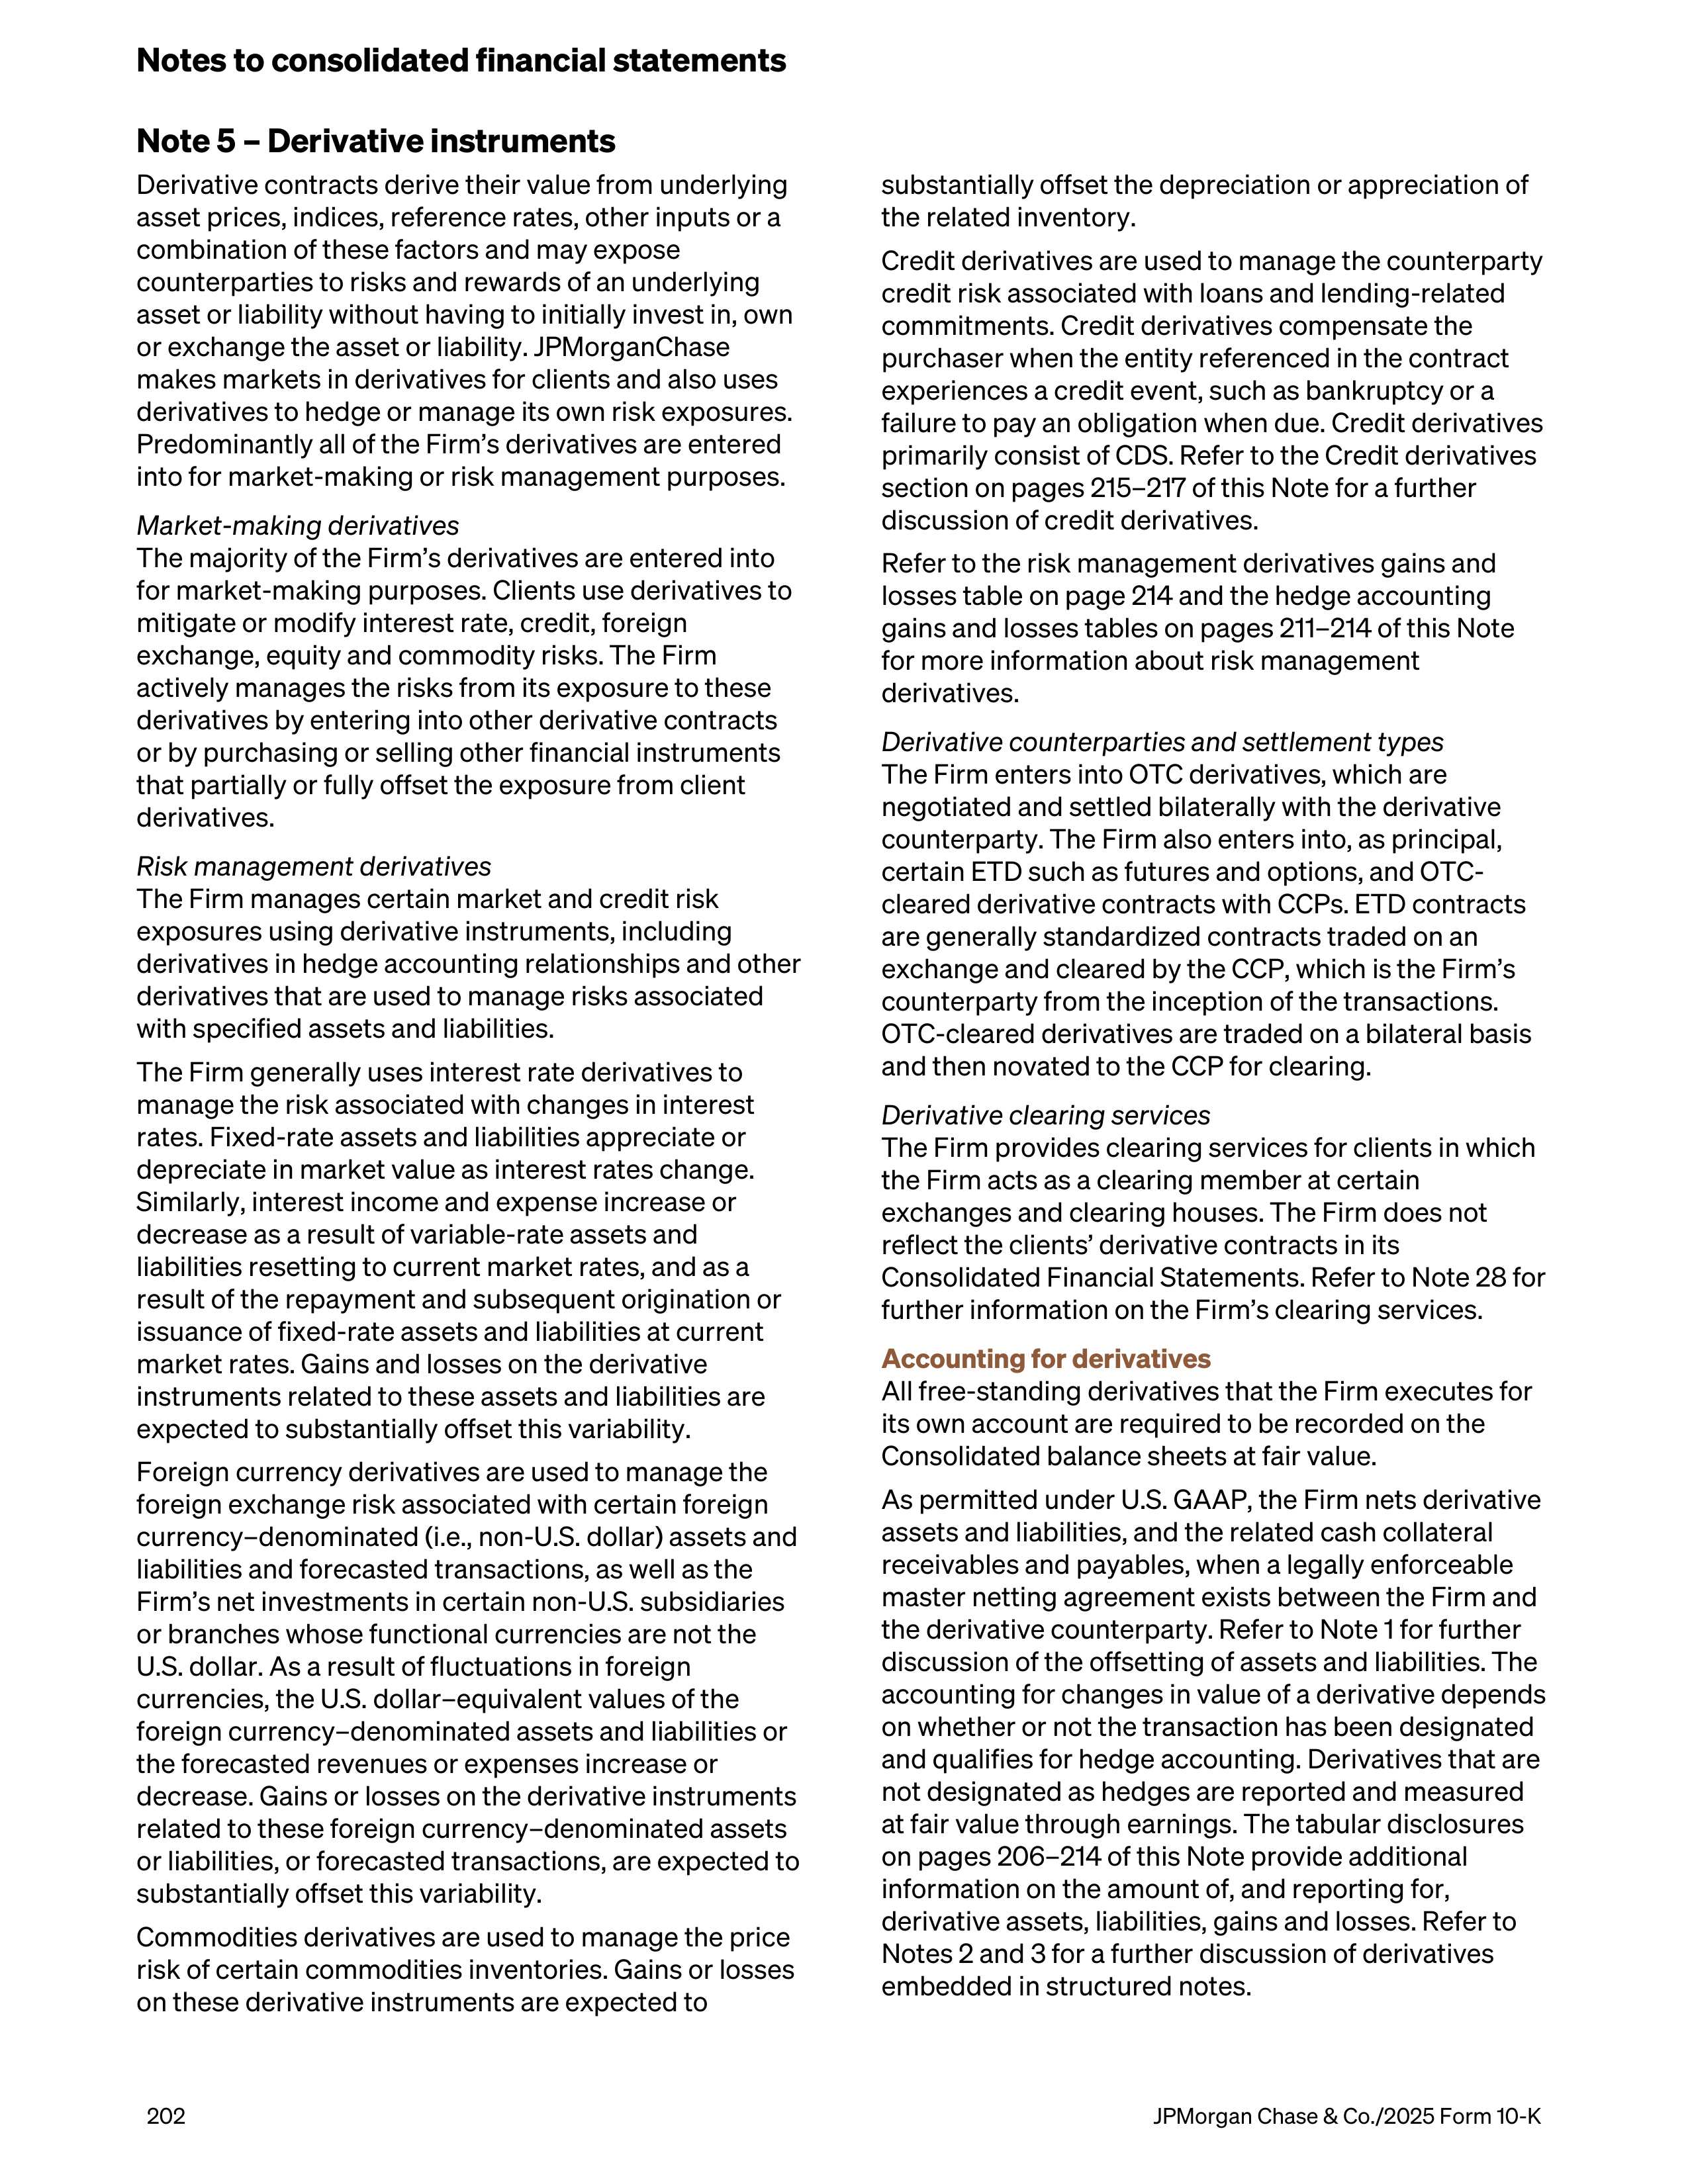
Note 5 – Derivative instruments
Derivative contracts derive their value from underlying
asset prices, indices, reference rates, other inputs or a
combination of these factors and may expose
counterparties to risks and rewards of an underlying
asset or liability without having to initially invest in, own
or exchange the asset or liability. JPMorganChase
makes markets in derivatives for clients and also uses
derivatives to hedge or manage its own risk exposures.
Predominantly all of the Firm’s derivatives are entered
into for market-making or risk management purposes.
Market-making derivatives
The majority of the Firm’s derivatives are entered into
for market-making purposes. Clients use derivatives to
mitigate or modify interest rate, credit, foreign
exchange, equity and commodity risks. The Firm
actively manages the risks from its exposure to these
derivatives by entering into other derivative contracts
or by purchasing or selling other financial instruments
that partially or fully offset the exposure from client
derivatives.
Risk management derivatives
The Firm manages certain market and credit risk
exposures using derivative instruments, including
derivatives in hedge accounting relationships and other
derivatives that are used to manage risks associated
with specified assets and liabilities.
The Firm generally uses interest rate derivatives to
manage the risk associated with changes in interest
rates. Fixed-rate assets and liabilities appreciate or
depreciate in market value as interest rates change.
Similarly, interest income and expense increase or
decrease as a result of variable-rate assets and
liabilities resetting to current market rates, and as a
result of the repayment and subsequent origination or
issuance of fixed-rate assets and liabilities at current
market rates. Gains and losses on the derivative
instruments related to these assets and liabilities are
expected to substantially offset this variability.
Foreign currency derivatives are used to manage the
foreign exchange risk associated with certain foreign
currency–denominated (i.e., non-U.S. dollar) assets and
liabilities and forecasted transactions, as well as the
Firm’s net investments in certain non-U.S. subsidiaries
or branches whose functional currencies are not the
U.S. dollar. As a result of fluctuations in foreign
currencies, the U.S. dollar–equivalent values of the
foreign currency–denominated assets and liabilities or
the forecasted revenues or expenses increase or
decrease. Gains or losses on the derivative instruments
related to these foreign currency–denominated assets
or liabilities, or forecasted transactions, are expected to
substantially offset this variability.
Commodities derivatives are used to manage the price
risk of certain commodities inventories. Gains or losses
on these derivative instruments are expected to
substantially offset the depreciation or appreciation of
the related inventory.
Credit derivatives are used to manage the counterparty
credit risk associated with loans and lending-related
commitments. Credit derivatives compensate the
purchaser when the entity referenced in the contract
experiences a credit event, such as bankruptcy or a
failure to pay an obligation when due. Credit derivatives
primarily consist of CDS. Refer to the Credit derivatives
section on pages 215–217 of this Note for a further
discussion of credit derivatives.
Refer to the risk management derivatives gains and
losses table on page 214 and the hedge accounting
gains and losses tables on pages 211–214 of this Note
for more information about risk management
derivatives.
Derivative counterparties and settlement types
The Firm enters into OTC derivatives, which are
negotiated and settled bilaterally with the derivative
counterparty. The Firm also enters into, as principal,
certain ETD such as futures and options, and OTC-
cleared derivative contracts with CCPs. ETD contracts
are generally standardized contracts traded on an
exchange and cleared by the CCP, which is the Firm’s
counterparty from the inception of the transactions.
OTC-cleared derivatives are traded on a bilateral basis
and then novated to the CCP for clearing.
Derivative clearing services
The Firm provides clearing services for clients in which
the Firm acts as a clearing member at certain
exchanges and clearing houses. The Firm does not
reflect the clients’ derivative contracts in its
Consolidated Financial Statements. Refer to Note 28 for
further information on the Firm’s clearing services.
Accounting for derivatives
All free-standing derivatives that the Firm executes for
its own account are required to be recorded on the
Consolidated balance sheets at fair value.
As permitted under U.S. GAAP, the Firm nets derivative
assets and liabilities, and the related cash collateral
receivables and payables, when a legally enforceable
master netting agreement exists between the Firm and
the derivative counterparty. Refer to Note 1 for further
discussion of the offsetting of assets and liabilities. The
accounting for changes in value of a derivative depends
on whether or not the transaction has been designated
and qualifies for hedge accounting. Derivatives that are
not designated as hedges are reported and measured
at fair value through earnings. The tabular disclosures
on pages 206–214 of this Note provide additional
information on the amount of, and reporting for,
derivative assets, liabilities, gains and losses. Refer to
Notes 2 and 3 for a further discussion of derivatives
embedded in structured notes.
Notes to consolidated financial statements
202
JPMorgan Chase & Co./2025 Form 10-K
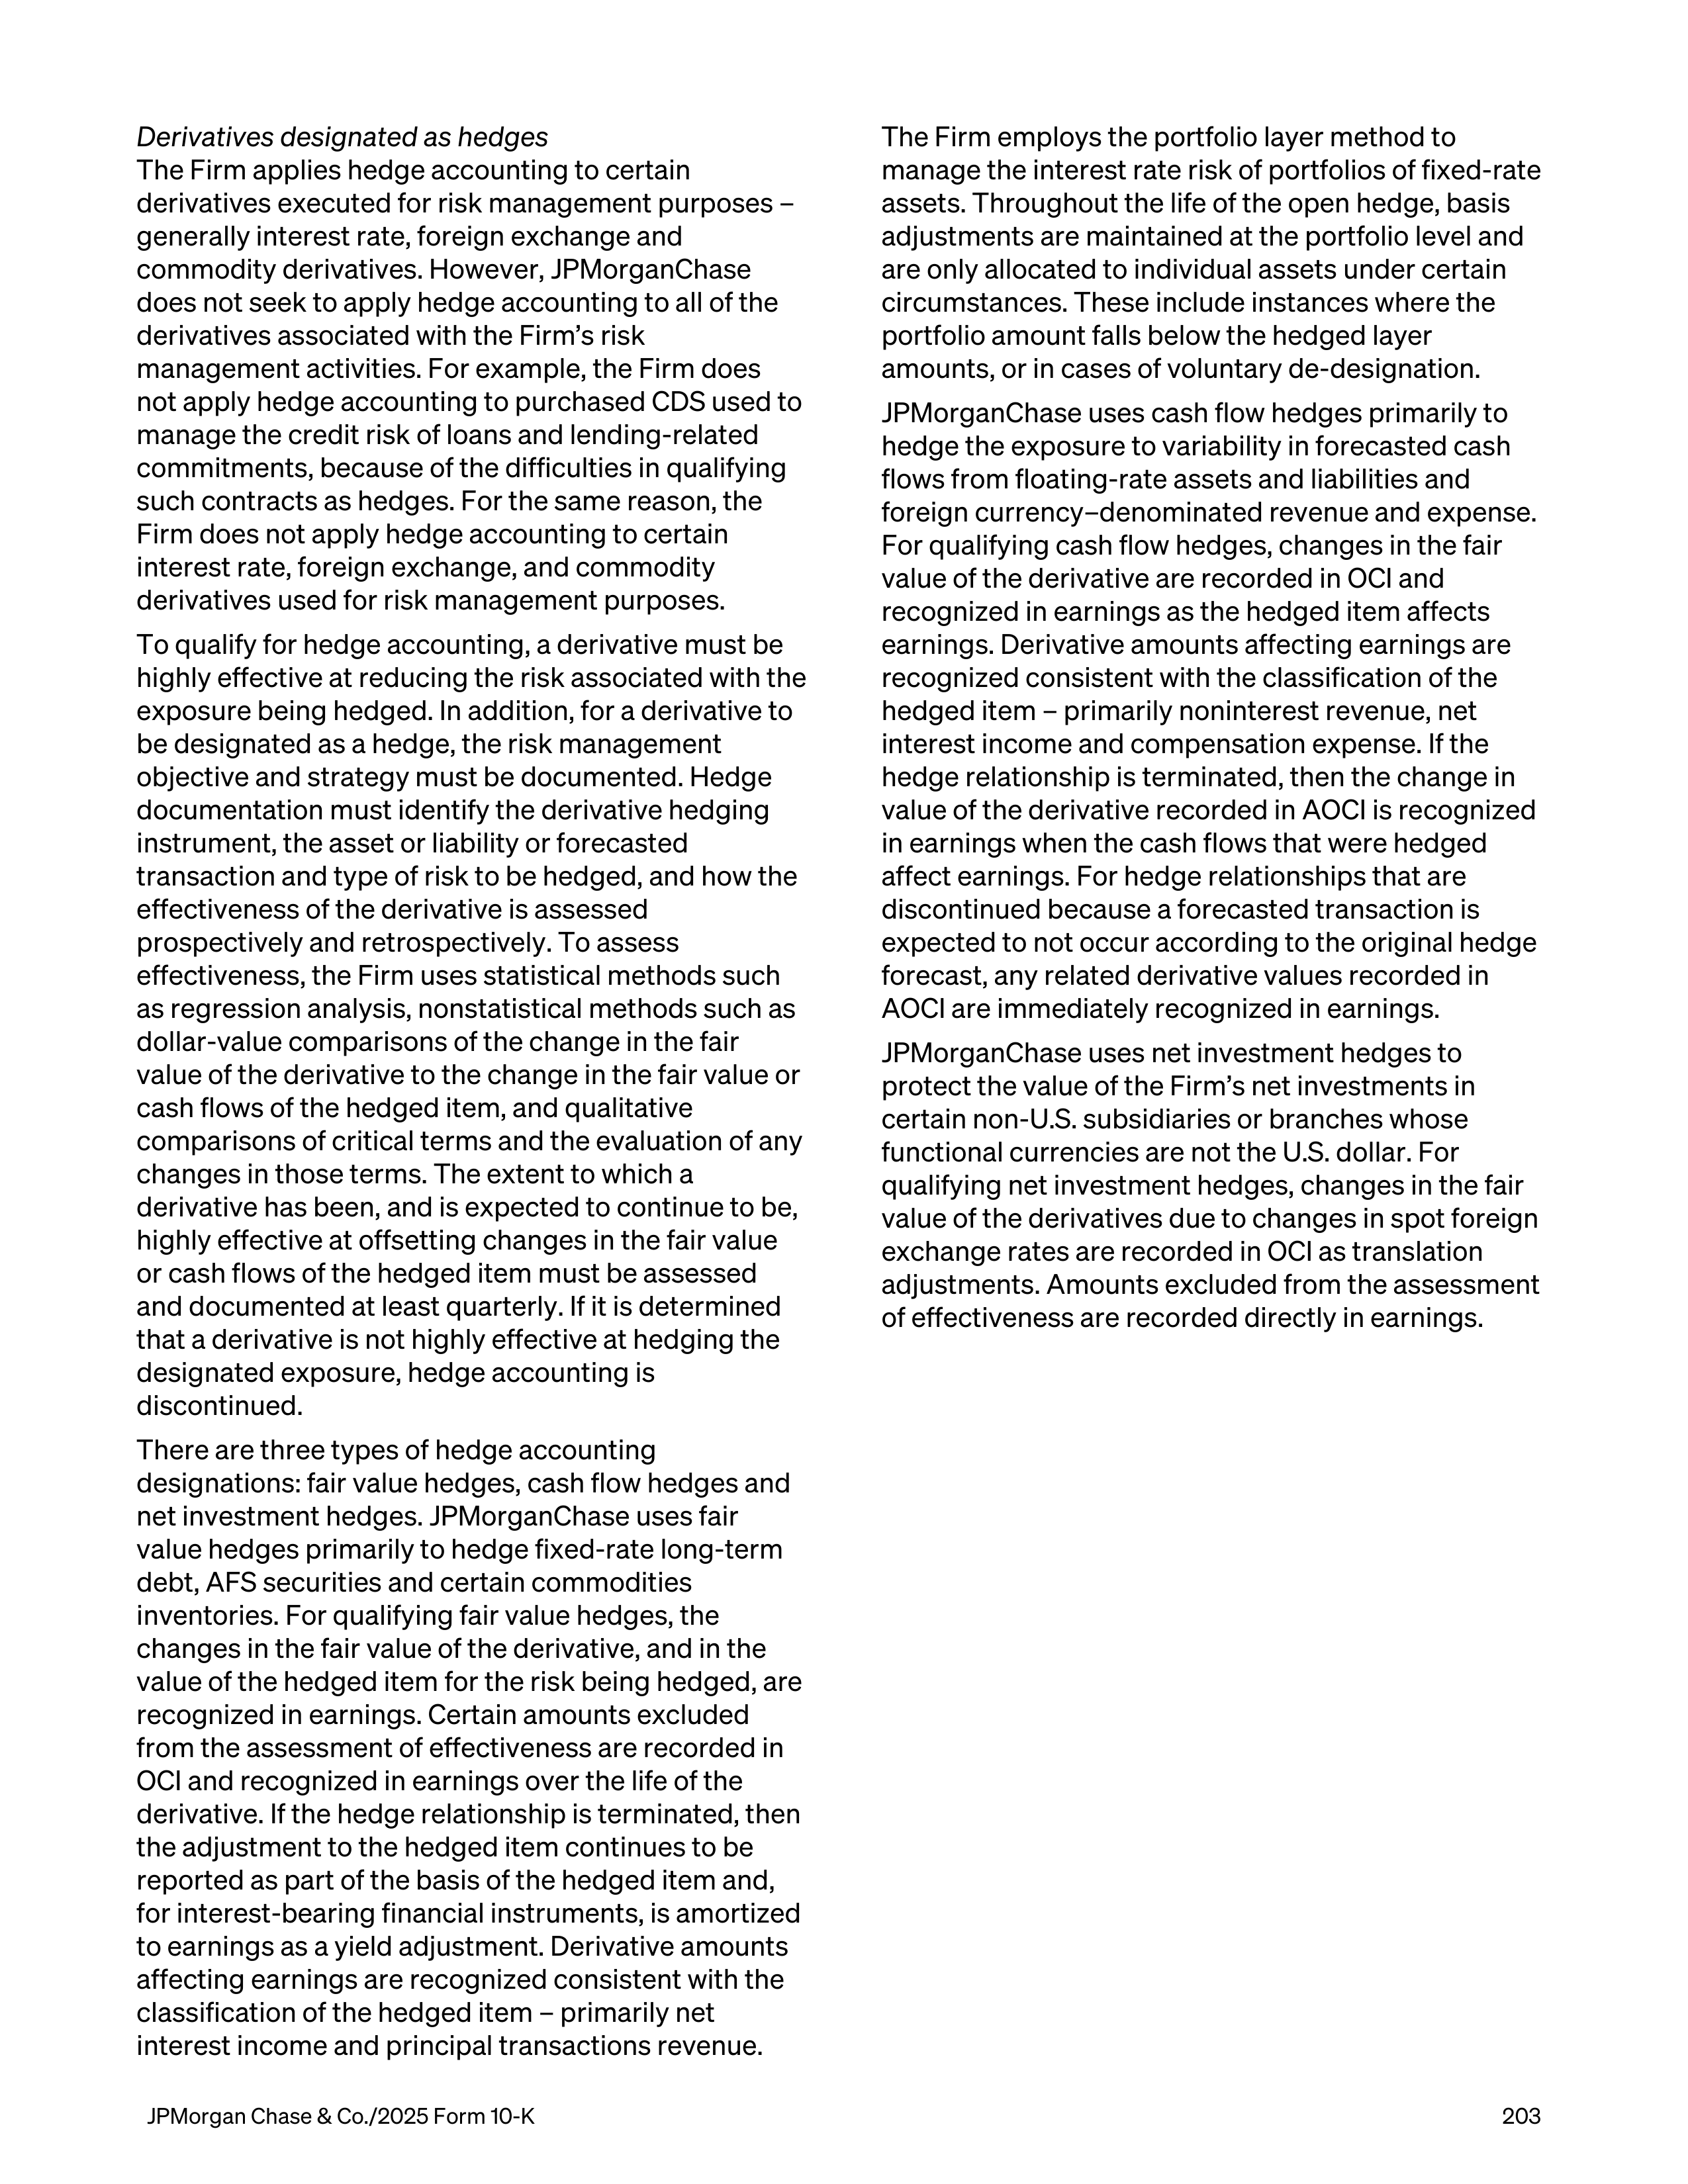
Derivatives designated as hedges
The Firm applies hedge accounting to certain
derivatives executed for risk management purposes –
generally interest rate, foreign exchange and
commodity derivatives. However, JPMorganChase
does not seek to apply hedge accounting to all of the
derivatives associated with the Firm’s risk
management activities. For example, the Firm does
not apply hedge accounting to purchased CDS used to
manage the credit risk of loans and lending-related
commitments, because of the difficulties in qualifying
such contracts as hedges. For the same reason, the
Firm does not apply hedge accounting to certain
interest rate, foreign exchange, and commodity
derivatives used for risk management purposes.
To qualify for hedge accounting, a derivative must be
highly effective at reducing the risk associated with the
exposure being hedged. In addition, for a derivative to
be designated as a hedge, the risk management
objective and strategy must be documented. Hedge
documentation must identify the derivative hedging
instrument, the asset or liability or forecasted
transaction and type of risk to be hedged, and how the
effectiveness of the derivative is assessed
prospectively and retrospectively. To assess
effectiveness, the Firm uses statistical methods such
as regression analysis, nonstatistical methods such as
dollar-value comparisons of the change in the fair
value of the derivative to the change in the fair value or
cash flows of the hedged item, and qualitative
comparisons of critical terms and the evaluation of any
changes in those terms. The extent to which a
derivative has been, and is expected to continue to be,
highly effective at offsetting changes in the fair value
or cash flows of the hedged item must be assessed
and documented at least quarterly. If it is determined
that a derivative is not highly effective at hedging the
designated exposure, hedge accounting is
discontinued.
There are three types of hedge accounting
designations: fair value hedges, cash flow hedges and
net investment hedges. JPMorganChase uses fair
value hedges primarily to hedge fixed-rate long-term
debt, AFS securities and certain commodities
inventories. For qualifying fair value hedges, the
changes in the fair value of the derivative, and in the
value of the hedged item for the risk being hedged, are
recognized in earnings. Certain amounts excluded
from the assessment of effectiveness are recorded in
OCI and recognized in earnings over the life of the
derivative. If the hedge relationship is terminated, then
the adjustment to the hedged item continues to be
reported as part of the basis of the hedged item and,
for interest-bearing financial instruments, is amortized
to earnings as a yield adjustment. Derivative amounts
affecting earnings are recognized consistent with the
classification of the hedged item – primarily net
interest income and principal transactions revenue.
The Firm employs the portfolio layer method to
manage the interest rate risk of portfolios of fixed-rate
assets. Throughout the life of the open hedge, basis
adjustments are maintained at the portfolio level and
are only allocated to individual assets under certain
circumstances. These include instances where the
portfolio amount falls below the hedged layer
amounts, or in cases of voluntary de-designation.
JPMorganChase uses cash flow hedges primarily to
hedge the exposure to variability in forecasted cash
flows from floating-rate assets and liabilities and
foreign currency–denominated revenue and expense.
For qualifying cash flow hedges, changes in the fair
value of the derivative are recorded in OCI and
recognized in earnings as the hedged item affects
earnings. Derivative amounts affecting earnings are
recognized consistent with the classification of the
hedged item – primarily noninterest revenue, net
interest income and compensation expense. If the
hedge relationship is terminated, then the change in
value of the derivative recorded in AOCI is recognized
in earnings when the cash flows that were hedged
affect earnings. For hedge relationships that are
discontinued because a forecasted transaction is
expected to not occur according to the original hedge
forecast, any related derivative values recorded in
AOCI are immediately recognized in earnings.
JPMorganChase uses net investment hedges to
protect the value of the Firm’s net investments in
certain non-U.S. subsidiaries or branches whose
functional currencies are not the U.S. dollar. For
qualifying net investment hedges, changes in the fair
value of the derivatives due to changes in spot foreign
exchange rates are recorded in OCI as translation
adjustments. Amounts excluded from the assessment
of effectiveness are recorded directly in earnings.
JPMorgan Chase & Co./2025 Form 10-K
203
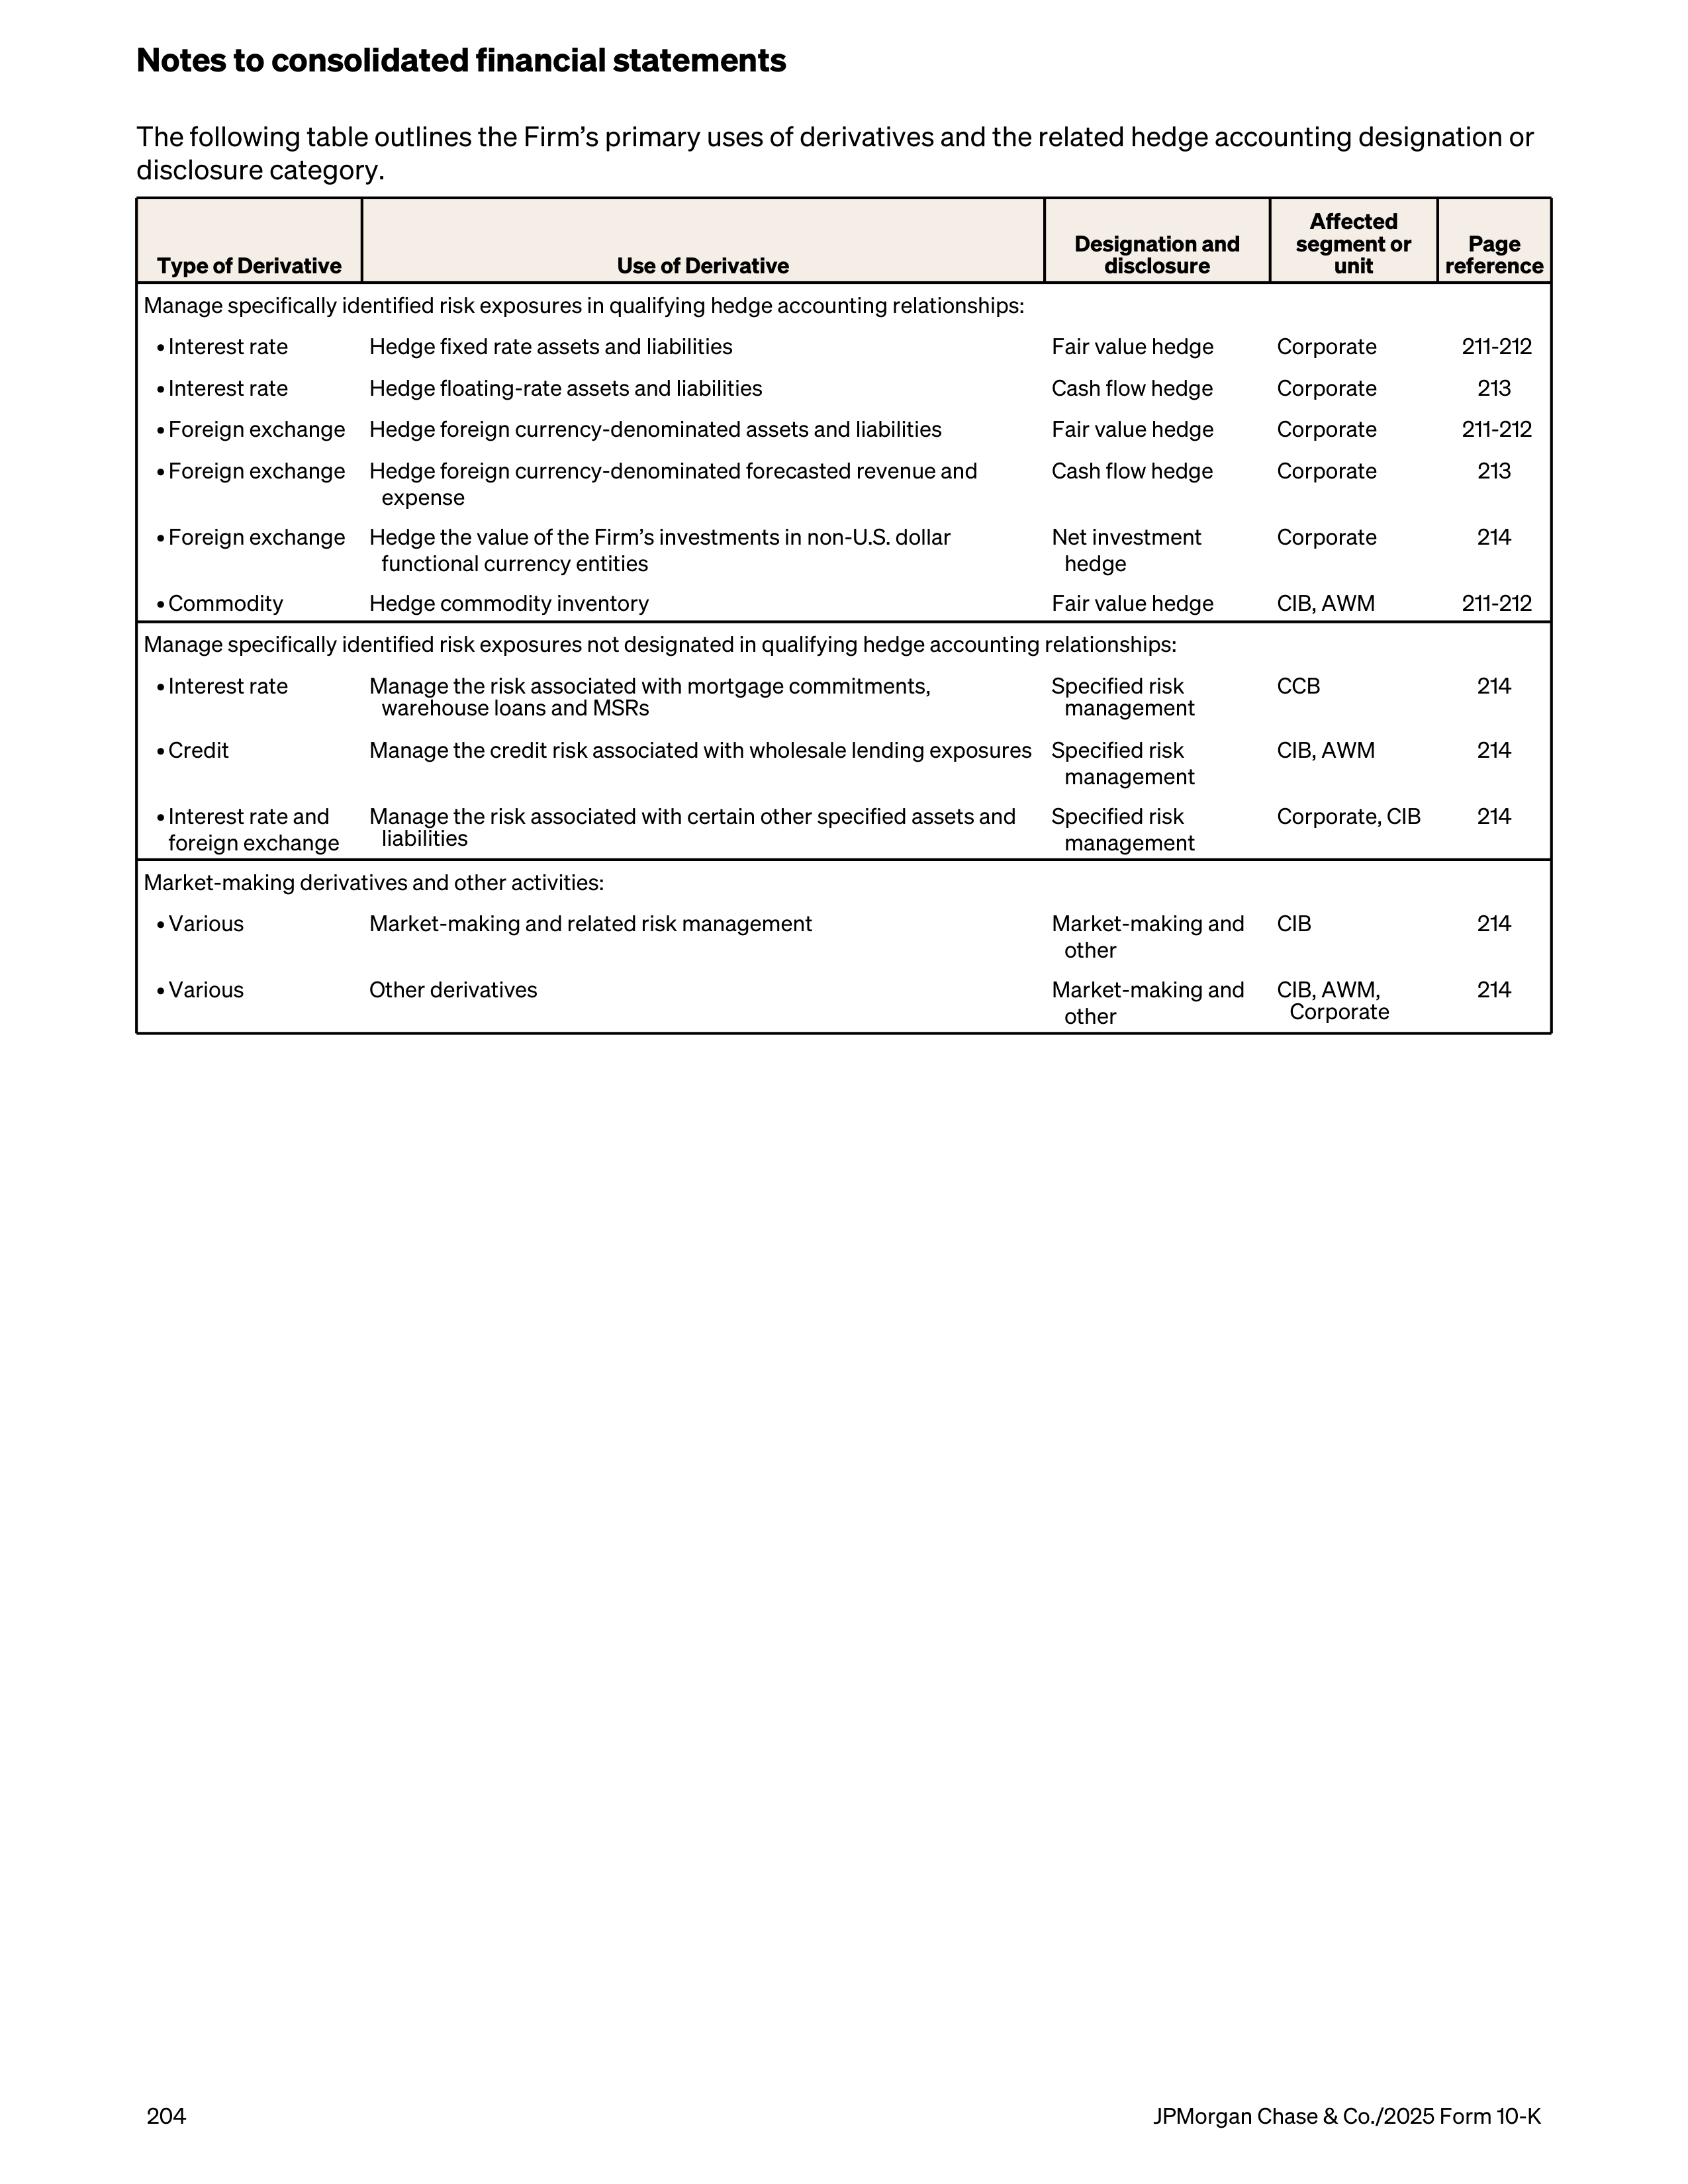
The following table outlines the Firm’s primary uses of derivatives and the related hedge accounting designation or
disclosure category.
Type of Derivative
Use of Derivative
Designation and
disclosure
Affected
segment or
unit
Page
reference
Manage specifically identified risk exposures in qualifying hedge accounting relationships:
• Interest rate
Hedge fixed rate assets and liabilities
Fair value hedge
Corporate
211-212
• Interest rate
Hedge floating-rate assets and liabilities
Cash flow hedge
Corporate
213
• Foreign exchange
Hedge foreign currency-denominated assets and liabilities
Fair value hedge
Corporate
211-212
• Foreign exchange
Hedge foreign currency-denominated forecasted revenue and
expense
Cash flow hedge
Corporate
213
• Foreign exchange
Hedge the value of the Firm’s investments in non-U.S. dollar
functional currency entities
Net investment
hedge
Corporate
214
• Commodity
Hedge commodity inventory
Fair value hedge
CIB, AWM
211-212
Manage specifically identified risk exposures not designated in qualifying hedge accounting relationships:
• Interest rate
Manage the risk associated with mortgage commitments,
warehouse loans and MSRs
Specified risk
management
CCB
214
• Credit
Manage the credit risk associated with wholesale lending exposures
Specified risk
management
CIB, AWM
214
• Interest rate and
foreign exchange
Manage the risk associated with certain other specified assets and
liabilities
Specified risk
management
Corporate, CIB
214
Market-making derivatives and other activities:
• Various
Market-making and related risk management
Market-making and
other
CIB
214
• Various
Other derivatives
Market-making and
other
CIB, AWM,
Corporate
214
Notes to consolidated financial statements
204
JPMorgan Chase & Co./2025 Form 10-K
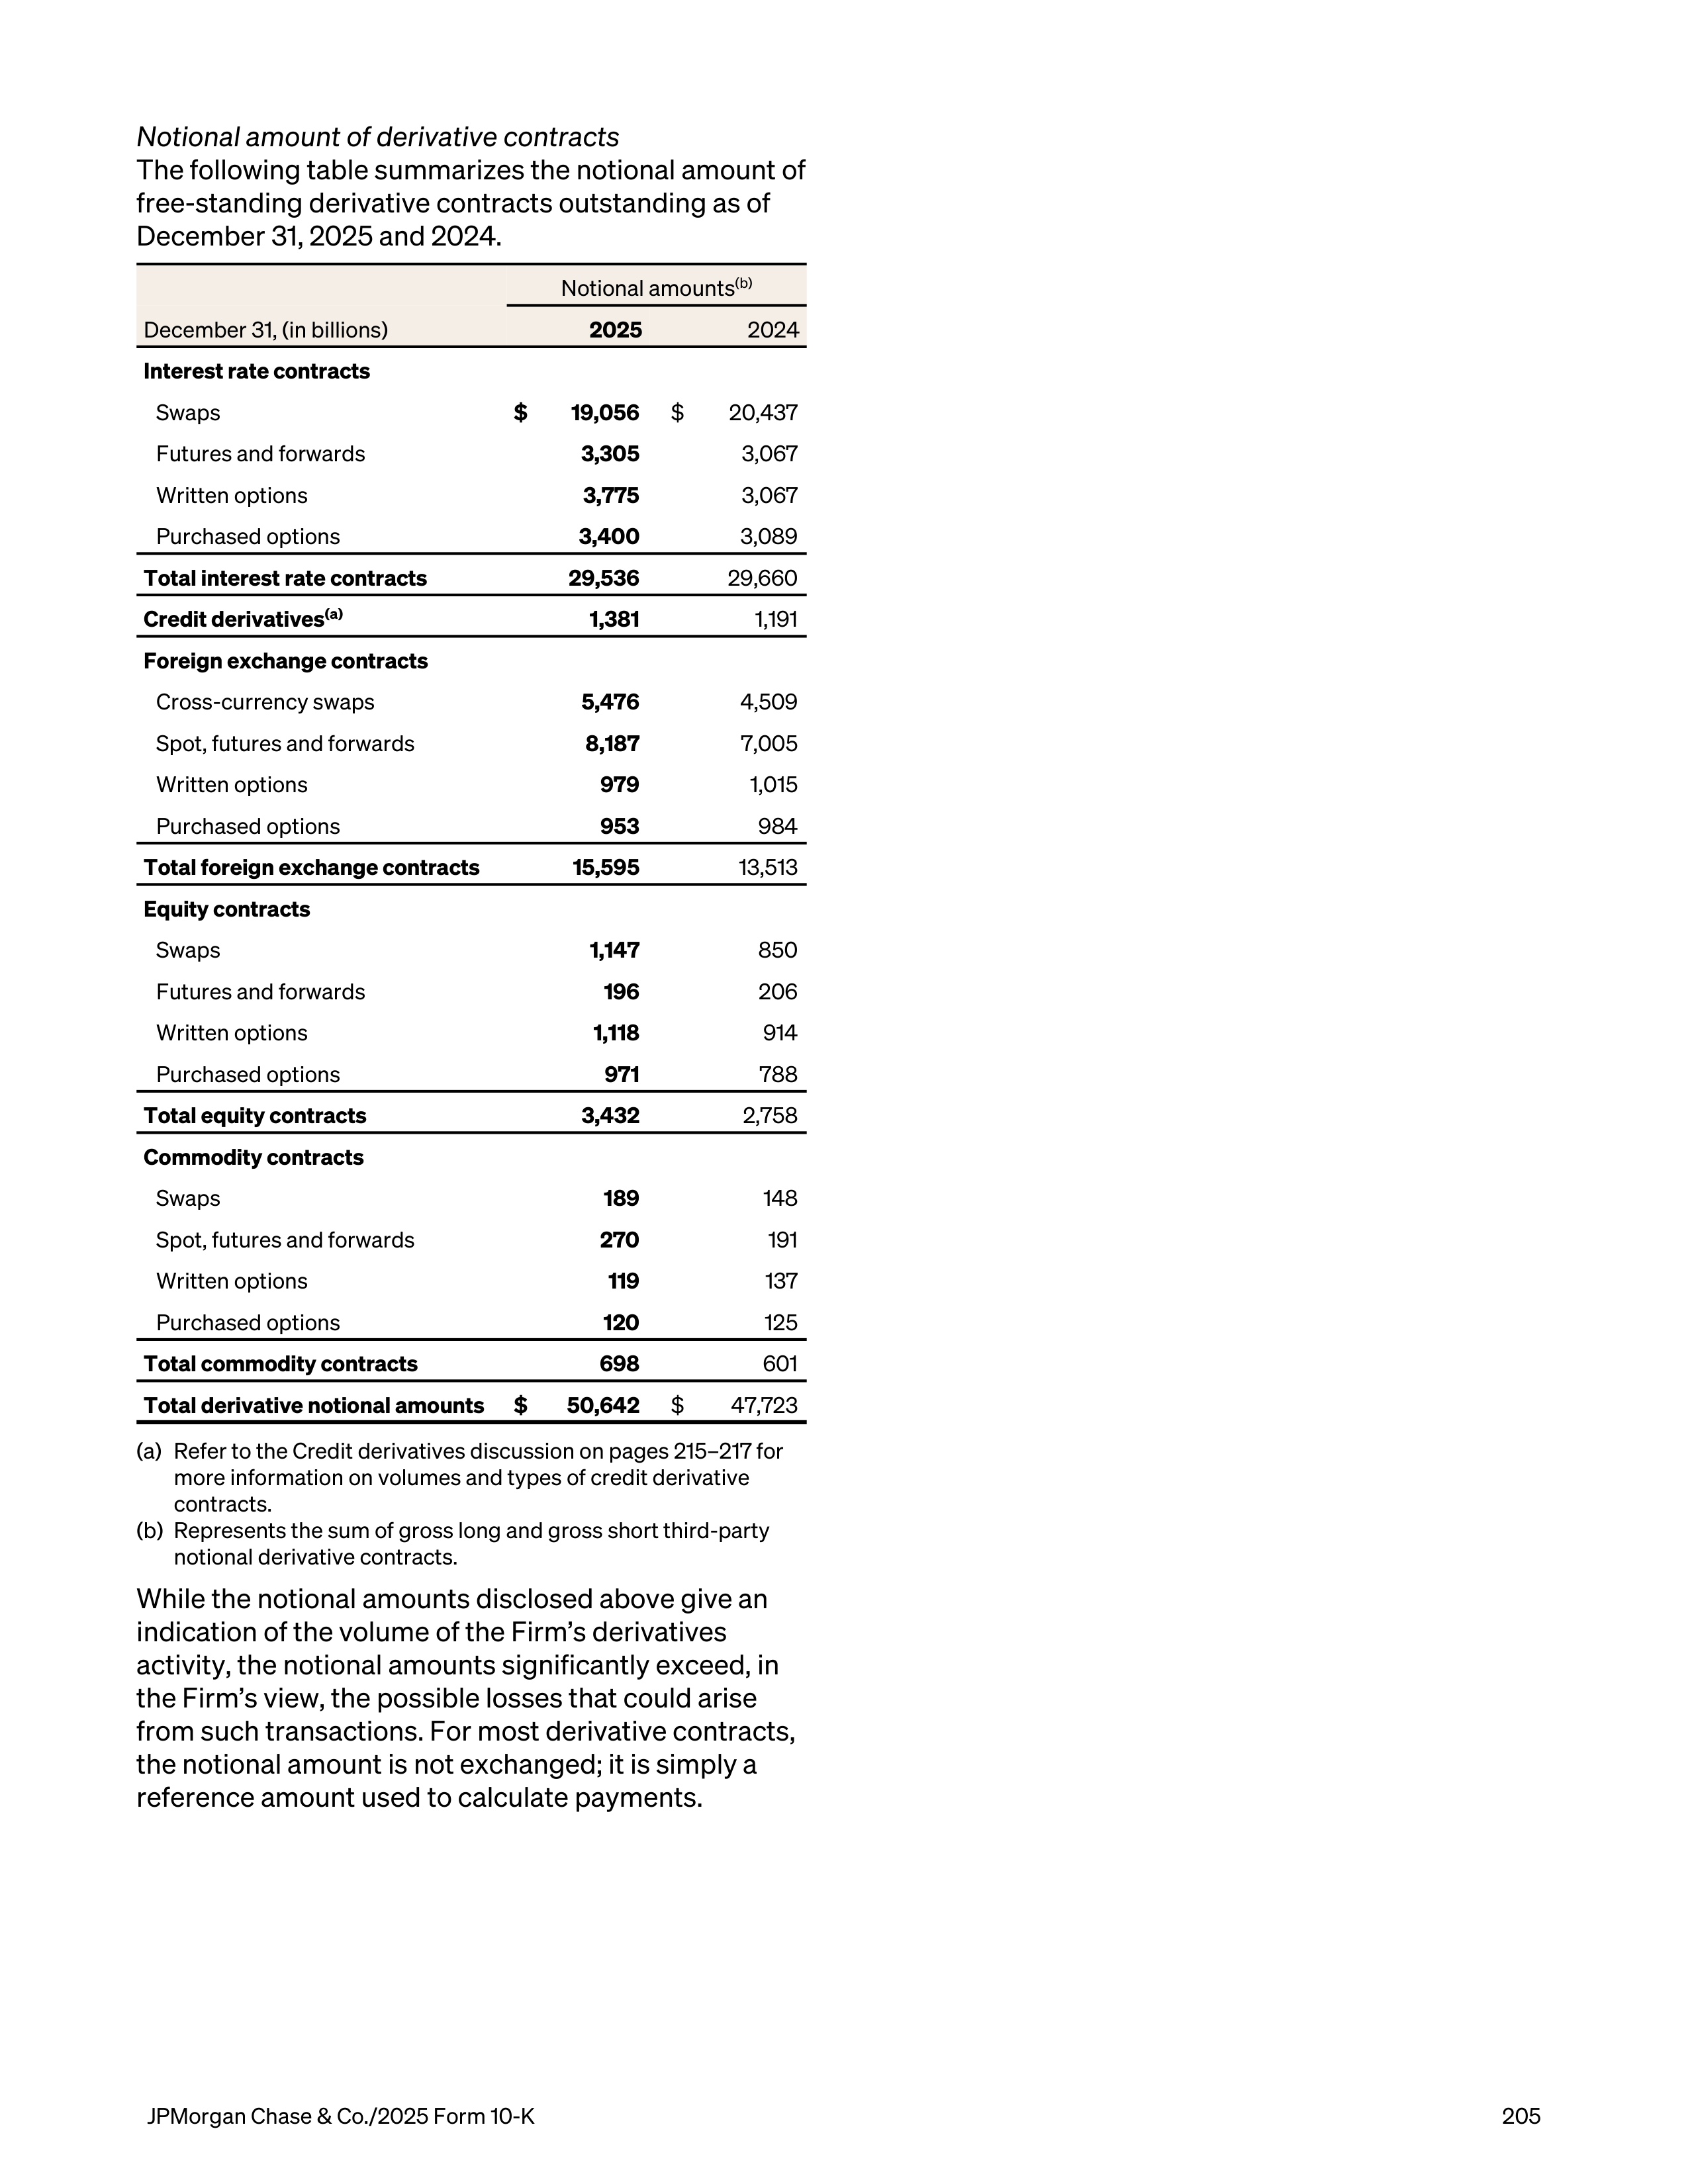
Notional amount of derivative contracts
The following table summarizes the notional amount of
free-standing derivative contracts outstanding as of
December 31, 2025 and 2024.
Notional amounts
(b)
December 31, (in billions)
2025
2024
Interest rate contracts
Swaps
$
19,056
$
20,437
Futures and forwards
3,305
3,067
Written options
3,775
3,067
Purchased options
3,400
3,089
Total interest rate contracts
29,536
29,660
Credit derivatives
(a)
1,381
1,191
Foreign exchange contracts
Cross-currency swaps
5,476
4,509
Spot, futures and forwards
8,187
7,005
Written options
979
1,015
Purchased options
953
984
Total foreign exchange contracts
15,595
13,513
Equity contracts
Swaps
1,147
850
Futures and forwards
196
206
Written options
1,118
914
Purchased options
971
788
Total equity contracts
3,432
2,758
Commodity contracts
Swaps
189
148
Spot, futures and forwards
270
191
Written options
119
137
Purchased options
120
125
Total commodity contracts
698
601
Total derivative notional amounts
$
50,642
$
47,723
(a)
Refer to the Credit derivatives discussion on pages 215–217 for
more information on volumes and types of credit derivative
contracts.
(b)
Represents the sum of gross long and gross short third-party
notional derivative contracts.
While the notional amounts disclosed above give an
indication of the volume of the Firm’s derivatives
activity, the notional amounts significantly exceed, in
the Firm’s view, the possible losses that could arise
from such transactions. For most derivative contracts,
the notional amount is not exchanged; it is simply a
reference amount used to calculate payments.
JPMorgan Chase & Co./2025 Form 10-K
205
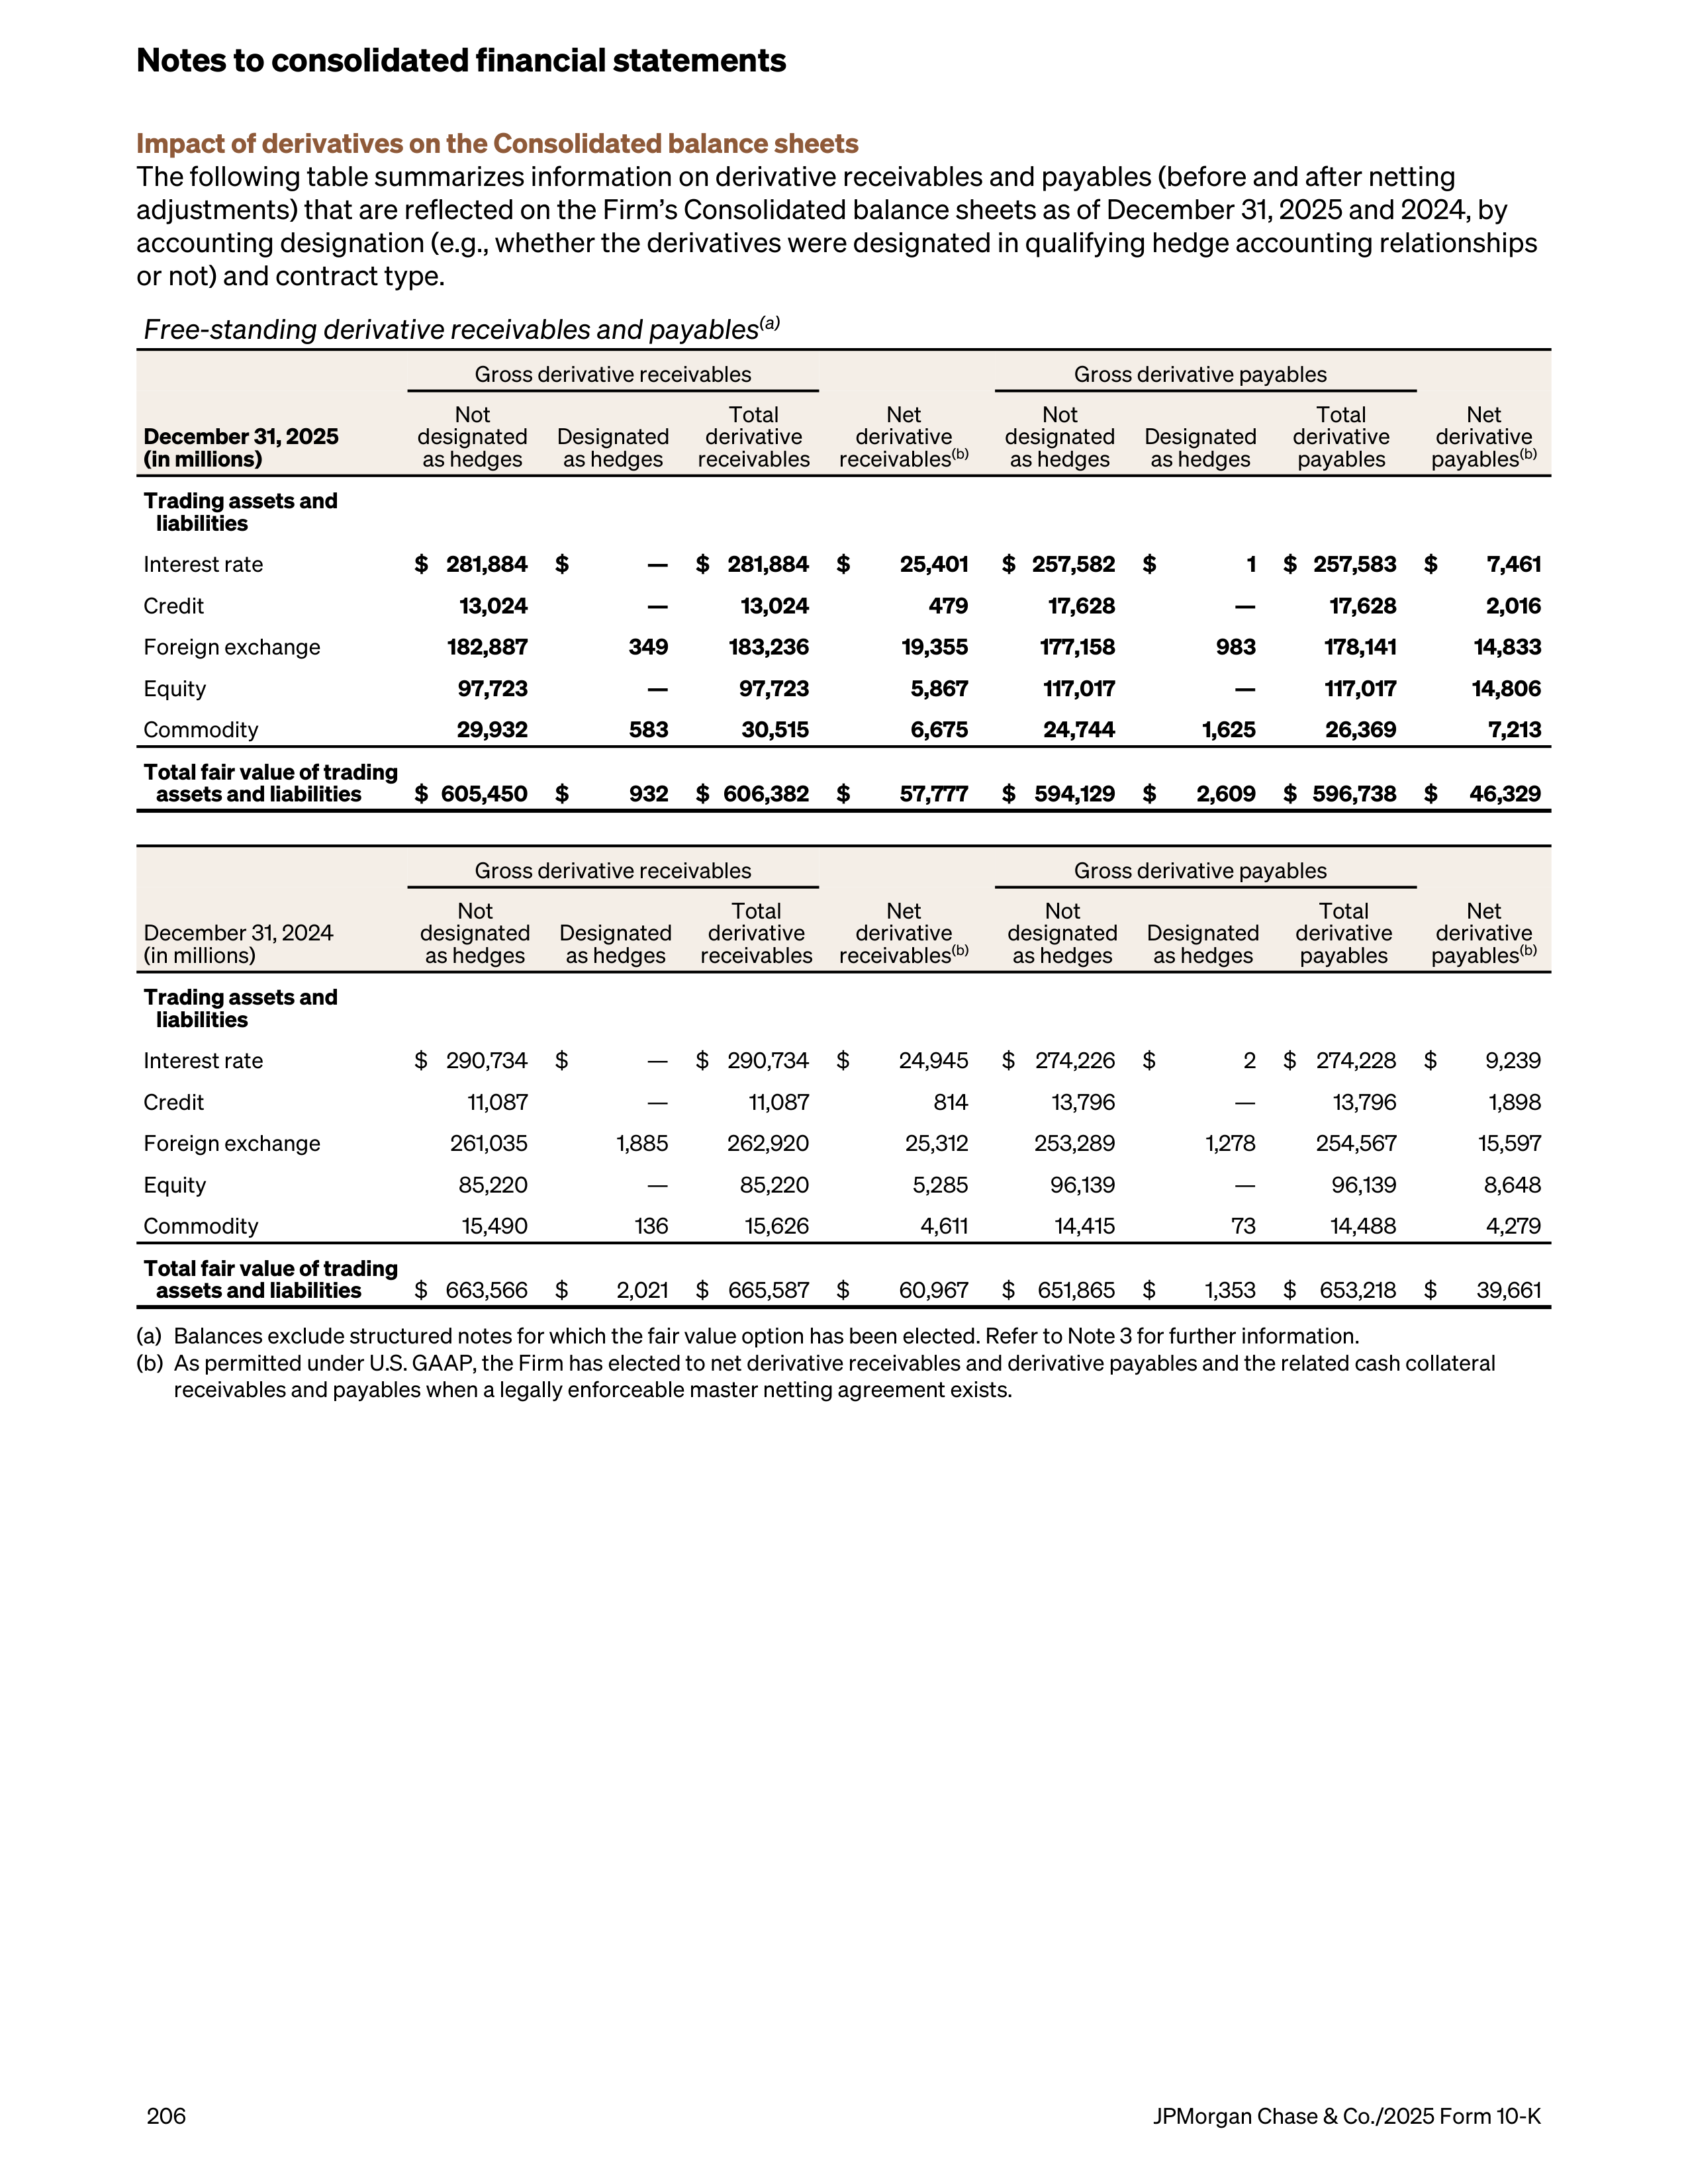
Impact of derivatives on the Consolidated balance sheets
The following table summarizes information on derivative receivables and payables (before and after netting
adjustments) that are reflected on the Firm’s Consolidated balance sheets as of December 31, 2025 and 2024, by
accounting designation (e.g., whether the derivatives were designated in qualifying hedge accounting relationships
or not) and contract type.
Free-standing derivative receivables and payables
(a)
Gross derivative receivables
Gross derivative payables
December 31, 2025
(in millions)
Not
designated
as hedges
Designated
as hedges
Total
derivative
receivables
Net
derivative
receivables
(b)
Not
designated
as hedges
Designated
as hedges
Total
derivative
payables
Net
derivative
payables
(b)
Trading assets and
liabilities
Interest rate
$ 281,884
$
—
$ 281,884
$
25,401
$ 257,582
$
1
$ 257,583
$
7,461
Credit
13,024
—
13,024
479
17,628
—
17,628
2,016
Foreign exchange
182,887
349
183,236
19,355
177,158
983
178,141
14,833
Equity
97,723
—
97,723
5,867
117,017
—
117,017
14,806
Commodity
29,932
583
30,515
6,675
24,744
1,625
26,369
7,213
Total fair value of trading
assets and liabilities
$ 605,450
$
932
$ 606,382
$
57,777
$ 594,129
$
2,609
$ 596,738
$
46,329
Gross derivative receivables
Gross derivative payables
December 31, 2024
(in millions)
Not
designated
as hedges
Designated
as hedges
Total
derivative
receivables
Net
derivative
receivables
(b)
Not
designated
as hedges
Designated
as hedges
Total
derivative
payables
Net
derivative
payables
(b)
Trading assets and
liabilities
Interest rate
$ 290,734
$
—
$ 290,734
$
24,945
$ 274,226
$
2
$ 274,228
$
9,239
Credit
11,087
—
11,087
814
13,796
—
13,796
1,898
Foreign exchange
261,035
1,885
262,920
25,312
253,289
1,278
254,567
15,597
Equity
85,220
—
85,220
5,285
96,139
—
96,139
8,648
Commodity
15,490
136
15,626
4,611
14,415
73
14,488
4,279
Total fair value of trading
assets and liabilities
$ 663,566
$
2,021
$ 665,587
$
60,967
$
651,865
$
1,353
$
653,218
$
39,661
(a)
Balances exclude structured notes for which the fair value option has been elected. Refer to Note 3 for further information.
(b)
As permitted under U.S. GAAP, the Firm has elected to net derivative receivables and derivative payables and the related cash collateral
receivables and payables when a legally enforceable master netting agreement exists.
Notes to consolidated financial statements
206
JPMorgan Chase & Co./2025 Form 10-K
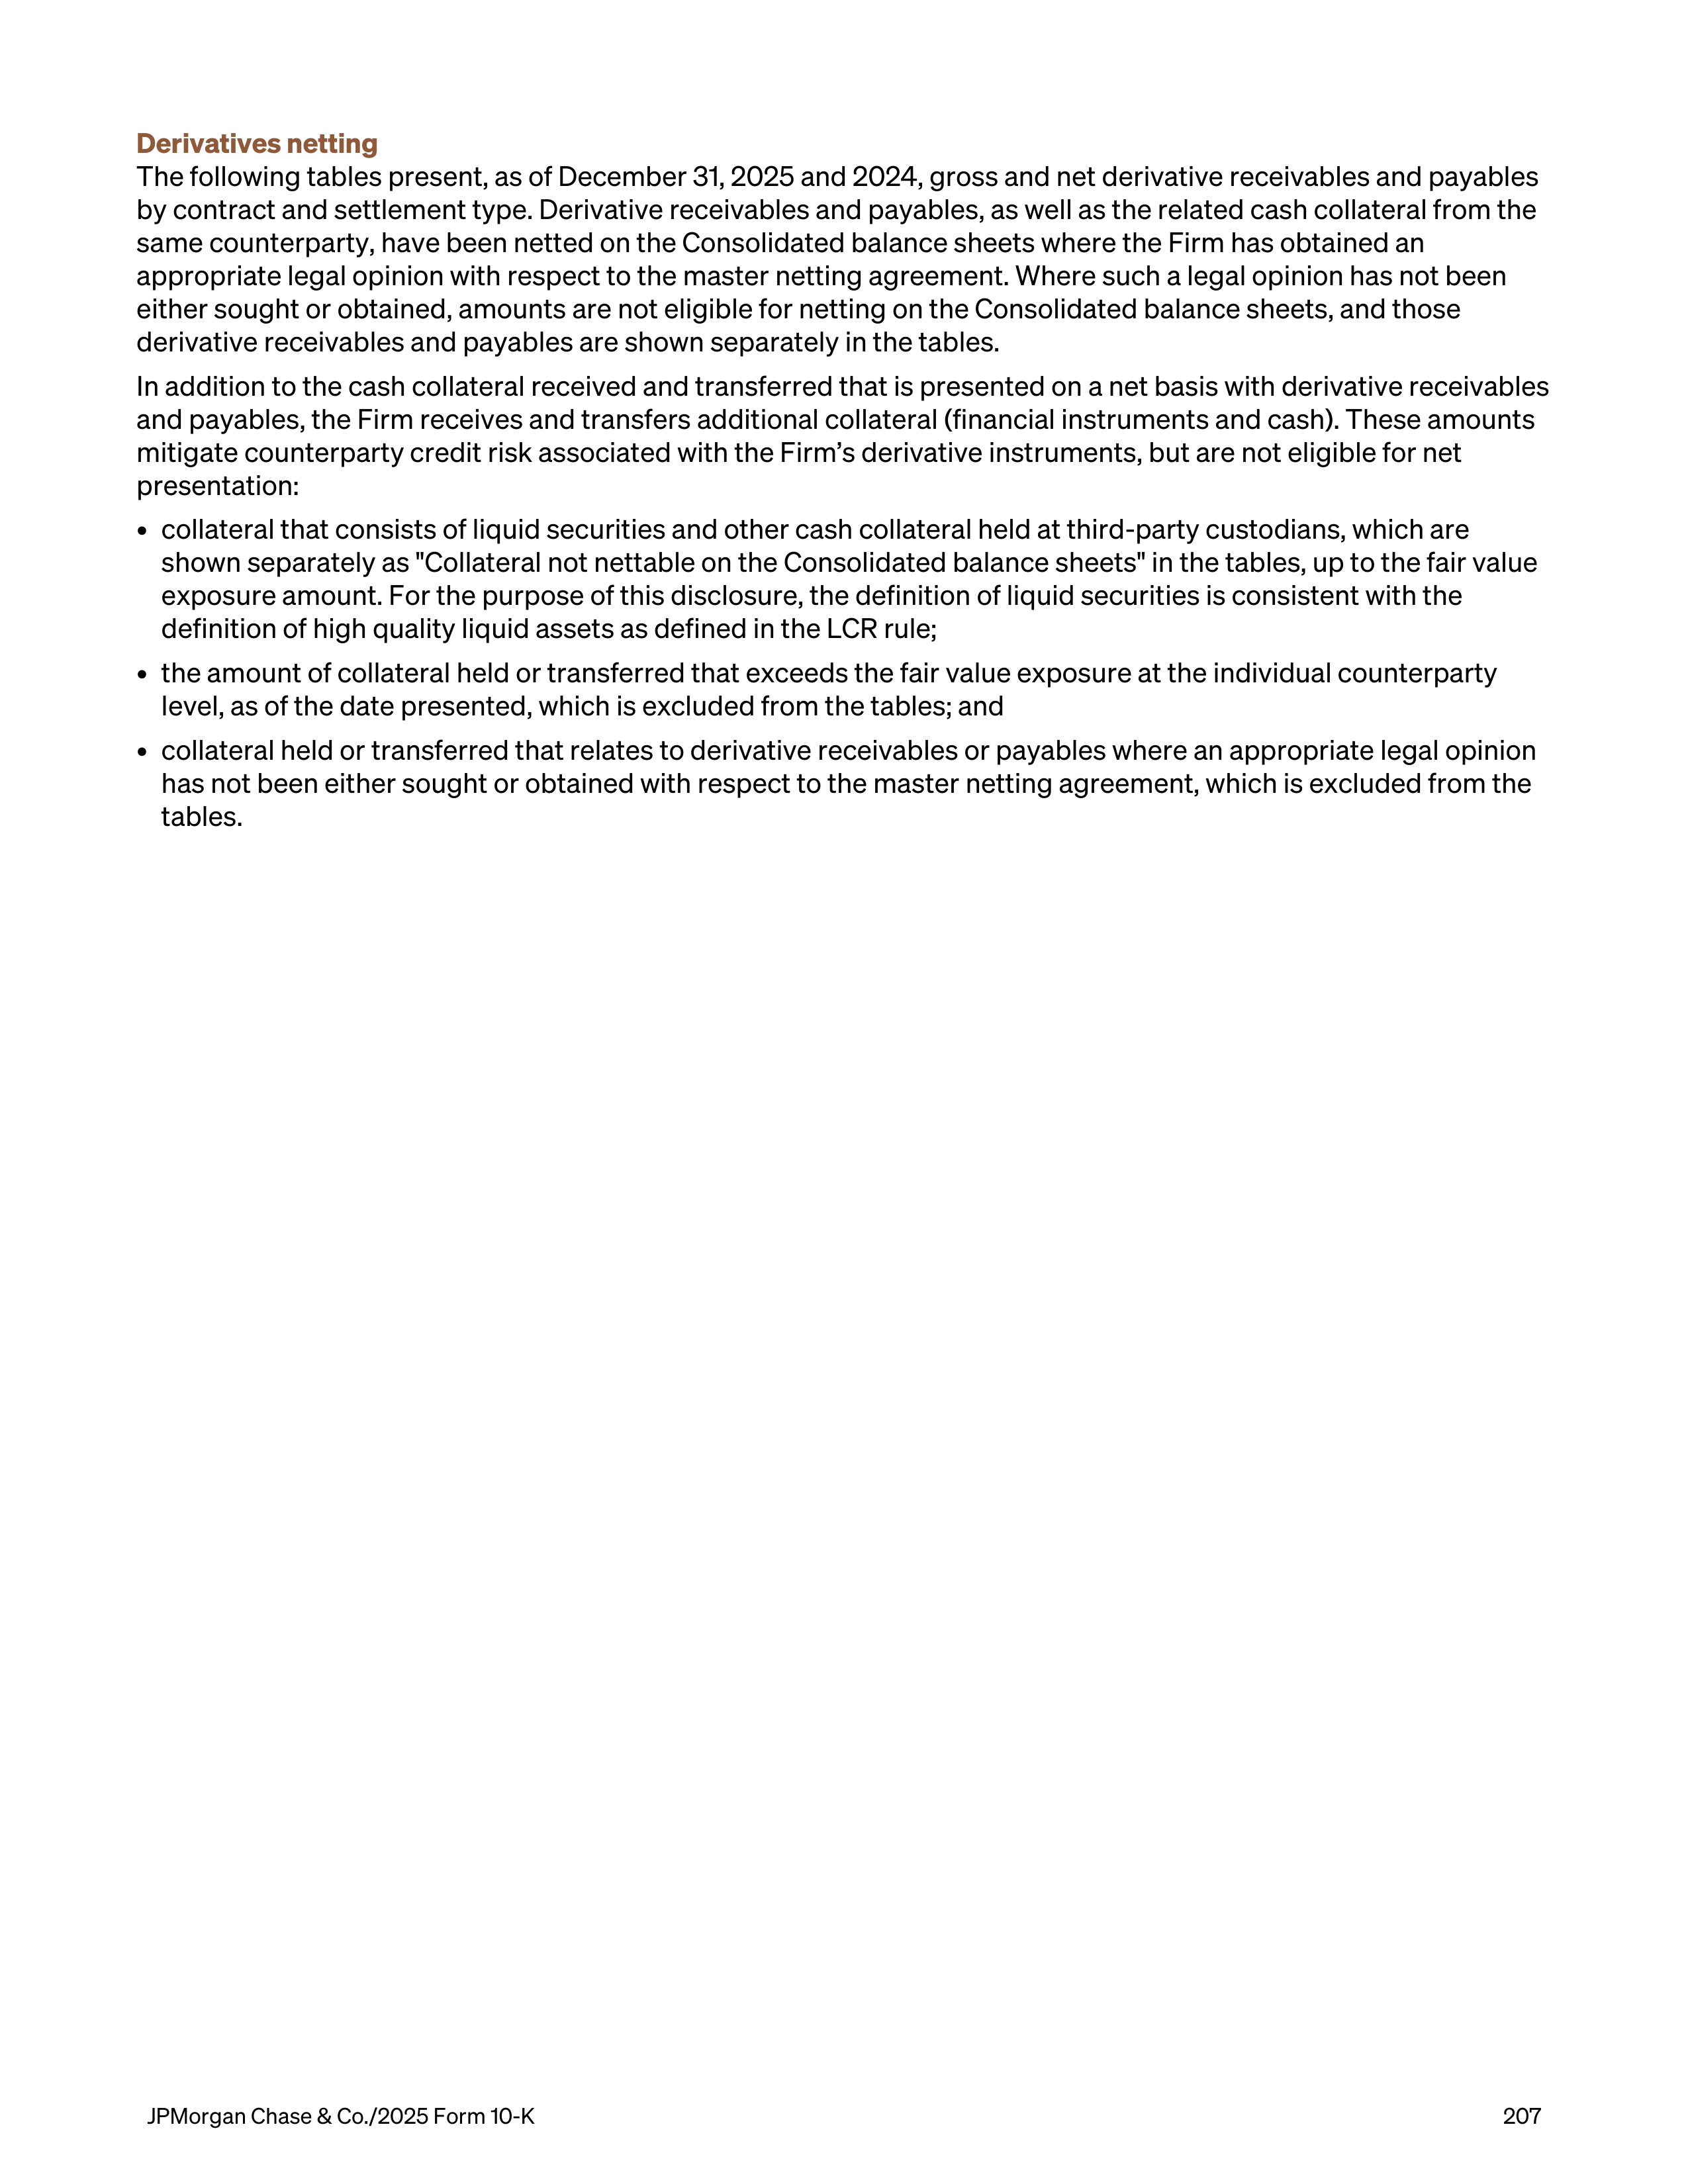
Derivatives netting
The following tables present, as of December 31, 2025 and 2024, gross and net derivative receivables and payables
by contract and settlement type. Derivative receivables and payables, as well as the related cash collateral from the
same counterparty, have been netted on the Consolidated balance sheets where the Firm has obtained an
appropriate legal opinion with respect to the master netting agreement. Where such a legal opinion has not been
either sought or obtained, amounts are not eligible for netting on the Consolidated balance sheets, and those
derivative receivables and payables are shown separately in the tables.
In addition to the cash collateral received and transferred that is presented on a net basis with derivative receivables
and payables, the Firm receives and transfers additional collateral (financial instruments and cash). These amounts
mitigate counterparty credit risk associated with the Firm’s derivative instruments, but are not eligible for net
presentation:
•
collateral that consists of liquid securities and other cash collateral held at third-party custodians, which are
shown separately as "Collateral not nettable on the Consolidated balance sheets" in the tables, up to the fair value
exposure amount. For the purpose of this disclosure, the definition of liquid securities is consistent with the
definition of high quality liquid assets as defined in the LCR rule;
•
the amount of collateral held or transferred that exceeds the fair value exposure at the individual counterparty
level, as of the date presented, which is excluded from the tables; and
•
collateral held or transferred that relates to derivative receivables or payables where an appropriate legal opinion
has not been either sought or obtained with respect to the master netting agreement, which is excluded from the
tables.
JPMorgan Chase & Co./2025 Form 10-K
207
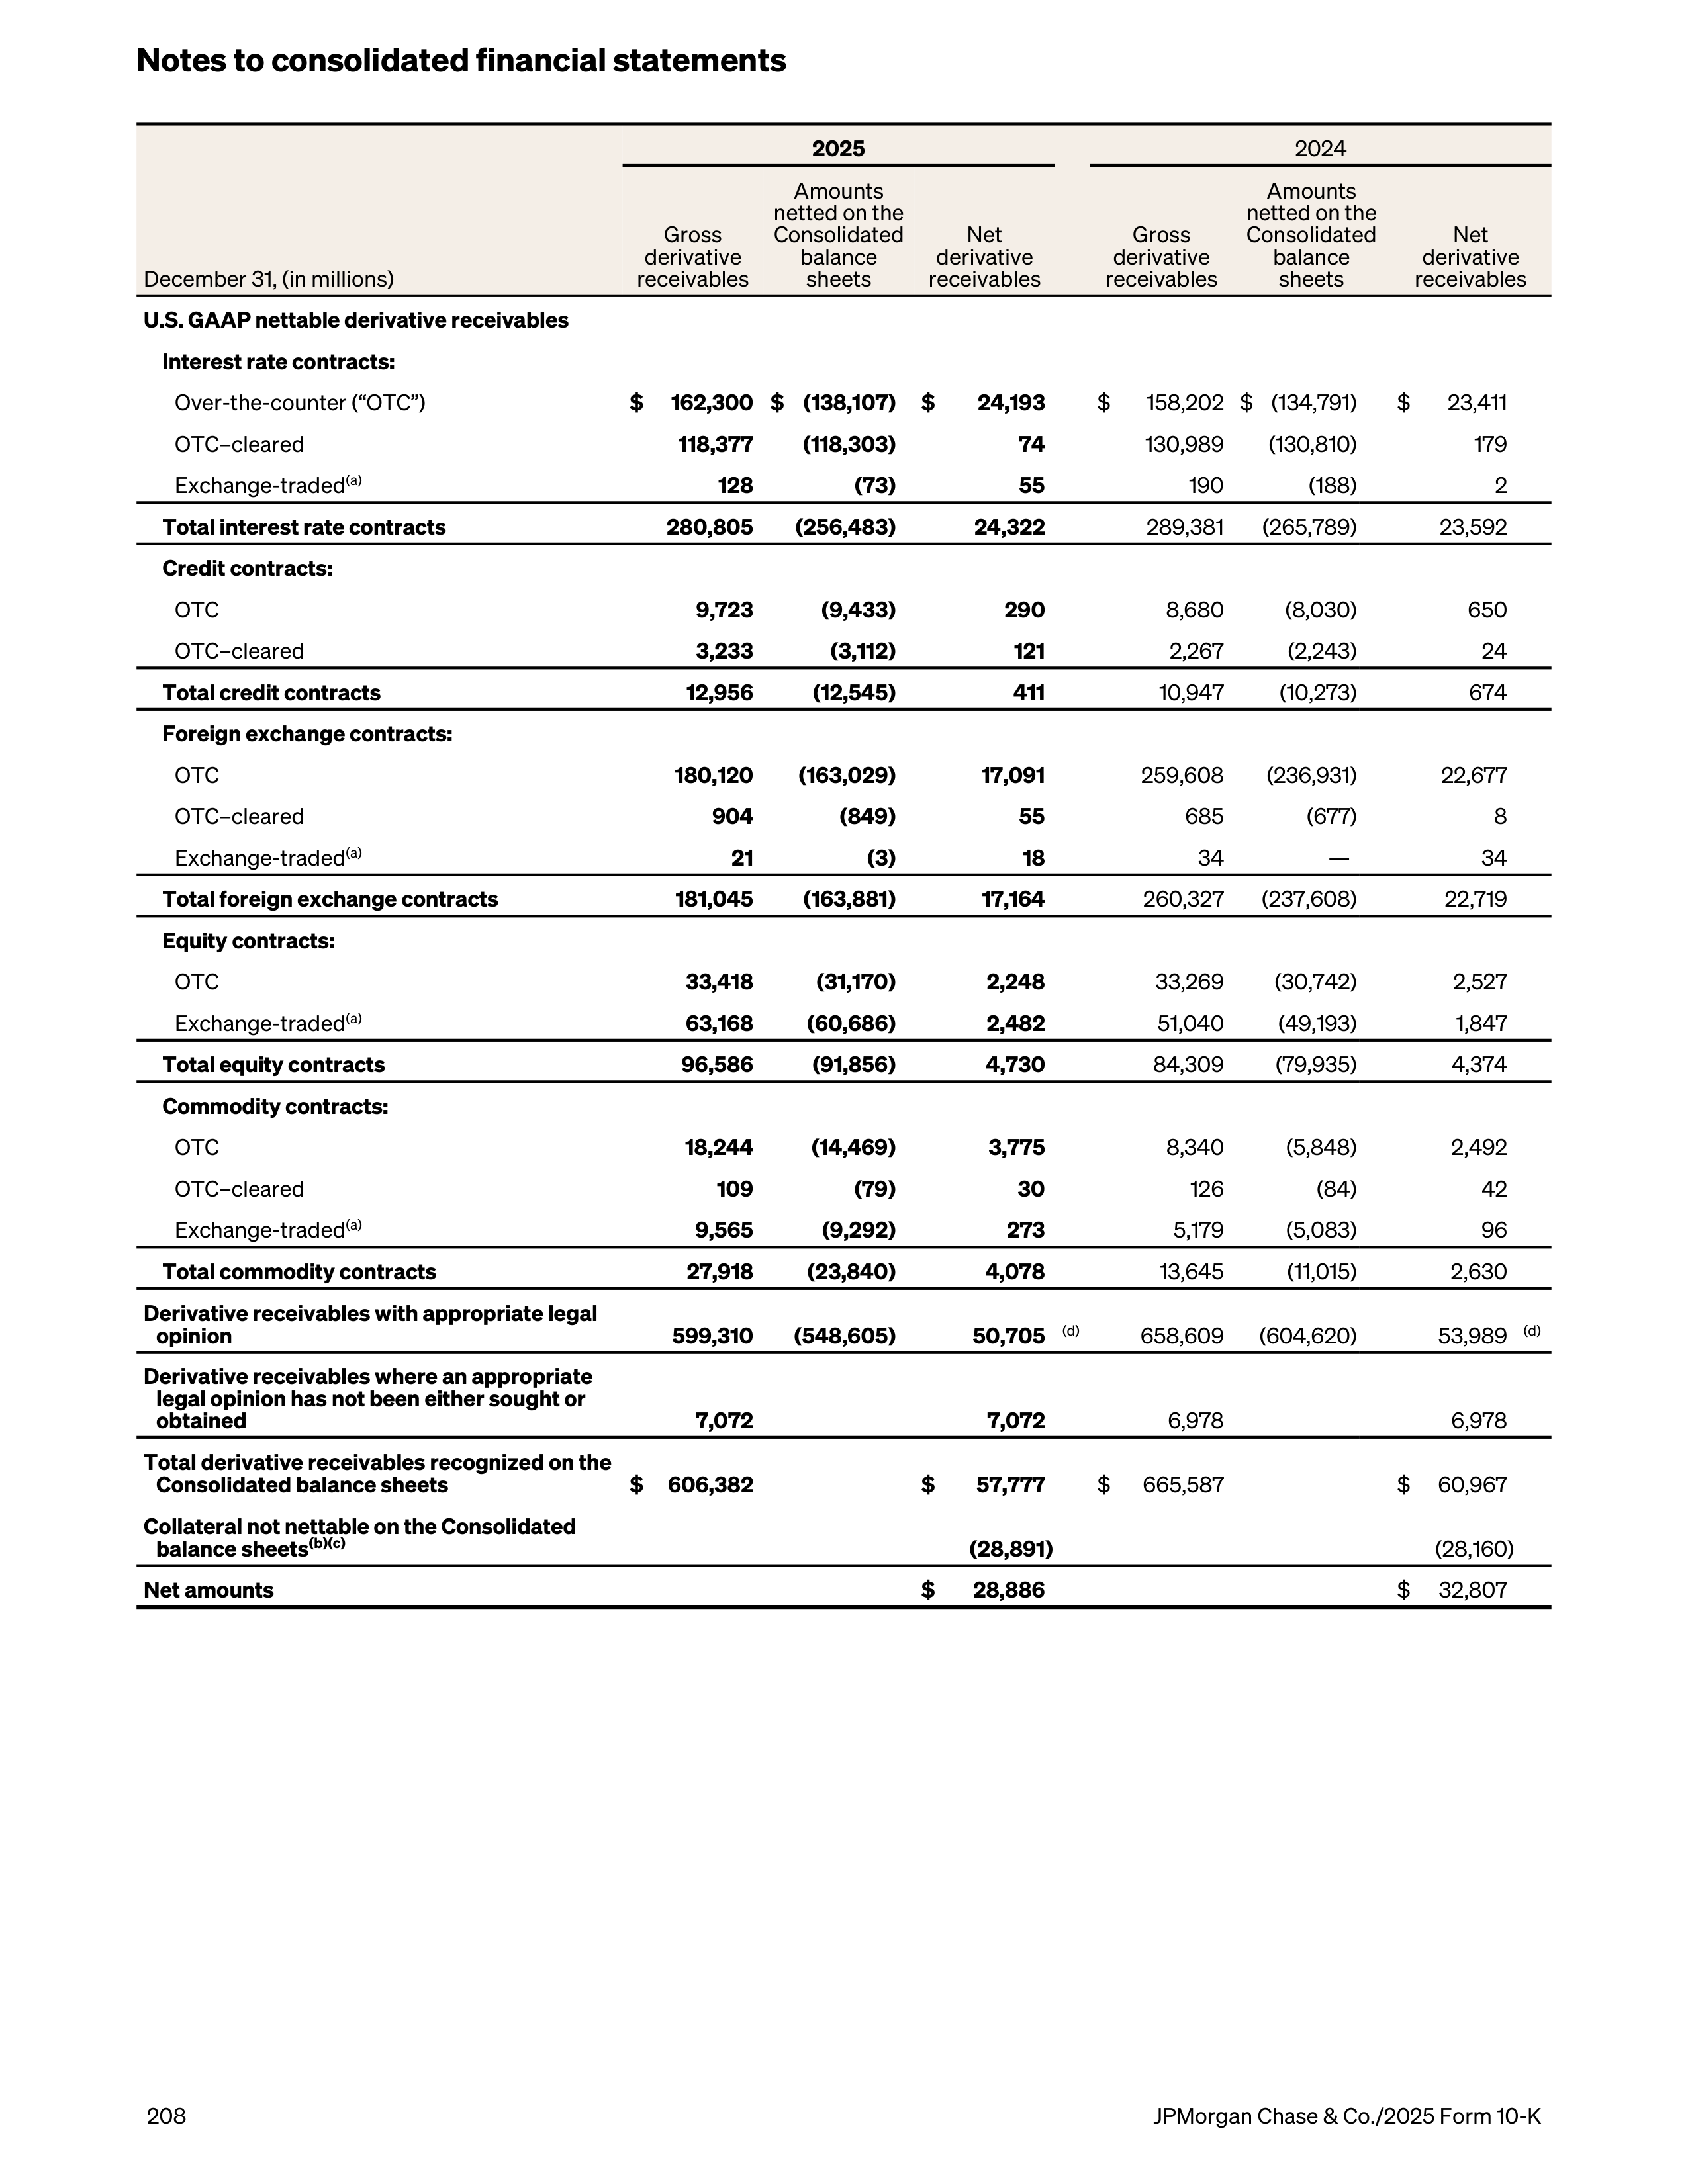
2025
2024
December 31, (in millions)
Gross
derivative
receivables
Amounts
netted on the
Consolidated
balance
sheets
Net
derivative
receivables
Gross
derivative
receivables
Amounts
netted on the
Consolidated
balance
sheets
Net
derivative
receivables
U.S. GAAP nettable derivative receivables
Interest rate contracts:
Over-the-counter (“OTC”)
$
162,300 $ (138,107)
$
24,193
$
158,202 $ (134,791)
$
23,411
OTC–cleared
118,377
(118,303)
74
130,989
(130,810)
179
Exchange-traded
(a)
128
(73)
55
190
(188)
2
Total interest rate contracts
280,805
(256,483)
24,322
289,381
(265,789)
23,592
Credit contracts:
OTC
9,723
(9,433)
290
8,680
(8,030)
650
OTC–cleared
3,233
(3,112)
121
2,267
(2,243)
24
Total credit contracts
12,956
(12,545)
411
10,947
(10,273)
674
Foreign exchange contracts:
OTC
180,120
(163,029)
17,091
259,608
(236,931)
22,677
OTC–cleared
904
(849)
55
685
(677)
8
Exchange-traded
(a)
21
(3)
18
34
—
34
Total foreign exchange contracts
181,045
(163,881)
17,164
260,327 (237,608)
22,719
Equity contracts:
OTC
33,418
(31,170)
2,248
33,269
(30,742)
2,527
Exchange-traded
(a)
63,168
(60,686)
2,482
51,040
(49,193)
1,847
Total equity contracts
96,586
(91,856)
4,730
84,309
(79,935)
4,374
Commodity contracts:
OTC
18,244
(14,469)
3,775
8,340
(5,848)
2,492
OTC–cleared
109
(79)
30
126
(84)
42
Exchange-traded
(a)
9,565
(9,292)
273
5,179
(5,083)
96
Total commodity contracts
27,918
(23,840)
4,078
13,645
(11,015)
2,630
Derivative receivables with appropriate legal
opinion
599,310
(548,605)
50,705
(d)
658,609 (604,620)
53,989
(d)
Derivative receivables where an appropriate
legal opinion has not been either sought or
obtained
7,072
7,072
6,978
6,978
Total derivative receivables recognized on the
Consolidated balance sheets
$
606,382
$
57,777
$
665,587
$
60,967
Collateral not nettable on the Consolidated
balance sheets
(b)(c)
(28,891)
(28,160)
Net amounts
$
28,886
$
32,807
Notes to consolidated financial statements
208
JPMorgan Chase & Co./2025 Form 10-K
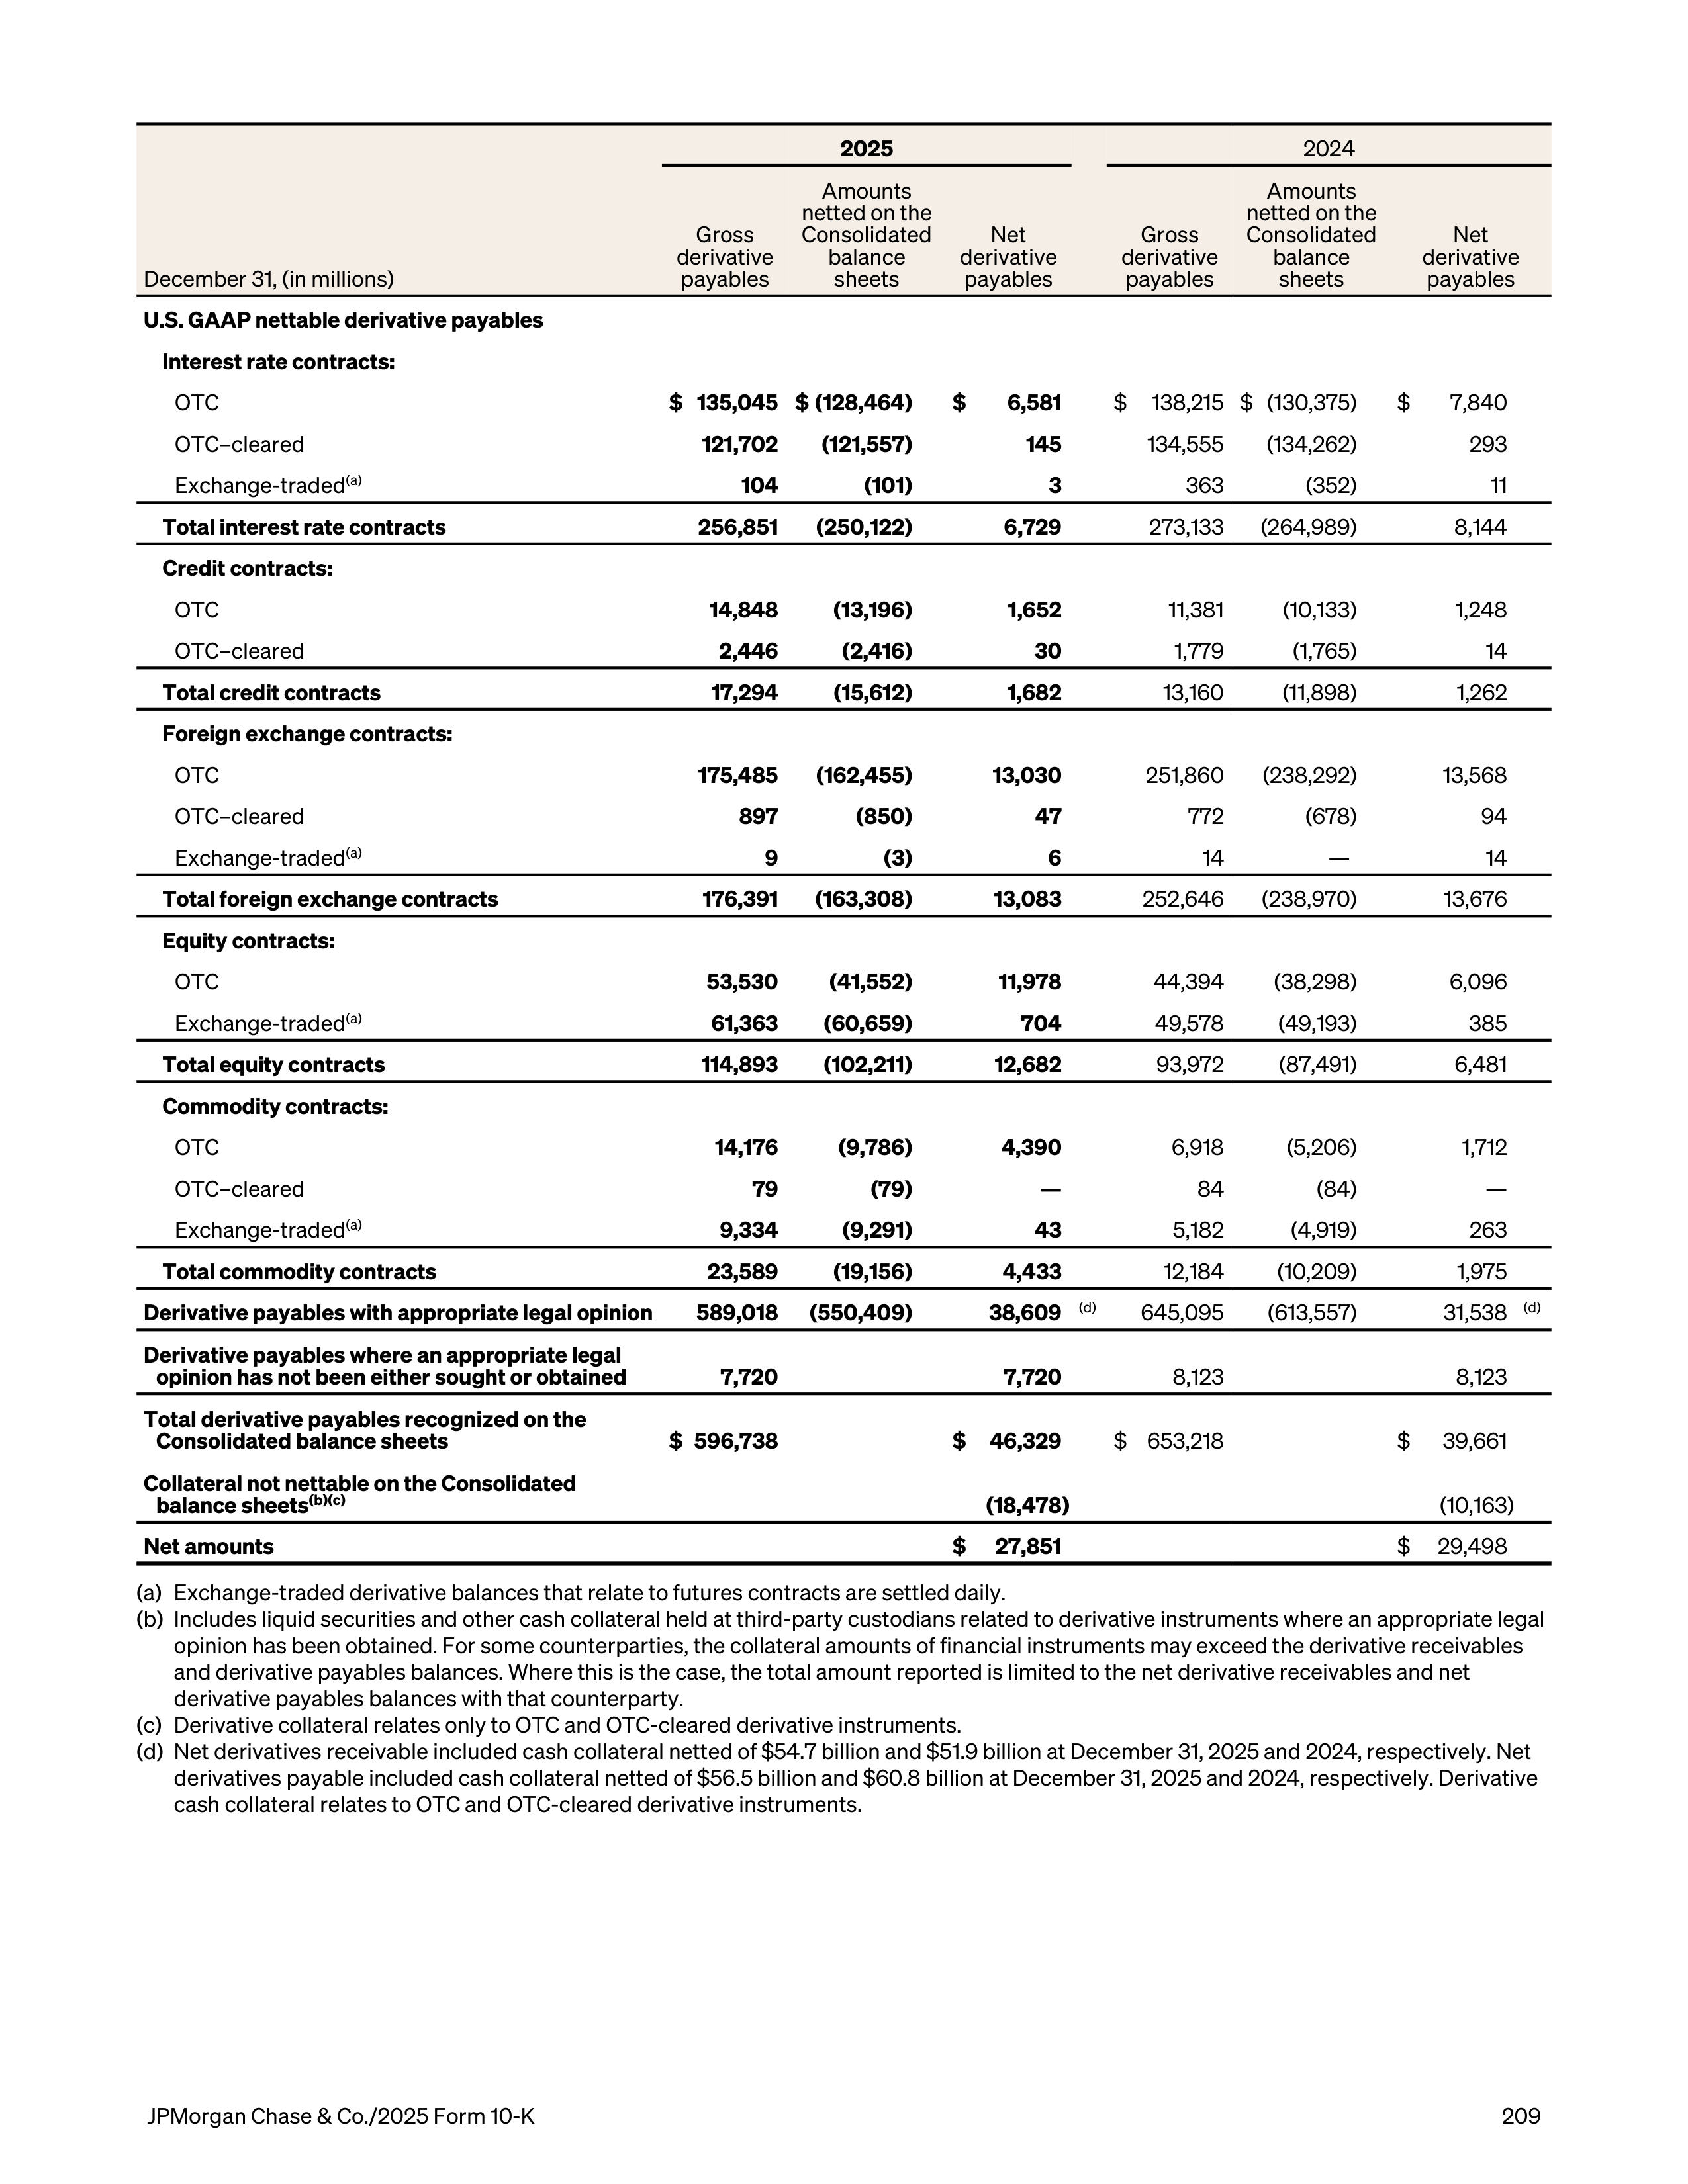
2025
2024
December 31, (in millions)
Gross
derivative
payables
Amounts
netted on the
Consolidated
balance
sheets
Net
derivative
payables
Gross
derivative
payables
Amounts
netted on the
Consolidated
balance
sheets
Net
derivative
payables
U.S. GAAP nettable derivative payables
Interest rate contracts:
OTC
$ 135,045 $ (128,464)
$
6,581
$
138,215 $ (130,375)
$
7,840
OTC–cleared
121,702
(121,557)
145
134,555
(134,262)
293
Exchange-traded
(a)
104
(101)
3
363
(352)
11
Total interest rate contracts
256,851 (250,122)
6,729
273,133 (264,989)
8,144
Credit contracts:
OTC
14,848
(13,196)
1,652
11,381
(10,133)
1,248
OTC–cleared
2,446
(2,416)
30
1,779
(1,765)
14
Total credit contracts
17,294
(15,612)
1,682
13,160
(11,898)
1,262
Foreign exchange contracts:
OTC
175,485 (162,455)
13,030
251,860
(238,292)
13,568
OTC–cleared
897
(850)
47
772
(678)
94
Exchange-traded
(a)
9
(3)
6
14
—
14
Total foreign exchange contracts
176,391 (163,308)
13,083
252,646 (238,970)
13,676
Equity contracts:
OTC
53,530
(41,552)
11,978
44,394
(38,298)
6,096
Exchange-traded
(a)
61,363
(60,659)
704
49,578
(49,193)
385
Total equity contracts
114,893
(102,211)
12,682
93,972
(87,491)
6,481
Commodity contracts:
OTC
14,176
(9,786)
4,390
6,918
(5,206)
1,712
OTC–cleared
79
(79)
—
84
(84)
—
Exchange-traded
(a)
9,334
(9,291)
43
5,182
(4,919)
263
Total commodity contracts
23,589
(19,156)
4,433
12,184
(10,209)
1,975
Derivative payables with appropriate legal opinion
589,018 (550,409)
38,609
(d)
645,095
(613,557)
31,538
(d)
Derivative payables where an appropriate legal
opinion has not been either sought or obtained
7,720
7,720
8,123
8,123
Total derivative payables recognized on the
Consolidated balance sheets
$ 596,738
$
46,329
$ 653,218
$
39,661
Collateral not nettable on the Consolidated
balance sheets
(b)(c)
(18,478)
(10,163)
Net amounts
$
27,851
$
29,498
(a)
Exchange-traded derivative balances that relate to futures contracts are settled daily.
(b)
Includes liquid securities and other cash collateral held at third-party custodians related to derivative instruments where an appropriate legal
opinion has been obtained. For some counterparties, the collateral amounts of financial instruments may exceed the derivative receivables
and derivative payables balances. Where this is the case, the total amount reported is limited to the net derivative receivables and net
derivative payables balances with that counterparty.
(c)
Derivative collateral relates only to OTC and OTC-cleared derivative instruments.
(d)
Net derivatives receivable included cash collateral netted of $54.7 billion and $51.9 billion at December 31, 2025 and 2024, respectively. Net
derivatives payable included cash collateral netted of $56.5 billion and $60.8 billion at December 31, 2025 and 2024, respectively. Derivative
cash collateral relates to OTC and OTC-cleared derivative instruments.
JPMorgan Chase & Co./2025 Form 10-K
209
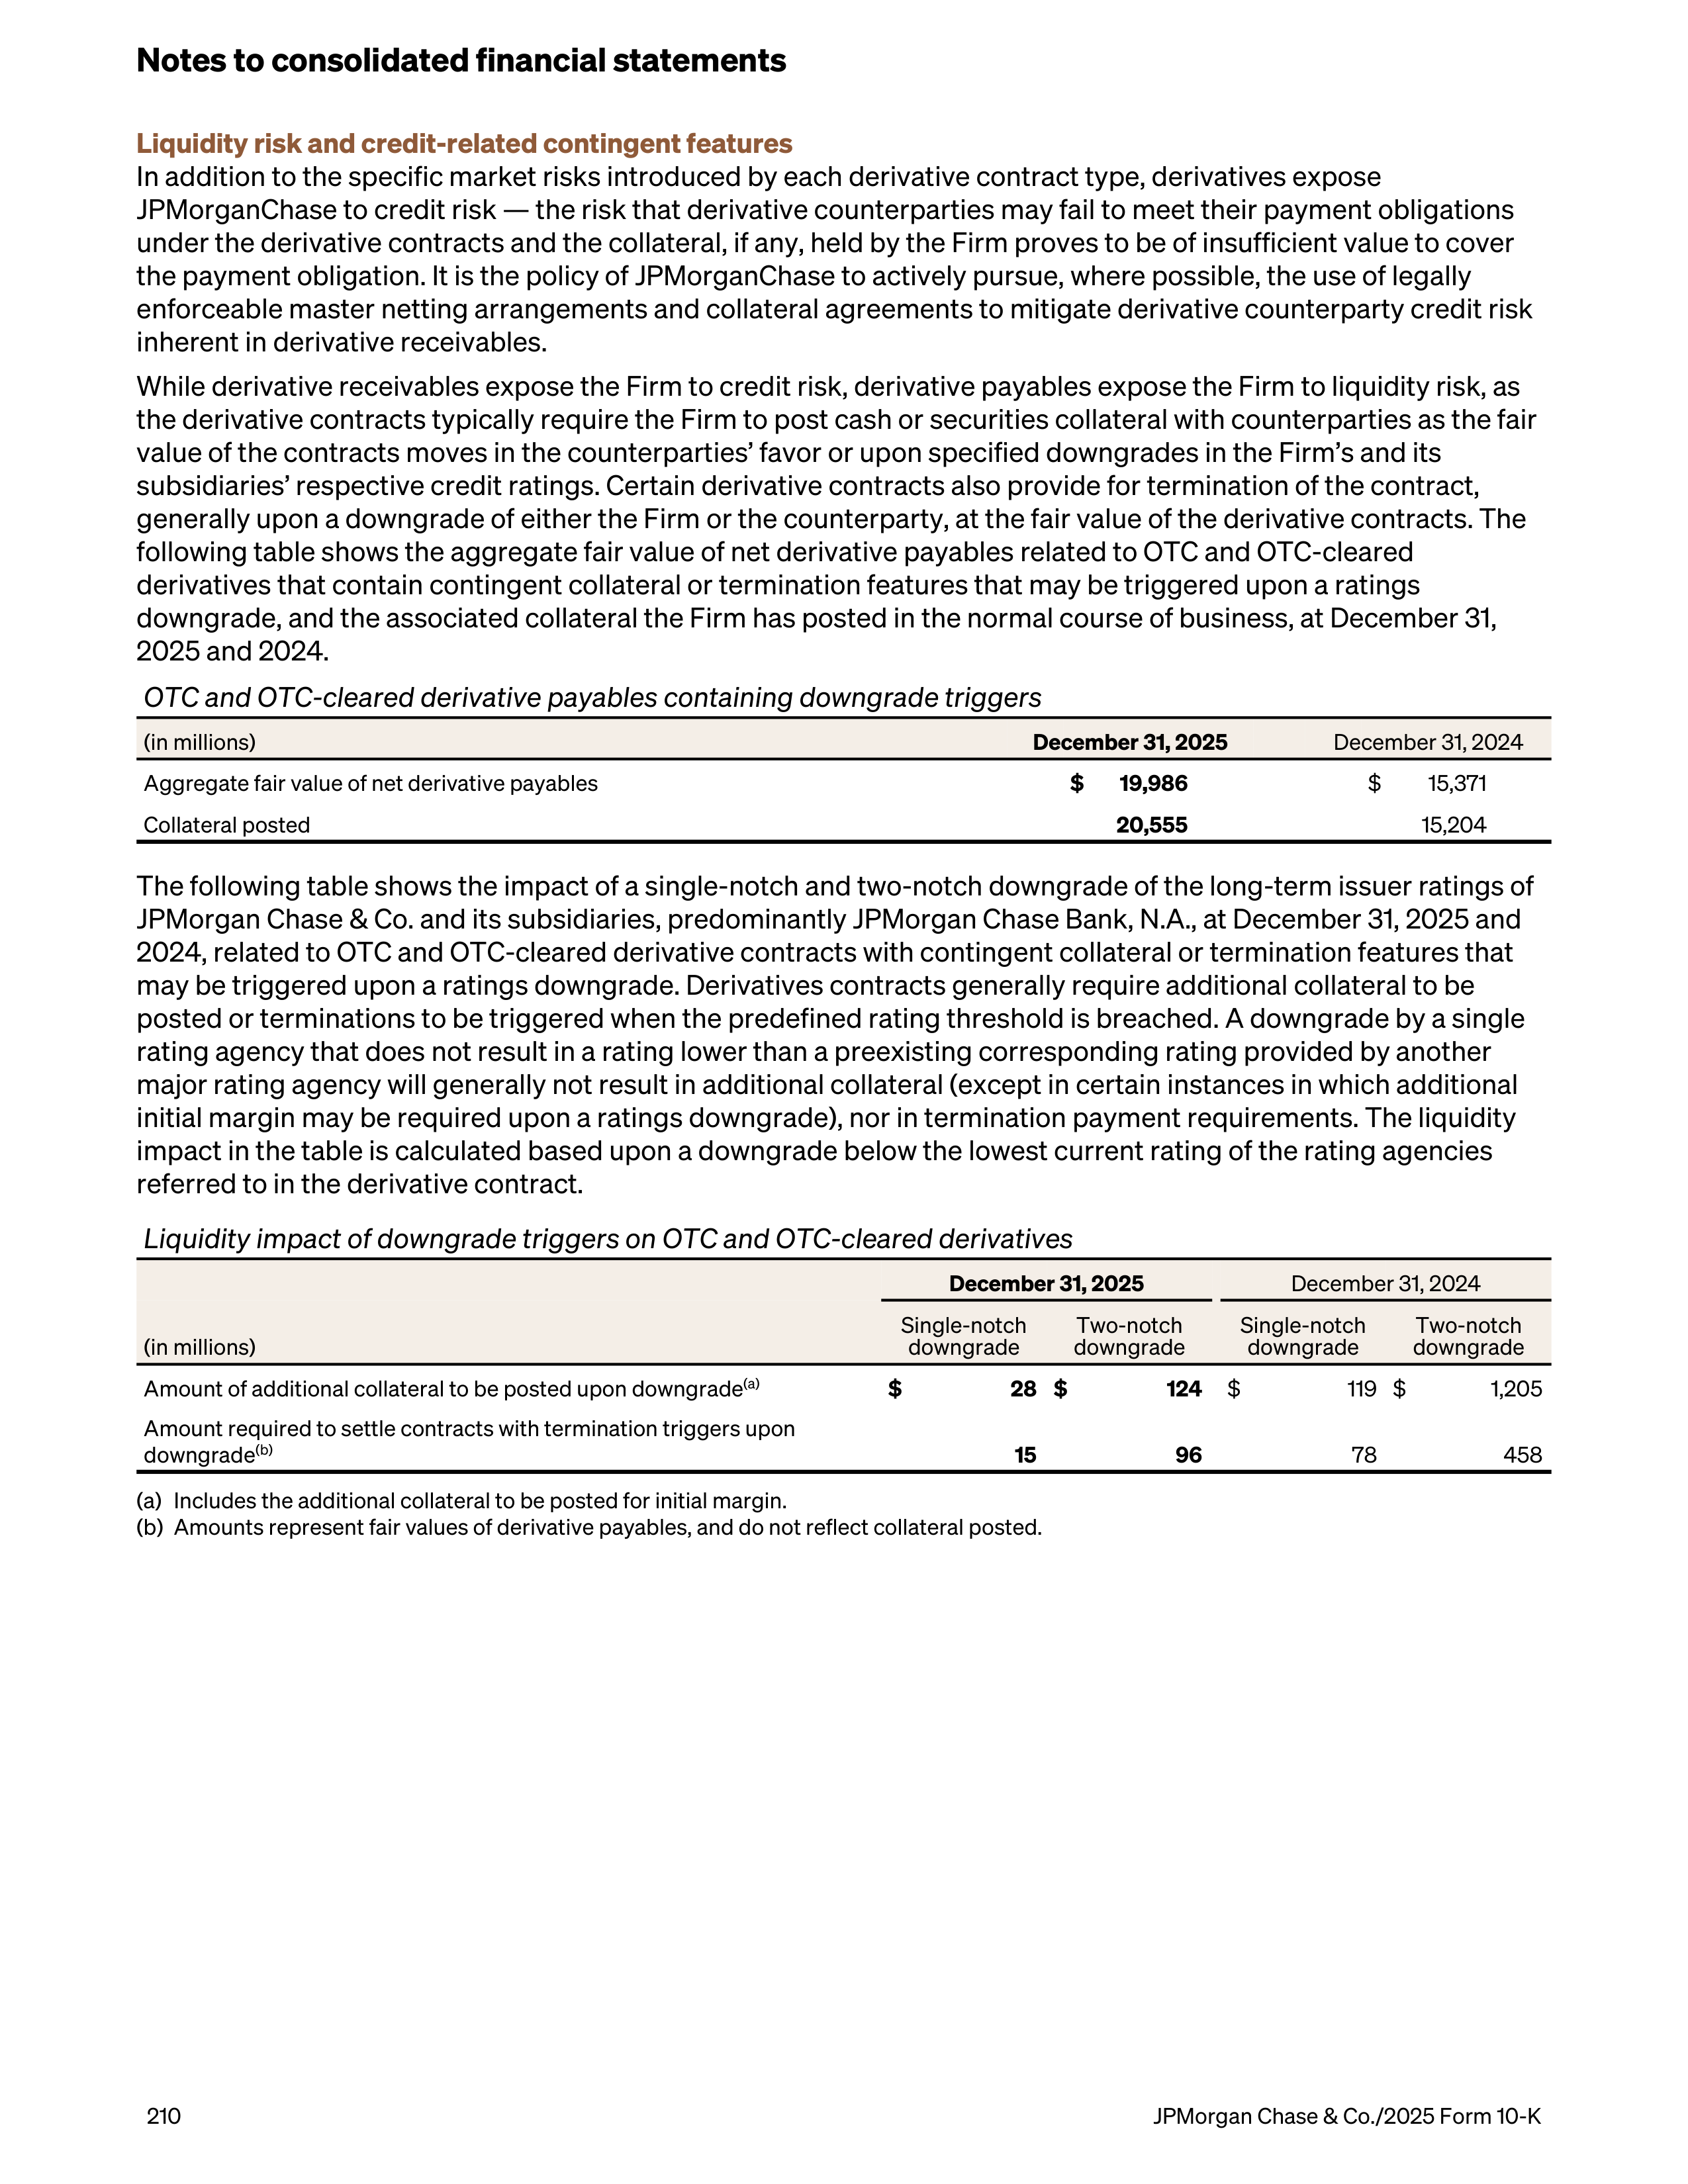
Liquidity risk and credit-related contingent features
In addition to the specific market risks introduced by each derivative contract type, derivatives expose
JPMorganChase to credit risk — the risk that derivative counterparties may fail to meet their payment obligations
under the derivative contracts and the collateral, if any, held by the Firm proves to be of insufficient value to cover
the payment obligation. It is the policy of JPMorganChase to actively pursue, where possible, the use of legally
enforceable master netting arrangements and collateral agreements to mitigate derivative counterparty credit risk
inherent in derivative receivables.
While derivative receivables expose the Firm to credit risk, derivative payables expose the Firm to liquidity risk, as
the derivative contracts typically require the Firm to post cash or securities collateral with counterparties as the fair
value of the contracts moves in the counterparties’ favor or upon specified downgrades in the Firm’s and its
subsidiaries’ respective credit ratings. Certain derivative contracts also provide for termination of the contract,
generally upon a downgrade of either the Firm or the counterparty, at the fair value of the derivative contracts. The
following table shows the aggregate fair value of net derivative payables related to OTC and OTC-cleared
derivatives that contain contingent collateral or termination features that may be triggered upon a ratings
downgrade, and the associated collateral the Firm has posted in the normal course of business, at December 31,
2025 and 2024.
OTC and OTC-cleared derivative payables containing downgrade triggers
(in millions)
December 31, 2025
December 31, 2024
Aggregate fair value of net derivative payables
$
19,986
$
15,371
Collateral posted
20,555
15,204
The following table shows the impact of a single-notch and two-notch downgrade of the long-term issuer ratings of
JPMorgan Chase & Co. and its subsidiaries, predominantly JPMorgan Chase Bank, N.A., at December 31, 2025 and
2024, related to OTC and OTC-cleared derivative contracts with contingent collateral or termination features that
may be triggered upon a ratings downgrade. Derivatives contracts generally require additional collateral to be
posted or terminations to be triggered when the predefined rating threshold is breached. A downgrade by a single
rating agency that does not result in a rating lower than a preexisting corresponding rating provided by another
major rating agency will generally not result in additional collateral (except in certain instances in which additional
initial margin may be required upon a ratings downgrade), nor in termination payment requirements. The liquidity
impact in the table is calculated based upon a downgrade below the lowest current rating of the rating agencies
referred to in the derivative contract.
Liquidity impact of downgrade triggers on OTC and OTC-cleared derivatives
December 31, 2025
December 31, 2024
(in millions)
Single-notch
downgrade
Two-notch
downgrade
Single-notch
downgrade
Two-notch
downgrade
Amount of additional collateral to be posted upon downgrade
(a)
$
28 $
124
$
119 $
1,205
Amount required to settle contracts with termination triggers upon
downgrade
(b)
15
96
78
458
(a)
Includes the additional collateral to be posted for initial margin.
(b)
Amounts represent fair values of derivative payables, and do not reflect collateral posted.
Notes to consolidated financial statements
210
JPMorgan Chase & Co./2025 Form 10-K
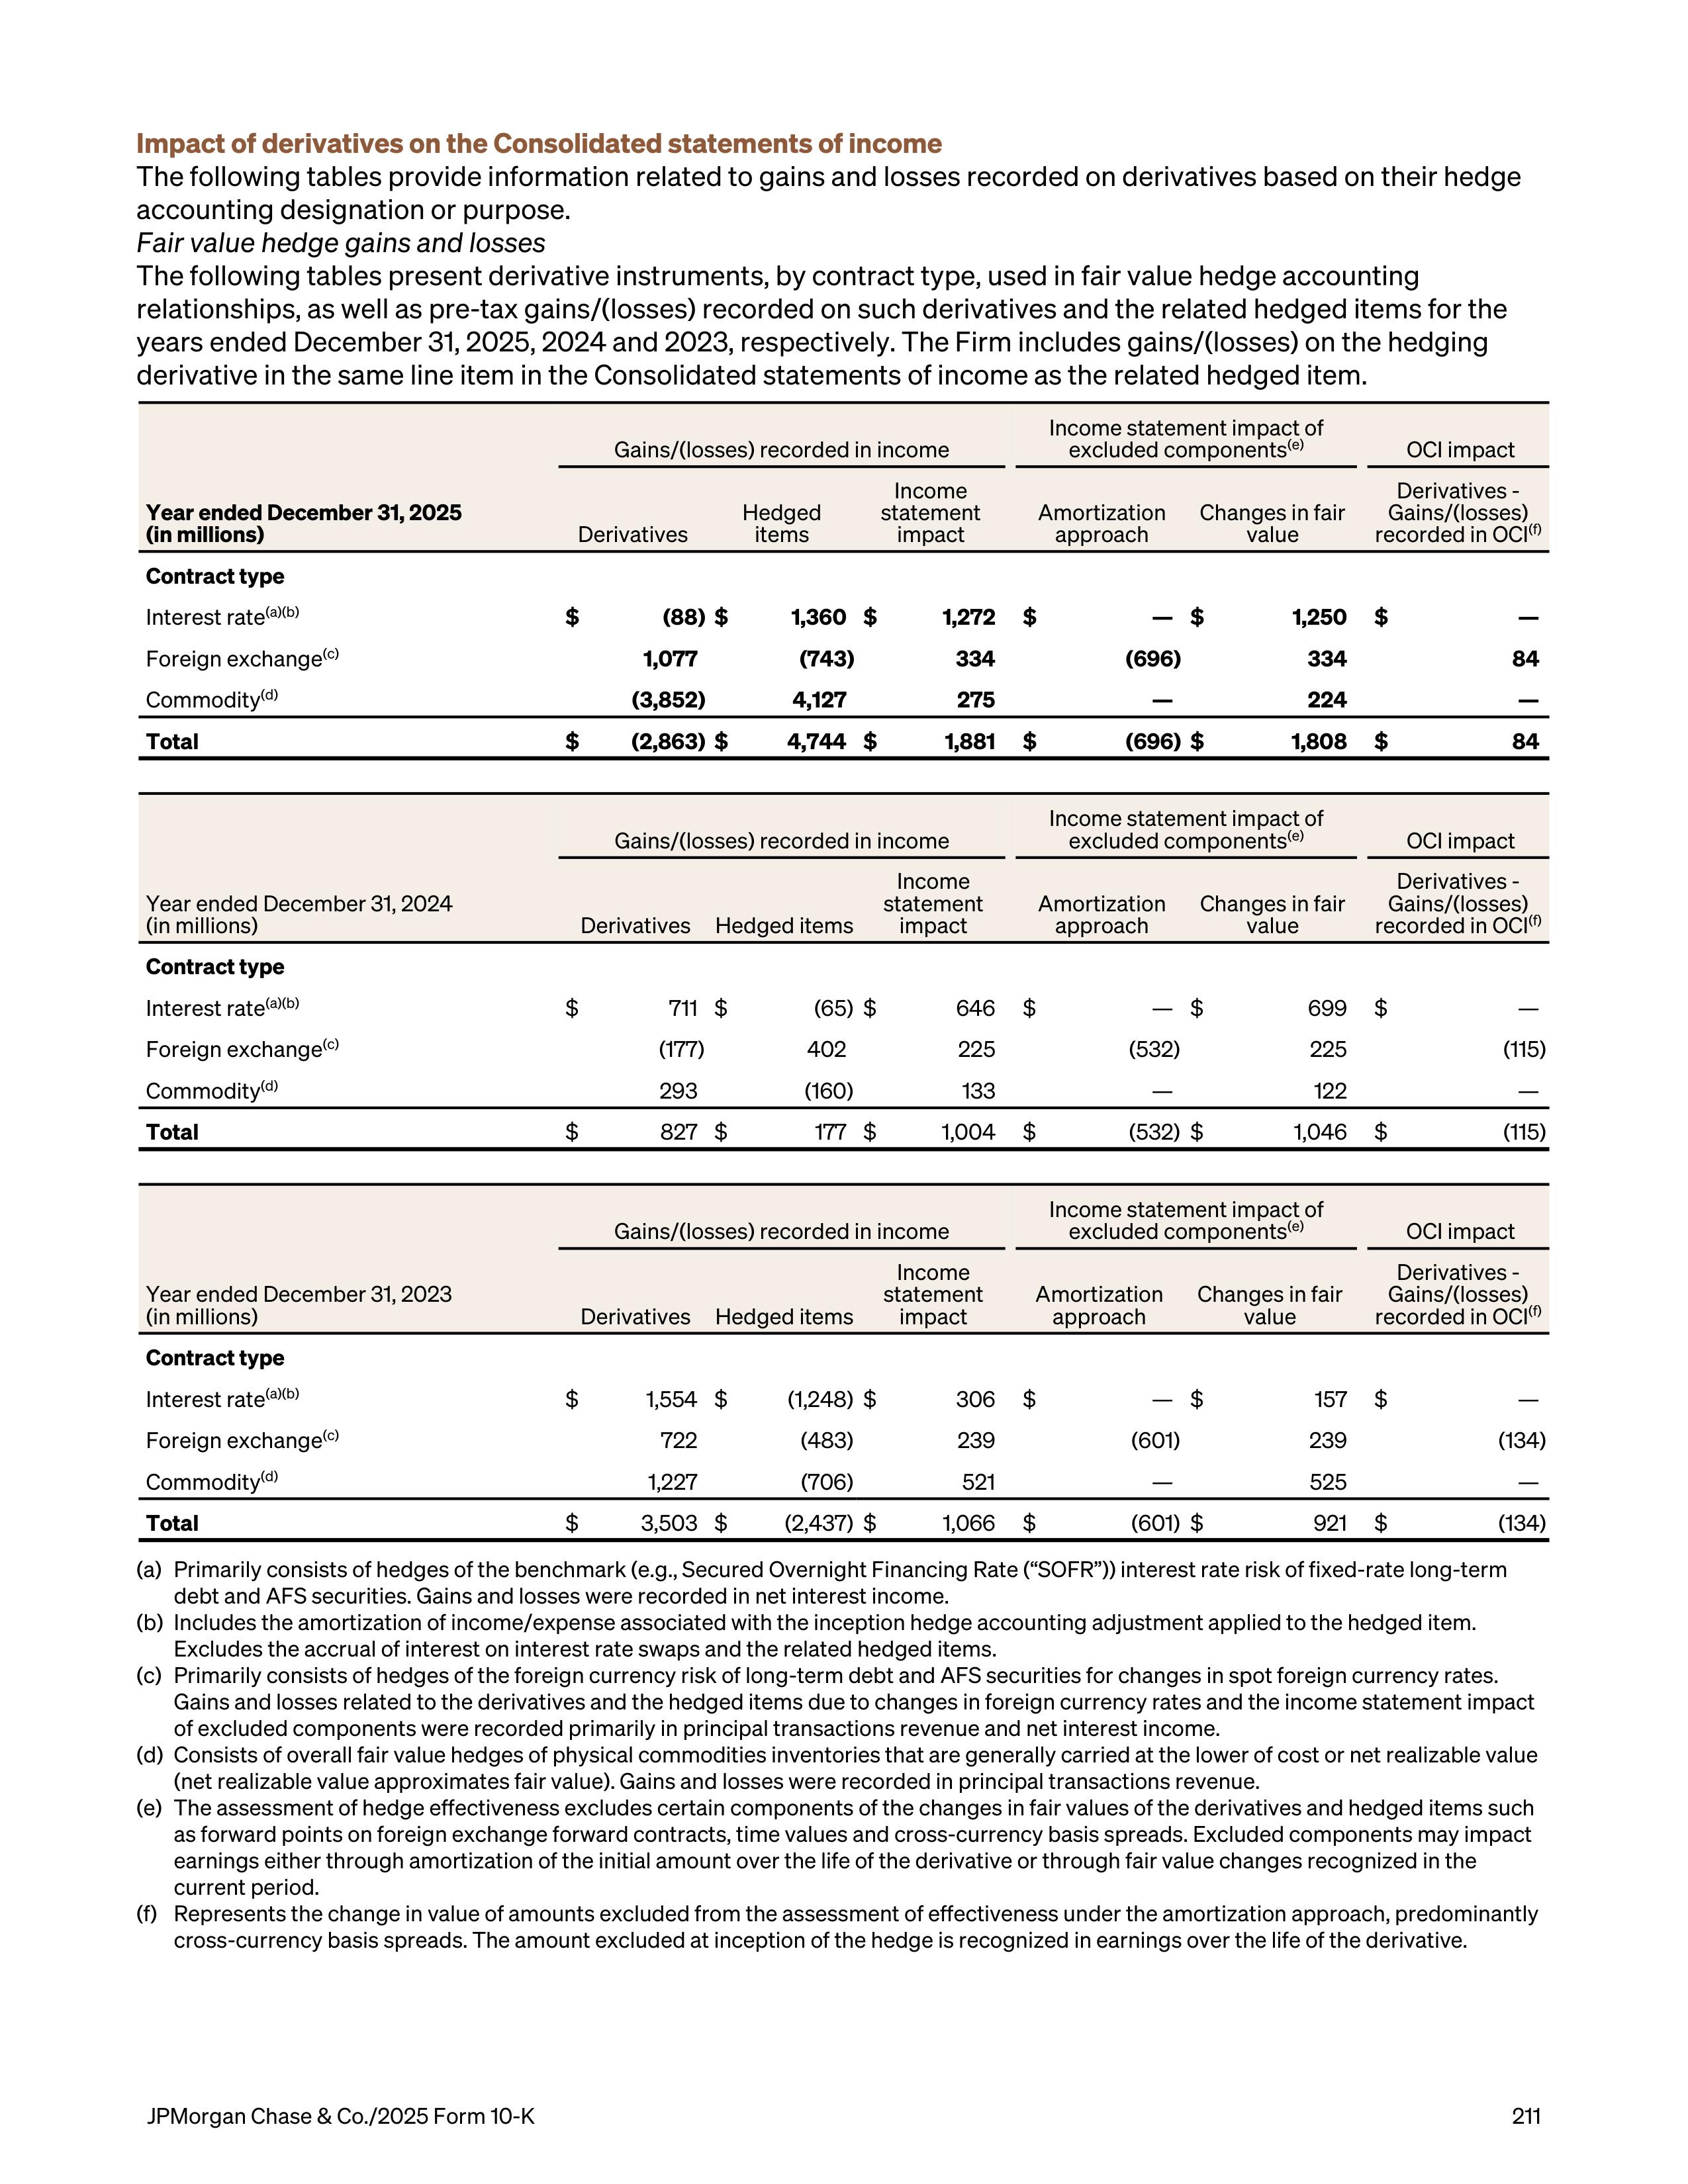
Impact of derivatives on the Consolidated statements of income
The following tables provide information related to gains and losses recorded on derivatives based on their hedge
accounting designation or purpose.
Fair value hedge gains and losses
The following tables present derivative instruments, by contract type, used in fair value hedge accounting
relationships, as well as pre-tax gains/(losses) recorded on such derivatives and the related hedged items for the
years ended December 31, 2025, 2024 and 2023, respectively. The Firm includes gains/(losses) on the hedging
derivative in the same line item in the Consolidated statements of income as the related hedged item.
Gains/(losses) recorded in income
Income statement impact of
excluded components
(e)
OCI impact
Year ended December 31, 2025
(in millions)
Derivatives
Hedged
items
Income
statement
impact
Amortization
approach
Changes in fair
value
Derivatives -
Gains/(losses)
recorded in OCI
(f)
Contract type
Interest rate
(a)(b)
$
(88) $
1,360 $
1,272
$
— $
1,250
$
—
Foreign exchange
(c)
1,077
(743)
334
(696)
334
84
Commodity
(d)
(3,852)
4,127
275
—
224
—
Total
$
(2,863) $
4,744 $
1,881
$
(696) $
1,808
$
84
Gains/(losses) recorded in income
Income statement impact of
excluded components
(e)
OCI impact
Year ended December 31, 2024
(in millions)
Derivatives
Hedged items
Income
statement
impact
Amortization
approach
Changes in fair
value
Derivatives -
Gains/(losses)
recorded in OCI
(f)
Contract type
Interest rate
(a)(b)
$
711 $
(65) $
646
$
— $
699
$
—
Foreign exchange
(c)
(177)
402
225
(532)
225
(115)
Commodity
(d)
293
(160)
133
—
122
—
Total
$
827 $
177 $
1,004
$
(532) $
1,046
$
(115)
Gains/(losses) recorded in income
Income statement impact of
excluded components
(e)
OCI impact
Year ended December 31, 2023
(in millions)
Derivatives
Hedged items
Income
statement
impact
Amortization
approach
Changes in fair
value
Derivatives -
Gains/(losses)
recorded in OCI
(f)
Contract type
Interest rate
(a)(b)
$
1,554 $
(1,248) $
306
$
— $
157
$
—
Foreign exchange
(c)
722
(483)
239
(601)
239
(134)
Commodity
(d)
1,227
(706)
521
—
525
—
Total
$
3,503 $
(2,437) $
1,066
$
(601) $
921
$
(134)
(a)
Primarily consists of hedges of the benchmark (e.g., Secured Overnight Financing Rate (“SOFR”)) interest rate risk of fixed-rate long-term
debt and AFS securities. Gains and losses were recorded in net interest income.
(b)
Includes the amortization of income/expense associated with the inception hedge accounting adjustment applied to the hedged item.
Excludes the accrual of interest on interest rate swaps and the related hedged items.
(c)
Primarily consists of hedges of the foreign currency risk of long-term debt and AFS securities for changes in spot foreign currency rates.
Gains and losses related to the derivatives and the hedged items due to changes in foreign currency rates and the income statement impact
of excluded components were recorded primarily in principal transactions revenue and net interest income.
(d)
Consists of overall fair value hedges of physical commodities inventories that are generally carried at the lower of cost or net realizable value
(net realizable value approximates fair value). Gains and losses were recorded in principal transactions revenue.
(e)
The assessment of hedge effectiveness excludes certain components of the changes in fair values of the derivatives and hedged items such
as forward points on foreign exchange forward contracts, time values and cross-currency basis spreads. Excluded components may impact
earnings either through amortization of the initial amount over the life of the derivative or through fair value changes recognized in the
current period.
(f)
Represents the change in value of amounts excluded from the assessment of effectiveness under the amortization approach, predominantly
cross-currency basis spreads. The amount excluded at inception of the hedge is recognized in earnings over the life of the derivative.
JPMorgan Chase & Co./2025 Form 10-K
211
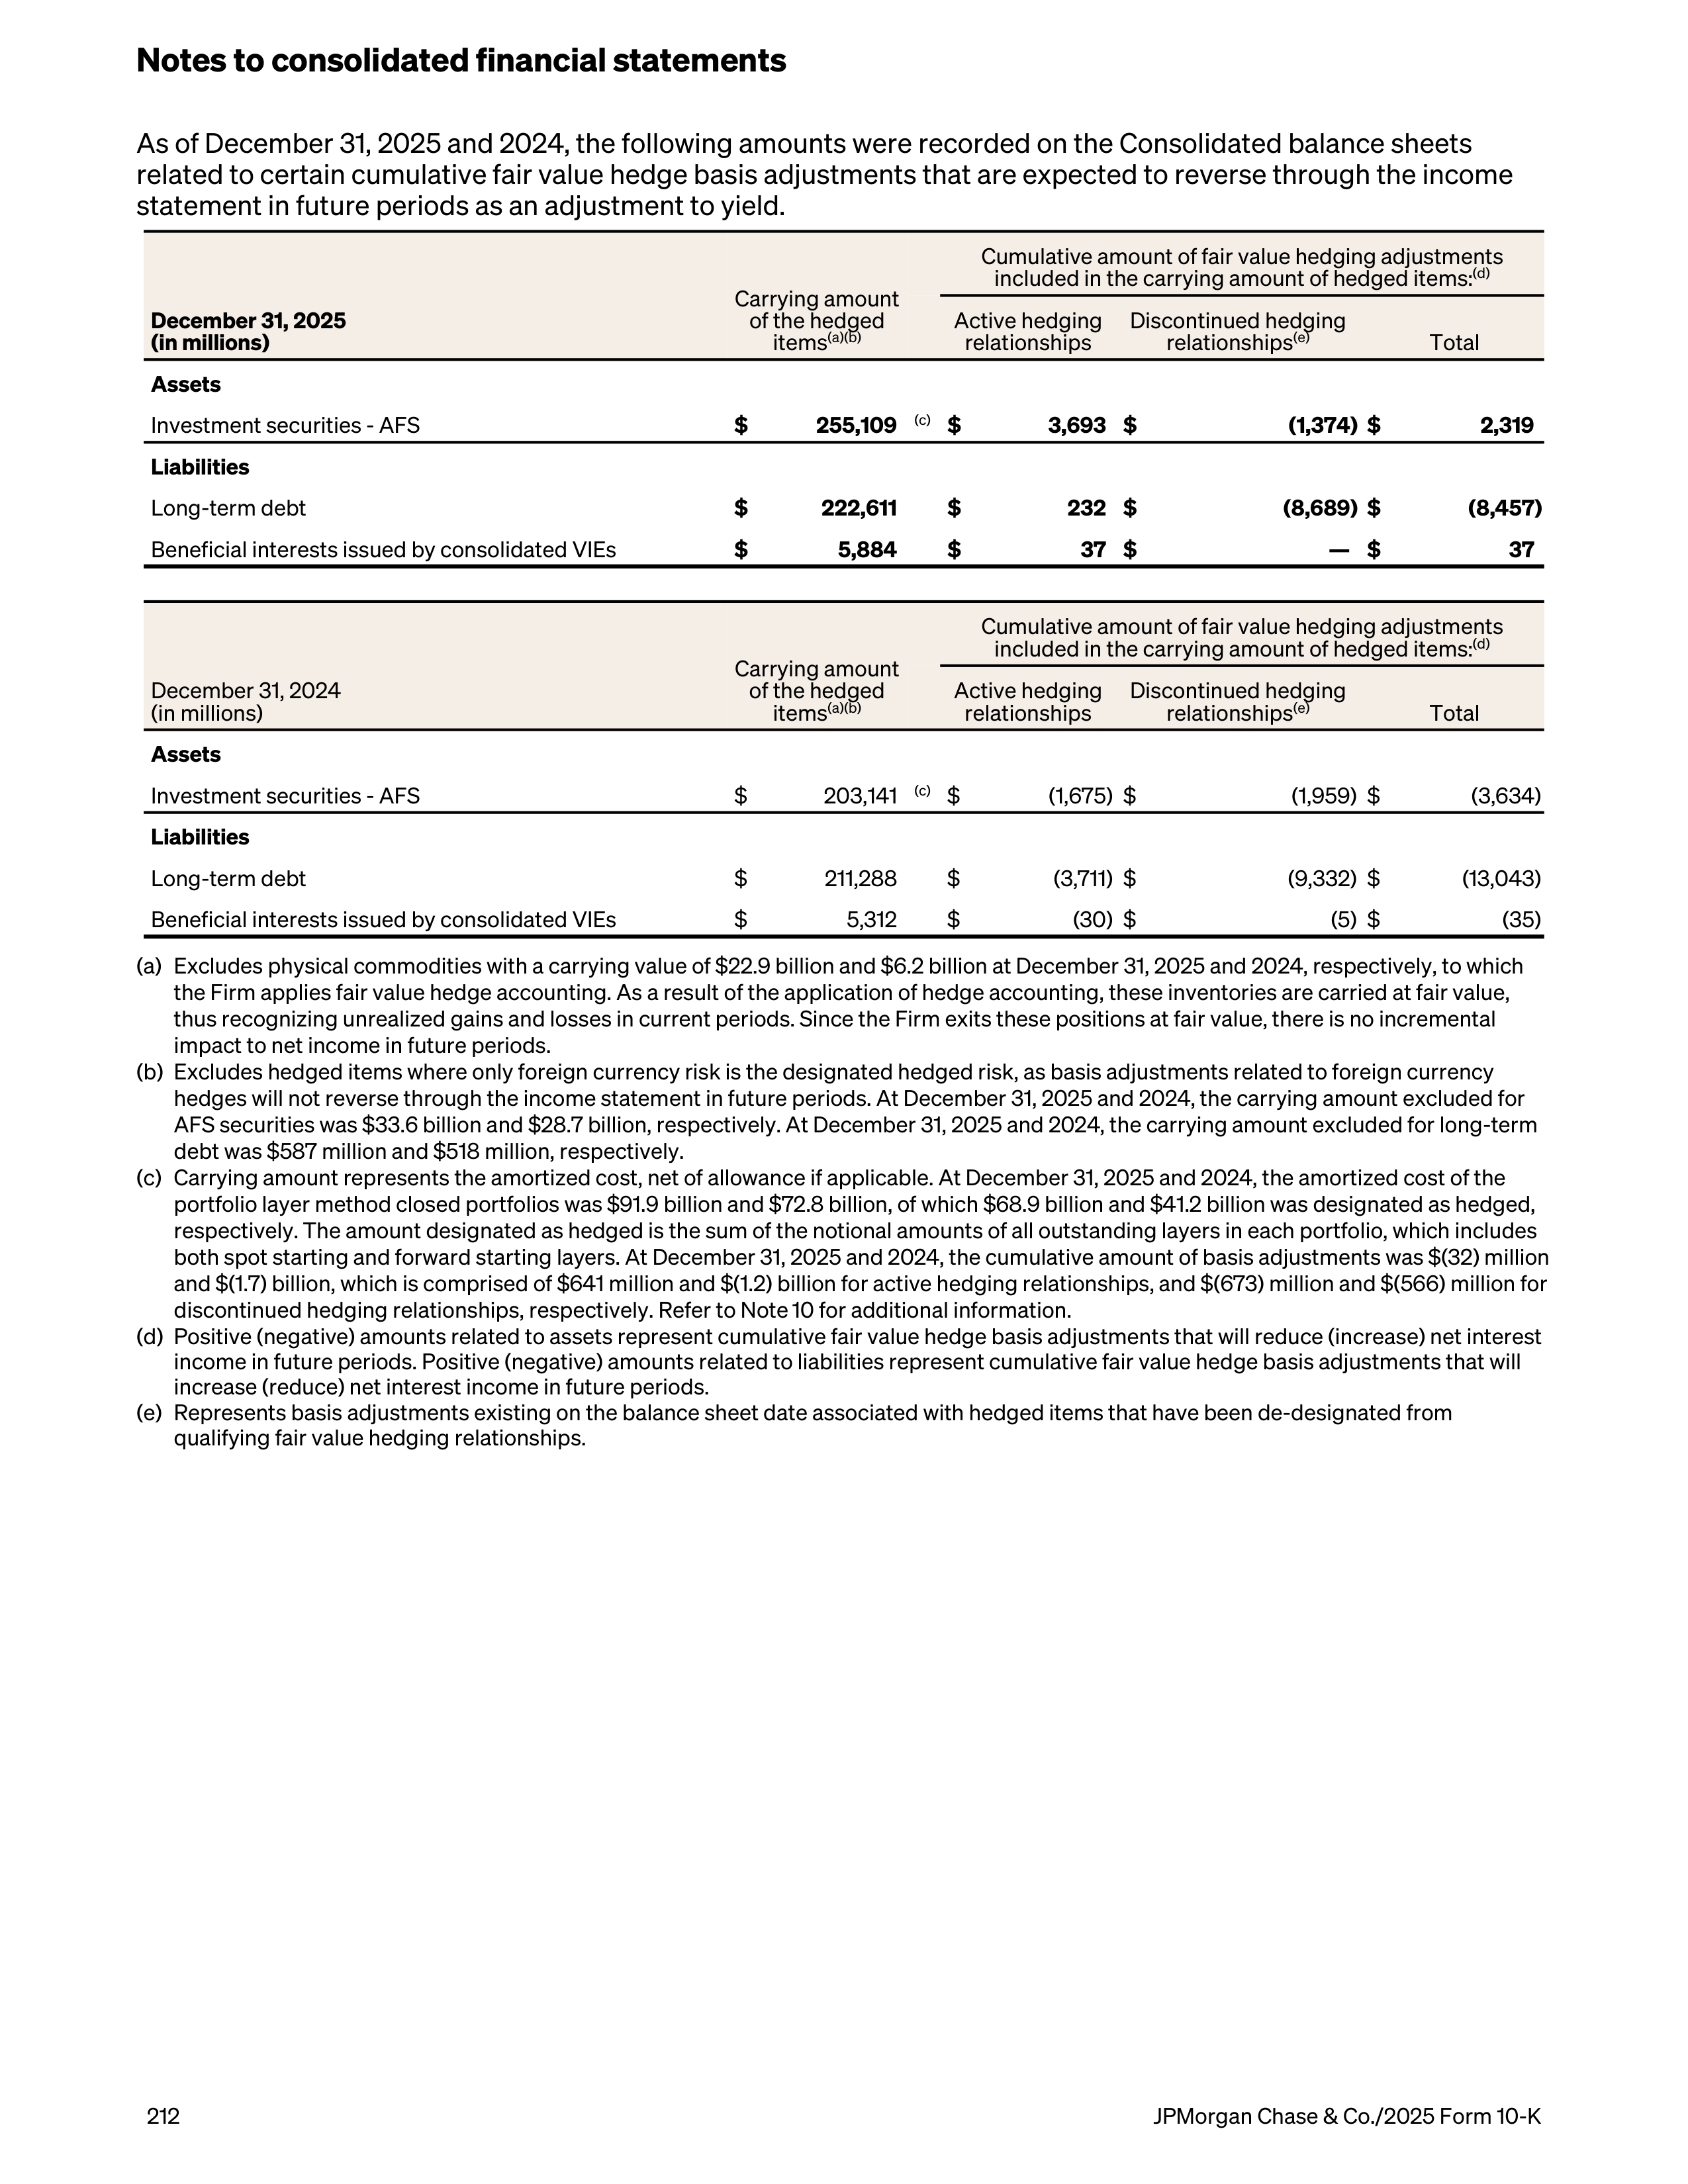
As of December 31, 2025 and 2024, the following amounts were recorded on the Consolidated balance sheets
related to certain cumulative fair value hedge basis adjustments that are expected to reverse through the income
statement in future periods as an adjustment to yield.
Carrying amount
of the hedged
items
(a)(b)
Cumulative amount of fair value hedging adjustments
included in the carrying amount of hedged items:
(d)
December 31, 2025
(in millions)
Active hedging
relationships
Discontinued hedging
relationships
(e)
Total
Assets
Investment securities - AFS
$
255,109
(c)
$
3,693 $
(1,374) $
2,319
Liabilities
Long-term debt
$
222,611
$
232 $
(8,689) $
(8,457)
Beneficial interests issued by consolidated VIEs
$
5,884
$
37 $
— $
37
Carrying amount
of the hedged
items
(a)(b)
Cumulative amount of fair value hedging adjustments
included in the carrying amount of hedged items:
(d)
December 31, 2024
(in millions)
Active hedging
relationships
Discontinued hedging
relationships
(e)
Total
Assets
Investment securities - AFS
$
203,141
(c)
$
(1,675) $
(1,959) $
(3,634)
Liabilities
Long-term debt
$
211,288
$
(3,711) $
(9,332) $
(13,043)
Beneficial interests issued by consolidated VIEs
$
5,312
$
(30) $
(5) $
(35)
(a)
Excludes physical commodities with a carrying value of $22.9 billion and $6.2 billion at December 31, 2025 and 2024, respectively, to which
the Firm applies fair value hedge accounting. As a result of the application of hedge accounting, these inventories are carried at fair value,
thus recognizing unrealized gains and losses in current periods. Since the Firm exits these positions at fair value, there is no incremental
impact to net income in future periods.
(b)
Excludes hedged items where only foreign currency risk is the designated hedged risk, as basis adjustments related to foreign currency
hedges will not reverse through the income statement in future periods. At December 31, 2025 and 2024, the carrying amount excluded for
AFS securities was $33.6 billion and $28.7 billion, respectively. At December 31, 2025 and 2024, the carrying amount excluded for long-term
debt was $587 million and $518 million, respectively.
(c)
Carrying amount represents the amortized cost, net of allowance if applicable. At December 31, 2025 and 2024, the amortized cost of the
portfolio layer method closed portfolios was $91.9 billion and $72.8 billion, of which $68.9 billion and $41.2 billion was designated as hedged,
respectively. The amount designated as hedged is the sum of the notional amounts of all outstanding layers in each portfolio, which includes
both spot starting and forward starting layers. At December 31, 2025 and 2024, the cumulative amount of basis adjustments was $(32) million
and $(1.7) billion, which is comprised of $641 million and $(1.2) billion for active hedging relationships, and $(673) million and $(566) million for
discontinued hedging relationships, respectively. Refer to Note
10 for additional information.
(d)
Positive (negative) amounts related to assets represent cumulative fair value hedge basis adjustments that will reduce (increase) net interest
income in future periods. Positive (negative) amounts related to liabilities represent cumulative fair value hedge basis adjustments that will
increase (reduce) net interest income in future periods.
(e)
Represents basis adjustments existing on the balance sheet date associated with hedged items that have been de-designated from
qualifying fair value hedging relationships.
Notes to consolidated financial statements
212
JPMorgan Chase & Co./2025 Form 10-K
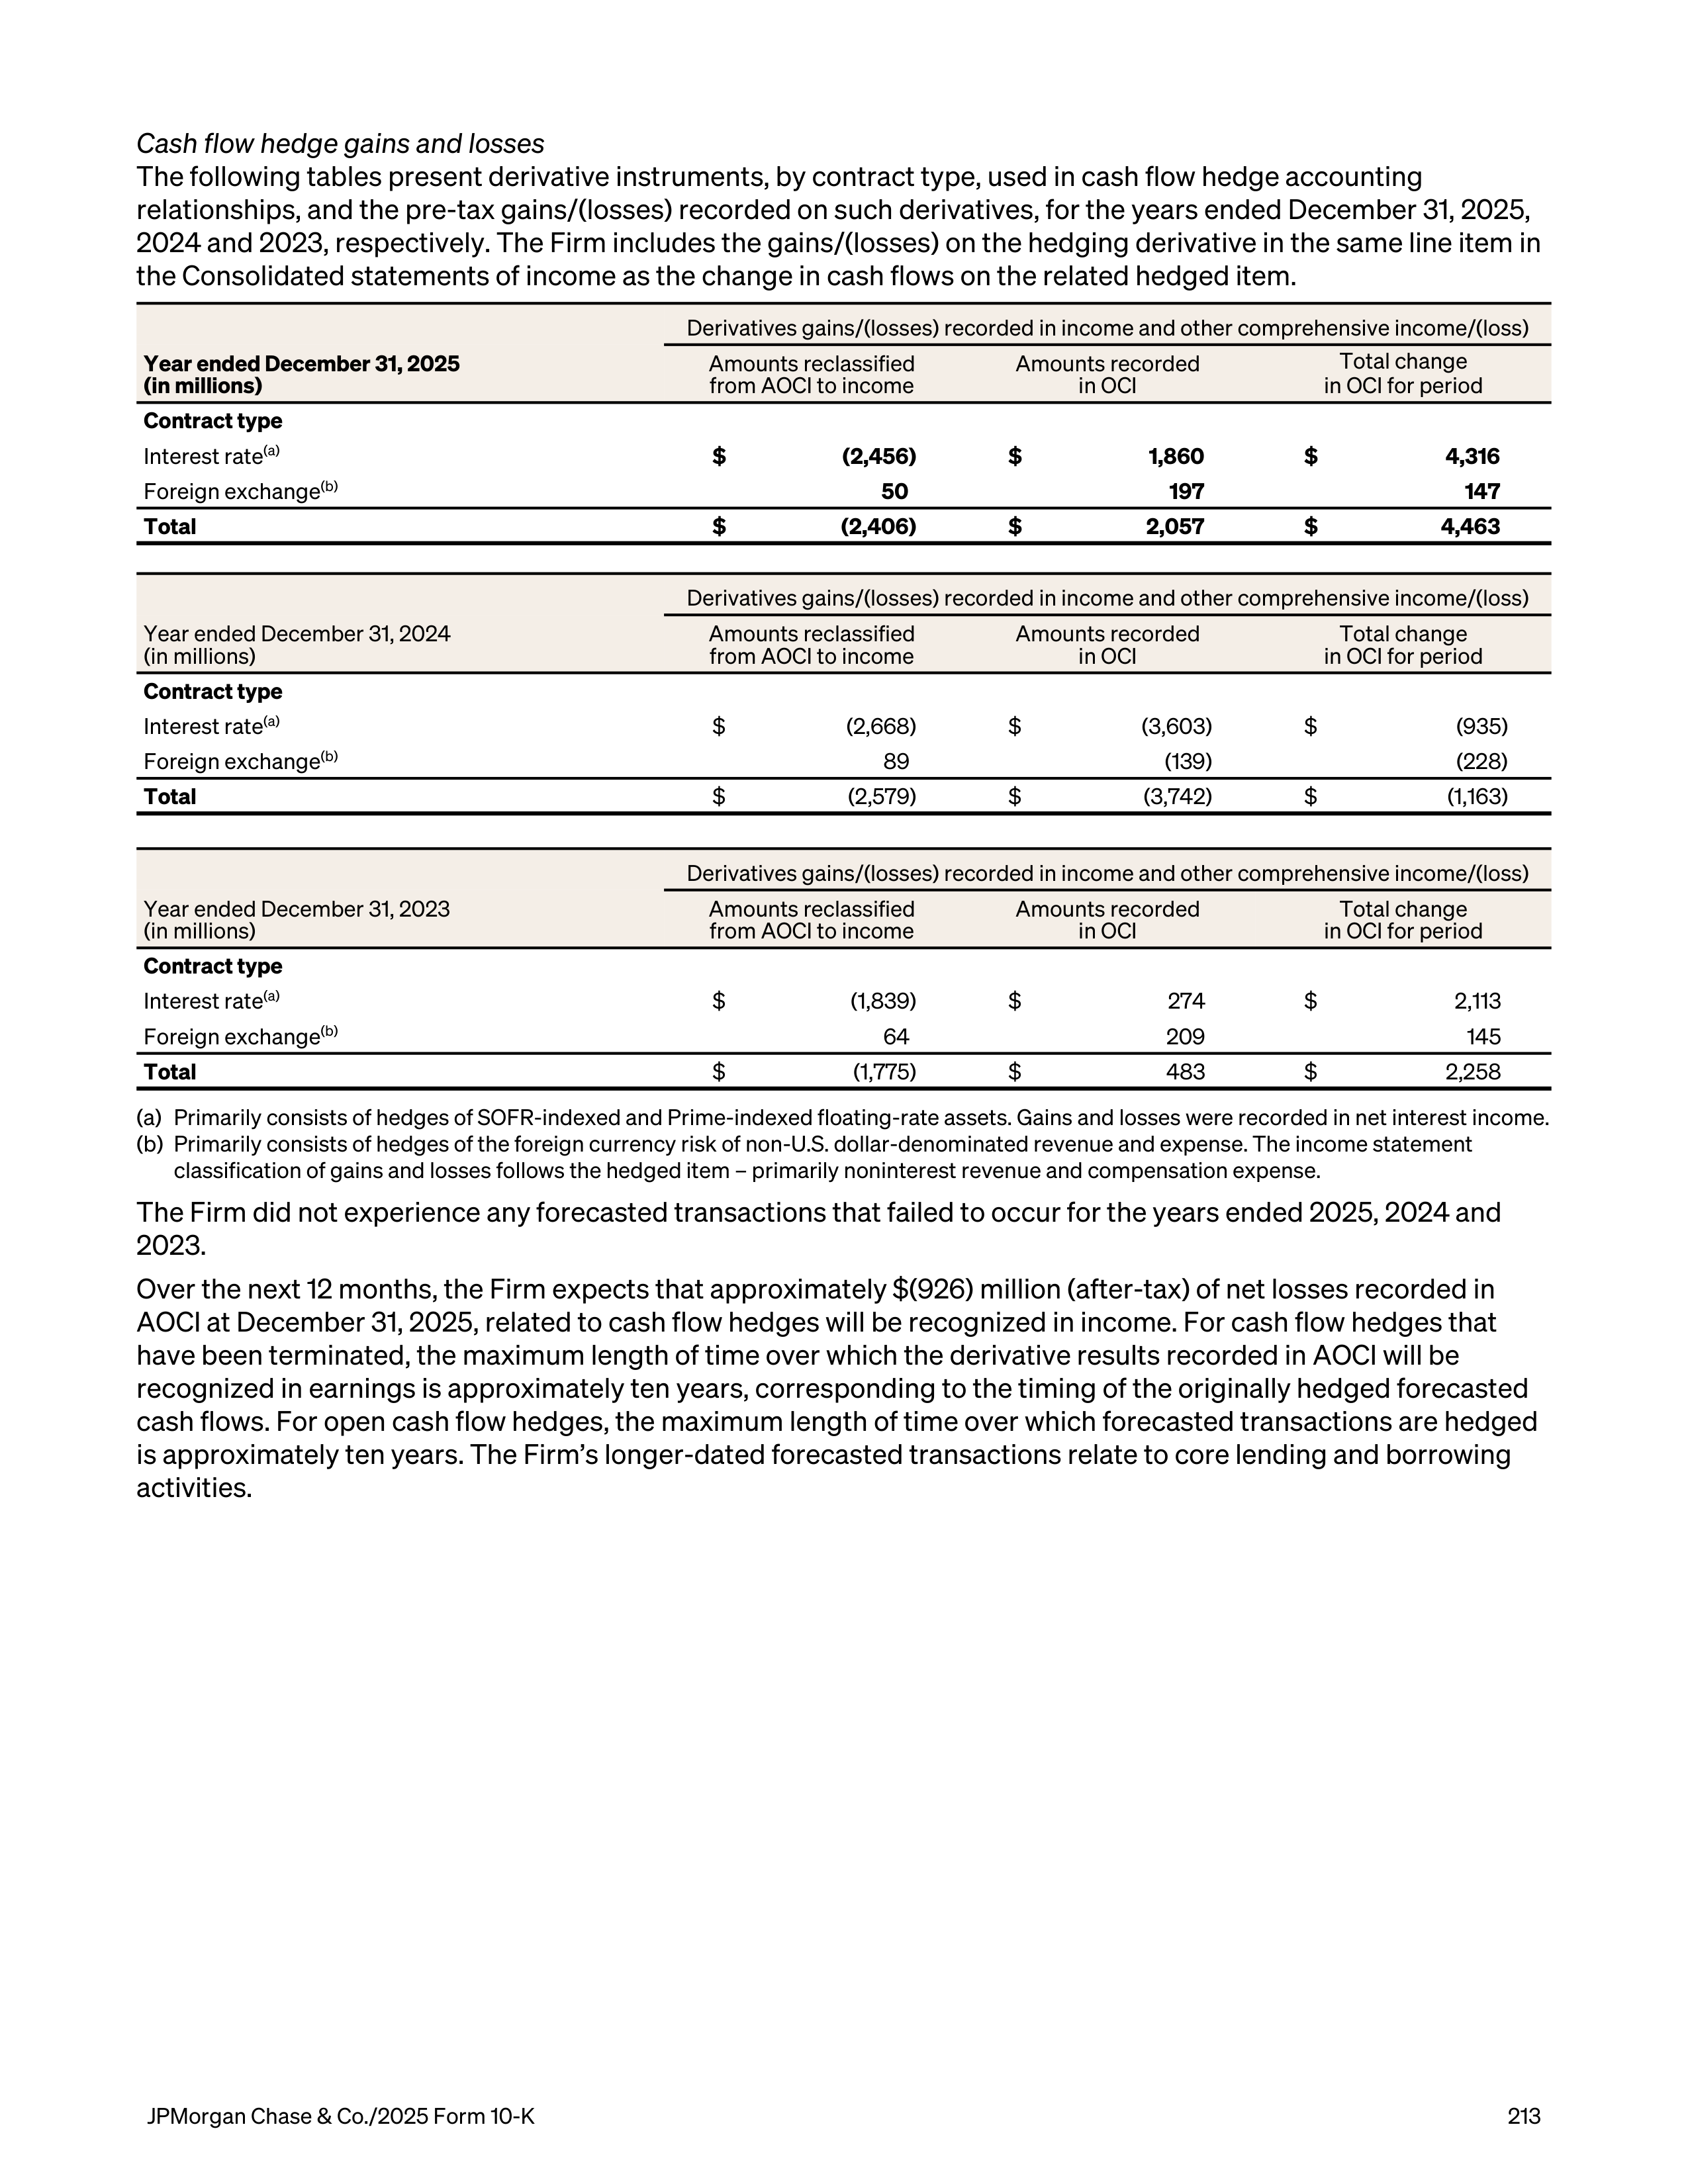
Cash flow hedge gains and losses
The following tables present derivative instruments, by contract type, used in cash flow hedge accounting
relationships, and the pre-tax gains/(losses) recorded on such derivatives, for the years ended December 31, 2025,
2024 and 2023, respectively. The Firm includes the gains/(losses) on the hedging derivative in the same line item in
the Consolidated statements of income as the change in cash flows on the related hedged item.
Derivatives gains/(losses) recorded in income and other comprehensive income/(loss)
Year ended December 31, 2025
(in millions)
Amounts reclassified
from AOCI to income
Amounts recorded
in OCI
Total change
in OCI for period
Contract type
Interest rate
(a)
$
(2,456)
$
1,860
$
4,316
Foreign exchange
(b)
50
197
147
Total
$
(2,406)
$
2,057
$
4,463
Derivatives gains/(losses) recorded in income and other comprehensive income/(loss)
Year ended December 31, 2024
(in millions)
Amounts reclassified
from AOCI to income
Amounts recorded
in OCI
Total change
in OCI for period
Contract type
Interest rate
(a)
$
(2,668)
$
(3,603)
$
(935)
Foreign exchange
(b)
89
(139)
(228)
Total
$
(2,579)
$
(3,742)
$
(1,163)
Derivatives gains/(losses) recorded in income and other comprehensive income/(loss)
Year ended December 31, 2023
(in millions)
Amounts reclassified
from AOCI to income
Amounts recorded
in OCI
Total change
in OCI for period
Contract type
Interest rate
(a)
$
(1,839)
$
274
$
2,113
Foreign exchange
(b)
64
209
145
Total
$
(1,775)
$
483
$
2,258
(a)
Primarily consists of hedges of SOFR-indexed and Prime-indexed floating-rate assets. Gains and losses were recorded in net interest income.
(b)
Primarily consists of hedges of the foreign currency risk of non-U.S. dollar-denominated revenue and expense. The income statement
classification of gains and losses follows the hedged item – primarily noninterest revenue and compensation expense.
The Firm did not experience any forecasted transactions that failed to occur for the years ended 2025, 2024 and
2023.
Over the next 12 months, the Firm expects that approximately $(926) million (after-tax) of net losses recorded in
AOCI at December 31, 2025, related to cash flow hedges will be recognized in income. For cash flow hedges that
have been terminated, the maximum length of time over which the derivative results recorded in AOCI will be
recognized in earnings is approximately ten years, corresponding to the timing of the originally hedged forecasted
cash flows. For open cash flow hedges, the maximum length of time over which forecasted transactions are hedged
is approximately ten years. The Firm’s longer-dated forecasted transactions relate to core lending and borrowing
activities.
JPMorgan Chase & Co./2025 Form 10-K
213
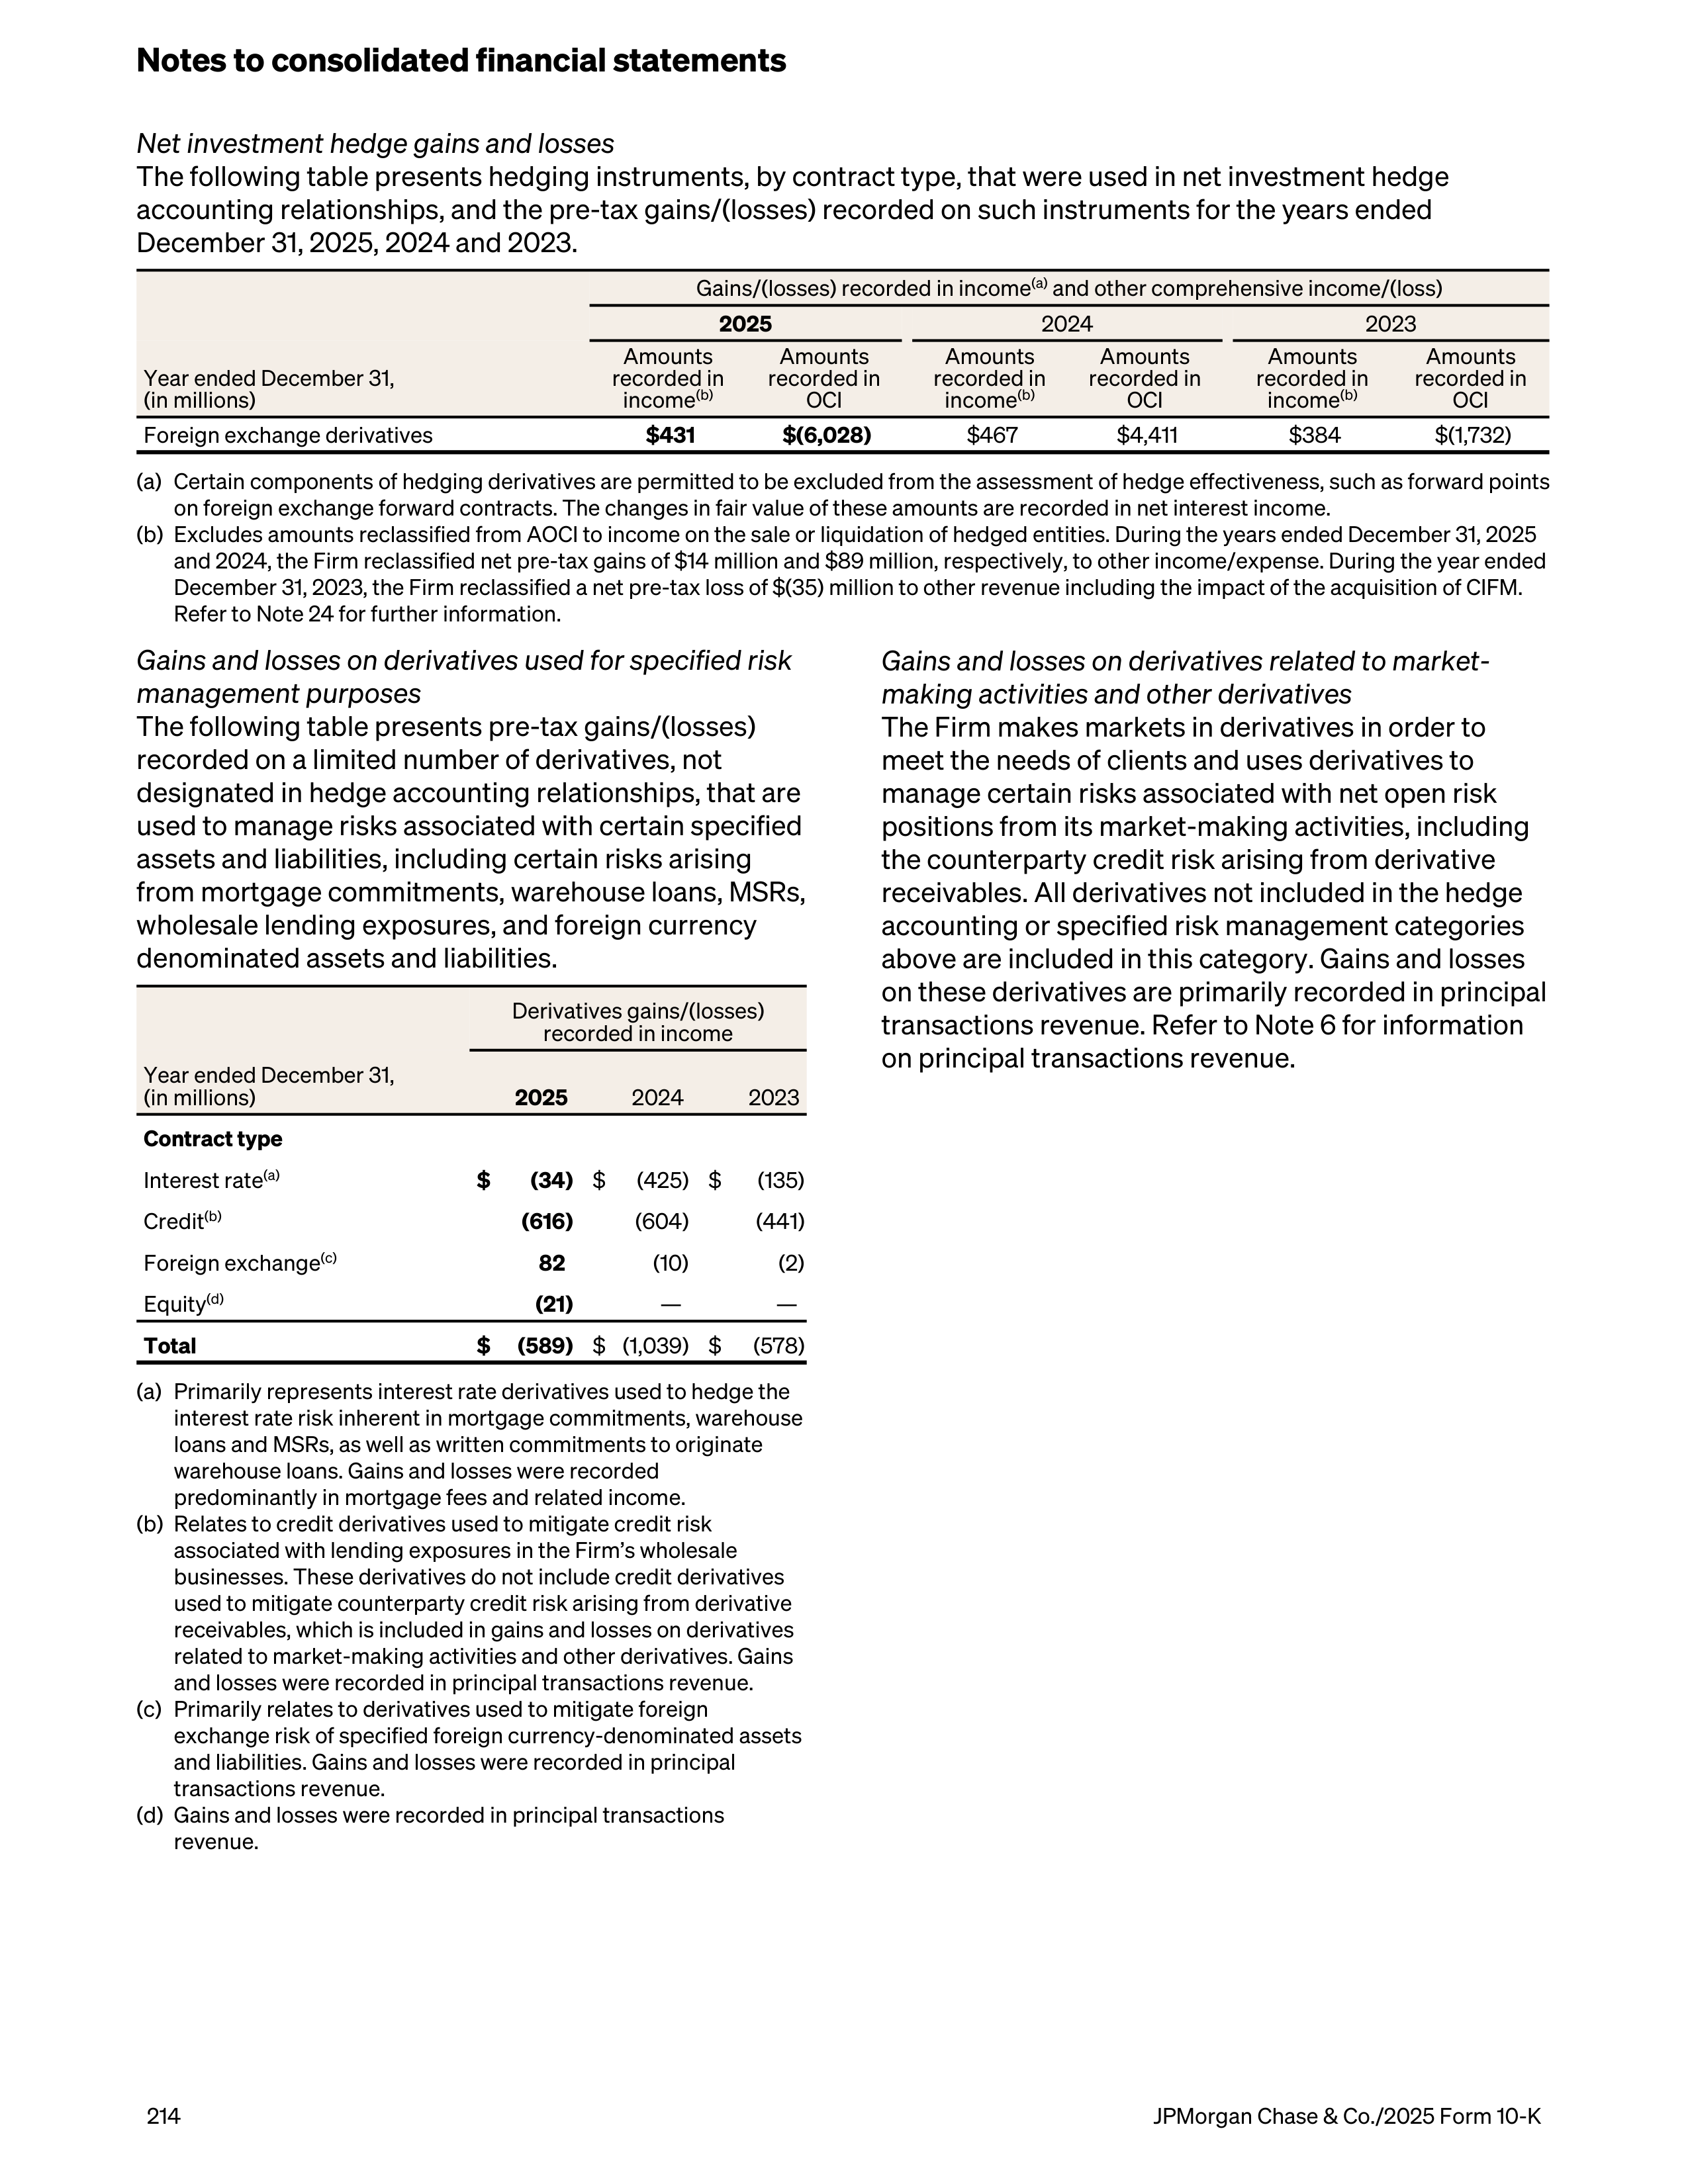
Net investment hedge gains and losses
The following table presents hedging instruments, by contract type, that were used in net investment hedge
accounting relationships, and the pre-tax gains/(losses) recorded on such instruments for the years ended
December 31, 2025, 2024 and 2023.
Gains/(losses) recorded in income
(a)
and other comprehensive income/(loss)
2025
2024
2023
Year ended December 31,
(in millions)
Amounts
recorded in
income
(b)
Amounts
recorded in
OCI
Amounts
recorded in
income
(b)
Amounts
recorded in
OCI
Amounts
recorded in
income
(b)
Amounts
recorded in
OCI
Foreign exchange derivatives
$431
$(6,028)
$467
$4,411
$384
$(1,732)
(a)
Certain components of hedging derivatives are permitted to be excluded from the assessment of hedge effectiveness, such as forward points
on foreign exchange forward contracts. The changes in fair value of these amounts are recorded in net interest income.
(b)
Excludes amounts reclassified from AOCI to income on the sale or liquidation of hedged entities. During the years ended December 31, 2025
and 2024, the Firm reclassified net pre-tax gains of $14 million and $89 million, respectively, to other income/expense. During the year ended
December 31, 2023, the Firm reclassified a net pre-tax loss of $(35) million to other revenue including the impact of the acquisition of CIFM.
Refer to Note 24 for further information.
Gains and losses on derivatives used for specified risk
management purposes
The following table presents pre-tax gains/(losses)
recorded on a limited number of derivatives, not
designated in hedge accounting relationships, that are
used to manage risks associated with certain specified
assets and liabilities, including certain risks arising
from mortgage commitments, warehouse loans, MSRs,
wholesale lending exposures, and foreign currency
denominated assets and liabilities.
Derivatives gains/(losses)
recorded in income
Year ended December 31,
(in millions)
2025
2024
2023
Contract type
Interest rate
(a)
$
(34)
$
(425) $
(135)
Credit
(b)
(616)
(604)
(441)
Foreign exchange
(c)
82
(10)
(2)
Equity
(d)
(21)
—
—
Total
$
(589)
$ (1,039) $
(578)
(a)
Primarily represents interest rate derivatives used to hedge the
interest rate risk inherent in mortgage commitments, warehouse
loans and MSRs, as well as written commitments to originate
warehouse loans. Gains and losses were recorded
predominantly in mortgage fees and related income.
(b)
Relates to credit derivatives used to mitigate credit risk
associated with lending exposures in the Firm’s wholesale
businesses. These derivatives do not include credit derivatives
used to mitigate counterparty credit risk arising from derivative
receivables, which is included in gains and losses on derivatives
related to market-making activities and other derivatives. Gains
and losses were recorded in principal transactions revenue.
(c)
Primarily relates to derivatives used to mitigate foreign
exchange risk of specified foreign currency-denominated assets
and liabilities. Gains and losses were recorded in principal
transactions revenue.
(d)
Gains and losses were recorded in principal transactions
revenue.
Gains and losses on derivatives related to market-
making activities and other derivatives
The Firm makes markets in derivatives in order to
meet the needs of clients and uses derivatives to
manage certain risks associated with net open risk
positions from its market-making activities, including
the counterparty credit risk arising from derivative
receivables. All derivatives not included in the hedge
accounting or specified risk management categories
above are included in this category. Gains and losses
on these derivatives are primarily recorded in principal
transactions revenue. Refer to Note 6 for information
on principal transactions revenue.
Notes to consolidated financial statements
214
JPMorgan Chase & Co./2025 Form 10-K
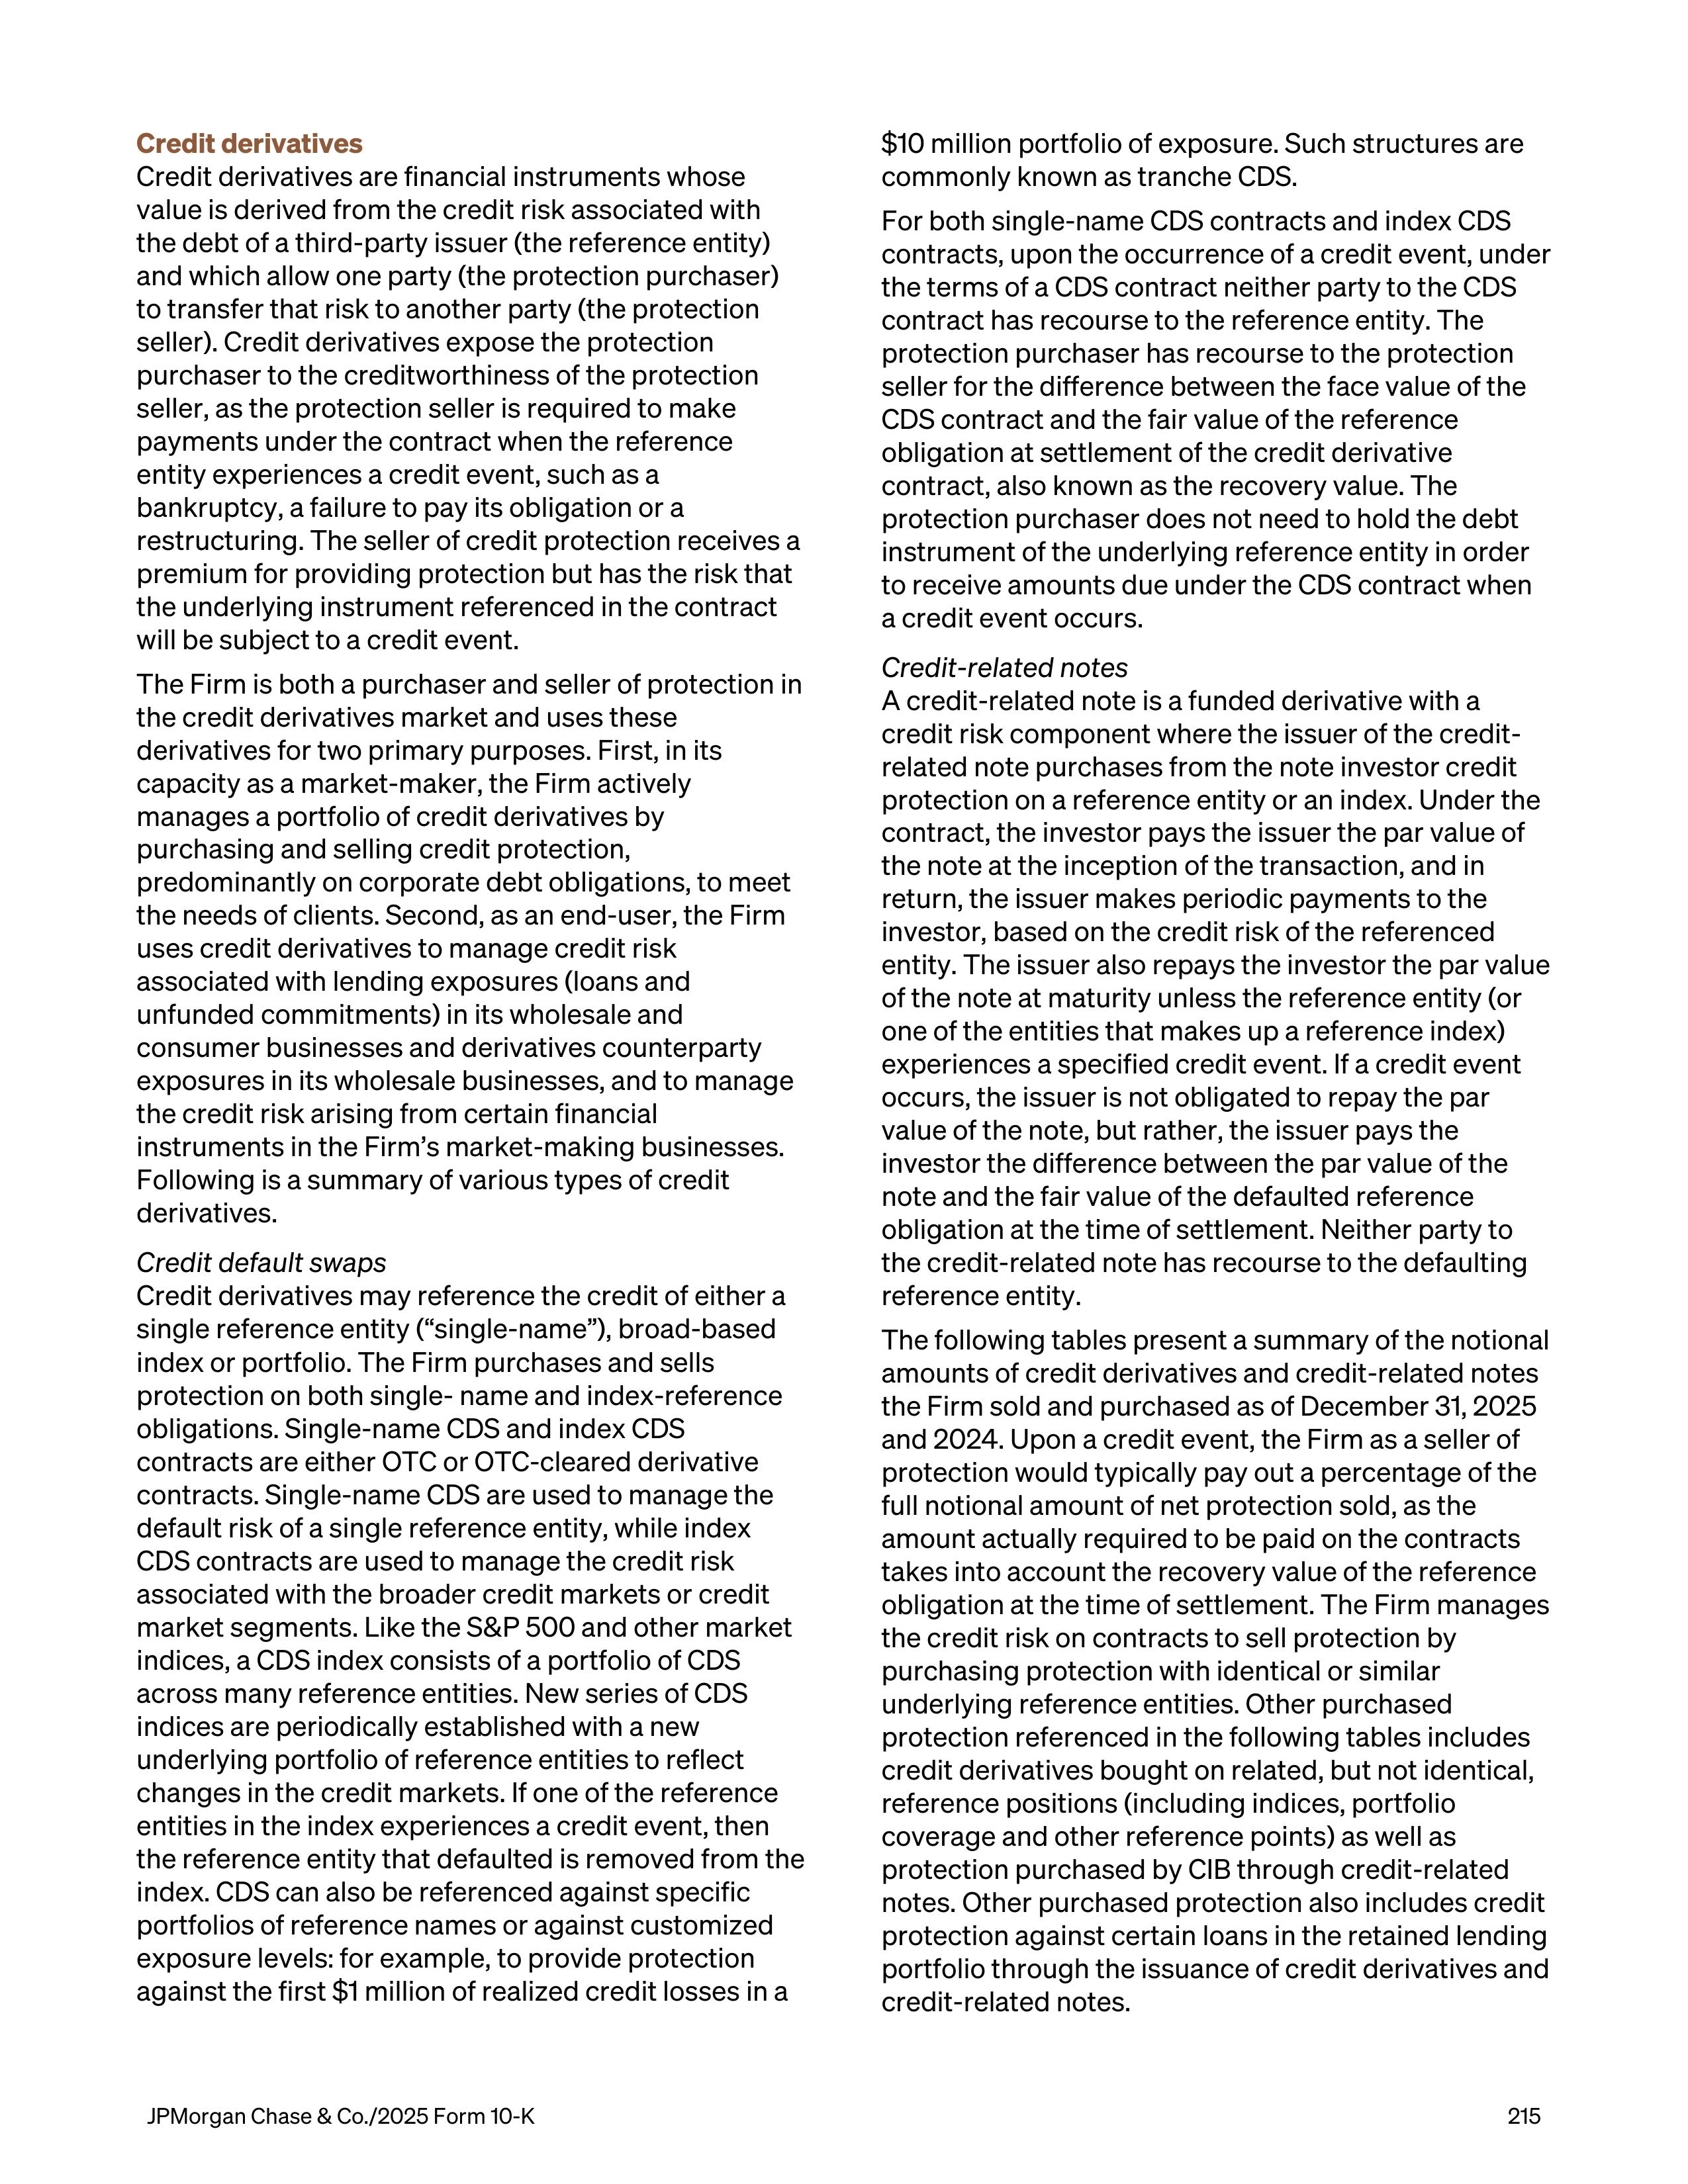
Credit derivatives
Credit derivatives are financial instruments whose
value is derived from the credit risk associated with
the debt of a third-party issuer (the reference entity)
and which allow one party (the protection purchaser)
to transfer that risk to another party (the protection
seller). Credit derivatives expose the protection
purchaser to the creditworthiness of the protection
seller, as the protection seller is required to make
payments under the contract when the reference
entity experiences a credit event, such as a
bankruptcy, a failure to pay its obligation or a
restructuring. The seller of credit protection receives a
premium for providing protection but has the risk that
the underlying instrument referenced in the contract
will be subject to a credit event.
The Firm is both a purchaser and seller of protection in
the credit derivatives market and uses these
derivatives for two primary purposes. First, in its
capacity as a market-maker, the Firm actively
manages a portfolio of credit derivatives by
purchasing and selling credit protection,
predominantly on corporate debt obligations, to meet
the needs of clients. Second, as an end-user, the Firm
uses credit derivatives to manage credit risk
associated with lending exposures (loans and
unfunded commitments) in its wholesale and
consumer businesses and derivatives counterparty
exposures in its wholesale businesses, and to manage
the credit risk arising from certain financial
instruments in the Firm’s market-making businesses.
Following is a summary of various types of credit
derivatives.
Credit default swaps
Credit derivatives may reference the credit of either a
single reference entity (“single-name”), broad-based
index or portfolio. The Firm purchases and sells
protection on both single- name and index-reference
obligations. Single-name CDS and index CDS
contracts are either OTC or OTC-cleared derivative
contracts. Single-name CDS are used to manage the
default risk of a single reference entity, while index
CDS contracts are used to manage the credit risk
associated with the broader credit markets or credit
market segments. Like the S&P 500 and other market
indices, a CDS index consists of a portfolio of CDS
across many reference entities. New series of CDS
indices are periodically established with a new
underlying portfolio of reference entities to reflect
changes in the credit markets. If one of the reference
entities in the index experiences a credit event, then
the reference entity that defaulted is removed from the
index. CDS can also be referenced against specific
portfolios of reference names or against customized
exposure levels: for example, to provide protection
against the first $1 million of realized credit losses in a
$10 million portfolio of exposure. Such structures are
commonly known as tranche CDS.
For both single-name CDS contracts and index CDS
contracts, upon the occurrence of a credit event, under
the terms of a CDS contract neither party to the CDS
contract has recourse to the reference entity. The
protection purchaser has recourse to the protection
seller for the difference between the face value of the
CDS contract and the fair value of the reference
obligation at settlement of the credit derivative
contract, also known as the recovery value. The
protection purchaser does not need to hold the debt
instrument of the underlying reference entity in order
to receive amounts due under the CDS contract when
a credit event occurs.
Credit-related notes
A credit-related note is a funded derivative with a
credit risk component where the issuer of the credit-
related note purchases from the note investor credit
protection on a reference entity or an index. Under the
contract, the investor pays the issuer the par value of
the note at the inception of the transaction, and in
return, the issuer makes periodic payments to the
investor, based on the credit risk of the referenced
entity. The issuer also repays the investor the par value
of the note at maturity unless the reference entity (or
one of the entities that makes up a reference index)
experiences a specified credit event. If a credit event
occurs, the issuer is not obligated to repay the par
value of the note, but rather, the issuer pays the
investor the difference between the par value of the
note and the fair value of the defaulted reference
obligation at the time of settlement. Neither party to
the credit-related note has recourse to the defaulting
reference entity.
The following tables present a summary of the notional
amounts of credit derivatives and credit-related notes
the Firm sold and purchased as of December 31, 2025
and 2024. Upon a credit event, the Firm as a seller of
protection would typically pay out a percentage of the
full notional amount of net protection sold, as the
amount actually required to be paid on the contracts
takes into account the recovery value of the reference
obligation at the time of settlement. The Firm manages
the credit risk on contracts to sell protection by
purchasing protection with identical or similar
underlying reference entities. Other purchased
protection referenced in the following tables includes
credit derivatives bought on related, but not identical,
reference positions (including indices, portfolio
coverage and other reference points) as well as
protection purchased by CIB through credit-related
notes. Other purchased protection also includes credit
protection against certain loans in the retained lending
portfolio through the issuance of credit derivatives and
credit-related notes.
JPMorgan Chase & Co./2025 Form 10-K
215
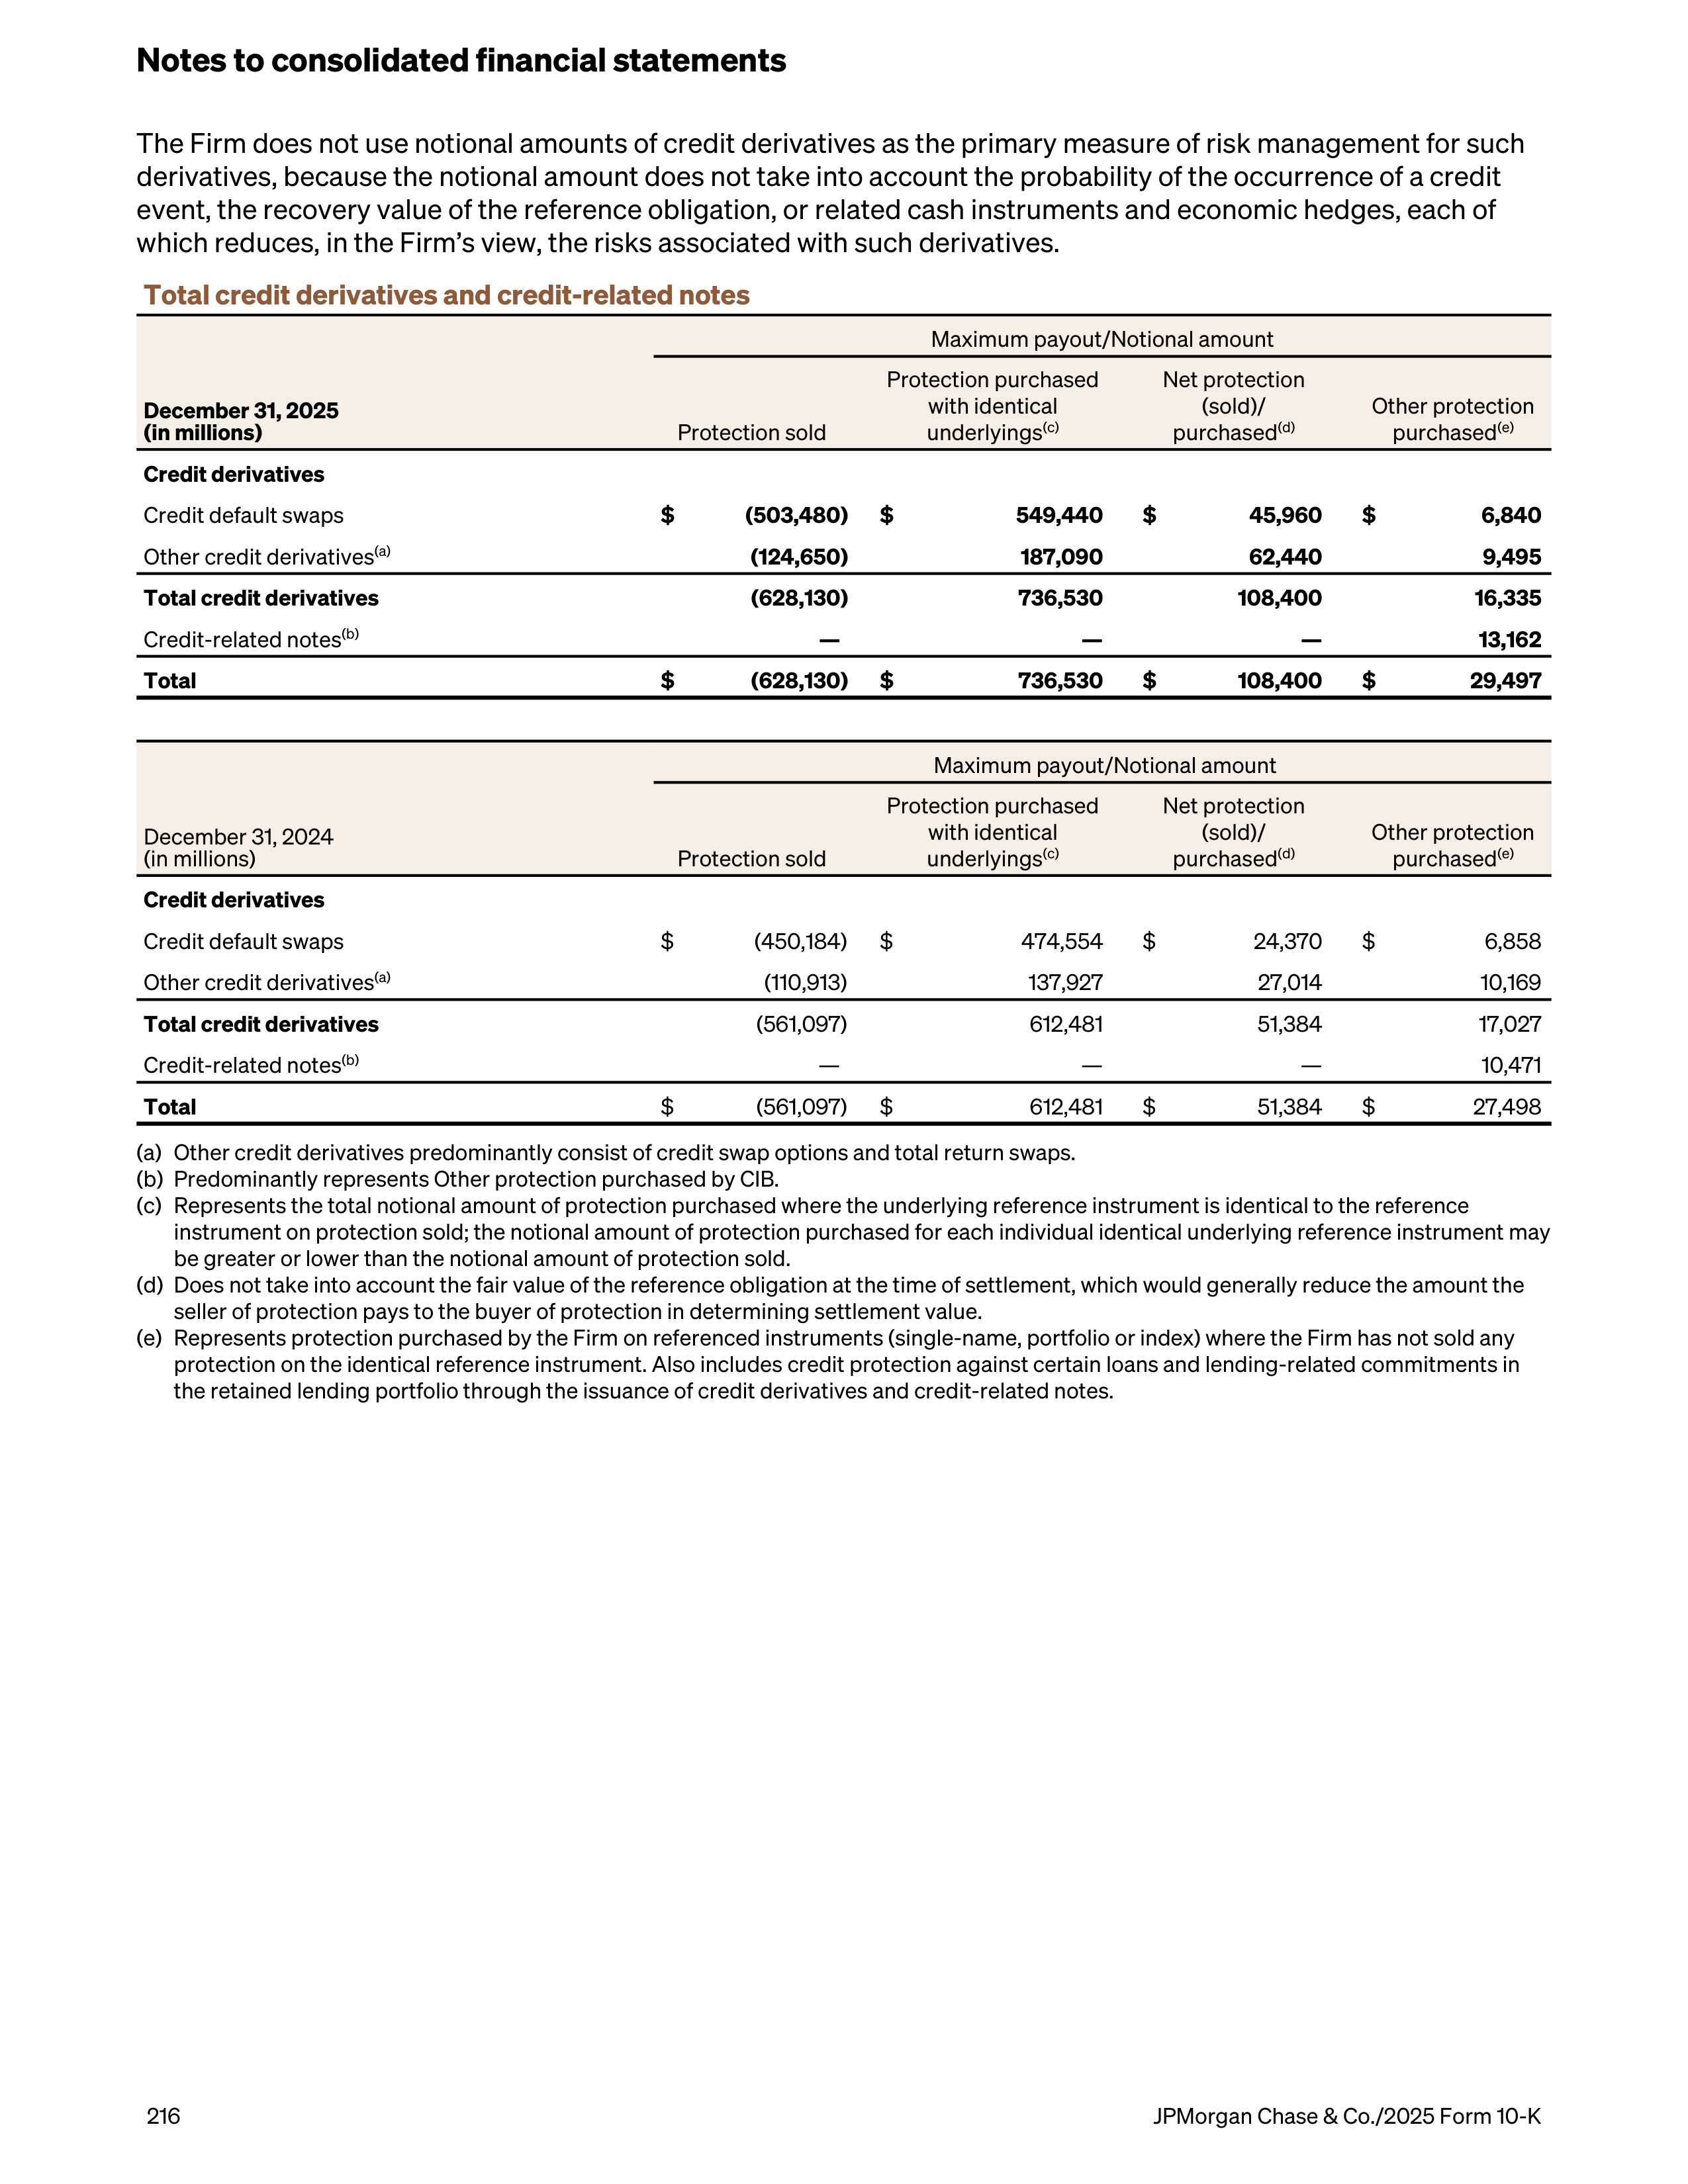
The Firm does not use notional amounts of credit derivatives as the primary measure of risk management for such
derivatives, because the notional amount does not take into account the probability of the occurrence of a credit
event, the recovery value of the reference obligation, or related cash instruments and economic hedges, each of
which reduces, in the Firm’s view, the risks associated with such derivatives.
Total credit derivatives and credit-related notes
Maximum payout/Notional amount
December 31, 2025
(in millions)
Protection sold
Protection purchased
with identical
underlyings
(c)
Net protection
(sold)/
purchased
(d)
Other protection
purchased
(e)
Credit derivatives
Credit default swaps
$
(503,480)
$
549,440
$
45,960
$
6,840
Other credit derivatives
(a)
(124,650)
187,090
62,440
9,495
Total credit derivatives
(628,130)
736,530
108,400
16,335
Credit-related notes
(b)
—
—
—
13,162
Total
$
(628,130)
$
736,530
$
108,400
$
29,497
Maximum payout/Notional amount
December 31, 2024
(in millions)
Protection sold
Protection purchased
with identical
underlyings
(c)
Net protection
(sold)/
purchased
(d)
Other protection
purchased
(e)
Credit derivatives
Credit default swaps
$
(450,184)
$
474,554
$
24,370
$
6,858
Other credit derivatives
(a)
(110,913)
137,927
27,014
10,169
Total credit derivatives
(561,097)
612,481
51,384
17,027
Credit-related notes
(b)
—
—
—
10,471
Total
$
(561,097)
$
612,481
$
51,384
$
27,498
(a)
Other credit derivatives predominantly consist of credit swap options and total return swaps.
(b)
Predominantly represents Other protection purchased by CIB.
(c)
Represents the total notional amount of protection purchased where the underlying reference instrument is identical to the reference
instrument on protection sold; the notional amount of protection purchased for each individual identical underlying reference instrument may
be greater or lower than the notional amount of protection sold.
(d)
Does not take into account the fair value of the reference obligation at the time of settlement, which would generally reduce the amount the
seller of protection pays to the buyer of protection in determining settlement value.
(e)
Represents protection purchased by the Firm on referenced instruments (single-name, portfolio or index) where the Firm has not sold any
protection on the identical reference instrument. Also includes credit protection against certain loans and lending-related commitments in
the retained lending portfolio through the issuance of credit derivatives and credit-related notes.
Notes to consolidated financial statements
216
JPMorgan Chase & Co./2025 Form 10-K
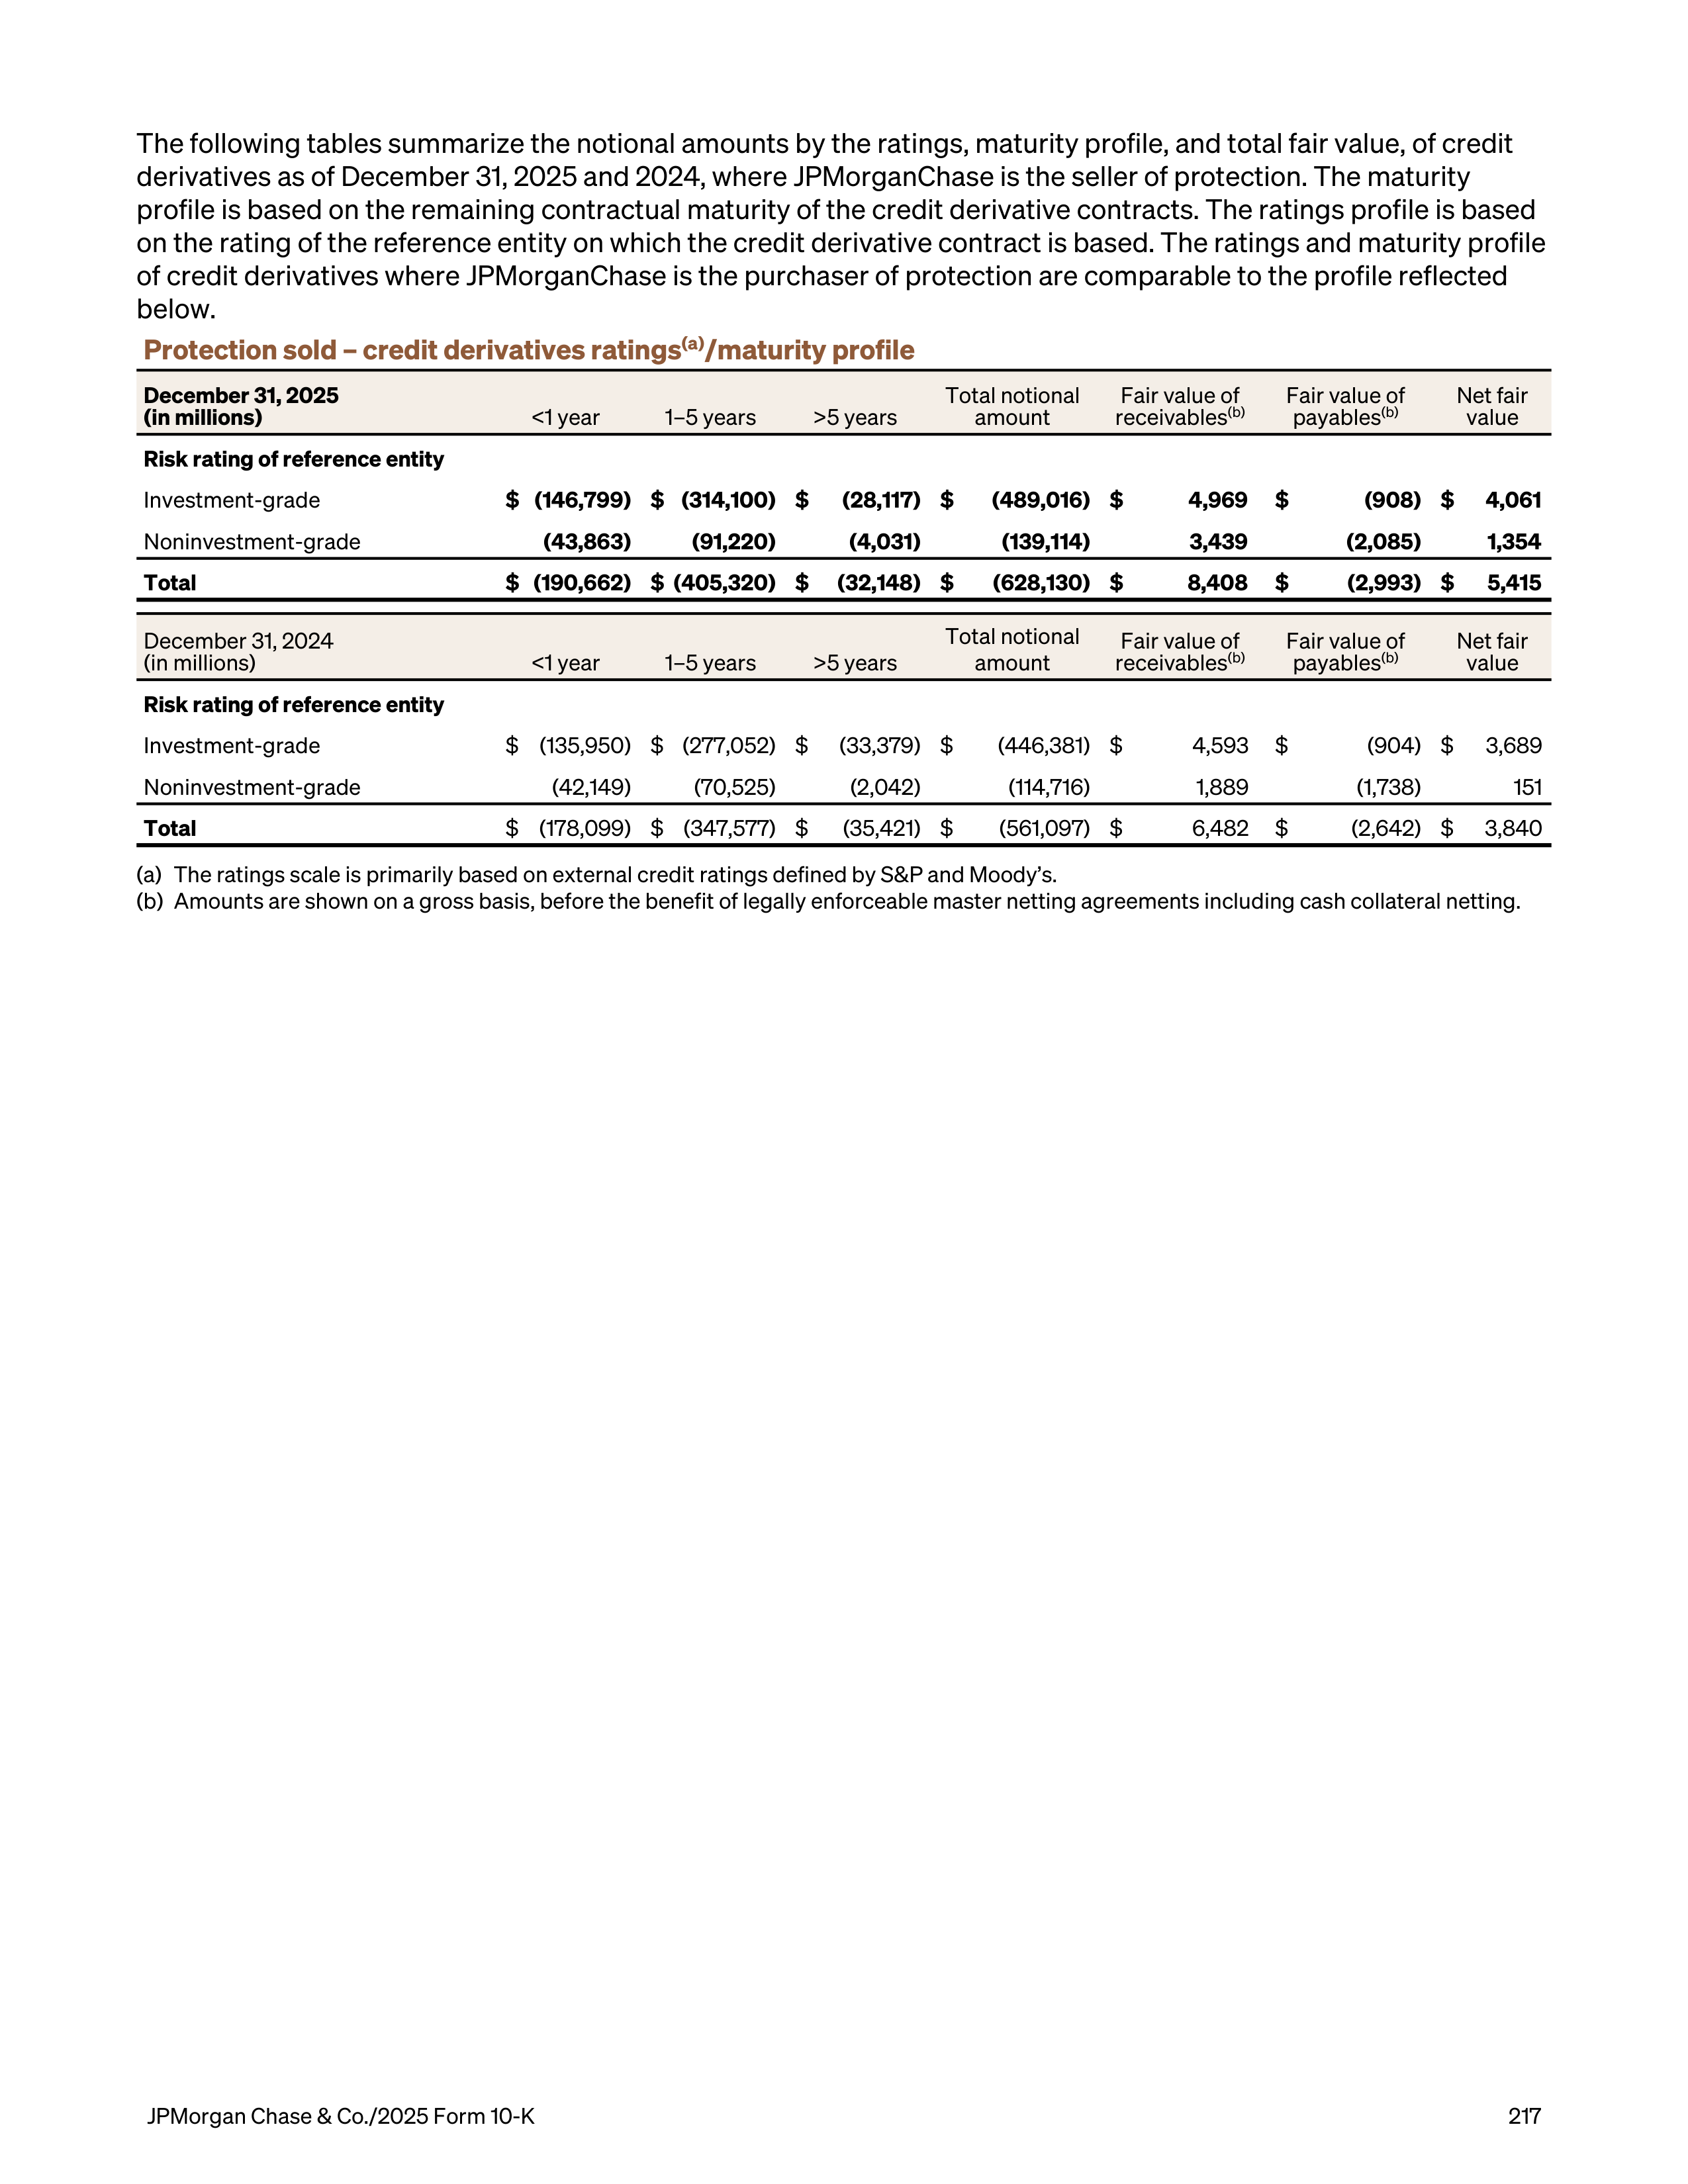
The following tables summarize the notional amounts by the ratings, maturity profile, and total fair value, of credit
derivatives as of December 31, 2025 and 2024, where JPMorganChase is the seller of protection. The maturity
profile is based on the remaining contractual maturity of the credit derivative contracts. The ratings profile is based
on the rating of the reference entity on which the credit derivative contract is based. The ratings and maturity profile
of credit derivatives where JPMorganChase is the purchaser of protection are comparable to the profile reflected
below.
Protection sold – credit derivatives ratings
(a)
/maturity profile
December 31, 2025
(in millions)
<1 year
1–5 years
>5 years
Total notional
amount
Fair value of
receivables
(b)
Fair value of
payables
(b)
Net fair
value
Risk rating of reference entity
Investment-grade
$ (146,799) $ (314,100) $
(28,117) $
(489,016) $
4,969
$
(908) $
4,061
Noninvestment-grade
(43,863)
(91,220)
(4,031)
(139,114)
3,439
(2,085)
1,354
Total
$ (190,662) $ (405,320) $
(32,148) $
(628,130) $
8,408
$
(2,993) $
5,415
December 31, 2024
(in millions)
<1 year
1–5 years
>5 years
Total notional
amount
Fair value of
receivables
(b)
Fair value of
payables
(b)
Net fair
value
Risk rating of reference entity
Investment-grade
$ (135,950) $ (277,052) $
(33,379) $
(446,381) $
4,593
$
(904) $
3,689
Noninvestment-grade
(42,149)
(70,525)
(2,042)
(114,716)
1,889
(1,738)
151
Total
$ (178,099) $ (347,577) $
(35,421) $
(561,097) $
6,482
$
(2,642) $
3,840
(a)
The ratings scale is primarily based on external credit ratings defined by S&P and Moody’s.
(b)
Amounts are shown on a gross basis, before the benefit of legally enforceable master netting agreements including cash collateral netting.
JPMorgan Chase & Co./2025 Form 10-K
217
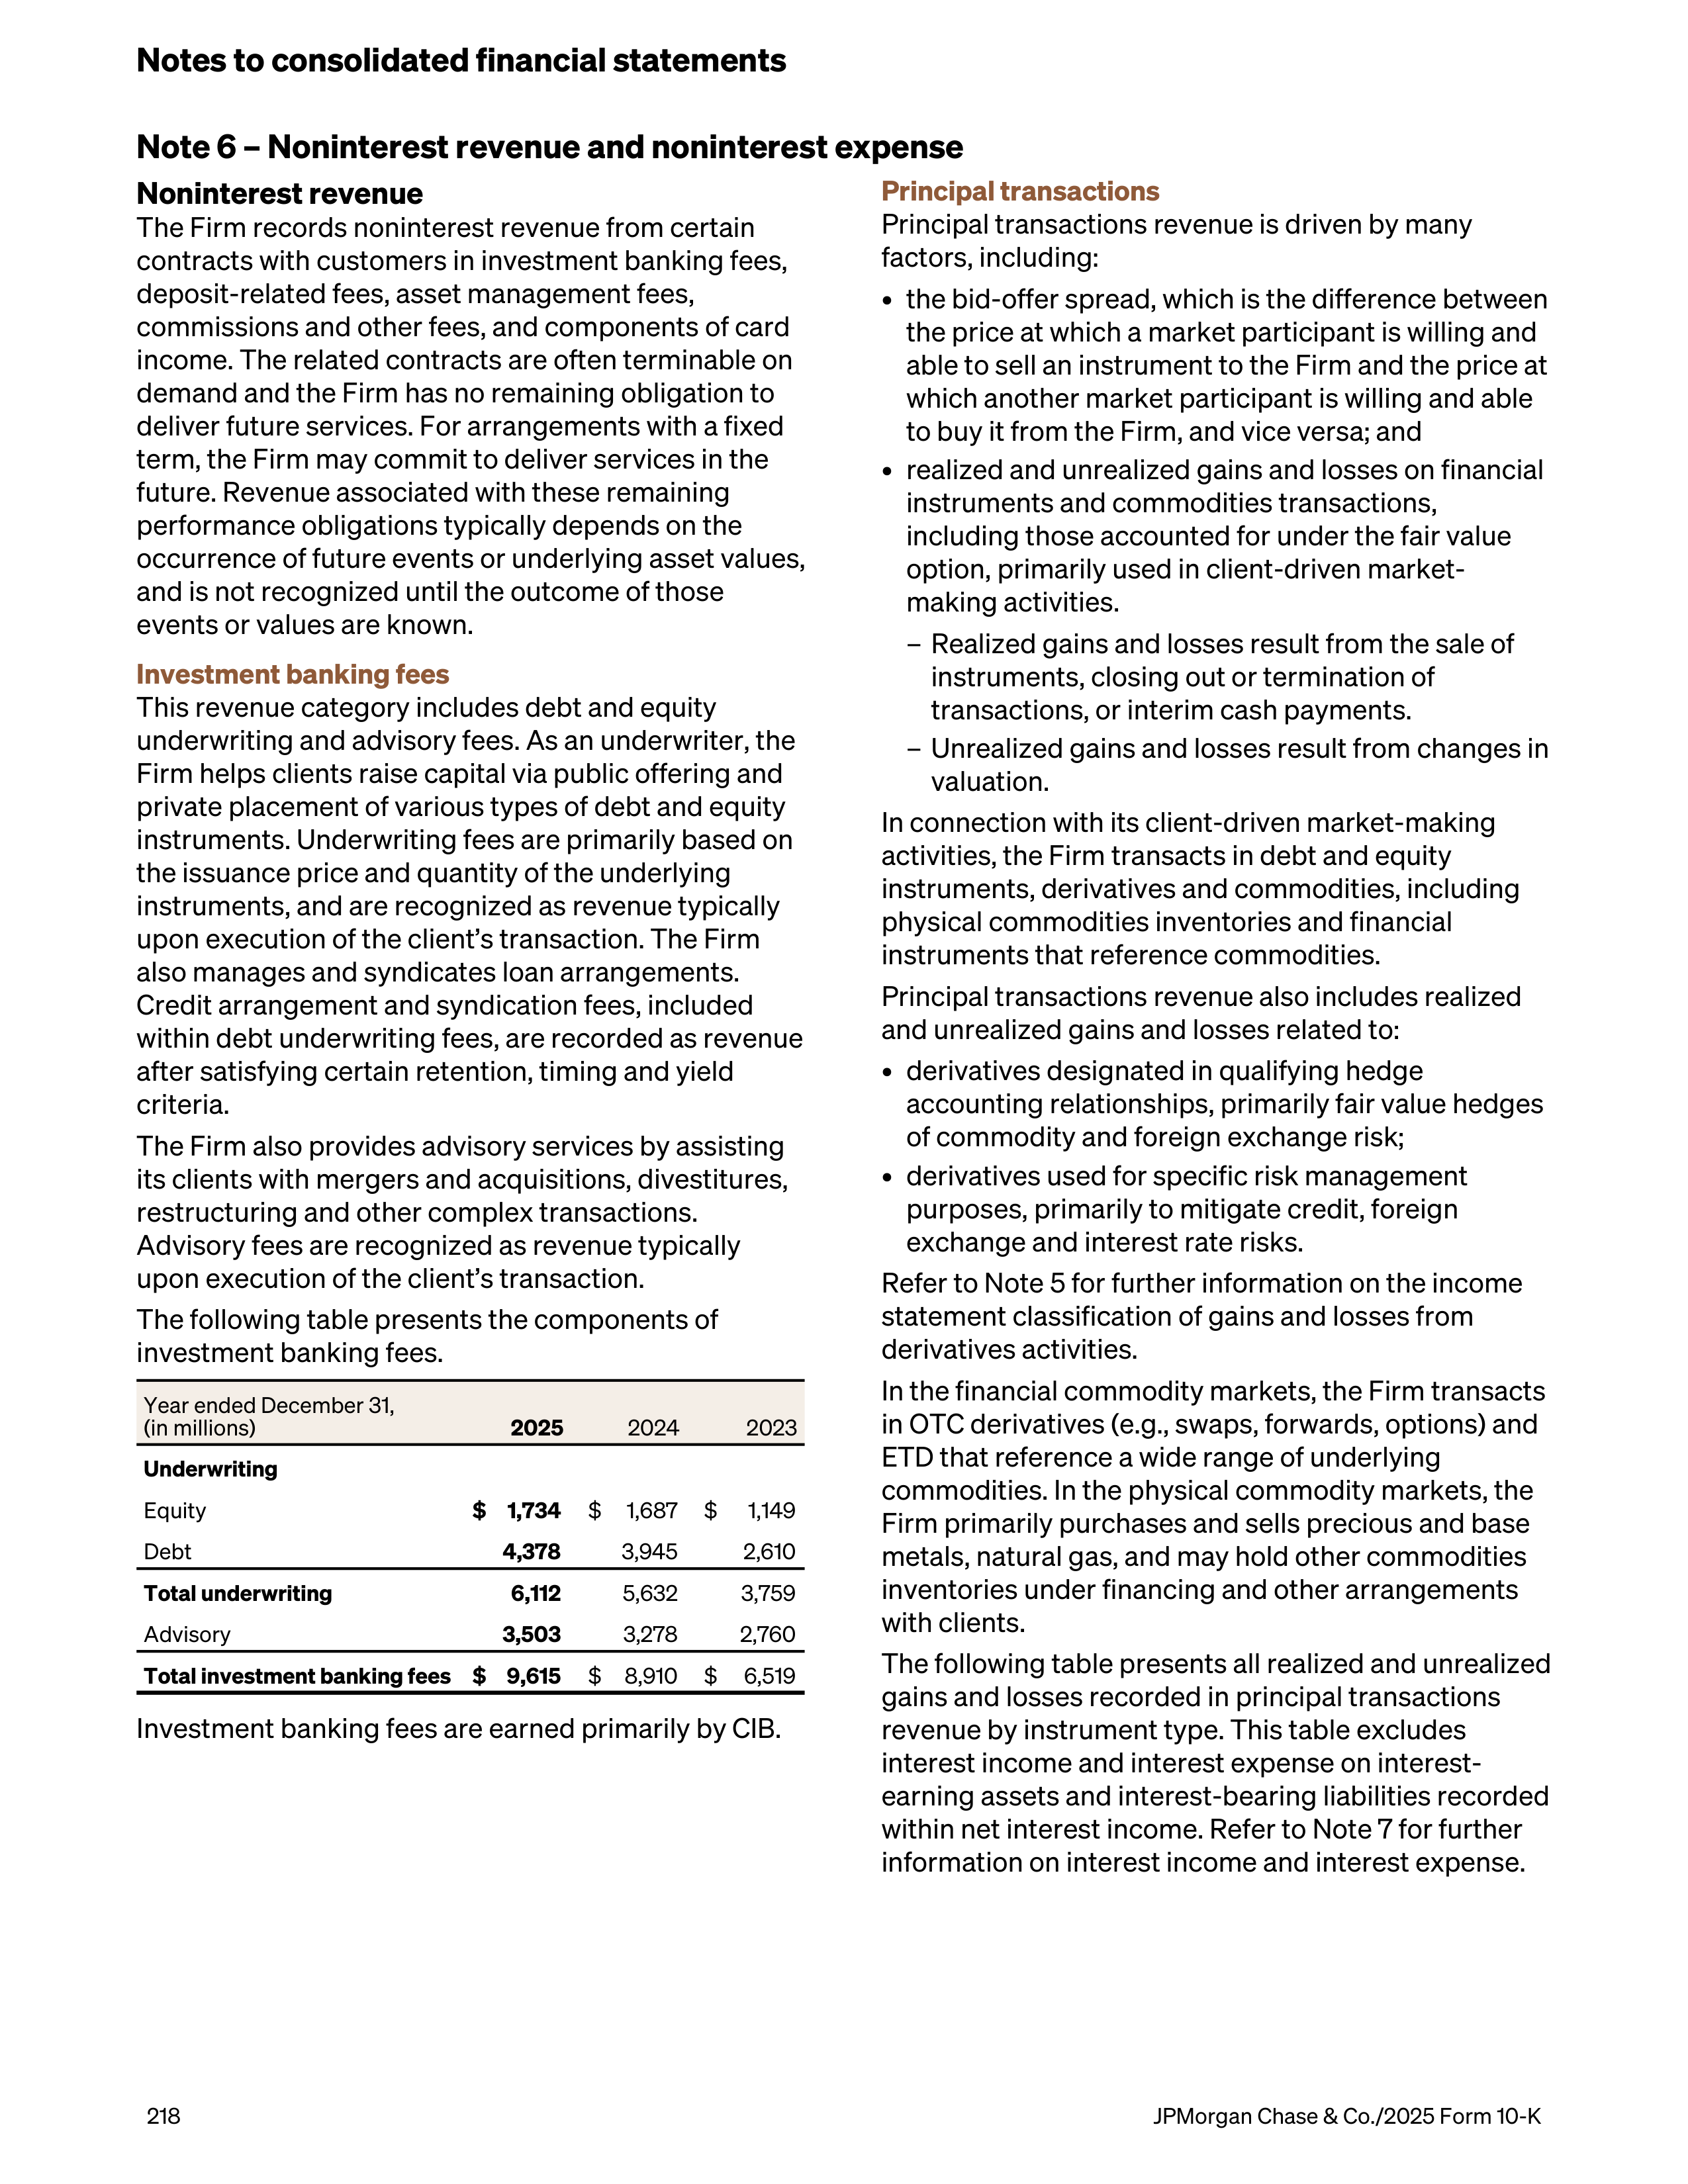
Note 6 – Noninterest revenue and noninterest expense
Noninterest revenue
The Firm records noninterest revenue from certain
contracts with customers in investment banking fees,
deposit-related fees, asset management fees,
commissions and other fees, and components of card
income. The related contracts are often terminable on
demand and the Firm has no remaining obligation to
deliver future services. For arrangements with a fixed
term, the Firm may commit to deliver services in the
future. Revenue associated with these remaining
performance obligations typically depends on the
occurrence of future events or underlying asset values,
and is not recognized until the outcome of those
events or values are known.
Investment banking fees
This revenue category includes debt and equity
underwriting and advisory fees. As an underwriter, the
Firm helps clients raise capital via public offering and
private placement of various types of debt and equity
instruments. Underwriting fees are primarily based on
the issuance price and quantity of the underlying
instruments, and are recognized as revenue typically
upon execution of the client’s transaction. The Firm
also manages and syndicates loan arrangements.
Credit arrangement and syndication fees, included
within debt underwriting fees, are recorded as revenue
after satisfying certain retention, timing and yield
criteria.
The Firm also provides advisory services by assisting
its clients with mergers and acquisitions, divestitures,
restructuring and other complex transactions.
Advisory fees are recognized as revenue typically
upon execution of the client’s transaction.
The following table presents the components of
investment banking fees.
Year ended December 31,
(in millions)
2025
2024
2023
Underwriting
Equity
$ 1,734
$
1,687
$
1,149
Debt
4,378
3,945
2,610
Total underwriting
6,112
5,632
3,759
Advisory
3,503
3,278
2,760
Total investment banking fees
$ 9,615
$
8,910
$
6,519
Investment banking fees are earned primarily by CIB.
Principal transactions
Principal transactions revenue is driven by many
factors, including:
•
the bid-offer spread, which is the difference between
the price at which a market participant is willing and
able to sell an instrument to the Firm and the price at
which another market participant is willing and able
to buy it from the Firm, and vice versa; and
•
realized and unrealized gains and losses on financial
instruments and commodities transactions,
including those accounted for under the fair value
option, primarily used in client-driven market-
making activities.
–
Realized gains and losses result from the sale of
instruments, closing out or termination of
transactions, or interim cash payments.
–
Unrealized gains and losses result from changes in
valuation.
In connection with its client-driven market-making
activities, the Firm transacts in debt and equity
instruments, derivatives and commodities, including
physical commodities inventories and financial
instruments that reference commodities.
Principal transactions revenue also includes realized
and unrealized gains and losses related to:
•
derivatives designated in qualifying hedge
accounting relationships, primarily fair value hedges
of commodity and foreign exchange risk;
•
derivatives used for specific risk management
purposes, primarily to mitigate credit, foreign
exchange and interest rate risks.
Refer to Note 5 for further information on the income
statement classification of gains and losses from
derivatives activities.
In the financial commodity markets, the Firm transacts
in OTC derivatives (e.g., swaps, forwards, options) and
ETD that reference a wide range of underlying
commodities. In the physical commodity markets, the
Firm primarily purchases and sells precious and base
metals, natural gas, and may hold other commodities
inventories under financing and other arrangements
with clients.
The following table presents all realized and unrealized
gains and losses recorded in principal transactions
revenue by instrument type. This table excludes
interest income and interest expense on interest-
earning assets and interest-bearing liabilities recorded
within net interest income. Refer to Note 7 for further
information on interest income and interest expense.
Notes to consolidated financial statements
218
JPMorgan Chase & Co./2025 Form 10-K
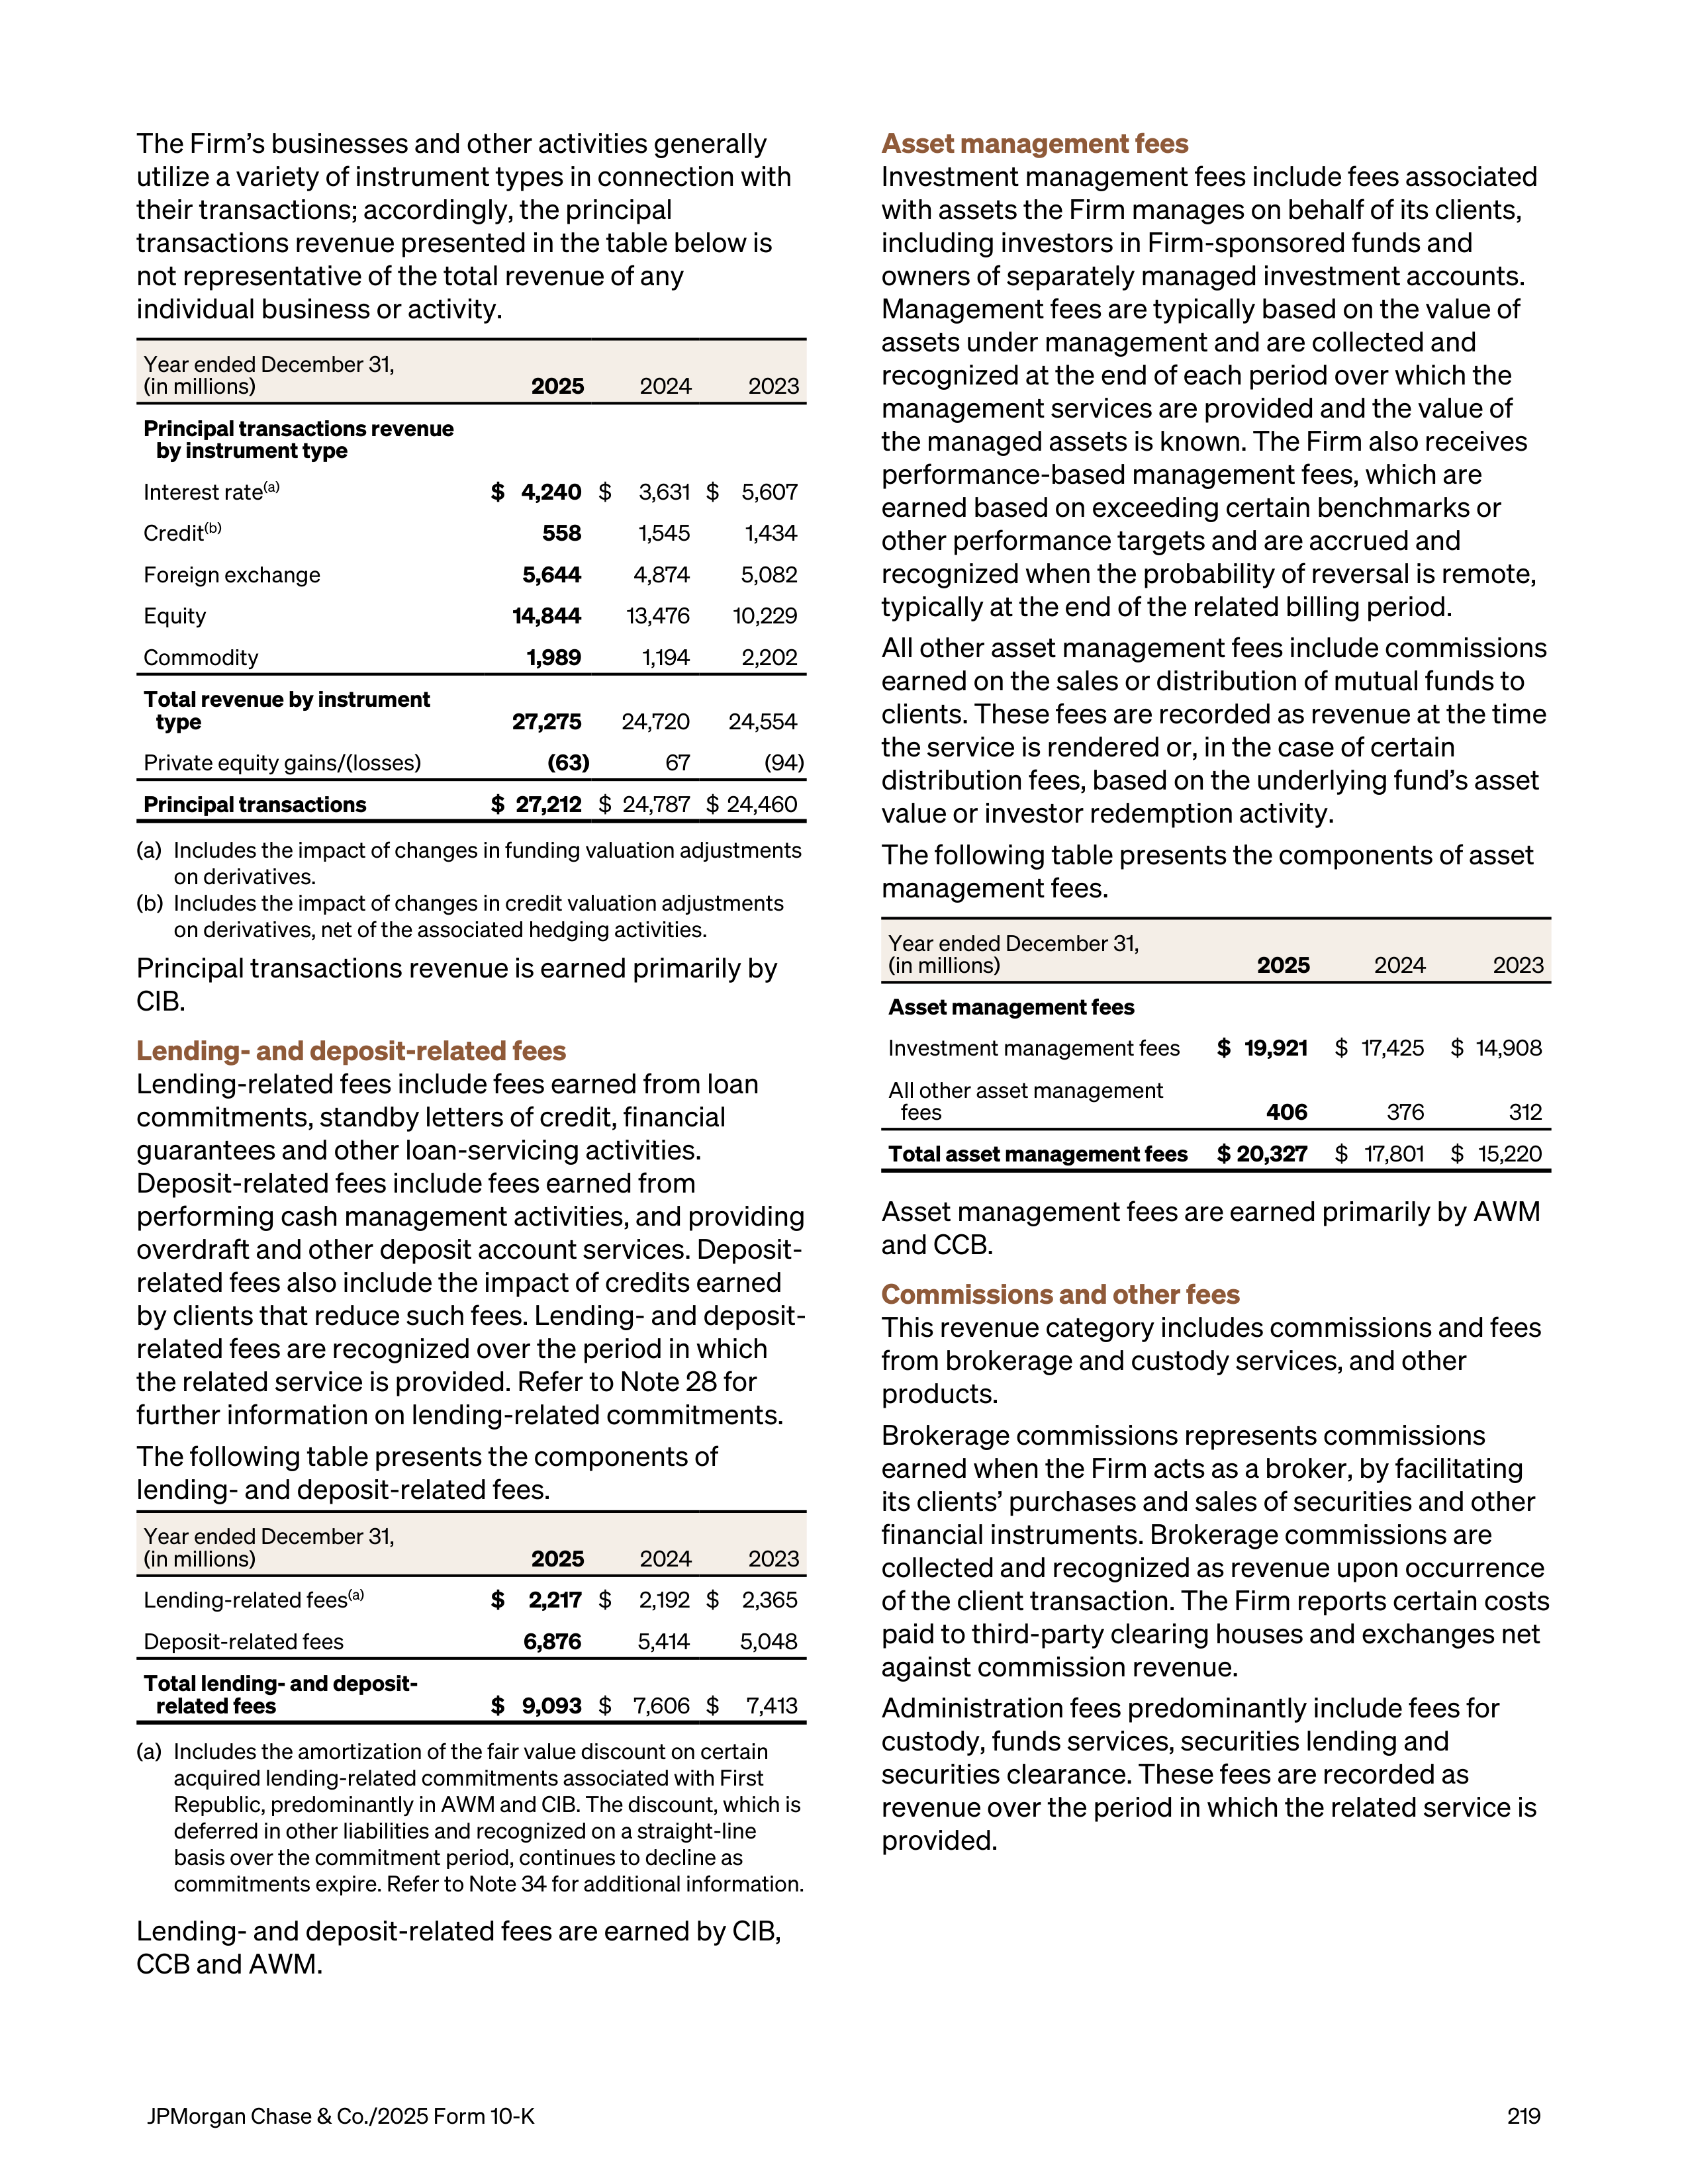
The Firm’s businesses and other activities generally
utilize a variety of instrument types in connection with
their transactions; accordingly, the principal
transactions revenue presented in the table below is
not representative of the total revenue of any
individual business or activity.
Year ended December 31,
(in millions)
2025
2024
2023
Principal transactions revenue
by instrument type
Interest rate
(a)
$ 4,240
$
3,631 $
5,607
Credit
(b)
558
1,545
1,434
Foreign exchange
5,644
4,874
5,082
Equity
14,844
13,476
10,229
Commodity
1,989
1,194
2,202
Total revenue by instrument
type
27,275
24,720
24,554
Private equity gains/(losses)
(63)
67
(94)
Principal transactions
$ 27,212
$ 24,787 $ 24,460
(a)
Includes the impact of changes in funding valuation adjustments
on derivatives.
(b)
Includes the impact of changes in credit valuation adjustments
on derivatives, net of the associated hedging activities.
Principal transactions revenue is earned primarily by
CIB.
Lending- and deposit-related fees
Lending-related fees include fees earned from loan
commitments, standby letters of credit, financial
guarantees and other loan-servicing activities.
Deposit-related fees include fees earned from
performing cash management activities, and providing
overdraft and other deposit account services. Deposit-
related fees also include the impact of credits earned
by clients that reduce such fees. Lending- and deposit-
related fees are recognized over the period in which
the related service is provided. Refer to Note 28 for
further information on lending-related commitments.
The following table presents the components of
lending- and deposit-related fees.
Year ended December 31,
(in millions)
2025
2024
2023
Lending-related fees
(a)
$
2,217
$
2,192 $
2,365
Deposit-related fees
6,876
5,414
5,048
Total lending- and deposit-
related fees
$ 9,093
$ 7,606 $
7,413
(a) Includes the amortization of the fair value discount on certain
acquired lending-related commitments associated with First
Republic, predominantly in AWM and CIB. The discount, which is
deferred in other liabilities and recognized on a straight-line
basis over the commitment period, continues to decline as
commitments expire. Refer to Note 34 for additional information.
Lending- and deposit-related fees are earned by CIB,
CCB and AWM.
Asset management fees
Investment management fees include fees associated
with assets the Firm manages on behalf of its clients,
including investors in Firm-sponsored funds and
owners of separately managed investment accounts.
Management fees are typically based on the value of
assets under management and are collected and
recognized at the end of each period over which the
management services are provided and the value of
the managed assets is known. The Firm also receives
performance-based management fees, which are
earned based on exceeding certain benchmarks or
other performance targets and are accrued and
recognized when the probability of reversal is remote,
typically at the end of the related billing period.
All other asset management fees include commissions
earned on the sales or distribution of mutual funds to
clients. These fees are recorded as revenue at the time
the service is rendered or, in the case of certain
distribution fees, based on the underlying fund’s asset
value or investor redemption activity.
The following table presents the components of asset
management fees.
Year ended December 31,
(in millions)
2025
2024
2023
Asset management fees
Investment management fees
$ 19,921
$ 17,425
$ 14,908
All other asset management
fees
406
376
312
Total asset management fees
$ 20,327
$ 17,801
$ 15,220
Asset management fees are earned primarily by AWM
and CCB.
Commissions and other fees
This revenue category includes commissions and fees
from brokerage and custody services, and other
products.
Brokerage commissions represents commissions
earned when the Firm acts as a broker, by facilitating
its clients’ purchases and sales of securities and other
financial instruments. Brokerage commissions are
collected and recognized as revenue upon occurrence
of the client transaction. The Firm reports certain costs
paid to third-party clearing houses and exchanges net
against commission revenue.
Administration fees predominantly include fees for
custody, funds services, securities lending and
securities clearance. These fees are recorded as
revenue over the period in which the related service is
provided.
JPMorgan Chase & Co./2025 Form 10-K
219
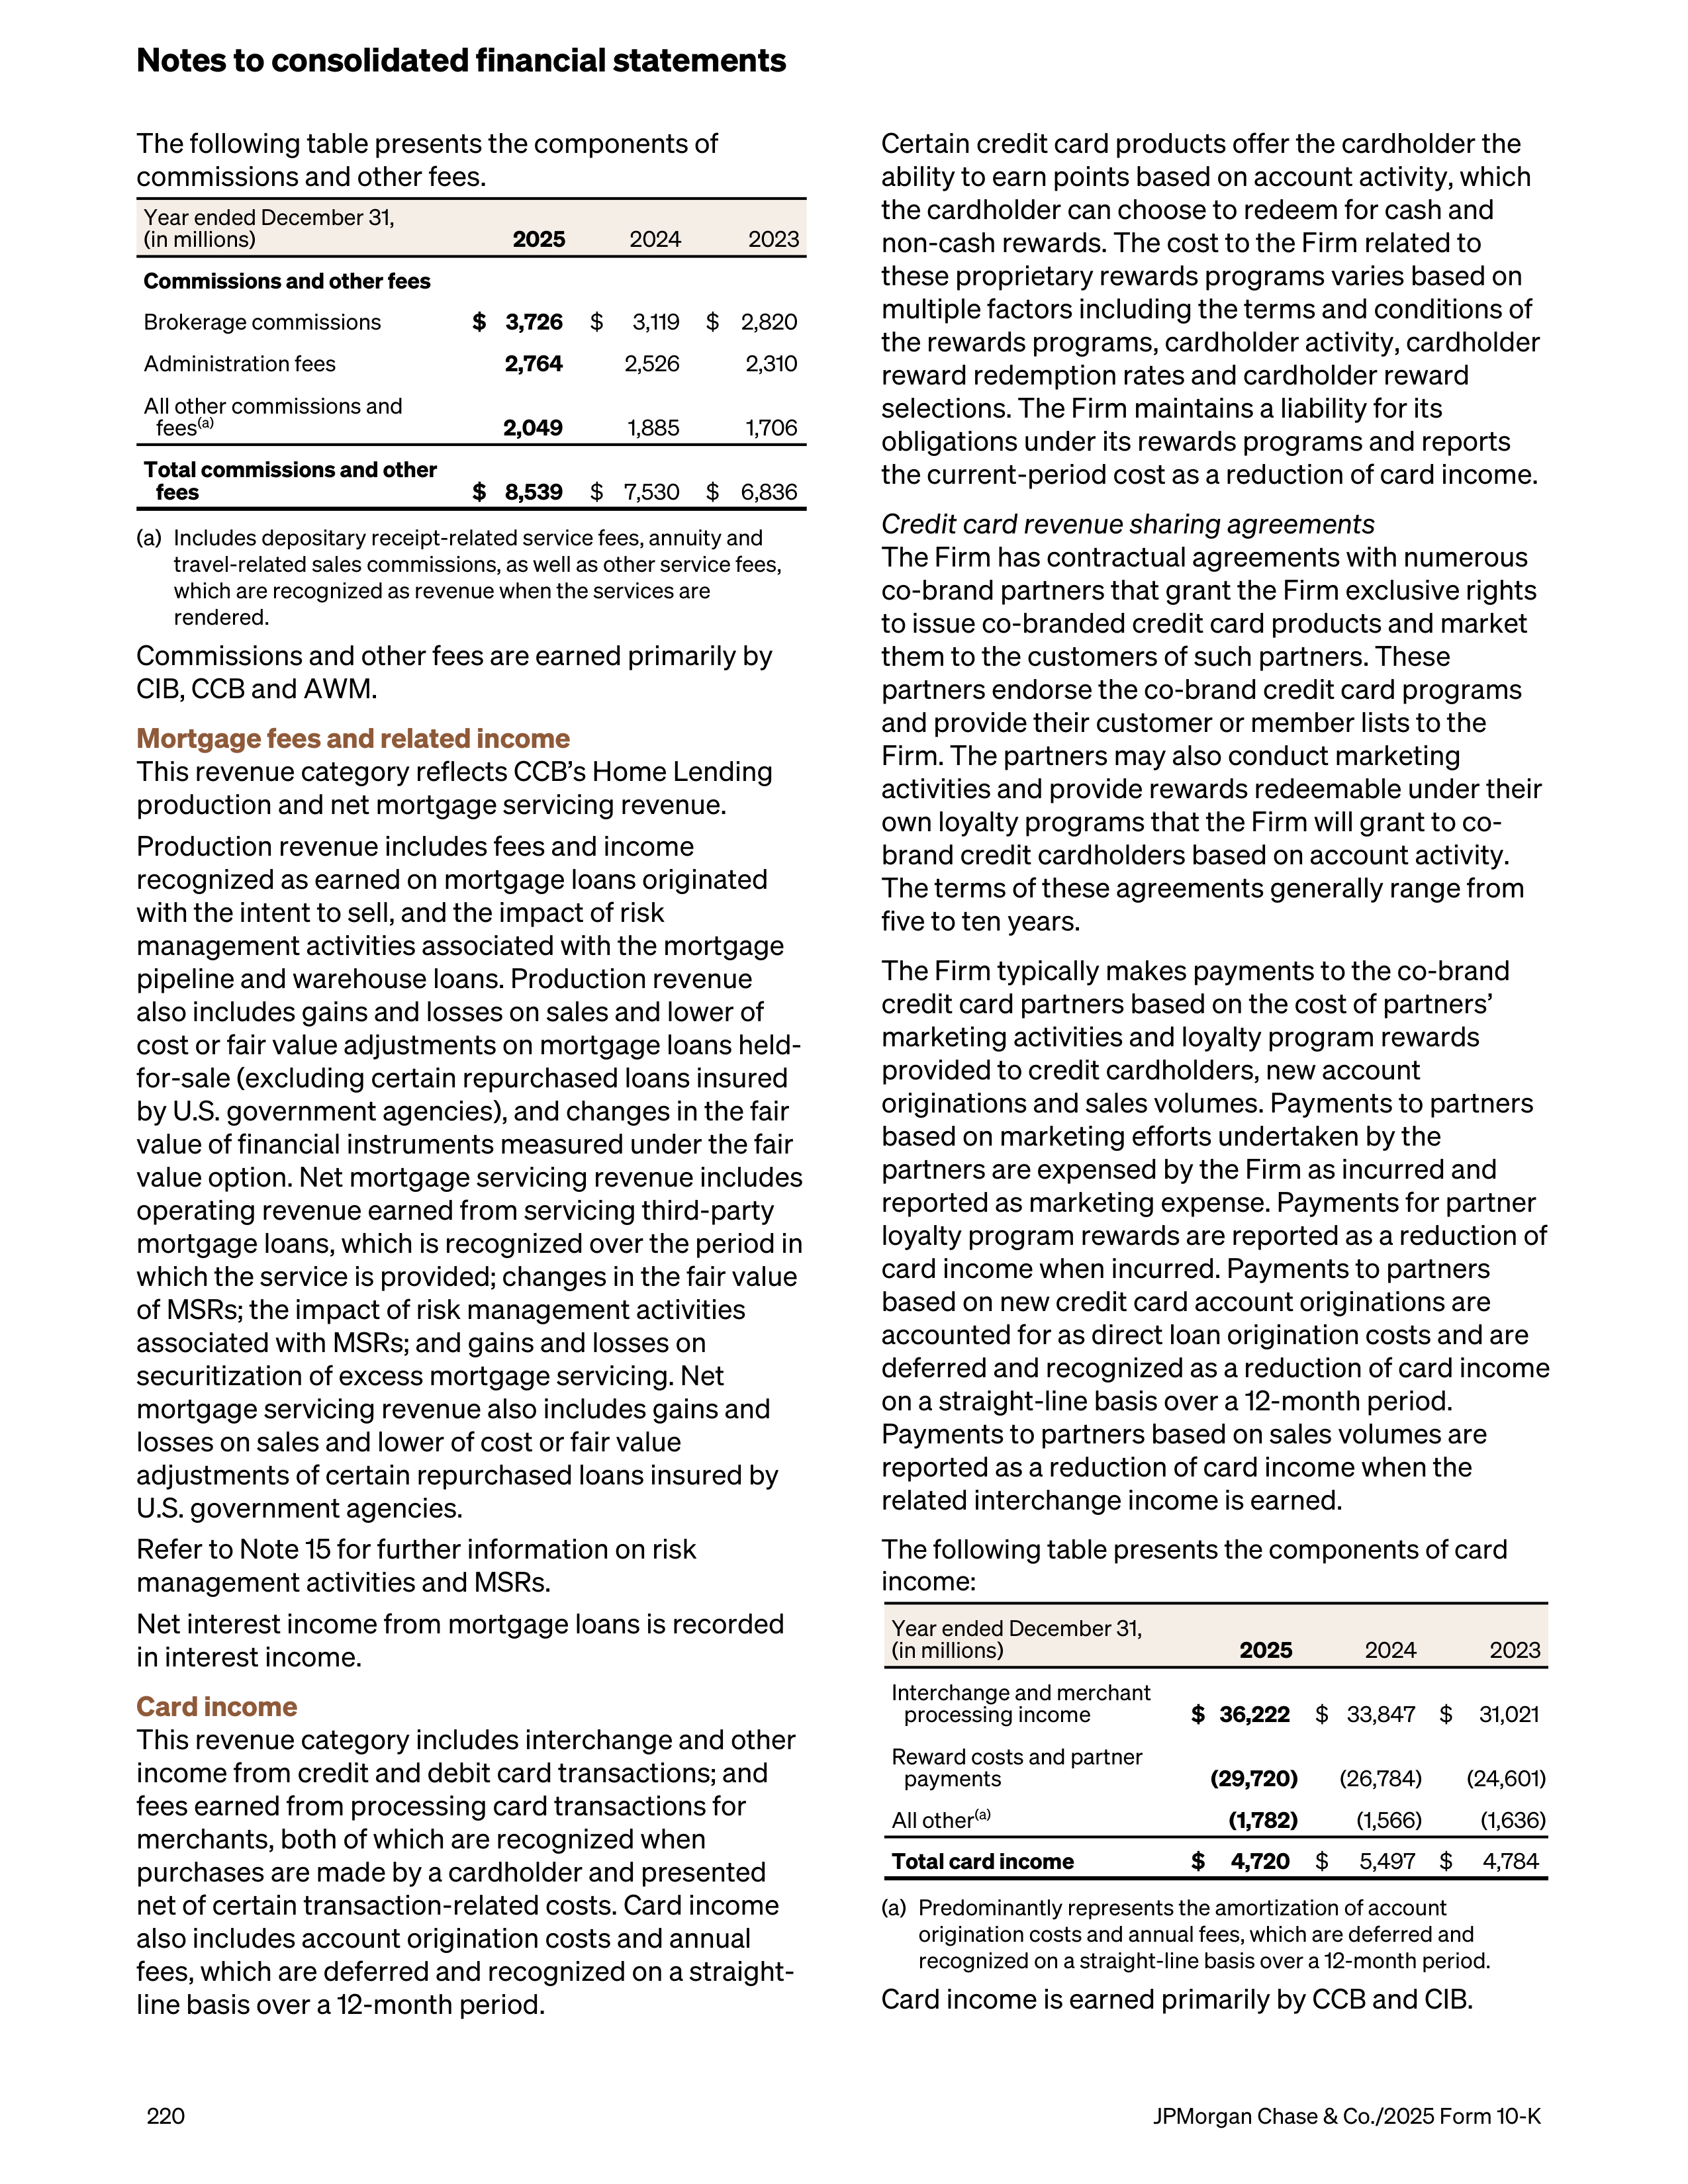
The following table presents the components of
commissions and other fees.
Year ended December 31,
(in millions)
2025
2024
2023
Commissions and other fees
Brokerage commissions
$ 3,726
$
3,119
$ 2,820
Administration fees
2,764
2,526
2,310
All other commissions and
fees
(a)
2,049
1,885
1,706
Total commissions and other
fees
$ 8,539
$ 7,530
$ 6,836
(a)
Includes depositary receipt-related service fees, annuity and
travel-related sales commissions, as well as other service fees,
which are recognized as revenue when the services are
rendered.
Commissions and other fees are earned primarily by
CIB, CCB and AWM.
Mortgage fees and related income
This revenue category reflects CCB’s Home Lending
production and net mortgage servicing revenue.
Production revenue includes fees and income
recognized as earned on mortgage loans originated
with the intent to sell, and the impact of risk
management activities associated with the mortgage
pipeline and warehouse loans. Production revenue
also includes gains and losses on sales and lower of
cost or fair value adjustments on mortgage loans held-
for-sale (excluding certain repurchased loans insured
by U.S. government agencies), and changes in the fair
value of financial instruments measured under the fair
value option. Net mortgage servicing revenue includes
operating revenue earned from servicing third-party
mortgage loans, which is recognized over the period in
which the service is provided; changes in the fair value
of MSRs; the impact of risk management activities
associated with MSRs; and gains and losses on
securitization of excess mortgage servicing. Net
mortgage servicing revenue also includes gains and
losses on sales and lower of cost or fair value
adjustments of certain repurchased loans insured by
U.S. government agencies.
Refer to Note 15 for further information on risk
management activities and MSRs.
Net interest income from mortgage loans is recorded
in interest income.
Card income
This revenue category includes interchange and other
income from credit and debit card transactions; and
fees earned from processing card transactions for
merchants, both of which are recognized when
purchases are made by a cardholder and presented
net of certain transaction-related costs. Card income
also includes account origination costs and annual
fees, which are deferred and recognized on a straight-
line basis over a 12-month period.
Certain credit card products offer the cardholder the
ability to earn points based on account activity, which
the cardholder can choose to redeem for cash and
non-cash rewards. The cost to the Firm related to
these proprietary rewards programs varies based on
multiple factors including the terms and conditions of
the rewards programs, cardholder activity, cardholder
reward redemption rates and cardholder reward
selections. The Firm maintains a liability for its
obligations under its rewards programs and reports
the current-period cost as a reduction of card income.
Credit card revenue sharing agreements
The Firm has contractual agreements with numerous
co-brand partners that grant the Firm exclusive rights
to issue co-branded credit card products and market
them to the customers of such partners. These
partners endorse the co-brand credit card programs
and provide their customer or member lists to the
Firm. The partners may also conduct marketing
activities and provide rewards redeemable under their
own loyalty programs that the Firm will grant to co-
brand credit cardholders based on account activity.
The terms of these agreements generally range from
five to ten years.
The Firm typically makes payments to the co-brand
credit card partners based on the cost of partners’
marketing activities and loyalty program rewards
provided to credit cardholders, new account
originations and sales volumes. Payments to partners
based on marketing efforts undertaken by the
partners are expensed by the Firm as incurred and
reported as marketing expense. Payments for partner
loyalty program rewards are reported as a reduction of
card income when incurred. Payments to partners
based on new credit card account originations are
accounted for as direct loan origination costs and are
deferred and recognized as a reduction of card income
on a straight-line basis over a 12-month period.
Payments to partners based on sales volumes are
reported as a reduction of card income when the
related interchange income is earned.
The following table presents the components of card
income:
Year ended December 31,
(in millions)
2025
2024
2023
Interchange and merchant
processing income
$ 36,222
$ 33,847
$
31,021
Reward costs and partner
payments
(29,720)
(26,784)
(24,601)
All other
(a)
(1,782)
(1,566)
(1,636)
Total card income
$
4,720
$
5,497
$
4,784
(a)
Predominantly represents the amortization of account
origination costs and annual fees, which are deferred and
recognized on a straight-line basis over a 12-month period.
Card income is earned primarily by CCB and CIB.
Notes to consolidated financial statements
220
JPMorgan Chase & Co./2025 Form 10-K
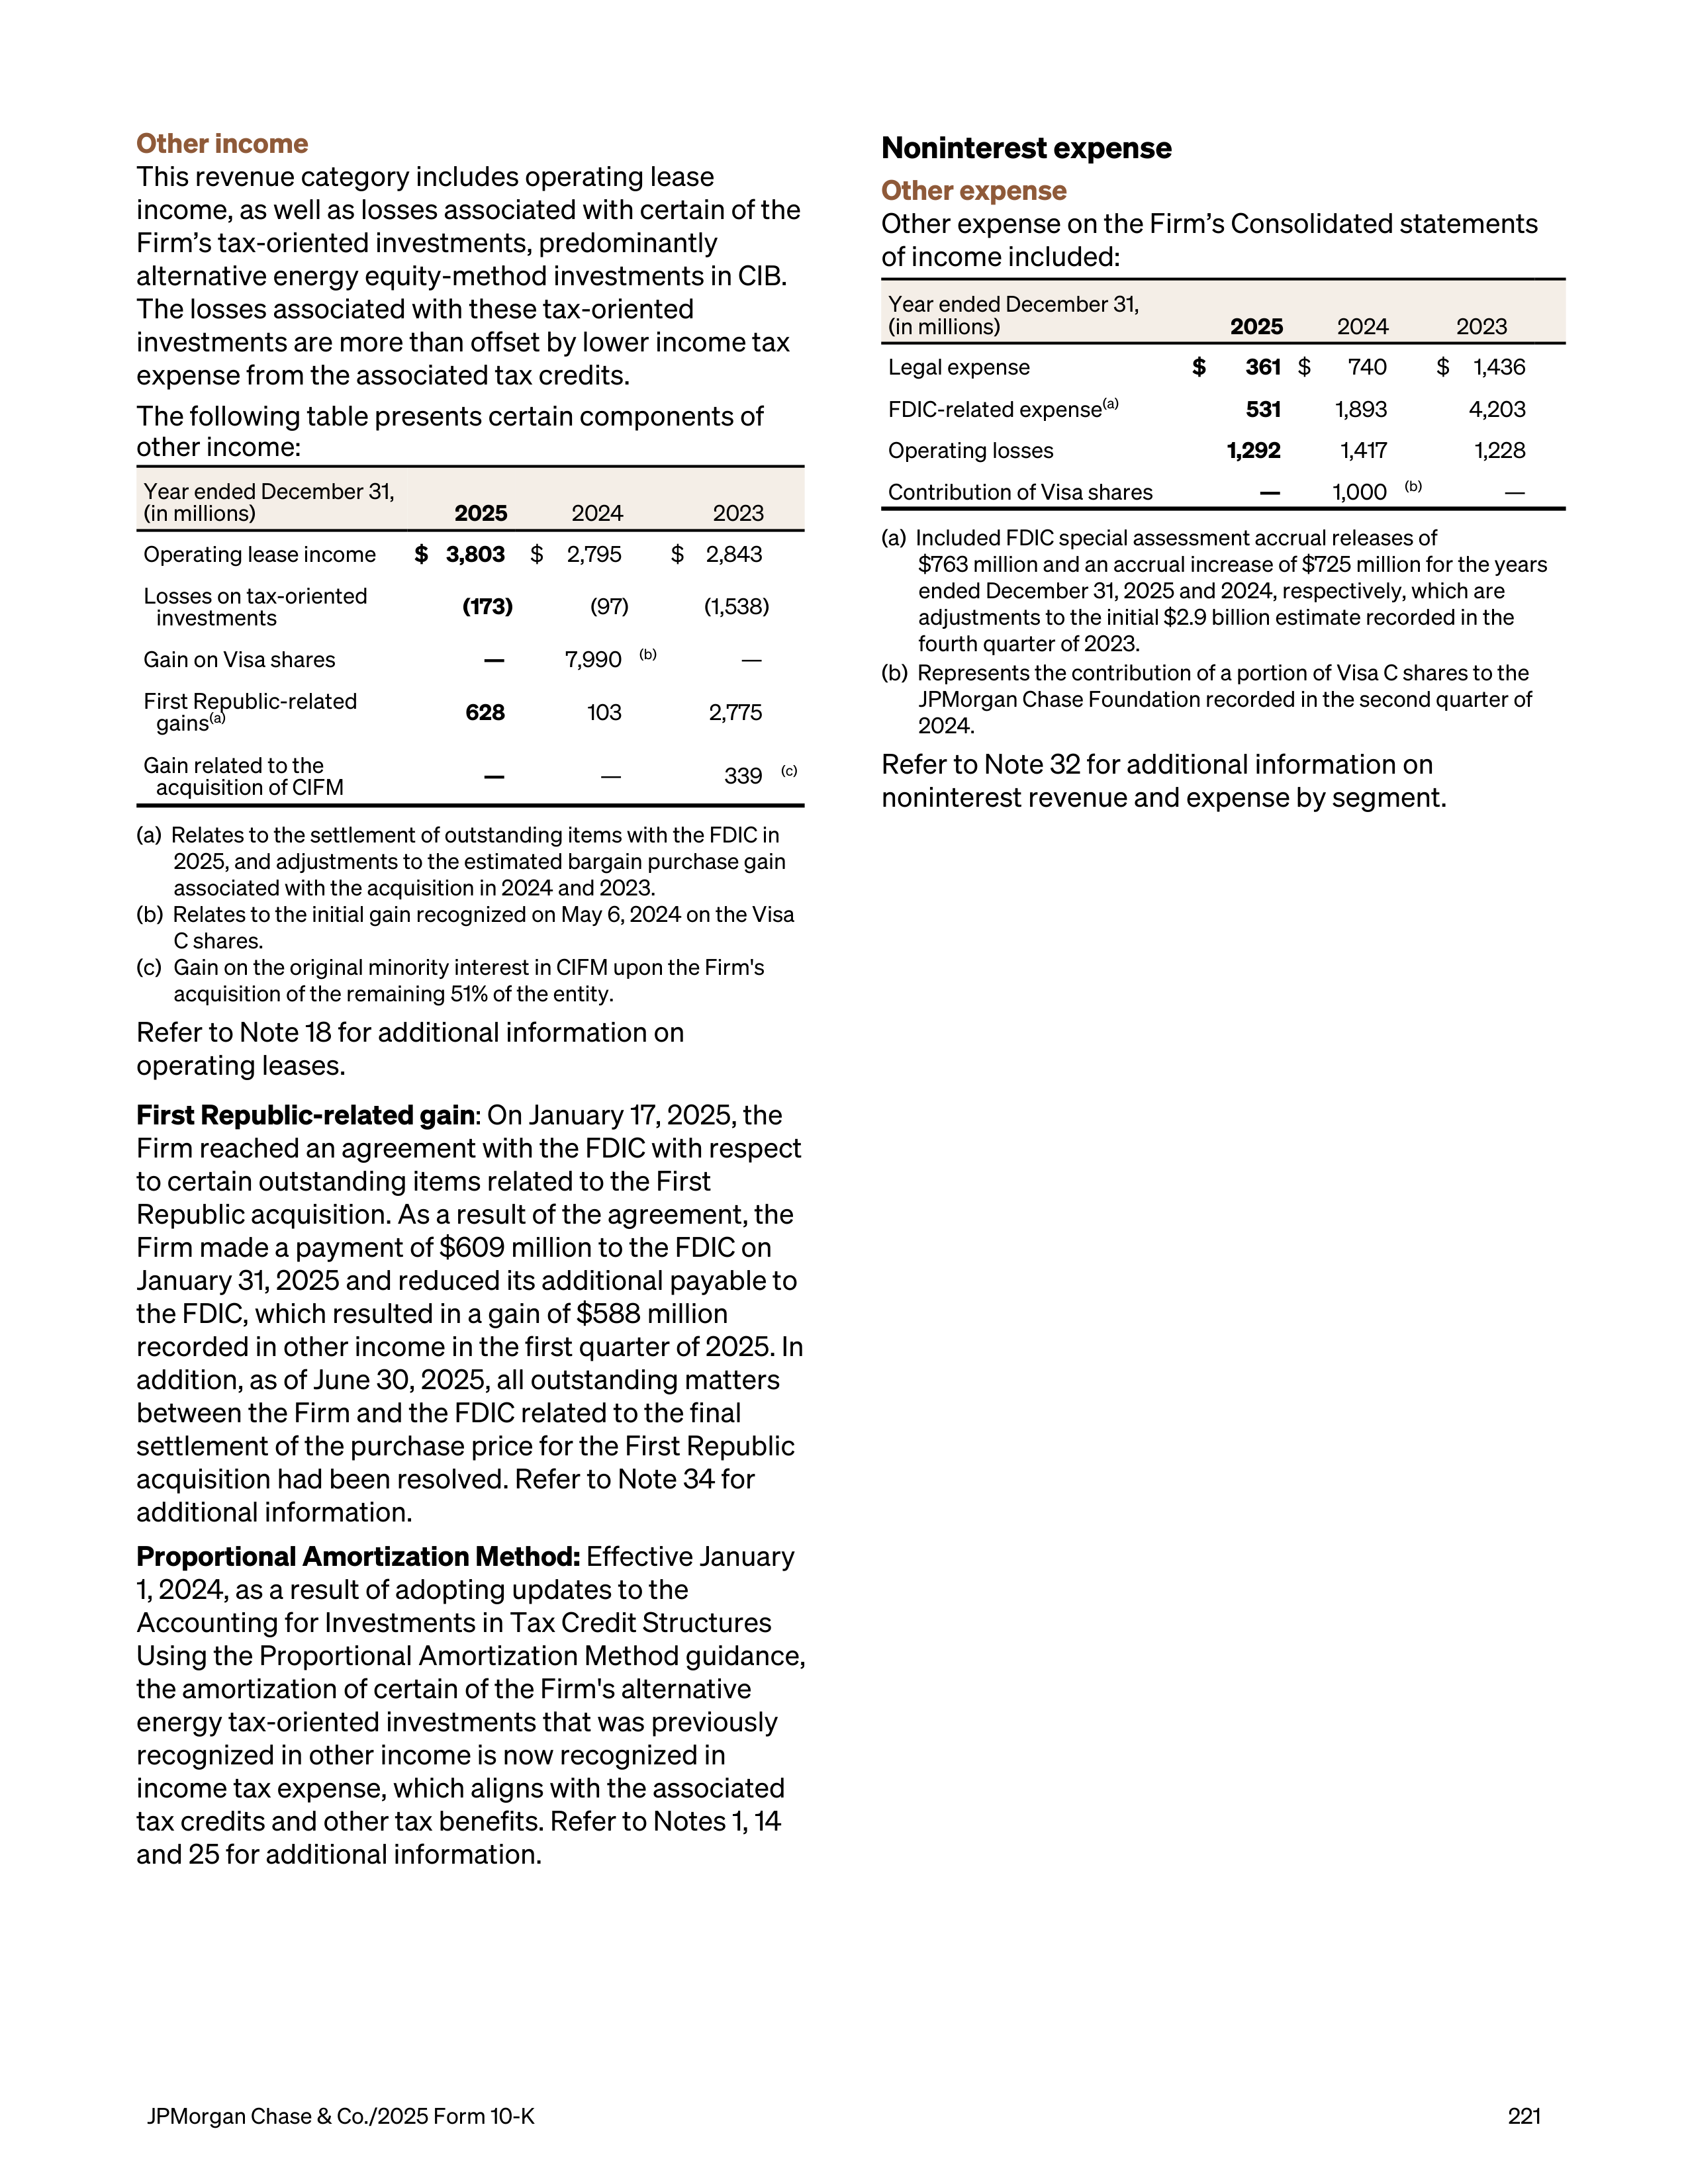
Other income
This revenue category includes operating lease
income, as well as losses associated with certain of the
Firm’s tax-oriented investments, predominantly
alternative energy equity-method investments in CIB.
The losses associated with these tax-oriented
investments are more than offset by lower income tax
expense from the associated tax credits.
The following table presents certain components of
other income:
Operating lease income
$ 3,803
$
2,795
$
2,843
Losses on tax-oriented
investments
(173)
(97)
(1,538)
Gain on Visa shares
—
7,990
(b)
—
First Republic-related
gains
(a)
628
103
2,775
Gain related to the
acquisition of CIFM
—
—
339
(c)
Year ended December 31,
(in millions)
2025
2024
2023
(a) Relates to the settlement of outstanding items with the FDIC in
2025, and adjustments to the estimated bargain purchase gain
associated with the acquisition in 2024 and 2023.
(b) Relates to the initial gain recognized on May 6, 2024 on the Visa
C shares.
(c) Gain on the original minority interest in CIFM upon the Firm's
acquisition of the remaining 51% of the entity.
Refer to Note 18 for additional information on
operating leases.
First Republic-related gain
: On January 17, 2025, the
Firm reached an agreement with the FDIC with respect
to certain outstanding items related to the First
Republic acquisition. As a result of the agreement, the
Firm made a payment of $609 million to the FDIC on
January 31, 2025 and reduced its additional payable to
the FDIC, which resulted in a gain of $588 million
recorded in other income in the first quarter of 2025. In
addition, as of June 30, 2025, all outstanding matters
between the Firm and the FDIC related to the final
settlement of the purchase price for the First Republic
acquisition had been resolved. Refer to Note 34 for
additional information.
Proportional Amortization Method:
Effective January
1, 2024, as a result of adopting updates to the
Accounting for Investments in Tax Credit Structures
Using the Proportional Amortization Method guidance,
the amortization of certain of the Firm's alternative
energy tax-oriented investments that was previously
recognized in other income is now recognized in
income tax expense, which aligns with the associated
tax credits and other tax benefits. Refer to Notes 1, 14
and 25 for additional information.
Noninterest expense
Other expense
Other expense on the Firm’s Consolidated statements
of income included:
Year ended December 31,
(in millions)
2025
2024
2023
Legal expense
$
361
$
740
$
1,436
FDIC-related expense
(a)
531
1,893
4,203
Operating losses
1,292
1,417
1,228
Contribution of Visa shares
—
1,000
(b)
—
(a) Included FDIC special assessment accrual releases of
$763 million and an accrual increase of $725 million for the years
ended December 31, 2025 and 2024, respectively, which are
adjustments to the initial $2.9 billion estimate recorded in the
fourth quarter of 2023.
(b) Represents the contribution of a portion of Visa C shares to the
JPMorgan Chase Foundation recorded in the second quarter of
2024.
Refer to Note 32 for additional information on
noninterest revenue and expense by segment.
JPMorgan Chase & Co./2025 Form 10-K
221
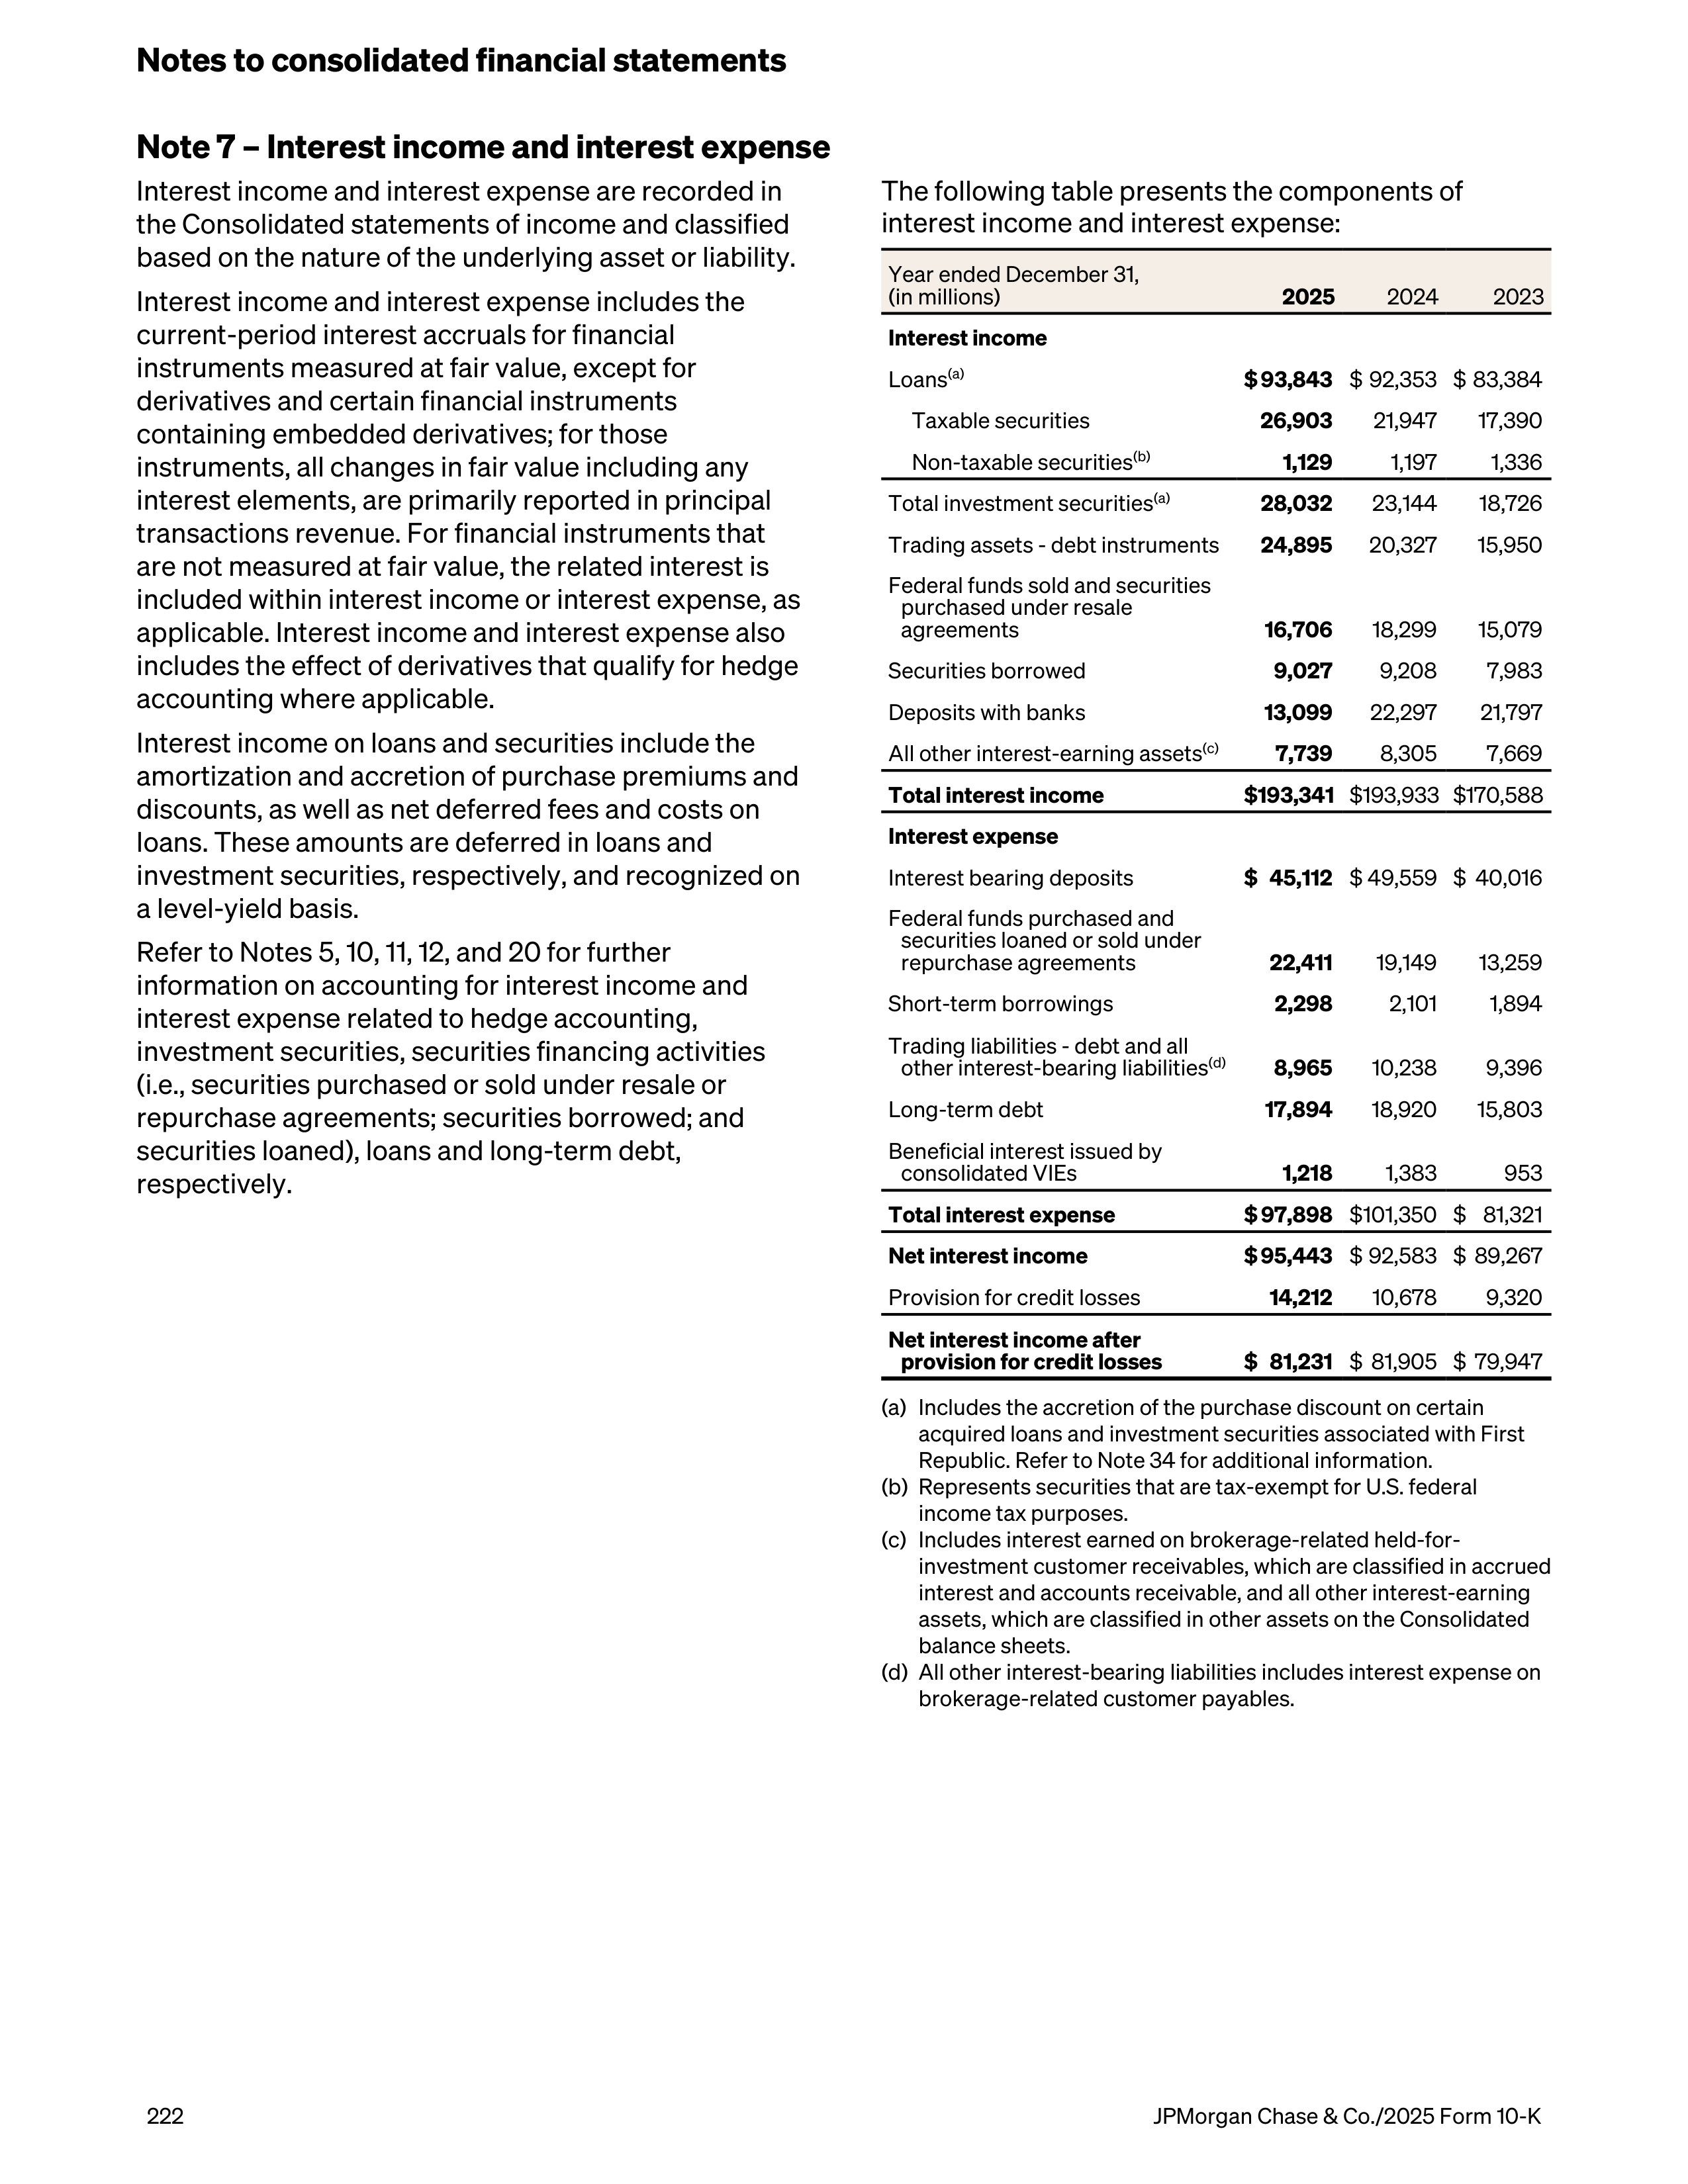
Note 7 – Interest income and interest expense
Interest income and interest expense are recorded in
the Consolidated statements of income and classified
based on the nature of the underlying asset or liability.
Interest income and interest expense includes the
current-period interest accruals for financial
instruments measured at fair value, except for
derivatives and certain financial instruments
containing embedded derivatives; for those
instruments, all changes in fair value including any
interest elements, are primarily reported in principal
transactions revenue. For financial instruments that
are not measured at fair value, the related interest is
included within interest income or interest expense, as
applicable. Interest income and interest expense also
includes the effect of derivatives that qualify for hedge
accounting where applicable.
Interest income on loans and securities include the
amortization and accretion of purchase premiums and
discounts, as well as net deferred fees and costs on
loans. These amounts are deferred in loans and
investment securities, respectively, and recognized on
a level-yield basis.
Refer to Notes 5, 10, 11, 12, and 20 for further
information on accounting for interest income and
interest expense related to hedge accounting,
investment securities, securities financing activities
(i.e., securities purchased or sold under resale or
repurchase agreements; securities borrowed; and
securities loaned), loans and long-term debt,
respectively.
The following table presents the components of
interest income and interest expense:
Year ended December 31,
(in millions)
2025
2024
2023
Interest income
Loans
(a)
$ 93,843
$ 92,353 $ 83,384
Taxable securities
26,903
21,947
17,390
Non-taxable securities
(b)
1,129
1,197
1,336
Total investment securities
(a)
28,032
23,144
18,726
Trading assets - debt instruments
24,895
20,327
15,950
Federal funds sold and securities
purchased under resale
agreements
16,706
18,299
15,079
Securities borrowed
9,027
9,208
7,983
Deposits with banks
13,099
22,297
21,797
All other interest-earning assets
(c)
7,739
8,305
7,669
Total interest income
$ 193,341
$ 193,933 $ 170,588
Interest expense
Interest bearing deposits
$ 45,112
$ 49,559 $ 40,016
Federal funds purchased and
securities loaned or sold under
repurchase agreements
22,411
19,149
13,259
Short-term borrowings
2,298
2,101
1,894
Trading liabilities - debt and all
other interest-bearing liabilities
(d)
8,965
10,238
9,396
Long-term debt
17,894
18,920
15,803
Beneficial interest issued by
consolidated VIEs
1,218
1,383
953
Total interest expense
$ 97,898
$ 101,350 $ 81,321
Net interest income
$ 95,443
$ 92,583 $ 89,267
Provision for credit losses
14,212
10,678
9,320
Net interest income after
provision for credit losses
$ 81,231
$ 81,905 $ 79,947
(a)
Includes the accretion of the purchase discount on certain
acquired loans and investment securities associated with First
Republic. Refer to Note 34 for additional information.
(b)
Represents securities that are tax-exempt for U.S. federal
income tax purposes.
(c)
Includes interest earned on brokerage-related held-for-
investment customer receivables, which are classified in accrued
interest and accounts receivable, and all other interest-earning
assets, which are classified in other assets on the Consolidated
balance sheets.
(d)
All other interest-bearing liabilities includes interest expense on
brokerage-related customer payables.
Notes to consolidated financial statements
222
JPMorgan Chase & Co./2025 Form 10-K
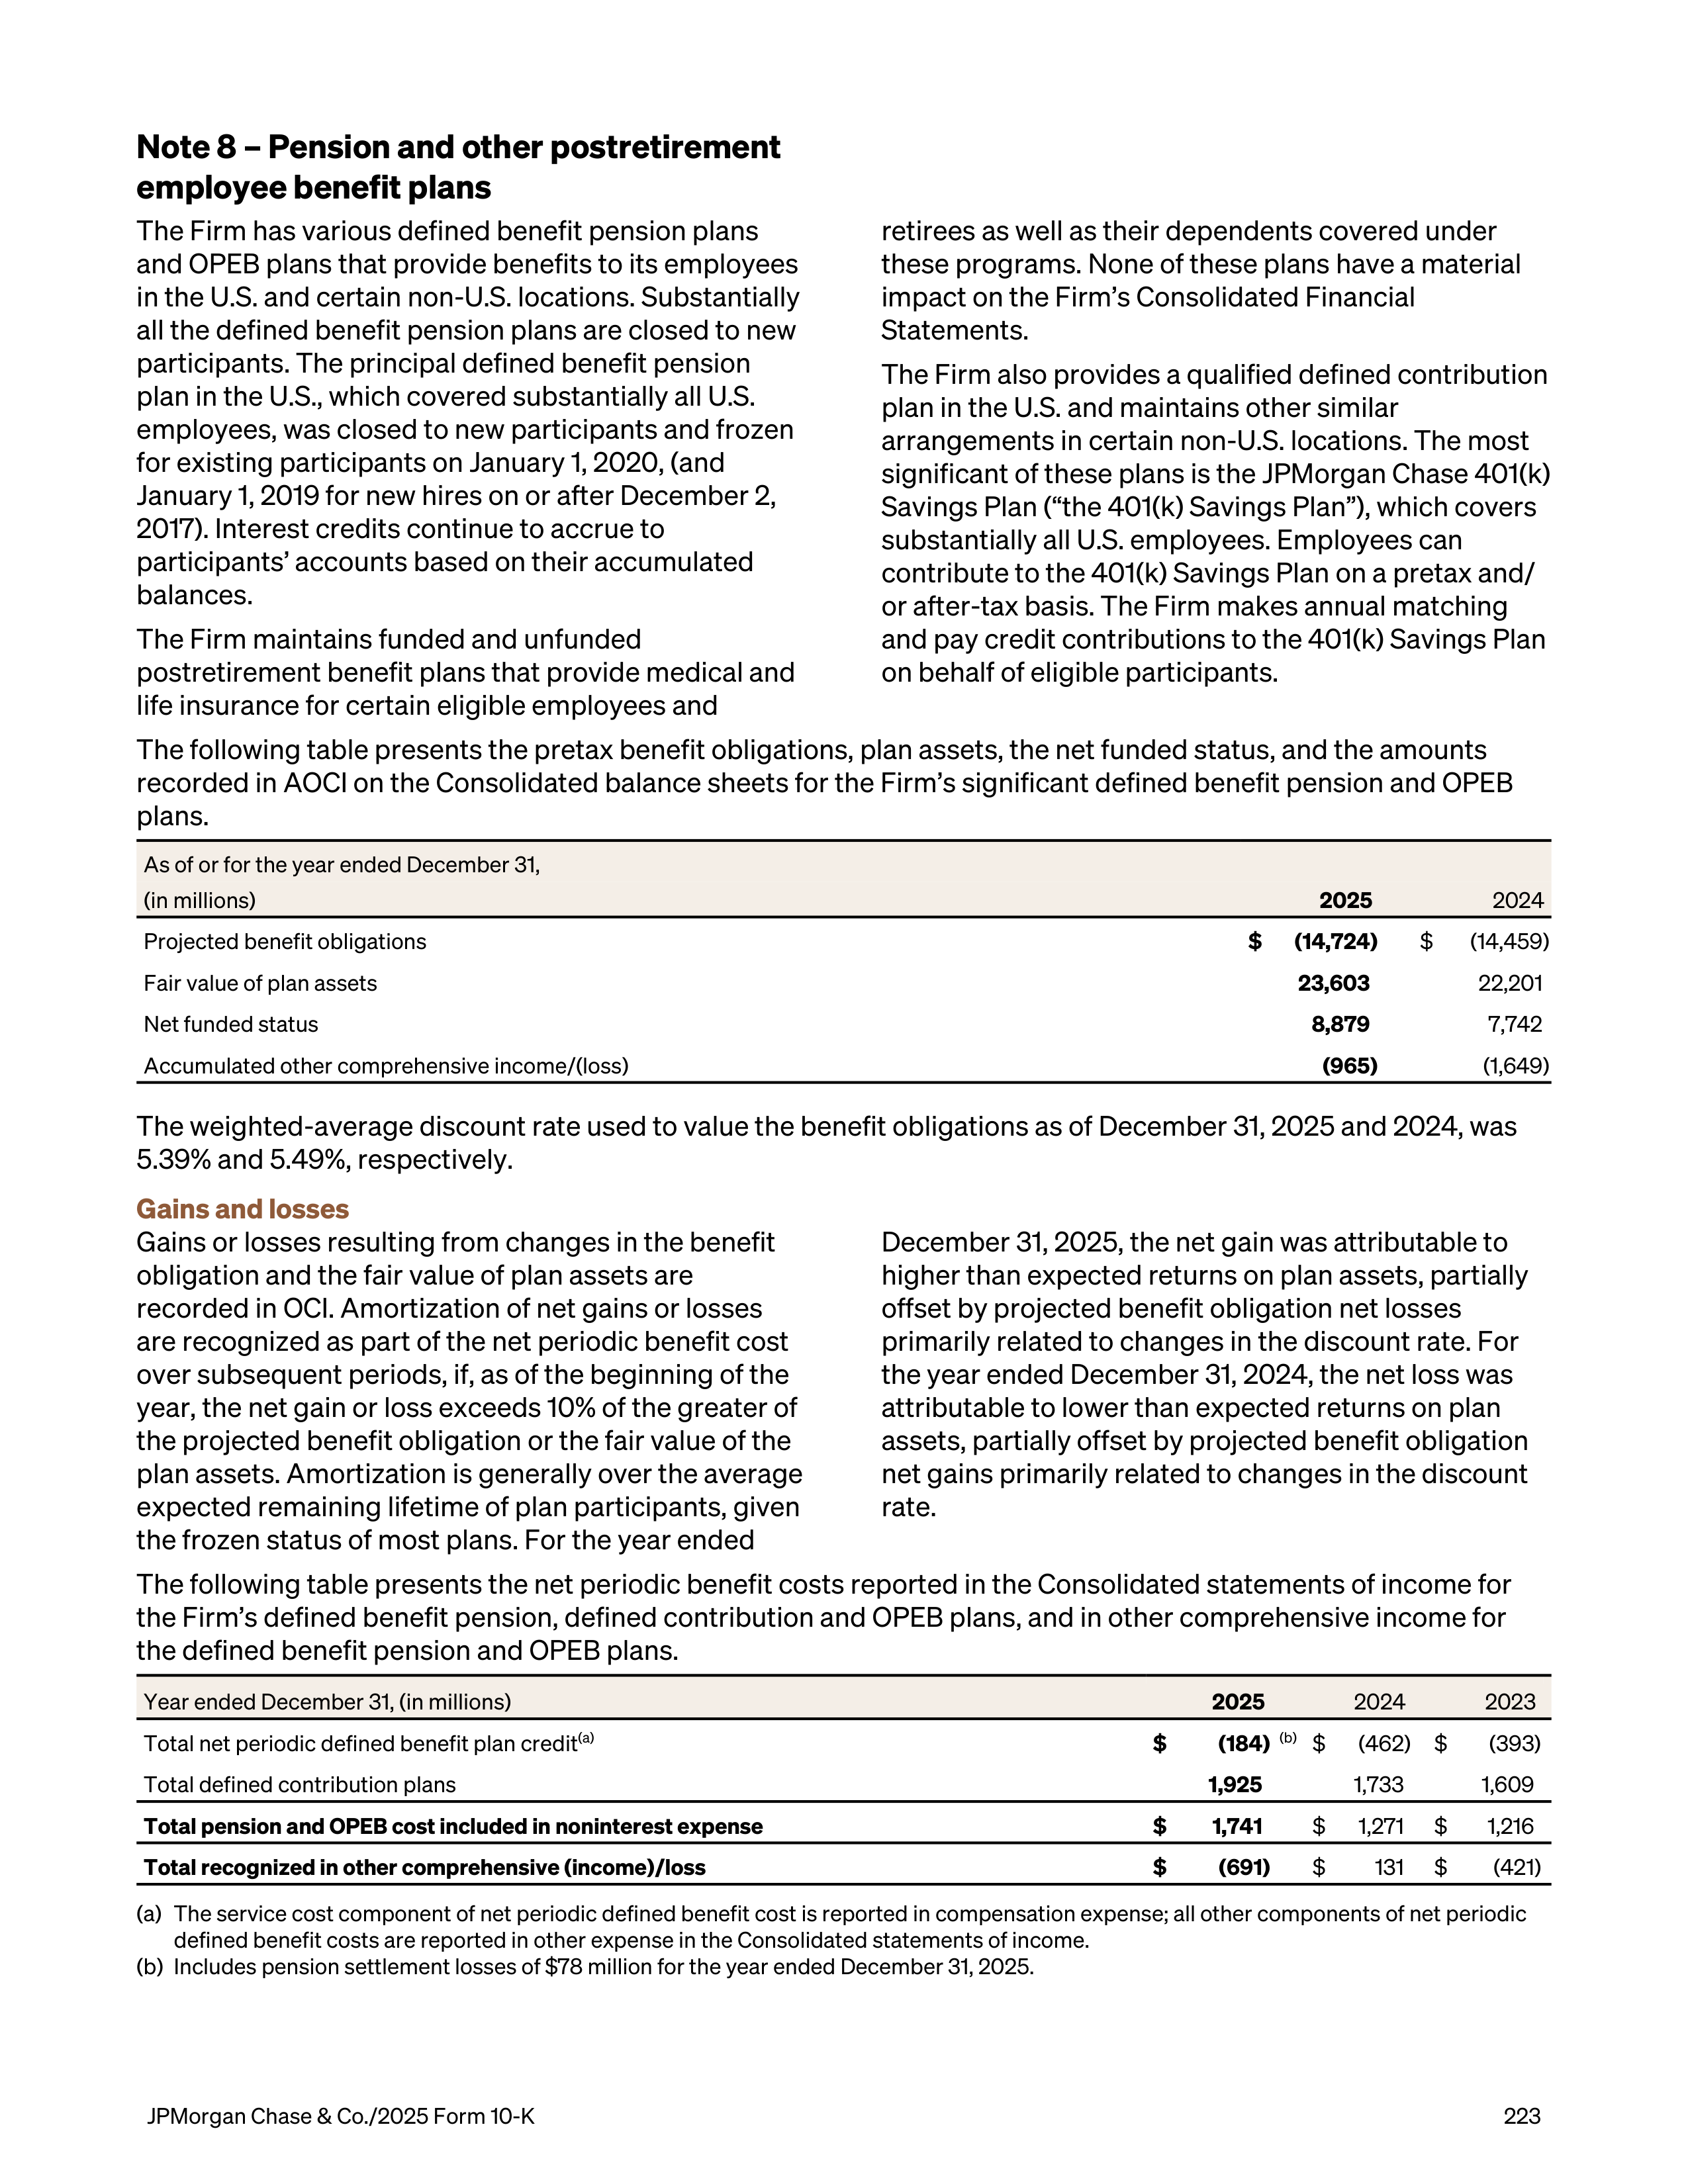
Note 8 – Pension and other postretirement
employee benefit plans
The Firm has various defined benefit pension plans
and OPEB plans that provide benefits to its employees
in the U.S. and certain non-U.S. locations. Substantially
all the defined benefit pension plans are closed to new
participants. The principal defined benefit pension
plan in the U.S., which covered substantially all U.S.
employees, was closed to new participants and frozen
for existing participants on January 1, 2020, (and
January 1, 2019 for new hires on or after December 2,
2017). Interest credits continue to accrue to
participants’ accounts based on their accumulated
balances.
The Firm maintains funded and unfunded
postretirement benefit plans that provide medical and
life insurance for certain eligible employees and
retirees as well as their dependents covered under
these programs. None of these plans have a material
impact on the Firm’s Consolidated Financial
Statements.
The Firm also provides a qualified defined contribution
plan in the U.S. and maintains other similar
arrangements in certain non-U.S. locations. The most
significant of these plans is the JPMorgan Chase 401(k)
Savings Plan (“the 401(k) Savings Plan”), which covers
substantially all U.S. employees. Employees can
contribute to the 401(k) Savings Plan on a pretax and/
or after-tax basis. The Firm makes annual matching
and pay credit contributions to the 401(k) Savings Plan
on behalf of eligible participants.
The following table presents the pretax benefit obligations, plan assets, the net funded status, and the amounts
recorded in AOCI on the Consolidated balance sheets for the Firm’s significant defined benefit pension and OPEB
plans.
As of or for the year ended December 31,
(in millions)
2025
2024
Projected benefit obligations
$
(14,724)
$
(14,459)
Fair value of plan assets
23,603
22,201
Net funded status
8,879
7,742
Accumulated other comprehensive income/(loss)
(965)
(1,649)
The weighted-average discount rate used to value the benefit obligations as of December 31, 2025 and 2024, was
5.39% and 5.49%, respectively.
Gains and losses
Gains or losses resulting from changes in the benefit
obligation and the fair value of plan assets are
recorded in OCI. Amortization of net gains or losses
are recognized as part of the net periodic benefit cost
over subsequent periods, if, as of the beginning of the
year, the net gain or loss exceeds 10% of the greater of
the projected benefit obligation or the fair value of the
plan assets. Amortization is generally over the average
expected remaining lifetime of plan participants, given
the frozen status of most plans. For the year ended
December 31, 2025, the net gain was attributable to
higher than expected returns on plan assets, partially
offset by projected benefit obligation net losses
primarily related to changes in the discount rate. For
the year ended December 31, 2024, the net loss was
attributable to lower than expected returns on plan
assets, partially offset by projected benefit obligation
net gains primarily related to changes in the discount
rate.
The following table presents the net periodic benefit costs reported in the Consolidated statements of income for
the Firm’s defined benefit pension, defined contribution and OPEB plans, and in other comprehensive income for
the defined benefit pension and OPEB plans.
Year ended December 31, (in millions)
2025
2024
2023
Total net periodic defined benefit plan credit
(a)
$
(184)
(b)
$
(462)
$
(393)
Total defined contribution plans
1,925
1,733
1,609
Total pension and OPEB cost included in noninterest expense
$
1,741
$
1,271
$
1,216
Total recognized in other comprehensive (income)/loss
$
(691)
$
131
$
(421)
(a)
The service cost component of net periodic defined benefit cost is reported in compensation expense; all other components of net periodic
defined benefit costs are reported in other expense in the Consolidated statements of income.
(b)
Includes pension settlement losses of $78 million for the year ended December 31, 2025.
JPMorgan Chase & Co./2025 Form 10-K
223
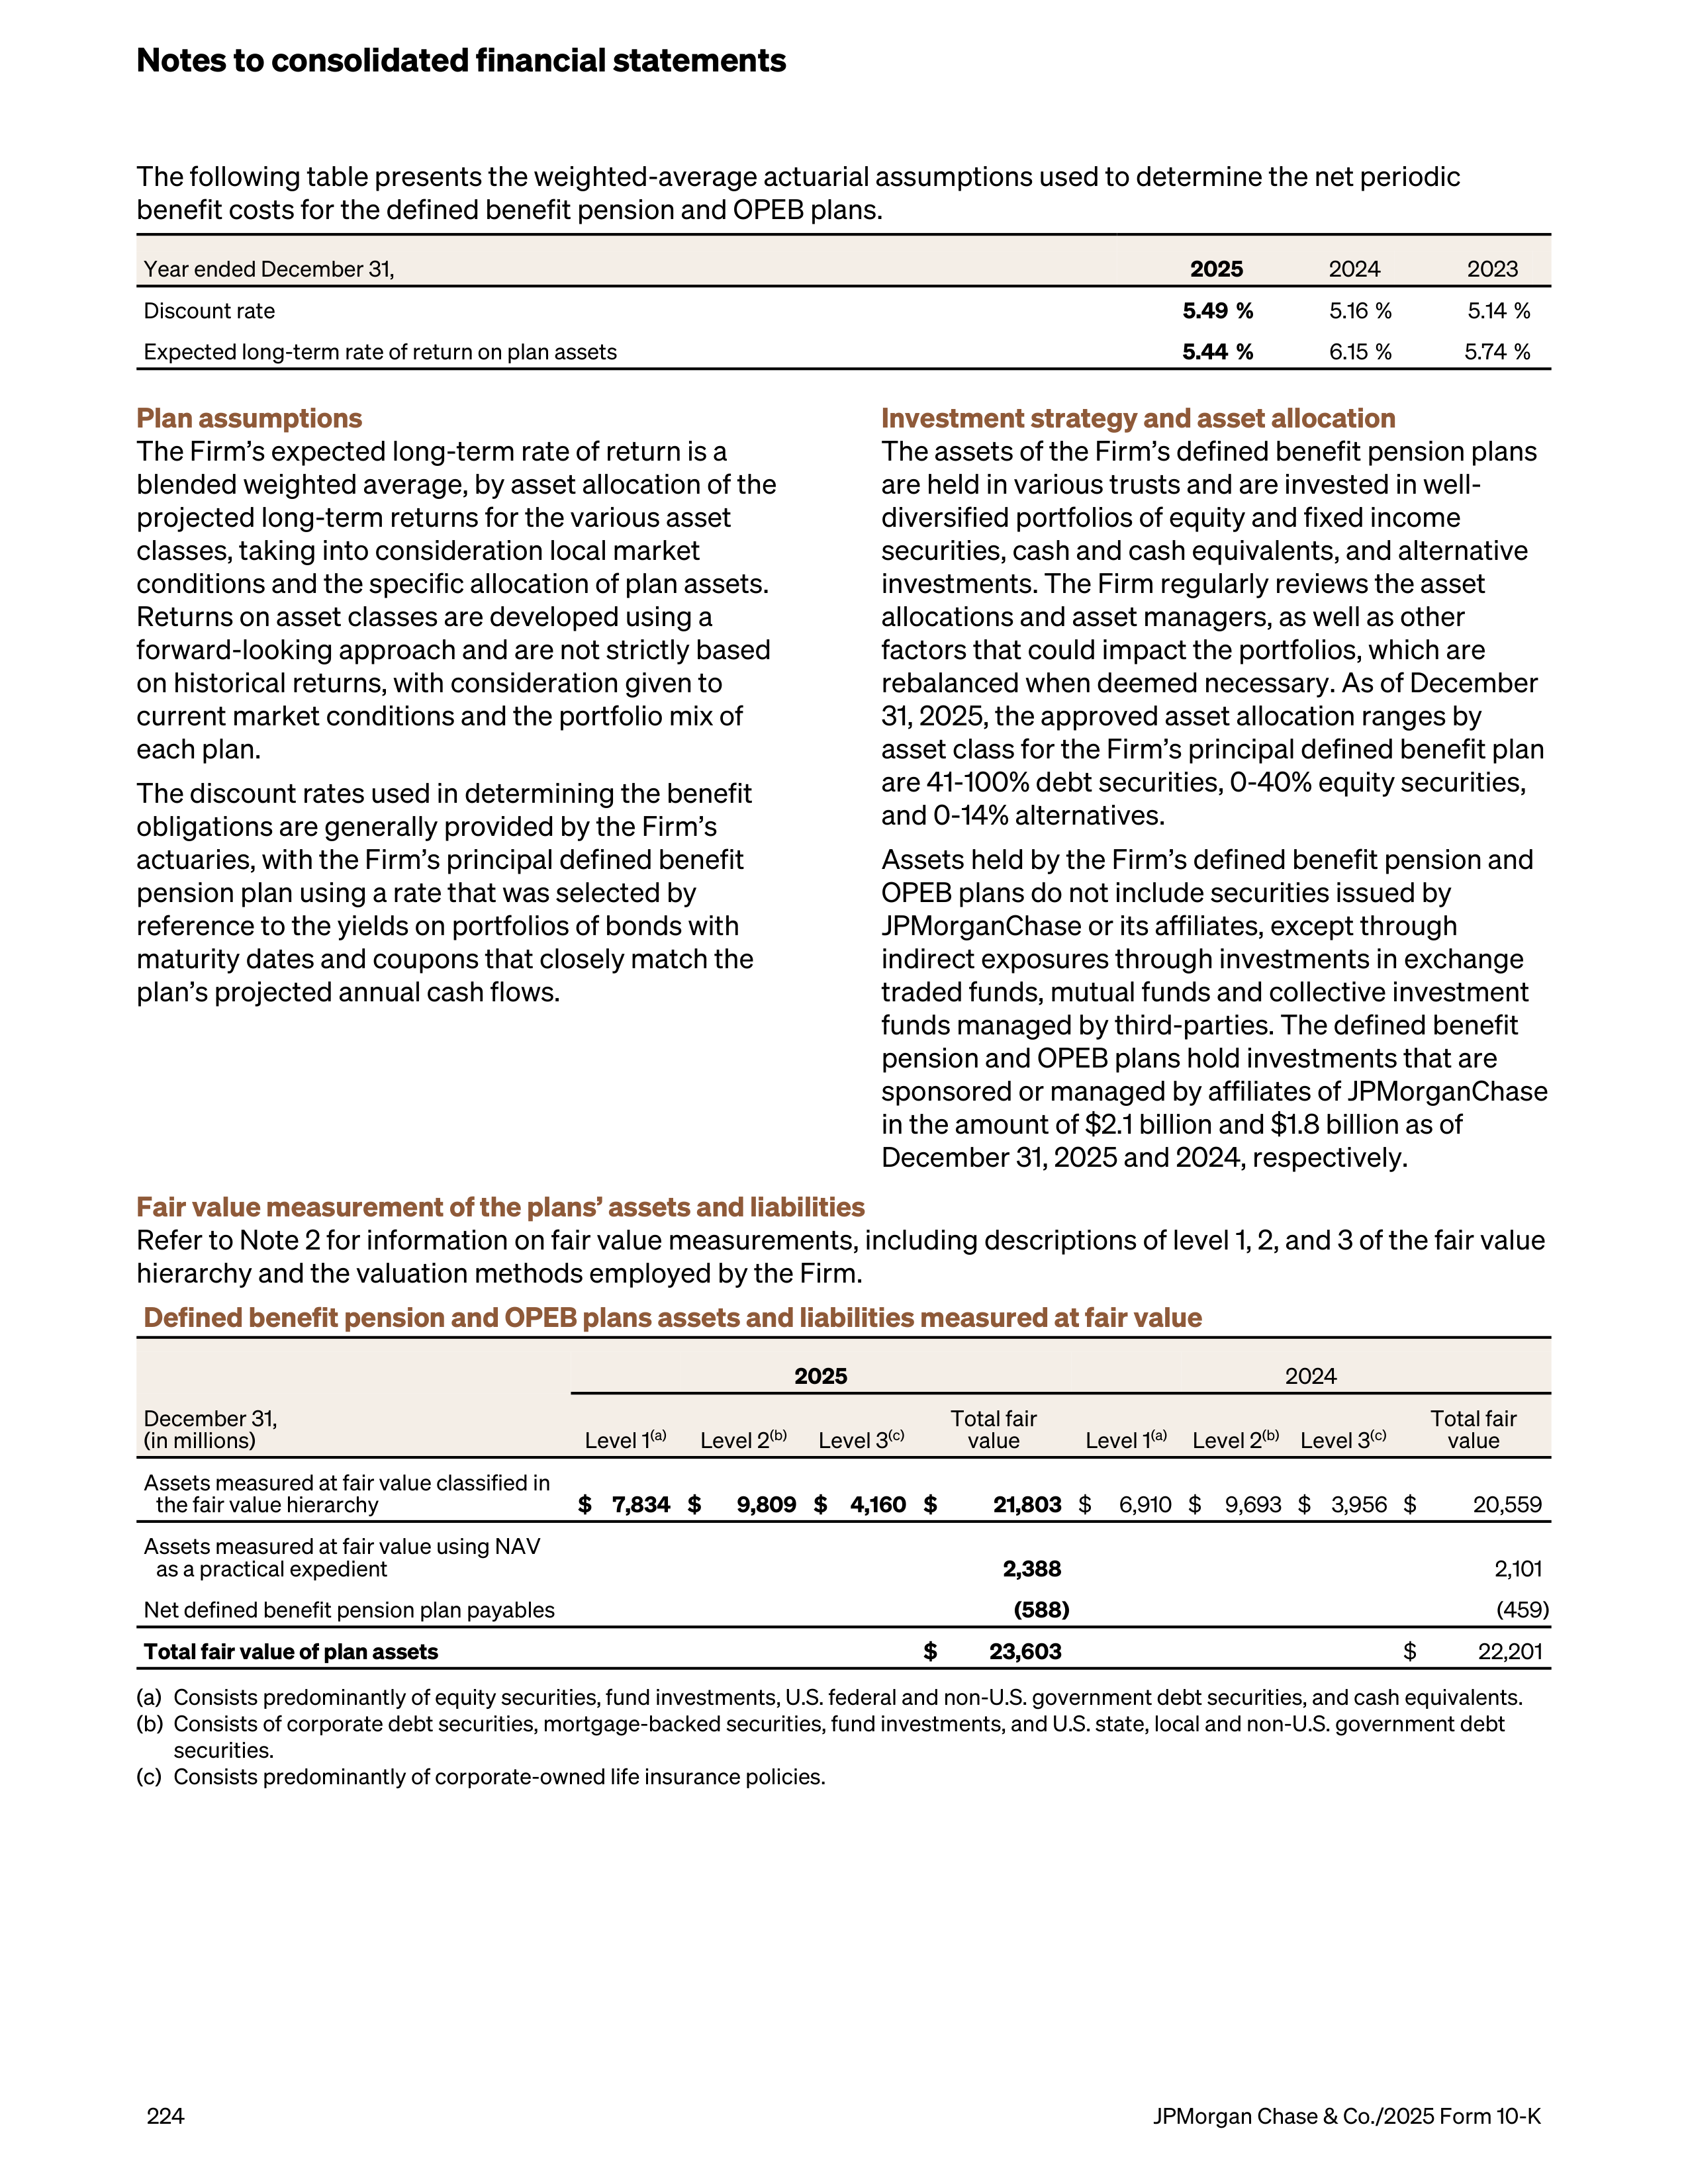
The following table presents the weighted-average actuarial assumptions used to determine the net periodic
benefit costs for the defined benefit pension and OPEB plans.
Year ended December 31,
2025
2024
2023
Discount rate
5.49 %
5.16 %
5.14 %
Expected long-term rate of return on plan assets
5.44 %
6.15 %
5.74 %
Plan assumptions
The Firm’s expected long-term rate of return is a
blended weighted average, by asset allocation of the
projected long-term returns for the various asset
classes, taking into consideration local market
conditions and the specific allocation of plan assets.
Returns on asset classes are developed using a
forward-looking approach and are not strictly based
on historical returns, with consideration given to
current market conditions and the portfolio mix of
each plan.
The discount rates used in determining the benefit
obligations are generally provided by the Firm’s
actuaries, with the Firm’s principal defined benefit
pension plan using a rate that was selected by
reference to the yields on portfolios of bonds with
maturity dates and coupons that closely match the
plan’s projected annual cash flows.
Investment strategy and asset allocation
The assets of the Firm’s defined benefit pension plans
are held in various trusts and are invested in well-
diversified portfolios of equity and fixed income
securities, cash and cash equivalents, and alternative
investments. The Firm regularly reviews the asset
allocations and asset managers, as well as other
factors that could impact the portfolios, which are
rebalanced when deemed necessary. As of December
31, 2025, the approved asset allocation ranges by
asset class for the Firm’s principal defined benefit plan
are 41-100% debt securities, 0-40% equity securities,
and 0-14% alternatives.
Assets held by the Firm’s defined benefit pension and
OPEB plans do not include securities issued by
JPMorganChase or its affiliates, except through
indirect exposures through investments in exchange
traded funds, mutual funds and collective investment
funds managed by third-parties. The defined benefit
pension and OPEB plans hold investments that are
sponsored or managed by affiliates of JPMorganChase
in the amount of $2.1 billion and $1.8 billion as of
December 31, 2025 and 2024, respectively.
Fair value measurement of the plans’ assets and liabilities
Refer to Note 2 for information on fair value measurements, including descriptions of level 1, 2, and 3 of the fair value
hierarchy and the valuation methods employed by the Firm.
Defined benefit pension and OPEB plans assets and liabilities measured at fair value
2025
2024
December 31,
(in millions)
Level 1
(a)
Level 2
(b)
Level 3
(c)
Total fair
value
Level 1
(a)
Level 2
(b)
Level 3
(c)
Total fair
value
Assets measured at fair value classified in
the fair value hierarchy
$ 7,834 $
9,809 $
4,160 $
21,803
$
6,910 $
9,693 $ 3,956 $
20,559
Assets measured at fair value using NAV
as a practical expedient
2,388
2,101
Net defined benefit pension plan payables
(588)
(459)
Total fair value of plan assets
$
23,603
$
22,201
(a)
Consists predominantly of equity securities, fund investments, U.S. federal and non-U.S. government debt securities, and cash equivalents.
(b)
Consists of corporate debt securities, mortgage-backed securities, fund investments, and U.S. state, local and non-U.S. government debt
securities.
(c)
Consists predominantly of corporate-owned life insurance policies.
Notes to consolidated financial statements
224
JPMorgan Chase & Co./2025 Form 10-K
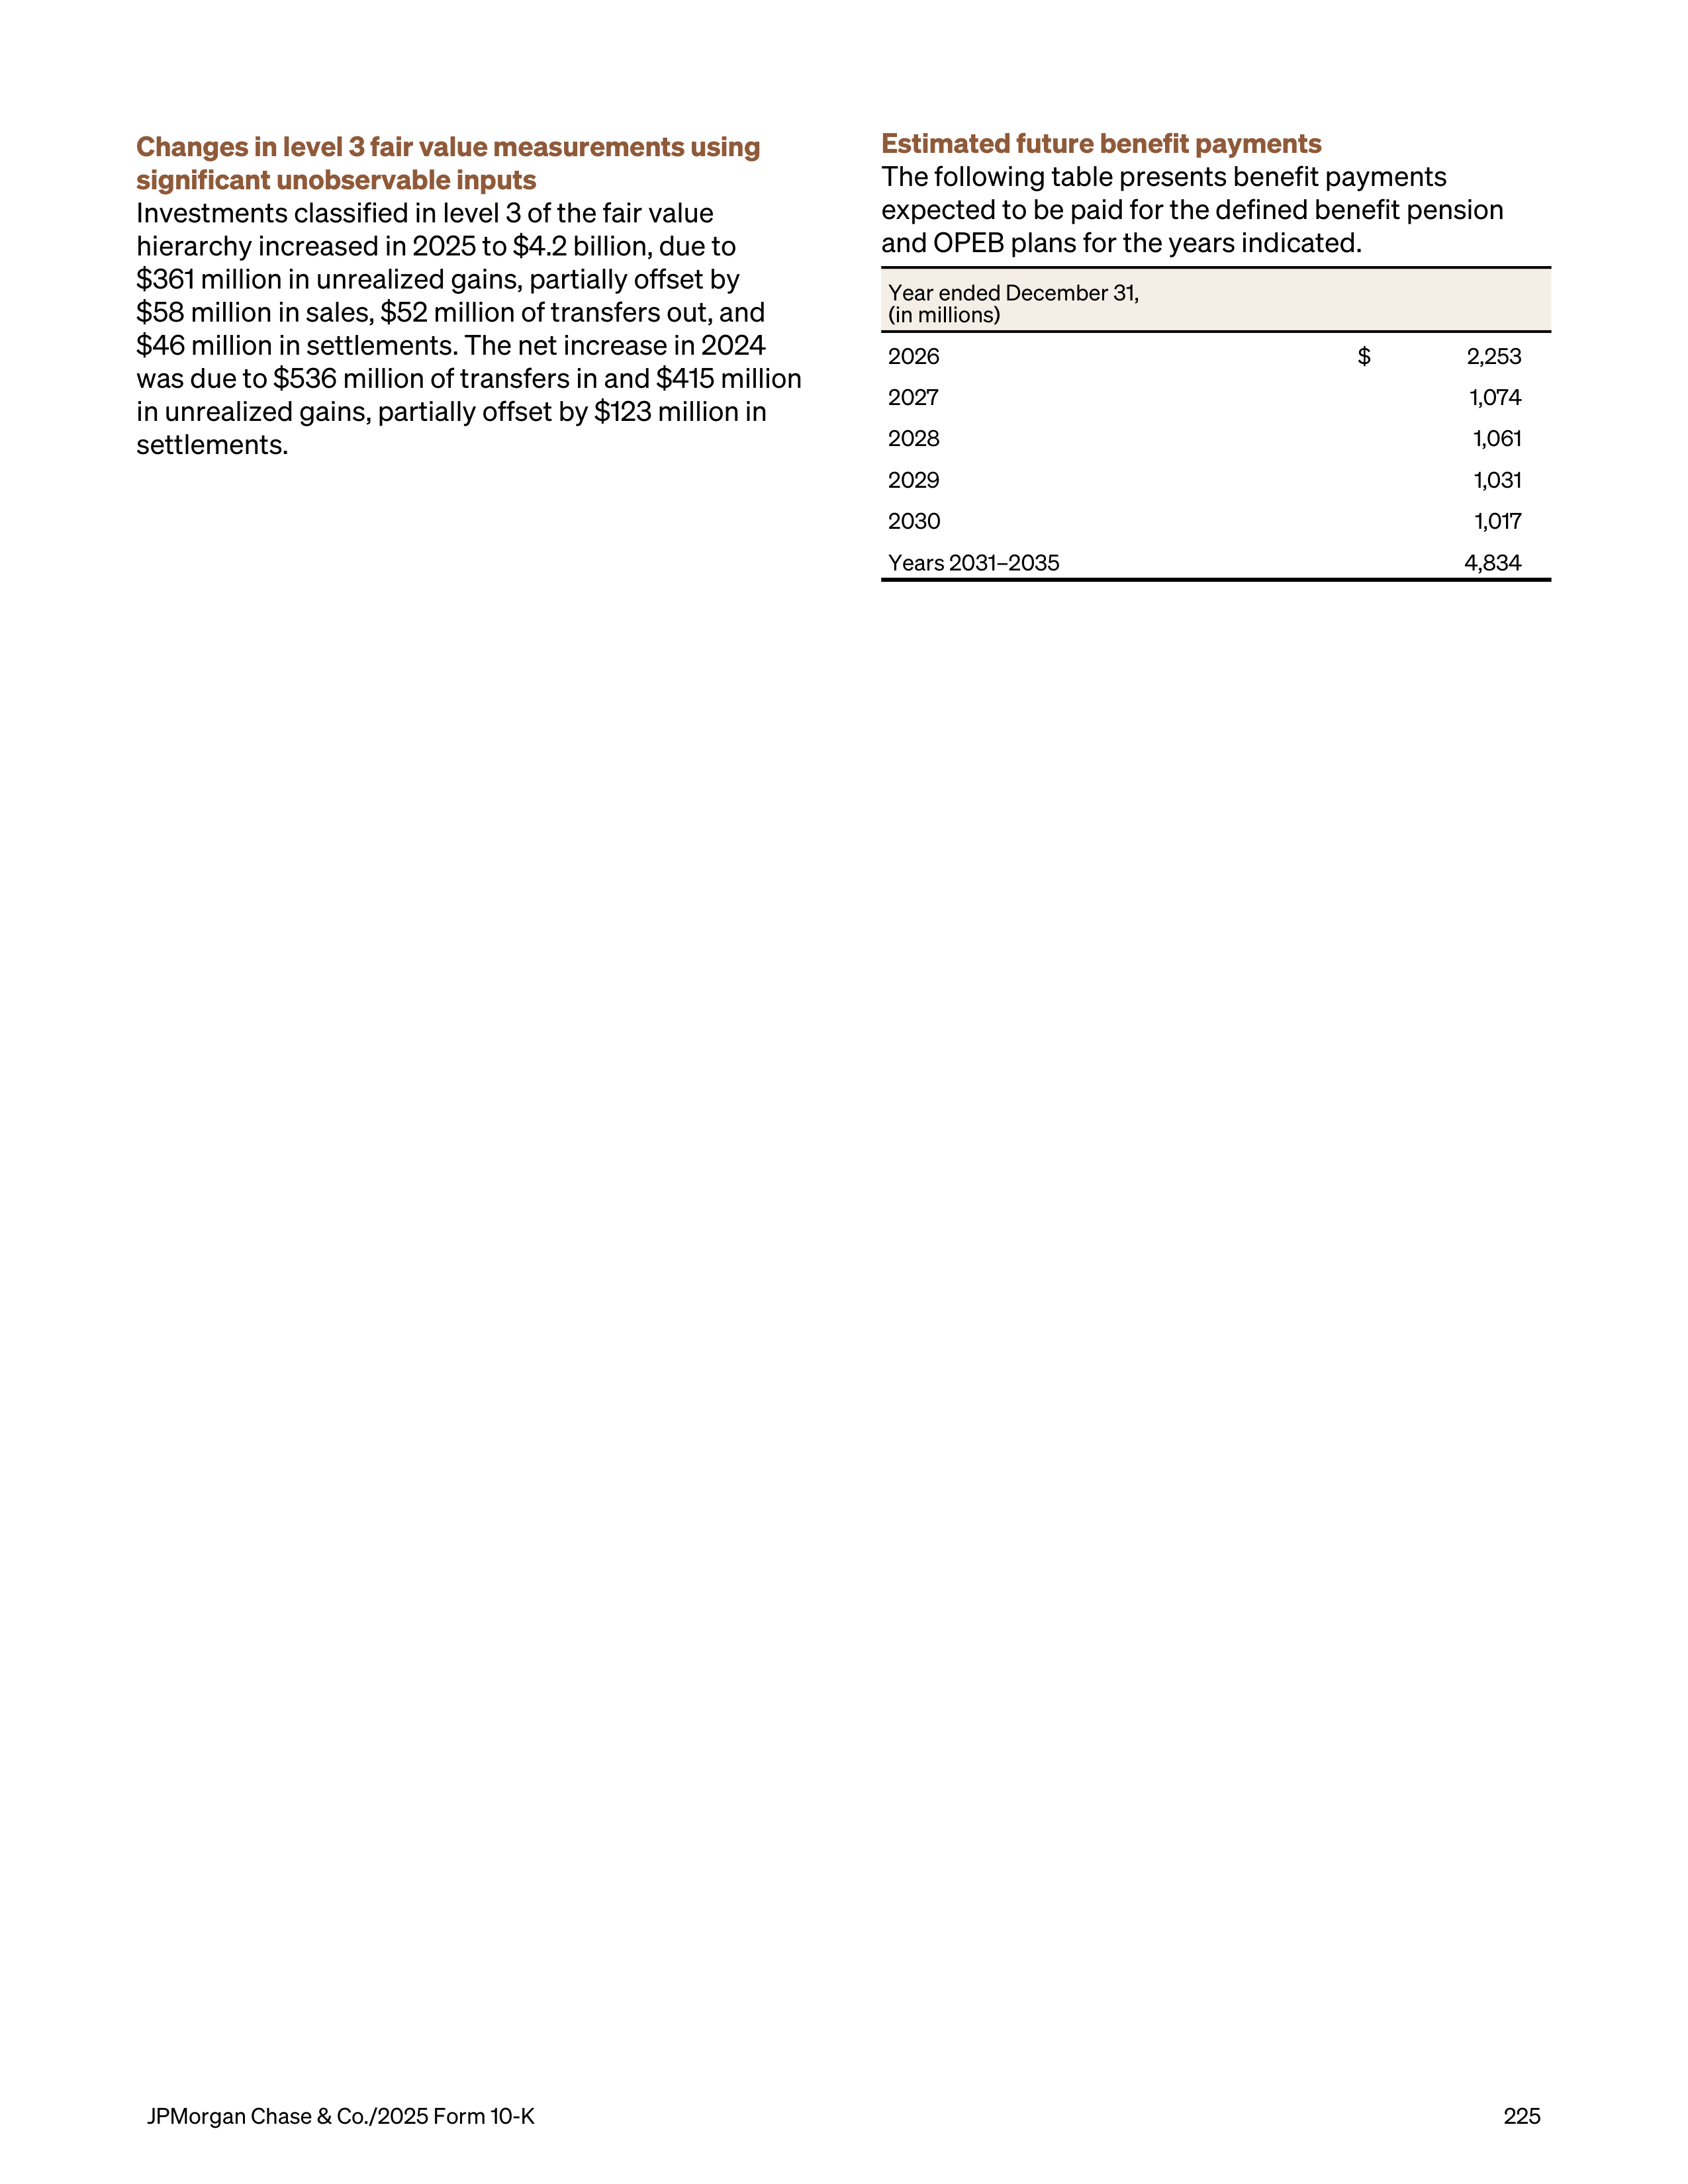
Changes in level 3 fair value measurements using
significant unobservable inputs
Investments classified in level 3 of the fair value
hierarchy increased in 2025 to $4.2 billion, due to
$361 million in unrealized gains, partially offset by
$58 million in sales, $52 million of transfers out, and
$46 million in settlements. The net increase in 2024
was due to $536 million of transfers in and $415 million
in unrealized gains, partially offset by $123 million in
settlements.
Estimated future benefit payments
The following table presents benefit payments
expected to be paid for the defined benefit pension
and OPEB plans for the years indicated.
Year ended December 31,
(in millions)
2026
$
2,253
2027
1,074
2028
1,061
2029
1,031
2030
1,017
Years 2031–2035
4,834
JPMorgan Chase & Co./2025 Form 10-K
225
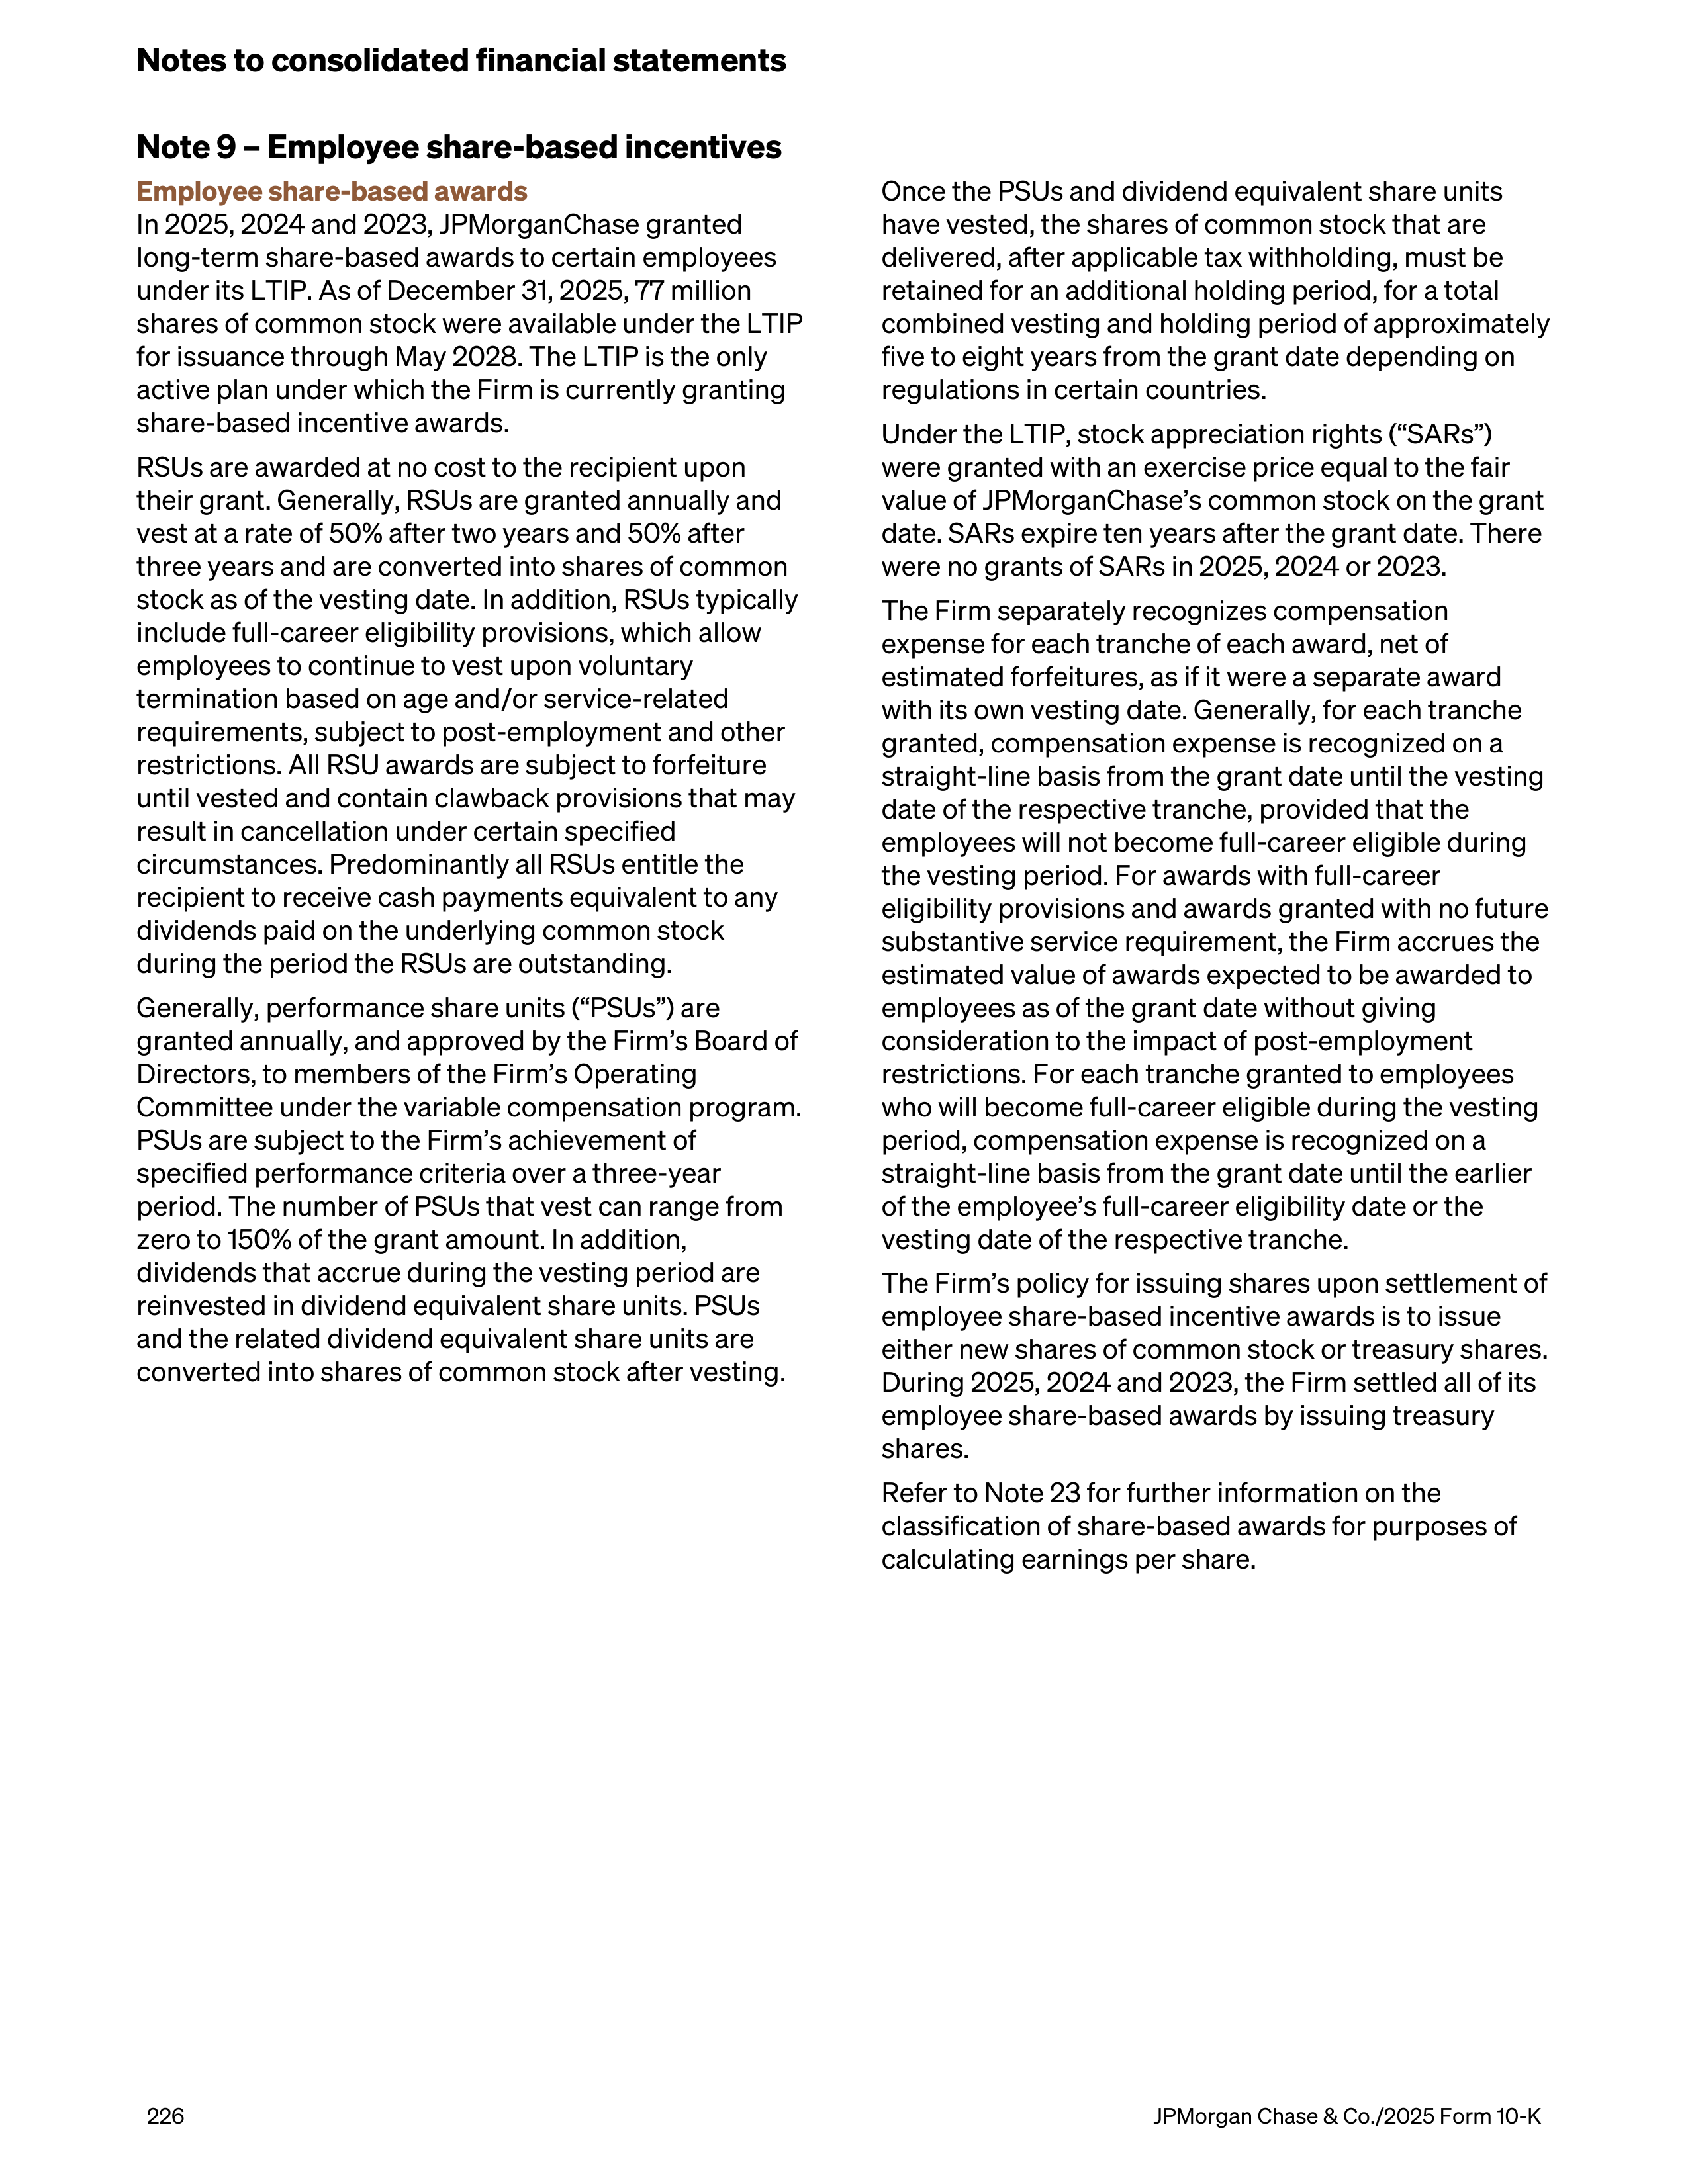
Note 9 – Employee share-based incentives
Employee share-based awards
In 2025, 2024 and 2023, JPMorganChase granted
long-term share-based awards to certain employees
under its LTIP. As of December 31, 2025, 77 million
shares of common stock were available under the LTIP
for issuance through May 2028. The LTIP is the only
active plan under which the Firm is currently granting
share-based incentive awards.
RSUs are awarded at no cost to the recipient upon
their grant. Generally, RSUs are granted annually and
vest at a rate of 50% after two years and 50% after
three years and are converted into shares of common
stock as of the vesting date. In addition, RSUs typically
include full-career eligibility provisions, which allow
employees to continue to vest upon voluntary
termination based on age and/or service-related
requirements, subject to post-employment and other
restrictions. All RSU awards are subject to forfeiture
until vested and contain clawback provisions that may
result in cancellation under certain specified
circumstances. Predominantly all RSUs entitle the
recipient to receive cash payments equivalent to any
dividends paid on the underlying common stock
during the period the RSUs are outstanding.
Generally, performance share units (“PSUs”) are
granted annually, and approved by the Firm’s Board of
Directors, to members of the Firm’s Operating
Committee under the variable compensation program.
PSUs are subject to the Firm’s achievement of
specified performance criteria over a three-year
period. The number of PSUs that vest can range from
zero to 150% of the grant amount. In addition,
dividends that accrue during the vesting period are
reinvested in dividend equivalent share units. PSUs
and the related dividend equivalent share units are
converted into shares of common stock after vesting.
Once the PSUs and dividend equivalent share units
have vested, the shares of common stock that are
delivered, after applicable tax withholding, must be
retained for an additional holding period, for a total
combined vesting and holding period of approximately
five to eight years from the grant date depending on
regulations in certain countries.
Under the LTIP, stock appreciation rights (“SARs”)
were granted with an exercise price equal to the fair
value of JPMorganChase’s common stock on the grant
date. SARs expire ten years after the grant date. There
were no grants of SARs in 2025, 2024 or 2023.
The Firm separately recognizes compensation
expense for each tranche of each award, net of
estimated forfeitures, as if it were a separate award
with its own vesting date. Generally, for each tranche
granted, compensation expense is recognized on a
straight-line basis from the grant date until the vesting
date of the respective tranche, provided that the
employees will not become full-career eligible during
the vesting period. For awards with full-career
eligibility provisions and awards granted with no future
substantive service requirement, the Firm accrues the
estimated value of awards expected to be awarded to
employees as of the grant date without giving
consideration to the impact of post-employment
restrictions. For each tranche granted to employees
who will become full-career eligible during the vesting
period, compensation expense is recognized on a
straight-line basis from the grant date until the earlier
of the employee’s full-career eligibility date or the
vesting date of the respective tranche.
The Firm’s policy for issuing shares upon settlement of
employee share-based incentive awards is to issue
either new shares of common stock or treasury shares.
During 2025, 2024 and 2023, the Firm settled all of its
employee share-based awards by issuing treasury
shares.
Refer to Note 23 for further information on the
classification of share-based awards for purposes of
calculating earnings per share.
Notes to consolidated financial statements
226
JPMorgan Chase & Co./2025 Form 10-K
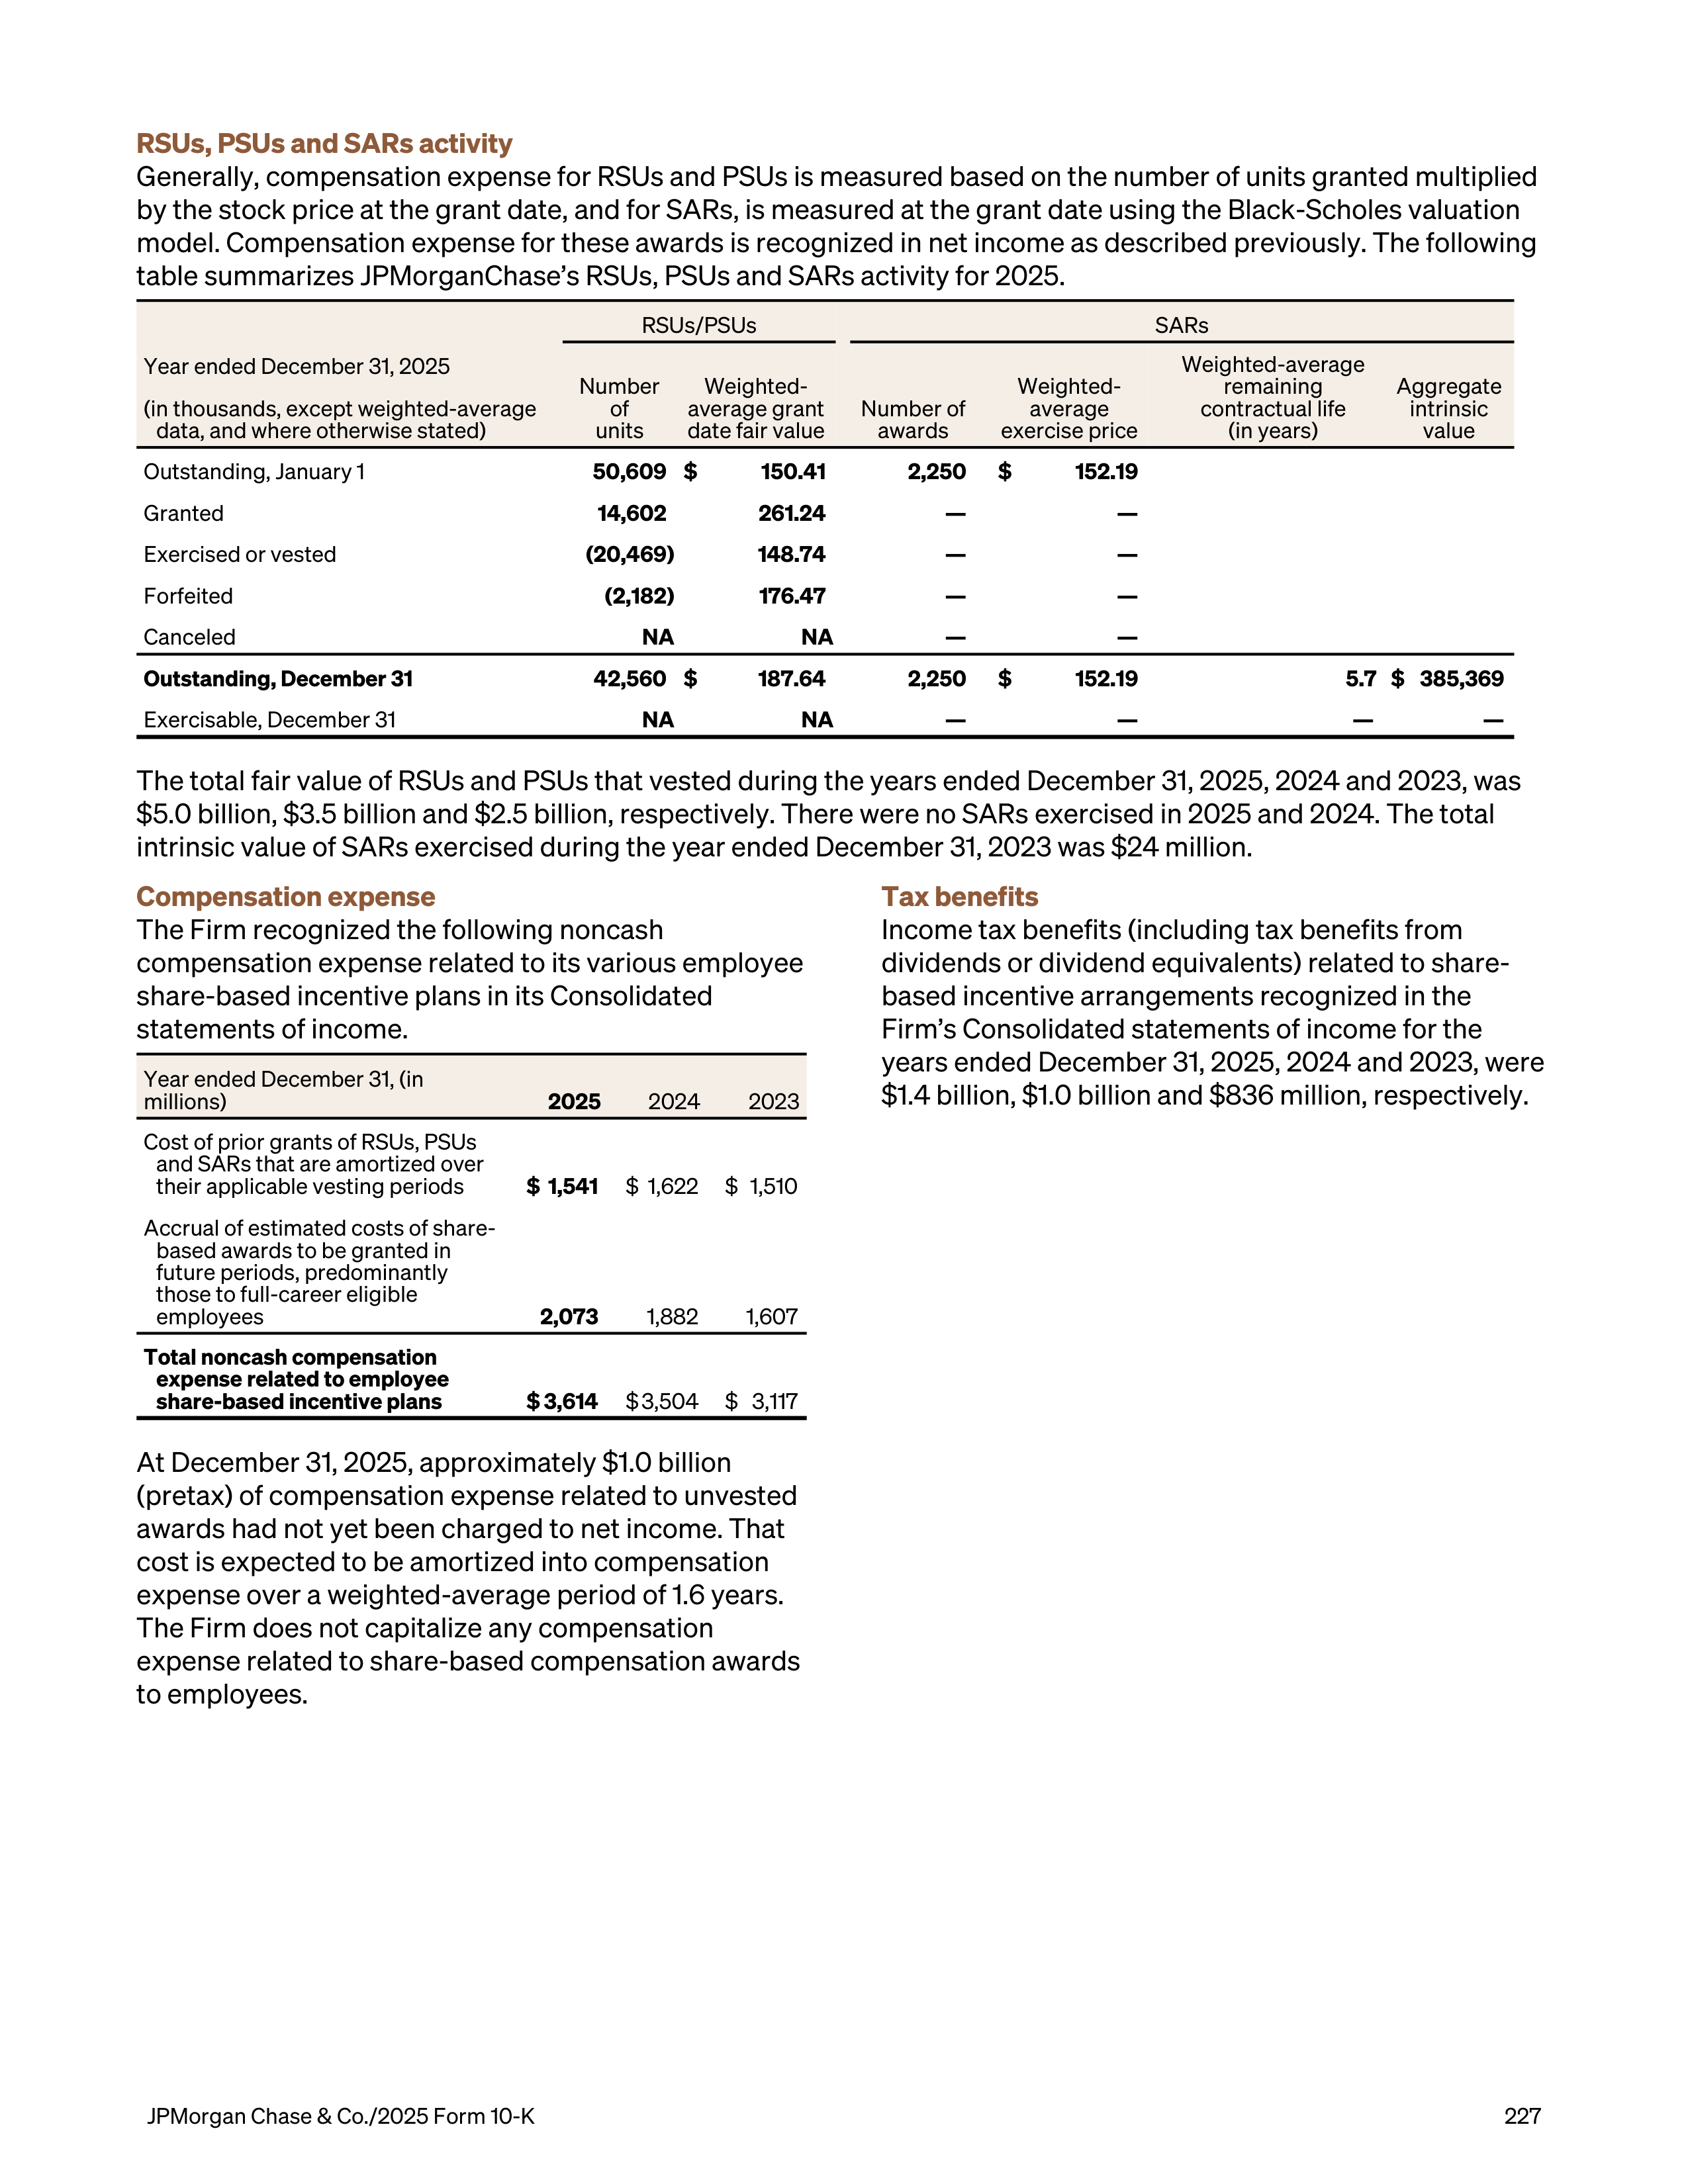
RSUs, PSUs and SARs activity
Generally, compensation expense for RSUs and PSUs is measured based on the number of units granted multiplied
by the stock price at the grant date, and for SARs, is measured at the grant date using the Black-Scholes valuation
model. Compensation expense for these awards is recognized in net income as described previously. The following
table summarizes JPMorganChase’s RSUs, PSUs and SARs activity for 2025.
RSUs/PSUs
SARs
Year ended December 31, 2025
Number
of
units
Weighted-
average grant
date fair value
Number of
awards
Weighted-
average
exercise price
Weighted-average
remaining
contractual life
(in years)
Aggregate
intrinsic
value
(in thousands, except weighted-average
data, and where otherwise stated)
Outstanding, January 1
50,609 $
150.41
2,250
$
152.19
Granted
14,602
261.24
—
—
Exercised or vested
(20,469)
148.74
—
—
Forfeited
(2,182)
176.47
—
—
Canceled
NA
NA
—
—
Outstanding, December 31
42,560 $
187.64
2,250
$
152.19
5.7
$ 385,369
Exercisable, December 31
NA
NA
—
—
—
—
The total fair value of RSUs and PSUs that vested during the years ended December 31, 2025, 2024 and 2023, was
$5.0 billion, $3.5 billion and $2.5 billion, respectively. There were no SARs exercised in 2025 and 2024. The total
intrinsic value of SARs exercised during the year ended December 31, 2023 was $24 million.
Compensation expense
The Firm recognized the following noncash
compensation expense related to its various employee
share-based incentive plans in its Consolidated
statements of income.
Year ended December 31, (in
millions)
2025
2024
2023
Cost of prior grants of RSUs, PSUs
and SARs that are amortized over
their applicable vesting periods
$ 1,541
$ 1,622
$ 1,510
Accrual of estimated costs of share-
based awards to be granted in
future periods, predominantly
those to full-career eligible
employees
2,073
1,882
1,607
Total noncash compensation
expense related to employee
share-based incentive plans
$ 3,614
$ 3,504
$ 3,117
At December 31, 2025, approximately $1.0 billion
(pretax) of compensation expense related to unvested
awards had not yet been charged to net income. That
cost is expected to be amortized into compensation
expense over a weighted-average period of 1.6 years.
The Firm does not capitalize any compensation
expense related to share-based compensation awards
to employees.
Tax benefits
Income tax benefits (including tax benefits from
dividends or dividend equivalents) related to share-
based incentive arrangements recognized in the
Firm’s Consolidated statements of income for the
years ended December 31, 2025, 2024 and 2023, were
$1.4 billion, $1.0 billion and $836 million, respectively.
JPMorgan Chase & Co./2025 Form 10-K
227
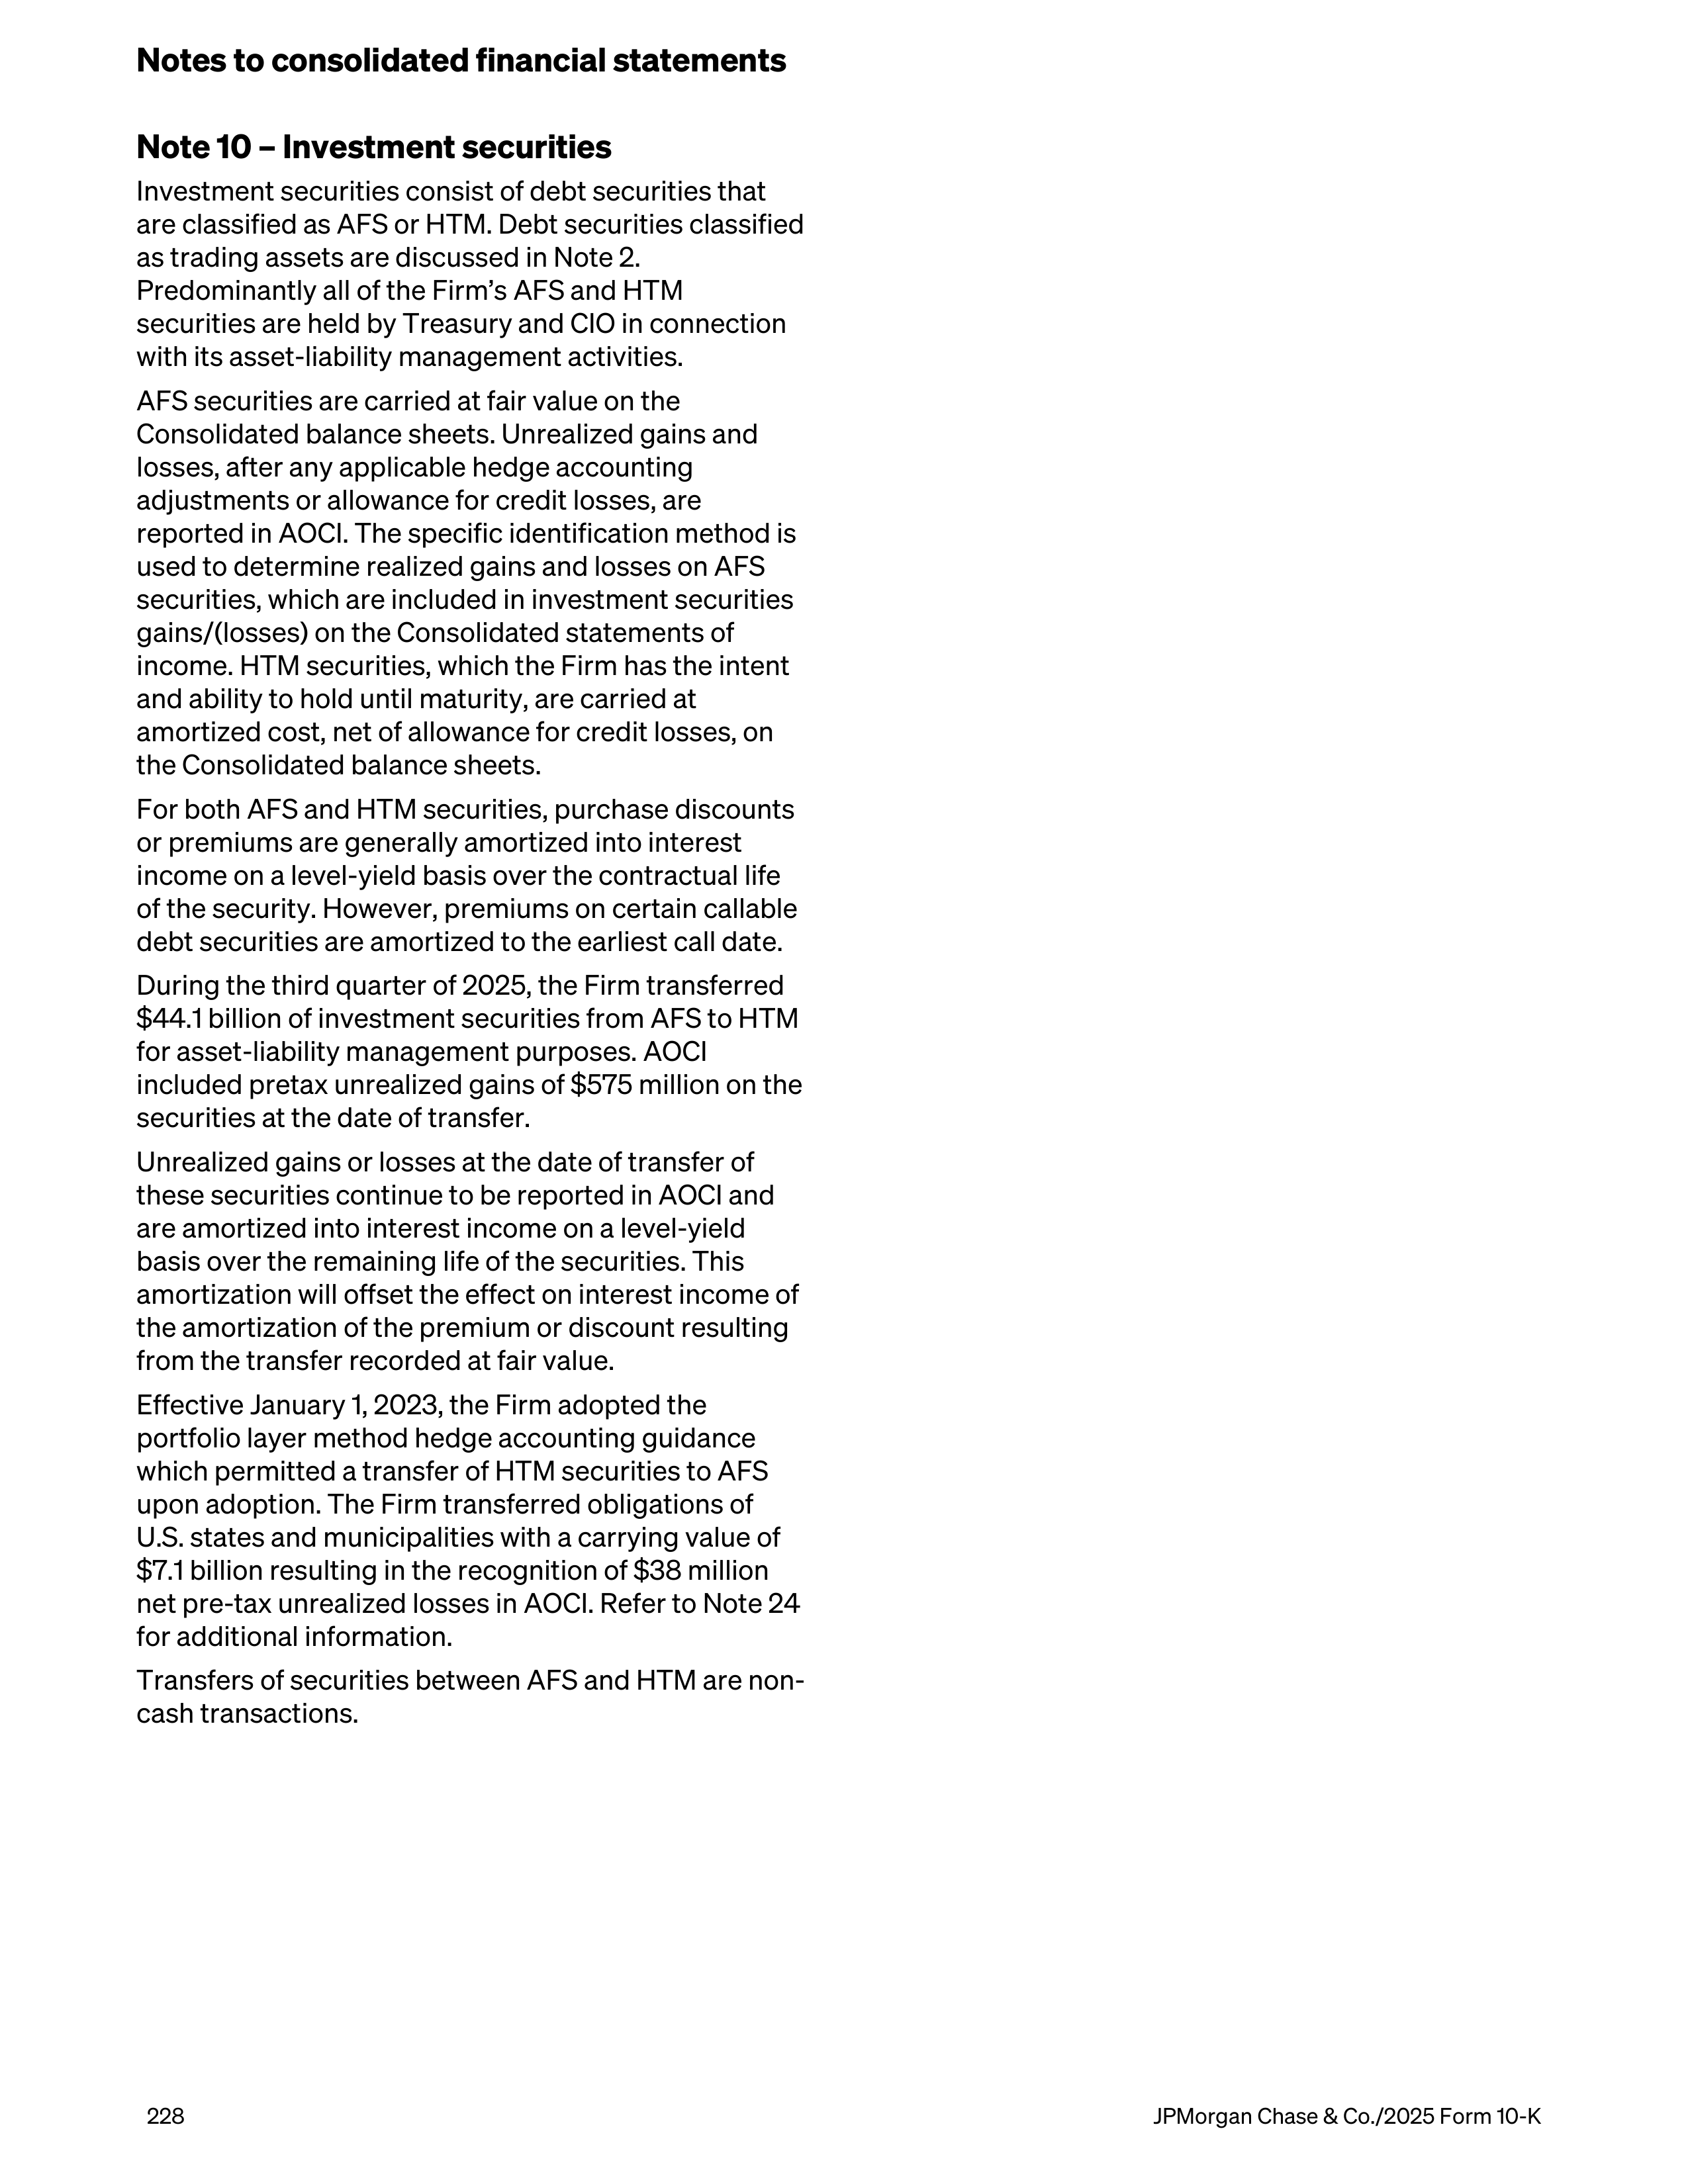
Note 10 – Investment securities
Investment securities consist of debt securities that
are classified as AFS or HTM. Debt securities classified
as trading assets are discussed in Note 2.
Predominantly all of the Firm’s AFS and HTM
securities are held by Treasury and CIO in connection
with its asset-liability management activities.
AFS securities are carried at fair value on the
Consolidated balance sheets. Unrealized gains and
losses, after any applicable hedge accounting
adjustments or allowance for credit losses, are
reported in AOCI. The specific identification method is
used to determine realized gains and losses on AFS
securities, which are included in investment securities
gains/(losses) on the Consolidated statements of
income. HTM securities, which the Firm has the intent
and ability to hold until maturity, are carried at
amortized cost, net of allowance for credit losses, on
the Consolidated balance sheets.
For both AFS and HTM securities, purchase discounts
or premiums are generally amortized into interest
income on a level-yield basis over the contractual life
of the security. However, premiums on certain callable
debt securities are amortized to the earliest call date.
During the third quarter of 2025, the Firm transferred
$44.1 billion of investment securities from AFS to HTM
for asset-liability management purposes. AOCI
included pretax unrealized gains of $575 million on the
securities at the date of transfer.
Unrealized gains or losses at the date of transfer of
these securities continue to be reported in AOCI and
are amortized into interest income on a level-yield
basis over the remaining life of the securities. This
amortization will offset the effect on interest income of
the amortization of the premium or discount resulting
from the transfer recorded at fair value.
Effective January 1, 2023, the Firm adopted the
portfolio layer method hedge accounting guidance
which permitted a transfer of HTM securities to AFS
upon adoption. The Firm transferred obligations of
U.S. states and municipalities with a carrying value of
$7.1 billion resulting in the recognition of $38 million
net pre-tax unrealized losses in AOCI. Refer to Note 24
for additional information.
Transfers of securities between AFS and HTM are non-
cash transactions.
Notes to consolidated financial statements
228
JPMorgan Chase & Co./2025 Form 10-K
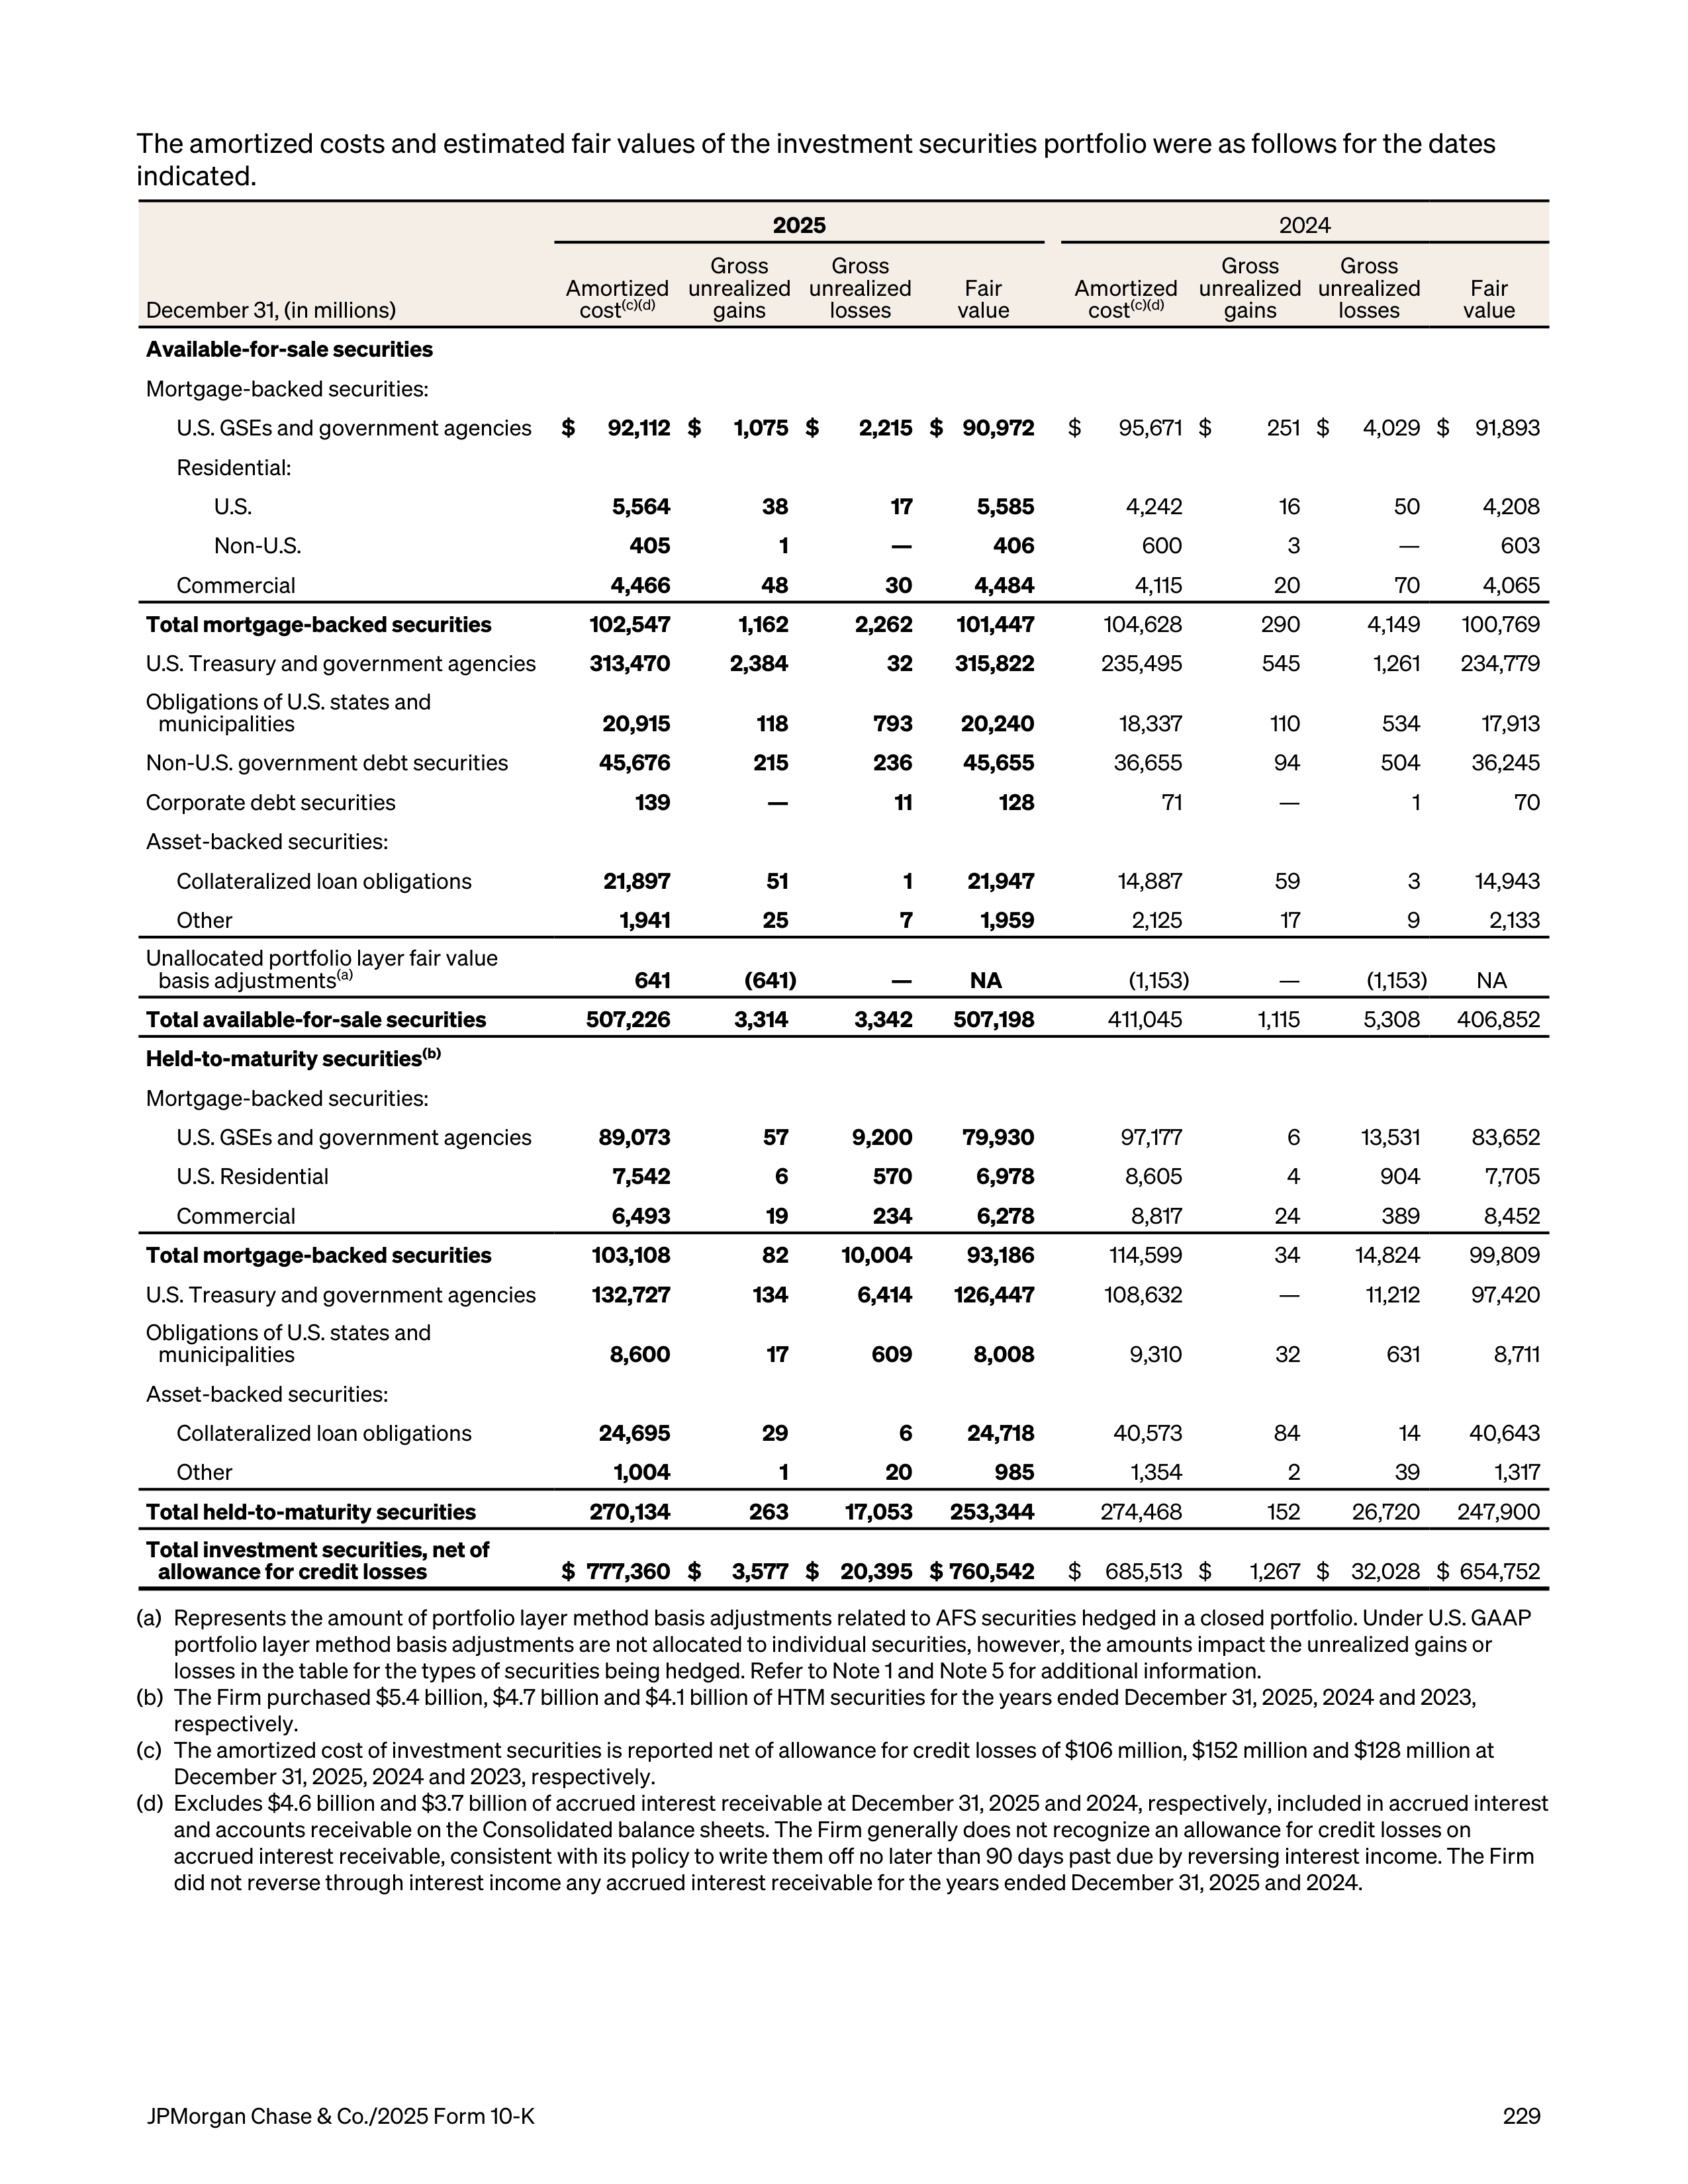
The amortized costs and estimated fair values of the investment securities portfolio were as follows for the dates
indicated.
2025
2024
December 31, (in millions)
Amortized
cost
(c)(d)
Gross
unrealized
gains
Gross
unrealized
losses
Fair
value
Amortized
cost
(c)(d)
Gross
unrealized
gains
Gross
unrealized
losses
Fair
value
Available-for-sale securities
Mortgage-backed securities:
U.S. GSEs and government agencies
$
92,112 $
1,075 $
2,215 $ 90,972
$
95,671 $
251 $
4,029 $
91,893
Residential:
U.S.
5,564
38
17
5,585
4,242
16
50
4,208
Non-U.S.
405
1
—
406
600
3
—
603
Commercial
4,466
48
30
4,484
4,115
20
70
4,065
Total mortgage-backed securities
102,547
1,162
2,262
101,447
104,628
290
4,149
100,769
U.S. Treasury and government agencies
313,470
2,384
32
315,822
235,495
545
1,261
234,779
Obligations of U.S. states and
municipalities
20,915
118
793
20,240
18,337
110
534
17,913
Non-U.S. government debt securities
45,676
215
236
45,655
36,655
94
504
36,245
Corporate debt securities
139
—
11
128
71
—
1
70
Asset-backed securities:
Collateralized loan obligations
21,897
51
1
21,947
14,887
59
3
14,943
Other
1,941
25
7
1,959
2,125
17
9
2,133
Unallocated portfolio layer fair value
basis adjustments
(a)
641
(641)
—
NA
(1,153)
—
(1,153)
NA
Total available-for-sale securities
507,226
3,314
3,342
507,198
411,045
1,115
5,308 406,852
Held-to-maturity securities
(b)
Mortgage-backed securities:
U.S. GSEs and government agencies
89,073
57
9,200
79,930
97,177
6
13,531
83,652
U.S. Residential
7,542
6
570
6,978
8,605
4
904
7,705
Commercial
6,493
19
234
6,278
8,817
24
389
8,452
Total mortgage-backed securities
103,108
82
10,004
93,186
114,599
34
14,824
99,809
U.S. Treasury and government agencies
132,727
134
6,414
126,447
108,632
—
11,212
97,420
Obligations of U.S. states and
municipalities
8,600
17
609
8,008
9,310
32
631
8,711
Asset-backed securities:
Collateralized loan obligations
24,695
29
6
24,718
40,573
84
14
40,643
Other
1,004
1
20
985
1,354
2
39
1,317
Total held-to-maturity securities
270,134
263
17,053 253,344
274,468
152
26,720 247,900
Total investment securities, net of
allowance for credit losses
$ 777,360 $
3,577 $ 20,395 $ 760,542
$
685,513 $
1,267 $ 32,028 $ 654,752
(a)
Represents the amount of portfolio layer method basis adjustments related to AFS securities hedged in a closed portfolio. Under U.S. GAAP
portfolio layer method basis adjustments are not allocated to individual securities, however, the amounts impact the unrealized gains or
losses in the table for the types of securities being hedged. Refer to Note 1 and Note 5 for additional information.
(b)
The Firm purchased $5.4 billion, $4.7 billion and $4.1 billion of HTM securities for the years ended December 31, 2025, 2024 and 2023,
respectively.
(c)
The amortized cost of investment securities is reported net of allowance for credit losses of $106 million, $152 million and $128 million at
December 31, 2025, 2024 and 2023, respectively.
(d)
Excludes $4.6 billion and $3.7 billion of accrued interest receivable at December 31, 2025 and 2024, respectively, included in accrued interest
and accounts receivable on the Consolidated balance sheets. The Firm generally does not recognize an allowance for credit losses on
accrued interest receivable, consistent with its policy to write them off no later than 90 days past due by reversing interest income. The Firm
did not reverse through interest income any accrued interest receivable for the years ended December 31, 2025 and 2024.
JPMorgan Chase & Co./2025 Form 10-K
229
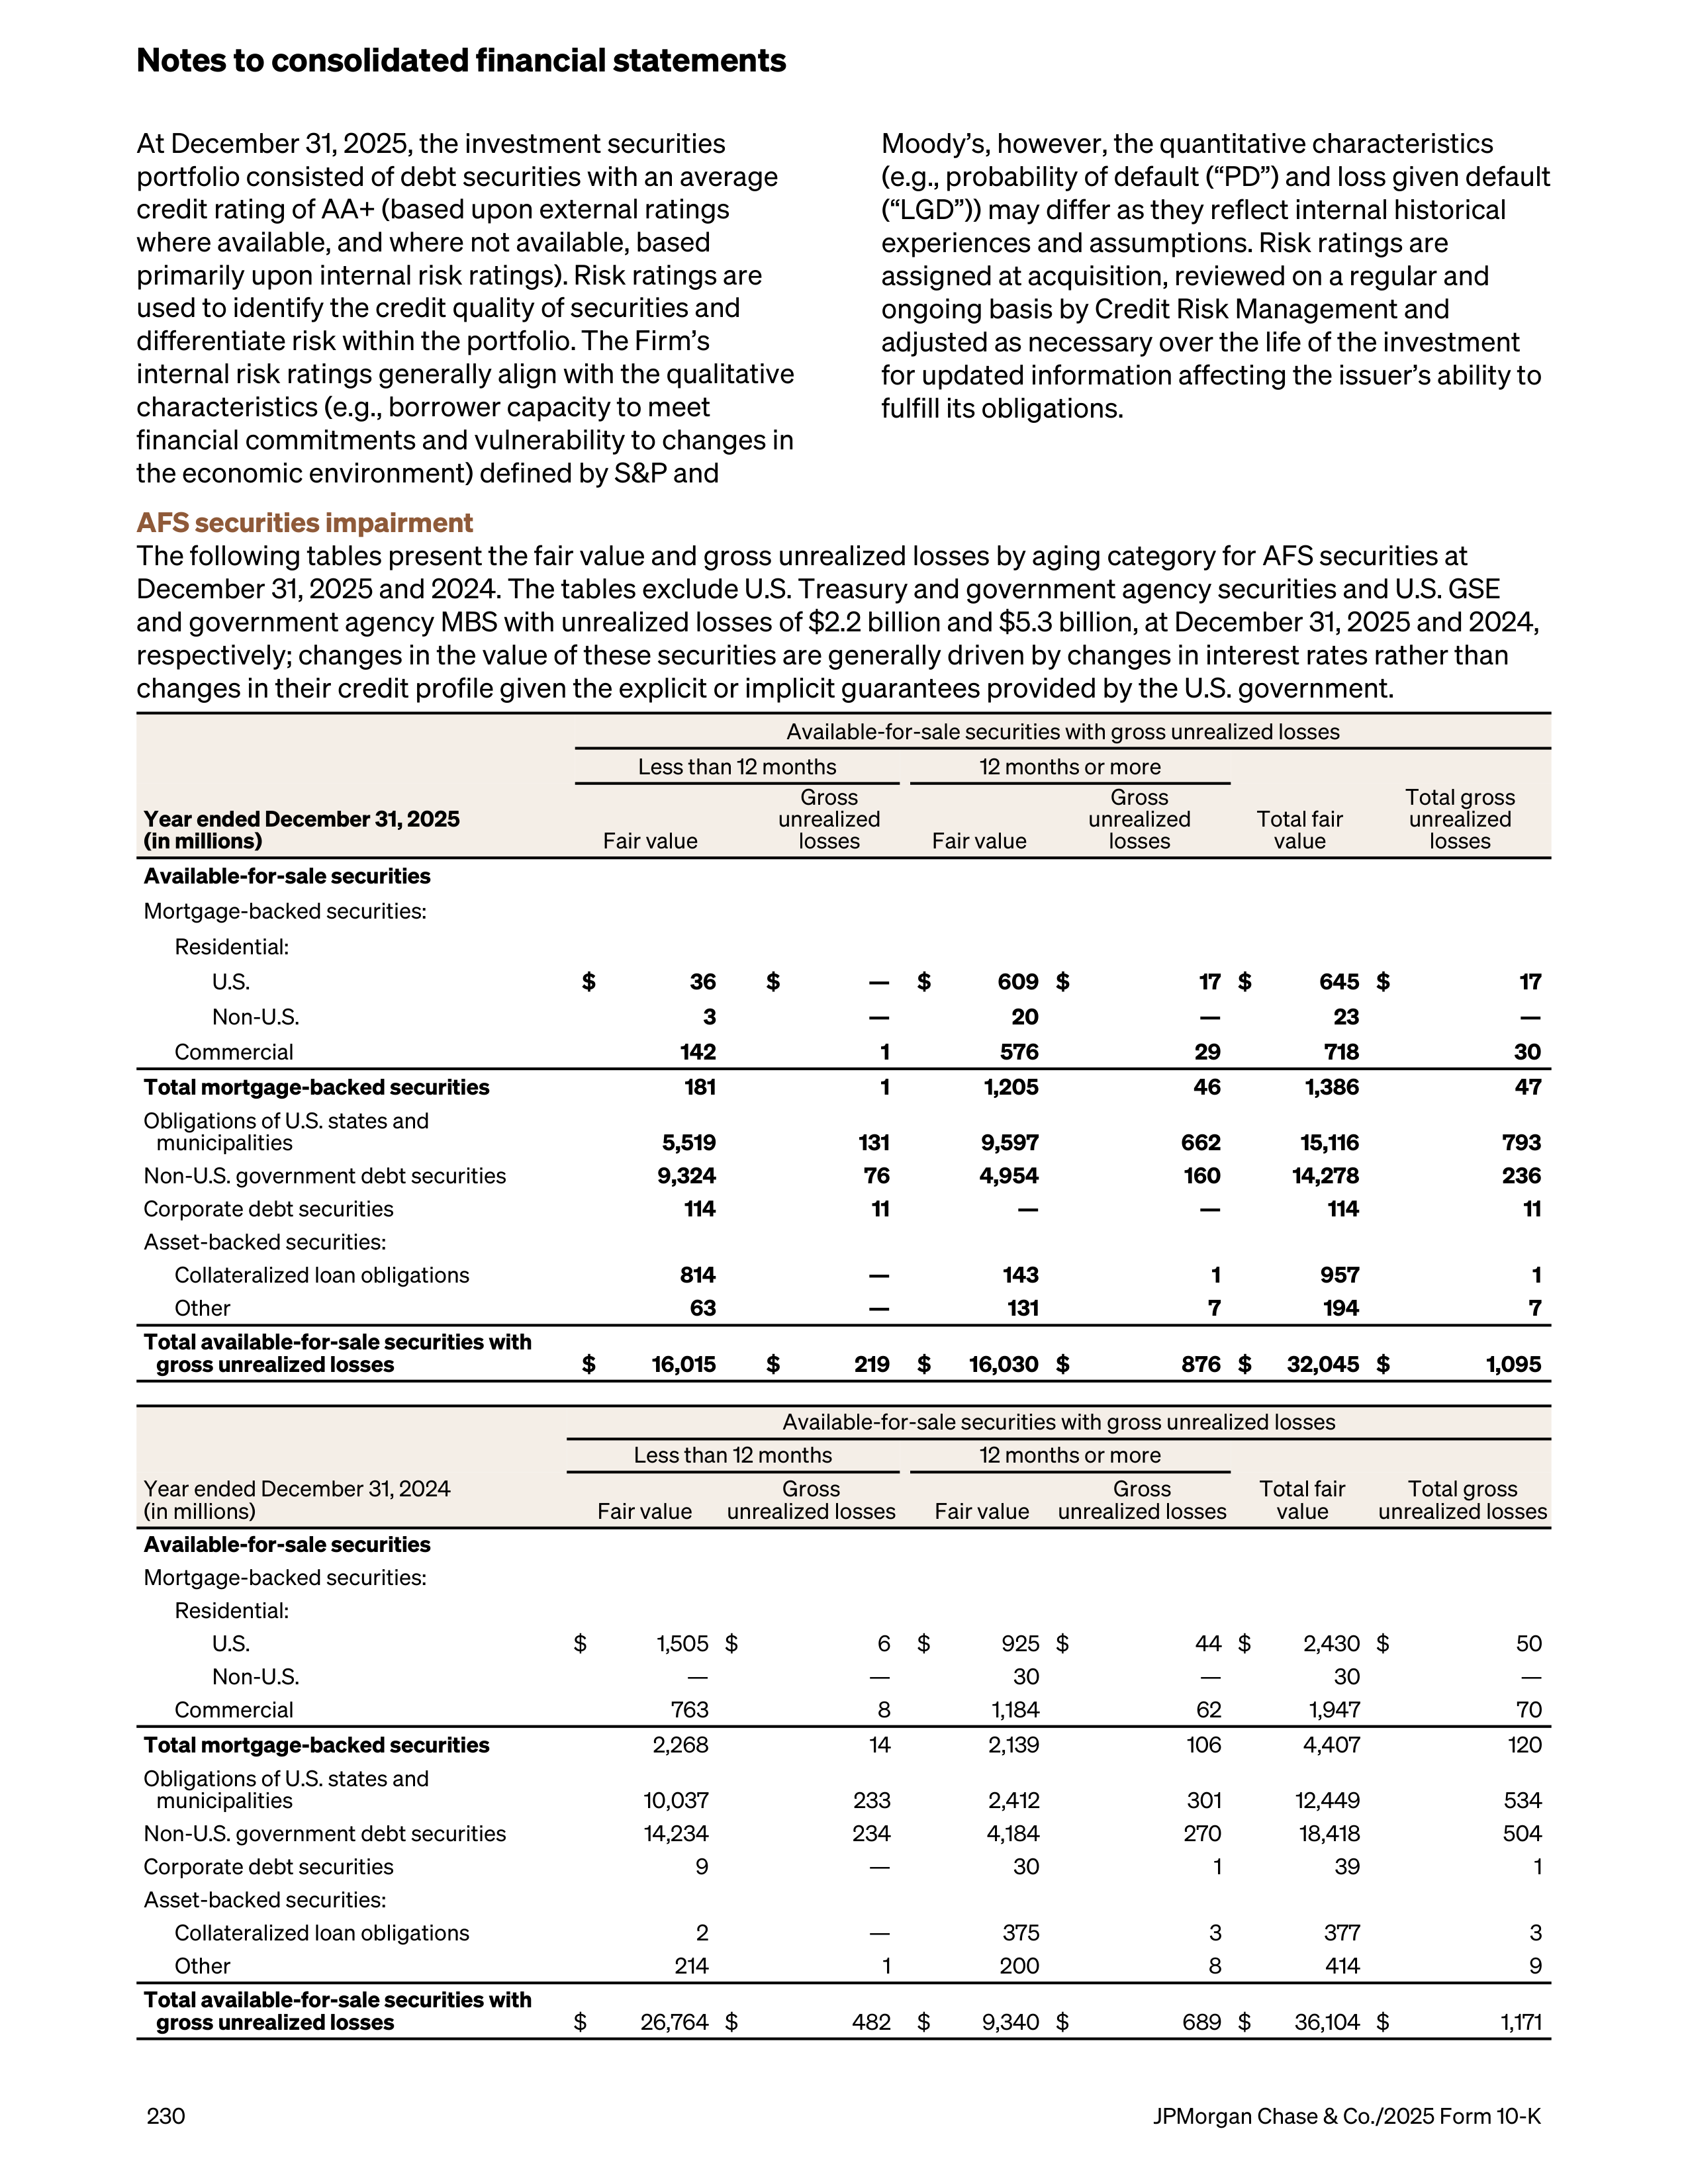
At
December 31, 2025
, the investment securities
portfolio consisted of debt securities with an average
credit rating of AA+ (based upon external ratings
where available, and where not available, based
primarily upon internal risk ratings). Risk ratings are
used to identify the credit quality of securities and
differentiate risk within the portfolio.
The Firm’s
internal risk ratings generally align with the qualitative
characteristics (e.g., borrower capacity to meet
financial commitments and vulnerability to changes in
the economic environment) defined by S&P and
Moody’s, however, the quantitative characteristics
(e.g., probability of default (“PD”) and loss given default
(“LGD”)) may differ as they reflect internal historical
experiences and assumptions.
Risk ratings are
assigned at acquisition, reviewed on a regular and
ongoing basis by Credit Risk Management and
adjusted as necessary over the life of the investment
for updated information affecting the issuer’s ability to
fulfill its obligations.
AFS securities impairment
The following tables present the fair value and gross unrealized losses by aging category for AFS securities at
December 31, 2025 and 2024. The tables exclude U.S. Treasury and government agency securities and U.S. GSE
and government agency MBS with unrealized losses of $2.2 billion and $5.3 billion, at December 31, 2025 and 2024,
respectively; changes in the value of these securities are generally driven by changes in interest rates rather than
changes in their credit profile given the explicit or implicit guarantees provided by the U.S. government.
Available-for-sale securities with gross unrealized losses
Less than 12 months
12 months or more
Year ended December 31, 2025
(in millions)
Fair value
Gross
unrealized
losses
Fair value
Gross
unrealized
losses
Total fair
value
Total gross
unrealized
losses
Available-for-sale securities
Mortgage-backed securities:
Residential:
U.S.
$
36
$
—
$
609 $
17 $
645 $
17
Non-U.S.
3
—
20
—
23
—
Commercial
142
1
576
29
718
30
Total mortgage-backed securities
181
1
1,205
46
1,386
47
Obligations of U.S. states and
municipalities
5,519
131
9,597
662
15,116
793
Non-U.S. government debt securities
9,324
76
4,954
160
14,278
236
Corporate debt securities
114
11
—
—
114
11
Asset-backed securities:
Collateralized loan obligations
814
—
143
1
957
1
Other
63
—
131
7
194
7
Total available-for-sale securities with
gross unrealized losses
$
16,015
$
219
$
16,030 $
876 $
32,045 $
1,095
Available-for-sale securities with gross unrealized losses
Less than 12 months
12 months or more
Year ended December 31, 2024
(in millions)
Fair value
Gross
unrealized losses
Fair value
Gross
unrealized losses
Total fair
value
Total gross
unrealized losses
Available-for-sale securities
Mortgage-backed securities:
Residential:
U.S.
$
1,505 $
6
$
925 $
44 $
2,430 $
50
Non-U.S.
—
—
30
—
30
—
Commercial
763
8
1,184
62
1,947
70
Total mortgage-backed securities
2,268
14
2,139
106
4,407
120
Obligations of U.S. states and
municipalities
10,037
233
2,412
301
12,449
534
Non-U.S. government debt securities
14,234
234
4,184
270
18,418
504
Corporate debt securities
9
—
30
1
39
1
Asset-backed securities:
Collateralized loan obligations
2
—
375
3
377
3
Other
214
1
200
8
414
9
Total available-for-sale securities with
gross unrealized losses
$
26,764 $
482
$
9,340 $
689 $
36,104 $
1,171
Notes to consolidated financial statements
230
JPMorgan Chase & Co./2025 Form 10-K
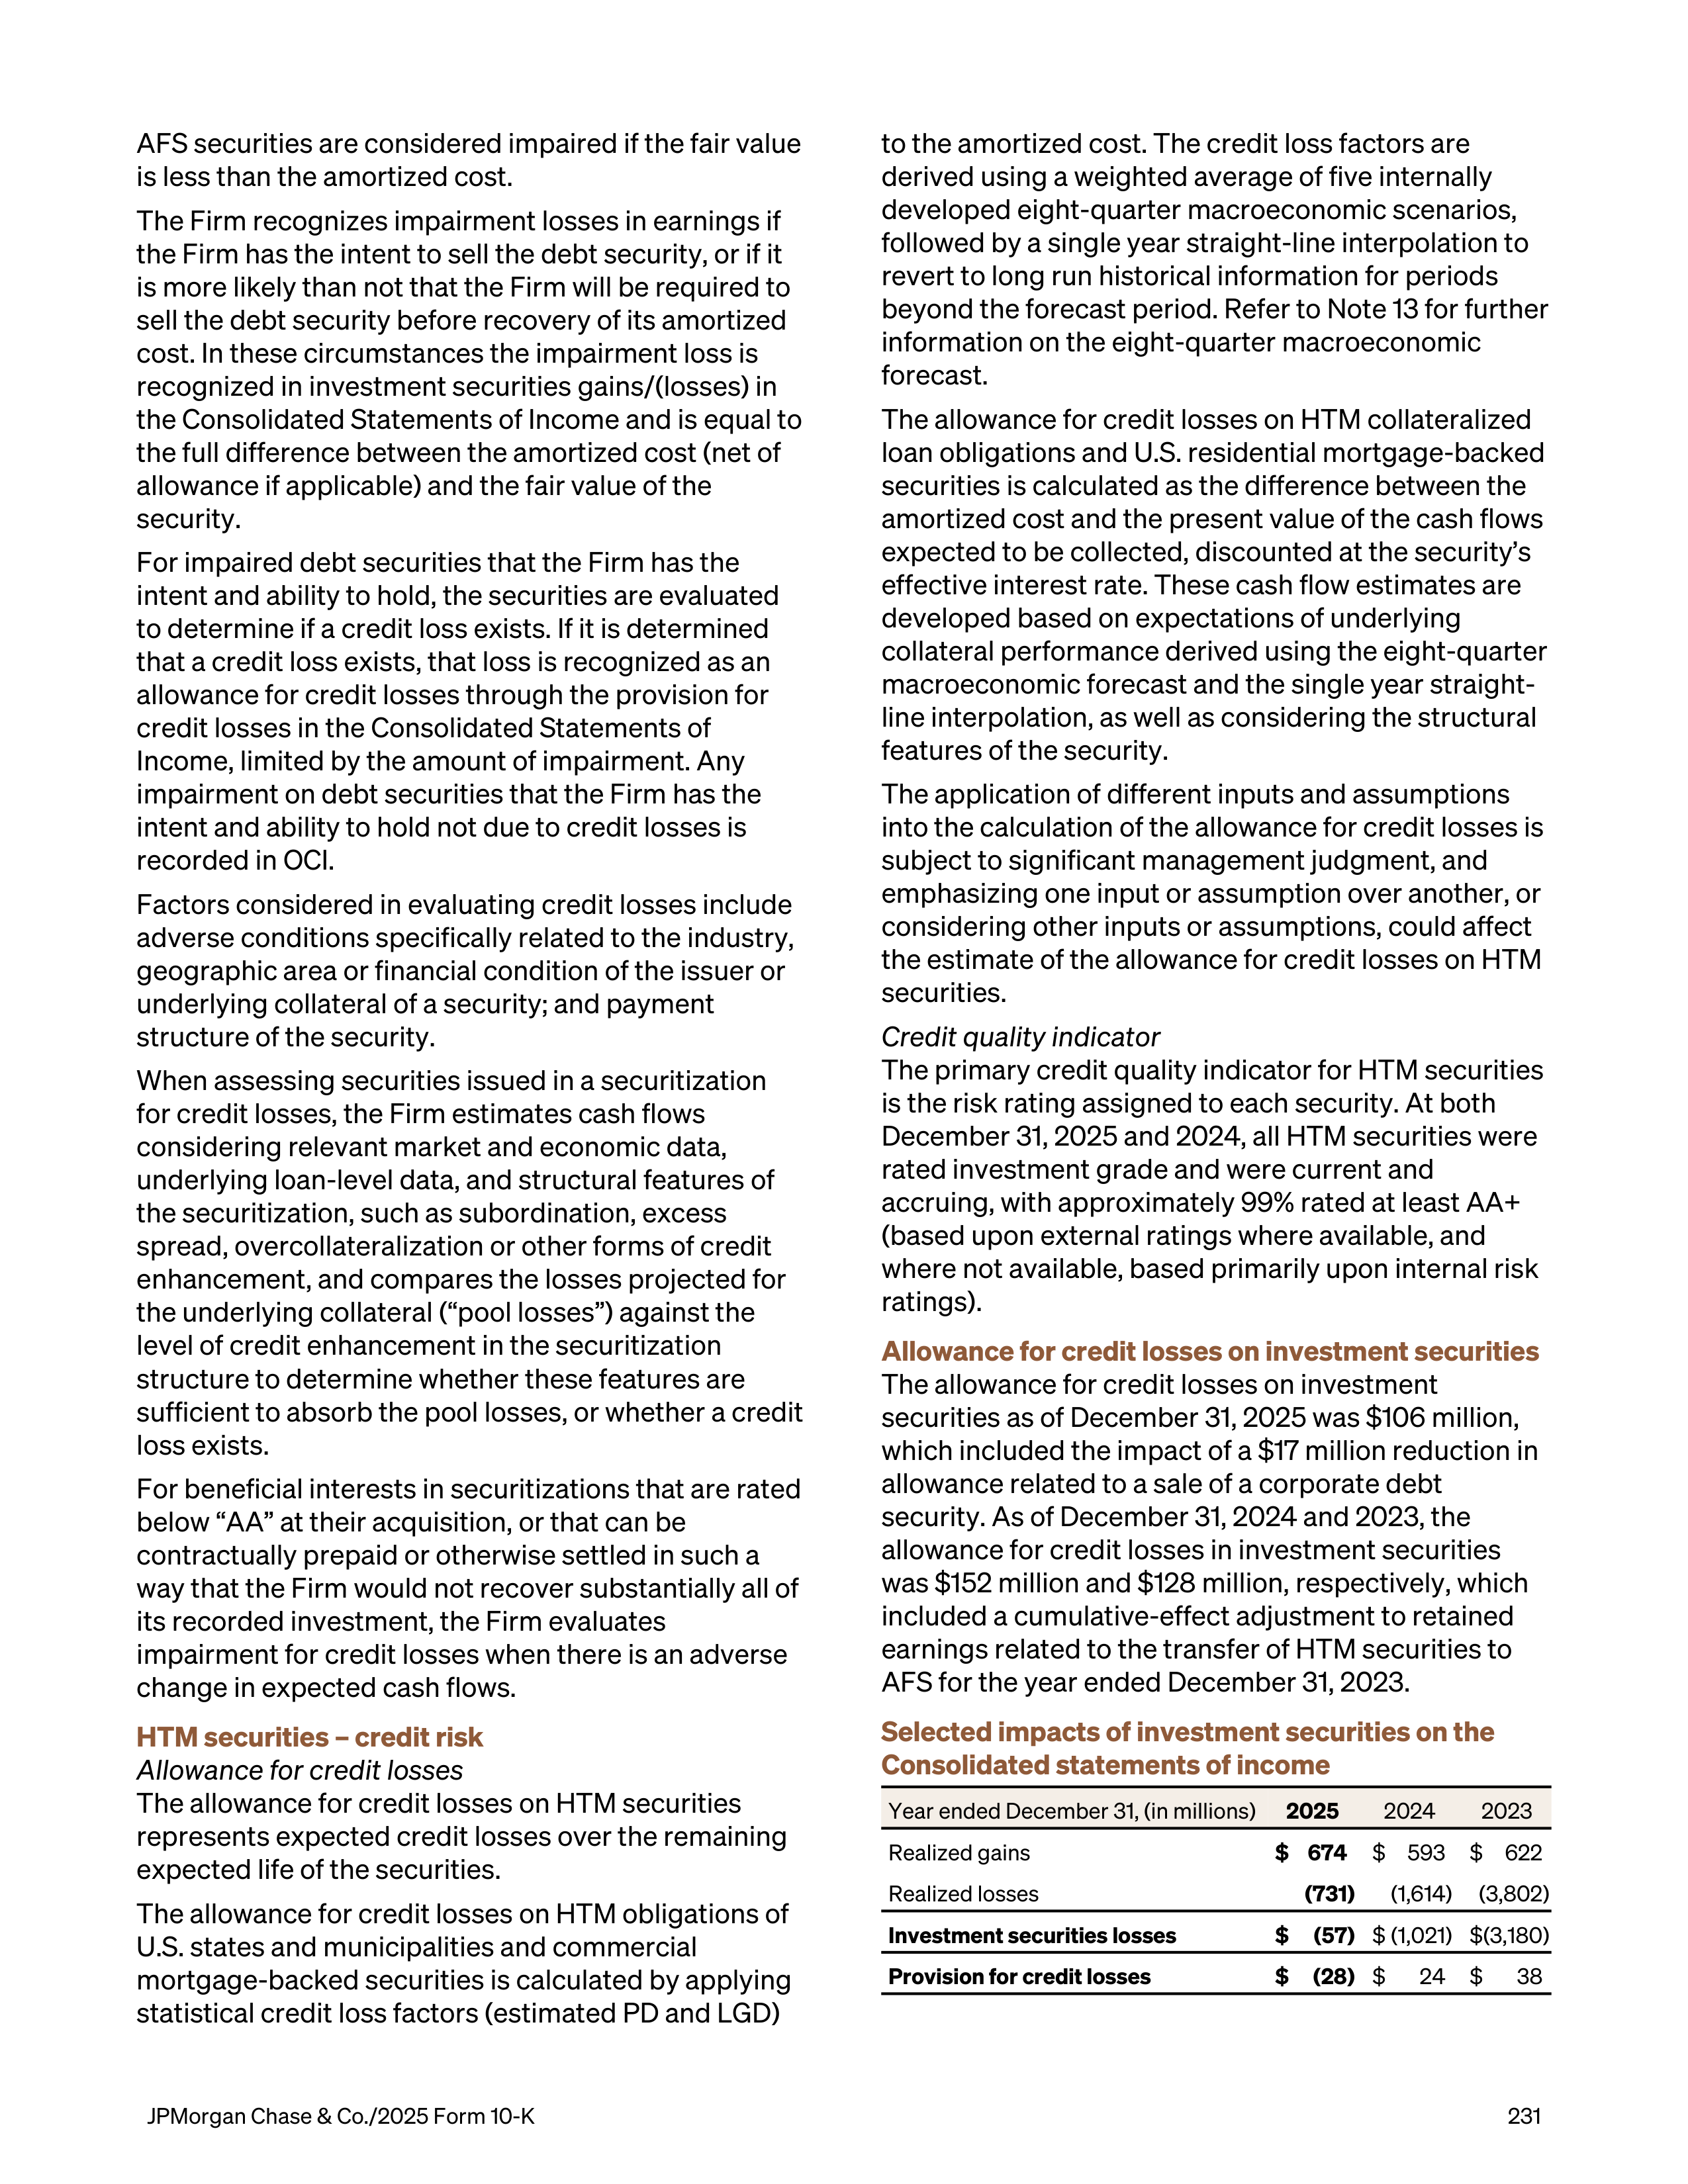
AFS securities are considered impaired if the fair value
is less than the amortized cost.
The Firm recognizes impairment losses in earnings if
the Firm has the intent to sell the debt security, or if it
is more likely than not that the Firm will be required to
sell the debt security before recovery of its amortized
cost. In these circumstances the impairment loss is
recognized in investment securities gains/(losses) in
the Consolidated Statements of Income and is equal to
the full difference between the amortized cost (net of
allowance if applicable) and the fair value of the
security.
For impaired debt securities that the Firm has the
intent and ability to hold, the securities are evaluated
to determine if a credit loss exists. If it is determined
that a credit loss exists, that loss is recognized as an
allowance for credit losses through the provision for
credit losses in the Consolidated Statements of
Income, limited by the amount of impairment. Any
impairment on debt securities that the Firm has the
intent and ability to hold not due to credit losses is
recorded in OCI.
Factors considered in evaluating credit losses include
adverse conditions specifically related to the industry,
geographic area or financial condition of the issuer or
underlying collateral of a security; and payment
structure of the security.
When assessing securities issued in a securitization
for credit losses, the Firm estimates cash flows
considering relevant market and economic data,
underlying loan-level data, and structural features of
the securitization, such as subordination, excess
spread, overcollateralization or other forms of credit
enhancement, and compares the losses projected for
the underlying collateral (“pool losses”) against the
level of credit enhancement in the securitization
structure to determine whether these features are
sufficient to absorb the pool losses, or whether a credit
loss exists.
For beneficial interests in securitizations that are rated
below “AA” at their acquisition, or that can be
contractually prepaid or otherwise settled in such a
way that the Firm would not recover substantially all of
its recorded investment, the Firm evaluates
impairment for credit losses when there is an adverse
change in expected cash flows.
HTM securities – credit risk
Allowance for credit losses
The allowance for credit losses on HTM securities
represents expected credit losses over the remaining
expected life of the securities.
The allowance for credit losses on HTM obligations of
U.S. states and municipalities and commercial
mortgage-backed securities is calculated by applying
statistical credit loss factors (estimated PD and LGD)
to the amortized cost. The credit loss factors are
derived using a weighted average of five internally
developed eight-quarter macroeconomic scenarios,
followed by a single year straight-line interpolation to
revert to long run historical information for periods
beyond the forecast period. Refer to Note 13 for further
information on the eight-quarter macroeconomic
forecast.
The allowance for credit losses on HTM collateralized
loan obligations and U.S. residential mortgage-backed
securities is calculated as the difference between the
amortized cost and the present value of the cash flows
expected to be collected, discounted at the security’s
effective interest rate. These cash flow estimates are
developed based on expectations of underlying
collateral performance derived using the eight-quarter
macroeconomic forecast and the single year straight-
line interpolation, as well as considering the structural
features of the security.
The application of different inputs and assumptions
into the calculation of the allowance for credit losses is
subject to significant management judgment, and
emphasizing one input or assumption over another, or
considering other inputs or assumptions, could affect
the estimate of the allowance for credit losses on HTM
securities.
Credit quality indicator
The primary credit quality indicator for HTM securities
is the risk rating assigned to each security. At both
December 31, 2025 and 2024, all HTM securities were
rated investment grade and were current and
accruing, with approximately 99% rated at least AA+
(based upon external ratings where available, and
where not available, based primarily upon internal risk
ratings).
Allowance for credit losses on investment securities
The allowance for credit losses on investment
securities as of December 31, 2025 was $106 million,
which included the impact of a $17 million reduction in
allowance related to a sale of a corporate debt
security. As of December 31, 2024 and 2023, the
allowance for credit losses in investment securities
was $152 million and $128 million, respectively, which
included a cumulative-effect adjustment to retained
earnings related to the transfer of HTM securities to
AFS for the year ended December 31, 2023.
Selected impacts of investment securities on the
Consolidated statements of income
Year ended December 31, (in millions)
2025
2024
2023
Realized gains
$ 674
$ 593
$
622
Realized losses
(731)
(1,614) (3,802)
Investment securities losses
$
(57)
$ (1,021) $ (3,180)
Provision for credit losses
$
(28)
$
24
$
38
JPMorgan Chase & Co./2025 Form 10-K
231
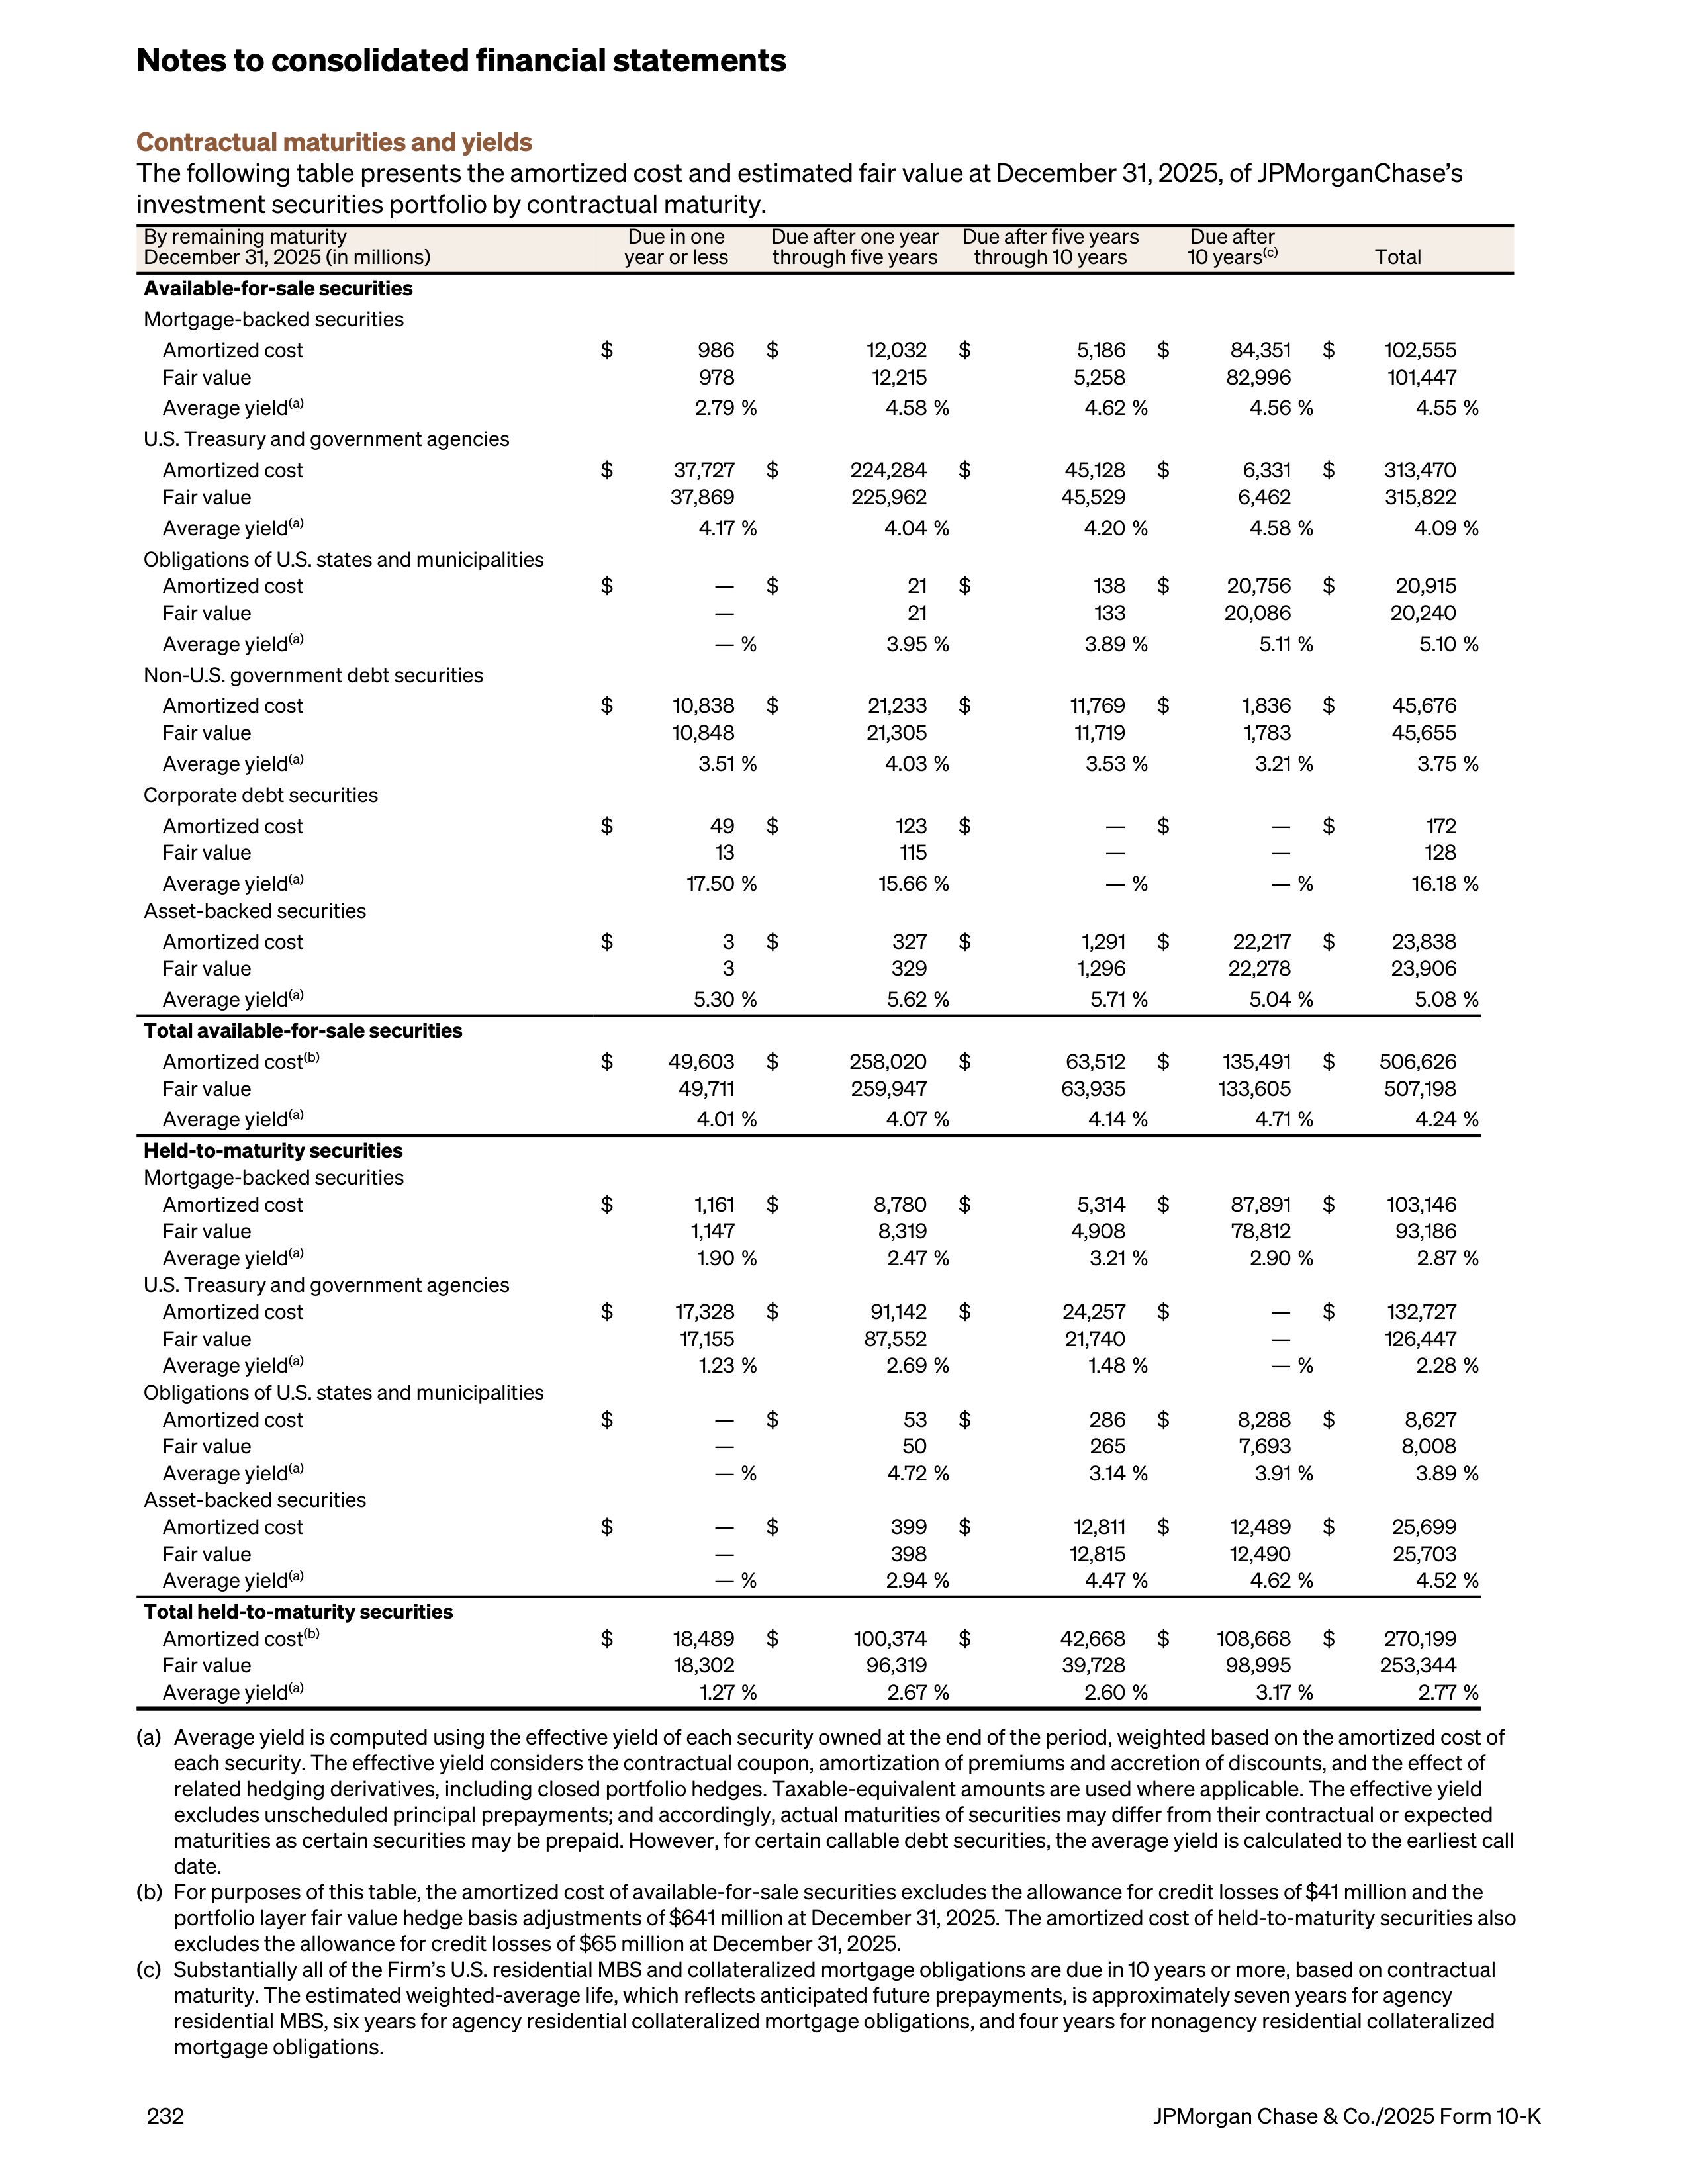
Contractual maturities and yields
The following table presents the amortized cost and estimated fair value at December 31, 2025, of JPMorganChase’s
investment securities portfolio by contractual maturity.
By remaining maturity
December 31, 2025 (in millions)
Due in one
year or less
Due after one year
through five years
Due after five years
through 10 years
Due after
10 years
(c)
Total
Available-for-sale securities
Mortgage-backed securities
Amortized cost
$
986
$
12,032
$
5,186
$
84,351
$
102,555
Fair value
978
12,215
5,258
82,996
101,447
Average yield
(a)
2.79 %
4.58 %
4.62 %
4.56 %
4.55 %
U.S. Treasury and government agencies
Amortized cost
$
37,727
$
224,284
$
45,128
$
6,331
$
313,470
Fair value
37,869
225,962
45,529
6,462
315,822
Average yield
(a)
4.17 %
4.04 %
4.20 %
4.58 %
4.09 %
Obligations of U.S. states and municipalities
Amortized cost
$
—
$
21
$
138
$
20,756
$
20,915
Fair value
—
21
133
20,086
20,240
Average yield
(a)
— %
3.95 %
3.89 %
5.11 %
5.10 %
Non-U.S. government debt securities
Amortized cost
$
10,838
$
21,233
$
11,769
$
1,836
$
45,676
Fair value
10,848
21,305
11,719
1,783
45,655
Average yield
(a)
3.51 %
4.03 %
3.53 %
3.21 %
3.75 %
Corporate debt securities
Amortized cost
$
49
$
123
$
—
$
—
$
172
Fair value
13
115
—
—
128
Average yield
(a)
17.50 %
15.66 %
— %
— %
16.18 %
Asset-backed securities
Amortized cost
$
3
$
327
$
1,291
$
22,217
$
23,838
Fair value
3
329
1,296
22,278
23,906
Average yield
(a)
5.30 %
5.62 %
5.71 %
5.04 %
5.08 %
Total available-for-sale securities
Amortized cost
(b)
$
49,603
$
258,020
$
63,512
$
135,491
$
506,626
Fair value
49,711
259,947
63,935
133,605
507,198
Average yield
(a)
4.01 %
4.07 %
4.14 %
4.71 %
4.24 %
Held-to-maturity securities
Mortgage-backed securities
Amortized cost
$
1,161
$
8,780
$
5,314
$
87,891
$
103,146
Fair value
1,147
8,319
4,908
78,812
93,186
Average yield
(a)
1.90 %
2.47 %
3.21 %
2.90 %
2.87 %
U.S. Treasury and government agencies
Amortized cost
$
17,328
$
91,142
$
24,257
$
—
$
132,727
Fair value
17,155
87,552
21,740
—
126,447
Average yield
(a)
1.23 %
2.69 %
1.48 %
— %
2.28 %
Obligations of U.S. states and municipalities
Amortized cost
$
—
$
53
$
286
$
8,288
$
8,627
Fair value
—
50
265
7,693
8,008
Average yield
(a)
— %
4.72 %
3.14 %
3.91 %
3.89 %
Asset-backed securities
Amortized cost
$
—
$
399
$
12,811
$
12,489
$
25,699
Fair value
—
398
12,815
12,490
25,703
Average yield
(a)
— %
2.94 %
4.47 %
4.62 %
4.52 %
Total held-to-maturity securities
Amortized cost
(b)
$
18,489
$
100,374
$
42,668
$
108,668
$
270,199
Fair value
18,302
96,319
39,728
98,995
253,344
Average yield
(a)
1.27 %
2.67 %
2.60 %
3.17 %
2.77 %
(a)
Average yield is computed using the effective yield of each security owned at the end of the period, weighted based on the amortized cost of
each security. The effective yield considers the contractual coupon, amortization of premiums and accretion of discounts, and the effect of
related hedging derivatives, including closed portfolio hedges. Taxable-equivalent amounts are used where applicable. The effective yield
excludes unscheduled principal prepayments; and accordingly, actual maturities of securities may differ from their contractual or expected
maturities as certain securities may be prepaid. However, for certain callable debt securities, the average yield is calculated to the earliest call
date.
(b)
For purposes of this table, the amortized cost of available-for-sale securities excludes the allowance for credit losses of $41 million and the
portfolio layer fair value hedge basis adjustments of $641 million at December 31, 2025. The amortized cost of held-to-maturity securities also
excludes the allowance for credit losses of $65 million at December 31, 2025.
(c)
Substantially all of the Firm’s U.S. residential MBS and collateralized mortgage obligations are due in 10 years or more, based on contractual
maturity. The estimated weighted-average life, which reflects anticipated future prepayments, is approximately seven years for agency
residential MBS, six years for agency residential collateralized mortgage obligations, and four years for nonagency residential collateralized
mortgage obligations.
Notes to consolidated financial statements
232
JPMorgan Chase & Co./2025 Form 10-K
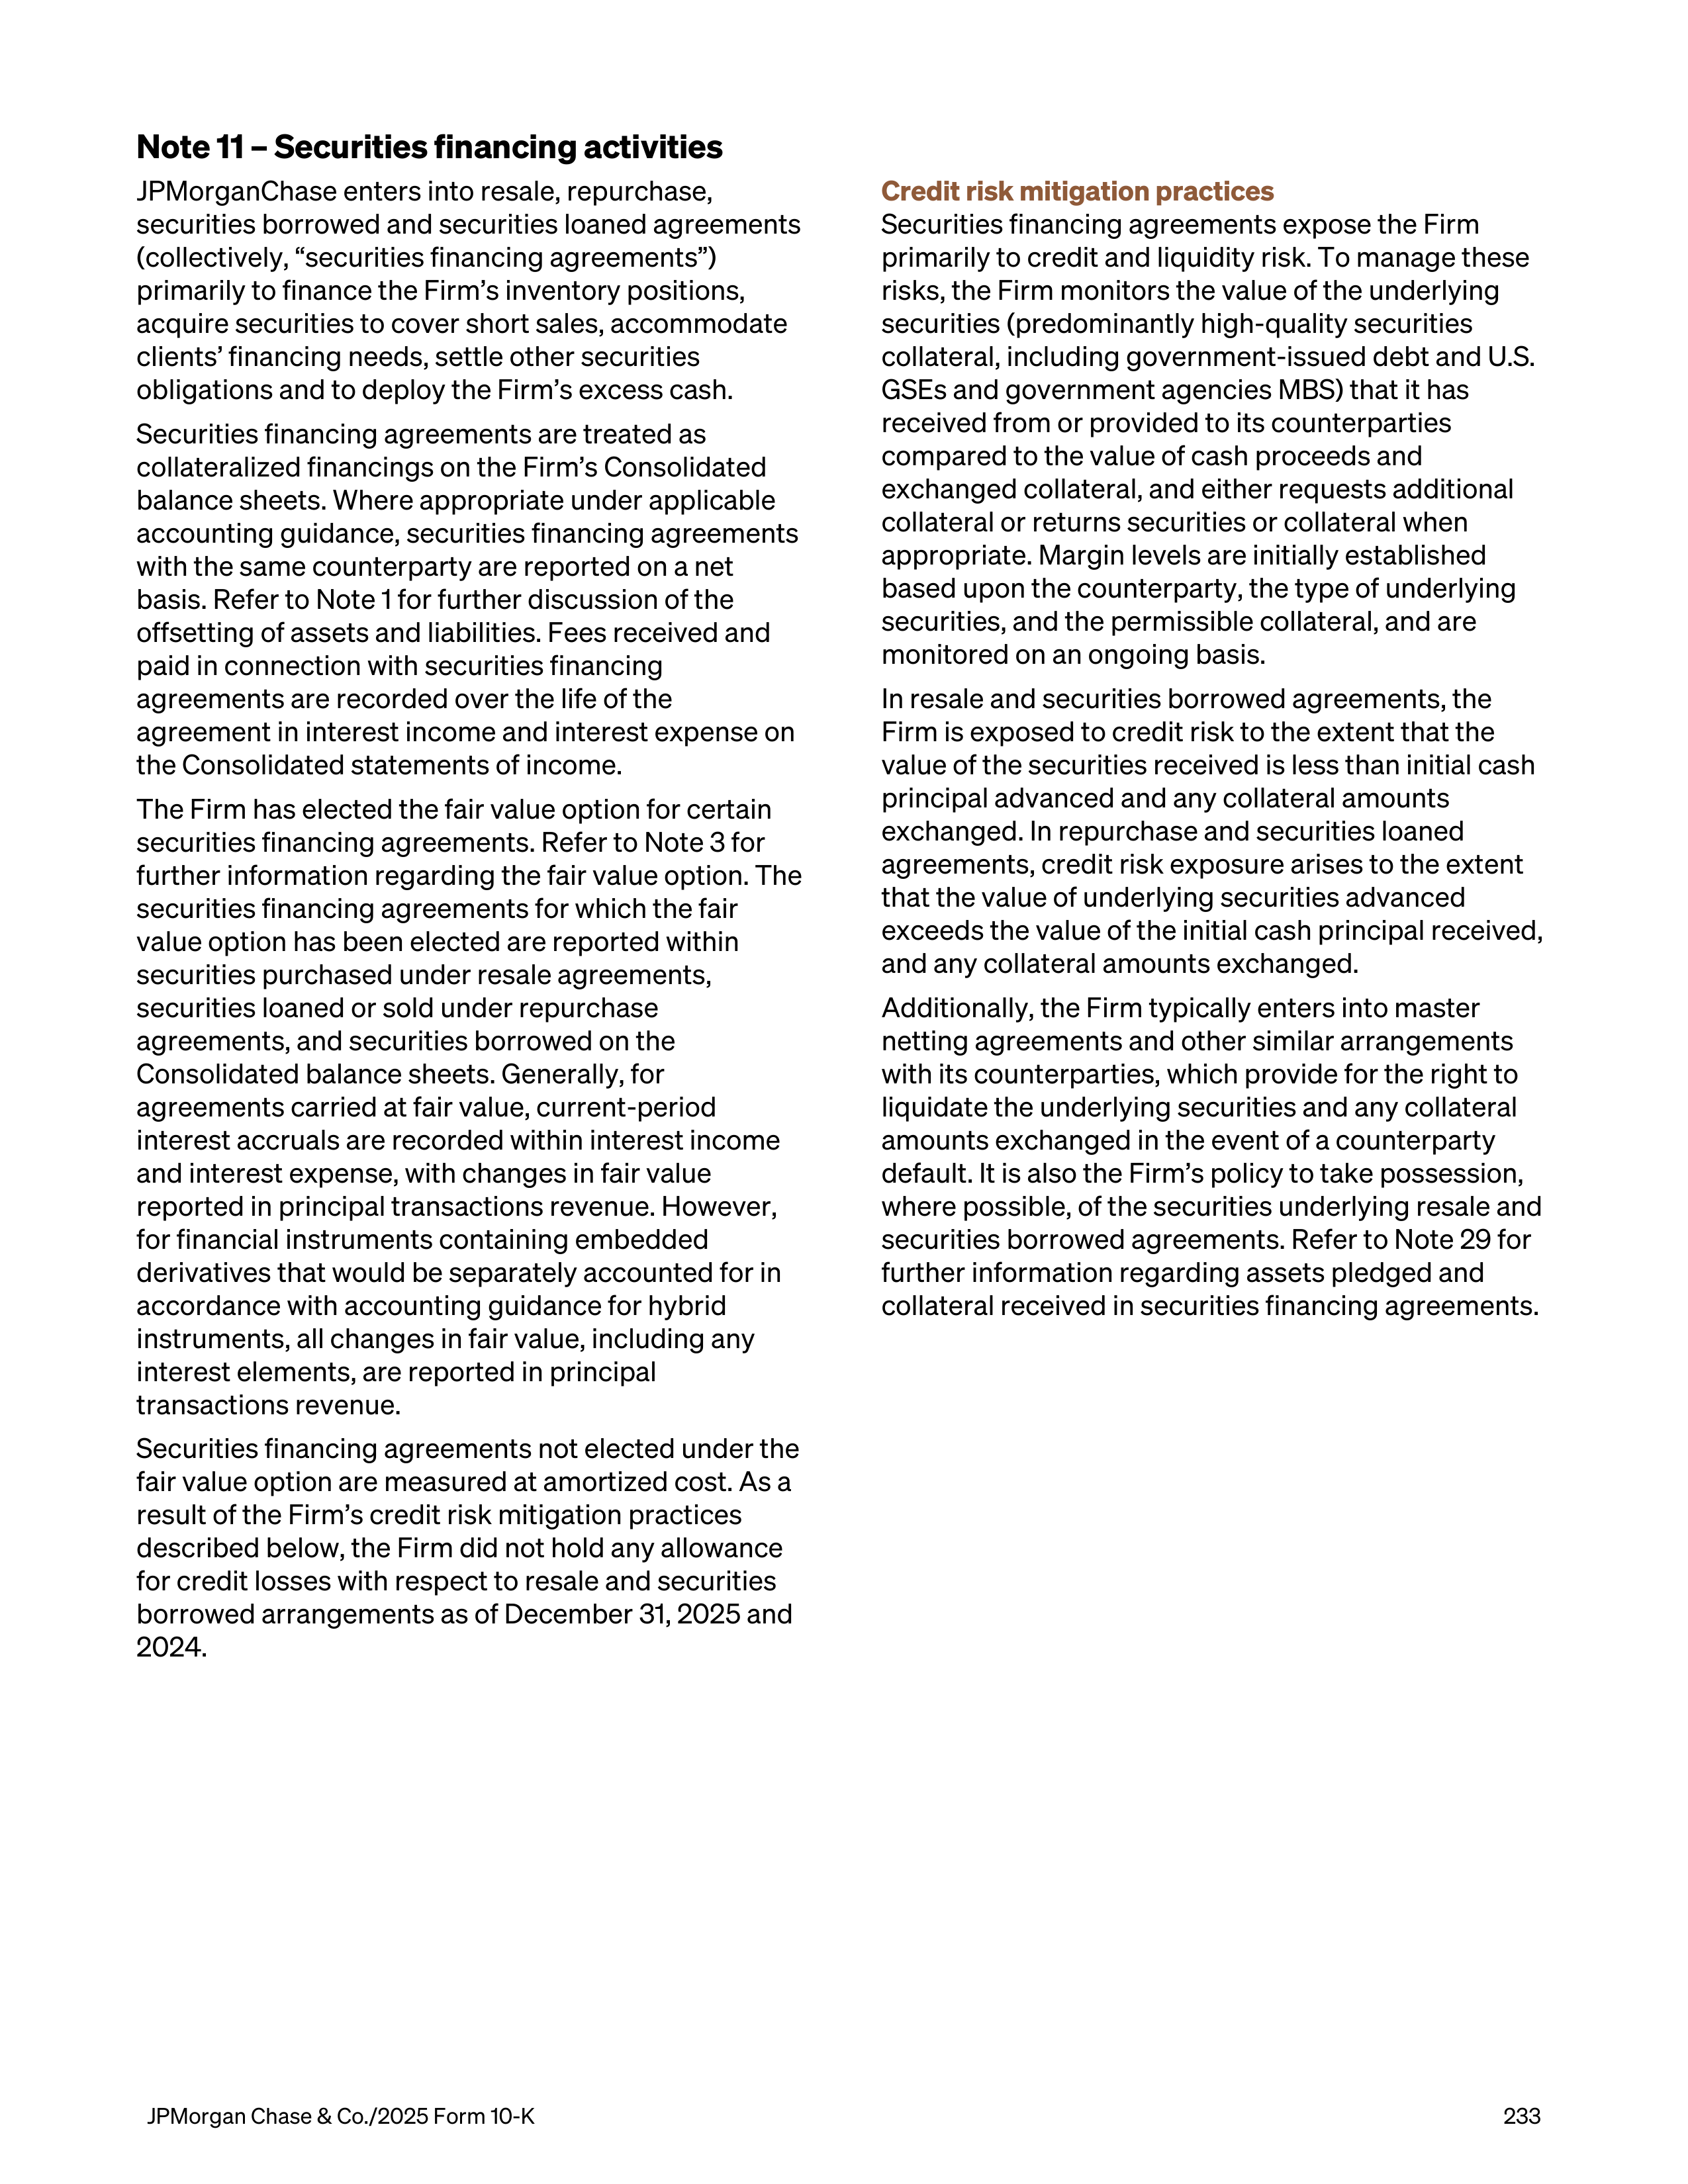
Note 11 – Securities financing activities
JPMorganChase enters into resale, repurchase,
securities borrowed and securities loaned agreements
(collectively, “securities financing agreements”)
primarily to finance the Firm’s inventory positions,
acquire securities to cover short sales, accommodate
clients’ financing needs, settle other securities
obligations and to deploy the Firm’s excess cash.
Securities financing agreements are treated as
collateralized financings on the Firm’s Consolidated
balance sheets. Where appropriate under applicable
accounting guidance, securities financing agreements
with the same counterparty are reported on a net
basis. Refer to Note 1 for further discussion of the
offsetting of assets and liabilities. Fees received and
paid in connection with securities financing
agreements are recorded over the life of the
agreement in interest income and interest expense on
the Consolidated statements of income.
The Firm has elected the fair value option for certain
securities financing agreements. Refer to Note 3 for
further information regarding the fair value option. The
securities financing agreements for which the fair
value option has been elected are reported within
securities purchased under resale agreements,
securities loaned or sold under repurchase
agreements, and securities borrowed on the
Consolidated balance sheets. Generally, for
agreements carried at fair value, current-period
interest accruals are recorded within interest income
and interest expense, with changes in fair value
reported in principal transactions revenue. However,
for financial instruments containing embedded
derivatives that would be separately accounted for in
accordance with accounting guidance for hybrid
instruments, all changes in fair value, including any
interest elements, are reported in principal
transactions revenue.
Securities financing agreements not elected under the
fair value option are measured at amortized cost. As a
result of the Firm’s credit risk mitigation practices
described below, the Firm did not hold any allowance
for credit losses with respect to resale and securities
borrowed arrangements as of December 31, 2025 and
2024.
Credit risk mitigation practices
Securities financing agreements expose the Firm
primarily to credit and liquidity risk. To manage these
risks, the Firm monitors the value of the underlying
securities (predominantly high-quality securities
collateral, including government-issued debt and U.S.
GSEs and government agencies MBS) that it has
received from or provided to its counterparties
compared to the value of cash proceeds and
exchanged collateral, and either requests additional
collateral or returns securities or collateral when
appropriate. Margin levels are initially established
based upon the counterparty, the type of underlying
securities, and the permissible collateral, and are
monitored on an ongoing basis.
In resale and securities borrowed agreements, the
Firm is exposed to credit risk to the extent that the
value of the securities received is less than initial cash
principal advanced and any collateral amounts
exchanged. In repurchase and securities loaned
agreements, credit risk exposure arises to the extent
that the value of underlying securities advanced
exceeds the value of the initial cash principal received,
and any collateral amounts exchanged.
Additionally, the Firm typically enters into master
netting agreements and other similar arrangements
with its counterparties, which provide for the right to
liquidate the underlying securities and any collateral
amounts exchanged in the event of a counterparty
default. It is also the Firm’s policy to take possession,
where possible, of the securities underlying resale and
securities borrowed agreements. Refer to Note 29 for
further information regarding assets pledged and
collateral received in securities financing agreements.
JPMorgan Chase & Co./2025 Form 10-K
233
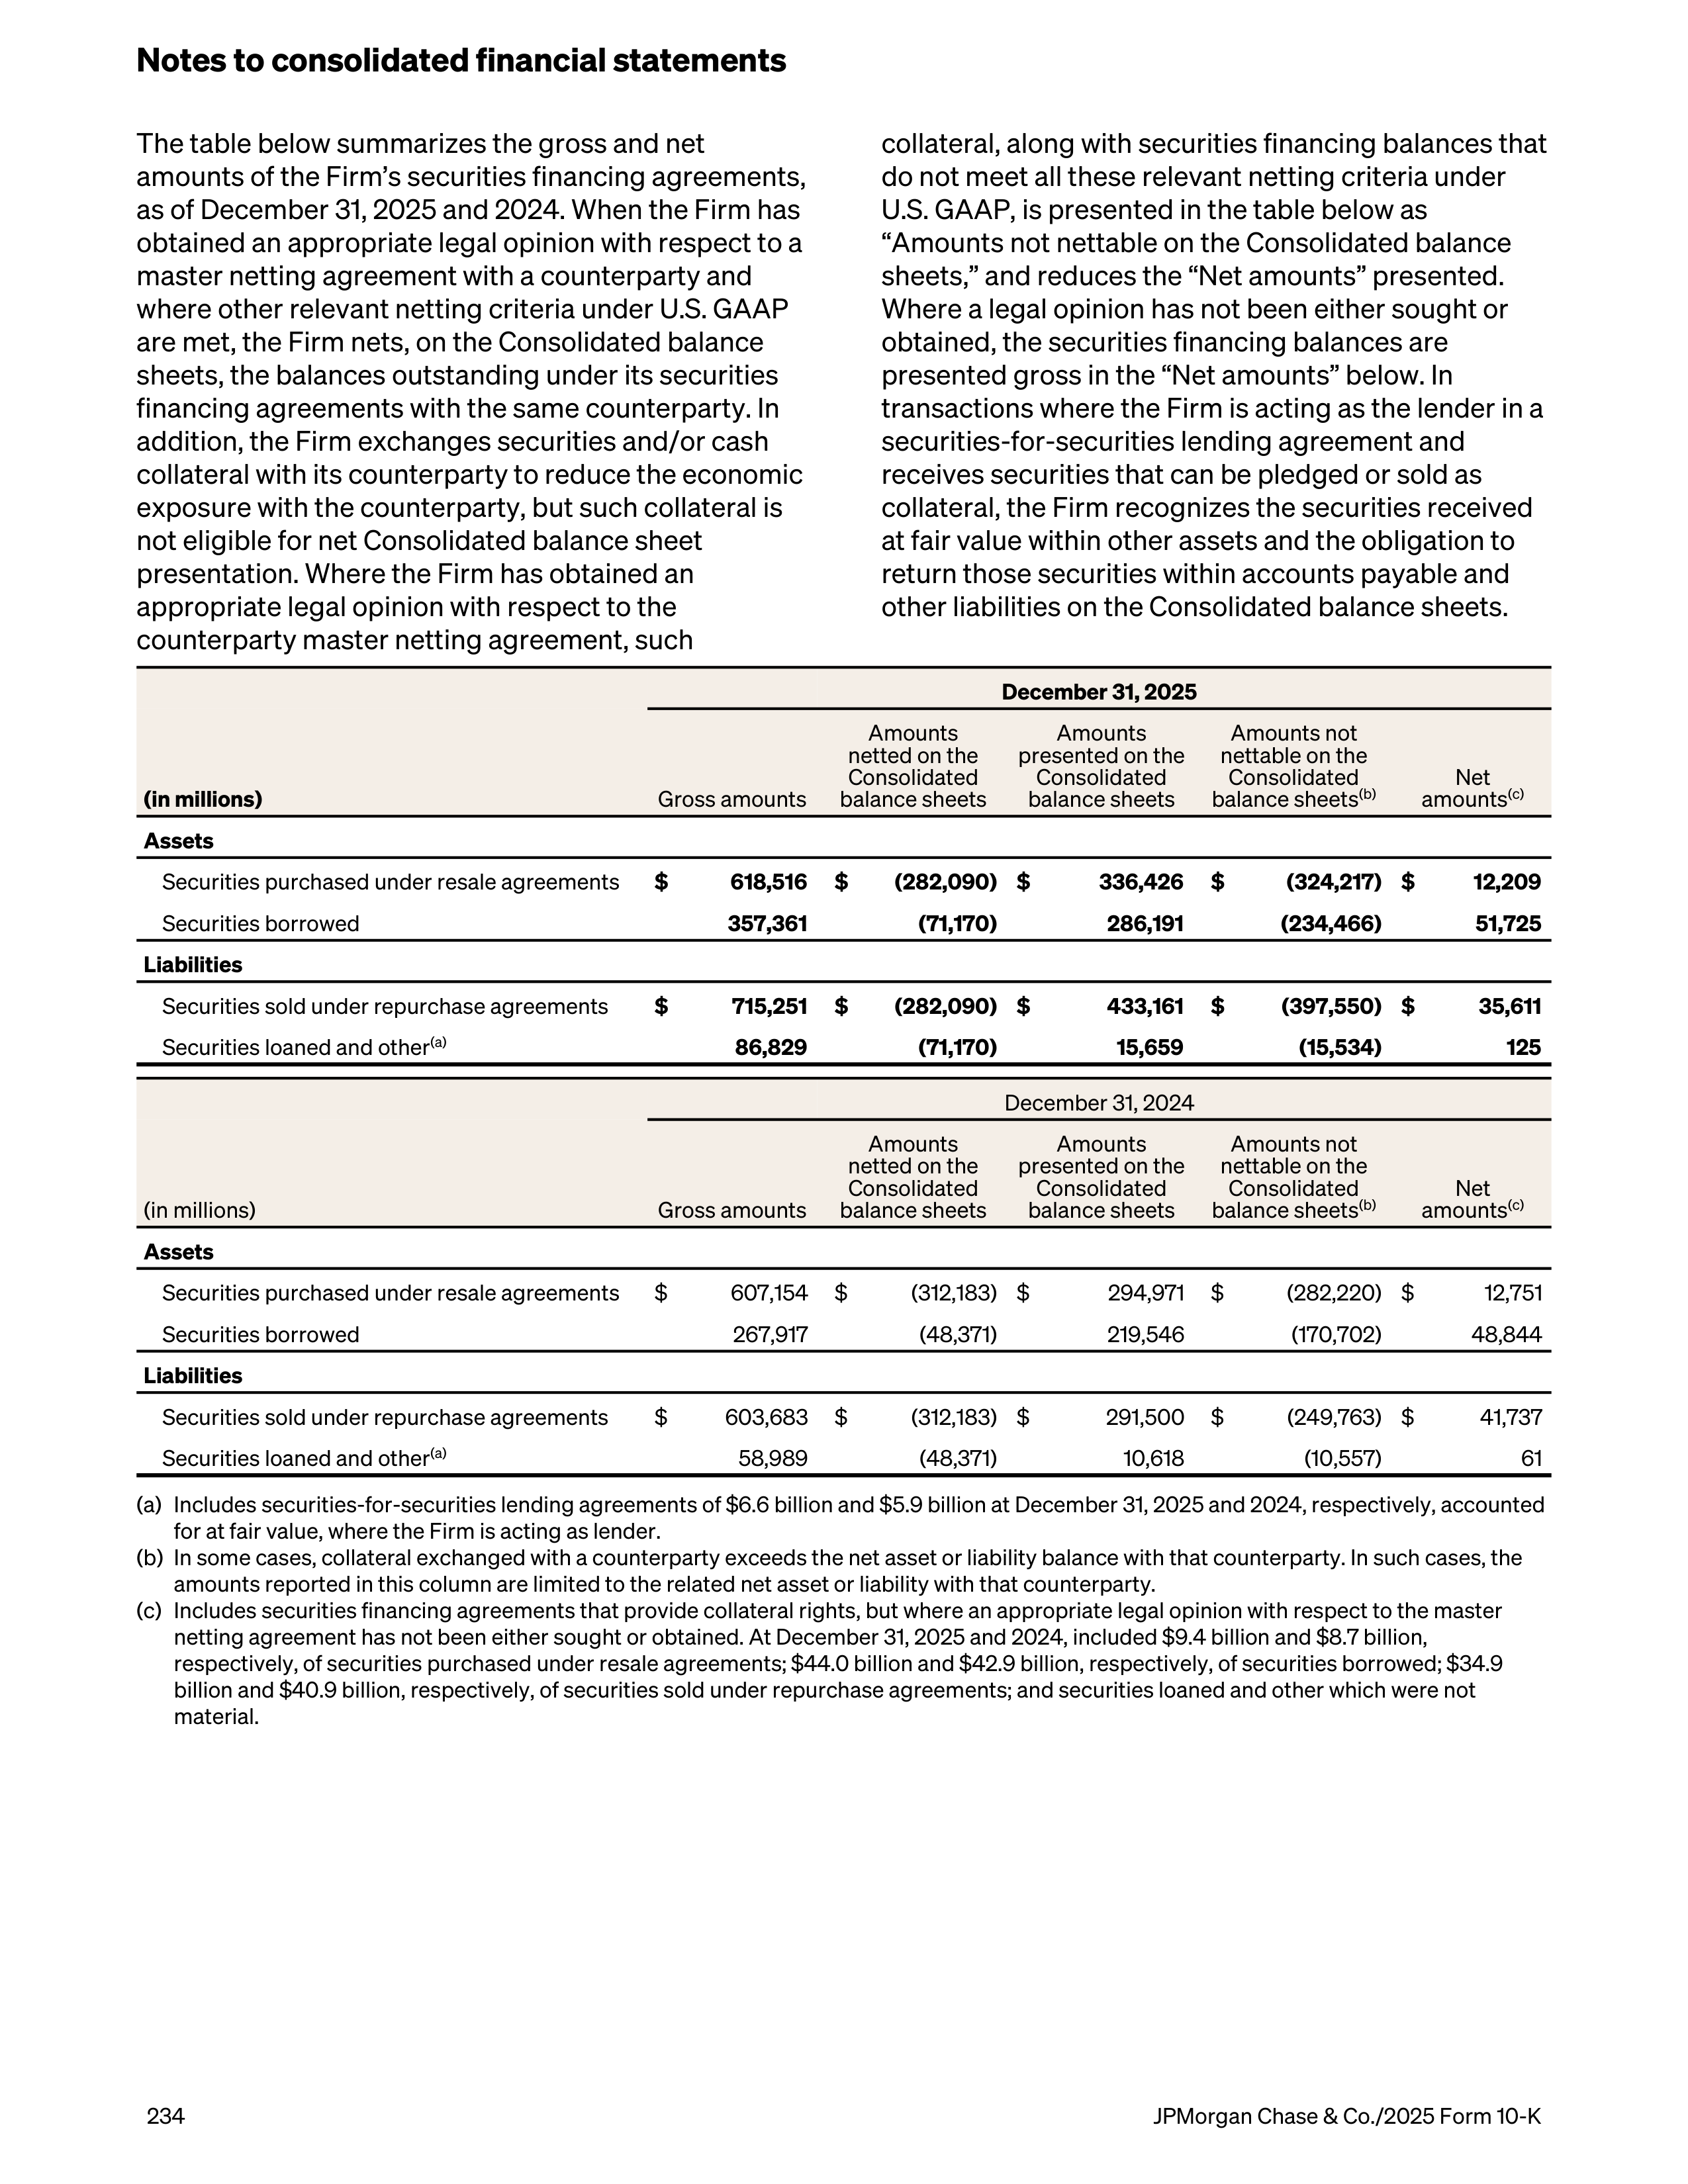
The table below summarizes the gross and net
amounts of the Firm’s securities financing agreements,
as of December 31, 2025 and 2024. When the Firm has
obtained an appropriate legal opinion with respect to a
master netting agreement with a counterparty and
where other relevant netting criteria under U.S. GAAP
are met, the Firm nets, on the Consolidated balance
sheets, the balances outstanding under its securities
financing agreements with the same counterparty. In
addition, the Firm exchanges securities and/or cash
collateral with its counterparty to reduce the economic
exposure with the counterparty, but such collateral is
not eligible for net Consolidated balance sheet
presentation. Where the Firm has obtained an
appropriate legal opinion with respect to the
counterparty master netting agreement, such
collateral, along with securities financing balances that
do not meet all these relevant netting criteria under
U.S. GAAP, is presented in the table below as
“Amounts not nettable on the Consolidated balance
sheets,” and reduces the “Net amounts” presented.
Where a legal opinion has not been either sought or
obtained, the securities financing balances are
presented gross in the “Net amounts” below. In
transactions where the Firm is acting as the lender in a
securities-for-securities lending agreement and
receives securities that can be pledged or sold as
collateral, the Firm recognizes the securities received
at fair value within other assets and the obligation to
return those securities within accounts payable and
other liabilities on the Consolidated balance sheets.
December 31, 2025
(in millions)
Gross amounts
Amounts
netted on the
Consolidated
balance sheets
Amounts
presented on the
Consolidated
balance sheets
Amounts not
nettable on the
Consolidated
balance sheets
(b)
Net
amounts
(c)
Assets
Securities purchased under resale agreements
$
618,516
$
(282,090) $
336,426
$
(324,217) $
12,209
Securities borrowed
357,361
(71,170)
286,191
(234,466)
51,725
Liabilities
Securities sold under repurchase agreements
$
715,251
$
(282,090) $
433,161
$
(397,550) $
35,611
Securities loaned and other
(a)
86,829
(71,170)
15,659
(15,534)
125
December 31, 2024
(in millions)
Gross amounts
Amounts
netted on the
Consolidated
balance sheets
Amounts
presented on the
Consolidated
balance sheets
Amounts not
nettable on the
Consolidated
balance sheets
(b)
Net
amounts
(c)
Assets
Securities purchased under resale agreements
$
607,154
$
(312,183) $
294,971
$
(282,220) $
12,751
Securities borrowed
267,917
(48,371)
219,546
(170,702)
48,844
Liabilities
Securities sold under repurchase agreements
$
603,683
$
(312,183) $
291,500
$
(249,763) $
41,737
Securities loaned and other
(a)
58,989
(48,371)
10,618
(10,557)
61
(a)
Includes securities-for-securities lending agreements of $6.6 billion and $5.9 billion at December 31, 2025 and 2024, respectively, accounted
for at fair value, where the Firm is acting as lender.
(b)
In some cases, collateral exchanged with a counterparty exceeds the net asset or liability balance with that counterparty. In such cases, the
amounts reported in this column are limited to the related net asset or liability with that counterparty.
(c)
Includes securities financing agreements that provide collateral rights, but where an appropriate legal opinion with respect to the master
netting agreement has not been either sought or obtained. At December 31, 2025 and 2024, included $9.4 billion and $8.7 billion,
respectively, of securities purchased under resale agreements; $44.0 billion and $42.9 billion, respectively, of securities borrowed; $34.9
billion and $40.9 billion, respectively, of securities sold under repurchase agreements; and securities loaned and other which were not
material.
Notes to consolidated financial statements
234
JPMorgan Chase & Co./2025 Form 10-K
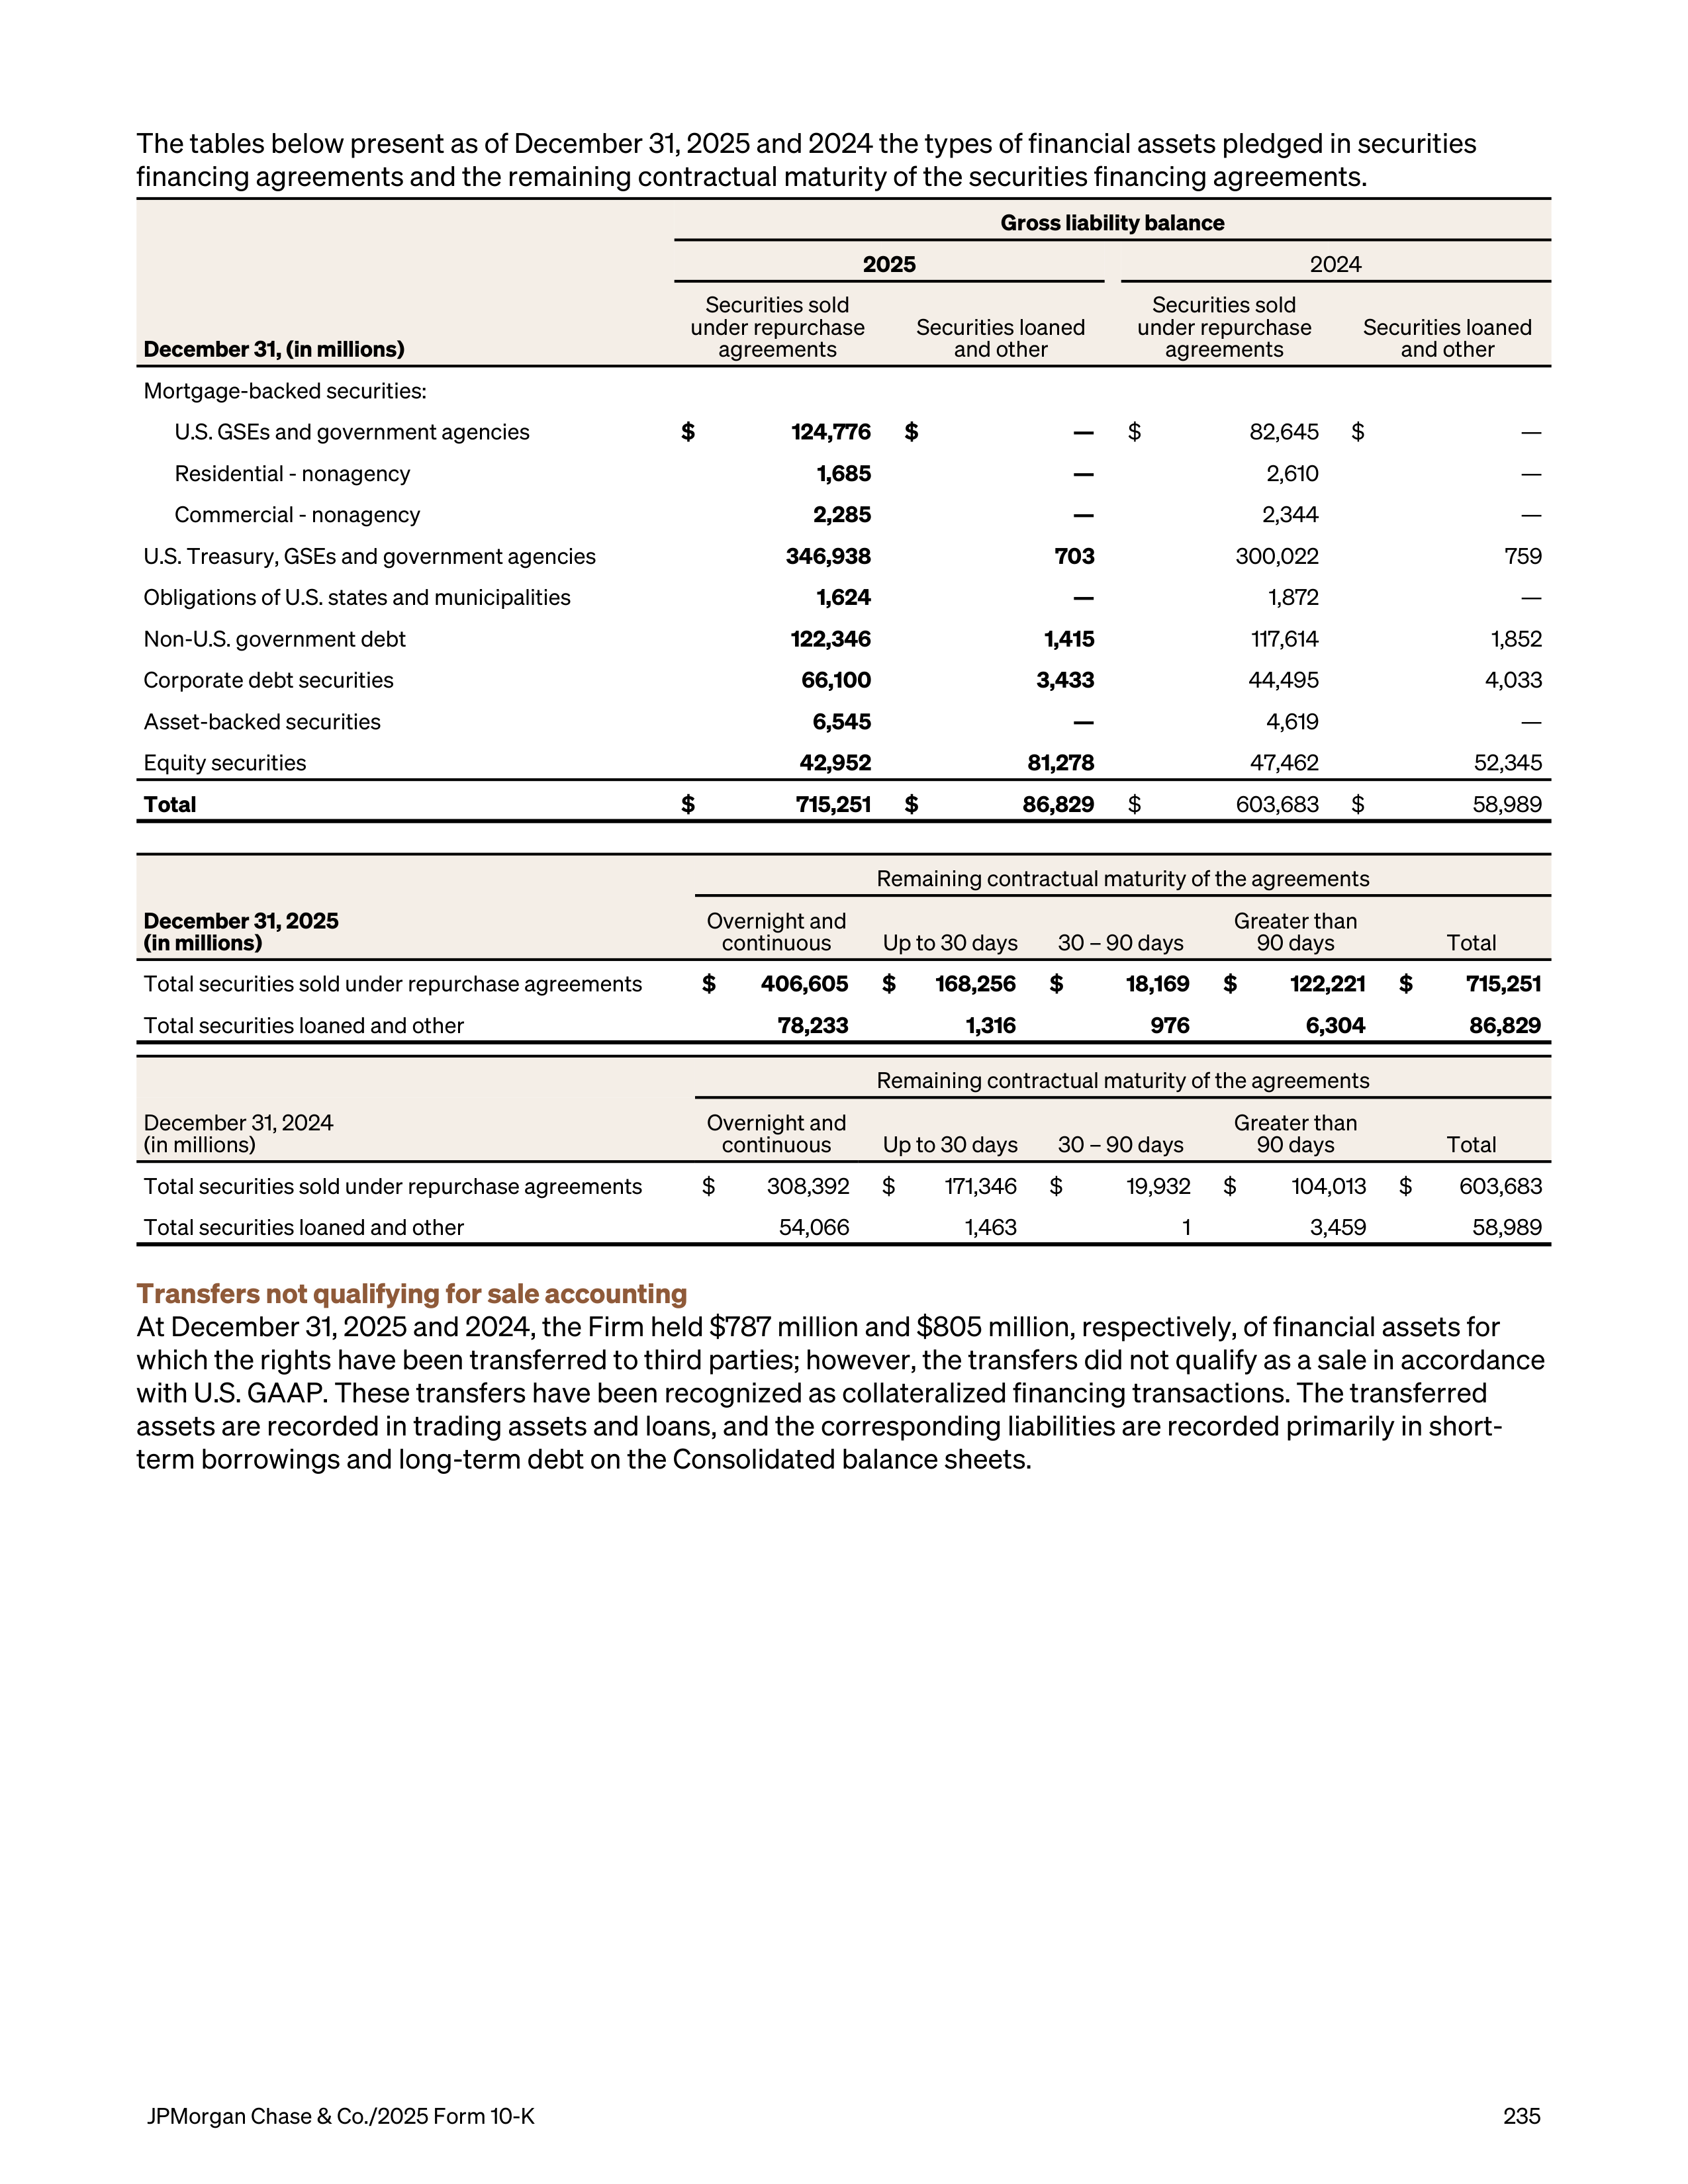
The tables below present as of December 31, 2025 and 2024 the types of financial assets pledged in securities
financing agreements and the remaining contractual maturity of the securities financing agreements.
Gross liability balance
2025
2024
December 31, (in millions)
Securities sold
under repurchase
agreements
Securities loaned
and other
Securities sold
under repurchase
agreements
Securities loaned
and other
Mortgage-backed securities:
U.S. GSEs and government agencies
$
124,776
$
—
$
82,645
$
—
Residential - nonagency
1,685
—
2,610
—
Commercial - nonagency
2,285
—
2,344
—
U.S. Treasury, GSEs and government agencies
346,938
703
300,022
759
Obligations of U.S. states and municipalities
1,624
—
1,872
—
Non-U.S. government debt
122,346
1,415
117,614
1,852
Corporate debt securities
66,100
3,433
44,495
4,033
Asset-backed securities
6,545
—
4,619
—
Equity securities
42,952
81,278
47,462
52,345
Total
$
715,251
$
86,829
$
603,683
$
58,989
Remaining contractual maturity of the agreements
December 31, 2025
(in millions)
Overnight and
continuous
Up to 30 days
30 – 90 days
Greater than
90 days
Total
Total securities sold under repurchase agreements
$
406,605
$
168,256
$
18,169
$
122,221
$
715,251
Total securities loaned and other
78,233
1,316
976
6,304
86,829
Remaining contractual maturity of the agreements
December 31, 2024
(in millions)
Overnight and
continuous
Up to 30 days
30 – 90 days
Greater than
90 days
Total
Total securities sold under repurchase agreements
$
308,392
$
171,346
$
19,932
$
104,013
$
603,683
Total securities loaned and other
54,066
1,463
1
3,459
58,989
Transfers not qualifying for sale accounting
At December 31, 2025 and 2024, the Firm held $787 million and $805 million, respectively, of financial assets for
which the rights have been transferred to third parties; however, the transfers did not qualify as a sale in accordance
with U.S. GAAP. These transfers have been recognized as collateralized financing transactions. The transferred
assets are recorded in trading assets and loans, and the corresponding liabilities are recorded primarily in short-
term borrowings and long-term debt on the Consolidated balance sheets.
JPMorgan Chase & Co./2025 Form 10-K
235
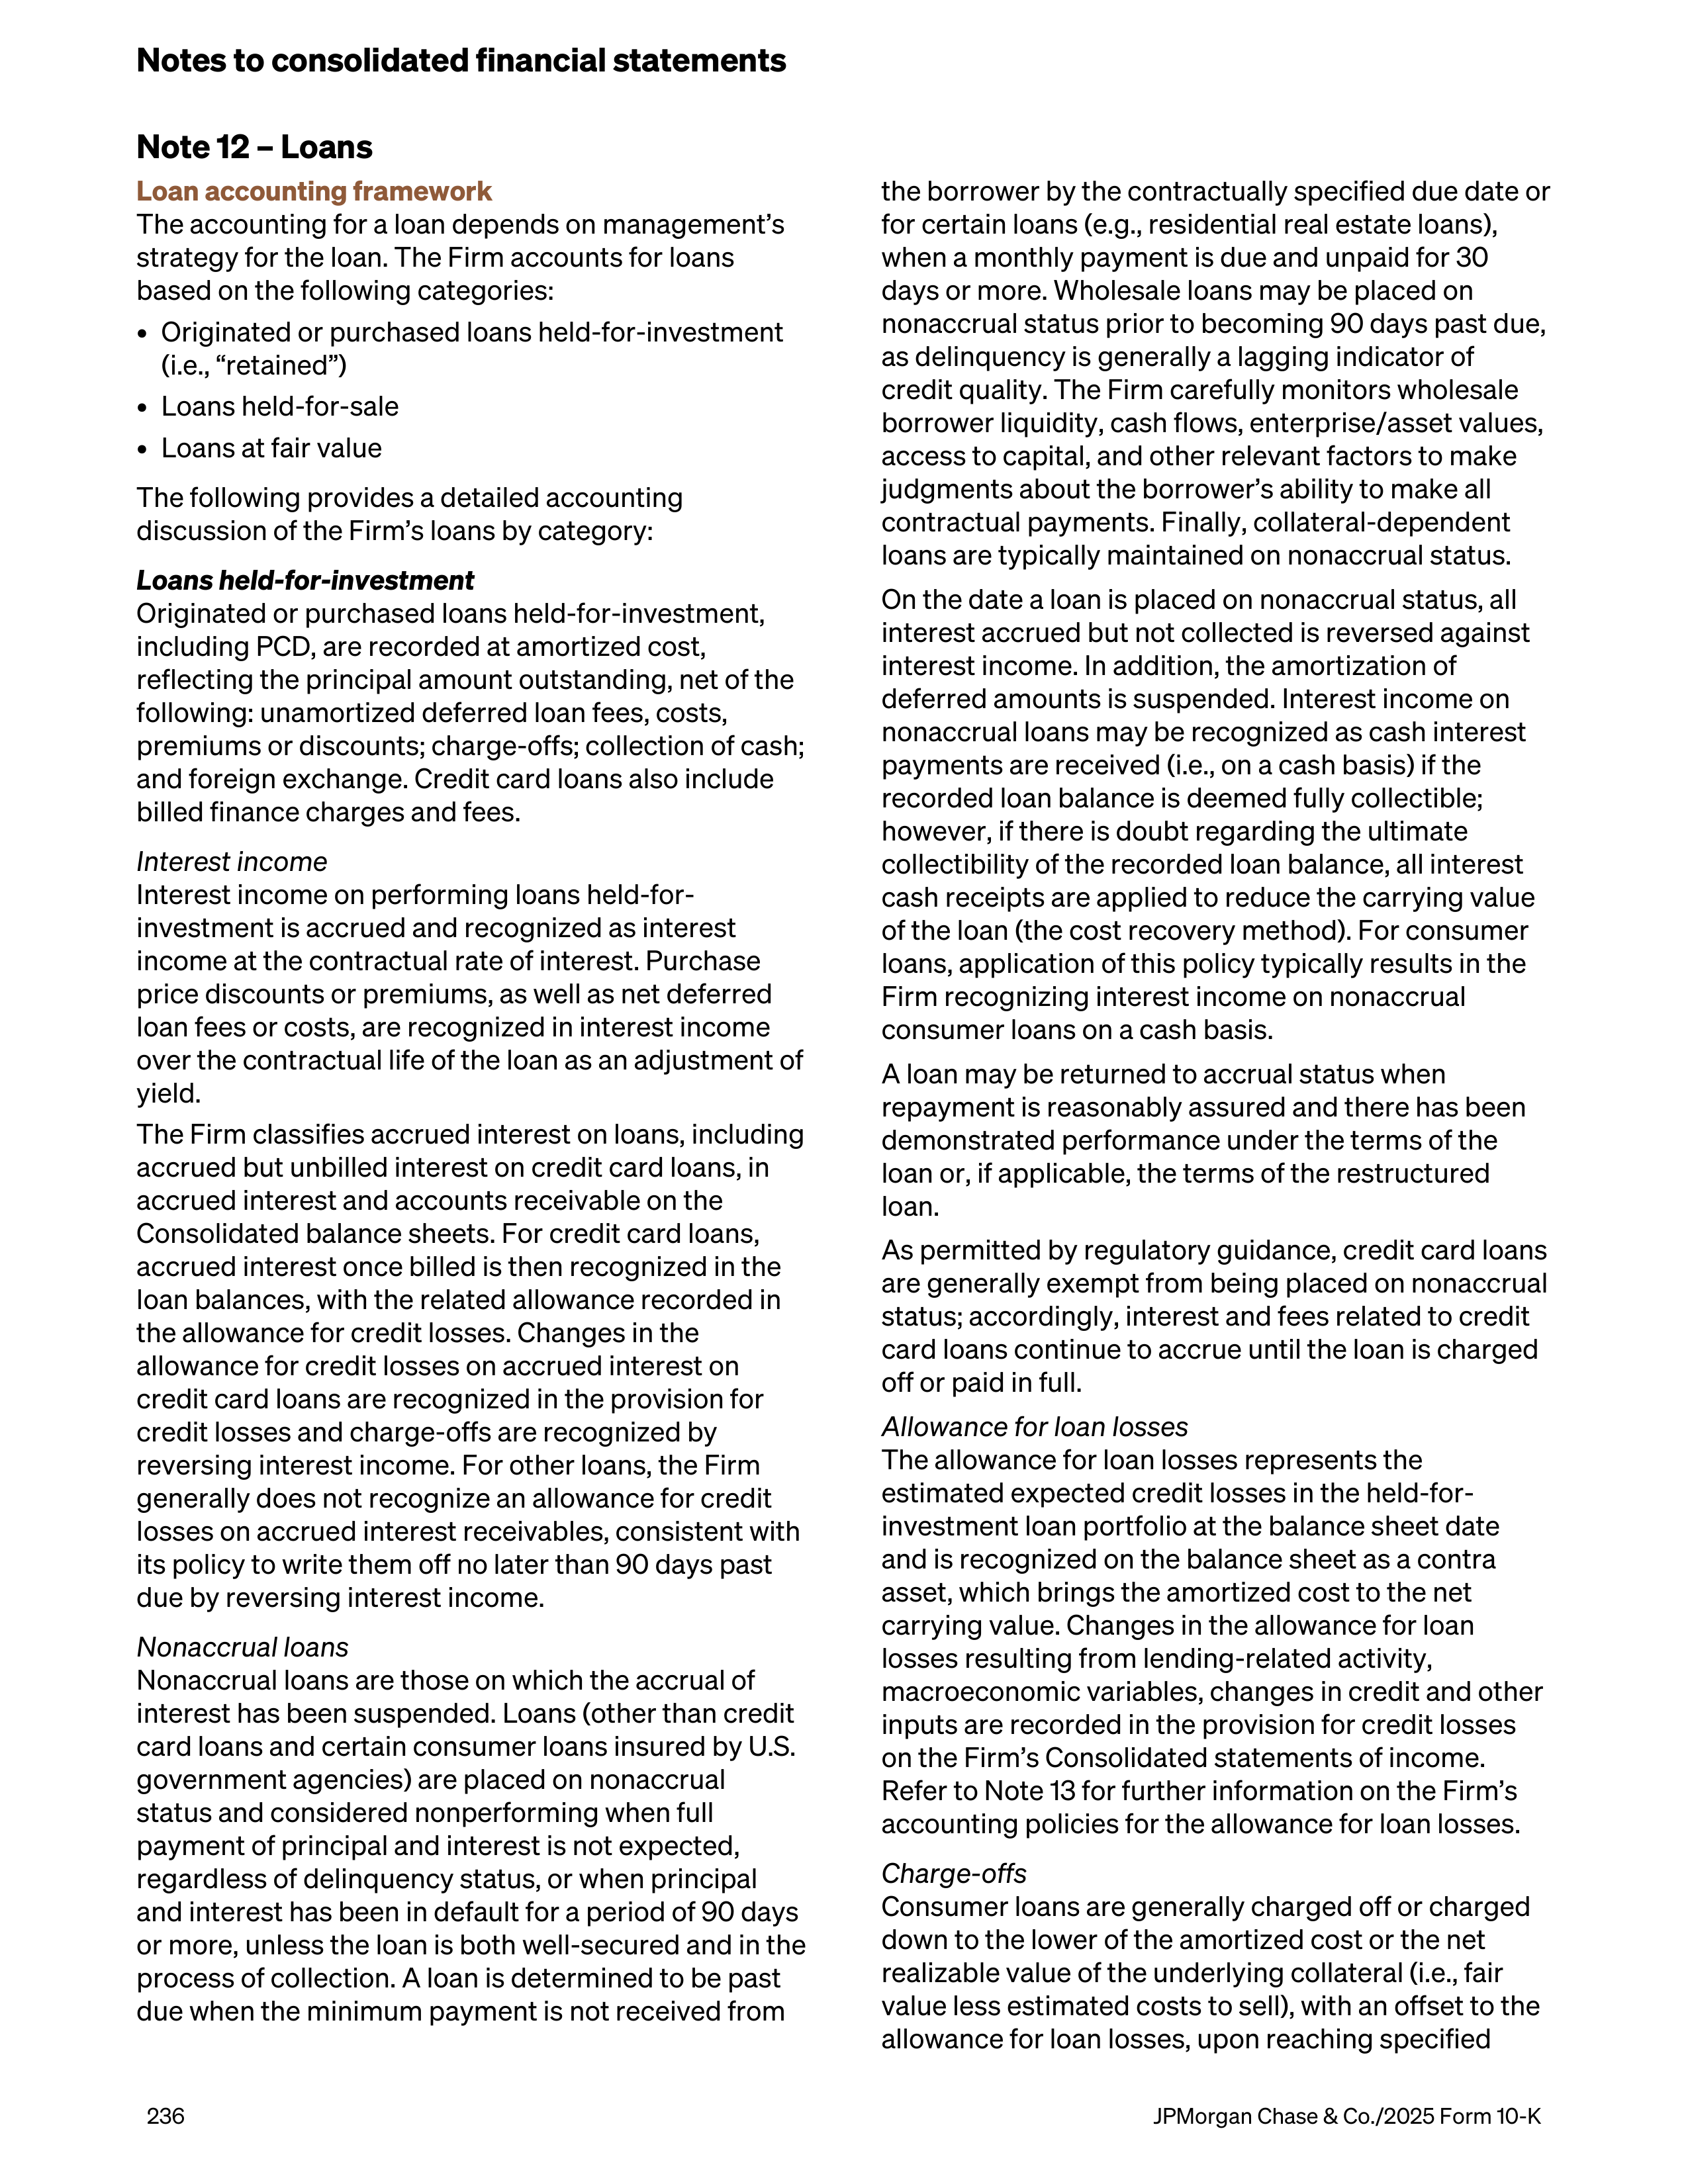
Note 12 – Loans
Loan accounting framework
The accounting for a loan depends on management’s
strategy for the loan. The Firm accounts for loans
based on the following categories:
•
Originated or purchased loans held-for-investment
(i.e., “retained”)
•
Loans held-for-sale
•
Loans at fair value
The following provides a detailed accounting
discussion of the Firm’s loans by category:
Loans held-for-investment
Originated or purchased loans held-for-investment,
including PCD, are recorded at amortized cost,
reflecting the principal amount outstanding, net of the
following: unamortized deferred loan fees, costs,
premiums or discounts; charge-offs; collection of cash;
and foreign exchange. Credit card loans also include
billed finance charges and fees.
Interest income
Interest income on performing loans held-for-
investment is accrued and recognized as interest
income at the contractual rate of interest. Purchase
price discounts or premiums, as well as net deferred
loan fees or costs, are recognized in interest income
over the contractual life of the loan as an adjustment of
yield.
The Firm classifies accrued interest on loans, including
accrued but unbilled interest on credit card loans, in
accrued interest and accounts receivable on the
Consolidated balance sheets. For credit card loans,
accrued interest once billed is then recognized in the
loan balances, with the related allowance recorded in
the allowance for credit losses. Changes in the
allowance for credit losses on accrued interest on
credit card loans are recognized in the provision for
credit losses and charge-offs are recognized by
reversing interest income. For other loans, the Firm
generally does not recognize an allowance for credit
losses on accrued interest receivables, consistent with
its policy to write them off no later than 90 days past
due by reversing interest income.
Nonaccrual loans
Nonaccrual loans are those on which the accrual of
interest has been suspended. Loans (other than credit
card loans and certain consumer loans insured by U.S.
government agencies) are placed on nonaccrual
status and considered nonperforming when full
payment of principal and interest is not expected,
regardless of delinquency status, or when principal
and interest has been in default for a period of 90 days
or more, unless the loan is both well-secured and in the
process of collection. A loan is determined to be past
due when the minimum payment is not received from
the borrower by the contractually specified due date or
for certain loans (e.g., residential real estate loans),
when a monthly payment is due and unpaid for 30
days or more. Wholesale loans may be placed on
nonaccrual status prior to becoming 90 days past due,
as delinquency is generally a lagging indicator of
credit quality. The Firm carefully monitors wholesale
borrower liquidity, cash flows, enterprise/asset values,
access to capital, and other relevant factors to make
judgments about the borrower’s ability to make all
contractual payments. Finally, collateral-dependent
loans are typically maintained on nonaccrual status.
On the date a loan is placed on nonaccrual status, all
interest accrued but not collected is reversed against
interest income. In addition, the amortization of
deferred amounts is suspended. Interest income on
nonaccrual loans may be recognized as cash interest
payments are received (i.e., on a cash basis) if the
recorded loan balance is deemed fully collectible;
however, if there is doubt regarding the ultimate
collectibility of the recorded loan balance, all interest
cash receipts are applied to reduce the carrying value
of the loan (the cost recovery method). For consumer
loans, application of this policy typically results in the
Firm recognizing interest income on nonaccrual
consumer loans on a cash basis.
A loan may be returned to accrual status when
repayment is reasonably assured and there has been
demonstrated performance under the terms of the
loan or, if applicable, the terms of the restructured
loan.
As permitted by regulatory guidance, credit card loans
are generally exempt from being placed on nonaccrual
status; accordingly, interest and fees related to credit
card loans continue to accrue until the loan is charged
off or paid in full.
Allowance for loan losses
The allowance for loan losses represents the
estimated expected credit losses in the held-for-
investment loan portfolio at the balance sheet date
and is recognized on the balance sheet as a contra
asset, which brings the amortized cost to the net
carrying value. Changes in the allowance for loan
losses resulting from lending-related activity,
macroeconomic variables, changes in credit and other
inputs are recorded in the provision for credit losses
on the Firm’s Consolidated statements of income.
Refer to Note 13 for further information on the Firm’s
accounting policies for the allowance for loan losses.
Charge-offs
Consumer loans are generally charged off or charged
down to the lower of the amortized cost or the net
realizable value of the underlying collateral (i.e., fair
value less estimated costs to sell), with an offset to the
allowance for loan losses, upon reaching specified
Notes to consolidated financial statements
236
JPMorgan Chase & Co./2025 Form 10-K
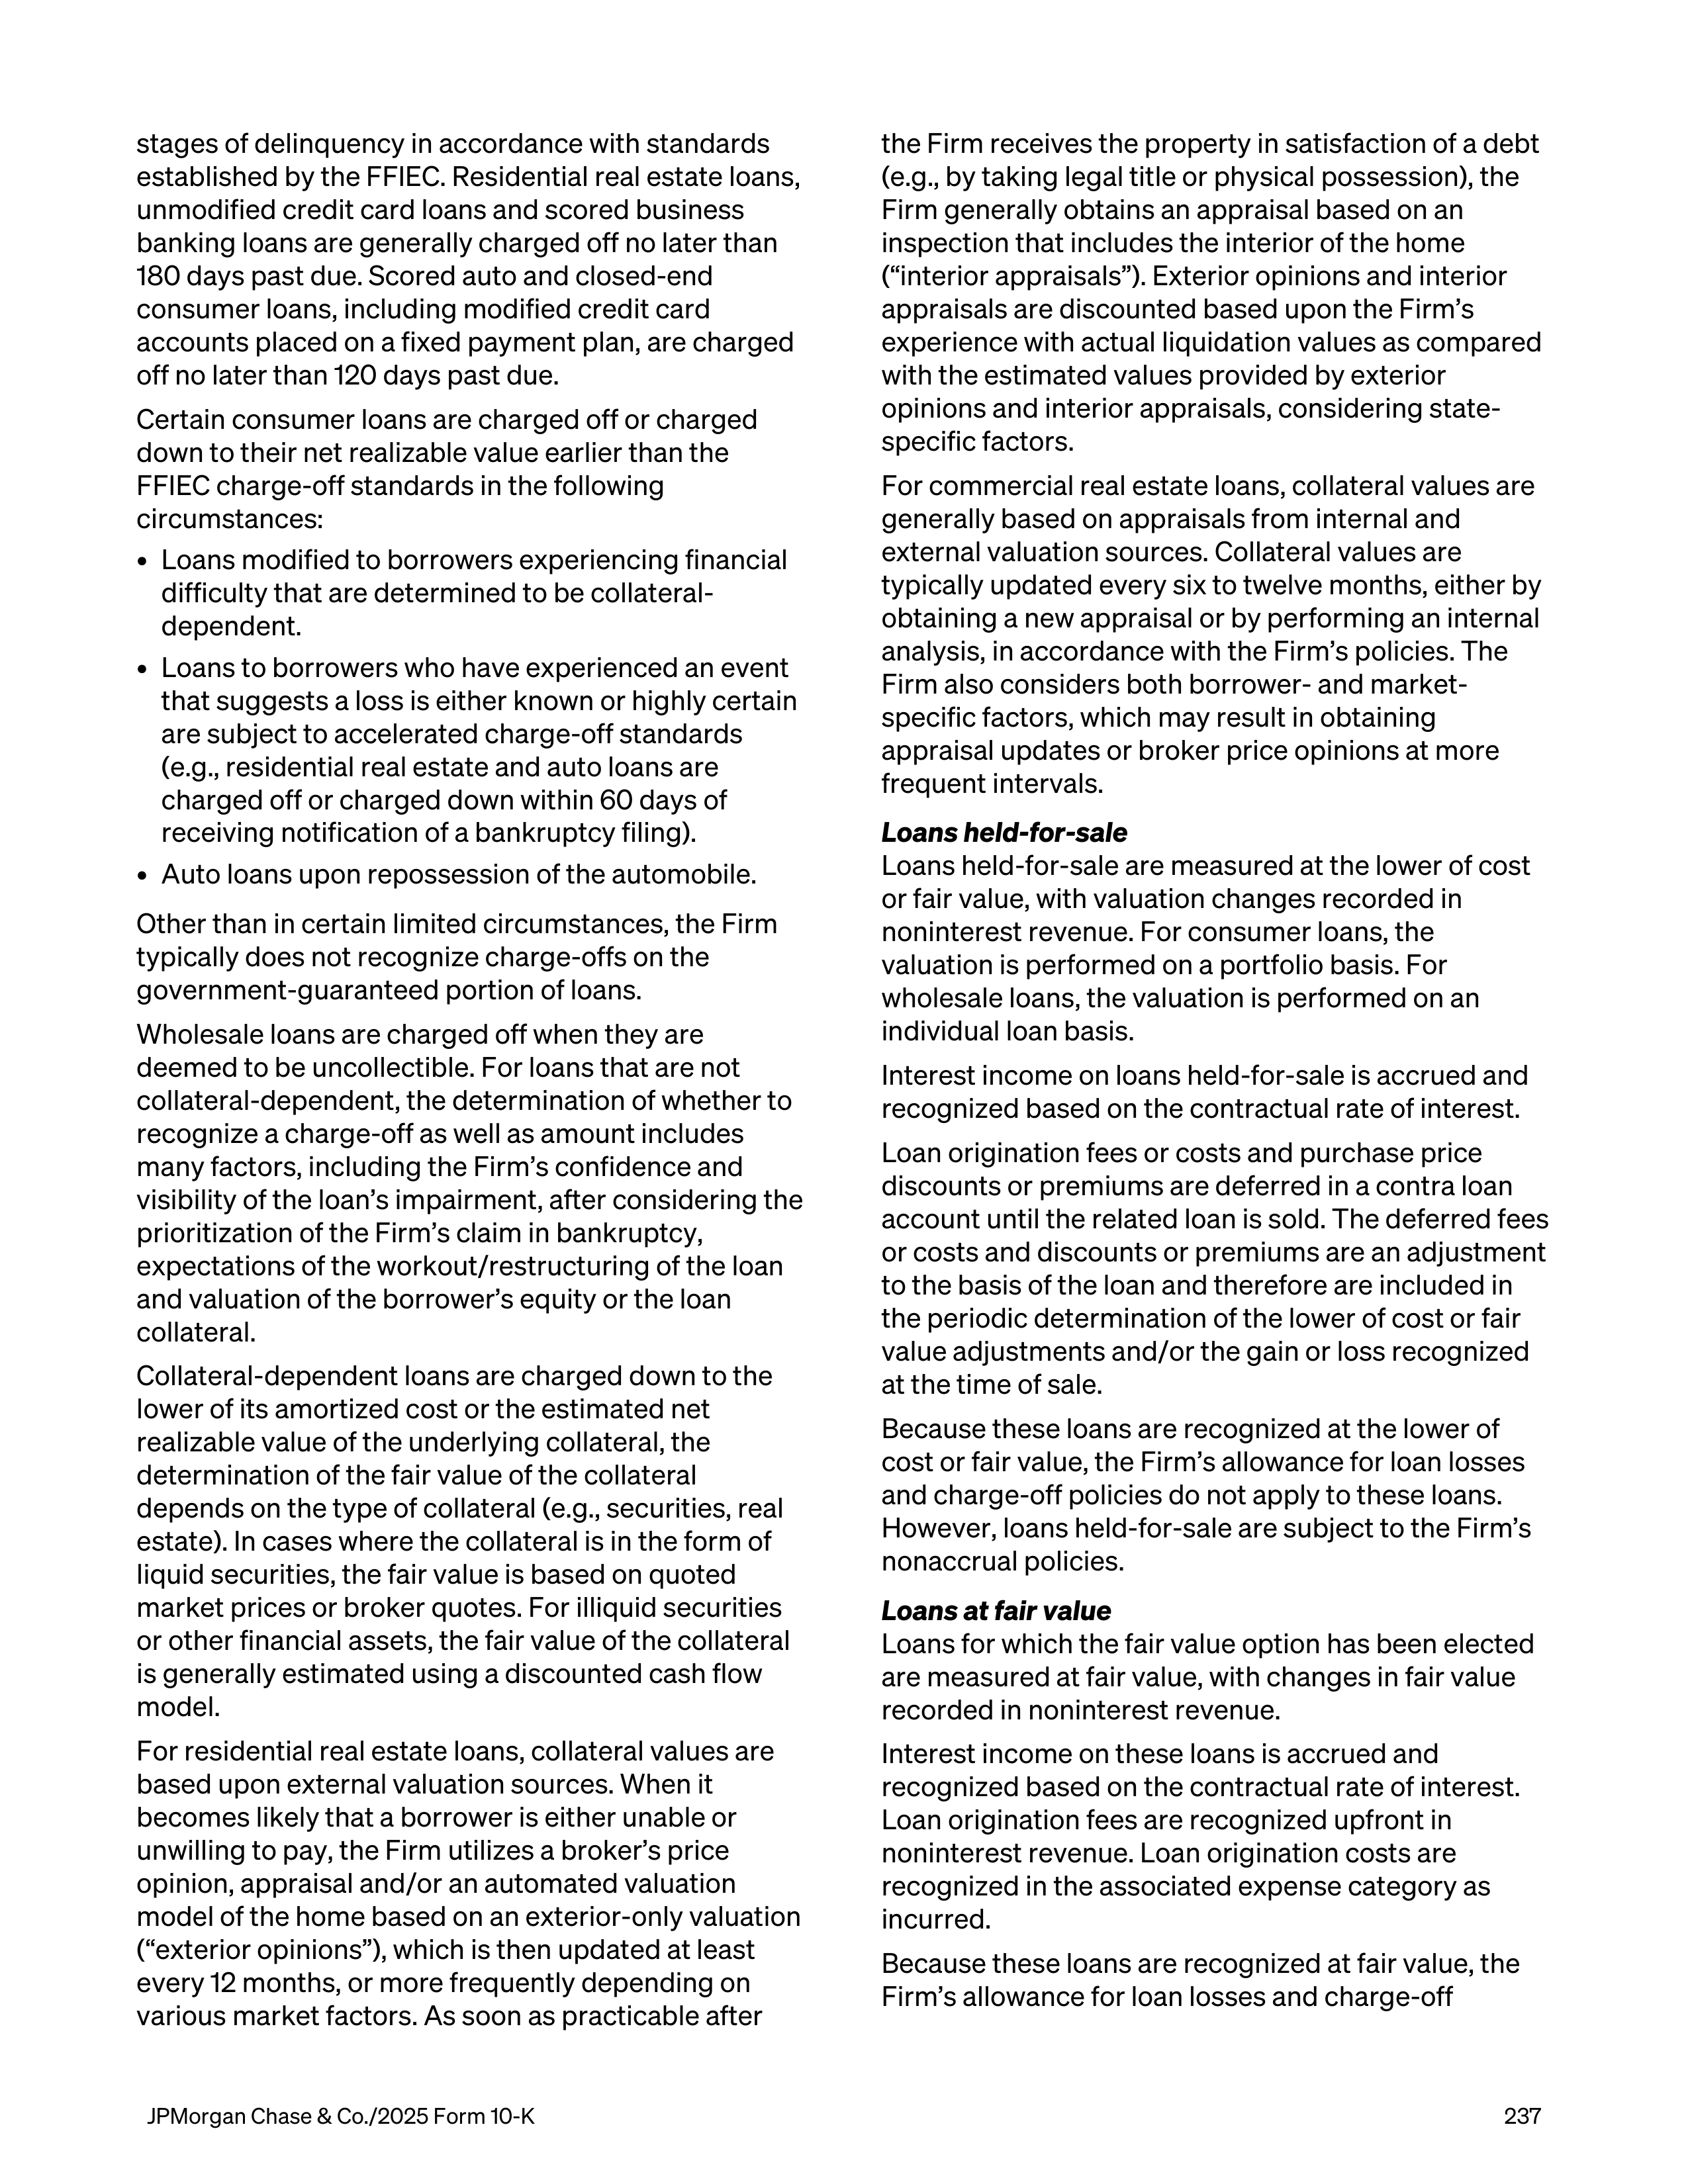
stages of delinquency in accordance with standards
established by the FFIEC. Residential real estate loans,
unmodified credit card loans and scored business
banking loans are generally charged off no later than
180 days past due. Scored auto and closed-end
consumer loans, including modified credit card
accounts placed on a fixed payment plan, are charged
off no later than 120 days past due.
Certain consumer loans are charged off or charged
down to their net realizable value earlier than the
FFIEC charge-off standards in the following
circumstances:
•
Loans modified to borrowers experiencing financial
difficulty that are determined to be collateral-
dependent.
•
Loans to borrowers who have experienced an event
that suggests a loss is either known or highly certain
are subject to accelerated charge-off standards
(e.g., residential real estate and auto loans are
charged off or charged down within 60 days of
receiving notification of a bankruptcy filing).
•
Auto loans upon repossession of the automobile.
Other than in certain limited circumstances, the Firm
typically does not recognize charge-offs on the
government-guaranteed portion of loans.
Wholesale loans are charged off when they are
deemed to be uncollectible. For loans that are not
collateral-dependent, the determination of whether to
recognize a charge-off as well as amount includes
many factors, including the Firm’s confidence and
visibility of the loan’s impairment, after considering the
prioritization of the Firm’s claim in bankruptcy,
expectations of the workout/restructuring of the loan
and valuation of the borrower’s equity or the loan
collateral.
Collateral-dependent loans are charged down to the
lower of its amortized cost or the estimated net
realizable value of the underlying collateral, the
determination of the fair value of the collateral
depends on the type of collateral (e.g., securities, real
estate). In cases where the collateral is in the form of
liquid securities, the fair value is based on quoted
market prices or broker quotes. For illiquid securities
or other financial assets, the fair value of the collateral
is generally estimated using a discounted cash flow
model.
For residential real estate loans, collateral values are
based upon external valuation sources. When it
becomes likely that a borrower is either unable or
unwilling to pay, the Firm utilizes a broker’s price
opinion, appraisal and/or an automated valuation
model of the home based on an exterior-only valuation
(“exterior opinions”), which is then updated at least
every 12 months, or more frequently depending on
various market factors. As soon as practicable after
the Firm receives the property in satisfaction of a debt
(e.g., by taking legal title or physical possession), the
Firm generally obtains an appraisal based on an
inspection that includes the interior of the home
(“interior appraisals”). Exterior opinions and interior
appraisals are discounted based upon the Firm’s
experience with actual liquidation values as compared
with the estimated values provided by exterior
opinions and interior appraisals, considering state-
specific factors.
For commercial real estate loans, collateral values are
generally based on appraisals from internal and
external valuation sources. Collateral values are
typically updated every six to twelve months, either by
obtaining a new appraisal or by performing an internal
analysis, in accordance with the Firm’s policies. The
Firm also considers both borrower- and market-
specific factors, which may result in obtaining
appraisal updates or broker price opinions at more
frequent intervals.
Loans held-for-sale
Loans held-for-sale are measured at the lower of cost
or fair value, with valuation changes recorded in
noninterest revenue. For consumer loans, the
valuation is performed on a portfolio basis. For
wholesale loans, the valuation is performed on an
individual loan basis.
Interest income on loans held-for-sale is accrued and
recognized based on the contractual rate of interest.
Loan origination fees or costs and purchase price
discounts or premiums are deferred in a contra loan
account until the related loan is sold. The deferred fees
or costs and discounts or premiums are an adjustment
to the basis of the loan and therefore are included in
the periodic determination of the lower of cost or fair
value adjustments and/or the gain or loss recognized
at the time of sale.
Because these loans are recognized at the lower of
cost or fair value, the Firm’s allowance for loan losses
and charge-off policies do not apply to these loans.
However, loans held-for-sale are subject to the Firm’s
nonaccrual policies.
Loans at fair value
Loans for which the fair value option has been elected
are measured at fair value, with changes in fair value
recorded in noninterest revenue.
Interest income on these loans is accrued and
recognized based on the contractual rate of interest.
Loan origination fees are recognized upfront in
noninterest revenue. Loan origination costs are
recognized in the associated expense category as
incurred.
Because these loans are recognized at fair value, the
Firm’s allowance for loan losses and charge-off
JPMorgan Chase & Co./2025 Form 10-K
237
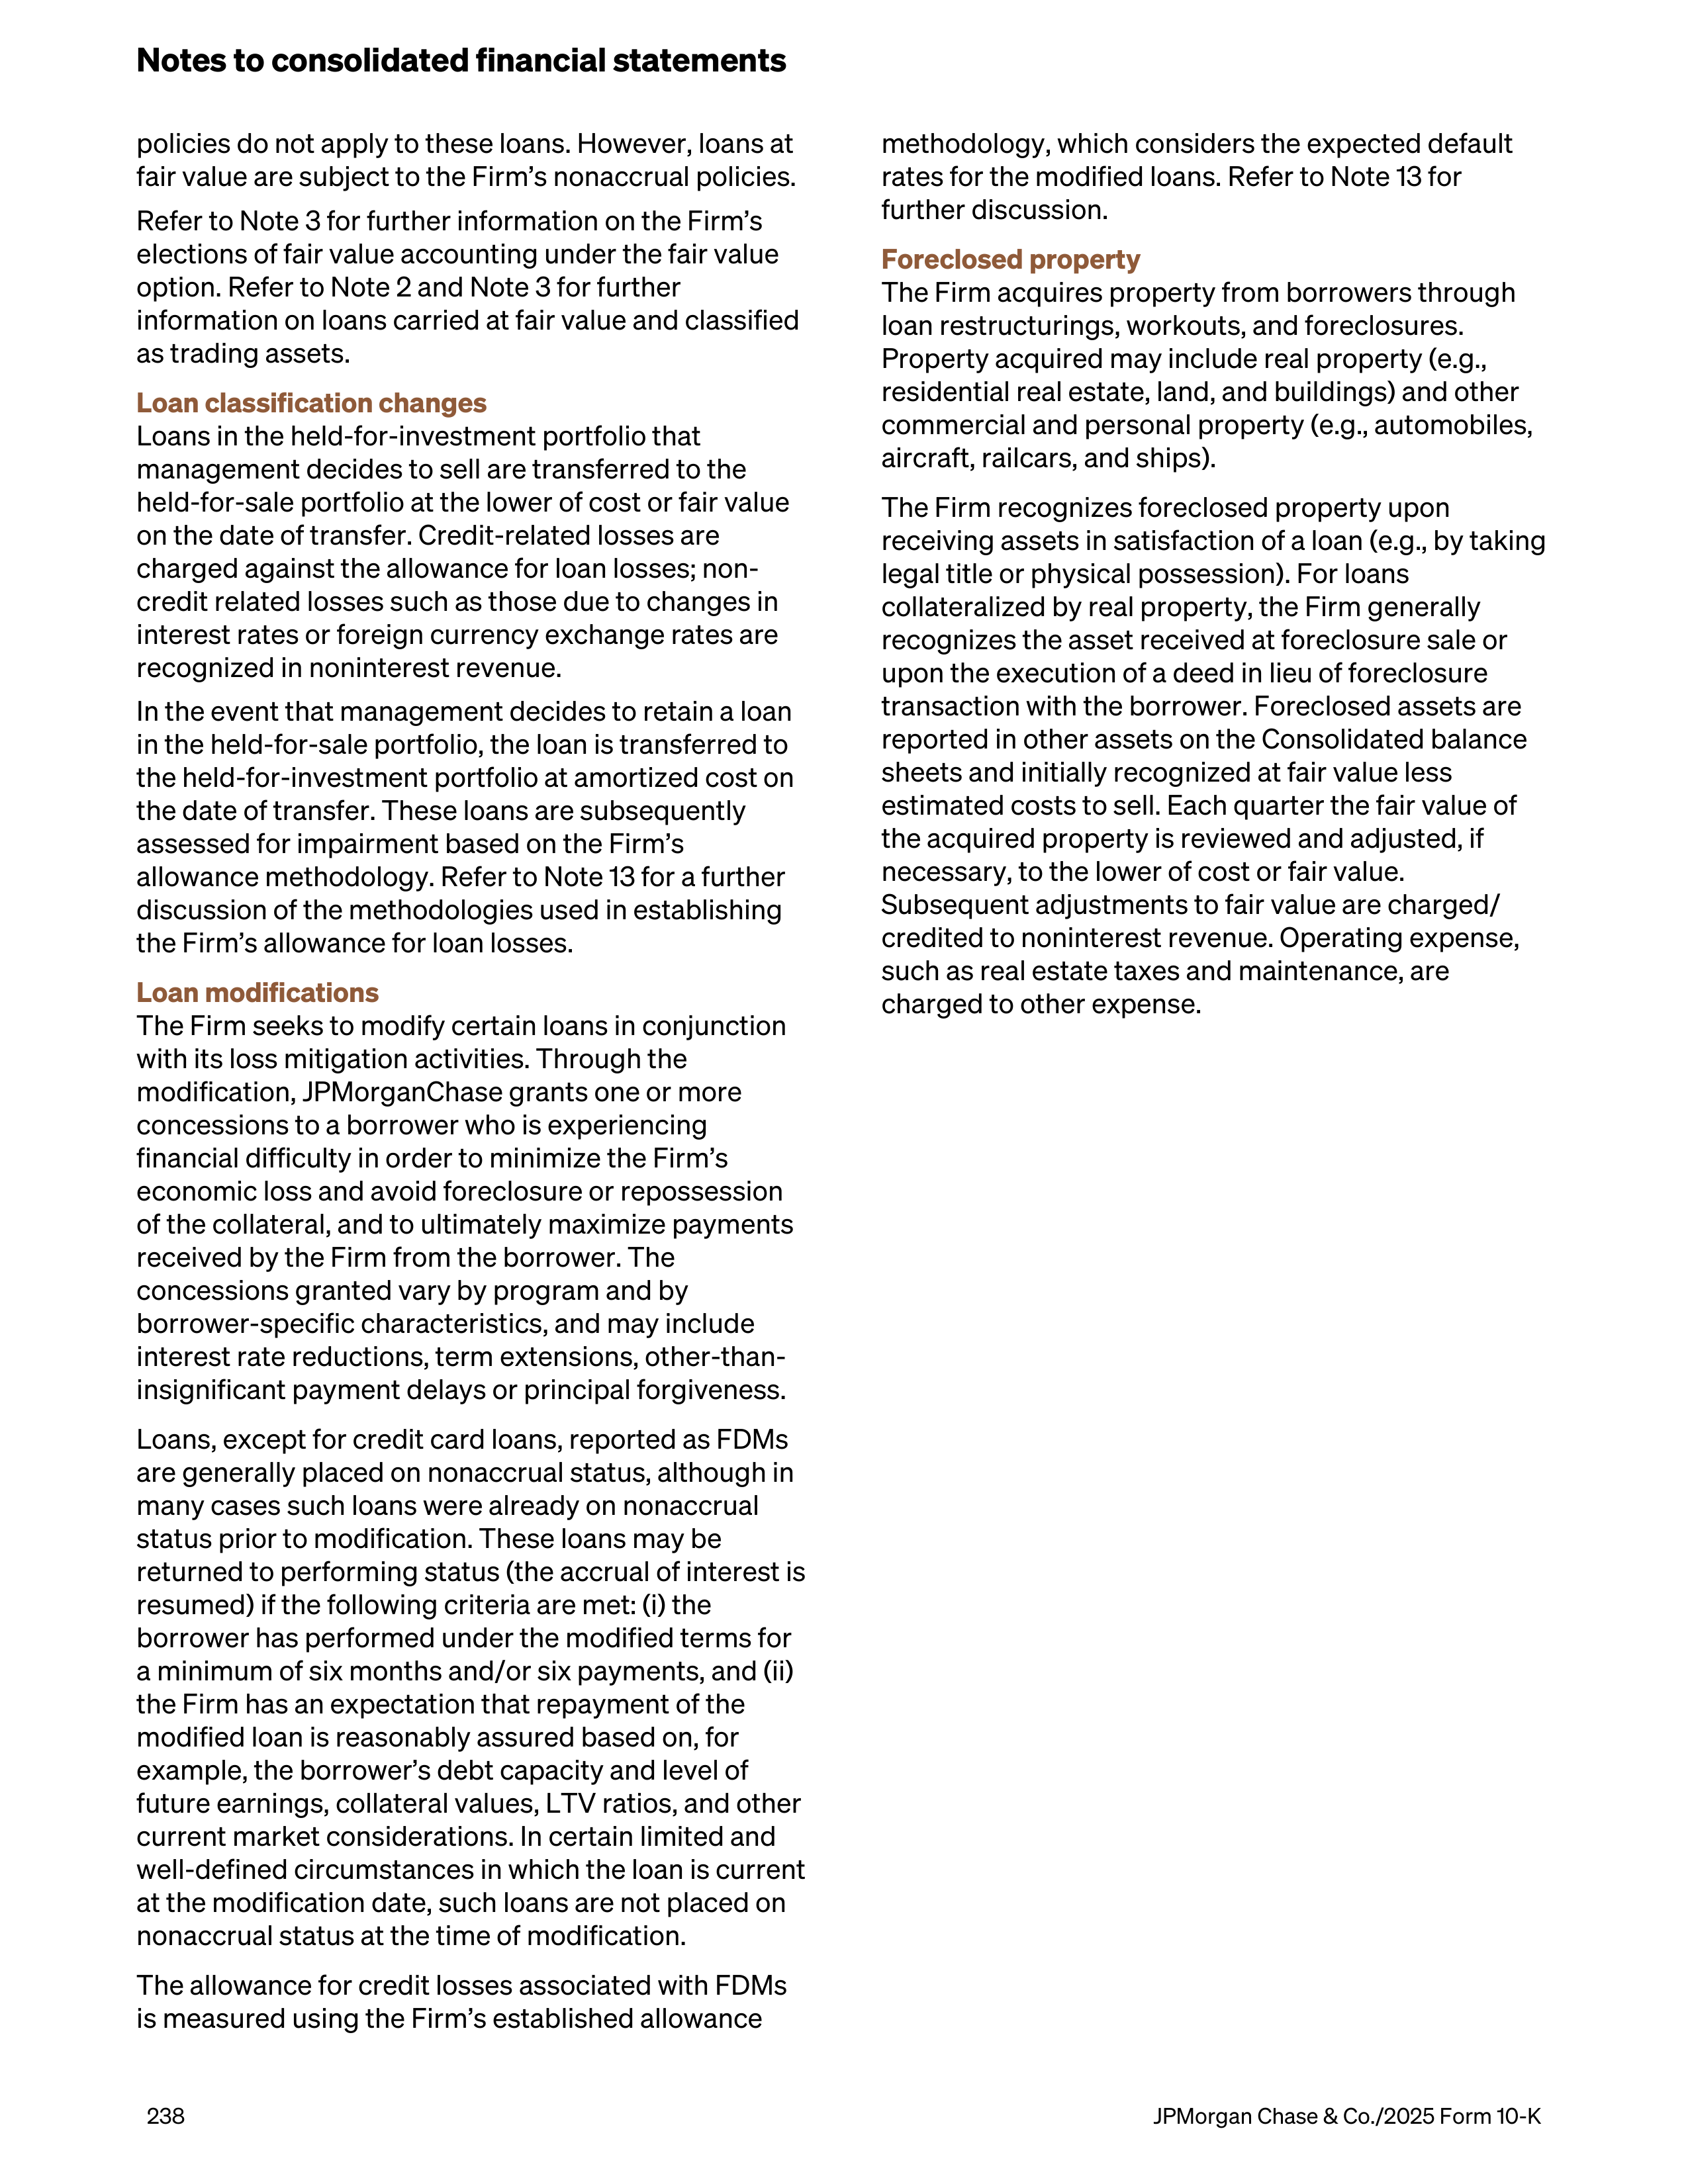
policies do not apply to these loans. However, loans at
fair value are subject to the Firm’s nonaccrual policies.
Refer to Note 3 for further information on the Firm’s
elections of fair value accounting under the fair value
option. Refer to Note 2 and Note 3 for further
information on loans carried at fair value and classified
as trading assets.
Loan classification changes
Loans in the held-for-investment portfolio that
management decides to sell are transferred to the
held-for-sale portfolio at the lower of cost or fair value
on the date of transfer. Credit-related losses are
charged against the allowance for loan losses; non-
credit related losses such as those due to changes in
interest rates or foreign currency exchange rates are
recognized in noninterest revenue.
In the event that management decides to retain a loan
in the held-for-sale portfolio, the loan is transferred to
the held-for-investment portfolio at amortized cost on
the date of transfer. These loans are subsequently
assessed for impairment based on the Firm’s
allowance methodology. Refer to Note 13 for a further
discussion of the methodologies used in establishing
the Firm’s allowance for loan losses.
Loan modifications
The Firm seeks to modify certain loans in conjunction
with its loss mitigation activities. Through the
modification, JPMorganChase grants one or more
concessions to a borrower who is experiencing
financial difficulty in order to minimize the Firm’s
economic loss and avoid foreclosure or repossession
of the collateral, and to ultimately maximize payments
received by the Firm from the borrower. The
concessions granted vary by program and by
borrower-specific characteristics, and may include
interest rate reductions, term extensions, other-than-
insignificant payment delays or principal forgiveness.
Loans, except for credit card loans, reported as FDMs
are generally placed on nonaccrual status, although in
many cases such loans were already on nonaccrual
status prior to modification. These loans may be
returned to performing status (the accrual of interest is
resumed) if the following criteria are met: (i) the
borrower has performed under the modified terms for
a minimum of six months and/or six payments, and (ii)
the Firm has an expectation that repayment of the
modified loan is reasonably assured based on, for
example, the borrower’s debt capacity and level of
future earnings, collateral values, LTV ratios, and other
current market considerations. In certain limited and
well-defined circumstances in which the loan is current
at the modification date, such loans are not placed on
nonaccrual status at the time of modification.
The allowance for credit losses associated with FDMs
is measured using the Firm’s established allowance
methodology, which considers the expected default
rates for the modified loans. Refer to Note 13 for
further discussion.
Foreclosed
property
The Firm acquires property from borrowers through
loan restructurings, workouts, and foreclosures.
Property acquired may include real property (e.g.,
residential real estate, land, and buildings) and other
commercial and personal property (e.g., automobiles,
aircraft, railcars, and ships).
The Firm recognizes foreclosed property upon
receiving assets in satisfaction of a loan (e.g., by taking
legal title or physical possession). For loans
collateralized by real property, the Firm generally
recognizes the asset received at foreclosure sale or
upon the execution of a deed in lieu of foreclosure
transaction with the borrower. Foreclosed assets are
reported in other assets on the Consolidated balance
sheets and initially recognized at fair value less
estimated costs to sell. Each quarter the fair value of
the acquired property is reviewed and adjusted, if
necessary, to the lower of cost or fair value.
Subsequent adjustments to fair value are charged/
credited to noninterest revenue. Operating expense,
such as real estate taxes and maintenance, are
charged to other expense.
Notes to consolidated financial statements
238
JPMorgan Chase & Co./2025 Form 10-K
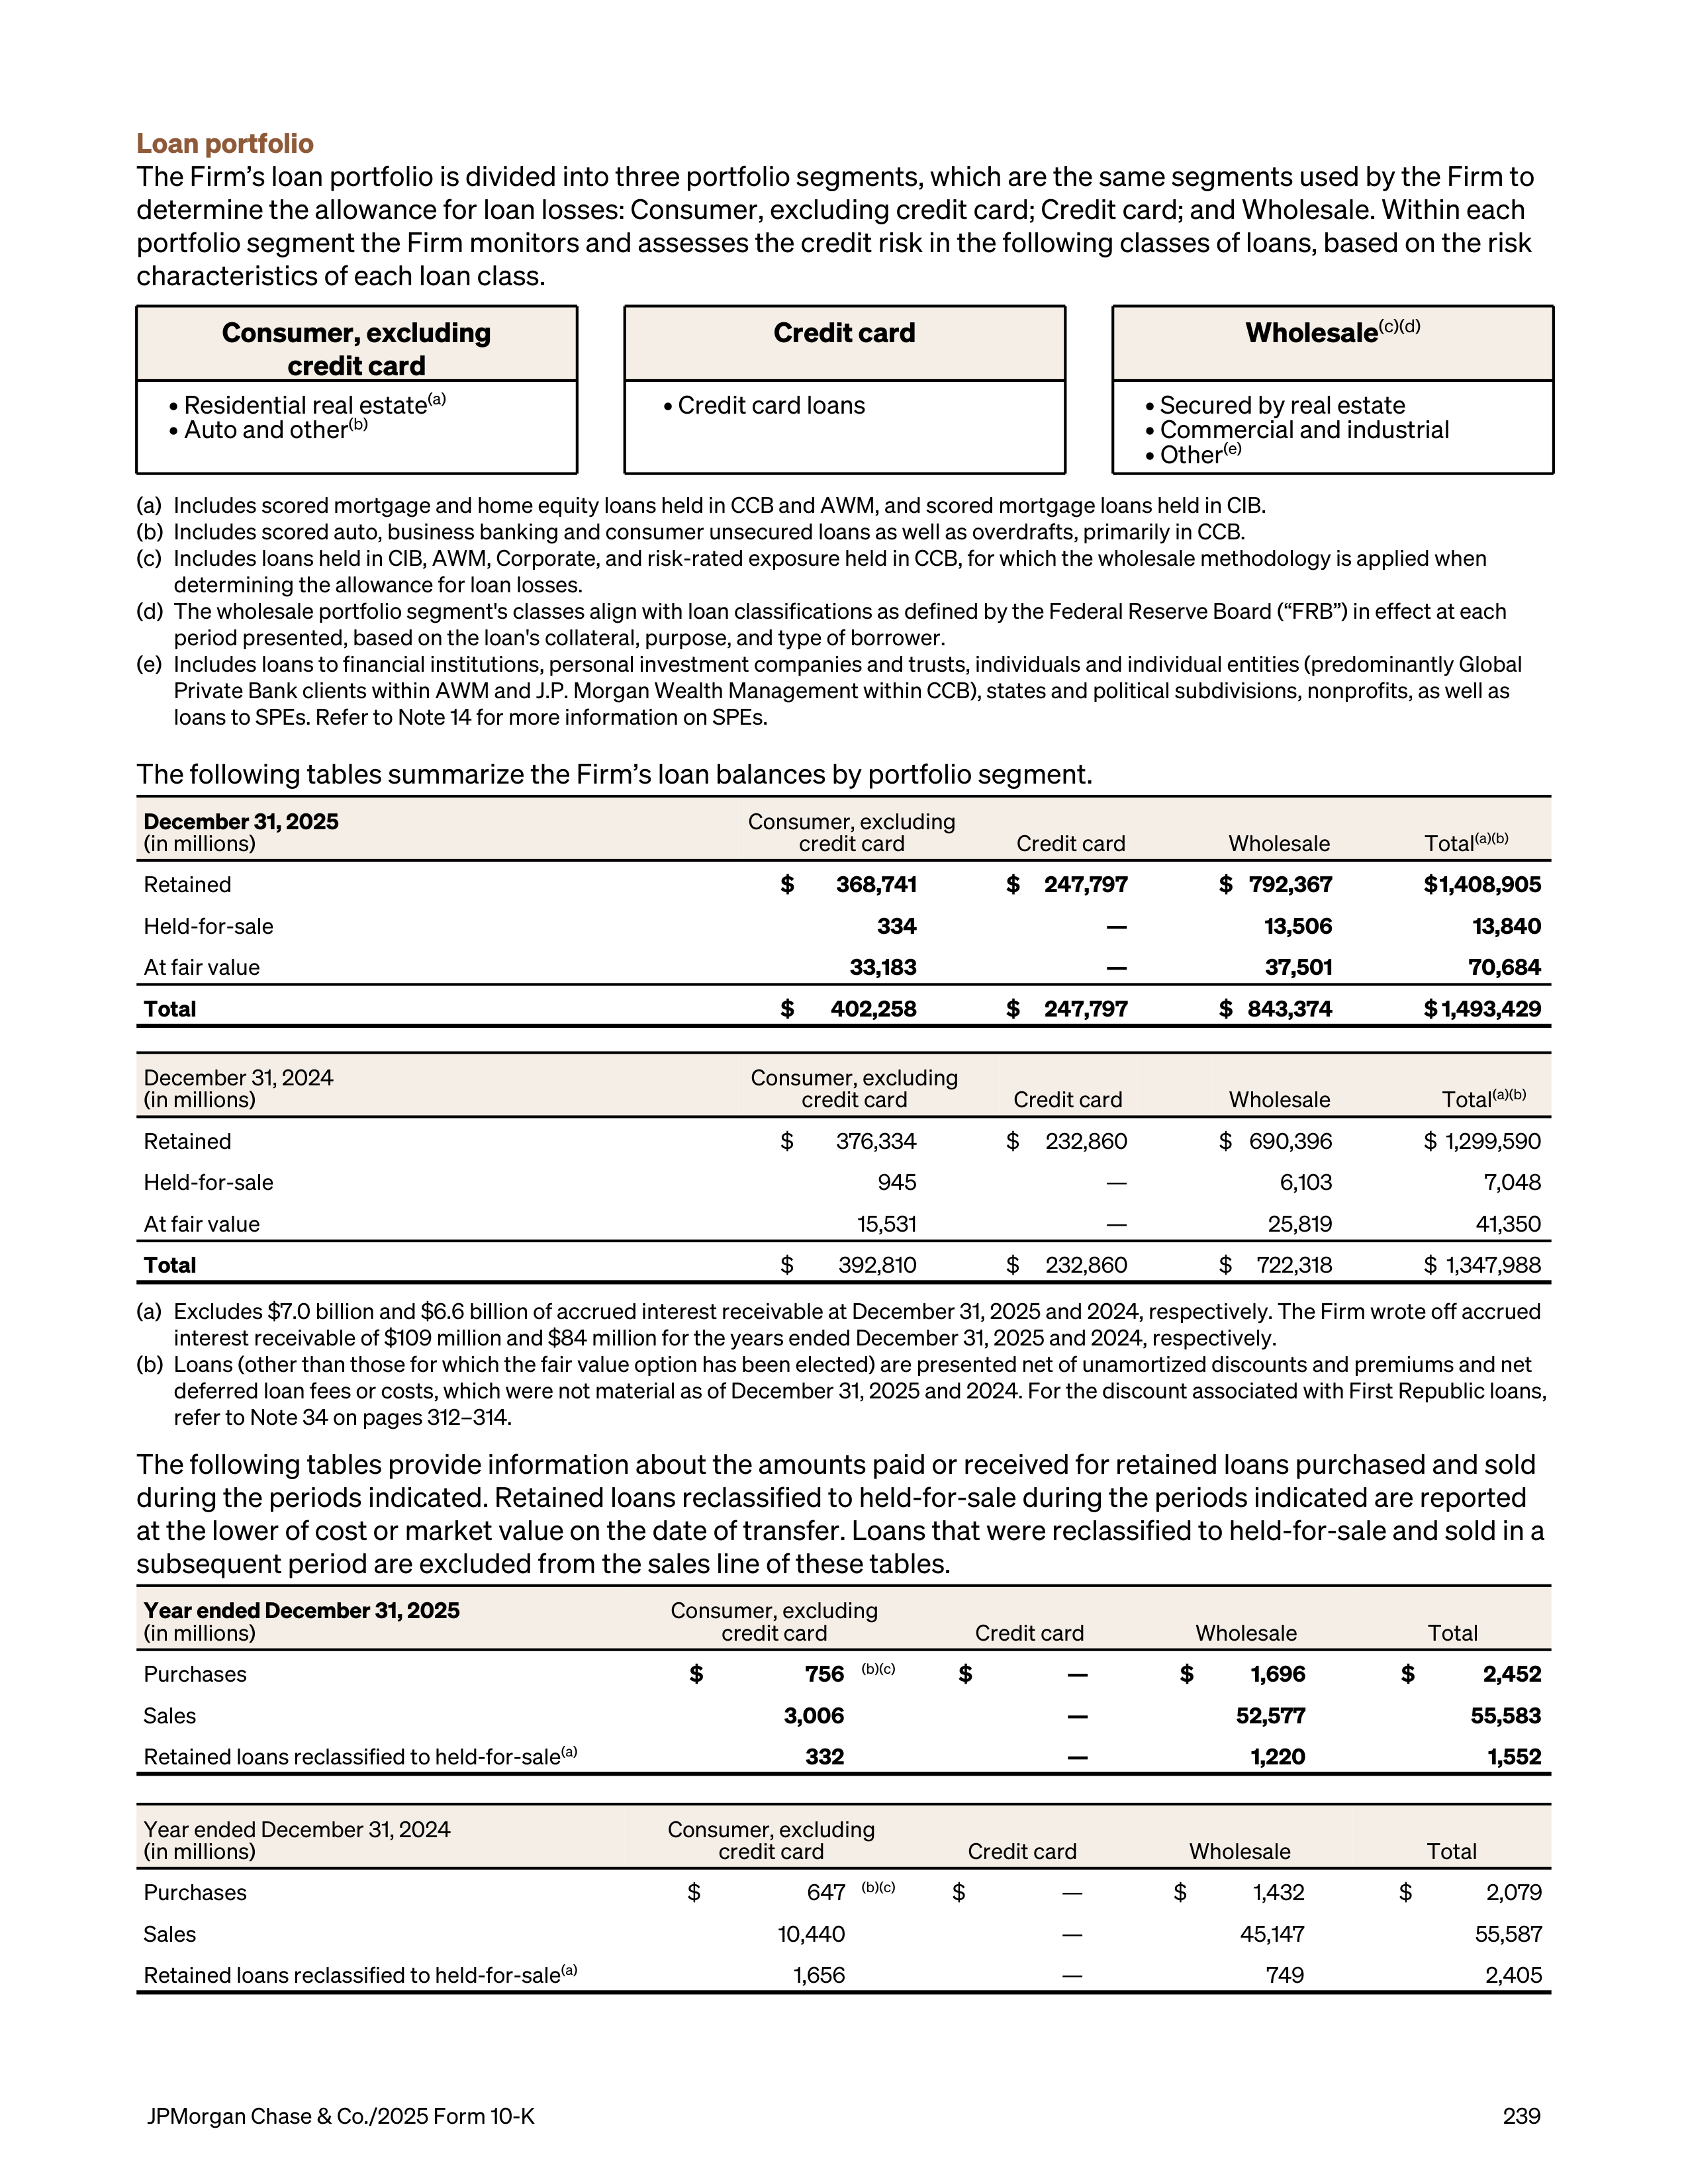
Loan portfolio
The Firm’s loan portfolio is divided into three portfolio segments, which are the same segments used by the Firm to
determine the allowance for loan losses: Consumer, excluding credit card; Credit card; and Wholesale. Within each
portfolio segment the Firm monitors and assesses the credit risk in the following classes of loans, based on the risk
characteristics of each loan class.
Consumer, excluding
credit card
Credit card
Wholesale
(c)(d)
• Residential real estate
(a)
• Auto and other
(b)
• Credit card loans
• Secured by real estate
• Commercial and industrial
• Other
(e)
(a)
Includes scored mortgage and home equity loans held in CCB and AWM, and scored mortgage loans held in CIB.
(b)
Includes scored auto, business banking and consumer unsecured loans as well as overdrafts, primarily in CCB.
(c)
Includes loans held in CIB, AWM, Corporate, and risk-rated exposure held in CCB, for which the wholesale methodology is applied when
determining the allowance for loan losses.
(d)
The wholesale portfolio segment's classes align with loan classifications as defined by the Federal Reserve Board (“FRB”) in effect at each
period presented, based on the loan's collateral, purpose, and type of borrower.
(e)
Includes loans to financial institutions, personal investment companies and trusts, individuals and individual entities (predominantly Global
Private Bank clients within AWM and J.P. Morgan Wealth Management within CCB), states and political subdivisions, nonprofits, as well as
loans to SPEs. Refer to Note 14 for more information on SPEs.
The following tables summarize the Firm’s loan balances by portfolio segment.
December 31, 2025
(in millions)
Consumer, excluding
credit card
Credit card
Wholesale
Total
(a)(b)
Retained
$
368,741
$
247,797
$ 792,367
$ 1,408,905
Held-for-sale
334
—
13,506
13,840
At fair value
33,183
—
37,501
70,684
Total
$
402,258
$
247,797
$ 843,374
$ 1,493,429
December 31, 2024
(in millions)
Consumer, excluding
credit card
Credit card
Wholesale
Total
(a)(b)
Retained
$
376,334
$
232,860
$ 690,396
$ 1,299,590
Held-for-sale
945
—
6,103
7,048
At fair value
15,531
—
25,819
41,350
Total
$
392,810
$
232,860
$
722,318
$ 1,347,988
(a)
Excludes $7.0 billion and $6.6 billion of accrued interest receivable at December 31, 2025 and 2024, respectively. The Firm wrote off accrued
interest receivable of $109 million and $84 million for the years ended December 31, 2025 and 2024, respectively.
(b)
Loans (other than those for which the fair value option has been elected) are presented net of unamortized discounts and premiums and net
deferred loan fees or costs, which were not material as of December 31, 2025 and 2024. For the discount associated with First Republic loans,
refer to Note 34 on pages 312–314.
The following tables provide information about the amounts paid or received for retained loans purchased and sold
during the periods indicated. Retained loans reclassified to held-for-sale during the periods indicated are reported
at the lower of cost or market value on the date of transfer. Loans that were reclassified to held-for-sale and sold in a
subsequent period are excluded from the sales line of these tables.
Year ended December 31, 2025
(in millions)
Consumer, excluding
credit card
Credit card
Wholesale
Total
Purchases
$
756
(b)(c)
$
—
$
1,696
$
2,452
Sales
3,006
—
52,577
55,583
Retained loans reclassified to held-for-sale
(a)
332
—
1,220
1,552
Year ended December 31, 2024
(in millions)
Consumer, excluding
credit card
Credit card
Wholesale
Total
Purchases
$
647
(b)(c)
$
—
$
1,432
$
2,079
Sales
10,440
—
45,147
55,587
Retained loans reclassified to held-for-sale
(a)
1,656
—
749
2,405
JPMorgan Chase & Co./2025 Form 10-K
239
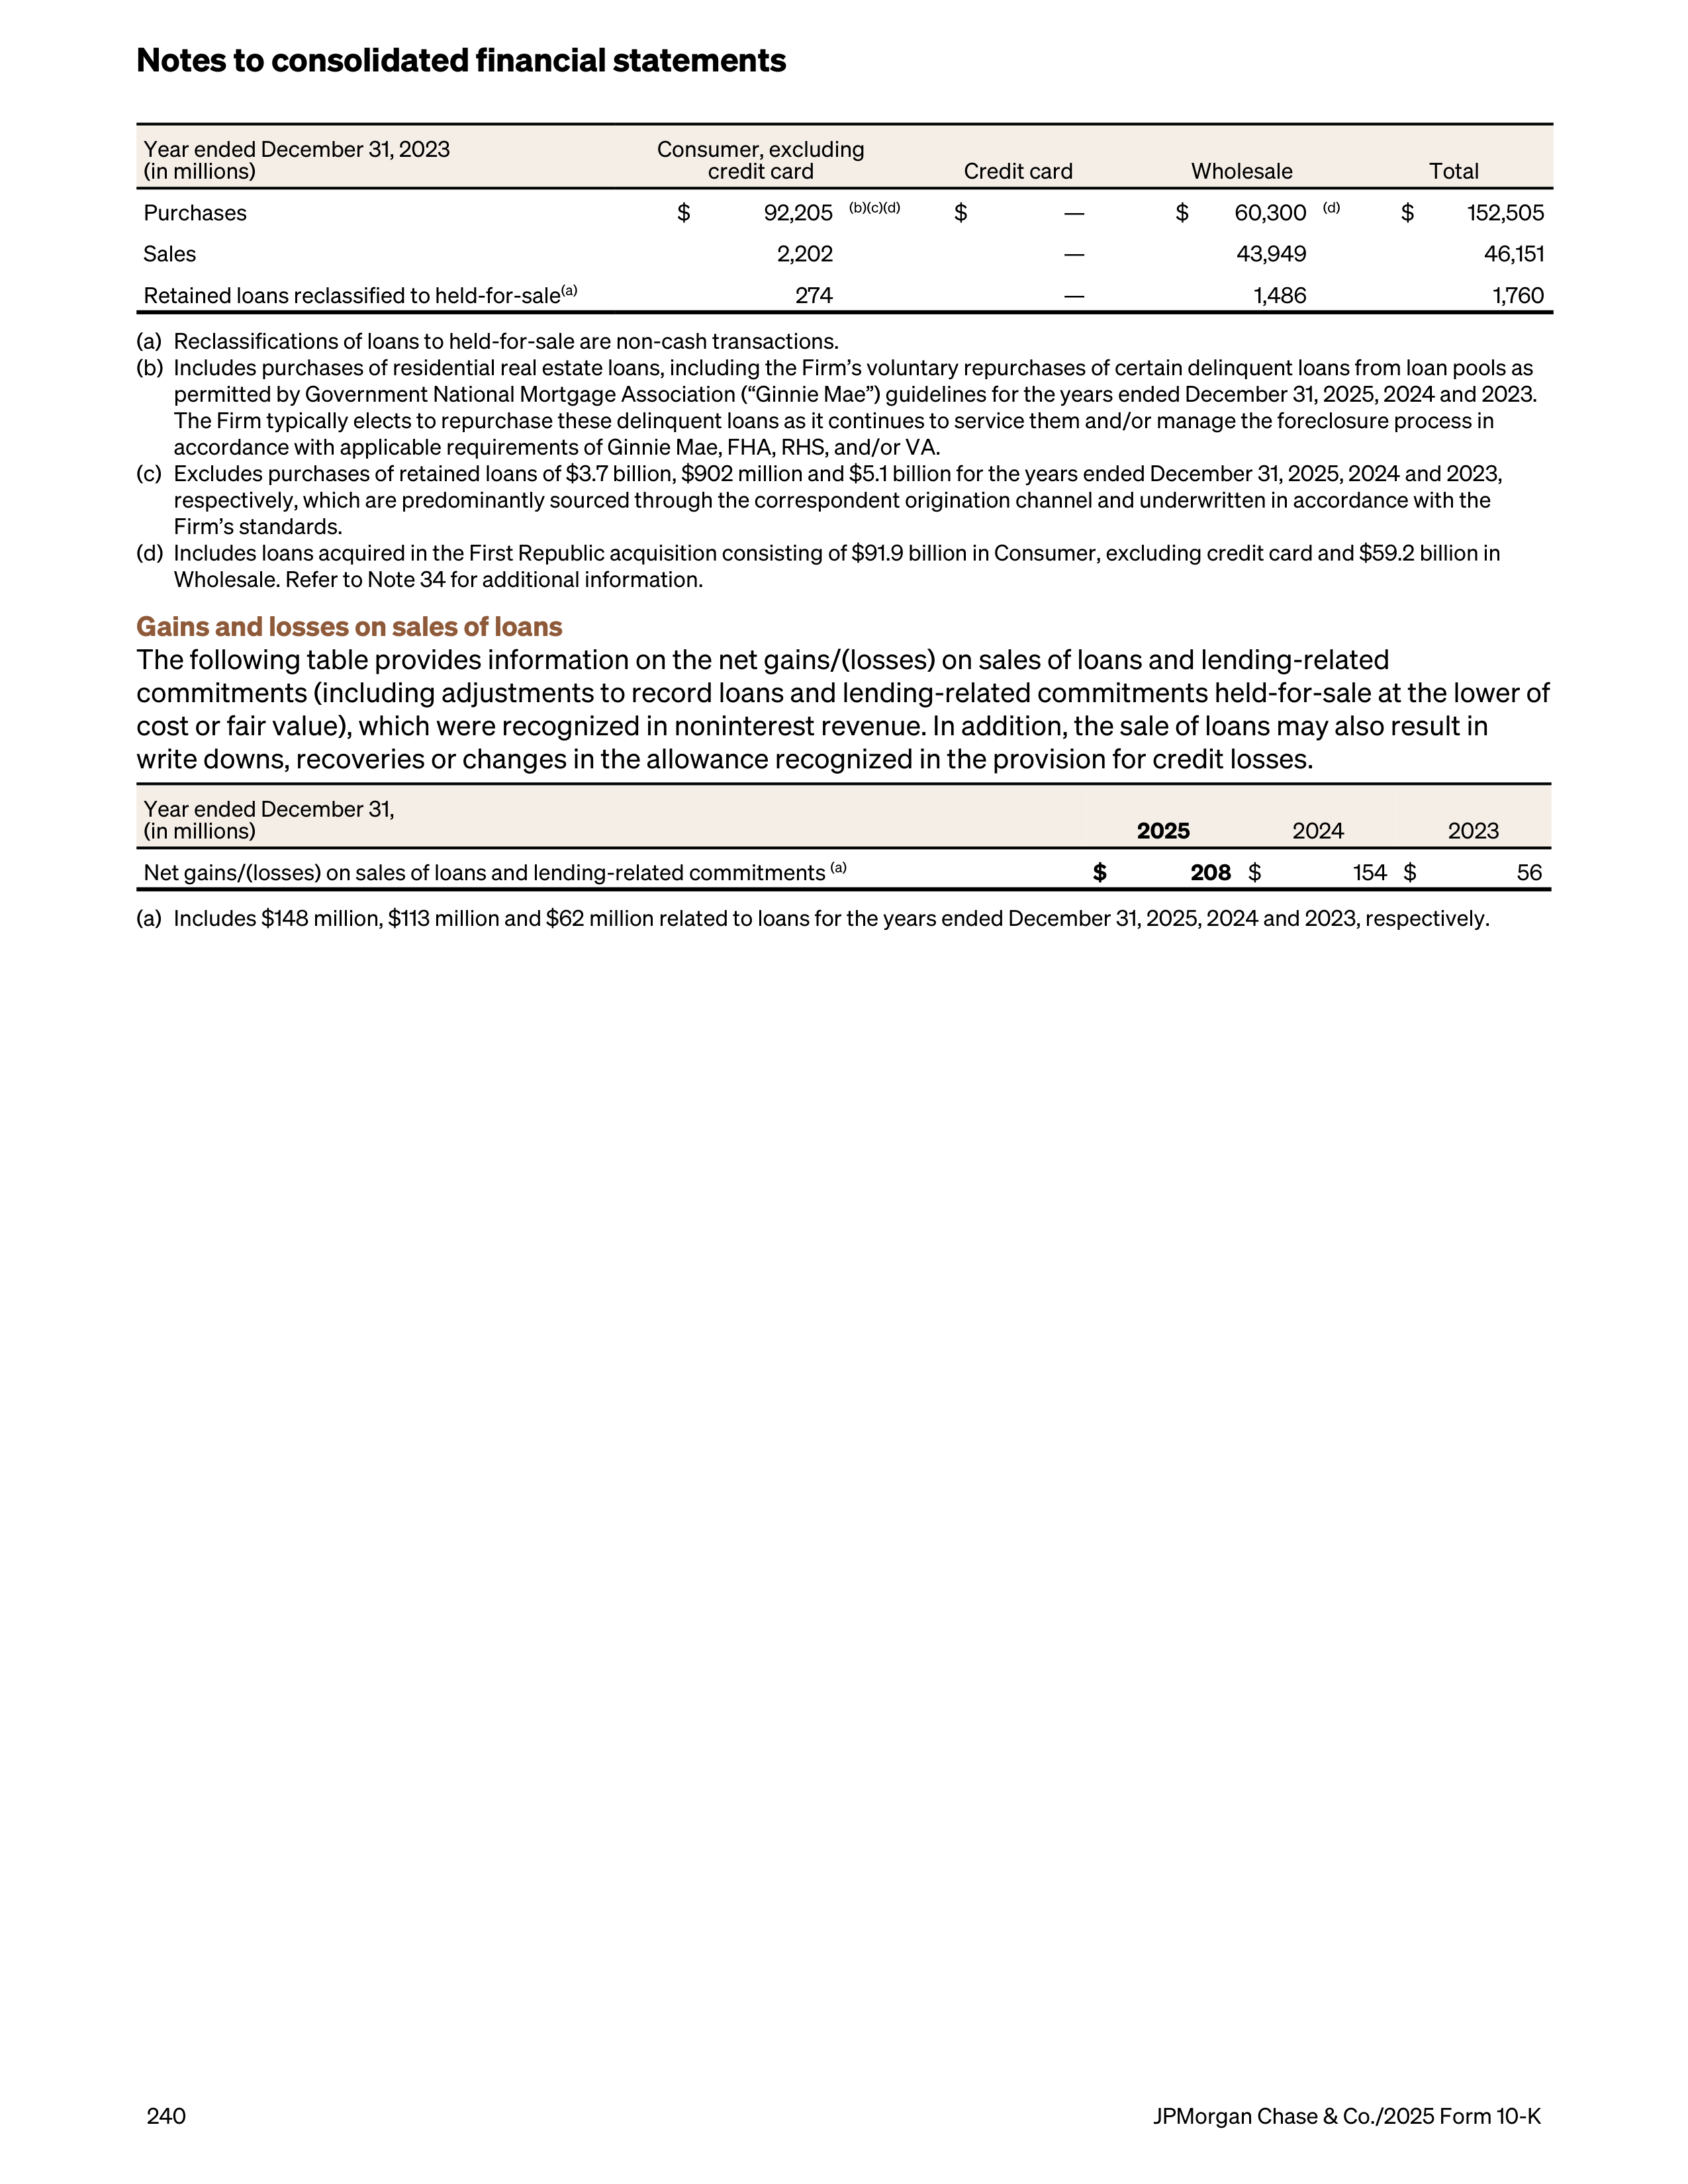
Year ended December 31, 2023
(in millions)
Consumer, excluding
credit card
Credit card
Wholesale
Total
Purchases
$
92,205
(b)(c)(d)
$
—
$
60,300
(d)
$
152,505
Sales
2,202
—
43,949
46,151
Retained loans reclassified to held-for-sale
(a)
274
—
1,486
1,760
(a)
Reclassifications of loans to held-for-sale are non-cash transactions.
(b)
Includes purchases of residential real estate loans, including the Firm’s voluntary repurchases of certain delinquent loans from loan pools as
permitted by Government National Mortgage Association (“Ginnie Mae”) guidelines for the years ended December 31, 2025, 2024 and 2023.
The Firm typically elects to repurchase these delinquent loans as it continues to service them and/or manage the foreclosure process in
accordance with applicable requirements of Ginnie Mae, FHA, RHS, and/or VA.
(c)
Excludes purchases of retained loans of $3.7 billion, $902 million and $5.1 billion for the years ended December 31, 2025, 2024 and 2023,
respectively, which are predominantly sourced through the correspondent origination channel and underwritten in accordance with the
Firm’s standards.
(d)
Includes loans acquired in the First Republic acquisition consisting of $91.9 billion in Consumer, excluding credit card and $59.2 billion in
Wholesale. Refer to Note 34 for additional information.
Gains and losses on sales of loans
The following table provides information on the net gains/(losses) on sales of loans and lending-related
commitments (including adjustments to record loans and lending-related commitments held-for-sale at the lower of
cost or fair value), which were recognized in noninterest revenue. In addition, the sale of loans may also result in
write downs, recoveries or changes in the allowance recognized in the provision for credit losses.
Year ended December 31,
(in millions)
2025
2024
2023
Net gains/(losses) on sales of loans and lending-related commitments
(a)
$
208
$
154 $
56
(a)
Includes $148 million, $113 million and $62 million related to loans for the years ended December 31, 2025, 2024 and 2023, respectively.
Notes to consolidated financial statements
240
JPMorgan Chase & Co./2025 Form 10-K
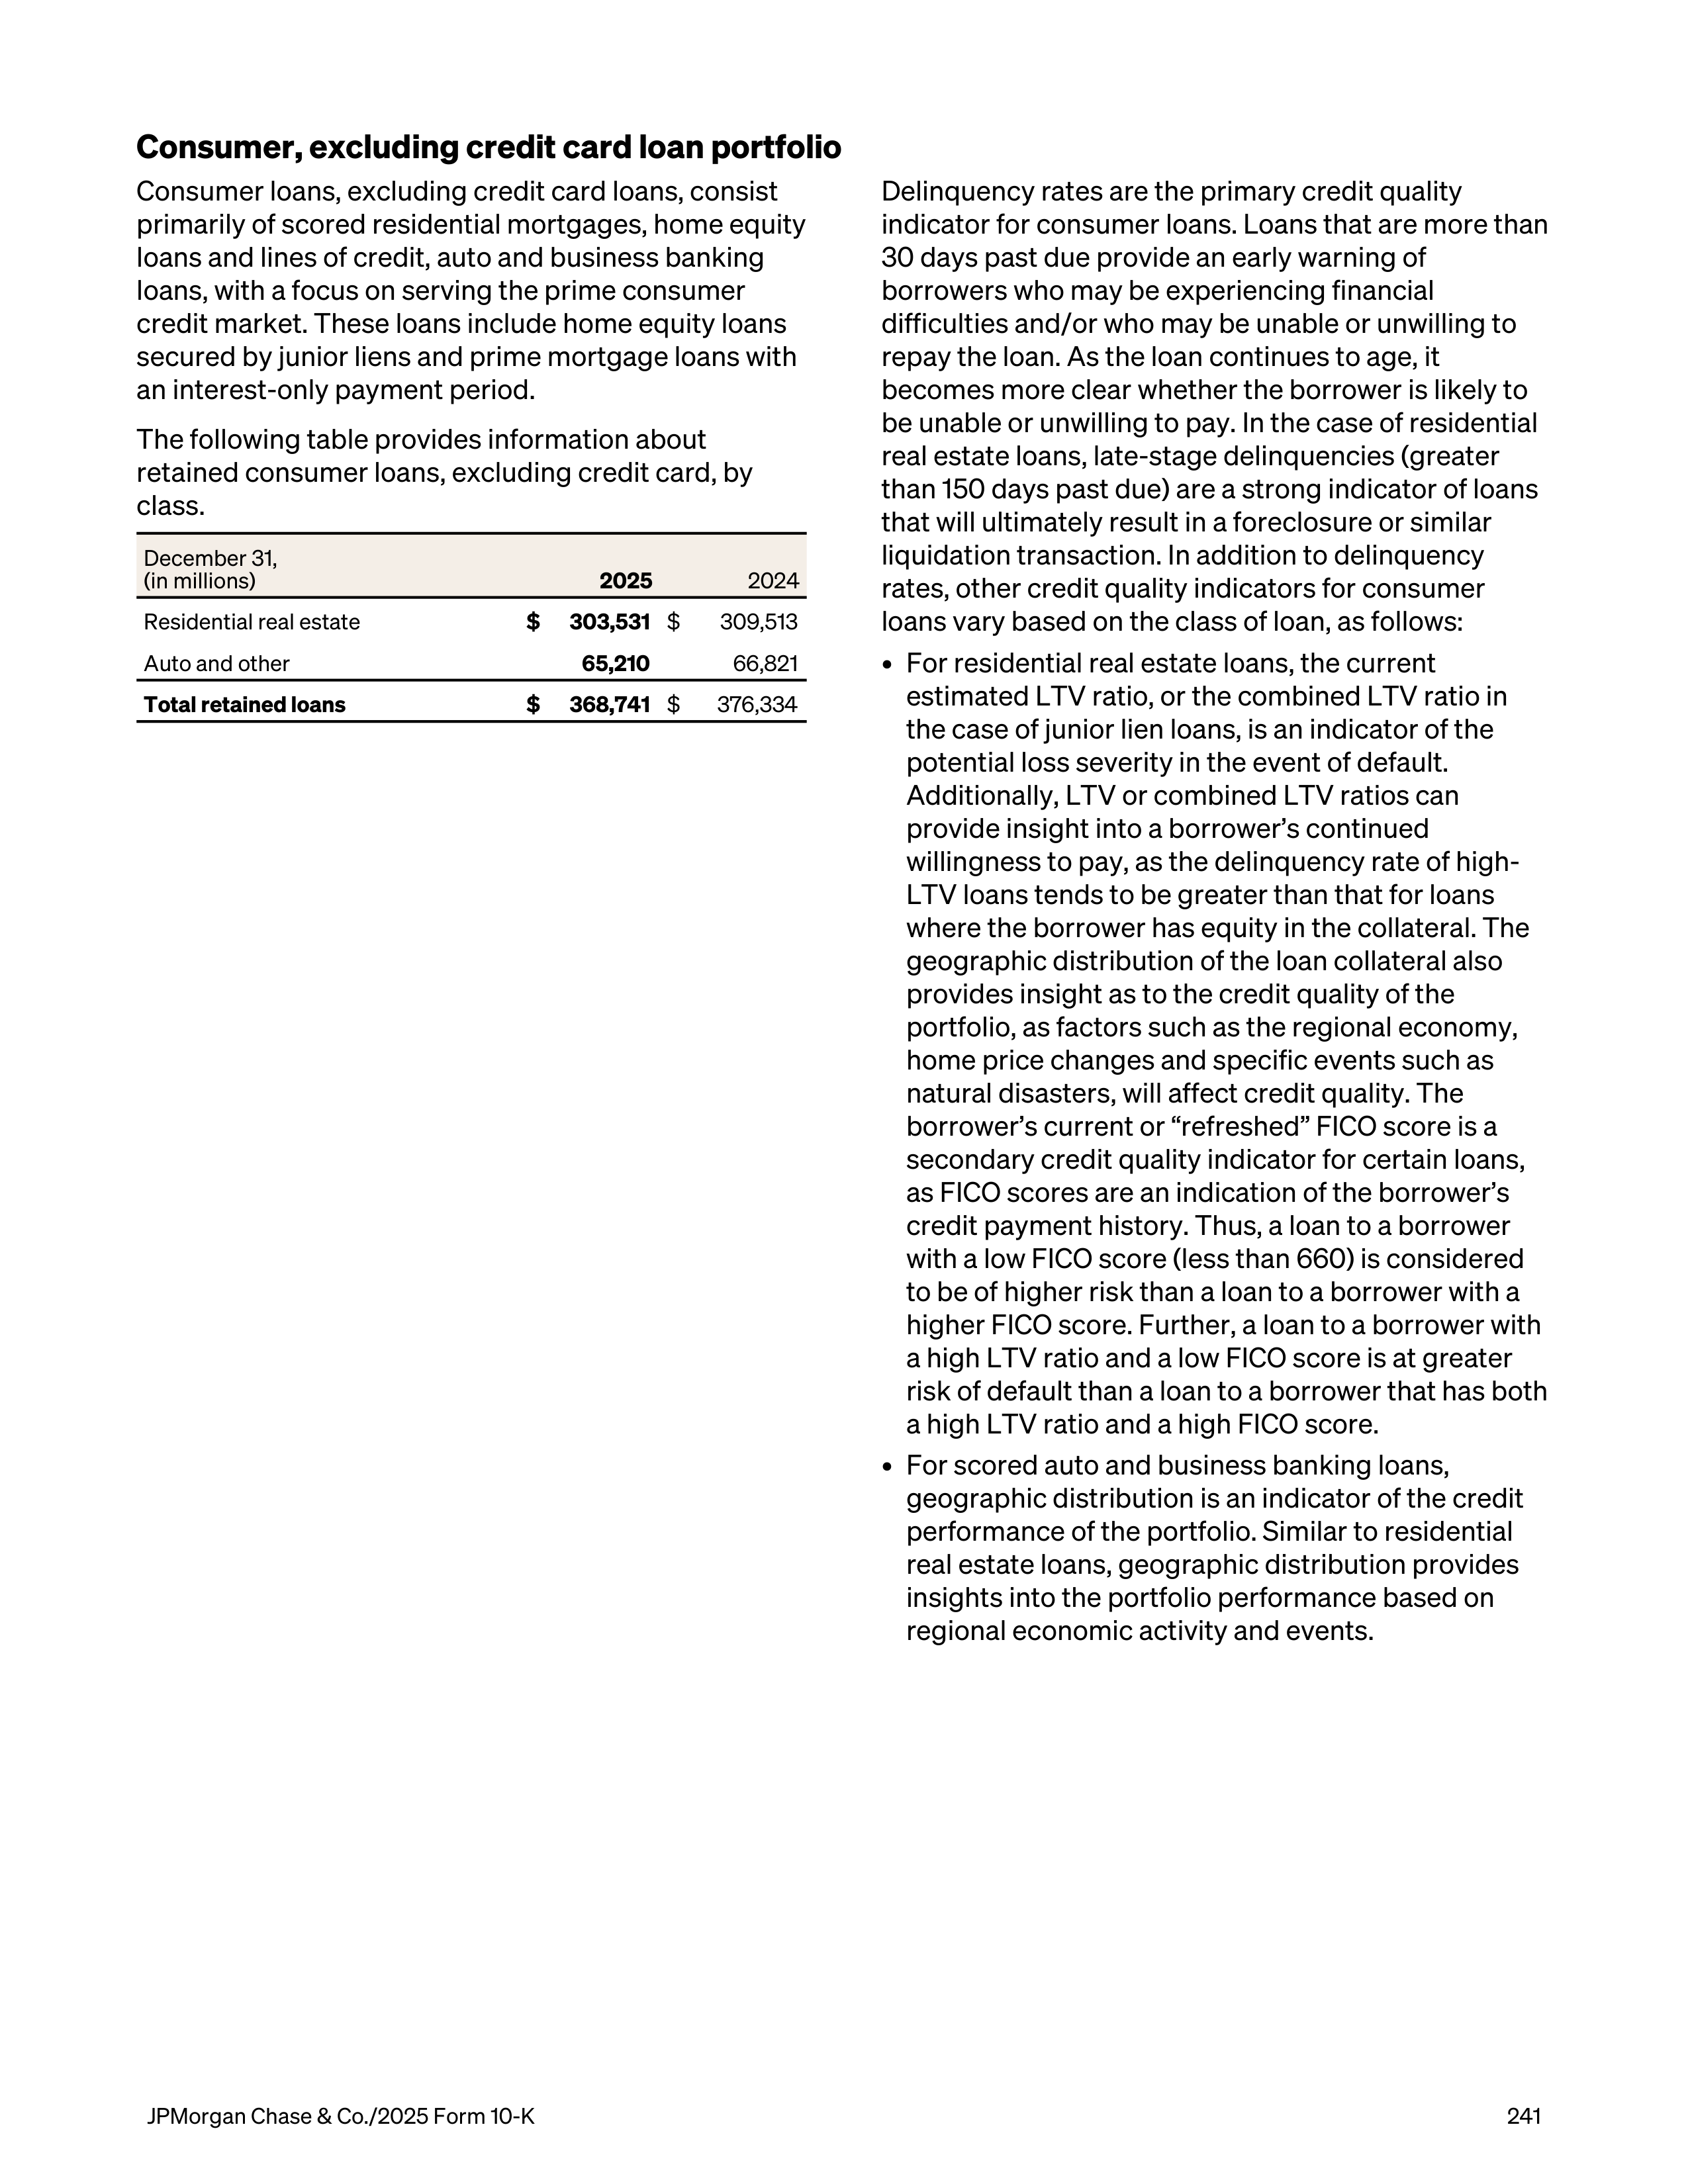
Consumer, excluding credit card loan portfolio
Consumer loans, excluding credit card loans, consist
primarily of scored residential mortgages, home equity
loans and lines of credit, auto and business banking
loans, with a focus on serving the prime consumer
credit market. These loans include home equity loans
secured by junior liens and prime mortgage loans with
an interest-only payment period.
The following table provides information about
retained consumer loans, excluding credit card, by
class.
December 31,
(in millions)
2025
2024
Residential real estate
$
303,531
$
309,513
Auto and other
65,210
66,821
Total retained loans
$
368,741
$
376,334
Delinquency rates are the primary credit quality
indicator for consumer loans. Loans that are more than
30 days past due provide an early warning of
borrowers who may be experiencing financial
difficulties and/or who may be unable or unwilling to
repay the loan. As the loan continues to age, it
becomes more clear whether the borrower is likely to
be unable or unwilling to pay. In the case of residential
real estate loans, late-stage delinquencies (greater
than 150 days past due) are a strong indicator of loans
that will ultimately result in a foreclosure or similar
liquidation transaction. In addition to delinquency
rates, other credit quality indicators for consumer
loans vary based on the class of loan, as follows:
•
For residential real estate loans, the current
estimated LTV ratio, or the combined LTV ratio in
the case of junior lien loans, is an indicator of the
potential loss severity in the event of default.
Additionally, LTV or combined LTV ratios can
provide insight into a borrower’s continued
willingness to pay, as the delinquency rate of high-
LTV loans tends to be greater than that for loans
where the borrower has equity in the collateral. The
geographic distribution of the loan collateral also
provides insight as to the credit quality of the
portfolio, as factors such as the regional economy,
home price changes and specific events such as
natural disasters, will affect credit quality. The
borrower’s current or “refreshed” FICO score is a
secondary credit quality indicator for certain loans,
as FICO scores are an indication of the borrower’s
credit payment history. Thus, a loan to a borrower
with a low FICO score (less than 660) is considered
to be of higher risk than a loan to a borrower with a
higher FICO score. Further, a loan to a borrower with
a high LTV ratio and a low FICO score is at greater
risk of default than a loan to a borrower that has both
a high LTV ratio and a high FICO score.
•
For scored auto and business banking loans,
geographic distribution is an indicator of the credit
performance of the portfolio. Similar to residential
real estate loans, geographic distribution provides
insights into the portfolio performance based on
regional economic activity and events.
JPMorgan Chase & Co./2025 Form 10-K
241
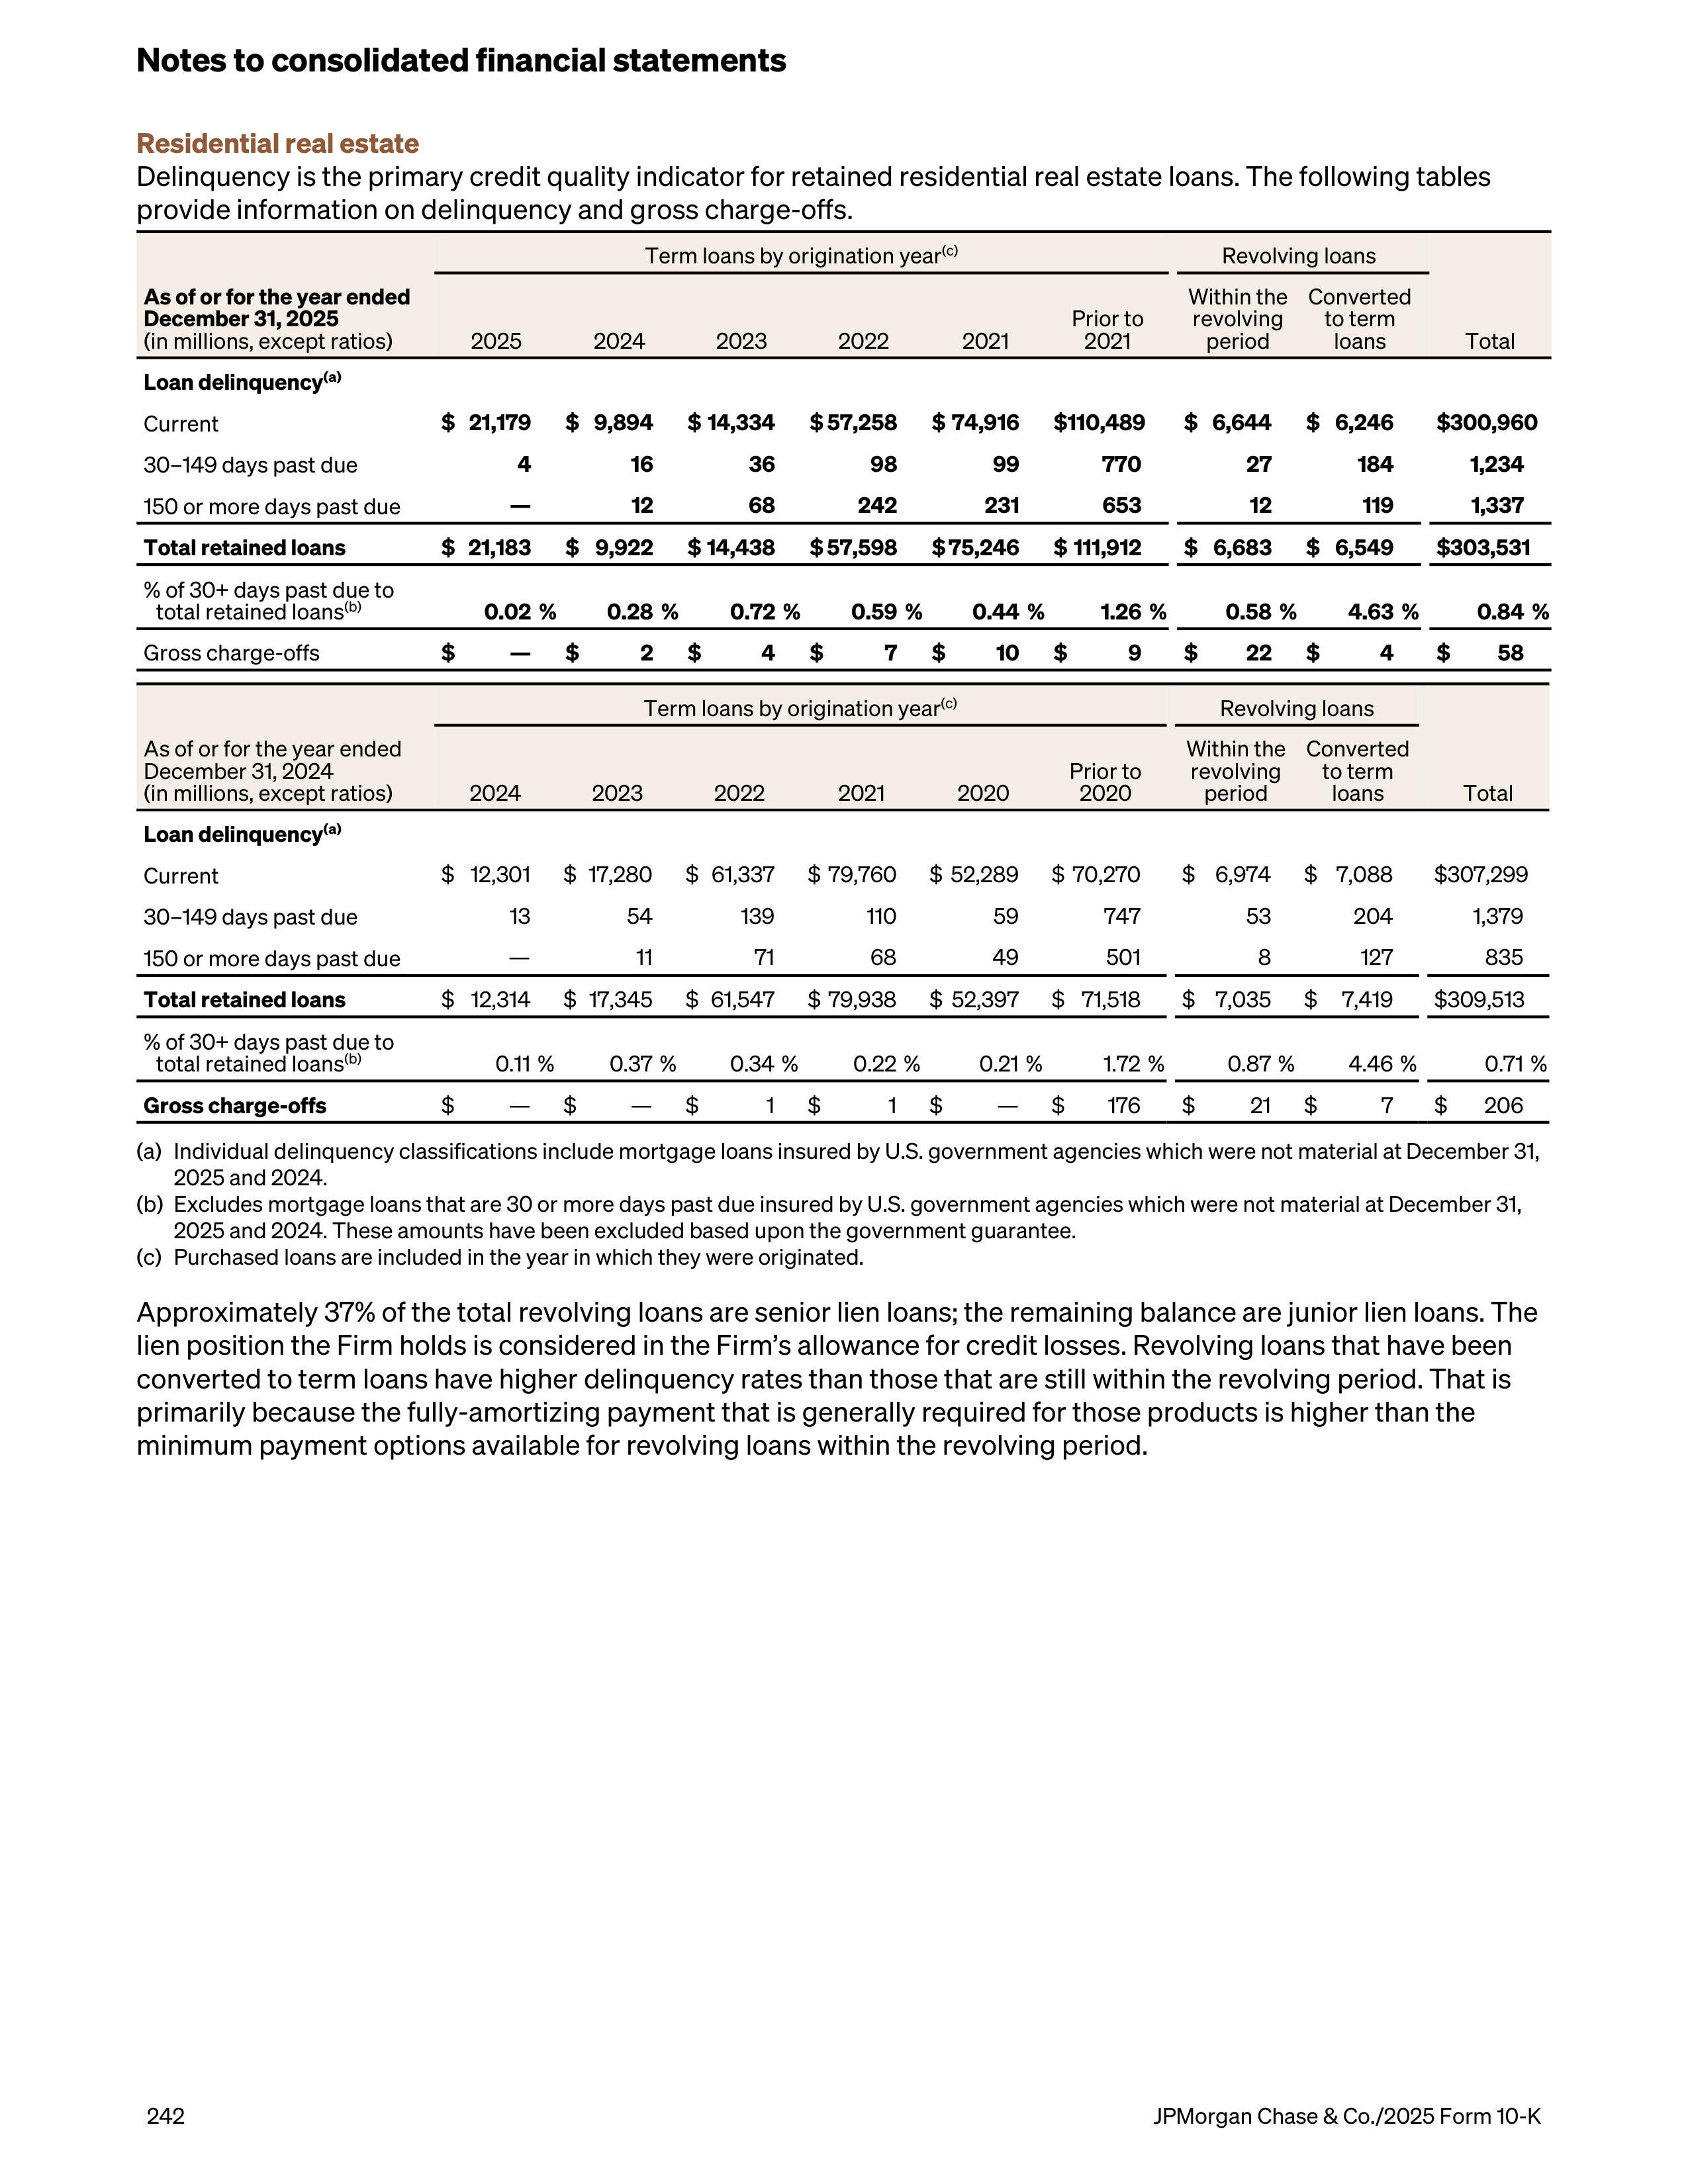
Residential real estate
Delinquency is the primary credit quality indicator for retained residential real estate loans. The following tables
provide information on delinquency and gross charge-offs.
As of or for the year ended
December 31, 2025
(in millions, except ratios)
Term loans by origination year
(c)
Revolving loans
Total
2025
2024
2023
2022
2021
Prior to
2021
Within the
revolving
period
Converted
to term
loans
Loan delinquency
(a)
Current
$ 21,179
$ 9,894
$ 14,334
$ 57,258
$ 74,916
$ 110,489
$ 6,644
$ 6,246
$ 300,960
30–149 days past due
4
16
36
98
99
770
27
184
1,234
150 or more days past due
—
12
68
242
231
653
12
119
1,337
Total retained loans
$ 21,183
$ 9,922
$ 14,438
$ 57,598
$ 75,246
$ 111,912
$ 6,683
$ 6,549
$ 303,531
% of 30+ days past due to
total retained loans
(b)
0.02 %
0.28 %
0.72 %
0.59 %
0.44 %
1.26 %
0.58 %
4.63 %
0.84 %
Gross charge-offs
$
—
$
2
$
4
$
7
$
10
$
9
$
22
$
4
$
58
As of or for the year ended
December 31, 2024
(in millions, except ratios)
Term loans by origination year
(c)
Revolving loans
Total
2024
2023
2022
2021
2020
Prior to
2020
Within the
revolving
period
Converted
to term
loans
Loan delinquency
(a)
Current
$ 12,301
$ 17,280
$ 61,337
$ 79,760
$ 52,289
$ 70,270
$ 6,974
$ 7,088
$ 307,299
30–149 days past due
13
54
139
110
59
747
53
204
1,379
150 or more days past due
—
11
71
68
49
501
8
127
835
Total retained loans
$ 12,314
$ 17,345
$ 61,547
$ 79,938
$ 52,397
$ 71,518
$ 7,035
$
7,419
$ 309,513
% of 30+ days past due to
total retained loans
(b)
0.11 %
0.37 %
0.34 %
0.22 %
0.21 %
1.72 %
0.87 %
4.46 %
0.71 %
Gross charge-offs
$
—
$
—
$
1
$
1
$
—
$
176
$
21
$
7
$
206
(a)
Individual delinquency classifications include mortgage loans insured by U.S. government agencies which were not material at December 31,
2025 and 2024.
(b)
Excludes mortgage loans that are 30 or more days past due insured by U.S. government agencies which were not material at December 31,
2025 and 2024. These amounts have been excluded based upon the government guarantee.
(c)
Purchased loans are included in the year in which they were originated.
Approximately 37% of the total revolving loans are senior lien loans; the remaining balance are junior lien loans. The
lien position the Firm holds is considered in the Firm’s allowance for credit losses. Revolving loans that have been
converted to term loans have higher delinquency rates than those that are still within the revolving period. That is
primarily because the fully-amortizing payment that is generally required for those products is higher than the
minimum payment options available for revolving loans within the revolving period.
Notes to consolidated financial statements
242
JPMorgan Chase & Co./2025 Form 10-K
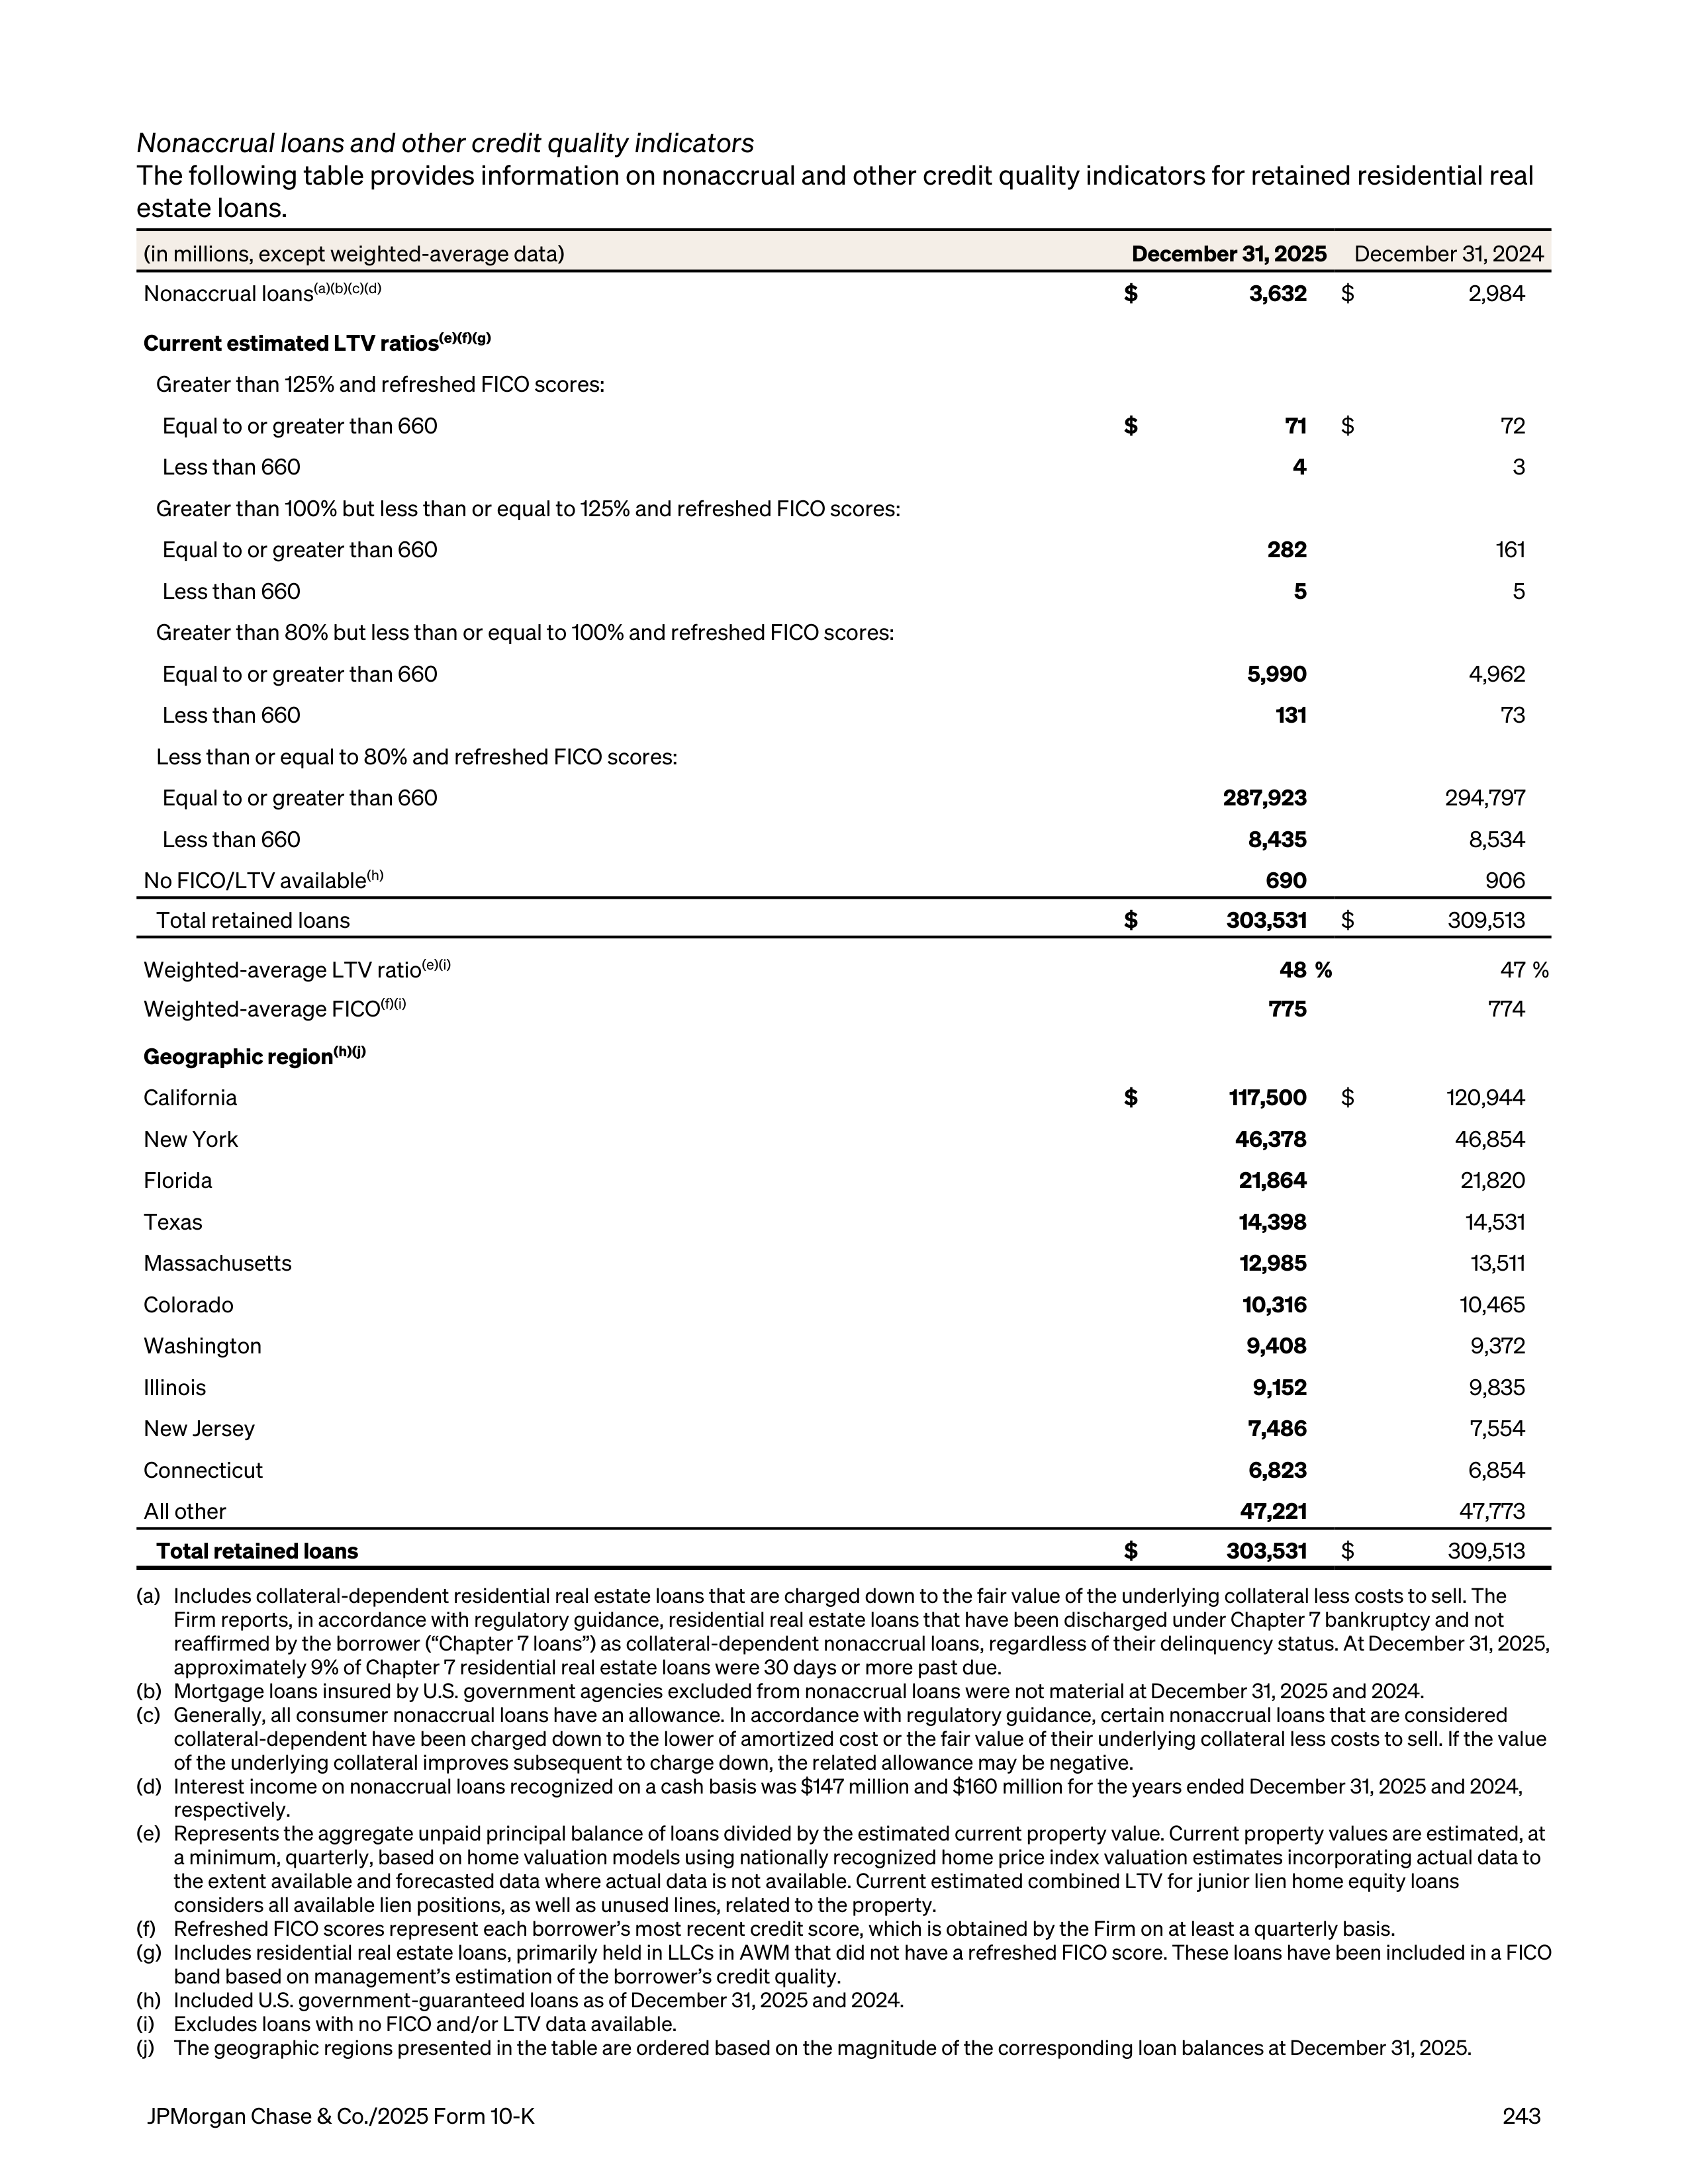
Nonaccrual loans and other credit quality indicators
The following table provides information on nonaccrual and other credit quality indicators for retained residential real
estate loans.
(in millions, except weighted-average data)
December 31, 2025
December 31, 2024
Nonaccrual loans
(a)(b)(c)(d)
$
3,632
$
2,984
Current estimated LTV ratios
(e)(f)(g)
Greater than 125% and refreshed FICO scores:
Equal to or greater than 660
$
71
$
72
Less than 660
4
3
Greater than 100% but less than or equal to 125% and refreshed FICO scores:
Equal to or greater than 660
282
161
Less than 660
5
5
Greater than 80% but less than or equal to 100% and refreshed FICO scores:
Equal to or greater than 660
5,990
4,962
Less than 660
131
73
Less than or equal to 80% and refreshed FICO scores:
Equal to or greater than 660
287,923
294,797
Less than 660
8,435
8,534
No FICO/LTV available
(h)
690
906
Total retained loans
$
303,531
$
309,513
Weighted-average LTV ratio
(e)(i)
48 %
47 %
Weighted-average FICO
(f)(i)
775
774
Geographic region
(h)(j)
California
$
117,500
$
120,944
New York
46,378
46,854
Florida
21,864
21,820
Texas
14,398
14,531
Massachusetts
12,985
13,511
Colorado
10,316
10,465
Washington
9,408
9,372
Illinois
9,152
9,835
New Jersey
7,486
7,554
Connecticut
6,823
6,854
All other
47,221
47,773
Total retained loans
$
303,531
$
309,513
(a)
Includes collateral-dependent residential real estate loans that are charged down to the fair value of the underlying collateral less costs to sell. The
Firm reports, in accordance with regulatory guidance, residential real estate loans that have been discharged under Chapter 7 bankruptcy and not
reaffirmed by the borrower (“Chapter 7 loans”) as collateral-dependent nonaccrual loans, regardless of their delinquency status. At December 31, 2025,
approximately 9% of Chapter 7 residential real estate loans were 30 days or more past due.
(b)
Mortgage loans insured by U.S. government agencies excluded from nonaccrual loans were not material at December 31, 2025 and 2024.
(c)
Generally, all consumer nonaccrual loans have an allowance. In accordance with regulatory guidance, certain nonaccrual loans that are considered
collateral-dependent have been charged down to the lower of amortized cost or the fair value of their underlying collateral less costs to sell. If the value
of the underlying collateral improves subsequent to charge down, the related allowance may be negative.
(d)
Interest income on nonaccrual loans recognized on a cash basis was $147 million and $160 million for the years ended December 31, 2025 and 2024,
respectively.
(e)
Represents the aggregate unpaid principal balance of loans divided by the estimated current property value. Current property values are estimated, at
a minimum, quarterly, based on home valuation models using nationally recognized home price index valuation estimates incorporating actual data to
the extent available and forecasted data where actual data is not available. Current estimated combined LTV for junior lien home equity loans
considers all available lien positions, as well as unused lines, related to the property.
(f)
Refreshed FICO scores represent each borrower’s most recent credit score, which is obtained by the Firm on at least a quarterly basis.
(g)
Includes residential real estate loans, primarily held in LLCs in AWM that did not have a refreshed FICO score. These loans have been included in a FICO
band based on management’s estimation of the borrower’s credit quality.
(h)
Included U.S. government-guaranteed loans as of December 31, 2025 and 2024.
(i)
Excludes loans with no FICO and/or LTV data available.
(j)
The geographic regions presented in the table are ordered based on the magnitude of the corresponding loan balances at December 31, 2025.
JPMorgan Chase & Co./2025 Form 10-K
243
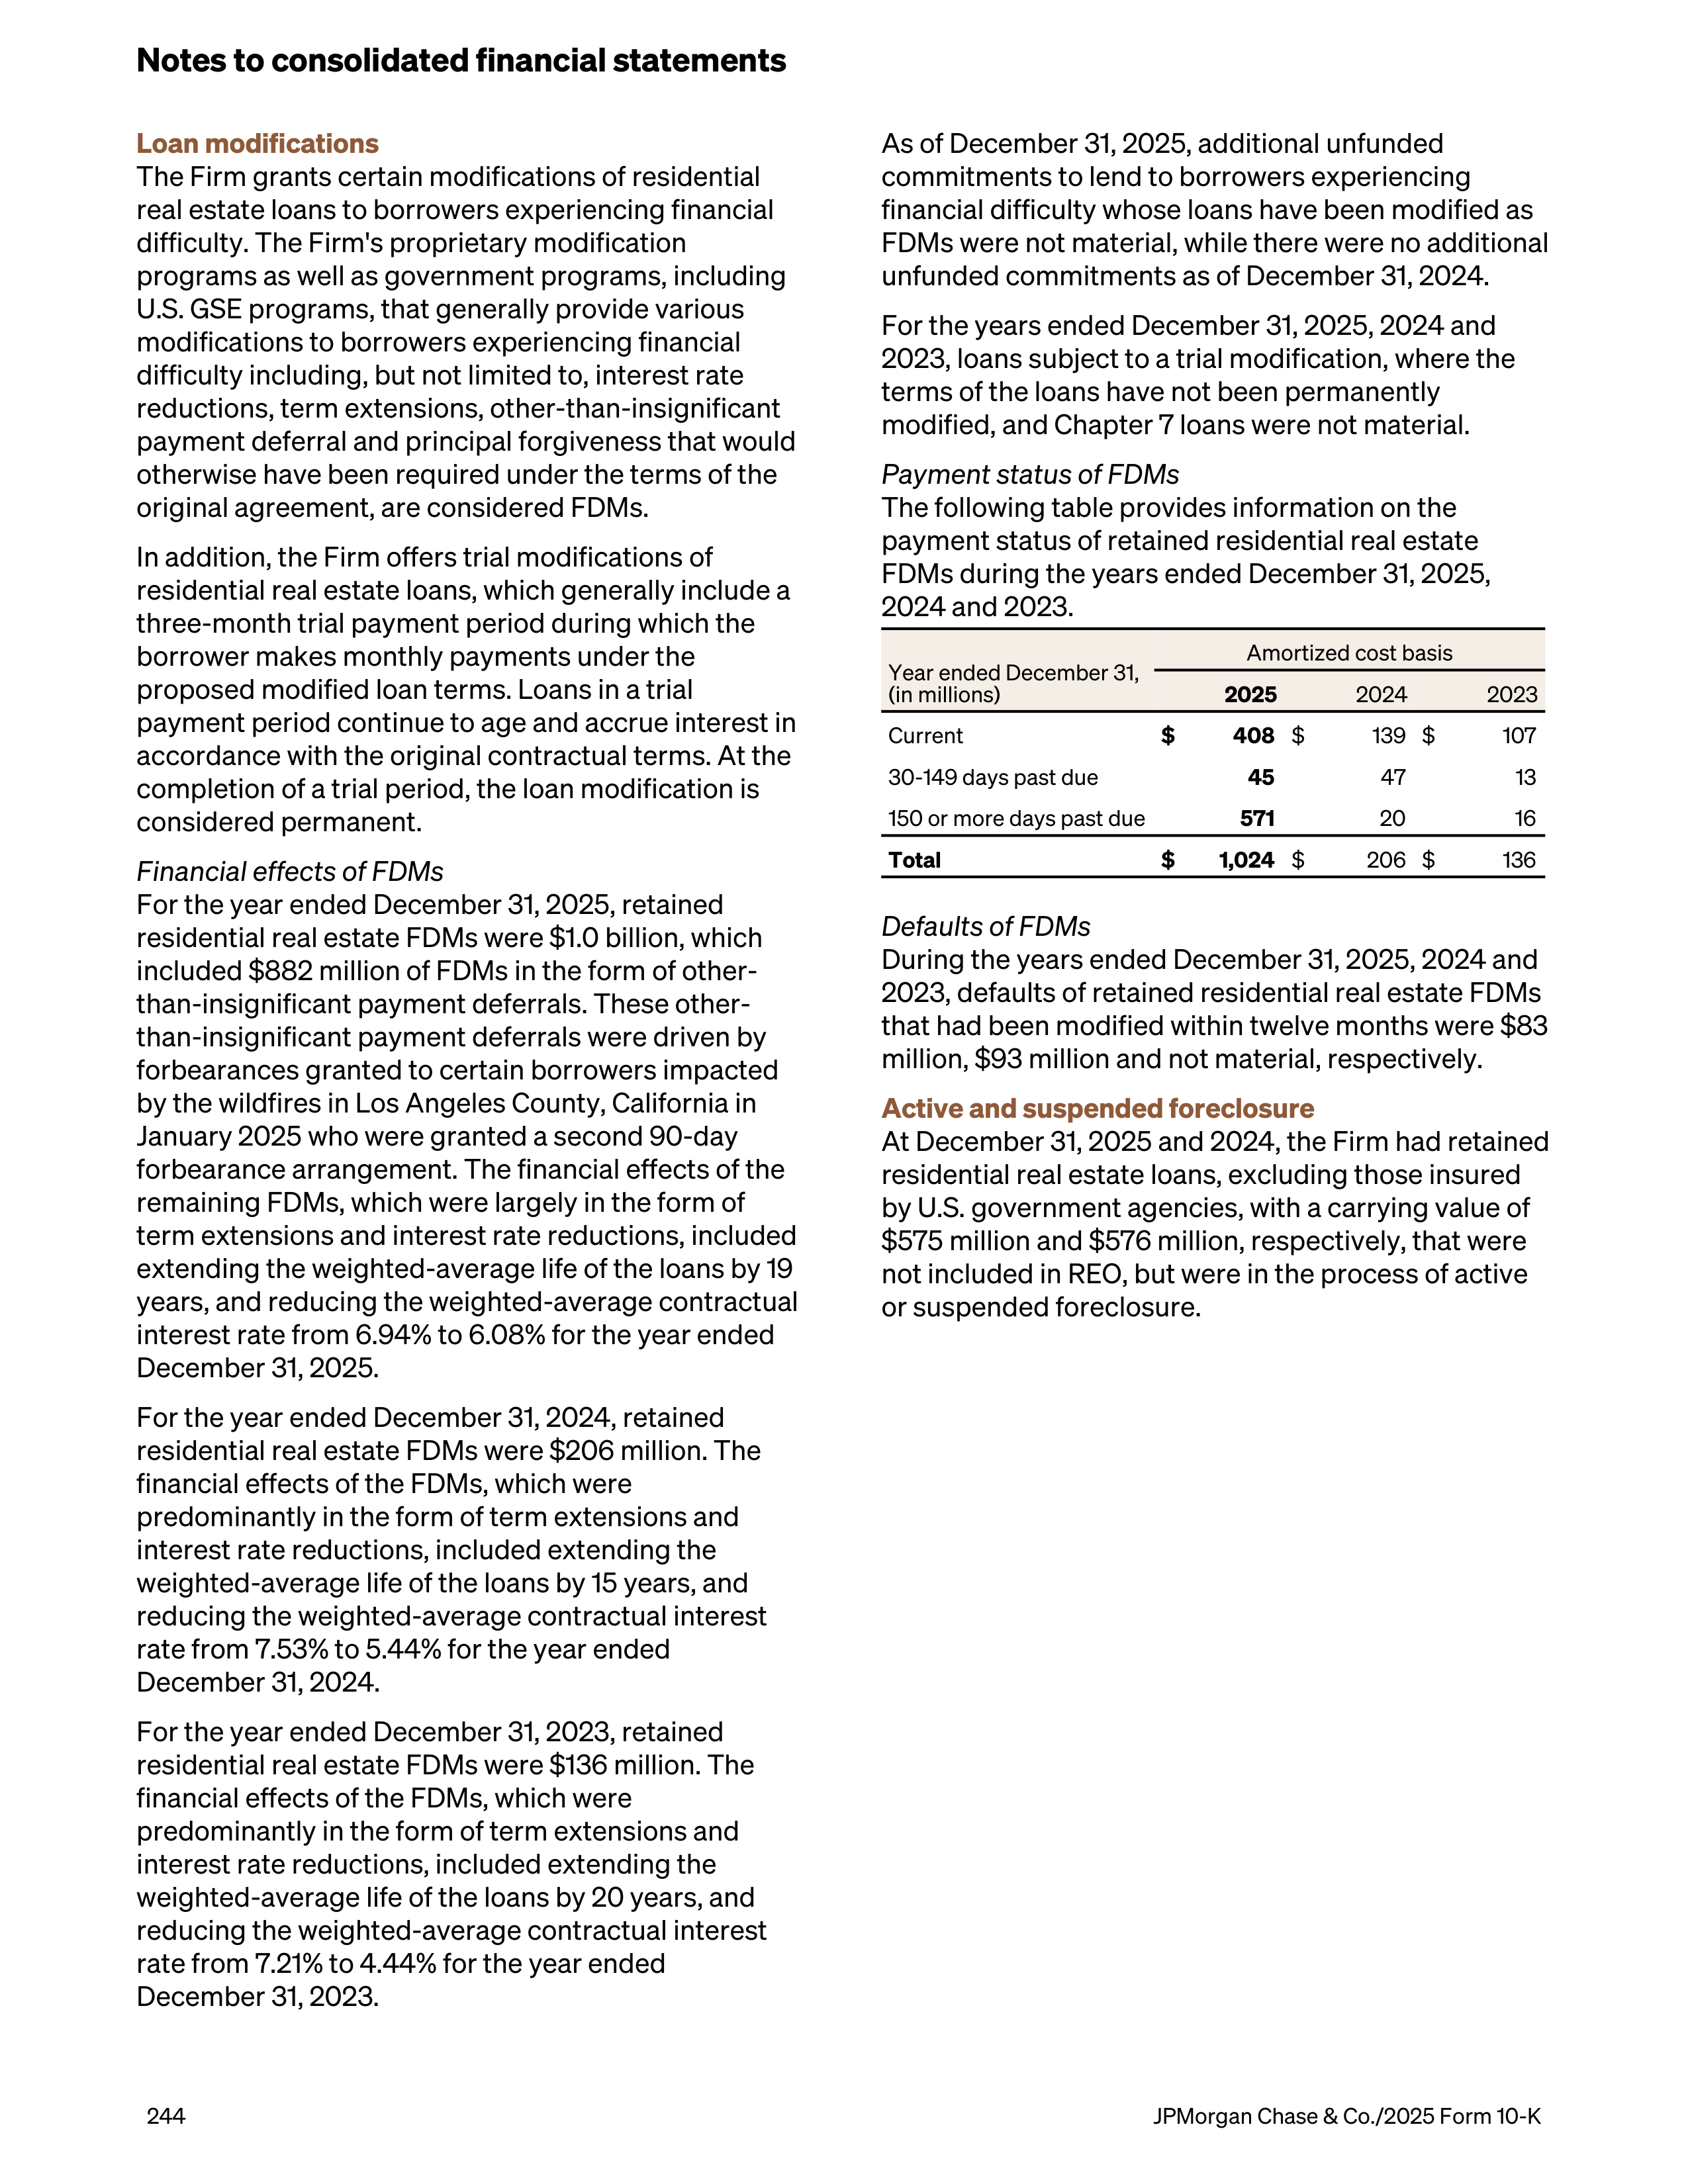
Loan modifications
The Firm grants certain modifications of residential
real estate loans to borrowers experiencing financial
difficulty. The Firm's proprietary modification
programs as well as government programs, including
U.S. GSE programs, that generally provide various
modifications to borrowers experiencing financial
difficulty including, but not limited to, interest rate
reductions, term extensions, other-than-insignificant
payment deferral and principal forgiveness that would
otherwise have been required under the terms of the
original agreement, are considered FDMs.
In addition, the Firm offers trial modifications of
residential real estate loans, which generally include a
three-month trial payment period during which the
borrower makes monthly payments under the
proposed modified loan terms. Loans in a trial
payment period continue to age and accrue interest in
accordance with the original contractual terms. At the
completion of a trial period, the loan modification is
considered permanent.
Financial effects of FDMs
For the year ended December 31, 2025, retained
residential real estate FDMs were $1.0 billion, which
included $882 million of FDMs in the form of other-
than-insignificant payment deferrals. These other-
than-insignificant payment deferrals were driven by
forbearances granted to certain borrowers impacted
by the wildfires in Los Angeles County, California in
January 2025 who were granted a second 90-day
forbearance arrangement. The financial effects of the
remaining FDMs, which were largely in the form of
term extensions and interest rate reductions, included
extending the weighted-average life of the loans by 19
years, and reducing the weighted-average contractual
interest rate from 6.94% to 6.08% for the year ended
December 31, 2025.
For the year ended December 31, 2024, retained
residential real estate FDMs were $206 million. The
financial effects of the FDMs, which were
predominantly in the form of term extensions and
interest rate reductions, included extending the
weighted-average life of the loans by 15 years, and
reducing the weighted-average contractual interest
rate from 7.53% to 5.44% for the year ended
December 31, 2024.
For the year ended December 31, 2023, retained
residential real estate FDMs were $136 million. The
financial effects of the FDMs, which were
predominantly in the form of term extensions and
interest rate reductions, included extending the
weighted-average life of the loans by 20 years, and
reducing the weighted-average contractual interest
rate from 7.21% to 4.44% for the year ended
December 31, 2023.
As of December 31, 2025, additional unfunded
commitments to lend to borrowers experiencing
financial difficulty whose loans have been modified as
FDMs were not material, while there were no additional
unfunded commitments as of December 31, 2024.
For the years ended December 31, 2025, 2024 and
2023, loans subject to a trial modification, where the
terms of the loans have not been permanently
modified, and Chapter 7 loans were not material.
Payment status of FDMs
The following table provides information on the
payment status of retained residential real estate
FDMs during the years ended December 31, 2025,
2024 and 2023.
Year ended December 31,
(in millions)
Amortized cost basis
2025
2024
2023
Current
$
408
$
139 $
107
30-149 days past due
45
47
13
150 or more days past due
571
20
16
Total
$
1,024
$
206 $
136
Defaults of FDMs
During the years ended December 31, 2025, 2024 and
2023, defaults of retained residential real estate FDMs
that had been modified within twelve months were $83
million, $93 million and not material, respectively.
Active and suspended foreclosure
At December 31, 2025 and 2024, the Firm had retained
residential real estate loans, excluding those insured
by U.S. government agencies, with a carrying value of
$575 million and $576 million, respectively, that were
not included in REO, but were in the process of active
or suspended foreclosure.
Notes to consolidated financial statements
244
JPMorgan Chase & Co./2025 Form 10-K
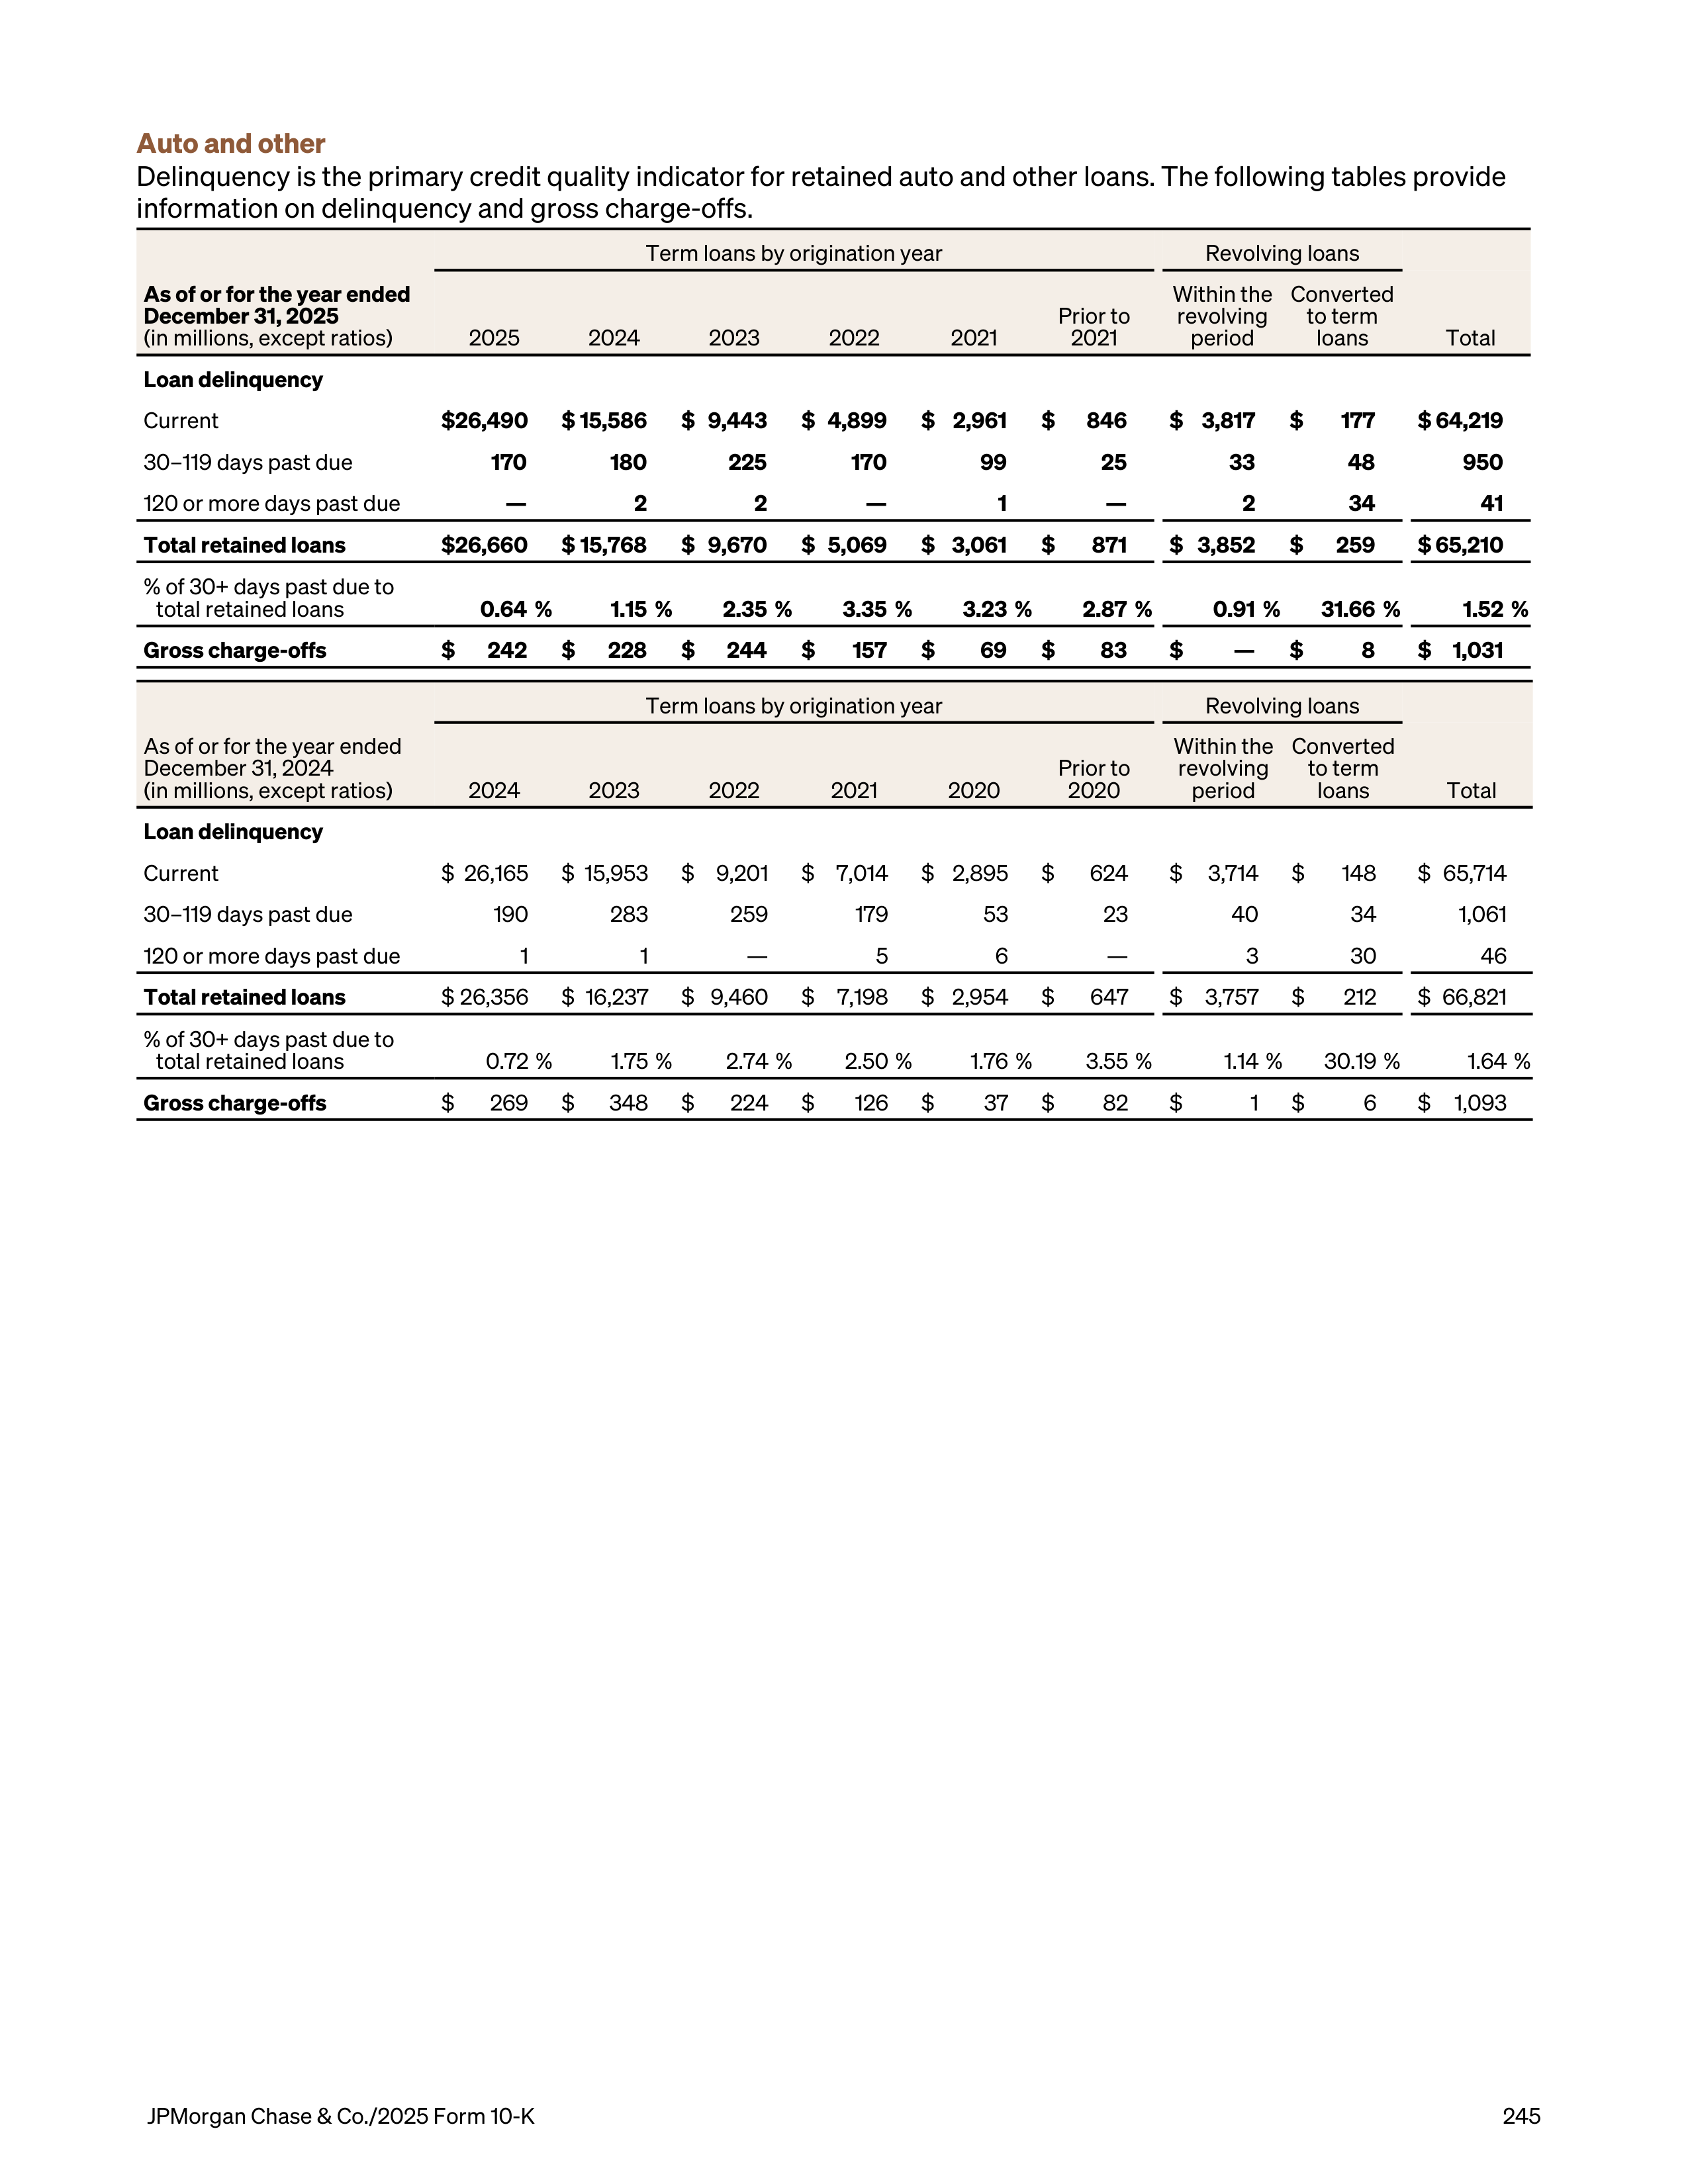
Auto and other
Delinquency is the primary credit quality indicator for retained auto and other loans. The following tables provide
information on delinquency and gross charge-offs.
As of or for the year ended
December 31, 2025
(in millions, except ratios)
Term loans by origination year
Revolving loans
2025
2024
2023
2022
2021
Prior to
2021
Within the
revolving
period
Converted
to term
loans
Total
Loan delinquency
Current
$ 26,490
$ 15,586
$ 9,443
$ 4,899
$ 2,961
$
846
$ 3,817
$
177
$ 64,219
30–119 days past due
170
180
225
170
99
25
33
48
950
120 or more days past due
—
2
2
—
1
—
2
34
41
Total retained loans
$ 26,660
$ 15,768
$ 9,670
$ 5,069
$ 3,061
$
871
$ 3,852
$
259
$ 65,210
% of 30+ days past due to
total retained loans
0.64 %
1.15 %
2.35 %
3.35 %
3.23 %
2.87 %
0.91 %
31.66 %
1.52 %
Gross charge-offs
$
242
$
228
$
244
$
157
$
69
$
83
$
—
$
8
$ 1,031
As of or for the year ended
December 31, 2024
(in millions, except ratios)
Term loans by origination year
Revolving loans
2024
2023
2022
2021
2020
Prior to
2020
Within the
revolving
period
Converted
to term
loans
Total
Loan delinquency
Current
$ 26,165
$ 15,953
$ 9,201
$ 7,014
$ 2,895
$
624
$
3,714
$
148
$ 65,714
30–119 days past due
190
283
259
179
53
23
40
34
1,061
120 or more days past due
1
1
—
5
6
—
3
30
46
Total retained loans
$ 26,356
$ 16,237
$ 9,460
$
7,198
$ 2,954
$
647
$
3,757
$
212
$ 66,821
% of 30+ days past due to
total retained loans
0.72 %
1.75 %
2.74 %
2.50 %
1.76 %
3.55 %
1.14 %
30.19 %
1.64 %
Gross charge-offs
$
269
$
348
$
224
$
126
$
37
$
82
$
1
$
6
$
1,093
JPMorgan Chase & Co./2025 Form 10-K
245
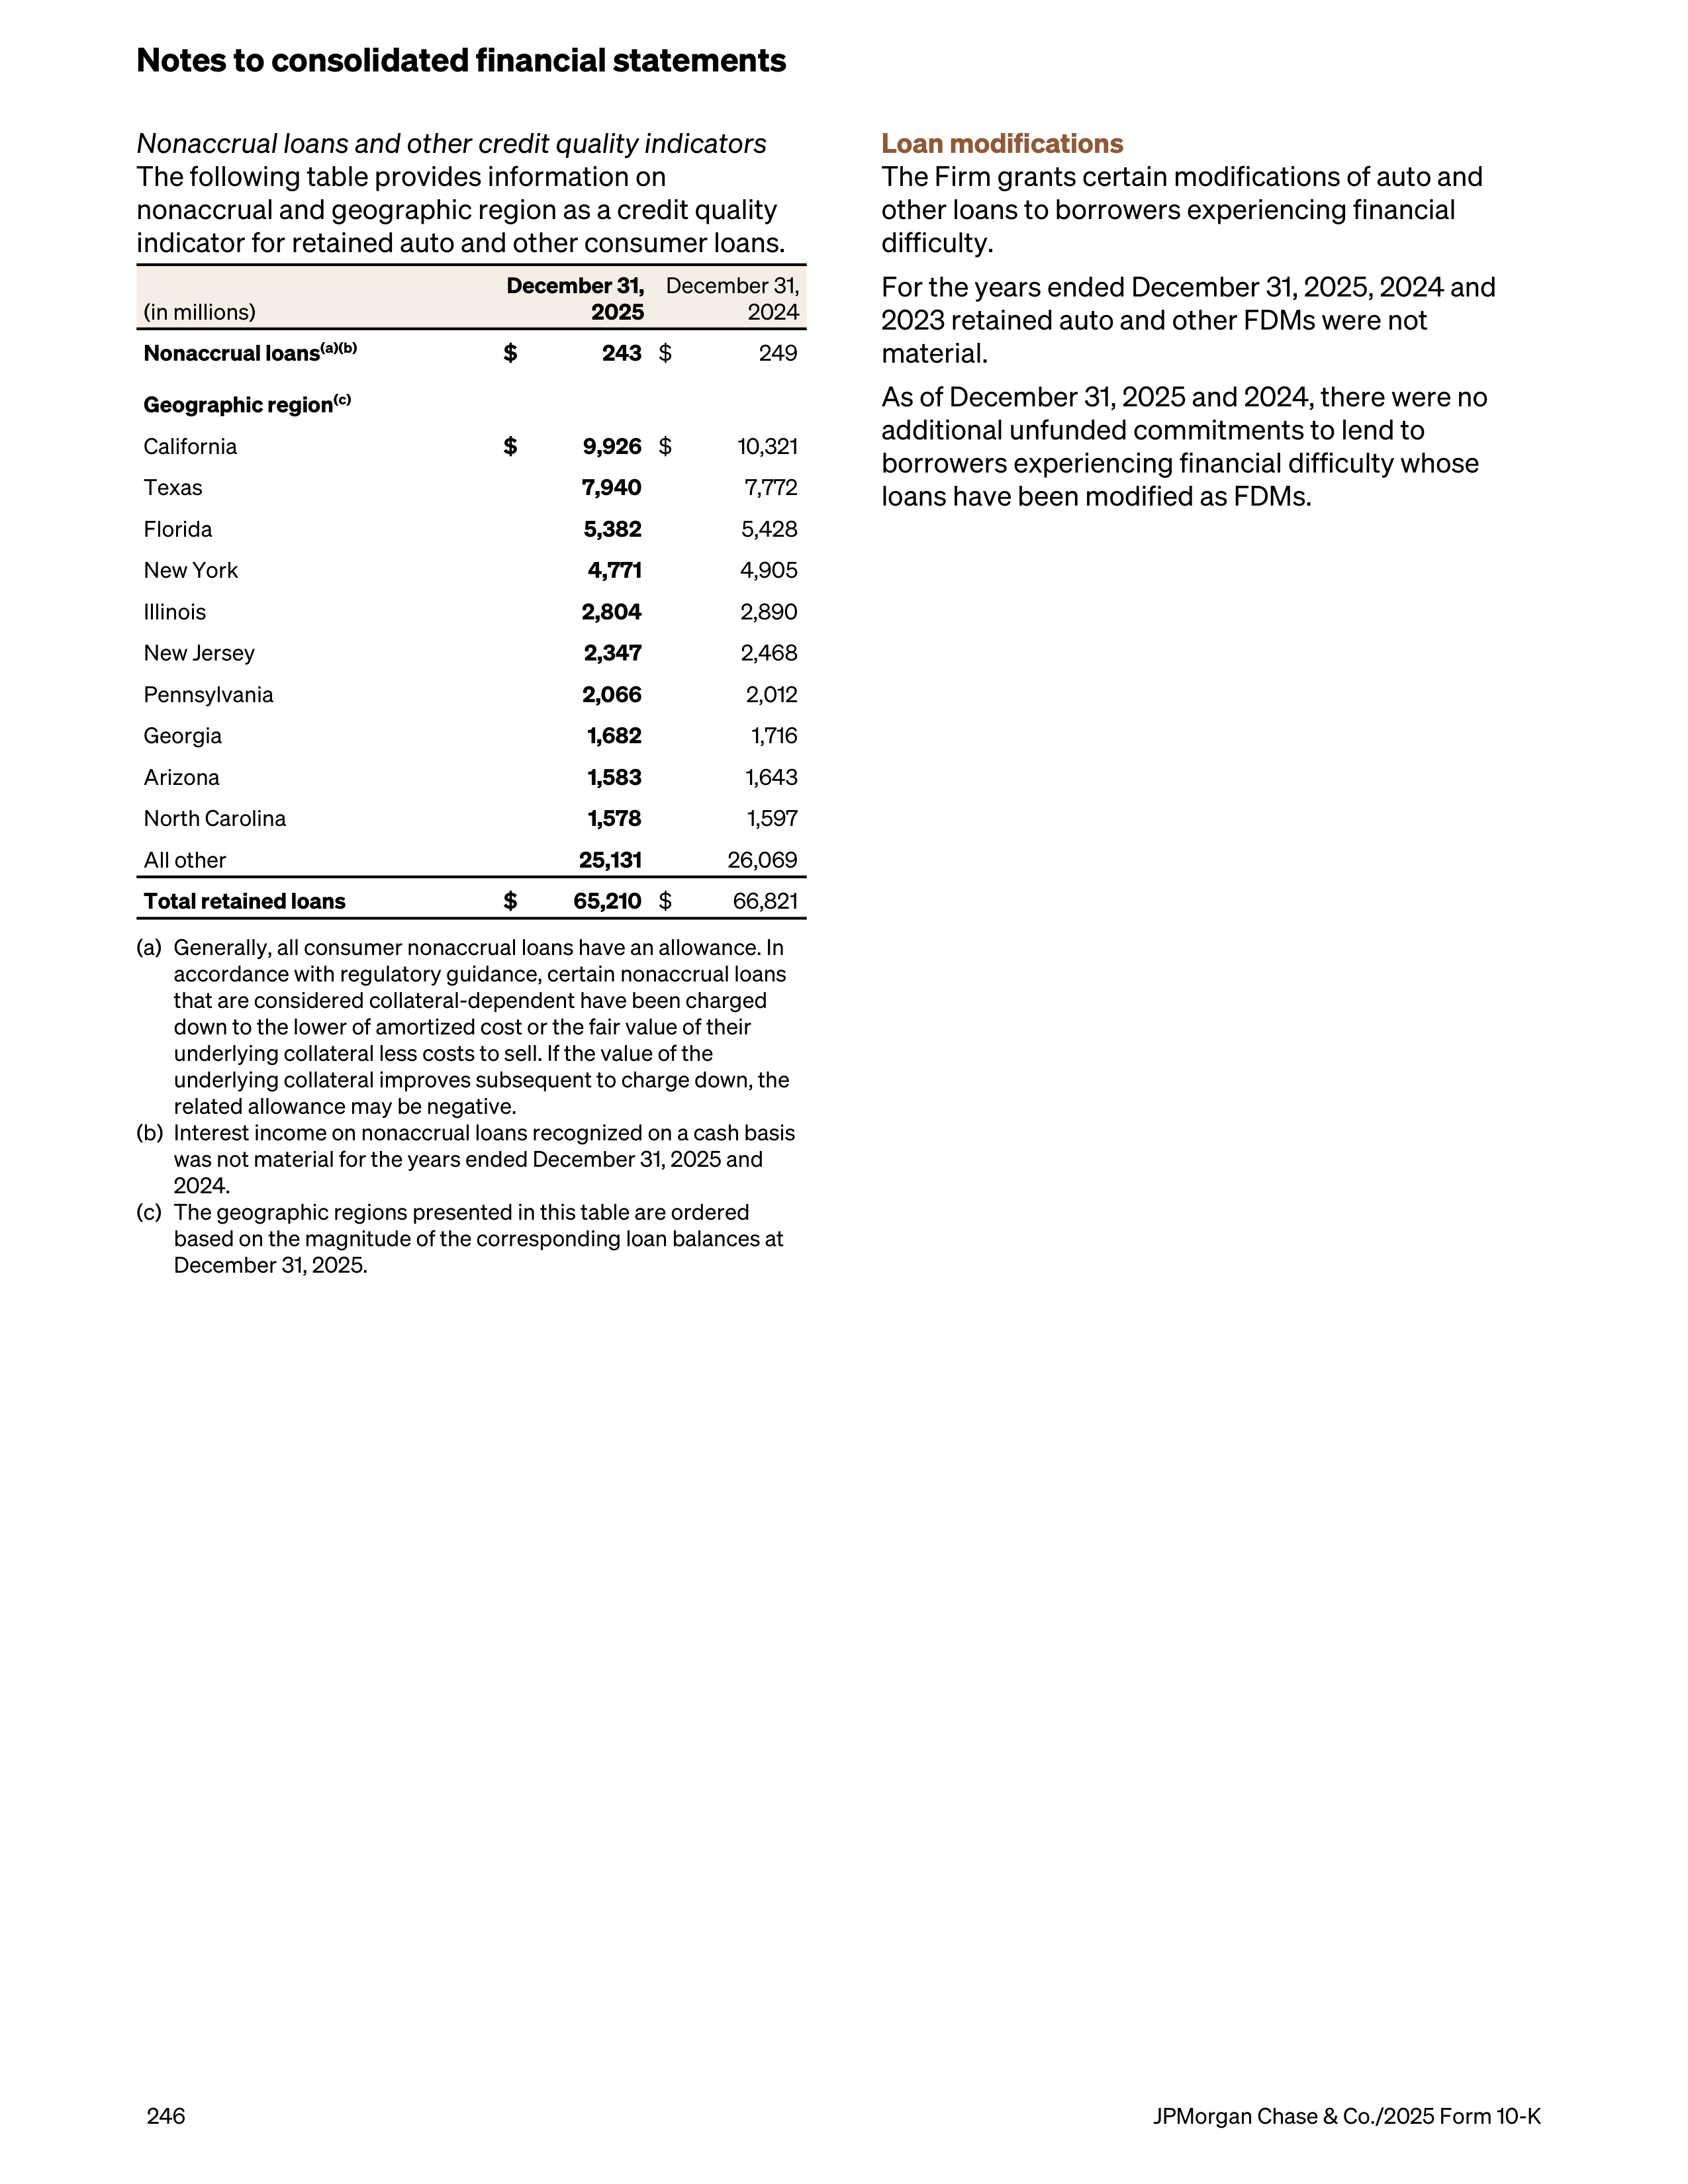
Nonaccrual loans and other credit quality indicators
The following table provides information on
nonaccrual and geographic region as a credit quality
indicator for retained auto and other consumer loans.
(in millions)
December 31,
2025
December 31,
2024
Nonaccrual loans
(a)(b)
$
243
$
249
Geographic region
(c)
California
$
9,926
$
10,321
Texas
7,940
7,772
Florida
5,382
5,428
New York
4,771
4,905
Illinois
2,804
2,890
New Jersey
2,347
2,468
Pennsylvania
2,066
2,012
Georgia
1,682
1,716
Arizona
1,583
1,643
North Carolina
1,578
1,597
All other
25,131
26,069
Total retained loans
$
65,210
$
66,821
(a)
Generally, all consumer nonaccrual loans have an allowance. In
accordance with regulatory guidance, certain nonaccrual loans
that are considered collateral-dependent have been charged
down to the lower of amortized cost or the fair value of their
underlying collateral less costs to sell. If the value of the
underlying collateral improves subsequent to charge down, the
related allowance may be negative.
(b)
Interest income on nonaccrual loans recognized on a cash basis
was not material for the years ended December 31, 2025 and
2024.
(c)
The geographic regions presented in this table are ordered
based on the magnitude of the corresponding loan balances at
December 31, 2025.
Loan modifications
The Firm grants certain modifications of auto and
other loans to borrowers experiencing financial
difficulty.
For the years ended December 31, 2025, 2024 and
2023 retained auto and other FDMs were not
material.
As of December 31, 2025 and 2024, there were no
additional unfunded commitments to lend to
borrowers experiencing financial difficulty whose
loans have been modified as FDMs.
Notes to consolidated financial statements
246
JPMorgan Chase & Co./2025 Form 10-K
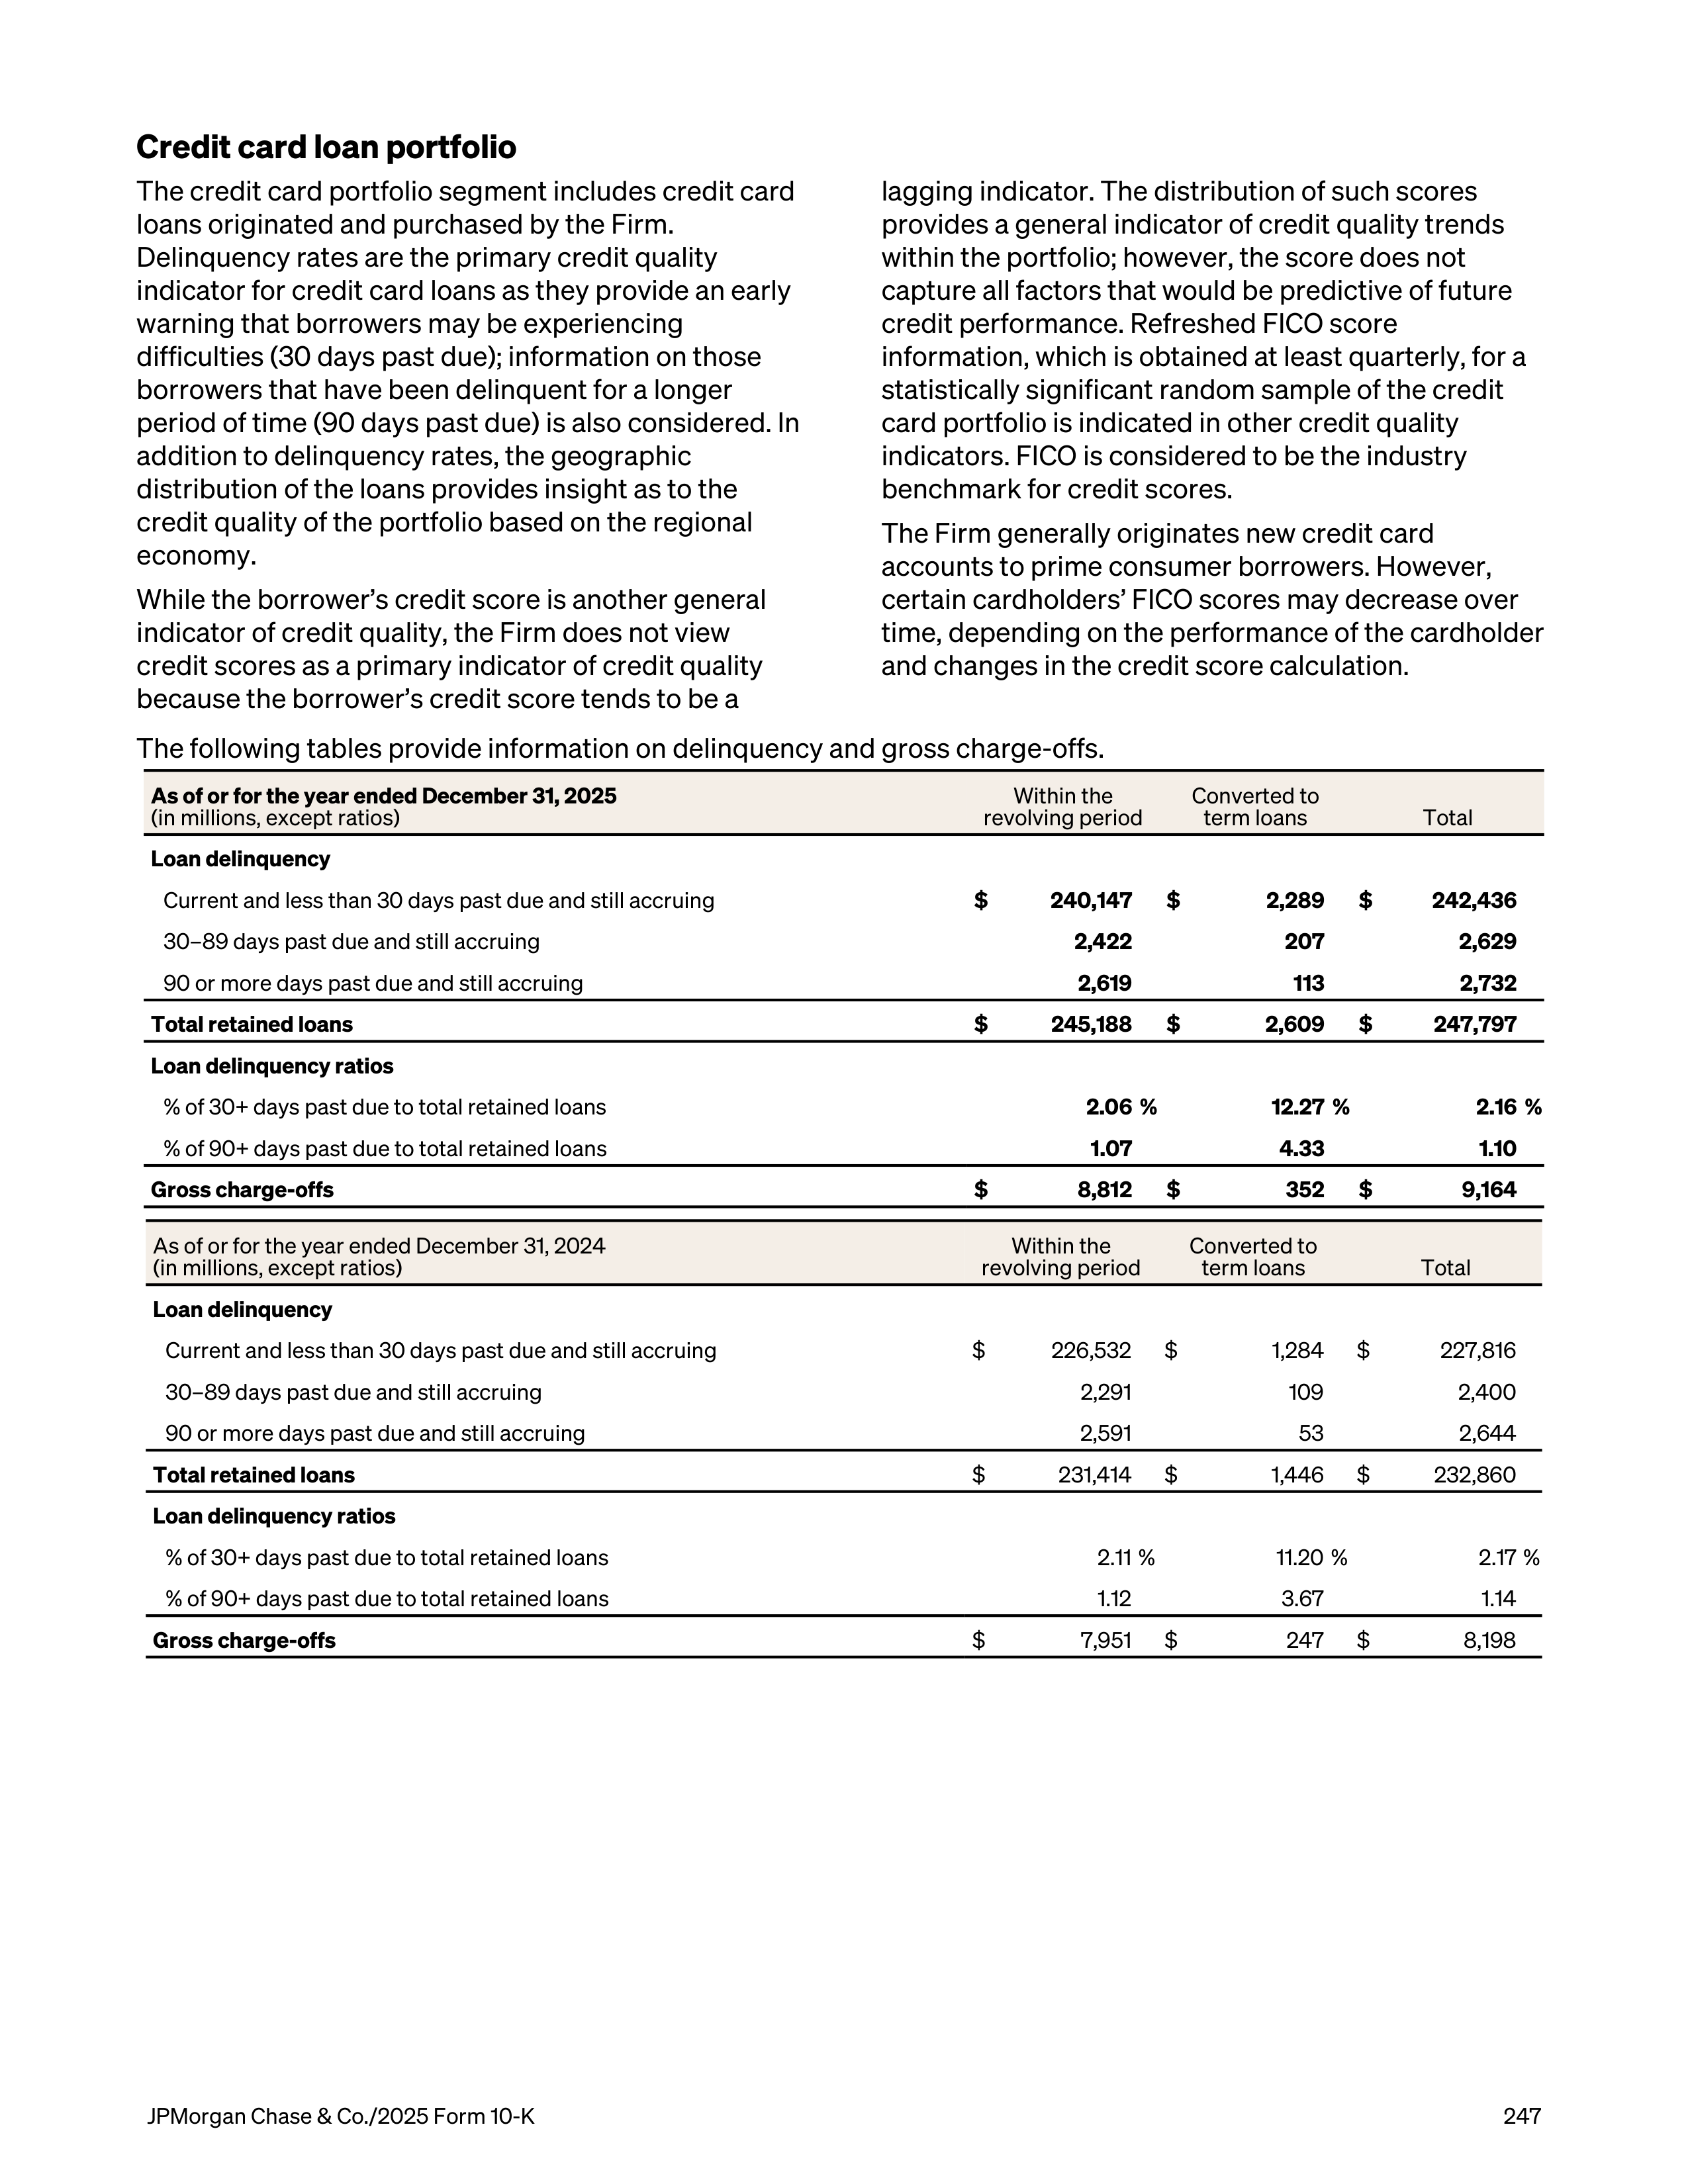
Credit card loan portfolio
The credit card portfolio segment includes credit card
loans originated and purchased by the Firm.
Delinquency rates are the primary credit quality
indicator for credit card loans as they provide an early
warning that borrowers may be experiencing
difficulties (30 days past due); information on those
borrowers that have been delinquent for a longer
period of time (90 days past due) is also considered. In
addition to delinquency rates, the geographic
distribution of the loans provides insight as to the
credit quality of the portfolio based on the regional
economy.
While the borrower’s credit score is another general
indicator of credit quality, the Firm does not view
credit scores as a primary indicator of credit quality
because the borrower’s credit score tends to be a
lagging indicator. The distribution of such scores
provides a general indicator of credit quality trends
within the portfolio; however, the score does not
capture all factors that would be predictive of future
credit performance. Refreshed FICO score
information, which is obtained at least quarterly, for a
statistically significant random sample of the credit
card portfolio is indicated in other credit quality
indicators. FICO is considered to be the industry
benchmark for credit scores.
The Firm generally originates new credit card
accounts to prime consumer borrowers. However,
certain cardholders’ FICO scores may decrease over
time, depending on the performance of the cardholder
and changes in the credit score calculation.
The following tables provide information on delinquency and gross charge-offs.
As of or for the year ended December 31, 2025
(in millions, except ratios)
Within the
revolving period
Converted to
term loans
Total
Loan delinquency
Current and less than 30 days past due and still accruing
$
240,147
$
2,289
$
242,436
30–89 days past due and still accruing
2,422
207
2,629
90 or more days past due and still accruing
2,619
113
2,732
Total retained loans
$
245,188
$
2,609
$
247,797
Loan delinquency ratios
% of 30+ days past due to total retained loans
2.06 %
12.27 %
2.16 %
% of 90+ days past due to total retained loans
1.07
4.33
1.10
Gross charge-offs
$
8,812
$
352
$
9,164
As of or for the year ended December 31, 2024
(in millions, except ratios)
Within the
revolving period
Converted to
term loans
Total
Loan delinquency
Current and less than 30 days past due and still accruing
$
226,532
$
1,284
$
227,816
30–89 days past due and still accruing
2,291
109
2,400
90 or more days past due and still accruing
2,591
53
2,644
Total retained loans
$
231,414
$
1,446
$
232,860
Loan delinquency ratios
% of 30+ days past due to total retained loans
2.11 %
11.20 %
2.17 %
% of 90+ days past due to total retained loans
1.12
3.67
1.14
Gross charge-offs
$
7,951
$
247
$
8,198
JPMorgan Chase & Co./2025 Form 10-K
247
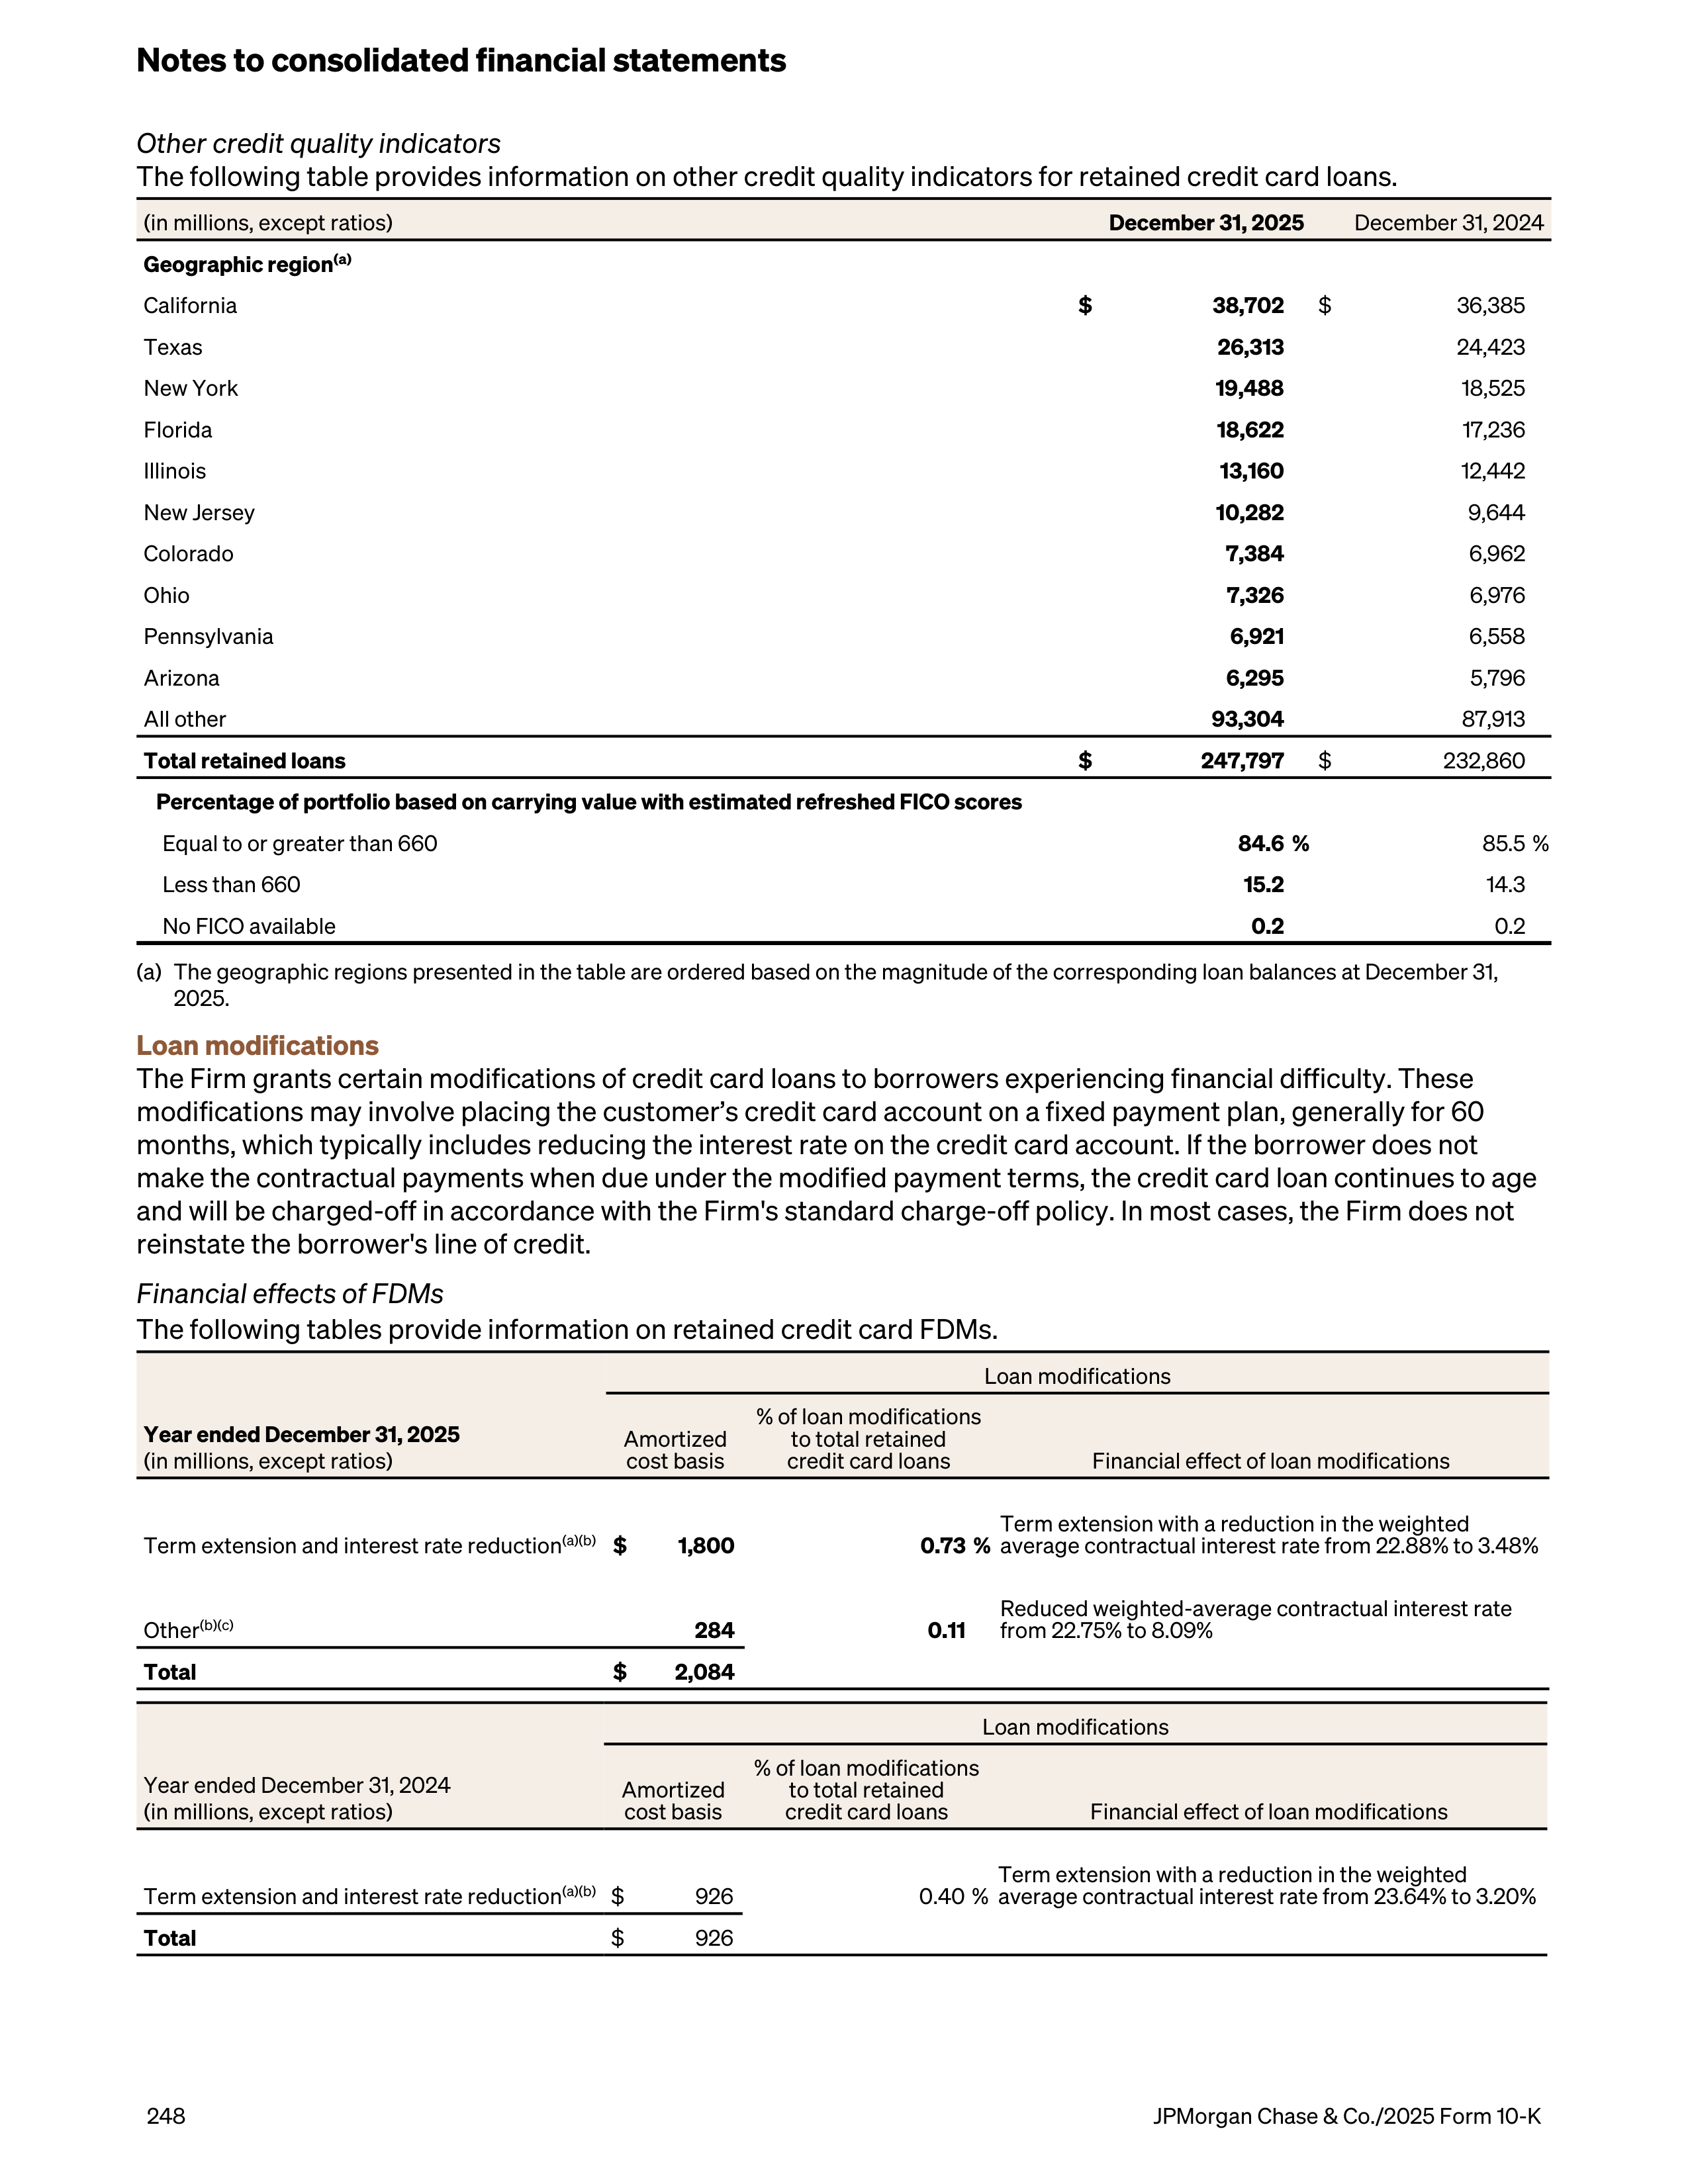
Other credit quality indicators
The following table provides information on other credit quality indicators for retained credit card loans.
(in millions, except ratios)
December 31, 2025
December 31, 2024
Geographic region
(a)
California
$
38,702
$
36,385
Texas
26,313
24,423
New York
19,488
18,525
Florida
18,622
17,236
Illinois
13,160
12,442
New Jersey
10,282
9,644
Colorado
7,384
6,962
Ohio
7,326
6,976
Pennsylvania
6,921
6,558
Arizona
6,295
5,796
All other
93,304
87,913
Total retained loans
$
247,797
$
232,860
Percentage of portfolio based on carrying value with estimated refreshed FICO scores
Equal to or greater than 660
84.6 %
85.5 %
Less than 660
15.2
14.3
No FICO available
0.2
0.2
(a)
The geographic regions presented in the table are ordered based on the magnitude of the corresponding loan balances at December 31,
2025.
Loan modifications
The Firm grants certain modifications of credit card loans to borrowers experiencing financial difficulty. These
modifications may involve placing the customer’s credit card account on a fixed payment plan, generally for 60
months, which typically includes reducing the interest rate on the credit card account. If the borrower does not
make the contractual payments when due under the modified payment terms, the credit card loan continues to age
and will be charged-off in accordance with the Firm's standard charge-off policy. In most cases, the Firm does not
reinstate the borrower's line of credit.
Financial effects of FDMs
The following tables provide information on retained credit card FDMs.
Loan modifications
Year ended December 31, 2025
(in millions, except ratios)
Amortized
cost basis
% of loan modifications
to total retained
credit card loans
Financial effect of loan modifications
Term extension and interest rate reduction
(a)(b)
$
1,800
0.73 %
Term extension with a reduction in the weighted
average contractual interest rate from 22.88% to 3.48%
Other
(b)(c)
284
0.11
Reduced weighted-average contractual interest rate
from 22.75% to 8.09%
Total
$
2,084
Loan modifications
Year ended December 31, 2024
(in millions, except ratios)
Amortized
cost basis
% of loan modifications
to total retained
credit card loans
Financial effect of loan modifications
Term extension and interest rate reduction
(a)(b)
$
926
0.40 %
Term extension with a reduction in the weighted
average contractual interest rate from 23.64% to 3.20%
Total
$
926
Notes to consolidated financial statements
248
JPMorgan Chase & Co./2025 Form 10-K
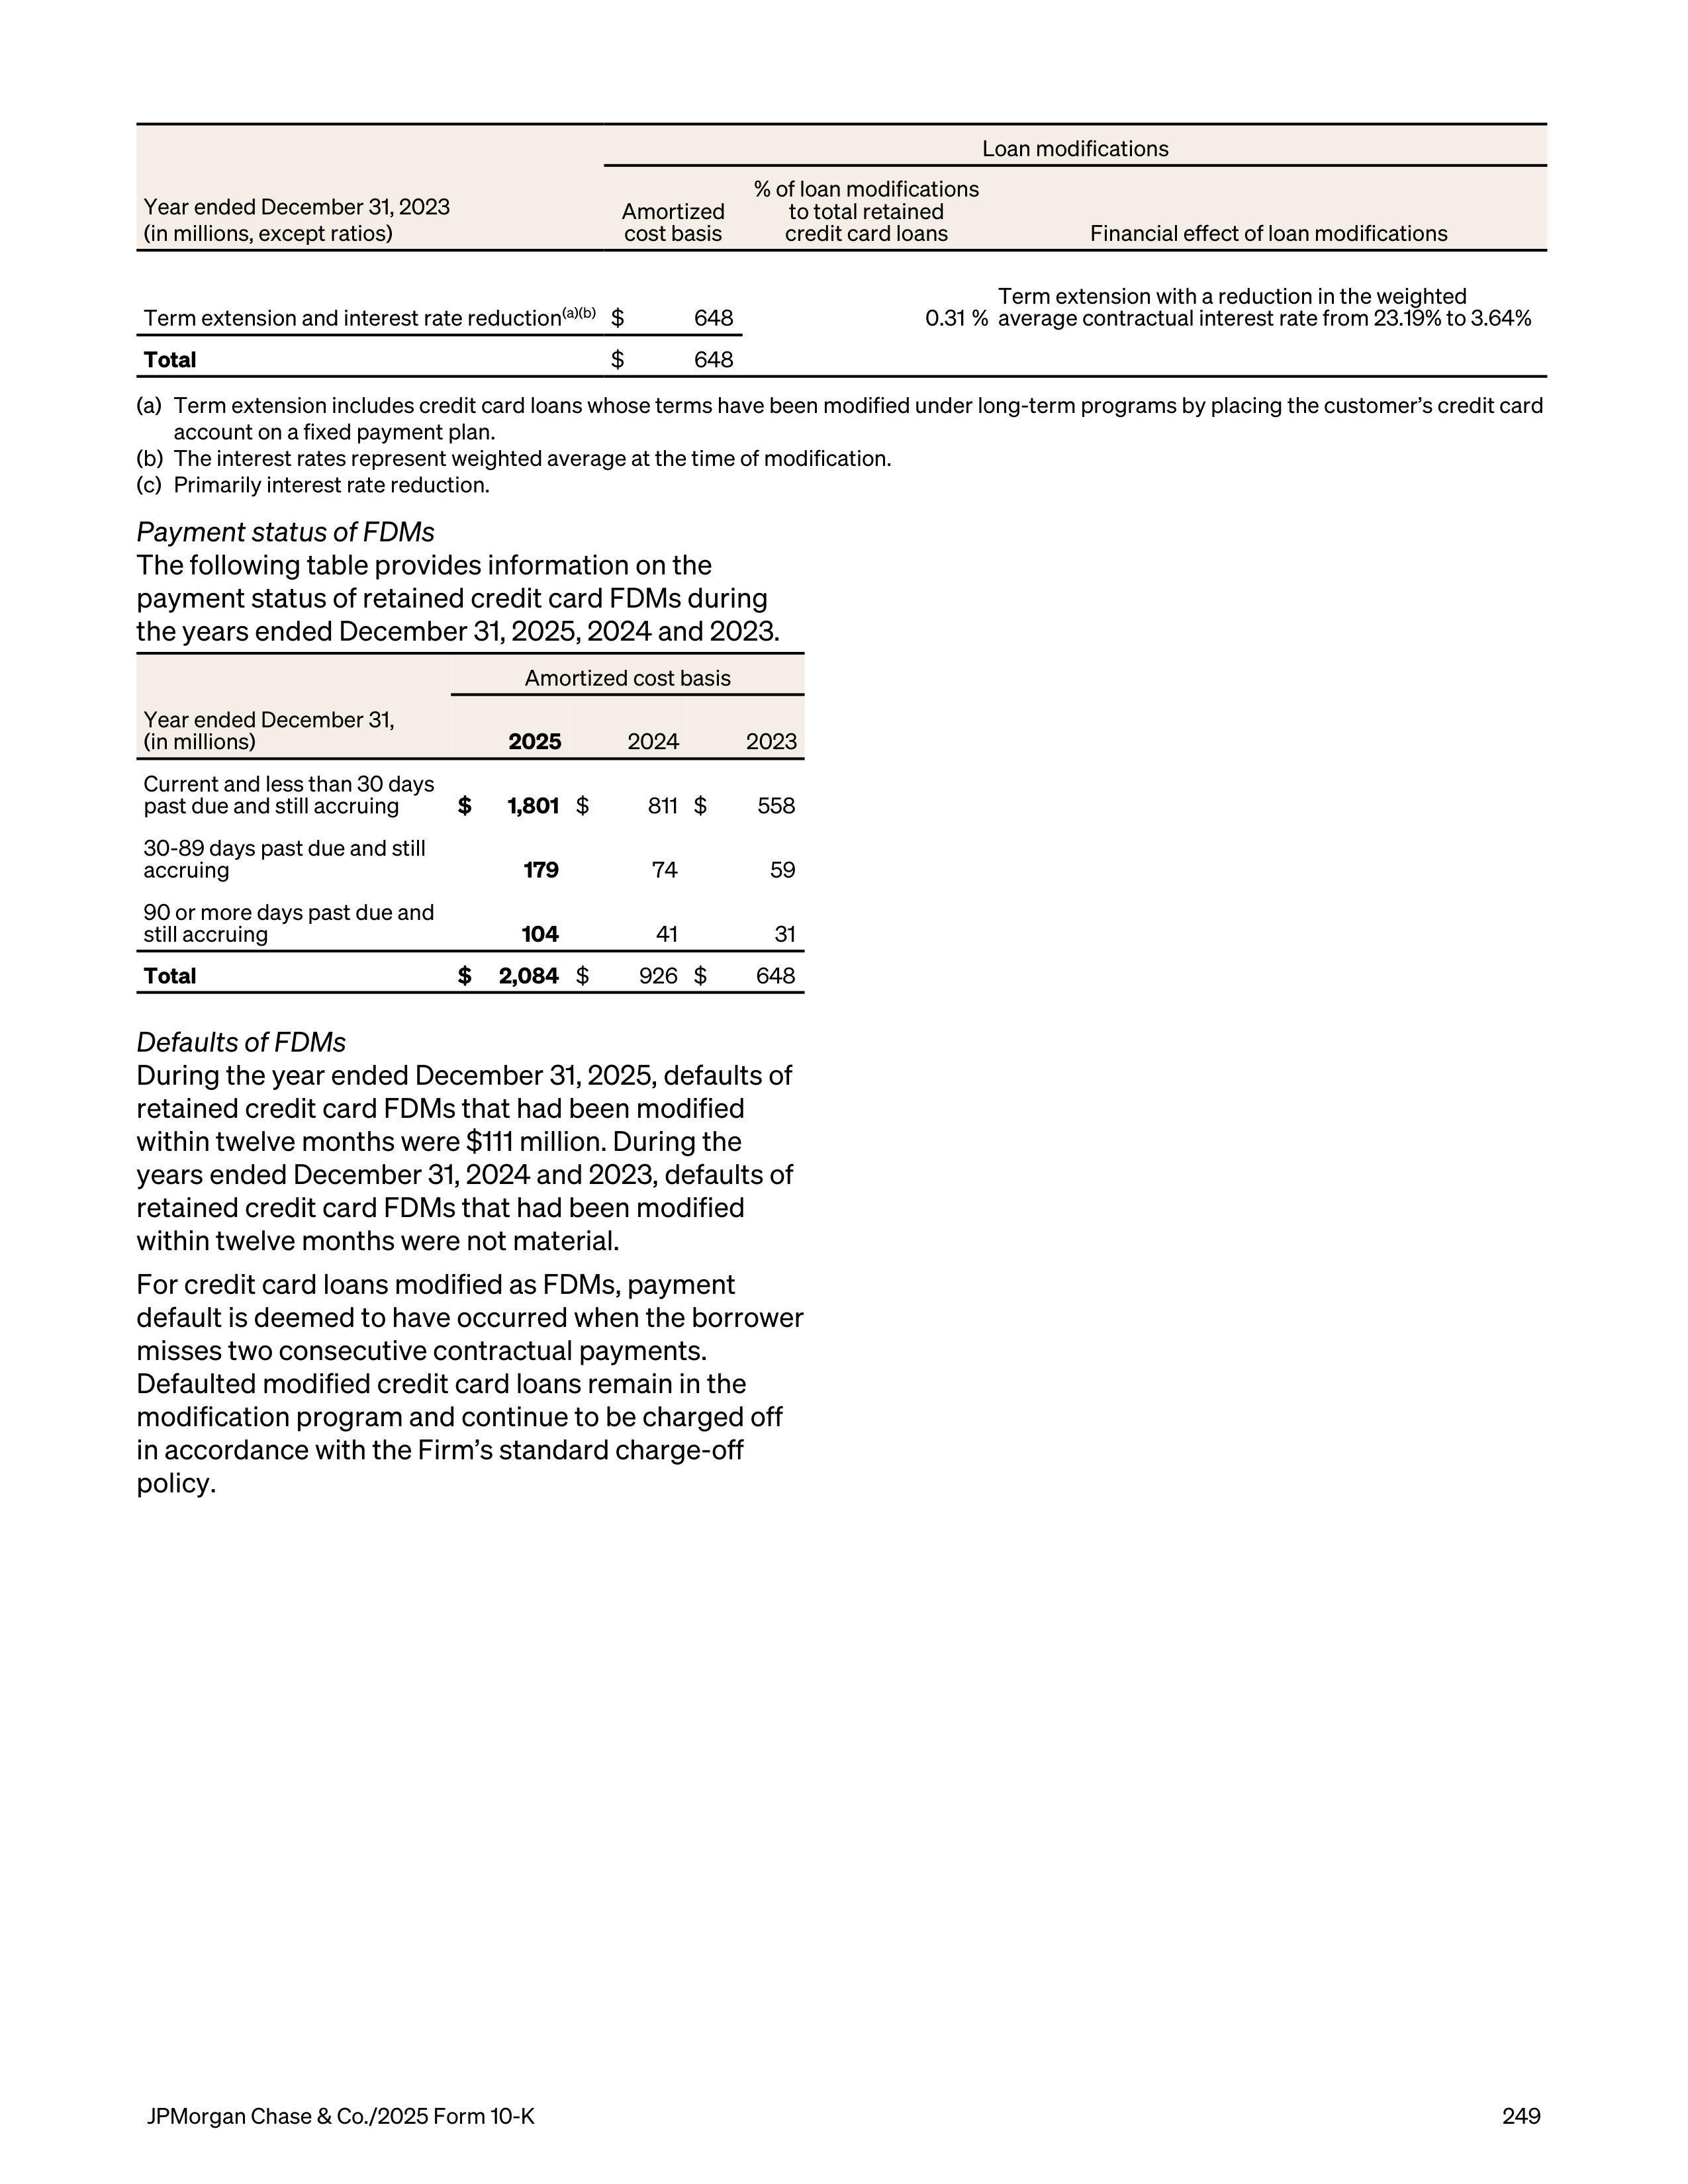
Loan modifications
Year ended December 31, 2023
(in millions, except ratios)
Amortized
cost basis
% of loan modifications
to total retained
credit card loans
Financial effect of loan modifications
Term extension and interest rate reduction
(a)(b)
$
648
0.31 %
Term extension with a reduction in the weighted
average contractual interest rate from 23.19% to 3.64%
Total
$
648
(a)
Term extension includes credit card loans whose terms have been modified under long-term programs by placing the customer’s credit card
account on a fixed payment plan.
(b)
The interest rates represent weighted average at the time of modification.
(c)
Primarily interest rate reduction.
Payment status of FDMs
The following table provides information on the
payment status of retained credit card FDMs during
the years ended December 31, 2025, 2024 and 2023.
Amortized cost basis
Year ended December 31,
(in millions)
2025
2024
2023
Current and less than 30 days
past due and still accruing
$
1,801
$
811 $
558
30-89 days past due and still
accruing
179
74
59
90 or more days past due and
still accruing
104
41
31
Total
$
2,084
$
926 $
648
Defaults of FDMs
During the year ended December 31, 2025, defaults of
retained credit card FDMs that had been modified
within twelve months were $111 million. During the
years ended December 31, 2024 and 2023, defaults of
retained credit card FDMs that had been modified
within twelve months were not material.
For credit card loans modified as FDMs, payment
default is deemed to have occurred when the borrower
misses two consecutive contractual payments.
Defaulted modified credit card loans remain in the
modification program and continue to be charged off
in accordance with the Firm’s standard charge-off
policy.
JPMorgan Chase & Co./2025 Form 10-K
249
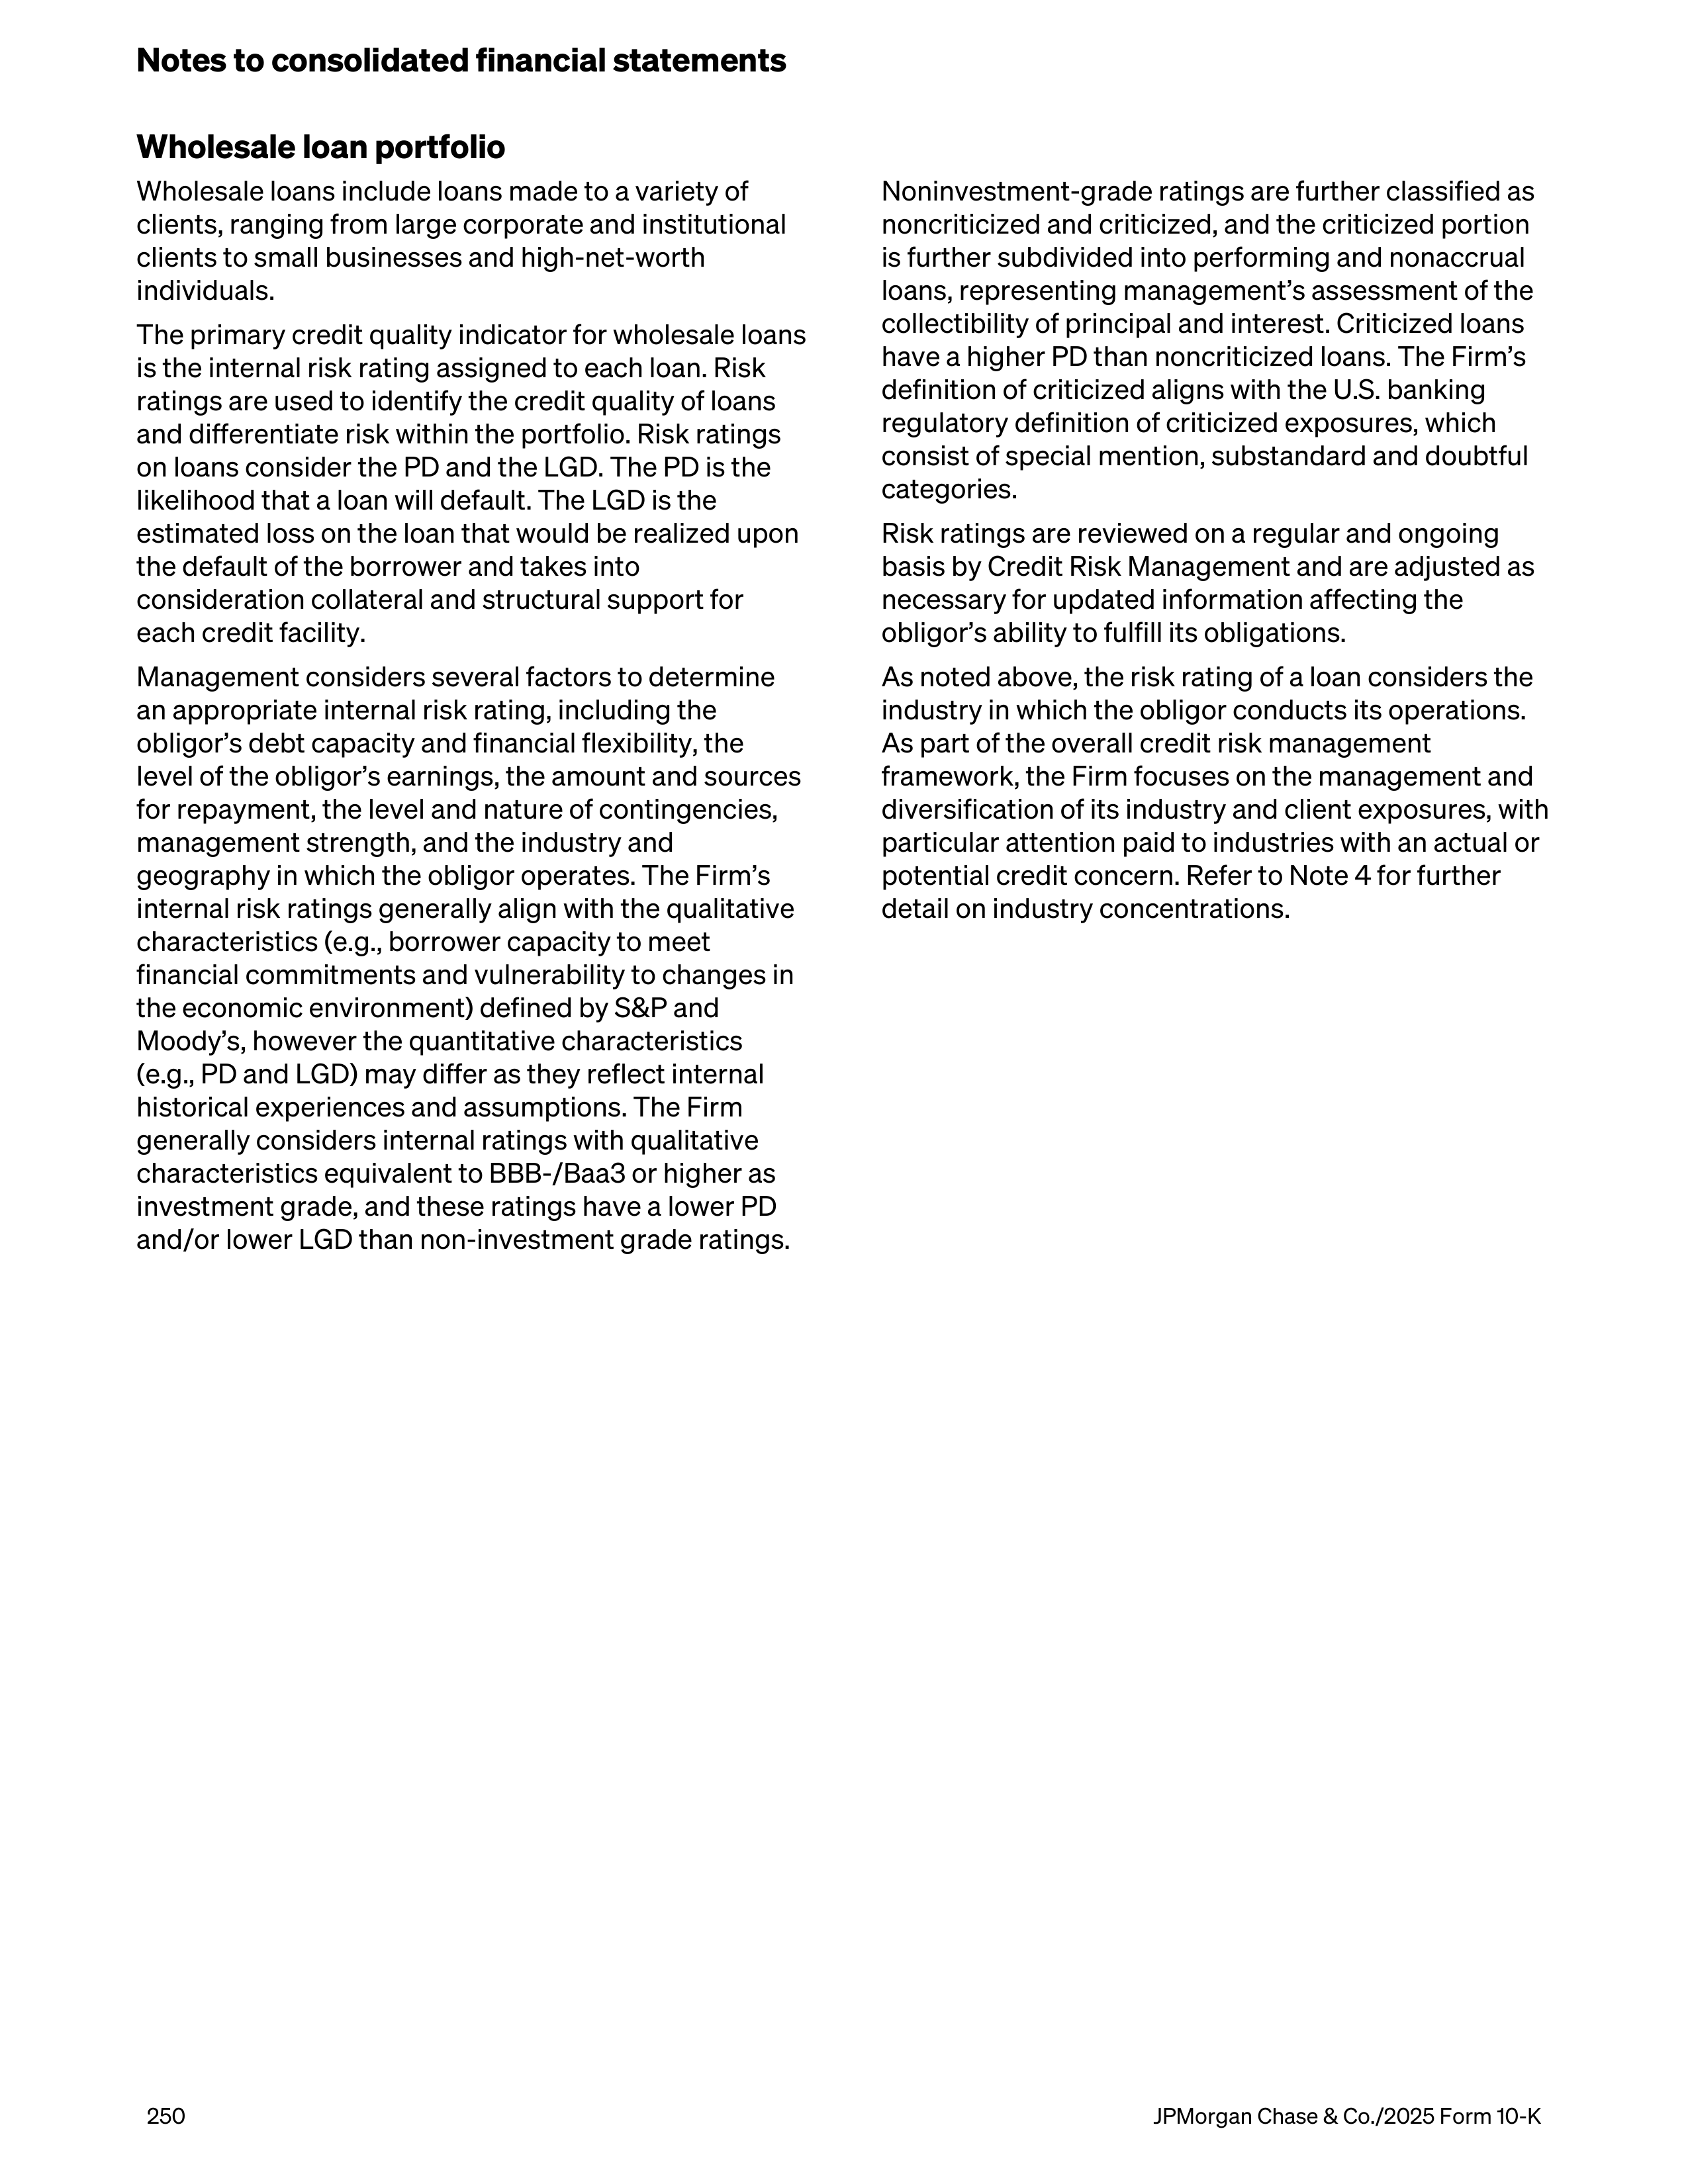
Wholesale loan portfolio
Wholesale loans include loans made to a variety of
clients, ranging from large corporate and institutional
clients to small businesses and high-net-worth
individuals.
The primary credit quality indicator for wholesale loans
is the internal risk rating assigned to each loan. Risk
ratings are used to identify the credit quality of loans
and differentiate risk within the portfolio. Risk ratings
on loans consider the PD and the LGD. The PD is the
likelihood that a loan will default. The LGD is the
estimated loss on the loan that would be realized upon
the default of the borrower and takes into
consideration collateral and structural support for
each credit facility.
Management considers several factors to determine
an appropriate internal risk rating, including the
obligor’s debt capacity and financial flexibility, the
level of the obligor’s earnings, the amount and sources
for repayment, the level and nature of contingencies,
management strength, and the industry and
geography in which the obligor operates. The Firm’s
internal risk ratings generally align with the qualitative
characteristics (e.g., borrower capacity to meet
financial commitments and vulnerability to changes in
the economic environment) defined by S&P and
Moody’s, however the quantitative characteristics
(e.g., PD and LGD) may differ as they reflect internal
historical experiences and assumptions. The Firm
generally considers internal ratings with qualitative
characteristics equivalent to BBB-/Baa3 or higher as
investment grade, and these ratings have a lower PD
and/or lower LGD than non-investment grade ratings.
Noninvestment-grade ratings are further classified as
noncriticized and criticized, and the criticized portion
is further subdivided into performing and nonaccrual
loans, representing management’s assessment of the
collectibility of principal and interest. Criticized loans
have a higher PD than noncriticized loans. The Firm’s
definition of criticized aligns with the U.S. banking
regulatory definition of criticized exposures, which
consist of special mention, substandard and doubtful
categories.
Risk ratings are reviewed on a regular and ongoing
basis by Credit Risk Management and are adjusted as
necessary for updated information affecting the
obligor’s ability to fulfill its obligations.
As noted above, the risk rating of a loan considers the
industry in which the obligor conducts its operations.
As part of the overall credit risk management
framework, the Firm focuses on the management and
diversification of its industry and client exposures, with
particular attention paid to industries with an actual or
potential credit concern. Refer to Note 4 for further
detail on industry concentrations.
Notes to consolidated financial statements
250
JPMorgan Chase & Co./2025 Form 10-K
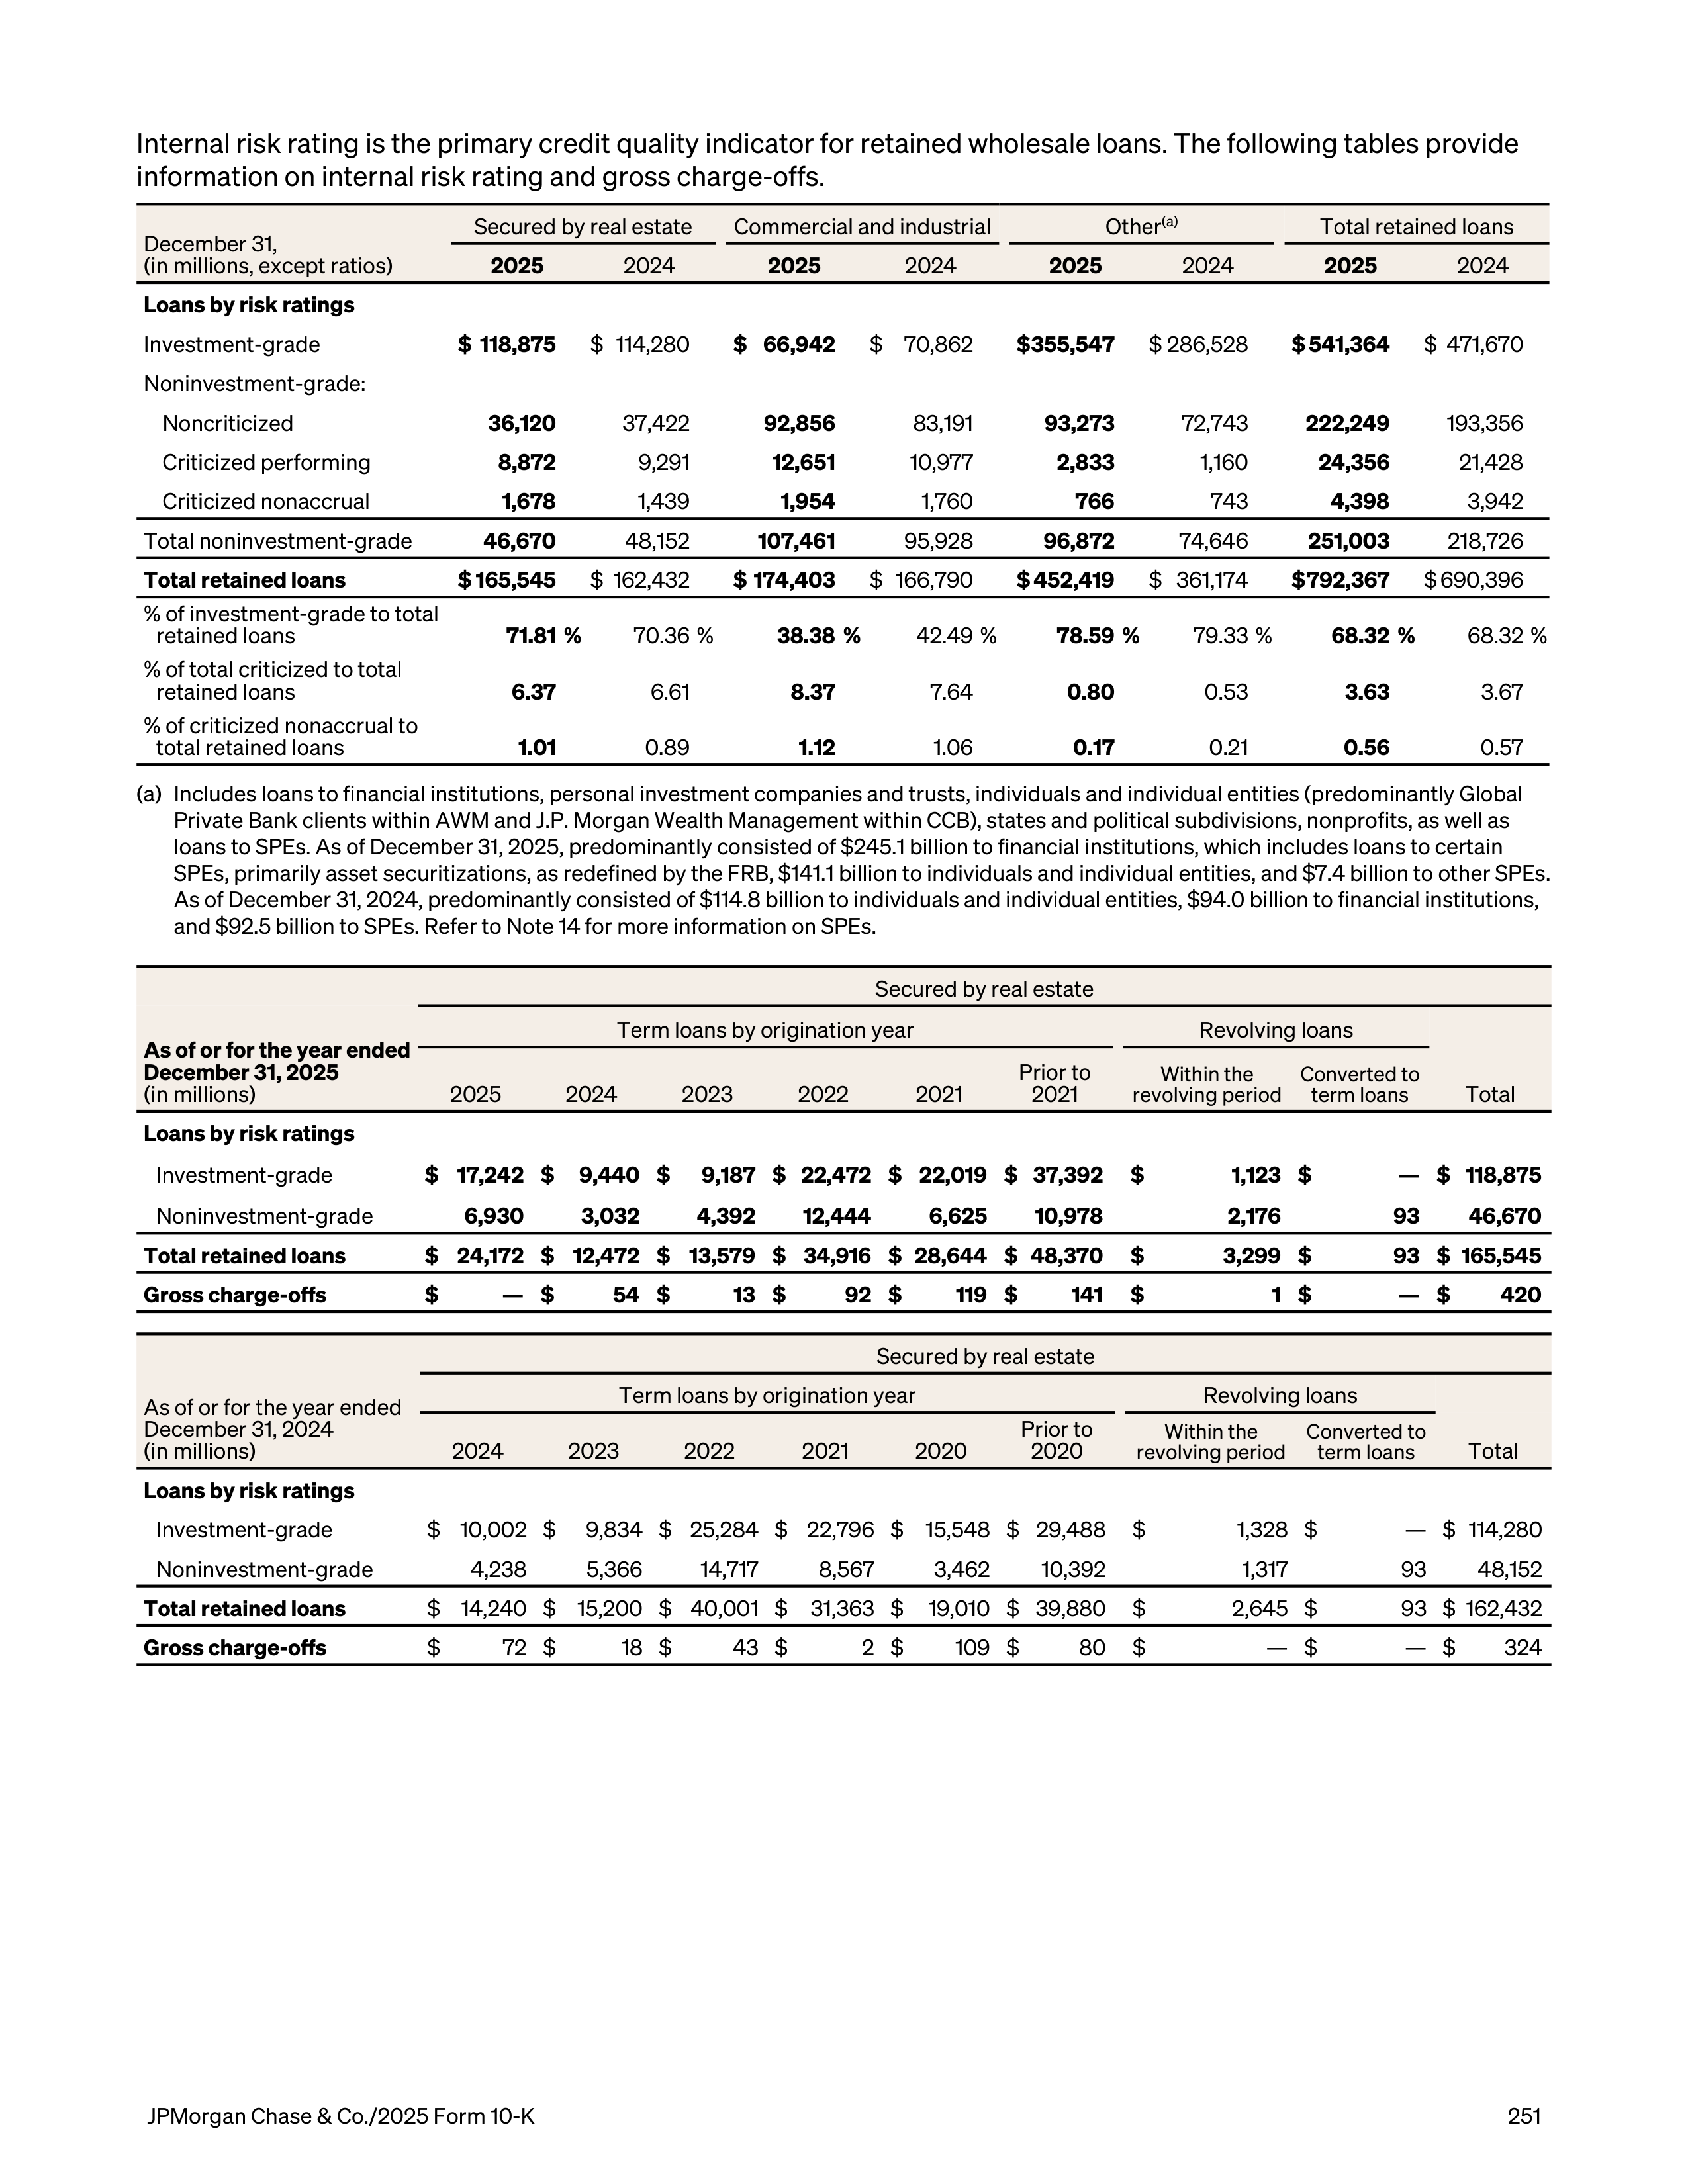
Internal risk rating is the primary credit quality indicator for retained wholesale loans. The following tables provide
information on internal risk rating and gross charge-offs.
December 31,
(in millions, except ratios)
Secured by real estate
Commercial and industrial
Other
(a)
Total retained loans
2025
2024
2025
2024
2025
2024
2025
2024
Loans by risk ratings
Investment-grade
$ 118,875
$ 114,280
$ 66,942
$ 70,862
$ 355,547
$ 286,528
$ 541,364
$ 471,670
Noninvestment-grade:
Noncriticized
36,120
37,422
92,856
83,191
93,273
72,743
222,249
193,356
Criticized performing
8,872
9,291
12,651
10,977
2,833
1,160
24,356
21,428
Criticized nonaccrual
1,678
1,439
1,954
1,760
766
743
4,398
3,942
Total noninvestment-grade
46,670
48,152
107,461
95,928
96,872
74,646
251,003
218,726
Total retained loans
$ 165,545
$ 162,432
$ 174,403
$ 166,790
$ 452,419
$ 361,174
$ 792,367
$ 690,396
% of investment-grade to total
retained loans
71.81 %
70.36 %
38.38 %
42.49 %
78.59 %
79.33 %
68.32 %
68.32 %
% of total criticized to total
retained loans
6.37
6.61
8.37
7.64
0.80
0.53
3.63
3.67
% of criticized nonaccrual to
total retained loans
1.01
0.89
1.12
1.06
0.17
0.21
0.56
0.57
(a)
Includes loans to financial institutions, personal investment companies and trusts, individuals and individual entities (predominantly Global
Private Bank clients within AWM and J.P. Morgan Wealth Management within CCB), states and political subdivisions, nonprofits, as well as
loans to SPEs. As of December 31, 2025, predominantly consisted of $245.1 billion to financial institutions, which includes loans to certain
SPEs, primarily asset securitizations, as redefined by the FRB, $141.1 billion to individuals and individual entities, and $7.4 billion to other SPEs.
As of December 31, 2024, predominantly consisted of $114.8 billion to individuals and individual entities, $94.0 billion to financial institutions,
and $92.5 billion to SPEs. Refer to Note 14 for more information on SPEs.
Secured by real estate
As of or for the year ended
December 31, 2025
(in millions)
Term loans by origination year
Revolving loans
2025
2024
2023
2022
2021
Prior to
2021
Within the
revolving period
Converted to
term loans
Total
Loans by risk ratings
Investment-grade
$ 17,242 $
9,440 $
9,187 $ 22,472 $ 22,019 $ 37,392
$
1,123 $
— $ 118,875
Noninvestment-grade
6,930
3,032
4,392
12,444
6,625
10,978
2,176
93
46,670
Total retained loans
$ 24,172 $ 12,472 $ 13,579 $ 34,916 $ 28,644 $ 48,370
$
3,299 $
93 $ 165,545
Gross charge-offs
$
— $
54 $
13 $
92 $
119 $
141
$
1 $
— $
420
Secured by real estate
As of or for the year ended
December 31, 2024
(in millions)
Term loans by origination year
Revolving loans
2024
2023
2022
2021
2020
Prior to
2020
Within the
revolving period
Converted to
term loans
Total
Loans by risk ratings
Investment-grade
$ 10,002 $
9,834 $ 25,284 $ 22,796 $ 15,548 $ 29,488
$
1,328 $
— $ 114,280
Noninvestment-grade
4,238
5,366
14,717
8,567
3,462
10,392
1,317
93
48,152
Total retained loans
$ 14,240 $ 15,200 $ 40,001 $
31,363 $
19,010 $ 39,880
$
2,645 $
93 $ 162,432
Gross charge-offs
$
72 $
18 $
43 $
2 $
109 $
80
$
— $
— $
324
JPMorgan Chase & Co./2025 Form 10-K
251
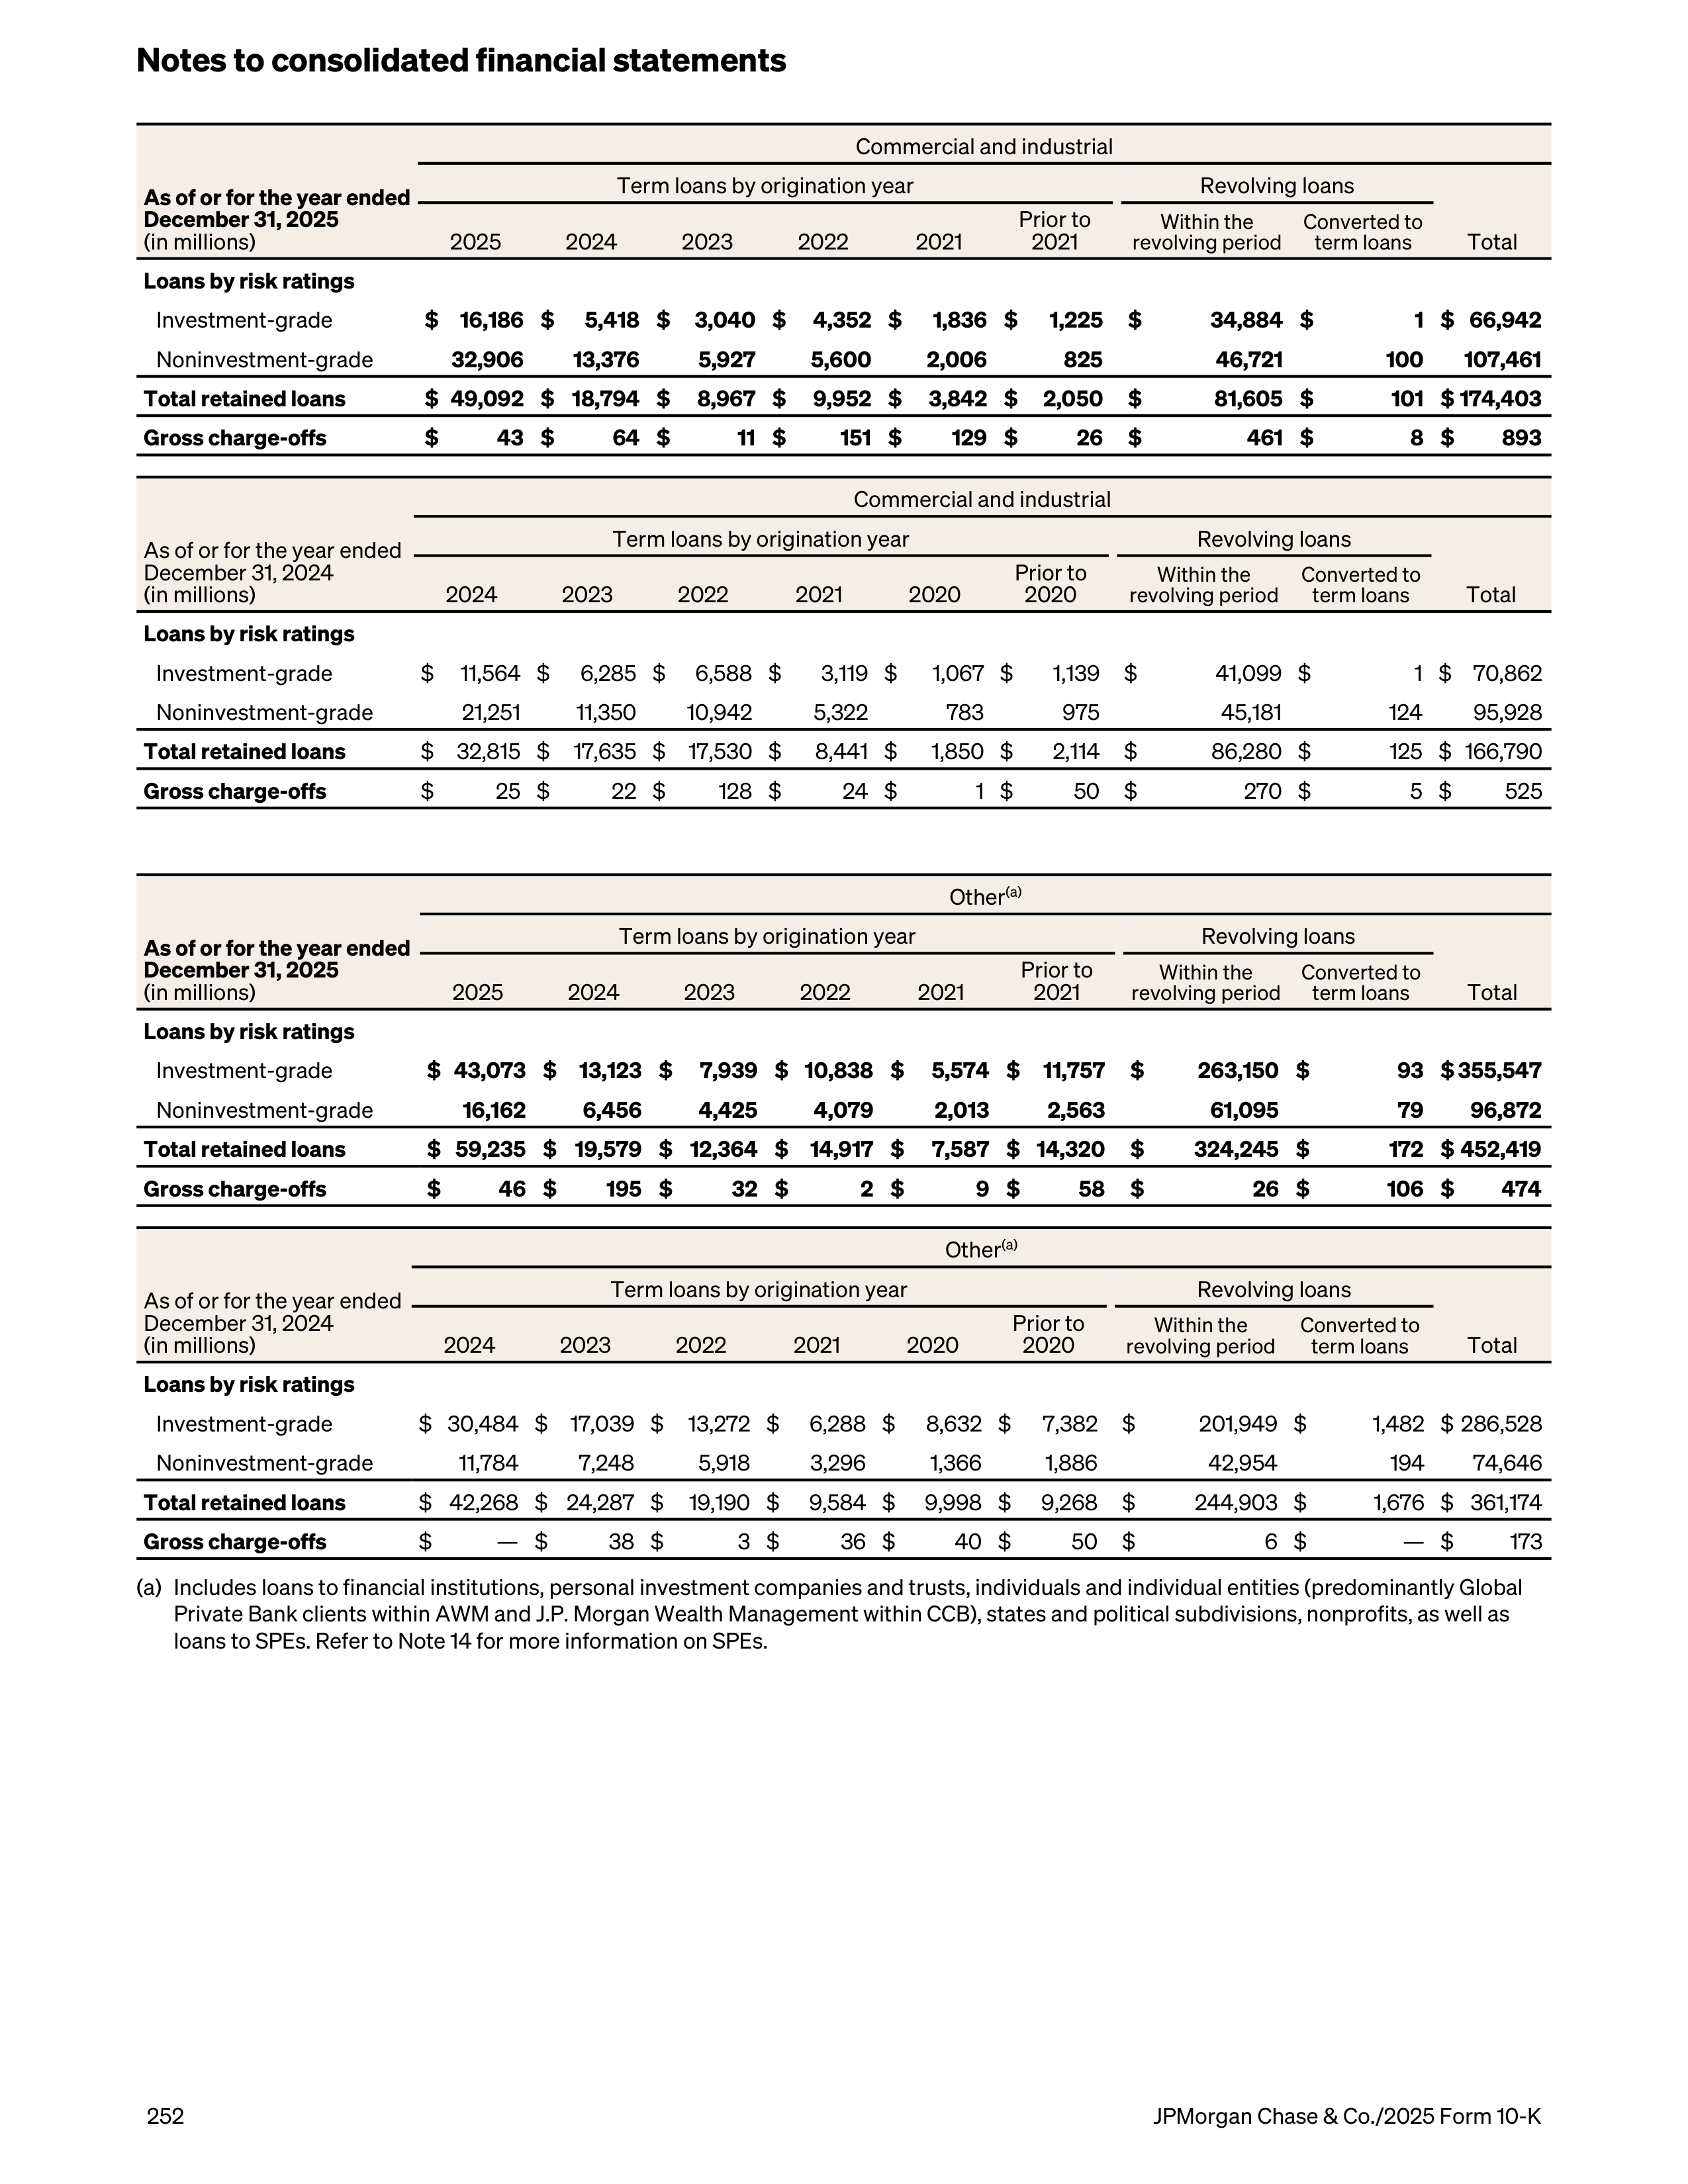
Commercial and industrial
As of or for the year ended
December 31, 2025
(in millions)
Term loans by origination year
Revolving loans
2025
2024
2023
2022
2021
Prior to
2021
Within the
revolving period
Converted to
term loans
Total
Loans by risk ratings
Investment-grade
$ 16,186 $
5,418 $
3,040 $
4,352 $
1,836 $
1,225
$
34,884 $
1 $ 66,942
Noninvestment-grade
32,906
13,376
5,927
5,600
2,006
825
46,721
100
107,461
Total retained loans
$ 49,092 $ 18,794 $
8,967 $
9,952 $
3,842 $
2,050
$
81,605 $
101 $ 174,403
Gross charge-offs
$
43 $
64 $
11 $
151 $
129 $
26
$
461 $
8 $
893
Commercial and industrial
As of or for the year ended
December 31, 2024
(in millions)
Term loans by origination year
Revolving loans
2024
2023
2022
2021
2020
Prior to
2020
Within the
revolving period
Converted to
term loans
Total
Loans by risk ratings
Investment-grade
$
11,564 $
6,285 $
6,588 $
3,119 $
1,067 $
1,139
$
41,099 $
1 $ 70,862
Noninvestment-grade
21,251
11,350
10,942
5,322
783
975
45,181
124
95,928
Total retained loans
$
32,815 $
17,635 $
17,530 $
8,441 $
1,850 $
2,114
$
86,280 $
125 $ 166,790
Gross charge-offs
$
25 $
22 $
128 $
24 $
1 $
50
$
270 $
5 $
525
Other
(a)
As of or for the year ended
December 31, 2025
(in millions)
Term loans by origination year
Revolving loans
2025
2024
2023
2022
2021
Prior to
2021
Within the
revolving period
Converted to
term loans
Total
Loans by risk ratings
Investment-grade
$ 43,073 $
13,123 $
7,939 $ 10,838 $
5,574 $
11,757
$
263,150 $
93 $ 355,547
Noninvestment-grade
16,162
6,456
4,425
4,079
2,013
2,563
61,095
79
96,872
Total retained loans
$ 59,235 $ 19,579 $ 12,364 $
14,917 $
7,587 $ 14,320
$
324,245 $
172 $ 452,419
Gross charge-offs
$
46 $
195 $
32 $
2 $
9 $
58
$
26 $
106 $
474
Other
(a)
As of or for the year ended
December 31, 2024
(in millions)
Term loans by origination year
Revolving loans
2024
2023
2022
2021
2020
Prior to
2020
Within the
revolving period
Converted to
term loans
Total
Loans by risk ratings
Investment-grade
$ 30,484 $
17,039 $
13,272 $
6,288 $
8,632 $
7,382
$
201,949 $
1,482 $ 286,528
Noninvestment-grade
11,784
7,248
5,918
3,296
1,366
1,886
42,954
194
74,646
Total retained loans
$ 42,268 $ 24,287 $
19,190 $
9,584 $
9,998 $
9,268
$
244,903 $
1,676 $ 361,174
Gross charge-offs
$
— $
38 $
3 $
36 $
40 $
50
$
6 $
— $
173
(a)
Includes loans to financial institutions, personal investment companies and trusts, individuals and individual entities (predominantly Global
Private Bank clients within AWM and J.P. Morgan Wealth Management within CCB), states and political subdivisions, nonprofits, as well as
loans to SPEs. Refer to Note 14 for more information on SPEs.
Notes to consolidated financial statements
252
JPMorgan Chase & Co./2025 Form 10-K
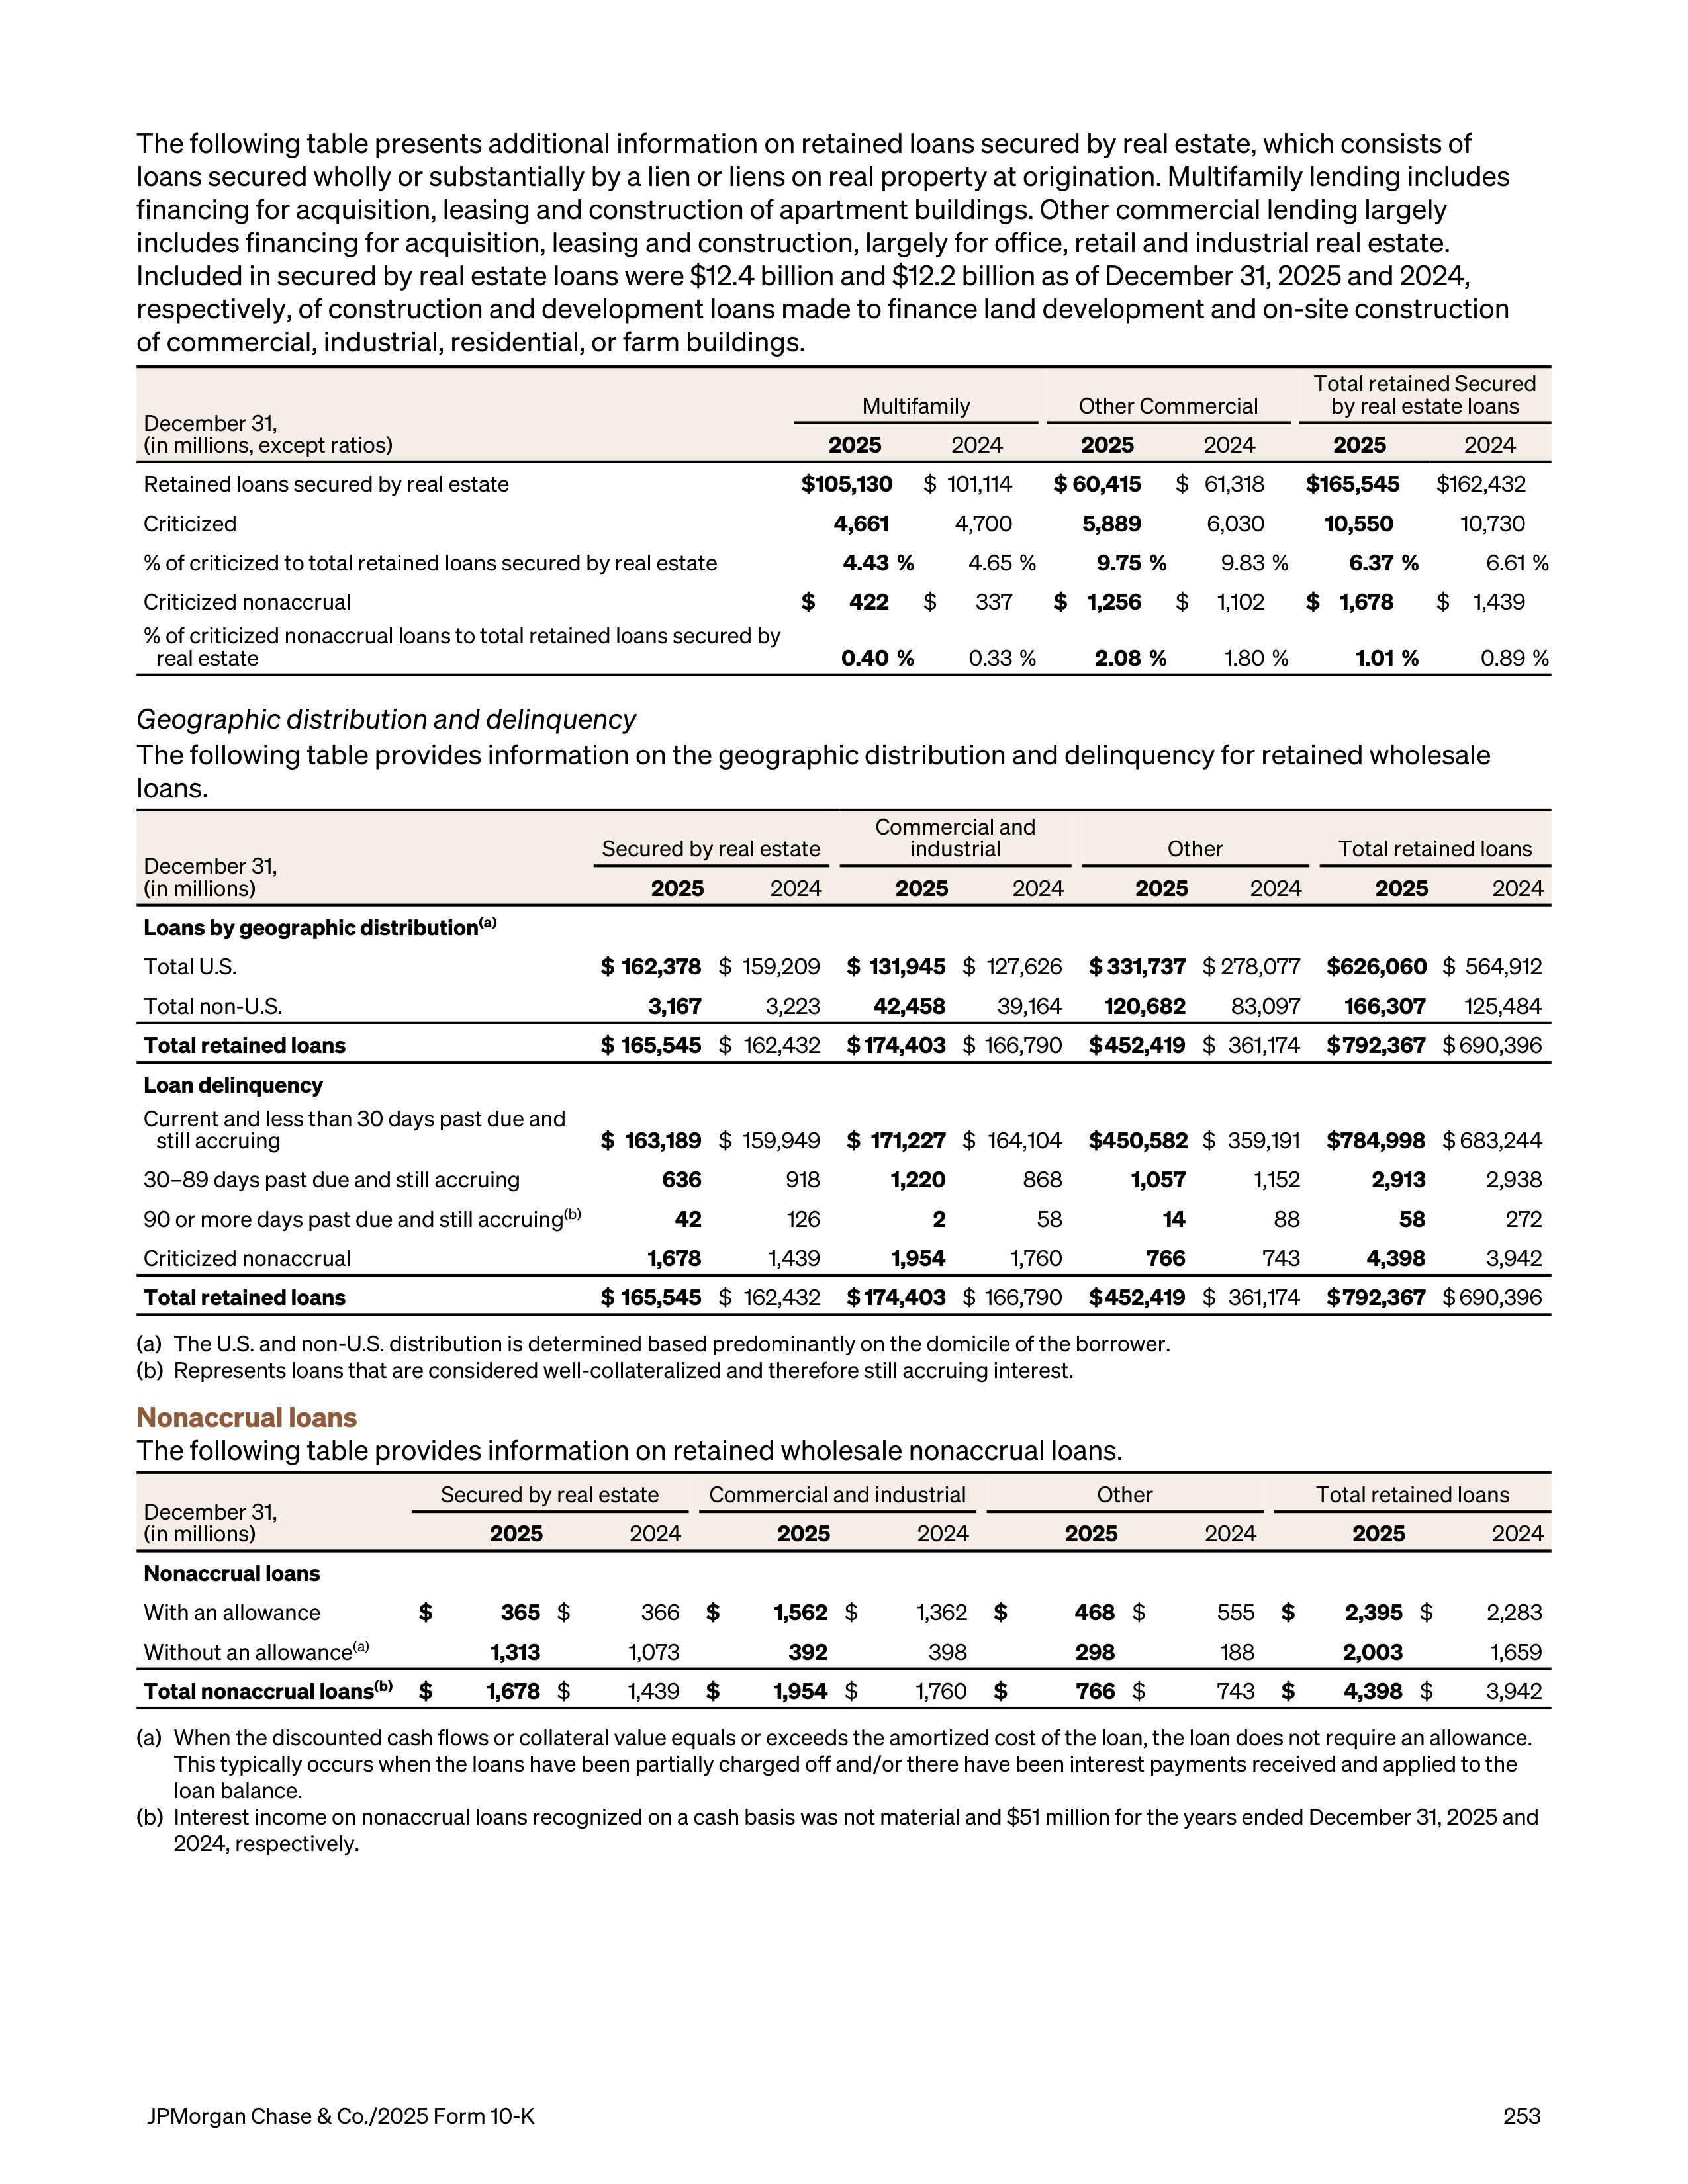
The following table presents additional information on retained loans secured by real estate, which consists of
loans secured wholly or substantially by a lien or liens on real property at origination. Multifamily lending includes
financing for acquisition, leasing and construction of apartment buildings. Other commercial lending largely
includes financing for acquisition, leasing and construction, largely for office, retail and industrial real estate.
Included in secured by real estate loans were $12.4 billion and $12.2 billion as of December 31, 2025 and 2024,
respectively, of construction and development loans made to finance land development and on-site construction
of commercial, industrial, residential, or farm buildings
.
December 31,
(in millions, except ratios)
Multifamily
Other Commercial
Total retained Secured
by real estate loans
2025
2024
2025
2024
2025
2024
Retained loans secured by real estate
$ 105,130
$ 101,114
$ 60,415
$ 61,318
$ 165,545
$ 162,432
Criticized
4,661
4,700
5,889
6,030
10,550
10,730
% of criticized to total retained loans secured by real estate
4.43 %
4.65 %
9.75 %
9.83 %
6.37 %
6.61 %
Criticized nonaccrual
$
422
$
337
$ 1,256
$
1,102
$ 1,678
$
1,439
% of criticized nonaccrual loans to total retained loans secured by
real estate
0.40 %
0.33 %
2.08 %
1.80 %
1.01 %
0.89 %
Geographic distribution and delinquency
The following table provides information on the geographic distribution and delinquency for retained wholesale
loans.
December 31,
(in millions)
Secured by real estate
Commercial and
industrial
Other
Total retained loans
2025
2024
2025
2024
2025
2024
2025
2024
Loans by geographic distribution
(a)
Total U.S.
$ 162,378
$ 159,209
$ 131,945
$ 127,626
$ 331,737
$ 278,077
$ 626,060
$ 564,912
Total non-U.S.
3,167
3,223
42,458
39,164
120,682
83,097
166,307
125,484
Total retained loans
$ 165,545
$ 162,432
$ 174,403
$ 166,790
$ 452,419
$ 361,174
$ 792,367
$ 690,396
Loan delinquency
Current and less than 30 days past due and
still accruing
$ 163,189
$ 159,949
$ 171,227
$ 164,104
$ 450,582
$ 359,191
$ 784,998
$ 683,244
30–89 days past due and still accruing
636
918
1,220
868
1,057
1,152
2,913
2,938
90 or more days past due and still accruing
(b)
42
126
2
58
14
88
58
272
Criticized nonaccrual
1,678
1,439
1,954
1,760
766
743
4,398
3,942
Total retained loans
$ 165,545
$ 162,432
$ 174,403
$ 166,790
$ 452,419
$ 361,174
$ 792,367
$ 690,396
(a)
The U.S. and non-U.S. distribution is determined based predominantly on the domicile of the borrower.
(b)
Represents loans that are considered well-collateralized and therefore still accruing interest.
Nonaccrual loans
The following table provides information on retained wholesale nonaccrual loans.
December 31,
(in millions)
Secured by real estate
Commercial and industrial
Other
Total retained loans
2025
2024
2025
2024
2025
2024
2025
2024
Nonaccrual loans
With an allowance
$
365
$
366
$
1,562
$
1,362
$
468
$
555
$
2,395
$
2,283
Without an allowance
(a)
1,313
1,073
392
398
298
188
2,003
1,659
Total nonaccrual loans
(b)
$
1,678
$
1,439
$
1,954
$
1,760
$
766
$
743
$
4,398
$
3,942
(a)
When the discounted cash flows or collateral value equals or exceeds the amortized cost of the loan, the loan does not require an allowance.
This typically occurs when the loans have been partially charged off and/or there have been interest payments received and applied to the
loan balance.
(b)
Interest income on nonaccrual loans recognized on a cash basis was not material and $51 million for the years ended December 31, 2025 and
2024, respectively.
JPMorgan Chase & Co./2025 Form 10-K
253
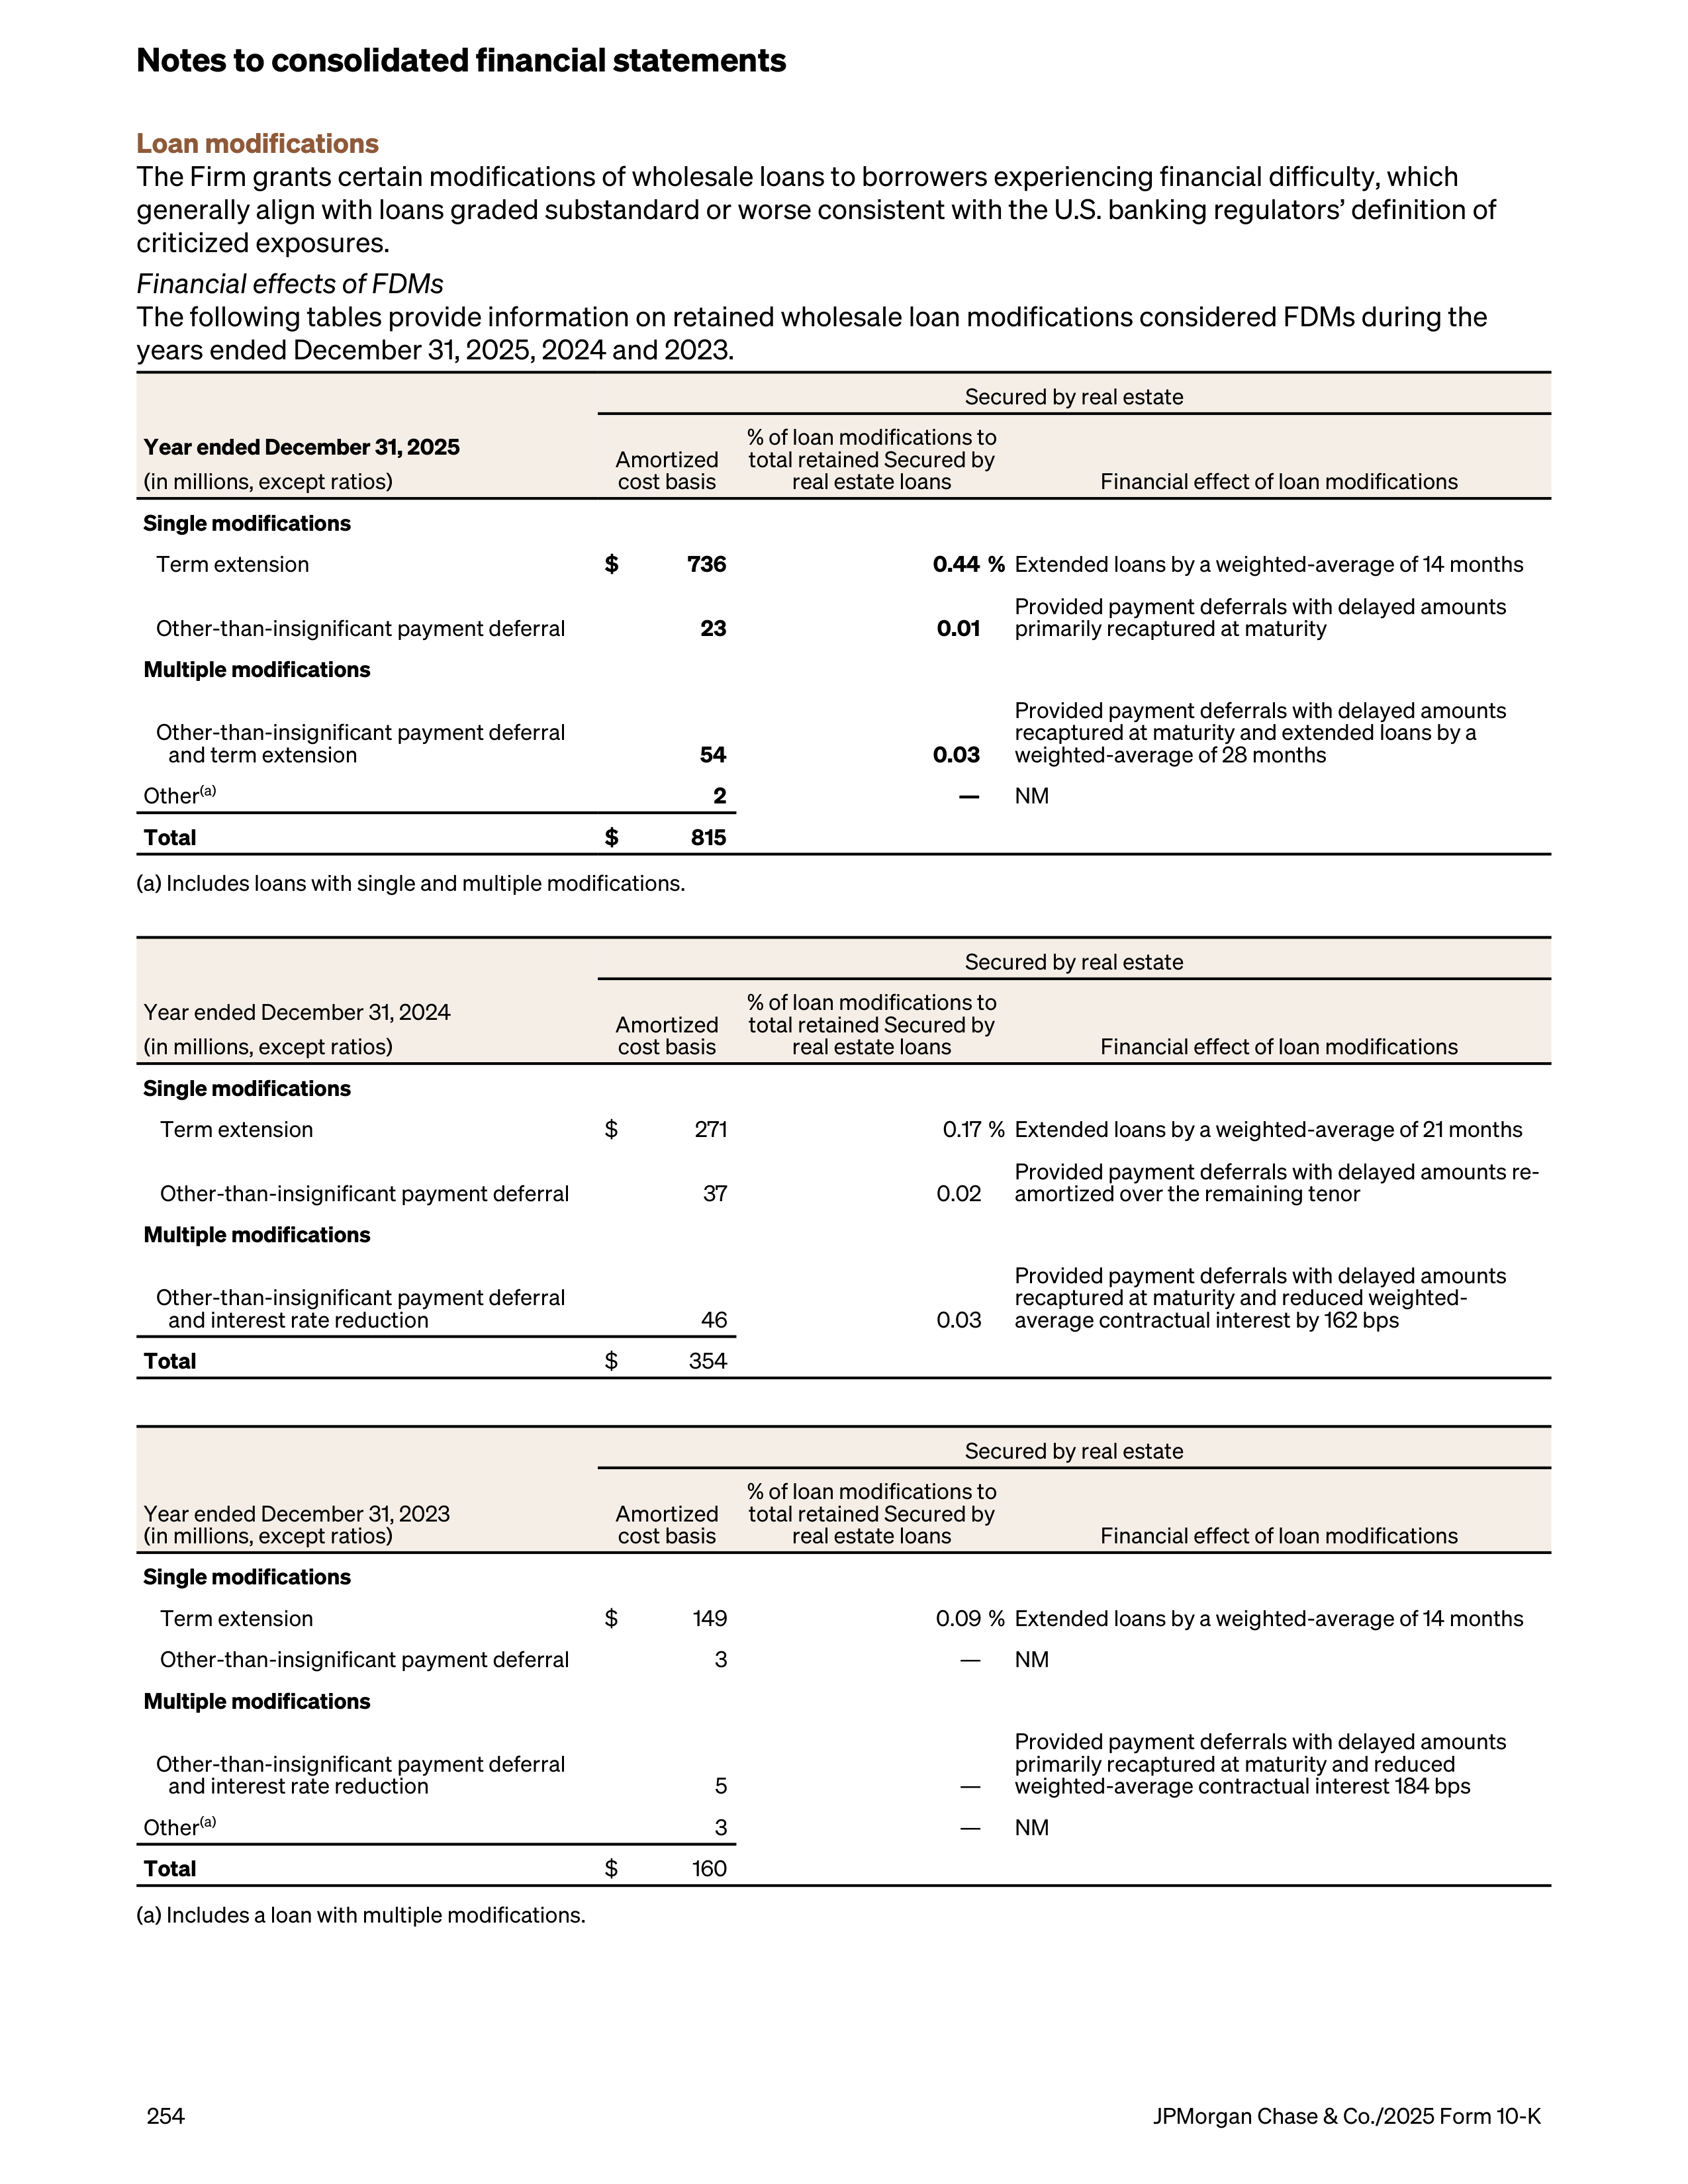
Loan modifications
The Firm grants certain modifications of wholesale loans to borrowers experiencing financial difficulty, which
generally align with loans graded substandard or worse consistent with the U.S. banking regulators’ definition of
criticized exposures.
Financial effects of FDMs
The following tables provide information on retained wholesale loan modifications considered FDMs during the
years ended December 31, 2025, 2024 and 2023.
Secured by real estate
Year ended December 31, 2025
(in millions, except ratios)
Amortized
cost basis
% of loan modifications to
total retained Secured by
real estate loans
Financial effect of loan modifications
Single modifications
Term extension
$
736
0.44 %
Extended loans by a weighted-average of 14 months
Other-than-insignificant payment deferral
23
0.01
Provided payment deferrals with delayed amounts
primarily recaptured at maturity
Multiple modifications
Other-than-insignificant payment deferral
and term extension
54
0.03
Provided payment deferrals with delayed amounts
recaptured at maturity and extended loans by a
weighted-average of 28 months
Other
(a)
2
—
NM
Total
$
815
(a) Includes loans with single and multiple modifications.
Secured by real estate
Year ended December 31, 2024
(in millions, except ratios)
Amortized
cost basis
% of loan modifications to
total retained Secured by
real estate loans
Financial effect of loan modifications
Single modifications
Term extension
$
271
0.17 %
Extended loans by a weighted-average of 21 months
Other-than-insignificant payment deferral
37
0.02
Provided payment deferrals with delayed amounts re-
amortized over the remaining tenor
Multiple modifications
Other-than-insignificant payment deferral
and interest rate reduction
46
0.03
Provided payment deferrals with delayed amounts
recaptured at maturity and reduced weighted-
average contractual interest by 162 bps
Total
$
354
Secured by real estate
Year ended December 31, 2023
(in millions, except ratios)
Amortized
cost basis
% of loan modifications to
total retained Secured by
real estate loans
Financial effect of loan modifications
Single modifications
Term extension
$
149
0.09 %
Extended loans by a weighted-average of 14 months
Other-than-insignificant payment deferral
3
—
NM
Multiple modifications
Other-than-insignificant payment deferral
and interest rate reduction
5
—
Provided payment deferrals with delayed amounts
primarily recaptured at maturity and reduced
weighted-average contractual interest 184 bps
Other
(a)
3
—
NM
Total
$
160
(a) Includes a loan with multiple modifications.
Notes to consolidated financial statements
254
JPMorgan Chase & Co./2025 Form 10-K
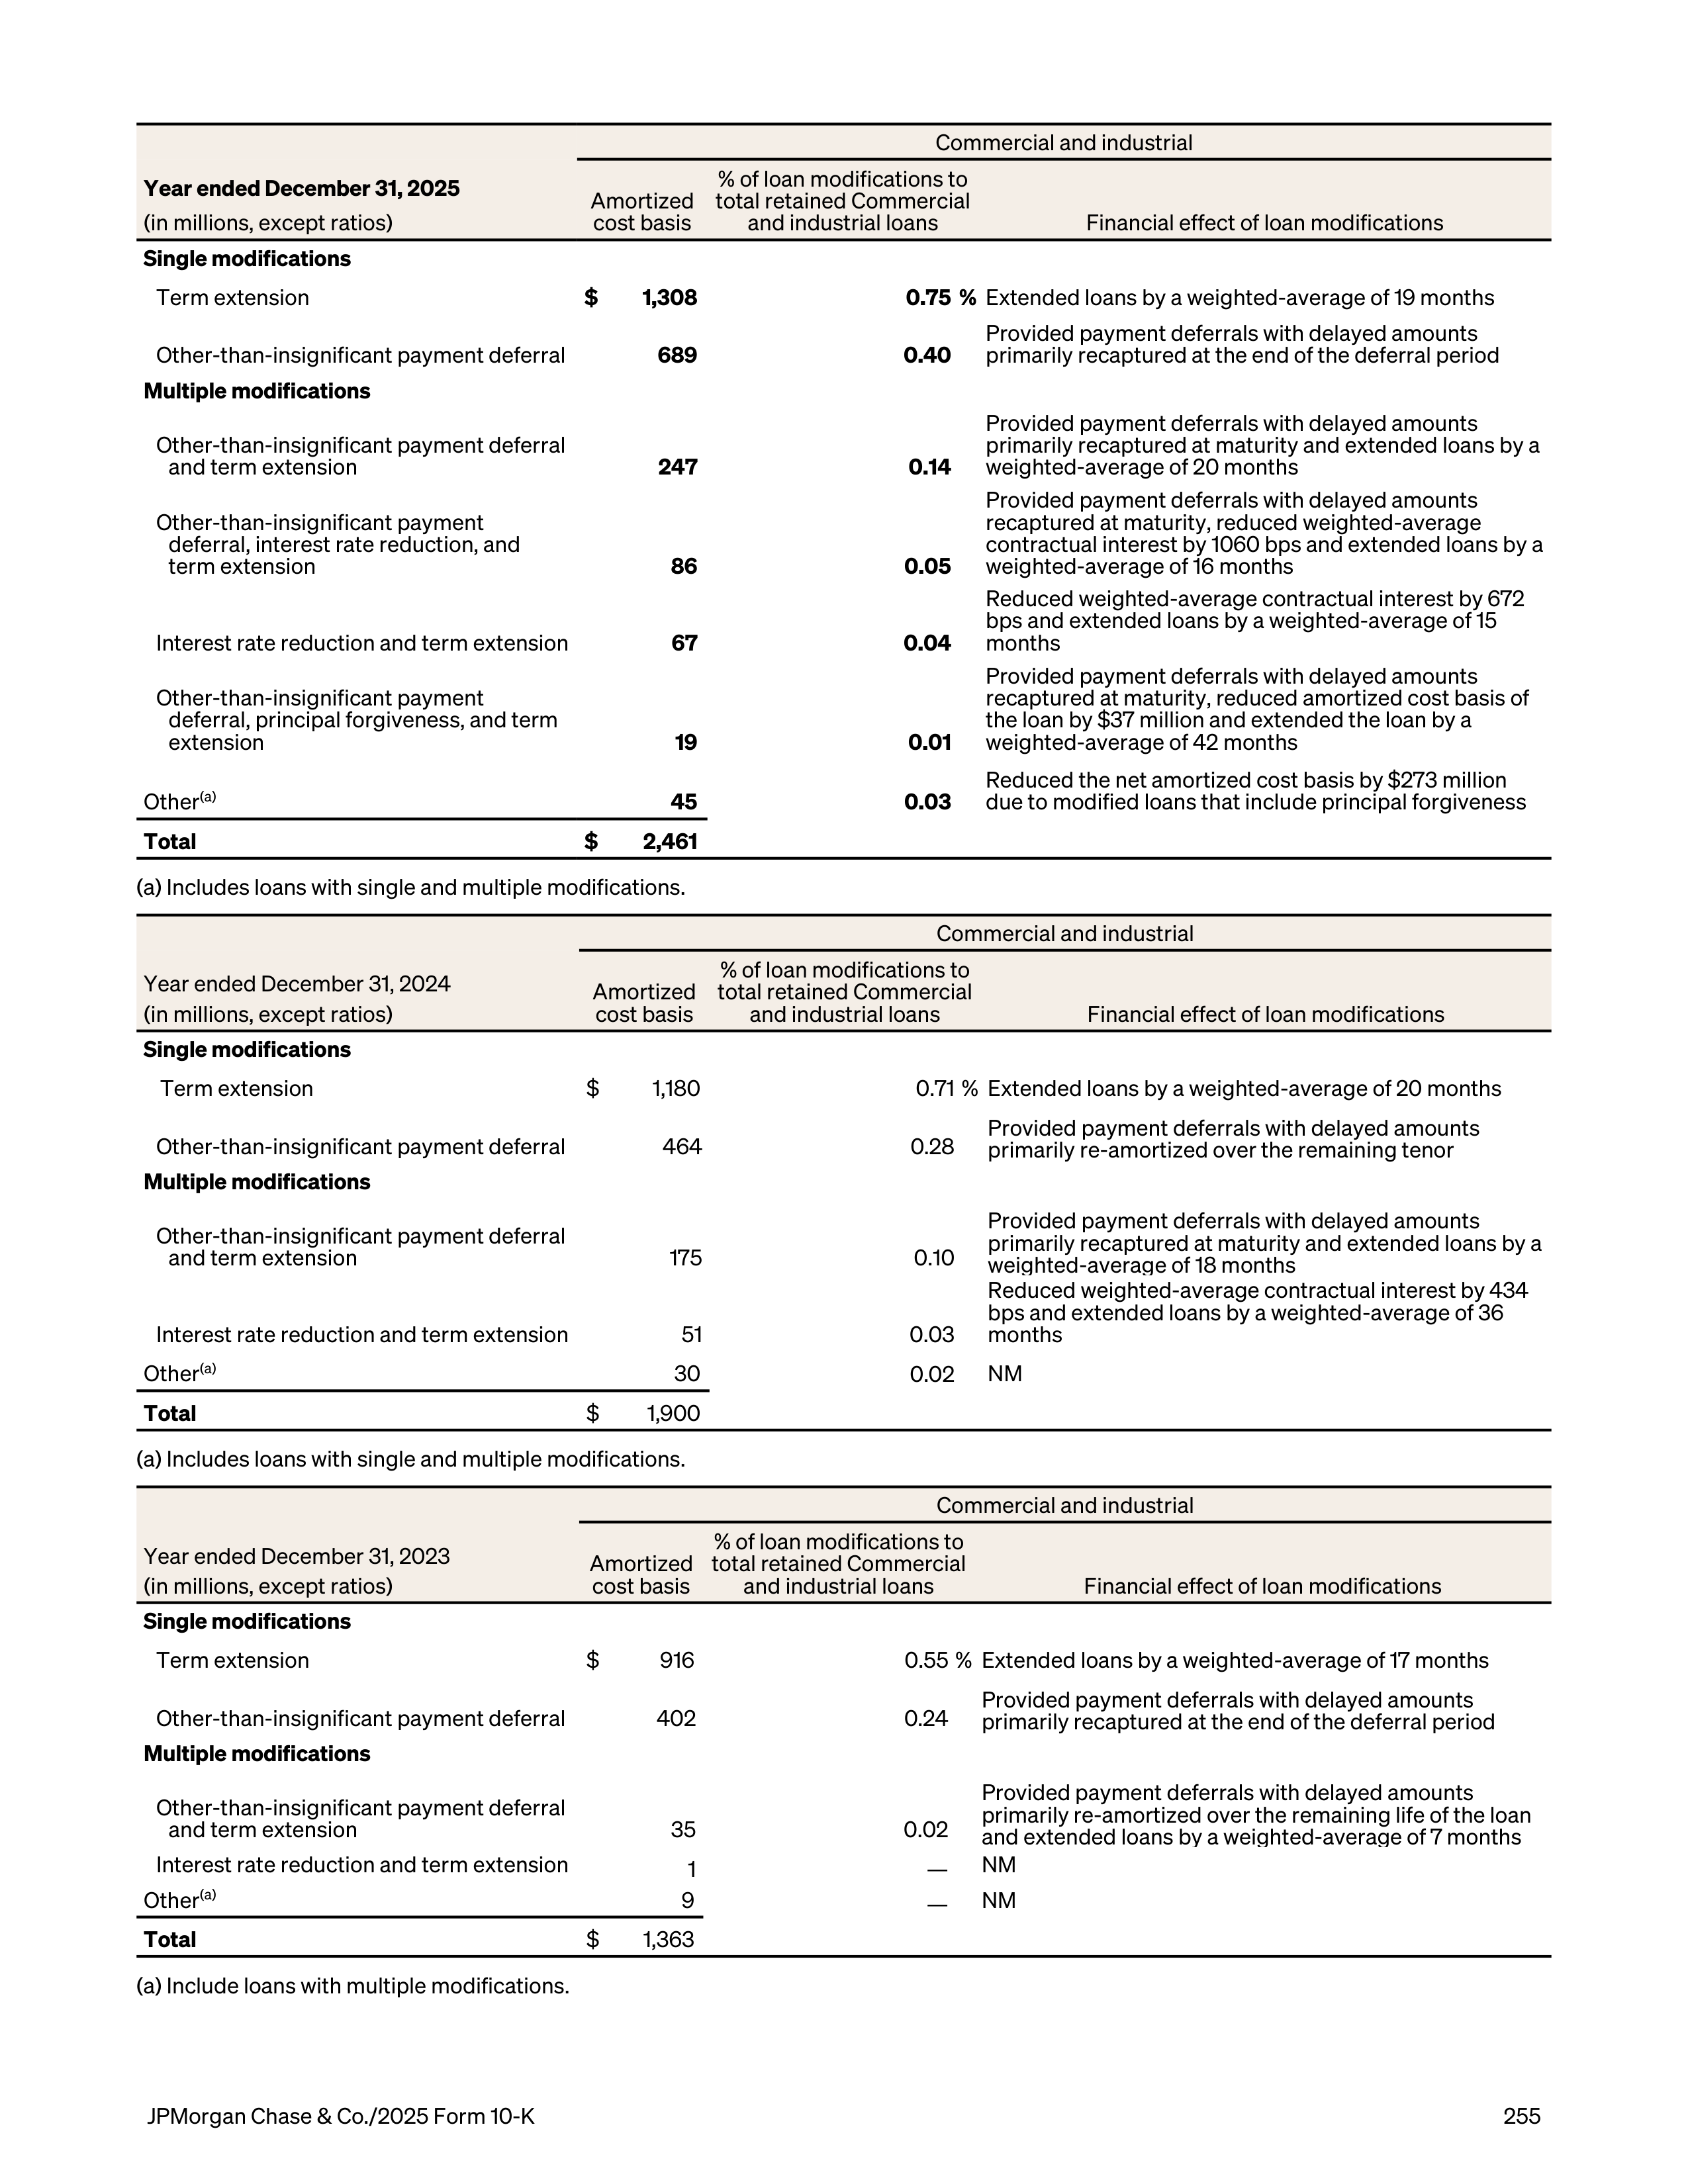
Commercial and industrial
Year ended December 31, 2025
(in millions, except ratios)
Amortized
cost basis
% of loan modifications to
total retained Commercial
and industrial loans
Financial effect of loan modifications
Single modifications
Term extension
$
1,308
0.75 %
Extended loans by a weighted-average of 19 months
Other-than-insignificant payment deferral
689
0.40
Provided payment deferrals with delayed amounts
primarily recaptured at the end of the deferral period
Multiple modifications
Other-than-insignificant payment deferral
and term extension
247
0.14
Provided payment deferrals with delayed amounts
primarily recaptured at maturity and extended loans by a
weighted-average of 20 months
Other-than-insignificant payment
deferral, interest rate reduction, and
term extension
86
0.05
Provided payment deferrals with delayed amounts
recaptured at maturity, reduced weighted-average
contractual interest by 1060 bps and extended loans by a
weighted-average of 16 months
Interest rate reduction and term extension
67
0.04
Reduced weighted-average contractual interest by 672
bps and extended loans by a weighted-average of 15
months
Other-than-insignificant payment
deferral, principal forgiveness, and term
extension
19
0.01
Provided payment deferrals with delayed amounts
recaptured at maturity, reduced amortized cost basis of
the loan by $37 million and extended the loan by a
weighted-average of 42 months
Other
(a)
45
0.03
Reduced the net amortized cost basis by $273 million
due to modified loans that include principal forgiveness
Total
$
2,461
(a) Includes loans with single and multiple modifications.
Commercial and industrial
Year ended December 31, 2024
(in millions, except ratios)
Amortized
cost basis
% of loan modifications to
total retained Commercial
and industrial loans
Financial effect of loan modifications
Single modifications
Term extension
$
1,180
0.71 %
Extended loans by a weighted-average of 20 months
Other-than-insignificant payment deferral
464
0.28
Provided payment deferrals with delayed amounts
primarily re-amortized over the remaining tenor
Multiple modifications
Other-than-insignificant payment deferral
and term extension
175
0.10
Provided payment deferrals with delayed amounts
primarily recaptured at maturity and extended loans by a
weighted-average of 18 months
Interest rate reduction and term extension
51
0.03
Reduced weighted-average contractual interest by 434
bps and extended loans by a weighted-average of 36
months
Other
(a)
30
0.02
NM
Total
$
1,900
(a) Includes loans with single and multiple modifications.
Commercial and industrial
Year ended December 31, 2023
(in millions, except ratios)
Amortized
cost basis
% of loan modifications to
total retained Commercial
and industrial loans
Financial effect of loan modifications
Single modifications
Term extension
$
916
0.55 %
Extended loans by a weighted-average of 17 months
Other-than-insignificant payment deferral
402
0.24
Provided payment deferrals with delayed amounts
primarily recaptured at the end of the deferral period
Multiple modifications
Other-than-insignificant payment deferral
and term extension
35
0.02
Provided payment deferrals with delayed amounts
primarily re-amortized over the remaining life of the loan
and extended loans by a weighted-average of 7 months
Interest rate reduction and term extension
1
—
NM
Other
(a)
9
—
NM
Total
$
1,363
(a) Include loans with multiple modifications.
JPMorgan Chase & Co./2025 Form 10-K
255
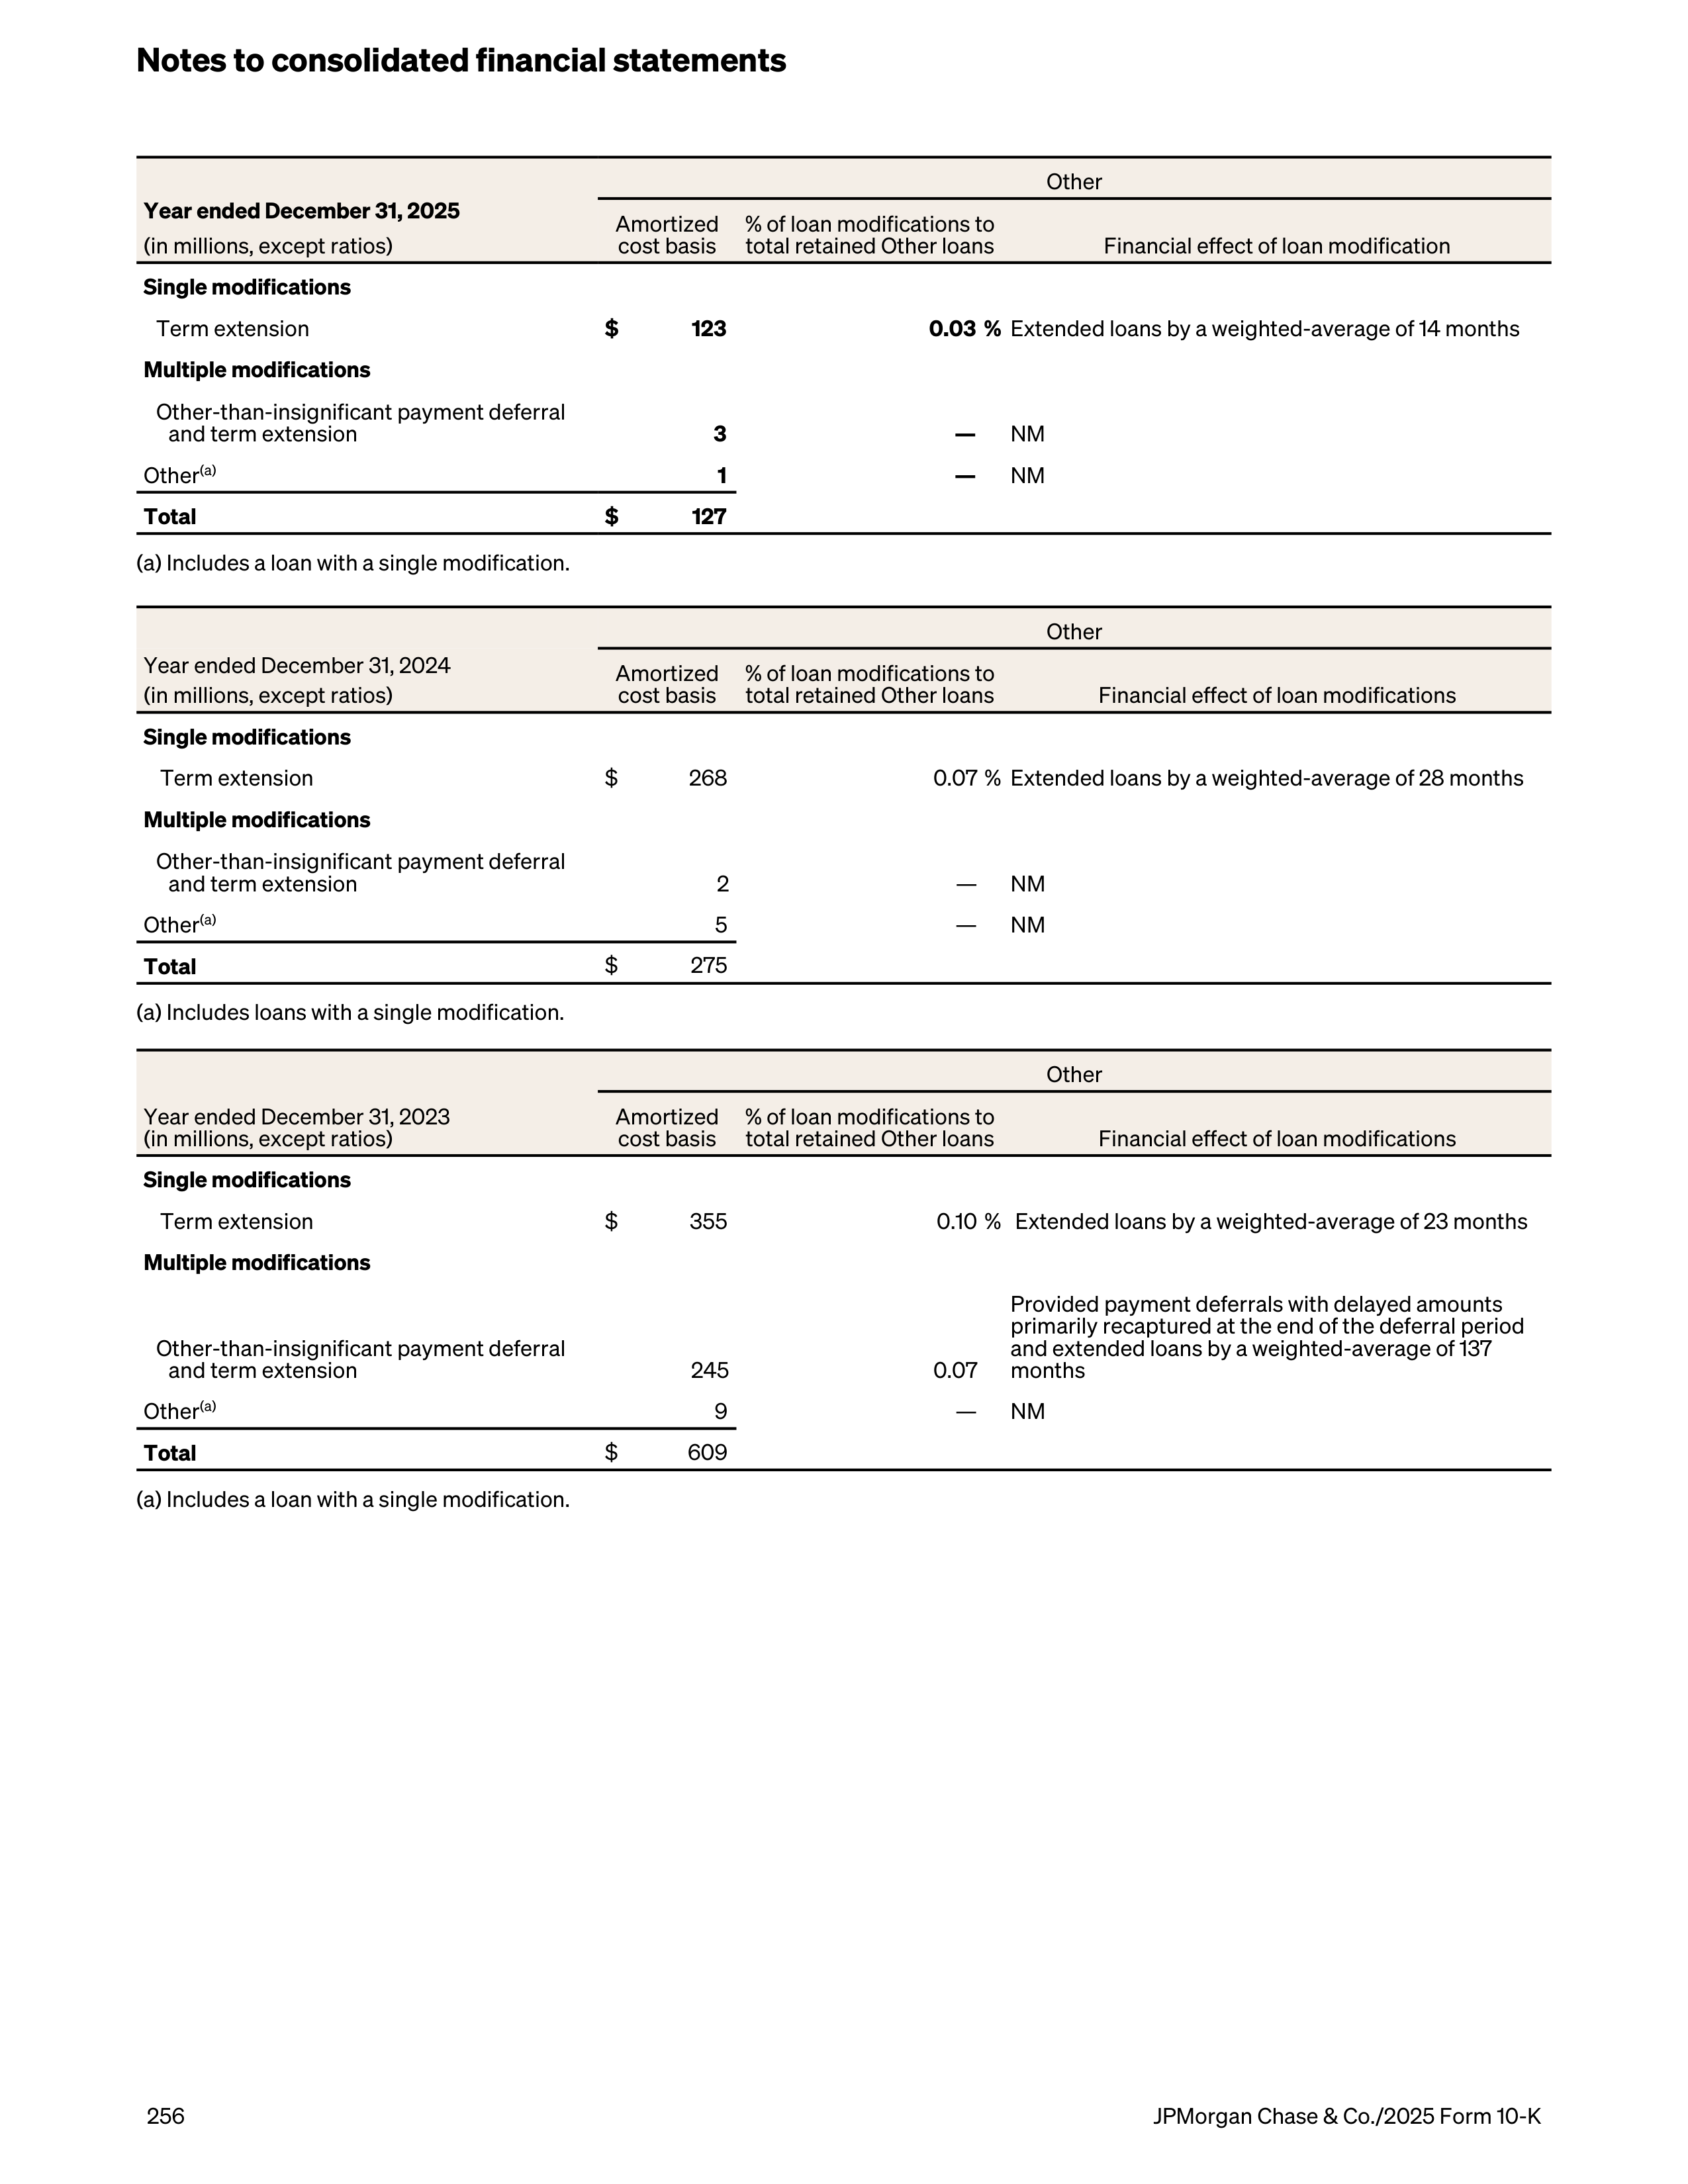
Other
Year ended December 31, 2025
(in millions, except ratios)
Amortized
cost basis
% of loan modifications to
total retained Other loans
Financial effect of loan modification
Single modifications
Term extension
$
123
0.03 %
Extended loans by a weighted-average of 14 months
Multiple modifications
Other-than-insignificant payment deferral
and term extension
3
—
NM
Other
(a)
1
—
NM
Total
$
127
(a) Includes a loan with a single modification.
Other
Year ended December 31, 2024
(in millions, except ratios)
Amortized
cost basis
% of loan modifications to
total retained Other loans
Financial effect of loan modifications
Single modifications
Term extension
$
268
0.07 %
Extended loans by a weighted-average of 28 months
Multiple modifications
Other-than-insignificant payment deferral
and term extension
2
—
NM
Other
(a)
5
—
NM
Total
$
275
(a) Includes loans with a single modification.
Other
Year ended December 31, 2023
(in millions, except ratios)
Amortized
cost basis
% of loan modifications to
total retained Other loans
Financial effect of loan modifications
Single modifications
Term extension
$
355
0.10 % Extended loans by a weighted-average of 23 months
Multiple modifications
Other-than-insignificant payment deferral
and term extension
245
0.07
Provided payment deferrals with delayed amounts
primarily recaptured at the end of the deferral period
and extended loans by a weighted-average of 137
months
Other
(a)
9
—
NM
Total
$
609
(a) Includes a loan with a single modification.
Notes to consolidated financial statements
256
JPMorgan Chase & Co./2025 Form 10-K
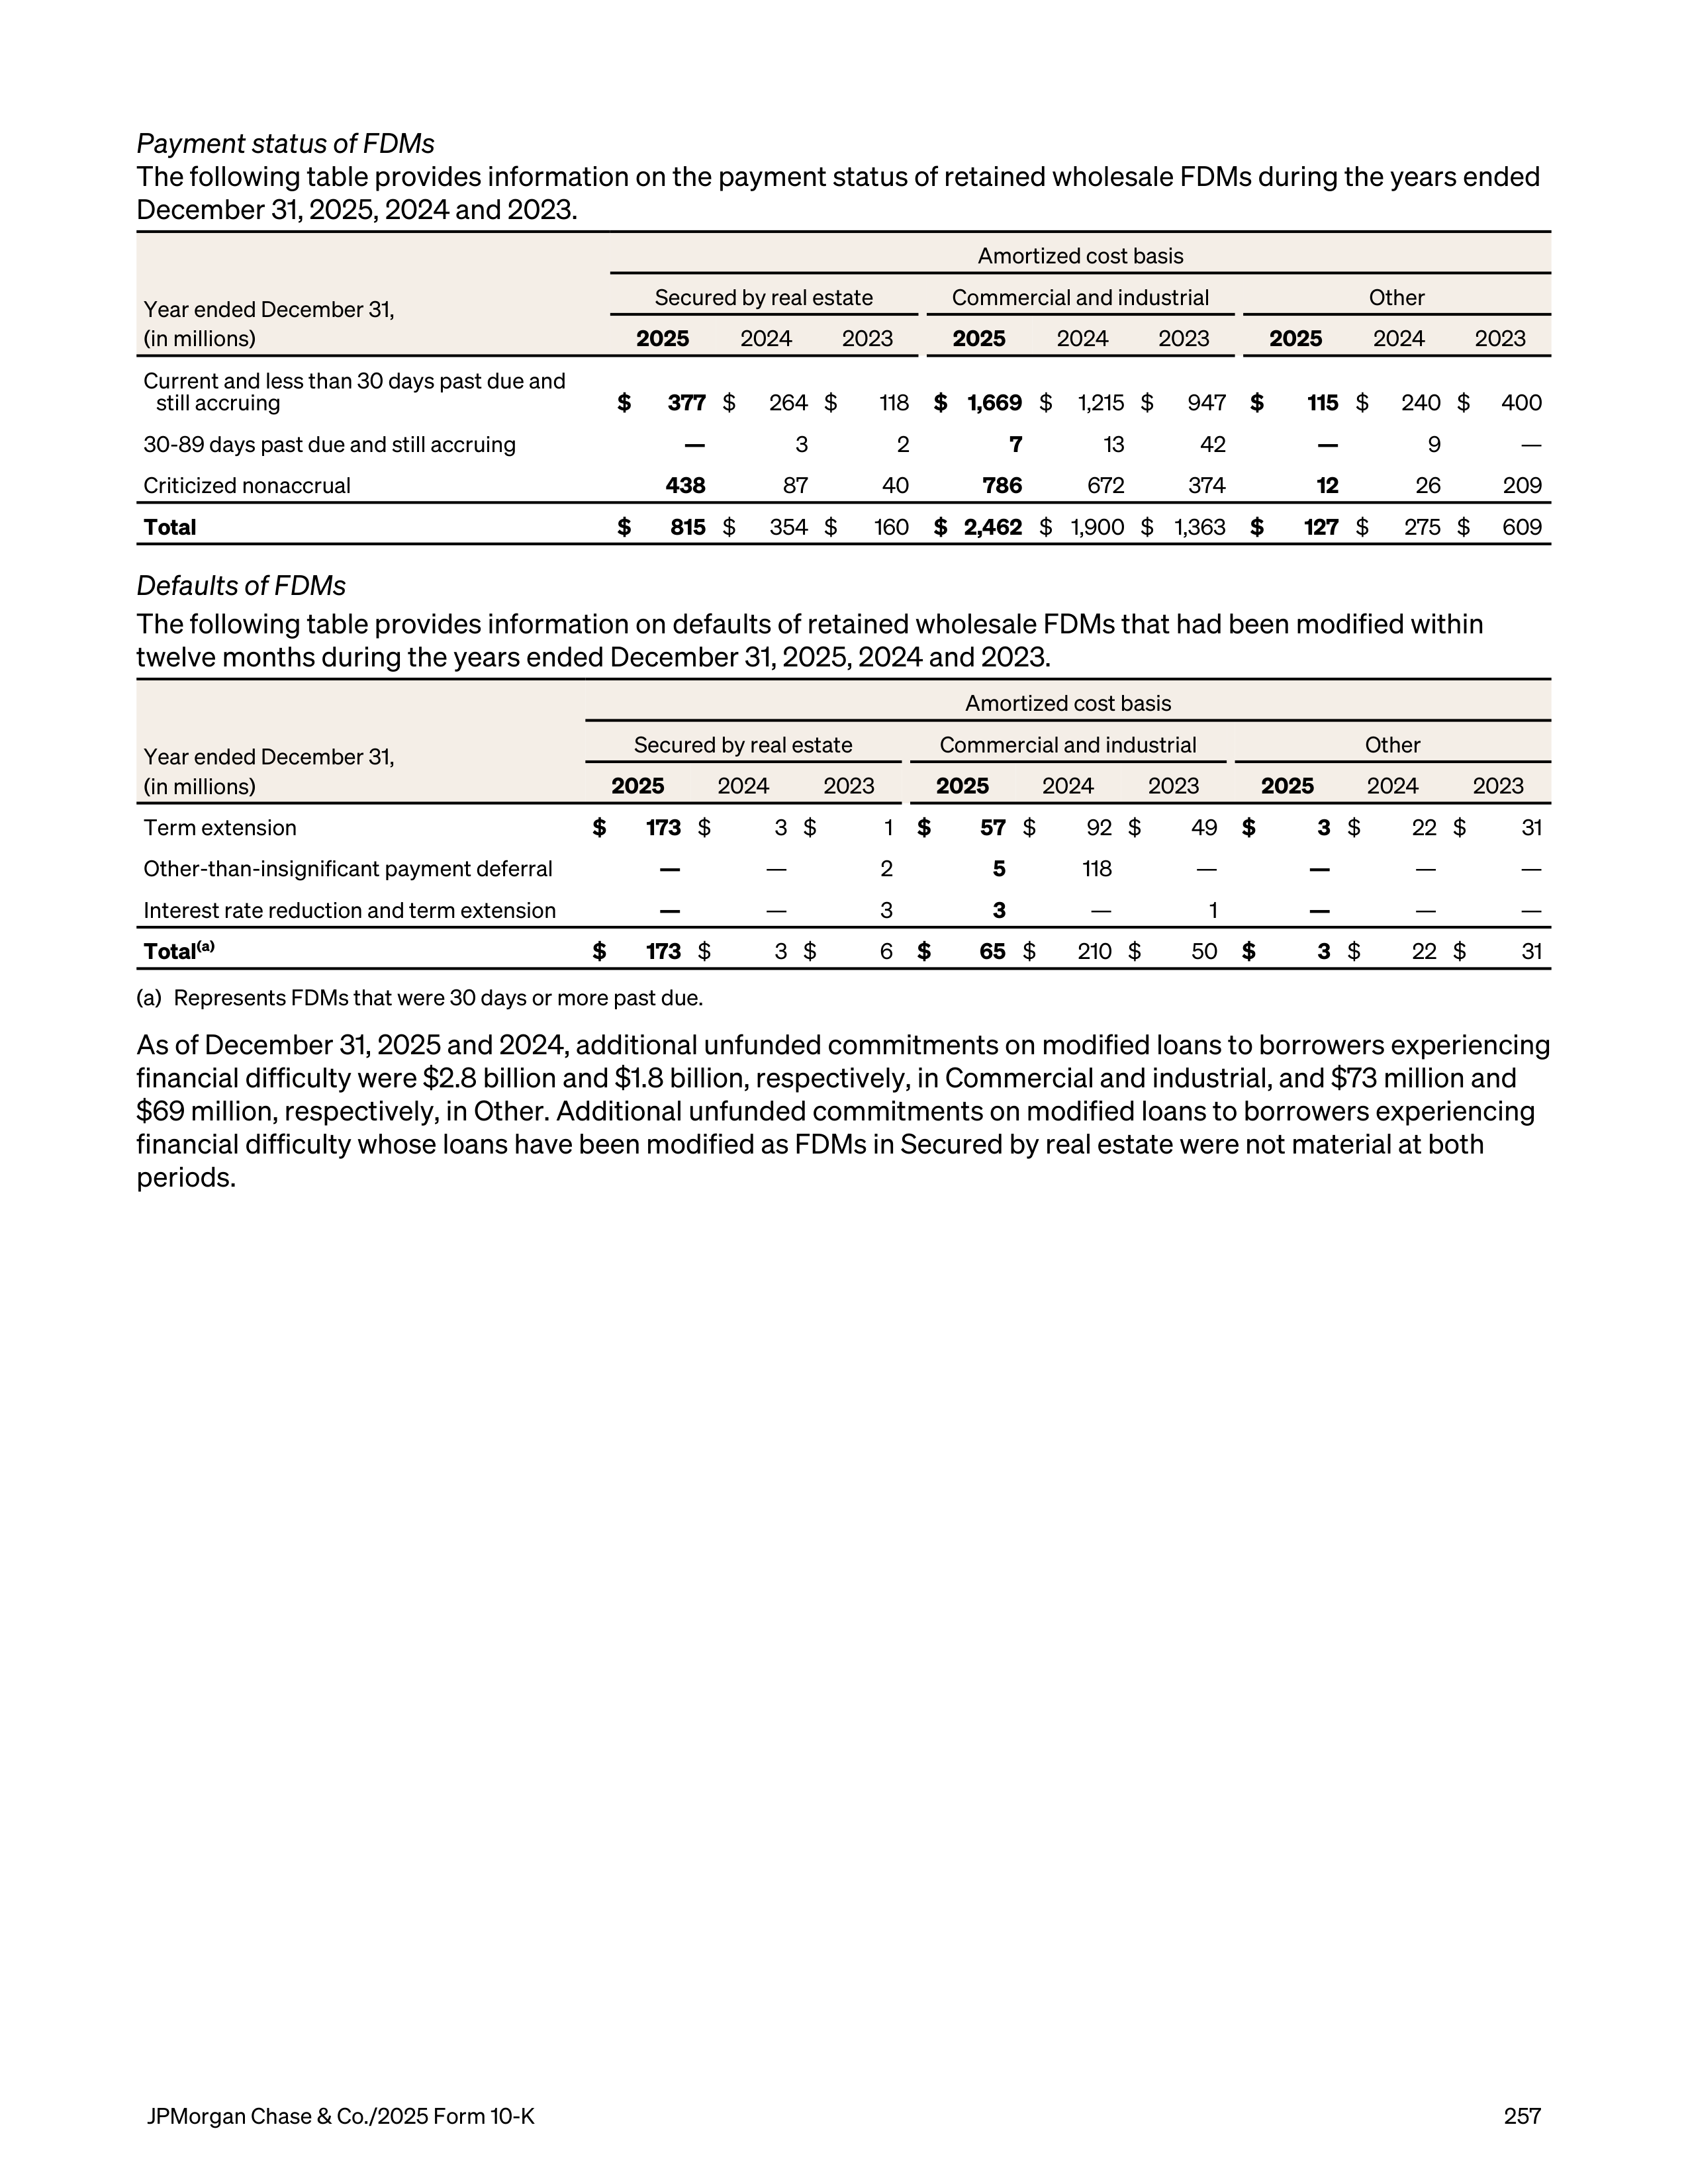
Payment status of FDMs
The following table provides information on the payment status of retained wholesale FDMs during the years ended
December 31, 2025, 2024 and 2023.
Year ended December 31,
(in millions)
Amortized cost basis
Secured by real estate
Commercial and industrial
Other
2025
2024
2023
2025
2024
2023
2025
2024
2023
Current and less than 30 days past due and
still accruing
$
377
$
264 $
118
$ 1,669
$
1,215 $
947
$
115
$
240 $
400
30-89 days past due and still accruing
—
3
2
7
13
42
—
9
—
Criticized nonaccrual
438
87
40
786
672
374
12
26
209
Total
$
815
$
354 $
160
$ 2,462
$ 1,900 $ 1,363
$
127
$
275 $
609
Defaults of FDMs
The following table provides information on defaults of retained wholesale FDMs that had been modified within
twelve months during the years ended December 31, 2025, 2024 and 2023.
Year ended December 31,
(in millions)
Amortized cost basis
Secured by real estate
Commercial and industrial
Other
2025
2024
2023
2025
2024
2023
2025
2024
2023
Term extension
$
173
$
3 $
1
$
57
$
92 $
49
$
3
$
22 $
31
Other-than-insignificant payment deferral
—
—
2
5
118
—
—
—
—
Interest rate reduction and term extension
—
—
3
3
—
1
—
—
—
Total
(a)
$
173
$
3 $
6
$
65
$
210 $
50
$
3
$
22 $
31
(a)
Represents FDMs that were 30 days or more past due.
As of December 31, 2025 and 2024, additional unfunded commitments on modified loans to borrowers experiencing
financial difficulty were $2.8 billion and $1.8 billion, respectively, in Commercial and industrial, and $73 million and
$69 million, respectively, in Other. Additional unfunded commitments on modified loans to borrowers experiencing
financial difficulty whose loans have been modified as FDMs in Secured by real estate were not material at both
periods.
JPMorgan Chase & Co./2025 Form 10-K
257
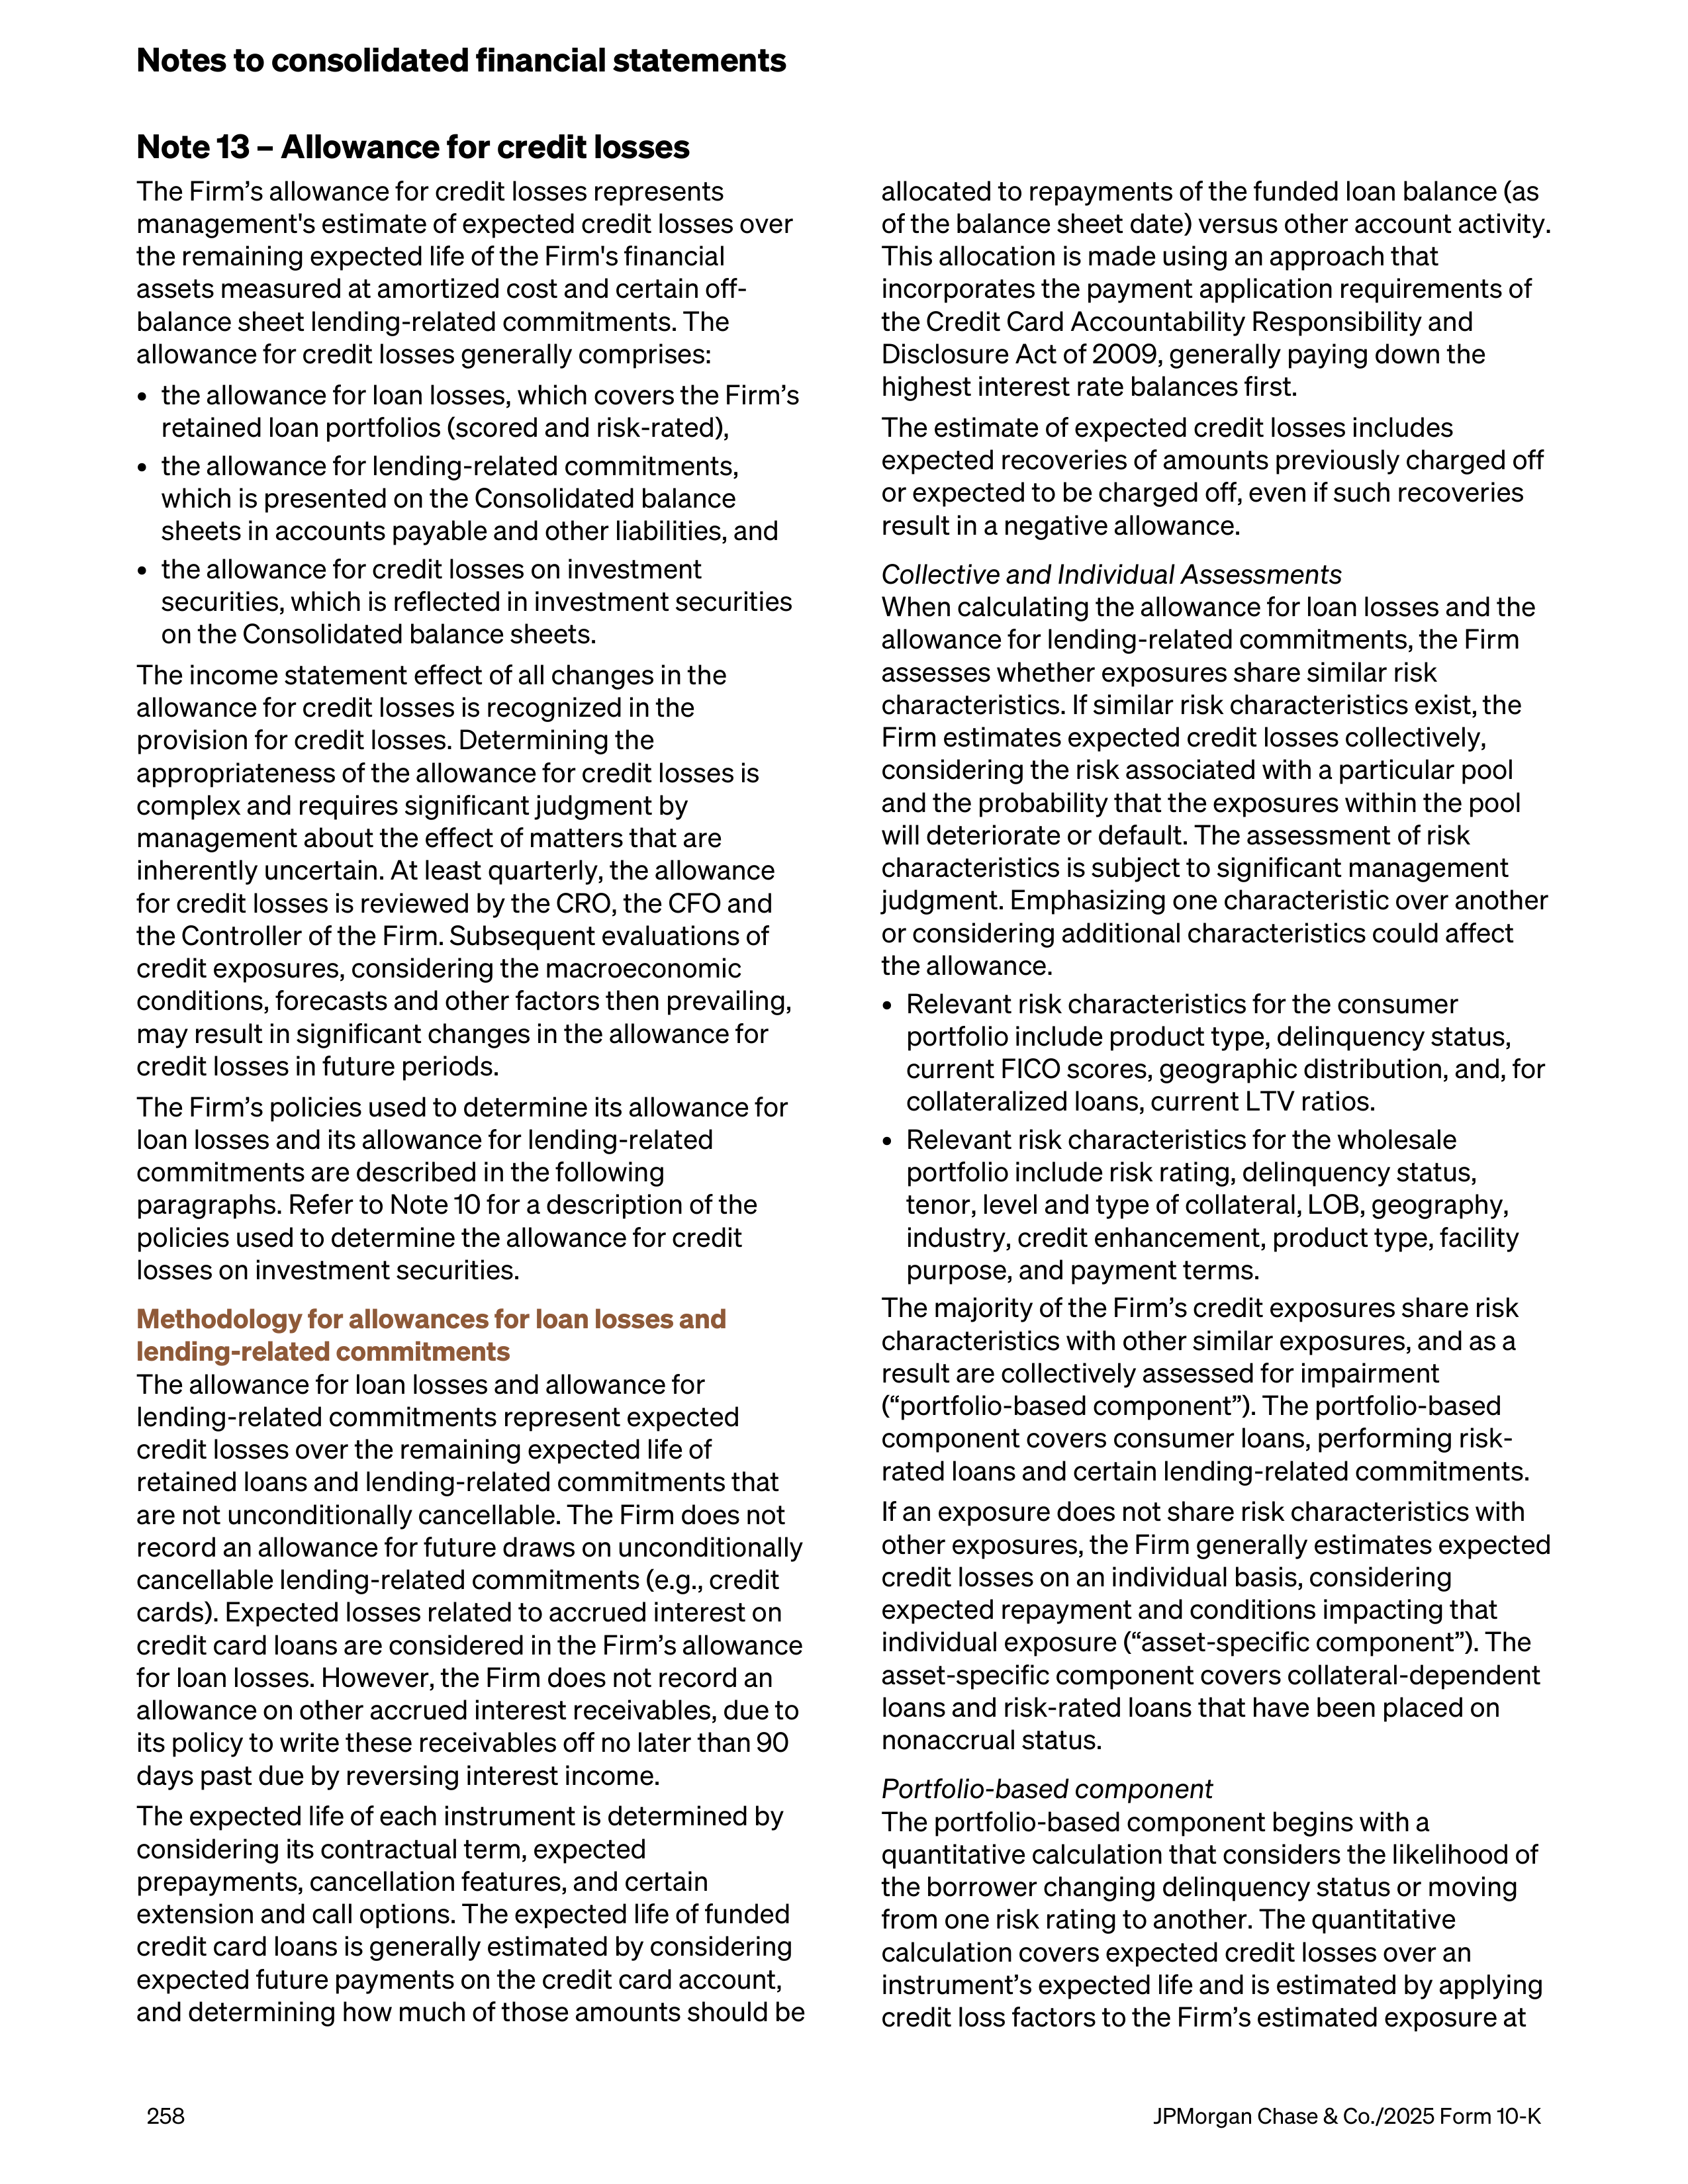
Note 13 – Allowance for credit losses
The Firm’s allowance for credit losses represents
management's estimate of expected credit losses over
the remaining expected life of the Firm's financial
assets measured at amortized cost and certain off-
balance sheet lending-related commitments. The
allowance for credit losses generally comprises:
•
the allowance for loan losses, which covers the Firm’s
retained loan portfolios (scored and risk-rated),
•
the allowance for lending-related commitments,
which is presented on the Consolidated balance
sheets in accounts payable and other liabilities, and
•
the allowance for credit losses on investment
securities, which is reflected in investment securities
on the Consolidated balance sheets.
The income statement effect of all changes in the
allowance for credit losses is recognized in the
provision for credit losses. Determining the
appropriateness of the allowance for credit losses is
complex and requires significant judgment by
management about the effect of matters that are
inherently uncertain. At least quarterly, the allowance
for credit losses is reviewed by the CRO, the CFO and
the Controller of the Firm. Subsequent evaluations of
credit exposures, considering the macroeconomic
conditions, forecasts and other factors then prevailing,
may result in significant changes in the allowance for
credit losses in future periods.
The Firm’s policies used to determine its allowance for
loan losses and its allowance for lending-related
commitments are described in the following
paragraphs. Refer to Note 10 for a description of the
policies used to determine the allowance for credit
losses on investment securities.
Methodology for allowances for loan losses and
lending-related commitments
The allowance for loan losses and allowance for
lending-related commitments represent expected
credit losses over the remaining expected life of
retained loans and lending-related commitments that
are not unconditionally cancellable. The Firm does not
record an allowance for future draws on unconditionally
cancellable lending-related commitments (e.g., credit
cards). Expected losses related to accrued interest on
credit card loans are considered in the Firm’s allowance
for loan losses. However, the Firm does not record an
allowance on other accrued interest receivables, due to
its policy to write these receivables off no later than 90
days past due by reversing interest income.
The expected life of each instrument is determined by
considering its contractual term, expected
prepayments, cancellation features, and certain
extension and call options. The expected life of funded
credit card loans is generally estimated by considering
expected future payments on the credit card account,
and determining how much of those amounts should be
allocated to repayments of the funded loan balance (as
of the balance sheet date) versus other account activity.
This allocation is made using an approach that
incorporates the payment application requirements of
the Credit Card Accountability Responsibility and
Disclosure Act of 2009, generally paying down the
highest interest rate balances first.
The estimate of expected credit losses includes
expected recoveries of amounts previously charged off
or expected to be charged off, even if such recoveries
result in a negative allowance.
Collective and Individual Assessments
When calculating the allowance for loan losses and the
allowance for lending-related commitments, the Firm
assesses whether exposures share similar risk
characteristics. If similar risk characteristics exist, the
Firm estimates expected credit losses collectively,
considering the risk associated with a particular pool
and the probability that the exposures within the pool
will deteriorate or default. The assessment of risk
characteristics is subject to significant management
judgment. Emphasizing one characteristic over another
or considering additional characteristics could affect
the allowance.
•
Relevant risk characteristics for the consumer
portfolio include product type, delinquency status,
current FICO scores, geographic distribution, and, for
collateralized loans, current LTV ratios.
•
Relevant risk characteristics for the wholesale
portfolio include risk rating, delinquency status,
tenor, level and type of collateral, LOB, geography,
industry, credit enhancement, product type, facility
purpose, and payment terms.
The majority of the Firm’s credit exposures share risk
characteristics with other similar exposures, and as a
result are collectively assessed for impairment
(“portfolio-based component”). The portfolio-based
component covers consumer loans, performing risk-
rated loans and certain lending-related commitments.
If an exposure does not share risk characteristics with
other exposures, the Firm generally estimates expected
credit losses on an individual basis, considering
expected repayment and conditions impacting that
individual exposure (“asset-specific component”). The
asset-specific component covers collateral-dependent
loans and risk-rated loans that have been placed on
nonaccrual status.
Portfolio-based component
The portfolio-based component begins with a
quantitative calculation that considers the likelihood of
the borrower changing delinquency status or moving
from one risk rating to another. The quantitative
calculation covers expected credit losses over an
instrument’s expected life and is estimated by applying
credit loss factors to the Firm’s estimated exposure at
Notes to consolidated financial statements
258
JPMorgan Chase & Co./2025 Form 10-K
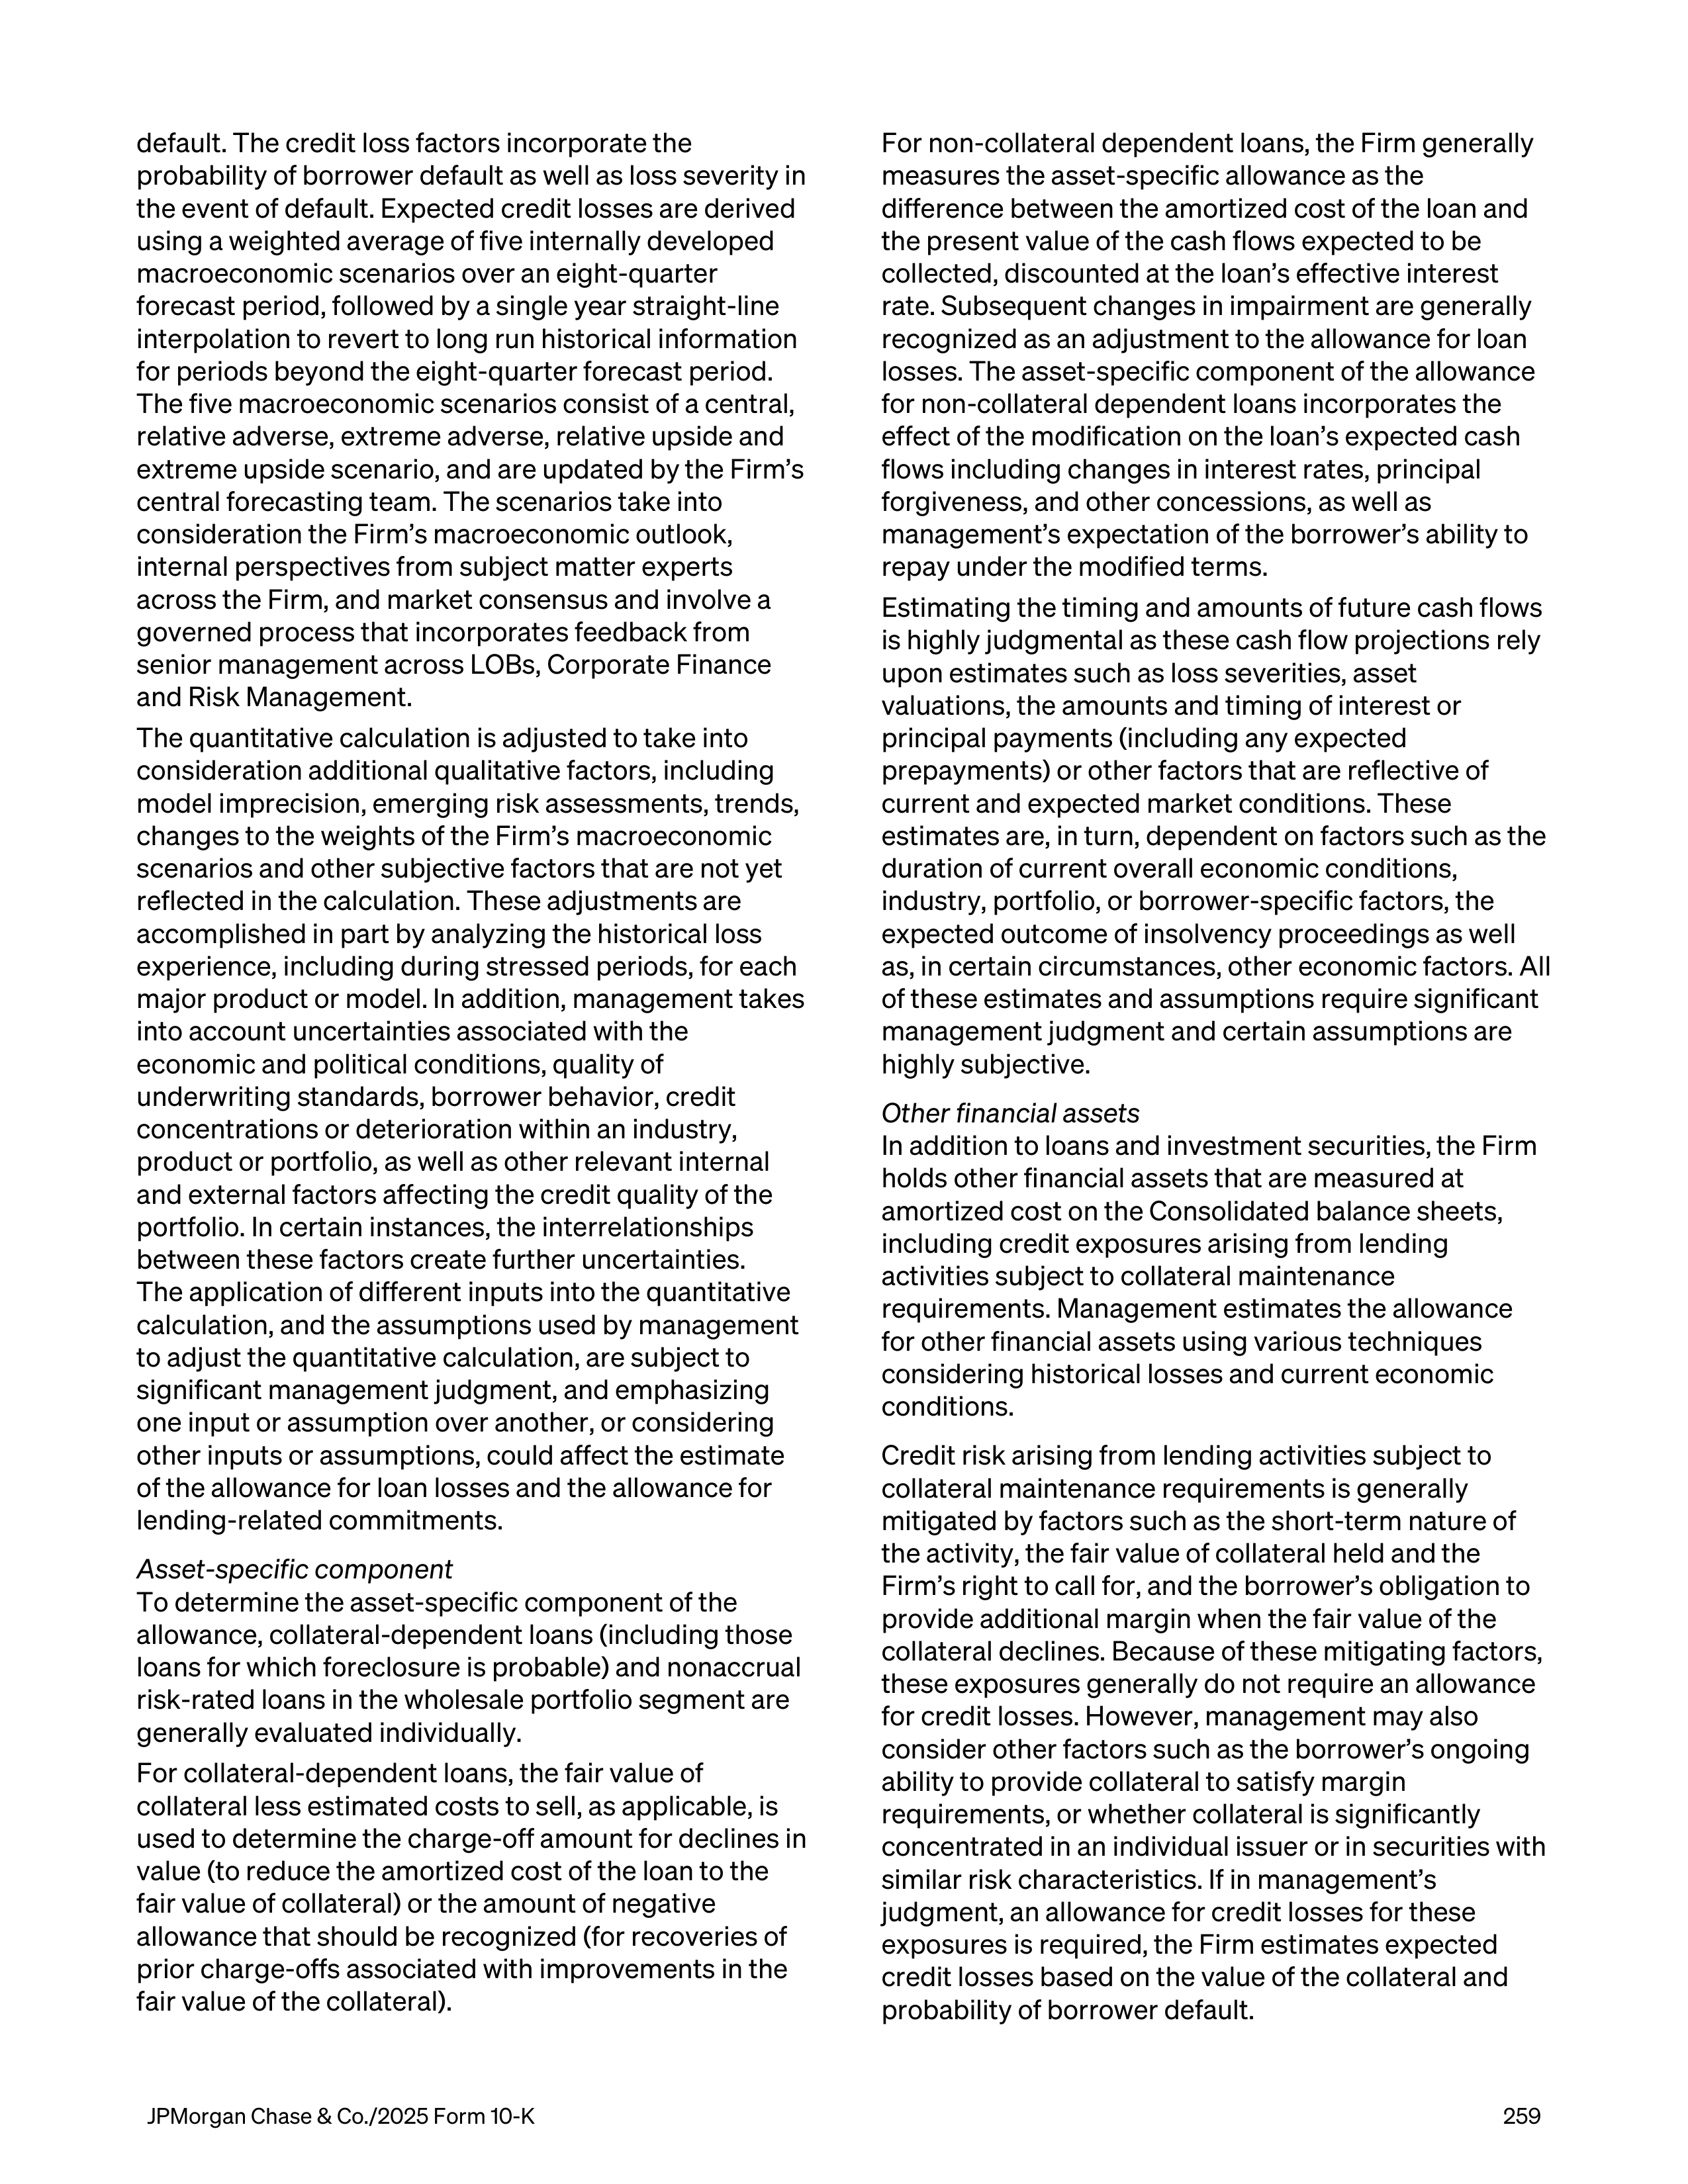
default. The credit loss factors incorporate the
probability of borrower default as well as loss severity in
the event of default. Expected credit losses are derived
using a weighted average of five internally developed
macroeconomic scenarios over an eight-quarter
forecast period, followed by a single year straight-line
interpolation to revert to long run historical information
for periods beyond the eight-quarter forecast period.
The five macroeconomic scenarios consist of a central,
relative adverse, extreme adverse, relative upside and
extreme upside scenario, and are updated by the Firm’s
central forecasting team. The scenarios take into
consideration the Firm’s macroeconomic outlook,
internal perspectives from subject matter experts
across the Firm, and market consensus and involve a
governed process that incorporates feedback from
senior management across LOBs, Corporate Finance
and Risk Management.
The quantitative calculation is adjusted to take into
consideration additional qualitative factors, including
model imprecision, emerging risk assessments, trends,
changes to the weights of the Firm’s macroeconomic
scenarios and other subjective factors that are not yet
reflected in the calculation. These adjustments are
accomplished in part by analyzing the historical loss
experience, including during stressed periods, for each
major product or model. In addition, management takes
into account uncertainties associated with the
economic and political conditions, quality of
underwriting standards, borrower behavior, credit
concentrations or deterioration within an industry,
product or portfolio, as well as other relevant internal
and external factors affecting the credit quality of the
portfolio. In certain instances, the interrelationships
between these factors create further uncertainties.
The application of different inputs into the quantitative
calculation, and the assumptions used by management
to adjust the quantitative calculation, are subject to
significant management judgment, and emphasizing
one input or assumption over another, or considering
other inputs or assumptions, could affect the estimate
of the allowance for loan losses and the allowance for
lending-related commitments.
Asset-specific component
To determine the asset-specific component of the
allowance, collateral-dependent loans (including those
loans for which foreclosure is probable) and nonaccrual
risk-rated loans in the wholesale portfolio segment are
generally evaluated individually.
For collateral-dependent loans, the fair value of
collateral less estimated costs to sell, as applicable, is
used to determine the charge-off amount for declines in
value (to reduce the amortized cost of the loan to the
fair value of collateral) or the amount of negative
allowance that should be recognized (for recoveries of
prior charge-offs associated with improvements in the
fair value of the collateral).
For non-collateral dependent loans, the Firm generally
measures the asset-specific allowance as the
difference between the amortized cost of the loan and
the present value of the cash flows expected to be
collected, discounted at the loan’s effective interest
rate. Subsequent changes in impairment are generally
recognized as an adjustment to the allowance for loan
losses. The asset-specific component of the allowance
for non-collateral dependent loans incorporates the
effect of the modification on the loan’s expected cash
flows including changes in interest rates, principal
forgiveness, and other concessions, as well as
management’s expectation of the borrower’s ability to
repay under the modified terms.
Estimating the timing and amounts of future cash flows
is highly judgmental as these cash flow projections rely
upon estimates such as loss severities, asset
valuations, the amounts and timing of interest or
principal payments (including any expected
prepayments) or other factors that are reflective of
current and expected market conditions. These
estimates are, in turn, dependent on factors such as the
duration of current overall economic conditions,
industry, portfolio, or borrower-specific factors, the
expected outcome of insolvency proceedings as well
as, in certain circumstances, other economic factors. All
of these estimates and assumptions require significant
management judgment and certain assumptions are
highly subjective.
Other financial assets
In addition to loans and investment securities, the Firm
holds other financial assets that are measured at
amortized cost on the Consolidated balance sheets,
including credit exposures arising from lending
activities subject to collateral maintenance
requirements. Management estimates the allowance
for other financial assets using various techniques
considering historical losses and current economic
conditions.
Credit risk arising from lending activities subject to
collateral maintenance requirements is generally
mitigated by factors such as the short-term nature of
the activity, the fair value of collateral held and the
Firm’s right to call for, and the borrower’s obligation to
provide additional margin when the fair value of the
collateral declines. Because of these mitigating factors,
these exposures generally do not require an allowance
for credit losses. However, management may also
consider other factors such as the borrower’s ongoing
ability to provide collateral to satisfy margin
requirements, or whether collateral is significantly
concentrated in an individual issuer or in securities with
similar risk characteristics. If in management’s
judgment, an allowance for credit losses for these
exposures is required, the Firm estimates expected
credit losses based on the value of the collateral and
probability of borrower default.
JPMorgan Chase & Co./2025 Form 10-K
259
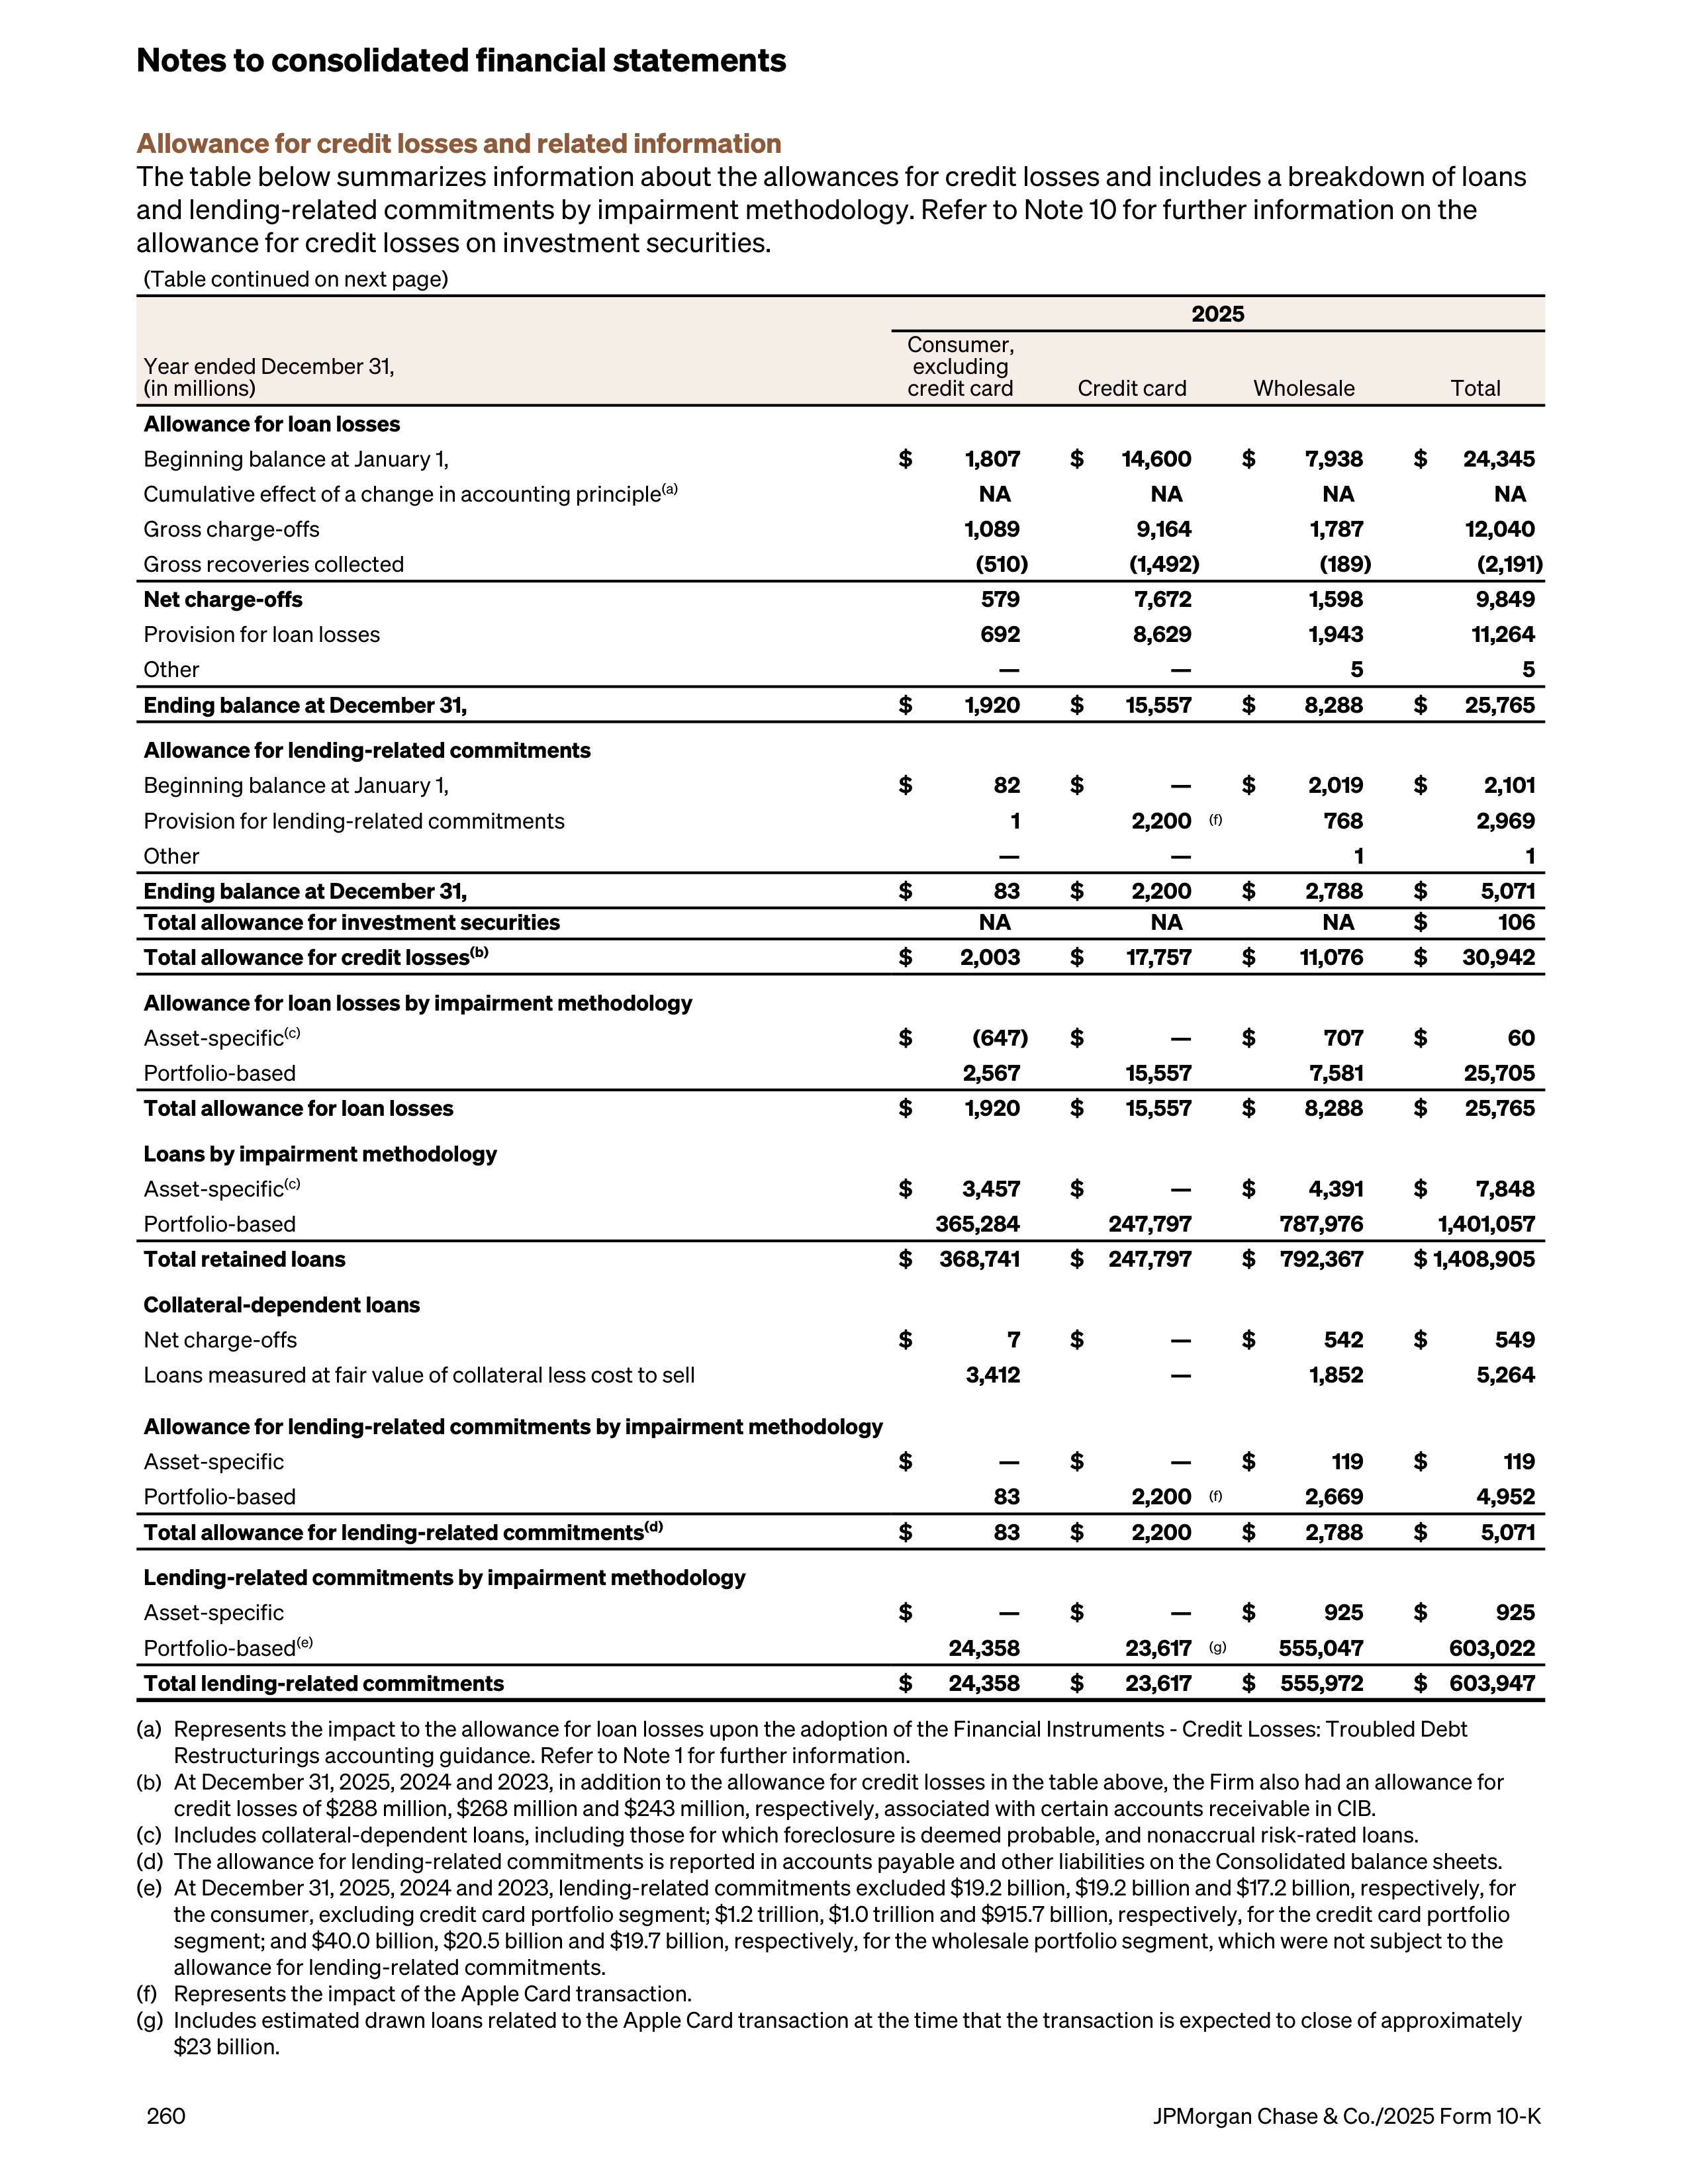
Allowance for credit losses and related information
The table below summarizes information about the allowances for credit losses and includes a breakdown of loans
and lending-related commitments by impairment methodology. Refer to Note 10 for further information on the
allowance for credit losses on investment securities.
(Table continued on next page)
2025
Year ended December 31,
(in millions)
Consumer,
excluding
credit card
Credit card
Wholesale
Total
Allowance for loan losses
Beginning balance at January 1,
$
1,807
$
14,600
$
7,938
$
24,345
Cumulative effect of a change in accounting principle
(a)
NA
NA
NA
NA
Gross charge-offs
1,089
9,164
1,787
12,040
Gross recoveries collected
(510)
(1,492)
(189)
(2,191)
Net charge-offs
579
7,672
1,598
9,849
Provision for loan losses
692
8,629
1,943
11,264
Other
—
—
5
5
Ending balance at December 31,
$
1,920
$
15,557
$
8,288
$
25,765
Allowance for lending-related commitments
Beginning balance at January 1,
$
82
$
—
$
2,019
$
2,101
Provision for lending-related commitments
1
2,200
(f)
768
2,969
Other
—
—
1
1
Ending balance at December 31,
$
83
$
2,200
$
2,788
$
5,071
Total allowance for investment securities
NA
NA
NA
$
106
Total allowance for credit losses
(b)
$
2,003
$
17,757
$
11,076
$
30,942
Allowance for loan losses by impairment methodology
Asset-specific
(c)
$
(647)
$
—
$
707
$
60
Portfolio-based
2,567
15,557
7,581
25,705
Total allowance for loan losses
$
1,920
$
15,557
$
8,288
$
25,765
Loans by impairment methodology
Asset-specific
(c)
$
3,457
$
—
$
4,391
$
7,848
Portfolio-based
365,284
247,797
787,976
1,401,057
Total retained loans
$
368,741
$
247,797
$
792,367
$ 1,408,905
Collateral-dependent loans
Net charge-offs
$
7
$
—
$
542
$
549
Loans measured at fair value of collateral less cost to sell
3,412
—
1,852
5,264
Allowance for lending-related commitments by impairment methodology
Asset-specific
$
—
$
—
$
119
$
119
Portfolio-based
83
2,200
(f)
2,669
4,952
Total allowance for lending-related commitments
(d)
$
83
$
2,200
$
2,788
$
5,071
Lending-related commitments by impairment methodology
Asset-specific
$
—
$
—
$
925
$
925
Portfolio-based
(e)
24,358
23,617
(g)
555,047
603,022
Total lending-related commitments
$
24,358
$
23,617
$
555,972
$
603,947
(a)
Represents the impact to the allowance for loan losses upon the adoption of the Financial Instruments - Credit Losses: Troubled Debt
Restructurings accounting guidance. Refer to Note 1 for further information.
(b)
At December 31, 2025, 2024 and 2023, in addition to the allowance for credit losses in the table above, the Firm also had an allowance for
credit losses of $288 million, $268 million and $243 million, respectively, associated with certain accounts receivable in CIB.
(c)
Includes collateral-dependent loans, including those for which foreclosure is deemed probable, and nonaccrual risk-rated loans.
(d)
The allowance for lending-related commitments is reported in accounts payable and other liabilities on the Consolidated balance sheets.
(e)
At December 31, 2025, 2024 and 2023, lending-related commitments excluded $19.2 billion, $19.2 billion and $17.2 billion, respectively, for
the consumer, excluding credit card portfolio segment; $1.2 trillion, $1.0 trillion and $915.7 billion, respectively, for the credit card portfolio
segment; and $40.0 billion, $20.5 billion and $19.7 billion, respectively, for the wholesale portfolio segment, which were not subject to the
allowance for lending-related commitments.
(f)
Represents the impact of the Apple Card transaction.
(g)
Includes estimated drawn loans related to the Apple Card transaction at the time that the transaction is expected to close of approximately
$23 billion.
Notes to consolidated financial statements
260
JPMorgan Chase & Co./2025 Form 10-K
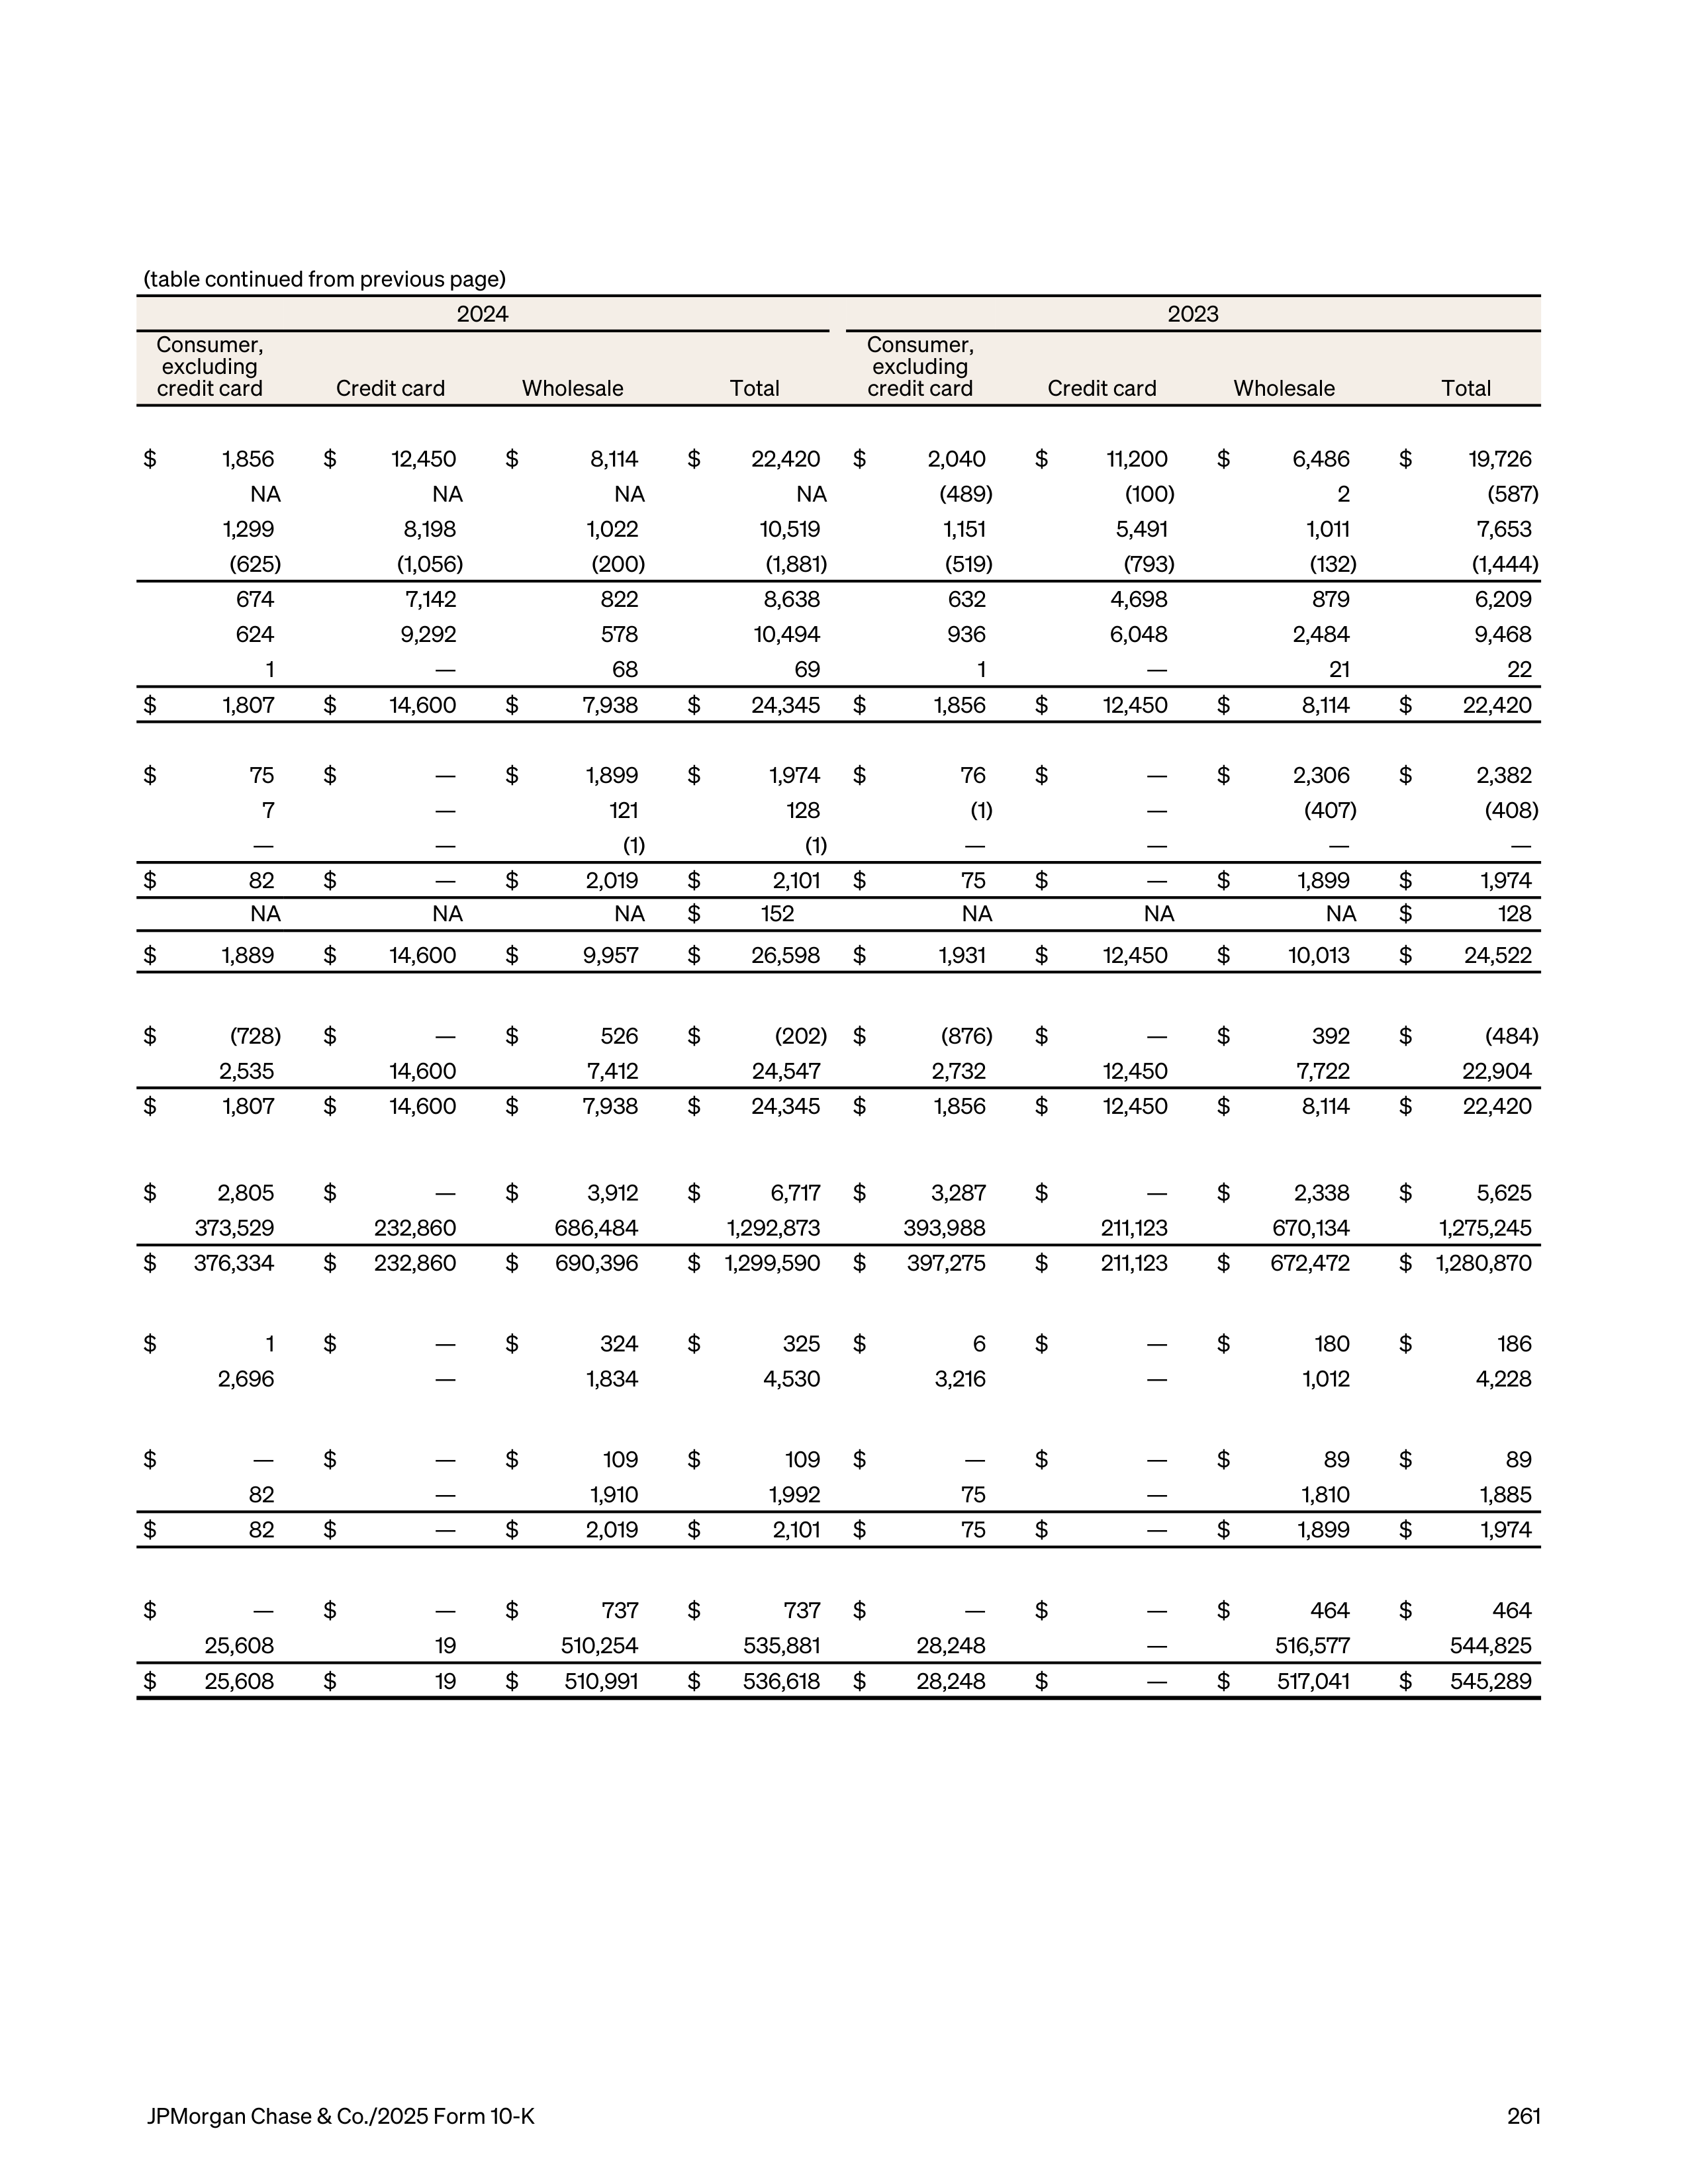
(table continued from previous page)
2024
2023
Consumer,
excluding
credit card
Credit card
Wholesale
Total
Consumer,
excluding
credit card
Credit card
Wholesale
Total
$
1,856
$
12,450
$
8,114
$
22,420
$
2,040
$
11,200
$
6,486
$
19,726
NA
NA
NA
NA
(489)
(100)
2
(587)
1,299
8,198
1,022
10,519
1,151
5,491
1,011
7,653
(625)
(1,056)
(200)
(1,881)
(519)
(793)
(132)
(1,444)
674
7,142
822
8,638
632
4,698
879
6,209
624
9,292
578
10,494
936
6,048
2,484
9,468
1
—
68
69
1
—
21
22
$
1,807
$
14,600
$
7,938
$
24,345
$
1,856
$
12,450
$
8,114
$
22,420
$
75
$
—
$
1,899
$
1,974
$
76
$
—
$
2,306
$
2,382
7
—
121
128
(1)
—
(407)
(408)
—
—
(1)
(1)
—
—
—
—
$
82
$
—
$
2,019
$
2,101
$
75
$
—
$
1,899
$
1,974
NA
NA
NA
$
152
NA
NA
NA
$
128
$
1,889
$
14,600
$
9,957
$
26,598
$
1,931
$
12,450
$
10,013
$
24,522
$
(728)
$
—
$
526
$
(202)
$
(876)
$
—
$
392
$
(484)
2,535
14,600
7,412
24,547
2,732
12,450
7,722
22,904
$
1,807
$
14,600
$
7,938
$
24,345
$
1,856
$
12,450
$
8,114
$
22,420
$
2,805
$
—
$
3,912
$
6,717
$
3,287
$
—
$
2,338
$
5,625
373,529
232,860
686,484
1,292,873
393,988
211,123
670,134
1,275,245
$
376,334
$
232,860
$
690,396
$
1,299,590
$
397,275
$
211,123
$
672,472
$
1,280,870
$
1
$
—
$
324
$
325
$
6
$
—
$
180
$
186
2,696
—
1,834
4,530
3,216
—
1,012
4,228
$
—
$
—
$
109
$
109
$
—
$
—
$
89
$
89
82
—
1,910
1,992
75
—
1,810
1,885
$
82
$
—
$
2,019
$
2,101
$
75
$
—
$
1,899
$
1,974
$
—
$
—
$
737
$
737
$
—
$
—
$
464
$
464
25,608
19
510,254
535,881
28,248
—
516,577
544,825
$
25,608
$
19
$
510,991
$
536,618
$
28,248
$
—
$
517,041
$
545,289
JPMorgan Chase & Co./2025 Form 10-K
261
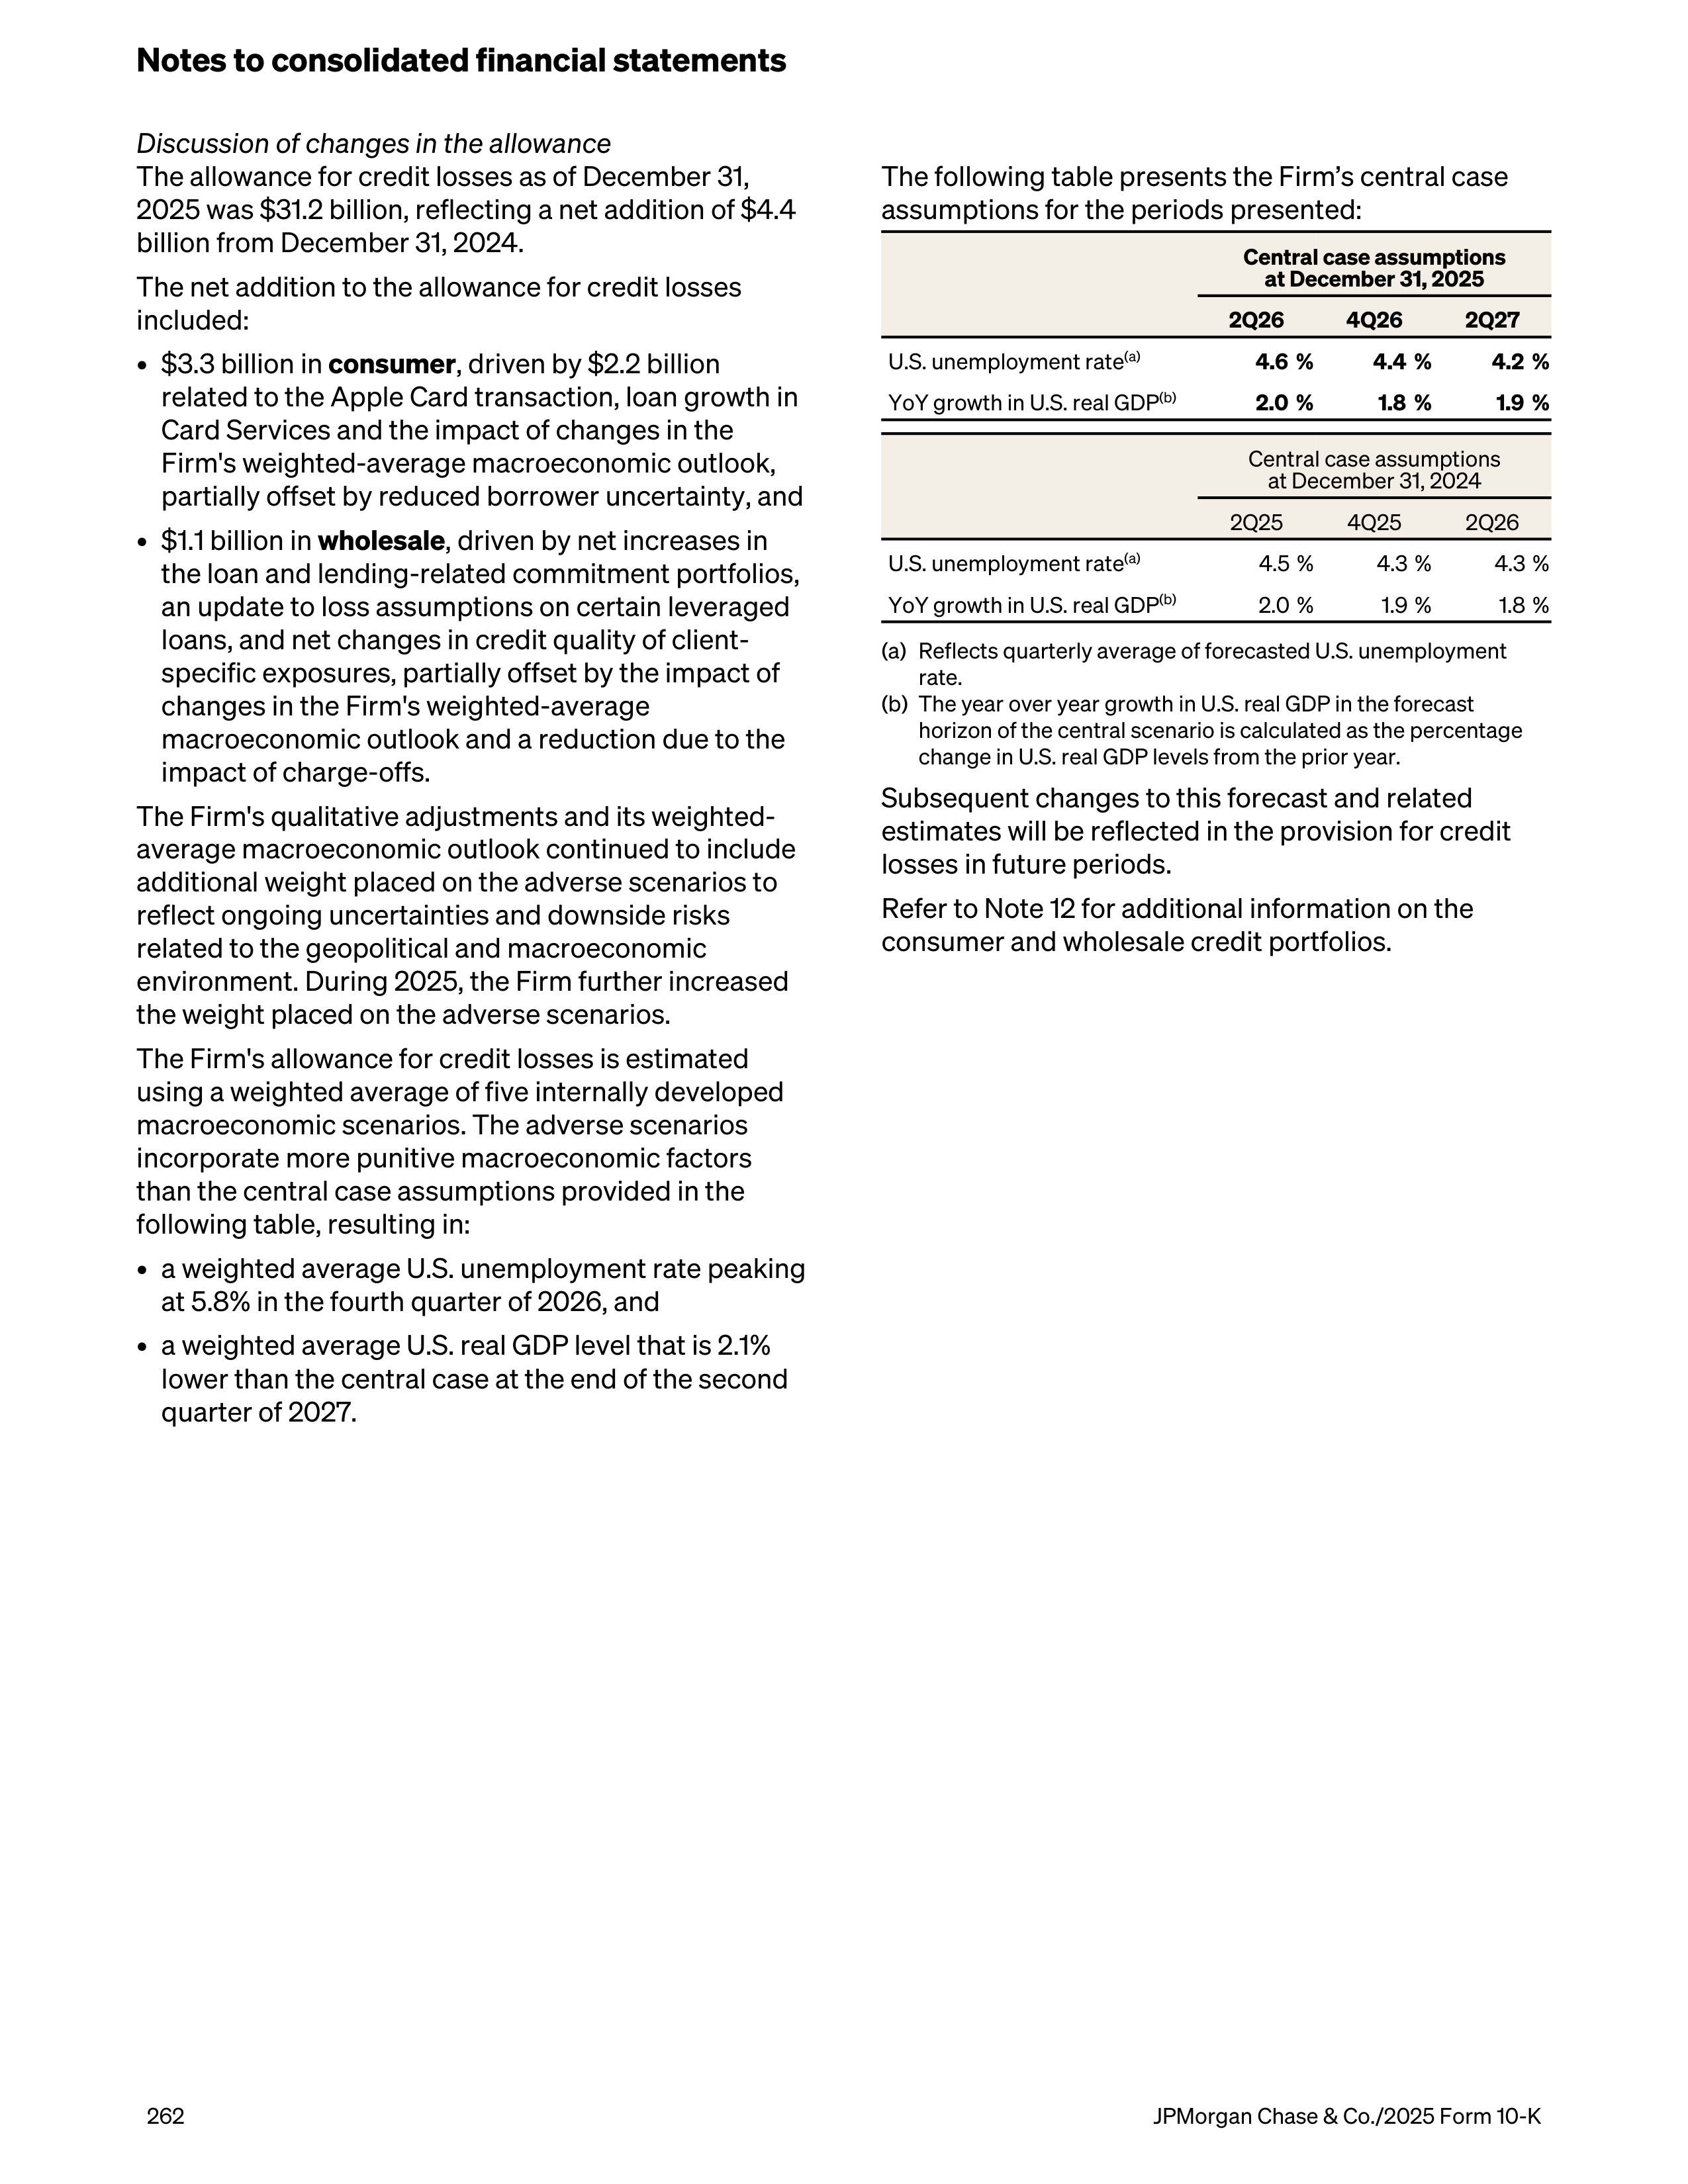
Discussion of changes in the allowance
The allowance for credit losses as of December 31,
2025 was $31.2 billion, reflecting a net addition of $4.4
billion from December 31, 2024.
The net addition to the allowance for credit losses
included:
•
$3.3 billion in
consumer
, driven by $2.2 billion
related to the Apple Card transaction, loan growth in
Card Services and the impact of changes in the
Firm's weighted-average macroeconomic outlook,
partially offset by reduced borrower uncertainty, and
•
$1.1 billion in
wholesale
, driven by net increases in
the loan and lending-related commitment portfolios,
an update to loss assumptions on certain leveraged
loans, and net changes in credit quality of client-
specific exposures, partially offset by the impact of
changes in the Firm's weighted-average
macroeconomic outlook and a reduction due to the
impact of charge-offs.
The Firm's qualitative adjustments and its weighted-
average macroeconomic outlook continued to include
additional weight placed on the adverse scenarios to
reflect ongoing uncertainties and downside risks
related to the geopolitical and macroeconomic
environment. During 2025, the Firm further increased
the weight placed on the adverse scenarios.
The Firm's allowance for credit losses is estimated
using a weighted average of five internally developed
macroeconomic scenarios. The adverse scenarios
incorporate more punitive macroeconomic factors
than the central case assumptions provided in the
following table, resulting in:
•
a weighted average U.S. unemployment rate peaking
at 5.8% in the fourth quarter of 2026, and
•
a weighted average U.S. real GDP level that is 2.1%
lower than the central case at the end of the second
quarter of 2027.
The following table presents the Firm’s central case
assumptions for the periods presented:
Central case assumptions
at December 31, 2025
2Q26
4Q26
2Q27
U.S. unemployment rate
(a)
4.6 %
4.4 %
4.2 %
YoY growth in U.S. real GDP
(b)
2.0 %
1.8 %
1.9 %
Central case assumptions
at December 31, 2024
2Q25
4Q25
2Q26
U.S. unemployment rate
(a)
4.5 %
4.3 %
4.3 %
YoY growth in U.S. real GDP
(b)
2.0 %
1.9 %
1.8 %
(a)
Reflects quarterly average of forecasted U.S. unemployment
rate.
(b)
The year over year growth in U.S. real GDP in the forecast
horizon of the central scenario is calculated as the percentage
change in U.S. real GDP levels from the prior year.
Subsequent changes to this forecast and related
estimates will be reflected in the provision for credit
losses in future periods.
Refer to Note 12 for additional information on the
consumer and wholesale credit portfolios.
Notes to consolidated financial statements
262
JPMorgan Chase & Co./2025 Form 10-K
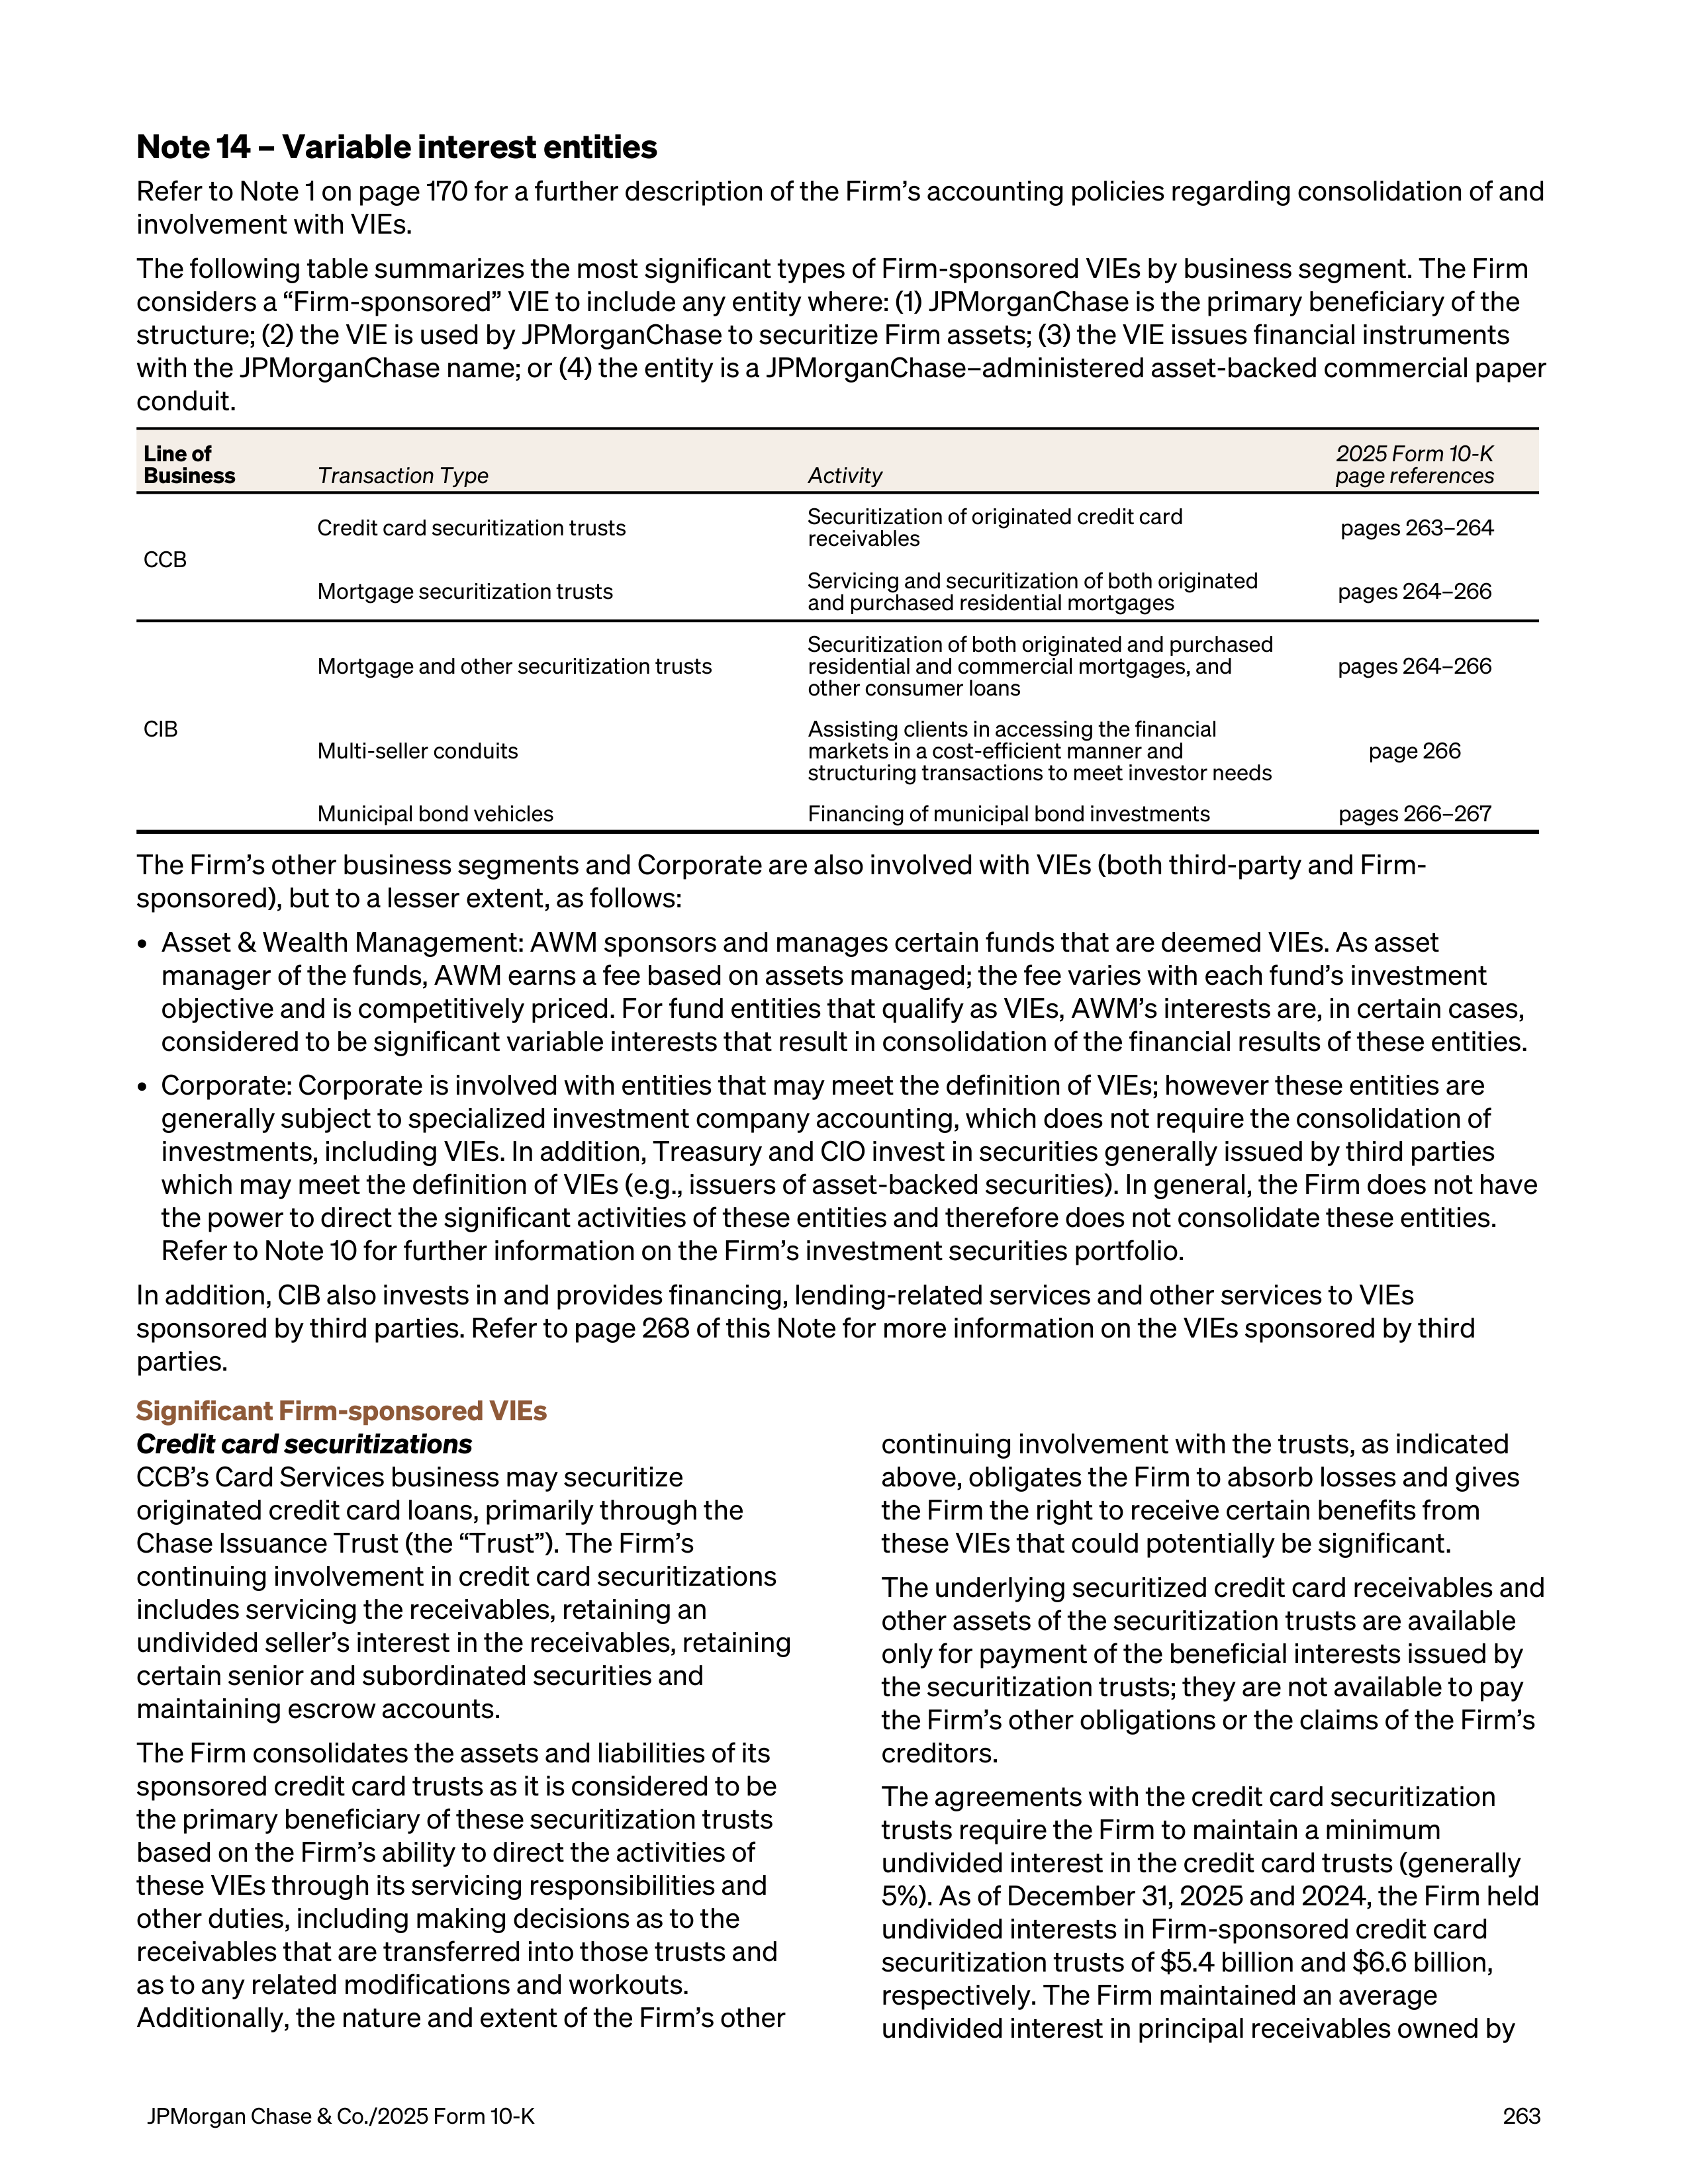
Note 14 – Variable interest entities
Refer to Note 1 on page 170 for a further description of the Firm’s accounting policies regarding consolidation of and
involvement with VIEs.
The following table summarizes the most significant types of Firm-sponsored VIEs by business segment. The Firm
considers a “Firm-sponsored” VIE to include any entity where: (1) JPMorganChase is the primary beneficiary of the
structure; (2) the VIE is used by JPMorganChase to securitize Firm assets; (3) the VIE issues financial instruments
with the JPMorganChase name; or (4) the entity is a JPMorganChase–administered asset-backed commercial paper
conduit.
Line of
Business
Transaction Type
Activity
2025 Form 10-K
page references
CCB
Credit card securitization trusts
Securitization of originated credit card
receivables
pages 263–264
Mortgage securitization trusts
Servicing and securitization of both originated
and purchased residential mortgages
pages 264–266
CIB
Mortgage and other securitization trusts
Securitization of both originated and purchased
residential and commercial mortgages, and
other consumer loans
pages 264–266
Multi-seller conduits
Assisting clients in accessing the financial
markets in a cost-efficient manner and
structuring transactions to meet investor needs
page 266
Municipal bond vehicles
Financing of municipal bond investments
pages 266–267
The Firm’s other business segments and Corporate are also involved with VIEs (both third-party and Firm-
sponsored), but to a lesser extent, as follows:
•
Asset & Wealth Management: AWM sponsors and manages certain funds that are deemed VIEs. As asset
manager of the funds, AWM earns a fee based on assets managed; the fee varies with each fund’s investment
objective and is competitively priced. For fund entities that qualify as VIEs, AWM’s interests are, in certain cases,
considered to be significant variable interests that result in consolidation of the financial results of these entities.
•
Corporate: Corporate is involved with entities that may meet the definition of VIEs; however these entities are
generally subject to specialized investment company accounting, which does not require the consolidation of
investments, including VIEs. In addition, Treasury and CIO invest in securities generally issued by third parties
which may meet the definition of VIEs (e.g., issuers of asset-backed securities). In general, the Firm does not have
the power to direct the significant activities of these entities and therefore does not consolidate these entities.
Refer to Note 10 for further information on the Firm’s investment securities portfolio.
In addition, CIB also invests in and provides financing, lending-related services and other services to VIEs
sponsored by third parties. Refer to page 268 of this Note for more information on the VIEs sponsored by third
parties.
Significant Firm-sponsored VIEs
Credit card securitizations
CCB’s Card Services business may securitize
originated credit card loans, primarily through the
Chase Issuance Trust (the “Trust”). The Firm’s
continuing involvement in credit card securitizations
includes servicing the receivables, retaining an
undivided seller’s interest in the receivables, retaining
certain senior and subordinated securities and
maintaining escrow accounts.
The Firm consolidates the assets and liabilities of its
sponsored credit card trusts as it is considered to be
the primary beneficiary of these securitization trusts
based on the Firm’s ability to direct the activities of
these VIEs through its servicing responsibilities and
other duties, including making decisions as to the
receivables that are transferred into those trusts and
as to any related modifications and workouts.
Additionally, the nature and extent of the Firm’s other
continuing involvement with the trusts, as indicated
above, obligates the Firm to absorb losses and gives
the Firm the right to receive certain benefits from
these VIEs that could potentially be significant.
The underlying securitized credit card receivables and
other assets of the securitization trusts are available
only for payment of the beneficial interests issued by
the securitization trusts; they are not available to pay
the Firm’s other obligations or the claims of the Firm’s
creditors.
The agreements with the credit card securitization
trusts require the Firm to maintain a minimum
undivided interest in the credit card trusts (generally
5%). As of December 31, 2025 and 2024, the Firm held
undivided interests in Firm-sponsored credit card
securitization trusts of $5.4 billion and $6.6 billion,
respectively. The Firm maintained an average
undivided interest in principal receivables owned by
JPMorgan Chase & Co./2025 Form 10-K
263
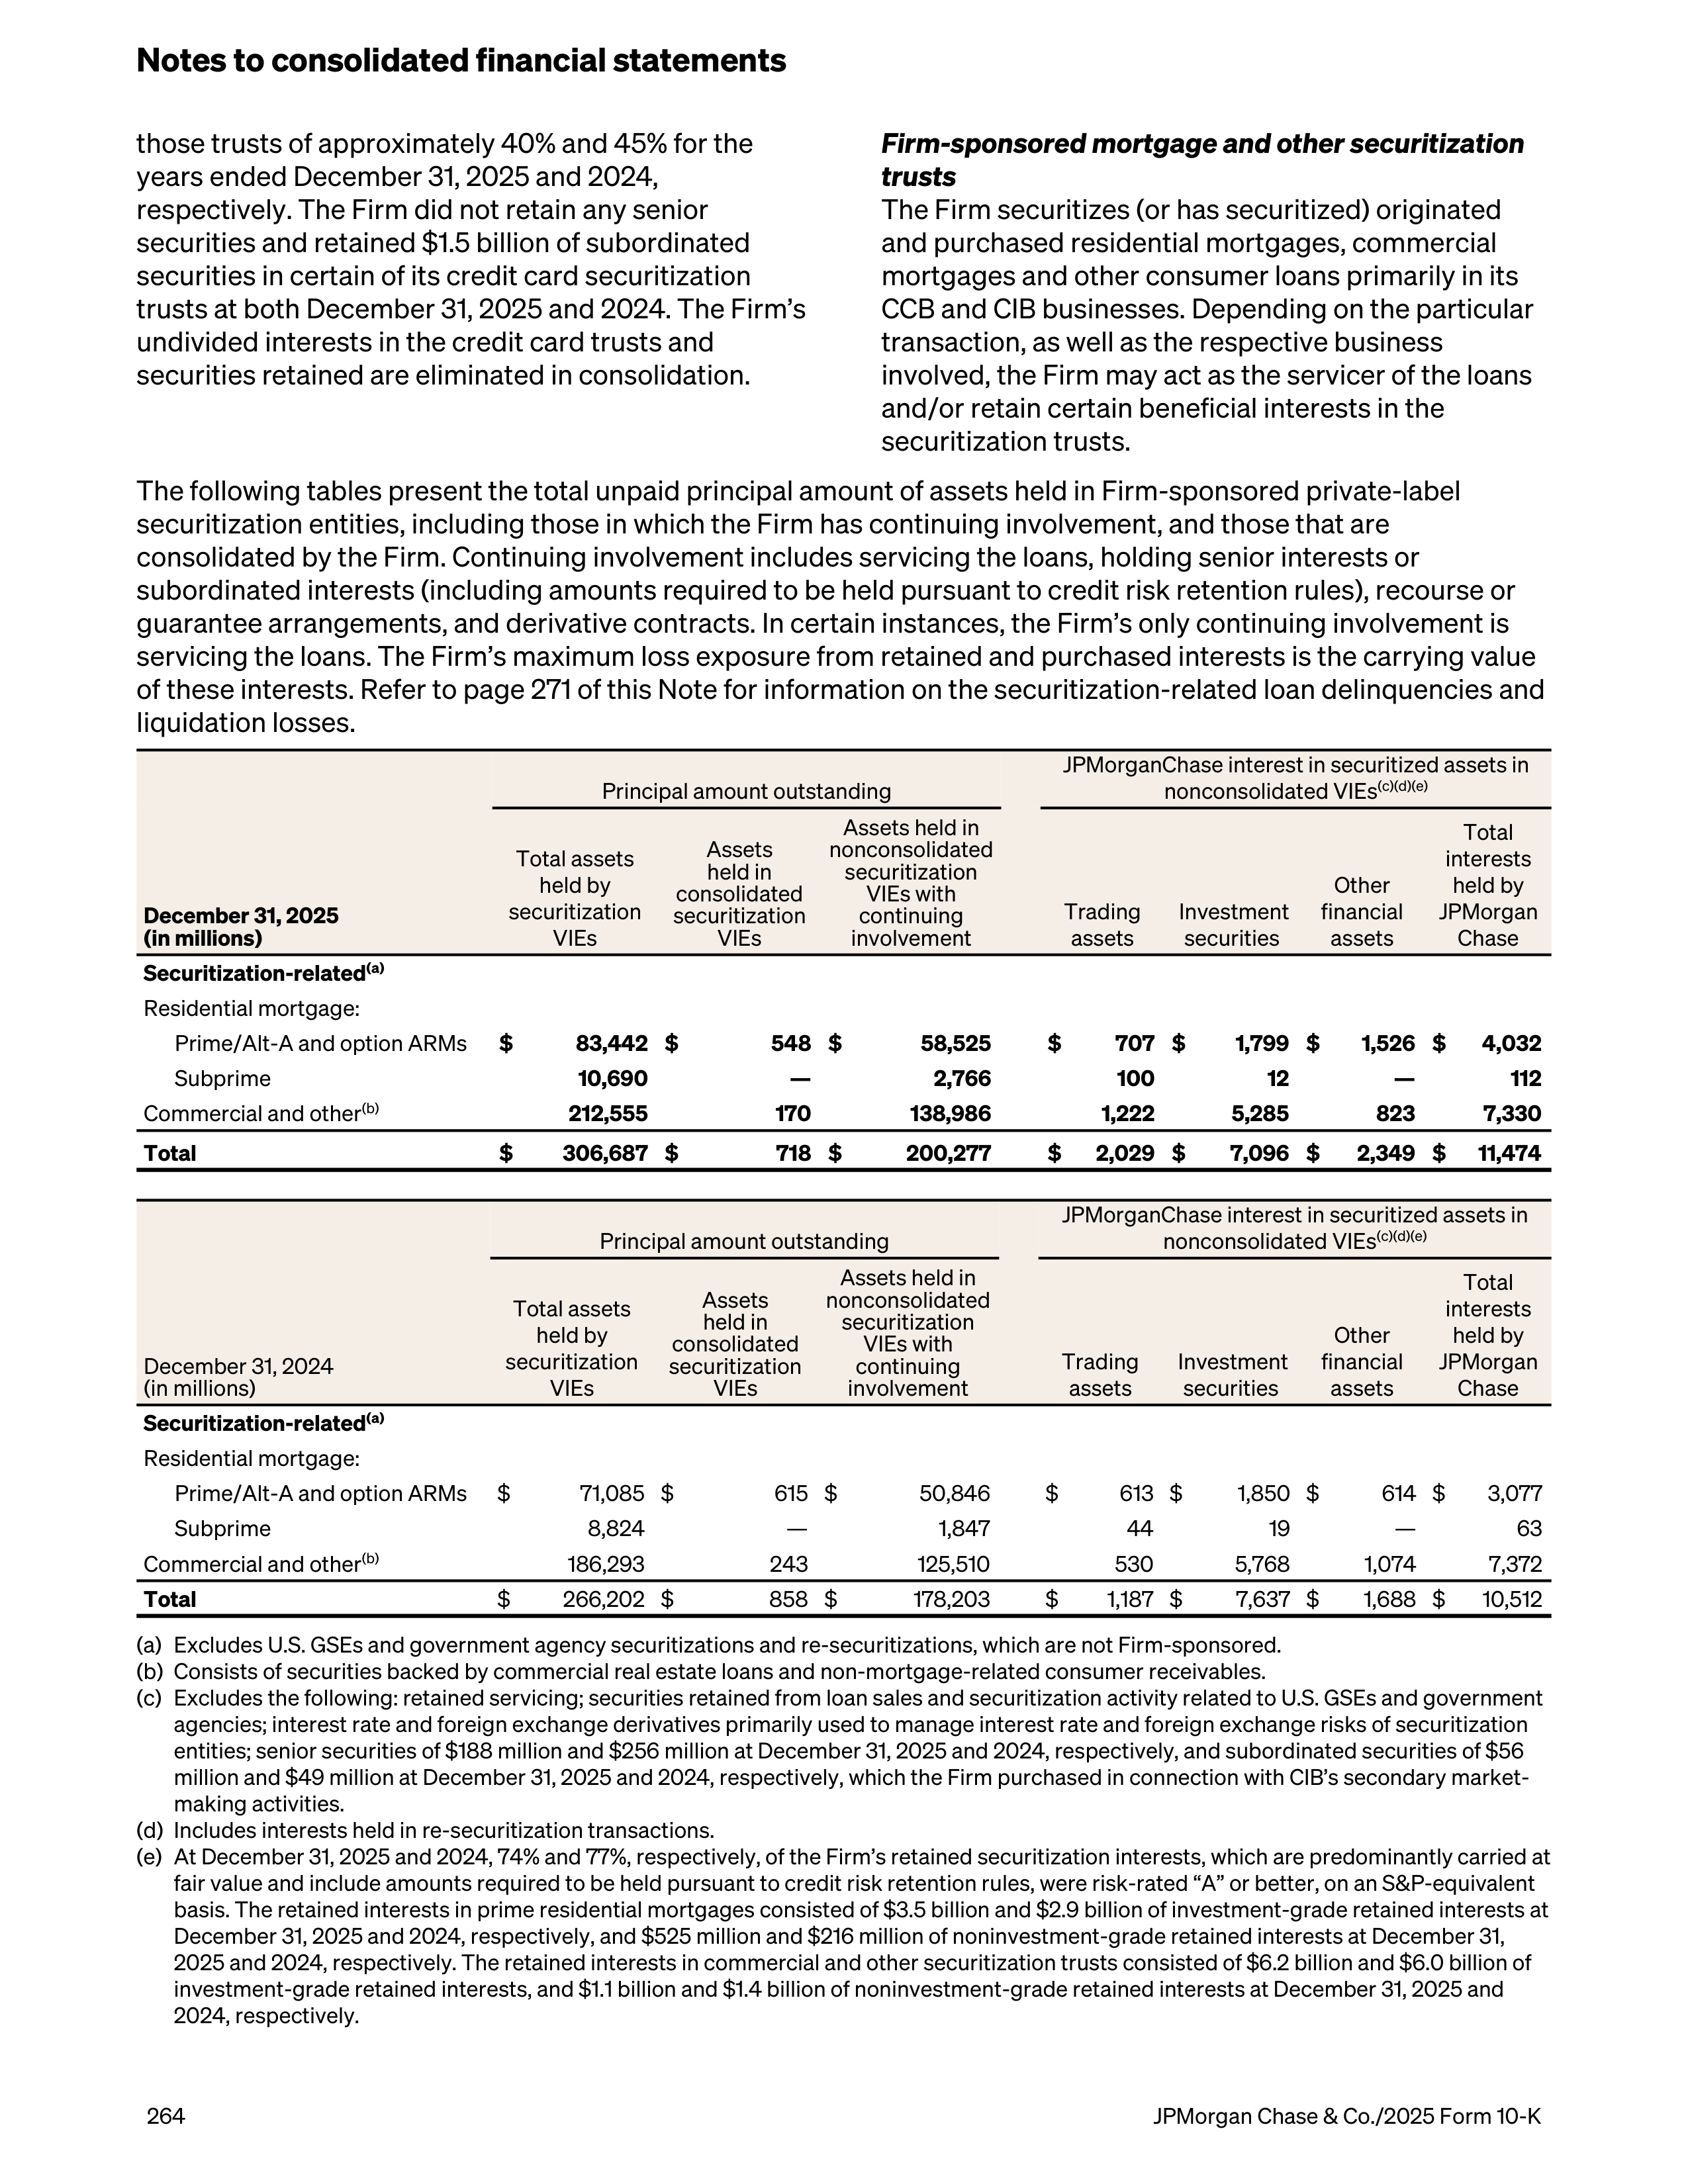
those trusts of approximately 40% and 45% for the
years ended December 31, 2025 and 2024,
respectively. The Firm did not retain any senior
securities and retained $1.5 billion of subordinated
securities in certain of its credit card securitization
trusts at both December 31, 2025 and 2024. The Firm’s
undivided interests in the credit card trusts and
securities retained are eliminated in consolidation.
Firm-sponsored mortgage and other securitization
trusts
The Firm securitizes (or has securitized) originated
and purchased residential mortgages, commercial
mortgages and other consumer loans primarily in its
CCB and CIB businesses. Depending on the particular
transaction, as well as the respective business
involved, the Firm may act as the servicer of the loans
and/or retain certain beneficial interests in the
securitization trusts.
The following tables present the total unpaid principal amount of assets held in Firm-sponsored private-label
securitization entities, including those in which the Firm has continuing involvement, and those that are
consolidated by the Firm. Continuing involvement includes servicing the loans, holding senior interests or
subordinated interests (including amounts required to be held pursuant to credit risk retention rules), recourse or
guarantee arrangements, and derivative contracts. In certain instances, the Firm’s only continuing involvement is
servicing the loans. The Firm’s maximum loss exposure from retained and purchased interests is the carrying value
of these interests. Refer to page 271 of this Note for information on the securitization-related loan delinquencies and
liquidation losses.
Principal amount outstanding
JPMorganChase interest in securitized assets in
nonconsolidated VIEs
(c)(d)(e)
December 31, 2025
(in millions)
Total assets
held by
securitization
VIEs
Assets
held in
consolidated
securitization
VIEs
Assets held in
nonconsolidated
securitization
VIEs with
continuing
involvement
Trading
assets
Investment
securities
Other
financial
assets
Total
interests
held by
JPMorgan
Chase
Securitization-related
(a)
Residential mortgage:
Prime/Alt-A and option ARMs
$
83,442 $
548 $
58,525
$
707 $
1,799 $
1,526 $
4,032
Subprime
10,690
—
2,766
100
12
—
112
Commercial and other
(b)
212,555
170
138,986
1,222
5,285
823
7,330
Total
$
306,687 $
718 $
200,277
$
2,029 $
7,096 $
2,349 $
11,474
Principal amount outstanding
JPMorganChase interest in securitized assets in
nonconsolidated VIEs
(c)(d)(e)
December 31, 2024
(in millions)
Total assets
held by
securitization
VIEs
Assets
held in
consolidated
securitization
VIEs
Assets held in
nonconsolidated
securitization
VIEs with
continuing
involvement
Trading
assets
Investment
securities
Other
financial
assets
Total
interests
held by
JPMorgan
Chase
Securitization-related
(a)
Residential mortgage:
Prime/Alt-A and option ARMs
$
71,085 $
615 $
50,846
$
613 $
1,850 $
614 $
3,077
Subprime
8,824
—
1,847
44
19
—
63
Commercial and other
(b)
186,293
243
125,510
530
5,768
1,074
7,372
Total
$
266,202 $
858 $
178,203
$
1,187 $
7,637 $
1,688 $
10,512
(a)
Excludes U.S. GSEs and government agency securitizations and re-securitizations, which are not Firm-sponsored.
(b)
Consists of securities backed by commercial real estate loans and non-mortgage-related consumer receivables.
(c)
Excludes the following: retained servicing; securities retained from loan sales and securitization activity related to U.S. GSEs and government
agencies; interest rate and foreign exchange derivatives primarily used to manage interest rate and foreign exchange risks of securitization
entities; senior securities of $188 million and $256 million at December 31, 2025 and 2024, respectively, and subordinated securities of $56
million and $49 million at December 31, 2025 and 2024, respectively, which the Firm purchased in connection with CIB’s secondary market-
making activities.
(d)
Includes interests held in re-securitization transactions.
(e)
At December 31, 2025 and 2024, 74% and 77%, respectively, of the Firm’s retained securitization interests, which are predominantly carried at
fair value and include amounts required to be held pursuant to credit risk retention rules, were risk-rated “A” or better, on an S&P-equivalent
basis. The retained interests in prime residential mortgages consisted of $3.5 billion and $2.9 billion of investment-grade retained interests at
December 31, 2025 and 2024, respectively, and $525 million and $216 million of noninvestment-grade retained interests at December 31,
2025 and 2024, respectively. The retained interests in commercial and other securitization trusts consisted of $6.2 billion and $6.0 billion of
investment-grade retained interests, and $1.1 billion and $1.4 billion of noninvestment-grade retained interests at December 31, 2025 and
2024, respectively.
Notes to consolidated financial statements
264
JPMorgan Chase & Co./2025 Form 10-K
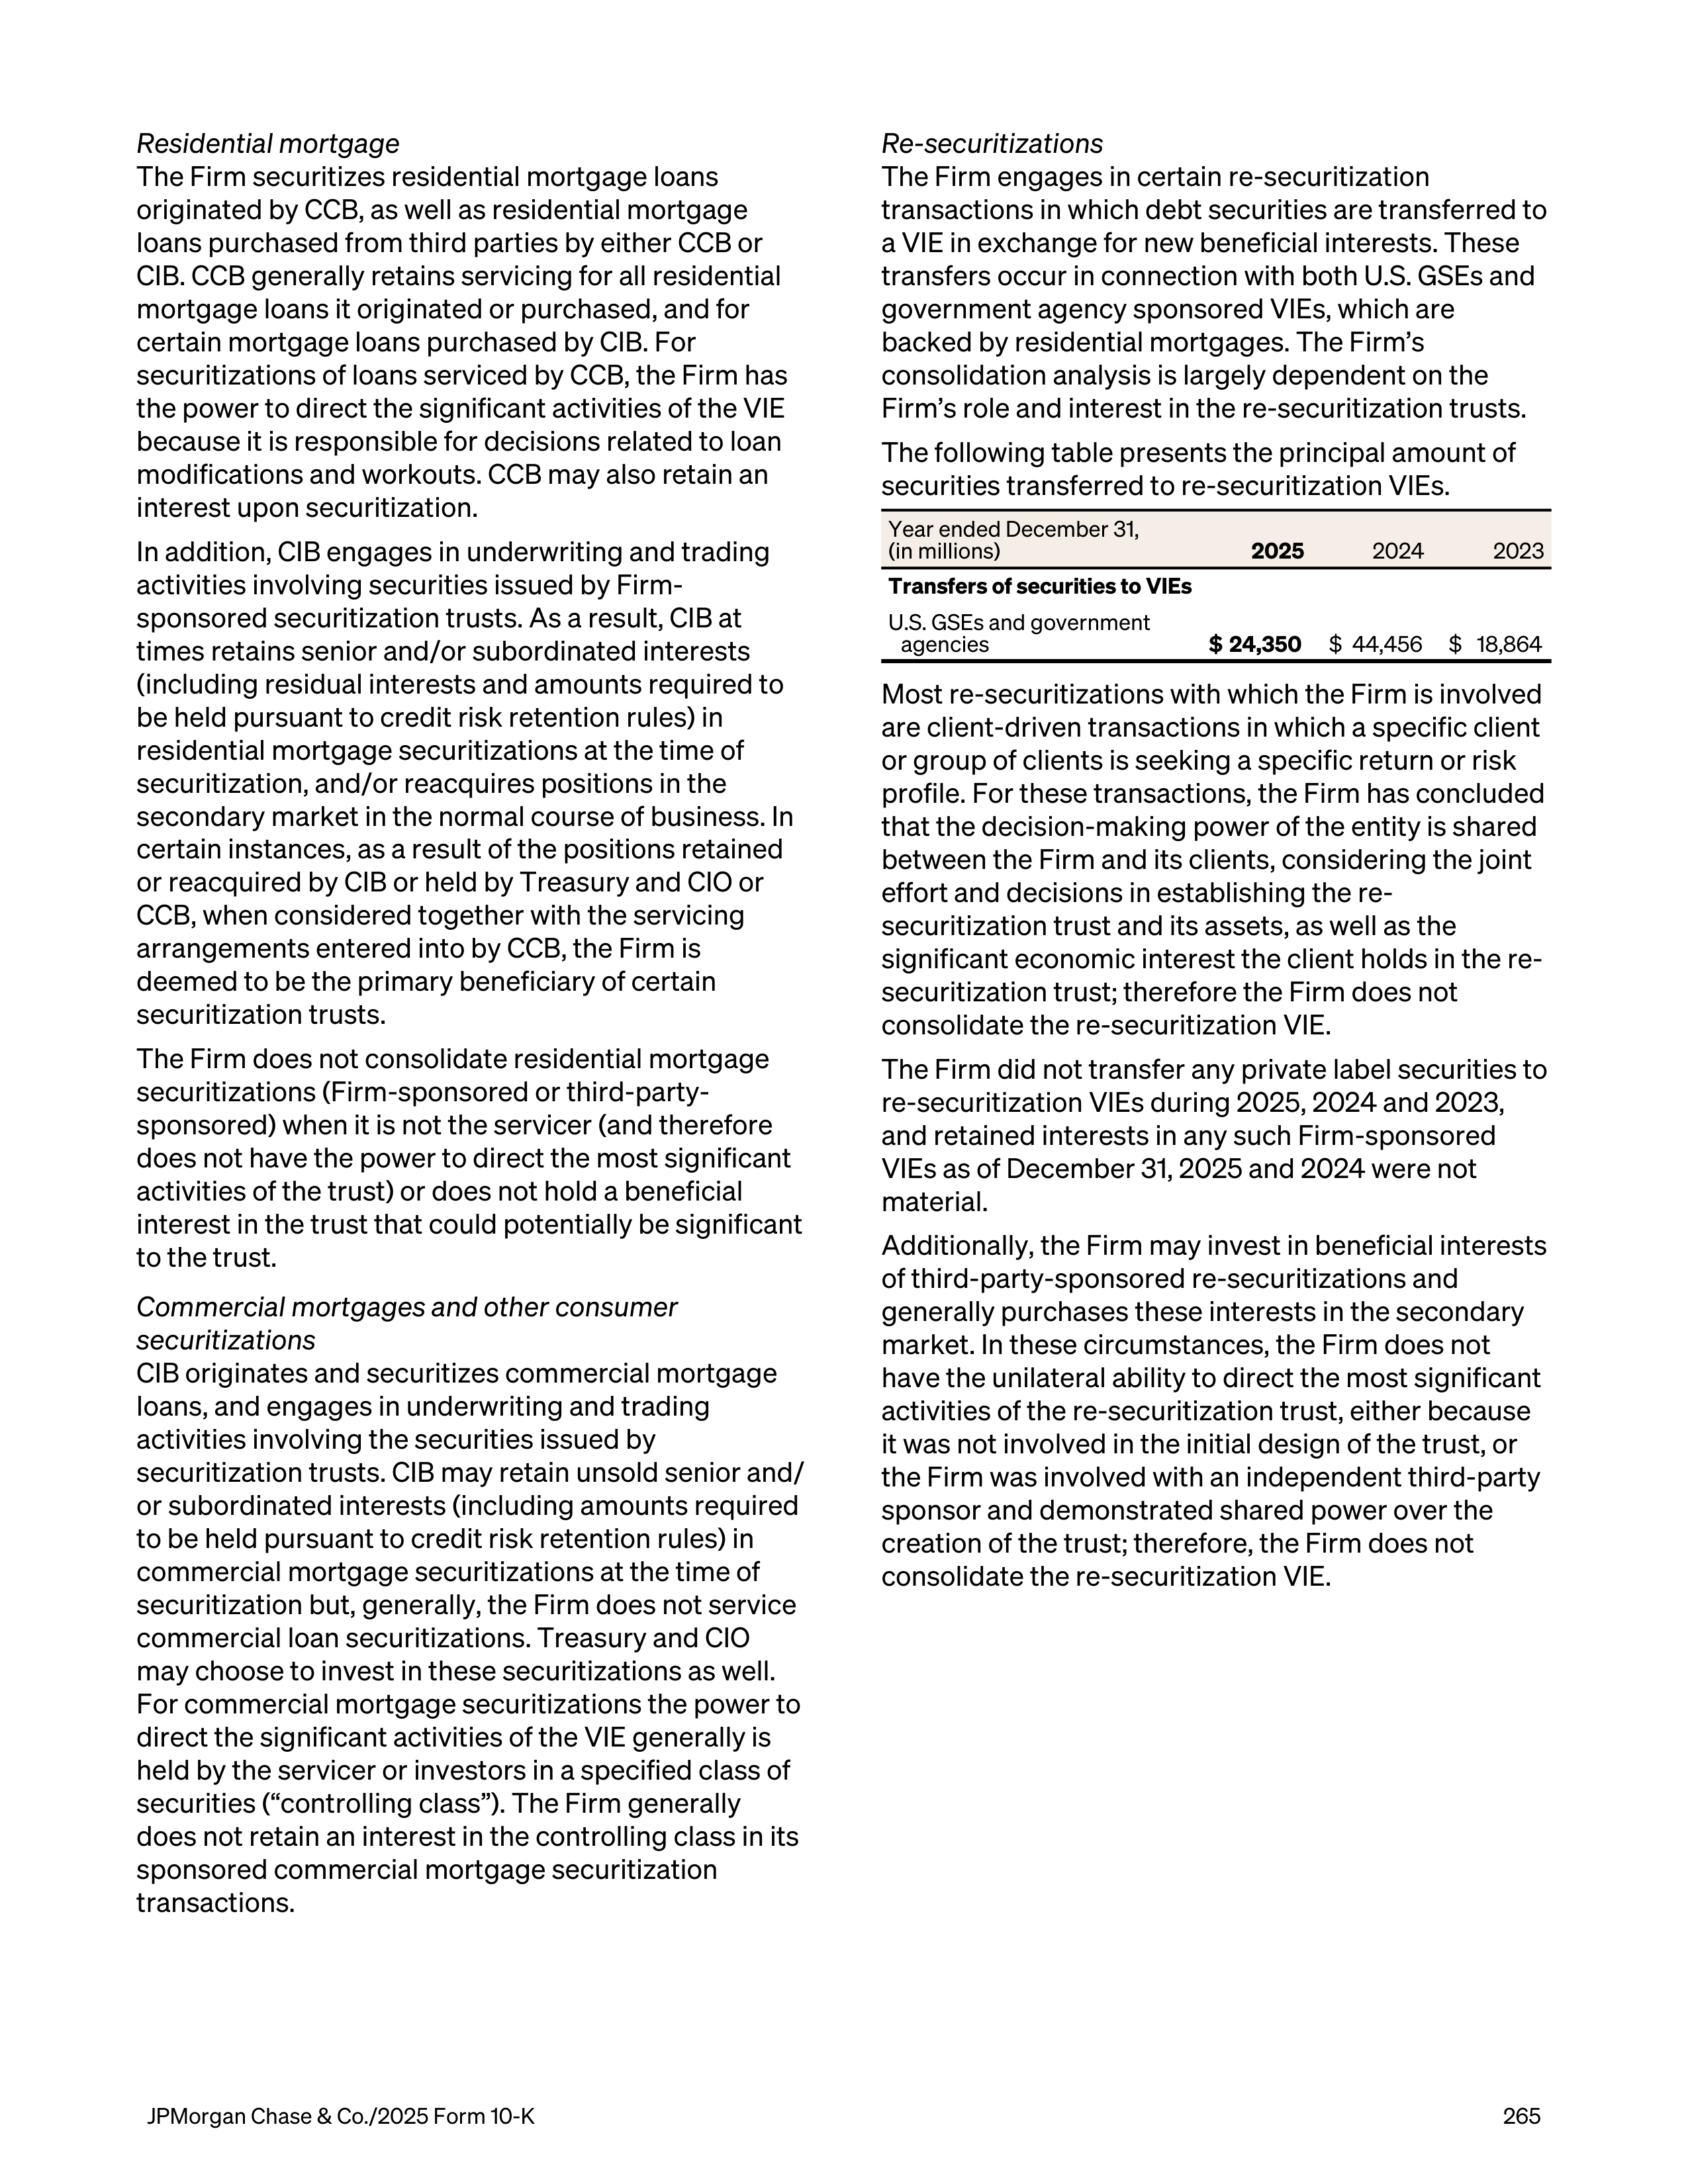
Residential mortgage
The Firm securitizes residential mortgage loans
originated by CCB, as well as residential mortgage
loans purchased from third parties by either CCB or
CIB. CCB generally retains servicing for all residential
mortgage loans it originated or purchased, and for
certain mortgage loans purchased by CIB. For
securitizations of loans serviced by CCB, the Firm has
the power to direct the significant activities of the VIE
because it is responsible for decisions related to loan
modifications and workouts. CCB may also retain an
interest upon securitization.
In addition, CIB engages in underwriting and trading
activities involving securities issued by Firm-
sponsored securitization trusts. As a result, CIB at
times retains senior and/or subordinated interests
(including residual interests and amounts required to
be held pursuant to credit risk retention rules) in
residential mortgage securitizations at the time of
securitization, and/or reacquires positions in the
secondary market in the normal course of business. In
certain instances, as a result of the positions retained
or reacquired by CIB or held by Treasury and CIO or
CCB, when considered together with the servicing
arrangements entered into by CCB, the Firm is
deemed to be the primary beneficiary of certain
securitization trusts.
The Firm does not consolidate residential mortgage
securitizations (Firm-sponsored or third-party-
sponsored) when it is not the servicer (and therefore
does not have the power to direct the most significant
activities of the trust) or does not hold a beneficial
interest in the trust that could potentially be significant
to the trust.
Commercial mortgages and other consumer
securitizations
CIB originates and securitizes commercial mortgage
loans, and engages in underwriting and trading
activities involving the securities issued by
securitization trusts. CIB may retain unsold senior and/
or subordinated interests (including amounts required
to be held pursuant to credit risk retention rules) in
commercial mortgage securitizations at the time of
securitization but, generally, the Firm does not service
commercial loan securitizations. Treasury and CIO
may choose to invest in these securitizations as well.
For commercial mortgage securitizations the power to
direct the significant activities of the VIE generally is
held by the servicer or investors in a specified class of
securities (“controlling class”). The Firm generally
does not retain an interest in the controlling class in its
sponsored commercial mortgage securitization
transactions.
Re-securitizations
The Firm engages in certain re-securitization
transactions in which debt securities are transferred to
a VIE in exchange for new beneficial interests. These
transfers occur in connection with both U.S. GSEs and
government agency sponsored VIEs, which are
backed by residential mortgages. The Firm’s
consolidation analysis is largely dependent on the
Firm’s role and interest in the re-securitization trusts.
The following table presents the principal amount of
securities transferred to re-securitization VIEs.
Year ended December 31,
(in millions)
2025
2024
2023
Transfers of securities to VIEs
U.S. GSEs and government
agencies
$ 24,350
$ 44,456
$ 18,864
Most re-securitizations with which the Firm is involved
are client-driven transactions in which a specific client
or group of clients is seeking a specific return or risk
profile. For these transactions, the Firm has concluded
that the decision-making power of the entity is shared
between the Firm and its clients, considering the joint
effort and decisions in establishing the re-
securitization trust and its assets, as well as the
significant economic interest the client holds in the re-
securitization trust; therefore the Firm does not
consolidate the re-securitization VIE.
The Firm did not transfer any private label securities to
re-securitization VIEs during 2025, 2024 and 2023,
and retained interests in any such Firm-sponsored
VIEs as of December 31, 2025 and 2024 were not
material.
Additionally, the Firm may invest in beneficial interests
of third-party-sponsored re-securitizations and
generally purchases these interests in the secondary
market. In these circumstances, the Firm does not
have the unilateral ability to direct the most significant
activities of the re-securitization trust, either because
it was not involved in the initial design of the trust, or
the Firm was involved with an independent third-party
sponsor and demonstrated shared power over the
creation of the trust; therefore, the Firm does not
consolidate the re-securitization VIE.
JPMorgan Chase & Co./2025 Form 10-K
265
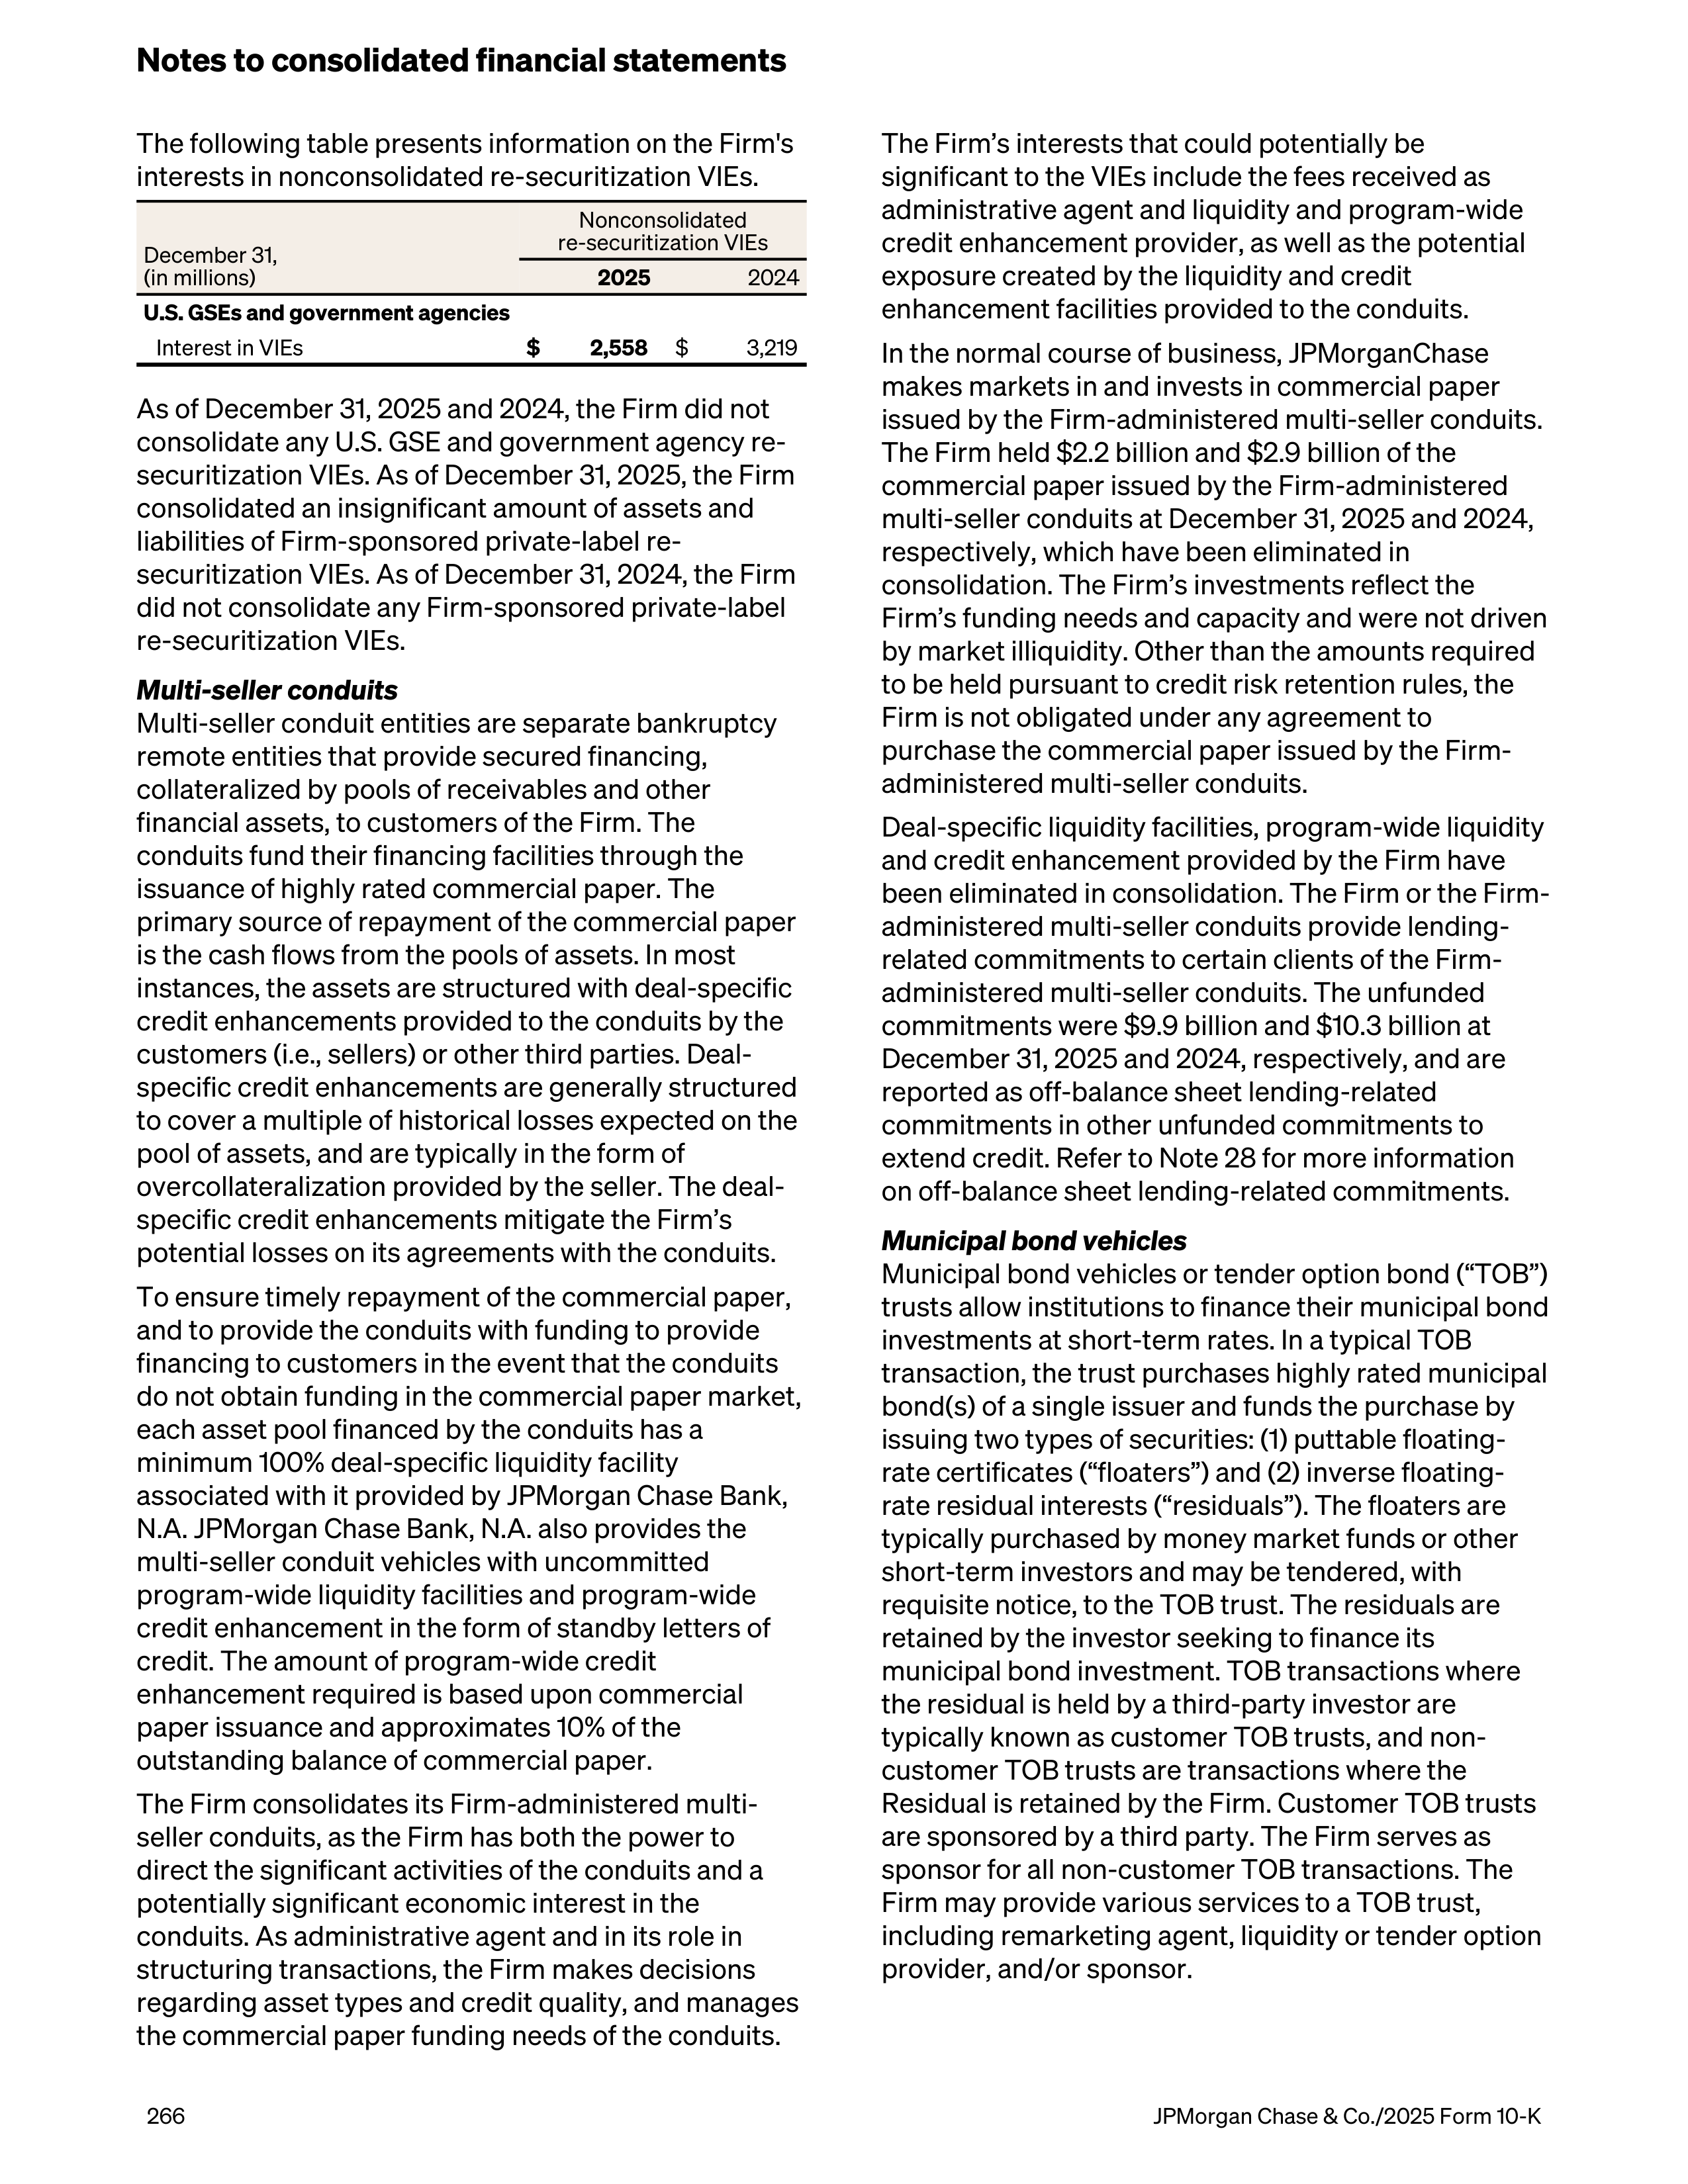
The following table presents information on the Firm's
interests in nonconsolidated re-securitization VIEs.
December 31,
(in millions)
Nonconsolidated
re-securitization VIEs
2025
2024
U.S. GSEs and government agencies
Interest in VIEs
$
2,558
$
3,219
As of December 31, 2025 and 2024, the Firm did not
consolidate any U.S. GSE and government agency re-
securitization VIEs. As of December 31, 2025, the Firm
consolidated an insignificant amount of assets and
liabilities of Firm-sponsored private-label re-
securitization VIEs. As of December 31, 2024, the Firm
did not consolidate any Firm-sponsored private-label
re-securitization VIEs.
Multi-seller conduits
Multi-seller conduit entities are separate bankruptcy
remote entities that provide secured financing,
collateralized by pools of receivables and other
financial assets, to customers of the Firm. The
conduits fund their financing facilities through the
issuance of highly rated commercial paper. The
primary source of repayment of the commercial paper
is the cash flows from the pools of assets. In most
instances, the assets are structured with deal-specific
credit enhancements provided to the conduits by the
customers (i.e., sellers) or other third parties. Deal-
specific credit enhancements are generally structured
to cover a multiple of historical losses expected on the
pool of assets, and are typically in the form of
overcollateralization provided by the seller. The deal-
specific credit enhancements mitigate the Firm’s
potential losses on its agreements with the conduits.
To ensure timely repayment of the commercial paper,
and to provide the conduits with funding to provide
financing to customers in the event that the conduits
do not obtain funding in the commercial paper market,
each asset pool financed by the conduits has a
minimum 100% deal-specific liquidity facility
associated with it provided by JPMorgan Chase Bank,
N.A. JPMorgan Chase Bank, N.A. also provides the
multi-seller conduit vehicles with uncommitted
program-wide liquidity facilities and program-wide
credit enhancement in the form of standby letters of
credit. The amount of program-wide credit
enhancement required is based upon commercial
paper issuance and approximates 10% of the
outstanding balance of commercial paper.
The Firm consolidates its Firm-administered multi-
seller conduits, as the Firm has both the power to
direct the significant activities of the conduits and a
potentially significant economic interest in the
conduits. As administrative agent and in its role in
structuring transactions, the Firm makes decisions
regarding asset types and credit quality, and manages
the commercial paper funding needs of the conduits.
The Firm’s interests that could potentially be
significant to the VIEs include the fees received as
administrative agent and liquidity and program-wide
credit enhancement provider, as well as the potential
exposure created by the liquidity and credit
enhancement facilities provided to the conduits.
In the normal course of business, JPMorganChase
makes markets in and invests in commercial paper
issued by the Firm-administered multi-seller conduits.
The Firm held $2.2 billion and $2.9 billion of the
commercial paper issued by the Firm-administered
multi-seller conduits at December 31, 2025 and 2024,
respectively, which have been eliminated in
consolidation. The Firm’s investments reflect the
Firm’s funding needs and capacity and were not driven
by market illiquidity. Other than the amounts required
to be held pursuant to credit risk retention rules, the
Firm is not obligated under any agreement to
purchase the commercial paper issued by the Firm-
administered multi-seller conduits.
Deal-specific liquidity facilities, program-wide liquidity
and credit enhancement provided by the Firm have
been eliminated in consolidation. The Firm or the Firm-
administered multi-seller conduits provide lending-
related commitments to certain clients of the Firm-
administered multi-seller conduits. The unfunded
commitments were $9.9 billion and $10.3 billion at
December 31, 2025 and 2024, respectively, and are
reported as off-balance sheet lending-related
commitments in other unfunded commitments to
extend credit. Refer to Note 28 for more information
on off-balance sheet lending-related commitments.
Municipal bond vehicles
Municipal bond vehicles or tender option bond (“TOB”)
trusts allow institutions to finance their municipal bond
investments at short-term rates. In a typical TOB
transaction, the trust purchases highly rated municipal
bond(s) of a single issuer and funds the purchase by
issuing two types of securities: (1) puttable floating-
rate certificates (“floaters”) and (2) inverse floating-
rate residual interests (“residuals”). The floaters are
typically purchased by money market funds or other
short-term investors and may be tendered, with
requisite notice, to the TOB trust. The residuals are
retained by the investor seeking to finance its
municipal bond investment. TOB transactions where
the residual is held by a third-party investor are
typically known as customer TOB trusts, and non-
customer TOB trusts are transactions where the
Residual is retained by the Firm. Customer TOB trusts
are sponsored by a third party. The Firm serves as
sponsor for all non-customer TOB transactions. The
Firm may provide various services to a TOB trust,
including remarketing agent, liquidity or tender option
provider, and/or sponsor.
Notes to consolidated financial statements
266
JPMorgan Chase & Co./2025 Form 10-K
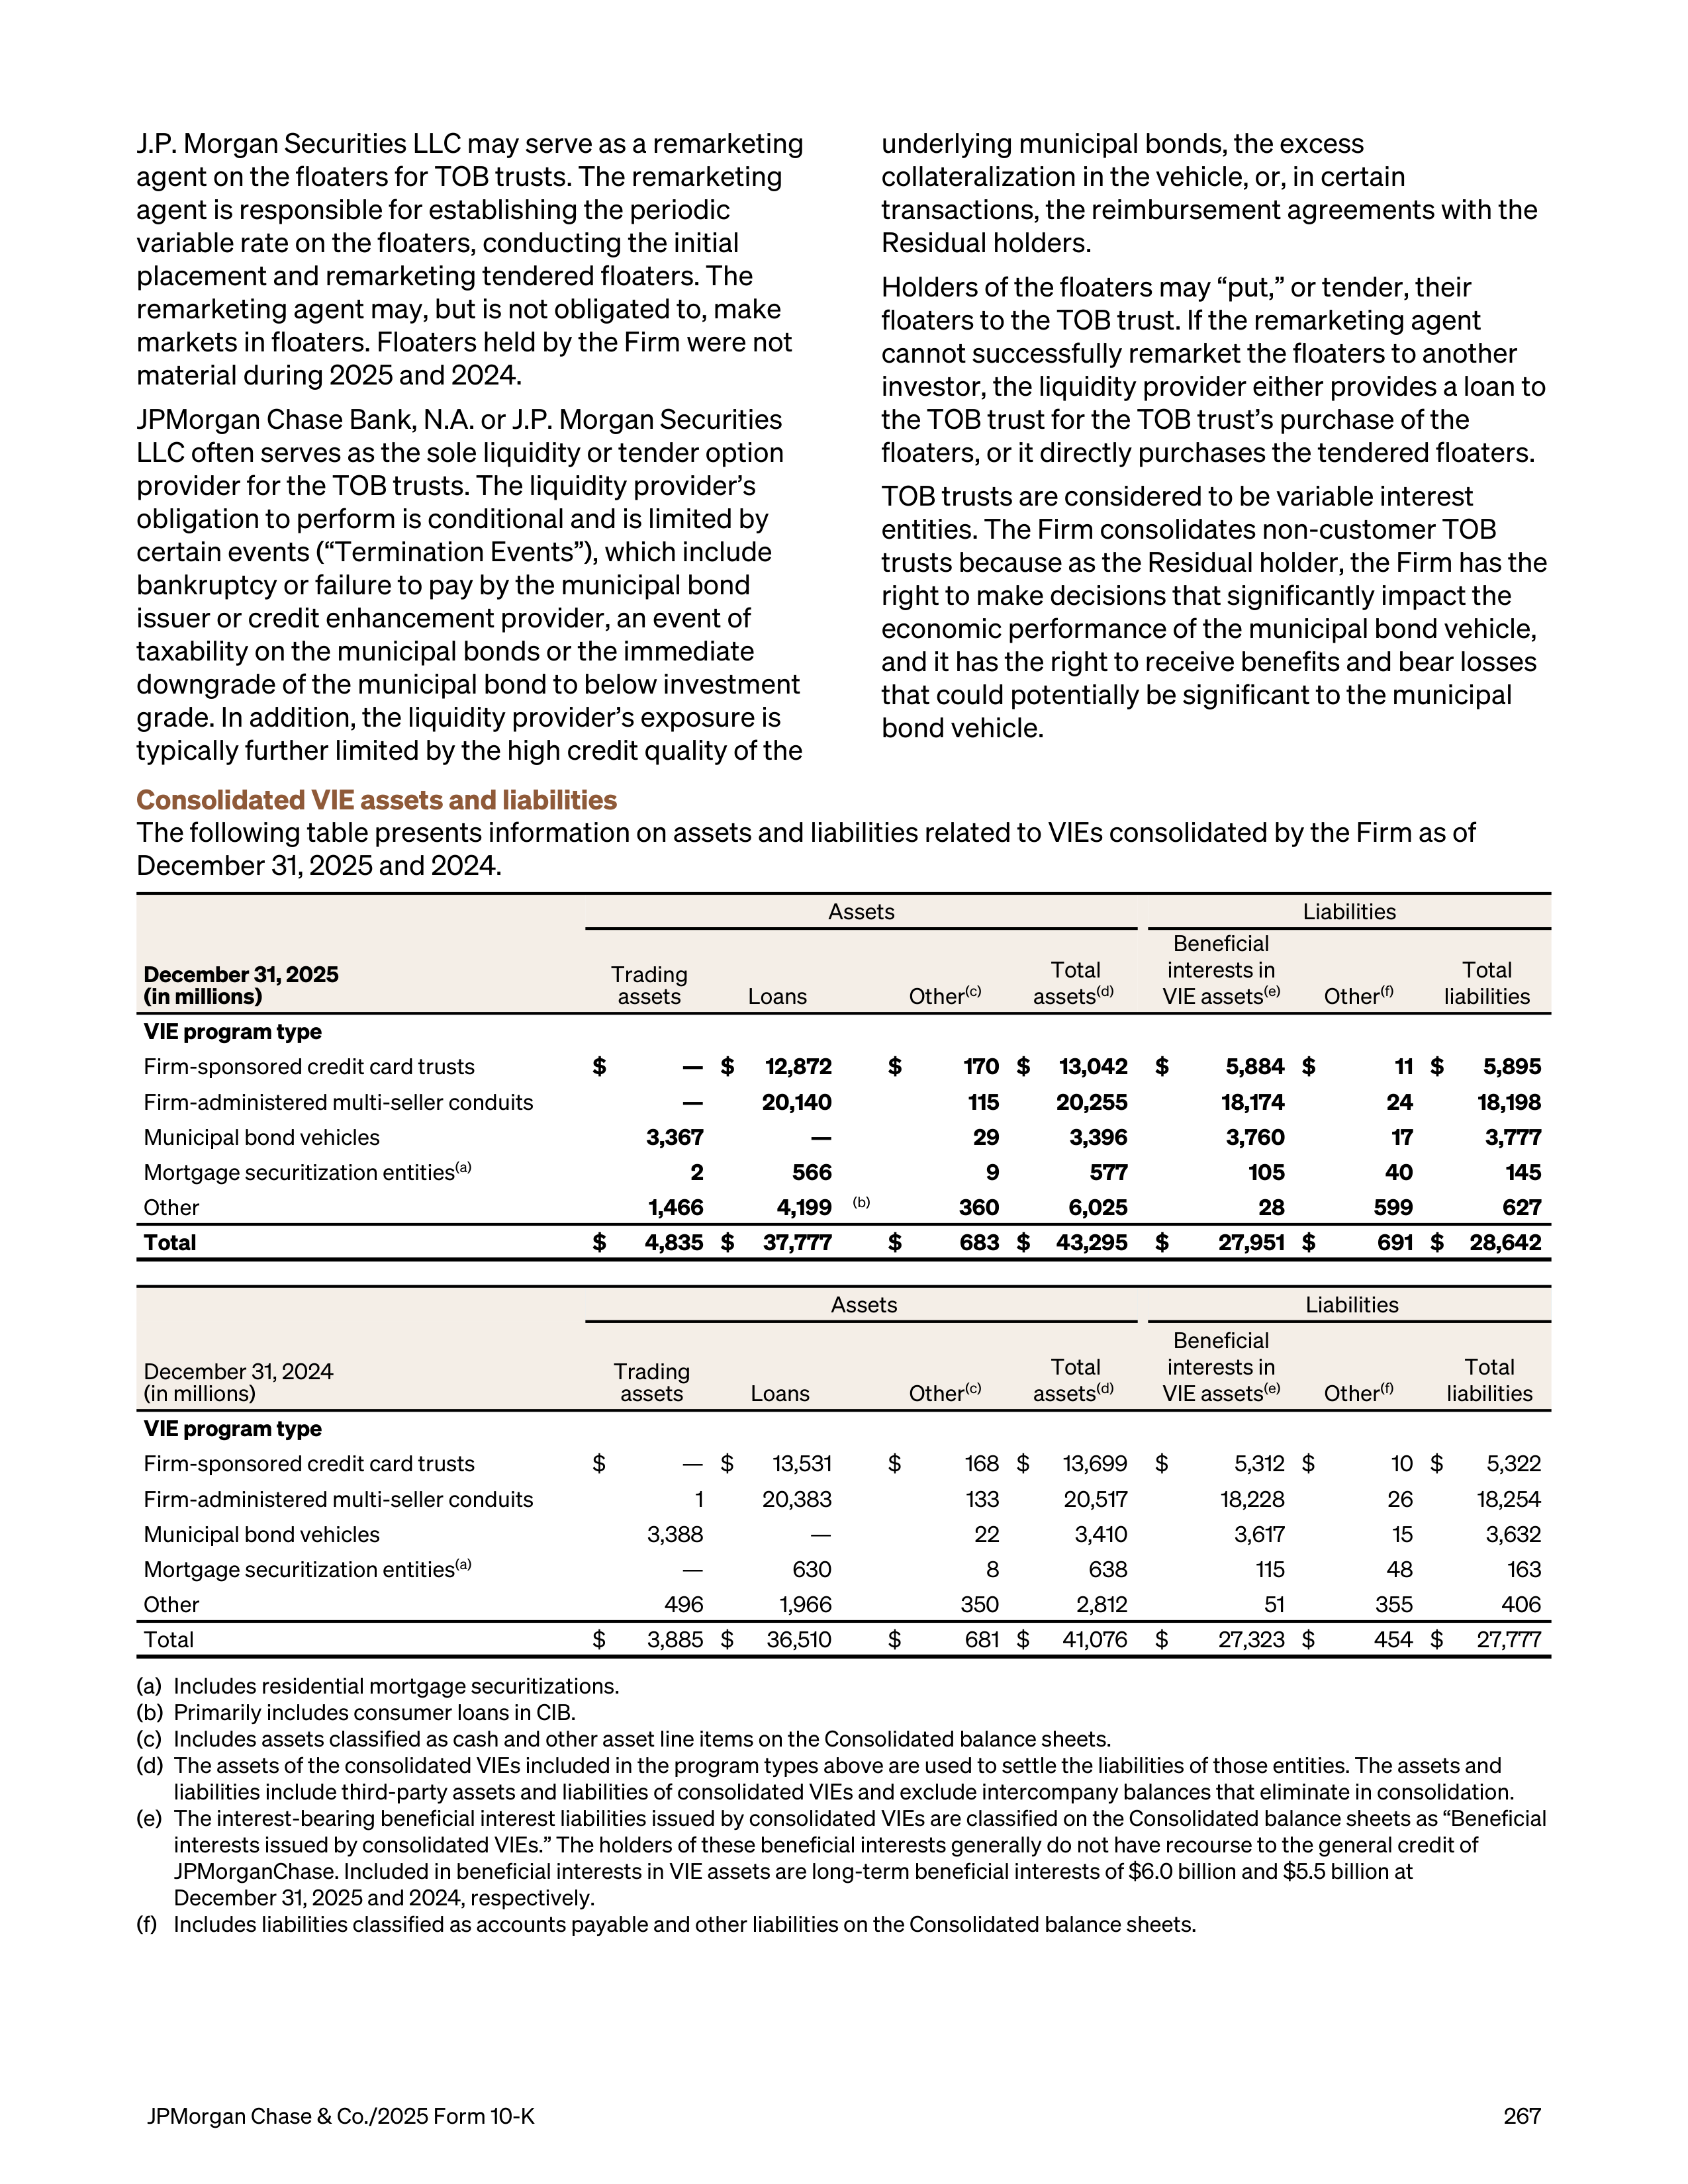
J.P. Morgan Securities LLC may serve as a remarketing
agent on the floaters for TOB trusts. The remarketing
agent is responsible for establishing the periodic
variable rate on the floaters, conducting the initial
placement and remarketing tendered floaters. The
remarketing agent may, but is not obligated to, make
markets in floaters. Floaters held by the Firm were not
material during 2025 and 2024.
JPMorgan Chase Bank, N.A. or J.P. Morgan Securities
LLC often serves as the sole liquidity or tender option
provider for the TOB trusts. The liquidity provider’s
obligation to perform is conditional and is limited by
certain events (“Termination Events”), which include
bankruptcy or failure to pay by the municipal bond
issuer or credit enhancement provider, an event of
taxability on the municipal bonds or the immediate
downgrade of the municipal bond to below investment
grade. In addition, the liquidity provider’s exposure is
typically further limited by the high credit quality of the
underlying municipal bonds, the excess
collateralization in the vehicle, or, in certain
transactions, the reimbursement agreements with the
Residual holders.
Holders of the floaters may “put,” or tender, their
floaters to the TOB trust. If the remarketing agent
cannot successfully remarket the floaters to another
investor, the liquidity provider either provides a loan to
the TOB trust for the TOB trust’s purchase of the
floaters, or it directly purchases the tendered floaters.
TOB trusts are considered to be variable interest
entities. The Firm consolidates non-customer TOB
trusts because as the Residual holder, the Firm has the
right to make decisions that significantly impact the
economic performance of the municipal bond vehicle,
and it has the right to receive benefits and bear losses
that could potentially be significant to the municipal
bond vehicle.
Consolidated VIE assets and liabilities
The following table presents information on assets and liabilities related to VIEs consolidated by the Firm as of
December 31, 2025 and 2024.
Assets
Liabilities
December 31, 2025
(in millions)
Trading
assets
Loans
Other
(c)
Total
assets
(d)
Beneficial
interests in
VIE assets
(e)
Other
(f)
Total
liabilities
VIE program type
Firm-sponsored credit card trusts
$
— $
12,872
$
170 $
13,042
$
5,884 $
11 $
5,895
Firm-administered multi-seller conduits
—
20,140
115
20,255
18,174
24
18,198
Municipal bond vehicles
3,367
—
29
3,396
3,760
17
3,777
Mortgage securitization entities
(a)
2
566
9
577
105
40
145
Other
1,466
4,199
(b)
360
6,025
28
599
627
Total
$
4,835 $
37,777
$
683 $
43,295
$
27,951 $
691 $
28,642
Assets
Liabilities
December 31, 2024
(in millions)
Trading
assets
Loans
Other
(c)
Total
assets
(d)
Beneficial
interests in
VIE assets
(e)
Other
(f)
Total
liabilities
VIE program type
Firm-sponsored credit card trusts
$
— $
13,531
$
168 $
13,699
$
5,312 $
10 $
5,322
Firm-administered multi-seller conduits
1
20,383
133
20,517
18,228
26
18,254
Municipal bond vehicles
3,388
—
22
3,410
3,617
15
3,632
Mortgage securitization entities
(a)
—
630
8
638
115
48
163
Other
496
1,966
350
2,812
51
355
406
Total
$
3,885 $
36,510
$
681 $
41,076
$
27,323 $
454 $
27,777
(a)
Includes residential mortgage securitizations.
(b)
Primarily includes consumer loans in CIB.
(c)
Includes assets classified as cash and other asset line items on the Consolidated balance sheets.
(d)
The assets of the consolidated VIEs included in the program types above are used to settle the liabilities of those entities. The assets and
liabilities include third-party assets and liabilities of consolidated VIEs and exclude intercompany balances that eliminate in consolidation.
(e)
The interest-bearing beneficial interest liabilities issued by consolidated VIEs are classified on the Consolidated balance sheets as “Beneficial
interests issued by consolidated VIEs.” The holders of these beneficial interests generally do not have recourse to the general credit of
JPMorganChase. Included in beneficial interests in VIE assets are long-term beneficial interests of $6.0 billion and $5.5 billion at
December 31, 2025 and 2024, respectively.
(f)
Includes liabilities classified as accounts payable and other liabilities on the Consolidated balance sheets.
JPMorgan Chase & Co./2025 Form 10-K
267
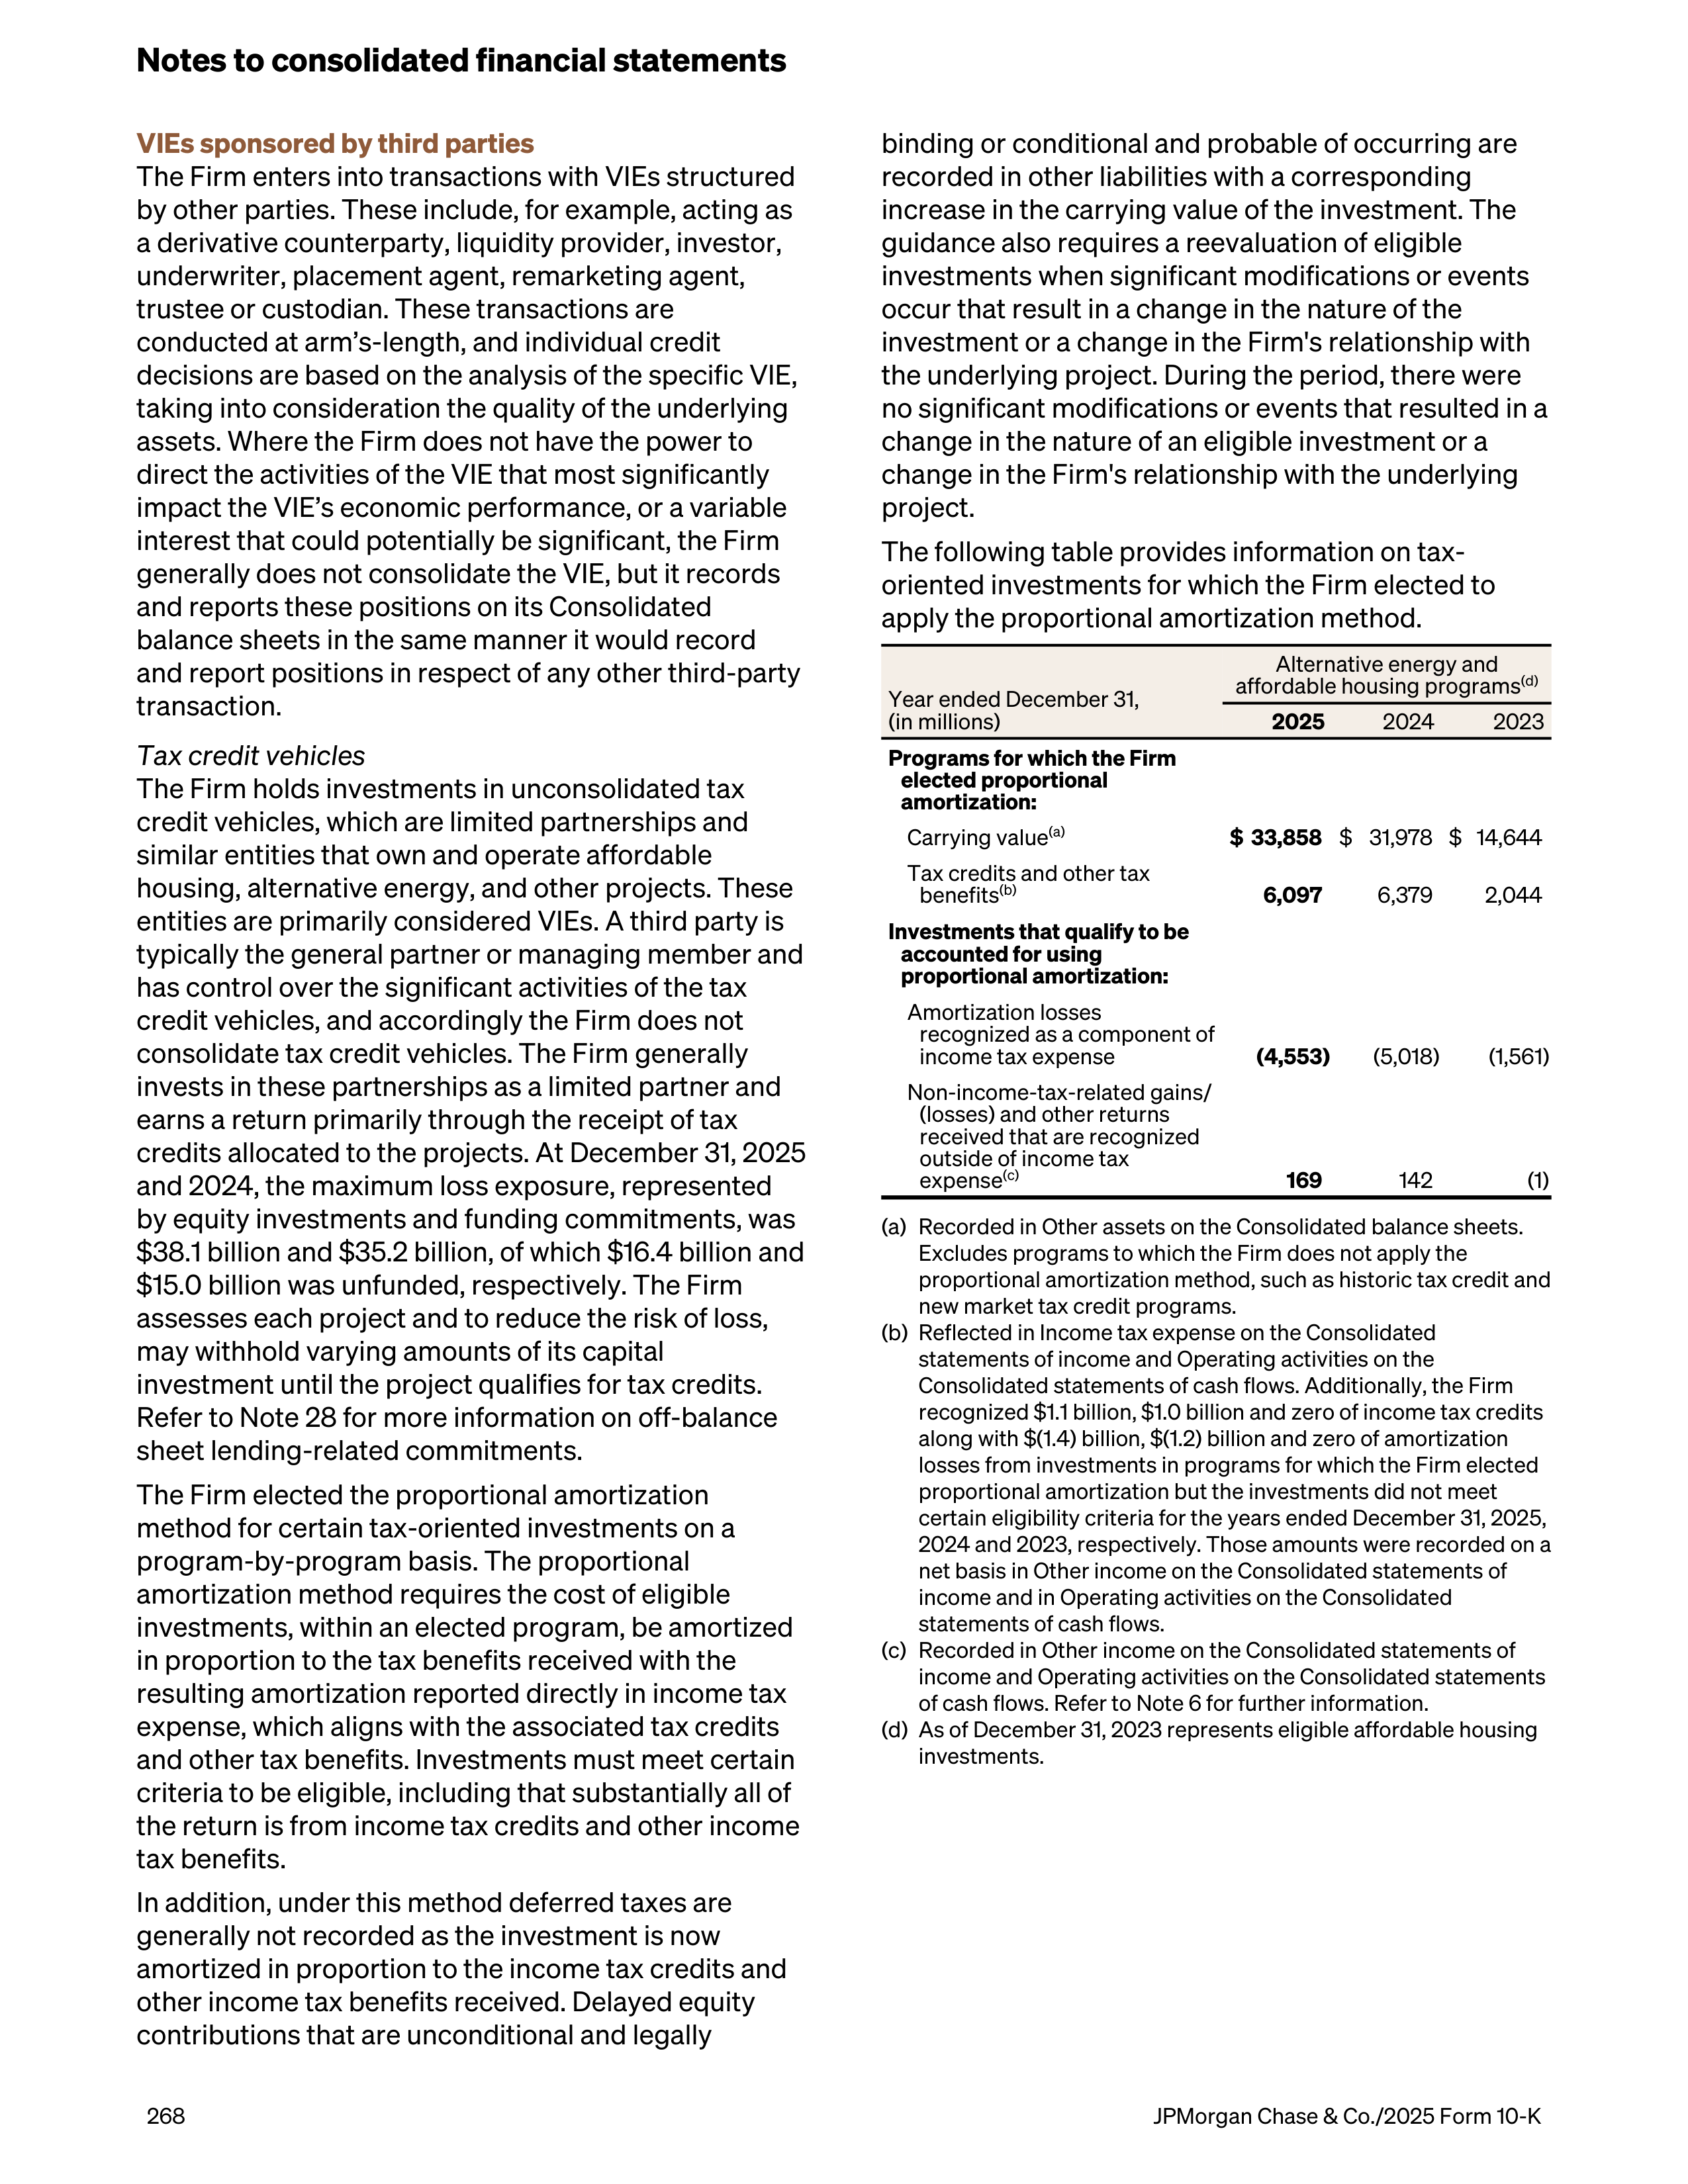
VIEs sponsored by third parties
The Firm enters into transactions with VIEs structured
by other parties. These include, for example, acting as
a derivative counterparty, liquidity provider, investor,
underwriter, placement agent, remarketing agent,
trustee or custodian. These transactions are
conducted at arm’s-length, and individual credit
decisions are based on the analysis of the specific VIE,
taking into consideration the quality of the underlying
assets. Where the Firm does not have the power to
direct the activities of the VIE that most significantly
impact the VIE’s economic performance, or a variable
interest that could potentially be significant, the Firm
generally does not consolidate the VIE, but it records
and reports these positions on its Consolidated
balance sheets in the same manner it would record
and report positions in respect of any other third-party
transaction.
Tax credit vehicles
The Firm holds investments in unconsolidated tax
credit vehicles, which are limited partnerships and
similar entities that own and operate affordable
housing, alternative energy, and other projects. These
entities are primarily considered VIEs. A third party is
typically the general partner or managing member and
has control over the significant activities of the tax
credit vehicles, and accordingly the Firm does not
consolidate tax credit vehicles. The Firm generally
invests in these partnerships as a limited partner and
earns a return primarily through the receipt of tax
credits allocated to the projects. At December 31, 2025
and 2024, the maximum loss exposure, represented
by equity investments and funding commitments, was
$38.1 billion and $35.2 billion, of which $16.4 billion and
$15.0 billion was unfunded, respectively. The Firm
assesses each project and to reduce the risk of loss,
may withhold varying amounts of its capital
investment until the project qualifies for tax credits.
Refer to Note 28 for more information on off-balance
sheet lending-related commitments.
The Firm elected the proportional amortization
method for certain tax-oriented investments on a
program-by-program basis. The proportional
amortization method requires the cost of eligible
investments, within an elected program, be amortized
in proportion to the tax benefits received with the
resulting amortization reported directly in income tax
expense, which aligns with the associated tax credits
and other tax benefits. Investments must meet certain
criteria to be eligible, including that substantially all of
the return is from income tax credits and other income
tax benefits.
In addition, under this method deferred taxes are
generally not recorded as the investment is now
amortized in proportion to the income tax credits and
other income tax benefits received. Delayed equity
contributions that are unconditional and legally
binding or conditional and probable of occurring are
recorded in other liabilities with a corresponding
increase in the carrying value of the investment. The
guidance also requires a reevaluation of eligible
investments when significant modifications or events
occur that result in a change in the nature of the
investment or a change in the Firm's relationship with
the underlying project. During the period, there were
no significant modifications or events that resulted in a
change in the nature of an eligible investment or a
change in the Firm's relationship with the underlying
project.
The following table provides information on tax-
oriented investments for which the Firm elected to
apply the proportional amortization method.
Year ended December 31,
(in millions)
Alternative energy and
affordable housing programs
(d)
2025
2024
2023
Programs for which the Firm
elected proportional
amortization:
Carrying value
(a)
$ 33,858
$ 31,978 $ 14,644
Tax credits and other tax
benefits
(b)
6,097
6,379
2,044
Investments that qualify to be
accounted for using
proportional amortization:
Amortization losses
recognized as a component of
income tax expense
(4,553)
(5,018)
(1,561)
Non-income-tax-related gains/
(losses) and other returns
received that are recognized
outside of income tax
expense
(c)
169
142
(1)
(a)
Recorded in Other assets on the Consolidated balance sheets.
Excludes programs to which the Firm does not apply the
proportional amortization method, such as historic tax credit and
new market tax credit programs.
(b)
Reflected in Income tax expense on the Consolidated
statements of income and Operating activities on the
Consolidated statements of cash flows. Additionally, the Firm
recognized $1.1 billion, $1.0 billion and zero of income tax credits
along with $(1.4) billion, $(1.2) billion and zero of amortization
losses from investments in programs for which the Firm elected
proportional amortization but the investments did not meet
certain eligibility criteria for the years ended December 31, 2025,
2024 and 2023, respectively. Those amounts were recorded on a
net basis in Other income on the Consolidated statements of
income and in Operating activities on the Consolidated
statements of cash flows.
(c)
Recorded in Other income on the Consolidated statements of
income and Operating activities on the Consolidated statements
of cash flows. Refer to Note 6 for further information.
(d)
As of December 31, 2023 represents eligible affordable housing
investments.
Notes to consolidated financial statements
268
JPMorgan Chase & Co./2025 Form 10-K
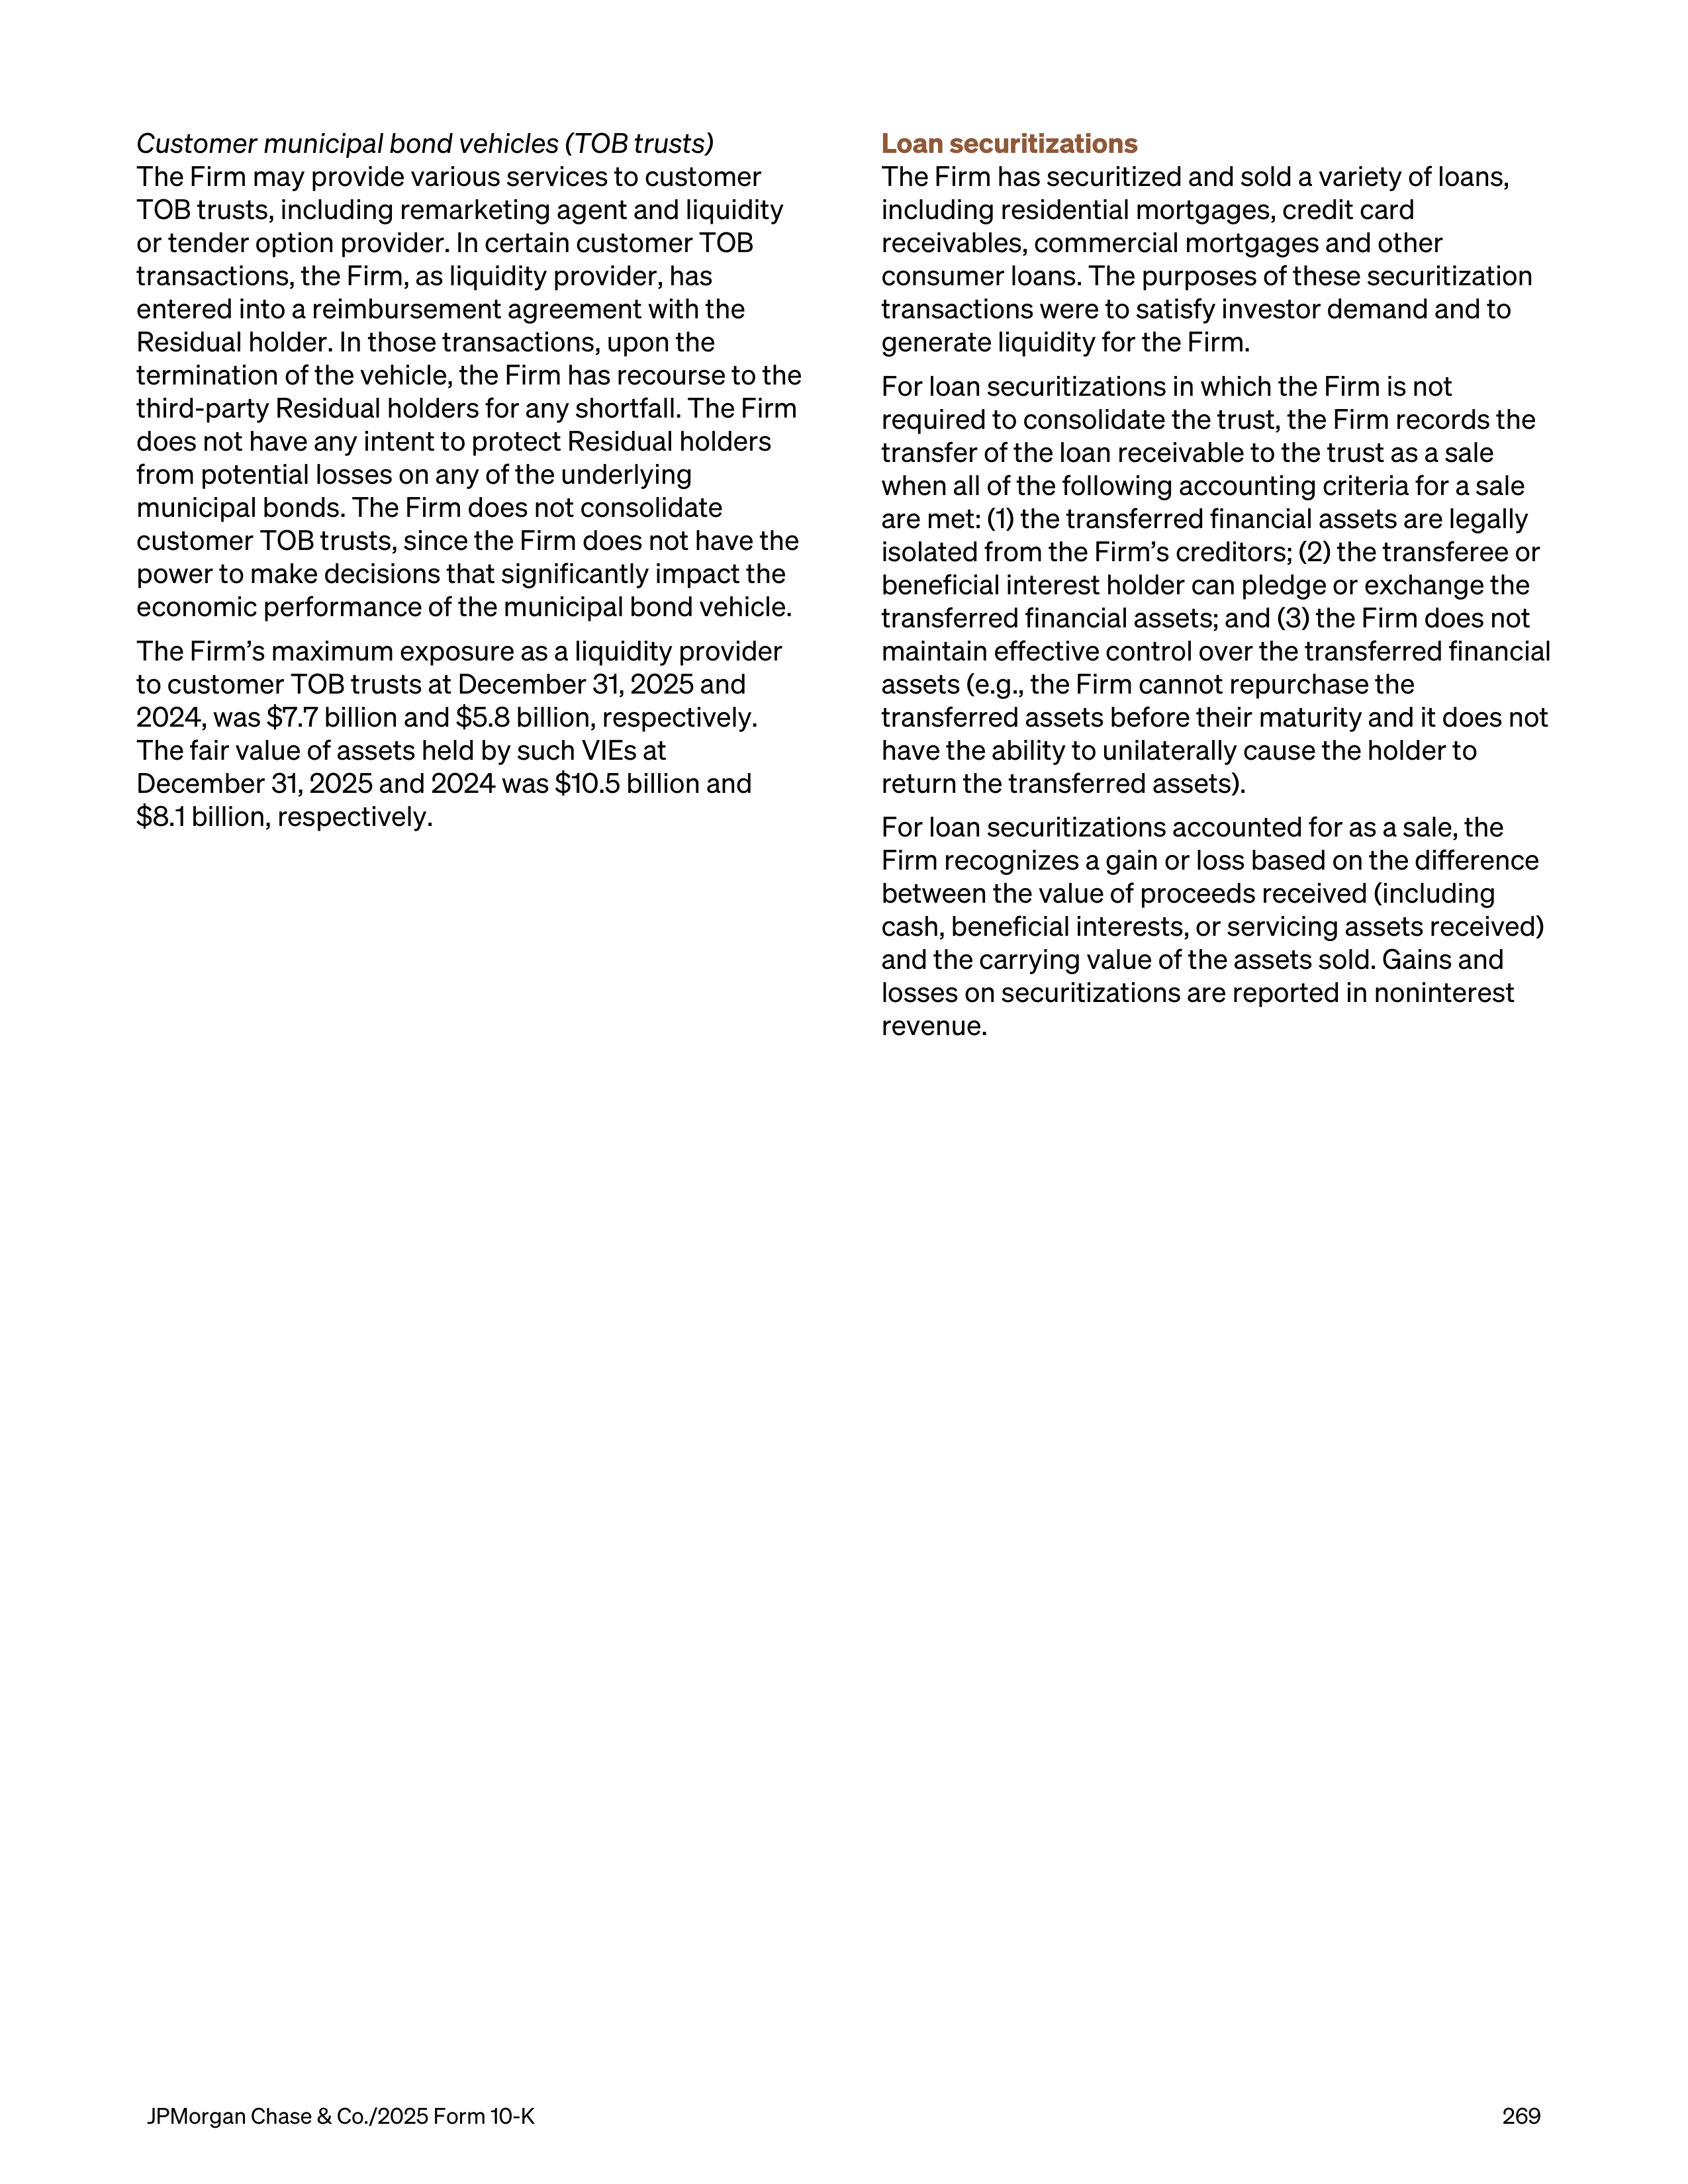
Customer municipal bond vehicles (TOB trusts)
The Firm may provide various services to customer
TOB trusts, including remarketing agent and liquidity
or tender option provider. In certain customer TOB
transactions, the Firm, as liquidity provider, has
entered into a reimbursement agreement with the
Residual holder. In those transactions, upon the
termination of the vehicle, the Firm has recourse to the
third-party Residual holders for any shortfall. The Firm
does not have any intent to protect Residual holders
from potential losses on any of the underlying
municipal bonds. The Firm does not consolidate
customer TOB trusts, since the Firm does not have the
power to make decisions that significantly impact the
economic performance of the municipal bond vehicle.
The Firm’s maximum exposure as a liquidity provider
to customer TOB trusts at December 31, 2025 and
2024, was $7.7 billion and $5.8 billion, respectively.
The fair value of assets held by such VIEs at
December 31, 2025 and 2024 was $10.5 billion and
$8.1 billion, respectively.
Loan securitizations
The Firm has securitized and sold a variety of loans,
including residential mortgages, credit card
receivables, commercial mortgages and other
consumer loans. The purposes of these securitization
transactions were to satisfy investor demand and to
generate liquidity for the Firm.
For loan securitizations in which the Firm is not
required to consolidate the trust, the Firm records the
transfer of the loan receivable to the trust as a sale
when all of the following accounting criteria for a sale
are met: (1) the transferred financial assets are legally
isolated from the Firm’s creditors; (2) the transferee or
beneficial interest holder can pledge or exchange the
transferred financial assets; and (3) the Firm does not
maintain effective control over the transferred financial
assets (e.g., the Firm cannot repurchase the
transferred assets before their maturity and it does not
have the ability to unilaterally cause the holder to
return the transferred assets).
For loan securitizations accounted for as a sale, the
Firm recognizes a gain or loss based on the difference
between the value of proceeds received (including
cash, beneficial interests, or servicing assets received)
and the carrying value of the assets sold. Gains and
losses on securitizations are reported in noninterest
revenue.
JPMorgan Chase & Co./2025 Form 10-K
269
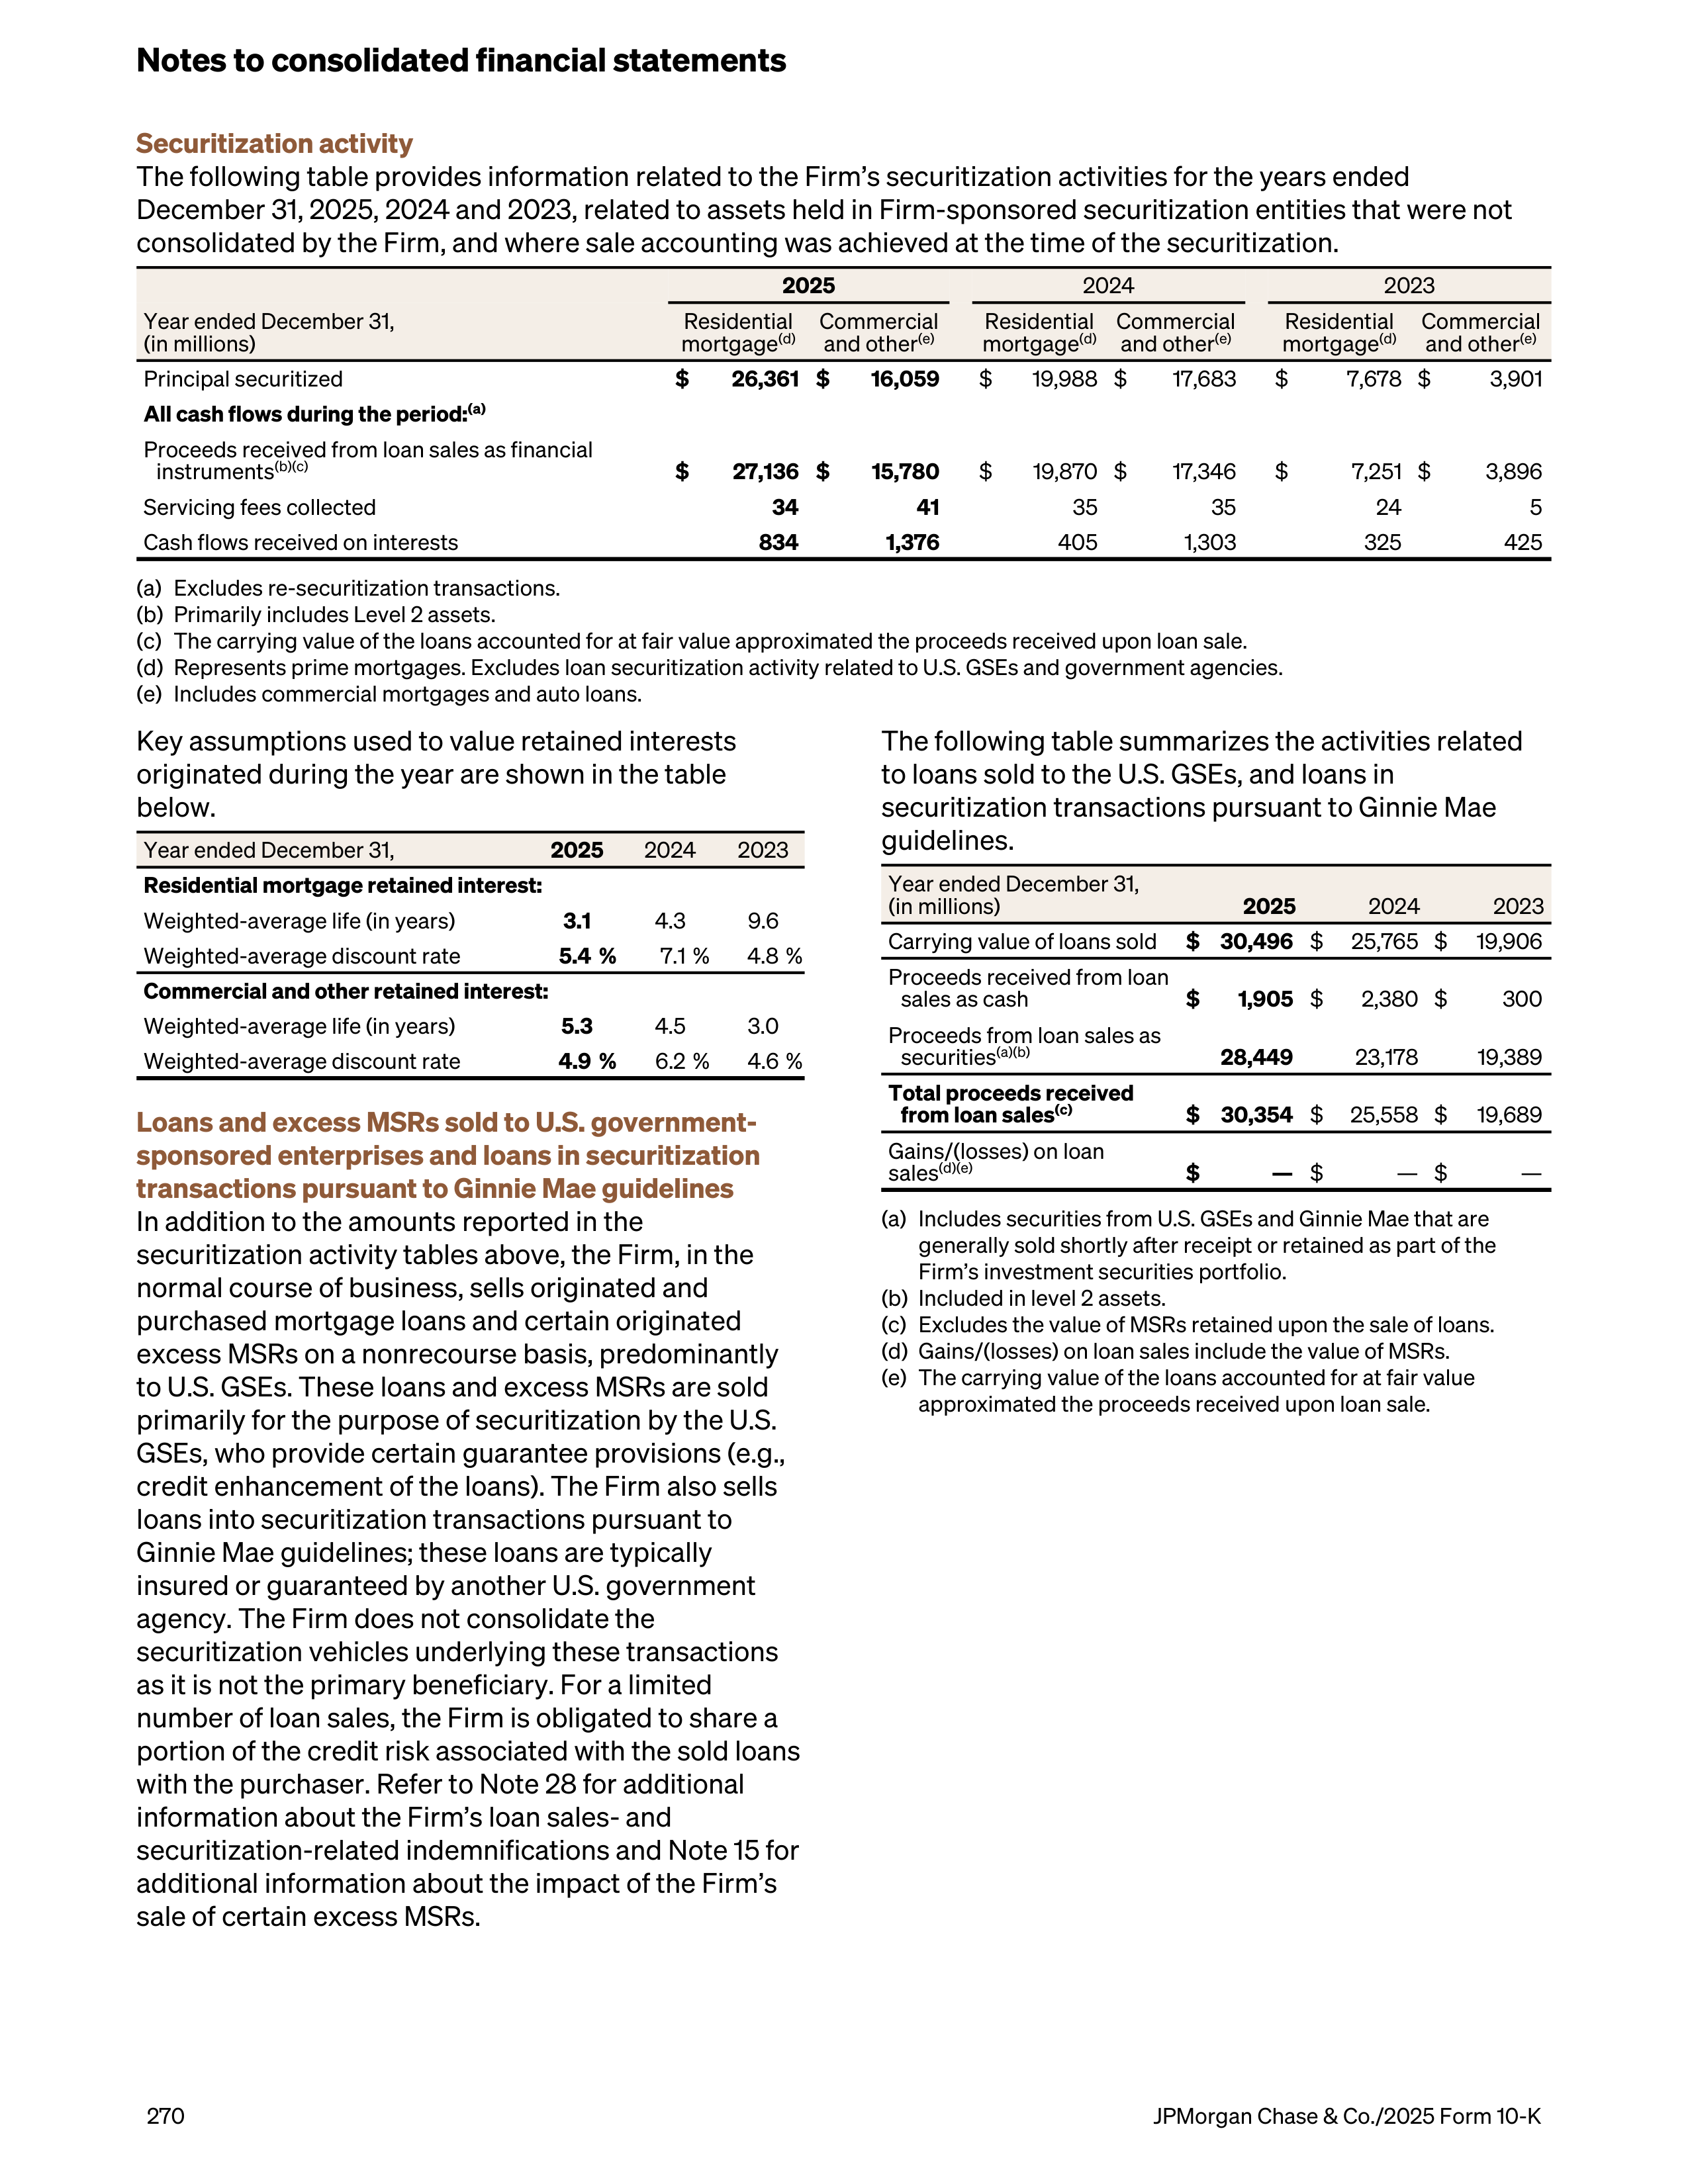
Securitization activity
The following table provides information related to the Firm’s securitization activities for the years ended
December 31, 2025, 2024 and 2023, related to assets held in Firm-sponsored securitization entities that were not
consolidated by the Firm, and where sale accounting was achieved at the time of the securitization.
2025
2024
2023
Year ended December 31,
(in millions)
Residential
mortgage
(d)
Commercial
and other
(e)
Residential
mortgage
(d)
Commercial
and other
(e)
Residential
mortgage
(d)
Commercial
and other
(e)
Principal securitized
$
26,361 $
16,059
$
19,988 $
17,683
$
7,678 $
3,901
All cash flows during the period:
(a)
Proceeds received from loan sales as financial
instruments
(b)(c)
$
27,136 $
15,780
$
19,870 $
17,346
$
7,251 $
3,896
Servicing fees collected
34
41
35
35
24
5
Cash flows received on interests
834
1,376
405
1,303
325
425
(a)
Excludes re-securitization transactions.
(b)
Primarily includes Level 2 assets.
(c)
The carrying value of the loans accounted for at fair value approximated the proceeds received upon loan sale.
(d)
Represents prime mortgages. Excludes loan securitization activity related to U.S. GSEs and government agencies.
(e)
Includes commercial mortgages and auto loans.
Key assumptions used to value retained interests
originated during the year are shown in the table
below.
Year ended December 31,
2025
2024
2023
Residential mortgage retained interest:
Weighted-average life (in years)
3.1
4.3
9.6
Weighted-average discount rate
5.4 %
7.1 %
4.8 %
Commercial and other retained interest:
Weighted-average life (in years)
5.3
4.5
3.0
Weighted-average discount rate
4.9 %
6.2 %
4.6 %
Loans and excess MSRs sold to U.S. government-
sponsored enterprises and loans in securitization
transactions pursuant to Ginnie Mae guidelines
In addition to the amounts reported in the
securitization activity tables above, the Firm, in the
normal course of business, sells originated and
purchased mortgage loans and certain originated
excess MSRs on a nonrecourse basis, predominantly
to U.S. GSEs. These loans and excess MSRs are sold
primarily for the purpose of securitization by the U.S.
GSEs, who provide certain guarantee provisions (e.g.,
credit enhancement of the loans). The Firm also sells
loans into securitization transactions pursuant to
Ginnie Mae guidelines; these loans are typically
insured or guaranteed by another U.S. government
agency. The Firm does not consolidate the
securitization vehicles underlying these transactions
as it is not the primary beneficiary. For a limited
number of loan sales, the Firm is obligated to share a
portion of the credit risk associated with the sold loans
with the purchaser. Refer to Note 28 for additional
information about the Firm’s loan sales- and
securitization-related indemnifications and Note 15 for
additional information about the impact of the Firm’s
sale of certain excess MSRs.
The following table summarizes the activities related
to loans sold to the U.S. GSEs, and loans in
securitization transactions pursuant to Ginnie Mae
guidelines.
Year ended December 31,
(in millions)
2025
2024
2023
Carrying value of loans sold
$ 30,496
$
25,765 $
19,906
Proceeds received from loan
sales as cash
$
1,905
$
2,380 $
300
Proceeds from loan sales as
securities
(a)(b)
28,449
23,178
19,389
Total proceeds received
from loan sales
(c)
$ 30,354
$
25,558 $
19,689
Gains/(losses) on loan
sales
(d)(e)
$
—
$
— $
—
(a)
Includes securities from U.S. GSEs and Ginnie Mae that are
generally sold shortly after receipt or retained as part of the
Firm’s investment securities portfolio.
(b)
Included in level 2 assets.
(c)
Excludes the value of MSRs retained upon the sale of loans.
(d)
Gains/(losses) on loan sales include the value of MSRs.
(e)
The carrying value of the loans accounted for at fair value
approximated the proceeds received upon loan sale.
Notes to consolidated financial statements
270
JPMorgan Chase & Co./2025 Form 10-K
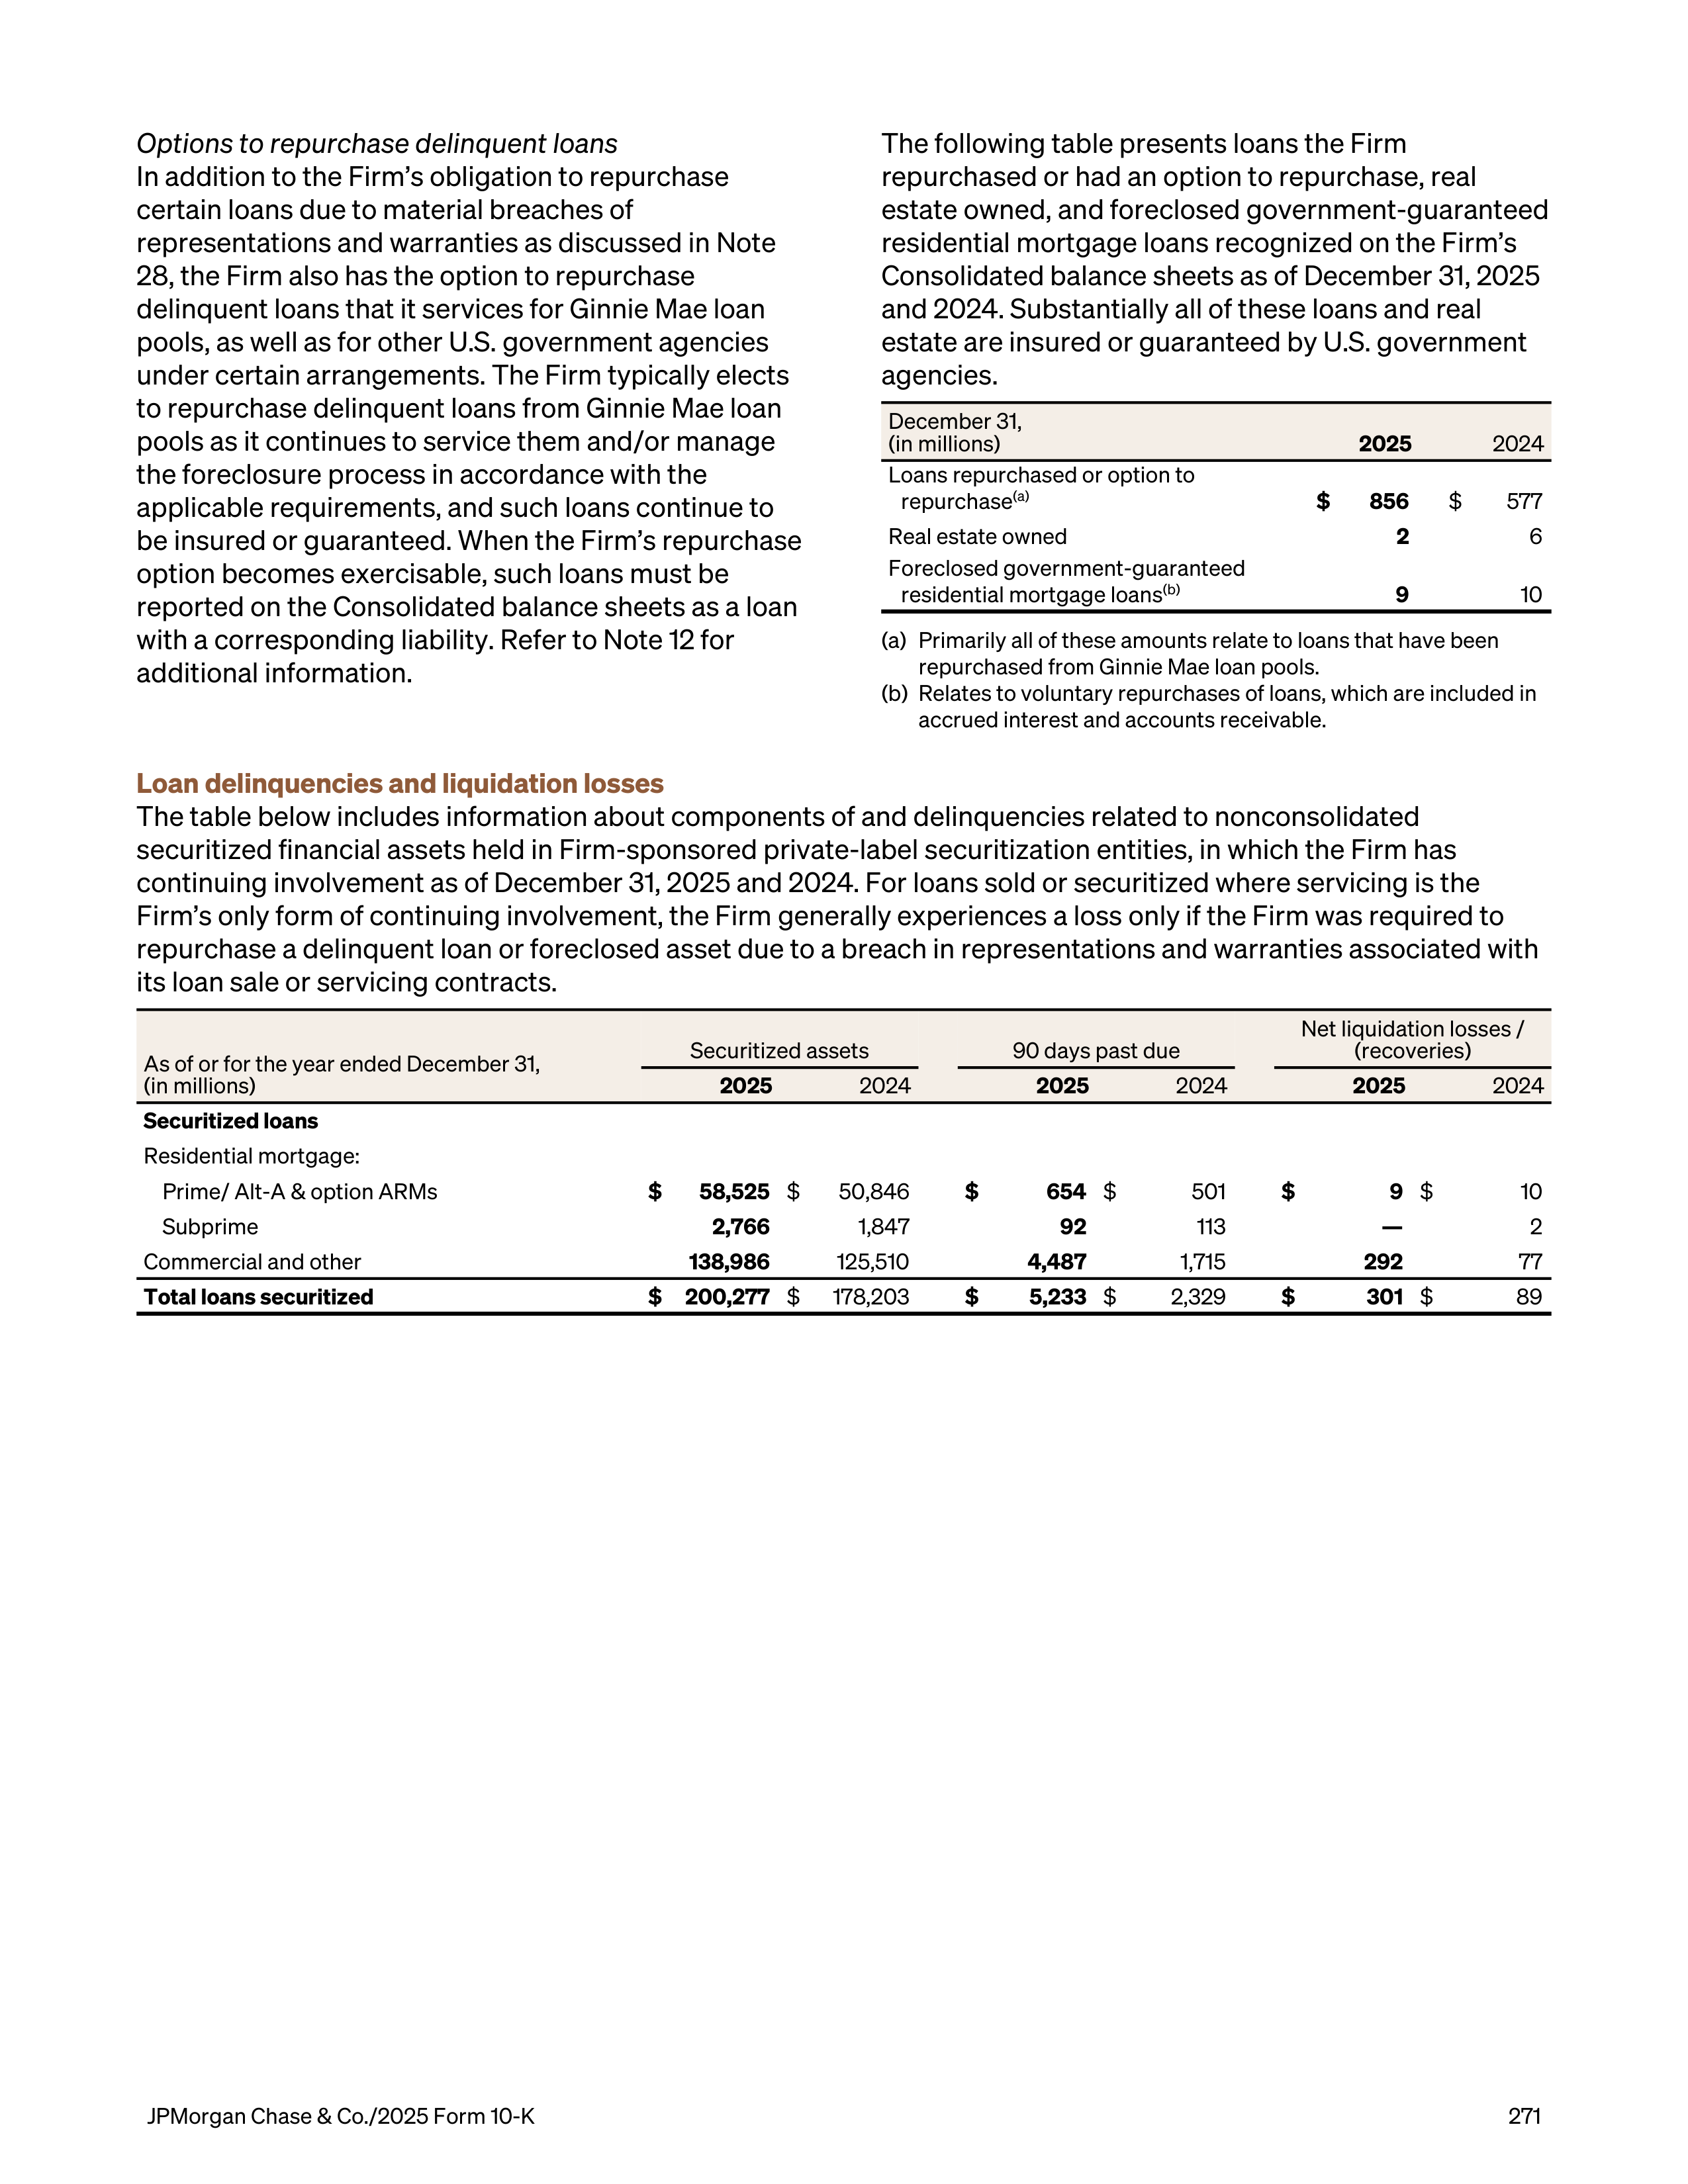
Options to repurchase delinquent loans
In addition to the Firm’s obligation to repurchase
certain loans due to material breaches of
representations and warranties as discussed in Note
28, the Firm also has the option to repurchase
delinquent loans that it services for Ginnie Mae loan
pools, as well as for other U.S. government agencies
under certain arrangements. The Firm typically elects
to repurchase delinquent loans from Ginnie Mae loan
pools as it continues to service them and/or manage
the foreclosure process in accordance with the
applicable requirements, and such loans continue to
be insured or guaranteed. When the Firm’s repurchase
option becomes exercisable, such loans must be
reported on the Consolidated balance sheets as a loan
with a corresponding liability. Refer to Note 12 for
additional information.
The following table presents loans the Firm
repurchased or had an option to repurchase, real
estate owned, and foreclosed government-guaranteed
residential mortgage loans recognized on the Firm’s
Consolidated balance sheets as of December 31, 2025
and 2024. Substantially all of these loans and real
estate are insured or guaranteed by U.S. government
agencies.
December 31,
(in millions)
2025
2024
Loans repurchased or option to
repurchase
(a)
$
856
$
577
Real estate owned
2
6
Foreclosed government-guaranteed
residential mortgage loans
(b)
9
10
(a)
Primarily all of these amounts relate to loans that have been
repurchased from Ginnie Mae loan pools.
(b)
Relates to voluntary repurchases of loans, which are included in
accrued interest and accounts receivable.
Loan delinquencies and liquidation losses
The table below includes information about components of and delinquencies related to nonconsolidated
securitized financial assets held in Firm-sponsored private-label securitization entities, in which the Firm has
continuing involvement as of December 31, 2025 and 2024. For loans sold or securitized where servicing is the
Firm’s only form of continuing involvement, the Firm generally experiences a loss only if the Firm was required to
repurchase a delinquent loan or foreclosed asset due to a breach in representations and warranties associated with
its loan sale or servicing contracts.
As of or for the year ended December 31,
(in millions)
Securitized assets
90 days past due
Net liquidation losses /
(recoveries)
2025
2024
2025
2024
2025
2024
Securitized loans
Residential mortgage:
Prime/ Alt-A & option ARMs
$
58,525
$
50,846
$
654
$
501
$
9
$
10
Subprime
2,766
1,847
92
113
—
2
Commercial and other
138,986
125,510
4,487
1,715
292
77
Total loans securitized
$
200,277
$
178,203
$
5,233
$
2,329
$
301
$
89
JPMorgan Chase & Co./2025 Form 10-K
271
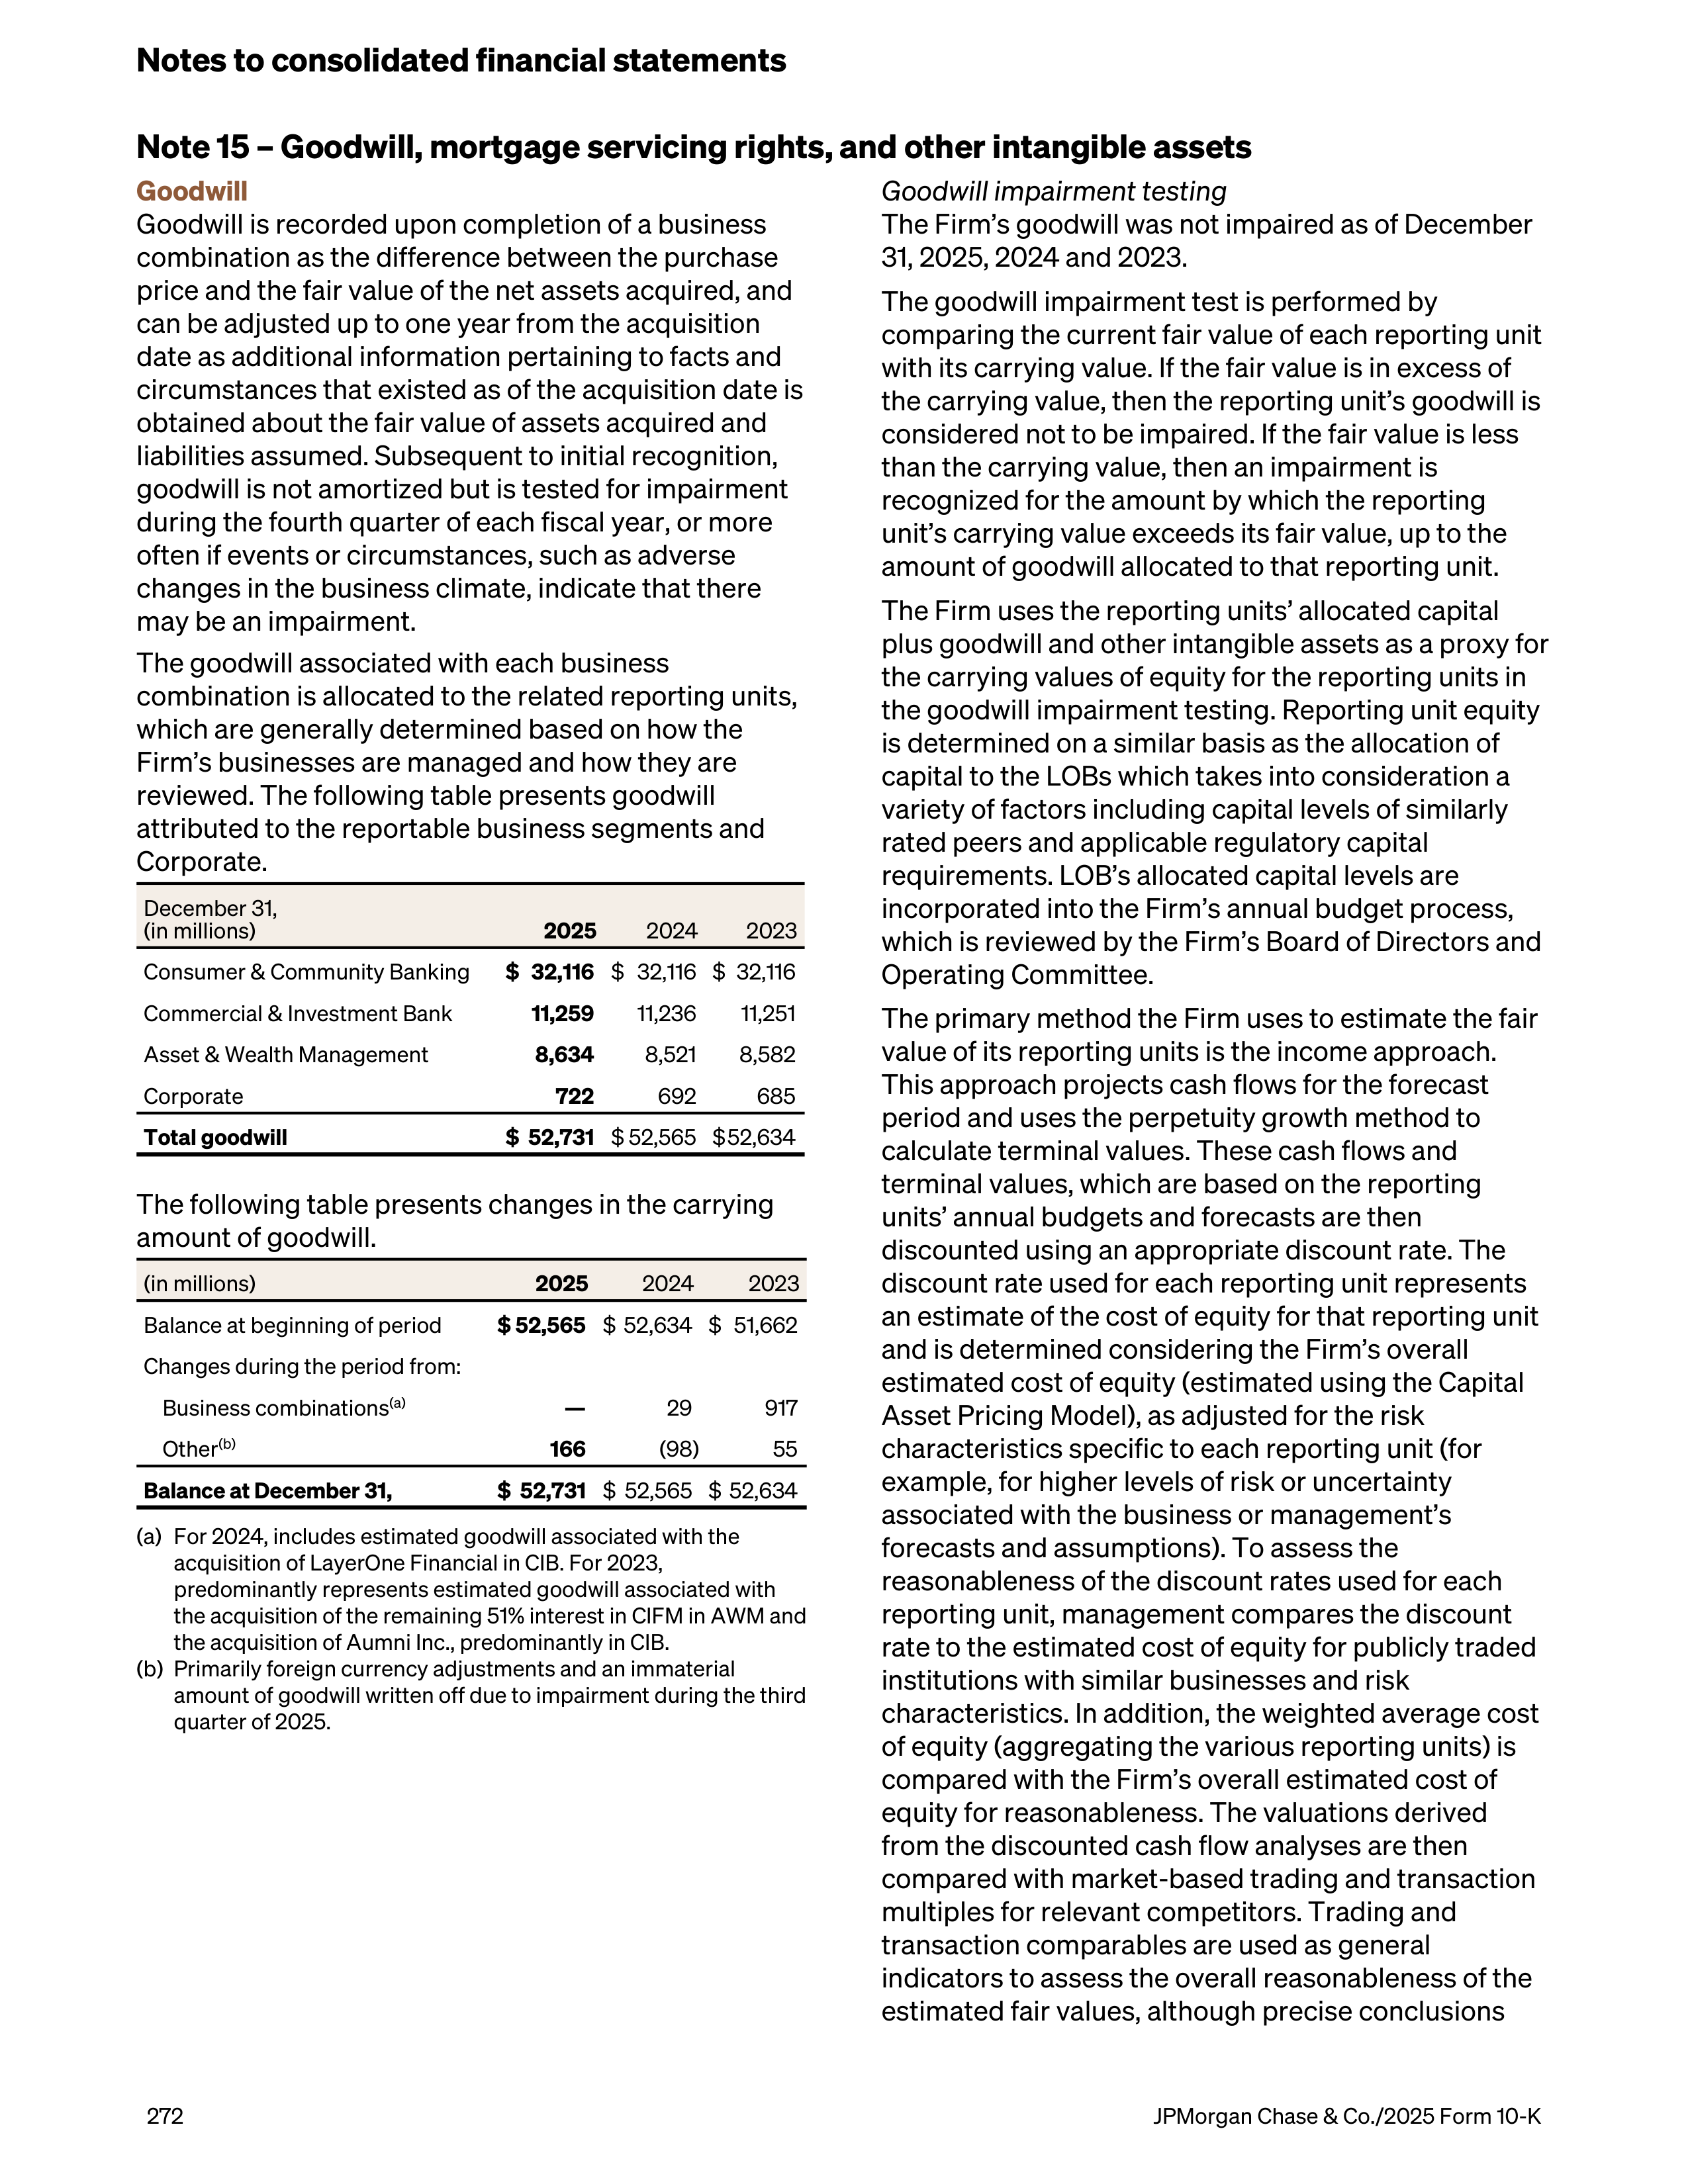
Note 15 – Goodwill, mortgage servicing rights, and other intangible assets
Goodwill
Goodwill is recorded upon completion of a business
combination as the difference between the purchase
price and the fair value of the net assets acquired, and
can be adjusted up to one year from the acquisition
date as additional information pertaining to facts and
circumstances that existed as of the acquisition date is
obtained about the fair value of assets acquired and
liabilities assumed. Subsequent to initial recognition,
goodwill is not amortized but is tested for impairment
during the fourth quarter of each fiscal year, or more
often if events or circumstances, such as adverse
changes in the business climate, indicate that there
may be an impairment.
The goodwill associated with each business
combination is allocated to the related reporting units,
which are generally determined based on how the
Firm’s businesses are managed and how they are
reviewed. The following table presents goodwill
attributed to the reportable business segments and
Corporate.
December 31,
(in millions)
2025
2024
2023
Consumer & Community Banking
$ 32,116
$ 32,116 $ 32,116
Commercial & Investment Bank
11,259
11,236
11,251
Asset & Wealth Management
8,634
8,521
8,582
Corporate
722
692
685
Total goodwill
$ 52,731
$ 52,565 $ 52,634
The following table presents changes in the carrying
amount of goodwill.
(in millions)
2025
2024
2023
Balance at beginning of period
$ 52,565
$ 52,634 $ 51,662
Changes during the period from:
Business combinations
(a)
—
29
917
Other
(b)
166
(98)
55
Balance at December 31,
$ 52,731
$ 52,565 $ 52,634
(a)
For 2024, includes estimated goodwill associated with the
acquisition of LayerOne Financial in CIB. For 2023,
predominantly represents estimated goodwill associated with
the acquisition of the remaining 51% interest in CIFM in AWM and
the acquisition of Aumni Inc., predominantly in CIB.
(b)
Primarily foreign currency adjustments and an immaterial
amount of goodwill written off due to impairment during the third
quarter of 2025.
Goodwill impairment testing
The Firm’s goodwill was not impaired as of December
31, 2025, 2024 and 2023.
The goodwill impairment test is performed by
comparing the current fair value of each reporting unit
with its carrying value. If the fair value is in excess of
the carrying value, then the reporting unit’s goodwill is
considered not to be impaired. If the fair value is less
than the carrying value, then an impairment is
recognized for the amount by which the reporting
unit’s carrying value exceeds its fair value, up to the
amount of goodwill allocated to that reporting unit.
The Firm uses the reporting units’ allocated capital
plus goodwill and other intangible assets as a proxy for
the carrying values of equity for the reporting units in
the goodwill impairment testing. Reporting unit equity
is determined on a similar basis as the allocation of
capital to the LOBs which takes into consideration a
variety of factors including capital levels of similarly
rated peers and applicable regulatory capital
requirements. LOB’s allocated capital levels are
incorporated into the Firm’s annual budget process,
which is reviewed by the Firm’s Board of Directors and
Operating Committee.
The primary method the Firm uses to estimate the fair
value of its reporting units is the income approach.
This approach projects cash flows for the forecast
period and uses the perpetuity growth method to
calculate terminal values. These cash flows and
terminal values, which are based on the reporting
units’ annual budgets and forecasts are then
discounted using an appropriate discount rate. The
discount rate used for each reporting unit represents
an estimate of the cost of equity for that reporting unit
and is determined considering the Firm’s overall
estimated cost of equity (estimated using the Capital
Asset Pricing Model), as adjusted for the risk
characteristics specific to each reporting unit (for
example, for higher levels of risk or uncertainty
associated with the business or management’s
forecasts and assumptions). To assess the
reasonableness of the discount rates used for each
reporting unit, management compares the discount
rate to the estimated cost of equity for publicly traded
institutions with similar businesses and risk
characteristics. In addition, the weighted average cost
of equity (aggregating the various reporting units) is
compared with the Firm’s overall estimated cost of
equity for reasonableness. The valuations derived
from the discounted cash flow analyses are then
compared with market-based trading and transaction
multiples for relevant competitors. Trading and
transaction comparables are used as general
indicators to assess the overall reasonableness of the
estimated fair values, although precise conclusions
Notes to consolidated financial statements
272
JPMorgan Chase & Co./2025 Form 10-K
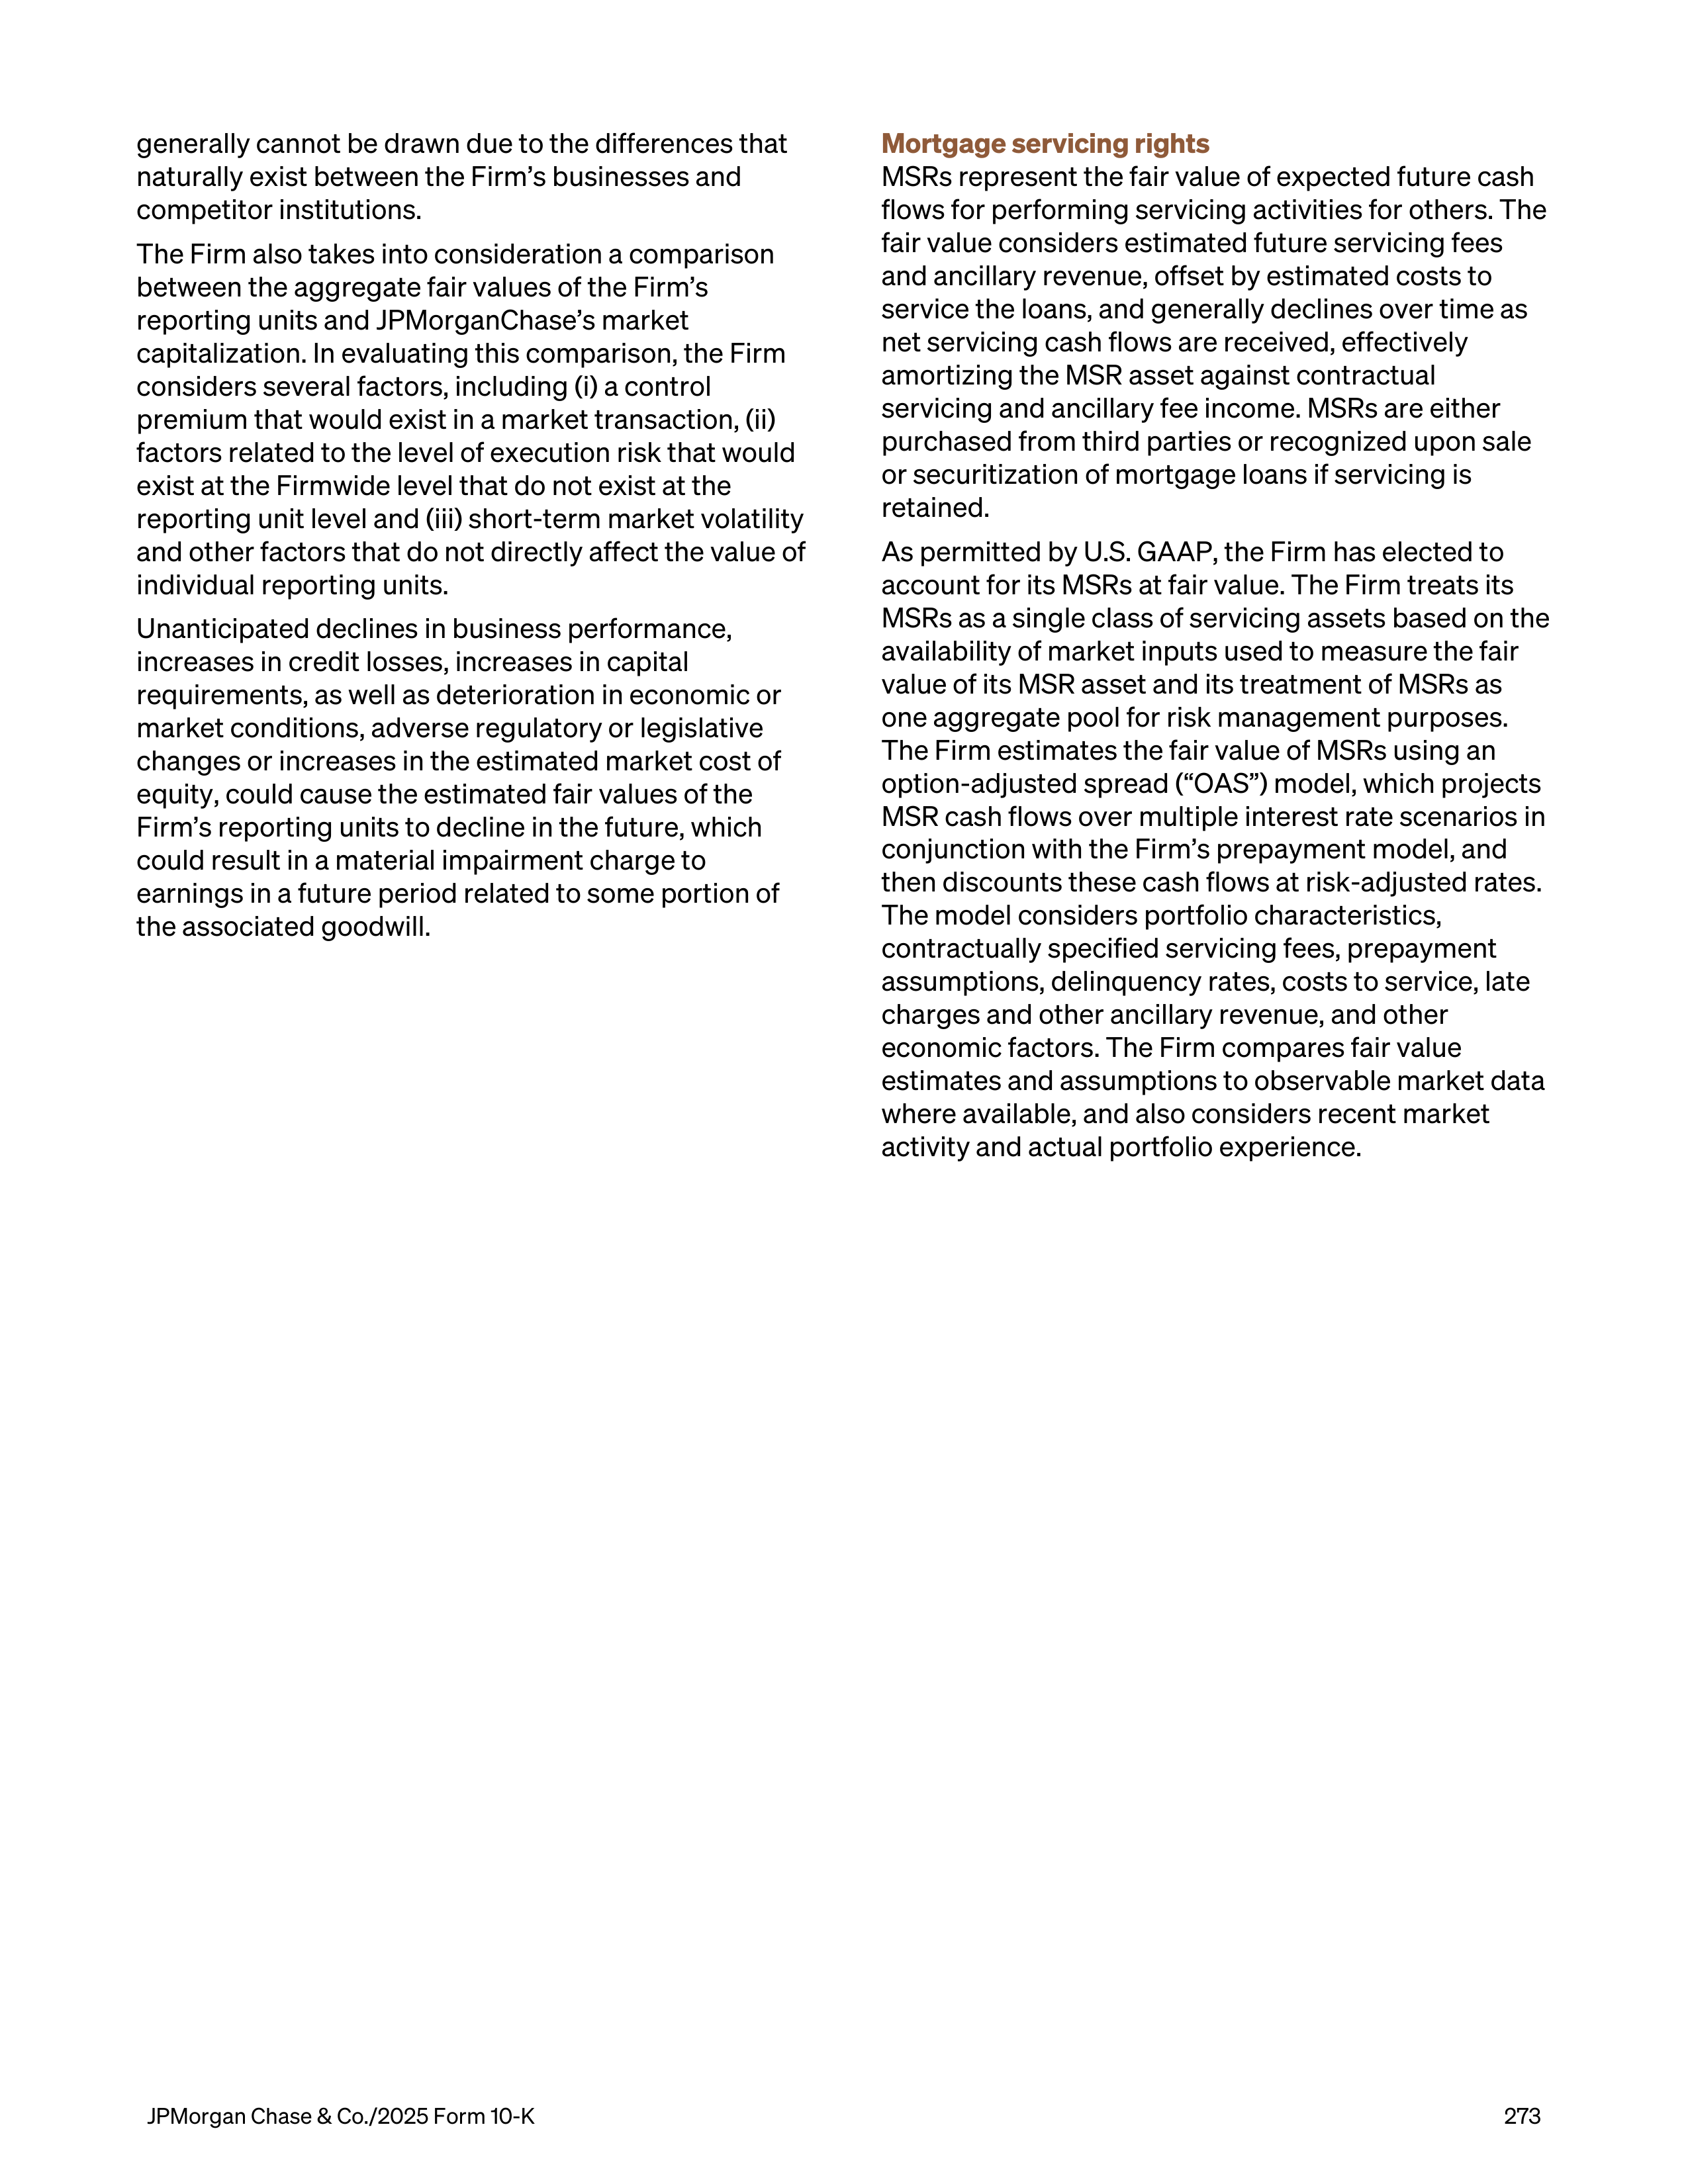
generally cannot be drawn due to the differences that
naturally exist between the Firm’s businesses and
competitor institutions.
The Firm also takes into consideration a comparison
between the aggregate fair values of the Firm’s
reporting units and JPMorganChase’s market
capitalization. In evaluating this comparison, the Firm
considers several factors, including (i) a control
premium that would exist in a market transaction, (ii)
factors related to the level of execution risk that would
exist at the Firmwide level that do not exist at the
reporting unit level and (iii) short-term market volatility
and other factors that do not directly affect the value of
individual reporting units.
Unanticipated declines in business performance,
increases in credit losses, increases in capital
requirements, as well as deterioration in economic or
market conditions, adverse regulatory or legislative
changes or increases in the estimated market cost of
equity, could cause the estimated fair values of the
Firm’s reporting units to decline in the future, which
could result in a material impairment charge to
earnings in a future period related to some portion of
the associated goodwill.
Mortgage servicing rights
MSRs represent the fair value of expected future cash
flows for performing servicing activities for others. The
fair value considers estimated future servicing fees
and ancillary revenue, offset by estimated costs to
service the loans, and generally declines over time as
net servicing cash flows are received, effectively
amortizing the MSR asset against contractual
servicing and ancillary fee income. MSRs are either
purchased from third parties or recognized upon sale
or securitization of mortgage loans if servicing is
retained.
As permitted by U.S. GAAP, the Firm has elected to
account for its MSRs at fair value. The Firm treats its
MSRs as a single class of servicing assets based on the
availability of market inputs used to measure the fair
value of its MSR asset and its treatment of MSRs as
one aggregate pool for risk management purposes.
The Firm estimates the fair value of MSRs using an
option-adjusted spread (“OAS”) model, which projects
MSR cash flows over multiple interest rate scenarios in
conjunction with the Firm’s prepayment model, and
then discounts these cash flows at risk-adjusted rates.
The model considers portfolio characteristics,
contractually specified servicing fees, prepayment
assumptions, delinquency rates, costs to service, late
charges and other ancillary revenue, and other
economic factors. The Firm compares fair value
estimates and assumptions to observable market data
where available, and also considers recent market
activity and actual portfolio experience.
JPMorgan Chase & Co./2025 Form 10-K
273
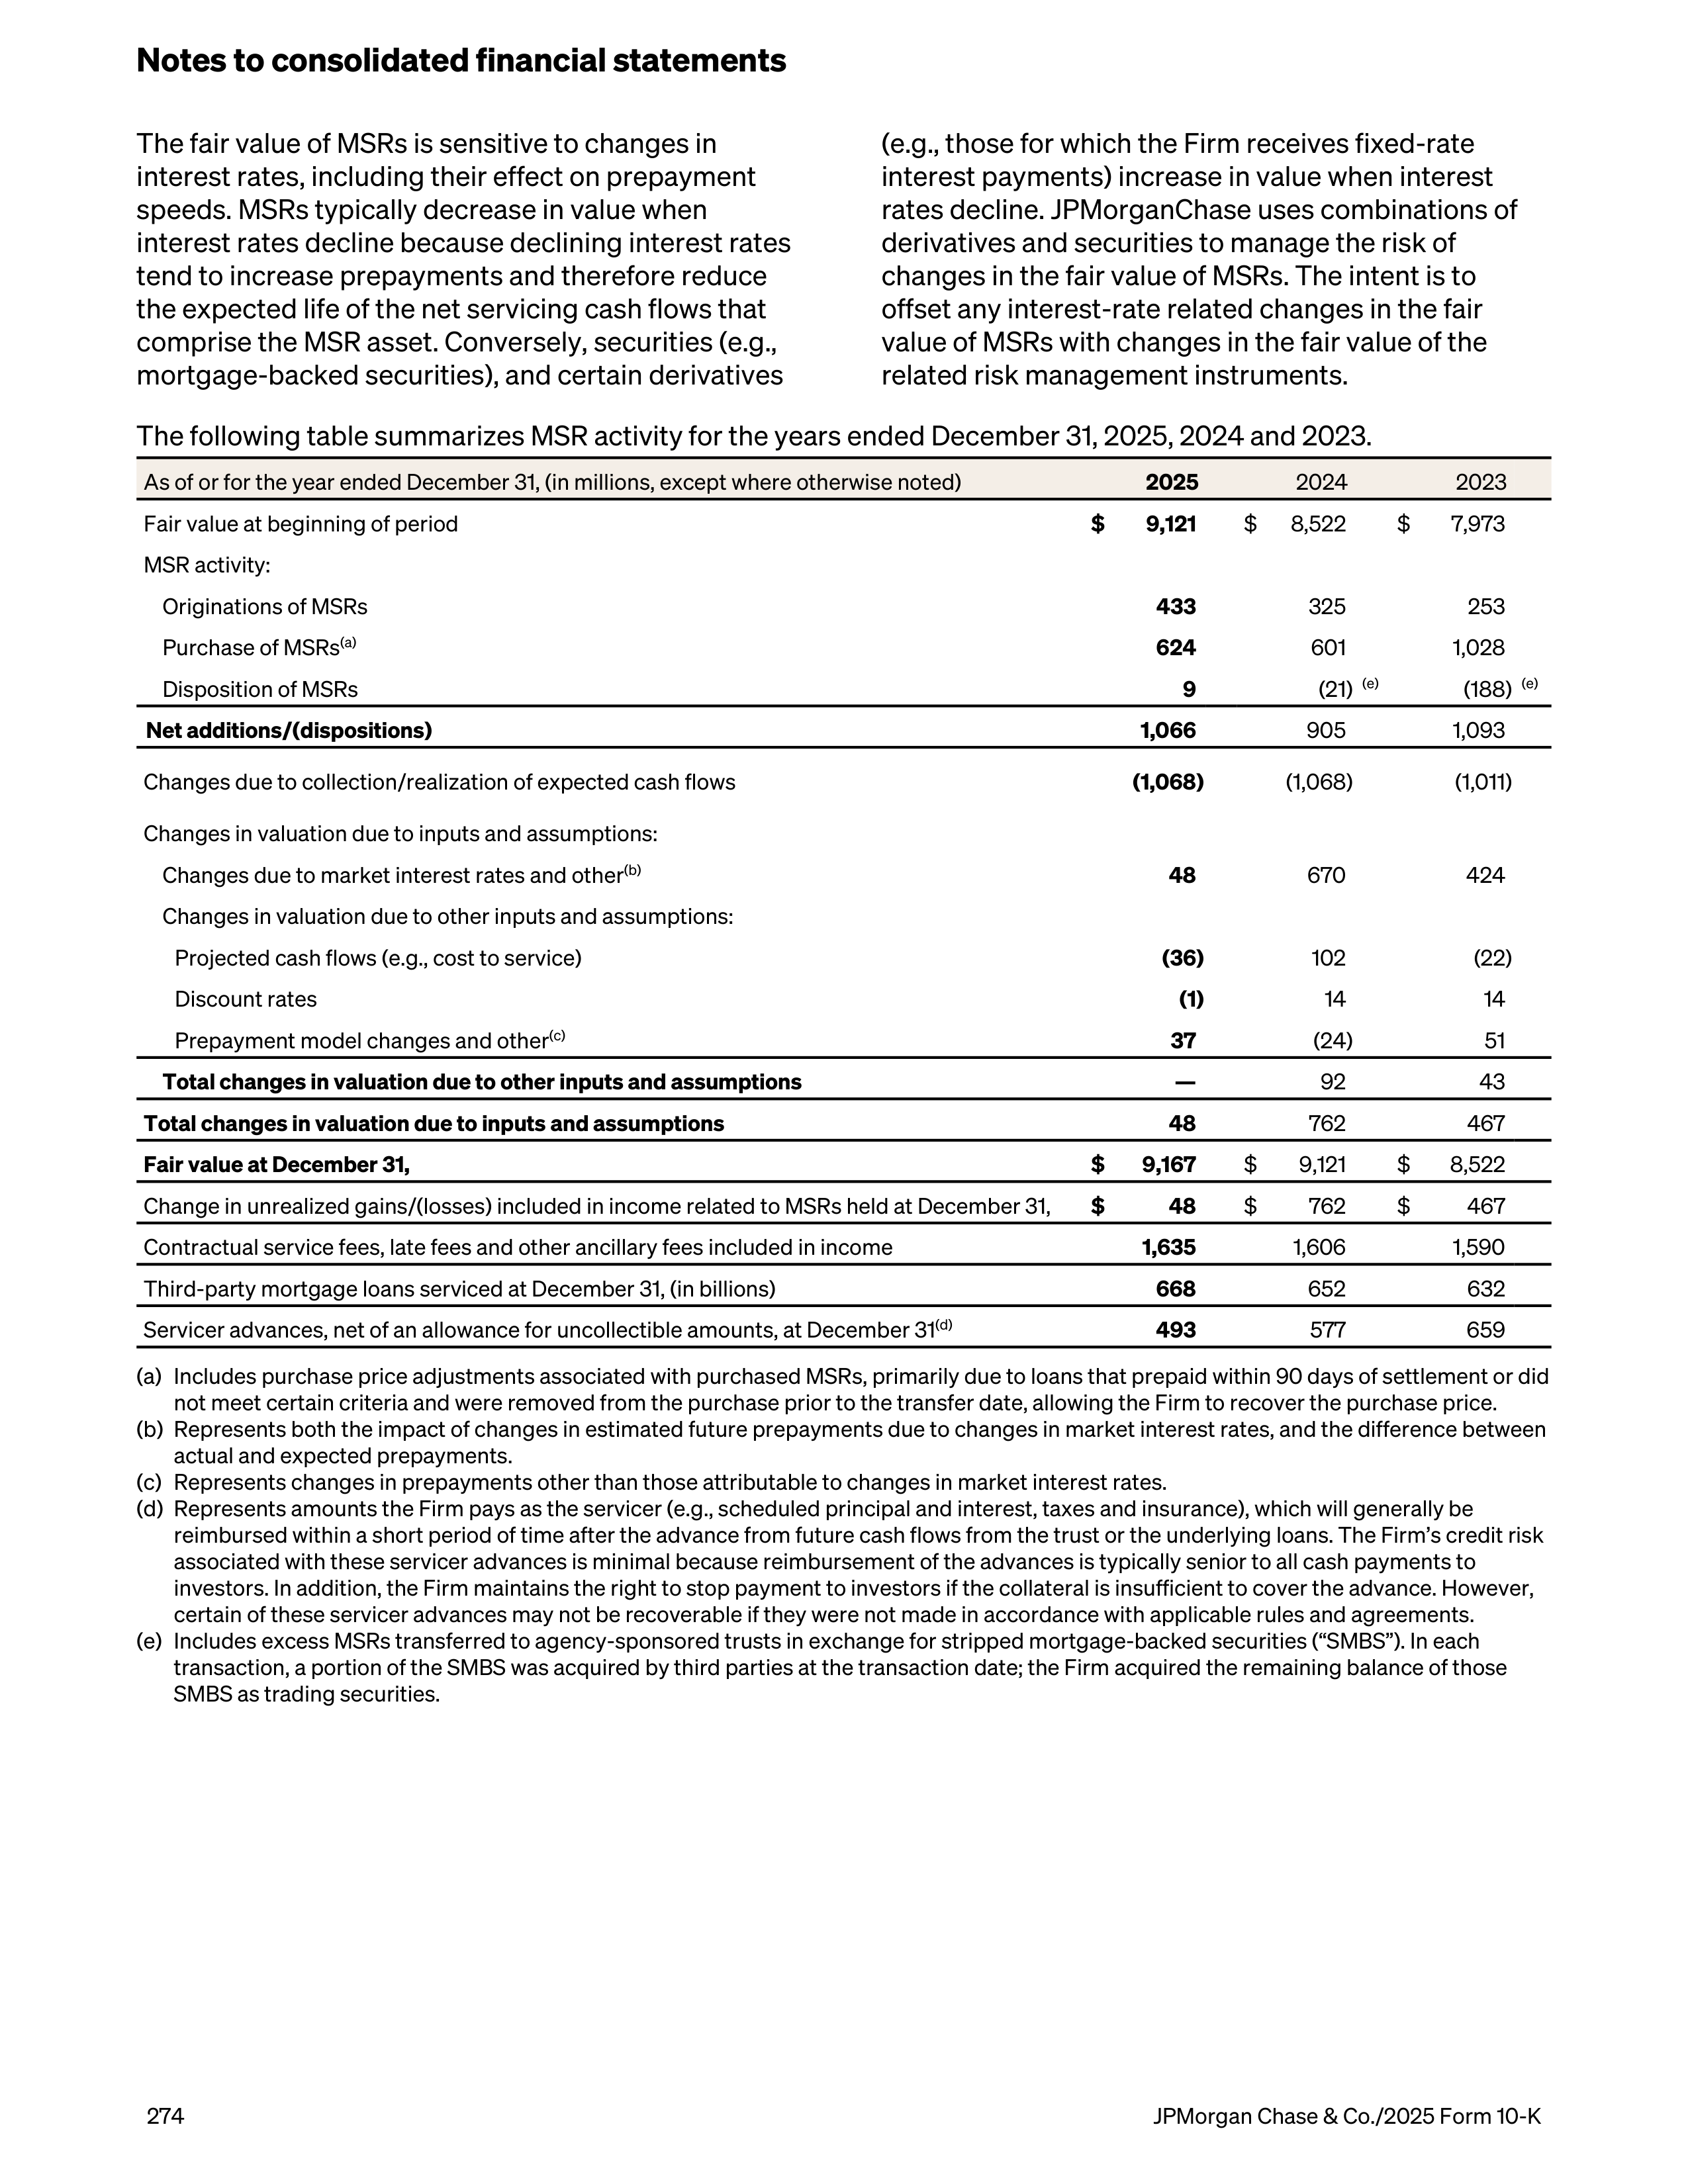
The fair value of MSRs is sensitive to changes in
interest rates, including their effect on prepayment
speeds. MSRs typically decrease in value when
interest rates decline because declining interest rates
tend to increase prepayments and therefore reduce
the expected life of the net servicing cash flows that
comprise the MSR asset. Conversely, securities (e.g.,
mortgage-backed securities), and certain derivatives
(e.g., those for which the Firm receives fixed-rate
interest payments) increase in value when interest
rates decline. JPMorganChase uses combinations of
derivatives and securities to manage the risk of
changes in the fair value of MSRs. The intent is to
offset any interest-rate related changes in the fair
value of MSRs with changes in the fair value of the
related risk management instruments.
The following table summarizes MSR activity for the years ended December 31, 2025, 2024 and 2023.
As of or for the year ended December 31, (in millions, except where otherwise noted)
2025
2024
2023
Fair value at beginning of period
$
9,121
$
8,522
$
7,973
MSR activity:
Originations of MSRs
433
325
253
Purchase of MSRs
(a)
624
601
1,028
Disposition of MSRs
9
(21)
(e)
(188)
(e)
Net additions/(dispositions)
1,066
905
1,093
Changes due to collection/realization of expected cash flows
(1,068)
(1,068)
(1,011)
Changes in valuation due to inputs and assumptions:
Changes due to market interest rates and other
(b)
48
670
424
Changes in valuation due to other inputs and assumptions:
Projected cash flows (e.g., cost to service)
(36)
102
(22)
Discount rates
(1)
14
14
Prepayment model changes and other
(c)
37
(24)
51
Total changes in valuation due to other inputs and assumptions
—
92
43
Total changes in valuation due to inputs and assumptions
48
762
467
Fair value at December 31,
$
9,167
$
9,121
$
8,522
Change in unrealized gains/(losses) included in income related to MSRs held at December 31,
$
48
$
762
$
467
Contractual service fees, late fees and other ancillary fees included in income
1,635
1,606
1,590
Third-party mortgage loans serviced at December 31, (in billions)
668
652
632
Servicer advances, net of an allowance for uncollectible amounts, at December 31
(d)
493
577
659
(a)
Includes purchase price adjustments associated with purchased MSRs, primarily due to loans that prepaid within 90 days of settlement or did
not meet certain criteria and were removed from the purchase prior to the transfer date, allowing the Firm to recover the purchase price.
(b)
Represents both the impact of changes in estimated future prepayments due to changes in market interest rates, and the difference between
actual and expected prepayments.
(c)
Represents changes in prepayments other than those attributable to changes in market interest rates.
(d)
Represents amounts the Firm pays as the servicer (e.g., scheduled principal and interest, taxes and insurance), which will generally be
reimbursed within a short period of time after the advance from future cash flows from the trust or the underlying loans. The Firm’s credit risk
associated with these servicer advances is minimal because reimbursement of the advances is typically senior to all cash payments to
investors. In addition, the Firm maintains the right to stop payment to investors if the collateral is insufficient to cover the advance. However,
certain of these servicer advances may not be recoverable if they were not made in accordance with applicable rules and agreements.
(e)
Includes excess MSRs transferred to agency-sponsored trusts in exchange for stripped mortgage-backed securities (“SMBS”). In each
transaction, a portion of the SMBS was acquired by third parties at the transaction date; the Firm acquired the remaining balance of those
SMBS as trading securities.
Notes to consolidated financial statements
274
JPMorgan Chase & Co./2025 Form 10-K
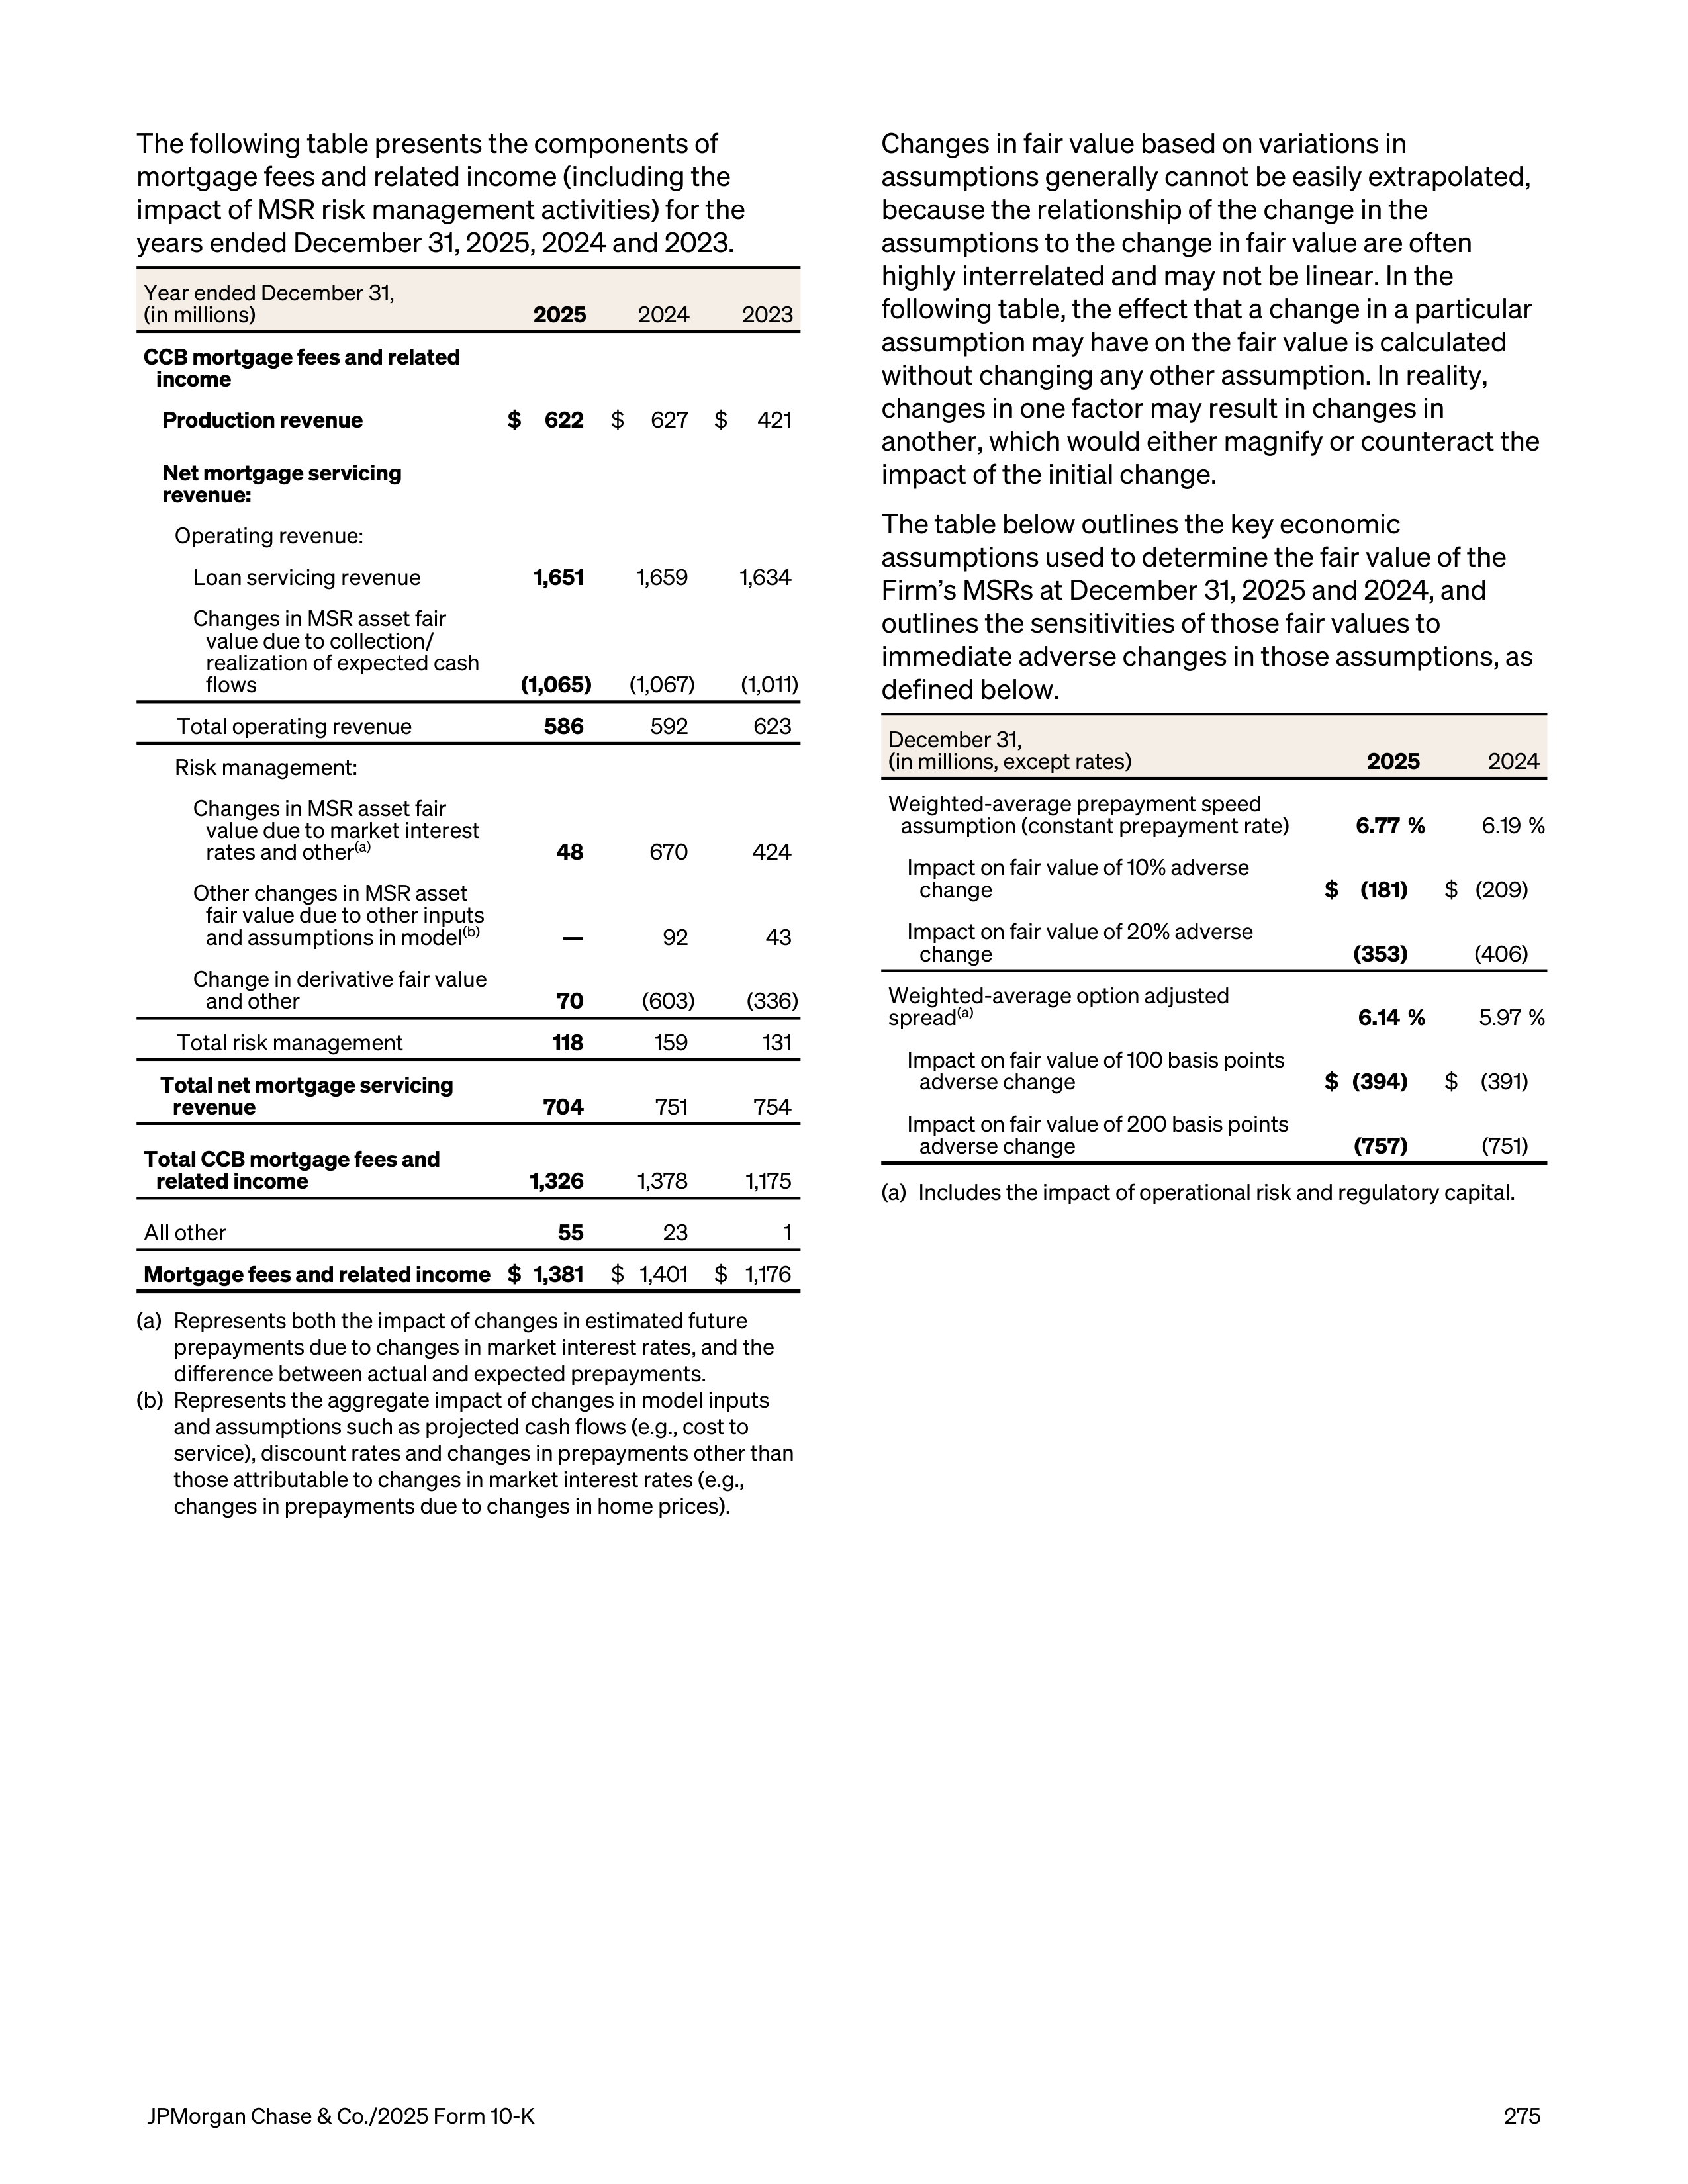
The following table presents the components of
mortgage fees and related income (including the
impact of MSR risk management activities) for the
years ended December 31, 2025, 2024 and 2023.
Year ended December 31,
(in millions)
2025
2024
2023
CCB mortgage fees and related
income
Production revenue
$
622
$
627
$
421
Net mortgage servicing
revenue:
Operating revenue:
Loan servicing revenue
1,651
1,659
1,634
Changes in MSR asset fair
value due to collection/
realization of expected cash
flows
(1,065)
(1,067)
(1,011)
Total operating revenue
586
592
623
Risk management:
Changes in MSR asset fair
value due to market interest
rates and other
(a)
48
670
424
Other changes in MSR asset
fair value due to other inputs
and assumptions in model
(b)
—
92
43
Change in derivative fair value
and other
70
(603)
(336)
Total risk management
118
159
131
Total net mortgage servicing
revenue
704
751
754
Total CCB mortgage fees and
related income
1,326
1,378
1,175
All other
55
23
1
Mortgage fees and related income
$ 1,381
$ 1,401
$ 1,176
(a)
Represents both the impact of changes in estimated future
prepayments due to changes in market interest rates, and the
difference between actual and expected prepayments.
(b)
Represents the aggregate impact of changes in model inputs
and assumptions such as projected cash flows (e.g., cost to
service), discount rates and changes in prepayments other than
those attributable to changes in market interest rates (e.g.,
changes in prepayments due to changes in home prices).
Changes in fair value based on variations in
assumptions generally cannot be easily extrapolated,
because the relationship of the change in the
assumptions to the change in fair value are often
highly interrelated and may not be linear. In the
following table, the effect that a change in a particular
assumption may have on the fair value is calculated
without changing any other assumption. In reality,
changes in one factor may result in changes in
another, which would either magnify or counteract the
impact of the initial change.
The table below outlines the key economic
assumptions used to determine the fair value of the
Firm’s MSRs at December 31, 2025 and 2024, and
outlines the sensitivities of those fair values to
immediate adverse changes in those assumptions, as
defined below.
December 31,
(in millions, except rates)
2025
2024
Weighted-average prepayment speed
assumption (constant prepayment rate)
6.77 %
6.19 %
Impact on fair value of 10% adverse
change
$
(181)
$ (209)
Impact on fair value of 20% adverse
change
(353)
(406)
Weighted-average option adjusted
spread
(a)
6.14 %
5.97 %
Impact on fair value of 100 basis points
adverse change
$ (394)
$
(391)
Impact on fair value of 200 basis points
adverse change
(757)
(751)
(a)
Includes the impact of operational risk and regulatory capital.
JPMorgan Chase & Co./2025 Form 10-K
275
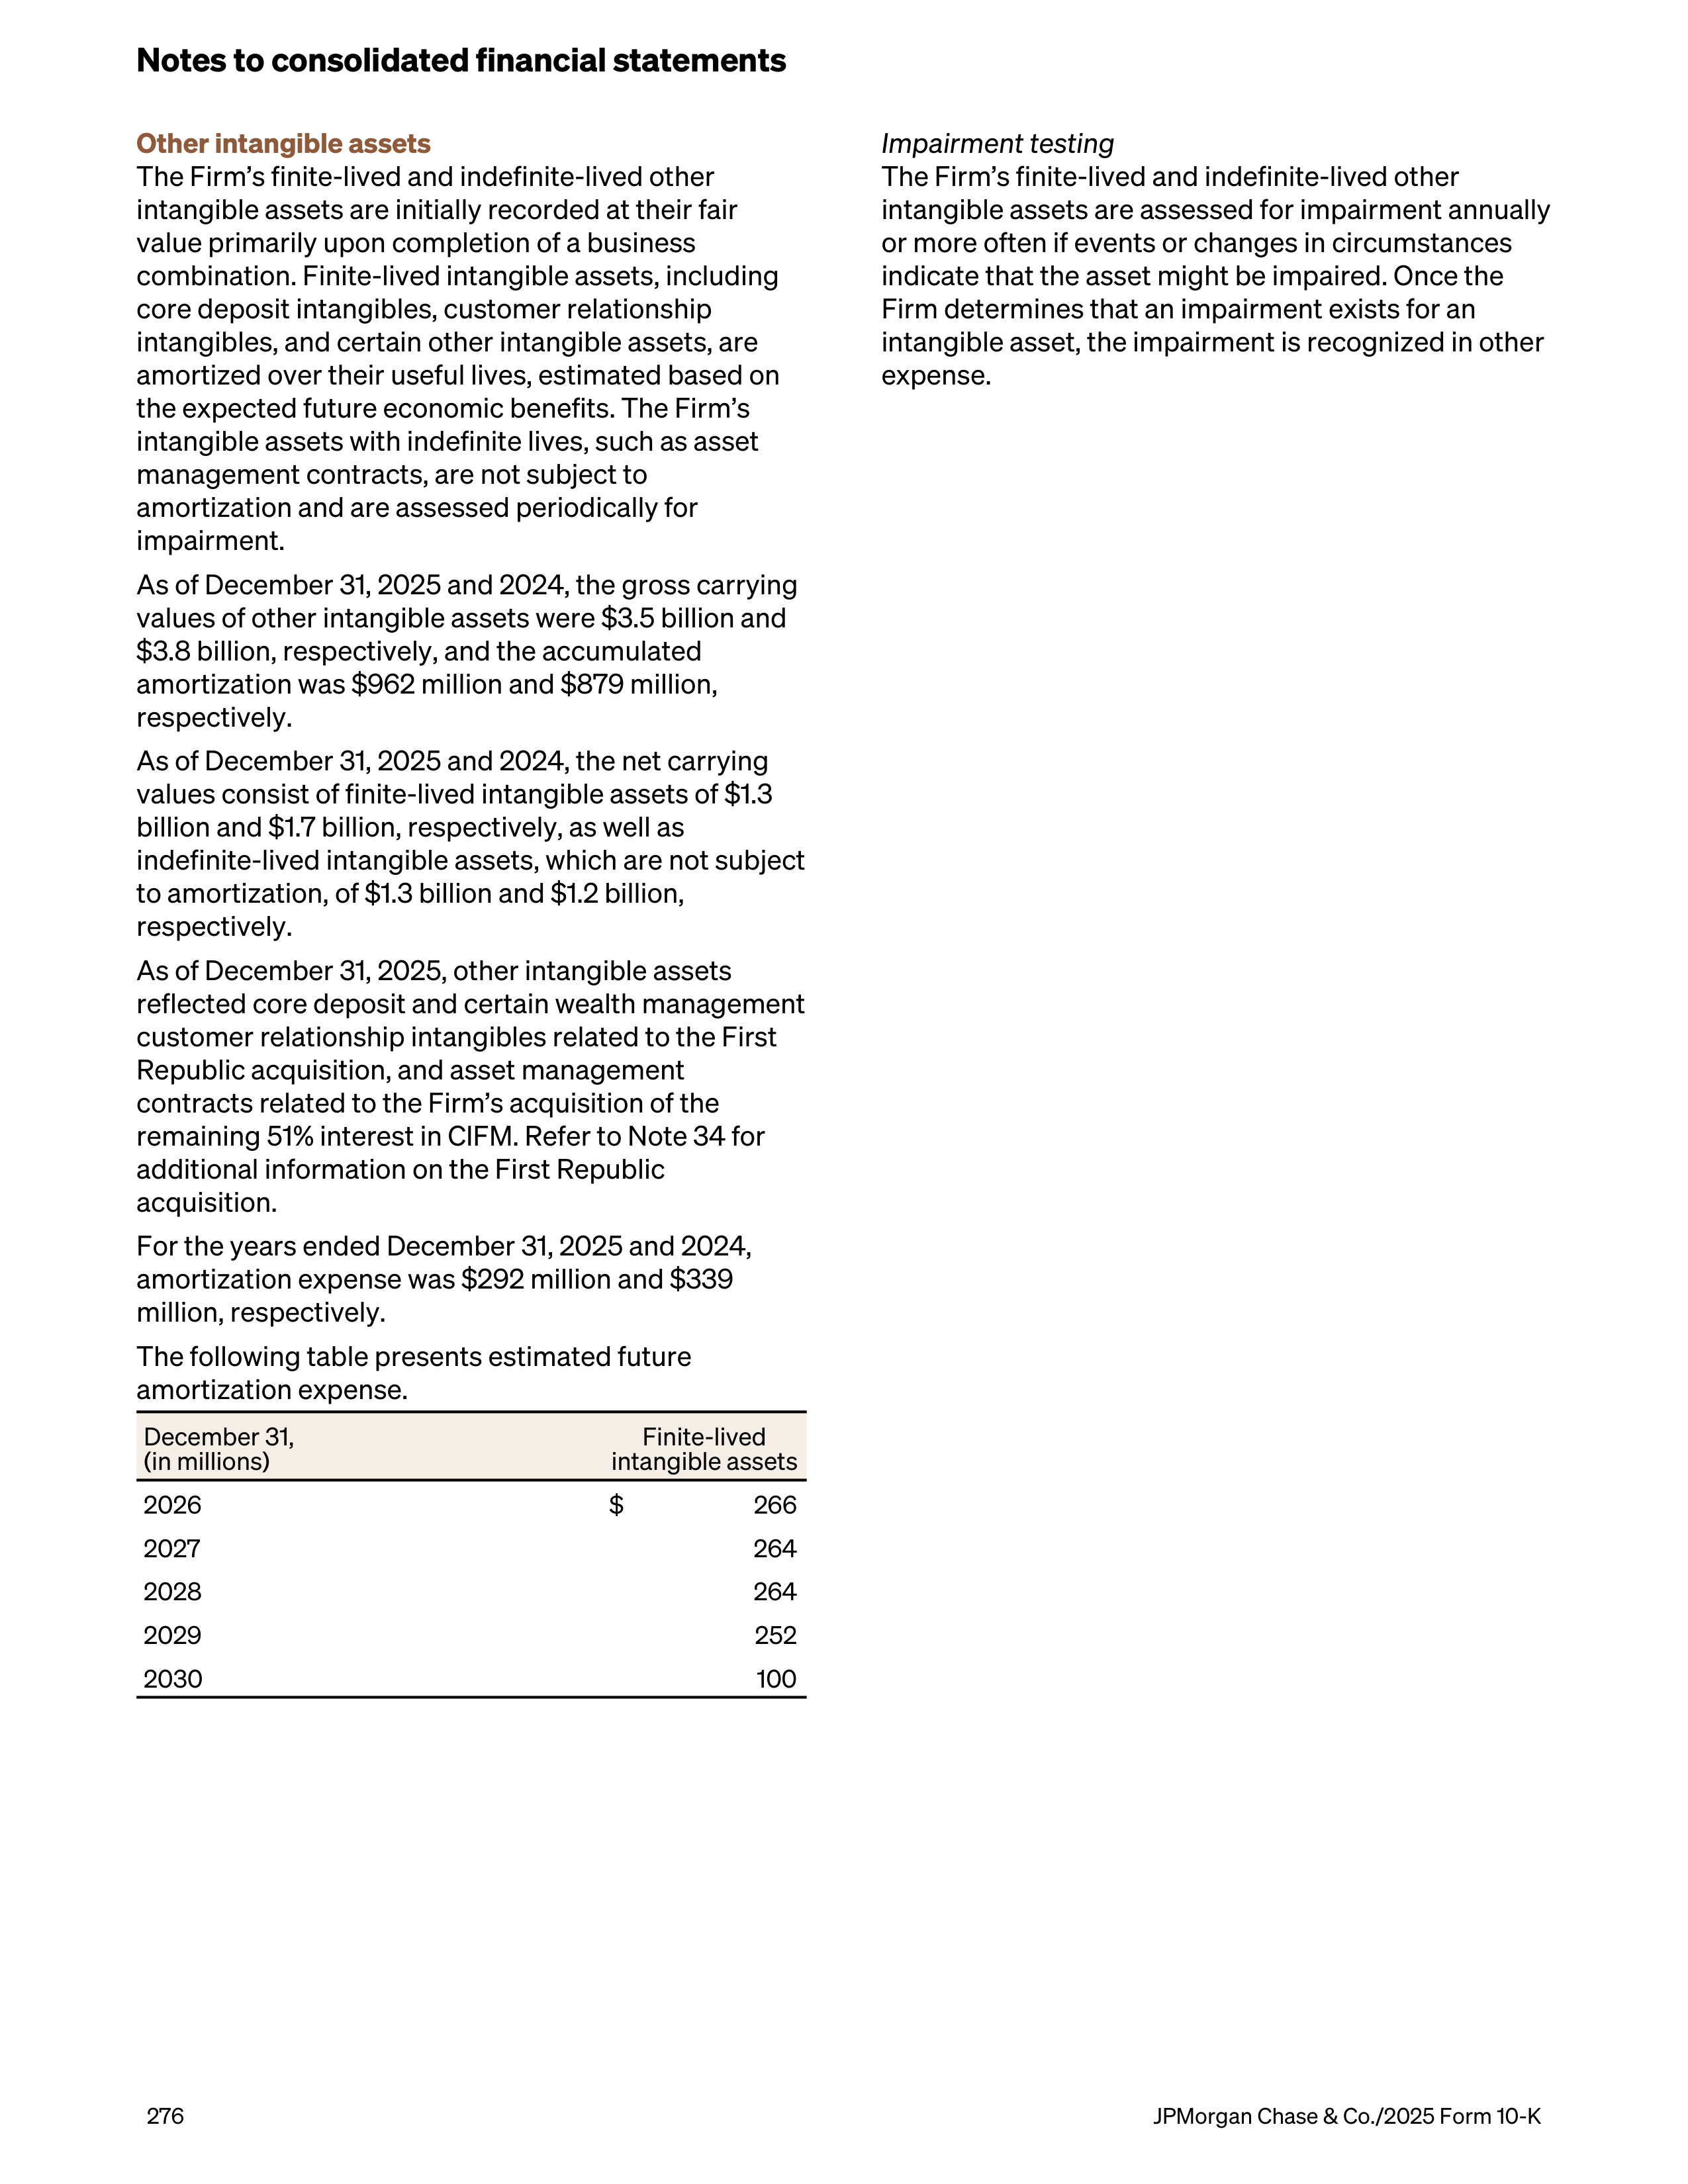
Other intangible assets
The Firm’s finite-lived and indefinite-lived other
intangible assets are initially recorded at their fair
value primarily upon completion of a business
combination. Finite-lived intangible assets, including
core deposit intangibles, customer relationship
intangibles, and certain other intangible assets, are
amortized over their useful lives, estimated based on
the expected future economic benefits. The Firm’s
intangible assets with indefinite lives, such as asset
management contracts, are not subject to
amortization and are assessed periodically for
impairment.
As of December 31, 2025 and 2024, the gross carrying
values of other intangible assets were $3.5 billion and
$3.8 billion, respectively, and the accumulated
amortization was $962 million and $879 million,
respectively.
As of December 31, 2025 and 2024, the net carrying
values consist of finite-lived intangible assets of $1.3
billion and $1.7 billion, respectively, as well as
indefinite-lived intangible assets, which are not subject
to amortization, of $1.3 billion and $1.2 billion,
respectively.
As of December 31, 2025, other intangible assets
reflected core deposit and certain wealth management
customer relationship intangibles related to the First
Republic acquisition, and asset management
contracts related to the Firm’s acquisition of the
remaining 51% interest in CIFM. Refer to Note 34 for
additional information on the First Republic
acquisition.
For the years ended December 31, 2025 and 2024,
amortization expense was $292 million and $339
million, respectively.
The following table presents estimated future
amortization expense.
December 31,
(in millions)
Finite-lived
intangible assets
2026
$
266
2027
264
2028
264
2029
252
2030
100
Impairment testing
The Firm’s finite-lived and indefinite-lived other
intangible assets are assessed for impairment annually
or more often if events or changes in circumstances
indicate that the asset might be impaired. Once the
Firm determines that an impairment exists for an
intangible asset, the impairment is recognized in other
expense.
Notes to consolidated financial statements
276
JPMorgan Chase & Co./2025 Form 10-K
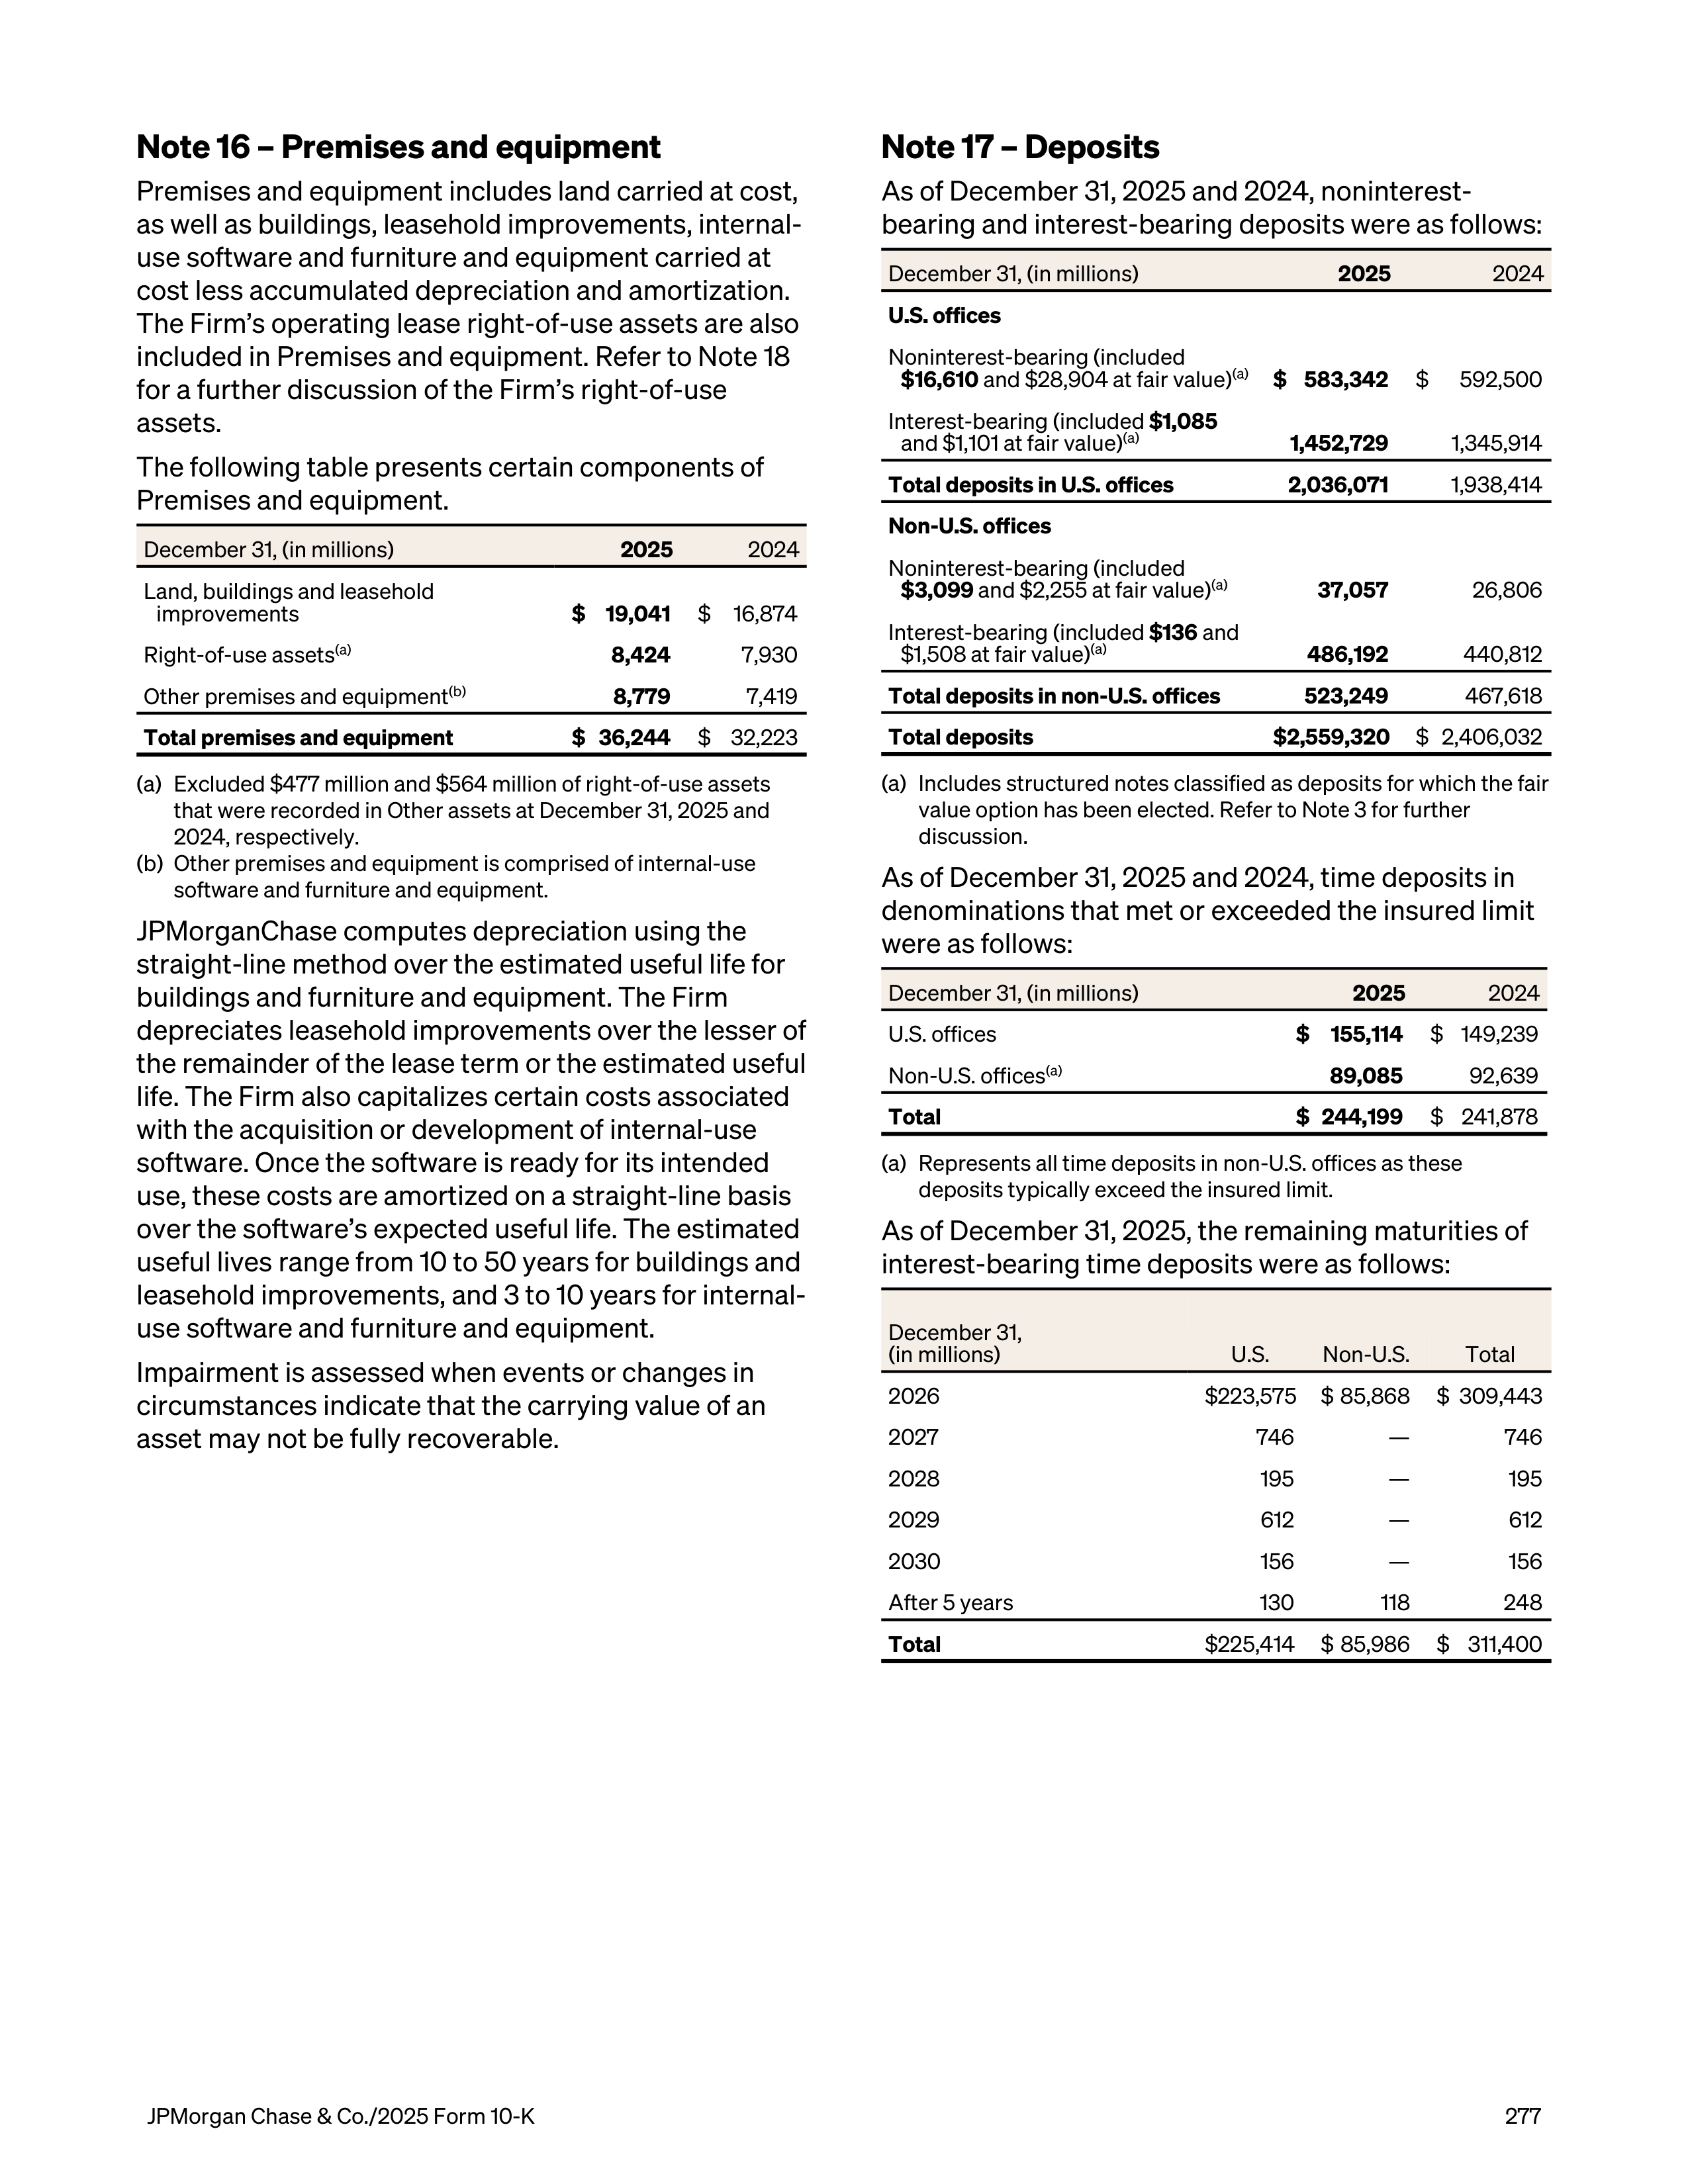
Note 16 – Premises and equipment
Premises and equipment includes land carried at cost,
as well as buildings, leasehold improvements, internal-
use software and furniture and equipment carried at
cost less accumulated depreciation and amortization.
The Firm’s operating lease right-of-use assets are also
included in Premises and equipment. Refer to Note 18
for a further discussion of the Firm’s right-of-use
assets.
The following table presents certain components of
Premises and equipment.
December 31, (in millions)
2025
2024
Land, buildings and leasehold
improvements
$ 19,041
$
16,874
Right-of-use assets
(a)
8,424
7,930
Other premises and equipment
(b)
8,779
7,419
Total premises and equipment
$ 36,244
$ 32,223
(a)
Excluded $477 million and $564 million of right-of-use assets
that were recorded in Other assets at December 31, 2025 and
2024, respectively.
(b)
Other premises and equipment is comprised of internal-use
software and furniture and equipment.
JPMorganChase computes depreciation using the
straight-line method over the estimated useful life for
buildings and furniture and equipment. The Firm
depreciates leasehold improvements over the lesser of
the remainder of the lease term or the estimated useful
life. The Firm also capitalizes certain costs associated
with the acquisition or development of internal-use
software. Once the software is ready for its intended
use, these costs are amortized on a straight-line basis
over the software’s expected useful life. The estimated
useful lives range from 10 to 50 years for buildings and
leasehold improvements, and 3 to 10 years for internal-
use software and furniture and equipment.
Impairment is assessed when events or changes in
circumstances indicate that the carrying value of an
asset may not be fully recoverable.
Note 17 – Deposits
As of December 31, 2025 and 2024, noninterest-
bearing and interest-bearing deposits were as follows:
December 31, (in millions)
2025
2024
U.S. offices
Noninterest-bearing (included
$16,610
and $28,904 at fair value)
(a)
$ 583,342
$
592,500
Interest-bearing (included
$1,085
and $1,101 at fair value)
(a)
1,452,729
1,345,914
Total deposits in U.S. offices
2,036,071
1,938,414
Non-U.S. offices
Noninterest-bearing (included
$3,099
and $2,255 at fair value)
(a)
37,057
26,806
Interest-bearing (included
$136
and
$1,508 at fair value)
(a)
486,192
440,812
Total deposits in non-U.S. offices
523,249
467,618
Total deposits
$ 2,559,320
$ 2,406,032
(a)
Includes structured notes classified as deposits for which the fair
value option has been elected. Refer to Note 3 for further
discussion.
As of December 31, 2025 and 2024, time deposits in
denominations that met or exceeded the insured limit
were as follows:
December 31, (in millions)
2025
2024
U.S. offices
$ 155,114
$ 149,239
Non-U.S. offices
(a)
89,085
92,639
Total
$ 244,199
$ 241,878
(a)
Represents all time deposits in non-U.S. offices as these
deposits typically exceed the insured limit.
As of December 31, 2025, the remaining maturities of
interest-bearing time deposits were as follows:
December 31,
(in millions)
U.S.
Non-U.S.
Total
2026
$ 223,575
$ 85,868
$ 309,443
2027
746
—
746
2028
195
—
195
2029
612
—
612
2030
156
—
156
After 5 years
130
118
248
Total
$ 225,414
$ 85,986
$ 311,400
JPMorgan Chase & Co./2025 Form 10-K
277
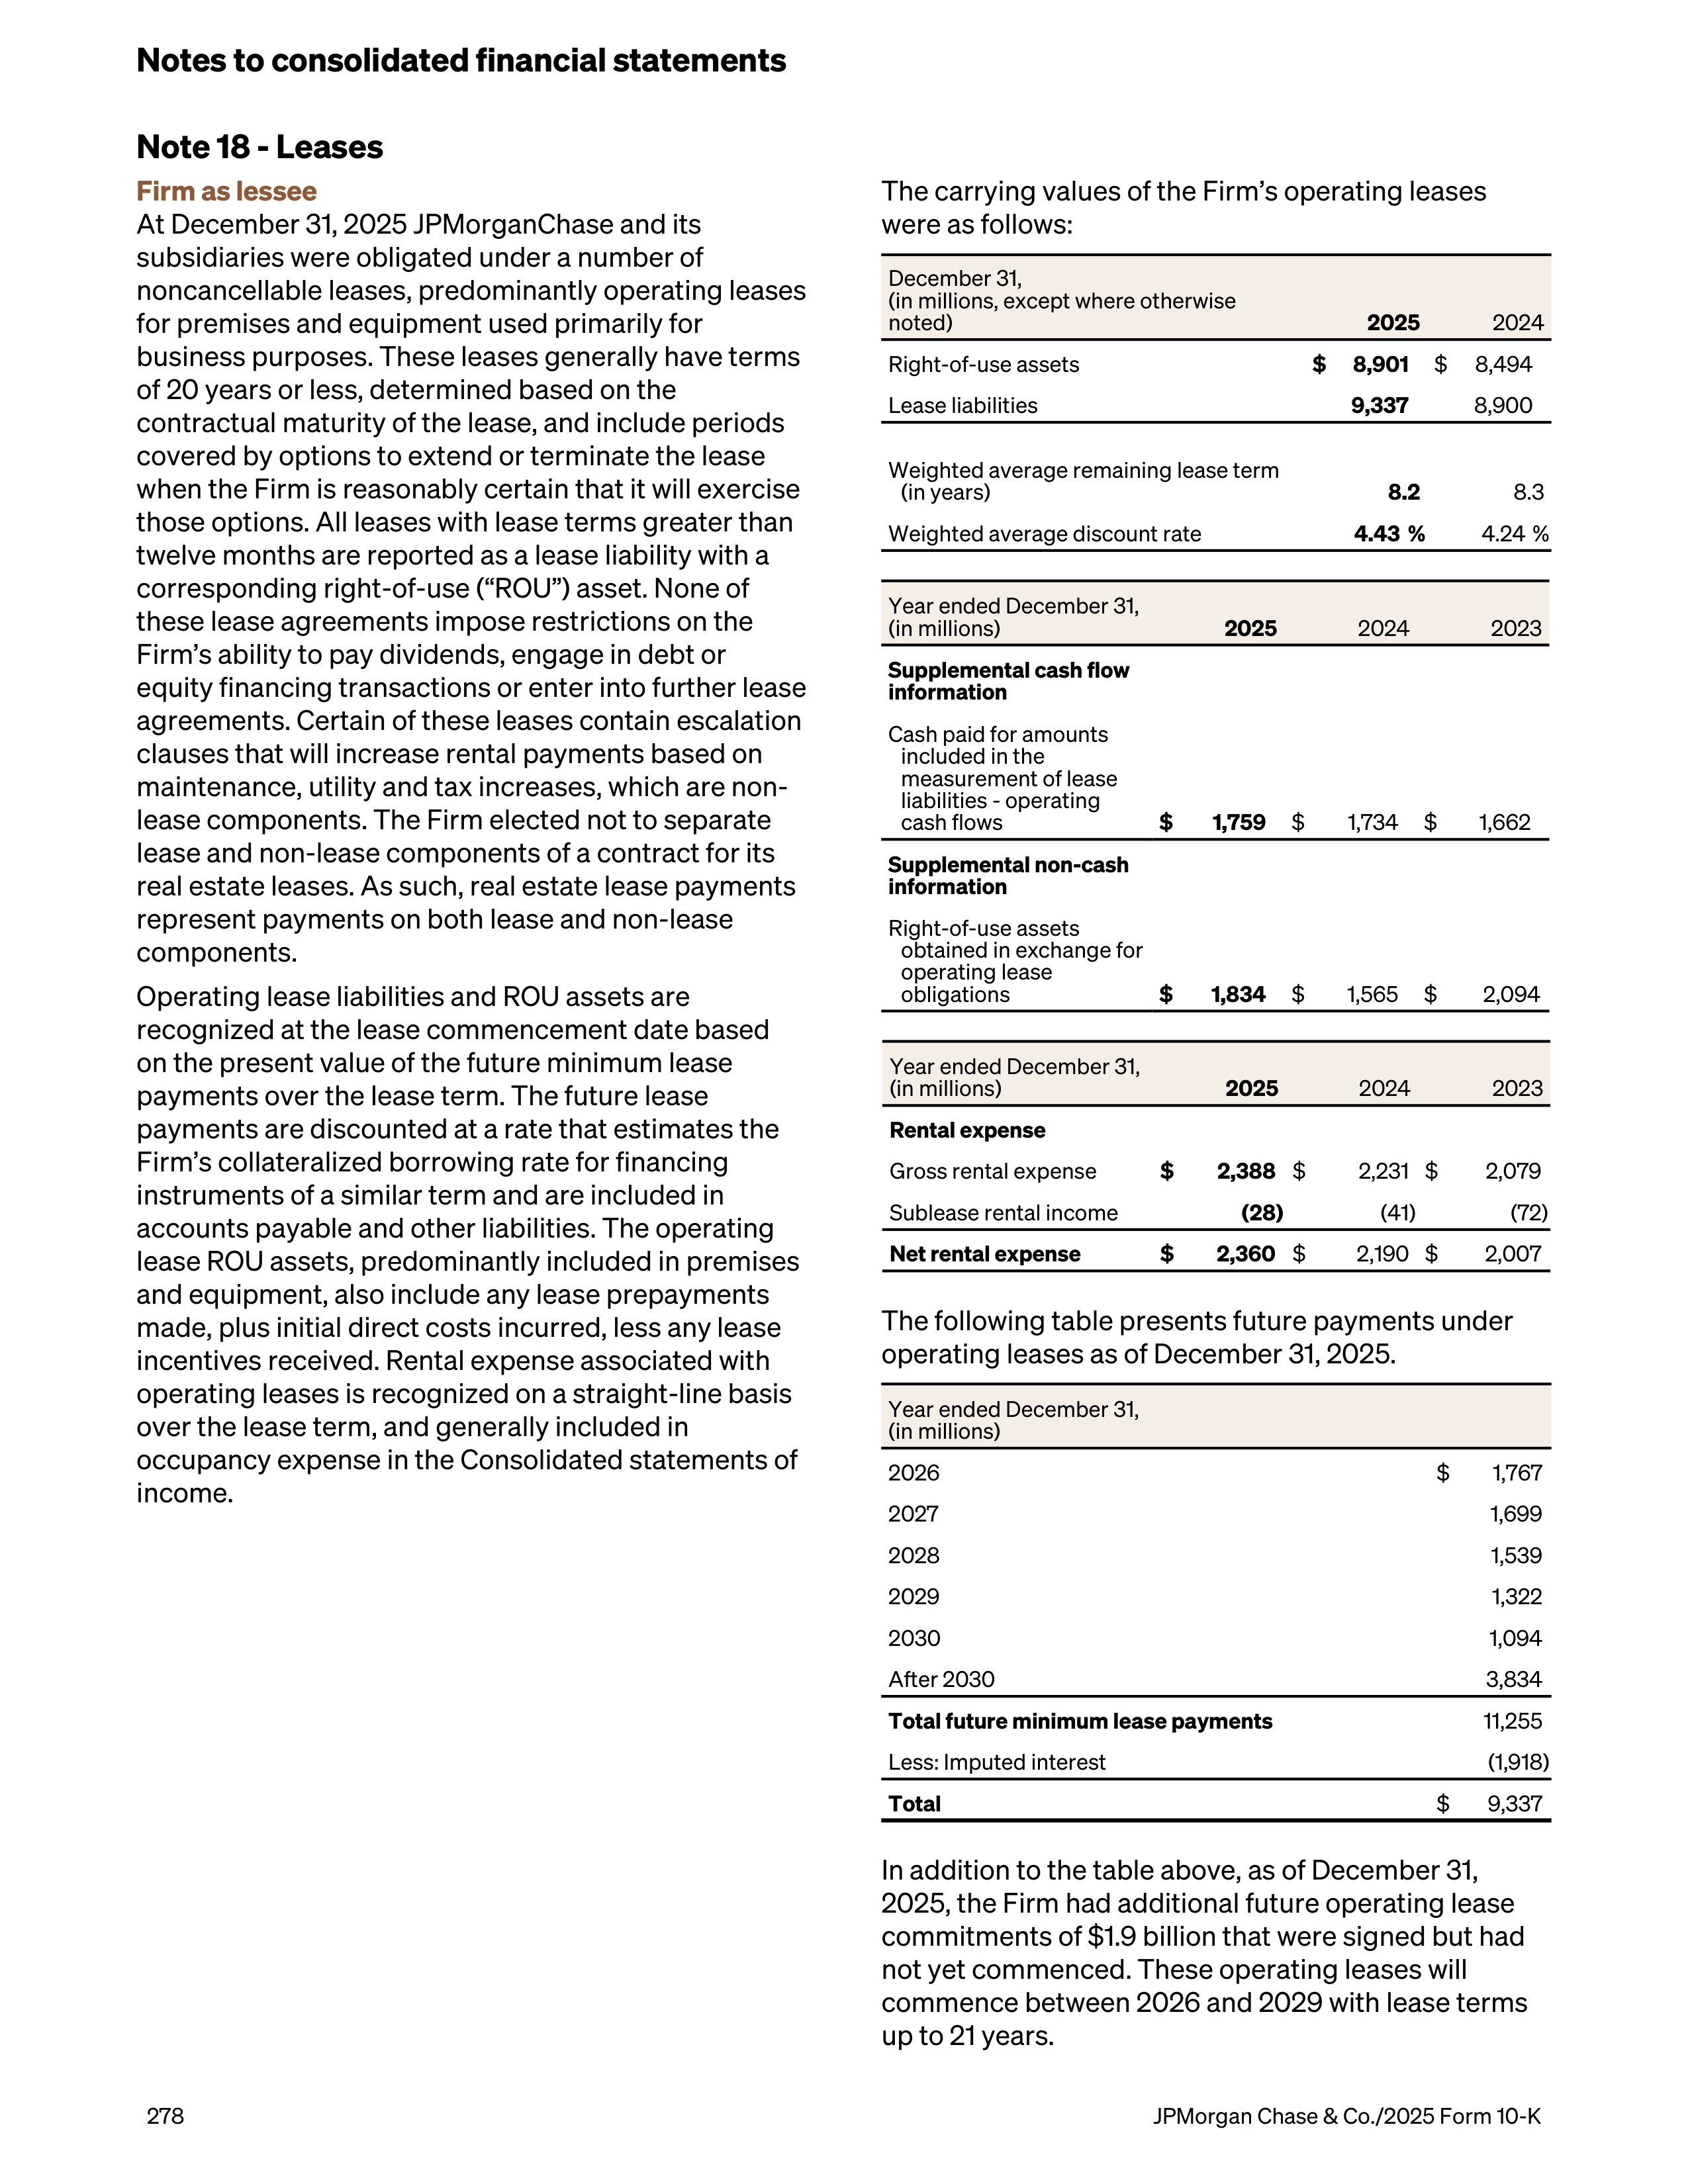
Note 18 - Leases
Firm as lessee
At December 31, 2025 JPMorganChase and its
subsidiaries were obligated under a number of
noncancellable leases, predominantly operating leases
for premises and equipment used primarily for
business purposes. These leases generally have terms
of 20 years or less, determined based on the
contractual maturity of the lease, and include periods
covered by options to extend or terminate the lease
when the Firm is reasonably certain that it will exercise
those options. All leases with lease terms greater than
twelve months are reported as a lease liability with a
corresponding right-of-use (“ROU”) asset. None of
these lease agreements impose restrictions on the
Firm’s ability to pay dividends, engage in debt or
equity financing transactions or enter into further lease
agreements. Certain of these leases contain escalation
clauses that will increase rental payments based on
maintenance, utility and tax increases, which are non-
lease components. The Firm elected not to separate
lease and non-lease components of a contract for its
real estate leases. As such, real estate lease payments
represent payments on both lease and non-lease
components.
Operating lease liabilities and ROU assets are
recognized at the lease commencement date based
on the present value of the future minimum lease
payments over the lease term. The future lease
payments are discounted at a rate that estimates the
Firm’s collateralized borrowing rate for financing
instruments of a similar term and are included in
accounts payable and other liabilities. The operating
lease ROU assets, predominantly included in premises
and equipment, also include any lease prepayments
made, plus initial direct costs incurred, less any lease
incentives received. Rental expense associated with
operating leases is recognized on a straight-line basis
over the lease term, and generally included in
occupancy expense in the Consolidated statements of
income.
The carrying values of the Firm’s operating leases
were as follows:
December 31,
(in millions, except where otherwise
noted)
2025
2024
Right-of-use assets
$
8,901
$
8,494
Lease liabilities
9,337
8,900
Weighted average remaining lease term
(in years)
8.2
8.3
Weighted average discount rate
4.43 %
4.24 %
Year ended December 31,
(in millions)
2025
2024
2023
Supplemental cash flow
information
Cash paid for amounts
included in the
measurement of lease
liabilities - operating
cash flows
$
1,759
$
1,734
$
1,662
Supplemental non-cash
information
Right-of-use assets
obtained in exchange for
operating lease
obligations
$
1,834
$
1,565
$
2,094
Year ended December 31,
(in millions)
2025
2024
2023
Rental expense
Gross rental expense
$
2,388
$
2,231 $
2,079
Sublease rental income
(28)
(41)
(72)
Net rental expense
$
2,360
$
2,190 $
2,007
The following table presents future payments under
operating leases as of December 31, 2025.
Year ended December 31,
(in millions)
2026
$
1,767
2027
1,699
2028
1,539
2029
1,322
2030
1,094
After 2030
3,834
Total future minimum lease payments
11,255
Less: Imputed interest
(1,918)
Total
$
9,337
In addition to the table above, as of December 31,
2025, the Firm had additional future operating lease
commitments of $1.9 billion that were signed but had
not yet commenced. These operating leases will
commence between 2026 and 2029 with lease terms
up to 21 years.
Notes to consolidated financial statements
278
JPMorgan Chase & Co./2025 Form 10-K
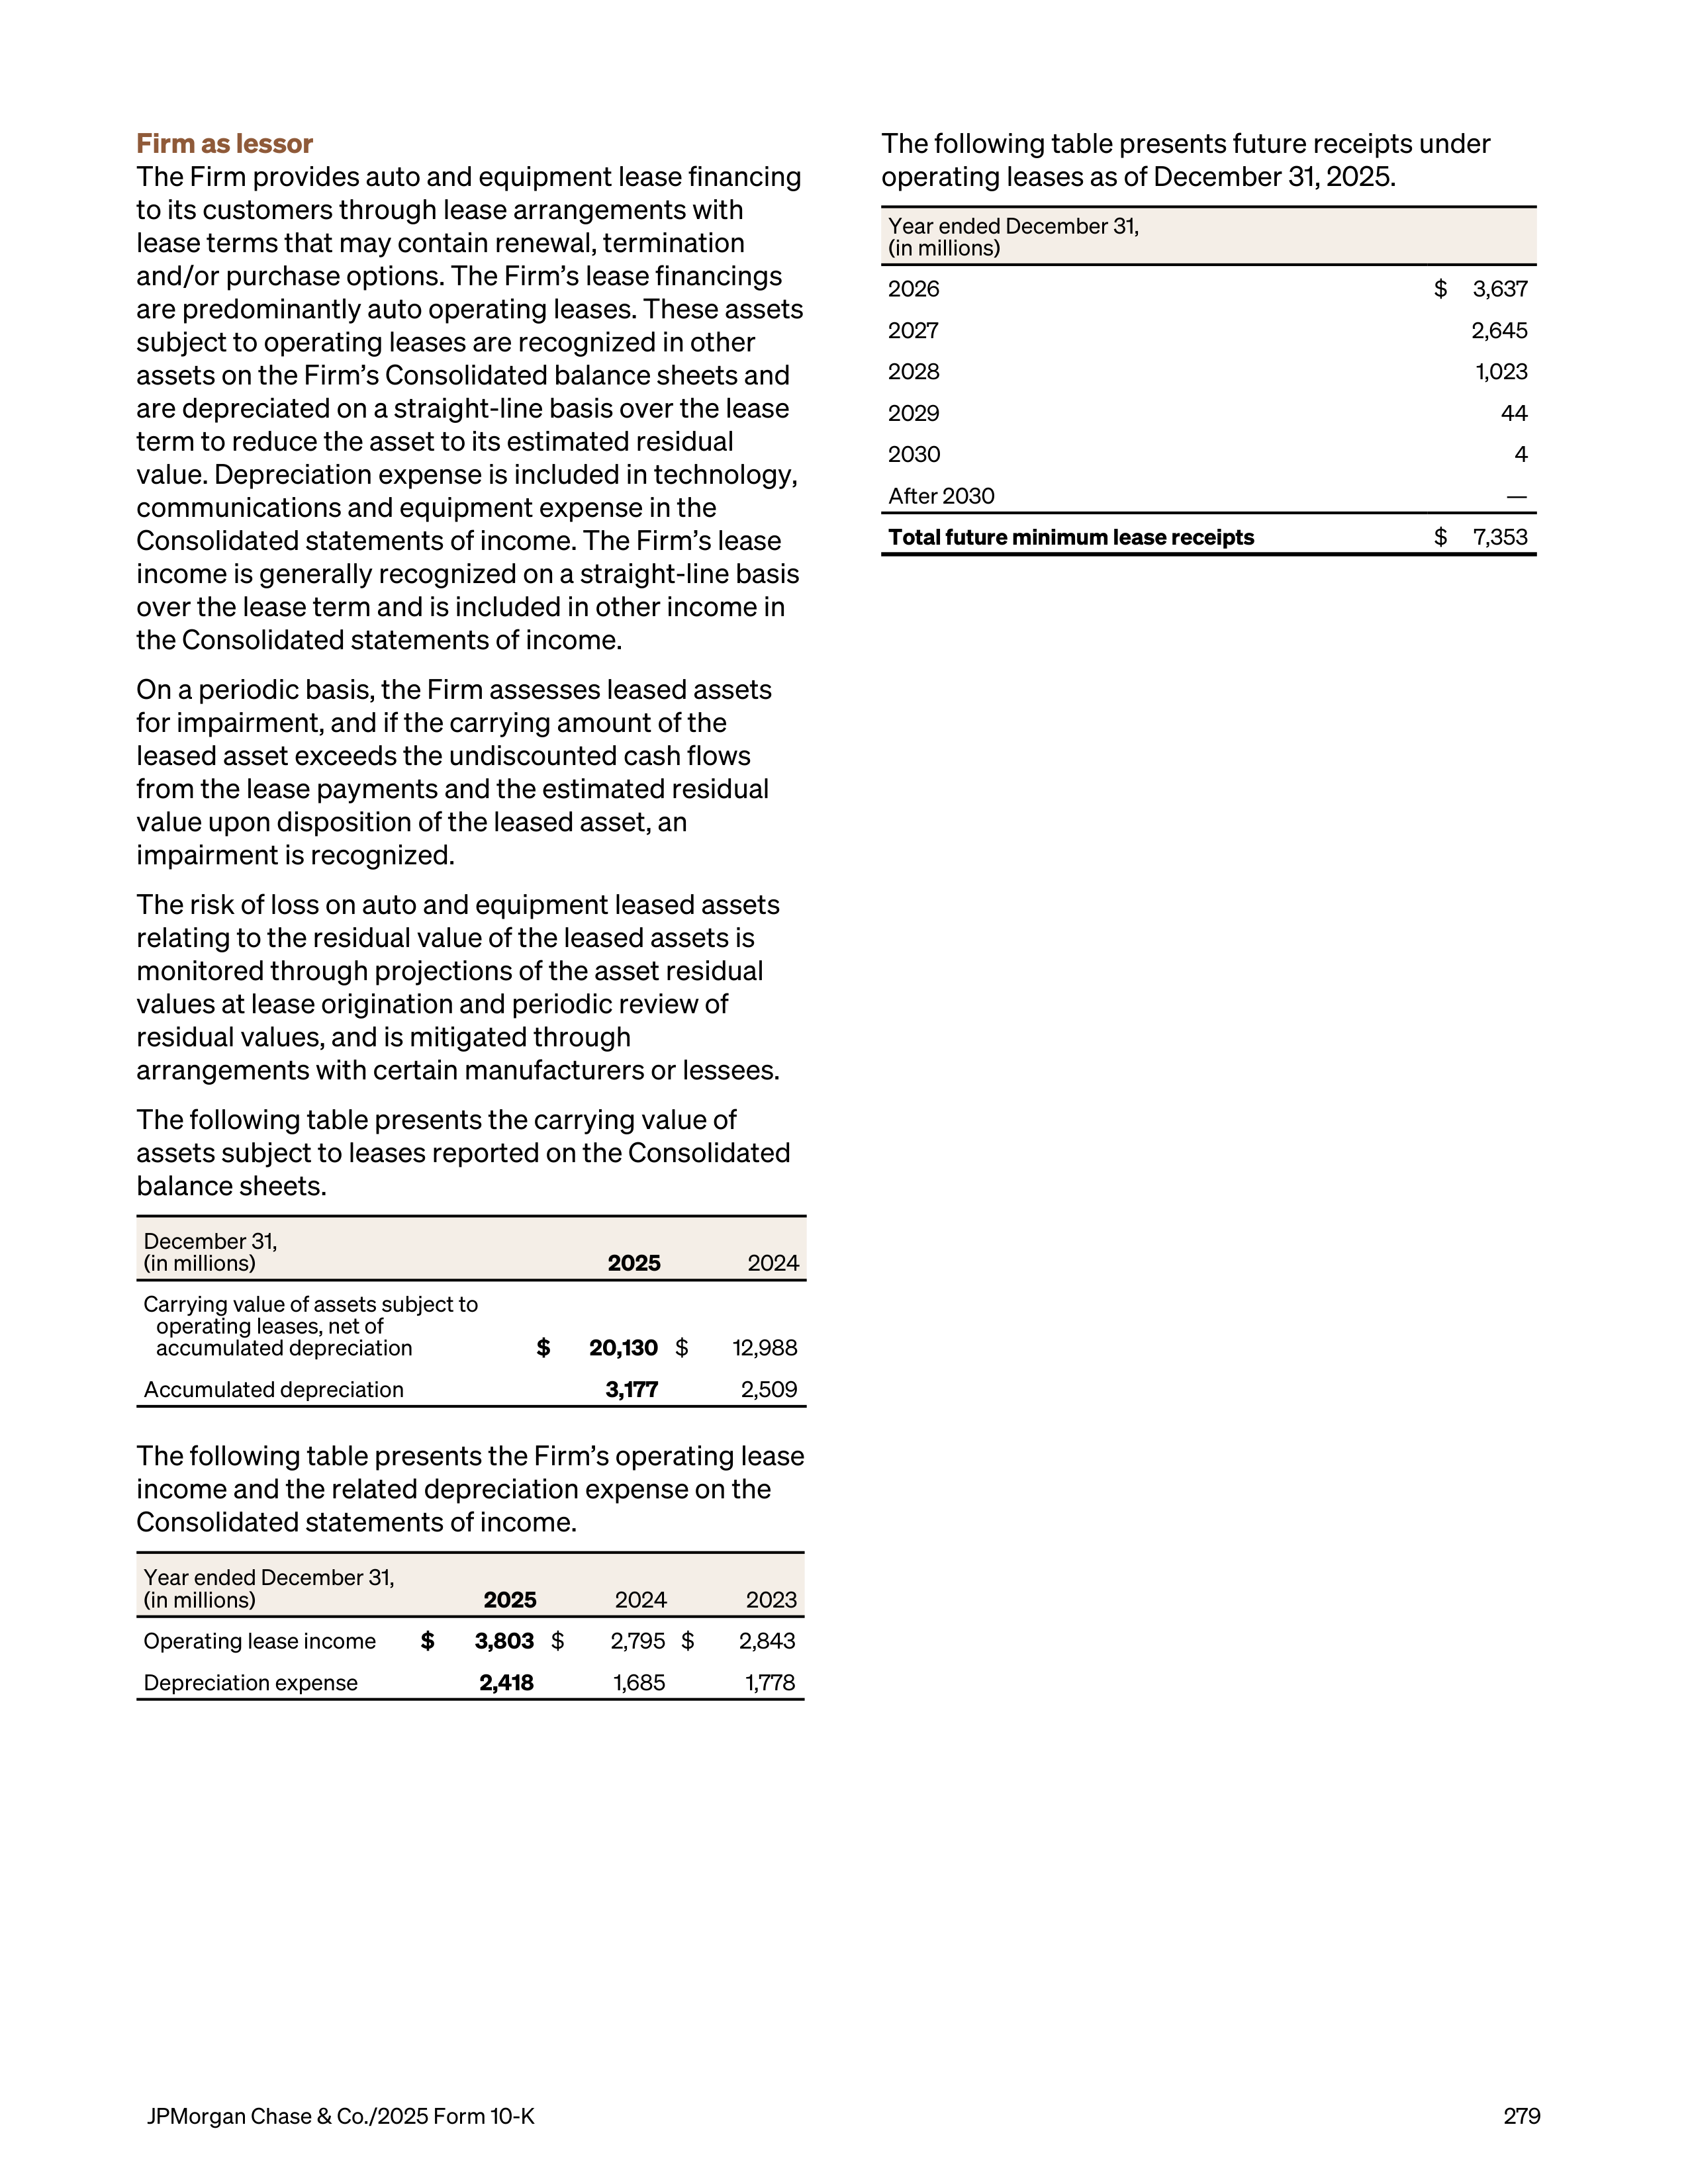
Firm as lessor
The Firm provides auto and equipment lease financing
to its customers through lease arrangements with
lease terms that may contain renewal, termination
and/or purchase options. The Firm’s lease financings
are predominantly auto operating leases. These assets
subject to operating leases are recognized in other
assets on the Firm’s Consolidated balance sheets and
are depreciated on a straight-line basis over the lease
term to reduce the asset to its estimated residual
value. Depreciation expense is included in technology,
communications and equipment expense in the
Consolidated statements of income. The Firm’s lease
income is generally recognized on a straight-line basis
over the lease term and is included in other income in
the Consolidated statements of income.
On a periodic basis, the Firm assesses leased assets
for impairment, and if the carrying amount of the
leased asset exceeds the undiscounted cash flows
from the lease payments and the estimated residual
value upon disposition of the leased asset, an
impairment is recognized.
The risk of loss on auto and equipment leased assets
relating to the residual value of the leased assets is
monitored through projections of the asset residual
values at lease origination and periodic review of
residual values, and is mitigated through
arrangements with certain manufacturers or lessees.
The following table presents the carrying value of
assets subject to leases reported on the Consolidated
balance sheets.
December 31,
(in millions)
2025
2024
Carrying value of assets subject to
operating leases, net of
accumulated depreciation
$
20,130
$
12,988
Accumulated depreciation
3,177
2,509
The following table presents the Firm’s operating lease
income and the related depreciation expense on the
Consolidated statements of income.
Year ended December 31,
(in millions)
2025
2024
2023
Operating lease income
$
3,803
$
2,795 $
2,843
Depreciation expense
2,418
1,685
1,778
The following table presents future receipts under
operating leases as of December 31, 2025.
Year ended December 31,
(in millions)
2026
$
3,637
2027
2,645
2028
1,023
2029
44
2030
4
After 2030
—
Total future minimum lease receipts
$
7,353
JPMorgan Chase & Co./2025 Form 10-K
279
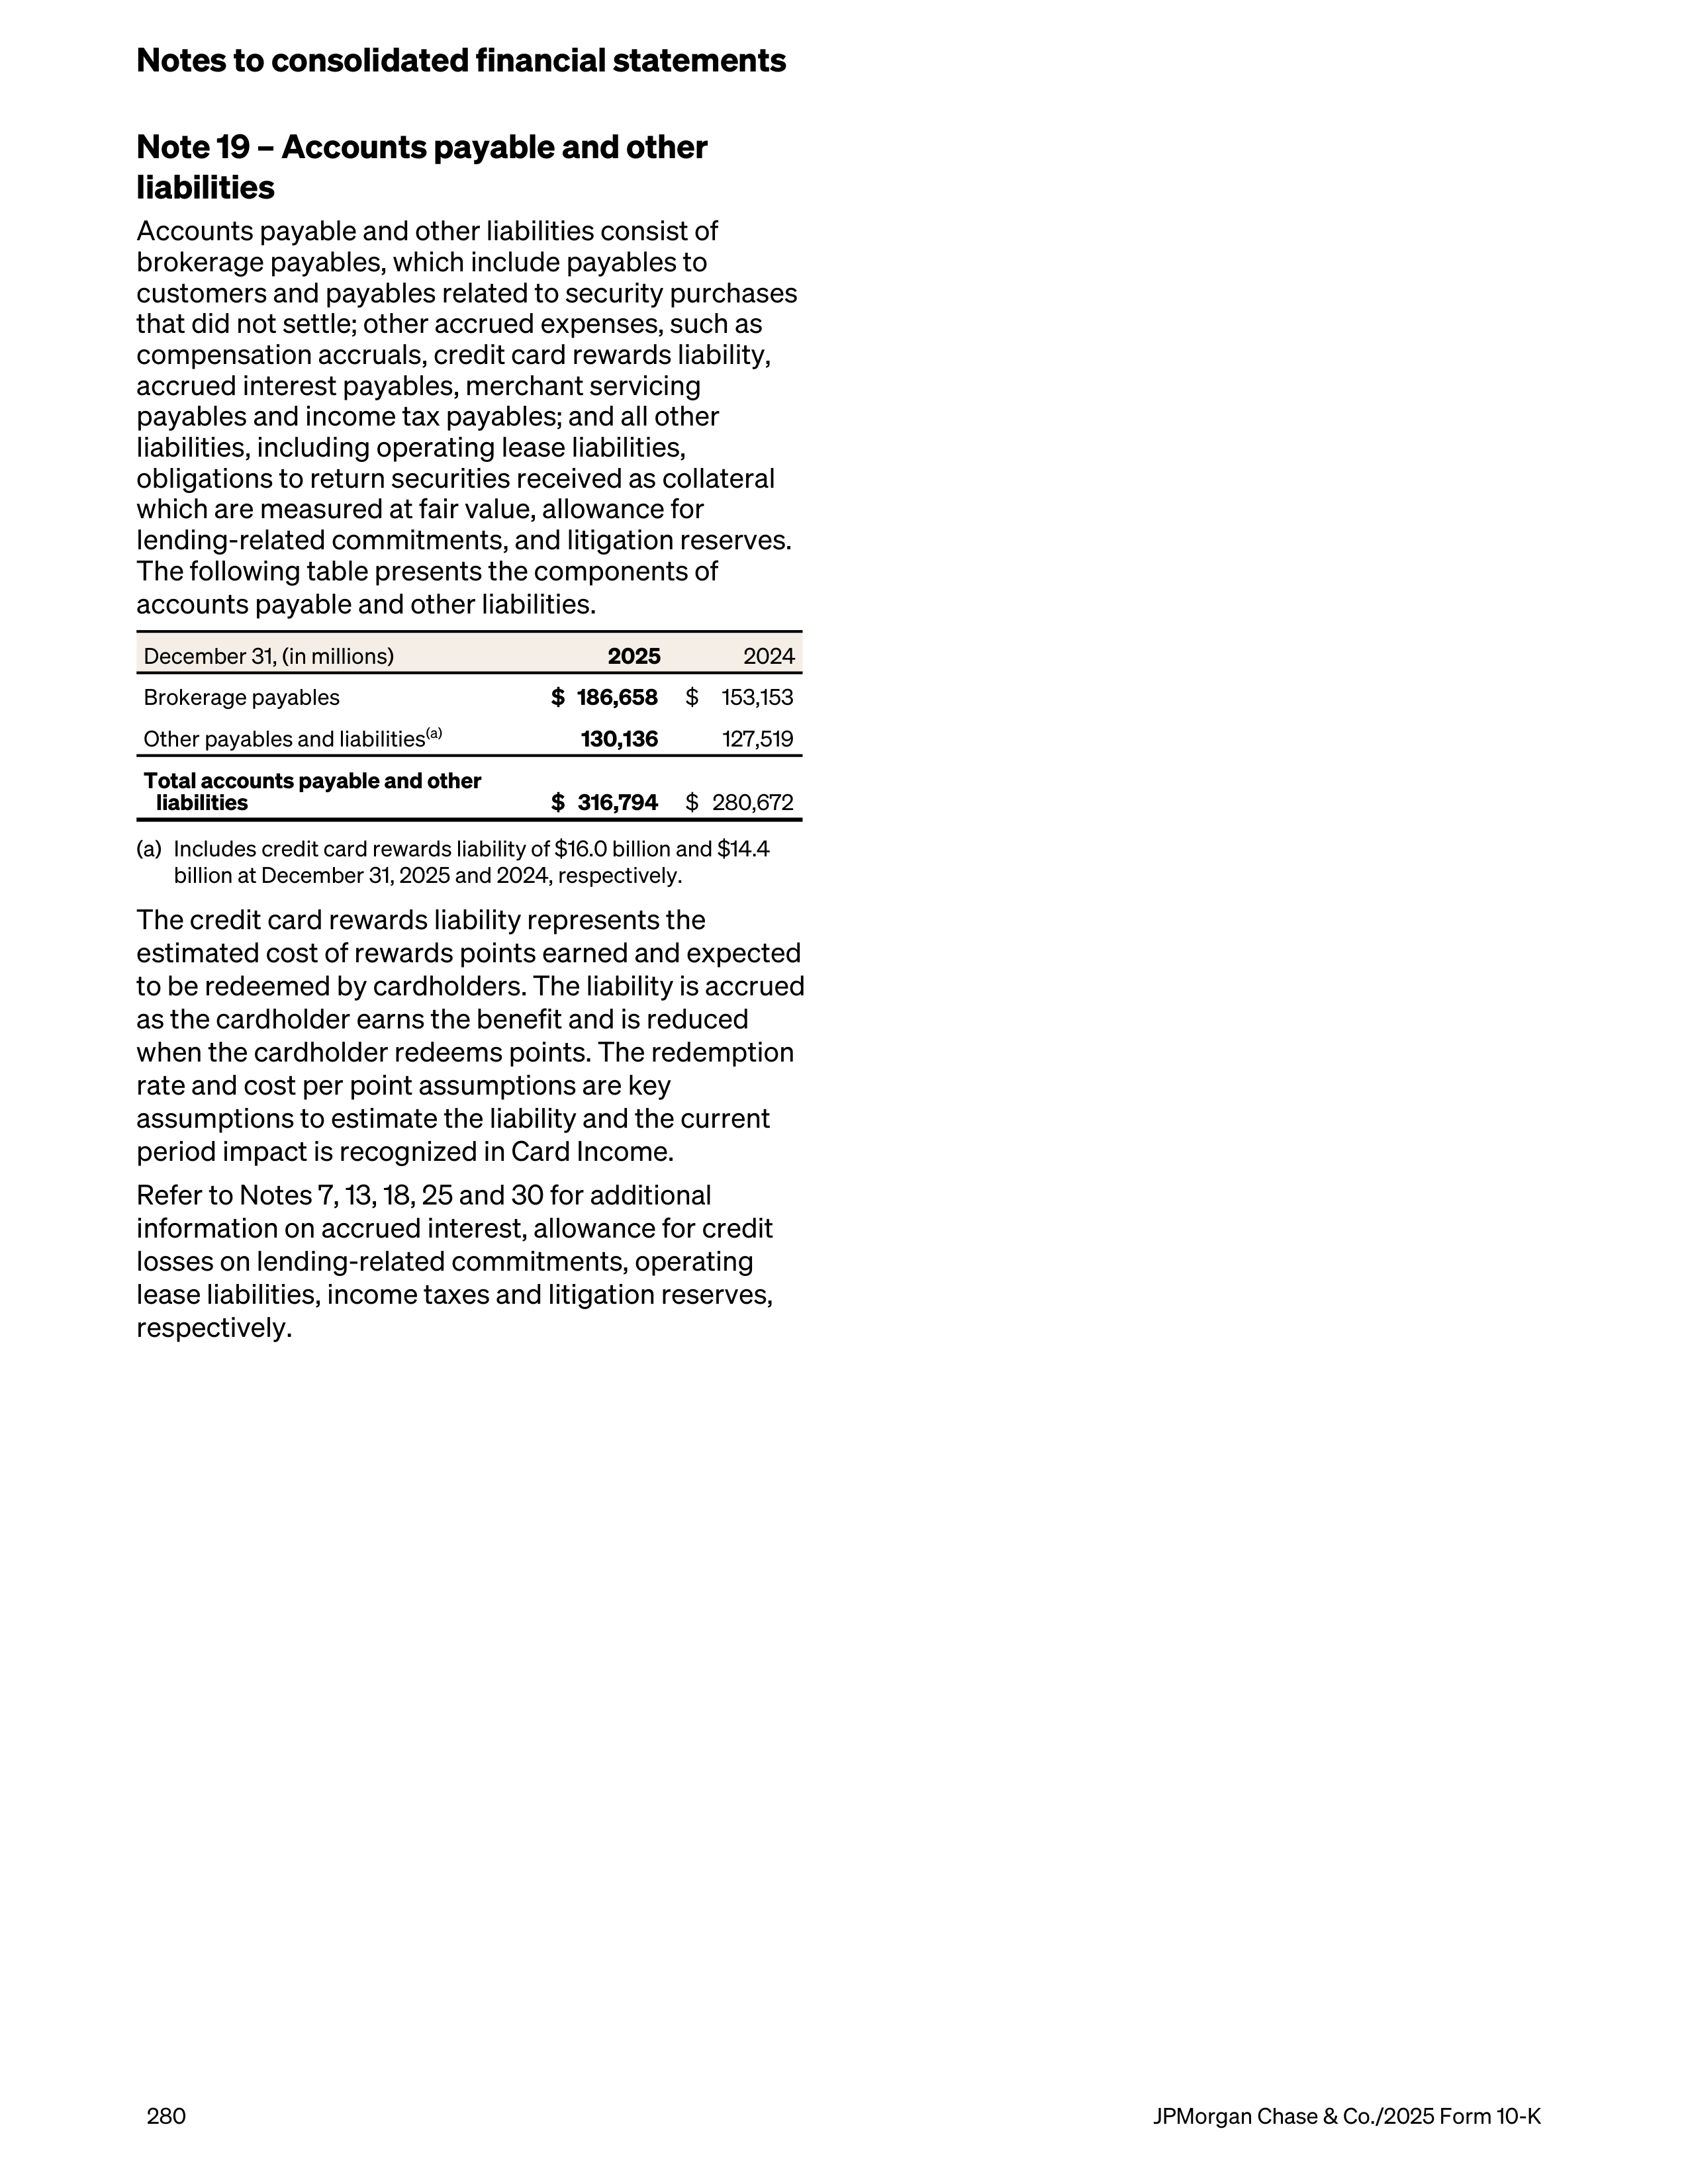
Note 19 – Accounts payable and other
liabilities
Accounts payable and other liabilities consist of
brokerage payables, which include payables to
customers and payables related to security purchases
that did not settle; other accrued expenses, such as
compensation accruals, credit card rewards liability,
accrued interest payables, merchant servicing
payables and income tax payables; and all other
liabilities, including operating lease liabilities,
obligations to return securities received as collateral
which are measured at fair value, allowance for
lending-related commitments, and litigation reserves.
The following table presents the components of
accounts payable and other liabilities.
December 31, (in millions)
2025
2024
Brokerage payables
$ 186,658
$
153,153
Other payables and liabilities
(a)
130,136
127,519
Total accounts payable and other
liabilities
$ 316,794
$ 280,672
(a) Includes credit card rewards liability of $16.0 billion and $14.4
billion at December 31, 2025 and 2024, respectively.
The credit card rewards liability represents the
estimated cost of rewards points earned and expected
to be redeemed by cardholders. The liability is accrued
as the cardholder earns the benefit and is reduced
when the cardholder redeems points. The redemption
rate and cost per point assumptions are key
assumptions to estimate the liability and the current
period impact is recognized in Card Income.
Refer to Notes 7, 13, 18, 25 and 30 for additional
information on accrued interest, allowance for credit
losses on lending-related commitments, operating
lease liabilities, income taxes and litigation reserves,
respectively.
Notes to consolidated financial statements
280
JPMorgan Chase & Co./2025 Form 10-K
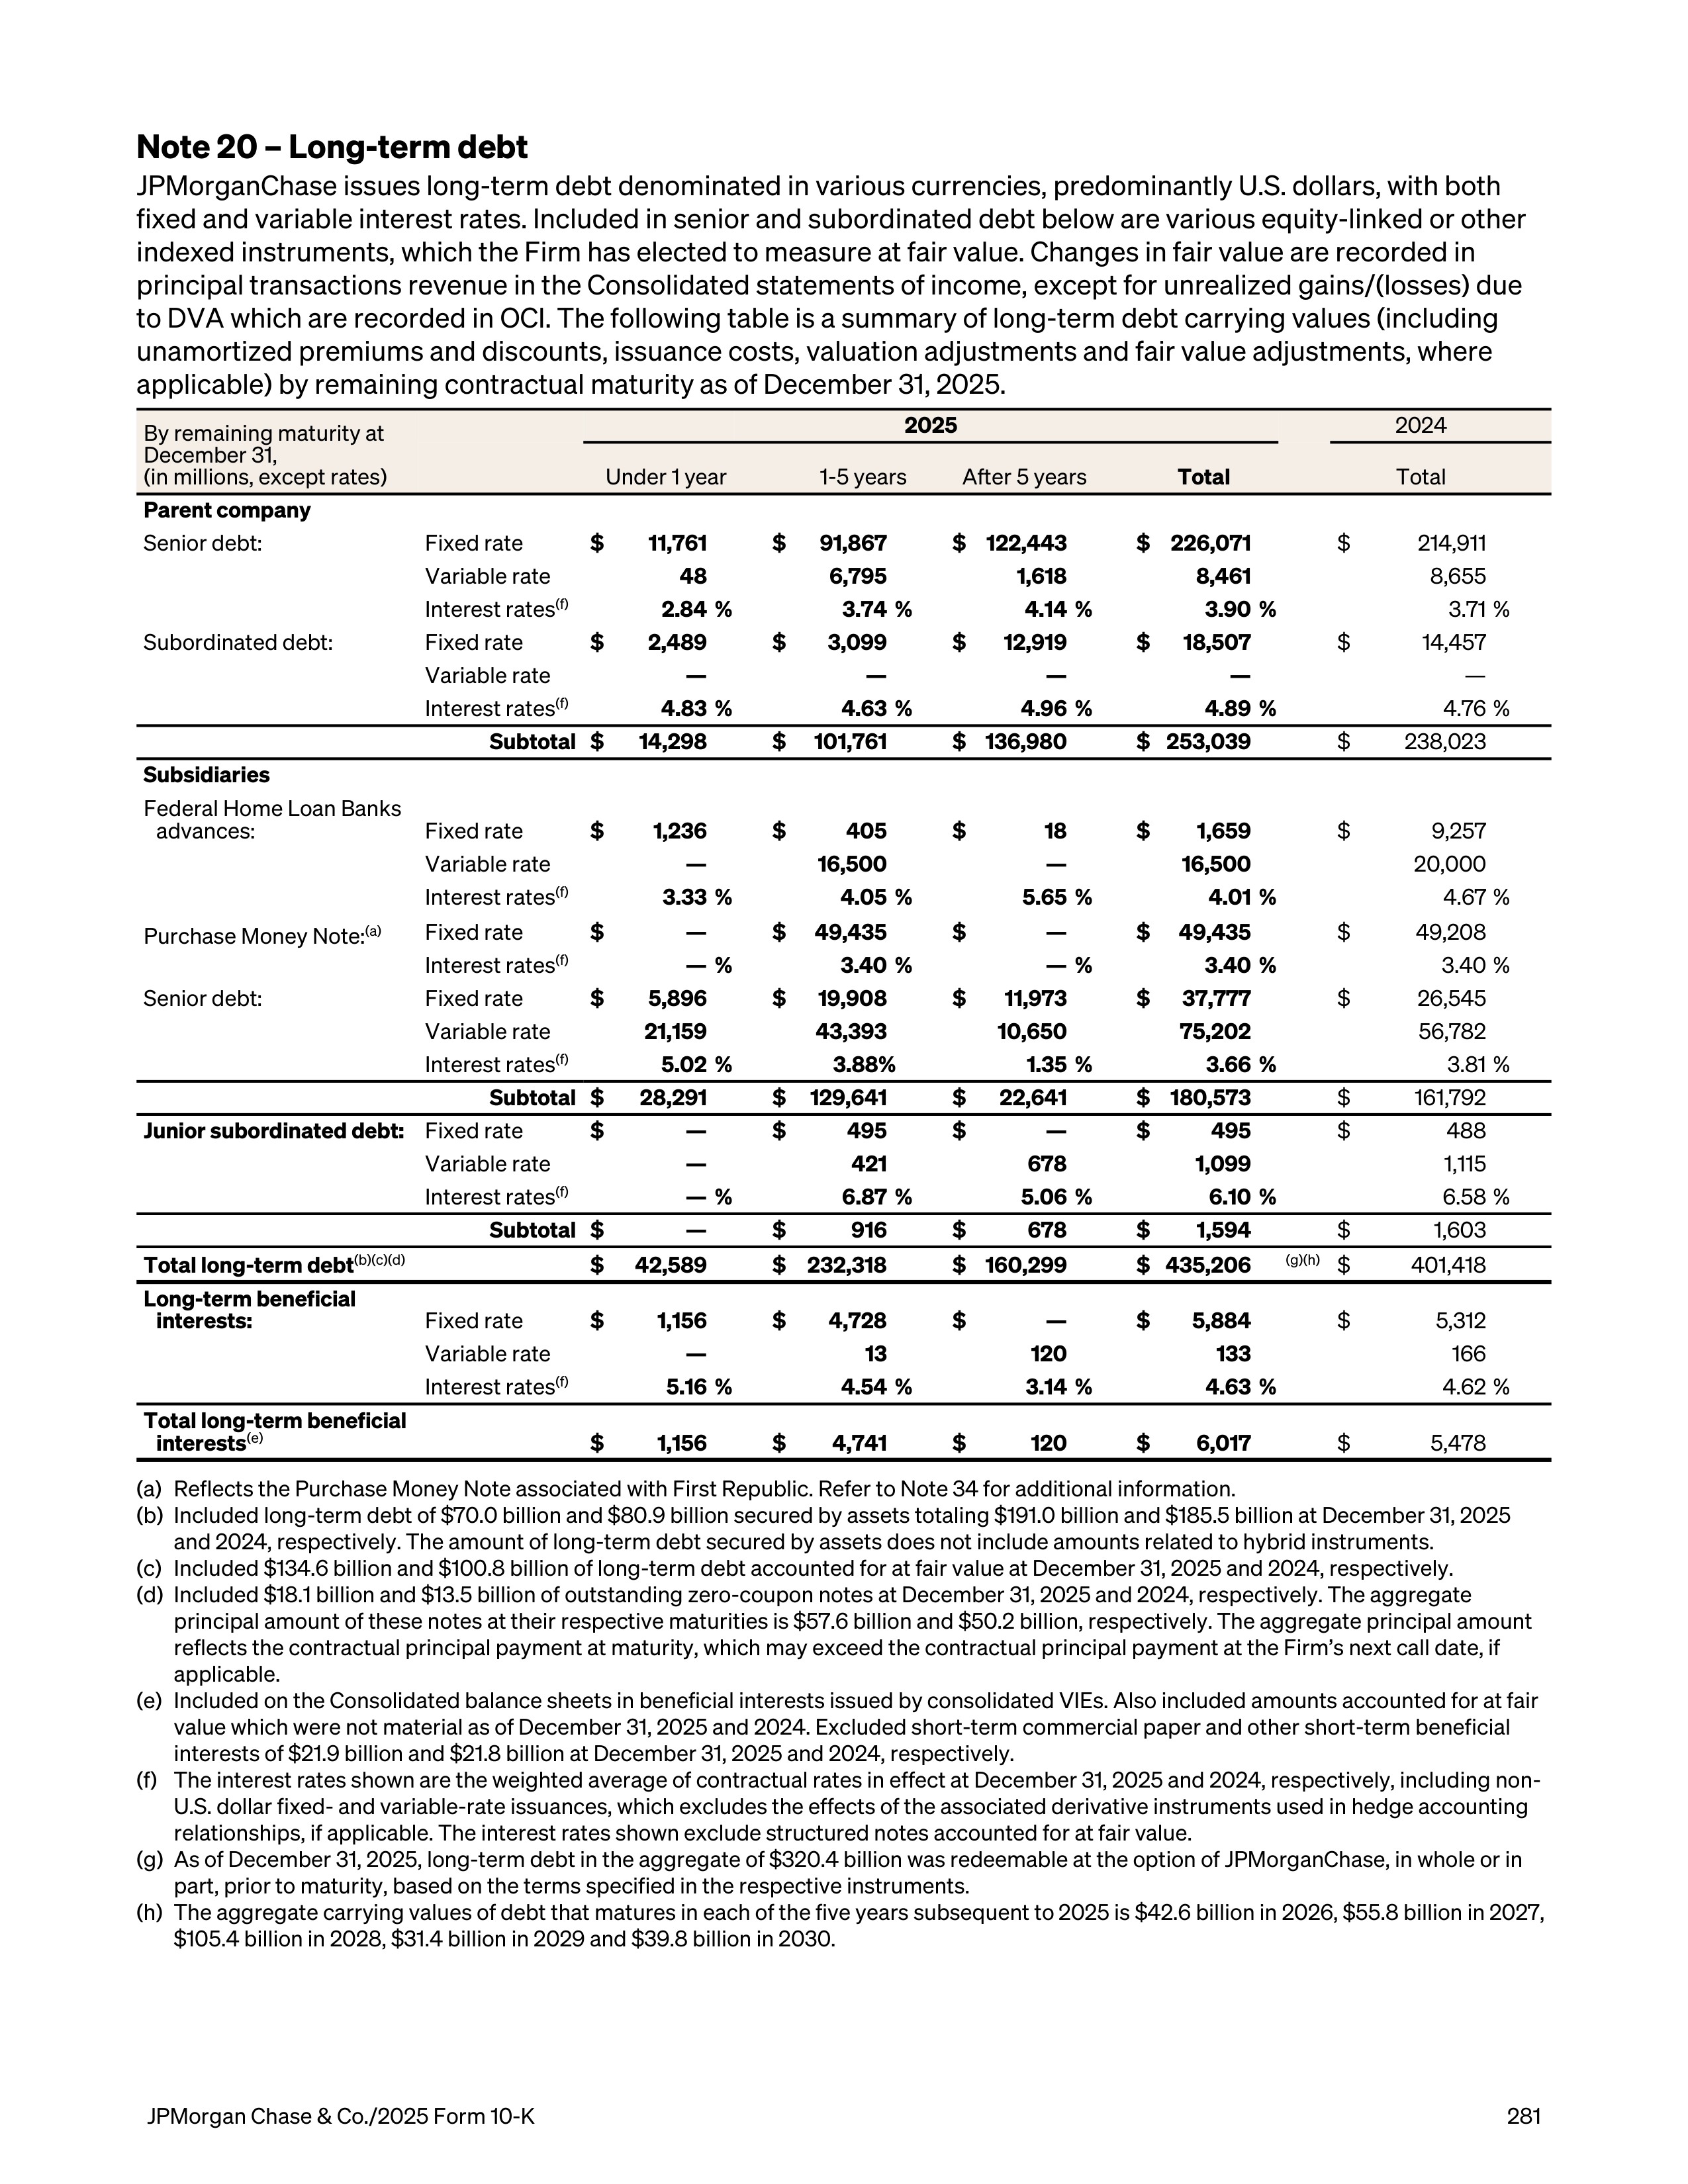
Note 20 – Long-term debt
JPMorganChase issues long-term debt denominated in various currencies, predominantly U.S. dollars, with both
fixed and variable interest rates. Included in senior and subordinated debt below are various equity-linked or other
indexed instruments, which the Firm has elected to measure at fair value. Changes in fair value are recorded in
principal transactions revenue in the Consolidated statements of income, except for unrealized gains/(losses) due
to DVA which are recorded in OCI. The following table is a summary of long-term debt carrying values (including
unamortized premiums and discounts, issuance costs, valuation adjustments and fair value adjustments, where
applicable) by remaining contractual maturity as of December 31, 2025.
By remaining maturity at
December 31,
(in millions, except rates)
2025
2024
Under 1 year
1-5 years
After 5 years
Total
Total
Parent company
Senior debt:
Fixed rate
$
11,761
$
91,867
$ 122,443
$ 226,071
$
214,911
Variable rate
48
6,795
1,618
8,461
8,655
Interest rates
(f)
2.84 %
3.74 %
4.14 %
3.90 %
3.71 %
Subordinated debt:
Fixed rate
$
2,489
$
3,099
$
12,919
$
18,507
$
14,457
Variable rate
—
—
—
—
—
Interest rates
(f)
4.83 %
4.63 %
4.96 %
4.89 %
4.76 %
Subtotal
$
14,298
$
101,761
$ 136,980
$ 253,039
$
238,023
Subsidiaries
Federal Home Loan Banks
advances:
Fixed rate
$
1,236
$
405
$
18
$
1,659
$
9,257
Variable rate
—
16,500
—
16,500
20,000
Interest rates
(f)
3.33 %
4.05 %
5.65 %
4.01 %
4.67 %
Purchase Money Note:
(a)
Fixed rate
$
—
$
49,435
$
—
$
49,435
$
49,208
Interest rates
(f)
— %
3.40 %
— %
3.40 %
3.40 %
Senior debt:
Fixed rate
$
5,896
$
19,908
$
11,973
$
37,777
$
26,545
Variable rate
21,159
43,393
10,650
75,202
56,782
Interest rates
(f)
5.02 %
3.88 %
1.35 %
3.66 %
3.81 %
Subtotal
$
28,291
$
129,641
$
22,641
$ 180,573
$
161,792
Junior subordinated debt:
Fixed rate
$
—
$
495
$
—
$
495
$
488
Variable rate
—
421
678
1,099
1,115
Interest rates
(f)
— %
6.87 %
5.06 %
6.10 %
6.58 %
Subtotal
$
—
$
916
$
678
$
1,594
$
1,603
Total long-term debt
(b)(c)(d)
$
42,589
$ 232,318
$ 160,299
$ 435,206
(g)(h)
$
401,418
Long-term beneficial
interests:
Fixed rate
$
1,156
$
4,728
$
—
$
5,884
$
5,312
Variable rate
—
13
120
133
166
Interest rates
(f)
5.16 %
4.54 %
3.14 %
4.63 %
4.62 %
Total long-term beneficial
interests
(e)
$
1,156
$
4,741
$
120
$
6,017
$
5,478
(a)
Reflects the Purchase Money Note associated with First Republic. Refer to Note 34 for additional information.
(b)
Included long-term debt of $70.0 billion and $80.9 billion secured by assets totaling $191.0 billion and $185.5 billion at December 31, 2025
and 2024, respectively. The amount of long-term debt secured by assets does not include amounts related to hybrid instruments.
(c)
Included $134.6 billion and $100.8 billion of long-term debt accounted for at fair value at December 31, 2025 and 2024, respectively.
(d)
Included $18.1 billion and $13.5 billion of outstanding zero-coupon notes at December 31, 2025 and 2024, respectively. The aggregate
principal amount of these notes at their respective maturities is $57.6 billion and $50.2 billion, respectively. The aggregate principal amount
reflects the contractual principal payment at maturity, which may exceed the contractual principal payment at the Firm’s next call date, if
applicable.
(e)
Included on the Consolidated balance sheets in beneficial interests issued by consolidated VIEs. Also included amounts accounted for at fair
value which were not material as of December 31, 2025 and 2024. Excluded short-term commercial paper and other short-term beneficial
interests of $21.9 billion and $21.8 billion at December 31, 2025 and 2024, respectively.
(f)
The interest rates shown are the weighted average of contractual rates in effect at December 31, 2025 and 2024, respectively, including non-
U.S. dollar fixed- and variable-rate issuances, which excludes the effects of the associated derivative instruments used in hedge accounting
relationships, if applicable. The interest rates shown exclude structured notes accounted for at fair value.
(g)
As of December 31, 2025, long-term debt in the aggregate of $320.4 billion was redeemable at the option of JPMorganChase, in whole or in
part, prior to maturity, based on the terms specified in the respective instruments.
(h)
The aggregate carrying values of debt that matures in each of the five years subsequent to 2025 is $42.6 billion in 2026, $55.8 billion in 2027,
$105.4 billion in 2028, $31.4 billion in 2029 and $39.8 billion in 2030.
JPMorgan Chase & Co./2025 Form 10-K
281
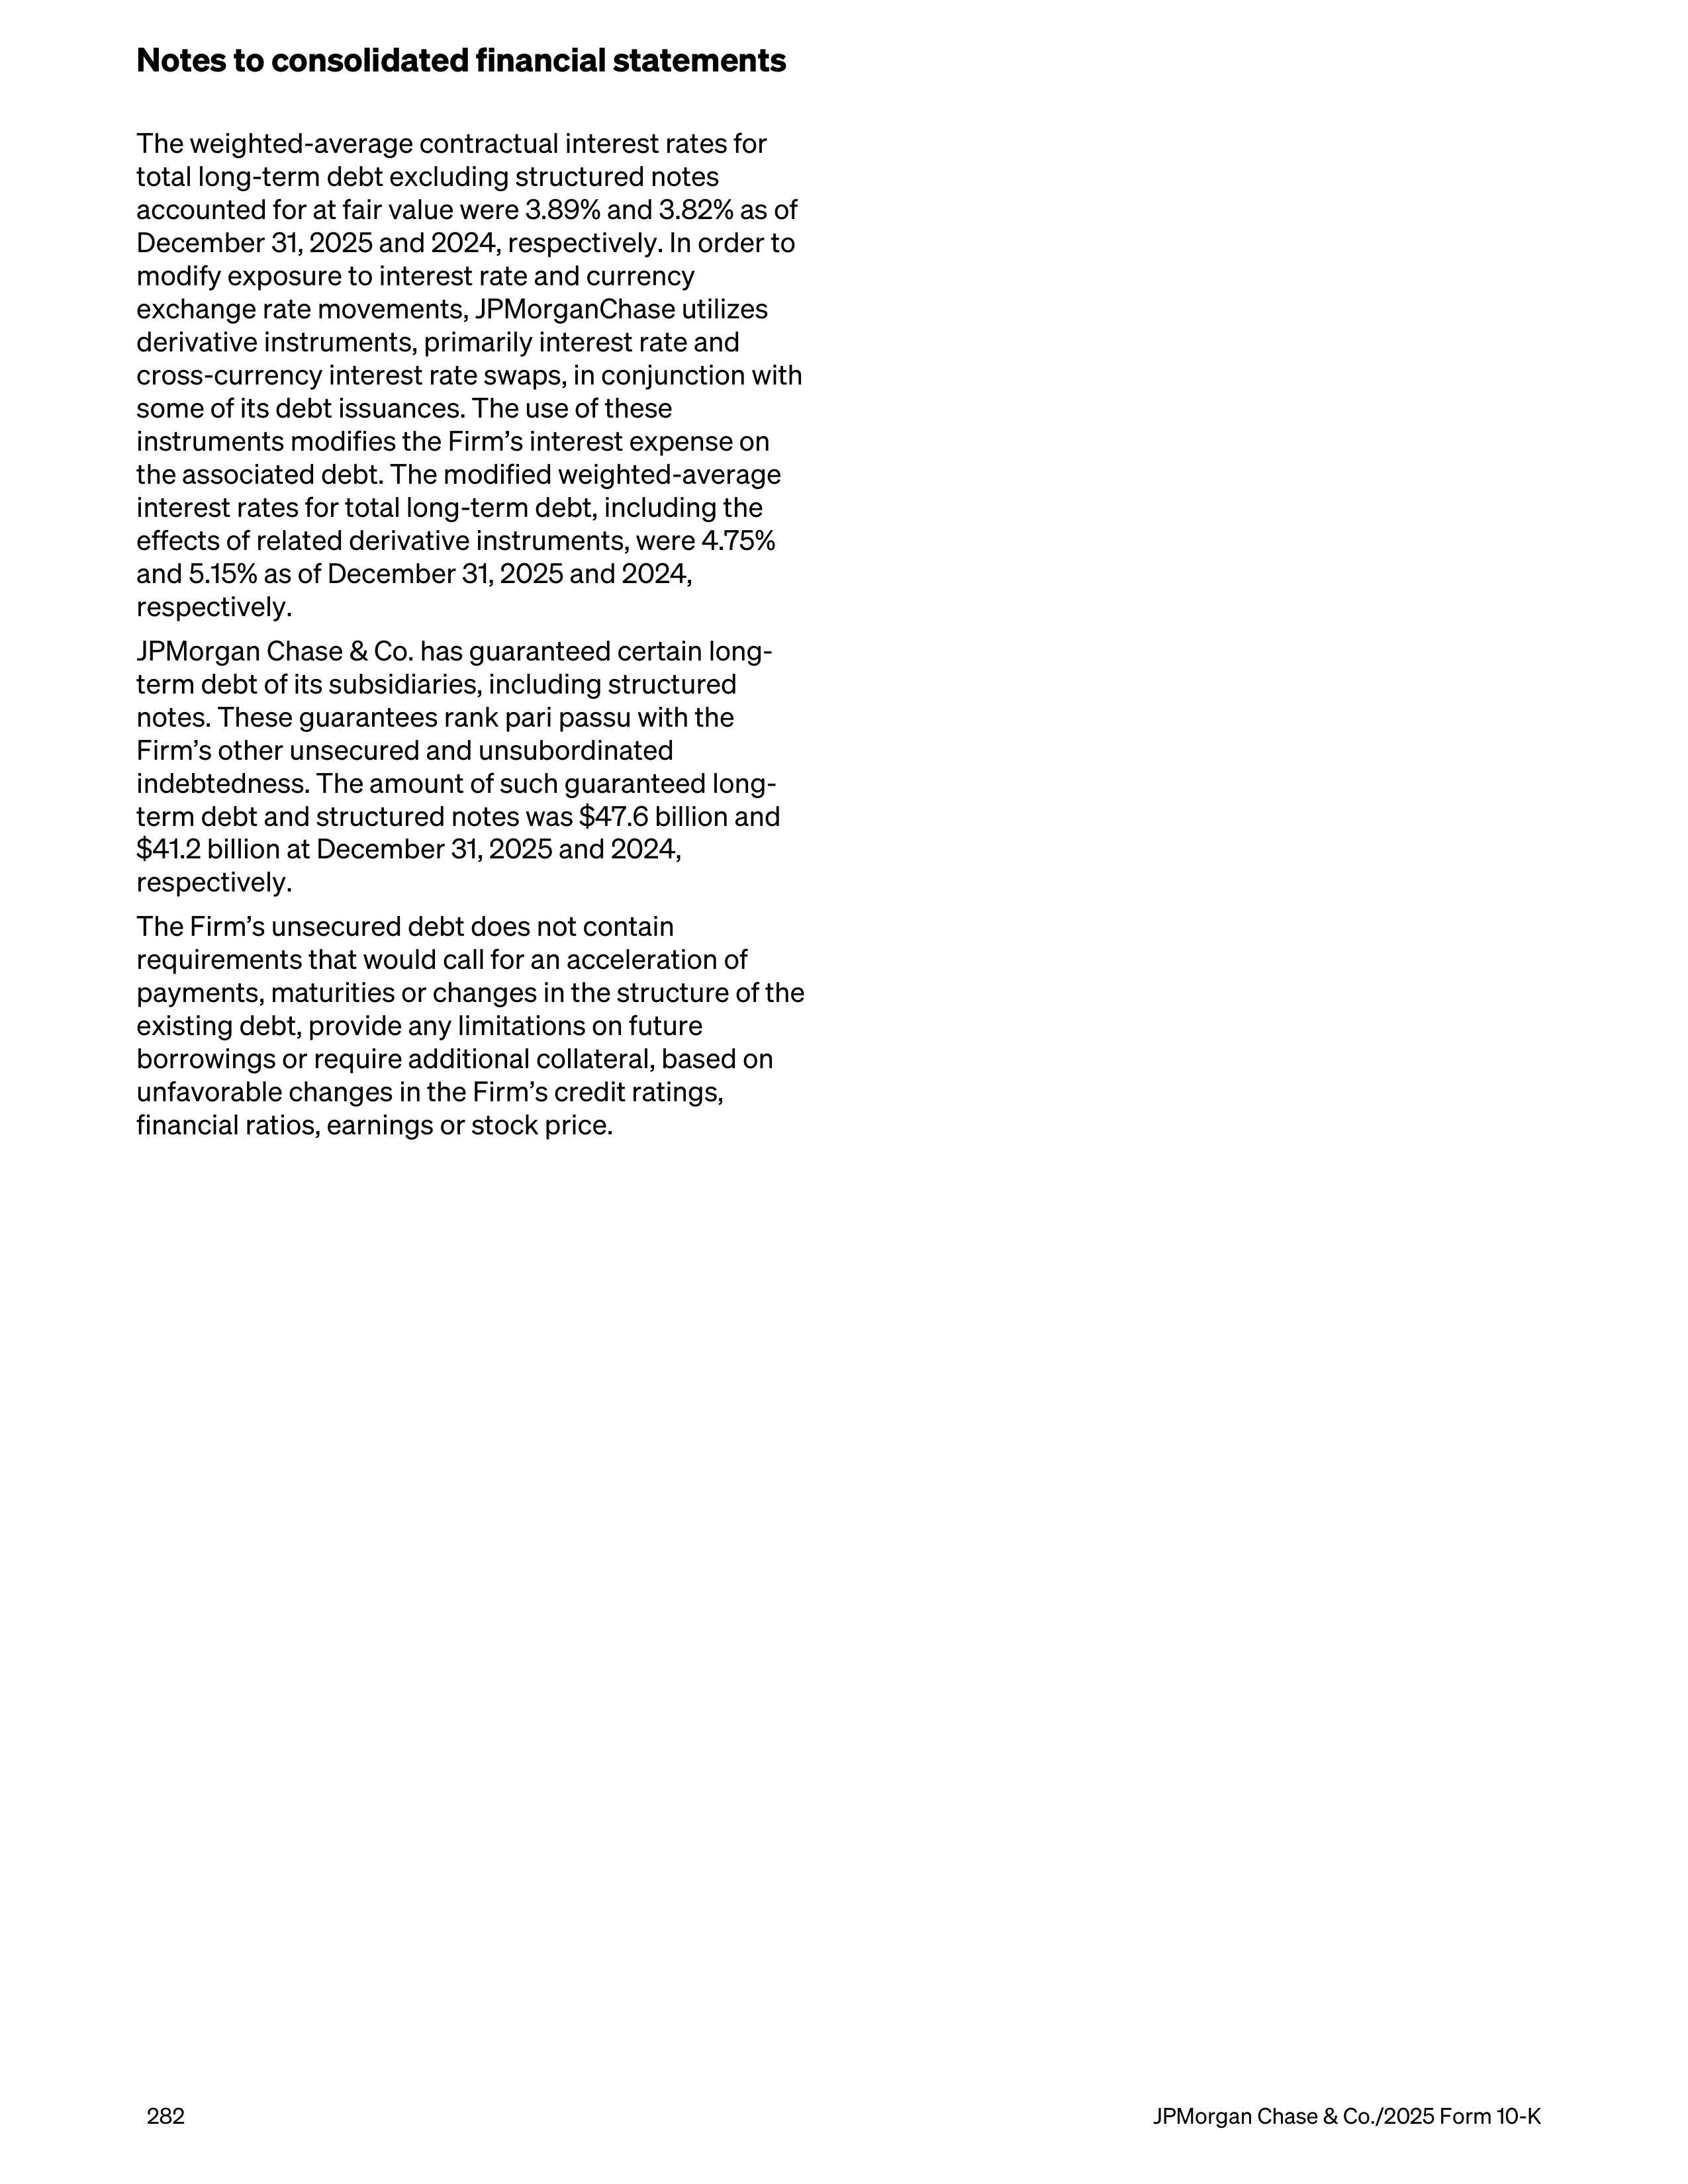
The weighted-average contractual interest rates for
total long-term debt excluding structured notes
accounted for at fair value were 3.89% and 3.82% as of
December 31, 2025 and 2024, respectively. In order to
modify exposure to interest rate and currency
exchange rate movements, JPMorganChase utilizes
derivative instruments, primarily interest rate and
cross-currency interest rate swaps, in conjunction with
some of its debt issuances. The use of these
instruments modifies the Firm’s interest expense on
the associated debt. The modified weighted-average
interest rates for total long-term debt, including the
effects of related derivative instruments, were 4.75%
and 5.15% as of December 31, 2025 and 2024,
respectively.
JPMorgan Chase & Co. has guaranteed certain long-
term debt of its subsidiaries, including structured
notes. These guarantees rank pari passu with the
Firm’s other unsecured and unsubordinated
indebtedness. The amount of such guaranteed long-
term debt and structured notes was $47.6 billion and
$41.2 billion at December 31, 2025 and 2024,
respectively.
The Firm’s unsecured debt does not contain
requirements that would call for an acceleration of
payments, maturities or changes in the structure of the
existing debt, provide any limitations on future
borrowings or require additional collateral, based on
unfavorable changes in the Firm’s credit ratings,
financial ratios, earnings or stock price.
Notes to consolidated financial statements
282
JPMorgan Chase & Co./2025 Form 10-K
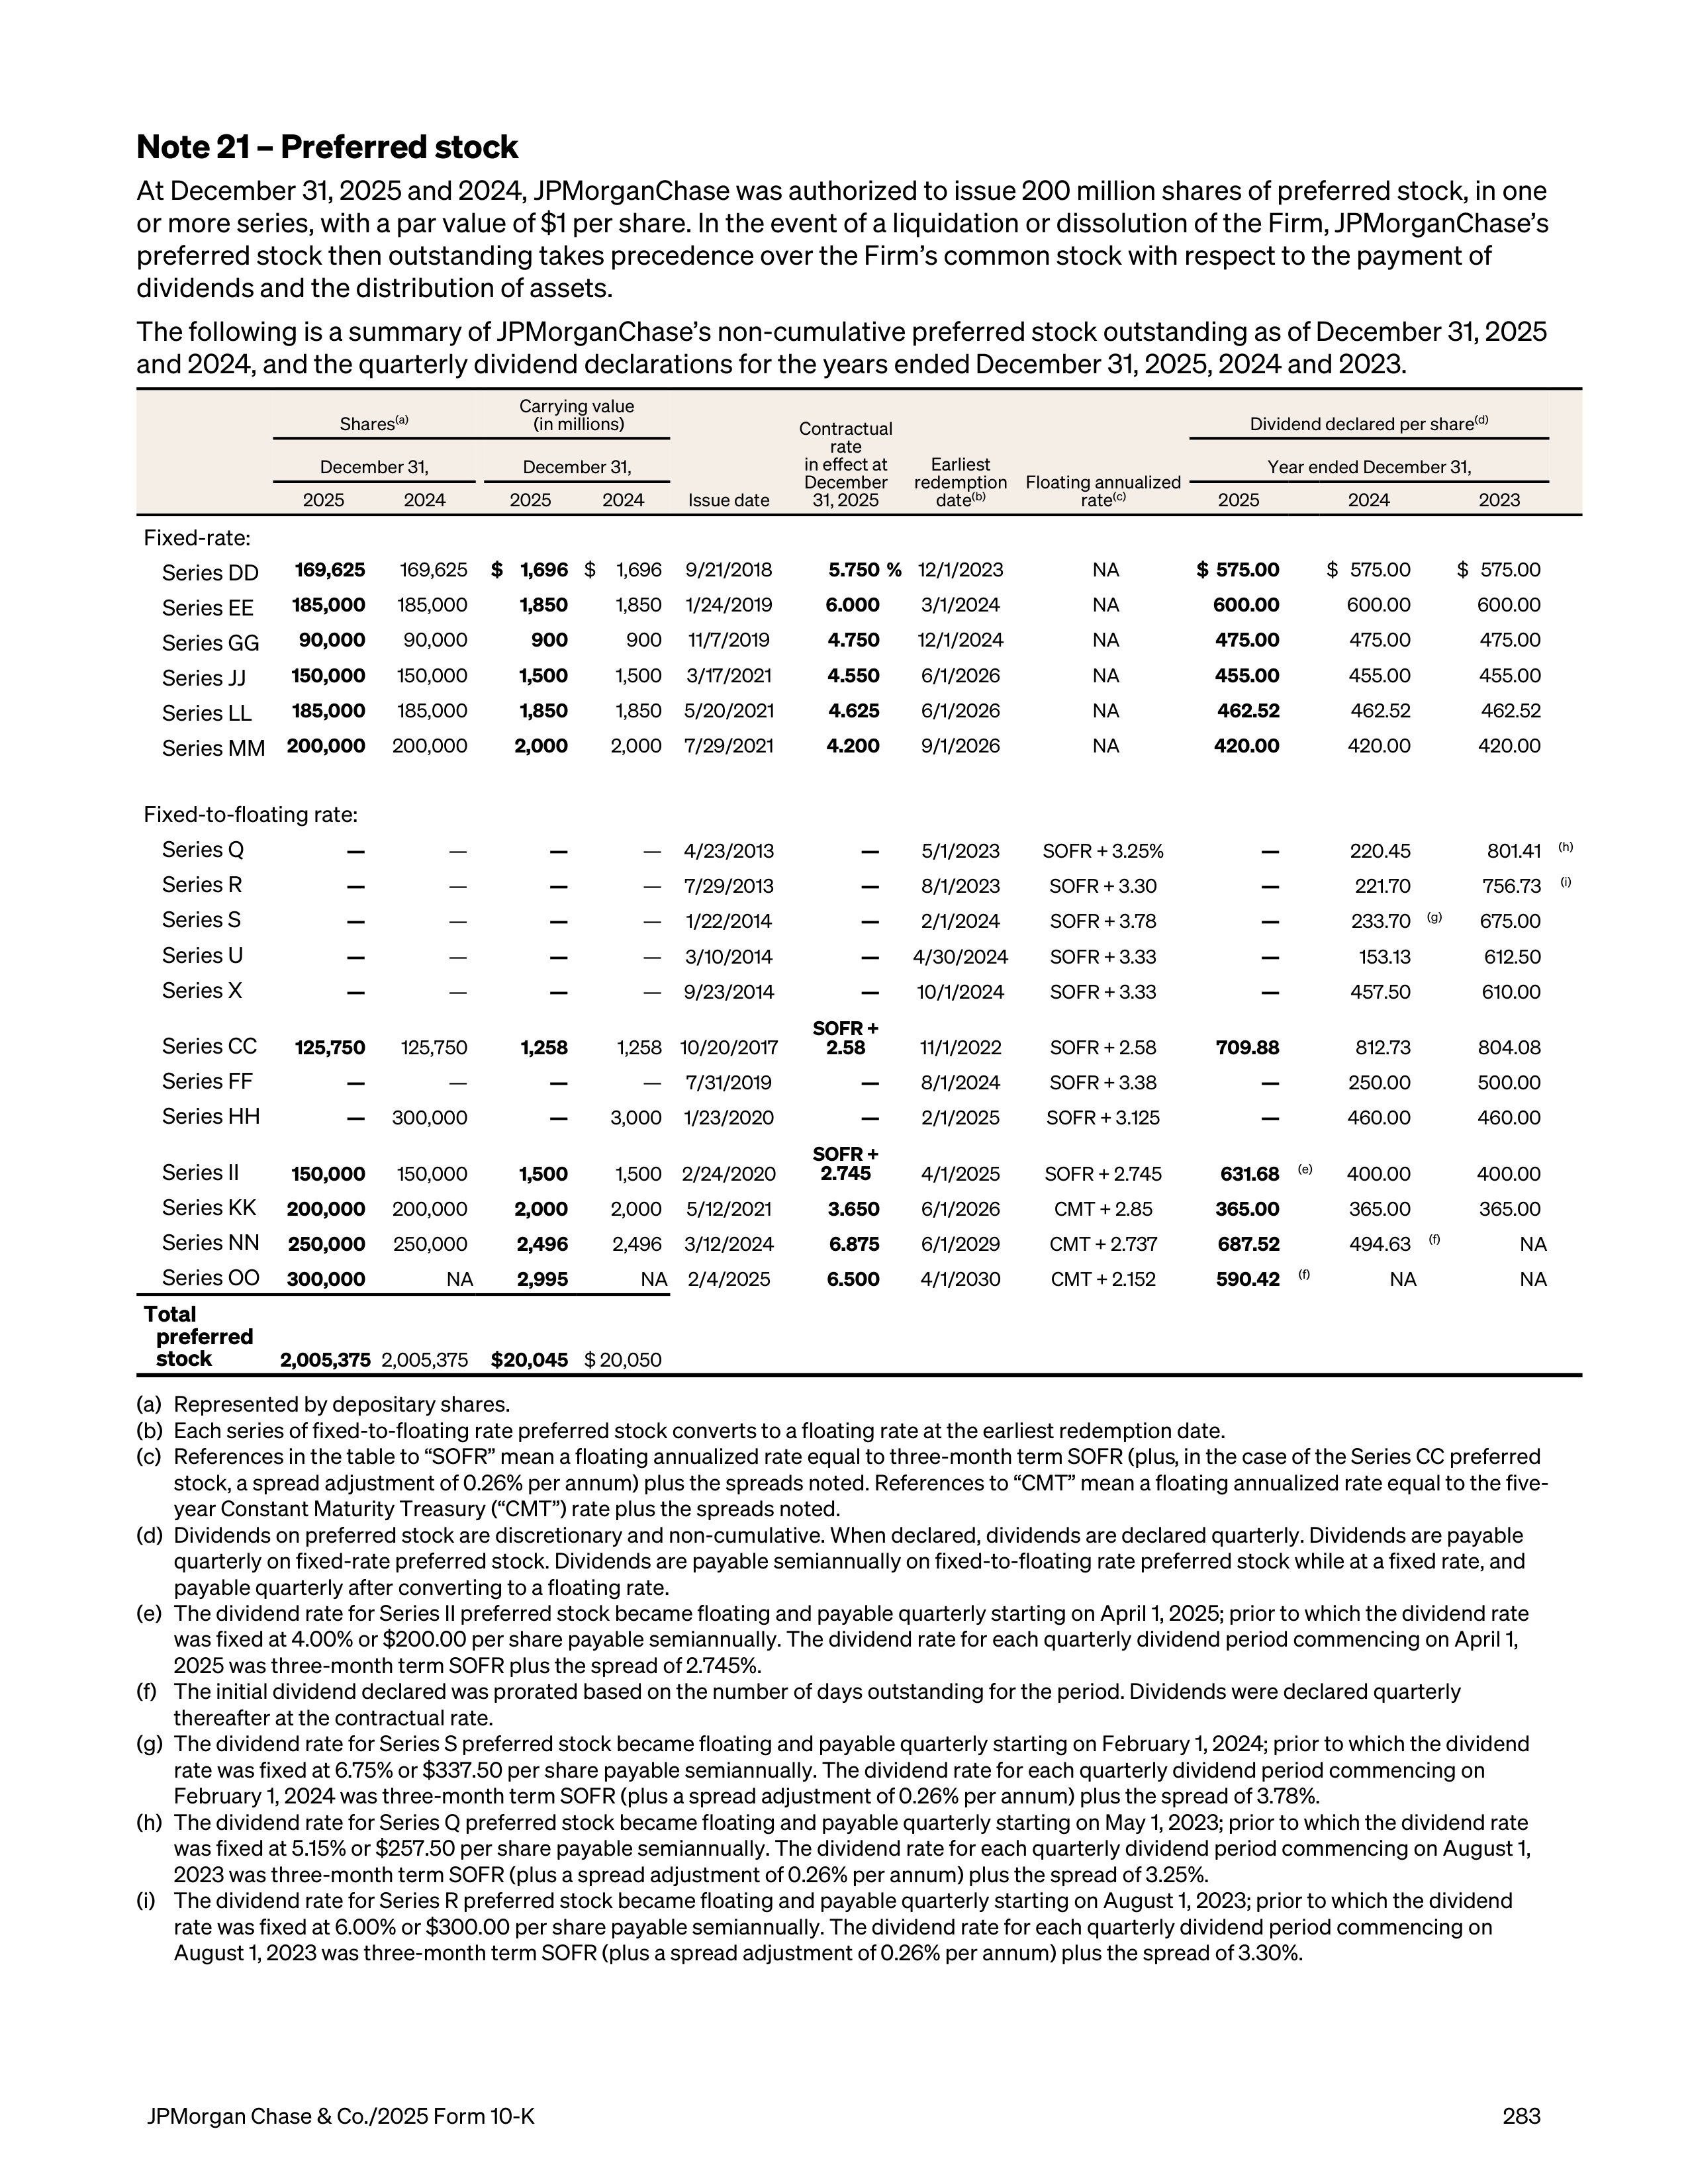
Note 21 – Preferred stock
At December 31, 2025 and 2024, JPMorganChase was authorized to issue 200 million shares of preferred stock, in one
or more series, with a par value of $1 per share. In the event of a liquidation or dissolution of the Firm, JPMorganChase’s
preferred stock then outstanding takes precedence over the Firm’s common stock with respect to the payment of
dividends and the distribution of assets.
The following is a summary of JPMorganChase’s non-cumulative preferred stock outstanding as of December 31, 2025
and 2024, and the quarterly dividend declarations for the years ended December 31, 2025, 2024 and 2023.
Shares
(a)
Carrying value
(in millions)
Issue date
Contractual
rate
in effect at
December
31, 2025
Earliest
redemption
date
(b)
Floating annualized
rate
(c)
Dividend declared per share
(d)
December 31,
December 31,
Year ended December 31,
2025
2024
2025
2024
2025
2024
2023
Fixed-rate:
Series DD
169,625
169,625
$ 1,696
$
1,696
9/21/2018
5.750 %
12/1/2023
NA
$ 575.00
$ 575.00
$ 575.00
Series EE
185,000
185,000
1,850
1,850
1/24/2019
6.000
3/1/2024
NA
600.00
600.00
600.00
Series GG
90,000
90,000
900
900
11/7/2019
4.750
12/1/2024
NA
475.00
475.00
475.00
Series JJ
150,000
150,000
1,500
1,500
3/17/2021
4.550
6/1/2026
NA
455.00
455.00
455.00
Series LL
185,000
185,000
1,850
1,850
5/20/2021
4.625
6/1/2026
NA
462.52
462.52
462.52
Series MM
200,000
200,000
2,000
2,000
7/29/2021
4.200
9/1/2026
NA
420.00
420.00
420.00
Fixed-to-floating rate:
Series Q
—
—
—
—
4/23/2013
—
5/1/2023
SOFR + 3.25%
—
220.45
801.41
(h)
Series R
—
—
—
—
7/29/2013
—
8/1/2023
SOFR + 3.30
—
221.70
756.73
(i)
Series S
—
—
—
—
1/22/2014
—
2/1/2024
SOFR + 3.78
—
233.70
(g)
675.00
Series U
—
—
—
—
3/10/2014
—
4/30/2024
SOFR + 3.33
—
153.13
612.50
Series X
—
—
—
—
9/23/2014
—
10/1/2024
SOFR + 3.33
—
457.50
610.00
Series CC
125,750
125,750
1,258
1,258 10/20/2017
SOFR +
2.58
11/1/2022
SOFR + 2.58
709.88
812.73
804.08
Series FF
—
—
—
—
7/31/2019
—
8/1/2024
SOFR + 3.38
—
250.00
500.00
Series HH
—
300,000
—
3,000
1/23/2020
—
2/1/2025
SOFR + 3.125
—
460.00
460.00
Series II
150,000
150,000
1,500
1,500
2/24/2020
SOFR +
2.745
4/1/2025
SOFR + 2.745
631.68
(e)
400.00
400.00
Series KK
200,000
200,000
2,000
2,000
5/12/2021
3.650
6/1/2026
CMT + 2.85
365.00
365.00
365.00
Series NN
250,000
250,000
2,496
2,496
3/12/2024
6.875
6/1/2029
CMT + 2.737
687.52
494.63
(f)
NA
Series OO
300,000
NA
2,995
NA
2/4/2025
6.500
4/1/2030
CMT + 2.152
590.42
(f)
NA
NA
Total
preferred
stock
2,005,375
2,005,375
$ 20,045
$ 20,050
(a)
Represented by depositary shares.
(b)
Each series of fixed-to-floating rate preferred stock converts to a floating rate at the earliest redemption date.
(c)
References in the table to “SOFR” mean a floating annualized rate equal to three-month term SOFR (plus, in the case of the Series CC preferred
stock, a spread adjustment of 0.26% per annum) plus the spreads noted. References to “CMT” mean a floating annualized rate equal to the five-
year Constant Maturity Treasury (“CMT”) rate plus the spreads noted.
(d)
Dividends on preferred stock are discretionary and non-cumulative. When declared, dividends are declared quarterly. Dividends are payable
quarterly on fixed-rate preferred stock. Dividends are payable semiannually on fixed-to-floating rate preferred stock while at a fixed rate, and
payable quarterly after converting to a floating rate.
(e)
The dividend rate for Series II preferred stock became floating and payable quarterly starting on April 1, 2025; prior to which the dividend rate
was fixed at 4.00% or $200.00 per share payable semiannually. The dividend rate for each quarterly dividend period commencing on April 1,
2025 was three-month term SOFR plus the spread of 2.745%.
(f)
The initial dividend declared was prorated based on the number of days outstanding for the period. Dividends were declared quarterly
thereafter at the contractual rate.
(g)
The dividend rate for Series S preferred stock became floating and payable quarterly starting on February 1, 2024; prior to which the dividend
rate was fixed at 6.75% or $337.50 per share payable semiannually. The dividend rate for each quarterly dividend period commencing on
February 1, 2024 was three-month term SOFR (plus a spread adjustment of 0.26% per annum) plus the spread of 3.78%.
(h)
The dividend rate for Series Q preferred stock became floating and payable quarterly starting on May 1, 2023; prior to which the dividend rate
was fixed at 5.15% or $257.50 per share payable semiannually. The dividend rate for each quarterly dividend period commencing on August 1,
2023 was three-month term SOFR (plus a spread adjustment of 0.26% per annum) plus the spread of 3.25%.
(i)
The dividend rate for Series R preferred stock became floating and payable quarterly starting on August 1, 2023; prior to which the dividend
rate was fixed at 6.00% or $300.00 per share payable semiannually. The dividend rate for each quarterly dividend period commencing on
August 1, 2023 was three-month term SOFR (plus a spread adjustment of 0.26% per annum) plus the spread of 3.30%.
JPMorgan Chase & Co./2025 Form 10-K
283
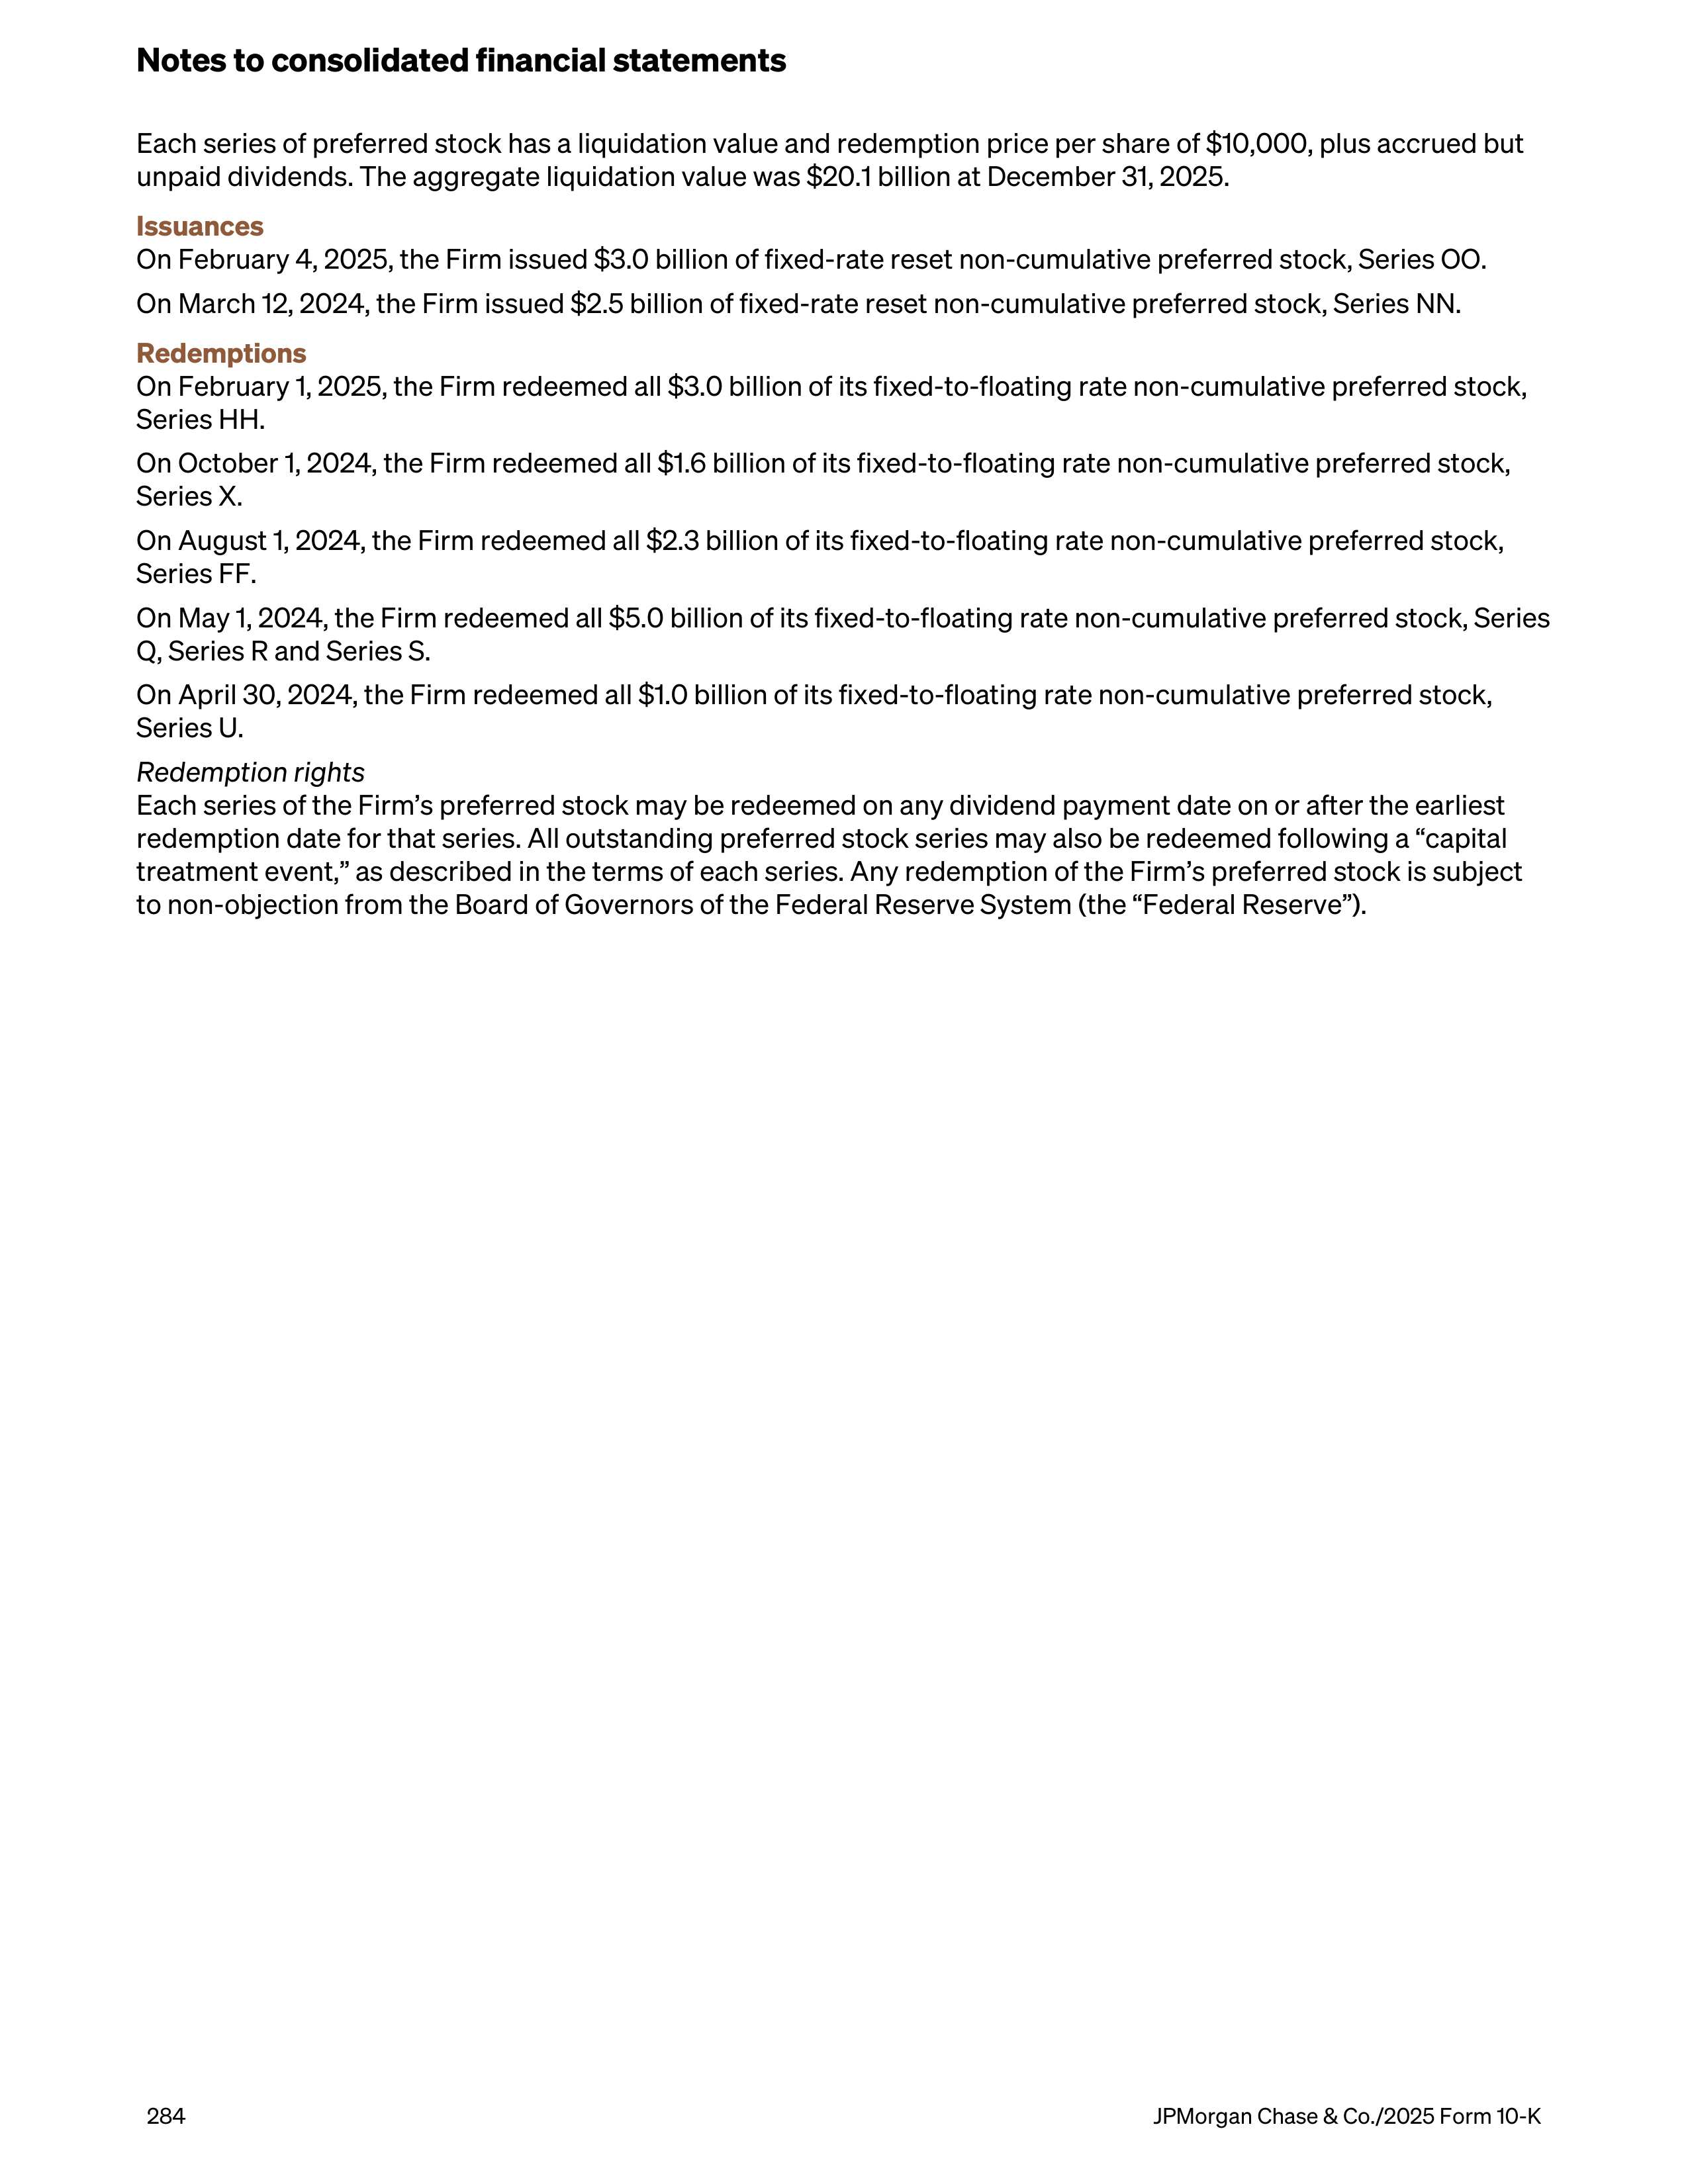
Each series of preferred stock has a liquidation value and redemption price per share of $10,000, plus accrued but
unpaid dividends. The aggregate liquidation value was $20.1 billion at December 31, 2025.
Issuances
On February 4, 2025, the Firm issued $3.0 billion of fixed-rate reset non-cumulative preferred stock, Series OO.
On March 12, 2024, the Firm issued $2.5 billion of fixed-rate reset non-cumulative preferred stock, Series NN.
Redemptions
On February 1, 2025, the Firm redeemed all $3.0 billion of its fixed-to-floating rate non-cumulative preferred stock,
Series HH.
On October 1, 2024, the Firm redeemed all $1.6 billion of its fixed-to-floating rate non-cumulative preferred stock,
Series X.
On August 1, 2024, the Firm redeemed all $2.3 billion of its fixed-to-floating rate non-cumulative preferred stock,
Series FF.
On May 1, 2024, the Firm redeemed all $5.0 billion of its fixed-to-floating rate non-cumulative preferred stock, Series
Q, Series R and Series S.
On April 30, 2024, the Firm redeemed all $1.0 billion of its fixed-to-floating rate non-cumulative preferred stock,
Series U.
Redemption rights
Each series of the Firm’s preferred stock may be redeemed on any dividend payment date on or after the earliest
redemption date for that series. All outstanding preferred stock series may also be redeemed following a “capital
treatment event,” as described in the terms of each series. Any redemption of the Firm’s preferred stock is subject
to non-objection from the Board of Governors of the Federal Reserve System (the “Federal Reserve”).
Notes to consolidated financial statements
284
JPMorgan Chase & Co./2025 Form 10-K
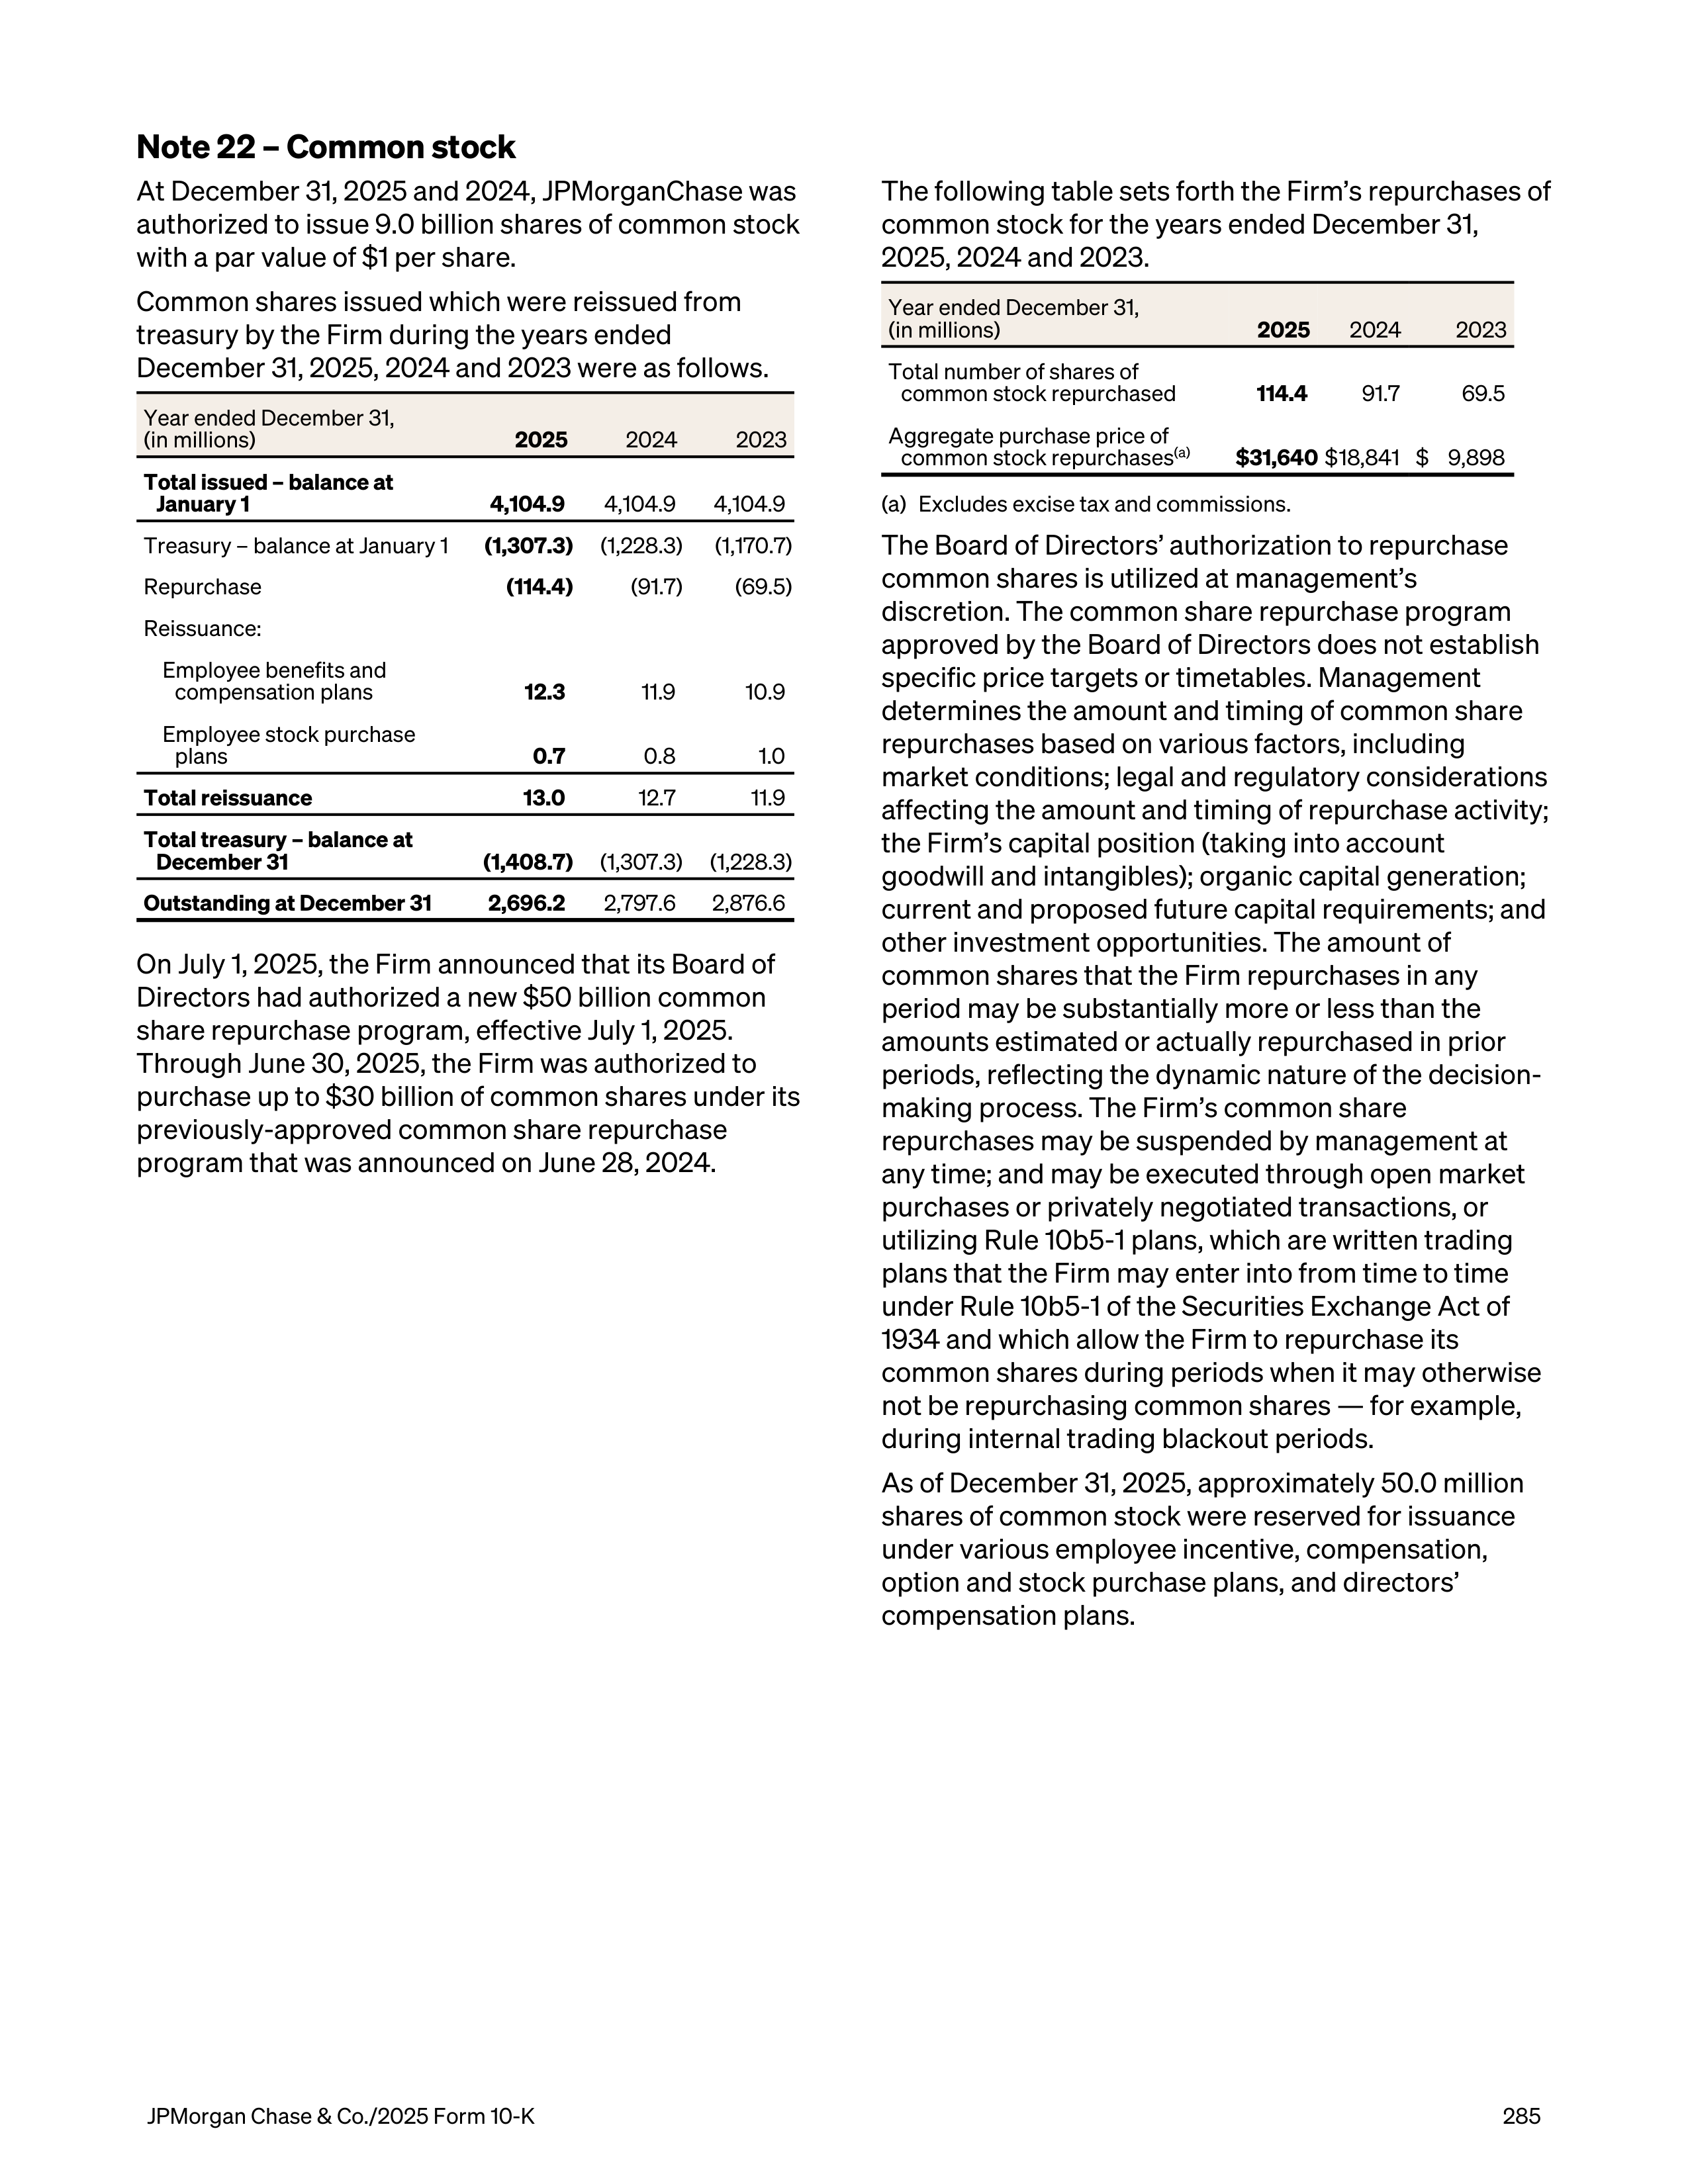
Note 22 – Common stock
At December 31, 2025 and 2024, JPMorganChase was
authorized to issue 9.0 billion shares of common stock
with a par value of $1 per share.
Common shares issued which were reissued from
treasury by the Firm during the years ended
December 31, 2025, 2024 and 2023 were as follows.
Year ended December 31,
(in millions)
2025
2024
2023
Total issued – balance at
January 1
4,104.9
4,104.9 4,104.9
Treasury – balance at January 1
(1,307.3)
(1,228.3)
(1,170.7)
Repurchase
(114.4)
(91.7)
(69.5)
Reissuance:
Employee benefits and
compensation plans
12.3
11.9
10.9
Employee stock purchase
plans
0.7
0.8
1.0
Total reissuance
13.0
12.7
11.9
Total treasury – balance at
December 31
(1,408.7)
(1,307.3) (1,228.3)
Outstanding at December 31
2,696.2
2,797.6 2,876.6
On July 1, 2025, the Firm announced that its Board of
Directors had authorized a new $50 billion common
share repurchase program, effective July 1, 2025.
Through June 30, 2025, the Firm was authorized to
purchase up to $30 billion of common shares under its
previously-approved common share repurchase
program that was announced on June 28, 2024.
The following table sets forth the Firm’s repurchases of
common stock for the years ended December 31,
2025, 2024 and 2023.
Year ended December 31,
(in millions)
2025
2024
2023
Total number of shares of
common stock repurchased
114.4
91.7
69.5
Aggregate purchase price of
common stock repurchases
(a)
$ 31,640
$ 18,841 $ 9,898
(a)
Excludes excise tax and commissions.
The Board of Directors’ authorization to repurchase
common shares is utilized at management’s
discretion. The common share repurchase program
approved by the Board of Directors does not establish
specific price targets or timetables. Management
determines the amount and timing of common share
repurchases based on various factors, including
market conditions; legal and regulatory considerations
affecting the amount and timing of repurchase activity;
the Firm’s capital position (taking into account
goodwill and intangibles); organic capital generation;
current and proposed future capital requirements; and
other investment opportunities. The amount of
common shares that the Firm repurchases in any
period may be substantially more or less than the
amounts estimated or actually repurchased in prior
periods, reflecting the dynamic nature of the decision-
making process. The Firm’s common share
repurchases may be suspended by management at
any time; and may be executed through open market
purchases or privately negotiated transactions, or
utilizing Rule 10b5-1 plans, which are written trading
plans that the Firm may enter into from time to time
under Rule 10b5-1 of the Securities Exchange Act of
1934 and which allow the Firm to repurchase its
common shares during periods when it may otherwise
not be repurchasing common shares — for example,
during internal trading blackout periods.
As of December 31, 2025, approximately 50.0 million
shares of common stock were reserved for issuance
under various employee incentive, compensation,
option and stock purchase plans, and directors’
compensation plans.
JPMorgan Chase & Co./2025 Form 10-K
285
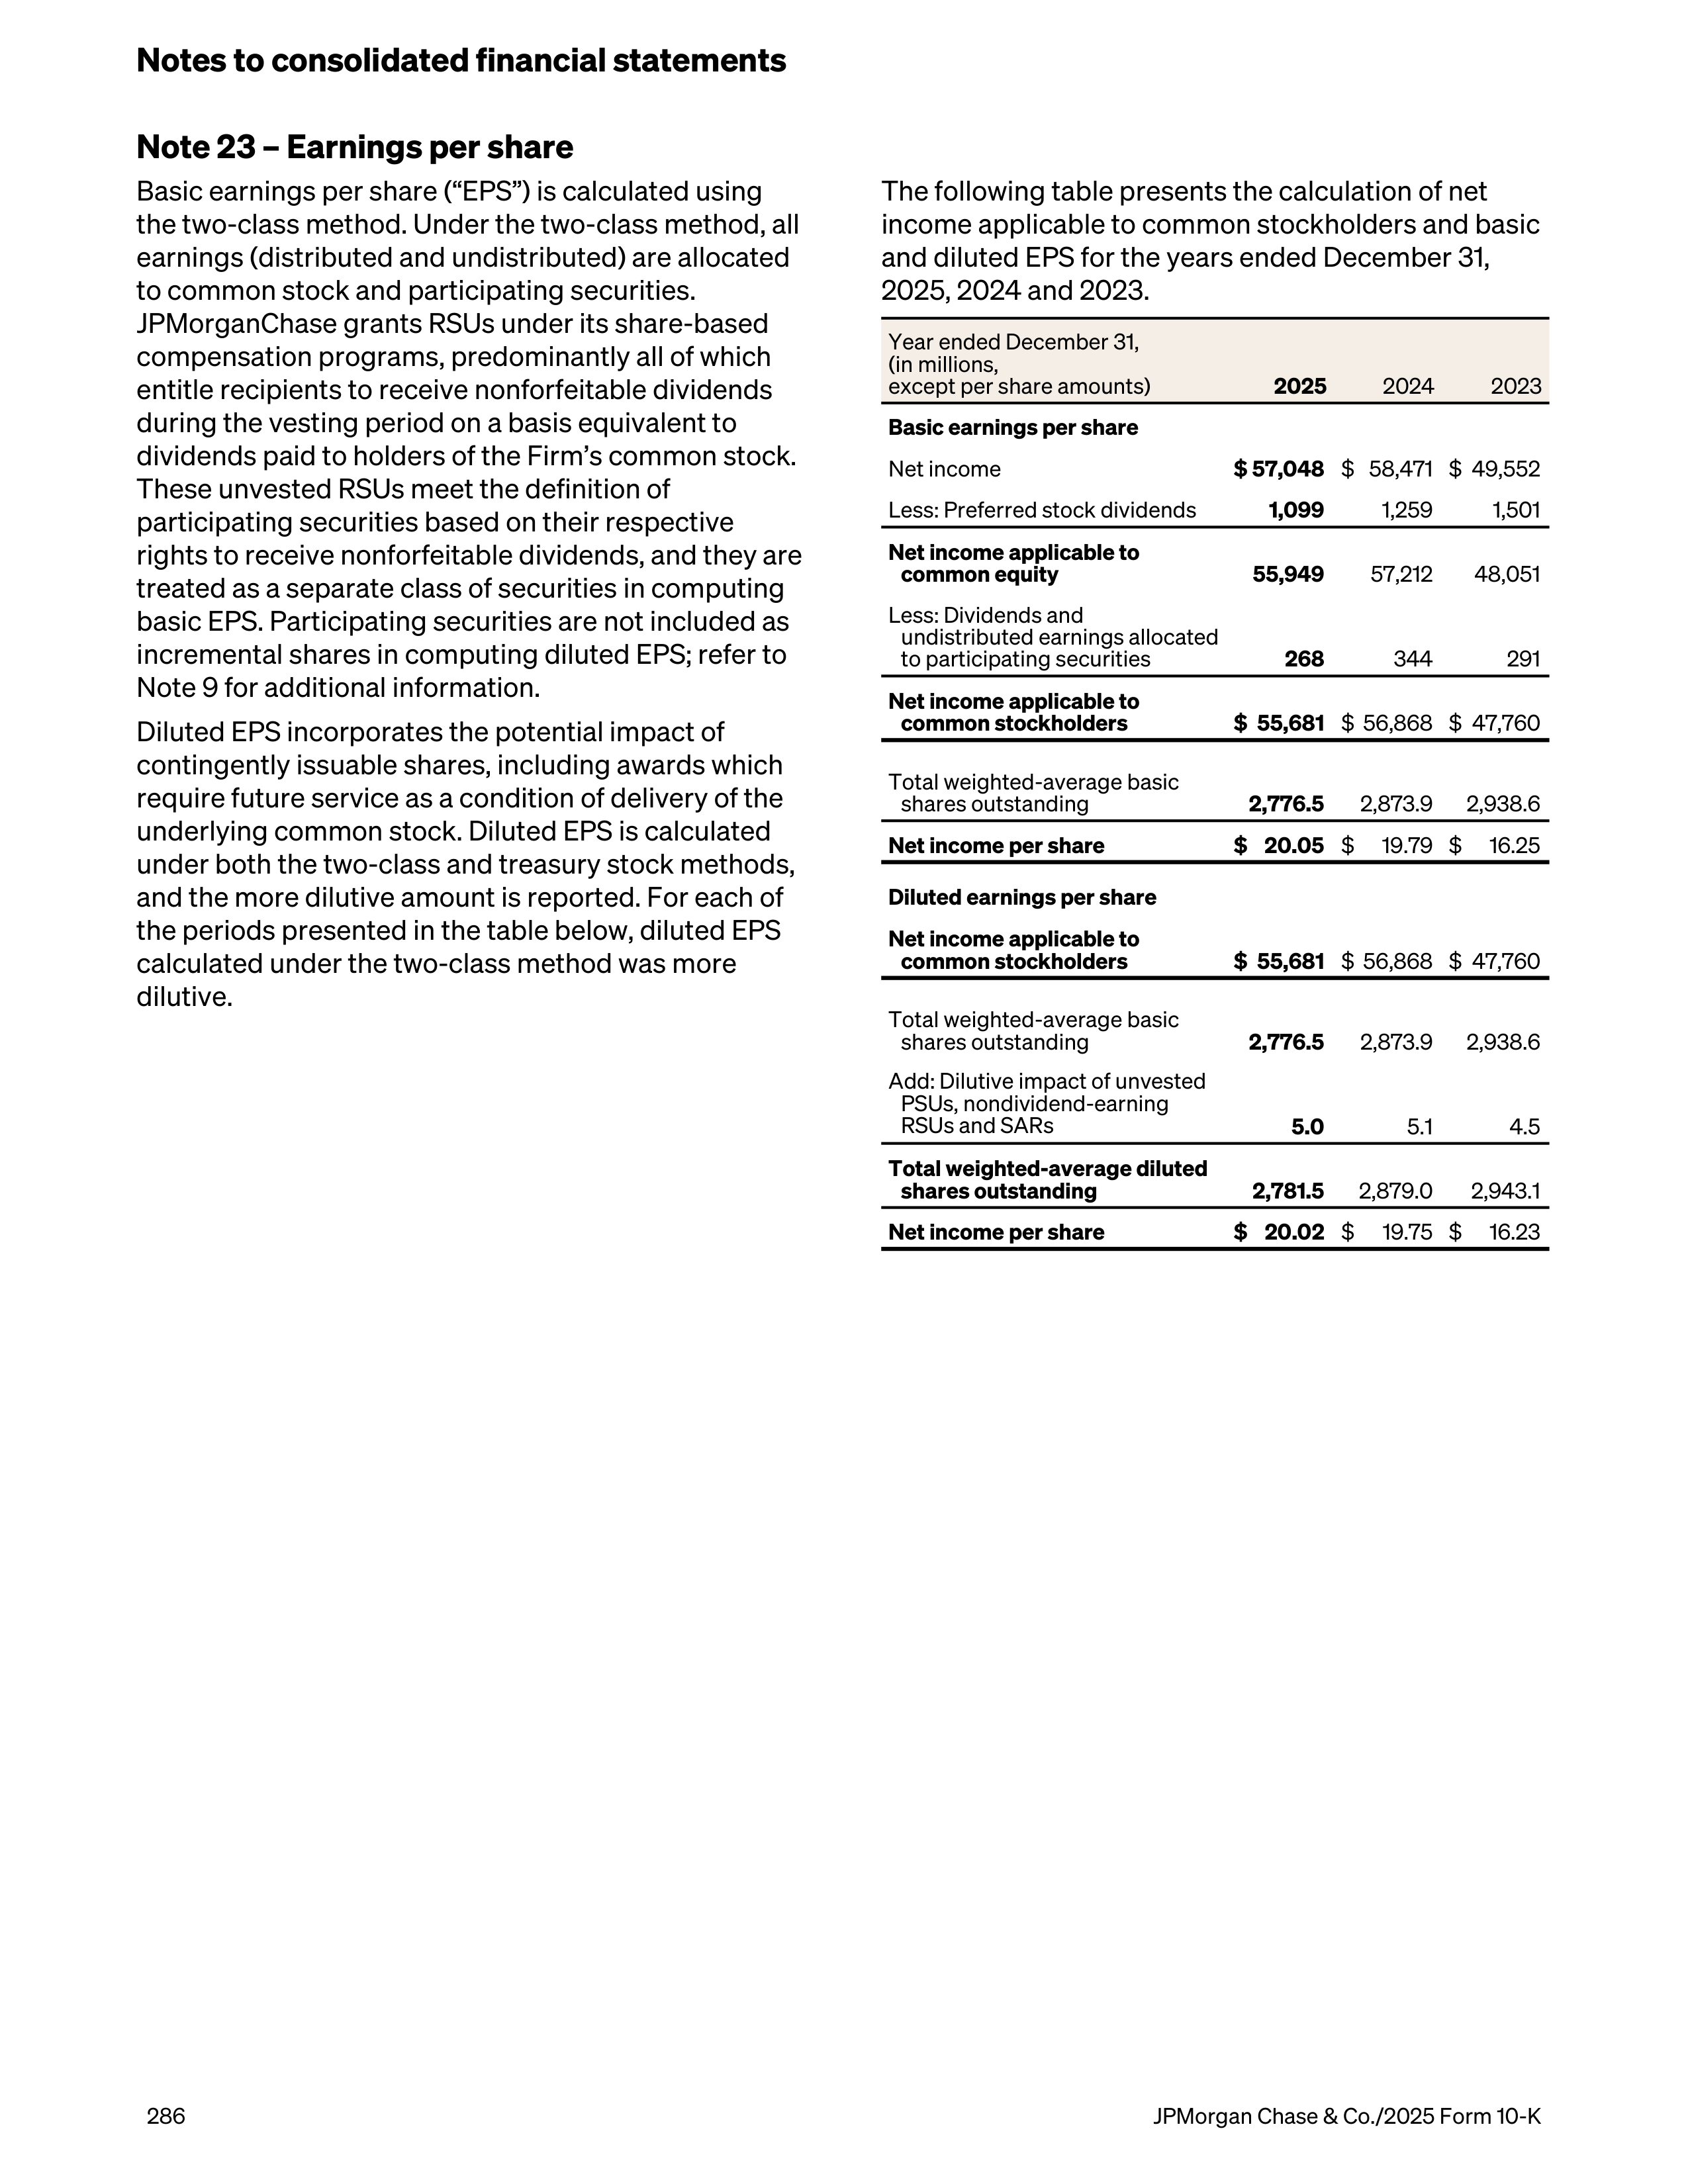
Note 23 – Earnings per share
Basic earnings per share (“EPS”) is calculated using
the two-class method. Under the two-class method, all
earnings (distributed and undistributed) are allocated
to common stock and participating securities.
JPMorganChase grants RSUs under its share-based
compensation programs, predominantly all of which
entitle recipients to receive nonforfeitable dividends
during the vesting period on a basis equivalent to
dividends paid to holders of the Firm’s common stock.
These unvested RSUs meet the definition of
participating securities based on their respective
rights to receive nonforfeitable dividends, and they are
treated as a separate class of securities in computing
basic EPS. Participating securities are not included as
incremental shares in computing diluted EPS; refer to
Note 9 for additional information.
Diluted EPS incorporates the potential impact of
contingently issuable shares, including awards which
require future service as a condition of delivery of the
underlying common stock. Diluted EPS is calculated
under both the two-class and treasury stock methods,
and the more dilutive amount is reported. For each of
the periods presented in the table below, diluted EPS
calculated under the two-class method was more
dilutive.
The following table presents the calculation of net
income applicable to common stockholders and basic
and diluted EPS for the years ended December 31,
2025, 2024 and 2023.
Year ended December 31,
(in millions,
except per share amounts)
2025
2024
2023
Basic earnings per share
Net income
$ 57,048
$ 58,471 $ 49,552
Less: Preferred stock dividends
1,099
1,259
1,501
Net income applicable to
common equity
55,949
57,212
48,051
Less: Dividends and
undistributed earnings allocated
to participating securities
268
344
291
Net income applicable to
common stockholders
$ 55,681
$ 56,868 $ 47,760
Total weighted-average basic
shares outstanding
2,776.5
2,873.9 2,938.6
Net income per share
$ 20.05
$
19.79 $
16.25
Diluted earnings per share
Net income applicable to
common stockholders
$ 55,681
$ 56,868 $ 47,760
Total weighted-average basic
shares outstanding
2,776.5
2,873.9 2,938.6
Add: Dilutive impact of unvested
PSUs, nondividend-earning
RSUs and SARs
5.0
5.1
4.5
Total weighted-average diluted
shares outstanding
2,781.5
2,879.0 2,943.1
Net income per share
$ 20.02
$
19.75 $
16.23
Notes to consolidated financial statements
286
JPMorgan Chase & Co./2025 Form 10-K
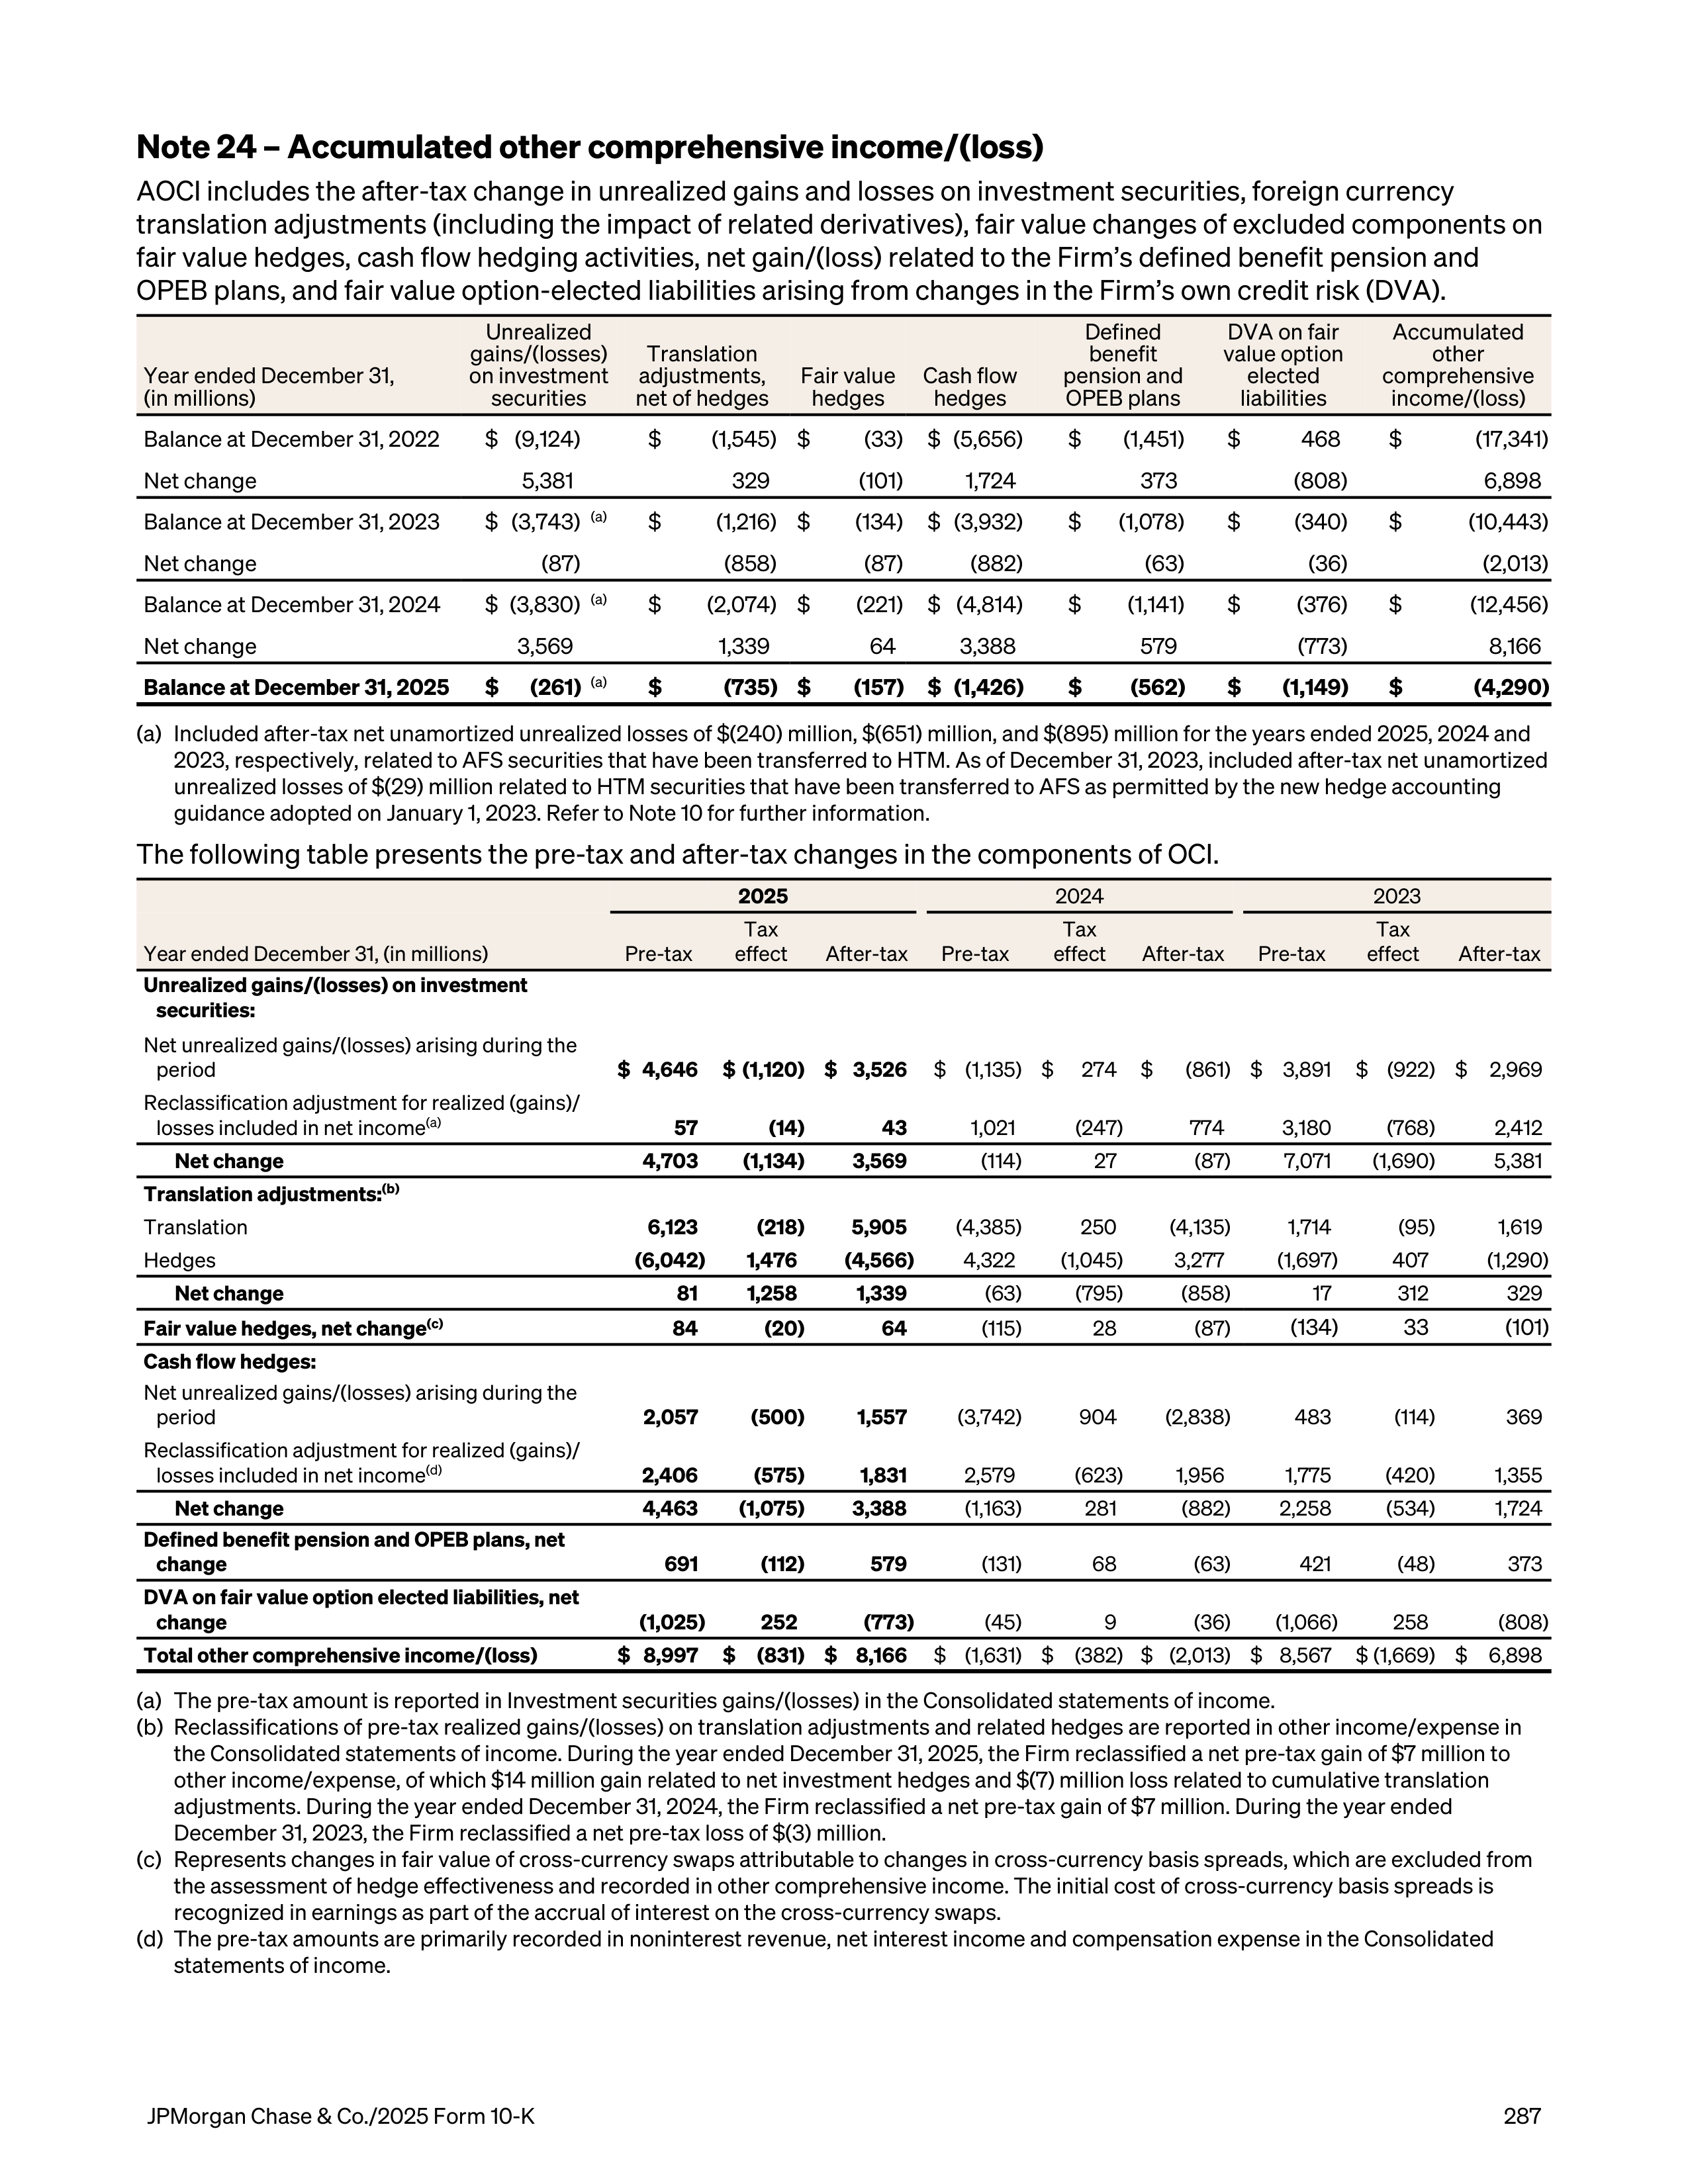
Note 24 – Accumulated other comprehensive income/(loss)
AOCI includes the after-tax change in unrealized gains and losses on investment securities, foreign currency
translation adjustments (including the impact of related derivatives), fair value changes of excluded components on
fair value hedges, cash flow hedging activities, net gain/(loss) related to the Firm’s defined benefit pension and
OPEB plans, and fair value option-elected liabilities arising from changes in the Firm’s own credit risk (DVA).
Year ended December 31,
(in millions)
Unrealized
gains/(losses)
on investment
securities
Translation
adjustments,
net of hedges
Fair value
hedges
Cash flow
hedges
Defined
benefit
pension and
OPEB plans
DVA on fair
value option
elected
liabilities
Accumulated
other
comprehensive
income/(loss)
Balance at December 31, 2022
$ (9,124)
$
(1,545) $
(33)
$ (5,656)
$
(1,451)
$
468
$
(17,341)
Net change
5,381
329
(101)
1,724
373
(808)
6,898
Balance at December 31, 2023
$ (3,743)
(a)
$
(1,216) $
(134)
$ (3,932)
$
(1,078)
$
(340)
$
(10,443)
Net change
(87)
(858)
(87)
(882)
(63)
(36)
(2,013)
Balance at December 31, 2024
$ (3,830)
(a)
$
(2,074) $
(221)
$ (4,814)
$
(1,141)
$
(376)
$
(12,456)
Net change
3,569
1,339
64
3,388
579
(773)
8,166
Balance at December 31, 2025
$
(261)
(a)
$
(735) $
(157)
$ (1,426)
$
(562)
$
(1,149)
$
(4,290)
(a)
Included after-tax net unamortized unrealized losses of $(240) million, $(651) million, and $(895) million for the years ended 2025, 2024 and
2023, respectively, related to AFS securities that have been transferred to HTM. As of December 31, 2023, included after-tax net unamortized
unrealized losses of $(29) million related to HTM securities that have been transferred to AFS as permitted by the new hedge accounting
guidance adopted on January 1, 2023. Refer to Note 10 for further information.
The following table presents the pre-tax and after-tax changes in the components of OCI.
2025
2024
2023
Year ended December 31, (in millions)
Pre-tax
Tax
effect
After-tax
Pre-tax
Tax
effect
After-tax
Pre-tax
Tax
effect
After-tax
Unrealized gains/(losses) on investment
securities:
Net unrealized gains/(losses) arising during the
period
$ 4,646
$ (1,120) $ 3,526
$ (1,135) $
274
$
(861) $ 3,891
$ (922) $
2,969
Reclassification adjustment for realized (gains)/
losses included in net income
(a)
57
(14)
43
1,021
(247)
774
3,180
(768)
2,412
Net change
4,703
(1,134)
3,569
(114)
27
(87)
7,071
(1,690)
5,381
Translation adjustments:
(b)
Translation
6,123
(218)
5,905
(4,385)
250
(4,135)
1,714
(95)
1,619
Hedges
(6,042)
1,476
(4,566)
4,322
(1,045)
3,277
(1,697)
407
(1,290)
Net change
81
1,258
1,339
(63)
(795)
(858)
17
312
329
Fair value hedges, net change
(c)
84
(20)
64
(115)
28
(87)
(134)
33
(101)
Cash flow hedges:
Net unrealized gains/(losses) arising during the
period
2,057
(500)
1,557
(3,742)
904
(2,838)
483
(114)
369
Reclassification adjustment for realized (gains)/
losses included in net income
(d)
2,406
(575)
1,831
2,579
(623)
1,956
1,775
(420)
1,355
Net change
4,463
(1,075)
3,388
(1,163)
281
(882)
2,258
(534)
1,724
Defined benefit pension and OPEB plans, net
change
691
(112)
579
(131)
68
(63)
421
(48)
373
DVA on fair value option elected liabilities, net
change
(1,025)
252
(773)
(45)
9
(36)
(1,066)
258
(808)
Total other comprehensive income/(loss)
$ 8,997
$
(831) $ 8,166
$ (1,631) $
(382) $ (2,013) $ 8,567
$ (1,669) $
6,898
(a)
The pre-tax amount is reported in Investment securities gains/(losses) in the Consolidated statements of income.
(b)
Reclassifications of pre-tax realized gains/(losses) on translation adjustments and related hedges are reported in other income/expense in
the Consolidated statements of income. During the year ended December 31, 2025, the Firm reclassified a net pre-tax gain of $7 million to
other income/expense, of which $14 million gain related to net investment hedges and $(7) million loss related to cumulative translation
adjustments. During the year ended December 31, 2024, the Firm reclassified a net pre-tax gain of $7 million. During the year ended
December 31, 2023, the Firm reclassified a net pre-tax loss of $(3) million.
(c)
Represents changes in fair value of cross-currency swaps attributable to changes in cross-currency basis spreads, which are excluded from
the assessment of hedge effectiveness and recorded in other comprehensive income. The initial cost of cross-currency basis spreads is
recognized in earnings as part of the accrual of interest on the cross-currency swaps.
(d)
The pre-tax amounts are primarily recorded in noninterest revenue, net interest income and compensation expense in the Consolidated
statements of income.
JPMorgan Chase & Co./2025 Form 10-K
287
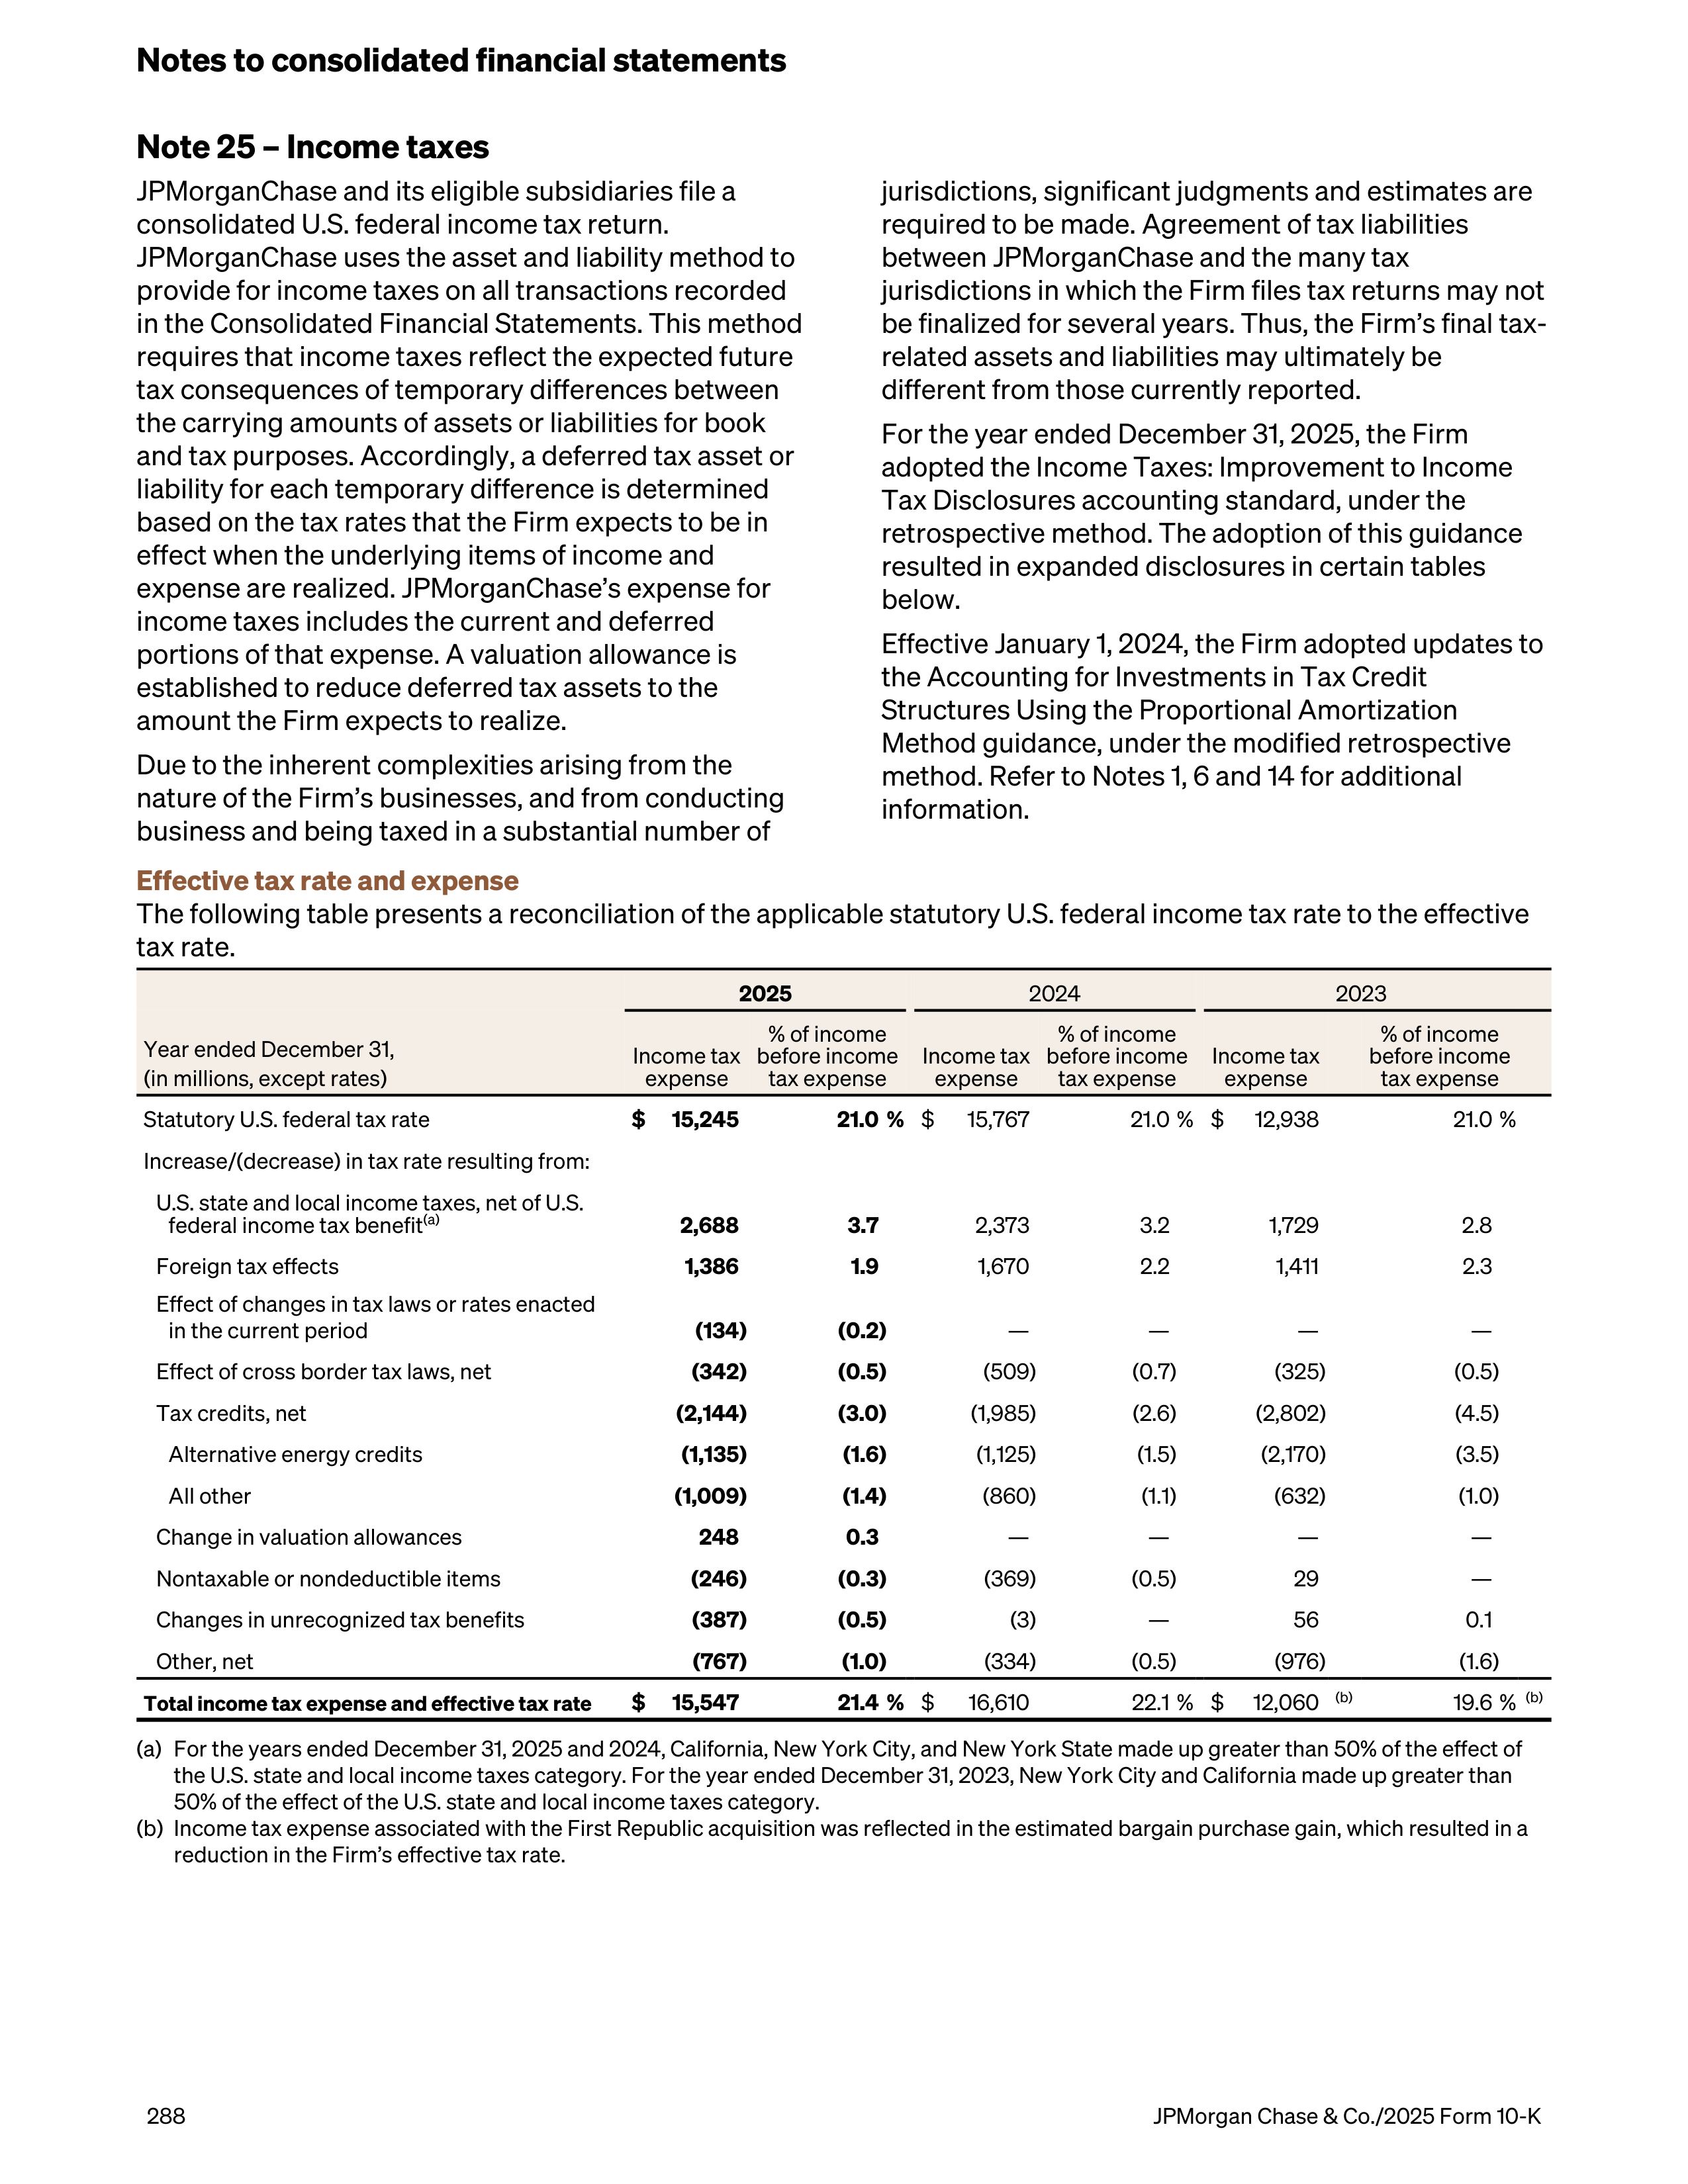
Note 25 – Income taxes
JPMorganChase and its eligible subsidiaries file a
consolidated U.S. federal income tax return.
JPMorganChase uses the asset and liability method to
provide for income taxes on all transactions recorded
in the Consolidated Financial Statements. This method
requires that income taxes reflect the expected future
tax consequences of temporary differences between
the carrying amounts of assets or liabilities for book
and tax purposes. Accordingly, a deferred tax asset or
liability for each temporary difference is determined
based on the tax rates that the Firm expects to be in
effect when the underlying items of income and
expense are realized. JPMorganChase’s expense for
income taxes includes the current and deferred
portions of that expense. A valuation allowance is
established to reduce deferred tax assets to the
amount the Firm expects to realize.
Due to the inherent complexities arising from the
nature of the Firm’s businesses, and from conducting
business and being taxed in a substantial number of
jurisdictions, significant judgments and estimates are
required to be made. Agreement of tax liabilities
between JPMorganChase and the many tax
jurisdictions in which the Firm files tax returns may not
be finalized for several years. Thus, the Firm’s final tax-
related assets and liabilities may ultimately be
different from those currently reported.
For the year ended December 31, 2025, the Firm
adopted the Income Taxes: Improvement to Income
Tax Disclosures accounting standard, under the
retrospective method. The adoption of this guidance
resulted in expanded disclosures in certain tables
below.
Effective January 1, 2024, the Firm adopted updates to
the Accounting for Investments in Tax Credit
Structures Using the Proportional Amortization
Method guidance, under the modified retrospective
method. Refer to Notes 1, 6 and 14 for additional
information.
Effective tax rate and expense
The following table presents a reconciliation of the applicable statutory U.S. federal income tax rate to the effective
tax rate.
2025
2024
2023
Year ended December 31,
(in millions, except rates)
Income tax
expense
% of income
before income
tax expense
Income tax
expense
% of income
before income
tax expense
Income tax
expense
% of income
before income
tax expense
Statutory U.S. federal tax rate
$
15,245
21.0 %
$
15,767
21.0 %
$
12,938
21.0 %
Increase/(decrease) in tax rate resulting from:
U.S. state and local income taxes, net of U.S.
federal income tax benefit
(a)
2,688
3.7
2,373
3.2
1,729
2.8
Foreign tax effects
1,386
1.9
1,670
2.2
1,411
2.3
Effect of changes in tax laws or rates enacted
in the current period
(134)
(0.2)
—
—
—
—
Effect of cross border tax laws, net
(342)
(0.5)
(509)
(0.7)
(325)
(0.5)
Tax credits, net
(2,144)
(3.0)
(1,985)
(2.6)
(2,802)
(4.5)
Alternative energy credits
(1,135)
(1.6)
(1,125)
(1.5)
(2,170)
(3.5)
All other
(1,009)
(1.4)
(860)
(1.1)
(632)
(1.0)
Change in valuation allowances
248
0.3
—
—
—
—
Nontaxable or nondeductible items
(246)
(0.3)
(369)
(0.5)
29
—
Changes in unrecognized tax benefits
(387)
(0.5)
(3)
—
56
0.1
Other, net
(767)
(1.0)
(334)
(0.5)
(976)
(1.6)
Total income tax expense and effective tax rate
$
15,547
21.4 %
$
16,610
22.1 %
$
12,060
(b)
19.6 %
(b)
(a)
For the years ended December 31, 2025 and 2024, California, New York City, and New York State made up greater than 50% of the effect of
the U.S. state and local income taxes category. For the year ended December 31, 2023, New York City and California made up greater than
50% of the effect of the U.S. state and local income taxes category.
(b)
Income tax expense associated with the First Republic acquisition was reflected in the estimated bargain purchase gain, which resulted in a
reduction in the Firm’s effective tax rate.
Notes to consolidated financial statements
288
JPMorgan Chase & Co./2025 Form 10-K
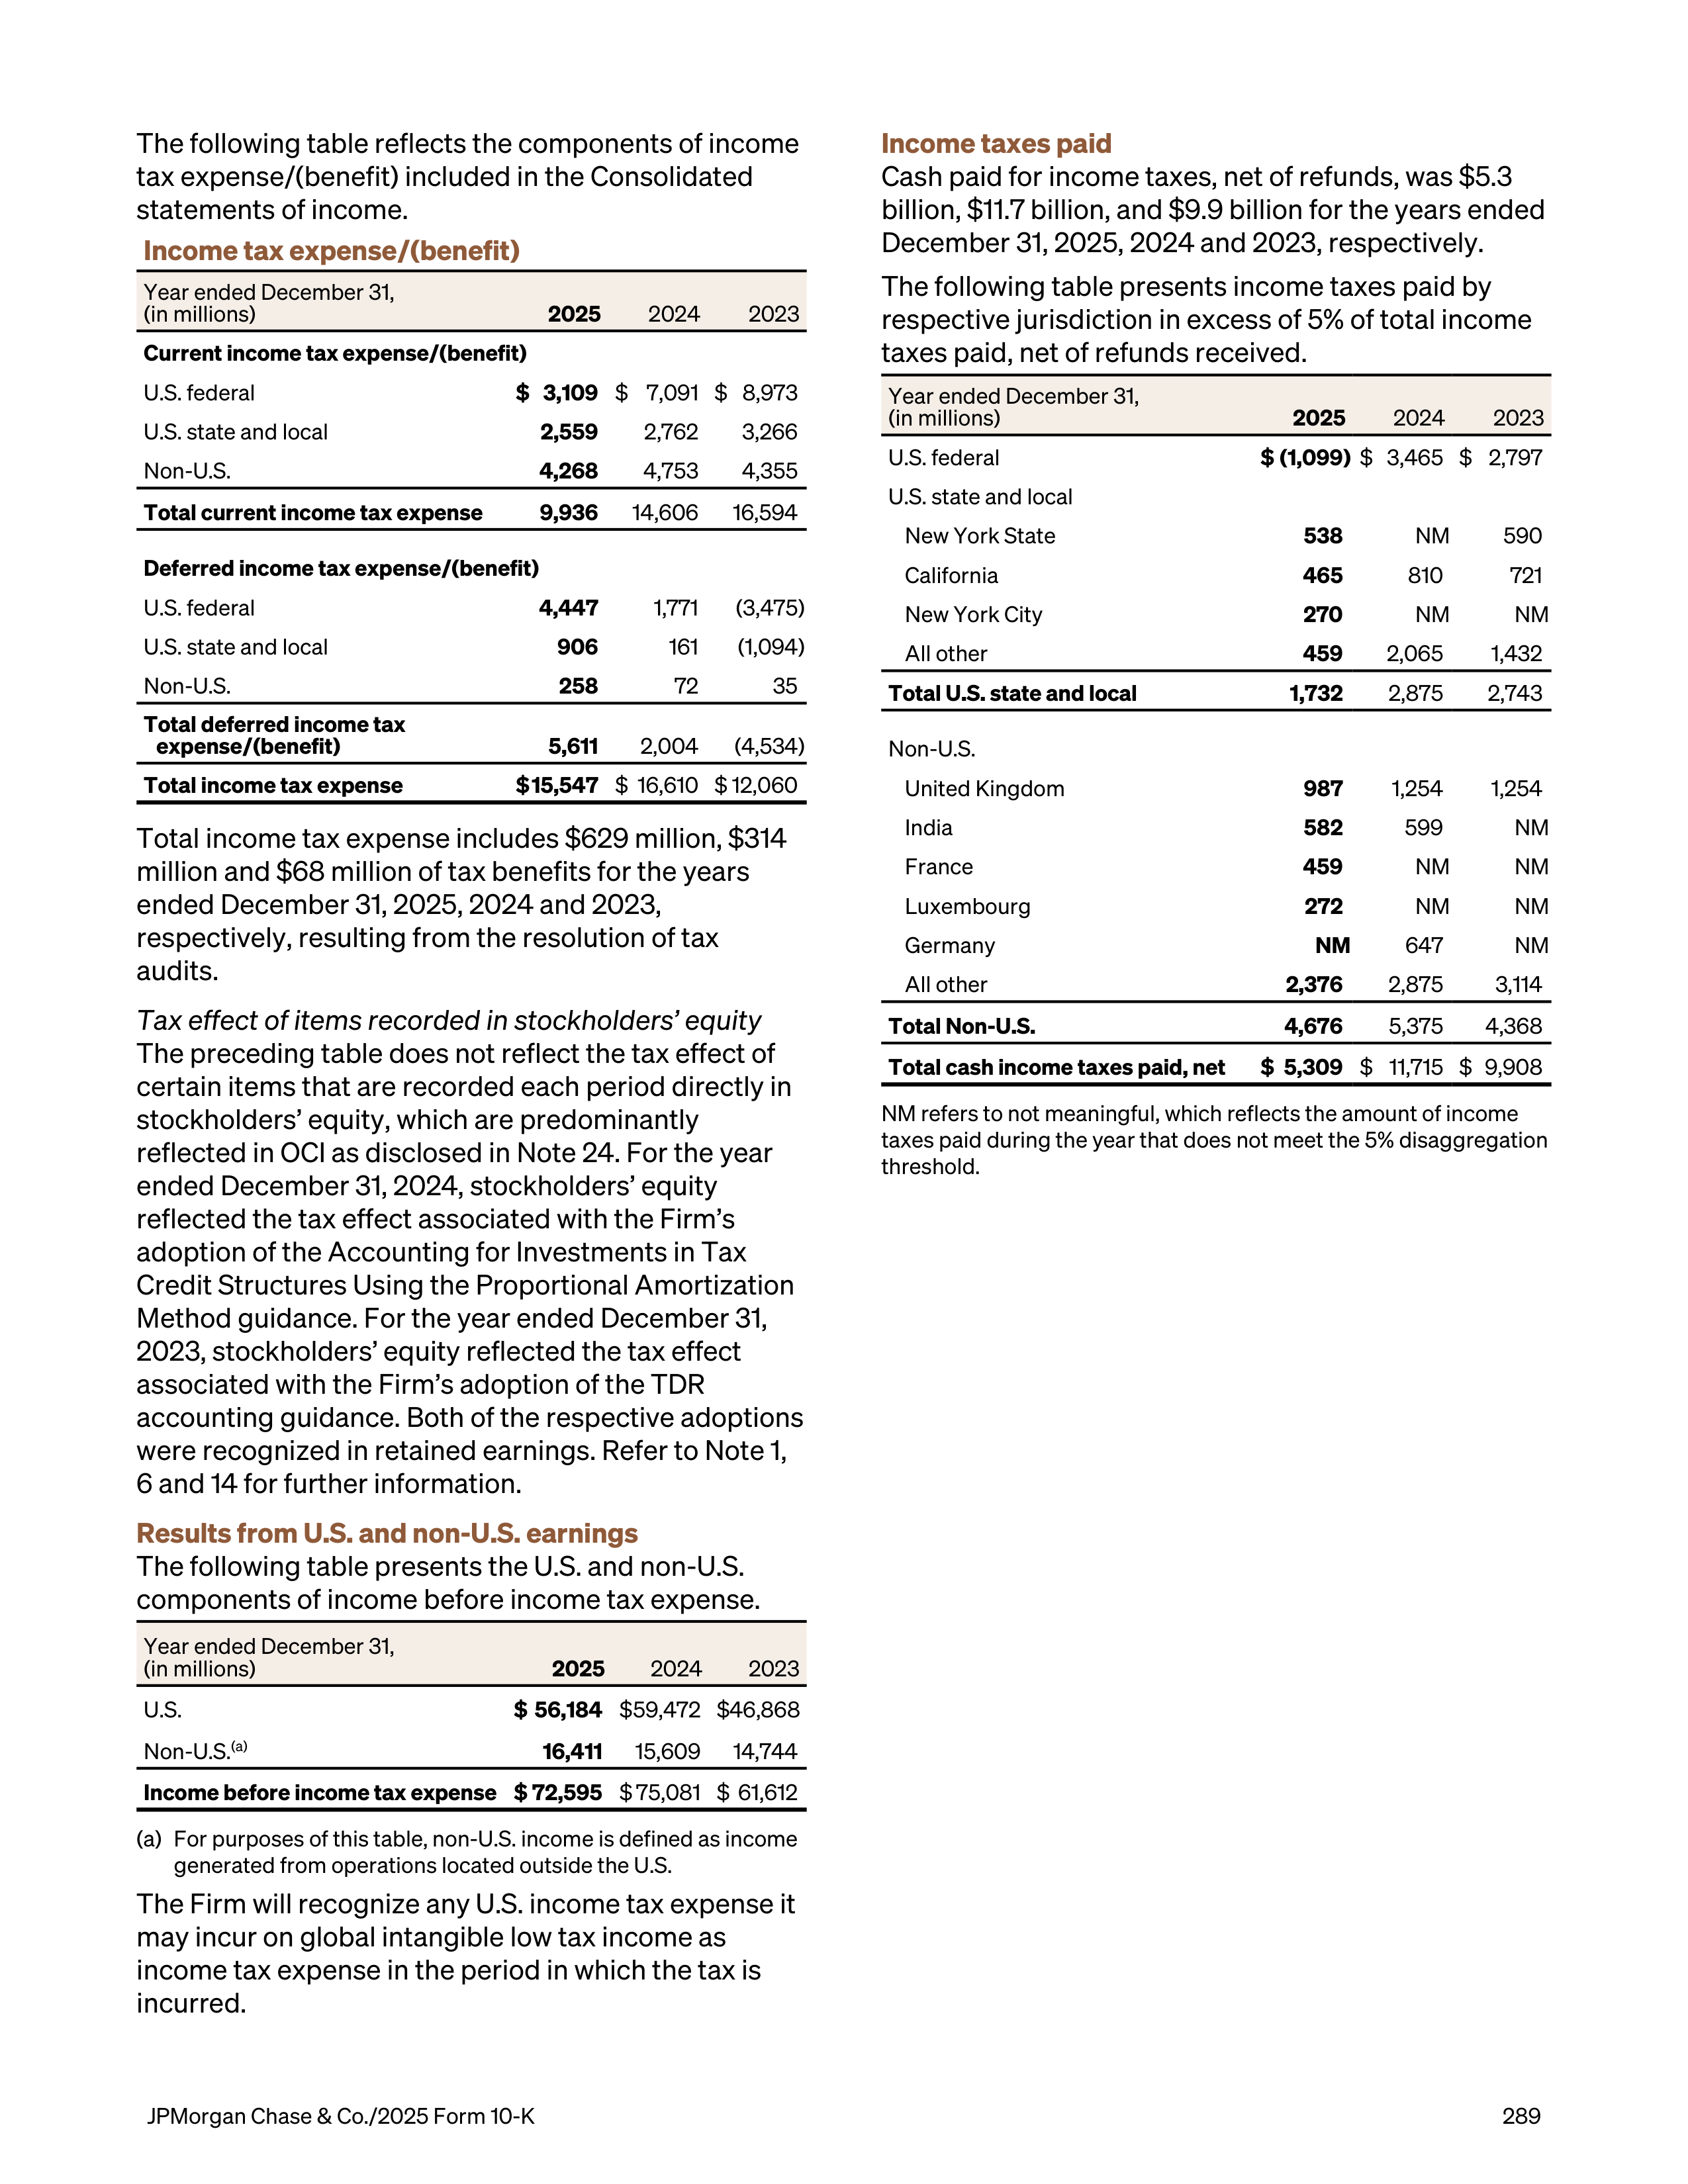
The following table reflects the components of income
tax expense/(benefit) included in the Consolidated
statements of income.
Income tax expense/(benefit)
Year ended December 31,
(in millions)
2025
2024
2023
Current income tax expense/(benefit)
U.S. federal
$ 3,109
$ 7,091 $ 8,973
U.S. state and local
2,559
2,762
3,266
Non-U.S.
4,268
4,753
4,355
Total current income tax expense
9,936
14,606 16,594
Deferred income tax expense/(benefit)
U.S. federal
4,447
1,771 (3,475)
U.S. state and local
906
161
(1,094)
Non-U.S.
258
72
35
Total deferred income tax
expense/(benefit)
5,611
2,004 (4,534)
Total income tax expense
$ 15,547
$ 16,610 $ 12,060
Total income tax expense includes $629 million, $314
million and $68 million of tax benefits for the years
ended December 31, 2025, 2024 and 2023,
respectively, resulting from the resolution of tax
audits.
Tax effect of items recorded in stockholders’ equity
The preceding table does not reflect the tax effect of
certain items that are recorded each period directly in
stockholders’ equity, which are predominantly
reflected in OCI as disclosed in Note 24. For the year
ended December 31, 2024, stockholders’ equity
reflected the tax effect associated with the Firm’s
adoption of the Accounting for Investments in Tax
Credit Structures Using the Proportional Amortization
Method guidance. For the year ended December 31,
2023, stockholders’ equity reflected the tax effect
associated with the Firm’s adoption of the TDR
accounting guidance. Both of the respective adoptions
were recognized in retained earnings. Refer to Note 1,
6 and 14 for further information.
Results from U.S. and non-U.S. earnings
The following table presents the U.S. and non-U.S.
components of income before income tax expense.
Year ended December 31,
(in millions)
2025
2024
2023
U.S.
$ 56,184
$ 59,472 $ 46,868
Non-U.S.
(a)
16,411
15,609 14,744
Income before income tax expense
$ 72,595
$ 75,081 $ 61,612
(a)
For purposes of this table, non-U.S. income is defined as income
generated from operations located outside the U.S.
The Firm will recognize any U.S. income tax expense it
may incur on global intangible low tax income as
income tax expense in the period in which the tax is
incurred.
Income taxes paid
Cash paid for income taxes, net of refunds, was $5.3
billion, $11.7 billion, and $9.9 billion for the years ended
December 31, 2025, 2024 and 2023, respectively.
The following table presents income taxes paid by
respective jurisdiction in excess of 5% of total income
taxes paid, net of refunds received.
Year ended December 31,
(in millions)
2025
2024
2023
U.S. federal
$ (1,099)
$ 3,465 $ 2,797
U.S. state and local
New York State
538
NM
590
California
465
810
721
New York City
270
NM
NM
All other
459
2,065
1,432
Total U.S. state and local
1,732
2,875
2,743
Non-U.S.
United Kingdom
987
1,254
1,254
India
582
599
NM
France
459
NM
NM
Luxembourg
272
NM
NM
Germany
NM
647
NM
All other
2,376
2,875
3,114
Total Non-U.S.
4,676
5,375
4,368
Total cash income taxes paid, net
$ 5,309
$ 11,715 $ 9,908
NM refers to not meaningful, which reflects the amount of income
taxes paid during the year that does not meet the 5% disaggregation
threshold.
JPMorgan Chase & Co./2025 Form 10-K
289
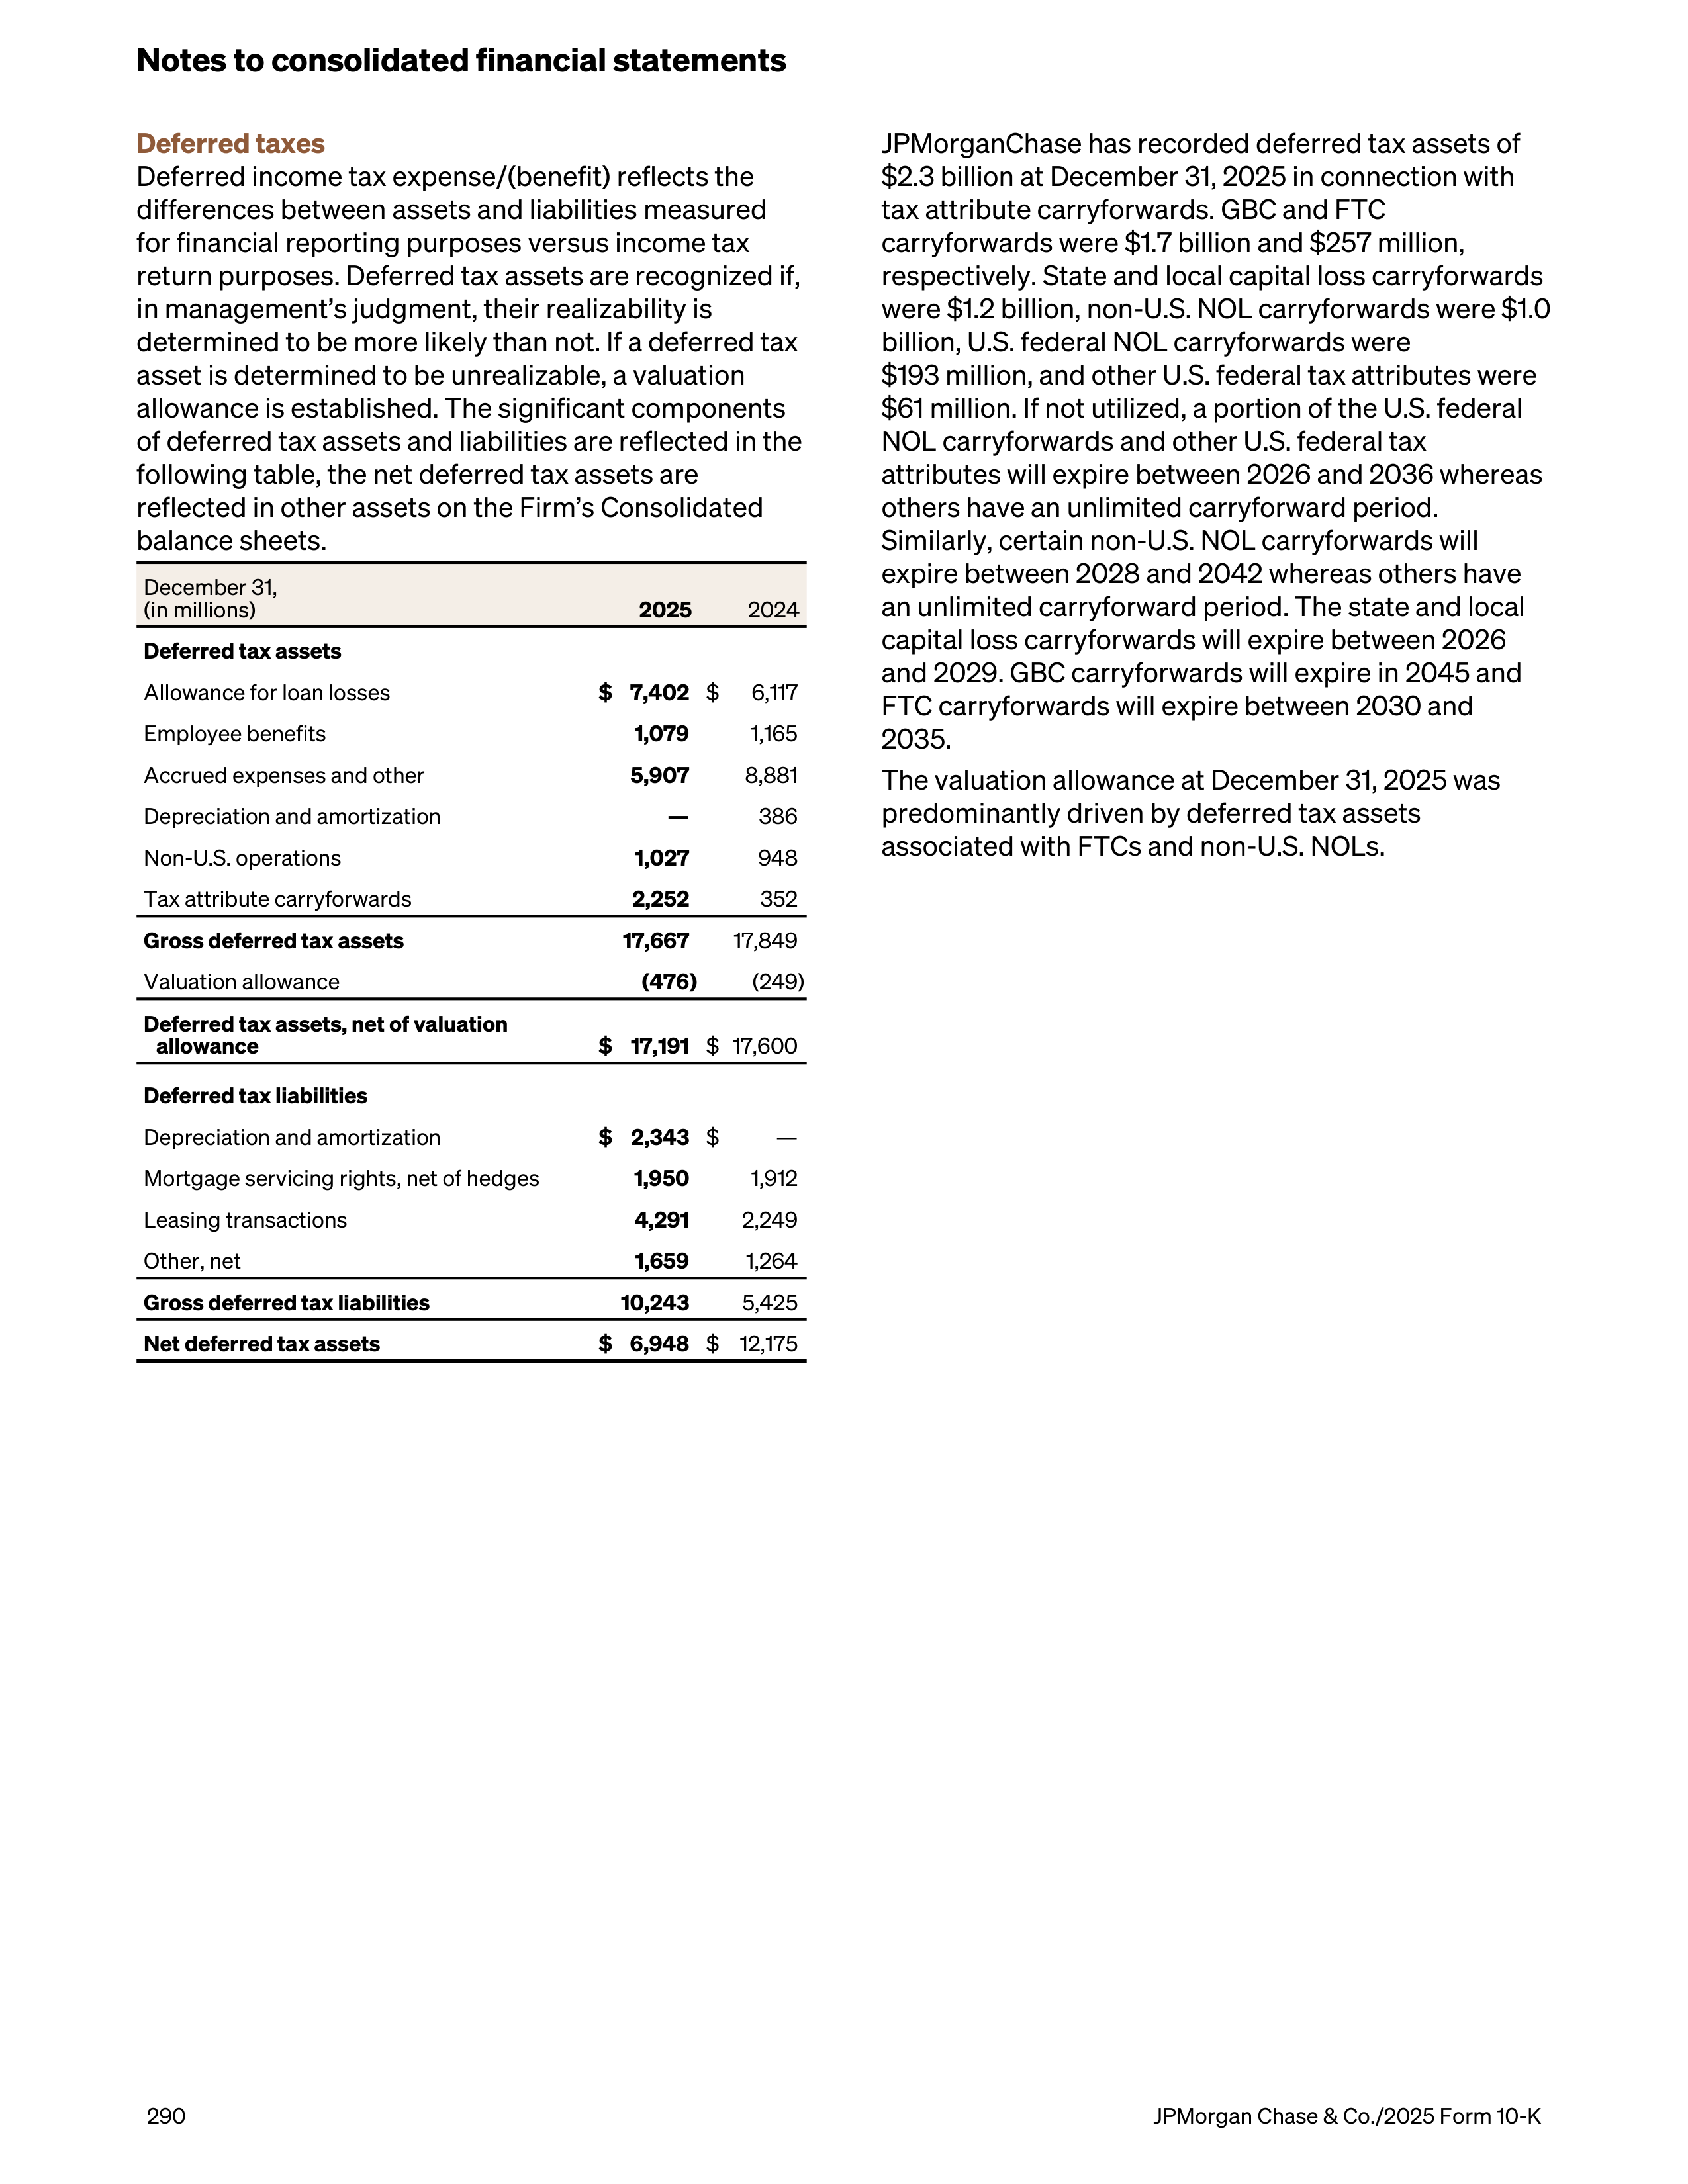
Deferred taxes
Deferred income tax expense/(benefit) reflects the
differences between assets and liabilities measured
for financial reporting purposes versus income tax
return purposes. Deferred tax assets are recognized if,
in management’s judgment, their realizability is
determined to be more likely than not. If a deferred tax
asset is determined to be unrealizable, a valuation
allowance is established. The significant components
of deferred tax assets and liabilities are reflected in the
following table, the net deferred tax assets are
reflected in other assets on the Firm’s Consolidated
balance sheets.
December 31,
(in millions)
2025
2024
Deferred tax assets
Allowance for loan losses
$ 7,402
$
6,117
Employee benefits
1,079
1,165
Accrued expenses and other
5,907
8,881
Depreciation and amortization
—
386
Non-U.S. operations
1,027
948
Tax attribute carryforwards
2,252
352
Gross deferred tax assets
17,667
17,849
Valuation allowance
(476)
(249)
Deferred tax assets, net of valuation
allowance
$ 17,191
$ 17,600
Deferred tax liabilities
Depreciation and amortization
$ 2,343
$
—
Mortgage servicing rights, net of hedges
1,950
1,912
Leasing transactions
4,291
2,249
Other, net
1,659
1,264
Gross deferred tax liabilities
10,243
5,425
Net deferred tax assets
$ 6,948
$ 12,175
JPMorganChase has recorded deferred tax assets of
$2.3 billion at December 31, 2025 in connection with
tax attribute carryforwards. GBC and FTC
carryforwards were $1.7 billion and $257 million,
respectively. State and local capital loss carryforwards
were $1.2 billion, non-U.S. NOL carryforwards were $1.0
billion, U.S. federal NOL carryforwards were
$193 million, and other U.S. federal tax attributes were
$61 million. If not utilized, a portion of the U.S. federal
NOL carryforwards and other U.S. federal tax
attributes will expire between 2026 and 2036 whereas
others have an unlimited carryforward period.
Similarly, certain non-U.S. NOL carryforwards will
expire between 2028 and 2042 whereas others have
an unlimited carryforward period. The state and local
capital loss carryforwards will expire between 2026
and 2029. GBC carryforwards will expire in 2045 and
FTC carryforwards will expire between 2030 and
2035.
The valuation allowance at December 31, 2025 was
predominantly driven by deferred tax assets
associated with FTCs and non-U.S. NOLs.
Notes to consolidated financial statements
290
JPMorgan Chase & Co./2025 Form 10-K
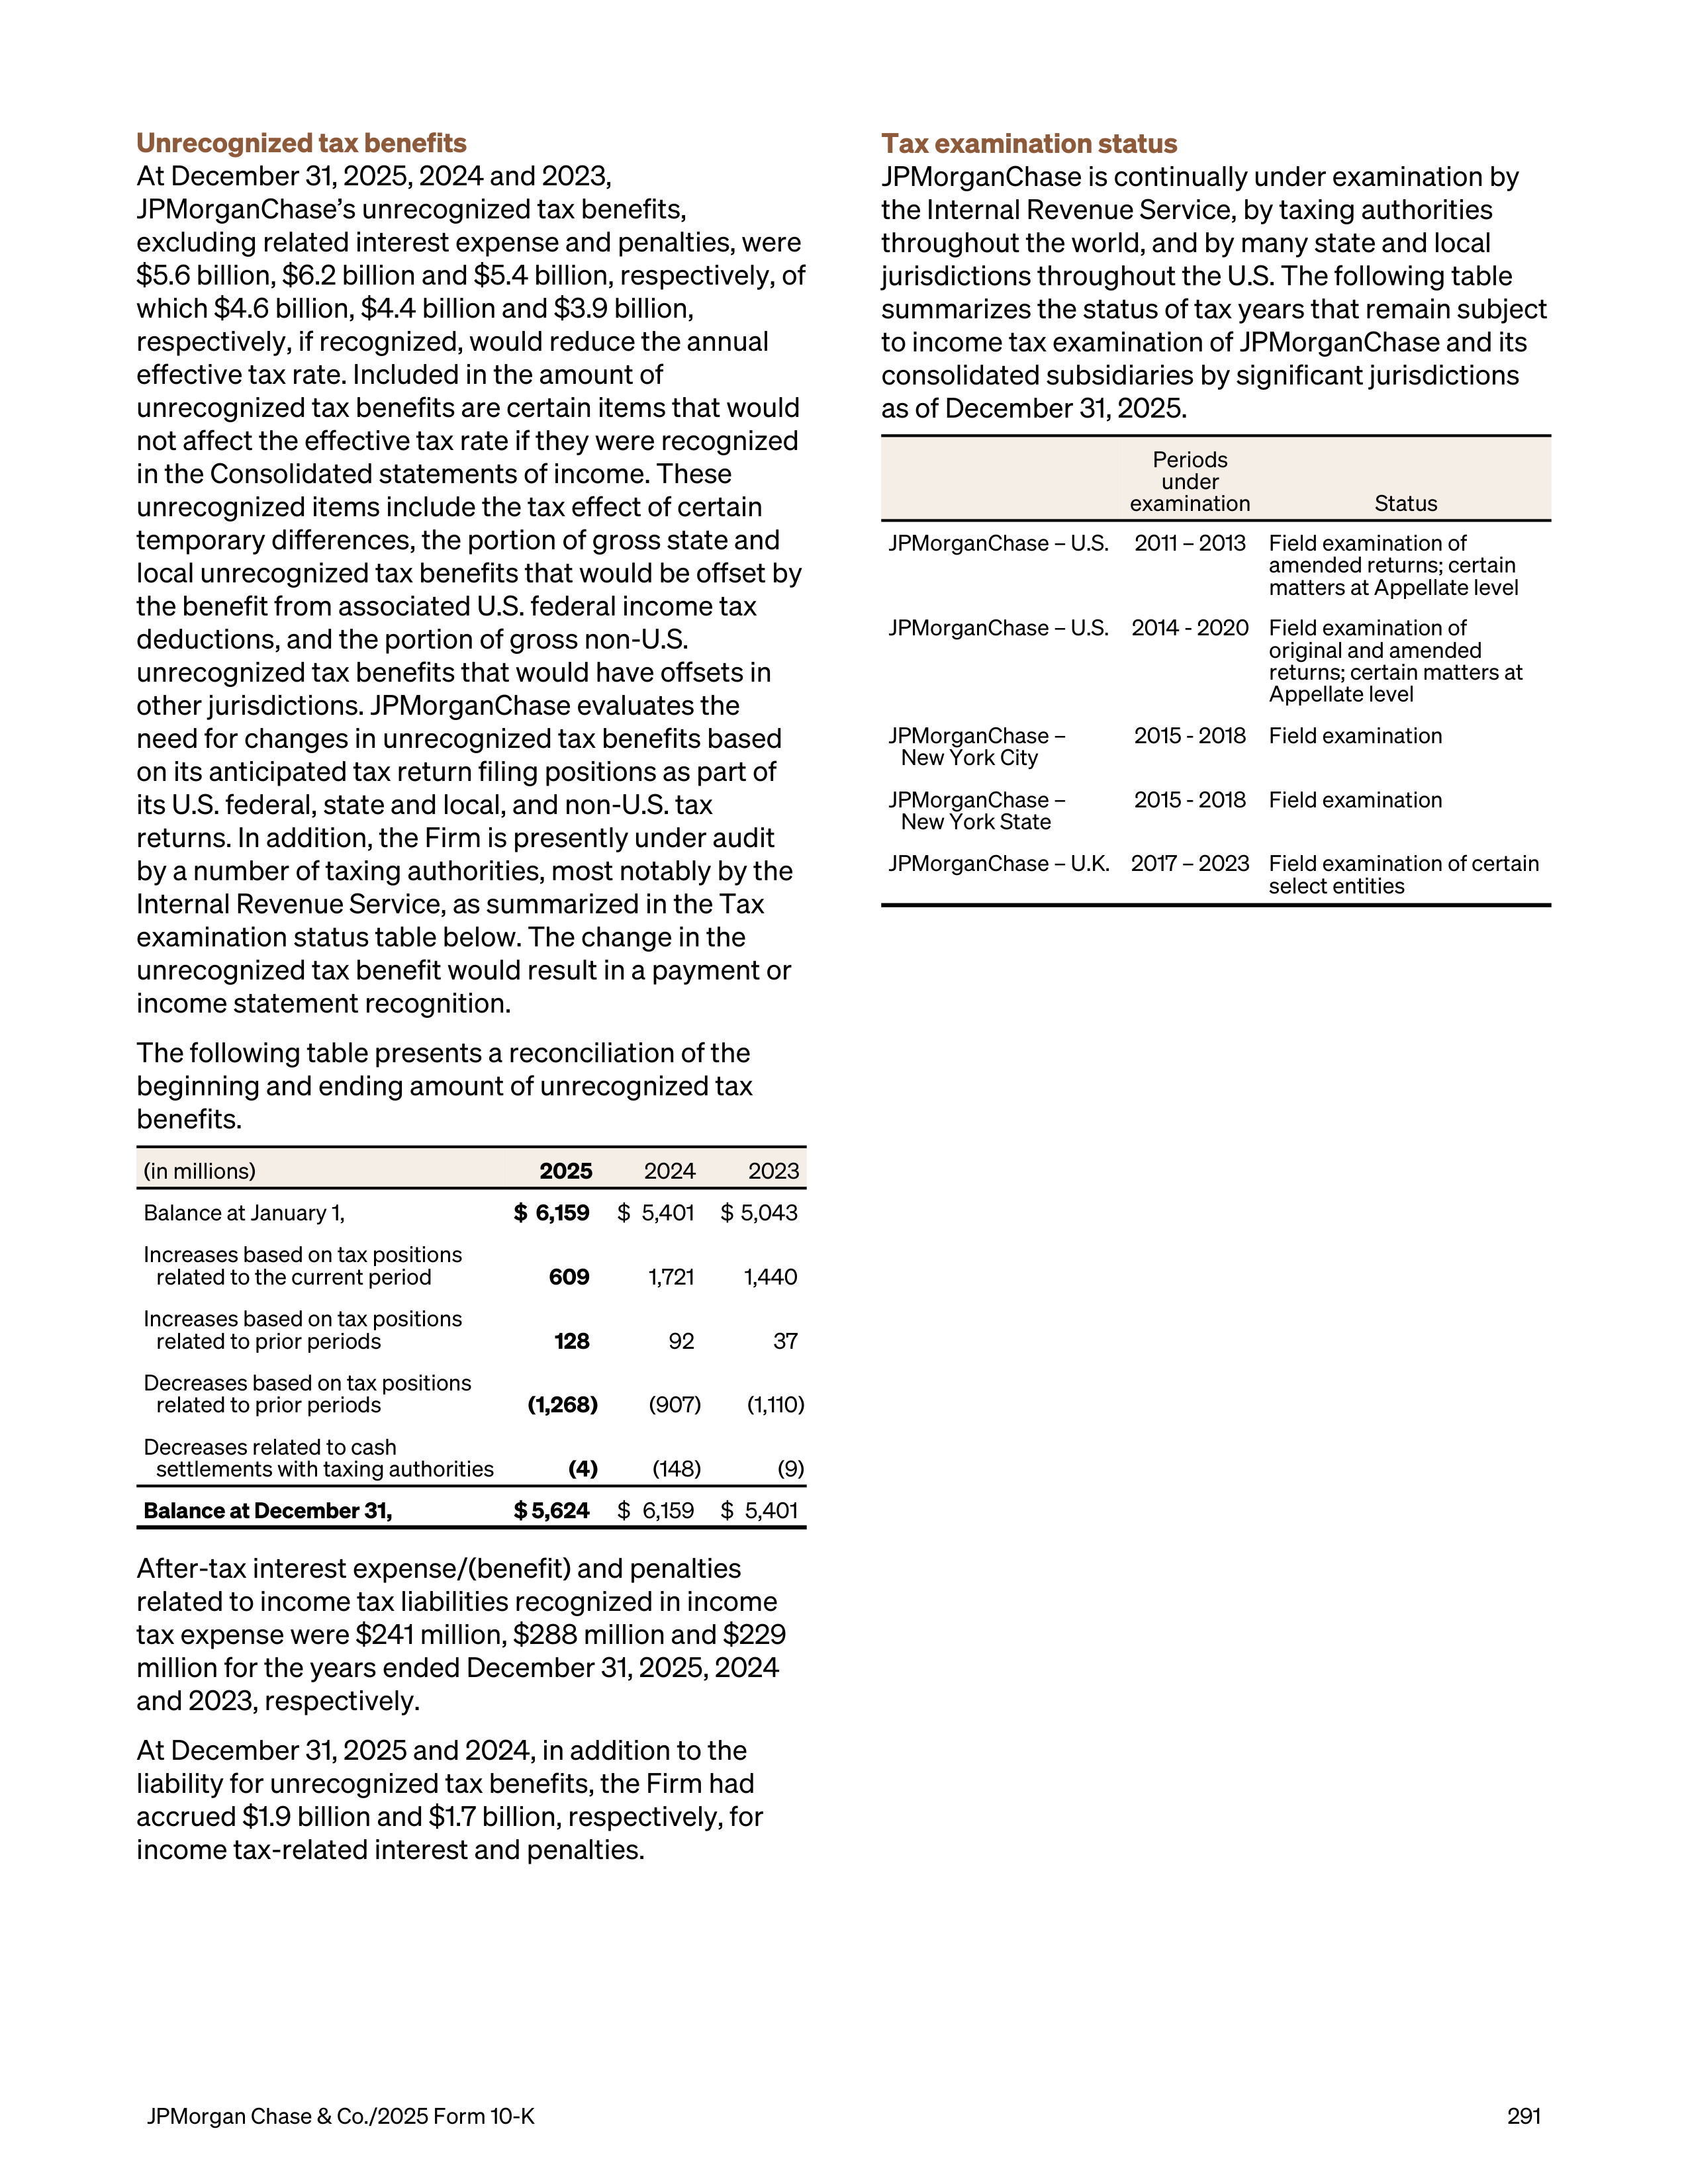
Unrecognized tax benefits
At December 31, 2025, 2024 and 2023,
JPMorganChase’s unrecognized tax benefits,
excluding related interest expense and penalties, were
$5.6 billion, $6.2 billion and $5.4 billion, respectively, of
which $4.6 billion, $4.4 billion and $3.9 billion,
respectively, if recognized, would reduce the annual
effective tax rate. Included in the amount of
unrecognized tax benefits are certain items that would
not affect the effective tax rate if they were recognized
in the Consolidated statements of income. These
unrecognized items include the tax effect of certain
temporary differences, the portion of gross state and
local unrecognized tax benefits that would be offset by
the benefit from associated U.S. federal income tax
deductions, and the portion of gross non-U.S.
unrecognized tax benefits that would have offsets in
other jurisdictions. JPMorganChase evaluates the
need for changes in unrecognized tax benefits based
on its anticipated tax return filing positions as part of
its U.S. federal, state and local, and non-U.S. tax
returns. In addition, the Firm is presently under audit
by a number of taxing authorities, most notably by the
Internal Revenue Service, as summarized in the Tax
examination status table below. The change in the
unrecognized tax benefit would result in a payment or
income statement recognition.
The following table presents a reconciliation of the
beginning and ending amount of unrecognized tax
benefits.
(in millions)
2025
2024
2023
Balance at January 1,
$ 6,159
$ 5,401
$ 5,043
Increases based on tax positions
related to the current period
609
1,721
1,440
Increases based on tax positions
related to prior periods
128
92
37
Decreases based on tax positions
related to prior periods
(1,268)
(907)
(1,110)
Decreases related to cash
settlements with taxing authorities
(4)
(148)
(9)
Balance at December 31,
$ 5,624
$ 6,159
$ 5,401
After-tax interest expense/(benefit) and penalties
related to income tax liabilities recognized in income
tax expense were $241 million, $288 million and $229
million for the years ended December 31, 2025, 2024
and 2023, respectively.
At December 31, 2025 and 2024, in addition to the
liability for unrecognized tax benefits, the Firm had
accrued $1.9 billion and $1.7 billion, respectively, for
income tax-related interest and penaltie
s.
Tax examination status
JPMorganChase is continually under examination by
the Internal Revenue Service, by taxing authorities
throughout the world, and by many state and local
jurisdictions throughout the U.S. The following table
summarizes the status of tax years that remain subject
to income tax examination of JPMorganChase and its
consolidated subsidiaries by significant jurisdictions
as of December 31, 2025.
Periods
under
examination
Status
JPMorganChase – U.S.
2011 – 2013
Field examination of
amended returns; certain
matters at Appellate level
JPMorganChase – U.S.
2014 - 2020
Field examination of
original and amended
returns; certain matters at
Appellate level
JPMorganChase –
New York City
2015 - 2018
Field examination
JPMorganChase –
New York State
2015 - 2018
Field examination
JPMorganChase – U.K.
2017 – 2023
Field examination of certain
select entities
JPMorgan Chase & Co./2025 Form 10-K
291
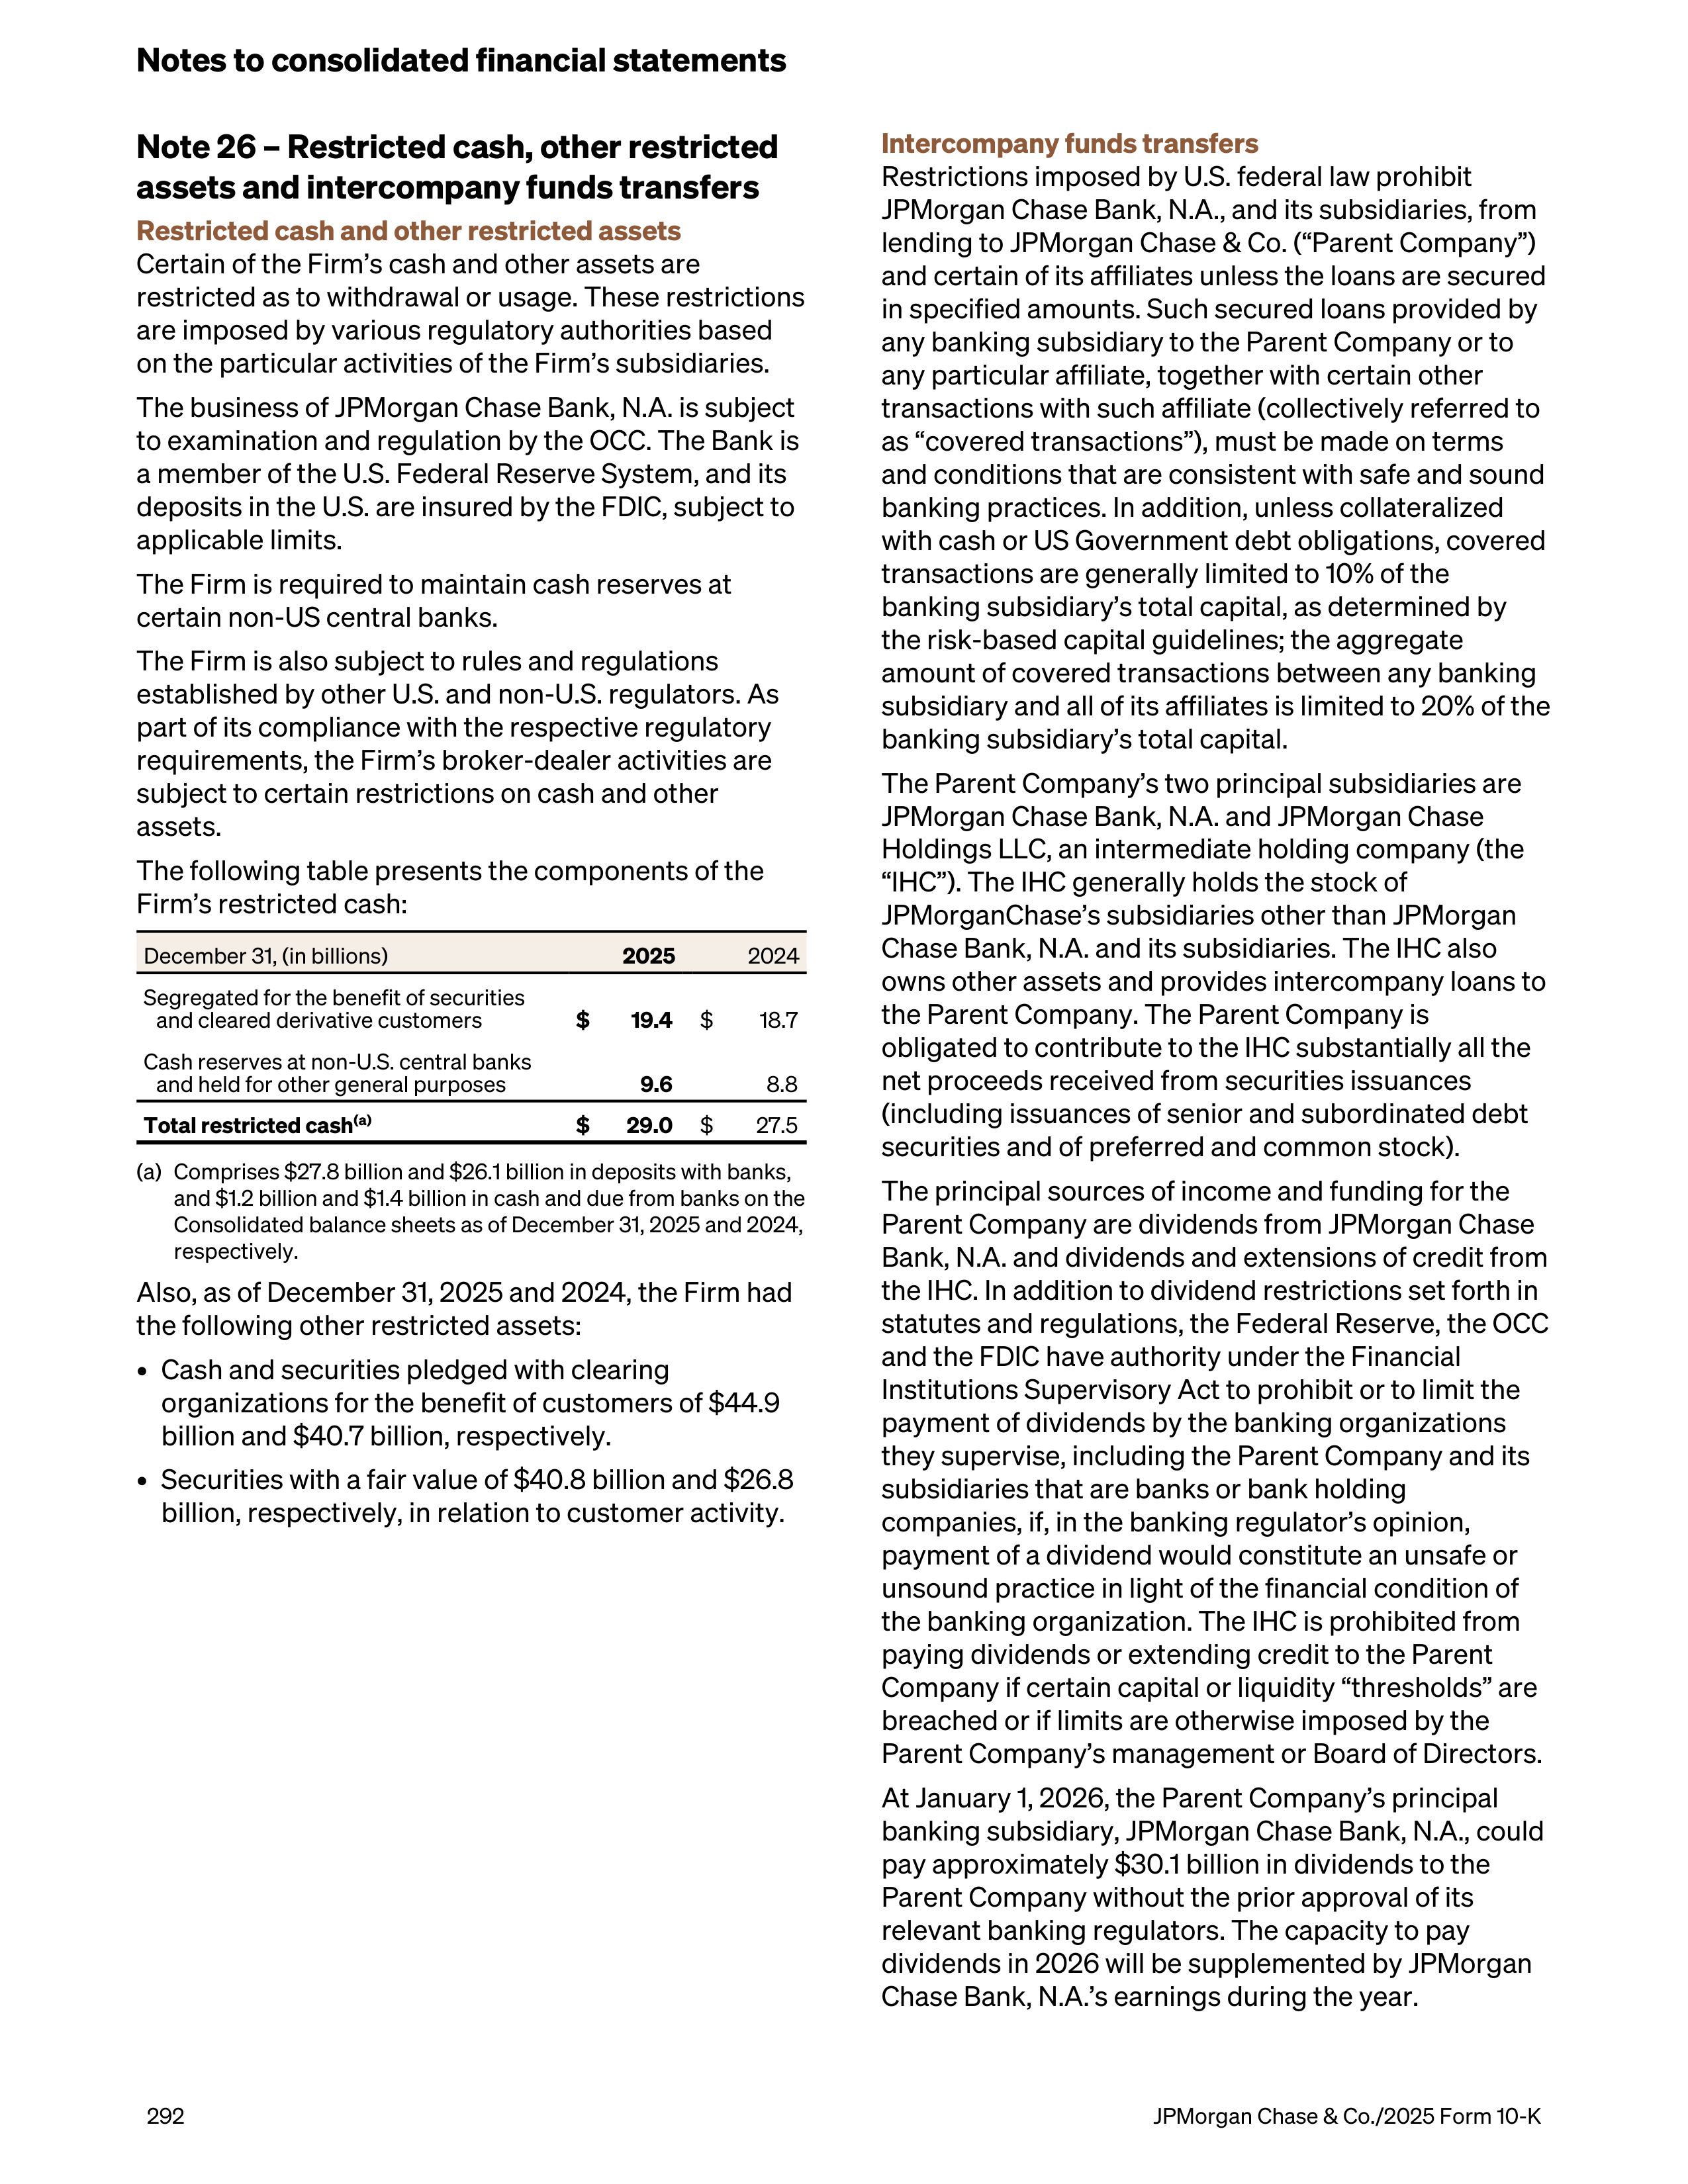
Note 26 – Restricted cash, other restricted
assets and intercompany funds transfers
Restricted cash and other restricted assets
Certain of the Firm’s cash and other assets are
restricted as to withdrawal or usage. These restrictions
are imposed by various regulatory authorities based
on the particular activities of the Firm’s subsidiaries.
The business of JPMorgan Chase Bank, N.A. is subject
to examination and regulation by the OCC. The Bank is
a member of the U.S. Federal Reserve System, and its
deposits in the U.S. are insured by the FDIC, subject to
applicable limits.
The Firm is required to maintain cash reserves at
certain non-US central banks.
The Firm is also subject to rules and regulations
established by other U.S. and non-U.S. regulators. As
part of its compliance with the respective regulatory
requirements, the Firm’s broker-dealer activities are
subject to certain restrictions on cash and other
assets.
The following table presents the components of the
Firm’s restricted cash:
December 31, (in billions)
2025
2024
Segregated for the benefit of securities
and cleared derivative customers
$
19.4
$
18.7
Cash reserves at non-U.S. central banks
and held for other general purposes
9.6
8.8
Total restricted cash
(a)
$
29.0
$
27.5
(a)
Comprises $27.8 billion and $26.1 billion in deposits with banks,
and $1.2 billion and $1.4 billion in cash and due from banks on the
Consolidated balance sheets as of December 31, 2025 and 2024,
respectively.
Also, as of December 31, 2025 and 2024, the Firm had
the following other restricted assets:
•
Cash and securities pledged with clearing
organizations for the benefit of customers of $44.9
billion and $40.7 billion, respectively.
•
Securities with a fair value of $40.8 billion and $26.8
billion, respectively, in relation to customer activity.
Intercompany funds transfers
Restrictions imposed by U.S. federal law prohibit
JPMorgan Chase Bank, N.A., and its subsidiaries, from
lending to JPMorgan Chase & Co. (“Parent Company”)
and certain of its affiliates unless the loans are secured
in specified amounts. Such secured loans provided by
any banking subsidiary to the Parent Company or to
any particular affiliate, together with certain other
transactions with such affiliate (collectively referred to
as “covered transactions”), must be made on terms
and conditions that are consistent with safe and sound
banking practices. In addition, unless collateralized
with cash or US Government debt obligations, covered
transactions are generally limited to 10% of the
banking subsidiary’s total capital, as determined by
the risk-based capital guidelines; the aggregate
amount of covered transactions between any banking
subsidiary and all of its affiliates is limited to 20% of the
banking subsidiary’s total capital.
The Parent Company’s two principal subsidiaries are
JPMorgan Chase Bank, N.A. and JPMorgan Chase
Holdings LLC, an intermediate holding company (the
“IHC”). The IHC generally holds the stock of
JPMorganChase’s subsidiaries other than JPMorgan
Chase Bank, N.A. and its subsidiaries. The IHC also
owns other assets and provides intercompany loans to
the Parent Company. The Parent Company is
obligated to contribute to the IHC substantially all the
net proceeds received from securities issuances
(including issuances of senior and subordinated debt
securities and of preferred and common stock).
The principal sources of income and funding for the
Parent Company are dividends from JPMorgan Chase
Bank, N.A. and dividends and extensions of credit from
the IHC. In addition to dividend restrictions set forth in
statutes and regulations, the Federal Reserve, the OCC
and the FDIC have authority under the Financial
Institutions Supervisory Act to prohibit or to limit the
payment of dividends by the banking organizations
they supervise, including the Parent Company and its
subsidiaries that are banks or bank holding
companies, if, in the banking regulator’s opinion,
payment of a dividend would constitute an unsafe or
unsound practice in light of the financial condition of
the banking organization. The IHC is prohibited from
paying dividends or extending credit to the Parent
Company if certain capital or liquidity “thresholds” are
breached or if limits are otherwise imposed by the
Parent Company’s management or Board of Directors.
At January 1, 2026, the Parent Company’s principal
banking subsidiary, JPMorgan Chase Bank, N.A., could
pay approximately $30.1 billion in dividends to the
Parent Company without the prior approval of its
relevant banking regulators. The capacity to pay
dividends in 2026 will be supplemented by JPMorgan
Chase Bank, N.A.’s earnings during the year.
Notes to consolidated financial statements
292
JPMorgan Chase & Co./2025 Form 10-K
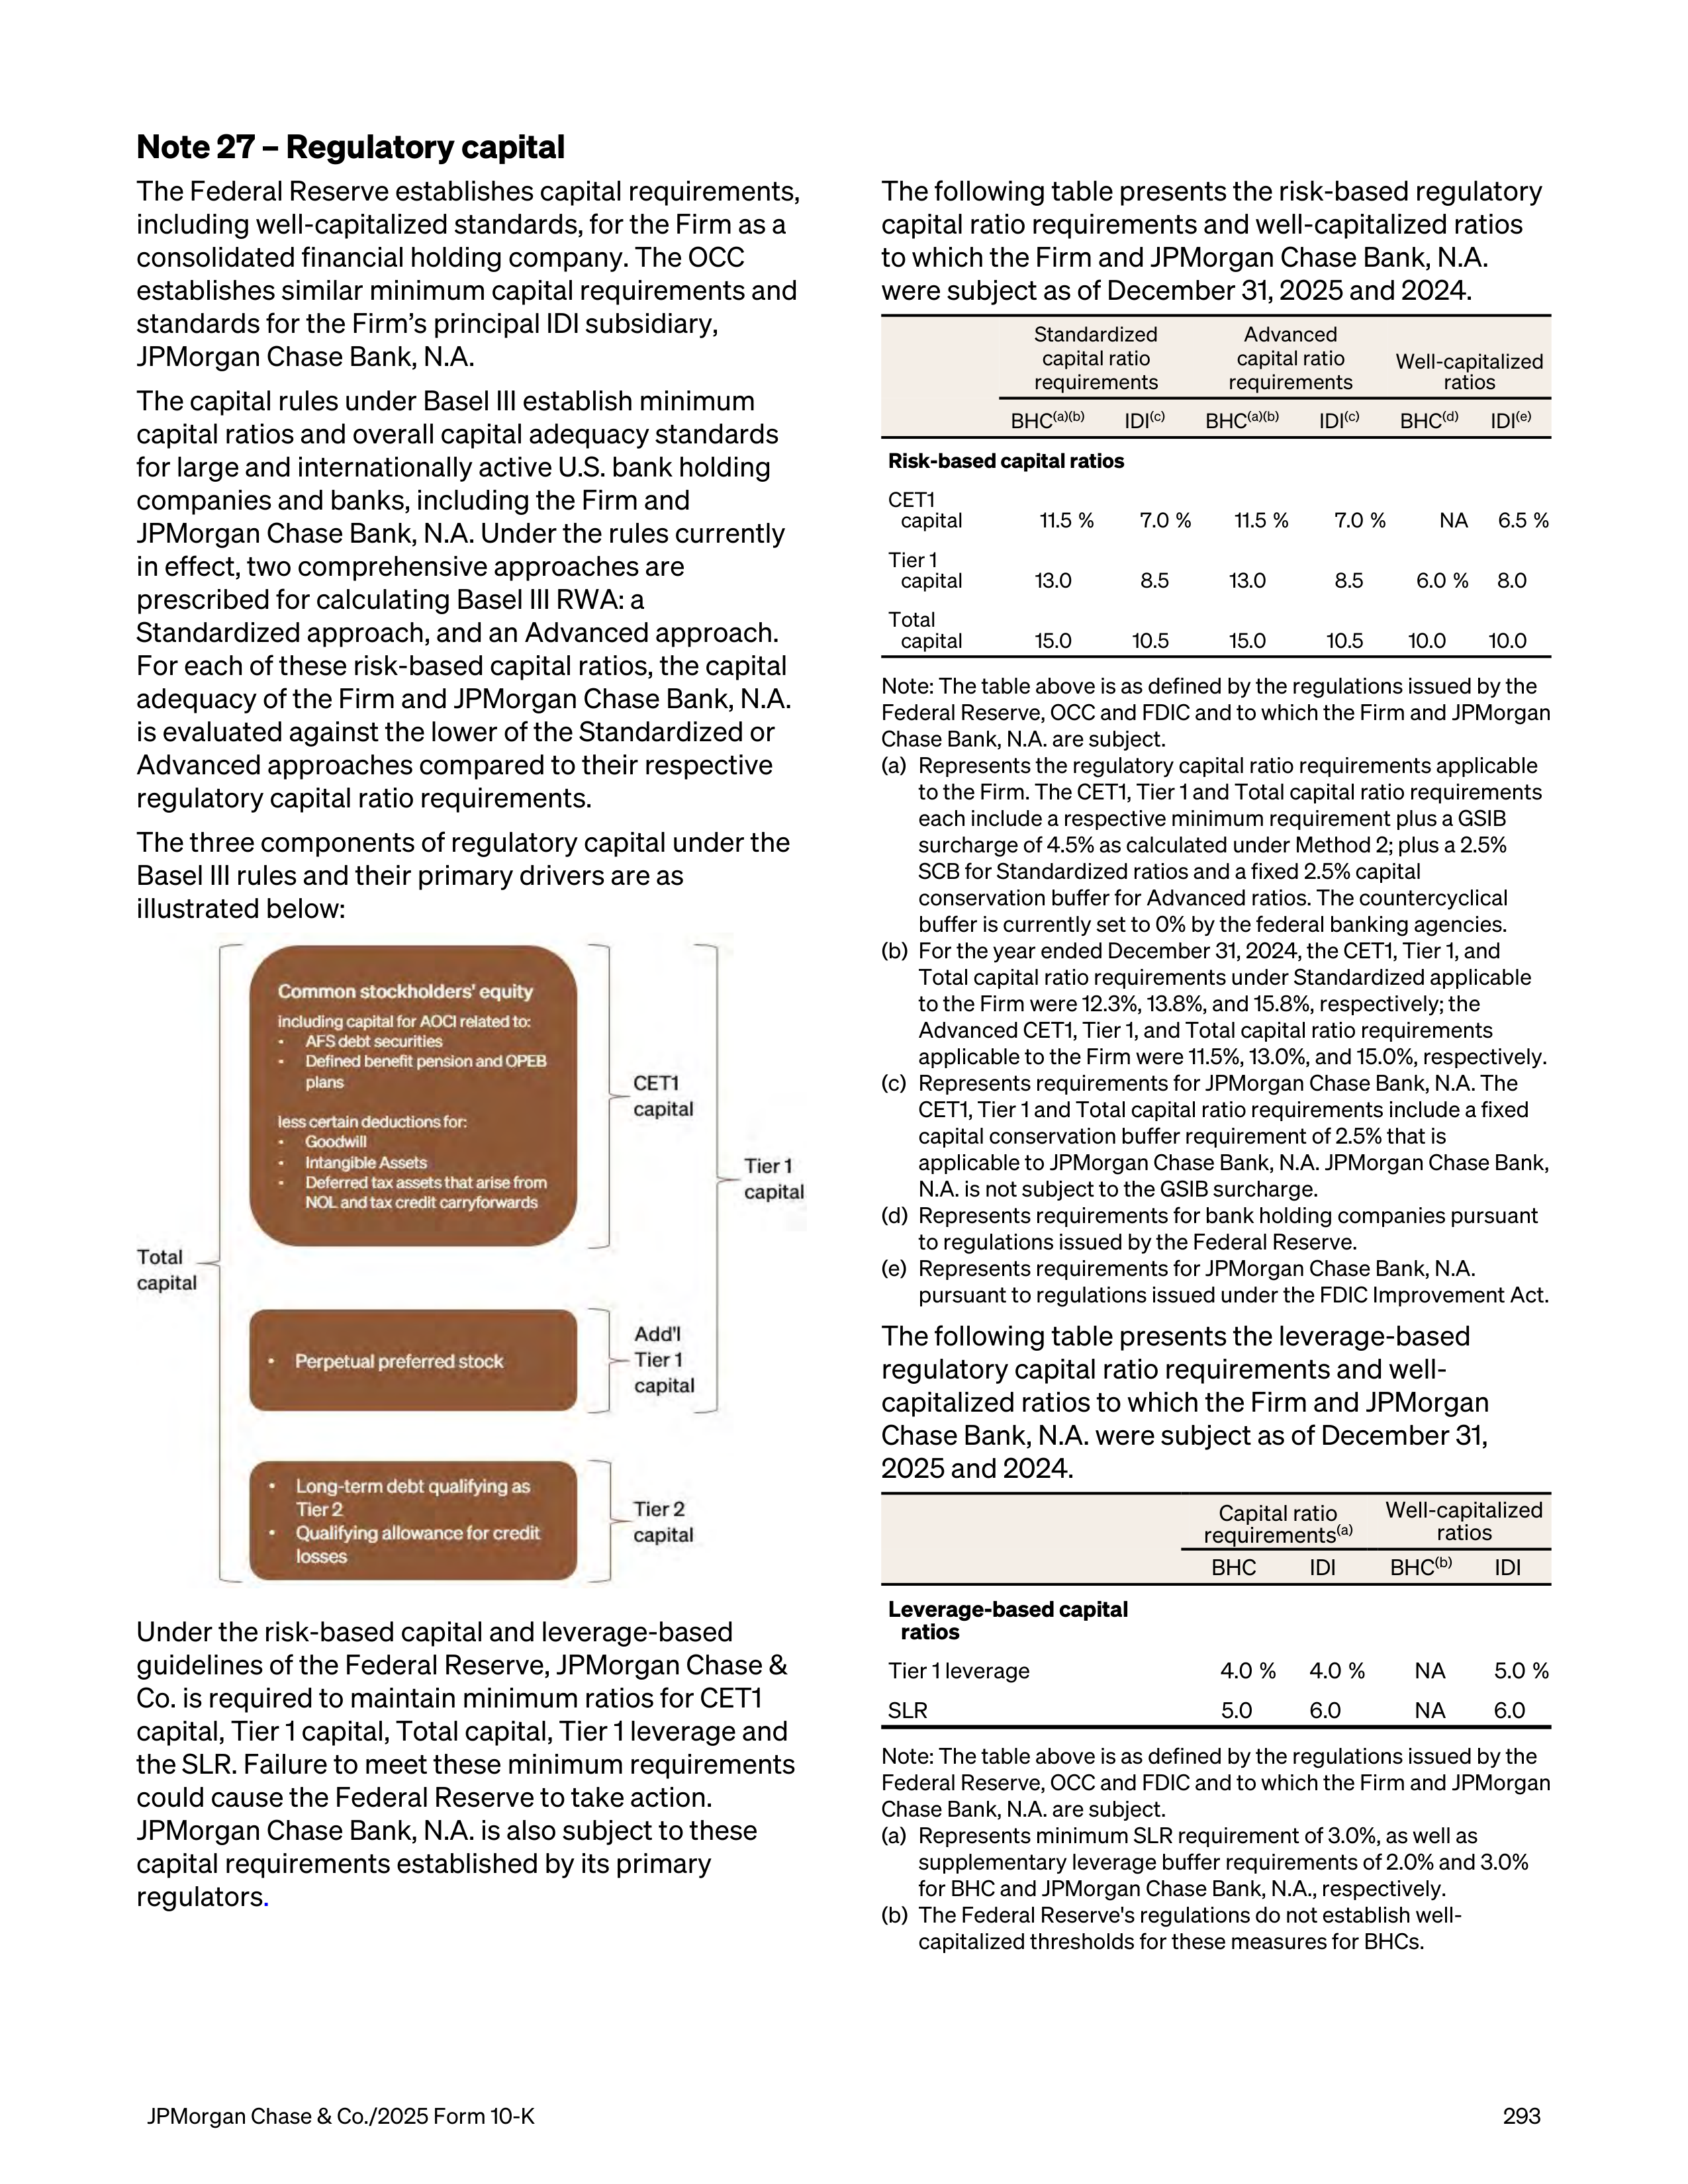
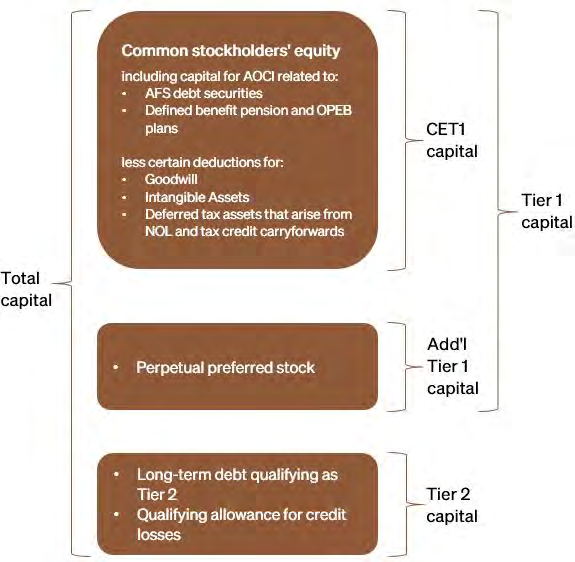
Note 27 – Regulatory capital
The Federal Reserve establishes capital requirements,
including well-capitalized standards, for the Firm as a
consolidated financial holding company. The OCC
establishes similar minimum capital requirements and
standards for the Firm’s principal IDI subsidiary,
JPMorgan Chase Bank, N.A.
The capital rules under Basel III establish minimum
capital ratios and overall capital adequacy standards
for large and internationally active U.S. bank holding
companies and banks, including the Firm and
JPMorgan Chase Bank, N.A. Under the rules currently
in effect, two comprehensive approaches are
prescribed for calculating Basel III RWA: a
Standardized approach, and an Advanced approach.
For each of these risk-based capital ratios, the capital
adequacy of the Firm and JPMorgan Chase Bank, N.A.
is evaluated against the lower of the Standardized or
Advanced approaches compared to their respective
regulatory capital ratio requirements.
The three components of regulatory capital under the
Basel III rules and their primary drivers are as
illustrated below:
Under the risk-based capital and leverage-based
guidelines of the Federal Reserve, JPMorgan Chase &
Co. is required to maintain minimum ratios for CET1
capital, Tier 1 capital, Total capital, Tier 1 leverage and
the SLR. Failure to meet these minimum requirements
could cause the Federal Reserve to take action.
JPMorgan Chase Bank, N.A. is also subject to these
capital requirements established by its primary
regulators
.
The following table presents the risk-based regulatory
capital ratio requirements and well-capitalized ratios
to which the Firm and JPMorgan Chase Bank, N.A.
were subject as of December 31, 2025 and 2024.
Standardized
capital ratio
requirements
Advanced
capital ratio
requirements
Well-capitalized
ratios
BHC
(a)(b)
IDI
(c)
BHC
(a)(b)
IDI
(c)
BHC
(d)
IDI
(e)
Risk-based capital ratios
CET1
capital
11.5 %
7.0 %
11.5 %
7.0 %
NA
6.5 %
Tier 1
capital
13.0
8.5
13.0
8.5
6.0 %
8.0
Total
capital
15.0
10.5
15.0
10.5
10.0
10.0
Note: The table above is as defined by the regulations issued by the
Federal Reserve, OCC and FDIC and to which the Firm and JPMorgan
Chase Bank, N.A. are subject.
(a)
Represents the regulatory capital ratio requirements applicable
to the Firm. The CET1, Tier 1 and Total capital ratio requirements
each include a respective minimum requirement plus a GSIB
surcharge of 4.5% as calculated under Method 2; plus a 2.5%
SCB for Standardized ratios and a fixed 2.5% capital
conservation buffer for Advanced ratios. The countercyclical
buffer is currently set to 0% by the federal banking agencies.
(b)
For the year ended December 31, 2024, the CET1, Tier 1, and
Total capital ratio requirements under Standardized applicable
to the Firm were 12.3%, 13.8%, and 15.8%, respectively; the
Advanced CET1, Tier 1, and Total capital ratio requirements
applicable to the Firm were 11.5%, 13.0%, and 15.0%, respectively.
(c)
Represents requirements for JPMorgan Chase Bank, N.A. The
CET1, Tier 1 and Total capital ratio requirements include a fixed
capital conservation buffer requirement of 2.5% that is
applicable to JPMorgan Chase Bank, N.A. JPMorgan Chase Bank,
N.A. is not subject to the GSIB surcharge.
(d)
Represents requirements for bank holding companies pursuant
to regulations issued by the Federal Reserve.
(e)
Represents requirements for JPMorgan Chase Bank, N.A.
pursuant to regulations issued under the FDIC Improvement Act.
The following table presents the leverage-based
regulatory capital ratio requirements and well-
capitalized ratios to which the Firm and JPMorgan
Chase Bank, N.A. were subject as of December 31,
2025 and 2024.
Capital ratio
requirements
(a)
Well-capitalized
ratios
BHC
IDI
BHC
(b)
IDI
Leverage-based capital
ratios
Tier 1 leverage
4.0 %
4.0 %
NA
5.0 %
SLR
5.0
6.0
NA
6.0
Note: The table above is as defined by the regulations issued by the
Federal Reserve, OCC and FDIC and to which the Firm and JPMorgan
Chase Bank, N.A. are subject.
(a)
Represents minimum SLR requirement of 3.0%, as well as
supplementary leverage buffer requirements of 2.0% and 3.0%
for BHC and JPMorgan Chase Bank, N.A., respectively.
(b)
The Federal Reserve's regulations do not establish well-
capitalized thresholds for these measures for BHCs.
JPMorgan Chase & Co./2025 Form 10-K
293
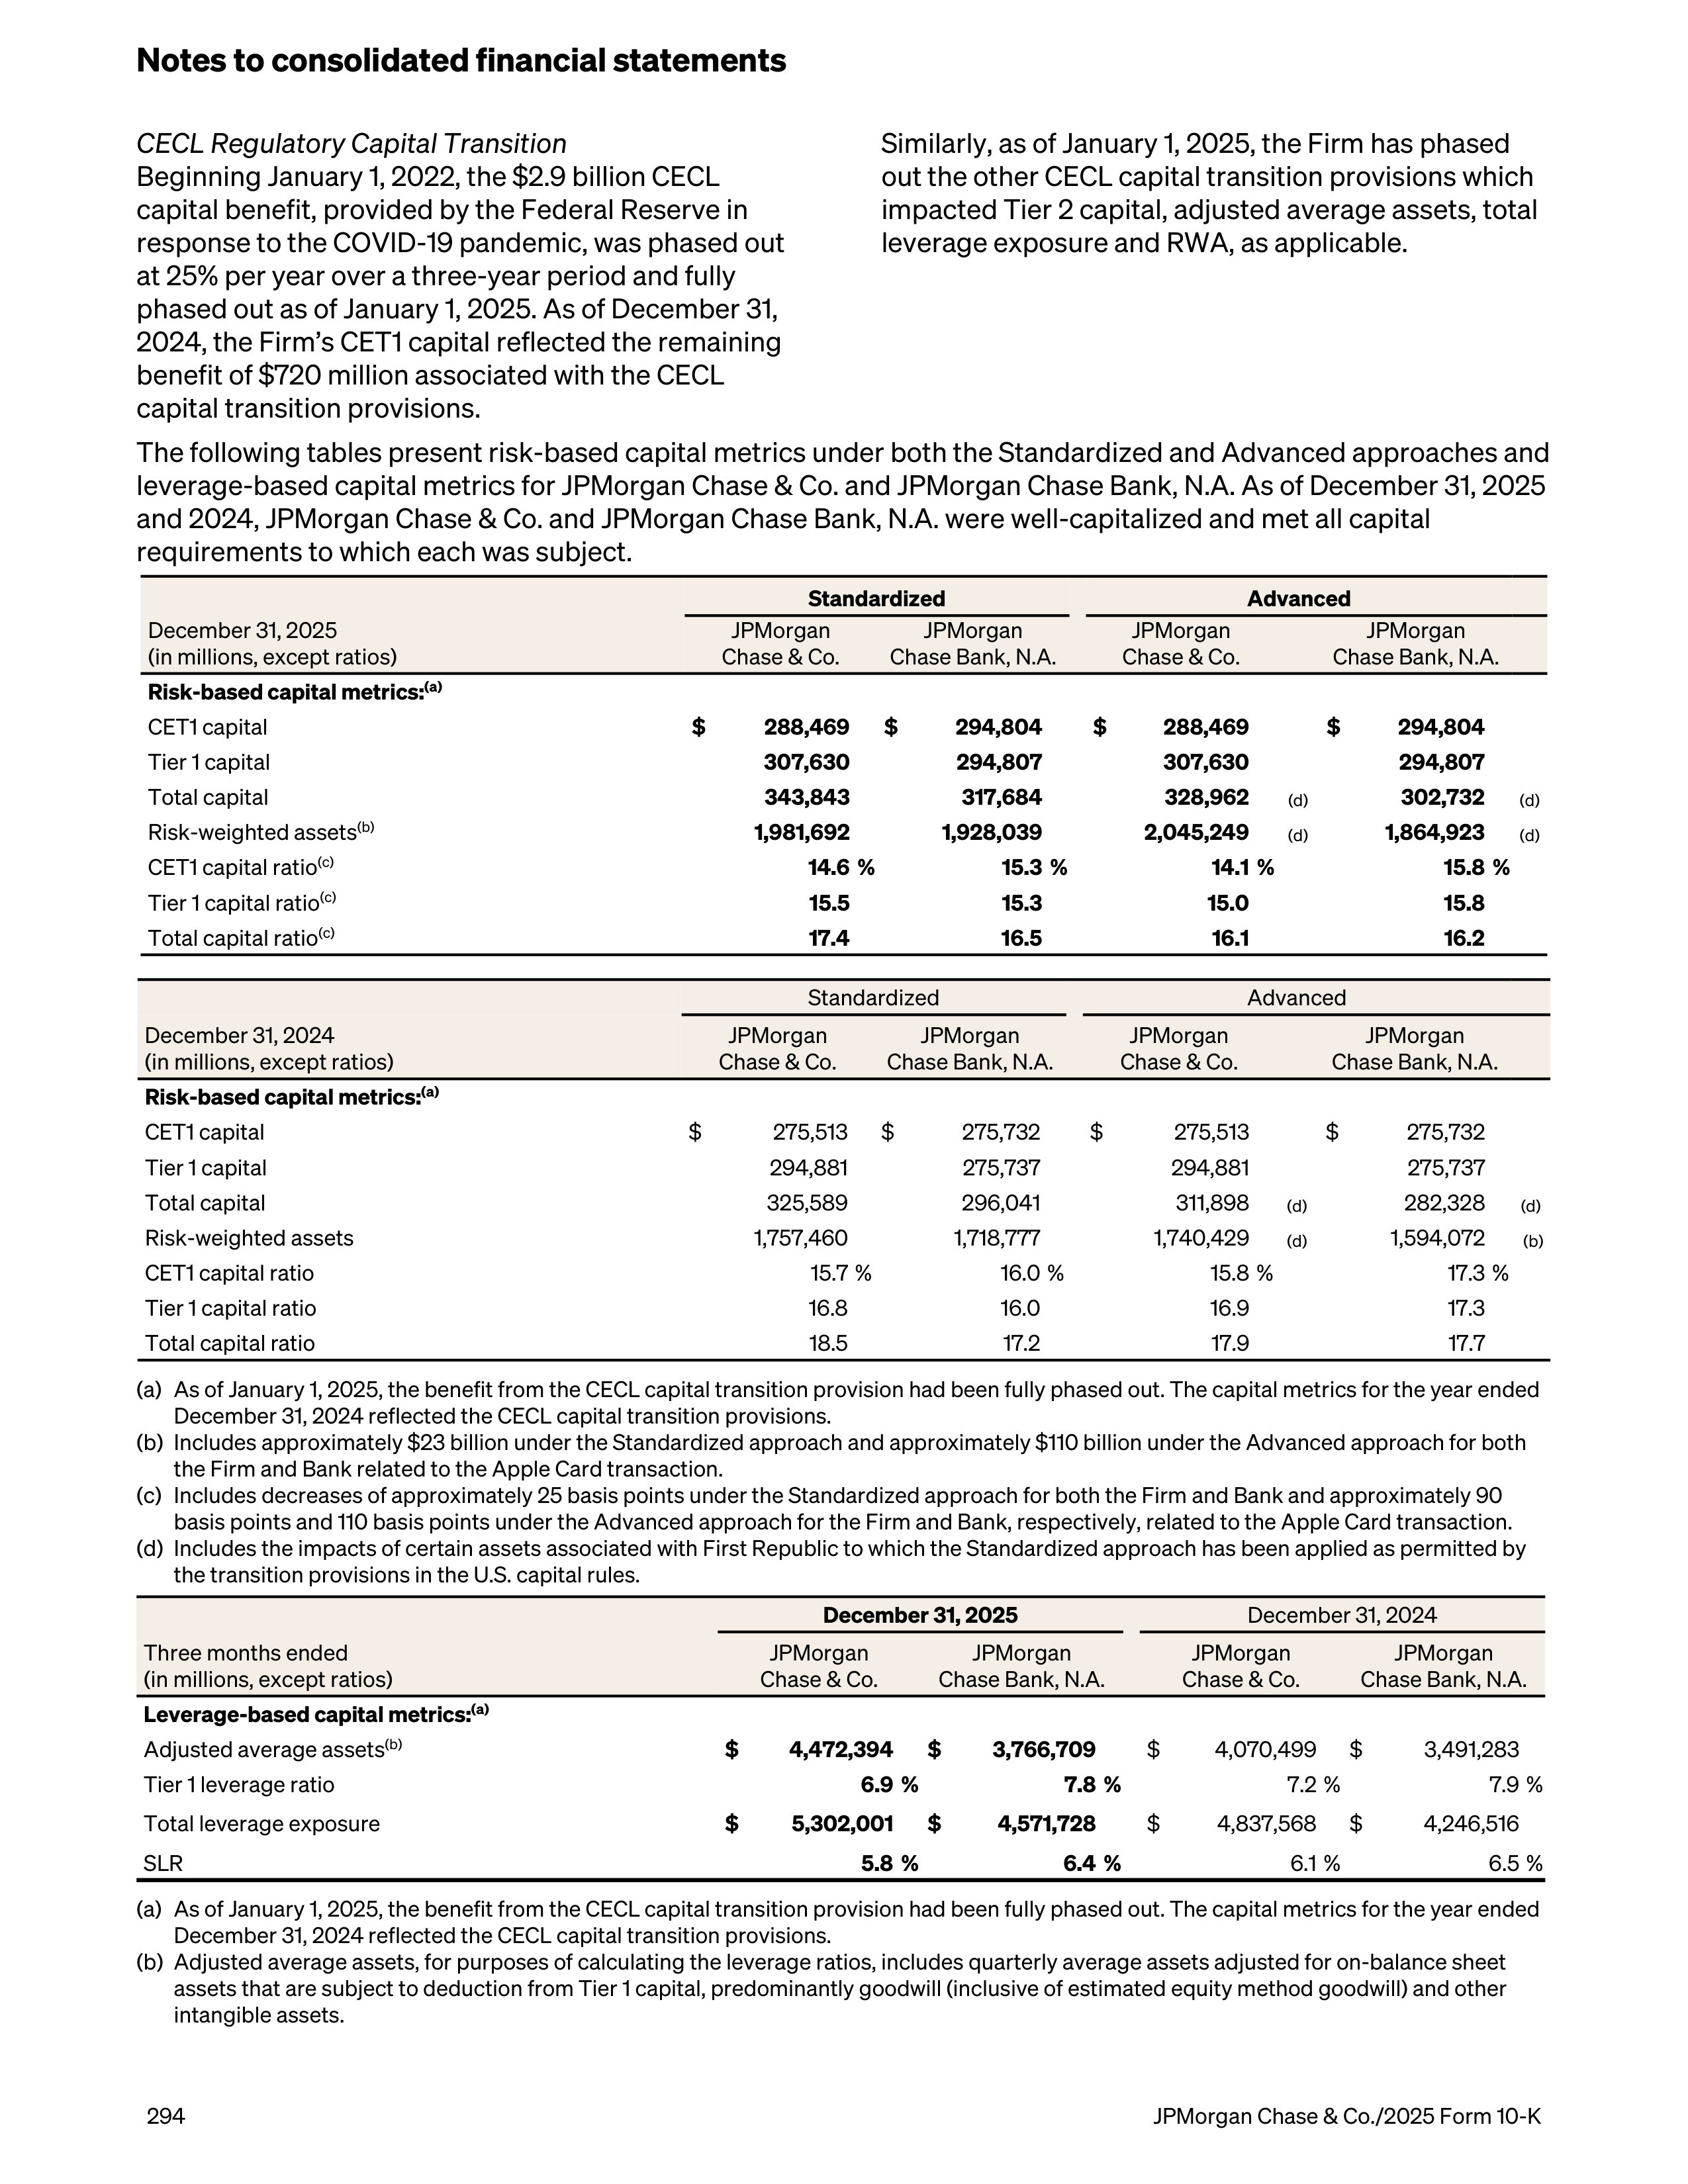
CECL Regulatory Capital Transition
Beginning January 1, 2022, the $2.9 billion CECL
capital benefit, provided by the Federal Reserve in
response to the COVID-19 pandemic, was phased out
at 25% per year over a three-year period and fully
phased out as of January 1, 2025. As of December 31,
2024, the Firm’s CET1 capital reflected the remaining
benefit of $720 million associated with the CECL
capital transition provisions.
Similarly, as of January 1, 2025, the Firm has phased
out the other CECL capital transition provisions which
impacted Tier 2 capital, adjusted average assets, total
leverage exposure and RWA, as applicable.
The following tables present risk-based capital metrics under both the Standardized and Advanced approaches and
leverage-based capital metrics for JPMorgan Chase & Co. and JPMorgan Chase Bank, N.A. As of December 31, 2025
and 2024, JPMorgan Chase & Co. and JPMorgan Chase Bank, N.A. were well-capitalized and met all capital
requirements to which each was subject.
December 31, 2025
(in millions, except ratios)
Standardized
Advanced
JPMorgan
Chase & Co.
JPMorgan
Chase Bank, N.A.
JPMorgan
Chase & Co.
JPMorgan
Chase Bank, N.A.
Risk-based capital metrics:
(a)
CET1 capital
$
288,469
$
294,804
$
288,469
$
294,804
Tier 1 capital
307,630
294,807
307,630
294,807
Total capital
343,843
317,684
328,962
(d)
302,732
(d)
Risk-weighted assets
(b)
1,981,692
1,928,039
2,045,249
(d)
1,864,923
(d)
CET1 capital ratio
(c)
14.6 %
15.3 %
14.1 %
15.8 %
Tier 1 capital ratio
(c)
15.5
15.3
15.0
15.8
Total capital ratio
(c)
17.4
16.5
16.1
16.2
December 31, 2024
(in millions, except ratios)
Standardized
Advanced
JPMorgan
Chase & Co.
JPMorgan
Chase Bank, N.A.
JPMorgan
Chase & Co.
JPMorgan
Chase Bank, N.A.
Risk-based capital metrics:
(a)
CET1 capital
$
275,513
$
275,732
$
275,513
$
275,732
Tier 1 capital
294,881
275,737
294,881
275,737
Total capital
325,589
296,041
311,898
(d)
282,328
(d)
Risk-weighted assets
1,757,460
1,718,777
1,740,429
(d)
1,594,072
(b)
CET1 capital ratio
15.7 %
16.0 %
15.8 %
17.3 %
Tier 1 capital ratio
16.8
16.0
16.9
17.3
Total capital ratio
18.5
17.2
17.9
17.7
(a)
As of January 1, 2025, the benefit from the CECL capital transition provision had been fully phased out. The capital metrics for the year ended
December 31, 2024 reflected the CECL capital transition provisions.
(b)
Includes approximately $23 billion under the Standardized approach and approximately $110 billion under the Advanced approach for both
the Firm and Bank related to the Apple Card transaction.
(c)
Includes decreases of approximately 25 basis points under the Standardized approach for both the Firm and Bank and approximately 90
basis points and 110 basis points under the Advanced approach for the Firm and Bank, respectively, related to the Apple Card transaction.
(d)
Includes the impacts of certain assets associated with First Republic to which the Standardized approach has been applied as permitted by
the transition provisions in the U.S. capital rules.
Three months ended
(in millions, except ratios)
December 31, 2025
December 31, 2024
JPMorgan
Chase & Co.
JPMorgan
Chase Bank, N.A.
JPMorgan
Chase & Co.
JPMorgan
Chase Bank, N.A.
Leverage-based capital metrics:
(a)
Adjusted average assets
(b)
$
4,472,394
$
3,766,709
$
4,070,499
$
3,491,283
Tier 1 leverage ratio
6.9 %
7.8 %
7.2 %
7.9 %
Total leverage exposure
$
5,302,001
$
4,571,728
$
4,837,568
$
4,246,516
SLR
5.8 %
6.4 %
6.1 %
6.5 %
(a)
As of January 1, 2025, the benefit from the CECL capital transition provision had been fully phased out. The capital metrics for the year ended
December 31, 2024 reflected the CECL capital transition provisions.
(b)
Adjusted average assets, for purposes of calculating the leverage ratios, includes quarterly average assets adjusted for on-balance sheet
assets that are subject to deduction from Tier 1 capital, predominantly goodwill (inclusive of estimated equity method goodwill) and other
intangible assets.
Notes to consolidated financial statements
294
JPMorgan Chase & Co./2025 Form 10-K
Note 28 – Off–balance sheet lending-related
financial instruments, guarantees, and
other commitments
Generally, JPMorganChase provides lending-related
financial instruments (e.g., commitments and
guarantees) to address the financing needs of its
customers and clients. The contractual amount of
these financial instruments represents the maximum
possible credit risk to the Firm should the customer or
client draw upon the commitment or the Firm be
required to fulfill its obligation under the guarantee,
and should the customer or client subsequently fail to
perform according to the terms of the contract. Most
of these commitments and guarantees have
historically been refinanced, extended, cancelled, or
expired without being fully drawn or a default
occurring. As a result, the total contractual amount of
these instruments is not, in the Firm’s view,
representative of its expected future credit exposure
or funding requirements.
To provide for expected credit losses in wholesale and
certain consumer lending-related commitments, an
allowance for credit losses on lending-related
commitments is maintained. Refer to Note 13 for
further information regarding the allowance for credit
losses on lending-related commitments.
The following table summarizes the contractual
amounts and carrying values of off-balance sheet
lending-related financial instruments, guarantees and
other commitments at December 31, 2025 and 2024.
The amounts in the table below for credit card, home
equity and certain scored business banking lending-
related commitments represent the total available
credit for these products. The Firm has not
experienced, and does not anticipate, that all available
lines of credit for these commitments will be utilized at
the same time. The Firm can generally reduce or
cancel these commitments, in accordance with the
contract, or to the extent otherwise permitted by law,
including when there has been a demonstrable decline
in the creditworthiness of the borrower or significant
decrease in the value of underlying property.
JPMorgan Chase & Co./2025 Form 10-K
295
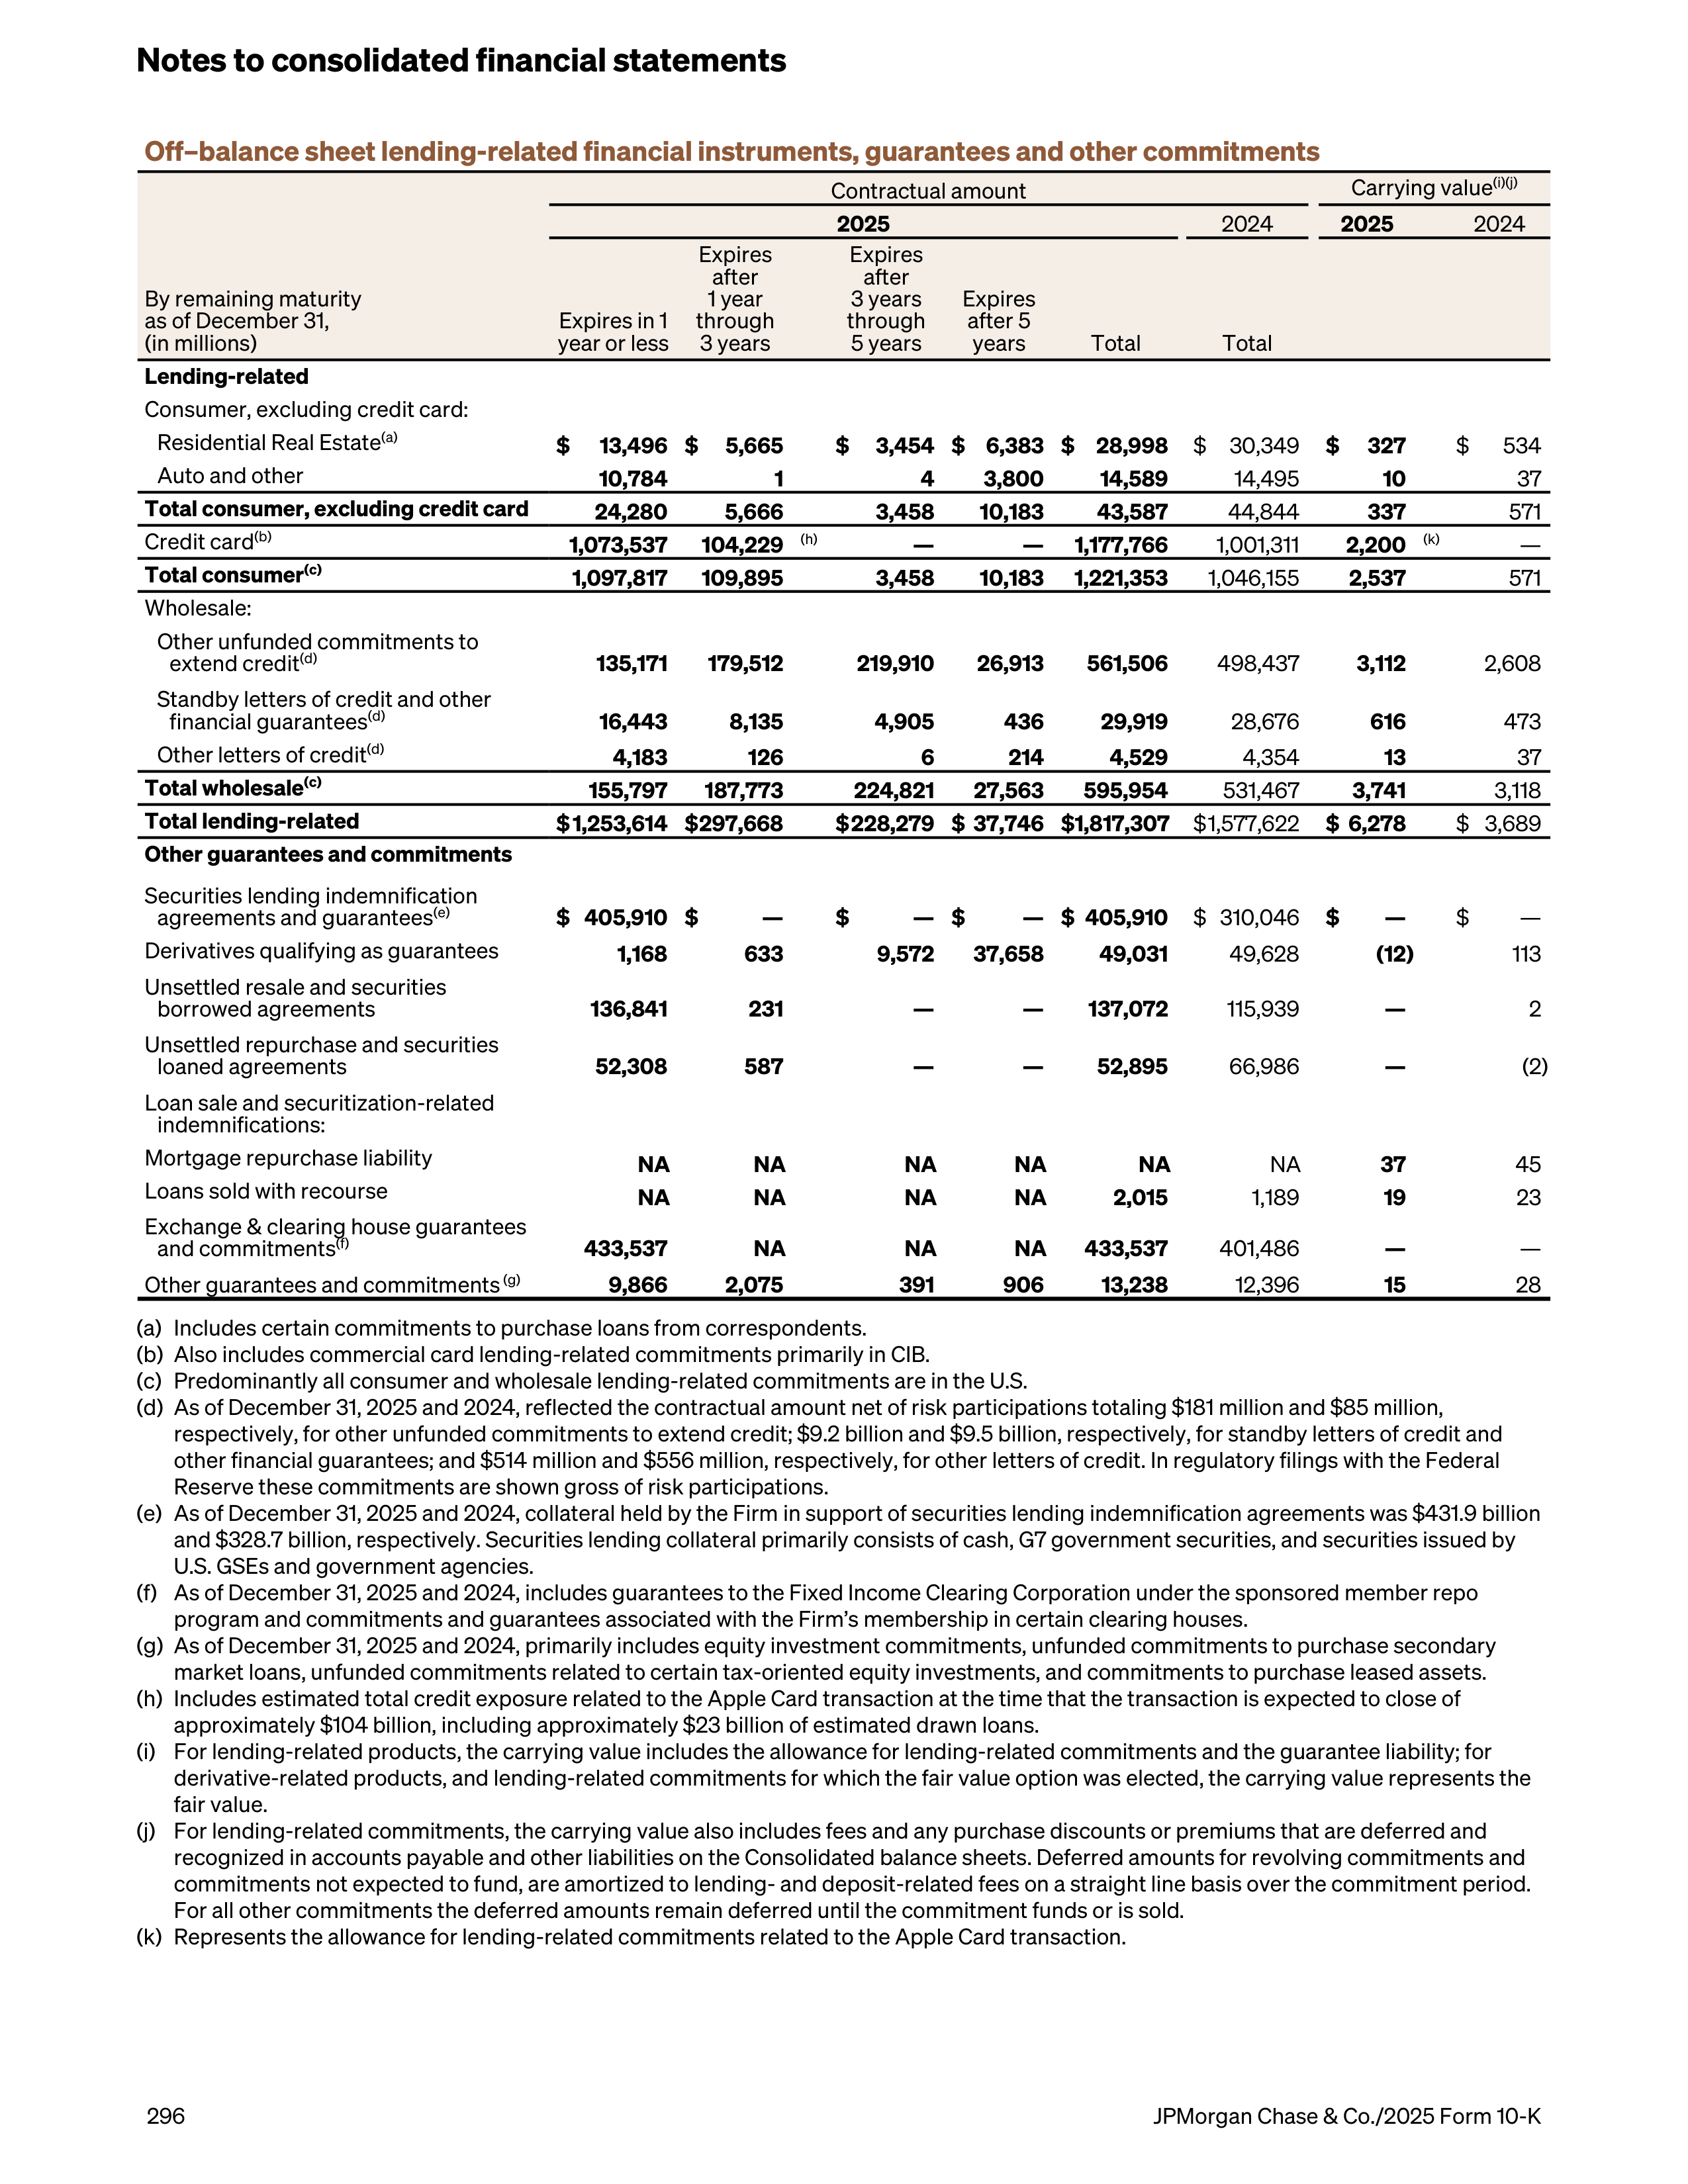
Off–balance sheet lending-related financial instruments, guarantees and other commitments
Contractual amount
Carrying value
(i)(j)
2025
2024
2025
2024
By remaining maturity
as of December 31,
(in millions)
Expires in 1
year or less
Expires
after
1 year
through
3 years
Expires
after
3 years
through
5 years
Expires
after 5
years
Total
Total
Lending-related
Consumer, excluding credit card:
Residential Real Estate
(a)
$
13,496 $
5,665
$
3,454 $ 6,383 $ 28,998
$
30,349
$
327
$
534
Auto and other
10,784
1
4
3,800
14,589
14,495
10
37
Total consumer, excluding credit card
24,280
5,666
3,458
10,183
43,587
44,844
337
571
Credit card
(b)
1,073,537 104,229
(h)
—
— 1,177,766
1,001,311
2,200
(k)
—
Total consumer
(c)
1,097,817 109,895
3,458
10,183 1,221,353
1,046,155
2,537
571
Wholesale:
Other unfunded commitments to
extend credit
(d)
135,171
179,512
219,910
26,913
561,506
498,437
3,112
2,608
Standby letters of credit and other
financial guarantees
(d)
16,443
8,135
4,905
436
29,919
28,676
616
473
Other letters of credit
(d)
4,183
126
6
214
4,529
4,354
13
37
Total wholesale
(c)
155,797 187,773
224,821
27,563
595,954
531,467
3,741
3,118
Total lending-related
$ 1,253,614 $ 297,668
$ 228,279 $ 37,746 $ 1,817,307
$ 1,577,622
$ 6,278
$ 3,689
Other guarantees and commitments
Securities lending indemnification
agreements and guarantees
(e)
$ 405,910 $
—
$
— $
— $ 405,910
$ 310,046
$
—
$
—
Derivatives qualifying as guarantees
1,168
633
9,572 37,658
49,031
49,628
(12)
113
Unsettled resale and securities
borrowed agreements
136,841
231
—
—
137,072
115,939
—
2
Unsettled repurchase and securities
loaned agreements
52,308
587
—
—
52,895
66,986
—
(2)
Loan sale and securitization-related
indemnifications:
Mortgage repurchase liability
NA
NA
NA
NA
NA
NA
37
45
Loans sold with recourse
NA
NA
NA
NA
2,015
1,189
19
23
Exchange & clearing house guarantees
and commitments
(f)
433,537
NA
NA
NA
433,537
401,486
—
—
Other guarantees and commitments
(g)
9,866
2,075
391
906
13,238
12,396
15
28
(a)
Includes certain commitments to purchase loans from correspondents.
(b)
Also includes commercial card lending-related commitments primarily in CIB.
(c)
Predominantly all consumer and wholesale lending-related commitments are in the U.S.
(d)
As of December 31, 2025 and 2024, reflected the contractual amount net of risk participations totaling $181 million and $85 million,
respectively, for other unfunded commitments to extend credit; $9.2 billion and $9.5 billion, respectively, for standby letters of credit and
other financial guarantees; and $514 million and $556 million, respectively, for other letters of credit. In regulatory filings with the Federal
Reserve these commitments are shown gross of risk participations.
(e)
As of December 31, 2025 and 2024, collateral held by the Firm in support of securities lending indemnification agreements was $431.9 billion
and $328.7 billion, respectively. Securities lending collateral primarily consists of cash, G7 government securities, and securities issued by
U.S. GSEs and government agencies.
(f)
As of December 31, 2025 and 2024, includes guarantees to the Fixed Income Clearing Corporation under the sponsored member repo
program and commitments and guarantees associated with the Firm’s membership in certain clearing houses.
(g)
As of December 31, 2025 and 2024, primarily includes equity investment commitments, unfunded commitments to purchase secondary
market loans, unfunded commitments related to certain tax-oriented equity investments, and commitments to purchase leased assets.
(h)
Includes estimated total credit exposure related to the Apple Card transaction at the time that the transaction is expected to close of
approximately $104 billion, including approximately $23 billion of estimated drawn loans.
(i)
For lending-related products, the carrying value includes the allowance for lending-related commitments and the guarantee liability; for
derivative-related products, and lending-related commitments for which the fair value option was elected, the carrying value represents the
fair value.
(j)
For lending-related commitments, the carrying value also includes fees and any purchase discounts or premiums that are deferred and
recognized in accounts payable and other liabilities on the Consolidated balance sheets. Deferred amounts for revolving commitments and
commitments not expected to fund, are amortized to lending- and deposit-related fees on a straight line basis over the commitment period.
For all other commitments the deferred amounts remain deferred until the commitment funds or is sold.
(k)
Represents the allowance for lending-related commitments related to the Apple Card transaction.
Notes to consolidated financial statements
296
JPMorgan Chase & Co./2025 Form 10-K
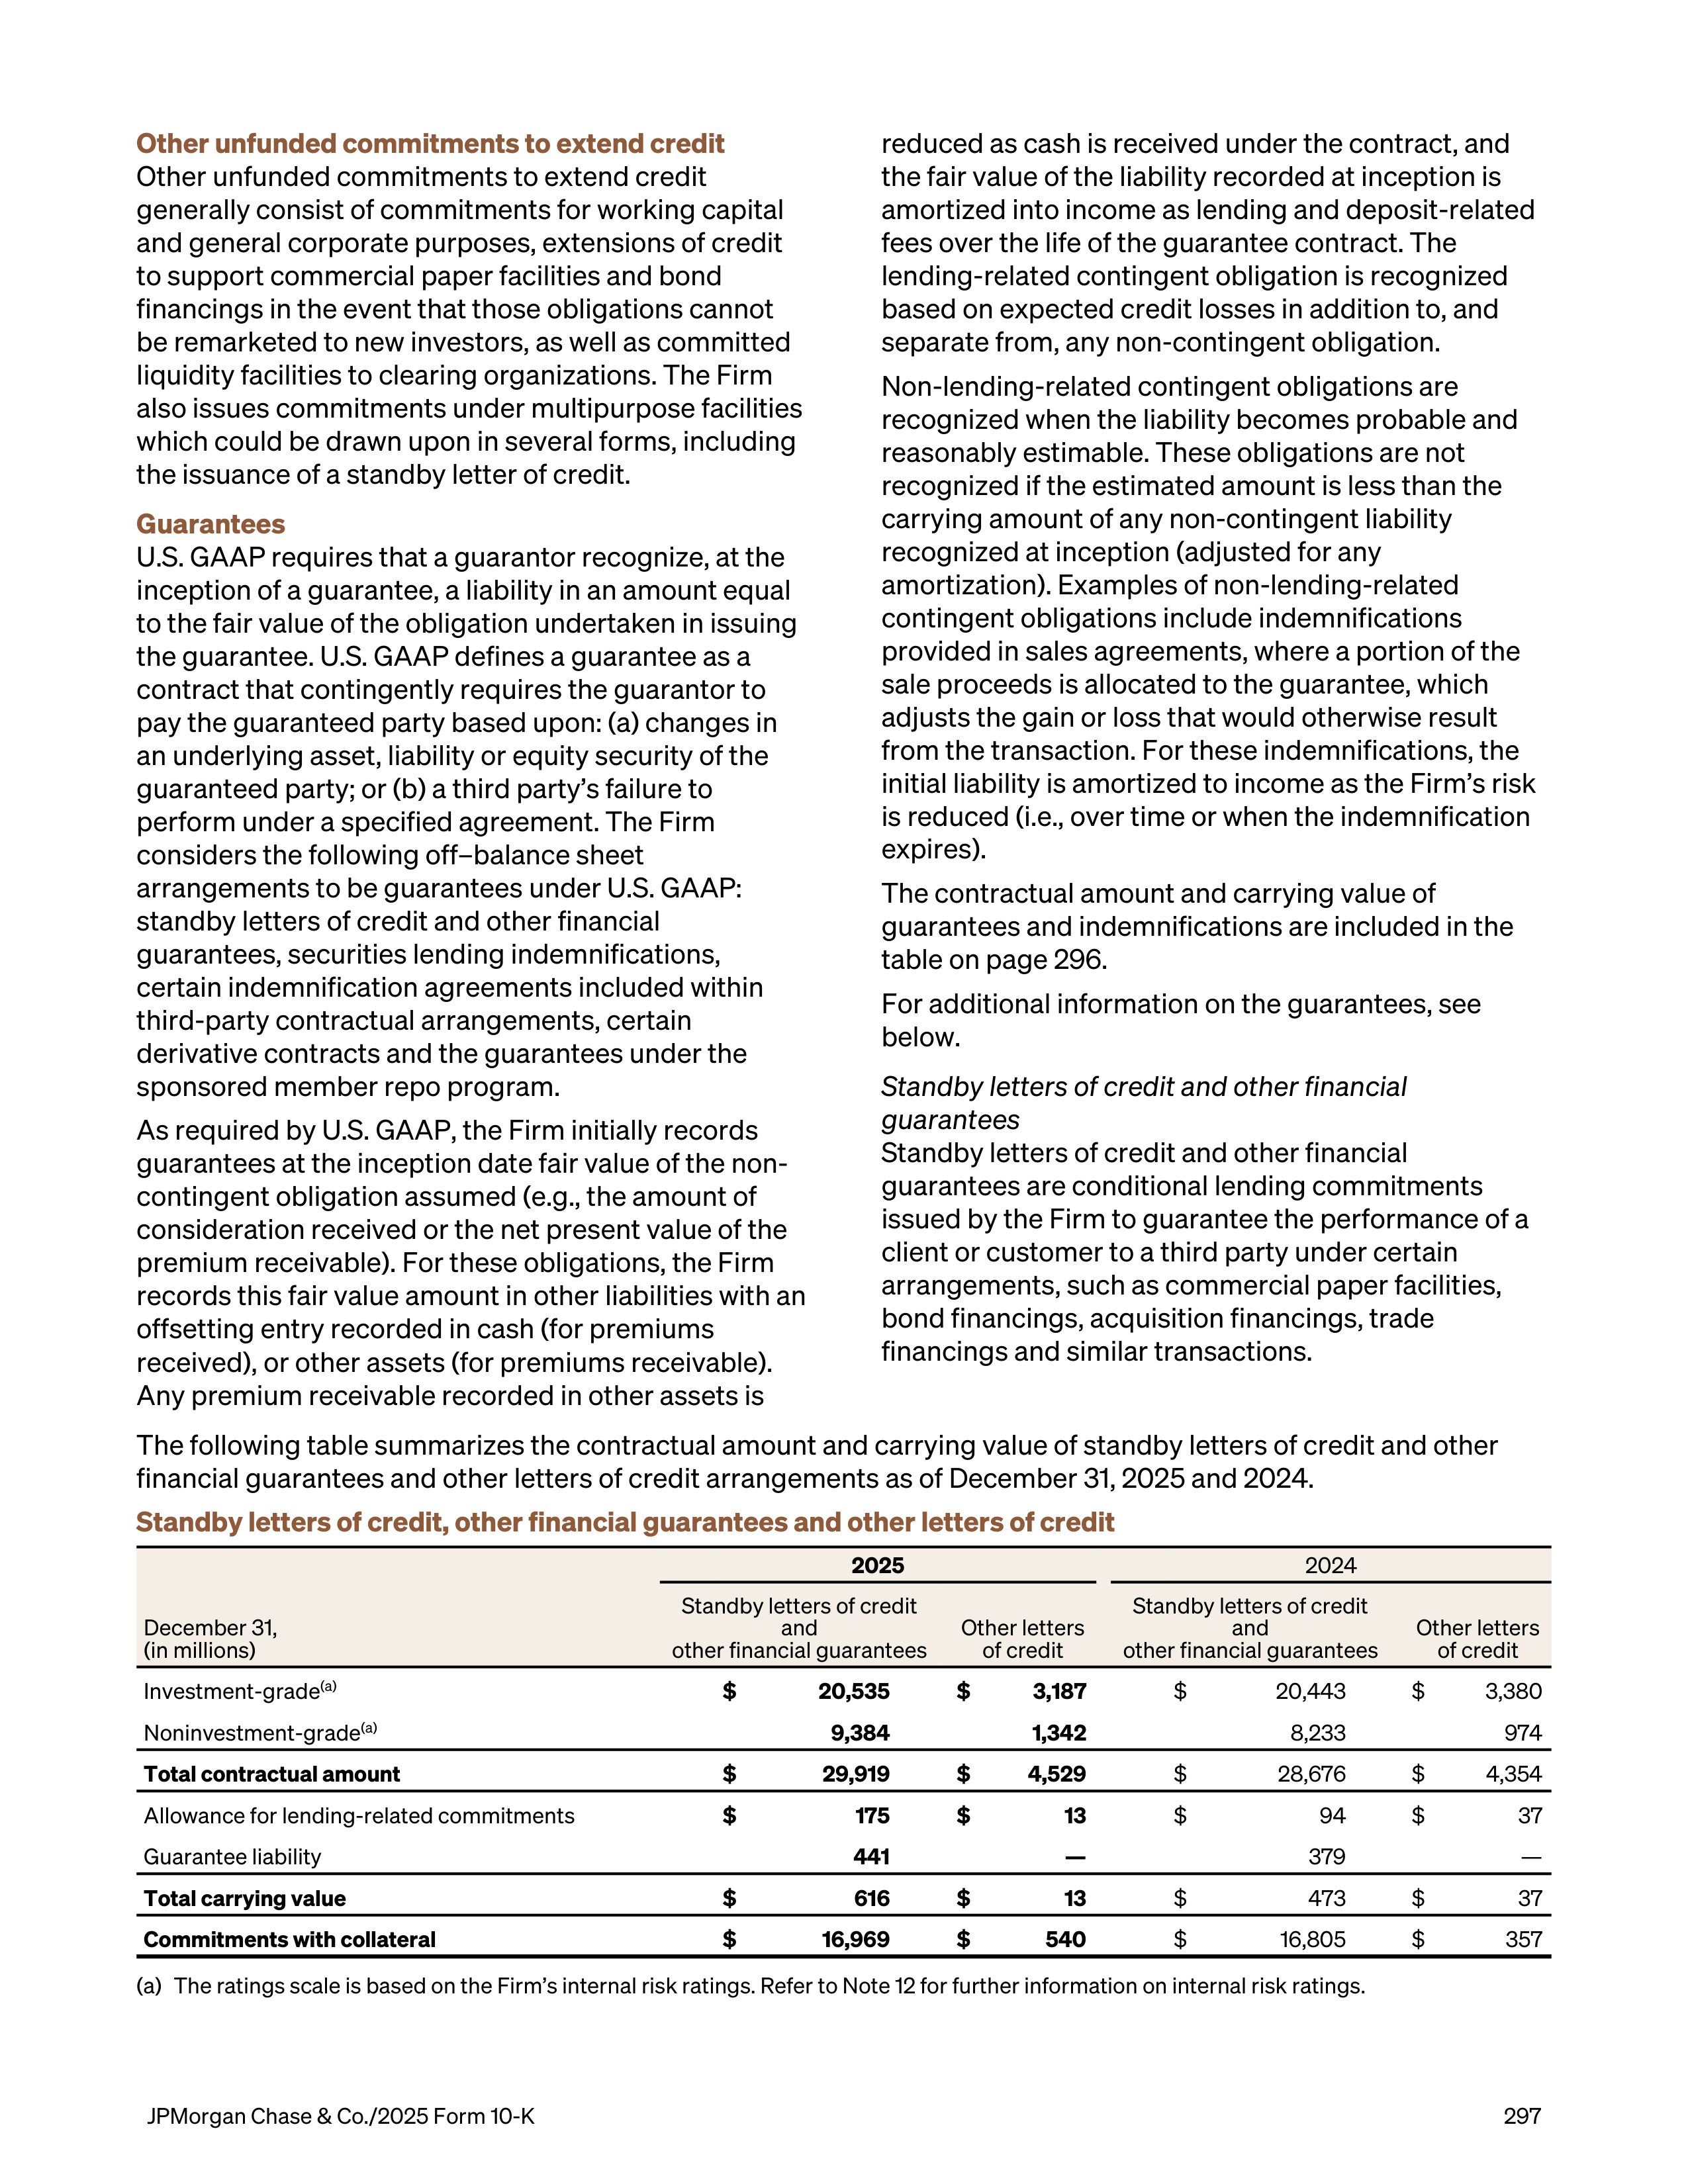
Other unfunded commitments to extend credit
Other unfunded commitments to extend credit
generally consist of commitments for working capital
and general corporate purposes, extensions of credit
to support commercial paper facilities and bond
financings in the event that those obligations cannot
be remarketed to new investors, as well as committed
liquidity facilities to clearing organizations. The Firm
also issues commitments under multipurpose facilities
which could be drawn upon in several forms, including
the issuance of a standby letter of credit.
Guarantees
U.S. GAAP requires that a guarantor recognize, at the
inception of a guarantee, a liability in an amount equal
to the fair value of the obligation undertaken in issuing
the guarantee. U.S. GAAP defines a guarantee as a
contract that contingently requires the guarantor to
pay the guaranteed party based upon: (a) changes in
an underlying asset, liability or equity security of the
guaranteed party; or (b) a third party’s failure to
perform under a specified agreement. The Firm
considers the following off–balance sheet
arrangements to be guarantees under U.S. GAAP:
standby letters of credit and other financial
guarantees, securities lending indemnifications,
certain indemnification agreements included within
third-party contractual arrangements, certain
derivative contracts and the guarantees under the
sponsored member repo program.
As required by U.S. GAAP, the Firm initially records
guarantees at the inception date fair value of the non-
contingent obligation assumed (e.g., the amount of
consideration received or the net present value of the
premium receivable). For these obligations, the Firm
records this fair value amount in other liabilities with an
offsetting entry recorded in cash (for premiums
received), or other assets (for premiums receivable).
Any premium receivable recorded in other assets is
reduced as cash is received under the contract, and
the fair value of the liability recorded at inception is
amortized into income as lending and deposit-related
fees over the life of the guarantee contract. The
lending-related contingent obligation is recognized
based on expected credit losses in addition to, and
separate from, any non-contingent obligation.
Non-lending-related contingent obligations are
recognized when the liability becomes probable and
reasonably estimable. These obligations are not
recognized if the estimated amount is less than the
carrying amount of any non-contingent liability
recognized at inception (adjusted for any
amortization). Examples of non-lending-related
contingent obligations include indemnifications
provided in sales agreements, where a portion of the
sale proceeds is allocated to the guarantee, which
adjusts the gain or loss that would otherwise result
from the transaction. For these indemnifications, the
initial liability is amortized to income as the Firm’s risk
is reduced (i.e., over time or when the indemnification
expires).
The contractual amount and carrying value of
guarantees and indemnifications are included in the
table on page 296.
For additional information on the guarantees, see
below.
Standby letters of credit and other financial
guarantees
Standby letters of credit and other financial
guarantees are conditional lending commitments
issued by the Firm to guarantee the performance of a
client or customer to a third party under certain
arrangements, such as commercial paper facilities,
bond financings, acquisition financings, trade
financings and similar transactions.
The following table summarizes the contractual amount and carrying value of standby letters of credit and other
financial guarantees and other letters of credit arrangements as of December 31, 2025 and 2024.
Standby letters of credit, other financial guarantees and other letters of credit
2025
2024
December 31,
(in millions)
Standby letters of credit
and
other financial guarantees
Other letters
of credit
Standby letters of credit
and
other financial guarantees
Other letters
of credit
Investment-grade
(a)
$
20,535
$
3,187
$
20,443
$
3,380
Noninvestment-grade
(a)
9,384
1,342
8,233
974
Total contractual amount
$
29,919
$
4,529
$
28,676
$
4,354
Allowance for lending-related commitments
$
175
$
13
$
94
$
37
Guarantee liability
441
—
379
—
Total carrying value
$
616
$
13
$
473
$
37
Commitments with collateral
$
16,969
$
540
$
16,805
$
357
(a)
The ratings scale is based on the Firm’s internal risk ratings. Refer to Note 12 for further information on internal risk ratings.
JPMorgan Chase & Co./2025 Form 10-K
297
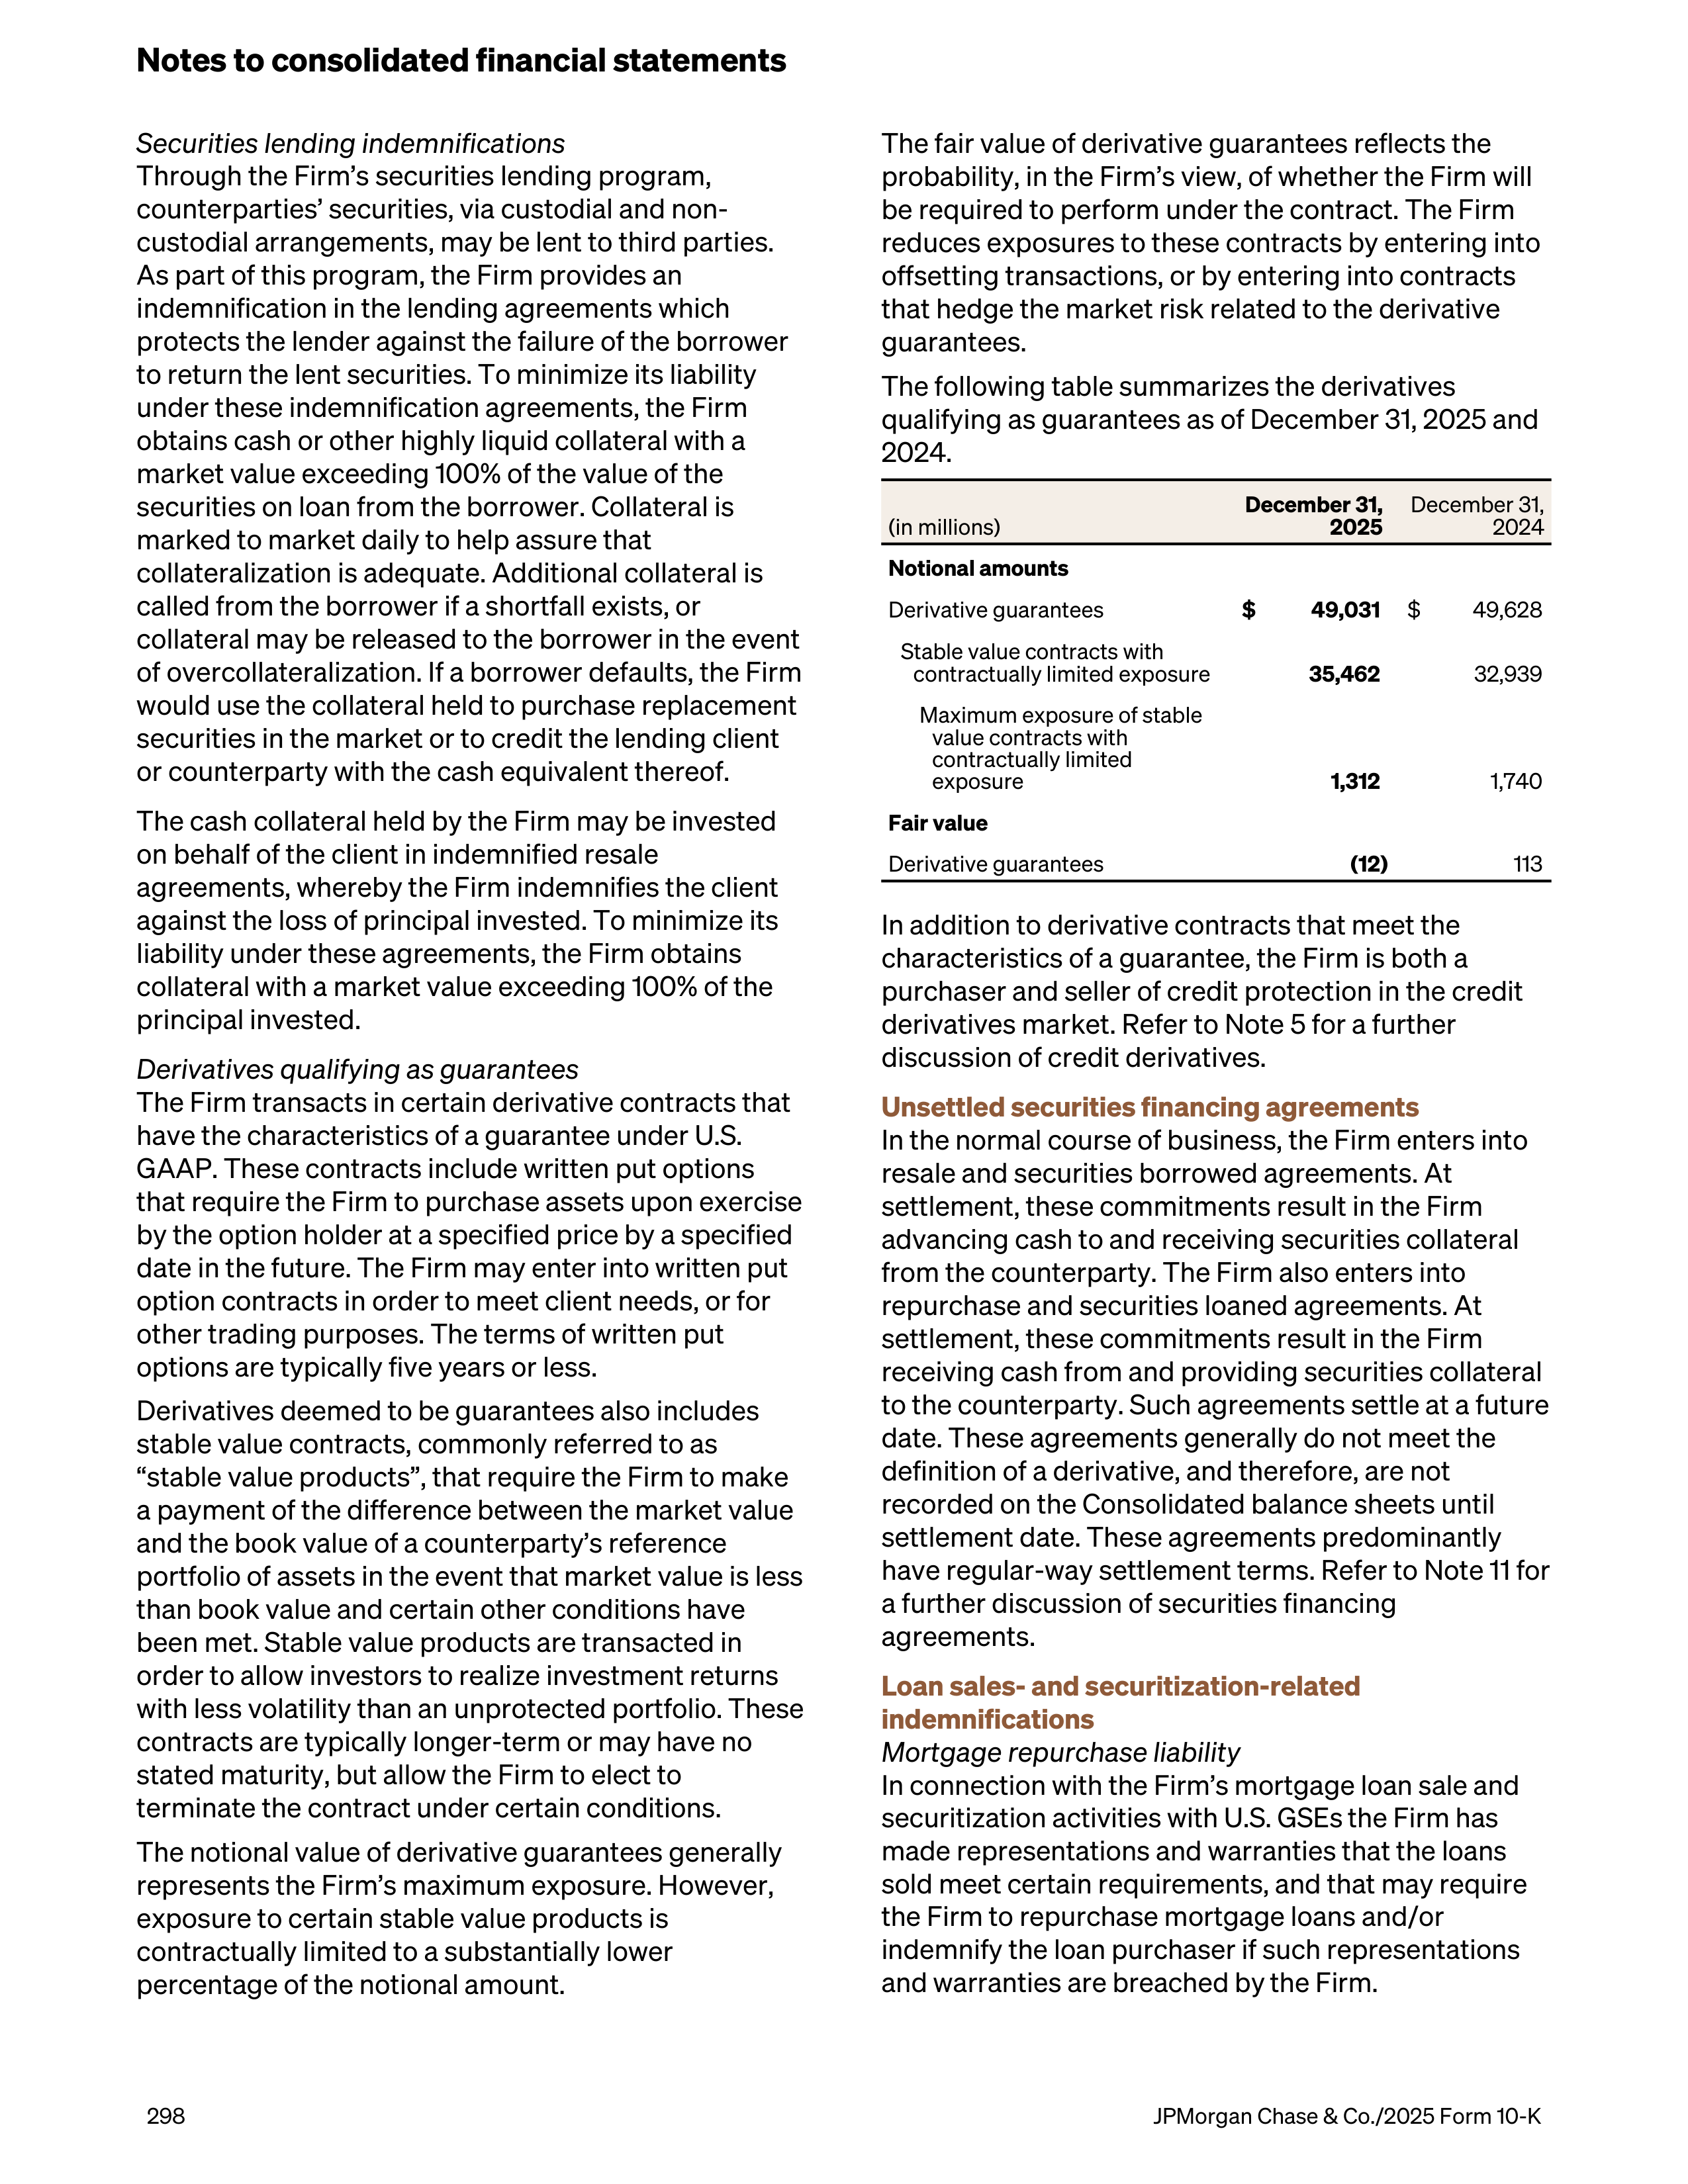
Securities lending indemnifications
Through the Firm’s securities lending program,
counterparties’ securities, via custodial and non-
custodial arrangements, may be lent to third parties.
As part of this program, the Firm provides an
indemnification in the lending agreements which
protects the lender against the failure of the borrower
to return the lent securities. To minimize its liability
under these indemnification agreements, the Firm
obtains cash or other highly liquid collateral with a
market value exceeding 100% of the value of the
securities on loan from the borrower. Collateral is
marked to market daily to help assure that
collateralization is adequate. Additional collateral is
called from the borrower if a shortfall exists, or
collateral may be released to the borrower in the event
of overcollateralization. If a borrower defaults, the Firm
would use the collateral held to purchase replacement
securities in the market or to credit the lending client
or counterparty with the cash equivalent thereof.
The cash collateral held by the Firm may be invested
on behalf of the client in indemnified resale
agreements, whereby the Firm indemnifies the client
against the loss of principal invested. To minimize its
liability under these agreements, the Firm obtains
collateral with a market value exceeding 100% of the
principal invested.
Derivatives qualifying as guarantees
The Firm transacts in certain derivative contracts that
have the characteristics of a guarantee under U.S.
GAAP. These contracts include written put options
that require the Firm to purchase assets upon exercise
by the option holder at a specified price by a specified
date in the future. The Firm may enter into written put
option contracts in order to meet client needs, or for
other trading purposes. The terms of written put
options are typically five years or less.
Derivatives deemed to be guarantees also includes
stable value contracts, commonly referred to as
“stable value products”, that require the Firm to make
a payment of the difference between the market value
and the book value of a counterparty’s reference
portfolio of assets in the event that market value is less
than book value and certain other conditions have
been met. Stable value products are transacted in
order to allow investors to realize investment returns
with less volatility than an unprotected portfolio. These
contracts are typically longer-term or may have no
stated maturity, but allow the Firm to elect to
terminate the contract under certain conditions.
The notional value of derivative guarantees generally
represents the Firm’s maximum exposure. However,
exposure to certain stable value products is
contractually limited to a substantially lower
percentage of the notional amount.
The fair value of derivative guarantees reflects the
probability, in the Firm’s view, of whether the Firm will
be required to perform under the contract. The Firm
reduces exposures to these contracts by entering into
offsetting transactions, or by entering into contracts
that hedge the market risk related to the derivative
guarantees.
The following table summarizes the derivatives
qualifying as guarantees as of December 31, 2025 and
2024.
(in millions)
December 31,
2025
December 31,
2024
Notional amounts
Derivative guarantees
$
49,031
$
49,628
Stable value contracts with
contractually limited exposure
35,462
32,939
Maximum exposure of stable
value contracts with
contractually limited
exposure
1,312
1,740
Fair value
Derivative guarantees
(12)
113
In addition to derivative contracts that meet the
characteristics of a guarantee, the Firm is both a
purchaser and seller of credit protection in the credit
derivatives market. Refer to Note 5 for a further
discussion of credit derivatives.
Unsettled securities financing agreements
In the normal course of business, the Firm enters into
resale and securities borrowed agreements. At
settlement, these commitments result in the Firm
advancing cash to and receiving securities collateral
from the counterparty. The Firm also enters into
repurchase and securities loaned agreements. At
settlement, these commitments result in the Firm
receiving cash from and providing securities collateral
to the counterparty. Such agreements settle at a future
date. These agreements generally do not meet the
definition of a derivative, and therefore, are not
recorded on the Consolidated balance sheets until
settlement date. These agreements predominantly
have regular-way settlement terms. Refer to Note 11 for
a further discussion of securities financing
agreements.
Loan sales- and securitization-related
indemnifications
Mortgage repurchase liability
In connection with the Firm’s mortgage loan sale and
securitization activities with U.S. GSEs the Firm has
made representations and warranties that the loans
sold meet certain requirements, and that may require
the Firm to repurchase mortgage loans and/or
indemnify the loan purchaser if such representations
and warranties are breached by the Firm.
Notes to consolidated financial statements
298
JPMorgan Chase & Co./2025 Form 10-K
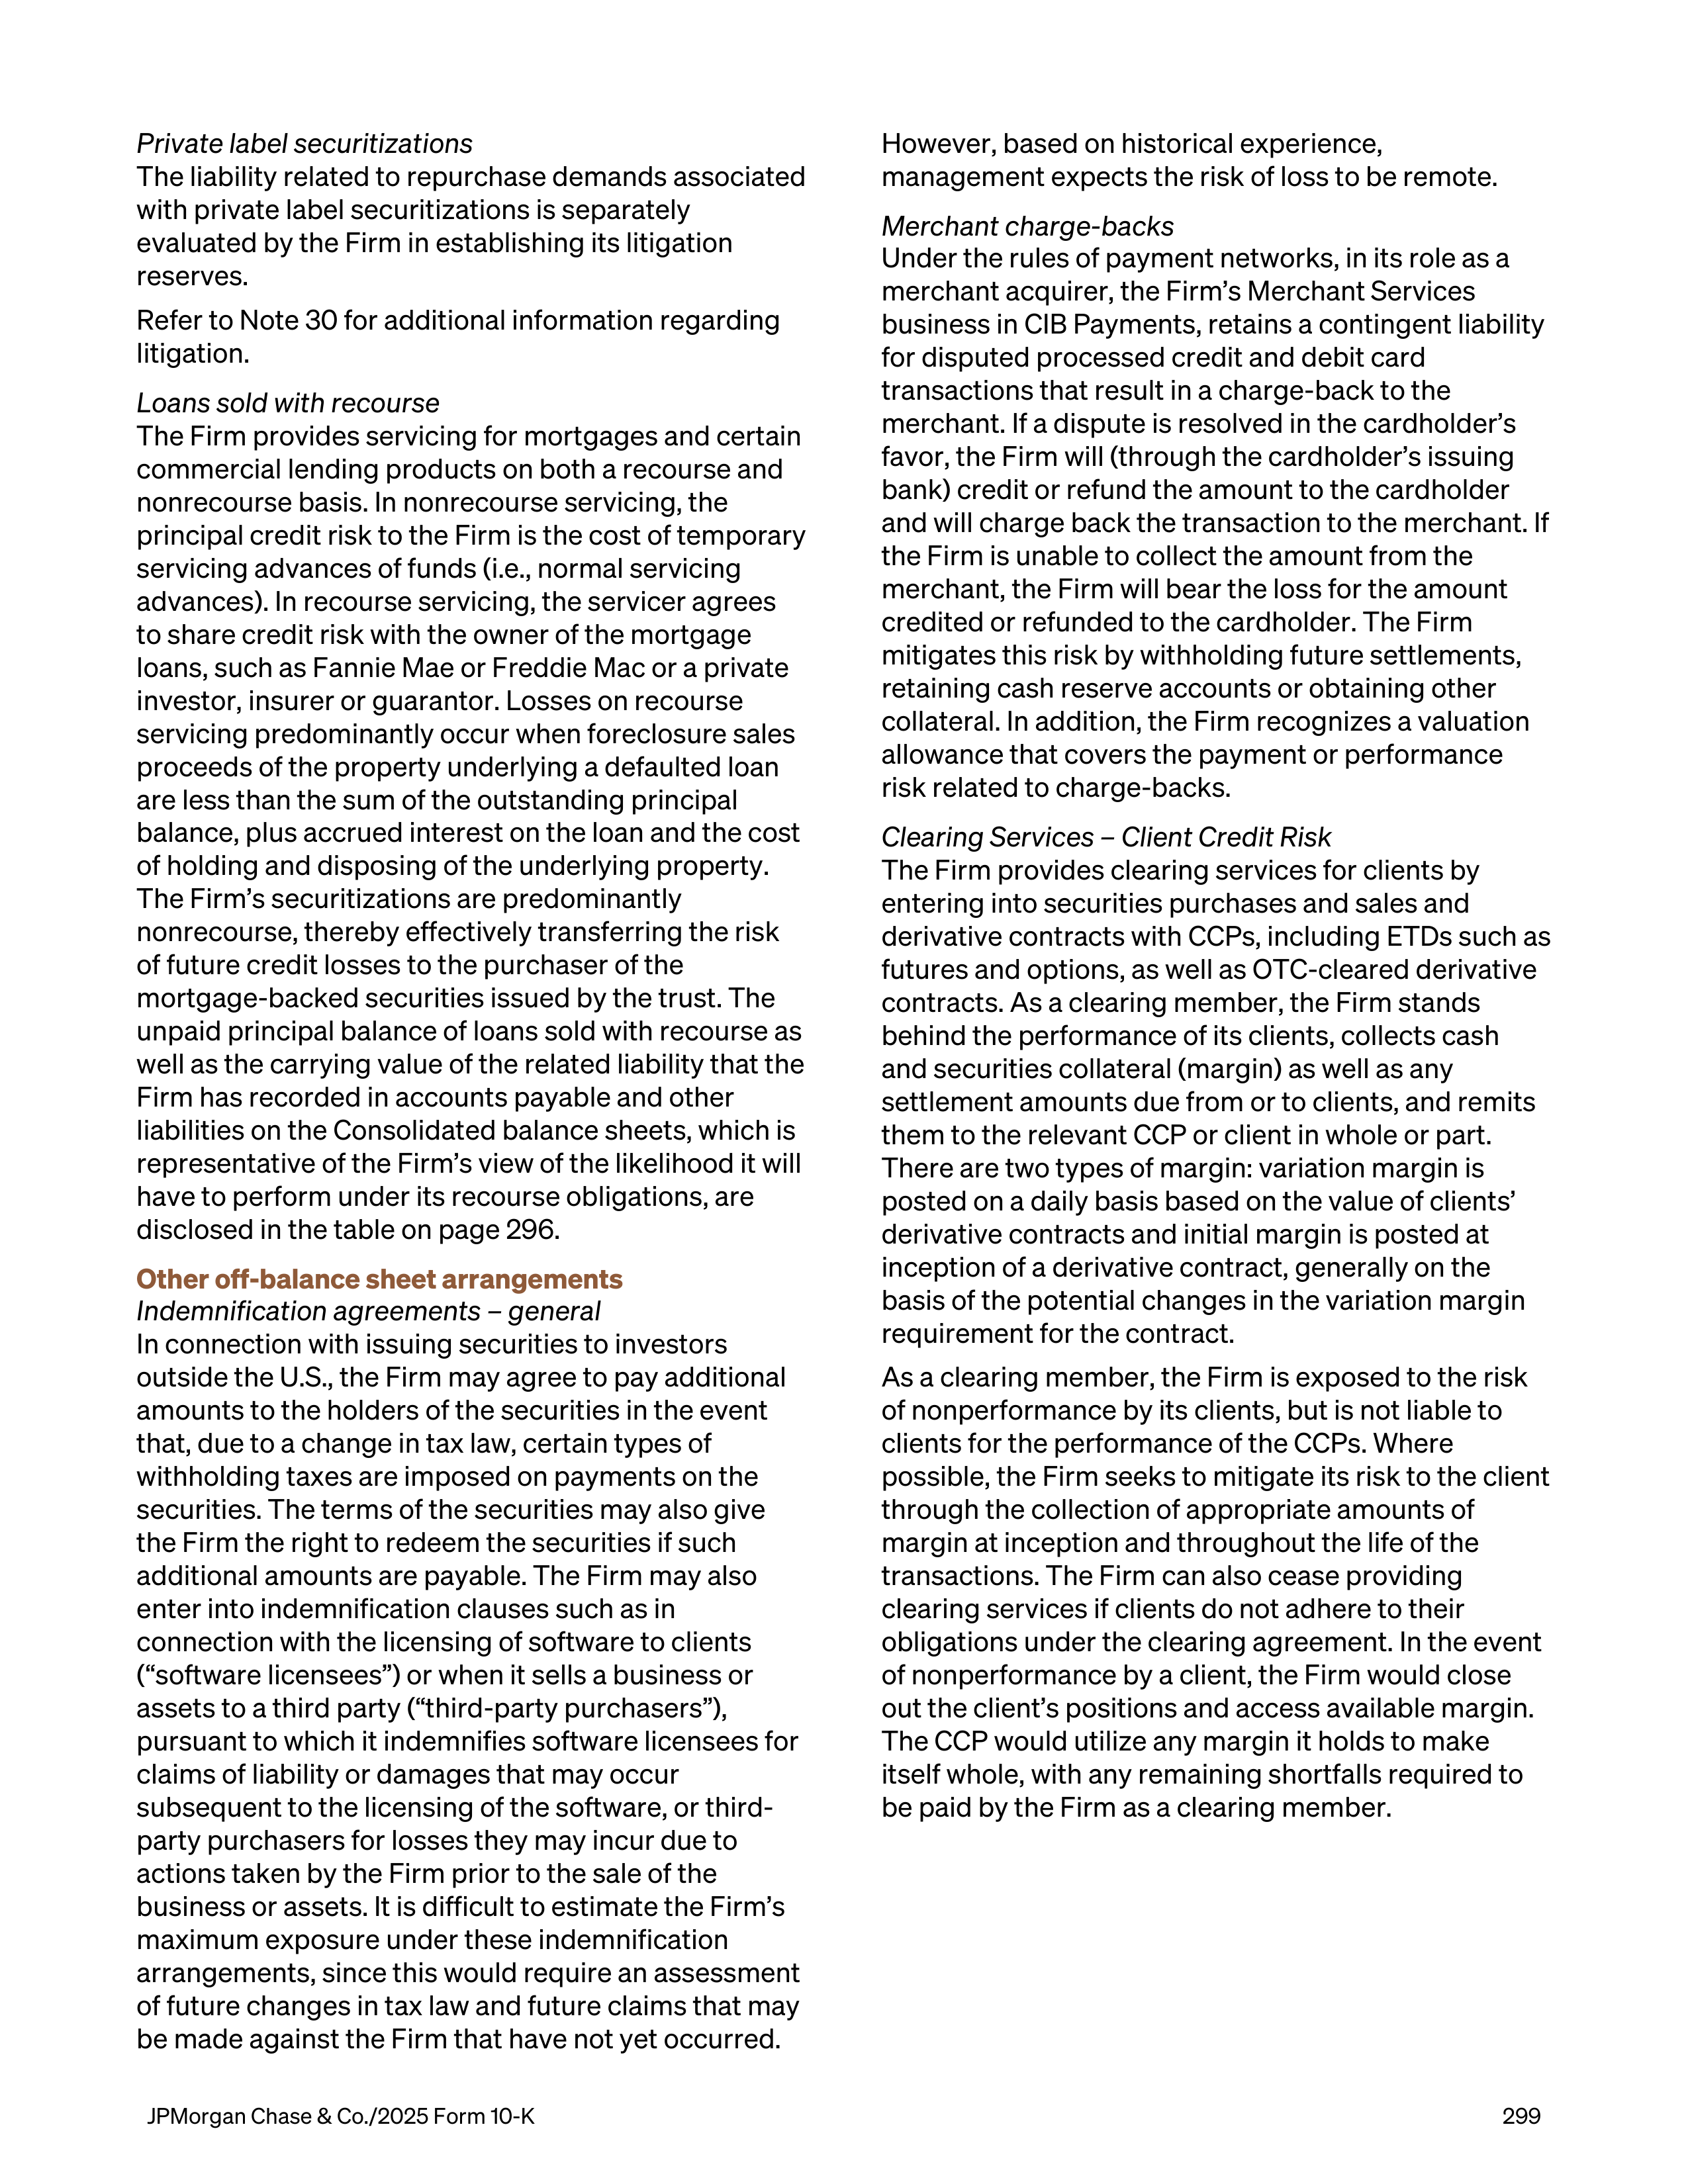
Private label securitizations
The liability related to repurchase demands associated
with private label securitizations is separately
evaluated by the Firm in establishing its litigation
reserves.
Refer to Note 30 for additional information regarding
litigation.
Loans sold with recourse
The Firm provides servicing for mortgages and certain
commercial lending products on both a recourse and
nonrecourse basis. In nonrecourse servicing, the
principal credit risk to the Firm is the cost of temporary
servicing advances of funds (i.e., normal servicing
advances). In recourse servicing, the servicer agrees
to share credit risk with the owner of the mortgage
loans, such as Fannie Mae or Freddie Mac or a private
investor, insurer or guarantor. Losses on recourse
servicing predominantly occur when foreclosure sales
proceeds of the property underlying a defaulted loan
are less than the sum of the outstanding principal
balance, plus accrued interest on the loan and the cost
of holding and disposing of the underlying property.
The Firm’s securitizations are predominantly
nonrecourse, thereby effectively transferring the risk
of future credit losses to the purchaser of the
mortgage-backed securities issued by the trust. The
unpaid principal balance of loans sold with recourse as
well as the carrying value of the related liability that the
Firm has recorded in accounts payable and other
liabilities on the Consolidated balance sheets, which is
representative of the Firm’s view of the likelihood it will
have to perform under its recourse obligations, are
disclosed in the table on page 296.
Other off-balance sheet arrangements
Indemnification agreements – general
In connection with issuing securities to investors
outside the U.S., the Firm may agree to pay additional
amounts to the holders of the securities in the event
that, due to a change in tax law, certain types of
withholding taxes are imposed on payments on the
securities. The terms of the securities may also give
the Firm the right to redeem the securities if such
additional amounts are payable. The Firm may also
enter into indemnification clauses such as in
connection with the licensing of software to clients
(“software licensees”) or when it sells a business or
assets to a third party (“third-party purchasers”),
pursuant to which it indemnifies software licensees for
claims of liability or damages that may occur
subsequent to the licensing of the software, or third-
party purchasers for losses they may incur due to
actions taken by the Firm prior to the sale of the
business or assets. It is difficult to estimate the Firm’s
maximum exposure under these indemnification
arrangements, since this would require an assessment
of future changes in tax law and future claims that may
be made against the Firm that have not yet occurred.
However, based on historical experience,
management expects the risk of loss to be remote.
Merchant charge-backs
Under the rules of payment networks, in its role as a
merchant acquirer, the Firm’s Merchant Services
business in CIB Payments, retains a contingent liability
for disputed processed credit and debit card
transactions that result in a charge-back to the
merchant. If a dispute is resolved in the cardholder’s
favor, the Firm will (through the cardholder’s issuing
bank) credit or refund the amount to the cardholder
and will charge back the transaction to the merchant. If
the Firm is unable to collect the amount from the
merchant, the Firm will bear the loss for the amount
credited or refunded to the cardholder. The Firm
mitigates this risk by withholding future settlements,
retaining cash reserve accounts or obtaining other
collateral. In addition, the Firm recognizes a valuation
allowance that covers the payment or performance
risk related to charge-backs.
Clearing Services – Client Credit Risk
The Firm provides clearing services for clients by
entering into securities purchases and sales and
derivative contracts with CCPs, including ETDs such as
futures and options, as well as OTC-cleared derivative
contracts. As a clearing member, the Firm stands
behind the performance of its clients, collects cash
and securities collateral (margin) as well as any
settlement amounts due from or to clients, and remits
them to the relevant CCP or client in whole or part.
There are two types of margin: variation margin is
posted on a daily basis based on the value of clients’
derivative contracts and initial margin is posted at
inception of a derivative contract, generally on the
basis of the potential changes in the variation margin
requirement for the contract.
As a clearing member, the Firm is exposed to the risk
of nonperformance by its clients, but is not liable to
clients for the performance of the CCPs. Where
possible, the Firm seeks to mitigate its risk to the client
through the collection of appropriate amounts of
margin at inception and throughout the life of the
transactions. The Firm can also cease providing
clearing services if clients do not adhere to their
obligations under the clearing agreement. In the event
of nonperformance by a client, the Firm would close
out the client’s positions and access available margin.
The CCP would utilize any margin it holds to make
itself whole, with any remaining shortfalls required to
be paid by the Firm as a clearing member.
JPMorgan Chase & Co./2025 Form 10-K
299
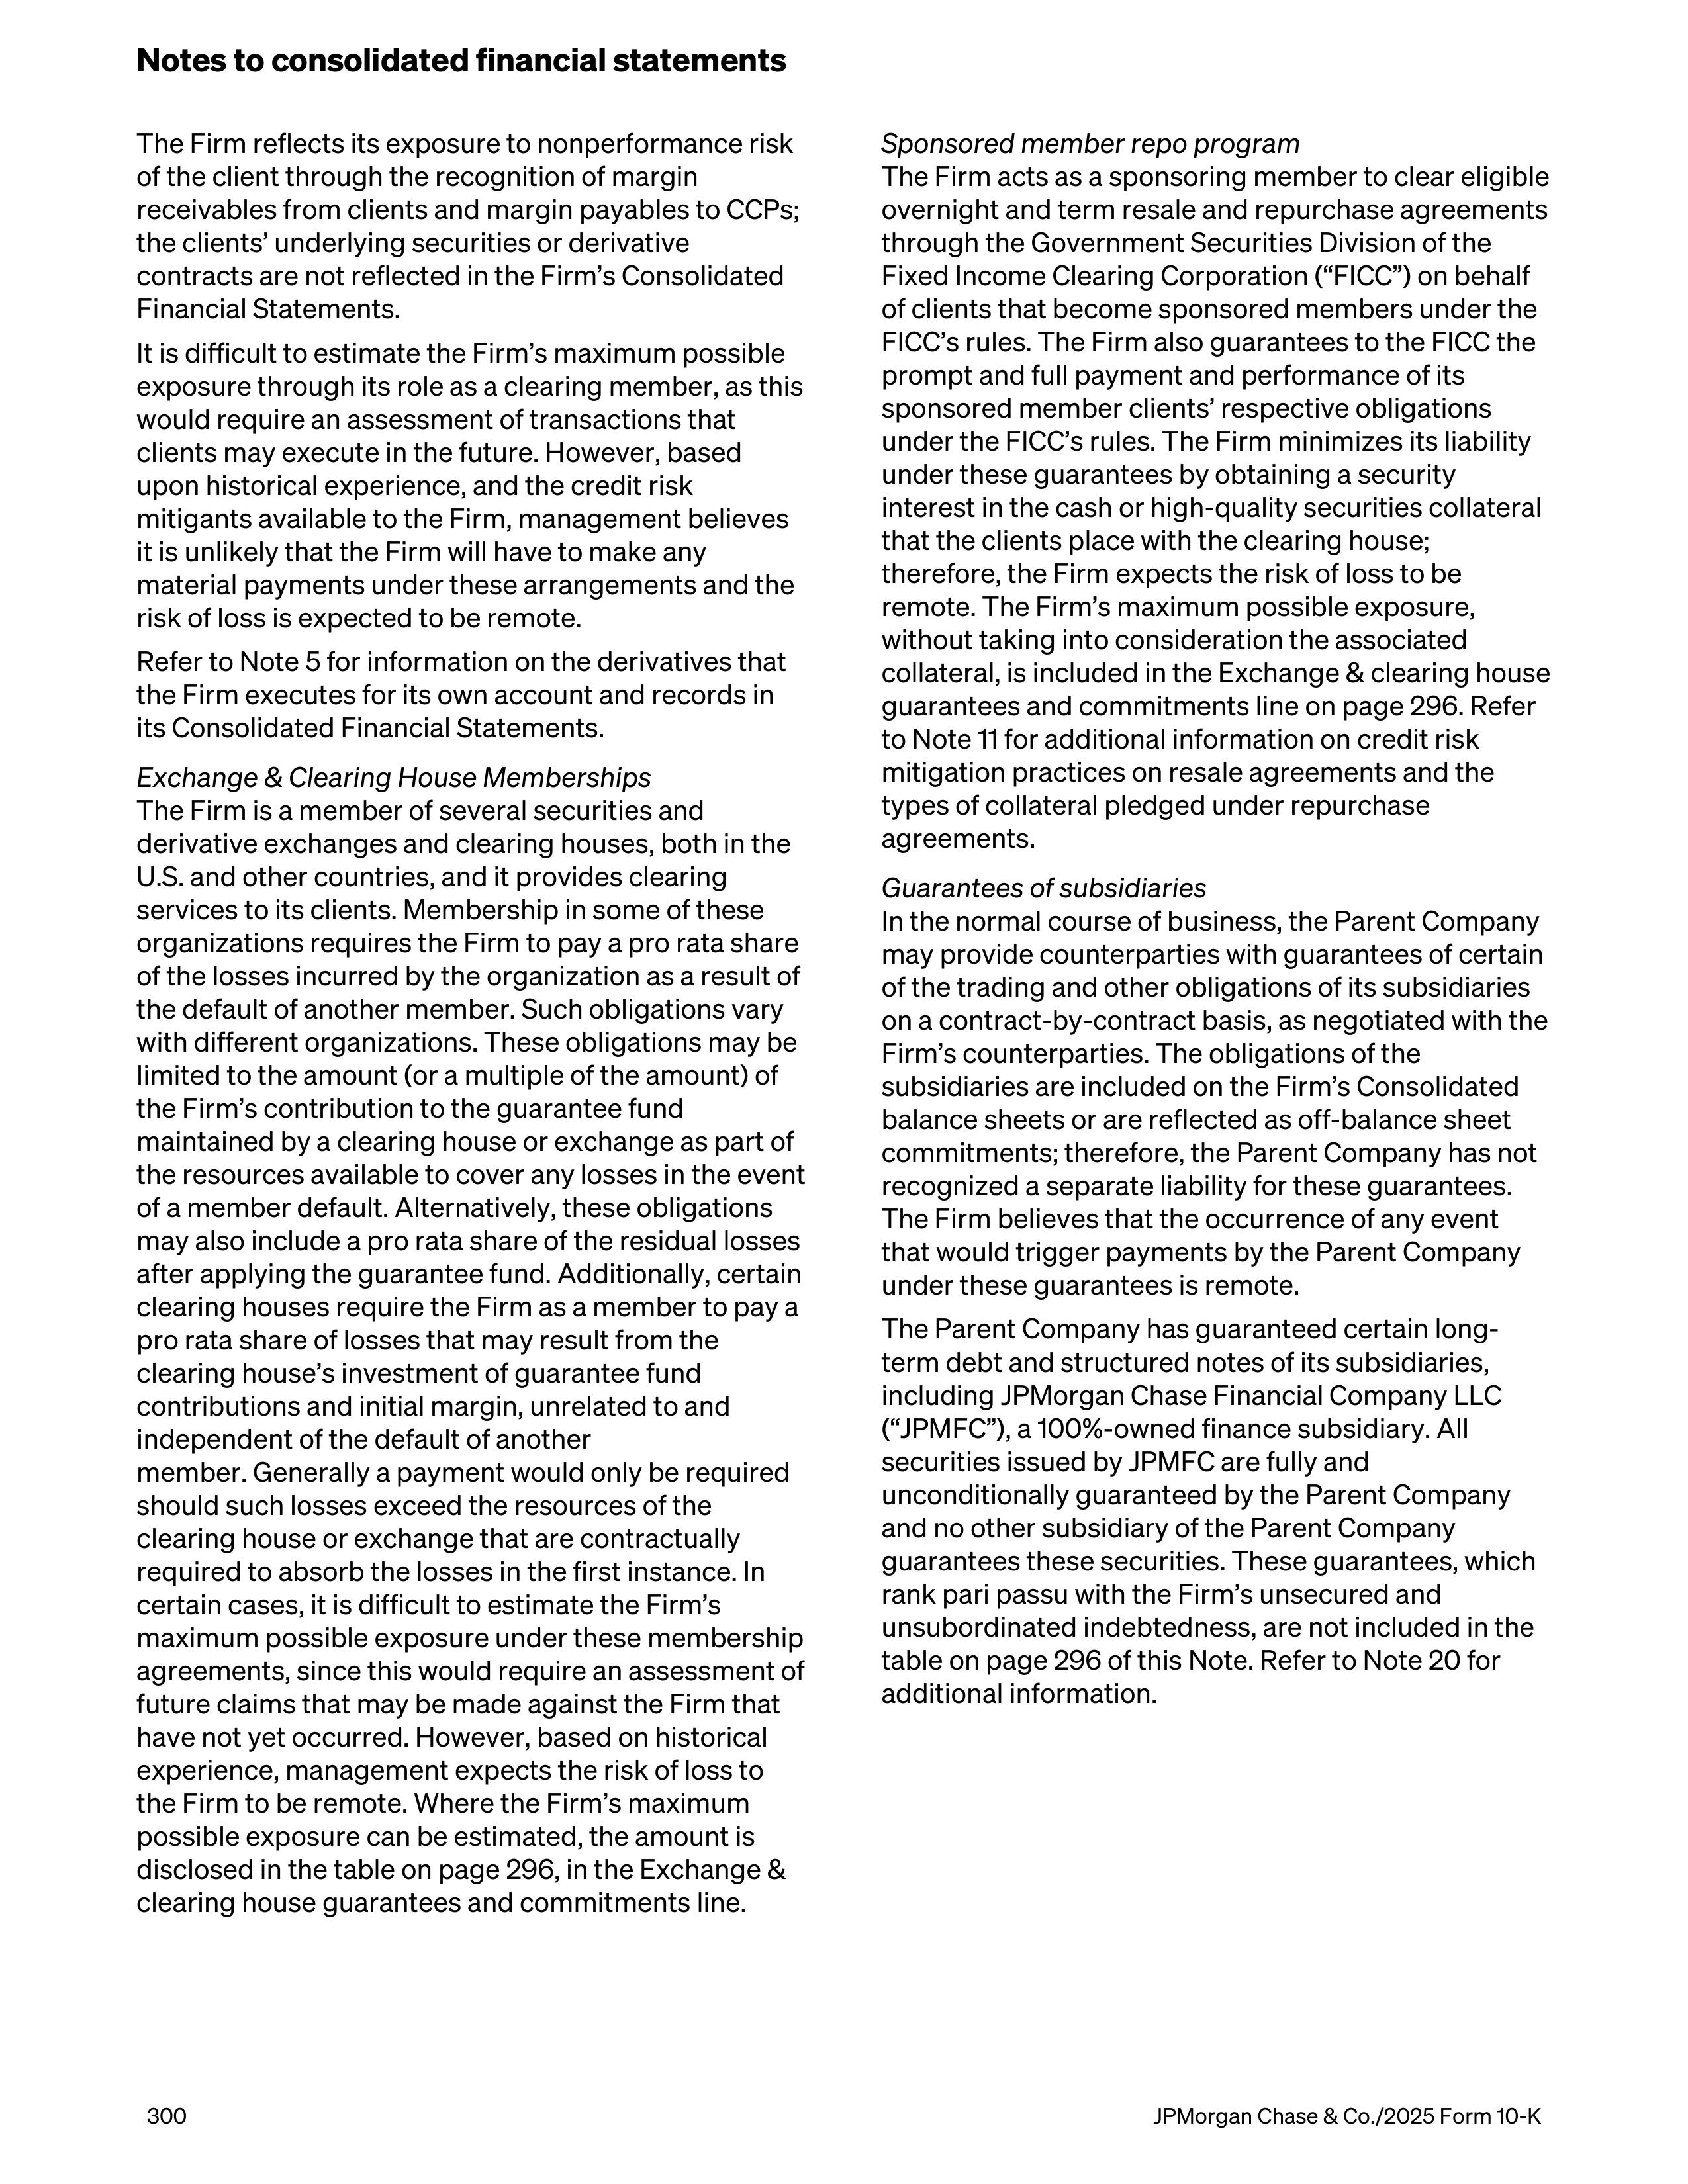
The Firm reflects its exposure to nonperformance risk
of the client through the recognition of margin
receivables from clients and margin payables to CCPs;
the clients’ underlying securities or derivative
contracts are not reflected in the Firm’s Consolidated
Financial Statements.
It is difficult to estimate the Firm’s maximum possible
exposure through its role as a clearing member, as this
would require an assessment of transactions that
clients may execute in the future. However, based
upon historical experience, and the credit risk
mitigants available to the Firm, management believes
it is unlikely that the Firm will have to make any
material payments under these arrangements and the
risk of loss is expected to be remote.
Refer to Note 5 for information on the derivatives that
the Firm executes for its own account and records in
its Consolidated Financial Statements.
Exchange & Clearing House Memberships
The Firm is a member of several securities and
derivative exchanges and clearing houses, both in the
U.S. and other countries, and it provides clearing
services to its clients. Membership in some of these
organizations requires the Firm to pay a pro rata share
of the losses incurred by the organization as a result of
the default of another member. Such obligations vary
with different organizations. These obligations may be
limited to the amount (or a multiple of the amount) of
the Firm’s contribution to the guarantee fund
maintained by a clearing house or exchange as part of
the resources available to cover any losses in the event
of a member default. Alternatively, these obligations
may also include a pro rata share of the residual losses
after applying the guarantee fund. Additionally, certain
clearing houses require the Firm as a member to pay a
pro rata share of losses that may result from the
clearing house’s investment of guarantee fund
contributions and initial margin, unrelated to and
independent of the default of another
member. Generally a payment would only be required
should such losses exceed the resources of the
clearing house or exchange that are contractually
required to absorb the losses in the first instance. In
certain cases, it is difficult to estimate the Firm’s
maximum possible exposure under these membership
agreements, since this would require an assessment of
future claims that may be made against the Firm that
have not yet occurred. However, based on historical
experience, management expects the risk of loss to
the Firm to be remote. Where the Firm’s maximum
possible exposure can be estimated, the amount is
disclosed in the table on page 296, in the Exchange &
clearing house guarantees and commitments line.
Sponsored member repo program
The Firm acts as a sponsoring member to clear eligible
overnight and term resale and repurchase agreements
through the Government Securities Division of the
Fixed Income Clearing Corporation (“FICC”) on behalf
of clients that become sponsored members under the
FICC’s rules. The Firm also guarantees to the FICC the
prompt and full payment and performance of its
sponsored member clients’ respective obligations
under the FICC’s rules. The Firm minimizes its liability
under these guarantees by obtaining a security
interest in the cash or high-quality securities collateral
that the clients place with the clearing house;
therefore, the Firm expects the risk of loss to be
remote. The Firm’s maximum possible exposure,
without taking into consideration the associated
collateral, is included in the Exchange & clearing house
guarantees and commitments line on page 296. Refer
to Note 11 for additional information on credit risk
mitigation practices on resale agreements and the
types of collateral pledged under repurchase
agreements.
Guarantees of subsidiaries
In the normal course of business, the Parent Company
may provide counterparties with guarantees of certain
of the trading and other obligations of its subsidiaries
on a contract-by-contract basis, as negotiated with the
Firm’s counterparties. The obligations of the
subsidiaries are included on the Firm’s Consolidated
balance sheets or are reflected as off-balance sheet
commitments; therefore, the Parent Company has not
recognized a separate liability for these guarantees.
The Firm believes that the occurrence of any event
that would trigger payments by the Parent Company
under these guarantees is remote.
The Parent Company has guaranteed certain long-
term debt and structured notes of its subsidiaries,
including JPMorgan Chase Financial Company LLC
(“JPMFC”), a 100%-owned finance subsidiary. All
securities issued by JPMFC are fully and
unconditionally guaranteed by the Parent Company
and no other subsidiary of the Parent Company
guarantees these securities. These guarantees, which
rank pari passu with the Firm’s unsecured and
unsubordinated indebtedness, are not included in the
table on page 296 of this Note. Refer to Note 20 for
additional information.
Notes to consolidated financial statements
300
JPMorgan Chase & Co./2025 Form 10-K
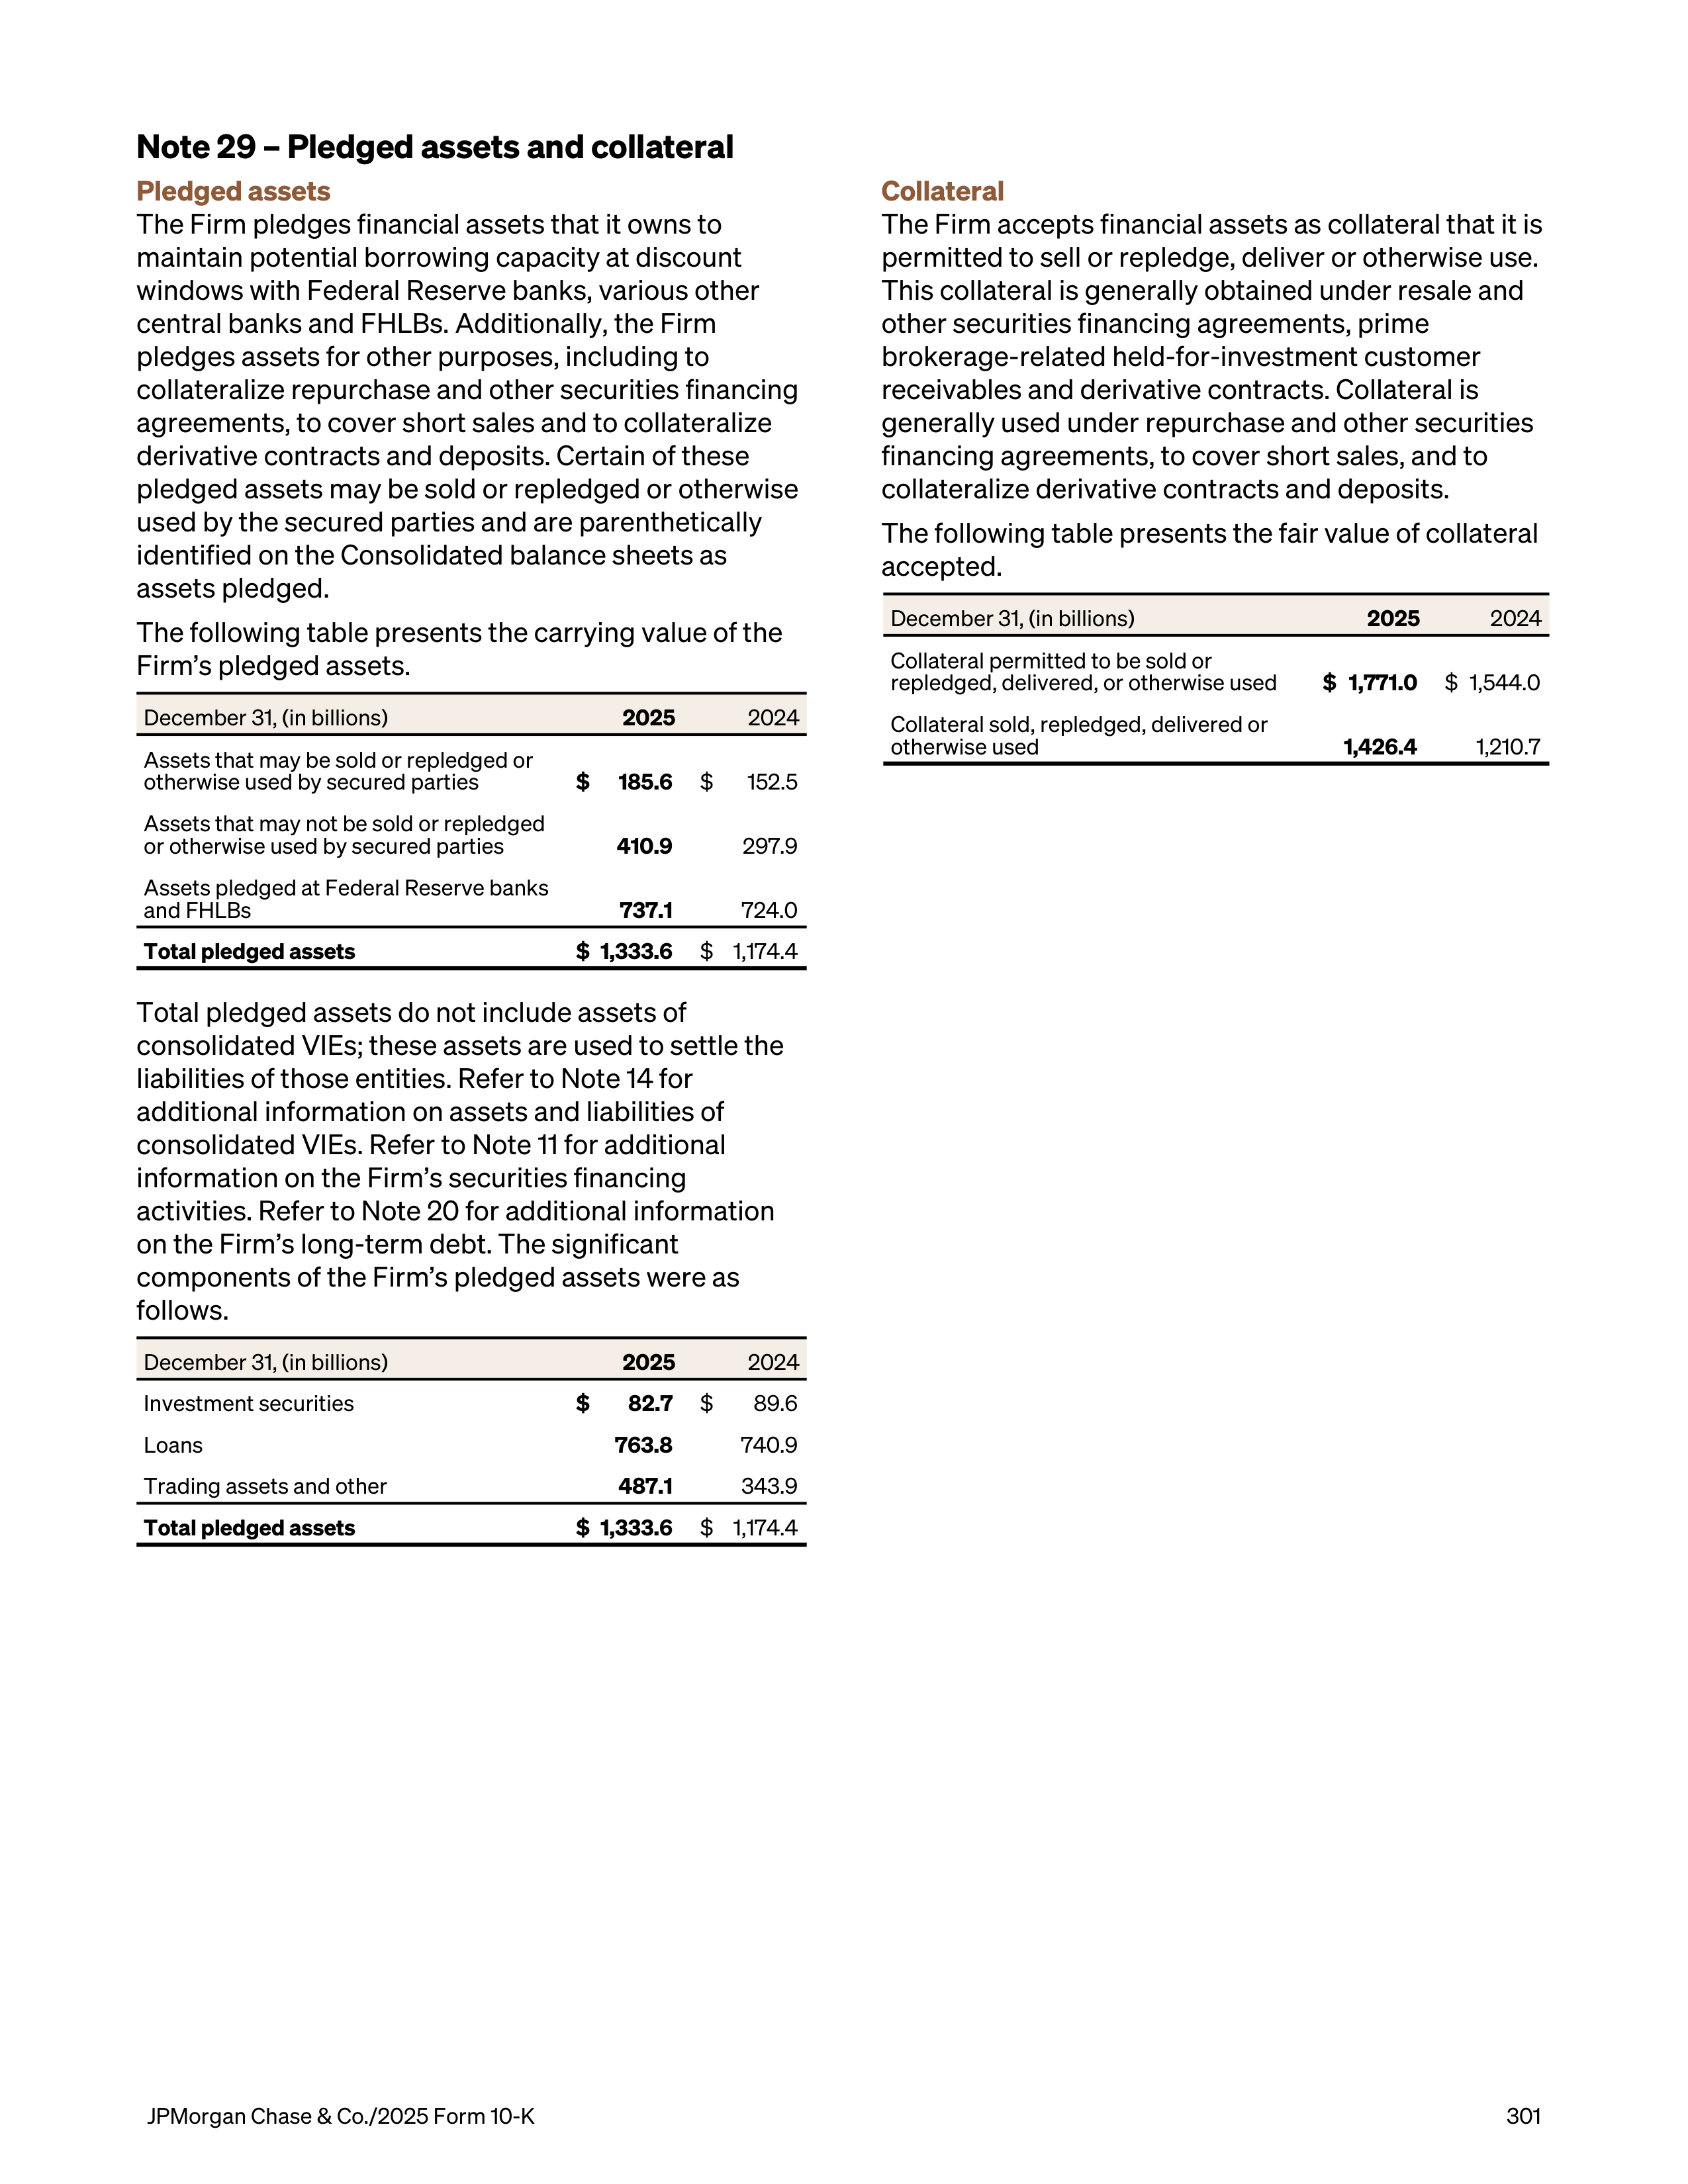
Note 29 – Pledged assets and collateral
Pledged assets
The Firm pledges financial assets that it owns to
maintain potential borrowing capacity at discount
windows with Federal Reserve banks, various other
central banks and FHLBs. Additionally, the Firm
pledges assets for other purposes, including to
collateralize repurchase and other securities financing
agreements, to cover short sales and to collateralize
derivative contracts and deposits. Certain of these
pledged assets may be sold or repledged or otherwise
used by the secured parties and are parenthetically
identified on the Consolidated balance sheets as
assets pledged.
The following table presents the carrying value of the
Firm’s pledged assets.
December 31, (in billions)
2025
2024
Assets that may be sold or repledged or
otherwise used by secured parties
$
185.6
$
152.5
Assets that may not be sold or repledged
or otherwise used by secured parties
410.9
297.9
Assets pledged at Federal Reserve banks
and FHLBs
737.1
724.0
Total pledged assets
$ 1,333.6
$ 1,174.4
Total pledged assets do not include assets of
consolidated VIEs; these assets are used to settle the
liabilities of those entities. Refer to Note 14 for
additional information on assets and liabilities of
consolidated VIEs. Refer to Note 11 for additional
information on the Firm’s securities financing
activities. Refer to Note 20 for additional information
on the Firm’s long-term debt. The significant
components of the Firm’s pledged assets were as
follows.
December 31, (in billions)
2025
2024
Investment securities
$
82.7
$
89.6
Loans
763.8
740.9
Trading assets and other
487.1
343.9
Total pledged assets
$ 1,333.6
$ 1,174.4
Collateral
The Firm accepts financial assets as collateral that it is
permitted to sell or repledge, deliver or otherwise use.
This collateral is generally obtained under resale and
other securities financing agreements, prime
brokerage-related held-for-investment customer
receivables and derivative contracts. Collateral is
generally used under repurchase and other securities
financing agreements, to cover short sales, and to
collateralize derivative contracts and deposits.
The following table presents the fair value of collateral
accepted.
December 31, (in billions)
2025
2024
Collateral permitted to be sold or
repledged, delivered, or otherwise used
$ 1,771.0
$ 1,544.0
Collateral sold, repledged, delivered or
otherwise used
1,426.4
1,210.7
JPMorgan Chase & Co./2025 Form 10-K
301
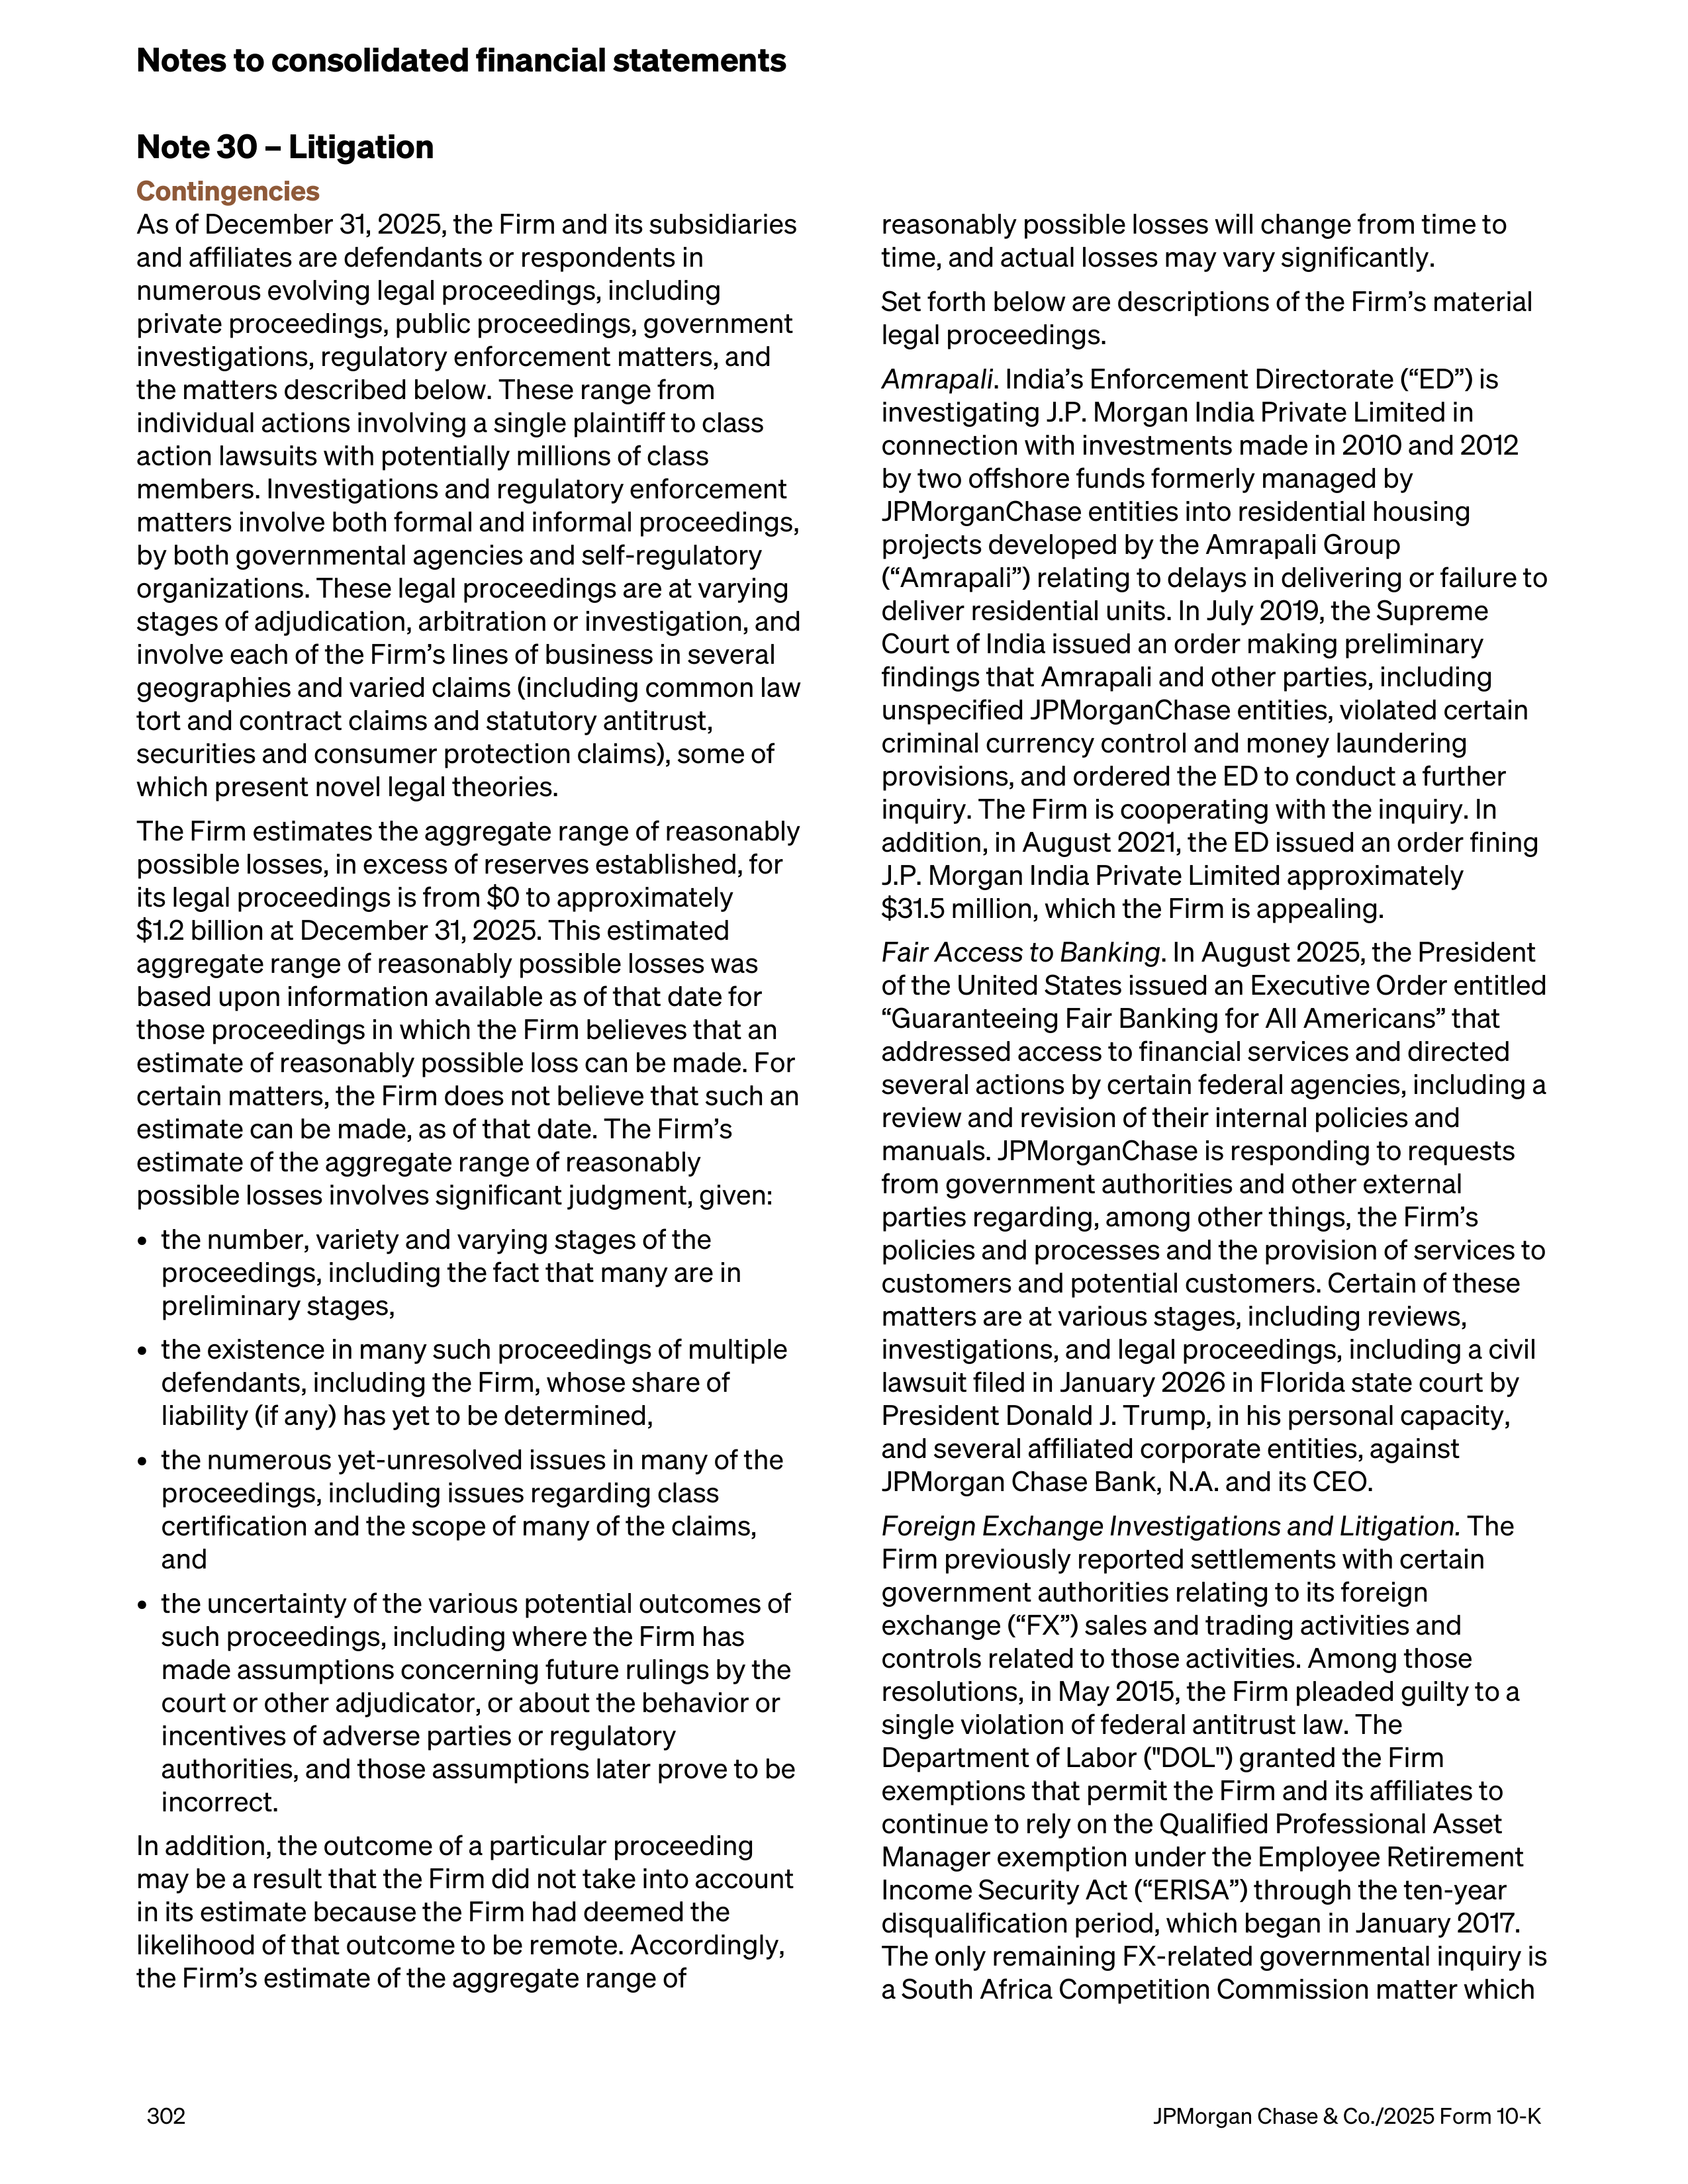
Note 30 – Litigation
Contingencies
As of December 31, 2025, the Firm and its subsidiaries
and affiliates are defendants or respondents in
numerous evolving legal proceedings, including
private proceedings, public proceedings, government
investigations, regulatory enforcement matters, and
the matters described below. These range from
individual actions involving a single plaintiff to class
action lawsuits with potentially millions of class
members. Investigations and regulatory enforcement
matters involve both formal and informal proceedings,
by both governmental agencies and self-regulatory
organizations. These legal proceedings are at varying
stages of adjudication, arbitration or investigation, and
involve each of the Firm’s lines of business in several
geographies and varied claims (including common law
tort and contract claims and statutory antitrust,
securities and consumer protection claims), some of
which present novel legal theories.
The Firm estimates the aggregate range of reasonably
possible losses, in excess of reserves established, for
its legal proceedings is from $0 to approximately
$1.2 billion at December 31, 2025. This estimated
aggregate range of reasonably possible losses was
based upon information available as of that date for
those proceedings in which the Firm believes that an
estimate of reasonably possible loss can be made. For
certain matters, the Firm does not believe that such an
estimate can be made, as of that date. The Firm’s
estimate of the aggregate range of reasonably
possible losses involves significant judgment, given:
•
the number, variety and varying stages of the
proceedings, including the fact that many are in
preliminary stages,
•
the existence in many such proceedings of multiple
defendants, including the Firm, whose share of
liability (if any) has yet to be determined,
•
the numerous yet-unresolved issues in many of the
proceedings, including issues regarding class
certification and the scope of many of the claims,
and
•
the uncertainty of the various potential outcomes of
such proceedings, including where the Firm has
made assumptions concerning future rulings by the
court or other adjudicator, or about the behavior or
incentives of adverse parties or regulatory
authorities, and those assumptions later prove to be
incorrect.
In addition, the outcome of a particular proceeding
may be a result that the Firm did not take into account
in its estimate because the Firm had deemed the
likelihood of that outcome to be remote. Accordingly,
the Firm’s estimate of the aggregate range of
reasonably possible losses will change from time to
time, and actual losses may vary significantly.
Set forth below are descriptions of the Firm’s material
legal proceedings.
Amrapali
. India’s Enforcement Directorate (“ED”) is
investigating J.P. Morgan India Private Limited in
connection with investments made in 2010 and 2012
by two offshore funds formerly managed by
JPMorganChase entities into residential housing
projects developed by the Amrapali Group
(“Amrapali”) relating to delays in delivering or failure to
deliver residential units. In July 2019, the Supreme
Court of India issued an order making preliminary
findings that Amrapali and other parties, including
unspecified JPMorganChase entities, violated certain
criminal currency control and money laundering
provisions, and ordered the ED to conduct a further
inquiry. The Firm is cooperating with the inquiry. In
addition, in August 2021, the ED issued an order fining
J.P. Morgan India Private Limited approximately
$31.5 million, which the Firm is appealing.
Fair Access to Banking
. In August 2025, the President
of the United States issued an Executive Order entitled
“Guaranteeing Fair Banking for All Americans” that
addressed access to financial services and directed
several actions by certain federal agencies, including a
review and revision of their internal policies and
manuals. JPMorganChase is responding to requests
from government authorities and other external
parties regarding, among other things, the Firm’s
policies and processes and the provision of services to
customers and potential customers. Certain of these
matters are at various stages, including reviews,
investigations, and legal proceedings, including a civil
lawsuit filed in January 2026 in Florida state court by
President Donald J. Trump, in his personal capacity,
and several affiliated corporate entities, against
JPMorgan Chase Bank, N.A. and its CEO.
Foreign Exchange Investigations and Litigation.
The
Firm previously reported settlements with certain
government authorities relating to its foreign
exchange (“FX”) sales and trading activities and
controls related to those activities. Among those
resolutions, in May 2015, the Firm pleaded guilty to a
single violation of federal antitrust law. The
Department of Labor ("DOL") granted the Firm
exemptions that permit the Firm and its affiliates to
continue to rely on the Qualified Professional Asset
Manager exemption under the Employee Retirement
Income Security Act (“ERISA”) through the ten-year
disqualification period, which began in January 2017.
The only remaining FX-related governmental inquiry is
a South Africa Competition Commission matter which
Notes to consolidated financial statements
302
JPMorgan Chase & Co./2025 Form 10-K
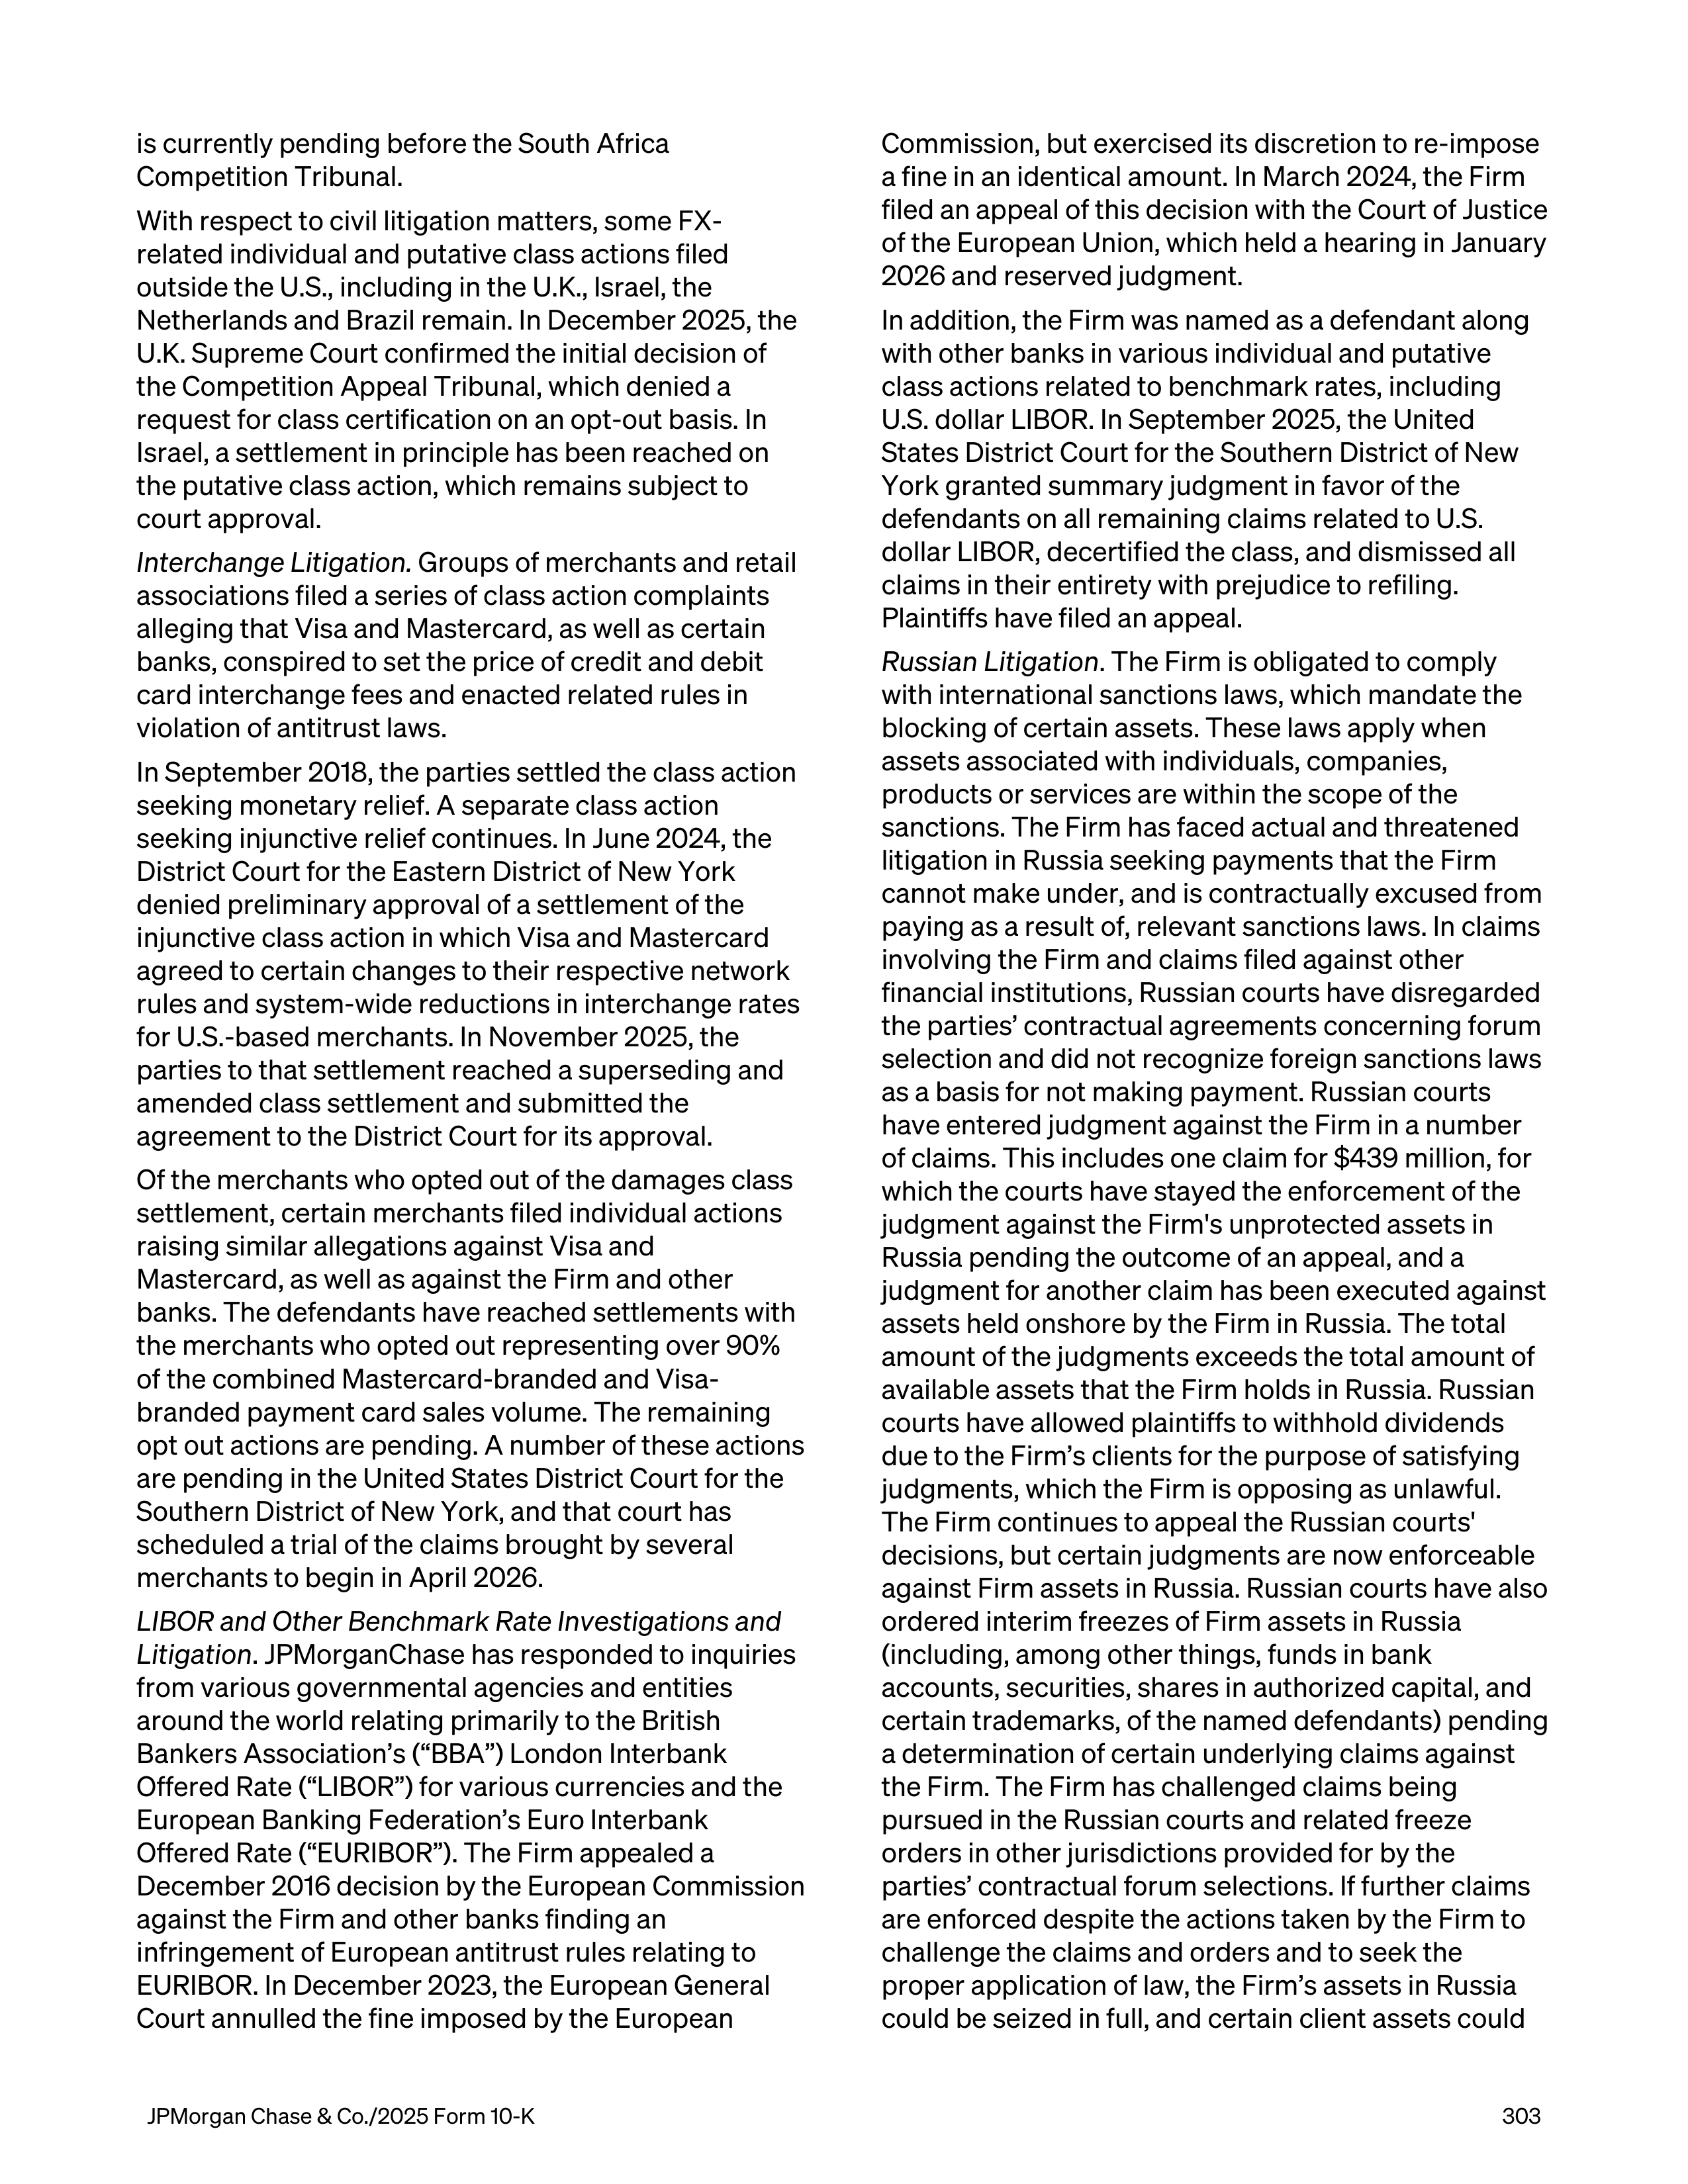
is currently pending before the South Africa
Competition Tribunal.
With respect to civil litigation matters, some FX-
related individual and putative class actions filed
outside the U.S., including in the U.K., Israel, the
Netherlands and Brazil remain. In December 2025, the
U.K. Supreme Court confirmed the initial decision of
the Competition Appeal Tribunal, which denied a
request for class certification on an opt-out basis. In
Israel, a settlement in principle has been reached on
the putative class action, which remains subject to
court approval.
Interchange Litigation.
Groups of merchants and retail
associations filed a series of class action complaints
alleging that Visa and Mastercard, as well as certain
banks, conspired to set the price of credit and debit
card interchange fees and enacted related rules in
violation of antitrust laws.
In September 2018, the parties settled the class action
seeking monetary relief. A separate class action
seeking injunctive relief continues. In June 2024, the
District Court for the Eastern District of New York
denied preliminary approval of a settlement of the
injunctive class action in which Visa and Mastercard
agreed to certain changes to their respective network
rules and system-wide reductions in interchange rates
for U.S.-based merchants. In November 2025, the
parties to that settlement reached a superseding and
amended class settlement and submitted the
agreement to the District Court for its approval.
Of the merchants who opted out of the damages class
settlement, certain merchants filed individual actions
raising similar allegations against Visa and
Mastercard, as well as against the Firm and other
banks. The defendants have reached settlements with
the merchants who opted out representing over 90%
of the combined Mastercard-branded and Visa-
branded payment card sales volume. The remaining
opt out actions are pending. A number of these actions
are pending in the United States District Court for the
Southern District of New York, and that court has
scheduled a trial of the claims brought by several
merchants to begin in April 2026.
LIBOR and Other Benchmark Rate Investigations and
Litigation
. JPMorganChase has responded to inquiries
from various governmental agencies and entities
around the world relating primarily to the British
Bankers Association’s (“BBA”) London Interbank
Offered Rate (“LIBOR”) for various currencies and the
European Banking Federation’s Euro Interbank
Offered Rate (“EURIBOR”). The Firm appealed a
December 2016 decision by the European Commission
against the Firm and other banks finding an
infringement of European antitrust rules relating to
EURIBOR. In December 2023, the European General
Court annulled the fine imposed by the European
Commission, but exercised its discretion to re-impose
a fine in an identical amount. In March 2024, the Firm
filed an appeal of this decision with the Court of Justice
of the European Union, which held a hearing in January
2026 and reserved judgment.
In addition, the Firm was named as a defendant along
with other banks in various individual and putative
class actions related to benchmark rates, including
U.S. dollar LIBOR. In September 2025, the United
States District Court for the Southern District of New
York granted summary judgment in favor of the
defendants on all remaining claims related to U.S.
dollar LIBOR, decertified the class, and dismissed all
claims in their entirety with prejudice to refiling.
Plaintiffs have filed an appeal.
Russian Litigation
. The Firm is obligated to comply
with international sanctions laws, which mandate the
blocking of certain assets. These laws apply when
assets associated with individuals, companies,
products or services are within the scope of the
sanctions. The Firm has faced actual and threatened
litigation in Russia seeking payments that the Firm
cannot make under, and is contractually excused from
paying as a result of, relevant sanctions laws. In claims
involving the Firm and claims filed against other
financial institutions, Russian courts have disregarded
the parties’ contractual agreements concerning forum
selection and did not recognize foreign sanctions laws
as a basis for not making payment. Russian courts
have entered judgment against the Firm in a number
of claims. This includes one claim for $439 million, for
which the courts have stayed the enforcement of the
judgment against the Firm's unprotected assets in
Russia pending the outcome of an appeal, and a
judgment for another claim has been executed against
assets held onshore by the Firm in Russia. The total
amount of the judgments exceeds the total amount of
available assets that the Firm holds in Russia. Russian
courts have allowed plaintiffs to withhold dividends
due to the Firm’s clients for the purpose of satisfying
judgments, which the Firm is opposing as unlawful.
The Firm continues to appeal the Russian courts'
decisions, but certain judgments are now enforceable
against Firm assets in Russia. Russian courts have also
ordered interim freezes of Firm assets in Russia
(including, among other things, funds in bank
accounts, securities, shares in authorized capital, and
certain trademarks, of the named defendants) pending
a determination of certain underlying claims against
the Firm. The Firm has challenged claims being
pursued in the Russian courts and related freeze
orders in other jurisdictions provided for by the
parties’ contractual forum selections. If further claims
are enforced despite the actions taken by the Firm to
challenge the claims and orders and to seek the
proper application of law, the Firm’s assets in Russia
could be seized in full, and certain client assets could
JPMorgan Chase & Co./2025 Form 10-K
303
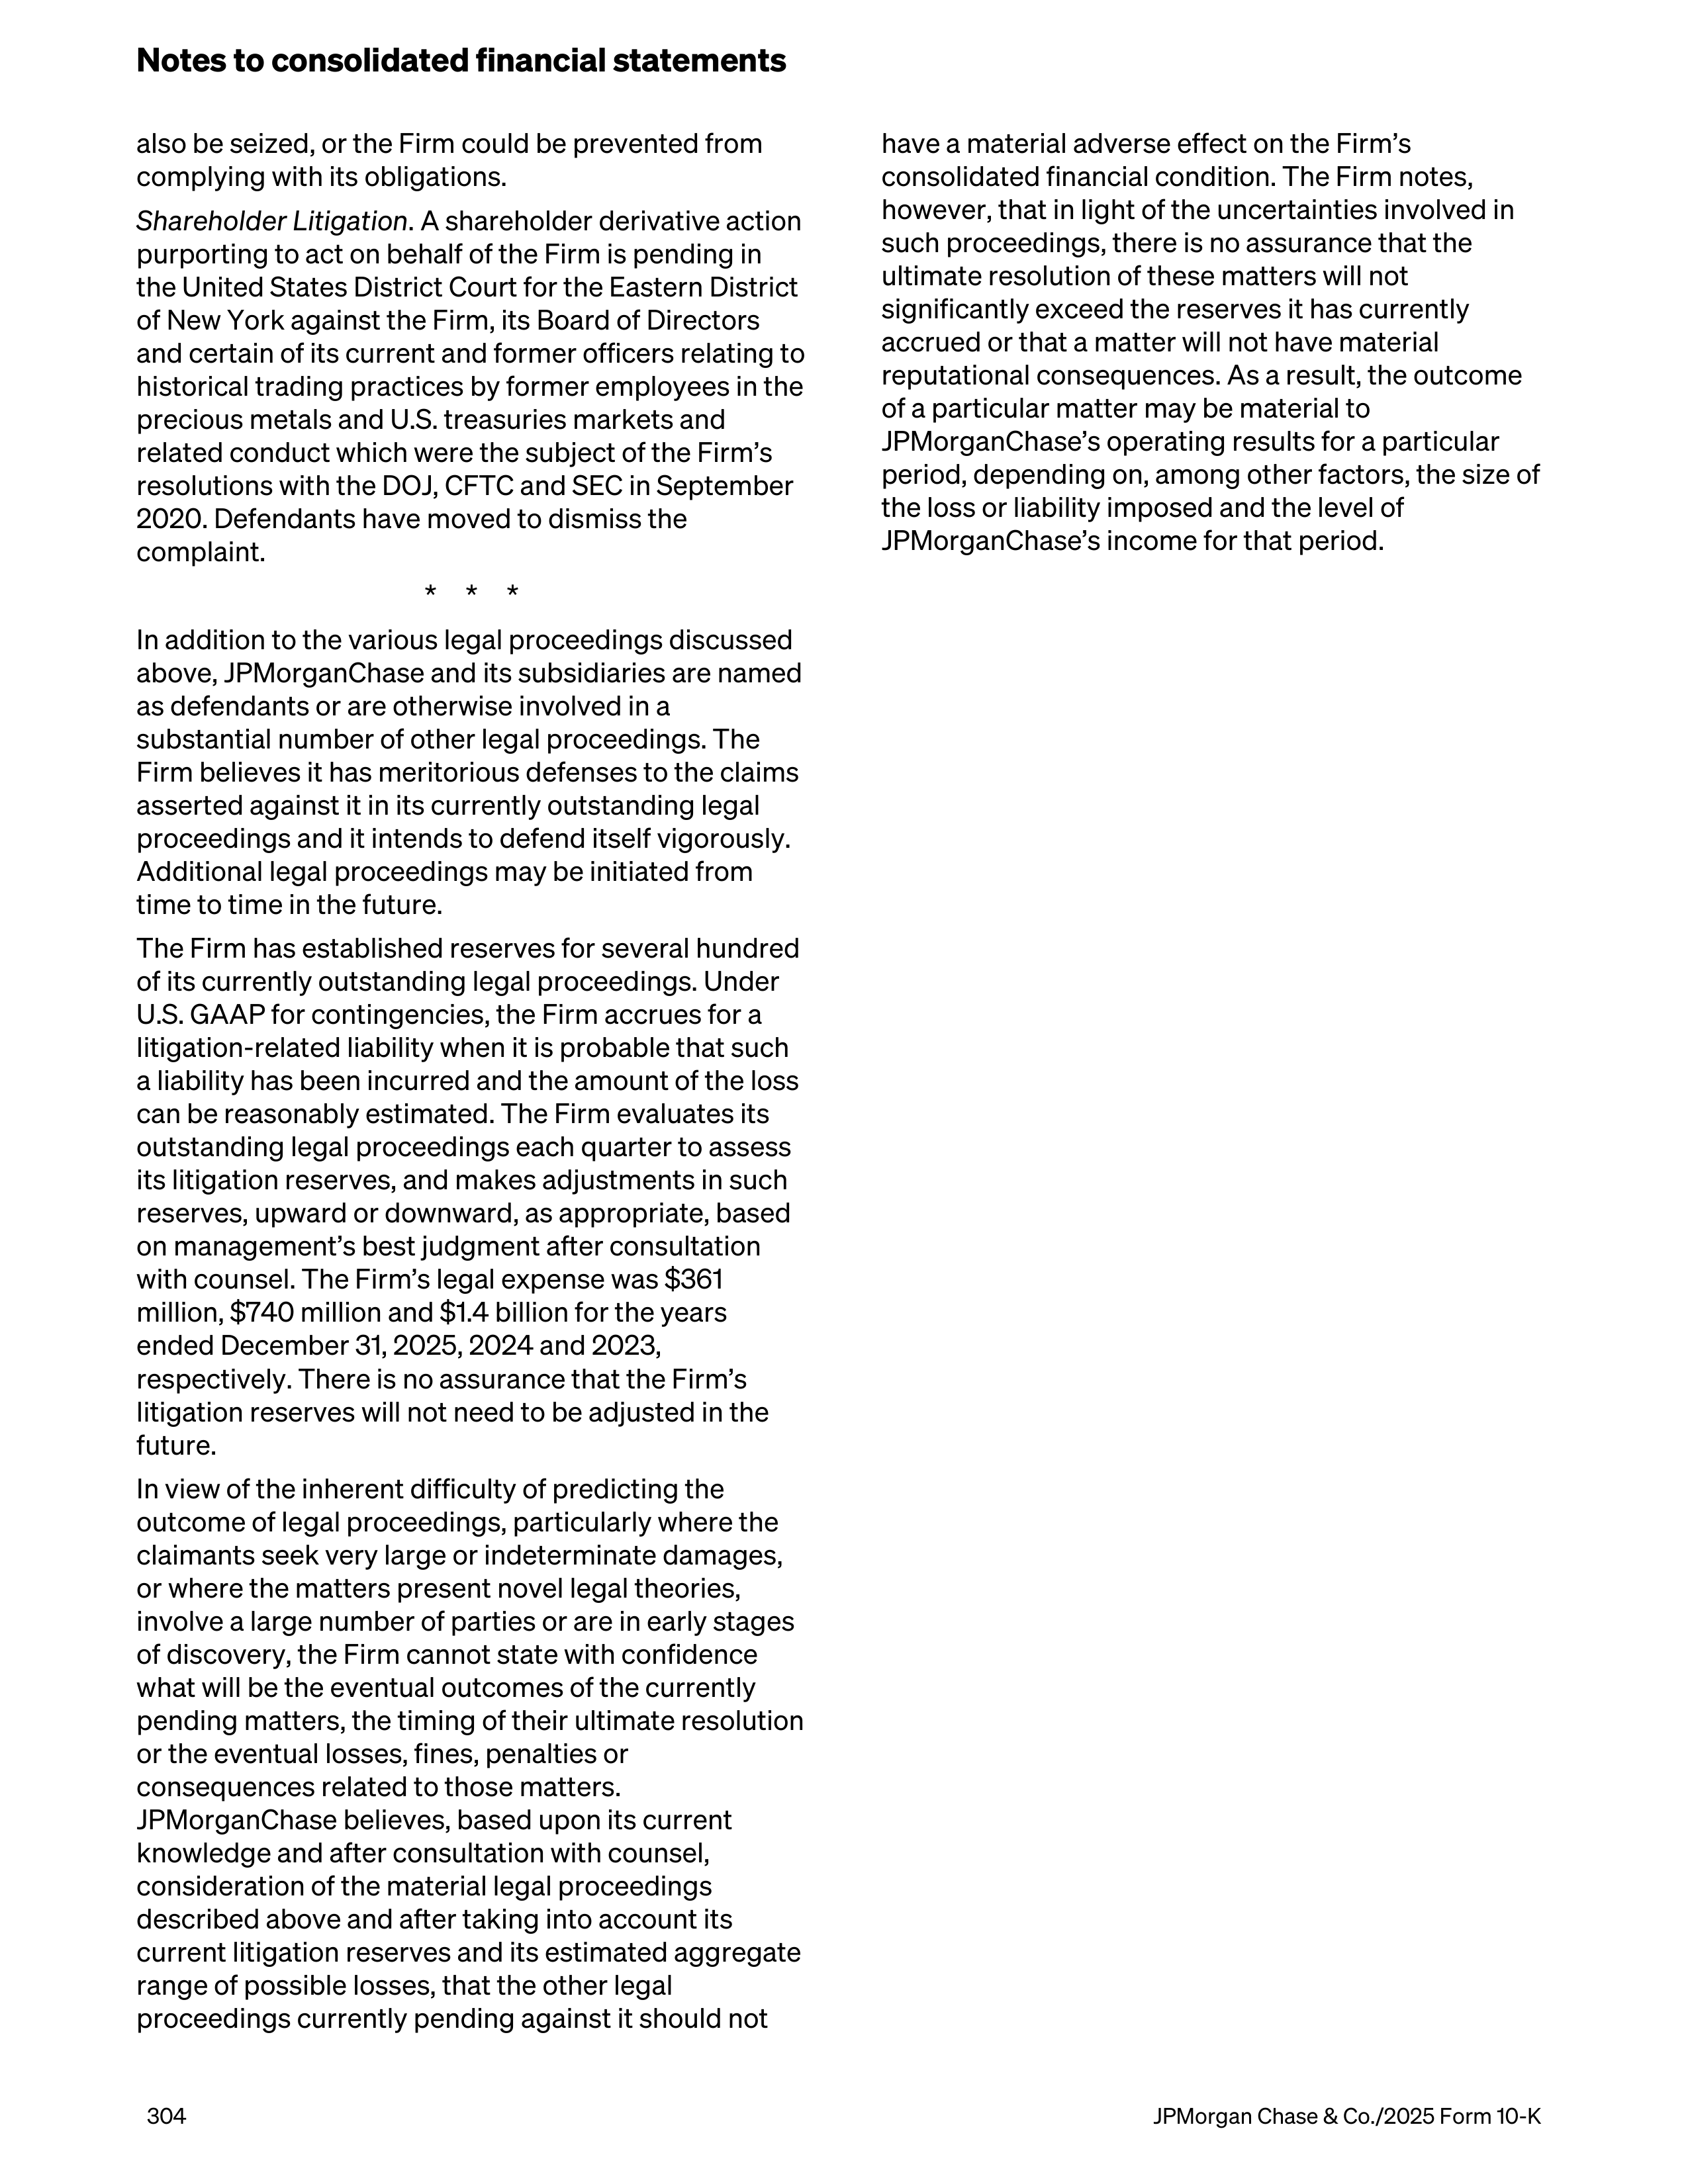
also be seized, or the Firm could be prevented from
complying with its obligations.
Shareholder Litigation
. A shareholder derivative action
purporting to act on behalf of the Firm is pending in
the United States District Court for the Eastern District
of New York against the Firm, its Board of Directors
and certain of its current and former officers relating to
historical trading practices by former employees in the
precious metals and U.S. treasuries markets and
related conduct which were the subject of the Firm’s
resolutions with the DOJ, CFTC and SEC in September
2020. Defendants have moved to dismiss the
complaint.
* * *
In addition to the various legal proceedings discussed
above, JPMorganChase and its subsidiaries are named
as defendants or are otherwise involved in a
substantial number of other legal proceedings. The
Firm believes it has meritorious defenses to the claims
asserted against it in its currently outstanding legal
proceedings and it intends to defend itself vigorously.
Additional legal proceedings may be initiated from
time to time in the future.
The Firm has established reserves for several hundred
of its currently outstanding legal proceedings. Under
U.S. GAAP for contingencies, the Firm accrues for a
litigation-related liability when it is probable that such
a liability has been incurred and the amount of the loss
can be reasonably estimated. The Firm evaluates its
outstanding legal proceedings each quarter to assess
its litigation reserves, and makes adjustments in such
reserves, upward or downward, as appropriate, based
on management’s best judgment after consultation
with counsel. The Firm’s legal expense was $361
million, $740 million and $1.4 billion for the years
ended December 31, 2025, 2024 and 2023,
respectively. There is no assurance that the Firm’s
litigation reserves will not need to be adjusted in the
future.
In view of the inherent difficulty of predicting the
outcome of legal proceedings, particularly where the
claimants seek very large or indeterminate damages,
or where the matters present novel legal theories,
involve a large number of parties or are in early stages
of discovery, the Firm cannot state with confidence
what will be the eventual outcomes of the currently
pending matters, the timing of their ultimate resolution
or the eventual losses, fines, penalties or
consequences related to those matters.
JPMorganChase believes, based upon its current
knowledge and after consultation with counsel,
consideration of the material legal proceedings
described above and after taking into account its
current litigation reserves and its estimated aggregate
range of possible losses, that the other legal
proceedings currently pending against it should not
have a material adverse effect on the Firm’s
consolidated financial condition. The Firm notes,
however, that in light of the uncertainties involved in
such proceedings, there is no assurance that the
ultimate resolution of these matters will not
significantly exceed the reserves it has currently
accrued or that a matter will not have material
reputational consequences. As a result, the outcome
of a particular matter may be material to
JPMorganChase’s operating results for a particular
period, depending on, among other factors, the size of
the loss or liability imposed and the level of
JPMorganChase’s income for that period.
Notes to consolidated financial statements
304
JPMorgan Chase & Co./2025 Form 10-K
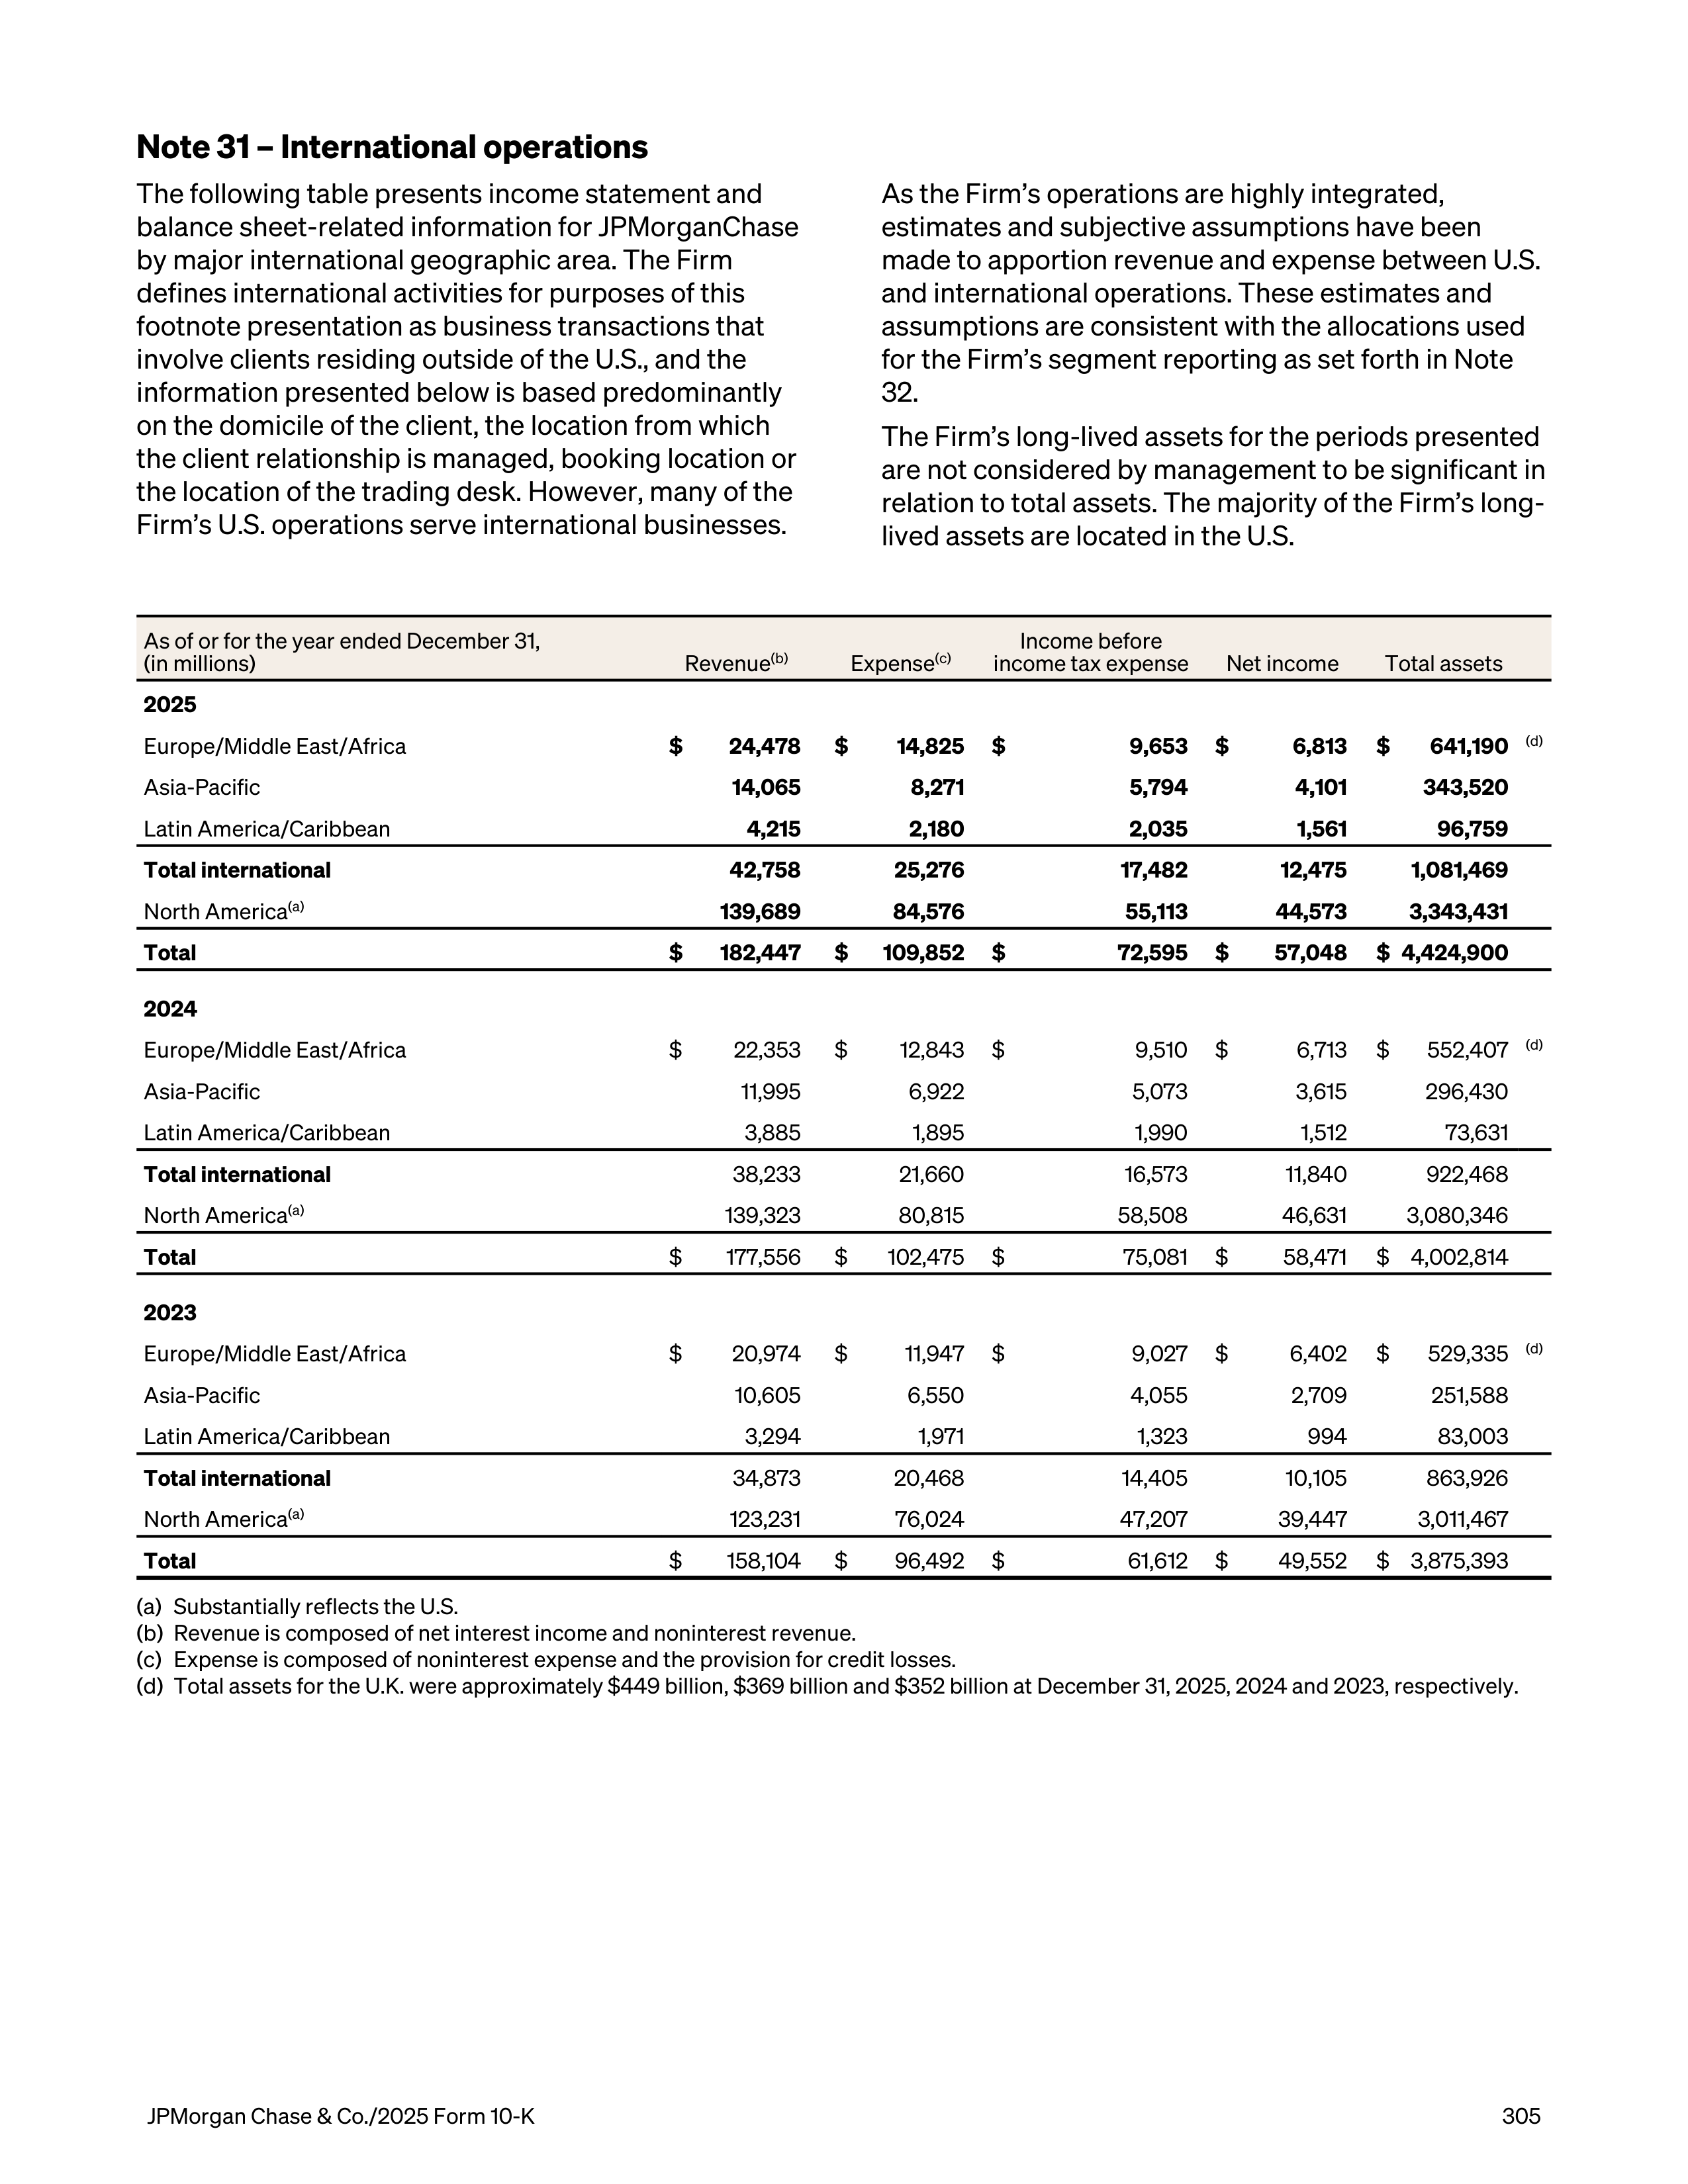
Note 31 – International operations
The following table presents income statement and
balance sheet-related information for JPMorganChase
by major international geographic area. The Firm
defines international activities for purposes of this
footnote presentation as business transactions that
involve clients residing outside of the U.S., and the
information presented below is based predominantly
on the domicile of the client, the location from which
the client relationship is managed, booking location or
the location of the trading desk. However, many of the
Firm’s U.S. operations serve international businesses.
As the Firm’s operations are highly integrated,
estimates and subjective assumptions have been
made to apportion revenue and expense between U.S.
and international operations. These estimates and
assumptions are consistent with the allocations used
for the Firm’s segment reporting as set forth in Note
32.
The Firm’s long-lived assets for the periods presented
are not considered by management to be significant in
relation to total assets. The majority of the Firm’s long-
lived assets are located in the U.S.
As of or for the year ended December 31,
(in millions)
Revenue
(b)
Expense
(c)
Income before
income tax expense
Net income
Total assets
2025
Europe/Middle East/Africa
$
24,478
$
14,825
$
9,653
$
6,813
$
641,190
(d)
Asia-Pacific
14,065
8,271
5,794
4,101
343,520
Latin America/Caribbean
4,215
2,180
2,035
1,561
96,759
Total international
42,758
25,276
17,482
12,475
1,081,469
North America
(a)
139,689
84,576
55,113
44,573
3,343,431
Total
$
182,447
$
109,852
$
72,595
$
57,048
$ 4,424,900
2024
Europe/Middle East/Africa
$
22,353
$
12,843
$
9,510
$
6,713
$
552,407
(d)
Asia-Pacific
11,995
6,922
5,073
3,615
296,430
Latin America/Caribbean
3,885
1,895
1,990
1,512
73,631
Total international
38,233
21,660
16,573
11,840
922,468
North America
(a)
139,323
80,815
58,508
46,631
3,080,346
Total
$
177,556
$
102,475
$
75,081
$
58,471
$ 4,002,814
2023
Europe/Middle East/Africa
$
20,974
$
11,947
$
9,027
$
6,402
$
529,335
(d)
Asia-Pacific
10,605
6,550
4,055
2,709
251,588
Latin America/Caribbean
3,294
1,971
1,323
994
83,003
Total international
34,873
20,468
14,405
10,105
863,926
North America
(a)
123,231
76,024
47,207
39,447
3,011,467
Total
$
158,104
$
96,492
$
61,612
$
49,552
$ 3,875,393
(a)
Substantially reflects the U.S.
(b)
Revenue is composed of net interest income and noninterest revenue.
(c)
Expense is composed of noninterest expense and the provision for credit losses.
(d)
Total assets for the U.K. were approximately $449 billion, $369 billion and $352 billion at December 31, 2025, 2024 and 2023, respectively.
JPMorgan Chase & Co./2025 Form 10-K
305
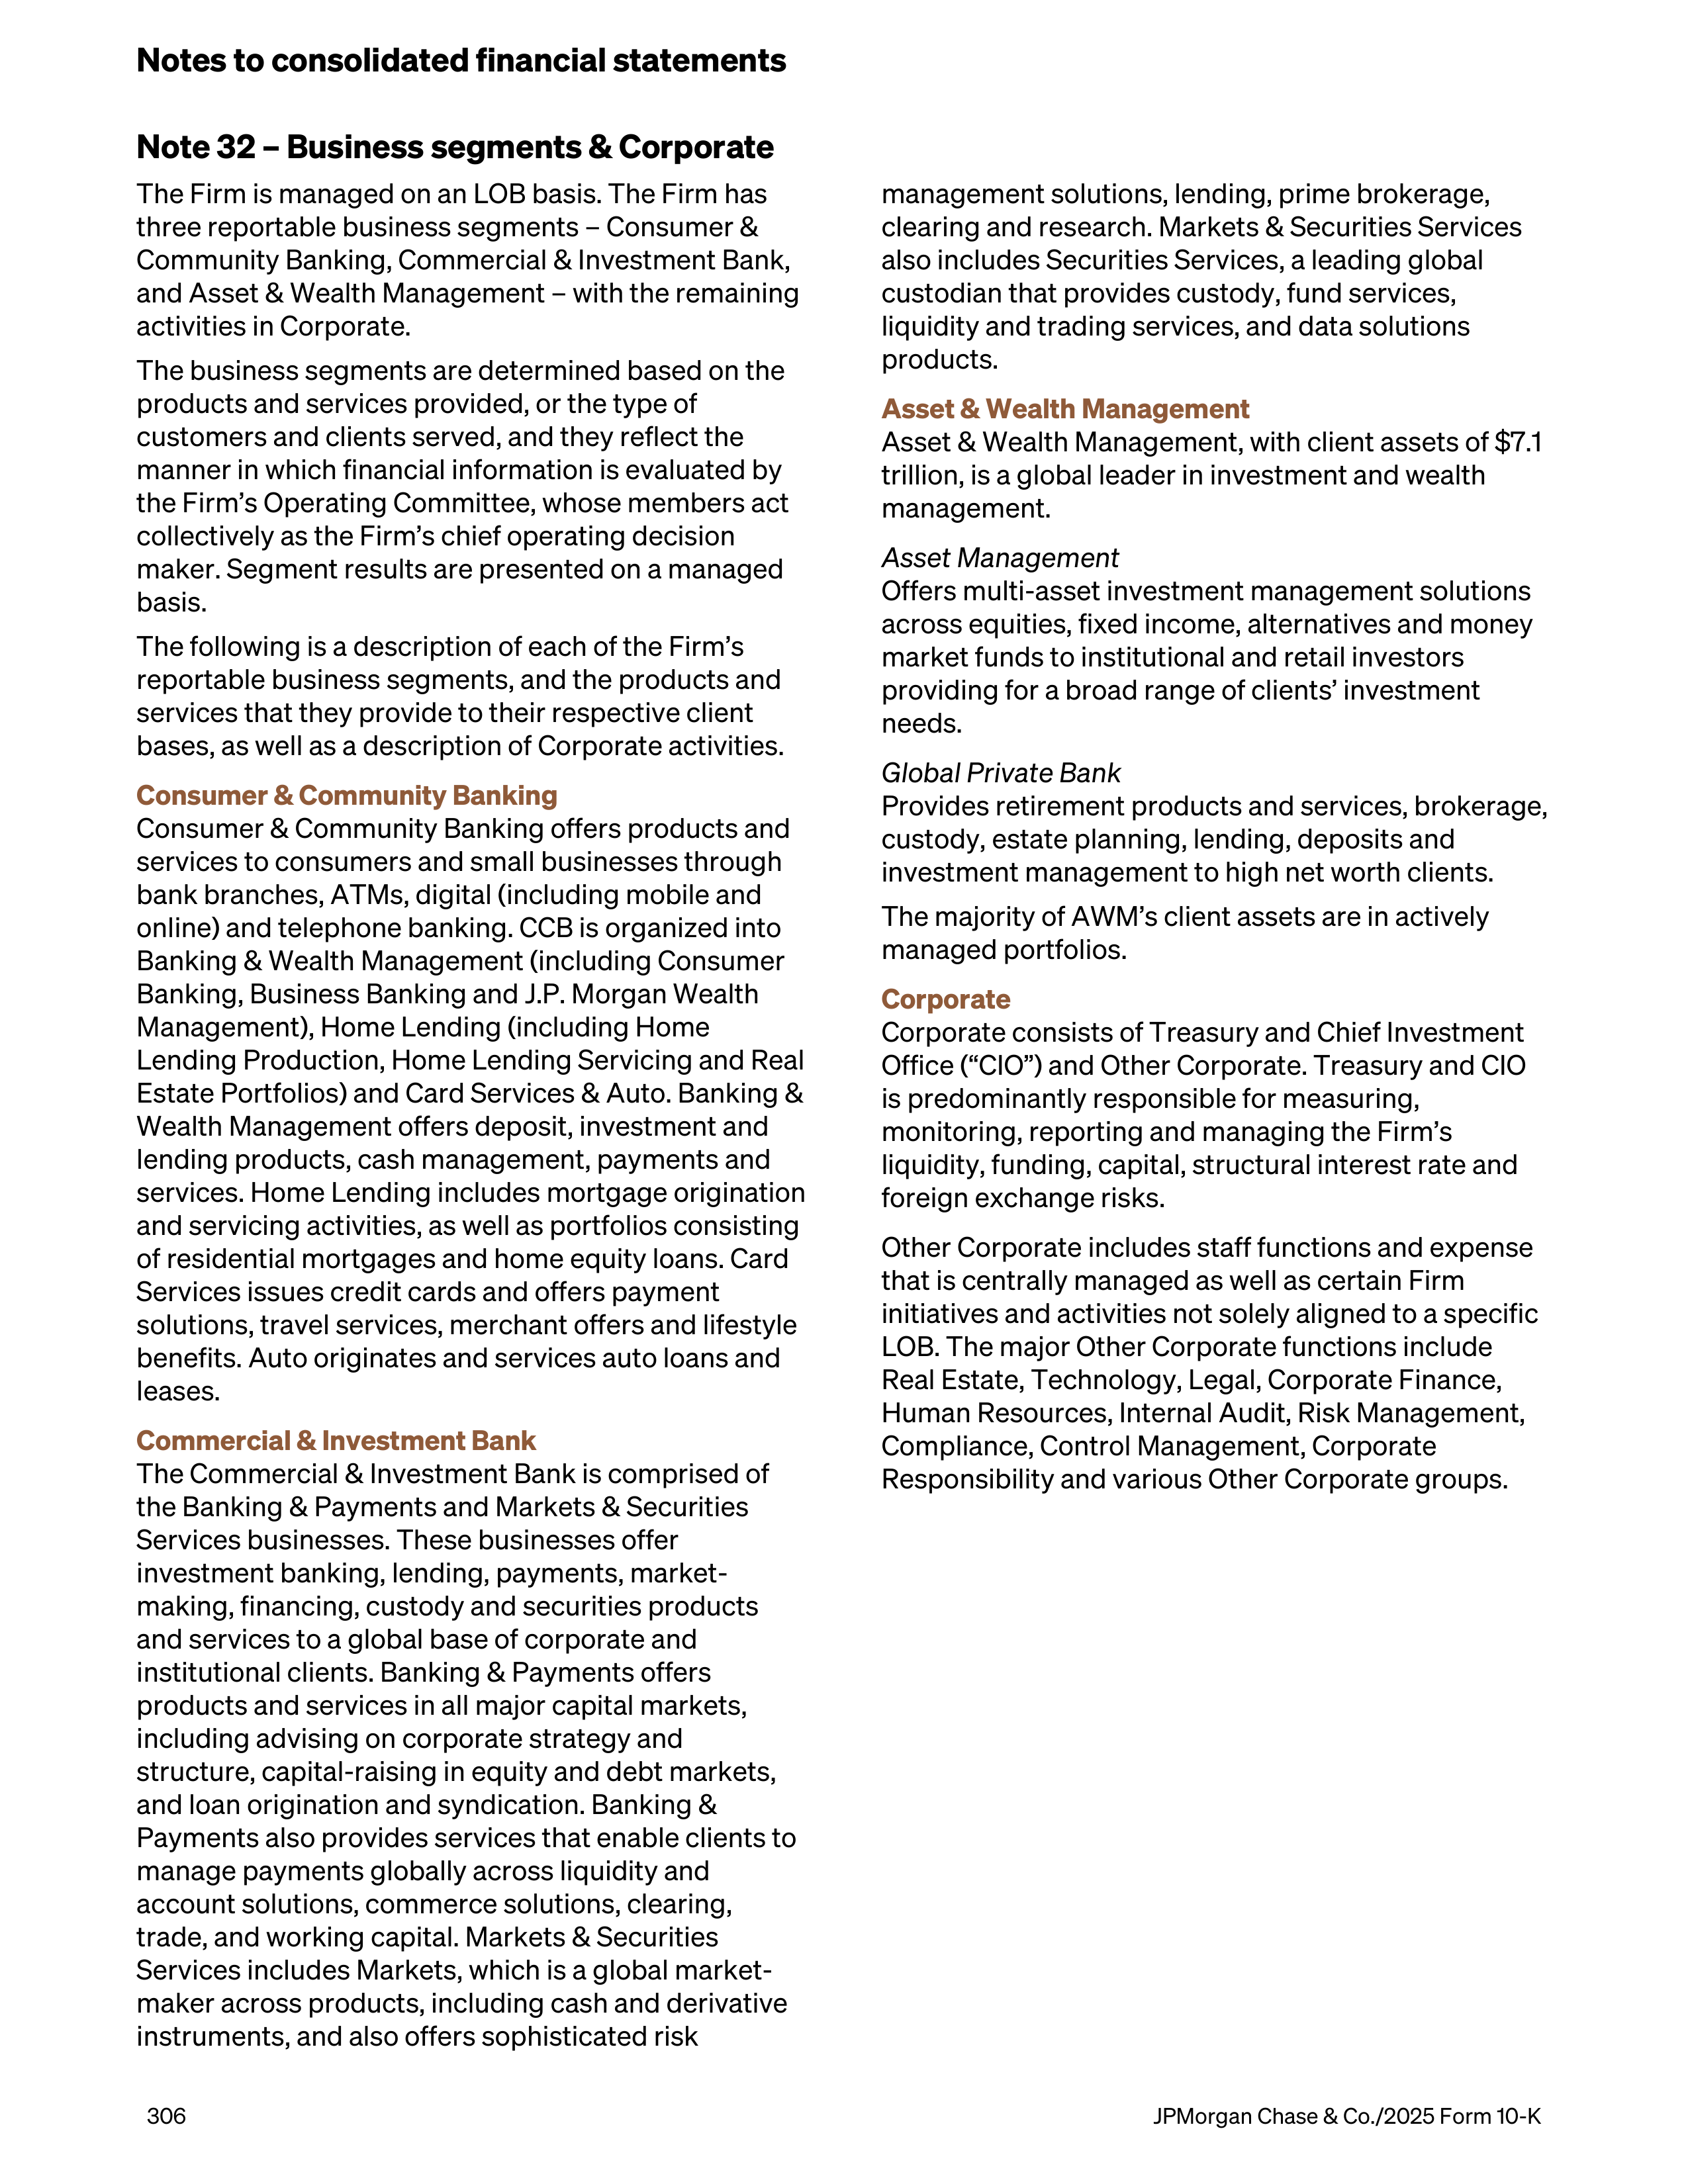
Note 32 – Business segments & Corporate
The Firm is managed on an LOB basis. The Firm has
three reportable business segments – Consumer &
Community Banking, Commercial & Investment Bank,
and Asset & Wealth Management – with the remaining
activities in Corporate.
The business segments are determined based on the
products and services provided, or the type of
customers and clients served, and they reflect the
manner in which financial information is evaluated by
the Firm’s Operating Committee, whose members act
collectively as the Firm’s chief operating decision
maker. Segment results are presented on a managed
basis.
The following is a description of each of the Firm’s
reportable business segments, and the products and
services that they provide to their respective client
bases, as well as a description of Corporate activities.
Consumer & Community Banking
Consumer & Community Banking offers products and
services to consumers and small businesses through
bank branches, ATMs, digital (including mobile and
online) and telephone banking. CCB is organized into
Banking & Wealth Management (including Consumer
Banking, Business Banking and J.P. Morgan Wealth
Management), Home Lending (including Home
Lending Production, Home Lending Servicing and Real
Estate Portfolios) and Card Services & Auto. Banking &
Wealth Management offers deposit, investment and
lending products, cash management, payments and
services. Home Lending includes mortgage origination
and servicing activities, as well as portfolios consisting
of residential mortgages and home equity loans. Card
Services issues credit cards and offers payment
solutions, travel services, merchant offers and lifestyle
benefits. Auto originates and services auto loans and
leases.
Commercial & Investment Bank
The Commercial & Investment Bank is comprised of
the Banking & Payments and Markets & Securities
Services businesses. These businesses offer
investment banking, lending, payments, market-
making, financing, custody and securities products
and services to a global base of corporate and
institutional clients. Banking & Payments offers
products and services in all major capital markets,
including advising on corporate strategy and
structure, capital-raising in equity and debt markets,
and loan origination and syndication. Banking &
Payments also provides services that enable clients to
manage payments globally across liquidity and
account solutions, commerce solutions, clearing,
trade, and working capital. Markets & Securities
Services includes Markets, which is a global market-
maker across products, including cash and derivative
instruments, and also offers sophisticated risk
management solutions, lending, prime brokerage,
clearing and research. Markets & Securities Services
also includes Securities Services, a leading global
custodian that provides custody, fund services,
liquidity and trading services, and data solutions
products.
Asset & Wealth Management
Asset & Wealth Management, with client assets of $7.1
trillion, is a global leader in investment and wealth
management.
Asset Management
Offers multi-asset investment management solutions
across equities, fixed income, alternatives and money
market funds to institutional and retail investors
providing for a broad range of clients’ investment
needs.
Global Private Bank
Provides retirement products and services, brokerage,
custody, estate planning, lending, deposits and
investment management to high net worth clients.
The majority of AWM’s client assets are in actively
managed portfolios.
Corporate
Corporate consists of Treasury and Chief Investment
Office (“CIO”) and Other Corporate. Treasury and CIO
is predominantly responsible for measuring,
monitoring, reporting and managing the Firm’s
liquidity, funding, capital, structural interest rate and
foreign exchange risks.
Other Corporate includes staff functions and expense
that is centrally managed as well as certain Firm
initiatives and activities not solely aligned to a specific
LOB. The major Other Corporate functions include
Real Estate, Technology, Legal, Corporate Finance,
Human Resources, Internal Audit, Risk Management,
Compliance, Control Management, Corporate
Responsibility and various Other Corporate groups.
Notes to consolidated financial statements
306
JPMorgan Chase & Co./2025 Form 10-K
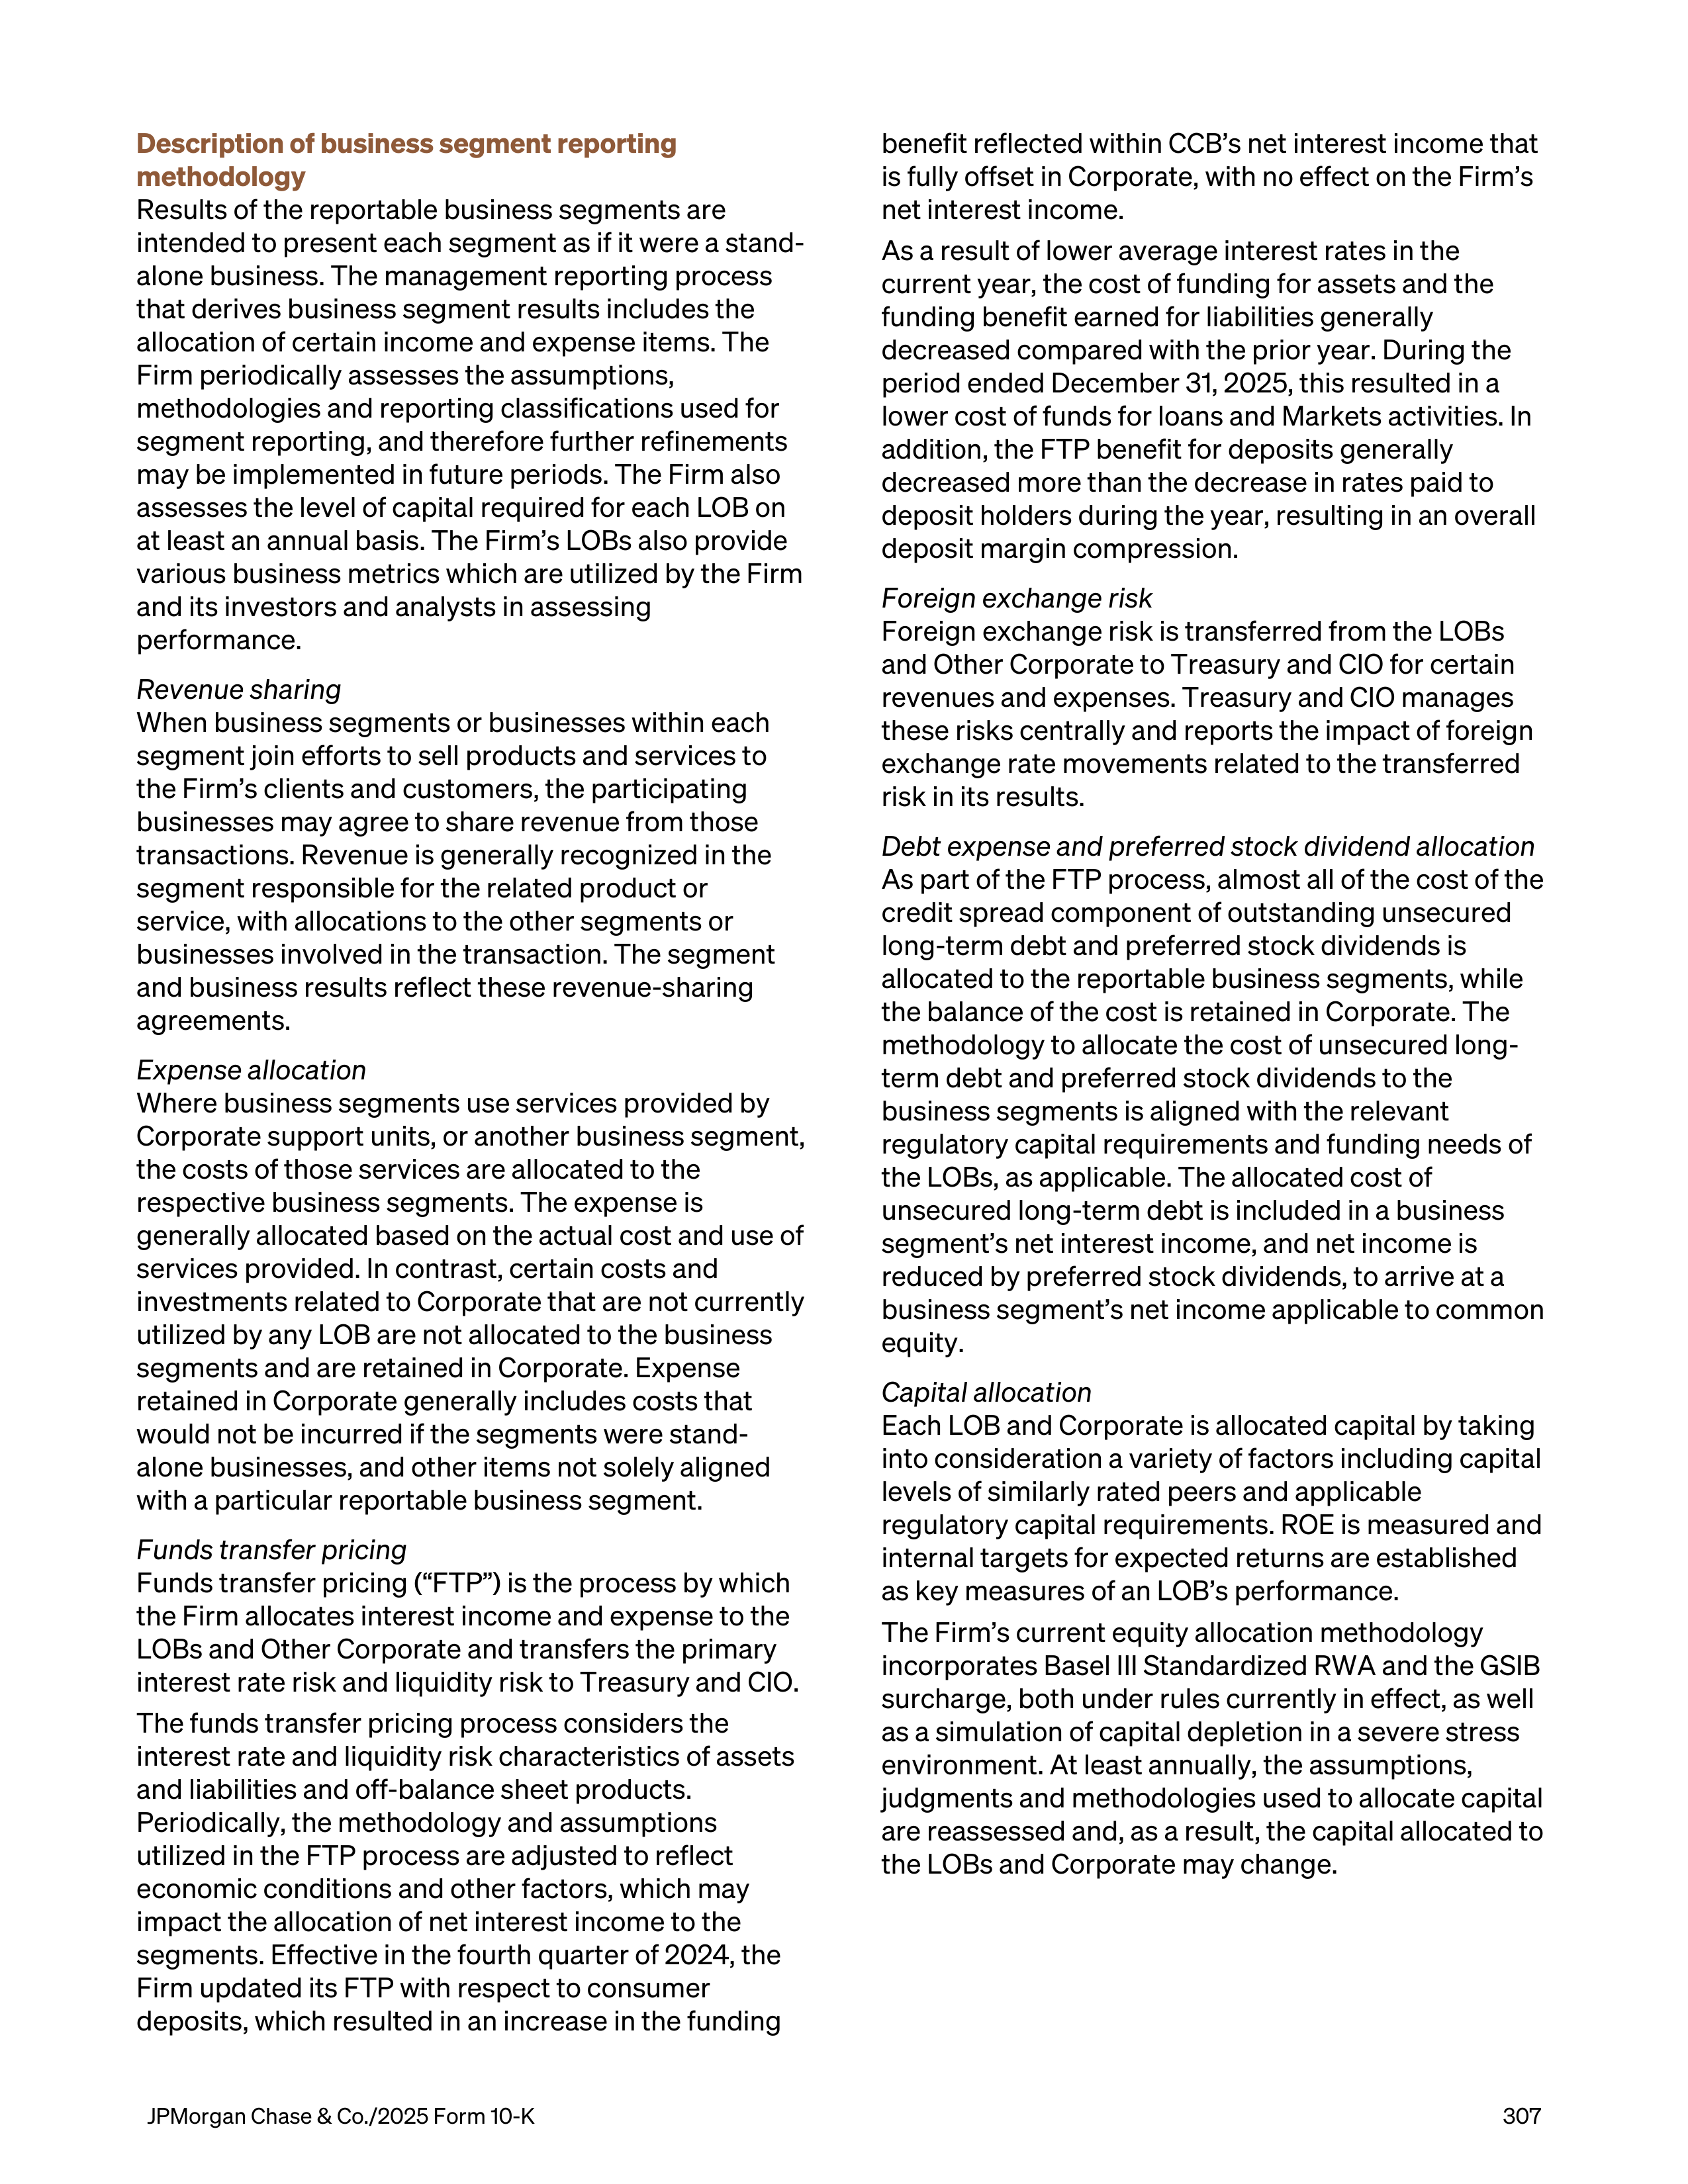
Description of business segment reporting
methodology
Results of the reportable business segments are
intended to present each segment as if it were a stand-
alone business. The management reporting process
that derives business segment results includes the
allocation of certain income and expense items. The
Firm periodically assesses the assumptions,
methodologies and reporting classifications used for
segment reporting, and therefore further refinements
may be implemented in future periods. The Firm also
assesses the level of capital required for each LOB on
at least an annual basis. The Firm’s LOBs also provide
various business metrics which are utilized by the Firm
and its investors and analysts in assessing
performance.
Revenue sharing
When business segments or businesses within each
segment join efforts to sell products and services to
the Firm’s clients and customers, the participating
businesses may agree to share revenue from those
transactions. Revenue is generally recognized in the
segment responsible for the related product or
service, with allocations to the other segments or
businesses involved in the transaction. The segment
and business results reflect these revenue-sharing
agreements.
Expense allocation
Where business segments use services provided by
Corporate support units, or another business segment,
the costs of those services are allocated to the
respective business segments. The expense is
generally allocated based on the actual cost and use of
services provided. In contrast, certain costs and
investments related to Corporate that are not currently
utilized by any LOB are not allocated to the business
segments and are retained in Corporate. Expense
retained in Corporate generally includes costs that
would not be incurred if the segments were stand-
alone businesses, and other items not solely aligned
with a particular reportable business segment.
Funds transfer pricing
Funds transfer pricing (“FTP”) is the process by which
the Firm allocates interest income and expense to the
LOBs and Other Corporate and transfers the primary
interest rate risk and liquidity risk to Treasury and CIO.
The funds transfer pricing process considers the
interest rate and liquidity risk characteristics of assets
and liabilities and off-balance sheet products.
Periodically, the methodology and assumptions
utilized in the FTP process are adjusted to reflect
economic conditions and other factors, which may
impact the allocation of net interest income to the
segments. Effective in the fourth quarter of 2024, the
Firm updated its FTP with respect to consumer
deposits, which resulted in an increase in the funding
benefit reflected within CCB’s net interest income that
is fully offset in Corporate, with no effect on the Firm’s
net interest income.
As a result of lower average interest rates in the
current year, the cost of funding for assets and the
funding benefit earned for liabilities generally
decreased compared with the prior year. During the
period ended December 31, 2025, this resulted in a
lower cost of funds for loans and Markets activities. In
addition, the FTP benefit for deposits generally
decreased more than the decrease in rates paid to
deposit holders during the year, resulting in an overall
deposit margin compression.
Foreign exchange risk
Foreign exchange risk is transferred from the LOBs
and Other Corporate to Treasury and CIO for certain
revenues and expenses. Treasury and CIO manages
these risks centrally and reports the impact of foreign
exchange rate movements related to the transferred
risk in its results.
Debt expense and preferred stock dividend allocation
As part of the FTP process, almost all of the cost of the
credit spread component of outstanding unsecured
long-term debt and preferred stock dividends is
allocated to the reportable business segments, while
the balance of the cost is retained in Corporate. The
methodology to allocate the cost of unsecured long-
term debt and preferred stock dividends to the
business segments is aligned with the relevant
regulatory capital requirements and funding needs of
the LOBs, as applicable. The allocated cost of
unsecured long-term debt is included in a business
segment’s net interest income, and net income is
reduced by preferred stock dividends, to arrive at a
business segment’s net income applicable to common
equity.
Capital allocation
Each LOB and Corporate is allocated capital by taking
into consideration a variety of factors including capital
levels of similarly rated peers and applicable
regulatory capital requirements. ROE is measured and
internal targets for expected returns are established
as key measures of an LOB’s performance.
The Firm’s current equity allocation methodology
incorporates Basel III Standardized RWA and the GSIB
surcharge, both under rules currently in effect, as well
as a simulation of capital depletion in a severe stress
environment. At least annually, the assumptions,
judgments and methodologies used to allocate capital
are reassessed and, as a result, the capital allocated to
the LOBs and Corporate may change.
JPMorgan Chase & Co./2025 Form 10-K
307
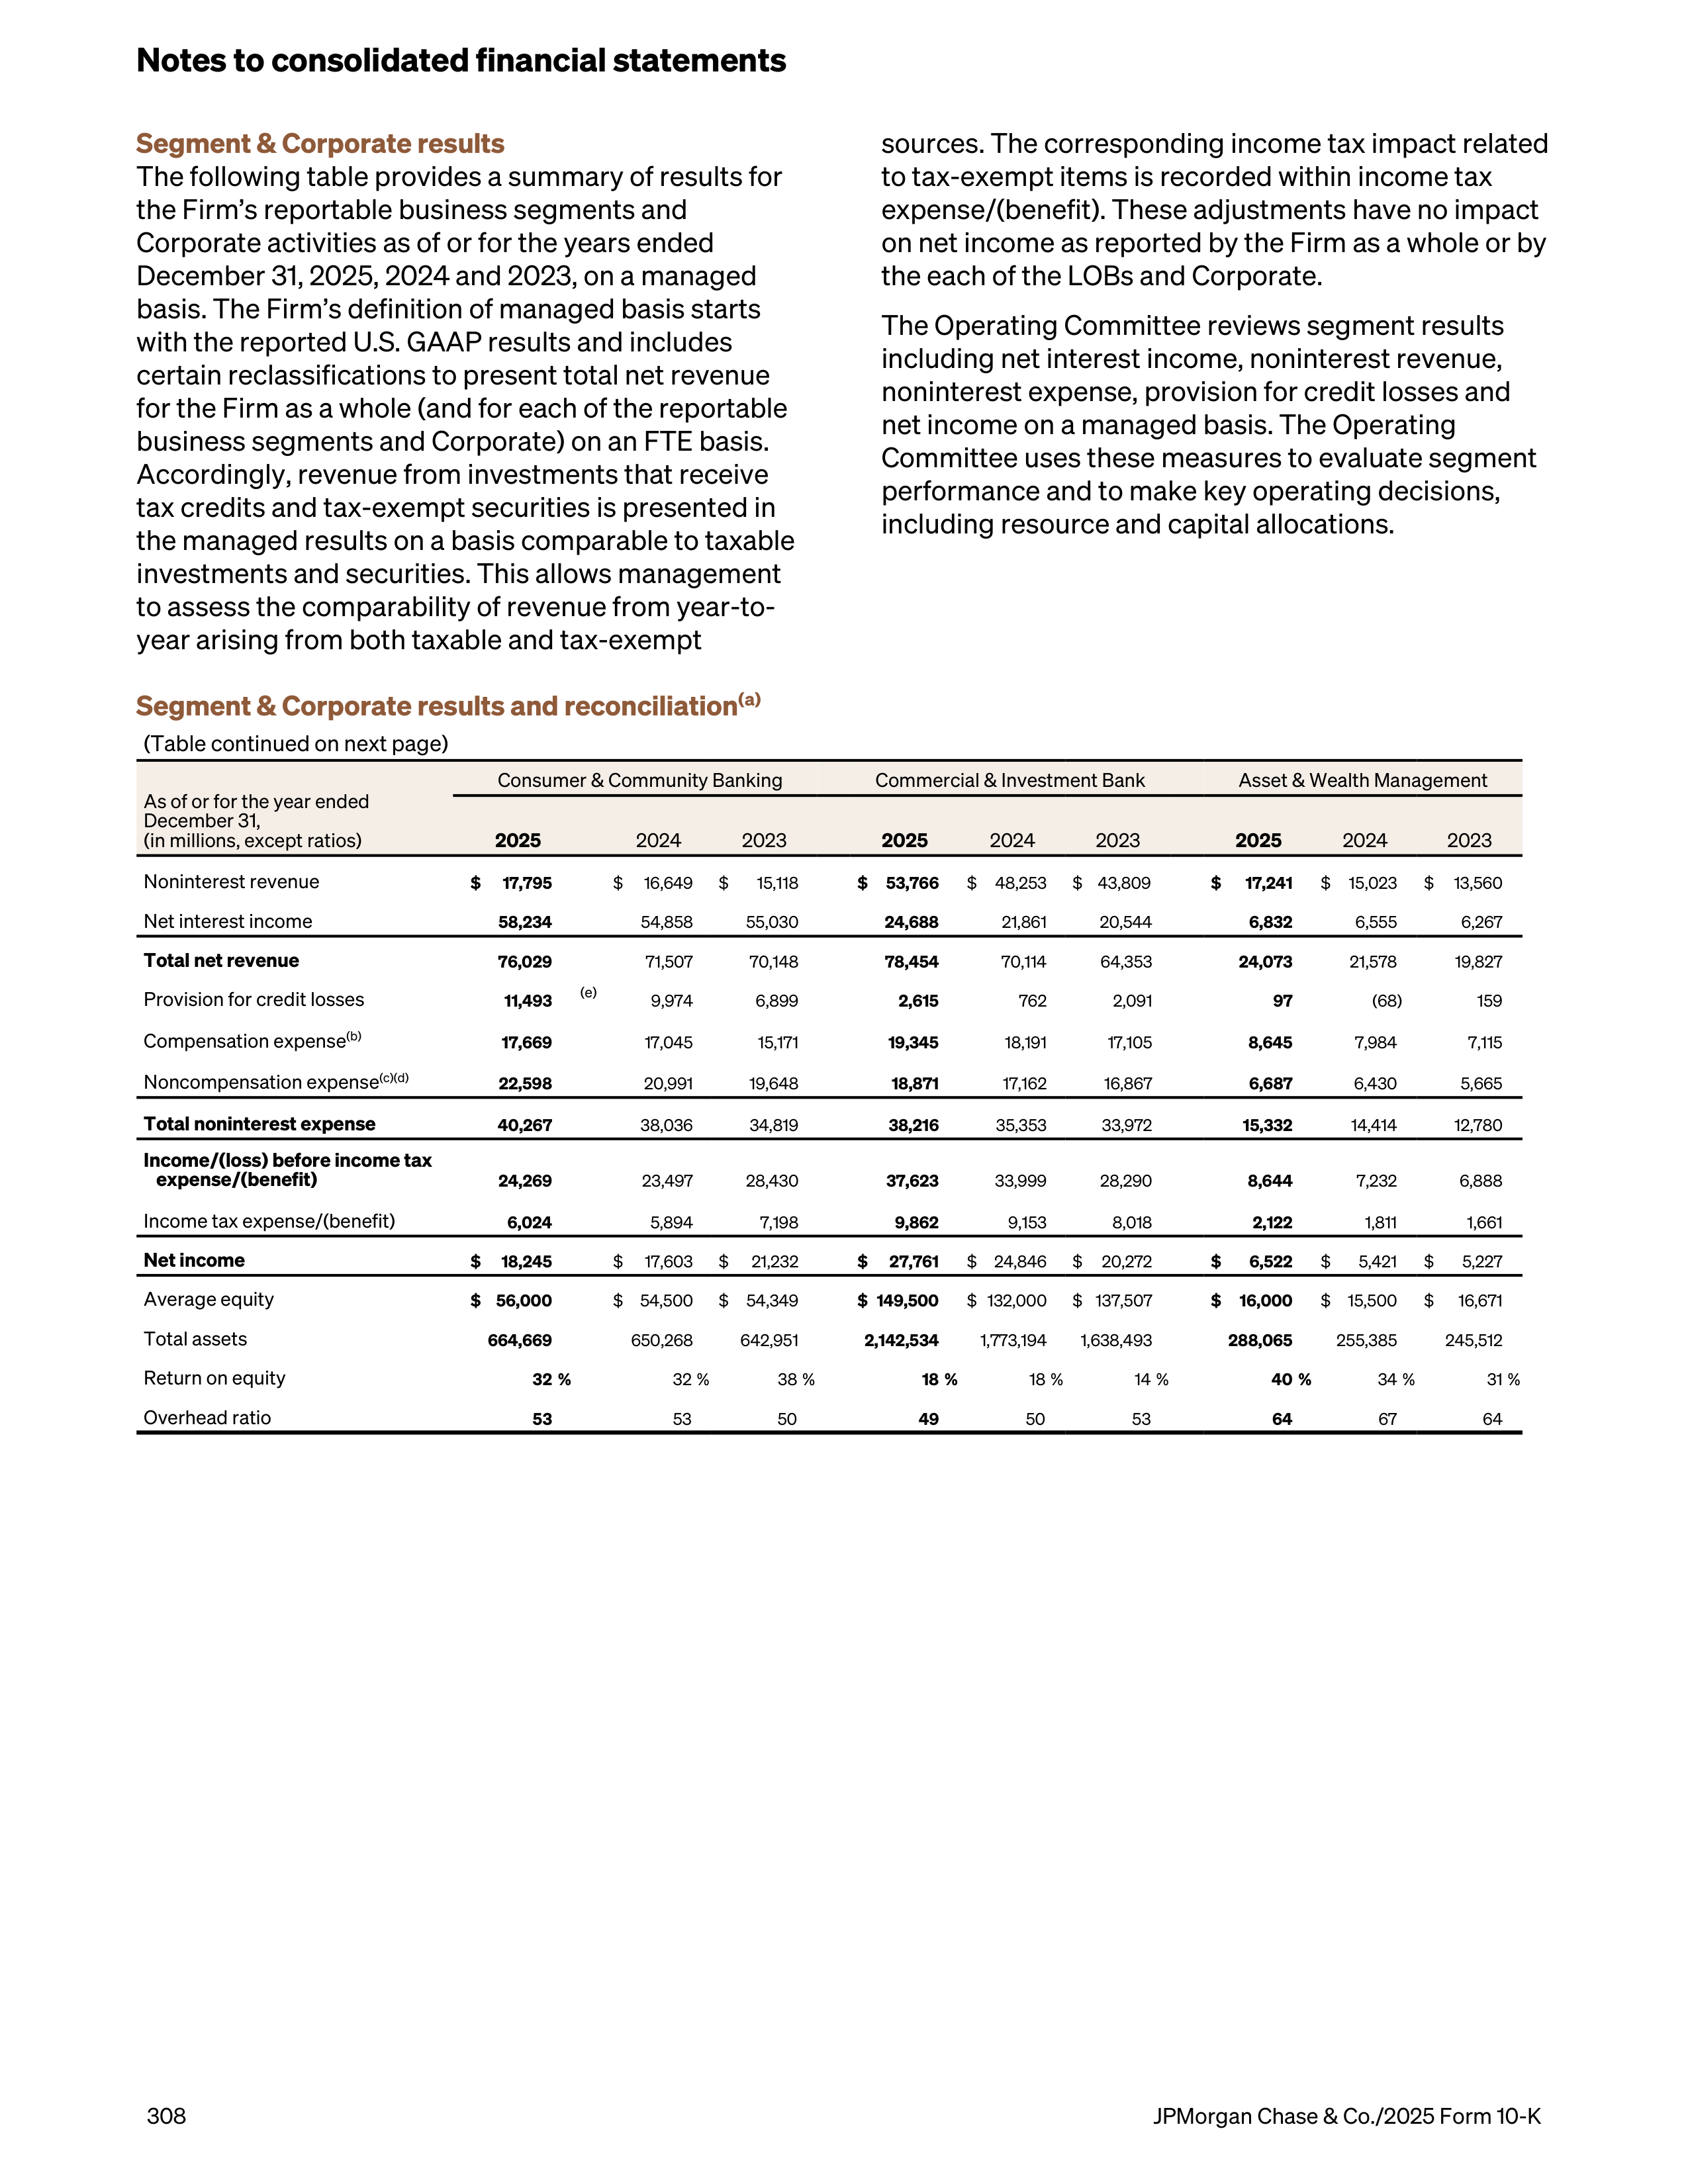
Segment & Corporate results
The following table provides a summary of results for
the Firm’s reportable business segments and
Corporate activities as of or for the years ended
December 31, 2025, 2024 and 2023, on a managed
basis. The Firm’s definition of managed basis starts
with the reported U.S. GAAP results and includes
certain reclassifications to present total net revenue
for the Firm as a whole (and for each of the reportable
business segments and Corporate) on an FTE basis.
Accordingly, revenue from investments that receive
tax credits and tax-exempt securities is presented in
the managed results on a basis comparable to taxable
investments and securities. This allows management
to assess the comparability of revenue from year-to-
year arising from both taxable and tax-exempt
sources. The corresponding income tax impact related
to tax-exempt items is recorded within income tax
expense/(benefit). These adjustments have no impact
on net income as reported by the Firm as a whole or by
the each of the LOBs and Corporate.
The Operating Committee reviews segment results
including net interest income, noninterest revenue,
noninterest expense, provision for credit losses and
net income on a managed basis. The Operating
Committee uses these measures to evaluate segment
performance and to make key operating decisions,
including resource and capital allocations.
Segment & Corporate results and reconciliation
(a)
(Table continued on next page)
As of or for the year ended
December 31,
(in millions, except ratios)
Consumer & Community Banking
Commercial & Investment Bank
Asset & Wealth Management
2025
2024
2023
2025
2024
2023
2025
2024
2023
Noninterest revenue
$
17,795
$
16,649
$
15,118
$
53,766
$
48,253
$ 43,809
$
17,241
$
15,023
$
13,560
Net interest income
58,234
54,858
55,030
24,688
21,861
20,544
6,832
6,555
6,267
Total net revenue
76,029
71,507
70,148
78,454
70,114
64,353
24,073
21,578
19,827
Provision for credit losses
11,493
(e)
9,974
6,899
2,615
762
2,091
97
(68)
159
Compensation expense
(b)
17,669
17,045
15,171
19,345
18,191
17,105
8,645
7,984
7,115
Noncompensation expense
(c)(d)
22,598
20,991
19,648
18,871
17,162
16,867
6,687
6,430
5,665
Total noninterest expense
40,267
38,036
34,819
38,216
35,353
33,972
15,332
14,414
12,780
Income/(loss) before income tax
expense/(benefit)
24,269
23,497
28,430
37,623
33,999
28,290
8,644
7,232
6,888
Income tax expense/(benefit)
6,024
5,894
7,198
9,862
9,153
8,018
2,122
1,811
1,661
Net income
$
18,245
$
17,603
$
21,232
$
27,761
$
24,846
$
20,272
$
6,522
$
5,421
$
5,227
Average equity
$ 56,000
$
54,500
$
54,349
$ 149,500
$ 132,000
$ 137,507
$
16,000
$
15,500
$
16,671
Total assets
664,669
650,268
642,951
2,142,534
1,773,194
1,638,493
288,065
255,385
245,512
Return on equity
32 %
32 %
38 %
18 %
18 %
14 %
40 %
34 %
31 %
Overhead ratio
53
53
50
49
50
53
64
67
64
Notes to consolidated financial statements
308
JPMorgan Chase & Co./2025 Form 10-K
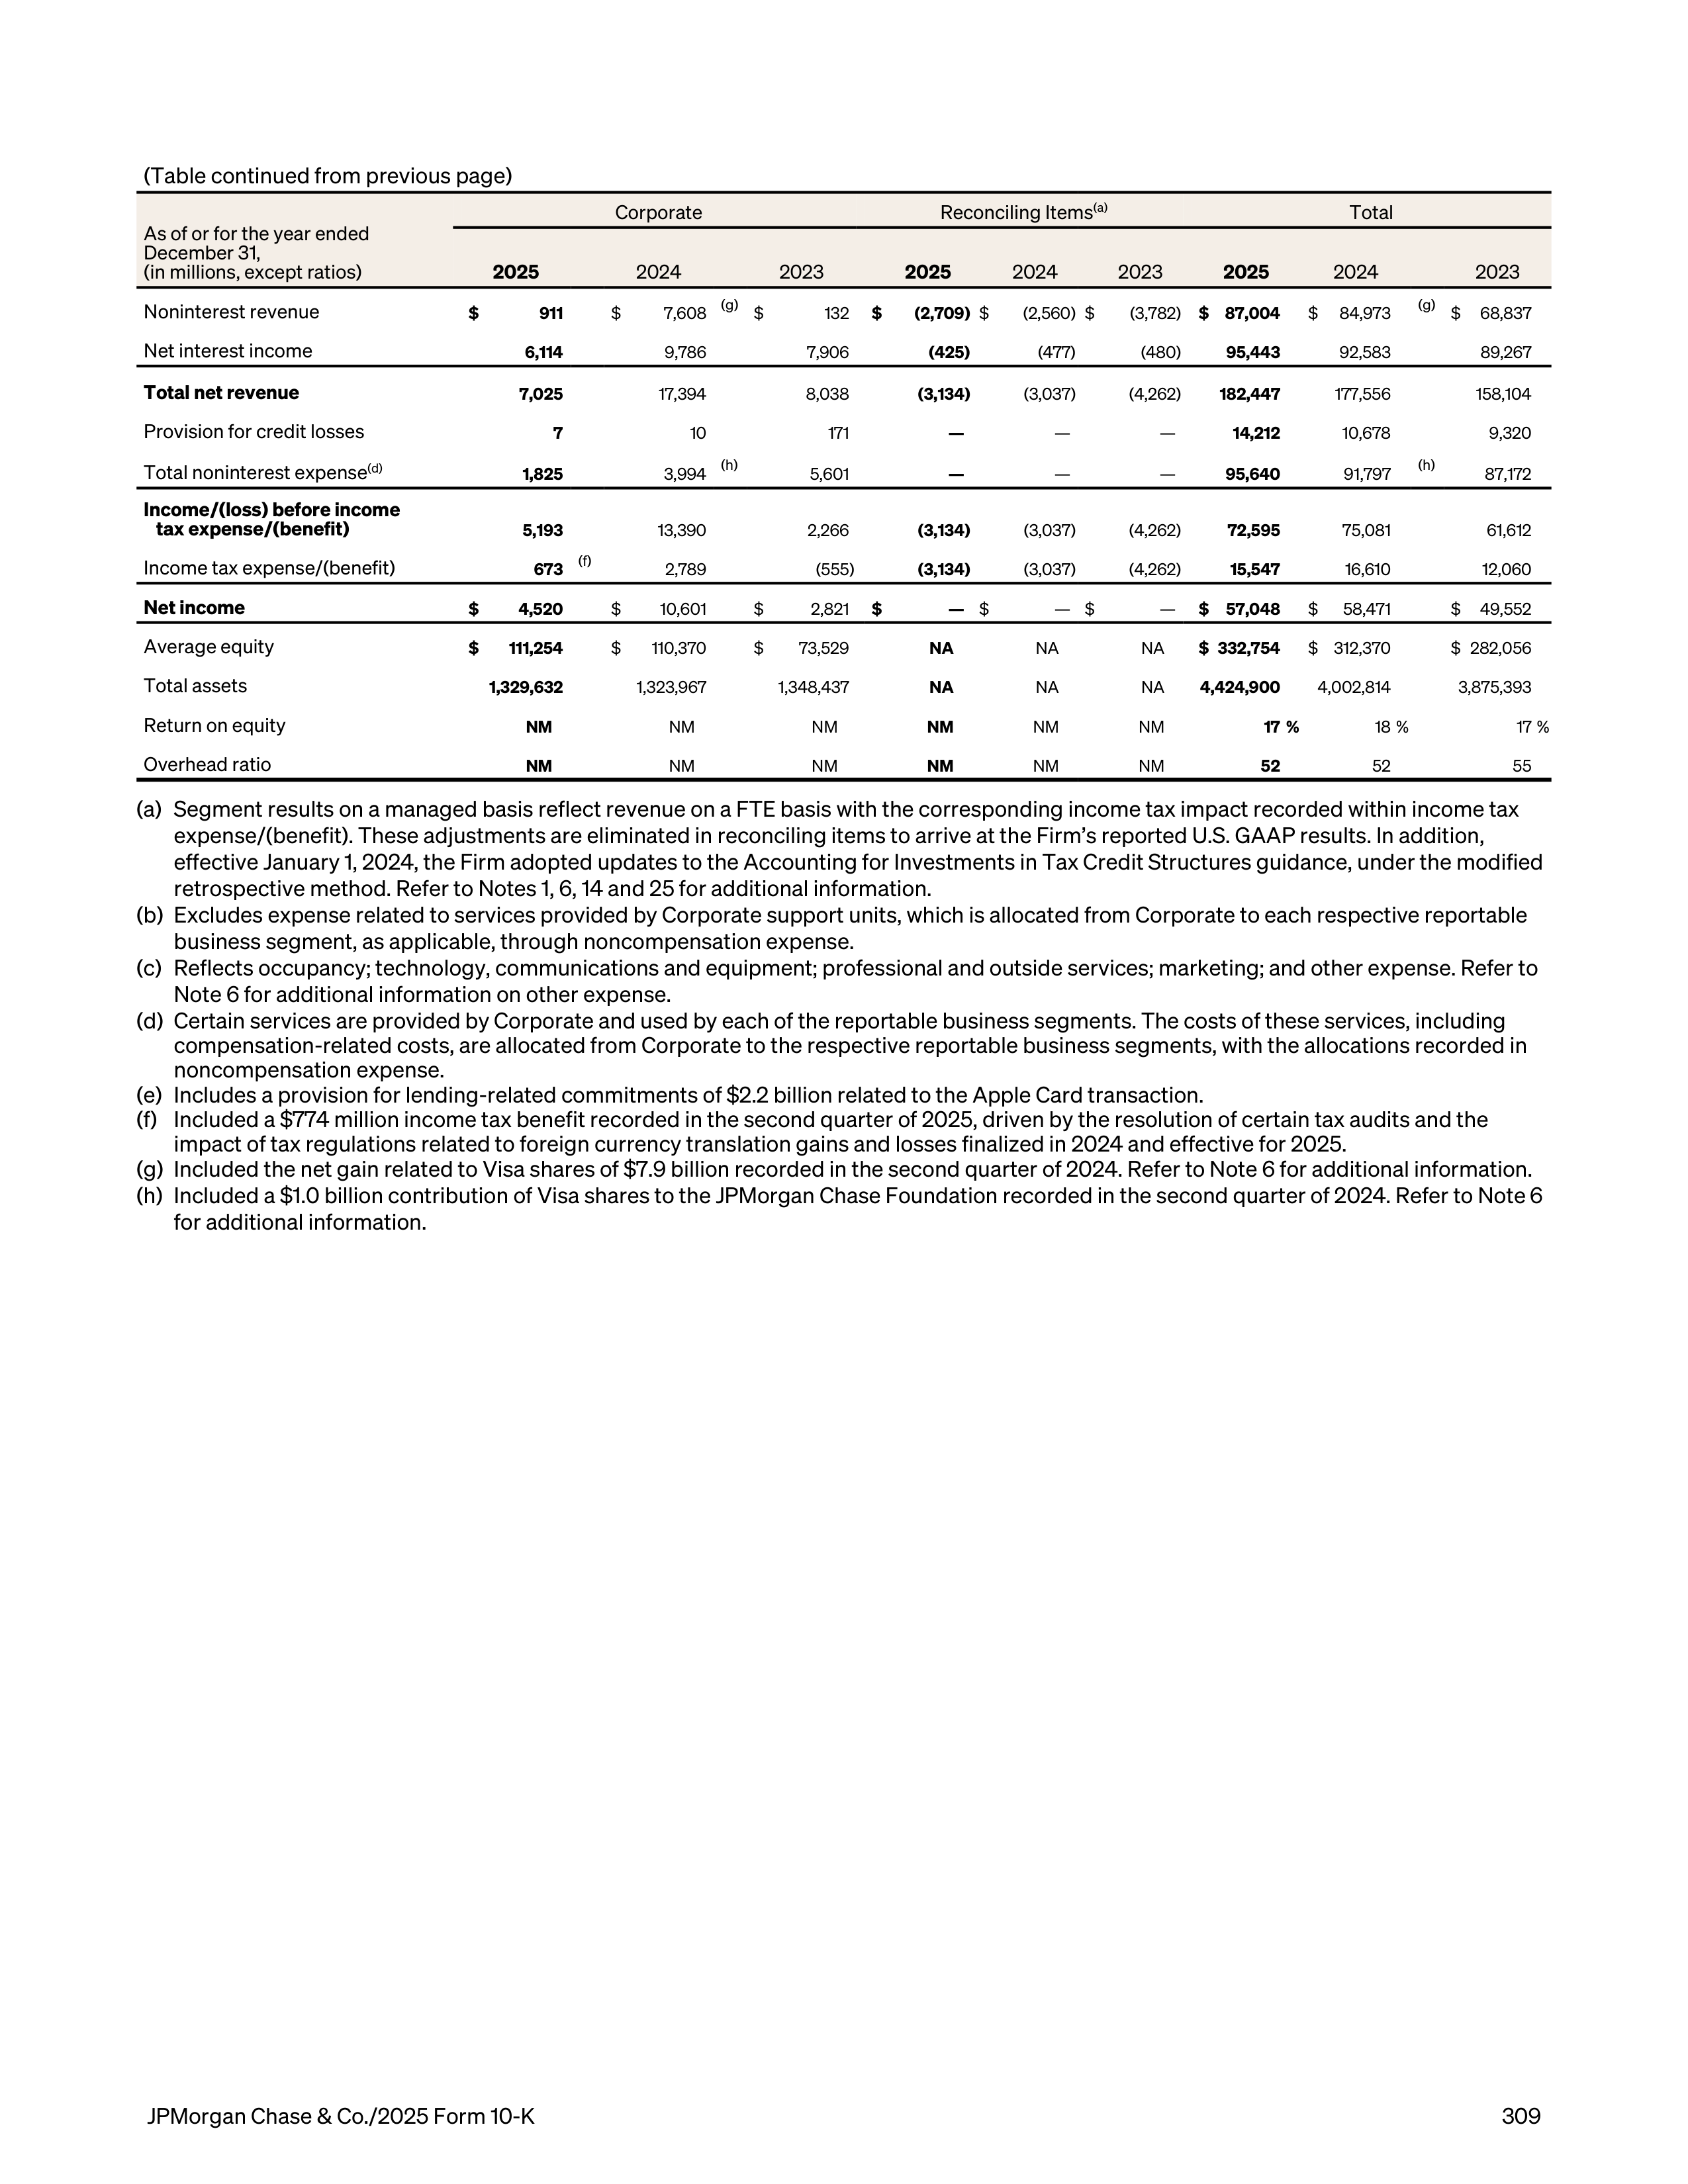
(Table continued from previous page)
As of or for the year ended
December 31,
(in millions, except ratios)
Corporate
Reconciling Items
(a)
Total
2025
2024
2023
2025
2024
2023
2025
2024
2023
Noninterest revenue
$
911
$
7,608
(g)
$
132
$
(2,709)
$
(2,560) $
(3,782)
$ 87,004
$
84,973
(g)
$
68,837
Net interest income
6,114
9,786
7,906
(425)
(477)
(480)
95,443
92,583
89,267
Total net revenue
7,025
17,394
8,038
(3,134)
(3,037)
(4,262)
182,447
177,556
158,104
Provision for credit losses
7
10
171
—
—
—
14,212
10,678
9,320
Total noninterest expense
(d)
1,825
3,994
(h)
5,601
—
—
—
95,640
91,797
(h)
87,172
Income/(loss) before income
tax expense/(benefit)
5,193
13,390
2,266
(3,134)
(3,037)
(4,262)
72,595
75,081
61,612
Income tax expense/(benefit)
673
(f)
2,789
(555)
(3,134)
(3,037)
(4,262)
15,547
16,610
12,060
Net income
$
4,520
$
10,601
$
2,821
$
—
$
— $
—
$
57,048
$
58,471
$
49,552
Average equity
$
111,254
$
110,370
$
73,529
NA
NA
NA
$ 332,754
$ 312,370
$ 282,056
Total assets
1,329,632
1,323,967
1,348,437
NA
NA
NA
4,424,900
4,002,814
3,875,393
Return on equity
NM
NM
NM
NM
NM
NM
17 %
18 %
17 %
Overhead ratio
NM
NM
NM
NM
NM
NM
52
52
55
(a)
Segment results on a managed basis reflect revenue on a FTE basis with the corresponding income tax impact recorded within income tax
expense/(benefit). These adjustments are eliminated in reconciling items to arrive at the Firm’s reported U.S. GAAP results. In addition,
effective January 1, 2024, the Firm adopted updates to the Accounting for Investments in Tax Credit Structures guidance, under the modified
retrospective method. Refer to Notes 1, 6, 14 and 25 for additional information.
(b)
Excludes expense related to services provided by Corporate support units, which is allocated from Corporate to each respective reportable
business segment, as applicable, through noncompensation expense.
(c)
Reflects occupancy; technology, communications and equipment; professional and outside services; marketing; and other expense. Refer to
Note 6 for additional information on other expense.
(d)
Certain services are provided by Corporate and used by each of the reportable business segments. The costs of these services, including
compensation-related costs, are allocated from Corporate to the respective reportable business segments, with the allocations recorded in
noncompensation expense.
(e)
Includes a provision for lending-related commitments of $2.2 billion related to the Apple Card transaction.
(f)
Included a $774 million income tax benefit recorded in the second quarter of 2025, driven by the resolution of certain tax audits and the
impact of tax regulations related to foreign currency translation gains and losses finalized in 2024 and effective for 2025.
(g)
Included the net gain related to Visa shares of $7.9 billion recorded in the second quarter of 2024. Refer to Note 6 for additional information.
(h)
Included a $1.0 billion contribution of Visa shares to the JPMorgan Chase Foundation recorded in the second quarter of 2024. Refer to Note 6
for additional information.
JPMorgan Chase & Co./2025 Form 10-K
309
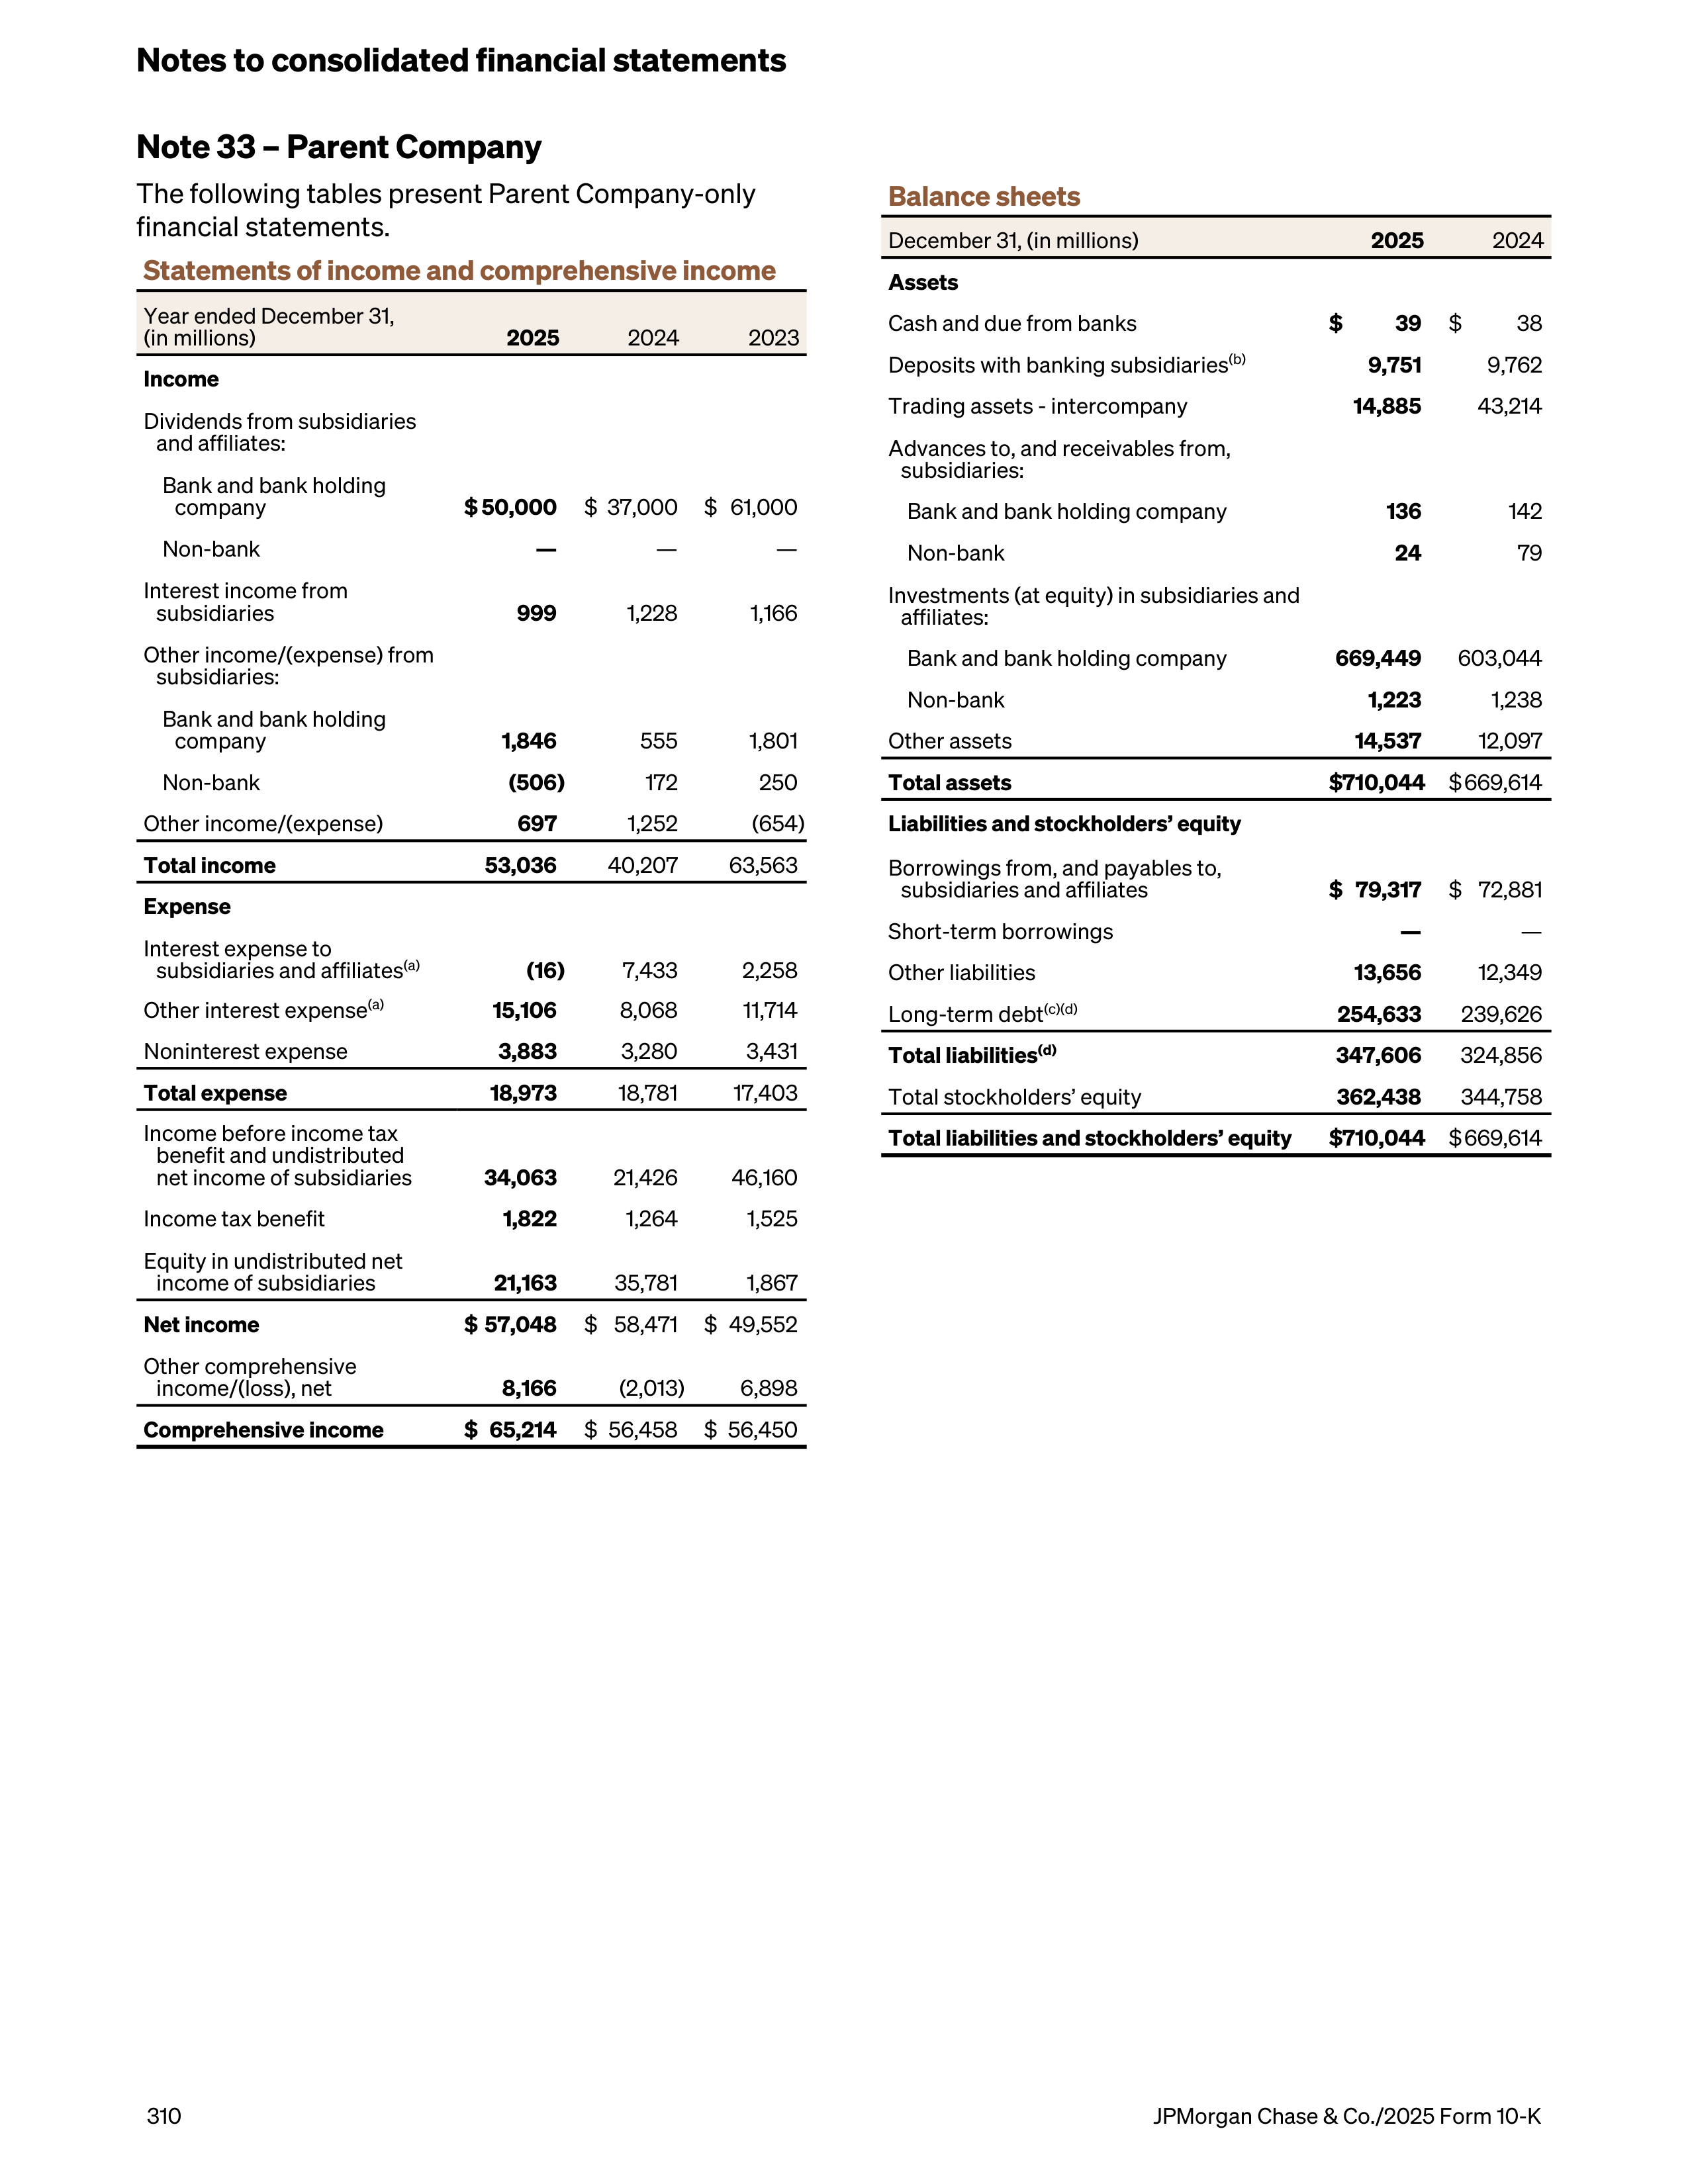
Note 33 – Parent Company
The following tables present Parent Company-only
financial statements.
Statements of income and comprehensive income
Year ended December 31,
(in millions)
2025
2024
2023
Income
Dividends from subsidiaries
and affiliates:
Bank and bank holding
company
$ 50,000
$ 37,000
$ 61,000
Non-bank
—
—
—
Interest income from
subsidiaries
999
1,228
1,166
Other income/(expense) from
subsidiaries:
Bank and bank holding
company
1,846
555
1,801
Non-bank
(506)
172
250
Other income/(expense)
697
1,252
(654)
Total income
53,036
40,207
63,563
Expense
Interest expense to
subsidiaries and affiliates
(a)
(16)
7,433
2,258
Other interest expense
(a)
15,106
8,068
11,714
Noninterest expense
3,883
3,280
3,431
Total expense
18,973
18,781
17,403
Income before income tax
benefit and undistributed
net income of subsidiaries
34,063
21,426
46,160
Income tax benefit
1,822
1,264
1,525
Equity in undistributed net
income of subsidiaries
21,163
35,781
1,867
Net income
$ 57,048
$ 58,471
$ 49,552
Other comprehensive
income/(loss), net
8,166
(2,013)
6,898
Comprehensive income
$ 65,214
$ 56,458
$ 56,450
Balance sheets
December 31, (in millions)
2025
2024
Assets
Cash and due from banks
$
39
$
38
Deposits with banking subsidiaries
(b)
9,751
9,762
Trading assets - intercompany
14,885
43,214
Advances to, and receivables from,
subsidiaries:
Bank and bank holding company
136
142
Non-bank
24
79
Investments (at equity) in subsidiaries and
affiliates:
Bank and bank holding company
669,449
603,044
Non-bank
1,223
1,238
Other assets
14,537
12,097
Total assets
$ 710,044
$ 669,614
Liabilities and stockholders’ equity
Borrowings from, and payables to,
subsidiaries and affiliates
$ 79,317
$ 72,881
Short-term borrowings
—
—
Other liabilities
13,656
12,349
Long-term debt
(c)(d)
254,633
239,626
Total liabilities
(d)
347,606
324,856
Total stockholders’ equity
362,438
344,758
Total liabilities and stockholders’ equity
$ 710,044
$ 669,614
Notes to consolidated financial statements
310
JPMorgan Chase & Co./2025 Form 10-K
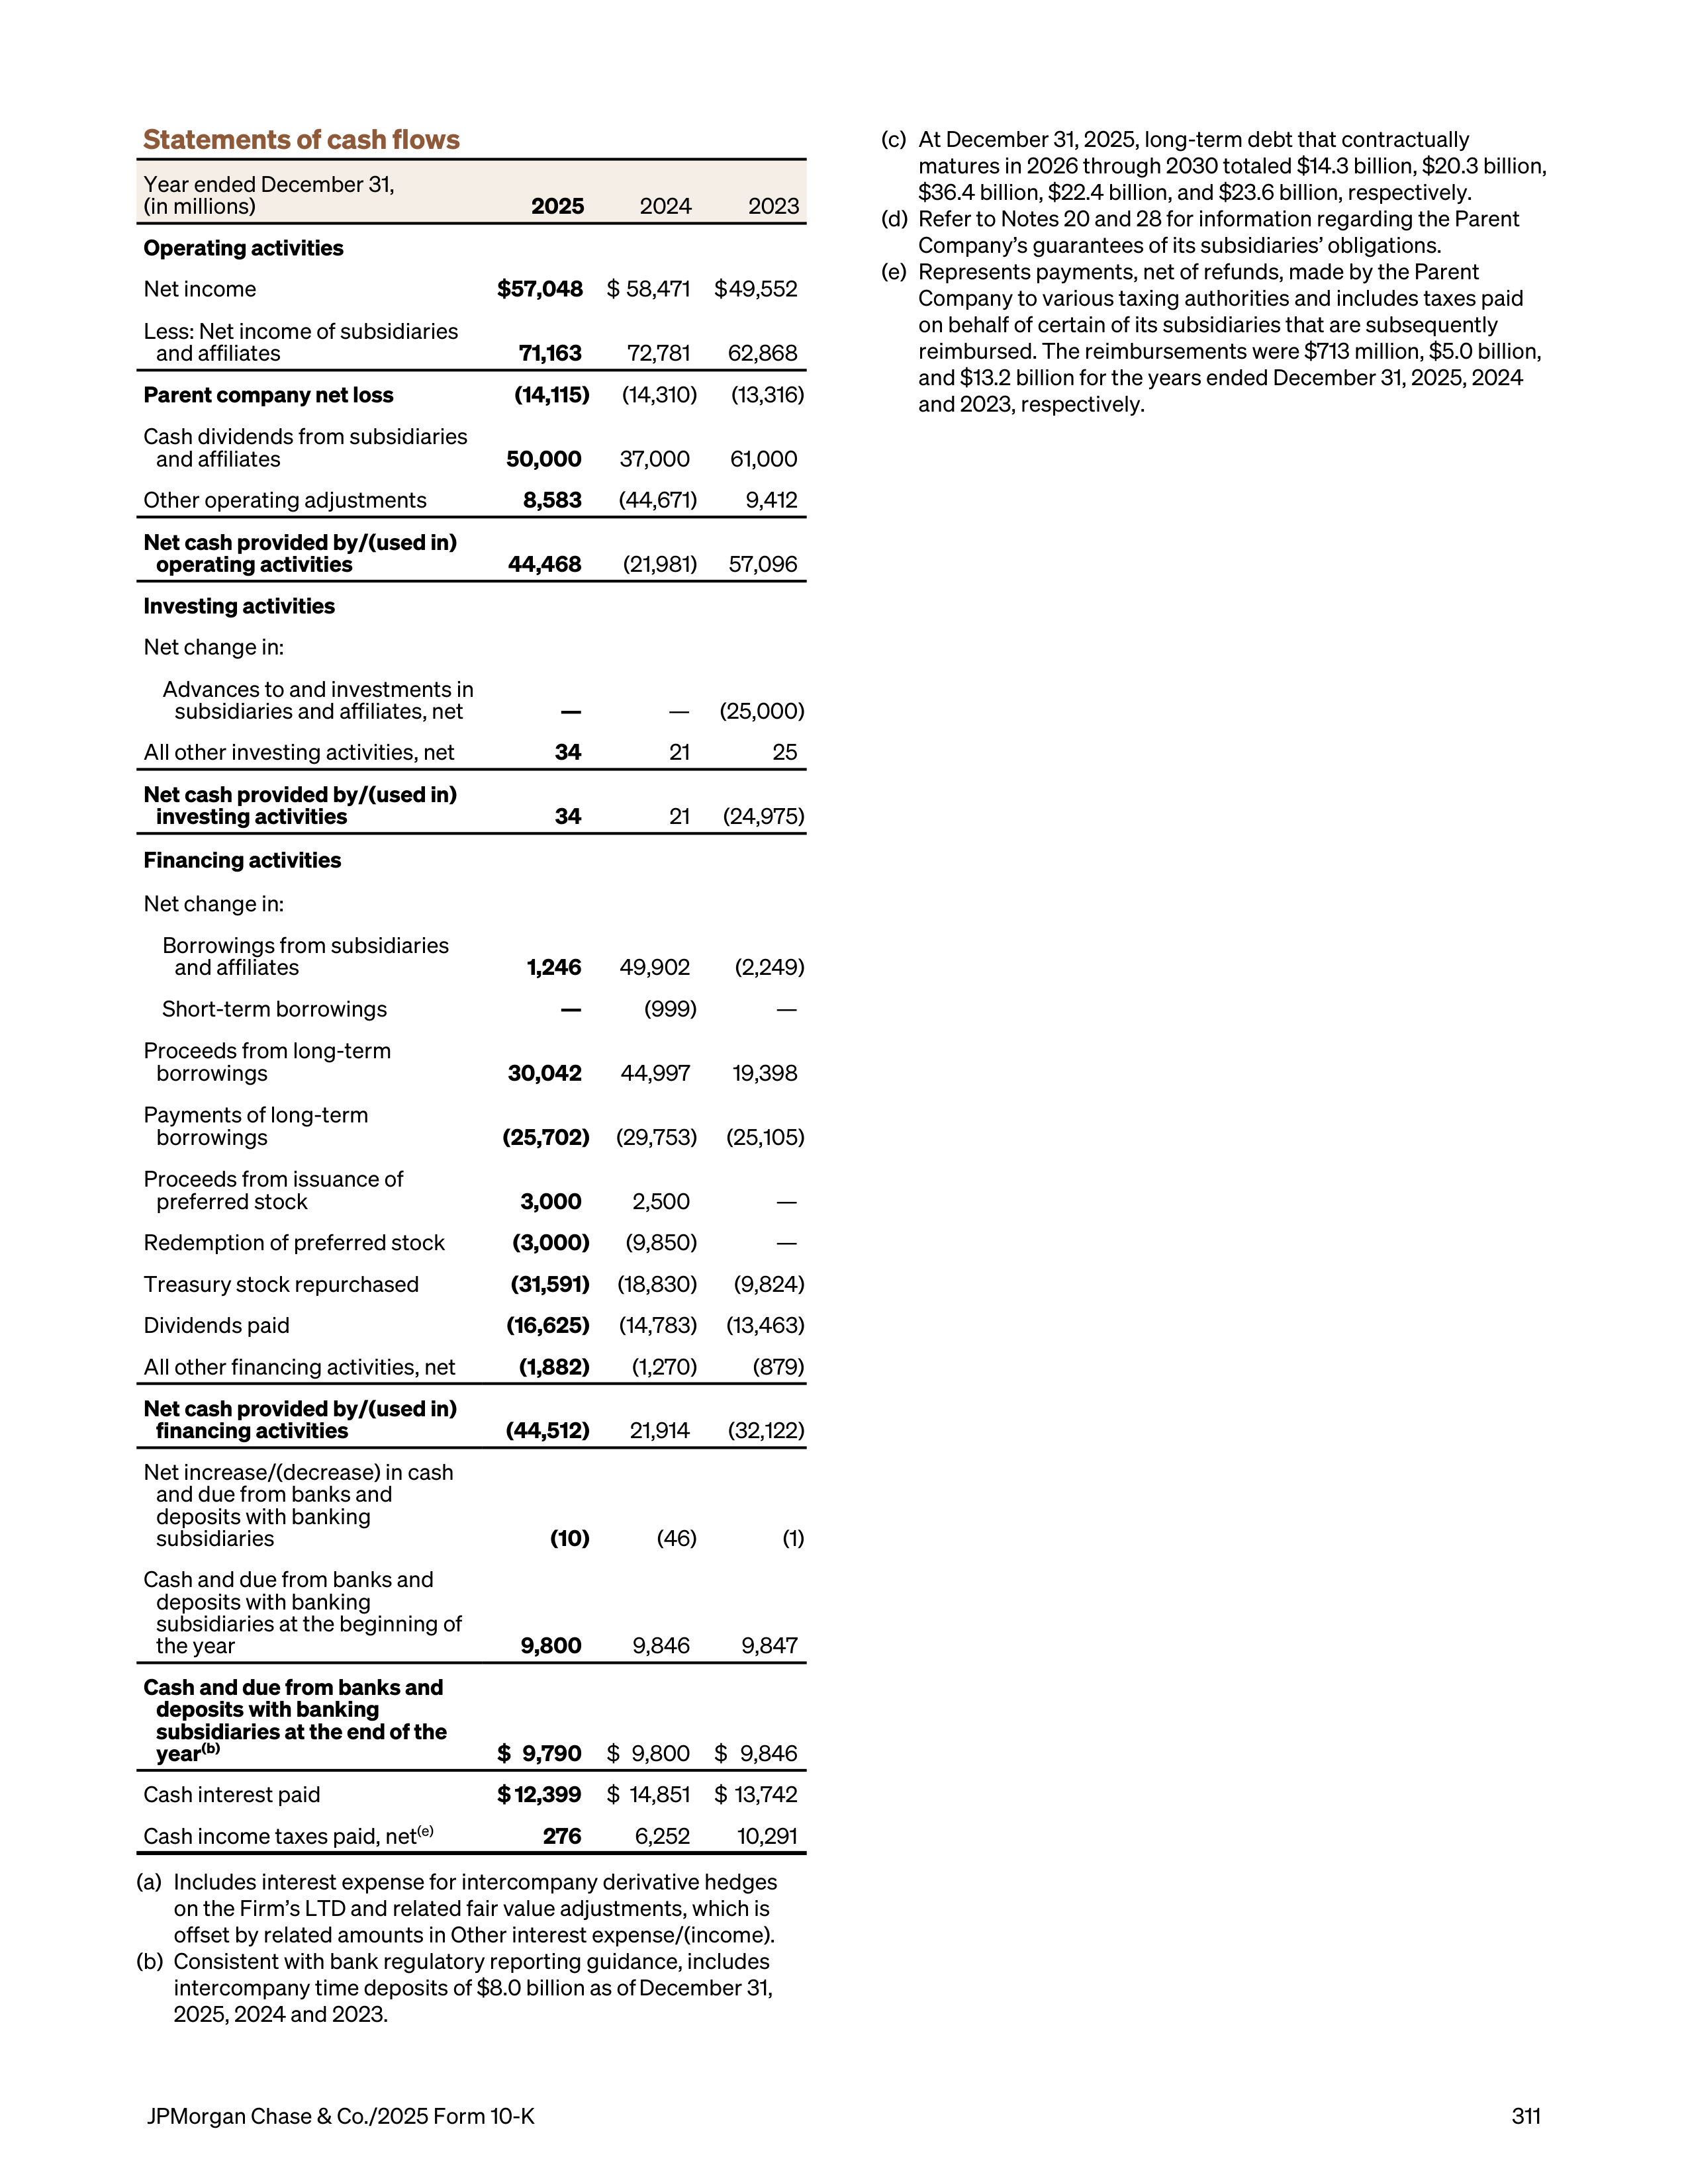
Statements of cash flows
Year ended December 31,
(in millions)
2025
2024
2023
Operating activities
Net income
$ 57,048
$ 58,471
$ 49,552
Less: Net income of subsidiaries
and affiliates
71,163
72,781
62,868
Parent company net loss
(14,115)
(14,310) (13,316)
Cash dividends from subsidiaries
and affiliates
50,000
37,000
61,000
Other operating adjustments
8,583
(44,671)
9,412
Net cash provided by/(used in)
operating activities
44,468
(21,981) 57,096
Investing activities
Net change in:
Advances to and investments in
subsidiaries and affiliates, net
—
—
(25,000)
All other investing activities, net
34
21
25
Net cash provided by/(used in)
investing activities
34
21
(24,975)
Financing activities
Net change in:
Borrowings from subsidiaries
and affiliates
1,246
49,902
(2,249)
Short-term borrowings
—
(999)
—
Proceeds from long-term
borrowings
30,042
44,997
19,398
Payments of long-term
borrowings
(25,702)
(29,753) (25,105)
Proceeds from issuance of
preferred stock
3,000
2,500
—
Redemption of preferred stock
(3,000)
(9,850)
—
Treasury stock repurchased
(31,591)
(18,830) (9,824)
Dividends paid
(16,625)
(14,783) (13,463)
All other financing activities, net
(1,882)
(1,270)
(879)
Net cash provided by/(used in)
financing activities
(44,512)
21,914
(32,122)
Net increase/(decrease) in cash
and due from banks and
deposits with banking
subsidiaries
(10)
(46)
(1)
Cash and due from banks and
deposits with banking
subsidiaries at the beginning of
the year
9,800
9,846
9,847
Cash and due from banks and
deposits with banking
subsidiaries at the end of the
year
(b)
$ 9,790
$ 9,800
$ 9,846
Cash interest paid
$ 12,399
$ 14,851
$ 13,742
Cash income taxes paid, net
(e)
276
6,252
10,291
(a)
Includes interest expense for intercompany derivative hedges
on the Firm’s LTD and related fair value adjustments, which is
offset by related amounts in Other interest expense/(income).
(b)
Consistent with bank regulatory reporting guidance, includes
intercompany time deposits of $8.0 billion as of
December 31,
2025, 2024 and 2023.
(c)
At December 31, 2025, long-term debt that contractually
matures in 2026 through 2030 totaled $14.3 billion, $20.3 billion,
$36.4 billion, $22.4 billion, and $23.6 billion, respectively.
(d)
Refer to Notes 20 and 28 for information regarding the Parent
Company’s guarantees of its subsidiaries’ obligations.
(e)
Represents payments, net of refunds, made by the Parent
Company to various taxing authorities and includes taxes paid
on behalf of certain of its subsidiaries that are subsequently
reimbursed. The reimbursements were $713 million, $5.0 billion,
and $13.2 billion for the years ended December 31, 2025, 2024
and 2023, respectively.
JPMorgan Chase & Co./2025 Form 10-K
311
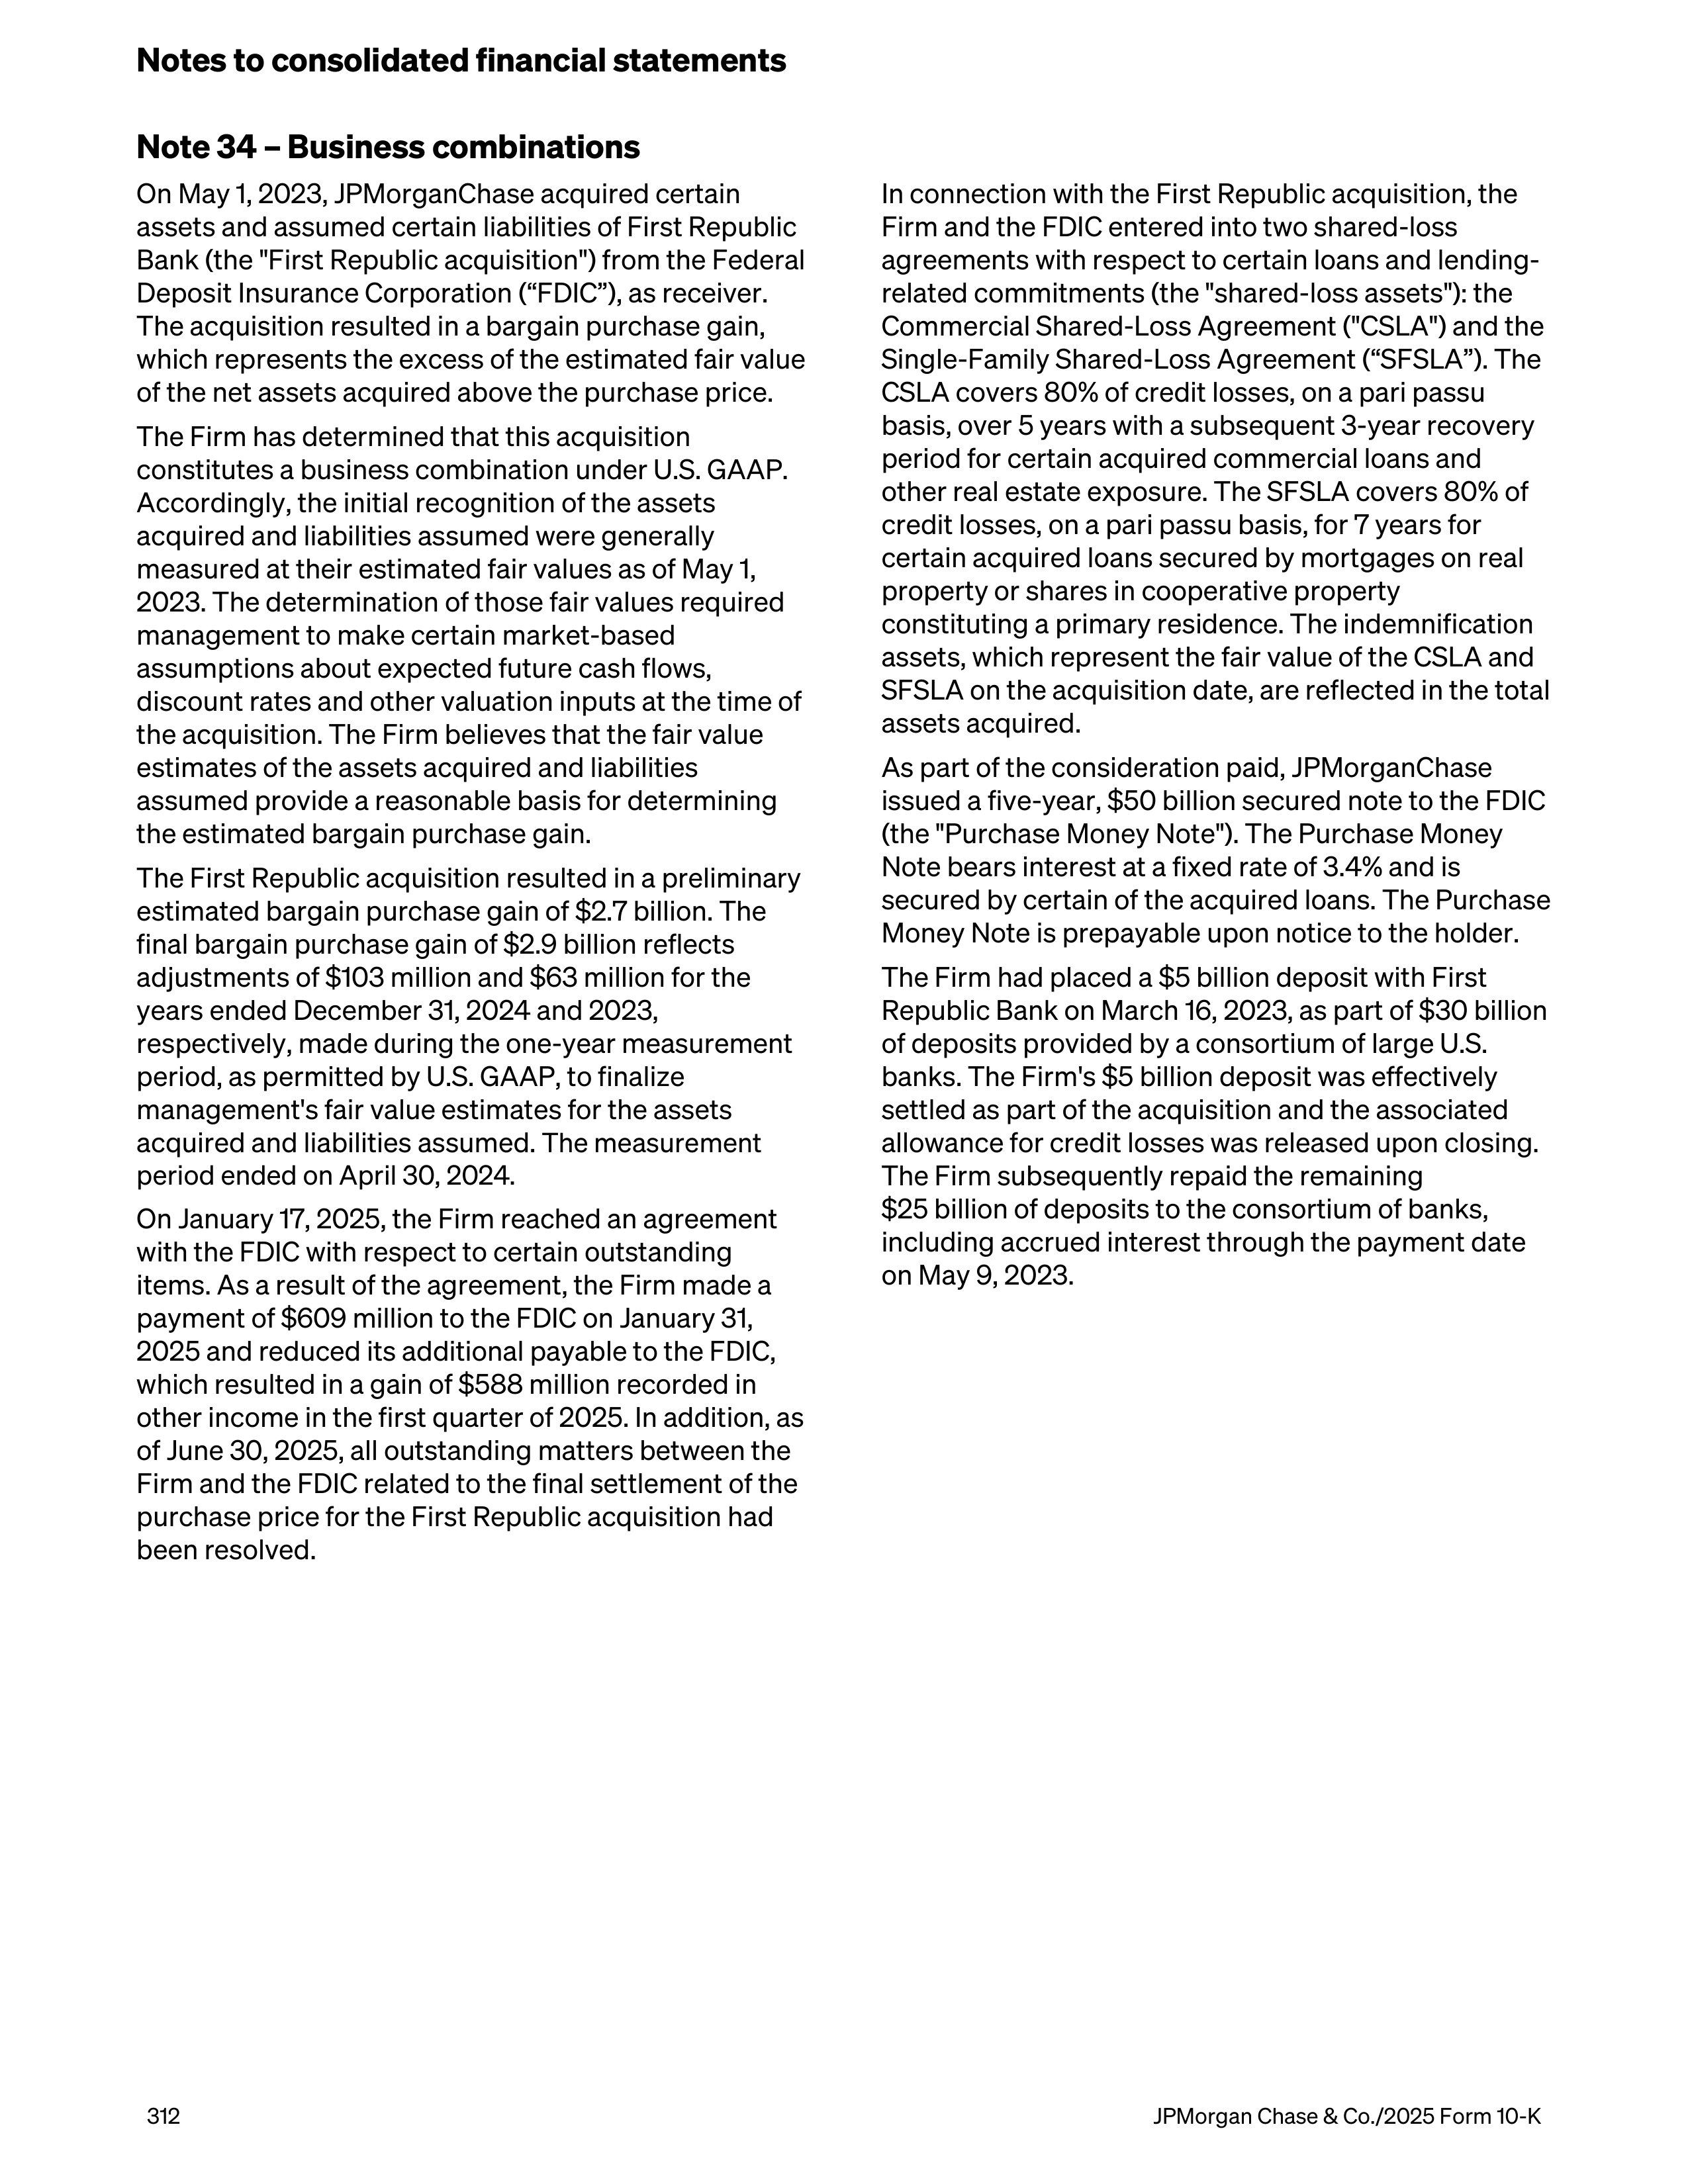
Note 34 – Business combinations
On May 1, 2023, JPMorganChase acquired certain
assets and assumed certain liabilities of First Republic
Bank (the "First Republic acquisition") from the Federal
Deposit Insurance Corporation (“FDIC”), as receiver.
The acquisition resulted in a bargain purchase gain,
which represents the excess of the estimated fair value
of the net assets acquired above the purchase price.
The Firm has determined that this acquisition
constitutes a business combination under U.S. GAAP.
Accordingly, the initial recognition of the assets
acquired and liabilities assumed were generally
measured at their estimated fair values as of May 1,
2023. The determination of those fair values required
management to make certain market-based
assumptions about expected future cash flows,
discount rates and other valuation inputs at the time of
the acquisition. The Firm believes that the fair value
estimates of the assets acquired and liabilities
assumed provide a reasonable basis for determining
the estimated bargain purchase gain.
The First Republic acquisition resulted in a preliminary
estimated bargain purchase gain of $2.7 billion. The
final bargain purchase gain of $2.9 billion reflects
adjustments of $103 million and $63 million for the
years ended December 31, 2024 and 2023,
respectively, made during the one-year measurement
period, as permitted by U.S. GAAP, to finalize
management's fair value estimates for the assets
acquired and liabilities assumed.
The measurement
period ended on April 30, 2024.
On January 17, 2025, the Firm reached an agreement
with the FDIC with respect to certain outstanding
items. As a result of the agreement, the Firm made a
payment of $609 million to the FDIC on January 31,
2025 and reduced its additional payable to the FDIC,
which resulted in a gain of $588 million recorded in
other income in the first quarter of 2025. In addition, as
of June 30, 2025, all outstanding matters between the
Firm and the FDIC related to the final settlement of the
purchase price for the First Republic acquisition had
been resolved.
In connection with the First Republic acquisition, the
Firm and the FDIC entered into two shared-loss
agreements with respect to certain loans and lending-
related commitments (the "shared-loss assets"): the
Commercial Shared-Loss Agreement ("CSLA") and the
Single-Family Shared-Loss Agreement (“SFSLA”). The
CSLA covers 80% of credit losses, on a pari passu
basis, over 5 years with a subsequent 3-year recovery
period for certain acquired commercial loans and
other real estate exposure. The SFSLA covers 80% of
credit losses, on a pari passu basis, for 7 years for
certain acquired loans secured by mortgages on real
property or shares in cooperative property
constituting a primary residence. The indemnification
assets, which represent the fair value of the CSLA and
SFSLA on the acquisition date, are reflected in the total
assets acquired.
As part of the consideration paid, JPMorganChase
issued a five-year, $50 billion secured note to the FDIC
(the "Purchase Money Note"). The Purchase Money
Note bears interest at a fixed rate of 3.4% and is
secured by certain of the acquired loans. The Purchase
Money Note is prepayable upon notice to the holder.
The Firm had placed a $5 billion deposit with First
Republic Bank on March 16, 2023, as part of $30 billion
of deposits provided by a consortium of large U.S.
banks. The Firm's $5 billion deposit was effectively
settled as part of the acquisition and the associated
allowance for credit losses was released upon closing.
The Firm subsequently repaid the remaining
$25 billion of deposits to the consortium of banks,
including accrued interest through the payment date
on May 9, 2023.
Notes to consolidated financial statements
312
JPMorgan Chase & Co./2025 Form 10-K
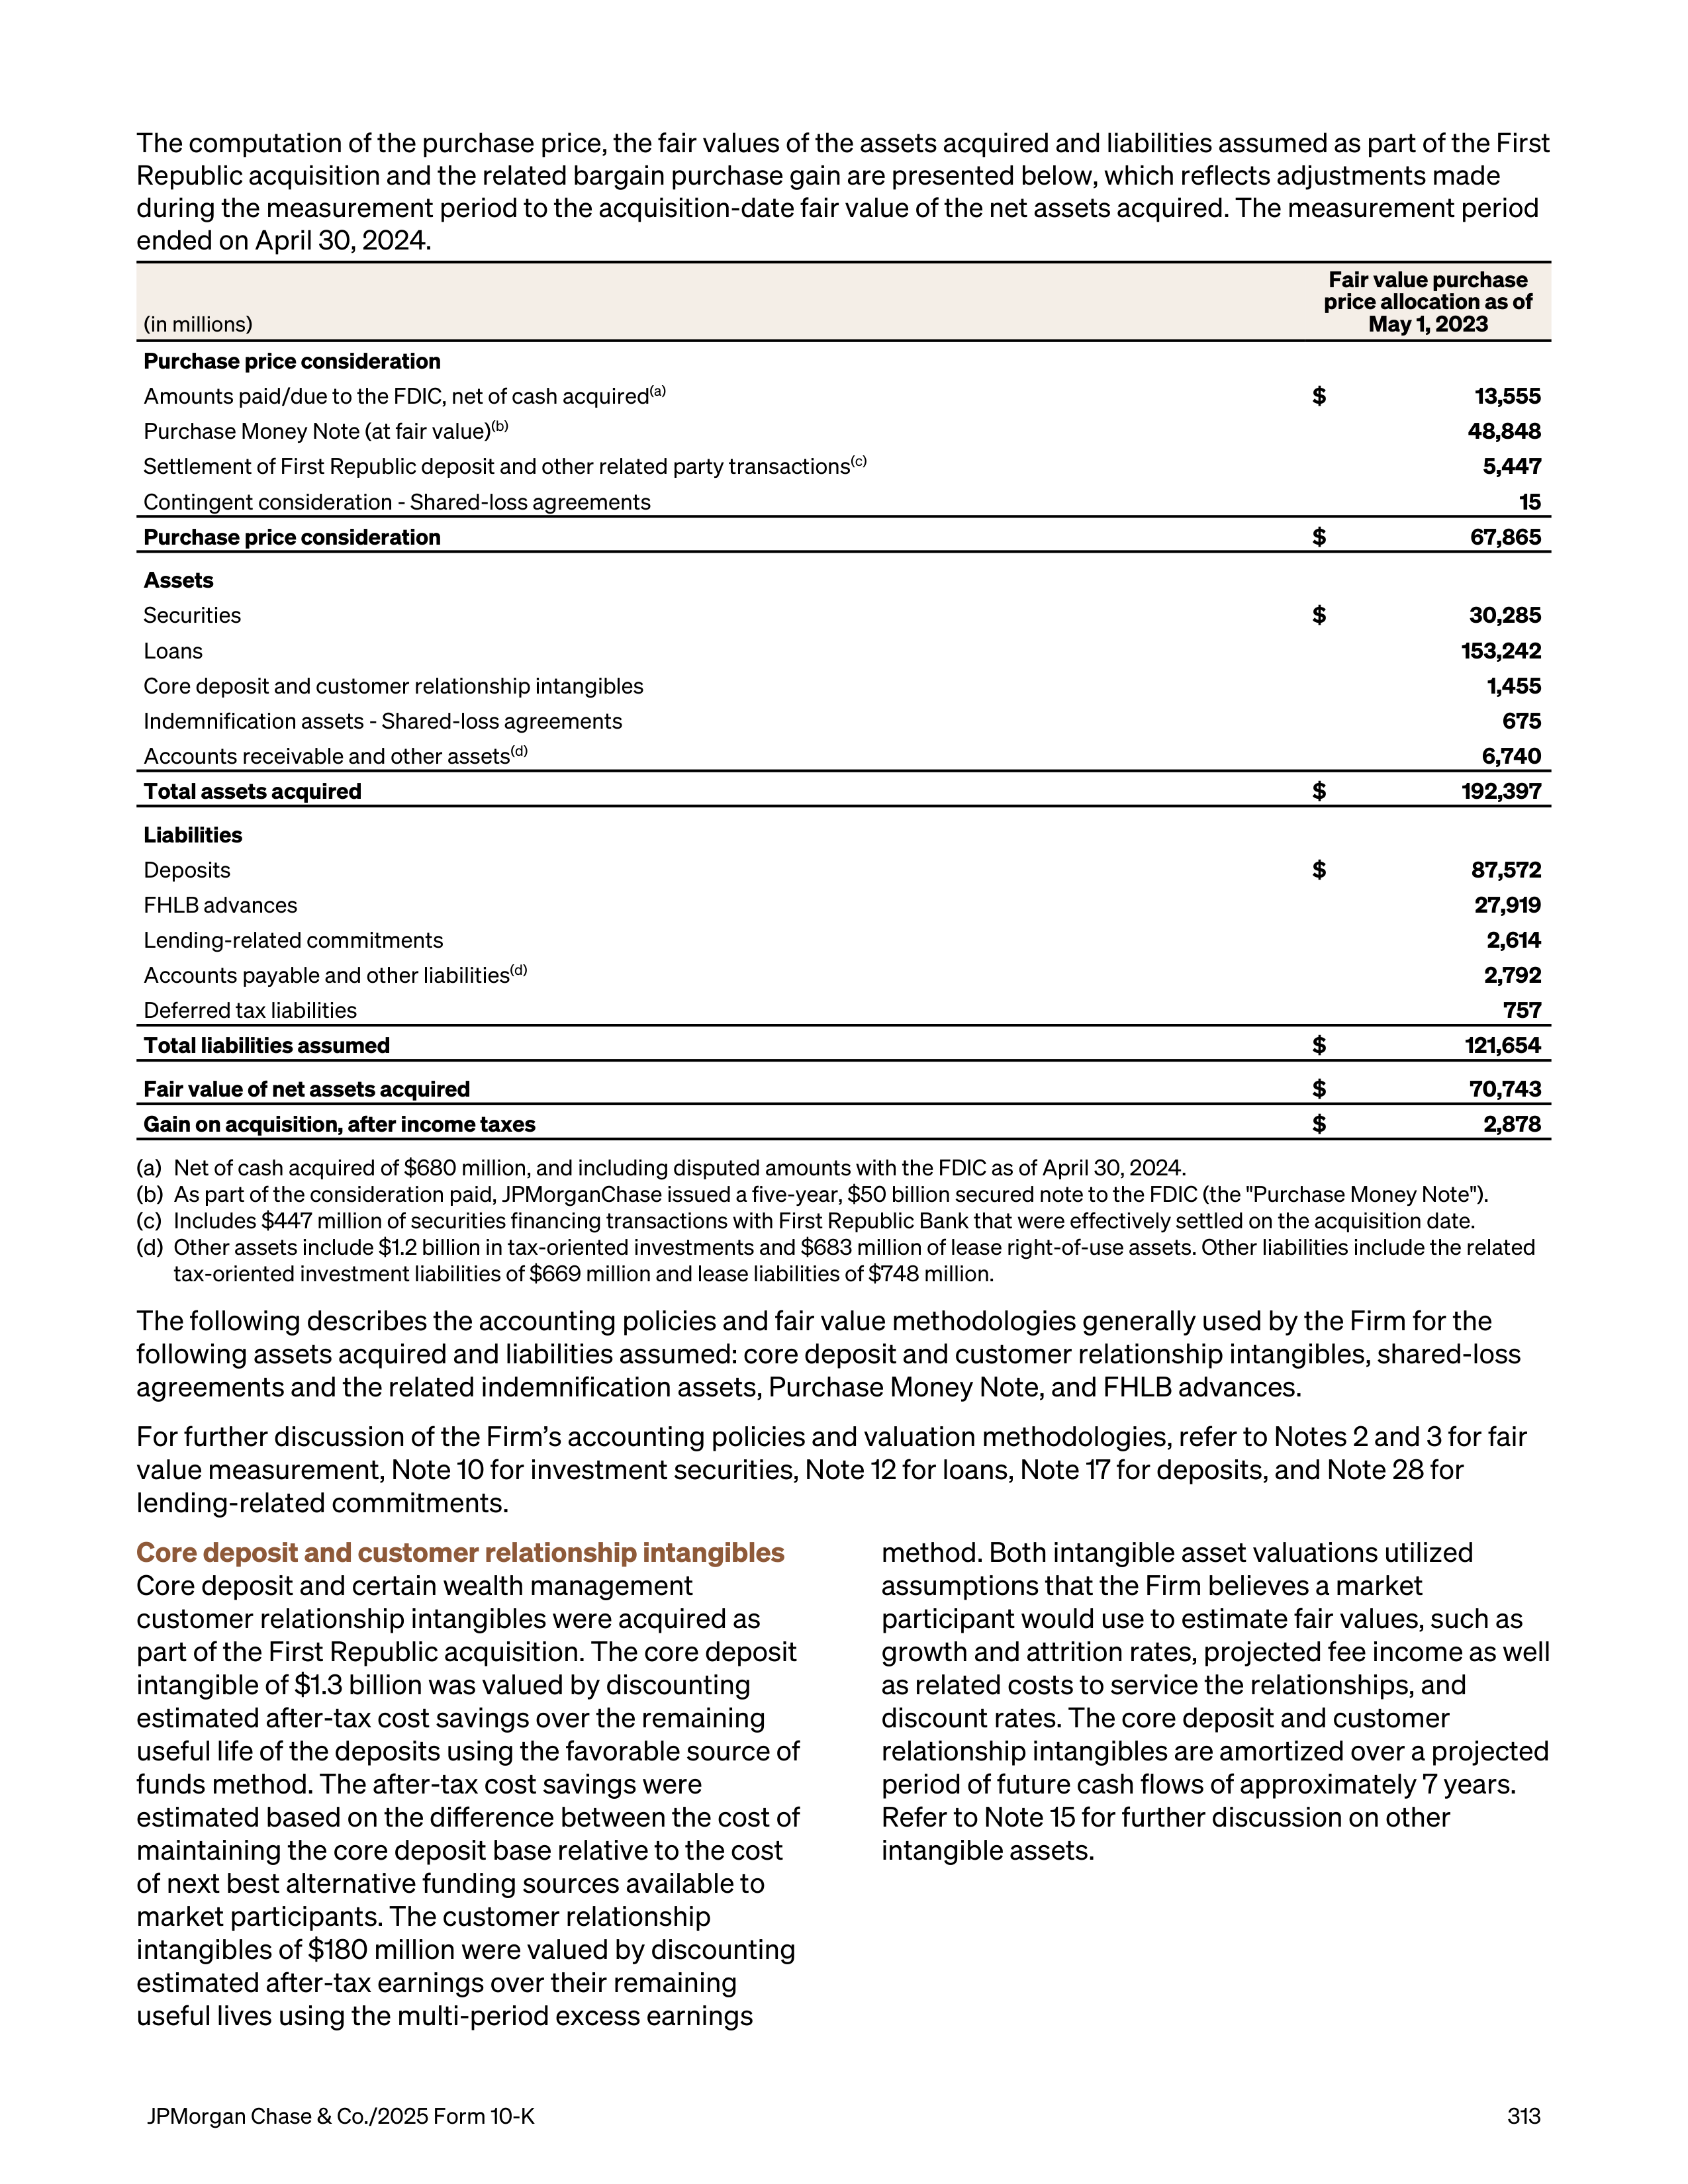
The computation of the purchase price, the fair values of the assets acquired and liabilities assumed as part of the First
Republic acquisition and the related bargain purchase gain are presented below, which reflects adjustments made
during the measurement period to the acquisition-date fair value of the net assets acquired. The measurement period
ended on April 30, 2024.
Fair value purchase
price allocation as of
May 1, 2023
(in millions)
Purchase price consideration
Amounts paid/due to the FDIC, net of cash acquired
(a)
$
13,555
Purchase Money Note (at fair value)
(b)
48,848
Settlement of First Republic deposit and other related party transactions
(c)
5,447
Contingent consideration - Shared-loss agreements
15
Purchase price consideration
$
67,865
Assets
Securities
$
30,285
Loans
153,242
Core deposit and customer relationship intangibles
1,455
Indemnification assets - Shared-loss agreements
675
Accounts receivable and other assets
(d)
6,740
Total assets acquired
$
192,397
Liabilities
Deposits
$
87,572
FHLB advances
27,919
Lending-related commitments
2,614
Accounts payable and other liabilities
(d)
2,792
Deferred tax liabilities
757
Total liabilities assumed
$
121,654
Fair value of net assets acquired
$
70,743
Gain on acquisition, after income taxes
$
2,878
(a)
Net of cash acquired of $680 million, and including disputed amounts with the FDIC as of April 30, 2024.
(b)
As part of the consideration paid, JPMorganChase issued a five-year, $50 billion secured note to the FDIC (the "Purchase Money Note").
(c)
Includes $447 million of securities financing transactions with First Republic Bank that were effectively settled on the acquisition date.
(d)
Other assets include $1.2 billion in tax-oriented investments and $683 million of lease right-of-use assets. Other liabilities include the related
tax-oriented investment liabilities of $669 million and lease liabilities of $748 million.
The following describes the accounting policies and fair value methodologies generally used by the Firm for the
following assets acquired and liabilities assumed: core deposit and customer relationship intangibles, shared-loss
agreements and the related indemnification assets, Purchase Money Note, and FHLB advances.
For further discussion of the Firm’s accounting policies and valuation methodologies, refer to Notes 2 and 3 for fair
value measurement, Note 10 for investment securities, Note 12 for loans, Note 17 for deposits, and Note 28 for
lending-related commitments.
Core deposit and customer relationship intangibles
Core deposit and certain wealth management
customer relationship intangibles were acquired as
part of the First Republic acquisition. The core deposit
intangible of $1.3 billion was valued by discounting
estimated after-tax cost savings over the remaining
useful life of the deposits using the favorable source of
funds method. The after-tax cost savings were
estimated based on the difference between the cost of
maintaining the core deposit base relative to the cost
of next best alternative funding sources available to
market participants. The customer relationship
intangibles of $180 million were valued by discounting
estimated after-tax earnings over their remaining
useful lives using the multi-period excess earnings
method. Both intangible asset valuations utilized
assumptions that the Firm believes a market
participant would use to estimate fair values, such as
growth and attrition rates, projected fee income as well
as related costs to service the relationships, and
discount rates. The core deposit and customer
relationship intangibles are amortized over a projected
period of future cash flows of approximately 7 years.
Refer to Note 15 for further discussion on other
intangible assets.
JPMorgan Chase & Co./2025 Form 10-K
313
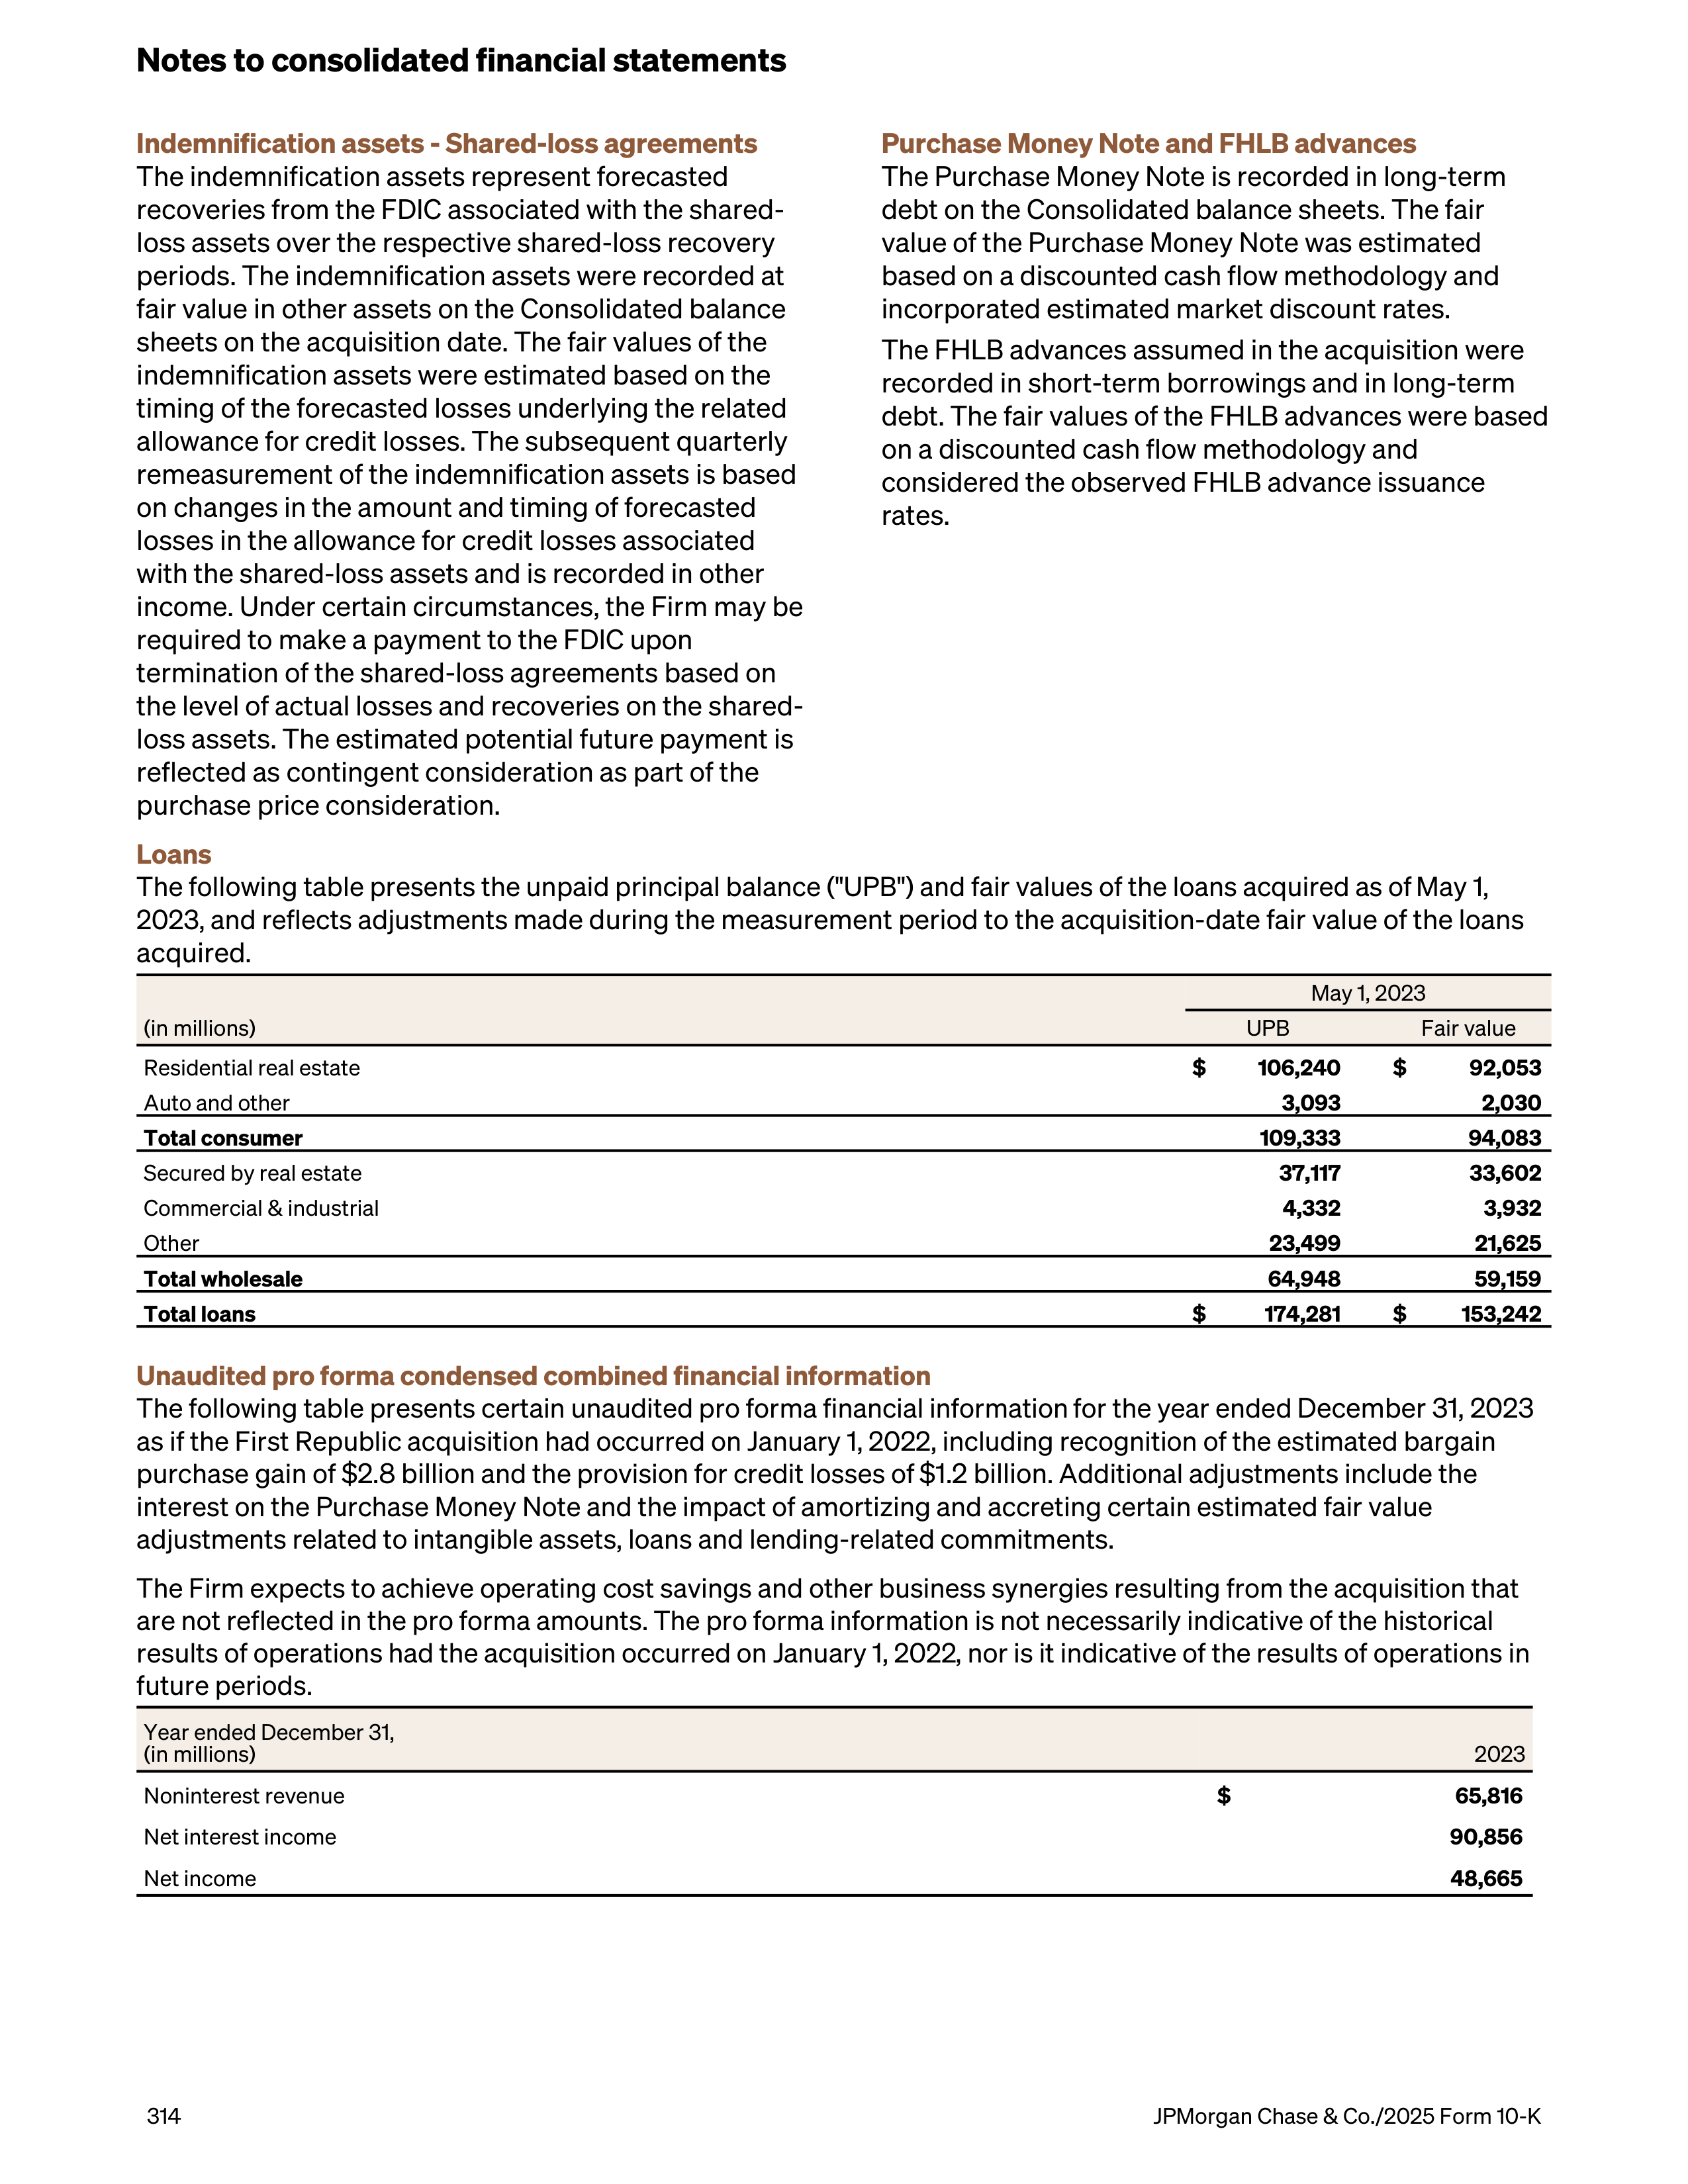
Indemnification assets - Shared-loss agreements
The indemnification assets represent forecasted
recoveries from the FDIC associated with the shared-
loss assets over the respective shared-loss recovery
periods. The indemnification assets were recorded at
fair value in other assets on the Consolidated balance
sheets on the acquisition date. The fair values of the
indemnification assets were estimated based on the
timing of the forecasted losses underlying the related
allowance for credit losses. The subsequent quarterly
remeasurement of the indemnification assets is based
on changes in the amount and timing of forecasted
losses in the allowance for credit losses associated
with the shared-loss assets and is recorded in other
income. Under certain circumstances, the Firm may be
required to make a payment to the FDIC upon
termination of the shared-loss agreements based on
the level of actual losses and recoveries on the shared-
loss assets. The estimated potential future payment is
reflected as contingent consideration as part of the
purchase price consideration.
Purchase Money Note and FHLB advances
The Purchase Money Note is recorded in long-term
debt on the Consolidated balance sheets. The fair
value of the Purchase Money Note was estimated
based on a discounted cash flow methodology and
incorporated estimated market discount rates.
The FHLB advances assumed in the acquisition were
recorded in short-term borrowings and in long-term
debt. The fair values of the FHLB advances were based
on a discounted cash flow methodology and
considered the observed FHLB advance issuance
rates.
Loans
The following table presents the unpaid principal balance ("UPB") and fair values of the loans acquired as of May 1,
2023, and reflects adjustments
made during the measurement period to the acquisition-date fair value of the loans
acquired
.
May 1, 2023
(in millions)
UPB
Fair value
Residential real estate
$
106,240
$
92,053
Auto and other
3,093
2,030
Total consumer
109,333
94,083
Secured by real estate
37,117
33,602
Commercial & industrial
4,332
3,932
Other
23,499
21,625
Total wholesale
64,948
59,159
Total loans
$
174,281
$
153,242
Unaudited pro forma condensed combined financial information
The following table presents certain unaudited pro forma financial information for the year ended
December 31, 2023
as if the First Republic acquisition had occurred on January 1, 2022, including recognition of the estimated bargain
purchase gain of
$2.8 billion
and the provision for credit losses of
$1.2 billion
. Additional adjustments include the
interest on the Purchase Money Note and the impact of amortizing and accreting certain estimated fair value
adjustments related to intangible assets, loans and lending-related commitments.
The Firm expects to achieve operating cost savings and other business synergies resulting from the acquisition that
are not reflected in the pro forma amounts. The pro forma information is not necessarily indicative of the historical
results of operations had the acquisition occurred on January 1, 2022, nor is it indicative of the results of operations in
future periods.
Year ended December 31,
(in millions)
2023
Noninterest revenue
$
65,816
Net interest income
90,856
Net income
48,665
Notes to consolidated financial statements
314
JPMorgan Chase & Co./2025 Form 10-K
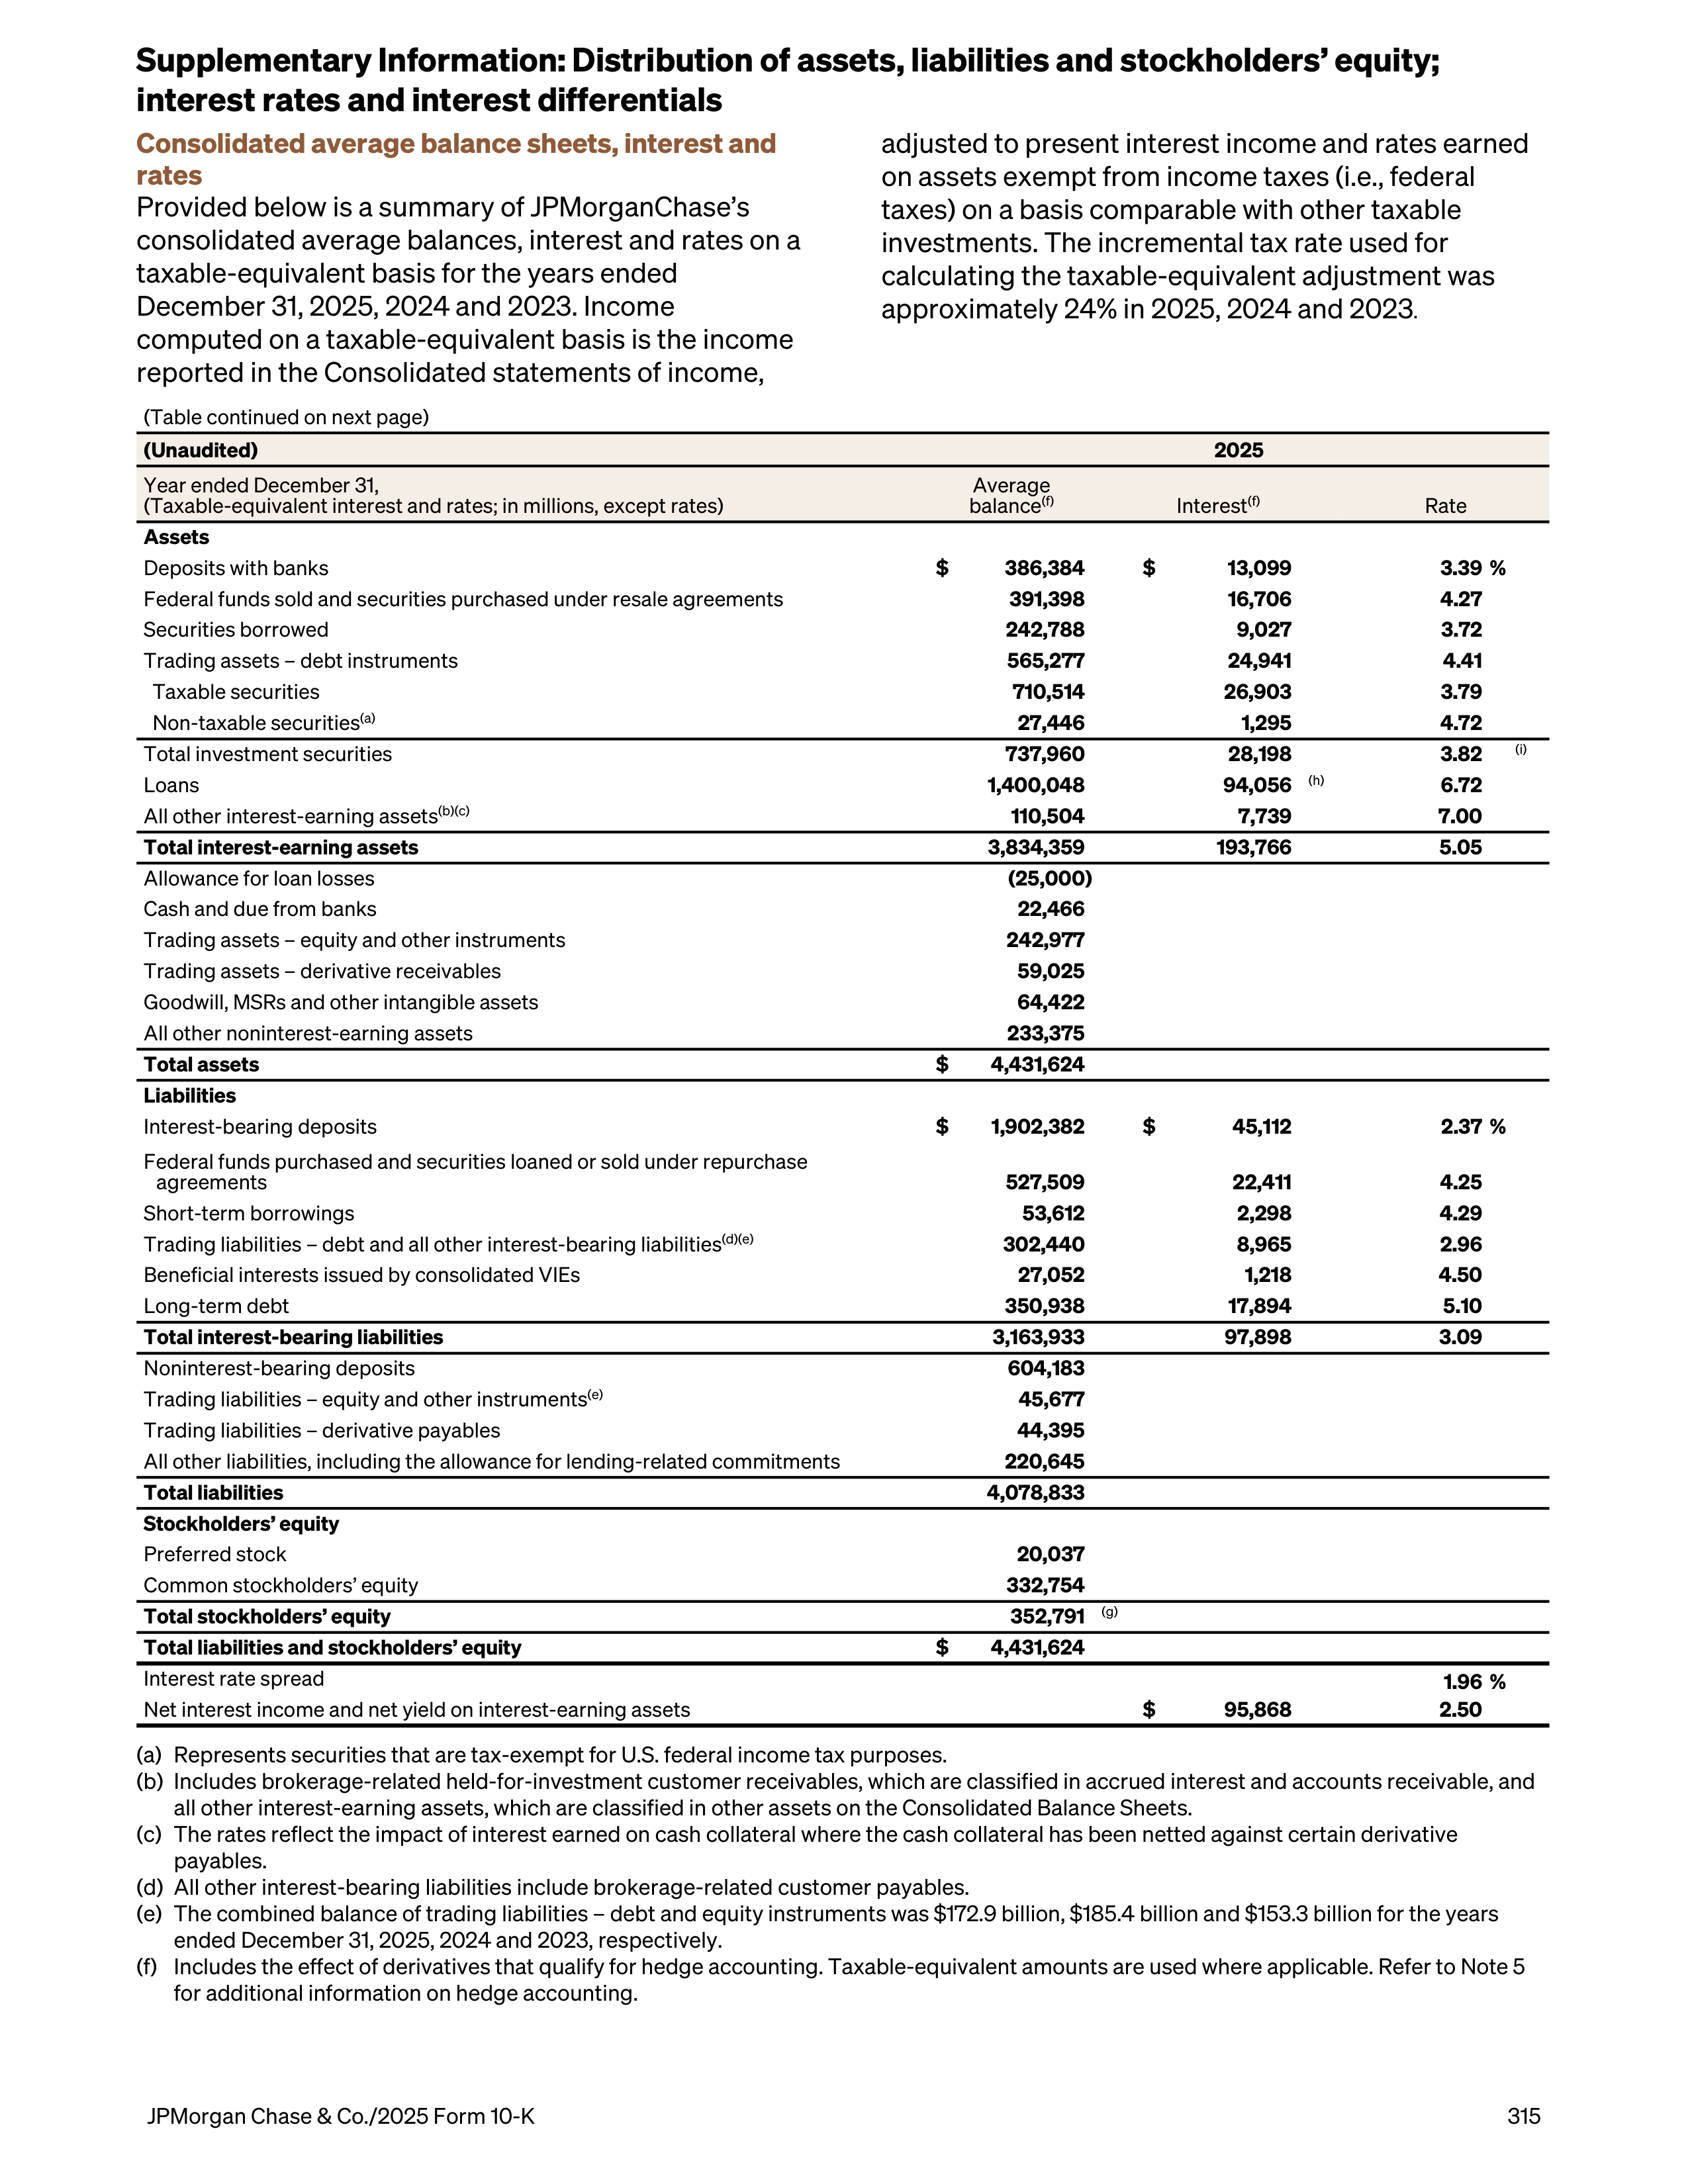
Consolidated average balance sheets, interest and
rates
Provided below is a summary of JPMorganChase’s
consolidated average balances, interest and rates on a
taxable-equivalent basis for the years ended
December 31, 2025, 2024 and 2023. Income
computed on a taxable-equivalent basis is the income
reported in the Consolidated statements of income,
adjusted to present interest income and rates earned
on assets exempt from income taxes (i.e., federal
taxes) on a basis comparable with other taxable
investments. The incremental tax rate used for
calculating the taxable-equivalent adjustment was
approximately 24% in 2025, 2024 and 2023
.
(Table continued on next page)
(Unaudited)
2025
Year ended December 31,
(Taxable-equivalent interest and rates; in millions, except rates)
Average
balance
(f)
Interest
(f)
Rate
Assets
Deposits with banks
$
386,384
$
13,099
3.39 %
Federal funds sold and securities purchased under resale agreements
391,398
16,706
4.27
Securities borrowed
242,788
9,027
3.72
Trading assets – debt instruments
565,277
24,941
4.41
Taxable securities
710,514
26,903
3.79
Non-taxable securities
(a)
27,446
1,295
4.72
Total investment securities
737,960
28,198
3.82
(i)
Loans
1,400,048
94,056
(h)
6.72
All other interest-earning assets
(b)(c)
110,504
7,739
7.00
Total interest-earning assets
3,834,359
193,766
5.05
Allowance for loan losses
(25,000)
Cash and due from banks
22,466
Trading assets – equity and other instruments
242,977
Trading assets – derivative receivables
59,025
Goodwill, MSRs and other intangible assets
64,422
All other noninterest-earning assets
233,375
Total assets
$
4,431,624
Liabilities
Interest-bearing deposits
$
1,902,382
$
45,112
2.37 %
Federal funds purchased and securities loaned or sold under repurchase
agreements
527,509
22,411
4.25
Short-term borrowings
53,612
2,298
4.29
Trading liabilities – debt and all other interest-bearing liabilities
(d)(e)
302,440
8,965
2.96
Beneficial interests issued by consolidated VIEs
27,052
1,218
4.50
Long-term debt
350,938
17,894
5.10
Total interest-bearing liabilities
3,163,933
97,898
3.09
Noninterest-bearing deposits
604,183
Trading liabilities – equity and other instruments
(e)
45,677
Trading liabilities – derivative payables
44,395
All other liabilities, including the allowance for lending-related commitments
220,645
Total liabilities
4,078,833
Stockholders’ equity
Preferred stock
20,037
Common stockholders’ equity
332,754
Total stockholders’ equity
352,791
(g)
Total liabilities and stockholders’ equity
$
4,431,624
Interest rate spread
1.96 %
Net interest income and net yield on interest-earning assets
$
95,868
2.50
(a)
Represents securities that are tax-exempt for U.S. federal income tax purposes.
(b)
Includes brokerage-related held-for-investment customer receivables, which are classified in accrued interest and accounts receivable, and
all other interest-earning assets, which are classified in other assets on the Consolidated Balance Sheets.
(c)
The rates reflect the impact of interest earned on cash collateral where the cash collateral has been netted against certain derivative
payables.
(d)
All other interest-bearing liabilities include brokerage-related customer payables.
(e)
The combined balance of trading liabilities – debt and equity instruments was $172.9 billion, $185.4 billion and $153.3 billion for the years
ended December 31, 2025, 2024 and 2023, respectively.
(f)
Includes the effect of derivatives that qualify for hedge accounting. Taxable-equivalent amounts are used where applicable. Refer to Note 5
for additional information on hedge accounting.
Supplementary Information: Distribution of assets, liabilities and stockholders’ equity;
interest rates and interest differentials
JPMorgan Chase & Co./2025 Form 10-K
315
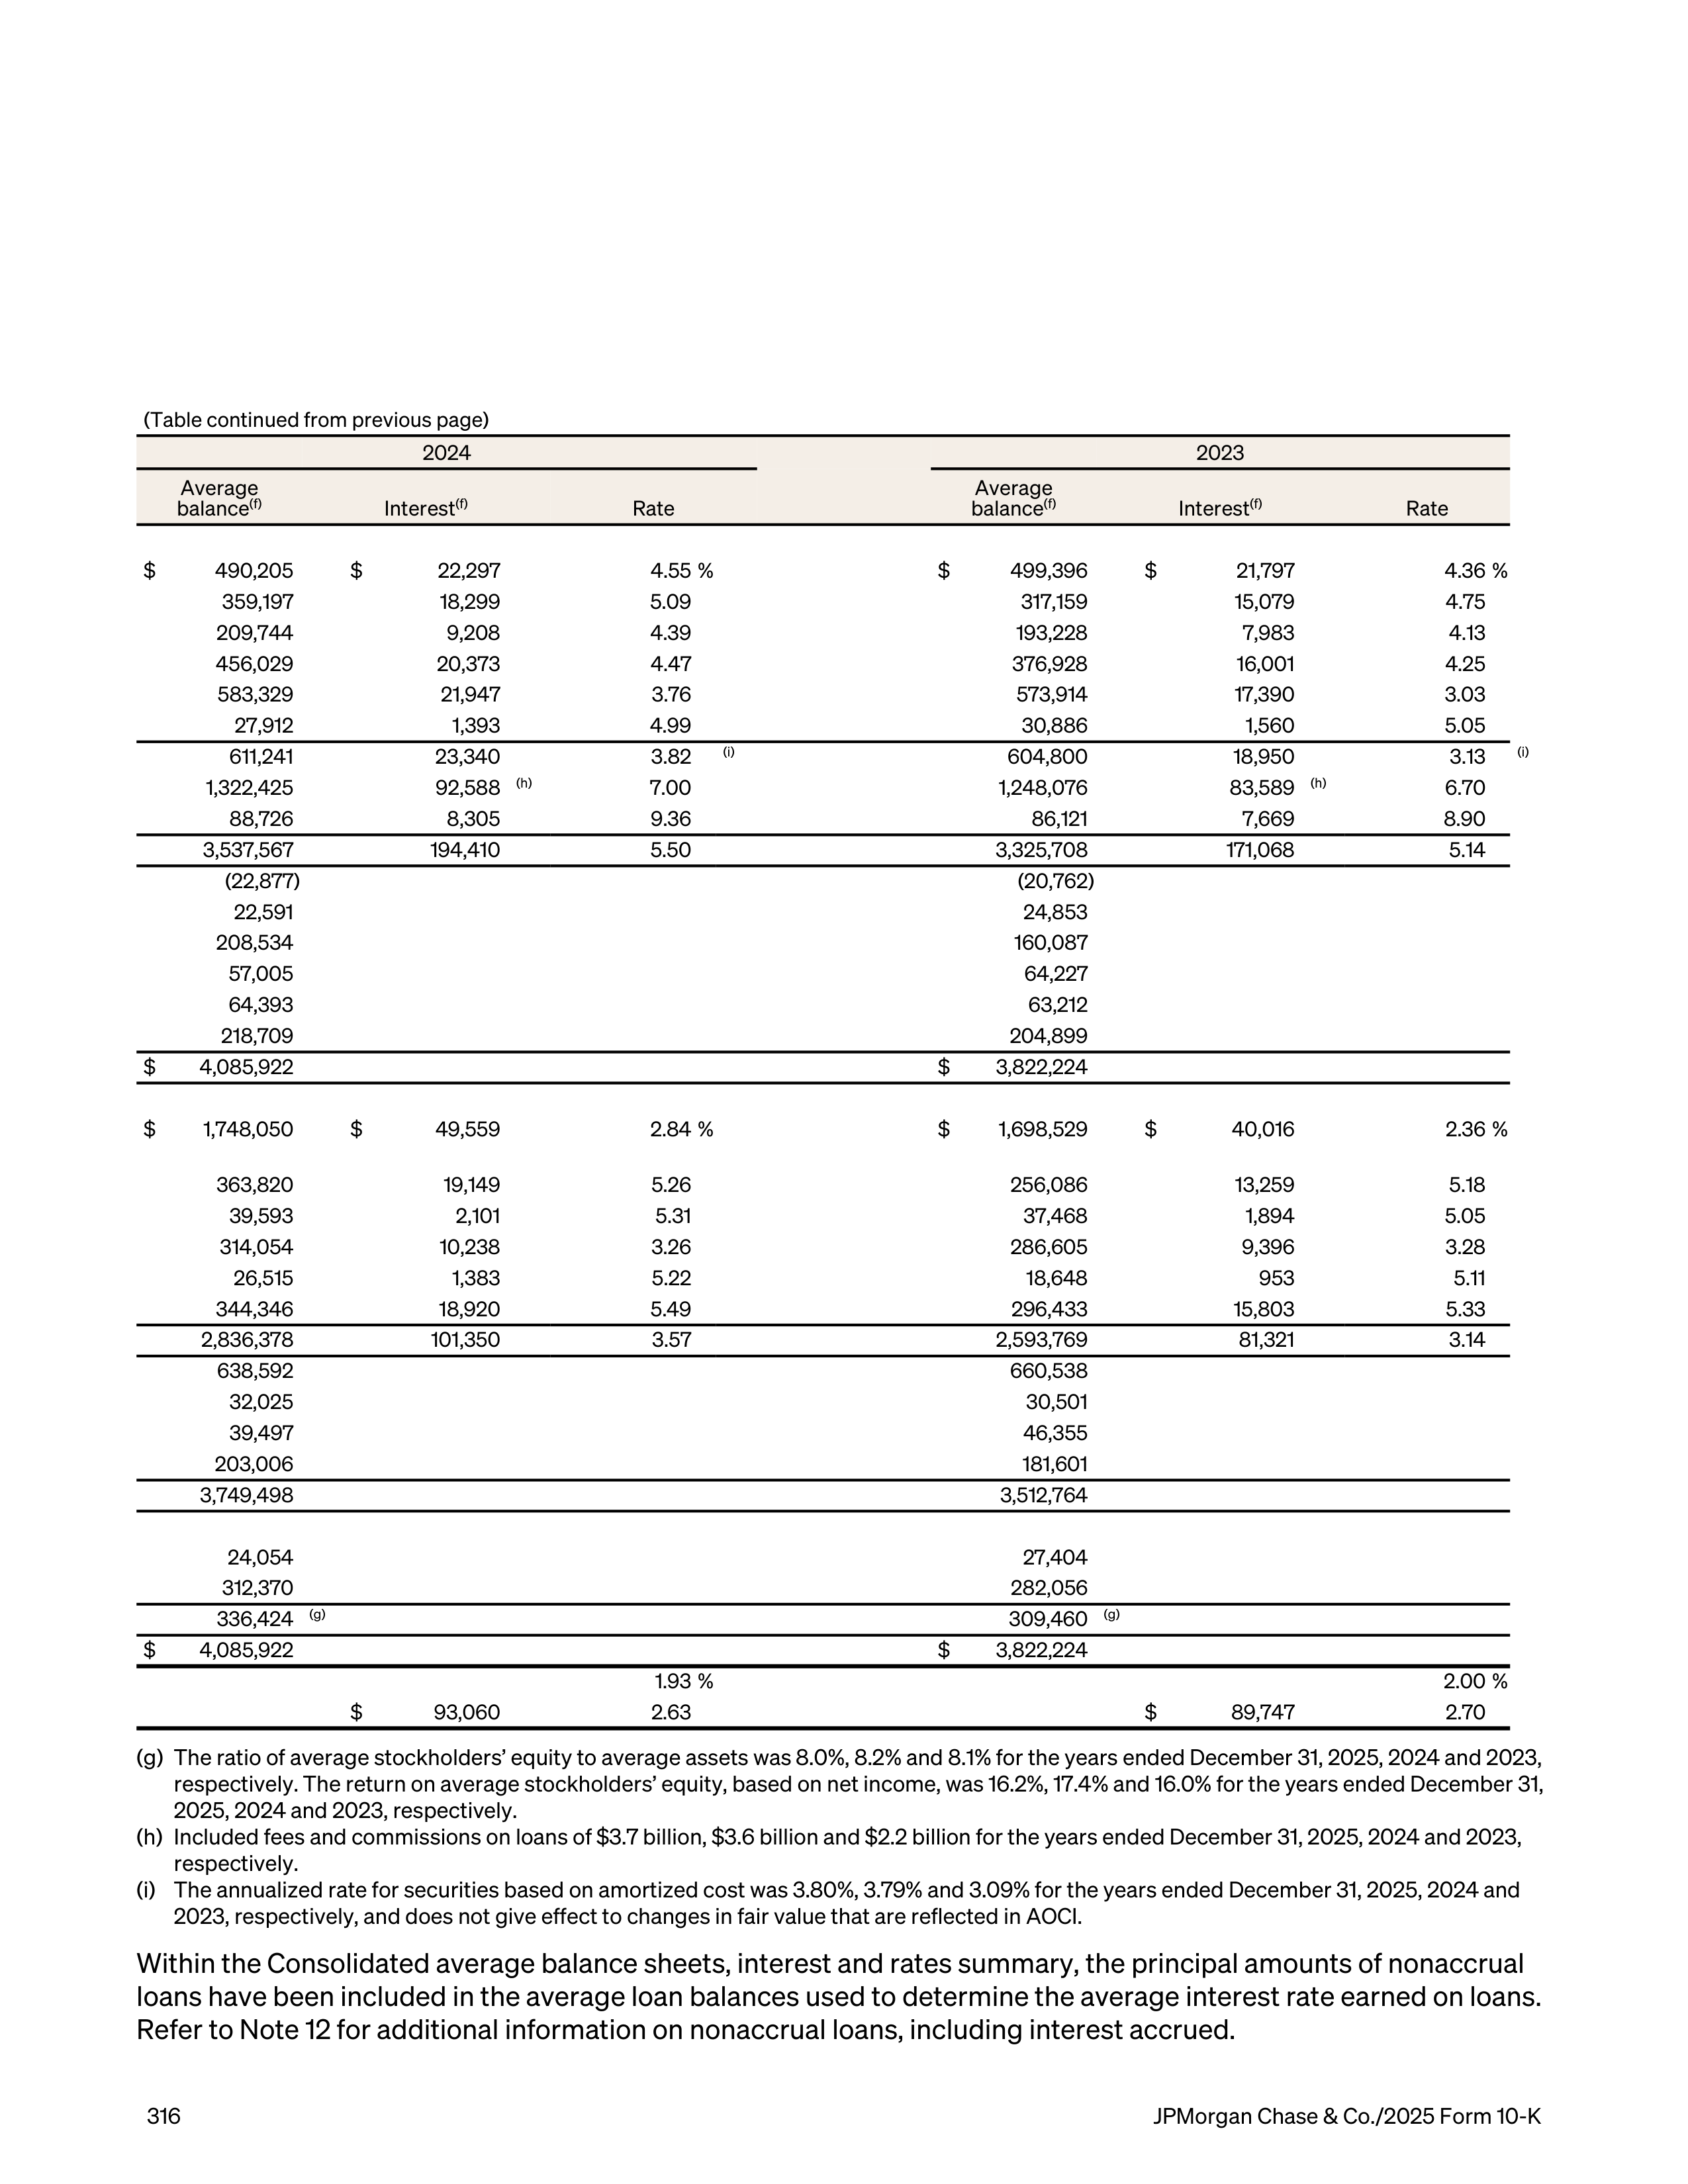
(Table continued from previous page)
2024
2023
Average
balance
(f)
Interest
(f)
Rate
Average
balance
(f)
Interest
(f)
Rate
$
490,205
$
22,297
4.55 %
$
499,396
$
21,797
4.36 %
359,197
18,299
5.09
317,159
15,079
4.75
209,744
9,208
4.39
193,228
7,983
4.13
456,029
20,373
4.47
376,928
16,001
4.25
583,329
21,947
3.76
573,914
17,390
3.03
27,912
1,393
4.99
30,886
1,560
5.05
611,241
23,340
3.82
(i)
604,800
18,950
3.13
(i)
1,322,425
92,588
(h)
7.00
1,248,076
83,589
(h)
6.70
88,726
8,305
9.36
86,121
7,669
8.90
3,537,567
194,410
5.50
3,325,708
171,068
5.14
(22,877)
(20,762)
22,591
24,853
208,534
160,087
57,005
64,227
64,393
63,212
218,709
204,899
$
4,085,922
$
3,822,224
$
1,748,050
$
49,559
2.84 %
$
1,698,529
$
40,016
2.36 %
363,820
19,149
5.26
256,086
13,259
5.18
39,593
2,101
5.31
37,468
1,894
5.05
314,054
10,238
3.26
286,605
9,396
3.28
26,515
1,383
5.22
18,648
953
5.11
344,346
18,920
5.49
296,433
15,803
5.33
2,836,378
101,350
3.57
2,593,769
81,321
3.14
638,592
660,538
32,025
30,501
39,497
46,355
203,006
181,601
3,749,498
3,512,764
24,054
27,404
312,370
282,056
336,424
(g)
309,460
(g)
$
4,085,922
$
3,822,224
1.93 %
2.00 %
$
93,060
2.63
$
89,747
2.70
(g)
The ratio of average stockholders’ equity to average assets was 8.0%, 8.2% and 8.1% for the years ended December 31, 2025, 2024 and 2023,
respectively. The return on average stockholders’ equity, based on net income, was 16.2%, 17.4% and 16.0% for the years ended December 31,
2025, 2024 and 2023, respectively.
(h)
Included fees and commissions on loans of $3.7 billion, $3.6 billion and $2.2 billion for the years ended December 31, 2025, 2024 and 2023,
respectively.
(i)
The annualized rate for securities based on amortized cost was 3.80%, 3.79% and 3.09% for the years ended December 31, 2025, 2024 and
2023, respectively, and does not give effect to changes in fair value that are reflected in AOCI.
Within the Consolidated average balance sheets, interest and rates summary, the principal amounts of nonaccrual
loans have been included in the average loan balances used to determine the average interest rate earned on loans.
Refer to Note 12 for additional information on nonaccrual loans, including interest accrued.
316
JPMorgan Chase & Co./2025 Form 10-K
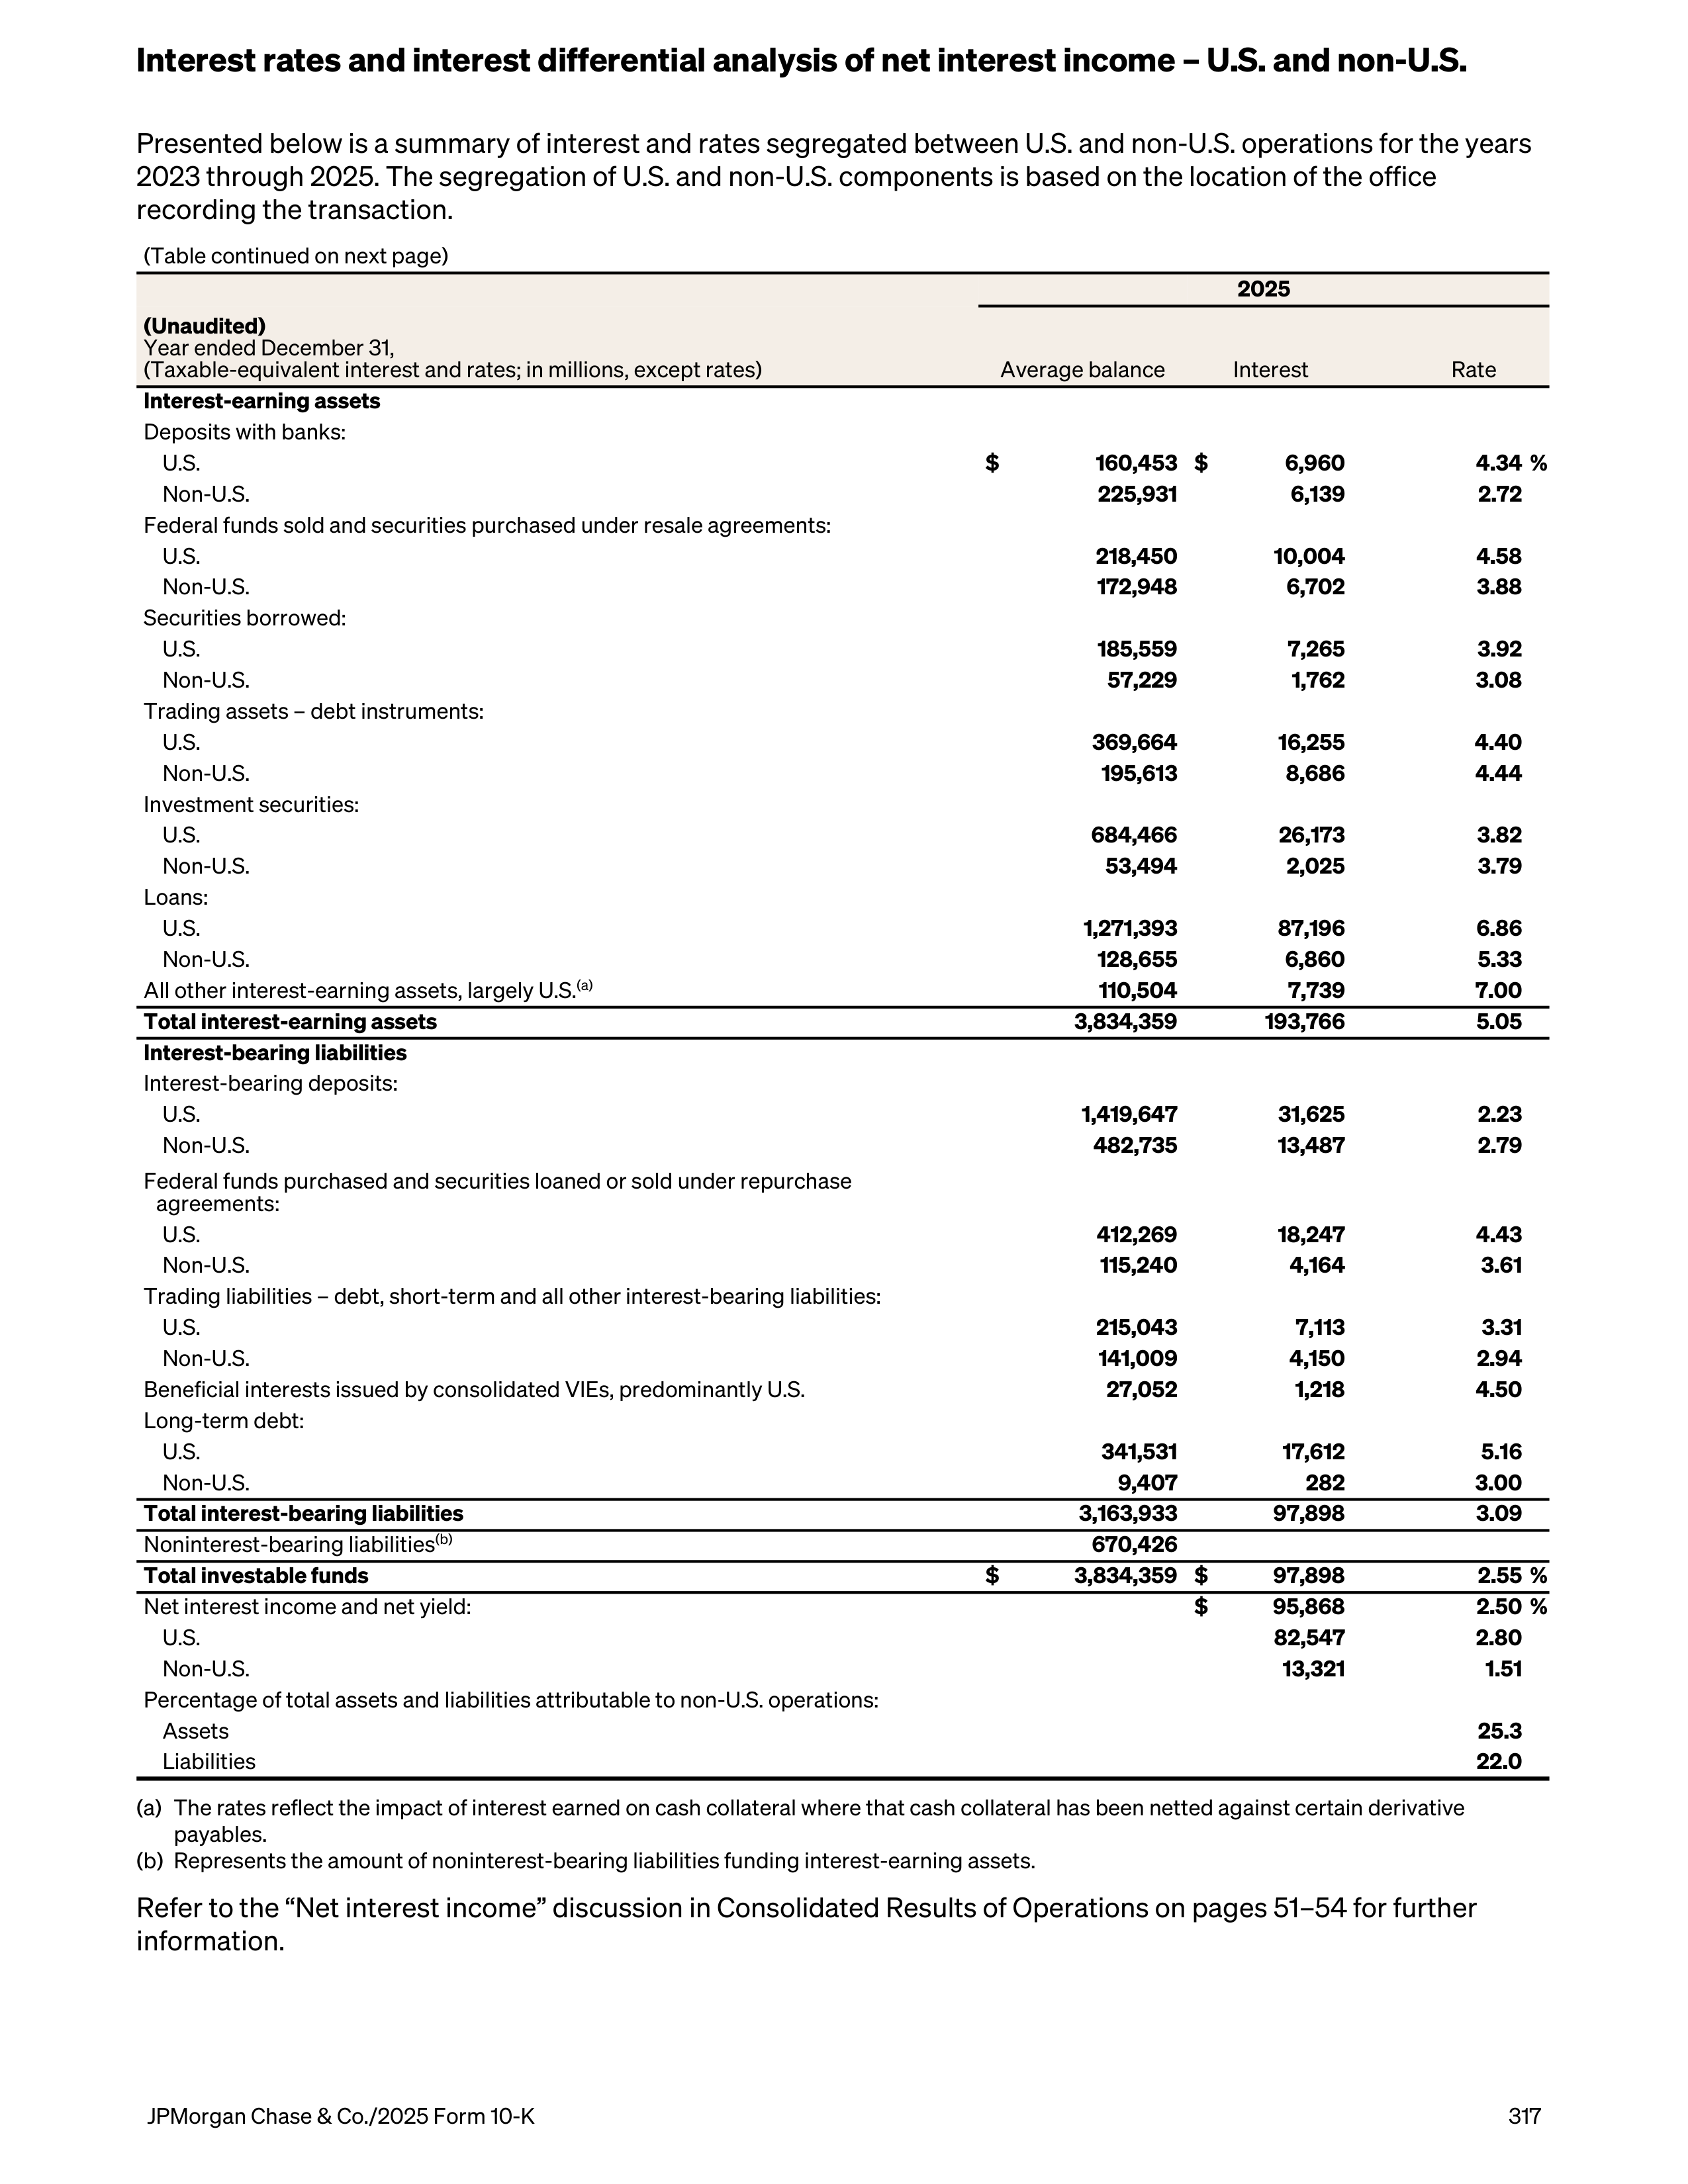
Presented below is a summary of interest and rates segregated between U.S. and non-U.S. operations for the years
2023 through 2025. The segregation of U.S. and non-U.S. components is based on the location of the office
recording the transaction.
(Table continued on next page)
2025
(Unaudited)
Year ended December 31,
(Taxable-equivalent interest and rates; in millions, except rates)
Average balance
Interest
Rate
Interest-earning assets
Deposits with banks:
U.S.
$
160,453 $
6,960
4.34 %
Non-U.S.
225,931
6,139
2.72
Federal funds sold and securities purchased under resale agreements:
U.S.
218,450
10,004
4.58
Non-U.S.
172,948
6,702
3.88
Securities borrowed:
U.S.
185,559
7,265
3.92
Non-U.S.
57,229
1,762
3.08
Trading assets – debt instruments:
U.S.
369,664
16,255
4.40
Non-U.S.
195,613
8,686
4.44
Investment securities:
U.S.
684,466
26,173
3.82
Non-U.S.
53,494
2,025
3.79
Loans:
U.S.
1,271,393
87,196
6.86
Non-U.S.
128,655
6,860
5.33
All other interest-earning assets, largely U.S.
(a)
110,504
7,739
7.00
Total interest-earning assets
3,834,359
193,766
5.05
Interest-bearing liabilities
Interest-bearing deposits:
U.S.
1,419,647
31,625
2.23
Non-U.S.
482,735
13,487
2.79
Federal funds purchased and securities loaned or sold under repurchase
agreements:
U.S.
412,269
18,247
4.43
Non-U.S.
115,240
4,164
3.61
Trading liabilities – debt, short-term and all other interest-bearing liabilities:
U.S.
215,043
7,113
3.31
Non-U.S.
141,009
4,150
2.94
Beneficial interests issued by consolidated VIEs, predominantly U.S.
27,052
1,218
4.50
Long-term debt:
U.S.
341,531
17,612
5.16
Non-U.S.
9,407
282
3.00
Total interest-bearing liabilities
3,163,933
97,898
3.09
Noninterest-bearing liabilities
(b)
670,426
Total investable funds
$
3,834,359 $
97,898
2.55 %
Net interest income and net yield:
$
95,868
2.50 %
U.S.
82,547
2.80
Non-U.S.
13,321
1.51
Percentage of total assets and liabilities attributable to non-U.S. operations:
Assets
25.3
Liabilities
22.0
(a)
The rates reflect the impact of interest earned on cash collateral where that cash collateral has been netted against certain derivative
payables.
(b)
Represents the amount of noninterest-bearing liabilities funding interest-earning assets.
Refer to the “Net interest income” discussion in Consolidated Results of Operations on pages 51–54 for further
information.
Interest rates and interest differential analysis of net interest income – U.S. and non-U.S.
JPMorgan Chase & Co./2025 Form 10-K
317
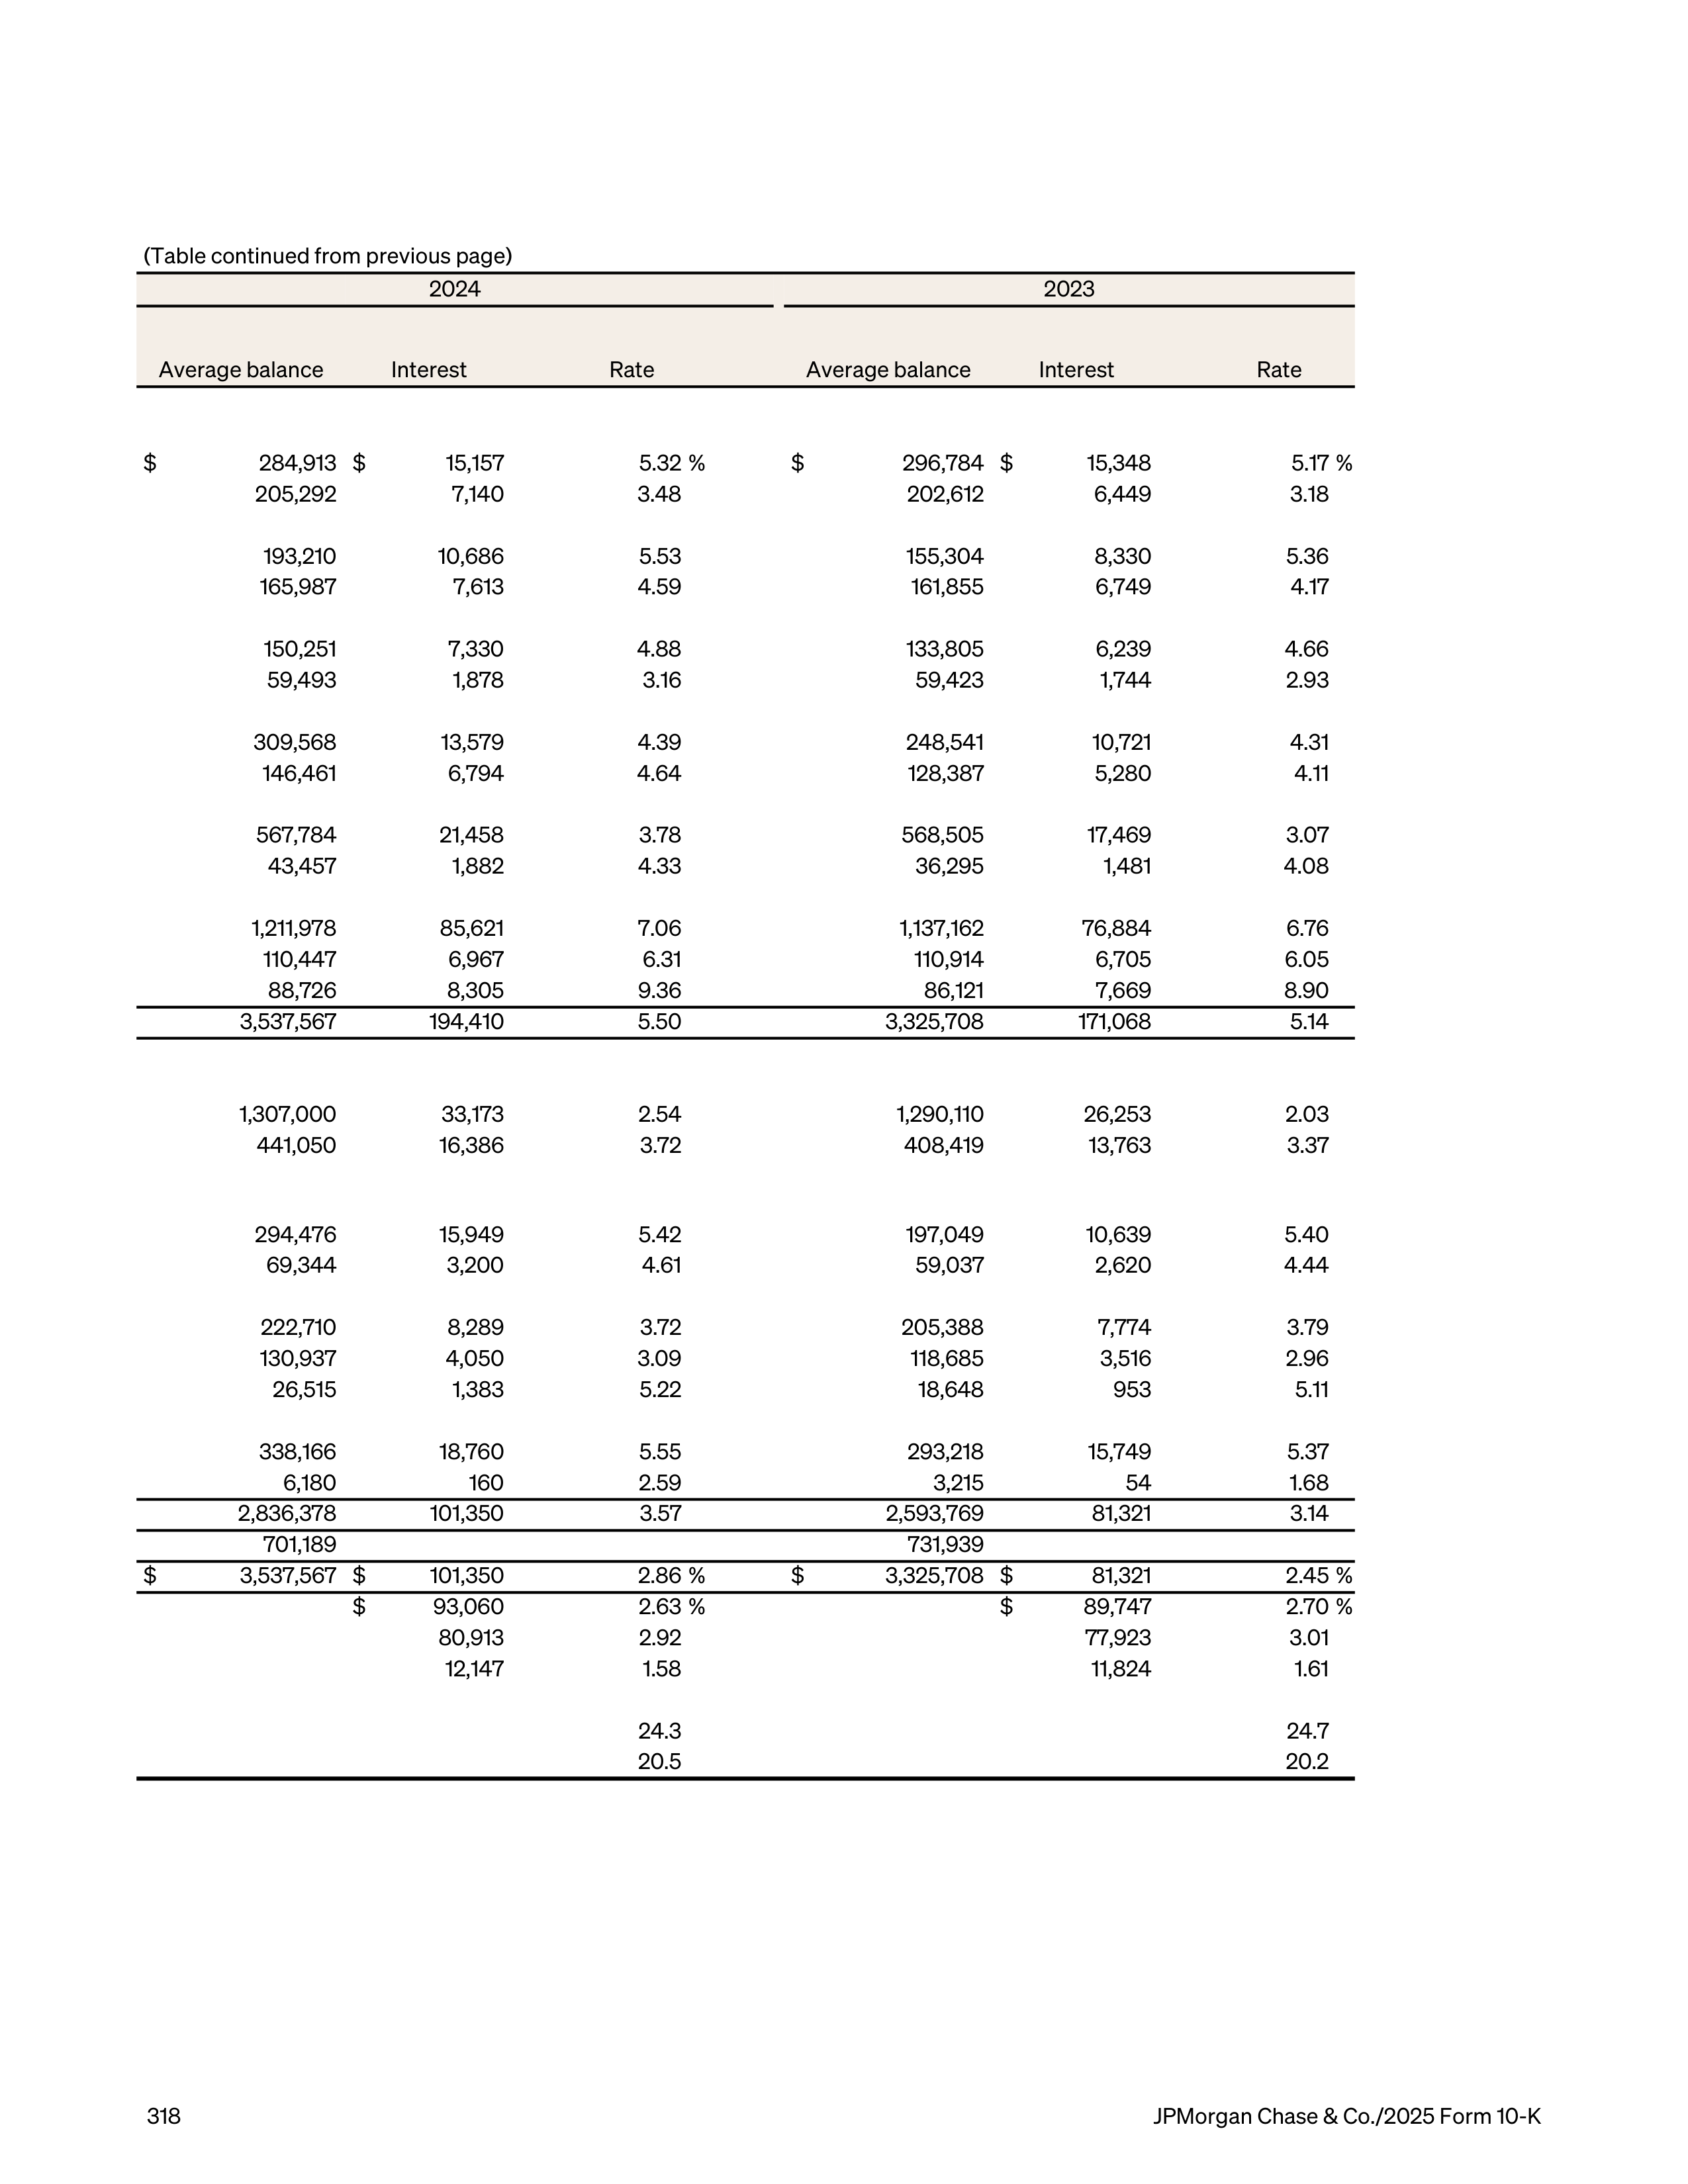
(Table continued from previous page)
2024
2023
Average balance
Interest
Rate
Average balance
Interest
Rate
$
284,913 $
15,157
5.32 %
$
296,784 $
15,348
5.17 %
205,292
7,140
3.48
202,612
6,449
3.18
193,210
10,686
5.53
155,304
8,330
5.36
165,987
7,613
4.59
161,855
6,749
4.17
150,251
7,330
4.88
133,805
6,239
4.66
59,493
1,878
3.16
59,423
1,744
2.93
309,568
13,579
4.39
248,541
10,721
4.31
146,461
6,794
4.64
128,387
5,280
4.11
567,784
21,458
3.78
568,505
17,469
3.07
43,457
1,882
4.33
36,295
1,481
4.08
1,211,978
85,621
7.06
1,137,162
76,884
6.76
110,447
6,967
6.31
110,914
6,705
6.05
88,726
8,305
9.36
86,121
7,669
8.90
3,537,567
194,410
5.50
3,325,708
171,068
5.14
1,307,000
33,173
2.54
1,290,110
26,253
2.03
441,050
16,386
3.72
408,419
13,763
3.37
294,476
15,949
5.42
197,049
10,639
5.40
69,344
3,200
4.61
59,037
2,620
4.44
222,710
8,289
3.72
205,388
7,774
3.79
130,937
4,050
3.09
118,685
3,516
2.96
26,515
1,383
5.22
18,648
953
5.11
338,166
18,760
5.55
293,218
15,749
5.37
6,180
160
2.59
3,215
54
1.68
2,836,378
101,350
3.57
2,593,769
81,321
3.14
701,189
731,939
$
3,537,567 $
101,350
2.86 %
$
3,325,708 $
81,321
2.45 %
$
93,060
2.63 %
$
89,747
2.70 %
80,913
2.92
77,923
3.01
12,147
1.58
11,824
1.61
24.3
24.7
20.5
20.2
318
JPMorgan Chase & Co./2025 Form 10-K
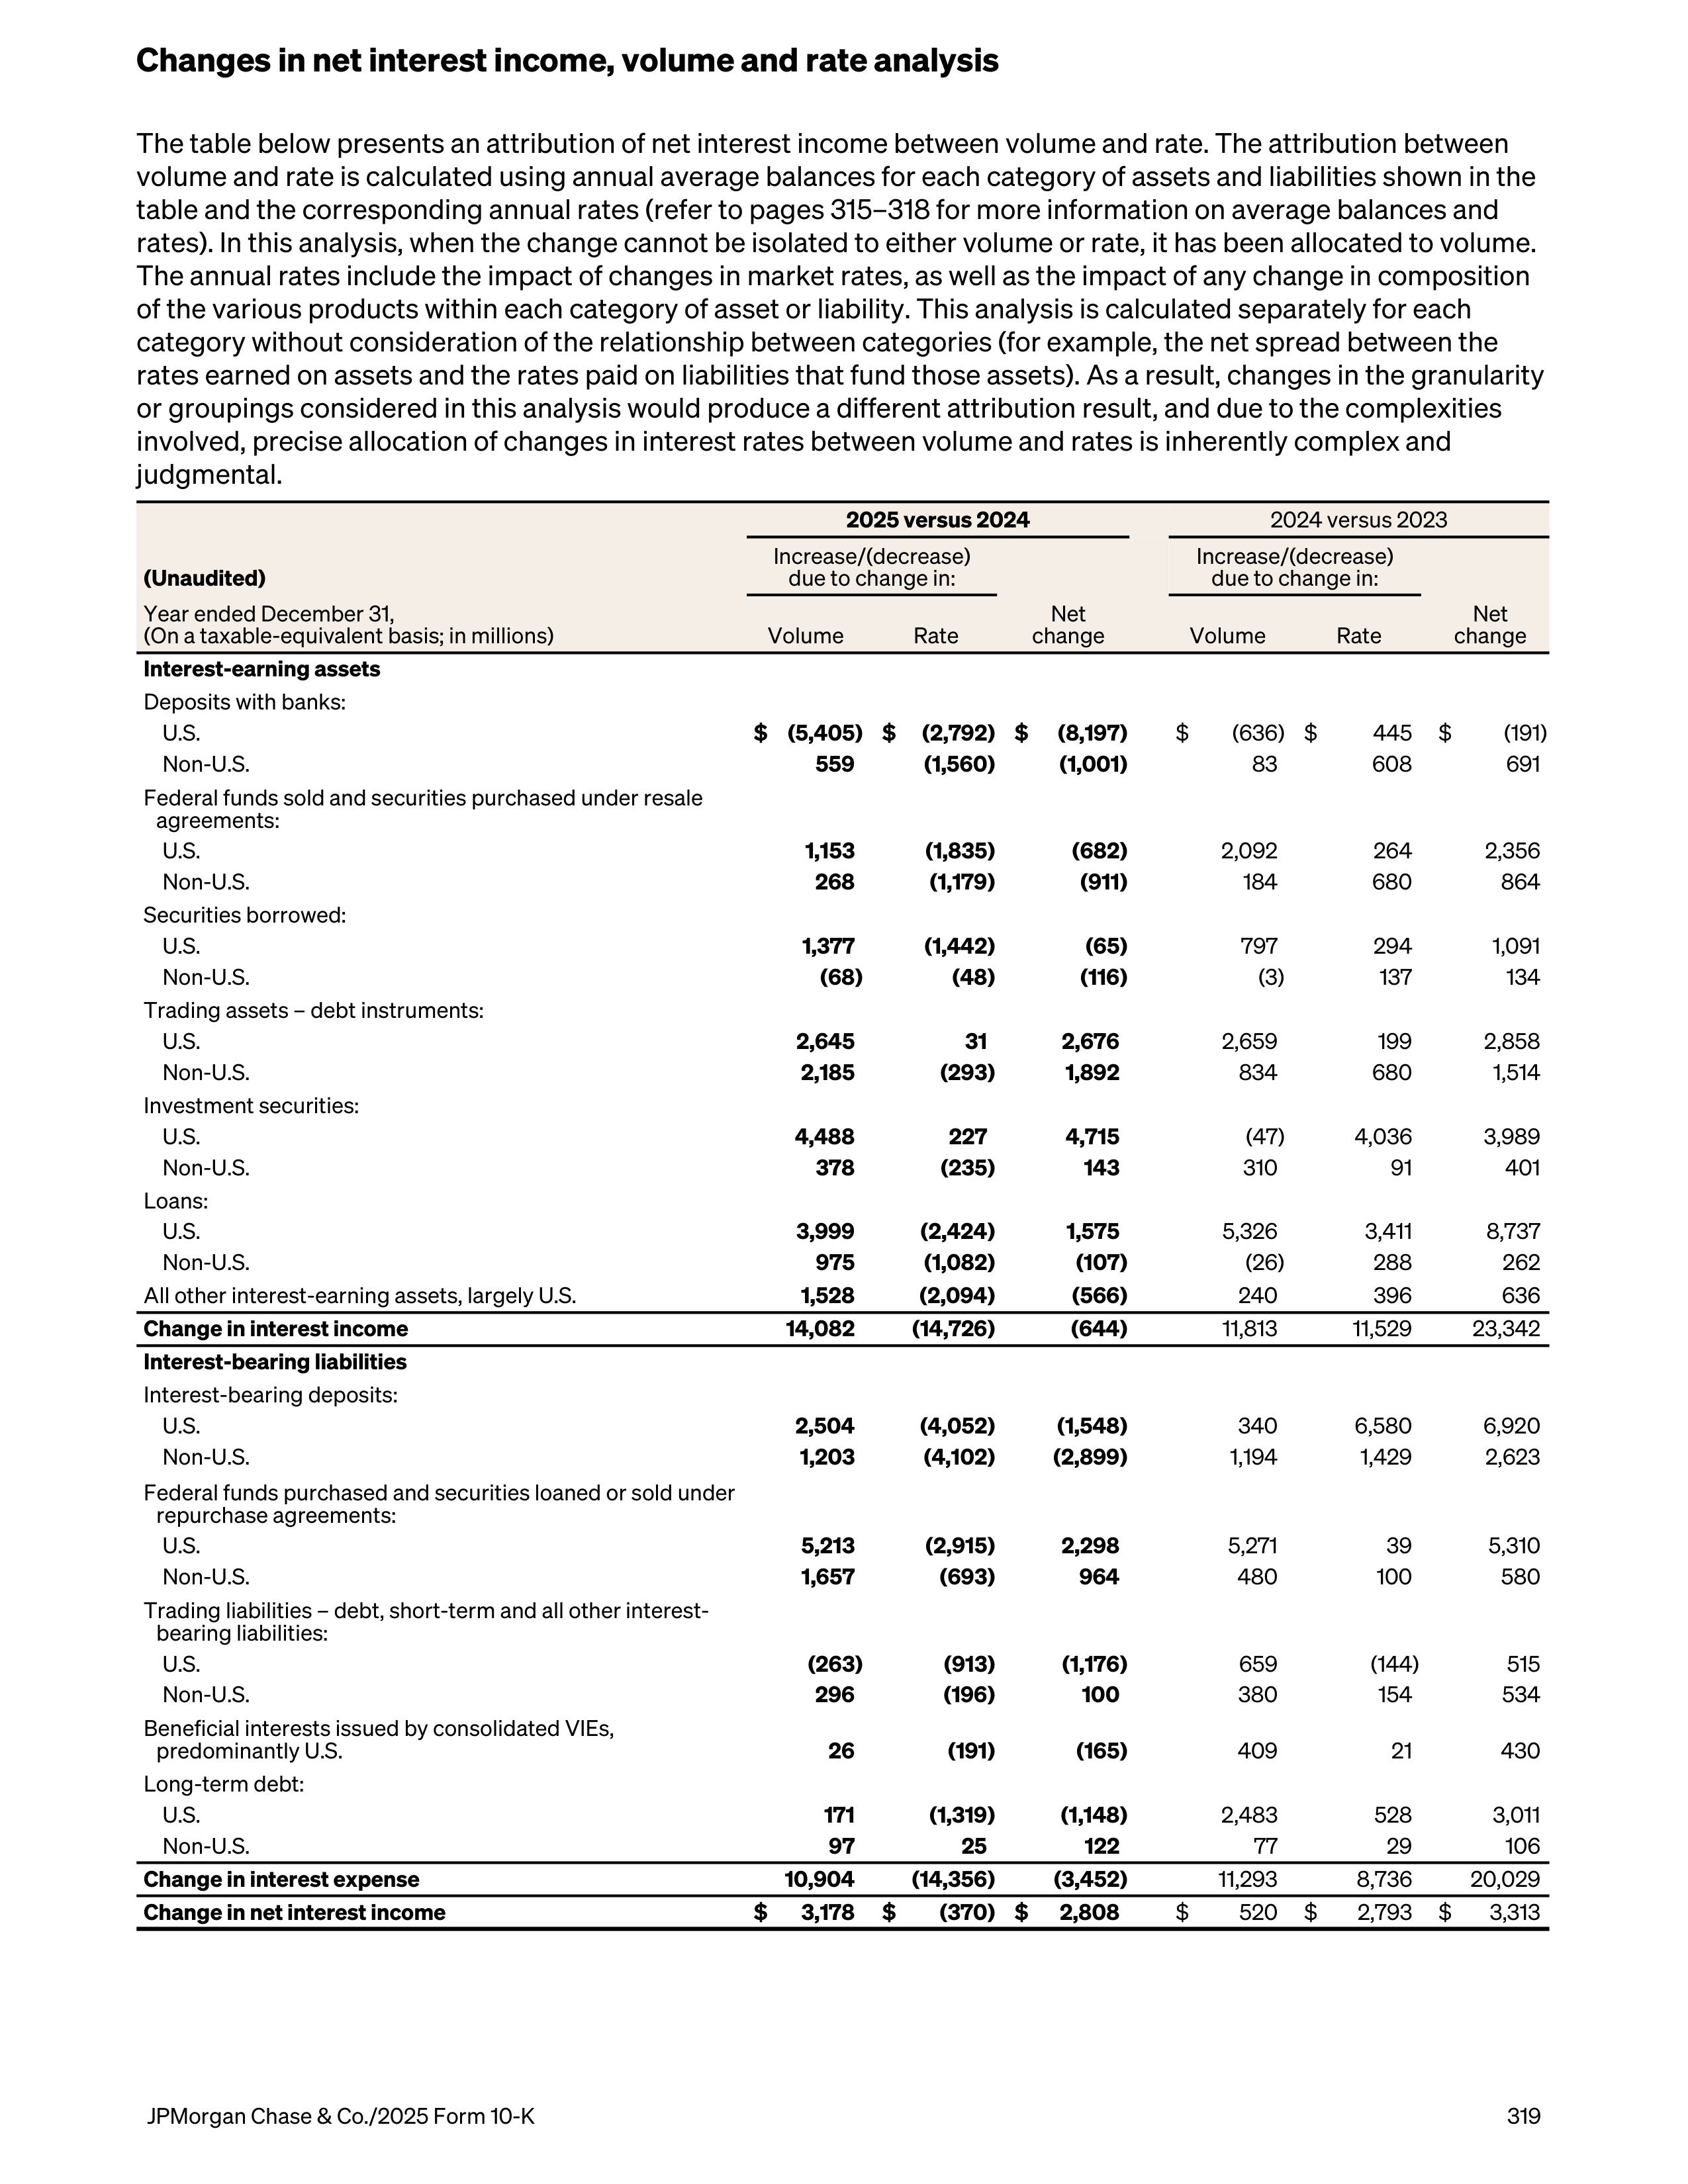
The table below presents an attribution of net interest income between volume and rate. The attribution between
volume and rate is calculated using annual average balances for each category of assets and liabilities shown in the
table and the corresponding annual rates (refer to pages 315–318 for more information on average balances and
rates). In this analysis, when the change cannot be isolated to either volume or rate, it has been allocated to volume.
The annual rates include the impact of changes in market rates, as well as the impact of any change in composition
of the various products within each category of asset or liability. This analysis is calculated separately for each
category without consideration of the relationship between categories (for example, the net spread between the
rates earned on assets and the rates paid on liabilities that fund those assets). As a result, changes in the granularity
or groupings considered in this analysis would produce a different attribution result, and due to the complexities
involved, precise allocation of changes in interest rates between volume and rates is inherently complex and
judgmental.
2025 versus 2024
2024 versus 2023
(Unaudited)
Increase/(decrease)
due to change in:
Increase/(decrease)
due to change in:
Year ended December 31,
(On a taxable-equivalent basis; in millions)
Volume
Rate
Net
change
Volume
Rate
Net
change
Interest-earning assets
Deposits with banks:
U.S.
$ (5,405) $
(2,792) $
(8,197)
$
(636) $
445
$
(191)
Non-U.S.
559
(1,560)
(1,001)
83
608
691
Federal funds sold and securities purchased under resale
agreements:
U.S.
1,153
(1,835)
(682)
2,092
264
2,356
Non-U.S.
268
(1,179)
(911)
184
680
864
Securities borrowed:
U.S.
1,377
(1,442)
(65)
797
294
1,091
Non-U.S.
(68)
(48)
(116)
(3)
137
134
Trading assets – debt instruments:
U.S.
2,645
31
2,676
2,659
199
2,858
Non-U.S.
2,185
(293)
1,892
834
680
1,514
Investment securities:
U.S.
4,488
227
4,715
(47)
4,036
3,989
Non-U.S.
378
(235)
143
310
91
401
Loans:
U.S.
3,999
(2,424)
1,575
5,326
3,411
8,737
Non-U.S.
975
(1,082)
(107)
(26)
288
262
All other interest-earning assets, largely U.S.
1,528
(2,094)
(566)
240
396
636
Change in interest income
14,082
(14,726)
(644)
11,813
11,529
23,342
Interest-bearing liabilities
Interest-bearing deposits:
U.S.
2,504
(4,052)
(1,548)
340
6,580
6,920
Non-U.S.
1,203
(4,102)
(2,899)
1,194
1,429
2,623
Federal funds purchased and securities loaned or sold under
repurchase agreements:
U.S.
5,213
(2,915)
2,298
5,271
39
5,310
Non-U.S.
1,657
(693)
964
480
100
580
Trading liabilities – debt, short-term and all other interest-
bearing liabilities:
U.S.
(263)
(913)
(1,176)
659
(144)
515
Non-U.S.
296
(196)
100
380
154
534
Beneficial interests issued by consolidated VIEs,
predominantly U.S.
26
(191)
(165)
409
21
430
Long-term debt:
U.S.
171
(1,319)
(1,148)
2,483
528
3,011
Non-U.S.
97
25
122
77
29
106
Change in interest expense
10,904
(14,356)
(3,452)
11,293
8,736
20,029
Change in net interest income
$
3,178
$
(370) $
2,808
$
520
$
2,793
$
3,313
Changes in net interest income, volume and rate analysis
JPMorgan Chase & Co./2025 Form 10-K
319
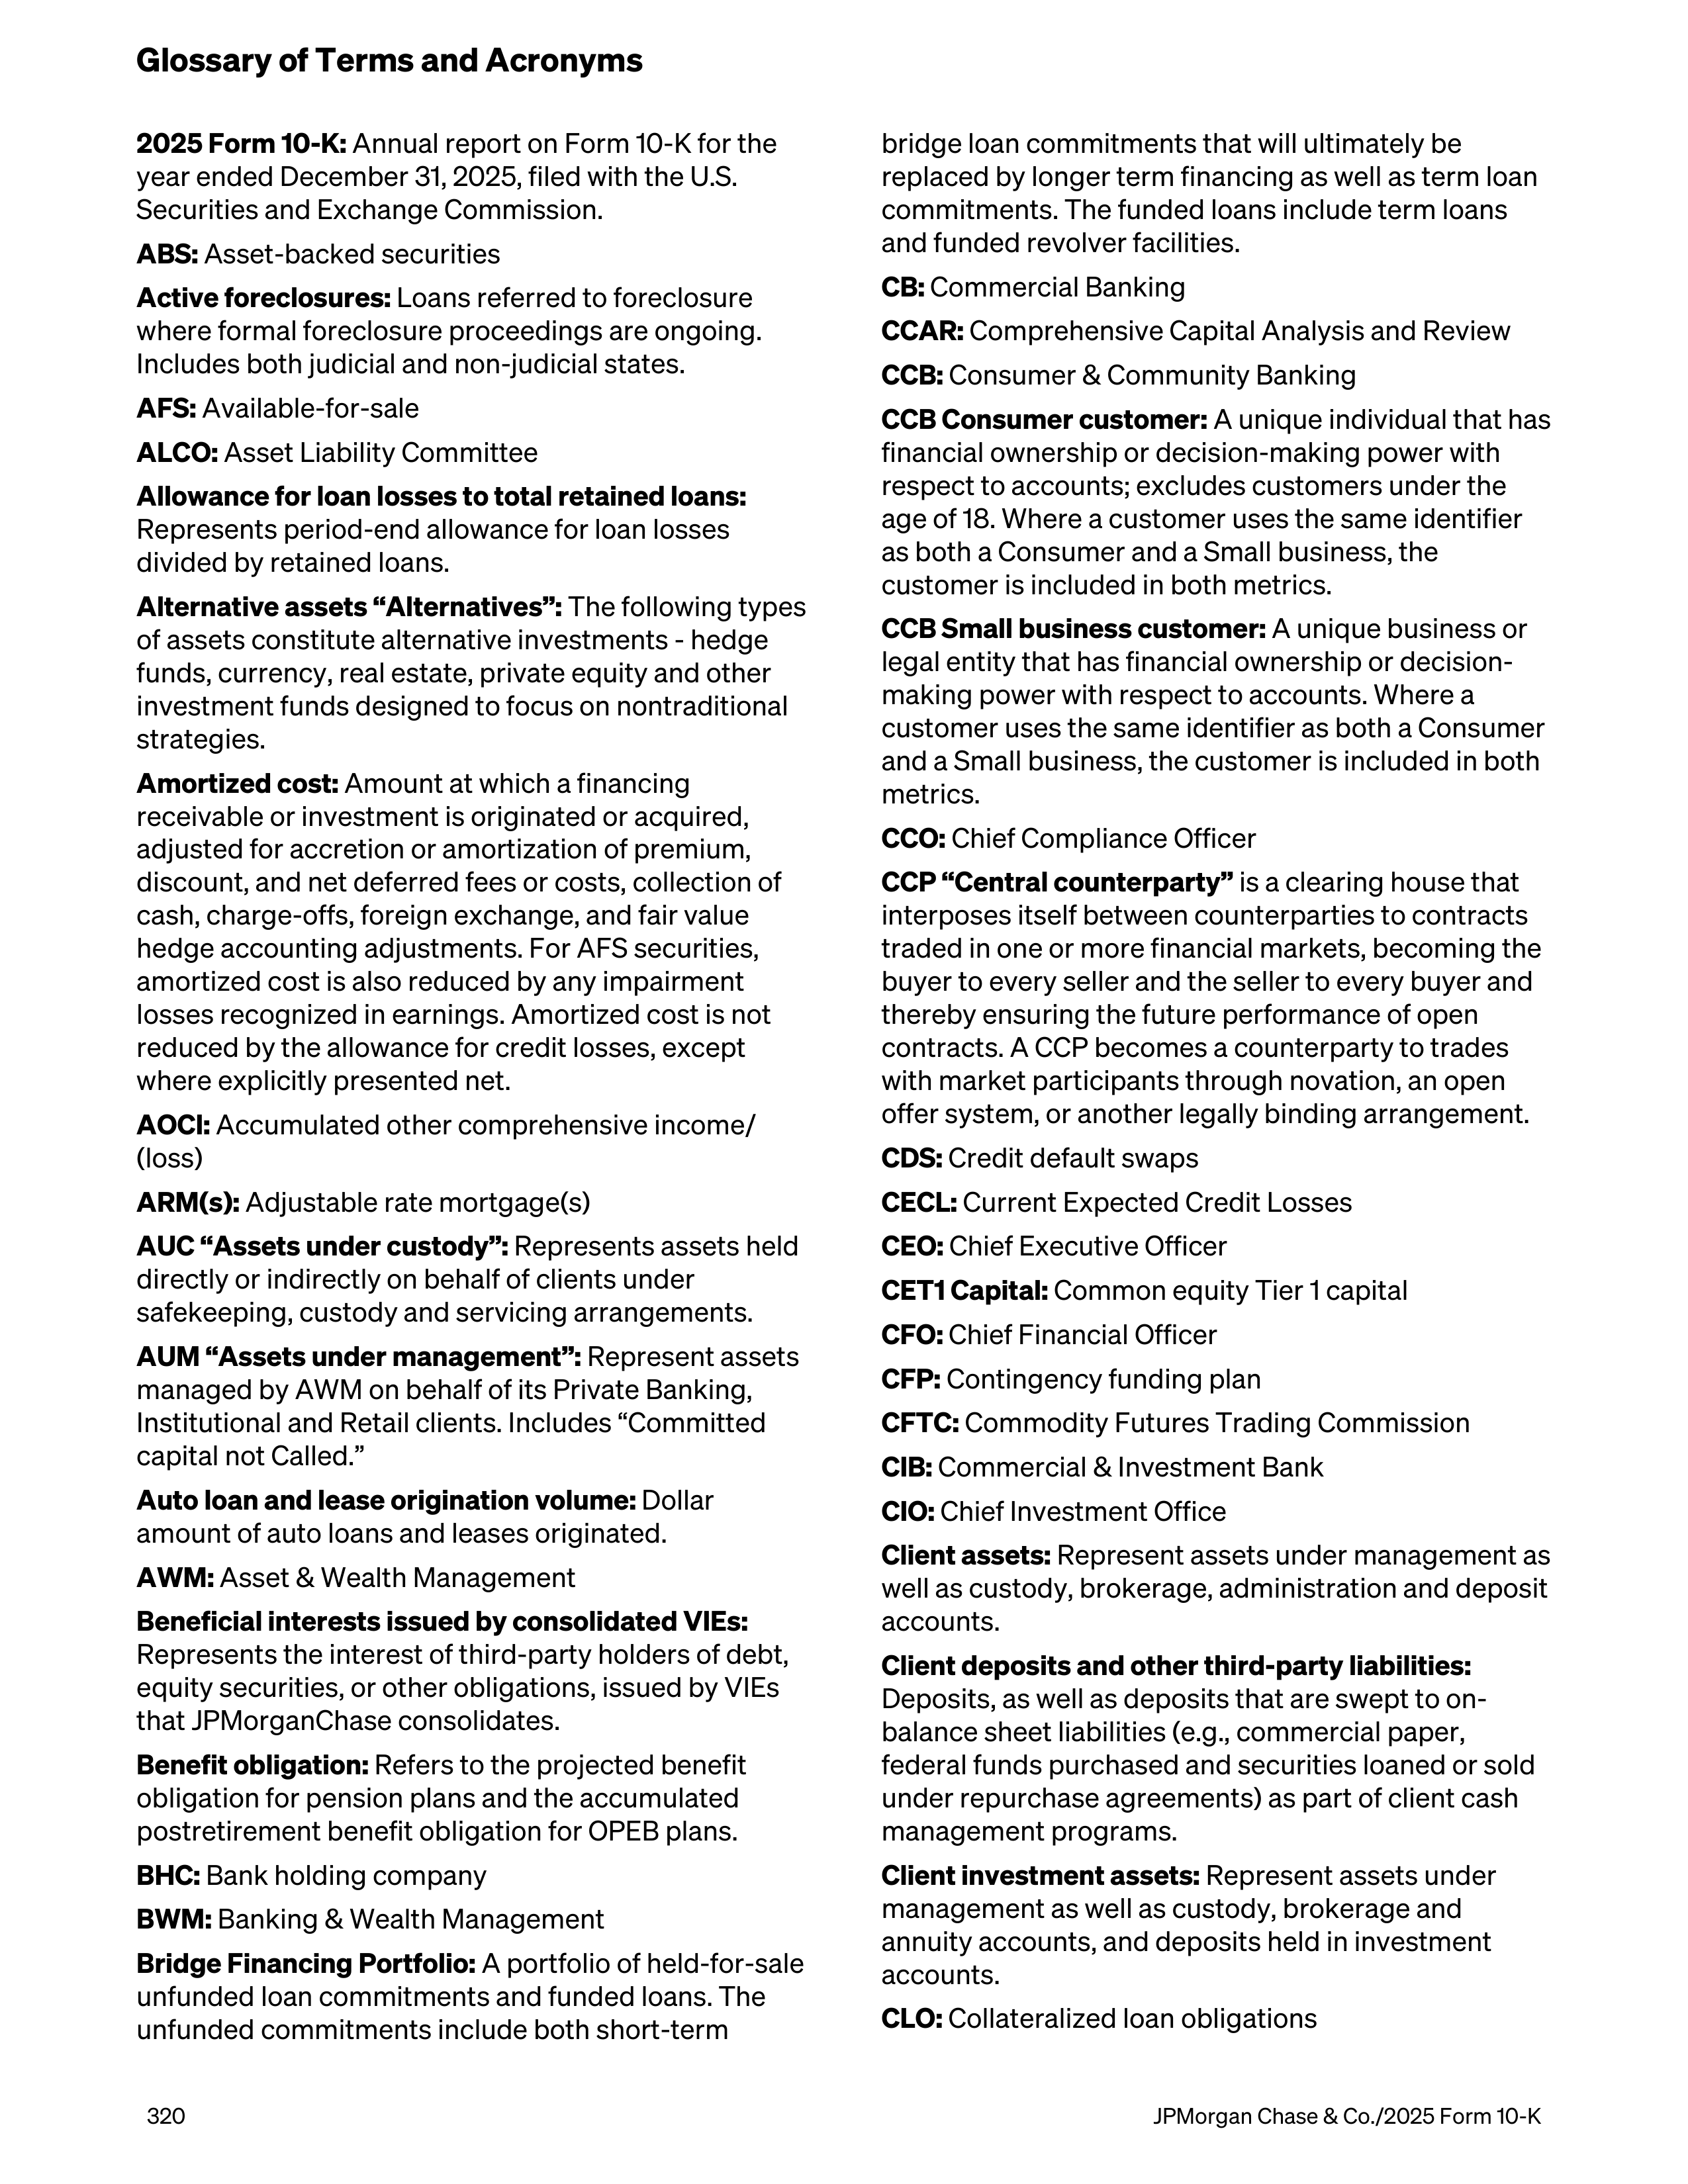
2025 Form 10-K:
Annual report on Form 10-K for the
year ended December 31, 2025, filed with the U.S.
Securities and Exchange Commission.
ABS:
Asset-backed securities
Active foreclosures:
Loans referred to foreclosure
where formal foreclosure proceedings are ongoing.
Includes both judicial and non-judicial states.
AFS:
Available-for-sale
ALCO:
Asset Liability Committee
Allowance for loan losses to total retained loans:
Represents period-end allowance for loan losses
divided by retained loans.
Alternative assets “Alternatives”:
The following types
of assets constitute alternative investments - hedge
funds, currency, real estate, private equity and other
investment funds designed to focus on nontraditional
strategies.
Amortized cost:
Amount at which a financing
receivable or investment is originated or acquired,
adjusted for accretion or amortization of premium,
discount, and net deferred fees or costs, collection of
cash, charge-offs, foreign exchange, and fair value
hedge accounting adjustments. For AFS securities,
amortized cost is also reduced by any impairment
losses recognized in earnings. Amortized cost is not
reduced by the allowance for credit losses, except
where explicitly presented net.
AOCI:
Accumulated other comprehensive income/
(loss)
ARM(s):
Adjustable rate mortgage(s)
AUC “Assets under custody”:
Represents assets held
directly or indirectly on behalf of clients under
safekeeping, custody and servicing arrangements.
AUM “Assets under management”:
Represent assets
managed by AWM on behalf of its Private Banking,
Institutional and Retail clients. Includes “Committed
capital not Called.”
Auto loan and lease origination volume:
Dollar
amount of auto loans and leases originated.
AWM:
Asset & Wealth Management
Beneficial interests issued by consolidated VIEs:
Represents the interest of third-party holders of debt,
equity securities, or other obligations, issued by VIEs
that JPMorganChase consolidates.
Benefit obligation:
Refers to the projected benefit
obligation for pension plans and the accumulated
postretirement benefit obligation for OPEB plans.
BHC:
Bank holding company
BWM:
Banking & Wealth Management
Bridge Financing Portfolio:
A portfolio of held-for-sale
unfunded loan commitments and funded loans. The
unfunded commitments include both short-term
bridge loan commitments that will ultimately be
replaced by longer term financing as well as term loan
commitments. The funded loans include term loans
and funded revolver facilities.
CB:
Commercial Banking
CCAR:
Comprehensive Capital Analysis and Review
CCB:
Consumer & Community Banking
CCB Consumer customer:
A unique individual that has
financial ownership or decision-making power with
respect to accounts; excludes customers under the
age of 18. Where a customer uses the same identifier
as both a Consumer and a Small business, the
customer is included in both metrics.
CCB Small business customer:
A unique business or
legal entity that has financial ownership or decision-
making power with respect to accounts. Where a
customer uses the same identifier as both a Consumer
and a Small business, the customer is included in both
metrics.
CCO:
Chief Compliance Officer
CCP “Central counterparty”
is a clearing house that
interposes itself between counterparties to contracts
traded in one or more financial markets, becoming the
buyer to every seller and the seller to every buyer and
thereby ensuring the future performance of open
contracts. A CCP becomes a counterparty to trades
with market participants through novation, an open
offer system, or another legally binding arrangement.
CDS:
Credit default swaps
CECL:
Current Expected Credit Losses
CEO:
Chief Executive Officer
CET1 Capital:
Common equity Tier 1 capital
CFO:
Chief Financial Officer
CFP:
Contingency funding plan
CFTC:
Commodity Futures Trading Commission
CIB:
Commercial & Investment Bank
CIO:
Chief Investment Office
Client assets:
Represent assets under management as
well as custody, brokerage, administration and deposit
accounts.
Client deposits and other third-party liabilities:
Deposits, as well as deposits that are swept to on-
balance sheet liabilities (e.g., commercial paper,
federal funds purchased and securities loaned or sold
under repurchase agreements) as part of client cash
management programs.
Client investment assets:
Represent assets under
management as well as custody, brokerage and
annuity accounts, and deposits held in investment
accounts.
CLO:
Collateralized loan obligations
Glossary of Terms and Acronyms
320
JPMorgan Chase & Co./2025 Form 10-K
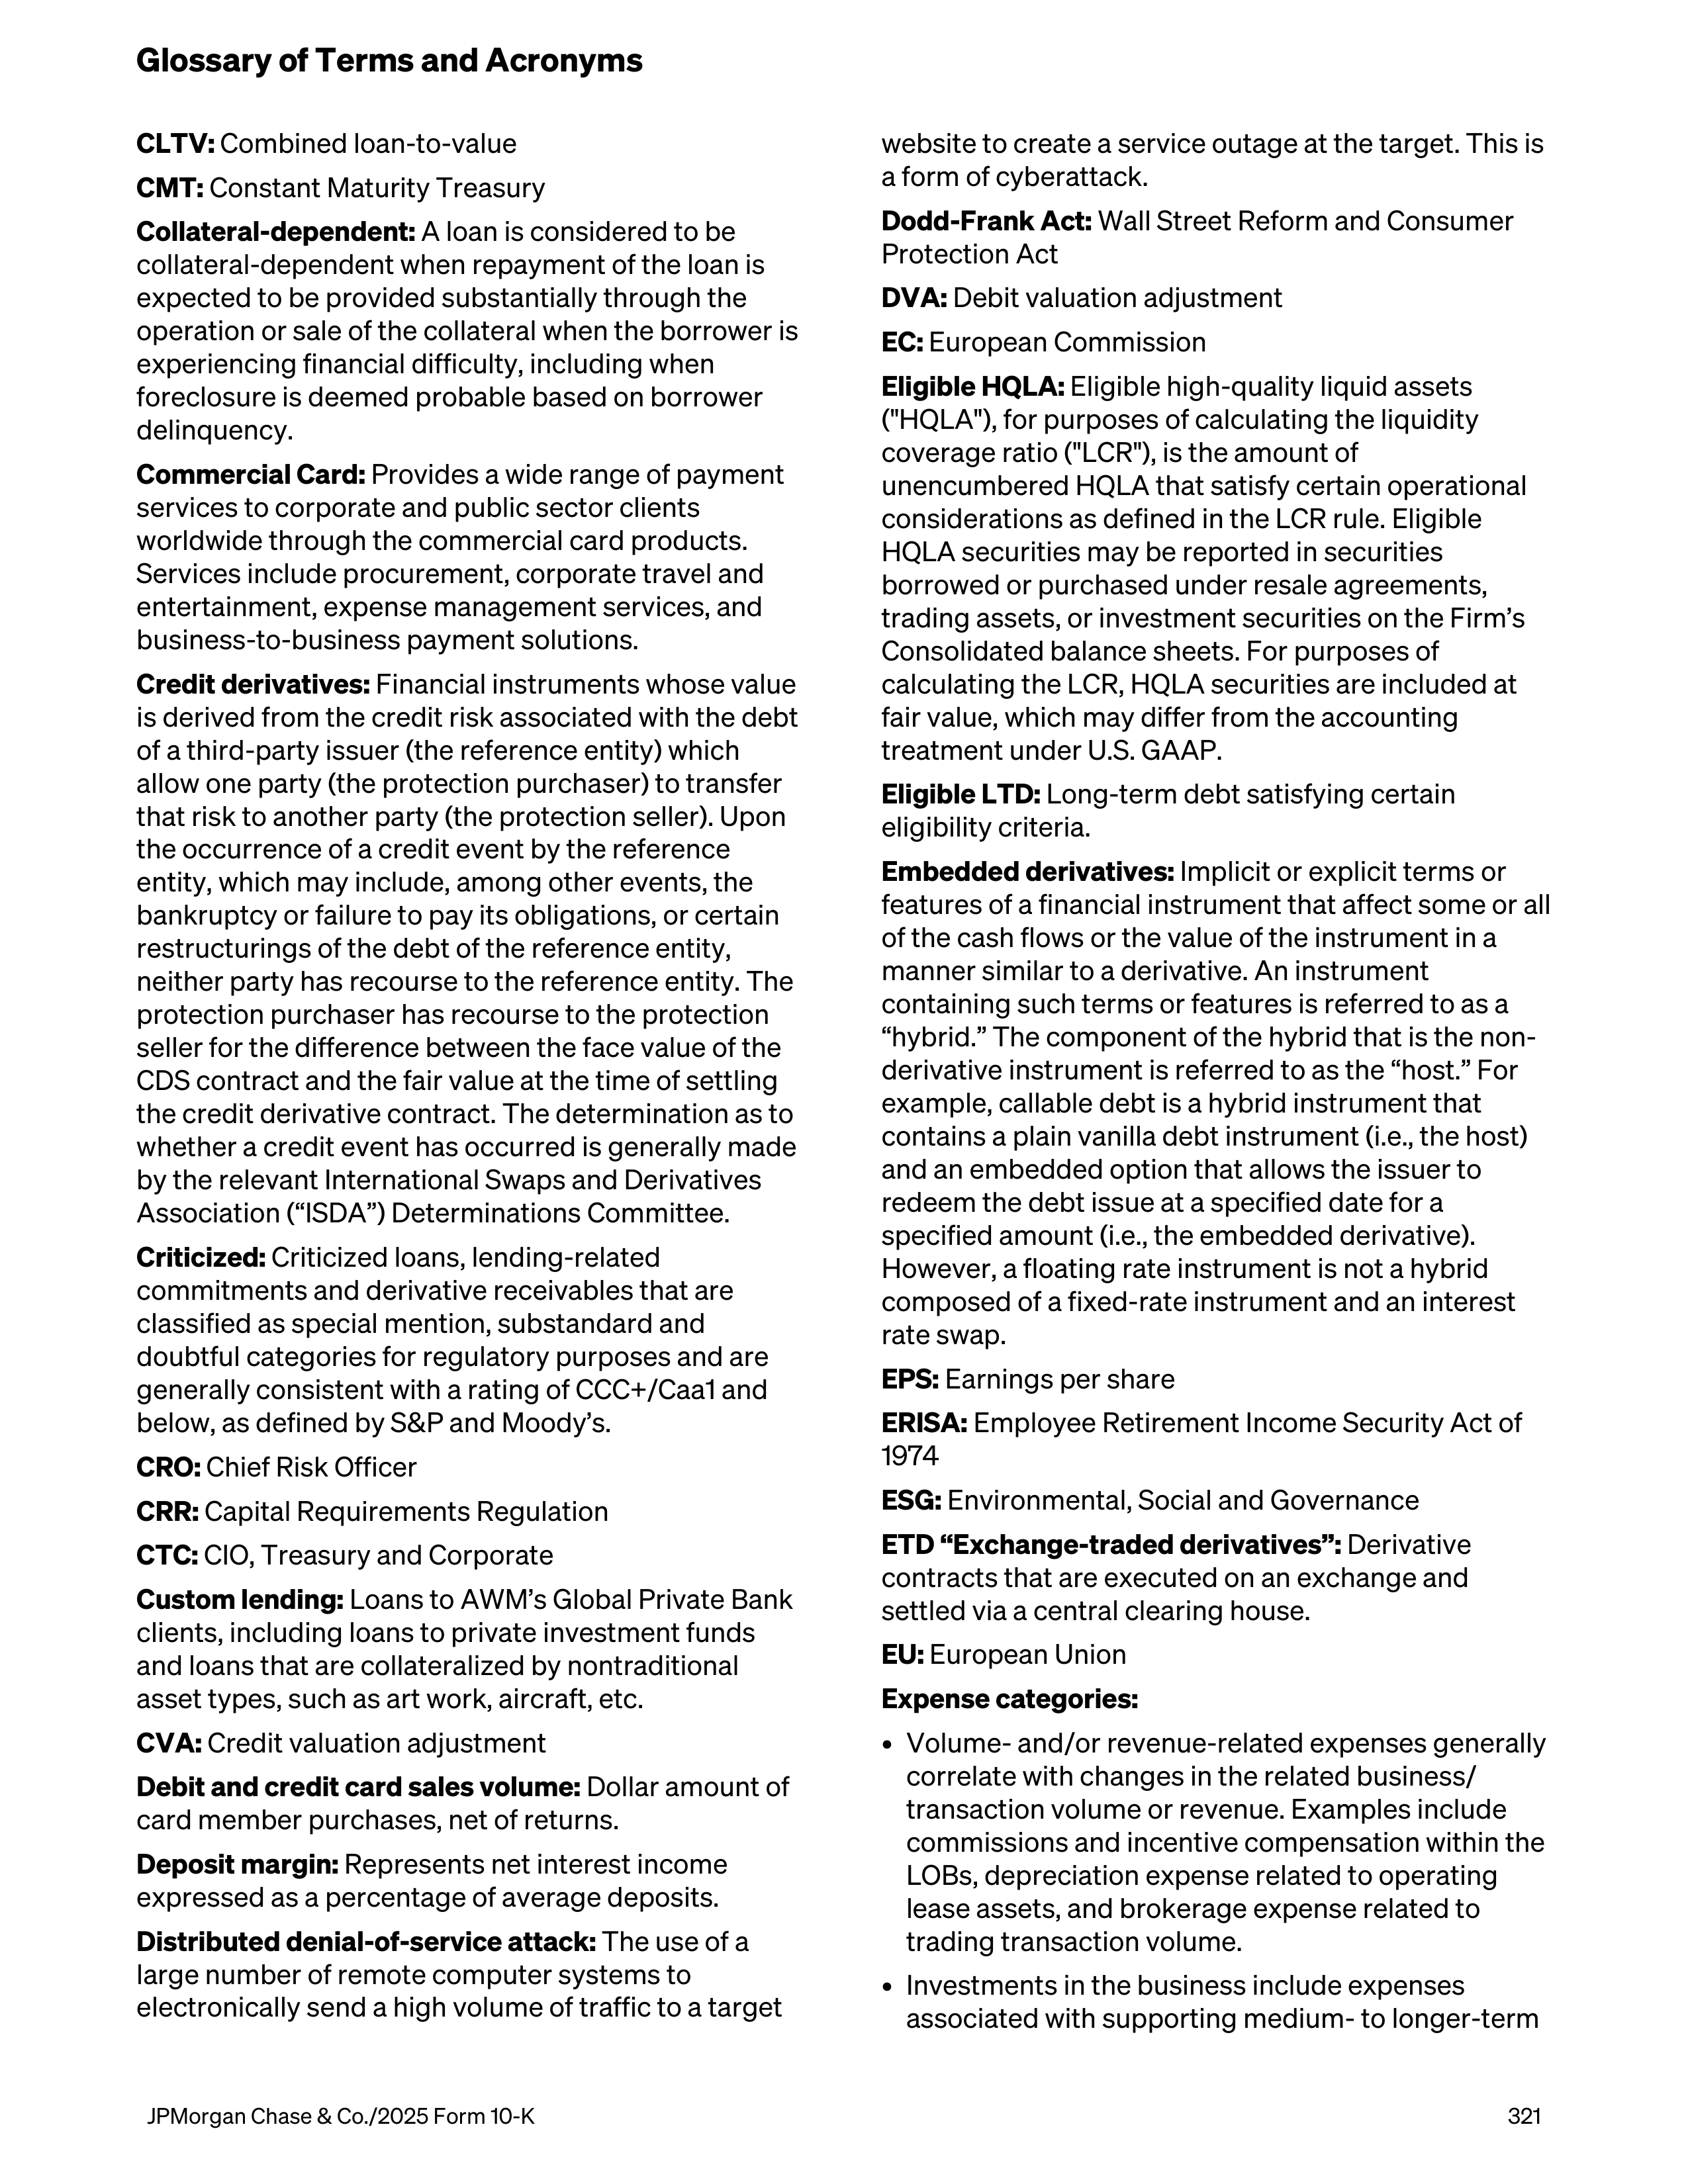
CLTV:
Combined loan-to-value
CMT:
Constant Maturity Treasury
Collateral-dependent:
A loan is considered to be
collateral-dependent when repayment of the loan is
expected to be provided substantially through the
operation or sale of the collateral when the borrower is
experiencing financial difficulty, including when
foreclosure is deemed probable based on borrower
delinquency.
Commercial Card:
Provides a wide range of payment
services to corporate and public sector clients
worldwide through the commercial card products.
Services include procurement, corporate travel and
entertainment, expense management services, and
business-to-business payment solutions.
Credit derivatives:
Financial instruments whose value
is derived from the credit risk associated with the debt
of a third-party issuer (the reference entity) which
allow one party (the protection purchaser) to transfer
that risk to another party (the protection seller). Upon
the occurrence of a credit event by the reference
entity, which may include, among other events, the
bankruptcy or failure to pay its obligations, or certain
restructurings of the debt of the reference entity,
neither party has recourse to the reference entity. The
protection purchaser has recourse to the protection
seller for the difference between the face value of the
CDS contract and the fair value at the time of settling
the credit derivative contract. The determination as to
whether a credit event has occurred is generally made
by the relevant International Swaps and Derivatives
Association (“ISDA”) Determinations Committee.
Criticized:
Criticized loans, lending-related
commitments and derivative receivables that are
classified as special mention, substandard and
doubtful categories for regulatory purposes and are
generally consistent with a rating of CCC+/Caa1 and
below, as defined by S&P and Moody’s.
CRO:
Chief Risk Officer
CRR:
Capital Requirements Regulation
CTC:
CIO, Treasury and Corporate
Custom lending:
Loans to AWM’s Global Private Bank
clients, including loans to private investment funds
and loans that are collateralized by nontraditional
asset types, such as art work, aircraft, etc.
CVA:
Credit valuation adjustment
Debit and credit card sales volume:
Dollar amount of
card member purchases, net of returns.
Deposit margin:
Represents net interest income
expressed as a percentage of average deposits.
Distributed denial-of-service attack:
The use of a
large number of remote computer systems to
electronically send a high volume of traffic to a target
website to create a service outage at the target. This is
a form of cyberattack.
Dodd-Frank Act:
Wall Street Reform and Consumer
Protection Act
DVA:
Debit valuation adjustment
EC:
European Commission
Eligible HQLA:
Eligible high-quality liquid assets
("HQLA"), for purposes of calculating the liquidity
coverage ratio ("LCR"), is the amount of
unencumbered HQLA that satisfy certain operational
considerations as defined in the LCR rule. Eligible
HQLA securities may be reported in securities
borrowed or purchased under resale agreements,
trading assets, or investment securities on the Firm’s
Consolidated balance sheets. For purposes of
calculating the LCR, HQLA securities are included at
fair value, which may differ from the accounting
treatment under U.S. GAAP.
Eligible LTD:
Long-term debt satisfying certain
eligibility criteria.
Embedded derivatives:
Implicit or explicit terms or
features of a financial instrument that affect some or all
of the cash flows or the value of the instrument in a
manner similar to a derivative. An instrument
containing such terms or features is referred to as a
“hybrid.” The component of the hybrid that is the non-
derivative instrument is referred to as the “host.” For
example, callable debt is a hybrid instrument that
contains a plain vanilla debt instrument (i.e., the host)
and an embedded option that allows the issuer to
redeem the debt issue at a specified date for a
specified amount (i.e., the embedded derivative).
However, a floating rate instrument is not a hybrid
composed of a fixed-rate instrument and an interest
rate swap.
EPS:
Earnings per share
ERISA:
Employee Retirement Income Security Act of
1974
ESG:
Environmental, Social and Governance
ETD “Exchange-traded derivatives”:
Derivative
contracts that are executed on an exchange and
settled via a central clearing house.
EU:
European Union
Expense categories:
•
Volume- and/or revenue-related expenses generally
correlate with changes in the related business/
transaction volume or revenue. Examples include
commissions and incentive compensation within the
LOBs, depreciation expense related to operating
lease assets, and brokerage expense related to
trading transaction volume.
•
Investments in the business include expenses
associated with supporting medium- to longer-term
Glossary of Terms and Acronyms
JPMorgan Chase & Co./2025 Form 10-K
321
strategic plans of the Firm. Examples include front
office growth, market expansion, initiatives in
technology (including related compensation),
marketing, and acquisitions.
•
Structural expenses are those associated with the
day-to-day cost of running the Firm and are
expenses not included in the above two categories.
Examples include employee salaries and benefits,
certain other incentive compensation, and costs
related to real estate.
Fannie Mae:
Federal National Mortgage Association
FASB:
Financial Accounting Standards Board
FCA:
Financial Conduct Authority
FCC:
Firmwide Control Committee
FDIC:
Federal Deposit Insurance Corporation
FDM "Financial difficulty modification"
applies to
loan modifications effective January 1, 2023, and
is
deemed to occur when the Firm modifies specific
terms of the original loan agreement. The following
types of modifications are considered FDMs: principal
forgiveness, interest rate reduction, other-than-
insignificant payment delay, term extension or a
combination of these modifications.
Federal Reserve:
The Board of the Governors of the
Federal Reserve System
FFIEC:
Federal Financial Institutions Examination
Council
FHA:
Federal Housing Administration
FHLB:
Federal Home Loan Bank
FICC:
The
Fixed Income Clearing Corporation
FICO score:
A measure of consumer credit risk based
on information in consumer credit reports produced
by Fair Isaac Corporation. Because certain aged data is
excluded from credit reports based on rules in the Fair
Credit Reporting Act, FICO scores may not reflect all
historical information about a consumer.
FINRA:
Financial Industry Regulatory Authority
Firm:
JPMorgan Chase & Co.
First Republic:
On May 1, 2023, JPMorganChase
acquired certain assets and assumed certain liabilities
of First Republic Bank (the “First Republic acquisition”)
from the FDIC. "First Republic-related," "associated
with First Republic" or similar expressions refer to the
relevant effects of the First Republic acquisition, as
well as subsequent related business and activities, as
applicable. Refer to Note 34 of the Firm's 2024 Form
10-K for additional information.
Forward points:
Represents the interest rate
differential between two currencies, which is either
added to or subtracted from the current exchange rate
(i.e., “spot rate”) to determine the forward exchange
rate.
FRC:
Firmwide Risk Committee
Freddie Mac:
Federal Home Loan Mortgage
Corporation
Free standing derivatives:
A derivative contract
entered into either separate and apart from any of the
Firm’s other financial instruments or equity
transactions. Or, in conjunction with some other
transaction and is legally detachable and separately
exercisable.
FSB:
Financial Stability Board
FTE:
Fully taxable equivalent
FVA:
Funding valuation adjustment
FX:
Foreign exchange
G7 Group of Seven nations:
Countries in the G7 are
Canada, France, Germany, Italy, Japan, the U.K. and the
U.S.
G7 government securities:
Securities issued by the
government of one of the G7 nations.
Ginnie Mae:
Government National Mortgage
Association
GSIB:
Global systemically important banks
HELOC:
Home equity line of credit
Home equity – senior lien:
Represents loans and
commitments where JPMorganChase holds the first
security interest on the property.
Home equity – junior lien:
Represents loans and
commitments where JPMorganChase holds a security
interest that is subordinate in rank to other liens.
HQLA:
High-quality liquid assets. Also refer to Eligible
HQLA.
HTM:
Held-to-maturity
IBOR:
Interbank Offered Rate
ICAAP:
Internal capital adequacy assessment process
IDI:
Insured depository institutions
IHC:
JPMorgan Chase Holdings LLC, an intermediate
holding company
Indirect tax expense:
Refers to taxes that are imposed
on goods and services rather than on income.
Examples of indirect taxes include value-added tax
(“VAT”) and sales tax, among others.
Investment-grade:
An indication of credit quality
based on JPMorganChase’s internal risk assessment.
The Firm considers ratings of BBB-/Baa3 or higher as
investment-grade.
IPO:
Initial public offering
IR:
Interest rate
ISDA:
International Swaps and Derivatives Association
JPMorganChase:
JPMorgan Chase & Co.
Glossary of Terms and Acronyms
322
JPMorgan Chase & Co./2025 Form 10-K
JPMorgan Chase Bank, N.A.:
JPMorgan Chase Bank,
National Association
JPMorgan Chase Foundation or the Firm’s
Foundation:
A not-for-profit organization that makes
contributions for charitable and educational purposes.
J.P. Morgan Securities:
J.P. Morgan Securities LLC
JPMSE:
J.P. Morgan SE
LCR:
Liquidity coverage ratio
LDA:
Loss Distribution Approach
LGD:
Loss given default
LIBOR:
London Interbank Offered Rate
LLC:
Limited Liability Company
LOB:
Line of business
LOB CROs:
Line of Business and CTC Chief Risk
Officers
LTIP:
Long-term incentive plan
LTV “Loan-to-value”:
For residential real estate loans,
the relationship, expressed as a percentage, between
the principal amount of a loan and the appraised value
of the collateral (i.e., residential real estate) securing
the loan.
Origination date LTV ratio:
The LTV ratio at the
origination date of the loan. Origination date LTV ratios
are calculated based on the actual appraised values of
collateral (i.e., loan-level data) at the origination date.
Current estimated LTV ratio:
An estimate of the LTV
as of a certain date. The current estimated LTV ratios
are calculated using estimated collateral values
derived from a nationally recognized home price index
measured at the metropolitan statistical area (“MSA”)
level. These MSA-level home price indices consist of
actual data to the extent available and forecasted data
where actual data is not available. As a result, the
estimated collateral values used to calculate these
ratios do not represent actual appraised loan-level
collateral values; as such, the resulting LTV ratios are
necessarily imprecise and should therefore be viewed
as estimates.
Combined LTV ratio:
The LTV ratio considering all
available lien positions, as well as unused lines, related
to the property. Combined LTV ratios are used for
junior lien home equity products.
Macro businesses:
The macro businesses include
Rates, Currencies and Emerging Markets, Fixed
Income Financing and Commodities in CIB's Fixed
Income Markets.
Managed basis:
A non-GAAP presentation of
Firmwide financial results that includes
reclassifications to present revenue on a fully taxable-
equivalent basis. Management also uses this financial
measure at the segment level, because it believes this
provides information to enable investors to
understand the underlying operational performance
and trends of the particular business segment and
facilitates a comparison of the business segment with
the performance of competitors.
Markets:
Consists of CIB’s Fixed Income Markets and
Equity Markets businesses.
Master netting agreement:
A single agreement with a
counterparty that permits multiple transactions
governed by that agreement to be terminated or
accelerated and settled through a single payment in a
single currency in the event of a default (e.g.,
bankruptcy, failure to make a required payment or
securities transfer or deliver collateral or margin when
due).
MBS:
Mortgage-backed securities
MD&A:
Management’s discussion and analysis
Measurement alternative:
Measures equity securities
without readily determinable fair values at cost less
impairment (if any), plus or minus observable price
changes from an identical or similar investment of the
same issuer.
Merchant Services:
Offers merchants payment
processing capabilities, fraud and risk management,
data and analytics, and other payments services.
Through Merchant Services, merchants of all sizes can
accept payments via credit and debit cards and
payments in multiple currencies.
MEVs "Macroeconomic variables":
Refer to
quantitative measures of current and forecasted
macroeconomic conditions - such as the
unemployment rates, gross domestic product growth
rate and interest rates - used by the Firm in its models
to estimate credit losses.
Moody’s:
Moody’s Investor Services
Mortgage origination channels:
Retail – Borrowers who buy or refinance a home
through direct contact with a mortgage banker
employed by the Firm using a branch office, the
Internet or by phone. Borrowers are frequently
referred to a mortgage banker by a banker in a Chase
branch, real estate brokers, home builders or other
third parties.
Correspondent – Banks, thrifts, other mortgage banks
and other financial institutions that sell closed loans to
the Firm.
Mortgage product types:
Alt-A
Alt-A loans are generally higher in credit quality than
subprime loans but have characteristics that would
disqualify the borrower from a traditional prime loan.
Alt-A lending characteristics may include one or more
of the following: (i) limited documentation; (ii) a high
CLTV ratio; (iii) loans secured by non-owner occupied
properties; or (iv) a debt-to-income ratio above normal
Glossary of Terms and Acronyms
JPMorgan Chase & Co./2025 Form 10-K
323
limits. A substantial proportion of the Firm’s Alt-A
loans are those where a borrower does not provide
complete documentation of his or her assets or the
amount or source of his or her income.
Option ARMs
The option ARM real estate loan product is an
adjustable-rate mortgage loan that provides the
borrower with the option each month to make a fully
amortizing, interest-only or minimum payment. The
minimum payment on an option ARM loan is based on
the interest rate charged during the introductory
period. This introductory rate is usually significantly
below the fully indexed rate. The fully indexed rate is
calculated using an index rate plus a margin. Once the
introductory period ends, the contractual interest rate
charged on the loan increases to the fully indexed rate
and adjusts monthly to reflect movements in the index.
The minimum payment is typically insufficient to cover
interest accrued in the prior month, and any unpaid
interest is deferred and added to the principal balance
of the loan. Option ARM loans are subject to payment
recast, which converts the loan to a variable-rate fully
amortizing loan upon meeting specified loan balance
and anniversary date triggers.
Prime
Prime mortgage loans are made to borrowers with
good credit records who meet specific underwriting
requirements, including prescriptive requirements
related to income and overall debt levels. New prime
mortgage borrowers provide full documentation and
generally have reliable payment histories.
Subprime
Subprime loans are loans that, prior to mid-2008, were
offered to certain customers with one or more high risk
characteristics, including but not limited to: (i)
unreliable or poor payment histories; (ii) a high LTV
ratio of greater than 80% (without borrower-paid
mortgage insurance); (iii) a high debt-to-income ratio;
(iv) an occupancy type for the loan is other than the
borrower’s primary residence; or (v) a history of
delinquencies or late payments on the loan.
MREL:
Minimum requirements for own funds and
eligible liabilities
MSR:
Mortgage servicing rights
Multi-asset:
Any fund or account that allocates assets
under management to more than one asset class.
NA:
Data is not applicable or available for the period
presented.
NAV:
Net Asset Value
Net Capital Rule:
Rule 15c3-1 under the Securities
Exchange Act of 1934.
Net charge-off/(recovery) rate:
Represents net
charge-offs/(recoveries) (annualized) divided by
average retained loans for the reporting period.
Net interchange income
includes the following
components:
•
Interchange income:
Fees earned by credit and
debit card issuers on sales transactions.
•
Rewards costs:
The cost to the Firm for points
earned by cardholders enrolled in credit card
rewards programs generally tied to sales
transactions.
•
Partner payments:
Payments to co-brand credit
card partners based on the cost of loyalty program
rewards earned by cardholders on credit card
transactions.
Net mortgage servicing revenue:
Includes operating
revenue earned from servicing third-party mortgage
loans, which is recognized over the period in which the
service is provided; changes in the fair value of MSRs;
the impact of risk management activities associated
with MSRs; and gains and losses on securitization of
excess mortgage servicing. Net mortgage servicing
revenue also includes gains and losses on sales and
lower of cost or fair value adjustments of certain
repurchased loans insured by U.S. government
agencies.
Net revenue rate:
Represents Card Services net
revenue (annualized) expressed as a percentage of
average loans for the period.
Net yield on interest-earning assets:
The average
rate for interest-earning assets less the average rate
paid for all sources of funds.
NFA:
National Futures Association
NM:
Not meaningful
NOL:
Net operating loss
Nonaccrual loans:
Loans for which interest income is
not recognized on an accrual basis. Loans (other than
credit card loans and certain consumer loans insured
by U.S. government agencies) are placed on
nonaccrual status when full payment of principal and
interest is not expected, regardless of delinquency
status, or when principal and interest have been in
default for a period of 90 days or more unless the loan
is both well-secured and in the process of collection.
Collateral-dependent loans are typically maintained on
nonaccrual status.
Nonperforming assets:
Nonperforming assets include
nonaccrual loans, nonperforming derivatives and
certain assets acquired in loan satisfactions,
predominantly real estate owned and other
commercial and personal property.
NSFR:
Net Stable Funding Ratio
OAS:
Option-adjusted spread
OCC:
Office of the Comptroller of the Currency
OCI:
Other comprehensive income/(loss)
OPEB:
Other postretirement employee benefit
Glossary of Terms and Acronyms
324
JPMorgan Chase & Co./2025 Form 10-K
Operating losses:
Primarily refer to fraud losses
associated with customer deposit accounts, credit and
debit cards; exclude legal expense.
Over-the-counter (“OTC”) derivatives:
Derivative
contracts that are negotiated, executed and settled
bilaterally between two derivative counterparties,
where one or both counterparties is a derivatives
dealer.
Over-the-counter cleared (“OTC-cleared”)
derivatives:
Derivative contracts that are negotiated
and executed bilaterally, but subsequently settled via a
central clearing house, such that each derivative
counterparty is only exposed to the default of that
clearing house.
Overhead ratio:
Noninterest expense as a percentage
of total net revenue.
Parent Company:
JPMorgan Chase & Co.
Participating securities:
Represents unvested share-
based compensation awards containing nonforfeitable
rights to dividends or dividend equivalents
(collectively, “dividends”), which are included in the
earnings per share calculation using the two-class
method. JPMorganChase grants RSUs to certain
employees under its share-based compensation
programs, which entitle the recipients to receive
nonforfeitable dividends during the vesting period on a
basis equivalent to the dividends paid to holders of
common stock. These unvested awards meet the
definition of participating securities. Under the two-
class method, all earnings (distributed and
undistributed) are allocated to each class of common
stock and participating securities, based on their
respective rights to receive dividends.
PCAOB:
Public Company Accounting Oversight Board
PCD
“Purchased credit deteriorated”
assets
represent acquired financial assets that as of the date
of acquisition have experienced a more-than-
insignificant deterioration in credit quality since
origination, as determined by the Firm.
PD:
Probability of default
Pillar 1:
The Basel framework consists of a three “Pillar”
approach. Pillar 1 establishes minimum capital
requirements, defines eligible capital instruments, and
prescribes rules for calculating RWA.
Pillar 3:
The Basel framework consists of a three
“Pillar” approach. Pillar 3 encourages market discipline
through disclosure requirements which allow market
participants to assess the risk and capital profiles of
banks.
PRA:
Prudential Regulation Authority
Preferred stock dividends:
Reflects dividends
declared and deemed dividends upon redemption of
preferred stock
Pre-provision profit/(loss):
Represents total net
revenue less noninterest expense. The Firm believes
that this financial measure is useful in assessing the
ability of a lending institution to generate income in
excess of its provision for credit losses.
Pre-tax margin:
Represents income before income tax
expense divided by total net revenue, which is, in
management’s view, a comprehensive measure of
pretax performance derived by measuring earnings
after all costs are taken into consideration. It is one
basis upon which management evaluates the
performance of AWM against the performance of their
respective competitors.
Principal transactions revenue:
Principal transactions
revenue is driven by many factors, including:
•
the bid-offer spread, which is the difference between
the price at which a market participant is willing and
able to sell an instrument to the Firm and the price at
which another market participant is willing and able
to buy it from the Firm, and vice versa; and
•
realized and unrealized gains and losses on financial
instruments and commodities transactions,
including those accounted for under the fair value
option, primarily used in client-driven market-
making activities.
–
Realized gains and losses result from the sale of
instruments, closing out or termination of
transactions, or interim cash payments.
–
Unrealized gains and losses result from changes in
valuation.
In connection with its client-driven market-making
activities, the Firm transacts in debt and equity
instruments, derivatives and commodities, including
physical commodities inventories and financial
instruments that reference commodities.
Principal transactions revenue also includes realized
and unrealized gains and losses related to:
•
derivatives designated in qualifying hedge
accounting relationships, primarily fair value hedges
of commodity and foreign exchange risk;
•
derivatives used for specific risk management
purposes, primarily to mitigate credit, foreign
exchange and interest rate risks.
Production revenue:
Includes fees and income
recognized as earned on mortgage loans originated
with the intent to sell, and the impact of risk
management activities associated with the mortgage
pipeline and warehouse loans. Production revenue
also includes gains and losses on sales and lower of
cost or fair value adjustments on mortgage loans held-
for-sale (excluding certain repurchased loans insured
by U.S. government agencies), and changes in the fair
value of financial instruments measured under the fair
value option.
Glossary of Terms and Acronyms
JPMorgan Chase & Co./2025 Form 10-K
325
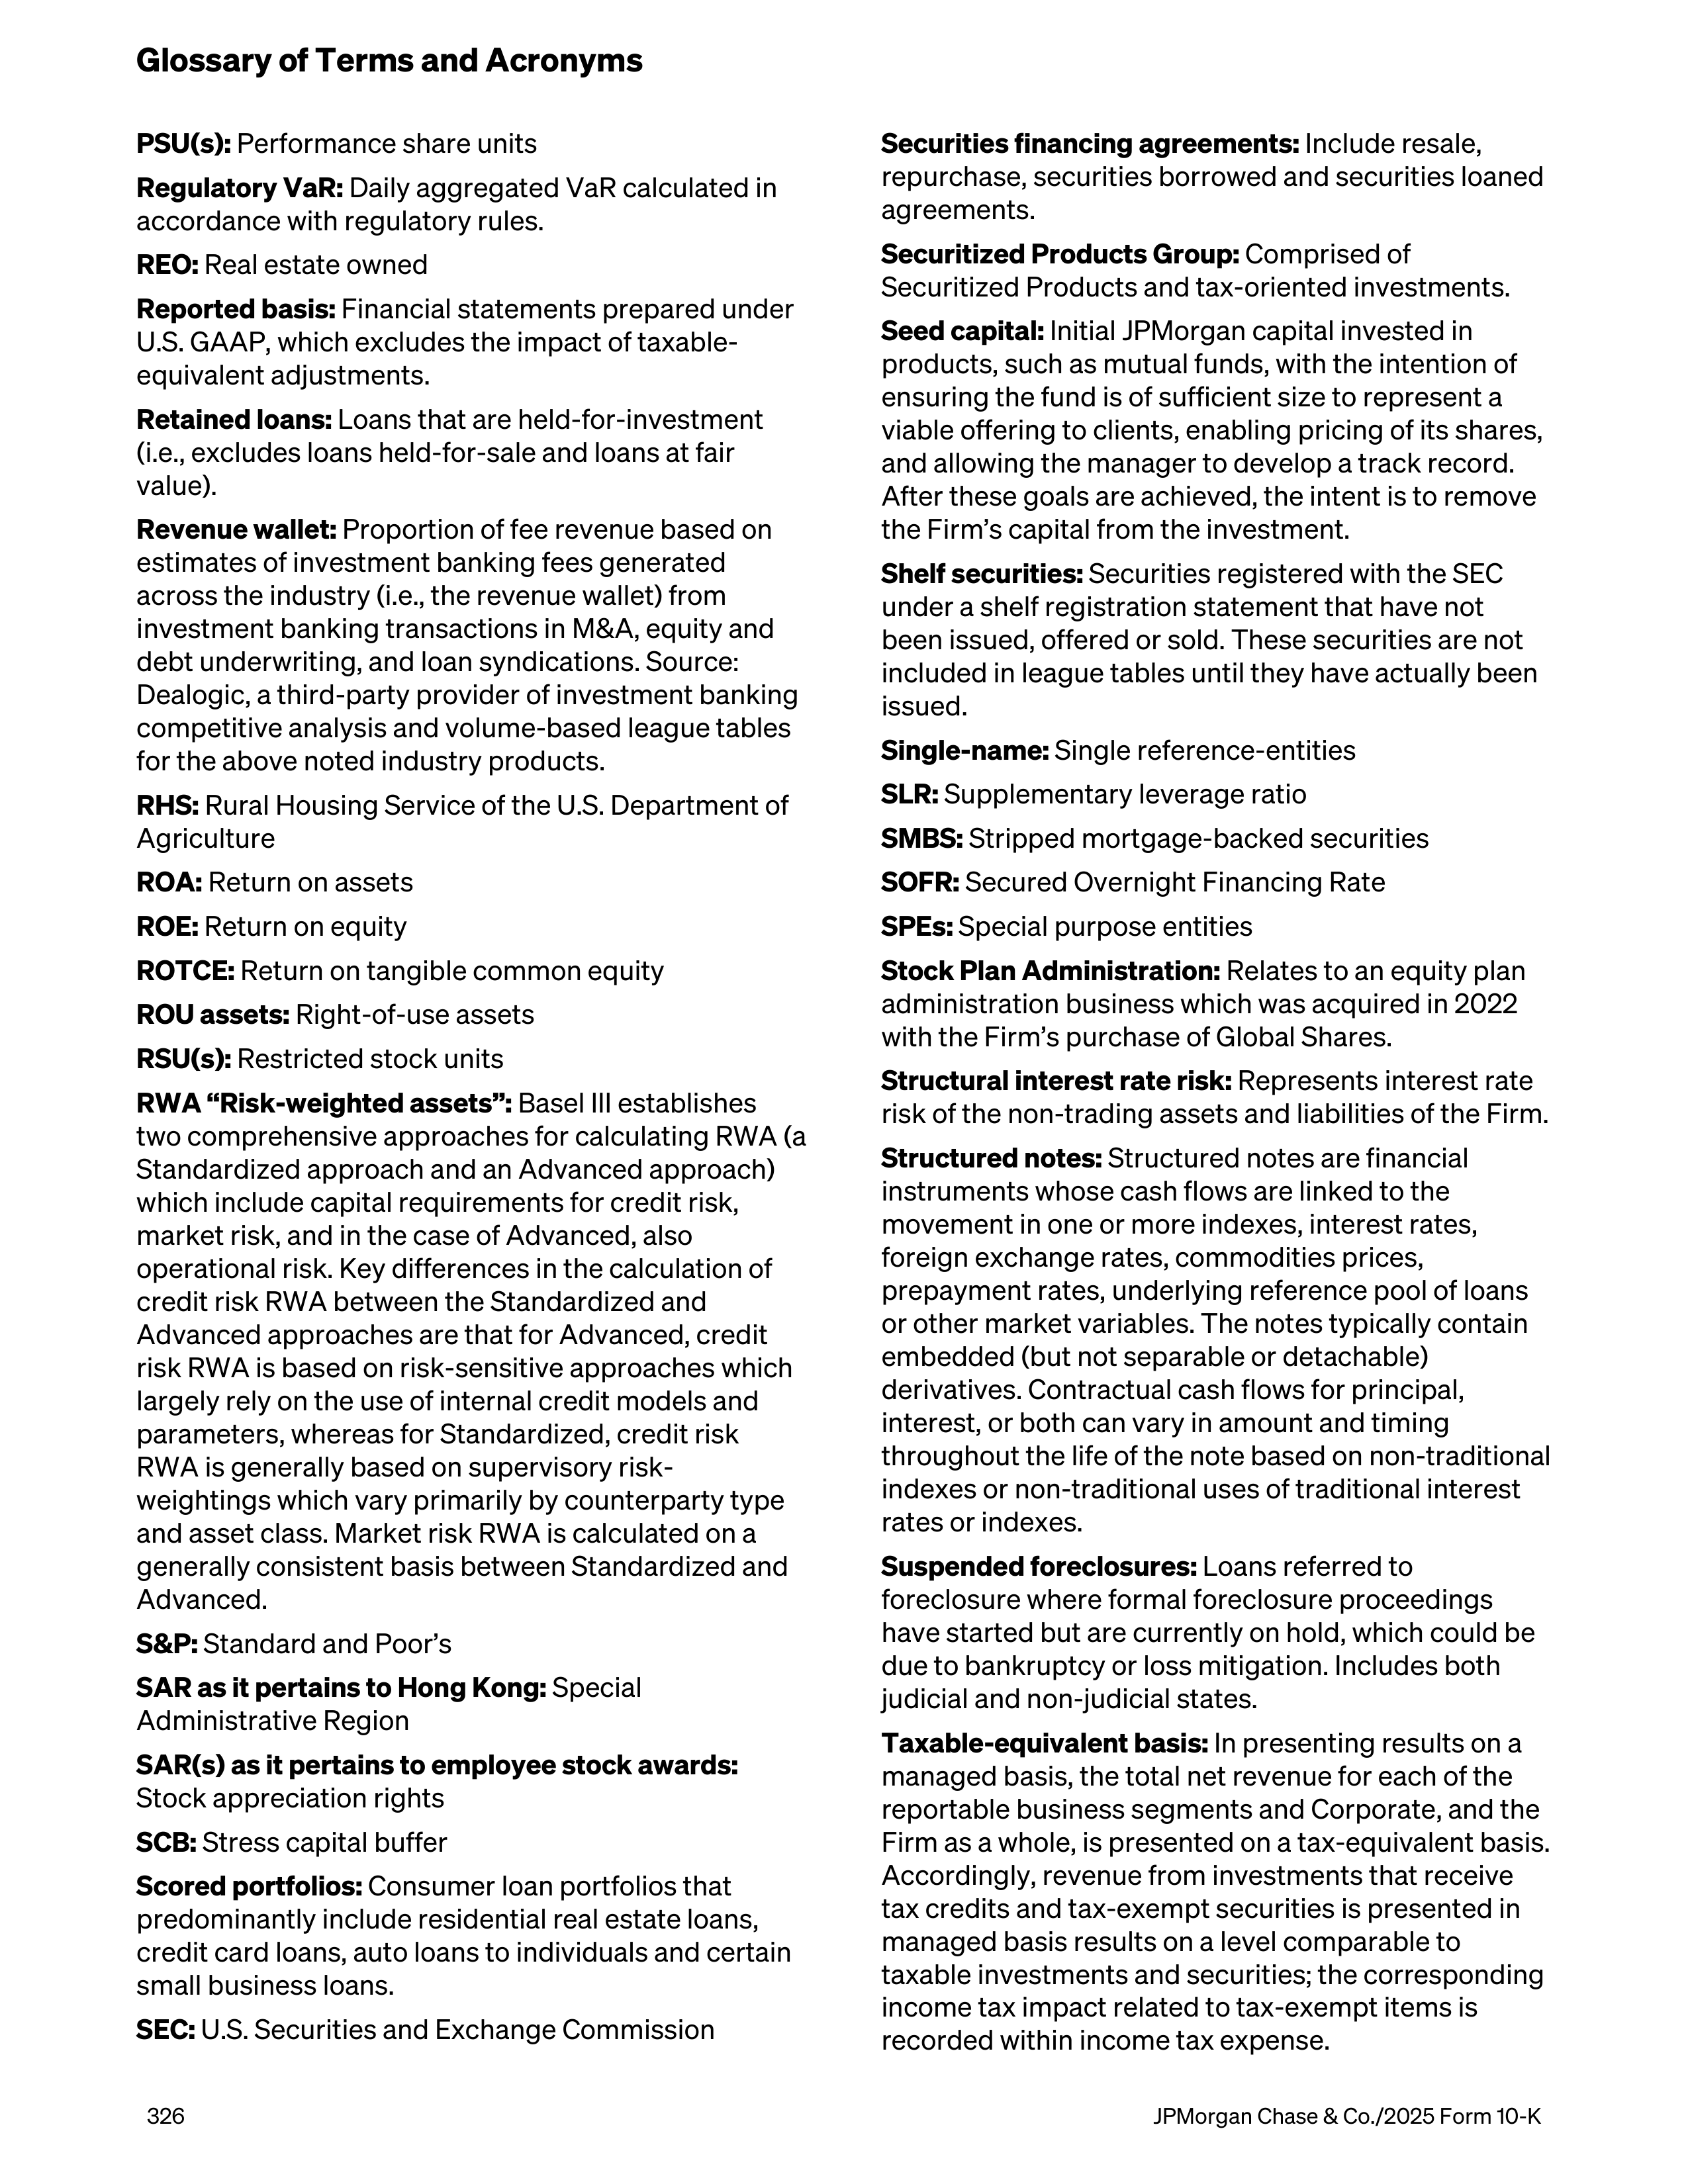
PSU(s):
Performance share units
Regulatory VaR:
Daily aggregated VaR calculated in
accordance with regulatory rules.
REO:
Real estate owned
Reported basis:
Financial statements prepared under
U.S. GAAP, which excludes the impact of taxable-
equivalent adjustments.
Retained loans:
Loans that are held-for-investment
(i.e., excludes loans held-for-sale and loans at fair
value).
Revenue wallet:
Proportion of fee revenue based on
estimates of investment banking fees generated
across the industry (i.e., the revenue wallet) from
investment banking transactions in M&A, equity and
debt underwriting, and loan syndications. Source:
Dealogic, a third-party provider of investment banking
competitive analysis and volume-based league tables
for the above noted industry products.
RHS:
Rural Housing Service of the U.S. Department of
Agriculture
ROA:
Return on assets
ROE:
Return on equity
ROTCE:
Return on tangible common equity
ROU assets:
Right-of-use assets
RSU(s):
Restricted stock units
RWA “Risk-weighted assets”:
Basel III establishes
two comprehensive approaches for calculating RWA (a
Standardized approach and an Advanced approach)
which include capital requirements for credit risk,
market risk, and in the case of Advanced, also
operational risk. Key differences in the calculation of
credit risk RWA between the Standardized and
Advanced approaches are that for Advanced, credit
risk RWA is based on risk-sensitive approaches which
largely rely on the use of internal credit models and
parameters, whereas for Standardized, credit risk
RWA is generally based on supervisory risk-
weightings which vary primarily by counterparty type
and asset class. Market risk RWA is calculated on a
generally consistent basis between Standardized and
Advanced.
S&P:
Standard and Poor’s
SAR as it pertains to Hong Kong:
Special
Administrative Region
SAR(s) as it pertains to employee stock awards:
Stock appreciation rights
SCB:
Stress capital buffer
Scored portfolios:
Consumer loan portfolios that
predominantly include residential real estate loans,
credit card loans, auto loans to individuals and certain
small business loans.
SEC:
U.S. Securities and Exchange Commission
Securities financing agreements:
Include resale,
repurchase, securities borrowed and securities loaned
agreements.
Securitized Products Group:
Comprised of
Securitized Products and tax-oriented investments.
Seed capital:
Initial JPMorgan capital invested in
products, such as mutual funds, with the intention of
ensuring the fund is of sufficient size to represent a
viable offering to clients, enabling pricing of its shares,
and allowing the manager to develop a track record.
After these goals are achieved, the intent is to remove
the Firm’s capital from the investment.
Shelf securities:
Securities registered with the SEC
under a shelf registration statement that have not
been issued, offered or sold. These securities are not
included in league tables until they have actually been
issued.
Single-name:
Single reference-entities
SLR:
Supplementary leverage ratio
SMBS:
Stripped mortgage-backed securities
SOFR:
Secured Overnight Financing Rate
SPEs:
Special purpose entities
Stock Plan Administration:
Relates to an equity plan
administration business which was acquired in 2022
with the Firm’s purchase of Global Shares.
Structural interest rate risk:
Represents interest rate
risk of the non-trading assets and liabilities of the Firm.
Structured notes:
Structured notes are financial
instruments whose cash flows are linked to the
movement in one or more indexes, interest rates,
foreign exchange rates, commodities prices,
prepayment rates, underlying reference pool of loans
or other market variables. The notes typically contain
embedded (but not separable or detachable)
derivatives. Contractual cash flows for principal,
interest, or both can vary in amount and timing
throughout the life of the note based on non-traditional
indexes or non-traditional uses of traditional interest
rates or indexes.
Suspended foreclosures:
Loans referred to
foreclosure where formal foreclosure proceedings
have started but are currently on hold, which could be
due to bankruptcy or loss mitigation. Includes both
judicial and non-judicial states.
Taxable-equivalent basis:
In presenting results on a
managed basis, the total net revenue for each of the
reportable business segments and Corporate, and the
Firm as a whole, is presented on a tax-equivalent basis.
Accordingly, revenue from investments that receive
tax credits and tax-exempt securities is presented in
managed basis results on a level comparable to
taxable investments and securities; the corresponding
income tax impact related to tax-exempt items is
recorded within income tax expense.
Glossary of Terms and Acronyms
326
JPMorgan Chase & Co./2025 Form 10-K
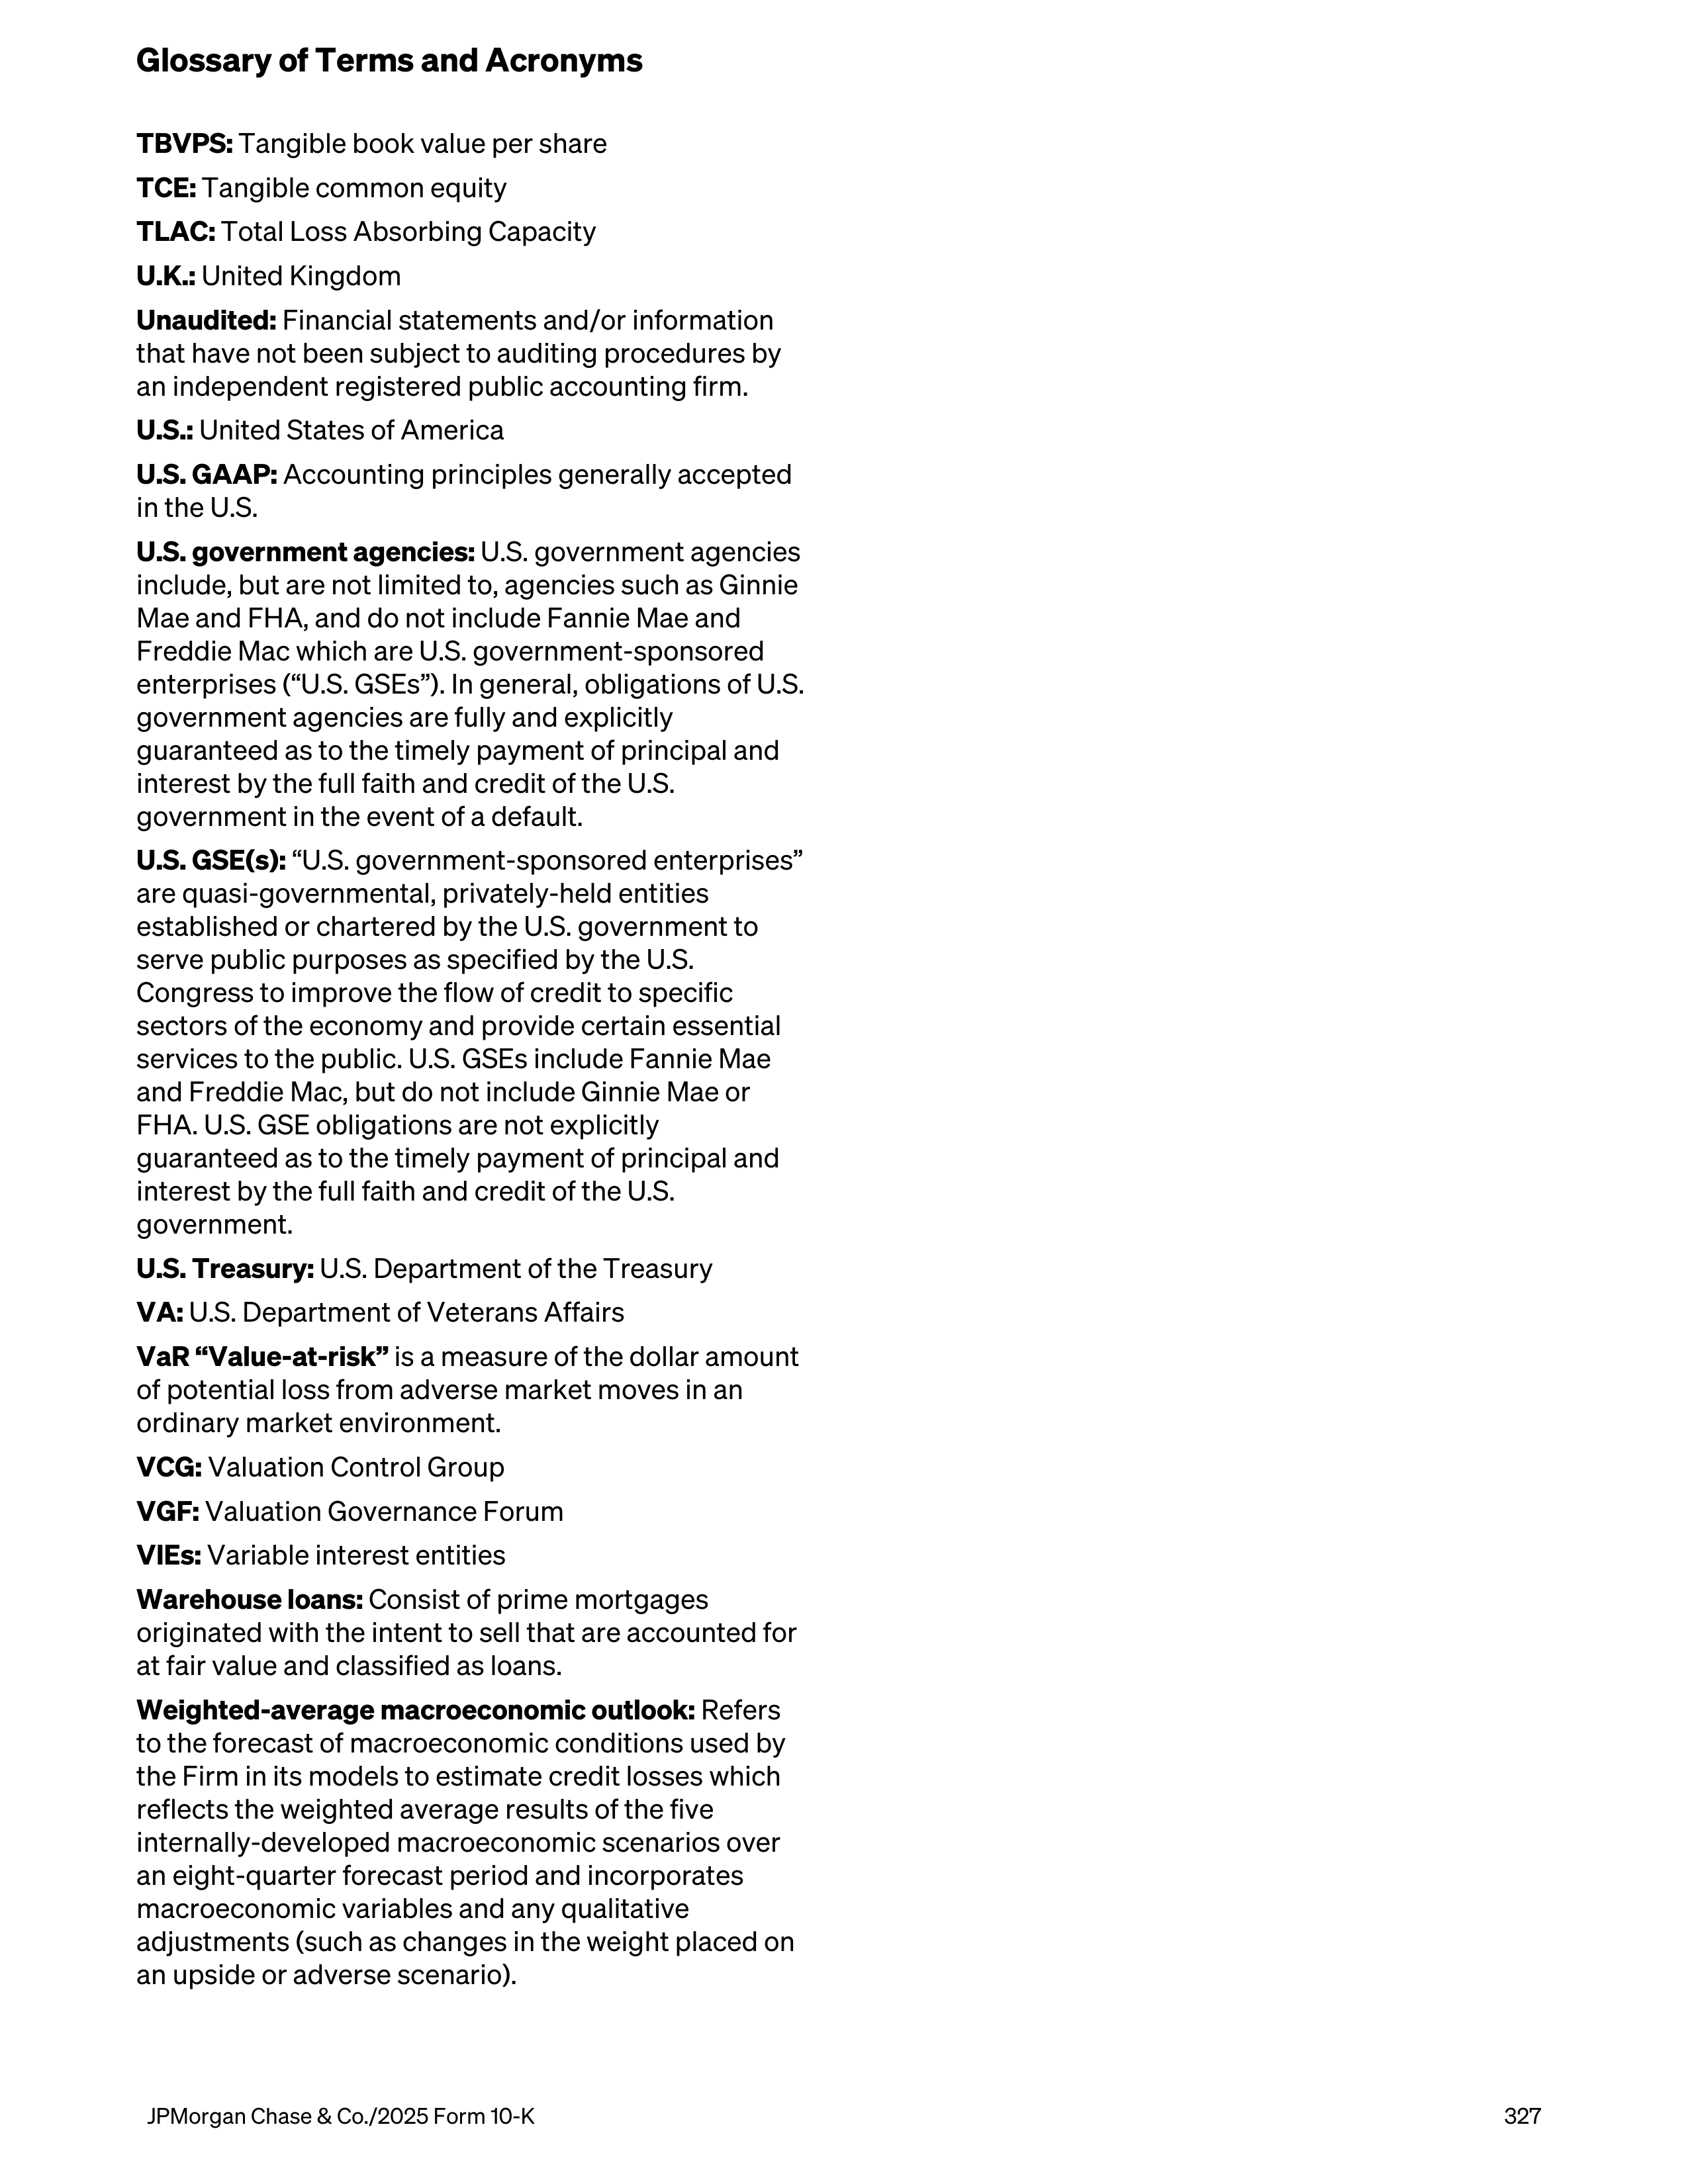
TBVPS:
Tangible book value per share
TCE:
Tangible common equity
TLAC:
Total Loss Absorbing Capacity
U.K.:
United Kingdom
Unaudited:
Financial statements and/or information
that have not been subject to auditing procedures by
an independent registered public accounting firm.
U.S.:
United States of America
U.S. GAAP:
Accounting principles generally accepted
in the U.S.
U.S. government agencies:
U.S. government agencies
include, but are not limited to, agencies such as Ginnie
Mae and FHA, and do not include Fannie Mae and
Freddie Mac which are U.S. government-sponsored
enterprises (“U.S. GSEs”). In general, obligations of U.S.
government agencies are fully and explicitly
guaranteed as to the timely payment of principal and
interest by the full faith and credit of the U.S.
government in the event of a default.
U.S. GSE(s):
“U.S. government-sponsored enterprises”
are quasi-governmental, privately-held entities
established or chartered by the U.S. government to
serve public purposes as specified by the U.S.
Congress to improve the flow of credit to specific
sectors of the economy and provide certain essential
services to the public. U.S. GSEs include Fannie Mae
and Freddie Mac, but do not include Ginnie Mae or
FHA. U.S. GSE obligations are not explicitly
guaranteed as to the timely payment of principal and
interest by the full faith and credit of the U.S.
government.
U.S. Treasury:
U.S. Department of the Treasury
VA:
U.S. Department of Veterans Affairs
VaR “Value-at-risk”
is a measure of the dollar amount
of potential loss from adverse market moves in an
ordinary market environment.
VCG:
Valuation Control Group
VGF:
Valuation Governance Forum
VIEs:
Variable interest entities
Warehouse loans:
Consist of prime mortgages
originated with the intent to sell that are accounted for
at fair value and classified as loans.
Weighted-average macroeconomic outlook:
Refers
to the forecast of macroeconomic conditions used by
the Firm in its models to estimate credit losses which
reflects the weighted average results of the five
internally-developed macroeconomic scenarios over
an eight-quarter forecast period and incorporates
macroeconomic variables and any qualitative
adjustments (such as changes in the weight placed on
an upside or adverse scenario).
Glossary of Terms and Acronyms
JPMorgan Chase & Co./2025 Form 10-K
327

328
JPMorgan Chase & Co./2025 Annual Report
Linda B. Bammann
2, 4
Retired Deputy Head of Risk
Management
JPMorgan Chase & Co.
(Financial services)
Michele G. Buck
1, 3
Retired Chairman, President
and Chief Executive Officer
The Hershey Company
(Snacks industry)
Stephen B. Burke
2, 3
Retired Chairman and
Chief Executive Officer
NBCUniversal, LLC
(Entertainment industry)
Alicia Boler Davis
4, 5
President of Ford Pro
Ford Motor Company
(Automotive manufacturing)
James Dimon
Chairman and
Chief Executive Officer
JPMorgan Chase & Co.
(Financial services)
Alex Gorsky
1, 3
Retired Chairman and
Chief Executive Officer
Johnson & Johnson
(Healthcare)
Mellody Hobson
4, 5
Co-CEO and President
Ariel Investments, LLC
(Investment management)
Phebe N. Novakovic
1, 5
Chairman and
Chief Executive Officer
General Dynamics
(Aerospace and defense)
Virginia M. Rometty
2, 3
Retired Executive Chairman,
President and Chief Executive Officer
International Business Machines
Corporation
(Technology)
Brad D. Smith
4, 5
President
Marshall University;
Retired Executive Chairman,
President and Chief Executive Officer
Intuit Inc.
(Education; Technology)
Mark A. Weinberger
1
Retired Global Chairman and
Chief Executive Officer
Ernst & Young LLP
(Professional services)
Member of:
1
Audit Committee
2
Compensation & Management
Development Committee
3
Corporate Governance &
Nominating Committee
4
Risk Committee
5
Public Responsibility
Committee
Board of Directors
Operating Committee
James Dimon
Chairman and Chief Executive
Officer
Ashley Bacon
Chief Risk Officer
Jeremy Barnum
Chief Financial Officer
Lori A. Beer
Global Chief Information Officer
Tim Berry
Global Head of Corporate
Responsibility and Chairman of
the Mid-Atlantic Region
Mary Callahan Erdoes
CEO, Asset & Wealth Management
Stacey Friedman
General Counsel
Teresa A. Heitsenrether
Chief Data & Analytics Officer
Marianne Lake
CEO, Consumer & Community
Banking
Robin Leopold
Head of Human Resources
Douglas B. Petno
Co-CEO, Commercial & Investment
Bank
Jennifer A. Piepszak
Chief Operating Officer
Troy L. Rohrbaugh
Co-CEO, Commercial & Investment
Bank
Other Corporate Officers
Reid R. Broda
Secretary
Joseph M. Evangelisti
Corporate Communications
Mikael Grubb
Investor Relations
Elena A. Korablina
Firmwide Controller
Lou Rauchenberger
Chief Audit Executive

JPMorgan Chase & Co./2025 Annual Report
329
Asia Pacific
Australia and New Zealand
Robert Bedwell
China
Rita Chan
Alan Ho
Hong Kong
Kam Shing Kwang
India
To be announced
Indonesia
Gioshia Ralie
Japan
Steve Teru Rinoie
Korea
Howard Kim
Malaysia
Hooi Ching Wong
Philippines
Carlos Ma. G Mendoza
Singapore
Wai Mei Hong
Taiwan
Carl K. Chien
Thailand
Marco Sucharitkul
Vietnam
Van Phan
Europe/Middle East/Africa
Belgium
Tanguy Piret
Commonwealth of
Independent States
Timur Kunanbayev
France
Thierry Sancier
Germany and Austria
Alex Mayer
Greece
Stelios Papadopoulos
Iberia
Ignacio de la Colina
Ireland
Marc Hussey
Israel
Roy Navon
Italy
Francesco Cardinali
Luxembourg
Philippe Ringard
Middle East and North Africa
Khaled Hobballah
Saudi Arabia and Bahrain
Bader Alamoudi
The Netherlands
Wendy Hohmann
Nordics
Klaus Thune
Jonas Wikmark
Poland
Michal Szwarc
Sub-Saharan Africa
Kevin Latter
Switzerland
Reinout Böttcher
Türkiye and Azerbaijan
Mustafa Bagriacik
Latin America
Andean, Caribbean and
Central America
Moises Mainster
Argentina
Facundo Gómez Minujin
Brazil
Marcelo Alvarez Gaiani
Chile
Andres Errazuriz
Colombia
Angela Hurtado
Mexico
Felipe García-Moreno
North America
Canada
David E. Rawlings
Senior Country Officers and Location Heads
Regional Chief Executive Officers
Asia Pacific
Sjoerd Leenart
Regional CEO
Europe/Middle East/Africa
Conor Hillery
Matthieu Wiltz
Regional Co-CEOs
Latin America/Canada
Alfonso Eyzaguirre
Regional CEO

330
JPMorgan Chase & Co./2025 Annual Report
The Rt. Hon. Tony Blair
Chairman of the Council
Executive Chairman
Tony Blair Institute for Global Change
Former Prime Minister of
Great Britain and Northern Ireland
London, United Kingdom
The Hon. Robert M. Gates
Vice Chairman of the Council
Principal
Rice, Hadley, Gates & Manuel LLC
Washington, District of Columbia
Khaldoon Al Mubarak
Group Chief Executive Officer and
Managing Director
Mubadala Investment Company
Abu Dhabi, United Arab Emirates
Paul Bulcke
Honorary Chairman
Nestlé S.A.
Vevey, Switzerland
Natarajan Chandrasekaran
Chairman
Tata Sons
Mumbai, India
Aliko Dangote
Group President and Chief Executive
Dangote Group
Lagos, Nigeria
Juan Pablo del Valle
Chairman
Orbia SAB and
Elementia Materiales SAB
Mexico City, Mexico
Jamie Dimon
*
Chairman and Chief Executive Officer
JPMorganChase
New York, New York
Axel Dumas
Chief Executive Officer
Hermès International
Paris, France
John Elkann
Chief Executive Officer, Exor N.V.
Chairman, Ferrari N.V. and
Stellantis N.V.
Turin, Italy
David Feffer
President of the Board
Suzano Holding S.A.
São Paulo, Brazil
Adena Friedman
Chair and Chief Executive Officer
Nasdaq
New York, New York
Ignacio S. Galán
Executive Chairman
Iberdrola, S.A.
Madrid, Spain
Marcos Galperin
Executive Chairman
Mercado Libre
Montevideo, Uruguay
Alex Gorsky
Former Chairman and
Chief Executive Officer
Johnson & Johnson
New Brunswick, New Jersey
Joe Kaeser
Chairman of the Supervisory Board
Siemens Energy AG and
Daimler Truck Holding AG
Munich, Germany
Lee Hsien Loong
Senior Minister
Singapore
Nancy McKinstry
Former Chief Executive Officer
and Chair of the Executive Board
Wolters Kluwer
Alphen aan den Rijn,
The Netherlands
Carlo Messina
Managing Director and
Chief Executive Officer
Intesa Sanpaolo
Milan, Italy
Amin H. Nasser
President and
Chief Executive Officer
Saudi Aramco
Dhahran, Saudi Arabia
Matteo Renzi
Senator of the Italian Republic
Rome, Italy
The Hon. Condoleezza Rice
Principal
Rice, Hadley, Gates & Manuel LLC
Stanford, California
David A. Ricks
Chair and Chief Executive Officer
Eli Lilly and Company
Indianapolis, Indiana
Paul Ryan
Former Speaker of the
U.S. House of Representatives
Partner
Solamere Capital
New York, New York
Nassef Sawiris
Executive Chair
OCI Global
London, United Kingdom
Joseph C. Tsai
Co-Founder and Chairman
Alibaba Group
Hong Kong SAR, China
Kenichiro Yoshida
Executive Chairman
Sony Group Corporation
Tokyo, Japan
Jaime Augusto Zobel de Ayala
Chairman
Ayala Corporation
Makati City, Philippines
J.P. Morgan International Council
*Ex-officio
As of March 1, 2026

Corporate headquarters
270 Park Avenue
New York, NY 10017
Telephone: 212-270-6000
jpmorganchase.com
Annual Report on Form 10-K
The Annual Report on Form 10-K of
JPMorganChase as filed with the
U.S. Securities and Exchange Commission
will be made available without charge
upon request to:
Office of the Secretary
JPMorganChase
270 Park Avenue
New York, NY 10017
corporate.secretary@jpmchase.com
Stock listing
New York Stock Exchange
The New York Stock Exchange ticker
symbol for the common stock of
JPMorganChase is JPM.
Financial information about JPMorgan
Chase & Co. can be accessed by visiting
our website at jpmorganchase.com
and clicking on “Investor Relations.”
Additional questions should be
addressed to:
Investor Relations
JPMorganChase
270 Park Avenue
New York, NY 10017
Telephone: 212-270-2479
JPMCinvestorrelations@jpmchase.com
Directors
To contact any of the Board members or
committee chairs, the Lead Independent
Director or the non-management
directors as a group, please mail or email
correspondence to:
JPMorganChase
Attention (Board member(s))
Office of the Secretary
270 Park Avenue
New York, NY 10017
corporate.secretary@jpmchase.com
The Corporate Governance Principles, the
charters of the principal standing Board
committees, the Code of Conduct, the
Code of Ethics for Finance Professionals
and other governance information can
be accessed by visiting our website at
jpmorganchase.com and clicking on
“Governance” under the “About us” tab.
Transfer agent and registrar
Computershare
150 Royall Street, Suite 101
Canton, MA 02021-1031
United States
Telephone: 800-982-7089
www.computershare.com/investor
Investor Services Program
JPMorganChase’s Investor Services
Program offers a variety of convenient,
low-cost services to make it easier to
reinvest dividends and buy and sell shares
of JPMorganChase common stock.
A brochure and enrollment materials may
be obtained by contacting the Program
Administrator, Computershare, by calling
800-982-7089, by writing to the address
indicated above or by visiting its website at
www-us.computershare.com/investor.
Direct deposit of dividends
For information about direct deposit of
dividends, please contact Computershare.
Stockholder inquiries
Contact Computershare:
By telephone:
Within the United States, Canada and
Puerto Rico: 800-982-7089
(toll free)
From all other locations:
201-680-6862 (collect)
TDD service for the hearing impaired
within the United States, Canada and
Puerto Rico: 800-231-5469
(toll free)
All other locations:
201-680-6610 (collect)
By regular mail:
Computershare
P.O. Box 43078
Providence, RI 02940-3078
United States
By overnight delivery:
Computershare
150 Royall Street, Suite 101
Canton, MA 02021-1031
United States
Duplicate mailings
If you receive duplicate mailings
because you have more than one
account listing and you wish to
consolidate your accounts, please
contact Computershare.
Independent registered public
accounting firm
PricewaterhouseCoopers LLP
300 Madison Avenue
New York, NY 10017
© 2026 JPMorgan Chase & Co.
All rights reserved. Printed in the U.S.A.
“JPMorganChase,” “J.P. Morgan,” “Chase,” the
Octagon symbol and other words or symbols in this
report that identify JPMorganChase services are
service marks of JPMorgan Chase & Co. Other
words or symbols in this report that identify other
parties’ goods or services may be trademarks or
service marks of those other parties.
This Annual Report is printed on paper made
from well-managed forests and other controlled
sources. The paper is independently certified by
Bureau Veritas Quality International according to
Forest Stewardship Council
®
standards.
Paper from
responsible sources
FSC
®
C020268


For 227 years, an unwavering
commitment to lift up our nation
and the world around us.