
FISCAL YEAR 2025 ANNUAL FINANCIAL REPORT

UNITED STATES
SECURITIES AND EXCHANGE COMMISSION
Washington, D.C. 20549
FORM 10-K
☒
ANNUAL REPORT PURSUANT TO SECTION 13 OR 15(d) OF THE SECURITIES EXCHANGE ACT OF 1934
For the fiscal year ended September 27, 2025
or
☐
TRANSITION REPORT PURSUANT TO SECTION 13 OR 15(d) OF THE SECURITIES EXCHANGE ACT OF 1934
For the transition period from __________ to __________.
Commission File Number 001-38842
Delaware
83-0940635
State or Other Jurisdiction of
I.R.S. Employer Identification
Incorporation or Organization
500 South Buena Vista Street
Burbank, California 91521
Address of Principal Executive Offices and Zip Code
(818) 560-1000
Registrant’s Telephone Number, Including Area Code
Securities registered pursuant to Section 12(b) of the Act:
Title of each class
Trading Symbol(s)
Name of each exchange on which registered
Common Stock, $0.01 par value
DIS
New York Stock Exchange
Securities Registered Pursuant to Section 12(g) of the Act: None.
Indicate by check mark if the registrant is a well-known seasoned issuer, as defined in Rule 405 of the Securities Act. Yes
x
No
o
Indicate by check mark if the registrant is not required to file reports pursuant to Section 13 or Section 15(d) of the Act. Yes
☐
No
x
Indicate by check mark whether the registrant (1) has filed all reports required to be filed by Section 13 or 15(d) of the Securities Exchange Act
of 1934 during the preceding 12 months (or for such shorter period that the registrant was required to file such reports), and (2) has been subject to such
filing requirements for the past 90 days. Yes
x
No
o
Indicate by check mark whether the registrant has submitted electronically every Interactive Data File required to be submitted pursuant to Rule
405 of Regulation S-T during the preceding 12 months (or for such shorter period that the registrant was required to submit such files). Yes
x
No
o
Indicate by check mark whether the registrant is a large accelerated filer, an accelerated filer, a non-accelerated filer, a smaller reporting
company or an emerging growth company. See the definitions of “large accelerated filer”, “accelerated filer”, “smaller reporting company”, and
“emerging growth company” in Rule 12b-2 of the Exchange Act.
Large accelerated filer
x
Accelerated filer
☐
Non-accelerated filer
☐
Smaller reporting company
☐
Emerging growth company
☐
If an emerging growth company, indicate by check mark if the registrant has elected not to use the extended transition period for complying with
any new or revised financial accounting standards provided pursuant to Section 13(a) of the Exchange Act.
¨
Indicate by check mark whether the registrant has filed a report on and attestation to its management’s assessment of the effectiveness of its
internal control over financial reporting under Section 404(b) of the Sarbanes-Oxley Act (15 U.S.C. 7262(b)) by the registered public accounting firm
that prepared or issued its audit report.
☒
If securities are registered pursuant to Section 12(b) of the Act, indicate by check mark whether the financial statements of the registrant included
in the filing reflect the correction of an error to previously issued financial statements.
☐
Indicate by check mark whether any of those error corrections are restatements that required a recovery analysis of incentive-based compensation
received by any of the registrant’s executive officers during the relevant recovery period pursuant to §240.10D-1(b).
☐
Indicate by check mark whether the registrant is a shell company (as defined in Rule 12b-2 of the Act). Yes
☐
No
x
The aggregate market value of common stock held by non-affiliates (based on the closing price on the last business day of the registrant’s most
recently completed second fiscal quarter as reported on the New York Stock Exchange-Composite Transactions) was $176.6 billion. All executive
officers and directors of the registrant and all persons filing a Schedule 13D with the Securities and Exchange Commission in respect to registrant’s
common stock have been deemed, solely for the purpose of the foregoing calculation, to be “affiliates” of the registrant.
There were 1,785,288,846 shares of common stock outstanding as of November 5, 2025.
Documents Incorporated by Reference
Certain information required for Part III of this report is incorporated herein by reference to the proxy statement for the 2026 annual meeting of
the Company’s shareholders.
THE WALT DISNEY COMPANY AND SUBSIDIARIES
TABLE OF CONTENTS
Page
PART I
ITEM 1.
Business
2
ITEM 1A.
Risk Factors
17
ITEM 1B.
Unresolved Staff Comments
27
ITEM 1C.
Cybersecurity
27
ITEM 2.
Properties
28
ITEM 3.
Legal Proceedings
29
ITEM 4.
Mine Safety Disclosures
29
Information About our Executive Officers
29
PART II
ITEM 5.
Market for the Company’s Common Equity, Related Stockholder Matters and Issuer Purchases of Equity
Securities
31
ITEM 7.
Management’s Discussion and Analysis of Financial Condition and Results of Operations
32
ITEM 7A.
Quantitative and Qualitative Disclosures About Market Risk
56
ITEM 8.
Financial Statements and Supplementary Data
58
ITEM 9.
Changes in and Disagreements with Accountants on Accounting and Financial Disclosure
58
ITEM 9A.
Controls and Procedures
58
ITEM 9B.
Other Information
58
ITEM 9C
Disclosure Regarding Foreign Jurisdictions that Prevent Inspections
58
PART III
ITEM 10.
Directors, Executive Officers and Corporate Governance
59
ITEM 11.
Executive Compensation
59
ITEM 12.
Security Ownership of Certain Beneficial Owners and Management and Related Stockholder Matters
59
ITEM 13.
Certain Relationships and Related Transactions, and Director Independence
59
ITEM 14.
Principal Accounting Fees and Services
59
PART IV
ITEM 15.
Exhibits and Financial Statement Schedules
60
ITEM 16.
Form 10-K Summary
65
SIGNATURES
66
Consolidated Financial Information — The Walt Disney Company
67
Cautionary Note on Forward-Looking Statements
This Annual Report on Form 10-K contains forward-looking statements within the meaning of Section 27A of the
Securities Act of 1933, as amended, and Section 21E of the Securities Exchange Act of 1934, as amended. Forward-looking
statements generally relate to future events or our future financial or operating performance and may include statements
concerning, among other things, financial results; business plans (including statements regarding new products and services,
future expenditures, cost, investments and transactions for which conditions to close have not been satisfied, including entering
into additional agreements, regulatory or other approvals or other conditions); future liabilities and other obligations;
impairments and amortization; estimates of the financial impact of certain items, accounting treatment, events or circumstances;
competition and seasonality on our businesses and results of operations; and capital allocation, including share repurchases and
dividends. In some cases, you can identify forward-looking statements because they contain words such as “may,” “will,”
“would,” “expects,” “plans,” “could,” “intends,” “target,” “projects,” “forecasts,” “believes,” “estimates,” “anticipates,”
“potential,” “continue,” “assumption” or “judgment” or the negative of these words or other similar terms or expressions that
concern our expectations, strategy, plans or intentions. These statements reflect our current views with respect to future events
and are based on assumptions as of the date of this report. These statements are subject to known and unknown risks,
uncertainties and other factors that may cause our actual results, performance or achievements to be materially different from
expectations or results projected or implied by forward-looking statements.
Such differences may result from actions taken by the Company, including restructuring or strategic initiatives (including
capital investments, asset acquisitions or dispositions, new or expanded business lines or cessation of certain operations), our
execution of our business plans (including the content we create and intellectual properties (IP) we invest in, our pricing
decisions, our cost structure and our management and other personnel decisions), our ability to quickly execute on cost
rationalization while preserving revenue, the discovery of additional information or other business decisions, as well as from
developments beyond the Company’s control, including:
•
the occurrence of subsequent events;
•
deterioration in domestic and global economic conditions or failure of conditions to improve as anticipated;
•
deterioration in or pressures from competitive conditions, including competition to create or acquire content,
competition for talent and competition for advertising revenue;
•
consumer preferences and acceptance of our content, offerings, pricing model and price increases, and corresponding
subscriber additions and churn, and the market for advertising sales on our direct-to-consumer services and linear
networks;
•
health concerns and their impact on our businesses and productions;
•
international, including tariffs and other trade policies, political or military developments;
•
regulatory and legal developments;
•
technological developments;
•
labor markets and activities, including work stoppages;
•
adverse weather conditions or natural disasters; and
•
availability of content.
Such developments may further affect entertainment, travel and leisure businesses generally and may, among other things,
affect (or further affect, as applicable):
•
our operations, business plans or profitability, including direct-to-consumer profitability;
•
demand for our products and services;
•
the performance of the Company’s content;
•
our ability to create or obtain desirable content at or under the value we assign the content;
•
the advertising market for programming;
•
taxation; and
•
performance of some or all Company businesses either directly or through their impact on those who distribute our
products.
Additional factors include those described in this Annual Report on Form 10-K, including under the captions “Risk
Factors,” “Management’s Discussion and Analysis of Financial Condition and Results of Operations,” and “Business,” in our
subsequent quarterly reports on Form 10-Q, including under the captions “Risk Factors” and “Management’s Discussion and
Analysis of Financial Condition and Results of Operations,” and in our subsequent filings with the Securities and Exchange
Commission.
A forward-looking statement is neither a prediction nor a guarantee of future events or circumstances. You should not
place undue reliance on the forward-looking statements. Unless required by federal securities laws, we assume no obligation to
update any of these forward-looking statements, or to update the reasons actual results could differ materially from those
anticipated, to reflect circumstances or events that occur after the statements are made.
1
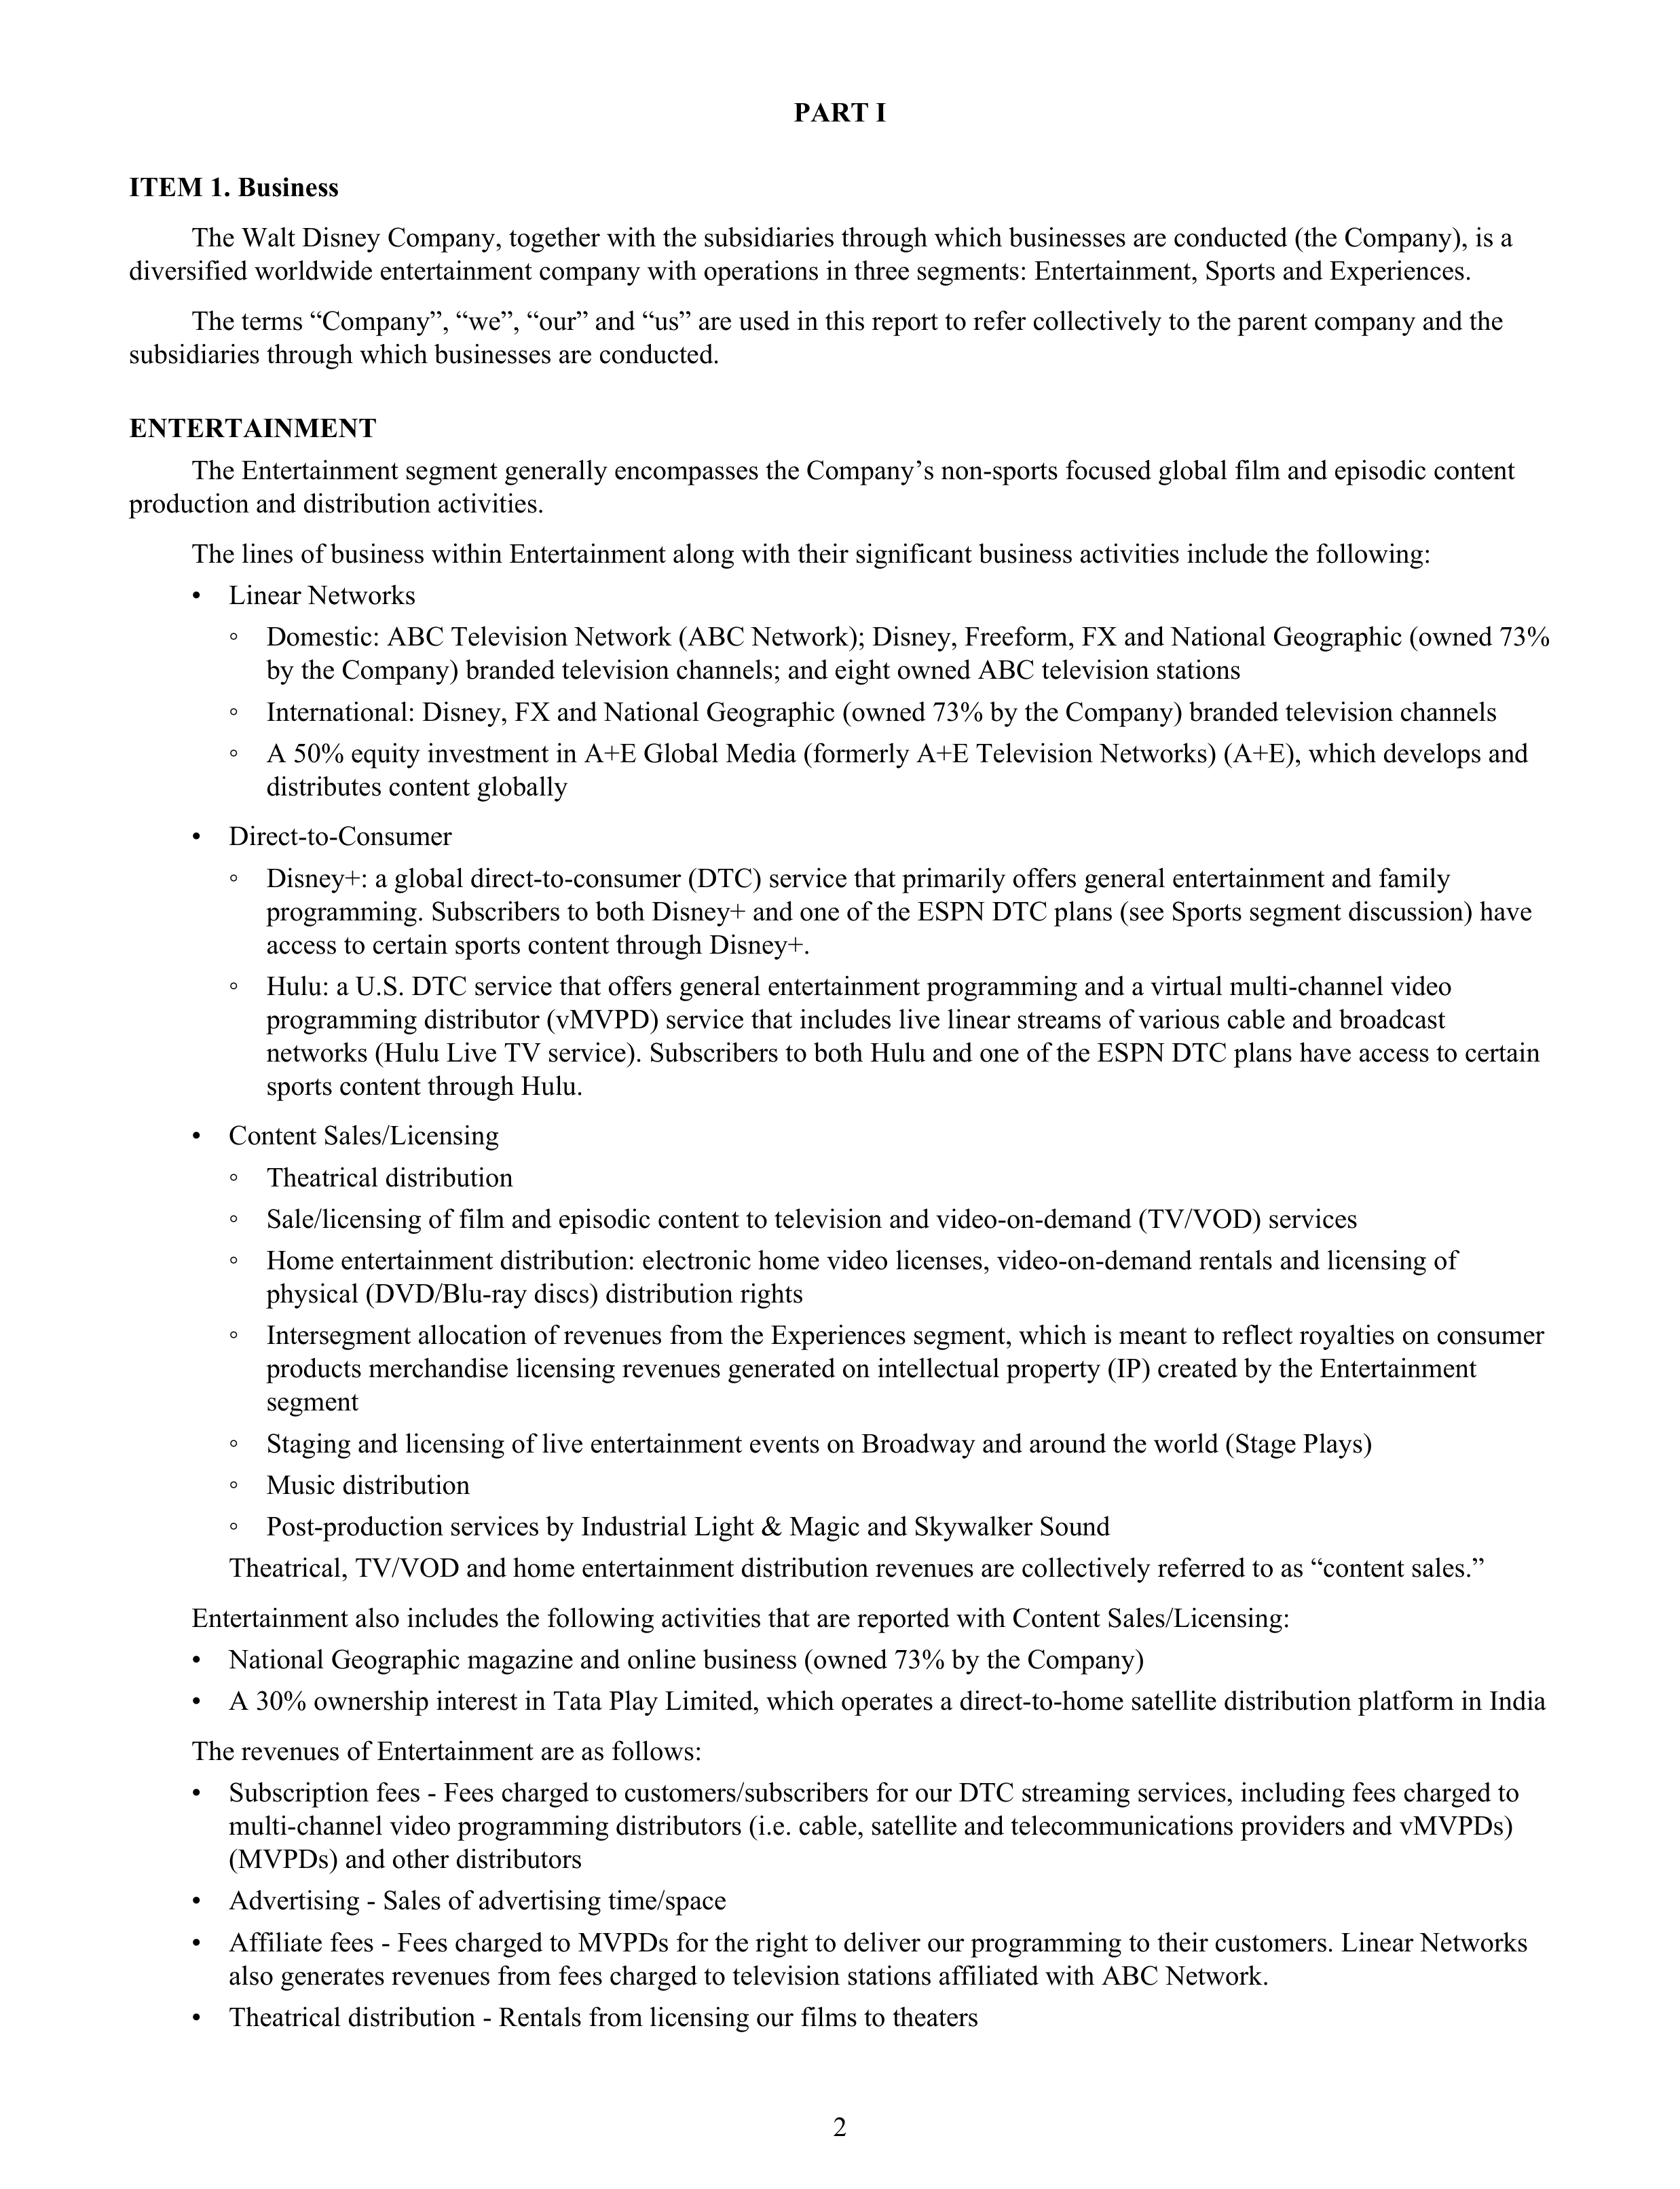
PART I
ITEM 1. Business
The Walt Disney Company, together with the subsidiaries through which businesses are conducted (the Company), is a
diversified worldwide entertainment company with operations in three segments: Entertainment, Sports and Experiences.
The terms “Company”, “we”, “our” and “us” are used in this report to refer collectively to the parent company and the
subsidiaries through which businesses are conducted.
ENTERTAINMENT
The Entertainment segment generally encompasses the Company’s non-sports focused global film and episodic content
production and distribution activities.
The lines of business within Entertainment along with their significant business activities include the following:
•
Linear Networks
◦
Domestic: ABC Television Network (ABC Network); Disney, Freeform, FX and National Geographic (owned 73%
by the Company) branded television channels; and eight owned ABC television stations
◦
International: Disney, FX and National Geographic (owned 73% by the Company) branded television channels
◦
A 50% equity investment in A+E Global Media (formerly A+E Television Networks) (A+E), which develops and
distributes content globally
•
Direct-to-Consumer
◦
Disney+: a global direct-to-consumer (DTC) service that primarily offers general entertainment and family
programming. Subscribers to both Disney+ and one of the ESPN DTC plans (see Sports segment discussion) have
access to certain sports content through Disney+.
◦
Hulu: a U.S. DTC service that offers general entertainment programming and a virtual multi-channel video
programming distributor (vMVPD) service that includes live linear streams of various cable and broadcast
networks (Hulu Live TV service). Subscribers to both Hulu and one of the ESPN DTC plans have access to certain
sports content through Hulu.
•
Content Sales/Licensing
◦
Theatrical distribution
◦
Sale/licensing of film and episodic content to television and video-on-demand (TV/VOD) services
◦
Home entertainment distribution: electronic home video licenses, video-on-demand rentals and licensing of
physical (DVD/Blu-ray discs) distribution rights
◦
Intersegment allocation of revenues from the Experiences segment, which is meant to reflect royalties on consumer
products merchandise licensing revenues generated on intellectual property (IP) created by the Entertainment
segment
◦
Staging and licensing of live entertainment events on Broadway and around the world (Stage Plays)
◦
Music distribution
◦
Post-production services by Industrial Light & Magic and Skywalker Sound
Theatrical, TV/VOD and home entertainment distribution revenues are collectively referred to as “content sales.”
Entertainment also includes the following activities that are reported with Content Sales/Licensing:
•
National Geographic magazine and online business (owned 73% by the Company)
•
A 30% ownership interest in Tata Play Limited, which operates a direct-to-home satellite distribution platform in India
The revenues of Entertainment are as follows:
•
Subscription fees - Fees charged to customers/subscribers for our DTC streaming services, including fees charged to
multi-channel video programming distributors (i.e. cable, satellite and telecommunications providers and vMVPDs)
(MVPDs) and other distributors
•
Advertising - Sales of advertising time/space
•
Affiliate fees - Fees charged to MVPDs for the right to deliver our programming to their customers. Linear Networks
also generates revenues from fees charged to television stations affiliated with ABC Network.
•
Theatrical distribution - Rentals from licensing our films to theaters
2
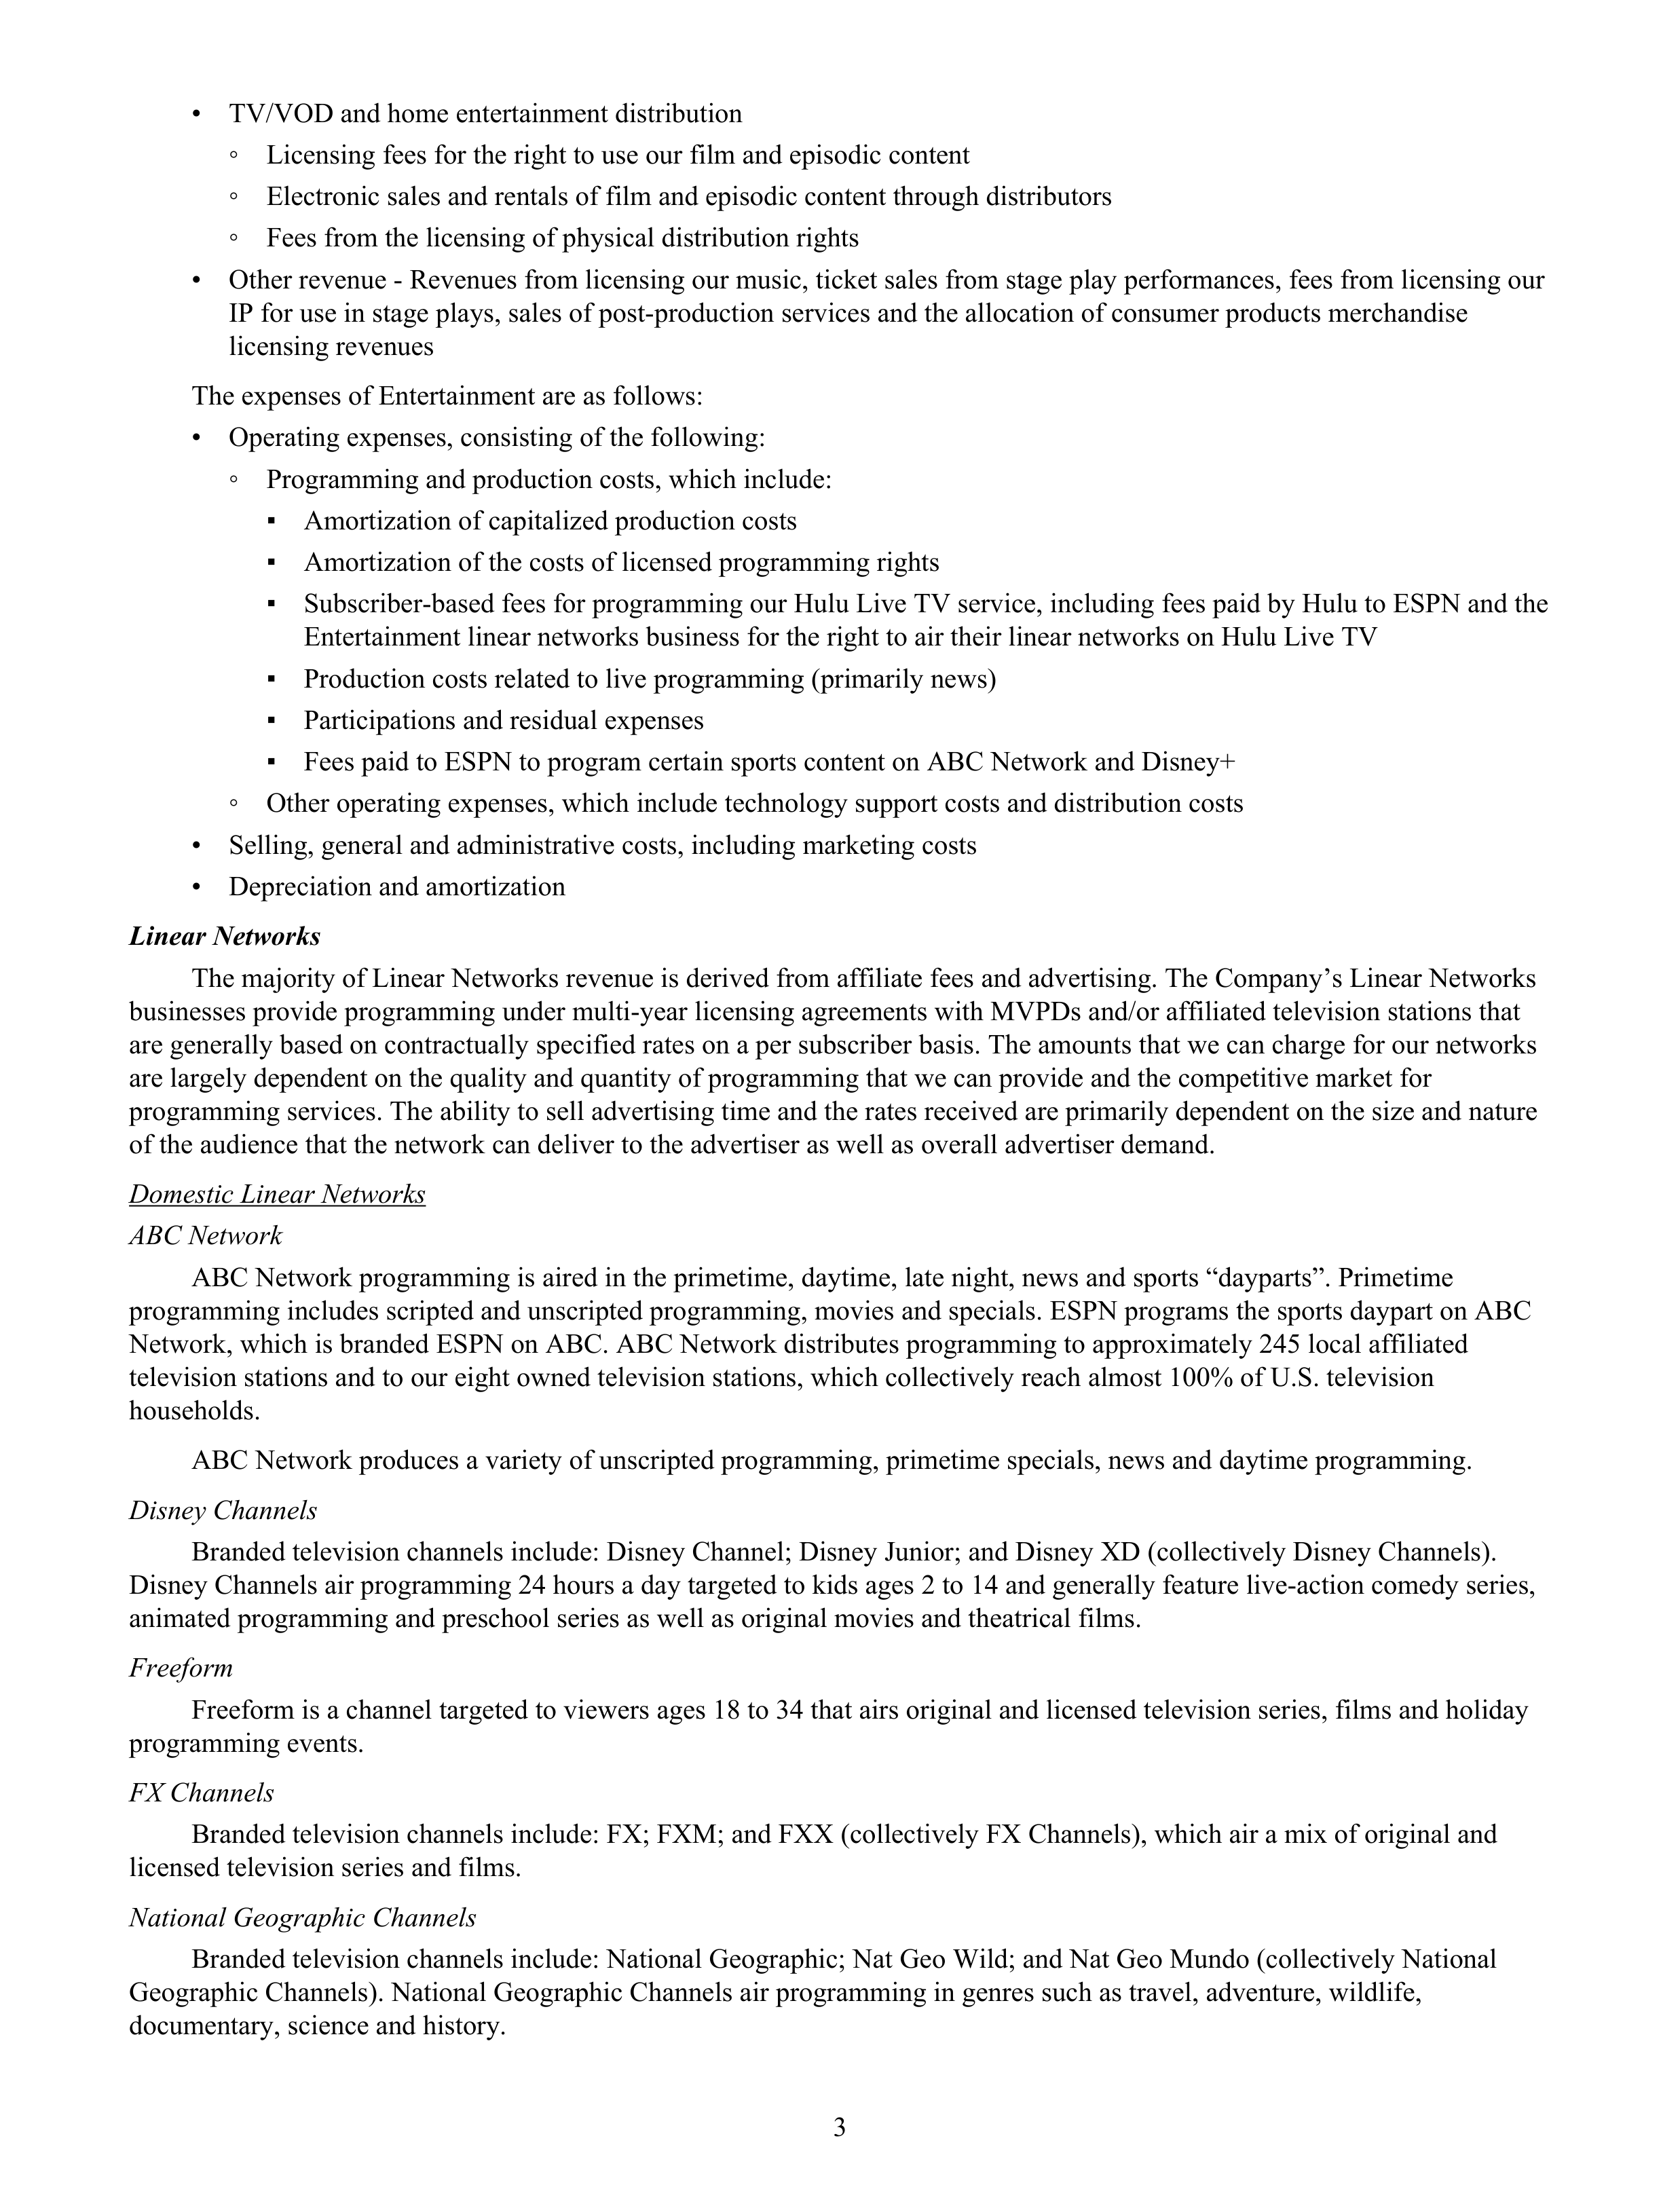
•
TV/VOD and home entertainment distribution
◦
Licensing fees for the right to use our film and episodic content
◦
Electronic sales and rentals of film and episodic content through distributors
◦
Fees from the licensing of physical distribution rights
•
Other revenue - Revenues from licensing our music, ticket sales from stage play performances, fees from licensing our
IP for use in stage plays, sales of post-production services and the allocation of consumer products merchandise
licensing revenues
The expenses of Entertainment are as follows:
•
Operating expenses, consisting of the following:
◦
Programming and production costs, which include:
▪
Amortization of capitalized production costs
▪
Amortization of the costs of licensed programming rights
▪
Subscriber-based fees for programming our Hulu Live TV service, including fees paid by Hulu to ESPN and the
Entertainment linear networks business for the right to air their linear networks on Hulu Live TV
▪
Production costs related to live programming (primarily news)
▪
Participations and residual expenses
▪
Fees paid to ESPN to program certain sports content on ABC Network and Disney+
◦
Other operating expenses, which include technology support costs and distribution costs
•
Selling, general and administrative costs, including marketing costs
•
Depreciation and amortization
Linear Networks
The majority of Linear Networks revenue is derived from affiliate fees and advertising. The Company’s Linear Networks
businesses provide programming under multi-year licensing agreements with MVPDs and/or affiliated television stations that
are generally based on contractually specified rates on a per subscriber basis. The amounts that we can charge for our networks
are largely dependent on the quality and quantity of programming that we can provide and the competitive market for
programming services. The ability to sell advertising time and the rates received are primarily dependent on the size and nature
of the audience that the network can deliver to the advertiser as well as overall advertiser demand.
Domestic Linear Networks
ABC Network
ABC Network programming is aired in the primetime, daytime, late night, news and sports “dayparts”. Primetime
programming includes scripted and unscripted programming, movies and specials. ESPN programs the sports daypart on ABC
Network, which is branded ESPN on ABC. ABC Network distributes programming to approximately 245 local affiliated
television stations and to our eight owned television stations, which collectively reach almost 100% of U.S. television
households.
ABC Network produces a variety of unscripted programming, primetime specials, news and daytime programming.
Disney Channels
Branded television channels include: Disney Channel; Disney Junior; and Disney XD (collectively Disney Channels).
Disney Channels air programming 24 hours a day targeted to kids ages 2 to 14 and generally feature live-action comedy series,
animated programming and preschool series as well as original movies and theatrical films.
Freeform
Freeform is a channel targeted to viewers ages 18 to 34 that airs original and licensed television series, films and holiday
programming events.
FX Channels
Branded television channels include: FX; FXM; and FXX (collectively FX Channels), which air a mix of original and
licensed television series and films.
National Geographic Channels
Branded television channels include: National Geographic; Nat Geo Wild; and Nat Geo Mundo (collectively National
Geographic Channels). National Geographic Channels air programming in genres such as travel, adventure, wildlife,
documentary, science and history.
3
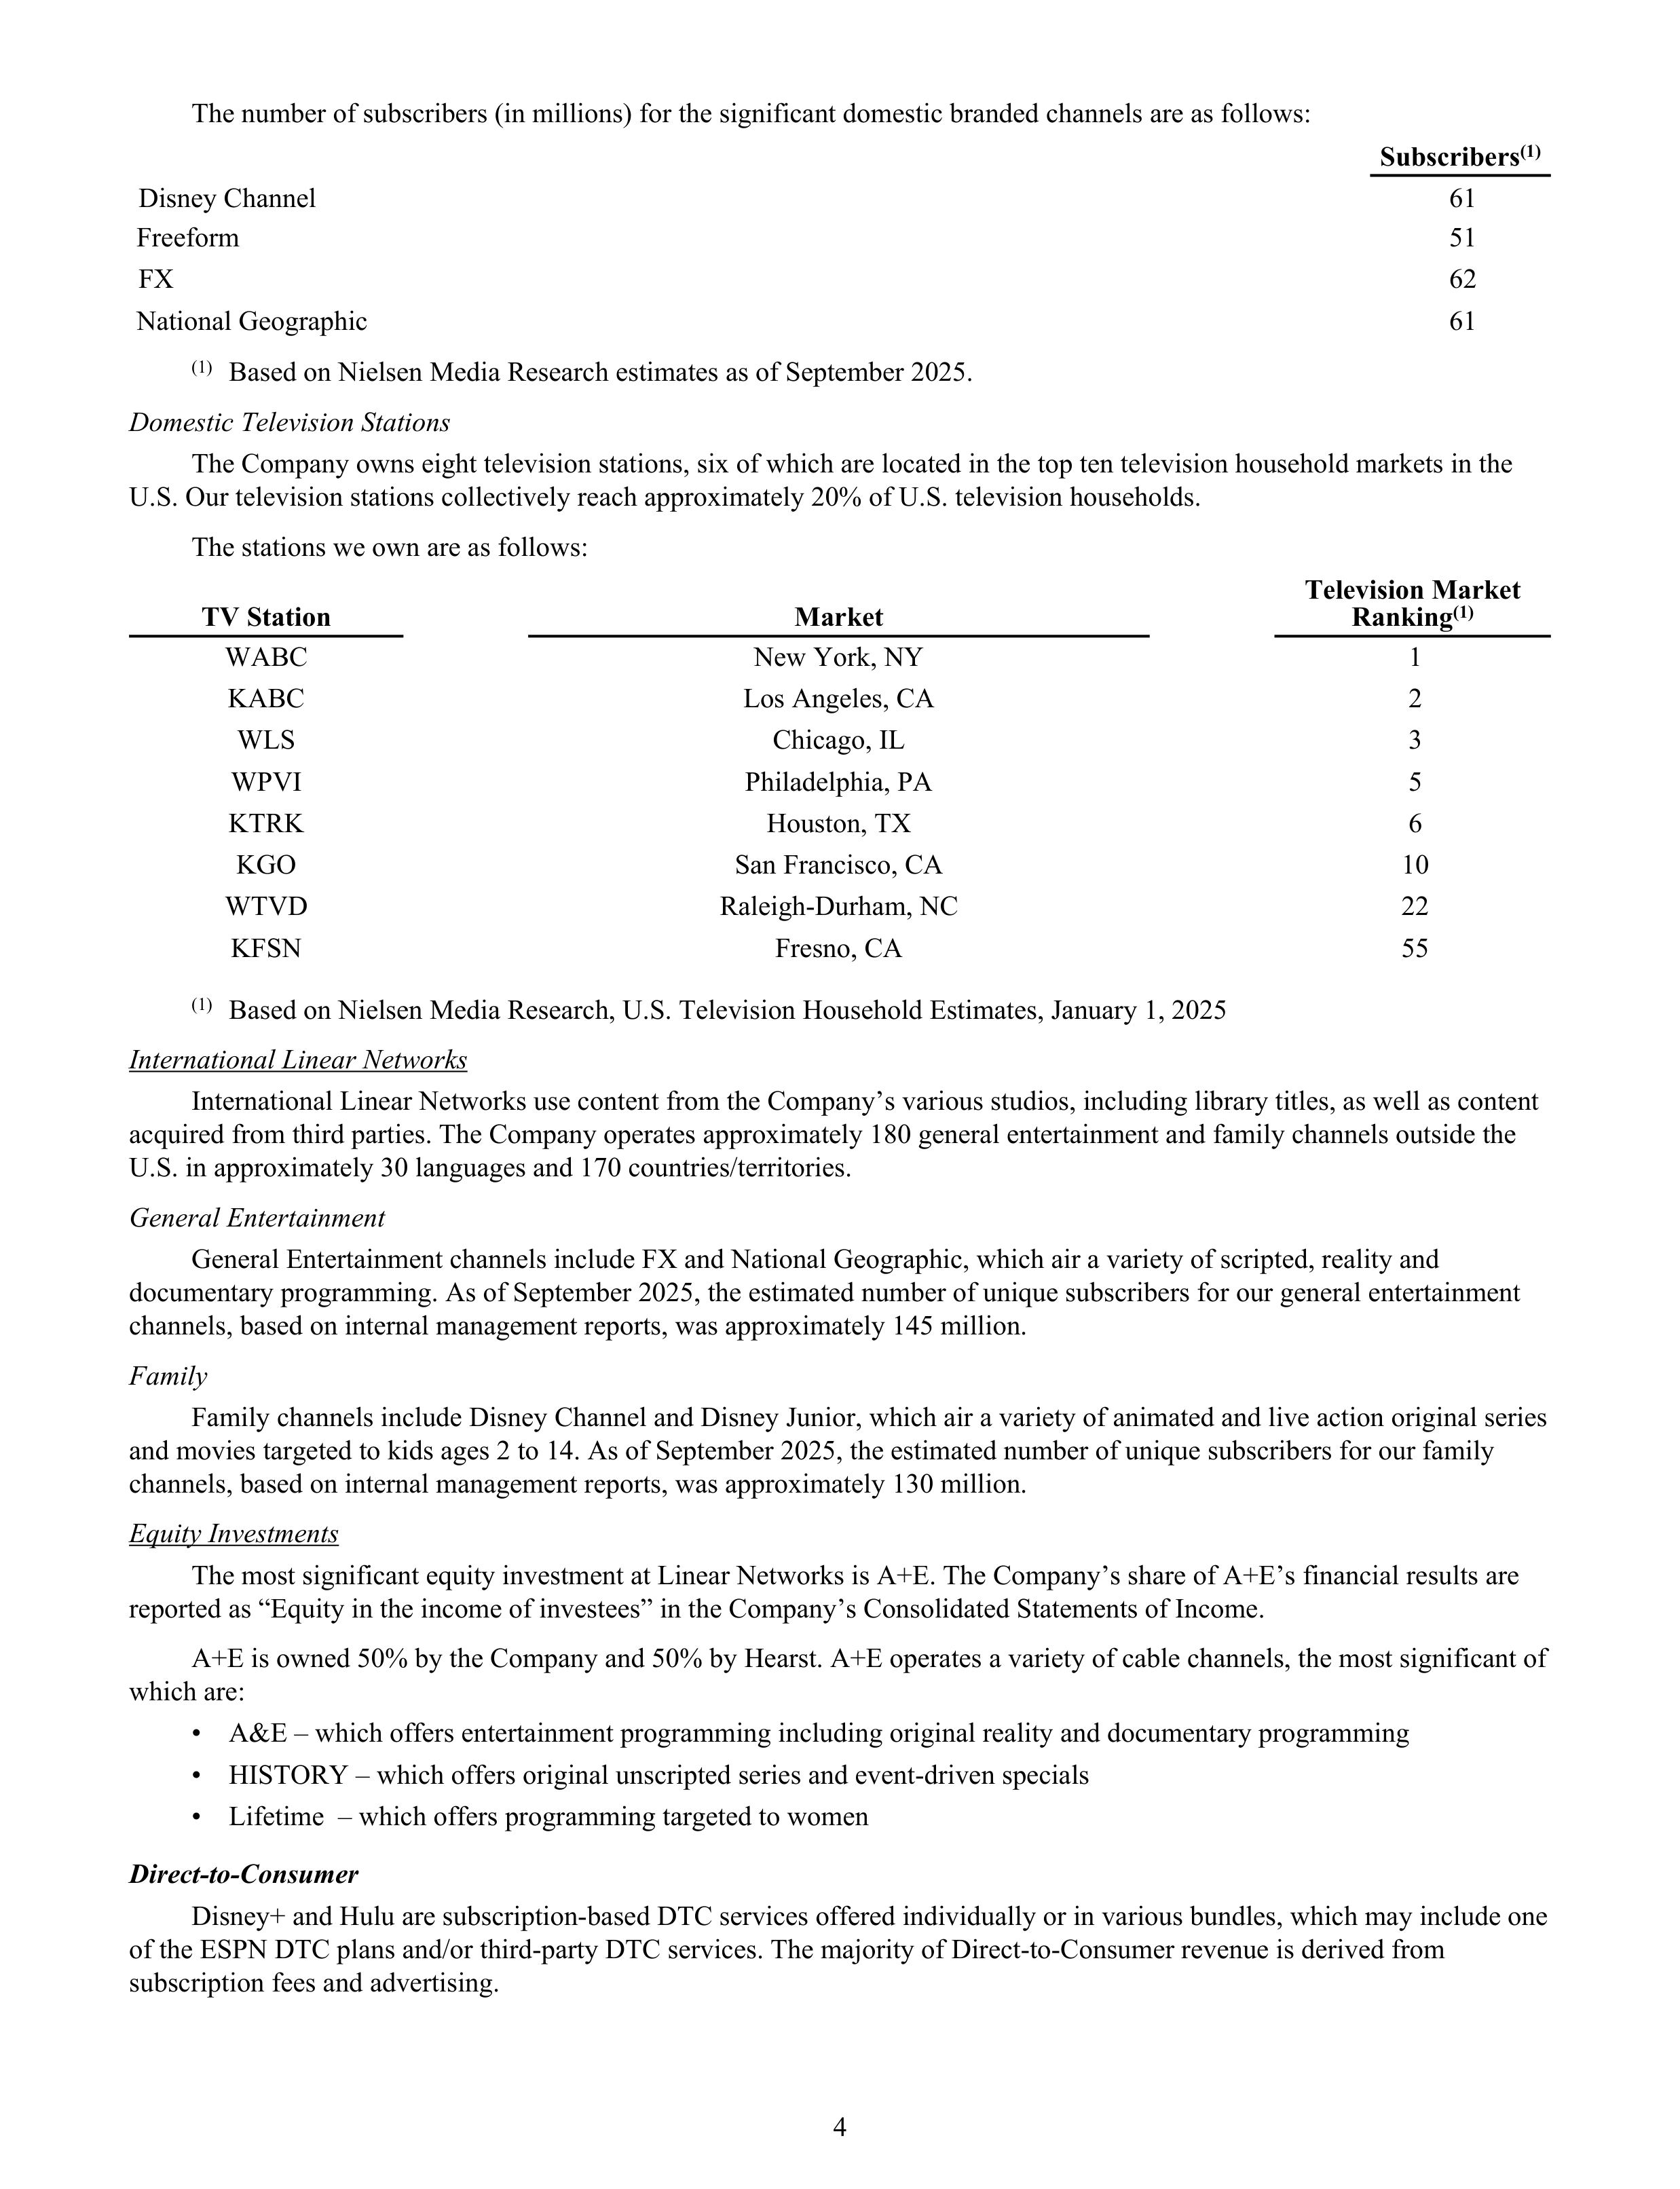
The number of subscribers (in millions) for the significant domestic branded channels are as follows:
Subscribers
(1)
Disney Channel
61
Freeform
51
FX
62
National Geographic
61
(1)
Based on Nielsen Media Research estimates as of September 2025.
Domestic Television Stations
The Company owns eight television stations, six of which are located in the top ten television household markets in the
U.S. Our television stations collectively reach approximately 20% of U.S. television households.
The stations we own are as follows:
TV Station
Market
Television Market
Ranking
(1)
WABC
New York, NY
1
KABC
Los Angeles, CA
2
WLS
Chicago, IL
3
WPVI
Philadelphia, PA
5
KTRK
Houston, TX
6
KGO
San Francisco, CA
10
WTVD
Raleigh-Durham, NC
22
KFSN
Fresno, CA
55
(1)
Based on Nielsen Media Research, U.S. Television Household Estimates, January 1, 2025
International Linear Networks
International Linear Networks use content from the Company’s various studios, including library titles, as well as content
acquired from third parties. The Company operates approximately 180 general entertainment and family channels outside the
U.S. in approximately 30 languages and 170 countries/territories.
General Entertainment
General Entertainment channels include FX and National Geographic, which air a variety of scripted, reality and
documentary programming. As of September 2025, the estimated number of unique subscribers for our general entertainment
channels, based on internal management reports, was approximately 145 million.
Family
Family channels include Disney Channel and Disney Junior, which air a variety of animated and live action original series
and movies targeted to kids ages 2 to 14. As of September 2025, the estimated number of unique subscribers for our family
channels, based on internal management reports, was approximately 130 million.
Equity Investments
The most significant equity investment at Linear Networks is A+E. The Company’s share of A+E’s financial results are
reported as “Equity in the income of investees” in the Company’s Consolidated Statements of Income.
A+E is owned 50% by the Company and 50% by Hearst. A+E operates a variety of cable channels, the most significant of
which are:
•
A&E – which offers entertainment programming including original reality and documentary programming
•
HISTORY – which offers original unscripted series and event-driven specials
•
Lifetime – which offers programming targeted to women
Direct-to-Consumer
Disney+ and Hulu are subscription-based DTC services offered individually or in various bundles, which may include one
of the ESPN DTC plans and/or third-party DTC services. The majority of Direct-to-Consumer revenue is derived from
subscription fees and advertising.
4
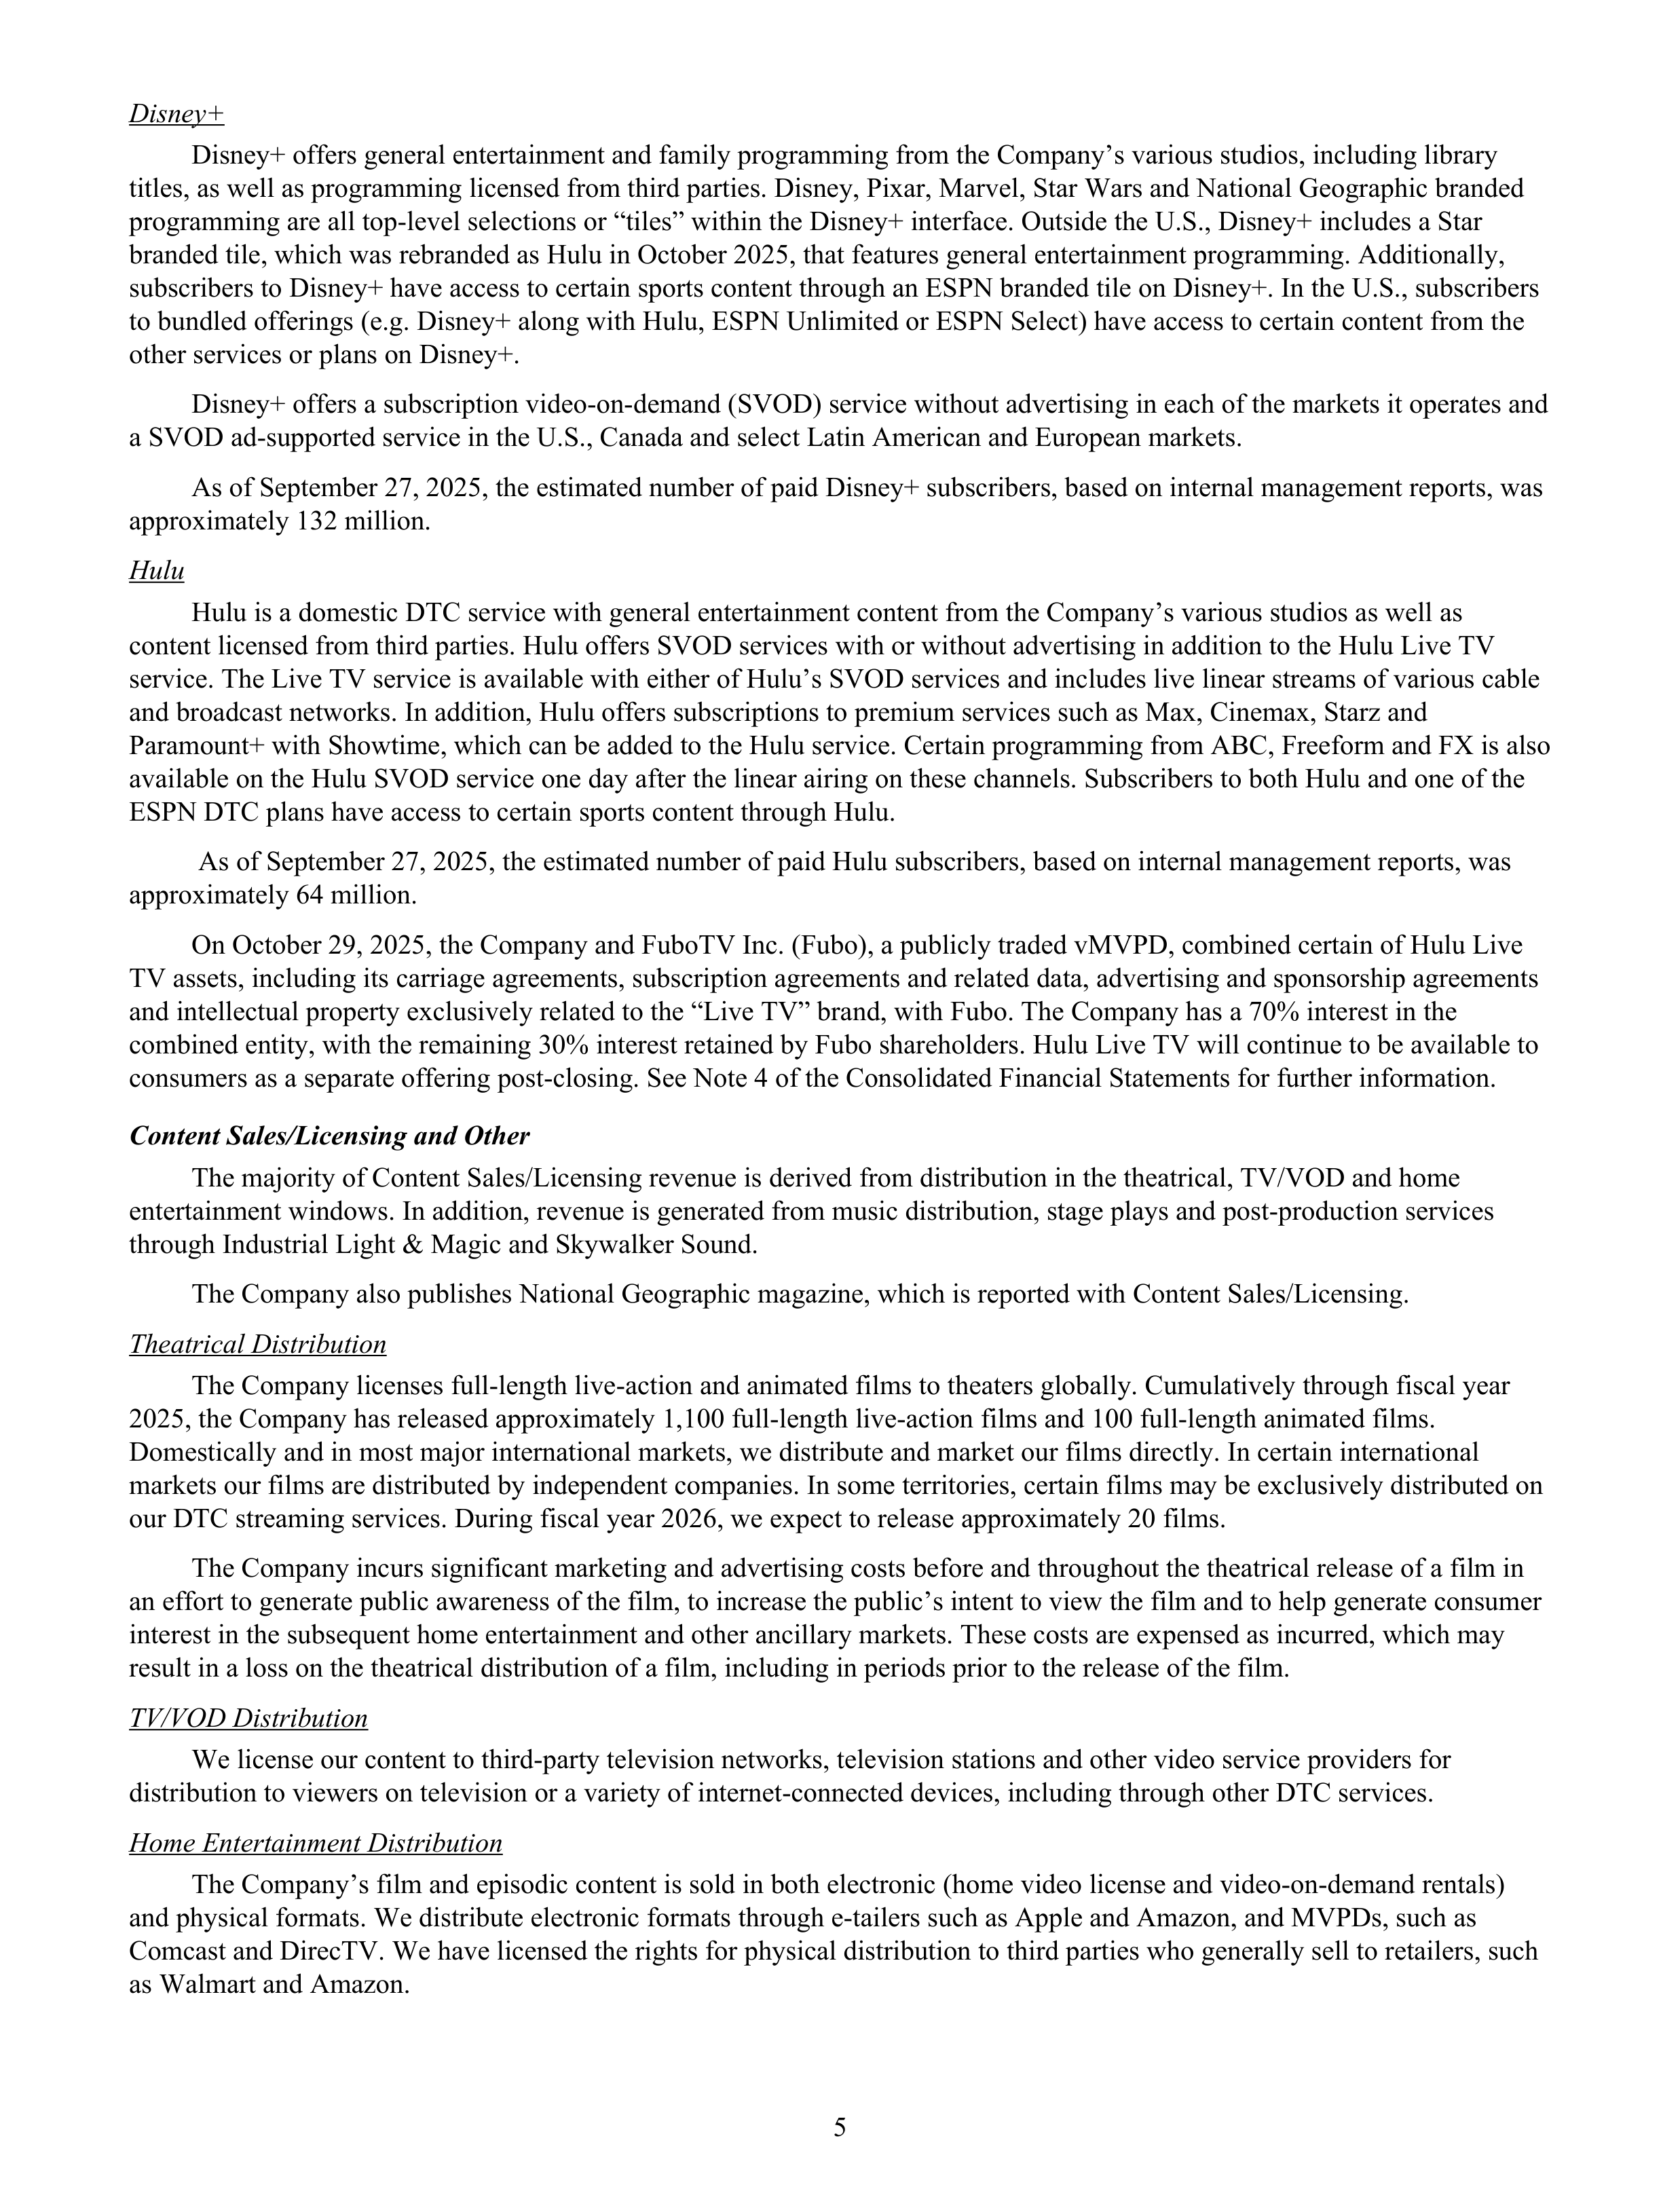
Disney+
Disney+ offers general entertainment and family programming from the Company’s various studios, including library
titles, as well as programming licensed from third parties. Disney, Pixar, Marvel, Star Wars and National Geographic branded
programming are all top-level selections or “tiles” within the Disney+ interface. Outside the U.S., Disney+ includes a Star
branded tile, which was rebranded as Hulu in October 2025, that features general entertainment programming. Additionally,
subscribers to Disney+ have access to certain sports content through an ESPN branded tile on Disney+. In the U.S., subscribers
to bundled offerings (e.g. Disney+ along with Hulu, ESPN Unlimited or ESPN Select) have access to certain content from the
other services or plans on Disney+.
Disney+ offers a subscription video-on-demand (SVOD) service without advertising in each of the markets it operates and
a SVOD ad-supported service in the U.S., Canada and select Latin American and European markets.
As of September 27, 2025, the estimated number of paid Disney+ subscribers, based on internal management reports, was
approximately 132 million.
Hulu
Hulu is a domestic DTC service with general entertainment content from the Company’s various studios as well as
content licensed from third parties. Hulu offers SVOD services with or without advertising in addition to the Hulu Live TV
service. The Live TV service is available with either of Hulu’s SVOD services and includes live linear streams of various cable
and broadcast networks. In addition, Hulu offers subscriptions to premium services such as Max, Cinemax, Starz and
Paramount+ with Showtime, which can be added to the Hulu service. Certain programming from ABC, Freeform and FX is also
available on the Hulu SVOD service one day after the linear airing on these channels. Subscribers to both Hulu and one of the
ESPN DTC plans have access to certain sports content through Hulu.
As of September 27, 2025, the estimated number of paid Hulu subscribers, based on internal management reports, was
approximately 64 million.
On October 29, 2025, the Company and FuboTV Inc. (Fubo), a publicly traded vMVPD, combined certain of Hulu Live
TV assets, including its carriage agreements, subscription agreements and related data, advertising and sponsorship agreements
and intellectual property exclusively related to the “Live TV” brand, with Fubo. The Company has a 70% interest in the
combined entity, with the remaining 30% interest retained by Fubo shareholders. Hulu Live TV will continue to be available to
consumers as a separate offering post-closing. See Note 4 of the Consolidated Financial Statements for further information.
Content Sales/Licensing and Other
The majority of Content Sales/Licensing revenue is derived from distribution in the theatrical, TV/VOD and home
entertainment windows. In addition, revenue is generated from music distribution, stage plays and post-production services
through Industrial Light & Magic and Skywalker Sound.
The Company also publishes National Geographic magazine, which is reported with Content Sales/Licensing.
Theatrical Distribution
The Company licenses full-length live-action and animated films to theaters globally. Cumulatively through fiscal year
2025, the Company has released approximately 1,100 full-length live-action films and 100 full-length animated films.
Domestically and in most major international markets, we distribute and market our films directly. In certain international
markets our films are distributed by independent companies. In some territories, certain films may be exclusively distributed on
our DTC streaming services. During fiscal year 2026, we expect to release approximately 20 films.
The Company incurs significant marketing and advertising costs before and throughout the theatrical release of a film in
an effort to generate public awareness of the film, to increase the public’s intent to view the film and to help generate consumer
interest in the subsequent home entertainment and other ancillary markets. These costs are expensed as incurred, which may
result in a loss on the theatrical distribution of a film, including in periods prior to the release of the film.
TV/VOD Distribution
We license our content to third-party television networks, television stations and other video service providers for
distribution to viewers on television or a variety of internet-connected devices, including through other DTC services.
Home Entertainment Distribution
The Company’s film and episodic content is sold in both electronic (home video license and video-on-demand rentals)
and physical formats. We distribute electronic formats through e-tailers such as Apple and Amazon, and MVPDs, such as
Comcast and DirecTV. We have licensed the rights for physical distribution to third parties who generally sell to retailers, such
as Walmart and Amazon.
5
Electronic formats of film content in the home entertainment window are typically available approximately two months
after the theatrical release and physical distribution generally starts within three to four months after the theatrical release.
Disney Theatrical Group
Disney Theatrical Group develops, produces and licenses live entertainment events on Broadway and around the world.
Productions include
The Lion King
,
Aladdin
,
Beauty and the Beast
,
Frozen
and
Hercules
.
Disney Theatrical Group also licenses the Company’s IP to Feld Entertainment, the producer of
Disney On Ice
.
Disney Music Group
The Disney Music Group encompasses all aspects of the Company’s music commercialization and marketing including:
recorded music (Walt Disney Records and Hollywood Records); music publishing; and concerts. Disney Music Group
distributes music both physically and digitally and also licenses music throughout the world in various forms of media,
including: television; print; gaming; and consumer products.
Equity Investment
The Company has a 30% effective interest in Tata Play Limited, which operates a direct-to-home satellite distribution
platform in India.
Content Production and Acquisition
Produced content primarily consists of original films and episodic programs and network news and daytime/late night
programming. Acquired content includes rights to episodic programming, movies and specials. Original content is generally
produced under the following banners: Disney Branded Television; FX Productions; Lucasfilm; Marvel; National Geographic
Studios; Pixar; Searchlight Pictures; Twentieth Century Studios; 20th Television; and Walt Disney Pictures. Original content is
also commissioned from and produced by various third-party studios. Program development is carried out in collaboration with
writers, producers and creative teams.
Costs to produce content are generally capitalized and allocated across Entertainment’s businesses based on the estimated
relative value of the distribution windows.
Generally, the Company has full production and distribution rights to its IP. However, Sony Pictures Entertainment has
the rights to produce and distribute Spider-Man films as a result of licensing these rights from Marvel prior to the Company’s
acquisition of Marvel.
The Company has a significant library of content spanning approximately 100 years of production history as well as
acquired libraries. The library of content includes approximately 5,300 live-action film titles, 460 animated film titles and
episodic series (series with four or more seasons include approximately: 80 dramas; 55 comedies; 40 non-scripted series; 15
animated series; and 10 live-action series). In addition, the library includes approximately 150 series and 100 films that were
produced for initial distribution on our DTC platforms.
In fiscal 2026, the Company will continue to produce or commission a significant number of episodic and film titles, of
which the vast majority will initially be distributed on our Linear Networks and/or DTC platforms or theatrically. Programming
is also produced for third parties, who typically have exclusive domestic linear distribution rights for a certain time period (after
which the rights revert back to the Company) while the Company retains domestic video-on-demand and international
distribution rights.
Competition and Seasonality
Linear Networks and Direct-to-Consumer compete for viewers’ attention and audience share primarily with other
television networks, independent television stations and other media, such as other DTC streaming services, social media and
video games. With respect to the sale of advertising time, we compete with other television networks, independent television
stations, MVPDs, other DTC streaming services and other advertising media such as online search, marketplaces, social media
and other digital content, newspapers, magazines, radio and billboards. Our television stations primarily compete for audiences
and advertisers in local market areas.
Linear Networks compete with other networks for carriage by MVPDs. The Company’s contractual agreements with
MVPDs are renewed or renegotiated from time to time in the ordinary course of business. Consolidation and other market
conditions in the cable, satellite and telecommunication distribution industry, including changes in subscriber levels, the
prevalence of streaming services and other factors may adversely affect the Company’s ability to obtain and maintain
contractual terms for the distribution of its various programming services that are as favorable as those currently in place.
Content Sales/Licensing businesses compete with all forms of entertainment and a significant number of companies that
produce and/or distribute film and episodic content, distribute products in the home entertainment market, provide pay TV/
VOD services, and produce music and live theater.
6
The operating results of Content Sales/Licensing fluctuate due to the timing and performance of releases in the theatrical,
home entertainment and television markets. Release dates are determined by several factors, including competition and the
timing of vacation and holiday periods.
We also compete with other media and entertainment companies, independent production companies and video-on-
demand services for creative and performing talent, story properties, show concepts, scripted and other programming, advertiser
support, production facilities and exhibition outlets that are essential to the success of our Entertainment businesses.
Advertising revenues at Linear Networks and Direct-to-Consumer are subject to seasonal and cyclical advertising patterns
and changes in viewership levels. In general, domestic advertising revenues are typically somewhat higher during the fall and
somewhat lower during the summer months. Affiliate and subscription revenues vary with the subscriber levels of MVPDs and
our streaming services.
SPORTS
The Sports segment generally encompasses the Company’s sports-focused global television and DTC video streaming
content production and distribution activities.
The lines of business within Sports include the following:
•
ESPN (generally owned 80% by the Company) (See Note 4 of the Consolidated Financial Statements for further
information on potential future changes in ESPN ownership)
◦
Domestic:
▪
ESPN-branded television channels
▪
ESPN DTC
▪
ESPN on ABC (sports programmed on the ABC Network by ESPN)
◦
International: ESPN-branded channels outside of the U.S.
The revenues of Sports are as follows:
•
Affiliate and subscription fees
•
Advertising
•
Other revenue - Fees from the following activities: pay-per-view events on the ESPN DTC services, sub-licensing of
sports rights, programming ESPN on ABC and licensing the ESPN brand
The expenses of Sports are as follows:
•
Operating expenses, consisting of programming and production costs and other operating expenses. Programming and
production costs include amortization of licensed sports rights and production costs related to live sports and other
sports-related programming. Other operating expenses include technology support costs and distribution costs.
•
Selling, general and administrative costs, including marketing costs
•
Depreciation and amortization
Domestic ESPN
Branded television channels include the following 24-hour domestic television sports channels:
•
ESPN and ESPN2 - both dedicated to professional and college sports as well as sports news and original programming
•
ESPNU - dedicated to college sports
•
ESPNEWS - re-airs select ESPN studio shows and airs a variety of other programming
•
SEC Network - dedicated to Southeastern Conference college athletics
•
ACC Network - dedicated to Atlantic Coast Conference college athletics
•
ESPN Deportes - airs professional and college sports as well as studio shows in Spanish
ESPN offers a U.S. subscription-based DTC service with two plans: ESPN Select and ESPN Unlimited, which started in
August 2025. ESPN Select, previously the ESPN+ service through August 2025, offers thousands of live sporting events, on-
demand sports content and other original content. ESPN Unlimited includes access to all of ESPN’s branded television channels
and ESPN Select content. The ESPN DTC plans are offered individually or in various bundles, including with Disney+ and
Hulu. Consumers may also access the service through certain MVPDs.
ESPN programs ESPN on ABC, recognizes the direct revenues and costs for this programming and receives a fee from
the ABC Network, which is eliminated in consolidation.
7
ESPN earns advertising and licensing revenues from providing promotional services and licensing the ESPN BET
trademark to PENN Entertainment, Inc. in connection with its operation of a sportsbook. In November 2025, this agreement
was terminated effective December 1, 2025, and ESPN entered into a promotional services agreement with DraftKings Inc.,
under which DraftKings Inc. will serve as the exclusive sportsbook and odds provider of ESPN effective December 1, 2025.
The Company has various sports programming rights, which are used to produce content, including live events and sports
news, aired on ESPN linear and digital platforms. Rights include the National Football League (NFL), college football
(including bowl games and the College Football Playoff) and basketball, the National Basketball Association (NBA), mixed
martial arts (through the end of calendar 2025), Major League Baseball (MLB), the National Hockey League (NHL), soccer,
US Open Tennis, Formula 1 (through the end of calendar 2025), the Wimbledon Championships, the Masters golf tournament,
the Women’s National Basketball Association (WNBA) and the Professional Golfers’ Association (PGA) Championship.
Beginning in September 2025, ESPN platforms became the exclusive distributor for all World Wrestling Entertainment
Premium Live Events.
The number of subscribers (in millions) for the significant domestic branded channels are as follows:
Subscribers
ESPN
(1)
61
ESPN2
(1)
61
ESPNU
(1)
42
ESPNEWS
(2)
38
SEC Network
(2)
42
ACC Network
(2)
41
(1)
Based on Nielsen Media Research estimates as of September 2025. Estimates include traditional MVPD and vMPVD
subscriber counts.
(2)
Because Nielsen Media Research does not measure this channel, estimated subscribers are according to SNL Kagan as
of December 2024.
In October 2025, ESPN and NFL Enterprises LLC reached a binding agreement for ESPN to acquire the NFL Network
and certain other media assets owned and controlled by NFL Enterprises LLC, including NFL’s RedZone Channel pay TV
distribution and NFL Fantasy, in exchange for a 10% noncontrolling interest of ESPN (the NFL Transaction). The NFL
Transaction is expected to close in calendar year 2026, subject to certain regulatory approvals, including from federal and
foreign antitrust authorities, and other customary closing conditions. See Note 4 of the Consolidated Financial Statements for
further information.
International ESPN
The Company operates approximately 45 ESPN branded sports channels outside the U.S. in 4 languages and
approximately 110 countries/territories. In the Netherlands, the ESPN branded channels are operated by Eredivisie Media &
Marketing CV (EMM) (owned 51% by the Company), which has the media rights to the Dutch Premier League for soccer.
Rights include various soccer leagues (including English Premier League, LaLiga, Bundesliga and multiple UEFA leagues).
Equity Investments
The most significant equity investment at Sports is a 30% interest in CTV Specialty Television, Inc. (CTV), which
operates primarily sports-related television networks in Canada. The Company’s share of CTV’s financial results is reported as
“Equity in the income of investees” in the Company’s Consolidated Statements of Income.
Competition and Seasonality
Sports competes for viewers’ attention and audience share primarily with other television networks, independent
television stations and other media, such as other DTC streaming services, social media and video games. With respect to the
sale of advertising time, we compete with other television networks, independent television stations, MVPDs and other
advertising media such as online search, marketplaces, social media and other digital content, newspapers, magazines, radio and
billboards.
The Sports television networks compete with other networks for carriage by MVPDs. The Company’s contractual
agreements with MVPDs are renewed or renegotiated from time to time in the ordinary course of business. Consolidation and
other market conditions in the cable, satellite and telecommunication distribution industry and other factors may adversely
affect the Company’s ability to obtain and maintain contractual terms for the distribution of its various programming services
that are as favorable as those currently in place.
8
We also compete with other media and entertainment companies and video-on-demand services for sports rights, creative
and performing talent and other programming, advertiser support and production facilities that are essential to the success of
our Sports businesses.
Advertising revenues are subject to changes in viewership levels and the demand for sports programming. Advertising
revenues generated from sports programming are also impacted by the timing of sports seasons and events, which timing may
vary throughout the year or may take place periodically (e.g. biannually, quadrennially). Affiliate and subscription revenues
vary with the subscriber levels of MVPDs and our streaming services.
EXPERIENCES
The lines of business within Experiences along with their significant business activities include the following:
•
Parks & Experiences:
◦
Domestic:
▪
Theme parks and resorts:
•
Walt Disney World Resort in Florida
•
Disneyland Resort in California
▪
Experiences:
•
Disney Cruise Line
•
Disney Vacation Club, including Aulani, a Disney Resort & Spa in Hawaii
•
National Geographic Expeditions (owned 73% by the Company) and Adventures by Disney
◦
International:
▪
Theme parks and resorts:
•
Disneyland Paris
•
Hong Kong Disneyland Resort (48% ownership interest and consolidated in our financial results)
•
Shanghai Disney Resort (43% ownership interest and consolidated in our financial results)
•
In addition, the Company licenses its IP to a third party that owns and operates Tokyo Disney Resort
•
Consumer Products:
◦
Licensing of our trade names, characters, visual, literary and other IP to various manufacturers, game developers,
publishers and retailers throughout the world, for use on merchandise, published materials and games
◦
Sale of branded merchandise through online, retail and wholesale businesses, and development and publishing of
books, comic books and magazines (except National Geographic magazine, which is reported in Entertainment)
The revenues of Experiences are as follows:
•
Theme park admissions - Sales of tickets for admission to our theme parks and for premium access to certain
attractions
•
Resorts and vacations - Sales of room nights at hotels, sales of cruise and other vacations and sales and rentals of
vacation club properties
•
Parks & Experiences merchandise, food and beverage - Sales of merchandise, food and beverages at our theme parks
and resorts and cruise ships
•
Merchandise licensing and retail:
◦
Merchandise licensing - Royalties from licensing our IP for use on consumer goods
◦
Retail - Sales of merchandise through internet shopping sites, at The Disney Store and to wholesalers
•
Parks licensing and other - Revenues from sponsorships and co-branding opportunities, real estate rent and sales and
royalties earned on Tokyo Disney Resort revenues
The expenses of Experiences are as follows:
•
Operating expenses, consisting of operating labor, infrastructure costs, costs of goods sold and distribution costs and
other operating expenses. Infrastructure costs include technology support costs, repairs and maintenance, utilities and
fuel, property taxes, retail occupancy costs, insurance and transportation. Other operating expenses include costs for
such items as supplies, commissions and entertainment offerings.
•
Selling, general and administrative costs, including marketing costs
•
Depreciation and amortization
9
Capital investments:
•
In recent years, the majority of the Company’s capital spend has been at our parks and experiences business,
principally for theme park and resort expansion, new attractions, cruise ships, capital improvements and systems
infrastructure.
Parks & Experiences
Walt Disney World Resort
The Walt Disney World Resort is located approximately 20 miles southwest of Orlando, Florida, on approximately 25,000
acres of land. The resort includes theme parks (the Magic Kingdom, EPCOT, Disney’s Hollywood Studios and Disney’s
Animal Kingdom); hotels; vacation club properties; a retail, dining and entertainment complex (Disney Springs); a sports
complex; conference centers; campgrounds; golf courses; water parks; and other recreational facilities designed to attract
visitors for an extended stay.
The Walt Disney World Resort is marketed through a variety of international, national and local advertising and
promotional activities. A number of attractions and restaurants in the theme parks are sponsored or operated by other companies
under multi-year agreements.
Magic Kingdom
— The Magic Kingdom consists of six themed areas: Adventureland, Fantasyland, Frontierland, Liberty
Square, Main Street USA and Tomorrowland. Each area provides a unique guest experience featuring themed attractions,
restaurants, merchandise shops and entertainment experiences.
EPCOT
— EPCOT consists of four major themed areas: World Showcase, World Celebration, World Nature and World
Discovery. All areas feature themed attractions, restaurants, merchandise shops and entertainment experiences. Countries
represented with pavilions include Canada, China, France, Germany, Italy, Japan, Mexico, Morocco, Norway, the United
Kingdom and the U.S.
Disney’s Hollywood Studios
— Disney’s Hollywood Studios consists of eight themed areas: Animation Courtyard,
Commissary Lane, Echo Lake, Grand Avenue, Hollywood Boulevard,
Star Wars
: Galaxy’s Edge, Sunset Boulevard and Toy
Story Land. The areas provide behind-the-scenes glimpses of Hollywood-style action through various themed attractions,
restaurants, merchandise shops and entertainment experiences.
Disney’s Animal Kingdom
— Disney’s Animal Kingdom consists of a 145-foot tall Tree of Life centerpiece surrounded
by five themed areas: Africa, Asia, DinoLand USA, Discovery Island and Pandora - The World of Avatar. Each area contains
themed attractions, restaurants, merchandise shops and entertainment experiences. The park features more than 300 species of
live mammals, birds, reptiles and amphibians and 3,000 varieties of vegetation. DinoLand USA will be rethemed and in 2027,
is planned to open as Tropical Americas, which will feature themed attractions, restaurants, merchandise shops and
entertainment experiences.
Hotels, Vacation Club Properties and Other Resort Facilities
— As of September 27, 2025, the Company owned and
operated 18 resort hotels and vacation club properties at the Walt Disney World Resort, with approximately 23,000 rooms and
3,900 vacation club units. Resort facilities include 500,000 square feet of conference meeting space and Disney’s Fort
Wilderness camping and recreational area, which offers approximately 800 campsites.
Disney Springs is an approximately 120 acre themed retail, dining and entertainment complex and consists of four areas:
Marketplace, The Landing, Town Center and West Side. The areas are home to approximately 150 venues including the World
of Disney retail store, which includes approximately 38,000 square feet of retail space. Most of the offerings at Disney Springs
are operated by third parties that pay rent to the Company.
Ten independently-operated hotels with approximately 7,000 rooms are situated on property leased from the Company.
The ESPN Wide World of Sports Complex is an approximately 230 acre center that hosts professional-caliber training and
competitions, festival and tournament events and interactive sports activities. The complex, which welcomes both amateur and
professional athletes, accommodates multiple sporting events, including baseball, basketball, football, soccer, softball, tennis
and track and field. It also includes a stadium and two venues designed for cheerleading, dance competitions and other indoor
sports.
Other recreational amenities and activities available at the Walt Disney World Resort include three championship golf
courses, miniature golf courses, full-service spas, tennis, sailing, swimming, horseback riding and a number of other sports and
leisure time activities. The resort also includes two water parks: Disney’s Blizzard Beach and Disney’s Typhoon Lagoon.
10
Disneyland Resort
The Disneyland Resort is located in Anaheim, California on approximately 550 acres of land. The resort includes two
theme parks (Disneyland and Disney California Adventure), three hotels and a retail, dining and entertainment complex
(Downtown Disney).
The Disneyland Resort is marketed through a variety of international, national and local advertising and promotional
activities. A number of attractions and restaurants in the theme parks are sponsored or operated by other companies under
multi-year agreements.
Disneyland
— Disneyland consists of nine themed areas: Adventureland, Bayou Country, Fantasyland, Frontierland, Main
Street USA, Mickey’s Toontown, New Orleans Square,
Star Wars
: Galaxy’s Edge and Tomorrowland. These areas feature
themed attractions, restaurants, merchandise shops and entertainment experiences.
Disney California Adventure
— Disney California Adventure includes eight themed areas: Avengers Campus, Buena
Vista Street, Cars Land, Grizzly Peak, Hollywood Land, Paradise Gardens Park, Pixar Pier and San Fransokyo Square. These
areas include themed attractions, restaurants, merchandise shops and entertainment experiences.
Hotels, Vacation Club Units and Other Resort Facilities
— As of September 27, 2025, the Company owned and operated
three resort hotels and vacation club properties at the Disneyland Resort, with approximately 2,400 rooms and 180 vacation
club units. Resort facilities included approximately 170,000 square feet of conference meeting space.
Downtown Disney is an approximately 15-acre themed retail, dining and entertainment complex with approximately 40
venues including the World of Disney retail store, which includes approximately 25,000 square feet of retail space. Most of the
offerings at Downtown Disney are operated by third parties that pay rent to the Company.
Disneyland Paris
Disneyland Paris is located approximately 20 miles east of Paris, France in Marne-la-Vallée on a 5,200-acre site that is
being developed by Disneyland Paris pursuant to a master agreement with French governmental authorities. To date,
approximately two-thirds of the site has been developed including properties owned and operated by third parties and a planned
community (Val d’Europe). Disneyland Paris’ operations include two theme parks (Disneyland Park and Walt Disney Studios
Park); seven themed resort hotels; two convention centers; and a retail, dining and entertainment complex (Disney Village).
Disneyland Park
— Disneyland Park consists of five themed areas: Adventureland, Discoveryland, Fantasyland,
Frontierland and Main Street USA. These areas include themed attractions, restaurants, merchandise shops and entertainment
experiences.
Walt Disney Studios Park
— Walt Disney Studios Park includes four themed areas: Front Lot, World Premiere Plaza,
Worlds of Pixar and Avengers Campus. These areas include themed attractions, restaurants, merchandise shops and
entertainment experiences. Walt Disney Studios Park is undergoing a multi-year expansion that will include a new themed area
based on
Frozen
, which is planned to open in 2026 and coincide with the renaming of Walt Disney Studios Park to Disney
Adventure World.
Hotels and Other Facilities
— Disneyland Paris operates seven resort hotels, with approximately 5,750 rooms and
250,000 square feet of conference meeting space.
Disney Village is an approximately 500,000-square-foot themed retail, dining and entertainment complex. Construction is
currently underway on a multi-year transformation of Disney Village. Several of the offerings at Disney Village are operated by
third parties that pay rent to the Company.
Val d’Europe is a planned community near Disneyland Paris that is being developed in phases. Val d’Europe currently
includes a regional train station, hotels and a town center consisting of a shopping center as well as office, commercial and
residential space. Third parties operate these developments on land leased or purchased from the Company.
Hong Kong Disneyland Resort
The Company owns a 48% interest in Hong Kong Disneyland Resort and the Government of the Hong Kong Special
Administrative Region (HKSAR) owns a 52% interest. The resort is located on Lantau Island on 310 acres of land and is in
close proximity to the Hong Kong International Airport and the Hong Kong-Zhuhai-Macau Bridge. Hong Kong Disneyland
Resort includes one theme park and three themed resort hotels. A separate Hong Kong subsidiary of the Company is
responsible for managing Hong Kong Disneyland Resort. The Company is entitled to receive royalties and management fees
based on the revenues and operating performance, respectively, of Hong Kong Disneyland Resort.
Hong Kong Disneyland
— Hong Kong Disneyland consists of eight themed areas: Adventureland, Fantasyland, Grizzly
Gulch, Main Street USA, Mystic Point, Tomorrowland, Toy Story Land and World of Frozen. These areas feature themed
attractions, restaurants, merchandise shops and entertainment experiences.
11
Hotels
— Hong Kong Disneyland Resort includes three themed hotels with approximately 1,750 rooms and 16,000 square
feet of conference meeting space.
Shanghai Disney Resort
The Company owns a 43% interest in Shanghai Disney Resort and Shanghai Shendi (Group) Co., Ltd (Shendi) owns a
57% interest. The resort is located in the Pudong district of Shanghai on approximately 1,000 acres of land, which includes the
Shanghai Disneyland theme park; two themed resort hotels; a retail, dining and entertainment complex (Disneytown); and an
outdoor recreation area. A management company, in which the Company has a 70% interest and Shendi has a 30% interest, is
responsible for operating the resort and receives a management fee based on the operating performance of Shanghai Disney
Resort. The Company is also entitled to royalties based on the resort’s revenues.
Shanghai Disneyland
— Shanghai Disneyland consists of eight themed areas: Adventure Isle, Fantasyland, Gardens of
Imagination, Mickey Avenue, Tomorrowland, Toy Story Land, Treasure Cove and Zootopia. These areas feature themed
attractions, shows, restaurants, merchandise shops and entertainment experiences.
Hotels and Other Facilities
— Shanghai Disneyland Resort includes two themed hotels with approximately 1,200 rooms.
Disneytown is an 11-acre outdoor complex of retail, dining, and entertainment venues located adjacent to Shanghai Disneyland.
Most of the offerings at Disneytown are operated by third parties that pay rent to Shanghai Disney Resort. A third themed hotel,
which will have approximately 400 rooms, is currently under construction.
Tokyo Disney Resort
Tokyo Disney Resort is located six miles east of downtown Tokyo, Japan, on 494 acres of land. The Company earns
royalties on revenues generated by the Tokyo Disney Resort, which is owned and operated by Oriental Land Co., Ltd. (OLC), a
third-party Japanese corporation. The resort includes two theme parks (Tokyo Disneyland and Tokyo DisneySea); hotels; a
retail, dining and entertainment complex (Ikspiari); and Bon Voyage, a Disney-themed merchandise location.
Tokyo Disneyland
— Tokyo Disneyland consists of seven themed areas: Adventureland, Critter Country, Fantasyland,
Tomorrowland, Toontown, Westernland and World Bazaar.
Tokyo DisneySea
— Tokyo DisneySea is divided into eight “ports of call,” including American Waterfront, Arabian
Coast, Lost River Delta, Mediterranean Harbor, Mermaid Lagoon, Mysterious Island, Port Discovery and Fantasy Springs.
Hotels and Other Resort Facilities
— Tokyo Disney Resort includes six Disney-branded hotels, with approximately 3,500
rooms and a monorail, which links the theme parks and resort hotels with Ikspiari.
Abu Dhabi Resort
In May 2025, the Company and Miral LLC (Miral) agreed to create a Disney-branded theme park and resort in Abu
Dhabi, United Arab Emirates, to be built and operated by Miral. The Company will license its IP for the operation of the resort
and provide certain development and management services. The Company will earn royalties based on the resort’s revenues and
fees for development and management services. The Company will not provide capital for the development and operation of the
resort. The development of the resort is subject to finalizing agreements among the parties.
Disney Cruise Line
Disney Cruise Line operates six ships out of ports in North America, Europe and the South Pacific which cater to families,
children, teenagers and adults, with themed areas and activities for each group. The
Disney Magic
and the
Disney Wonder
are
85,000-ton 875-stateroom ships; the
Disney Dream
and the
Disney Fantasy
are 130,000-ton 1,250-stateroom ships; and the
Disney Wish
and the
Disney Treasure
are 140,000-ton 1,250-stateroom ships. Many cruises include a visit to Disney Castaway
Cay, a 1,000-acre private Bahamian island, and/or Disney Lookout Cay at Lighthouse Point, which is located on approximately
600 acres of land on the island of Eleuthera.
In fiscal 2026, Disney Cruise Line will add two new ships, the
Disney Destiny
and the
Disney Adventure.
The
Disney
Destiny
will be approximately 140,000 tons with 1,250 staterooms and is scheduled to begin sailing on November 20, 2025 in
North America. The
Disney Adventure
will be approximately 200,000 tons with approximately 2,100 staterooms and is
scheduled to begin sailing in March 2026 in Southeast Asia.
Between calendar years 2027 and 2031, Disney Cruise Line plans to launch four additional cruise ships, all of which are
currently under contract to be built.
The Company has a licensing agreement with OLC, under which OLC will own and operate a Disney-branded cruise ship
based in Japan. This ship is currently under construction, with sailings expected to commence by 2029. The Company will earn
royalties on revenues generated by OLC.
12
Disney Vacation Club (DVC)
DVC offers ownership interests in 17 resort properties located at the Walt Disney World Resort; Disneyland Resort;
Aulani, a Disney Resort & Spa in Hawaii; Vero Beach, Florida; and Hilton Head Island, South Carolina. Available units are
offered for sale under vacation ownership plans and are operated as hotel rooms when not occupied by DVC members.
Aulani, a Disney Resort & Spa is a family resort on a 21 acre oceanfront property on Oahu, Hawaii featuring
approximately 480 vacation club units, 350 hotel rooms, an 18,000-square-foot spa and 12,000 square feet of conference
meeting space.
DVC had a total of approximately 4,700 (two-bedroom equivalent) vacation club units as of fiscal year end 2025.
Development is underway at Disney Lakeshore Lodge, which is projected to open in 2027, and will include approximately 430
vacation club units.
Adventures by Disney and National Geographic Expeditions
Adventures by Disney and National Geographic Expeditions offer guided tour packages around the world, predominantly
at third party locations.
Storyliving by Disney
The Company is collaborating with developers to build
Storyliving by Disney
residential communities:
Cotino
in Rancho
Mirage, California; and
Asteria
in Pittsboro, North Carolina. The communities are currently under development.
Consumer Products
Licensing
The Company’s merchandise licensing operations cover a diverse range of product categories, including: toys, apparel,
games, home décor and furnishings, accessories, health and beauty, food, stationery, footwear and consumer electronics. The
Company licenses characters from its film, television and other properties for use on third-party products in these categories
and earns royalties, which are usually based on a fixed percentage of the wholesale or retail selling price of the products and
often include minimum guarantee payments from the licensees. Major properties licensed by the Company include: Mickey and
Friends, Lilo & Stitch, Star Wars, Spider-Man, Disney Princess, Frozen, Avengers, Winnie the Pooh and Toy Story.
Retail
The Company sells Disney-, Marvel-, Pixar- and Star Wars-branded products through Disney Store internet sites and
retail locations. At fiscal year end 2025, the Company operated approximately 40 stores in Japan, 20 stores in North America,
two stores in Europe and one store in China.
The Company creates, distributes and publishes a variety of products, primarily children’s books and comic books, in
multiple countries and languages based on the Company’s branded franchises.
Competition and Seasonality
The Company’s Parks & Experiences businesses compete with other forms of entertainment, lodging, tourism and
recreational activities. The profitability of the leisure-time industry may be influenced by various factors that are not directly
controllable, such as economic conditions including business cycle and exchange rate fluctuations, health concerns, the political
environment, travel industry trends, amount of available leisure time, oil and transportation prices, weather patterns and natural
disasters. The licensing and retail business competes with other licensors, retailers and publishers of character, brand and
celebrity names, as well as other licensors, publishers and developers of game software, online video content, websites, other
types of home entertainment and retailers of toys and kids merchandise.
All of the Parks & Experiences businesses are operated on a year-round basis. Typically, theme park attendance and resort
occupancy fluctuate based on the seasonal nature of vacation travel and leisure activities, the opening of new guest offerings
and pricing and promotional offers. Peak attendance and resort occupancy generally occur during the summer months when
school vacations occur and during early winter and spring holiday periods. In addition, theme park and resort revenues may be
higher during significant celebrations such as theme park or character anniversaries and lower in the periods following such
celebrations. The licensing, retail and wholesale businesses are influenced by seasonal consumer purchasing behavior, which
generally results in higher revenues during the Company’s first and fourth fiscal quarter, and by the timing and performance of
theatrical and game releases and direct-to-consumer programming.
INDIA JOINT VENTURE
On November 14, 2024, the Company and Reliance Industries Limited (RIL) formed a joint venture (the India joint
venture) that combined the Company’s Star-branded and other general entertainment and sports television channels and
Disney+ Hotstar direct-to-consumer service in India (Star India) with certain media and entertainment businesses controlled by
13
RIL (the Star India Transaction). The Company owns 37% of the India joint venture and recognizes its share of the joint
venture’s results in “Equity in the income of investees” in the Company’s Consolidated Statement of Income. Star India results
through November 14, 2024 were consolidated in the Company’s financial results. See Note 4 of the Consolidated Financial
Statements for additional information.
HUMAN CAPITAL
The Company seeks to attract, retain and develop the highest quality talent. The Company’s human resources programs
are designed to develop talent to prepare them for critical roles and leadership positions for the future; reward and support
employees through competitive pay, benefit and perquisite programs; enhance the Company’s culture through efforts aimed at
making the workplace more engaging and inclusive; acquire talent and facilitate internal talent mobility to create a high-
performing workforce; engage employees as brand ambassadors of the Company and evolve and invest in technology, tools and
resources to enable employees at work.
The Company employed approximately 231,000 people as of fiscal year end 2025, of which approximately 172,000 were
employed in the U.S. and approximately 59,000 were employed outside the U.S. Our global workforce comprises
approximately 76% full-time and 16% part-time employees, with another 8% being seasonal employees. A significant number
of employees in various parts of our businesses, including employees of our theme parks, and writers, directors, actors and
production personnel for our productions are covered by collective bargaining agreements. In addition, some of our employees
outside the U.S. are represented by works councils, trade unions or other employee associations.
Some of our key programs and initiatives to attract, develop and retain our workforce include:
•
Health, financial, family resources, well-being and other benefits:
Disney’s benefit offerings are designed to meet
the varied and evolving needs of our employees and their families. These benefit offerings for eligible employees
include:
◦
Healthcare options aimed at improving quality of care while limiting out-of-pocket costs
◦
Retirement and savings programs that help employees adapt to changing needs and unexpected events and drive
financial security in the present and the future
◦
Family care resources, such as childcare and senior care programs, long-term care coverage and a family building
benefit
◦
Paid time-off programs, including vacation and sick and family care leave
◦
Free mental health and well-being resources
◦
Global well-being programs, including in-person offerings through campus health clubs and virtual and onsite
events and activities focused on physical, emotional, financial and social well-being
◦
Two Centers for Living Well in the Orlando area that offer convenient, on-demand access to board-certified
physicians and counselors
•
Talent Development and Education:
We invest in creating opportunities to help employees grow and build their
careers through training, professional development and educational programs.
◦
Our professional development programs are designed to support the career aspirations of our employees. In fiscal
2025, we launched new leadership development opportunities, including new professional coaching opportunities.
◦
Our education investment program, Disney Aspire, offers assistance for tuition, books and fees to eligible
participating employees at a variety of in-network learning providers and universities at levels ranging from high
school completion to undergraduate degrees.
•
Social Impact:
The Company has a longstanding commitment to social impact by supporting children and
communities through our philanthropic efforts, including through our support of wish granting and children’s
hospitals. We also support communities in which we operate and the contributions of our employees. The Company
supports employees who make monetary donations to eligible nonprofits with a generous U.S. matching gifts program.
In addition, through the Disney VoluntEARS program, we encourage employees to donate their time and talents to
their local communities and provide grants that allow eligible employees to direct donations from the Company to
nonprofits of their choosing as a benefit for the time they spend volunteering.
ENVIRONMENTAL SUSTAINABILITY
The Company has developed measurable environmental sustainability goals for 2030, based on our assessment of where
the Company’s operations have the most significant environmental impacts and where we can most effectively mitigate those
impacts. The Company’s goals encompass science-based targets for Scope 1, 2 and 3 emissions, water stewardship, waste
reduction, sustainable design in construction and use of more sustainable materials in our products.
14
INTELLECTUAL PROPERTY PROTECTION
The Company’s businesses throughout the world are affected by its ability to exploit and protect against infringement of
its IP, including trademarks, trade names, copyrights, patents and trade secrets. Important IP includes rights in the content of
motion pictures, television programs, electronic games, sound recordings, character likenesses, theme park attractions, books
and magazines and merchandise. Risks related to the protection and exploitation of IP rights and information concerning the
expiration of certain of our copyrights are set forth in Item 1A – Risk Factors.
REGULATION
Federal Communications Commission Regulation
Television broadcasting is subject to extensive regulation by the Federal Communications Commission (FCC) under
federal laws and regulations, including the Communications Act of 1934, as amended. Violation of FCC regulations can result
in substantial monetary fines, limited renewals of licenses and, in egregious cases, denial of license renewal or revocation of a
license. FCC regulations that affect linear channels include the following:
•
Licensing of television stations
. Each of the television stations we own must be licensed by the FCC. These licenses
are granted for periods of up to eight years, and we must obtain renewal of licenses as they expire in order to continue
operating the stations. We (and the acquiring entity in the case of a divestiture) must also obtain FCC approval
whenever we seek to have a license transferred in connection with the acquisition or divestiture of a station. The FCC
may decline to renew or approve the transfer of a license in certain circumstances and may delay renewals while
permitting a licensee to continue operating. Although we have received such renewals and approvals in the past or
have been permitted to continue operations when renewal is delayed, there can be no assurance that this will be the
case in the future.
•
Station ownership limits
. The FCC imposes limitations on the number of television stations and radio stations an entity
can own in a specific market, on the combined number of television and radio stations an entity can own in a single
market and on the aggregate percentage of the national audience that can be reached by television stations. Currently:
◦
FCC regulations may restrict our ability to own more than one television station in a market, depending on the size
and nature of the market. We do not own more than one television station in any market.
◦
Federal statutes permit our television stations in the aggregate to reach a maximum of 39% of the national
audience. Pursuant to the most recent decision by the FCC as to how to calculate compliance with this limit, our
eight stations reach approximately 20% of the national audience.
•
Dual networks
. FCC rules currently prohibit any of the four major broadcast television networks — ABC, CBS, Fox
and NBC — from being under common ownership or control.
•
Foreign ownership
. The Communications Act generally restricts foreign individuals or entities from collectively
owning more than 25% of the voting or equity interest in a U.S. entity that controls a broadcast television licensee.
FCC approval is required to exceed the 25% threshold.
•
Regulation of programming
. The FCC regulates broadcast programming by, among other things, banning “indecent”
programming, regulating political advertising and imposing commercial time limits during children’s programming.
Penalties for broadcasting indecent programming can be over $400,000 per indecent utterance or image per station.
Federal legislation and FCC rules also limit the amount of commercial matter that may be shown on broadcast or cable
channels during programming designed for children 12 years of age and younger. In addition, broadcast stations are
generally required to provide an average of three hours per week of programming that has as a “significant purpose”
meeting the educational and informational needs of children 16 years of age and younger. FCC rules also give
television station owners the right to reject or refuse network programming in certain circumstances or to substitute
programming that the licensee reasonably believes to be of greater local or national importance.
•
Cable and satellite carriage of broadcast television stations.
With respect to MVPDs operating within a television
station’s Designated Market Area, FCC rules require that every three years each television station elect either “must
carry” status, pursuant to which MVPDs generally must carry a local television station in the station’s market, or
“retransmission consent” status, pursuant to which the MVPDs must negotiate with the television station to obtain the
consent of the television station prior to carrying its signal. The ABC owned television stations have historically
elected retransmission consent.
•
Cable and satellite carriage of programming.
The Communications Act and FCC rules regulate some aspects of
negotiations between programmers and distributors regarding the carriage of networks by cable and satellite
distribution companies, and some cable and satellite distribution companies have sought regulation of additional
aspects of the carriage of programming on their systems. New legislation, court action or regulation in this area could
have an impact on the Company’s operations.
15
The foregoing is a brief summary of certain provisions of the Communications Act, other legislation and specific FCC
rules and policies. Reference should be made to the Communications Act, other legislation, FCC rules and public notices and
rulings of the FCC for further information concerning the nature and extent of the FCC’s regulatory authority.
FCC laws and regulations are subject to change, and the Company generally cannot predict whether new legislation, court
action or regulations, or a change in the extent of application or enforcement of current laws and regulations, would have an
adverse impact on our operations.
Privacy and Data Protection Regulation
Our businesses are subject to various privacy and data protection laws and regulations in most of the domestic and
international jurisdictions in which our businesses operate. Those laws and regulations govern our use, collection, storage,
retention and sharing of personal information and vary from jurisdiction to jurisdiction, including within the U.S. at the federal
level and among the 50 states. This patchwork of domestic and international laws creates different obligations that are, at times,
inconsistent with one another.
While there is no comprehensive privacy law in the U.S. at the federal level, there are a number of sector-specific federal
privacy laws applicable to our operations, such as the Video Privacy Protection Act, which restricts the ability to share personal
information along with specific viewing information with third parties. In addition, various U.S. states, including California,
have passed comprehensive data privacy laws that establish various consumer rights with respect to their personal information,
including the right to opt out of the sale or sharing of personal information with third parties, to gain access to the personal
information that companies hold about them, to delete personal information and to limit the use and disclosure of sensitive
information. We are also subject to privacy legal and regulatory requirements in many jurisdictions outside the United States,
including the General Data Protection Regulation in the European Union and similar comprehensive data privacy legislation in
the UK. These laws require organizations that process the personal data of EU and UK citizens to comply with certain data
protection standards and privacy rights, including requirements to implement privacy by design; parental consent for processing
children’s data; detailed privacy notices and related consents; breach notifications; and data subject rights to enforce access,
rectification, objection, restriction, portability and deletion.
We also are subject to laws and regulations that are intended to protect the privacy of children online, including the
Children’s Online Protection Privacy Act, a U.S. federal law that requires websites and online services to obtain parental
consent before collecting personal information from children under 13, as well as codes of conduct relating to the design of
digital products and services likely to be accessed by children, such as the UK’s Age Appropriate Design Code. These laws,
regulations and codes of conduct have an impact on the marketing of our products and services, the advertising on certain of our
and third-party digital platforms that distribute our content and the design of certain of our new media offerings.
In addition, U.S. state laws and many international data protection laws require notifications to consumers and regulators
in the event of a data breach, mandating that businesses provide consumers and/or government agencies notice of unauthorized
access or disclosure of certain information.
Interpretation of privacy and data protection laws and enforcement priorities continue to evolve and in some cases,
regulators seek to apply novel interpretations of existing laws.
Compliance with privacy and data protection laws and regulations entails significant investments and is costly and
requires us to employ dedicated compliance personnel and processes. In addition, many of these laws and regulations provide
for substantial fines, private rights of action for damages and other relief.
International Content Regulation
The laws and regulations in many international jurisdictions in which we operate require our linear networks or our DTC
streaming services to include a certain amount of programming produced in specific jurisdictions or languages or require us to
invest specified amounts of our revenues in local content or to acquire content produced by local independent production
companies. In addition, some countries regulate the content of films and television programming, which can impact our ability
to distribute certain content in those jurisdictions or can require us to make adjustments to the films or programming. These
laws and regulations increase our costs and impact the way we operate our DTC streaming services and linear networks and the
distribution of our films and programming in these markets.
AVAILABLE INFORMATION
Our annual report on Form 10-K, quarterly reports on Form 10-Q, current reports on Form 8-K and amendments to those
reports are available without charge on our website, www.disney.com/investors, as soon as reasonably practicable after they are
filed electronically with the U.S. Securities and Exchange Commission (SEC).
16
We also use our Investor Relations website as a means of disclosing material non-public information. We may also use
our Investor Relations website for the purpose of complying with our disclosure obligations under Regulation FD. Therefore,
we encourage investors, the media, and others interested in Disney to review the information we post on our Investor Relations
website.
We are providing the address to our website solely for the information of investors. We do not intend our website address
to be an active link or to otherwise incorporate the contents of the website into this report.
ITEM 1A. Risk Factors
For an enterprise as large and complex as the Company, a wide range of factors could materially affect future
developments and performance. In addition to the factors affecting specific business operations identified in connection with the
description of these operations and the financial results of these operations elsewhere in our filings with the SEC, the most
significant factors affecting our business include the following:
RISKS RELATED TO OUR BUSINESSES AND INDUSTRY
Declines in U.S., global and regional economic conditions adversely affect our results of operations and financial
condition.
Declines in U.S., global and regional economic conditions, such as recessions, other less severe slowdowns in economic
activity and/or inflationary conditions typically adversely affect demand for our products and services and/or costs to operate
our businesses, reducing our revenue and earnings. While a number of different factors affect the demand for our products and
services, actual or perceived declines in economic conditions typically have impacts across our businesses, including, among
others, lower attendance and spending at our parks and experiences businesses, fees received for our cable programming and
DTC services, including as a result of declines in subscription levels, purchases of and prices for advertising on our DTC
services and linear networks or licensing fees, while in the case of inflationary conditions, also increasing the prices we pay for
goods, services and labor, as well as typically our borrowing costs due to elevated interest rates, making it more difficult to
obtain financing for our operations and investments on favorable terms. Even when inflationary pressures moderate, we expect
certain costs, such as for labor, to remain elevated. In addition, an increase in price levels generally, or in price levels in a
particular sector, could result in a shift in consumer demand away from the entertainment and experiences we offer, which
could also adversely affect our revenues, while at the same time, increase our costs. A decline in economic conditions or a
failure of conditions to improve as anticipated could impact implementation or success of our business plans, such as our
investment plans for our Experiences segment, plans for our DTC ad-supported services, enhancements, product offerings,
pricing structure and price increases and plans for strategic investments. Unfavorable economic conditions also impair the
ability of those with whom we do business to satisfy their obligations to us. The adverse impact on our businesses of actual or
perceived declines in economic conditions or a failure of conditions to improve as anticipated depends, in part, on their severity
and duration, and our ability to mitigate these impacts on our businesses is limited.
Fluctuations in foreign currency exchange rates impact our results of operations, including our revenues and costs.
Fluctuations in foreign currency exchange rates against the U.S. dollar impact our results of operations, including by
impacting the cost in U.S. dollars of providing our goods and services, our revenues in U.S. dollars generated by our
international businesses and the international demand for our domestic products and services. An increase or sustained strength
in the value of the U.S. dollar adversely impacts the U.S. dollar value of revenue we receive and expect to receive from other
markets and contributes to reduced international demand for our domestic products and services, including international travel
to our domestic parks and resorts. A decrease or sustained weakness in the value of the U.S. dollar often increases the cost of
labor, goods and services in, or originating from, as applicable, non-U.S. markets. Although we hedge exposure to fluctuations
in certain foreign currencies, any such hedging activity may not substantially offset the negative financial impact of exchange
rate fluctuations and is not expected to offset all such negative financial impact, particularly in periods of sustained U.S. dollar
strength or weakness relative to multiple foreign currencies. Further, economic or political conditions in certain countries
outside the U.S. also limit, our ability to hedge exposure to currency fluctuations in those countries or our ability to repatriate
revenue from those countries.
Changes in technology, in consumer consumption patterns and in how entertainment products and services are created
affect demand for, the revenue we can generate from and the cost of producing or distributing our entertainment
offerings and our results of operations.
The media entertainment and technology businesses in which we participate increasingly depend on our ability to
successfully adapt to new technologies, including shifting patterns of content consumption and how entertainment products and
services are generated. New technologies affect the demand for our products and services, the manner in which our
entertainment offerings are distributed to consumers, the ways we charge for and receive revenue for our entertainment
products and services and the stability of those revenue streams, the sources and nature of competing entertainment offerings,
the time and manner in which consumers acquire and view some of our entertainment offerings and the options available to
17
advertisers for reaching their desired audiences. These developments have impacted the business model for certain traditional
forms of distribution, as evidenced by the industry-wide decline in ratings for broadcast and cable television, the reduction in
demand for home entertainment sales of theatrical content, the development of alternative distribution channels for broadcast
and cable programming and declines in subscriber levels for traditional cable channels. In addition, the implementation of our
DTC strategy may further contribute to such declines. These developments have decreased advertising and affiliate revenue at
some of our linear networks and have led, and may lead in the future, to the impairment of the value of certain of our assets. In
addition, theater-going to watch movies has remained below levels that existed prior to the COVID-19 pandemic.
Regulations governing new technological developments, such as developments in artificial intelligence (AI), including
generative AI and large language model tools, remain unsettled, and these developments may affect aspects of our existing
business models, including revenue streams for the use of our IP, how we create our entertainment offerings and the
competition we face. In order to respond to the impact of new technologies on our businesses, we regularly consider, and from
time to time implement, new initiatives and changes to our business models, including by developing and investing in DTC
streaming services and content offerings and new media offerings. There can be no assurance that our DTC offerings, new
media offerings and other efforts will successfully respond to technological changes. In addition, declines in certain traditional
forms of distribution impact the cost of content allocable to our DTC offerings. As part of our DTC strategy, we forgo revenue
from certain traditional sources. Initially, our DTC streaming services experienced significant losses. There can be no assurance
that the DTC model and other business models we may develop will each be or remain profitable or be as profitable over the
long term as our historic business models.
We face risks relating to misalignment with public and consumer tastes and preferences for entertainment, travel and
consumer products, which impacts demand for our entertainment offerings and products and services and our results of
operations.
Our businesses create entertainment, travel and consumer products, the success of which depends substantially on
consumer tastes and preferences that change in often unpredictable ways. The success of our businesses depends on our ability
to consistently produce compelling creative content, which may be distributed, among other ways, through DTC services, linear
networks and theaters and used in theme park attractions, hotels and other resort facilities and travel experiences and consumer
products. Such distribution must meet the changing preferences of the broad consumer market and respond to competition from
an expanding array of choices facilitated by technological developments in the delivery of content. The success of our theme
parks, resorts, cruise ships and experiences, as well as our theatrical releases, depends on demand for out-of-home
entertainment experiences. Demand for certain out-of-home entertainment experiences, such as theater-going to watch movies,
has not returned to levels that existed prior to the COVID-19 pandemic. In addition, as a global entertainment company with a
global consumer base, the success of our businesses depends on our ability to predict and adapt to constantly evolving and often
divergent consumer tastes and preferences across various domestic and international markets. Evolving tourist preferences
regarding travel to destinations in the U.S. and other geographical regions where our parks and experiences businesses operate
sometimes affect travel to those businesses. Moreover, we must often make substantial investments in content production and
acquisition, acquisition of sports and other programming rights, theme park attractions, cruise ships or hotels and other facilities
or customer facing platforms before we know the extent to which these products will earn consumer acceptance, and the
market, economic or social conditions are sometimes significantly different from the ones we anticipated at the time of the
investment decisions. Further, preferences of some consumers are affected by their perceptions of our position on matters of
public interest, including regarding environmental and social issues, and such perceptions sometimes lead to consumer
boycotts. Generally, our results of operations and financial condition are adversely impacted when our entertainment offerings
and products and services, as well as our methods to make our offerings and products and services available to consumers, do
not align with constantly evolving and often conflicting consumer preferences and tastes or achieve sufficient consumer
acceptance.
A variety of uncontrollable events disrupt our businesses, reduce demand for or consumption of our products and
services, impair our ability to provide our products and services or increase the cost of providing our products and
services, adversely impacting our results of operations and financial condition.
The operation of, and demand for and consumption of our products and services, particularly our parks and experiences
businesses, are highly dependent on the general environment for travel and tourism, including in the specific regions in which
our parks and experiences businesses operate. In addition, we have extensive international operations, including our
international theme parks and resorts, which are dependent on domestic and international regulations consistent with trade and
investment in those regions. The operation of our businesses, the environment for travel and tourism, the demand for and
consumption of our other products and services and ultimately our results of operations and financial condition are subject to
adverse impacts from a variety of factors beyond our control in the U.S., globally or in specific geographic regions around the
world where we operate, including: health concerns; adverse weather conditions arising from short-term weather patterns or
long-term climate change, including longer and more regular excessive heat conditions, catastrophic events or natural disasters
(such as excessive heat or rain, hurricanes, wildfires, typhoons, floods, droughts, tsunamis and earthquakes); international,
political or military developments, including tariffs and other trade and international disputes and social unrest; legal and
18
regulatory developments; macroeconomic conditions, including a decline in economic activity, inflation and foreign exchange
rates; and terrorist attacks. These events and others, such as fluctuations in travel and energy costs, supply chain disruptions and
malware and other cyber-related attacks or intrusions or other widespread computing, telecommunications or payment
processing failures, from time to time disrupt our ability to provide our products and services, raise the cost of providing our
products and services and in certain instances affect our ability to obtain insurance coverage with respect to some of these
events. An incident or other event that affected our property directly, including a security incident, earthquake or hurricane,
would have a direct impact on our ability to provide products and services and could result in closure of impacted operations or
have an extended effect of discouraging consumers from attending our facilities. Moreover, we incur costs to protect against
such incidents.
For example, COVID-19 and measures to prevent its spread impacted our businesses in a number of ways, including the
closure of our theme parks and resorts, suspension of cruise ship sailings and guided tours, delayed, or in some cases, shortened
or canceled, theatrical releases and disruptions in the production and availability of content, significantly reducing revenues
across all of our segments. Certain of our business operations have been temporarily disrupted by payment processing outages
and widespread computing failures. Hurricanes have caused park closures and other impacts to the operations of Walt Disney
World Resort, adversely affecting segment results, and may do so in the future. The Company has ceased certain operations in
certain regions, including in response to sanctions, trade restrictions and related developments, resulting in impairment charges.
In addition, we derive affiliate fees and royalties from the distribution of our programming, sales of our licensed products
and services by third parties, and the management of businesses operated under brands licensed from the Company and
advertising revenues from the purchase of advertising on our various platforms, including DTC services and linear networks,
and we are therefore dependent on the successes of those third parties for that portion of our revenue. Our results of operations
could be adversely impacted by a significant contraction of distribution channels for our products and services, including
through third-party licensees or sellers of our licensed goods and services, or a contraction in the number or kind of advertisers
purchasing advertising on our platforms, including as a result of legal or regulatory developments. In addition, third-party
suppliers provide products and services essential to the operation of a number of our businesses. A wide variety of factors could
influence the success of those third parties and if negative factors significantly impacted a sufficient number of those third
parties or materially impacted a supplier of a significant product or service, our results of operations could be adversely
affected. In specific geographic markets, we have experienced delayed and/or partial payments from certain third parties due to
liquidity issues.
We obtain insurance against the risk of losses relating to some of these events, generally including certain physical
damage to our property and resulting business interruption, certain injuries occurring on our property and some liabilities for
alleged breach of legal responsibilities. When insurance is obtained it is subject to deductibles, exclusions, terms, conditions
and limits of liability. The types and levels of coverage we obtain vary from time to time depending on our view of the
likelihood of specific types and levels of loss in relation to the cost of obtaining coverage for such types and levels of loss and
we experience losses not covered by our insurance, which could be material.
We face risks related to changes in our business strategies and plans, which have affected and may continue to affect our
cost structure, the value of our assets and/or our results of operations.
We adjust our business strategies and plans from time to time in connection with changes in senior management and in
our efforts to respond to changes in technology, consumer purchasing and consumption patterns, acceptance of our
entertainment offerings, the market for advertising, macroeconomic conditions and other changes in the business environment.
For example, in October 2025, we completed a combination of certain Hulu Live TV assets with Fubo to acquire a 70% interest
in Fubo; in fiscal 2025, we announced plans for ESPN to acquire the NFL Network and certain other media assets owned and
controlled by the NFL in exchange for a 10% noncontrolling interest in ESPN; in fiscal 2024, we transferred Star India into a
joint venture and recorded related impairment charges and announced an investment in a multi-year project with Epic Games;
in fiscal 2023, we reorganized our media and entertainment operations, which had been previously reported in one segment,
into two segments, Entertainment and Sports; in fiscal 2023 we announced that we would review content, primarily on our DTC
services, for alignment with a strategic change in our approach to content curation, resulting in removal of certain content from
our platforms and related impairment charges; and from time to time, we announce exploration of new types of businesses. Our
new business strategies and plans are, among other things, subject to execution risk and may not produce the anticipated
benefits, such as supporting our growth strategies and enhancing shareholder value, and over the long term could be less
successful than our prior strategies and plans. For example, the cost of executing on our DTC strategy may continue to grow or
be reduced more slowly than anticipated, which may impact our distribution strategy across businesses/distribution platforms,
the types of content we distribute through various businesses/distribution platforms, the timing and sequencing of content
windows and ultimately, the financial results of our DTC services and other businesses/distribution platforms.
In addition, changing technology, consumer purchasing patterns and acceptance of content offerings and macroeconomic
conditions may impair the value of our assets. We incur costs in connection with changes to our business strategy and plans and
have needed and may in the future need to write-down the value of our assets. Among other assets, in connection with changes
19
in strategy, we have impaired the value of our content primarily at our DTC services and goodwill and intangible assets at our
linear networks and impaired the value of certain of our retail store assets and certain hotel experiences assets. We may write
down other assets as our strategy evolves to account for the business environment.
We also make investments in existing or new businesses, including investments in international expansion of our business
and in new business lines. For example, in recent years, we have expanded our fleet of cruise ships, with announced plans for
further fleet expansion, and increased investment in our parks and resorts; completed the acquisition of Hulu and of a 70%
interest in Fubo; and made substantial investments related to DTC offerings. The ultimate success of these investments is
uncertain, some of these and future investments may ultimately result in returns that are negative or lower than anticipated, and
these investments may negatively impact the resources available to our other businesses and ultimately, our results of
operations. In addition, our costs increase in connection with these investments, and we may have significant charges associated
with the write-down of assets if the investments are not as successful as anticipated. Over the long term, our new strategies
could be less successful than previous strategies. Even if our strategies are effective in the long term, our new offerings
generally negatively impact results of operations in the short term, results of our new offerings are unlikely to be even quarter
over quarter and we may not expand into new markets as or when anticipated. Our ability to forecast for new businesses is
impacted by our lack of experience operating in those new businesses, speed with which the competitive landscape changes,
volatility beyond our control (such as the events beyond our control noted above) and our ability to obtain or develop the
content and rights on which our projections are based. Accordingly, we may not achieve our forecasted outcomes.
Increased competitive pressures impact our revenues, increase our costs and impact our results of operations.
We face substantial competition in each of our businesses from alternative providers of the products and services we offer
and from other forms of entertainment, lodging, tourism and recreational activities. This includes, among other types,
competition for personnel, content and other resources we require in operating our businesses. For example:
•
Our programming and production operations compete to obtain creative, performing, production and business talent,
sports and other programming, story properties, advertiser support, production facilities and market share with
traditional and new media platforms, including other video-on-demand services and sources of broadband delivered
content, studio operators and television networks.
•
Our linear networks and DTC streaming services compete for viewers and subscribers with an increasing number of
competitors, including other DTC and linear offerings, all other forms of media and all other forms of entertainment,
as well as for technology, creative, performing and business talent and for content.
•
Our linear networks, television stations and DTC services compete for the sale of advertising time with traditional and
new media platforms, including other television and video-on-demand services and various forms of internet and
mobile delivered platforms and content, which offer advertising delivery technologies that are more targeted than can
be achieved through traditional means, as well as with other forms of advertising.
•
Our linear networks compete for carriage of their programming with other programming providers.
•
Our theme parks, resorts and experiences compete for guests with other theme parks and resorts, all other forms of
entertainment, lodging, tourism and recreation activities and compete for technology, creative, performing and
business talent, including with other theme park and resort operators.
•
Our content sales/licensing operations, including theatrical releases, compete for customers with all other forms of
entertainment.
•
Our consumer products business competes with other licensors and creators of IP.
Competition for the acquisition of resources sometimes further increases the cost of producing our products and services;
changes the composition of our offerings, including sports; deprives us of talent needed for our entertainment and experiences
businesses, which talent is necessary to produce high quality creative material; increases employee turnover and staffing
instability; and increases our labor costs. Competition also reduces, or limits growth in, prices for our products and services,
including advertising rates and subscription fees at our linear networks and DTC offerings, parks and resorts admissions and
room rates and prices for consumer products from which we derive licensing revenues. For example, our advertising revenue is
negatively impacted by the increased supply of advertising tools and platforms on which to place advertising, including search,
social media, online marketplaces and other ad-supported DTC services, which depresses advertising rates across our DTC
streaming services and linear networks and creates demand uncertainty.
Technological developments, including developments in generative AI tools that can be used to create competing low-cost
content and products, and changes in market structure, including consolidation of suppliers of resources and distribution
channels, increase competition in these areas. Increased competition raises the cost of programming, including for sports and
other products, and diverts consumers from our offerings to other products and services or other forms of entertainment and
experiences. In addition, given the nature of travel planning, consumers sometimes delay travel to our theme parks and resorts
in connection with planned major product launches of regional travel industry competitors. Each of these competitive pressures
could reduce our revenue and increase our marketing and other costs.
20
We face risks related to the renewal of long-term programming or distribution contracts on sufficiently favorable terms.
We enter into long-term contracts for both the acquisition and the distribution of media programming and products,
including contracts for the acquisition of programming rights for sporting events and other programs, and contracts for the
distribution of our programming to content distributors. As these contracts expire, we renew or renegotiate the contracts, which
from time to time has led to service blackouts when distribution contracts expired before renewal terms were agreed. We may
lose programming rights or distribution rights if we are unable to renew these contracts on acceptable terms. Renewal
negotiations with certain MVPDs for distribution contracts scheduled to expire in fiscal 2026 could lead to temporary or longer-
term service blackouts, negatively impacting our results of operations. On October 30, 2025, the Company’s channels were
removed from YouTube TV following the expiration of the parties’ distribution contract without agreement on renewal terms,
and the Company cannot predict how long this service blackout will last or reasonably estimate the adverse impact on our
results of operations. Further, as a result, our portfolio of acquired programming rights, such as sporting events, and the
distributors of our programming and the portfolio of programming rights our distributors acquire have changed and will
continue to change over time. Even if these contracts are renewed, the cost of obtaining certain programming rights has
increased and may continue to increase (or increase at faster rates than our historical experience) and programming distributors
demand terms (including with respect to the pricing for, and the nature and amount of, programming distributed) that reduce
our revenue from distribution of programs or increase revenue at slower rates than our historical experience. For example, the
terms of certain renewals of carriage agreements have included fewer of our linear networks or the opportunity to offer multiple
genre-specific bundle options of fewer than all our linear networks while providing for certain of our DTC streaming services to
be made available to the distributor’s subscribers. Moreover, our ability to renew these contracts on favorable terms is affected
by a number of factors, such as consolidation in the market for program distribution and the entrance of new participants in the
market for distribution of content on digital platforms. With respect to the acquisition of programming rights, particularly sports
programming rights, the impact of these long-term contracts on our results over the term of the contracts depends on a number
of factors, including the strength of advertising markets, subscription levels and programming rights costs increases,
effectiveness of marketing efforts and the size of viewer audiences. There can be no assurance that revenues from programming
based on these rights will exceed the cost of the rights plus the other costs of producing and distributing the programming.
We face risks related to environmental, social and governance matters and related reporting obligations.
Domestic and international laws and regulations relating to environmental, social and governance matters, including
environmental sustainability, climate change, human rights and human capital management, have been adopted or are under
consideration, some of which include specific, target-driven disclosure requirements or obligations. Responding to these laws
and regulations has increased our compliance costs, including from increased investment in technology and appropriate
expertise and has required the implementation of new reporting processes, entailing additional compliance risk.
In addition, we have undertaken or announced a number of related actions and goals, which will require changes to
operations and ongoing investment. There is no assurance that our initiatives will achieve their intended outcomes or that we
will achieve any of these goals. Consumer, government and other stakeholder perceptions of our initiatives often differ widely
and present risks to our reputation and brands. In addition, our ability to implement some initiatives or achieve some goals is
dependent on external factors. For example, our ability to meet certain environmental sustainability goals or initiatives will
depend in part on third-party collaboration, the availability of suppliers that can satisfy new requirements, mitigation
innovations and/or the availability of economically feasible solutions at scale.
We face risks related to damage to our reputation or brands.
Our reputation and globally recognizable brands are integral to the success of our businesses. Because our brands engage
consumers across our businesses, some types of damage to our reputation or brands have an impact on all of our businesses.
Because some of our brands are globally recognized, some types of brand damage are not locally contained. Maintenance of the
reputation of our Company and brands depends on many factors, including the quality of our offerings, maintenance of trust
with our customers and our ability to successfully innovate. In addition, we may pursue brand or product integration combining
previously separate brands or products targeting different audiences under one brand or pursue other business initiatives
inconsistent with one or more of our brands, and there is no assurance that these initiatives will be accepted by our customers
and not adversely impact one or more of our brands. Significant negative claims or publicity regarding the Company or its
operations, products, management, employees, practices, business partners, business decisions, social responsibility and culture,
which may be amplified by social media, adversely impact our brands or reputation, even if such claims are untrue. From time
to time, these negative claims and publicity have led, and may lead in the future, to calls for consumer or other action, including
boycotts, litigation, investigations or regulatory actions. These negative perceptions and other damage to our reputation or
brands could persist, negatively impacting our sales, business opportunities, results of operations, financial condition and price
of our common stock.
Various risks may impact the success of our DTC streaming services.
The success of our DTC streaming services will be impacted by the success of our content curation and investment
decisions and ability to offer compelling content and product features; our ability to grow subscription and advertising
21
revenues, including by increasing subscriber and viewership levels and managing churn; our pricing, bundling, product features
and content distribution determinations, including across windows; and our ability to contain costs. The initial costs of
marketing campaigns are generally recognized in the business of initial exploitation, and amortization of capitalized production
costs and licensed programming rights are generally allocated across businesses based on the estimated relative value of the
distribution windows. Accordingly, our distribution determinations impact the costs of each business, including the applicable
DTC service. There are a number of competing DTC businesses. Consumers may not be willing to pay for an expanding set of
DTC services at increasing prices, potentially exacerbated by challenging economic conditions, such as during periods of high
inflation or declines in economic activity. In addition, such economic conditions negatively impact the purchase of and price for
advertising on our DTC streaming services. We face competition for creative talent and sports and other programming rights
and are sometimes not successful in recruiting and retaining talent and obtaining desired programming rights and face increased
costs to do so. We have experienced flat subscriber growth or net losses of subscribers in periods. Our content does not always
successfully attract and retain subscribers in the quantities that we expect. Our content is subject to cost pressures and may cost
more than we expect. We may not successfully manage our costs to meet our goals. Government regulations, including revised
foreign content and ownership regulations as well as government-imposed content restrictions, impact the implementation of
our DTC business plans and increase our costs. The highly competitive environment in which we operate puts pricing pressure
on our DTC offerings and may require us to lower our prices or not increase our prices to attract or retain customers or lead to
higher churn rates. These and other risks may impact the success of our DTC streaming services and our results of operations.
Potential credit ratings actions, increases in interest rates, volatility in the U.S. and global financial markets or periods
of elevated indebtedness could impede access to, or increase the cost of, financing our operations and investments and
have the effect of decreasing of business flexibility.
Our borrowing costs have been and can be affected by short- and long-term debt ratings assigned by nationally recognized
ratings agencies that are based, in part, on the Company’s performance as measured by credit metrics such as leverage and
interest coverage ratios. For example, our elevated indebtedness and leverage ratios in response to the financial impact of
COVID-19 on our businesses resulted in certain rating agencies downgrading our debt ratings. As of September 27, 2025,
Moody’s Ratings’ long- and short-term debt ratings for the Company were A2 and P-1 (Stable), respectively; and S&P Global
Ratings’ long- and short-term debt ratings for the Company were A and A-1 (Stable), respectively. Any future downgrades
could increase our cost of borrowing and/or make it more difficult for us to obtain financing on acceptable terms.
In addition, increases in interest rates have increased our cost of borrowing and volatility in U.S. and global financial
markets could impact our access to, or further increase the cost of, financing. Past disruptions in the U.S. and global credit and
equity markets made it more difficult for many businesses to obtain financing on acceptable terms. These conditions tended to
increase the cost of borrowing and if they recur, our cost of borrowing could increase and it may be more difficult to obtain
financing for our operations or investments.
Further, periods of elevated indebtedness could have the effect of, among other things, reducing our financial flexibility
and our ability to respond to changing business and economic conditions and other uncontrollable events, including by reducing
funds available for investments, capital expenditures, share repurchases and dividends and other activities, and putting us at a
competitive disadvantage relative to companies with lower debt levels.
Labor disputes disrupt our operations and adversely affect the profitability of our businesses.
A significant number of employees in various parts of our businesses, including employees of our theme parks, and
writers, directors, actors and production personnel for our productions are covered by collective bargaining agreements. In
addition, some of our employees outside the U.S. are represented by works councils, trade unions or other employee
associations. Further, some employees of licensees who manufacture and retailers who sell our licensed consumer products, and
employees of providers of programming content (such as sports leagues) are covered by labor agreements with their employers.
From time to time, collective bargaining agreements and other labor agreements expire, requiring renegotiation of their terms.
In general, labor disputes and work stoppages involving our employees; persons employed on our productions; athletes or
others employed by, or otherwise connected with, sports leagues or organizers; or the employees of our licensees or retailers
who sell our licensed consumer products or providers of programming content may disrupt or lead to closure of certain
operations and reduce our revenues and the profitability of our businesses. For example, in fiscal 2023, members of the Writers
Guild of America (WGA) commenced a work stoppage, which lasted for almost five months, and members of SAG-AFTRA,
the union representing television and movie actors, also commenced a work stoppage, which lasted for almost four months.
These work stoppages affected our productions and the pipeline for programming and theatrical releases, which resulted in
reduced revenue for the impacted businesses. The resulting collective bargaining agreements with these and other entertainment
guilds, some of which are scheduled to expire in fiscal 2026, and with certain labor unions at our domestic parks and resorts
will increase our costs to create our content and to operate our domestic parks and resorts, respectively. As a general matter,
resolution of labor disputes and negotiation of new collective bargaining agreements, including as a result of rate increases and
other changes to employee benefits, has in the past increased our costs and may increase our costs in the future.
22
The seasonality of certain of our businesses and timing of certain of our product offerings could exacerbate negative
impacts on our operations.
Each of our businesses is normally subject to seasonal variations and variations in connection with the timing of our
product offerings, including as follows:
•
Revenues at the Experiences segment fluctuate with changes in theme park attendance and resort occupancy resulting
from the seasonal nature of vacation travel and leisure activities and seasonal consumer purchasing behavior, which
generally results in increased revenues during the Company’s first and fourth fiscal quarters. Peak attendance and
resort occupancy generally occur during the summer months when school vacations occur and during early winter and
spring holiday periods. Revenues at the Experiences segment also sometimes fluctuate with changes in theme park
attendance and resort occupancy resulting from special celebrations or events that increase demand in the applicable
periods and decrease demand in prior or later periods as guests time their vacations to occur during such special
celebrations or events. In addition, licensing revenues fluctuate with the timing and performance of our theatrical
releases and cable programming broadcasts.
•
Revenues from television networks and stations are subject to seasonal and other cyclical advertising patterns and
changes in viewership levels, including related to certain sporting events. In general, domestic general entertainment
linear networks advertising revenues are typically somewhat higher during the fall and somewhat lower during the
summer months, domestic advertising revenues are typically higher during election cycles and sports advertising
revenues are impacted by the timing of sports seasons and events, which varies throughout the year and/or take place
periodically.
•
Revenues from content sales/licensing fluctuate due to the timing of content releases across various distribution
markets. Release dates and methods are determined by a number of factors, including, among others, competition, and
the timing of vacation and holiday periods.
•
DTC revenues fluctuate based on changes in the number of subscribers, mix of subscribers to different offerings and
subscriber fees; viewership levels; and the demand for sports and film and television content. Each of these is sensitive
to the availability of content, which varies from time to time throughout the year based on, among other things, sports
seasons, content production schedules and sports league work stoppages.
Accordingly, negative impacts on our business occurring during a time of typical high seasonal demand such as our park
closures due to hurricane damage during the summer travel season or other high seasons, could have a disproportionate effect
on the results of that business for the year.
Our operations are impacted by our ability to attract and retain employees and costs of employee wages and health,
welfare and retirement benefits, including postretirement medical benefits for some employees and retirees, may
negatively impact our results of operations and financial condition.
With approximately 231,000 employees, the success of our businesses is substantially affected by our ability to attract and
retain a workforce with the necessary skills for our varied businesses, including executing successfully on succession planning
for the talent at all levels necessary to advance the Company’s key objectives and strategies. Further, our results of operations
are substantially affected by labor costs, including wages and our health, welfare and retirement benefits, including the costs of
medical benefits for current employees and the costs of postretirement medical benefits for some current employees and
retirees. We may experience significant increases in these costs as a result of macroeconomic, regulatory, competitive and other
factors. For example, labor costs in our parks and resorts have increased, and we expect will continue to increase, as a result of
collective bargaining agreements and wage laws and regulations where we operate. Further, the cost of providing medical
insurance and other medical benefits for our employees have increased, and we expect will continue to increase. In addition, for
benefits provided to certain employees, changes in asset values, investment returns and discount rates used to calculate pension
and postretirement medical expense and related assets and liabilities can be volatile and may have an unfavorable impact on our
costs in some years. These factors may also increase future funding requirements for these benefit plans. There can be no
assurance that we will succeed in attracting and retaining the human resources necessary for the success of our businesses or in
limiting cost increases from wages and other employee benefits, negatively impacting our results of operations and financial
condition.
RISKS RELATED TO INTELLECTUAL PROPERTY, LITIGATION, CYBERSECURITY AND REGULATORY
REQUIREMENTS
The success of our businesses is highly dependent on the existence and maintenance of intellectual property rights in the
entertainment products and services we create.
The value to us of our IP is dependent on the scope and duration of our rights as defined by applicable laws in the U.S.
and abroad and the manner in which those laws are construed. Where those laws are drafted or interpreted in ways that limit the
extent or duration of our rights, or if existing laws are changed, our ability to generate revenue from our IP may decrease, or the
cost of obtaining and maintaining rights may increase. In the United States and countries that look to the United States
23
copyright term when shorter than their own, the copyright term for early works and the specific early versions of characters
depicted in those works expires at the end of the 95th calendar year after the date the copyright was originally secured in the
United States. The terms of some copyrights for IP related to some of our products and services have expired, and other
copyrights will expire in the future. For example, the copyright term for the short film Steamboat Willie (1928) and early
versions of characters depicted in this film have expired. As copyrights expire, we expect that revenues generated from such IP
will be negatively impacted to some extent.
The unauthorized use of our IP typically increases our costs, including in connection with our efforts to protect rights in
our IP, and may reduce our revenues. The convergence of computing, communications and entertainment devices, increased
broadband internet speed and penetration, increased availability and speed of mobile data transmission and increasingly
sophisticated attempts to obtain unauthorized access to data systems have made the unauthorized digital copying and
distribution of our films, television productions and other creative works easier and faster and protection and the enforcement of
IP rights more challenging. The unauthorized distribution and access to entertainment content generally continues to be a
significant challenge for IP rights holders. Further, the availability of certain AI tools has facilitated the creation of infringing
works based on the unauthorized use of our IP. Inadequate laws or weak enforcement mechanisms to protect entertainment
industry IP in one country can adversely affect the results of the Company’s operations worldwide, despite the Company’s
efforts to protect its IP rights. Distribution innovations have increased opportunities to access content in unauthorized ways.
Additionally, negative economic conditions or a shift in government priorities or policies could lead to less enforcement. These
developments require us to devote substantial resources to protecting our IP against unlicensed use and present the risk of
increased losses of revenue as a result of unlicensed distribution of our content and other commercial misuses of our IP. The
legal landscape for some new technologies, including some AI tools, remains uncertain, and development of the law or other
regulatory frameworks in this area could impact our ability to protect against unauthorized uses.
With respect to IP developed by the Company and rights acquired by the Company from others, the Company is subject to
the risk of challenges to our copyright, trademark and patent rights by third parties. In addition, the availability of copyright
protection and other legal protections for IP generated by certain new technologies, such as generative AI, is uncertain.
Successful challenges to our rights in IP typically result in increased costs for obtaining rights or the loss of the opportunity to
earn revenue from or utilize the IP that is the subject of challenged rights. Routinely, third parties allege that the Company is
infringing certain third-party IP rights. Technological changes in industries in which the Company operates and extensive
patent coverage in those areas increase the risk of such claims being brought and prevailing. For example, from time to time,
the Company’s streaming services and technology are the subject of patent infringement litigation and other claims seeking
damages and injunctive relief, and the resolution of these matters in aggregate may negatively impact our results of operations.
We face risks from claims, litigation, governmental investigations and other proceedings to our businesses, reputation,
results of operation and financial condition.
We are subject to various actual and threatened claims, litigation, investigations and other proceedings, including private
individual actions, class actions and actions and investigations by governmental and other regulatory authorities, relating to a
range of issues, including securities; competition and antitrust; intellectual property, including patent and copyright;
employment and labor; taxes; privacy and data protection; data security; personal injury and property damage; consumer
protection; contractual and commercial disputes; the production, distribution and licensing of our content; and other matters.
For example, a private securities class action lawsuit was filed in federal court against the Company and certain current and
former senior management on behalf of certain purchasers of securities of the Company seeking unspecified damages, plus
interest and costs and fees, and an adverse final judgment or the terms of a settlement of such matter could result in the payment
of substantial monetary damages. See Note 14 to the Consolidated Financial Statements for more details regarding this lawsuit
and above in these risk factors regarding patent infringement litigation and other claims. In addition, from time to time, we
pursue litigation against third parties seeking to vindicate our rights.
Actual and threatened proceedings and investigations increase our costs, divert management resources and disrupt
business operations and may negatively impact our reputation and brands. The outcomes of such matters are inherently
unpredictable, and determining legal reserves or potential losses from such matters involves judgment. If the losses to resolve
such matters exceed the amounts recorded in any given reporting period, our results of operations for that interim or annual
reporting period could be materially adversely affected. Further, from time to time, adverse resolutions or settlements of such
matters result in substantial monetary damages or substantial future payment obligations and injunctive relief or other orders or
actions that limit or prevent our implementation of our business plans, including our ability to complete strategic transactions
and offer certain products and services, impact the enforcement or validity of our property and other (including intellectual
property) rights, franchises and licenses or cause us to alter our business practices, which individually or taken together,
negatively impact our business prospects, our results of operations, our financial condition and price of our common stock.
While we maintain insurance for certain types of claims, our insurance may not be adequate to cover all losses and does not
cover all types of claims that may arise.
24
Cybersecurity and other data compromises and/or attempted compromises increase our costs, disrupt our services and
business plans, lead to the disclosure of our confidential information, including unauthorized use of our intellectual
property, and negatively impact our reputation.
We maintain information necessary to conduct our businesses, including confidential and proprietary information as well
as personal information regarding our customers and employees, in digital form. We also use computer and cloud-based
systems to deliver our products and services and operate our businesses. Such data and systems are subject to the risk of
compromise and other cyberattacks, including unauthorized access, modification, exfiltration, destruction or denial of access,
which also can result in disruptions in service. We also provide confidential, proprietary and personal information to third
parties in certain cases and use many third-party systems and software, which are also subject to compromise and other
cyberattacks.
We have developed and maintain an information security program to assess, identify and manage cyber risks and the
continued development and maintenance of this program is costly and requires ongoing monitoring and updating as
technologies change, including as a result of the proliferation of AI tools, and efforts to overcome security measures become
more sophisticated. We face an increasingly challenging cybersecurity environment with expanding and evolving threats from a
variety of potential bad actors. While we employ various tools in an effort to protect our data and systems, certain aspects of our
defenses remain subject to human error. Remote work by our employees and contractors and those of the third parties with
whom we engage create additional risks. Despite our efforts, the risk of a potentially material incident as a result of
unauthorized access, modification, exfiltration, destruction or denial of access with respect to data or systems and other
cybersecurity attacks cannot be eliminated, and from time to time our systems and third-party systems have been compromised
in this manner, and are subject to the risk of future compromise.
If our information or cyber security systems or data are compromised in a material way, our ability to conduct our
business may be impaired, we may lose profitable opportunities or the value of those opportunities may be diminished and, as
described above, we may lose revenue as a result of unlicensed use of our intellectual property. We have experienced and may
in the future experience cybersecurity attacks that result in the misappropriation of personal information of our customers and/
or employees, which may result in reputational damage, loss of business and/or harm to employee morale. Related remediation
of harm to our customers and employees or damages arising from litigation and/or fines or other actions we take with respect to
judicial or regulatory actions arising out of an incident create additional costs and/or impacts to our businesses. Insurance does
not cover all potential losses or damages associated with such attacks or events. Our systems and users and those of third parties
with whom we engage are continually attacked, sometimes successfully, and there can be no assurance that future incidents will
not have material adverse effects on our operations or financial results.
Regulations applicable to our businesses impact the profitability of our businesses.
Each of our businesses, including our broadcast networks and television stations, is subject to a variety of U.S. and
international regulations, which impact the operations and profitability of our businesses. Some of these regulations include:
•
U.S. Federal Communications Commission (FCC) regulation of our television and radio networks, our national
programming networks and our owned television stations. See Item 1 — Federal Communications Commission
Regulation.
•
Federal, state and foreign privacy and data protection laws and regulations, including with respect to child safety. See
Item 1 — Privacy and Data Protection Regulation.
•
Regulation of the safety and supply chain of consumer products and theme park operations, including regulation
regarding the sourcing, importation and the sale of goods.
•
Land planning, use and development regulations applicable to our theme parks operations.
•
Environmental protection and sustainability regulations.
•
U.S. and international anti-corruption laws, sanction programs, trade restrictions, tariffs, anti-money laundering laws
or currency controls.
•
Restrictions on the manner in which content is currently licensed and distributed, ownership restrictions or film or
television content requirements, investment obligations or quotas. See Item 1 — International Content Regulation.
•
Domestic and international labor laws, tax laws and antitrust laws.
Laws and regulations in any of these and other areas and changes in judicial and agency interpretation or regulatory
priorities, actions or initiatives (or, if applicable, private litigation to enforce such laws and regulations), as well as an
increasingly unpredictable regulatory landscape, require us to incur additional costs and may limit our ability to implement our
business strategies as planned or offer products and services in ways that are profitable, or at all. In addition, ongoing and future
developments in international political, trade and security policy may lead to new regulations that increase the cost of providing
our products and services, negatively impact demand for our products and services and limit international trade and investment,
25
disrupting our operations in and outside the U.S., including our international theme parks and resorts operations in France,
mainland China and Hong Kong.
For example, in 2022 the U.S. and other countries implemented a series of sanctions against Russia in response to events
in Russia and Ukraine; U.S. agencies have enhanced trade restrictions, including new prohibitions on the importation of goods
from certain regions and other jurisdictions are considering similar measures; and U.S. state governments have become more
active in passing legislation targeted at specific sectors and companies and applying existing laws in novel ways to new
technologies, including streaming and online commerce. In 2025, tariffs were announced with respect to and by certain U.S.
trading partners, which could, depending on how these or future tariffs or other regulations with respect to trade are
implemented, have a significant impact on our results of operations, including by impacting the macroeconomic environment,
increasing costs or adversely affecting demand for our products and services. Further, the legal and regulatory landscape for
certain new technologies, such as AI, is uncertain and evolving and our compliance obligations could increase our costs or limit
how we may use these technologies in one or more of our businesses.
Our operations outside the U.S. are affected by the operation of laws in those jurisdictions.
Our operations outside the U.S. are in many cases subject to the laws of the jurisdictions in which they operate rather than,
or in addition to, U.S. law. Laws in some international jurisdictions differ in significant respects from those in the U.S. These
differences can affect our ability to react to changes in our businesses, and our rights or ability to enforce rights are sometimes
different than would be expected under U.S. law. Moreover, enforcement of laws in some international jurisdictions can be
inconsistent and unpredictable, which can affect both our ability to enforce our rights and to undertake activities that we believe
are beneficial to our businesses. In addition, the business and political climate in some jurisdictions may encourage corruption,
which could reduce our ability to compete successfully in those jurisdictions while remaining in compliance with local laws or
U.S. anti-corruption laws applicable to our businesses. As a result, our ability to generate revenue and our expenses in non-U.S.
jurisdictions may differ from what would be expected if U.S. law alone governed these operations.
RISKS RELATED TO OWNERSHIP OF OUR STOCK
The price of our common stock has been, and may continue to be, volatile.
The price of our common stock has experienced substantial volatility and may continue to be volatile. Various factors
have impacted, and may continue to impact, the price of our common stock, including, among others, changes in management;
variations in our operating results; variations between our actual results and expectations of securities analysts; changes in our
estimates, guidance or business plans; changes in financial estimates and recommendations by securities analysts; the activities,
operating results or stock price of our competitors or other industry participants in the industries in which we operate; the
announcement or completion of significant transactions by us or a competitor; events affecting the stock market generally; and
the economic, trade and political conditions in the U.S. and internationally, as well as other factors described in this Item 1A.
Some of these factors may adversely impact the price of our common stock, regardless of our operating performance. Further,
volatility in the price of our common stock may negatively impact one or more of our businesses, including by increasing stock
awards for our employees who participate in our stock incentive programs or limiting our financing options for acquisitions and
other business expansion.
GENERAL RISKS
The Company’s amended and restated bylaws provide to the fullest extent permitted by law that the Court of Chancery
of the State of Delaware will be the exclusive forum for certain legal actions between the Company and its stockholders,
which could increase costs to bring a claim, discourage claims or limit the ability of the Company’s stockholders to
bring a claim in a judicial forum viewed by the stockholders as more favorable for disputes with the Company or the
Company’s directors, officers or other employees.
The Company’s amended and restated bylaws provide to the fullest extent permitted by law that unless the Company
consents in writing to the selection of an alternative forum, the Court of Chancery of the State of Delaware will be the sole and
exclusive forum for any (i) derivative action or proceeding brought on behalf of the Company, (ii) any action or proceeding
asserting a claim of breach of a fiduciary duty owed by any current or former director, officer or stockholder of the Company to
the Company or the Company’s stockholders, (iii) any action or proceeding asserting a claim arising pursuant to, or seeking to
enforce any right, obligation or remedy under, any provision of the General Corporation Law of the State of Delaware (the
“DGCL”), the Certificate of Incorporation or these Bylaws (as each may be amended from time to time), (iv) any action or
proceeding as to which the General Corporation Law of the State of Delaware confers jurisdiction on the Court of Chancery of
the State of Delaware, (v) or any action or proceeding asserting a claim governed by the internal affairs doctrine. The choice of
forum provision may increase costs to bring a claim, discourage claims or limit a stockholder’s ability to bring a claim in a
judicial forum that it finds favorable for disputes with the Company or the Company’s directors, officers or other employees,
which may discourage such lawsuits against the Company or the Company’s directors, officers and other employees.
Alternatively, if a court were to find the choice of forum provision contained in the Company’s amended and restated bylaws to
be inapplicable or unenforceable in an action, the Company may incur additional costs associated with resolving such action in
26
other jurisdictions. The exclusive forum provision in the Company’s amended and restated bylaws will not preclude or contract
the scope of exclusive federal or concurrent jurisdiction for actions brought under the federal securities laws including the
Securities Exchange Act of 1934, as amended, or the Securities Act of 1933, as amended, or the respective rules and regulations
promulgated thereunder.
ITEM 1B. Unresolved Staff Comments
The Company has received no written comments regarding its periodic or current reports from the staff of the SEC that
were issued 180 days or more preceding the end of fiscal 2025 that remain unresolved.
ITEM 1C. Cybersecurity
Risk Management and Strategy
We have implemented processes for assessing, identifying and managing material risks from cybersecurity threats as part
of our overall risk management program. Our cybersecurity program is informed by the National Institute of Standards and
Technology Cybersecurity Framework and other applicable globally recognized standards. We use a layered defense model,
incorporating a wide range of technologies and practices in an effort to prevent, detect and mitigate threats. These measures
include intrusion detection and prevention systems, multi-factor authentication, account management and access controls,
encryption and endpoint protection tools. We also implement threat detection and response solutions. To address emerging
threats, we employ automated monitoring, vulnerability scans and patch management processes, network monitoring and
defenses, antivirus/antimalware protections and network segmentations. Regular assessments, such as penetration tests, security
audits and table-top exercises, are conducted to identify vulnerabilities and promote incident response and risk mitigation. We
also provide privacy and information security trainings for our employees on a recurring basis. From time to time, we engage
auditors, assessors, consultants and other third parties to assist with assessing, identifying and managing cybersecurity risks,
including assisting us to conduct some of the foregoing assessments. Our cybersecurity risk management processes also are
informed by intelligence received from law enforcement and other governmental agencies, private sector intelligence networks,
recognized cybersecurity and intelligence firms and other third-party sources, and as appropriate we engage outside counsel to
advise on regulatory compliance and other cybersecurity risk management efforts.
In addition, we have processes designed to oversee and identify cybersecurity risks associated with our use of third-party
service providers. Where appropriate based on the data and intellectual property to which these providers are reasonably
expected to have access, we conduct security assessments and due diligence reviews of third-party systems for compliance with
our security standards, and we include data protection language in our agreements with these third parties.
Further, as part of our cybersecurity risk management processes, we maintain a cybersecurity incident response plan
(CIRP) that establishes a set of procedures for reporting and handling cybersecurity events. The CIRP delegates to an internal
incident response team the initial assessment, investigation and remediation of the event and includes, among other procedures,
guidelines for escalation to senior management and engagement with law enforcement. In certain instances, events are escalated
to the Cybersecurity Incident Disclosure Subcommittee, which is a subcommittee of the Company’s Risk Management
Committee (RMC) (discussed further below) and is responsible for, among other things, the accurate and timely disclosure of
material cybersecurity incidents under the federal securities laws, including making the materiality determination and approving
related securities disclosures.
As discussed in further detail in Item 1A – Risk Factors, the Company faces an increasingly challenging cybersecurity
environment, and from time to time the persistent efforts of bad actors to gain unauthorized access to our and our service
providers’ information systems and our confidential and proprietary information are successful. In fiscal 2025, we did not
identify any cybersecurity threats that have materially affected or are reasonably likely to materially affect our business
strategy, results of operations or financial condition. However, despite our efforts, we cannot eliminate all risks from
cybersecurity threats or provide assurances that we have not experienced undetected cybersecurity incidents or will not discover
additional information about previously detected events.
Governance
The Company’s Board of Directors has delegated to the Audit Committee oversight responsibility for information
technology risks, including cybersecurity and data security risks and mitigation strategies. The Audit Committee at least
annually receives reports from the Senior Vice President, Chief Information Security Officer (CISO) concerning the Company’s
cybersecurity and data security risks, including ongoing efforts to prevent, detect, monitor, remediate and manage such
cybersecurity threats, the threat environment, incident updates and emerging cybersecurity practices and technologies. The
Chair of the Audit Committee reports on its discussion, including concerning cybersecurity matters, to the full Board. In
27
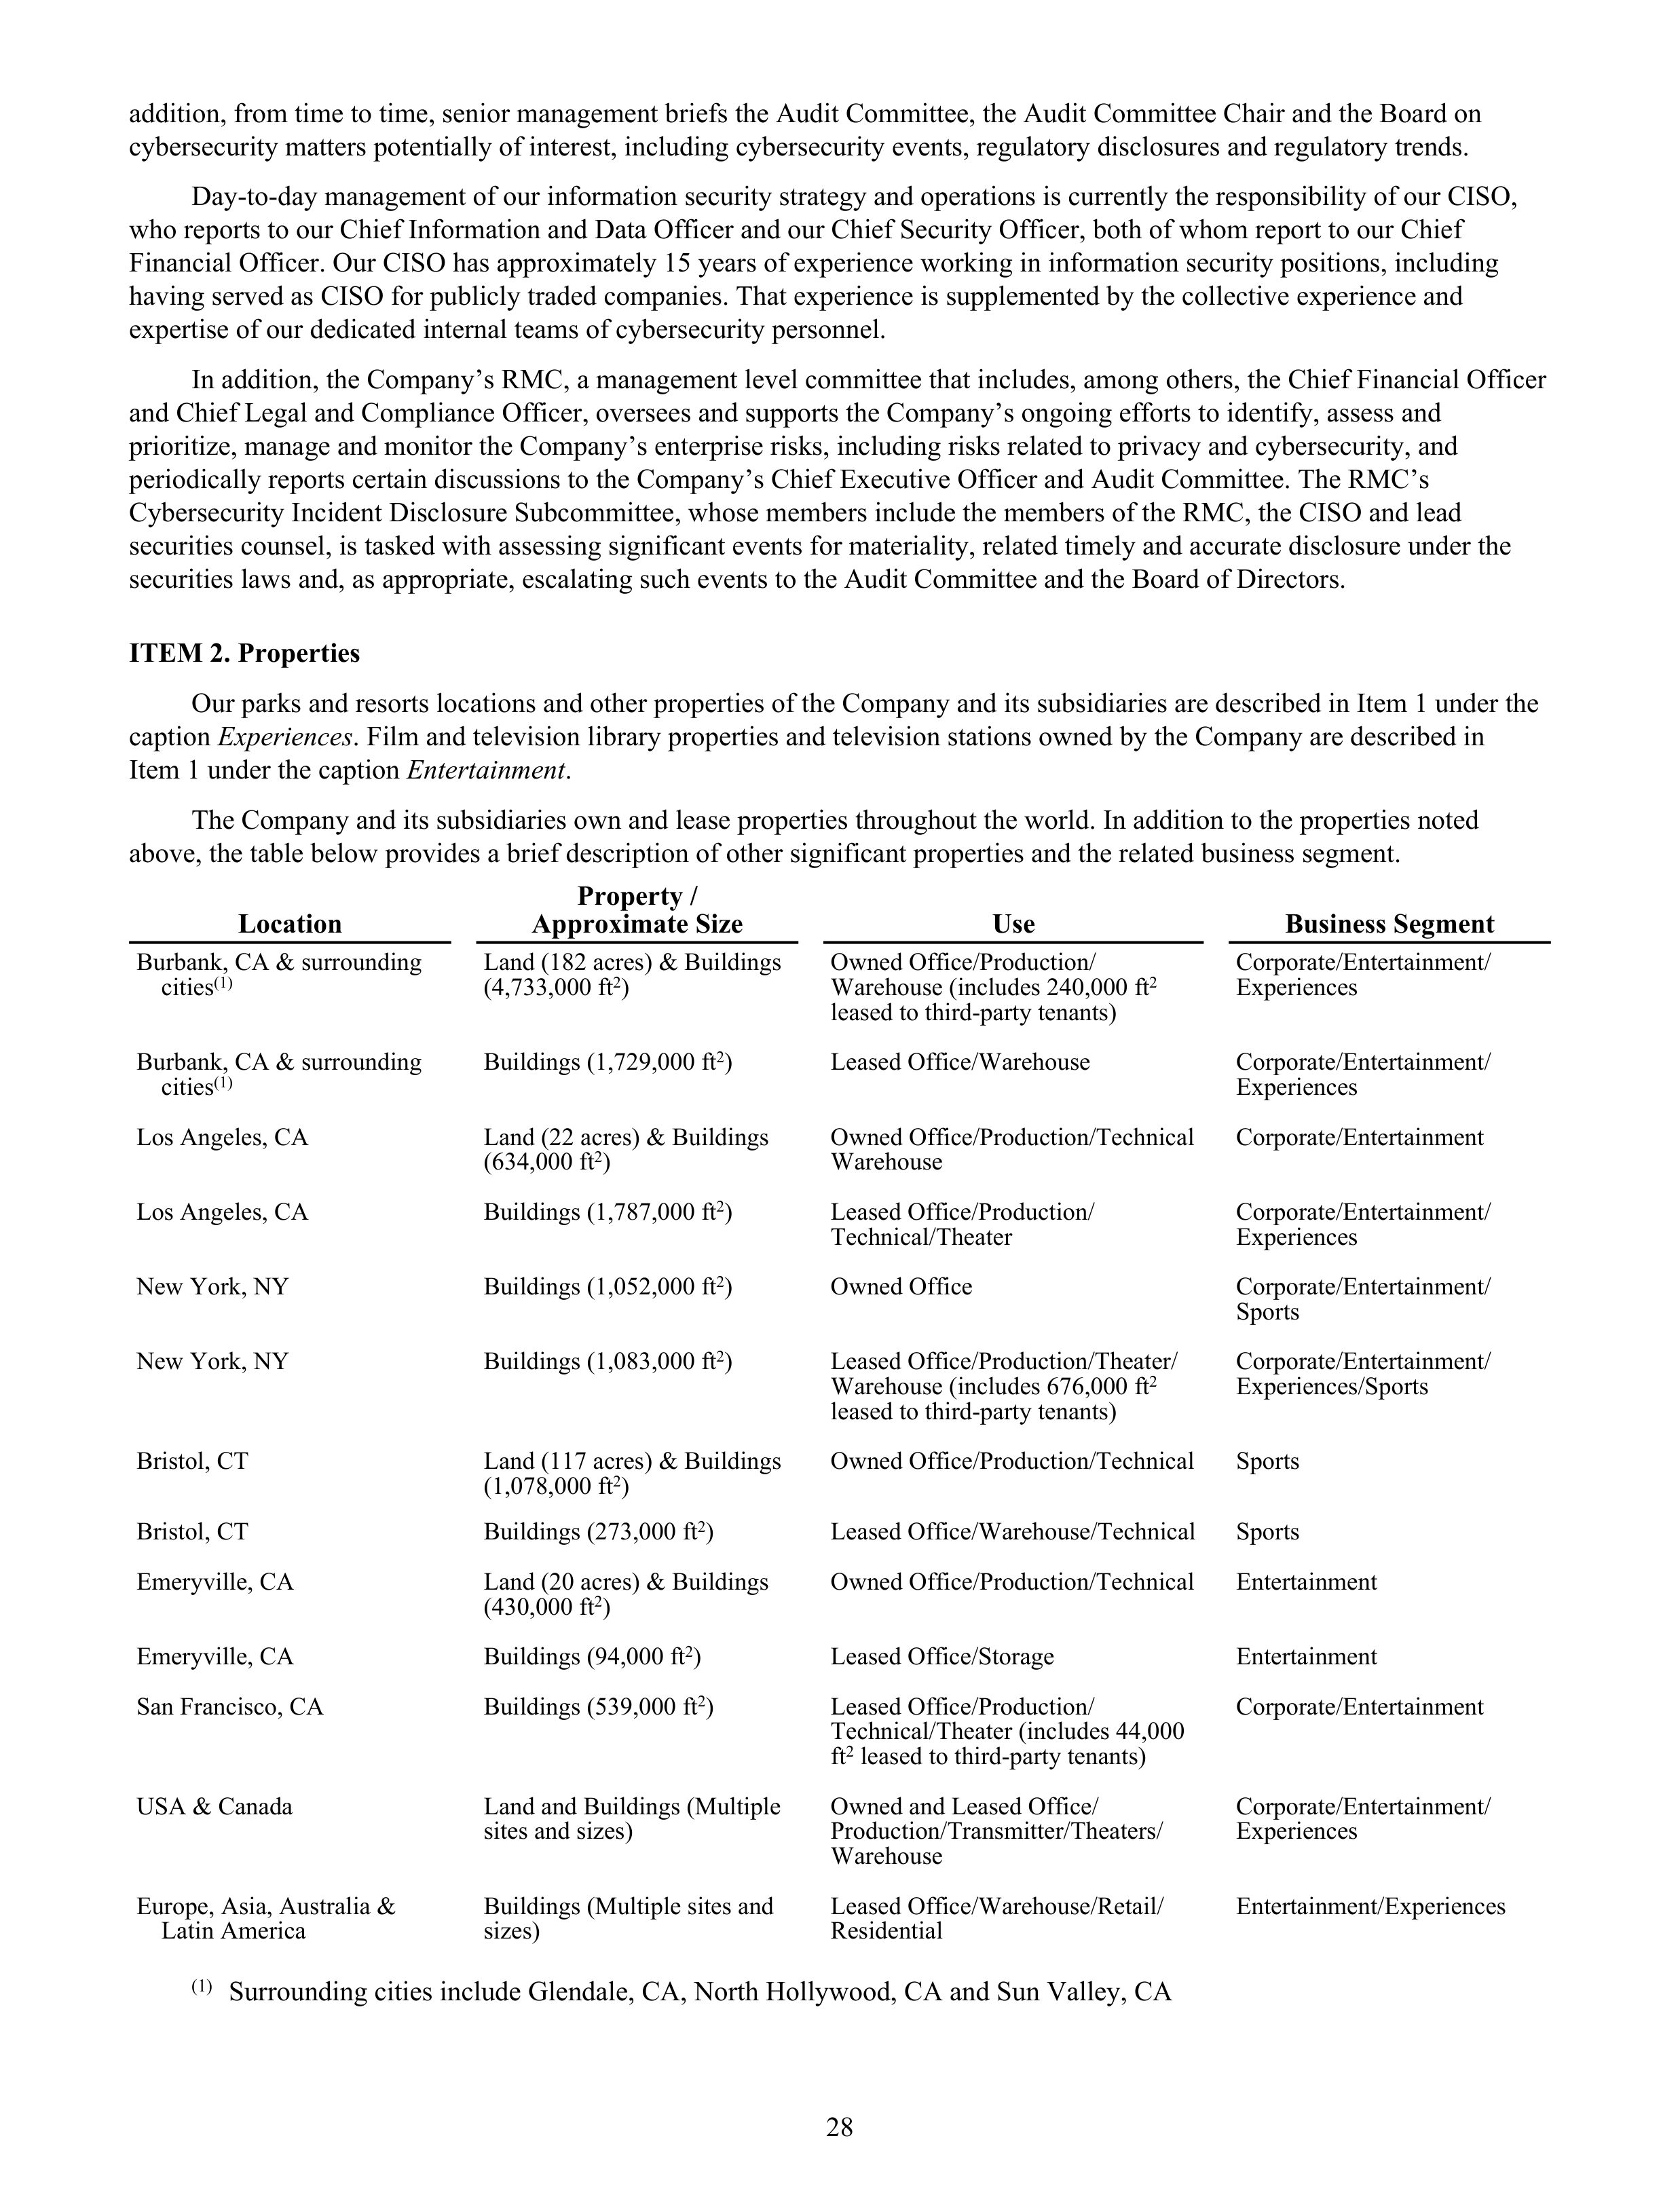
addition, from time to time, senior management briefs the Audit Committee, the Audit Committee Chair and the Board on
cybersecurity matters potentially of interest, including cybersecurity events, regulatory disclosures and regulatory trends.
Day-to-day management of our information security strategy and operations is currently the responsibility of our CISO,
who reports to our Chief Information and Data Officer and our Chief Security Officer, both of whom report to our Chief
Financial Officer. Our CISO has approximately 15 years of experience working in information security positions, including
having served as CISO for publicly traded companies. That experience is supplemented by the collective experience and
expertise of our dedicated internal teams of cybersecurity personnel.
In addition, the Company’s RMC, a management level committee that includes, among others, the Chief Financial Officer
and Chief Legal and Compliance Officer, oversees and supports the Company’s ongoing efforts to identify, assess and
prioritize, manage and monitor the Company’s enterprise risks, including risks related to privacy and cybersecurity, and
periodically reports certain discussions to the Company’s Chief Executive Officer and Audit Committee. The RMC’s
Cybersecurity Incident Disclosure Subcommittee, whose members include the members of the RMC, the CISO and lead
securities counsel, is tasked with assessing significant events for materiality, related timely and accurate disclosure under the
securities laws and, as appropriate, escalating such events to the Audit Committee and the Board of Directors.
ITEM 2. Properties
Our parks and resorts locations and other properties of the Company and its subsidiaries are described in Item 1 under the
caption
Experiences
. Film and television library properties and television stations owned by the Company are described in
Item 1 under the caption
Entertainment
.
The Company and its subsidiaries own and lease properties throughout the world. In addition to the properties noted
above, the table below provides a brief description of other significant properties and the related business segment.
Location
Property /
Approximate Size
Use
Business Segment
Burbank, CA & surrounding
cities
(1)
Land (182 acres) & Buildings
(4,733,000 ft
2
)
Owned Office/Production/
Warehouse (includes 240,000 ft
2
leased to third-party tenants)
Corporate/Entertainment/
Experiences
Burbank, CA & surrounding
cities
(1)
Buildings (1,729,000 ft
2
)
Leased Office/Warehouse
Corporate/Entertainment/
Experiences
Los Angeles, CA
Land (22 acres) & Buildings
(634,000 ft
2
)
Owned Office/Production/Technical
Warehouse
Corporate/Entertainment
Los Angeles, CA
Buildings (1,787,000 ft
2
)
Leased Office/Production/
Technical/Theater
Corporate/Entertainment/
Experiences
New York, NY
Buildings (1,052,000 ft
2
)
Owned Office
Corporate/Entertainment/
Sports
New York, NY
Buildings (1,083,000 ft
2
)
Leased Office/Production/Theater/
Warehouse (includes 676,000 ft
2
leased to third-party tenants)
Corporate/Entertainment/
Experiences/Sports
Bristol, CT
Land (117 acres) & Buildings
(1,078,000 ft
2
)
Owned Office/Production/Technical
Sports
Bristol, CT
Buildings (273,000 ft
2
)
Leased Office/Warehouse/Technical
Sports
Emeryville, CA
Land (20 acres) & Buildings
(430,000 ft
2
)
Owned Office/Production/Technical
Entertainment
Emeryville, CA
Buildings (94,000 ft
2
)
Leased Office/Storage
Entertainment
San Francisco, CA
Buildings (539,000 ft
2
)
Leased Office/Production/
Technical/Theater (includes 44,000
ft
2
leased to third-party tenants)
Corporate/Entertainment
USA & Canada
Land and Buildings (Multiple
sites and sizes)
Owned and Leased Office/
Production/Transmitter/Theaters/
Warehouse
Corporate/Entertainment/
Experiences
Europe, Asia, Australia &
Latin America
Buildings (Multiple sites and
sizes)
Leased Office/Warehouse/Retail/
Residential
Entertainment/Experiences
(1)
Surrounding cities include Glendale, CA, North Hollywood, CA and Sun Valley, CA
28
ITEM 3. Legal Proceedings
As disclosed in Note 14 to the Consolidated Financial Statements, the Company is engaged in certain legal matters, and
the disclosure set forth in Note 14 relating to certain legal matters is incorporated herein by reference.
ITEM 4. Mine Safety Disclosures
Not applicable.
Information About Our Executive Officers
The executive officers of the Company are elected each year at the organizational meeting of the Board of Directors,
which follows the annual meeting of the shareholders, and at other Board of Directors meetings, as appropriate. Each of the
executive officers has been employed by the Company in the position or positions indicated in the list and pertinent notes
below.
The executive officers of the Company are:
Name
Age
Title
Executive
Officer Since
Robert A. Iger
74
Chief Executive Officer
(1)
2022
Hugh F. Johnston
64
Senior Executive Vice President and Chief Financial Officer
(2)
2023
Horacio E. Gutierrez
60
Senior Executive Vice President, Chief Legal and Global Affairs
Officer
(3)
2022
Sonia L. Coleman
53
Senior Executive Vice President and Chief People Officer
(4)
2023
Kristina K. Schake
55
Senior Executive Vice President and Chief Communications Officer
(5)
2022
(1)
Mr. Iger was appointed Chief Executive Officer effective November 20, 2022. He also serves as a director on the
Board of Directors from November 20, 2022. He previously served as Executive Chairman of the Company from
February 2020 through December 2021 and as Chief Executive Officer of the Company from September 2005 to
February 2020. He served as Chairman of the Board of Directors from 2012 to 2021.
(2)
Mr. Johnston was appointed Chief Financial Officer effective December 4, 2023. Prior to joining the Company, he
served as Executive Vice President and Chief Financial Officer, from 2010, and Vice Chairman, from 2015 to
November 2023 of PepsiCo, Inc. (“PepsiCo”). His portfolio included a variety of responsibilities, including leadership
of PepsiCo’s information technology function from 2015, PepsiCo’s global e-commerce business from 2015 to 2019,
and the Quaker Foods North America division from 2014 to 2016. He also held a number of other leadership roles
during his PepsiCo career, having served as Executive Vice President, Global Operations from 2009 to 2010, President
of Pepsi-Cola North America from 2007 to 2009, Executive Vice President, Operations from 2006 to 2007 and Senior
Vice President, Transformation from 2005 to 2006. Prior to that, he served as Senior Vice President and Chief
Financial Officer of PepsiCo Beverages and Foods from 2002 through 2005, and as PepsiCo’s Senior Vice President
of Mergers and Acquisitions in 2002. He joined PepsiCo in 1987 as a Business Planner and held various finance
positions until 1999 when he left to join Merck & Co., Inc. as Vice President, Retail, a position which he held until he
rejoined PepsiCo in 2002. Mr. Johnston serves on the board of directors of Microsoft Corporation, which he joined in
2017, and on the board of HCA Healthcare, Inc., which he joined in 2021.
(3)
Mr. Gutierrez was appointed Senior Executive Vice President and General Counsel effective February 1, 2022,
appointed Senior Executive Vice President, General Counsel and Chief Compliance Officer effective March 27, 2023,
appointed Senior Executive Vice President, Chief Legal and Compliance Officer effective December 21, 2023 and
appointed Senior Executive Vice President, Chief Legal and Global Affairs Officer effective November 4, 2025. Prior
to joining the Company, he served as Head of Global Affairs and Chief Legal Officer for Spotify Technology S.A.
(Spotify) from November 2019 to January 2022, where he led a global, multi-disciplinary team of business, corporate
communications and public affairs, government relations, licensing, operations and legal professionals responsible for
the company’s work in areas including industry relations, content partnerships, public policy, and trust & safety. He
was previously Spotify’s General Counsel - Vice President, Business & Legal Affairs from April 2016 to November
2019.
(4)
Ms. Coleman was appointed Senior Executive Vice President and Chief Human Resources Officer effective April 8,
2023 and appointed Senior Executive Vice President and Chief People Officer effective September 27, 2025. She was
previously Senior Vice President, Human Resources at Disney General Entertainment and ESPN from August 2021.
Ms. Coleman served as Senior Vice President, Human Resources for Disney General Entertainment from April 2017,
29

Vice President, Human Resources for the Company from May 2016 and Vice President, Human Resources, Disney
Consumer Products from May 2010.
(5)
Ms. Schake was appointed Senior Executive Vice President and Chief Communications Officer effective June 29,
2022. Previously, she served as Executive Vice President, Global Communications from April 2022. Prior to joining
the Company, she was appointed by the President of the United States as Counselor for Strategic Communications to
the Secretary of the U.S. Department of Health and Human Services, leading a nationwide public education campaign
from March 2021 to December 2021. Prior to that, she served as Global Communications Director for Instagram, a
product of Meta Platforms, Inc., from March 2017 to March 2019, where she oversaw the communications teams in
North America, Latin America, Europe and Asia.
30
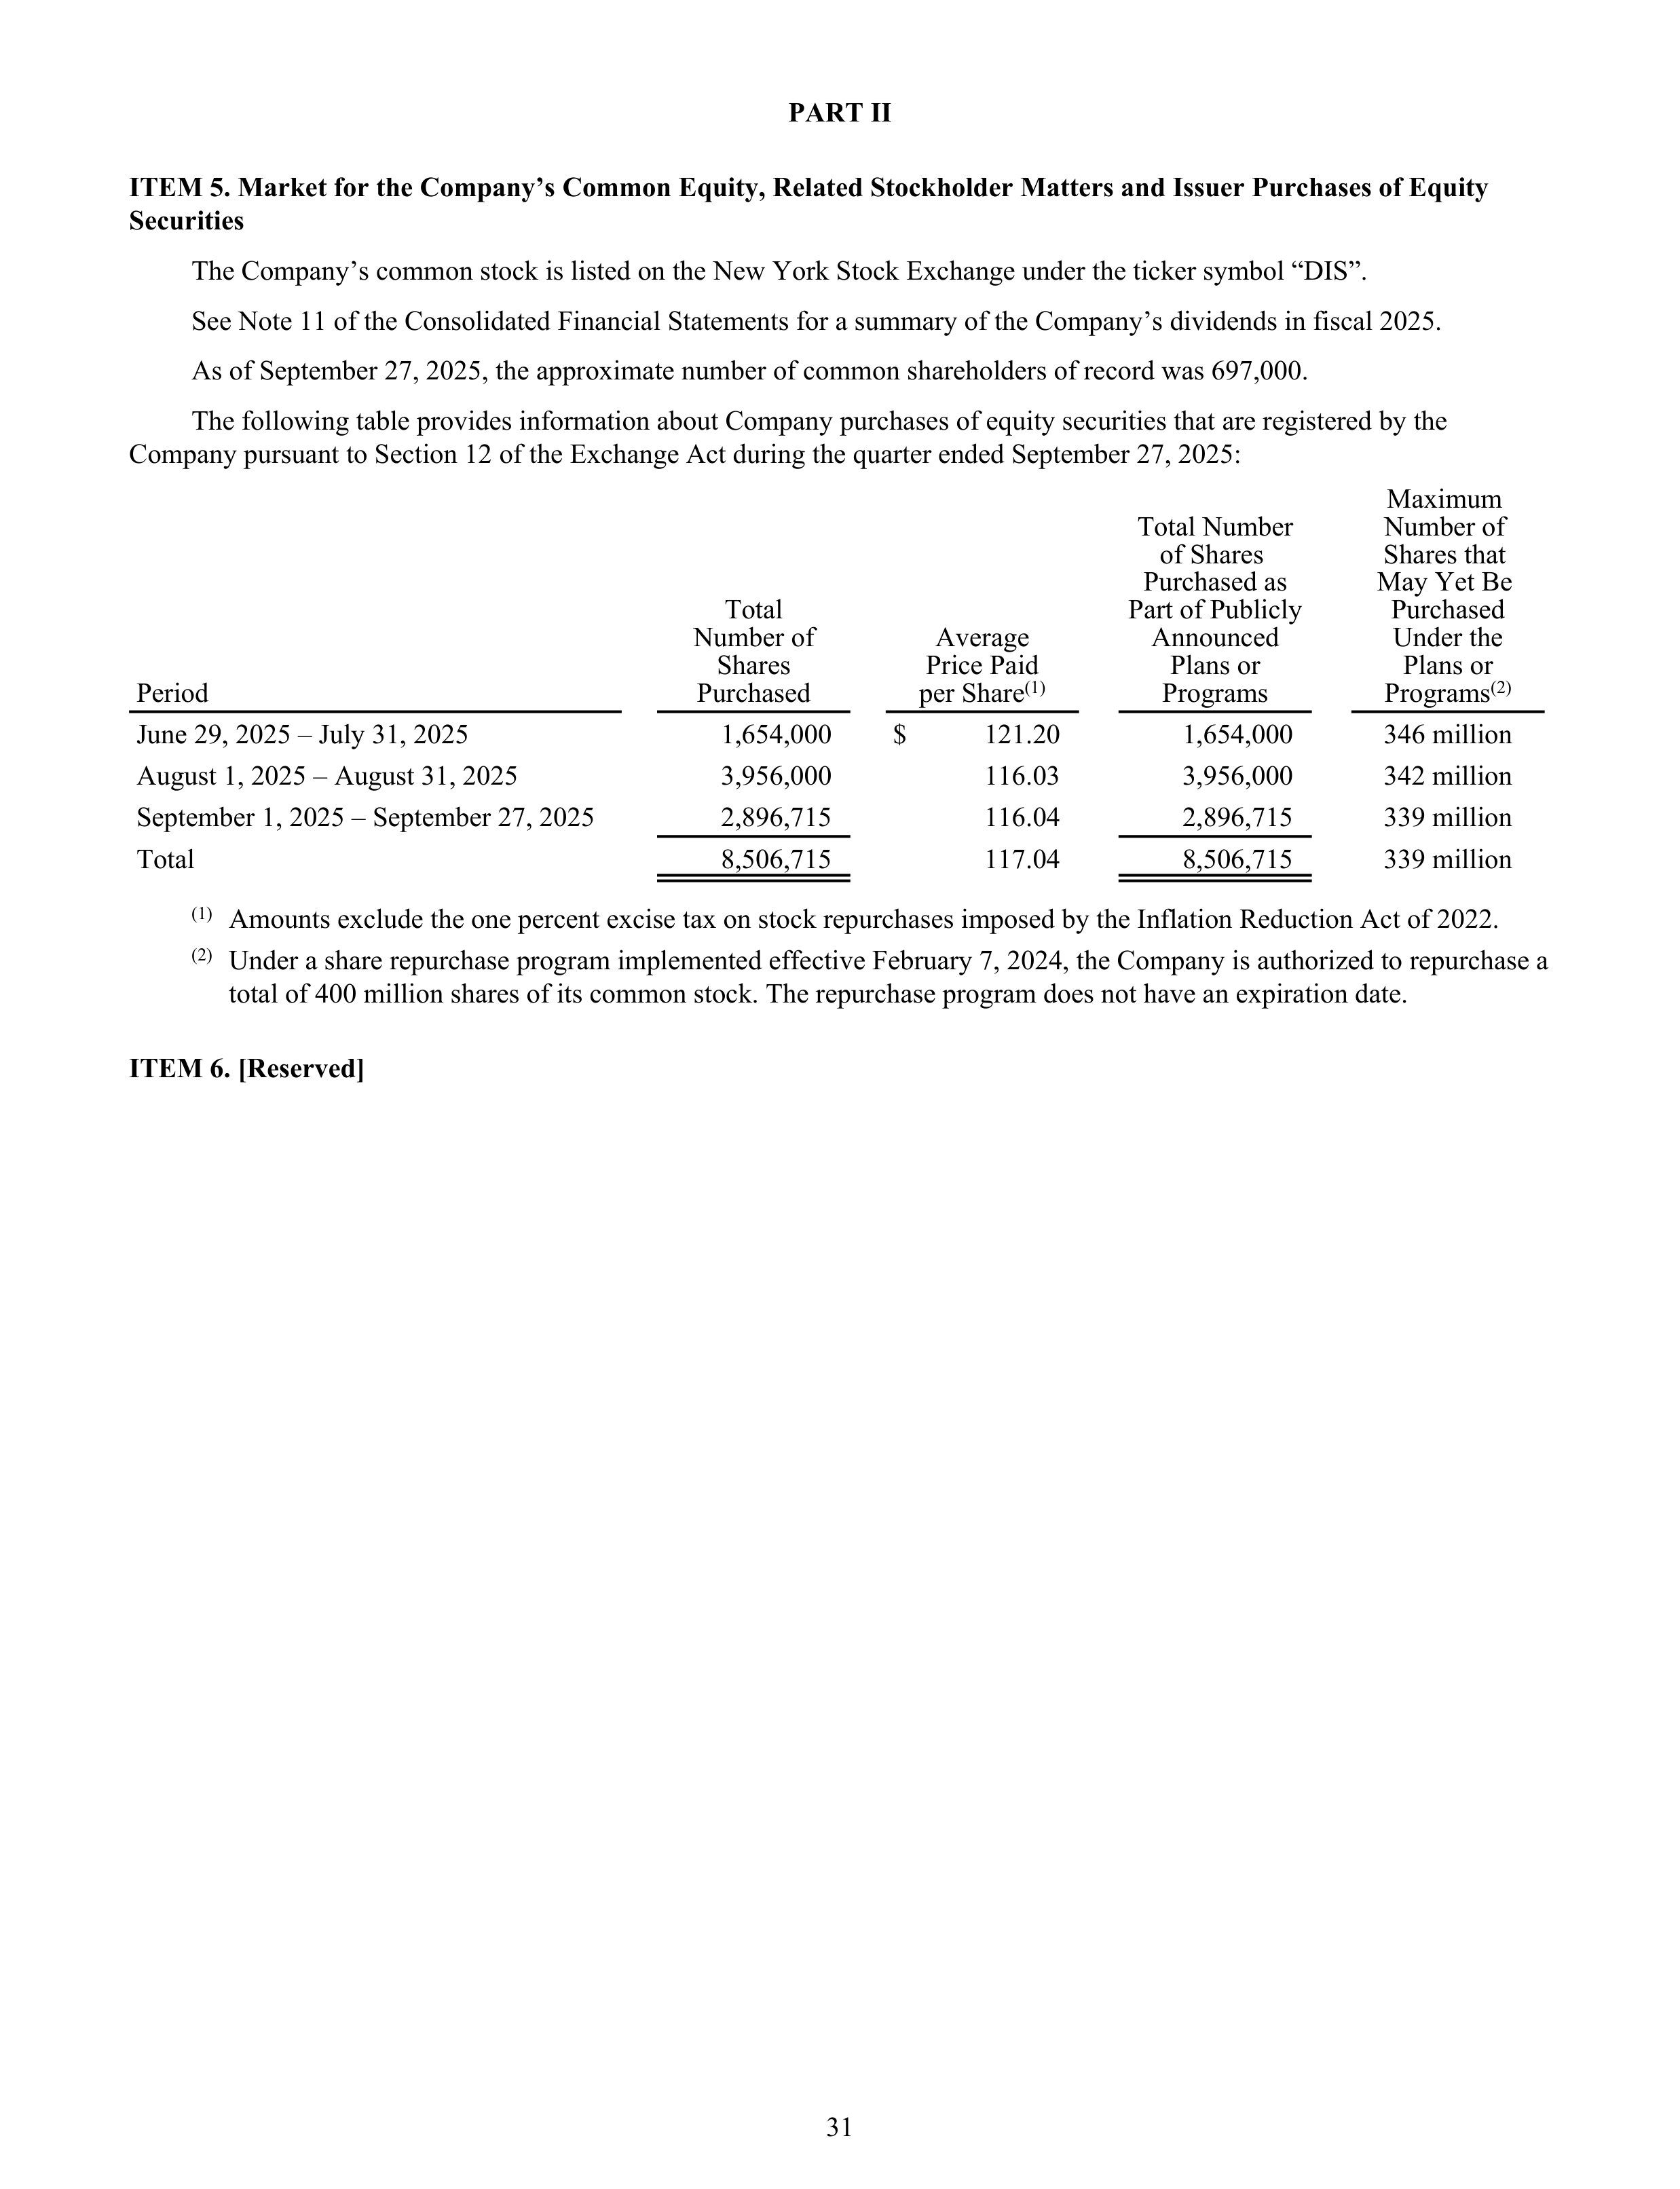
PART II
ITEM 5. Market for the Company’s Common Equity, Related Stockholder Matters and Issuer Purchases of Equity
Securities
The Company’s common stock is listed on the New York Stock Exchange under the ticker symbol “DIS”.
See Note 11 of the Consolidated Financial Statements for a summary of the Company’s dividends in fiscal 2025.
As of September 27, 2025, the approximate number of common shareholders of record was 697,000.
The following table provides information about Company purchases of equity securities that are registered by the
Company pursuant to Section 12 of the Exchange Act during the quarter ended September 27, 2025:
Period
Total
Number of
Shares
Purchased
Average
Price Paid
per Share
(1)
Total Number
of Shares
Purchased as
Part of Publicly
Announced
Plans or
Programs
Maximum
Number of
Shares that
May Yet Be
Purchased
Under the
Plans or
Programs
(2)
June 29, 2025 – July 31, 2025
1,654,000
$
121.20
1,654,000
346 million
August 1, 2025 – August 31, 2025
3,956,000
116.03
3,956,000
342 million
September 1, 2025 – September 27, 2025
2,896,715
116.04
2,896,715
339 million
Total
8,506,715
117.04
8,506,715
339 million
(1)
Amounts exclude the one percent excise tax on stock repurchases imposed by the Inflation Reduction Act of 2022.
(2)
Under a share repurchase program implemented effective February 7, 2024, the Company is authorized to repurchase a
total of 400 million shares of its common stock. The repurchase program does not have an expiration date.
ITEM 6. [Reserved]
31
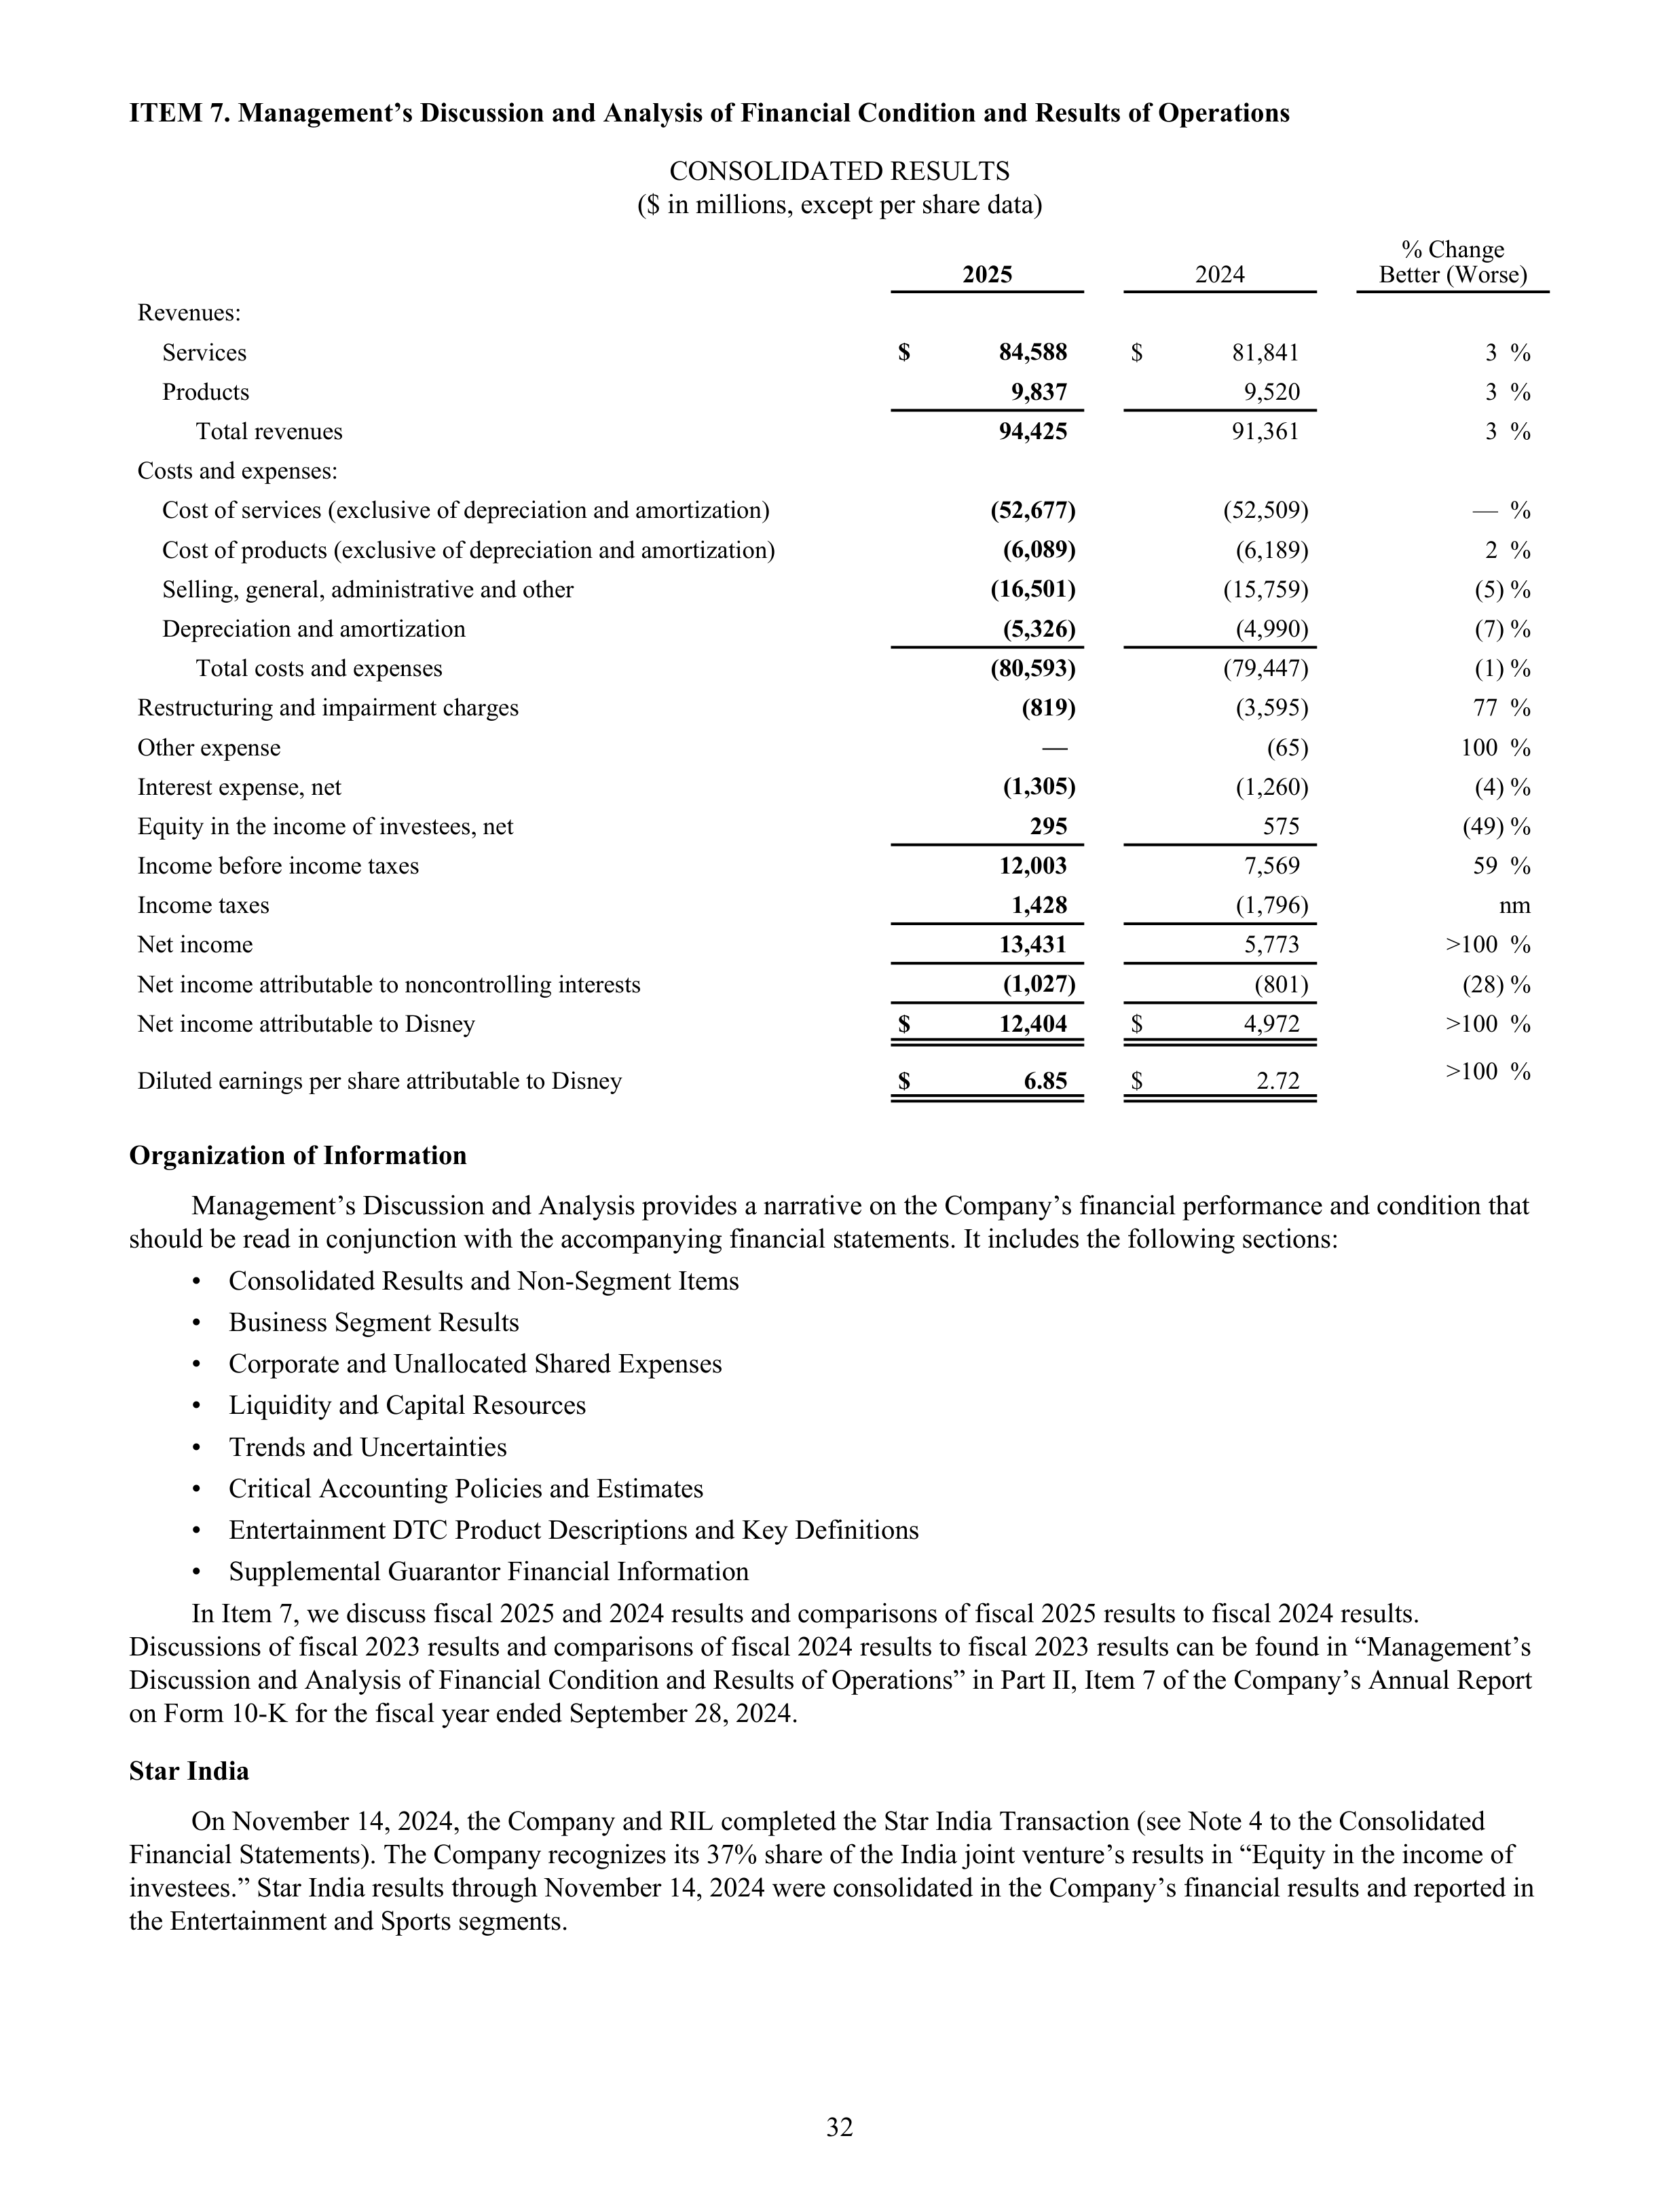
ITEM 7. Management’s Discussion and Analysis of Financial Condition and Results of Operations
CONSOLIDATED RESULTS
($ in millions, except per share data)
2025
2024
% Change
Better (Worse)
Revenues:
Services
$
84,588
$
81,841
3 %
Products
9,837
9,520
3 %
Total revenues
94,425
91,361
3 %
Costs and expenses:
Cost of services (exclusive of depreciation and amortization)
(52,677)
(52,509)
— %
Cost of products (exclusive of depreciation and amortization)
(6,089)
(6,189)
2 %
Selling, general, administrative and other
(16,501)
(15,759)
(5) %
Depreciation and amortization
(5,326)
(4,990)
(7) %
Total costs and expenses
(80,593)
(79,447)
(1) %
Restructuring and impairment charges
(819)
(3,595)
77 %
Other expense
—
(65)
100 %
Interest expense, net
(1,305)
(1,260)
(4) %
Equity in the income of investees, net
295
575
(49) %
Income before income taxes
12,003
7,569
59 %
Income taxes
1,428
(1,796)
nm
Net income
13,431
5,773
>100 %
Net income attributable to noncontrolling interests
(1,027)
(801)
(28) %
Net income attributable to Disney
$
12,404
$
4,972
>100 %
Diluted earnings per share attributable to Disney
$
6.85
$
2.72
>100 %
Organization of Information
Management’s Discussion and Analysis provides a narrative on the Company’s financial performance and condition that
should be read in conjunction with the accompanying financial statements. It includes the following sections:
•
Consolidated Results and Non-Segment Items
•
Business Segment Results
•
Corporate and Unallocated Shared Expenses
•
Liquidity and Capital Resources
•
Trends and Uncertainties
•
Critical Accounting Policies and Estimates
•
Entertainment DTC Product Descriptions and Key Definitions
•
Supplemental Guarantor Financial Information
In Item 7, we discuss fiscal 2025 and 2024 results and comparisons of fiscal 2025 results to fiscal 2024 results.
Discussions of fiscal 2023 results and comparisons of fiscal 2024 results to fiscal 2023 results can be found in “Management’s
Discussion and Analysis of Financial Condition and Results of Operations” in Part II, Item 7 of the Company’s Annual Report
on Form 10-K for the fiscal year ended September 28, 2024.
Star India
On November 14, 2024, the Company and RIL completed the Star India Transaction (see Note 4 to the Consolidated
Financial Statements). The Company recognizes its 37% share of the India joint venture’s results in “Equity in the income of
investees.” Star India results through November 14, 2024 were consolidated in the Company’s financial results and reported in
the Entertainment and Sports segments.
32
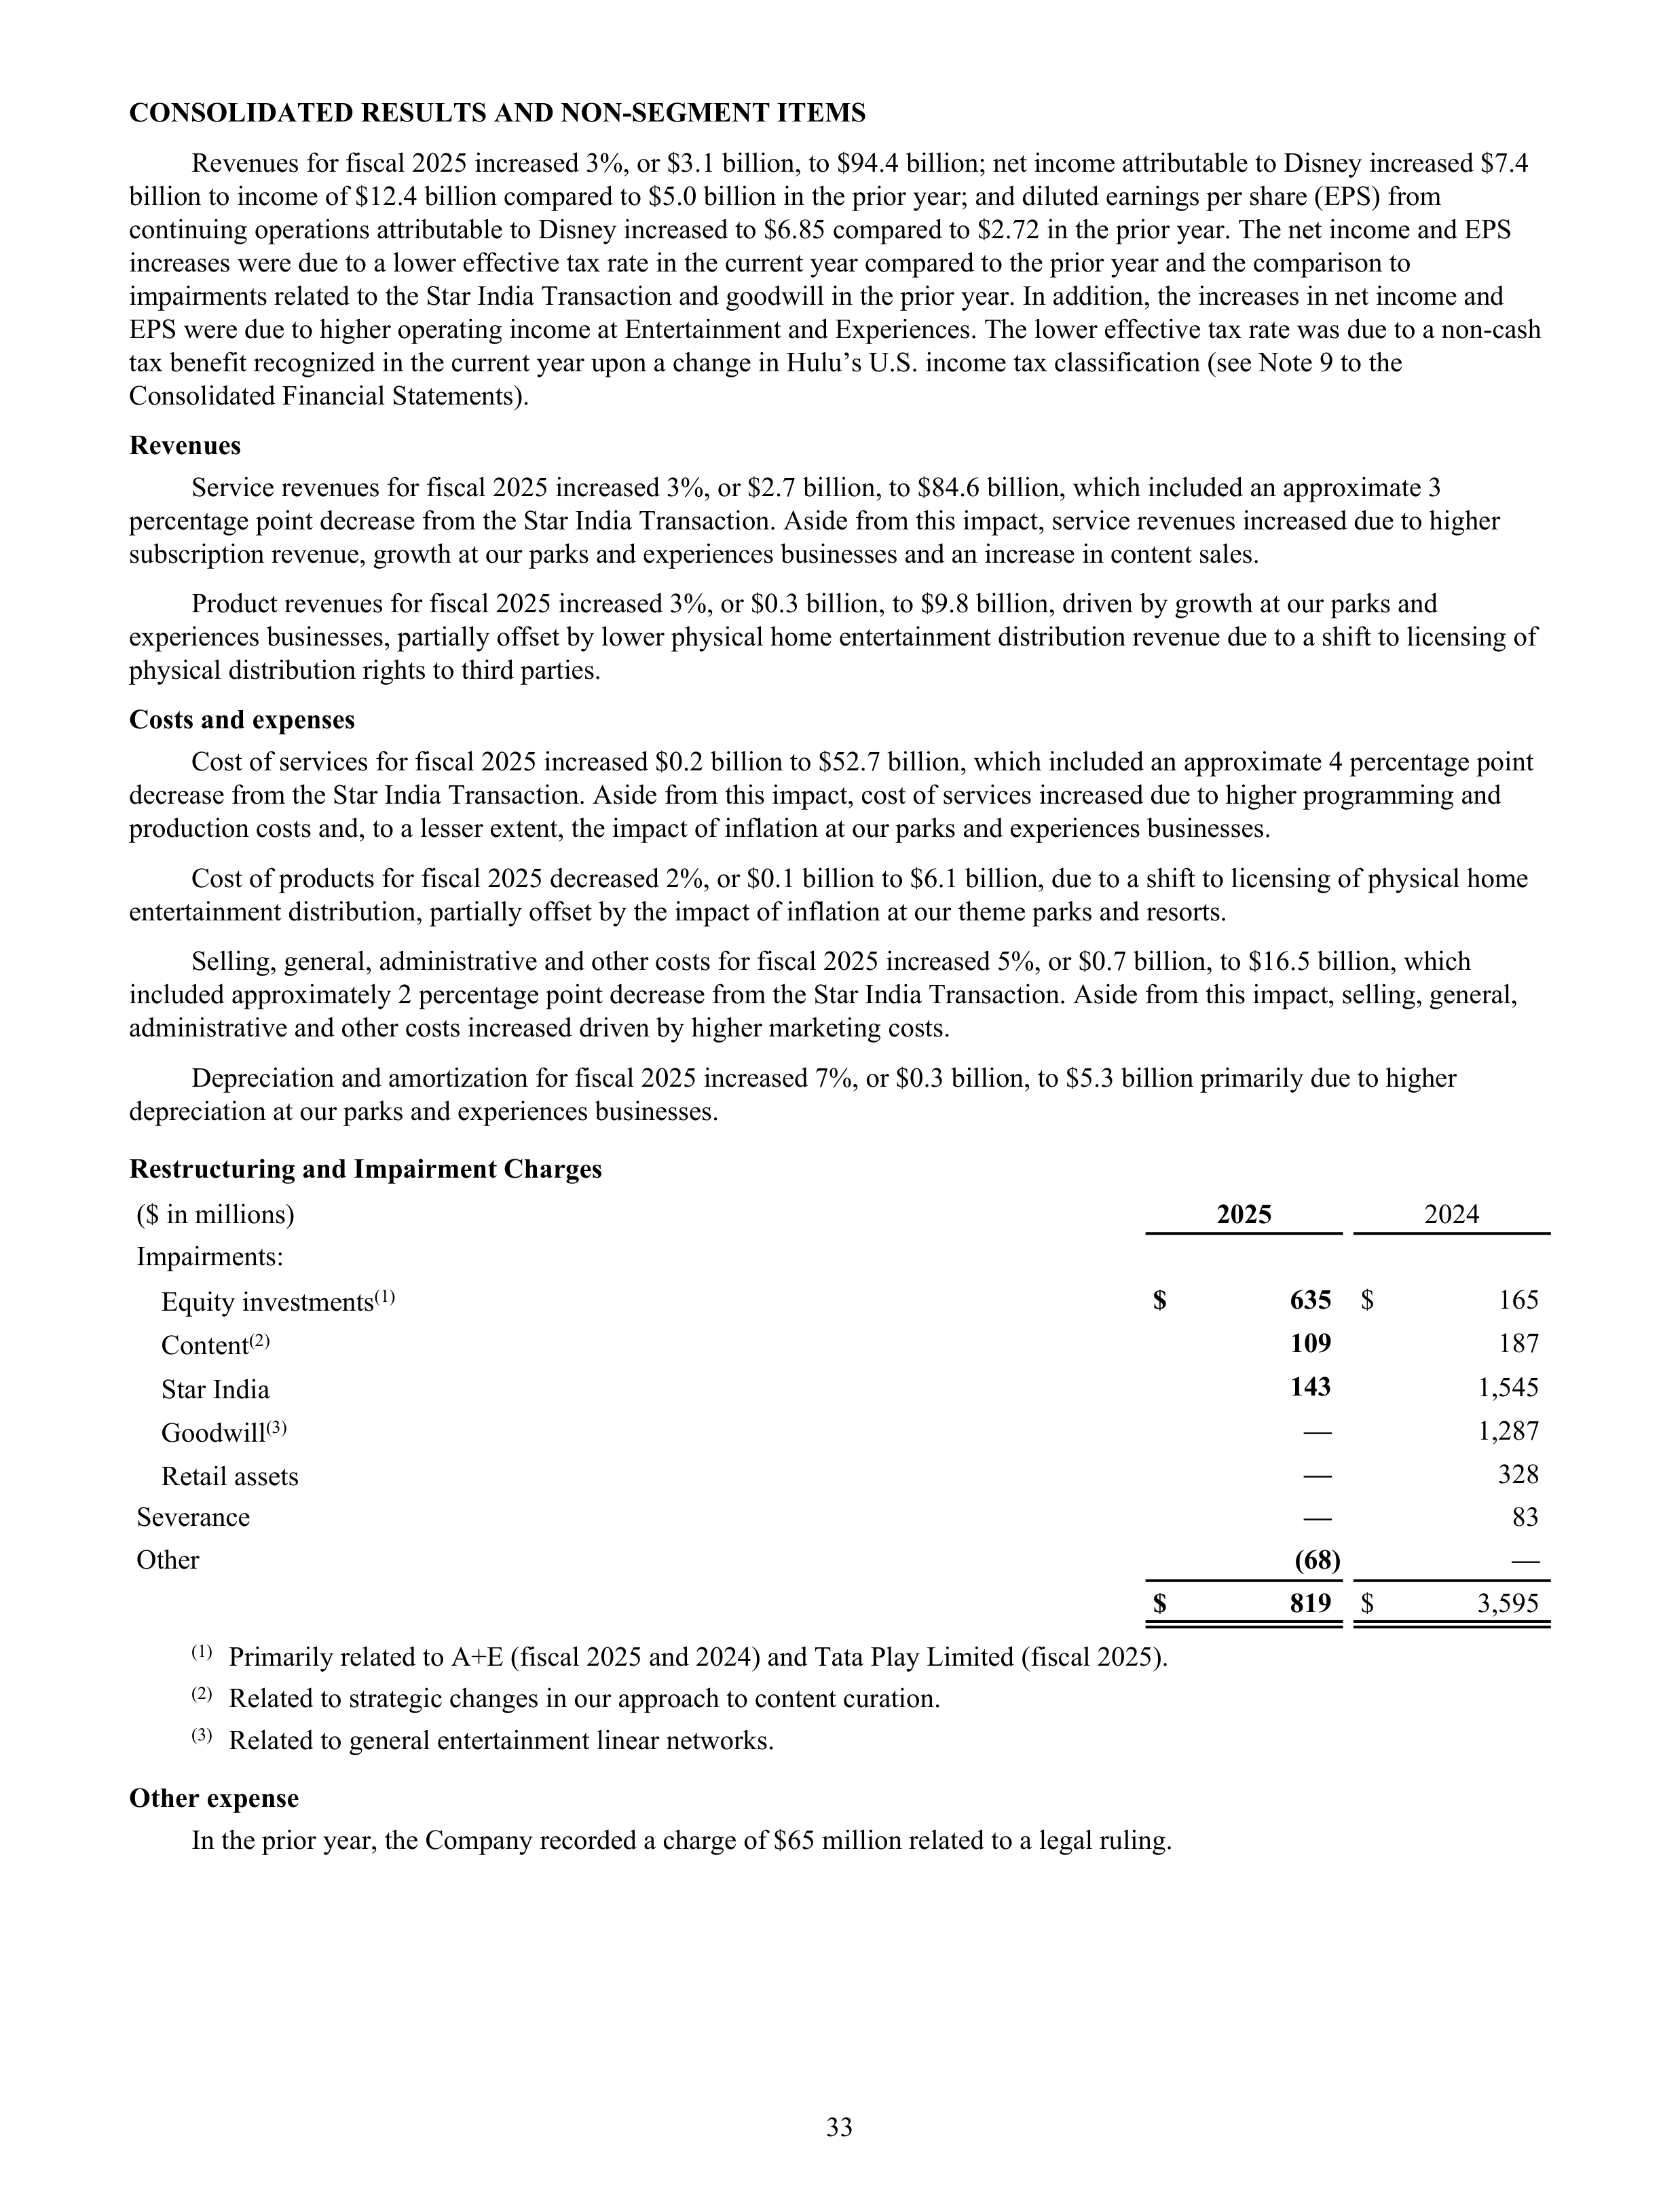
CONSOLIDATED RESULTS AND NON-SEGMENT ITEMS
Revenues for fiscal 2025 increased 3%, or $3.1 billion, to $94.4 billion; net income attributable to Disney increased $7.4
billion to income of $12.4 billion compared to $5.0 billion in the prior year; and diluted earnings per share (EPS) from
continuing operations attributable to Disney increased to $6.85 compared to $2.72 in the prior year. The net income and EPS
increases were due to a lower effective tax rate in the current year compared to the prior year and the comparison to
impairments related to the Star India Transaction and goodwill in the prior year. In addition, the increases in net income and
EPS were due to higher operating income at Entertainment and Experiences. The lower effective tax rate was due to a non-cash
tax benefit recognized in the current year upon a change in Hulu’s U.S. income tax classification (see Note 9 to the
Consolidated Financial Statements).
Revenues
Service revenues for fiscal 2025 increased 3%, or $2.7 billion, to $84.6 billion, which included an approximate 3
percentage point decrease from the Star India Transaction. Aside from this impact, service revenues increased due to higher
subscription revenue, growth at our parks and experiences businesses and an increase in content sales.
Product revenues for fiscal 2025 increased 3%, or $0.3 billion, to $9.8 billion, driven by growth at our parks and
experiences businesses, partially offset by lower physical home entertainment distribution revenue due to a shift to licensing of
physical distribution rights to third parties.
Costs and expenses
Cost of services for fiscal 2025 increased $0.2 billion to $52.7 billion, which included an approximate 4 percentage point
decrease from the Star India Transaction. Aside from this impact, cost of services increased due to higher programming and
production costs and, to a lesser extent, the impact of inflation at our parks and experiences businesses.
Cost of products for fiscal 2025 decreased 2%, or $0.1 billion to $6.1 billion, due to a shift to licensing of physical home
entertainment distribution, partially offset by the impact of inflation at our theme parks and resorts.
Selling, general, administrative and other costs for fiscal 2025 increased 5%, or $0.7 billion, to $16.5 billion, which
included approximately 2 percentage point decrease from the Star India Transaction. Aside from this impact, selling, general,
administrative and other costs increased driven by higher marketing costs.
Depreciation and amortization for fiscal 2025 increased 7%, or $0.3 billion, to $5.3 billion primarily due to higher
depreciation at our parks and experiences businesses.
Restructuring and Impairment Charges
($ in millions)
2025
2024
Impairments:
Equity investments
(1)
$
635
$
165
Content
(2)
109
187
Star India
143
1,545
Goodwill
(3)
—
1,287
Retail assets
—
328
Severance
—
83
Other
(68)
—
$
819
$
3,595
(1)
Primarily related to A+E (fiscal 2025 and 2024) and Tata Play Limited (fiscal 2025).
(2)
Related to strategic changes in our approach to content curation.
(3)
Related to general entertainment linear networks.
Other expense
In the prior year, the Company recorded a charge of $65 million related to a legal ruling.
33
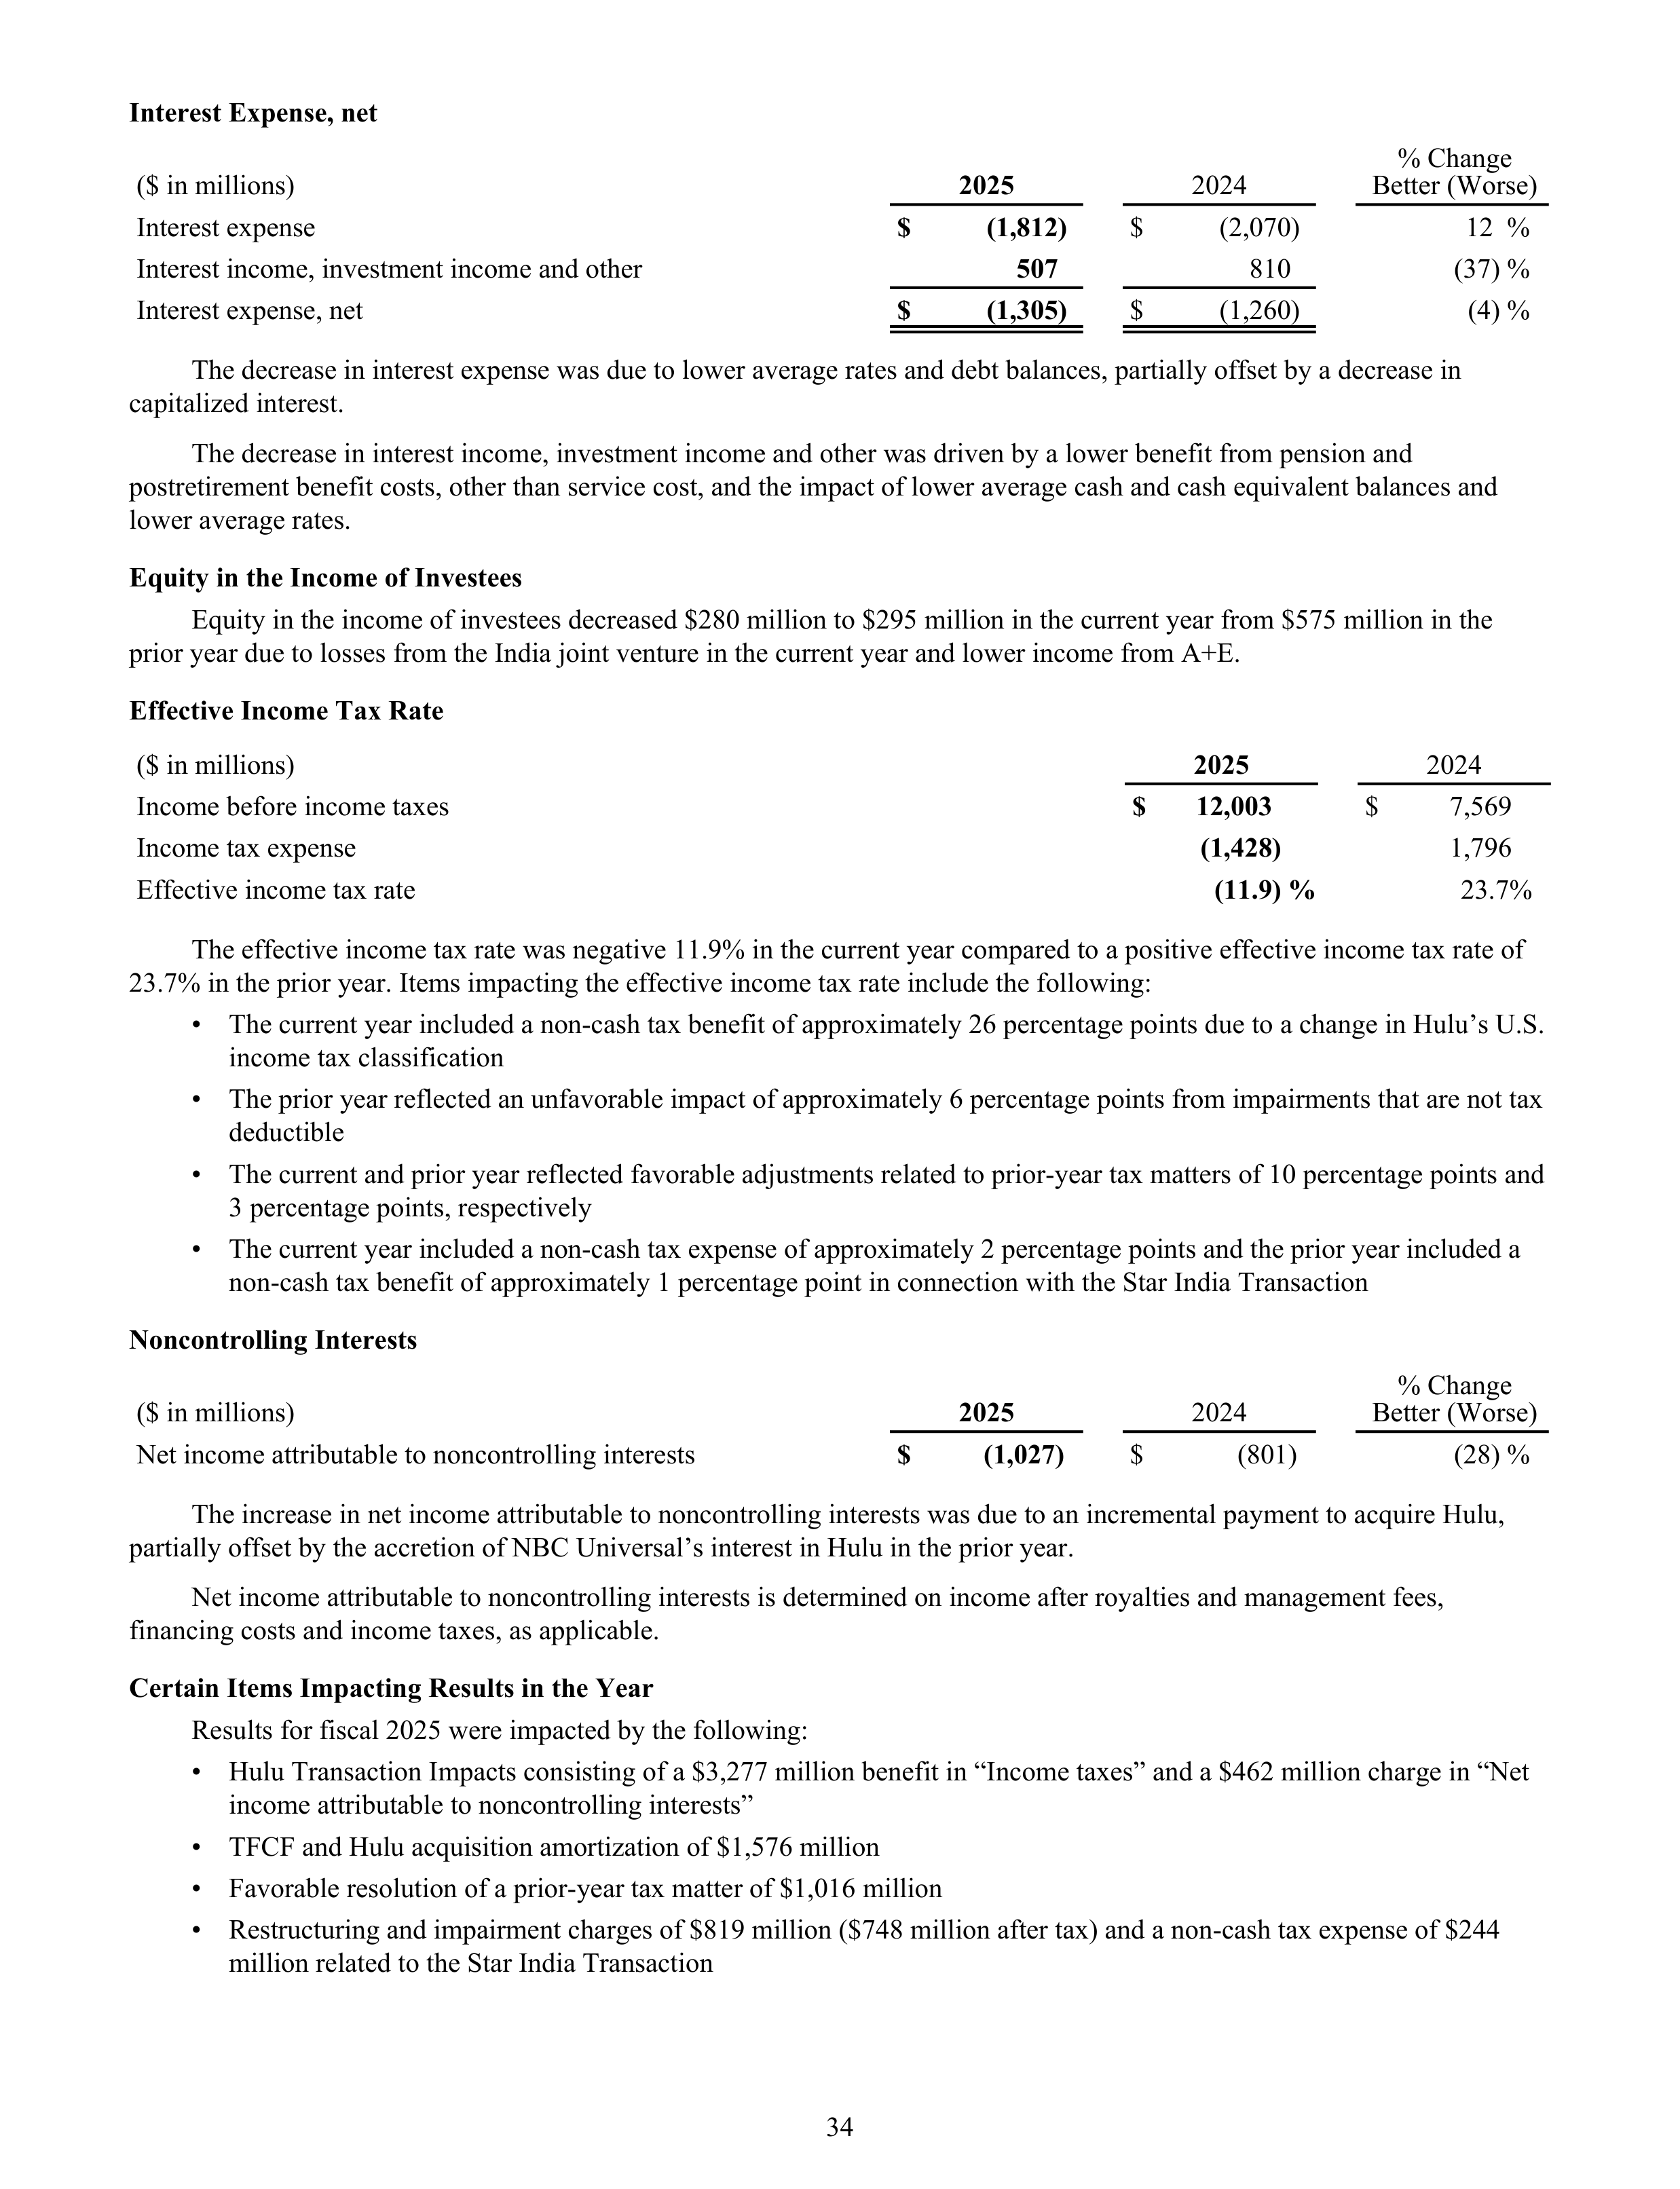
Interest Expense, net
($ in millions)
2025
2024
% Change
Better (Worse)
Interest expense
$
(1,812)
$
(2,070)
12 %
Interest income, investment income and other
507
810
(37) %
Interest expense, net
$
(1,305)
$
(1,260)
(4) %
The decrease in interest expense was due to lower average rates and debt balances, partially offset by a decrease in
capitalized interest.
The decrease in interest income, investment income and other was driven by a lower benefit from pension and
postretirement benefit costs, other than service cost, and the impact of lower average cash and cash equivalent balances and
lower average rates.
Equity in the Income of Investees
Equity in the income of investees decreased $280 million to $295 million in the current year from $575 million in the
prior year due to losses from the India joint venture in the current year and lower income from A+E.
Effective Income Tax Rate
($ in millions)
2025
2024
Income before income taxes
$
12,003
$
7,569
Income tax expense
(1,428)
1,796
Effective income tax rate
(11.9) %
23.7 %
The effective income tax rate was negative 11.9% in the current year compared to a positive effective income tax rate of
23.7% in the prior year. Items impacting the effective income tax rate include the following:
•
The current year included a non-cash tax benefit of approximately 26 percentage points due to a change in Hulu’s U.S.
income tax classification
•
The prior year reflected an unfavorable impact of approximately 6 percentage points from impairments that are not tax
deductible
•
The current and prior year reflected favorable adjustments related to prior-year tax matters of 10 percentage points and
3 percentage points, respectively
•
The current year included a non-cash tax expense of approximately 2 percentage points and the prior year included a
non-cash tax benefit of approximately 1 percentage point in connection with the Star India Transaction
Noncontrolling Interests
($ in millions)
2025
2024
% Change
Better (Worse)
Net income attributable to noncontrolling interests
$
(1,027)
$
(801)
(28) %
The increase in net income attributable to noncontrolling interests was due to an incremental payment to acquire Hulu,
partially offset by the accretion of NBC Universal’s interest in Hulu in the prior year.
Net income attributable to noncontrolling interests is determined on income after royalties and management fees,
financing costs and income taxes, as applicable.
Certain Items Impacting Results in the Year
Results for fiscal 2025 were impacted by the following:
•
Hulu Transaction Impacts consisting of a $3,277 million benefit in “Income taxes” and a $462 million charge in “Net
income attributable to noncontrolling interests”
•
TFCF and Hulu acquisition amortization of $1,576 million
•
Favorable resolution of a prior-year tax matter of $1,016 million
•
Restructuring and impairment charges of $819 million ($748 million after tax) and a non-cash tax expense of $244
million related to the Star India Transaction
34
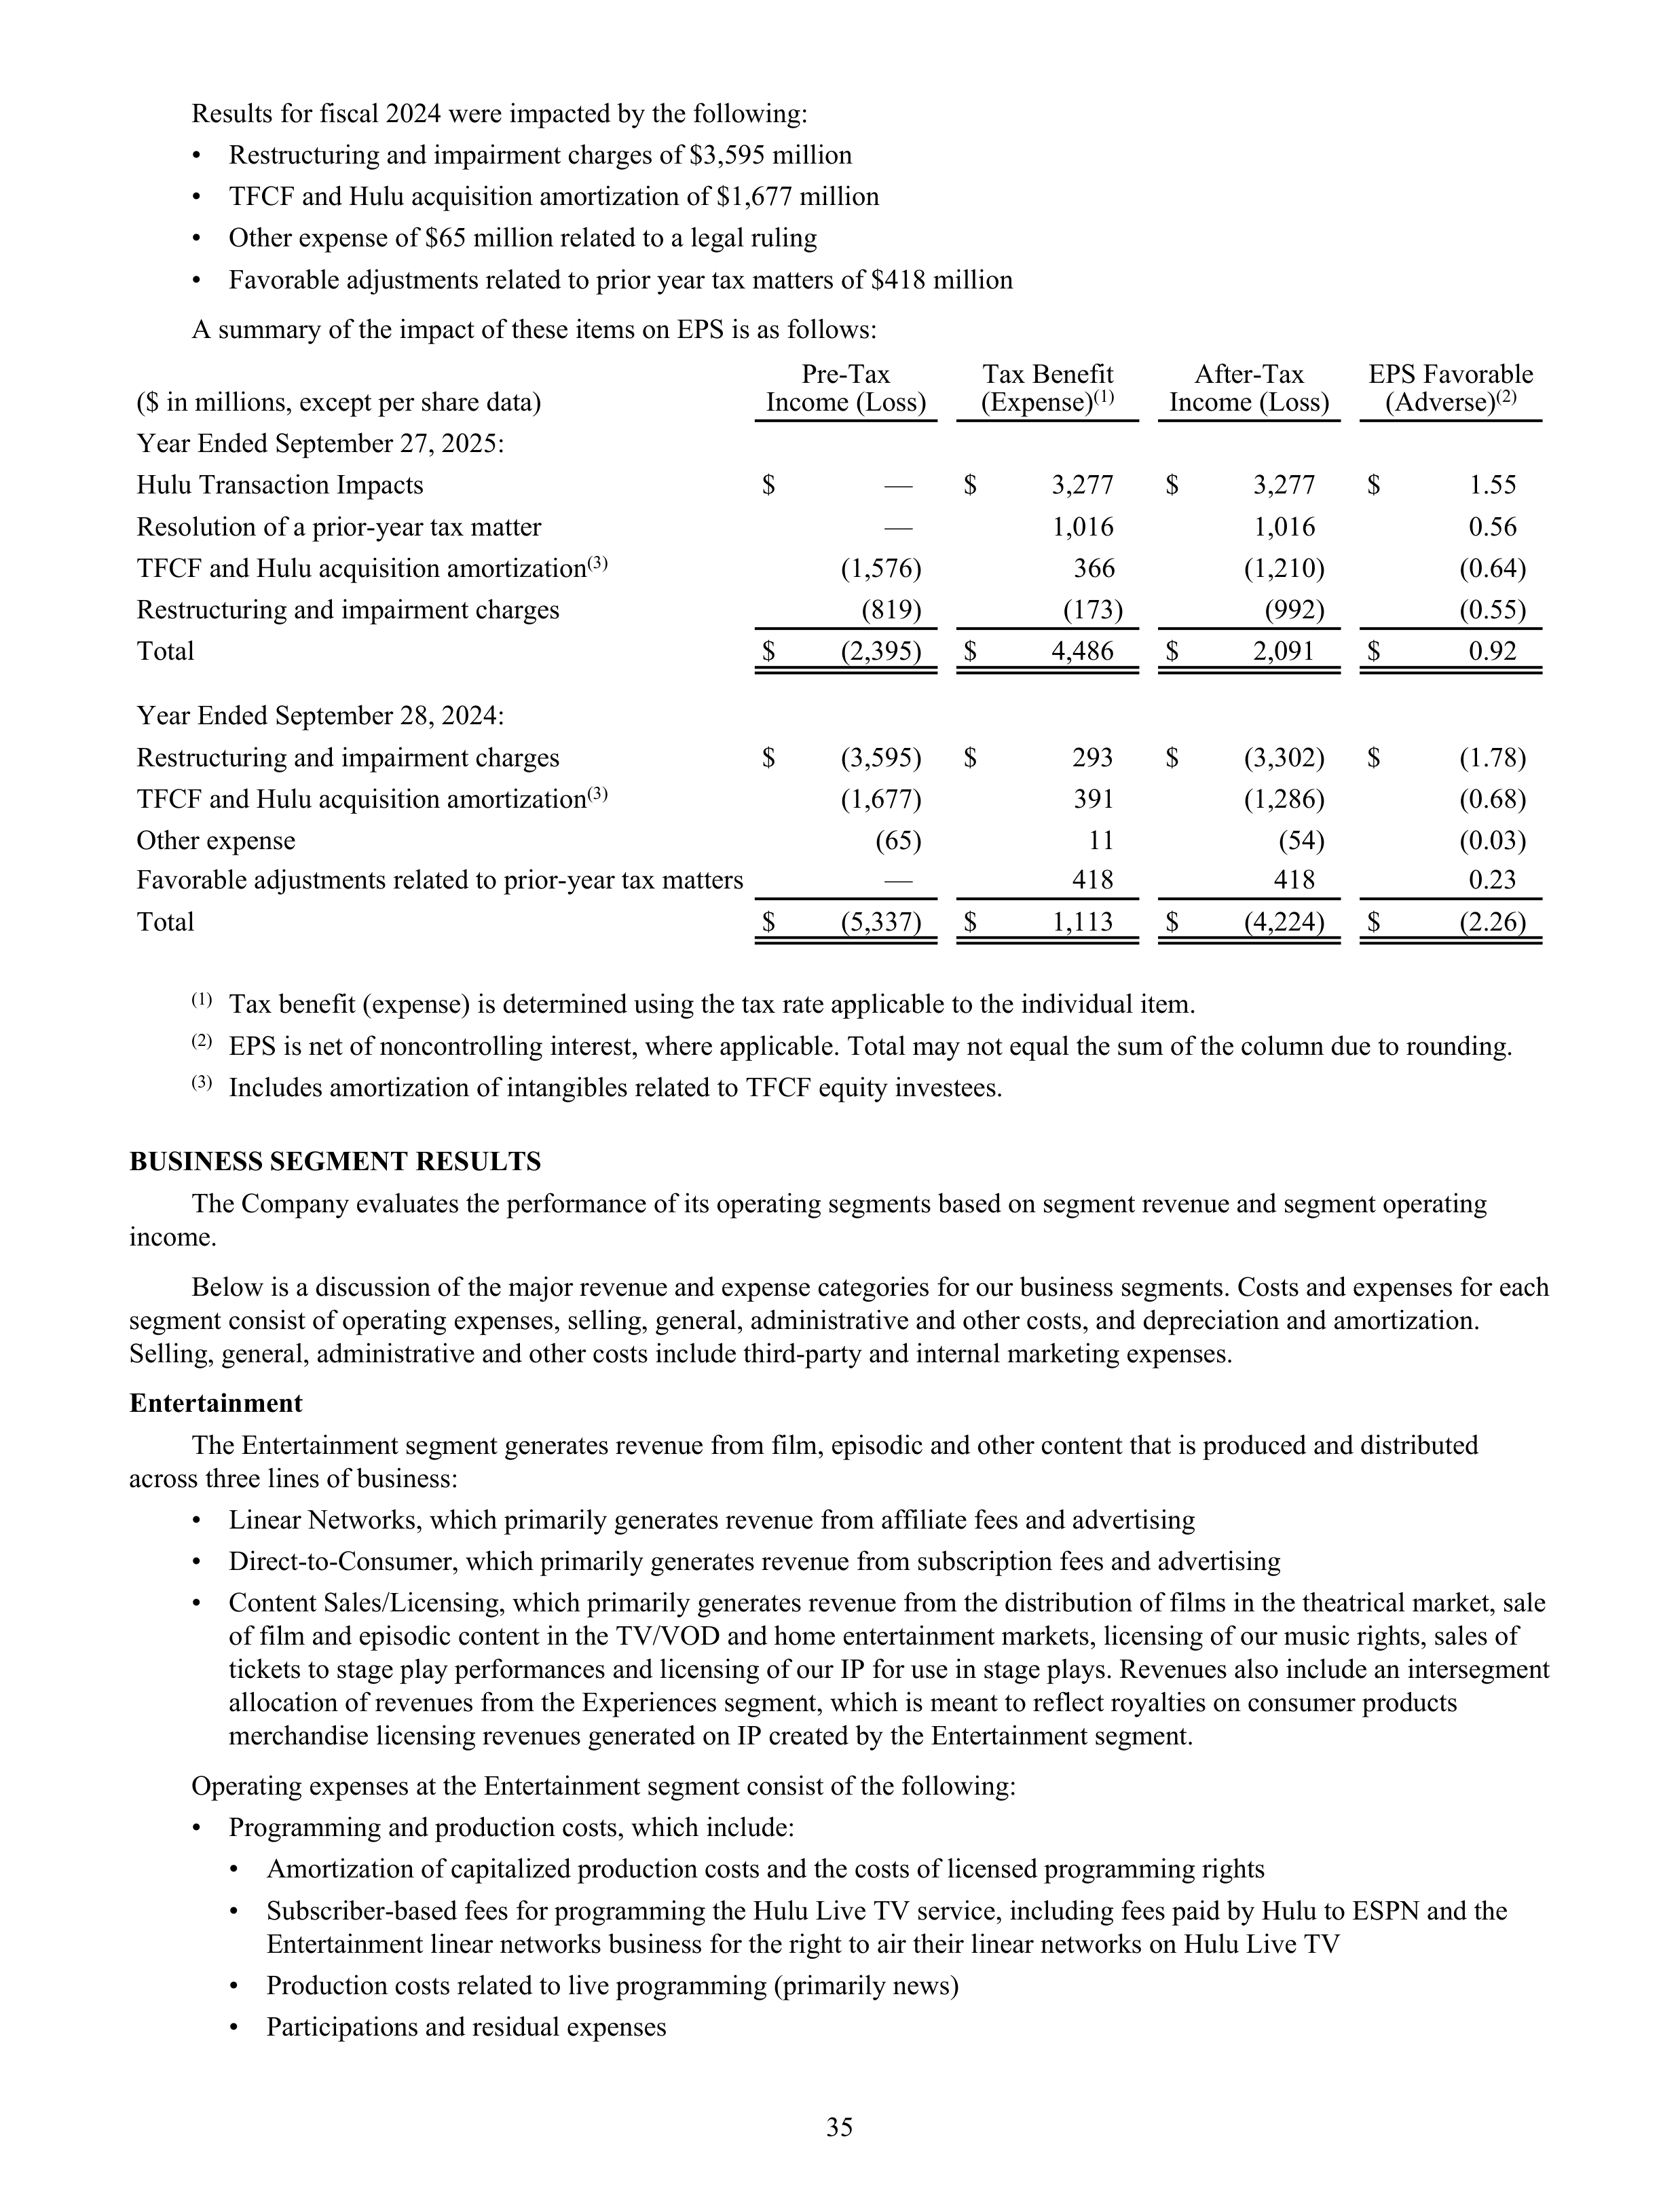
Results for fiscal 2024 were impacted by the following:
•
Restructuring and impairment charges of $3,595 million
•
TFCF and Hulu acquisition amortization of $1,677 million
•
Other expense of $65 million related to a legal ruling
•
Favorable adjustments related to prior year tax matters of $418 million
A summary of the impact of these items on EPS is as follows:
($ in millions, except per share data)
Pre-Tax
Income (Loss)
Tax Benefit
(Expense)
(1)
After-Tax
Income (Loss)
EPS Favorable
(Adverse)
(2)
Year Ended September 27, 2025:
Hulu Transaction Impacts
$
—
$
3,277
$
3,277
$
1.55
Resolution of a prior-year tax matter
—
1,016
1,016
0.56
TFCF and Hulu acquisition amortization
(3)
(1,576)
366
(1,210)
(0.64)
Restructuring and impairment charges
(819)
(173)
(992)
(0.55)
Total
$
(2,395)
$
4,486
$
2,091
$
0.92
Year Ended September 28, 2024:
Restructuring and impairment charges
$
(3,595)
$
293
$
(3,302)
$
(1.78)
TFCF and Hulu acquisition amortization
(3)
(1,677)
391
(1,286)
(0.68)
Other expense
(65)
11
(54)
(0.03)
Favorable adjustments related to prior-year tax matters
—
418
418
0.23
Total
$
(5,337)
$
1,113
$
(4,224)
$
(2.26)
(1)
Tax benefit (expense) is determined using the tax rate applicable to the individual item.
(2)
EPS is net of noncontrolling interest, where applicable. Total may not equal the sum of the column due to rounding.
(3)
Includes amortization of intangibles related to TFCF equity investees.
BUSINESS SEGMENT RESULTS
The Company evaluates the performance of its operating segments based on segment revenue and segment operating
income.
Below is a discussion of the major revenue and expense categories for our business segments. Costs and expenses for each
segment consist of operating expenses, selling, general, administrative and other costs, and depreciation and amortization.
Selling, general, administrative and other costs include third-party and internal marketing expenses.
Entertainment
The Entertainment segment generates revenue from film, episodic and other content that is produced and distributed
across three lines of business:
•
Linear Networks, which primarily generates revenue from affiliate fees and advertising
•
Direct-to-Consumer, which primarily generates revenue from subscription fees and advertising
•
Content Sales/Licensing, which primarily generates revenue from the distribution of films in the theatrical market, sale
of film and episodic content in the TV/VOD and home entertainment markets, licensing of our music rights, sales of
tickets to stage play performances and licensing of our IP for use in stage plays. Revenues also include an intersegment
allocation of revenues from the Experiences segment, which is meant to reflect royalties on consumer products
merchandise licensing revenues generated on IP created by the Entertainment segment.
Operating expenses at the Entertainment segment consist of the following:
•
Programming and production costs, which include:
•
Amortization of capitalized production costs and the costs of licensed programming rights
•
Subscriber-based fees for programming the Hulu Live TV service, including fees paid by Hulu to ESPN and the
Entertainment linear networks business for the right to air their linear networks on Hulu Live TV
•
Production costs related to live programming (primarily news)
•
Participations and residual expenses
35
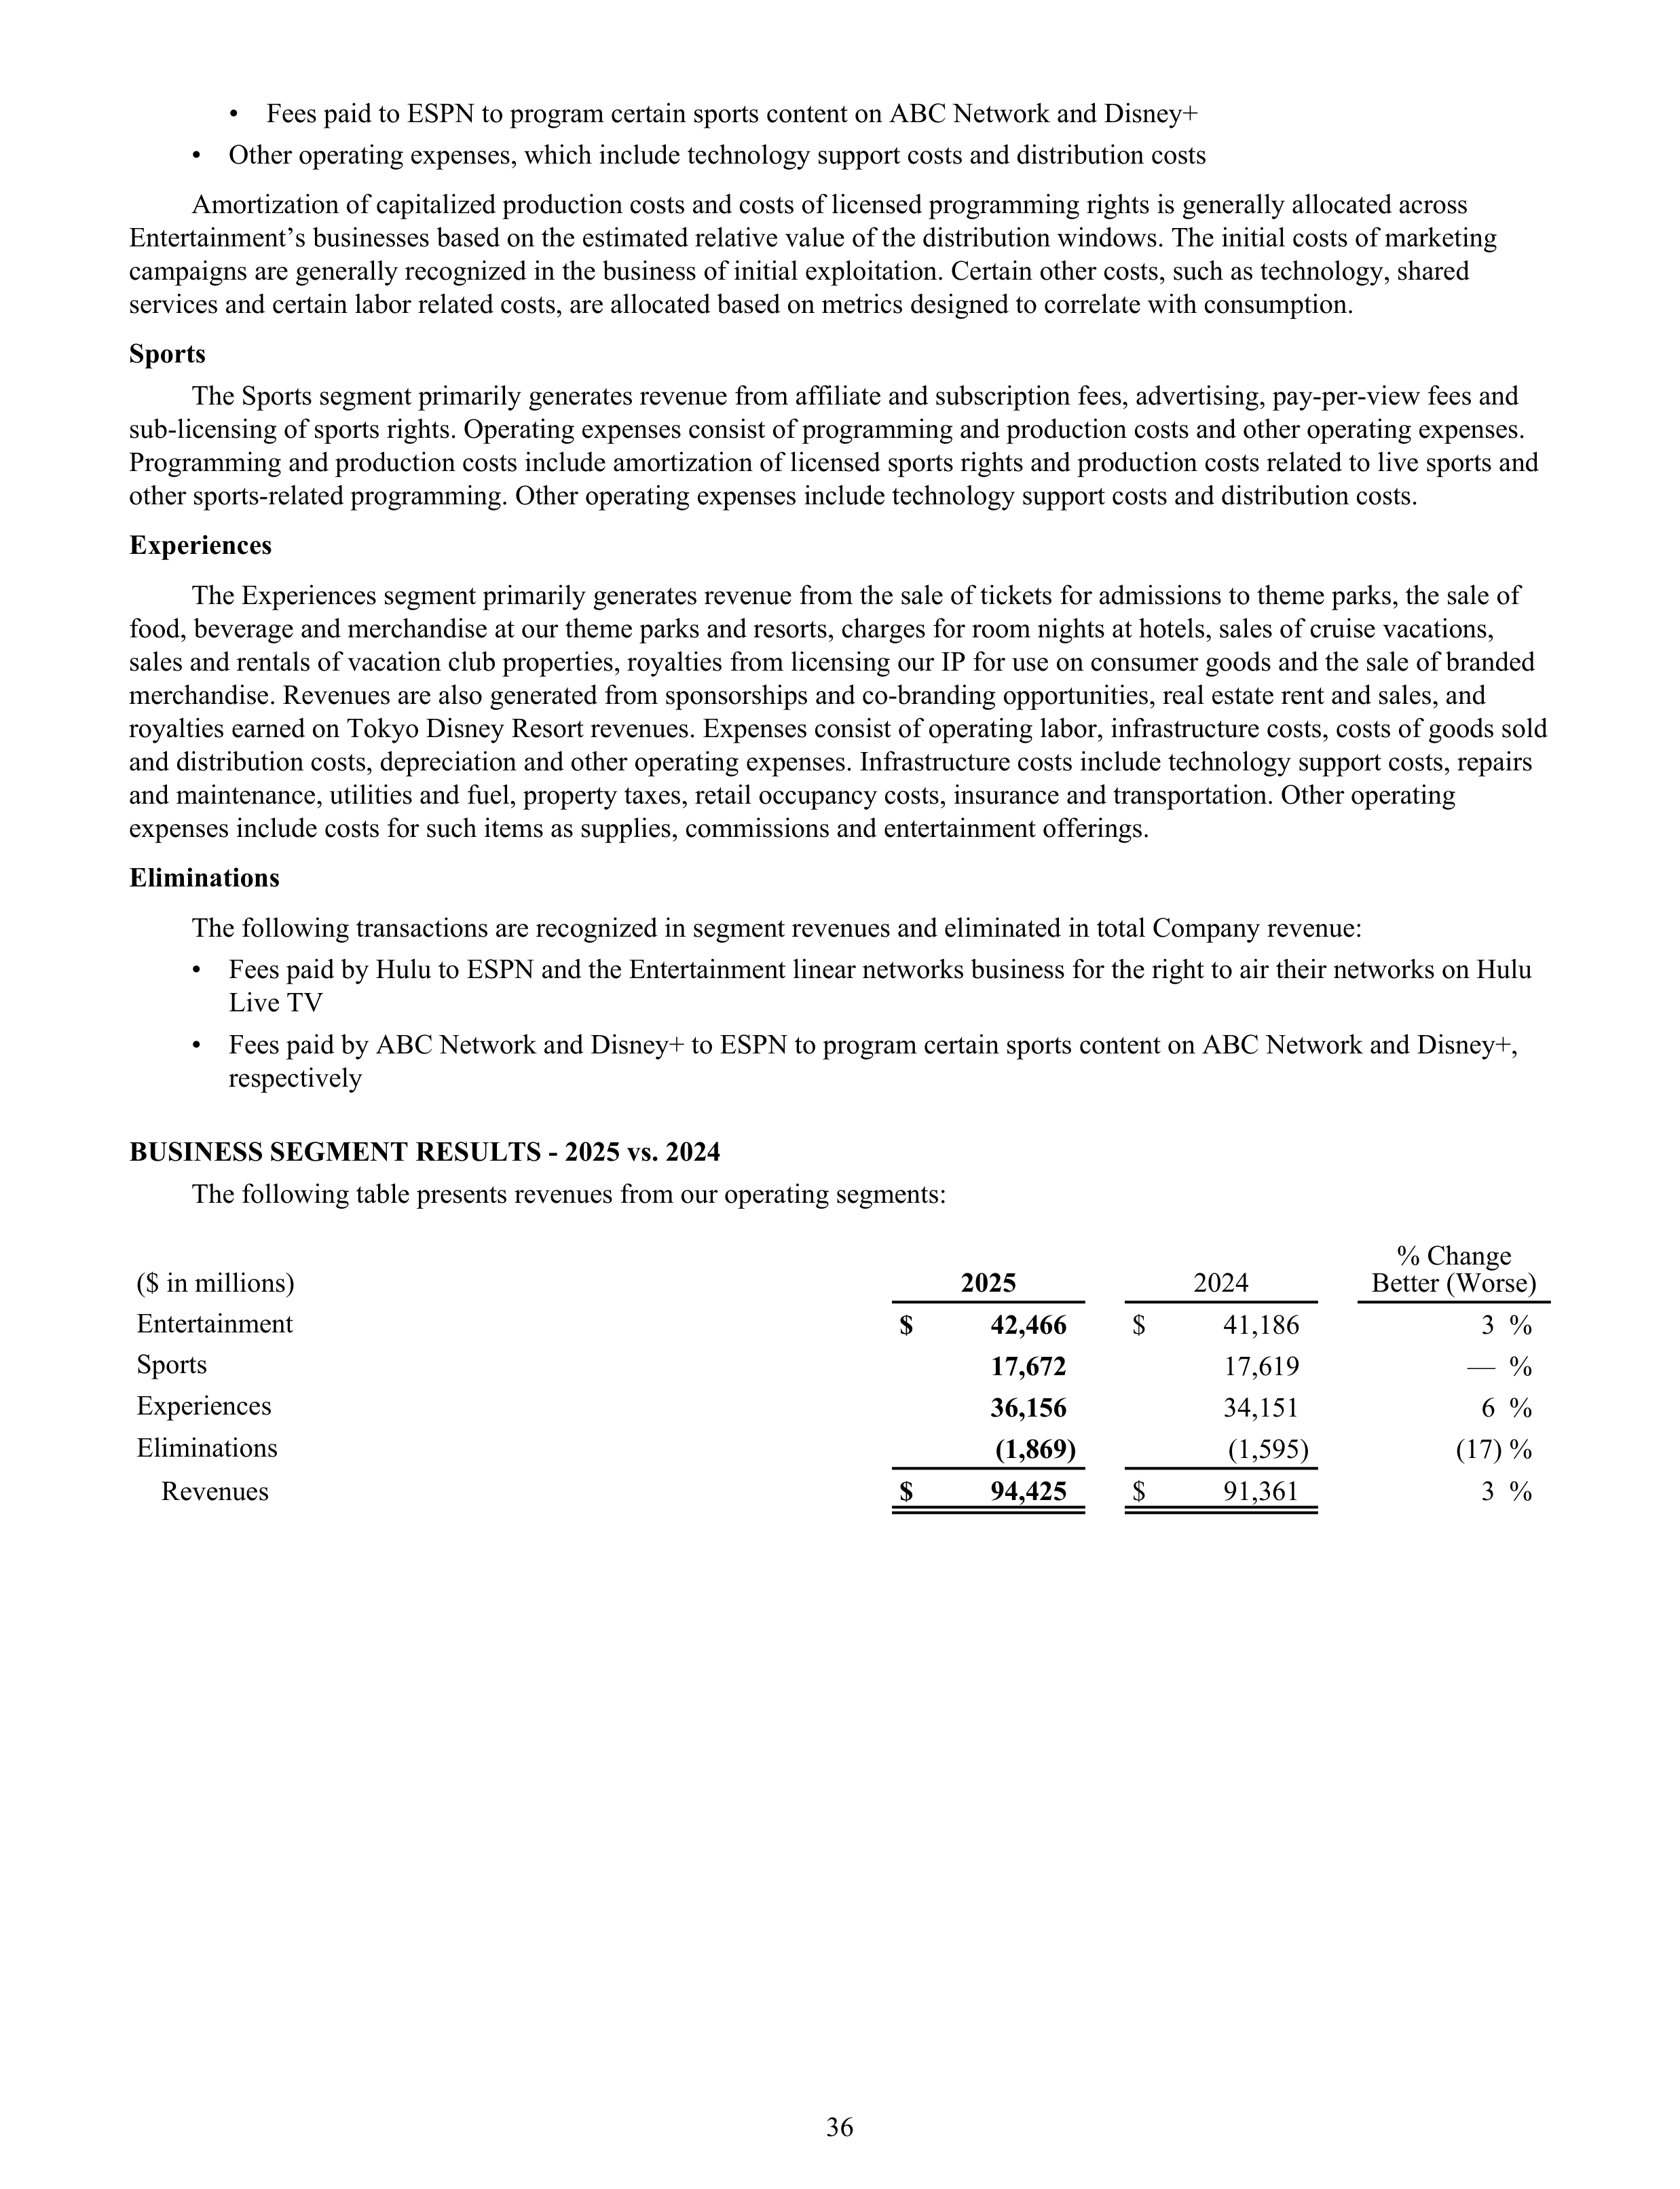
•
Fees paid to ESPN to program certain sports content on ABC Network and Disney+
•
Other operating expenses, which include technology support costs and distribution costs
Amortization of capitalized production costs and costs of licensed programming rights is generally allocated across
Entertainment’s businesses based on the estimated relative value of the distribution windows. The initial costs of marketing
campaigns are generally recognized in the business of initial exploitation. Certain other costs, such as technology, shared
services and certain labor related costs, are allocated based on metrics designed to correlate with consumption.
Sports
The Sports segment primarily generates revenue from affiliate and subscription fees, advertising, pay-per-view fees and
sub-licensing of sports rights. Operating expenses consist of programming and production costs and other operating expenses.
Programming and production costs include amortization of licensed sports rights and production costs related to live sports and
other sports-related programming. Other operating expenses include technology support costs and distribution costs.
Experiences
The Experiences segment primarily generates revenue from the sale of tickets for admissions to theme parks, the sale of
food, beverage and merchandise at our theme parks and resorts, charges for room nights at hotels, sales of cruise vacations,
sales and rentals of vacation club properties, royalties from licensing our IP for use on consumer goods and the sale of branded
merchandise. Revenues are also generated from sponsorships and co-branding opportunities, real estate rent and sales, and
royalties earned on Tokyo Disney Resort revenues. Expenses consist of operating labor, infrastructure costs, costs of goods sold
and distribution costs, depreciation and other operating expenses. Infrastructure costs include technology support costs, repairs
and maintenance, utilities and fuel, property taxes, retail occupancy costs, insurance and transportation. Other operating
expenses include costs for such items as supplies, commissions and entertainment offerings.
Eliminations
The following transactions are recognized in segment revenues and eliminated in total Company revenue:
•
Fees paid by Hulu to ESPN and the Entertainment linear networks business for the right to air their networks on Hulu
Live TV
•
Fees paid by ABC Network and Disney+ to ESPN to program certain sports content on ABC Network and Disney+,
respectively
BUSINESS SEGMENT RESULTS - 2025 vs. 2024
The following table presents revenues from our operating segments:
($ in millions)
2025
2024
% Change
Better (Worse)
Entertainment
$
42,466
$
41,186
3 %
Sports
17,672
17,619
— %
Experiences
36,156
34,151
6 %
Eliminations
(1,869)
(1,595)
(17) %
Revenues
$
94,425
$
91,361
3 %
36
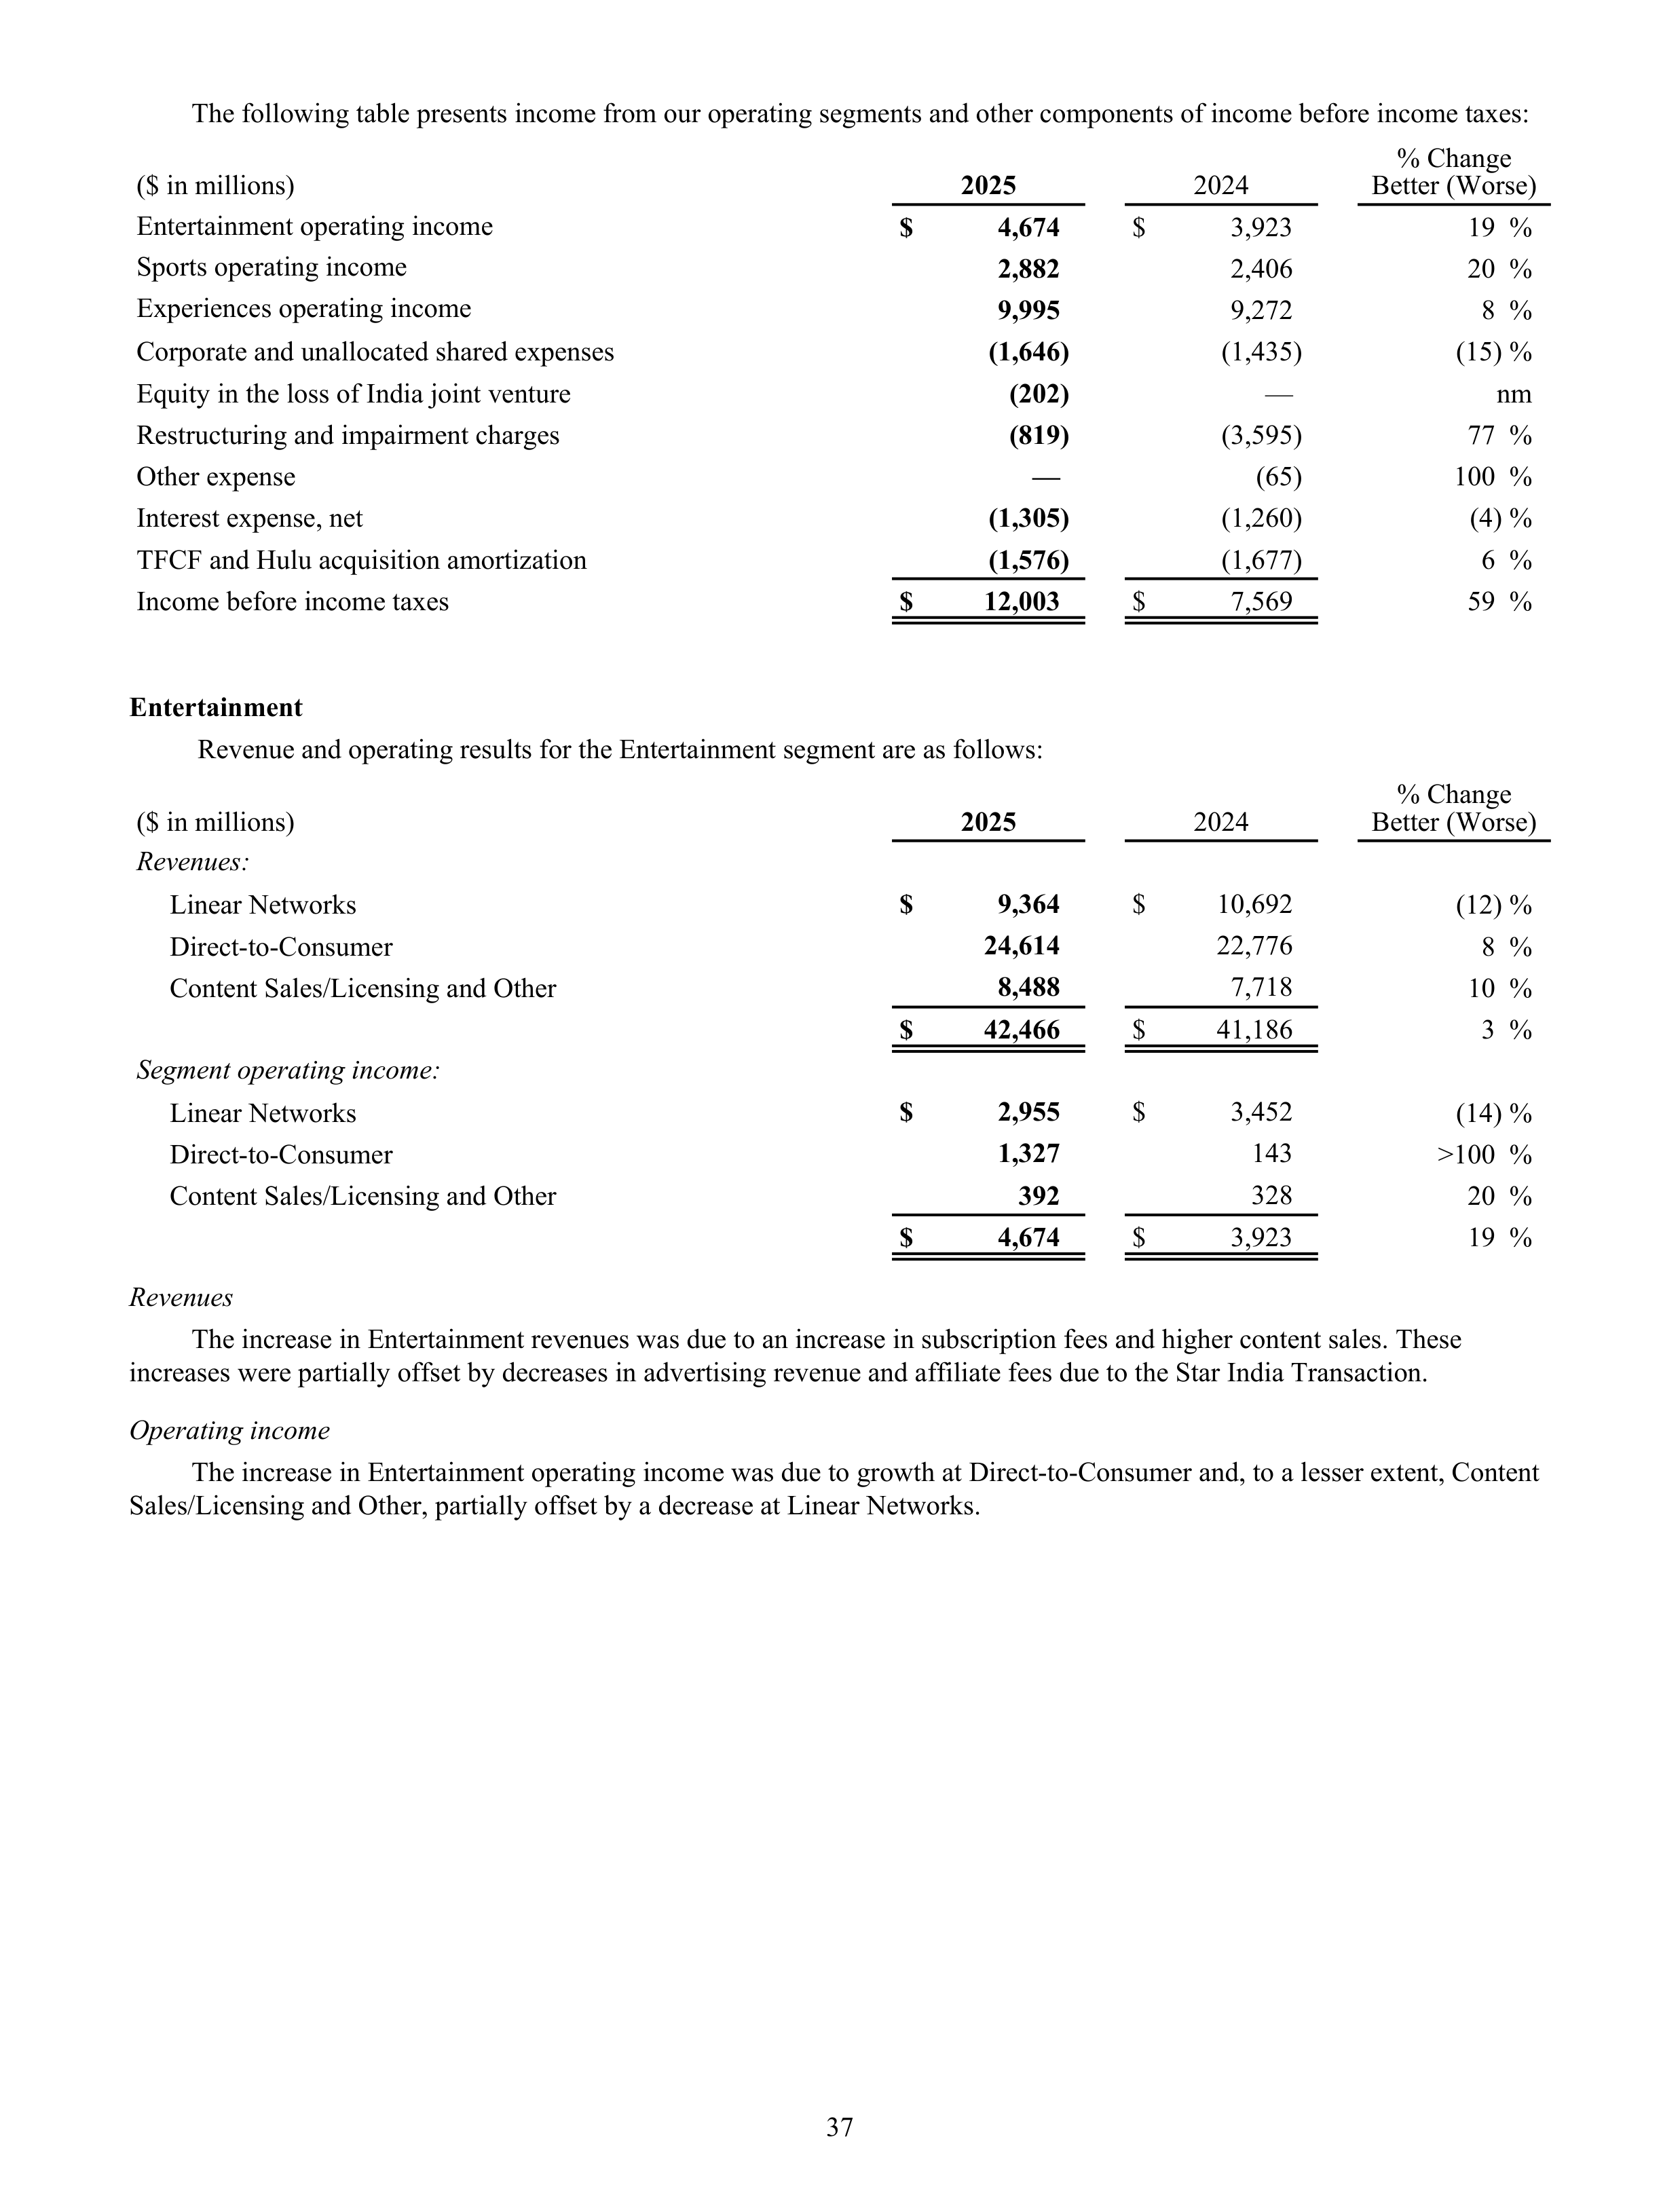
The following table presents income from our operating segments and other components of income before income taxes:
($ in millions)
2025
2024
% Change
Better (Worse)
Entertainment operating income
$
4,674
$
3,923
19 %
Sports operating income
2,882
2,406
20 %
Experiences operating income
9,995
9,272
8 %
Corporate and unallocated shared expenses
(1,646)
(1,435)
(15) %
Equity in the loss of India joint venture
(202)
—
nm
Restructuring and impairment charges
(819)
(3,595)
77 %
Other expense
—
(65)
100 %
Interest expense, net
(1,305)
(1,260)
(4) %
TFCF and Hulu acquisition amortization
(1,576)
(1,677)
6 %
Income before income taxes
$
12,003
$
7,569
59 %
Entertainment
Revenue and operating results for the Entertainment segment are as follows:
($ in millions)
2025
2024
% Change
Better (Worse)
Revenues:
Linear Networks
$
9,364
$
10,692
(12) %
Direct-to-Consumer
24,614
22,776
8 %
Content Sales/Licensing and Other
8,488
7,718
10 %
$
42,466
$
41,186
3 %
Segment operating income:
Linear Networks
$
2,955
$
3,452
(14) %
Direct-to-Consumer
1,327
143
>100 %
Content Sales/Licensing and Other
392
328
20 %
$
4,674
$
3,923
19 %
Revenues
The increase in Entertainment revenues was due to an increase in subscription fees and higher content sales. These
increases were partially offset by decreases in advertising revenue and affiliate fees due to the Star India Transaction.
Operating income
The increase in Entertainment operating income was due to growth at Direct-to-Consumer and, to a lesser extent, Content
Sales/Licensing and Other, partially offset by a decrease at Linear Networks.
37
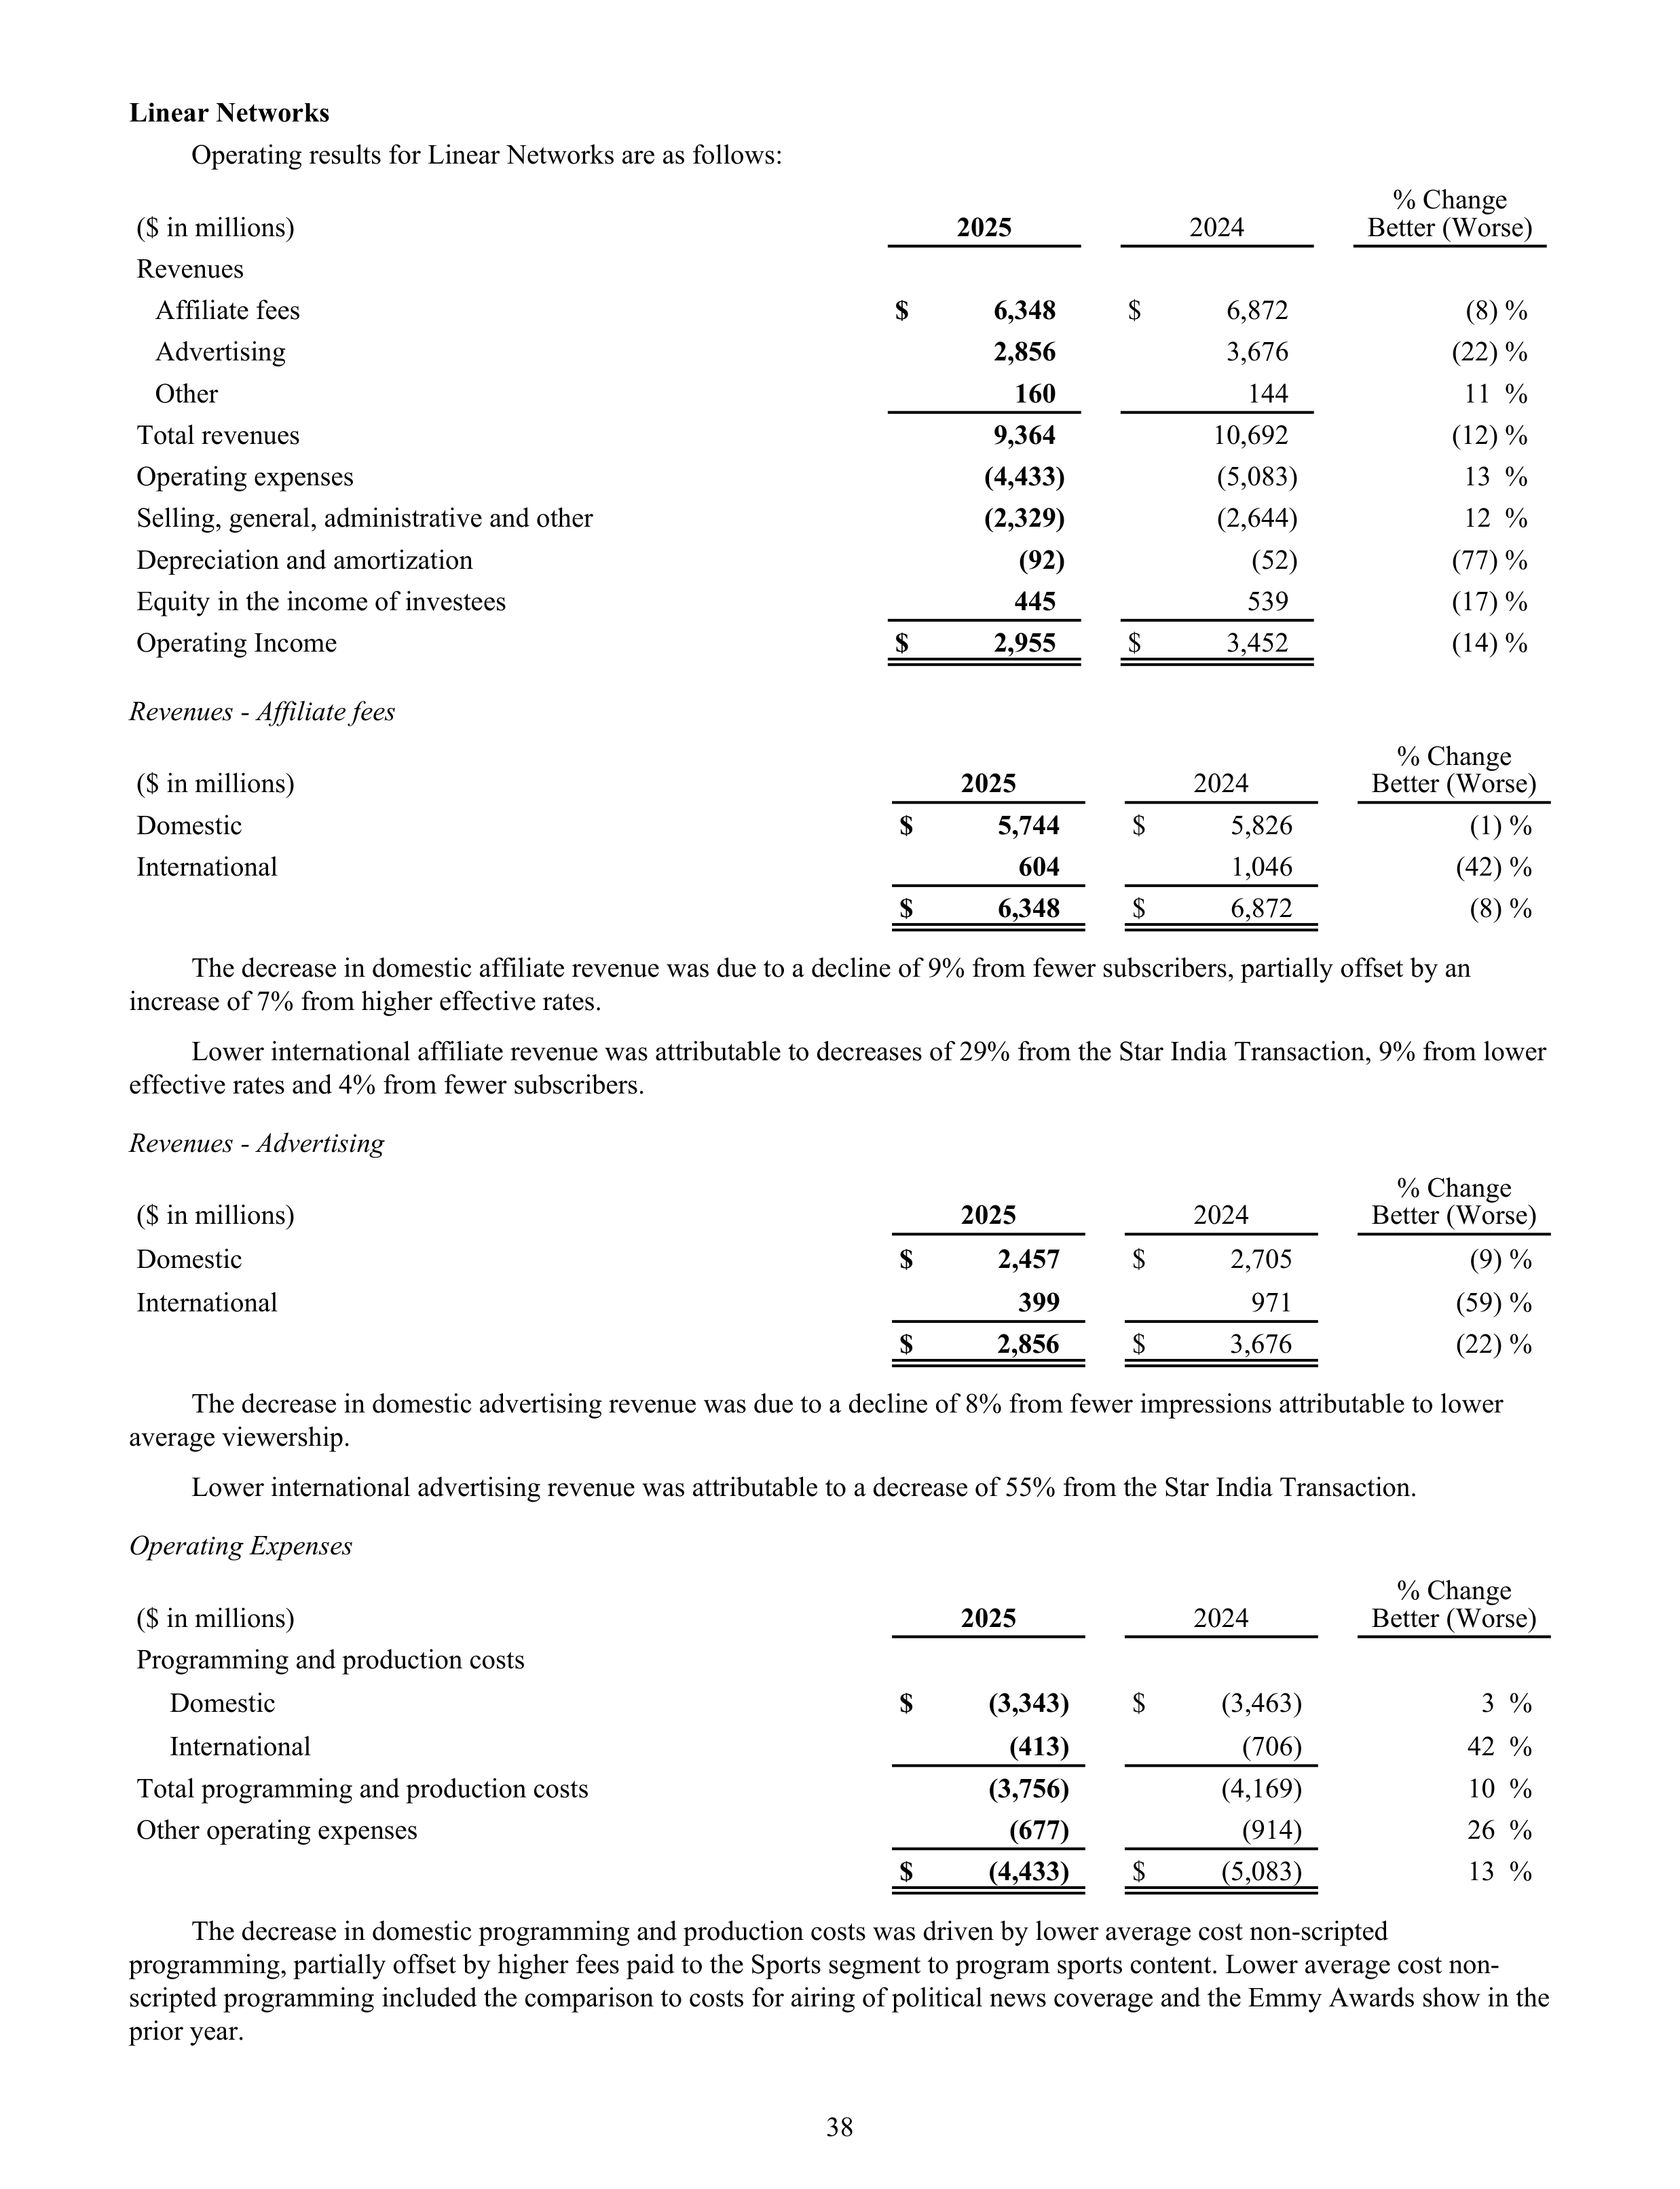
Linear Networks
Operating results for Linear Networks are as follows:
($ in millions)
2025
2024
% Change
Better (Worse)
Revenues
Affiliate fees
$
6,348
$
6,872
(8) %
Advertising
2,856
3,676
(22) %
Other
160
144
11 %
Total revenues
9,364
10,692
(12) %
Operating expenses
(4,433)
(5,083)
13 %
Selling, general, administrative and other
(2,329)
(2,644)
12 %
Depreciation and amortization
(92)
(52)
(77) %
Equity in the income of investees
445
539
(17) %
Operating Income
$
2,955
$
3,452
(14) %
Revenues - Affiliate fees
% Change
Better (Worse)
($ in millions)
2025
2024
Domestic
$
5,744
$
5,826
(1) %
International
604
1,046
(42) %
$
6,348
$
6,872
(8) %
The decrease in domestic affiliate revenue was due to a decline of 9% from fewer subscribers, partially offset by an
increase of 7% from higher effective rates.
Lower international affiliate revenue was attributable to decreases of 29% from the Star India Transaction, 9% from lower
effective rates and 4% from fewer subscribers.
Revenues - Advertising
% Change
Better (Worse)
($ in millions)
2025
2024
Domestic
$
2,457
$
2,705
(9) %
International
399
971
(59) %
$
2,856
$
3,676
(22) %
The decrease in domestic advertising revenue was due to a decline of 8% from fewer impressions attributable to lower
average viewership.
Lower international advertising revenue was attributable to a decrease of 55% from the Star India Transaction.
Operating Expenses
% Change
Better (Worse)
($ in millions)
2025
2024
Programming and production costs
Domestic
$
(3,343)
$
(3,463)
3 %
International
(413)
(706)
42 %
Total programming and production costs
(3,756)
(4,169)
10 %
Other operating expenses
(677)
(914)
26 %
$
(4,433)
$
(5,083)
13 %
The decrease in domestic programming and production costs was driven by lower average cost non-scripted
programming, partially offset by higher fees paid to the Sports segment to program sports content. Lower average cost non-
scripted programming included the comparison to costs for airing of political news coverage and the Emmy Awards show in the
prior year.
38
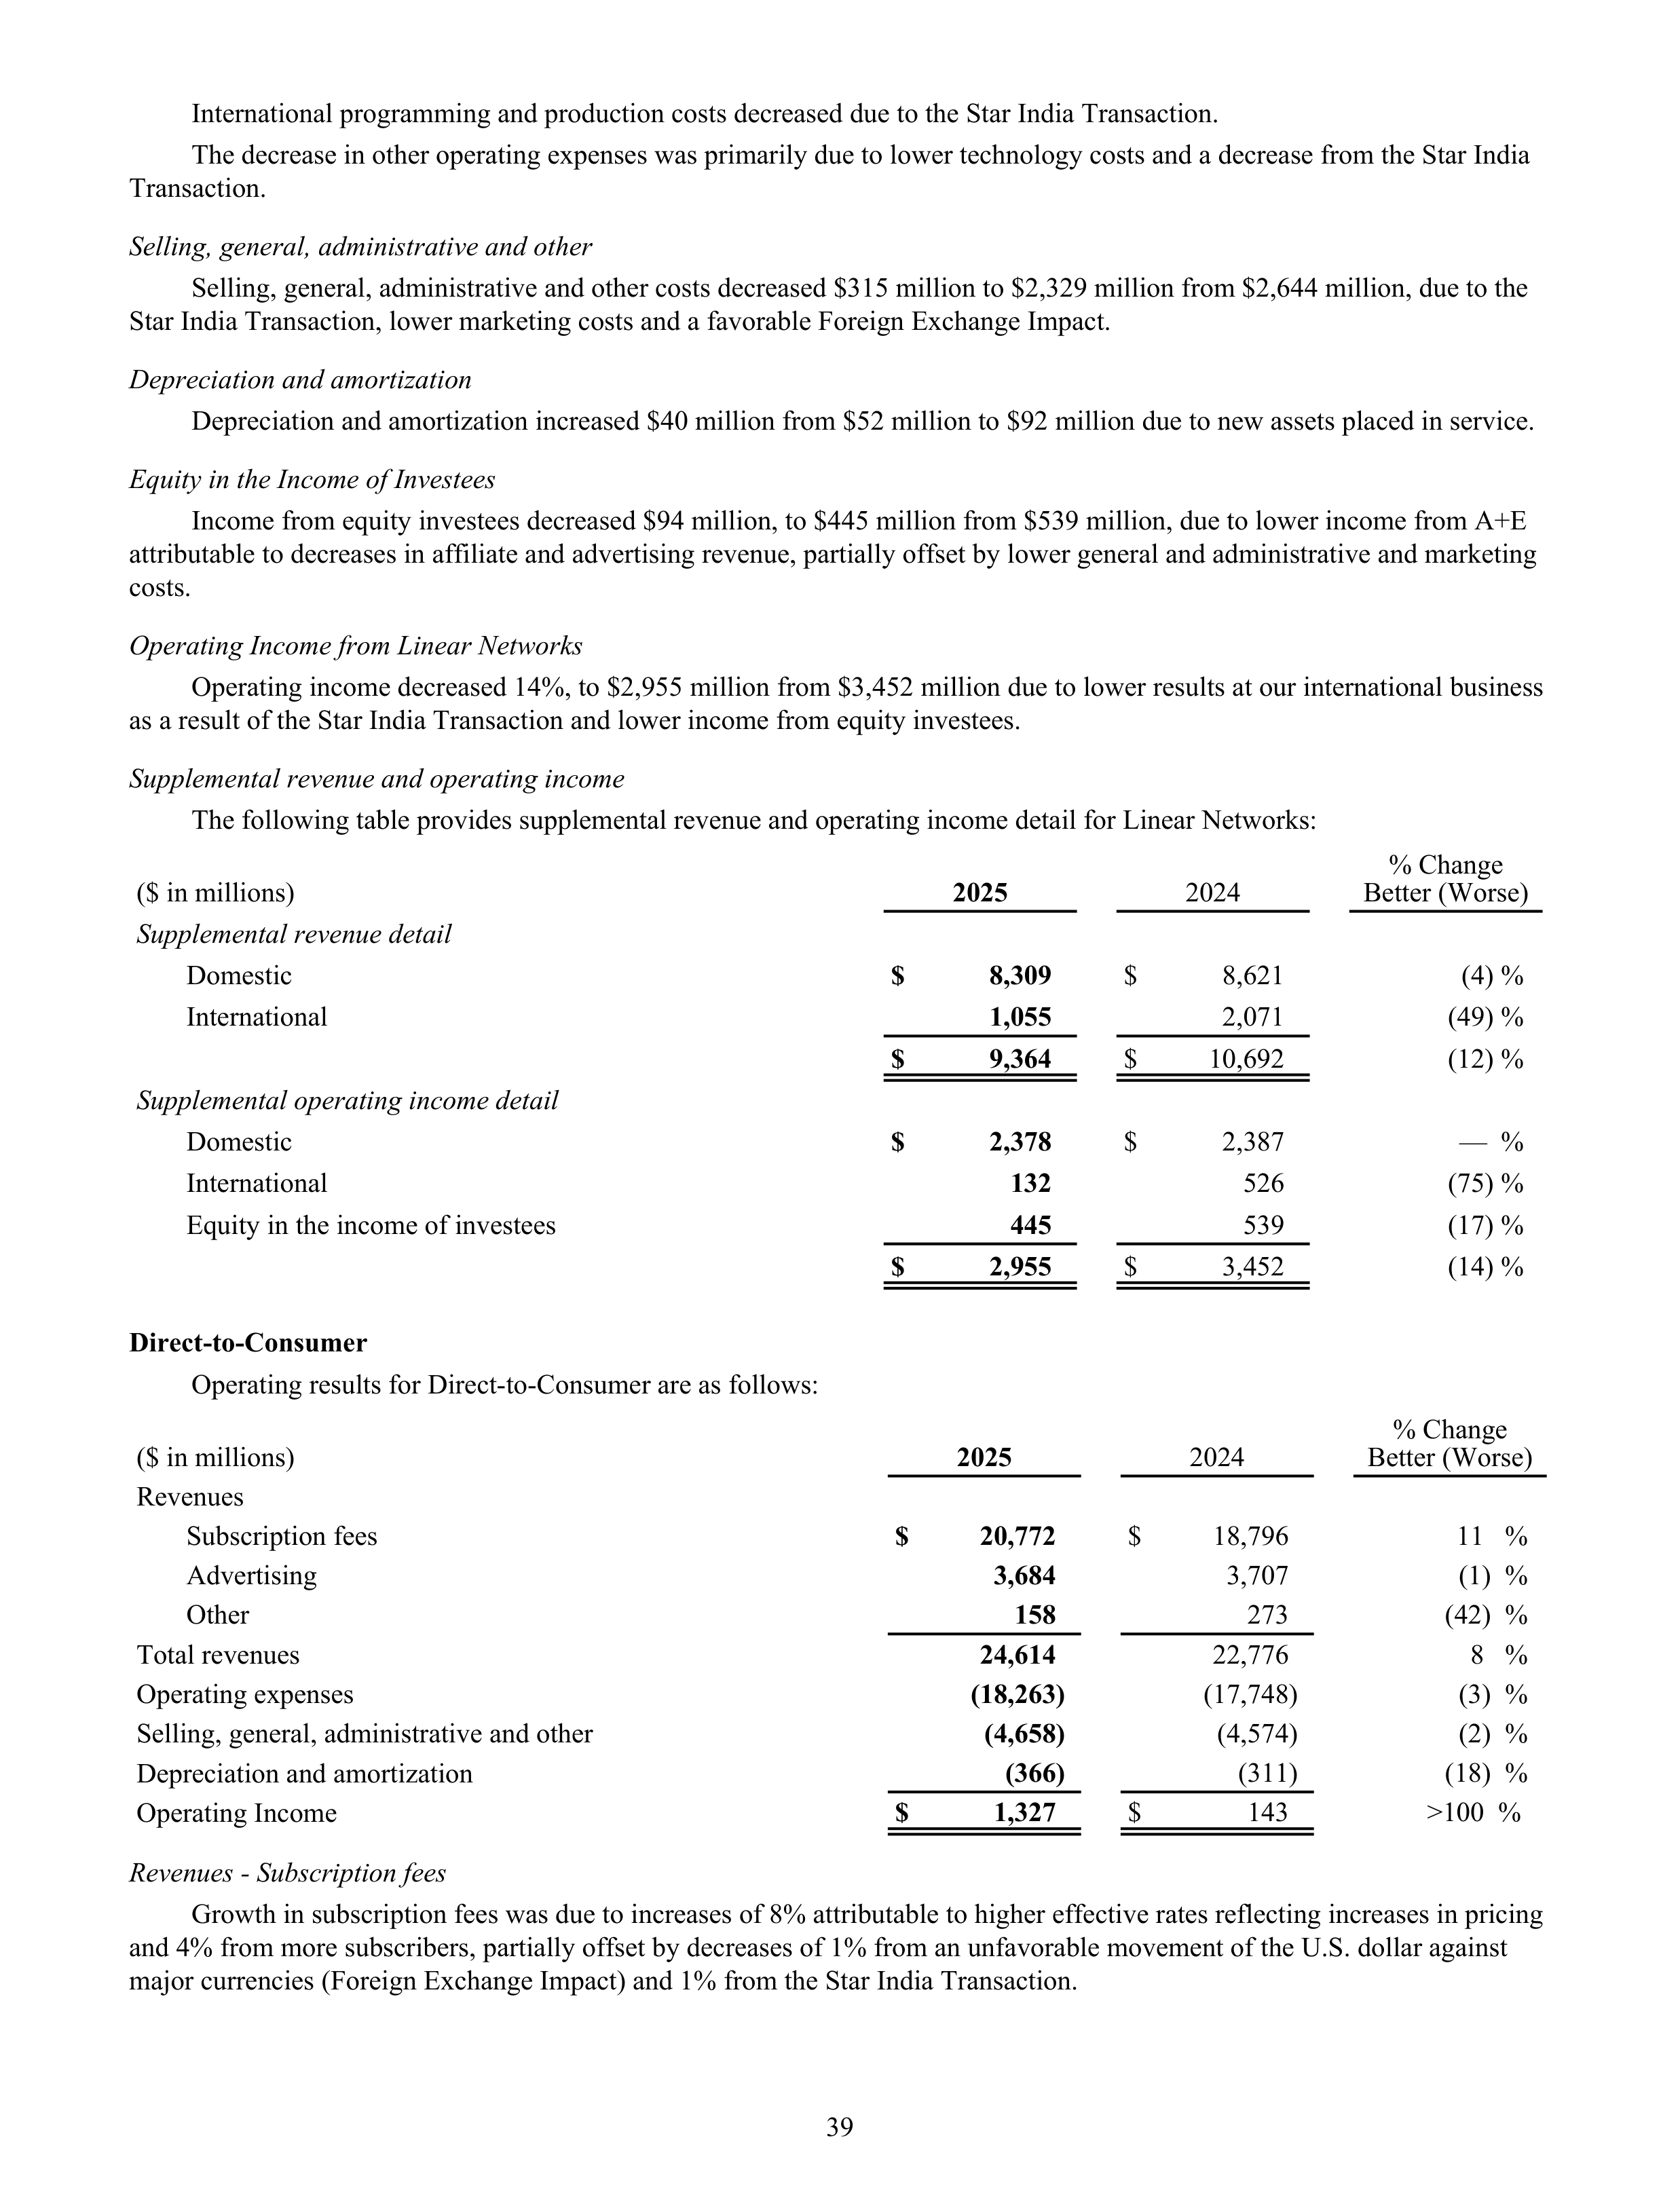
International programming and production costs decreased due to the Star India Transaction.
The decrease in other operating expenses was primarily due to lower technology costs and a decrease from the Star India
Transaction.
Selling, general, administrative and other
Selling, general, administrative and other costs decreased $315 million to $2,329 million from $2,644 million, due to the
Star India Transaction, lower marketing costs and a favorable Foreign Exchange Impact.
Depreciation and amortization
Depreciation and amortization increased $40 million from $52 million to $92 million due to new assets placed in service.
Equity in the Income of Investees
Income from equity investees decreased $94 million, to $445 million from $539 million, due to lower income from A+E
attributable to decreases in affiliate and advertising revenue, partially offset by lower general and administrative and marketing
costs.
Operating Income from Linear Networks
Operating income decreased 14%, to $2,955 million from $3,452 million due to lower results at our international business
as a result of the Star India Transaction and lower income from equity investees.
Supplemental revenue and operating income
The following table provides supplemental revenue and operating income detail for Linear Networks:
% Change
Better (Worse)
($ in millions)
2025
2024
Supplemental revenue detail
Domestic
$
8,309
$
8,621
(4) %
International
1,055
2,071
(49) %
$
9,364
$
10,692
(12) %
Supplemental operating income detail
Domestic
$
2,378
$
2,387
— %
International
132
526
(75) %
Equity in the income of investees
445
539
(17) %
$
2,955
$
3,452
(14) %
Direct-to-Consumer
Operating results for Direct-to-Consumer are as follows:
% Change
Better (Worse)
($ in millions)
2025
2024
Revenues
Subscription fees
$
20,772
$
18,796
11 %
Advertising
3,684
3,707
(1)
%
Other
158
273
(42)
%
Total revenues
24,614
22,776
8 %
Operating expenses
(18,263)
(17,748)
(3)
%
Selling, general, administrative and other
(4,658)
(4,574)
(2)
%
Depreciation and amortization
(366)
(311)
(18)
%
Operating Income
$
1,327
$
143
>100 %
Revenues - Subscription fees
Growth in subscription fees was due to increases of 8% attributable to higher effective rates reflecting increases in pricing
and 4% from more subscribers, partially offset by decreases of 1% from an unfavorable movement of the U.S. dollar against
major currencies (Foreign Exchange Impact) and 1% from the Star India Transaction.
39
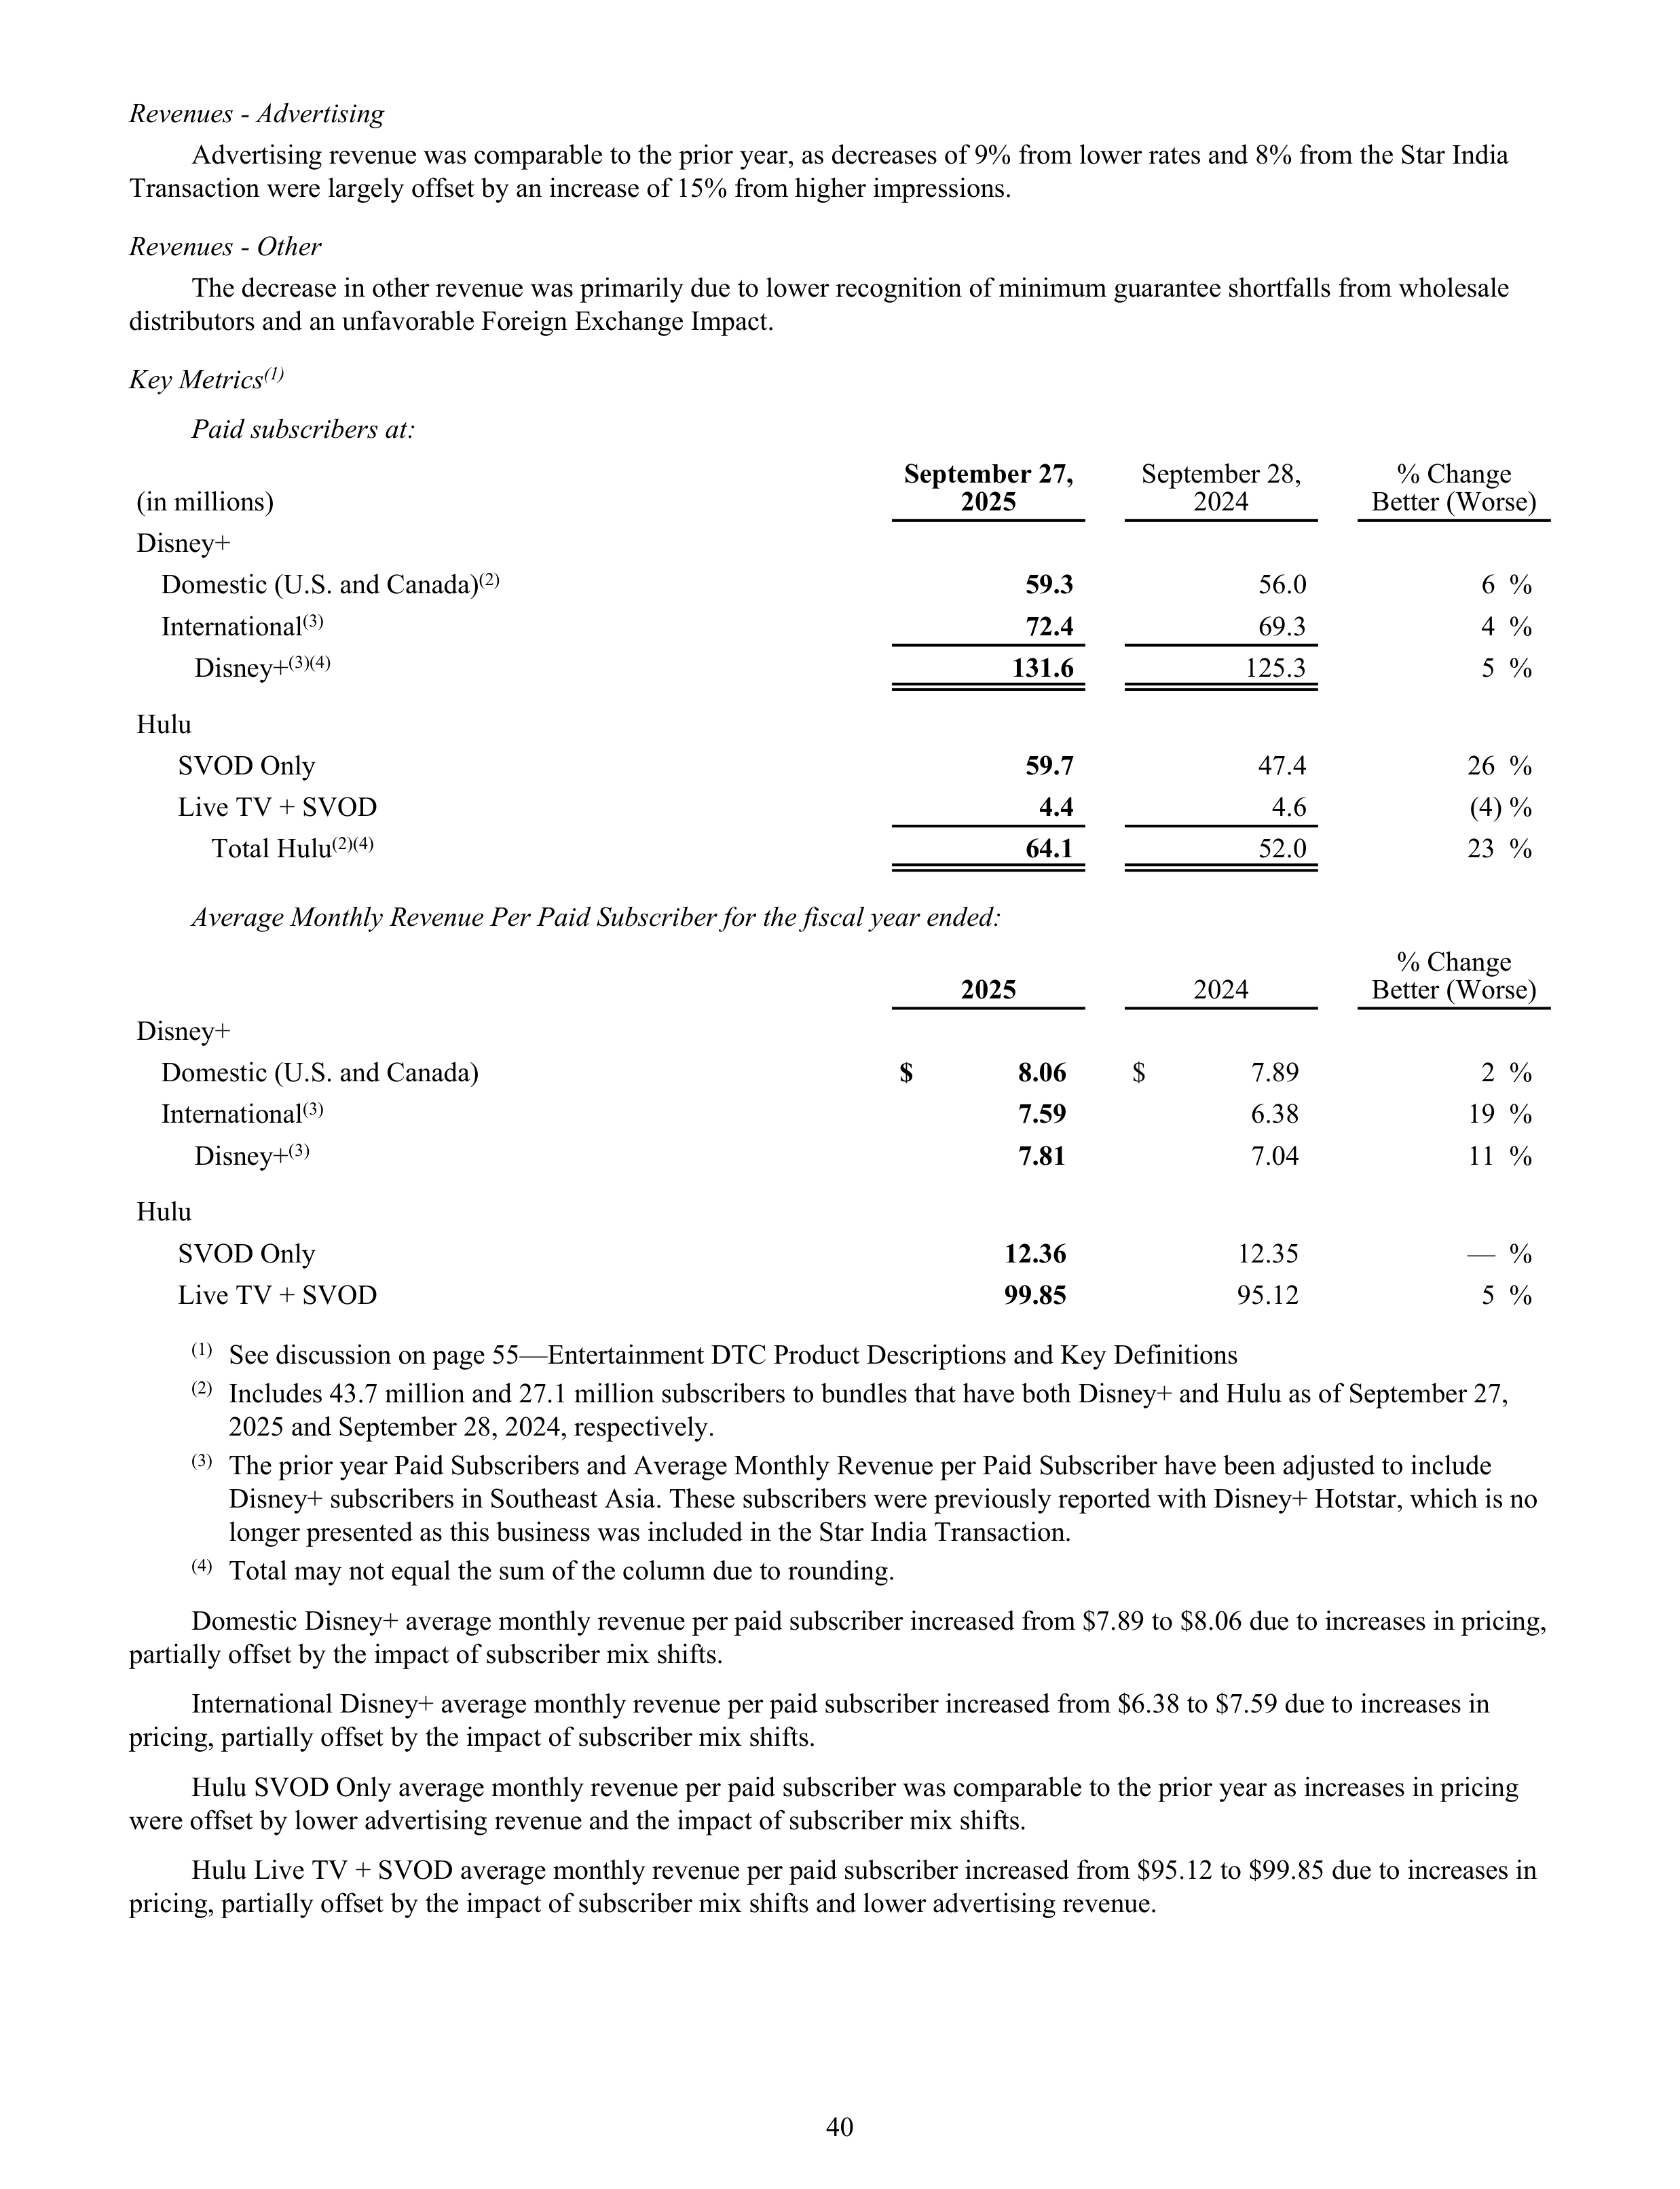
Revenues - Advertising
Advertising revenue was comparable to the prior year, as decreases of 9% from lower rates and 8% from the Star India
Transaction were largely offset by an increase of 15% from higher impressions.
Revenues - Other
The decrease in other revenue was primarily due to lower recognition of minimum guarantee shortfalls from wholesale
distributors and an unfavorable Foreign Exchange Impact.
Key Metrics
(1)
Paid subscribers at:
(in millions)
September 27,
2025
September 28,
2024
% Change
Better (Worse)
Disney+
Domestic (U.S. and Canada)
(2)
59.3
56.0
6 %
International
(3)
72.4
69.3
4 %
Disney+
(3)(4)
131.6
125.3
5 %
Hulu
SVOD Only
59.7
47.4
26 %
Live TV + SVOD
4.4
4.6
(4) %
Total Hulu
(2)(4)
64.1
52.0
23 %
Average Monthly Revenue Per Paid Subscriber for the fiscal year ended:
2025
2024
% Change
Better (Worse)
Disney+
Domestic (U.S. and Canada)
$
8.06
$
7.89
2 %
International
(3)
7.59
6.38
19 %
Disney+
(3)
7.81
7.04
11 %
Hulu
SVOD Only
12.36
12.35
— %
Live TV + SVOD
99.85
95.12
5 %
(1)
See discussion on page 55—Entertainment DTC Product Descriptions and Key Definitions
(2)
Includes 43.7 million and 27.1 million subscribers to bundles that have both Disney+ and Hulu as of September 27,
2025 and September 28, 2024, respectively.
(3)
The prior year Paid Subscribers and Average Monthly Revenue per Paid Subscriber have been adjusted to include
Disney+ subscribers in Southeast Asia. These subscribers were previously reported with Disney+ Hotstar, which is no
longer presented as this business was included in the Star India Transaction.
(4)
Total may not equal the sum of the column due to rounding.
Domestic Disney+ average monthly revenue per paid subscriber increased from $7.89 to $8.06 due to increases in pricing,
partially offset by the impact of subscriber mix shifts.
International Disney+ average monthly revenue per paid subscriber increased from $6.38 to $7.59 due to increases in
pricing, partially offset by the impact of subscriber mix shifts.
Hulu SVOD Only average monthly revenue per paid subscriber was comparable to the prior year as increases in pricing
were offset by lower advertising revenue and the impact of subscriber mix shifts.
Hulu Live TV + SVOD average monthly revenue per paid subscriber increased from $95.12 to $99.85 due to increases in
pricing, partially offset by the impact of subscriber mix shifts and lower advertising revenue.
40
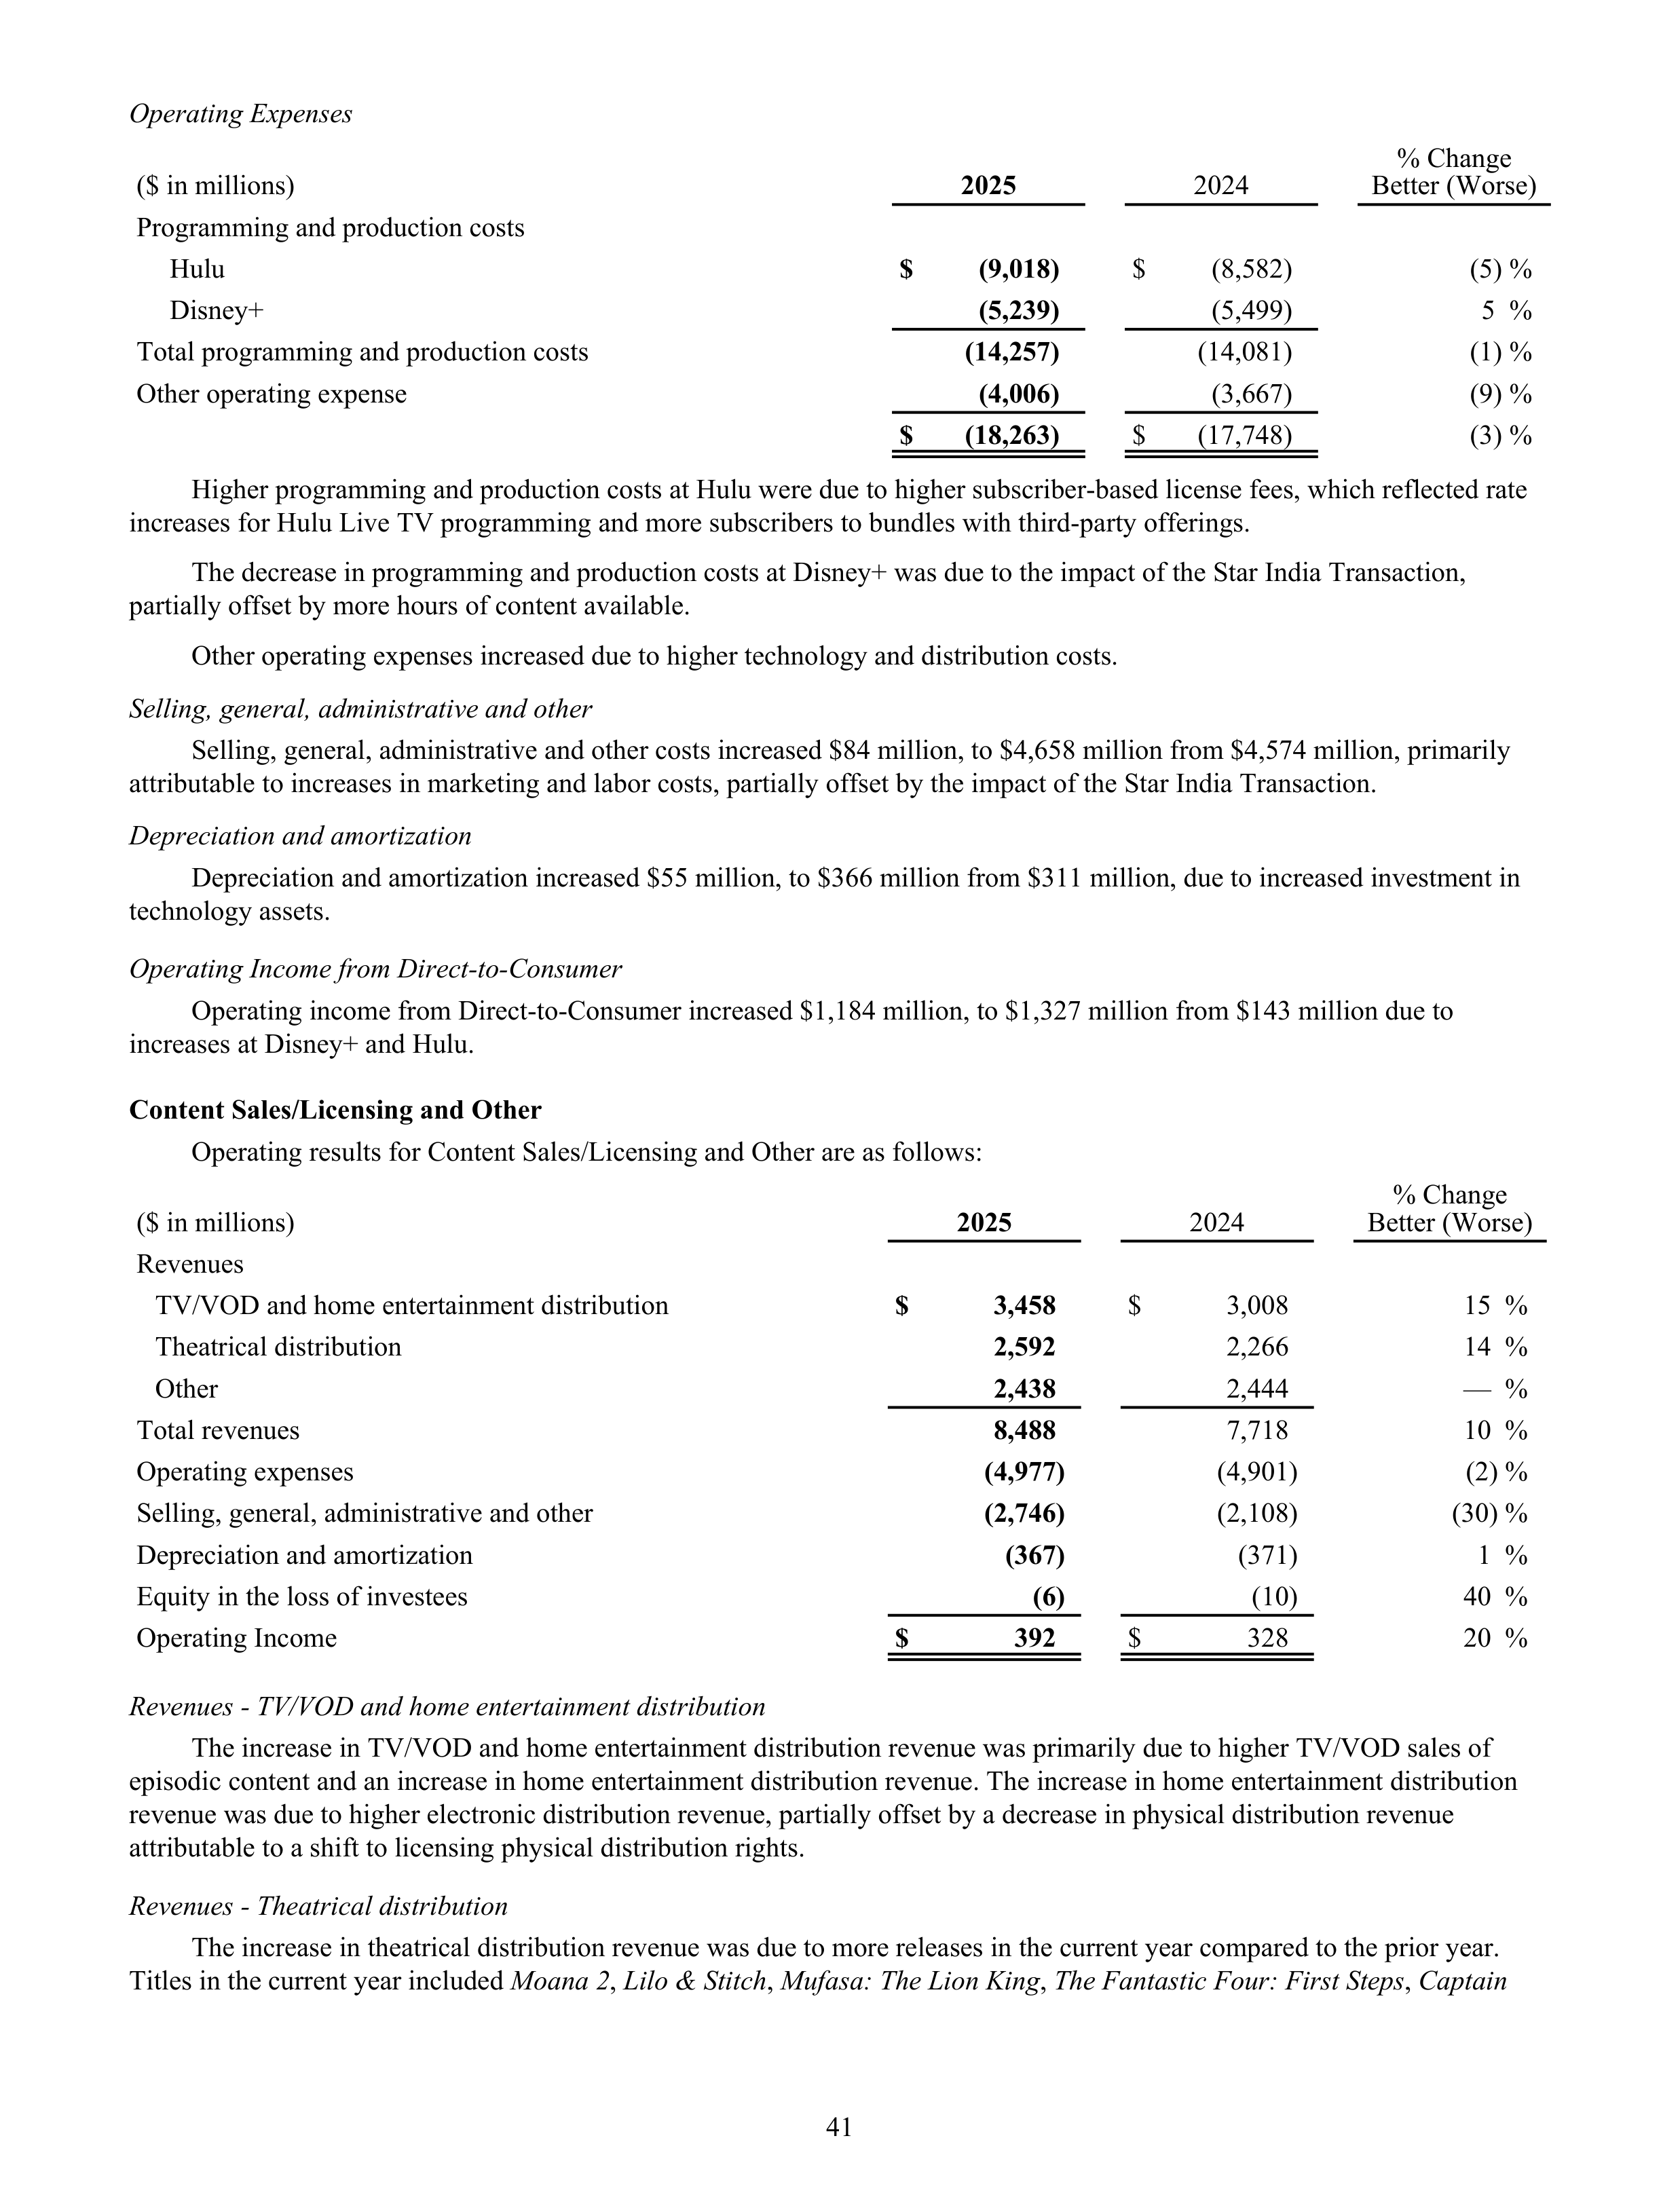
Operating Expenses
($ in millions)
2025
2024
% Change
Better (Worse)
Programming and production costs
Hulu
$
(9,018)
$
(8,582)
(5) %
Disney+
(5,239)
(5,499)
5 %
Total programming and production costs
(14,257)
(14,081)
(1) %
Other operating expense
(4,006)
(3,667)
(9) %
$
(18,263)
$
(17,748)
(3) %
Higher programming and production costs at Hulu were due to higher subscriber-based license fees, which reflected rate
increases for Hulu Live TV programming and more subscribers to bundles with third-party offerings.
The decrease in programming and production costs at Disney+ was due to the impact of the Star India Transaction,
partially offset by more hours of content available.
Other operating expenses increased due to higher technology and distribution costs.
Selling, general, administrative and other
Selling, general, administrative and other costs increased $84 million, to $4,658 million from $4,574 million, primarily
attributable to increases in marketing and labor costs, partially offset by the impact of the Star India Transaction.
Depreciation and amortization
Depreciation and amortization increased $55 million, to $366 million from $311 million, due to increased investment in
technology assets.
Operating Income from Direct-to-Consumer
Operating income from Direct-to-Consumer increased $1,184 million, to $1,327 million from $143 million due to
increases at Disney+ and Hulu.
Content Sales/Licensing and Other
Operating results for Content Sales/Licensing and Other are as follows:
% Change
Better (Worse)
($ in millions)
2025
2024
Revenues
TV/VOD and home entertainment distribution
$
3,458
$
3,008
15 %
Theatrical distribution
2,592
2,266
14 %
Other
2,438
2,444
— %
Total revenues
8,488
7,718
10 %
Operating expenses
(4,977)
(4,901)
(2) %
Selling, general, administrative and other
(2,746)
(2,108)
(30) %
Depreciation and amortization
(367)
(371)
1 %
Equity in the loss of investees
(6)
(10)
40 %
Operating Income
$
392
$
328
20 %
Revenues - TV/VOD and home entertainment distribution
The increase in TV/VOD and home entertainment distribution revenue was primarily due to higher TV/VOD sales of
episodic content and an increase in home entertainment distribution revenue. The increase in home entertainment distribution
revenue was due to higher electronic distribution revenue, partially offset by a decrease in physical distribution revenue
attributable to a shift to licensing physical distribution rights.
Revenues - Theatrical distribution
The increase in theatrical distribution revenue was due to more releases in the current year compared to the prior year.
Titles in the current year included
Moana 2
,
Lilo & Stitch
,
Mufasa: The Lion King
,
The Fantastic Four: First Steps
,
Captain
41
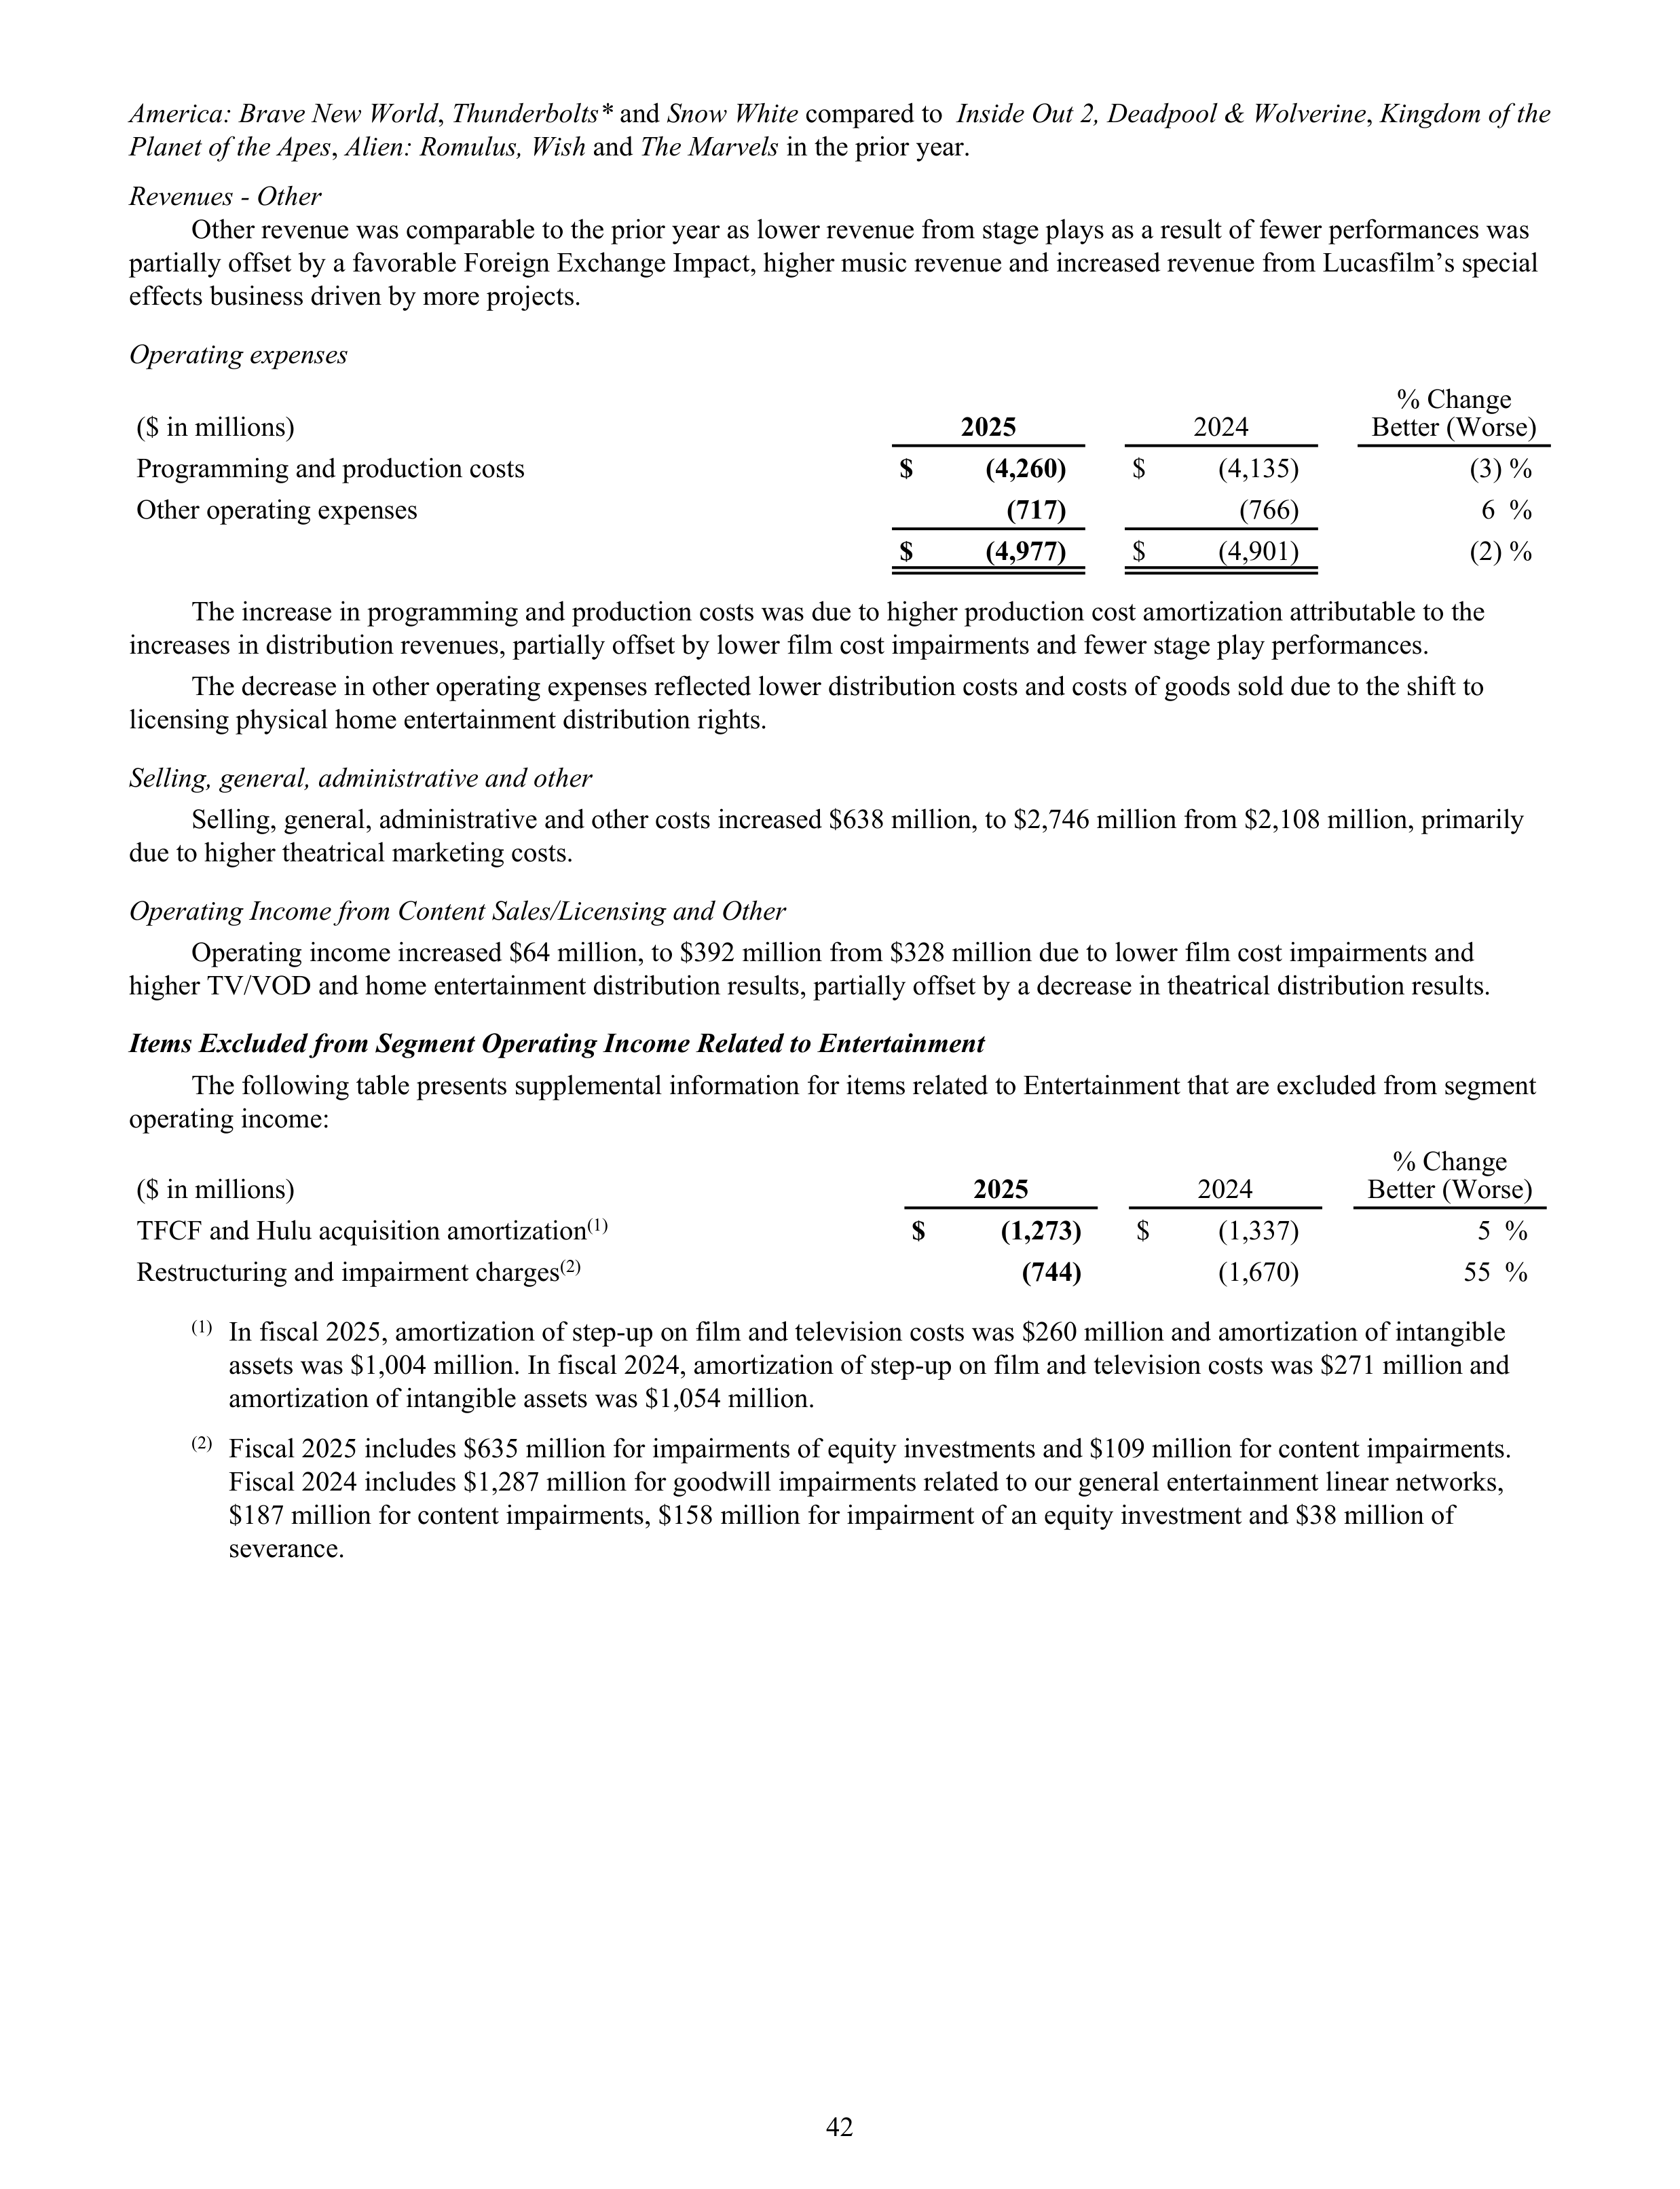
America: Brave New World
,
Thunderbolts*
and
Snow White
compared to
Inside Out 2,
Deadpool & Wolverine
,
Kingdom of the
Planet of the Apes
,
Alien: Romulus, Wish
and
The Marvels
in the prior year.
Revenues - Other
Other revenue was comparable to the prior year as lower revenue from stage plays as a result of fewer performances was
partially offset by a favorable Foreign Exchange Impact, higher music revenue and increased revenue from Lucasfilm’s special
effects business driven by more projects.
Operating expenses
% Change
Better (Worse)
($ in millions)
2025
2024
Programming and production costs
$
(4,260)
$
(4,135)
(3) %
Other operating expenses
(717)
(766)
6 %
$
(4,977)
$
(4,901)
(2) %
The increase in programming and production costs was due to higher production cost amortization attributable to the
increases in distribution revenues, partially offset by lower film cost impairments and fewer stage play performances.
The decrease in other operating expenses reflected lower distribution costs and costs of goods sold due to the shift to
licensing physical home entertainment distribution rights.
Selling, general, administrative and other
Selling, general, administrative and other costs increased $638 million, to $2,746 million from $2,108 million, primarily
due to higher theatrical marketing costs.
Operating Income from Content Sales/Licensing and Other
Operating income increased $64 million, to $392 million from $328 million due to lower film cost impairments and
higher TV/VOD and home entertainment distribution results, partially offset by a decrease in theatrical distribution results.
Items Excluded from Segment Operating Income Related to Entertainment
The following table presents supplemental information for items related to Entertainment that are excluded from segment
operating income:
($ in millions)
2025
2024
% Change
Better (Worse)
TFCF and Hulu acquisition amortization
(1)
$
(1,273)
$
(1,337)
5 %
Restructuring and impairment charges
(2)
(744)
(1,670)
55 %
(1)
In fiscal 2025, amortization of step-up on film and television costs was $260 million and amortization of intangible
assets was $1,004 million. In fiscal 2024, amortization of step-up on film and television costs was $271 million and
amortization of intangible assets was $1,054 million.
(2)
Fiscal 2025 includes $635 million for impairments of equity investments and $109 million for content impairments.
Fiscal 2024 includes $1,287 million for goodwill impairments related to our general entertainment linear networks,
$187 million for content impairments, $158 million for impairment of an equity investment and $38 million of
severance.
42
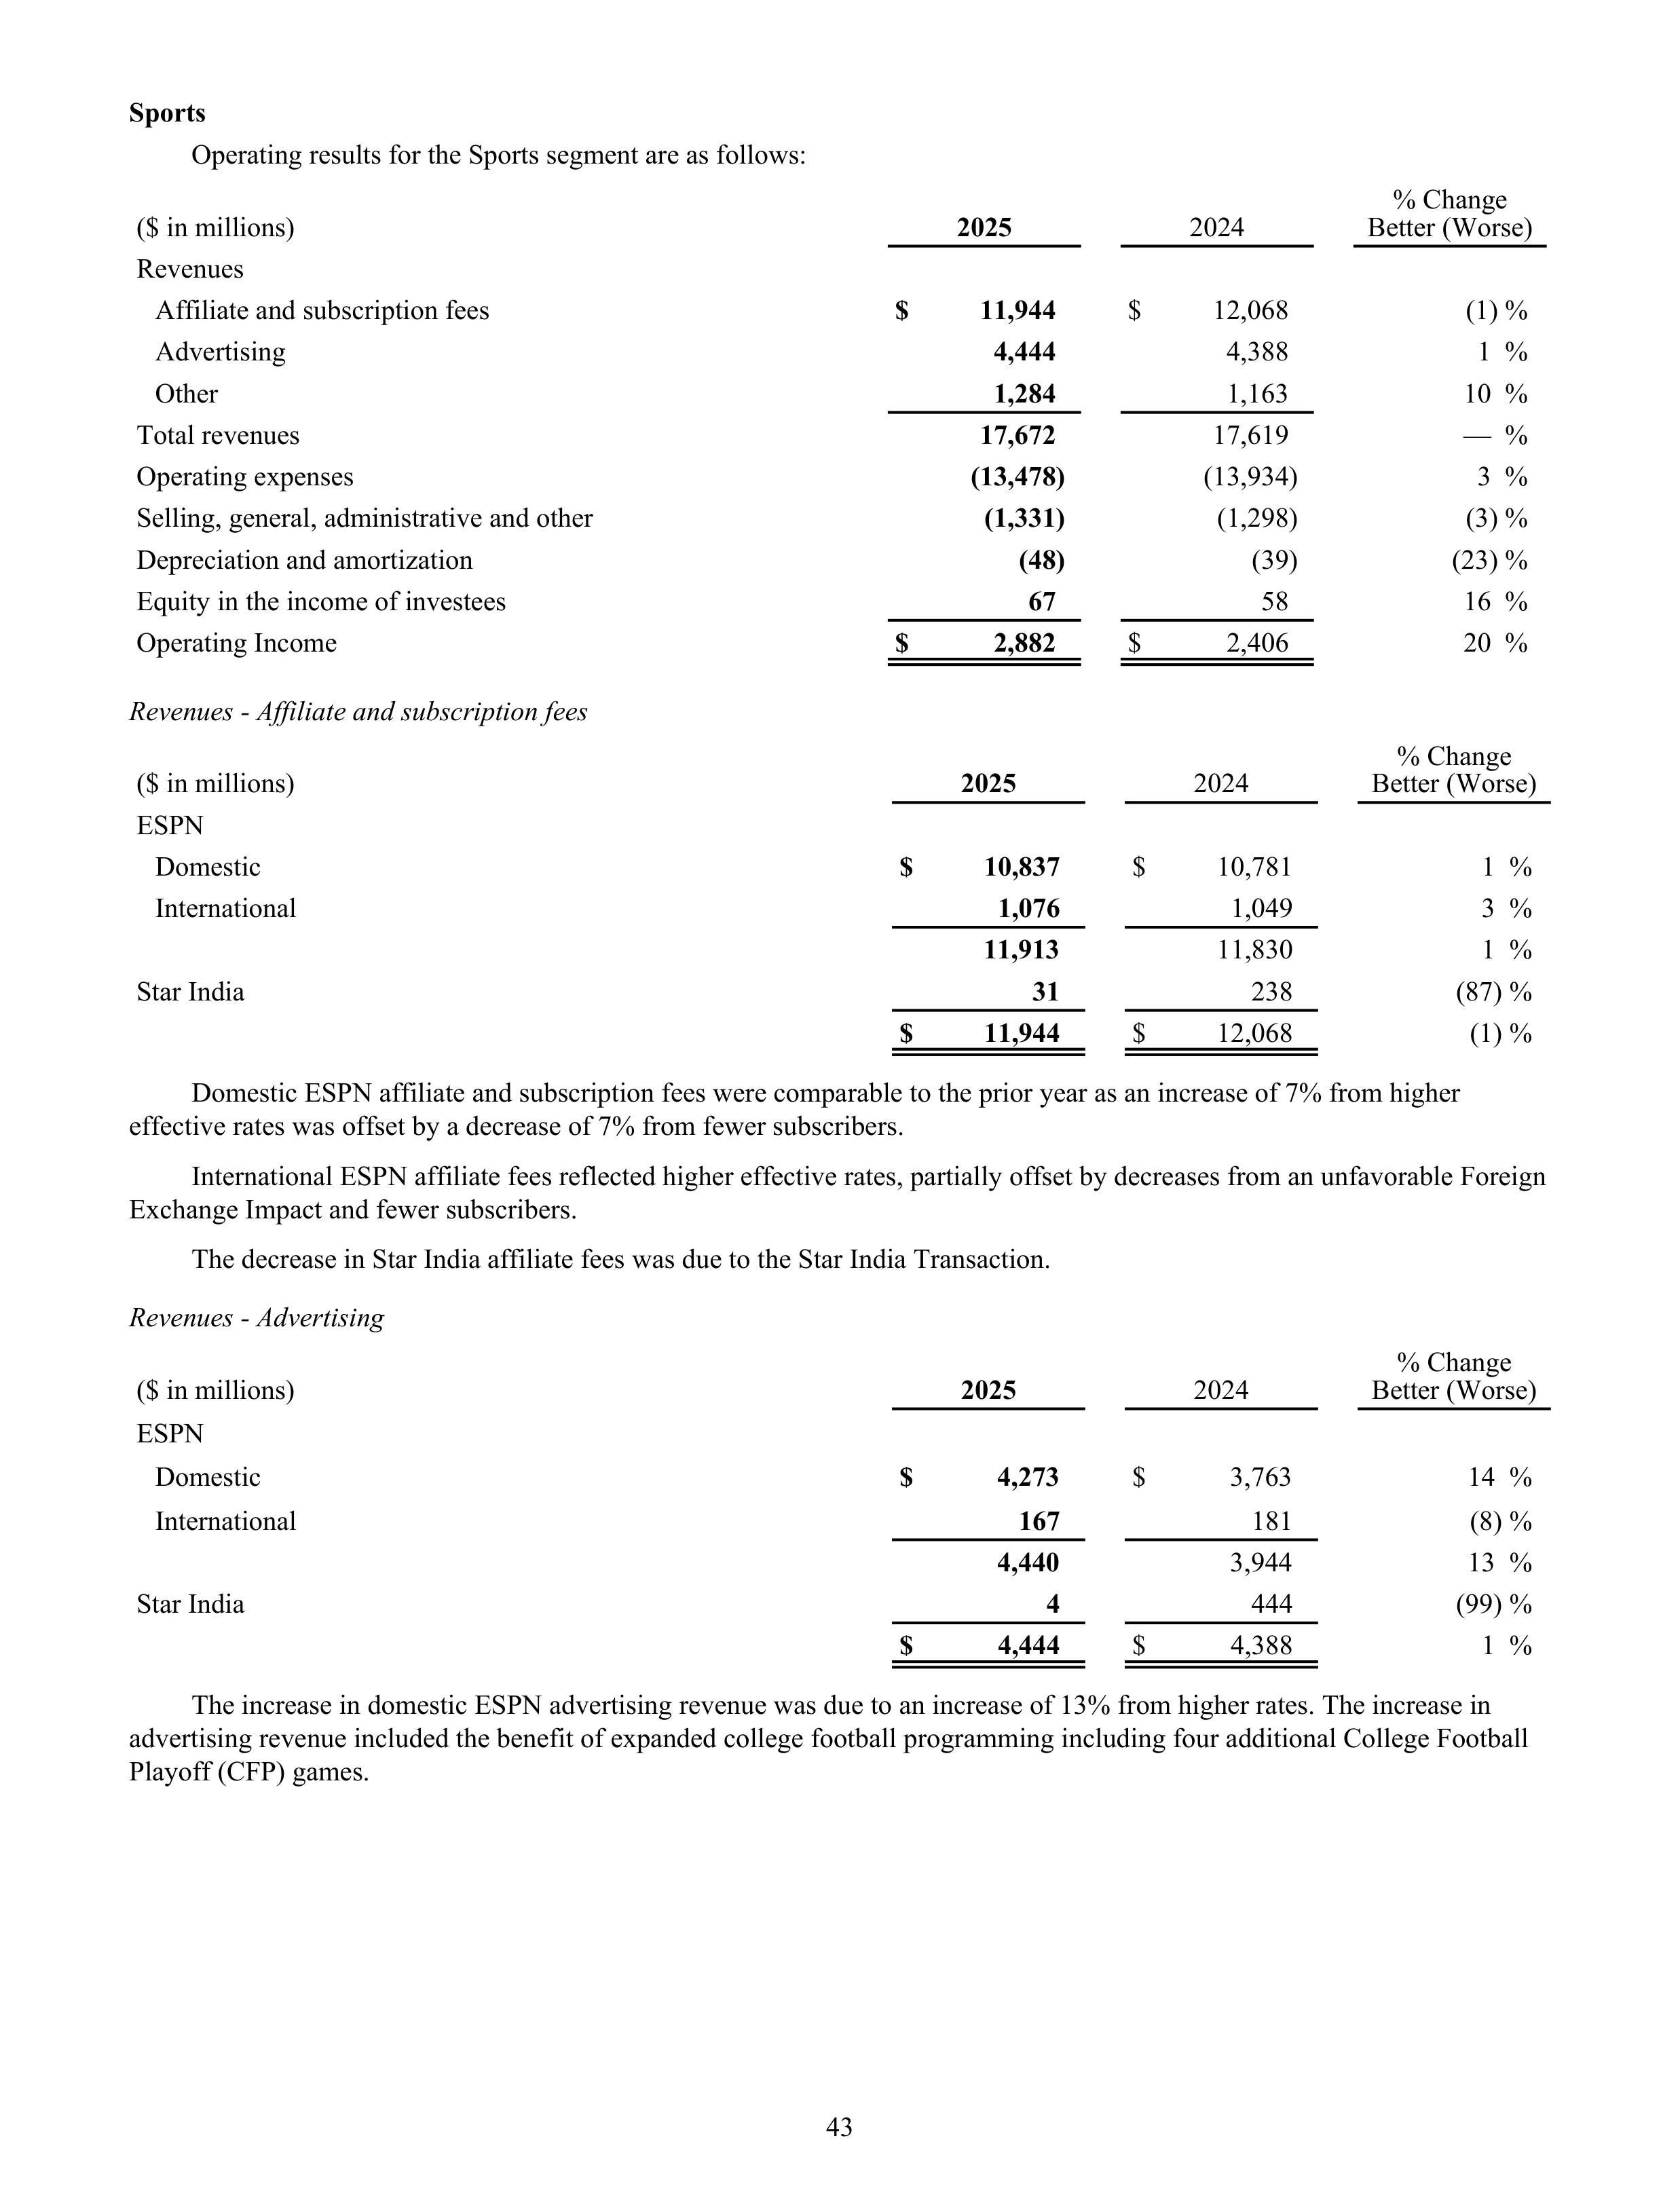
Sports
Operating results for the Sports segment are as follows:
($ in millions)
2025
2024
% Change
Better (Worse)
Revenues
Affiliate and subscription fees
$
11,944
$
12,068
(1) %
Advertising
4,444
4,388
1 %
Other
1,284
1,163
10 %
Total revenues
17,672
17,619
— %
Operating expenses
(13,478)
(13,934)
3 %
Selling, general, administrative and other
(1,331)
(1,298)
(3) %
Depreciation and amortization
(48)
(39)
(23) %
Equity in the income of investees
67
58
16 %
Operating Income
$
2,882
$
2,406
20 %
Revenues - Affiliate and subscription fees
% Change
Better (Worse)
($ in millions)
2025
2024
ESPN
Domestic
$
10,837
$
10,781
1 %
International
1,076
1,049
3 %
11,913
11,830
1 %
Star India
31
238
(87) %
$
11,944
$
12,068
(1) %
Domestic ESPN affiliate and subscription fees were comparable to the prior year as an increase of 7% from higher
effective rates was offset by a decrease of 7% from fewer subscribers.
International ESPN affiliate fees reflected higher effective rates, partially offset by decreases from an unfavorable Foreign
Exchange Impact and fewer subscribers.
The decrease in Star India affiliate fees was due to the Star India Transaction.
Revenues - Advertising
% Change
Better (Worse)
($ in millions)
2025
2024
ESPN
Domestic
$
4,273
$
3,763
14 %
International
167
181
(8) %
4,440
3,944
13 %
Star India
4
444
(99) %
$
4,444
$
4,388
1 %
The increase in domestic ESPN advertising revenue was due to an increase of 13% from higher rates. The increase in
advertising revenue included the benefit of expanded college football programming including four additional College Football
Playoff (CFP) games.
43
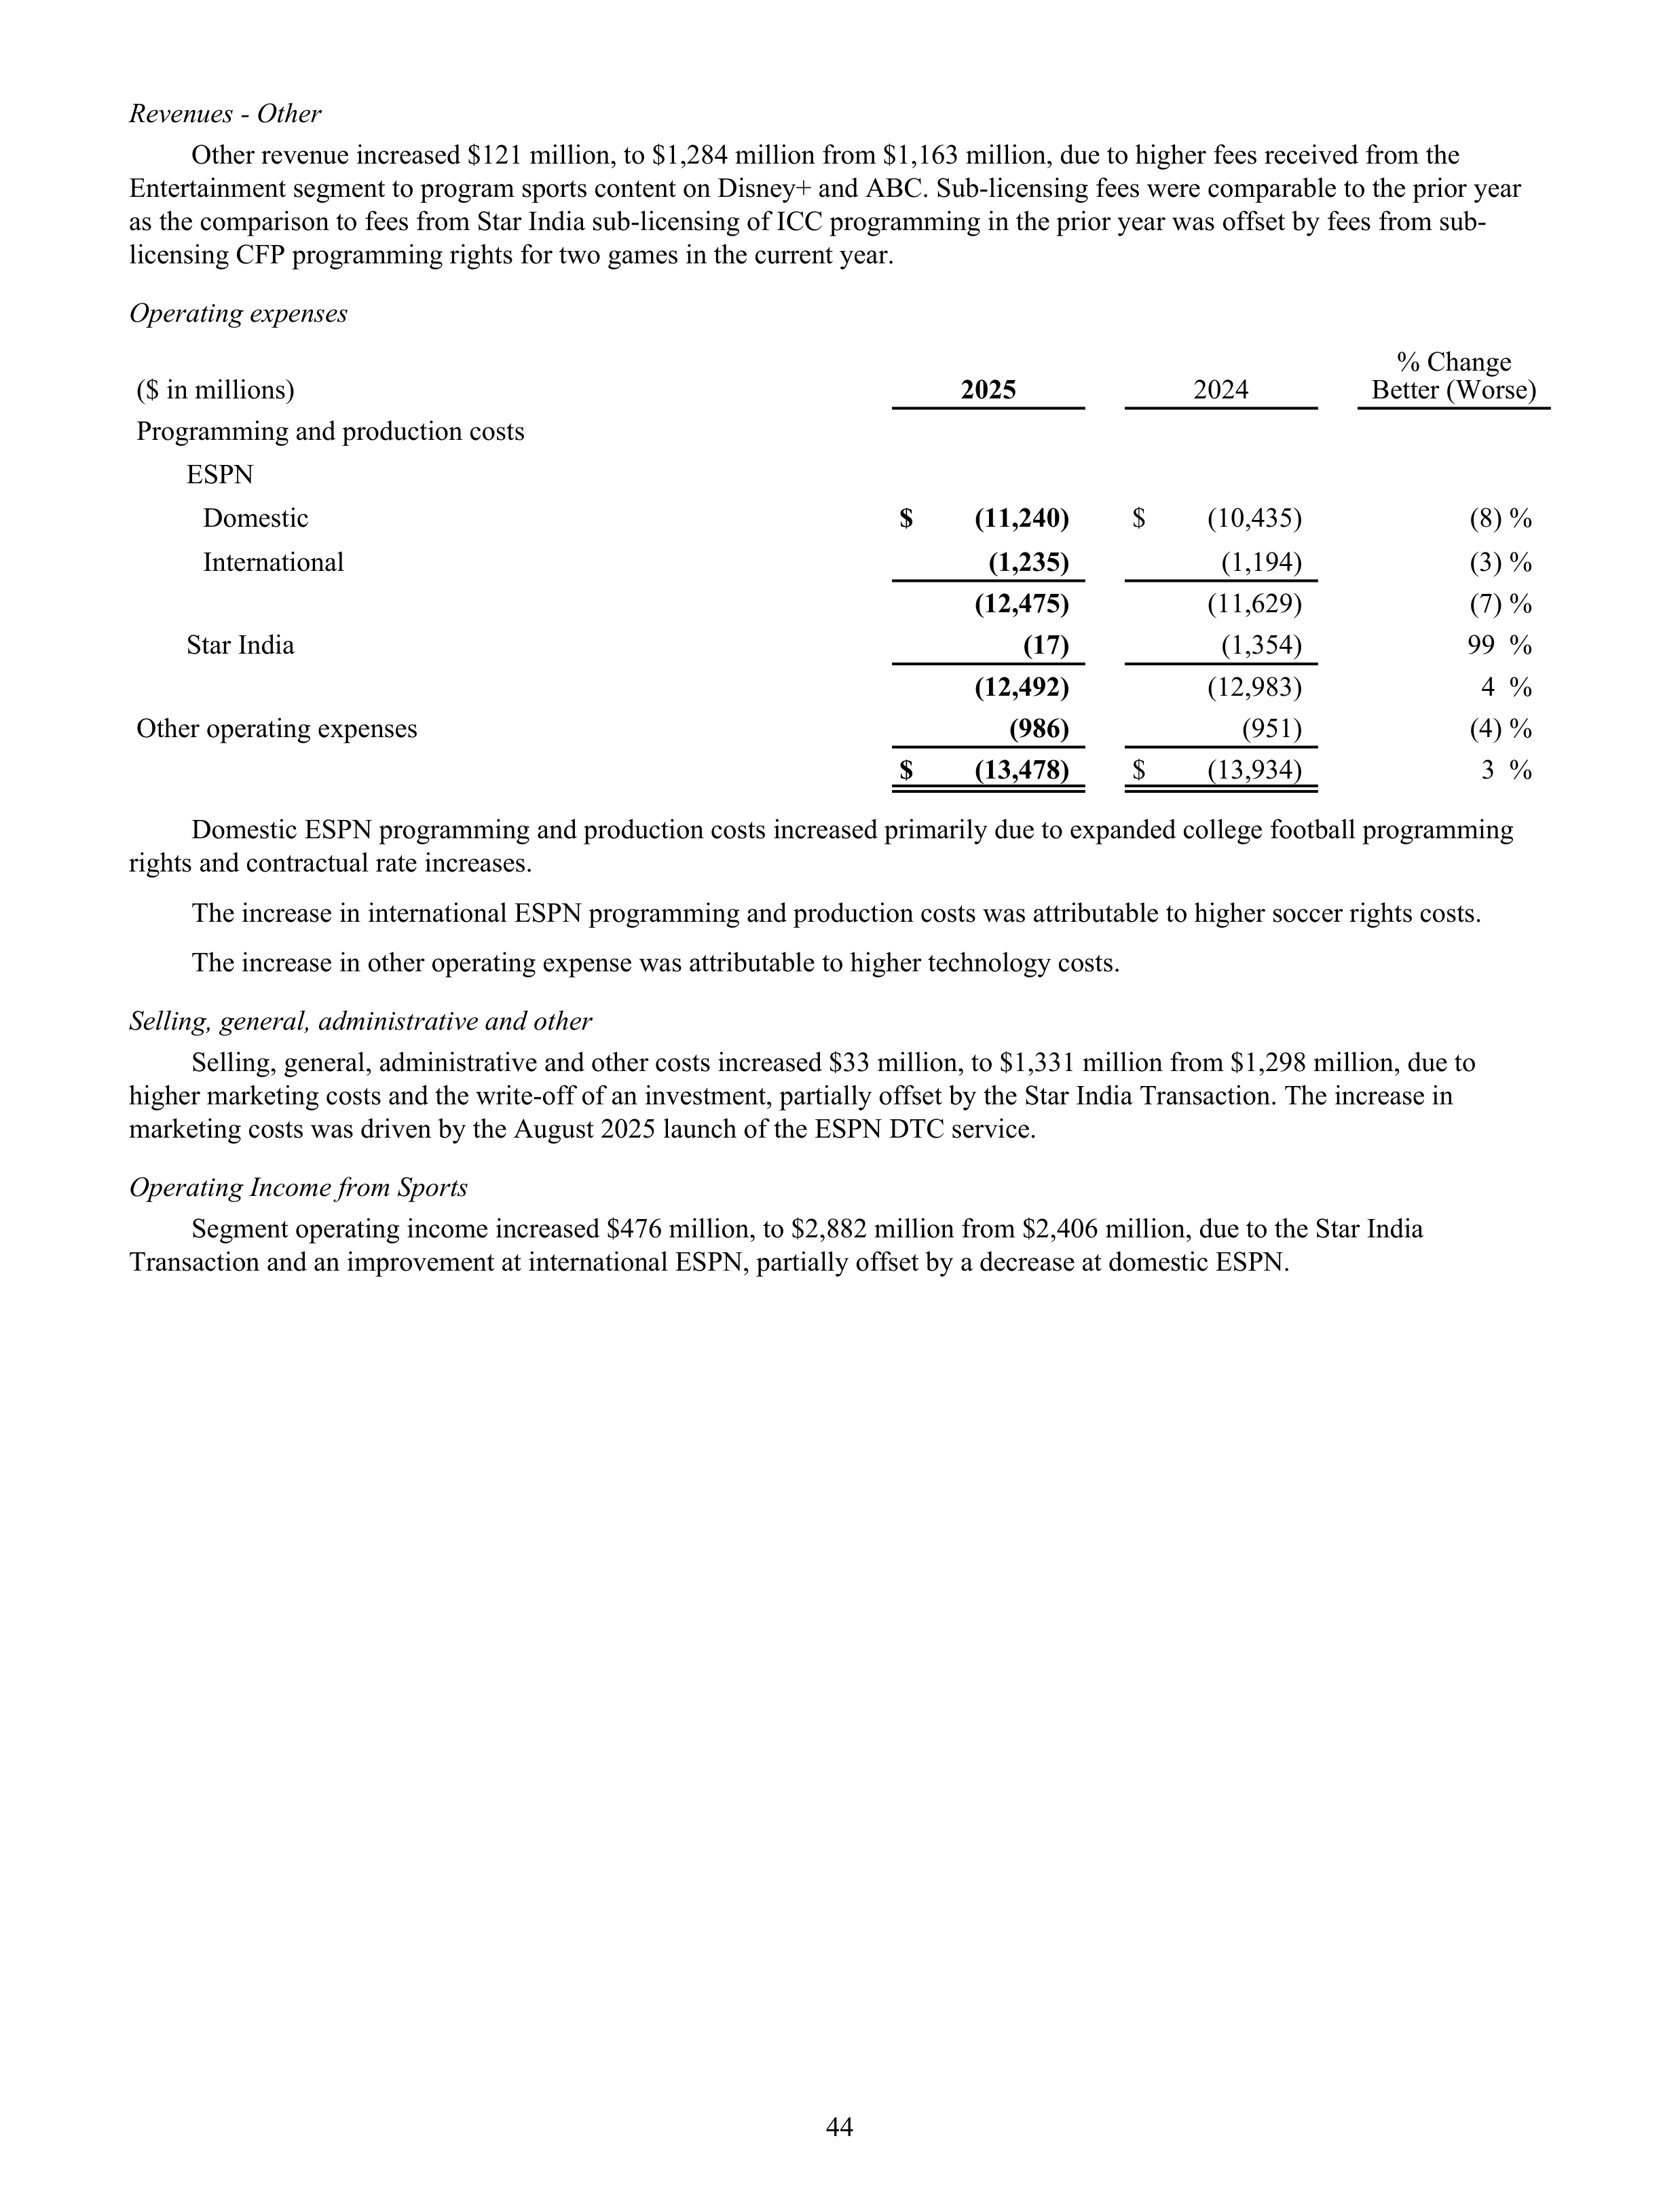
Revenues - Other
Other revenue increased $121 million, to $1,284 million from $1,163 million, due to higher fees received from the
Entertainment segment to program sports content on Disney+ and ABC. Sub-licensing fees were comparable to the prior year
as the comparison to fees from Star India sub-licensing of ICC programming in the prior year was offset by fees from sub-
licensing CFP programming rights for two games in the current year.
Operating expenses
% Change
Better (Worse)
($ in millions)
2025
2024
Programming and production costs
ESPN
Domestic
$
(11,240)
$
(10,435)
(8) %
International
(1,235)
(1,194)
(3) %
(12,475)
(11,629)
(7) %
Star India
(17)
(1,354)
99 %
(12,492)
(12,983)
4 %
Other operating expenses
(986)
(951)
(4) %
$
(13,478)
$
(13,934)
3 %
Domestic ESPN programming and production costs increased primarily due to expanded college football programming
rights and contractual rate increases.
The increase in international ESPN programming and production costs was attributable to higher soccer rights costs.
The increase in other operating expense was attributable to higher technology costs.
Selling, general, administrative and other
Selling, general, administrative and other costs increased $33 million, to $1,331 million from $1,298 million, due to
higher marketing costs and the write-off of an investment, partially offset by the Star India Transaction. The increase in
marketing costs was driven by the August 2025 launch of the ESPN DTC service.
Operating Income from Sports
Segment operating income increased $476 million, to $2,882 million from $2,406 million, due to the Star India
Transaction and an improvement at international ESPN, partially offset by a decrease at domestic ESPN.
44
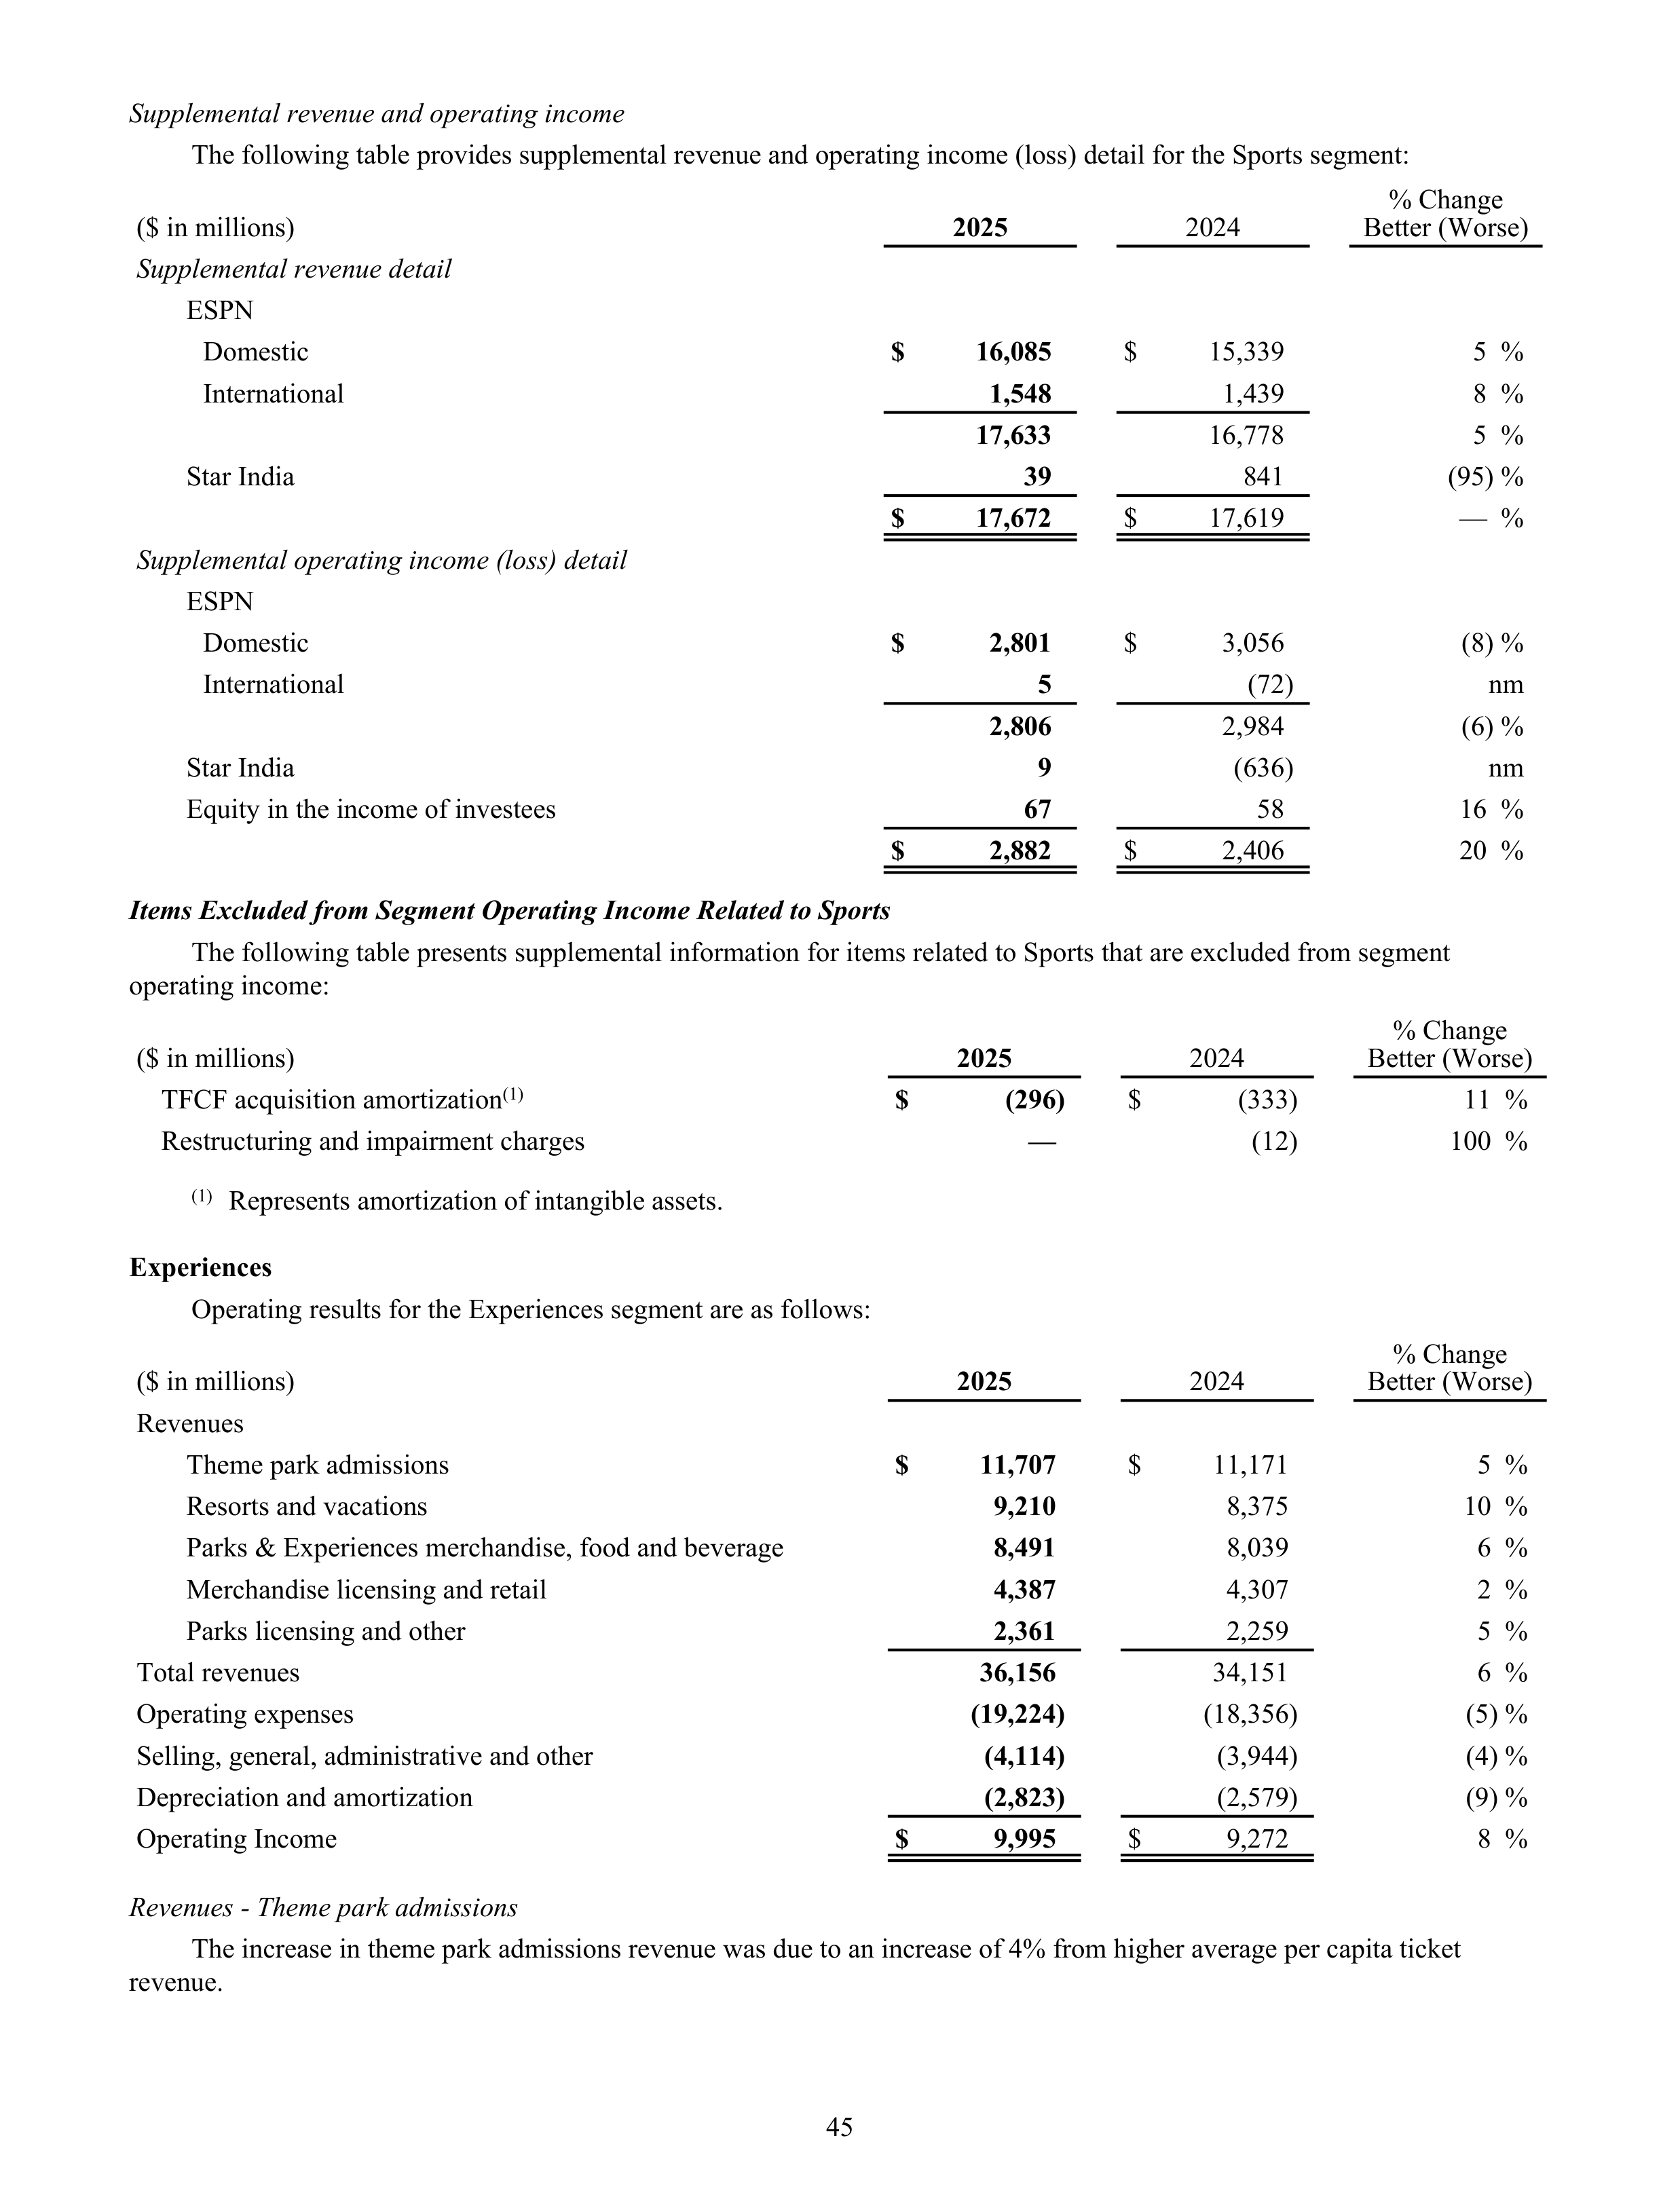
Supplemental revenue and operating income
The following table provides supplemental revenue and operating income (loss) detail for the Sports segment:
% Change
Better (Worse)
($ in millions)
2025
2024
Supplemental revenue detail
ESPN
Domestic
$
16,085
$
15,339
5 %
International
1,548
1,439
8 %
17,633
16,778
5 %
Star India
39
841
(95) %
$
17,672
$
17,619
— %
Supplemental operating income (loss) detail
ESPN
Domestic
$
2,801
$
3,056
(8) %
International
5
(72)
nm
2,806
2,984
(6) %
Star India
9
(636)
nm
Equity in the income of investees
67
58
16 %
$
2,882
$
2,406
20 %
Items Excluded from Segment Operating Income Related to Sports
The following table presents supplemental information for items related to Sports that are excluded from segment
operating income:
% Change
Better (Worse)
($ in millions)
2025
2024
TFCF acquisition amortization
(1)
$
(296)
$
(333)
11 %
Restructuring and impairment charges
—
(12)
100 %
(1)
Represents amortization of intangible assets.
Experiences
Operating results for the Experiences segment are as follows:
% Change
Better (Worse)
($ in millions)
2025
2024
Revenues
Theme park admissions
$
11,707
$
11,171
5 %
Resorts and vacations
9,210
8,375
10 %
Parks & Experiences merchandise, food and beverage
8,491
8,039
6 %
Merchandise licensing and retail
4,387
4,307
2 %
Parks licensing and other
2,361
2,259
5 %
Total revenues
36,156
34,151
6 %
Operating expenses
(19,224)
(18,356)
(5) %
Selling, general, administrative and other
(4,114)
(3,944)
(4) %
Depreciation and amortization
(2,823)
(2,579)
(9) %
Operating Income
$
9,995
$
9,272
8 %
Revenues - Theme park admissions
The increase in theme park admissions revenue was due to an increase of 4% from higher average per capita ticket
revenue.
45
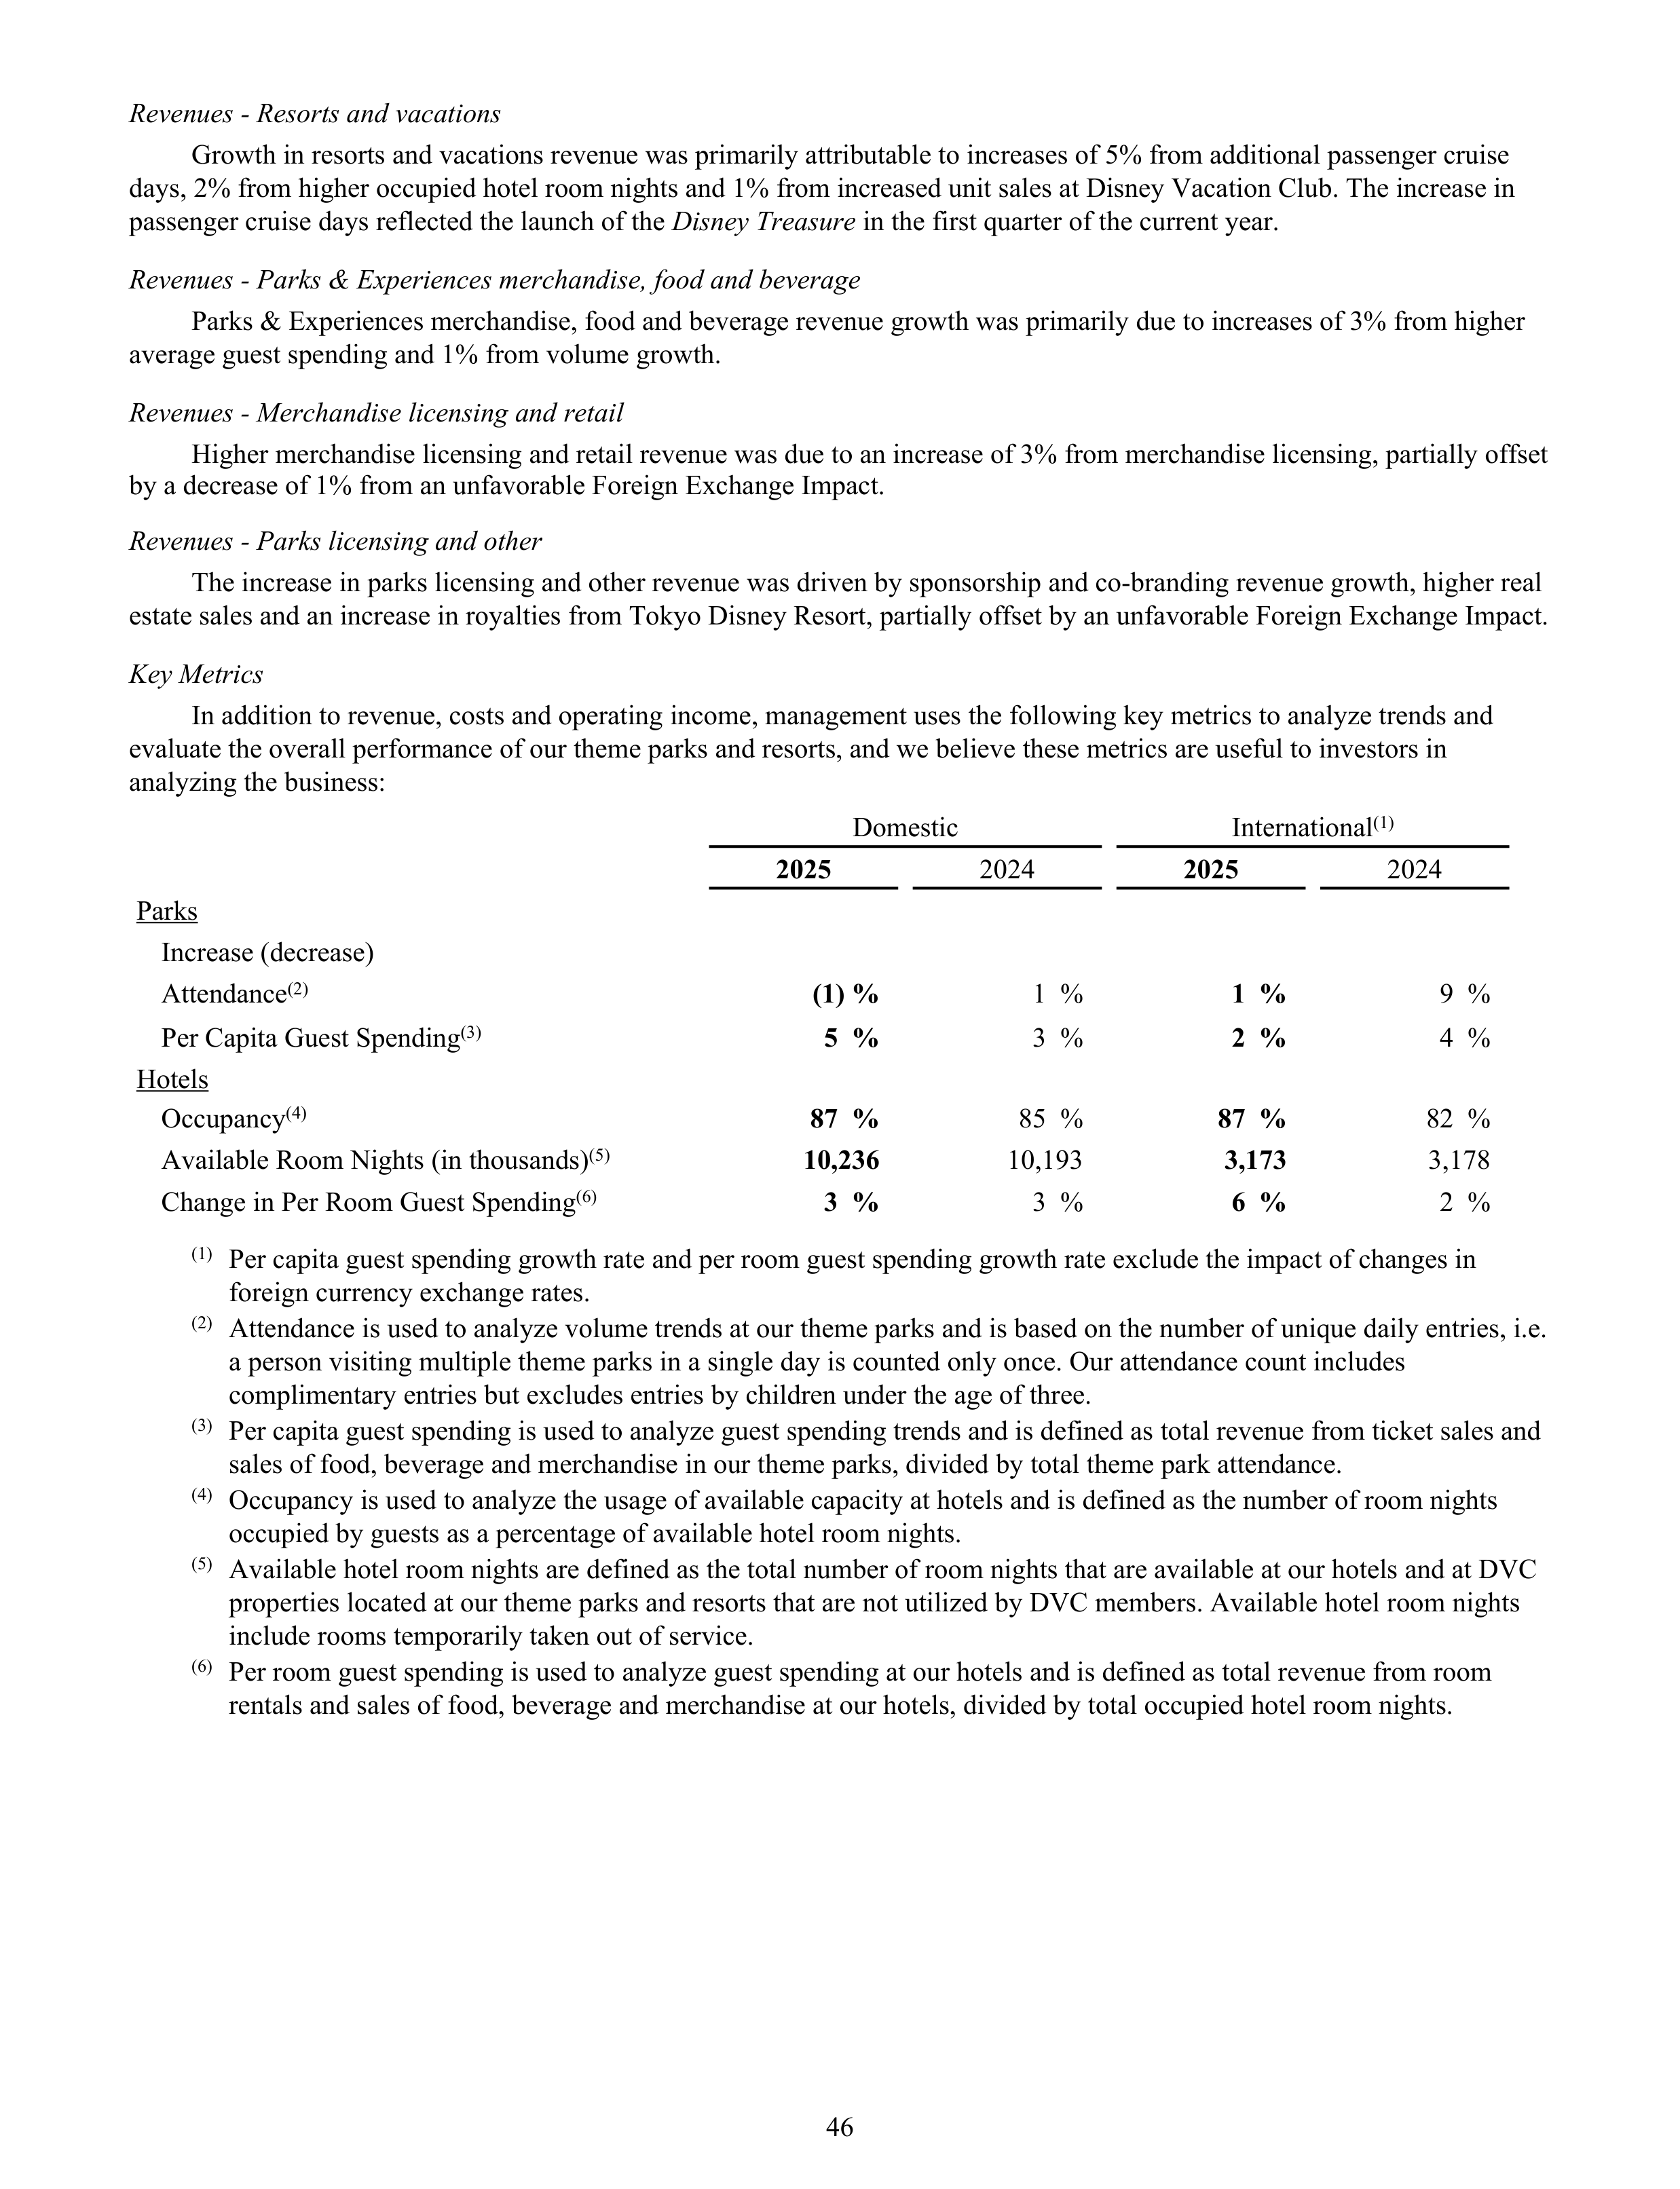
Revenues - Resorts and vacations
Growth in resorts and vacations revenue was primarily attributable to increases of 5% from additional passenger cruise
days, 2% from higher occupied hotel room nights and 1% from increased unit sales at Disney Vacation Club. The increase in
passenger cruise days reflected the launch of the
Disney Treasure
in the first quarter of the current year.
Revenues - Parks & Experiences merchandise, food and beverage
Parks & Experiences merchandise, food and beverage revenue growth was primarily due to increases of 3% from higher
average guest spending and 1% from volume growth.
Revenues - Merchandise licensing and retail
Higher merchandise licensing and retail revenue was due to an increase of 3% from merchandise licensing, partially offset
by a decrease of 1% from an unfavorable Foreign Exchange Impact.
Revenues - Parks licensing and other
The increase in parks licensing and other revenue was driven by sponsorship and co-branding revenue growth, higher real
estate sales and an increase in royalties from Tokyo Disney Resort, partially offset by an unfavorable Foreign Exchange Impact.
Key Metrics
In addition to revenue, costs and operating income, management uses the following key metrics to analyze trends and
evaluate the overall performance of our theme parks and resorts, and we believe these metrics are useful to investors in
analyzing the business:
Domestic
International
(1)
2025
2024
2025
2024
Parks
Increase (decrease)
Attendance
(2)
(1) %
1 %
1 %
9 %
Per Capita Guest Spending
(3)
5 %
3 %
2 %
4 %
Hotels
Occupancy
(4)
87 %
85 %
87 %
82 %
Available Room Nights (in thousands)
(5)
10,236
10,193
3,173
3,178
Change in Per Room Guest Spending
(6)
3 %
3 %
6 %
2 %
(1)
Per capita guest spending growth rate and per room guest spending growth rate exclude the impact of changes in
foreign currency exchange rates.
(2)
Attendance is used to analyze volume trends at our theme parks and is based on the number of unique daily entries, i.e.
a person visiting multiple theme parks in a single day is counted only once. Our attendance count includes
complimentary entries but excludes entries by children under the age of three.
(3)
Per capita guest spending is used to analyze guest spending trends and is defined as total revenue from ticket sales and
sales of food, beverage and merchandise in our theme parks, divided by total theme park attendance.
(4)
Occupancy is used to analyze the usage of available capacity at hotels and is defined as the number of room nights
occupied by guests as a percentage of available hotel room nights.
(5)
Available hotel room nights are defined as the total number of room nights that are available at our hotels and at DVC
properties located at our theme parks and resorts that are not utilized by DVC members. Available hotel room nights
include rooms temporarily taken out of service.
(6)
Per room guest spending is used to analyze guest spending at our hotels and is defined as total revenue from room
rentals and sales of food, beverage and merchandise at our hotels, divided by total occupied hotel room nights.
46
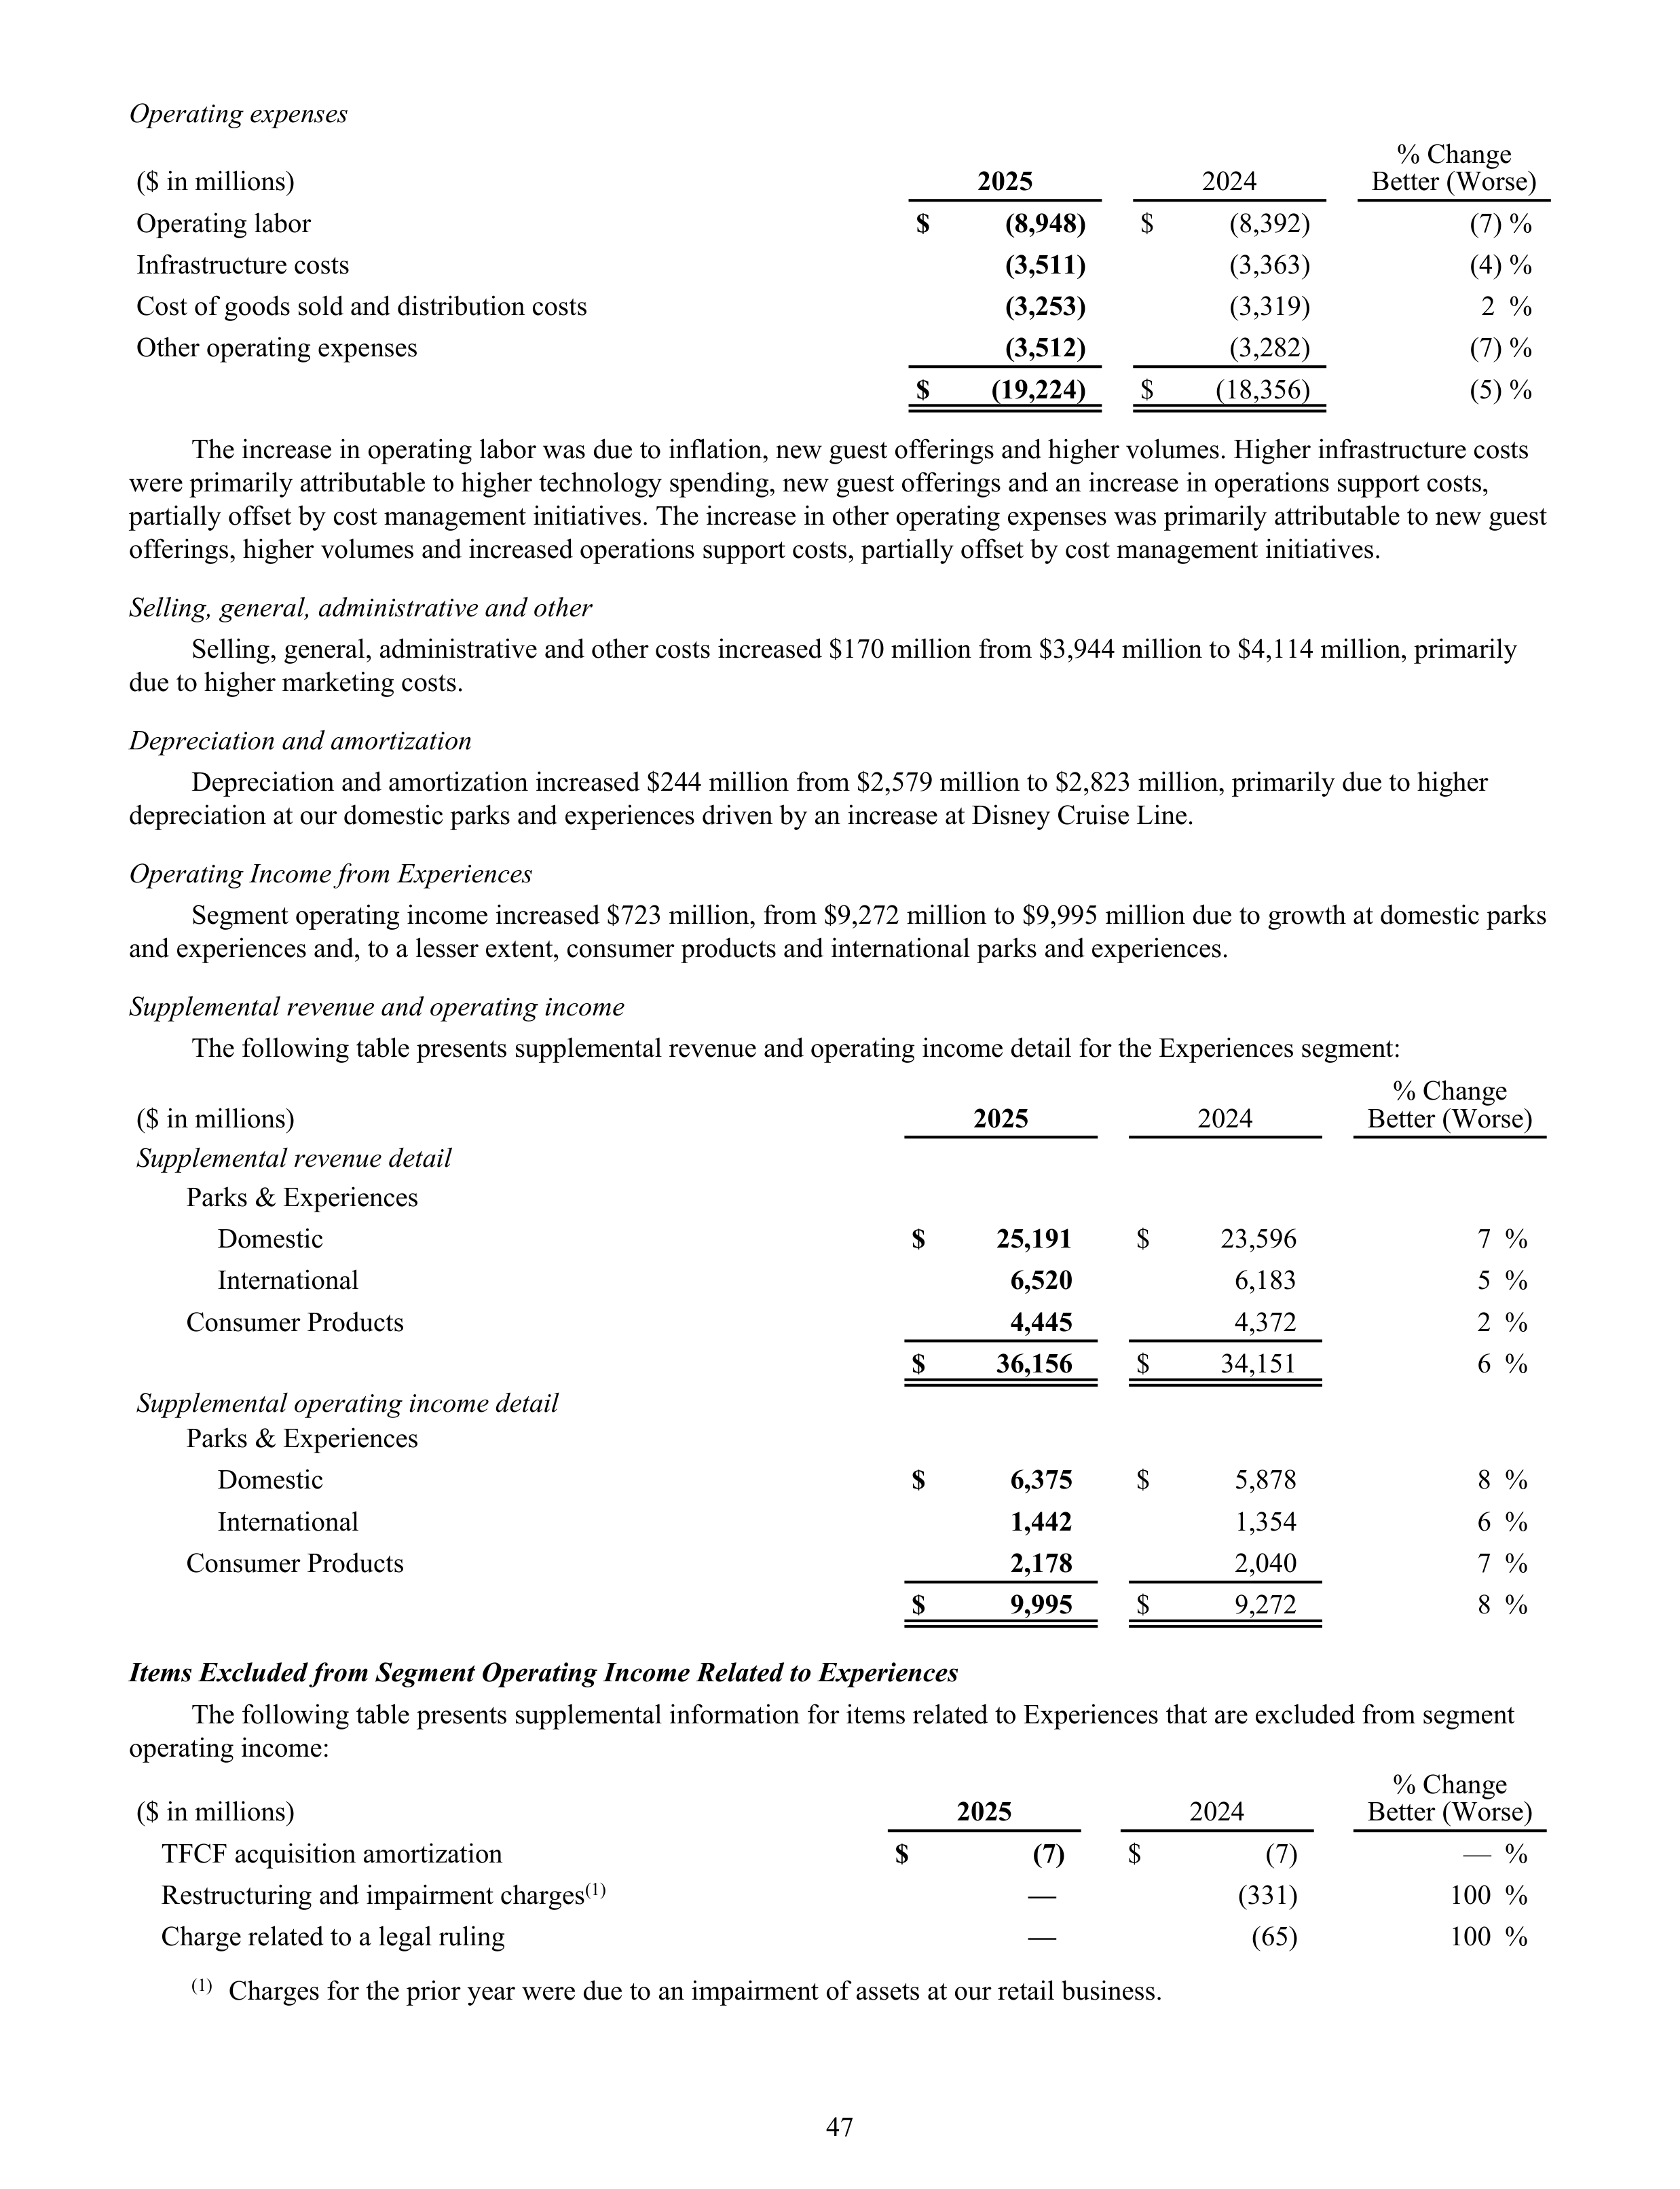
Operating expenses
($ in millions)
2025
2024
% Change
Better (Worse)
Operating labor
$
(8,948)
$
(8,392)
(7) %
Infrastructure costs
(3,511)
(3,363)
(4) %
Cost of goods sold and distribution costs
(3,253)
(3,319)
2 %
Other operating expenses
(3,512)
(3,282)
(7) %
$
(19,224)
$
(18,356)
(5) %
The increase in operating labor was due to inflation, new guest offerings and higher volumes. Higher infrastructure costs
were primarily attributable to higher technology spending, new guest offerings and an increase in operations support costs,
partially offset by cost management initiatives. The increase in other operating expenses was primarily attributable to new guest
offerings, higher volumes and increased operations support costs, partially offset by cost management initiatives.
Selling, general, administrative and other
Selling, general, administrative and other costs increased $170 million from $3,944 million to $4,114 million, primarily
due to higher marketing costs.
Depreciation and amortization
Depreciation and amortization increased $244 million from $2,579 million to $2,823 million, primarily due to higher
depreciation at our domestic parks and experiences driven by an increase at Disney Cruise Line.
Operating Income from Experiences
Segment operating income increased $723 million, from $9,272 million to $9,995 million due to growth at domestic parks
and experiences and, to a lesser extent, consumer products and international parks and experiences.
Supplemental revenue and operating income
The following table presents supplemental revenue and operating income detail for the Experiences segment:
% Change
Better (Worse)
($ in millions)
2025
2024
Supplemental revenue detail
Parks & Experiences
Domestic
$
25,191
$
23,596
7 %
International
6,520
6,183
5 %
Consumer Products
4,445
4,372
2 %
$
36,156
$
34,151
6 %
Supplemental operating income detail
Parks & Experiences
Domestic
$
6,375
$
5,878
8 %
International
1,442
1,354
6 %
Consumer Products
2,178
2,040
7 %
$
9,995
$
9,272
8 %
Items Excluded from Segment Operating Income Related to Experiences
The following table presents supplemental information for items related to Experiences that are excluded from segment
operating income:
% Change
Better (Worse)
($ in millions)
2025
2024
TFCF acquisition amortization
$
(7)
$
(7)
— %
Restructuring and impairment charges
(1)
—
(331)
100 %
Charge related to a legal ruling
—
(65)
100 %
(1)
Charges for the prior year were due to an impairment of assets at our retail business.
47
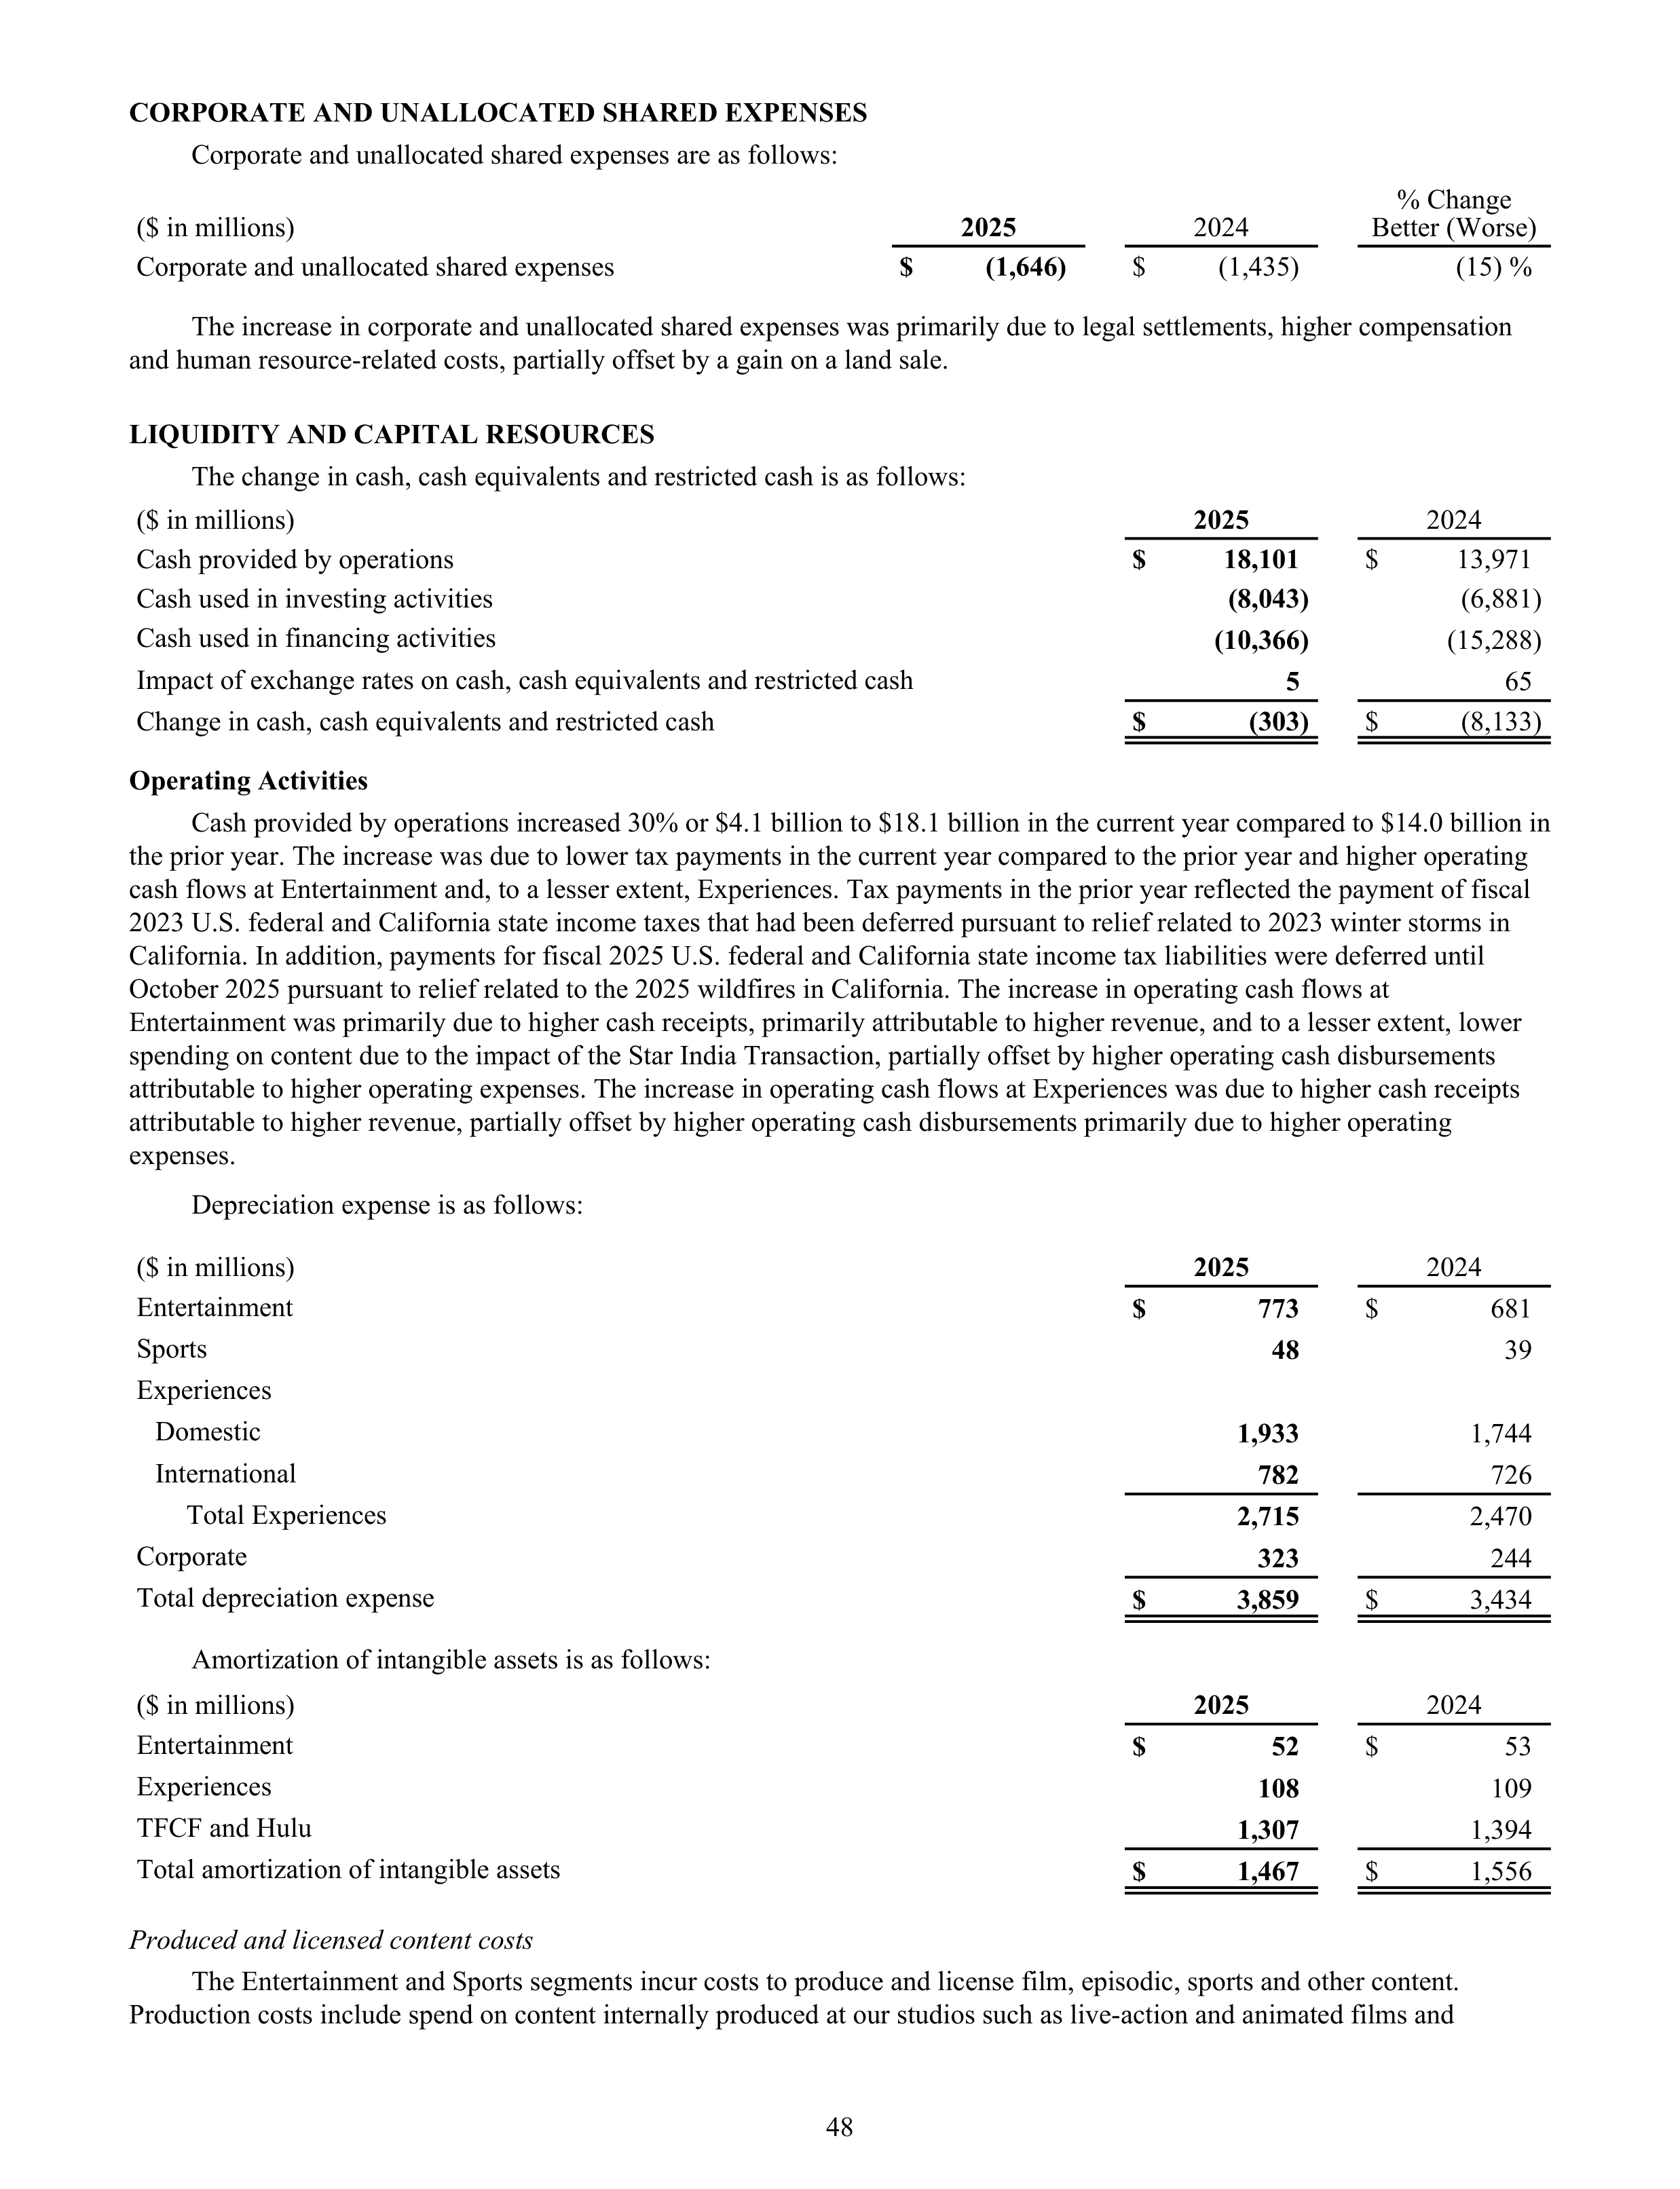
CORPORATE AND UNALLOCATED SHARED EXPENSES
Corporate and unallocated shared expenses are as follows:
($ in millions)
2025
2024
% Change
Better (Worse)
Corporate and unallocated shared expenses
$
(1,646)
$
(1,435)
(15) %
The increase in corporate and unallocated shared expenses was primarily due to legal settlements, higher compensation
and human resource-related costs, partially offset by a gain on a land sale.
LIQUIDITY AND CAPITAL RESOURCES
The change in cash, cash equivalents and restricted cash is as follows:
($ in millions)
2025
2024
Cash provided by operations
$
18,101
$
13,971
Cash used in investing activities
(8,043)
(6,881)
Cash used in financing activities
(10,366)
(15,288)
Impact of exchange rates on cash, cash equivalents and restricted cash
5
65
Change in cash, cash equivalents and restricted cash
$
(303)
$
(8,133)
Operating Activities
Cash provided by operations increased 30% or $4.1 billion to $18.1 billion in the current year compared to $14.0 billion in
the prior year. The increase was due to lower tax payments in the current year compared to the prior year and higher operating
cash flows at Entertainment and, to a lesser extent, Experiences. Tax payments in the prior year reflected the payment of fiscal
2023 U.S. federal and California state income taxes that had been deferred pursuant to relief related to 2023 winter storms in
California. In addition, payments for fiscal 2025 U.S. federal and California state income tax liabilities were deferred until
October 2025 pursuant to relief related to the 2025 wildfires in California. The increase in operating cash flows at
Entertainment was primarily due to higher cash receipts, primarily attributable to higher revenue, and to a lesser extent, lower
spending on content due to the impact of the Star India Transaction, partially offset by higher operating cash disbursements
attributable to higher operating expenses. The increase in operating cash flows at Experiences was due to higher cash receipts
attributable to higher revenue, partially offset by higher operating cash disbursements primarily due to higher operating
expenses.
Depreciation expense is as follows:
($ in millions)
2025
2024
Entertainment
$
773
$
681
Sports
48
39
Experiences
Domestic
1,933
1,744
International
782
726
Total Experiences
2,715
2,470
Corporate
323
244
Total depreciation expense
$
3,859
$
3,434
Amortization of intangible assets is as follows:
($ in millions)
2025
2024
Entertainment
$
52
$
53
Experiences
108
109
TFCF and Hulu
1,307
1,394
Total amortization of intangible assets
$
1,467
$
1,556
Produced and licensed content costs
The Entertainment and Sports segments incur costs to produce and license film, episodic, sports and other content.
Production costs include spend on content internally produced at our studios such as live-action and animated films and
48
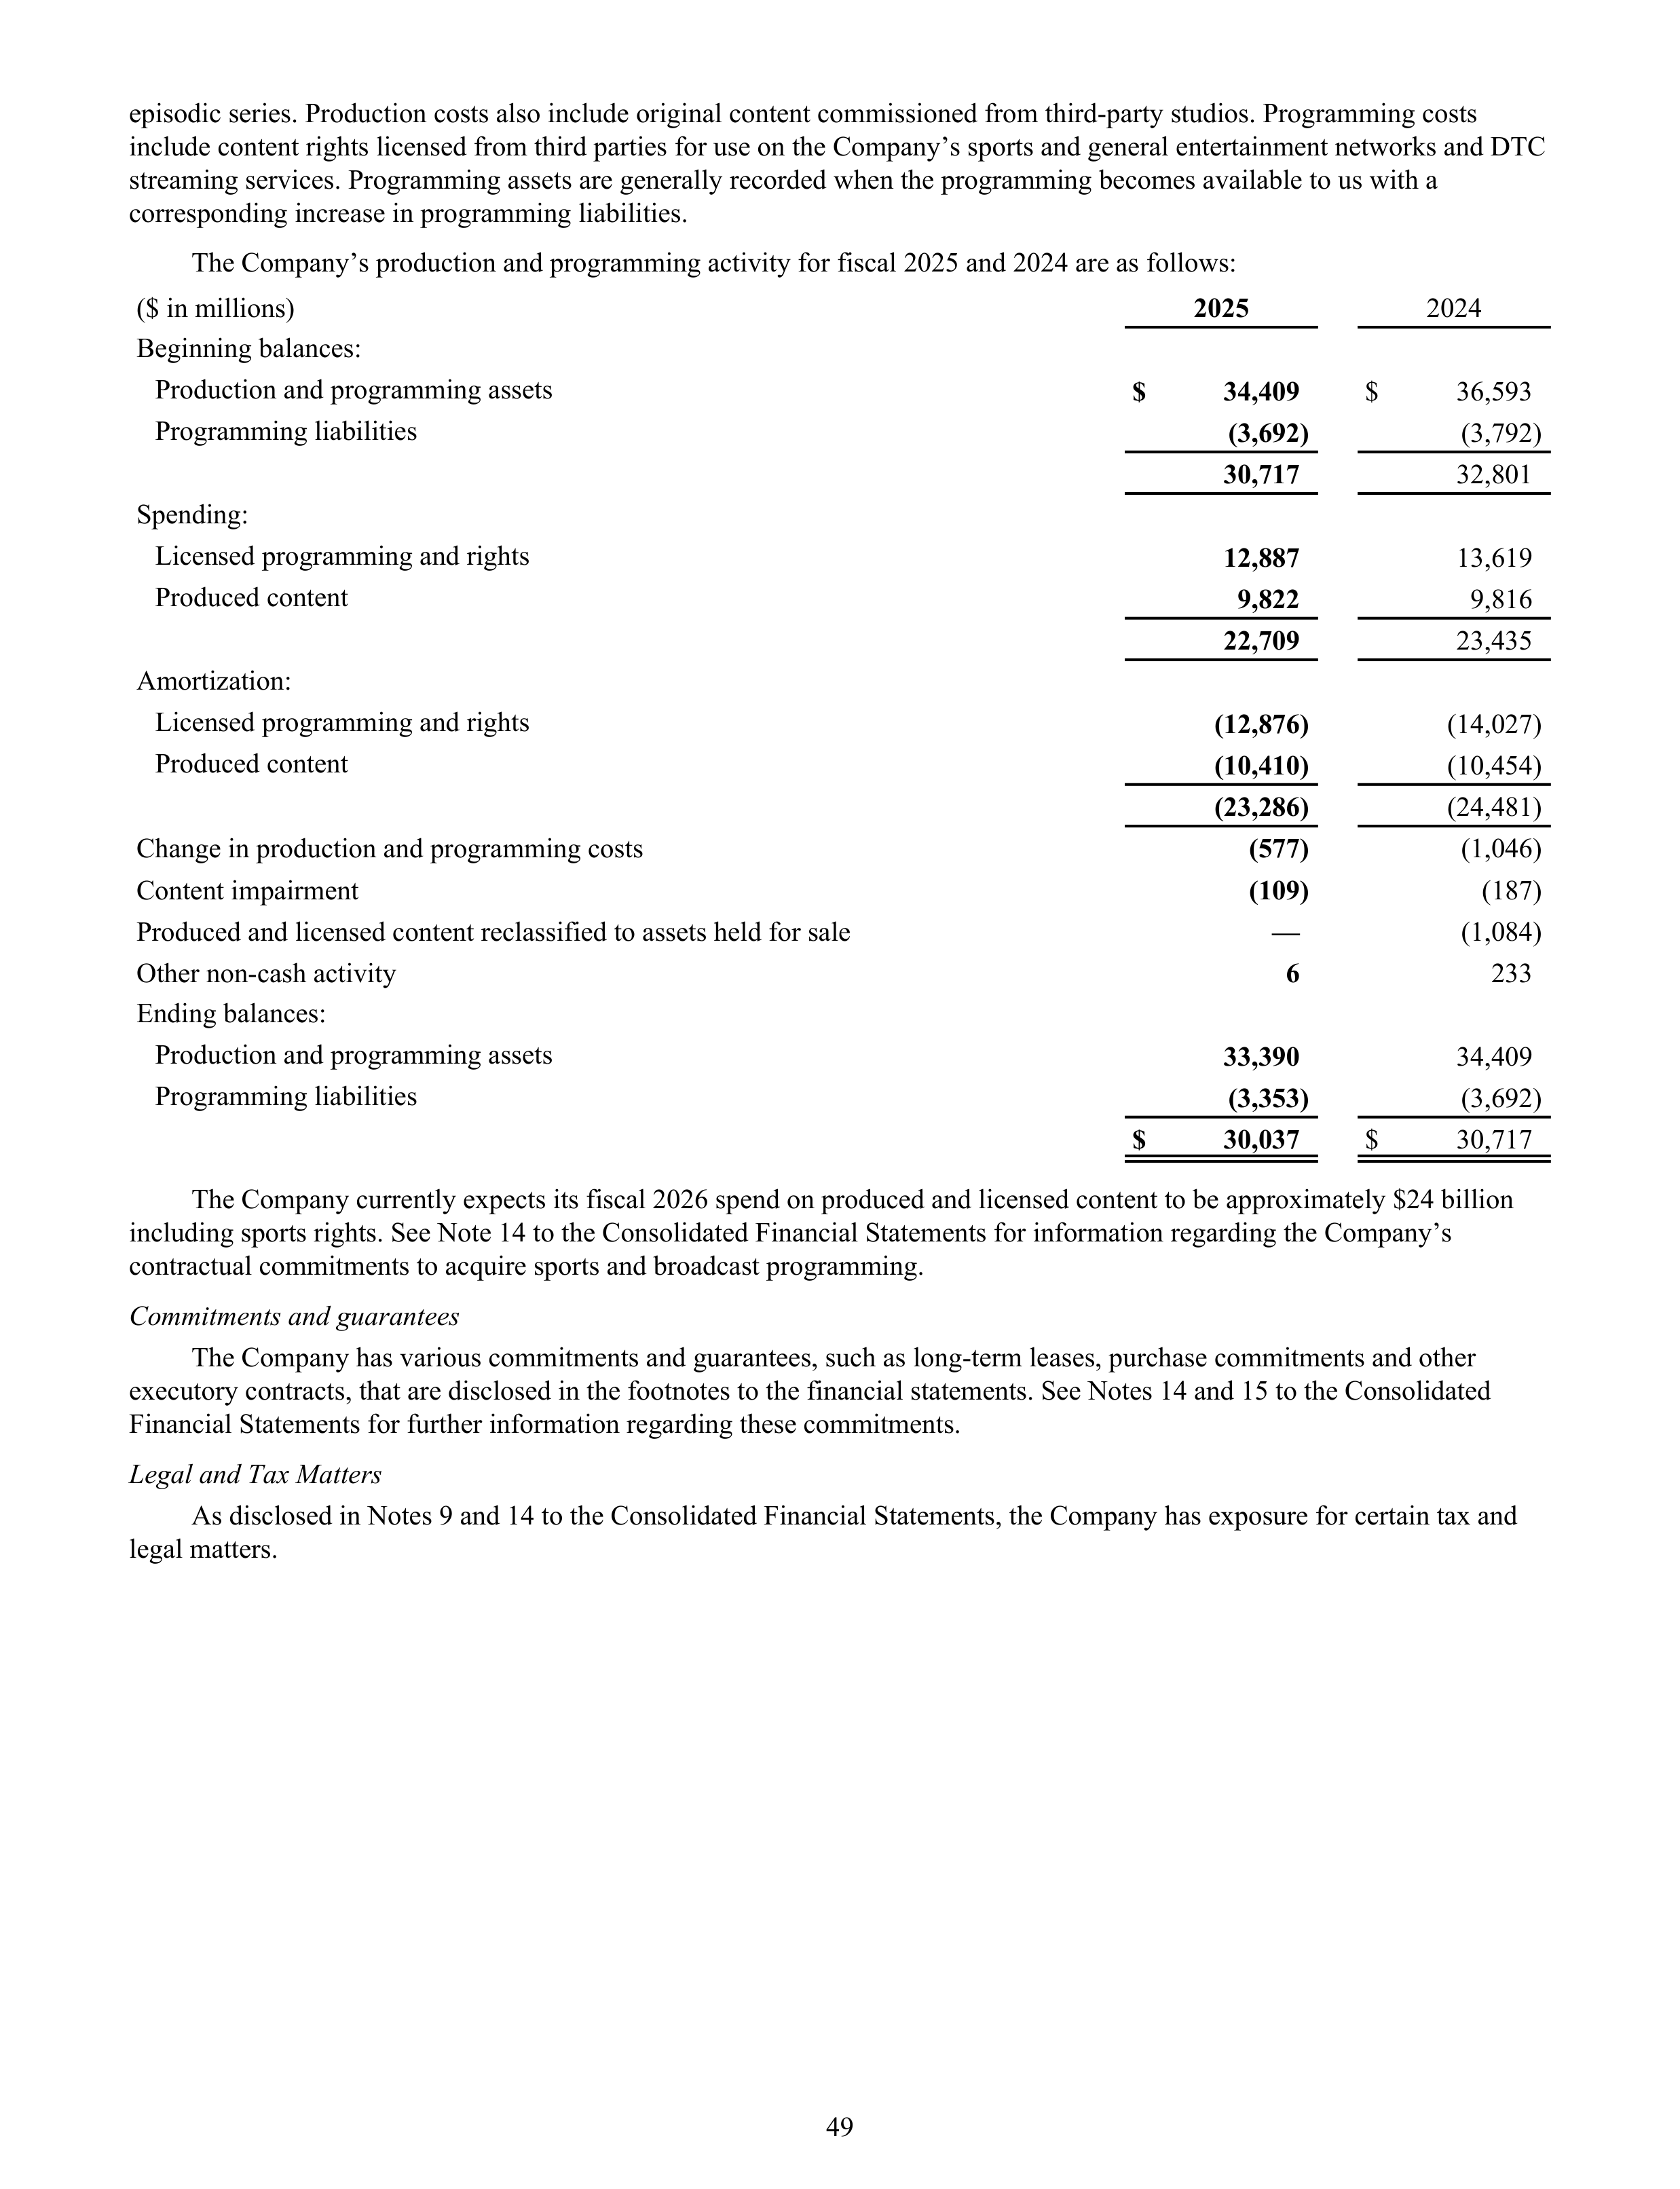
episodic series. Production costs also include original content commissioned from third-party studios. Programming costs
include content rights licensed from third parties for use on the Company’s sports and general entertainment networks and DTC
streaming services. Programming assets are generally recorded when the programming becomes available to us with a
corresponding increase in programming liabilities.
The Company’s production and programming activity for fiscal 2025 and 2024 are as follows:
($ in millions)
2025
2024
Beginning balances:
Production and programming assets
$
34,409
$
36,593
Programming liabilities
(3,692)
(3,792)
30,717
32,801
Spending:
Licensed programming and rights
12,887
13,619
Produced content
9,822
9,816
22,709
23,435
Amortization:
Licensed programming and rights
(12,876)
(14,027)
Produced content
(10,410)
(10,454)
(23,286)
(24,481)
Change in production and programming costs
(577)
(1,046)
Content impairment
(109)
(187)
Produced and licensed content reclassified to assets held for sale
—
(1,084)
Other non-cash activity
6
233
Ending balances:
Production and programming assets
33,390
34,409
Programming liabilities
(3,353)
(3,692)
$
30,037
$
30,717
The Company currently expects its fiscal 2026 spend on produced and licensed content to be approximately $24 billion
including sports rights. See Note 14 to the Consolidated Financial Statements for information regarding the Company’s
contractual commitments to acquire sports and broadcast programming.
Commitments and guarantees
The Company has various commitments and guarantees, such as long-term leases, purchase commitments and other
executory contracts, that are disclosed in the footnotes to the financial statements. See Notes 14 and 15 to the Consolidated
Financial Statements for further information regarding these commitments.
Legal and Tax Matters
As disclosed in Notes 9 and 14 to the Consolidated Financial Statements, the Company has exposure for certain tax and
legal matters.
49
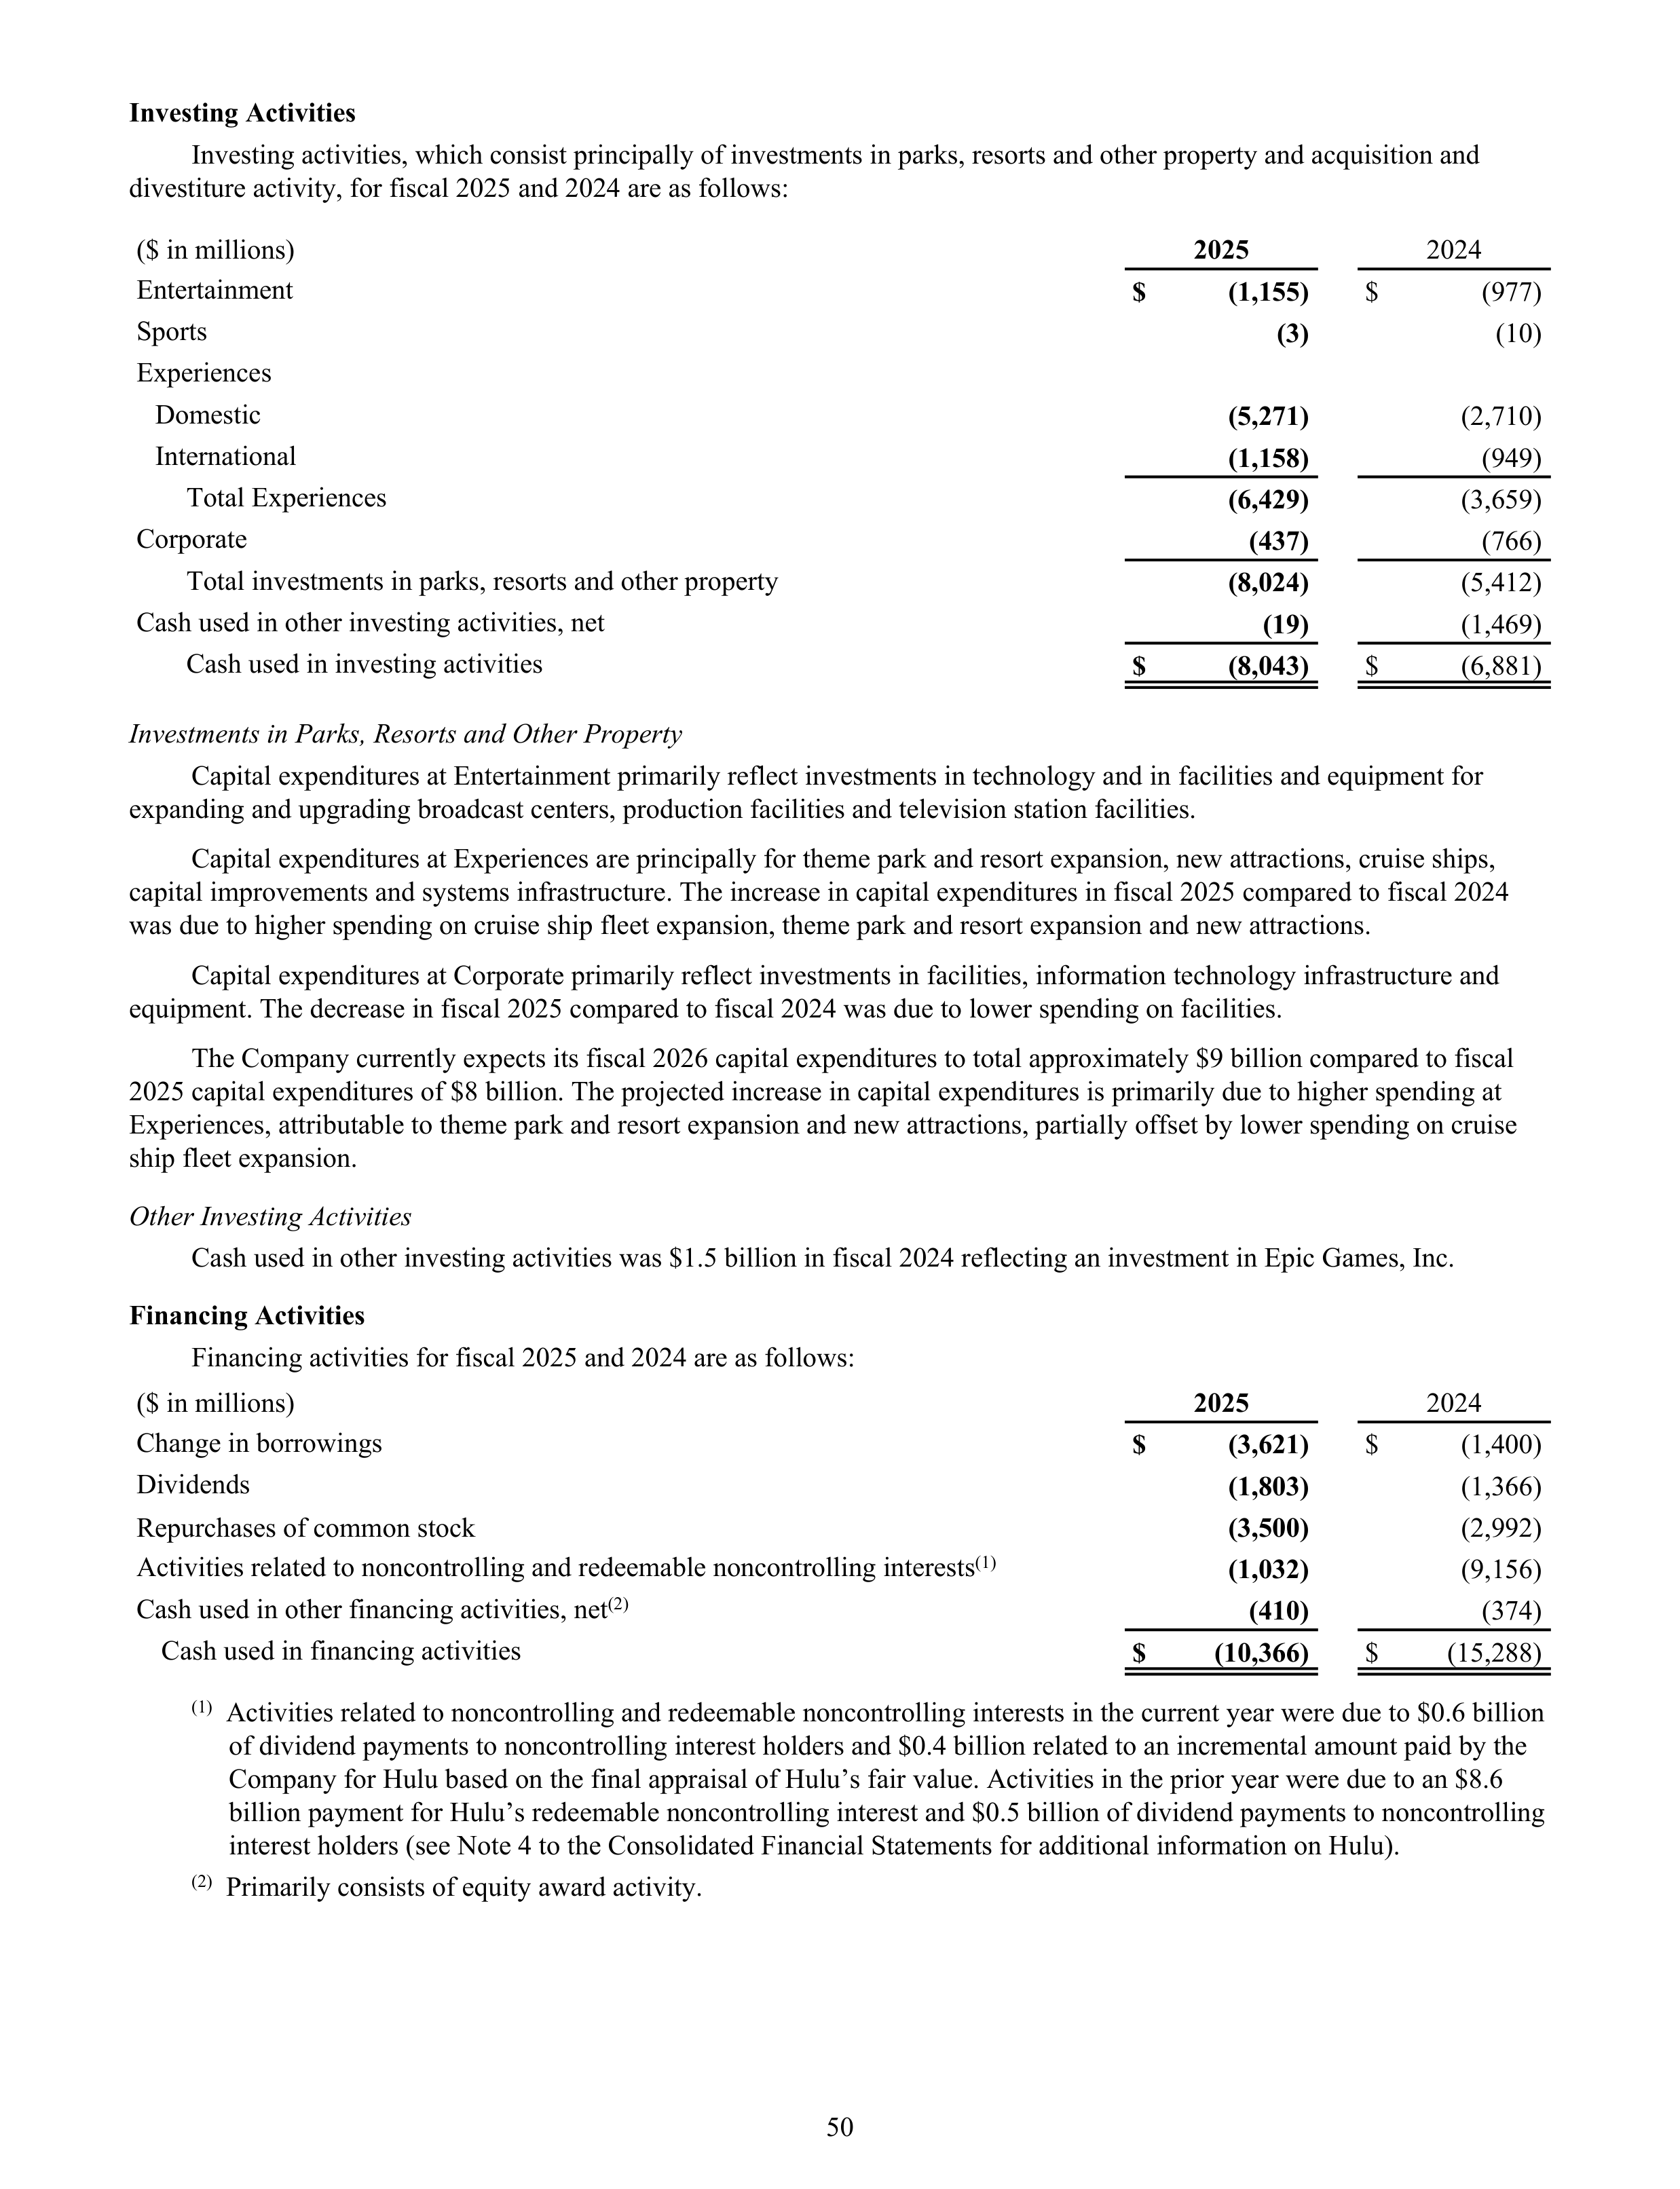
Investing Activities
Investing activities, which consist principally of investments in parks, resorts and other property and acquisition and
divestiture activity, for fiscal 2025 and 2024 are as follows:
($ in millions)
2025
2024
Entertainment
$
(1,155)
$
(977)
Sports
(3)
(10)
Experiences
Domestic
(5,271)
(2,710)
International
(1,158)
(949)
Total Experiences
(6,429)
(3,659)
Corporate
(437)
(766)
Total investments in parks, resorts and other property
(8,024)
(5,412)
Cash used in other investing activities, net
(19)
(1,469)
Cash used in investing activities
$
(8,043)
$
(6,881)
Investments in Parks, Resorts and Other Property
Capital expenditures at Entertainment primarily reflect investments in technology and in facilities and equipment for
expanding and upgrading broadcast centers, production facilities and television station facilities.
Capital expenditures at Experiences are principally for theme park and resort expansion, new attractions, cruise ships,
capital improvements and systems infrastructure. The increase in capital expenditures in fiscal 2025 compared to fiscal 2024
was due to higher spending on cruise ship fleet expansion, theme park and resort expansion and new attractions.
Capital expenditures at Corporate primarily reflect investments in facilities, information technology infrastructure and
equipment. The decrease in fiscal 2025 compared to fiscal 2024 was due to lower spending on facilities.
The Company currently expects its fiscal 2026 capital expenditures to total approximately $9 billion compared to fiscal
2025 capital expenditures of $8 billion. The projected increase in capital expenditures is primarily due to higher spending at
Experiences, attributable to theme park and resort expansion and new attractions, partially offset by lower spending on cruise
ship fleet expansion.
Other Investing Activities
Cash used in other investing activities was $1.5 billion in fiscal 2024 reflecting an investment in Epic Games, Inc.
Financing Activities
Financing activities for fiscal 2025 and 2024 are as follows:
($ in millions)
2025
2024
Change in borrowings
$
(3,621)
$
(1,400)
Dividends
(1,803)
(1,366)
Repurchases of common stock
(3,500)
(2,992)
Activities related to noncontrolling and redeemable noncontrolling interests
(1)
(1,032)
(9,156)
Cash used in other financing activities, net
(2)
(410)
(374)
Cash used in financing activities
$
(10,366)
$
(15,288)
(1)
Activities related to noncontrolling and redeemable noncontrolling interests in the current year were due to $0.6 billion
of dividend payments to noncontrolling interest holders and $0.4 billion related to an incremental amount paid by the
Company for Hulu based on the final appraisal of Hulu’s fair value. Activities in the prior year were due to an $8.6
billion payment for Hulu’s redeemable noncontrolling interest and $0.5 billion of dividend payments to noncontrolling
interest holders (see Note 4 to the Consolidated Financial Statements for additional information on Hulu).
(2)
Primarily consists of equity award activity.
50
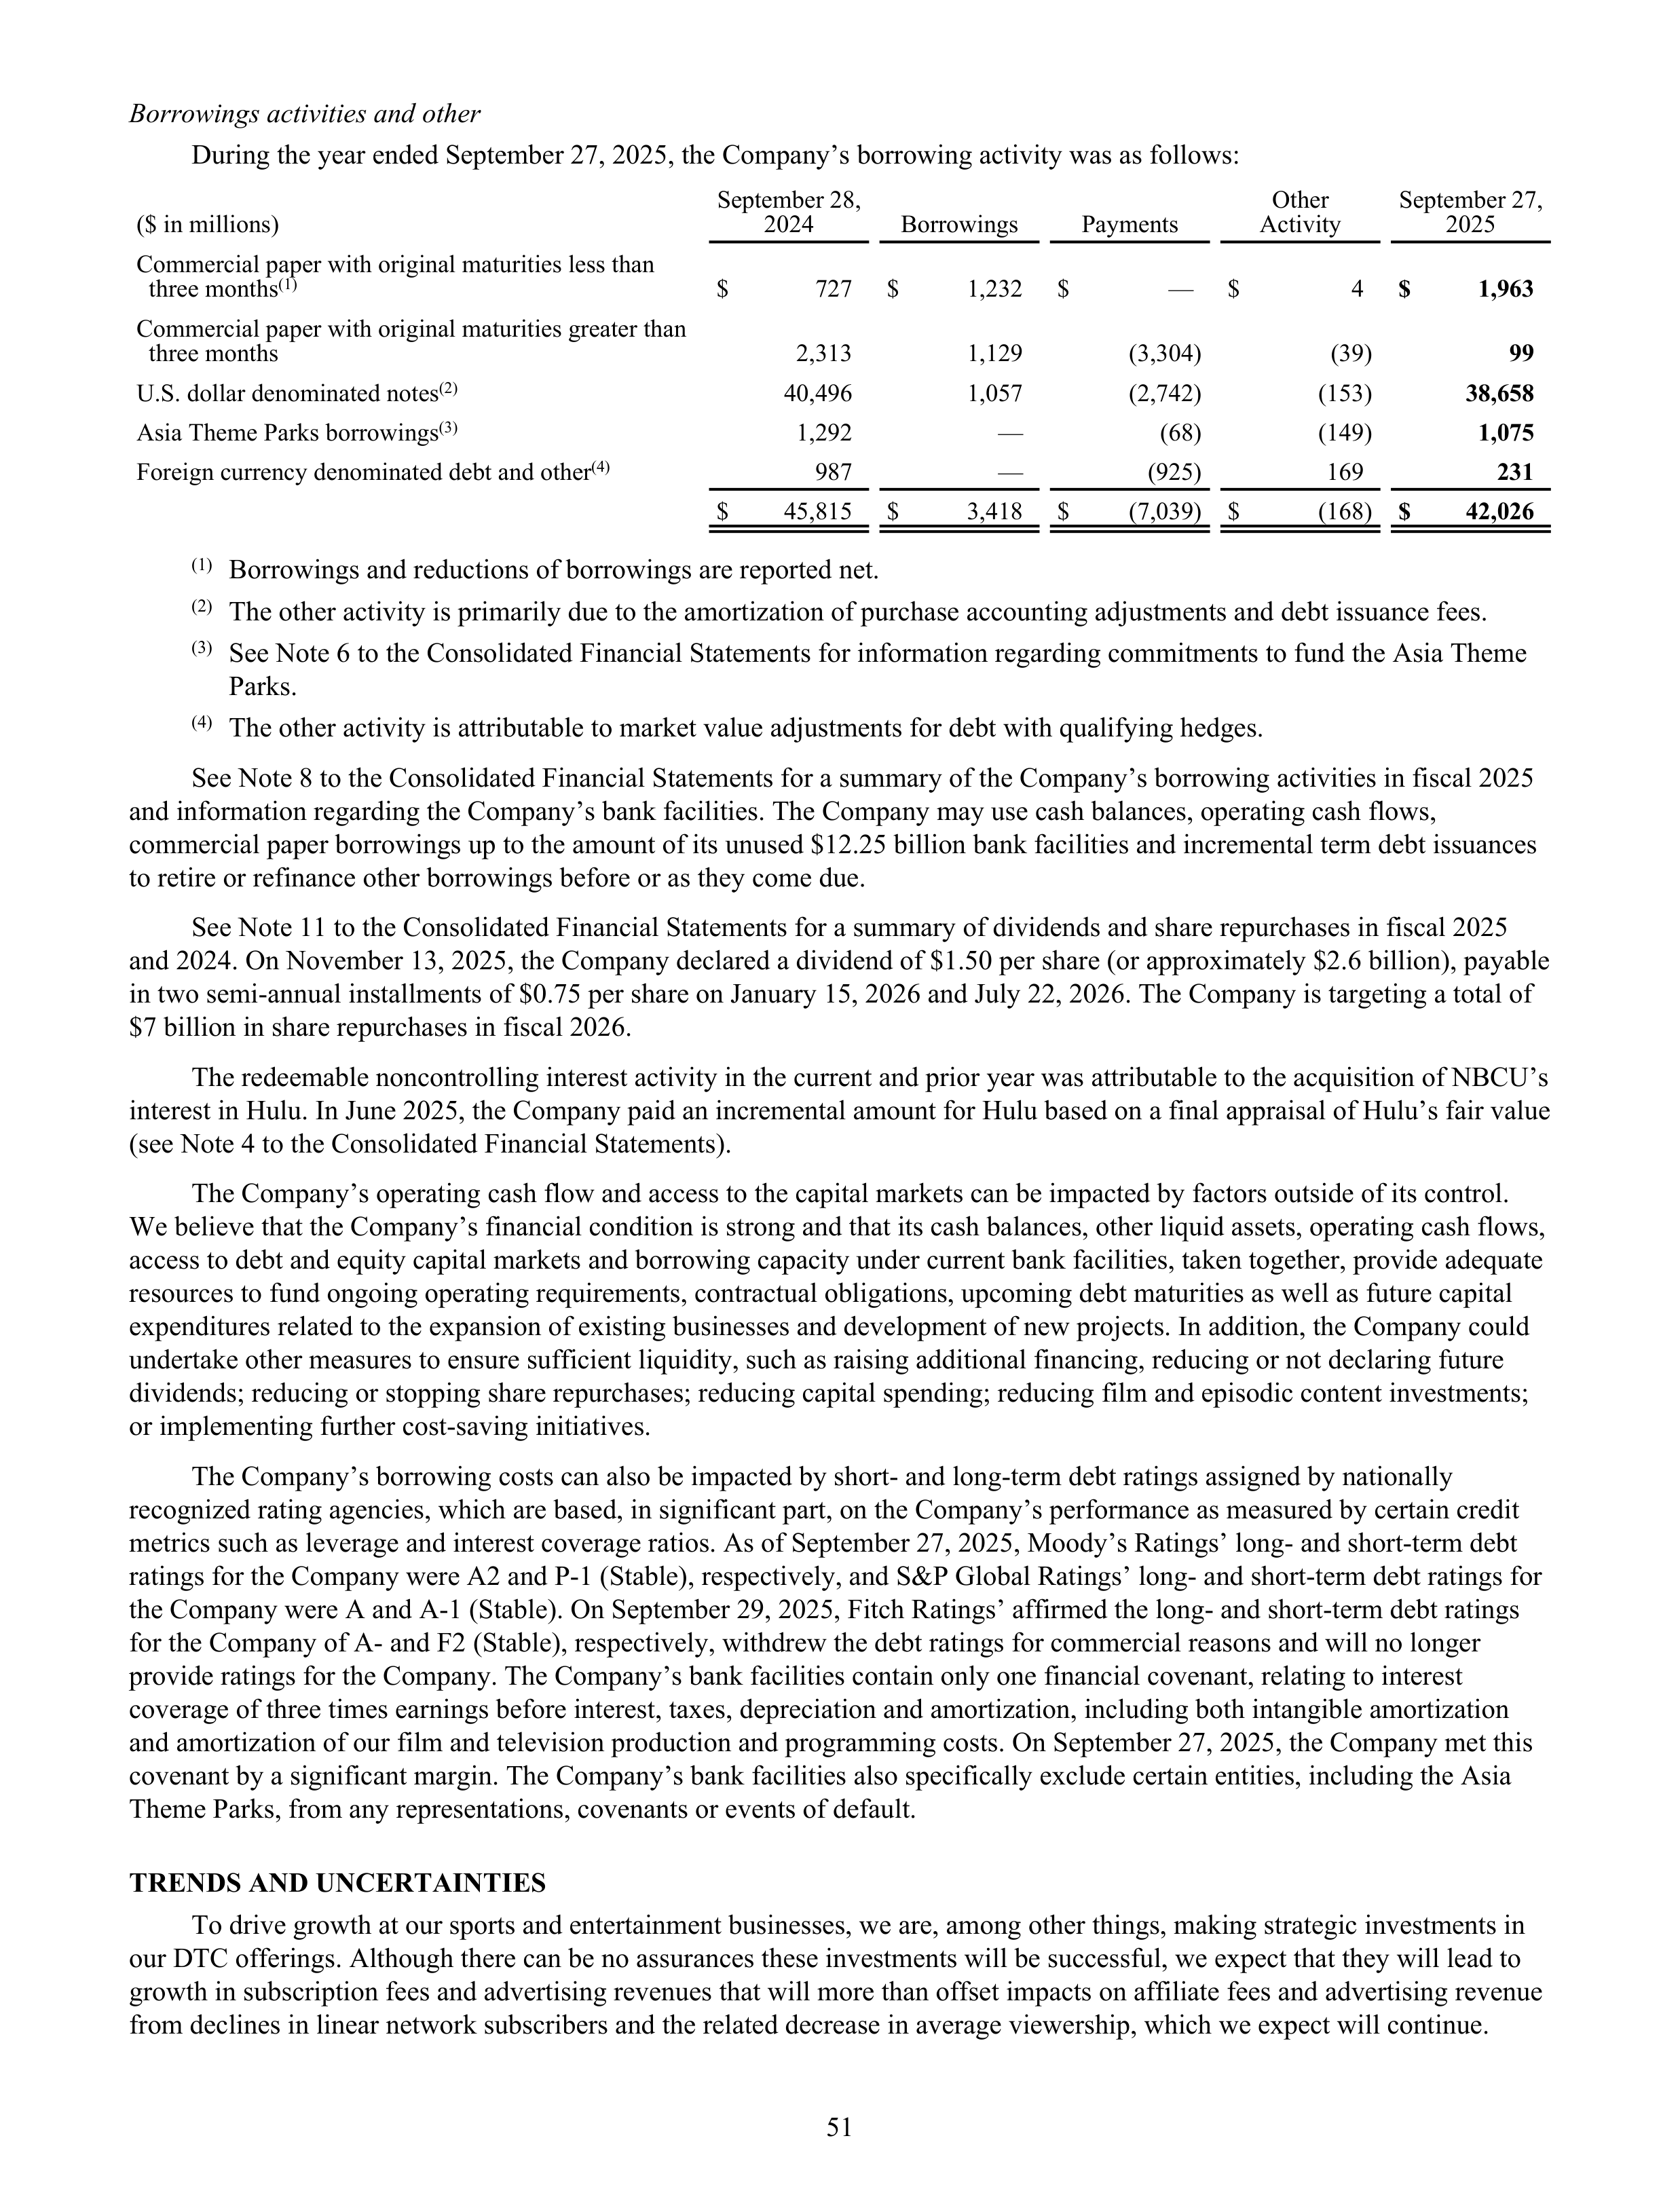
Borrowings activities and other
During the year ended September 27, 2025, the Company’s borrowing activity was as follows:
($ in millions)
September 28,
2024
Borrowings
Payments
Other
Activity
September 27,
2025
Commercial paper with original maturities less than
three months
(1)
$
727
$
1,232
$
— $
4
$
1,963
Commercial paper with original maturities greater than
three months
2,313
1,129
(3,304)
(39)
99
U.S. dollar denominated notes
(2)
40,496
1,057
(2,742)
(153)
38,658
Asia Theme Parks borrowings
(3)
1,292
—
(68)
(149)
1,075
Foreign currency denominated debt and other
(4)
987
—
(925)
169
231
$
45,815
$
3,418
$
(7,039) $
(168)
$
42,026
(1)
Borrowings and reductions of borrowings are reported net.
(2)
The other activity is primarily due to the amortization of purchase accounting adjustments and debt issuance fees.
(3)
See Note 6 to the Consolidated Financial Statements for information regarding commitments to fund the Asia Theme
Parks.
(4)
The other activity is attributable to market value adjustments for debt with qualifying hedges.
See Note 8 to the Consolidated Financial Statements for a summary of the Company’s borrowing activities in fiscal 2025
and information regarding the Company’s bank facilities. The Company may use cash balances, operating cash flows,
commercial paper borrowings up to the amount of its unused $12.25 billion bank facilities and incremental term debt issuances
to retire or refinance other borrowings before or as they come due.
See Note 11 to the Consolidated Financial Statements for a summary of dividends and share repurchases in fiscal 2025
and 2024. On November 13, 2025, the Company declared a dividend of $1.50 per share (or approximately $2.6 billion), payable
in two semi-annual installments of $0.75 per share on January 15, 2026 and July 22, 2026. The Company is targeting a total of
$7 billion in share repurchases in fiscal 2026.
The redeemable noncontrolling interest activity in the current and prior year was attributable to the acquisition of NBCU’s
interest in Hulu. In June 2025, the Company paid an incremental amount for Hulu based on a final appraisal of Hulu’s fair value
(see Note 4 to the Consolidated Financial Statements).
The Company’s operating cash flow and access to the capital markets can be impacted by factors outside of its control.
We believe that the Company’s financial condition is strong and that its cash balances, other liquid assets, operating cash flows,
access to debt and equity capital markets and borrowing capacity under current bank facilities, taken together, provide adequate
resources to fund ongoing operating requirements, contractual obligations, upcoming debt maturities as well as future capital
expenditures related to the expansion of existing businesses and development of new projects. In addition, the Company could
undertake other measures to ensure sufficient liquidity, such as raising additional financing, reducing or not declaring future
dividends; reducing or stopping share repurchases; reducing capital spending; reducing film and episodic content investments;
or implementing further cost-saving initiatives.
The Company’s borrowing costs can also be impacted by short- and long-term debt ratings assigned by nationally
recognized rating agencies, which are based, in significant part, on the Company’s performance as measured by certain credit
metrics such as leverage and interest coverage ratios. As of September 27, 2025, Moody’s Ratings’ long- and short-term debt
ratings for the Company were A2 and P-1 (Stable), respectively, and S&P Global Ratings’ long- and short-term debt ratings for
the Company were A and A-1 (Stable). On September 29, 2025, Fitch Ratings’ affirmed the long- and short-term debt ratings
for the Company of A- and F2 (Stable), respectively, withdrew the debt ratings for commercial reasons and will no longer
provide ratings for the Company. The Company’s bank facilities contain only one financial covenant, relating to interest
coverage of three times earnings before interest, taxes, depreciation and amortization, including both intangible amortization
and amortization of our film and television production and programming costs. On September 27, 2025, the Company met this
covenant by a significant margin. The Company’s bank facilities also specifically exclude certain entities, including the Asia
Theme Parks, from any representations, covenants or events of default.
TRENDS AND UNCERTAINTIES
To drive growth at our sports and entertainment businesses, we are, among other things, making strategic investments in
our DTC offerings. Although there can be no assurances these investments will be successful, we expect that they will lead to
growth in subscription fees and advertising revenues that will more than offset impacts on affiliate fees and advertising revenue
from declines in linear network subscribers and the related decrease in average viewership, which we expect will continue.
51
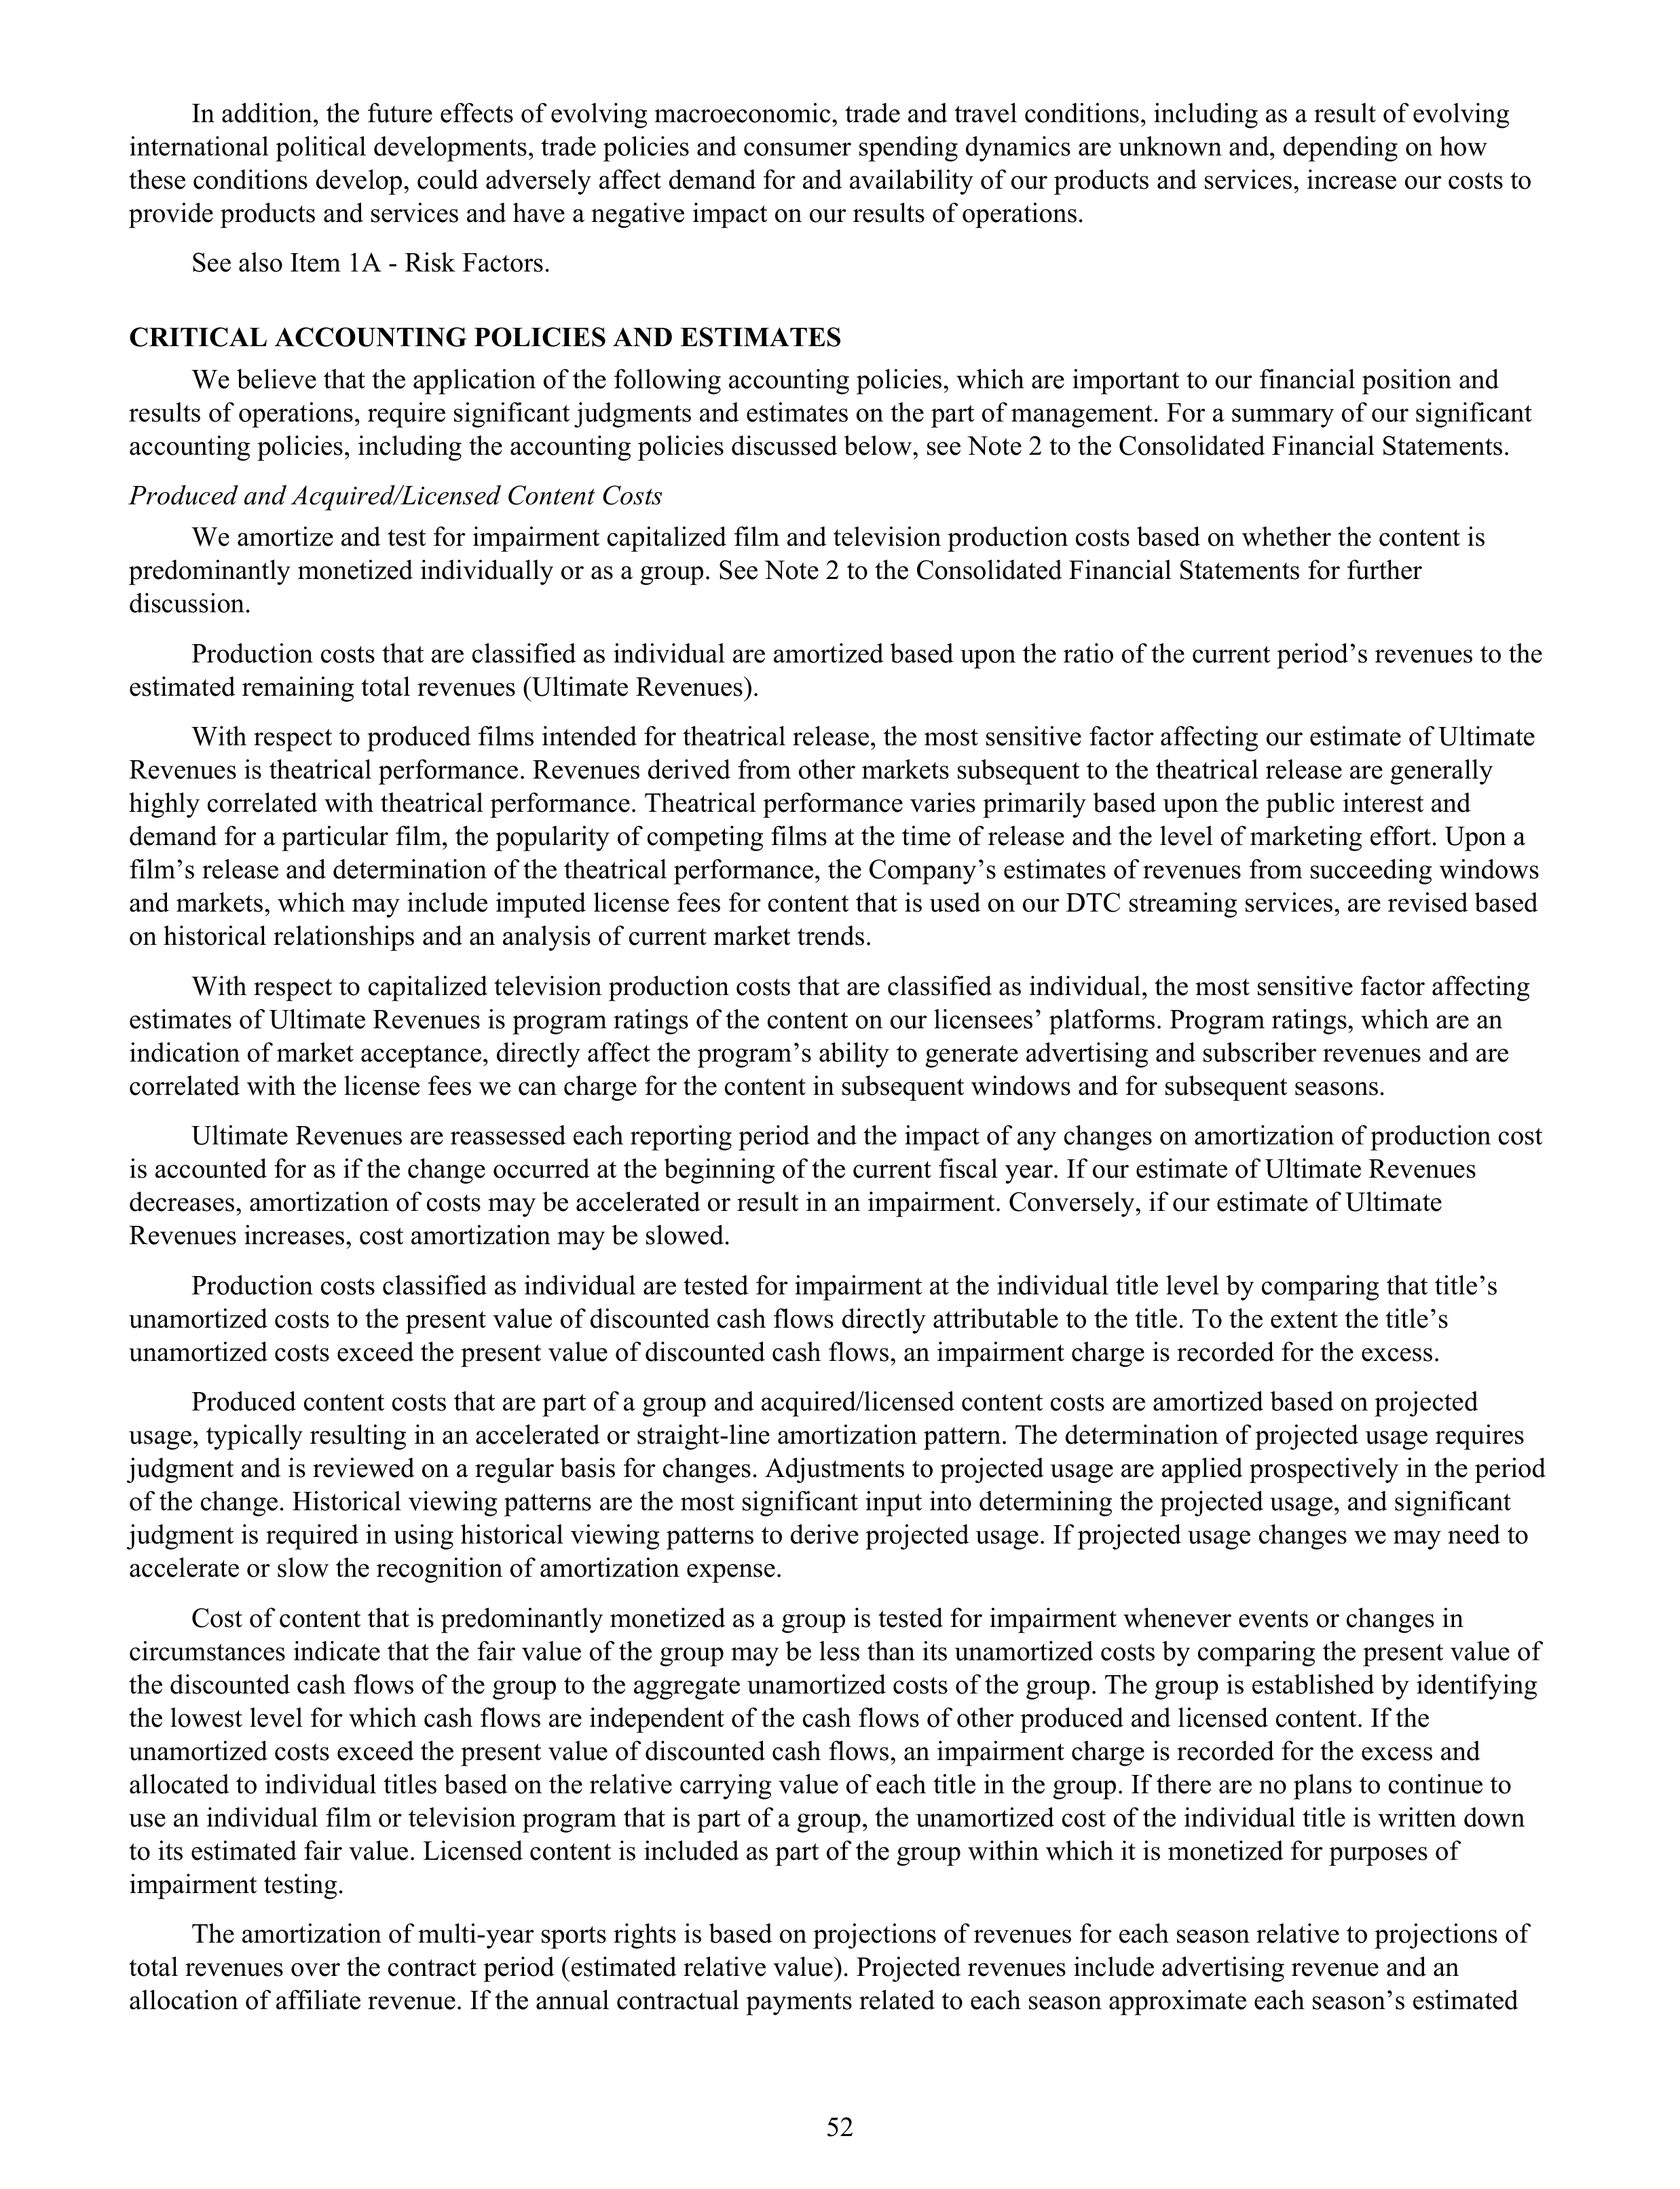
In addition, the future effects of evolving macroeconomic, trade and travel conditions, including as a result of evolving
international political developments, trade policies and consumer spending dynamics are unknown and, depending on how
these conditions develop, could adversely affect demand for and availability of our products and services, increase our costs to
provide products and services and have a negative impact on our results of operations.
See also Item 1A - Risk Factors.
CRITICAL ACCOUNTING POLICIES AND ESTIMATES
We believe that the application of the following accounting policies, which are important to our financial position and
results of operations, require significant judgments and estimates on the part of management. For a summary of our significant
accounting policies, including the accounting policies discussed below, see Note 2 to the Consolidated Financial Statements.
Produced and Acquired/Licensed Content Costs
We amortize and test for impairment capitalized film and television production costs based on whether the content is
predominantly monetized individually or as a group. See Note 2 to the Consolidated Financial Statements for further
discussion.
Production costs that are classified as individual are amortized based upon the ratio of the current period’s revenues to the
estimated remaining total revenues (Ultimate Revenues).
With respect to produced films intended for theatrical release, the most sensitive factor affecting our estimate of Ultimate
Revenues is theatrical performance. Revenues derived from other markets subsequent to the theatrical release are generally
highly correlated with theatrical performance. Theatrical performance varies primarily based upon the public interest and
demand for a particular film, the popularity of competing films at the time of release and the level of marketing effort. Upon a
film’s release and determination of the theatrical performance, the Company’s estimates of revenues from succeeding windows
and markets, which may include imputed license fees for content that is used on our DTC streaming services, are revised based
on historical relationships and an analysis of current market trends.
With respect to capitalized television production costs that are classified as individual, the most sensitive factor affecting
estimates of Ultimate Revenues is program ratings of the content on our licensees’ platforms. Program ratings, which are an
indication of market acceptance, directly affect the program’s ability to generate advertising and subscriber revenues and are
correlated with the license fees we can charge for the content in subsequent windows and for subsequent seasons.
Ultimate Revenues are reassessed each reporting period and the impact of any changes on amortization of production cost
is accounted for as if the change occurred at the beginning of the current fiscal year. If our estimate of Ultimate Revenues
decreases, amortization of costs may be accelerated or result in an impairment. Conversely, if our estimate of Ultimate
Revenues increases, cost amortization may be slowed.
Production costs classified as individual are tested for impairment at the individual title level by comparing that title’s
unamortized costs to the present value of discounted cash flows directly attributable to the title. To the extent the title’s
unamortized costs exceed the present value of discounted cash flows, an impairment charge is recorded for the excess.
Produced content costs that are part of a group and acquired/licensed content costs are amortized based on projected
usage, typically resulting in an accelerated or straight-line amortization pattern. The determination of projected usage requires
judgment and is reviewed on a regular basis for changes. Adjustments to projected usage are applied prospectively in the period
of the change. Historical viewing patterns are the most significant input into determining the projected usage, and significant
judgment is required in using historical viewing patterns to derive projected usage. If projected usage changes we may need to
accelerate or slow the recognition of amortization expense.
Cost of content that is predominantly monetized as a group is tested for impairment whenever events or changes in
circumstances indicate that the fair value of the group may be less than its unamortized costs by comparing the present value of
the discounted cash flows of the group to the aggregate unamortized costs of the group. The group is established by identifying
the lowest level for which cash flows are independent of the cash flows of other produced and licensed content. If the
unamortized costs exceed the present value of discounted cash flows, an impairment charge is recorded for the excess and
allocated to individual titles based on the relative carrying value of each title in the group. If there are no plans to continue to
use an individual film or television program that is part of a group, the unamortized cost of the individual title is written down
to its estimated fair value. Licensed content is included as part of the group within which it is monetized for purposes of
impairment testing.
The amortization of multi-year sports rights is based on projections of revenues for each season relative to projections of
total revenues over the contract period (estimated relative value). Projected revenues include advertising revenue and an
allocation of affiliate revenue. If the annual contractual payments related to each season approximate each season’s estimated
52
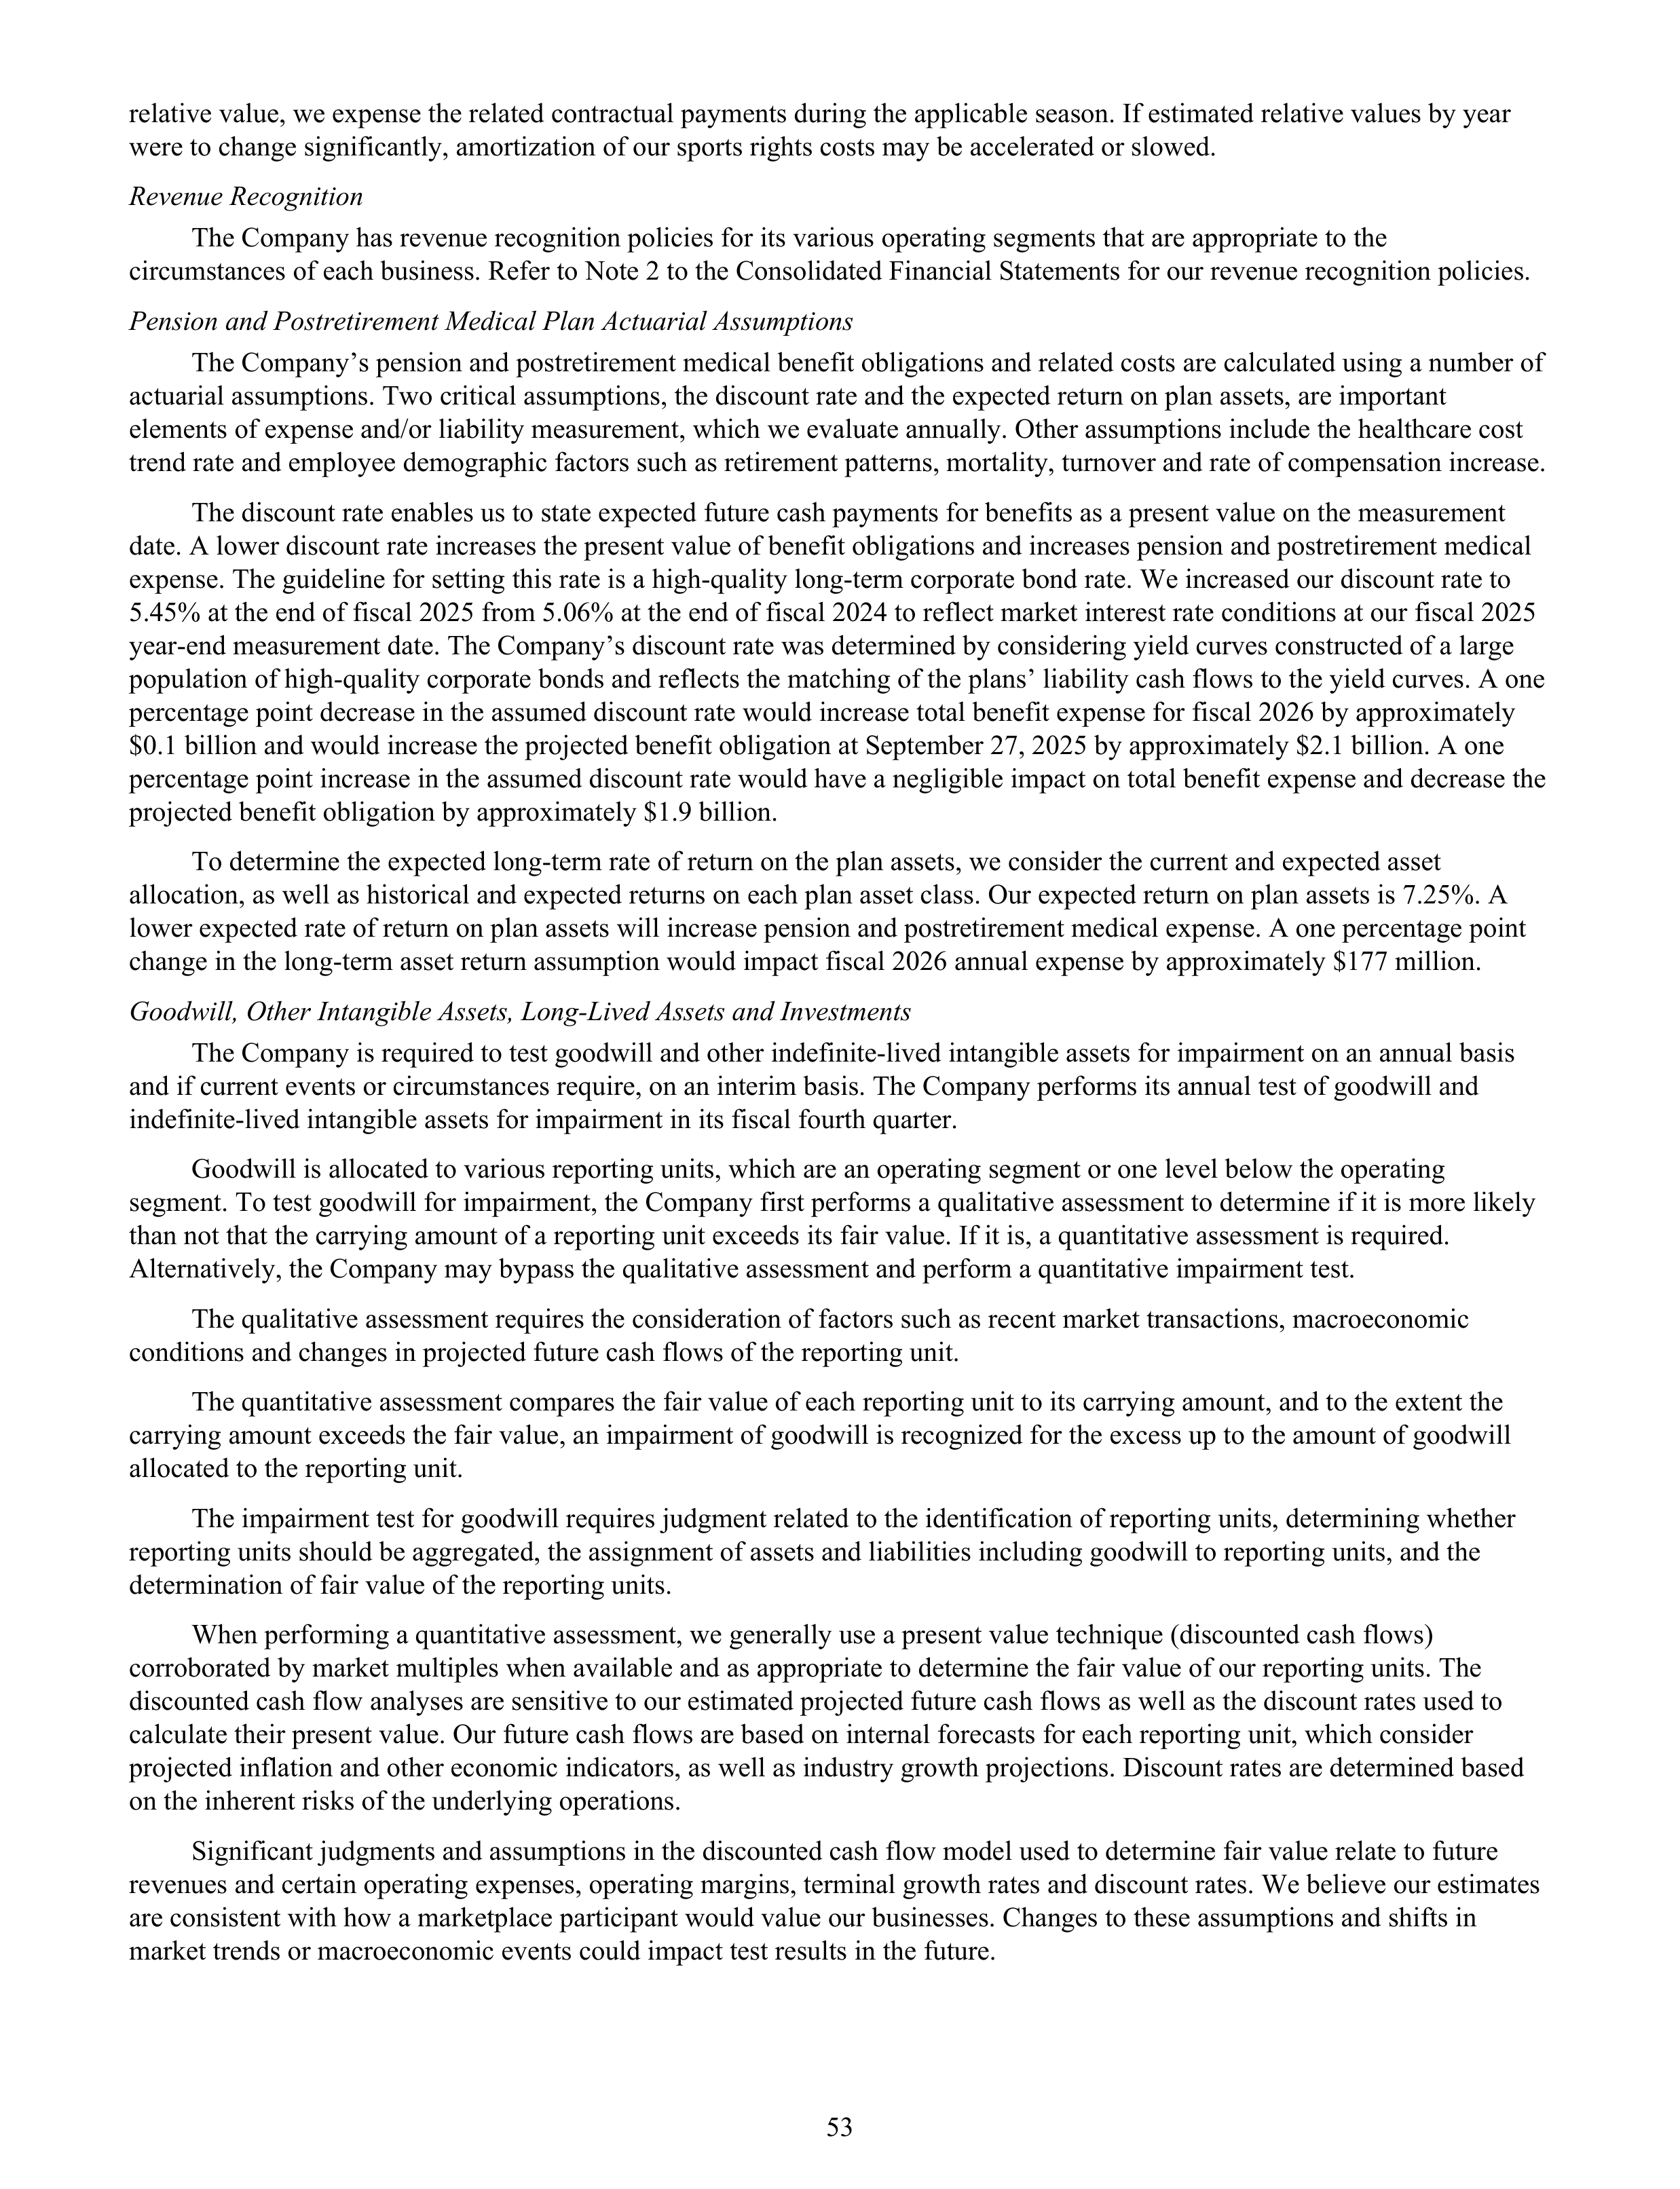
relative value, we expense the related contractual payments during the applicable season. If estimated relative values by year
were to change significantly, amortization of our sports rights costs may be accelerated or slowed.
Revenue Recognition
The Company has revenue recognition policies for its various operating segments that are appropriate to the
circumstances of each business. Refer to Note 2 to the Consolidated Financial Statements for our revenue recognition policies.
Pension and Postretirement Medical Plan Actuarial Assumptions
The Company’s pension and postretirement medical benefit obligations and related costs are calculated using a number of
actuarial assumptions. Two critical assumptions, the discount rate and the expected return on plan assets, are important
elements of expense and/or liability measurement, which we evaluate annually. Other assumptions include the healthcare cost
trend rate and employee demographic factors such as retirement patterns, mortality, turnover and rate of compensation increase.
The discount rate enables us to state expected future cash payments for benefits as a present value on the measurement
date. A lower discount rate increases the present value of benefit obligations and increases pension and postretirement medical
expense. The guideline for setting this rate is a high-quality long-term corporate bond rate. We increased our discount rate to
5.45% at the end of fiscal 2025 from 5.06% at the end of fiscal 2024 to reflect market interest rate conditions at our fiscal 2025
year-end measurement date. The Company’s discount rate was determined by considering yield curves constructed of a large
population of high-quality corporate bonds and reflects the matching of the plans’ liability cash flows to the yield curves. A one
percentage point decrease in the assumed discount rate would increase total benefit expense for fiscal 2026 by approximately
$0.1 billion and would increase the projected benefit obligation at September 27, 2025 by approximately $2.1 billion. A one
percentage point increase in the assumed discount rate would have a negligible impact on total benefit expense and decrease the
projected benefit obligation by approximately $1.9 billion.
To determine the expected long-term rate of return on the plan assets, we consider the current and expected asset
allocation, as well as historical and expected returns on each plan asset class. Our expected return on plan assets is 7.25%. A
lower expected rate of return on plan assets will increase pension and postretirement medical expense. A one percentage point
change in the long-term asset return assumption would impact fiscal 2026 annual expense by approximately $177 million.
Goodwill, Other Intangible Assets, Long-Lived Assets and Investments
The Company is required to test goodwill and other indefinite-lived intangible assets for impairment on an annual basis
and if current events or circumstances require, on an interim basis. The Company performs its annual test of goodwill and
indefinite-lived intangible assets for impairment in its fiscal fourth quarter.
Goodwill is allocated to various reporting units, which are an operating segment or one level below the operating
segment. To test goodwill for impairment, the Company first performs a qualitative assessment to determine if it is more likely
than not that the carrying amount of a reporting unit exceeds its fair value. If it is, a quantitative assessment is required.
Alternatively, the Company may bypass the qualitative assessment and perform a quantitative impairment test.
The qualitative assessment requires the consideration of factors such as recent market transactions, macroeconomic
conditions and changes in projected future cash flows of the reporting unit.
The quantitative assessment compares the fair value of each reporting unit to its carrying amount, and to the extent the
carrying amount exceeds the fair value, an impairment of goodwill is recognized for the excess up to the amount of goodwill
allocated to the reporting unit.
The impairment test for goodwill requires judgment related to the identification of reporting units, determining whether
reporting units should be aggregated, the assignment of assets and liabilities including goodwill to reporting units, and the
determination of fair value of the reporting units.
When performing a quantitative assessment, we generally use a present value technique (discounted cash flows)
corroborated by market multiples when available and as appropriate to determine the fair value of our reporting units. The
discounted cash flow analyses are sensitive to our estimated projected future cash flows as well as the discount rates used to
calculate their present value. Our future cash flows are based on internal forecasts for each reporting unit, which consider
projected inflation and other economic indicators, as well as industry growth projections. Discount rates are determined based
on the inherent risks of the underlying operations.
Significant judgments and assumptions in the discounted cash flow model used to determine fair value relate to future
revenues and certain operating expenses, operating margins, terminal growth rates and discount rates. We believe our estimates
are consistent with how a marketplace participant would value our businesses. Changes to these assumptions and shifts in
market trends or macroeconomic events could impact test results in the future.
53
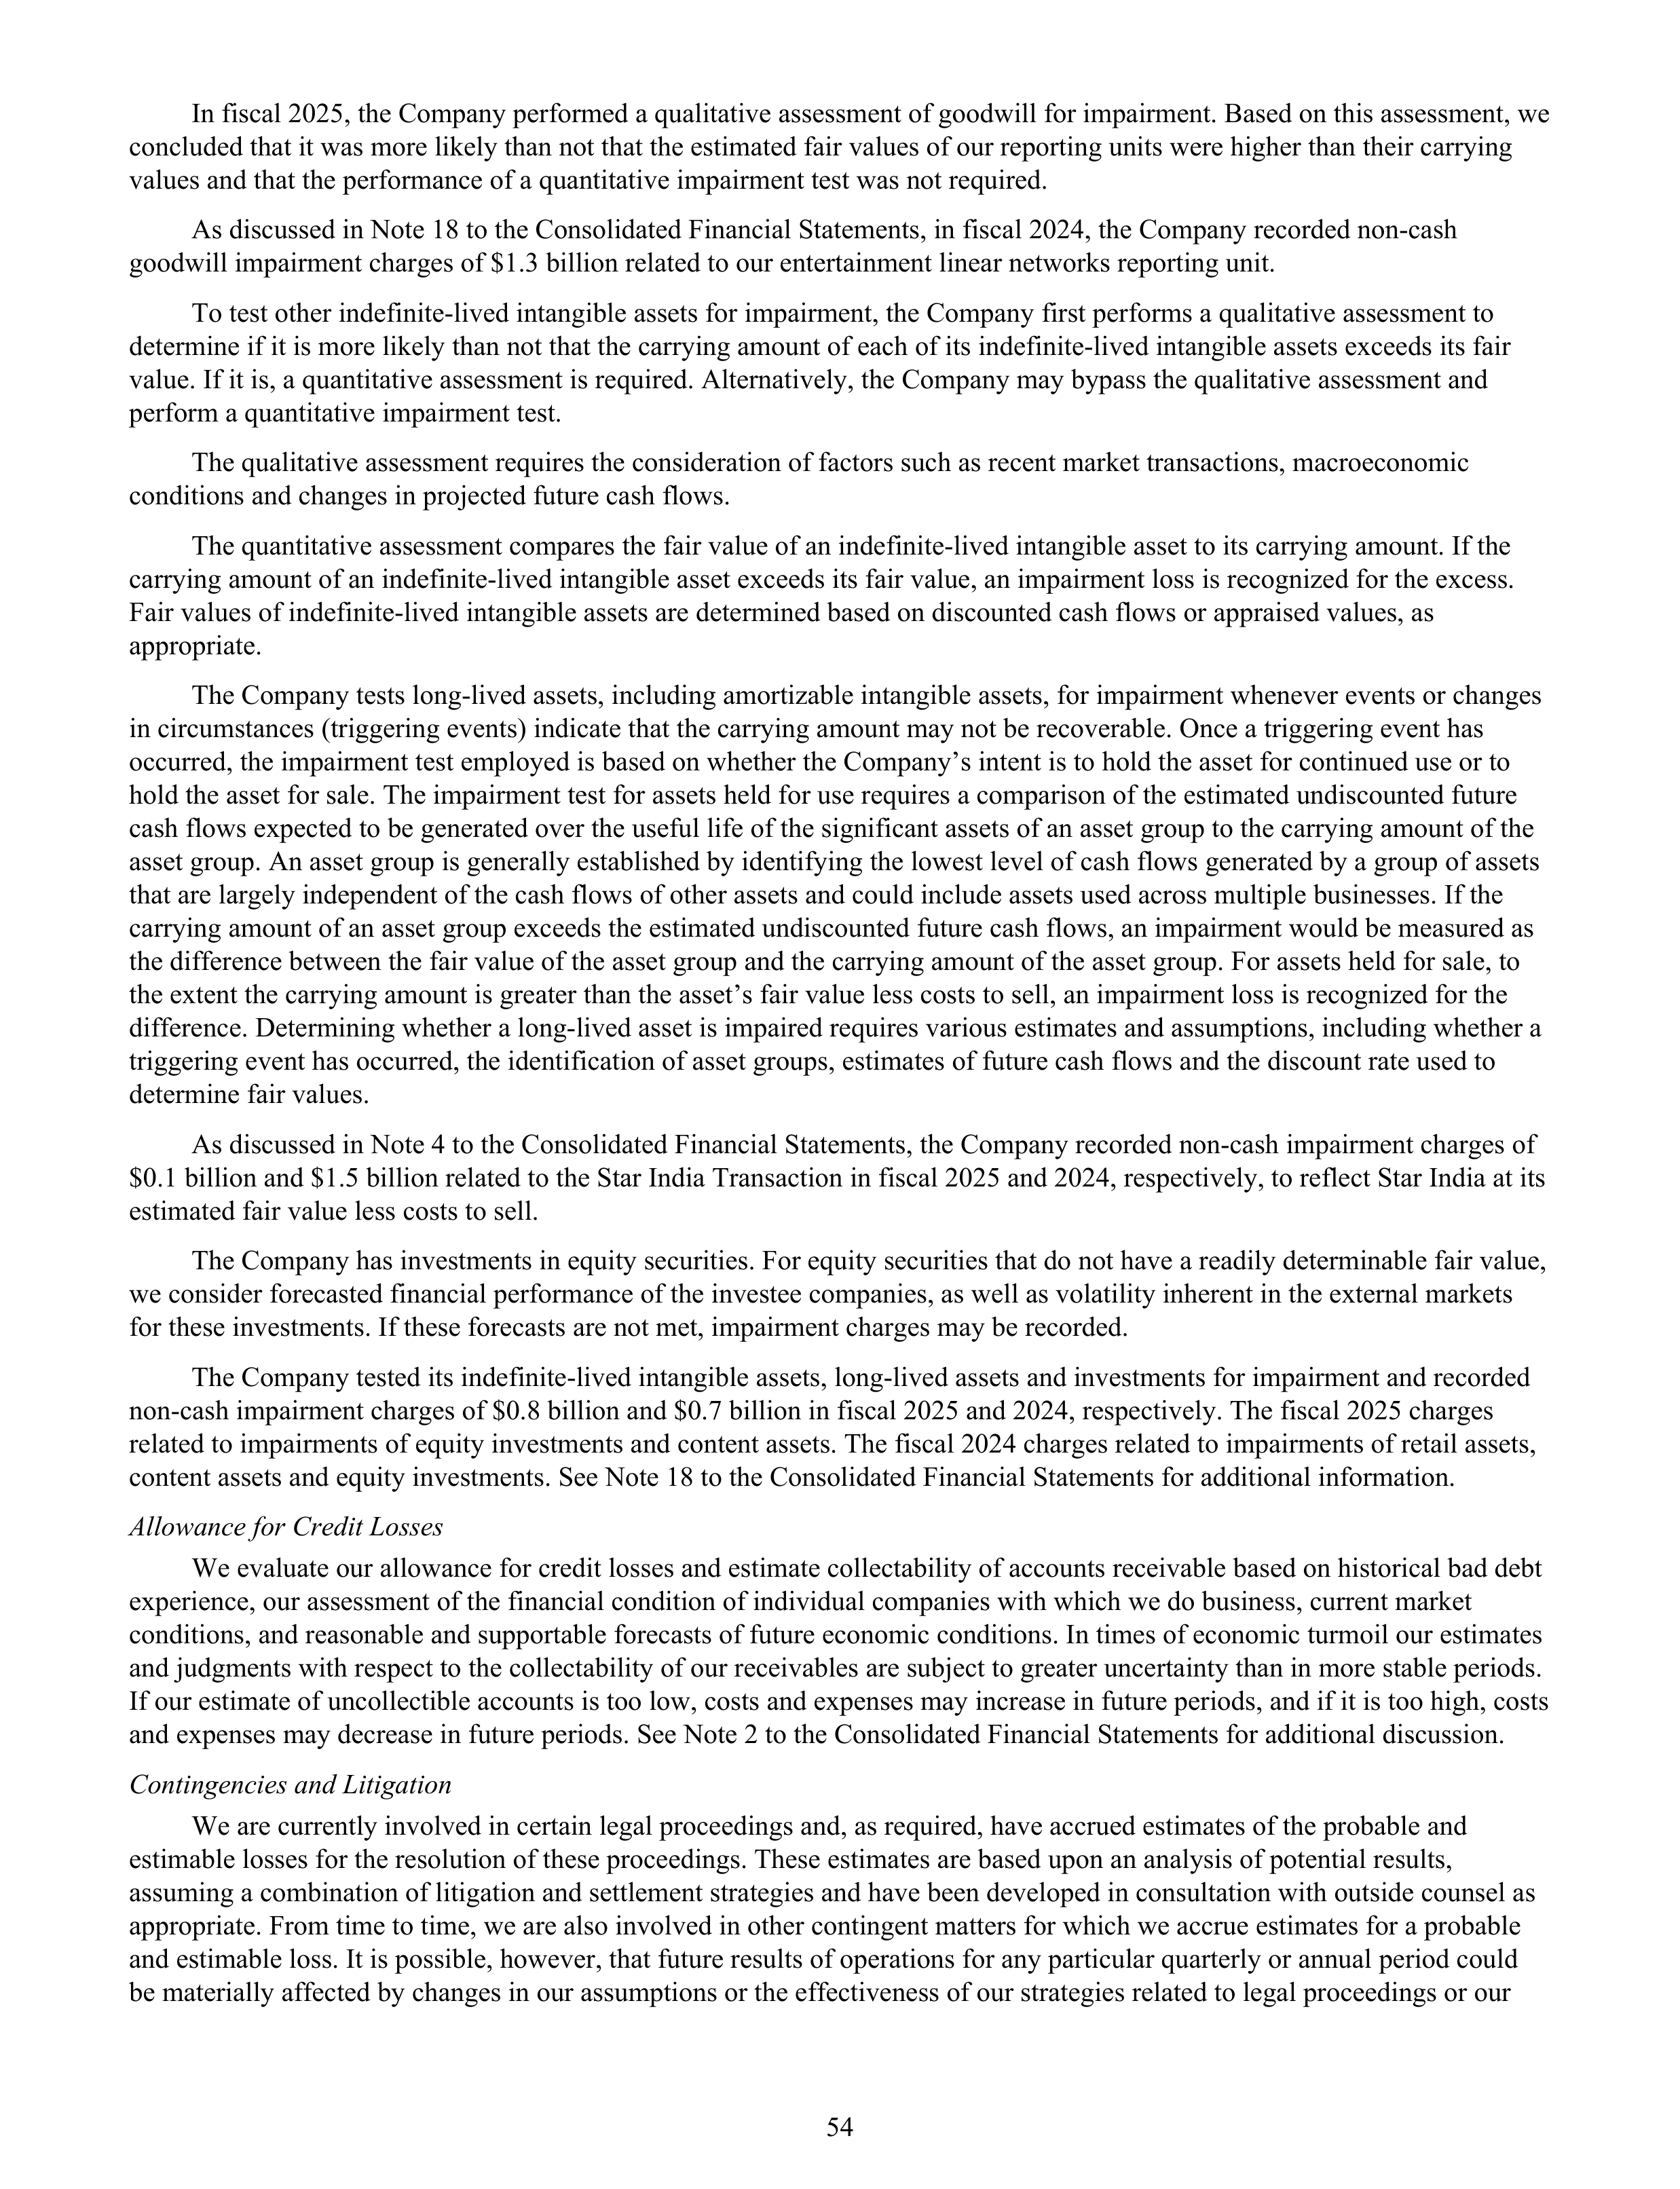
In fiscal 2025, the Company performed a qualitative assessment of goodwill for impairment. Based on this assessment, we
concluded that it was more likely than not that the estimated fair values of our reporting units were higher than their carrying
values and that the performance of a quantitative impairment test was not required.
As discussed in Note 18 to the Consolidated Financial Statements, in fiscal 2024, the Company recorded non-cash
goodwill impairment charges of $1.3 billion related to our entertainment linear networks reporting unit.
To test other indefinite-lived intangible assets for impairment, the Company first performs a qualitative assessment to
determine if it is more likely than not that the carrying amount of each of its indefinite-lived intangible assets exceeds its fair
value. If it is, a quantitative assessment is required. Alternatively, the Company may bypass the qualitative assessment and
perform a quantitative impairment test.
The qualitative assessment requires the consideration of factors such as recent market transactions, macroeconomic
conditions and changes in projected future cash flows.
The quantitative assessment compares the fair value of an indefinite-lived intangible asset to its carrying amount. If the
carrying amount of an indefinite-lived intangible asset exceeds its fair value, an impairment loss is recognized for the excess.
Fair values of indefinite-lived intangible assets are determined based on discounted cash flows or appraised values, as
appropriate.
The Company tests long-lived assets, including amortizable intangible assets, for impairment whenever events or changes
in circumstances (triggering events) indicate that the carrying amount may not be recoverable. Once a triggering event has
occurred, the impairment test employed is based on whether the Company’s intent is to hold the asset for continued use or to
hold the asset for sale. The impairment test for assets held for use requires a comparison of the estimated undiscounted future
cash flows expected to be generated over the useful life of the significant assets of an asset group to the carrying amount of the
asset group. An asset group is generally established by identifying the lowest level of cash flows generated by a group of assets
that are largely independent of the cash flows of other assets and could include assets used across multiple businesses. If the
carrying amount of an asset group exceeds the estimated undiscounted future cash flows, an impairment would be measured as
the difference between the fair value of the asset group and the carrying amount of the asset group. For assets held for sale, to
the extent the carrying amount is greater than the asset’s fair value less costs to sell, an impairment loss is recognized for the
difference. Determining whether a long-lived asset is impaired requires various estimates and assumptions, including whether a
triggering event has occurred, the identification of asset groups, estimates of future cash flows and the discount rate used to
determine fair values.
As discussed in Note 4 to the Consolidated Financial Statements, the Company recorded non-cash impairment charges of
$0.1 billion and $1.5 billion related to the Star India Transaction in fiscal 2025 and 2024, respectively, to reflect Star India at its
estimated fair value less costs to sell.
The Company has investments in equity securities. For equity securities that do not have a readily determinable fair value,
we consider forecasted financial performance of the investee companies, as well as volatility inherent in the external markets
for these investments. If these forecasts are not met, impairment charges may be recorded.
The Company tested its indefinite-lived intangible assets, long-lived assets and investments for impairment and recorded
non-cash impairment charges of $0.8 billion and $0.7 billion in fiscal 2025 and 2024, respectively. The fiscal 2025 charges
related to impairments of equity investments and content assets. The fiscal 2024 charges related to impairments of retail assets,
content assets and equity investments. See Note 18 to the Consolidated Financial Statements for additional information.
Allowance for Credit Losses
We evaluate our allowance for credit losses and estimate collectability of accounts receivable based on historical bad debt
experience, our assessment of the financial condition of individual companies with which we do business, current market
conditions, and reasonable and supportable forecasts of future economic conditions. In times of economic turmoil our estimates
and judgments with respect to the collectability of our receivables are subject to greater uncertainty than in more stable periods.
If our estimate of uncollectible accounts is too low, costs and expenses may increase in future periods, and if it is too high, costs
and expenses may decrease in future periods. See Note 2 to the Consolidated Financial Statements for additional discussion.
Contingencies and Litigation
We are currently involved in certain legal proceedings and, as required, have accrued estimates of the probable and
estimable losses for the resolution of these proceedings. These estimates are based upon an analysis of potential results,
assuming a combination of litigation and settlement strategies and have been developed in consultation with outside counsel as
appropriate. From time to time, we are also involved in other contingent matters for which we accrue estimates for a probable
and estimable loss. It is possible, however, that future results of operations for any particular quarterly or annual period could
be materially affected by changes in our assumptions or the effectiveness of our strategies related to legal proceedings or our
54
assumptions regarding other contingent matters. See Note 14 to the Consolidated Financial Statements for more information on
litigation exposure.
Income Tax
As a matter of course, the Company is regularly audited by federal, state and foreign tax authorities. From time to time,
these audits result in proposed assessments. Our determinations regarding the recognition of income tax benefits are made in
consultation with outside tax and legal counsel, where appropriate, and are based upon the technical merits of our tax positions
in consideration of applicable tax statutes and related interpretations and precedents and upon the expected outcome of
proceedings (or negotiations) with taxing and legal authorities. The tax benefits ultimately realized by the Company may differ
from those recognized in our future financial statements based on a number of factors, including the Company’s decision to
settle rather than litigate a matter, relevant legal precedent related to similar matters and the Company’s success in supporting
its filing positions with taxing authorities. See Note 9 to the Consolidated Financial Statements for additional discussion.
New Accounting Pronouncements
See Note 19 to the Consolidated Financial Statements for information regarding new accounting pronouncements.
ENTERTAINMENT DTC PRODUCT DESCRIPTIONS AND KEY DEFINITIONS
Entertainment DTC Product Offerings
In the U.S., Disney+ and Hulu SVOD Only are each offered as a standalone service or as part of various bundled
offerings, which may include one of the ESPN DTC plans. Hulu Live TV + SVOD includes Disney+ and ESPN Select.
Disney+ is available in more than 150 countries and territories outside the U.S. Depending on the market, our services can be
purchased on our websites or through third-party platforms/apps or are available via wholesale arrangements.
Paid Subscribers for Entertainment DTC services
Paid subscribers for Entertainment DTC services reflect subscribers for which we recognized subscription revenue.
Certain product offerings provide the option for an extra member to be added to an account (extra member add-on). These extra
members are not counted as paid subscribers. Subscribers cease to be a paid subscriber as of their effective cancellation date or
as a result of a failed payment method. Subscribers to bundled offerings in the U.S. are counted as a paid subscriber for each of
the Company's services included in the bundled offering and subscribers to Hulu Live TV + SVOD are counted as one paid
subscriber for each of the Hulu Live TV + SVOD and Disney+ services. Subscribers include those who receive an entitlement
to a service through wholesale arrangements, including those for which the service is available to each subscriber of an existing
content distribution tier. When we aggregate the total number of paid subscribers across our Entertainment DTC streaming
services, we refer to them as paid subscriptions.
International Disney+
International Disney+ includes the Disney+ service outside the U.S. and Canada.
Average Monthly Revenue Per Paid Subscriber for Entertainment DTC services
Hulu average monthly revenue per paid subscriber is calculated based on the average of the monthly average paid
subscribers for each month in the period. The monthly average paid subscribers is calculated as the sum of the beginning of the
month and end of the month paid subscriber count, divided by two. Disney+ average monthly revenue per paid subscriber is
calculated using a daily average of paid subscribers for the period. Revenue includes subscription fees, advertising (excluding
revenue earned from selling advertising spots to other Company businesses), premium and feature add-on revenue and extra
member add-on revenue. Advertising revenue generated by content on one DTC streaming service that is accessed through
another DTC streaming service by subscribers to both streaming services is allocated between both streaming services. The
average revenue per paid subscriber is net of discounts on offerings that carry more than one service. Revenue is allocated to
each service based on the relative retail or wholesale price of each service on a standalone basis. Hulu Live TV + SVOD
revenue is allocated to the SVOD services based on the wholesale price of the Hulu SVOD Only, Disney+ and ESPN Select
bundled offering. In general, wholesale arrangements have a lower average monthly revenue per paid subscriber than
subscribers that we acquire directly or through third-party platforms.
SUPPLEMENTAL GUARANTOR FINANCIAL INFORMATION
On March 20, 2019, as part of the acquisition of TFCF, The Walt Disney Company (“TWDC”) became the ultimate
parent of TWDC Enterprises 18 Corp. (formerly known as The Walt Disney Company) (“Legacy Disney”). Legacy Disney and
TWDC are collectively referred to as “Obligor Group”, and individually, as a “Guarantor”. Concurrent with the close of the
TFCF acquisition, $16.8 billion of TFCF’s assumed public debt (which then constituted 96% of such debt) was exchanged for
senior notes of TWDC (the “exchange notes”) issued pursuant to an exemption from registration under the Securities Act of
1933, as amended (the “Securities Act”), pursuant to an Indenture, dated as of March 20, 2019, between TWDC, Legacy
Disney, as guarantor, and Citibank, N.A., as trustee (the “TWDC Indenture”) and guaranteed by Legacy Disney. On November
55
26, 2019, $14.0 billion of the outstanding exchange notes were exchanged for new senior notes of TWDC registered under the
Securities Act, issued pursuant to the TWDC Indenture and guaranteed by Legacy Disney. In addition, contemporaneously with
the closing of the March 20, 2019 exchange offer, TWDC entered into a guarantee of the registered debt securities issued by
Legacy Disney under the Indenture dated as of September 24, 2001 between Legacy Disney and Wells Fargo Bank, National
Association, as trustee (the “2001 Trustee”) (as amended by the first supplemental indenture among Legacy Disney, as issuer,
TWDC, as guarantor, and the 2001 Trustee, as trustee).
Other subsidiaries of the Company do not guarantee the registered debt securities of either TWDC or Legacy Disney
(such subsidiaries are referred to as the “non-Guarantors”). The par value and carrying value of total outstanding and
guaranteed registered debt securities of the Obligor Group at September 27, 2025 was as follows:
TWDC
Legacy Disney
($ in millions)
Par Value
Carrying
Value
Par Value
Carrying
Value
Registered debt with unconditional guarantee
$
30,395 $
31,231 $
6,450 $
6,387
The guarantees by TWDC and Legacy Disney are full and unconditional and cover all payment obligations arising under
the guaranteed registered debt securities. The guarantees may be released and discharged upon (i) as a general matter, the
indebtedness for borrowed money of the consolidated subsidiaries of TWDC in aggregate constituting no more than 10% of all
consolidated indebtedness for borrowed money of TWDC and its subsidiaries (subject to certain exclusions), (ii) upon the sale,
transfer or disposition of all or substantially all of the equity interests or all or substantially all, or substantially as an entirety,
the assets of Legacy Disney to a third party, and (iii) other customary events constituting a discharge of a guarantor’s
obligations. In addition, in the case of Legacy Disney’s guarantee of registered debt securities issued by TWDC, Legacy Disney
may be released and discharged from its guarantee at any time Legacy Disney is not a borrower, issuer or guarantor under
certain material bank facilities or any debt securities.
Operations are conducted almost entirely through the Company’s subsidiaries. Accordingly, the Obligor Group’s cash
flow and ability to service its debt, including the public debt, are dependent upon the earnings of the Company’s subsidiaries
and the distribution of those earnings to the Obligor Group, whether by dividends, loans or otherwise. Holders of the guaranteed
registered debt securities have a direct claim only against the Obligor Group.
Set forth below are summarized financial information for the Obligor Group on a combined basis after elimination of (i)
intercompany transactions and balances between TWDC and Legacy Disney and (ii) equity in the earnings from and
investments in any subsidiary that is a non-Guarantor. This summarized financial information has been prepared and presented
pursuant to the Securities and Exchange Commission Regulation S-X Rule 13-01, “Financial Disclosures about Guarantors and
Issuers of Guaranteed Securities” and is not intended to present the financial position or results of operations of the Obligor
Group in accordance with U.S. GAAP.
Results of operations ($ in millions)
2025
Revenues
$
—
Costs and expenses
—
Net income (loss)
(2,703)
Net income (loss) attributable to TWDC shareholders
(2,703)
Balance Sheet ($ in millions)
September 27, 2025
September 28, 2024
Current assets
$
2,295
$
2,767
Noncurrent assets
3,613
3,336
Current liabilities
9,592
7,640
Noncurrent liabilities (excluding intercompany to non-Guarantors)
36,314
40,608
Intercompany payables to non-Guarantors
167,091
157,925
ITEM 7A. Quantitative and Qualitative Disclosures About Market Risk
The Company is exposed to the impact of interest rate changes, foreign currency fluctuations, commodity fluctuations and
changes in the market values of its investments.
Policies and Procedures
In the normal course of business, we employ established policies and procedures to manage the Company’s exposure to
changes in interest rates, foreign currencies and commodities using a variety of financial instruments.
Our objectives in managing exposure to interest rate changes are to limit the impact of interest rate volatility on earnings
and cash flows and to lower overall borrowing costs. To achieve these objectives, we primarily use interest rate swaps to
56
manage net exposure to interest rate changes related to the Company’s portfolio of borrowings. By policy, the Company targets
fixed-rate debt as a percentage of its net debt between minimum and maximum percentages.
Our objective in managing exposure to foreign currency fluctuations is to reduce volatility of earnings and cash flow in
order to allow management to focus on core business issues and challenges. Accordingly, the Company enters into various
contracts that change in value as foreign exchange rates change to protect the U.S. dollar equivalent value of its existing foreign
currency assets, liabilities, commitments and forecasted foreign currency revenues and expenses. The Company utilizes option
strategies and forward contracts that provide for the purchase or sale of foreign currencies to hedge probable, but not firmly
committed, transactions. The Company also uses forward and option contracts to hedge foreign currency assets and liabilities.
The principal foreign currencies hedged are the euro, Japanese yen, British pound, Chinese yuan and Canadian dollar. Cross-
currency swaps are used to effectively convert foreign currency denominated borrowings to U.S. dollar denominated
borrowings. By policy, the Company maintains hedge coverage between minimum and maximum percentages of its forecasted
foreign exchange exposures generally for periods not to exceed four years. The gains and losses on these contracts are intended
to offset changes in the U.S. dollar equivalent value of the related exposures. The economic or political conditions in certain
countries have reduced and in the future could further reduce our ability to hedge exposure to currency fluctuations in, or
repatriate cash from, those countries.
Our objectives in managing exposure to commodity fluctuations are to use commodity derivatives to reduce volatility of
earnings and cash flows arising from commodity price changes. The amounts hedged using commodity swap contracts are
based on forecasted levels of consumption of certain commodities, such as fuel, oil and gasoline.
Our objectives in managing exposures to market-based fluctuations in certain retirement liabilities are to use total return
swap contracts to reduce the volatility of earnings arising from changes in these retirement liabilities. The amounts hedged
using total return swap contracts are based on estimated liability balances.
It is the Company’s policy to enter into foreign currency and interest rate derivative transactions and other financial
instruments only to the extent considered necessary to meet its objectives as stated above. The Company does not enter into
these transactions or any other hedging transactions for speculative purposes.
See Note 17 of the Consolidated Financial Statements for additional information.
Value at Risk (VAR)
The Company utilizes a VAR model to estimate the maximum potential one-day loss in the fair value of its interest rate,
foreign exchange, commodities and market sensitive equity financial instruments. While various modeling techniques can be
used in a VAR computation, the Company’s computations are based on a variance/co-variance technique, which assesses the
interrelationships between movements in various interest rates, currencies, commodities and equity prices. These
interrelationships were determined by observing interest rate, foreign currency, commodity and equity market changes over the
preceding quarter for the calculation of VAR amounts at each fiscal quarter end. The model includes all of the Company’s debt,
interest rate, foreign exchange, and commodities derivatives, and market sensitive equity investments. Forecasted transactions,
firm commitments and accounts receivable and payable denominated in foreign currencies, which certain of these instruments
are intended to hedge, were excluded from the model. The VAR model estimates were made assuming normal market
conditions and a 95% confidence level.
The VAR model is a risk analysis tool and does not purport to represent actual losses in fair value that will be incurred by
the Company, nor does it consider the potential effect of favorable changes in market factors.
VAR on a combined basis decreased to $201 million at September 27, 2025 from $255 million at September 28, 2024 due
to reduced interest rate volatility.
The estimated maximum potential one-day loss in fair value, calculated using the VAR model, is as follows (unaudited, in
millions):
Fiscal 2025
Interest Rate
Sensitive
Financial
Instruments
Currency
Sensitive
Financial
Instruments
Equity
Sensitive
Financial
Instruments
Commodity
Sensitive
Financial
Instruments
Combined
Portfolio
Year end fiscal 2025 VAR
$
164
$
57
$
4
$
2
$
201
Average VAR
217
55
6
2
242
Highest VAR
243
80
11
2
269
Lowest VAR
164
41
4
1
201
Year end fiscal 2024 VAR
235
40
7
2
255
The VAR for Asia Theme Parks is immaterial as of September 27, 2025 and has been excluded from the above table.
57
ITEM 8. Financial Statements and Supplementary Data
See Index to Financial Statements and Supplemental Data on page 67.
ITEM 9. Changes in and Disagreements with Accountants on Accounting and Financial Disclosure
None.
ITEM 9A. Controls and Procedures
Evaluation of Disclosure Controls and Procedures
We have established disclosure controls and procedures to ensure that the information required to be disclosed by the
Company in the reports that it files or submits under the Securities Exchange Act of 1934 is recorded, processed, summarized
and reported within the time periods specified in SEC rules and forms and that such information is accumulated and made
known to the officers who certify the Company’s financial reports and to other members of senior management and the Board
of Directors as appropriate to allow timely decisions regarding required disclosure.
Based on their evaluation as of September 27, 2025, the principal executive officer and principal financial officer of the
Company have concluded that the Company’s disclosure controls and procedures (as defined in Rules 13a-15(e) and 15d-15(e)
under the Securities Exchange Act of 1934) are effective.
Management’s Report on Internal Control Over Financial Reporting
Management’s report set forth on page 68 is incorporated herein by reference.
Our internal control over financial reporting as of September 27, 2025, has been audited by PricewaterhouseCoopers LLP,
an independent registered public accounting firm, who has issued an audit report which is set forth on page 69 and is
incorporated herein by reference.
Changes in Internal Controls
There have been no changes in our internal control over financial reporting during the fourth quarter of the fiscal year
ended September 27, 2025 that have materially affected, or are reasonably likely to materially affect, our internal control over
financial reporting.
ITEM 9B. Other Information
Rule 10b5-1 Trading Arrangements
None of our directors or officers adopted or terminated a Rule 10b5-1 (as defined in Rule 16a-1(f)) trading arrangement or
a non-Rule 10b5-1 trading arrangement (as defined in Item 408(c) of Regulation S-K) during the quarter ended September 27,
2025.
Ratification of Equity Award Grants and Equity Issuances
On September 25, 2025, the Board adopted resolutions ratifying the issuance of certain equity awards (including options
and restricted stock units, including performance-based restricted stock units) under the Company’s Amended and Restated
2011 Stock Incentive Plan and The Walt Disney Company/Pixar 2004 Equity Incentive Plan and the issuance of shares of
Common Stock upon the exercise of such equity awards (which may constitute putative stock) pursuant to Section 204 of the
General Corporation Law of the State of Delaware (the “Ratification”) due to an inadvertent omission in the Compensation
Committee resolutions that delegated authority to certain officers to grant such equity awards to certain employees (other than
Section 16 officers or other members of senior leadership) of certain delegation parameters under Sections 152 and 157 of the
General Corporation Law. The dates of the issuances and the number of equity awards and shares of Common Stock issued
upon the exercise or vesting of such equity awards on such dates is set forth on Exhibit 99.1 hereto. Any claim that any
defective corporate act or putative stock ratified pursuant to the Ratification is void or voidable due to the failure of
authorization as described above, or that the Delaware Court of Chancery should declare in its discretion that the Ratification in
accordance with Section 204 of the General Corporation Law of the State of Delaware not be effective or be effective only on
certain conditions, must be brought within 120 days from the date that this Form 10-K is filed with the Securities and Exchange
Commission.
ITEM 9C. Disclosure Regarding Foreign Jurisdictions that Prevent Inspections
Not applicable.
58
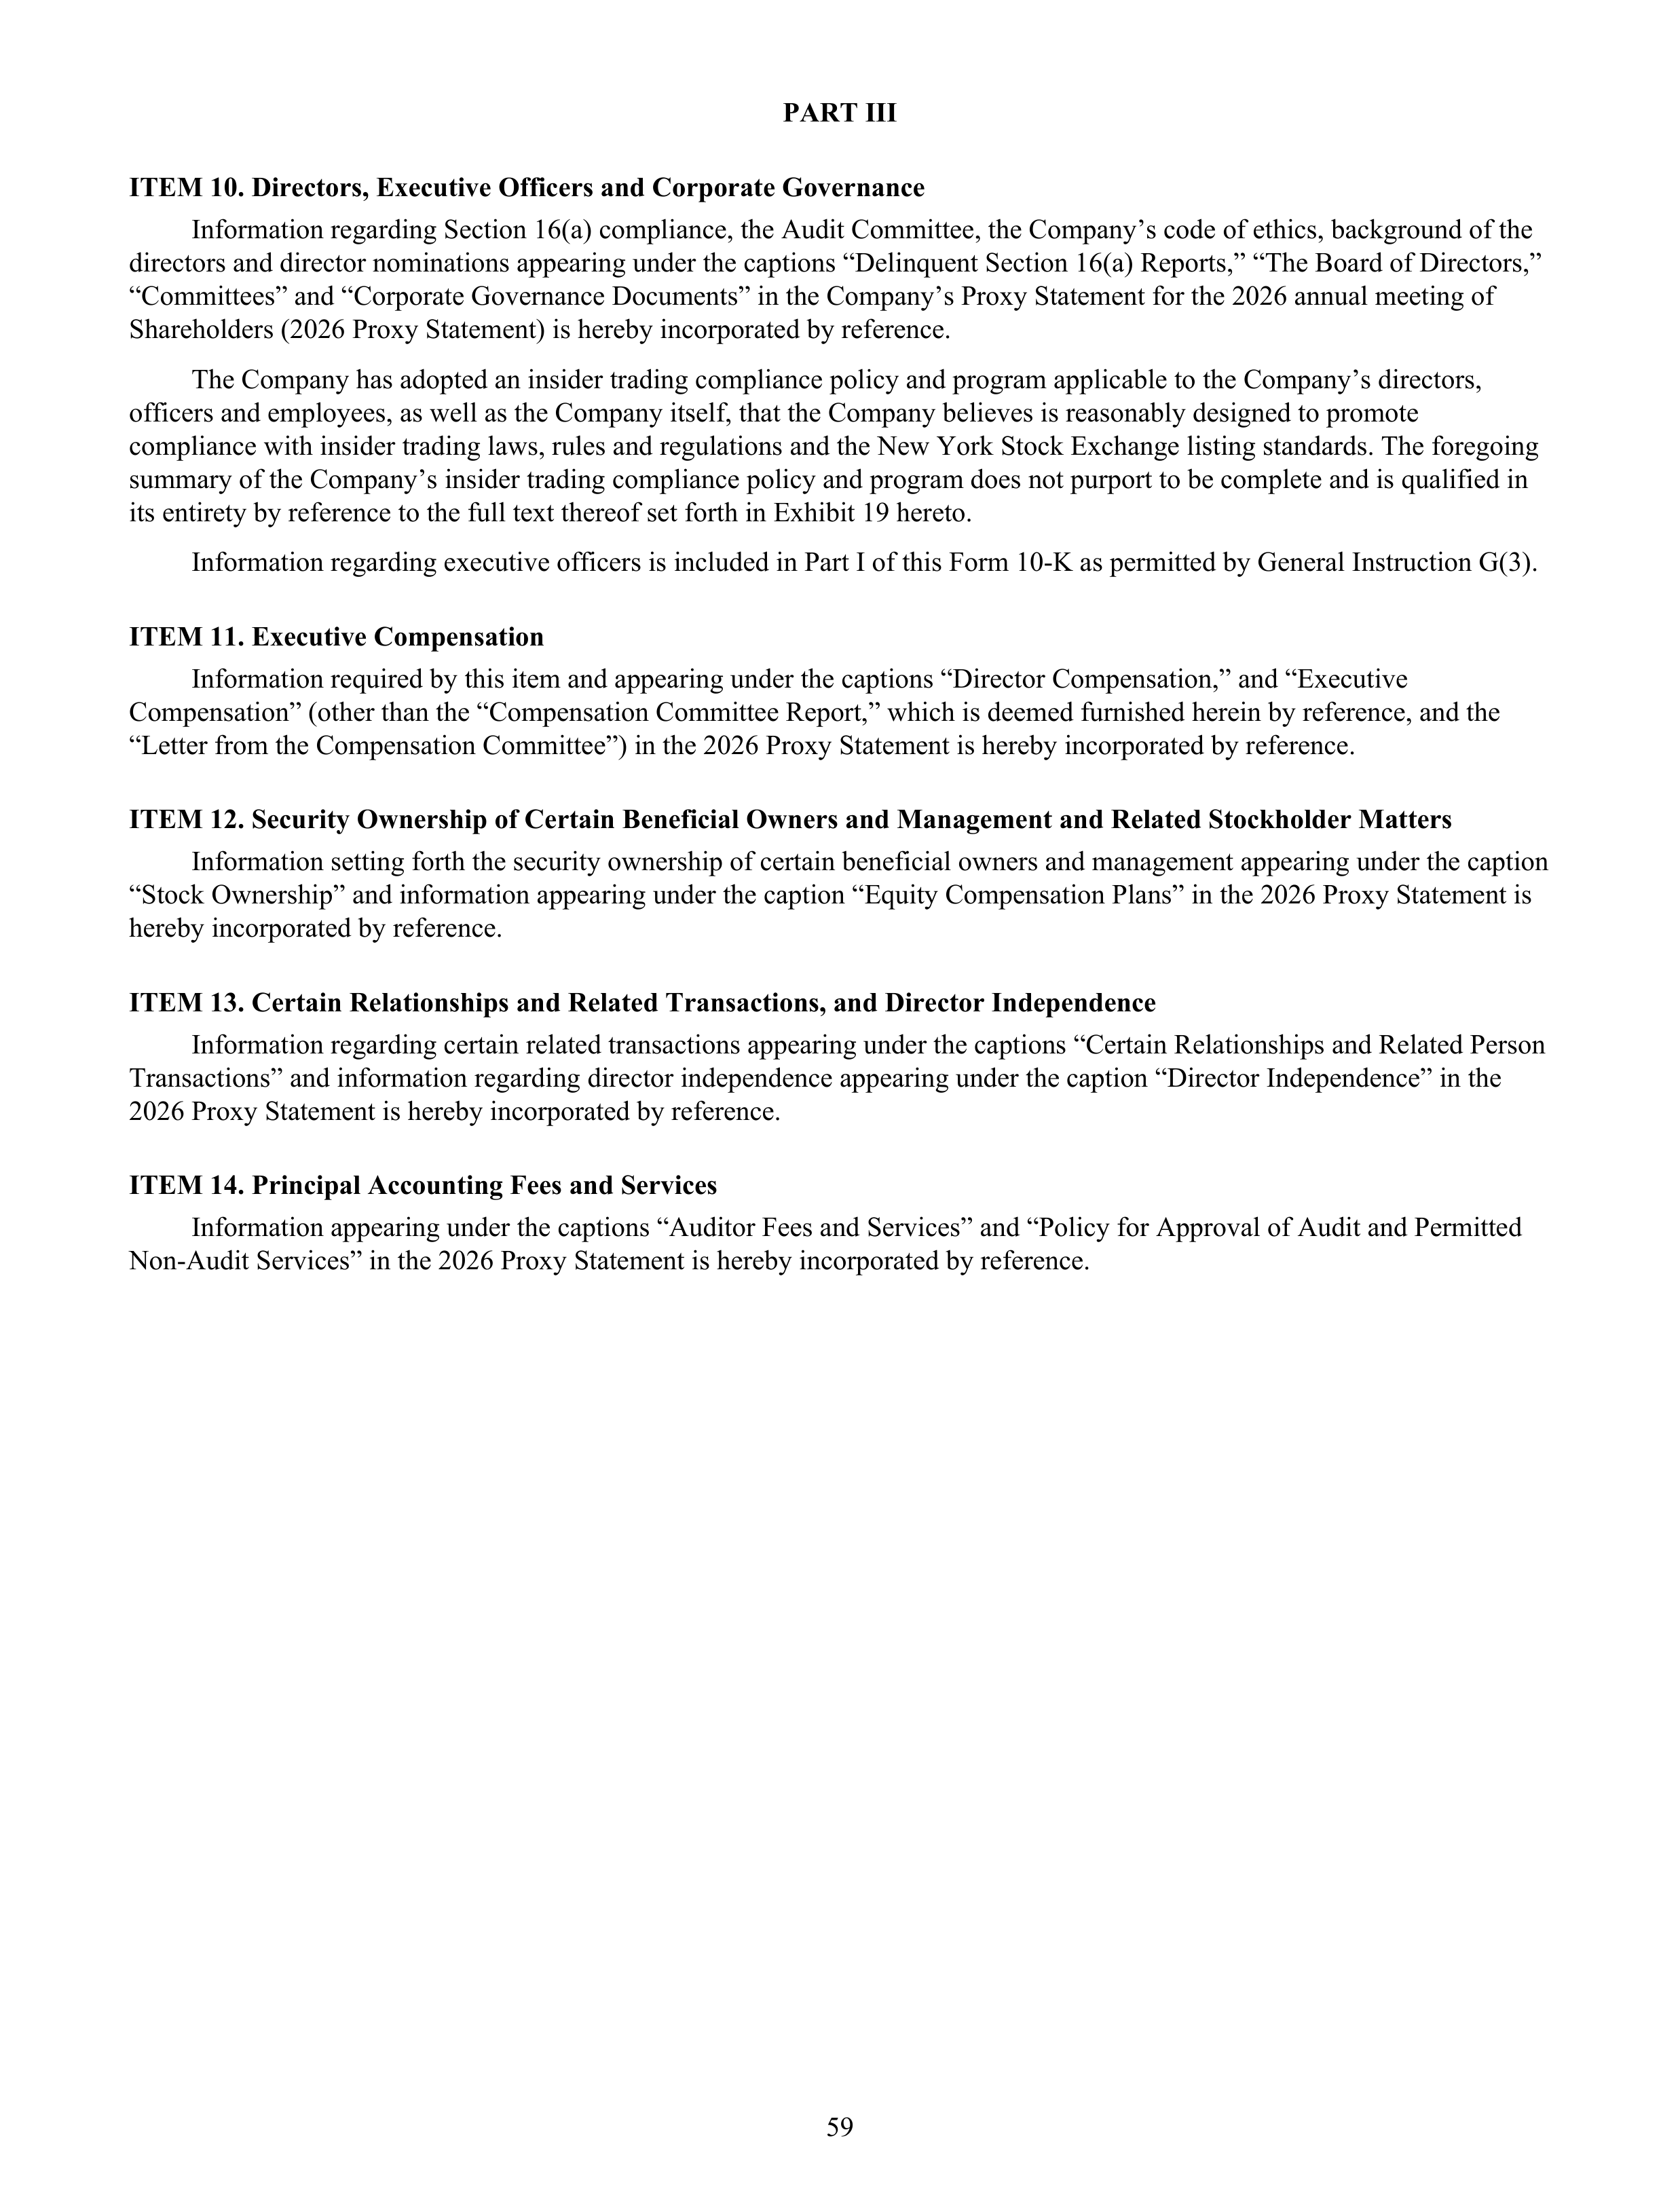
PART III
ITEM 10. Directors, Executive Officers and Corporate Governance
Information regarding Section 16(a) compliance, the Audit Committee, the Company’s code of ethics, background of the
directors and director nominations appearing under the captions “Delinquent Section 16(a) Reports,” “The Board of Directors,”
“Committees” and “Corporate Governance Documents” in the Company’s Proxy Statement for the 2026 annual meeting of
Shareholders (2026 Proxy Statement) is hereby incorporated by reference.
The Company has adopted an insider trading compliance policy and program applicable to the Company’s directors,
officers and employees, as well as the Company itself, that the Company believes is reasonably designed to promote
compliance with insider trading laws, rules and regulations and the New York Stock Exchange listing standards. The foregoing
summary of the Company’s insider trading compliance policy and program does not purport to be complete and is qualified in
its entirety by reference to the full text thereof set forth in Exhibit 19 hereto.
Information regarding executive officers is included in Part I of this Form 10-K as permitted by General Instruction G(3).
ITEM 11. Executive Compensation
Information required by this item and appearing under the captions “Director Compensation,” and “Executive
Compensation” (other than the “Compensation Committee Report,” which is deemed furnished herein by reference, and the
“Letter from the Compensation Committee”) in the 2026 Proxy Statement is hereby incorporated by reference.
ITEM 12. Security Ownership of Certain Beneficial Owners and Management and Related Stockholder Matters
Information setting forth the security ownership of certain beneficial owners and management appearing under the caption
“Stock Ownership” and information appearing under the caption “Equity Compensation Plans” in the 2026 Proxy Statement is
hereby incorporated by reference.
ITEM 13. Certain Relationships and Related Transactions, and Director Independence
Information regarding certain related transactions appearing under the captions “Certain Relationships and Related Person
Transactions” and information regarding director independence appearing under the caption “Director Independence” in the
2026 Proxy Statement is hereby incorporated by reference.
ITEM 14. Principal Accounting Fees and Services
Information appearing under the captions “Auditor Fees and Services” and “Policy for Approval of Audit and Permitted
Non-Audit Services” in the 2026 Proxy Statement is hereby incorporated by reference.
59
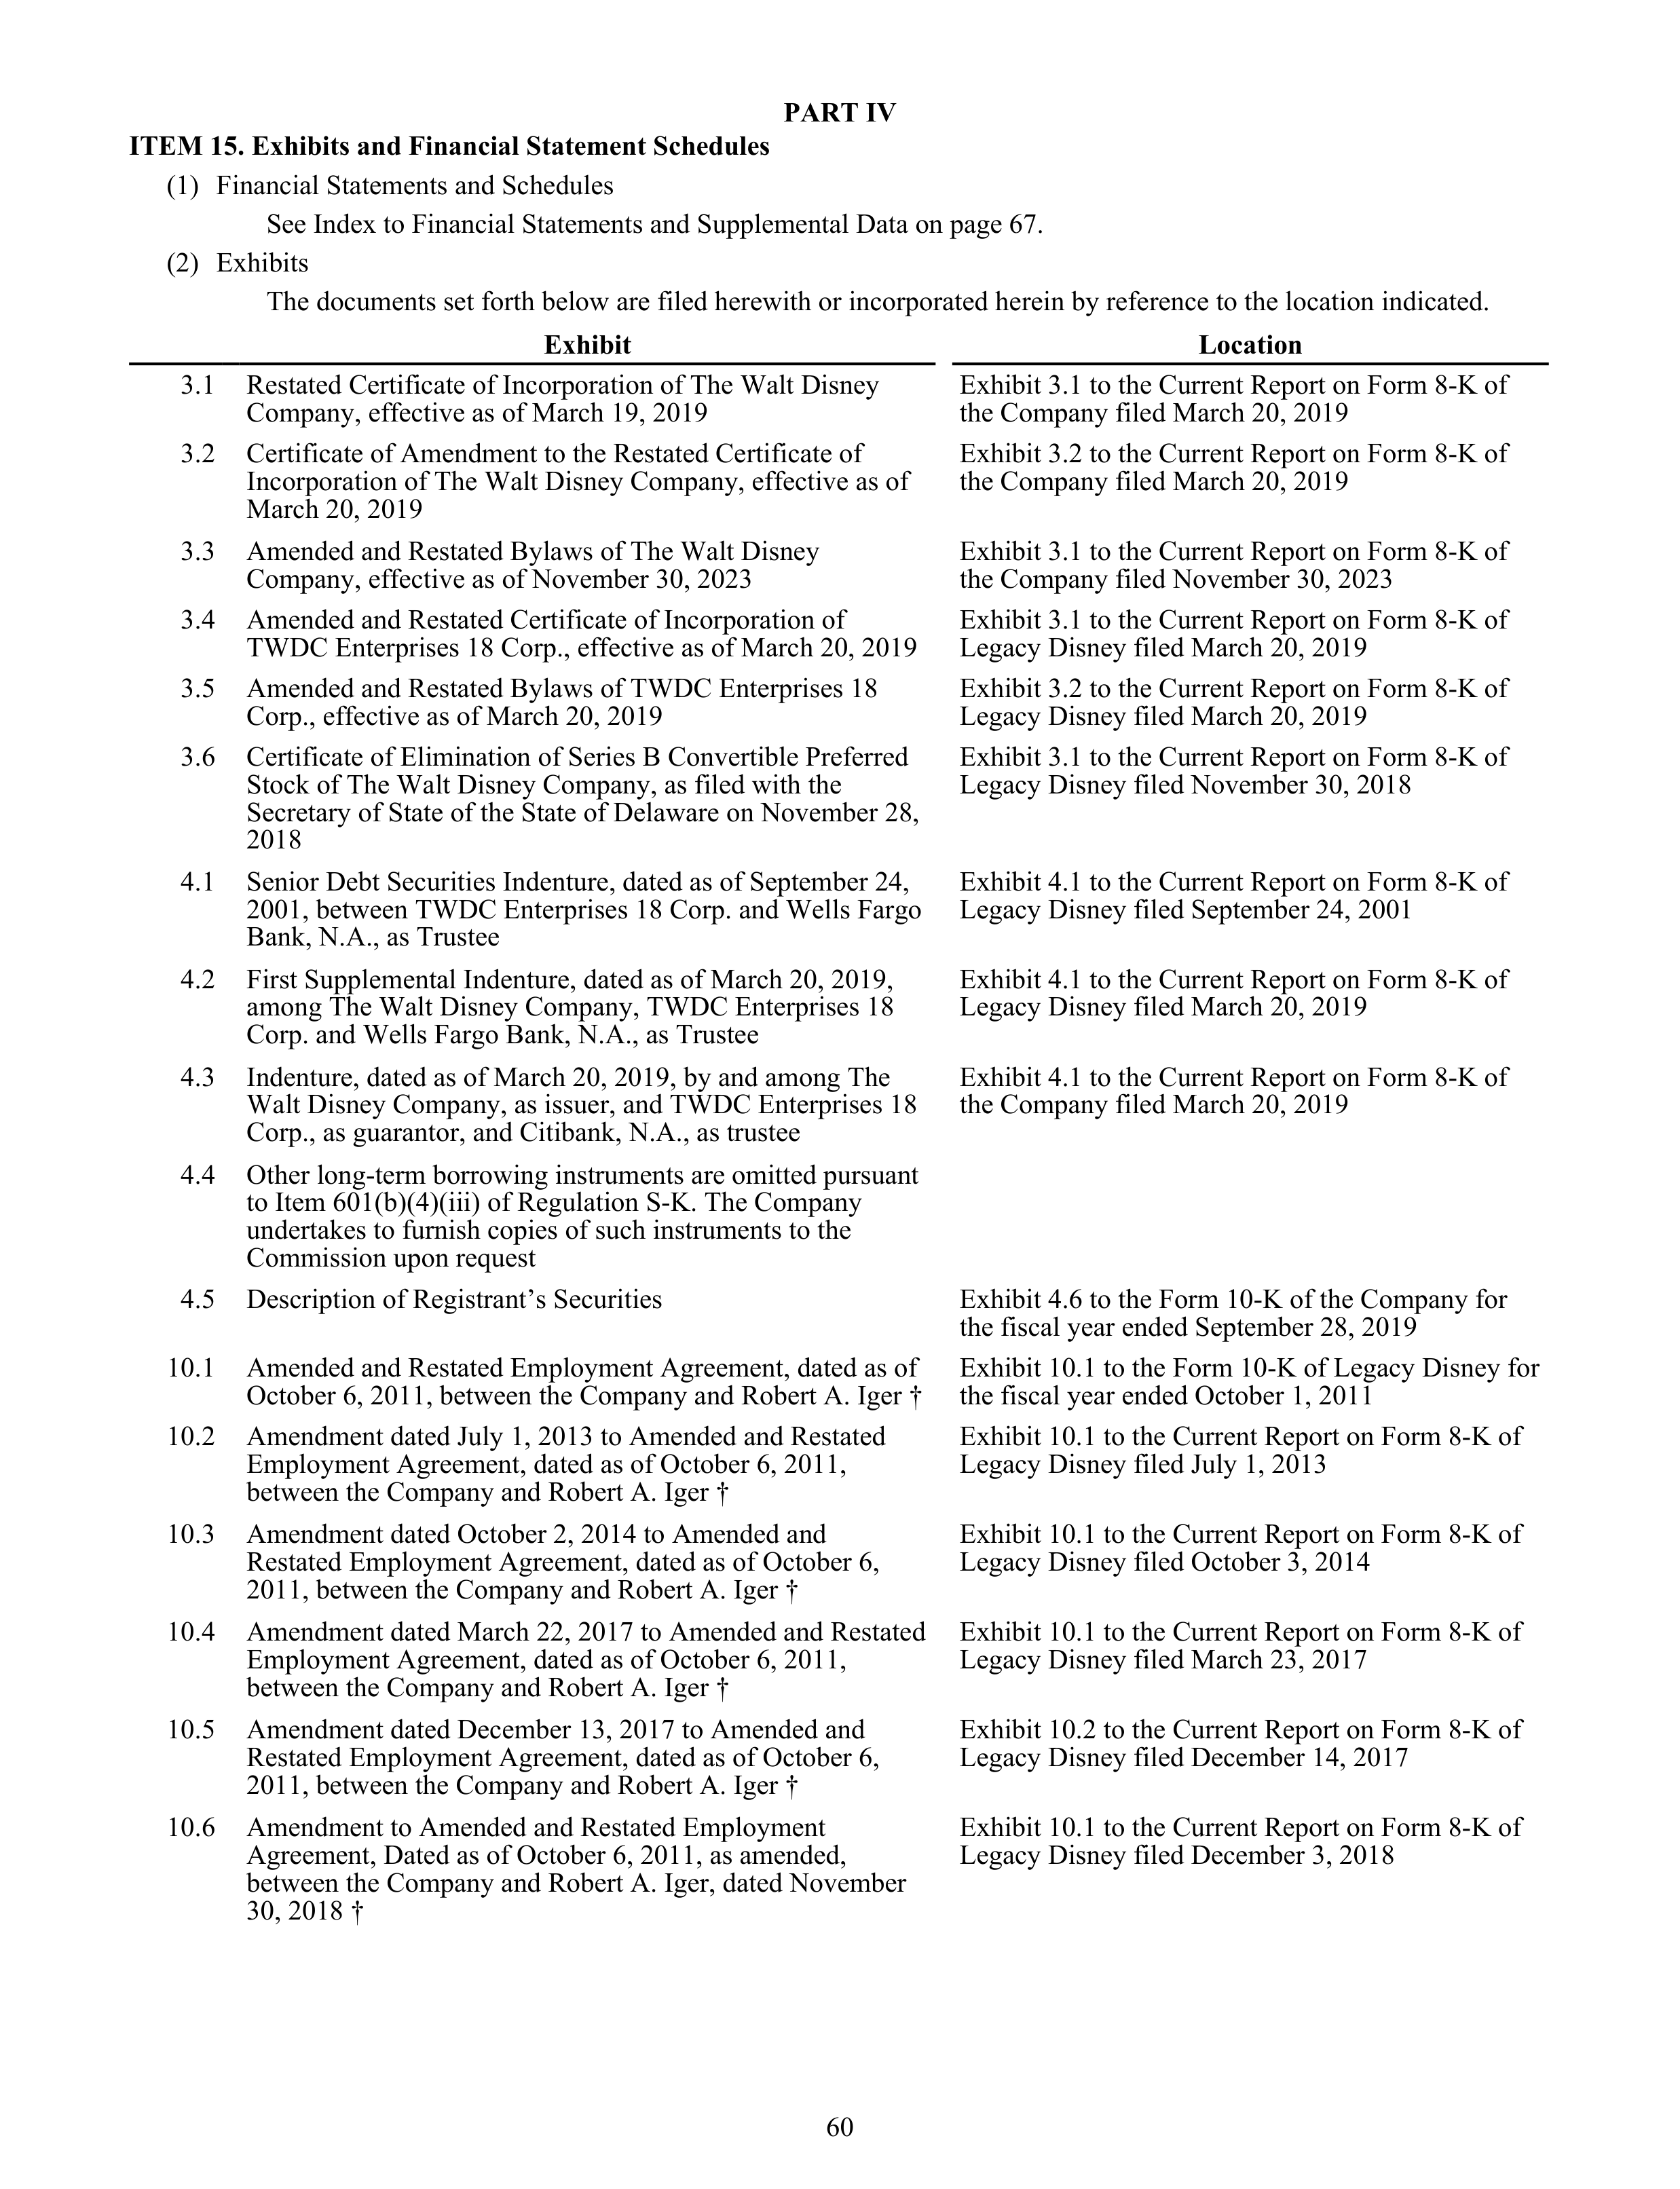
PART IV
ITEM 15. Exhibits and Financial Statement Schedules
(1)
Financial Statements and Schedules
See Index to Financial Statements and Supplemental Data on page 67.
(2)
Exhibits
The documents set forth below are filed herewith or incorporated herein by reference to the location indicated.
Exhibit
Location
3.1
Restated Certificate of Incorporation of The Walt Disney
Company, effective as of March 19, 2019
Exhibit 3.1 to the Current Report on Form 8-K of
the Company filed March 20, 2019
3.2
Certificate of Amendment to the Restated Certificate of
Incorporation of The Walt Disney Company, effective as of
March 20, 2019
Exhibit 3.2 to the Current Report on Form 8-K of
the Company filed March 20, 2019
3.3
Amended and Restated Bylaws of The Walt Disney
Company, effective as of November 30, 2023
Exhibit 3.1 to the Current Report on Form 8-K of
the Company filed November 30, 2023
3.4
Amended and Restated Certificate of Incorporation of
TWDC Enterprises 18 Corp., effective as of March 20, 2019
Exhibit 3.1 to the Current Report on Form 8-K of
Legacy Disney filed March 20, 2019
3.5
Amended and Restated Bylaws of TWDC Enterprises 18
Corp., effective as of March 20, 2019
Exhibit 3.2 to the Current Report on Form 8-K of
Legacy Disney filed March 20, 2019
3.6
Certificate of Elimination of Series B Convertible Preferred
Stock of The Walt Disney Company, as filed with the
Secretary of State of the State of Delaware on November 28,
2018
Exhibit 3.1 to the Current Report on Form 8-K of
Legacy Disney filed November 30, 2018
4.1
Senior Debt Securities Indenture, dated as of September 24,
2001, between TWDC Enterprises 18 Corp. and Wells Fargo
Bank, N.A., as Trustee
Exhibit 4.1 to the Current Report on Form 8-K of
Legacy Disney filed September 24, 2001
4.2
First Supplemental Indenture, dated as of March 20, 2019,
among The Walt Disney Company, TWDC Enterprises 18
Corp. and Wells Fargo Bank, N.A., as Trustee
Exhibit 4.1 to the Current Report on Form 8-K of
Legacy Disney filed March 20, 2019
4.3
Indenture, dated as of March 20, 2019, by and among The
Walt Disney Company, as issuer, and TWDC Enterprises 18
Corp., as guarantor, and Citibank, N.A., as trustee
Exhibit 4.1 to the Current Report on Form 8-K of
the Company filed March 20, 2019
4.4
Other long-term borrowing instruments are omitted pursuant
to Item 601(b)(4)(iii) of Regulation S-K. The Company
undertakes to furnish copies of such instruments to the
Commission upon request
4.5
Description of Registrant’s Securities
Exhibit 4.6 to the Form 10-K of the Company for
the fiscal year ended September 28, 2019
10.1
Amended and Restated Employment Agreement, dated as of
October 6, 2011, between the Company and Robert A. Iger †
Exhibit 10.1 to the Form 10-K of Legacy Disney for
the fiscal year ended October 1, 2011
10.2
Amendment dated July 1, 2013 to Amended and Restated
Employment Agreement, dated as of October 6, 2011,
between the Company and Robert A. Iger †
Exhibit 10.1 to the Current Report on Form 8-K of
Legacy Disney filed July 1, 2013
10.3
Amendment dated October 2, 2014 to Amended and
Restated Employment Agreement, dated as of October 6,
2011, between the Company and Robert A. Iger †
Exhibit 10.1 to the Current Report on Form 8-K of
Legacy Disney filed October 3, 2014
10.4
Amendment dated March 22, 2017 to Amended and Restated
Employment Agreement, dated as of October 6, 2011,
between the Company and Robert A. Iger †
Exhibit 10.1 to the Current Report on Form 8-K of
Legacy Disney filed March 23, 2017
10.5
Amendment dated December 13, 2017 to Amended and
Restated Employment Agreement, dated as of October 6,
2011, between the Company and Robert A. Iger †
Exhibit 10.2 to the Current Report on Form 8-K of
Legacy Disney filed December 14, 2017
10.6
Amendment to Amended and Restated Employment
Agreement, Dated as of October 6, 2011, as amended,
between the Company and Robert A. Iger, dated November
30, 2018 †
Exhibit 10.1 to the Current Report on Form 8-K of
Legacy Disney filed December 3, 2018
60
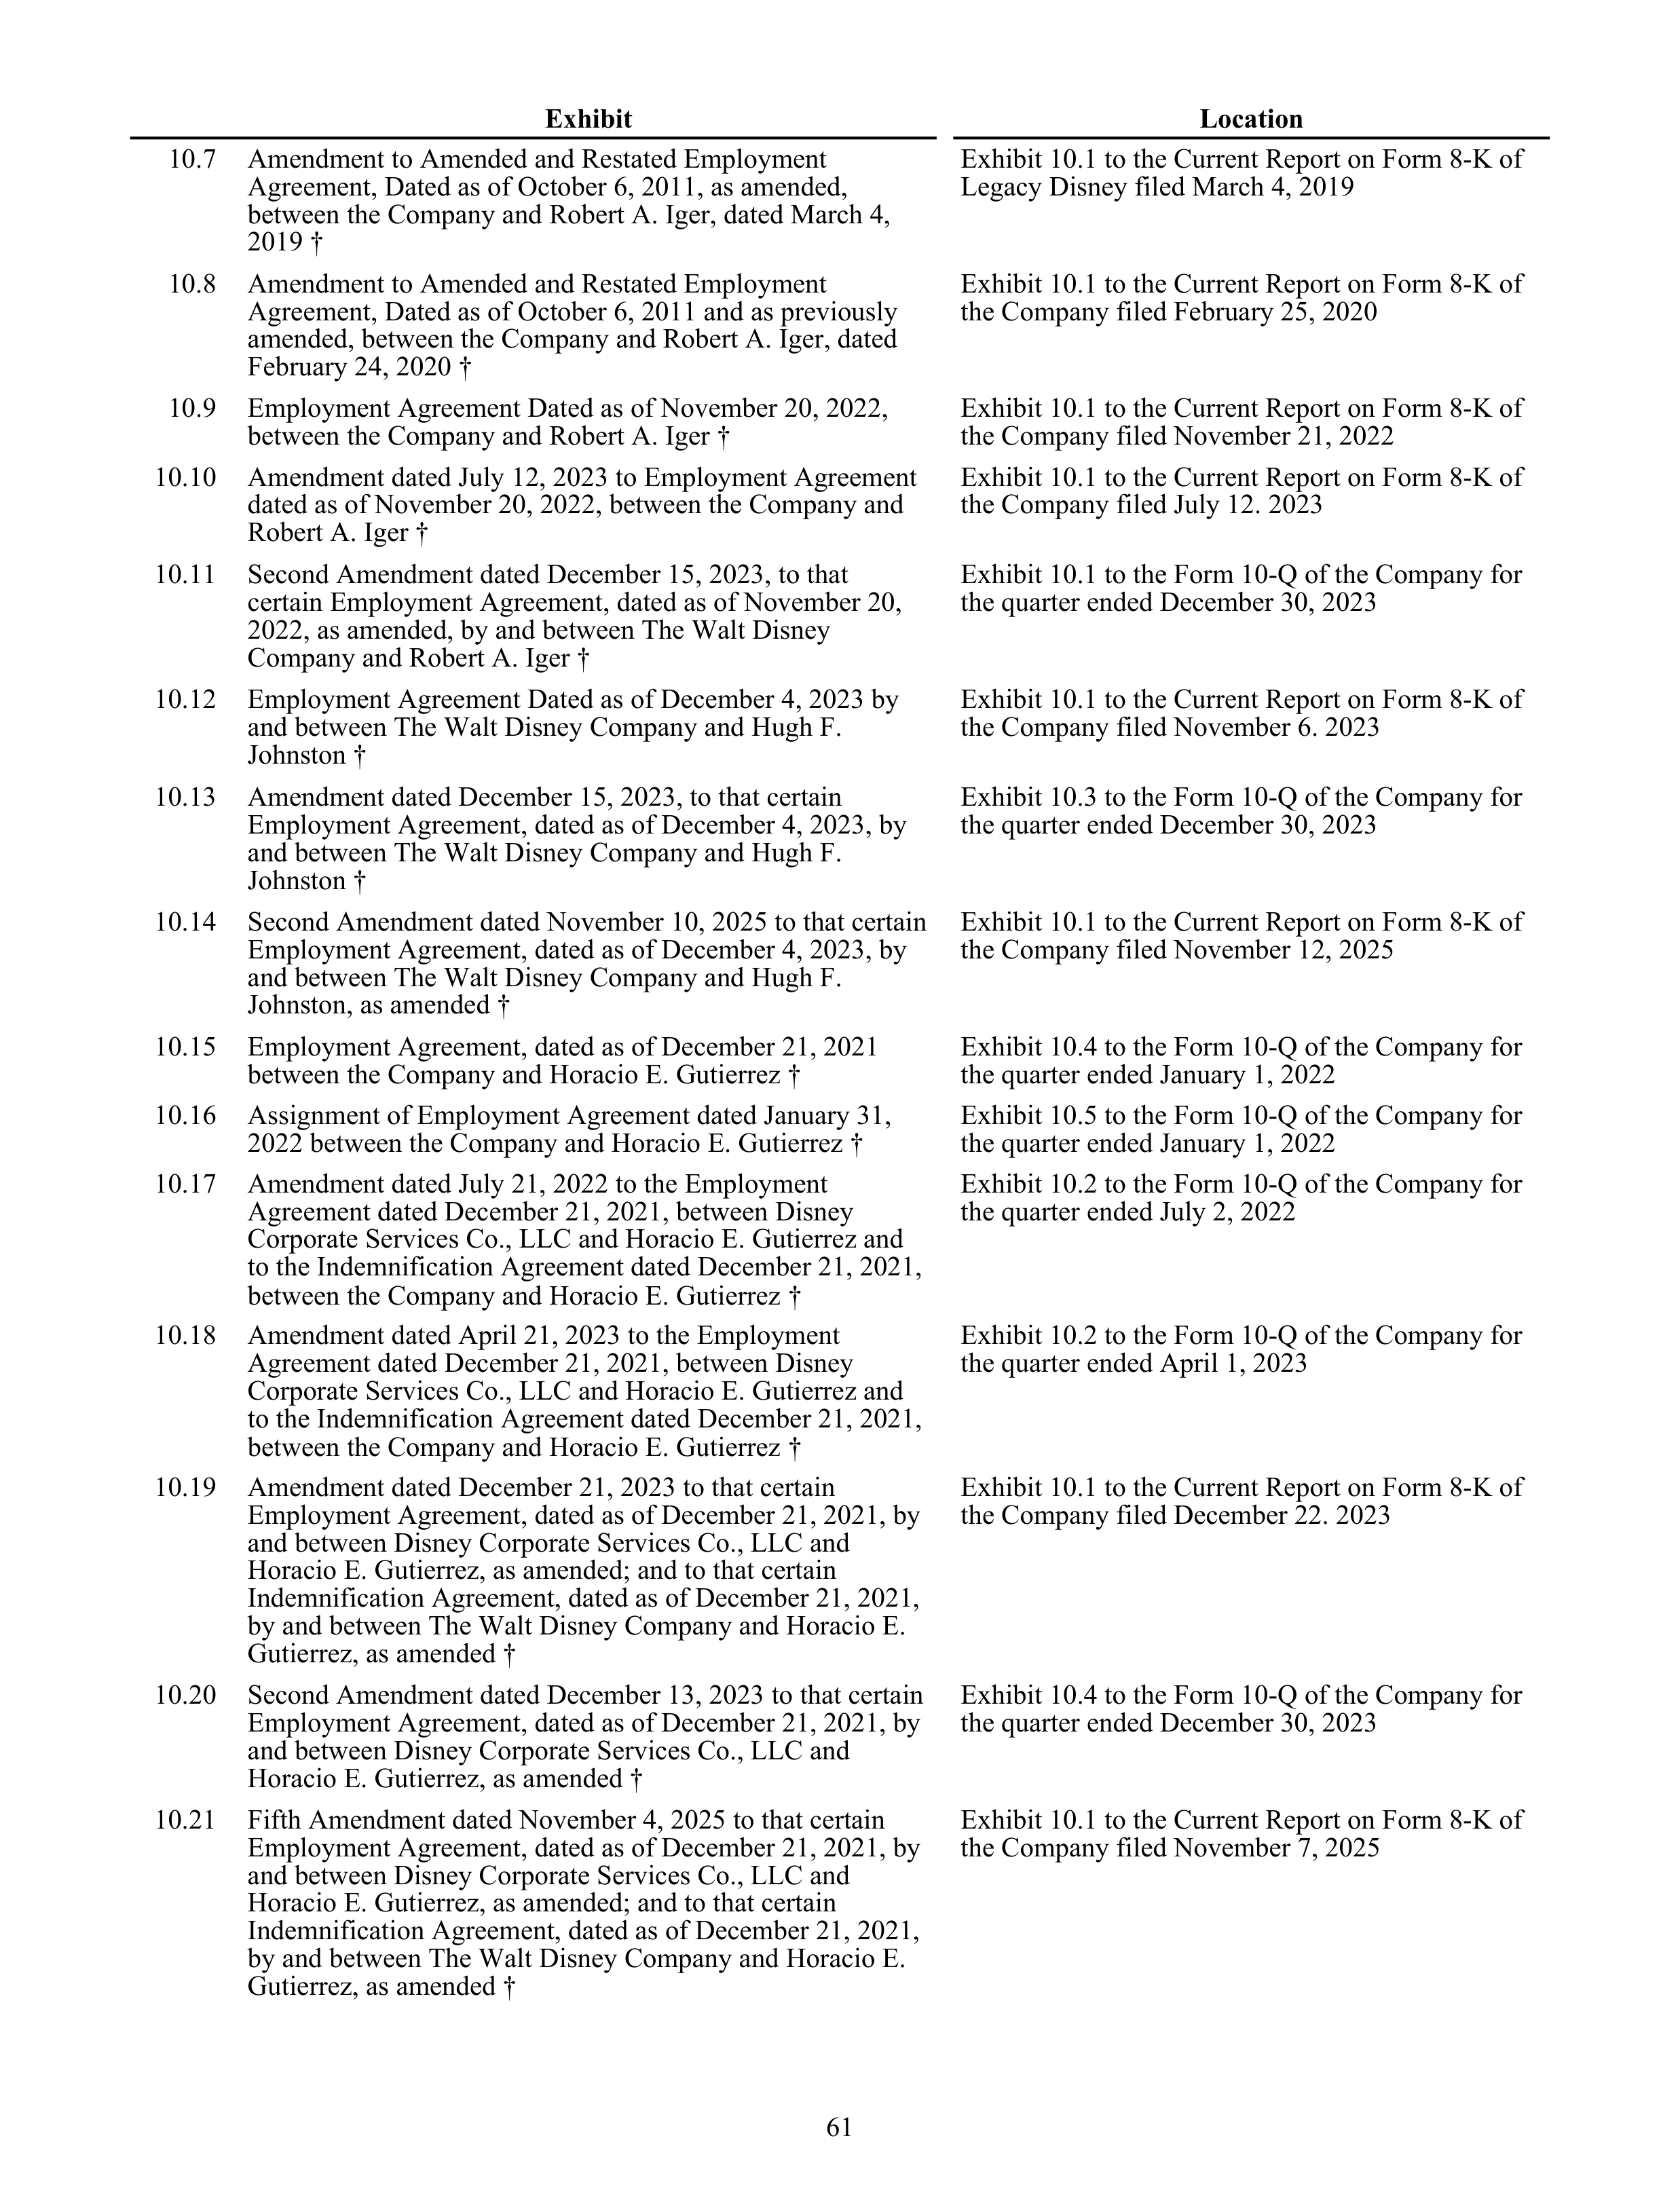
Exhibit
Location
10.7
Amendment to Amended and Restated Employment
Agreement, Dated as of October 6, 2011, as amended,
between the Company and Robert A. Iger, dated March 4,
2019 †
Exhibit 10.1 to the Current Report on Form 8-K of
Legacy Disney filed March 4, 2019
10.8
Amendment to Amended and Restated Employment
Agreement, Dated as of October 6, 2011 and as previously
amended, between the Company and Robert A. Iger, dated
February 24, 2020 †
Exhibit 10.1 to the Current Report on Form 8-K of
the Company filed February 25, 2020
10.9
Employment Agreement Dated as of November 20, 2022,
between the Company and Robert A. Iger †
Exhibit 10.1 to the Current Report on Form 8-K of
the Company filed November 21, 2022
10.10
Amendment dated July 12, 2023 to Employment Agreement
dated as of November 20, 2022, between the Company and
Robert A. Iger †
Exhibit 10.1 to the Current Report on Form 8-K of
the Company filed July 12. 2023
10.11
Second Amendment dated December 15, 2023, to that
certain Employment Agreement, dated as of November 20,
2022, as amended, by and between The Walt Disney
Company and Robert A. Iger †
Exhibit 10.1 to the Form 10-Q of the Company for
the quarter ended December 30, 2023
10.12
Employment Agreement Dated as of December 4, 2023 by
and between The Walt Disney Company and Hugh F.
Johnston †
Exhibit 10.1 to the Current Report on Form 8-K of
the Company filed November 6. 2023
10.13
Amendment dated December 15, 2023, to that certain
Employment Agreement, dated as of December 4, 2023, by
and between The Walt Disney Company and Hugh F.
Johnston †
Exhibit 10.3 to the Form 10-Q of the Company for
the quarter ended December 30, 2023
10.14
Second Amendment dated November 10, 2025 to that certain
Employment Agreement, dated as of December 4, 2023, by
and between The Walt Disney Company and Hugh F.
Johnston, as amended †
Exhibit 10.1 to the Current Report on Form 8-K of
the Company filed November 12, 2025
10.15
Employment Agreement, dated as of December 21, 2021
between the Company and Horacio E. Gutierrez †
Exhibit 10.4 to the Form 10-Q of the Company for
the quarter ended January 1, 2022
10.16
Assignment of Employment Agreement dated January 31,
2022 between the Company and Horacio E. Gutierrez †
Exhibit 10.5 to the Form 10-Q of the Company for
the quarter ended January 1, 2022
10.17
Amendment dated July 21, 2022 to the Employment
Agreement dated December 21, 2021, between Disney
Corporate Services Co., LLC and Horacio E. Gutierrez and
to the Indemnification Agreement dated December 21, 2021,
between the Company and Horacio E. Gutierrez
†
Exhibit 10.2 to the Form 10-Q of the Company for
the quarter ended July 2, 2022
10.18
Amendment dated April 21, 2023 to the Employment
Agreement dated December 21, 2021, between Disney
Corporate Services Co., LLC and Horacio E. Gutierrez and
to the Indemnification Agreement dated December 21, 2021,
between the Company and Horacio E. Gutierrez
†
Exhibit 10.2 to the Form 10-Q of the Company for
the quarter ended April 1, 2023
10.19
Amendment dated December 21, 2023 to that certain
Employment Agreement, dated as of December 21, 2021, by
and between Disney Corporate Services Co., LLC and
Horacio E. Gutierrez, as amended; and to that certain
Indemnification Agreement, dated as of December 21, 2021,
by and between The Walt Disney Company and Horacio E.
Gutierrez, as amended †
Exhibit 10.1 to the Current Report on Form 8-K of
the Company filed December 22. 2023
10.20
Second Amendment dated December 13, 2023 to that certain
Employment Agreement, dated as of December 21, 2021, by
and between Disney Corporate Services Co., LLC and
Horacio E. Gutierrez, as amended †
Exhibit 10.4 to the Form 10-Q of the Company for
the quarter ended December 30, 2023
10.21
Fifth Amendment dated November 4, 2025 to that certain
Employment Agreement, dated as of December 21, 2021, by
and between Disney Corporate Services Co., LLC and
Horacio E. Gutierrez, as amended; and to that certain
Indemnification Agreement, dated as of December 21, 2021,
by and between The Walt Disney Company and Horacio E.
Gutierrez, as amended †
Exhibit 10.1 to the Current Report on Form 8-K of
the Company filed November 7, 2025
61
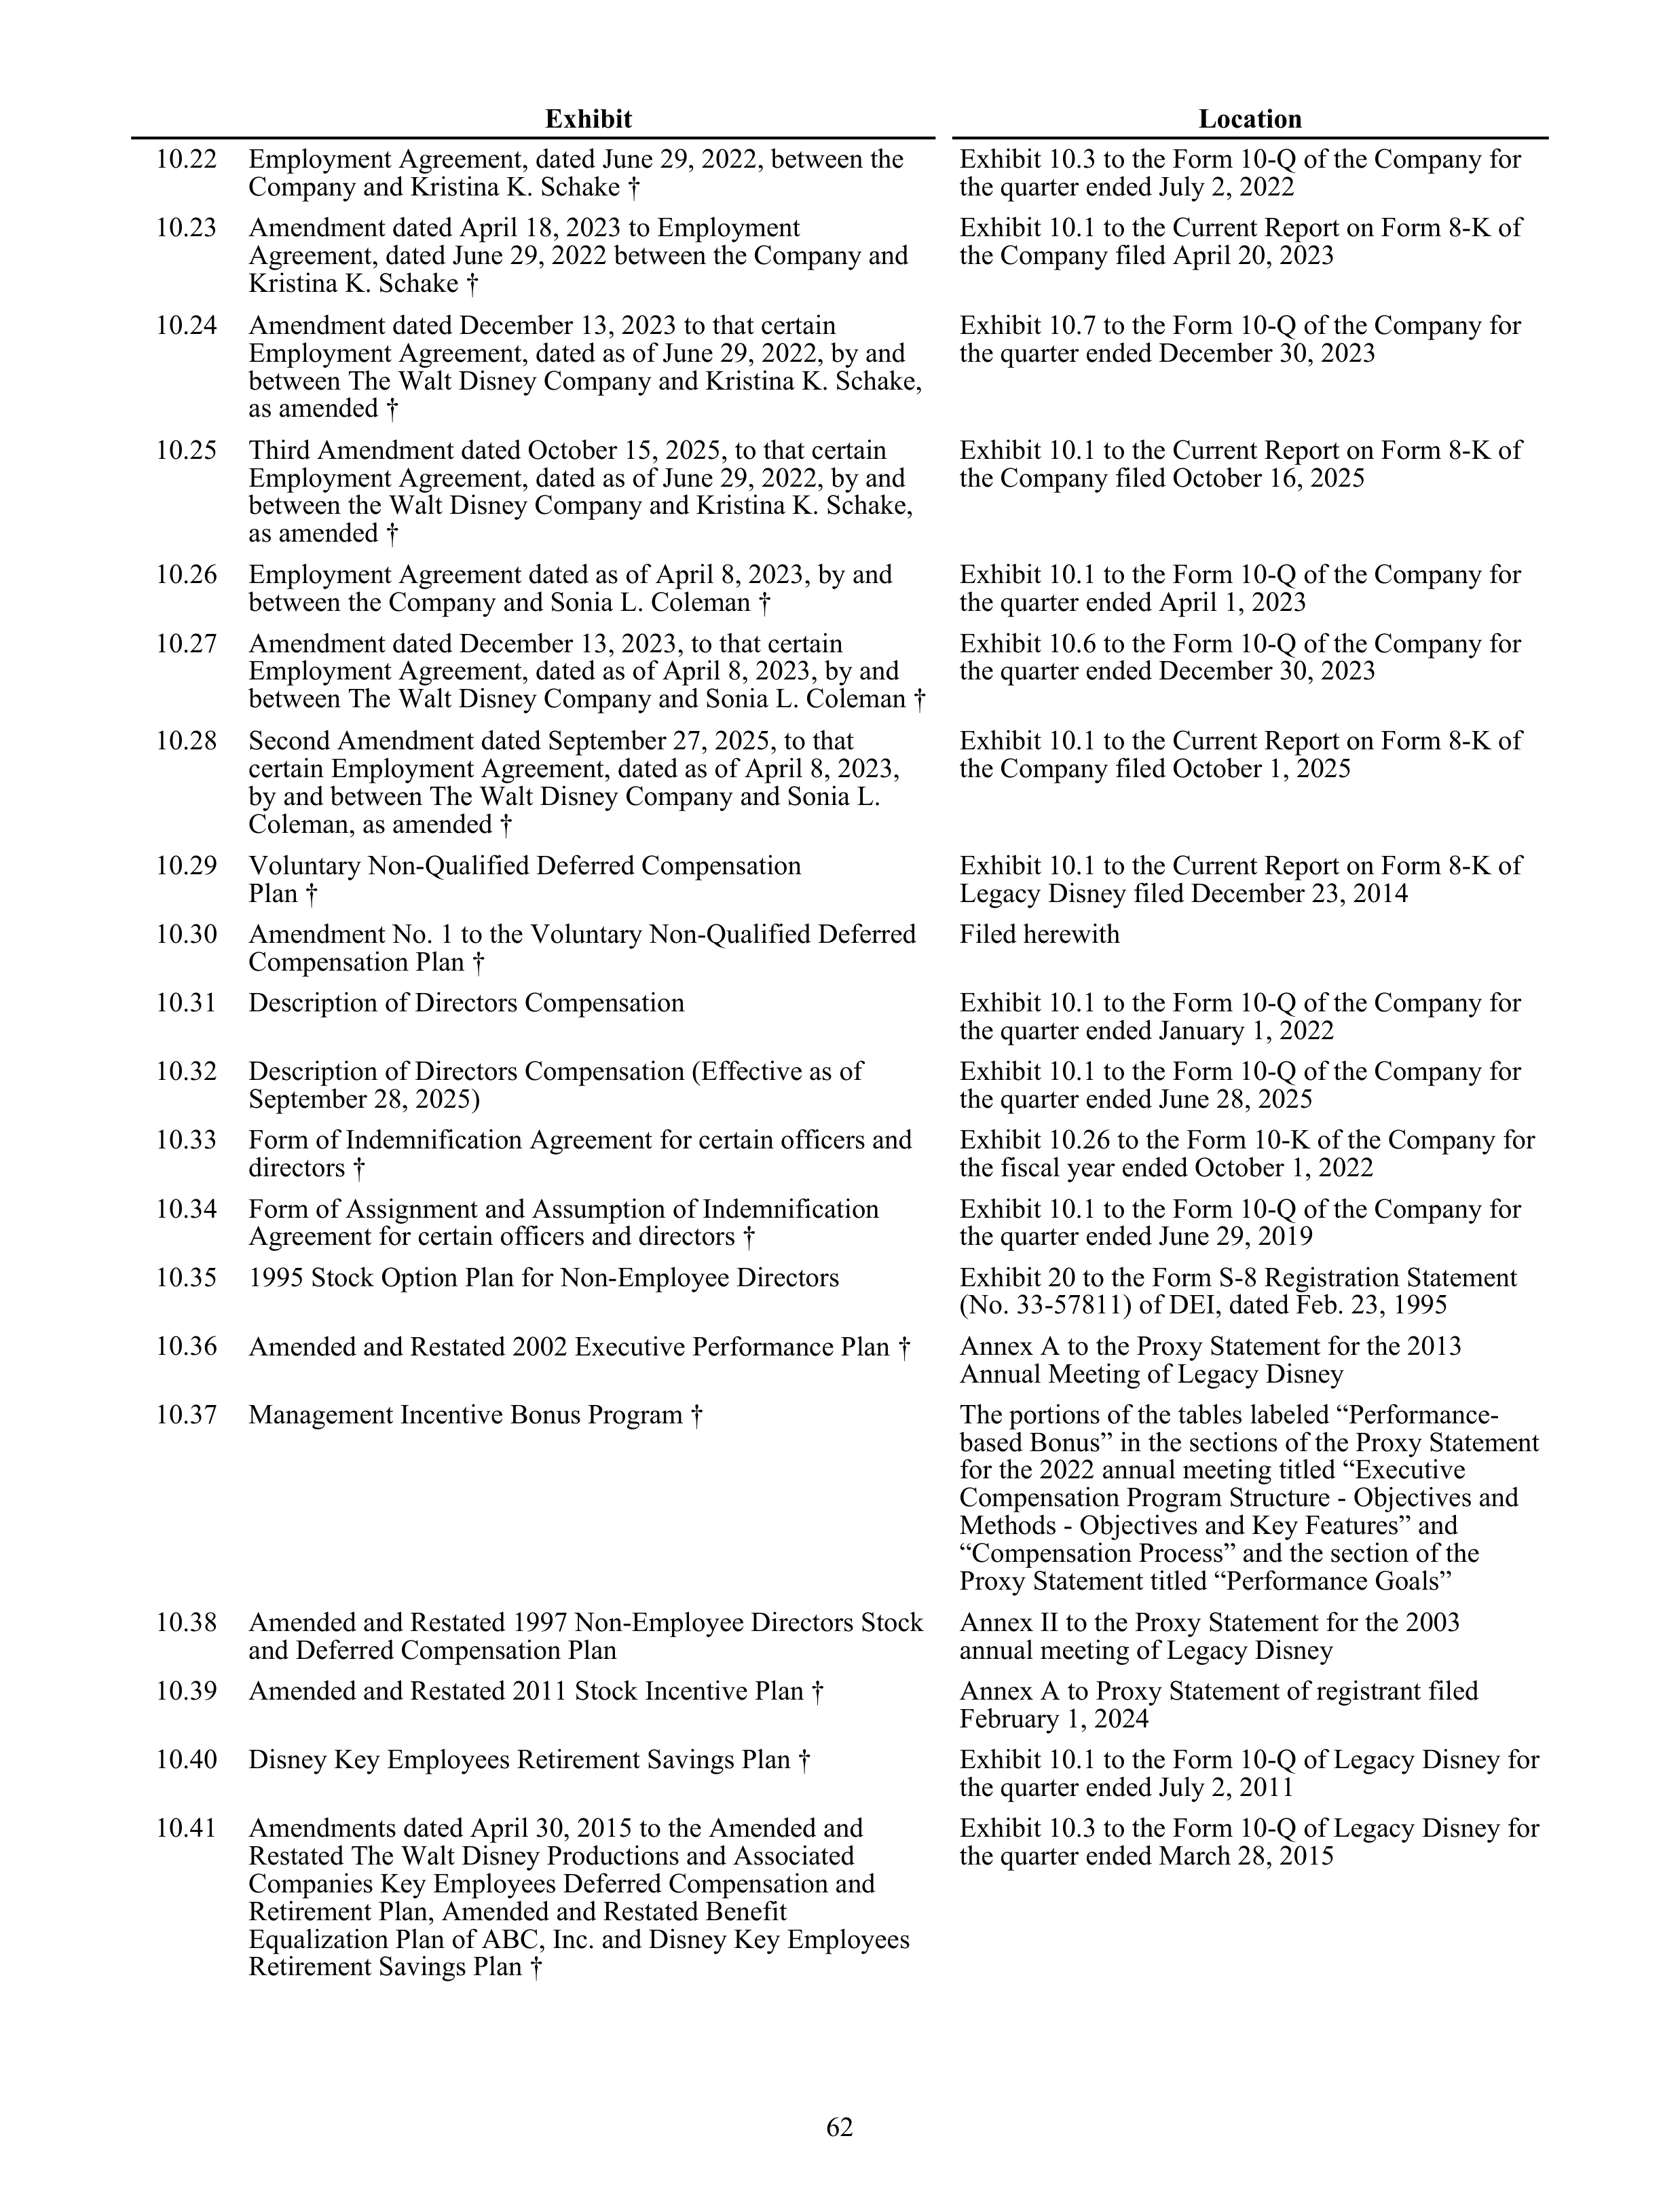
Exhibit
Location
10.22
Employment Agreement, dated June 29, 2022, between the
Company and Kristina K. Schake †
Exhibit 10.3 to the Form 10-Q of the Company for
the quarter ended July 2, 2022
10.23
Amendment dated April 18, 2023 to Employment
Agreement, dated June 29, 2022 between the Company and
Kristina K. Schake †
Exhibit 10.1 to the Current Report on Form 8-K of
the Company filed April 20, 2023
10.24
Amendment dated December 13, 2023 to that certain
Employment Agreement, dated as of June 29, 2022, by and
between The Walt Disney Company and Kristina K. Schake,
as amended †
Exhibit 10.7 to the Form 10-Q of the Company for
the quarter ended December 30, 2023
10.25
Third Amendment dated October 15, 2025, to that certain
Employment Agreement, dated as of June 29, 2022, by and
between the Walt Disney Company and Kristina K. Schake,
as amended †
Exhibit 10.1 to the Current Report on Form 8-K of
the Company filed October 16, 2025
10.26
Employment Agreement dated as of April 8, 2023, by and
between the Company and Sonia L. Coleman †
Exhibit 10.1 to the Form 10-Q of the Company for
the quarter ended April 1, 2023
10.27
Amendment dated December 13, 2023, to that certain
Employment Agreement, dated as of April 8, 2023, by and
between The Walt Disney Company and Sonia L. Coleman †
Exhibit 10.6 to the Form 10-Q of the Company for
the quarter ended December 30, 2023
10.28
Second Amendment dated September 27, 2025, to that
certain Employment Agreement, dated as of April 8, 2023,
by and between The Walt Disney Company and Sonia L.
Coleman, as amended †
Exhibit 10.1 to the Current Report on Form 8-K of
the Company filed October 1, 2025
10.29
Voluntary Non-Qualified Deferred Compensation
Plan †
Exhibit 10.1 to the Current Report on Form 8-K of
Legacy Disney filed December 23, 2014
10.30
Amendment No. 1 to the Voluntary Non-Qualified Deferred
Compensation Plan †
Filed herewith
10.31
Description of Directors Compensation
Exhibit 10.1 to the Form 10-Q of the Company for
the quarter ended January 1, 2022
10.32
Description of Directors Compensation (Effective as of
September 28, 2025)
Exhibit 10.1 to the Form 10-Q of the Company for
the quarter ended June 28, 2025
10.33
Form of Indemnification Agreement for certain officers and
directors †
Exhibit 10.26 to the Form 10-K of the Company for
the fiscal year ended October 1, 2022
10.34
Form of Assignment and Assumption of Indemnification
Agreement for certain officers and directors †
Exhibit 10.1 to the Form 10-Q of the Company for
the quarter ended June 29, 2019
10.35
1995 Stock Option Plan for Non-Employee Directors
Exhibit 20 to the Form S-8 Registration Statement
(No. 33-57811) of DEI, dated Feb. 23, 1995
10.36
Amended and Restated 2002 Executive Performance Plan
†
Annex A to the Proxy Statement for the 2013
Annual Meeting of Legacy Disney
10.37
Management Incentive Bonus Program †
The portions of the tables labeled “Performance-
based Bonus” in the sections of the Proxy Statement
for the 2022 annual meeting titled “Executive
Compensation Program Structure - Objectives and
Methods - Objectives and Key Features” and
“Compensation Process” and the section of the
Proxy Statement titled “Performance Goals”
10.38
Amended and Restated 1997 Non-Employee Directors Stock
and Deferred Compensation Plan
Annex II to the Proxy Statement for the 2003
annual meeting of Legacy Disney
10.39
Amended and Restated 2011 Stock Incentive Plan †
Annex A to Proxy Statement of registrant filed
February 1, 2024
10.40
Disney Key Employees Retirement Savings Plan †
Exhibit 10.1 to the Form 10-Q of Legacy Disney for
the quarter ended July 2, 2011
10.41
Amendments dated April 30, 2015 to the Amended and
Restated The Walt Disney Productions and Associated
Companies Key Employees Deferred Compensation and
Retirement Plan, Amended and Restated Benefit
Equalization Plan of ABC, Inc. and Disney Key Employees
Retirement Savings Plan †
Exhibit 10.3 to the Form 10-Q of Legacy Disney for
the quarter ended March 28, 2015
62
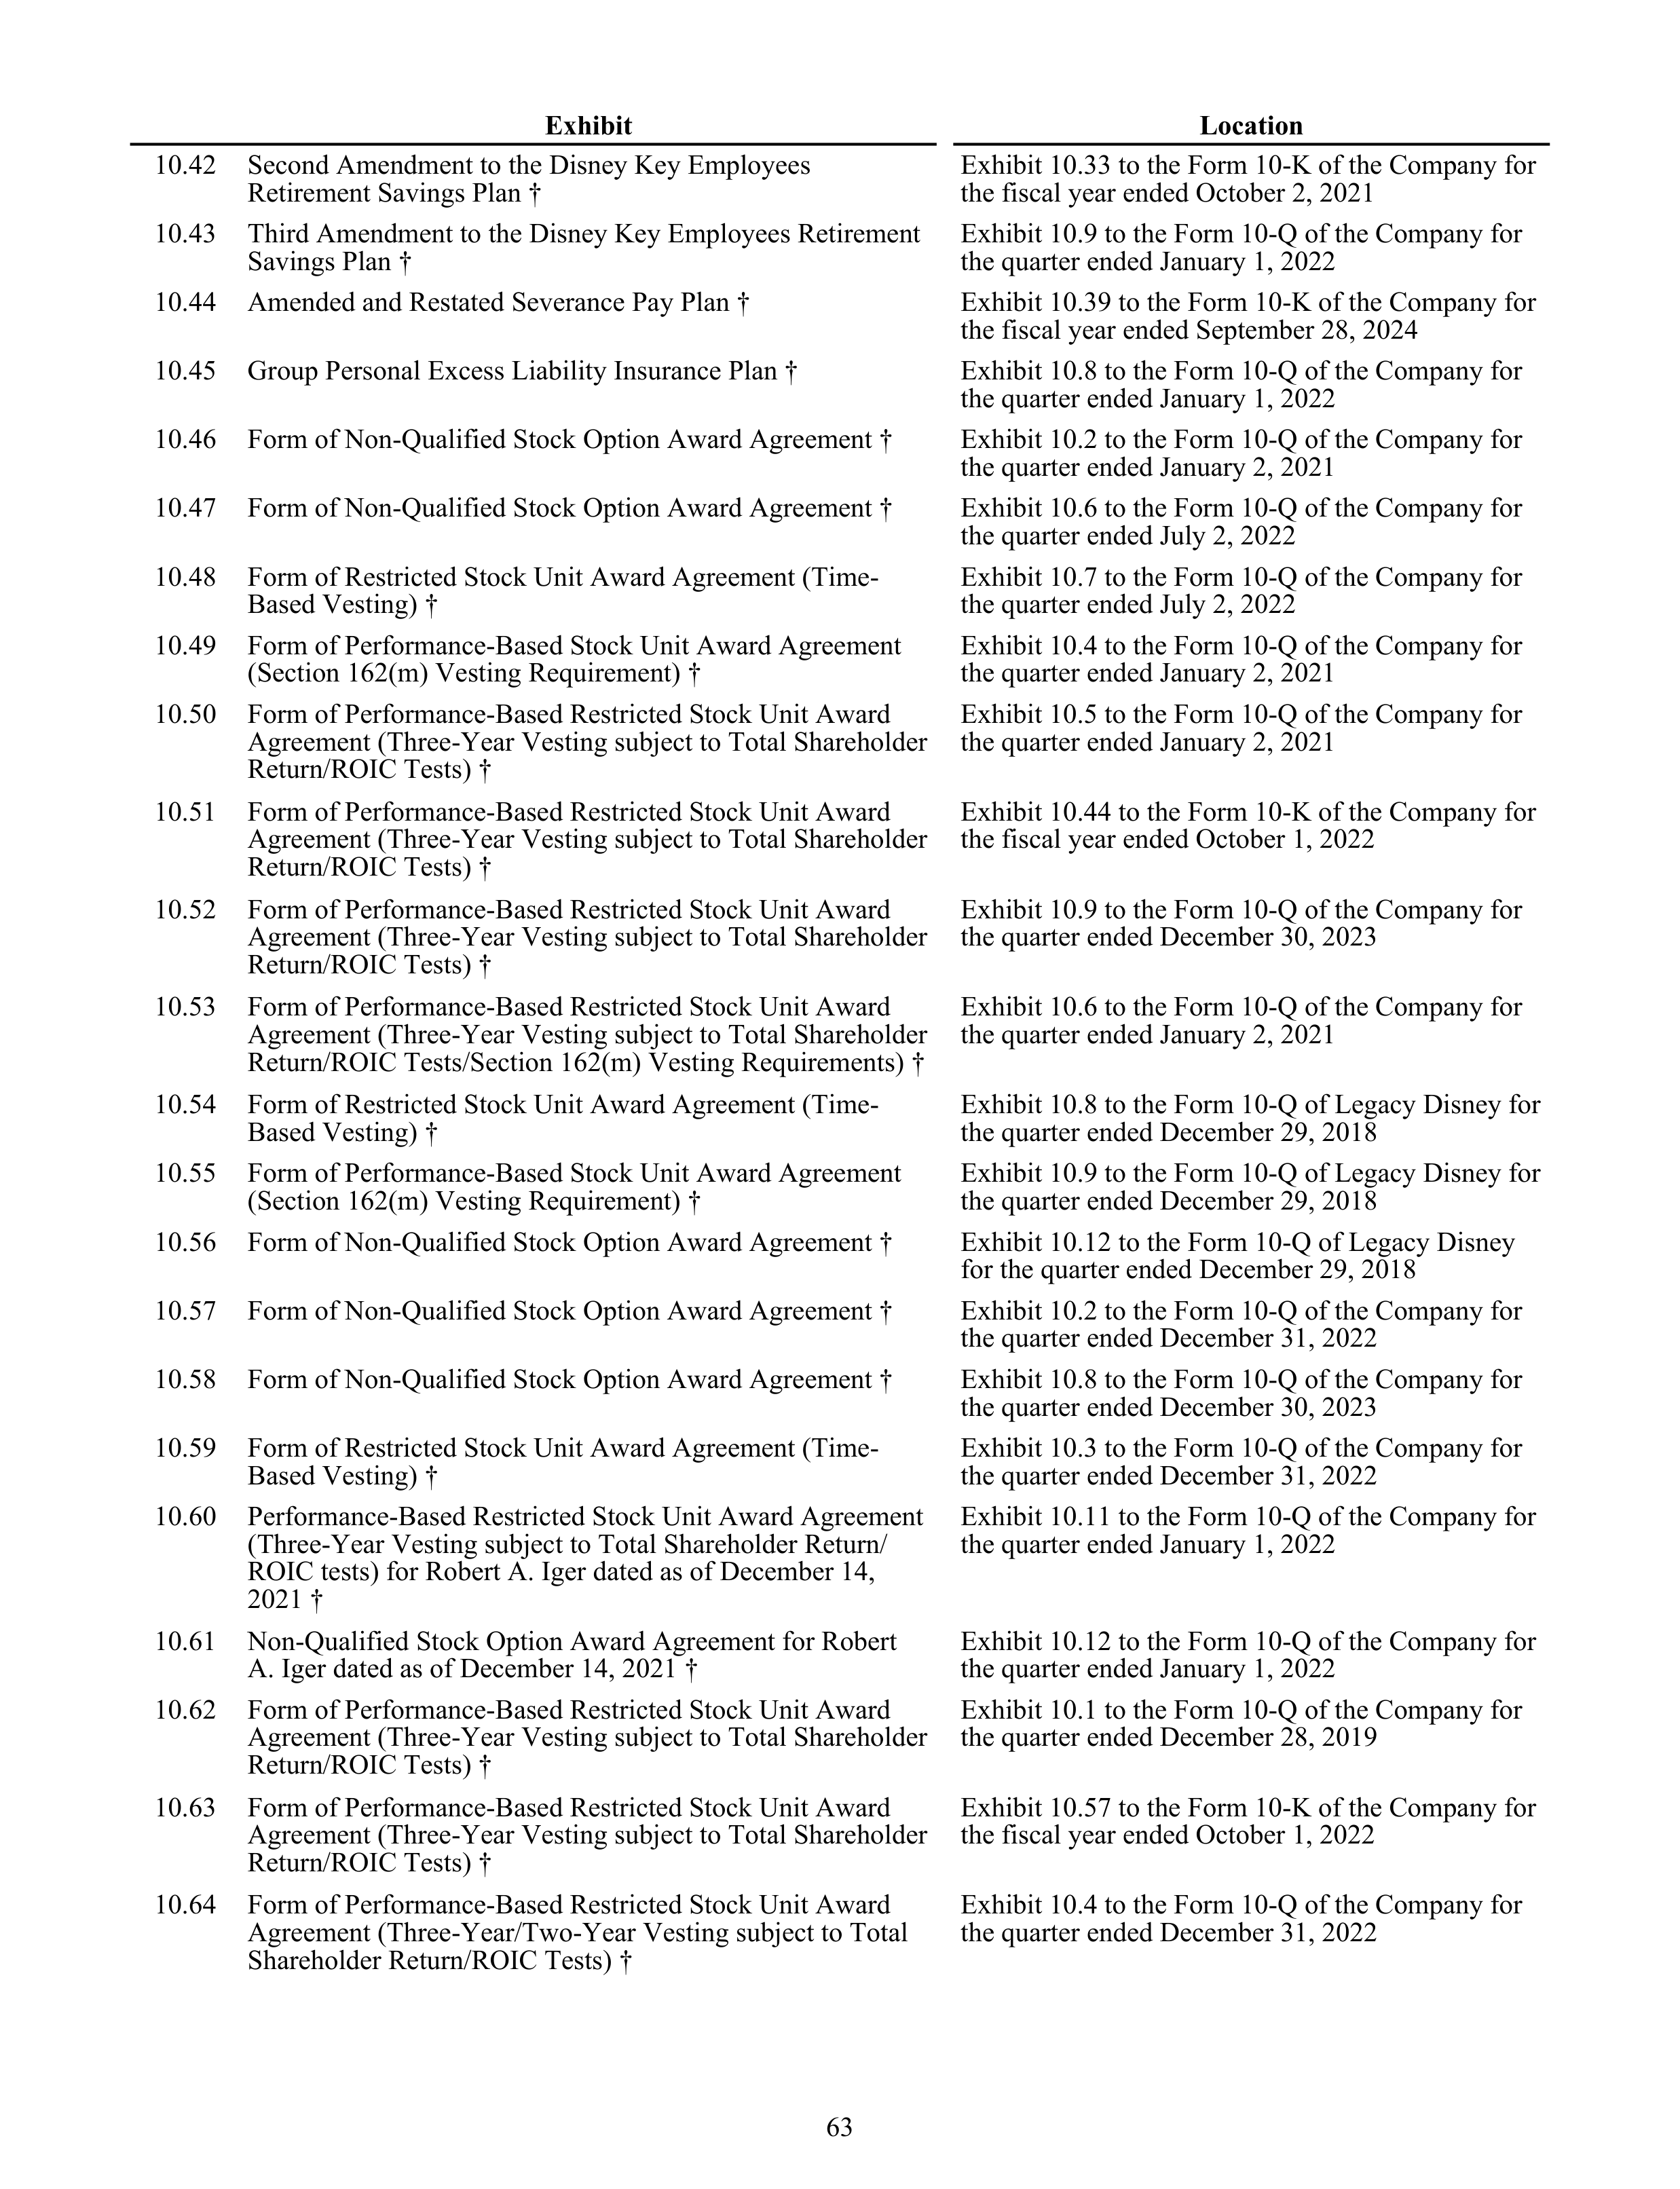
Exhibit
Location
10.42
Second Amendment to the Disney Key Employees
Retirement Savings Plan †
Exhibit 10.33 to the Form 10-K of the Company for
the fiscal year ended October 2, 2021
10.43
Third Amendment to the Disney Key Employees Retirement
Savings Plan †
Exhibit 10.9 to the Form 10-Q of the Company for
the quarter ended January 1, 2022
10.44
Amended and Restated Severance Pay Plan †
Exhibit 10.39 to the Form 10-K of the Company for
the fiscal year ended September 28, 2024
10.45
Group Personal Excess Liability Insurance Plan †
Exhibit 10.8 to the Form 10-Q of the Company for
the quarter ended January 1, 2022
10.46
Form of Non-Qualified Stock Option Award Agreement †
Exhibit 10.2 to the Form 10-Q of the Company for
the quarter ended January 2, 2021
10.47
Form of Non-Qualified Stock Option Award Agreement †
Exhibit 10.6 to the Form 10-Q of the Company for
the quarter ended July 2, 2022
10.48
Form of Restricted Stock Unit Award Agreement (Time-
Based Vesting) †
Exhibit 10.7 to the Form 10-Q of the Company for
the quarter ended July 2, 2022
10.49
Form of Performance-Based Stock Unit Award Agreement
(Section 162(m) Vesting Requirement) †
Exhibit 10.4 to the Form 10-Q of the Company for
the quarter ended January 2, 2021
10.50
Form of Performance-Based Restricted Stock Unit Award
Agreement (Three-Year Vesting subject to Total Shareholder
Return/ROIC Tests) †
Exhibit 10.5 to the Form 10-Q of the Company for
the quarter ended January 2, 2021
10.51
Form of Performance-Based Restricted Stock Unit Award
Agreement (Three-Year Vesting subject to Total Shareholder
Return/ROIC Tests) †
Exhibit 10.44 to the Form 10-K of the Company for
the fiscal year ended October 1, 2022
10.52
Form of Performance-Based Restricted Stock Unit Award
Agreement (Three-Year Vesting subject to Total Shareholder
Return/ROIC Tests) †
Exhibit 10.9 to the Form 10-Q of the Company for
the quarter ended December 30, 2023
10.53
Form of Performance-Based Restricted Stock Unit Award
Agreement (Three-Year Vesting subject to Total Shareholder
Return/ROIC Tests/Section 162(m) Vesting Requirements) †
Exhibit 10.6 to the Form 10-Q of the Company for
the quarter ended January 2, 2021
10.54
Form of Restricted Stock Unit Award Agreement (Time-
Based Vesting) †
Exhibit 10.8 to the Form 10-Q of Legacy Disney for
the quarter ended December 29, 2018
10.55
Form of Performance-Based Stock Unit Award Agreement
(Section 162(m) Vesting Requirement) †
Exhibit 10.9 to the Form 10-Q of Legacy Disney for
the quarter ended December 29, 2018
10.56
Form of Non-Qualified Stock Option Award Agreement †
Exhibit 10.12 to the Form 10-Q of Legacy Disney
for the quarter ended December 29, 2018
10.57
Form of Non-Qualified Stock Option Award Agreement †
Exhibit 10.2 to the Form 10-Q of the Company for
the quarter ended December 31, 2022
10.58
Form of Non-Qualified Stock Option Award Agreement †
Exhibit 10.8 to the Form 10-Q of the Company for
the quarter ended December 30, 2023
10.59
Form of Restricted Stock Unit Award Agreement (Time-
Based Vesting) †
Exhibit 10.3 to the Form 10-Q of the Company for
the quarter ended December 31, 2022
10.60
Performance-Based Restricted Stock Unit Award Agreement
(Three-Year Vesting subject to Total Shareholder Return/
ROIC tests) for Robert A. Iger dated as of December 14,
2021 †
Exhibit 10.11 to the Form 10-Q of the Company for
the quarter ended January 1, 2022
10.61
Non-Qualified Stock Option Award Agreement for Robert
A. Iger dated as of December 14, 2021 †
Exhibit 10.12 to the Form 10-Q of the Company for
the quarter ended January 1, 2022
10.62
Form of Performance-Based Restricted Stock Unit Award
Agreement (Three-Year Vesting subject to Total Shareholder
Return/ROIC Tests) †
Exhibit 10.1 to the Form 10-Q of the Company for
the quarter ended December 28, 2019
10.63
Form of Performance-Based Restricted Stock Unit Award
Agreement (Three-Year Vesting subject to Total Shareholder
Return/ROIC Tests) †
Exhibit 10.57 to the Form 10-K of the Company for
the fiscal year ended October 1, 2022
10.64
Form of Performance-Based Restricted Stock Unit Award
Agreement (Three-Year/Two-Year Vesting subject to Total
Shareholder Return/ROIC Tests) †
Exhibit 10.4 to the Form 10-Q of the Company for
the quarter ended December 31, 2022
63
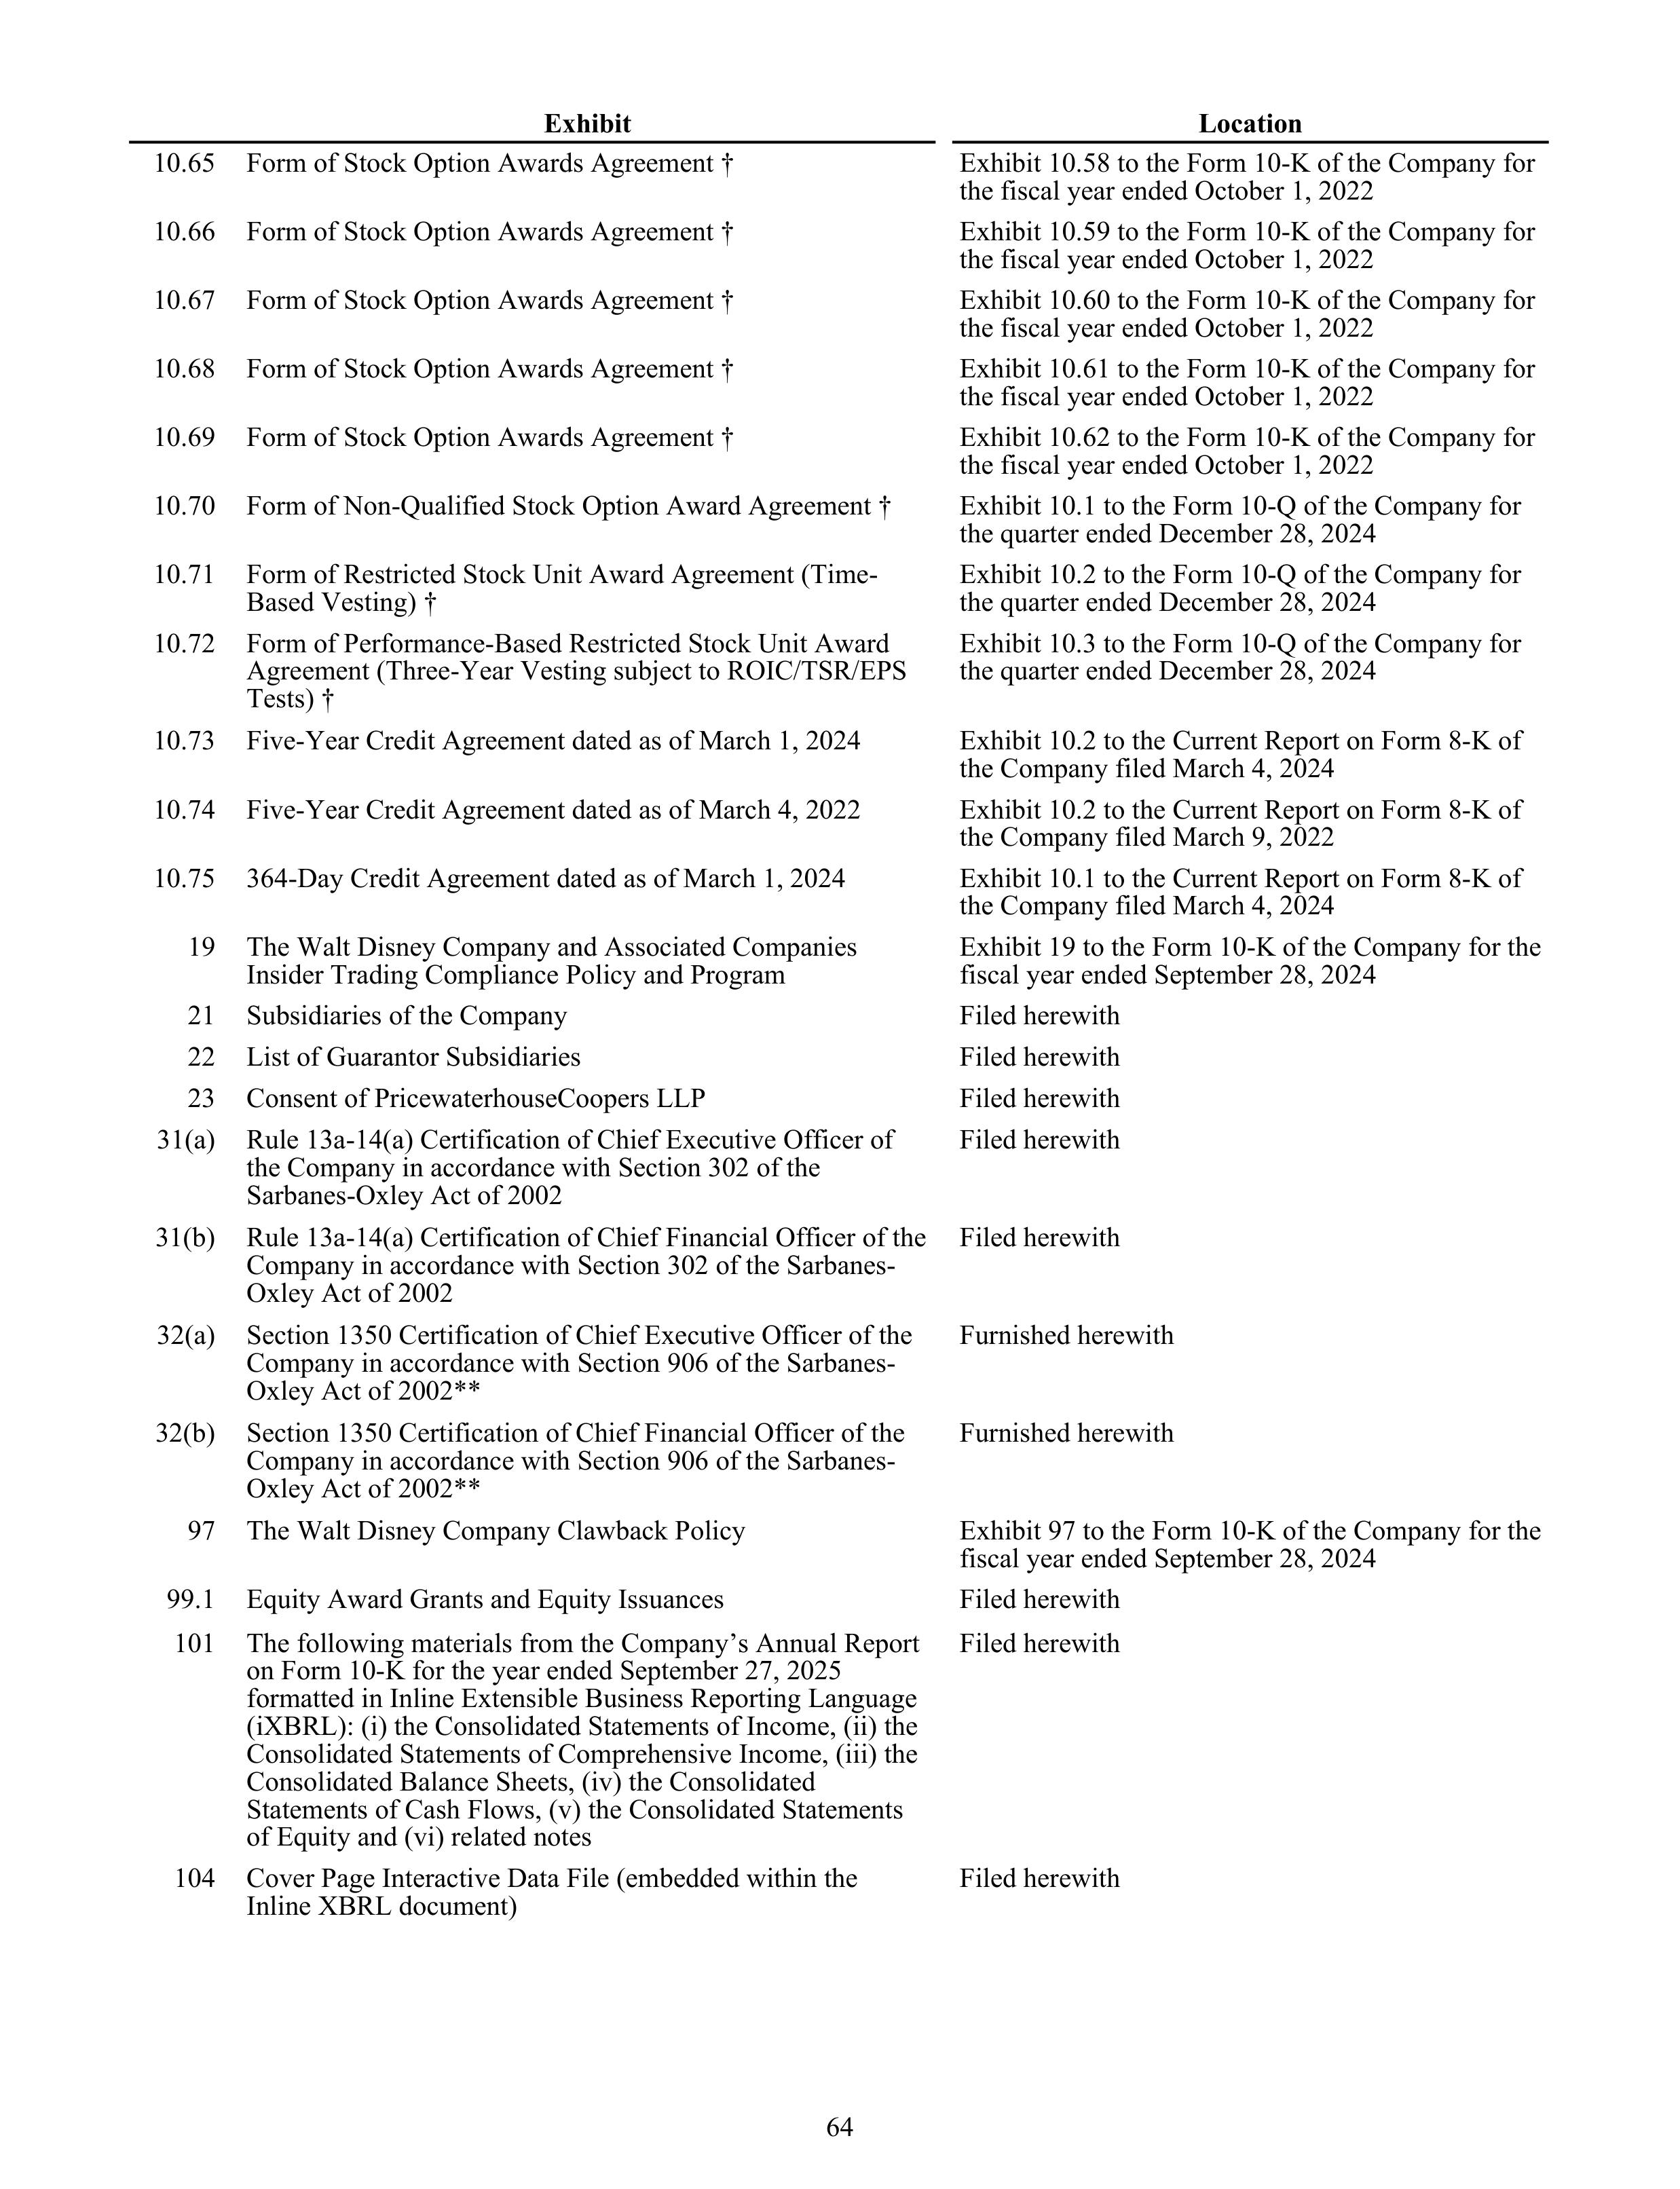
Exhibit
Location
10.65
Form of Stock Option Awards Agreement †
Exhibit 10.58 to the Form 10-K of the Company for
the fiscal year ended October 1, 2022
10.66
Form of Stock Option Awards Agreement †
Exhibit 10.59 to the Form 10-K of the Company for
the fiscal year ended October 1, 2022
10.67
Form of Stock Option Awards Agreement †
Exhibit 10.60 to the Form 10-K of the Company for
the fiscal year ended October 1, 2022
10.68
Form of Stock Option Awards Agreement †
Exhibit 10.61 to the Form 10-K of the Company for
the fiscal year ended October 1, 2022
10.69
Form of Stock Option Awards Agreement †
Exhibit 10.62 to the Form 10-K of the Company for
the fiscal year ended October 1, 2022
10.70
Form of Non-Qualified Stock Option Award Agreement †
Exhibit 10.1 to the Form 10-Q of the Company for
the quarter ended December 28, 2024
10.71
Form of Restricted Stock Unit Award Agreement (Time-
Based Vesting) †
Exhibit 10.2 to the Form 10-Q of the Company for
the quarter ended December 28, 2024
10.72
Form of Performance-Based Restricted Stock Unit Award
Agreement (Three-Year Vesting subject to ROIC/TSR/EPS
Tests) †
Exhibit 10.3 to the Form 10-Q of the Company for
the quarter ended December 28, 2024
10.73
Five-Year Credit Agreement dated as of March 1, 2024
Exhibit 10.2 to the Current Report on Form 8-K of
the Company filed March 4, 2024
10.74
Five-Year Credit Agreement dated as of March 4, 2022
Exhibit 10.2 to the Current Report on Form 8-K of
the Company filed March 9, 2022
10.75
364-Day Credit Agreement dated as of March 1, 2024
Exhibit 10.1 to the Current Report on Form 8-K of
the Company filed March 4, 2024
19
The Walt Disney Company and Associated Companies
Insider Trading Compliance Policy and Program
Exhibit 19 to the Form 10-K of the Company for the
fiscal year ended September 28, 2024
21
Subsidiaries of the Company
Filed herewith
22
List of Guarantor Subsidiaries
Filed herewith
23
Consent of PricewaterhouseCoopers LLP
Filed herewith
31(a)
Rule 13a-14(a) Certification of Chief Executive Officer of
the Company in accordance with Section 302 of the
Sarbanes-Oxley Act of 2002
Filed herewith
31(b)
Rule 13a-14(a) Certification of Chief Financial Officer of the
Company in accordance with Section 302 of the Sarbanes-
Oxley Act of 2002
Filed herewith
32(a)
Section 1350 Certification of Chief Executive Officer of the
Company in accordance with Section 906 of the Sarbanes-
Oxley Act of 2002**
Furnished herewith
32(b)
Section 1350 Certification of Chief Financial Officer of the
Company in accordance with Section 906 of the Sarbanes-
Oxley Act of 2002**
Furnished herewith
97
The Walt Disney Company Clawback Policy
Exhibit 97 to the Form 10-K of the Company for the
fiscal year ended September 28, 2024
99.1
Equity Award Grants and Equity Issuances
Filed herewith
101
The following materials from the Company’s Annual Report
on Form 10-K for the year ended September 27, 2025
formatted in Inline Extensible Business Reporting Language
(iXBRL): (i) the Consolidated Statements of Income, (ii) the
Consolidated Statements of Comprehensive Income, (iii) the
Consolidated Balance Sheets, (iv) the Consolidated
Statements of Cash Flows, (v) the Consolidated Statements
of Equity and (vi) related notes
Filed herewith
104
Cover Page Interactive Data File (embedded within the
Inline XBRL document)
Filed herewith
64

*
Certain schedules and exhibits have been omitted pursuant to Item 601(b)(2) of Regulation S-K. A copy of any omitted
schedule or exhibit will be furnished supplementally to the SEC upon request.
**
A signed original of this written statement required by Section 906 has been provided to the Company and will be
retained by the Company and furnished to the SEC or its staff upon request.
†
Management contract or compensatory plan or arrangement.
ITEM 16. Form 10-K Summary
None.
65
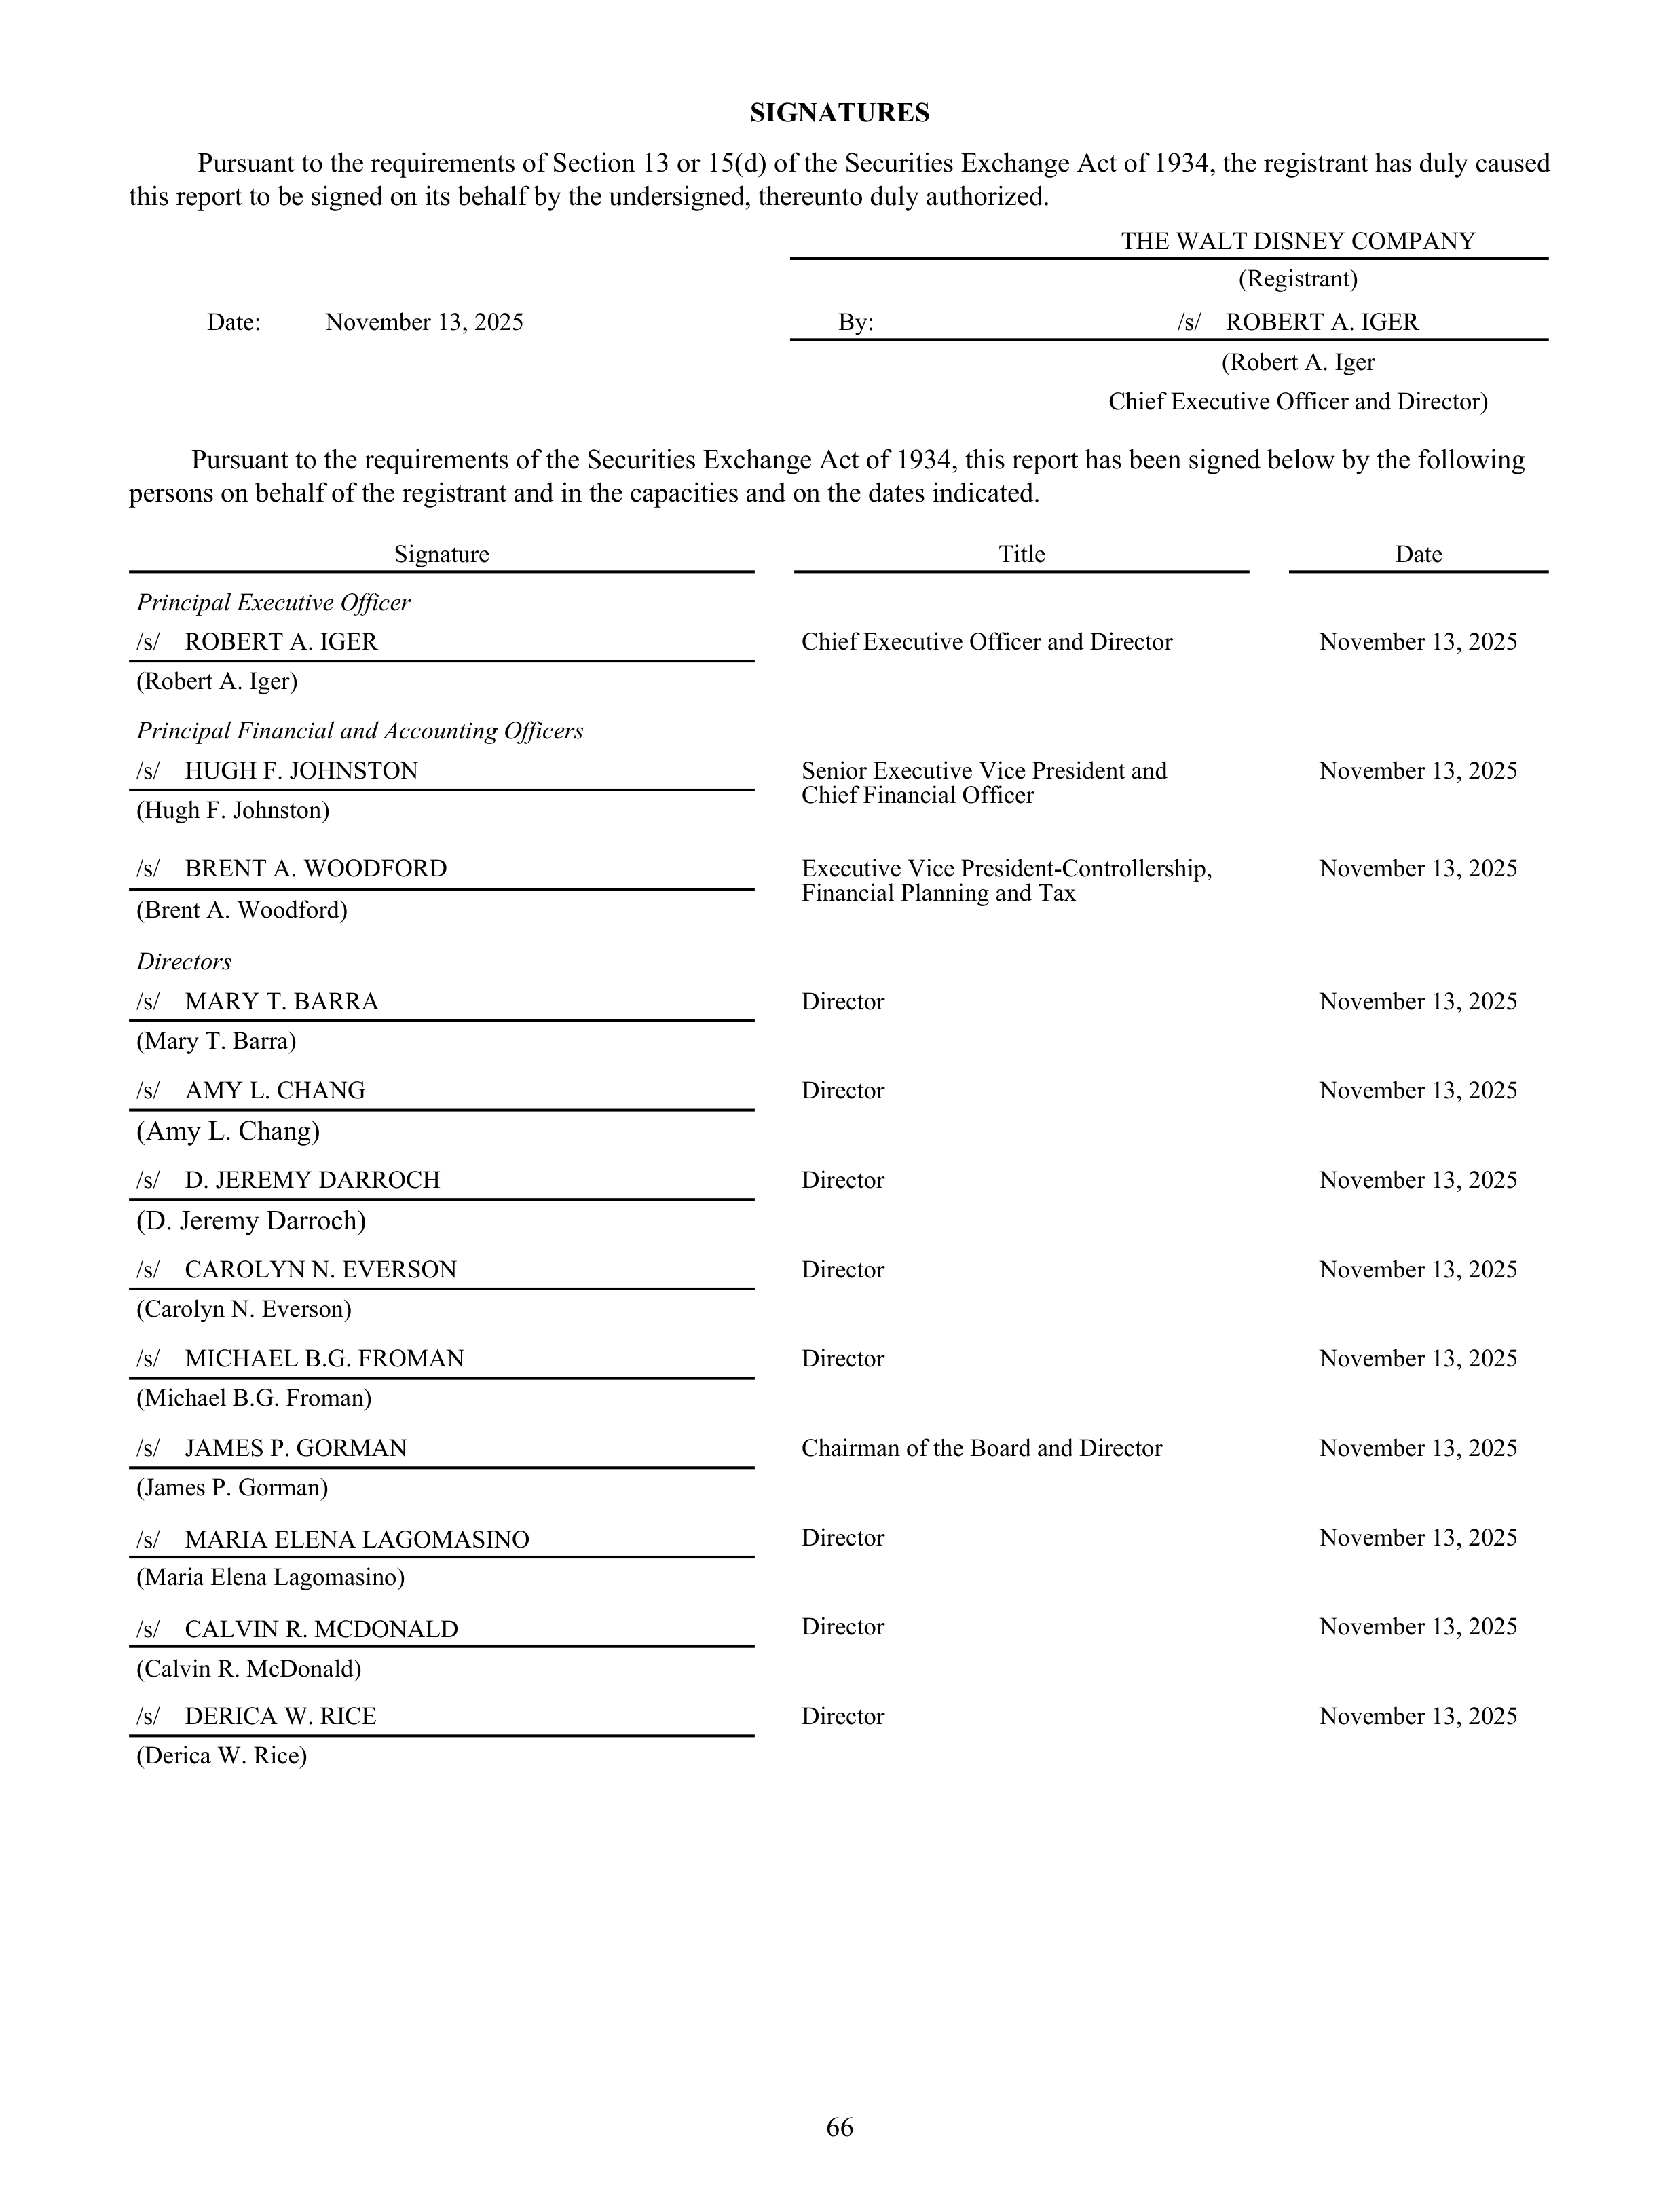
SIGNATURES
Pursuant to the requirements of Section 13 or 15(d) of the Securities Exchange Act of 1934, the registrant has duly caused
this report to be signed on its behalf by the undersigned, thereunto duly authorized.
THE WALT DISNEY COMPANY
(Registrant)
Date:
November 13, 2025
By:
/s/ ROBERT A. IGER
(Robert A. Iger
Chief Executive Officer and Director)
Pursuant to the requirements of the Securities Exchange Act of 1934, this report has been signed below by the following
persons on behalf of the registrant and in the capacities and on the dates indicated.
Signature
Title
Date
Principal Executive Officer
/s/ ROBERT A. IGER
Chief Executive Officer and Director
November 13, 2025
(Robert A. Iger)
Principal Financial and Accounting Officers
/s/ HUGH F. JOHNSTON
Senior Executive Vice President and
Chief Financial Officer
November 13, 2025
(Hugh F. Johnston)
/s/ BRENT A. WOODFORD
Executive Vice President-Controllership,
Financial Planning and Tax
November 13, 2025
(Brent A. Woodford)
Directors
/s/ MARY T. BARRA
Director
November 13, 2025
(Mary T. Barra)
/s/ AMY L. CHANG
Director
November 13, 2025
(Amy L. Chang)
/s/ D. JEREMY DARROCH
Director
November 13, 2025
(D. Jeremy Darroch)
/s/ CAROLYN N. EVERSON
Director
November 13, 2025
(Carolyn N. Everson)
/s/ MICHAEL B.G. FROMAN
Director
November 13, 2025
(Michael B.G. Froman)
/s/ JAMES P. GORMAN
Chairman of the Board and Director
November 13, 2025
(James P. Gorman)
/s/ MARIA ELENA LAGOMASINO
Director
November 13, 2025
(Maria Elena Lagomasino)
/s/ CALVIN R. MCDONALD
Director
November 13, 2025
(Calvin R. McDonald)
/s/ DERICA W. RICE
Director
November 13, 2025
(Derica W. Rice)
66
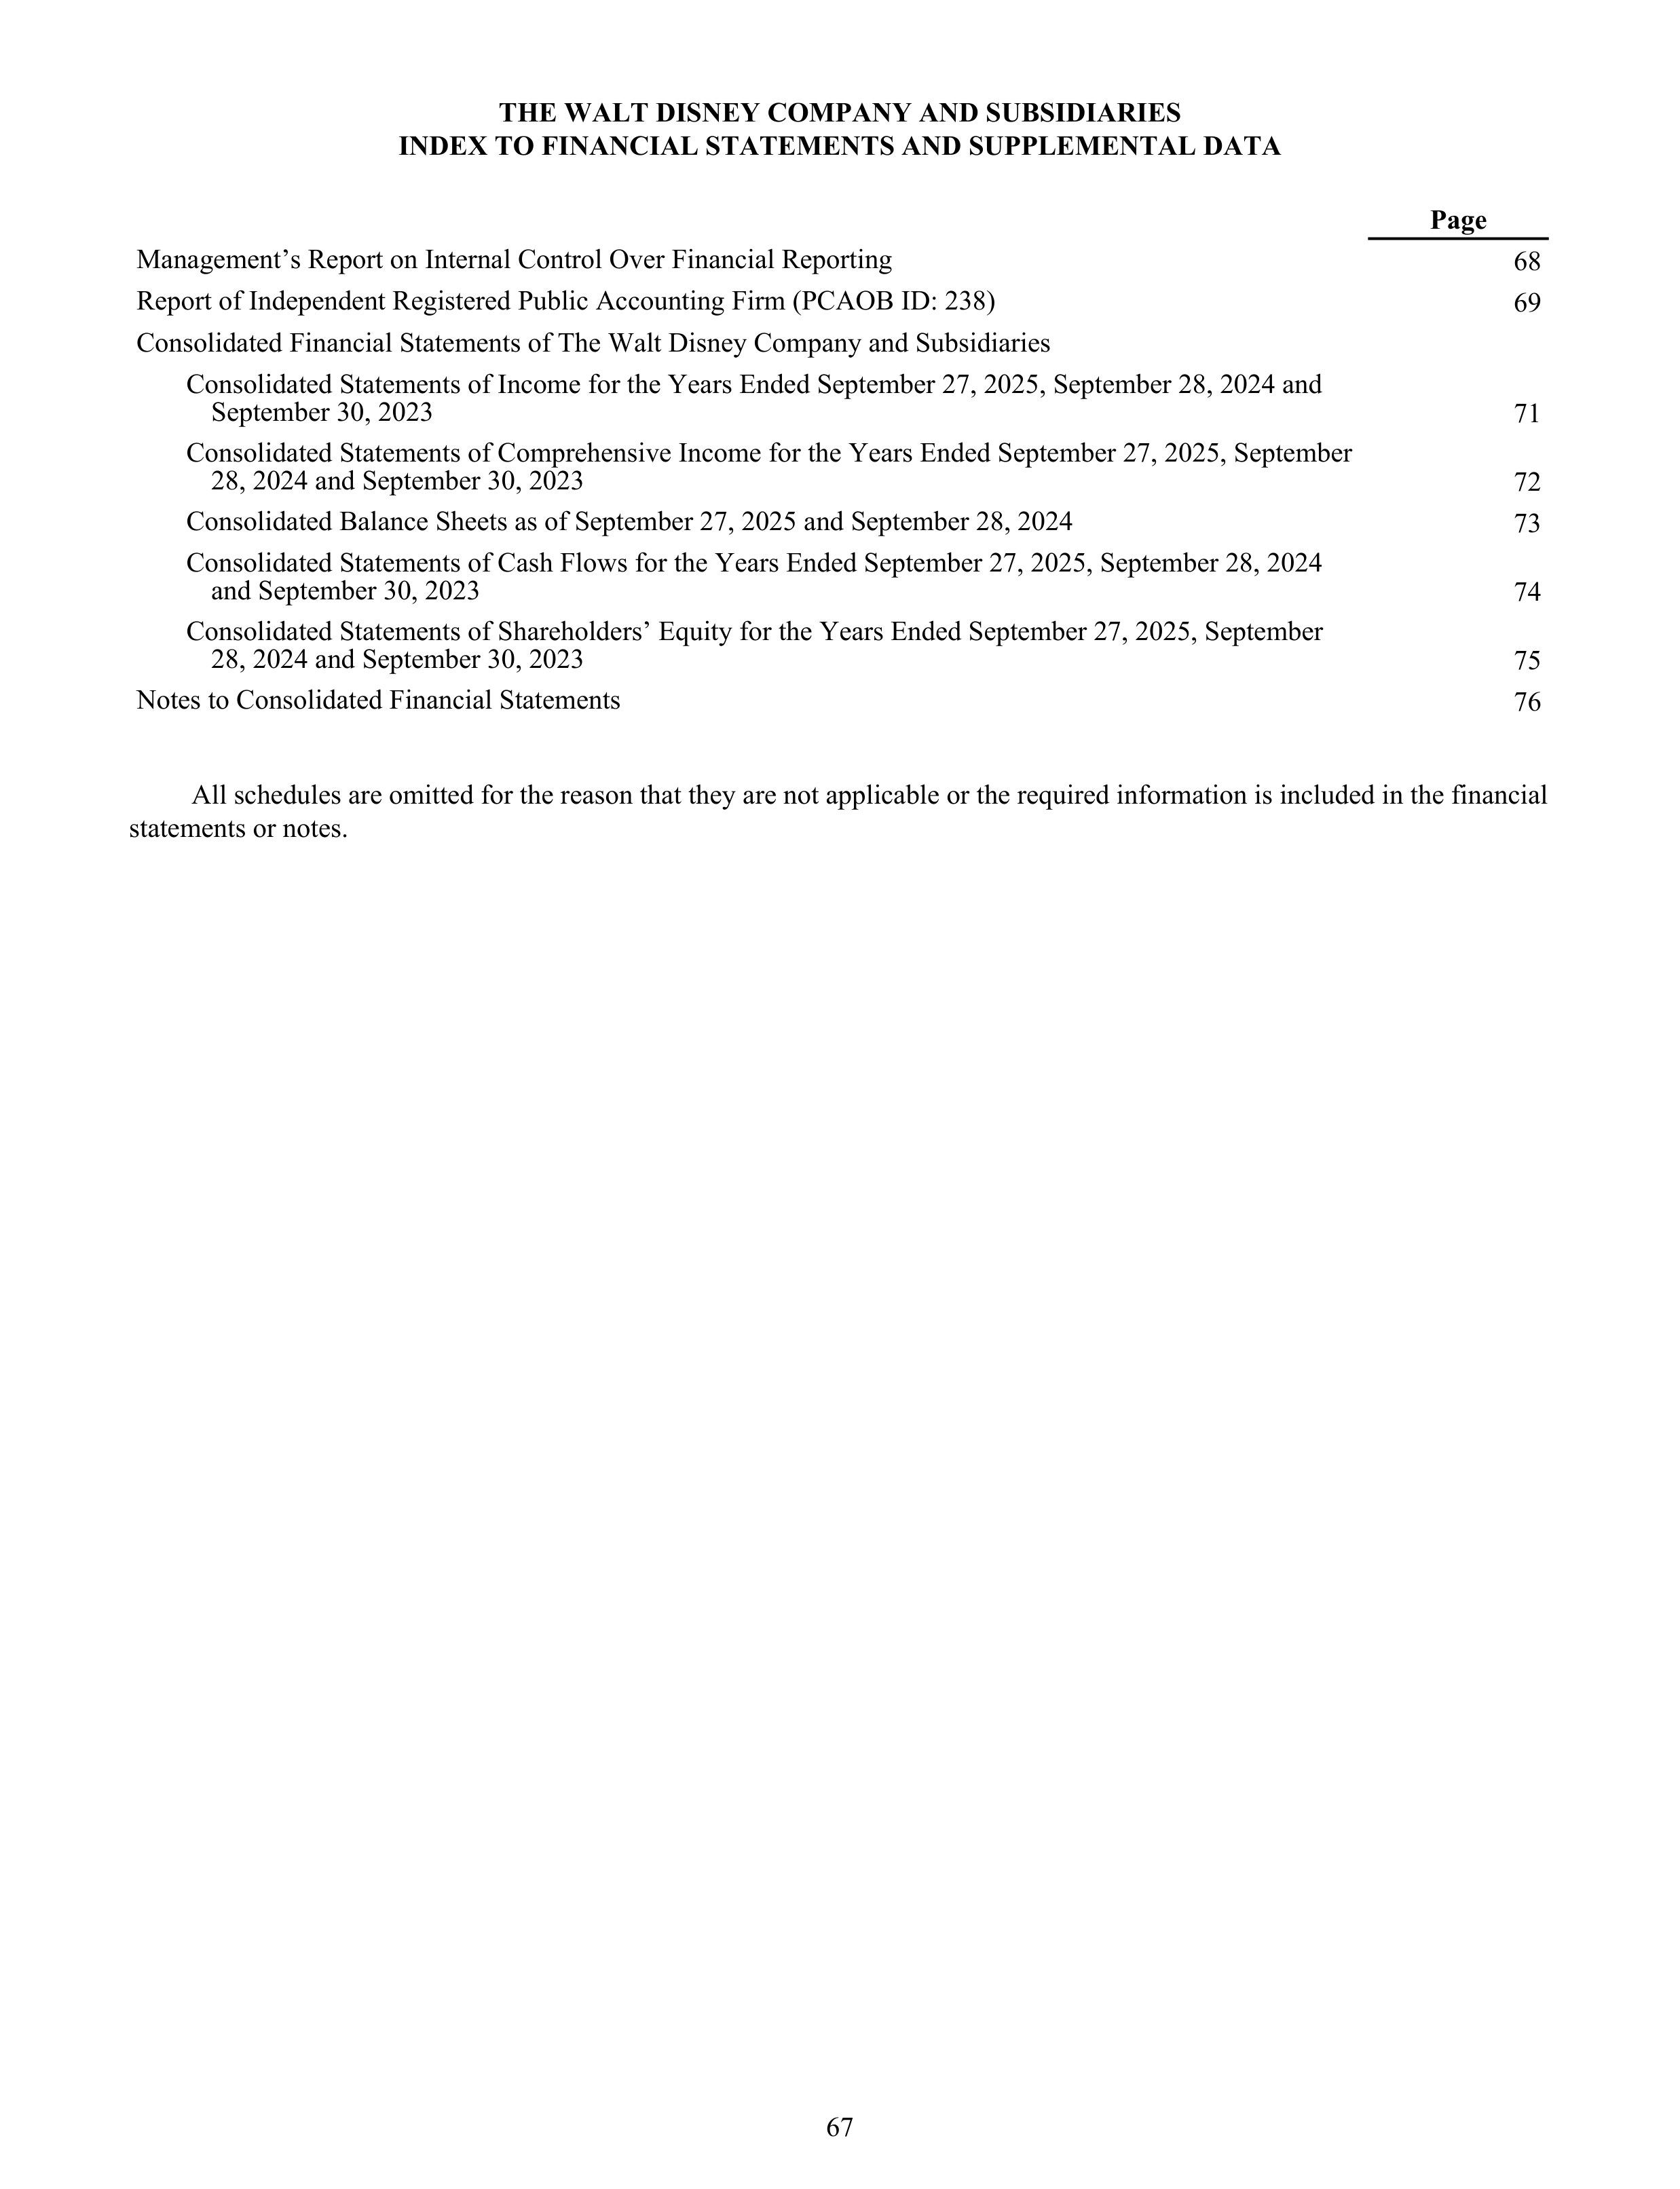
THE WALT DISNEY COMPANY AND SUBSIDIARIES
INDEX TO FINANCIAL STATEMENTS AND SUPPLEMENTAL DATA
Page
Management’s Report on Internal Control Over Financial Reporting
68
Report of Independent Registered Public Accounting Firm (PCAOB ID: 238)
69
Consolidated Financial Statements of The Walt Disney Company and Subsidiaries
Consolidated Statements of Income for the Years Ended September 27, 2025, September 28, 2024 and
September 30, 2023
71
Consolidated Statements of Comprehensive Income for the Years Ended September 27, 2025, September
28, 2024 and September 30, 2023
72
Consolidated Balance Sheets as of September 27, 2025 and September 28, 2024
73
Consolidated Statements of Cash Flows for the Years Ended September 27, 2025, September 28, 2024
and September 30, 2023
74
Consolidated Statements of Shareholders’ Equity for the Years Ended September 27, 2025, September
28, 2024 and September 30, 2023
75
Notes to Consolidated Financial Statements
76
All schedules are omitted for the reason that they are not applicable or the required information is included in the financial
statements or notes.
67
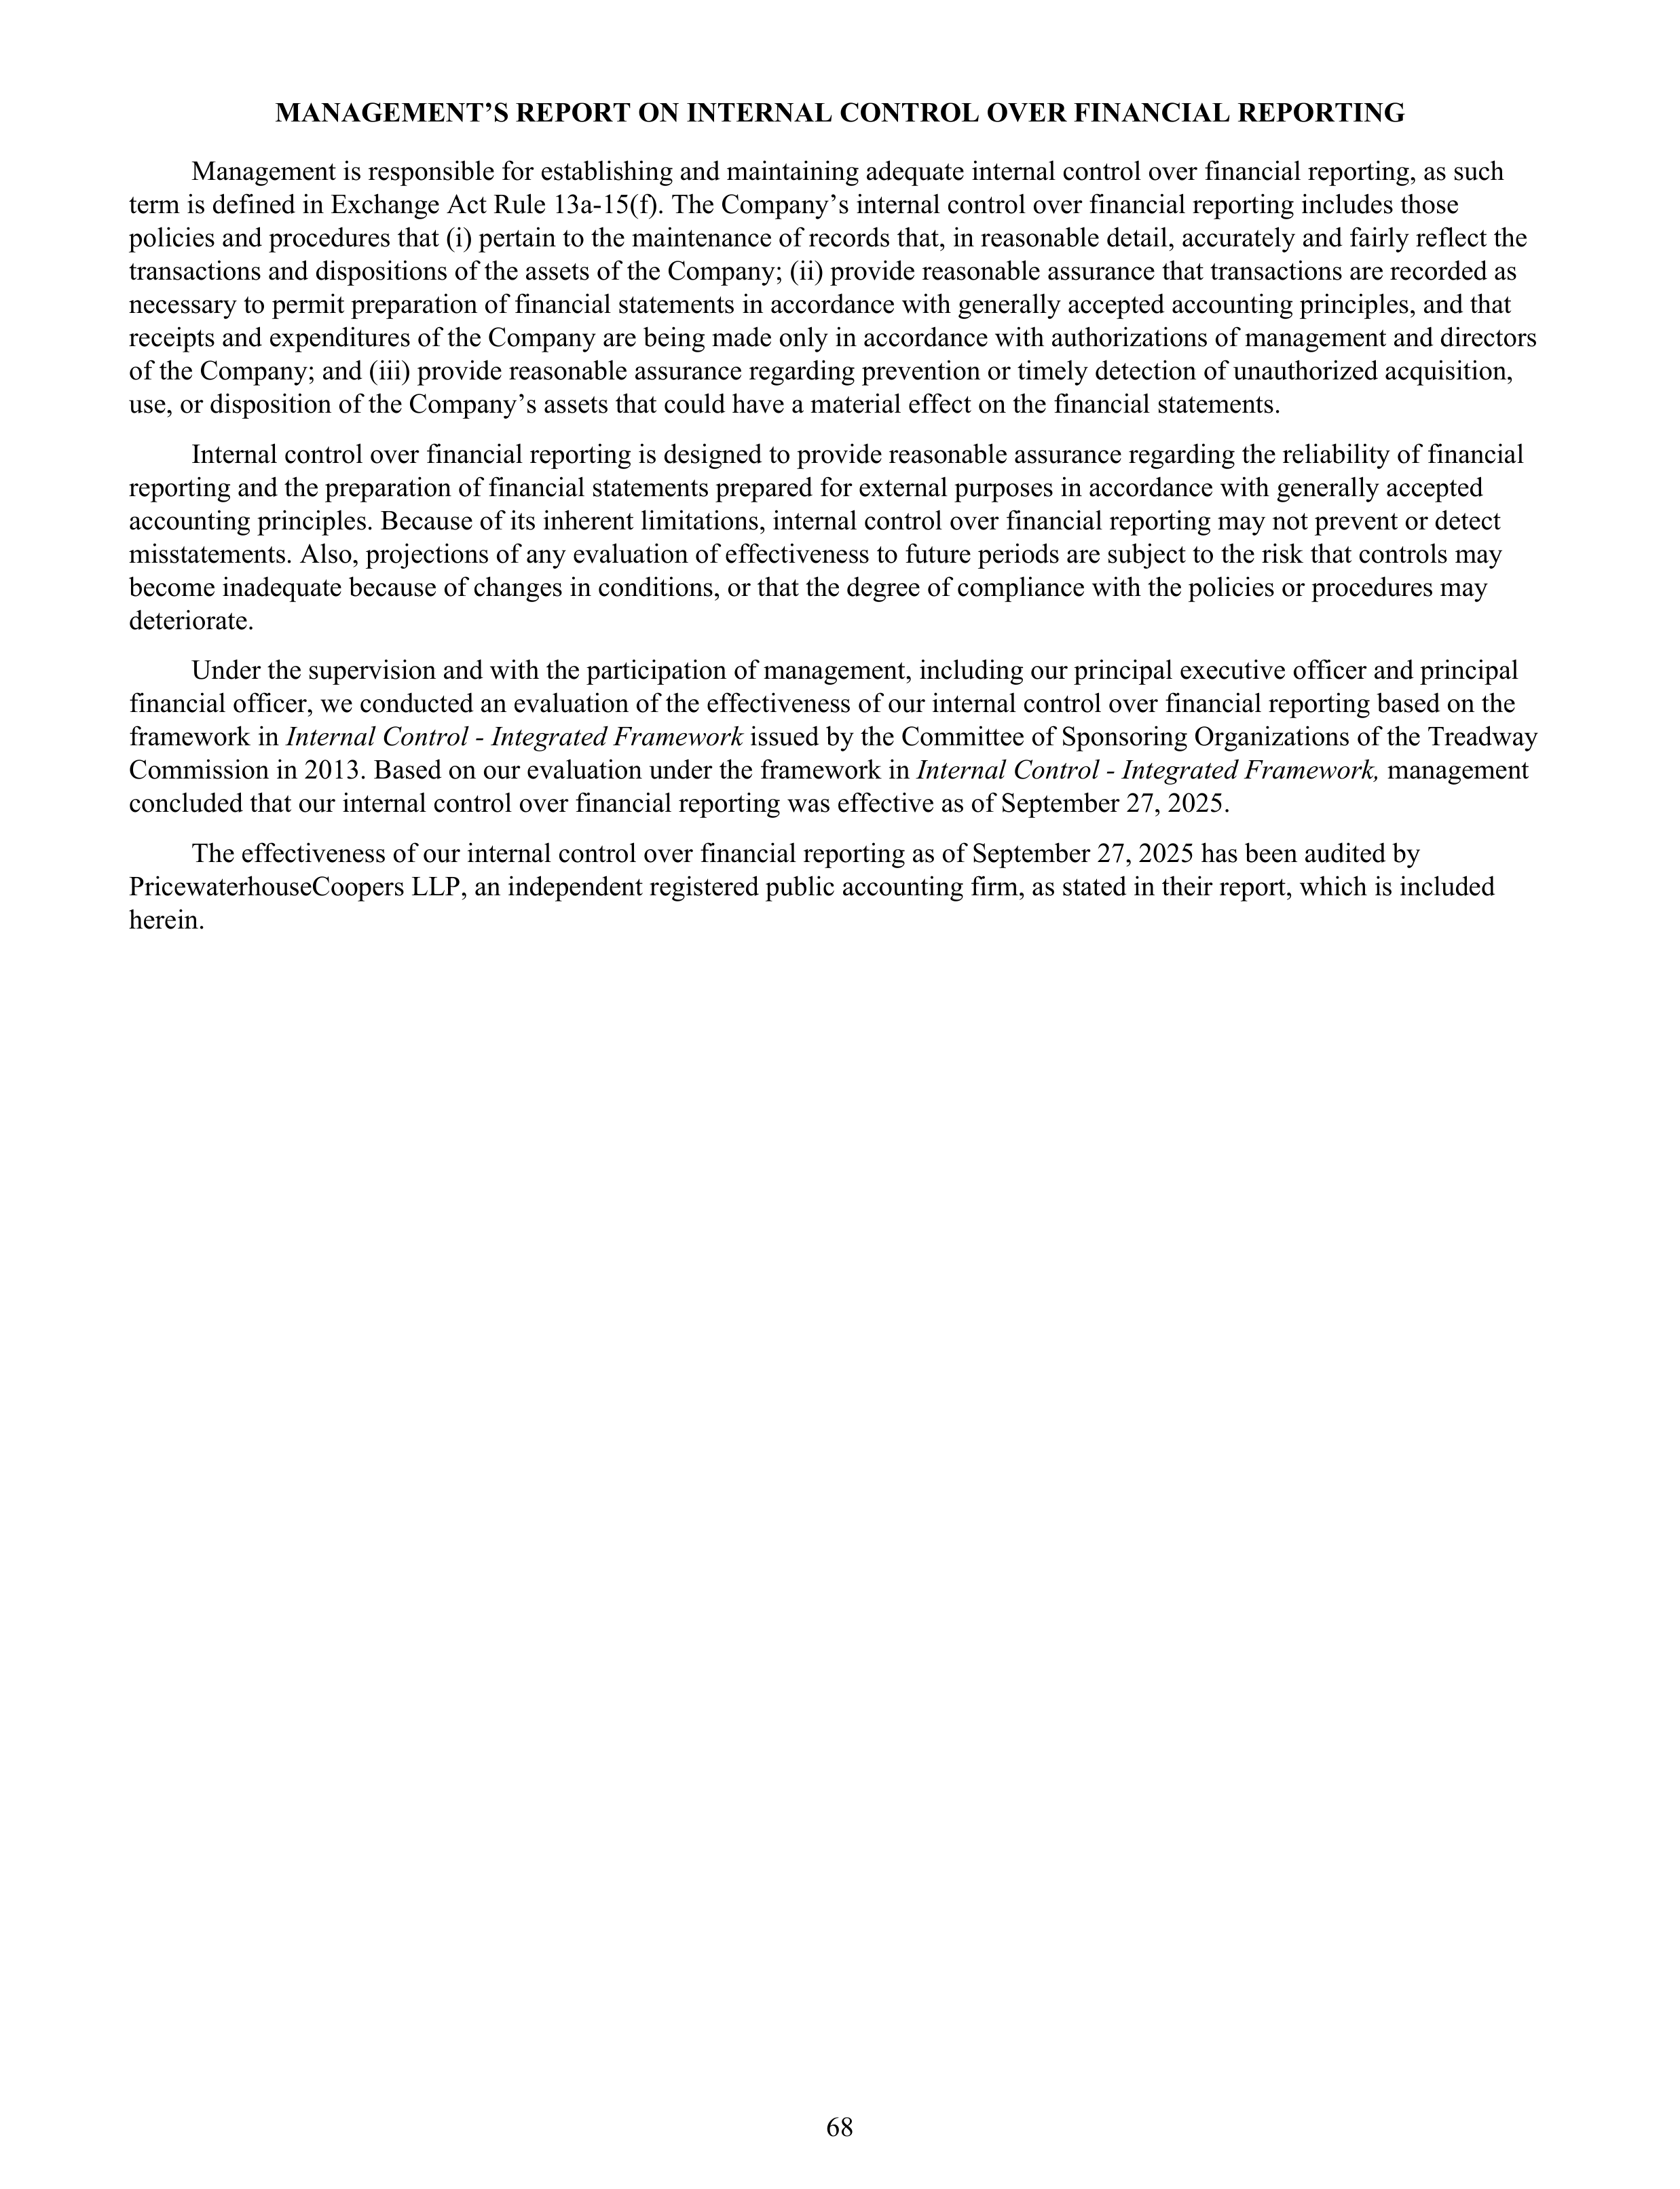
MANAGEMENT’S REPORT ON INTERNAL CONTROL OVER FINANCIAL REPORTING
Management is responsible for establishing and maintaining adequate internal control over financial reporting, as such
term is defined in Exchange Act Rule 13a-15(f). The Company’s internal control over financial reporting includes those
policies and procedures that (i) pertain to the maintenance of records that, in reasonable detail, accurately and fairly reflect the
transactions and dispositions of the assets of the Company; (ii) provide reasonable assurance that transactions are recorded as
necessary to permit preparation of financial statements in accordance with generally accepted accounting principles, and that
receipts and expenditures of the Company are being made only in accordance with authorizations of management and directors
of the Company; and (iii) provide reasonable assurance regarding prevention or timely detection of unauthorized acquisition,
use, or disposition of the Company’s assets that could have a material effect on the financial statements.
Internal control over financial reporting is designed to provide reasonable assurance regarding the reliability of financial
reporting and the preparation of financial statements prepared for external purposes in accordance with generally accepted
accounting principles. Because of its inherent limitations, internal control over financial reporting may not prevent or detect
misstatements. Also, projections of any evaluation of effectiveness to future periods are subject to the risk that controls may
become inadequate because of changes in conditions, or that the degree of compliance with the policies or procedures may
deteriorate.
Under the supervision and with the participation of management, including our principal executive officer and principal
financial officer, we conducted an evaluation of the effectiveness of our internal control over financial reporting based on the
framework in
Internal Control - Integrated Framework
issued by the Committee of Sponsoring Organizations of the Treadway
Commission in 2013. Based on our evaluation under the framework in
Internal Control - Integrated Framework,
management
concluded that our internal control over financial reporting was effective as of September 27, 2025.
The effectiveness of our internal control over financial reporting as of September 27, 2025 has been audited by
PricewaterhouseCoopers LLP, an independent registered public accounting firm, as stated in their report, which is included
herein.
68
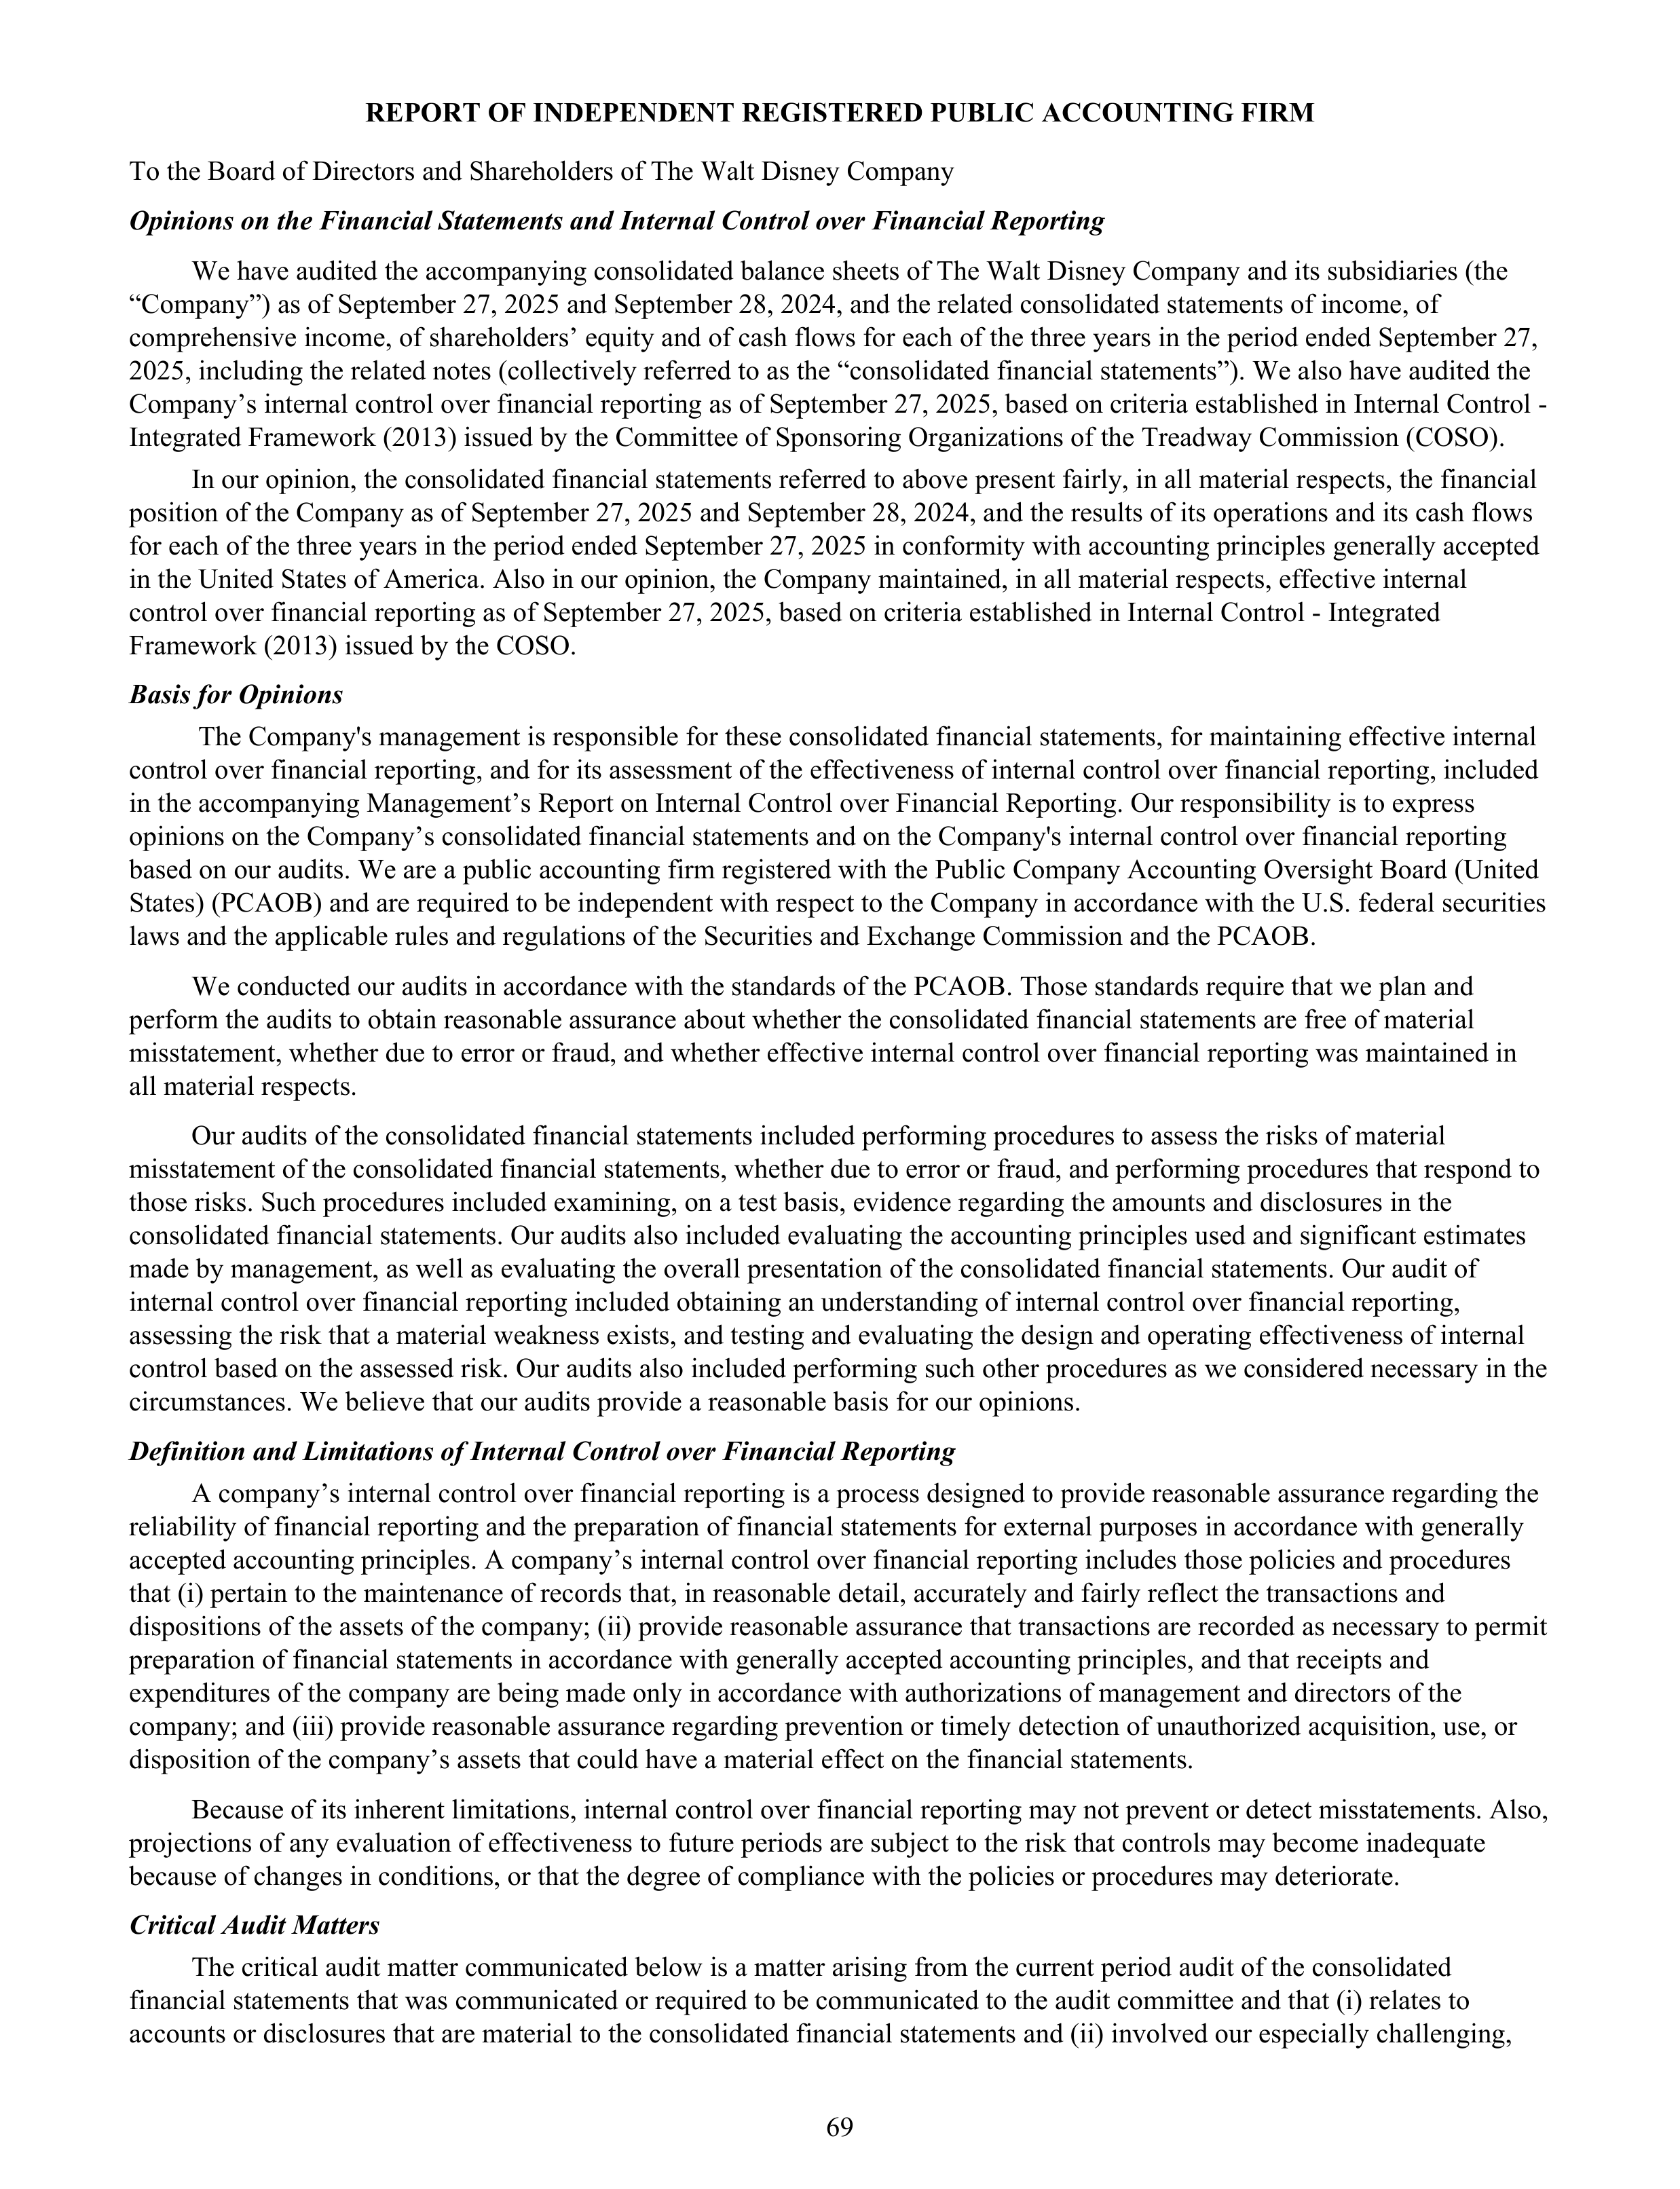
REPORT OF INDEPENDENT REGISTERED PUBLIC ACCOUNTING FIRM
To the Board of Directors and Shareholders of The Walt Disney Company
Opinions on the Financial Statements and Internal Control over Financial Reporting
We have audited the accompanying consolidated balance sheets of The Walt Disney Company and its subsidiaries (the
“Company”) as of September 27, 2025 and September 28, 2024, and the related consolidated statements of income, of
comprehensive income, of shareholders’ equity and of cash flows for each of the three years in the period ended September 27,
2025, including the related notes (collectively referred to as the “consolidated financial statements”). We also have audited the
Company’s internal control over financial reporting as of September 27, 2025, based on criteria established in Internal Control -
Integrated Framework (2013) issued by the Committee of Sponsoring Organizations of the Treadway Commission (COSO).
In our opinion, the consolidated financial statements referred to above present fairly, in all material respects, the financial
position of the Company as of September 27, 2025 and September 28, 2024, and the results of its operations and its cash flows
for each of the three years in the period ended September 27, 2025 in conformity with accounting principles generally accepted
in the United States of America. Also in our opinion, the Company maintained, in all material respects, effective internal
control over financial reporting as of September 27, 2025, based on criteria established in Internal Control - Integrated
Framework (2013) issued by the COSO.
Basis for Opinions
The Company's management is responsible for these consolidated financial statements, for maintaining effective internal
control over financial reporting, and for its assessment of the effectiveness of internal control over financial reporting, included
in the accompanying Management’s Report on Internal Control over Financial Reporting. Our responsibility is to express
opinions on the Company’s consolidated financial statements and on the Company's internal control over financial reporting
based on our audits. We are a public accounting firm registered with the Public Company Accounting Oversight Board (United
States) (PCAOB) and are required to be independent with respect to the Company in accordance with the U.S. federal securities
laws and the applicable rules and regulations of the Securities and Exchange Commission and the PCAOB.
We conducted our audits in accordance with the standards of the PCAOB. Those standards require that we plan and
perform the audits to obtain reasonable assurance about whether the consolidated financial statements are free of material
misstatement, whether due to error or fraud, and whether effective internal control over financial reporting was maintained in
all material respects.
Our audits of the consolidated financial statements included performing procedures to assess the risks of material
misstatement of the consolidated financial statements, whether due to error or fraud, and performing procedures that respond to
those risks. Such procedures included examining, on a test basis, evidence regarding the amounts and disclosures in the
consolidated financial statements. Our audits also included evaluating the accounting principles used and significant estimates
made by management, as well as evaluating the overall presentation of the consolidated financial statements. Our audit of
internal control over financial reporting included obtaining an understanding of internal control over financial reporting,
assessing the risk that a material weakness exists, and testing and evaluating the design and operating effectiveness of internal
control based on the assessed risk. Our audits also included performing such other procedures as we considered necessary in the
circumstances. We believe that our audits provide a reasonable basis for our opinions.
Definition and Limitations of Internal Control over Financial Reporting
A company’s internal control over financial reporting is a process designed to provide reasonable assurance regarding the
reliability of financial reporting and the preparation of financial statements for external purposes in accordance with generally
accepted accounting principles. A company’s internal control over financial reporting includes those policies and procedures
that (i) pertain to the maintenance of records that, in reasonable detail, accurately and fairly reflect the transactions and
dispositions of the assets of the company; (ii) provide reasonable assurance that transactions are recorded as necessary to permit
preparation of financial statements in accordance with generally accepted accounting principles, and that receipts and
expenditures of the company are being made only in accordance with authorizations of management and directors of the
company; and (iii) provide reasonable assurance regarding prevention or timely detection of unauthorized acquisition, use, or
disposition of the company’s assets that could have a material effect on the financial statements.
Because of its inherent limitations, internal control over financial reporting may not prevent or detect misstatements. Also,
projections of any evaluation of effectiveness to future periods are subject to the risk that controls may become inadequate
because of changes in conditions, or that the degree of compliance with the policies or procedures may deteriorate.
Critical Audit Matters
The critical audit matter communicated below is a matter arising from the current period audit of the consolidated
financial statements that was communicated or required to be communicated to the audit committee and that (i) relates to
accounts or disclosures that are material to the consolidated financial statements and (ii) involved our especially challenging,
69
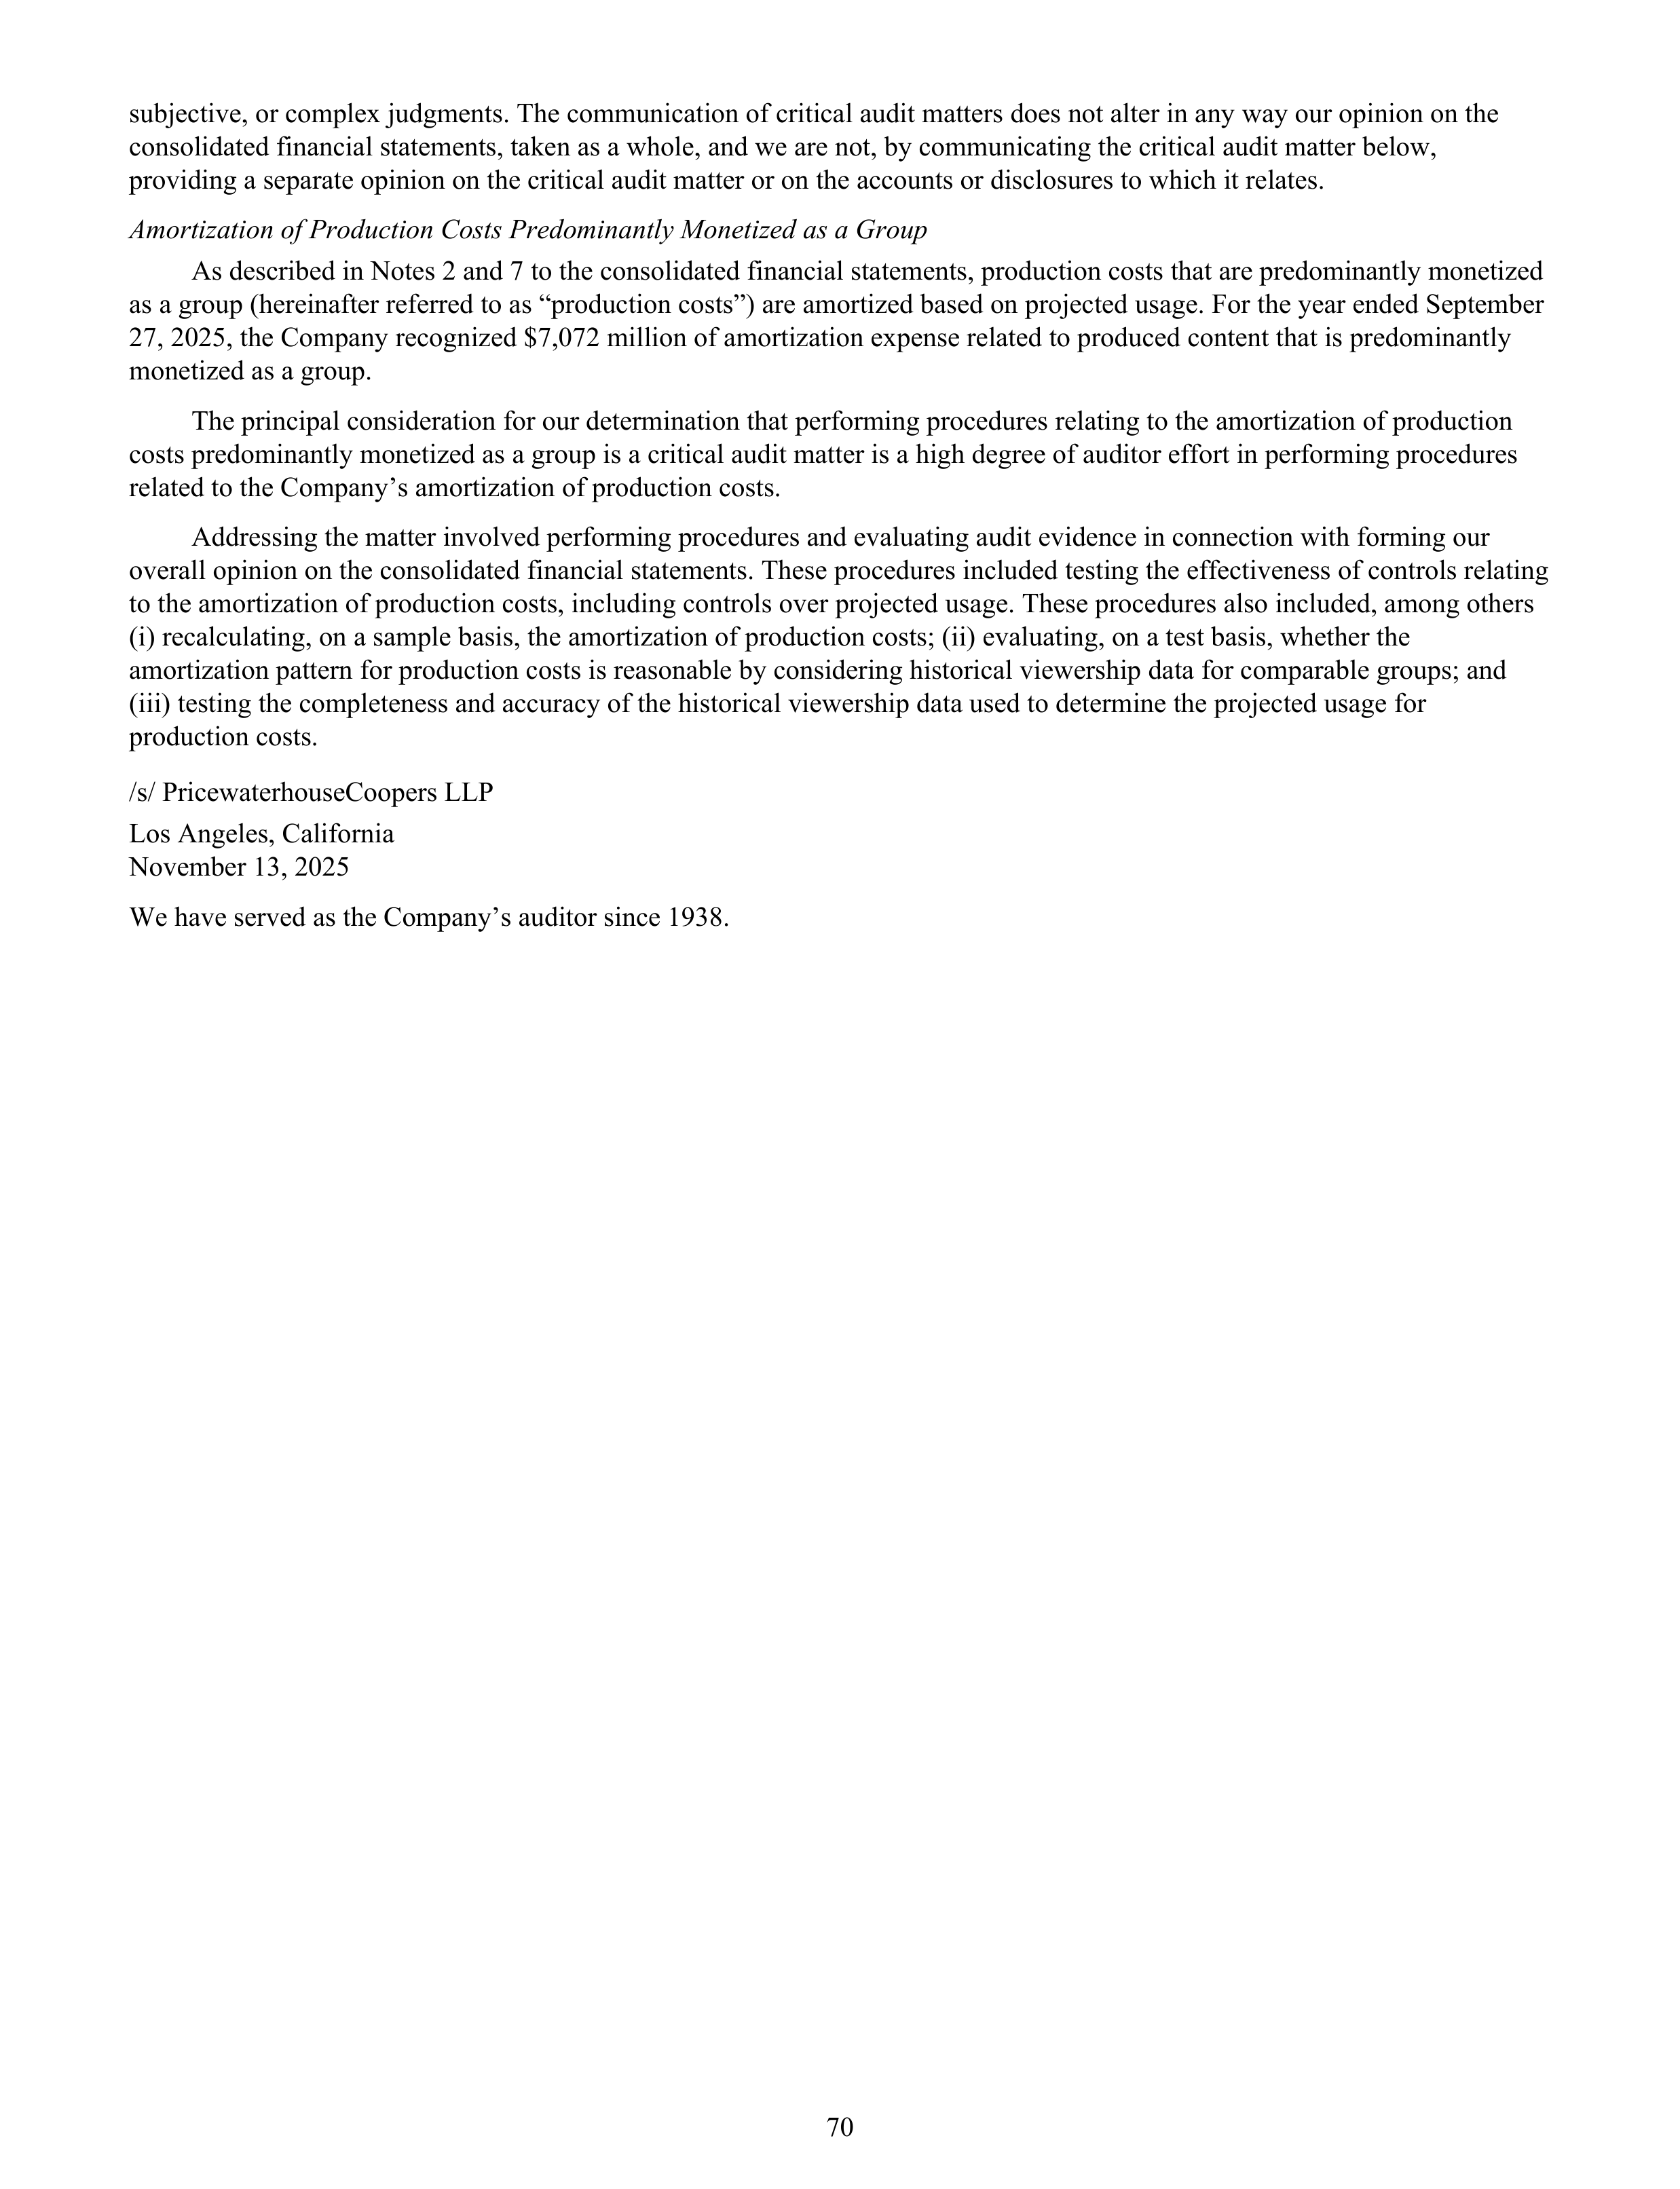
subjective, or complex judgments. The communication of critical audit matters does not alter in any way our opinion on the
consolidated financial statements, taken as a whole, and we are not, by communicating the critical audit matter below,
providing a separate opinion on the critical audit matter or on the accounts or disclosures to which it relates.
Amortization of Production Costs Predominantly Monetized as a Group
As described in Notes 2 and 7 to the consolidated financial statements, production costs that are predominantly monetized
as a group (hereinafter referred to as “production costs”) are amortized based on projected usage. For the year ended September
27, 2025, the Company recognized $7,072 million of amortization expense related to produced content that is predominantly
monetized as a group.
The principal consideration for our determination that performing procedures relating to the amortization of production
costs predominantly monetized as a group is a critical audit matter is a high degree of auditor effort in performing procedures
related to the Company’s amortization of production costs.
Addressing the matter involved performing procedures and evaluating audit evidence in connection with forming our
overall opinion on the consolidated financial statements. These procedures included testing the effectiveness of controls relating
to the amortization of production costs, including controls over projected usage. These procedures also included, among others
(i) recalculating, on a sample basis, the amortization of production costs; (ii) evaluating, on a test basis, whether the
amortization pattern for production costs is reasonable by considering historical viewership data for comparable groups; and
(iii) testing the completeness and accuracy of the historical viewership data used to determine the projected usage for
production costs.
/s/ PricewaterhouseCoopers LLP
Los Angeles, California
November 13, 2025
We have served as the Company’s auditor since 1938.
70
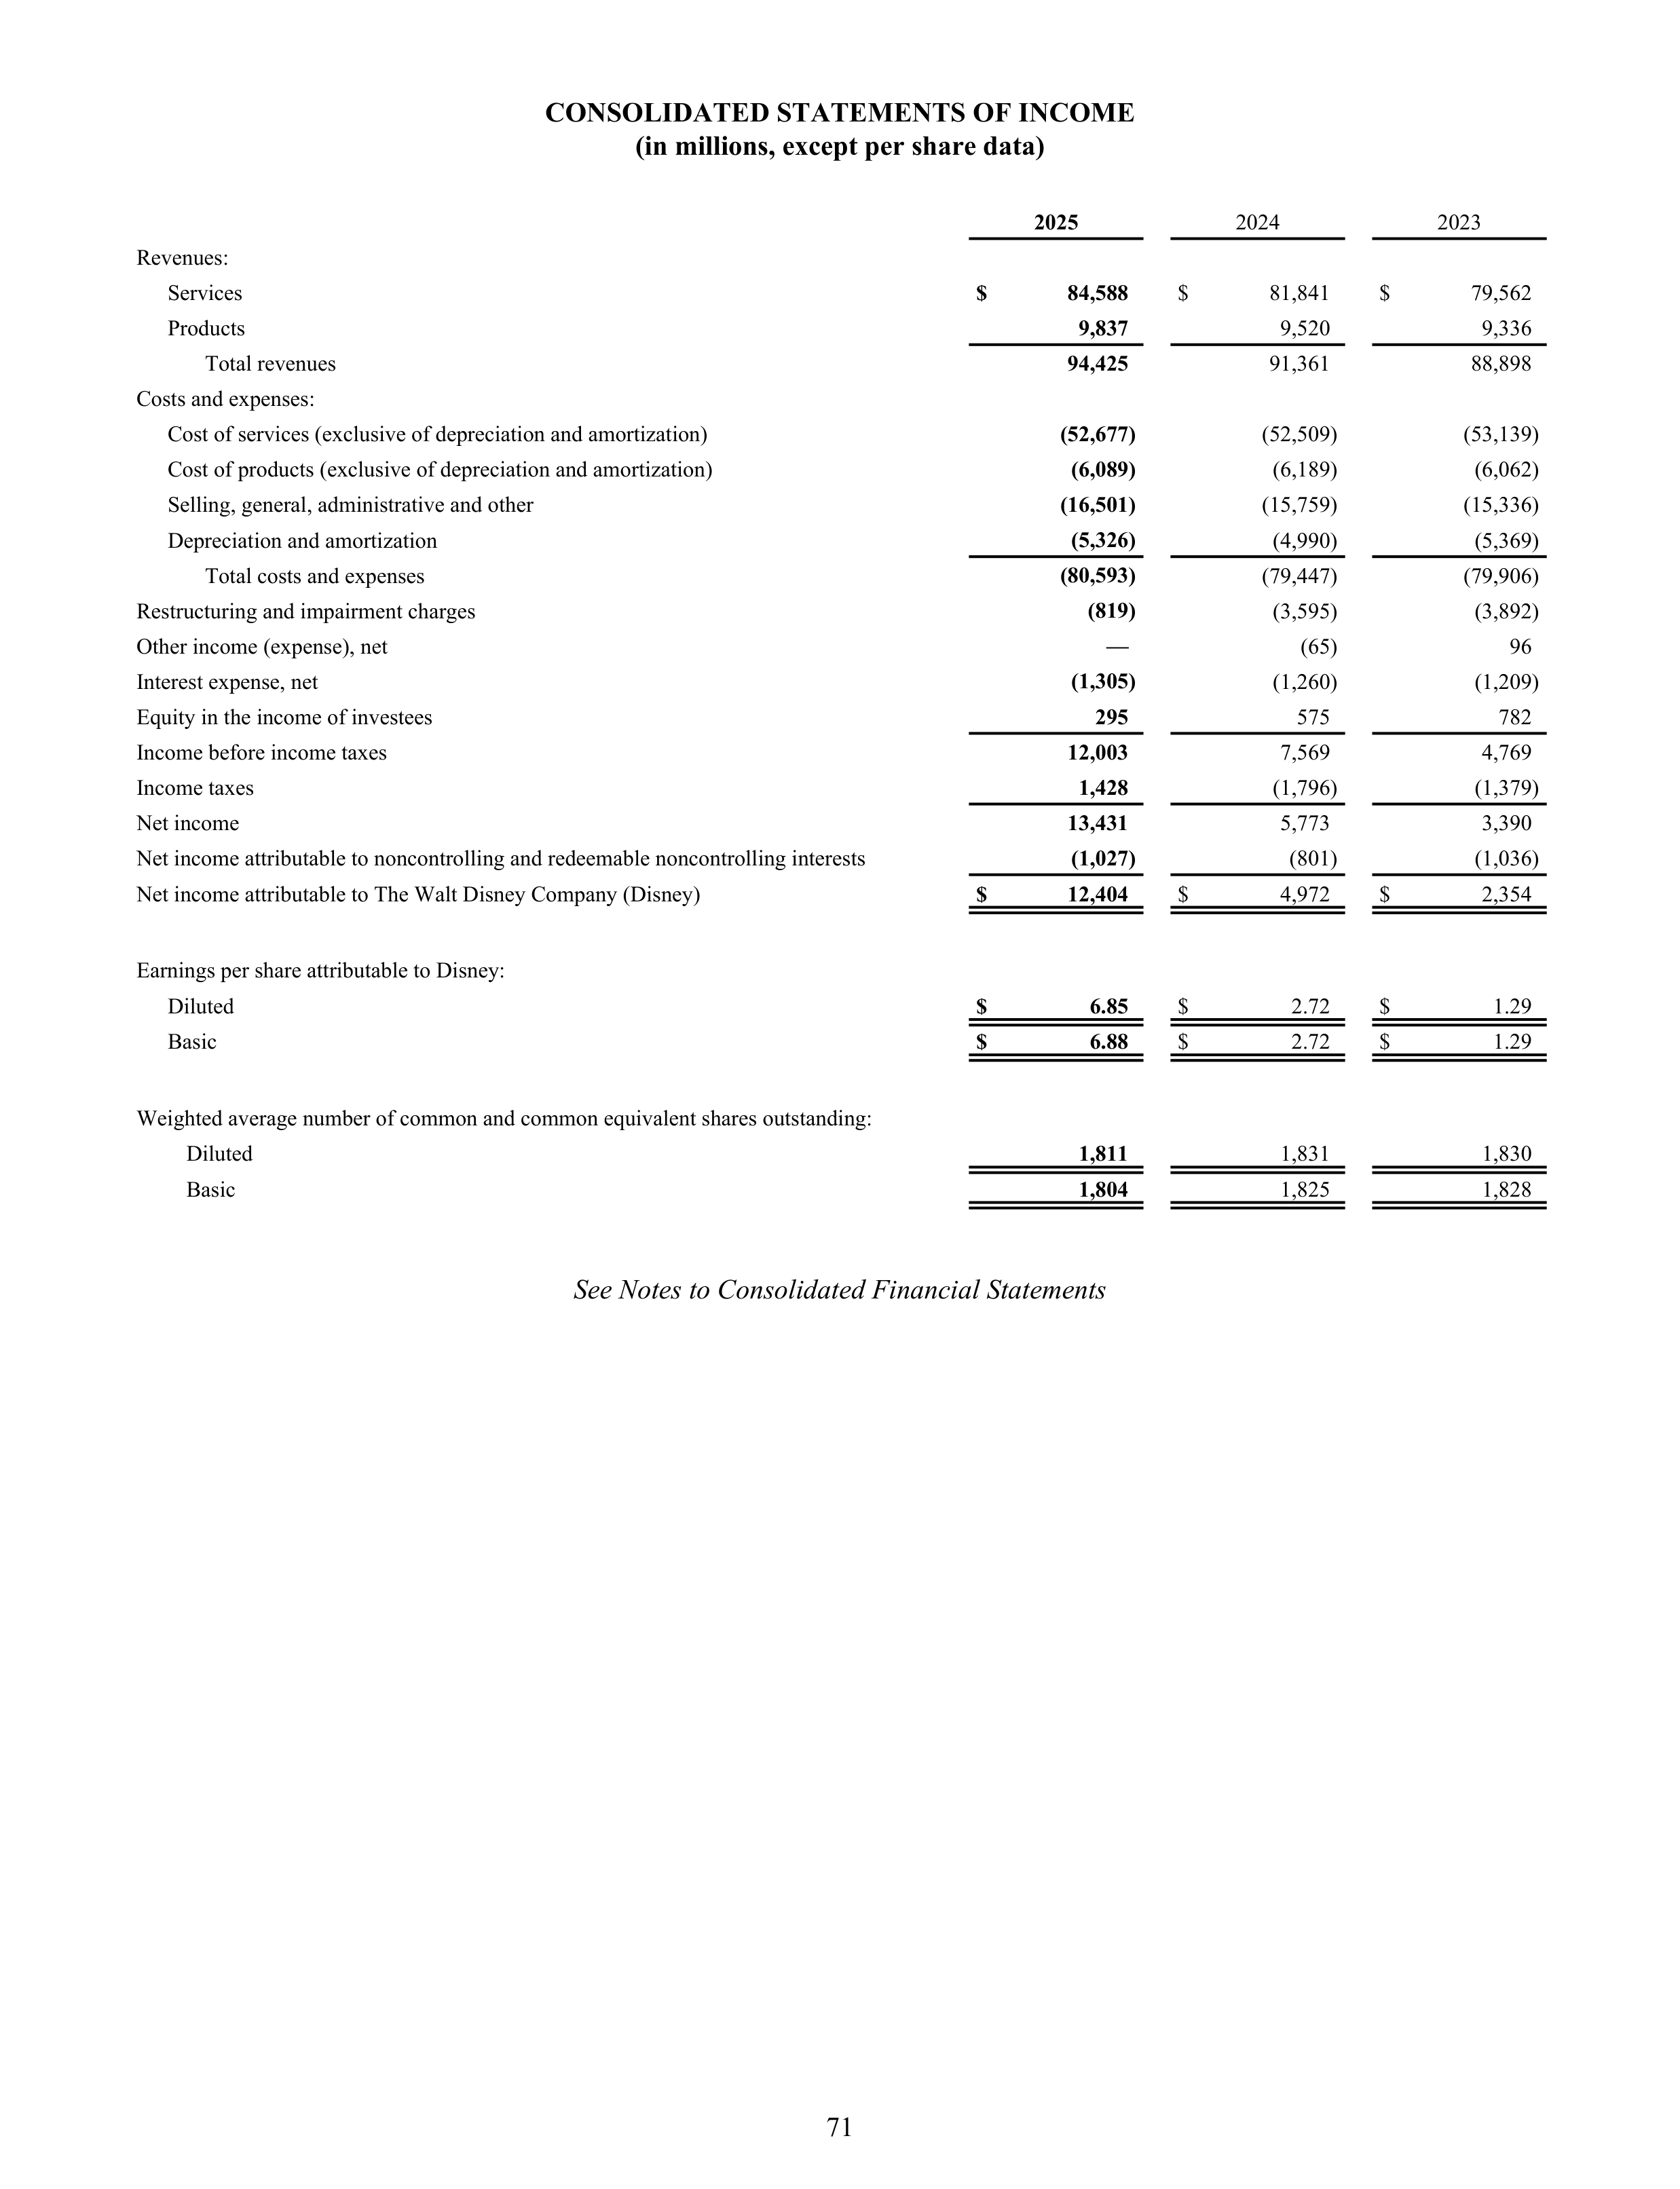
CONSOLIDATED STATEMENTS OF INCOME
(in millions, except per share data)
2025
2024
2023
Revenues:
Services
$
84,588
$
81,841
$
79,562
Products
9,837
9,520
9,336
Total revenues
94,425
91,361
88,898
Costs and expenses:
Cost of services (exclusive of depreciation and amortization)
(52,677)
(52,509)
(53,139)
Cost of products (exclusive of depreciation and amortization)
(6,089)
(6,189)
(6,062)
Selling, general, administrative and other
(16,501)
(15,759)
(15,336)
Depreciation and amortization
(5,326)
(4,990)
(5,369)
Total costs and expenses
(80,593)
(79,447)
(79,906)
Restructuring and impairment charges
(819)
(3,595)
(3,892)
Other income (expense), net
—
(65)
96
Interest expense, net
(1,305)
(1,260)
(1,209)
Equity in the income of investees
295
575
782
Income before income taxes
12,003
7,569
4,769
Income taxes
1,428
(1,796)
(1,379)
Net income
13,431
5,773
3,390
Net income attributable to noncontrolling and redeemable noncontrolling interests
(1,027)
(801)
(1,036)
Net income attributable to The Walt Disney Company (Disney)
$
12,404
$
4,972
$
2,354
Earnings per share attributable to Disney:
Diluted
$
6.85
$
2.72
$
1.29
Basic
$
6.88
$
2.72
$
1.29
Weighted average number of common and common equivalent shares outstanding:
Diluted
1,811
1,831
1,830
Basic
1,804
1,825
1,828
See Notes to Consolidated Financial Statements
71
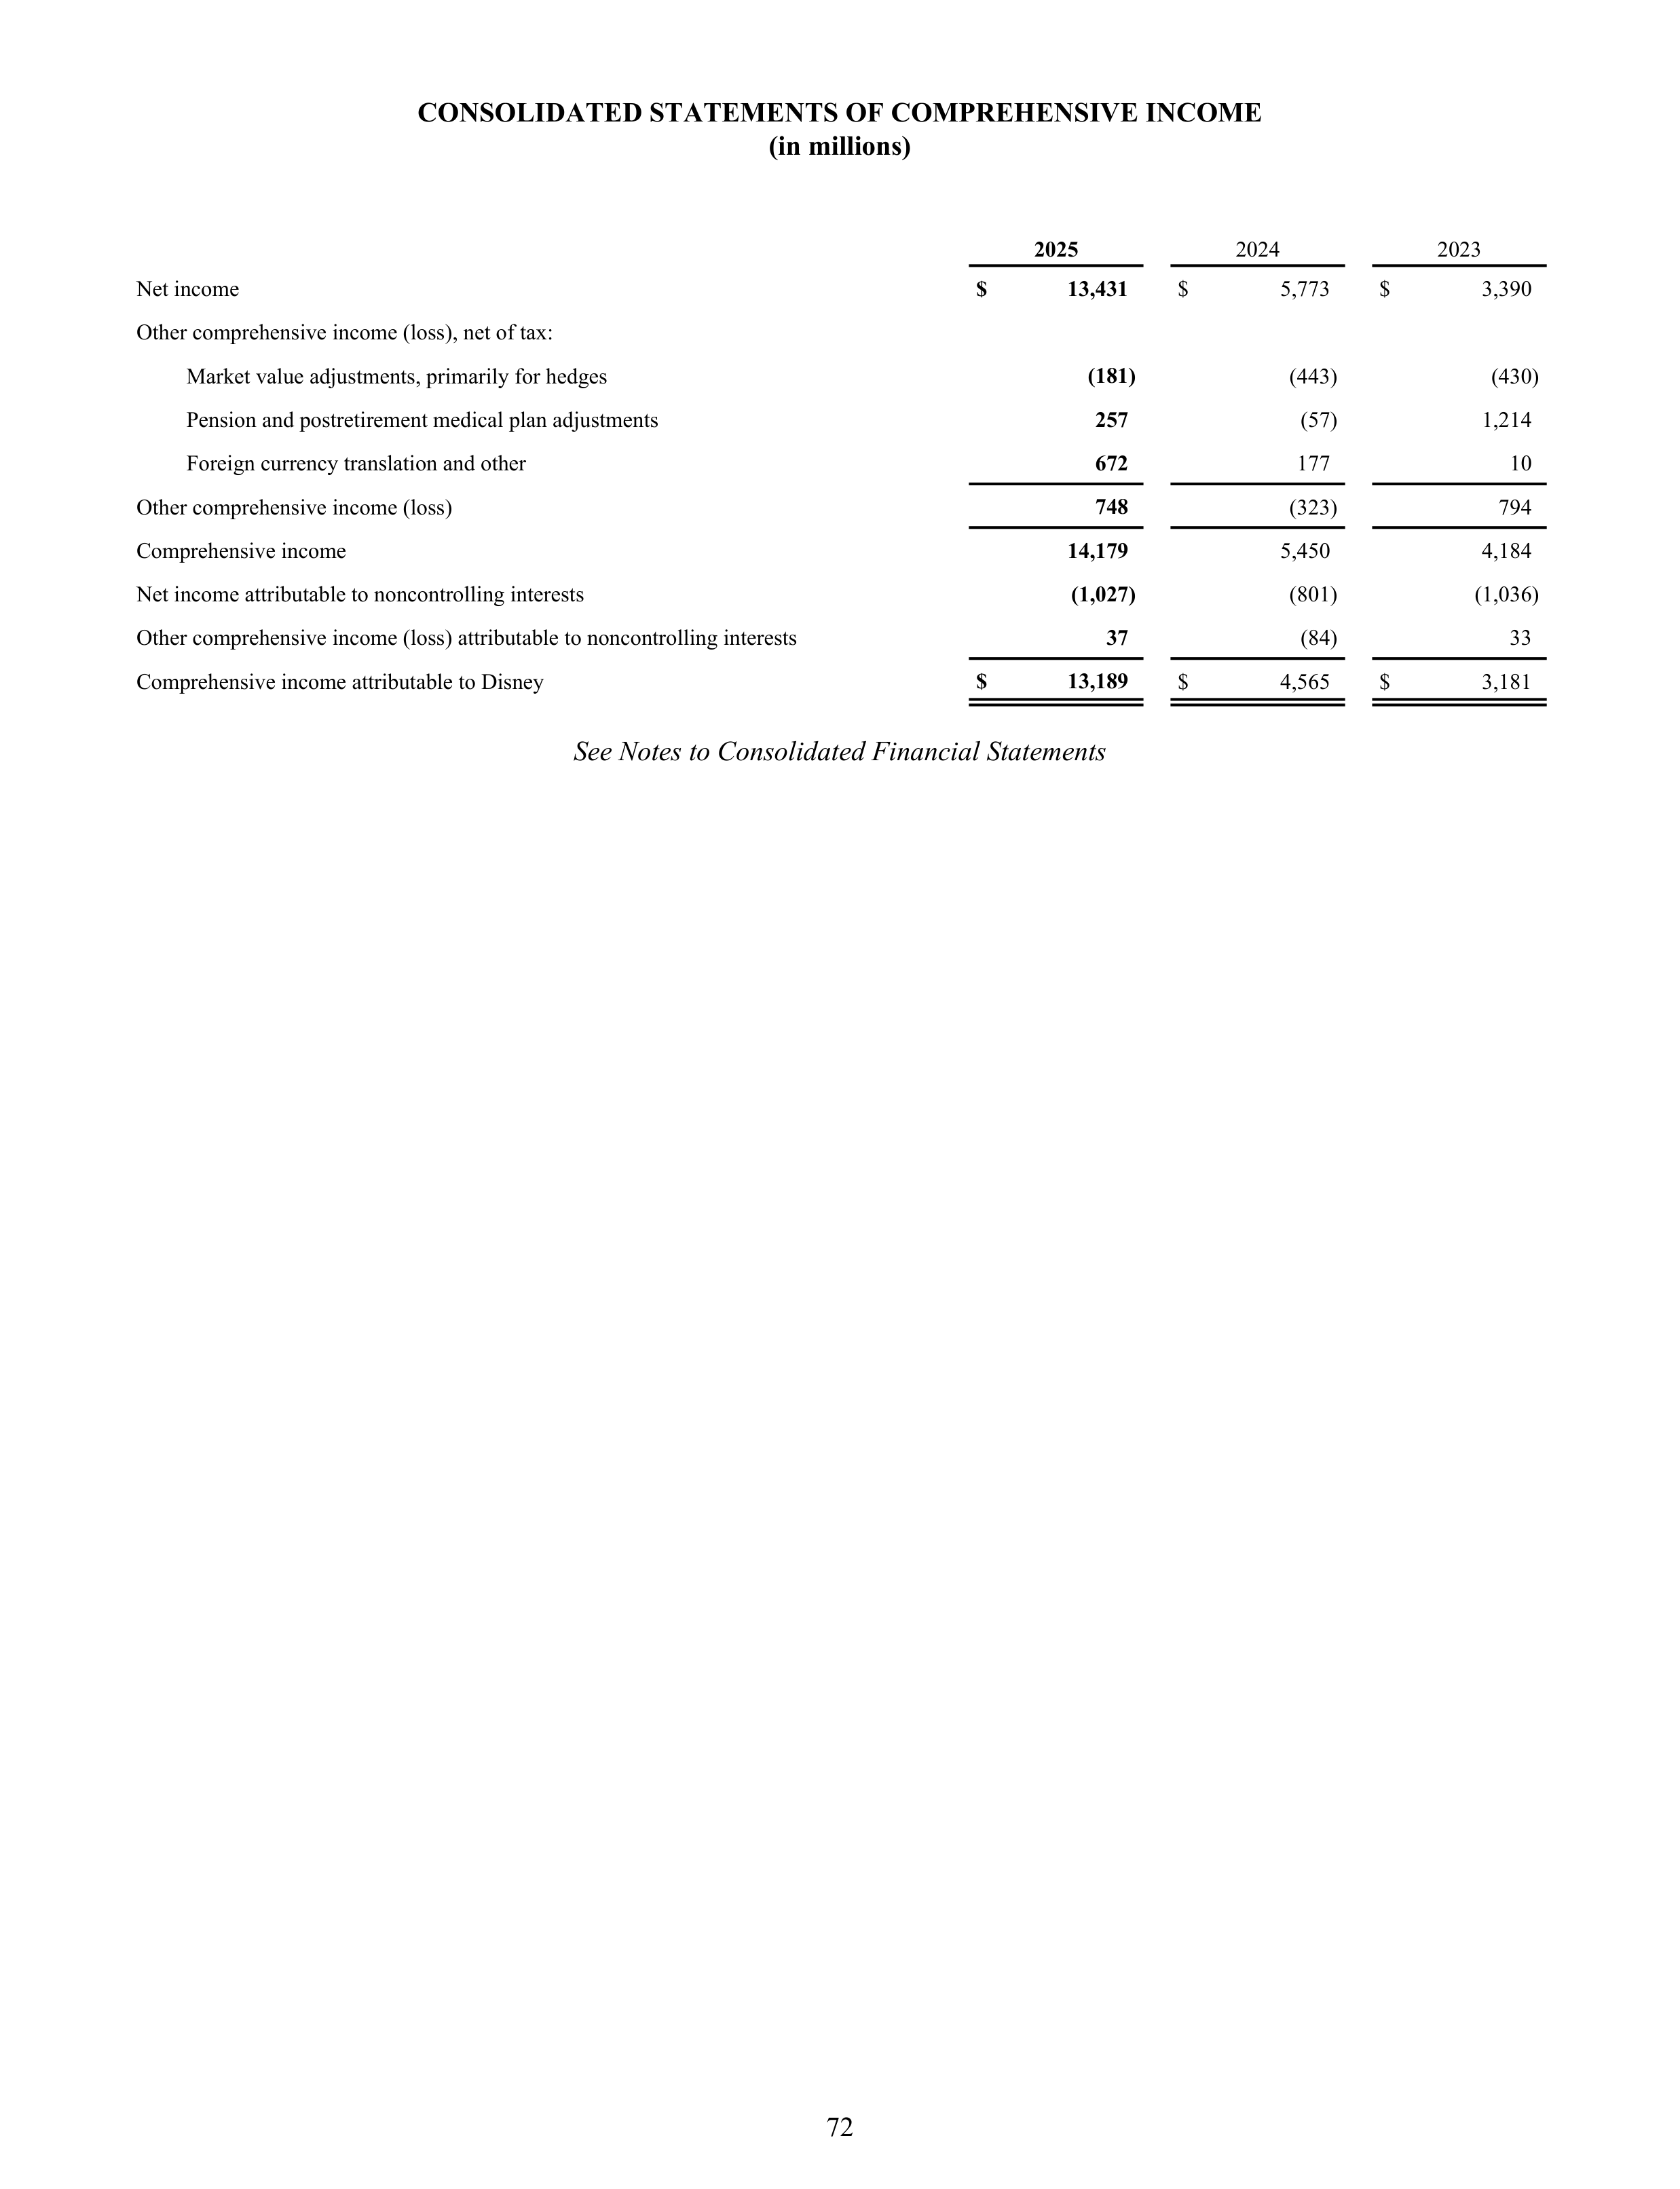
CONSOLIDATED STATEMENTS OF COMPREHENSIVE INCOME
(in millions)
2025
2024
2023
Net income
$
13,431
$
5,773
$
3,390
Other comprehensive income (loss), net of tax:
Market value adjustments, primarily for hedges
(181)
(443)
(430)
Pension and postretirement medical plan adjustments
257
(57)
1,214
Foreign currency translation and other
672
177
10
Other comprehensive income (loss)
748
(323)
794
Comprehensive income
14,179
5,450
4,184
Net income attributable to noncontrolling interests
(1,027)
(801)
(1,036)
Other comprehensive income (loss) attributable to noncontrolling interests
37
(84)
33
Comprehensive income attributable to Disney
$
13,189
$
4,565
$
3,181
See Notes to Consolidated Financial Statements
72
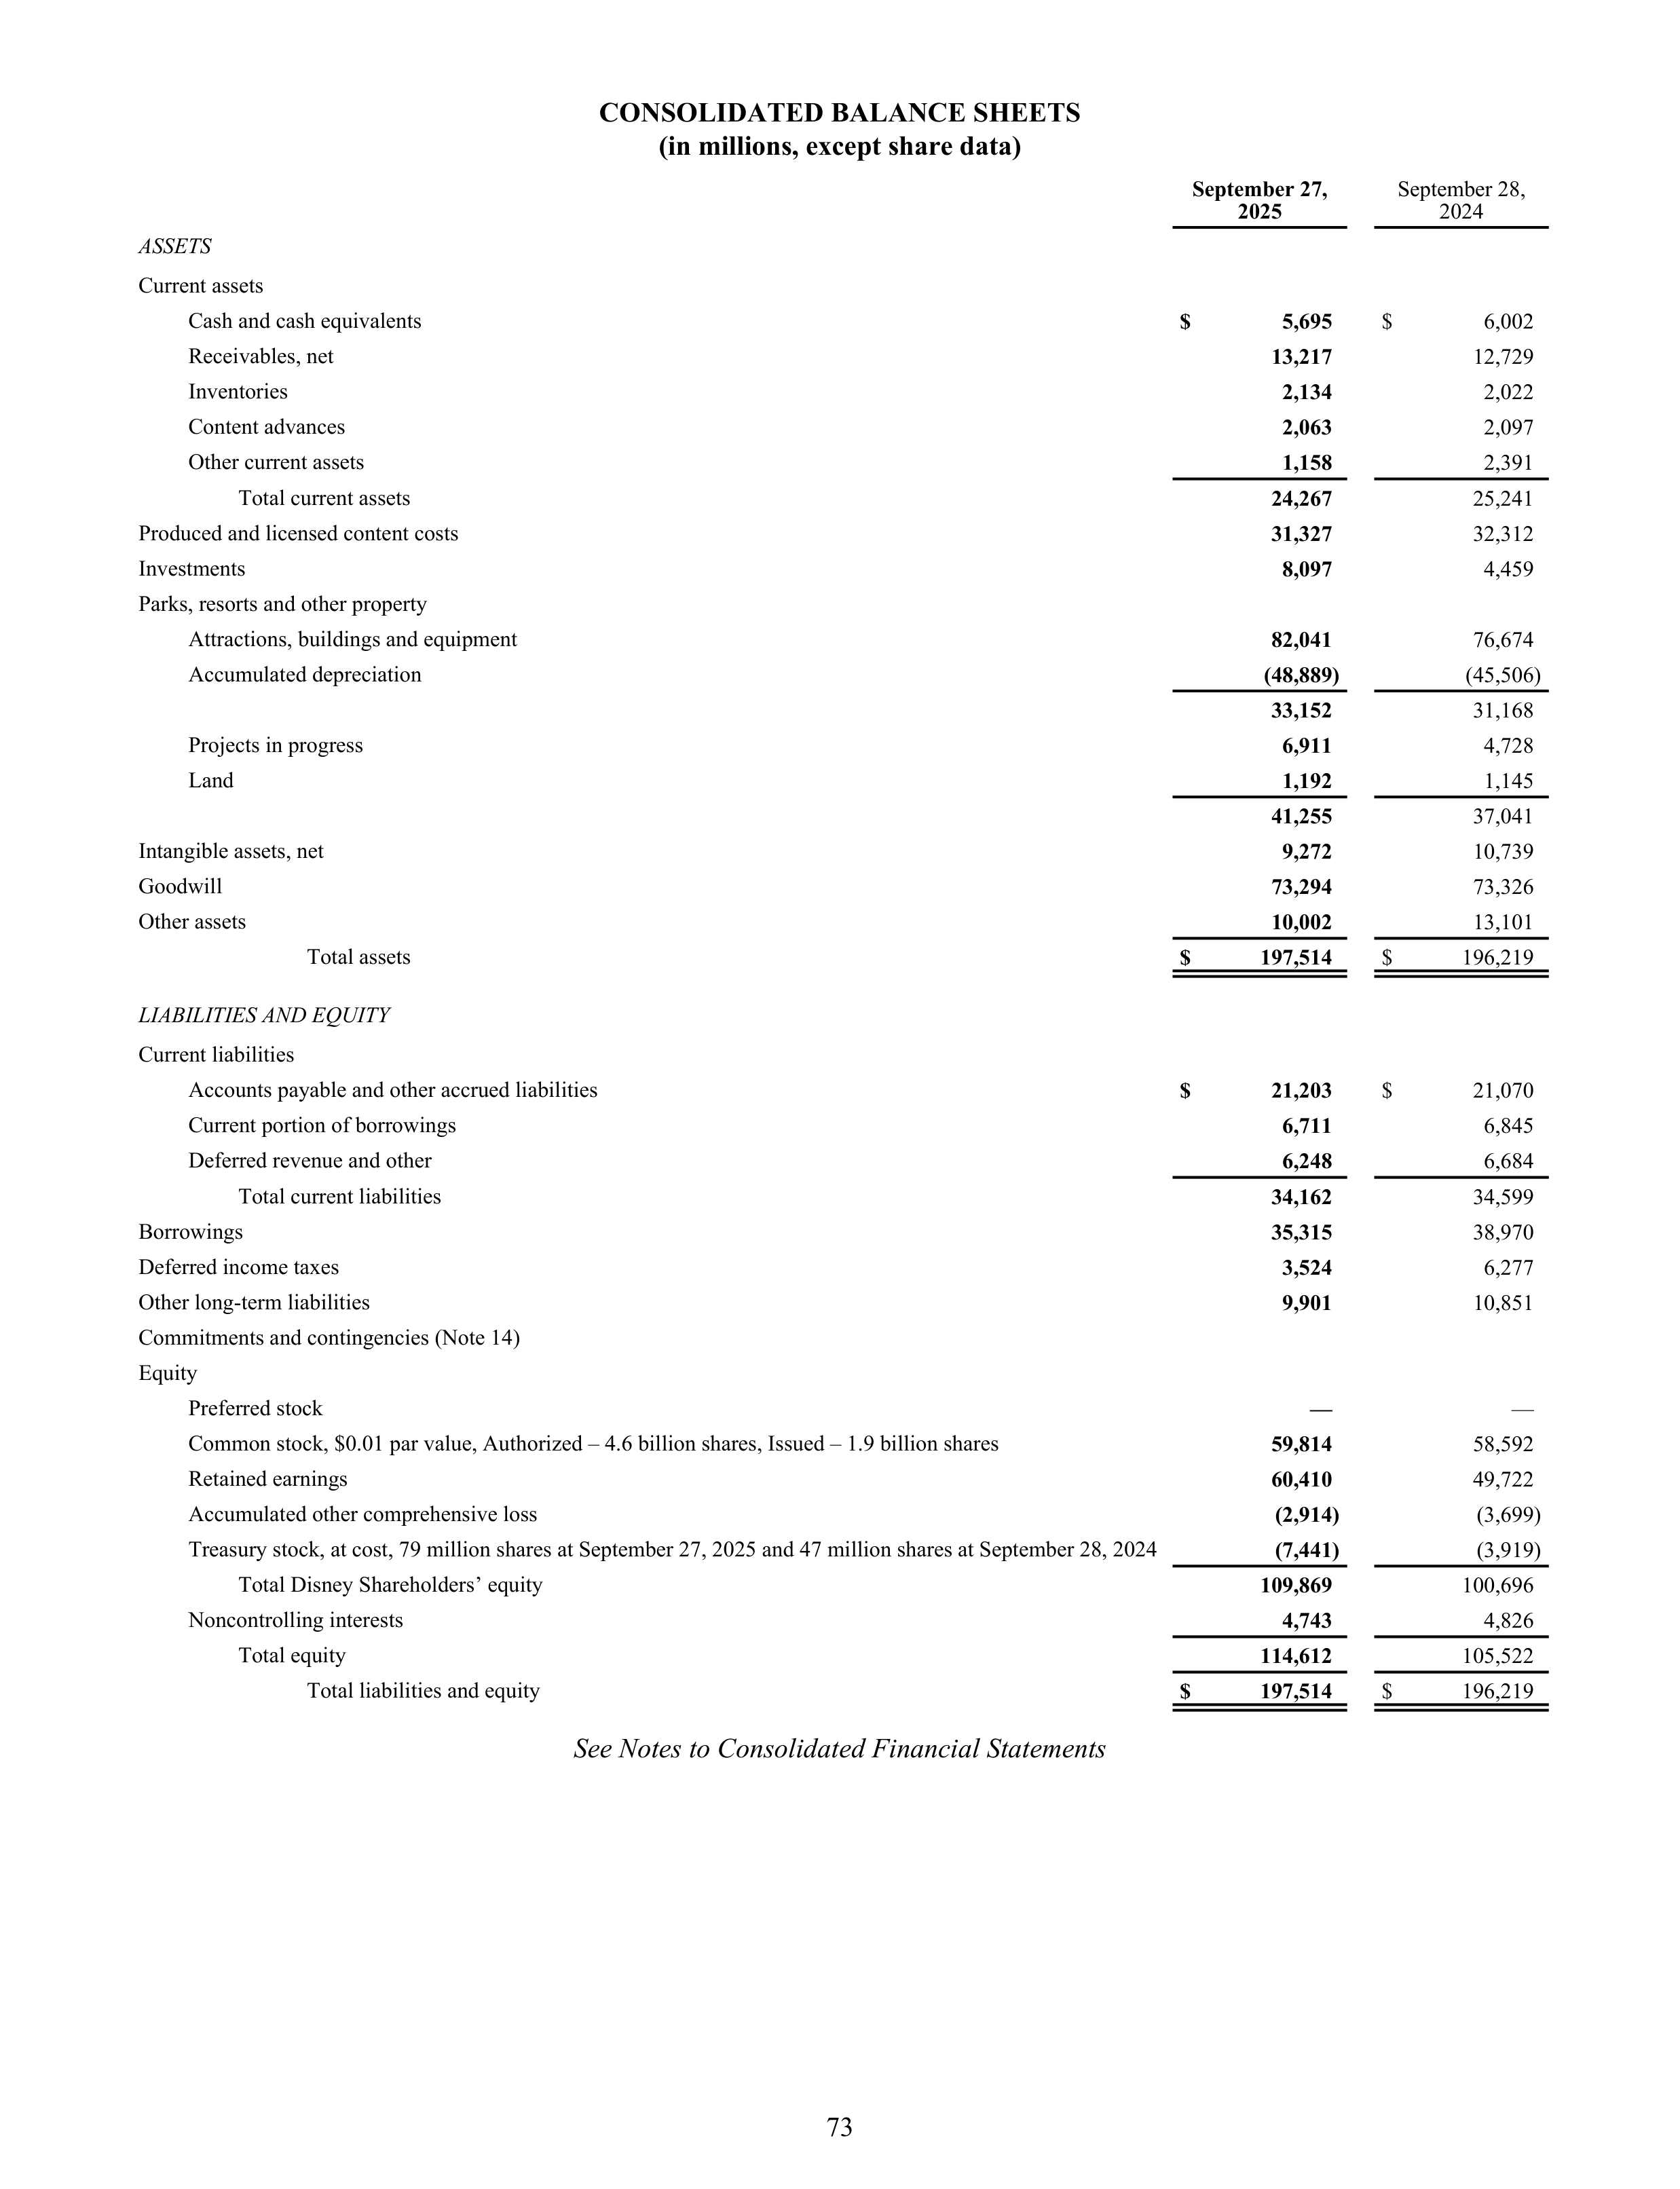
CONSOLIDATED BALANCE SHEETS
(in millions, except share data)
September 27,
2025
September 28,
2024
ASSETS
Current assets
Cash and cash equivalents
$
5,695
$
6,002
Receivables, net
13,217
12,729
Inventories
2,134
2,022
Content advances
2,063
2,097
Other current assets
1,158
2,391
Total current assets
24,267
25,241
Produced and licensed content costs
31,327
32,312
Investments
8,097
4,459
Parks, resorts and other property
Attractions, buildings and equipment
82,041
76,674
Accumulated depreciation
(48,889)
(45,506)
33,152
31,168
Projects in progress
6,911
4,728
Land
1,192
1,145
41,255
37,041
Intangible assets, net
9,272
10,739
Goodwill
73,294
73,326
Other assets
10,002
13,101
Total assets
$
197,514
$
196,219
LIABILITIES AND EQUITY
Current liabilities
Accounts payable and other accrued liabilities
$
21,203
$
21,070
Current portion of borrowings
6,711
6,845
Deferred revenue and other
6,248
6,684
Total current liabilities
34,162
34,599
Borrowings
35,315
38,970
Deferred income taxes
3,524
6,277
Other long-term liabilities
9,901
10,851
Commitments and contingencies (Note 14)
Equity
Preferred stock
—
—
Common stock, $0.01 par value, Authorized – 4.6 billion shares, Issued – 1.9 billion shares
59,814
58,592
Retained earnings
60,410
49,722
Accumulated other comprehensive loss
(2,914)
(3,699)
Treasury stock, at cost, 79 million shares at September 27, 2025 and 47 million shares at September 28, 2024
(7,441)
(3,919)
Total Disney Shareholders’ equity
109,869
100,696
Noncontrolling interests
4,743
4,826
Total equity
114,612
105,522
Total liabilities and equity
$
197,514
$
196,219
See Notes to Consolidated Financial Statements
73
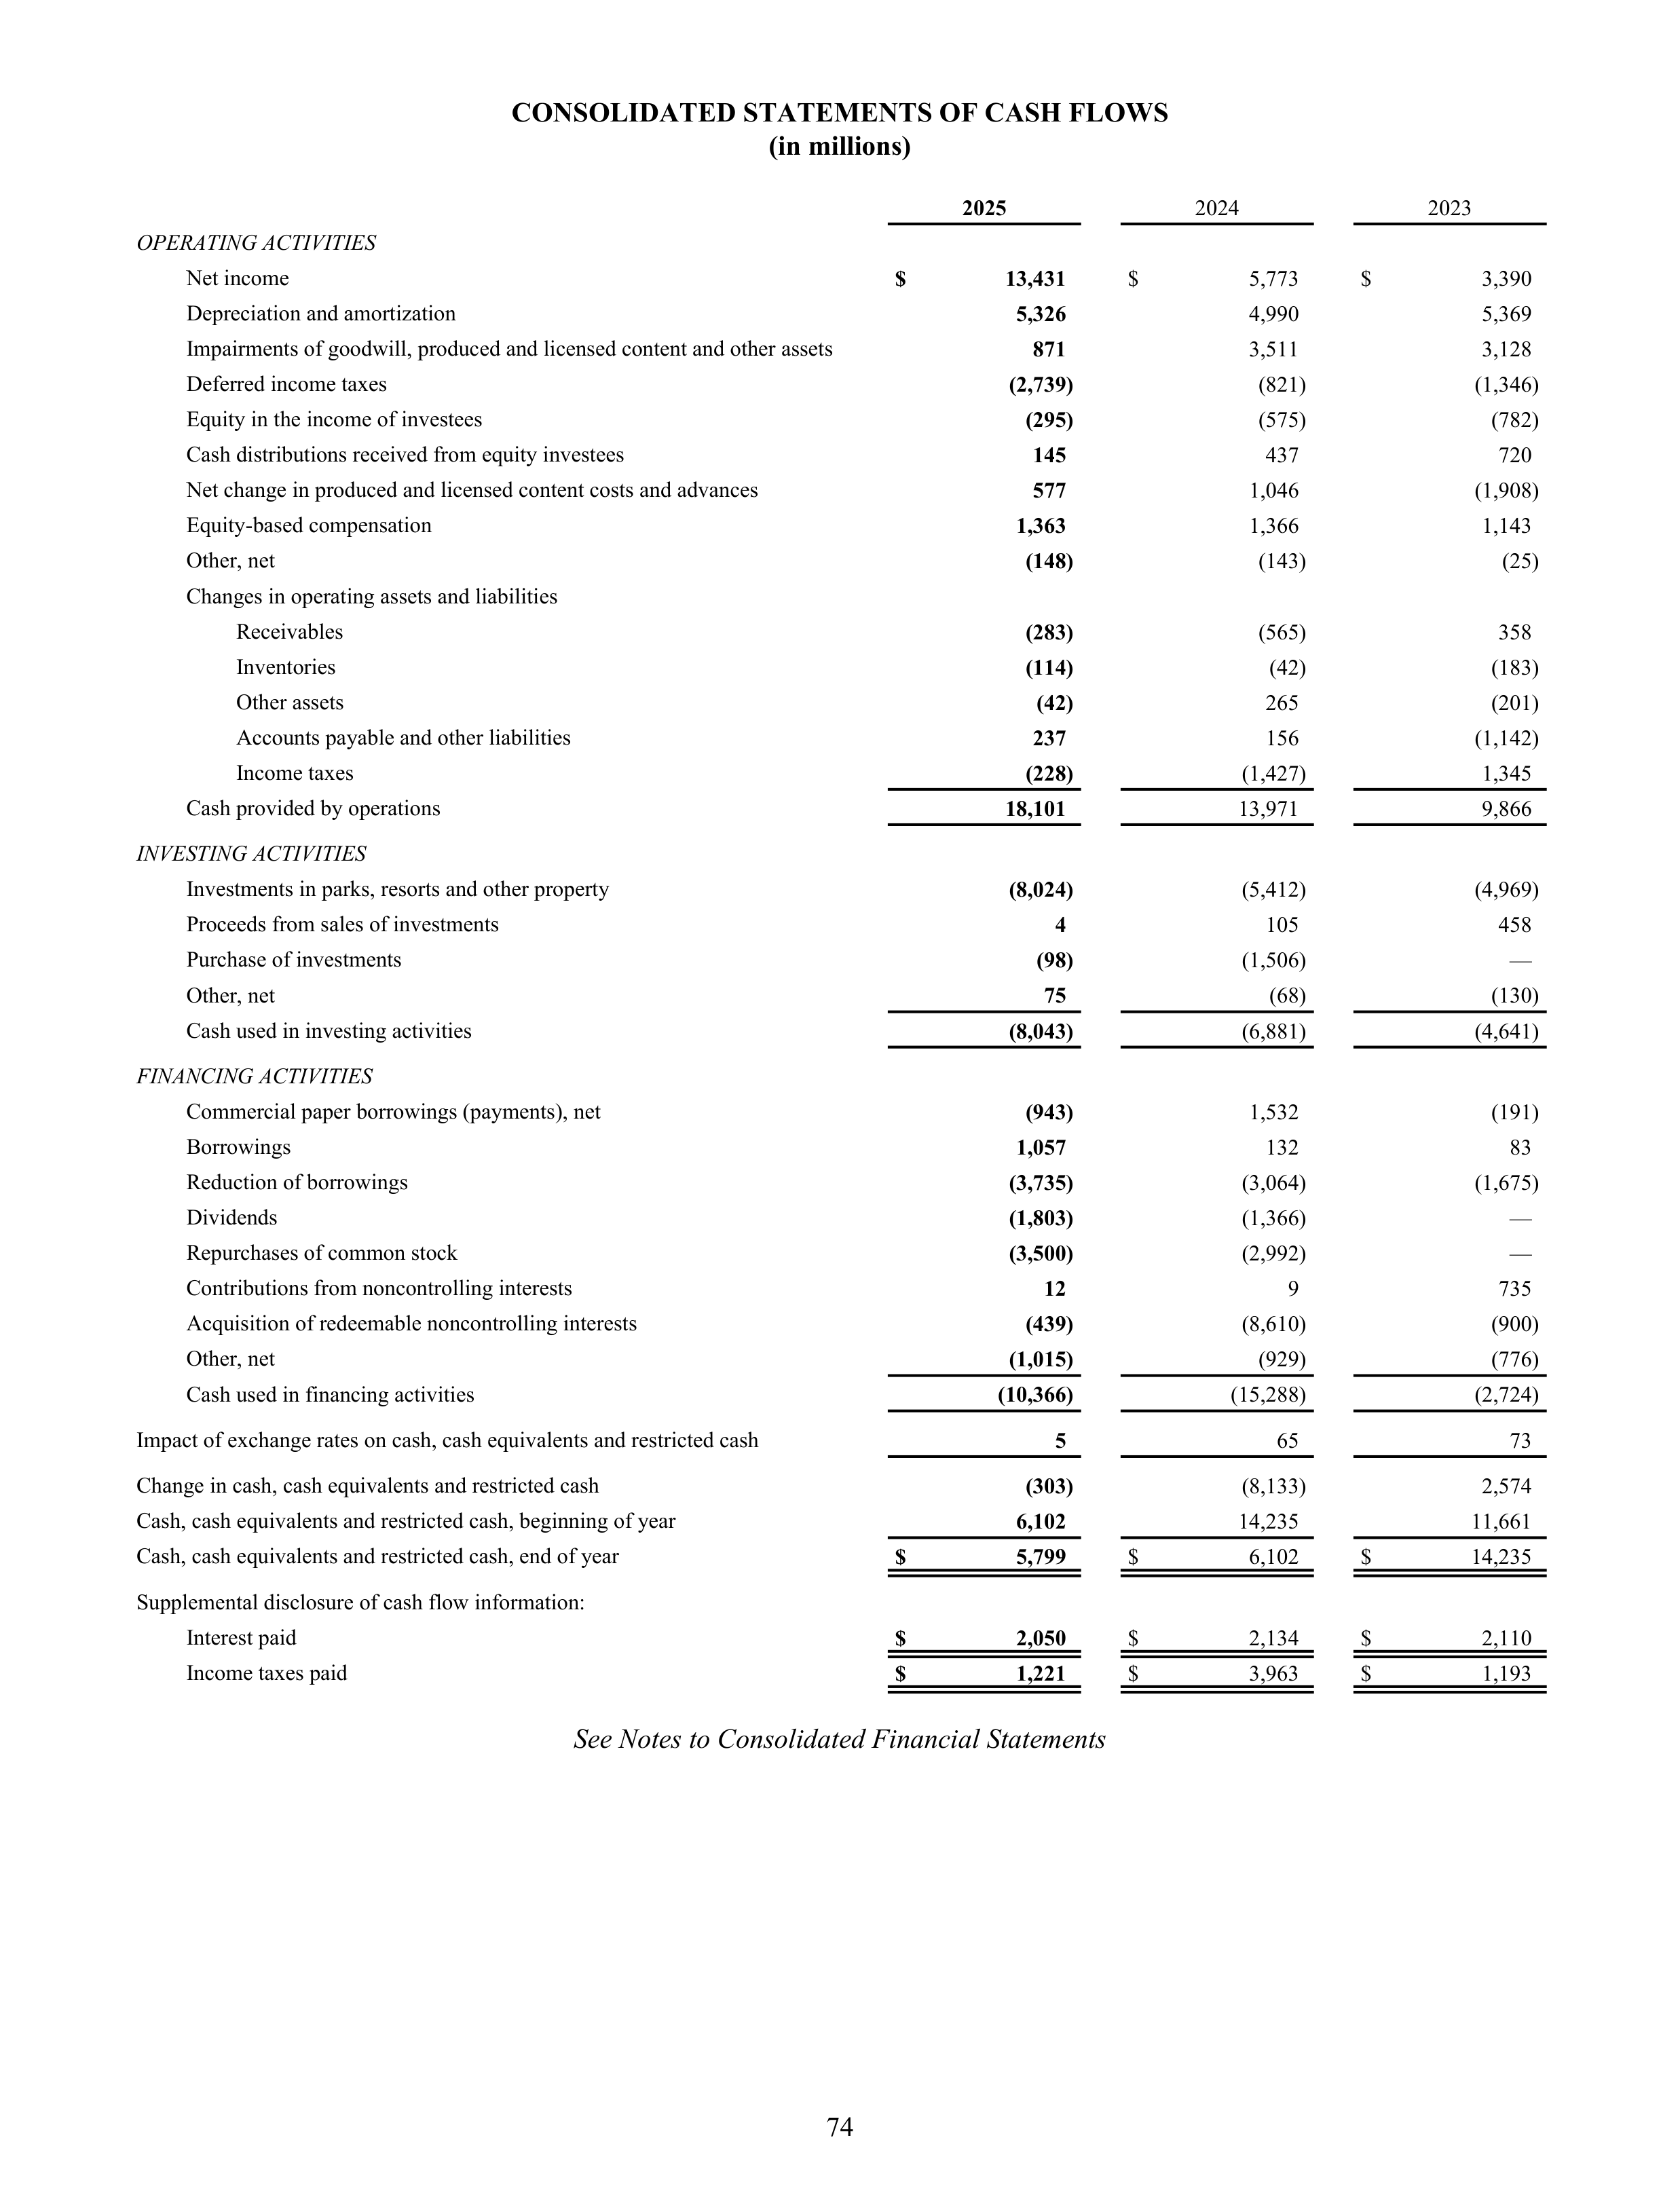
CONSOLIDATED STATEMENTS OF CASH FLOWS
(in millions)
2025
2024
2023
OPERATING ACTIVITIES
Net income
$
13,431
$
5,773
$
3,390
Depreciation and amortization
5,326
4,990
5,369
Impairments of goodwill, produced and licensed content and other assets
871
3,511
3,128
Deferred income taxes
(2,739)
(821)
(1,346)
Equity in the income of investees
(295)
(575)
(782)
Cash distributions received from equity investees
145
437
720
Net change in produced and licensed content costs and advances
577
1,046
(1,908)
Equity-based compensation
1,363
1,366
1,143
Other, net
(148)
(143)
(25)
Changes in operating assets and liabilities
Receivables
(283)
(565)
358
Inventories
(114)
(42)
(183)
Other assets
(42)
265
(201)
Accounts payable and other liabilities
237
156
(1,142)
Income taxes
(228)
(1,427)
1,345
Cash provided by operations
18,101
13,971
9,866
INVESTING ACTIVITIES
Investments in parks, resorts and other property
(8,024)
(5,412)
(4,969)
Proceeds from sales of investments
4
105
458
Purchase of investments
(98)
(1,506)
—
Other, net
75
(68)
(130)
Cash used in investing activities
(8,043)
(6,881)
(4,641)
FINANCING ACTIVITIES
Commercial paper borrowings (payments), net
(943)
1,532
(191)
Borrowings
1,057
132
83
Reduction of borrowings
(3,735)
(3,064)
(1,675)
Dividends
(1,803)
(1,366)
—
Repurchases of common stock
(3,500)
(2,992)
—
Contributions from noncontrolling interests
12
9
735
Acquisition of redeemable noncontrolling interests
(439)
(8,610)
(900)
Other, net
(1,015)
(929)
(776)
Cash used in financing activities
(10,366)
(15,288)
(2,724)
Impact of exchange rates on cash, cash equivalents and restricted cash
5
65
73
Change in cash, cash equivalents and restricted cash
(303)
(8,133)
2,574
Cash, cash equivalents and restricted cash, beginning of year
6,102
14,235
11,661
Cash, cash equivalents and restricted cash, end of year
$
5,799
$
6,102
$
14,235
Supplemental disclosure of cash flow information:
Interest paid
$
2,050
$
2,134
$
2,110
Income taxes paid
$
1,221
$
3,963
$
1,193
See Notes to Consolidated Financial Statements
74
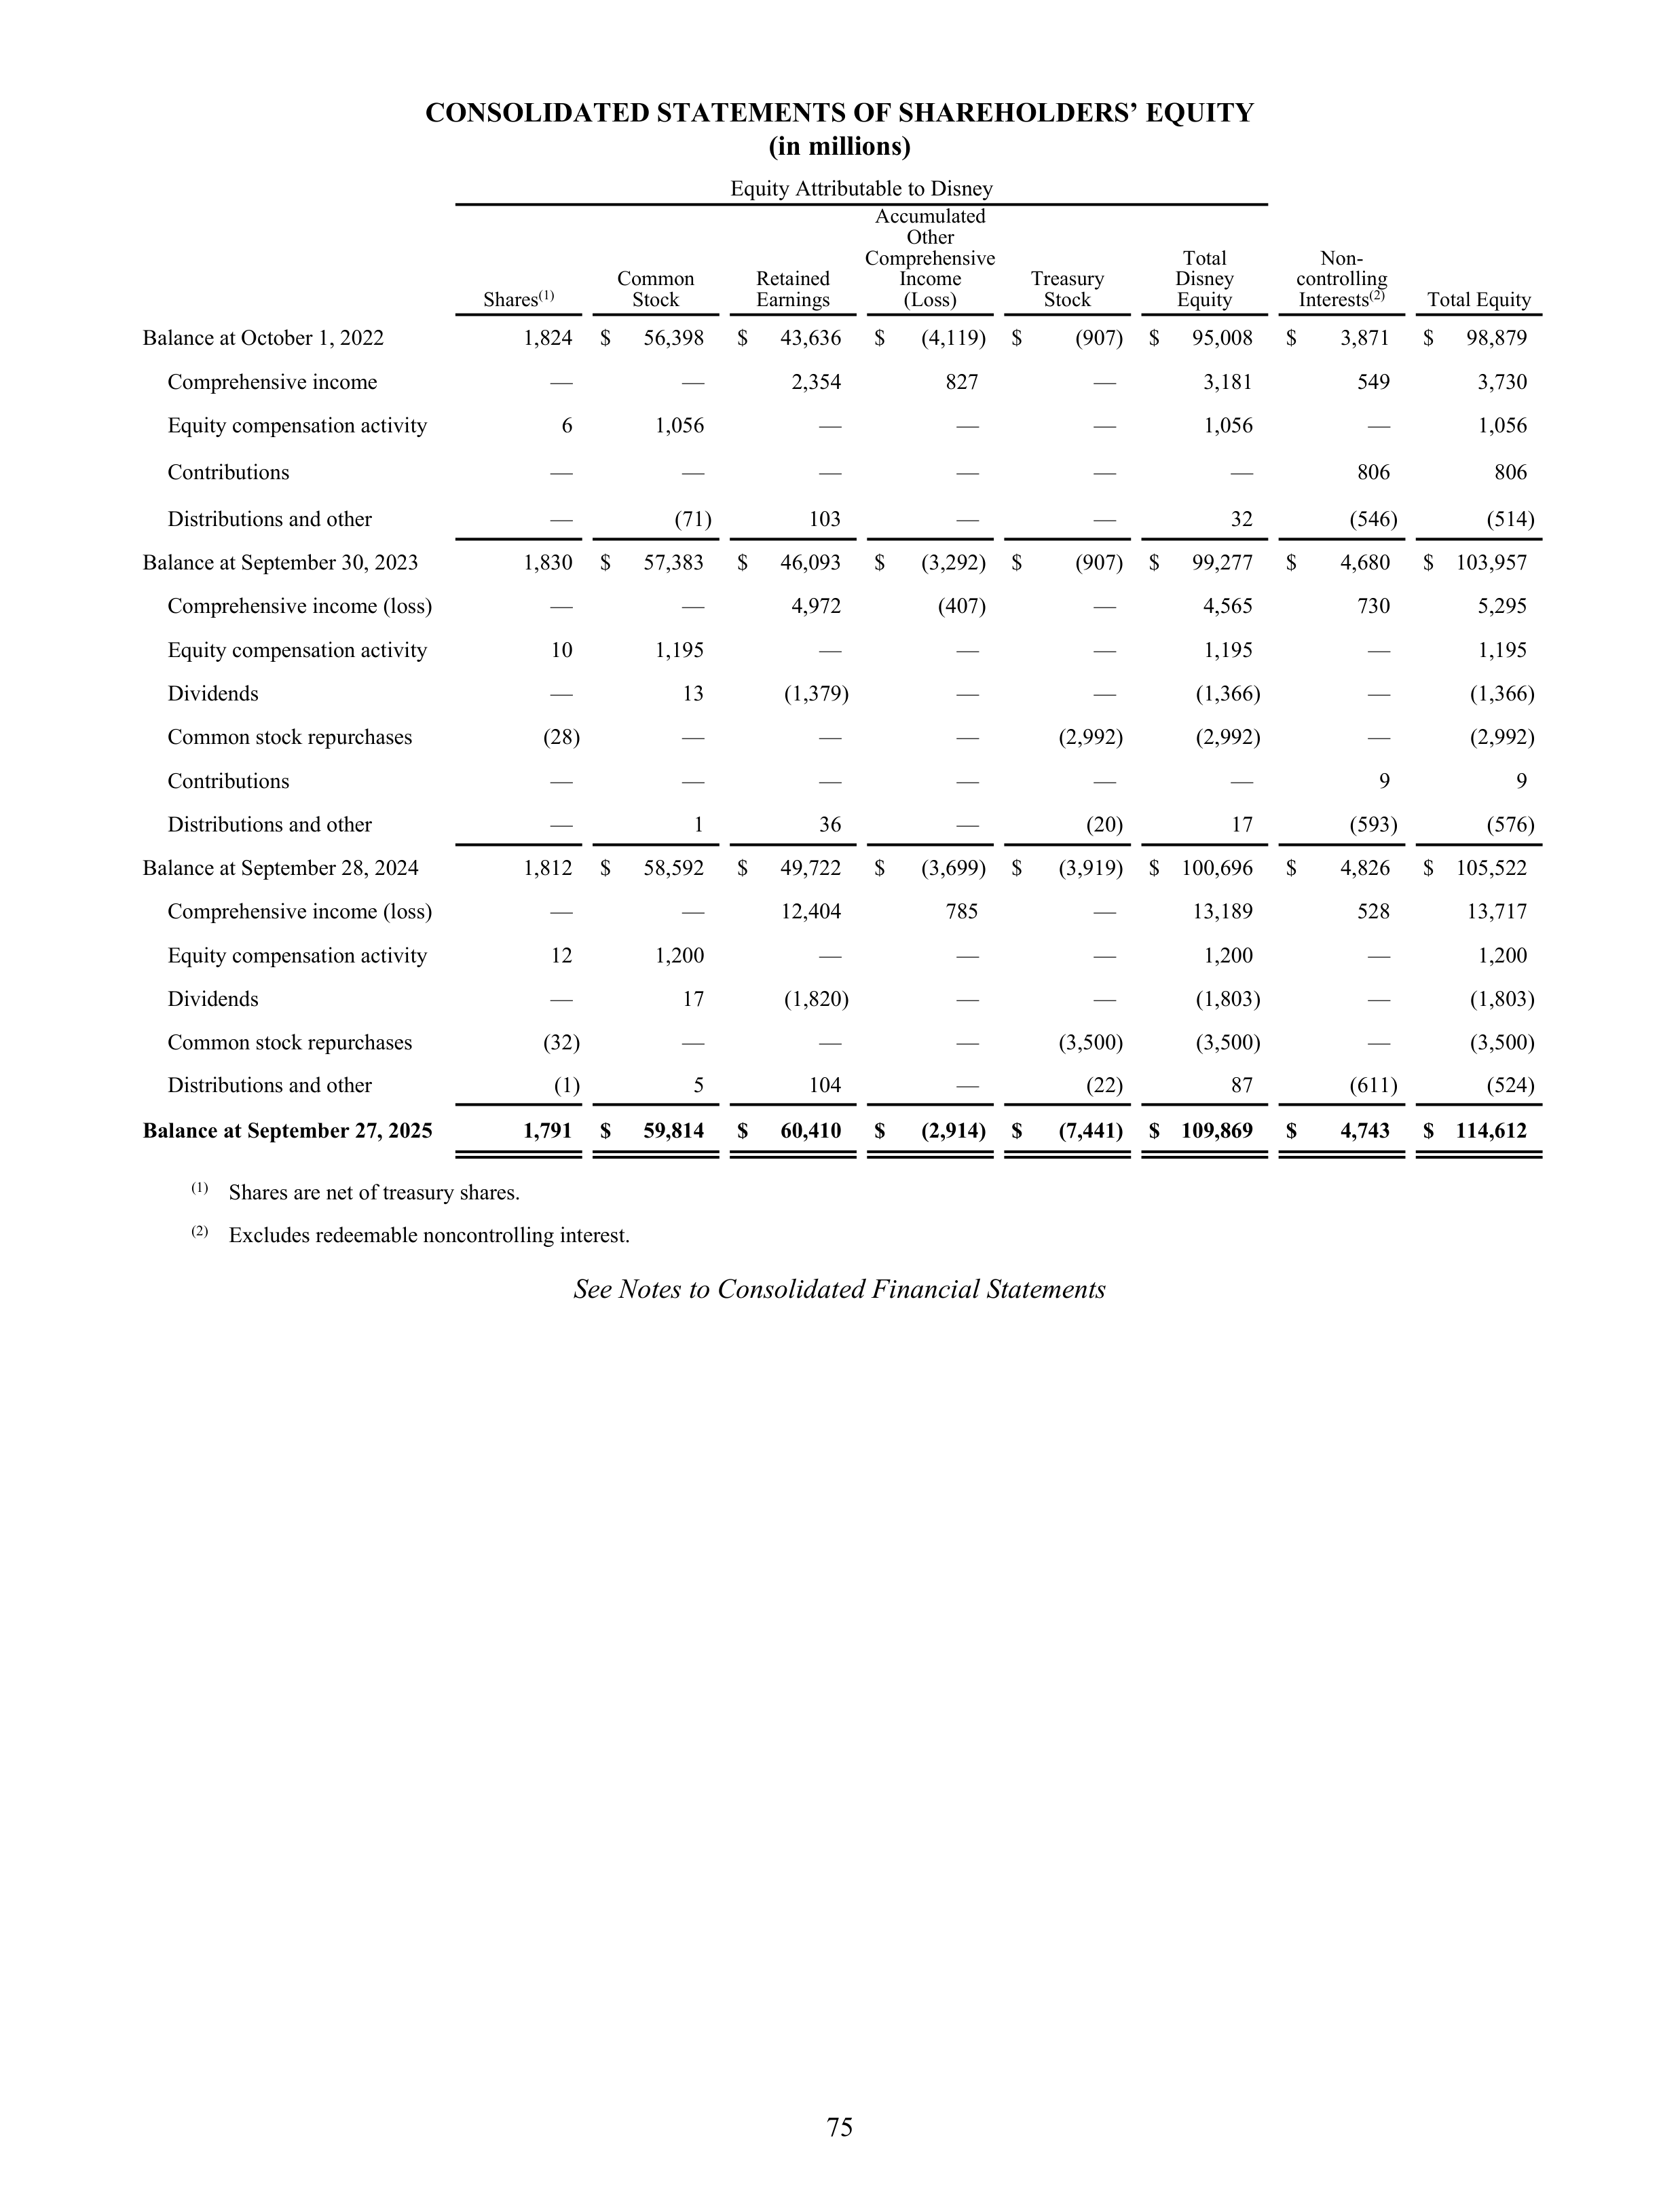
CONSOLIDATED STATEMENTS OF SHAREHOLDERS’ EQUITY
(in millions)
Equity Attributable to Disney
Shares
(1)
Common
Stock
Retained
Earnings
Accumulated
Other
Comprehensive
Income
(Loss)
Treasury
Stock
Total
Disney
Equity
Non-
controlling
Interests
(2)
Total Equity
Balance at October 1, 2022
1,824
$
56,398
$
43,636
$
(4,119)
$
(907)
$
95,008
$
3,871
$
98,879
Comprehensive income
—
—
2,354
827
—
3,181
549
3,730
Equity compensation activity
6
1,056
—
—
—
1,056
—
1,056
Contributions
—
—
—
—
—
—
806
806
Distributions and other
—
(71)
103
—
—
32
(546)
(514)
Balance at September 30, 2023
1,830
$
57,383
$
46,093
$
(3,292)
$
(907)
$
99,277
$
4,680
$ 103,957
Comprehensive income (loss)
—
—
4,972
(407)
—
4,565
730
5,295
Equity compensation activity
10
1,195
—
—
—
1,195
—
1,195
Dividends
—
13
(1,379)
—
—
(1,366)
—
(1,366)
Common stock repurchases
(28)
—
—
—
(2,992)
(2,992)
—
(2,992)
Contributions
—
—
—
—
—
—
9
9
Distributions and other
—
1
36
—
(20)
17
(593)
(576)
Balance at September 28, 2024
1,812
$
58,592
$
49,722
$
(3,699)
$
(3,919)
$ 100,696
$
4,826
$ 105,522
Comprehensive income (loss)
—
—
12,404
785
—
13,189
528
13,717
Equity compensation activity
12
1,200
—
—
—
1,200
—
1,200
Dividends
—
17
(1,820)
—
—
(1,803)
—
(1,803)
Common stock repurchases
(32)
—
—
—
(3,500)
(3,500)
—
(3,500)
Distributions and other
(1)
5
104
—
(22)
87
(611)
(524)
Balance at September 27, 2025
1,791
$
59,814
$
60,410
$
(2,914)
$
(7,441)
$ 109,869
$
4,743
$ 114,612
(1)
Shares are net of treasury shares.
(2)
Excludes redeemable noncontrolling interest.
See Notes to Consolidated Financial Statements
75
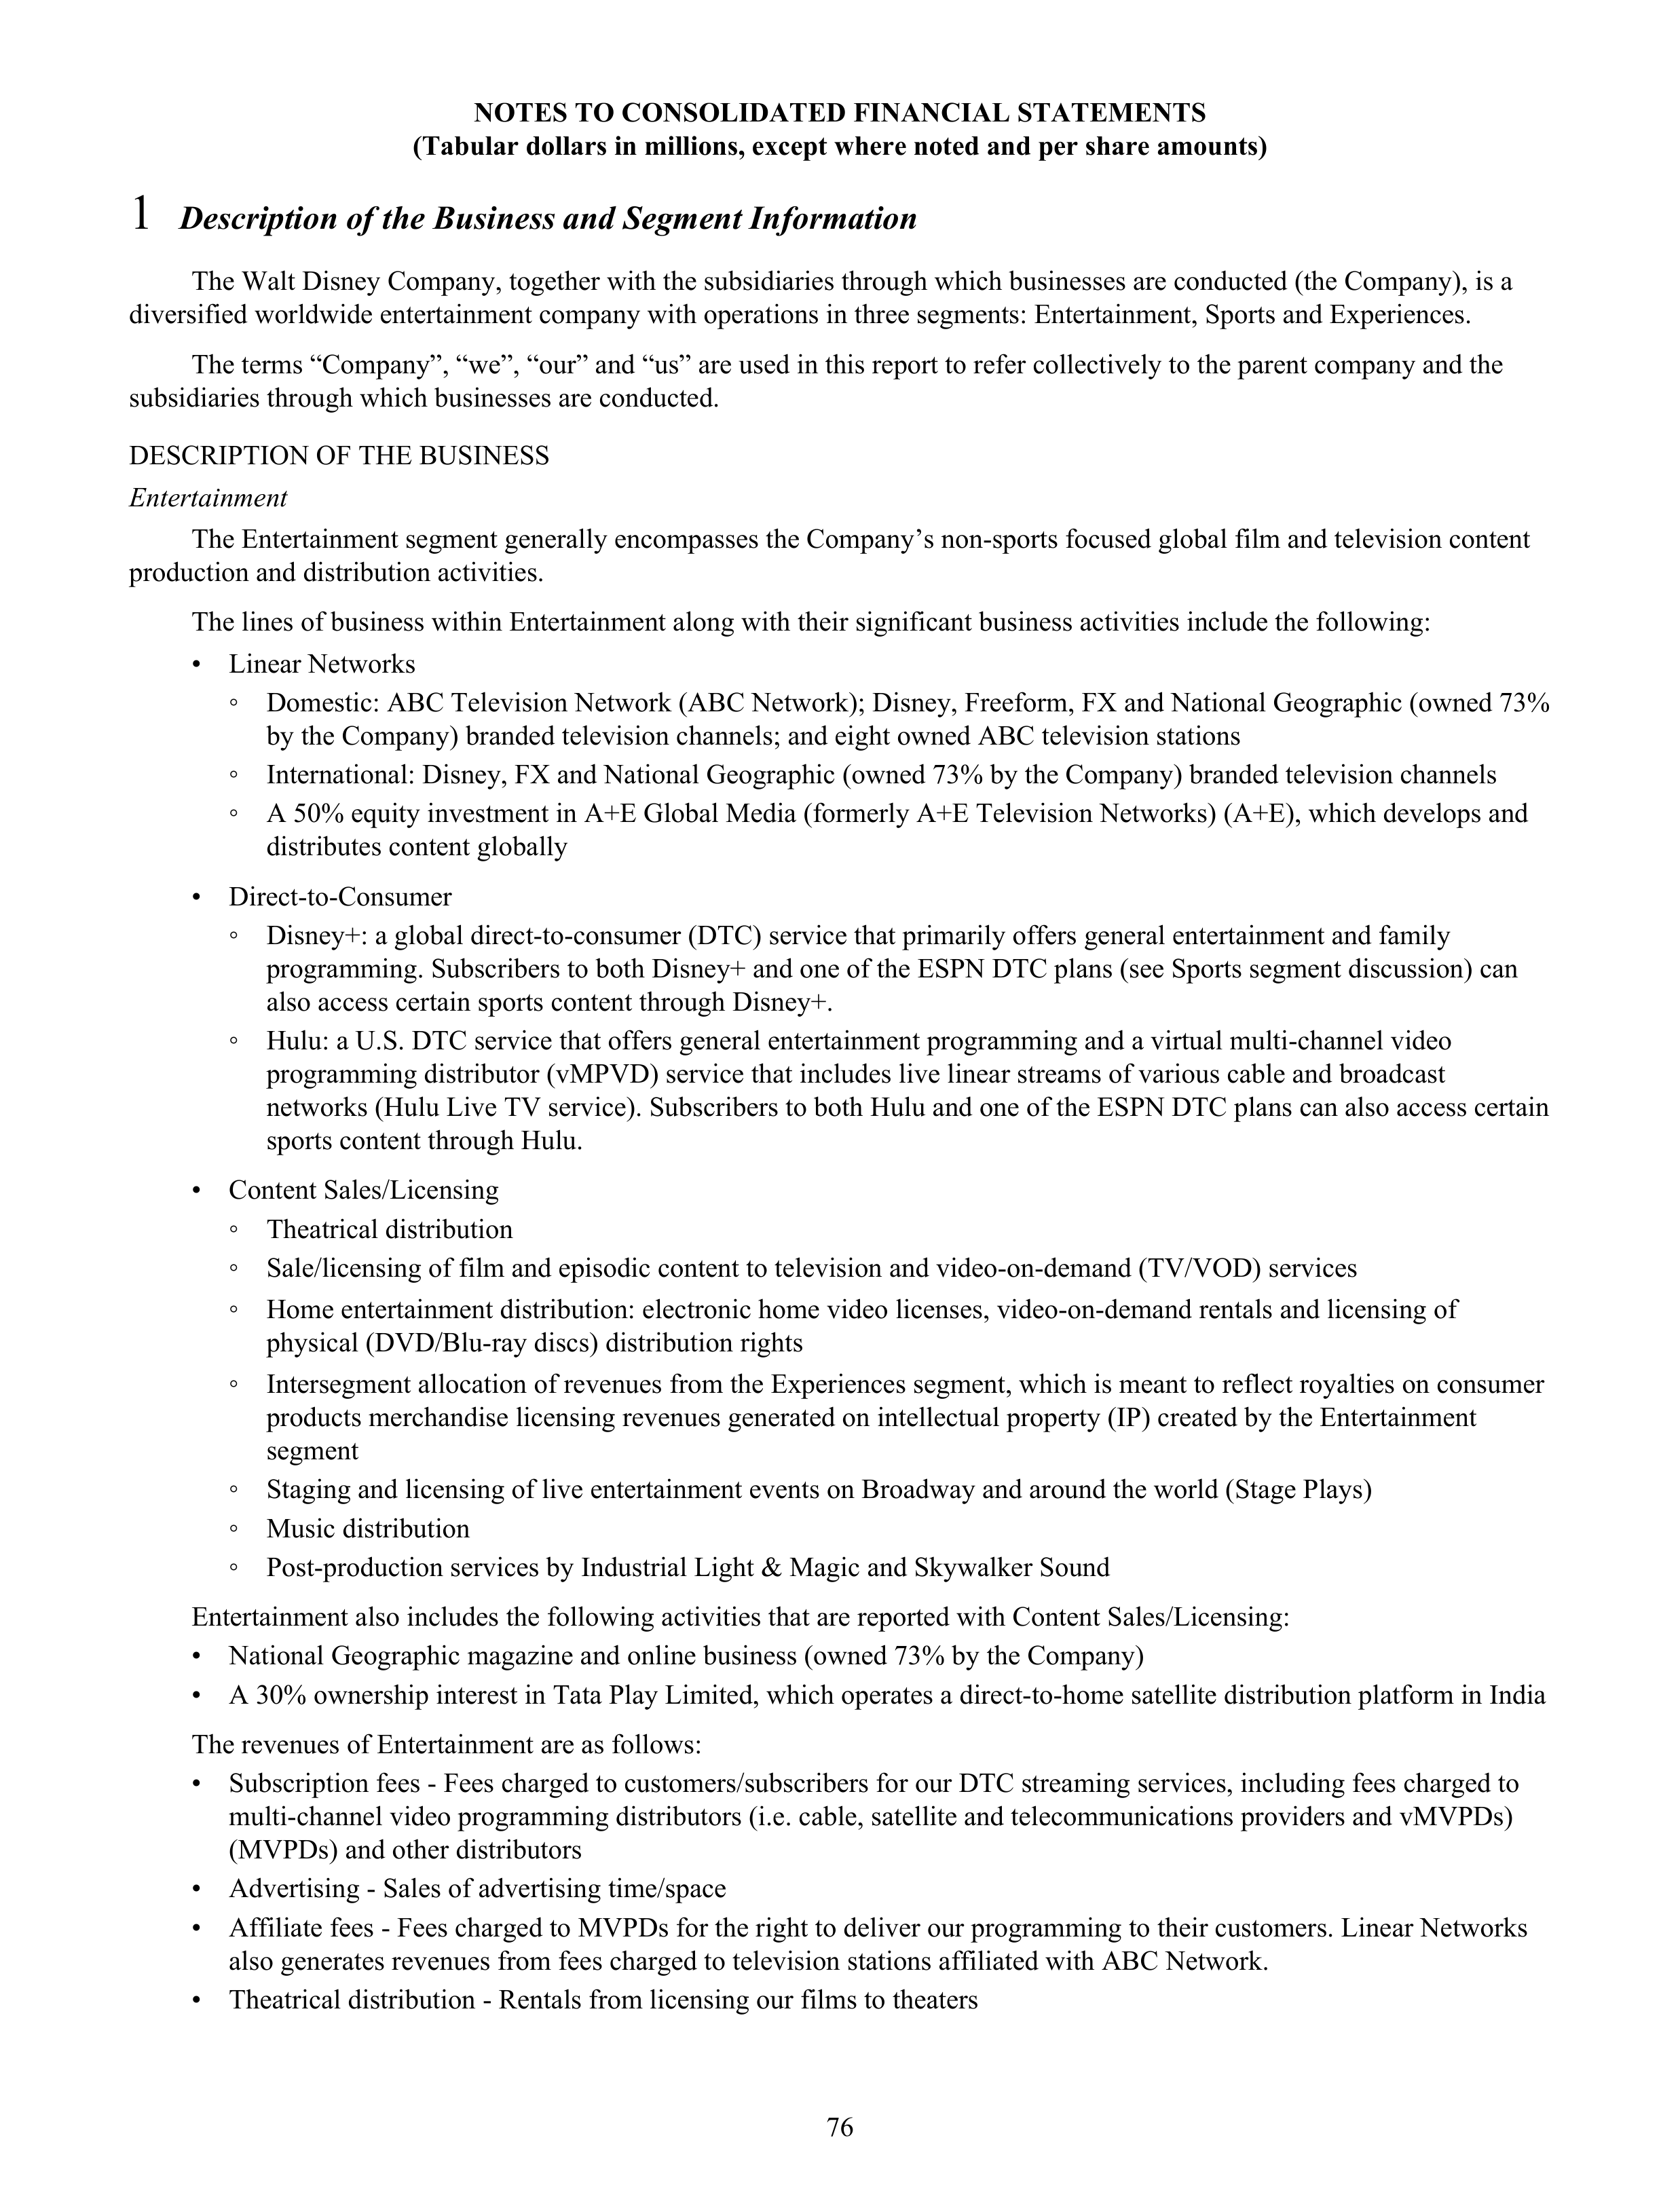
NOTES TO CONSOLIDATED FINANCIAL STATEMENTS
(Tabular dollars in millions, except where noted and per share amounts)
1
Description of the Business and Segment Information
The Walt Disney Company, together with the subsidiaries through which businesses are conducted (the Company), is a
diversified worldwide entertainment company with operations in three segments: Entertainment, Sports and Experiences.
The terms “Company”, “we”, “our” and “us” are used in this report to refer collectively to the parent company and the
subsidiaries through which businesses are conducted.
DESCRIPTION OF THE BUSINESS
Entertainment
The Entertainment segment generally encompasses the Company’s non-sports focused global film and television content
production and distribution activities.
The lines of business within Entertainment along with their significant business activities include the following:
•
Linear Networks
◦
Domestic: ABC Television Network (ABC Network); Disney, Freeform, FX and National Geographic (owned 73%
by the Company) branded television channels; and eight owned ABC television stations
◦
International: Disney, FX and National Geographic (owned 73% by the Company) branded television channels
◦
A 50% equity investment in A+E Global Media (formerly A+E Television Networks) (A+E), which develops and
distributes content globally
•
Direct-to-Consumer
◦
Disney+: a global direct-to-consumer (DTC) service that primarily offers general entertainment and family
programming. Subscribers to both Disney+ and one of the ESPN DTC plans (see Sports segment discussion) can
also access certain sports content through Disney+.
◦
Hulu: a U.S. DTC service that offers general entertainment programming and a virtual multi-channel video
programming distributor (vMPVD) service that includes live linear streams of various cable and broadcast
networks (Hulu Live TV service). Subscribers to both Hulu and one of the ESPN DTC plans can also access certain
sports content through Hulu.
•
Content Sales/Licensing
◦
Theatrical distribution
◦
Sale/licensing of film and episodic content to television and video-on-demand (TV/VOD) services
◦
Home entertainment distribution: electronic home video licenses, video-on-demand rentals and licensing of
physical (DVD/Blu-ray discs) distribution rights
◦
Intersegment allocation of revenues from the Experiences segment, which is meant to reflect royalties on consumer
products merchandise licensing revenues generated on intellectual property (IP) created by the Entertainment
segment
◦
Staging and licensing of live entertainment events on Broadway and around the world (Stage Plays)
◦
Music distribution
◦
Post-production services by Industrial Light & Magic and Skywalker Sound
Entertainment also includes the following activities that are reported with Content Sales/Licensing:
•
National Geographic magazine and online business (owned 73% by the Company)
•
A 30% ownership interest in Tata Play Limited, which operates a direct-to-home satellite distribution platform in India
The revenues of Entertainment are as follows:
•
Subscription fees - Fees charged to customers/subscribers for our DTC streaming services, including fees charged to
multi-channel video programming distributors (i.e. cable, satellite and telecommunications providers and vMVPDs)
(MVPDs) and other distributors
•
Advertising - Sales of advertising time/space
•
Affiliate fees - Fees charged to MVPDs for the right to deliver our programming to their customers. Linear Networks
also generates revenues from fees charged to television stations affiliated with ABC Network.
•
Theatrical distribution - Rentals from licensing our films to theaters
76
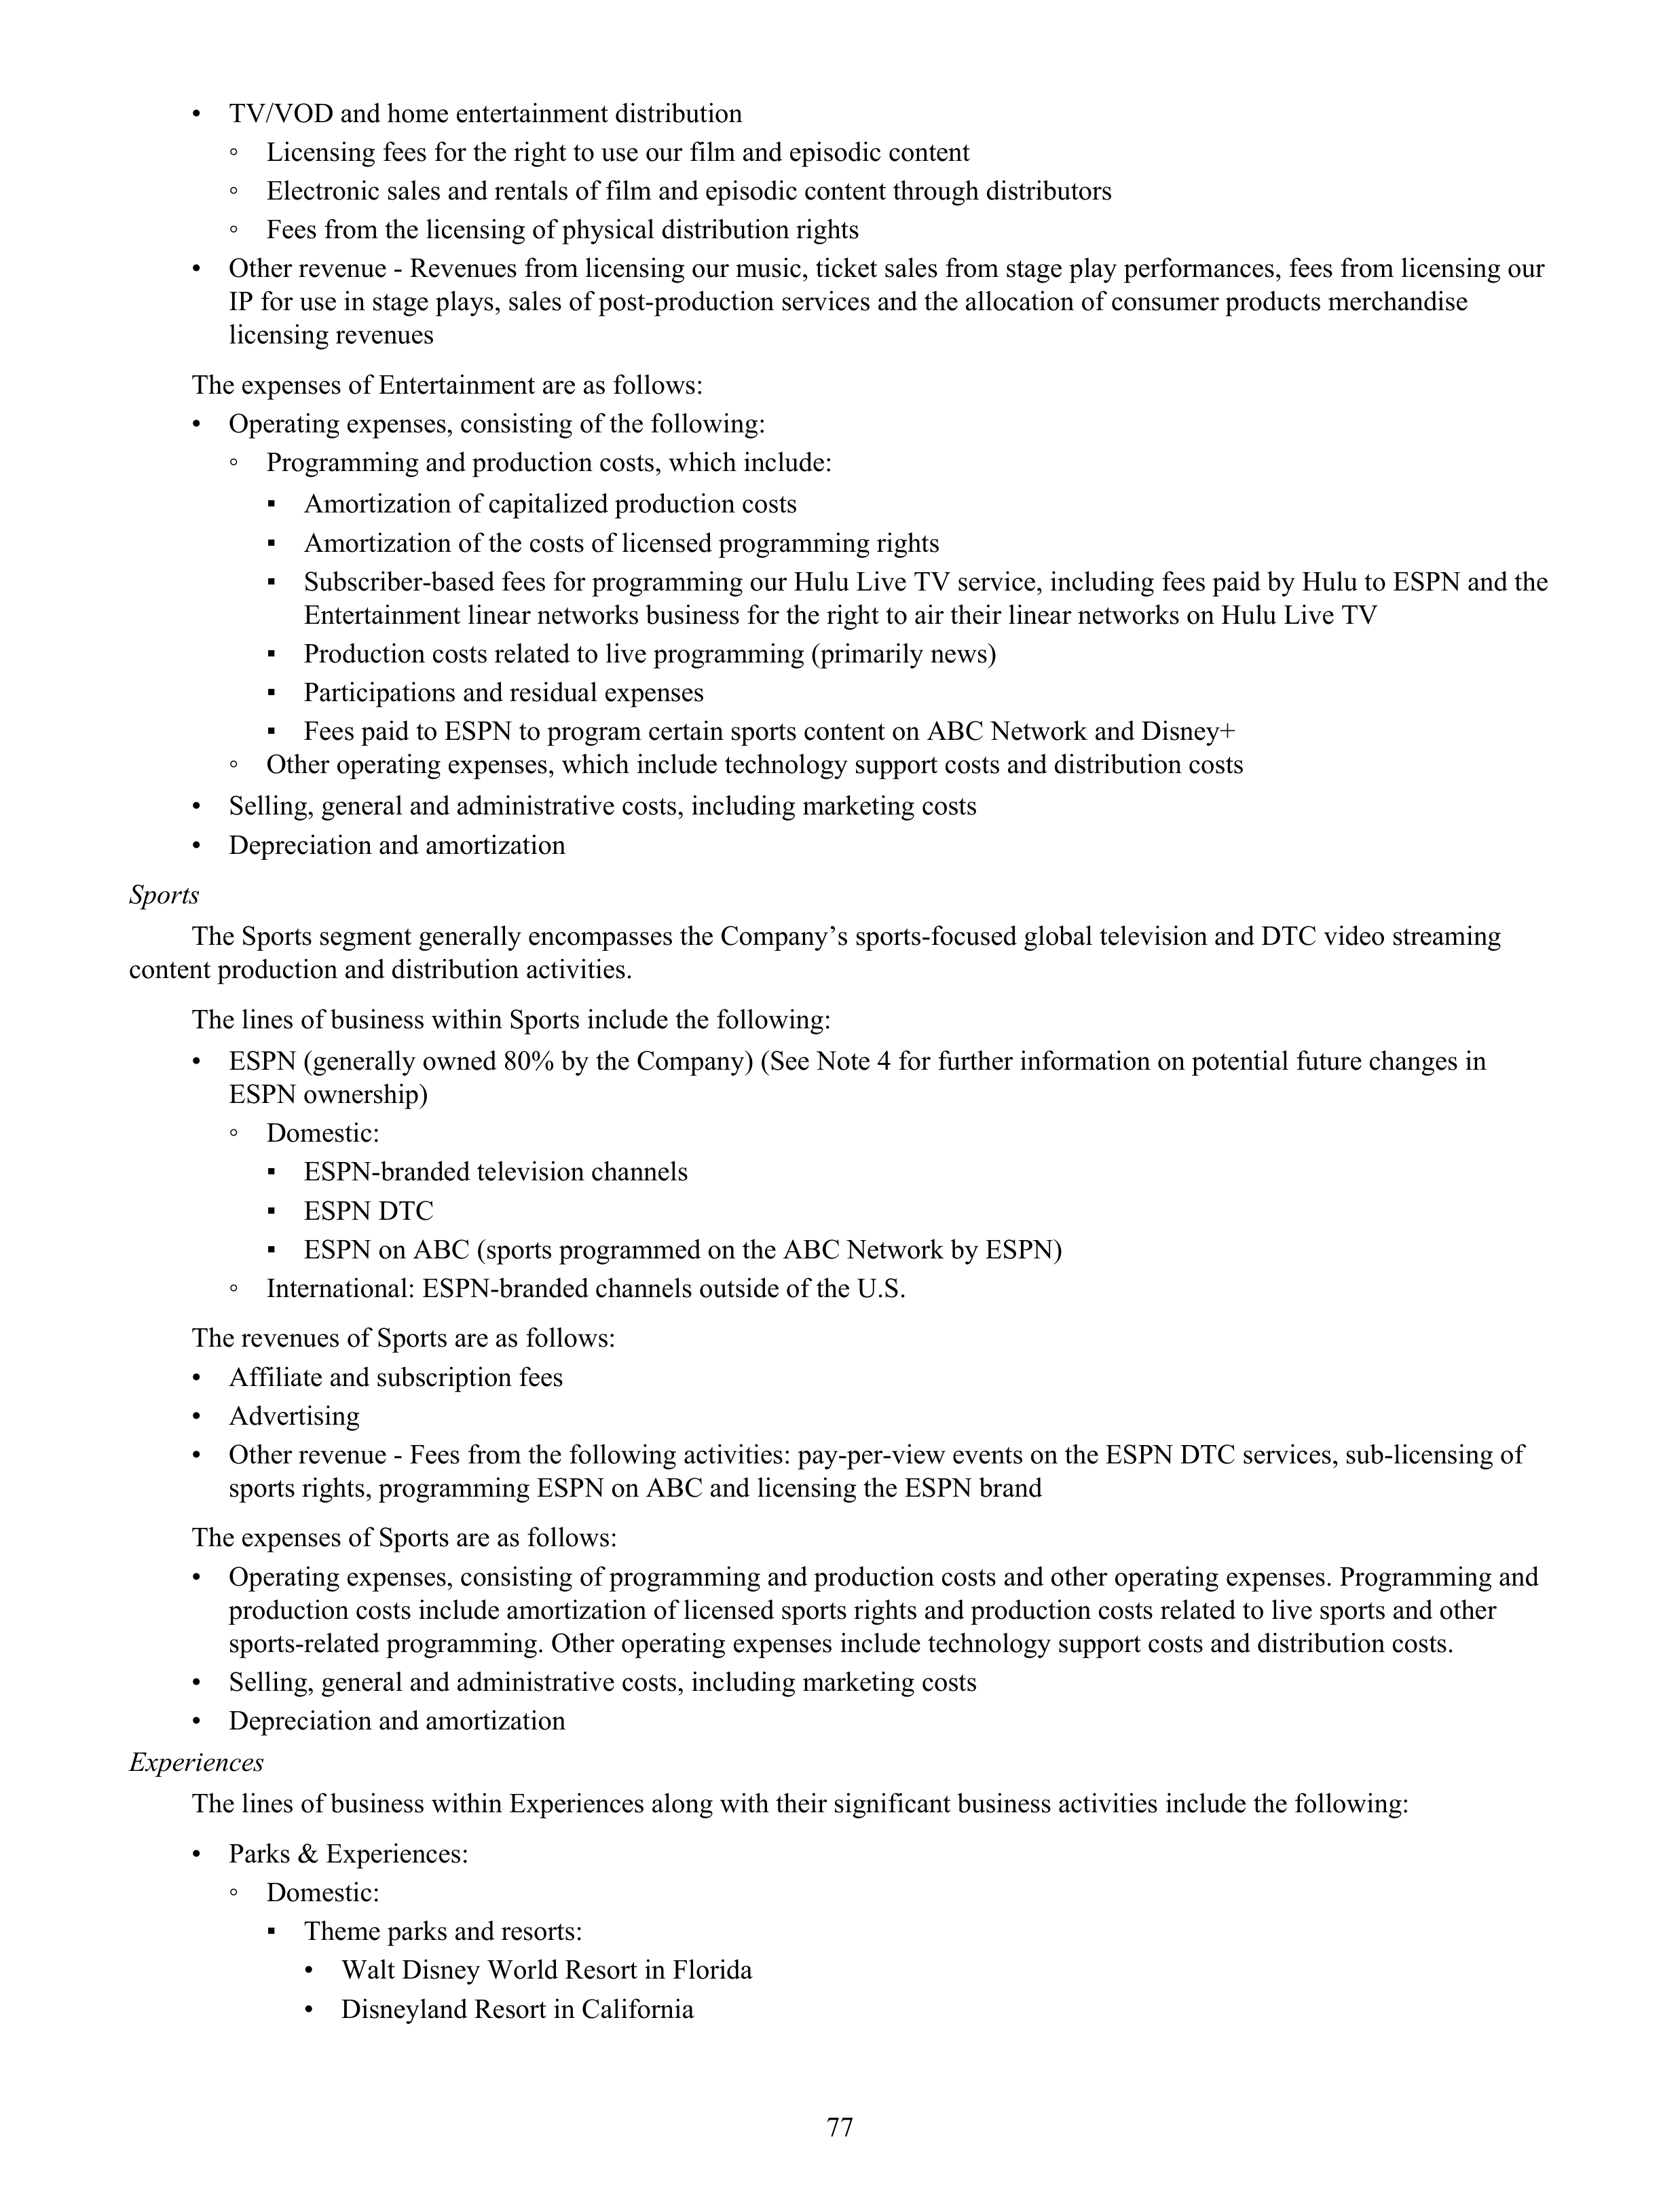
•
TV/VOD and home entertainment distribution
◦
Licensing fees for the right to use our film and episodic content
◦
Electronic sales and rentals of film and episodic content through distributors
◦
Fees from the licensing of physical distribution rights
•
Other revenue - Revenues from licensing our music, ticket sales from stage play performances, fees from licensing our
IP for use in stage plays, sales of post-production services and the allocation of consumer products merchandise
licensing revenues
The expenses of Entertainment are as follows:
•
Operating expenses, consisting of the following:
◦
Programming and production costs, which include:
▪
Amortization of capitalized production costs
▪
Amortization of the costs of licensed programming rights
▪
Subscriber-based fees for programming our Hulu Live TV service, including fees paid by Hulu to ESPN and the
Entertainment linear networks business for the right to air their linear networks on Hulu Live TV
▪
Production costs related to live programming (primarily news)
▪
Participations and residual expenses
▪
Fees paid to ESPN to program certain sports content on ABC Network and Disney+
◦
Other operating expenses, which include technology support costs and distribution costs
•
Selling, general and administrative costs, including marketing costs
•
Depreciation and amortization
Sports
The Sports segment generally encompasses the Company’s sports-focused global television and DTC video streaming
content production and distribution activities.
The lines of business within Sports include the following:
•
ESPN (generally owned 80% by the Company) (See Note 4 for further information on potential future changes in
ESPN ownership)
◦
Domestic:
▪
ESPN-branded television channels
▪
ESPN DTC
▪
ESPN on ABC (sports programmed on the ABC Network by ESPN)
◦
International: ESPN-branded channels outside of the U.S.
The revenues of Sports are as follows:
•
Affiliate and subscription fees
•
Advertising
•
Other revenue - Fees from the following activities: pay-per-view events on the ESPN DTC services, sub-licensing of
sports rights, programming ESPN on ABC and licensing the ESPN brand
The expenses of Sports are as follows:
•
Operating expenses, consisting of programming and production costs and other operating expenses. Programming and
production costs include amortization of licensed sports rights and production costs related to live sports and other
sports-related programming. Other operating expenses include technology support costs and distribution costs.
•
Selling, general and administrative costs, including marketing costs
•
Depreciation and amortization
Experiences
The lines of business within Experiences along with their significant business activities include the following:
•
Parks & Experiences:
◦
Domestic:
▪
Theme parks and resorts:
•
Walt Disney World Resort in Florida
•
Disneyland Resort in California
77
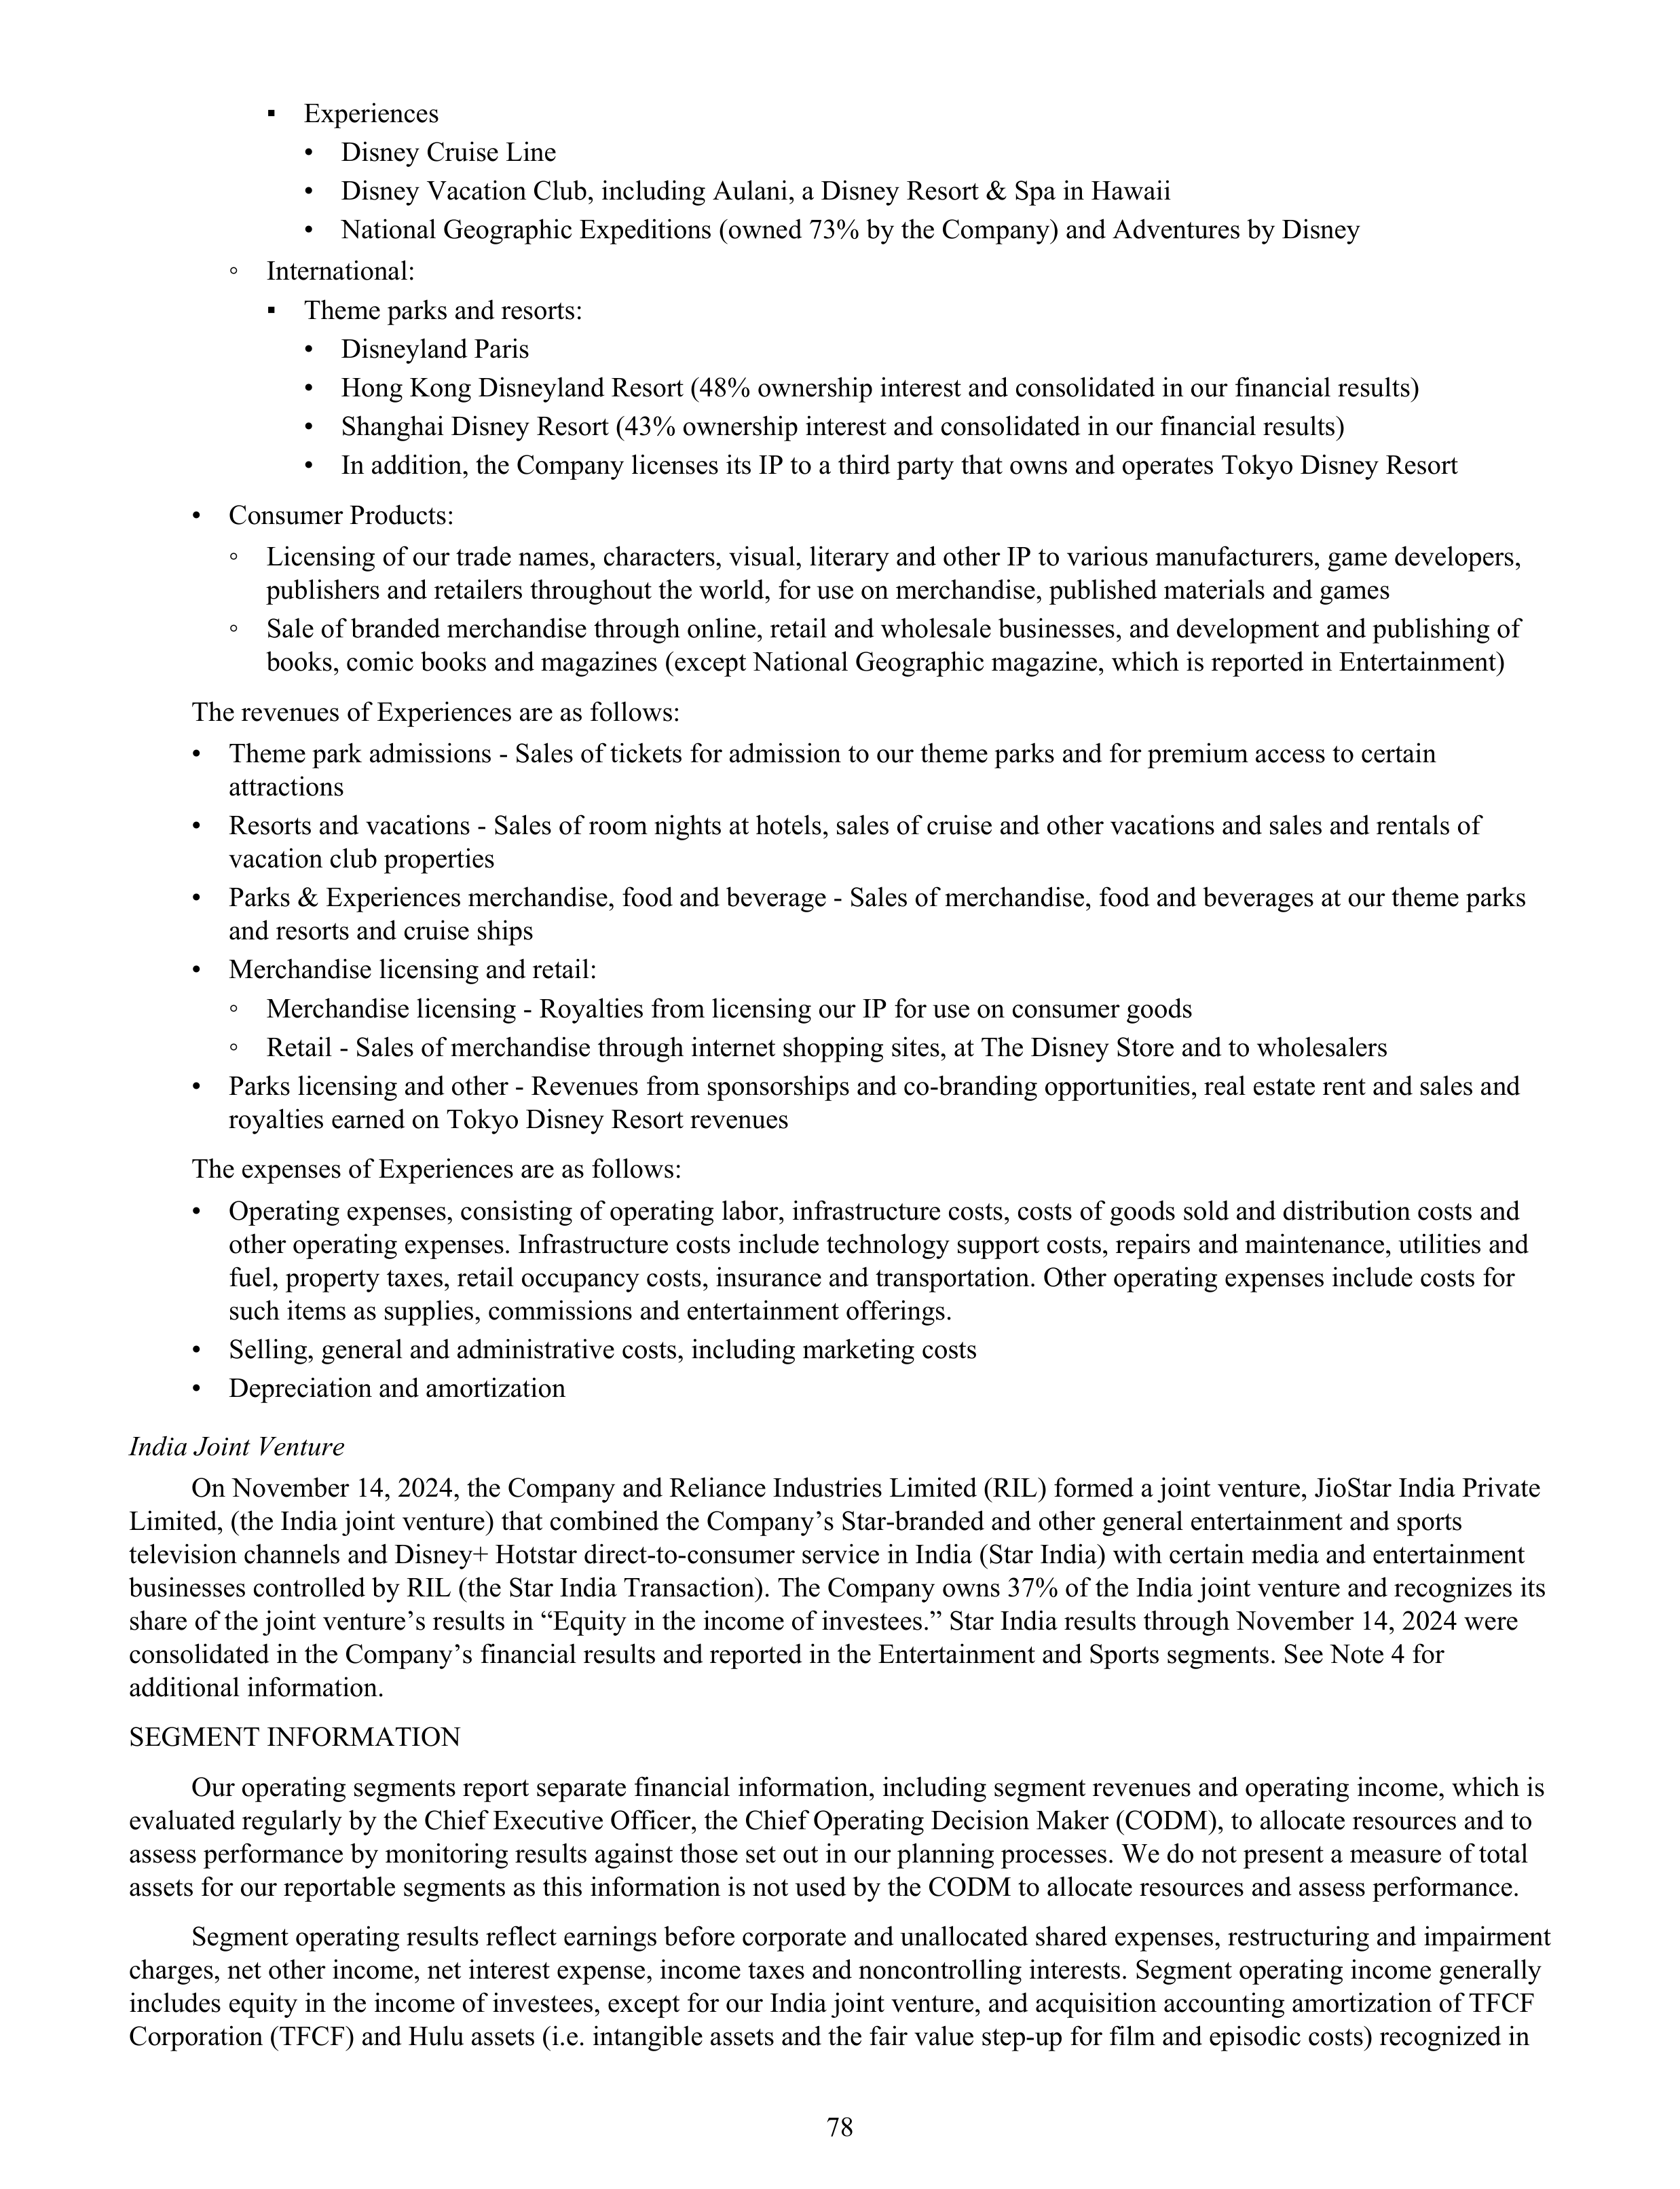
▪
Experiences
•
Disney Cruise Line
•
Disney Vacation Club, including Aulani, a Disney Resort & Spa in Hawaii
•
National Geographic Expeditions (owned 73% by the Company) and Adventures by Disney
◦
International:
▪
Theme parks and resorts:
•
Disneyland Paris
•
Hong Kong Disneyland Resort (48% ownership interest and consolidated in our financial results)
•
Shanghai Disney Resort (43% ownership interest and consolidated in our financial results)
•
In addition, the Company licenses its IP to a third party that owns and operates Tokyo Disney Resort
•
Consumer Products:
◦
Licensing of our trade names, characters, visual, literary and other IP to various manufacturers, game developers,
publishers and retailers throughout the world, for use on merchandise, published materials and games
◦
Sale of branded merchandise through online, retail and wholesale businesses, and development and publishing of
books, comic books and magazines (except National Geographic magazine, which is reported in Entertainment)
The revenues of Experiences are as follows:
•
Theme park admissions - Sales of tickets for admission to our theme parks and for premium access to certain
attractions
•
Resorts and vacations - Sales of room nights at hotels, sales of cruise and other vacations and sales and rentals of
vacation club properties
•
Parks & Experiences merchandise, food and beverage - Sales of merchandise, food and beverages at our theme parks
and resorts and cruise ships
•
Merchandise licensing and retail:
◦
Merchandise licensing - Royalties from licensing our IP for use on consumer goods
◦
Retail - Sales of merchandise through internet shopping sites, at The Disney Store and to wholesalers
•
Parks licensing and other - Revenues from sponsorships and co-branding opportunities, real estate rent and sales and
royalties earned on Tokyo Disney Resort revenues
The expenses of Experiences are as follows:
•
Operating expenses, consisting of operating labor, infrastructure costs, costs of goods sold and distribution costs and
other operating expenses. Infrastructure costs include technology support costs, repairs and maintenance, utilities and
fuel, property taxes, retail occupancy costs, insurance and transportation. Other operating expenses include costs for
such items as supplies, commissions and entertainment offerings.
•
Selling, general and administrative costs, including marketing costs
•
Depreciation and amortization
India Joint Venture
On November 14, 2024, the Company and Reliance Industries Limited (RIL) formed a joint venture, JioStar India Private
Limited, (the India joint venture) that combined the Company’s Star-branded and other general entertainment and sports
television channels and Disney+ Hotstar direct-to-consumer service in India (Star India) with certain media and entertainment
businesses controlled by RIL (the Star India Transaction). The Company owns 37% of the India joint venture and recognizes its
share of the joint venture’s results in “Equity in the income of investees.” Star India results through November 14, 2024 were
consolidated in the Company’s financial results and reported in the Entertainment and Sports segments. See Note 4 for
additional information.
SEGMENT INFORMATION
Our operating segments report separate financial information, including segment revenues and operating income, which is
evaluated regularly by the Chief Executive Officer, the Chief Operating Decision Maker (CODM), to allocate resources and to
assess performance by monitoring results against those set out in our planning processes. We do not present a measure of total
assets for our reportable segments as this information is not used by the CODM to allocate resources and assess performance.
Segment operating results reflect earnings before corporate and unallocated shared expenses, restructuring and impairment
charges, net other income, net interest expense, income taxes and noncontrolling interests. Segment operating income generally
includes equity in the income of investees, except for our India joint venture, and acquisition accounting amortization of TFCF
Corporation (TFCF) and Hulu assets (i.e. intangible assets and the fair value step-up for film and episodic costs) recognized in
78
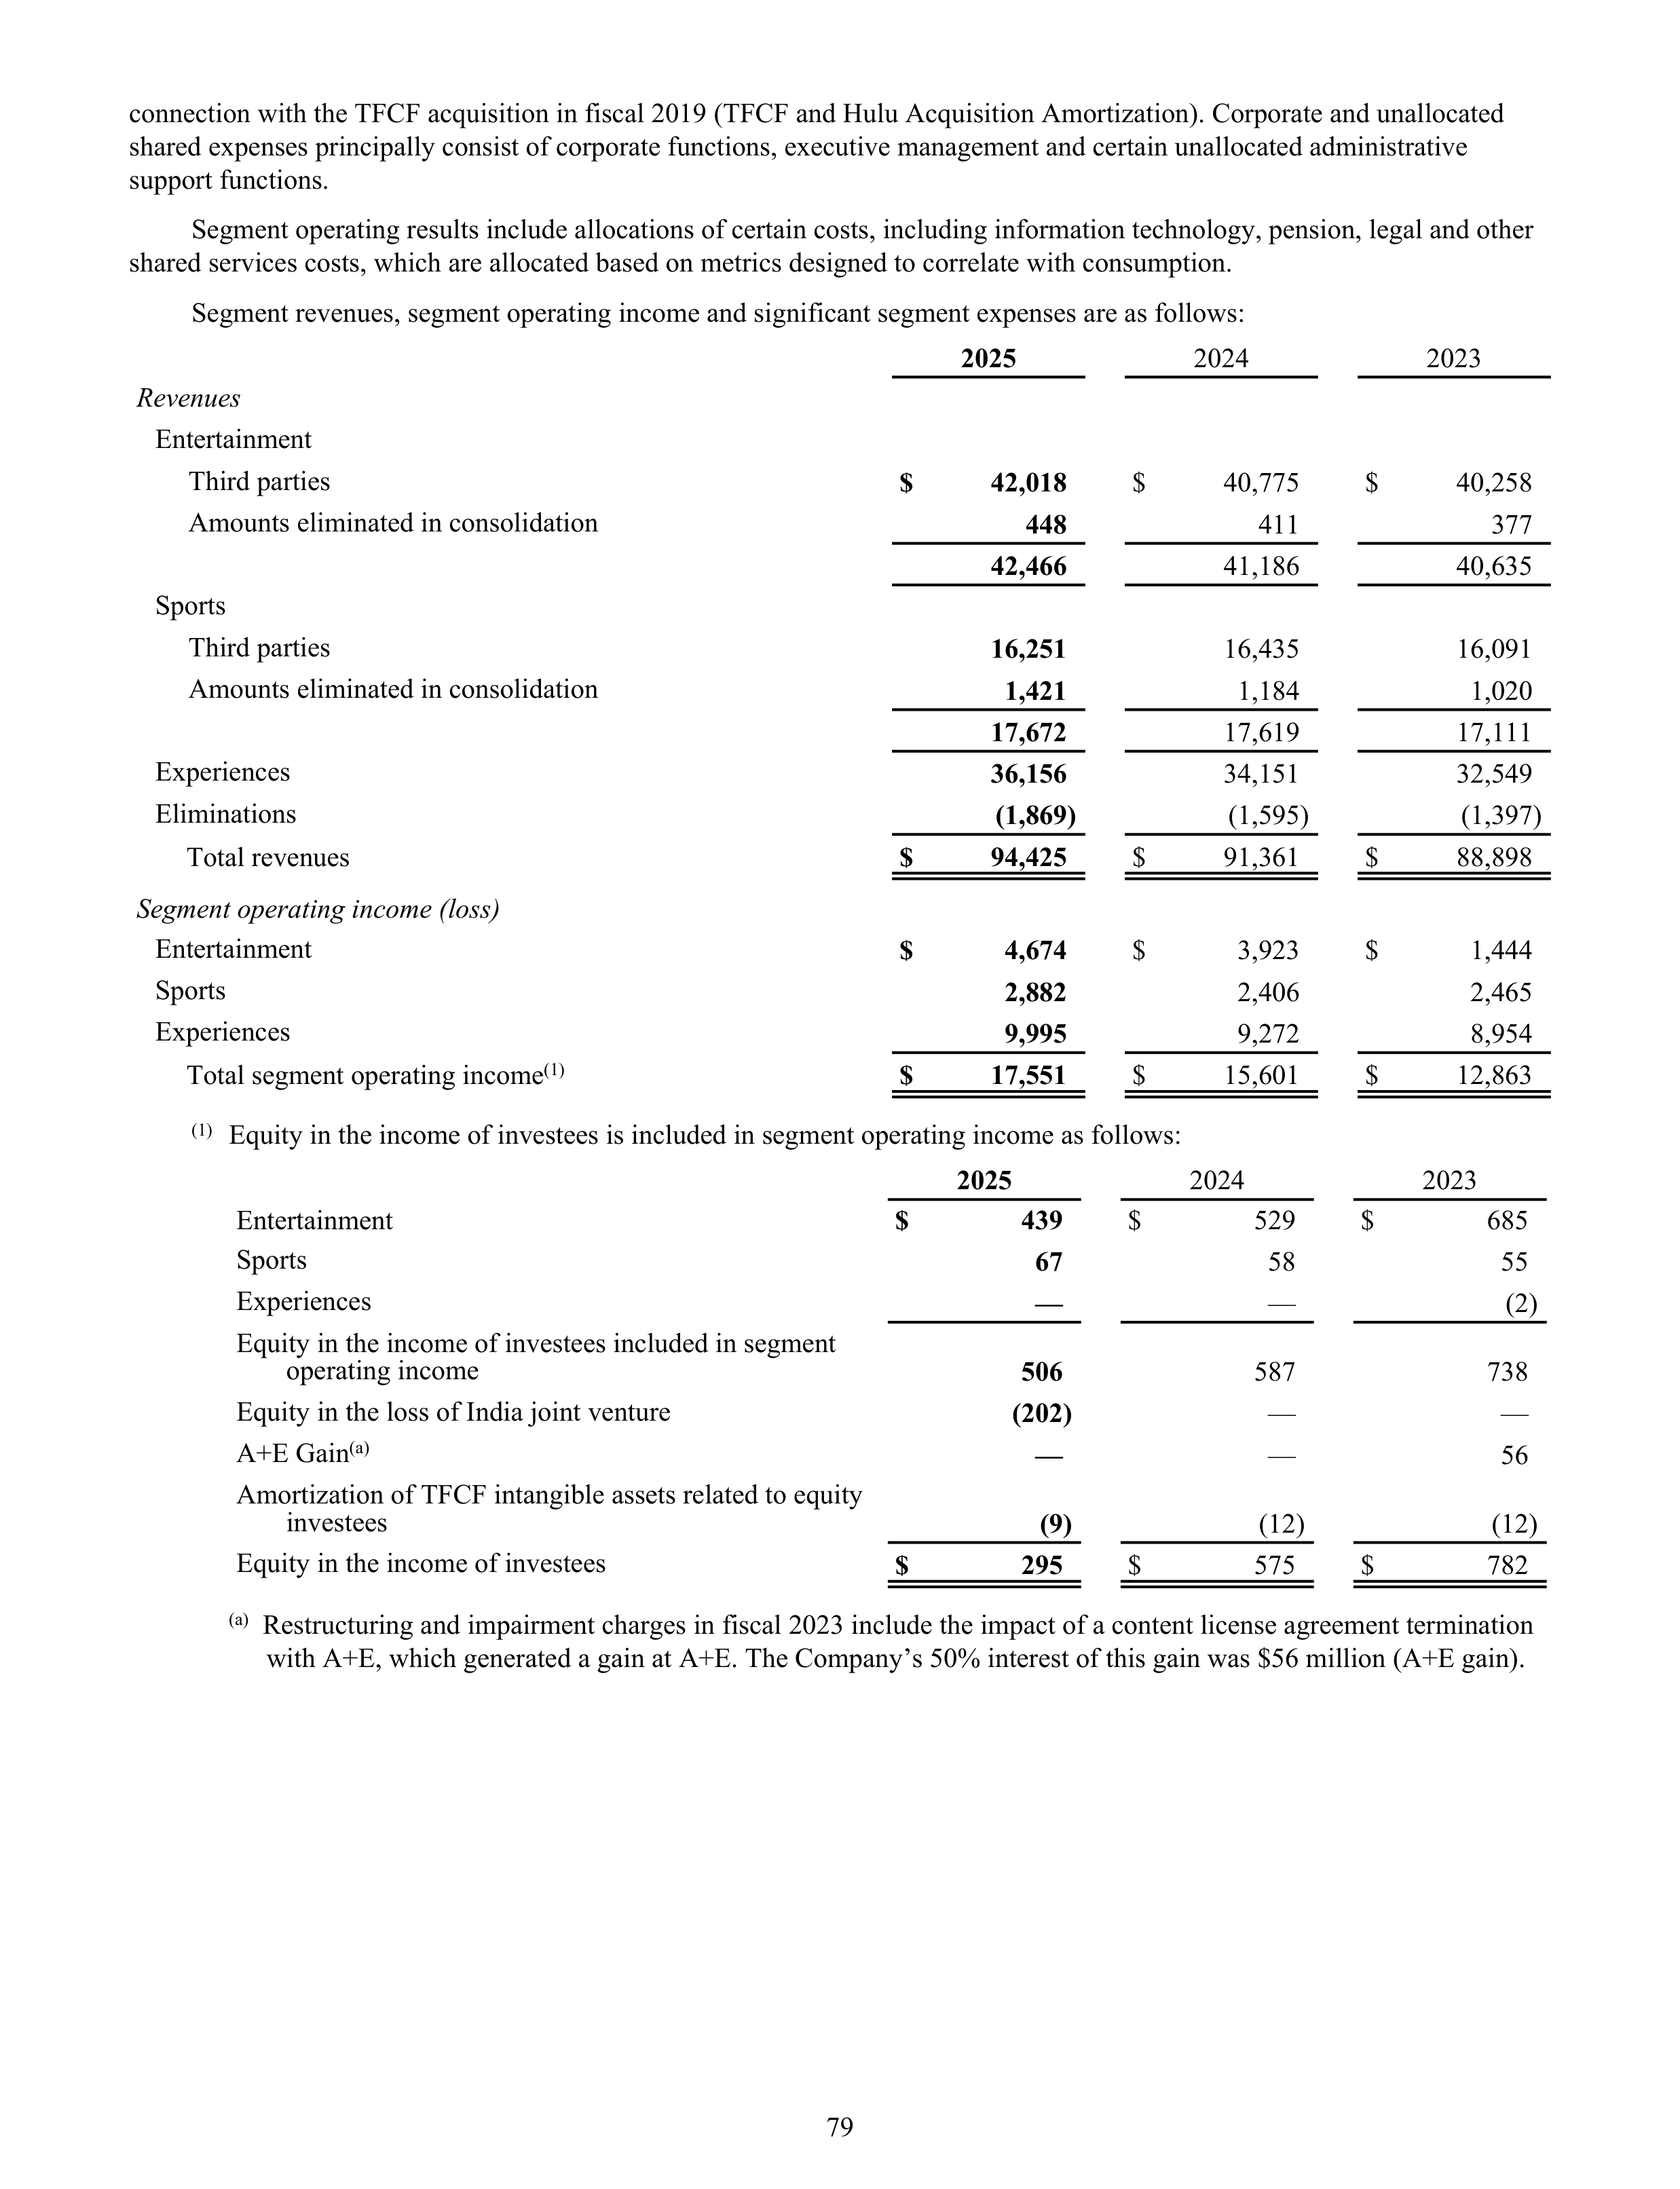
connection with the TFCF acquisition in fiscal 2019 (TFCF and Hulu Acquisition Amortization). Corporate and unallocated
shared expenses principally consist of corporate functions, executive management and certain unallocated administrative
support functions.
Segment operating results include allocations of certain costs, including information technology, pension, legal and other
shared services costs, which are allocated based on metrics designed to correlate with consumption.
Segment revenues, segment operating income and significant segment expenses are as follows:
2025
2024
2023
Revenues
Entertainment
Third parties
$
42,018
$
40,775
$
40,258
Amounts eliminated in consolidation
448
411
377
42,466
41,186
40,635
Sports
Third parties
16,251
16,435
16,091
Amounts eliminated in consolidation
1,421
1,184
1,020
17,672
17,619
17,111
Experiences
36,156
34,151
32,549
Eliminations
(1,869)
(1,595)
(1,397)
Total revenues
$
94,425
$
91,361
$
88,898
Segment operating income (loss)
Entertainment
$
4,674
$
3,923
$
1,444
Sports
2,882
2,406
2,465
Experiences
9,995
9,272
8,954
Total segment operating income
(1)
$
17,551
$
15,601
$
12,863
(1)
Equity in the income of investees is included in segment operating income as follows:
2025
2024
2023
Entertainment
$
439
$
529
$
685
Sports
67
58
55
Experiences
—
—
(2)
Equity in the income of investees included in segment
operating income
506
587
738
Equity in the loss of India joint venture
(202)
—
—
A+E Gain
(a)
—
—
56
Amortization of TFCF intangible assets related to equity
investees
(9)
(12)
(12)
Equity in the income of investees
$
295
$
575
$
782
(a)
Restructuring and impairment charges in fiscal 2023 include the impact of a content license agreement termination
with A+E, which generated a gain at A+E. The Company’s 50% interest of this gain was $56 million (A+E gain).
79
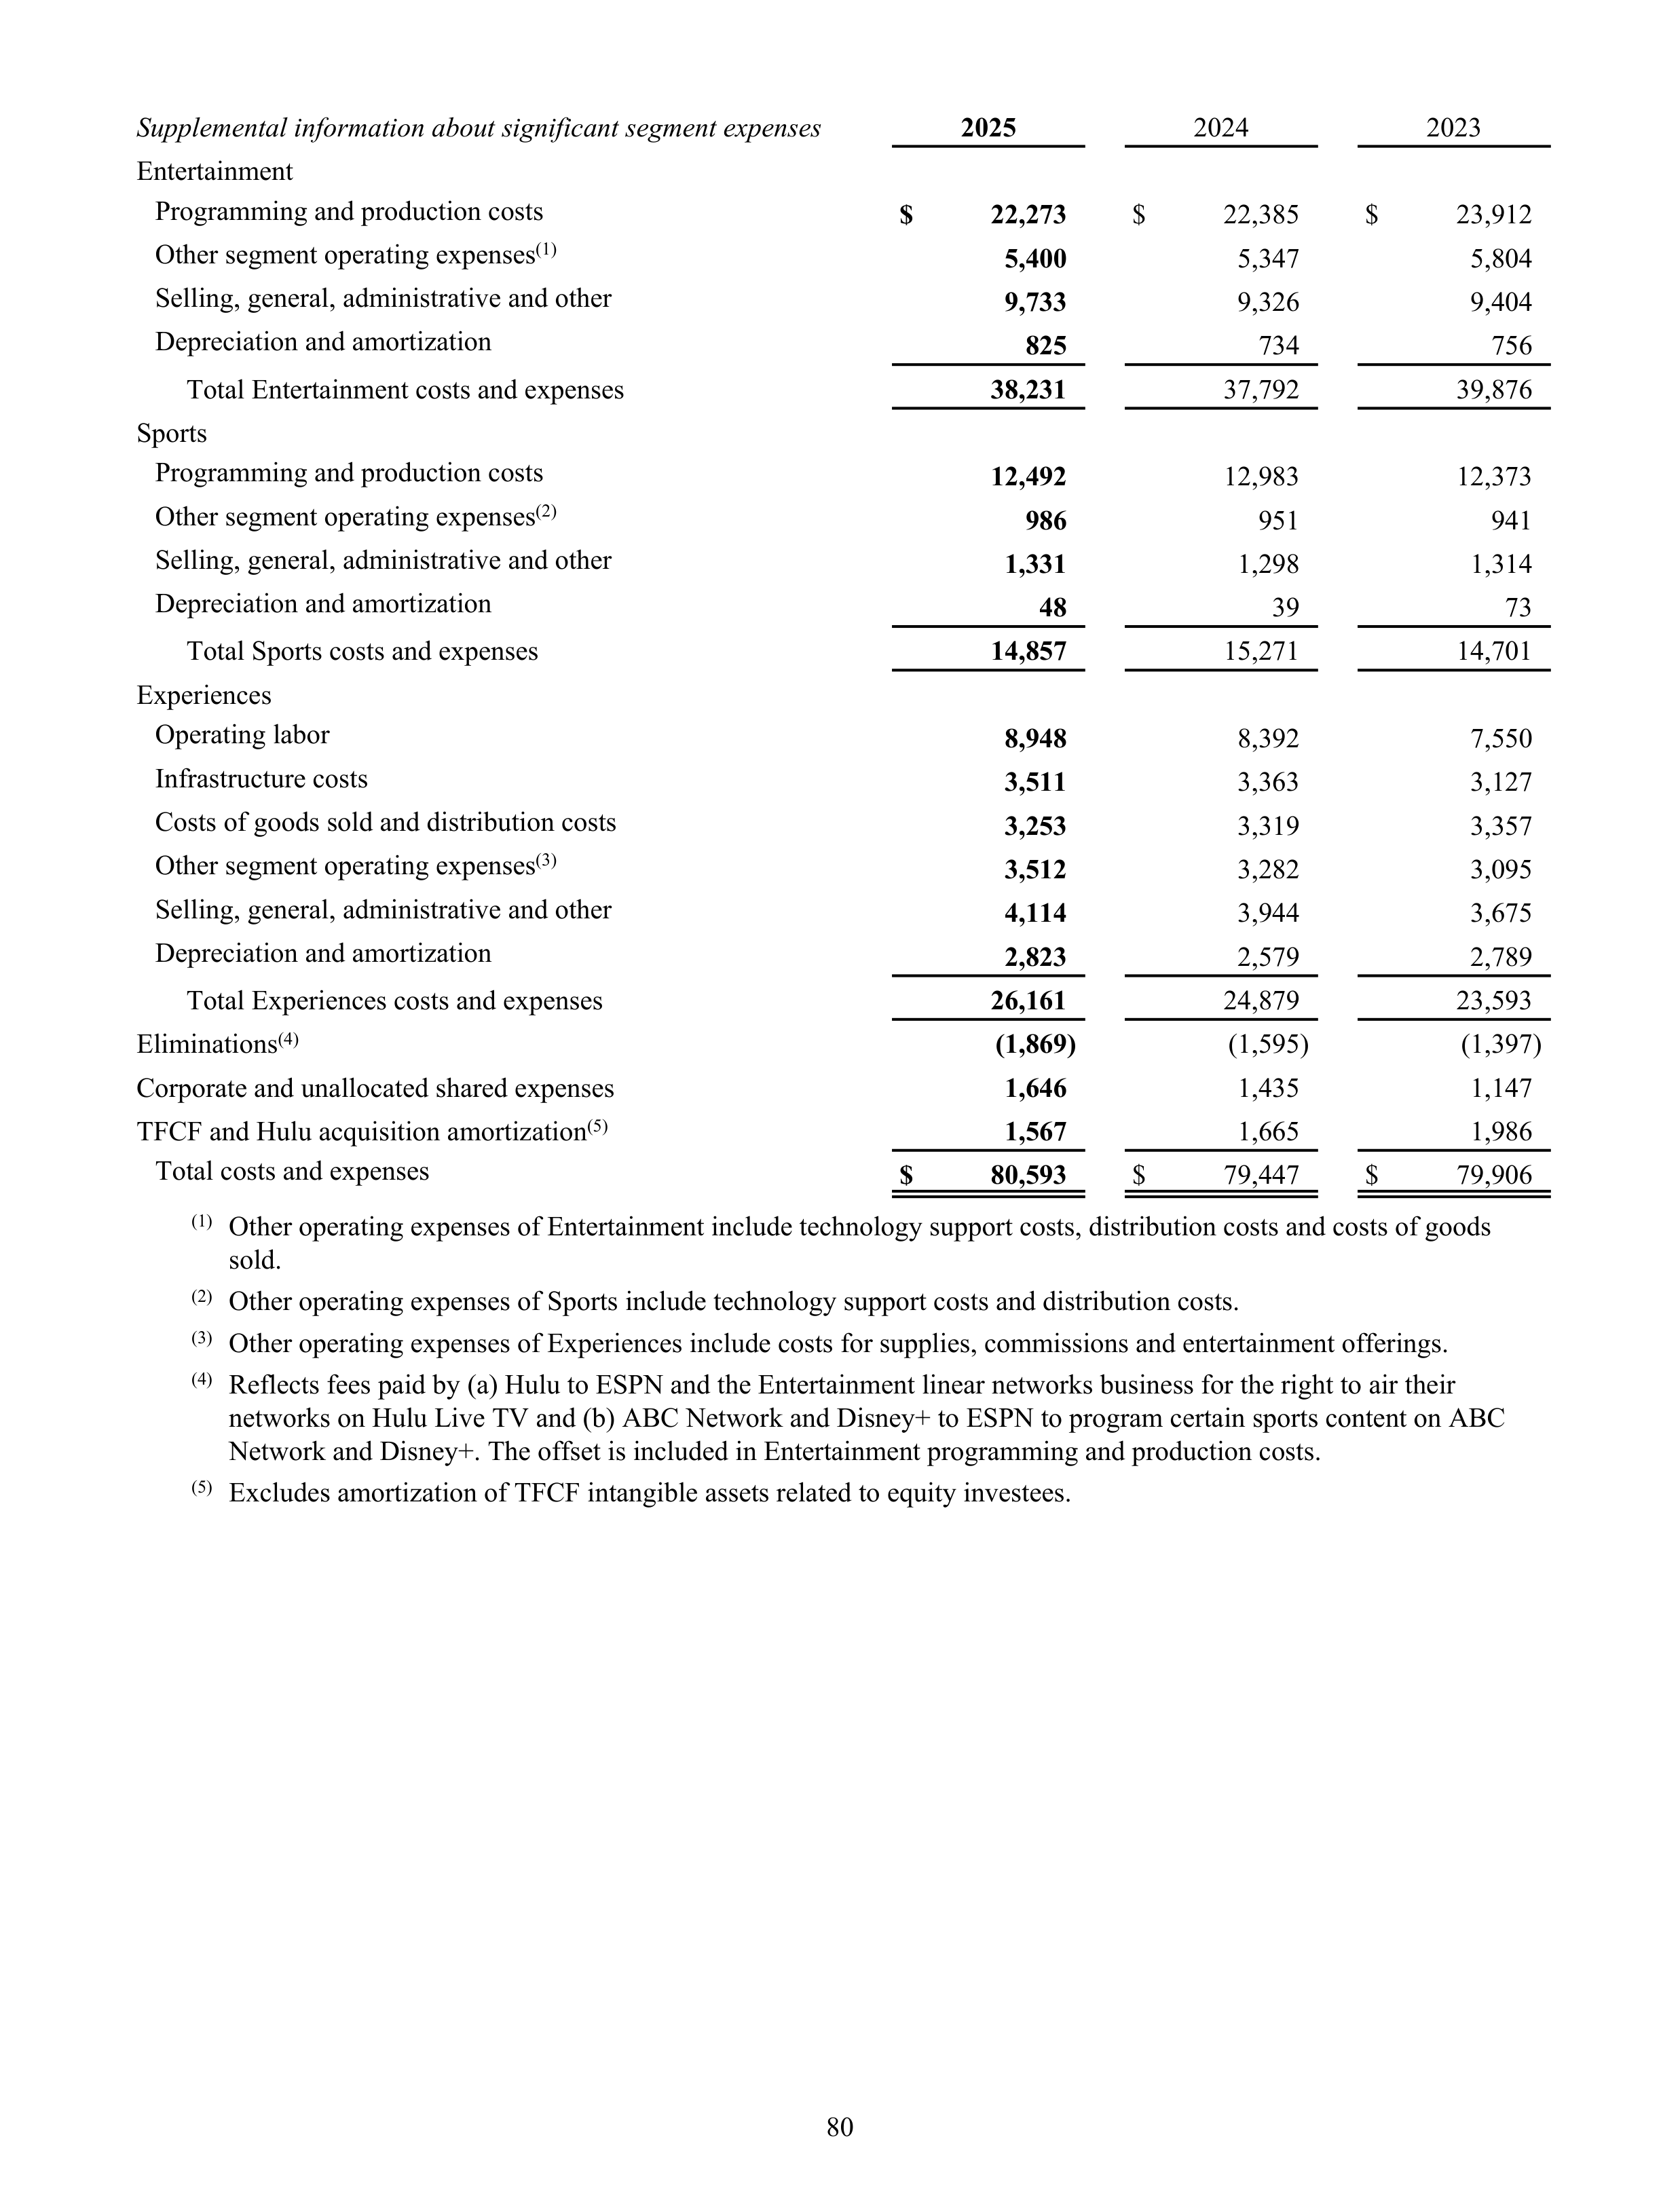
Supplemental information about significant segment expenses
2025
2024
2023
Entertainment
Programming and production costs
$
22,273
$
22,385
$
23,912
Other segment operating expenses
(1)
5,400
5,347
5,804
Selling, general, administrative and other
9,733
9,326
9,404
Depreciation and amortization
825
734
756
Total Entertainment costs and expenses
38,231
37,792
39,876
Sports
Programming and production costs
12,492
12,983
12,373
Other segment operating expenses
(2)
986
951
941
Selling, general, administrative and other
1,331
1,298
1,314
Depreciation and amortization
48
39
73
Total Sports costs and expenses
14,857
15,271
14,701
Experiences
Operating labor
8,948
8,392
7,550
Infrastructure costs
3,511
3,363
3,127
Costs of goods sold and distribution costs
3,253
3,319
3,357
Other segment operating expenses
(3)
3,512
3,282
3,095
Selling, general, administrative and other
4,114
3,944
3,675
Depreciation and amortization
2,823
2,579
2,789
Total Experiences costs and expenses
26,161
24,879
23,593
Eliminations
(4)
(1,869)
(1,595)
(1,397)
Corporate and unallocated shared expenses
1,646
1,435
1,147
TFCF and Hulu acquisition amortization
(5)
1,567
1,665
1,986
Total costs and expenses
$
80,593
$
79,447
$
79,906
(1)
Other operating expenses of Entertainment include technology support costs, distribution costs and costs of goods
sold.
(2)
Other operating expenses of Sports include technology support costs and distribution costs.
(3)
Other operating expenses of Experiences include costs for supplies, commissions and entertainment offerings.
(4)
Reflects fees paid by (a) Hulu to ESPN and the Entertainment linear networks business for the right to air their
networks on Hulu Live TV and (b) ABC Network and Disney+ to ESPN to program certain sports content on ABC
Network and Disney+. The offset is included in Entertainment programming and production costs.
(5)
Excludes amortization of TFCF intangible assets related to equity investees.
80
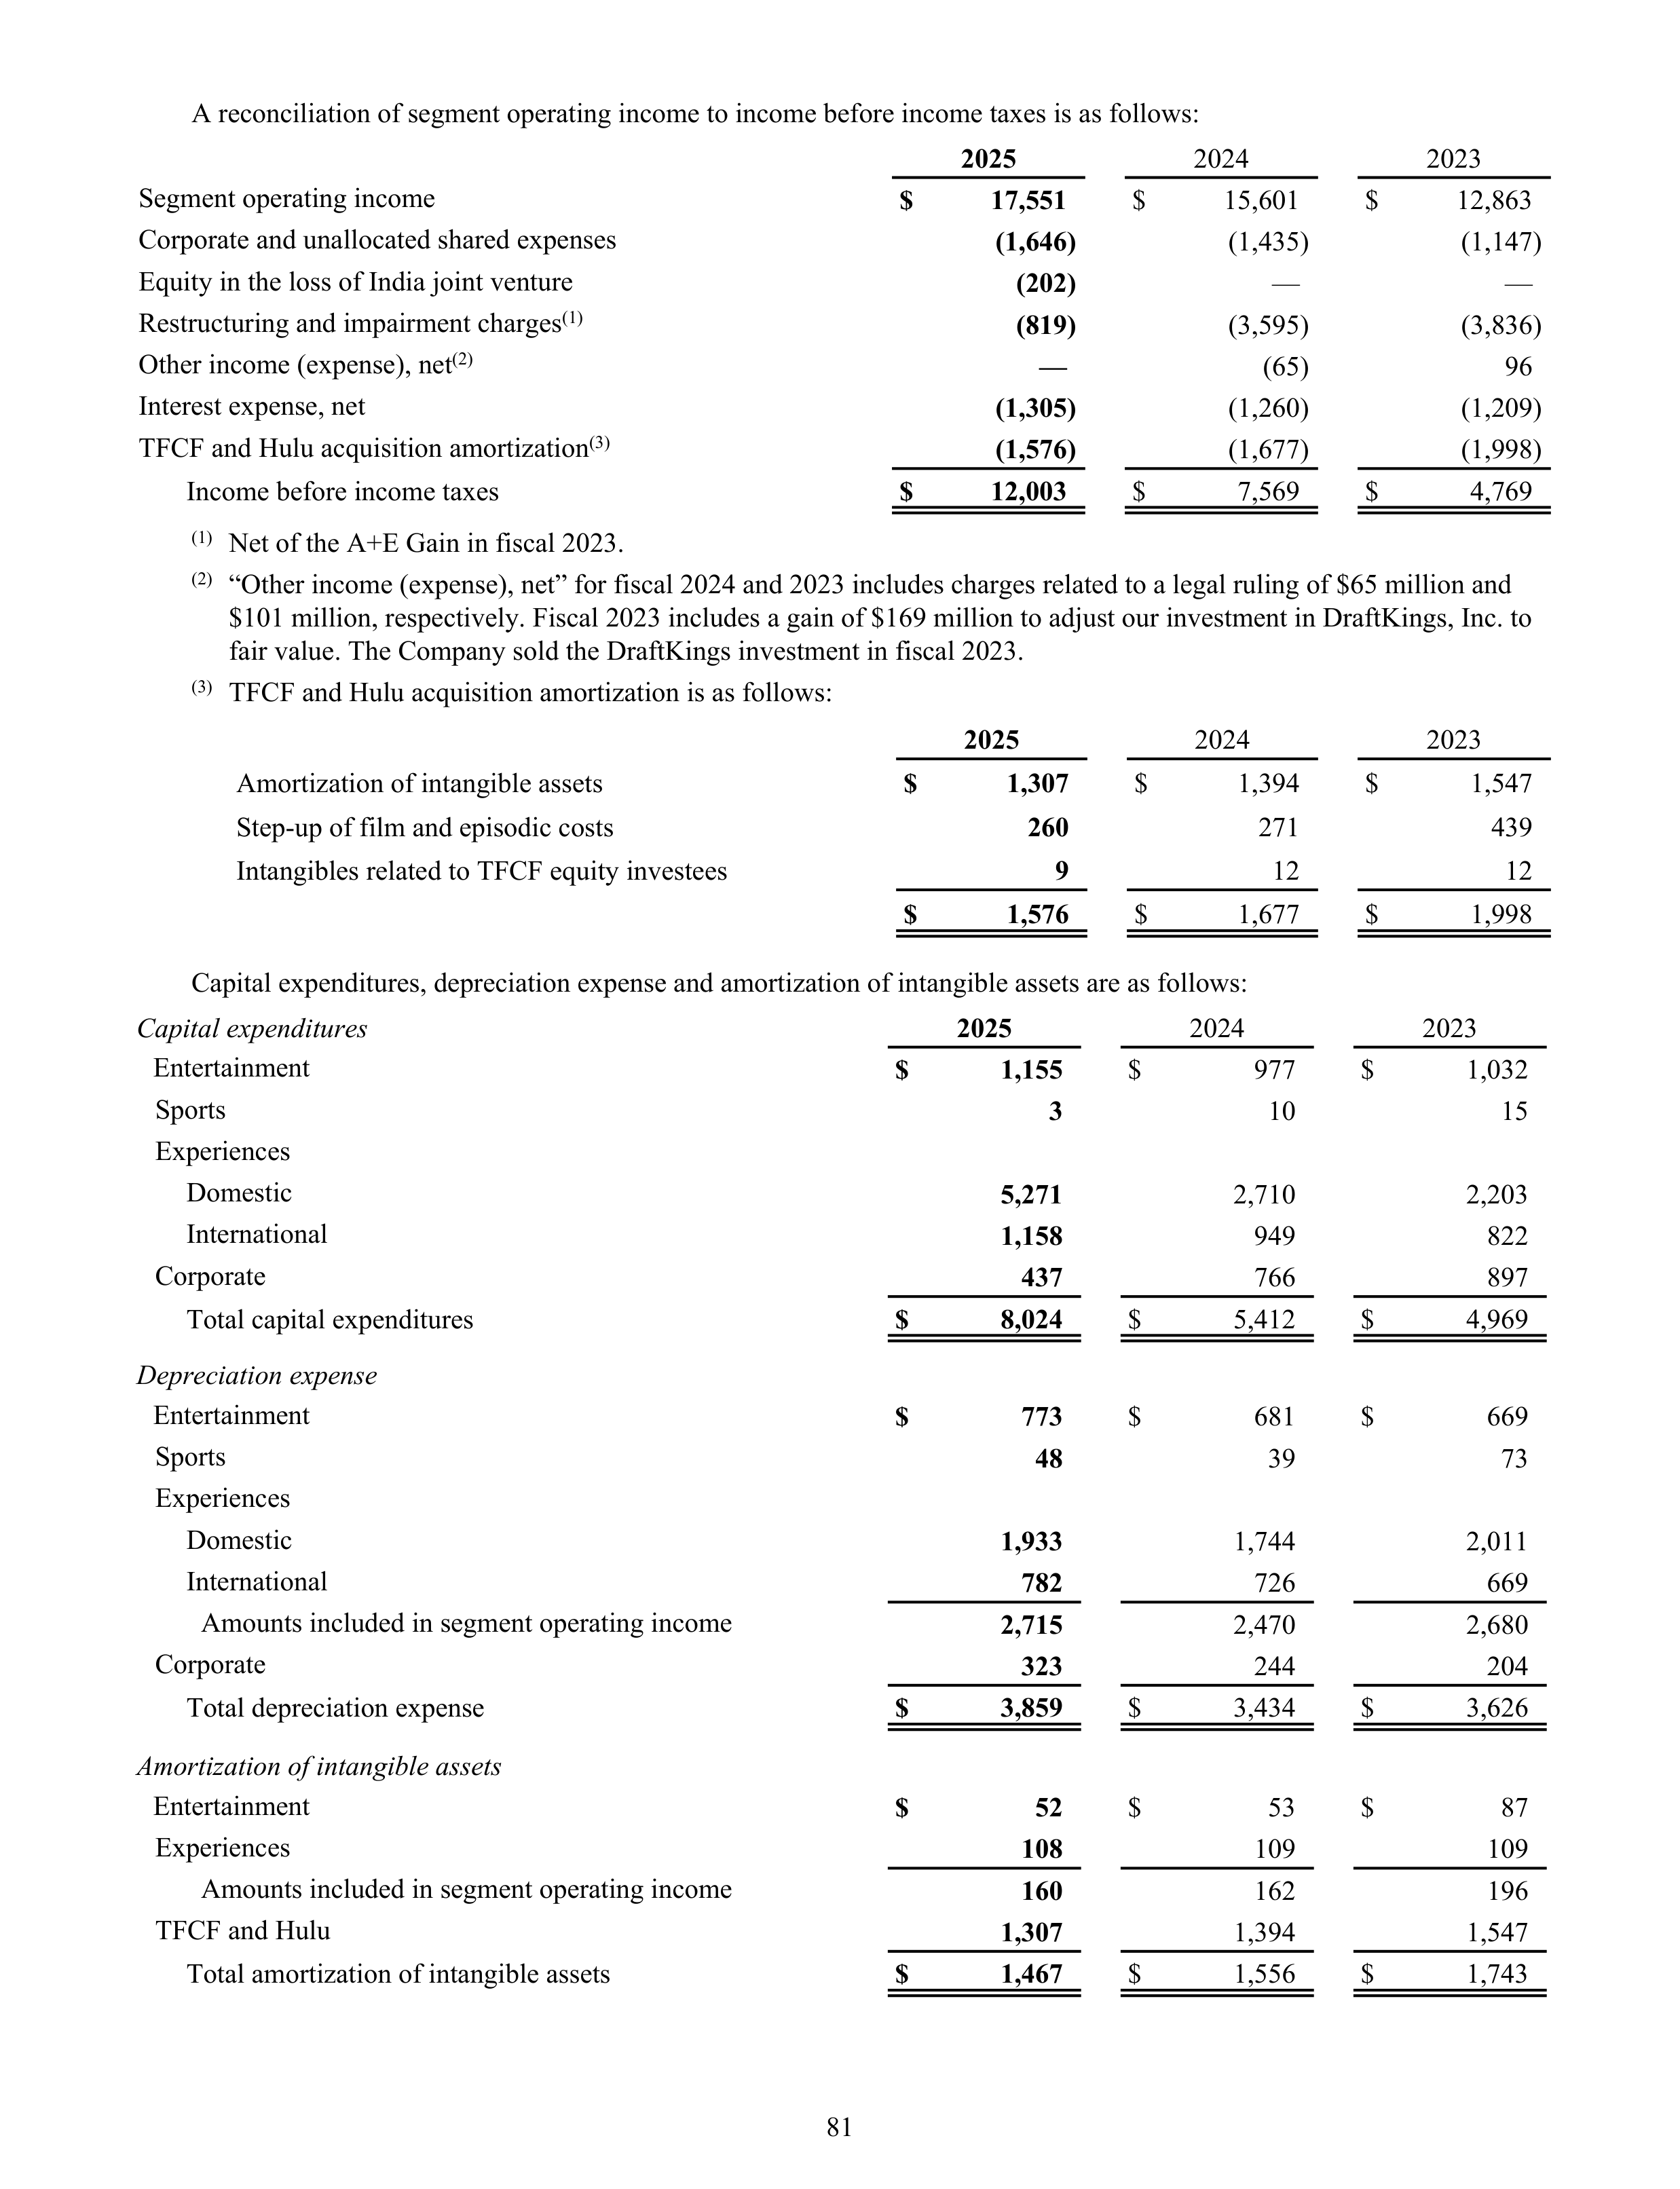
A reconciliation of segment operating income to income before income taxes is as follows:
2025
2024
2023
Segment operating income
$
17,551
$
15,601
$
12,863
Corporate and unallocated shared expenses
(1,646)
(1,435)
(1,147)
Equity in the loss of India joint venture
(202)
—
—
Restructuring and impairment charges
(1)
(819)
(3,595)
(3,836)
Other income (expense), net
(2)
—
(65)
96
Interest expense, net
(1,305)
(1,260)
(1,209)
TFCF and Hulu acquisition amortization
(3)
(1,576)
(1,677)
(1,998)
Income before income taxes
$
12,003
$
7,569
$
4,769
(1)
Net of the A+E Gain in fiscal 2023.
(2)
“Other income (expense), net” for fiscal 2024 and 2023 includes charges related to a legal ruling of $65 million and
$101 million, respectively. Fiscal 2023 includes a gain of $169 million to adjust our investment in DraftKings, Inc. to
fair value. The Company sold the DraftKings investment in fiscal 2023.
(3)
TFCF and Hulu acquisition amortization is as follows:
2025
2024
2023
Amortization of intangible assets
$
1,307
$
1,394
$
1,547
Step-up of film and episodic costs
260
271
439
Intangibles related to TFCF equity investees
9
12
12
$
1,576
$
1,677
$
1,998
Capital expenditures, depreciation expense and amortization of intangible assets are as follows:
Capital expenditures
2025
2024
2023
Entertainment
$
1,155
$
977
$
1,032
Sports
3
10
15
Experiences
Domestic
5,271
2,710
2,203
International
1,158
949
822
Corporate
437
766
897
Total capital expenditures
$
8,024
$
5,412
$
4,969
Depreciation expense
Entertainment
$
773
$
681
$
669
Sports
48
39
73
Experiences
Domestic
1,933
1,744
2,011
International
782
726
669
Amounts included in segment operating income
2,715
2,470
2,680
Corporate
323
244
204
Total depreciation expense
$
3,859
$
3,434
$
3,626
Amortization of intangible assets
Entertainment
$
52
$
53
$
87
Experiences
108
109
109
Amounts included in segment operating income
160
162
196
TFCF and Hulu
1,307
1,394
1,547
Total amortization of intangible assets
$
1,467
$
1,556
$
1,743
81
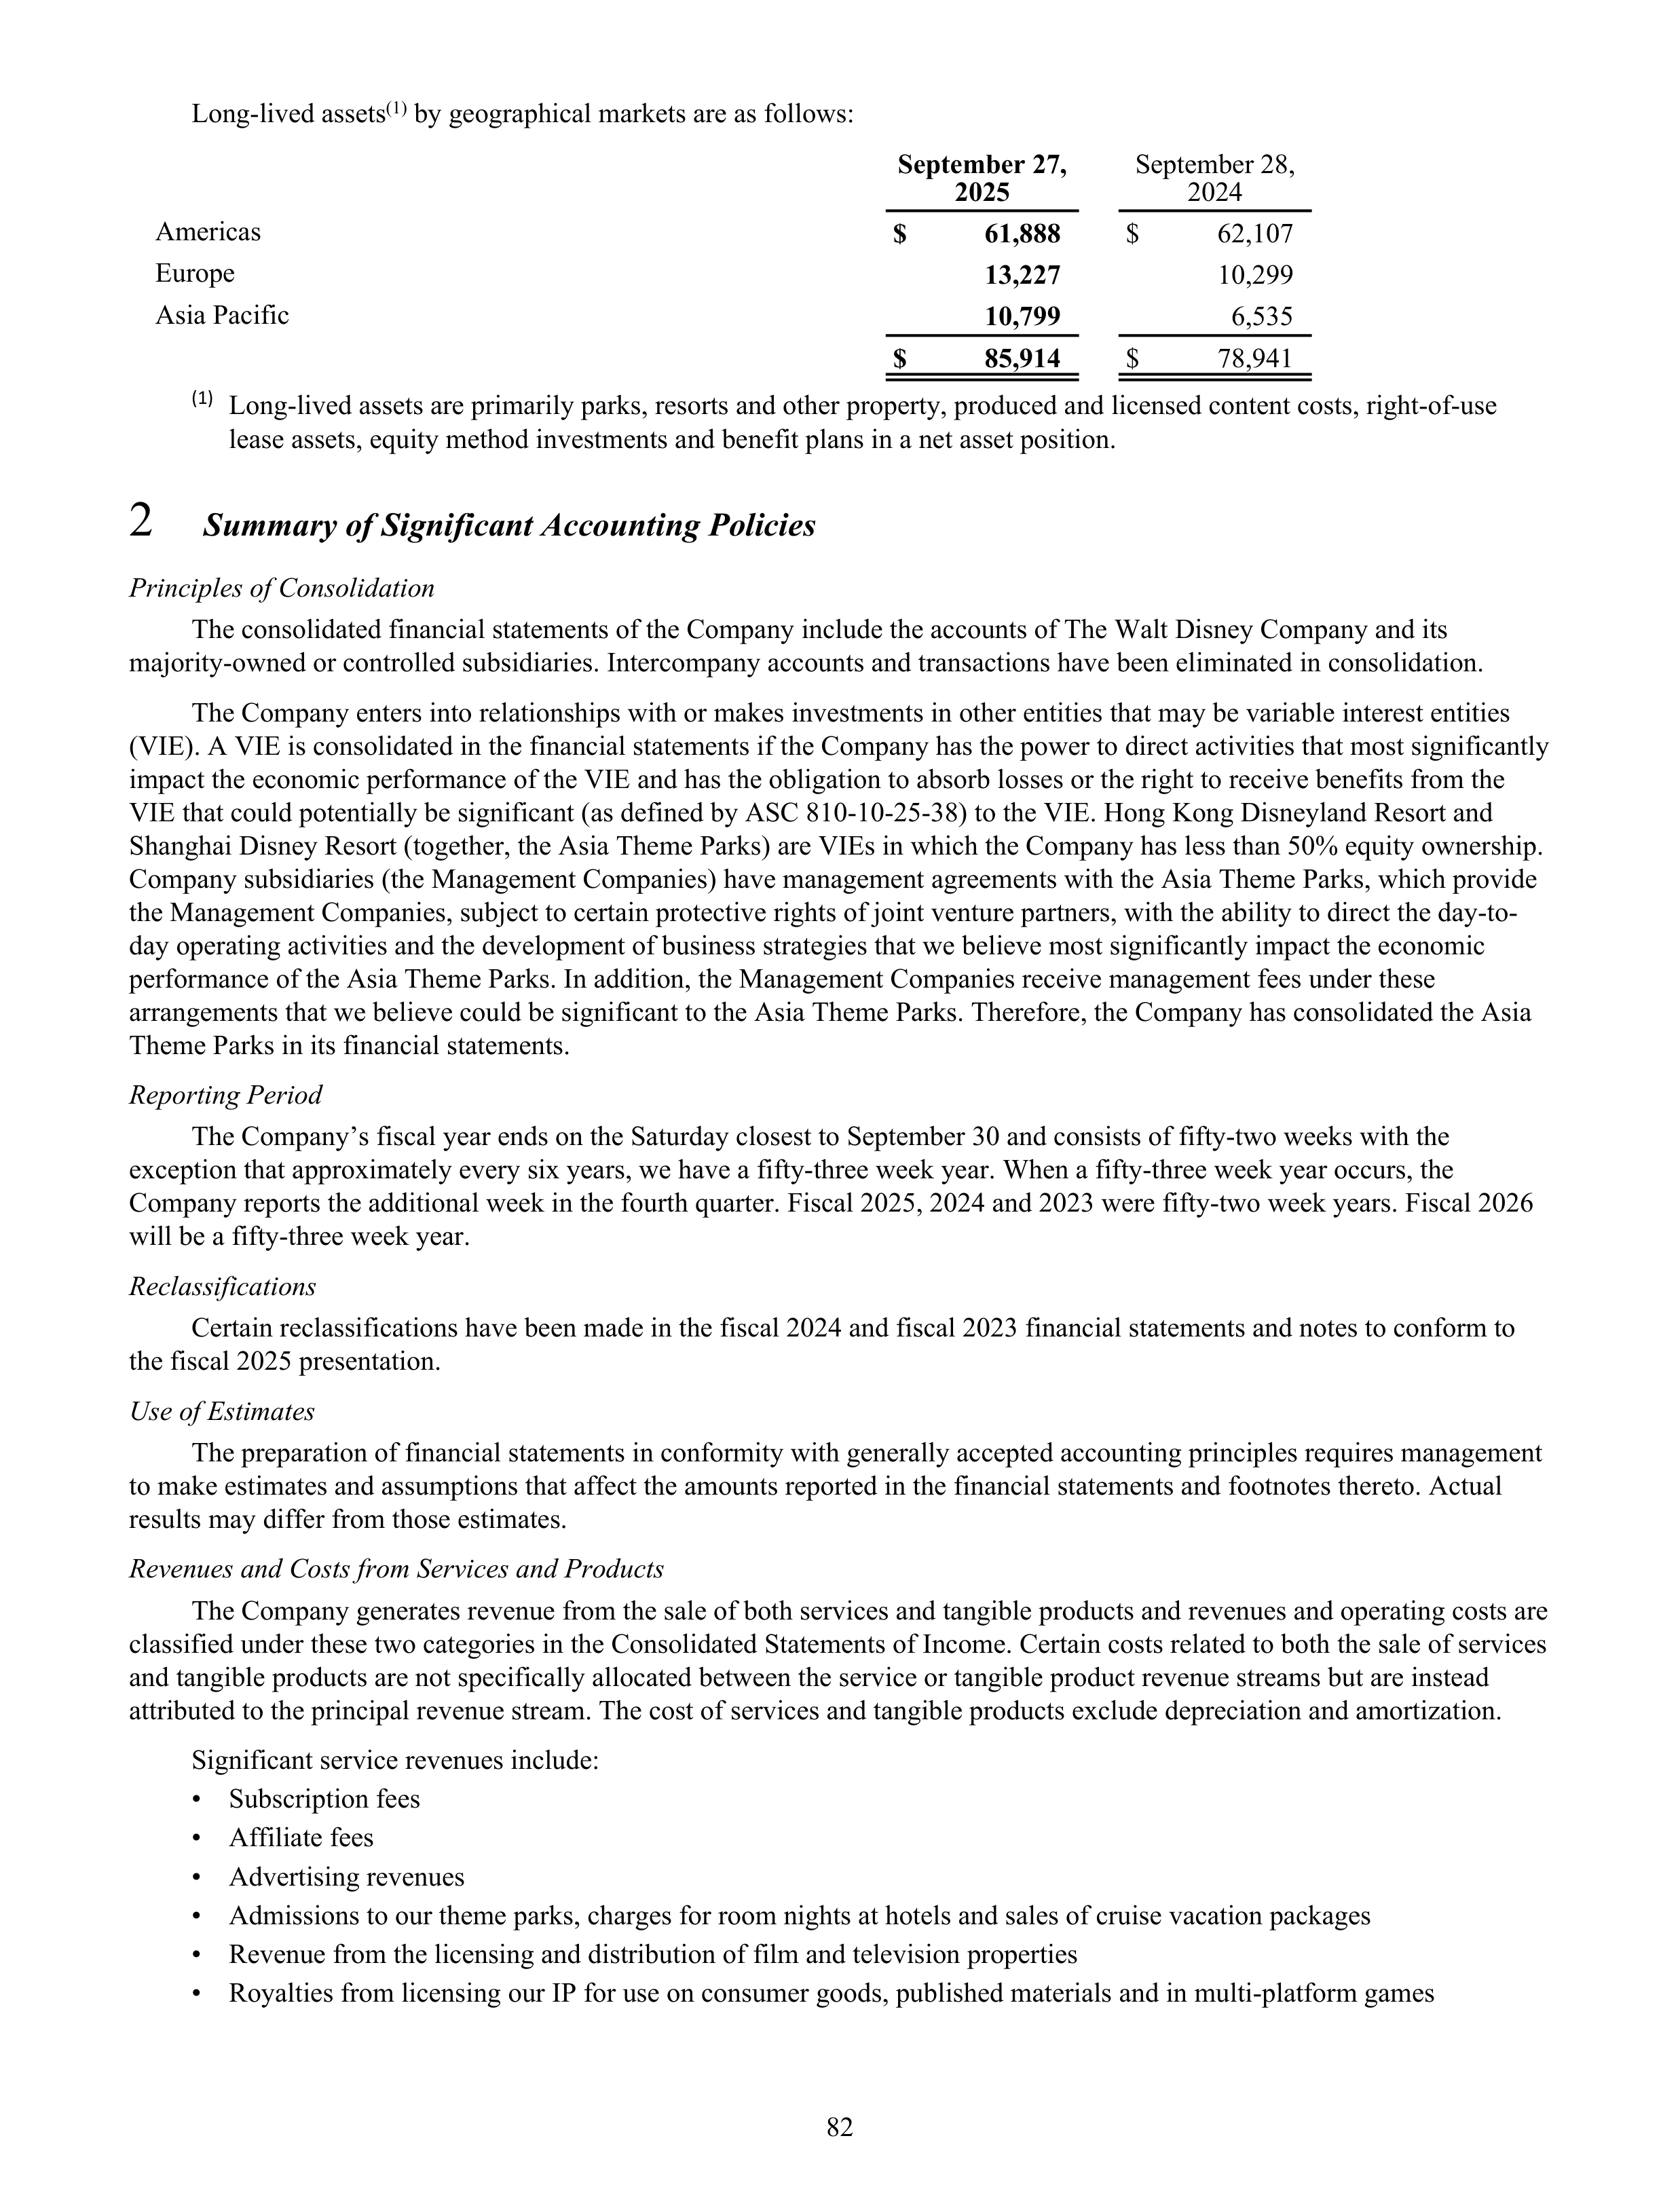
Long-lived assets
(1)
by geographical markets are as follows:
September 27,
2025
September 28,
2024
Americas
$
61,888
$
62,107
Europe
13,227
10,299
Asia Pacific
10,799
6,535
$
85,914
$
78,941
(1)
Long-lived assets are primarily parks, resorts and other property, produced and licensed content costs, right-of-use
lease assets, equity method investments and benefit plans in a net asset position.
2
Summary of Significant Accounting Policies
Principles of Consolidation
The consolidated financial statements of the Company include the accounts of The Walt Disney Company and its
majority-owned or controlled subsidiaries. Intercompany accounts and transactions have been eliminated in consolidation.
The Company enters into relationships with or makes investments in other entities that may be variable interest entities
(VIE). A VIE is consolidated in the financial statements if the Company has the power to direct activities that most significantly
impact the economic performance of the VIE and has the obligation to absorb losses or the right to receive benefits from the
VIE that could potentially be significant (as defined by ASC 810-10-25-38) to the VIE. Hong Kong Disneyland Resort and
Shanghai Disney Resort (together, the Asia Theme Parks) are VIEs in which the Company has less than 50% equity ownership.
Company subsidiaries (the Management Companies) have management agreements with the Asia Theme Parks, which provide
the Management Companies, subject to certain protective rights of joint venture partners, with the ability to direct the day-to-
day operating activities and the development of business strategies that we believe most significantly impact the economic
performance of the Asia Theme Parks. In addition, the Management Companies receive management fees under these
arrangements that we believe could be significant to the Asia Theme Parks. Therefore, the Company has consolidated the Asia
Theme Parks in its financial statements.
Reporting Period
The Company’s fiscal year ends on the Saturday closest to September 30 and consists of fifty-two weeks with the
exception that approximately every six years, we have a fifty-three week year. When a fifty-three week year occurs, the
Company reports the additional week in the fourth quarter. Fiscal 2025, 2024 and 2023 were fifty-two week years. Fiscal 2026
will be a fifty-three week year.
Reclassifications
Certain reclassifications have been made in the fiscal 2024 and fiscal 2023 financial statements and notes to conform to
the fiscal 2025 presentation.
Use of Estimates
The preparation of financial statements in conformity with generally accepted accounting principles requires management
to make estimates and assumptions that affect the amounts reported in the financial statements and footnotes thereto. Actual
results may differ from those estimates.
Revenues and Costs from Services and Products
The Company generates revenue from the sale of both services and tangible products and revenues and operating costs are
classified under these two categories in the Consolidated Statements of Income. Certain costs related to both the sale of services
and tangible products are not specifically allocated between the service or tangible product revenue streams but are instead
attributed to the principal revenue stream. The cost of services and tangible products exclude depreciation and amortization.
Significant service revenues include:
•
Subscription fees
•
Affiliate fees
•
Advertising revenues
•
Admissions to our theme parks, charges for room nights at hotels and sales of cruise vacation packages
•
Revenue from the licensing and distribution of film and television properties
•
Royalties from licensing our IP for use on consumer goods, published materials and in multi-platform games
82
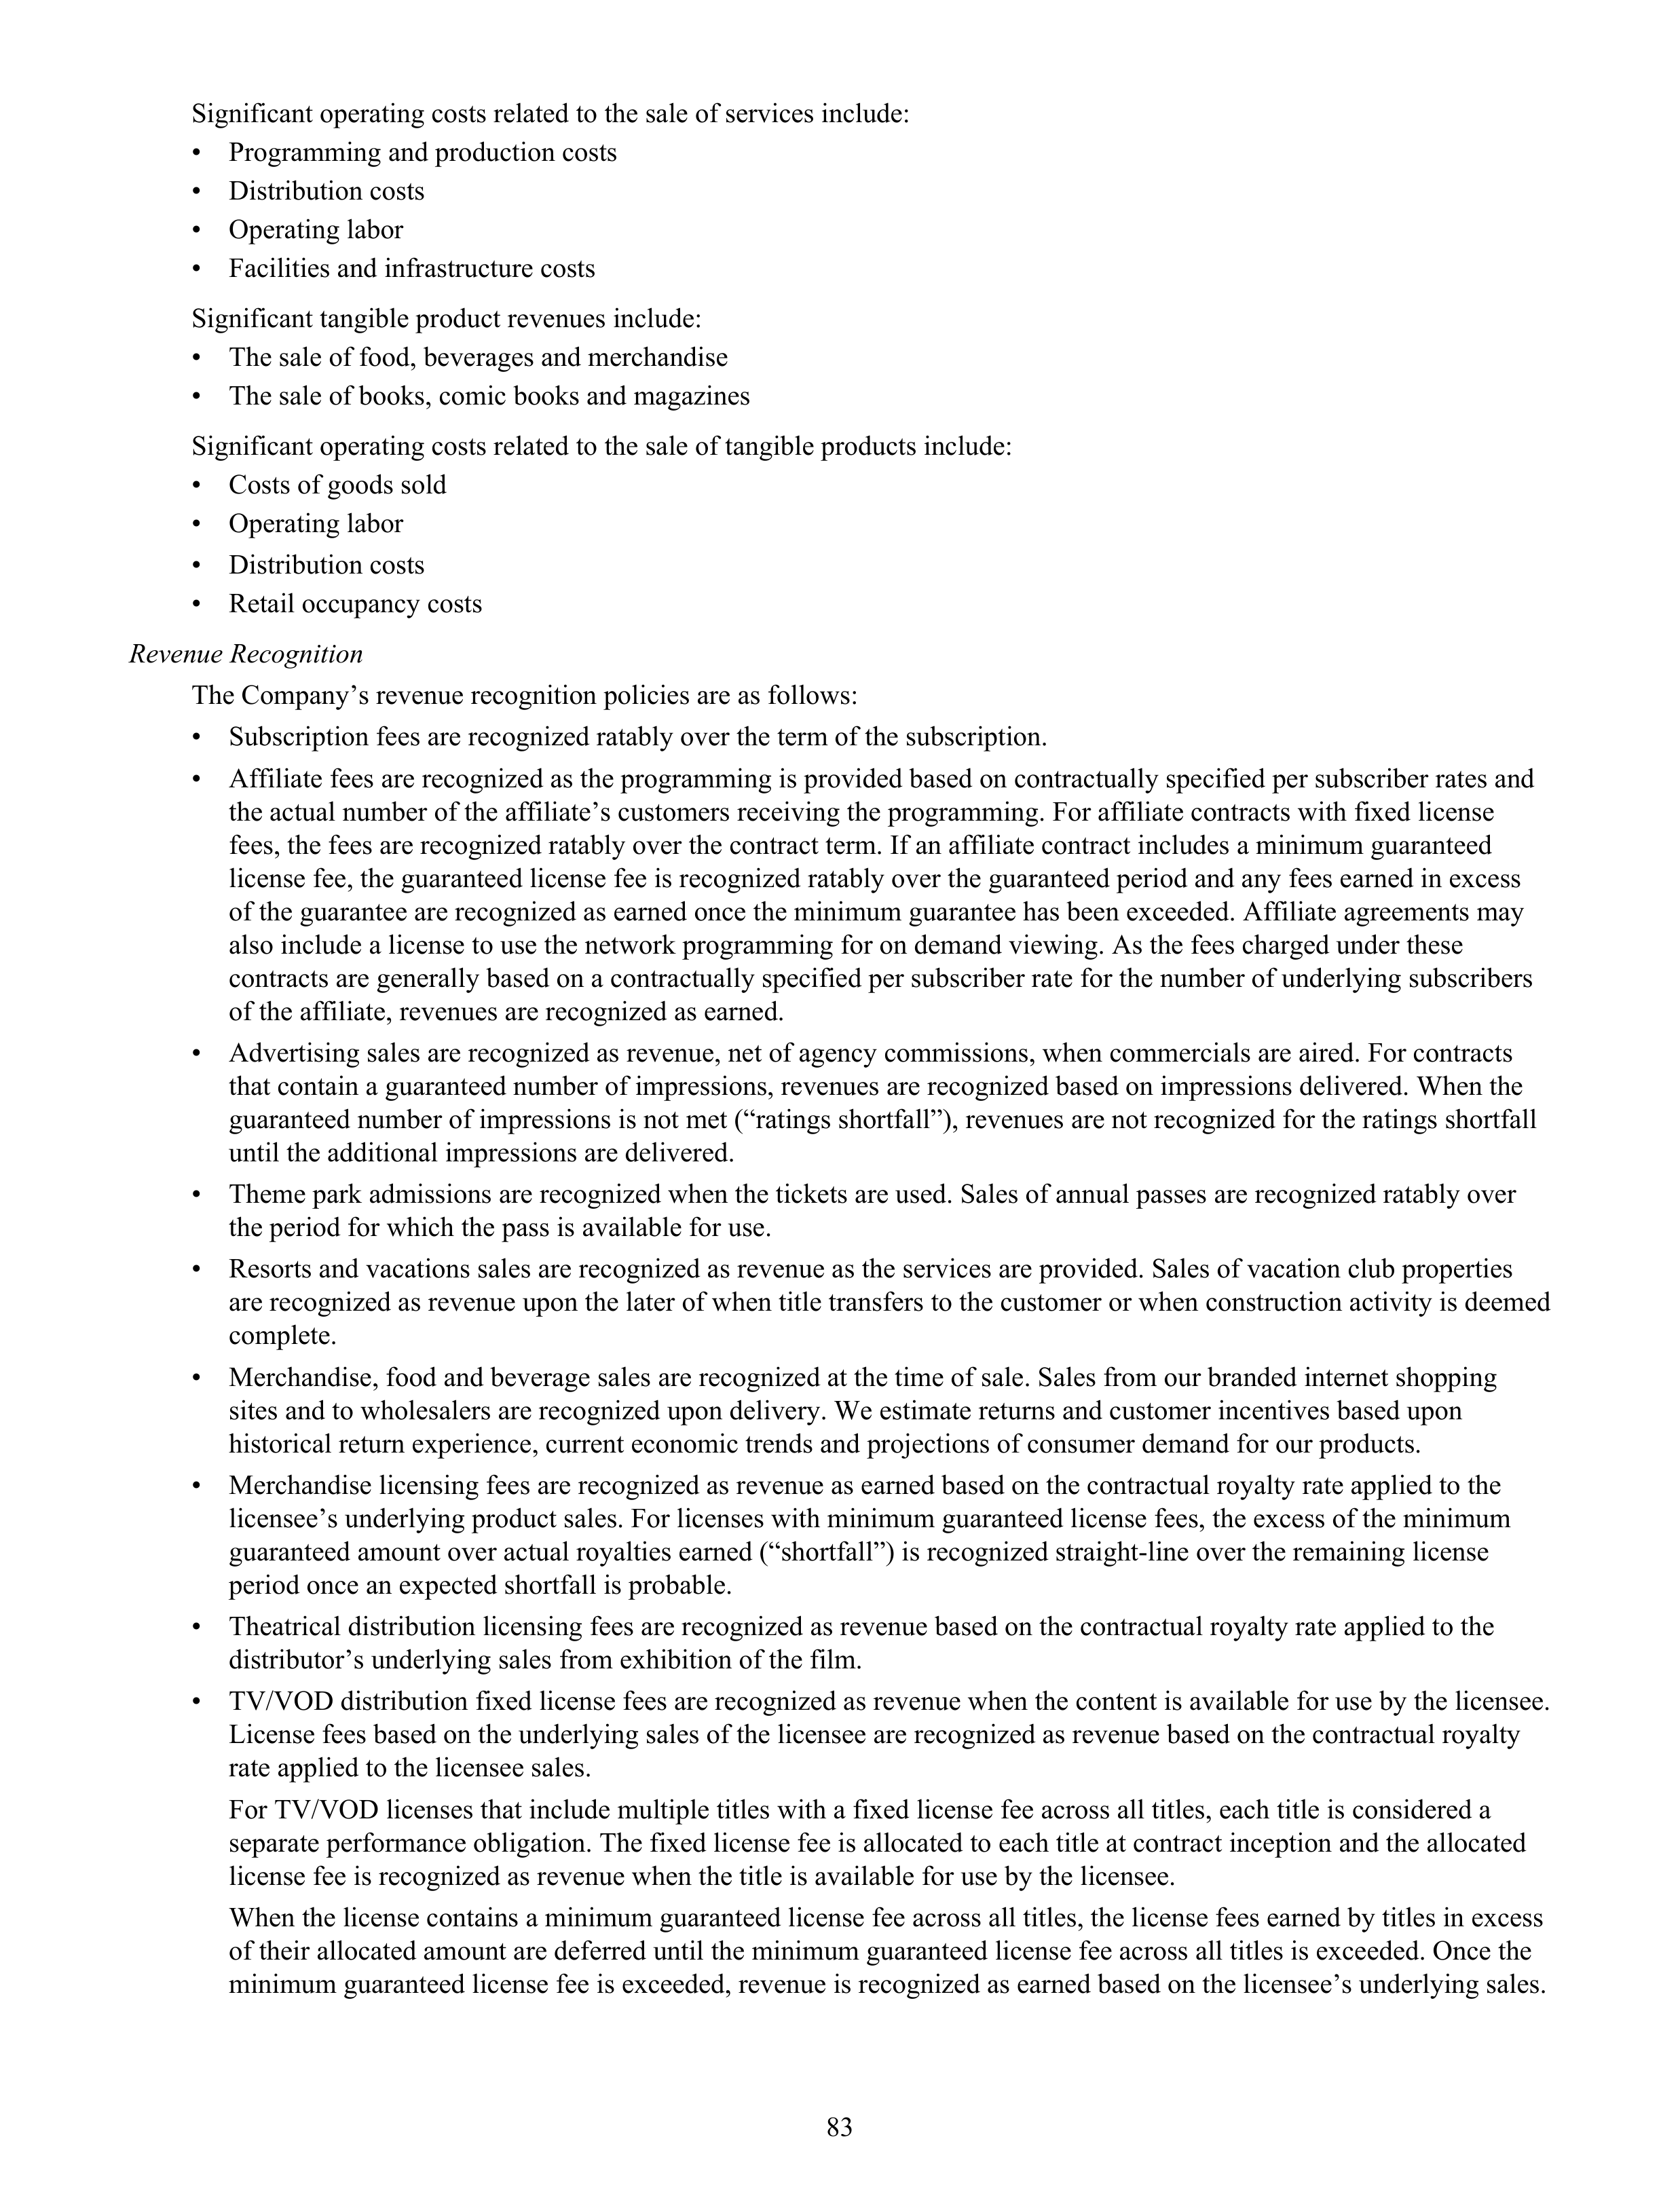
Significant operating costs related to the sale of services include:
•
Programming and production costs
•
Distribution costs
•
Operating labor
•
Facilities and infrastructure costs
Significant tangible product revenues include:
•
The sale of food, beverages and merchandise
•
The sale of books, comic books and magazines
Significant operating costs related to the sale of tangible products include:
•
Costs of goods sold
•
Operating labor
•
Distribution costs
•
Retail occupancy costs
Revenue Recognition
The Company’s revenue recognition policies are as follows:
•
Subscription fees are recognized ratably over the term of the subscription.
•
Affiliate fees are recognized as the programming is provided based on contractually specified per subscriber rates and
the actual number of the affiliate’s customers receiving the programming. For affiliate contracts with fixed license
fees, the fees are recognized ratably over the contract term. If an affiliate contract includes a minimum guaranteed
license fee, the guaranteed license fee is recognized ratably over the guaranteed period and any fees earned in excess
of the guarantee are recognized as earned once the minimum guarantee has been exceeded. Affiliate agreements may
also include a license to use the network programming for on demand viewing. As the fees charged under these
contracts are generally based on a contractually specified per subscriber rate for the number of underlying subscribers
of the affiliate, revenues are recognized as earned.
•
Advertising sales are recognized as revenue, net of agency commissions, when commercials are aired. For contracts
that contain a guaranteed number of impressions, revenues are recognized based on impressions delivered. When the
guaranteed number of impressions is not met (“ratings shortfall”), revenues are not recognized for the ratings shortfall
until the additional impressions are delivered.
•
Theme park admissions are recognized when the tickets are used. Sales of annual passes are recognized ratably over
the period for which the pass is available for use.
•
Resorts and vacations sales are recognized as revenue as the services are provided. Sales of vacation club properties
are recognized as revenue upon the later of when title transfers to the customer or when construction activity is deemed
complete.
•
Merchandise, food and beverage sales are recognized at the time of sale. Sales from our branded internet shopping
sites and to wholesalers are recognized upon delivery. We estimate returns and customer incentives based upon
historical return experience, current economic trends and projections of consumer demand for our products.
•
Merchandise licensing fees are recognized as revenue as earned based on the contractual royalty rate applied to the
licensee’s underlying product sales. For licenses with minimum guaranteed license fees, the excess of the minimum
guaranteed amount over actual royalties earned (“shortfall”) is recognized straight-line over the remaining license
period once an expected shortfall is probable.
•
Theatrical distribution licensing fees are recognized as revenue based on the contractual royalty rate applied to the
distributor’s underlying sales from exhibition of the film.
•
TV/VOD distribution fixed license fees are recognized as revenue when the content is available for use by the licensee.
License fees based on the underlying sales of the licensee are recognized as revenue based on the contractual royalty
rate applied to the licensee sales.
For TV/VOD licenses that include multiple titles with a fixed license fee across all titles, each title is considered a
separate performance obligation. The fixed license fee is allocated to each title at contract inception and the allocated
license fee is recognized as revenue when the title is available for use by the licensee.
When the license contains a minimum guaranteed license fee across all titles, the license fees earned by titles in excess
of their allocated amount are deferred until the minimum guaranteed license fee across all titles is exceeded. Once the
minimum guaranteed license fee is exceeded, revenue is recognized as earned based on the licensee’s underlying sales.
83
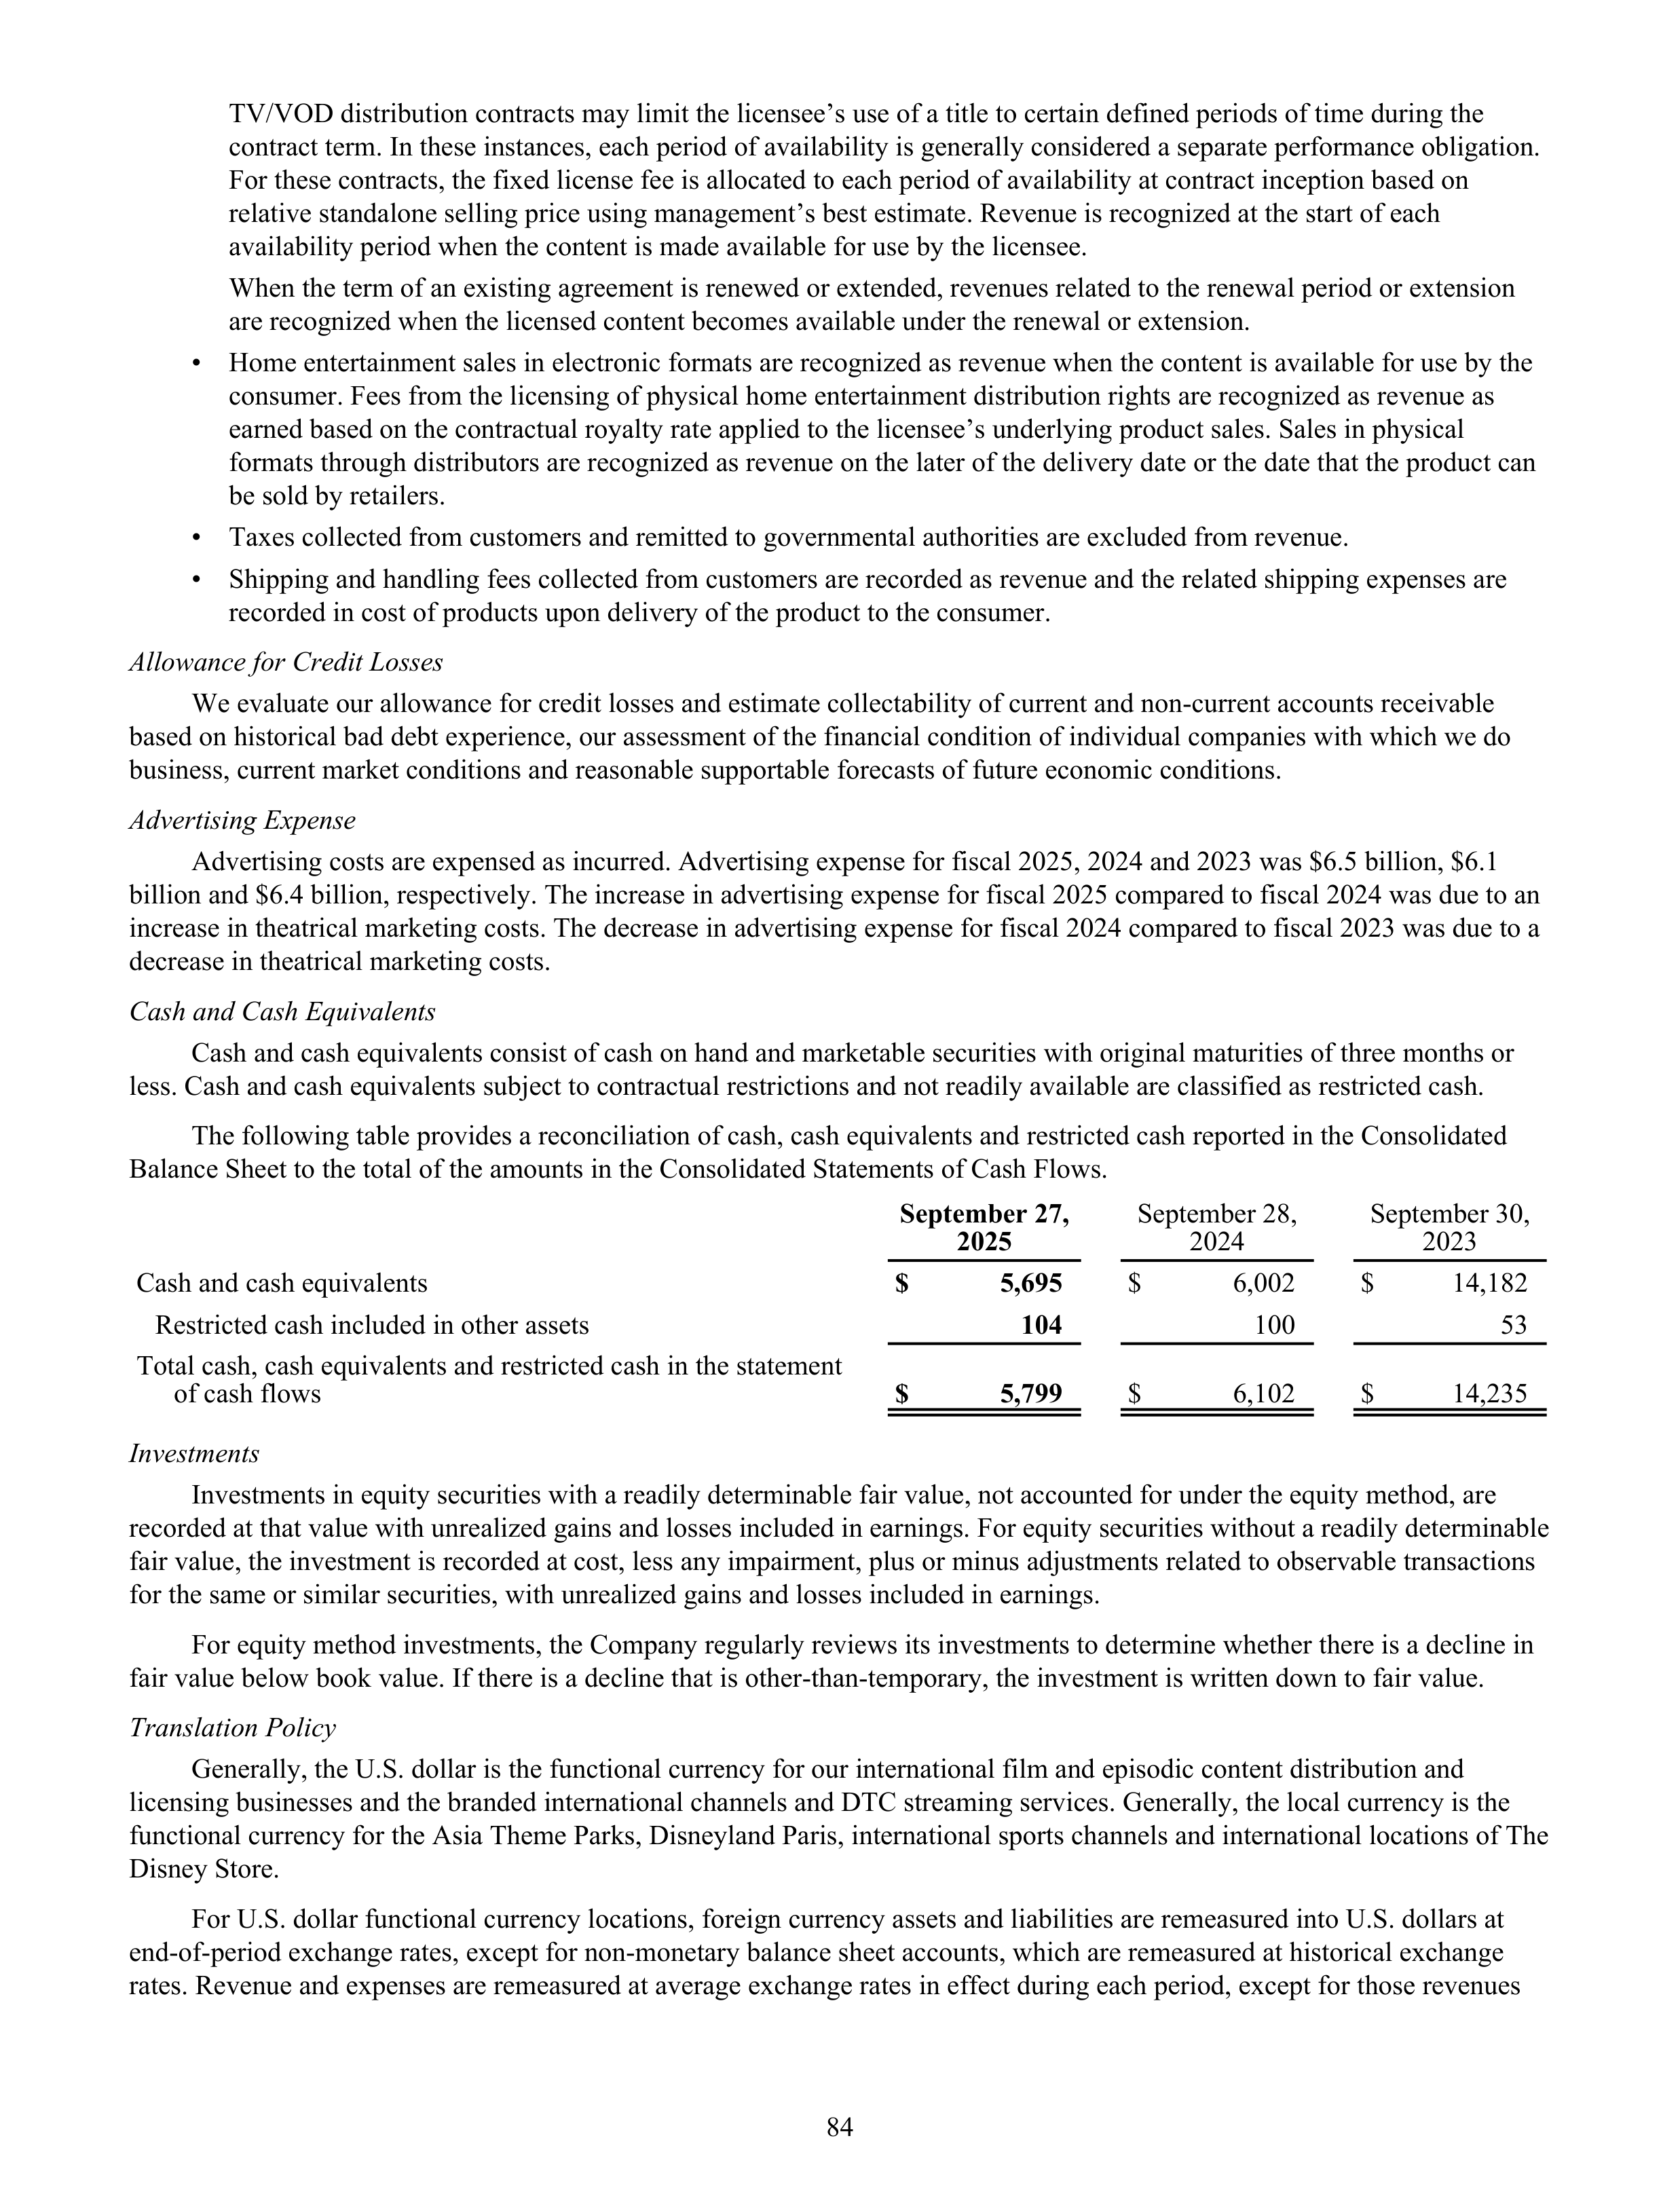
TV/VOD distribution contracts may limit the licensee’s use of a title to certain defined periods of time during the
contract term. In these instances, each period of availability is generally considered a separate performance obligation.
For these contracts, the fixed license fee is allocated to each period of availability at contract inception based on
relative standalone selling price using management’s best estimate. Revenue is recognized at the start of each
availability period when the content is made available for use by the licensee.
When the term of an existing agreement is renewed or extended, revenues related to the renewal period or extension
are recognized when the licensed content becomes available under the renewal or extension.
•
Home entertainment sales in electronic formats are recognized as revenue when the content is available for use by the
consumer. Fees from the licensing of physical home entertainment distribution rights are recognized as revenue as
earned based on the contractual royalty rate applied to the licensee’s underlying product sales. Sales in physical
formats through distributors are recognized as revenue on the later of the delivery date or the date that the product can
be sold by retailers.
•
Taxes collected from customers and remitted to governmental authorities are excluded from revenue.
•
Shipping and handling fees collected from customers are recorded as revenue and the related shipping expenses are
recorded in cost of products upon delivery of the product to the consumer.
Allowance for Credit Losses
We evaluate our allowance for credit losses and estimate collectability of current and non-current accounts receivable
based on historical bad debt experience, our assessment of the financial condition of individual companies with which we do
business, current market conditions and reasonable supportable forecasts of future economic conditions.
Advertising Expense
Advertising costs are expensed as incurred. Advertising expense for fiscal 2025, 2024 and 2023 was $6.5 billion, $6.1
billion and $6.4 billion, respectively. The increase in advertising expense for fiscal 2025 compared to fiscal 2024 was due to an
increase in theatrical marketing costs. The decrease in advertising expense for fiscal 2024 compared to fiscal 2023 was due to a
decrease in theatrical marketing costs.
Cash and Cash Equivalents
Cash and cash equivalents consist of cash on hand and marketable securities with original maturities of three months or
less. Cash and cash equivalents subject to contractual restrictions and not readily available are classified as restricted cash.
The following table provides a reconciliation of cash, cash equivalents and restricted cash reported in the Consolidated
Balance Sheet to the total of the amounts in the Consolidated Statements of Cash Flows.
September 27,
2025
September 28,
2024
September 30,
2023
Cash and cash equivalents
$
5,695
$
6,002
$
14,182
Restricted cash included in other assets
104
100
53
Total cash, cash equivalents and restricted cash in the statement
of cash flows
$
5,799
$
6,102
$
14,235
Investments
Investments in equity securities with a readily determinable fair value, not accounted for under the equity method, are
recorded at that value with unrealized gains and losses included in earnings. For equity securities without a readily determinable
fair value, the investment is recorded at cost, less any impairment, plus or minus adjustments related to observable transactions
for the same or similar securities, with unrealized gains and losses included in earnings.
For equity method investments, the Company regularly reviews its investments to determine whether there is a decline in
fair value below book value. If there is a decline that is other-than-temporary, the investment is written down to fair value.
Translation Policy
Generally, the U.S. dollar is the functional currency for our international film and episodic content distribution and
licensing businesses and the branded international channels and DTC streaming services. Generally, the local currency is the
functional currency for the Asia Theme Parks, Disneyland Paris, international sports channels and international locations of The
Disney Store.
For U.S. dollar functional currency locations, foreign currency assets and liabilities are remeasured into U.S. dollars at
end-of-period exchange rates, except for non-monetary balance sheet accounts, which are remeasured at historical exchange
rates. Revenue and expenses are remeasured at average exchange rates in effect during each period, except for those revenues
84
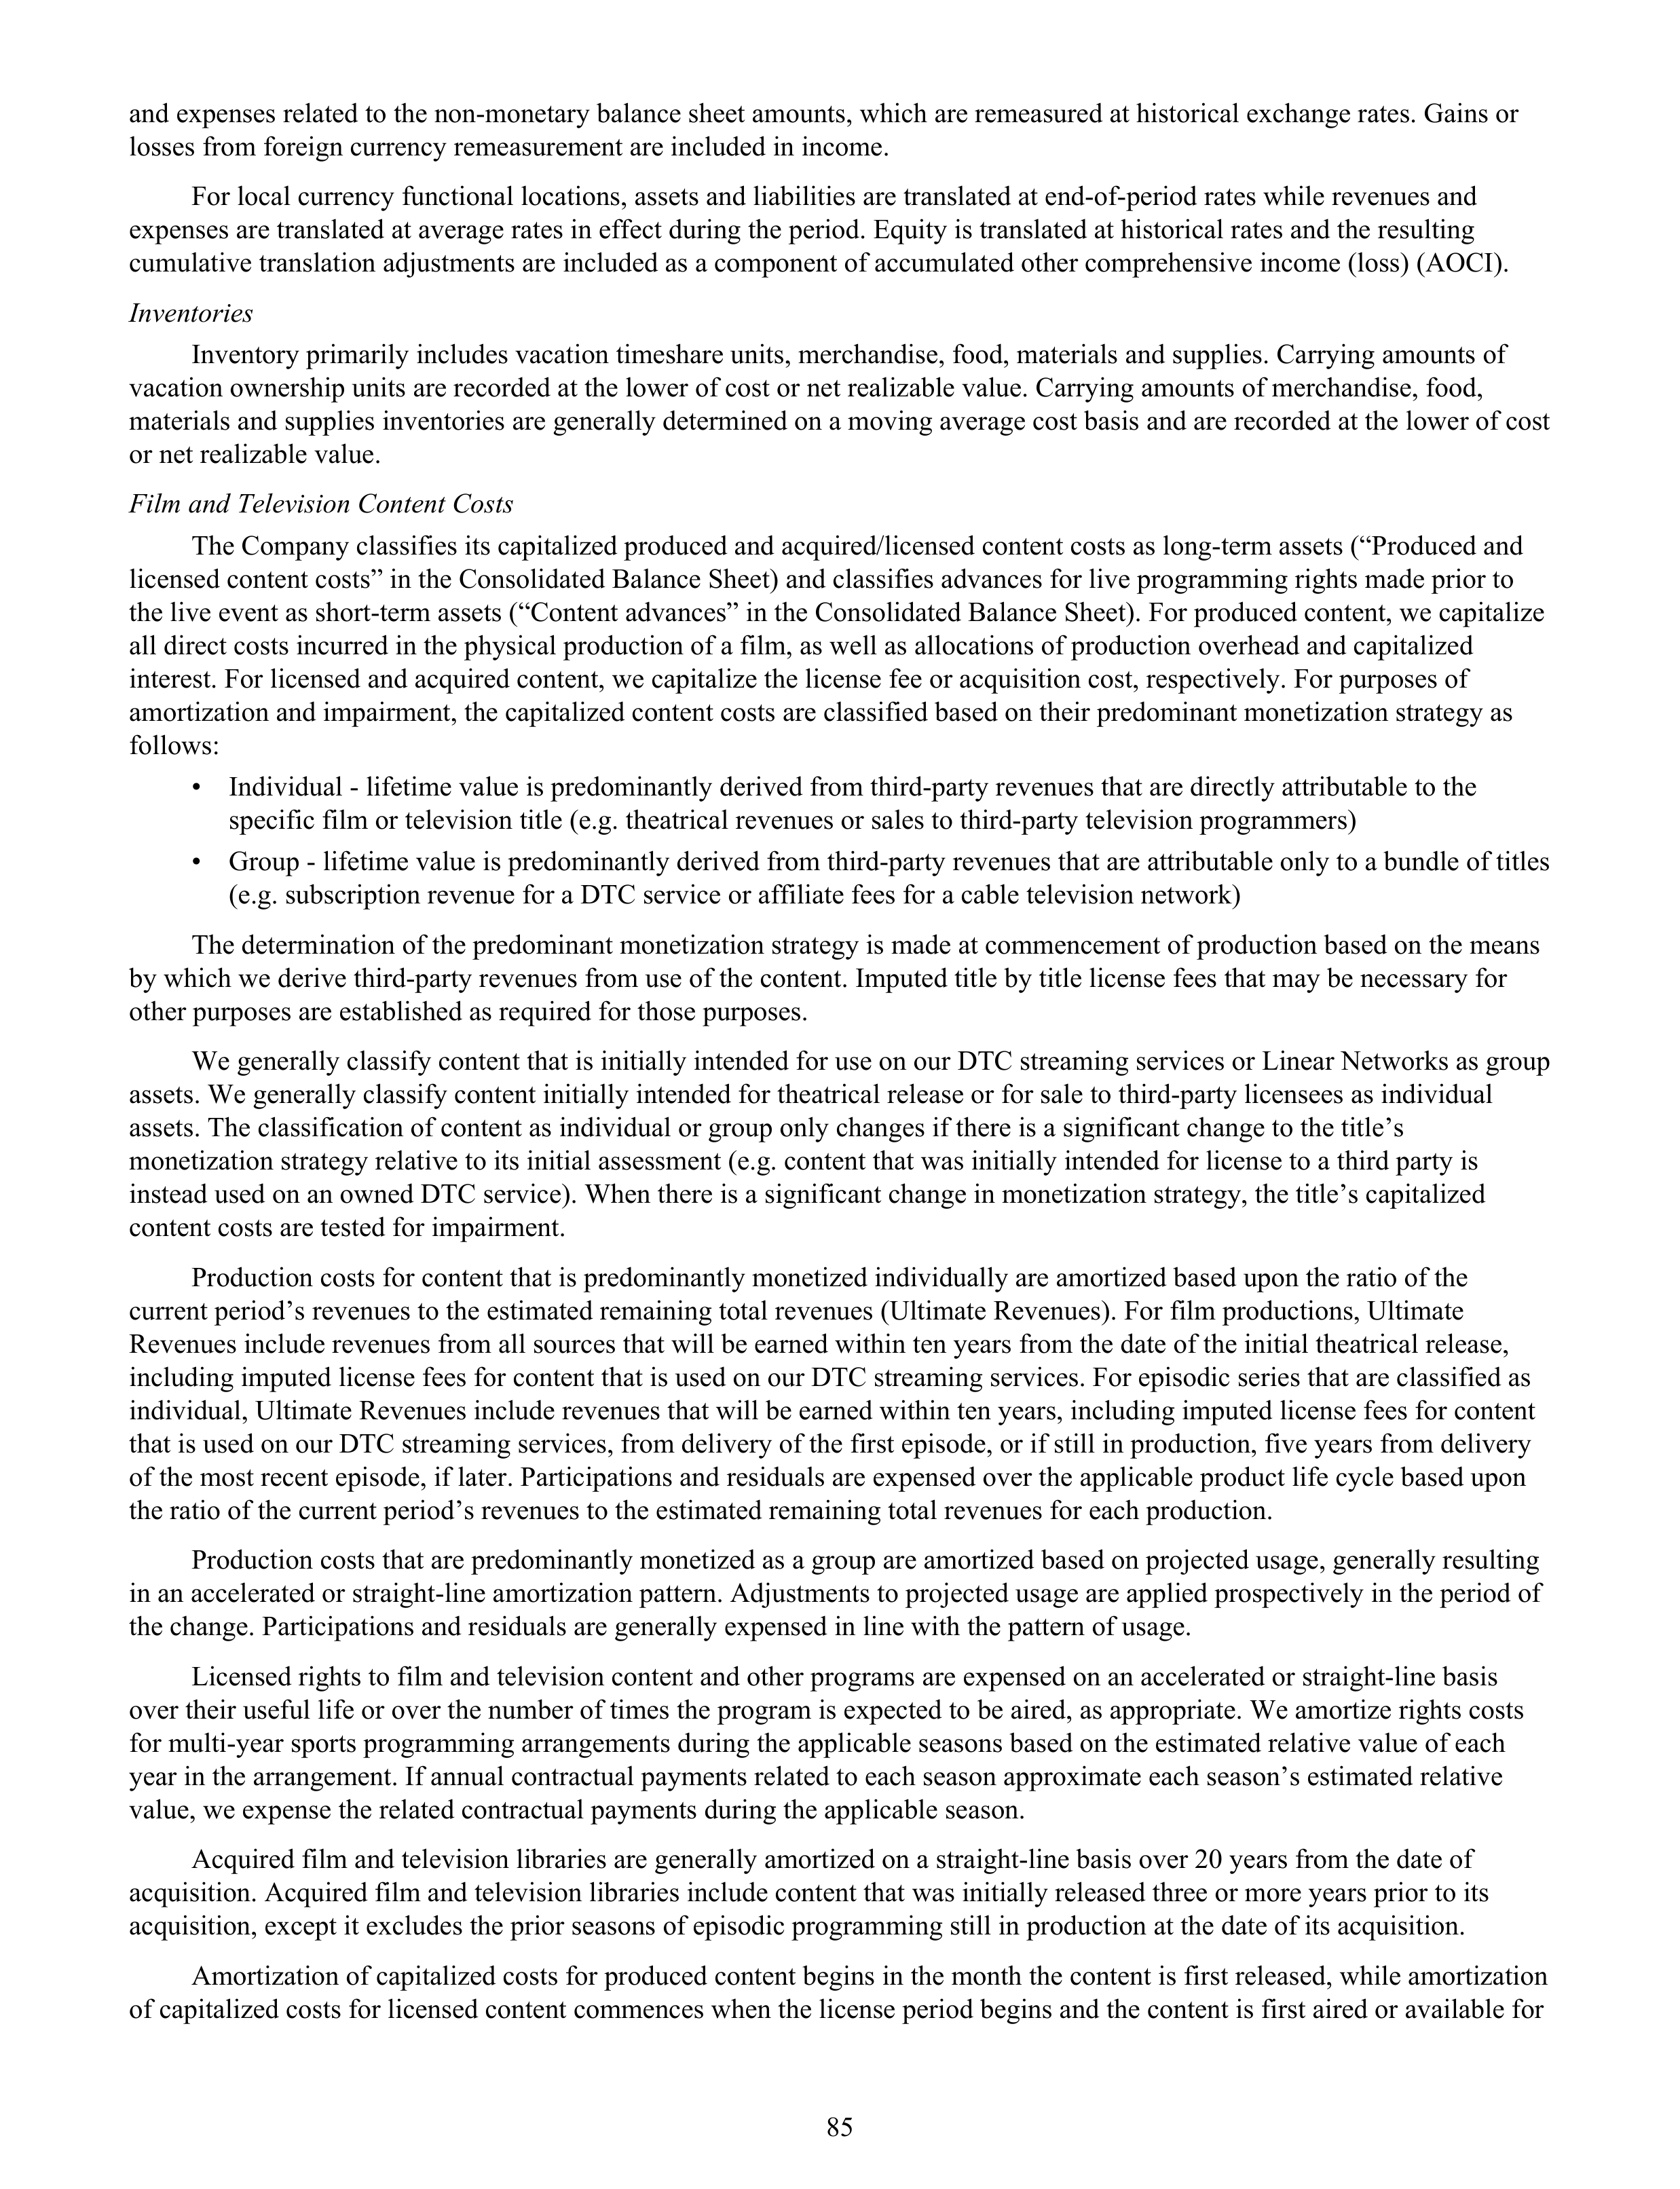
and expenses related to the non-monetary balance sheet amounts, which are remeasured at historical exchange rates. Gains or
losses from foreign currency remeasurement are included in income.
For local currency functional locations, assets and liabilities are translated at end-of-period rates while revenues and
expenses are translated at average rates in effect during the period. Equity is translated at historical rates and the resulting
cumulative translation adjustments are included as a component of accumulated other comprehensive income (loss) (AOCI).
Inventories
Inventory primarily includes vacation timeshare units, merchandise, food, materials and supplies. Carrying amounts of
vacation ownership units are recorded at the lower of cost or net realizable value. Carrying amounts of merchandise, food,
materials and supplies inventories are generally determined on a moving average cost basis and are recorded at the lower of cost
or net realizable value.
Film and Television Content Costs
The Company classifies its capitalized produced and acquired/licensed content costs as long-term assets (“Produced and
licensed content costs” in the Consolidated Balance Sheet) and classifies advances for live programming rights made prior to
the live event as short-term assets (“Content advances” in the Consolidated Balance Sheet). For produced content, we capitalize
all direct costs incurred in the physical production of a film, as well as allocations of production overhead and capitalized
interest. For licensed and acquired content, we capitalize the license fee or acquisition cost, respectively. For purposes of
amortization and impairment, the capitalized content costs are classified based on their predominant monetization strategy as
follows:
•
Individual - lifetime value is predominantly derived from third-party revenues that are directly attributable to the
specific film or television title (e.g. theatrical revenues or sales to third-party television programmers)
•
Group - lifetime value is predominantly derived from third-party revenues that are attributable only to a bundle of titles
(e.g. subscription revenue for a DTC service or affiliate fees for a cable television network)
The determination of the predominant monetization strategy is made at commencement of production based on the means
by which we derive third-party revenues from use of the content. Imputed title by title license fees that may be necessary for
other purposes are established as required for those purposes.
We generally classify content that is initially intended for use on our DTC streaming services or Linear Networks as group
assets. We generally classify content initially intended for theatrical release or for sale to third-party licensees as individual
assets. The classification of content as individual or group only changes if there is a significant change to the title’s
monetization strategy relative to its initial assessment (e.g. content that was initially intended for license to a third party is
instead used on an owned DTC service). When there is a significant change in monetization strategy, the title’s capitalized
content costs are tested for impairment.
Production costs for content that is predominantly monetized individually are amortized based upon the ratio of the
current period’s revenues to the estimated remaining total revenues (Ultimate Revenues). For film productions, Ultimate
Revenues include revenues from all sources that will be earned within ten years from the date of the initial theatrical release,
including imputed license fees for content that is used on our DTC streaming services. For episodic series that are classified as
individual, Ultimate Revenues include revenues that will be earned within ten years, including imputed license fees for content
that is used on our DTC streaming services, from delivery of the first episode, or if still in production, five years from delivery
of the most recent episode, if later. Participations and residuals are expensed over the applicable product life cycle based upon
the ratio of the current period’s revenues to the estimated remaining total revenues for each production.
Production costs that are predominantly monetized as a group are amortized based on projected usage, generally resulting
in an accelerated or straight-line amortization pattern. Adjustments to projected usage are applied prospectively in the period of
the change. Participations and residuals are generally expensed in line with the pattern of usage.
Licensed rights to film and television content and other programs are expensed on an accelerated or straight-line basis
over their useful life or over the number of times the program is expected to be aired, as appropriate. We amortize rights costs
for multi-year sports programming arrangements during the applicable seasons based on the estimated relative value of each
year in the arrangement. If annual contractual payments related to each season approximate each season’s estimated relative
value, we expense the related contractual payments during the applicable season.
Acquired film and television libraries are generally amortized on a straight-line basis over 20 years from the date of
acquisition. Acquired film and television libraries include content that was initially released three or more years prior to its
acquisition, except it excludes the prior seasons of episodic programming still in production at the date of its acquisition.
Amortization of capitalized costs for produced content begins in the month the content is first released, while amortization
of capitalized costs for licensed content commences when the license period begins and the content is first aired or available for
85
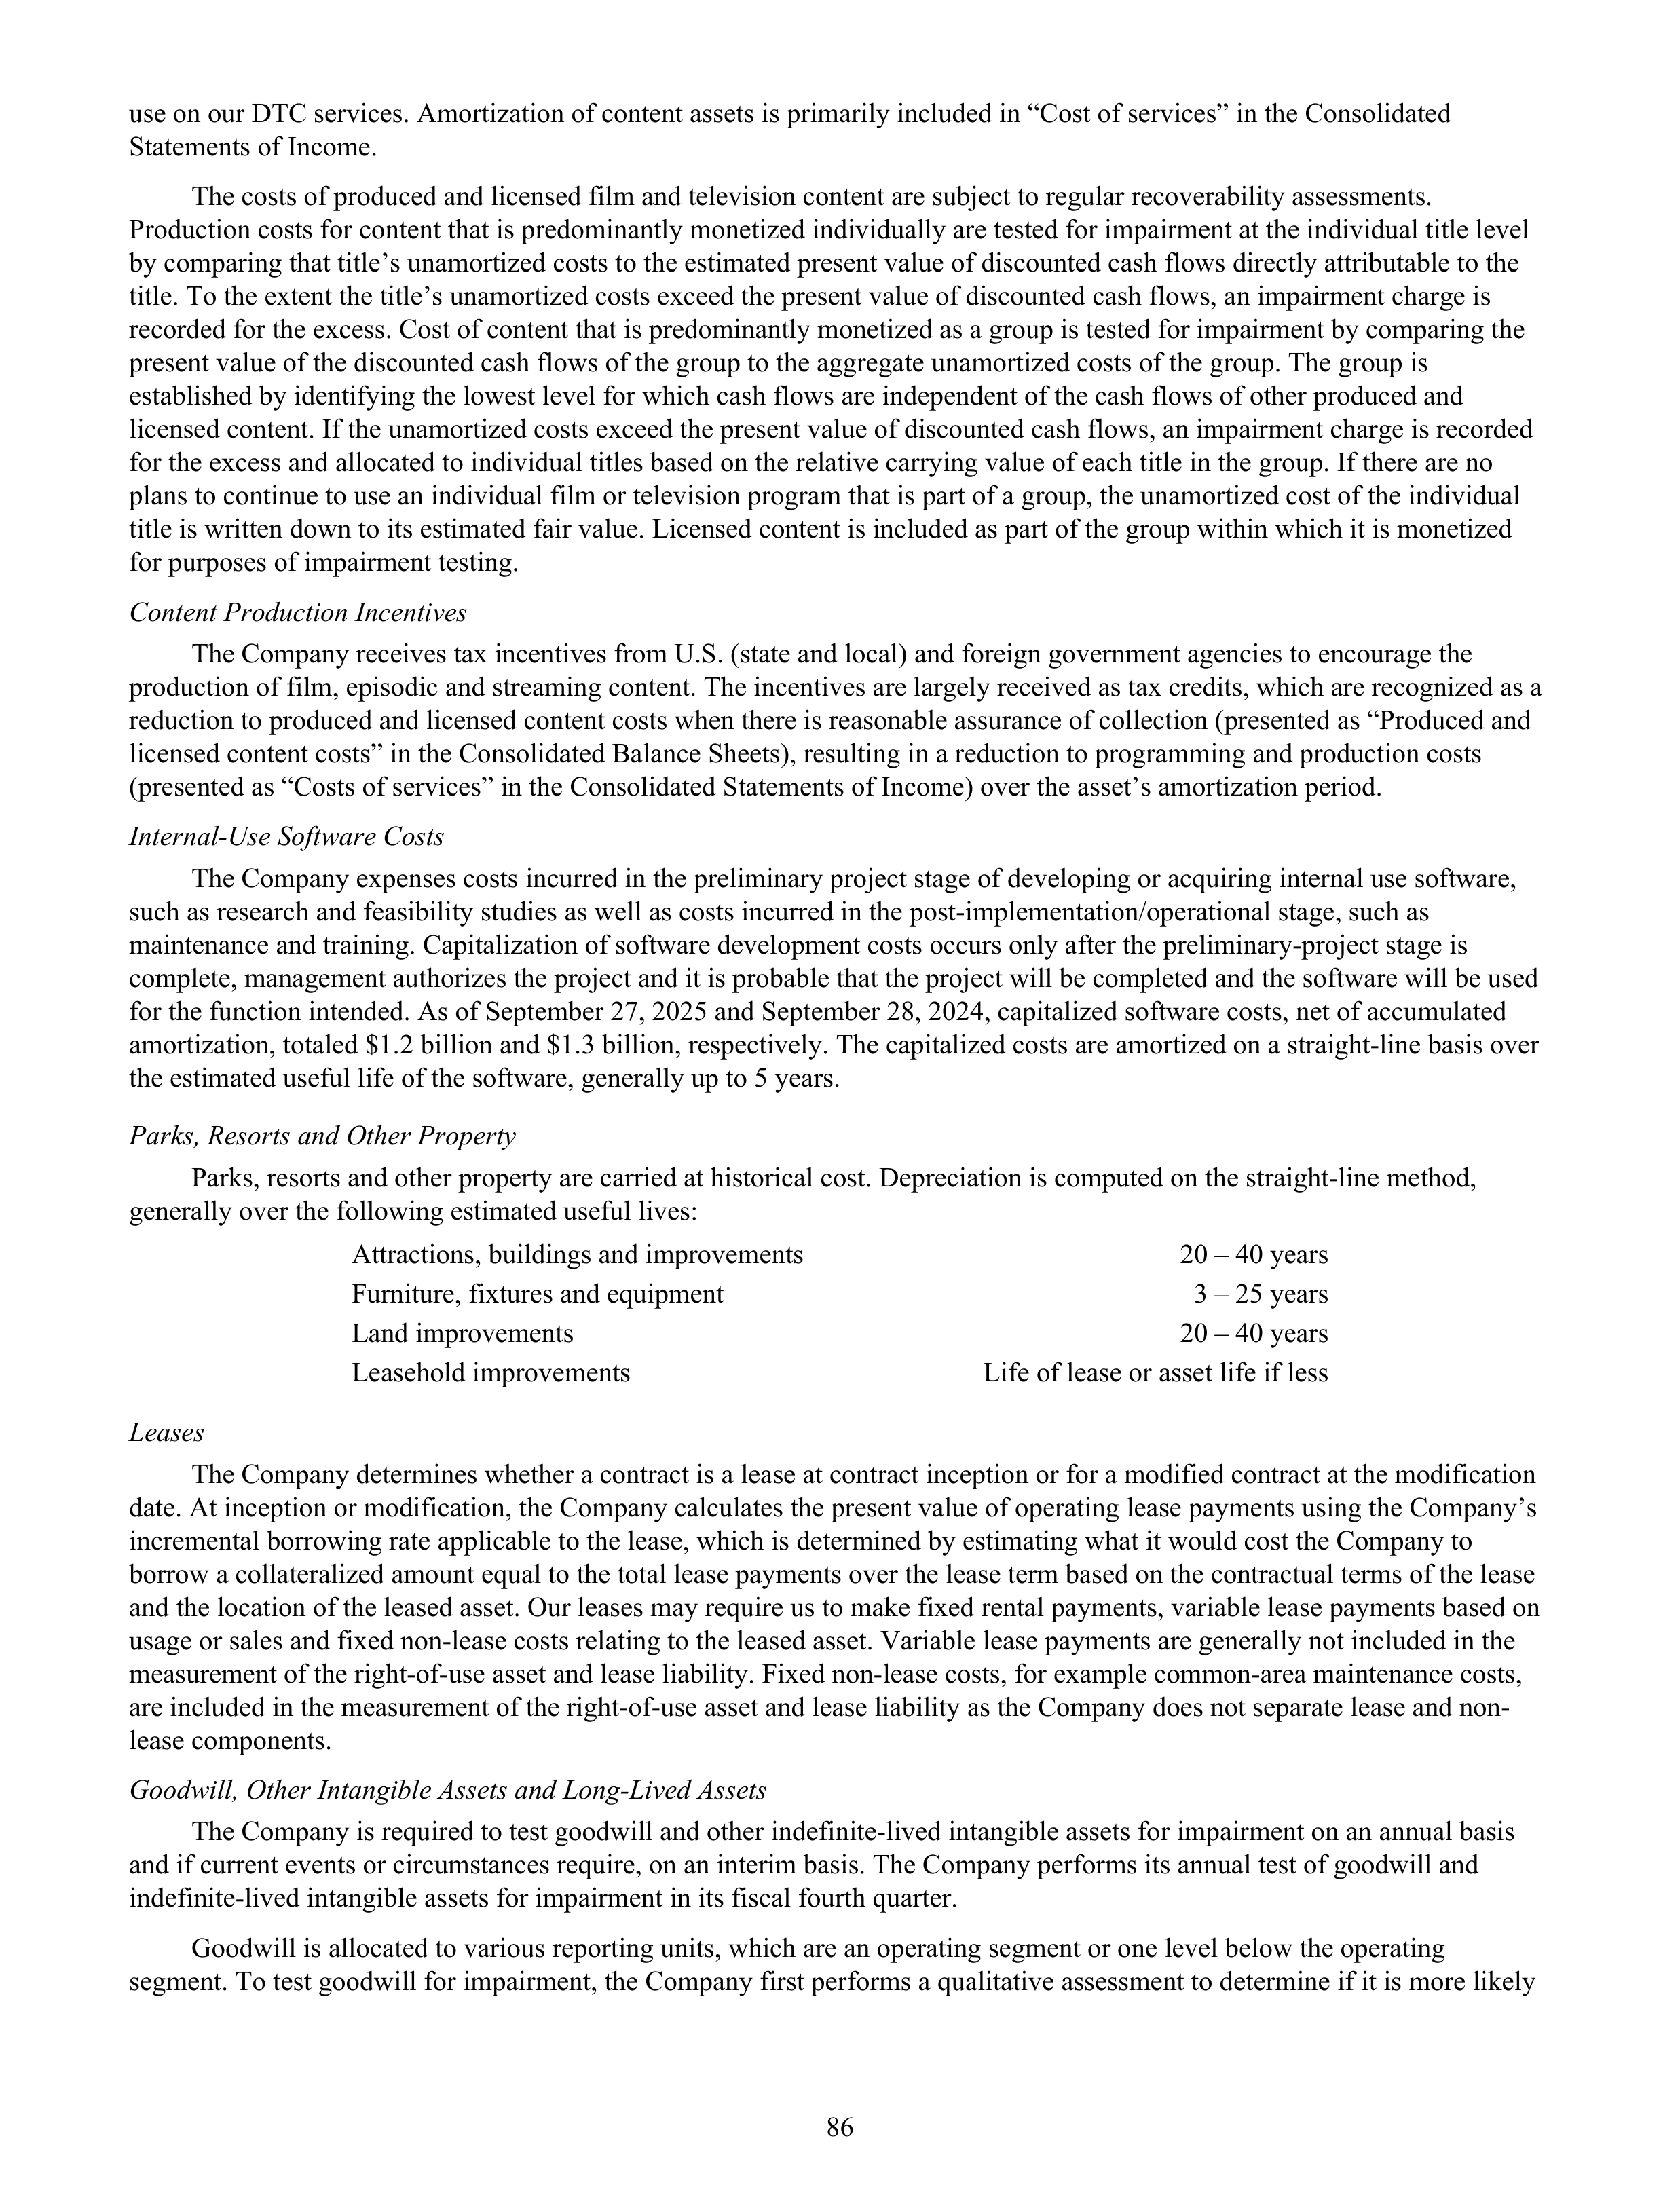
use on our DTC services. Amortization of content assets is primarily included in “Cost of services” in the Consolidated
Statements of Income.
The costs of produced and licensed film and television content are subject to regular recoverability assessments.
Production costs for content that is predominantly monetized individually are tested for impairment at the individual title level
by comparing that title’s unamortized costs to the estimated present value of discounted cash flows directly attributable to the
title. To the extent the title’s unamortized costs exceed the present value of discounted cash flows, an impairment charge is
recorded for the excess. Cost of content that is predominantly monetized as a group is tested for impairment by comparing the
present value of the discounted cash flows of the group to the aggregate unamortized costs of the group. The group is
established by identifying the lowest level for which cash flows are independent of the cash flows of other produced and
licensed content. If the unamortized costs exceed the present value of discounted cash flows, an impairment charge is recorded
for the excess and allocated to individual titles based on the relative carrying value of each title in the group. If there are no
plans to continue to use an individual film or television program that is part of a group, the unamortized cost of the individual
title is written down to its estimated fair value. Licensed content is included as part of the group within which it is monetized
for purposes of impairment testing.
Content Production Incentives
The Company receives tax incentives from U.S. (state and local) and foreign government agencies to encourage the
production of film, episodic and streaming content. The incentives are largely received as tax credits, which are recognized as a
reduction to produced and licensed content costs when there is reasonable assurance of collection (presented as “Produced and
licensed content costs” in the Consolidated Balance Sheets), resulting in a reduction to programming and production costs
(presented as “Costs of services” in the Consolidated Statements of Income) over the asset’s amortization period.
Internal-Use Software Costs
The Company expenses costs incurred in the preliminary project stage of developing or acquiring internal use software,
such as research and feasibility studies as well as costs incurred in the post-implementation/operational stage, such as
maintenance and training. Capitalization of software development costs occurs only after the preliminary-project stage is
complete, management authorizes the project and it is probable that the project will be completed and the software will be used
for the function intended. As of September 27, 2025 and September 28, 2024, capitalized software costs, net of accumulated
amortization, totaled $1.2 billion and $1.3 billion, respectively. The capitalized costs are amortized on a straight-line basis over
the estimated useful life of the software, generally up to 5 years.
Parks, Resorts and Other Property
Parks, resorts and other property are carried at historical cost. Depreciation is computed on the straight-line method,
generally over the following estimated useful lives:
Attractions, buildings and improvements
20 – 40 years
Furniture, fixtures and equipment
3 – 25 years
Land improvements
20 – 40 years
Leasehold improvements
Life of lease or asset life if less
Leases
The Company determines whether a contract is a lease at contract inception or for a modified contract at the modification
date. At inception or modification, the Company calculates the present value of operating lease payments using the Company’s
incremental borrowing rate applicable to the lease, which is determined by estimating what it would cost the Company to
borrow a collateralized amount equal to the total lease payments over the lease term based on the contractual terms of the lease
and the location of the leased asset. Our leases may require us to make fixed rental payments, variable lease payments based on
usage or sales and fixed non-lease costs relating to the leased asset. Variable lease payments are generally not included in the
measurement of the right-of-use asset and lease liability. Fixed non-lease costs, for example common-area maintenance costs,
are included in the measurement of the right-of-use asset and lease liability as the Company does not separate lease and non-
lease components.
Goodwill, Other Intangible Assets and Long-Lived Assets
The Company is required to test goodwill and other indefinite-lived intangible assets for impairment on an annual basis
and if current events or circumstances require, on an interim basis. The Company performs its annual test of goodwill and
indefinite-lived intangible assets for impairment in its fiscal fourth quarter.
Goodwill is allocated to various reporting units, which are an operating segment or one level below the operating
segment. To test goodwill for impairment, the Company first performs a qualitative assessment to determine if it is more likely
86
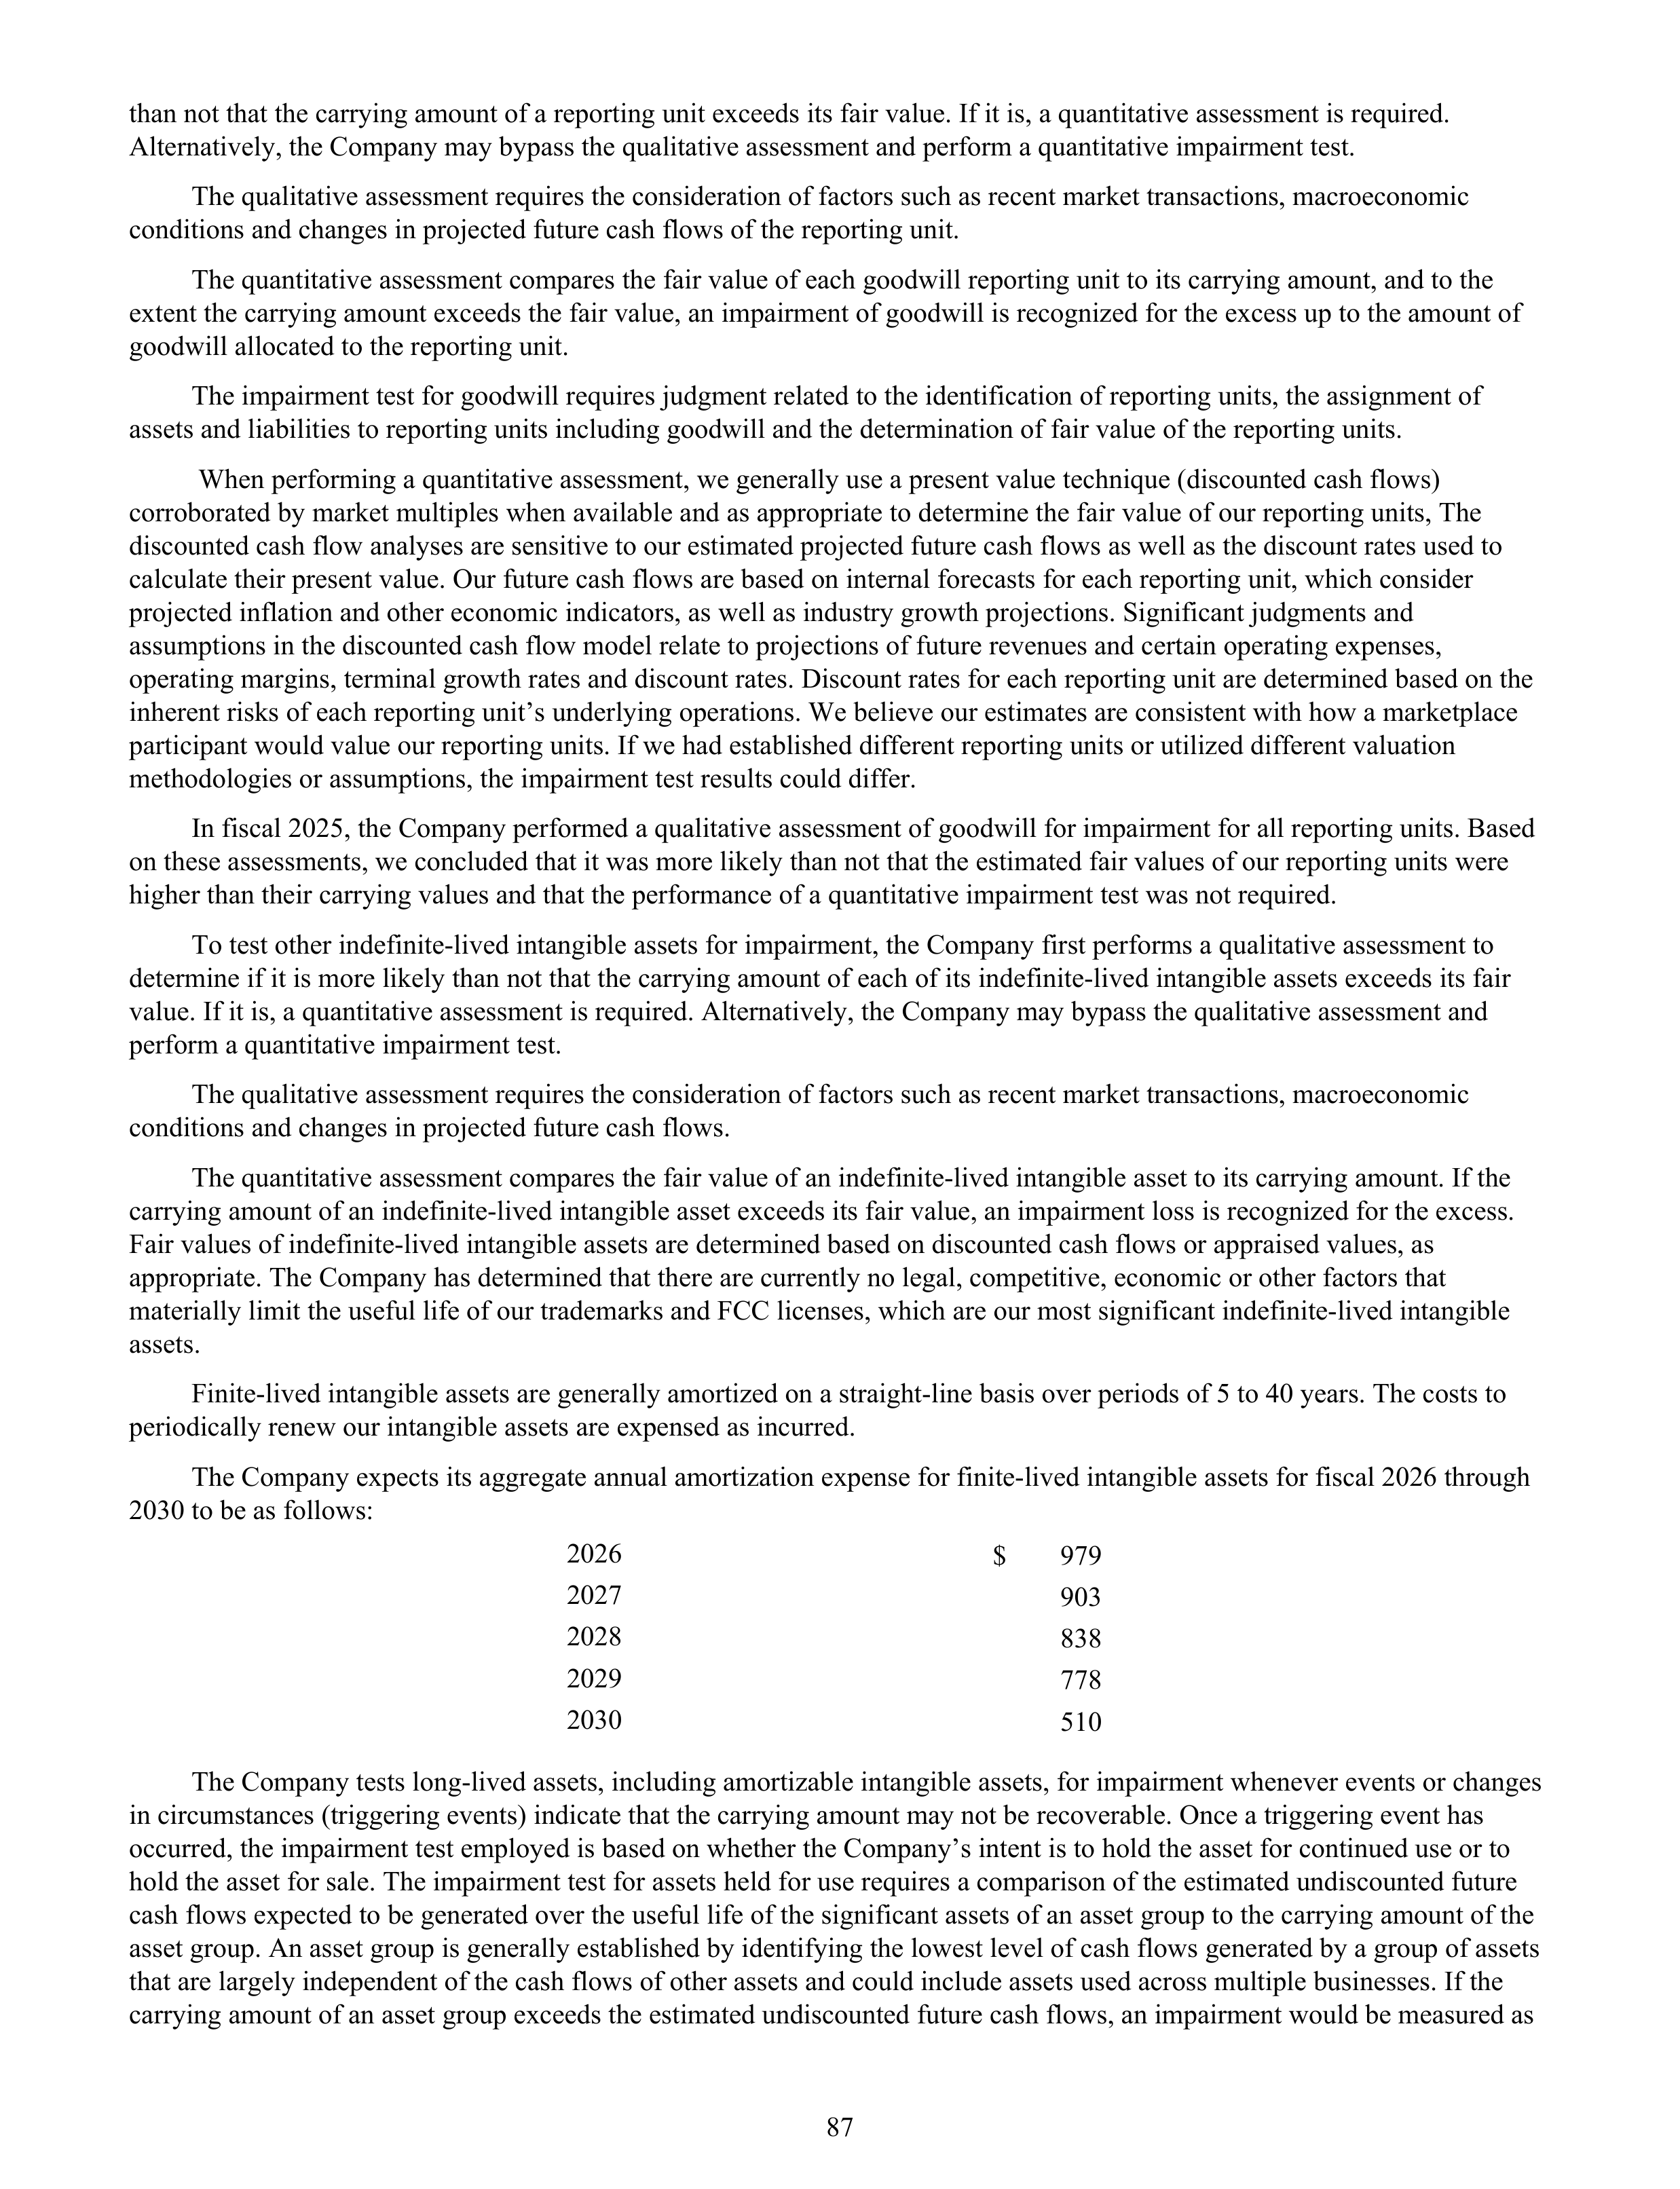
than not that the carrying amount of a reporting unit exceeds its fair value. If it is, a quantitative assessment is required.
Alternatively, the Company may bypass the qualitative assessment and perform a quantitative impairment test.
The qualitative assessment requires the consideration of factors such as recent market transactions, macroeconomic
conditions and changes in projected future cash flows of the reporting unit.
The quantitative assessment compares the fair value of each goodwill reporting unit to its carrying amount, and to the
extent the carrying amount exceeds the fair value, an impairment of goodwill is recognized for the excess up to the amount of
goodwill allocated to the reporting unit.
The impairment test for goodwill requires judgment related to the identification of reporting units, the assignment of
assets and liabilities to reporting units including goodwill and the determination of fair value of the reporting units.
When performing a quantitative assessment, we generally use a present value technique (discounted cash flows)
corroborated by market multiples when available and as appropriate to determine the fair value of our reporting units, The
discounted cash flow analyses are sensitive to our estimated projected future cash flows as well as the discount rates used to
calculate their present value. Our future cash flows are based on internal forecasts for each reporting unit, which consider
projected inflation and other economic indicators, as well as industry growth projections. Significant judgments and
assumptions in the discounted cash flow model relate to projections of future revenues and certain operating expenses,
operating margins, terminal growth rates and discount rates. Discount rates for each reporting unit are determined based on the
inherent risks of each reporting unit’s underlying operations. We believe our estimates are consistent with how a marketplace
participant would value our reporting units. If we had established different reporting units or utilized different valuation
methodologies or assumptions, the impairment test results could differ.
In fiscal 2025, the Company performed a qualitative assessment of goodwill for impairment for all reporting units. Based
on these assessments, we concluded that it was more likely than not that the estimated fair values of our reporting units were
higher than their carrying values and that the performance of a quantitative impairment test was not required.
To test other indefinite-lived intangible assets for impairment, the Company first performs a qualitative assessment to
determine if it is more likely than not that the carrying amount of each of its indefinite-lived intangible assets exceeds its fair
value. If it is, a quantitative assessment is required. Alternatively, the Company may bypass the qualitative assessment and
perform a quantitative impairment test.
The qualitative assessment requires the consideration of factors such as recent market transactions, macroeconomic
conditions and changes in projected future cash flows.
The quantitative assessment compares the fair value of an indefinite-lived intangible asset to its carrying amount. If the
carrying amount of an indefinite-lived intangible asset exceeds its fair value, an impairment loss is recognized for the excess.
Fair values of indefinite-lived intangible assets are determined based on discounted cash flows or appraised values, as
appropriate. The Company has determined that there are currently no legal, competitive, economic or other factors that
materially limit the useful life of our trademarks and FCC licenses, which are our most significant indefinite-lived intangible
assets.
Finite-lived intangible assets are generally amortized on a straight-line basis over periods of 5 to 40 years. The costs to
periodically renew our intangible assets are expensed as incurred.
The Company expects its aggregate annual amortization expense for finite-lived intangible assets for fiscal 2026 through
2030 to be as follows:
2026
$
979
2027
903
2028
838
2029
778
2030
510
The Company tests long-lived assets, including amortizable intangible assets, for impairment whenever events or changes
in circumstances (triggering events) indicate that the carrying amount may not be recoverable. Once a triggering event has
occurred, the impairment test employed is based on whether the Company’s intent is to hold the asset for continued use or to
hold the asset for sale. The impairment test for assets held for use requires a comparison of the estimated undiscounted future
cash flows expected to be generated over the useful life of the significant assets of an asset group to the carrying amount of the
asset group. An asset group is generally established by identifying the lowest level of cash flows generated by a group of assets
that are largely independent of the cash flows of other assets and could include assets used across multiple businesses. If the
carrying amount of an asset group exceeds the estimated undiscounted future cash flows, an impairment would be measured as
87
the difference between the fair value of the asset group and the carrying amount of the asset group. For assets held for sale, to
the extent the carrying amount is greater than the asset’s fair value less costs to sell, an impairment loss is recognized for the
difference.
The Company recorded non-cash impairment charges in fiscal 2025, 2024 and 2023 that are further described in Note 18.
Financial Risk Management Contracts
In the normal course of business, the Company employs a variety of financial instruments (derivatives) including interest
rate and cross-currency swap agreements and forward and option contracts to manage its exposure to fluctuations in interest
rates, foreign currency exchange rates and commodity prices.
The Company formally documents all relationships between hedges and hedged items as well as its risk management
objectives and strategies for undertaking various hedge transactions. The Company primarily enters into two types of
derivatives: hedges of fair value exposure and hedges of cash flow exposure. Hedges of fair value exposure are entered into in
order to hedge the fair value of a recognized asset, liability, or a firm commitment. Hedges of cash flow exposure are entered
into in order to hedge a forecasted transaction (e.g. forecasted revenue) or the variability of cash flows to be paid or received,
related to a recognized liability or asset (e.g. floating-rate debt).
The Company designates and assigns the derivatives as hedges of forecasted transactions, specific assets or specific
liabilities. When hedged assets or liabilities are sold or extinguished or the forecasted transactions being hedged impact
earnings or are no longer expected to occur, the Company recognizes the gain or loss on the designated derivatives.
The Company’s hedge positions are measured at fair value on the balance sheet. Realized gains and losses from hedges
are classified in the income statement consistent with the accounting treatment of the items being hedged. The Company
accrues the differential for interest rate swaps to be paid or received under the agreements as interest rates change as
adjustments to interest expense over the lives of the swaps. Gains and losses on the termination of effective swap agreements,
prior to their original maturity, are deferred and amortized to interest expense over the remaining term of the underlying hedged
transactions.
The Company enters into derivatives that are not designated as hedges and do not qualify for hedge accounting. These
derivatives are intended to offset certain economic exposures of the Company and are carried at fair value with changes in value
recorded in earnings. Cash flows from hedging activities are classified in the Consolidated Statements of Cash Flows under the
same category as the cash flows from the related assets, liabilities or forecasted transactions (see Notes 8 and 17).
Income Taxes
Deferred income tax assets and liabilities are recorded with respect to temporary differences in the accounting treatment
of items for financial reporting purposes and for income tax purposes. Where, based on the weight of available evidence, it is
more likely than not that some amount of recorded deferred tax assets will not be realized, a valuation allowance is established
for the amount that, in management’s judgment, is sufficient to reduce the deferred tax asset to an amount that is more likely
than not to be realized.
A tax position must meet a minimum probability threshold before a financial statement benefit is recognized. The
minimum threshold is defined as a tax position that is more likely than not to be sustained upon examination by the applicable
taxing authority, including resolution of any related appeals or litigation processes, based on the technical merits of the position.
The tax benefit to be recognized is measured as the largest amount of benefit that is greater than fifty percent likely of being
realized upon ultimate settlement.
Earnings Per Share
The Company presents both basic and diluted earnings per share (EPS) amounts. Basic EPS is calculated by dividing net
income attributable to Disney by the weighted average number of common shares outstanding during the year. Diluted EPS is
based upon the weighted average number of common and common equivalent shares outstanding during the year, which is
calculated using the treasury-stock method for equity-based awards (Awards). Common equivalent shares are excluded from
the computation in periods for which they have an anti-dilutive effect. Stock options for which the exercise price exceeds the
average market price over the period are anti-dilutive and, accordingly, are excluded from the calculation.
88
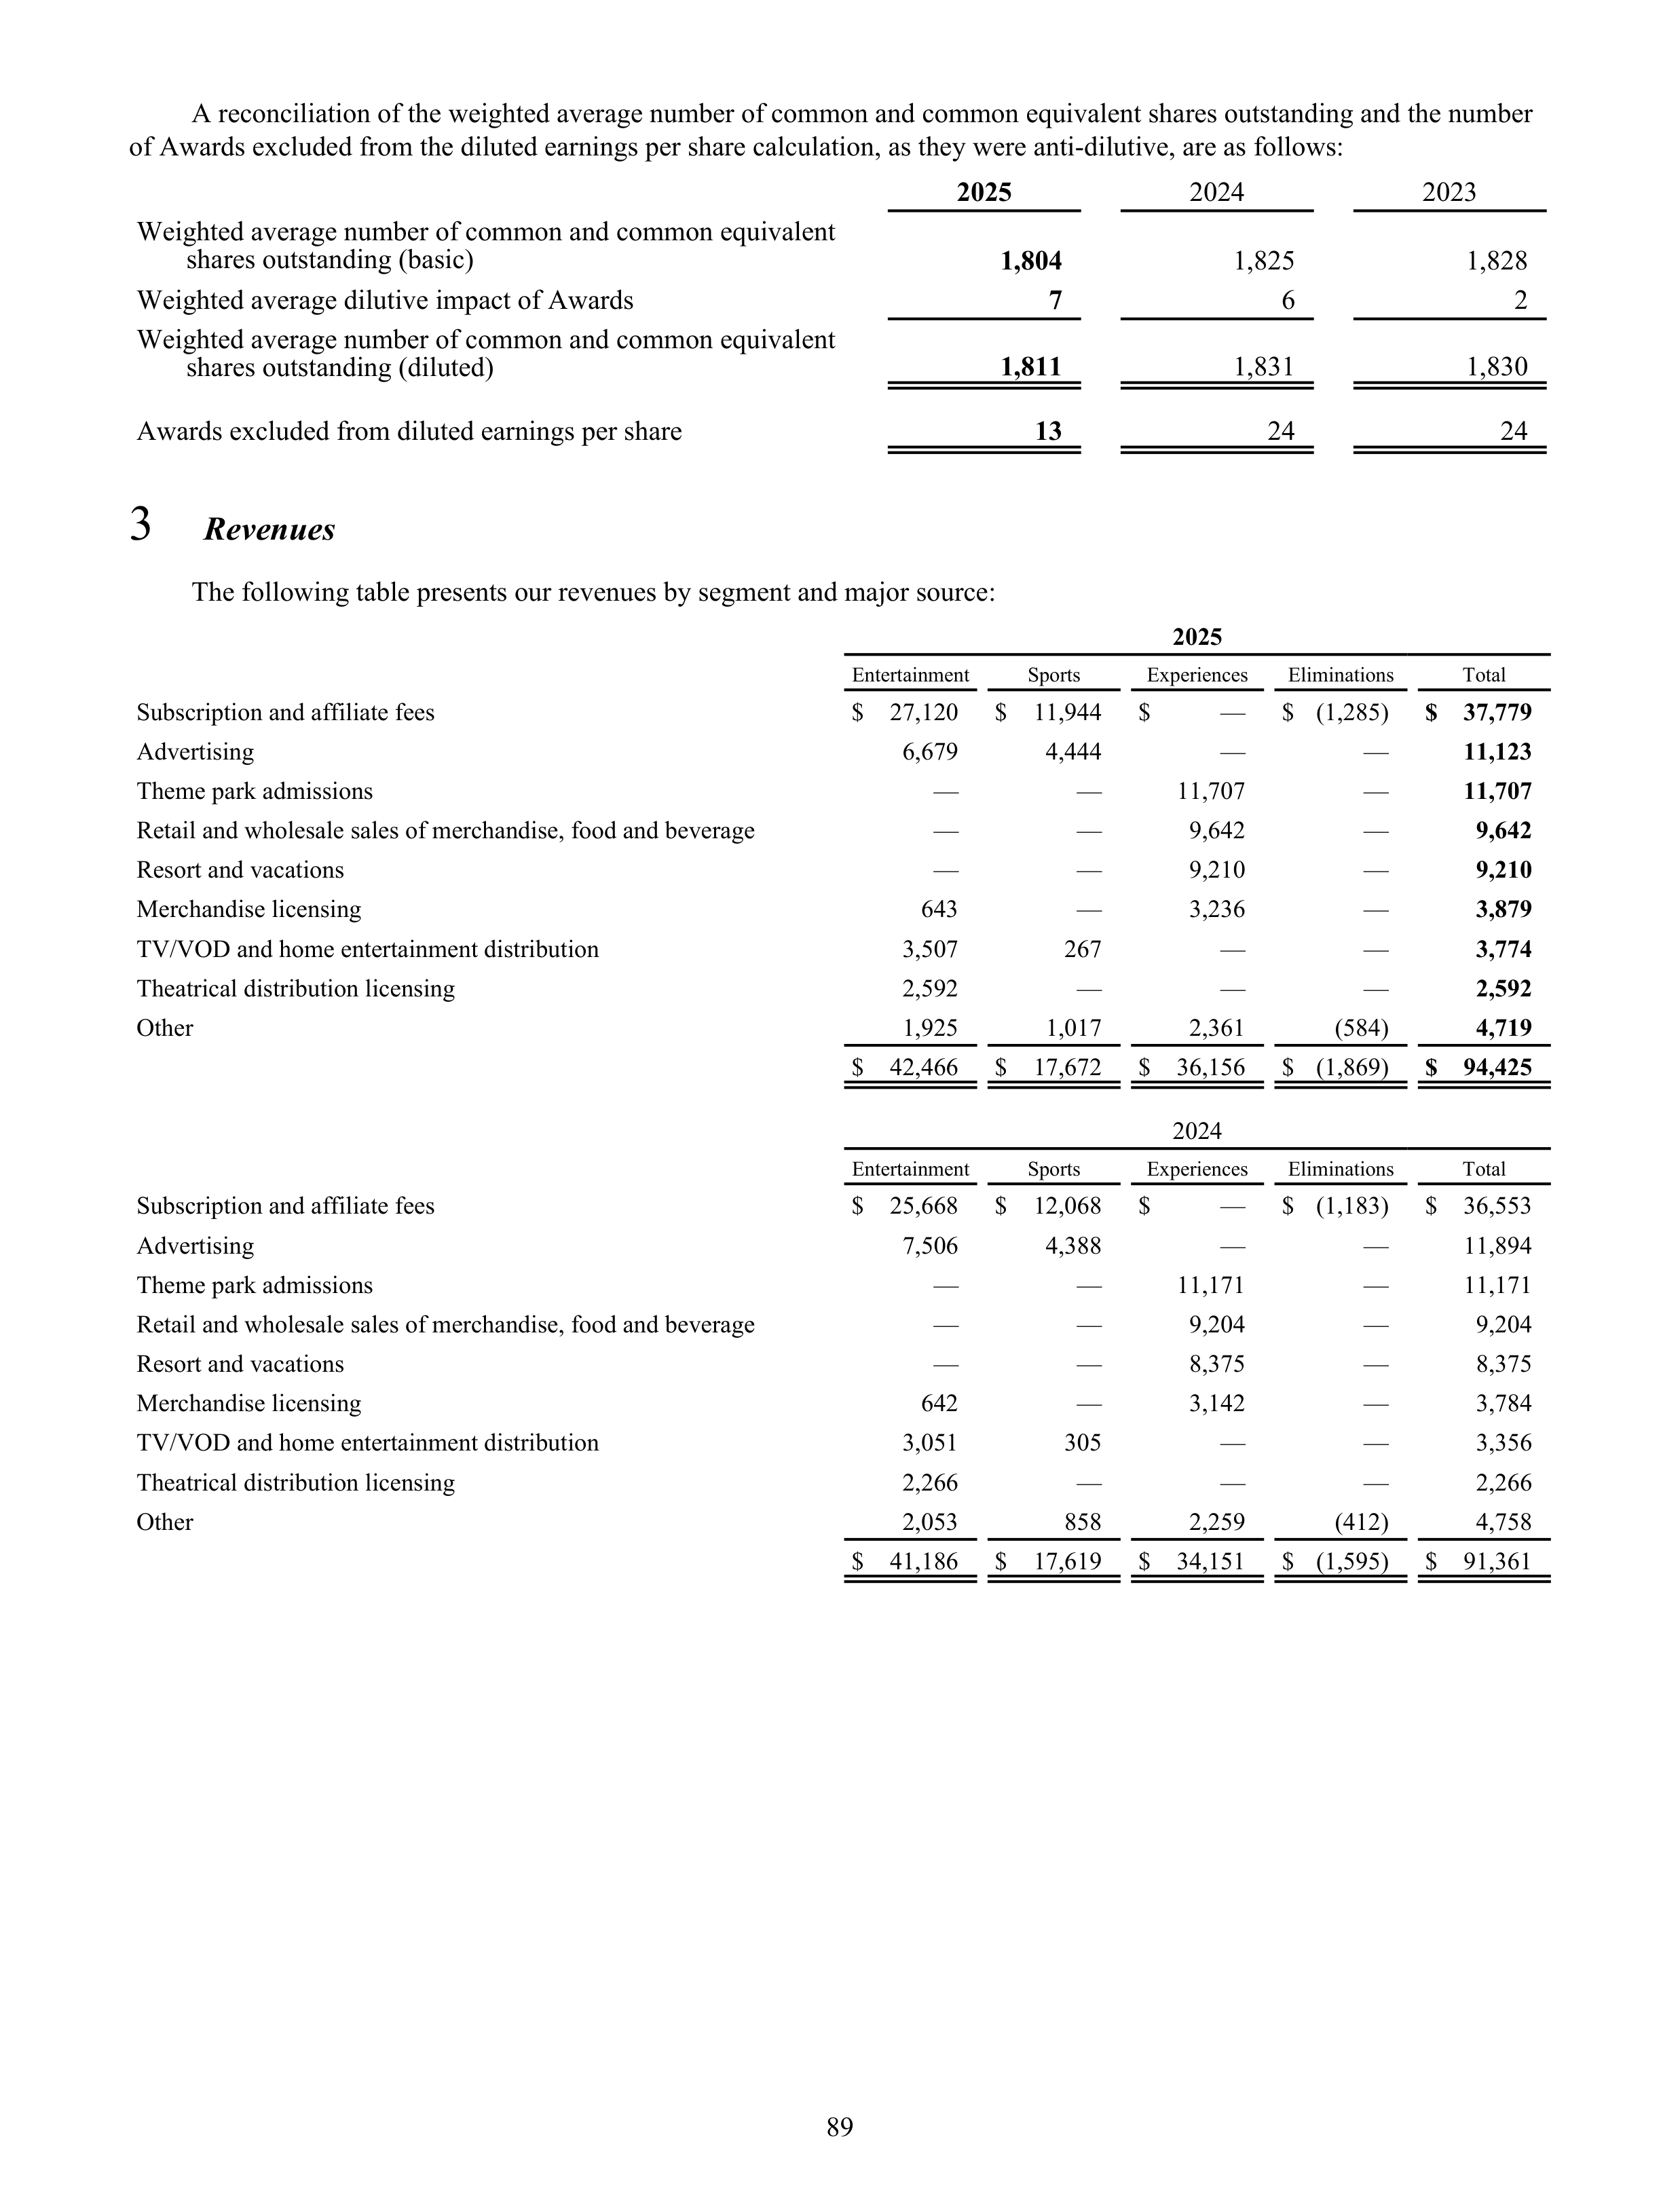
A reconciliation of the weighted average number of common and common equivalent shares outstanding and the number
of Awards excluded from the diluted earnings per share calculation, as they were anti-dilutive, are as follows:
2025
2024
2023
Weighted average number of common and common equivalent
shares outstanding (basic)
1,804
1,825
1,828
Weighted average dilutive impact of Awards
7
6
2
Weighted average number of common and common equivalent
shares outstanding (diluted)
1,811
1,831
1,830
Awards excluded from diluted earnings per share
13
24
24
3
Revenues
The following table presents our revenues by segment and major source:
2025
Entertainment
Sports
Experiences
Eliminations
Total
Subscription and affiliate fees
$ 27,120
$ 11,944
$
—
$ (1,285)
$ 37,779
Advertising
6,679
4,444
—
—
11,123
Theme park admissions
—
—
11,707
—
11,707
Retail and wholesale sales of merchandise, food and beverage
—
—
9,642
—
9,642
Resort and vacations
—
—
9,210
—
9,210
Merchandise licensing
643
—
3,236
—
3,879
TV/VOD and home entertainment distribution
3,507
267
—
—
3,774
Theatrical distribution licensing
2,592
—
—
—
2,592
Other
1,925
1,017
2,361
(584)
4,719
$ 42,466
$ 17,672
$ 36,156
$ (1,869)
$ 94,425
2024
Entertainment
Sports
Experiences
Eliminations
Total
Subscription and affiliate fees
$ 25,668
$ 12,068
$
—
$ (1,183)
$ 36,553
Advertising
7,506
4,388
—
—
11,894
Theme park admissions
—
—
11,171
—
11,171
Retail and wholesale sales of merchandise, food and beverage
—
—
9,204
—
9,204
Resort and vacations
—
—
8,375
—
8,375
Merchandise licensing
642
—
3,142
—
3,784
TV/VOD and home entertainment distribution
3,051
305
—
—
3,356
Theatrical distribution licensing
2,266
—
—
—
2,266
Other
2,053
858
2,259
(412)
4,758
$ 41,186
$ 17,619
$ 34,151
$ (1,595)
$ 91,361
89
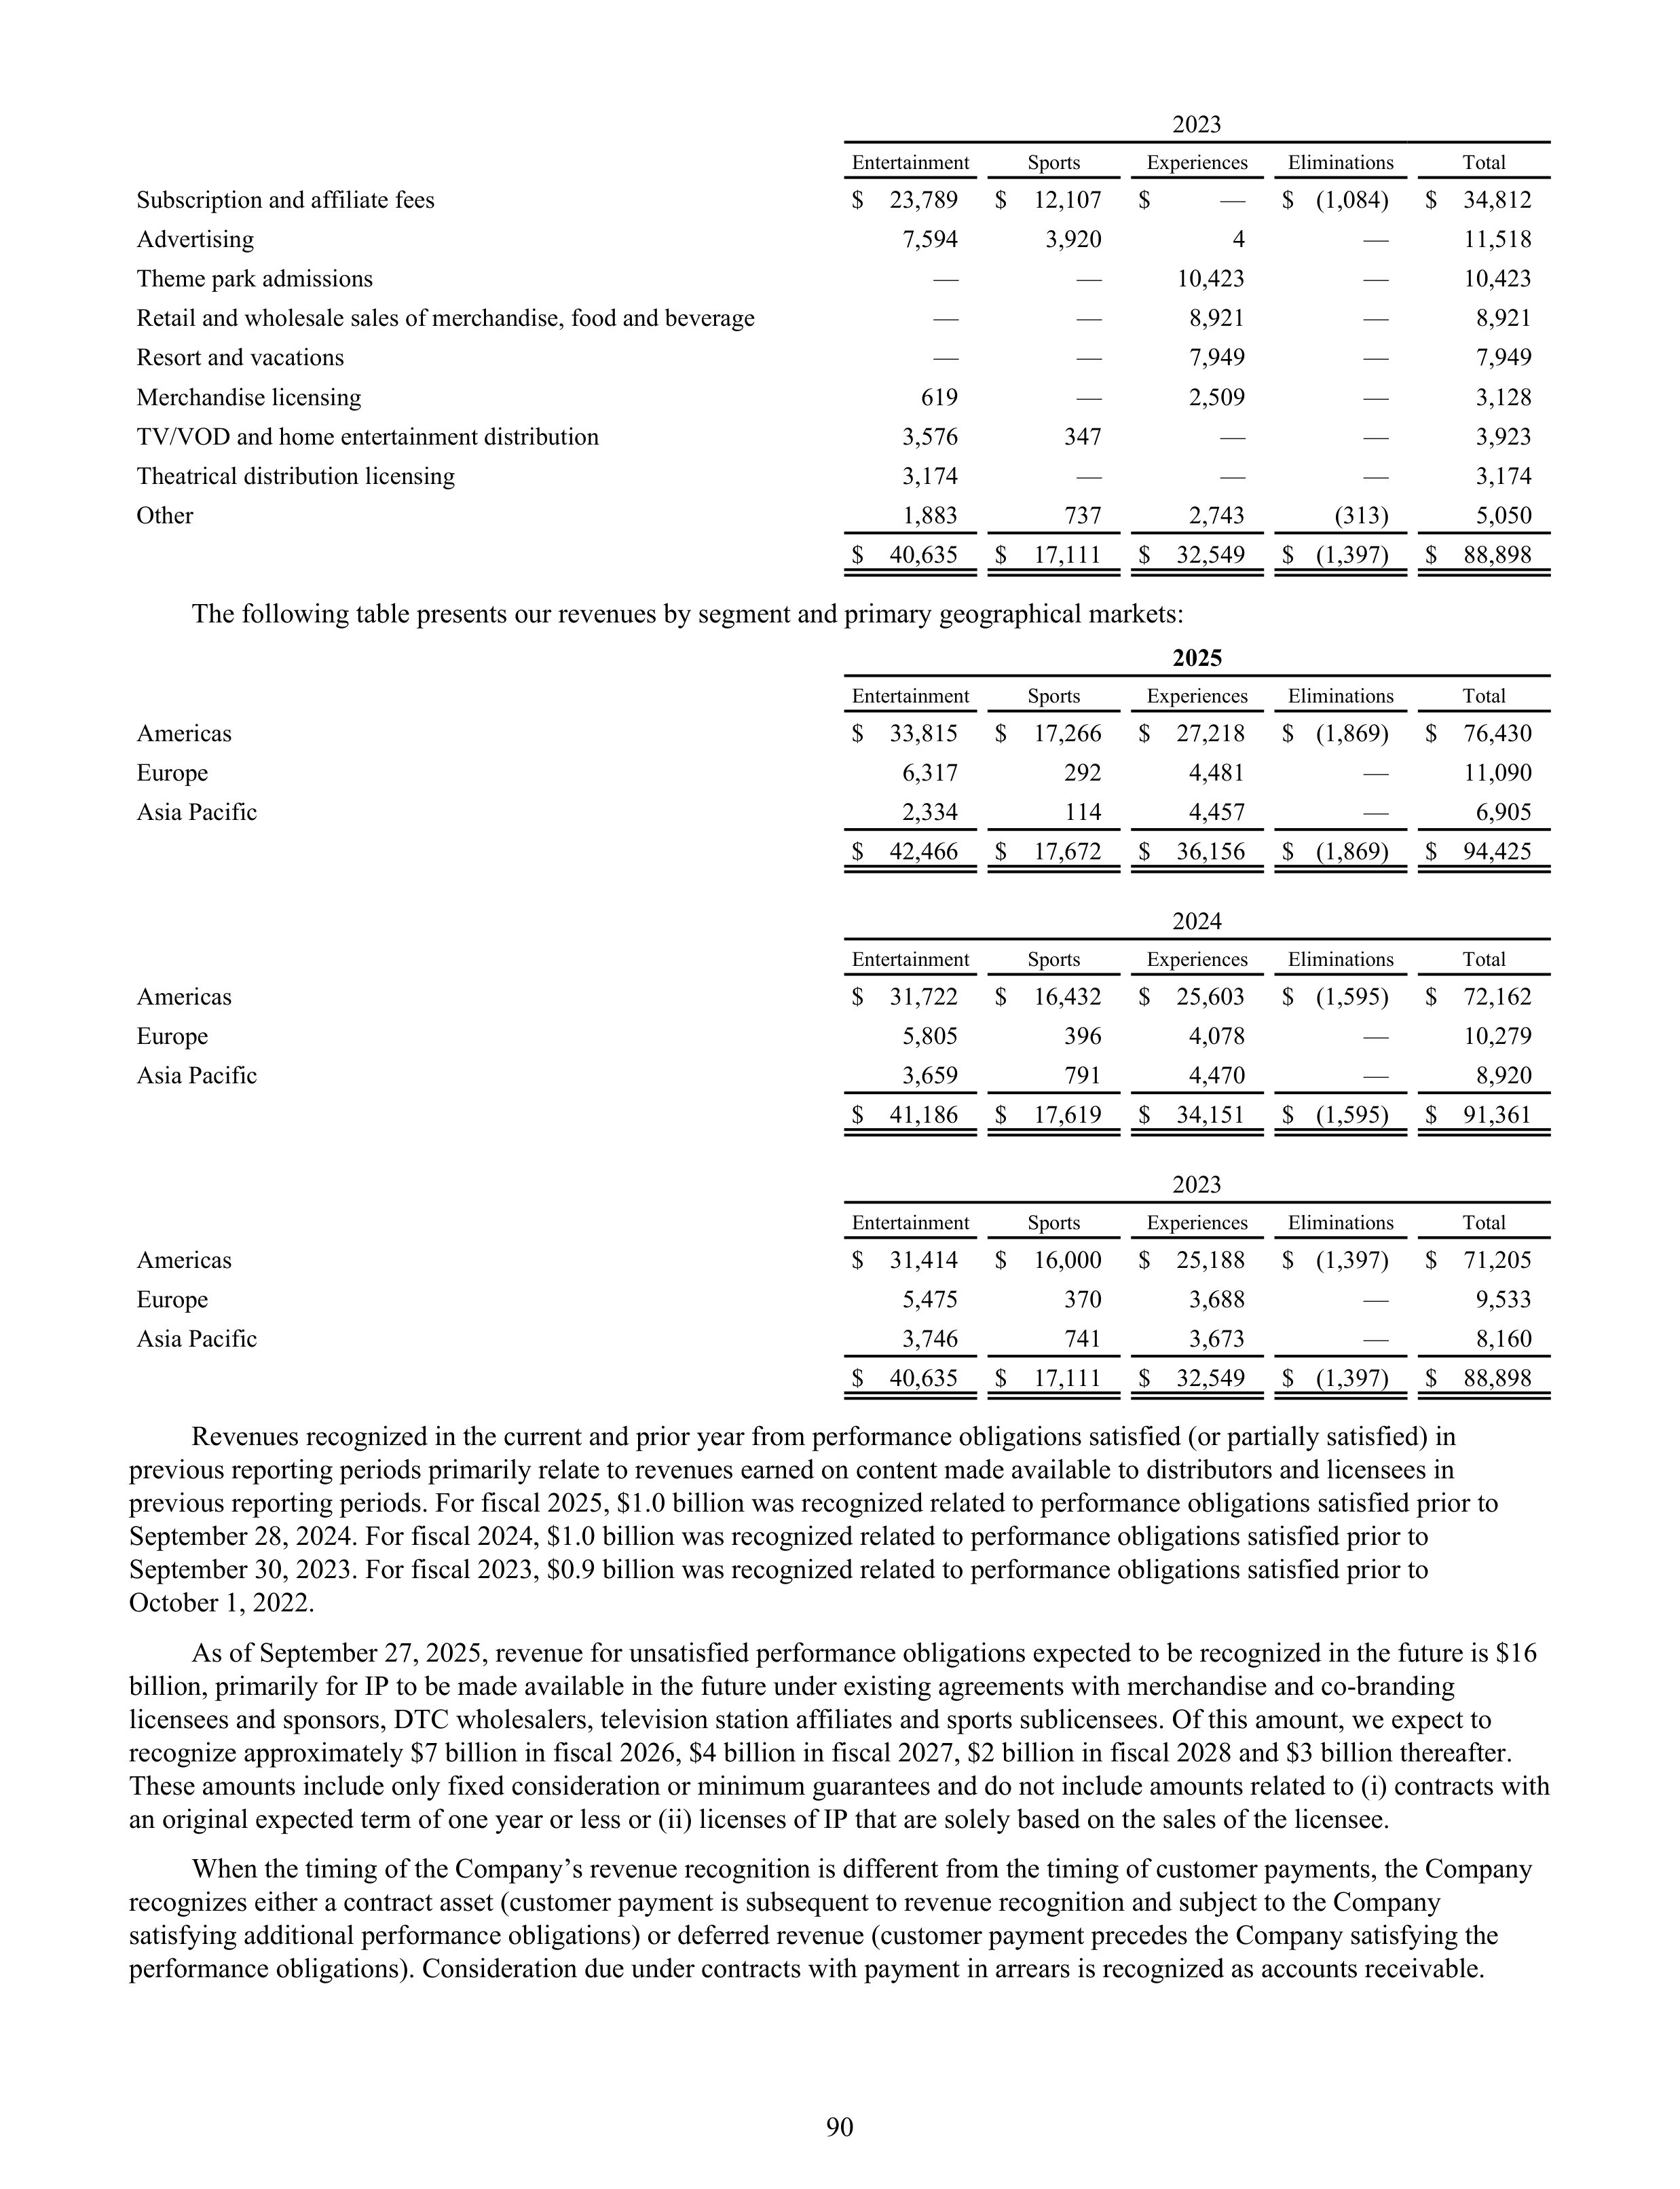
2023
Entertainment
Sports
Experiences
Eliminations
Total
Subscription and affiliate fees
$ 23,789
$ 12,107
$
—
$ (1,084)
$ 34,812
Advertising
7,594
3,920
4
—
11,518
Theme park admissions
—
—
10,423
—
10,423
Retail and wholesale sales of merchandise, food and beverage
—
—
8,921
—
8,921
Resort and vacations
—
—
7,949
—
7,949
Merchandise licensing
619
—
2,509
—
3,128
TV/VOD and home entertainment distribution
3,576
347
—
—
3,923
Theatrical distribution licensing
3,174
—
—
—
3,174
Other
1,883
737
2,743
(313)
5,050
$ 40,635
$ 17,111
$ 32,549
$ (1,397)
$ 88,898
The following table presents our revenues by segment and primary geographical markets:
2025
Entertainment
Sports
Experiences
Eliminations
Total
Americas
$ 33,815
$ 17,266
$ 27,218
$ (1,869)
$ 76,430
Europe
6,317
292
4,481
—
11,090
Asia Pacific
2,334
114
4,457
—
6,905
$ 42,466
$ 17,672
$ 36,156
$ (1,869)
$ 94,425
2024
Entertainment
Sports
Experiences
Eliminations
Total
Americas
$ 31,722
$ 16,432
$ 25,603
$ (1,595)
$ 72,162
Europe
5,805
396
4,078
—
10,279
Asia Pacific
3,659
791
4,470
—
8,920
$ 41,186
$ 17,619
$ 34,151
$ (1,595)
$ 91,361
2023
Entertainment
Sports
Experiences
Eliminations
Total
Americas
$ 31,414
$ 16,000
$ 25,188
$ (1,397)
$ 71,205
Europe
5,475
370
3,688
—
9,533
Asia Pacific
3,746
741
3,673
—
8,160
$ 40,635
$ 17,111
$ 32,549
$ (1,397)
$ 88,898
Revenues recognized in the current and prior year from performance obligations satisfied (or partially satisfied) in
previous reporting periods primarily relate to revenues earned on content made available to distributors and licensees in
previous reporting periods. For fiscal 2025, $1.0 billion was recognized related to performance obligations satisfied prior to
September 28, 2024. For fiscal 2024, $1.0 billion was recognized related to performance obligations satisfied prior to
September 30, 2023. For fiscal 2023, $0.9 billion was recognized related to performance obligations satisfied prior to
October 1, 2022.
As of September 27, 2025, revenue for unsatisfied performance obligations expected to be recognized in the future is $16
billion, primarily for IP to be made available in the future under existing agreements with merchandise and co-branding
licensees and sponsors, DTC wholesalers, television station affiliates and sports sublicensees. Of this amount, we expect to
recognize approximately $7 billion in fiscal 2026, $4 billion in fiscal 2027, $2 billion in fiscal 2028 and $3 billion thereafter.
These amounts include only fixed consideration or minimum guarantees and do not include amounts related to (i) contracts with
an original expected term of one year or less or (ii) licenses of IP that are solely based on the sales of the licensee.
When the timing of the Company’s revenue recognition is different from the timing of customer payments, the Company
recognizes either a contract asset (customer payment is subsequent to revenue recognition and subject to the Company
satisfying additional performance obligations) or deferred revenue (customer payment precedes the Company satisfying the
performance obligations). Consideration due under contracts with payment in arrears is recognized as accounts receivable.
90
Deferred revenues are recognized as (or when) the Company performs under the contract. The Company’s contract assets and
activity for the current and prior-year periods were not material.
Accounts receivable and deferred revenues from contracts with customers are as follows:
September 27,
2025
September 28,
2024
Accounts Receivable
Current
$
10,544
$
10,463
Non-current
985
1,040
Allowance for credit losses
(126)
(118)
Deferred revenues
Current
5,689
5,587
Non-current
785
858
For fiscal 2025, 2024 and 2023, the Company recognized revenue of $5.3 billion, $5.2 billion and $5.1 billion,
respectively, that was included in the deferred revenue balance at September 28, 2024, September 30, 2023 and October 1,
2022, respectively. Amounts deferred generally relate to theme park admissions and vacation packages, DTC subscriptions and
advances related to merchandise and TV/VOD licenses.
The Company has accounts receivable of $1.0 billion at both September 27, 2025 and September 28, 2024 with original
maturities greater than one year primarily related to the sale of vacation club properties. The receivables are recorded in other
non-current assets. The allowance for credit losses for these receivables and additions to/write-offs against the allowance for
fiscal 2025 and 2024 were not material.
4.
Acquisitions and Dispositions
NFL media assets
In October 2025, ESPN and NFL Enterprises LLC reached a binding agreement for ESPN to acquire the NFL Network
and certain other media assets owned and controlled by NFL Enterprises LLC, including NFL’s RedZone Channel pay TV
distribution and NFL Fantasy, in exchange for a 10% noncontrolling interest of ESPN (the NFL Transaction). The NFL
Transaction is expected to close in calendar year 2026, subject to certain regulatory approvals, including from federal and
foreign antitrust authorities, and other customary closing conditions. Upon consummation of the NFL Transaction, the
Company would have an effective 72% interest in ESPN, with Hearst Corporation (Hearst) and NFL Enterprises LLC holding
18% and 10%, respectively.
FuboTV Inc.
On October 29, 2025, the Company and FuboTV Inc. (Fubo), a publicly traded vMVPD, combined certain of Hulu Live
TV assets, including its carriage agreements, subscription agreements and related data, advertising and sponsorship agreements
and intellectual property exclusively related to the “Live TV” brand, with Fubo (the Fubo Transaction). The Company acquired
Fubo to enhance and expand our vMVPD offering and provide consumers with more high-quality offerings, choice and
increased flexibility.
The Company contributed certain Hulu Live TV assets to a newly formed entity, Fubo Operations LLC (Newco), that is
jointly owned by the Company and Fubo in exchange for units in Newco (Newco Units) representing a 70% equity interest in
Newco on a fully diluted basis, and Fubo issued the Company shares of Fubo Class B Common Stock, a newly created vote-
only class of Fubo common stock representing a 70% voting interest in Fubo on a fully diluted basis. As a result, the Company
has a 70% economic interest in the combined operations, a 70% voting interest in Fubo and the right to appoint a majority of
Fubo’s Board of Directors. The remaining 30% equity interest in Fubo is retained by Fubo public shareholders.
Based on the closing price of Fubo common stock of $3.69 on October 29, 2025, the estimated fair value of Fubo is
$1.3 billion, which will be allocated to tangible and identifiable intangible assets acquired and liabilities assumed based on their
fair values with the excess recorded as goodwill. The Company is in the process of finalizing the valuation of the assets
acquired, liabilities assumed, and noncontrolling interests.
The Company will include Fubo’s financial results in the Company’s Consolidated Financial Statements effective from
October 29, 2025.
Pursuant to an agreement entered into as part of the Fubo Transaction, the Company is the exclusive distributor of the
Hulu Live TV service for five years (renewable for an additional five-year term by mutual agreement) and pays a wholesale fee
91
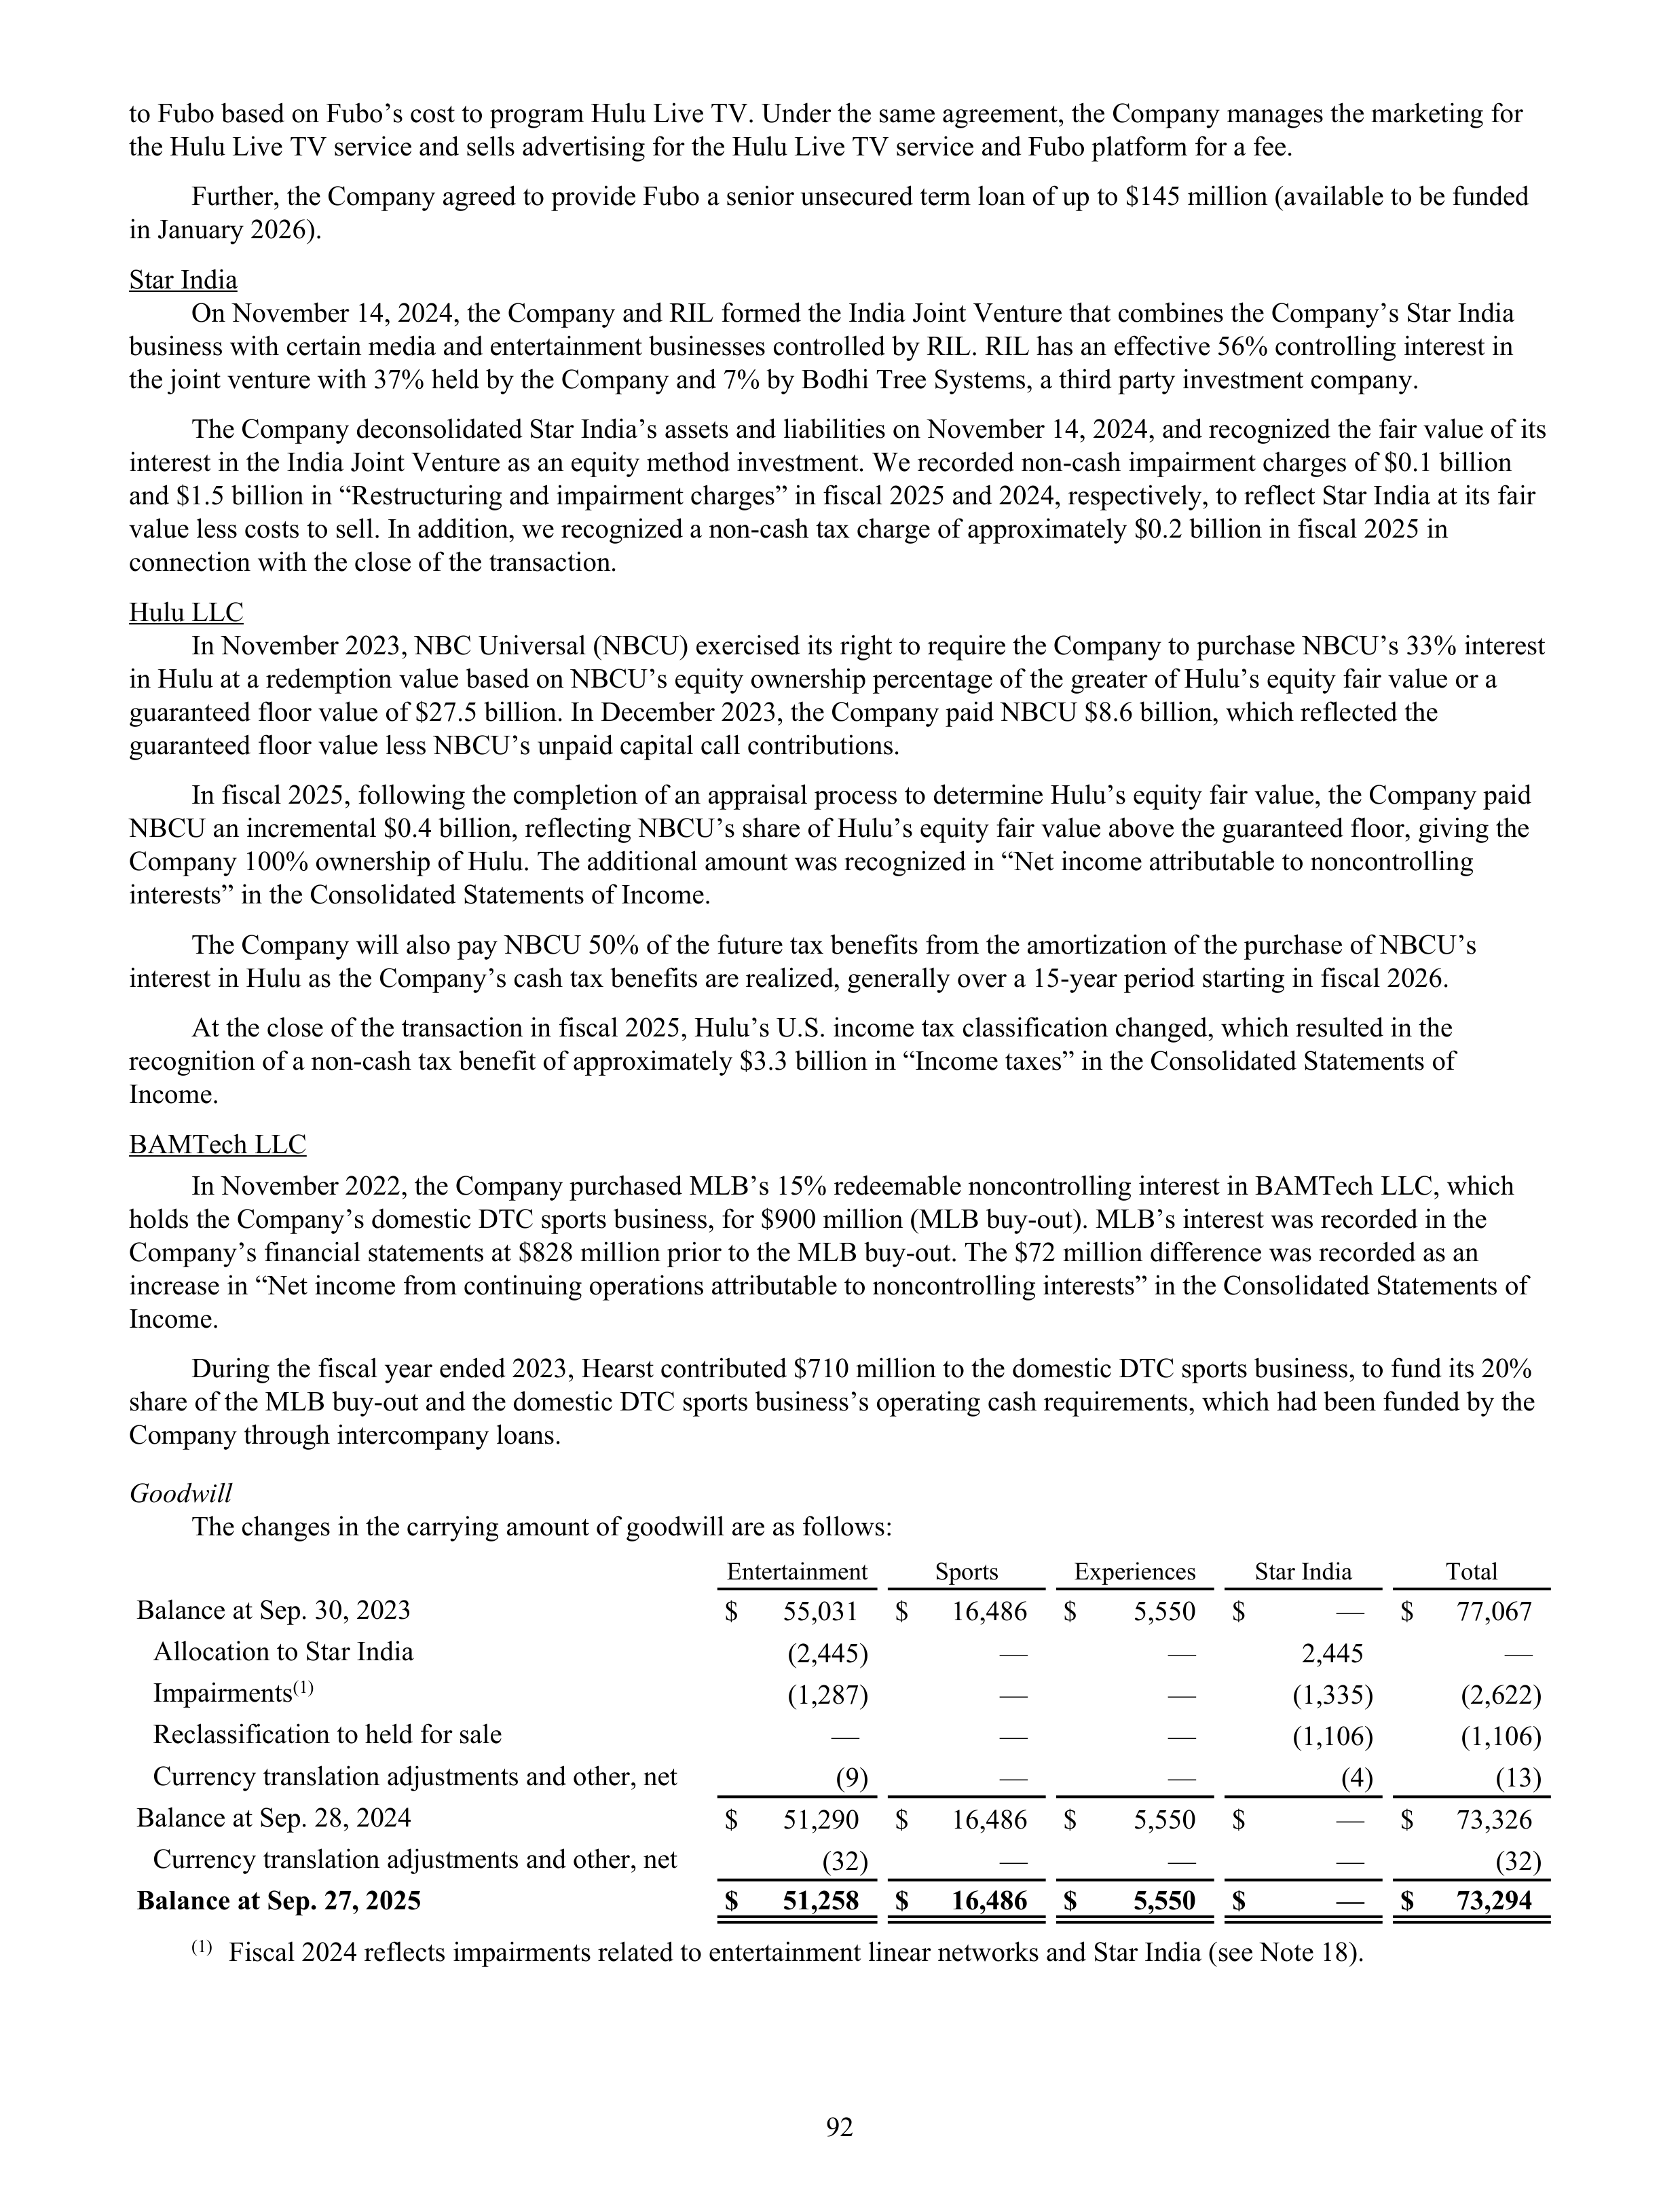
to Fubo based on Fubo’s cost to program Hulu Live TV. Under the same agreement, the Company manages the marketing for
the Hulu Live TV service and sells advertising for the Hulu Live TV service and Fubo platform for a fee.
Further, the Company agreed to provide Fubo a senior unsecured term loan of up to $145 million (available to be funded
in January 2026).
Star India
On November 14, 2024, the Company and RIL formed the India Joint Venture that combines the Company’s Star India
business with certain media and entertainment businesses controlled by RIL. RIL has an effective 56% controlling interest in
the joint venture with 37% held by the Company and 7% by Bodhi Tree Systems, a third party investment company.
The Company deconsolidated Star India’s assets and liabilities on November 14, 2024, and recognized the fair value of its
interest in the India Joint Venture as an equity method investment. We recorded non-cash impairment charges of $0.1 billion
and $1.5 billion in “Restructuring and impairment charges” in fiscal 2025 and 2024, respectively, to reflect Star India at its fair
value less costs to sell. In addition, we recognized a non-cash tax charge of approximately $0.2 billion in fiscal 2025 in
connection with the close of the transaction.
Hulu LLC
In November 2023, NBC Universal (NBCU) exercised its right to require the Company to purchase NBCU’s 33% interest
in Hulu at a redemption value based on NBCU’s equity ownership percentage of the greater of Hulu’s equity fair value or a
guaranteed floor value of $27.5 billion. In December 2023, the Company paid NBCU $8.6 billion, which reflected the
guaranteed floor value less NBCU’s unpaid capital call contributions.
In fiscal 2025, following the completion of an appraisal process to determine Hulu’s equity fair value, the Company paid
NBCU an incremental $0.4 billion, reflecting NBCU’s share of Hulu’s equity fair value above the guaranteed floor, giving the
Company 100% ownership of Hulu. The additional amount was recognized in “Net income attributable to noncontrolling
interests” in the Consolidated Statements of Income.
The Company will also pay NBCU 50% of the future tax benefits from the amortization of the purchase of NBCU’s
interest in Hulu as the Company’s cash tax benefits are realized, generally over a 15-year period starting in fiscal 2026.
At the close of the transaction in fiscal 2025, Hulu’s U.S. income tax classification changed, which resulted in the
recognition of a non-cash tax benefit of approximately $3.3 billion in “Income taxes” in the Consolidated Statements of
Income.
BAMTech LLC
In November 2022, the Company purchased MLB’s 15% redeemable noncontrolling interest in BAMTech LLC, which
holds the Company’s domestic DTC sports business, for $900 million (MLB buy-out). MLB’s interest was recorded in the
Company’s financial statements at $828 million prior to the MLB buy-out. The $72 million difference was recorded as an
increase in “Net income from continuing operations attributable to noncontrolling interests” in the Consolidated Statements of
Income.
During the fiscal year ended 2023, Hearst contributed $710 million to the domestic DTC sports business, to fund its 20%
share of the MLB buy-out and the domestic DTC sports business’s operating cash requirements, which had been funded by the
Company through intercompany loans.
Goodwill
The changes in the carrying amount of goodwill are as follows:
Entertainment
Sports
Experiences
Star India
Total
Balance at Sep. 30, 2023
$
55,031
$
16,486
$
5,550
$
— $
77,067
Allocation to Star India
(2,445)
—
—
2,445
—
Impairments
(1)
(1,287)
—
—
(1,335)
(2,622)
Reclassification to held for sale
—
—
—
(1,106)
(1,106)
Currency translation adjustments and other, net
(9)
—
—
(4)
(13)
Balance at Sep. 28, 2024
$
51,290
$
16,486
$
5,550
$
— $
73,326
Currency translation adjustments and other, net
(32)
—
—
—
(32)
Balance at Sep. 27, 2025
$
51,258
$
16,486
$
5,550
$
— $
73,294
(1)
Fiscal 2024 reflects impairments related to entertainment linear networks and Star India (see Note 18).
92
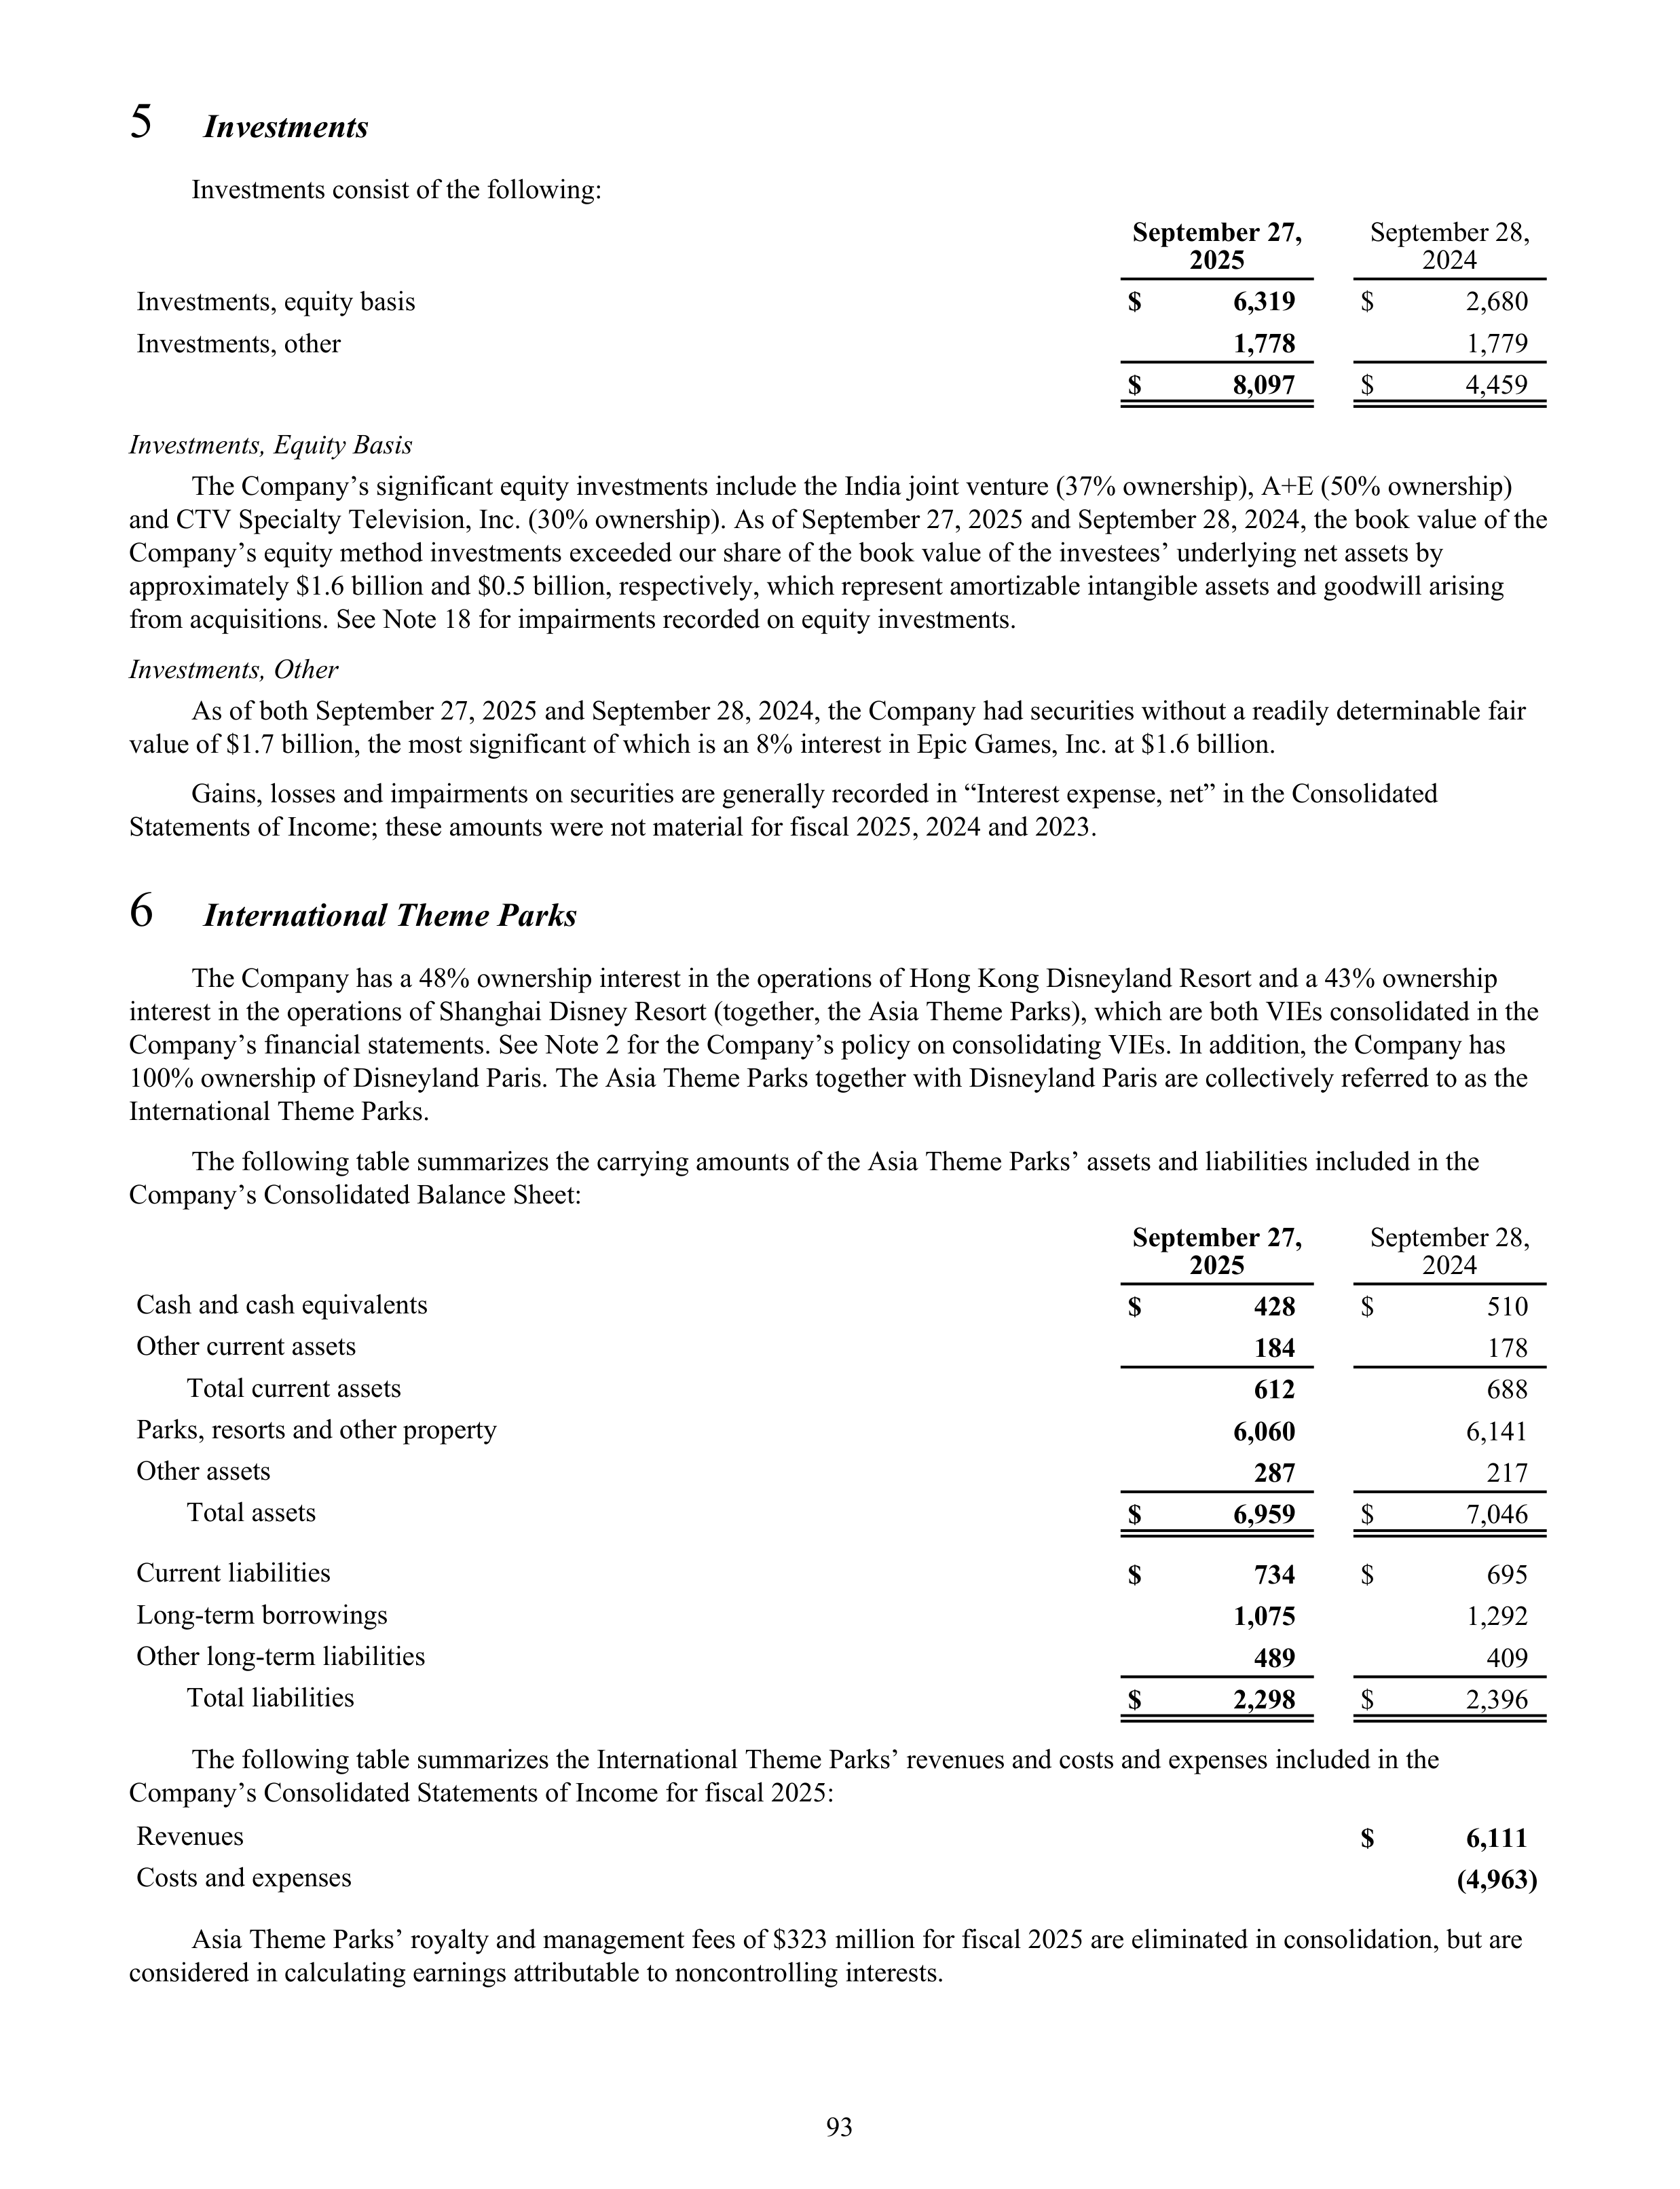
5
Investments
Investments consist of the following:
September 27,
2025
September 28,
2024
Investments, equity basis
$
6,319
$
2,680
Investments, other
1,778
1,779
$
8,097
$
4,459
Investments, Equity Basis
The Company’s significant equity investments include the India joint venture (37% ownership), A+E (50% ownership)
and CTV Specialty Television, Inc. (30% ownership). As of September 27, 2025 and September 28, 2024, the book value of the
Company’s equity method investments exceeded our share of the book value of the investees’ underlying net assets by
approximately $1.6 billion and $0.5 billion, respectively, which represent amortizable intangible assets and goodwill arising
from acquisitions. See Note 18 for impairments recorded on equity investments.
Investments, Other
As of both September 27, 2025 and September 28, 2024, the Company had securities without a readily determinable fair
value of $1.7 billion, the most significant of which is an 8% interest in Epic Games, Inc. at $1.6 billion.
Gains, losses and impairments on securities are generally recorded in “Interest expense, net” in the Consolidated
Statements of Income; these amounts were not material for fiscal 2025, 2024 and 2023.
6
International Theme Parks
The Company has a 48% ownership interest in the operations of Hong Kong Disneyland Resort and a 43% ownership
interest in the operations of Shanghai Disney Resort (together, the Asia Theme Parks), which are both VIEs consolidated in the
Company’s financial statements. See Note 2 for the Company’s policy on consolidating VIEs. In addition, the Company has
100% ownership of Disneyland Paris. The Asia Theme Parks together with Disneyland Paris are collectively referred to as the
International Theme Parks.
The following table summarizes the carrying amounts of the Asia Theme Parks’ assets and liabilities included in the
Company’s Consolidated Balance Sheet:
September 27,
2025
September 28,
2024
Cash and cash equivalents
$
428
$
510
Other current assets
184
178
Total current assets
612
688
Parks, resorts and other property
6,060
6,141
Other assets
287
217
Total assets
$
6,959
$
7,046
Current liabilities
$
734
$
695
Long-term borrowings
1,075
1,292
Other long-term liabilities
489
409
Total liabilities
$
2,298
$
2,396
The following table summarizes the International Theme Parks’ revenues and costs and expenses included in the
Company’s Consolidated Statements of Income for fiscal 2025:
Revenues
$
6,111
Costs and expenses
(4,963)
Asia Theme Parks’ royalty and management fees of $323 million for fiscal 2025 are eliminated in consolidation, but are
considered in calculating earnings attributable to noncontrolling interests.
93
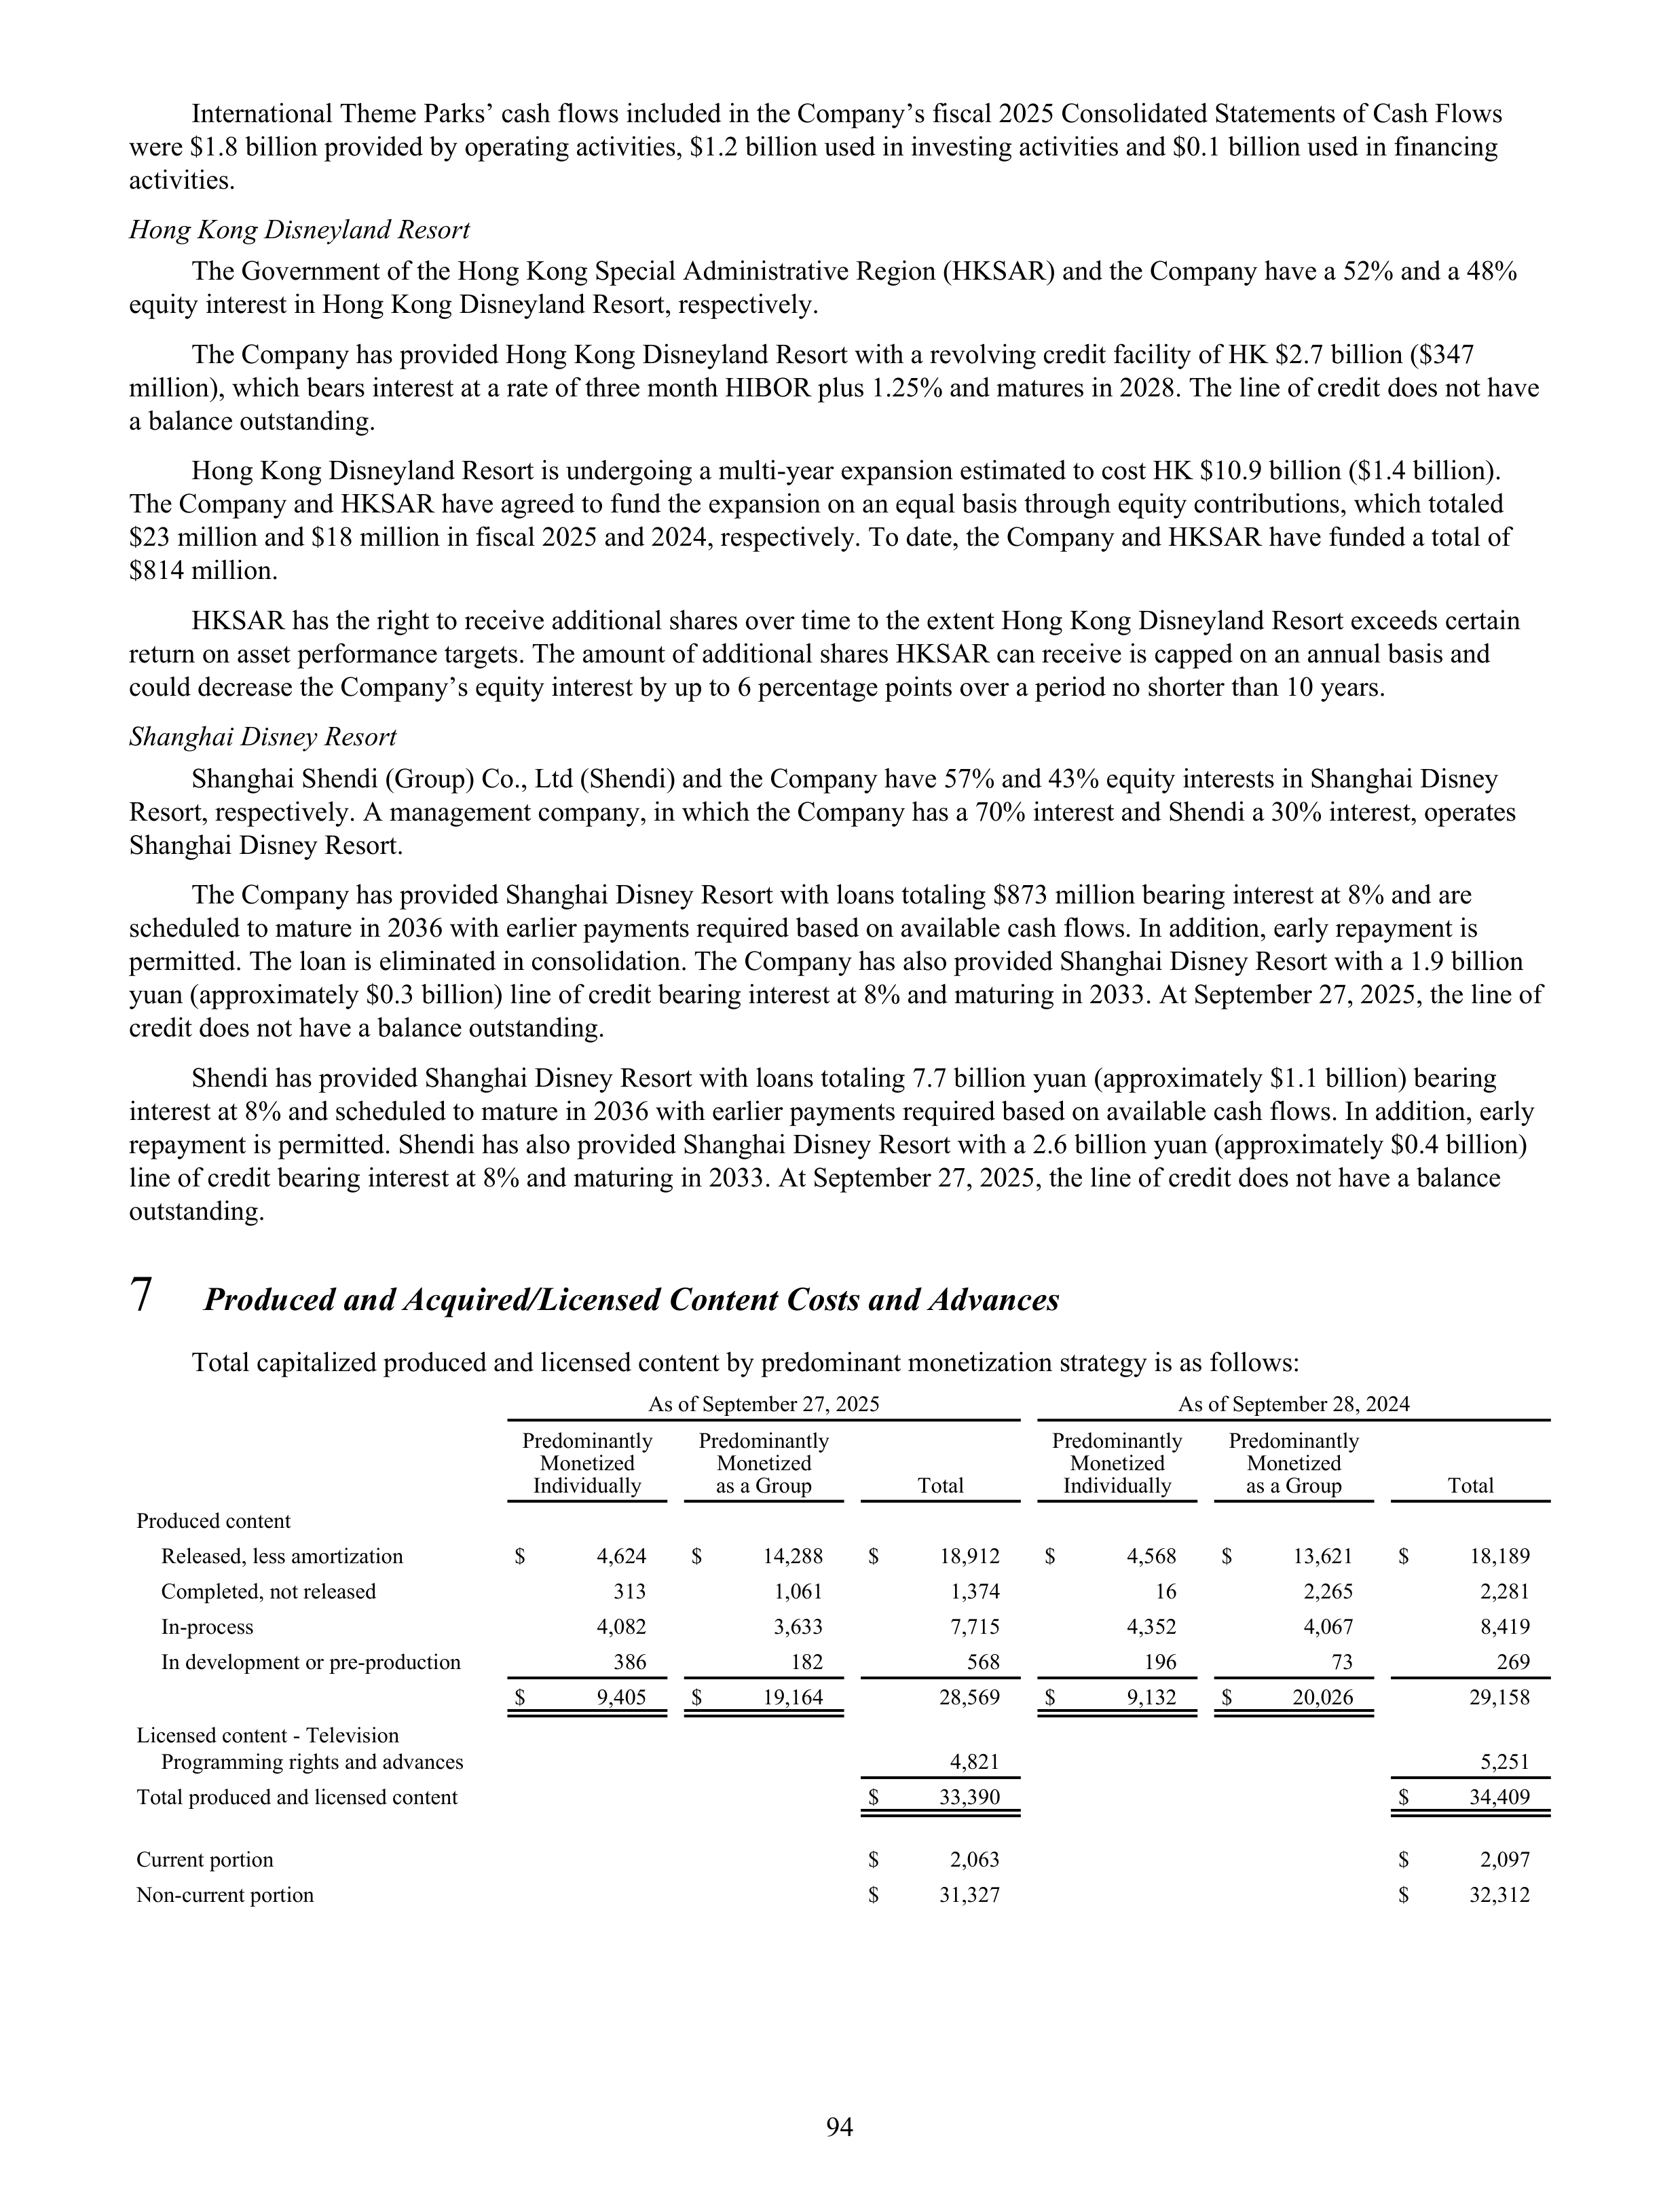
International Theme Parks’ cash flows included in the Company’s fiscal 2025 Consolidated Statements of Cash Flows
were $1.8 billion provided by operating activities, $1.2 billion used in investing activities and $0.1 billion used in financing
activities.
Hong Kong Disneyland Resort
The Government of the Hong Kong Special Administrative Region (HKSAR) and the Company have a 52% and a 48%
equity interest in Hong Kong Disneyland Resort, respectively.
The Company has provided Hong Kong Disneyland Resort with a revolving credit facility of HK $2.7 billion ($347
million), which bears interest at a rate of three month HIBOR plus 1.25% and matures in 2028. The line of credit does not have
a balance outstanding.
Hong Kong Disneyland Resort is undergoing a multi-year expansion estimated to cost HK $10.9 billion ($1.4 billion).
The Company and HKSAR have agreed to fund the expansion on an equal basis through equity contributions, which totaled
$23 million and $18 million in fiscal 2025 and 2024, respectively. To date, the Company and HKSAR have funded a total of
$814 million.
HKSAR has the right to receive additional shares over time to the extent Hong Kong Disneyland Resort exceeds certain
return on asset performance targets. The amount of additional shares HKSAR can receive is capped on an annual basis and
could decrease the Company’s equity interest by up to 6 percentage points over a period no shorter than 10 years.
Shanghai Disney Resort
Shanghai Shendi (Group) Co., Ltd (Shendi) and the Company have 57% and 43% equity interests in Shanghai Disney
Resort, respectively. A management company, in which the Company has a 70% interest and Shendi a 30% interest, operates
Shanghai Disney Resort.
The Company has provided Shanghai Disney Resort with loans totaling $873 million bearing interest at 8% and are
scheduled to mature in 2036 with earlier payments required based on available cash flows. In addition, early repayment is
permitted. The loan is eliminated in consolidation. The Company has also provided Shanghai Disney Resort with a 1.9 billion
yuan (approximately $0.3 billion) line of credit bearing interest at 8% and maturing in 2033. At September 27, 2025, the line of
credit does not have a balance outstanding.
Shendi has provided Shanghai Disney Resort with loans totaling 7.7 billion yuan (approximately $1.1 billion) bearing
interest at 8% and scheduled to mature in 2036 with earlier payments required based on available cash flows. In addition, early
repayment is permitted. Shendi has also provided Shanghai Disney Resort with a 2.6 billion yuan (approximately $0.4 billion)
line of credit bearing interest at 8% and maturing in 2033. At September 27, 2025, the line of credit does not have a balance
outstanding.
7
Produced and Acquired/Licensed Content Costs and Advances
Total capitalized produced and licensed content by predominant monetization strategy is as follows:
As of September 27, 2025
As of September 28, 2024
Predominantly
Monetized
Individually
Predominantly
Monetized
as a Group
Total
Predominantly
Monetized
Individually
Predominantly
Monetized
as a Group
Total
Produced content
Released, less amortization
$
4,624
$
14,288
$
18,912
$
4,568
$
13,621
$
18,189
Completed, not released
313
1,061
1,374
16
2,265
2,281
In-process
4,082
3,633
7,715
4,352
4,067
8,419
In development or pre-production
386
182
568
196
73
269
$
9,405
$
19,164
28,569
$
9,132
$
20,026
29,158
Licensed content - Television
Programming rights and advances
4,821
5,251
Total produced and licensed content
$
33,390
$
34,409
Current portion
$
2,063
$
2,097
Non-current portion
$
31,327
$
32,312
94
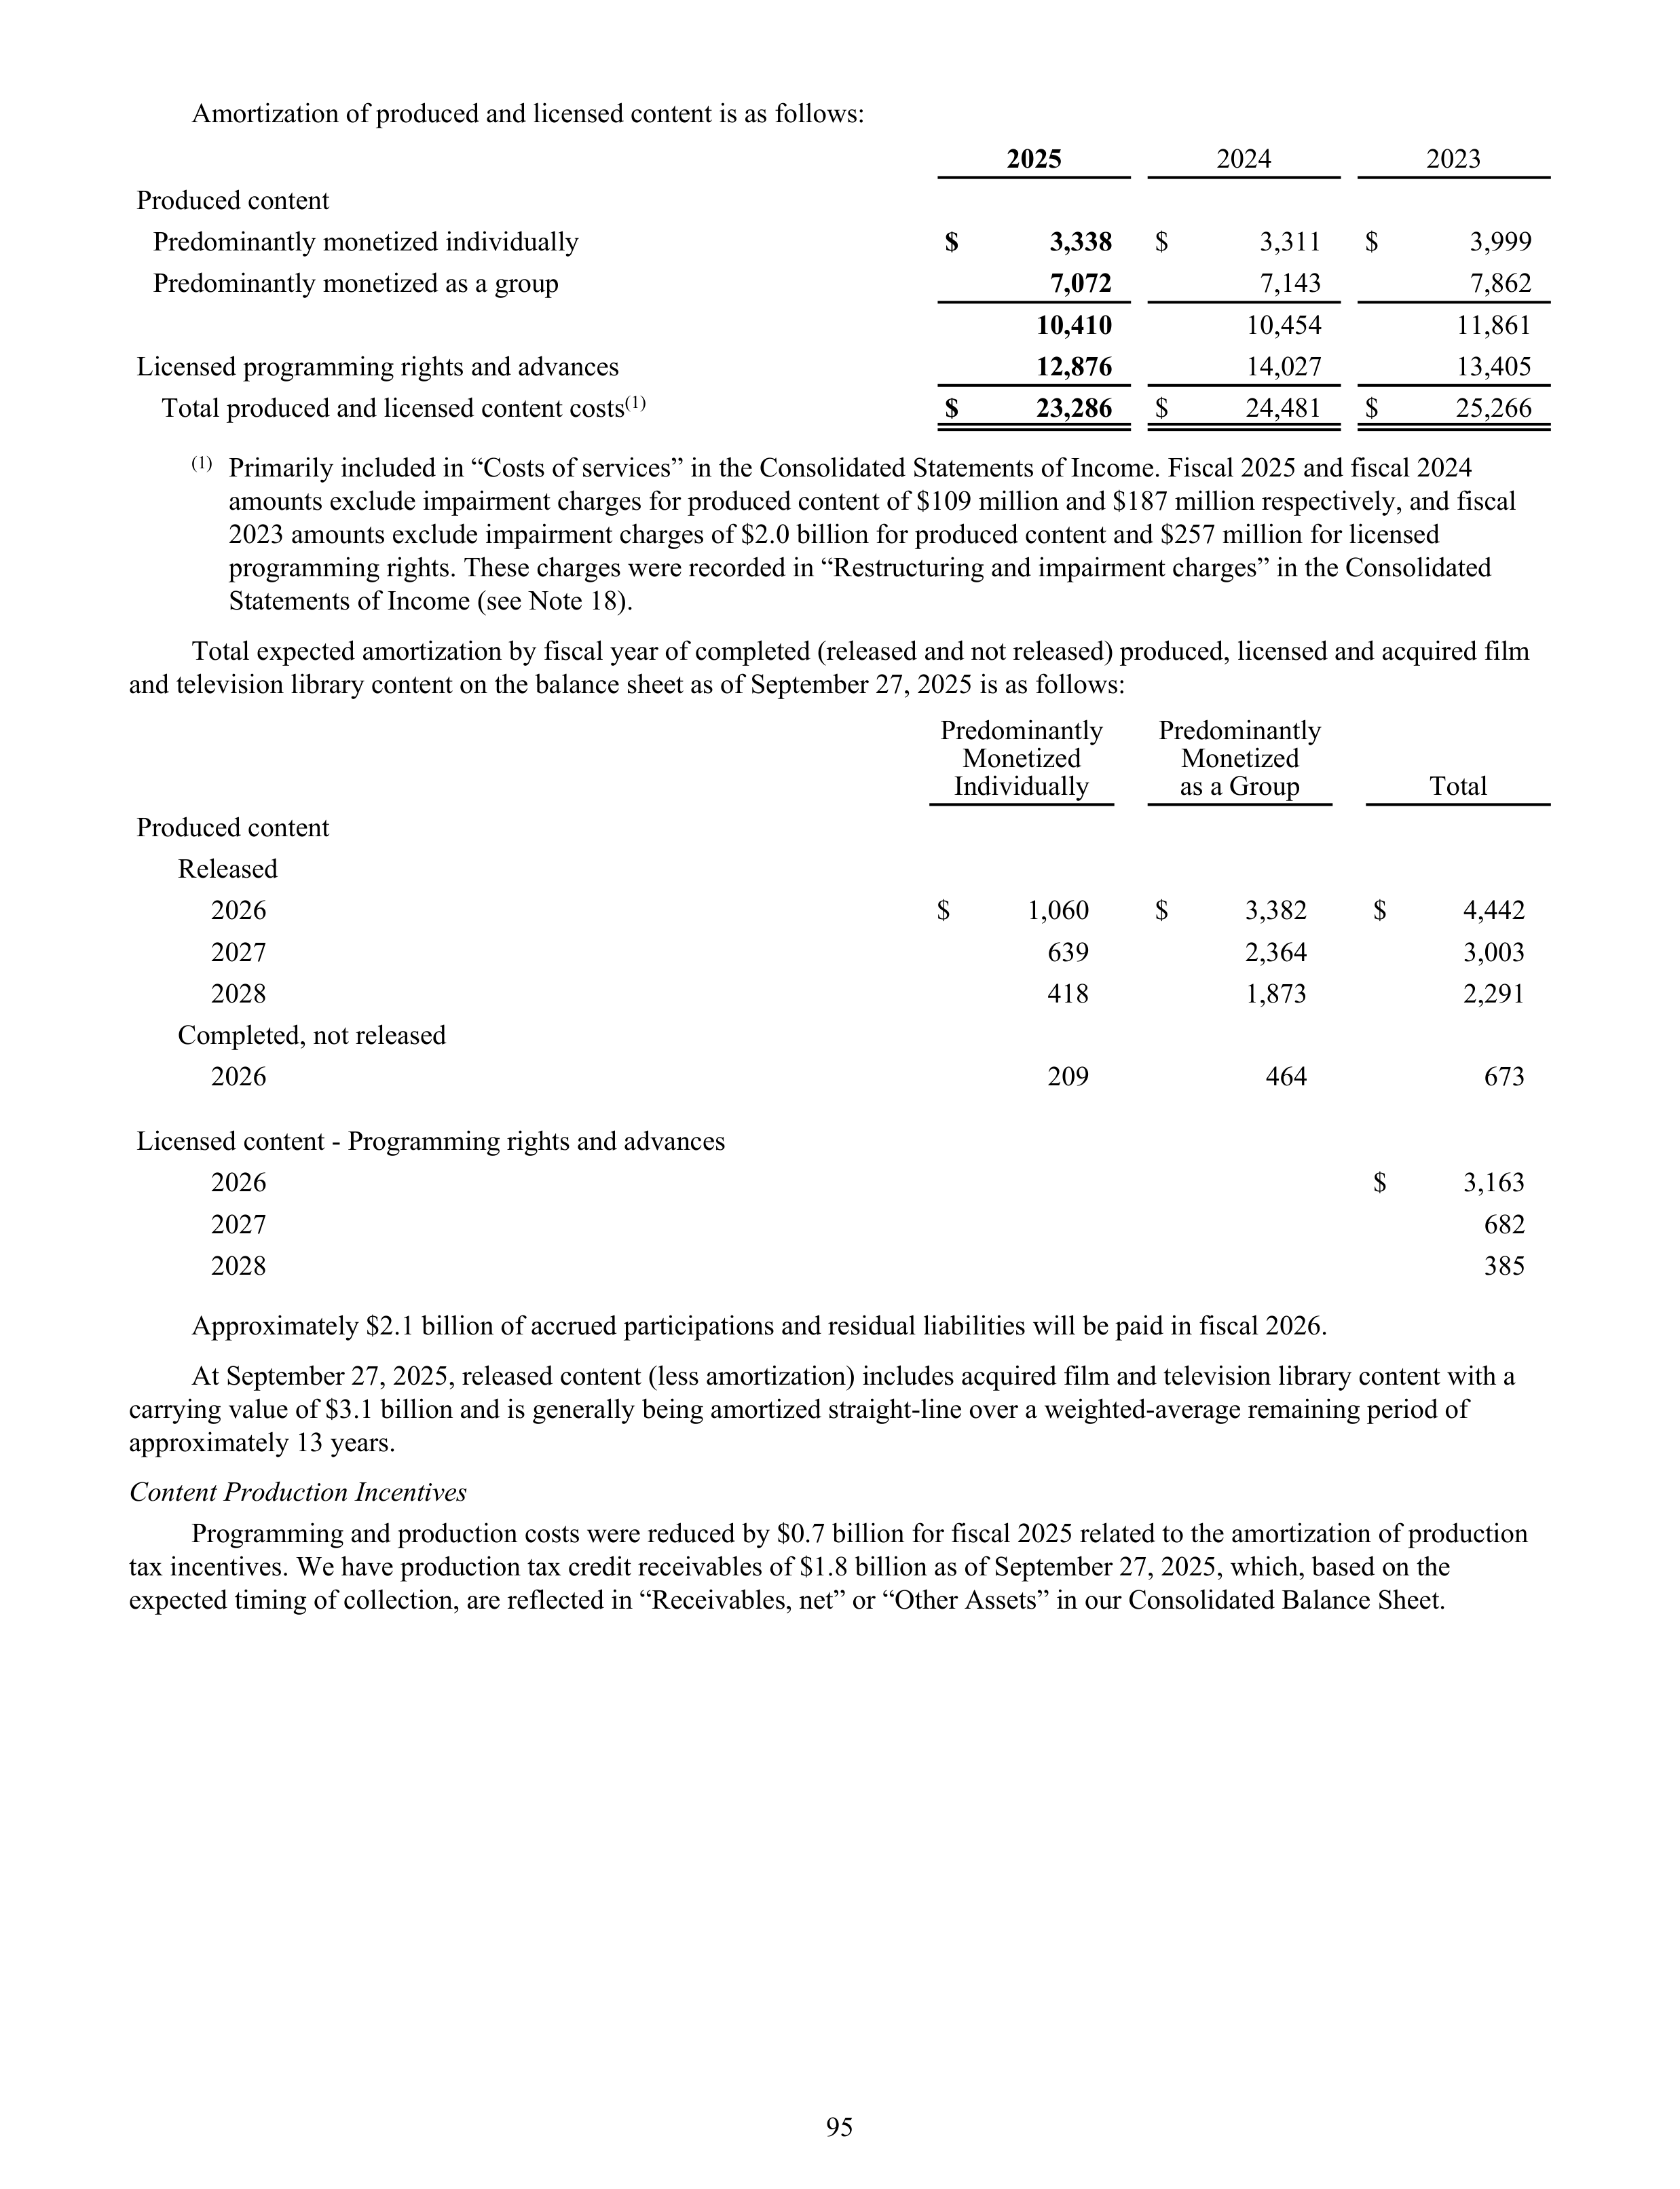
Amortization of produced and licensed content is as follows:
2025
2024
2023
Produced content
Predominantly monetized individually
$
3,338
$
3,311
$
3,999
Predominantly monetized as a group
7,072
7,143
7,862
10,410
10,454
11,861
Licensed programming rights and advances
12,876
14,027
13,405
Total produced and licensed content costs
(1)
$
23,286
$
24,481
$
25,266
(1)
Primarily included in “Costs of services” in the Consolidated Statements of Income. Fiscal 2025 and fiscal 2024
amounts exclude impairment charges for produced content of $109 million and $187 million respectively, and fiscal
2023 amounts exclude impairment charges of $2.0 billion for produced content and $257 million for licensed
programming rights. These charges were recorded in “Restructuring and impairment charges” in the Consolidated
Statements of Income (see Note 18).
Total expected amortization by fiscal year of completed (released and not released) produced, licensed and acquired film
and television library content on the balance sheet as of September 27, 2025 is as follows:
Predominantly
Monetized
Individually
Predominantly
Monetized
as a Group
Total
Produced content
Released
2026
$
1,060
$
3,382
$
4,442
2027
639
2,364
3,003
2028
418
1,873
2,291
Completed, not released
2026
209
464
673
Licensed content - Programming rights and advances
2026
$
3,163
2027
682
2028
385
Approximately $2.1 billion of accrued participations and residual liabilities will be paid in fiscal 2026.
At September 27, 2025, released content (less amortization) includes acquired film and television library content with a
carrying value of $3.1 billion and is generally being amortized straight-line over a weighted-average remaining period of
approximately 13 years.
Content Production Incentives
Programming and production costs were reduced by $0.7 billion for fiscal 2025 related to the amortization of production
tax incentives. We have production tax credit receivables of $1.8 billion as of September 27, 2025, which, based on the
expected timing of collection, are reflected in “Receivables, net” or “Other Assets” in our Consolidated Balance Sheet.
95
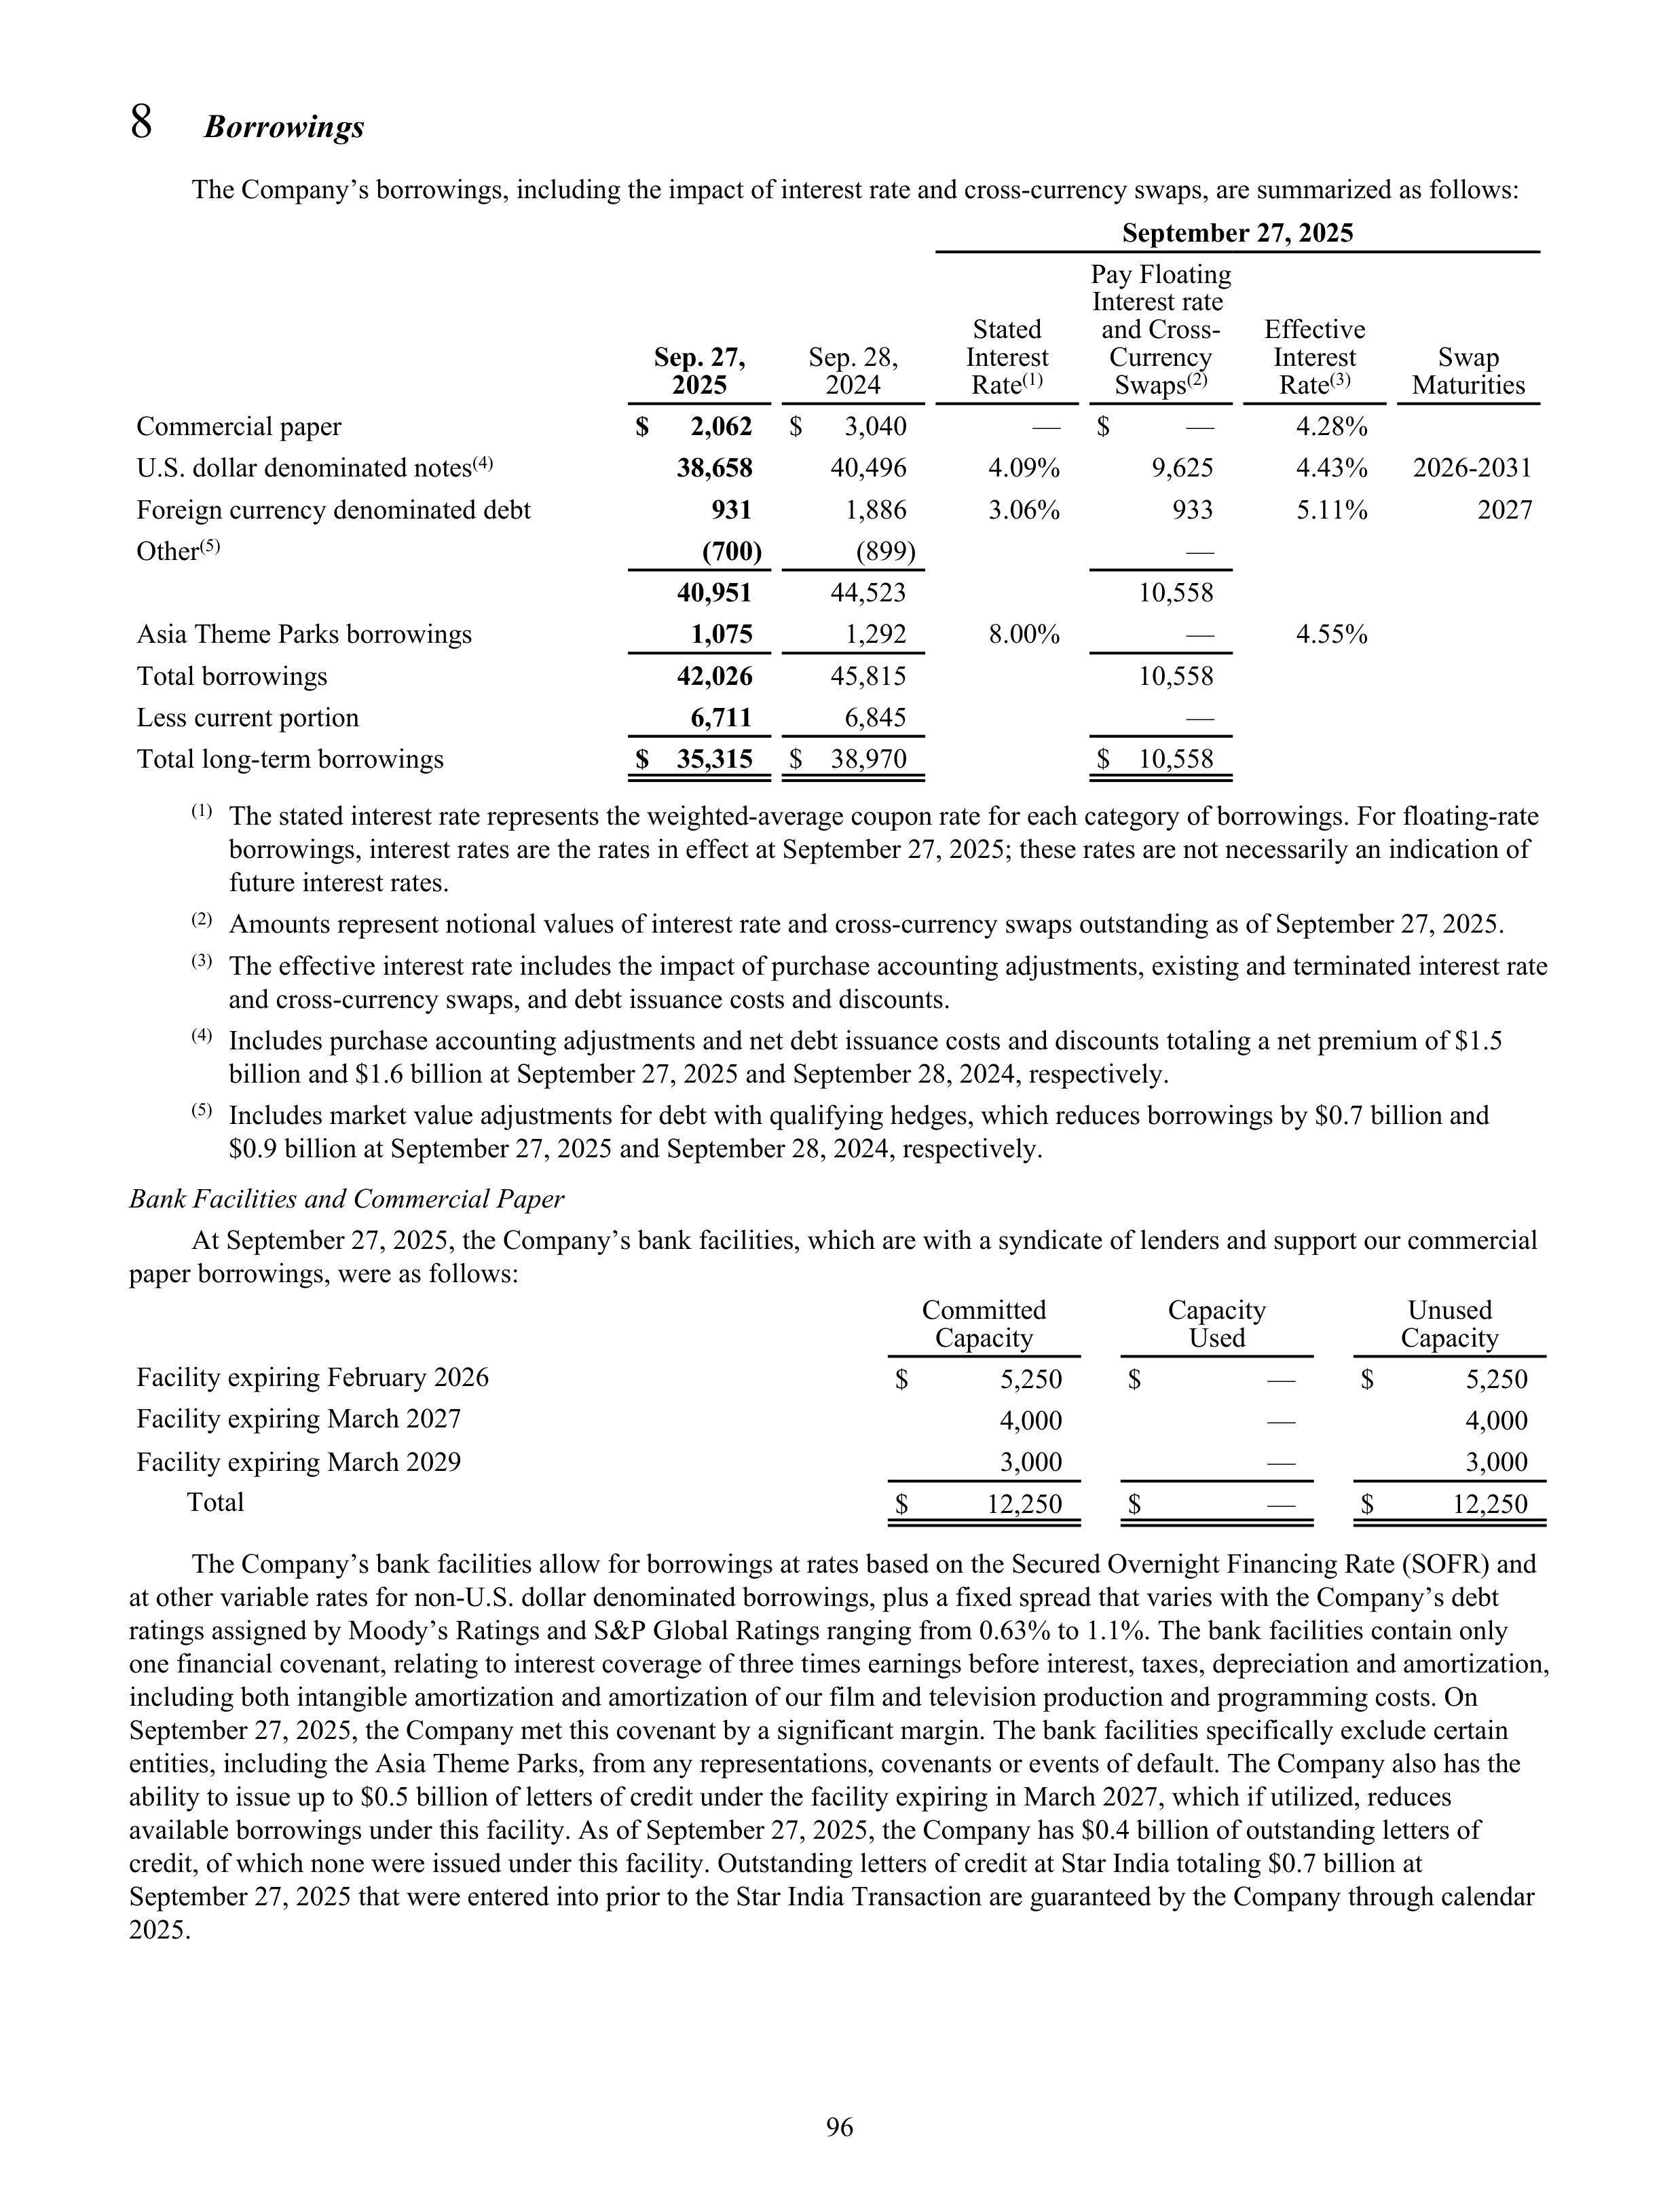
8
Borrowings
The Company’s borrowings, including the impact of interest rate and cross-currency swaps, are summarized as follows:
September 27, 2025
Sep. 27,
2025
Sep. 28,
2024
Stated
Interest
Rate
(1)
Pay Floating
Interest rate
and Cross-
Currency
Swaps
(2)
Effective
Interest
Rate
(3)
Swap
Maturities
Commercial paper
$
2,062
$
3,040
—
$
—
4.28 %
U.S. dollar denominated notes
(4)
38,658
40,496
4.09 %
9,625
4.43 %
2026-2031
Foreign currency denominated debt
931
1,886
3.06 %
933
5.11 %
2027
Other
(5)
(700)
(899)
—
40,951
44,523
10,558
Asia Theme Parks borrowings
1,075
1,292
8.00 %
—
4.55 %
Total borrowings
42,026
45,815
10,558
Less current portion
6,711
6,845
—
Total long-term borrowings
$ 35,315
$ 38,970
$ 10,558
(1)
The stated interest rate represents the weighted-average coupon rate for each category of borrowings. For floating-rate
borrowings, interest rates are the rates in effect at September 27, 2025; these rates are not necessarily an indication of
future interest rates.
(2)
Amounts represent notional values of interest rate and cross-currency swaps outstanding as of September 27, 2025.
(3)
The effective interest rate includes the impact of purchase accounting adjustments, existing and terminated interest rate
and cross-currency swaps, and debt issuance costs and discounts.
(4)
Includes purchase accounting adjustments and net debt issuance costs and discounts totaling a net premium of $1.5
billion and $1.6 billion at September 27, 2025 and September 28, 2024, respectively.
(5)
Includes market value adjustments for debt with qualifying hedges, which reduces borrowings by $0.7 billion and
$0.9 billion at September 27, 2025 and September 28, 2024, respectively.
Bank Facilities and Commercial Paper
At September 27, 2025, the Company’s bank facilities, which are with a syndicate of lenders and support our commercial
paper borrowings, were as follows:
Committed
Capacity
Capacity
Used
Unused
Capacity
Facility expiring February 2026
$
5,250
$
—
$
5,250
Facility expiring March 2027
4,000
—
4,000
Facility expiring March 2029
3,000
—
3,000
Total
$
12,250
$
—
$
12,250
The Company’s bank facilities allow for borrowings at rates based on the Secured Overnight Financing Rate (SOFR) and
at other variable rates for non-U.S. dollar denominated borrowings, plus a fixed spread that varies with the Company’s debt
ratings assigned by Moody’s Ratings and S&P Global Ratings ranging from 0.63% to 1.1%. The bank facilities contain only
one financial covenant, relating to interest coverage of three times earnings before interest, taxes, depreciation and amortization,
including both intangible amortization and amortization of our film and television production and programming costs. On
September 27, 2025, the Company met this covenant by a significant margin. The bank facilities specifically exclude certain
entities, including the Asia Theme Parks, from any representations, covenants or events of default. The Company also has the
ability to issue up to $0.5 billion of letters of credit under the facility expiring in March 2027, which if utilized, reduces
available borrowings under this facility. As of September 27, 2025, the Company has $0.4 billion of outstanding letters of
credit, of which none were issued under this facility. Outstanding letters of credit at Star India totaling $0.7 billion at
September 27, 2025 that were entered into prior to the Star India Transaction are guaranteed by the Company through calendar
2025.
96
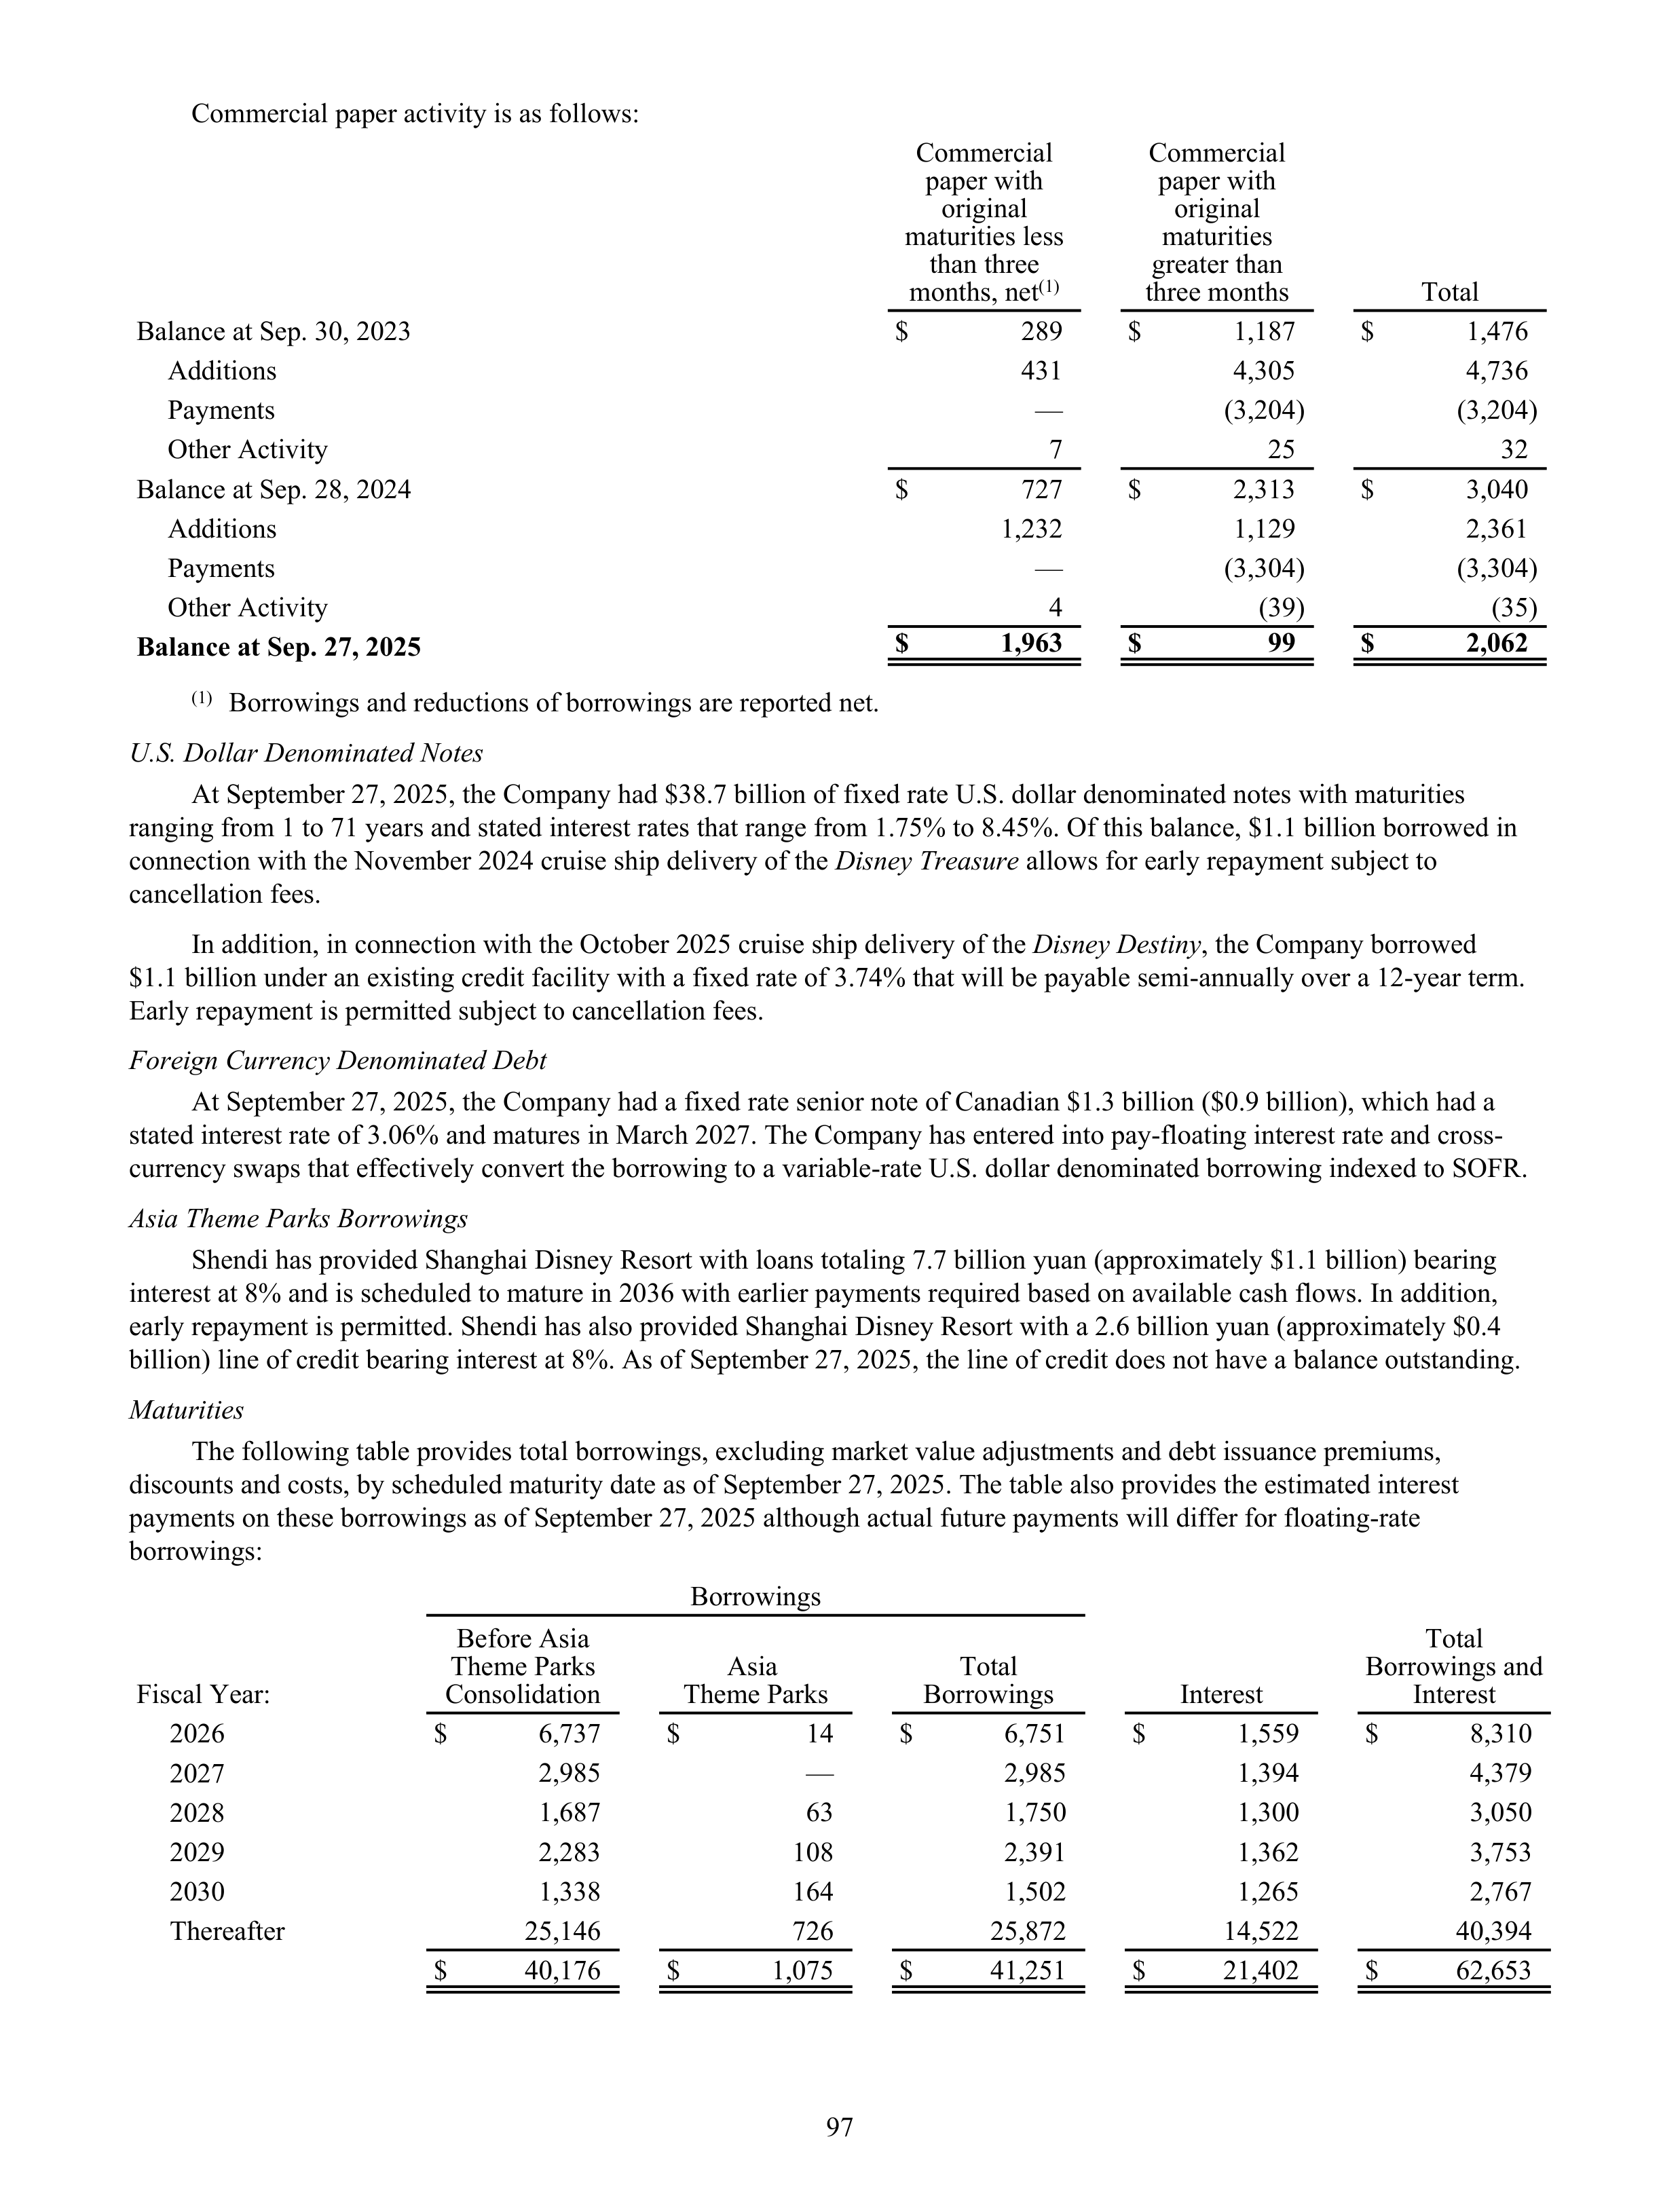
Commercial paper activity is as follows:
Commercial
paper with
original
maturities less
than three
months, net
(1)
Commercial
paper with
original
maturities
greater than
three months
Total
Balance at Sep. 30, 2023
$
289
$
1,187
$
1,476
Additions
431
4,305
4,736
Payments
—
(3,204)
(3,204)
Other Activity
7
25
32
Balance at Sep. 28, 2024
$
727
$
2,313
$
3,040
Additions
1,232
1,129
2,361
Payments
—
(3,304)
(3,304)
Other Activity
4
(39)
(35)
Balance at Sep. 27, 2025
$
1,963
$
99
$
2,062
(1)
Borrowings and reductions of borrowings are reported net.
U.S. Dollar Denominated Notes
At September 27, 2025, the Company had $38.7 billion of fixed rate U.S. dollar denominated notes with maturities
ranging from 1 to 71 years and stated interest rates that range from 1.75% to 8.45%. Of this balance, $1.1 billion borrowed in
connection with the November 2024 cruise ship delivery of the
Disney Treasure
allows for early repayment subject to
cancellation fees.
In addition, in connection with the October 2025 cruise ship delivery of the
Disney Destiny
, the Company borrowed
$1.1 billion under an existing credit facility with a fixed rate of 3.74% that will be payable semi-annually over a 12-year term.
Early repayment is permitted subject to cancellation fees.
Foreign Currency Denominated Debt
At September 27, 2025, the Company had a fixed rate senior note of Canadian $1.3 billion ($0.9 billion), which had a
stated interest rate of 3.06% and matures in March 2027. The Company has entered into pay-floating interest rate and cross-
currency swaps that effectively convert the borrowing to a variable-rate U.S. dollar denominated borrowing indexed to SOFR.
Asia Theme Parks Borrowings
Shendi has provided Shanghai Disney Resort with loans totaling 7.7 billion yuan (approximately $1.1 billion) bearing
interest at 8% and is scheduled to mature in 2036 with earlier payments required based on available cash flows. In addition,
early repayment is permitted. Shendi has also provided Shanghai Disney Resort with a 2.6 billion yuan (approximately $0.4
billion) line of credit bearing interest at 8%. As of September 27, 2025, the line of credit does not have a balance outstanding.
Maturities
The following table provides total borrowings, excluding market value adjustments and debt issuance premiums,
discounts and costs, by scheduled maturity date as of September 27, 2025. The table also provides the estimated interest
payments on these borrowings as of September 27, 2025 although actual future payments will differ for floating-rate
borrowings:
Borrowings
Fiscal Year:
Before Asia
Theme Parks
Consolidation
Asia
Theme Parks
Total
Borrowings
Interest
Total
Borrowings and
Interest
2026
$
6,737
$
14
$
6,751
$
1,559
$
8,310
2027
2,985
—
2,985
1,394
4,379
2028
1,687
63
1,750
1,300
3,050
2029
2,283
108
2,391
1,362
3,753
2030
1,338
164
1,502
1,265
2,767
Thereafter
25,146
726
25,872
14,522
40,394
$
40,176
$
1,075
$
41,251
$
21,402
$
62,653
97
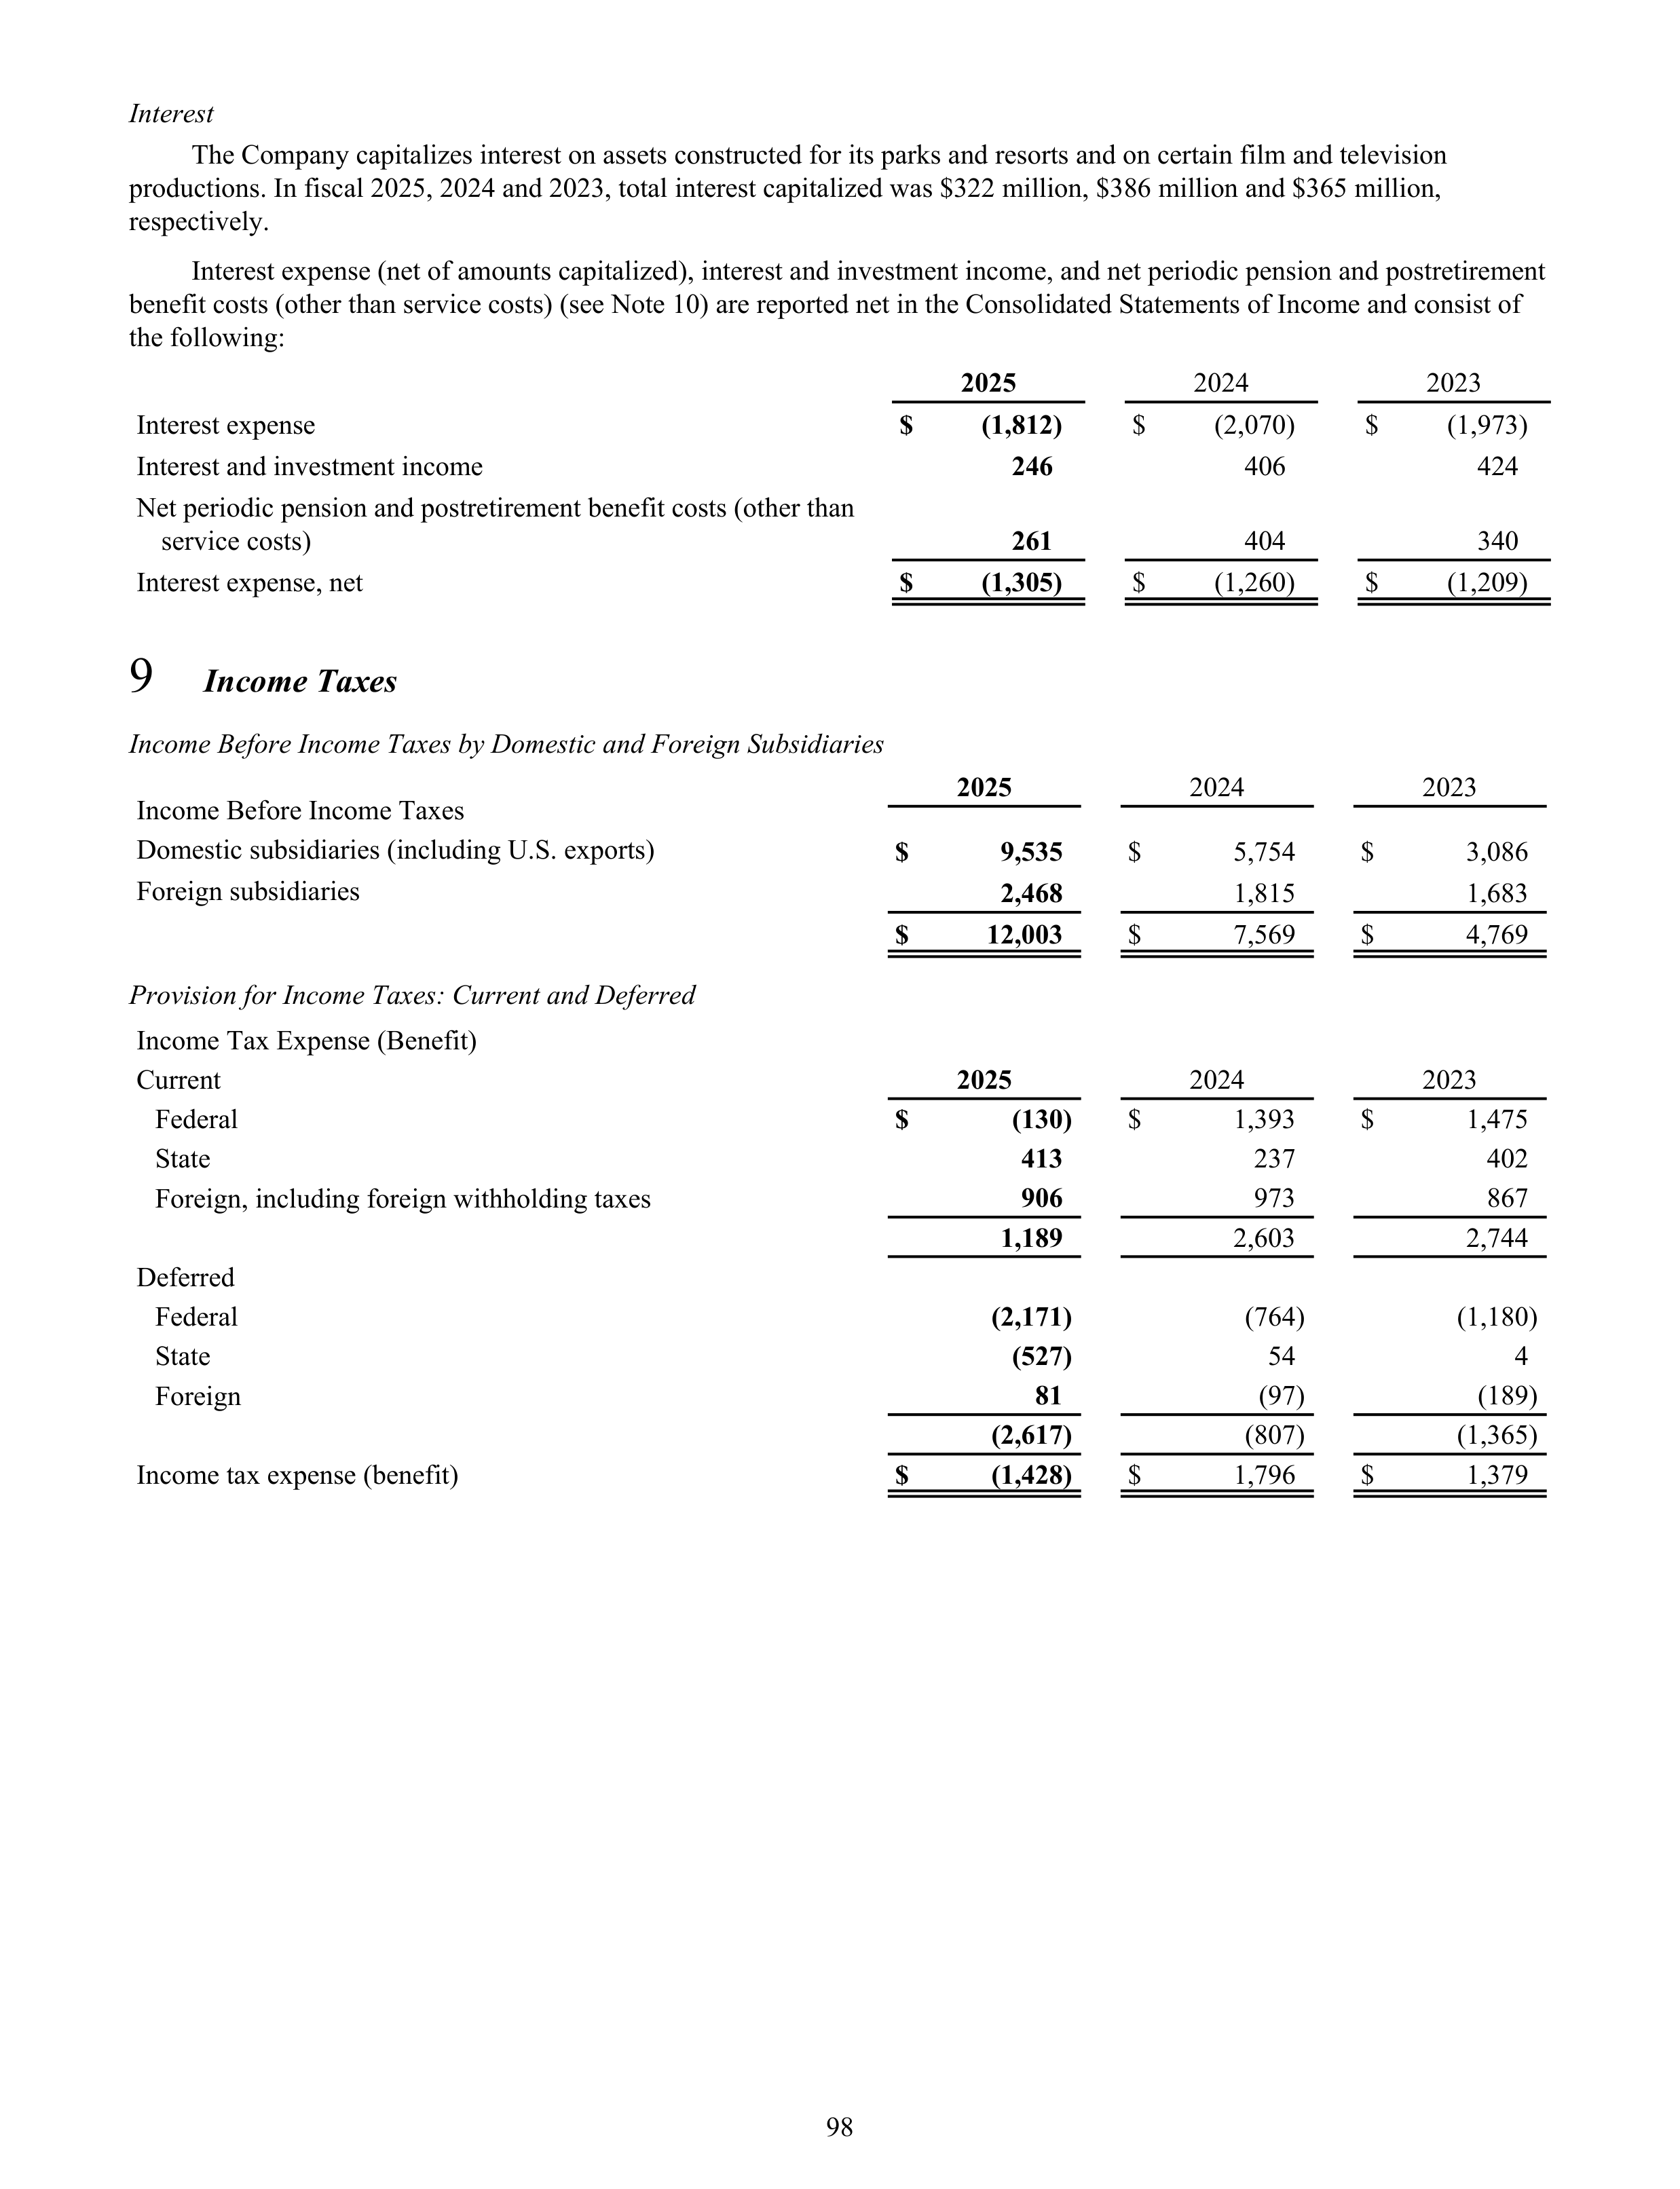
Interest
The Company capitalizes interest on assets constructed for its parks and resorts and on certain film and television
productions. In fiscal 2025, 2024 and 2023, total interest capitalized was $322 million, $386 million and $365 million,
respectively.
Interest expense (net of amounts capitalized), interest and investment income, and net periodic pension and postretirement
benefit costs (other than service costs) (see Note 10) are reported net in the Consolidated Statements of Income and consist of
the following:
2025
2024
2023
Interest expense
$
(1,812)
$
(2,070)
$
(1,973)
Interest and investment income
246
406
424
Net periodic pension and postretirement benefit costs (other than
service costs)
261
404
340
Interest expense, net
$
(1,305)
$
(1,260)
$
(1,209)
9
Income Taxes
Income Before Income Taxes by Domestic and Foreign Subsidiaries
Income Before Income Taxes
2025
2024
2023
Domestic subsidiaries (including U.S. exports)
$
9,535
$
5,754
$
3,086
Foreign subsidiaries
2,468
1,815
1,683
$
12,003
$
7,569
$
4,769
Provision for Income Taxes: Current and Deferred
Income Tax Expense (Benefit)
Current
2025
2024
2023
Federal
$
(130)
$
1,393
$
1,475
State
413
237
402
Foreign, including foreign withholding taxes
906
973
867
1,189
2,603
2,744
Deferred
Federal
(2,171)
(764)
(1,180)
State
(527)
54
4
Foreign
81
(97)
(189)
(2,617)
(807)
(1,365)
Income tax expense (benefit)
$
(1,428)
$
1,796
$
1,379
98
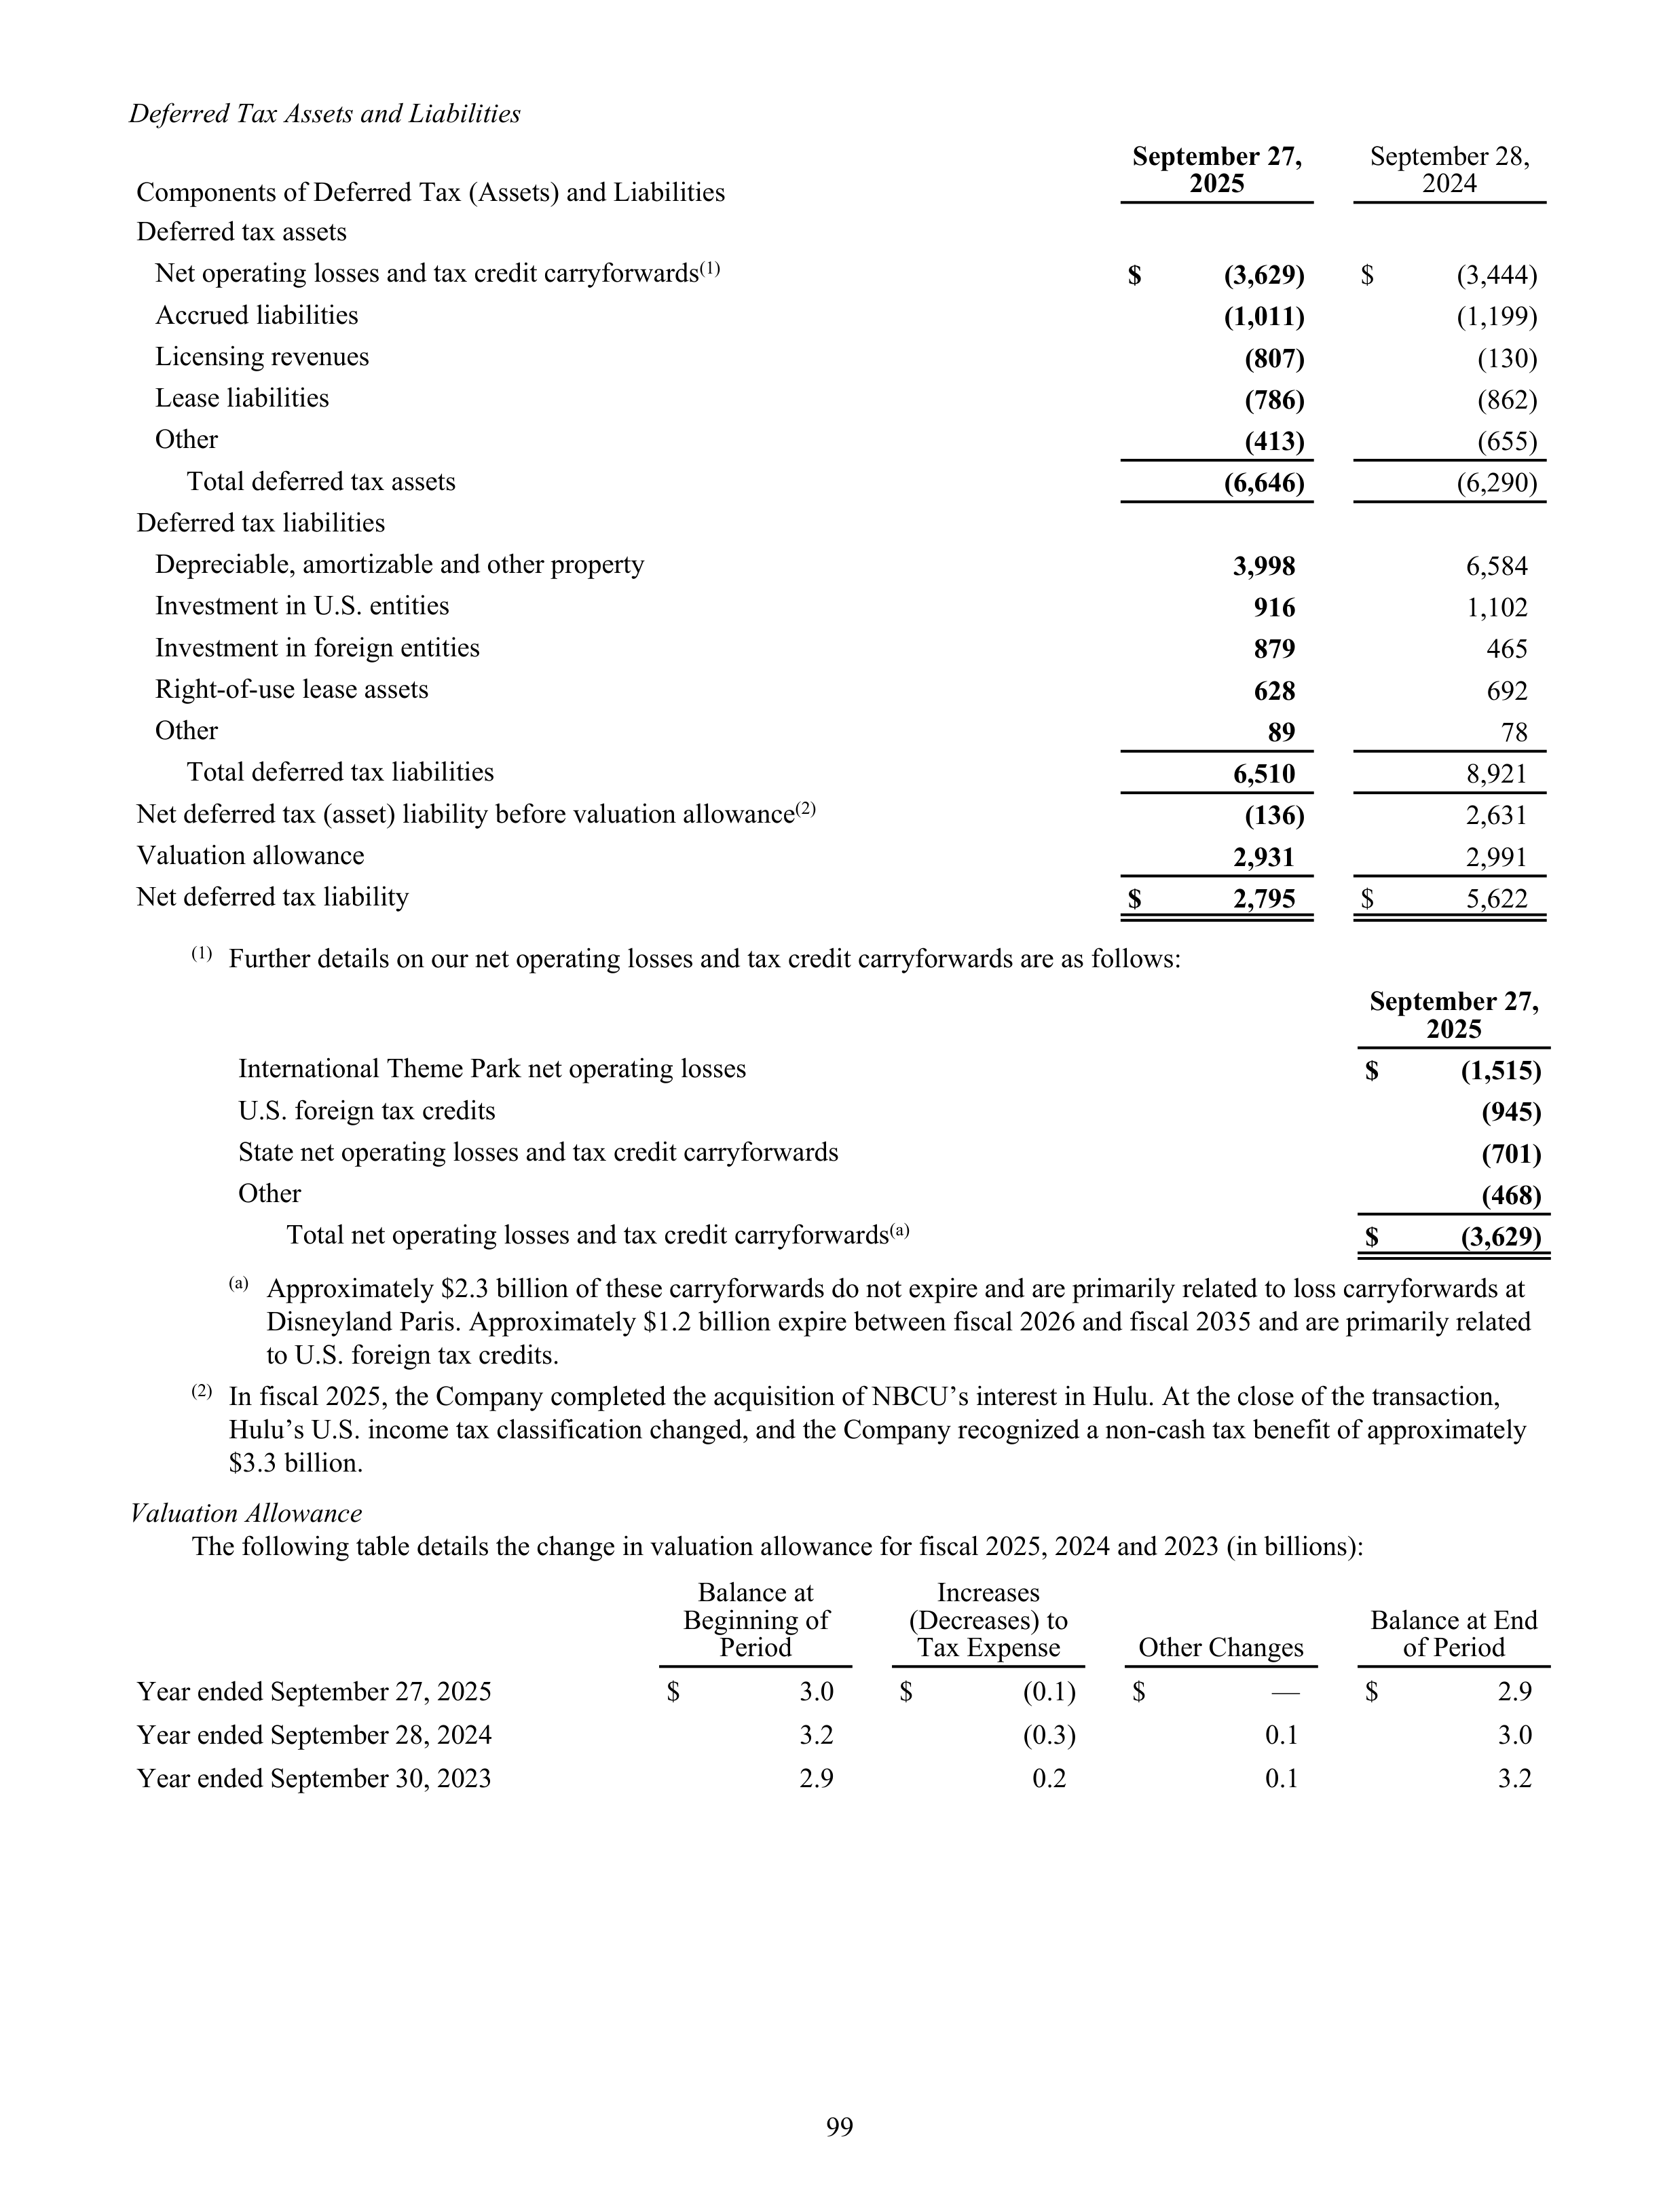
Deferred Tax Assets and Liabilities
Components of Deferred Tax (Assets) and Liabilities
September 27,
2025
September 28,
2024
Deferred tax assets
Net operating losses and tax credit carryforwards
(1)
$
(3,629)
$
(3,444)
Accrued liabilities
(1,011)
(1,199)
Licensing revenues
(807)
(130)
Lease liabilities
(786)
(862)
Other
(413)
(655)
Total deferred tax assets
(6,646)
(6,290)
Deferred tax liabilities
Depreciable, amortizable and other property
3,998
6,584
Investment in U.S. entities
916
1,102
Investment in foreign entities
879
465
Right-of-use lease assets
628
692
Other
89
78
Total deferred tax liabilities
6,510
8,921
Net deferred tax (asset) liability before valuation allowance
(2)
(136)
2,631
Valuation allowance
2,931
2,991
Net deferred tax liability
$
2,795
$
5,622
(1)
Further details on our net operating losses and tax credit carryforwards are as follows:
September 27,
2025
International Theme Park net operating losses
$
(1,515)
U.S. foreign tax credits
(945)
State net operating losses and tax credit carryforwards
(701)
Other
(468)
Total net operating losses and tax credit carryforwards
(a)
$
(3,629)
(a)
Approximately $2.3 billion of these carryforwards do not expire and are primarily related to loss carryforwards at
Disneyland Paris. Approximately $1.2 billion expire between fiscal 2026 and fiscal 2035 and are primarily related
to U.S. foreign tax credits.
(2)
In fiscal 2025, the Company completed the acquisition of NBCU’s interest in Hulu. At the close of the transaction,
Hulu’s U.S. income tax classification changed, and the Company recognized a non-cash tax benefit of approximately
$3.3 billion.
Valuation Allowance
The following table details the change in valuation allowance for fiscal 2025, 2024 and 2023 (in billions):
Balance at
Beginning of
Period
Increases
(Decreases) to
Tax Expense
Other Changes
Balance at End
of Period
Year ended September 27, 2025
$
3.0
$
(0.1)
$
—
$
2.9
Year ended September 28, 2024
3.2
(0.3)
0.1
3.0
Year ended September 30, 2023
2.9
0.2
0.1
3.2
99
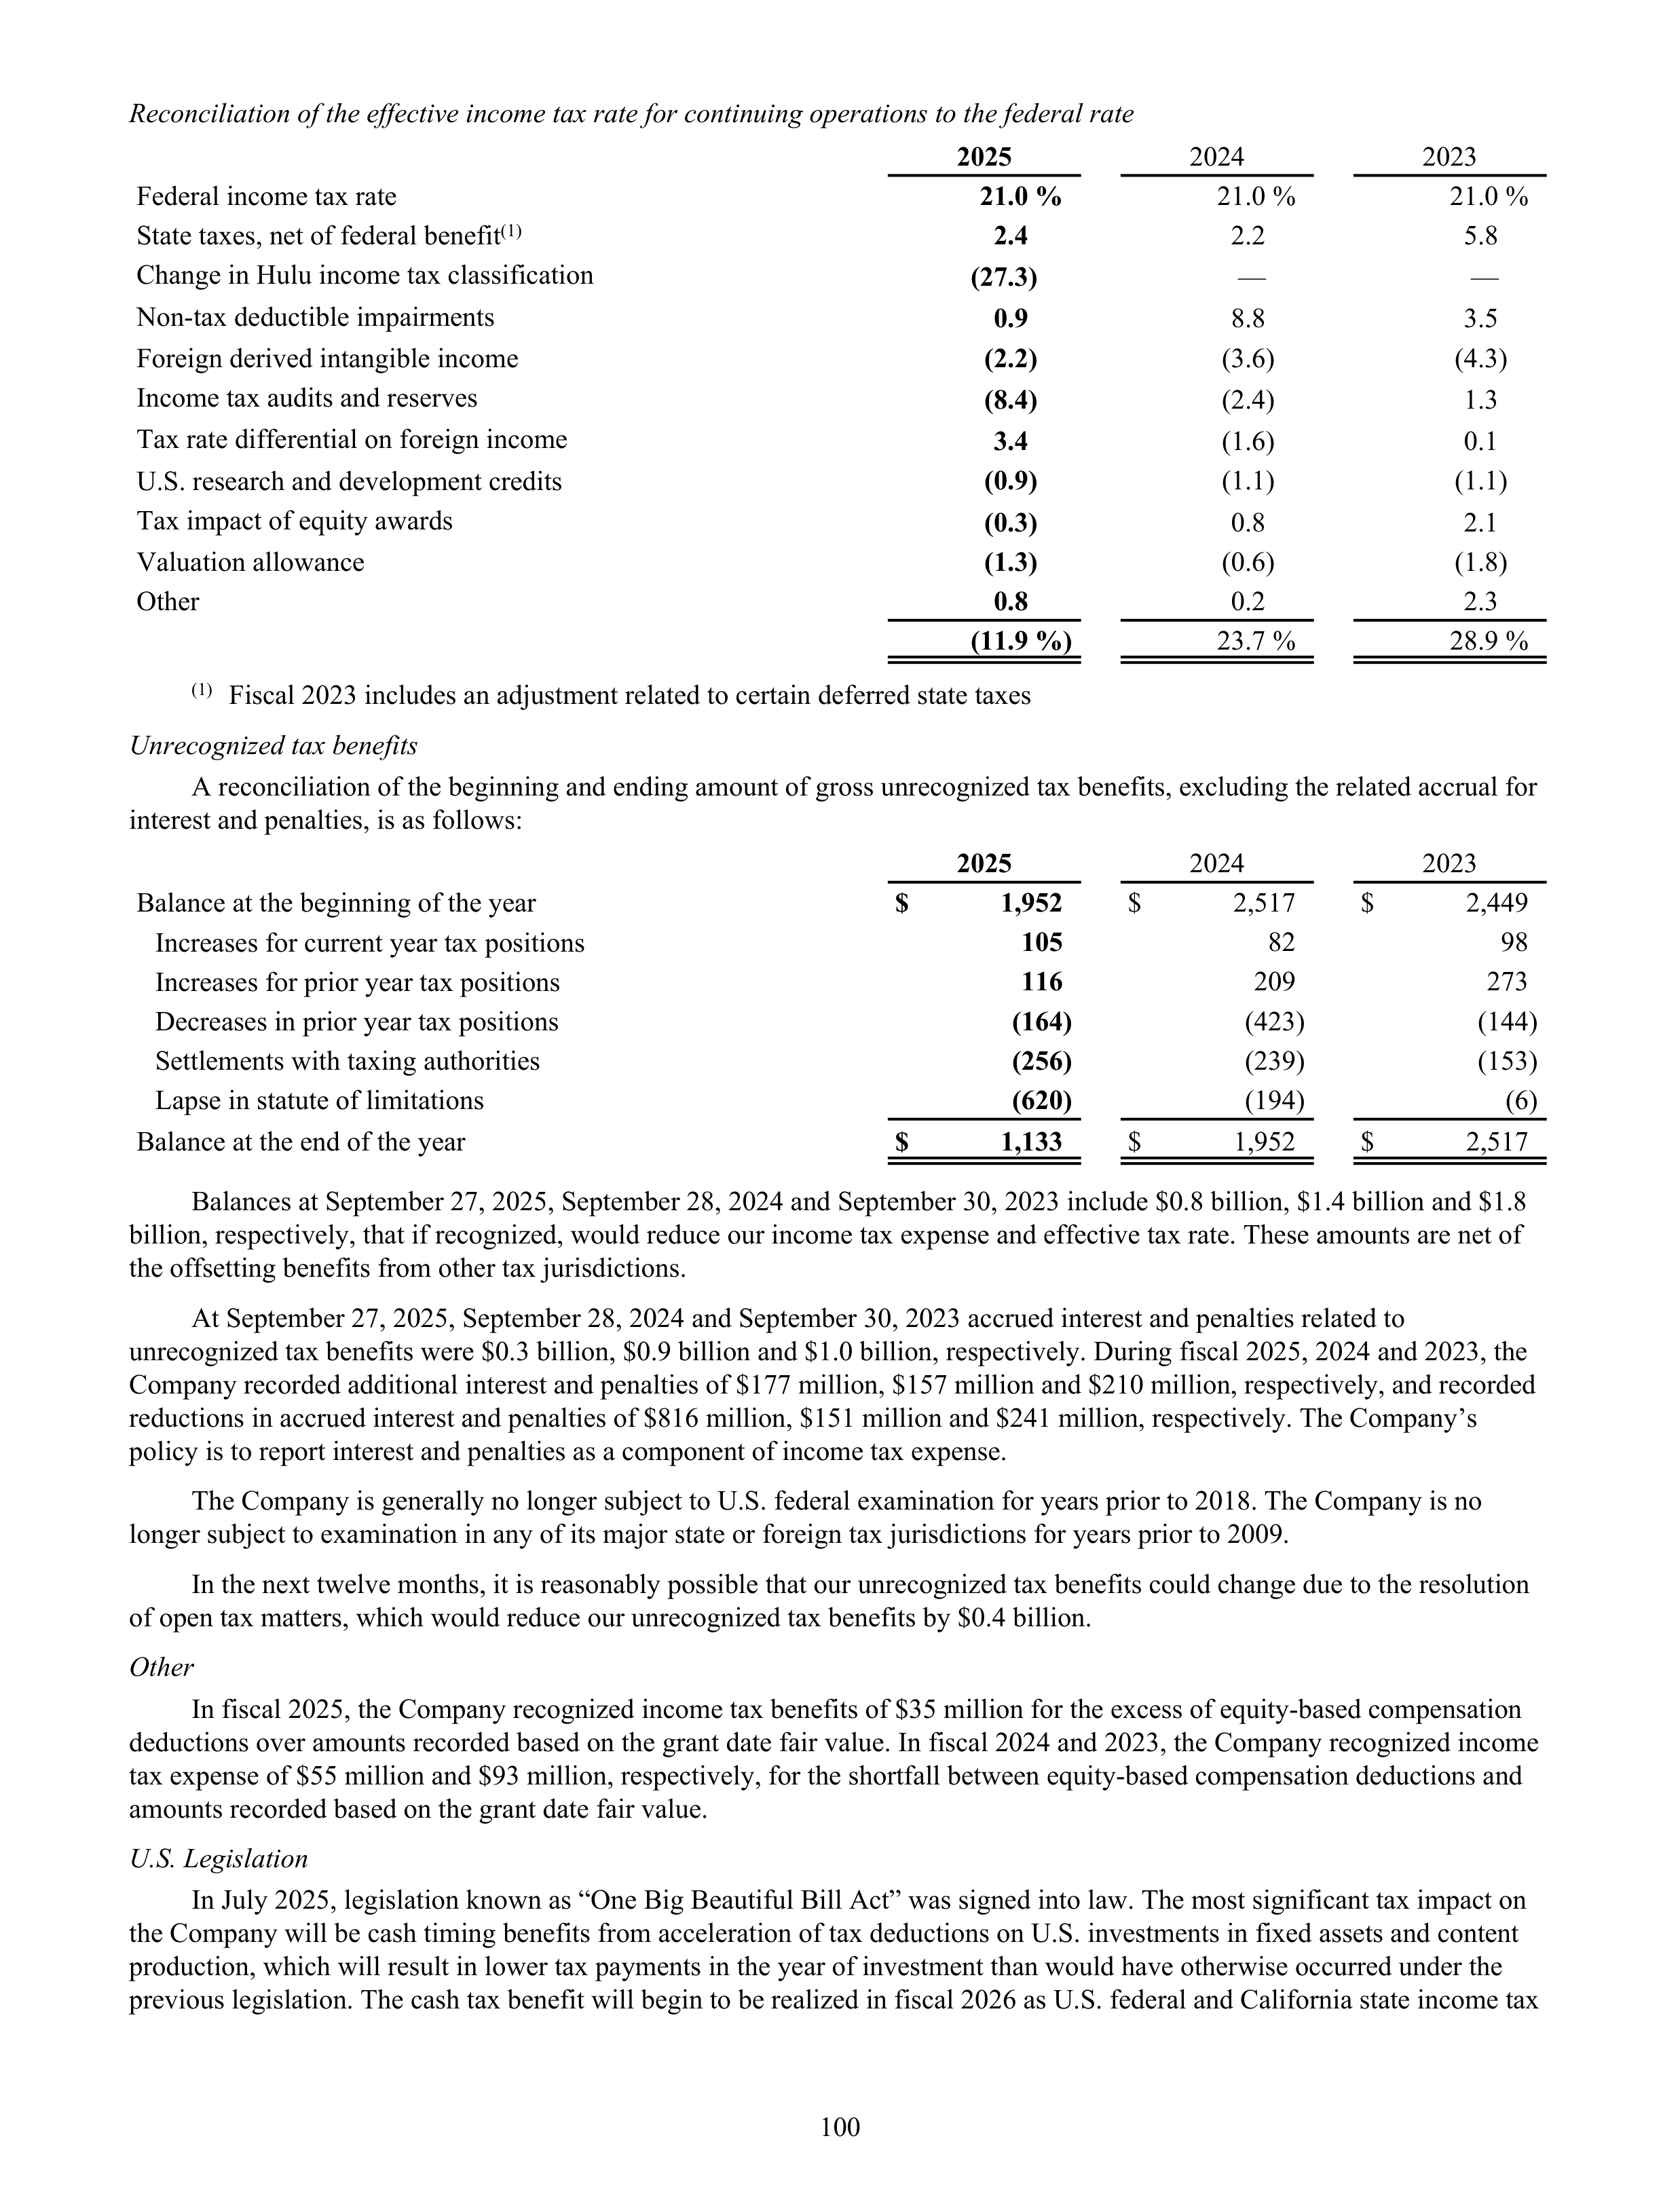
Reconciliation of the effective income tax rate for continuing operations to the federal rate
2025
2024
2023
Federal income tax rate
21.0 %
21.0 %
21.0 %
State taxes, net of federal benefit
(1)
2.4
2.2
5.8
Change in Hulu income tax classification
(27.3)
—
—
Non-tax deductible impairments
0.9
8.8
3.5
Foreign derived intangible income
(2.2)
(3.6)
(4.3)
Income tax audits and reserves
(8.4)
(2.4)
1.3
Tax rate differential on foreign income
3.4
(1.6)
0.1
U.S. research and development credits
(0.9)
(1.1)
(1.1)
Tax impact of equity awards
(0.3)
0.8
2.1
Valuation allowance
(1.3)
(0.6)
(1.8)
Other
0.8
0.2
2.3
(11.9 %)
23.7 %
28.9 %
(1)
Fiscal 2023 includes an adjustment related to certain deferred state taxes
Unrecognized tax benefits
A reconciliation of the beginning and ending amount of gross unrecognized tax benefits, excluding the related accrual for
interest and penalties, is as follows:
2025
2024
2023
Balance at the beginning of the year
$
1,952
$
2,517
$
2,449
Increases for current year tax positions
105
82
98
Increases for prior year tax positions
116
209
273
Decreases in prior year tax positions
(164)
(423)
(144)
Settlements with taxing authorities
(256)
(239)
(153)
Lapse in statute of limitations
(620)
(194)
(6)
Balance at the end of the year
$
1,133
$
1,952
$
2,517
Balances at September 27, 2025, September 28, 2024 and September 30, 2023 include $0.8 billion, $1.4 billion and $1.8
billion, respectively, that if recognized, would reduce our income tax expense and effective tax rate. These amounts are net of
the offsetting benefits from other tax jurisdictions.
At September 27, 2025, September 28, 2024 and September 30, 2023 accrued interest and penalties related to
unrecognized tax benefits were $0.3 billion, $0.9 billion and $1.0 billion, respectively. During fiscal 2025, 2024 and 2023, the
Company recorded additional interest and penalties of $177 million, $157 million and $210 million, respectively, and recorded
reductions in accrued interest and penalties of $816 million, $151 million and $241 million, respectively. The Company’s
policy is to report interest and penalties as a component of income tax expense.
The Company is generally no longer subject to U.S. federal examination for years prior to 2018. The Company is no
longer subject to examination in any of its major state or foreign tax jurisdictions for years prior to 2009.
In the next twelve months, it is reasonably possible that our unrecognized tax benefits could change due to the resolution
of open tax matters, which would reduce our unrecognized tax benefits by $0.4 billion.
Other
In fiscal 2025, the Company recognized income tax benefits of $35 million for the excess of equity-based compensation
deductions over amounts recorded based on the grant date fair value. In fiscal 2024 and 2023, the Company recognized income
tax expense of $55 million and $93 million, respectively, for the shortfall between equity-based compensation deductions and
amounts recorded based on the grant date fair value.
U.S. Legislation
In July 2025, legislation known as “One Big Beautiful Bill Act” was signed into law. The most significant tax impact on
the Company will be cash timing benefits from acceleration of tax deductions on U.S. investments in fixed assets and content
production, which will result in lower tax payments in the year of investment than would have otherwise occurred under the
previous legislation. The cash tax benefit will begin to be realized in fiscal 2026 as U.S. federal and California state income tax
100
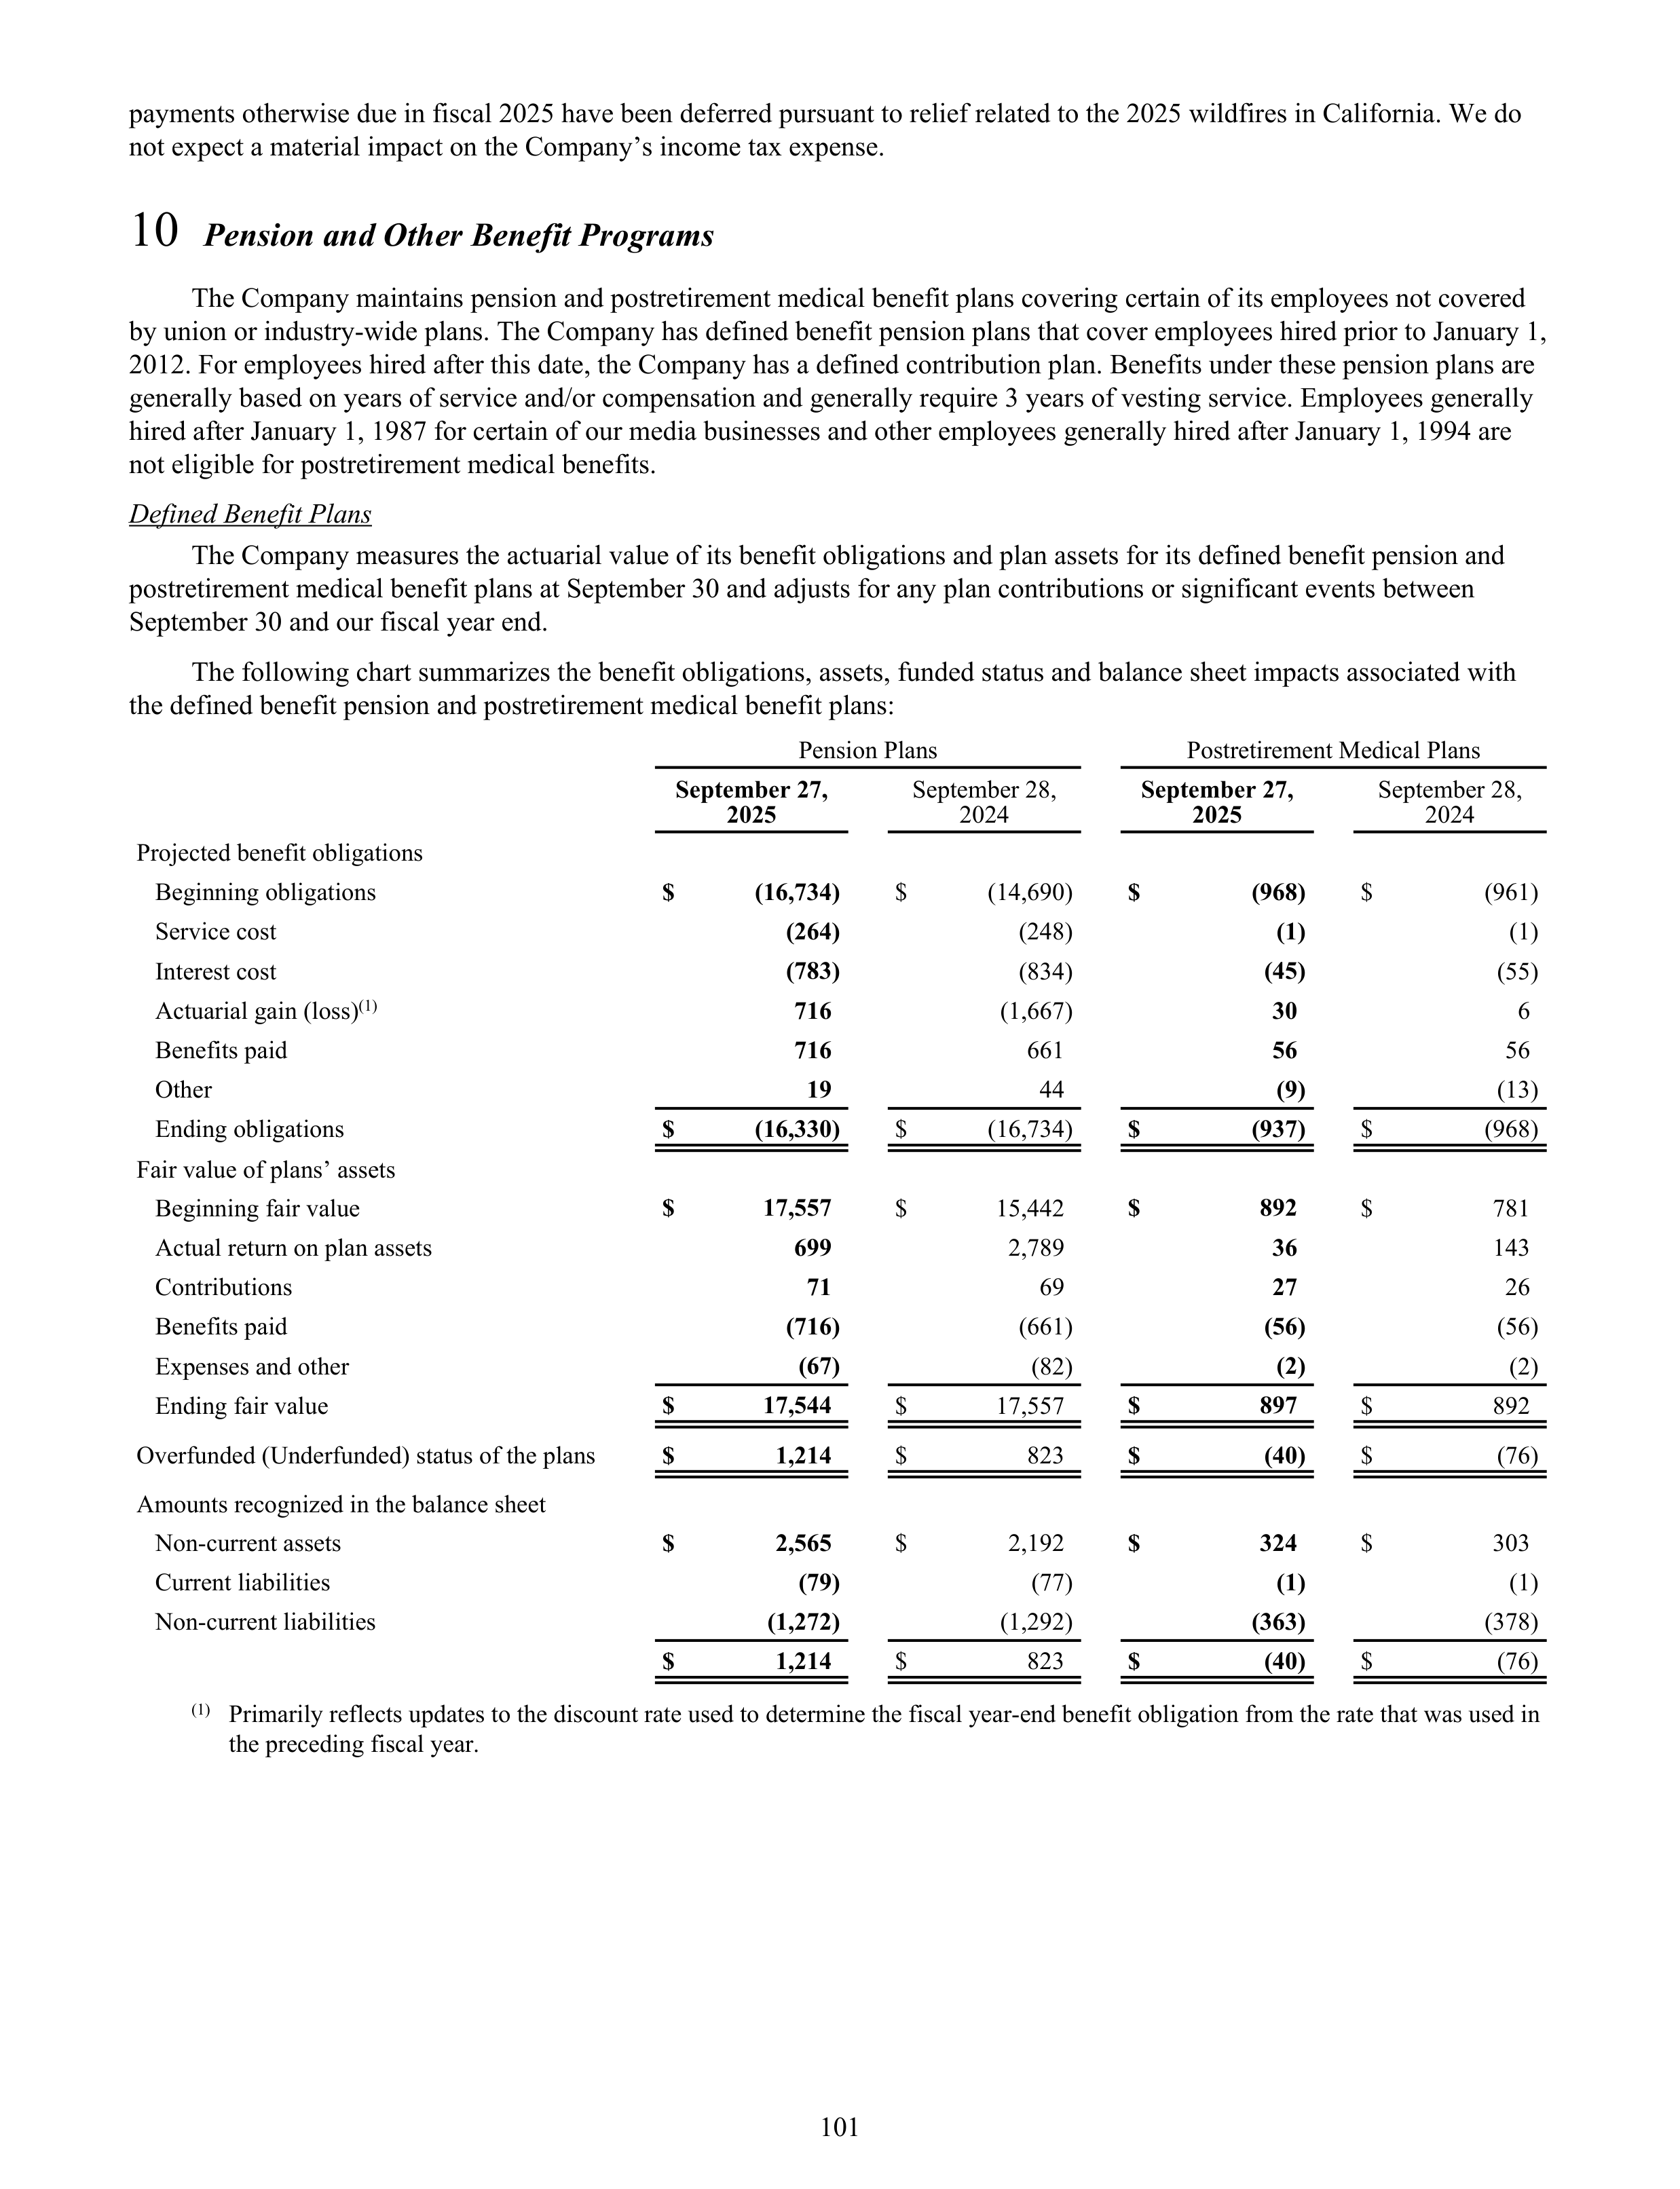
payments otherwise due in fiscal 2025 have been deferred pursuant to relief related to the 2025 wildfires in California. We do
not expect a material impact on the Company’s income tax expense.
10
Pension and Other Benefit Programs
The Company maintains pension and postretirement medical benefit plans covering certain of its employees not covered
by union or industry-wide plans. The Company has defined benefit pension plans that cover employees hired prior to January 1,
2012. For employees hired after this date, the Company has a defined contribution plan. Benefits under these pension plans are
generally based on years of service and/or compensation and generally require 3 years of vesting service. Employees generally
hired after January 1, 1987 for certain of our media businesses and other employees generally hired after January 1, 1994 are
not eligible for postretirement medical benefits.
Defined Benefit Plans
The Company measures the actuarial value of its benefit obligations and plan assets for its defined benefit pension and
postretirement medical benefit plans at September 30 and adjusts for any plan contributions or significant events between
September 30 and our fiscal year end.
The following chart summarizes the benefit obligations, assets, funded status and balance sheet impacts associated with
the defined benefit pension and postretirement medical benefit plans:
Pension Plans
Postretirement Medical Plans
September 27,
2025
September 28,
2024
September 27,
2025
September 28,
2024
Projected benefit obligations
Beginning obligations
$
(16,734)
$
(14,690)
$
(968)
$
(961)
Service cost
(264)
(248)
(1)
(1)
Interest cost
(783)
(834)
(45)
(55)
Actuarial gain (loss)
(1)
716
(1,667)
30
6
Benefits paid
716
661
56
56
Other
19
44
(9)
(13)
Ending obligations
$
(16,330)
$
(16,734)
$
(937)
$
(968)
Fair value of plans’ assets
Beginning fair value
$
17,557
$
15,442
$
892
$
781
Actual return on plan assets
699
2,789
36
143
Contributions
71
69
27
26
Benefits paid
(716)
(661)
(56)
(56)
Expenses and other
(67)
(82)
(2)
(2)
Ending fair value
$
17,544
$
17,557
$
897
$
892
Overfunded (Underfunded) status of the plans
$
1,214
$
823
$
(40)
$
(76)
Amounts recognized in the balance sheet
Non-current assets
$
2,565
$
2,192
$
324
$
303
Current liabilities
(79)
(77)
(1)
(1)
Non-current liabilities
(1,272)
(1,292)
(363)
(378)
$
1,214
$
823
$
(40)
$
(76)
(1)
Primarily reflects updates to the discount rate used to determine the fiscal year-end benefit obligation from the rate that was used in
the preceding fiscal year.
101
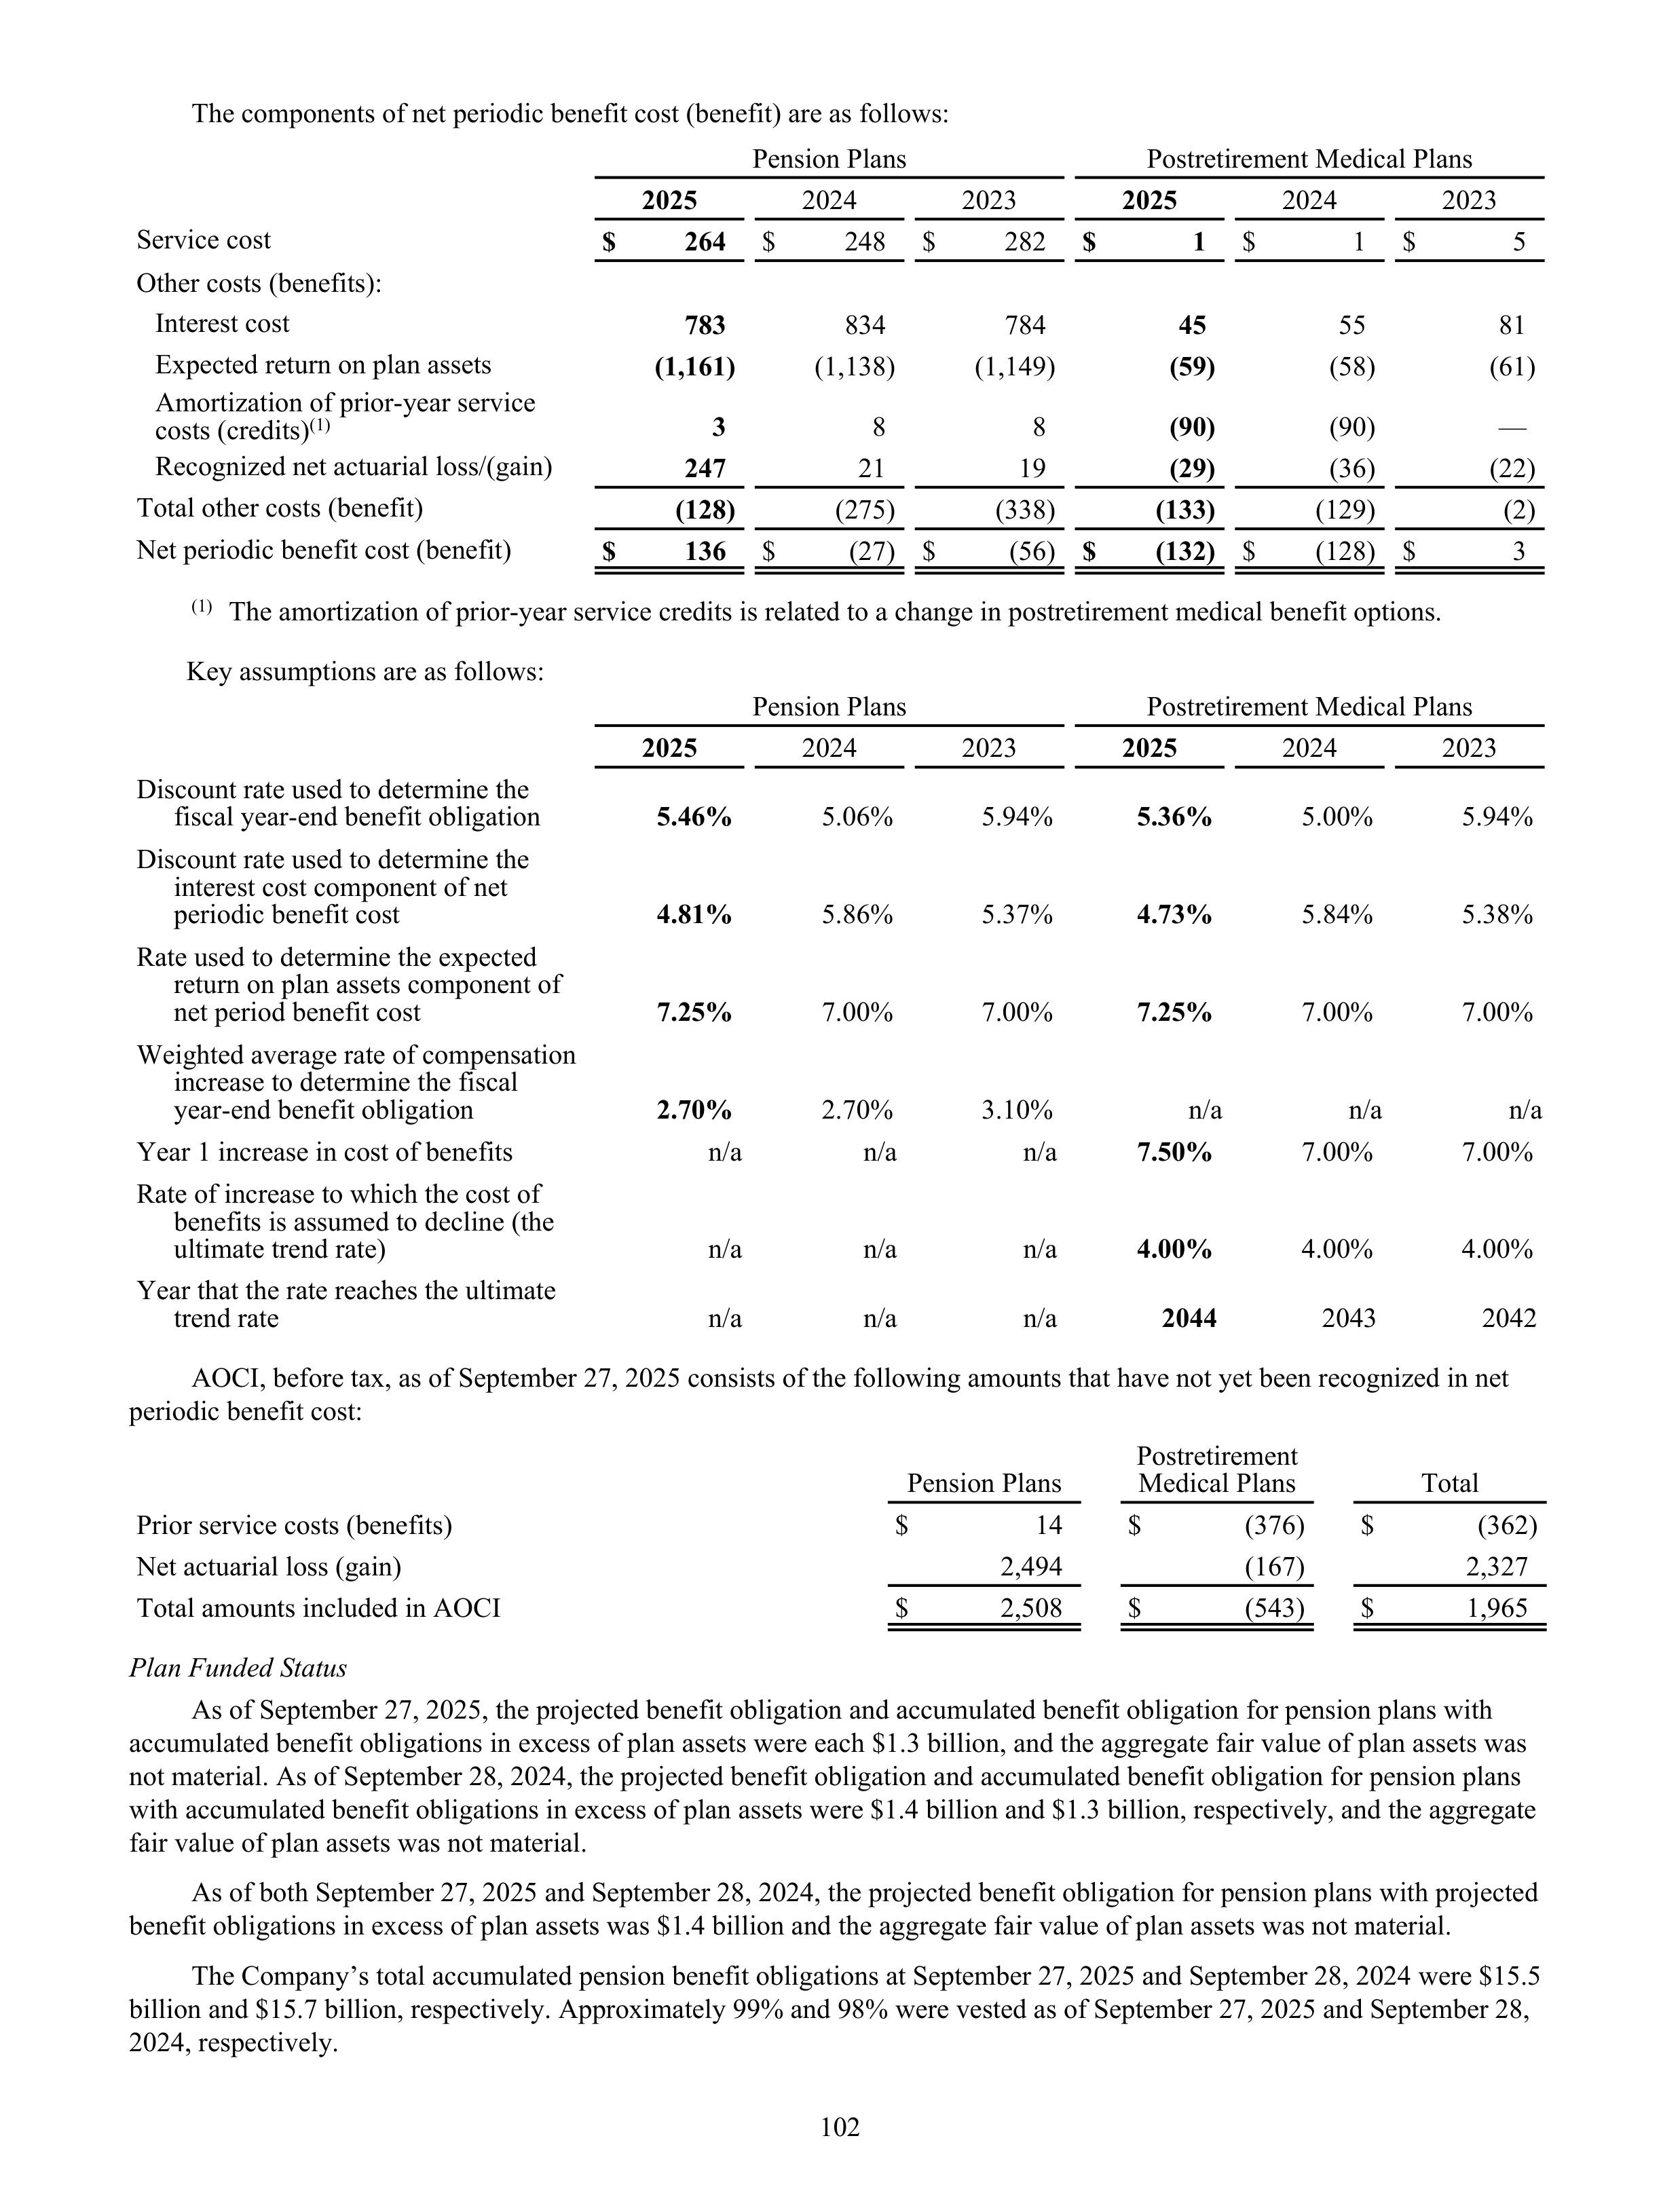
The components of net periodic benefit cost (benefit) are as follows:
Pension Plans
Postretirement Medical Plans
2025
2024
2023
2025
2024
2023
Service cost
$
264
$
248
$
282
$
1
$
1 $
5
Other costs (benefits):
Interest cost
783
834
784
45
55
81
Expected return on plan assets
(1,161)
(1,138)
(1,149)
(59)
(58)
(61)
Amortization of prior-year service
costs (credits)
(1)
3
8
8
(90)
(90)
—
Recognized net actuarial loss/(gain)
247
21
19
(29)
(36)
(22)
Total other costs (benefit)
(128)
(275)
(338)
(133)
(129)
(2)
Net periodic benefit cost (benefit)
$
136
$
(27)
$
(56)
$
(132)
$
(128)
$
3
(1)
The amortization of prior-year service credits is related to a change in postretirement medical benefit options.
Key assumptions are as follows:
Pension Plans
Postretirement Medical Plans
2025
2024
2023
2025
2024
2023
Discount rate used to determine the
fiscal year
-
end benefit obligation
5.46%
5.06%
5.94%
5.36%
5.00%
5.94%
Discount rate used to determine the
interest cost component of net
periodic benefit cost
4.81%
5.86%
5.37%
4.73%
5.84%
5.38%
Rate used to determine the expected
return on plan assets component of
net period benefit cost
7.25%
7.00%
7.00%
7.25%
7.00%
7.00%
Weighted average rate of compensation
increase to determine the fiscal
year
-
end benefit obligation
2.70%
2.70%
3.10%
n/a
n/a
n/a
Year 1 increase in cost of benefits
n/a
n/a
n/a
7.50%
7.00%
7.00%
Rate of increase to which the cost of
benefits is assumed to decline (the
ultimate trend rate)
n/a
n/a
n/a
4.00%
4.00%
4.00%
Year that the rate reaches the ultimate
trend rate
n/a
n/a
n/a
2044
2043
2042
AOCI, before tax, as of September 27, 2025 consists of the following amounts that have not yet been recognized in net
periodic benefit cost:
Pension Plans
Postretirement
Medical Plans
Total
Prior service costs (benefits)
$
14
$
(376)
$
(362)
Net actuarial loss (gain)
2,494
(167)
2,327
Total amounts included in AOCI
$
2,508
$
(543)
$
1,965
Plan Funded Status
As of September 27, 2025, the projected benefit obligation and accumulated benefit obligation for pension plans with
accumulated benefit obligations in excess of plan assets were each $1.3 billion, and the aggregate fair value of plan assets was
not material. As of September 28, 2024, the projected benefit obligation and accumulated benefit obligation for pension plans
with accumulated benefit obligations in excess of plan assets were $1.4 billion and $1.3 billion, respectively, and the aggregate
fair value of plan assets was not material.
As of both September 27, 2025 and September 28, 2024, the projected benefit obligation for pension plans with projected
benefit obligations in excess of plan assets was $1.4 billion and the aggregate fair value of plan assets was not material.
The Company’s total accumulated pension benefit obligations at September 27, 2025 and September 28, 2024 were $15.5
billion and $15.7 billion, respectively. Approximately 99% and 98% were vested as of September 27, 2025 and September 28,
2024, respectively.
102
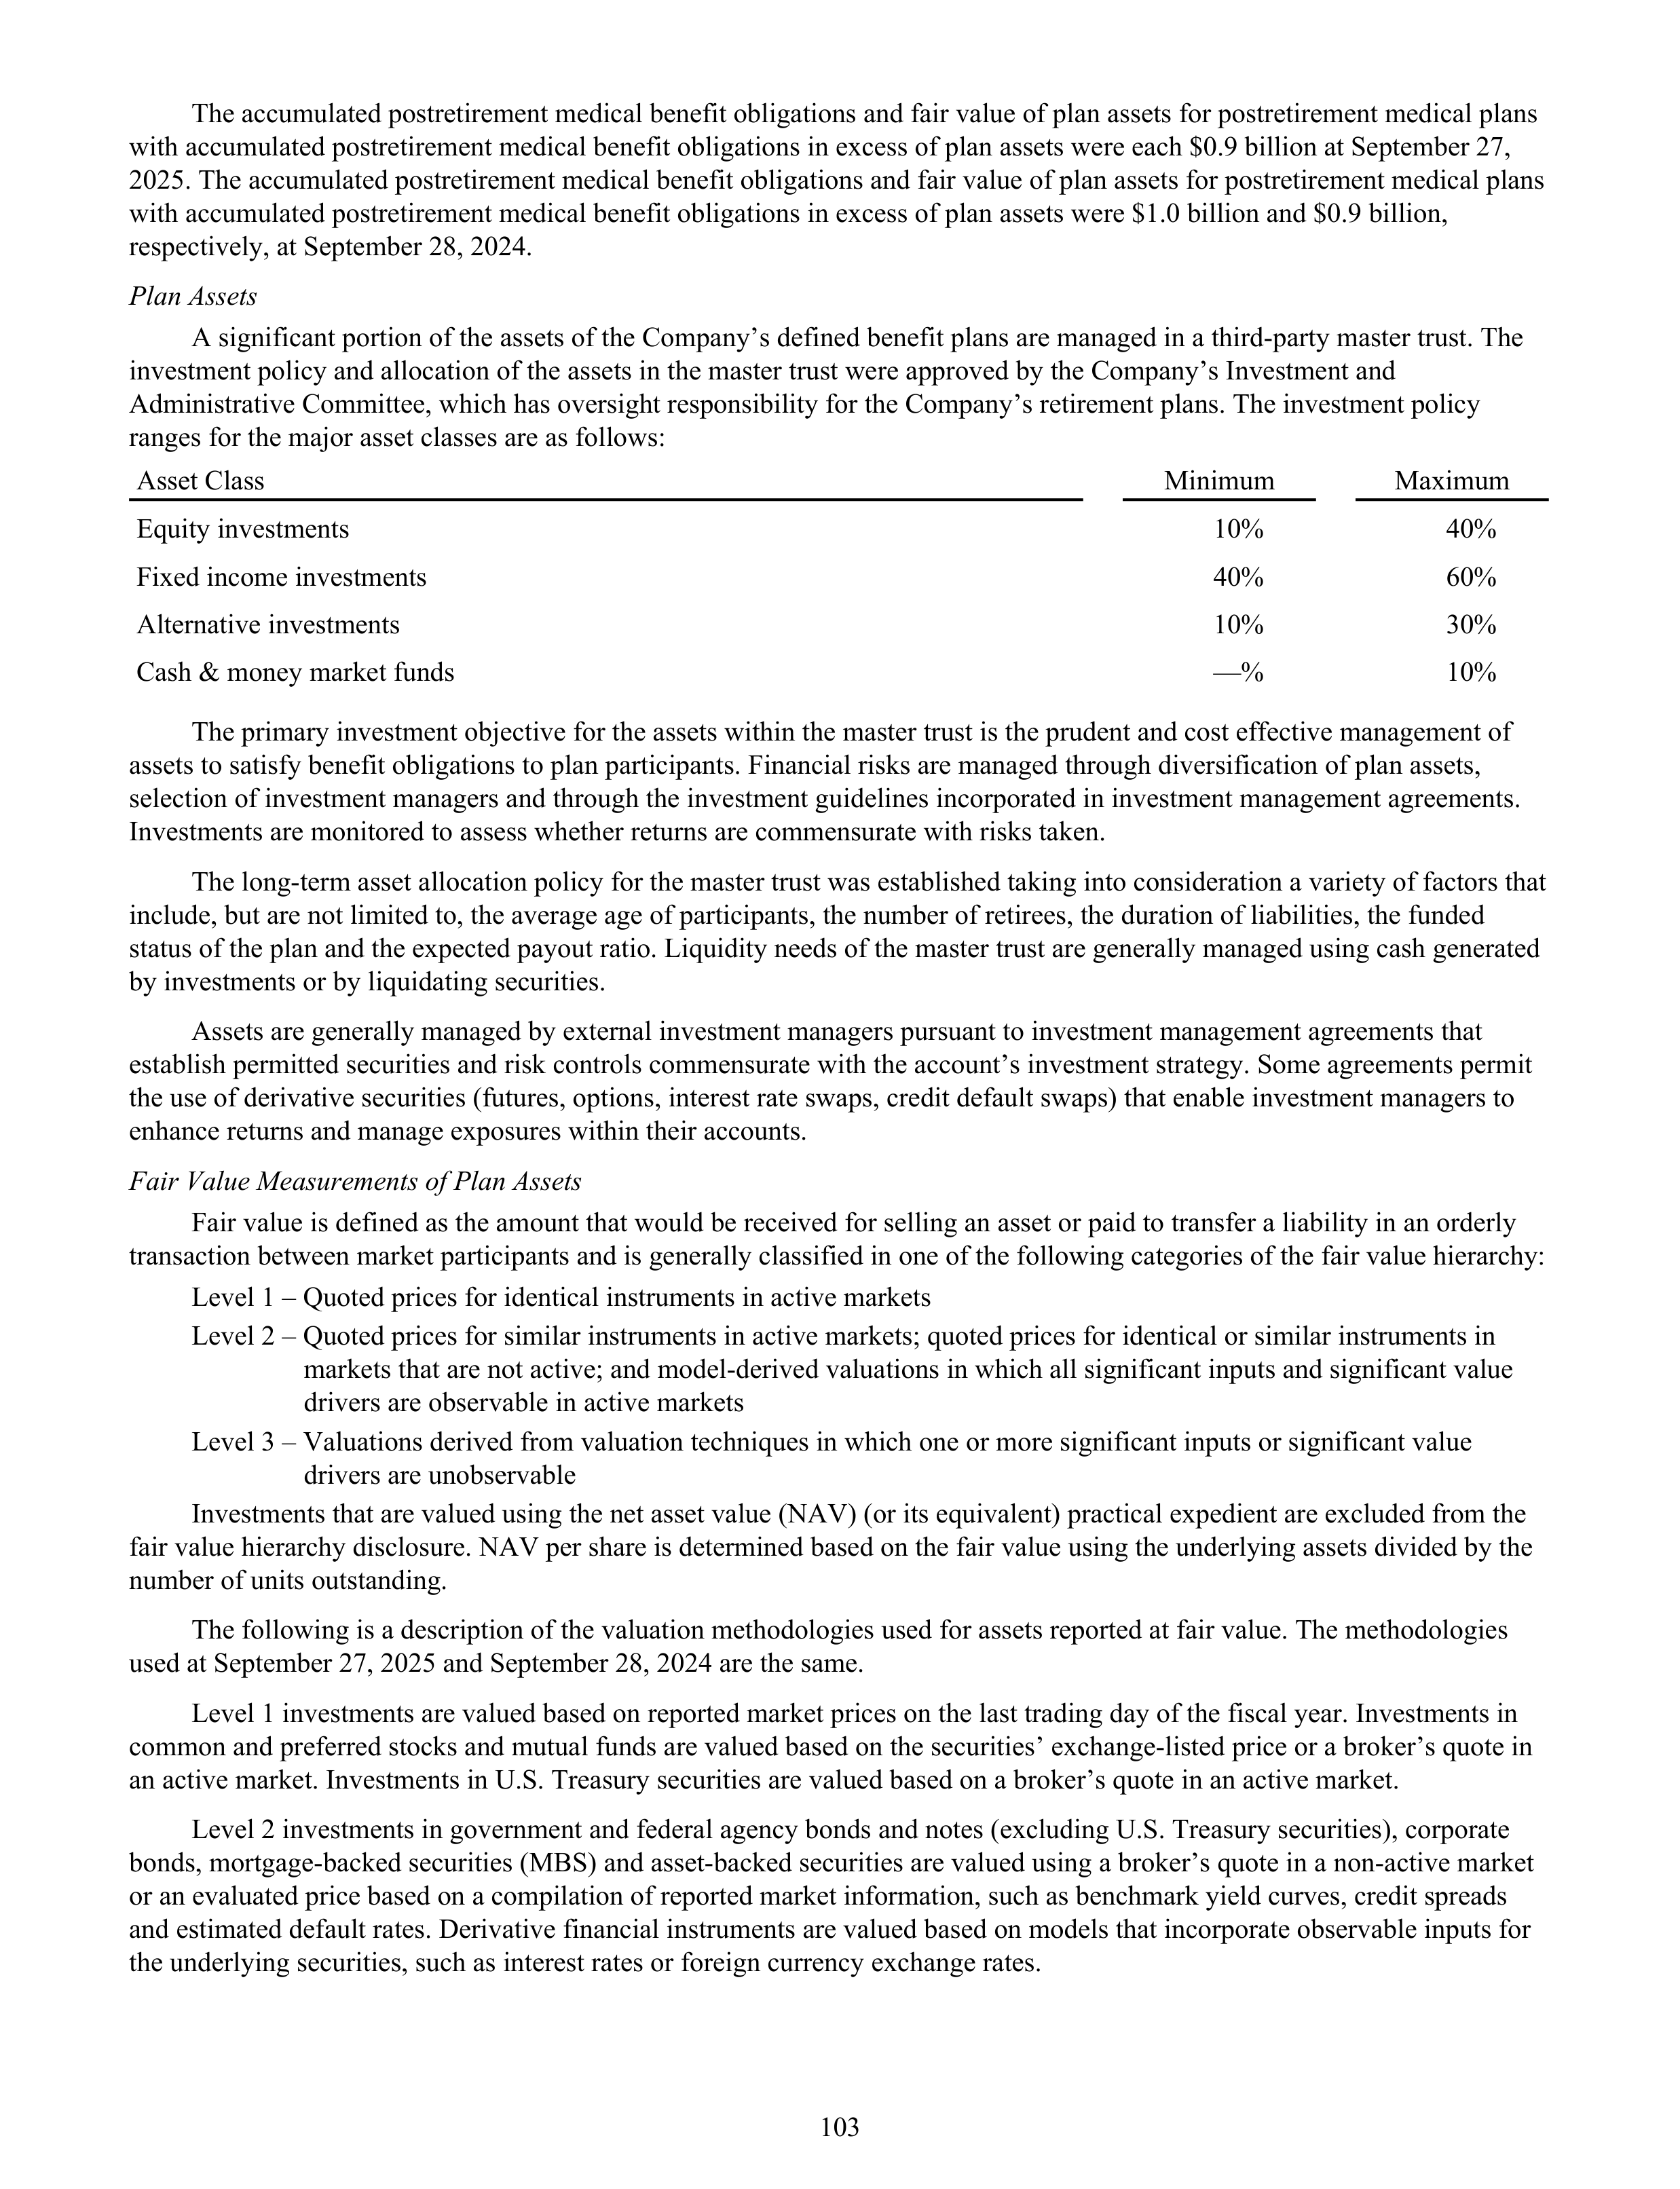
The accumulated postretirement medical benefit obligations and fair value of plan assets for postretirement medical plans
with accumulated postretirement medical benefit obligations in excess of plan assets were each $0.9 billion at September 27,
2025. The accumulated postretirement medical benefit obligations and fair value of plan assets for postretirement medical plans
with accumulated postretirement medical benefit obligations in excess of plan assets were $1.0 billion and $0.9 billion,
respectively, at September 28, 2024.
Plan Assets
A significant portion of the assets of the Company’s defined benefit plans are managed in a third-party master trust. The
investment policy and allocation of the assets in the master trust were approved by the Company’s Investment and
Administrative Committee, which has oversight responsibility for the Company’s retirement plans. The investment policy
ranges for the major asset classes are as follows:
Asset Class
Minimum
Maximum
Equity investments
10 %
40 %
Fixed income investments
40 %
60 %
Alternative investments
10 %
30 %
Cash & money market funds
— %
10 %
The primary investment objective for the assets within the master trust is the prudent and cost effective management of
assets to satisfy benefit obligations to plan participants. Financial risks are managed through diversification of plan assets,
selection of investment managers and through the investment guidelines incorporated in investment management agreements.
Investments are monitored to assess whether returns are commensurate with risks taken.
The long-term asset allocation policy for the master trust was established taking into consideration a variety of factors that
include, but are not limited to, the average age of participants, the number of retirees, the duration of liabilities, the funded
status of the plan and the expected payout ratio. Liquidity needs of the master trust are generally managed using cash generated
by investments or by liquidating securities.
Assets are generally managed by external investment managers pursuant to investment management agreements that
establish permitted securities and risk controls commensurate with the account’s investment strategy. Some agreements permit
the use of derivative securities (futures, options, interest rate swaps, credit default swaps) that enable investment managers to
enhance returns and manage exposures within their accounts.
Fair Value Measurements of Plan Assets
Fair value is defined as the amount that would be received for selling an asset or paid to transfer a liability in an orderly
transaction between market participants and is generally classified in one of the following categories of the fair value hierarchy:
Level 1 – Quoted prices for identical instruments in active markets
Level 2 – Quoted prices for similar instruments in active markets; quoted prices for identical or similar instruments in
markets that are not active; and model-derived valuations in which all significant inputs and significant value
drivers are observable in active markets
Level 3 – Valuations derived from valuation techniques in which one or more significant inputs or significant value
drivers are unobservable
Investments that are valued using the net asset value (NAV) (or its equivalent) practical expedient are excluded from the
fair value hierarchy disclosure. NAV per share is determined based on the fair value using the underlying assets divided by the
number of units outstanding.
The following is a description of the valuation methodologies used for assets reported at fair value. The methodologies
used at September 27, 2025 and September 28, 2024 are the same.
Level 1 investments are valued based on reported market prices on the last trading day of the fiscal year. Investments in
common and preferred stocks and mutual funds are valued based on the securities’ exchange-listed price or a broker’s quote in
an active market. Investments in U.S. Treasury securities are valued based on a broker’s quote in an active market.
Level 2 investments in government and federal agency bonds and notes (excluding U.S. Treasury securities), corporate
bonds, mortgage-backed securities (MBS) and asset-backed securities are valued using a broker’s quote in a non-active market
or an evaluated price based on a compilation of reported market information, such as benchmark yield curves, credit spreads
and estimated default rates. Derivative financial instruments are valued based on models that incorporate observable inputs for
the underlying securities, such as interest rates or foreign currency exchange rates.
103
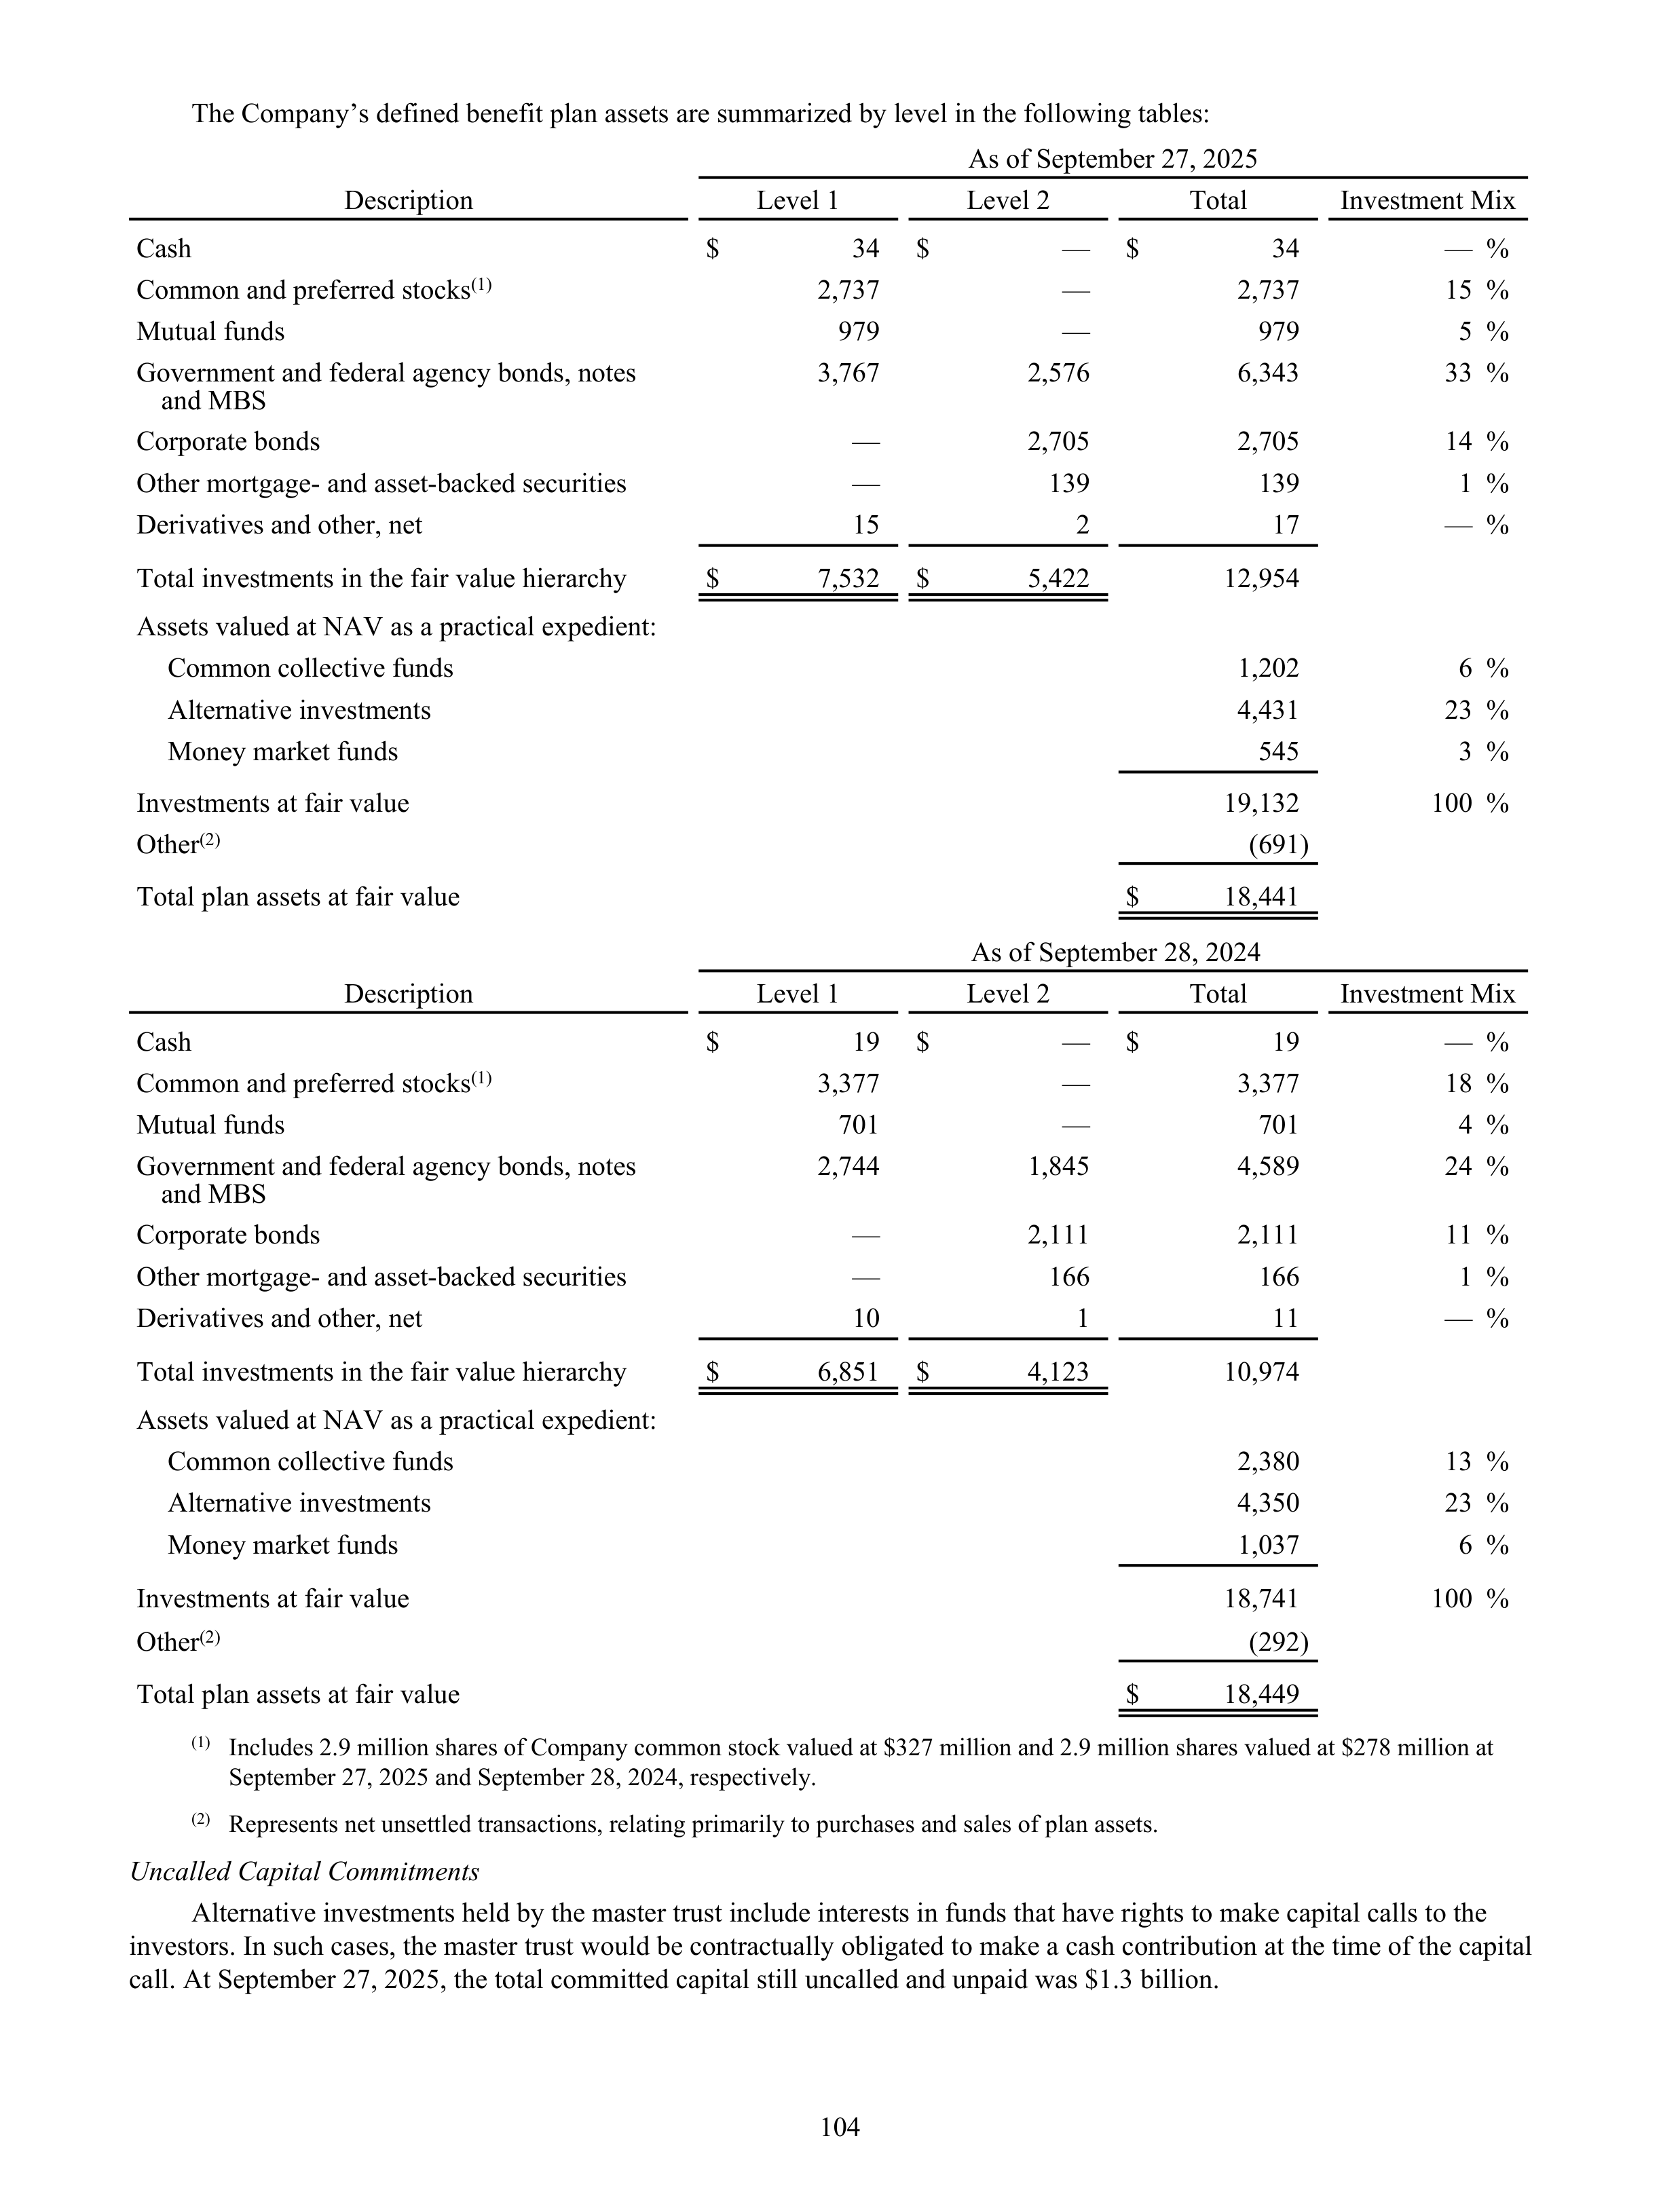
The Company’s defined benefit plan assets are summarized by level in the following tables:
As of September 27, 2025
Description
Level 1
Level 2
Total
Investment Mix
Cash
$
34
$
—
$
34
— %
Common and preferred stocks
(1)
2,737
—
2,737
15 %
Mutual funds
979
—
979
5 %
Government and federal agency bonds, notes
and MBS
3,767
2,576
6,343
33 %
Corporate bonds
—
2,705
2,705
14 %
Other mortgage- and asset-backed securities
—
139
139
1 %
Derivatives and other, net
15
2
17
— %
Total investments in the fair value hierarchy
$
7,532
$
5,422
12,954
Assets valued at NAV as a practical expedient:
Common collective funds
1,202
6 %
Alternative investments
4,431
23 %
Money market funds
545
3 %
Investments at fair value
19,132
100 %
Other
(2)
(691)
Total plan assets at fair value
$
18,441
As of September 28, 2024
Description
Level 1
Level 2
Total
Investment Mix
Cash
$
19
$
—
$
19
— %
Common and preferred stocks
(1)
3,377
—
3,377
18 %
Mutual funds
701
—
701
4 %
Government and federal agency bonds, notes
and MBS
2,744
1,845
4,589
24 %
Corporate bonds
—
2,111
2,111
11 %
Other mortgage- and asset-backed securities
—
166
166
1 %
Derivatives and other, net
10
1
11
— %
Total investments in the fair value hierarchy
$
6,851
$
4,123
10,974
Assets valued at NAV as a practical expedient:
Common collective funds
2,380
13 %
Alternative investments
4,350
23 %
Money market funds
1,037
6 %
Investments at fair value
18,741
100 %
Other
(2)
(292)
Total plan assets at fair value
$
18,449
(1)
Includes 2.9 million shares of Company common stock valued at $327 million and 2.9 million shares valued at $278 million at
September 27, 2025 and September 28, 2024, respectively.
(2)
Represents net unsettled transactions, relating primarily to purchases and sales of plan assets.
Uncalled Capital Commitments
Alternative investments held by the master trust include interests in funds that have rights to make capital calls to the
investors. In such cases, the master trust would be contractually obligated to make a cash contribution at the time of the capital
call. At September 27, 2025, the total committed capital still uncalled and unpaid was $1.3 billion.
104
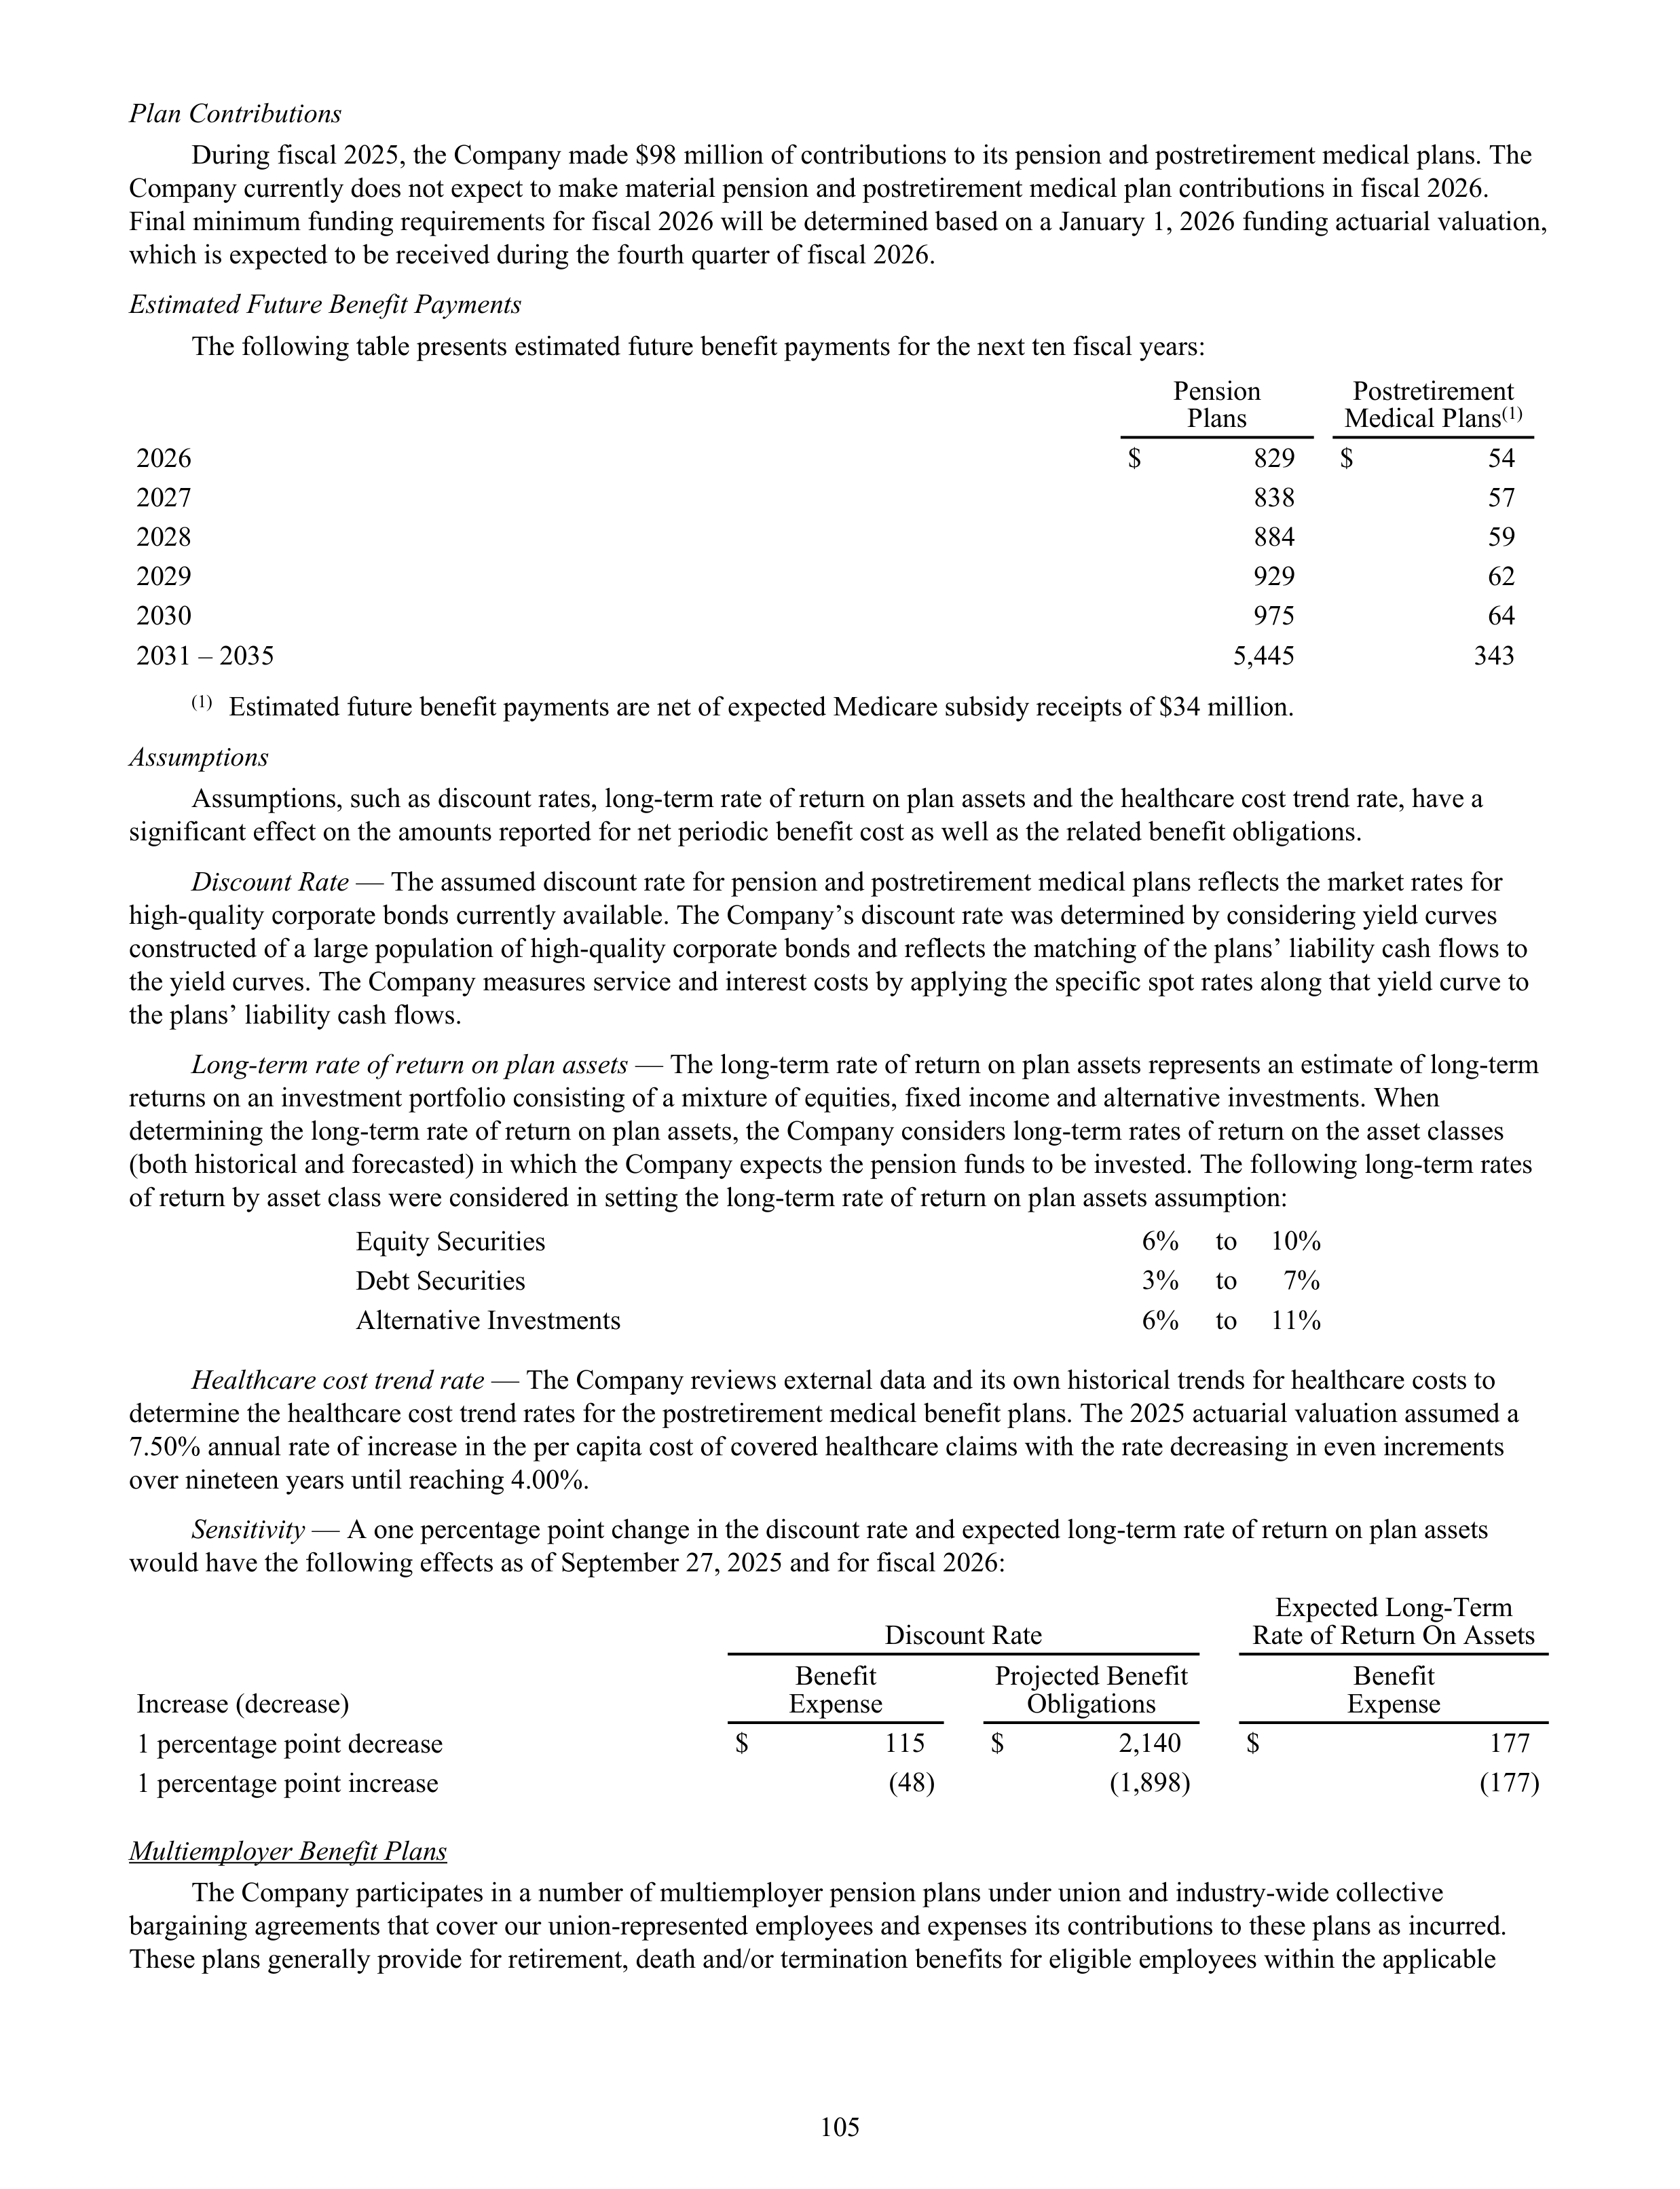
Plan Contributions
During fiscal 2025, the Company made $98 million of contributions to its pension and postretirement medical plans. The
Company currently does not expect to make material pension and postretirement medical plan contributions in fiscal 2026.
Final minimum funding requirements for fiscal 2026 will be determined based on a January 1, 2026 funding actuarial valuation,
which is expected to be received during the fourth quarter of fiscal 2026.
Estimated Future Benefit Payments
The following table presents estimated future benefit payments for the next ten fiscal years:
Pension
Plans
Postretirement
Medical Plans
(1)
2026
$
829
$
54
2027
838
57
2028
884
59
2029
929
62
2030
975
64
2031 – 2035
5,445
343
(1)
Estimated future benefit payments are net of expected Medicare subsidy receipts of $34 million.
Assumptions
Assumptions, such as discount rates, long-term rate of return on plan assets and the healthcare cost trend rate, have a
significant effect on the amounts reported for net periodic benefit cost as well as the related benefit obligations.
Discount Rate
— The assumed discount rate for pension and postretirement medical plans reflects the market rates for
high-quality corporate bonds currently available. The Company’s discount rate was determined by considering yield curves
constructed of a large population of high-quality corporate bonds and reflects the matching of the plans’ liability cash flows to
the yield curves. The Company measures service and interest costs by applying the specific spot rates along that yield curve to
the plans’ liability cash flows.
Long-term rate of return on plan assets
— The long-term rate of return on plan assets represents an estimate of long-term
returns on an investment portfolio consisting of a mixture of equities, fixed income and alternative investments. When
determining the long-term rate of return on plan assets, the Company considers long-term rates of return on the asset classes
(both historical and forecasted) in which the Company expects the pension funds to be invested. The following long-term rates
of return by asset class were considered in setting the long-term rate of return on plan assets assumption:
Equity Securities
6%
to
10%
Debt Securities
3%
to
7%
Alternative Investments
6%
to
11%
Healthcare cost trend rate
— The Company reviews external data and its own historical trends for healthcare costs to
determine the healthcare cost trend rates for the postretirement medical benefit plans. The 2025 actuarial valuation assumed a
7.50% annual rate of increase in the per capita cost of covered healthcare claims with the rate decreasing in even increments
over nineteen years until reaching 4.00%.
Sensitivity
— A one percentage point change in the discount rate and expected long-term rate of return on plan assets
would have the following effects as of September 27, 2025 and for fiscal 2026:
Discount Rate
Expected Long-Term
Rate of Return On Assets
Increase (decrease)
Benefit
Expense
Projected Benefit
Obligations
Benefit
Expense
1 percentage point decrease
$
115
$
2,140
$
177
1 percentage point increase
(48)
(1,898)
(177)
Multiemployer Benefit Plans
The Company participates in a number of multiemployer pension plans under union and industry-wide collective
bargaining agreements that cover our union-represented employees and expenses its contributions to these plans as incurred.
These plans generally provide for retirement, death and/or termination benefits for eligible employees within the applicable
105
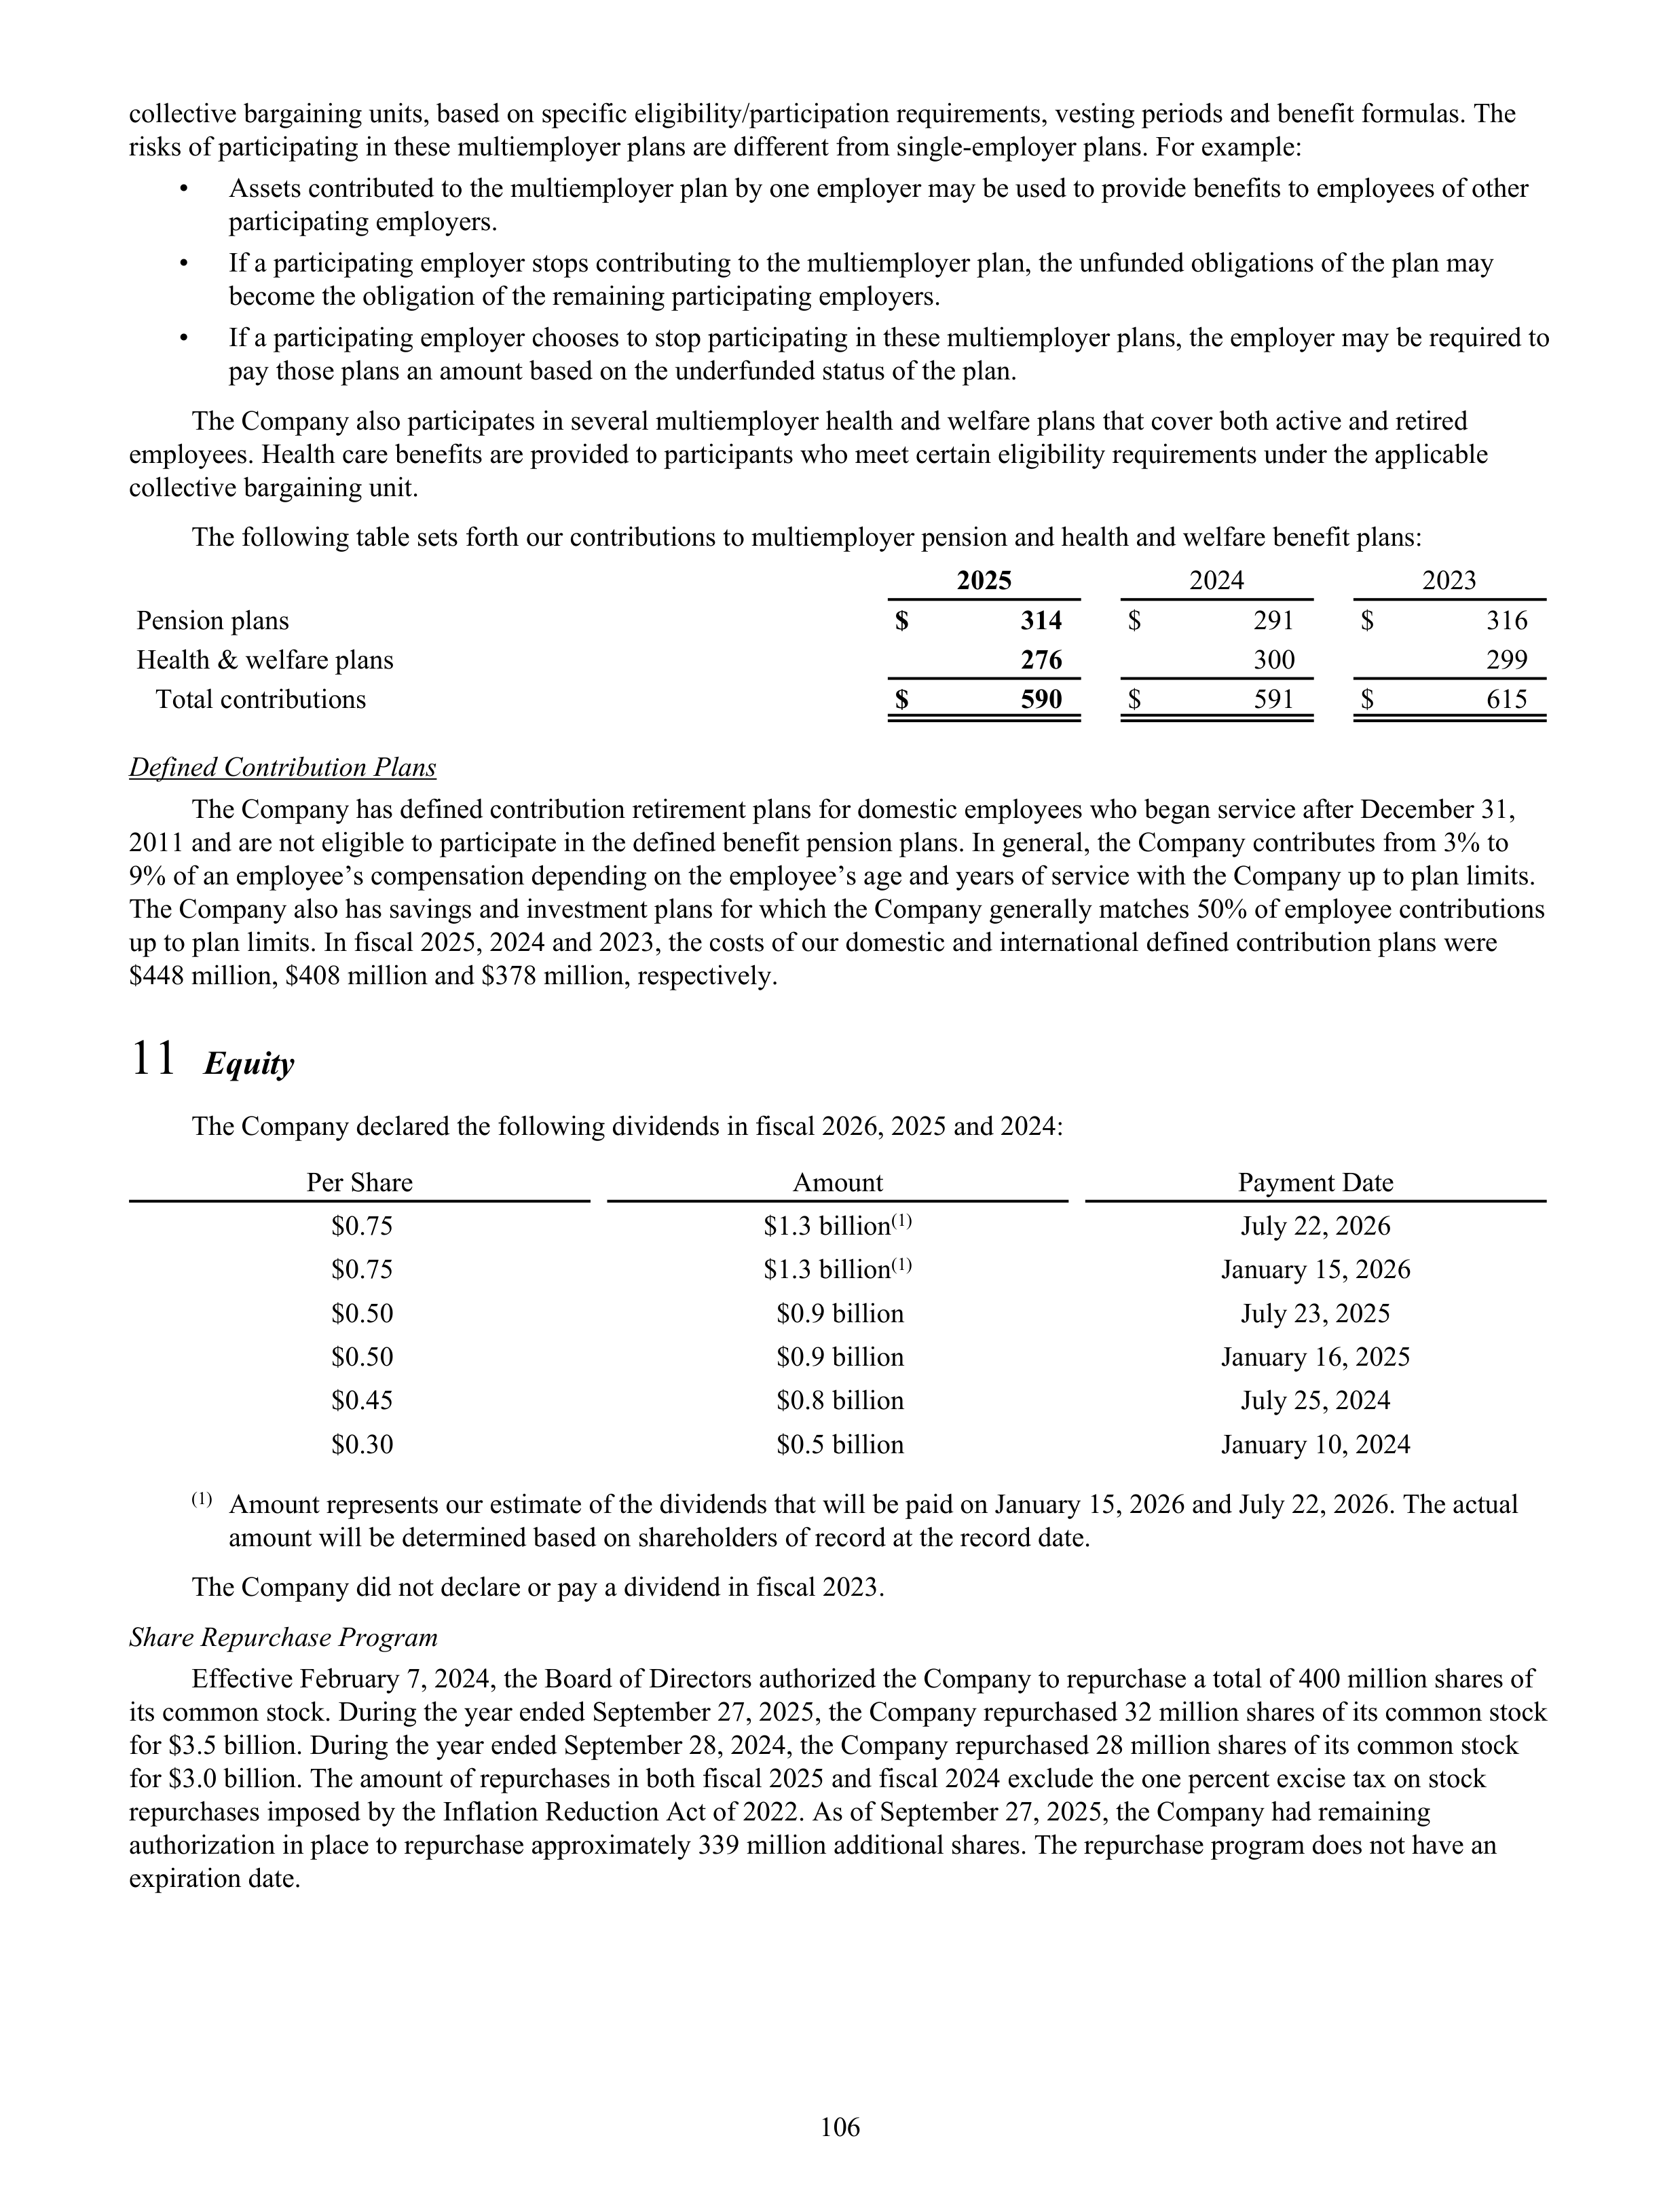
collective bargaining units, based on specific eligibility/participation requirements, vesting periods and benefit formulas. The
risks of participating in these multiemployer plans are different from single-employer plans. For example:
•
Assets contributed to the multiemployer plan by one employer may be used to provide benefits to employees of other
participating employers.
•
If a participating employer stops contributing to the multiemployer plan, the unfunded obligations of the plan may
become the obligation of the remaining participating employers.
•
If a participating employer chooses to stop participating in these multiemployer plans, the employer may be required to
pay those plans an amount based on the underfunded status of the plan.
The Company also participates in several multiemployer health and welfare plans that cover both active and retired
employees. Health care benefits are provided to participants who meet certain eligibility requirements under the applicable
collective bargaining unit.
The following table sets forth our contributions to multiemployer pension and health and welfare benefit plans:
2025
2024
2023
Pension plans
$
314
$
291
$
316
Health & welfare plans
276
300
299
Total contributions
$
590
$
591
$
615
Defined Contribution Plans
The Company has defined contribution retirement plans for domestic employees who began service after December 31,
2011 and are not eligible to participate in the defined benefit pension plans. In general, the Company contributes from 3% to
9% of an employee’s compensation depending on the employee’s age and years of service with the Company up to plan limits.
The Company also has savings and investment plans for which the Company generally matches 50% of employee contributions
up to plan limits. In fiscal 2025, 2024 and 2023, the costs of our domestic and international defined contribution plans were
$448 million, $408 million and $378 million, respectively.
11
Equity
The Company declared the following dividends in fiscal 2026, 2025 and 2024:
Per Share
Amount
Payment Date
$0.75
$1.3 billion
(1)
July 22, 2026
$0.75
$1.3 billion
(1)
January 15, 2026
$0.50
$0.9 billion
July 23, 2025
$0.50
$0.9 billion
January 16, 2025
$0.45
$0.8 billion
July 25, 2024
$0.30
$0.5 billion
January 10, 2024
(1)
Amount represents our estimate of the dividends that will be paid on January 15, 2026 and July 22, 2026. The actual
amount will be determined based on shareholders of record at the record date.
The Company did not declare or pay a dividend in fiscal 2023.
Share Repurchase Program
Effective February 7, 2024, the Board of Directors authorized the Company to repurchase a total of 400 million shares of
its common stock. During the year ended September 27, 2025, the Company repurchased 32 million shares of its common stock
for $3.5 billion. During the year ended September 28, 2024, the Company repurchased 28 million shares of its common stock
for $3.0 billion. The amount of repurchases in both fiscal 2025 and fiscal 2024 exclude the one percent excise tax on stock
repurchases imposed by the Inflation Reduction Act of 2022. As of September 27, 2025, the Company had remaining
authorization in place to repurchase approximately 339 million additional shares. The repurchase program does not have an
expiration date.
106
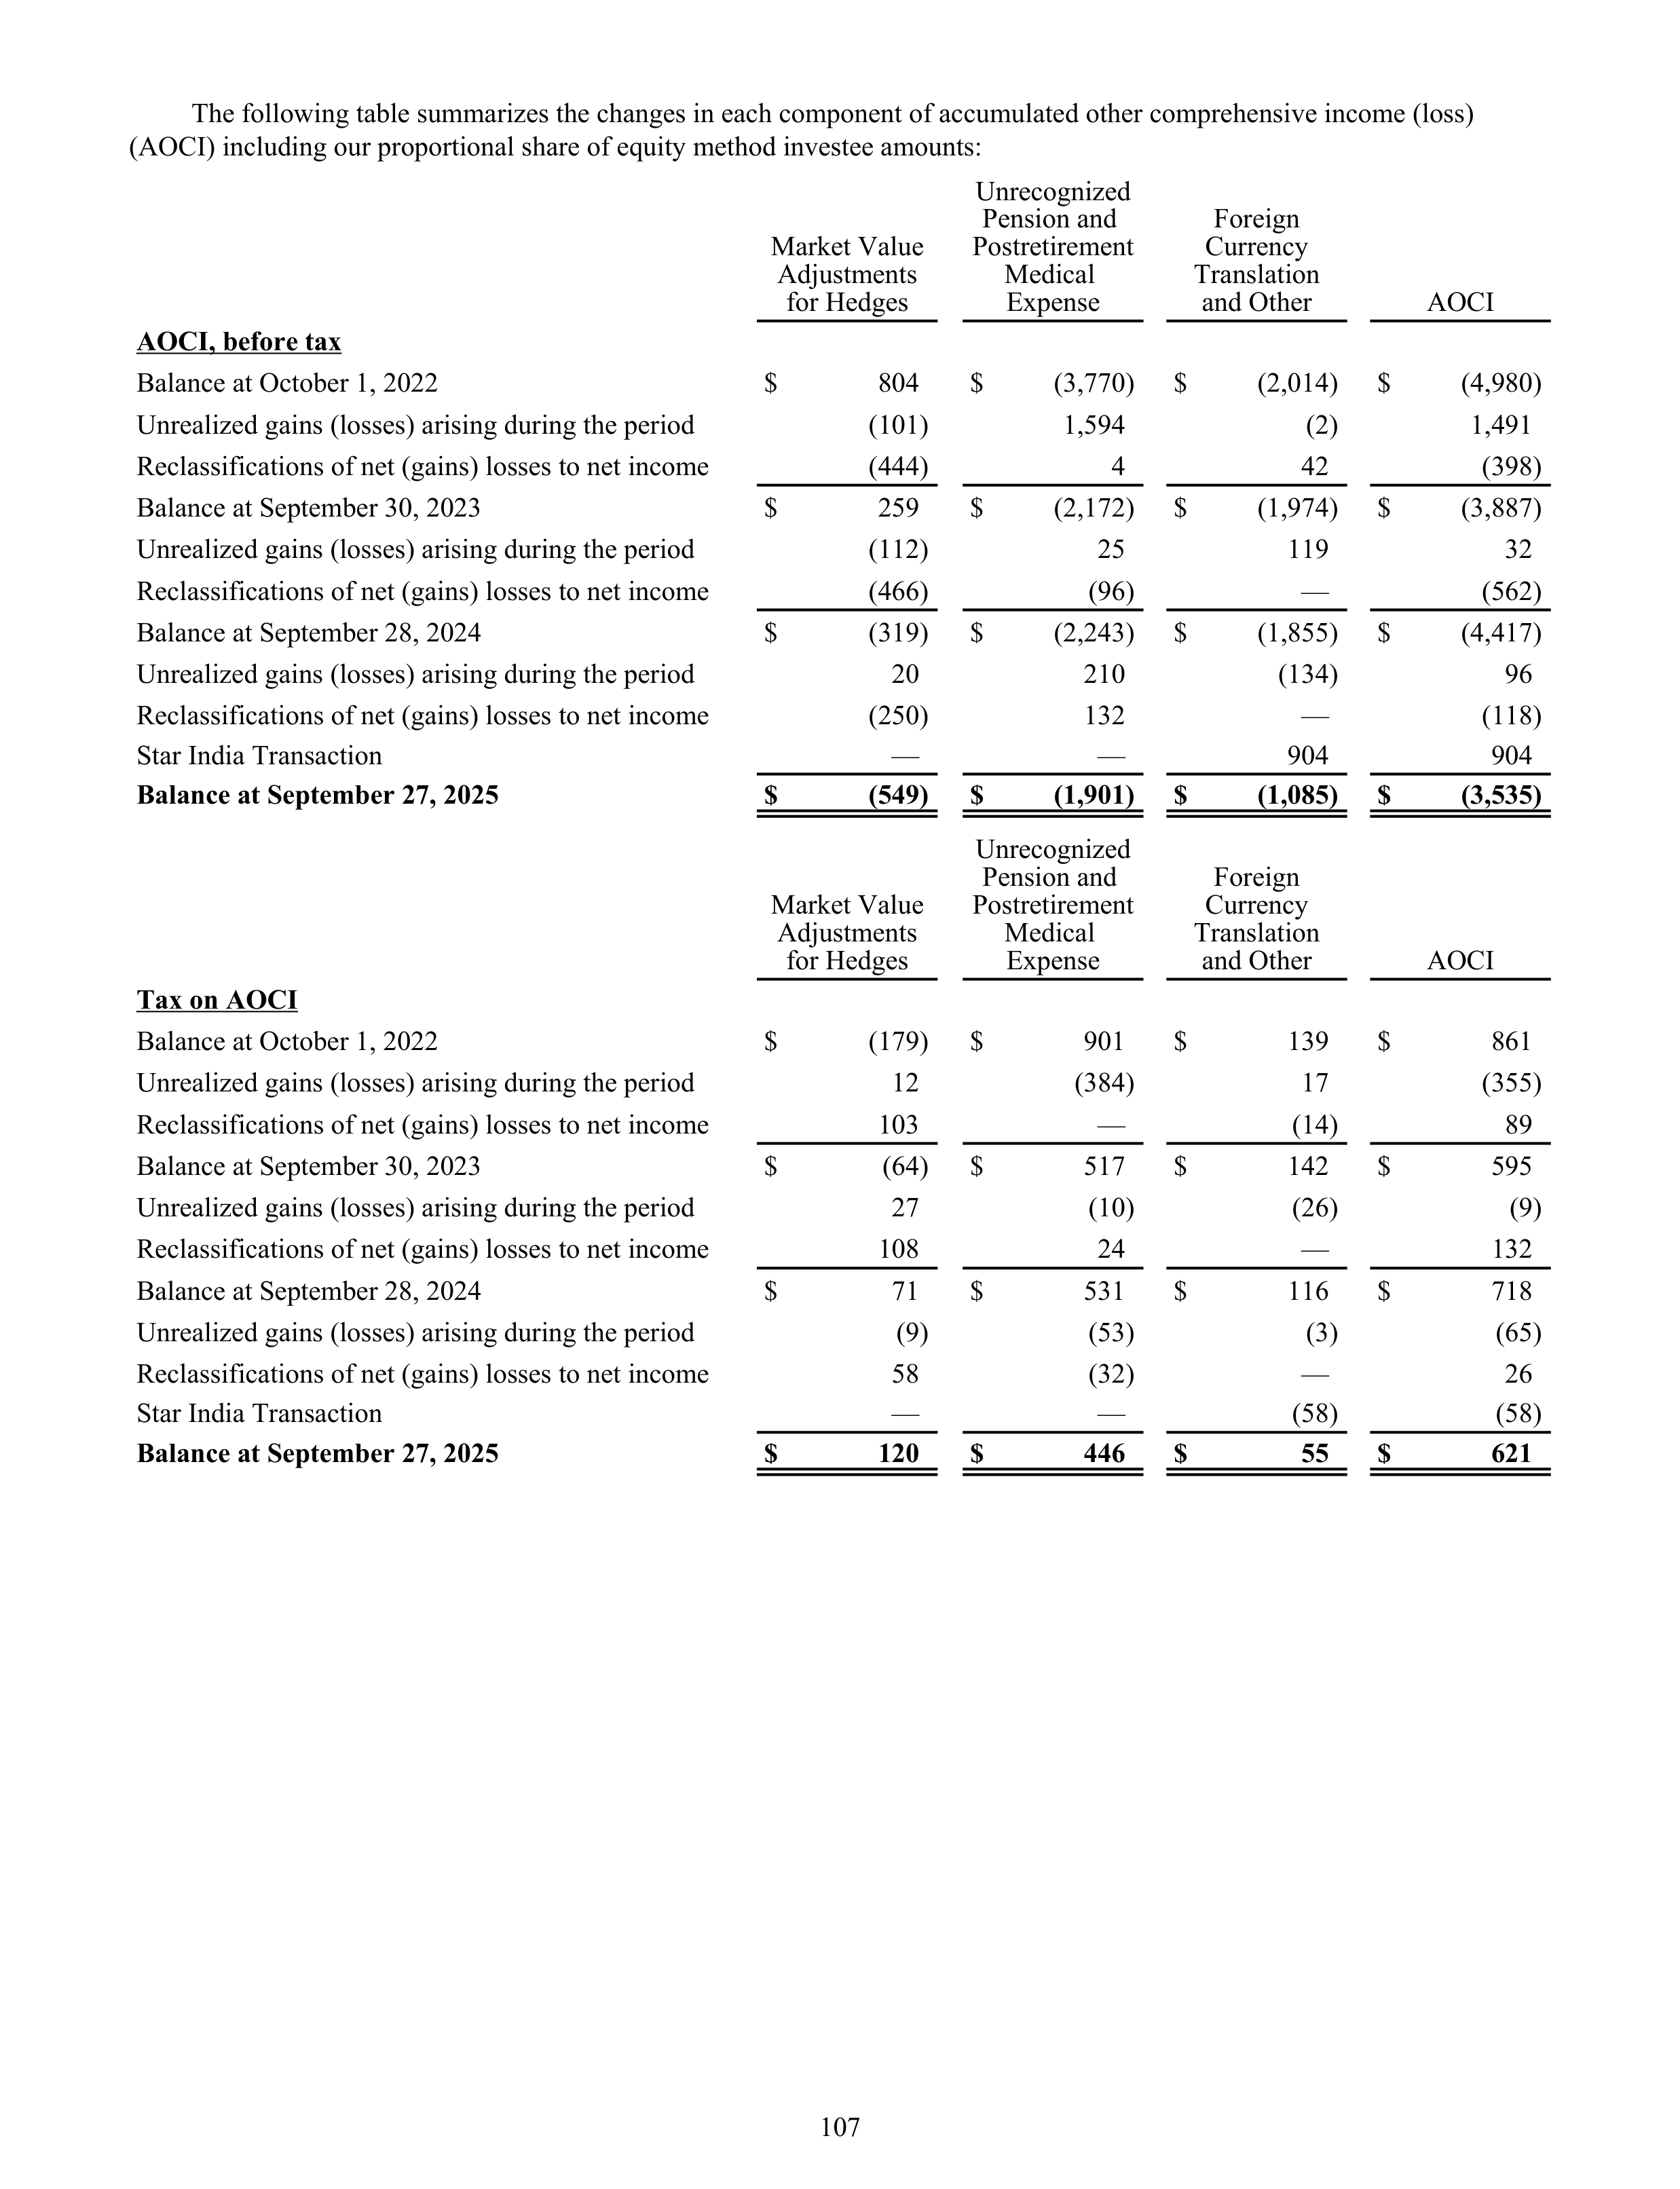
The following table summarizes the changes in each component of accumulated other comprehensive income (loss)
(AOCI) including our proportional share of equity method investee amounts:
Market Value
Adjustments
for Hedges
Unrecognized
Pension and
Postretirement
Medical
Expense
Foreign
Currency
Translation
and Other
AOCI
AOCI, before tax
Balance at October 1, 2022
$
804
$
(3,770)
$
(2,014)
$
(4,980)
Unrealized gains (losses) arising during the period
(101)
1,594
(2)
1,491
Reclassifications of net (gains) losses to net income
(444)
4
42
(398)
Balance at September 30, 2023
$
259
$
(2,172)
$
(1,974)
$
(3,887)
Unrealized gains (losses) arising during the period
(112)
25
119
32
Reclassifications of net (gains) losses to net income
(466)
(96)
—
(562)
Balance at September 28, 2024
$
(319)
$
(2,243)
$
(1,855)
$
(4,417)
Unrealized gains (losses) arising during the period
20
210
(134)
96
Reclassifications of net (gains) losses to net income
(250)
132
—
(118)
Star India Transaction
—
—
904
904
Balance at September 27, 2025
$
(549)
$
(1,901)
$
(1,085)
$
(3,535)
Market Value
Adjustments
for Hedges
Unrecognized
Pension and
Postretirement
Medical
Expense
Foreign
Currency
Translation
and Other
AOCI
Tax on AOCI
Balance at October 1, 2022
$
(179)
$
901
$
139
$
861
Unrealized gains (losses) arising during the period
12
(384)
17
(355)
Reclassifications of net (gains) losses to net income
103
—
(14)
89
Balance at September 30, 2023
$
(64)
$
517
$
142
$
595
Unrealized gains (losses) arising during the period
27
(10)
(26)
(9)
Reclassifications of net (gains) losses to net income
108
24
—
132
Balance at September 28, 2024
$
71
$
531
$
116
$
718
Unrealized gains (losses) arising during the period
(9)
(53)
(3)
(65)
Reclassifications of net (gains) losses to net income
58
(32)
—
26
Star India Transaction
—
—
(58)
(58)
Balance at September 27, 2025
$
120
$
446
$
55
$
621
107
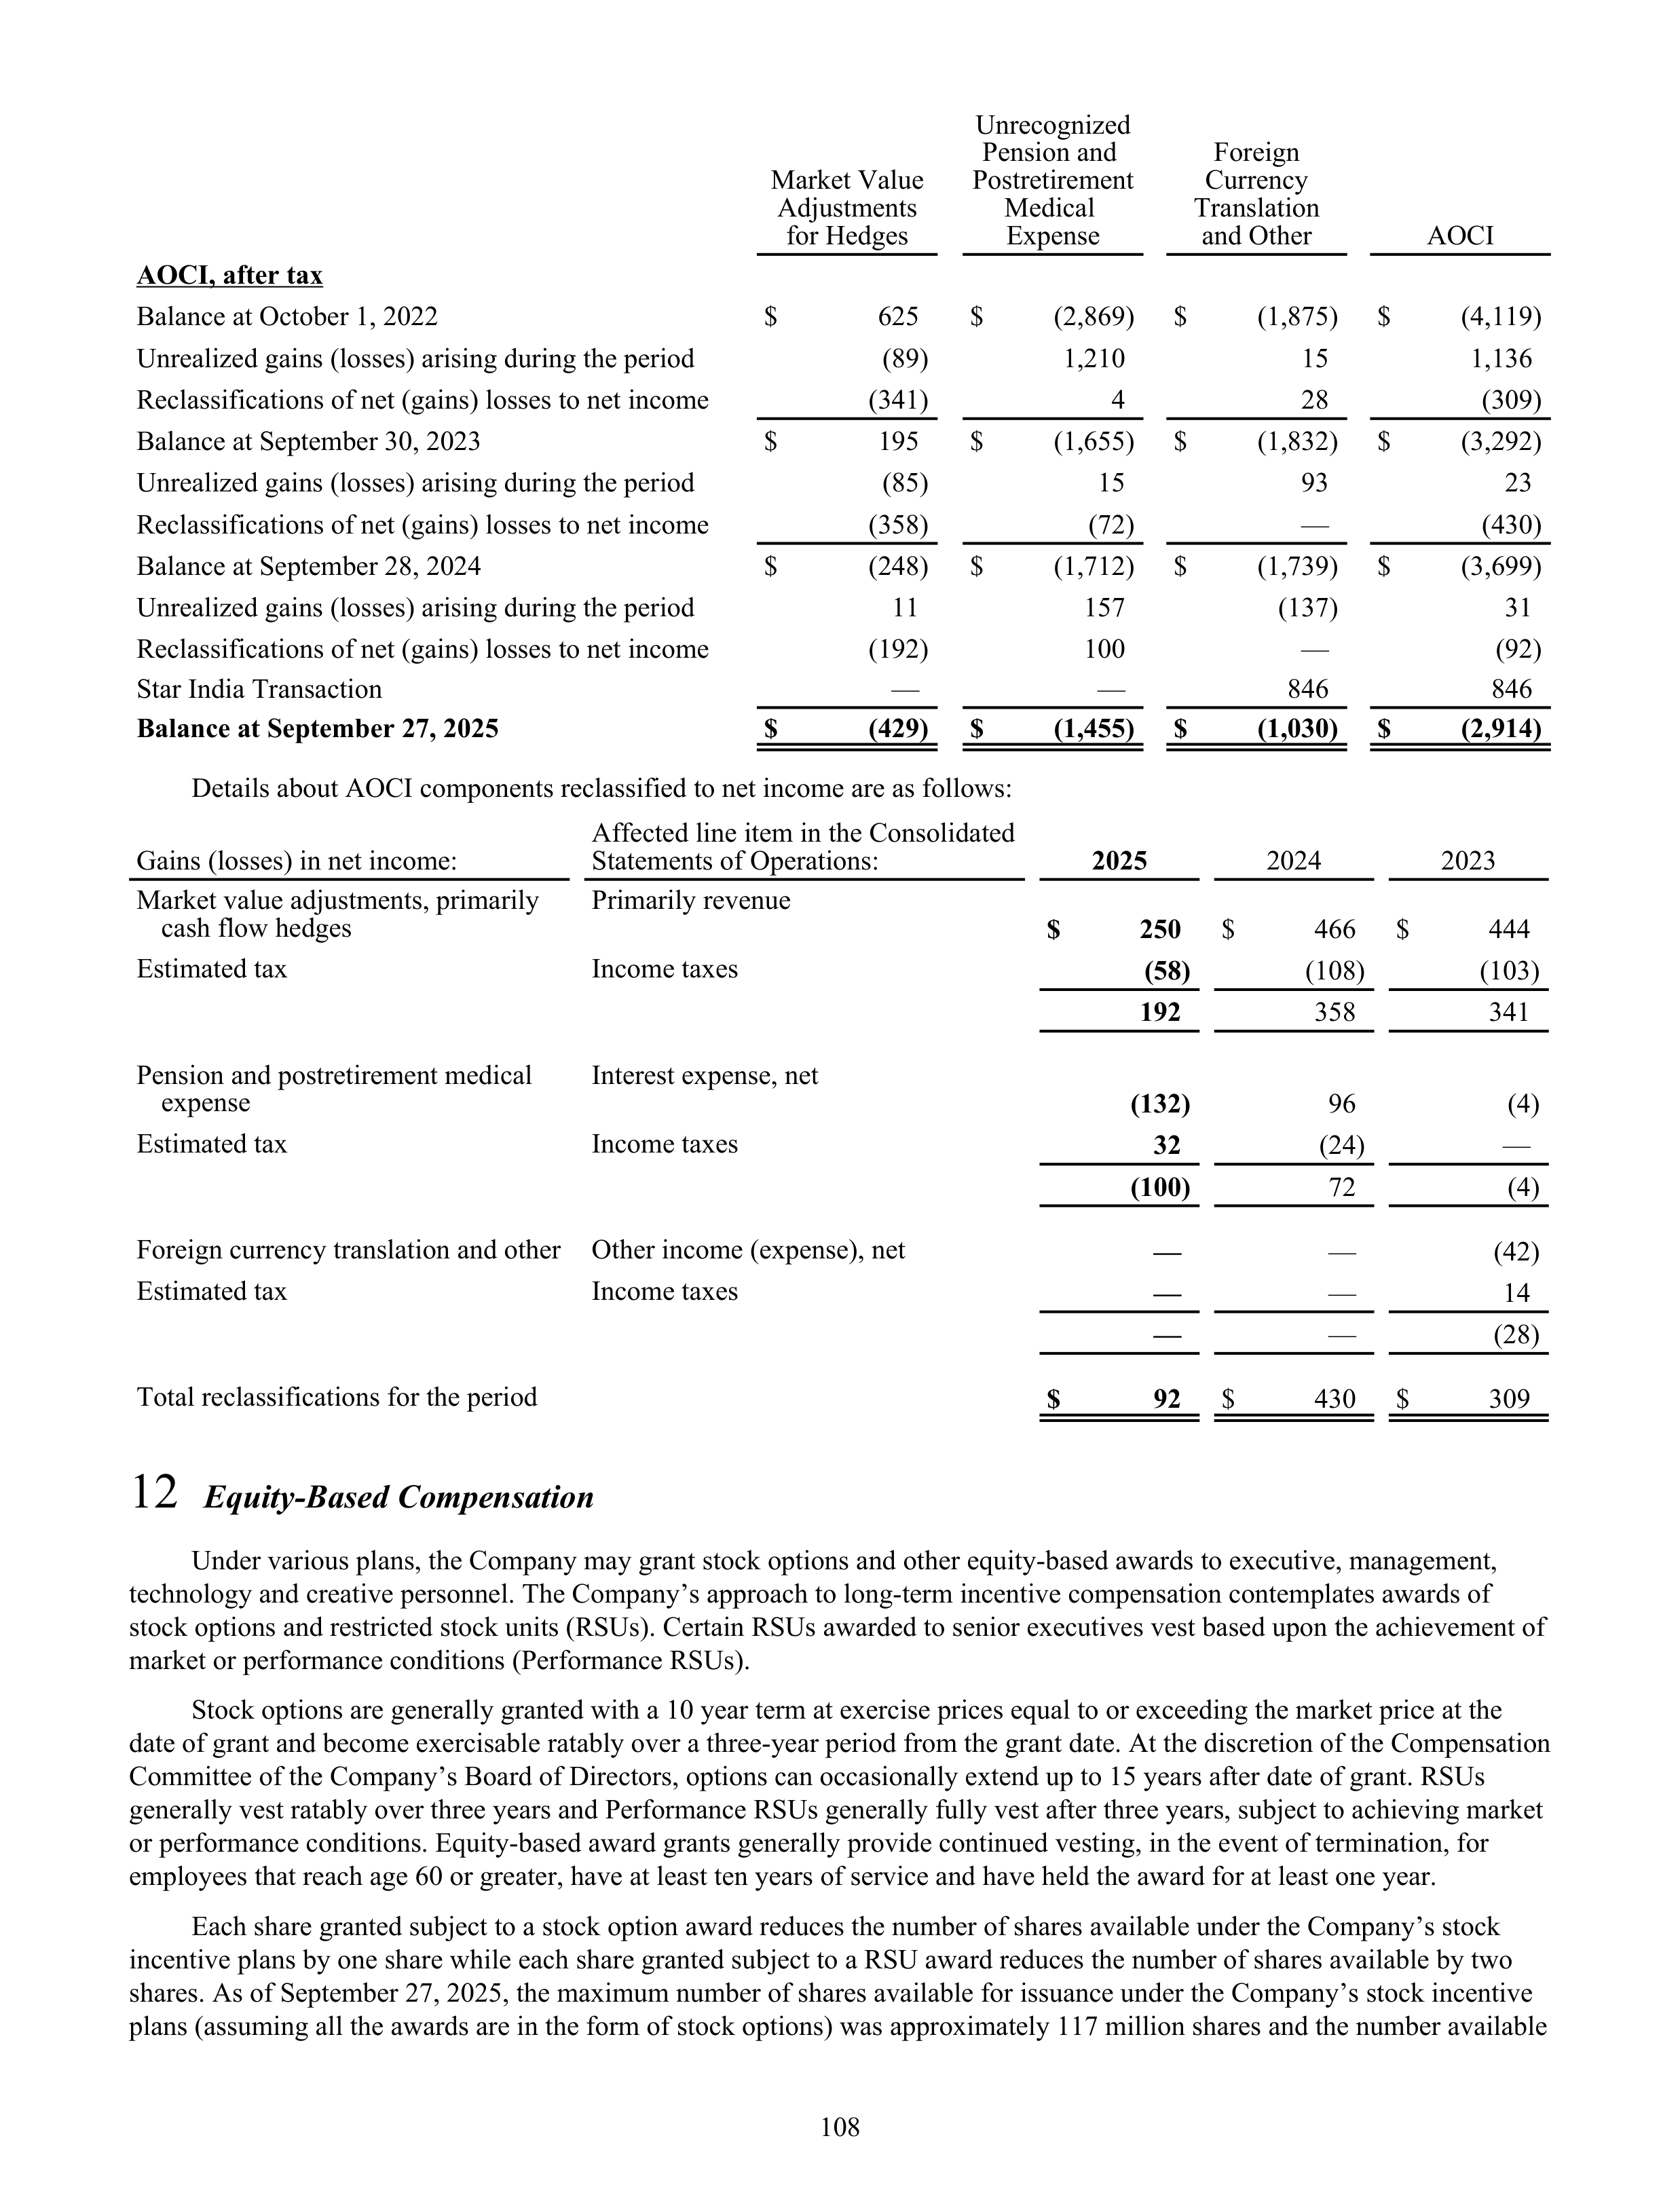
Market Value
Adjustments
for Hedges
Unrecognized
Pension and
Postretirement
Medical
Expense
Foreign
Currency
Translation
and Other
AOCI
AOCI, after tax
Balance at October 1, 2022
$
625
$
(2,869)
$
(1,875)
$
(4,119)
Unrealized gains (losses) arising during the period
(89)
1,210
15
1,136
Reclassifications of net (gains) losses to net income
(341)
4
28
(309)
Balance at September 30, 2023
$
195
$
(1,655)
$
(1,832)
$
(3,292)
Unrealized gains (losses) arising during the period
(85)
15
93
23
Reclassifications of net (gains) losses to net income
(358)
(72)
—
(430)
Balance at September 28, 2024
$
(248)
$
(1,712)
$
(1,739)
$
(3,699)
Unrealized gains (losses) arising during the period
11
157
(137)
31
Reclassifications of net (gains) losses to net income
(192)
100
—
(92)
Star India Transaction
—
—
846
846
Balance at September 27, 2025
$
(429)
$
(1,455)
$
(1,030)
$
(2,914)
Details about AOCI components reclassified to net income are as follows:
Gains (losses) in net income:
Affected line item in the Consolidated
Statements of Operations:
2025
2024
2023
Market value adjustments, primarily
cash flow hedges
Primarily revenue
$
250
$
466
$
444
Estimated tax
Income taxes
(58)
(108)
(103)
192
358
341
Pension and postretirement medical
expense
Interest expense, net
(132)
96
(4)
Estimated tax
Income taxes
32
(24)
—
(100)
72
(4)
Foreign currency translation and other
Other income (expense), net
—
—
(42)
Estimated tax
Income taxes
—
—
14
—
—
(28)
Total reclassifications for the period
$
92
$
430
$
309
12
Equity-Based Compensation
Under various plans, the Company may grant stock options and other equity-based awards to executive, management,
technology and creative personnel. The Company’s approach to long-term incentive compensation contemplates awards of
stock options and restricted stock units (RSUs). Certain RSUs awarded to senior executives vest based upon the achievement of
market or performance conditions (Performance RSUs).
Stock options are generally granted with a 10 year term at exercise prices equal to or exceeding the market price at the
date of grant and become exercisable ratably over a three-year period from the grant date. At the discretion of the Compensation
Committee of the Company’s Board of Directors, options can occasionally extend up to 15 years after date of grant. RSUs
generally vest ratably over three years and Performance RSUs generally fully vest after three years, subject to achieving market
or performance conditions. Equity-based award grants generally provide continued vesting, in the event of termination, for
employees that reach age 60 or greater, have at least ten years of service and have held the award for at least one year.
Each share granted subject to a stock option award reduces the number of shares available under the Company’s stock
incentive plans by one share while each share granted subject to a RSU award reduces the number of shares available by two
shares. As of September 27, 2025, the maximum number of shares available for issuance under the Company’s stock incentive
plans (assuming all the awards are in the form of stock options) was approximately 117 million shares and the number available
108
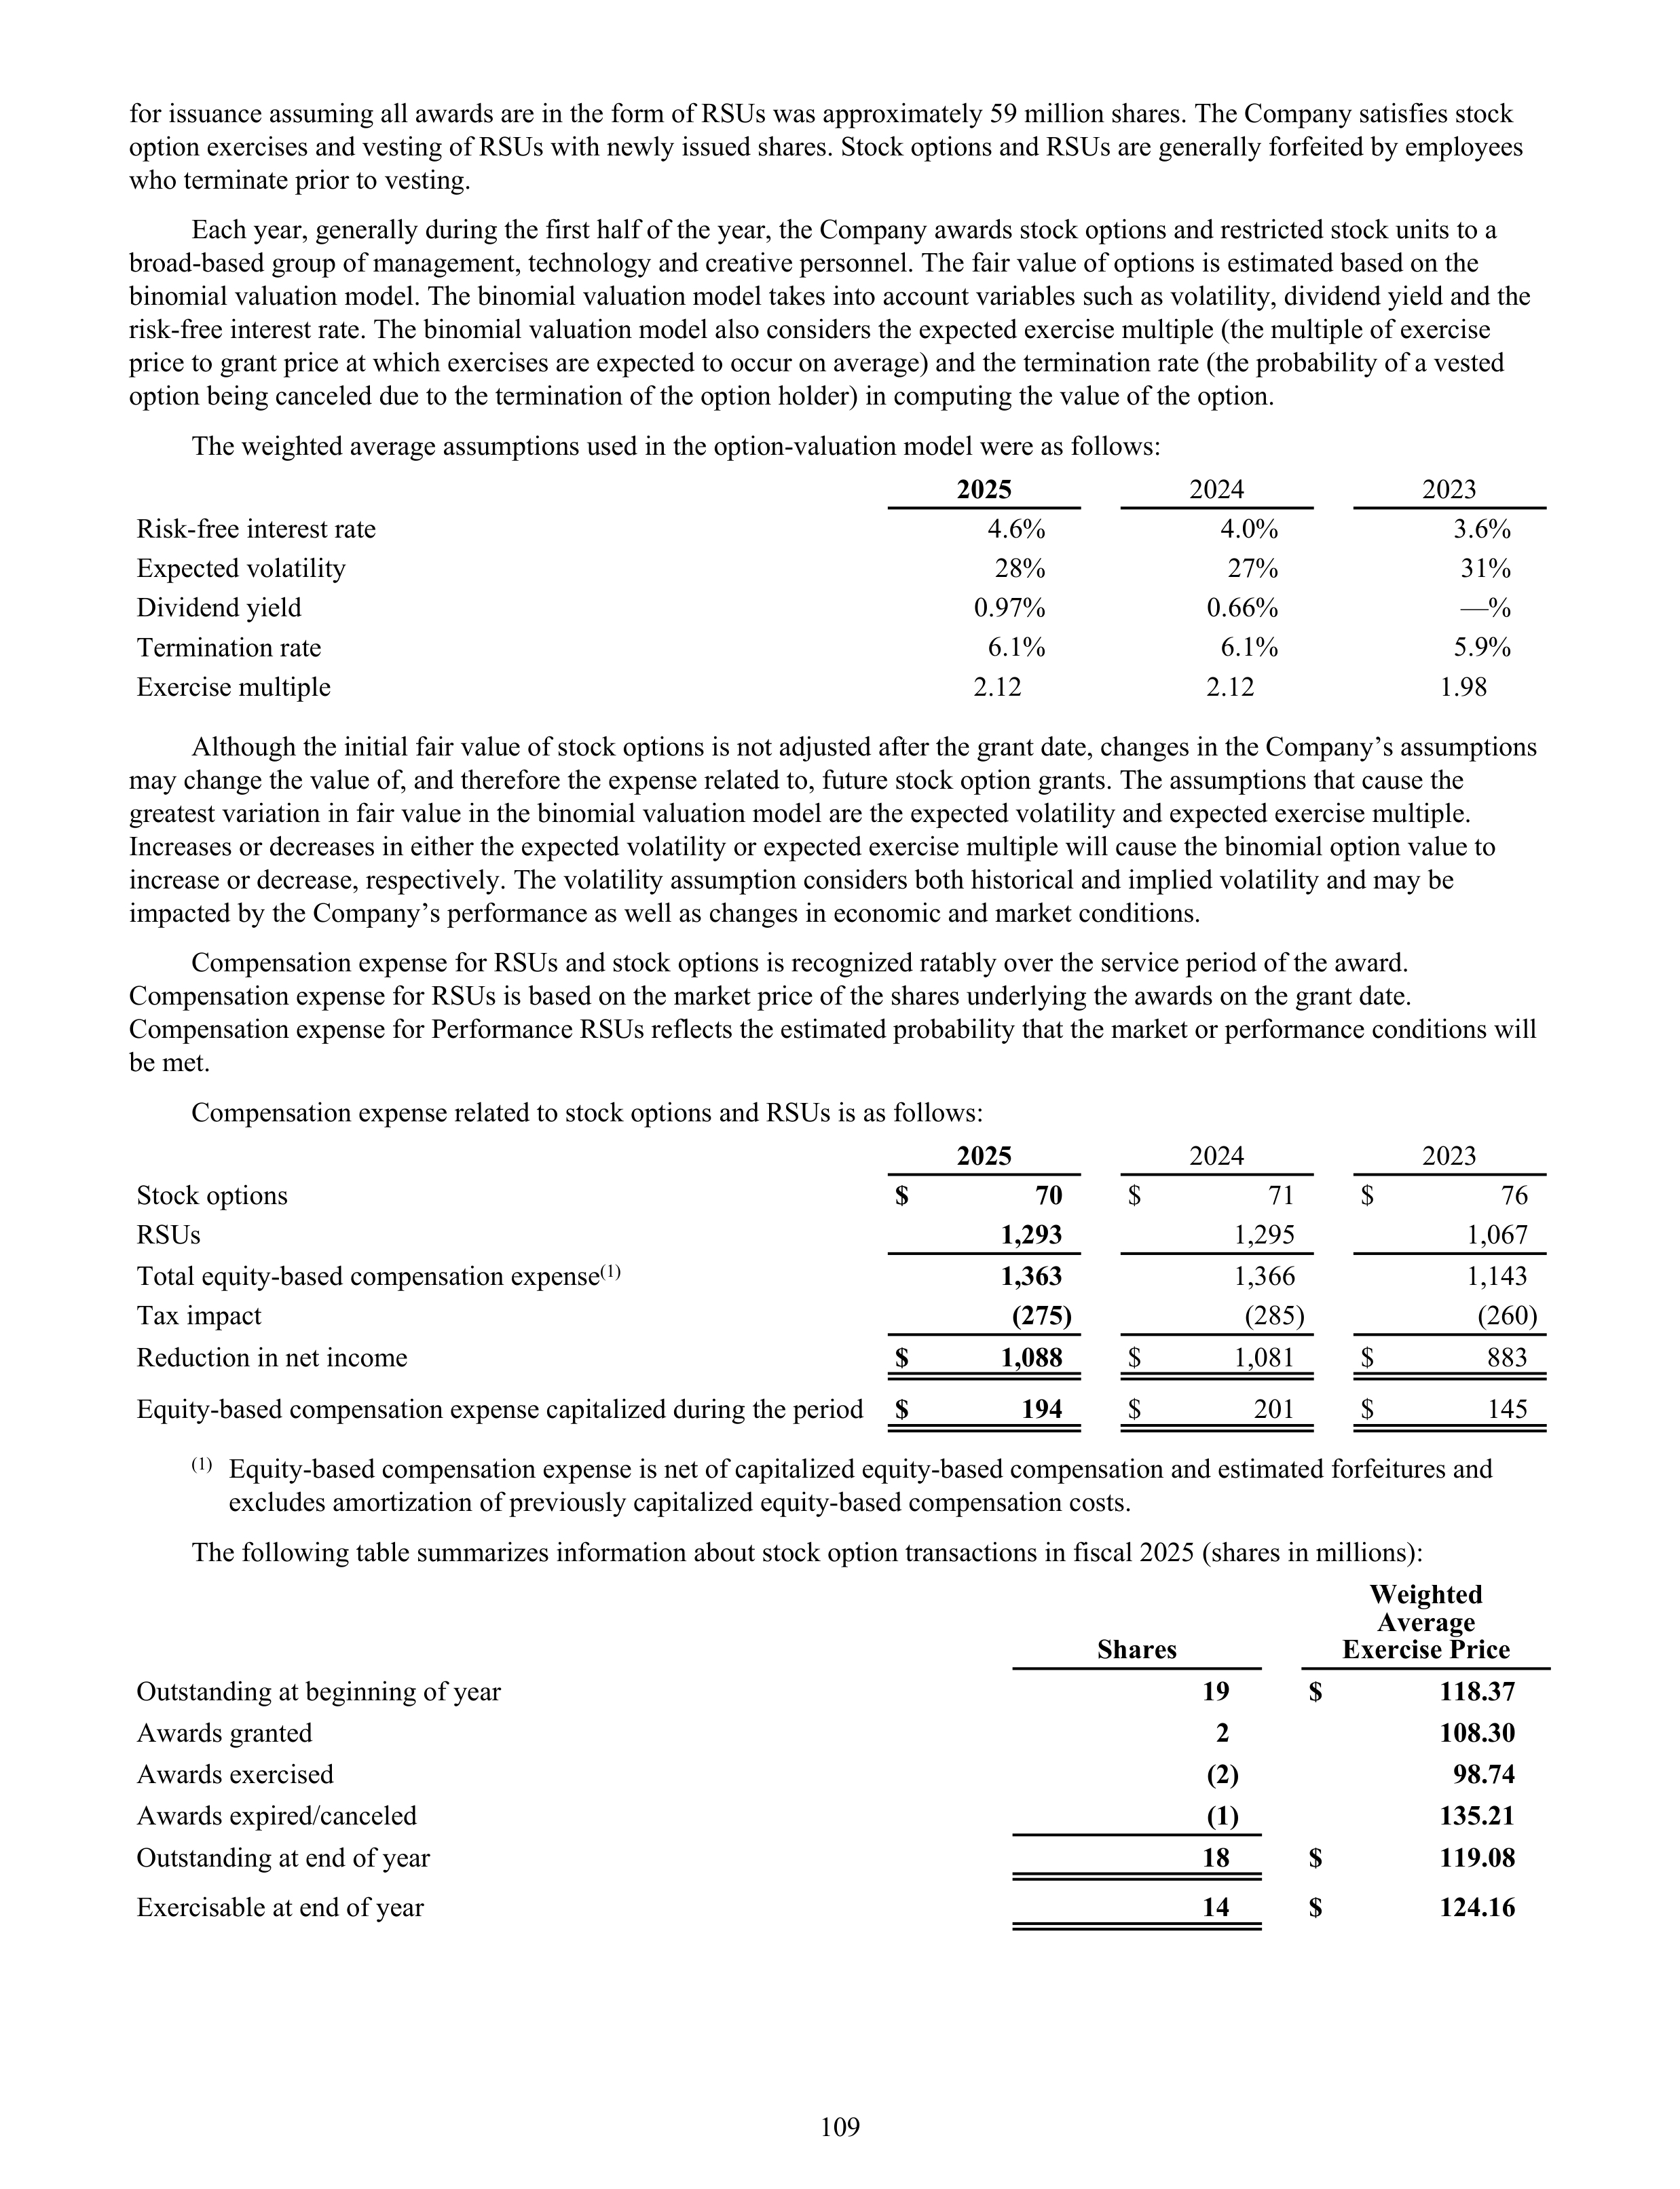
for issuance assuming all awards are in the form of RSUs was approximately 59 million shares. The Company satisfies stock
option exercises and vesting of RSUs with newly issued shares. Stock options and RSUs are generally forfeited by employees
who terminate prior to vesting.
Each year, generally during the first half of the year, the Company awards stock options and restricted stock units to a
broad-based group of management, technology and creative personnel. The fair value of options is estimated based on the
binomial valuation model. The binomial valuation model takes into account variables such as volatility, dividend yield and the
risk-free interest rate. The binomial valuation model also considers the expected exercise multiple (the multiple of exercise
price to grant price at which exercises are expected to occur on average) and the termination rate (the probability of a vested
option being canceled due to the termination of the option holder) in computing the value of the option.
The weighted average assumptions used in the option-valuation model were as follows:
2025
2024
2023
Risk-free interest rate
4.6 %
4.0 %
3.6 %
Expected volatility
28 %
27 %
31 %
Dividend yield
0.97 %
0.66 %
— %
Termination rate
6.1 %
6.1 %
5.9 %
Exercise multiple
2.12
2.12
1.98
Although the initial fair value of stock options is not adjusted after the grant date, changes in the Company’s assumptions
may change the value of, and therefore the expense related to, future stock option grants. The assumptions that cause the
greatest variation in fair value in the binomial valuation model are the expected volatility and expected exercise multiple.
Increases or decreases in either the expected volatility or expected exercise multiple will cause the binomial option value to
increase or decrease, respectively. The volatility assumption considers both historical and implied volatility and may be
impacted by the Company’s performance as well as changes in economic and market conditions.
Compensation expense for RSUs and stock options is recognized ratably over the service period of the award.
Compensation expense for RSUs is based on the market price of the shares underlying the awards on the grant date.
Compensation expense for Performance RSUs reflects the estimated probability that the market or performance conditions will
be met.
Compensation expense related to stock options and RSUs is as follows:
2025
2024
2023
Stock options
$
70
$
71
$
76
RSUs
1,293
1,295
1,067
Total equity-based compensation expense
(1)
1,363
1,366
1,143
Tax impact
(275)
(285)
(260)
Reduction in net income
$
1,088
$
1,081
$
883
Equity-based compensation expense capitalized during the period
$
194
$
201
$
145
(1)
Equity-based compensation expense is net of capitalized equity-based compensation and estimated forfeitures and
excludes amortization of previously capitalized equity-based compensation costs.
The following table summarizes information about stock option transactions in fiscal 2025 (shares in millions):
Shares
Weighted
Average
Exercise Price
Outstanding at beginning of year
19
$
118.37
Awards granted
2
108.30
Awards exercised
(2)
98.74
Awards expired/canceled
(1)
135.21
Outstanding at end of year
18
$
119.08
Exercisable at end of year
14
$
124.16
109
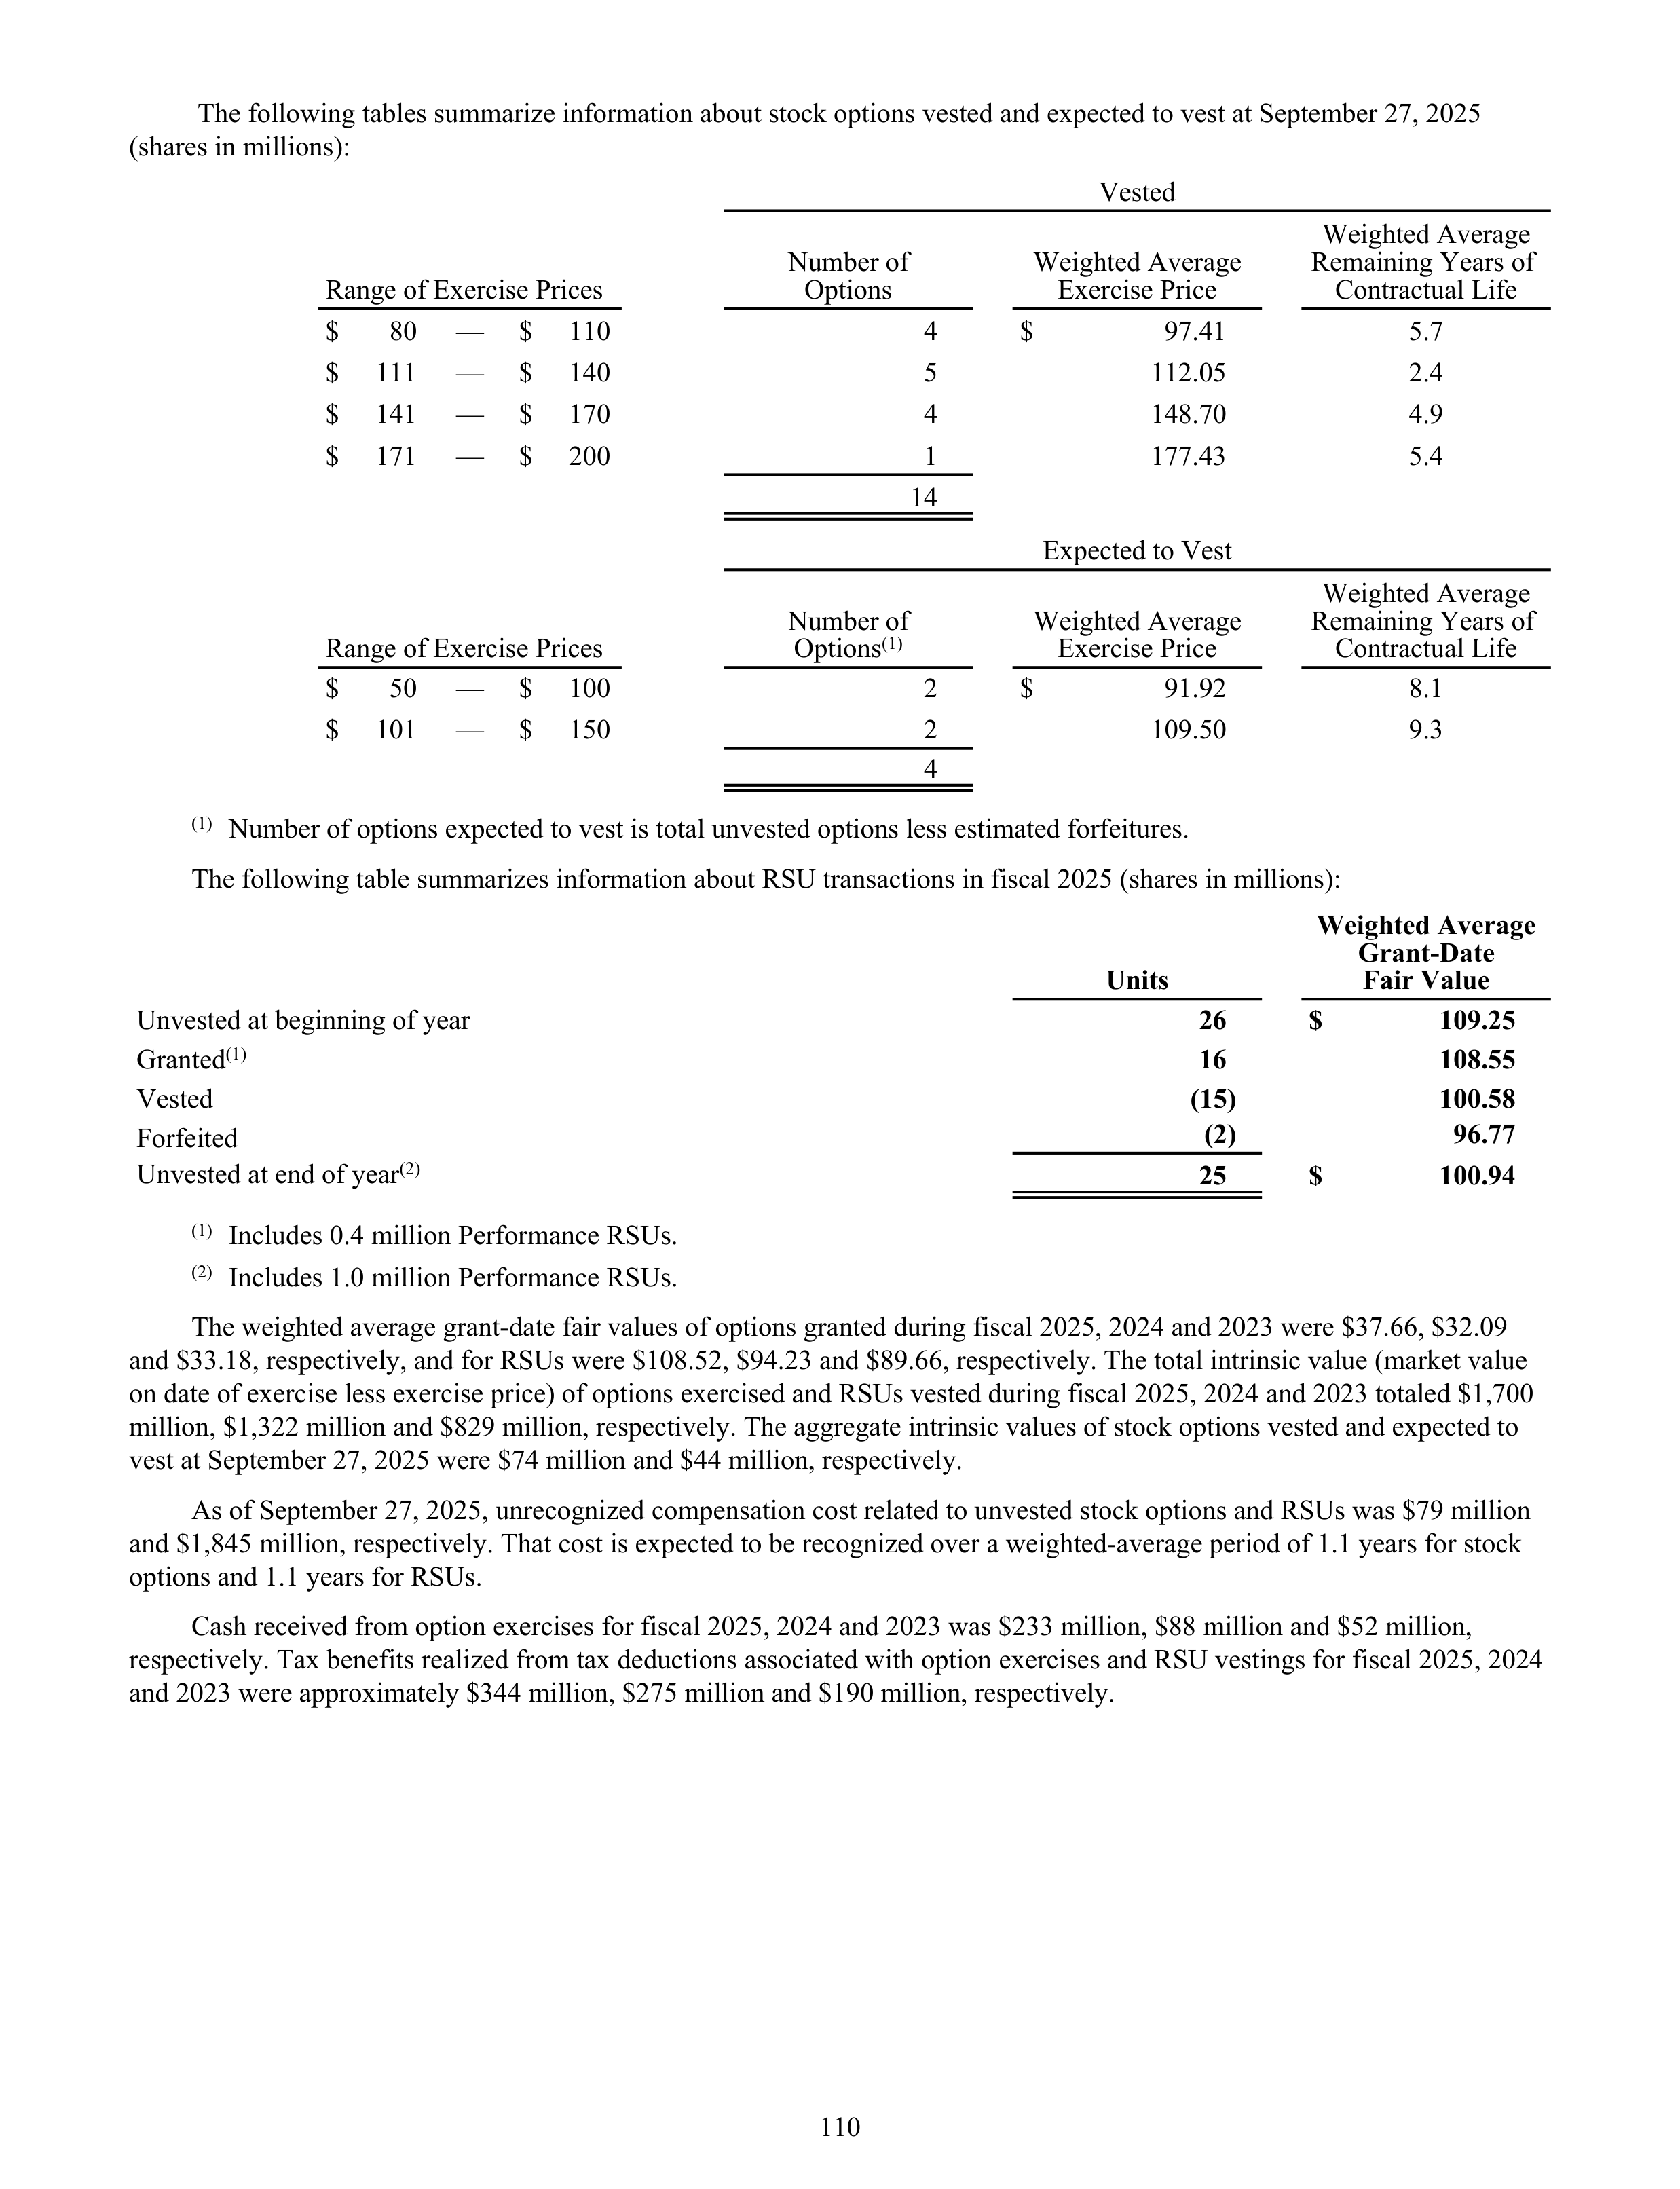
The following tables summarize information about stock options vested and expected to vest at September 27, 2025
(shares in millions):
Vested
Range of Exercise Prices
Number of
Options
Weighted Average
Exercise Price
Weighted Average
Remaining Years of
Contractual Life
$
80
—
$
110
4
$
97.41
5.7
$
111
—
$
140
5
112.05
2.4
$
141
—
$
170
4
148.70
4.9
$
171
—
$
200
1
177.43
5.4
14
Expected to Vest
Range of Exercise Prices
Number of
Options
(1)
Weighted Average
Exercise Price
Weighted Average
Remaining Years of
Contractual Life
$
50
—
$
100
2
$
91.92
8.1
$
101
—
$
150
2
109.50
9.3
4
(1)
Number of options expected to vest is total unvested options less estimated forfeitures.
The following table summarizes information about RSU transactions in fiscal 2025 (shares in millions):
Units
Weighted Average
Grant-Date
Fair Value
Unvested at beginning of year
26
$
109.25
Granted
(1)
16
108.55
Vested
(15)
100.58
Forfeited
(2)
96.77
Unvested at end of year
(2)
25
$
100.94
(1)
Includes 0.4 million Performance RSUs.
(2)
Includes 1.0 million Performance RSUs.
The weighted average grant-date fair values of options granted during fiscal 2025, 2024 and 2023 were $37.66, $32.09
and $33.18, respectively, and for RSUs were $108.52, $94.23 and $89.66, respectively. The total intrinsic value (market value
on date of exercise less exercise price) of options exercised and RSUs vested during fiscal 2025, 2024 and 2023 totaled $1,700
million, $1,322 million and $829 million, respectively. The aggregate intrinsic values of stock options vested and expected to
vest at September 27, 2025 were $74 million and $44 million, respectively.
As of September 27, 2025, unrecognized compensation cost related to unvested stock options and RSUs was $79 million
and $1,845 million, respectively. That cost is expected to be recognized over a weighted-average period of 1.1 years for stock
options and 1.1 years for RSUs.
Cash received from option exercises for fiscal 2025, 2024 and 2023 was $233 million, $88 million and $52 million,
respectively. Tax benefits realized from tax deductions associated with option exercises and RSU vestings for fiscal 2025, 2024
and 2023 were approximately $344 million, $275 million and $190 million, respectively.
110
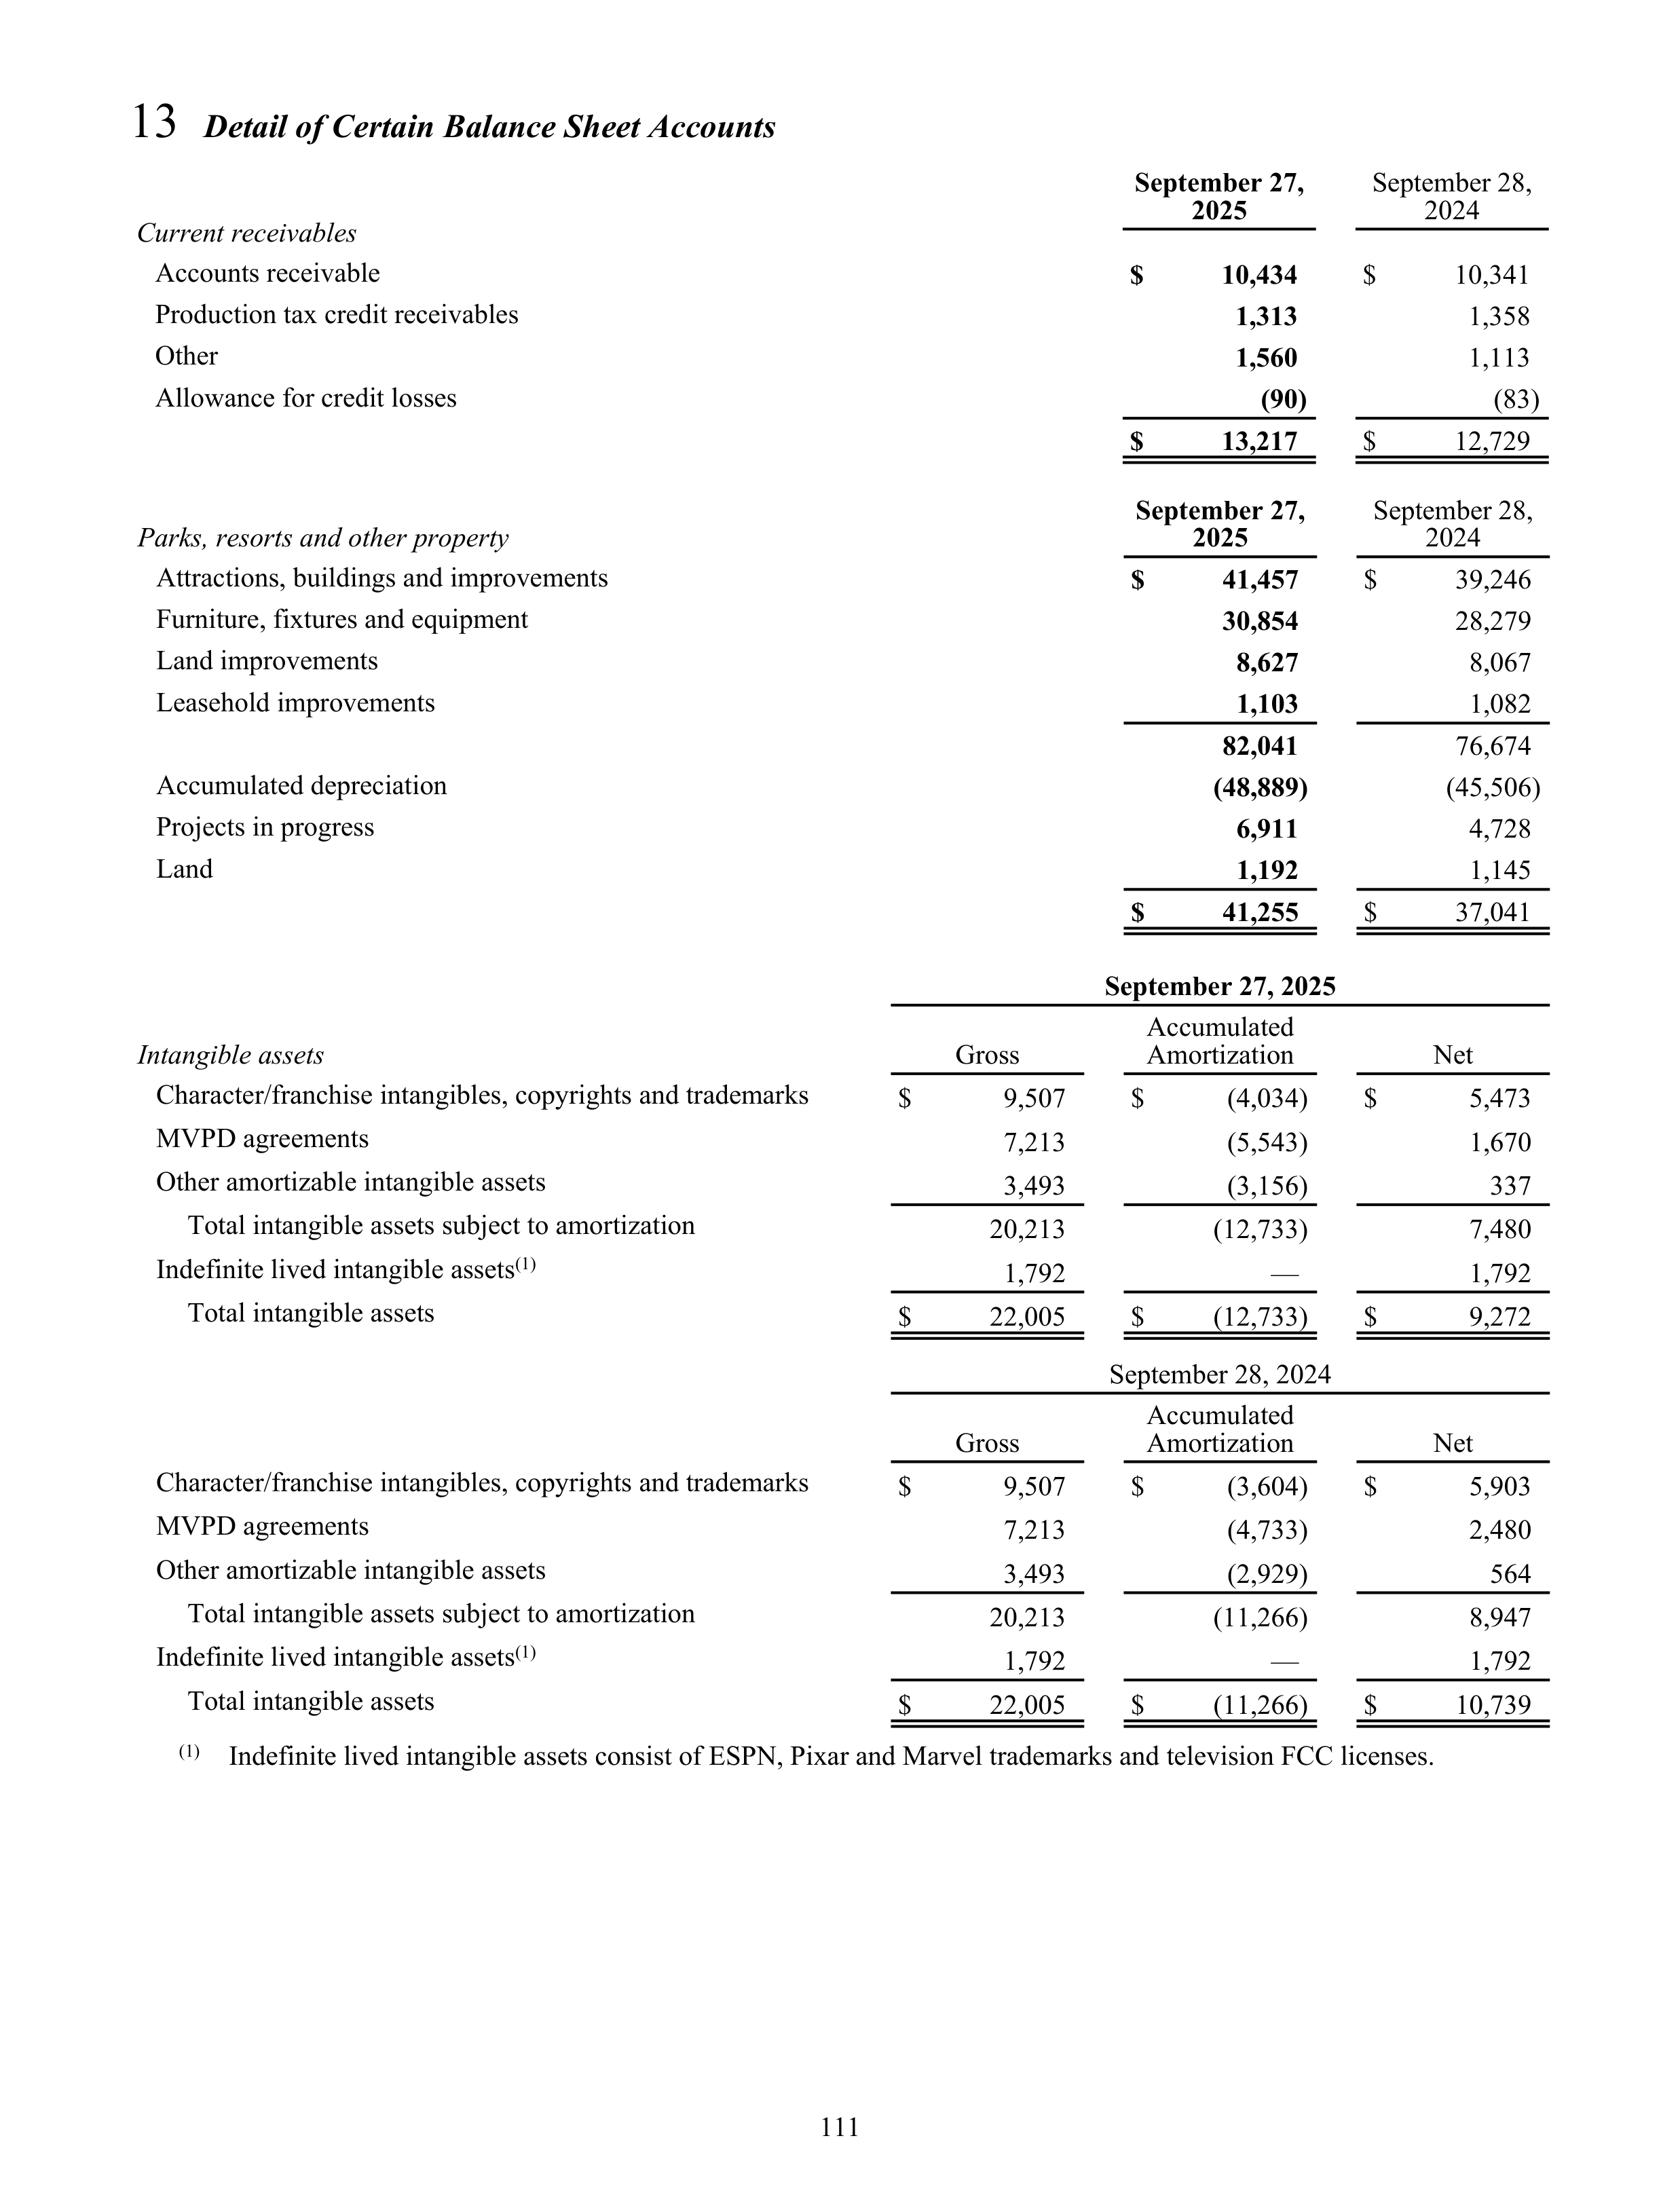
13
Detail of Certain Balance Sheet Accounts
Current receivables
September 27,
2025
September 28,
2024
Accounts receivable
$
10,434
$
10,341
Production tax credit receivables
1,313
1,358
Other
1,560
1,113
Allowance for credit losses
(90)
(83)
$
13,217
$
12,729
Parks, resorts and other property
September 27,
2025
September 28,
2024
Attractions, buildings and improvements
$
41,457
$
39,246
Furniture, fixtures and equipment
30,854
28,279
Land improvements
8,627
8,067
Leasehold improvements
1,103
1,082
82,041
76,674
Accumulated depreciation
(48,889)
(45,506)
Projects in progress
6,911
4,728
Land
1,192
1,145
$
41,255
$
37,041
September 27, 2025
Intangible assets
Gross
Accumulated
Amortization
Net
Character/franchise intangibles, copyrights and trademarks
$
9,507
$
(4,034)
$
5,473
MVPD agreements
7,213
(5,543)
1,670
Other amortizable intangible assets
3,493
(3,156)
337
Total intangible assets subject to amortization
20,213
(12,733)
7,480
Indefinite lived intangible assets
(1)
1,792
—
1,792
Total intangible assets
$
22,005
$
(12,733)
$
9,272
September 28, 2024
Gross
Accumulated
Amortization
Net
Character/franchise intangibles, copyrights and trademarks
$
9,507
$
(3,604)
$
5,903
MVPD agreements
7,213
(4,733)
2,480
Other amortizable intangible assets
3,493
(2,929)
564
Total intangible assets subject to amortization
20,213
(11,266)
8,947
Indefinite lived intangible assets
(1)
1,792
—
1,792
Total intangible assets
$
22,005
$
(11,266)
$
10,739
(1)
Indefinite lived intangible assets consist of ESPN, Pixar and Marvel trademarks and television FCC licenses.
111
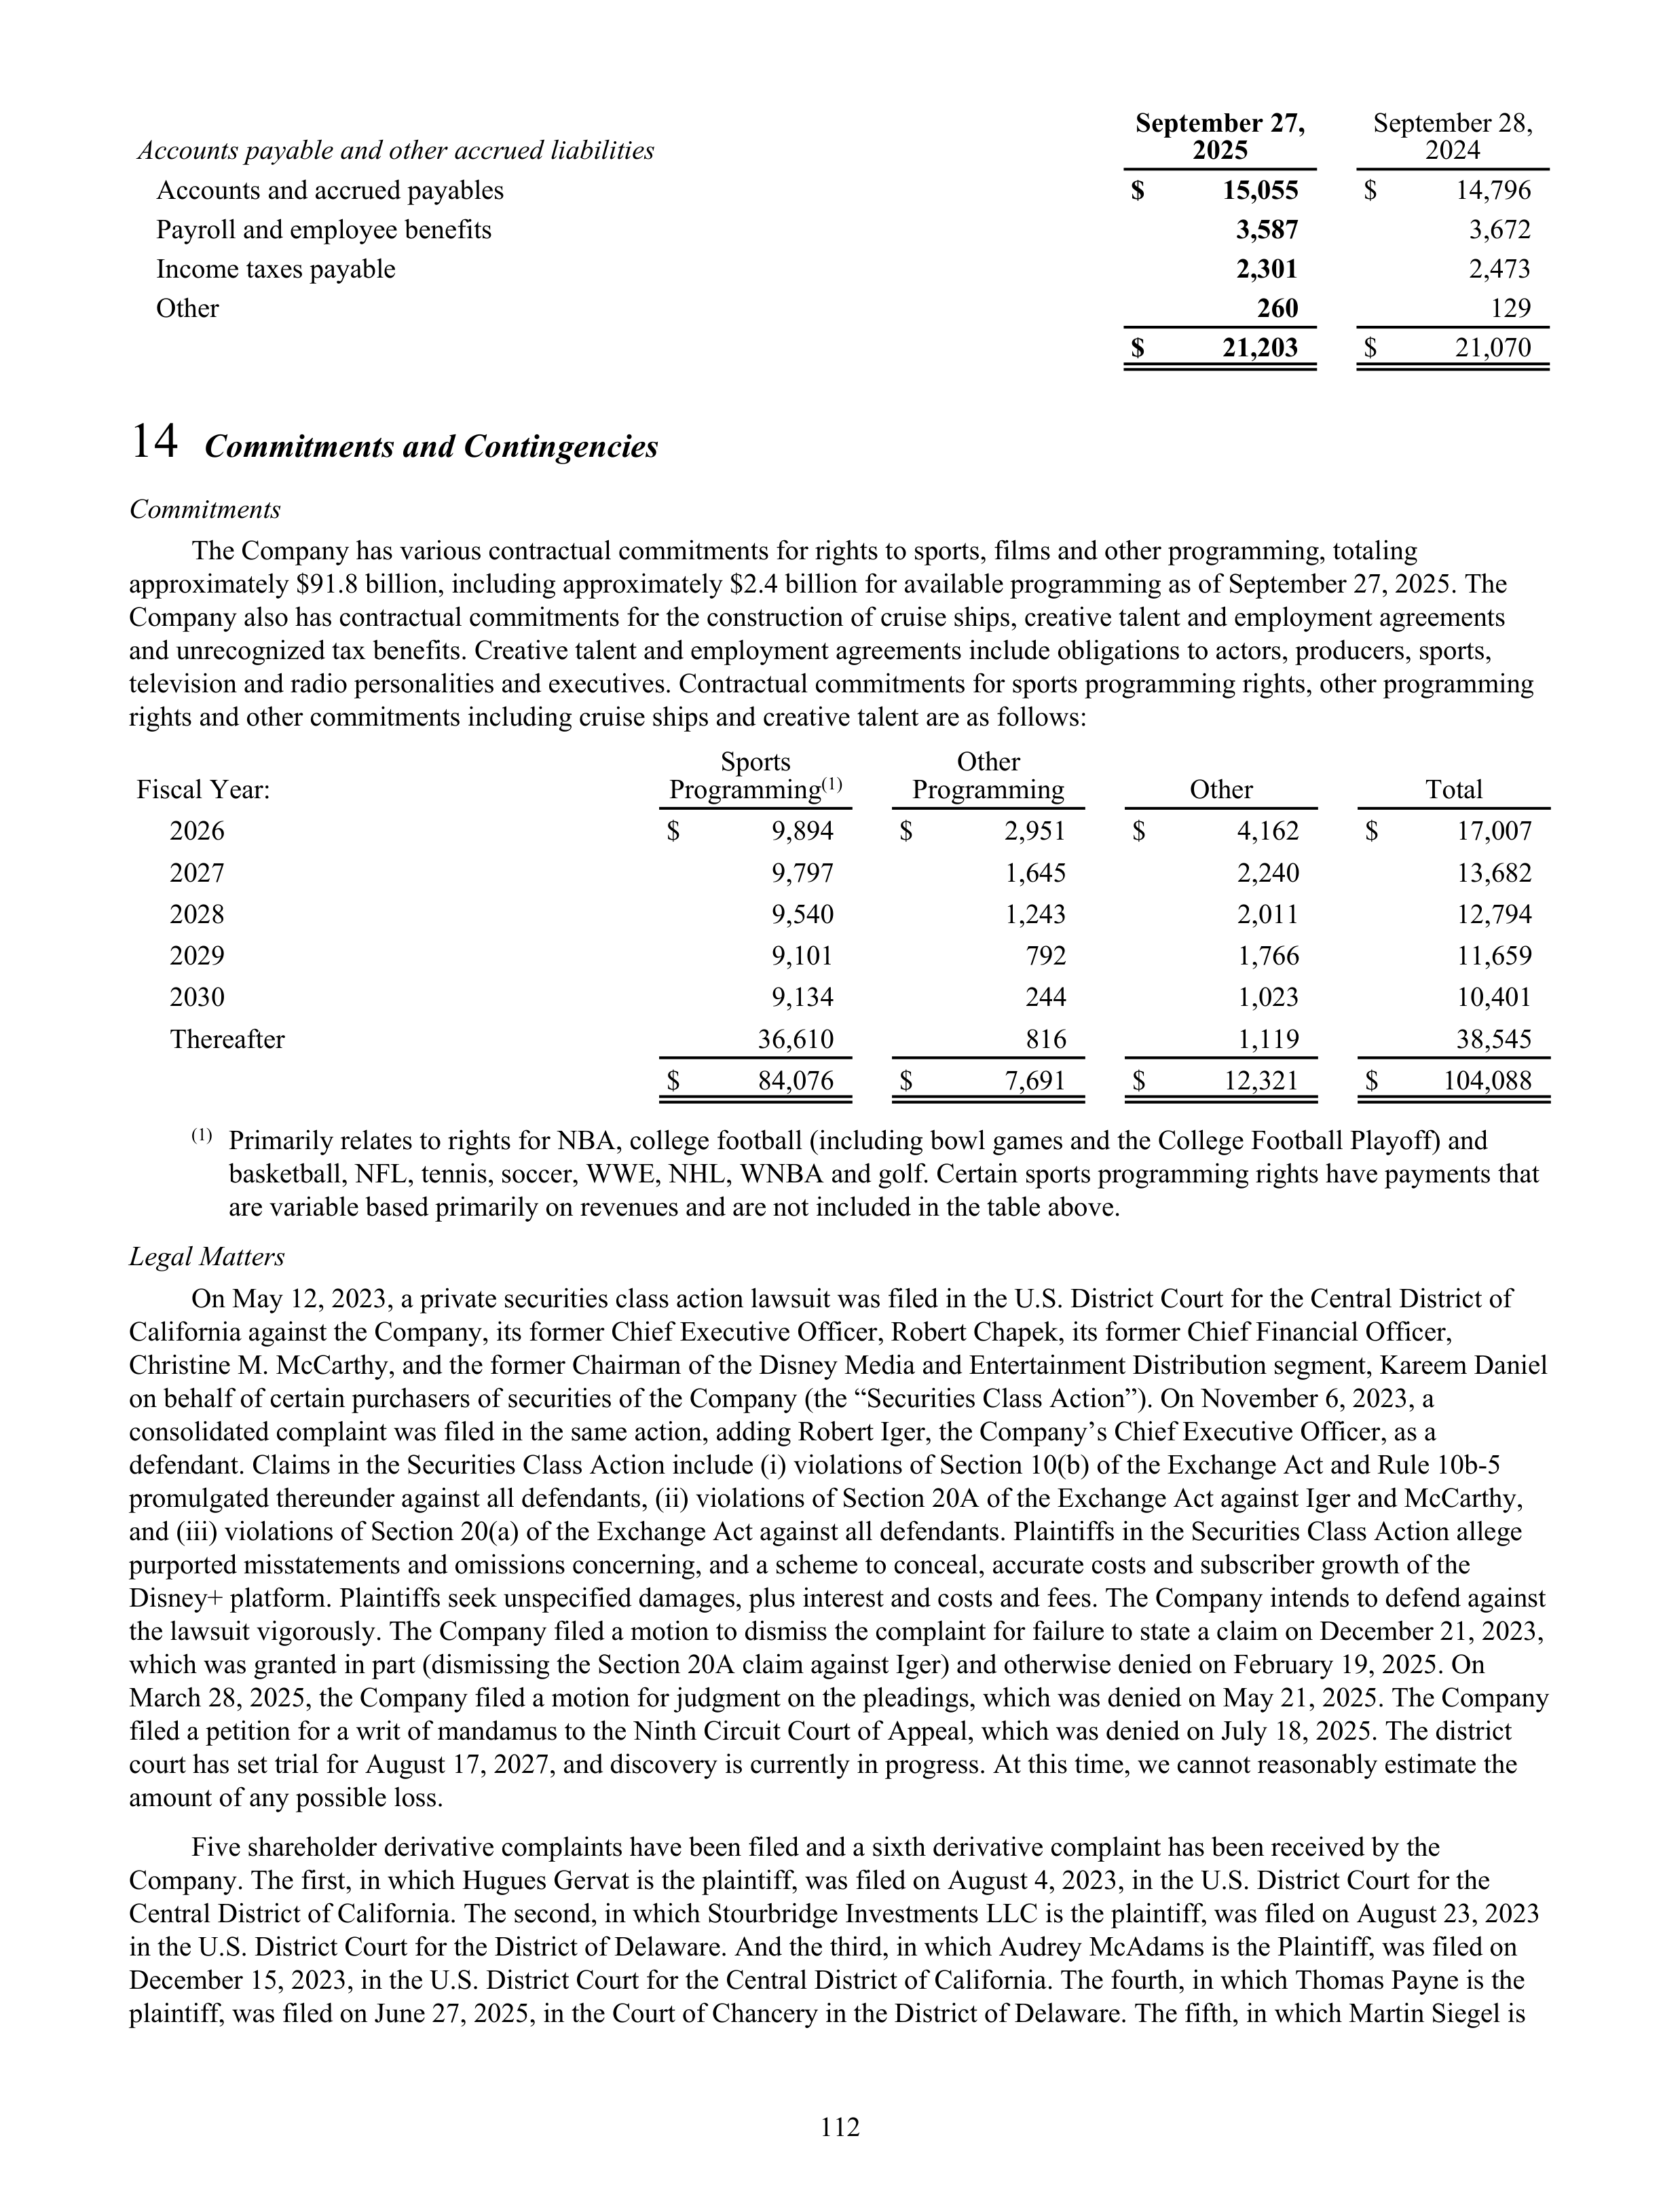
Accounts payable and other accrued liabilities
September 27,
2025
September 28,
2024
Accounts and accrued payables
$
15,055
$
14,796
Payroll and employee benefits
3,587
3,672
Income taxes payable
2,301
2,473
Other
260
129
$
21,203
$
21,070
14
Commitments and Contingencies
Commitments
The Company has various contractual commitments for rights to sports, films and other programming, totaling
approximately $91.8 billion, including approximately $2.4 billion for available programming as of September 27, 2025. The
Company also has contractual commitments for the construction of cruise ships, creative talent and employment agreements
and unrecognized tax benefits. Creative talent and employment agreements include obligations to actors, producers, sports,
television and radio personalities and executives. Contractual commitments for sports programming rights, other programming
rights and other commitments including cruise ships and creative talent are as follows:
Fiscal Year:
Sports
Programming
(1)
Other
Programming
Other
Total
2026
$
9,894
$
2,951
$
4,162
$
17,007
2027
9,797
1,645
2,240
13,682
2028
9,540
1,243
2,011
12,794
2029
9,101
792
1,766
11,659
2030
9,134
244
1,023
10,401
Thereafter
36,610
816
1,119
38,545
$
84,076
$
7,691
$
12,321
$
104,088
(1)
Primarily relates to rights for NBA, college football (including bowl games and the College Football Playoff) and
basketball, NFL, tennis, soccer, WWE, NHL, WNBA and golf. Certain sports programming rights have payments that
are variable based primarily on revenues and are not included in the table above.
Legal Matters
On May 12, 2023, a private securities class action lawsuit was filed in the U.S. District Court for the Central District of
California against the Company, its former Chief Executive Officer, Robert Chapek, its former Chief Financial Officer,
Christine M. McCarthy, and the former Chairman of the Disney Media and Entertainment Distribution segment, Kareem Daniel
on behalf of certain purchasers of securities of the Company (the “Securities Class Action”). On November 6, 2023, a
consolidated complaint was filed in the same action, adding Robert Iger, the Company’s Chief Executive Officer, as a
defendant. Claims in the Securities Class Action include (i) violations of Section 10(b) of the Exchange Act and Rule 10b-5
promulgated thereunder against all defendants, (ii) violations of Section 20A of the Exchange Act against Iger and McCarthy,
and (iii) violations of Section 20(a) of the Exchange Act against all defendants. Plaintiffs in the Securities Class Action allege
purported misstatements and omissions concerning, and a scheme to conceal, accurate costs and subscriber growth of the
Disney+ platform. Plaintiffs seek unspecified damages, plus interest and costs and fees. The Company intends to defend against
the lawsuit vigorously. The Company filed a motion to dismiss the complaint for failure to state a claim on December 21, 2023,
which was granted in part (dismissing the Section 20A claim against Iger) and otherwise denied on February 19, 2025. On
March 28, 2025, the Company filed a motion for judgment on the pleadings, which was denied on May 21, 2025. The Company
filed a petition for a writ of mandamus to the Ninth Circuit Court of Appeal, which was denied on July 18, 2025. The district
court has set trial for August 17, 2027, and discovery is currently in progress. At this time, we cannot reasonably estimate the
amount of any possible loss.
Five shareholder derivative complaints have been filed and a sixth derivative complaint has been received by the
Company. The first, in which Hugues Gervat is the plaintiff, was filed on August 4, 2023, in the U.S. District Court for the
Central District of California. The second, in which Stourbridge Investments LLC is the plaintiff, was filed on August 23, 2023
in the U.S. District Court for the District of Delaware. And the third, in which Audrey McAdams is the Plaintiff, was filed on
December 15, 2023, in the U.S. District Court for the Central District of California. The fourth, in which Thomas Payne is the
plaintiff, was filed on June 27, 2025, in the Court of Chancery in the District of Delaware. The fifth, in which Martin Siegel is
112
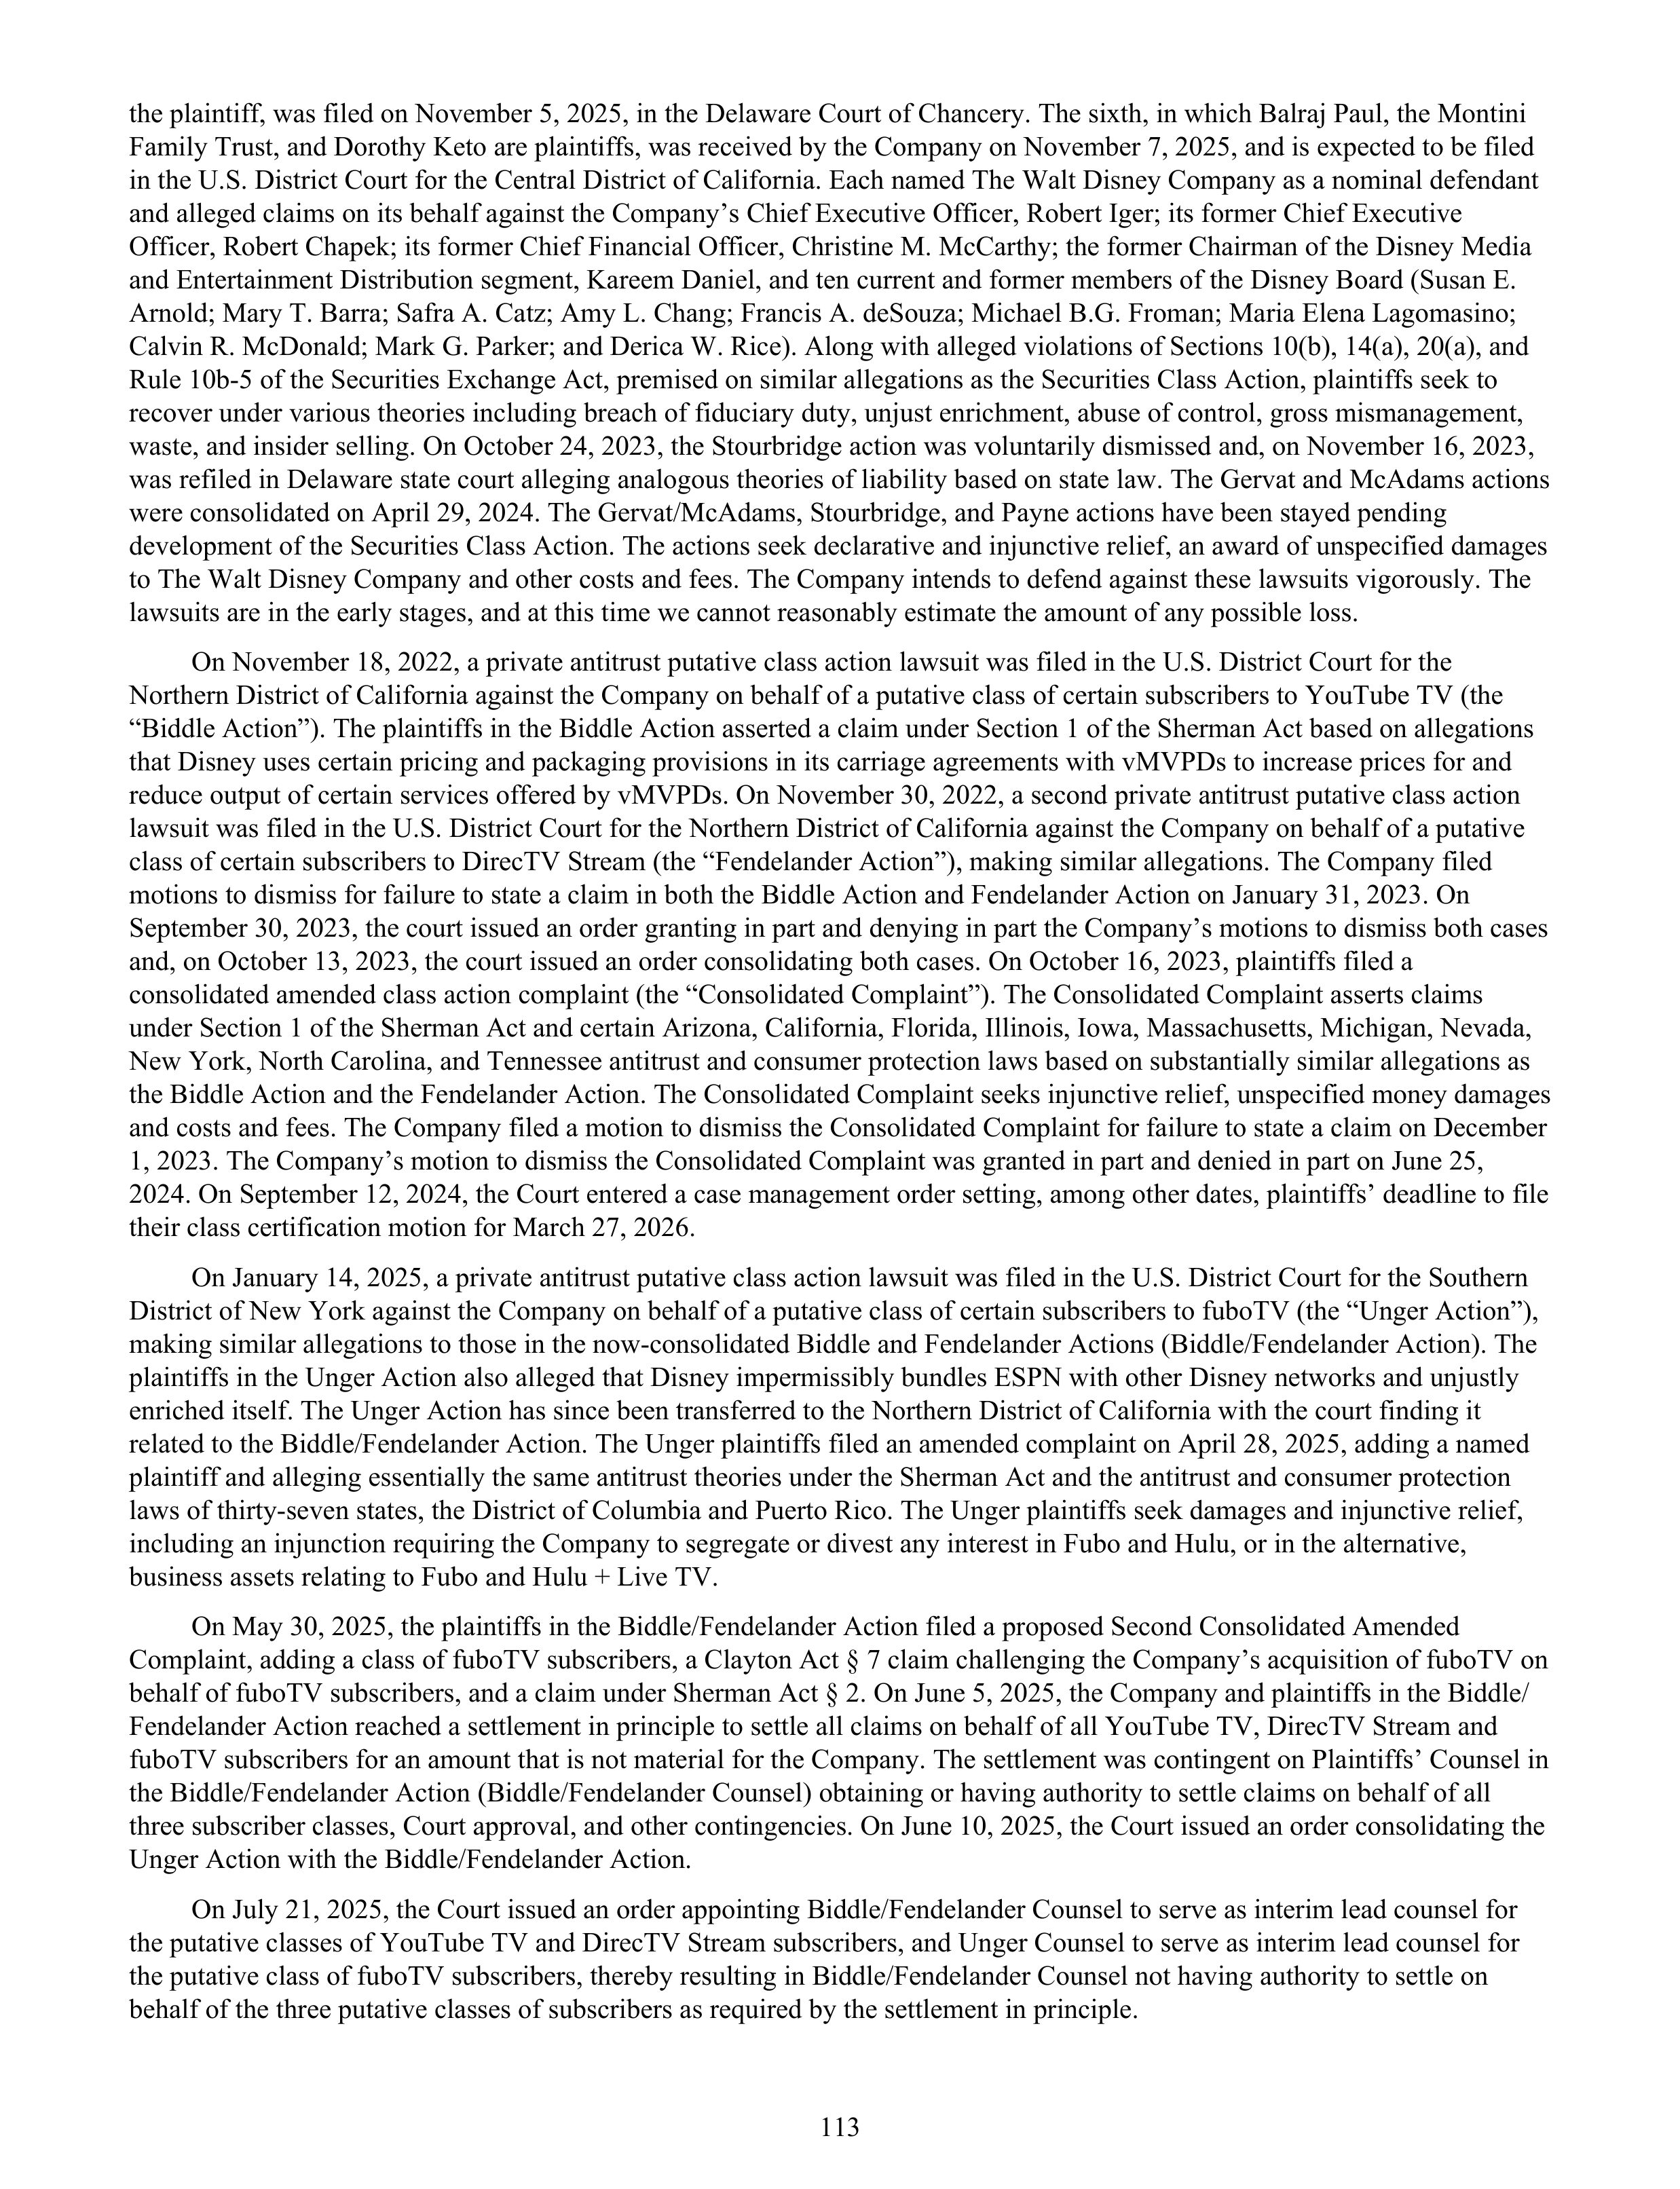
the plaintiff, was filed on November 5, 2025, in the Delaware Court of Chancery. The sixth, in which Balraj Paul, the Montini
Family Trust, and Dorothy Keto are plaintiffs, was received by the Company on November 7, 2025, and is expected to be filed
in the U.S. District Court for the Central District of California. Each named The Walt Disney Company as a nominal defendant
and alleged claims on its behalf against the Company’s Chief Executive Officer, Robert Iger; its former Chief Executive
Officer, Robert Chapek; its former Chief Financial Officer, Christine M. McCarthy; the former Chairman of the Disney Media
and Entertainment Distribution segment, Kareem Daniel, and ten current and former members of the Disney Board (Susan E.
Arnold; Mary T. Barra; Safra A. Catz; Amy L. Chang; Francis A. deSouza; Michael B.G. Froman; Maria Elena Lagomasino;
Calvin R. McDonald; Mark G. Parker; and Derica W. Rice). Along with alleged violations of Sections 10(b), 14(a), 20(a), and
Rule 10b-5 of the Securities Exchange Act, premised on similar allegations as the Securities Class Action, plaintiffs seek to
recover under various theories including breach of fiduciary duty, unjust enrichment, abuse of control, gross mismanagement,
waste, and insider selling. On October 24, 2023, the Stourbridge action was voluntarily dismissed and, on November 16, 2023,
was refiled in Delaware state court alleging analogous theories of liability based on state law. The Gervat and McAdams actions
were consolidated on April 29, 2024. The Gervat/McAdams, Stourbridge, and Payne actions have been stayed pending
development of the Securities Class Action. The actions seek declarative and injunctive relief, an award of unspecified damages
to The Walt Disney Company and other costs and fees. The Company intends to defend against these lawsuits vigorously. The
lawsuits are in the early stages, and at this time we cannot reasonably estimate the amount of any possible loss.
On November 18, 2022, a private antitrust putative class action lawsuit was filed in the U.S. District Court for the
Northern District of California against the Company on behalf of a putative class of certain subscribers to YouTube TV (the
“Biddle Action”). The plaintiffs in the Biddle Action asserted a claim under Section 1 of the Sherman Act based on allegations
that Disney uses certain pricing and packaging provisions in its carriage agreements with vMVPDs to increase prices for and
reduce output of certain services offered by vMVPDs. On November 30, 2022, a second private antitrust putative class action
lawsuit was filed in the U.S. District Court for the Northern District of California against the Company on behalf of a putative
class of certain subscribers to DirecTV Stream (the “Fendelander Action”), making similar allegations. The Company filed
motions to dismiss for failure to state a claim in both the Biddle Action and Fendelander Action on January 31, 2023. On
September 30, 2023, the court issued an order granting in part and denying in part the Company’s motions to dismiss both cases
and, on October 13, 2023, the court issued an order consolidating both cases. On October 16, 2023, plaintiffs filed a
consolidated amended class action complaint (the “Consolidated Complaint”). The Consolidated Complaint asserts claims
under Section 1 of the Sherman Act and certain Arizona, California, Florida, Illinois, Iowa, Massachusetts, Michigan, Nevada,
New York, North Carolina, and Tennessee antitrust and consumer protection laws based on substantially similar allegations as
the Biddle Action and the Fendelander Action. The Consolidated Complaint seeks injunctive relief, unspecified money damages
and costs and fees. The Company filed a motion to dismiss the Consolidated Complaint for failure to state a claim on December
1, 2023. The Company’s motion to dismiss the Consolidated Complaint was granted in part and denied in part on June 25,
2024. On September 12, 2024, the Court entered a case management order setting, among other dates, plaintiffs’ deadline to file
their class certification motion for March 27, 2026
.
On January 14, 2025, a private antitrust putative class action lawsuit was filed in the U.S. District Court for the Southern
District of New York against the Company on behalf of a putative class of certain subscribers to fuboTV (the “Unger Action”),
making similar allegations to those in the now-consolidated Biddle and Fendelander Actions (Biddle/Fendelander Action). The
plaintiffs in the Unger Action also alleged that Disney impermissibly bundles ESPN with other Disney networks and unjustly
enriched itself. The Unger Action has since been transferred to the Northern District of California with the court finding it
related to the Biddle/Fendelander Action. The Unger plaintiffs filed an amended complaint on April 28, 2025, adding a named
plaintiff and alleging essentially the same antitrust theories under the Sherman Act and the antitrust and consumer protection
laws of thirty-seven states, the District of Columbia and Puerto Rico. The Unger plaintiffs seek damages and injunctive relief,
including an injunction requiring the Company to segregate or divest any interest in Fubo and Hulu, or in the alternative,
business assets relating to Fubo and Hulu + Live TV.
On May 30, 2025, the plaintiffs in the Biddle/Fendelander Action filed a proposed Second Consolidated Amended
Complaint, adding a class of fuboTV subscribers, a Clayton Act § 7 claim challenging the Company’s acquisition of fuboTV on
behalf of fuboTV subscribers, and a claim under Sherman Act § 2. On June 5, 2025, the Company and plaintiffs in the Biddle/
Fendelander Action reached a settlement in principle to settle all claims on behalf of all YouTube TV, DirecTV Stream and
fuboTV subscribers for an amount that is not material for the Company. The settlement was contingent on Plaintiffs’ Counsel in
the Biddle/Fendelander Action (Biddle/Fendelander Counsel) obtaining or having authority to settle claims on behalf of all
three subscriber classes, Court approval, and other contingencies. On June 10, 2025, the Court issued an order consolidating the
Unger Action with the Biddle/Fendelander Action.
On July 21, 2025, the Court issued an order appointing Biddle/Fendelander Counsel to serve as interim lead counsel for
the putative classes of YouTube TV and DirecTV Stream subscribers, and Unger Counsel to serve as interim lead counsel for
the putative class of fuboTV subscribers, thereby resulting in Biddle/Fendelander Counsel not having authority to settle on
behalf of the three putative classes of subscribers as required by the settlement in principle.
113
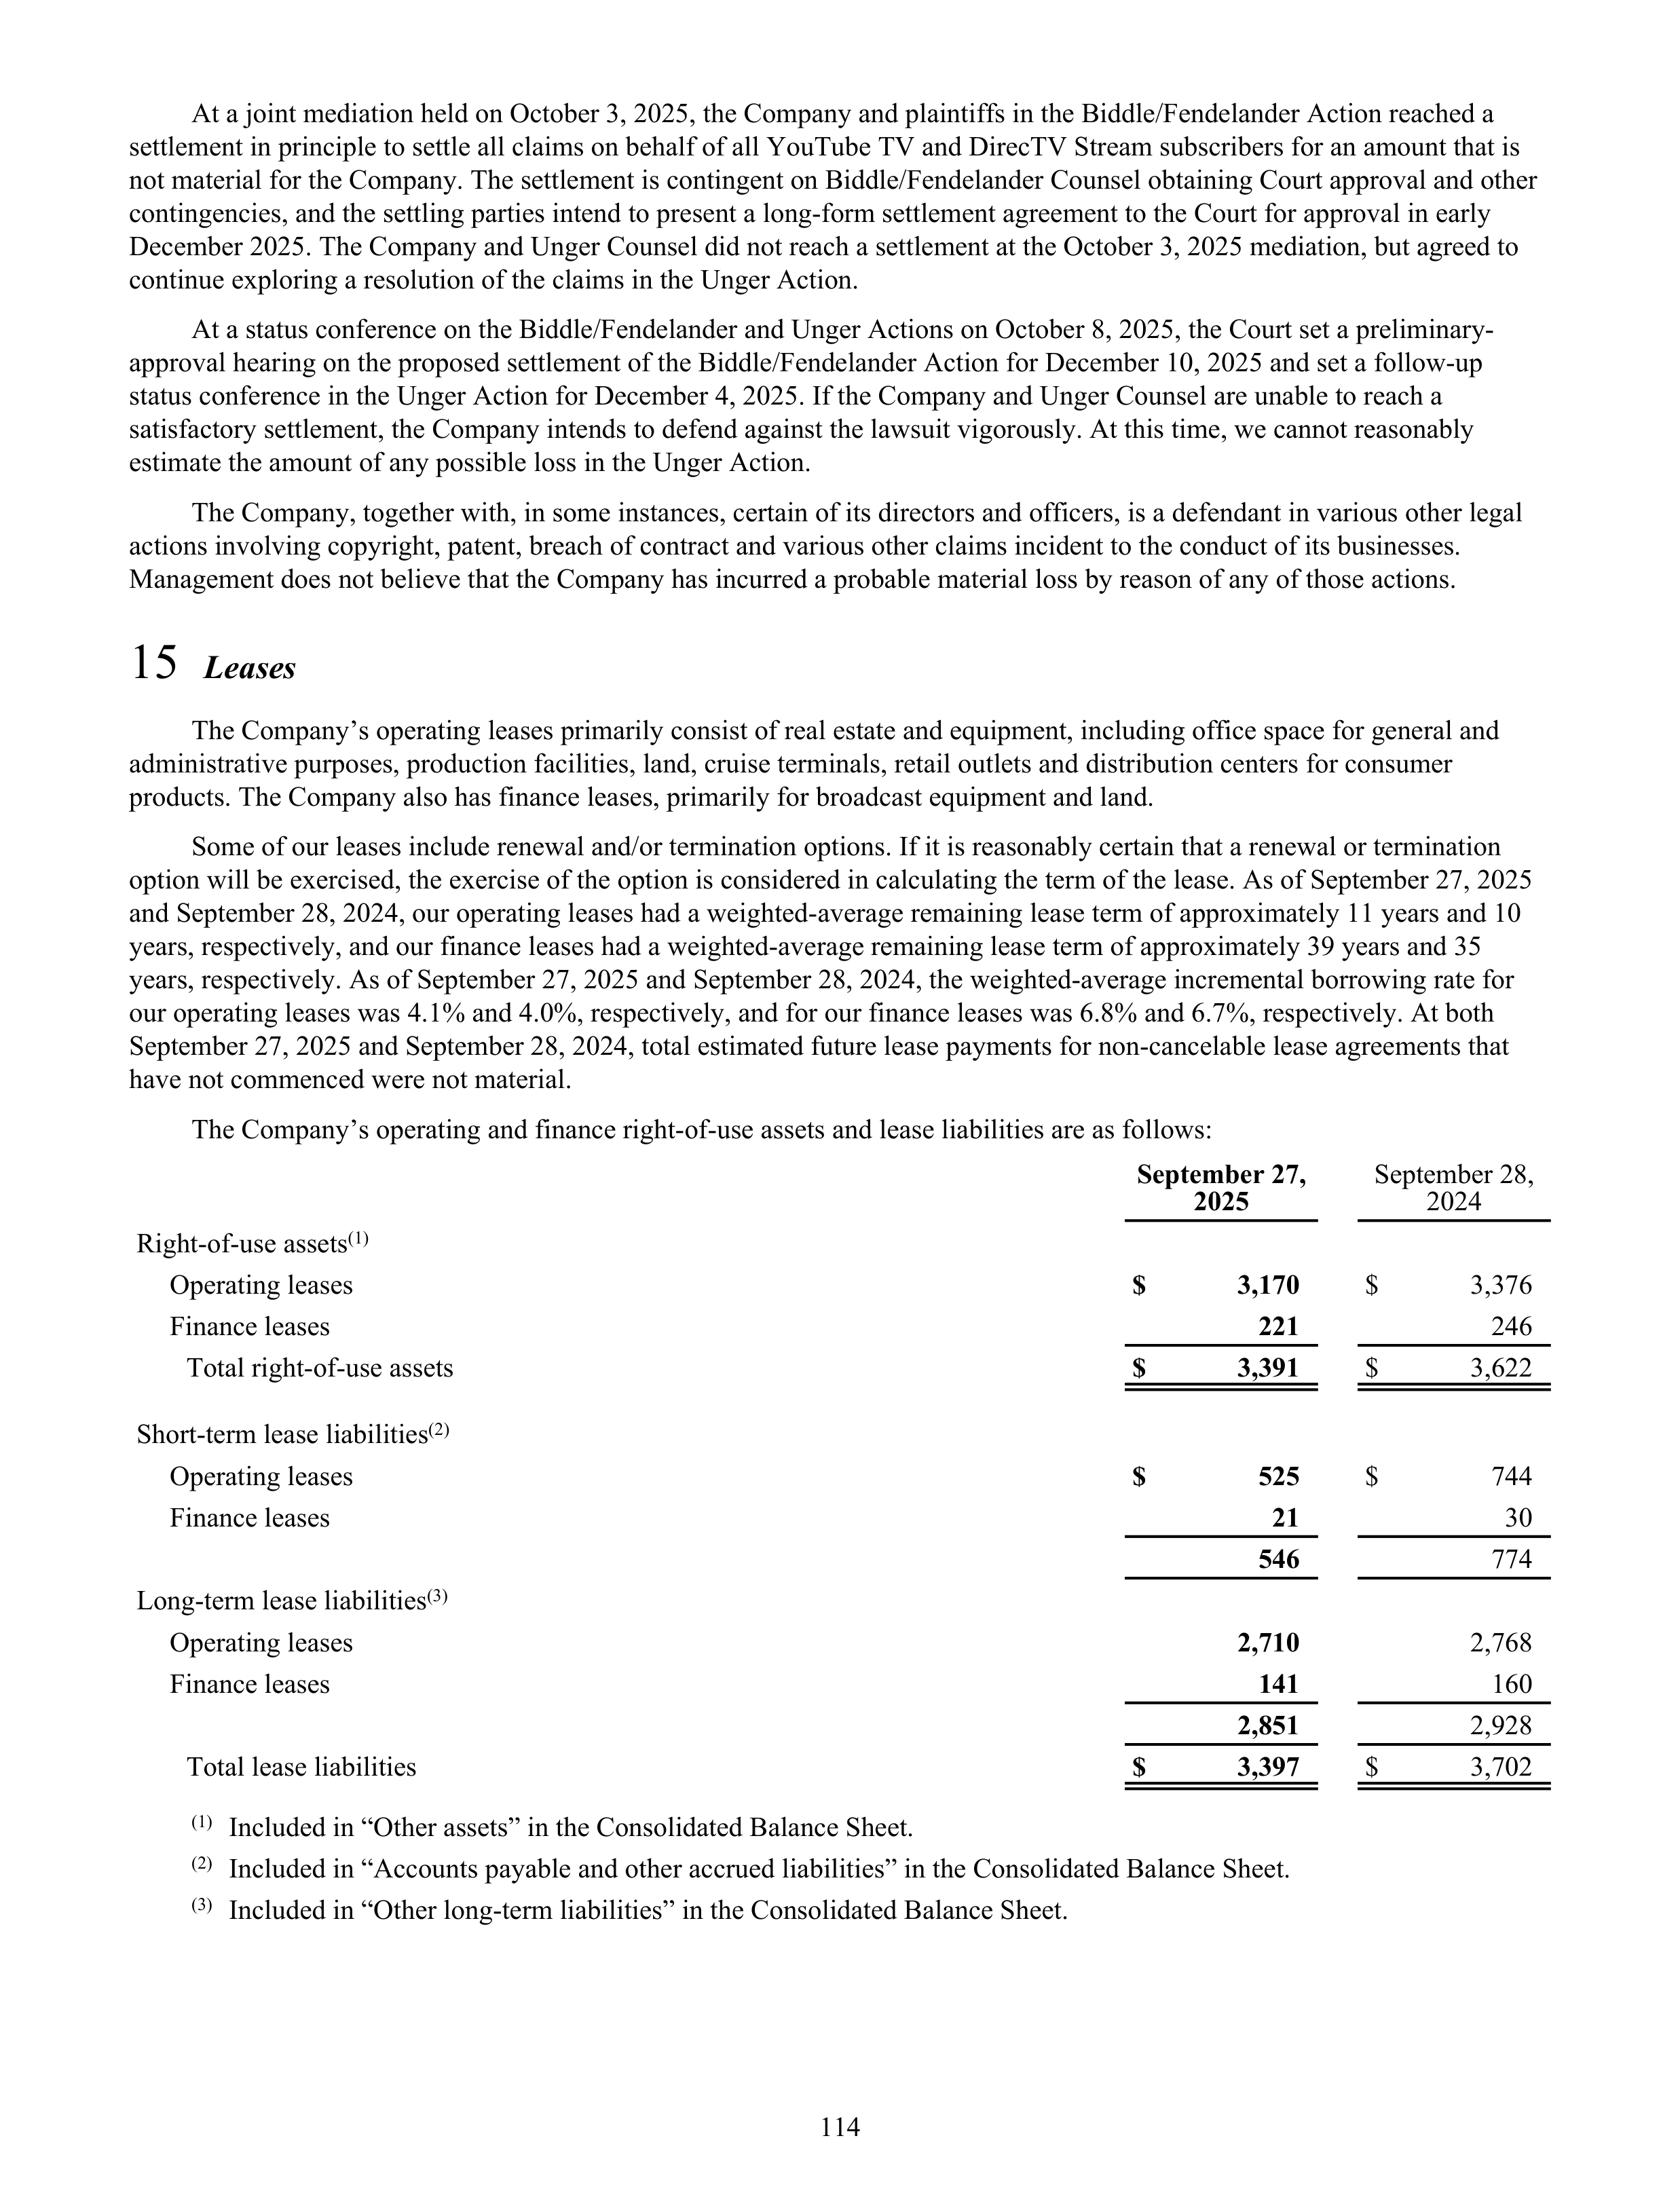
At a joint mediation held on October 3, 2025, the Company and plaintiffs in the Biddle/Fendelander Action reached a
settlement in principle to settle all claims on behalf of all YouTube TV and DirecTV Stream subscribers for an amount that is
not material for the Company. The settlement is contingent on Biddle/Fendelander Counsel obtaining Court approval and other
contingencies, and the settling parties intend to present a long-form settlement agreement to the Court for approval in early
December 2025. The Company and Unger Counsel did not reach a settlement at the October 3, 2025 mediation, but agreed to
continue exploring a resolution of the claims in the Unger Action.
At a status conference on the Biddle/Fendelander and Unger Actions on October 8, 2025, the Court set a preliminary-
approval hearing on the proposed settlement of the Biddle/Fendelander Action for December 10, 2025 and set a follow-up
status conference in the Unger Action for December 4, 2025. If the Company and Unger Counsel are unable to reach a
satisfactory settlement, the Company intends to defend against the lawsuit vigorously. At this time, we cannot reasonably
estimate the amount of any possible loss in the Unger Action.
The Company, together with, in some instances, certain of its directors and officers, is a defendant in various other legal
actions involving copyright, patent, breach of contract and various other claims incident to the conduct of its businesses.
Management does not believe that the Company has incurred a probable material loss by reason of any of those actions.
15
Leases
The Company’s operating leases primarily consist of real estate and equipment, including office space for general and
administrative purposes, production facilities, land, cruise terminals, retail outlets and distribution centers for consumer
products. The Company also has finance leases, primarily for broadcast equipment and land.
Some of our leases include renewal and/or termination options. If it is reasonably certain that a renewal or termination
option will be exercised, the exercise of the option is considered in calculating the term of the lease. As of September 27, 2025
and September 28, 2024, our operating leases had a weighted-average remaining lease term of approximately 11 years and 10
years, respectively, and our finance leases had a weighted-average remaining lease term of approximately 39 years and 35
years, respectively. As of September 27, 2025 and September 28, 2024, the weighted-average incremental borrowing rate for
our operating leases was 4.1% and 4.0%, respectively, and for our finance leases was 6.8% and 6.7%, respectively. At both
September 27, 2025 and September 28, 2024, total estimated future lease payments for non-cancelable lease agreements that
have not commenced were not material.
The Company’s operating and finance right-of-use assets and lease liabilities are as follows:
September 27,
2025
September 28,
2024
Right-of-use assets
(1)
Operating leases
$
3,170
$
3,376
Finance leases
221
246
Total right-of-use assets
$
3,391
$
3,622
Short-term lease liabilities
(2)
Operating leases
$
525
$
744
Finance leases
21
30
546
774
Long-term lease liabilities
(3)
Operating leases
2,710
2,768
Finance leases
141
160
2,851
2,928
Total lease liabilities
$
3,397
$
3,702
(1)
Included in “Other assets” in the Consolidated Balance Sheet.
(2)
Included in “Accounts payable and other accrued liabilities” in the Consolidated Balance Sheet.
(3)
Included in “Other long-term liabilities” in the Consolidated Balance Sheet.
114
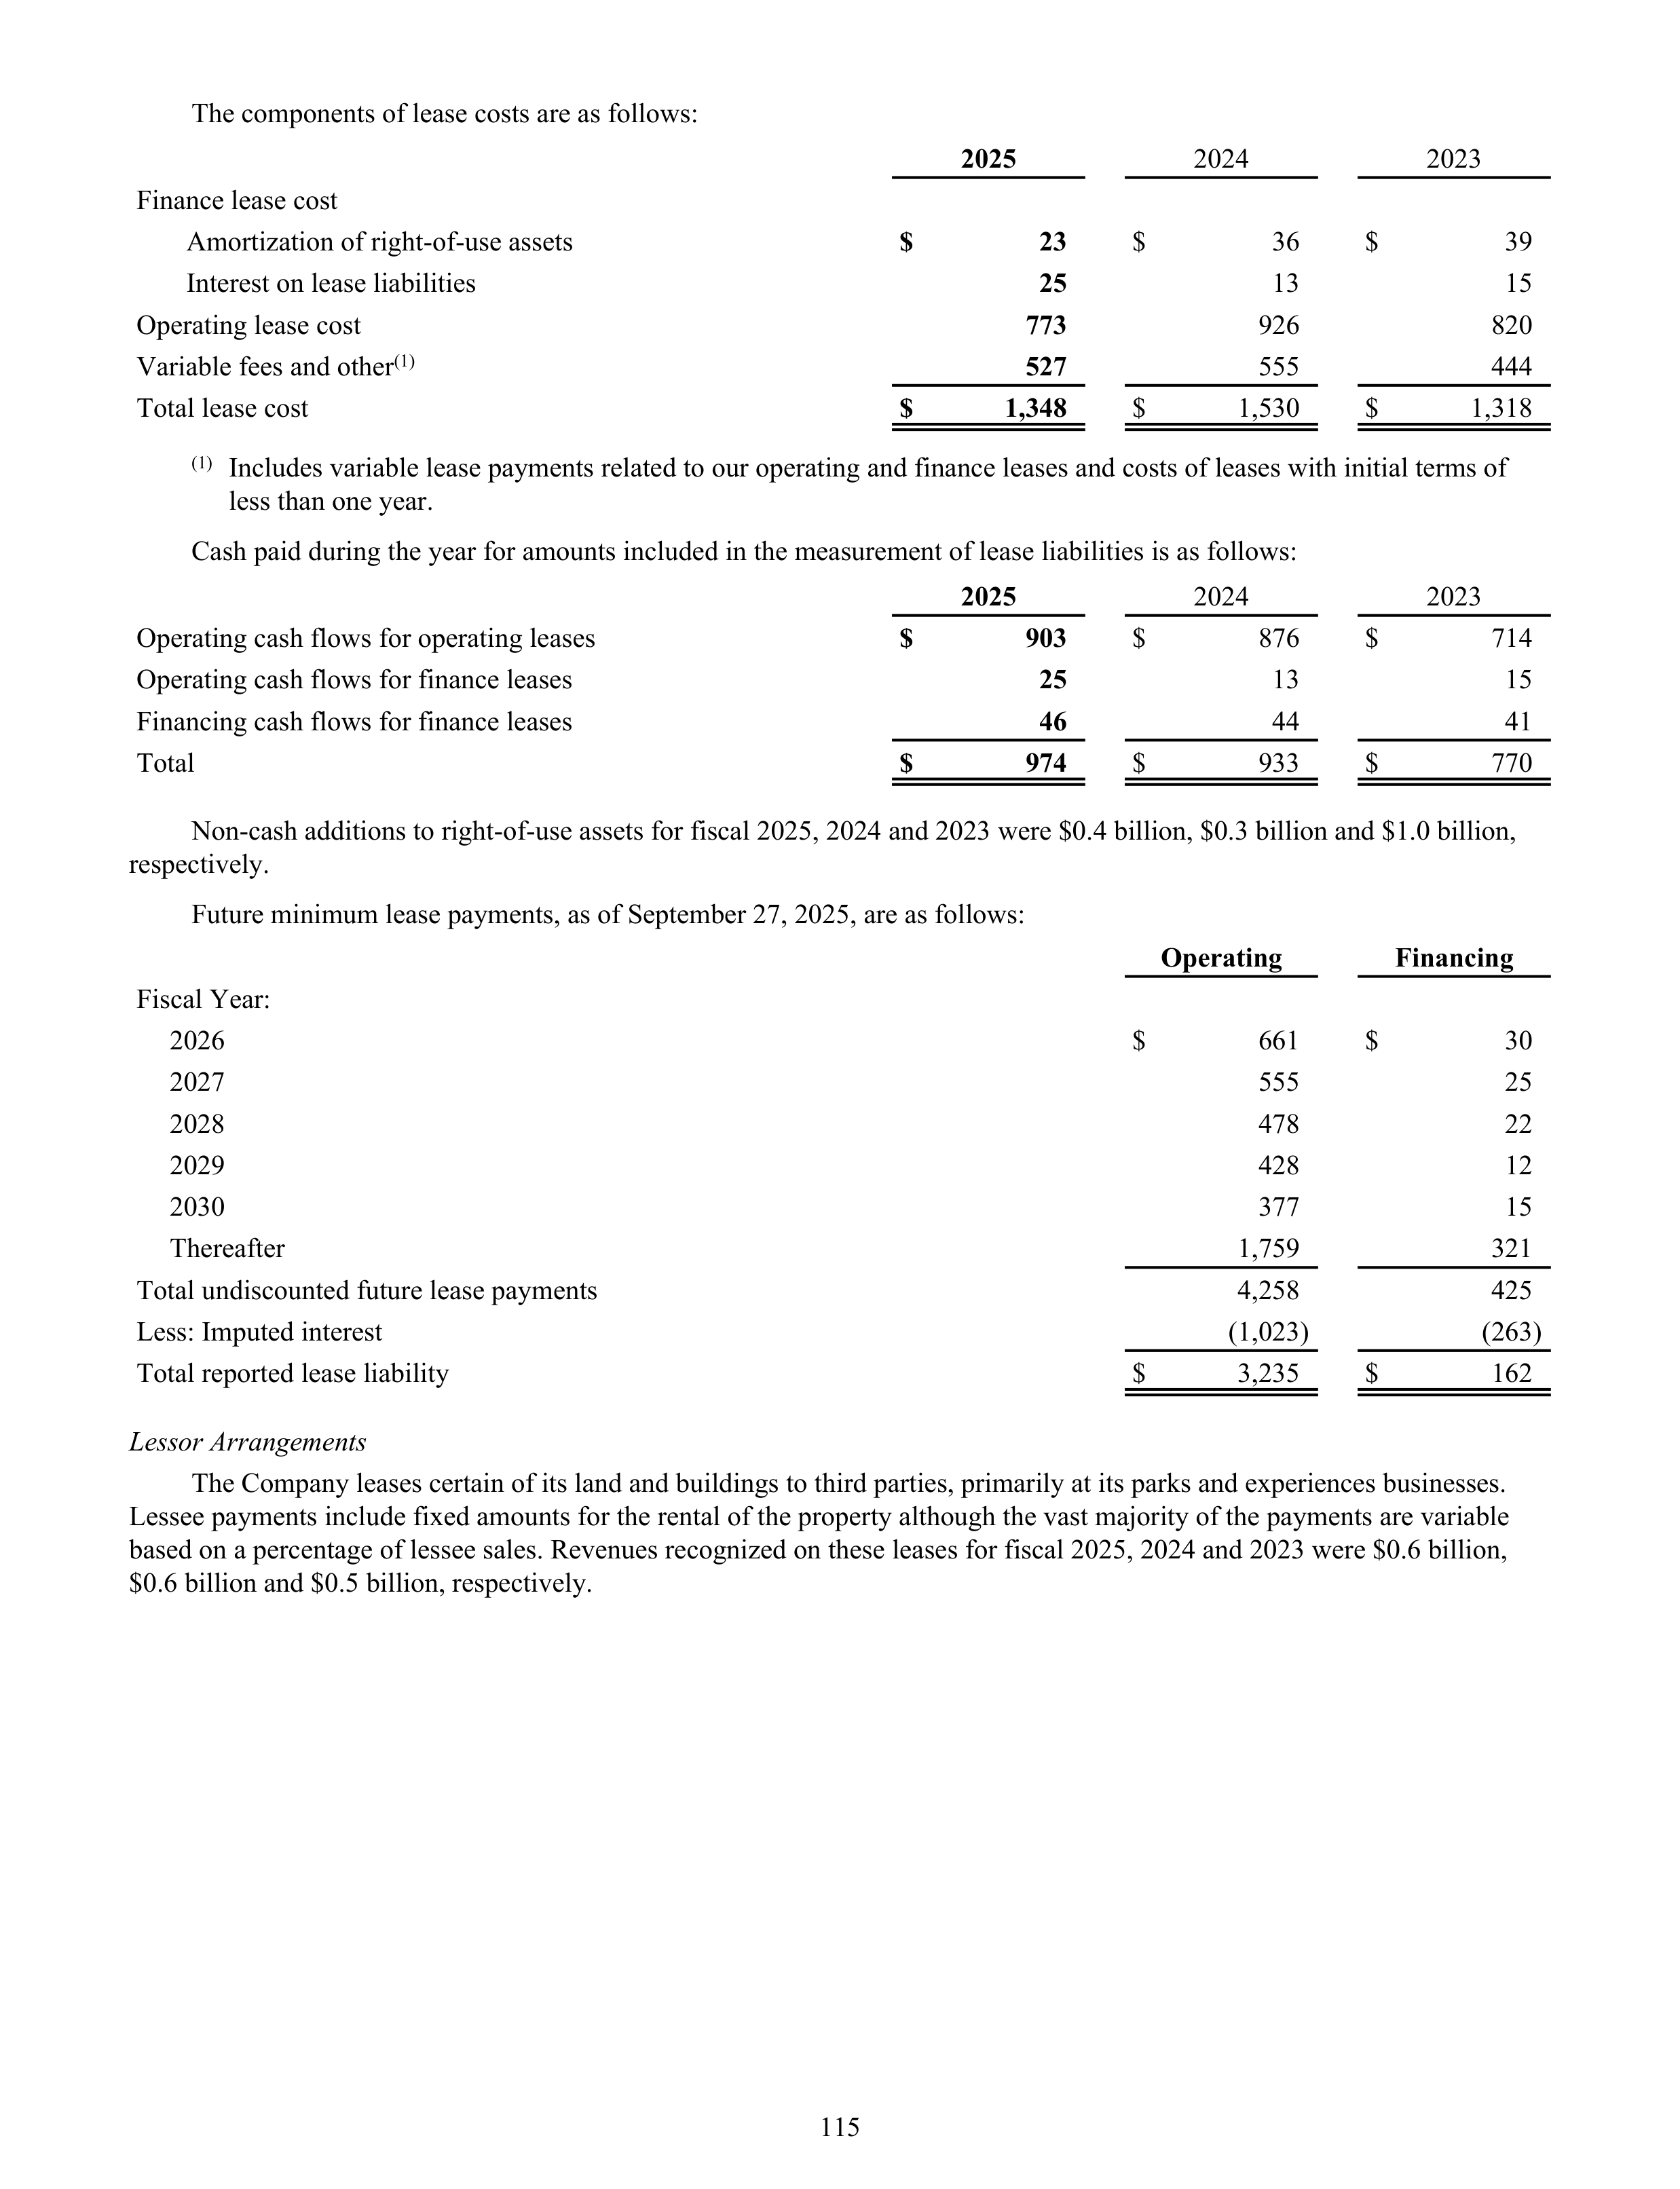
The components of lease costs are as follows:
2025
2024
2023
Finance lease cost
Amortization of right-of-use assets
$
23
$
36
$
39
Interest on lease liabilities
25
13
15
Operating lease cost
773
926
820
Variable fees and other
(1)
527
555
444
Total lease cost
$
1,348
$
1,530
$
1,318
(1)
Includes variable lease payments related to our operating and finance leases and costs of leases with initial terms of
less than one year.
Cash paid during the year for amounts included in the measurement of lease liabilities is as follows:
2025
2024
2023
Operating cash flows for operating leases
$
903
$
876
$
714
Operating cash flows for finance leases
25
13
15
Financing cash flows for finance leases
46
44
41
Total
$
974
$
933
$
770
Non-cash additions to right-of-use assets for fiscal 2025, 2024 and 2023 were $0.4 billion, $0.3 billion and $1.0 billion,
respectively.
Future minimum lease payments, as of September 27, 2025, are as follows:
Operating
Financing
Fiscal Year:
2026
$
661
$
30
2027
555
25
2028
478
22
2029
428
12
2030
377
15
Thereafter
1,759
321
Total undiscounted future lease payments
4,258
425
Less: Imputed interest
(1,023)
(263)
Total reported lease liability
$
3,235
$
162
Lessor Arrangements
The Company leases certain of its land and buildings to third parties, primarily at its parks and experiences businesses.
Lessee payments include fixed amounts for the rental of the property although the vast majority of the payments are variable
based on a percentage of lessee sales. Revenues recognized on these leases for fiscal 2025, 2024 and 2023 were $0.6 billion,
$0.6 billion and $0.5 billion, respectively.
115
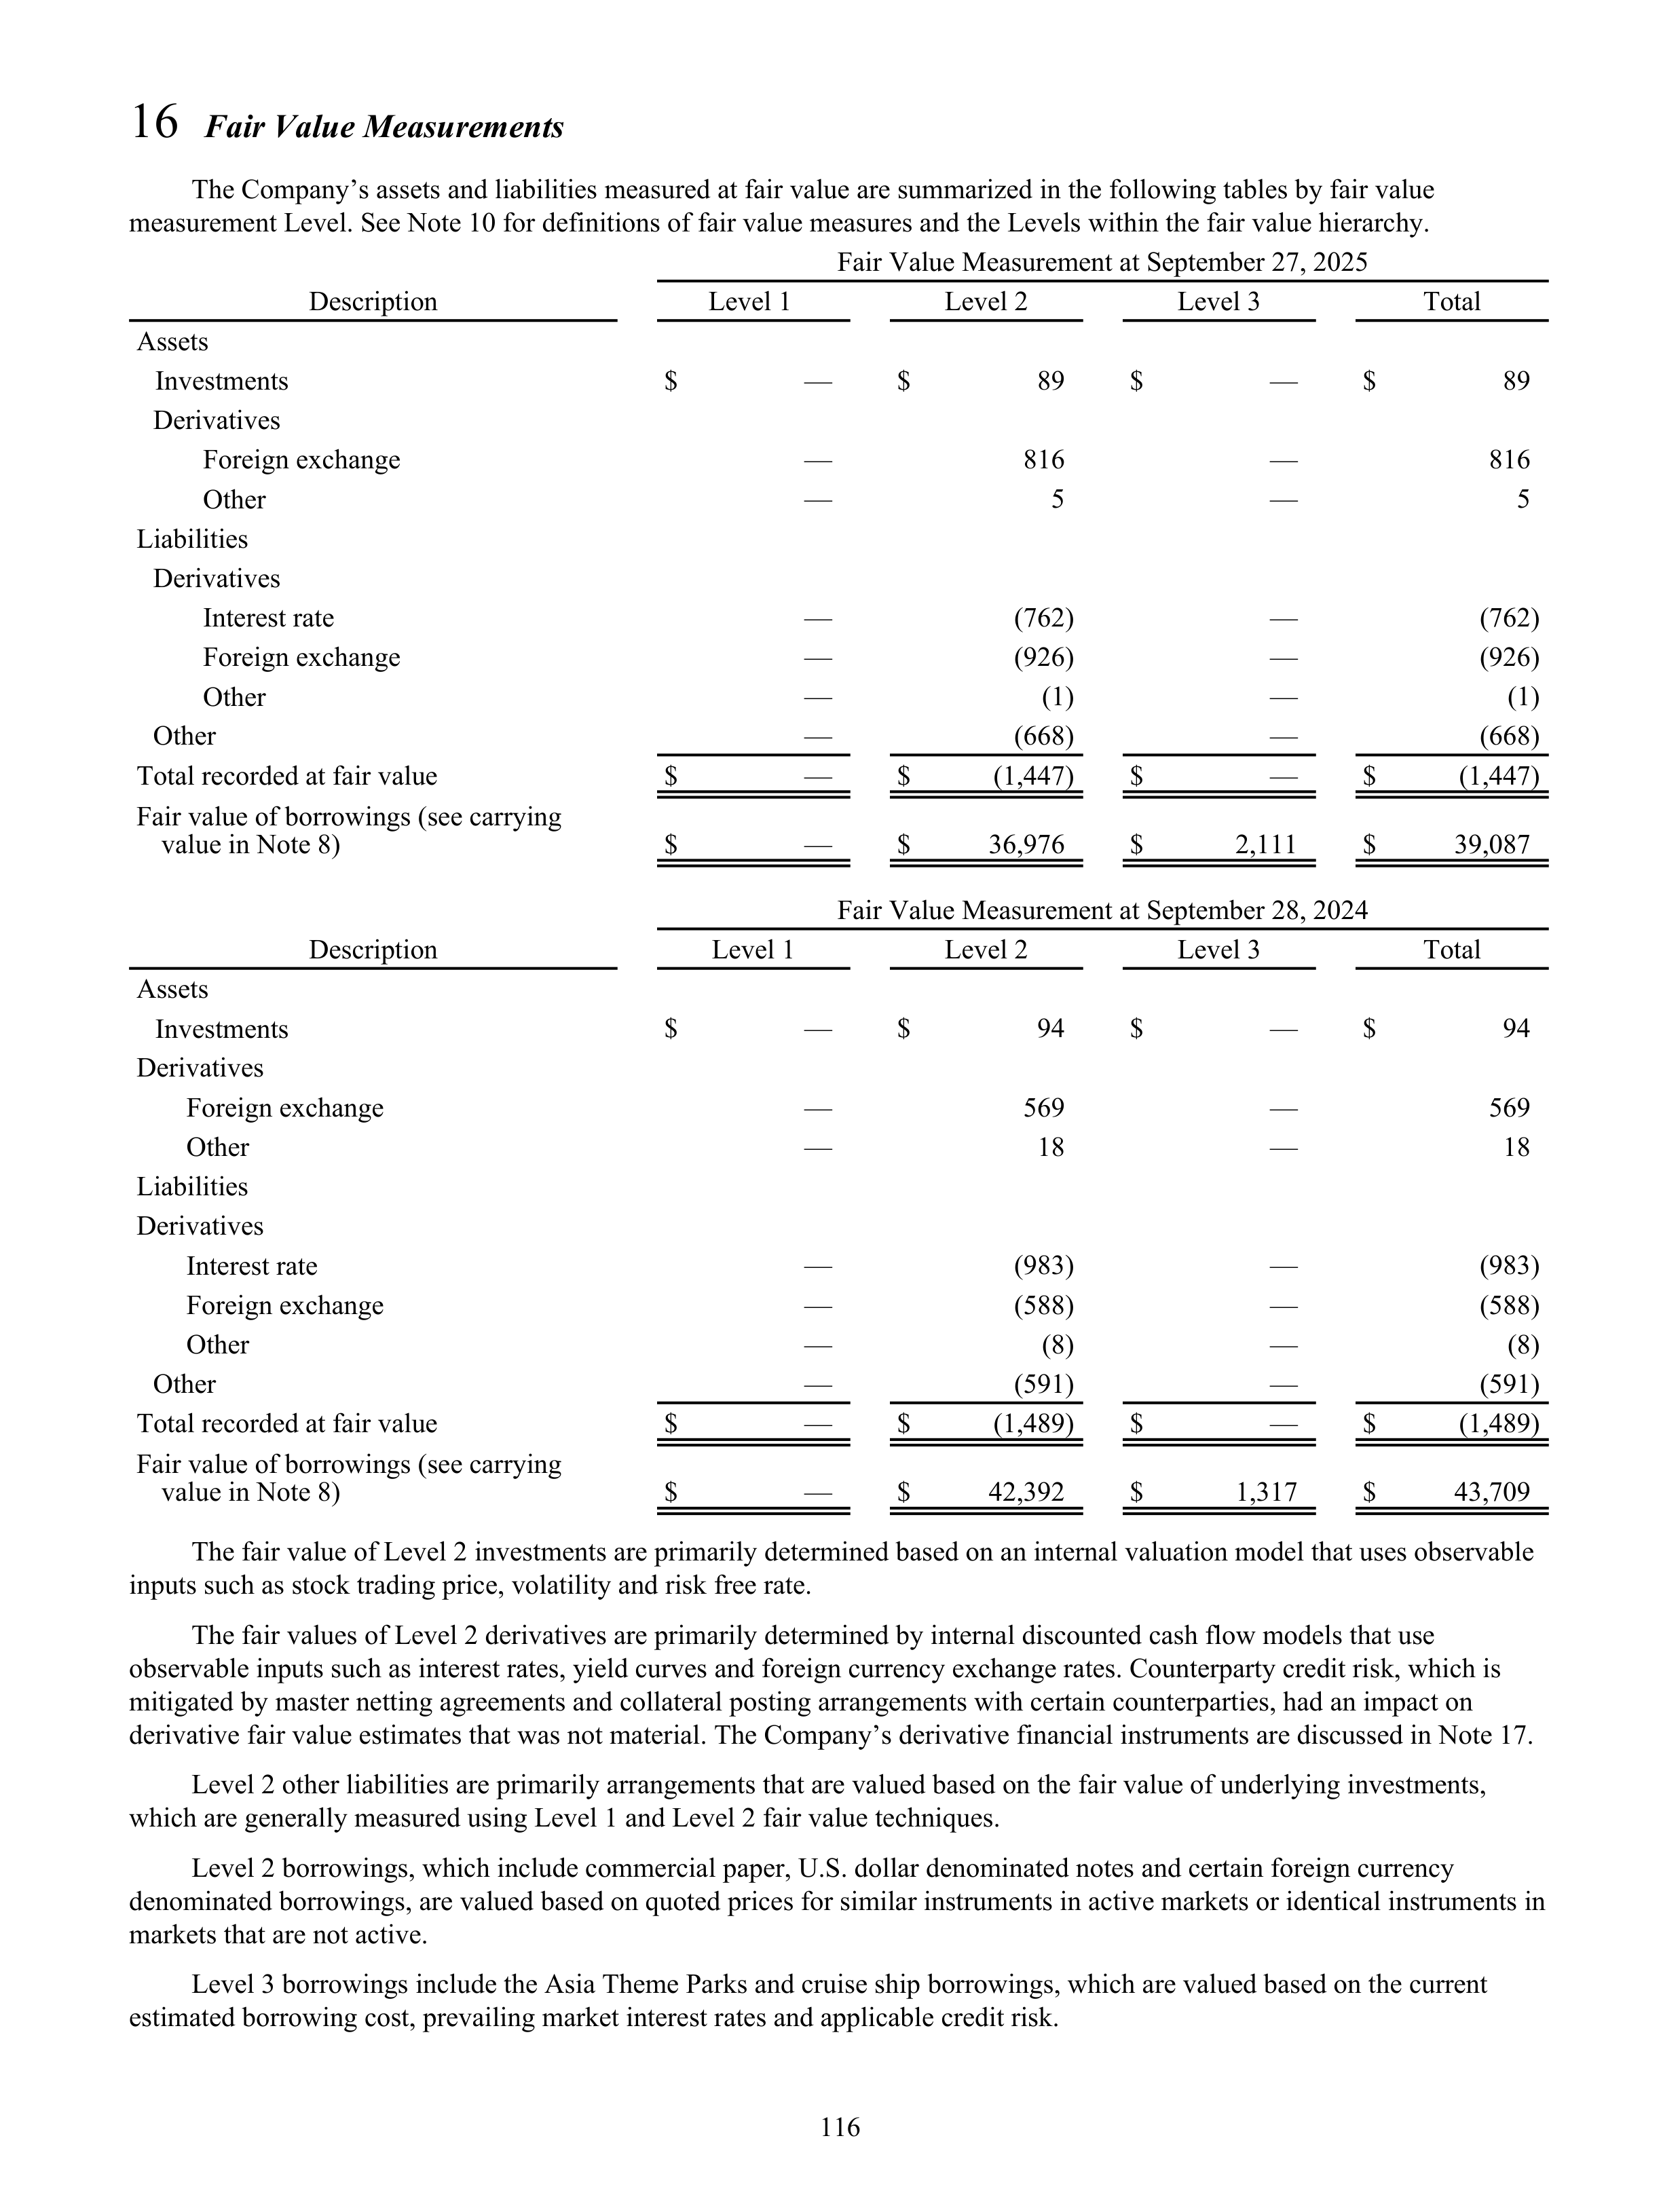
16
Fair Value Measurements
The Company’s assets and liabilities measured at fair value are summarized in the following tables by fair value
measurement Level. See Note 10 for definitions of fair value measures and the Levels within the fair value hierarchy.
Fair Value Measurement at September 27, 2025
Description
Level 1
Level 2
Level 3
Total
Assets
Investments
$
—
$
89
$
—
$
89
Derivatives
Foreign exchange
—
816
—
816
Other
—
5
—
5
Liabilities
Derivatives
Interest rate
—
(762)
—
(762)
Foreign exchange
—
(926)
—
(926)
Other
—
(1)
—
(1)
Other
—
(668)
—
(668)
Total recorded at fair value
$
—
$
(1,447)
$
—
$
(1,447)
Fair value of borrowings (see carrying
value in Note 8)
$
—
$
36,976
$
2,111
$
39,087
Fair Value Measurement at September 28, 2024
Description
Level 1
Level 2
Level 3
Total
Assets
Investments
$
—
$
94
$
—
$
94
Derivatives
Foreign exchange
—
569
—
569
Other
—
18
—
18
Liabilities
Derivatives
Interest rate
—
(983)
—
(983)
Foreign exchange
—
(588)
—
(588)
Other
—
(8)
—
(8)
Other
—
(591)
—
(591)
Total recorded at fair value
$
—
$
(1,489)
$
—
$
(1,489)
Fair value of borrowings (see carrying
value in Note 8)
$
—
$
42,392
$
1,317
$
43,709
The fair value of Level 2 investments are primarily determined based on an internal valuation model that uses observable
inputs such as stock trading price, volatility and risk free rate.
The fair values of Level 2 derivatives are primarily determined by internal discounted cash flow models that use
observable inputs such as interest rates, yield curves and foreign currency exchange rates. Counterparty credit risk, which is
mitigated by master netting agreements and collateral posting arrangements with certain counterparties, had an impact on
derivative fair value estimates that was not material. The Company’s derivative financial instruments are discussed in Note 17.
Level 2 other liabilities are primarily arrangements that are valued based on the fair value of underlying investments,
which are generally measured using Level 1 and Level 2 fair value techniques.
Level 2 borrowings, which include commercial paper, U.S. dollar denominated notes and certain foreign currency
denominated borrowings, are valued based on quoted prices for similar instruments in active markets or identical instruments in
markets that are not active.
Level 3 borrowings include the Asia Theme Parks and cruise ship borrowings, which are valued based on the current
estimated borrowing cost, prevailing market interest rates and applicable credit risk.
116
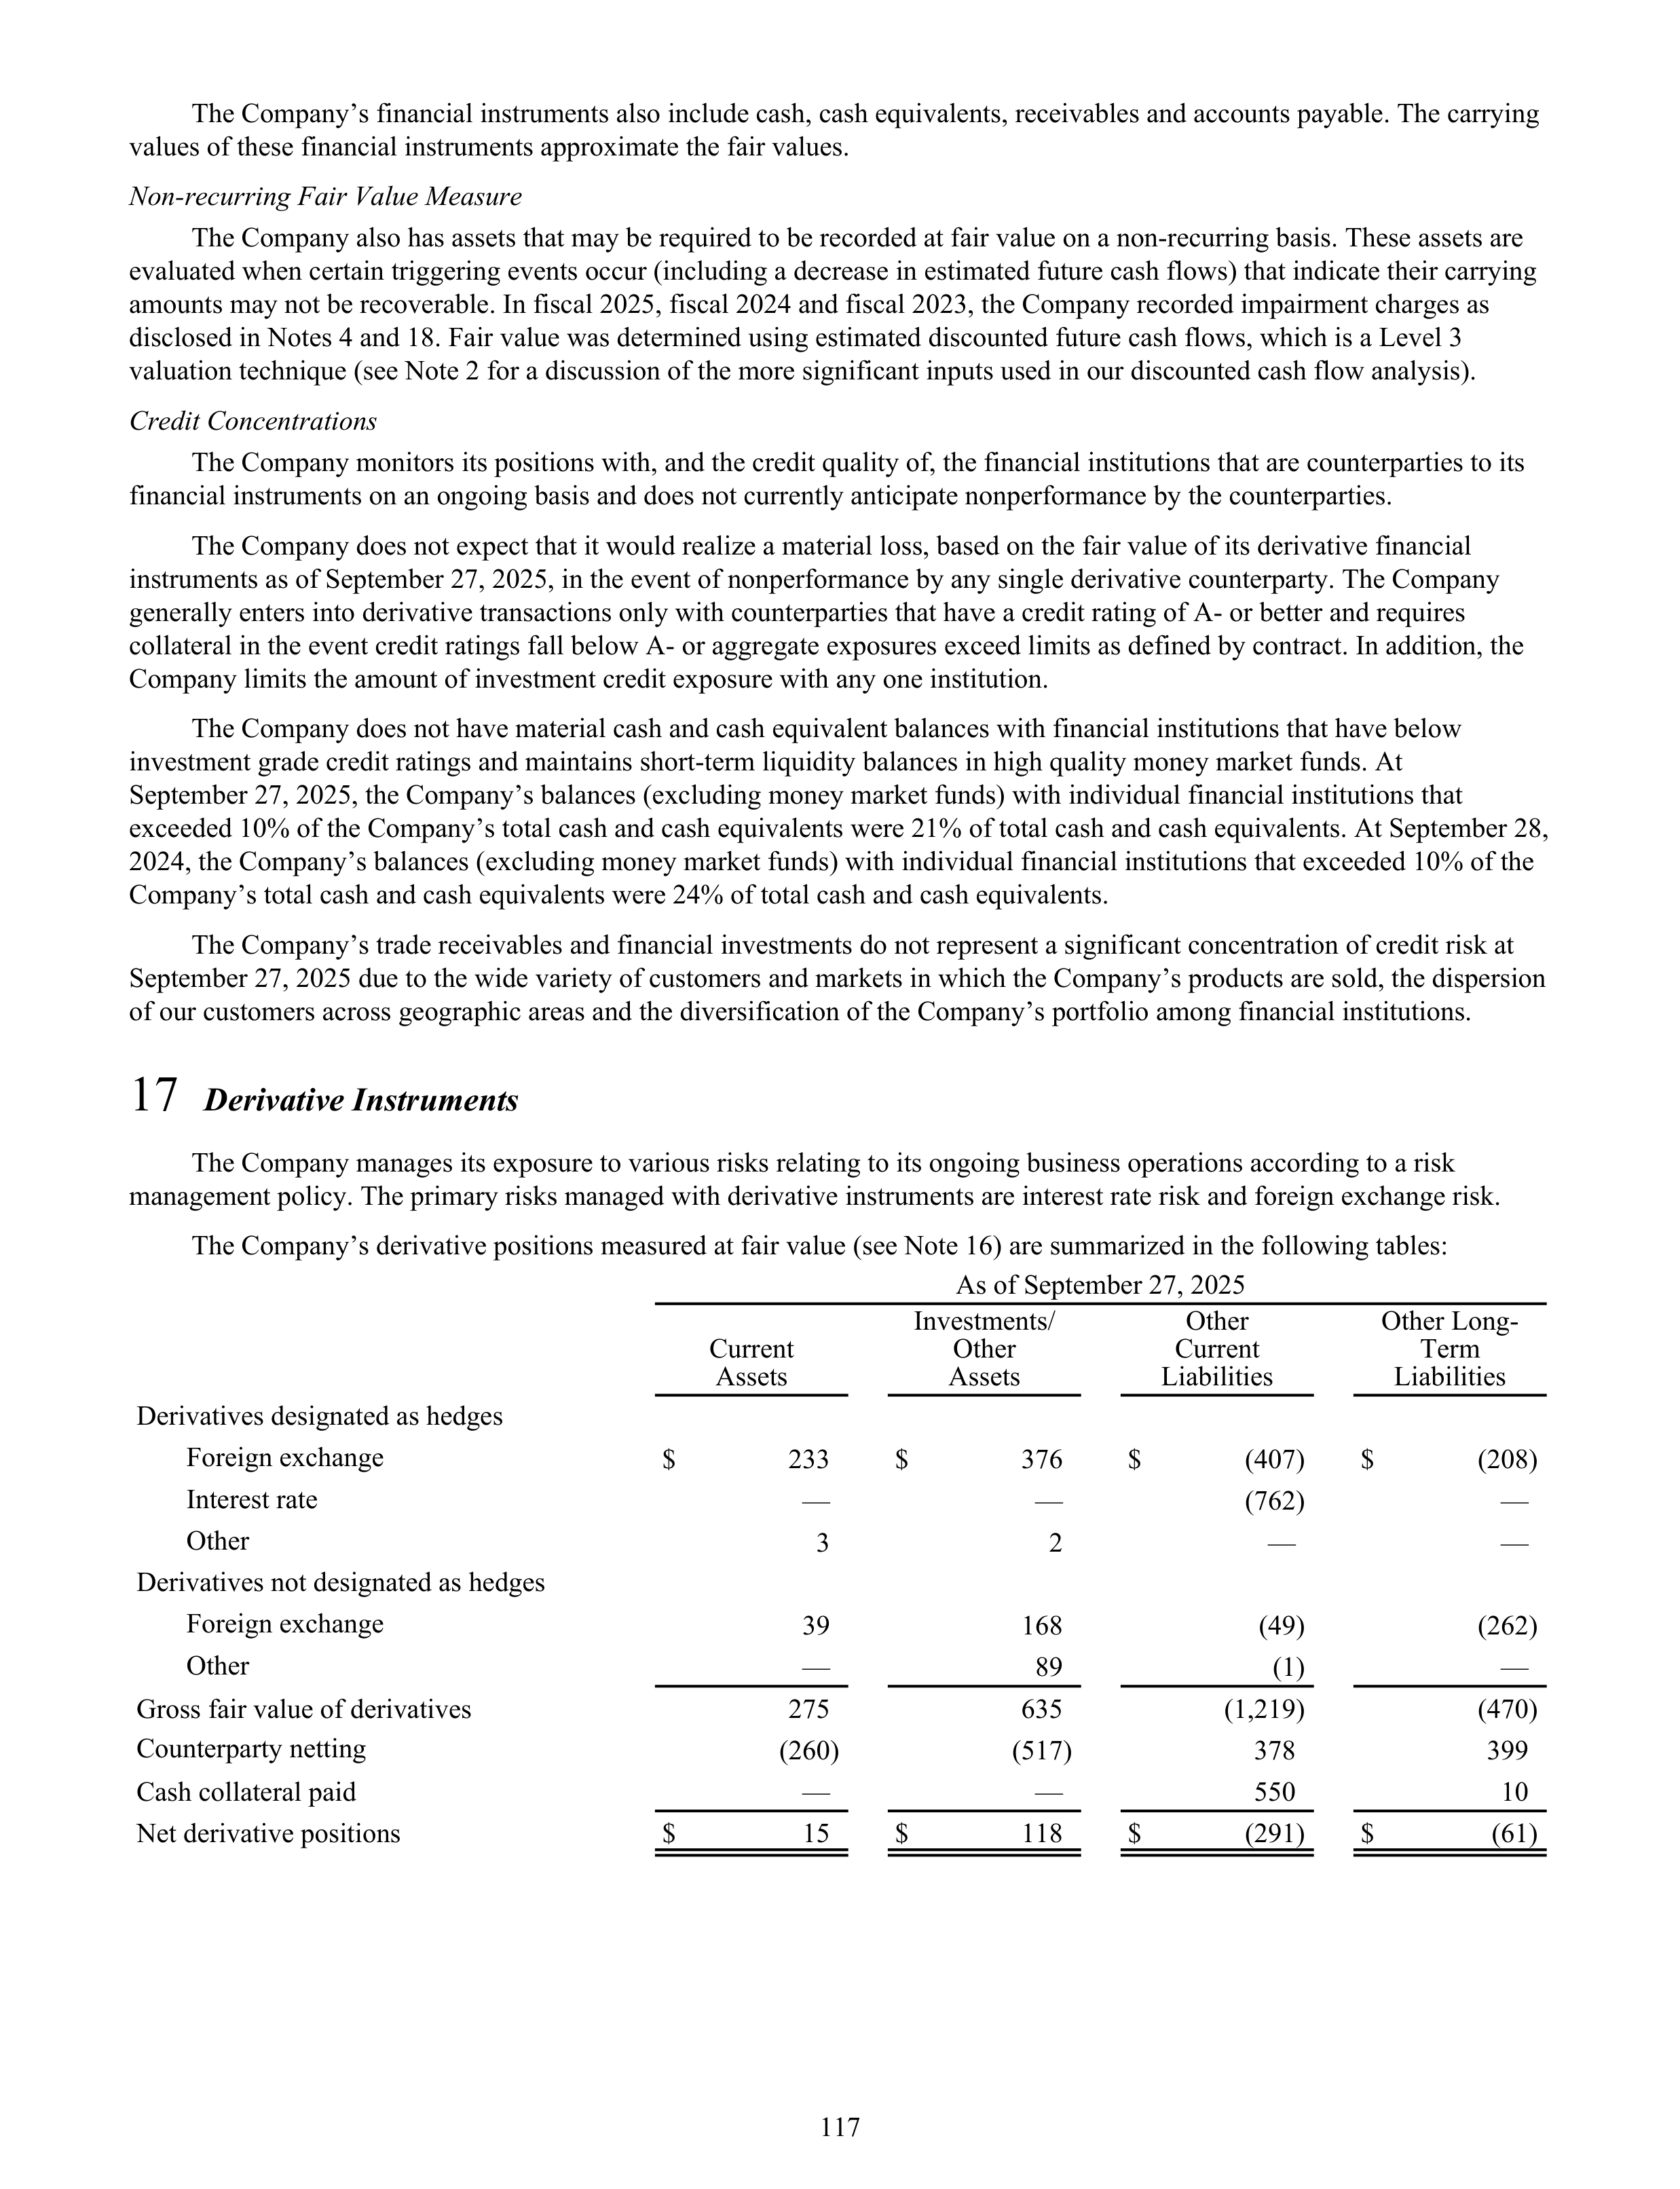
The Company’s financial instruments also include cash, cash equivalents, receivables and accounts payable. The carrying
values of these financial instruments approximate the fair values.
Non-recurring Fair Value Measure
The Company also has assets that may be required to be recorded at fair value on a non-recurring basis. These assets are
evaluated when certain triggering events occur (including a decrease in estimated future cash flows) that indicate their carrying
amounts may not be recoverable. In fiscal 2025, fiscal 2024 and fiscal 2023, the Company recorded impairment charges as
disclosed in Notes 4 and 18. Fair value was determined using estimated discounted future cash flows, which is a Level 3
valuation technique (see Note 2 for a discussion of the more significant inputs used in our discounted cash flow analysis).
Credit Concentrations
The Company monitors its positions with, and the credit quality of, the financial institutions that are counterparties to its
financial instruments on an ongoing basis and does not currently anticipate nonperformance by the counterparties.
The Company does not expect that it would realize a material loss, based on the fair value of its derivative financial
instruments as of September 27, 2025, in the event of nonperformance by any single derivative counterparty. The Company
generally enters into derivative transactions only with counterparties that have a credit rating of A- or better and requires
collateral in the event credit ratings fall below A- or aggregate exposures exceed limits as defined by contract. In addition, the
Company limits the amount of investment credit exposure with any one institution.
The Company does not have material cash and cash equivalent balances with financial institutions that have below
investment grade credit ratings and maintains short-term liquidity balances in high quality money market funds. At
September 27, 2025, the Company’s balances (excluding money market funds) with individual financial institutions that
exceeded 10% of the Company’s total cash and cash equivalents were 21% of total cash and cash equivalents. At September 28,
2024, the Company’s balances (excluding money market funds) with individual financial institutions that exceeded 10% of the
Company’s total cash and cash equivalents were 24% of total cash and cash equivalents.
The Company’s trade receivables and financial investments do not represent a significant concentration of credit risk at
September 27, 2025 due to the wide variety of customers and markets in which the Company’s products are sold, the dispersion
of our customers across geographic areas and the diversification of the Company’s portfolio among financial institutions.
17
Derivative Instruments
The Company manages its exposure to various risks relating to its ongoing business operations according to a risk
management policy. The primary risks managed with derivative instruments are interest rate risk and foreign exchange risk.
The Company’s derivative positions measured at fair value (see Note 16) are summarized in the following tables:
As of September 27, 2025
Current
Assets
Investments/
Other
Assets
Other
Current
Liabilities
Other Long-
Term
Liabilities
Derivatives designated as hedges
Foreign exchange
$
233
$
376
$
(407)
$
(208)
Interest rate
—
—
(762)
—
Other
3
2
—
—
Derivatives not designated as hedges
Foreign exchange
39
168
(49)
(262)
Other
—
89
(1)
—
Gross fair value of derivatives
275
635
(1,219)
(470)
Counterparty netting
(260)
(517)
378
399
Cash collateral paid
—
—
550
10
Net derivative positions
$
15
$
118
$
(291)
$
(61)
117
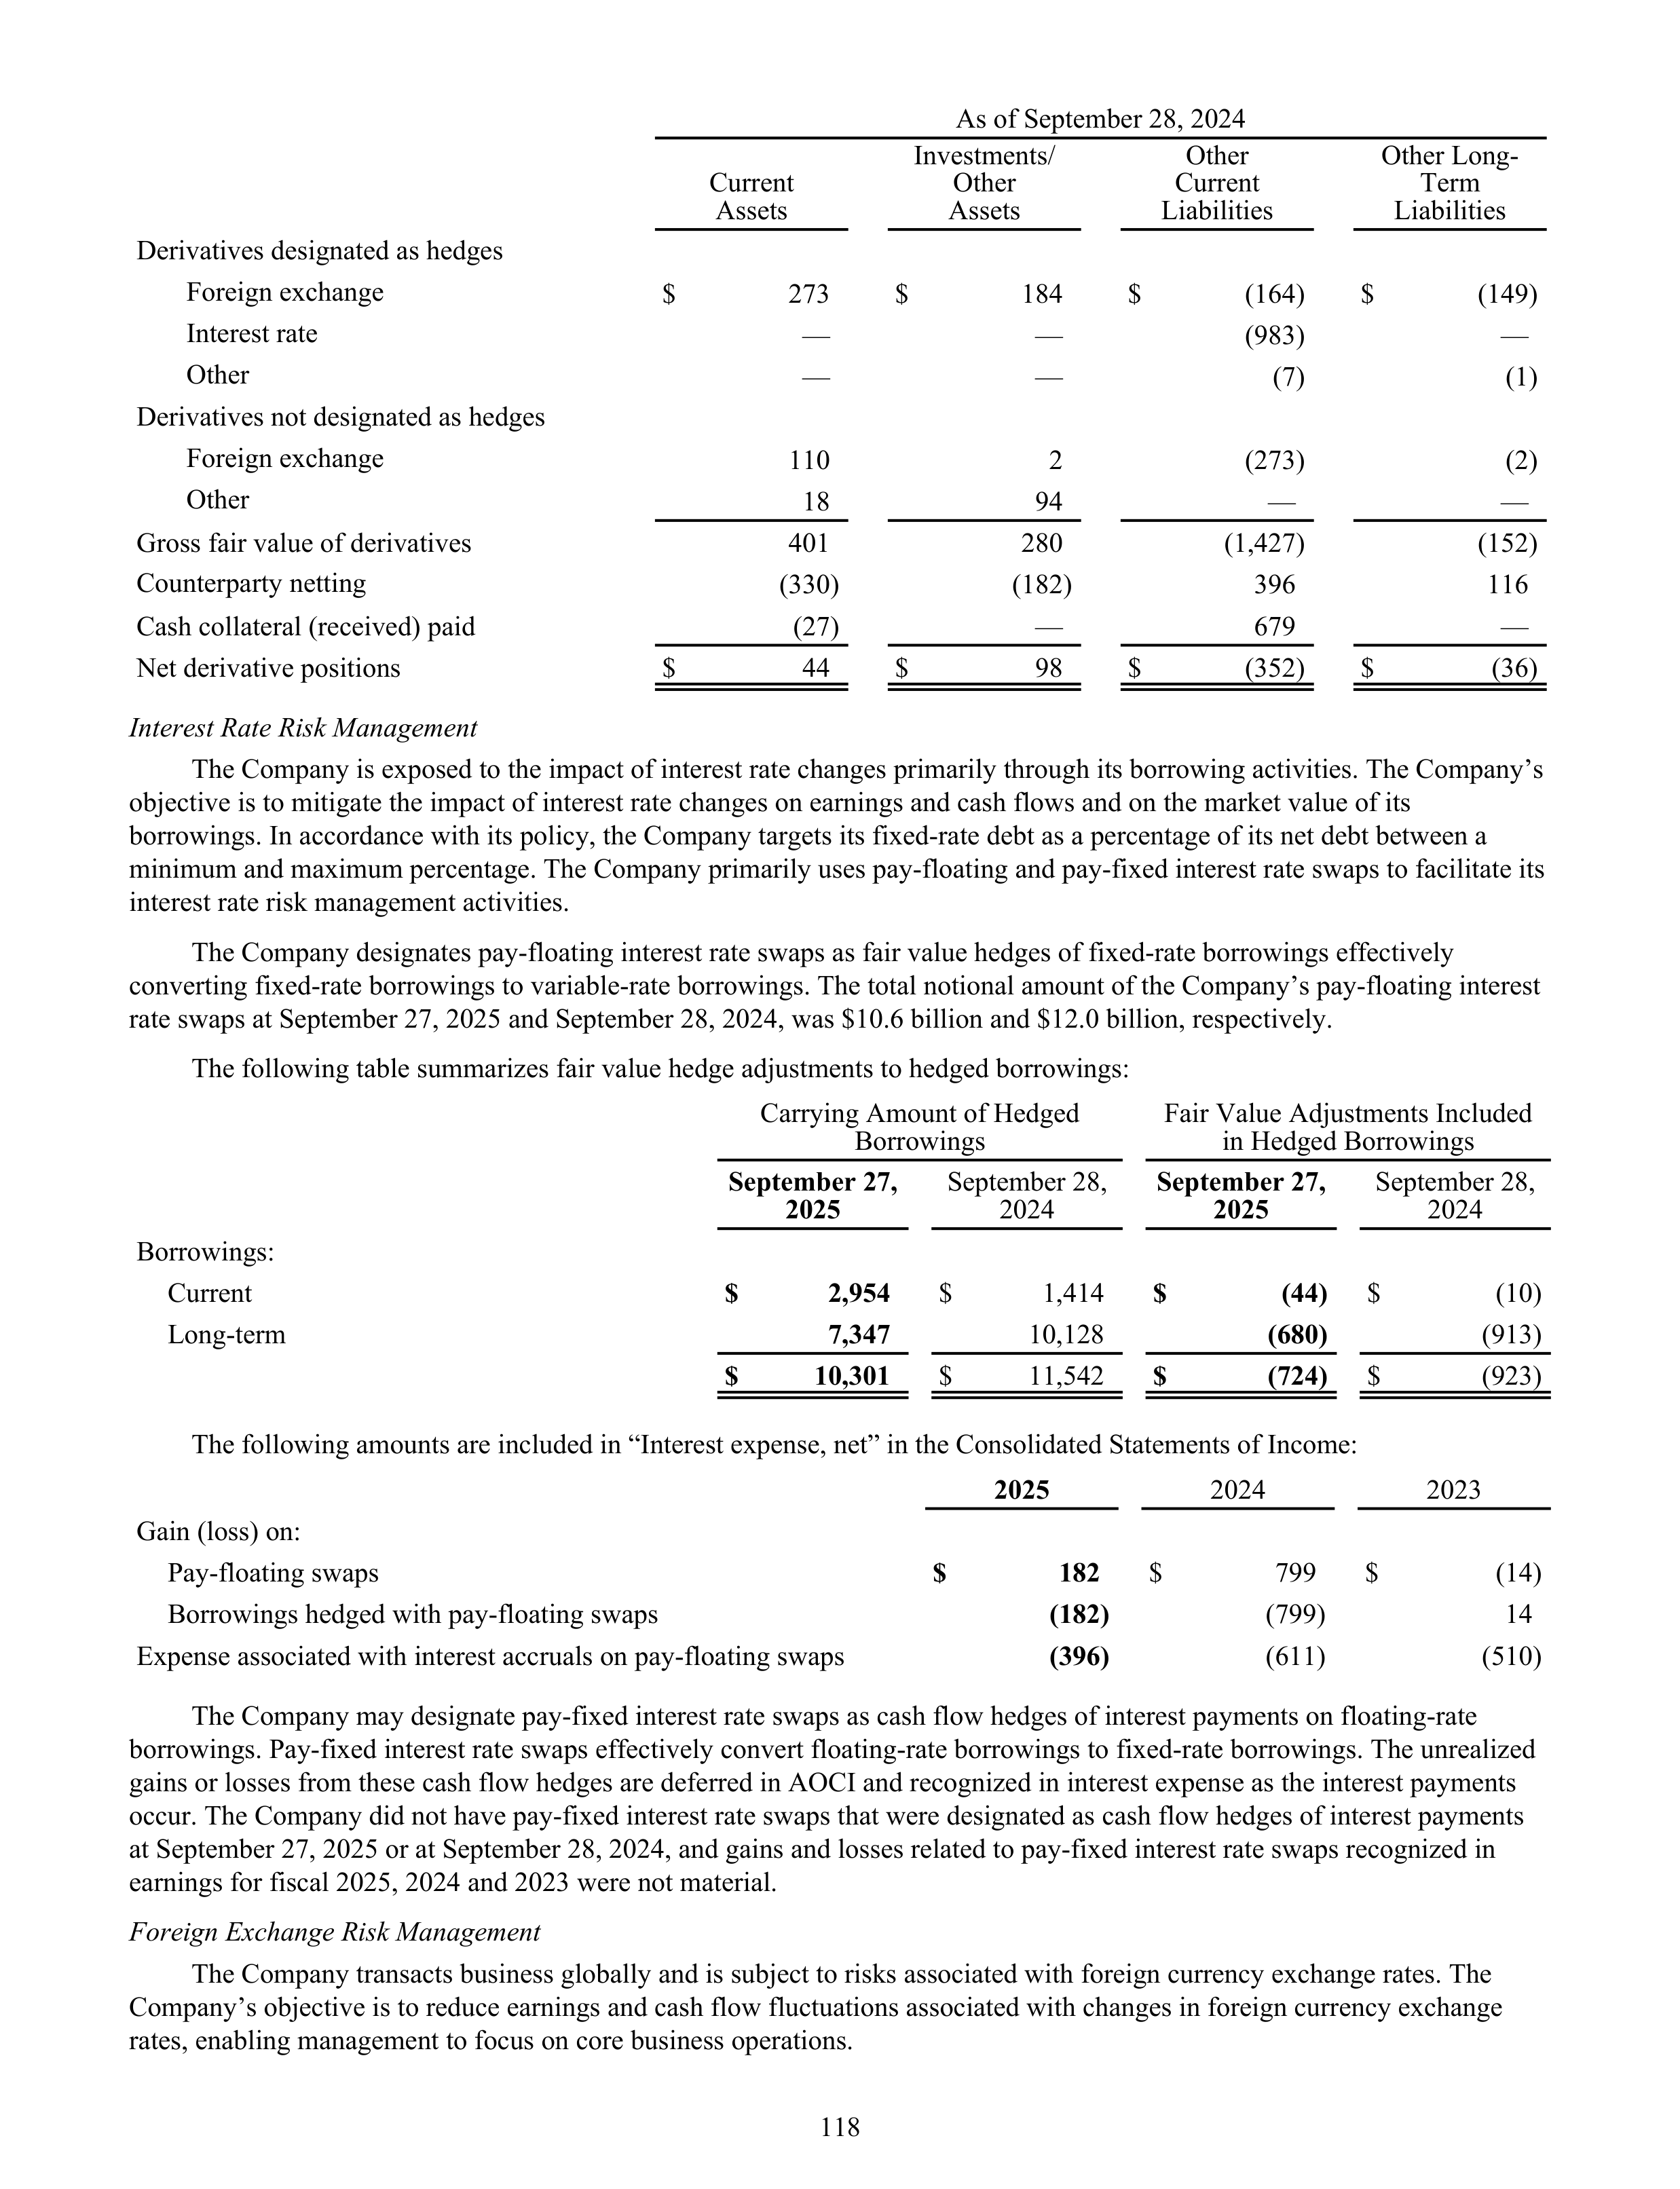
As of September 28, 2024
Current
Assets
Investments/
Other
Assets
Other
Current
Liabilities
Other Long-
Term
Liabilities
Derivatives designated as hedges
Foreign exchange
$
273
$
184
$
(164)
$
(149)
Interest rate
—
—
(983)
—
Other
—
—
(7)
(1)
Derivatives not designated as hedges
Foreign exchange
110
2
(273)
(2)
Other
18
94
—
—
Gross fair value of derivatives
401
280
(1,427)
(152)
Counterparty netting
(330)
(182)
396
116
Cash collateral (received) paid
(27)
—
679
—
Net derivative positions
$
44
$
98
$
(352)
$
(36)
Interest Rate Risk Management
The Company is exposed to the impact of interest rate changes primarily through its borrowing activities. The Company’s
objective is to mitigate the impact of interest rate changes on earnings and cash flows and on the market value of its
borrowings. In accordance with its policy, the Company targets its fixed-rate debt as a percentage of its net debt between a
minimum and maximum percentage. The Company primarily uses pay-floating and pay-fixed interest rate swaps to facilitate its
interest rate risk management activities.
The Company designates pay-floating interest rate swaps as fair value hedges of fixed-rate borrowings effectively
converting fixed-rate borrowings to variable-rate borrowings. The total notional amount of the Company’s pay-floating interest
rate swaps at September 27, 2025 and September 28, 2024, was $10.6 billion and $12.0 billion, respectively.
The following table summarizes fair value hedge adjustments to hedged borrowings:
Carrying Amount of Hedged
Borrowings
Fair Value Adjustments Included
in Hedged Borrowings
September 27,
2025
September 28,
2024
September 27,
2025
September 28,
2024
Borrowings:
Current
$
2,954
$
1,414
$
(44)
$
(10)
Long-term
7,347
10,128
(680)
(913)
$
10,301
$
11,542
$
(724)
$
(923)
The following amounts are included in “Interest expense, net” in the Consolidated Statements of Income:
2025
2024
2023
Gain (loss) on:
Pay-floating swaps
$
182
$
799
$
(14)
Borrowings hedged with pay-floating swaps
(182)
(799)
14
Expense associated with interest accruals on pay-floating swaps
(396)
(611)
(510)
The Company may designate pay-fixed interest rate swaps as cash flow hedges of interest payments on floating-rate
borrowings. Pay-fixed interest rate swaps effectively convert floating-rate borrowings to fixed-rate borrowings. The unrealized
gains or losses from these cash flow hedges are deferred in AOCI and recognized in interest expense as the interest payments
occur. The Company did not have pay-fixed interest rate swaps that were designated as cash flow hedges of interest payments
at September 27, 2025 or at September 28, 2024, and gains and losses related to pay-fixed interest rate swaps recognized in
earnings for fiscal 2025, 2024 and 2023 were not material.
Foreign Exchange Risk Management
The Company transacts business globally and is subject to risks associated with foreign currency exchange rates. The
Company’s objective is to reduce earnings and cash flow fluctuations associated with changes in foreign currency exchange
rates, enabling management to focus on core business operations.
118
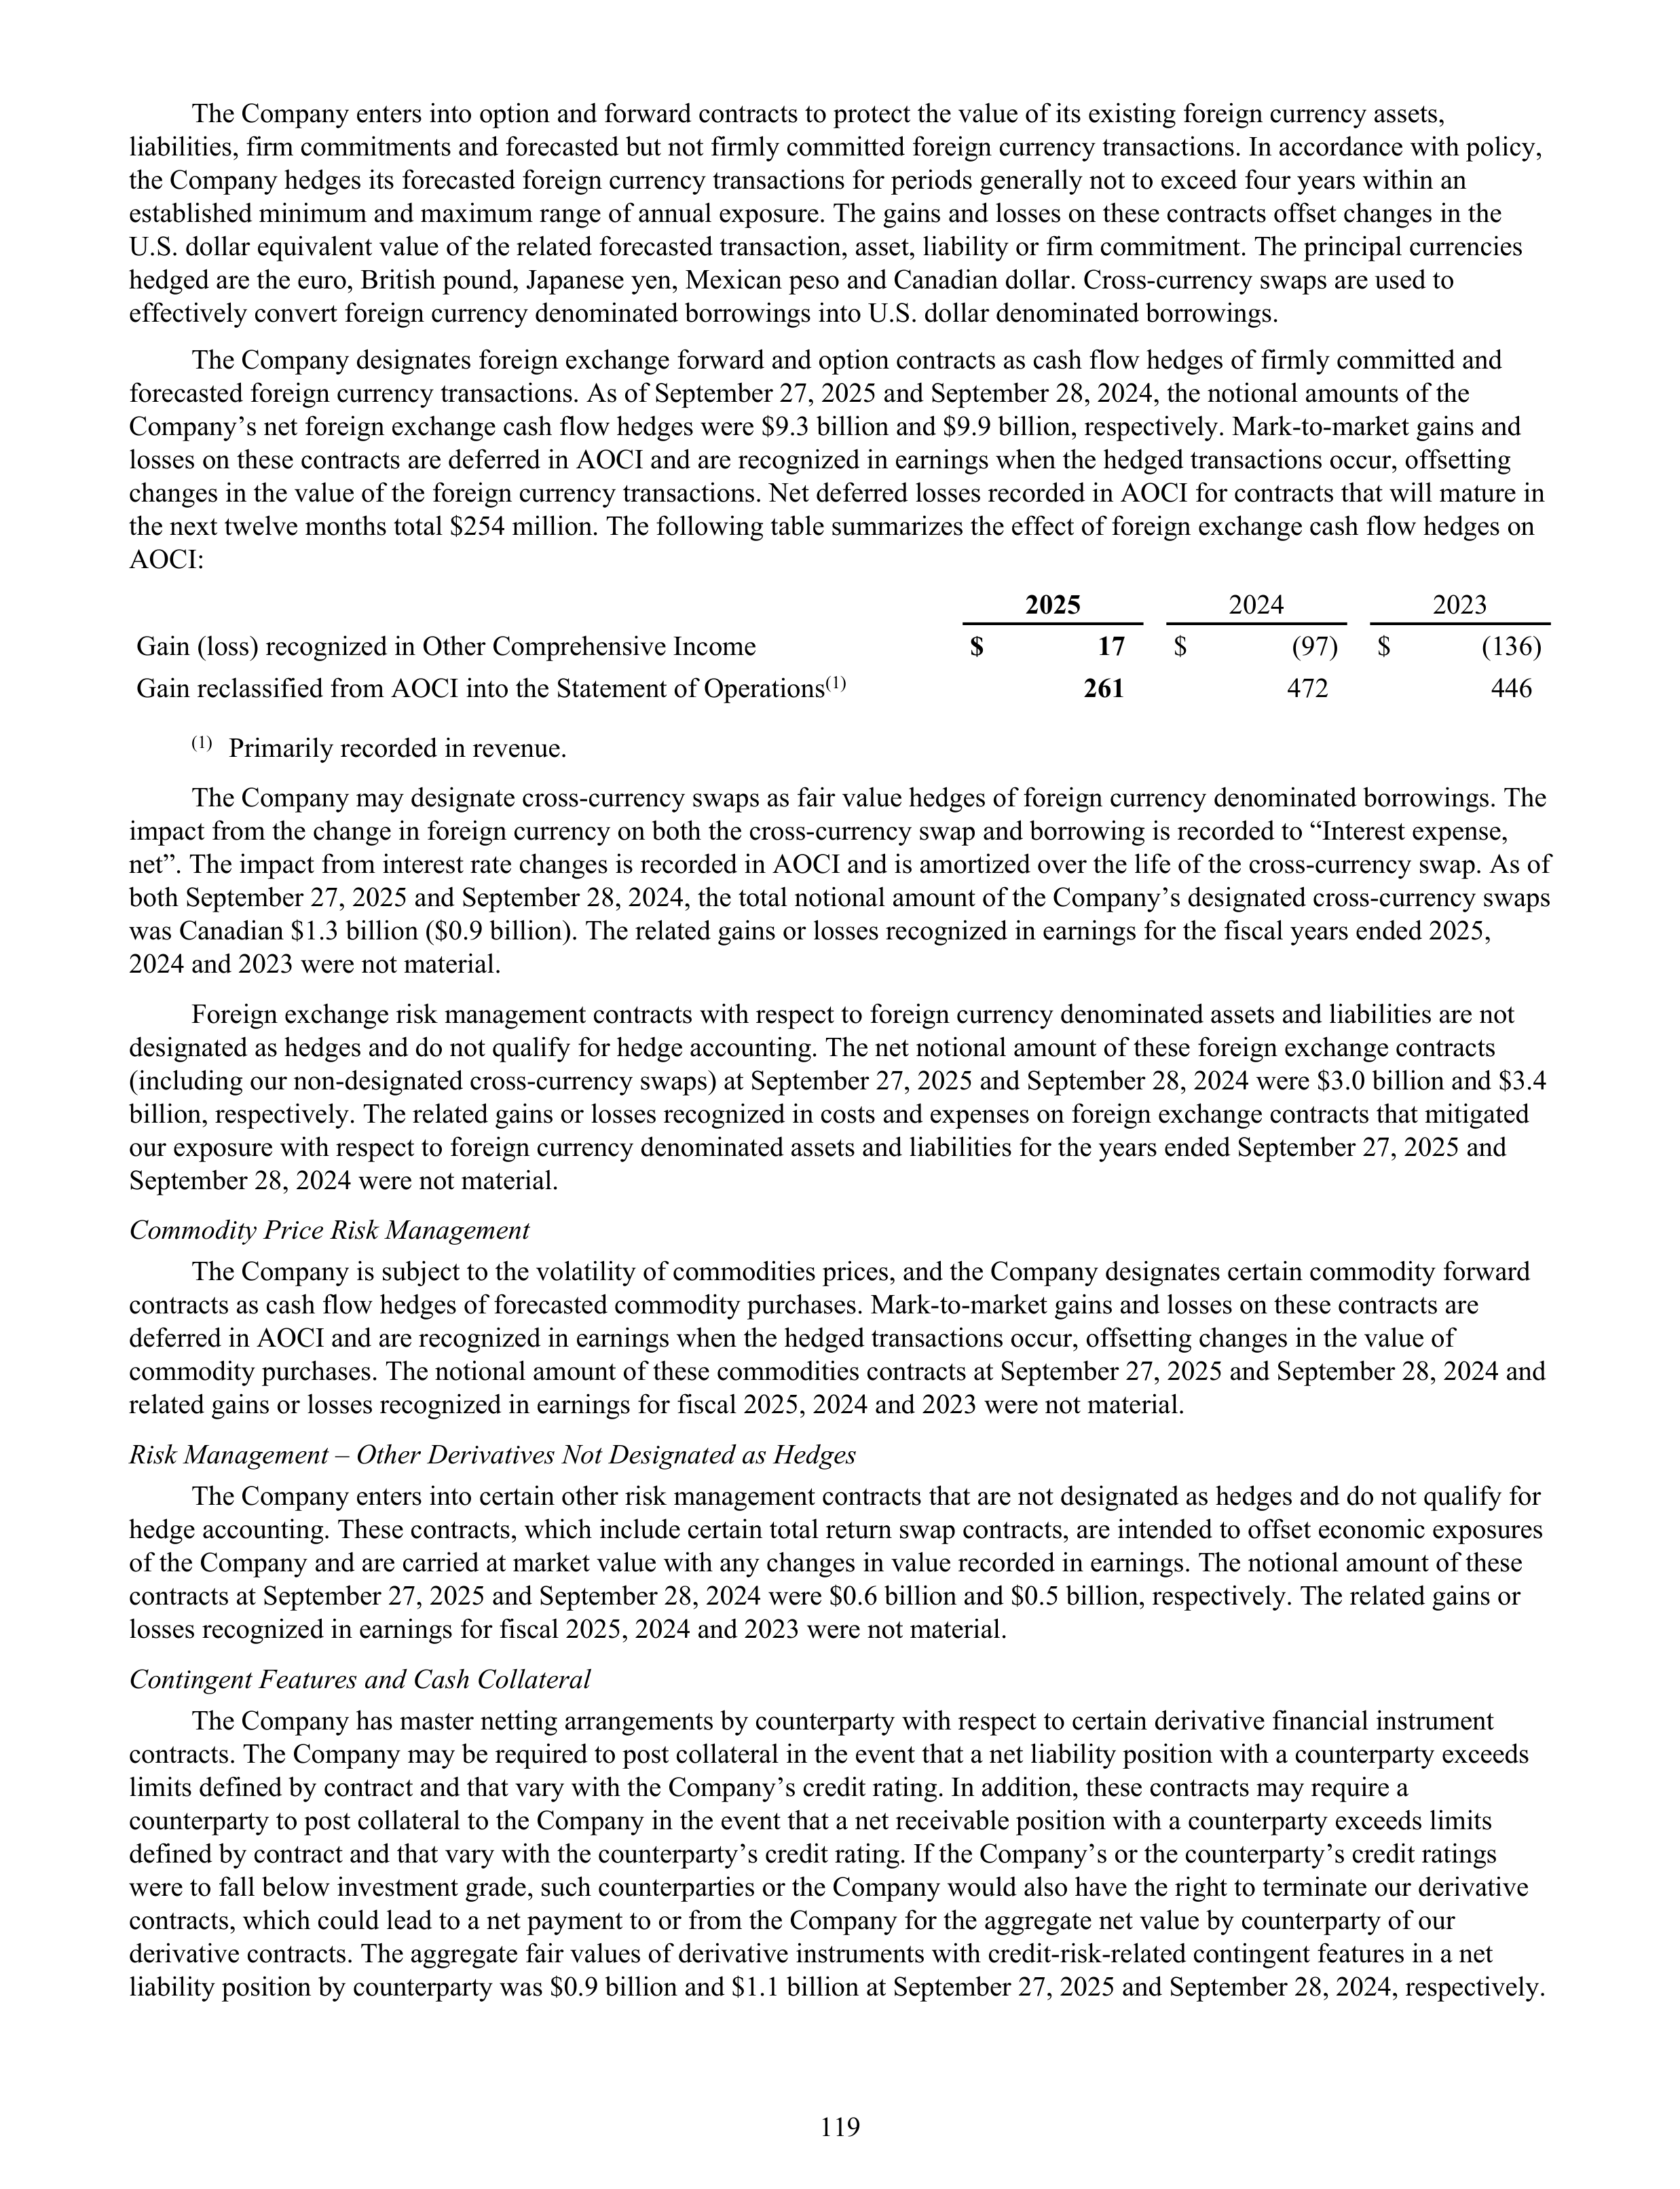
The Company enters into option and forward contracts to protect the value of its existing foreign currency assets,
liabilities, firm commitments and forecasted but not firmly committed foreign currency transactions. In accordance with policy,
the Company hedges its forecasted foreign currency transactions for periods generally not to exceed four years within an
established minimum and maximum range of annual exposure. The gains and losses on these contracts offset changes in the
U.S. dollar equivalent value of the related forecasted transaction, asset, liability or firm commitment. The principal currencies
hedged are the euro, British pound, Japanese yen, Mexican peso and Canadian dollar. Cross-currency swaps are used to
effectively convert foreign currency denominated borrowings into U.S. dollar denominated borrowings.
The Company designates foreign exchange forward and option contracts as cash flow hedges of firmly committed and
forecasted foreign currency transactions. As of September 27, 2025 and September 28, 2024, the notional amounts of the
Company’s net foreign exchange cash flow hedges were $9.3 billion and $9.9 billion, respectively. Mark-to-market gains and
losses on these contracts are deferred in AOCI and are recognized in earnings when the hedged transactions occur, offsetting
changes in the value of the foreign currency transactions. Net deferred losses recorded in AOCI for contracts that will mature in
the next twelve months total $254 million. The following table summarizes the effect of foreign exchange cash flow hedges on
AOCI:
2025
2024
2023
Gain (loss) recognized in Other Comprehensive Income
$
17
$
(97)
$
(136)
Gain reclassified from AOCI into the Statement of Operations
(1)
261
472
446
(1)
Primarily recorded in revenue.
The Company may designate cross-currency swaps as fair value hedges of foreign currency denominated borrowings. The
impact from the change in foreign currency on both the cross-currency swap and borrowing is recorded to “Interest expense,
net”. The impact from interest rate changes is recorded in AOCI and is amortized over the life of the cross-currency swap. As of
both September 27, 2025 and September 28, 2024, the total notional amount of the Company’s designated cross-currency swaps
was Canadian $1.3 billion ($0.9 billion). The related gains or losses recognized in earnings for the fiscal years ended 2025,
2024 and 2023 were not material.
Foreign exchange risk management contracts with respect to foreign currency denominated assets and liabilities are not
designated as hedges and do not qualify for hedge accounting. The net notional amount of these foreign exchange contracts
(including our non-designated cross-currency swaps) at September 27, 2025 and September 28, 2024 were $3.0 billion and $3.4
billion, respectively. The related gains or losses recognized in costs and expenses on foreign exchange contracts that mitigated
our exposure with respect to foreign currency denominated assets and liabilities for the years ended September 27, 2025 and
September 28, 2024 were not material.
Commodity Price Risk Management
The Company is subject to the volatility of commodities prices, and the Company designates certain commodity forward
contracts as cash flow hedges of forecasted commodity purchases. Mark-to-market gains and losses on these contracts are
deferred in AOCI and are recognized in earnings when the hedged transactions occur, offsetting changes in the value of
commodity purchases. The notional amount of these commodities contracts at September 27, 2025 and September 28, 2024 and
related gains or losses recognized in earnings for fiscal 2025, 2024 and 2023 were not material.
Risk Management – Other Derivatives Not Designated as Hedges
The Company enters into certain other risk management contracts that are not designated as hedges and do not qualify for
hedge accounting. These contracts, which include certain total return swap contracts, are intended to offset economic exposures
of the Company and are carried at market value with any changes in value recorded in earnings. The notional amount of these
contracts at September 27, 2025 and September 28, 2024 were $0.6 billion and $0.5 billion, respectively. The related gains or
losses recognized in earnings for fiscal 2025, 2024 and 2023 were not material.
Contingent Features and Cash Collateral
The Company has master netting arrangements by counterparty with respect to certain derivative financial instrument
contracts. The Company may be required to post collateral in the event that a net liability position with a counterparty exceeds
limits defined by contract and that vary with the Company’s credit rating. In addition, these contracts may require a
counterparty to post collateral to the Company in the event that a net receivable position with a counterparty exceeds limits
defined by contract and that vary with the counterparty’s credit rating. If the Company’s or the counterparty’s credit ratings
were to fall below investment grade, such counterparties or the Company would also have the right to terminate our derivative
contracts, which could lead to a net payment to or from the Company for the aggregate net value by counterparty of our
derivative contracts. The aggregate fair values of derivative instruments with credit-risk-related contingent features in a net
liability position by counterparty was $0.9 billion and $1.1 billion at September 27, 2025 and September 28, 2024, respectively.
119
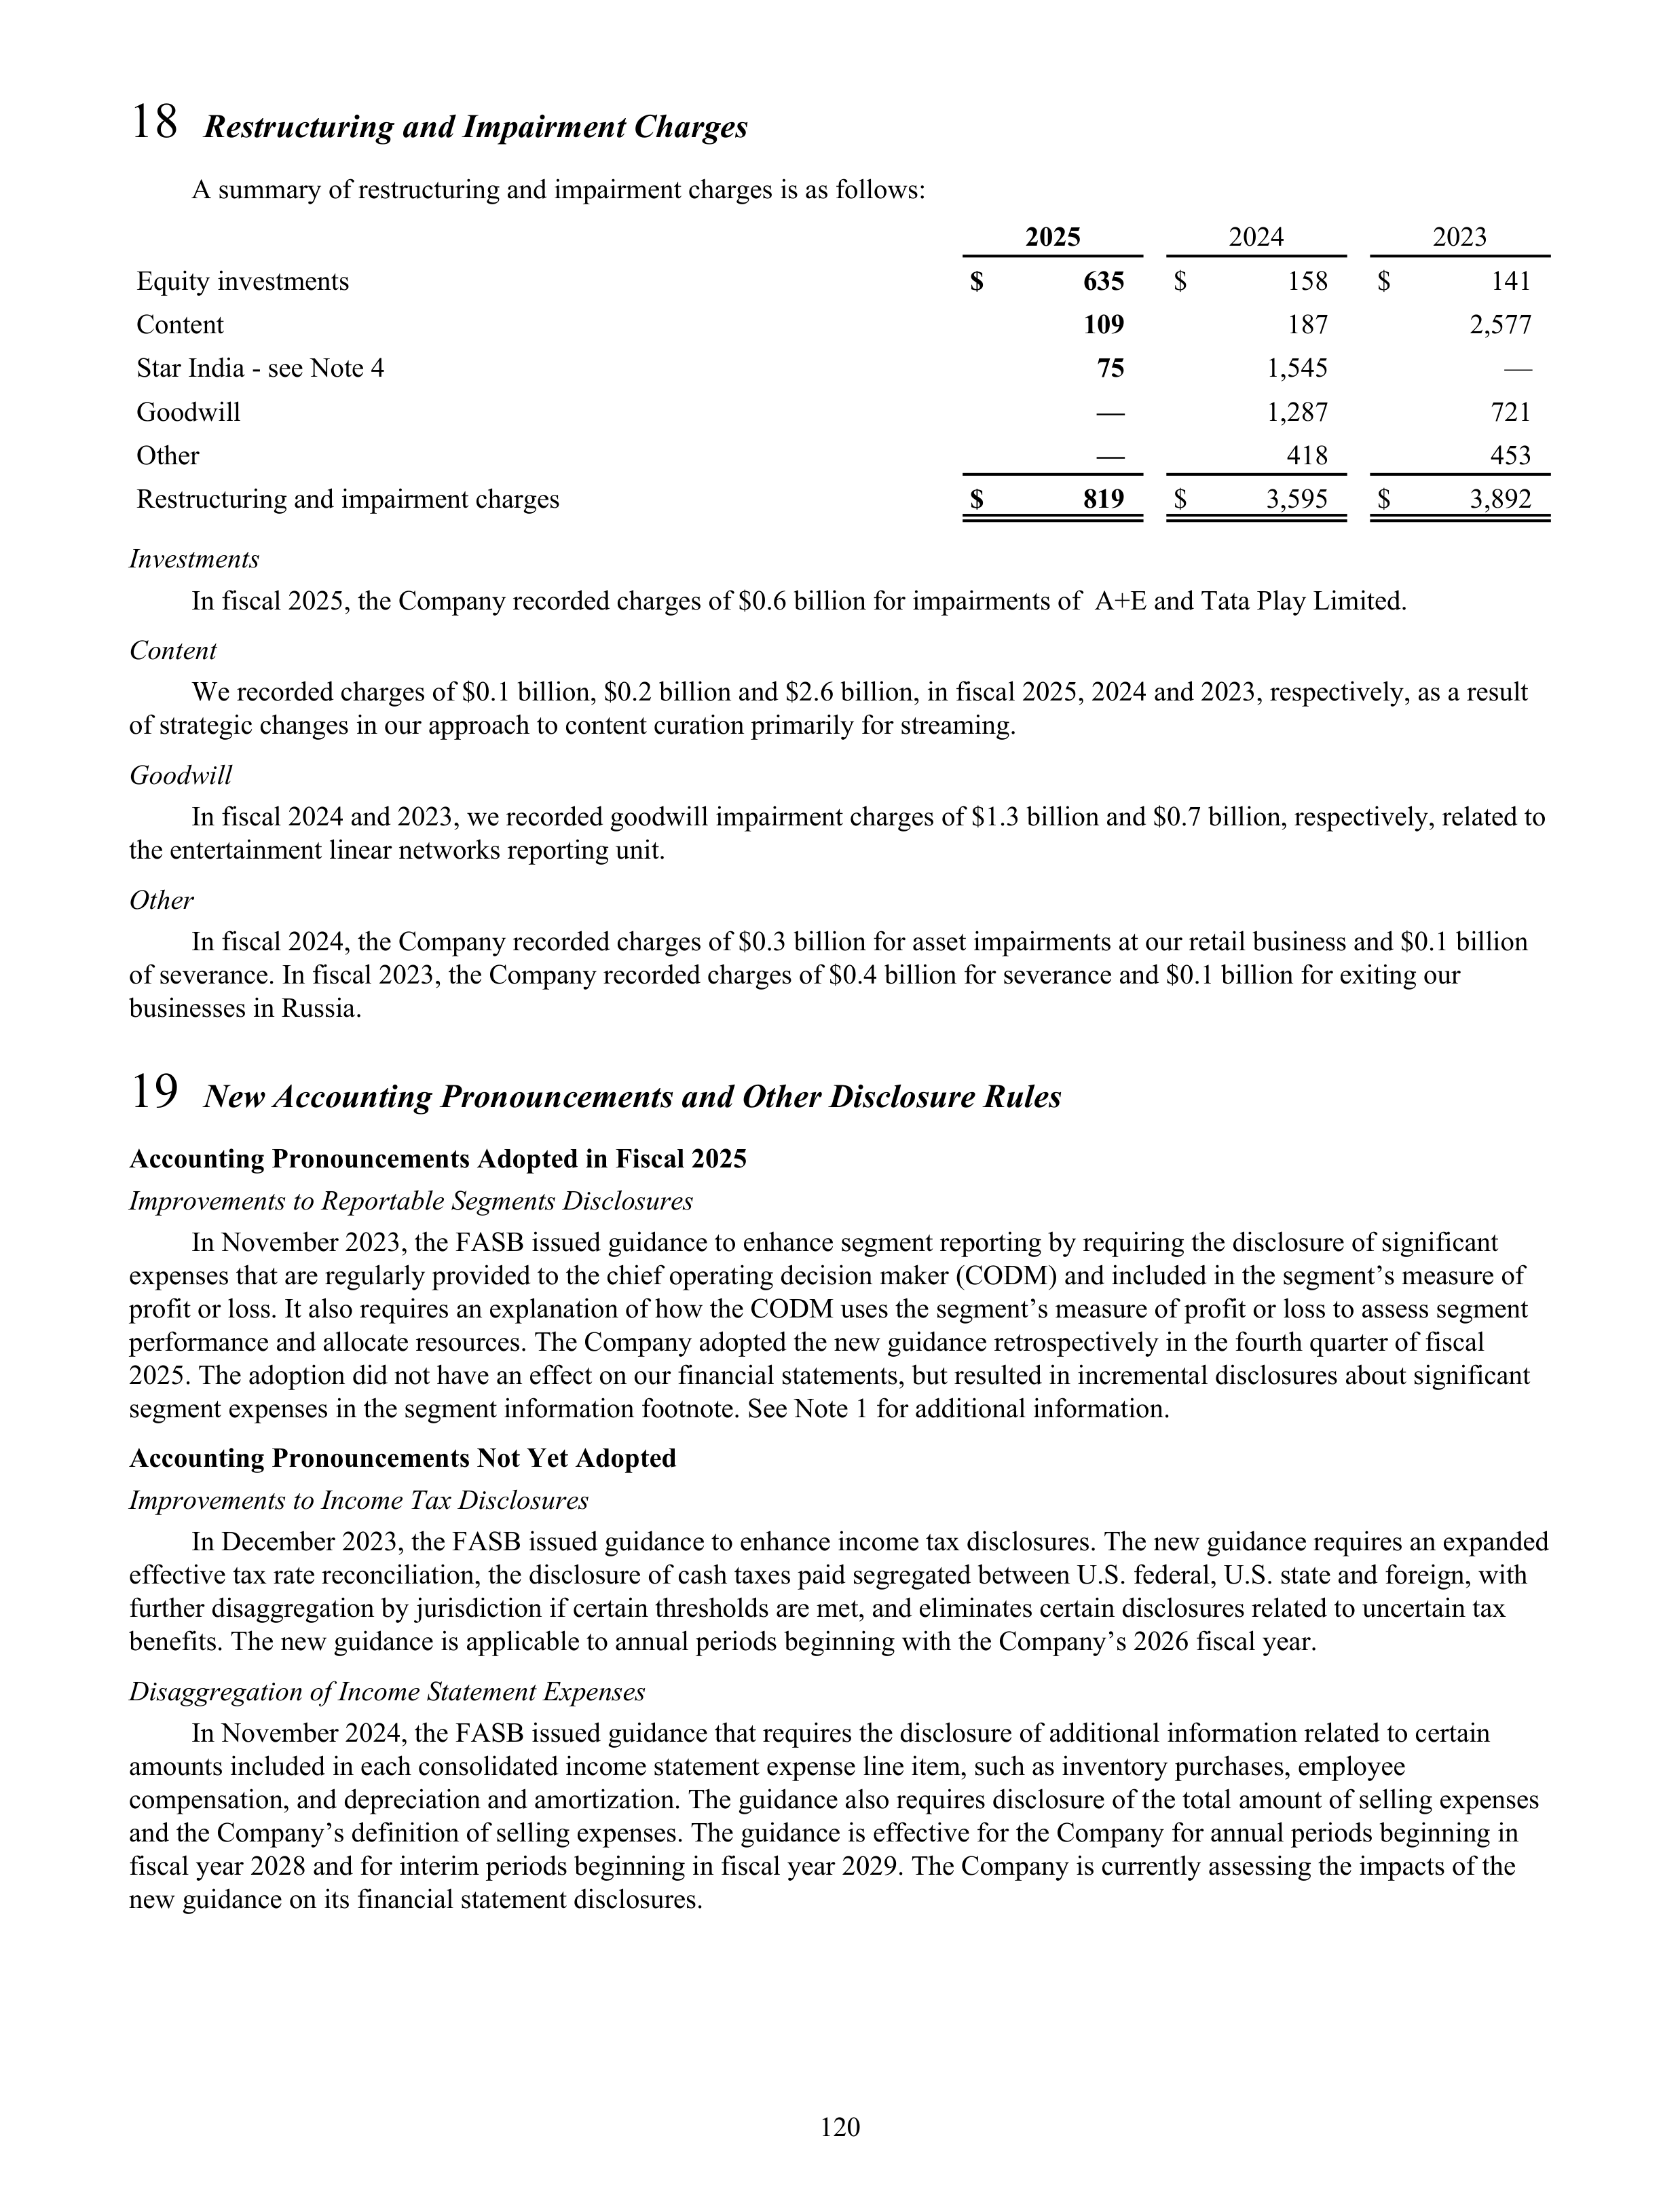
18
Restructuring and Impairment Charges
A summary of restructuring and impairment charges is as follows:
2025
2024
2023
Equity investments
$
635
$
158
$
141
Content
109
187
2,577
Star India - see Note 4
75
1,545
—
Goodwill
—
1,287
721
Other
—
418
453
Restructuring and impairment charges
$
819
$
3,595
$
3,892
Investments
In fiscal 2025, the Company recorded charges of $0.6 billion for impairments of A+E and Tata Play Limited.
Content
We recorded charges of $0.1 billion, $0.2 billion and $2.6 billion, in fiscal 2025, 2024 and 2023, respectively, as a result
of strategic changes in our approach to content curation primarily for streaming.
Goodwill
In fiscal 2024 and 2023, we recorded goodwill impairment charges of $1.3 billion and $0.7 billion, respectively, related to
the entertainment linear networks reporting unit.
Other
In fiscal 2024, the Company recorded charges of $0.3 billion for asset impairments at our retail business and $0.1 billion
of severance. In fiscal 2023, the Company recorded charges of $0.4 billion for severance and $0.1 billion for exiting our
businesses in Russia.
19
New Accounting Pronouncements and Other Disclosure Rules
Accounting Pronouncements Adopted in Fiscal 2025
Improvements to Reportable Segments Disclosures
In November 2023, the FASB issued guidance to enhance segment reporting by requiring the disclosure of significant
expenses that are regularly provided to the chief operating decision maker (CODM) and included in the segment’s measure of
profit or loss. It also requires an explanation of how the CODM uses the segment’s measure of profit or loss to assess segment
performance and allocate resources. The Company adopted the new guidance retrospectively in the fourth quarter of fiscal
2025. The adoption did not have an effect on our financial statements, but resulted in incremental disclosures about significant
segment expenses in the segment information footnote. See Note 1 for additional information.
Accounting Pronouncements Not Yet Adopted
Improvements to Income Tax Disclosures
In December 2023, the FASB issued guidance to enhance income tax disclosures. The new guidance requires an expanded
effective tax rate reconciliation, the disclosure of cash taxes paid segregated between U.S. federal, U.S. state and foreign, with
further disaggregation by jurisdiction if certain thresholds are met, and eliminates certain disclosures related to uncertain tax
benefits. The new guidance is applicable to annual periods beginning with the Company’s 2026 fiscal year.
Disaggregation of Income Statement Expenses
In November 2024, the FASB issued guidance that requires the disclosure of additional information related to certain
amounts included in each consolidated income statement expense line item, such as inventory purchases, employee
compensation, and depreciation and amortization. The guidance also requires disclosure of the total amount of selling expenses
and the Company’s definition of selling expenses. The guidance is effective for the Company for annual periods beginning in
fiscal year 2028 and for interim periods beginning in fiscal year 2029. The Company is currently assessing the impacts of the
new guidance on its financial statement disclosures.
120

Targeted Improvements to the Accounting for Internal-Use Software
In September 2025, the FASB issued guidance to modernize the accounting for internal-use software by removing
references to various stages of software development projects so that the guidance is neutral to different software development
methods and by clarifying that software cost capitalization begins when management has authorized and committed to funding,
and it is probable the software will be completed and perform its intended use. The guidance is effective for the Company
beginning with the first quarter of fiscal 2029. The new guidance is not expected to have a material impact on our financial
statements.
121
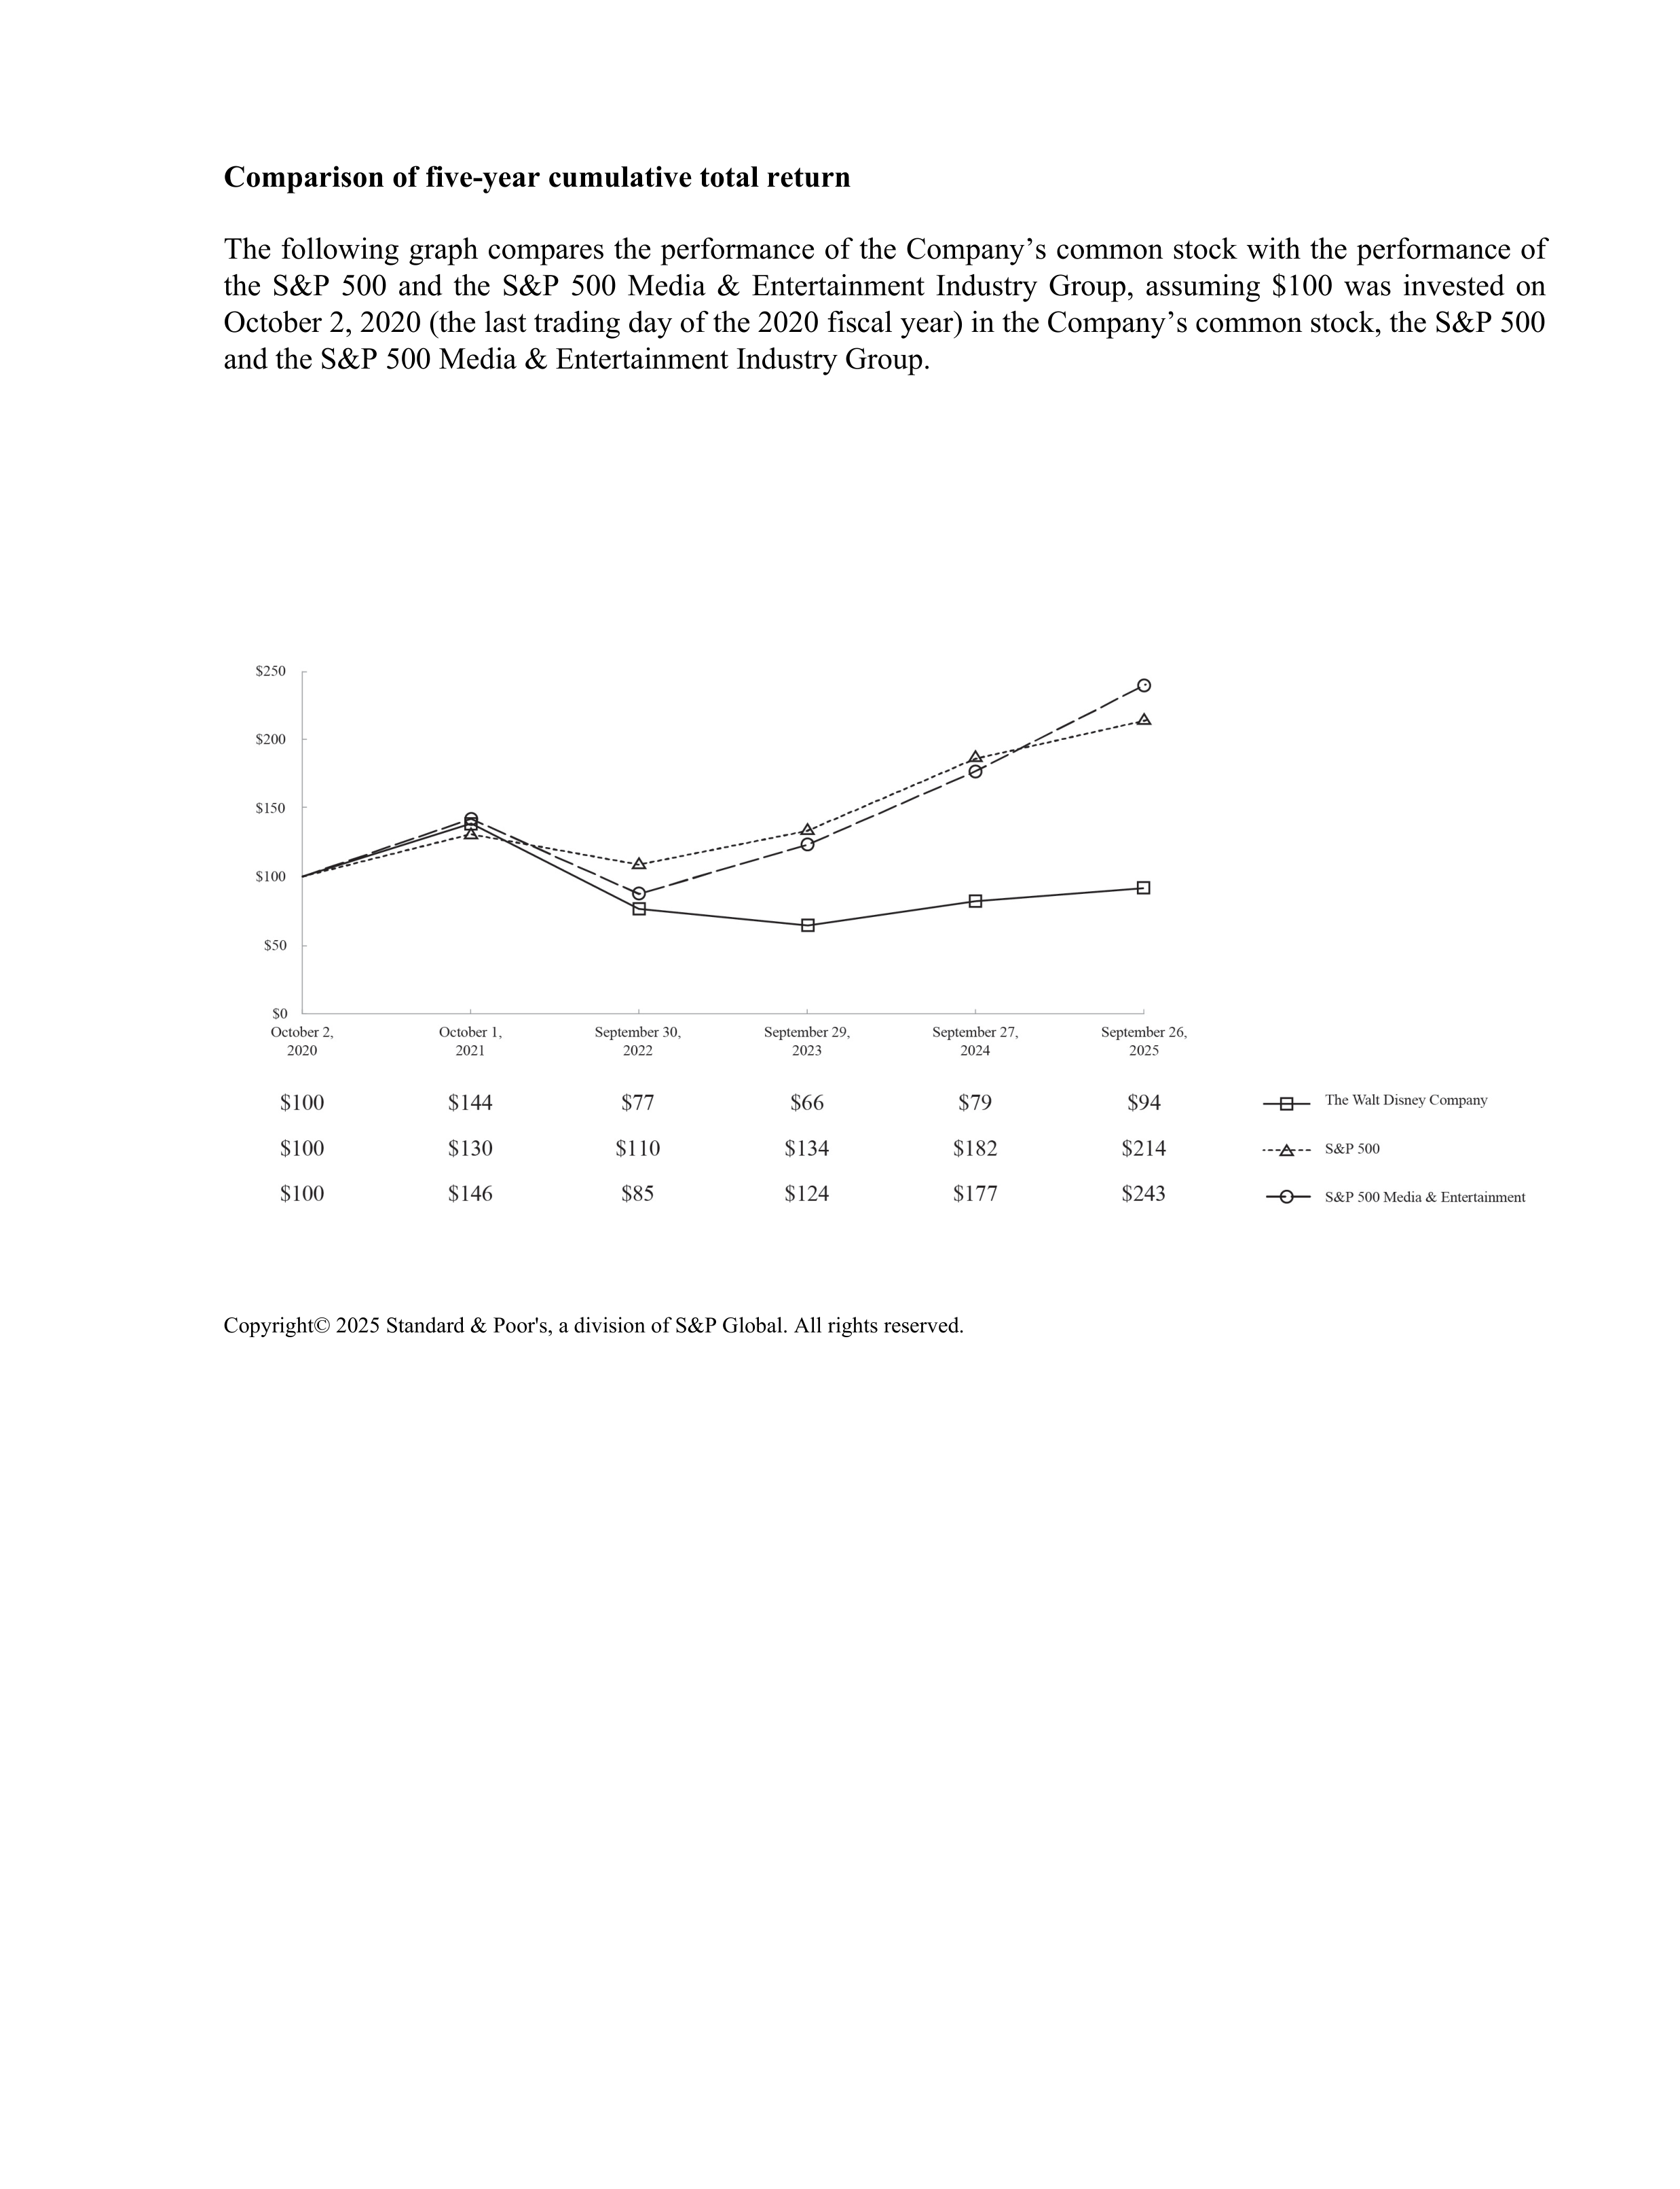
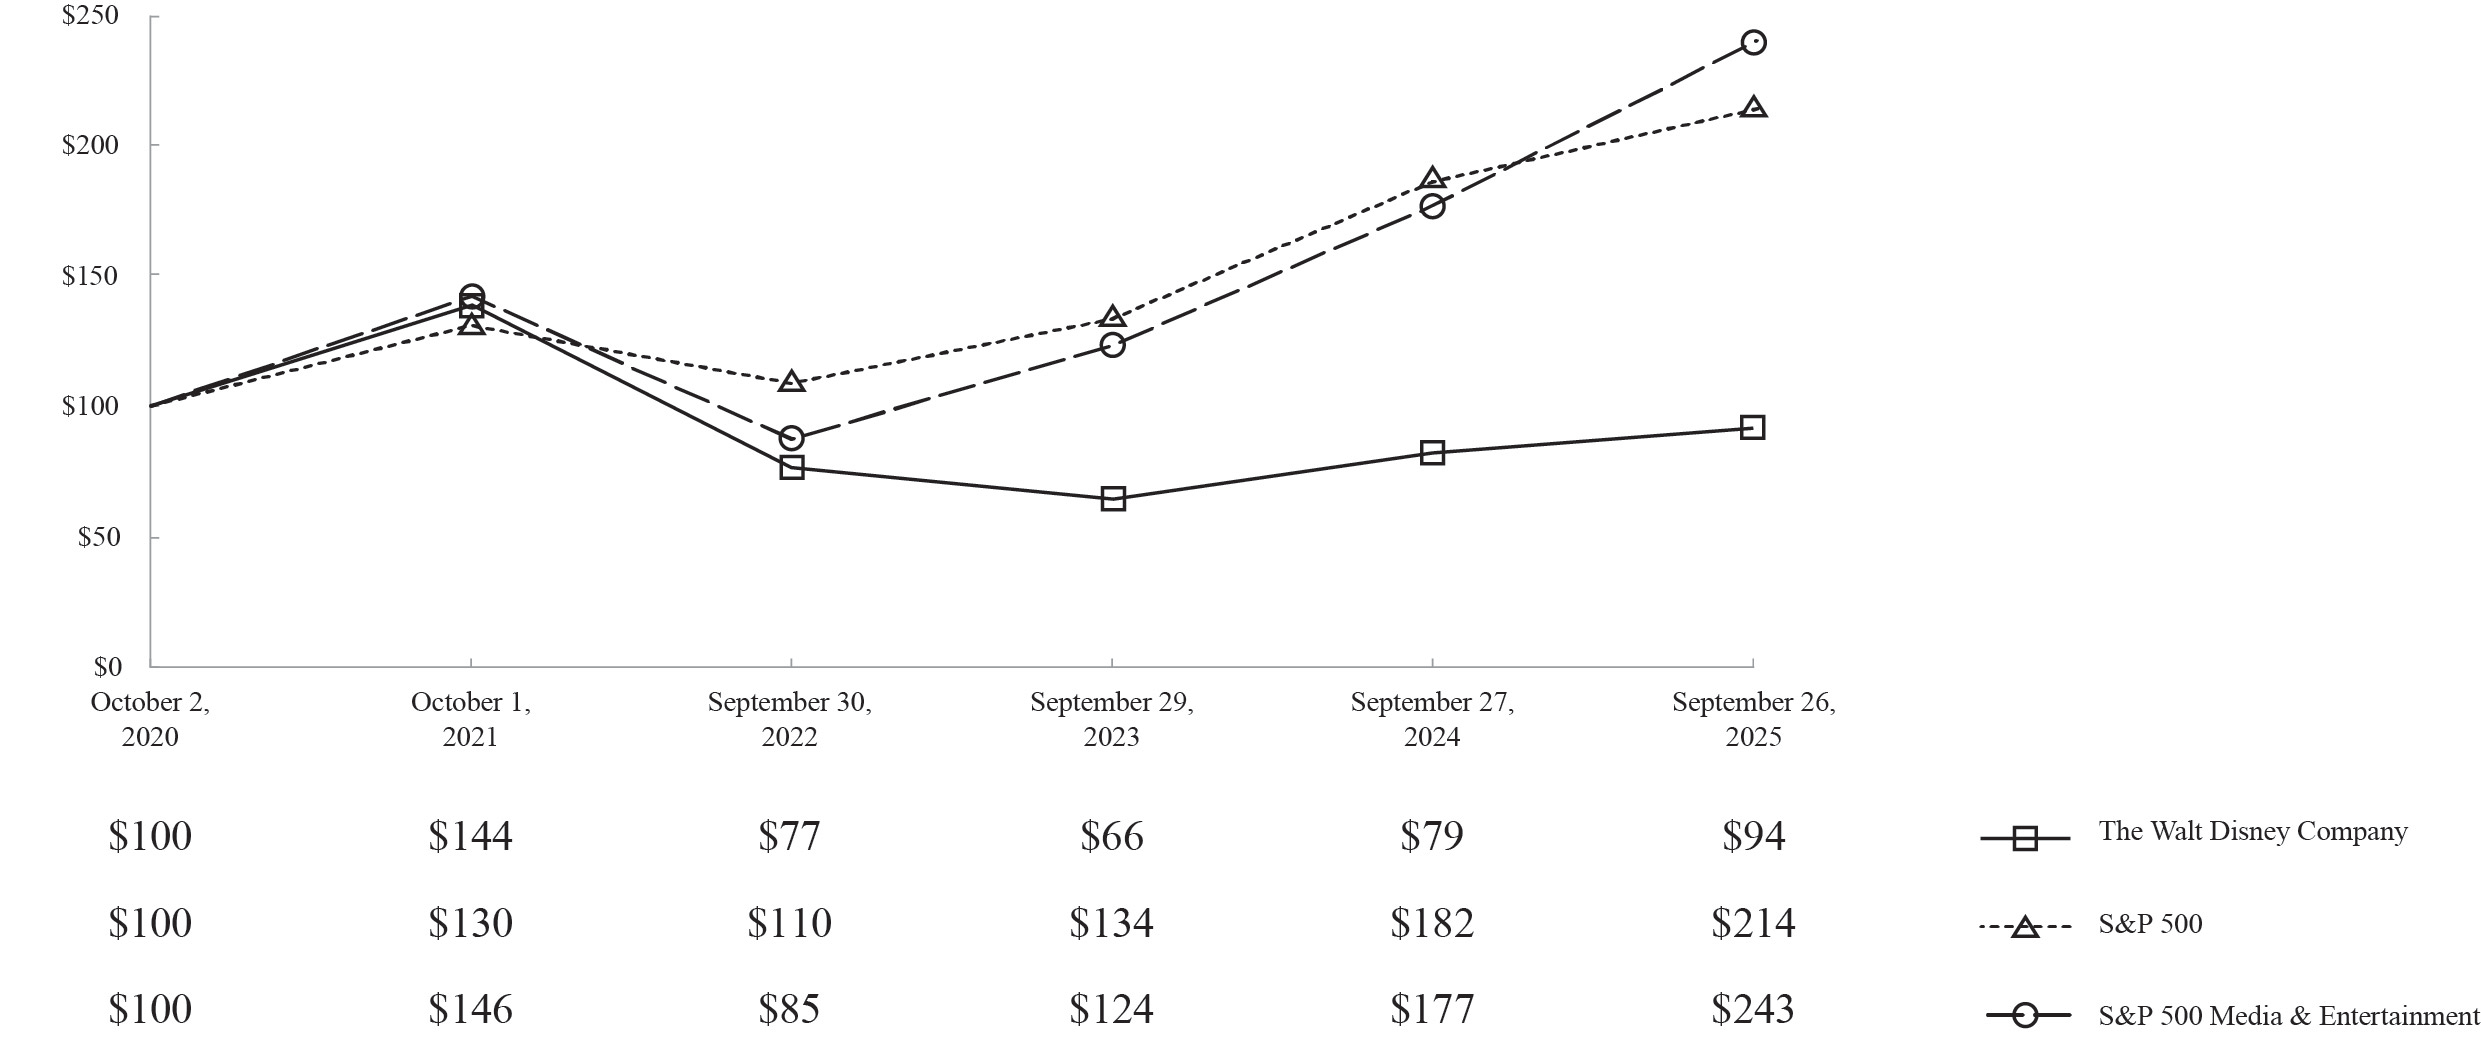
Comparison of five-year cumulative total return
The following graph compares the performance of the Company’s common stock with the performance of
the S&P 500 and the S&P 500 Media & Entertainment Industry Group, assuming $100 was invested on
October 2, 2020 (the last trading day of the 2020 fiscal year) in the Company’s common stock, the S&P 500
and the S&P 500 Media & Entertainment Industry Group.
Copyright© 2025 Standard & Poor's, a division of S&P Global. All rights reserved.
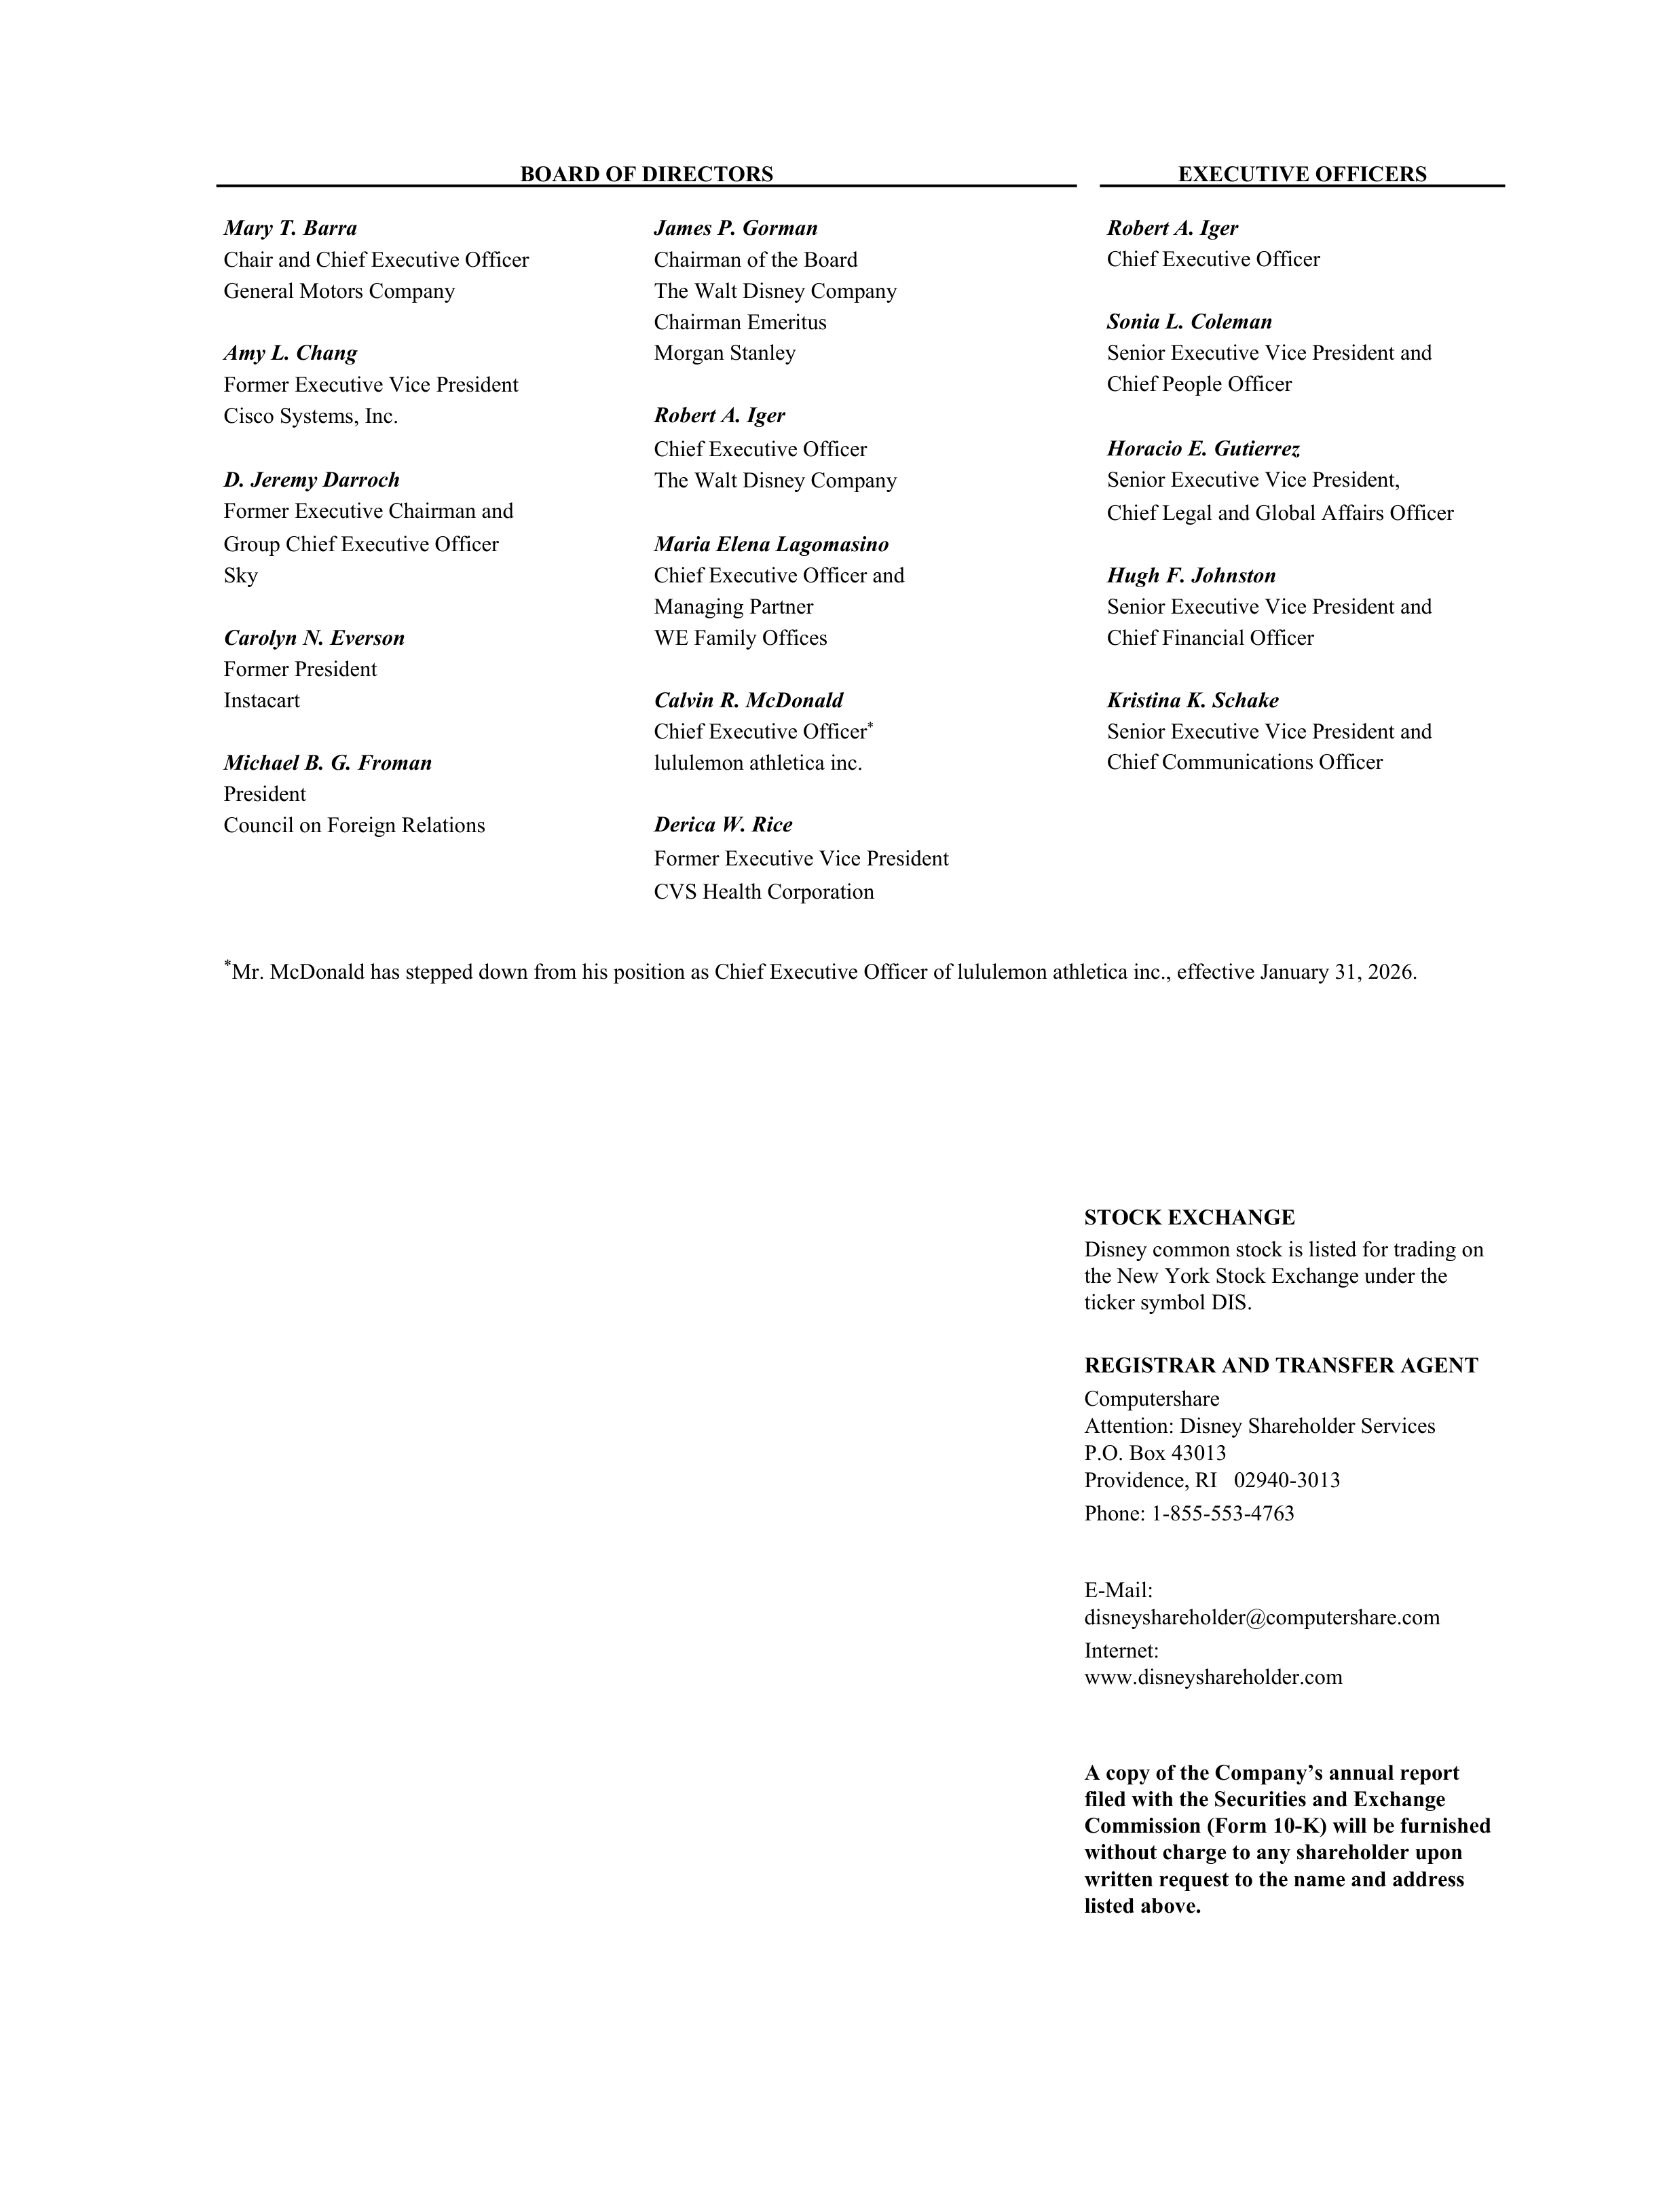
BOARD OF DIRECTORS
EXECUTIVE OFFICERS
Mary T. Barra
James P. Gorman
Robert A. Iger
Chair and Chief Executive Officer
Chairman of the Board
Chief Executive Officer
General Motors Company
The Walt Disney Company
Chairman Emeritus
Sonia L. Coleman
Amy L. Chang
Morgan Stanley
Senior Executive Vice President and
Former Executive Vice President
Chief People Officer
Cisco Systems, Inc.
Robert A. Iger
Chief Executive Officer
Horacio E. Gutierrez
D. Jeremy Darroch
The Walt Disney Company
Senior Executive Vice President,
Former Executive Chairman and
Chief Legal and Global Affairs Officer
Group Chief Executive Officer
Maria Elena Lagomasino
Sky
Chief Executive Officer and
Hugh F. Johnston
Managing Partner
Senior Executive Vice President and
Carolyn N. Everson
WE Family Offices
Chief Financial Officer
Former President
Instacart
Calvin R. McDonald
Kristina K. Schake
Chief Executive Officer
*
Senior Executive Vice President and
Michael B. G. Froman
lululemon athletica inc.
Chief Communications Officer
President
Council on Foreign Relations
Derica W. Rice
Former Executive Vice President
CVS Health Corporation
*
Mr. McDonald has stepped down from his position as Chief Executive Officer of lululemon athletica inc., effective January 31, 2026.
STOCK EXCHANGE
Disney common stock is listed for trading on
the New York Stock Exchange under the
ticker symbol DIS.
REGISTRAR AND TRANSFER AGENT
Computershare
Attention: Disney Shareholder Services
P.O. Box 43013
Providence, RI 02940-3013
Phone: 1-855-553-4763
E-Mail:
disneyshareholder@computershare.com
Internet:
www.disneyshareholder.com
A copy of the Company’s annual report
filed with the Securities and Exchange
Commission (Form 10-K) will be furnished
without charge to any shareholder upon
written request to the name and address
listed above.

©
Disney