


© 2026 UnitedHealth Group, Inc. All rights reserved.
1
Full Year 2025 Revenues of $447.6 Billion Grew 12% Year-
Over-Year; Earnings of $13.23 Per Share; Adjusted Earnings
of $16.35 Per Share
We confronted challenges directly and finished
2025 as a much stronger company, giving us
the momentum to better serve those who
count on us and continue to improve our core
performance.”
Stephen Hemsley
Chief Executive Officer, UnitedHealth Group
“
January 27, 2026
UnitedHealth Group (NYSE: UNH) today reported full year and fourth quarter 2025
results and issued its 2026 outlook.
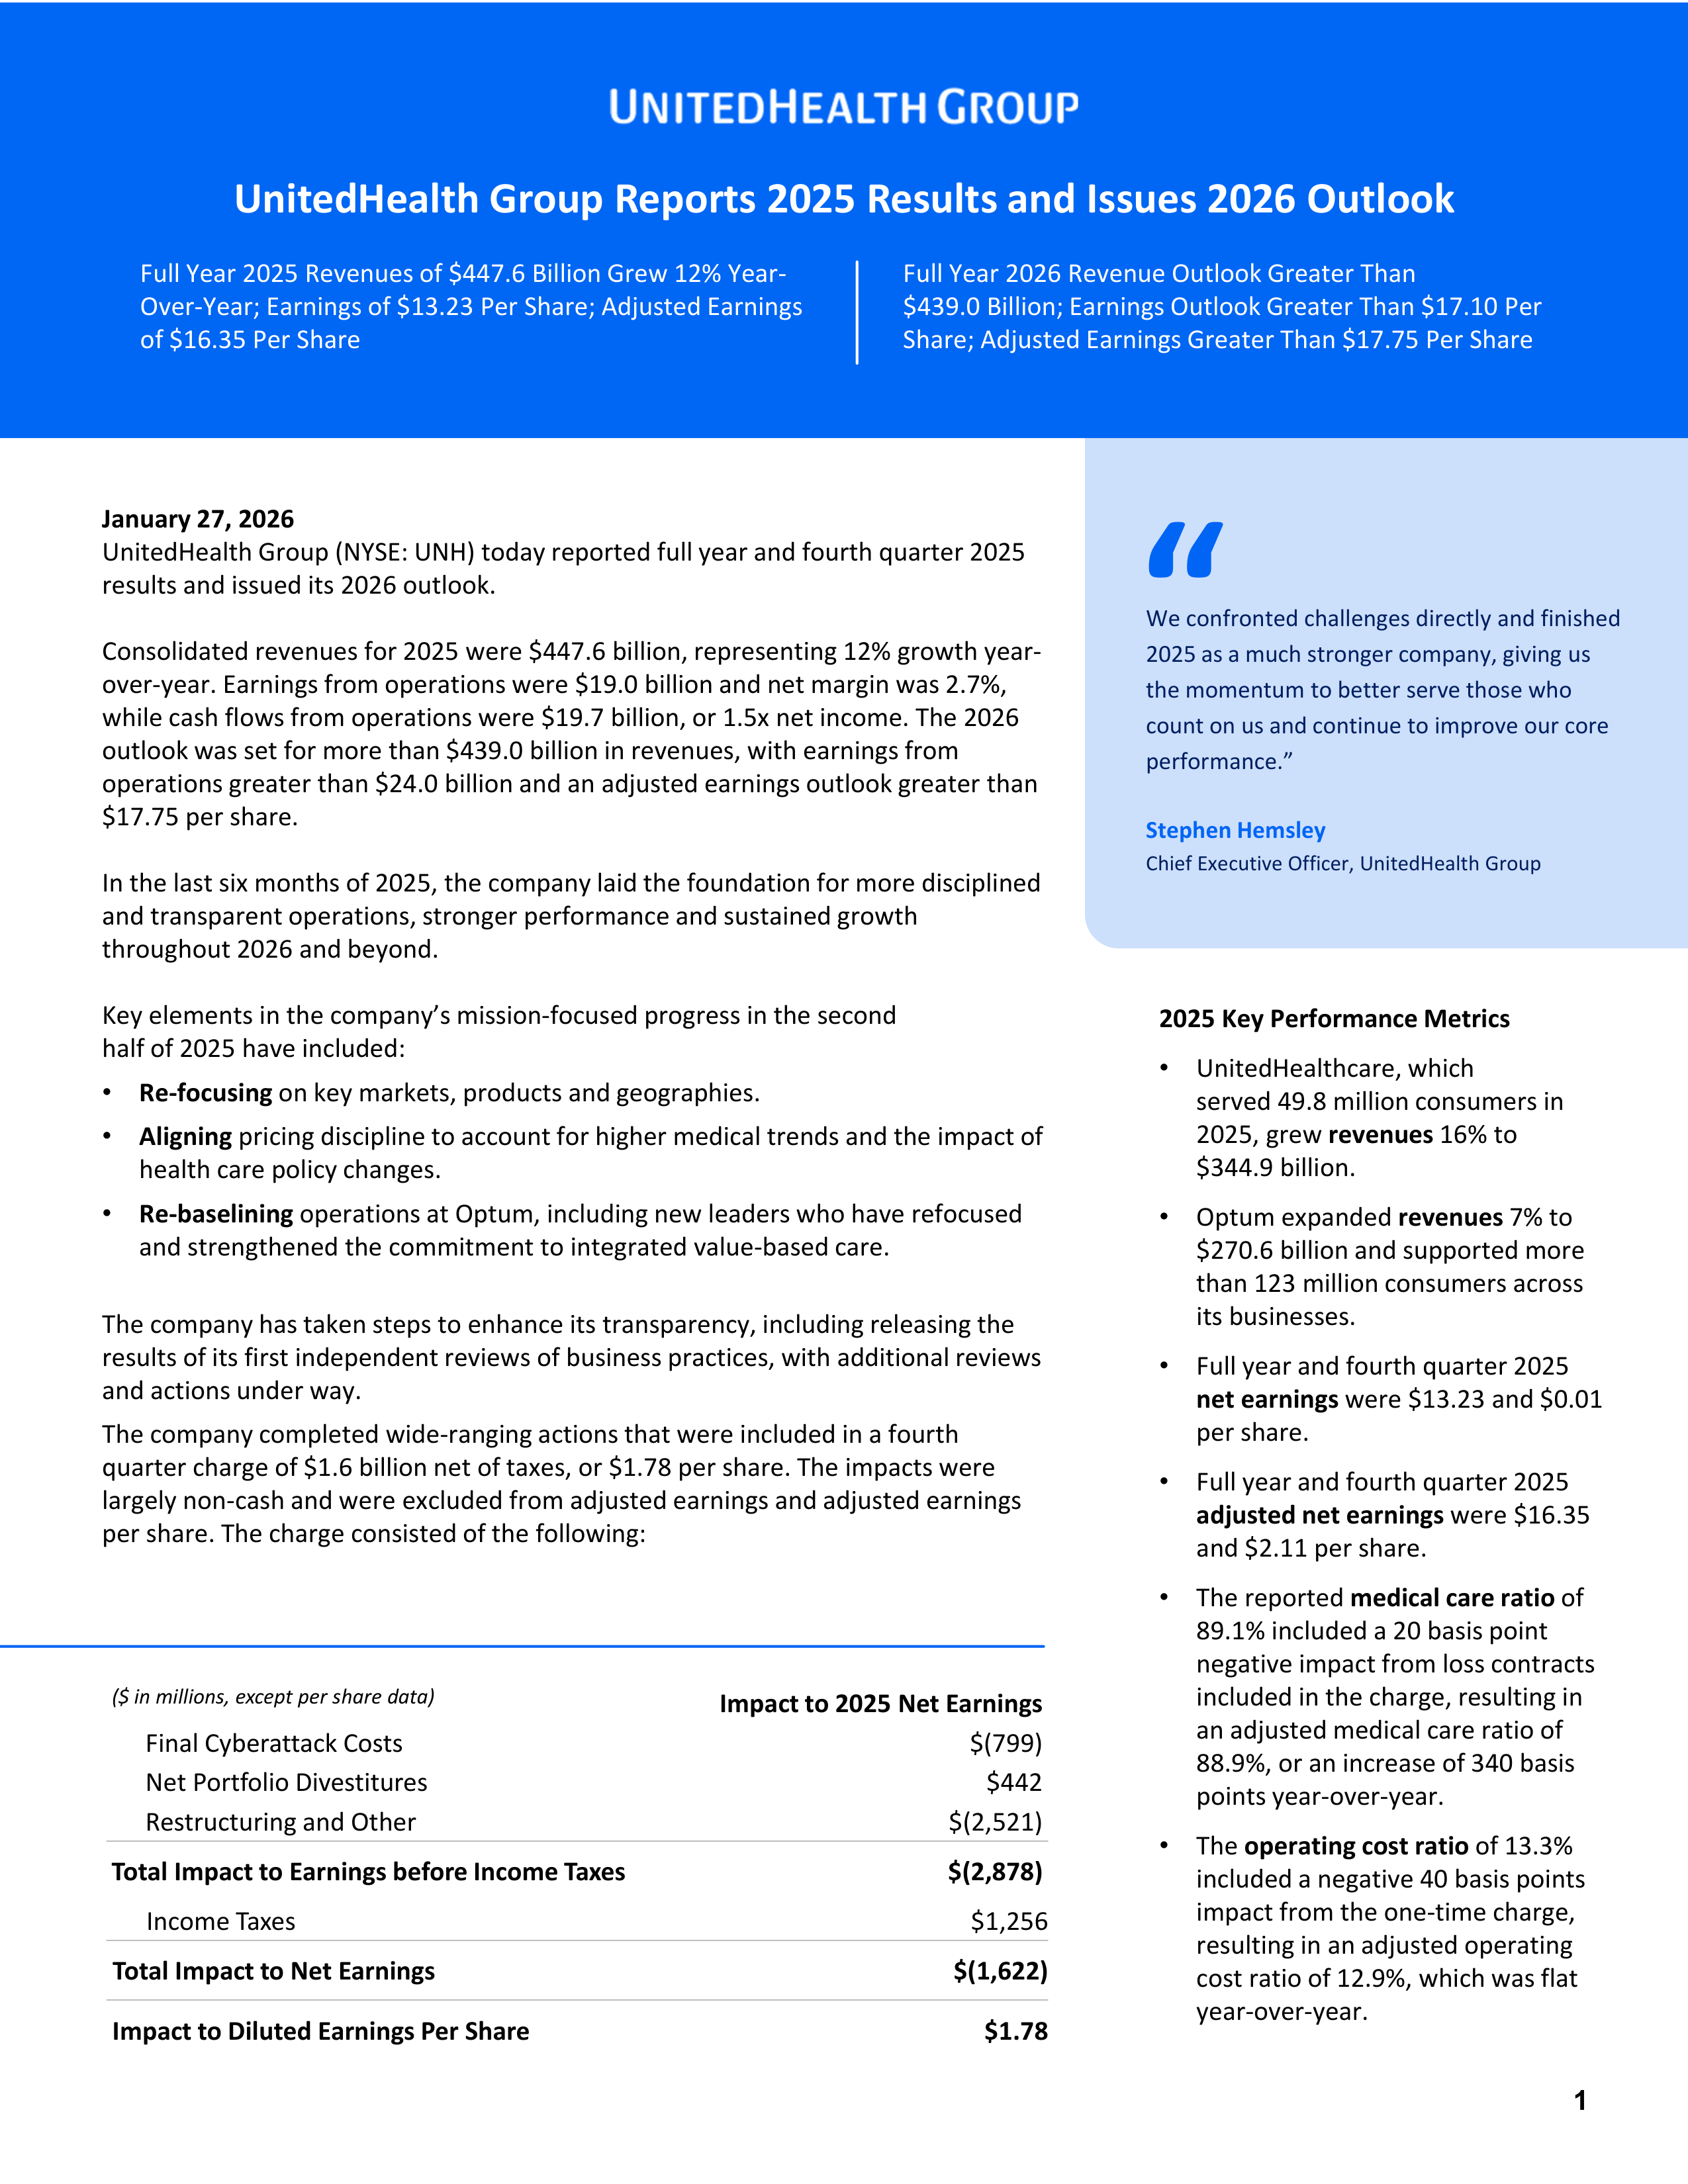
Consolidated revenues for 2025 were $447.6 billion, representing 12% growth year-
over-year. Earnings from operations were $19.0 billion and net margin was 2.7%,
while cash flows from operations were $19.7 billion, or 1.5x net income. The 2026
outlook was set for more than $439.0 billion in revenues, with earnings from
operations greater than $24.0 billion and an adjusted earnings outlook greater than
$17.75 per share.
In the last six months of 2025, the company laid the foundation for more disciplined
and transparent operations, stronger performance and sustained growth
throughout 2026 and beyond.
Key elements in the company’s mission-focused progress in the second
half of 2025 have included:
•
Re-focusing
on key markets, products and geographies.
•
Aligning
pricing discipline to account for higher medical trends and the impact of
health care policy changes.
•
Re-baselining
operations at Optum, including new leaders who have refocused
and strengthened the commitment to integrated value-based care.
The company has taken steps to enhance its transparency, including releasing the
results of its first independent reviews of business practices, with additional reviews
and actions under way.
The company completed wide-ranging actions that were included in a fourth
quarter charge of $1.6 billion net of taxes, or $1.78 per share. The impacts were
largely non-cash and were excluded from adjusted earnings and adjusted earnings
per share. The charge consisted of the following:
UnitedHealth Group Reports 2025 Results and Issues 2026 Outlook
2025 Key Performance Metrics
•
UnitedHealthcare, which
served 49.8 million consumers in
2025, grew
revenues
16% to
$344.9 billion.
•
Optum expanded
revenues
7% to
$270.6 billion and supported more
than 123 million consumers across
its businesses.
•
Full year and fourth quarter 2025
net earnings
were $13.23 and $0.01
per share.
•
Full year and fourth quarter 2025
adjusted net earnings
were $16.35
and $2.11 per share.
•
The reported
medical care ratio
of
89.1% included a 20 basis point
negative impact from loss contracts
included in the charge, resulting in
an adjusted medical care ratio of
88.9%, or an increase of 340 basis
points year-over-year.
•
The
operating cost ratio
of 13.3%
included a negative 40 basis points
impact from the one-time charge,
resulting in an adjusted operating
cost ratio of 12.9%, which was flat
year-over-year.
Impact to 2025 Net Earnings
($ in millions, except per share data)
$(799)
Final Cyberattack Costs
$442
Net Portfolio Divestitures
$(2,521)
Restructuring and Other
$(2,878)
Total Impact to Earnings before Income Taxes
$1,256
Income Taxes
$(1,622)
Total Impact to Net Earnings
$1.78
Impact to Diluted Earnings Per Share
Full Year 2026 Revenue Outlook Greater Than
$439.0 Billion; Earnings Outlook Greater Than $17.10 Per
Share; Adjusted Earnings Greater Than $17.75 Per Share


© 2026 UnitedHealth Group, Inc. All rights reserved.
2
Dec 31,
2024
Sept 30,
2025
Dec 31,
2025
Dec 31,
2024
Dec 31,
2025
Revenues
Flat
$100.8B
$113.2B
$113.2B
+12%
+12%
$400.3B
$447.6B
Three Months Ended
Year Ended
Dec 31,
2024
Sept 30,
2025
Dec 31,
2025
Dec 31,
2024
Dec 31,
2025
Earnings from Operations
-91%
$7.8B
$4.3B
$0.4B
-95%
-41%
$32.3B
$19.0B
Three Months Ended
Year Ended
Financial Performance
UnitedHealth Group
•
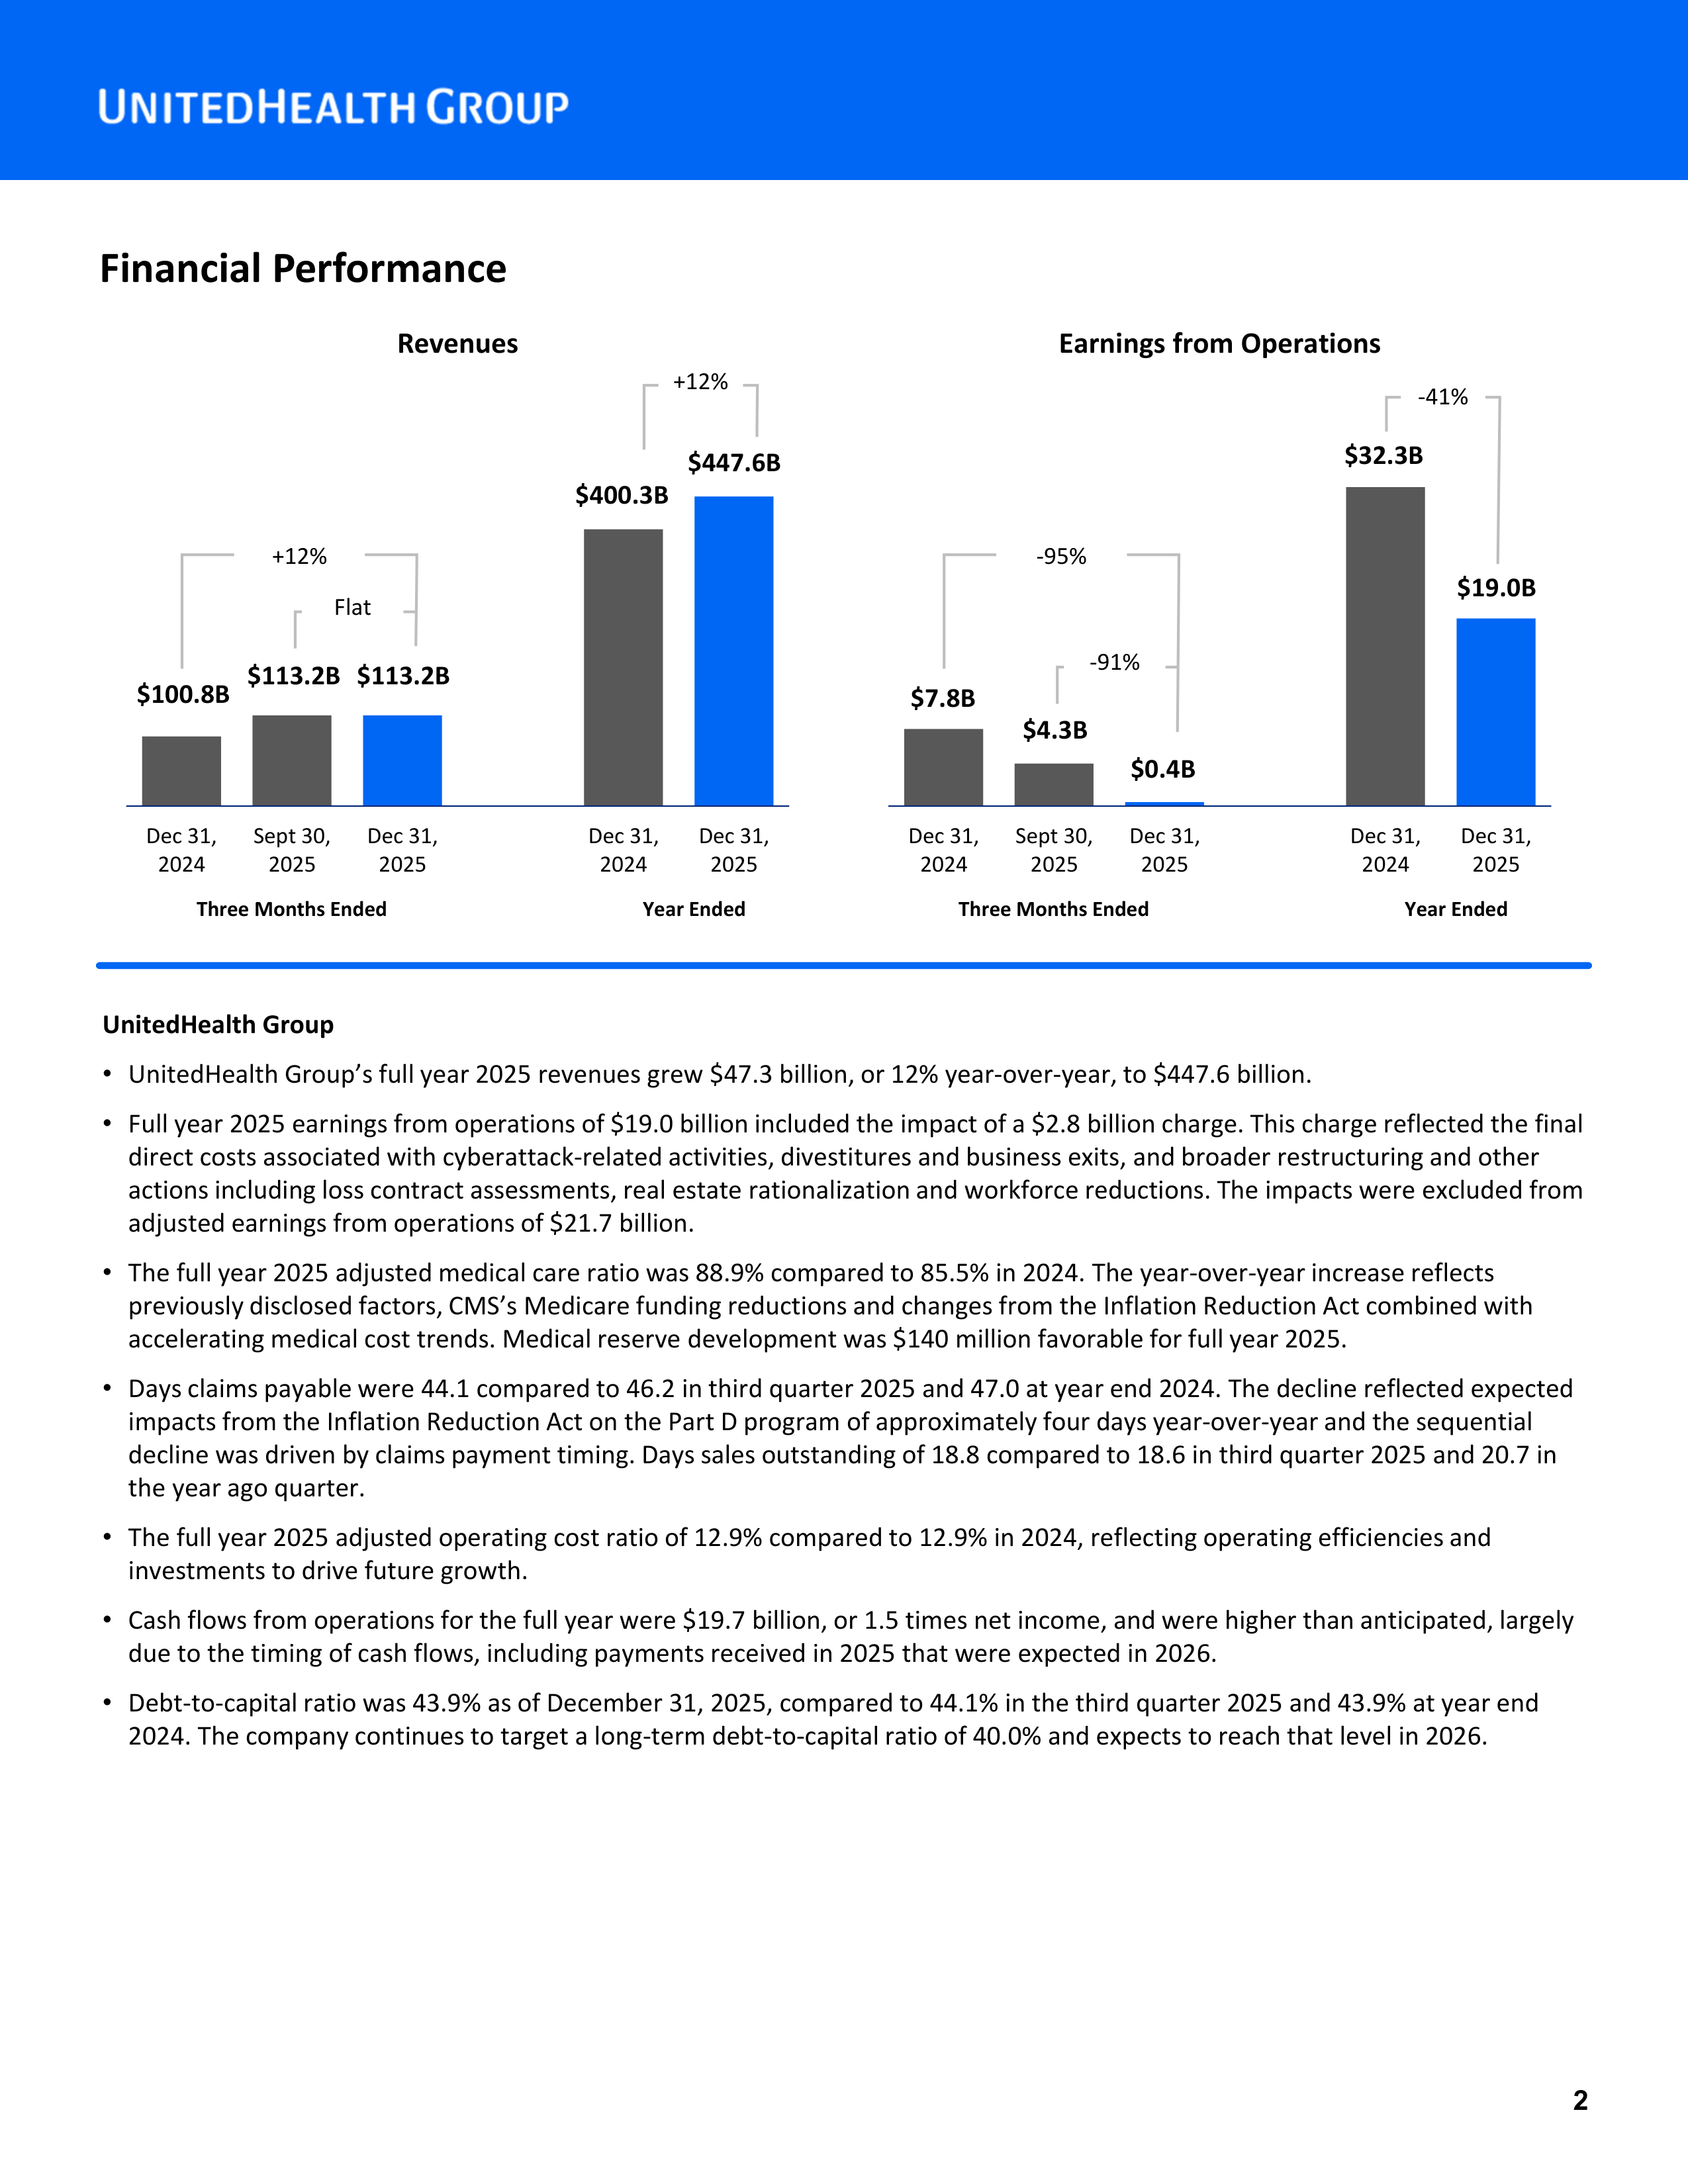
UnitedHealth Group’s full year 2025 revenues grew $47.3 billion, or 12% year-over-year, to $447.6 billion.
•
Full year 2025 earnings from operations of $19.0 billion included the impact of a $2.8 billion charge. This charge reflected the final
direct costs associated with cyberattack-related activities, divestitures and business exits, and broader restructuring and other
actions including loss contract assessments, real estate rationalization and workforce reductions. The impacts were excluded from
adjusted earnings from operations of $21.7 billion.
•
The full year 2025 adjusted medical care ratio was 88.9% compared to 85.5% in 2024. The year-over-year increase reflects
previously disclosed factors, CMS’s Medicare funding reductions and changes from the Inflation Reduction Act combined with
accelerating medical cost trends. Medical reserve development was $140 million favorable for full year 2025.
•
Days claims payable were 44.1 compared to 46.2 in third quarter 2025 and 47.0 at year end 2024. The decline reflected expected
impacts from the Inflation Reduction Act on the Part D program of approximately four days year-over-year and the sequential
decline was driven by claims payment timing. Days sales outstanding of 18.8 compared to 18.6 in third quarter 2025 and 20.7 in
the year ago quarter.
•
The full year 2025 adjusted operating cost ratio of 12.9% compared to 12.9% in 2024, reflecting operating efficiencies and
investments to drive future growth.
•
Cash flows from operations for the full year were $19.7 billion, or 1.5 times net income, and were higher than anticipated, largely
due to the timing of cash flows, including payments received in 2025 that were expected in 2026.
•
Debt-to-capital ratio was 43.9% as of December 31, 2025, compared to 44.1% in the third quarter 2025 and 43.9% at year end
2024. The company continues to target a long-term debt-to-capital ratio of 40.0% and expects to reach that level in 2026.


© 2026 UnitedHealth Group, Inc. All rights reserved.
3
UnitedHealthcare
•
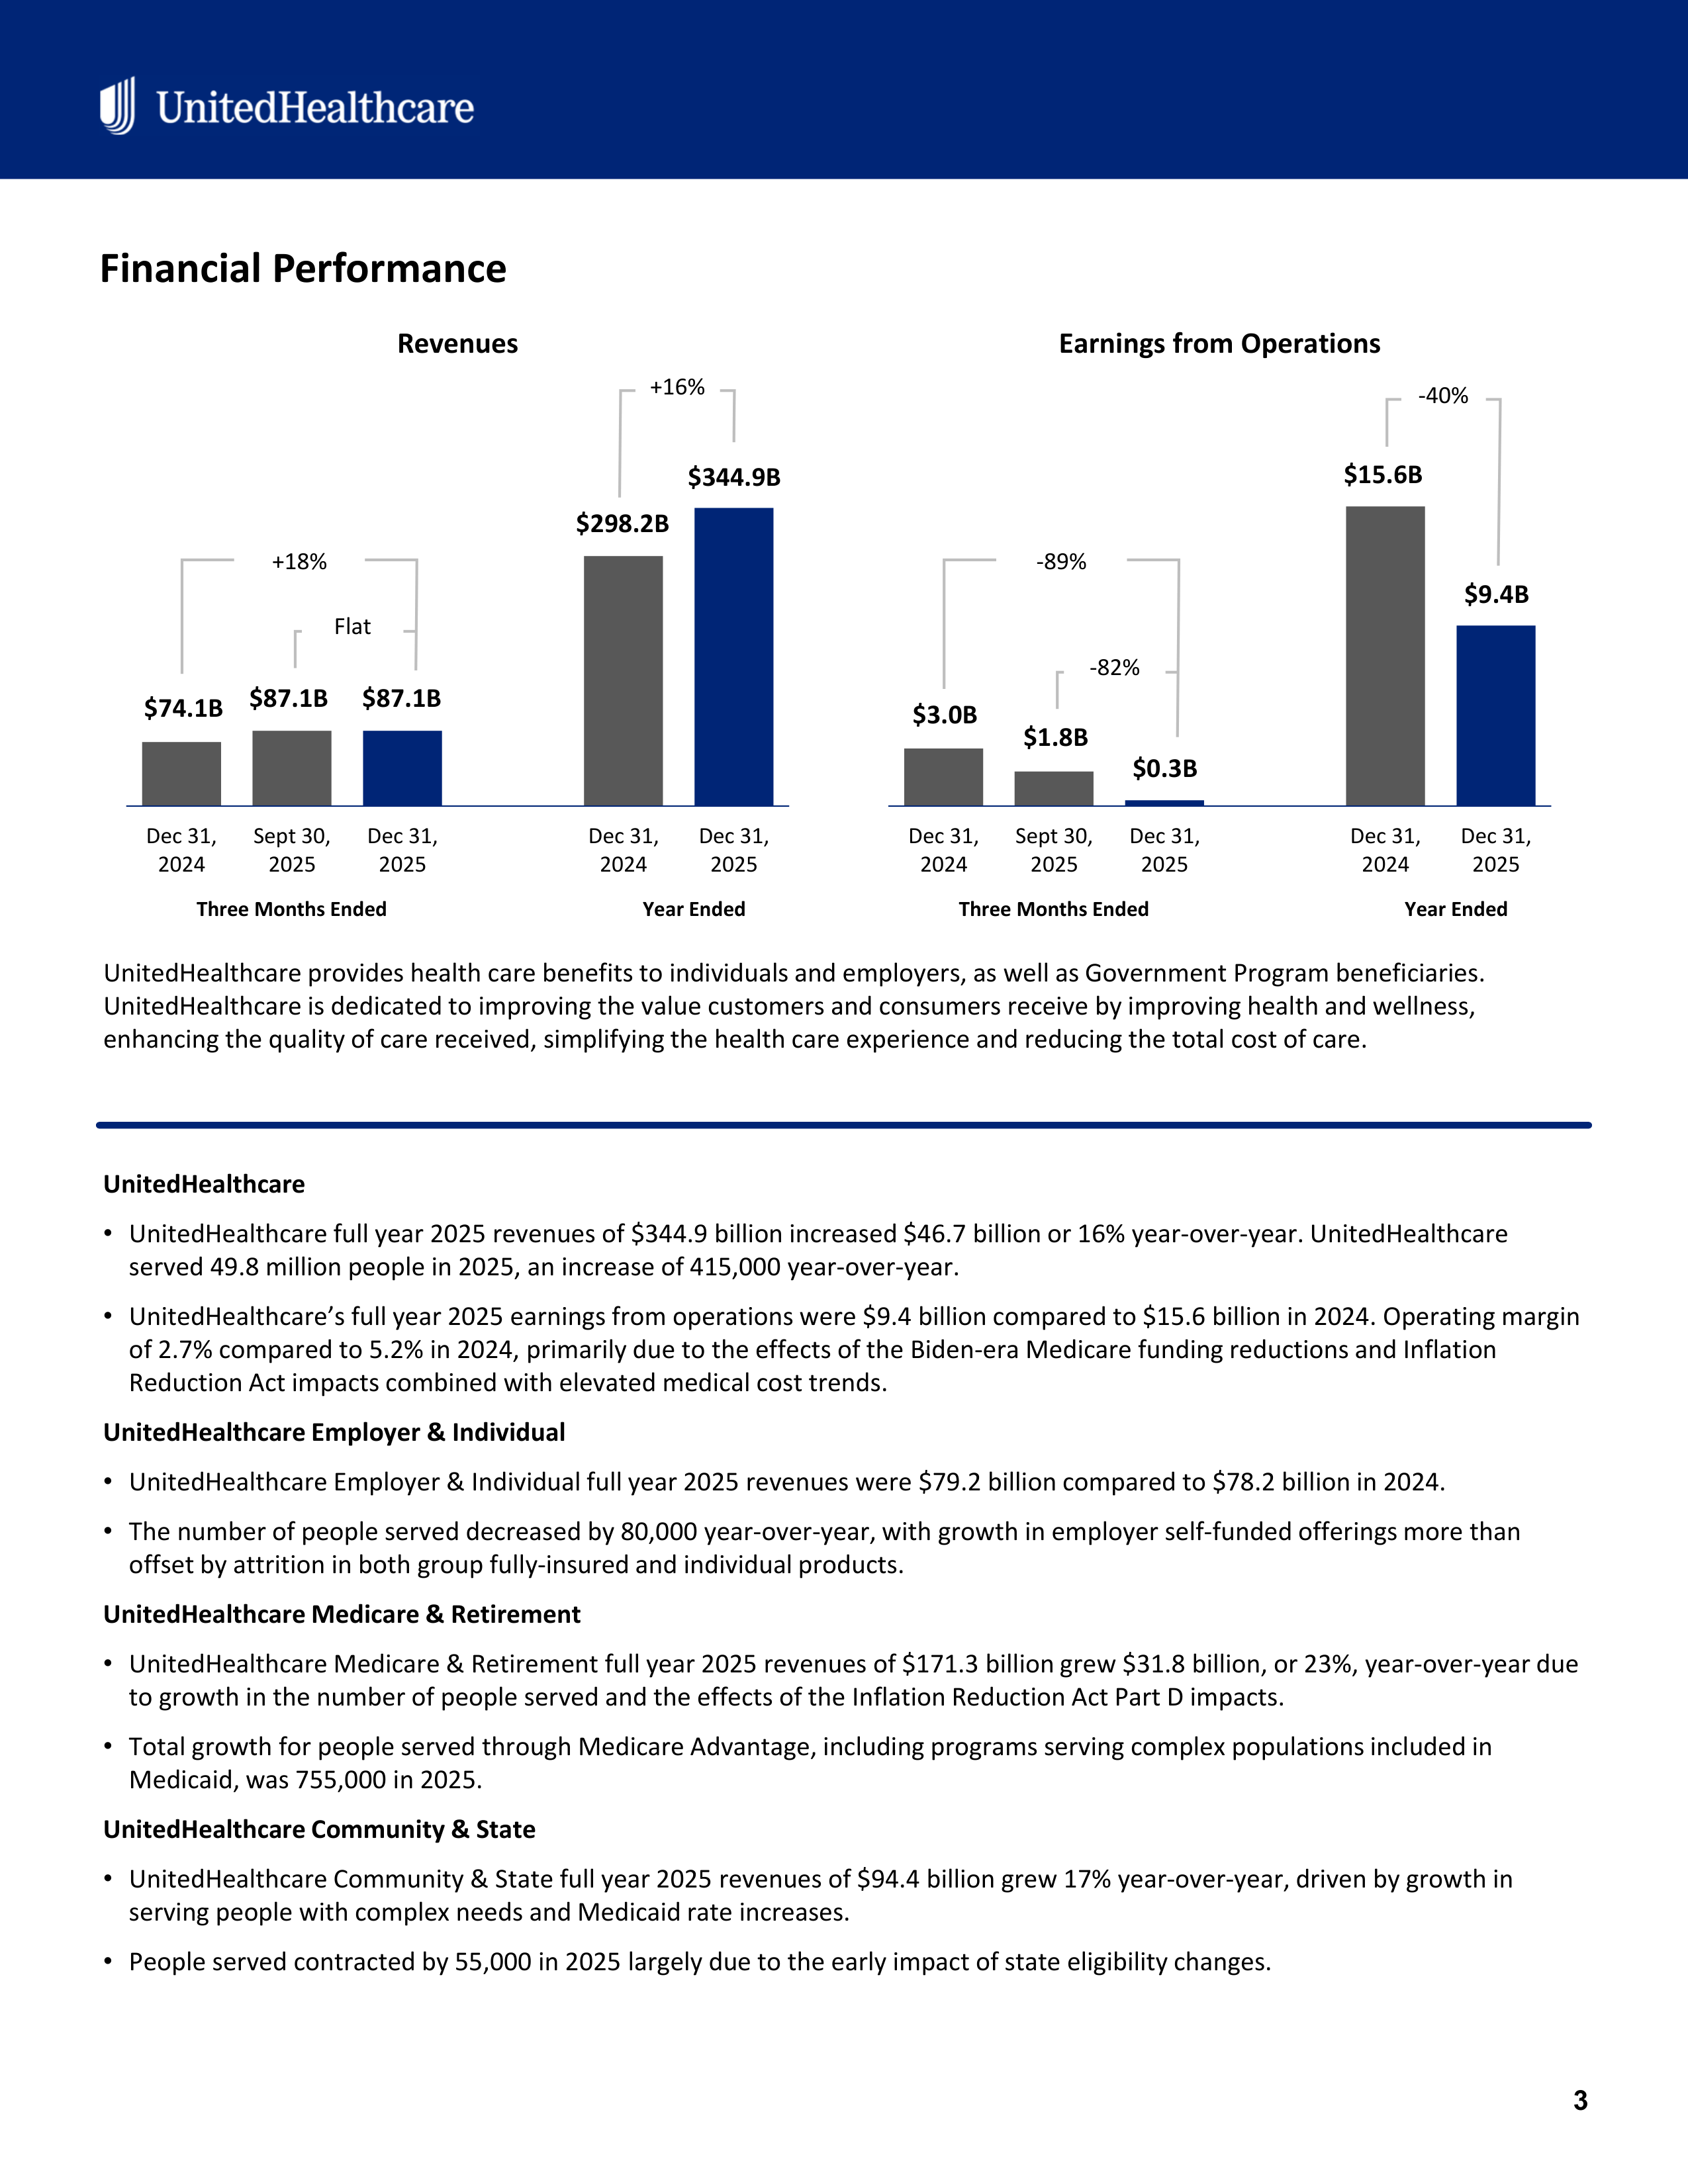
UnitedHealthcare full year 2025 revenues of $344.9 billion increased $46.7 billion or 16% year-over-year. UnitedHealthcare
served 49.8 million people in 2025, an increase of 415,000 year-over-year.
•
UnitedHealthcare’s full year 2025 earnings from operations were $9.4 billion compared to $15.6 billion in 2024. Operating margin
of 2.7% compared to 5.2% in 2024, primarily due to the effects of the Biden-era Medicare funding reductions and Inflation
Reduction Act impacts combined with elevated medical cost trends.
UnitedHealthcare Employer & Individual
•
UnitedHealthcare Employer & Individual full year 2025 revenues were $79.2 billion compared to $78.2 billion in 2024.
•
The number of people served decreased by 80,000 year-over-year, with growth in employer self-funded offerings more than
offset by attrition in both group fully-insured and individual products.
UnitedHealthcare Medicare & Retirement
•
UnitedHealthcare Medicare & Retirement full year 2025 revenues of $171.3 billion grew $31.8 billion, or 23%, year-over-year due
to growth in the number of people served and the effects of the Inflation Reduction Act Part D impacts.
•
Total growth for people served through Medicare Advantage, including programs serving complex populations included in
Medicaid, was 755,000 in 2025.
UnitedHealthcare Community & State
•
UnitedHealthcare Community & State full year 2025 revenues of $94.4 billion grew 17% year-over-year, driven by growth in
serving people with complex needs and Medicaid rate increases.
•
People served contracted by 55,000 in 2025 largely due to the early impact of state eligibility changes.
Dec 31,
2024
Sept 30,
2025
Dec 31,
2025
Dec 31,
2024
Dec 31,
2025
Revenues
Dec 31,
2024
Sept 30,
2025
Dec 31,
2025
Dec 31,
2024
Dec 31,
2025
Earnings from Operations
$74.1B
Flat
$87.1B
$87.1B
+18%
+16%
$298.2B
$344.9B
-82%
$3.0B
$1.8B
$0.3B
-89%
-40%
$15.6B
$9.4B
Three Months Ended
Year Ended
Three Months Ended
Year Ended
Financial Performance
UnitedHealthcare provides health care benefits to individuals and employers, as well as Government Program beneficiaries.
UnitedHealthcare is dedicated to improving the value customers and consumers receive by improving health and wellness,
enhancing the quality of care received, simplifying the health care experience and reducing the total cost of care.


© 2026 UnitedHealth Group, Inc. All rights reserved.
4
Optum Health
•
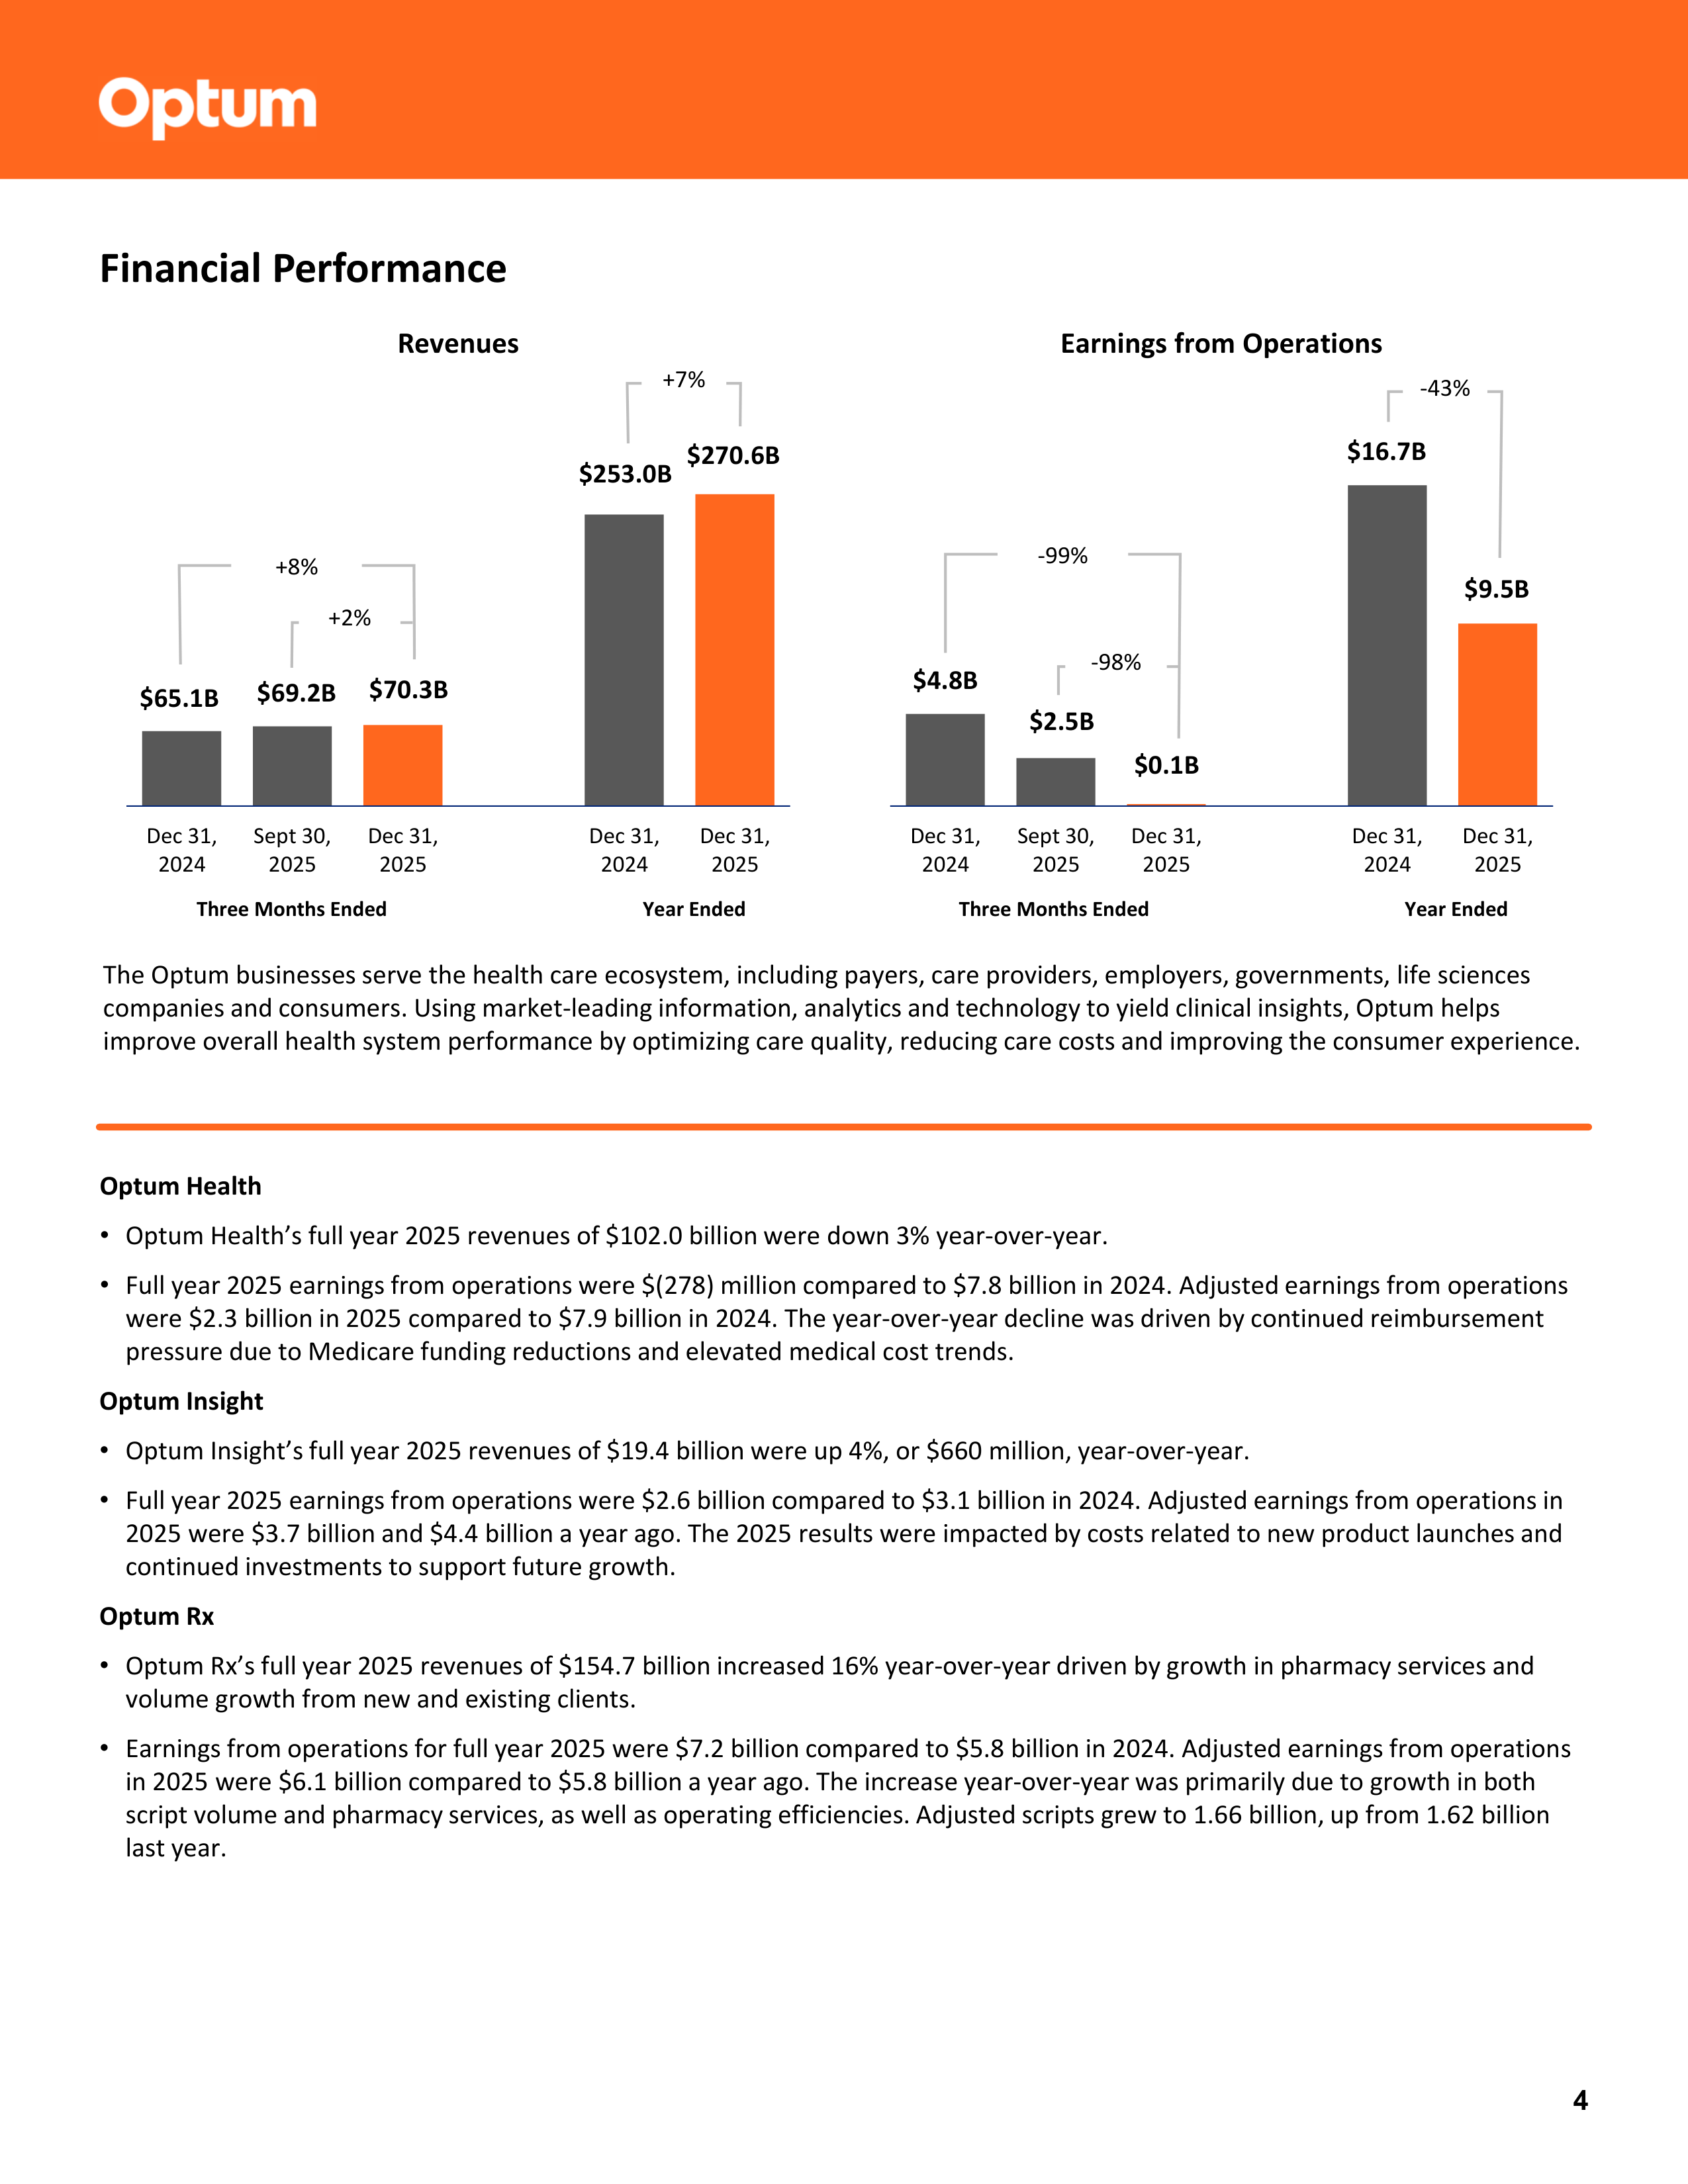
Optum Health’s full year 2025 revenues of $102.0 billion were down 3% year-over-year.
•
Full year 2025 earnings from operations were $(278) million compared to $7.8 billion in 2024. Adjusted earnings from operations
were $2.3 billion in 2025 compared to $7.9 billion in 2024. The year-over-year decline was driven by continued reimbursement
pressure due to Medicare funding reductions and elevated medical cost trends.
Optum Insight
•
Optum Insight’s full year 2025 revenues of $19.4 billion were up 4%, or $660 million, year-over-year.
•
Full year 2025 earnings from operations were $2.6 billion compared to $3.1 billion in 2024. Adjusted earnings from operations in
2025 were $3.7 billion and $4.4 billion a year ago. The 2025 results were impacted by costs related to new product launches and
continued investments to support future growth.
Optum Rx
•
Optum Rx’s full year 2025 revenues of $154.7 billion increased 16% year-over-year driven by growth in pharmacy services and
volume growth from new and existing clients.
•
Earnings from operations for full year 2025 were $7.2 billion compared to $5.8 billion in 2024. Adjusted earnings from operations
in 2025 were $6.1 billion compared to $5.8 billion a year ago. The increase year-over-year was primarily due to growth in both
script volume and pharmacy services, as well as operating efficiencies. Adjusted scripts grew to 1.66 billion, up from 1.62 billion
last year.
The Optum businesses serve the health care ecosystem, including payers, care providers, employers, governments, life sciences
companies and consumers. Using market-leading information, analytics and technology to yield clinical insights, Optum helps
improve overall health system performance by optimizing care quality, reducing care costs and improving the consumer experience.
Dec 31,
2024
Sept 30,
2025
Dec 31,
2025
Dec 31,
2024
Dec 31,
2025
Revenues
+2%
$65.1B
$69.2B
$70.3B
+8%
+7%
$253.0B
$270.6B
Dec 31,
2024
Sept 30,
2025
Dec 31,
2025
Dec 31,
2024
Dec 31,
2025
Earnings from Operations
-98%
$4.8B
$2.5B
$0.1B
-99%
-43%
$16.7B
$9.5B
Three Months Ended
Year Ended
Three Months Ended
Year Ended
Financial Performance


© 2026 UnitedHealth Group, Inc. All rights reserved.
5
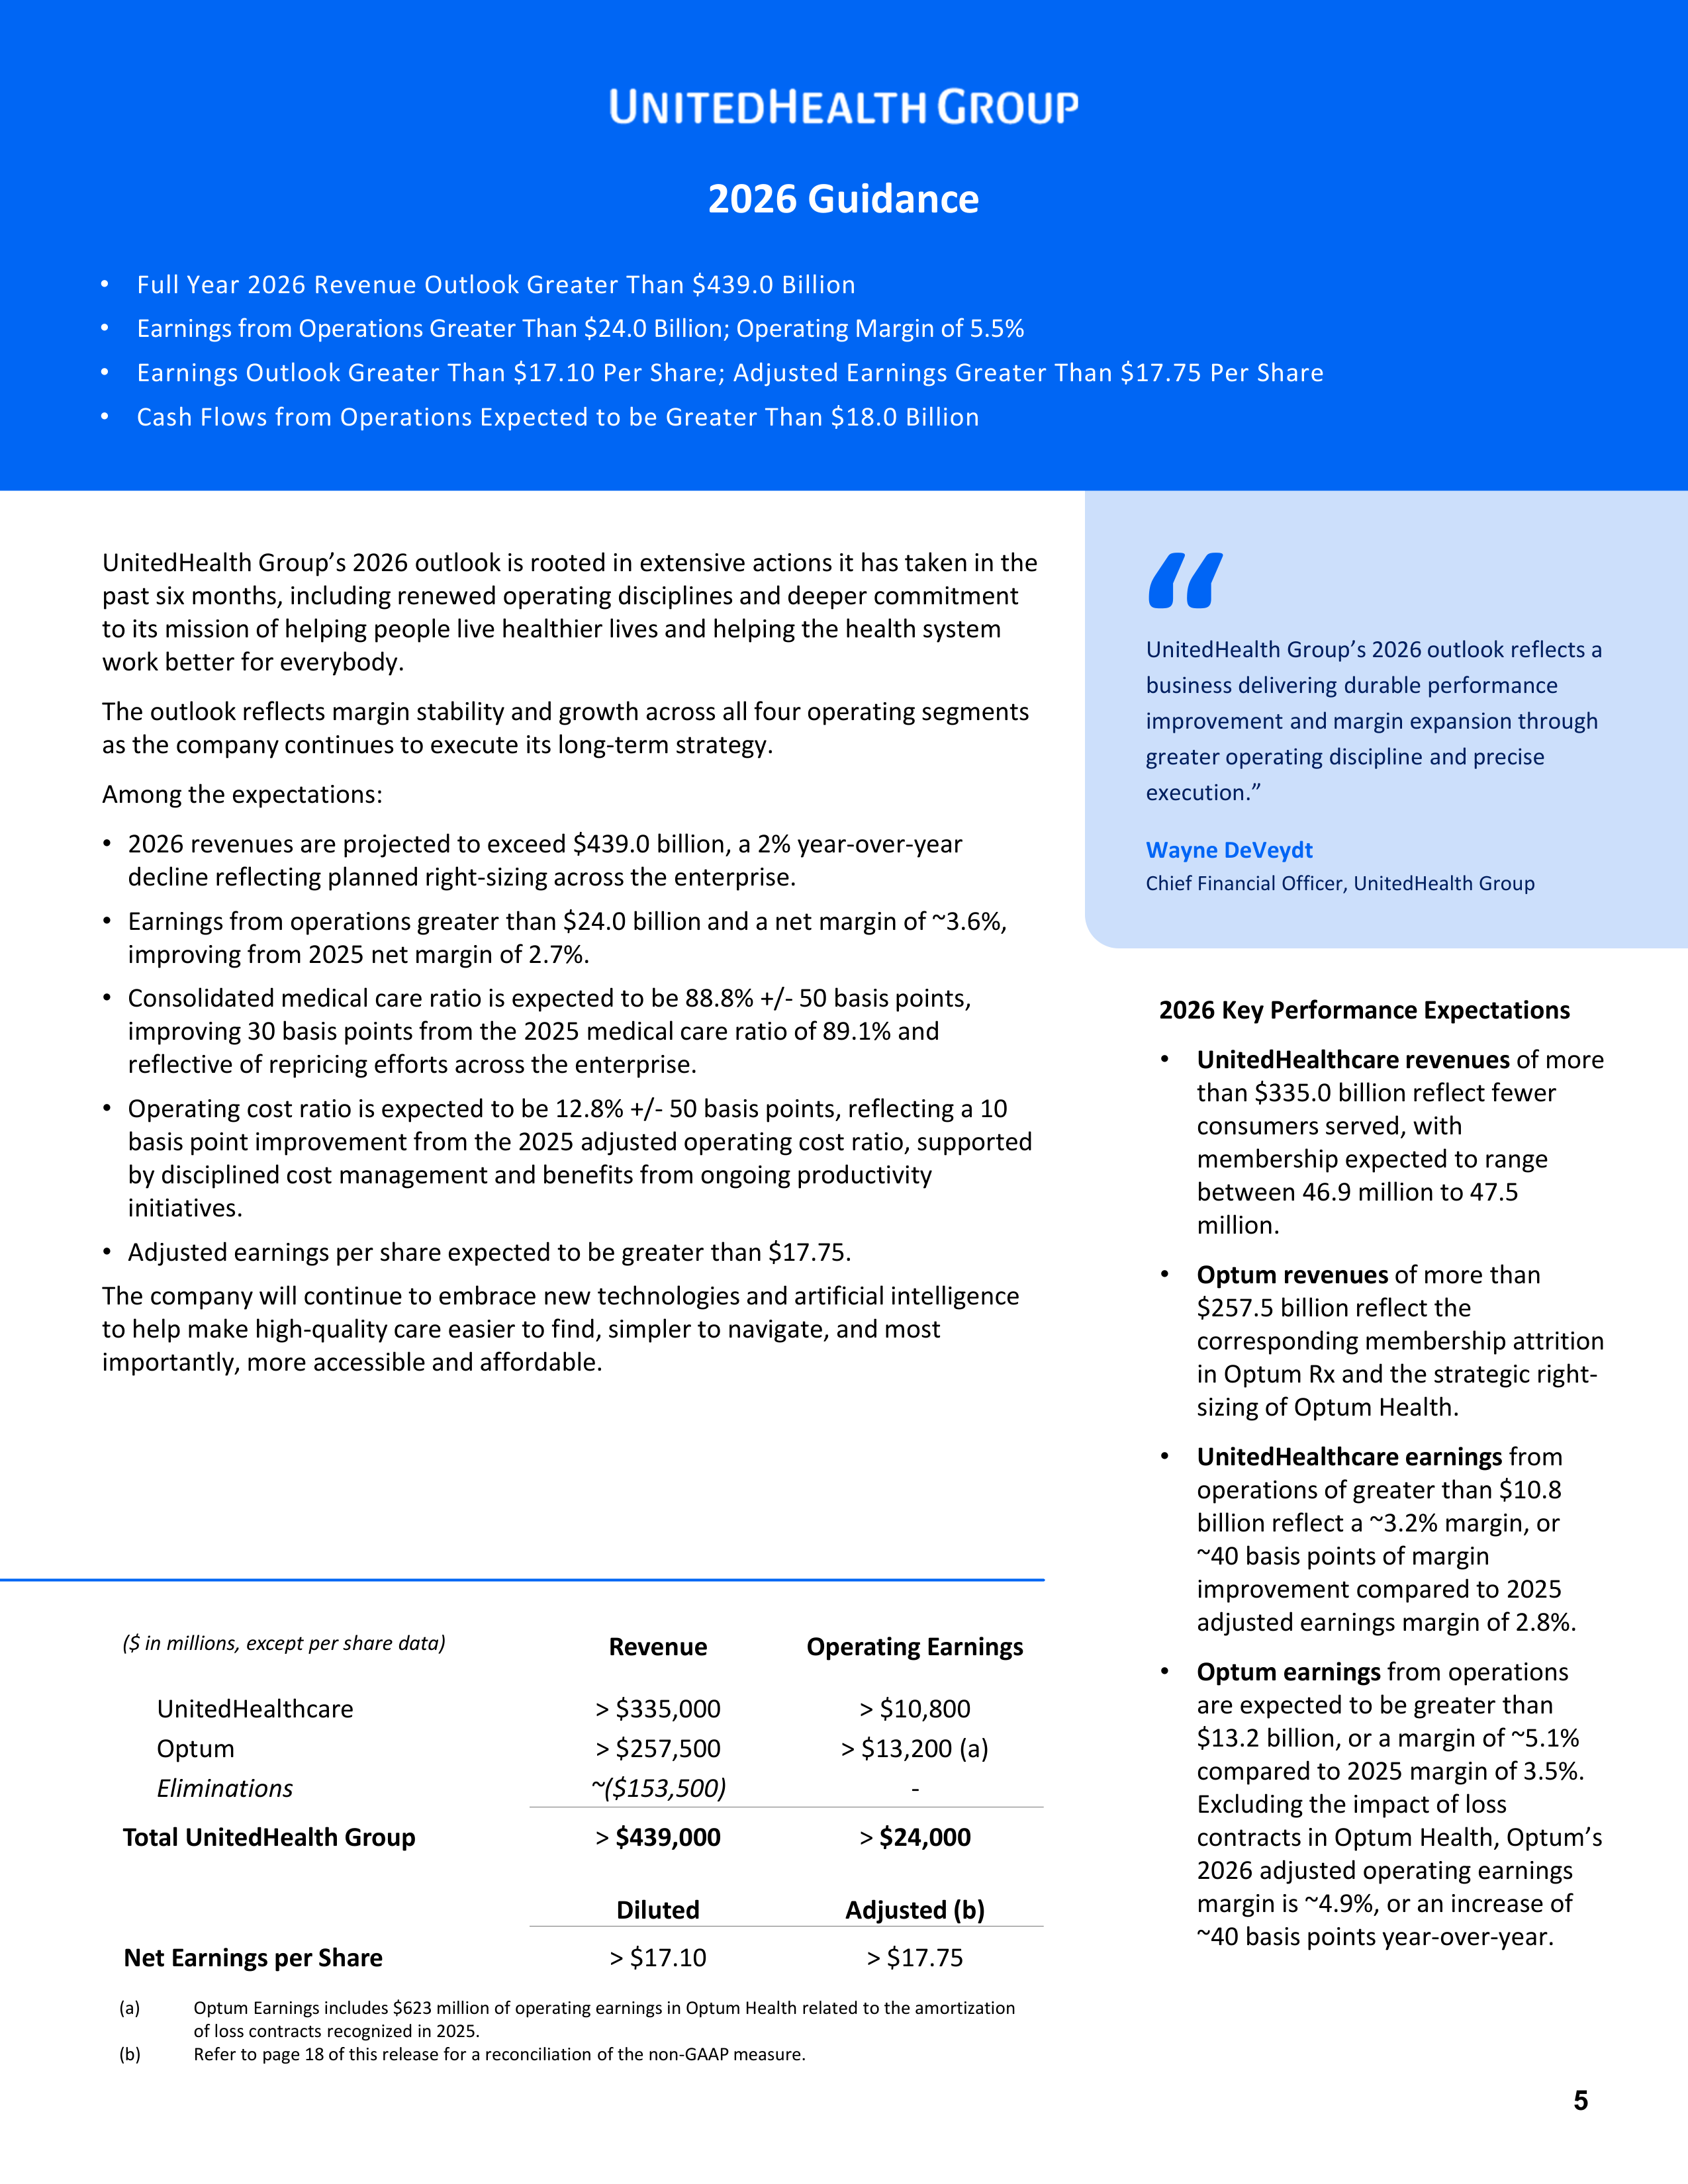
UnitedHealth Group’s 2026 outlook reflects a
business delivering durable performance
improvement and margin expansion through
greater operating discipline and precise
execution.”
Wayne DeVeydt
Chief Financial Officer, UnitedHealth Group
“
UnitedHealth Group’s 2026 outlook is rooted in extensive actions it has taken in the
past six months, including renewed operating disciplines and deeper commitment
to its mission of helping people live healthier lives and helping the health system
work better for everybody.
The outlook reflects margin stability and growth across all four operating segments
as the company continues to execute its long-term strategy.
Among the expectations:
•
2026 revenues are projected to exceed $439.0 billion, a 2% year-over-year
decline reflecting planned right-sizing across the enterprise.
•
Earnings from operations greater than $24.0 billion and a net margin of ~3.6%,
improving from 2025 net margin of 2.7%.
•
Consolidated medical care ratio is expected to be 88.8% +/- 50 basis points,
improving 30 basis points from the 2025 medical care ratio of 89.1% and
reflective of repricing efforts across the enterprise.
•
Operating cost ratio is expected to be 12.8% +/- 50 basis points, reflecting a 10
basis point improvement from the 2025 adjusted operating cost ratio, supported
by disciplined cost management and benefits from ongoing productivity
initiatives.
•
Adjusted earnings per share expected to be greater than $17.75.
The company will continue to embrace new technologies and artificial intelligence
to help make high-quality care easier to find, simpler to navigate, and most
importantly, more accessible and affordable.
2026 Guidance
2026 Key Performance Expectations
•
UnitedHealthcare revenues
of more
than $335.0 billion reflect fewer
consumers served, with
membership expected to range
between 46.9 million to 47.5
million.
•
Optum revenues
of more than
$257.5 billion reflect the
corresponding membership attrition
in Optum Rx and the strategic right-
sizing of Optum Health.
•
UnitedHealthcare earnings
from
operations of greater than $10.8
billion reflect a ~3.2% margin, or
~40 basis points of margin
improvement compared to 2025
adjusted earnings margin of 2.8%.
•
Optum earnings
from operations
are expected to be greater than
$13.2 billion, or a margin of ~5.1%
compared to 2025 margin of 3.5%.
Excluding the impact of loss
contracts in Optum Health, Optum’s
2026 adjusted operating earnings
margin is ~4.9%, or an increase of
~40 basis points year-over-year.
(a)
Optum Earnings includes $623 million of operating earnings in Optum Health related to the amortization
of loss contracts recognized in 2025.
(b)
Refer to page 18 of this release for a reconciliation of the non-GAAP measure.
Operating Earnings
Revenue
($ in millions, except per share data)
> $10,800
> $335,000
UnitedHealthcare
> $13,200 (a)
> $257,500
Optum
-
~($153,500)
Eliminations
>
$24,000
>
$439,000
Total UnitedHealth Group
Adjusted (b)
Diluted
> $17.75
> $17.10
Net Earnings per Share
•
Full Year 2026 Revenue Outlook Greater Than $439.0 Billion
•
Earnings from Operations Greater Than $24.0 Billion; Operating Margin of 5.5%
•
Earnings Outlook Greater Than $17.10 Per Share; Adjusted Earnings Greater Than $17.75 Per Share
•
Cash Flows from Operations Expected to be Greater Than $18.0 Billion


© 2026 UnitedHealth Group, Inc. All rights reserved.
6
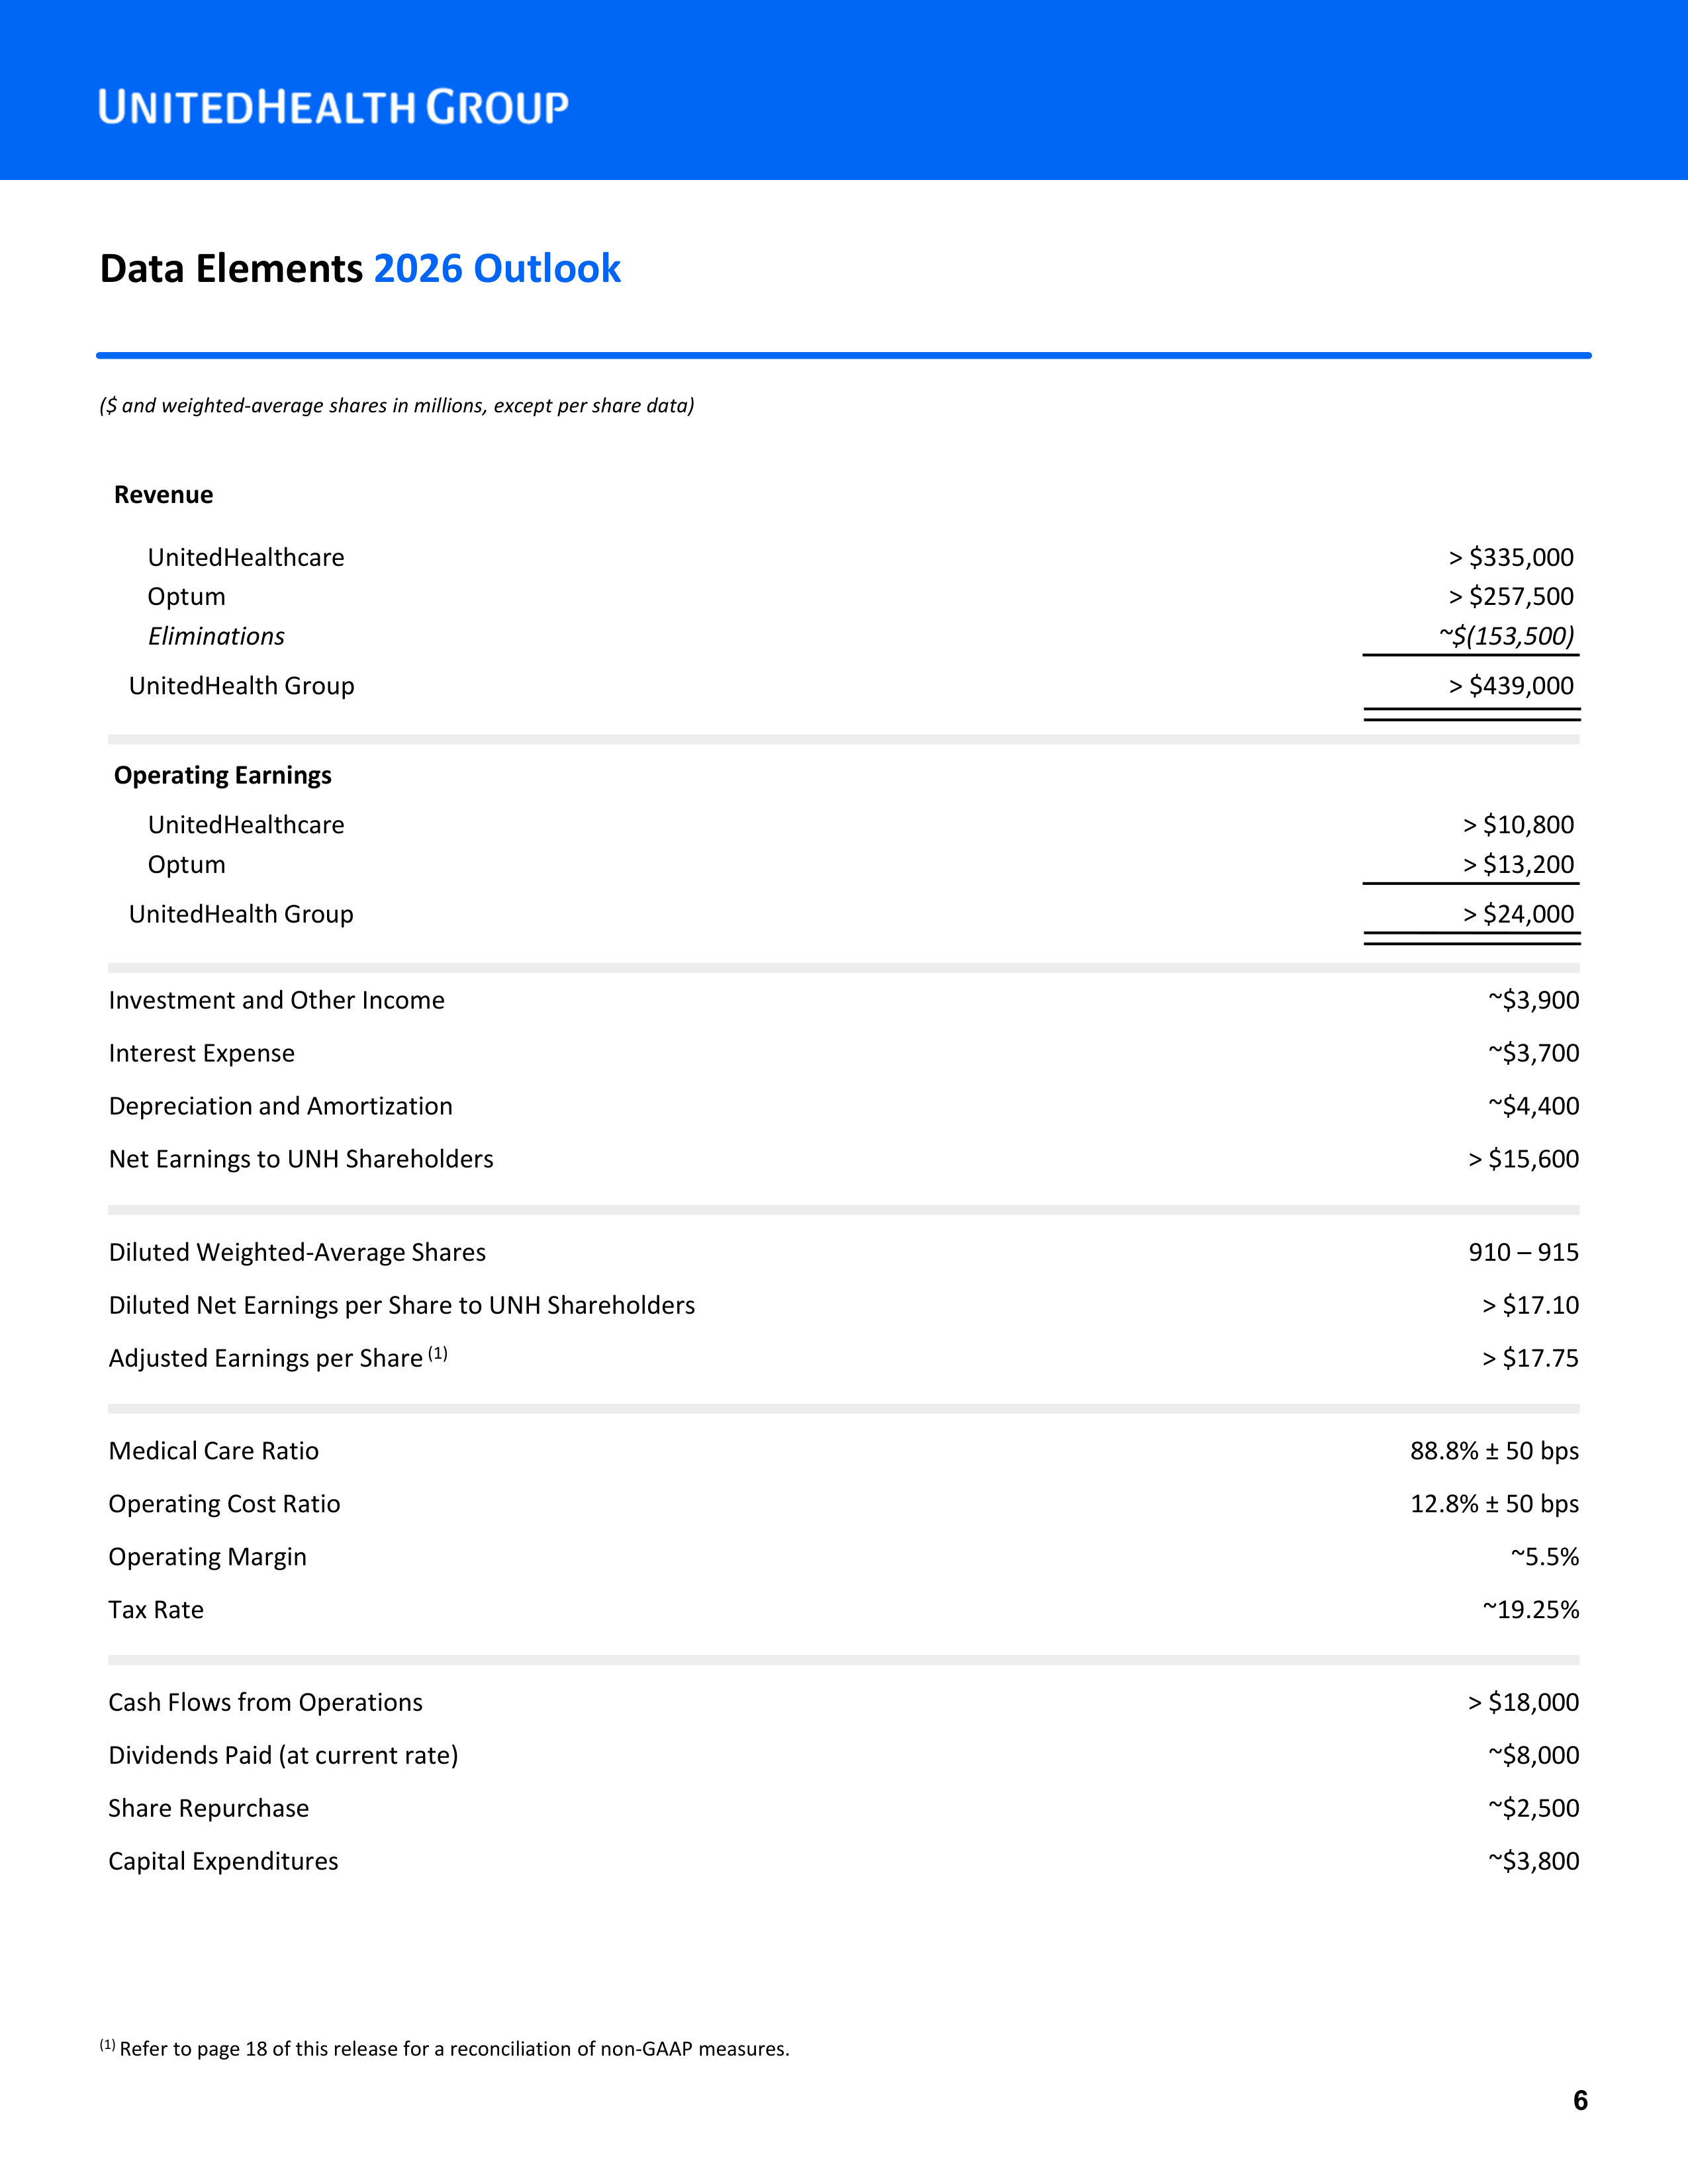
Data Elements
2026 Outlook
(1)
Refer to page 18 of this release for a reconciliation of non-GAAP measures.
($ and weighted-average shares in millions, except per share data)
Revenue
> $335,000
UnitedHealthcare
> $257,500
Optum
~$(153,500)
Eliminations
> $439,000
UnitedHealth Group
Operating Earnings
> $10,800
UnitedHealthcare
> $13,200
Optum
> $24,000
UnitedHealth Group
~$3,900
Investment and Other Income
~$3,700
Interest Expense
~$4,400
Depreciation and Amortization
> $15,600
Net Earnings to UNH Shareholders
910 – 915
Diluted Weighted-Average Shares
> $17.10
Diluted Net Earnings per Share to UNH Shareholders
> $17.75
Adjusted Earnings per Share
(1)
88.8% ± 50 bps
Medical Care Ratio
12.8% ± 50 bps
Operating Cost Ratio
~5.5%
Operating Margin
~19.25%
Tax Rate
> $18,000
Cash Flows from Operations
~$8,000
Dividends Paid (at current rate)
~$2,500
Share Repurchase
~$3,800
Capital Expenditures


© 2026 UnitedHealth Group, Inc. All rights reserved.
7
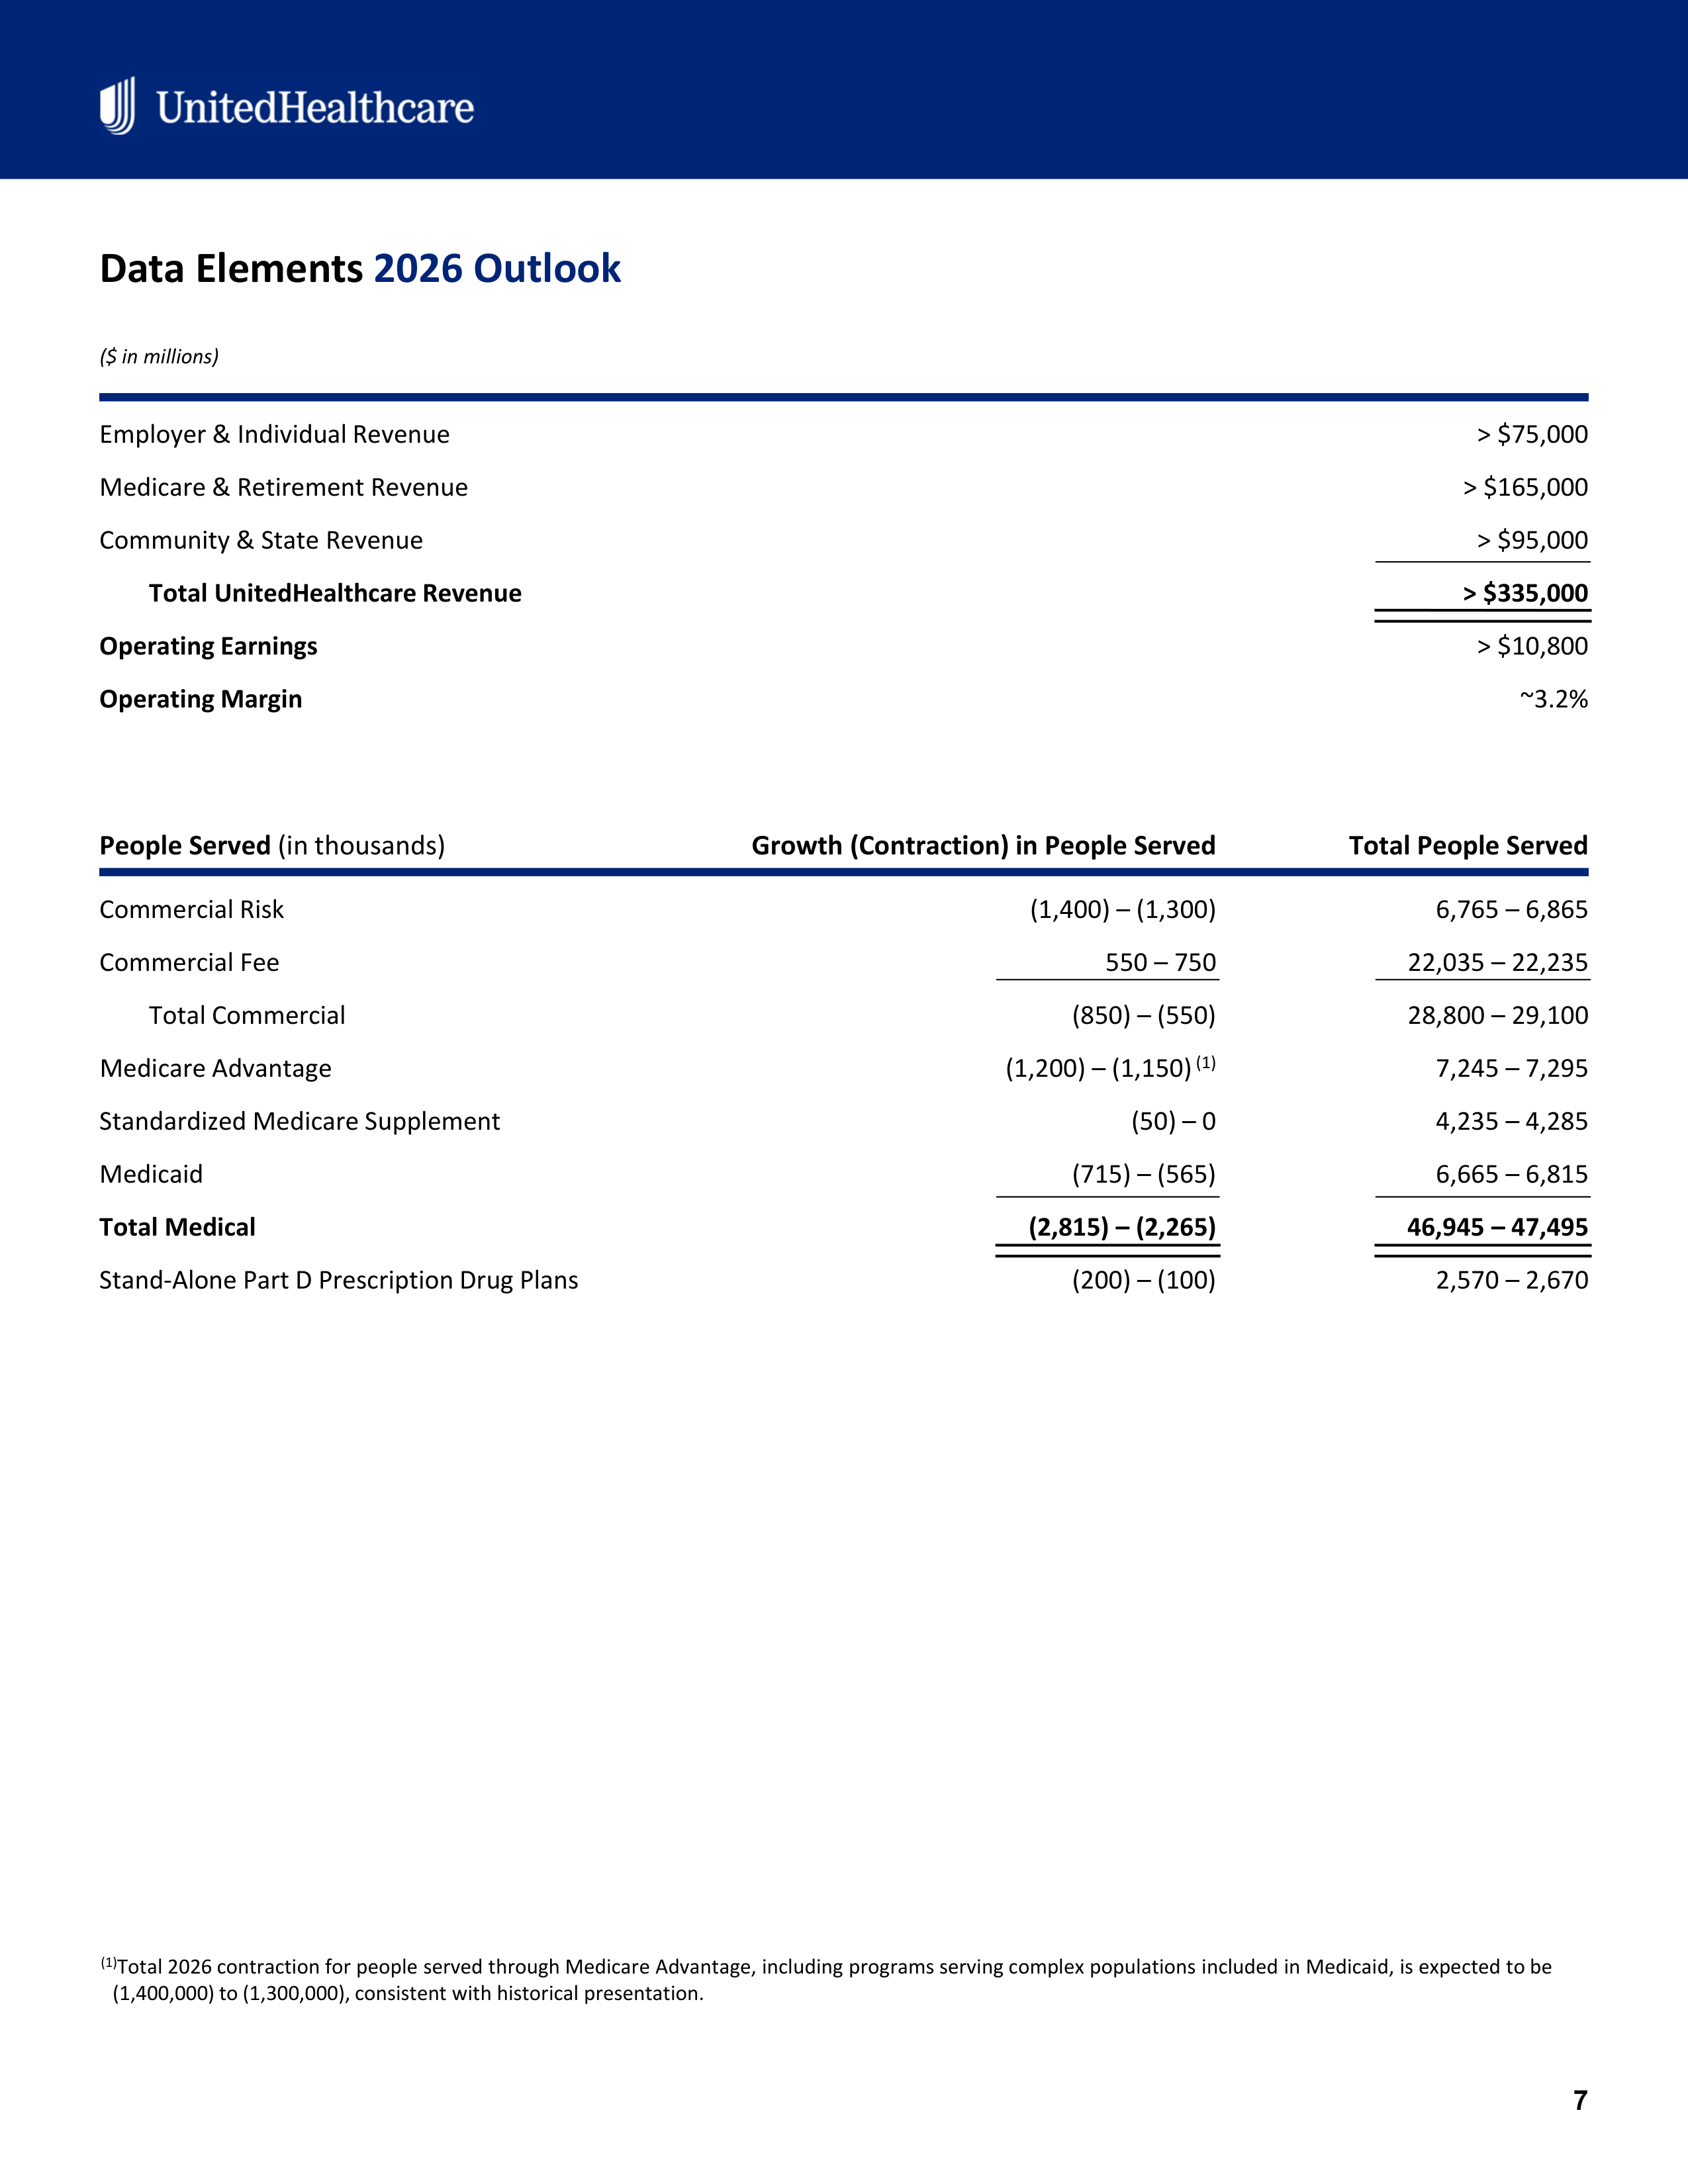
(1)
Total 2026 contraction for people served through Medicare Advantage, including programs serving complex populations included in Medicaid, is expected to be
(1,400,000) to (1,300,000), consistent with historical presentation.
> $75,000
Employer & Individual Revenue
> $165,000
Medicare & Retirement Revenue
> $95,000
Community & State Revenue
> $335,000
Total UnitedHealthcare Revenue
> $10,800
Operating Earnings
~3.2%
Operating Margin
Total People Served
Growth (Contraction) in People Served
People Served
(in thousands)
6,765 – 6,865
(1,400) – (1,300)
Commercial Risk
22,035 – 22,235
550 – 750
Commercial Fee
28,800 – 29,100
(850) – (550)
Total Commercial
7,245 – 7,295
(1,200) – (1,150)
(1)
Medicare Advantage
4,235 – 4,285
(50) – 0
Standardized Medicare Supplement
6,665 – 6,815
(715) – (565)
Medicaid
46,945 – 47,495
(2,815) – (2,265)
Total Medical
2,570 – 2,670
(200) – (100)
Stand-Alone Part D Prescription Drug Plans
Data Elements
2026 Outlook
($ in millions)


© 2026 UnitedHealth Group, Inc. All rights reserved.
8
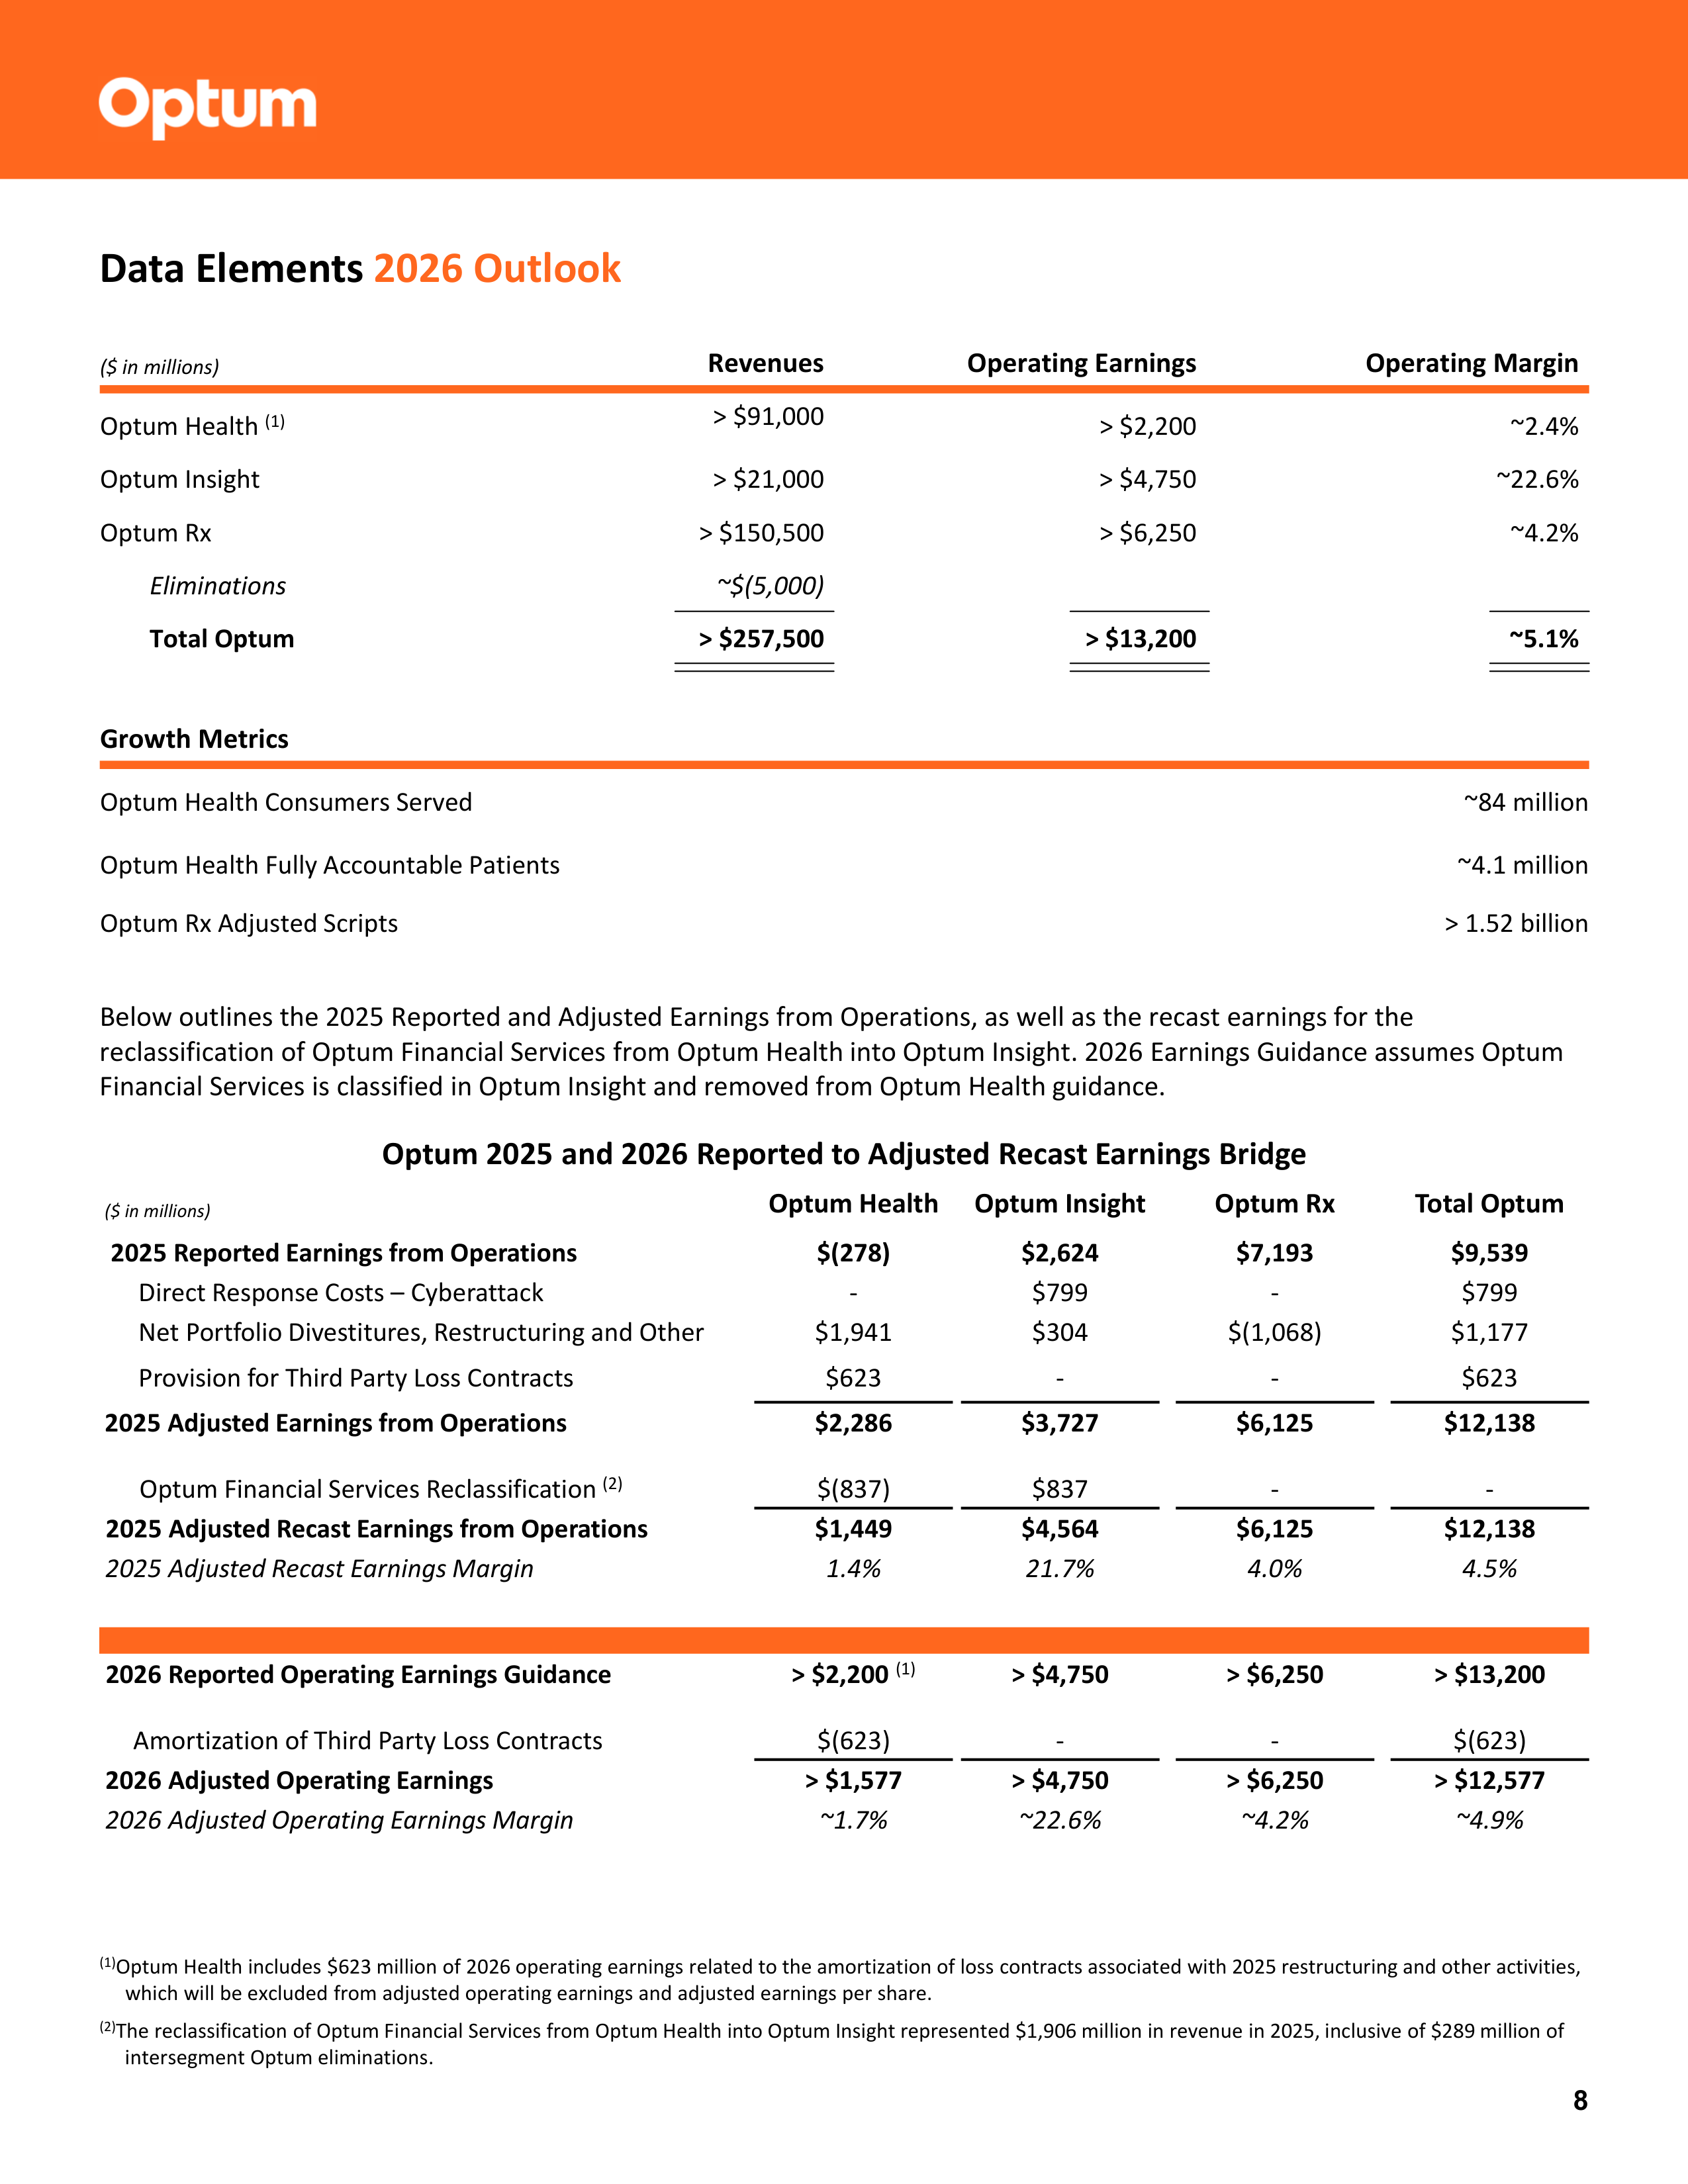
Operating Margin
Operating Earnings
Revenues
($ in millions)
~2.4%
> $2,200
> $91,000
Optum Health
(1)
~22.6%
> $4,750
> $21,000
Optum Insight
~4.2%
> $6,250
> $150,500
Optum Rx
~$(5,000)
Eliminations
~5.1%
> $13,200
> $257,500
Total Optum
Growth Metrics
~84 million
Optum Health Consumers Served
~4.1 million
Optum Health Fully Accountable Patients
> 1.52 billion
Optum Rx Adjusted Scripts
(1)
Optum Health includes $623 million of 2026 operating earnings related to the amortization of loss contracts associated with 2025 restructuring and other activities,
which will be excluded from adjusted operating earnings and adjusted earnings per share.
(2)
The reclassification of Optum Financial Services from Optum Health into Optum Insight represented $1,906 million in revenue in 2025, inclusive of $289 million of
intersegment Optum eliminations.
Optum 2025 and 2026 Reported to Adjusted Recast Earnings Bridge
Total Optum
Optum Rx
Optum Insight
Optum Health
($ in millions)
$9,539
$7,193
$2,624
$(278)
2025 Reported Earnings from Operations
$799
-
$799
-
Direct Response Costs – Cyberattack
$1,177
$(1,068)
$304
$1,941
Net Portfolio Divestitures, Restructuring and Other
$623
-
-
$623
Provision for Third Party Loss Contracts
$12,138
$6,125
$3,727
$2,286
2025 Adjusted Earnings from Operations
-
-
$837
$(837)
Optum Financial Services Reclassification
(2)
$12,138
$6,125
$4,564
$1,449
2025 Adjusted Recast Earnings from Operations
4.5%
4.0%
21.7%
1.4%
2025 Adjusted Recast Earnings Margin
> $13,200
> $6,250
> $4,750
> $2,200
(1)
2026 Reported Operating Earnings Guidance
$(623)
-
-
$(623)
Amortization of Third Party Loss Contracts
> $12,577
> $6,250
> $4,750
> $1,577
2026 Adjusted Operating Earnings
~4.9%
~4.2%
~22.6%
~1.7%
2026 Adjusted Operating Earnings Margin
Below outlines the 2025 Reported and Adjusted Earnings from Operations, as well as the recast earnings for the
reclassification of Optum Financial Services from Optum Health into Optum Insight. 2026 Earnings Guidance assumes Optum
Financial Services is classified in Optum Insight and removed from Optum Health guidance.
Data Elements
2026 Outlook




© 2026 UnitedHealth Group, Inc. All rights reserved.
9
About UnitedHealth Group
UnitedHealth Group (NYSE: UNH) is a health care and well-being company with a mission to help people live healthier lives and
help make the health system work better for everyone through two distinct and complementary businesses. Optum delivers
care aided by technology and data, empowering people, partners and providers with the guidance and tools they need to
achieve better health. UnitedHealthcare offers a full range of health benefits, enabling affordable coverage, simplifying the
health care experience and delivering access to high-quality care. Visit UnitedHealth Group at www.unitedhealthgroup.com
and follow UnitedHealth Group on LinkedIn.
Earnings Conference Call
As previously announced, UnitedHealth Group will discuss the company’s results, strategy and future outlook on a conference
call with investors at 8:00 a.m. Eastern Time today. UnitedHealth Group will host a live webcast of this conference call from
the Investor Relations page of the company’s website (www.unitedhealthgroup.com). Following the call, a webcast replay will
be on the Investor Relations page through February 10, 2026.
This earnings release and the Form 8-K dated January 27, 2026, can also be accessed from the Investor Relations page of the
company’s website.
Non-GAAP Financial Information
This news release presents non-GAAP financial information provided as a complement to the results provided in accordance
with accounting principles generally accepted in the United States of America (“GAAP”). A reconciliation of the non-GAAP
financial information to the most directly comparable GAAP financial measure is provided in the accompanying tables found at
the end of this release.
Investors:
Media:
Investor_relations@uhg.com
uhgmedia@uhg.com
9

© 2026 UnitedHealth Group, Inc. All rights reserved.
10
Forward-Looking Statements
The statements, estimates, projections, guidance or outlook contained in this document include “forward-looking” statements
which are intended to take advantage of the “safe harbor” provisions of the federal securities laws. The words “believe,”
“expect,” “intend,” “estimate,” “anticipate,” “forecast,” “outlook,” “plan,” “project,” “should” and similar expressions identify
forward-looking statements. These statements may contain information about financial prospects, economic conditions and
trends and involve risks and uncertainties. Actual results could differ materially from those that management expects,
depending on the outcome of certain factors including: our ability to effectively estimate, price for and manage medical costs;
new or changes in existing health care laws or regulations, or their enforcement or application; cyberattacks, other
privacy/data security incidents, or our failure to comply with related regulations; reductions in revenue or delays to cash flows
received under government programs; changes in Medicare, the CMS star ratings program or the application of risk
adjustment data validation audits; the DOJ’s legal actions concerning our participation in the Medicare program; our ability to
maintain and achieve improvement in quality scores impacting revenue; failure to maintain effective and efficient information
systems or if our technology products do not operate as intended; risks and uncertainties associated with our businesses
providing pharmacy care services; competitive pressures, including our ability to maintain or increase our market share;
changes in or challenges to our public sector contract awards; failure to achieve targeted operating cost productivity
improvements; failure to develop and maintain satisfactory relationships with health care payers, physicians, hospitals and
other service providers; the impact of potential changes in tax laws and regulations; increases in costs and other liabilities
associated with litigation, government investigations, audits or reviews; risks and uncertainties associated with our increasing
use of artificial intelligence and other emerging technologies; failure to complete, manage or integrate strategic transactions;
risks and uncertainties associated with the sale of our remaining operations in South America; risks associated with public
health crises arising from large-scale medical emergencies, pandemics, natural disasters and other extreme events; failure to
attract, develop, retain, and manage the succession of key employees and executives; our investment portfolio performance;
impairment of our goodwill and intangible assets; failure to protect proprietary rights to our databases, software and related
products; downgrades in our credit ratings; and our ability to obtain sufficient funds from our regulated subsidiaries or from
external financings to fund our obligations, reinvest in our business, maintain our debt to total capital ratio at targeted levels,
maintain our quarterly dividend payment cycle, or continue repurchasing shares of our common stock.
This above list is not exhaustive. We discuss these matters, and certain risks that may affect our business operations, financial
condition and results of operations, more fully in our filings with the SEC, including our reports on Forms 10-K, 10-Q and 8-K.
By their nature, forward-looking statements are not guarantees of future performance or results and are subject to risks,
uncertainties and assumptions that are difficult to predict or quantify. Actual results may vary materially from expectations
expressed or implied in this document or any of our prior communications. You should not place undue reliance on forward-
looking statements, which speak only as of the date they are made. We do not undertake to update or revise any forward-
looking statements, except as required by law.
UNITEDHEALTH GROUP
Earnings Release Schedules and Supplementary Information
Year Ended December 31, 2025
•
Condensed Consolidated Statements of Operations
•
Condensed Consolidated Balance Sheets
•
Condensed Consolidated Statements of Cash Flows
•
Revenues by Business - Supplemental Financial Information
•
Earnings by Business - Supplemental Financial Information
•
People Served and Performance Metrics - Supplemental Financial Information
•
Reconciliation of Non-GAAP Financial Measures
11
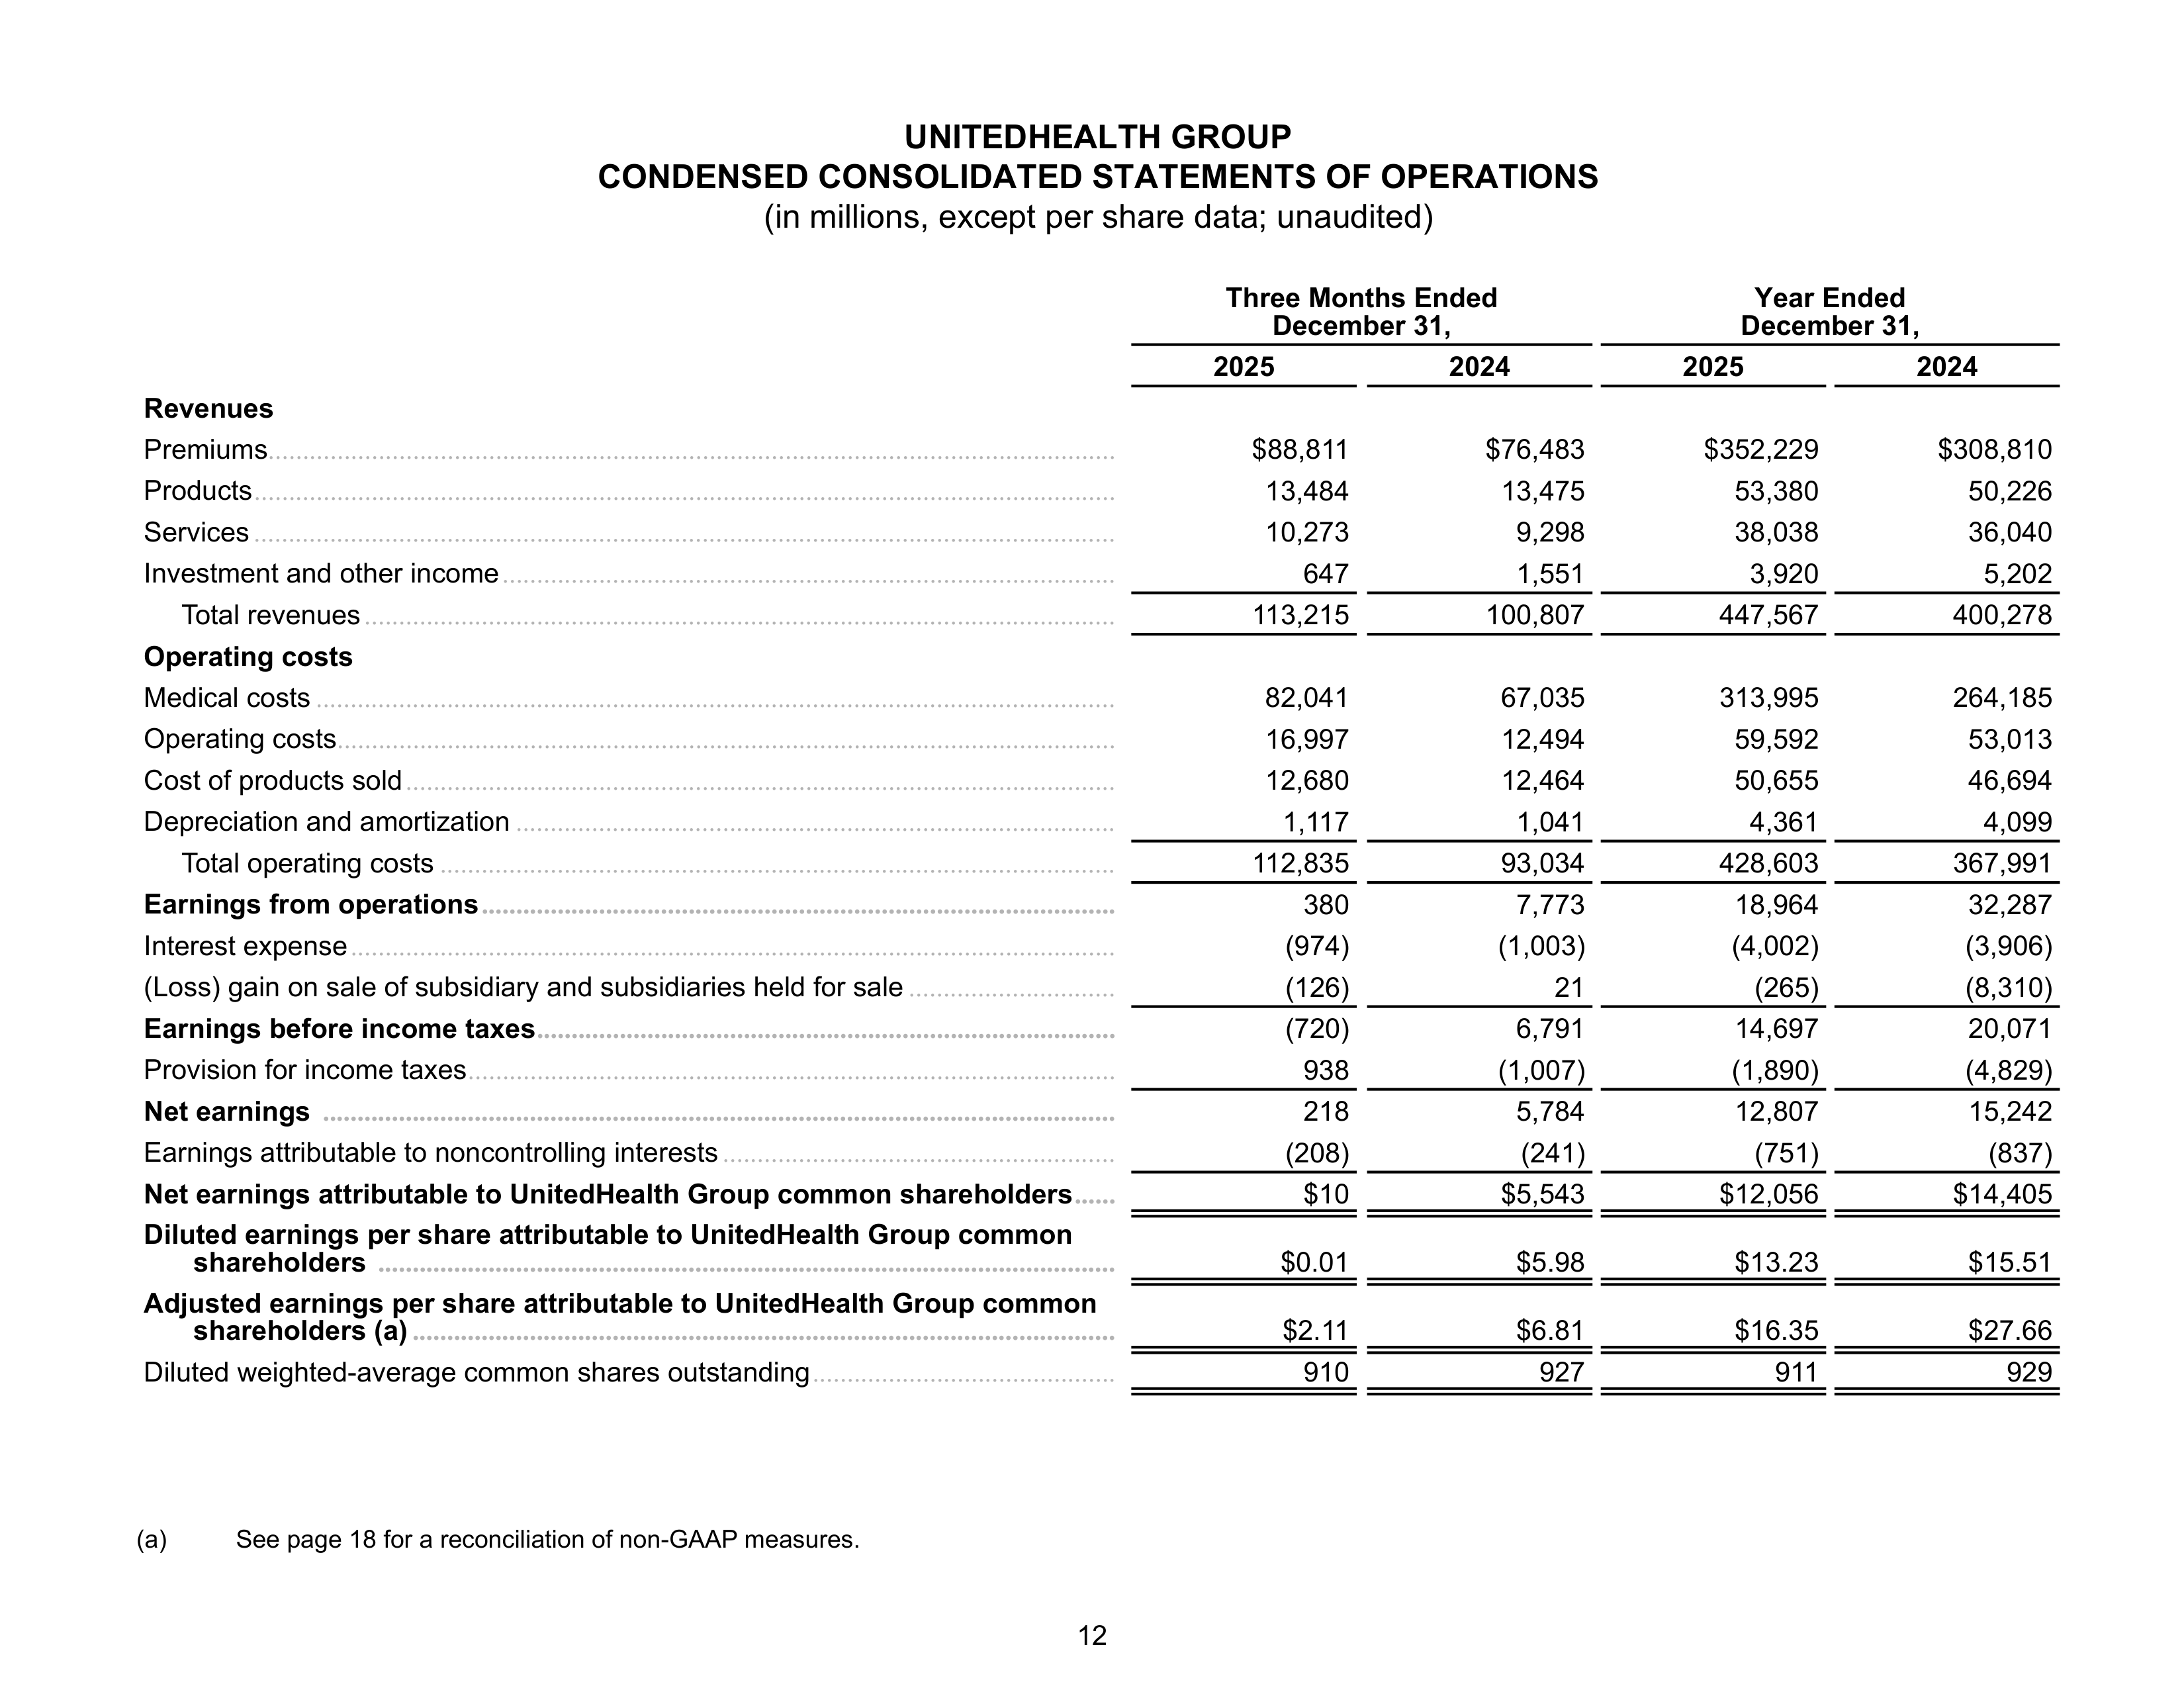
UNITEDHEALTH GROUP
CONDENSED CONSOLIDATED STATEMENTS OF OPERATIONS
(in millions, except per share data; unaudited)
Three Months Ended
December 31,
Year Ended
December 31,
2025
2024
2025
2024
Revenues
Premiums
...........................................................................................................................
$88,811
$76,483
$352,229
$308,810
Products
.............................................................................................................................
13,484
13,475
53,380
50,226
Services
.............................................................................................................................
10,273
9,298
38,038
36,040
Investment and other income
.........................................................................................
647
1,551
3,920
5,202
Total revenues
.............................................................................................................
113,215
100,807
447,567
400,278
Operating costs
Medical costs
....................................................................................................................
82,041
67,035
313,995
264,185
Operating costs
.................................................................................................................
16,997
12,494
59,592
53,013
Cost of products sold
.......................................................................................................
12,680
12,464
50,655
46,694
Depreciation and amortization
.......................................................................................
1,117
1,041
4,361
4,099
Total operating costs
..................................................................................................
112,835
93,034
428,603
367,991
Earnings from operations
............................................................................................
380
7,773
18,964
32,287
Interest expense
...............................................................................................................
(974)
(1,003)
(4,002)
(3,906)
(Loss) gain on sale of subsidiary and subsidiaries held for sale
..............................
(126)
21
(265)
(8,310)
Earnings before income taxes
....................................................................................
(720)
6,791
14,697
20,071
Provision for income taxes
..............................................................................................
938
(1,007)
(1,890)
(4,829)
Net earnings
...................................................................................................................
218
5,784
12,807
15,242
Earnings attributable to noncontrolling interests
.........................................................
(208)
(241)
(751)
(837)
Net earnings attributable to UnitedHealth Group common shareholders
......
$10
$5,543
$12,056
$14,405
Diluted earnings per share attributable to UnitedHealth Group common
shareholders
...........................................................................................................
$0.01
$5.98
$13.23
$15.51
Adjusted earnings per share attributable to UnitedHealth Group common
shareholders (a)
......................................................................................................
$2.11
$6.81
$16.35
$27.66
Diluted weighted-average common shares outstanding
............................................
910
927
911
929
(a)
See page 18 for a reconciliation of non-GAAP measures.
12
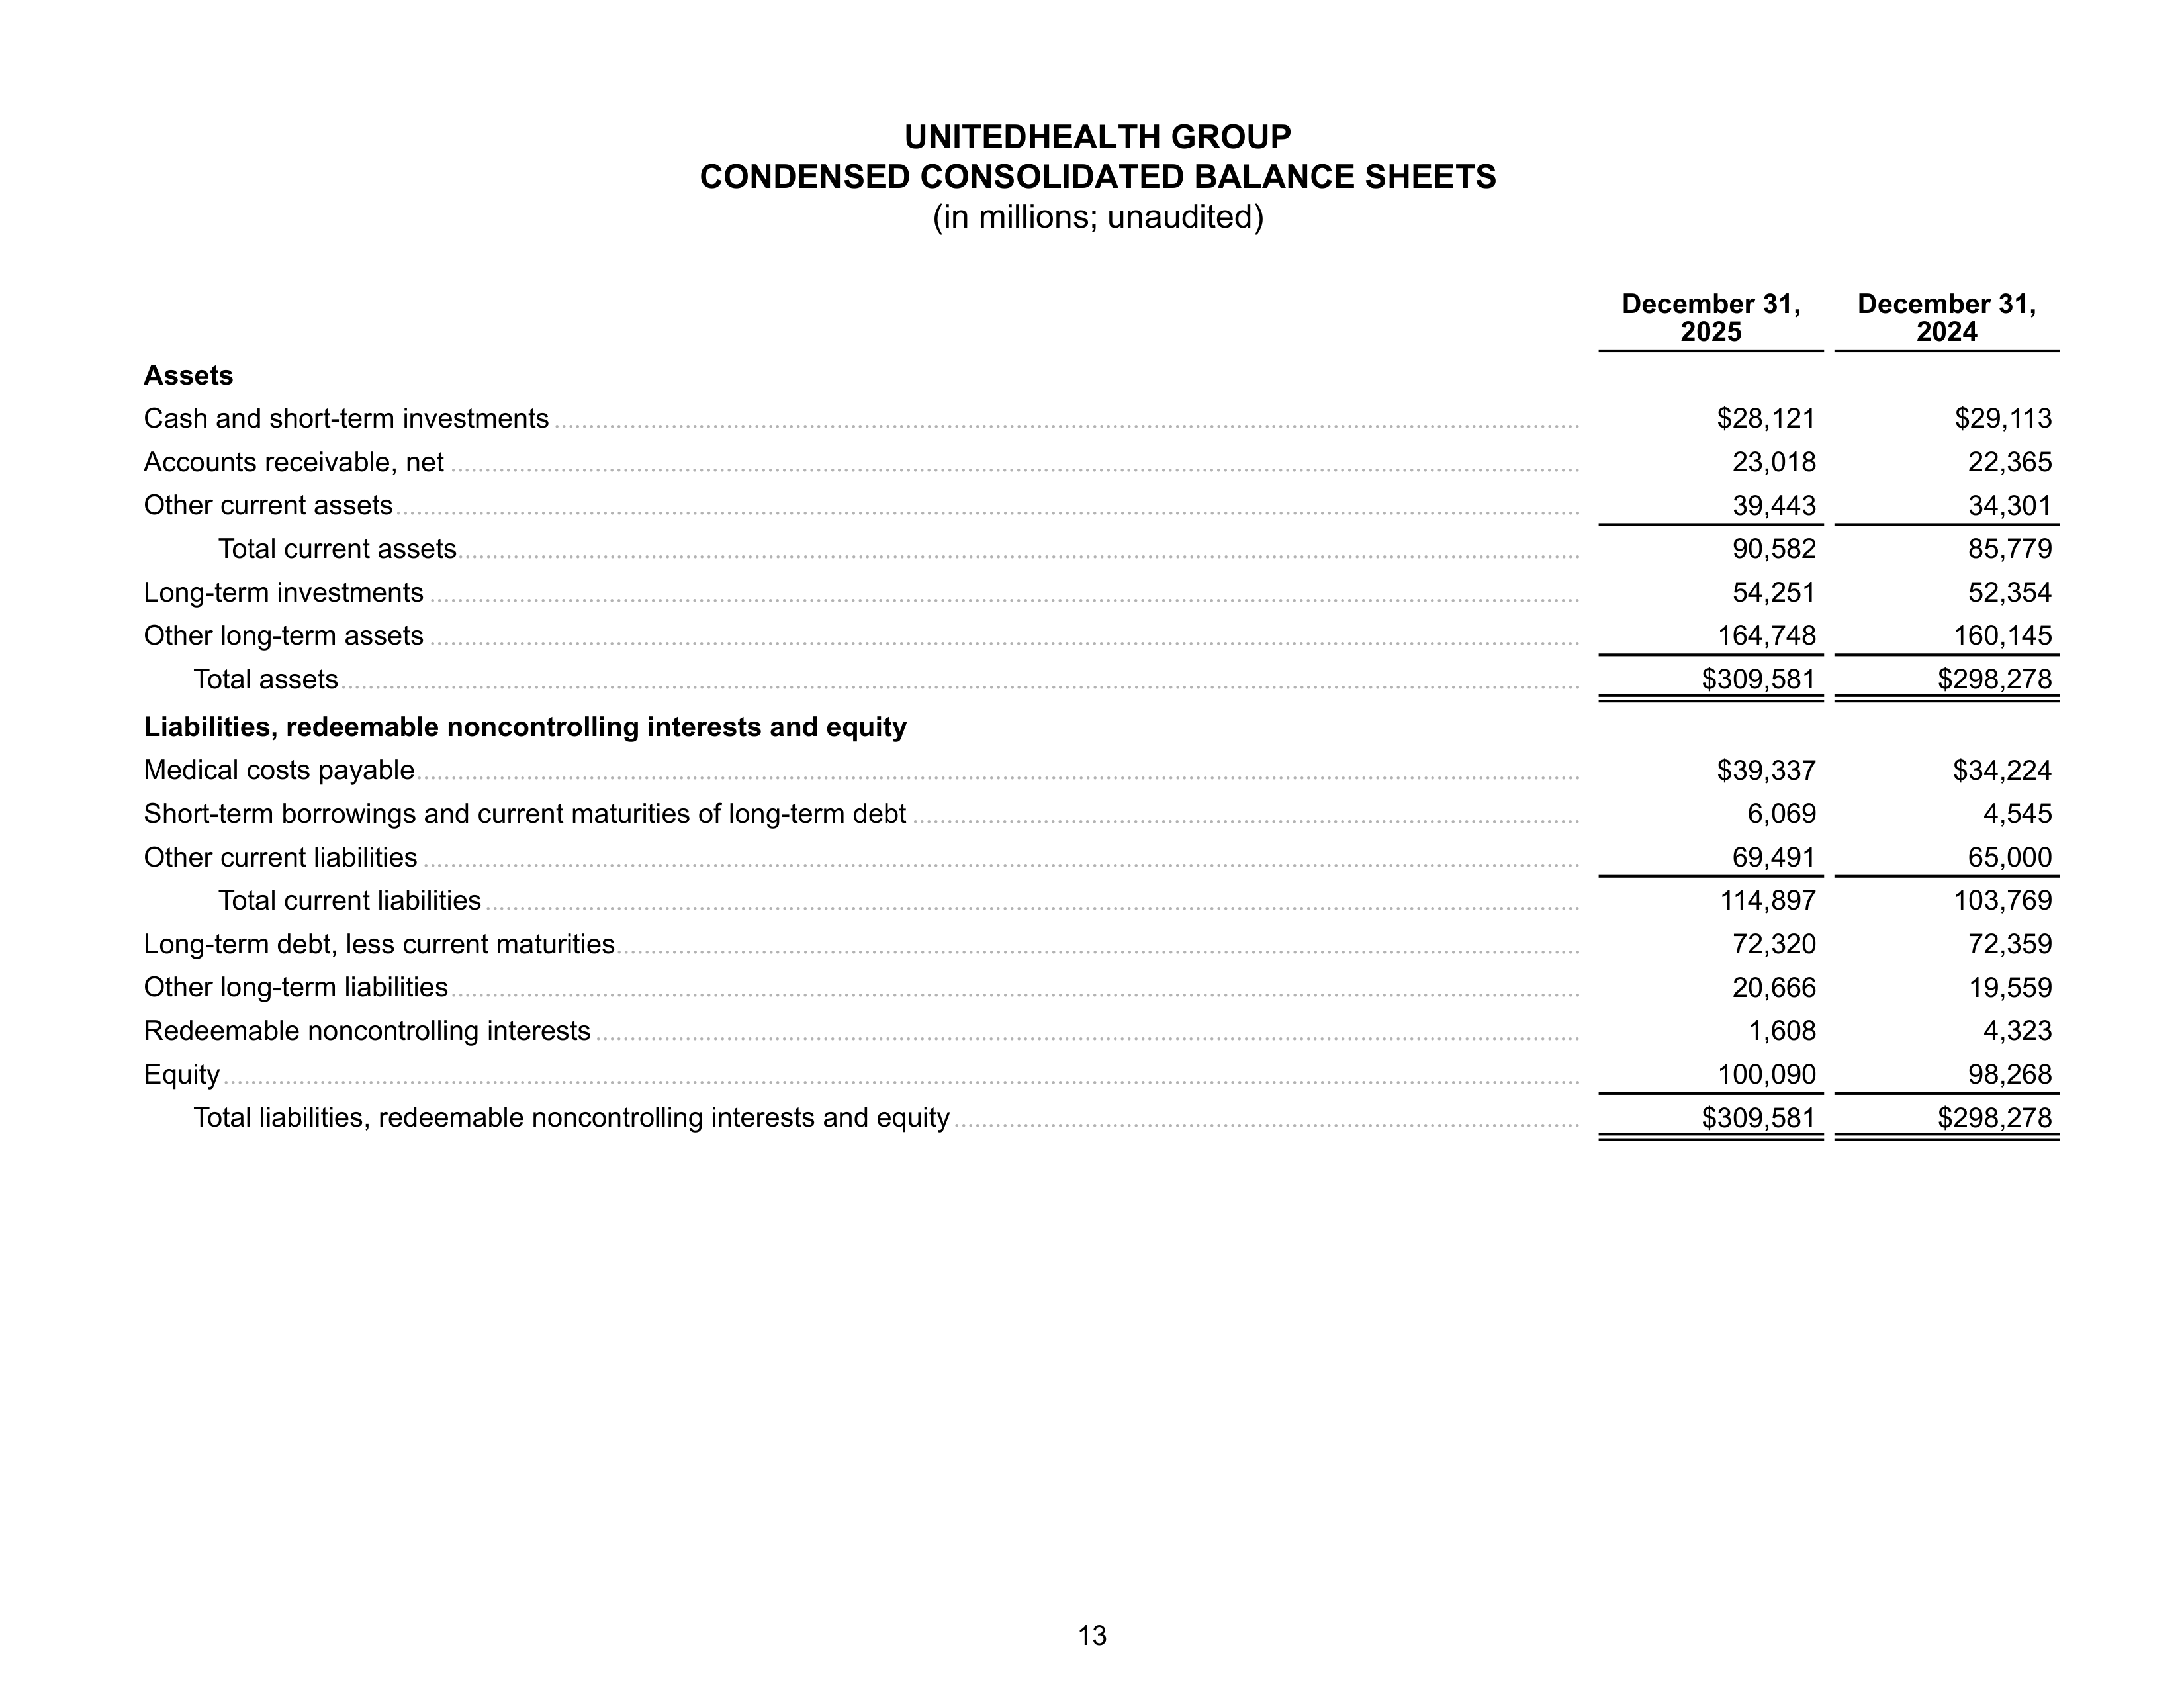
UNITEDHEALTH GROUP
CONDENSED CONSOLIDATED BALANCE SHEETS
(in millions; unaudited)
December 31,
2025
December 31,
2024
Assets
Cash and short-term investments
.....................................................................................................................................................
$28,121
$29,113
Accounts receivable, net
....................................................................................................................................................................
23,018
22,365
Other current assets
............................................................................................................................................................................
39,443
34,301
Total current assets
...................................................................................................................................................................
90,582
85,779
Long-term investments
.......................................................................................................................................................................
54,251
52,354
Other long-term assets
.......................................................................................................................................................................
164,748
160,145
Total assets
....................................................................................................................................................................................
$309,581
$298,278
Liabilities, redeemable noncontrolling interests and equity
Medical costs payable
.........................................................................................................................................................................
$39,337
$34,224
Short-term borrowings and current maturities of long-term debt
.................................................................................................
6,069
4,545
Other current liabilities
........................................................................................................................................................................
69,491
65,000
Total current liabilities
...............................................................................................................................................................
114,897
103,769
Long-term debt, less current maturities
............................................................................................................................................
72,320
72,359
Other long-term liabilities
....................................................................................................................................................................
20,666
19,559
Redeemable noncontrolling interests
...............................................................................................................................................
1,608
4,323
Equity
.....................................................................................................................................................................................................
100,090
98,268
Total liabilities, redeemable noncontrolling interests and equity
...........................................................................................
$309,581
$298,278
13
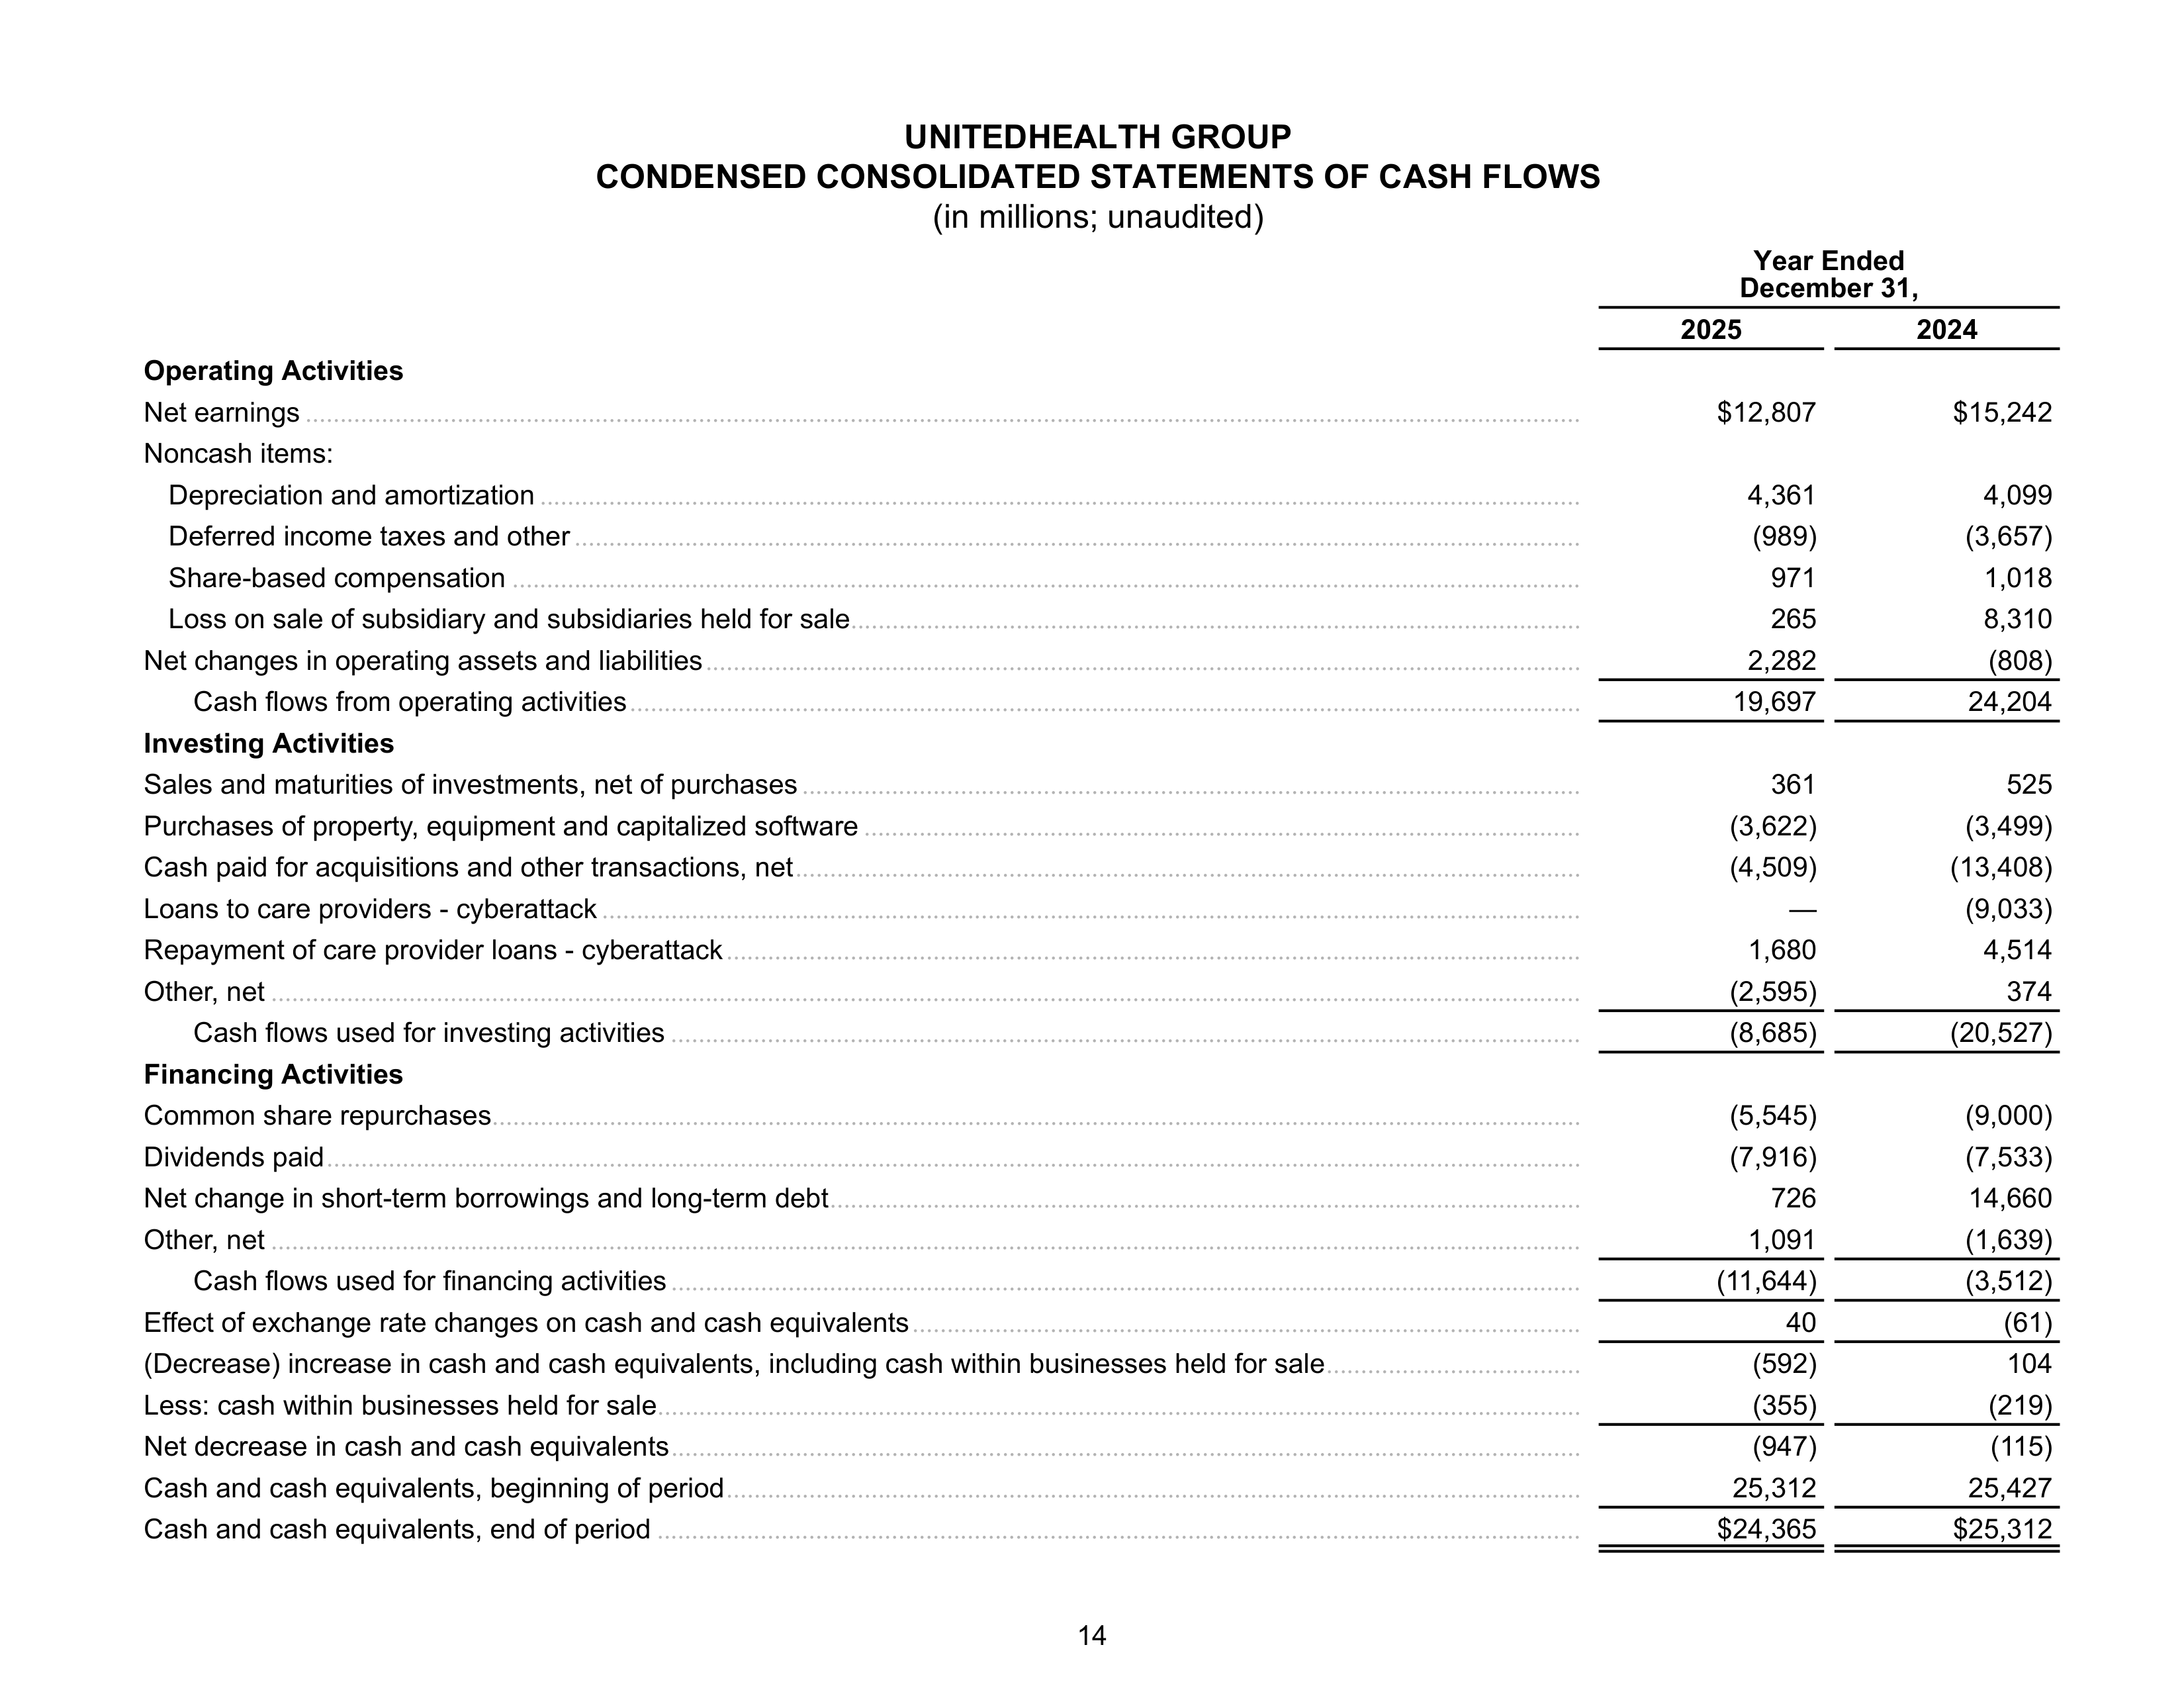
UNITEDHEALTH GROUP
CONDENSED CONSOLIDATED STATEMENTS OF CASH FLOWS
(in millions; unaudited)
Year Ended
December 31,
2025
2024
Operating Activities
Net earnings
.........................................................................................................................................................................................
$12,807
$15,242
Noncash items:
Depreciation and amortization
.......................................................................................................................................................
4,361
4,099
Deferred income taxes and other
..................................................................................................................................................
(989)
(3,657)
Share-based compensation
...........................................................................................................................................................
971
1,018
Loss on sale of subsidiary and subsidiaries held for sale
..........................................................................................................
265
8,310
Net changes in operating assets and liabilities
...............................................................................................................................
2,282
(808)
Cash flows from operating activities
..........................................................................................................................................
19,697
24,204
Investing Activities
Sales and maturities of investments, net of purchases
.................................................................................................................
361
525
Purchases of property, equipment and capitalized software
........................................................................................................
(3,622)
(3,499)
Cash paid for acquisitions and other transactions, net
..................................................................................................................
(4,509)
(13,408)
Loans to care providers - cyberattack
..............................................................................................................................................
—
(9,033)
Repayment of care provider loans - cyberattack
............................................................................................................................
1,680
4,514
Other, net
..............................................................................................................................................................................................
(2,595)
374
Cash flows used for investing activities
....................................................................................................................................
(8,685)
(20,527)
Financing Activities
Common share repurchases
..............................................................................................................................................................
(5,545)
(9,000)
Dividends paid
......................................................................................................................................................................................
(7,916)
(7,533)
Net change in short-term borrowings and long-term debt
.............................................................................................................
726
14,660
Other, net
..............................................................................................................................................................................................
1,091
(1,639)
Cash flows used for financing activities
....................................................................................................................................
(11,644)
(3,512)
Effect of exchange rate changes on cash and cash equivalents
.................................................................................................
40
(61)
(Decrease) increase in cash and cash equivalents, including cash within businesses held for sale
.....................................
(592)
104
Less: cash within businesses held for sale
......................................................................................................................................
(355)
(219)
Net decrease in cash and cash equivalents
....................................................................................................................................
(947)
(115)
Cash and cash equivalents, beginning of period
............................................................................................................................
25,312
25,427
Cash and cash equivalents, end of period
......................................................................................................................................
$24,365
$25,312
14
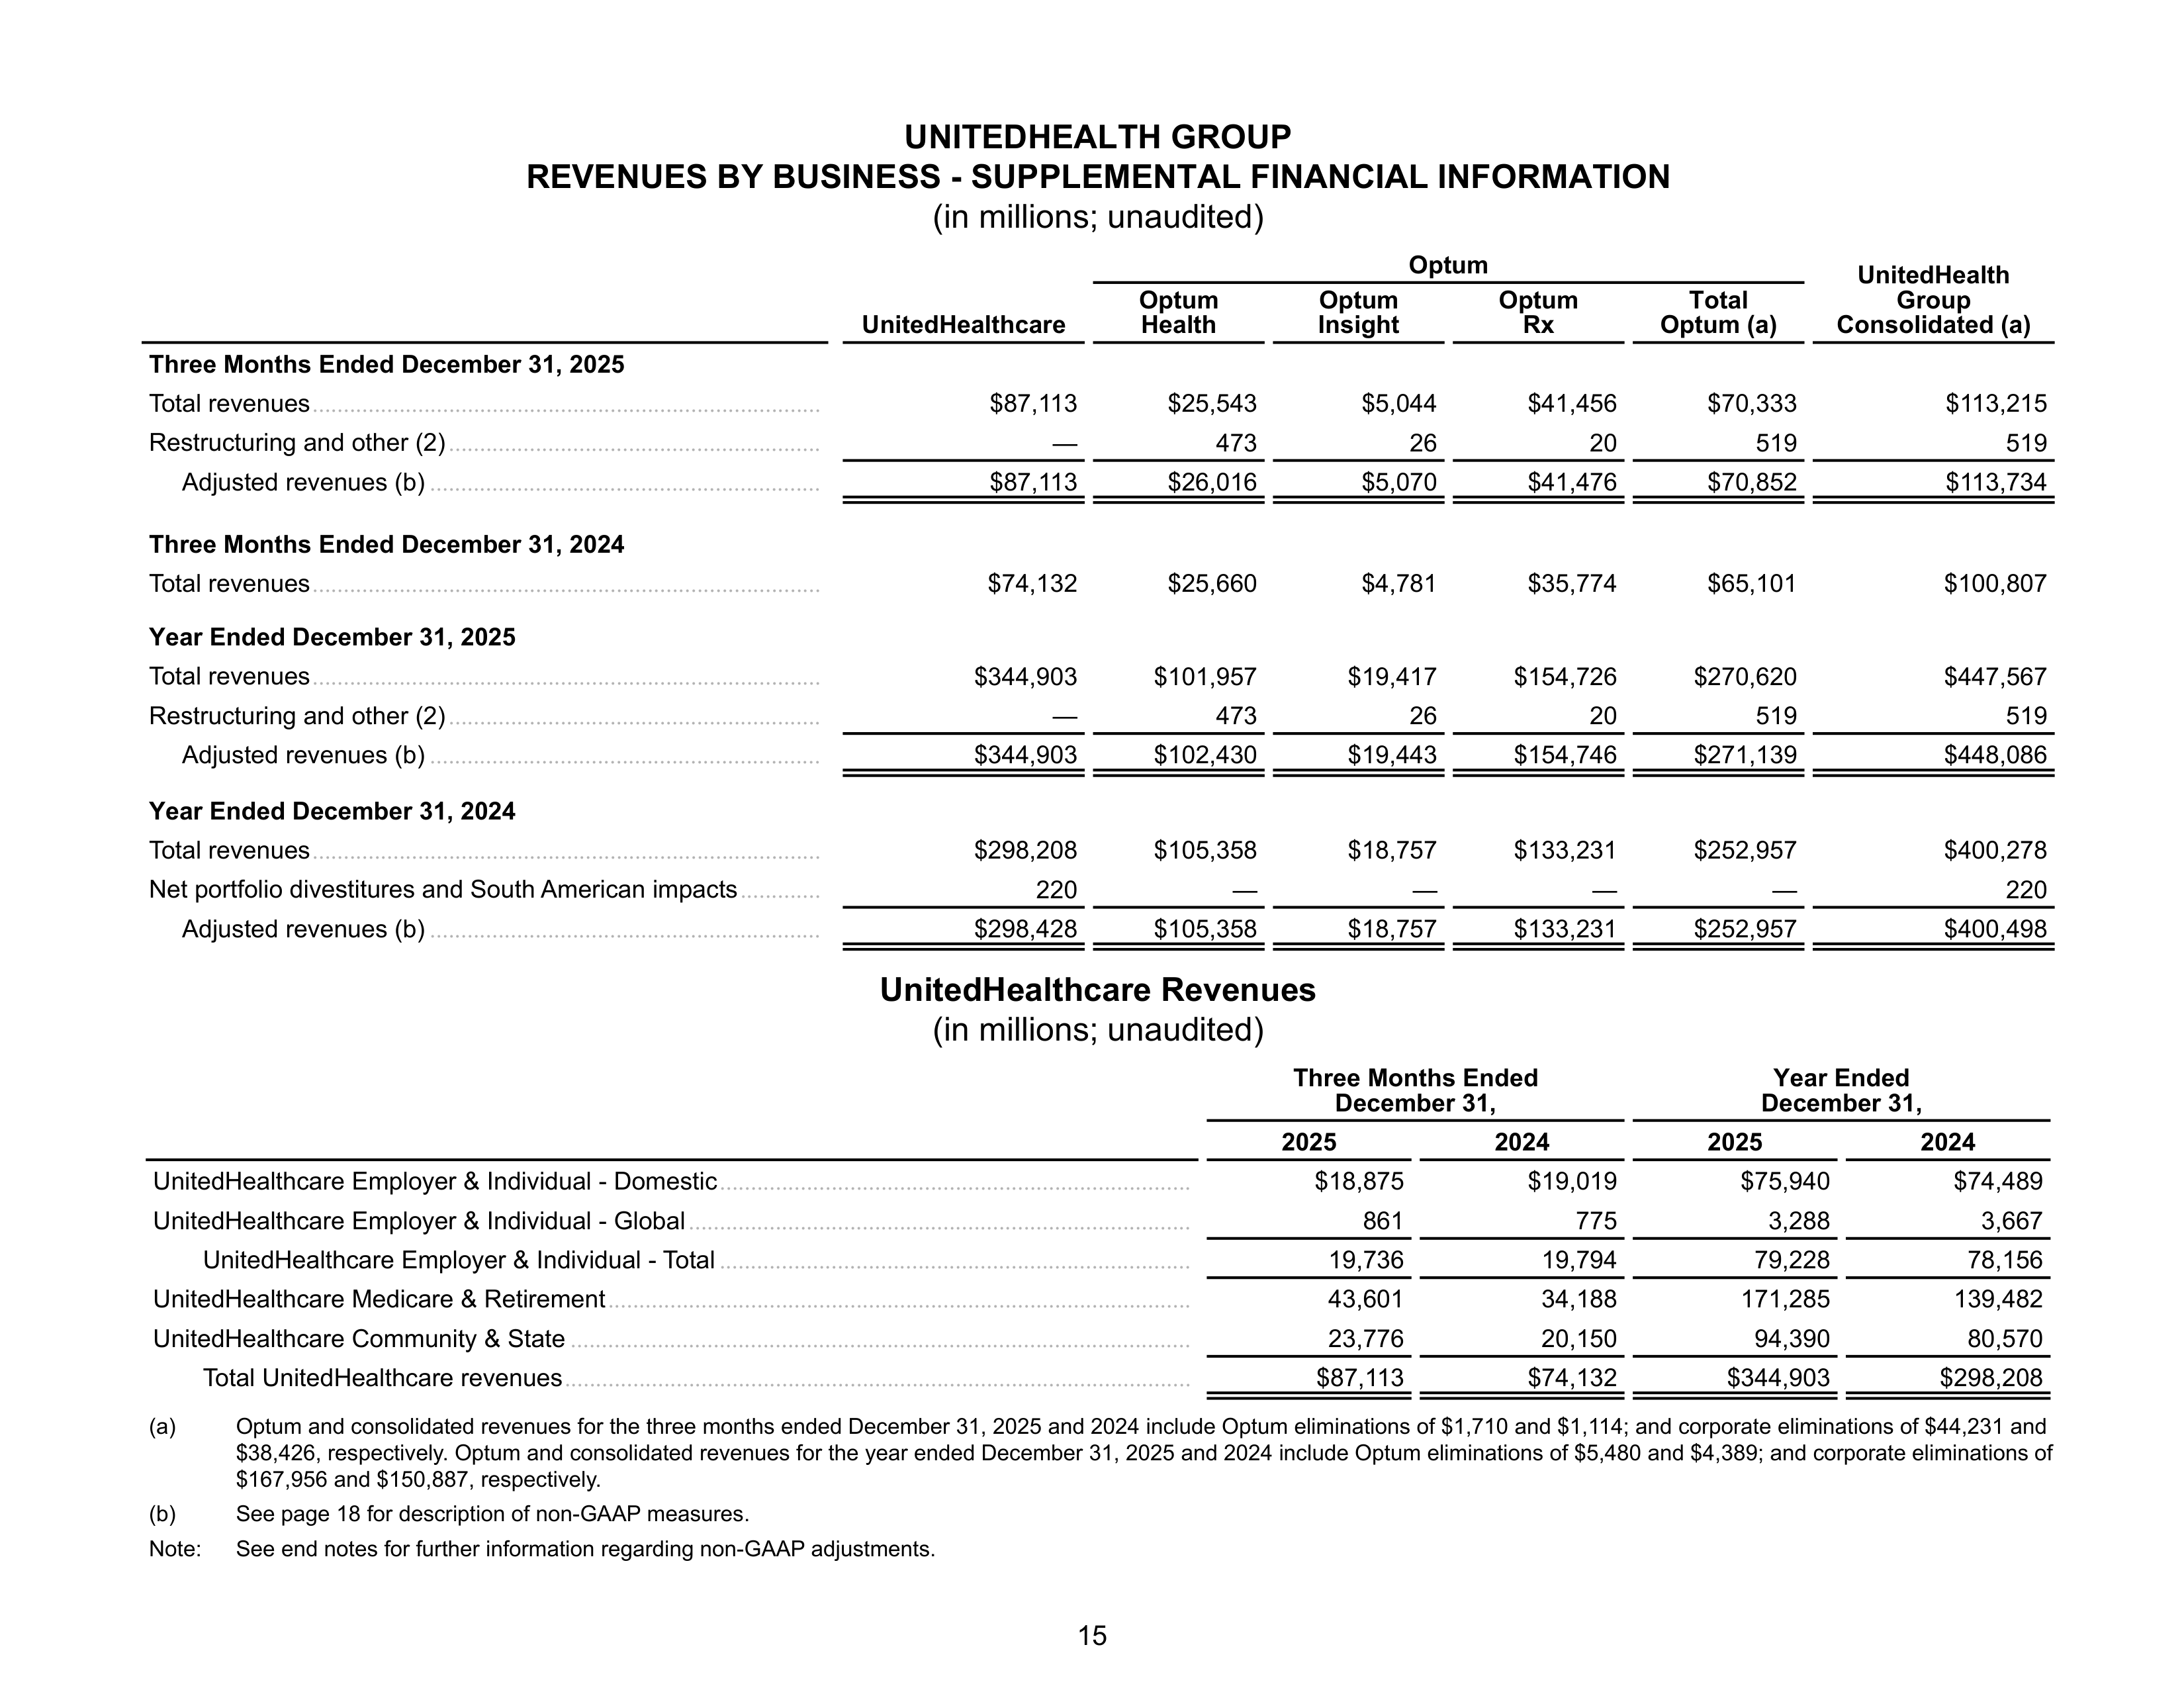
UNITEDHEALTH GROUP
REVENUES BY BUSINESS - SUPPLEMENTAL FINANCIAL INFORMATION
(in millions; unaudited)
Optum
UnitedHealth
Group
Consolidated (a)
UnitedHealthcare
Optum
Health
Optum
Insight
Optum
Rx
Total
Optum (a)
Three Months Ended December 31, 2025
Total revenues
..................................................................................
$87,113
$25,543
$5,044
$41,456
$70,333
$113,215
Restructuring and other (2)
............................................................
—
473
26
20
519
519
Adjusted revenues (b)
...............................................................
$87,113
$26,016
$5,070
$41,476
$70,852
$113,734
Three Months Ended December 31, 2024
Total revenues
..................................................................................
$74,132
$25,660
$4,781
$35,774
$65,101
$100,807
Year Ended December 31, 2025
Total revenues
..................................................................................
$344,903
$101,957
$19,417
$154,726
$270,620
$447,567
Restructuring and other (2)
............................................................
—
473
26
20
519
519
Adjusted revenues (b)
...............................................................
$344,903
$102,430
$19,443
$154,746
$271,139
$448,086
Year Ended December 31, 2024
Total revenues
..................................................................................
$298,208
$105,358
$18,757
$133,231
$252,957
$400,278
Net portfolio divestitures and South American impacts
.............
220
—
—
—
—
220
Adjusted revenues (b)
...............................................................
$298,428
$105,358
$18,757
$133,231
$252,957
$400,498
UnitedHealthcare Revenues
(in millions; unaudited)
Three Months Ended
December 31,
Year Ended
December 31,
2025
2024
2025
2024
UnitedHealthcare Employer & Individual - Domestic
............................................................................
$18,875
$19,019
$75,940
$74,489
UnitedHealthcare Employer & Individual - Global
.................................................................................
861
775
3,288
3,667
UnitedHealthcare Employer & Individual - Total
............................................................................
19,736
19,794
79,228
78,156
UnitedHealthcare Medicare & Retirement
..............................................................................................
43,601
34,188
171,285
139,482
UnitedHealthcare Community & State
....................................................................................................
23,776
20,150
94,390
80,570
Total UnitedHealthcare revenues
.....................................................................................................
$87,113
$74,132
$344,903
$298,208
(a)
Optum and consolidated revenues for the three months ended December 31, 2025 and 2024 include Optum eliminations of $1,710 and $1,114; and corporate eliminations of $44,231 and
$38,426, respectively.
Optum and consolidated revenues for the year ended December 31, 2025 and 2024 include Optum eliminations of $5,480 and $4,389; and corporate eliminations of
$167,956 and $150,887, respectively.
(b)
See page 18 for description of non-GAAP measures.
Note:
See end notes for further information regarding non-GAAP adjustments.
15
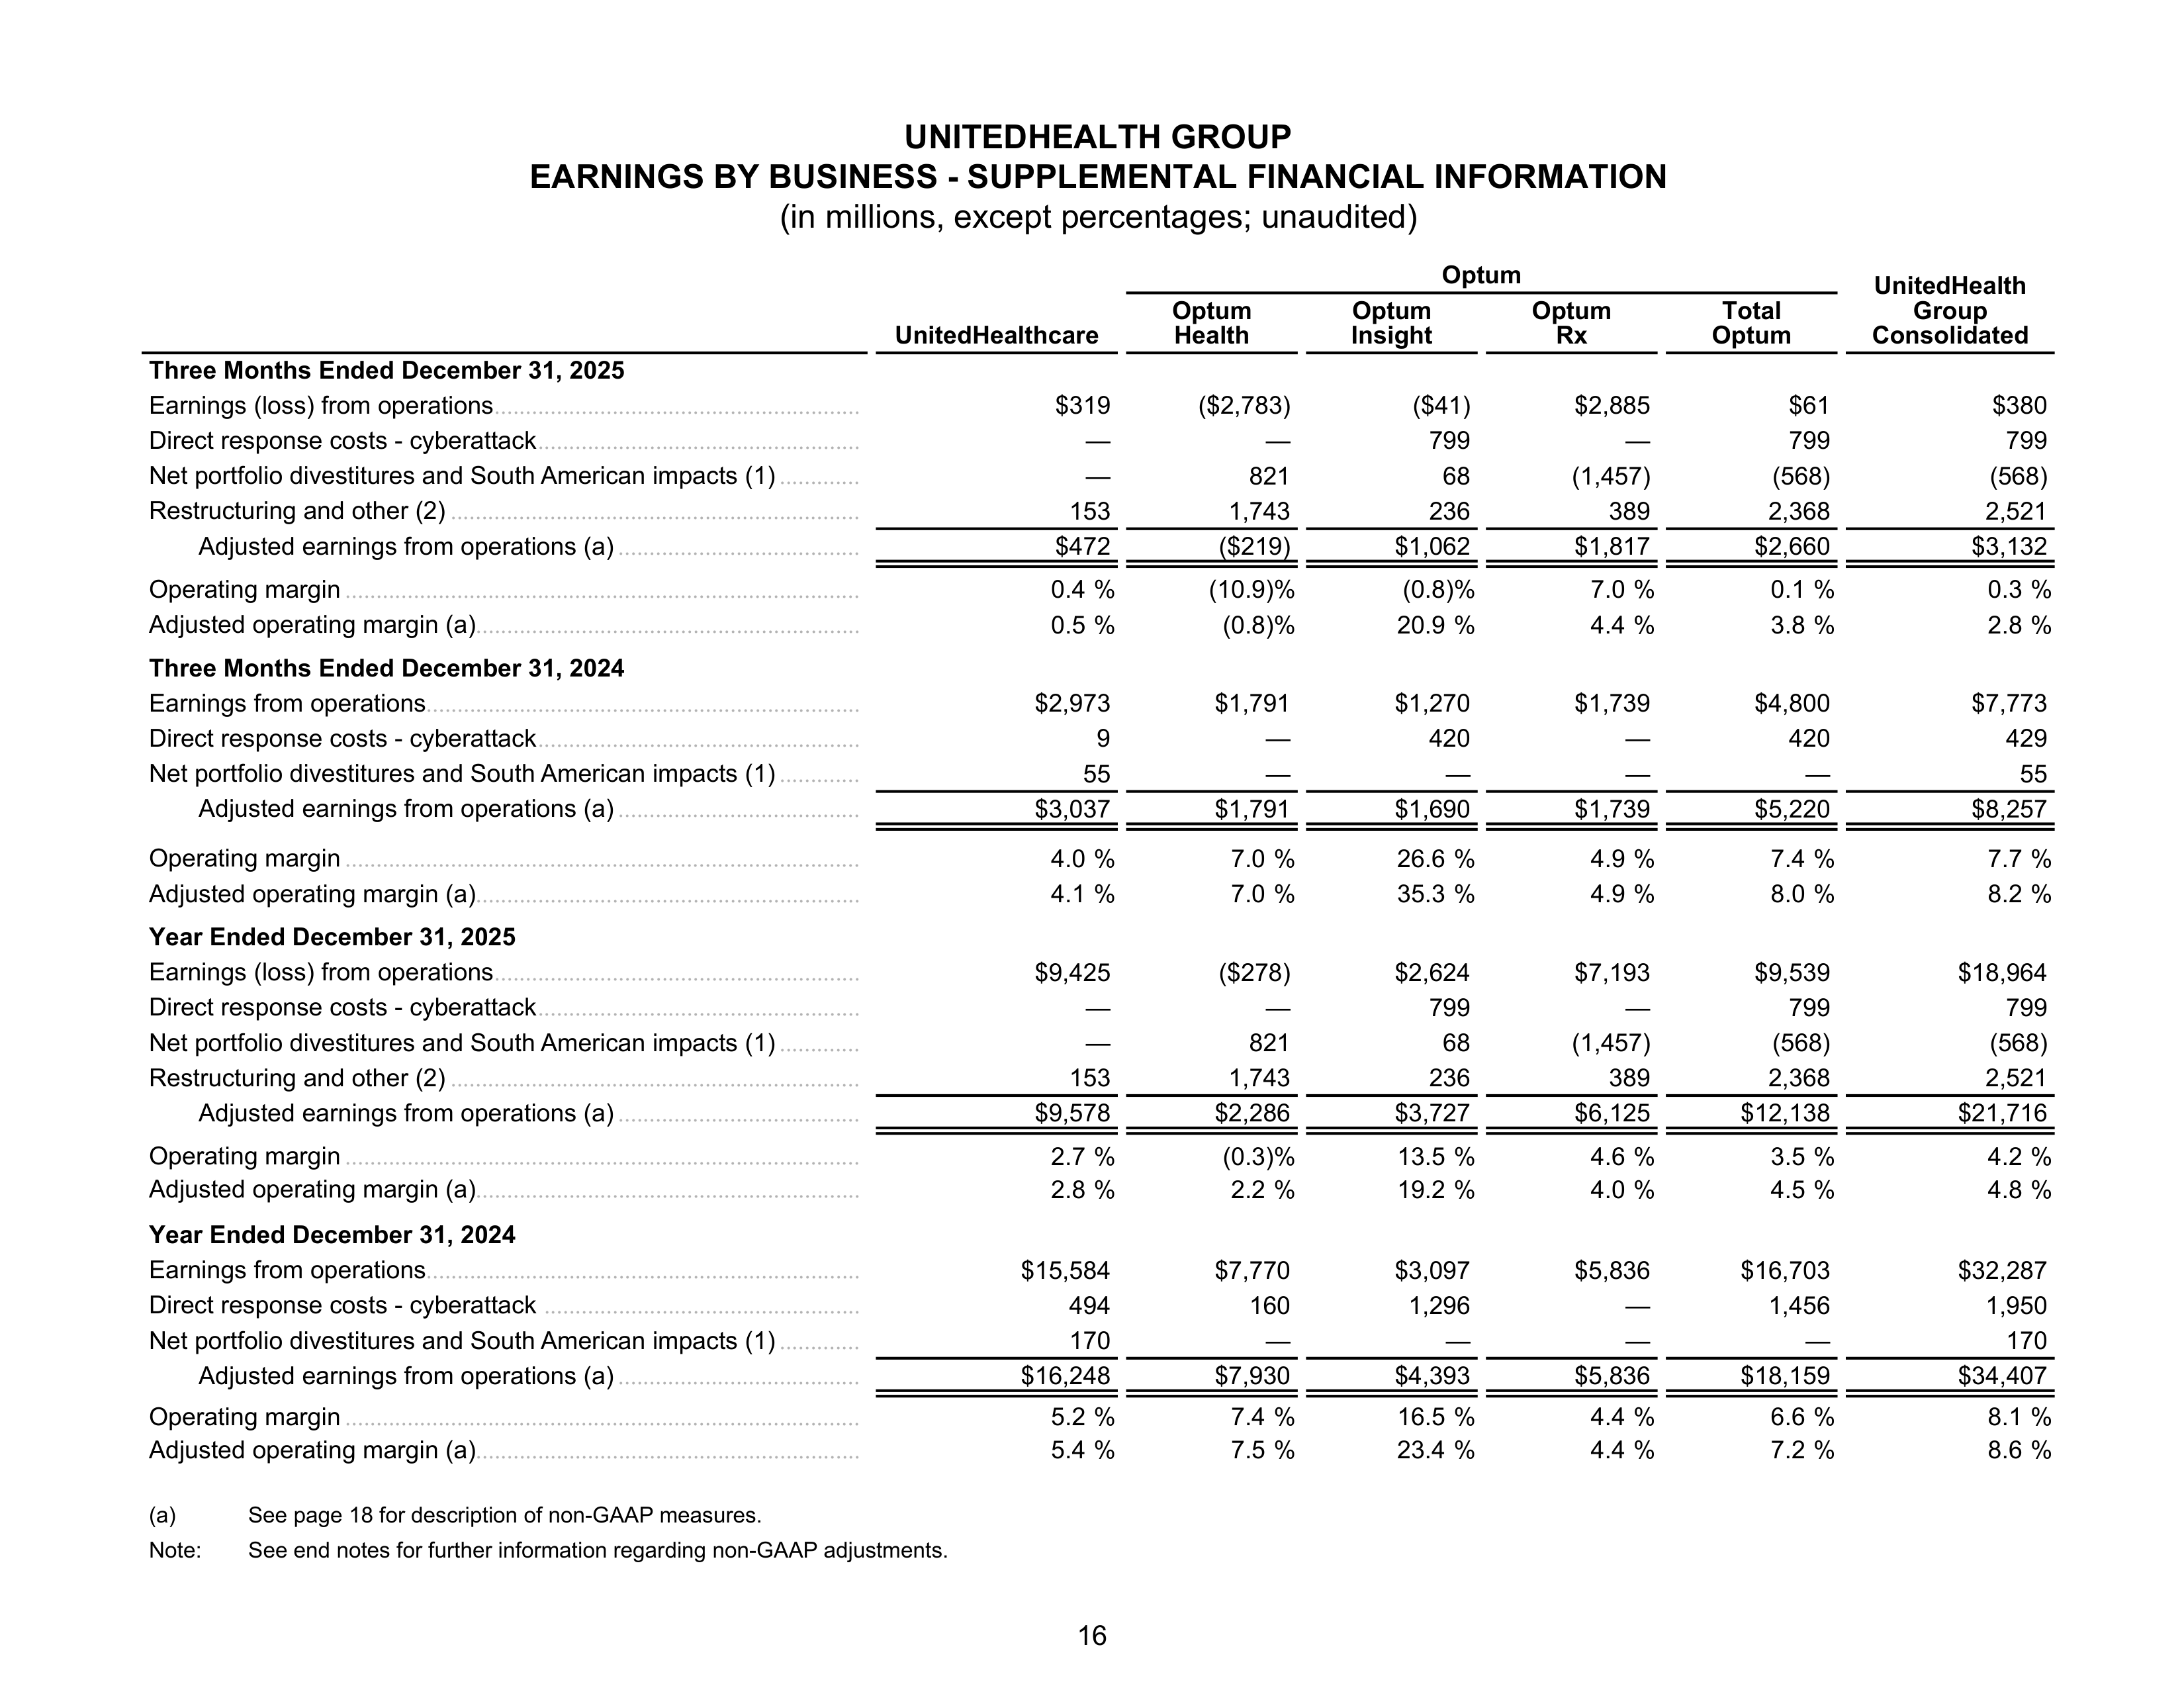
UNITEDHEALTH GROUP
EARNINGS BY BUSINESS - SUPPLEMENTAL FINANCIAL INFORMATION
(in millions, except percentages; unaudited)
Optum
UnitedHealth
Group
Consolidated
UnitedHealthcare
Optum
Health
Optum
Insight
Optum
Rx
Total
Optum
Three Months Ended December 31, 2025
Earnings (loss) from operations
...........................................................
$319
($2,783)
($41)
$2,885
$61
$380
Direct response costs - cyberattack
....................................................
—
—
799
—
799
799
Net portfolio divestitures and South American impacts (1)
.............
—
821
68
(1,457)
(568)
(568)
Restructuring and other (2)
..................................................................
153
1,743
236
389
2,368
2,521
Adjusted earnings from operations (a)
.......................................
$472
($219)
$1,062
$1,817
$2,660
$3,132
Operating margin
...................................................................................
0.4 %
(10.9) %
(0.8) %
7.0 %
0.1 %
0.3 %
Adjusted operating margin (a)
..............................................................
0.5 %
(0.8) %
20.9 %
4.4 %
3.8 %
2.8 %
Three Months Ended December 31, 2024
Earnings from operations
......................................................................
$2,973
$1,791
$1,270
$1,739
$4,800
$7,773
Direct response costs - cyberattack
....................................................
9
—
420
—
420
429
Net portfolio divestitures and South American impacts (1)
.............
55
—
—
—
—
55
Adjusted earnings from operations (a)
.......................................
$3,037
$1,791
$1,690
$1,739
$5,220
$8,257
Operating margin
...................................................................................
4.0 %
7.0 %
26.6 %
4.9 %
7.4 %
7.7 %
Adjusted operating margin (a)
..............................................................
4.1 %
7.0 %
35.3 %
4.9 %
8.0 %
8.2 %
Year Ended December 31, 2025
Earnings (loss) from operations
...........................................................
$9,425
($278)
$2,624
$7,193
$9,539
$18,964
Direct response costs - cyberattack
....................................................
—
—
799
—
799
799
Net portfolio divestitures and South American impacts (1)
.............
—
821
68
(1,457)
(568)
(568)
Restructuring and other (2)
..................................................................
153
1,743
236
389
2,368
2,521
Adjusted earnings from operations (a)
.......................................
$9,578
$2,286
$3,727
$6,125
$12,138
$21,716
Operating margin
...................................................................................
2.7 %
(0.3) %
13.5 %
4.6 %
3.5 %
4.2 %
Adjusted operating margin (a)
..............................................................
2.8 %
2.2 %
19.2 %
4.0 %
4.5 %
4.8 %
Year Ended December 31, 2024
Earnings from operations
......................................................................
$15,584
$7,770
$3,097
$5,836
$16,703
$32,287
Direct response costs - cyberattack
...................................................
494
160
1,296
—
1,456
1,950
Net portfolio divestitures and South American impacts (1)
.............
170
—
—
—
—
170
Adjusted earnings from operations (a)
.......................................
$16,248
$7,930
$4,393
$5,836
$18,159
$34,407
Operating margin
...................................................................................
5.2 %
7.4 %
16.5 %
4.4 %
6.6 %
8.1 %
Adjusted operating margin (a)
..............................................................
5.4 %
7.5 %
23.4 %
4.4 %
7.2 %
8.6 %
(a)
See page 18 for description of non-GAAP measures.
Note:
See end notes for further information regarding non-GAAP adjustments.
16
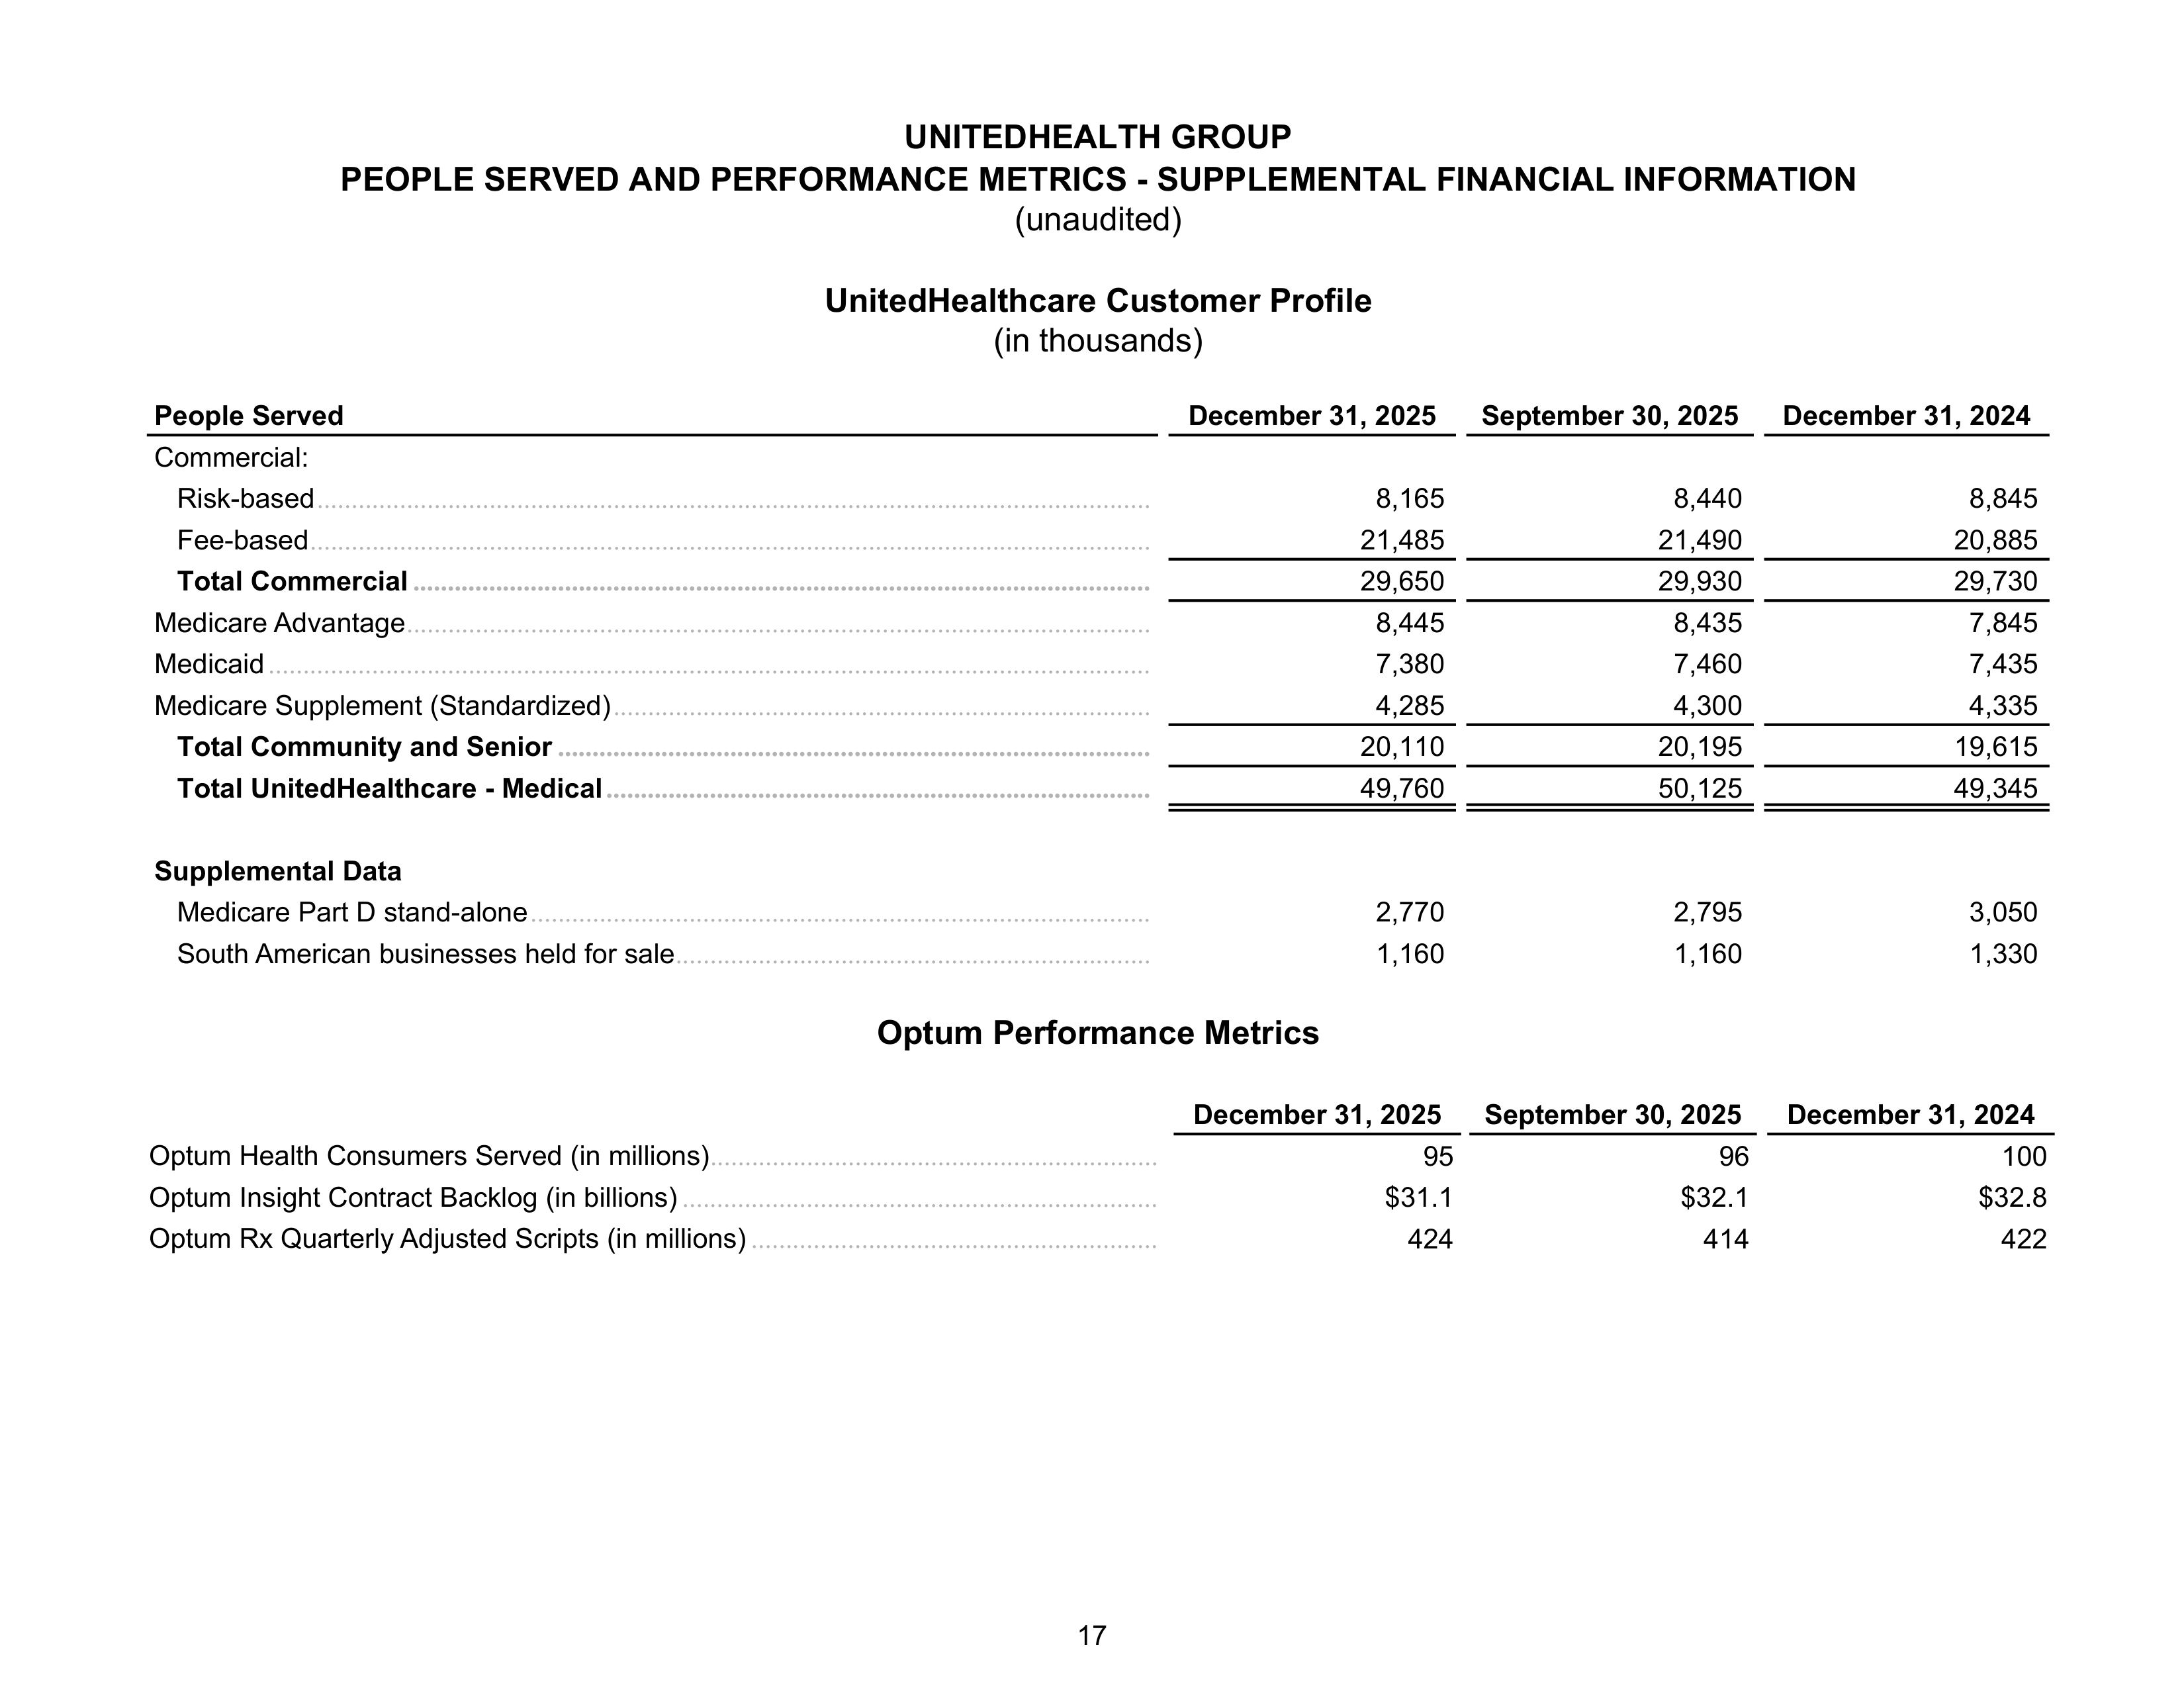
UNITEDHEALTH GROUP
PEOPLE SERVED AND PERFORMANCE METRICS - SUPPLEMENTAL FINANCIAL INFORMATION
(unaudited)
UnitedHealthcare Customer Profile
(in thousands)
People Served
December 31, 2025
September 30, 2025
December 31, 2024
Commercial:
Risk-based
.........................................................................................................................
8,165
8,440
8,845
Fee-based
..........................................................................................................................
21,485
21,490
20,885
Total Commercial
...........................................................................................................
29,650
29,930
29,730
Medicare Advantage
............................................................................................................
8,445
8,435
7,845
Medicaid
................................................................................................................................
7,380
7,460
7,435
Medicare Supplement (Standardized)
..............................................................................
4,285
4,300
4,335
Total Community and Senior
......................................................................................
20,110
20,195
19,615
Total UnitedHealthcare - Medical
...............................................................................
49,760
50,125
49,345
Supplemental Data
Medicare Part D stand-alone
..........................................................................................
2,770
2,795
3,050
South American businesses held for sale
.....................................................................
1,160
1,160
1,330
Optum Performance Metrics
December 31, 2025
September 30, 2025
December 31, 2024
Optum Health Consumers Served (in millions)
.................................................................
95
96
100
Optum Insight Contract Backlog (in billions)
.....................................................................
$31.1
$32.1
$32.8
Optum Rx Quarterly Adjusted Scripts (in millions)
...........................................................
424
414
422
17
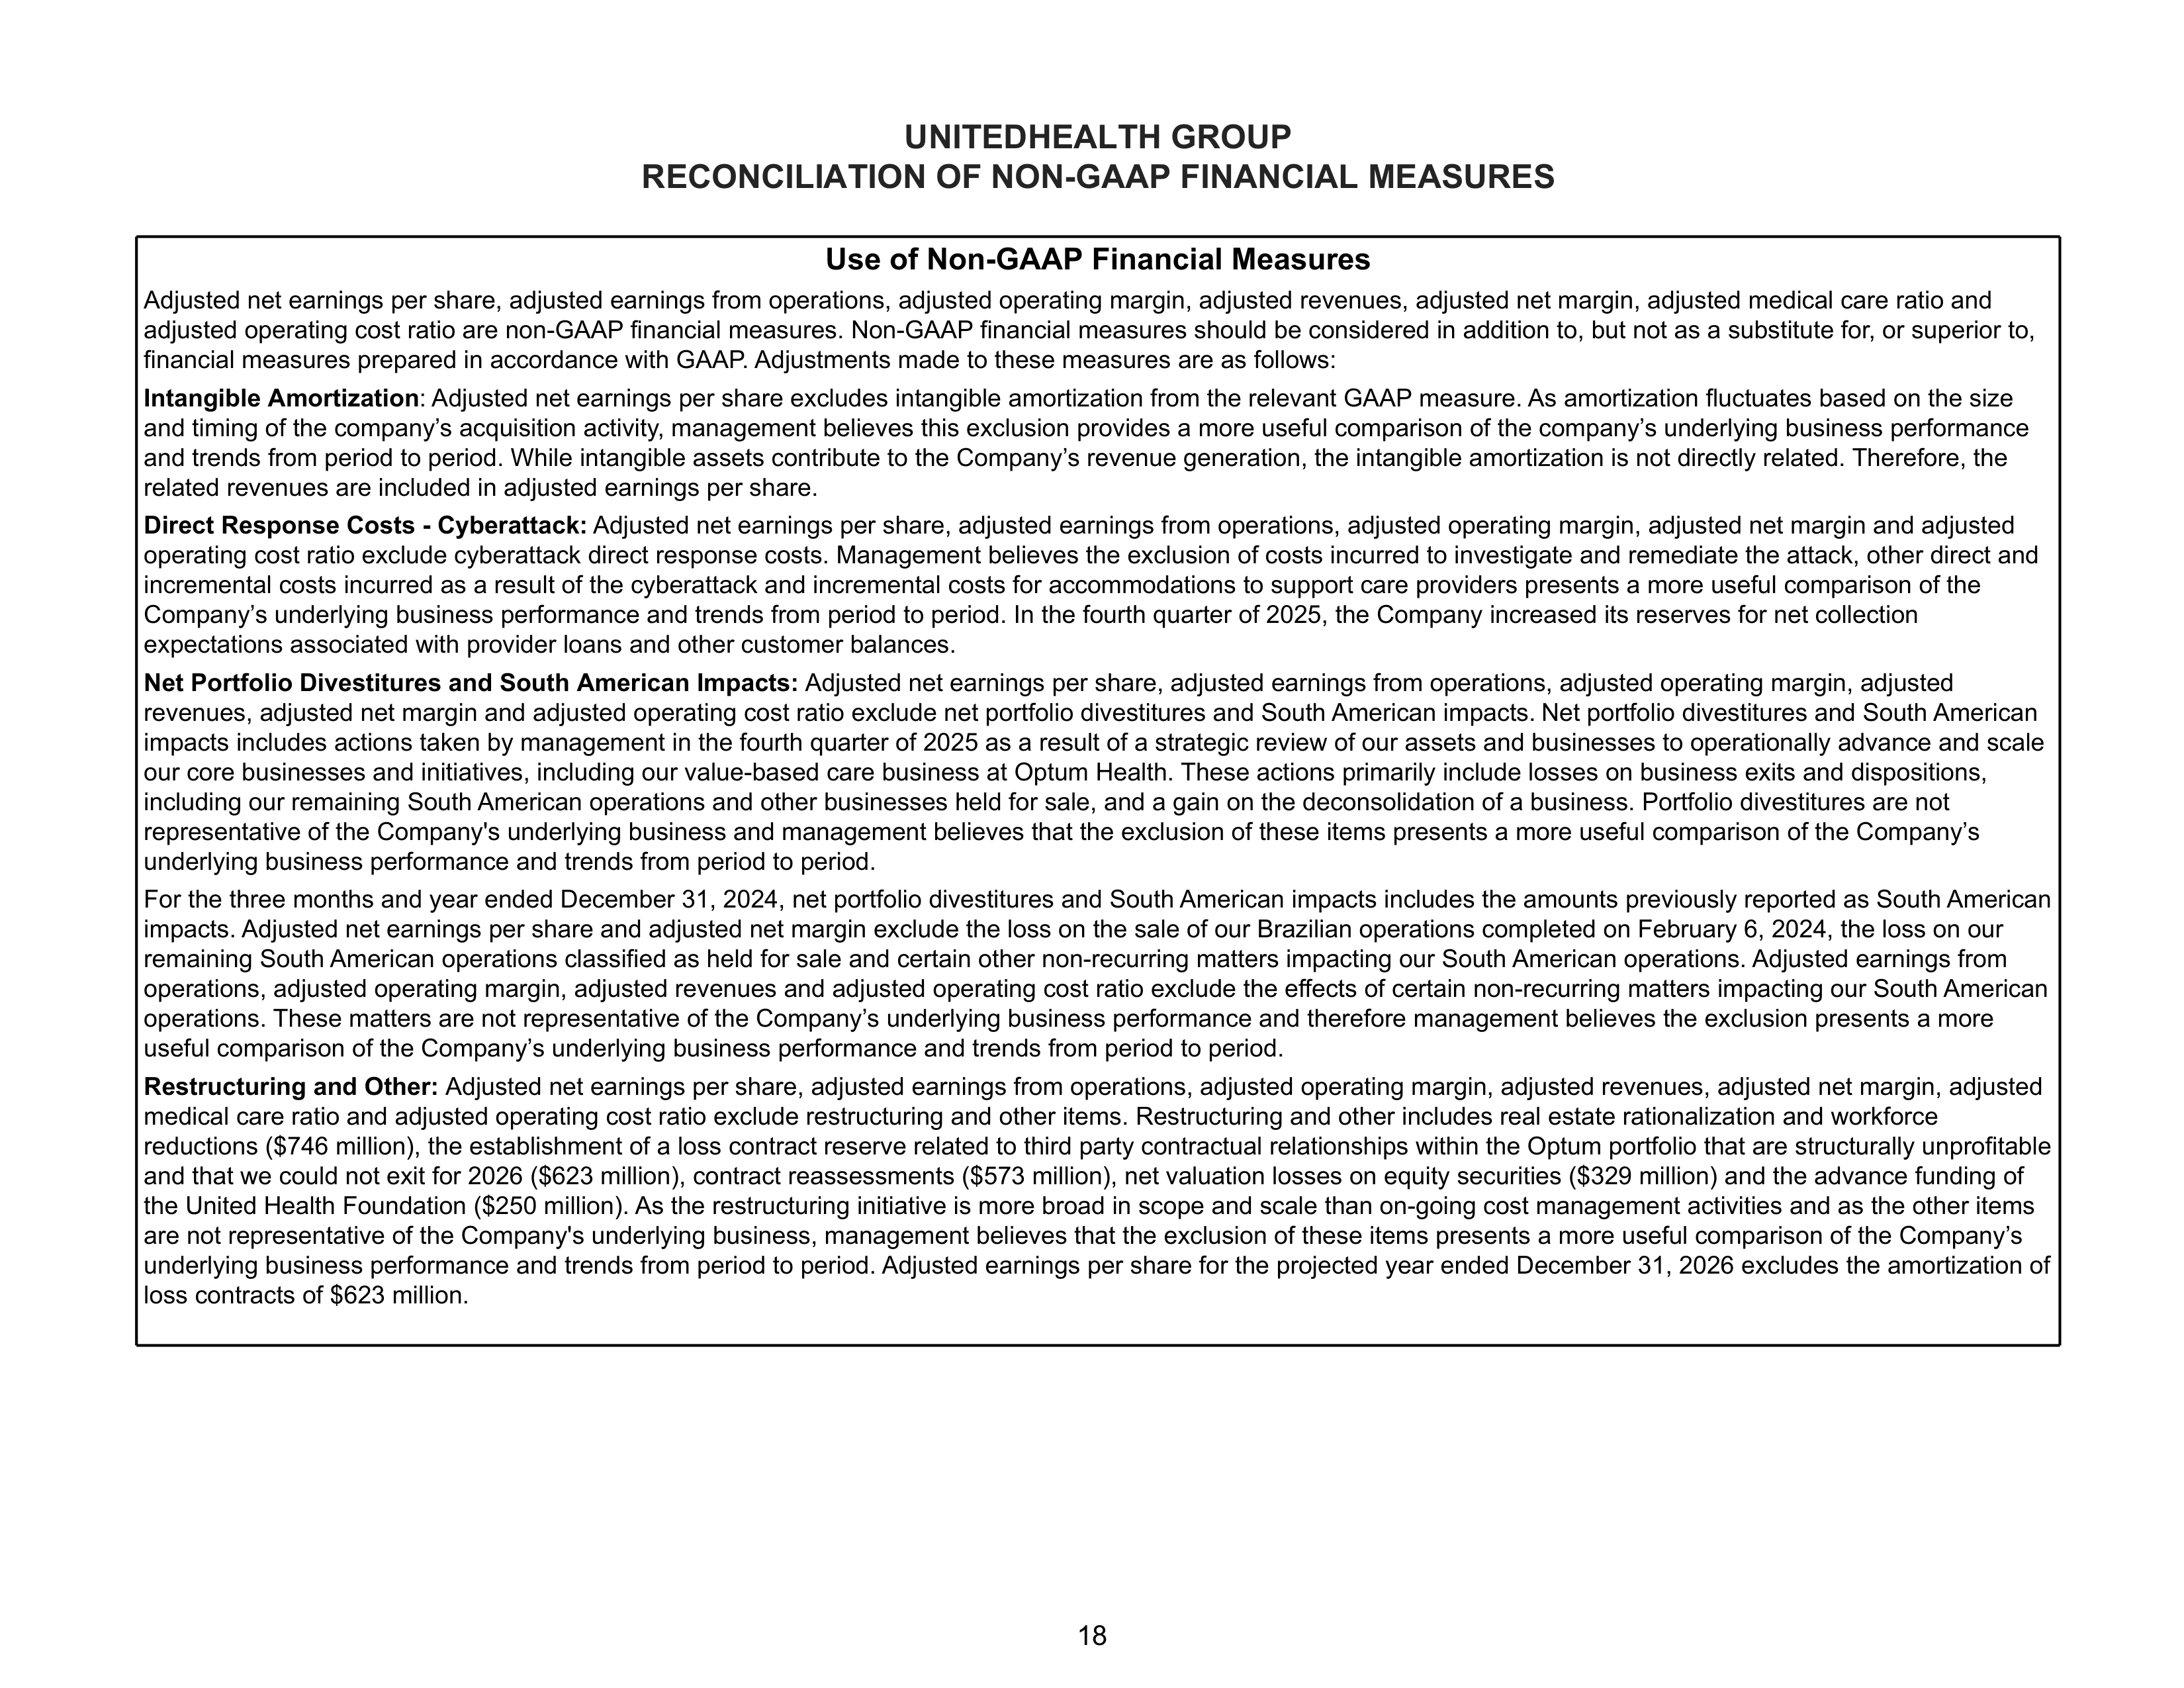
UNITEDHEALTH GROUP
RECONCILIATION OF NON-GAAP FINANCIAL MEASURES
Use of Non-GAAP Financial Measures
Adjusted net earnings per share, adjusted earnings from operations, adjusted operating margin, adjusted revenues, adjusted net margin, adjusted medical care ratio and
adjusted operating cost ratio are non-GAAP financial measures. Non-GAAP financial measures should be considered in addition to, but not as a substitute for, or superior to,
financial measures prepared in accordance with GAAP. Adjustments made to these measures are as follows:
Intangible Amortization
: Adjusted net earnings per share excludes intangible amortization from the relevant GAAP measure. As amortization fluctuates based on the size
and timing of the company’s acquisition activity, management believes this exclusion provides a more useful comparison of the company’s underlying business performance
and trends from period to period. While intangible assets contribute to the Company’s revenue generation, the intangible amortization is not directly related. Therefore, the
related revenues are included in adjusted earnings per share.
Direct Response Costs - Cyberattack:
Adjusted net earnings per share, adjusted earnings from operations, adjusted operating margin, adjusted net margin and adjusted
operating cost ratio exclude cyberattack direct response costs. Management believes the exclusion of costs incurred to investigate and remediate the attack, other direct and
incremental costs incurred as a result of the cyberattack and incremental costs for accommodations to support care providers presents a more useful comparison of the
Company’s underlying business performance and trends from period to period. In the fourth quarter of 2025, the Company increased its reserves for net collection
expectations associated with provider loans and other customer balances.
Net Portfolio Divestitures and South American Impacts:
Adjusted net earnings per share, adjusted earnings from operations, adjusted operating margin, adjusted
revenues, adjusted net margin and adjusted operating cost ratio exclude net portfolio divestitures and South American impacts.
Net portfolio divestitures and South American
impacts includes actions taken by management in the fourth quarter of 2025 as a result of a strategic review of our assets and businesses to operationally advance and scale
our core businesses and initiatives, including our value-based care business at Optum Health. These actions primarily include losses on business exits and dispositions,
including our remaining South American operations and other businesses held for sale, and a gain on the deconsolidation of a business. Portfolio divestitures are not
representative of the Company's underlying business and management believes that the exclusion of these items presents a more useful comparison of the Company’s
underlying business performance and trends from period to period.
For the three months and year ended December 31, 2024, net portfolio divestitures and South American impacts includes the amounts previously reported as South American
impacts. Adjusted net earnings per share and adjusted net margin exclude the loss on the sale of our Brazilian operations completed on February 6, 2024, the loss on our
remaining South American operations classified as held for sale and certain other non-recurring matters impacting our South American operations. Adjusted earnings from
operations, adjusted operating margin, adjusted revenues and adjusted operating cost ratio exclude the effects of certain non-recurring matters impacting our South American
operations. These matters are not representative of the Company’s underlying business performance and therefore management believes the exclusion presents a more
useful comparison of the Company’s underlying business performance and trends from period to period.
Restructuring and Other:
Adjusted net earnings per share, adjusted earnings from operations, adjusted operating margin, adjusted revenues, adjusted net margin, adjusted
medical care ratio and adjusted operating cost ratio exclude restructuring and other items. Restructuring and other includes real estate rationalization and workforce
reductions ($746 million), the establishment of a loss contract reserve related to third party contractual relationships within the Optum portfolio that are structurally unprofitable
and that we could not exit for 2026 ($623 million), contract reassessments ($573 million), net valuation losses on equity securities ($329 million) and the advance funding of
the United Health Foundation ($250 million). As the restructuring initiative is more broad in scope and scale than on-going cost management activities and as the other items
are not representative of the Company's underlying business, management believes that the exclusion of these items presents a more useful comparison of the Company’s
underlying business performance and trends from period to period. Adjusted earnings per share for the projected year ended December 31, 2026 excludes the amortization of
loss contracts of $623 million.
18
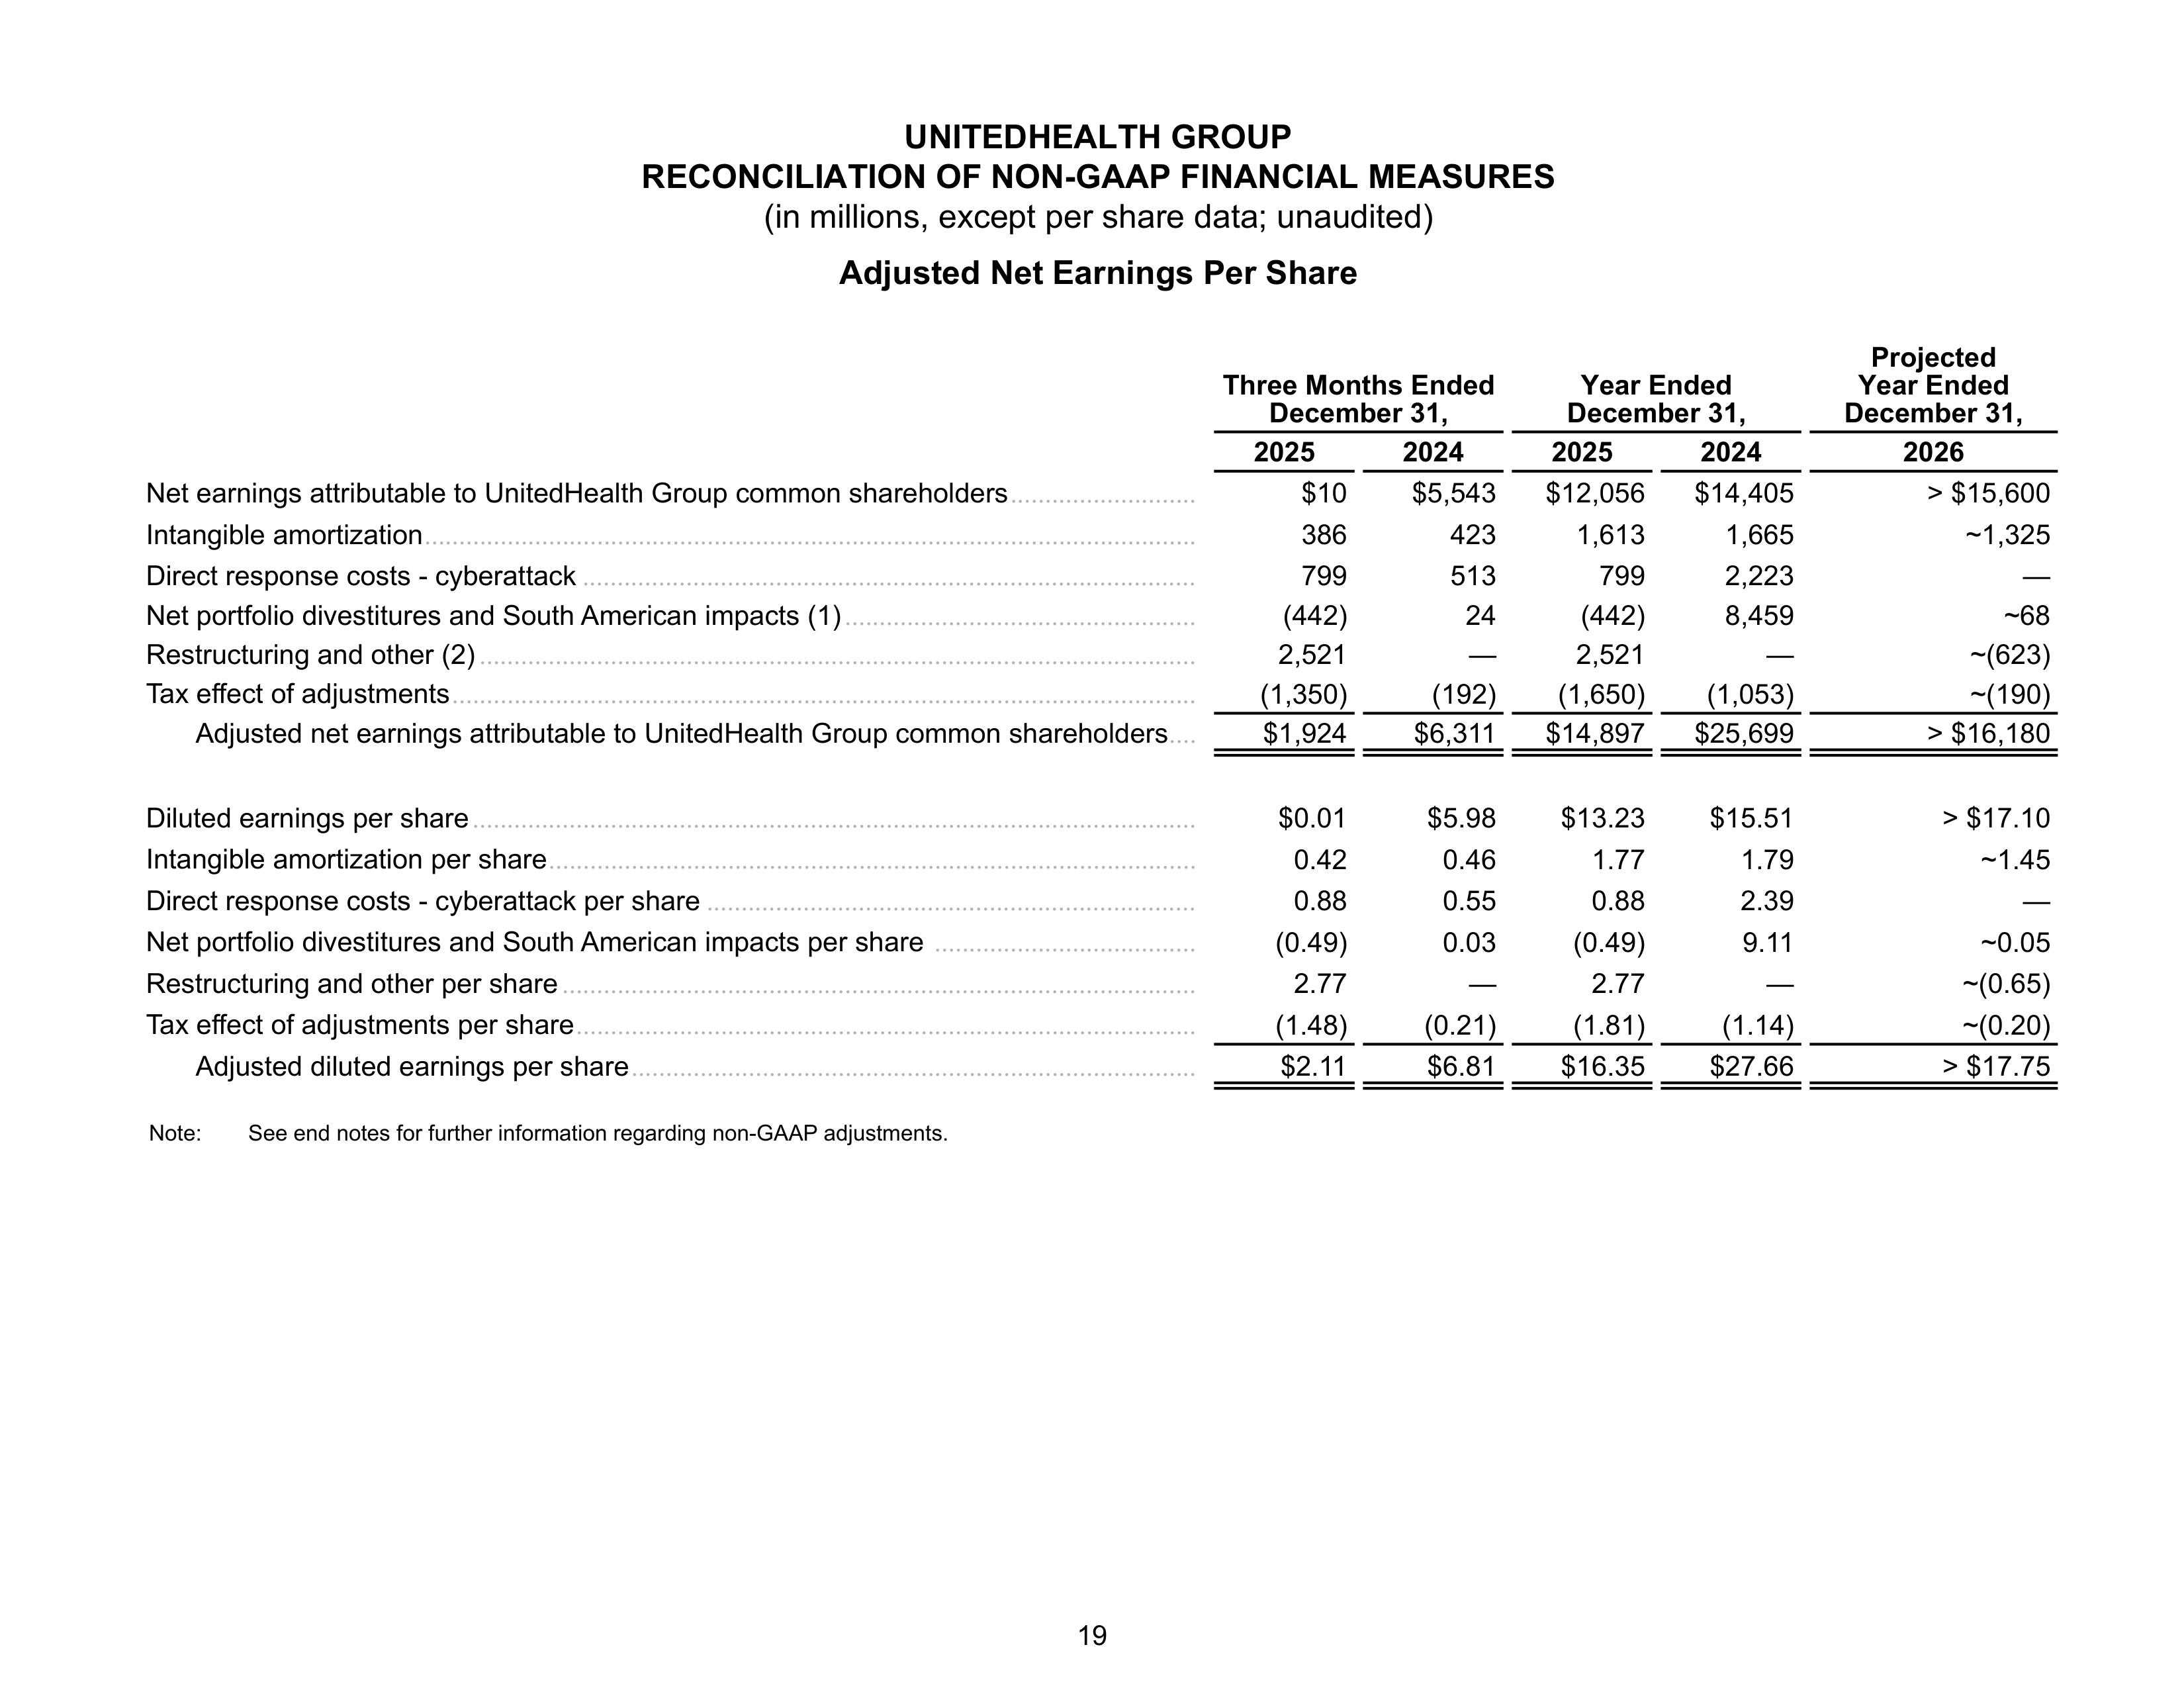
UNITEDHEALTH GROUP
RECONCILIATION OF NON-GAAP FINANCIAL MEASURES
(in millions, except per share data; unaudited)
Adjusted Net Earnings Per Share
Three Months Ended
December 31,
Year Ended
December 31,
Projected
Year Ended
December 31,
2025
2024
2025
2024
2026
Net earnings attributable to UnitedHealth Group common shareholders
...........................
$10
$5,543
$12,056
$14,405
> $15,600
Intangible amortization
................................................................................................................
386
423
1,613
1,665
~1,325
Direct response costs - cyberattack
.........................................................................................
799
513
799
2,223
—
Net portfolio divestitures and South American impacts (1)
...................................................
(442)
24
(442)
8,459
~68
Restructuring and other (2)
........................................................................................................
2,521
—
2,521
—
~(623)
Tax effect of adjustments
............................................................................................................
(1,350)
(192)
(1,650)
(1,053)
~(190)
Adjusted net earnings attributable to UnitedHealth Group common shareholders
....
$1,924
$6,311
$14,897
$25,699
> $16,180
Diluted earnings per share
.........................................................................................................
$0.01
$5.98
$13.23
$15.51
> $17.10
Intangible amortization per share
..............................................................................................
0.42
0.46
1.77
1.79
~1.45
Direct response costs - cyberattack per share
.......................................................................
0.88
0.55
0.88
2.39
—
Net portfolio divestitures and South American impacts per share
......................................
(0.49)
0.03
(0.49)
9.11
~0.05
Restructuring and other per share
............................................................................................
2.77
—
2.77
—
~(0.65)
Tax effect of adjustments per share
..........................................................................................
(1.48)
(0.21)
(1.81)
(1.14)
~(0.20)
Adjusted diluted earnings per share
..................................................................................
$2.11
$6.81
$16.35
$27.66
> $17.75
Note:
See end notes for further information regarding non-GAAP adjustments.
19
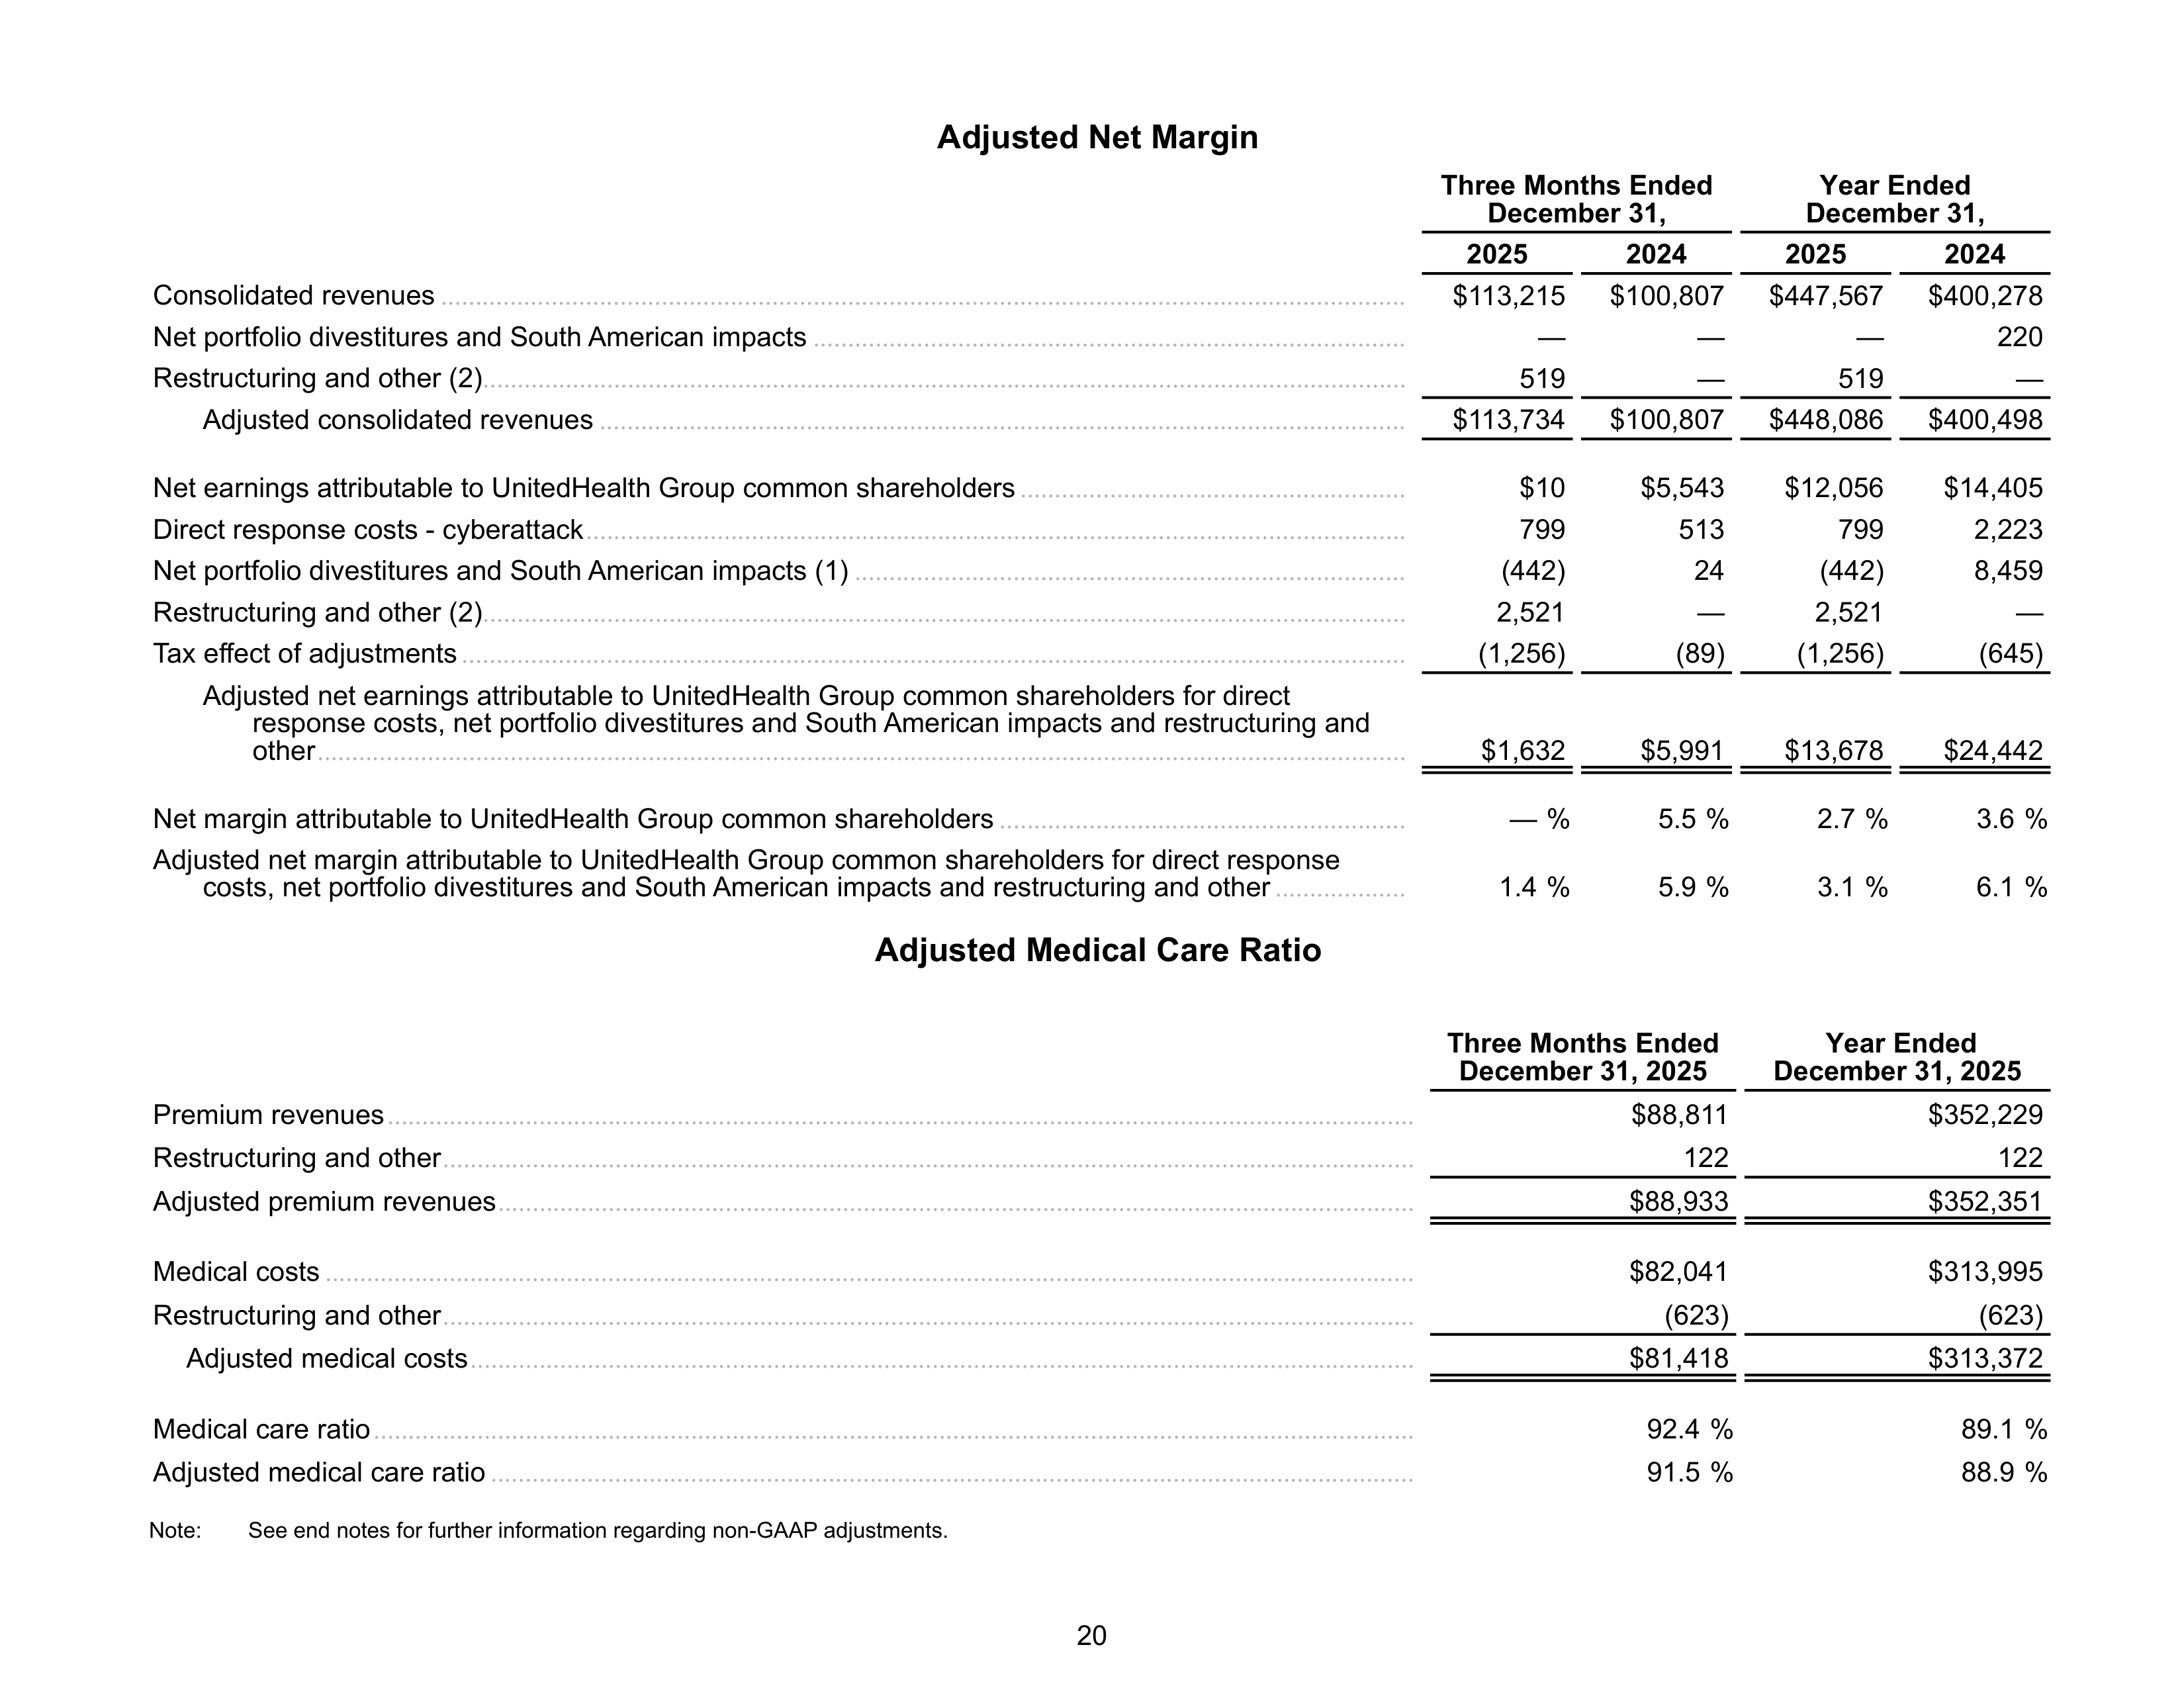
Adjusted Net Margin
Three Months Ended
December 31,
Year Ended
December 31,
2025
2024
2025
2024
Consolidated revenues
............................................................................................................................................
$113,215
$100,807
$447,567
$400,278
Net portfolio divestitures and South American impacts
......................................................................................
—
—
—
220
Restructuring and other (2)
......................................................................................................................................
519
—
519
—
Adjusted consolidated revenues
.....................................................................................................................
$113,734
$100,807
$448,086
$400,498
Net earnings attributable to UnitedHealth Group common shareholders
........................................................
$10
$5,543
$12,056
$14,405
Direct response costs - cyberattack
.......................................................................................................................
799
513
799
2,223
Net portfolio divestitures and South American impacts (1)
................................................................................
(442)
24
(442)
8,459
Restructuring and other (2)
......................................................................................................................................
2,521
—
2,521
—
Tax effect of adjustments
.........................................................................................................................................
(1,256)
(89)
(1,256)
(645)
Adjusted net earnings attributable to UnitedHealth Group common shareholders for direct
response costs, net portfolio divestitures and South American impacts and restructuring and
other
..............................................................................................................................................................
$1,632
$5,991
$13,678
$24,442
Net margin attributable to UnitedHealth Group common shareholders
...........................................................
— %
5.5 %
2.7 %
3.6 %
Adjusted net margin attributable to UnitedHealth Group common shareholders for direct response
costs, net portfolio divestitures and South American impacts and restructuring and other
...................
1.4 %
5.9 %
3.1 %
6.1 %
Adjusted Medical Care Ratio
Three Months Ended
December 31, 2025
Year Ended
December 31, 2025
Premium revenues
.....................................................................................................................................................
$88,811
$352,229
Restructuring and other
.............................................................................................................................................
122
122
Adjusted premium revenues
.....................................................................................................................................
$88,933
$352,351
Medical costs
..............................................................................................................................................................
$82,041
$313,995
Restructuring and other
.............................................................................................................................................
(623)
(623)
Adjusted medical costs
.........................................................................................................................................
$81,418
$313,372
Medical care ratio
.......................................................................................................................................................
92.4 %
89.1 %
Adjusted medical care ratio
......................................................................................................................................
91.5 %
88.9 %
Note:
See end notes for further information regarding non-GAAP adjustments.
20
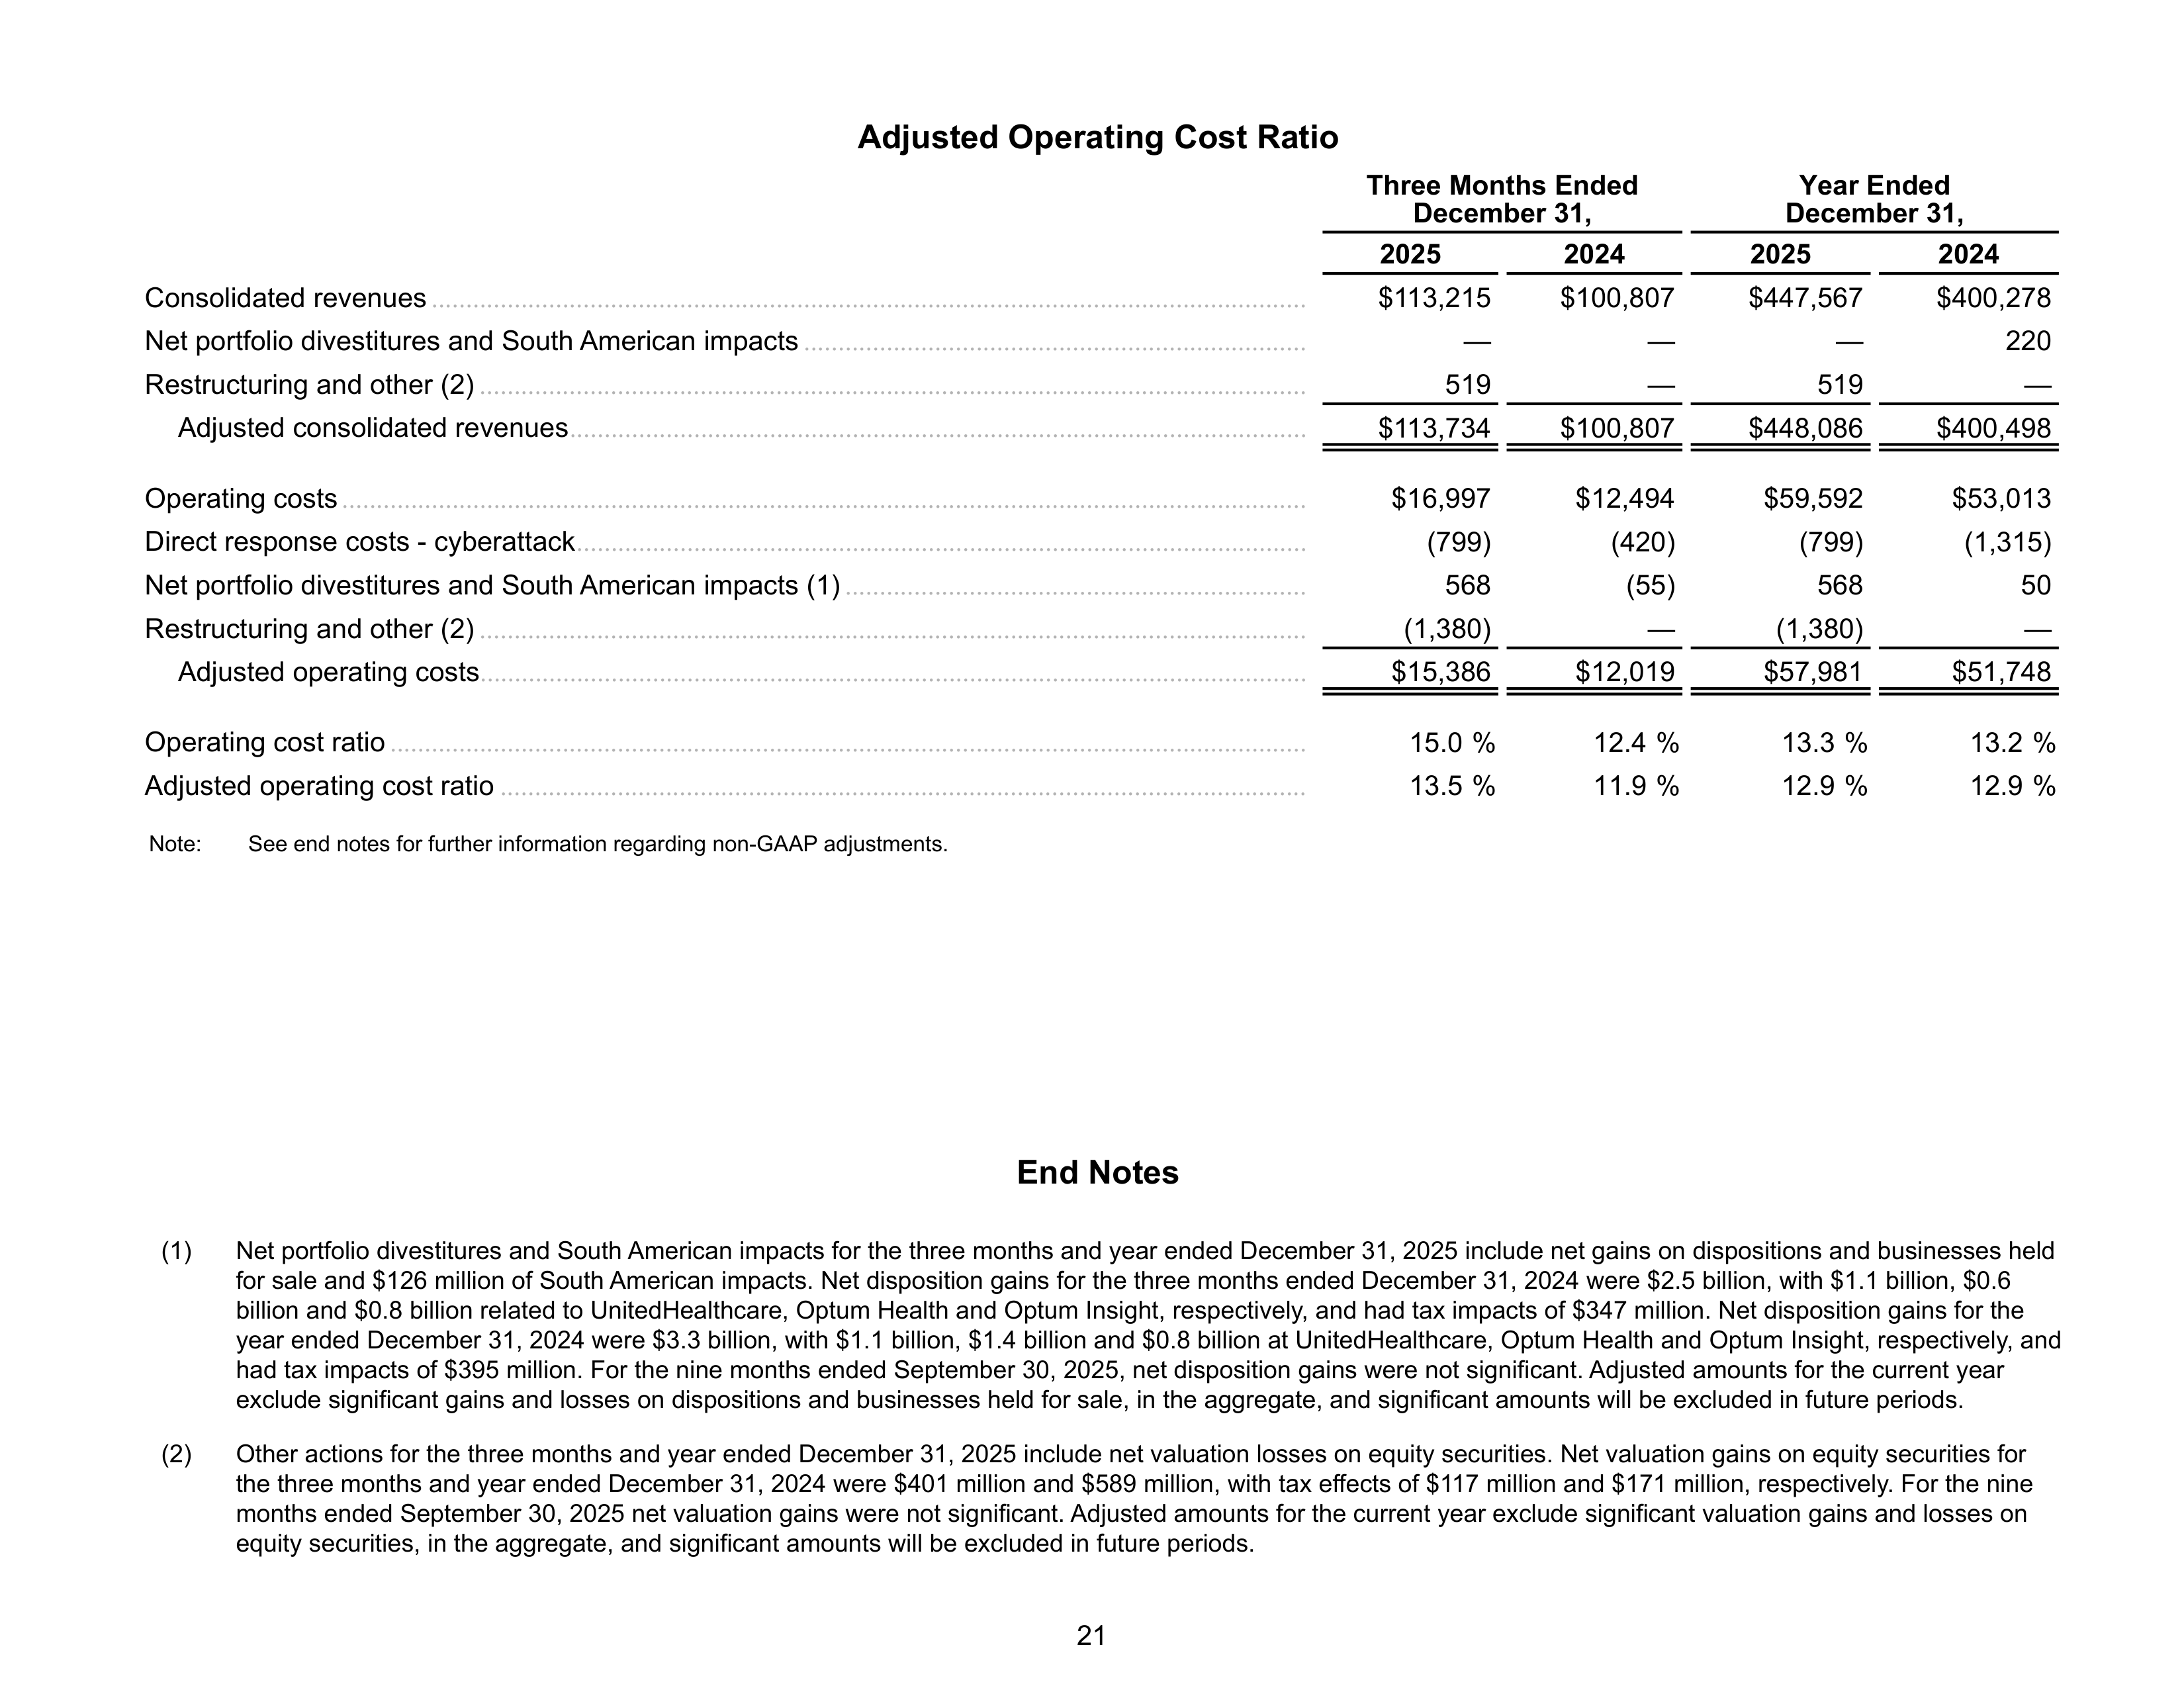
Adjusted Operating Cost Ratio
Three Months Ended
December 31,
Year Ended
December 31,
2025
2024
2025
2024
Consolidated revenues
...............................................................................................................................
$113,215
$100,807
$447,567
$400,278
Net portfolio divestitures and South American impacts
.........................................................................
—
—
—
220
Restructuring and other (2)
........................................................................................................................
519
—
519
—
Adjusted consolidated revenues
...........................................................................................................
$113,734
$100,807
$448,086
$400,498
Operating costs
............................................................................................................................................
$16,997
$12,494
$59,592
$53,013
Direct response costs - cyberattack
..........................................................................................................
(799)
(420)
(799)
(1,315)
Net portfolio divestitures and South American impacts (1)
...................................................................
568
(55)
568
50
Restructuring and other (2)
........................................................................................................................
(1,380)
—
(1,380)
—
Adjusted operating costs
........................................................................................................................
$15,386
$12,019
$57,981
$51,748
Operating cost ratio
.....................................................................................................................................
15.0 %
12.4 %
13.3 %
13.2 %
Adjusted operating cost ratio
.....................................................................................................................
13.5 %
11.9 %
12.9 %
12.9 %
Note:
See end notes for further information regarding non-GAAP adjustments.
End Notes
(1)
Net portfolio divestitures and South American impacts for the three months and year ended December 31, 2025 include net gains on dispositions and businesses held
for sale and $126 million of South American impacts. Net disposition gains for the three months ended December 31, 2024 were $2.5 billion, with $1.1 billion, $0.6
billion and $0.8 billion related to UnitedHealthcare, Optum Health and Optum Insight, respectively, and had tax impacts of $347 million. Net disposition gains for the
year ended December 31, 2024 were $3.3 billion, with $1.1 billion, $1.4 billion and $0.8 billion at UnitedHealthcare, Optum Health and Optum Insight, respectively, and
had tax impacts of $395 million. For the nine months ended September 30, 2025, net disposition gains were not significant. Adjusted amounts for the current year
exclude significant gains and losses on dispositions and businesses held for sale, in the aggregate, and significant amounts will be excluded in future periods.
(2)
Other actions for the three months and year ended December 31, 2025 include net valuation losses on equity securities. Net valuation gains on equity securities for
the three months and year ended December 31, 2024 were $401 million and $589 million, with tax effects of $117 million and $171 million, respectively. For the nine
months ended September 30, 2025 net valuation gains were not significant. Adjusted amounts for the current year exclude significant valuation gains and losses on
equity securities, in the aggregate, and significant amounts will be excluded in future periods.
21