





Page
1
of
37
March 2023
Report
Impact Review of
Walmart Foundation’s
Market Access
Program in India
March 2023
Submitted to
Submitted by
Page
2
of
37
Table of Contents
List of Figures .......................................................................................................................................................3
List of Tables ........................................................................................................................................................4
List of Abbreviations .............................................................................................................................................5
1
Landscape of Small and Marginal Farmers in India ....................................................................................6
2
The Market Access Program ......................................................................................................................6
3
The Impact Review ......................................................................................................................................7
3.1. Contours of the Impact Review .................................................................................................................7
4
Unpacking Findings on FPO sustainability ..................................................................................................8
4.1
FPO Profile ...........................................................................................................................................9
4.2
Organizational Capacity of FPOs .........................................................................................................9
4.3
Service Provision by FPOs ................................................................................................................ 11
4.3.1
Pre-harvest support ................................................................................................................... 11
4.3.2
Post-harvest support .................................................................................................................. 12
4.3.3
Sale of produce .......................................................................................................................... 13
4.3.4
Training and capacity building ................................................................................................... 13
4.4
Financial Viability of FPOs ................................................................................................................. 14
5
Unpacking Findings on SMF Livelihoods .................................................................................................. 16
5.1
Demographic and Socio-Economic Profile ........................................................................................ 17
5.2
Sources of Household Income .......................................................................................................... 17
5.3
SMF Engagement with FPOs ............................................................................................................ 18
5.4
Advisory and service provision .......................................................................................................... 18
5.5
Farm metrics ...................................................................................................................................... 20
6
Unpacking Findings from the Impact Review: Gender Outcomes ............................................................ 23
6.1
Engagement in FPOs ........................................................................................................................ 24
6.2
Decoding Key Farm Metrics .............................................................................................................. 26
7
Learnings and Recommendations ............................................................................................................ 28
7.1
FPO Sustainability ............................................................................................................................. 29
7.2
SMF Livelihoods ................................................................................................................................ 30
7.3
Women’s Empowerment .................................................................................................................... 31
7.4
Portfolio Strategy ............................................................................................................................... 31
8
Annexure 1 ................................................................................................................................................ 33
9
Annexure 2 ................................................................................................................................................ 36
Page
3
of
37
List of Figures
Figure 1: Stages in a Funder Portfolio Review .....................................................................................................7
Figure 2: Distribution of Managing Committee Members in FPOs .................................................................... 10
Figure 3: Use of Digital Technology .................................................................................................................. 11
Figure 4: Input Procurement Services ............................................................................................................... 12
Figure 5: Post Harvest Services ........................................................................................................................ 13
Figure 6: Crop Dealings of FPOs ...................................................................................................................... 14
Figure 7: FPO Profitability.................................................................................................................................. 15
Figure 8: Contribution of Cultivation to Household Income ............................................................................... 17
Figure 9: Services Provided by the FPO ........................................................................................................... 18
Figure 10: SMF Advisory Services .................................................................................................................... 19
Figure 11: Cultivation Patterns on Own Land .................................................................................................... 20
Figure 12: Loans Accessed by SMFs ................................................................................................................ 22
Figure 13: SMF Access to Processing Services ............................................................................................... 23
Figure 14: Women's Decision Making – Activities and Income ......................................................................... 25
Figure 15: Women's Access to Training ............................................................................................................ 26
Figure 16: Women's Cropping Intensity ............................................................................................................ 27
Figure 17: Access to Credit (Women and Men) ................................................................................................ 28
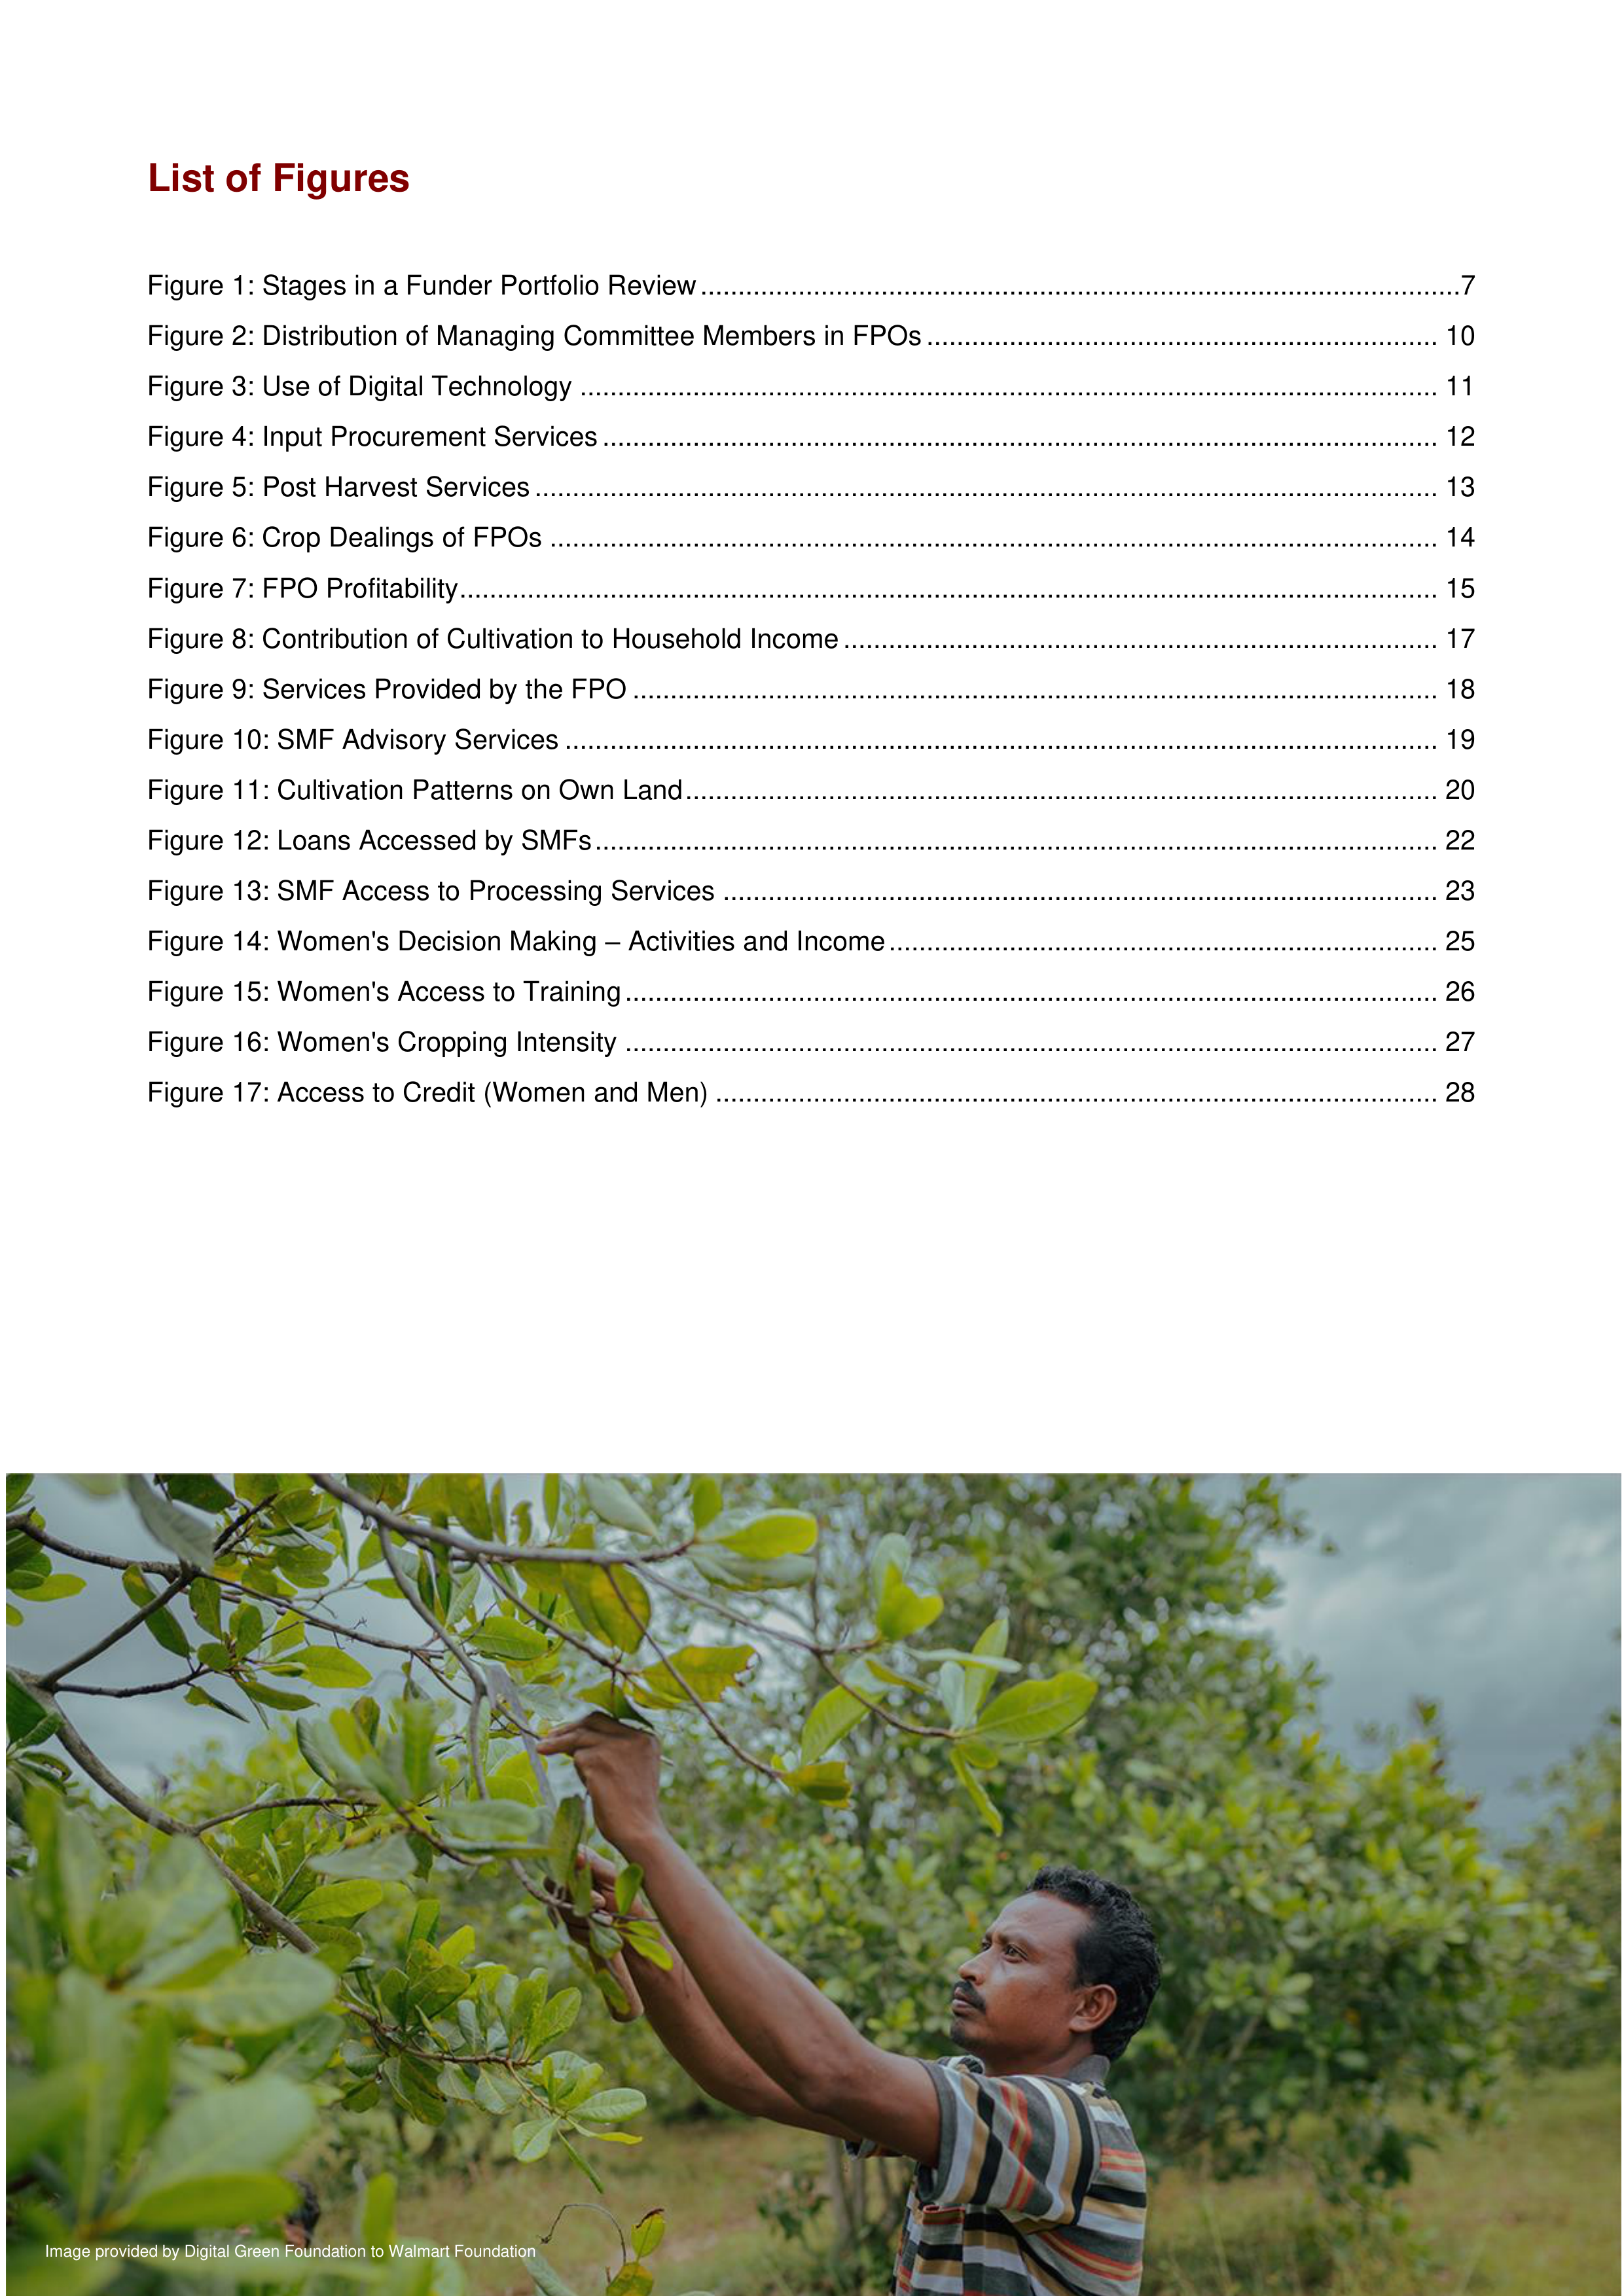
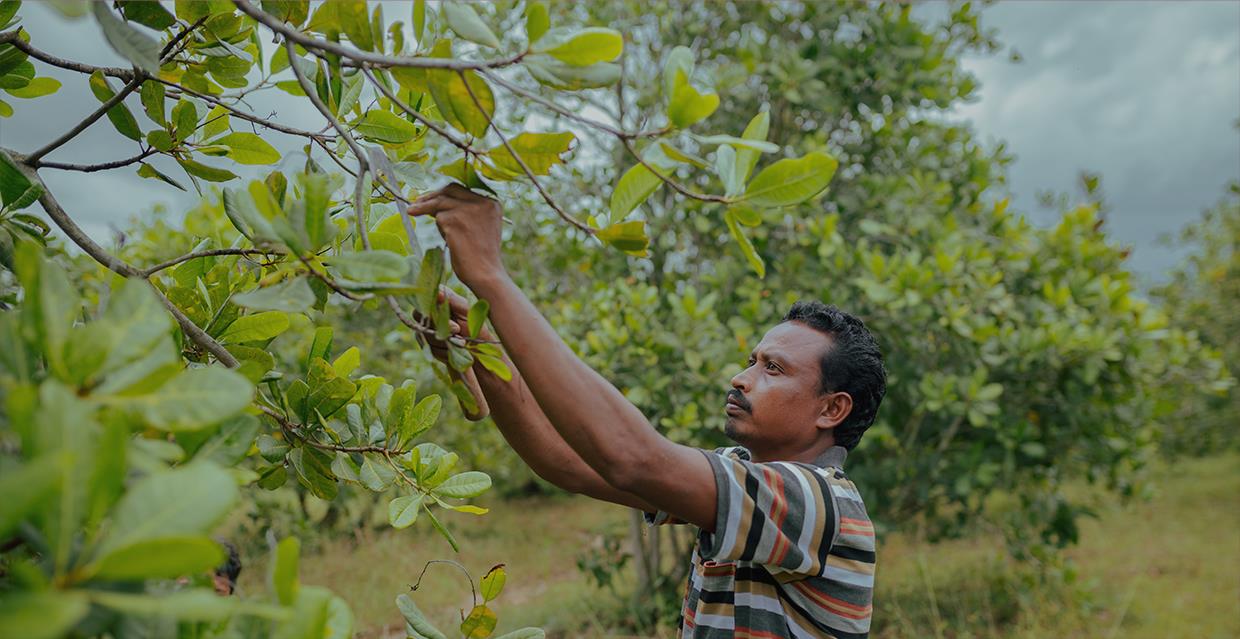
Image provided by Digital Green Foundation to Walmart Foundation
Page
4
of
37
List of Tables
Table 1 Contours of the Impact Review ...............................................................................................................8
Table 2 FPO Capitalization ................................................................................................................................ 15
Table 3 FPO profit sharing................................................................................................................................. 16
Table 4: Volumes cultivated and harvested....................................................................................................... 21
Table 5 Mix of Cash and Food Crops for Women and Men Respondent Households ..................................... 27
Image provided by Grameen Foundation USA to Walmart Foundation
Page
5
of
37
List of Abbreviations
AP
Andhra Pradesh
BoD
Board of Directors
CSR
Corporate Social Responsibility
FAO
Food and Agriculture Organization
FPO
Farmer Producer Organization
FY
Financial year
ICRISAT
International Crops Research Institute for the Semi-Arid Tropics
IFDC
International Fertilizer Development Center
JH
Jharkhand
KA
Karnataka
MC
Management Committee
MERL
Monitoring, Evaluation, Research and Learning
MGNREGA
Mahatma Gandhi National Rural Employment Guarantee Scheme
MIS
Management Information System
NABARD
National Bank for Agriculture and Rural Development
NBFC
Non-Banking Financial Company
OD
Odisha
PRADAN
Professional Assistance for Development Action
SFAC
Small Farmers Agribusiness Consortium
SMF
Small and marginal farmer
ToC
Theory of change
TS
Telangana
UP
Uttar Pradesh
WB
West Bengal
Image provided by Heifer International to Walmart Foundation
Page
6
of
37
1
Landscape of Small and Marginal Farmers in India
Small and marginal farmers (SMFs) constitute 86 percent of all farmers in India
1
. Owning 47 percent of total
operated area, the average landholding of this segment is just 1.48 acres
23
. Such a tiny parcel of land does not
allow for generation of surplus, rendering agriculture unviable beyond subsistence. The fragility of SMF
livelihoods is exacerbated by risks of climate change, absence of timely crop advisory, limited access to inputs,
credit, post-harvest services and market linkages. Within the SMF segment, women farmers face additional
constraints. Gendered norms limit their access to and control over land, information, finance, and markets,
reducing their participation in agriculture to “drudgery” activities
4
.
Aggregation of farmers into cooperatives, commodity groups and interest groups has emerged as a model to
mitigate challenges of SMFs and improve women’s participation in agri-value chains
5
. An aggregation model
that has gained traction is the farmer producer organisation (FPO). Reflective of a shift in understanding farming
as a “value-led enterprise”, it is believed that FPOs, through the provision of services such as bulk procurement
of inputs, marketing of outputs, primary and secondary processing, and facilitating access to credit, can help
SMFs avail of benefits of scale, thereby improving their incomes
67
. The central government’s “
Formation and
Promotion of 10,000 Farmer Producer Organisations (FPOs)”
and specific policies initiated in Karnataka, Odisha
and Telangana have provided further impetus to the formation of FPOs
8
.
2
The Market Access Program
The Walmart Foundation’s Market Access Program, launched in 2017, supports SMFs in India, Mexico and
Central America. The objective is to drive the income of smallholder farmers and producers. Improvements in
income are actuated by supporting programs that seek to increase
volume
and
time in market
(production,
cropping cycles),
value
(crop diversification, primary processing, digital adoption, access to finance, markets);
and
quality
(secondary processing, packaging, certification, branding). Walmart Foundation supports initiatives
for smallholder farmers and entrepreneurs in emerging markets to help improve their skills, market access and
to build resilience. For farmers, the priority is to help Farmer Producer Organizations (FPOs) boost their capacity
and reach, invest in sustainable practices and develop infrastructure to add value to crop production.
The program architecture rests on three design principles. First, is the
capacity development of FPOs
.
Strengthening capacities aids greater reach, helping FPOs perform more effectively, their role as aggregators
in terms of service provision and capacity building, keeping in mind the regional context. Contiguous focus is
on making FPOs market-ready, so that they can effectively interact with market stakeholders to ensure
profitability in transactions. Second, is the focus on
aligned
levers of income and growth,
such as training on
sustainable agricultural practices, infrastructure provision and facilitation of access to credit. Third, is the focus
on
empowering women farmers
– deepening their engagement across the agri-value chain and in FPOs.
In India, since its inception in 2018, the Foundation has invested over USD 39 million designed to reach
500 FPOs/FPGs targeting 800,000 farmers, of which more than half are women.
The market access
program can be viewed as a portfolio of 13 programs. These programs are deployed by grantee organizations
at the farm and FPO level in 7 states, viz., Andhra Pradesh, Odisha, Jharkhand, Karnataka, Telangana, West
Bengal and Uttar Pradesh.
9
Programs traverse the agri-value chain – strengthening FPO capacities, ensuring
access to credit and markets and providing processing services and training on good agricultural practices.
Gender sensitive programming is a key ingredient across several programs; and includes creation of women-
only FPOs, provision of bundled services like crop insurance and advisory and income diversification through
livestock and poultry. The Tata Cornell Institute for Agriculture and Nutrition (TCI), the research
partner of
the
market access program, has put together a FPO database for ecosystem stakeholders and is undertaking
1
Marginal and small farmers are those with less than 1 hectare (2.47 acres) and between 1 and 2 hectares (2.47 to 4.94 acres) of land
respectively.
2
Dept of Agriculture and Farmers Welfare, GoI. 10
th
Agricultural Census 2015-16 (provisional estimates)
3
Operated area includes both cultivated and uncultivated area, provided part of it is put to Agricultural production during the reference
period.
4
IFAD (2015). Promoting the leadership of women in producers’ organizations. Lessons from the experience of FAO and IFAD
5
National Association of Farmer Producer Organisations (https://www.nafpo.in/wp-content/uploads/2021/12/NAFPO-Gender-Equitable-
Transformation-of-Agriculture-_FPO-Guidelines.pdf)
6
Ministry of Agriculture and Farmer’s Welfare. GoI. (2019) Report of the Committee on Doubling Farmers’ Income
7
NABARD
(2015).
Farmer
Producer
Organisation.
Frequently
Asked
Questions
FAQs.
Available
at
(https://www.nabard.org/demo/auth/writereaddata/File/FARMER%20PRODUCER%20ORGANISATIONS.pdf)
8
Ministry
of
Agriculture
&
Farmers
Welfare,
Farmer
Producer
Organisations
(2021)
<
https://pib.gov.in/PressReleasePage.aspx?PRID=1739593> [accessed 3 February 2023]
9
More recently, Walmart Foundation has announced 3 grants in Madhya Pradesh and will be announcing 2 more grants in Maharashtra
and West Bengal. These do not form part of this impact review exercise.









Page
7
of
37
research on
the experiences and challenges of FPOs in different contexts to unearth actionable evidence-based
insights by ecosystem actors.
Additional details are provided in Annexure 1.
3
The Impact Review
The Impact Review assesses the collective impact made by the portfolio in improving SMF incomes. It highlights
achievements and gaps to meet goals and consolidates learnings to strengthen future programming and the
contours of the portfolio’s monitoring, evaluation, research and learning (MERL) architecture. Additionally, the
review serves as a repository of good practices to inform the community of practitioners and sharpen ongoing
and future philanthropic initiatives in the SMF livelihoods space.
The overarching framework used for the impact review is a funder portfolio review. A funder portfolio review
assesses the collective impact of efforts and resources spent on all programmes within a portfolio. What this
means is that findings from the review
do not answer
whether a specific programme undertaken by a grantee
in a state has achieved envisaged outcomes. Instead, it
answers
whether collectively, all programmes in the
portfolio have made progress or achieved the stated objectives of strengthened FPOs and improved SMF
incomes. Through this, the impact review fulfils the two purposes of
accountability
(summative assessment on
progress/achievement of the portfolio) and
learning
(insights to inform reorientation of portfolio direction,
strategy and design).
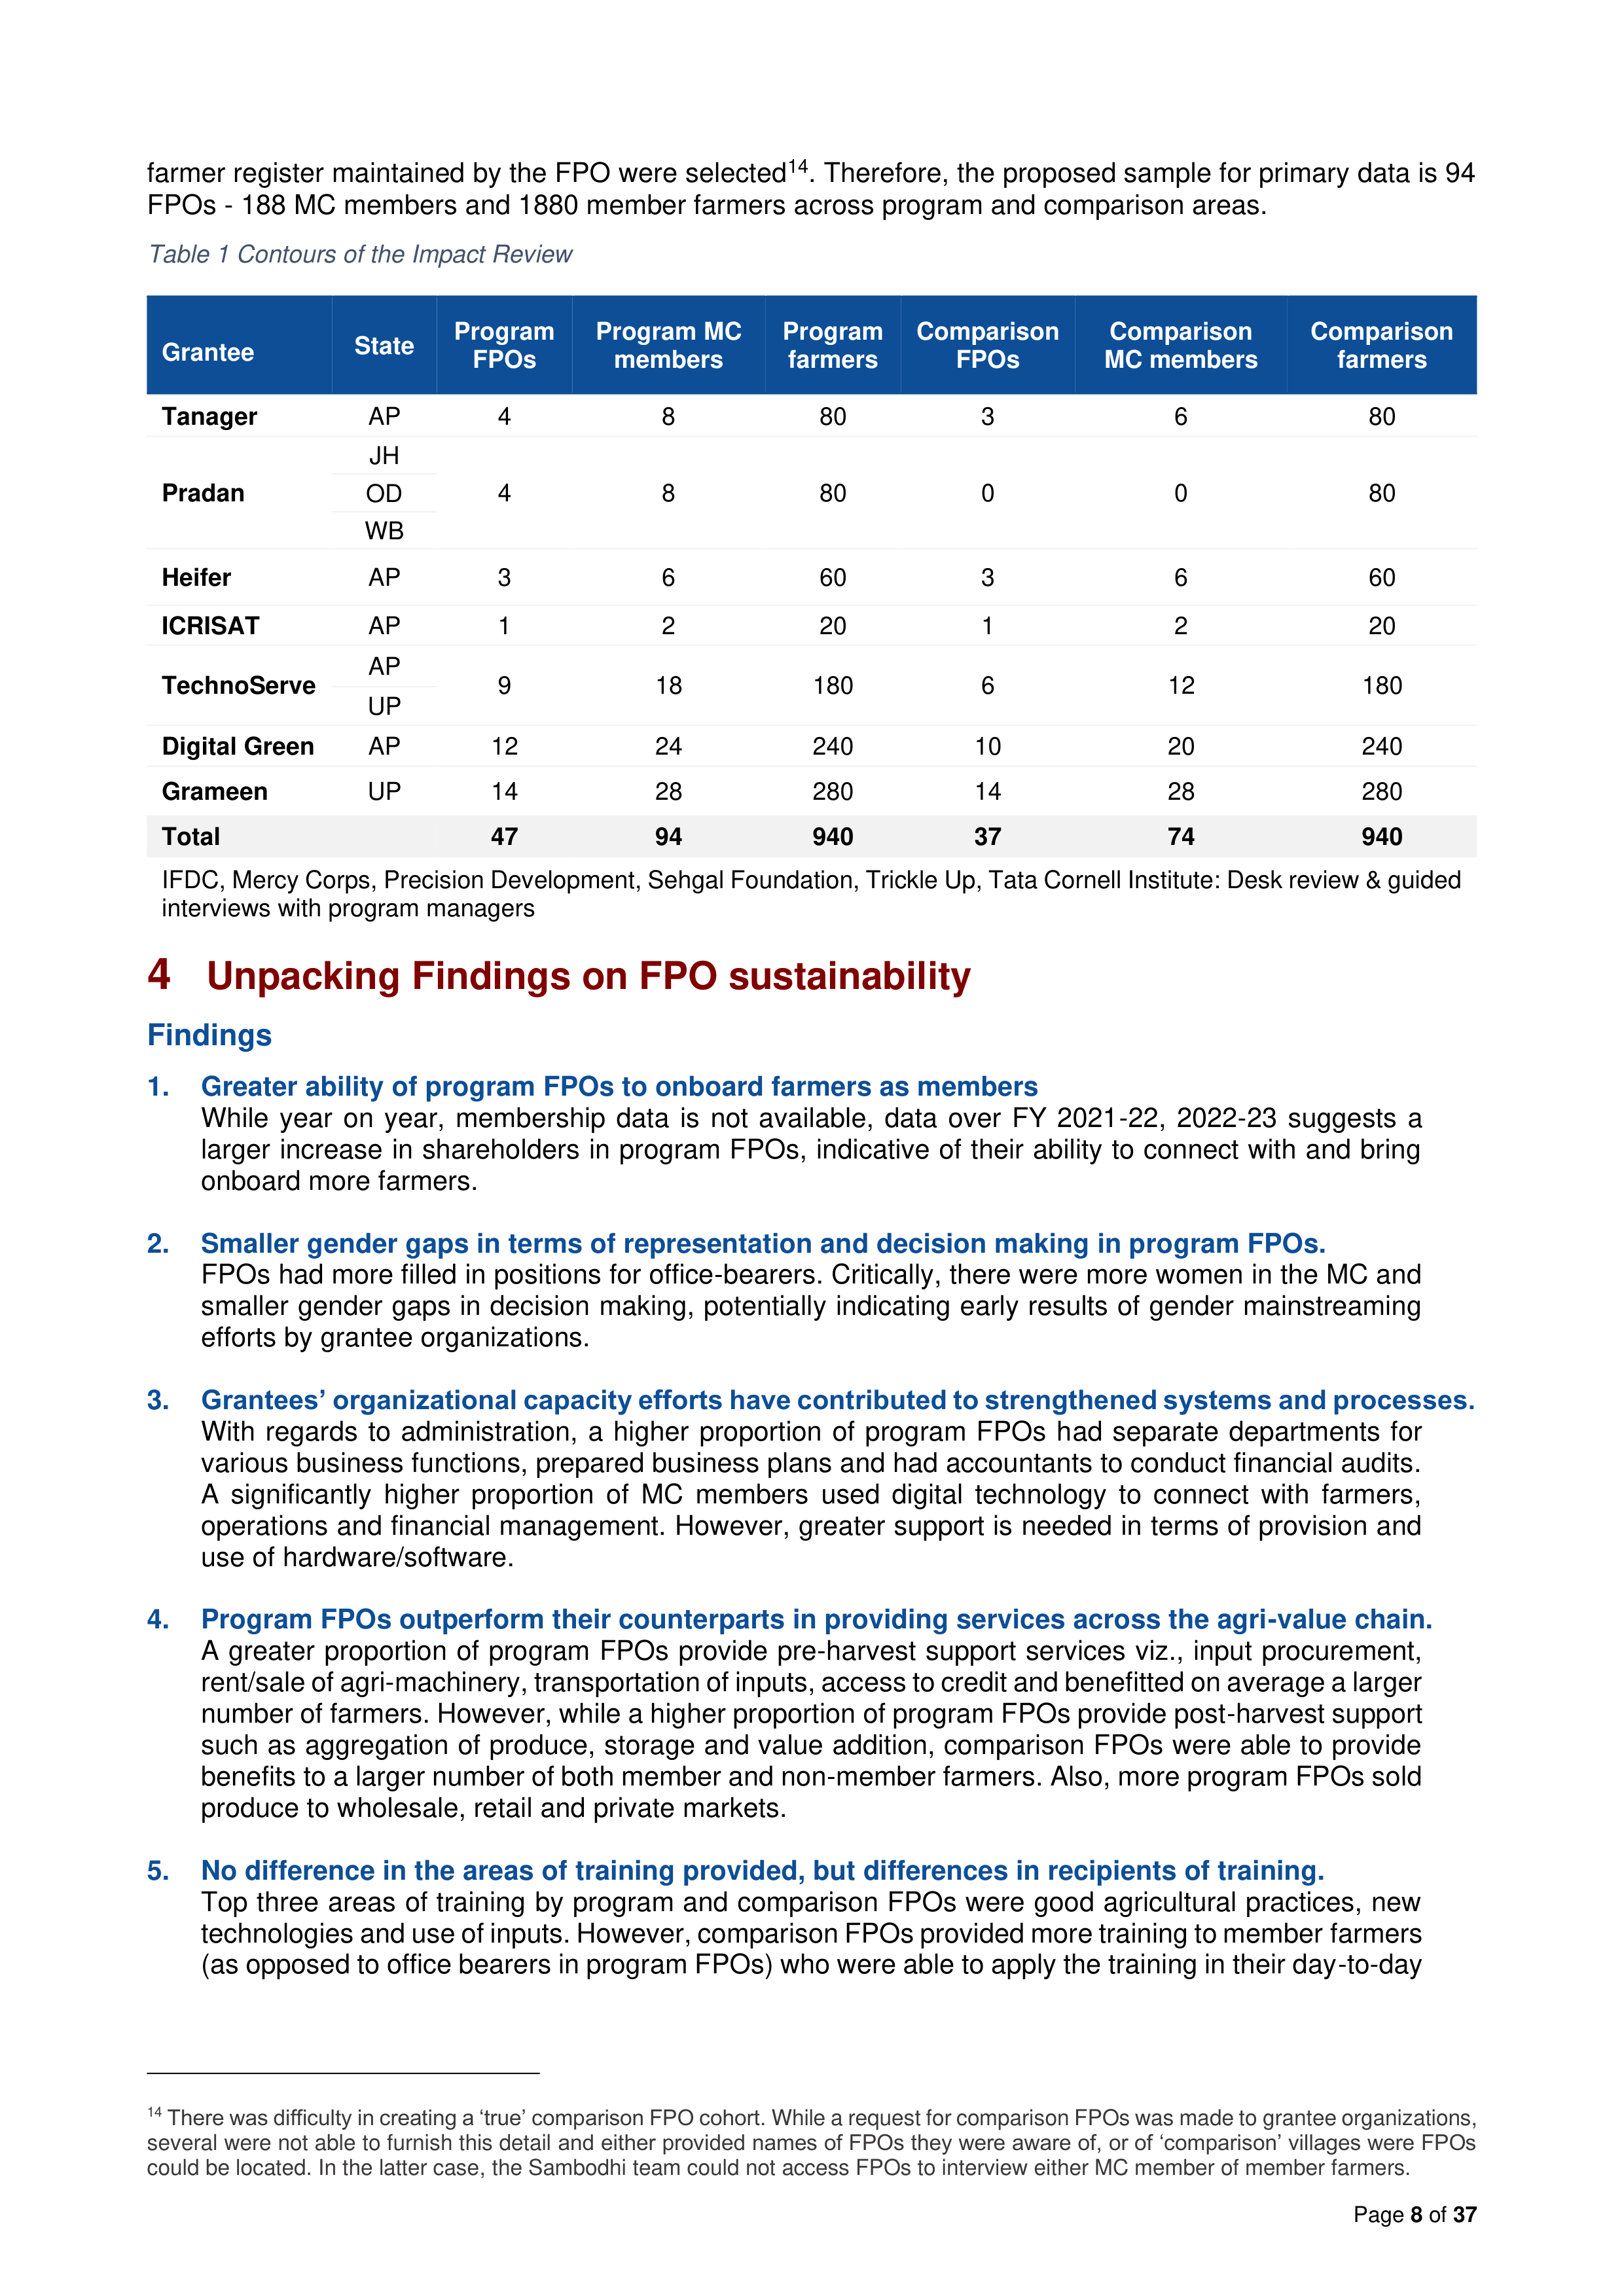
Figure 1: Stages in a Funder Portfolio Review
*Key metrices at the FPO level include organisational capacity, service provision and financial sustainability. At the farmer level, metrices
include volume, time in market, crop diversification, primary and secondary processing, provision of services and income.
3.1. Contours of the Impact Review
The impact review draws on an analysis of data from a desk review and primary research. Across all 13
organisations, desk review of relevant documentation was undertaken
10
, coupled with guided interviews with
program managers from the supported organisations to understand implementation pathways, successes and
challenges. Within the 13 organisations, there are 7 organisations whose programs are ending or have ended.
These include, Digital Green, Grameen Foundation, Heifer International, ICRISAT, PRADAN and Tanager, who
work in 5 states, viz., Andhra Pradesh, Jharkhand, Odisha, Uttar Pradesh, and West Bengal. For these
organisations, coupled with the desk review and guided interviews, primary data collection through semi-
structured interviews with management committee (MC) members
11
of FPOs and member farmers of the FPO
was undertaken.
Primary research with the afore-mentioned 7 organisations was undertaken to ascertain the causal impact of
the supported programs on FPOs and farmers. For this, a quasi-experimental design (i.e., program-comparison)
was adopted
12
. Given the lack of baseline data, change in key metrices was estimated between program and
comparison groups at a particular point in time (i.e., a one-point estimation approach). In order to ensure
statistical robustness
13
, a total of 47 program FPOs were randomly selected, and proportionately distributed
across the 7 organizations. A similar approach was followed for comparison FPOs (i.e., FPOs located in
proximate areas, with similar agro-ecological, socio-eco-political-cultural contexts, with no intervention by
grantee organizations under the aegis of the market access program). Within each FPO, 1 male and 1 female
MC member was interviewed based on their availability. Additionally, 20 farmers randomly selected from the
10
These include grant inception reports, progress and annual reports, MIS data, evaluation studies etc.
11
MC members include those who hold positions in office. These include board of directors (BoD), chief executive officer (CEO), president,
accountant, godown operator
12
Comparison FPOs, are FPOs proximate to the selected program FPOs, with similar agroecological, socio-eco-pol-cultural contexts, with
the only difference being that they are not supported by the grantee organisation under the market access program.
13
Powered to detect a change of 23 percent in household income of program farmer households.
Define the portfolio
Identify goals,
learning questions,
metrices
Create a Theory of
Change (ToC)
Document review
Review program
related
documentation
(inception, progress
reports, MIS)
Develop Data
Capture Matrix
Identify quantitative &
qualitative
information from
each program,
Enter & code into a
spreadsheet.
Garner primary data
Collect primary data
from sample of FPOs
and farmers.
Interviews with
program managers
Data Analysis
Analyze information
from data capture
matrix and primary
research to
comment on changes
in key change
Page
8
of
37
farmer register maintained by the FPO were selected
14
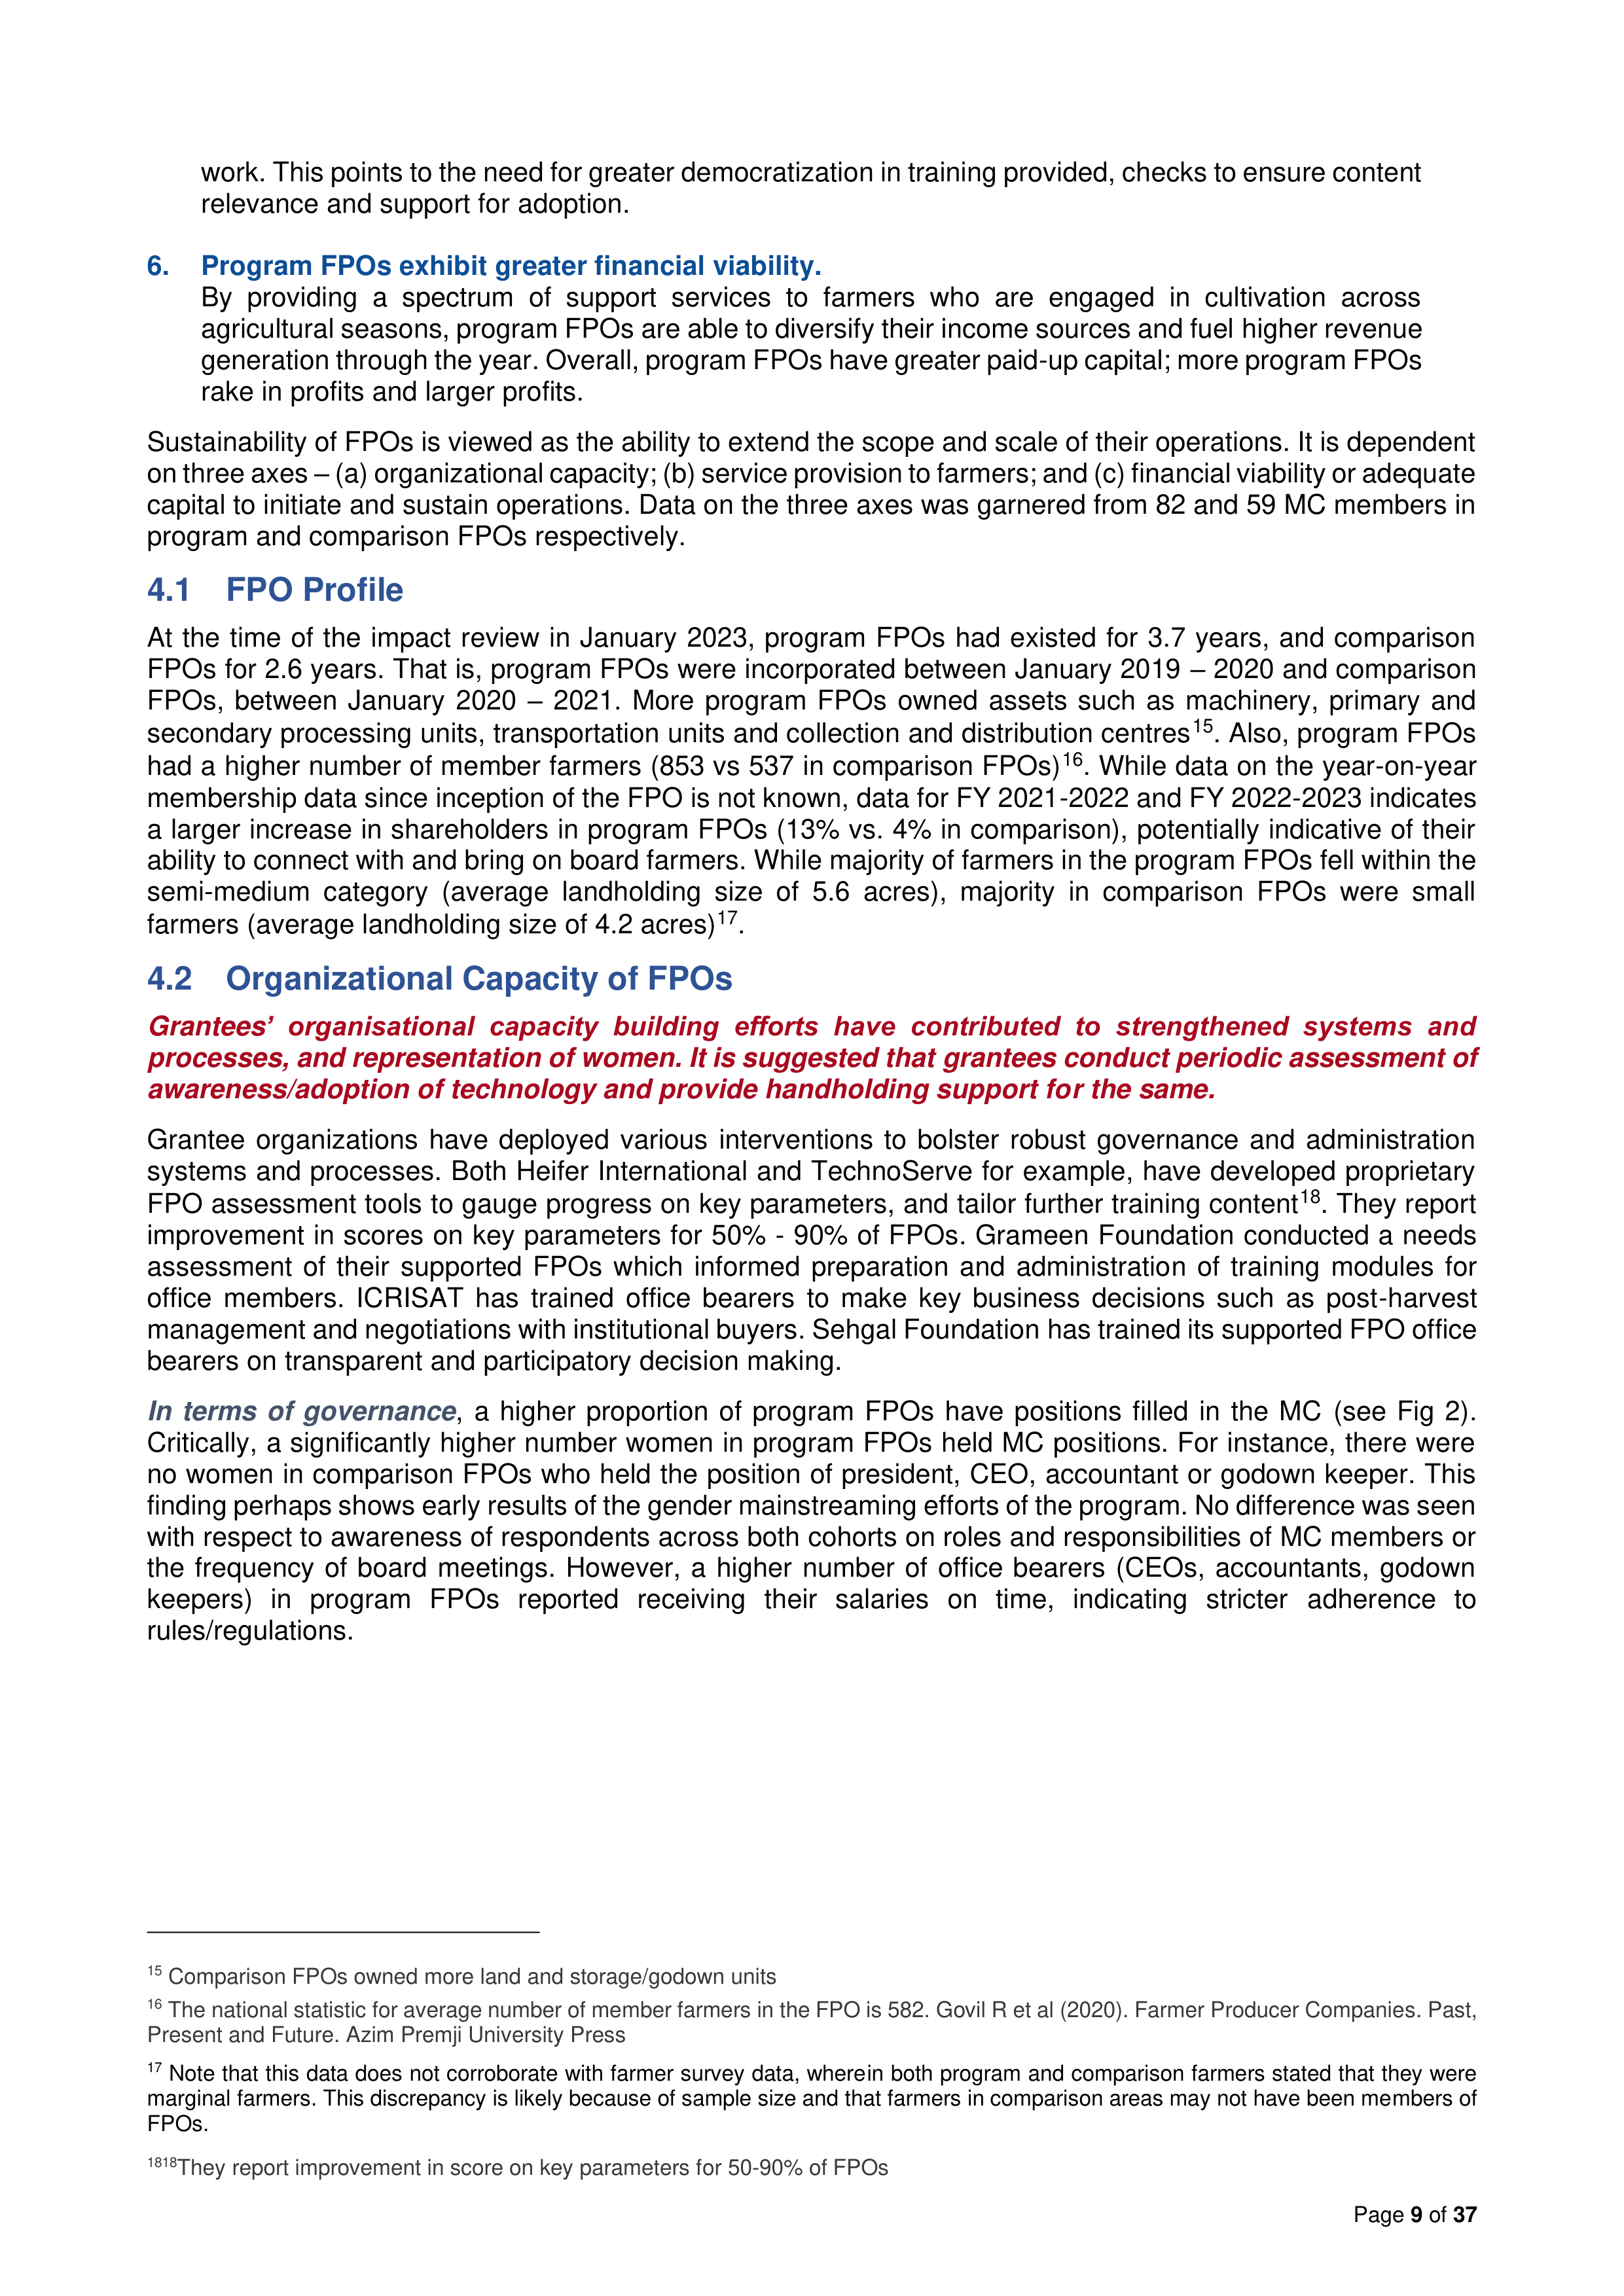
. Therefore, the proposed sample for primary data is 94
FPOs - 188 MC members and 1880 member farmers across program and comparison areas.
Table 1 Contours of the Impact Review
Grantee
State
Program
FPOs
Program MC
members
Program
farmers
Comparison
FPOs
Comparison
MC members
Comparison
farmers
Tanager
AP
4
8
80
3
6
80
Pradan
JH
4
8
80
0
0
80
OD
WB
Heifer
AP
3
6
60
3
6
60
ICRISAT
AP
1
2
20
1
2
20
TechnoServe
AP
9
18
180
6
12
180
UP
Digital Green
AP
12
24
240
10
20
240
Grameen
UP
14
28
280
14
28
280
Total
47
94
940
37
74
940
IFDC, Mercy Corps, Precision Development, Sehgal Foundation, Trickle Up, Tata Cornell Institute: Desk review & guided
interviews with program managers
4
Unpacking Findings on FPO sustainability
Findings
1.
Greater ability of program FPOs to onboard farmers as members
While year on year, membership data is not available, data over FY 2021-22, 2022-23 suggests a
larger increase in shareholders in program FPOs, indicative of their ability to connect with and bring
onboard more farmers.
2.
Smaller gender gaps in terms of representation and decision making in program FPOs.
FPOs had more filled in positions for office-bearers. Critically, there were more women in the MC and
smaller gender gaps in decision making, potentially indicating early results of gender mainstreaming
efforts by grantee organizations.
3.
Grantees’ organizational capacity efforts have contributed to strengthened systems and processes.
With regards to administration, a higher proportion of program FPOs had separate departments for
various business functions, prepared business plans and had accountants to conduct financial audits.
A significantly higher proportion of MC members used digital technology to connect with farmers,
operations and financial management. However, greater support is needed in terms of provision and
use of hardware/software.
4.
Program FPOs outperform their counterparts in providing services across the agri-value chain.
A greater proportion of program FPOs provide pre-harvest support services viz., input procurement,
rent/sale of agri-machinery, transportation of inputs, access to credit and benefitted on average a larger
number of farmers. However, while a higher proportion of program FPOs provide post-harvest support
such as aggregation of produce, storage and value addition, comparison FPOs were able to provide
benefits to a larger number of both member and non-member farmers. Also, more program FPOs sold
produce to wholesale, retail and private markets.
5.
No difference in the areas of training provided, but differences in recipients of training.
Top three areas of training by program and comparison FPOs were good agricultural practices, new
technologies and use of inputs. However, comparison FPOs provided more training to member farmers
(as opposed to office bearers in program FPOs) who were able to apply the training in their day-to-day
14
There was difficulty in creating a ‘true’ comparison FPO cohort. While a request for comparison FPOs was made to grantee organizations,
several were not able to furnish this detail and either provided names of FPOs they were aware of, or of ‘comparison’ villages were FPOs
could be located. In the latter case, the Sambodhi team could not access FPOs to interview either MC member of member farmers.
Page
9
of
37
work. This points to the need for greater democratization in training provided, checks to ensure content
relevance and support for adoption.
6.
Program FPOs exhibit greater financial viability.
By providing a spectrum of support services to farmers who are engaged in cultivation across
agricultural seasons, program FPOs are able to diversify their income sources and fuel higher revenue
generation through the year. Overall, program FPOs have greater paid-up capital; more program FPOs
rake in profits and larger profits.
Sustainability of FPOs is viewed as the ability to extend the scope and scale of their operations. It is dependent
on three axes – (a) organizational capacity; (b) service provision to farmers; and (c) financial viability or adequate
capital to initiate and sustain operations. Data on the three axes was garnered from 82 and 59 MC members in
program and comparison FPOs respectively.
4.1 FPO Profile
At the time of the impact review in January 2023, program FPOs had existed for 3.7 years, and comparison
FPOs for 2.6 years. That is, program FPOs were incorporated between January 2019 – 2020 and comparison
FPOs, between January 2020 – 2021. More program FPOs owned assets such as machinery, primary and
secondary processing units, transportation units and collection and distribution centres
15
. Also, program FPOs
had a higher number of member farmers (853 vs 537 in comparison FPOs)
16
. While data on the year-on-year
membership data since inception of the FPO is not known, data for FY 2021-2022 and FY 2022-2023 indicates
a larger increase in shareholders in program FPOs (13% vs. 4% in comparison), potentially indicative of their
ability to connect with and bring on board farmers. While majority of farmers in the program FPOs fell within the
semi-medium category (average landholding size of 5.6 acres), majority in comparison FPOs were small
farmers (average landholding size of 4.2 acres)
17
.
4.2 Organizational Capacity of FPOs
Grantees’ organisational capacity building efforts have contributed to strengthened systems and
processes, and representation of women. It is suggested that grantees conduct periodic assessment of
awareness/adoption of technology and provide handholding support for the same.
Grantee organizations have deployed various interventions to bolster robust governance and administration
systems and processes. Both Heifer International and TechnoServe for example, have developed proprietary
FPO assessment tools to gauge progress on key parameters, and tailor further training content
18
. They report
improvement in scores on key parameters for 50% - 90% of FPOs. Grameen Foundation conducted a needs
assessment of their supported FPOs which informed preparation and administration of training modules for
office members. ICRISAT has trained office bearers to make key business decisions such as post-harvest
management and negotiations with institutional buyers. Sehgal Foundation has trained its supported FPO office
bearers on transparent and participatory decision making.
In terms of governance
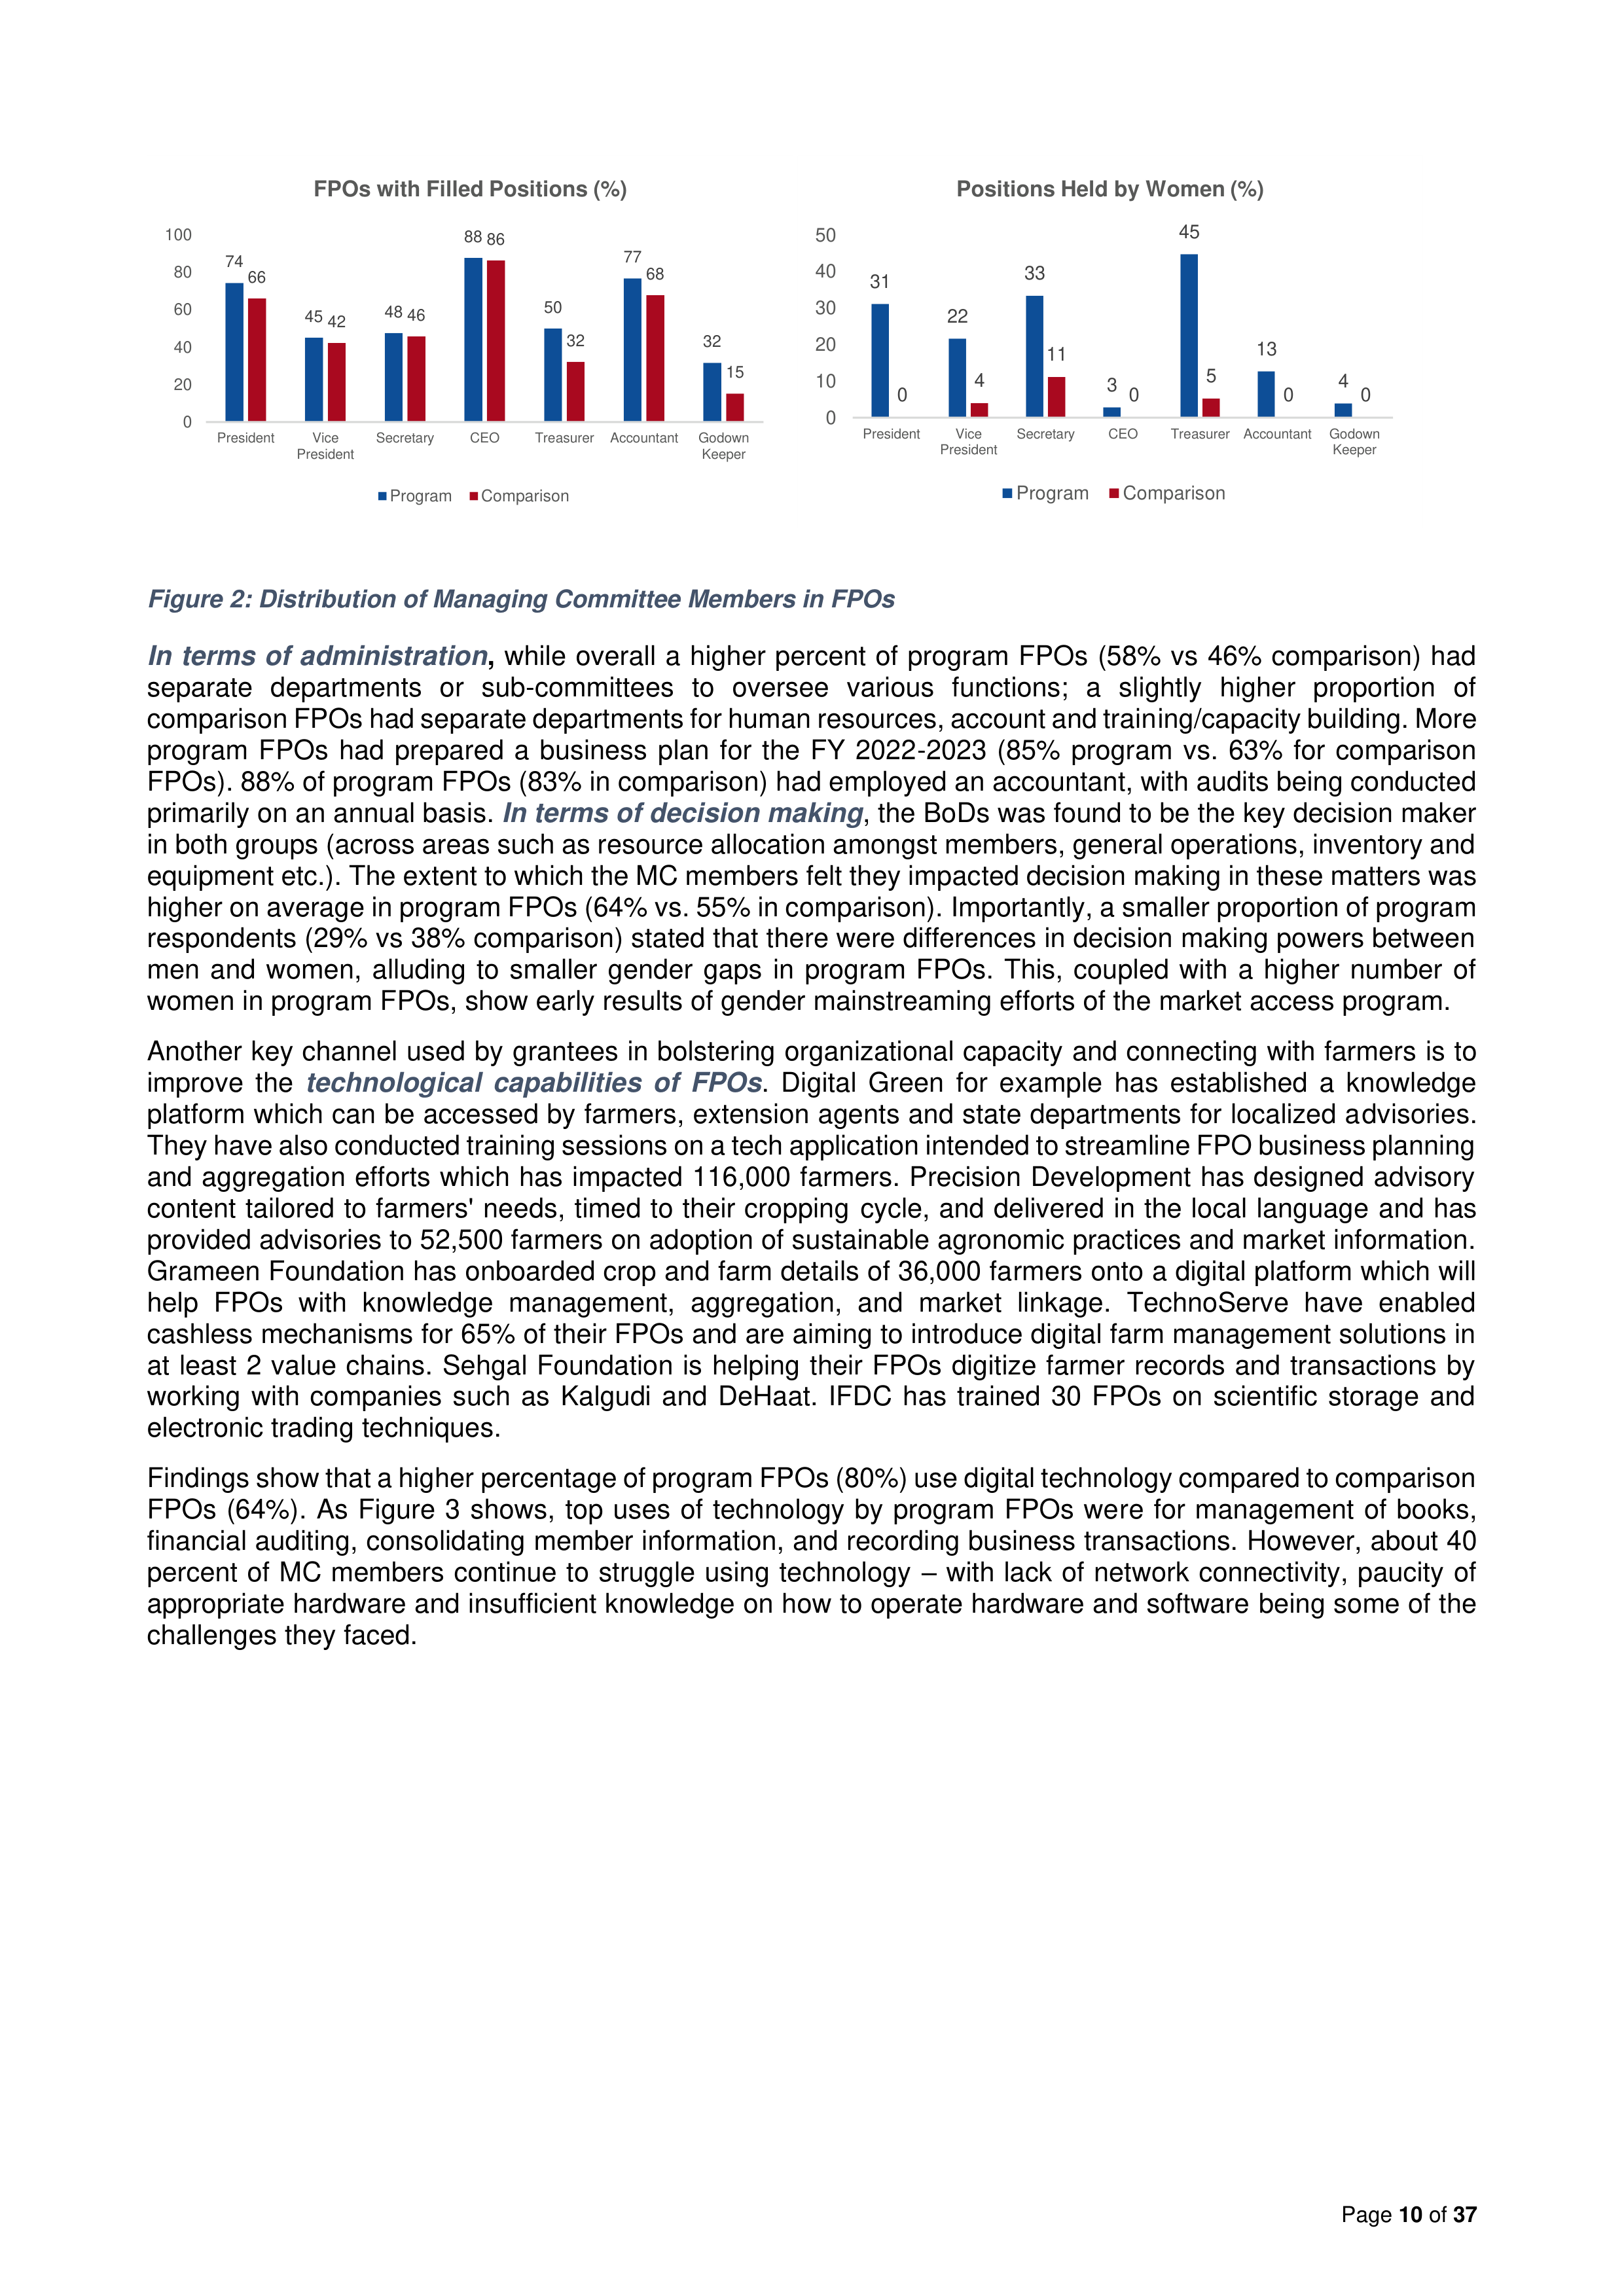
, a higher proportion of program FPOs have positions filled in the MC (see Fig 2).
Critically, a significantly higher number women in program FPOs held MC positions. For instance, there were
no women in comparison FPOs who held the position of president, CEO, accountant or godown keeper. This
finding perhaps shows early results of the gender mainstreaming efforts of the program. No difference was seen
with respect to awareness of respondents across both cohorts on roles and responsibilities of MC members or
the frequency of board meetings. However, a higher number of office bearers (CEOs, accountants, godown
keepers) in program FPOs reported receiving their salaries on time, indicating stricter adherence to
rules/regulations.
15
Comparison FPOs owned more land and storage/godown units
16
The national statistic for average number of member farmers in the FPO is 582. Govil R et al (2020). Farmer Producer Companies. Past,
Present and Future. Azim Premji University Press
17
Note that this data does not corroborate with farmer survey data, wherein both program and comparison farmers stated that they were
marginal farmers. This discrepancy is likely because of sample size and that farmers in comparison areas may not have been members of
FPOs.
1818
They report improvement in score on key parameters for 50-90% of FPOs
Page
10
of
37
Figure 2: Distribution of Managing Committee Members in FPOs
In terms of administration
,
while overall a higher percent of program FPOs (58% vs 46% comparison) had
separate departments or sub-committees to oversee various functions; a slightly higher proportion of
comparison FPOs had separate departments for human resources, account and training/capacity building. More
program FPOs had prepared a business plan for the FY 2022-2023 (85% program vs. 63% for comparison
FPOs). 88% of program FPOs (83% in comparison) had employed an accountant, with audits being conducted
primarily on an annual basis.
In terms of decision making
, the BoDs was found to be the key decision maker
in both groups (across areas such as resource allocation amongst members, general operations, inventory and
equipment etc.). The extent to which the MC members felt they impacted decision making in these matters was
higher on average in program FPOs (64% vs. 55% in comparison). Importantly, a smaller proportion of program
respondents (29% vs 38% comparison) stated that there were differences in decision making powers between
men and women, alluding to smaller gender gaps in program FPOs. This, coupled with a higher number of
women in program FPOs, show early results of gender mainstreaming efforts of the market access program.
Another key channel used by grantees in bolstering organizational capacity and connecting with farmers is to
improve the
technological capabilities of FPOs
. Digital Green for example has established a knowledge
platform which can be accessed by farmers, extension agents and state departments for localized advisories.
They have also conducted training sessions on a tech application intended to streamline FPO business planning
and aggregation efforts which has impacted 116,000 farmers. Precision Development has designed advisory
content tailored to farmers' needs, timed to their cropping
cycle, and delivered in the local language and has
provided advisories to 52,500 farmers on adoption of sustainable agronomic practices and market information.
Grameen Foundation has onboarded crop and farm details of 36,000 farmers onto a digital platform which will
help FPOs with knowledge management, aggregation, and market linkage. TechnoServe have enabled
cashless mechanisms for 65% of their FPOs and are aiming to introduce digital farm management solutions in
at least 2 value chains. Sehgal Foundation is helping their FPOs digitize farmer records and transactions by
working with companies such as Kalgudi and DeHaat. IFDC has trained 30 FPOs on scientific storage and
electronic trading techniques.
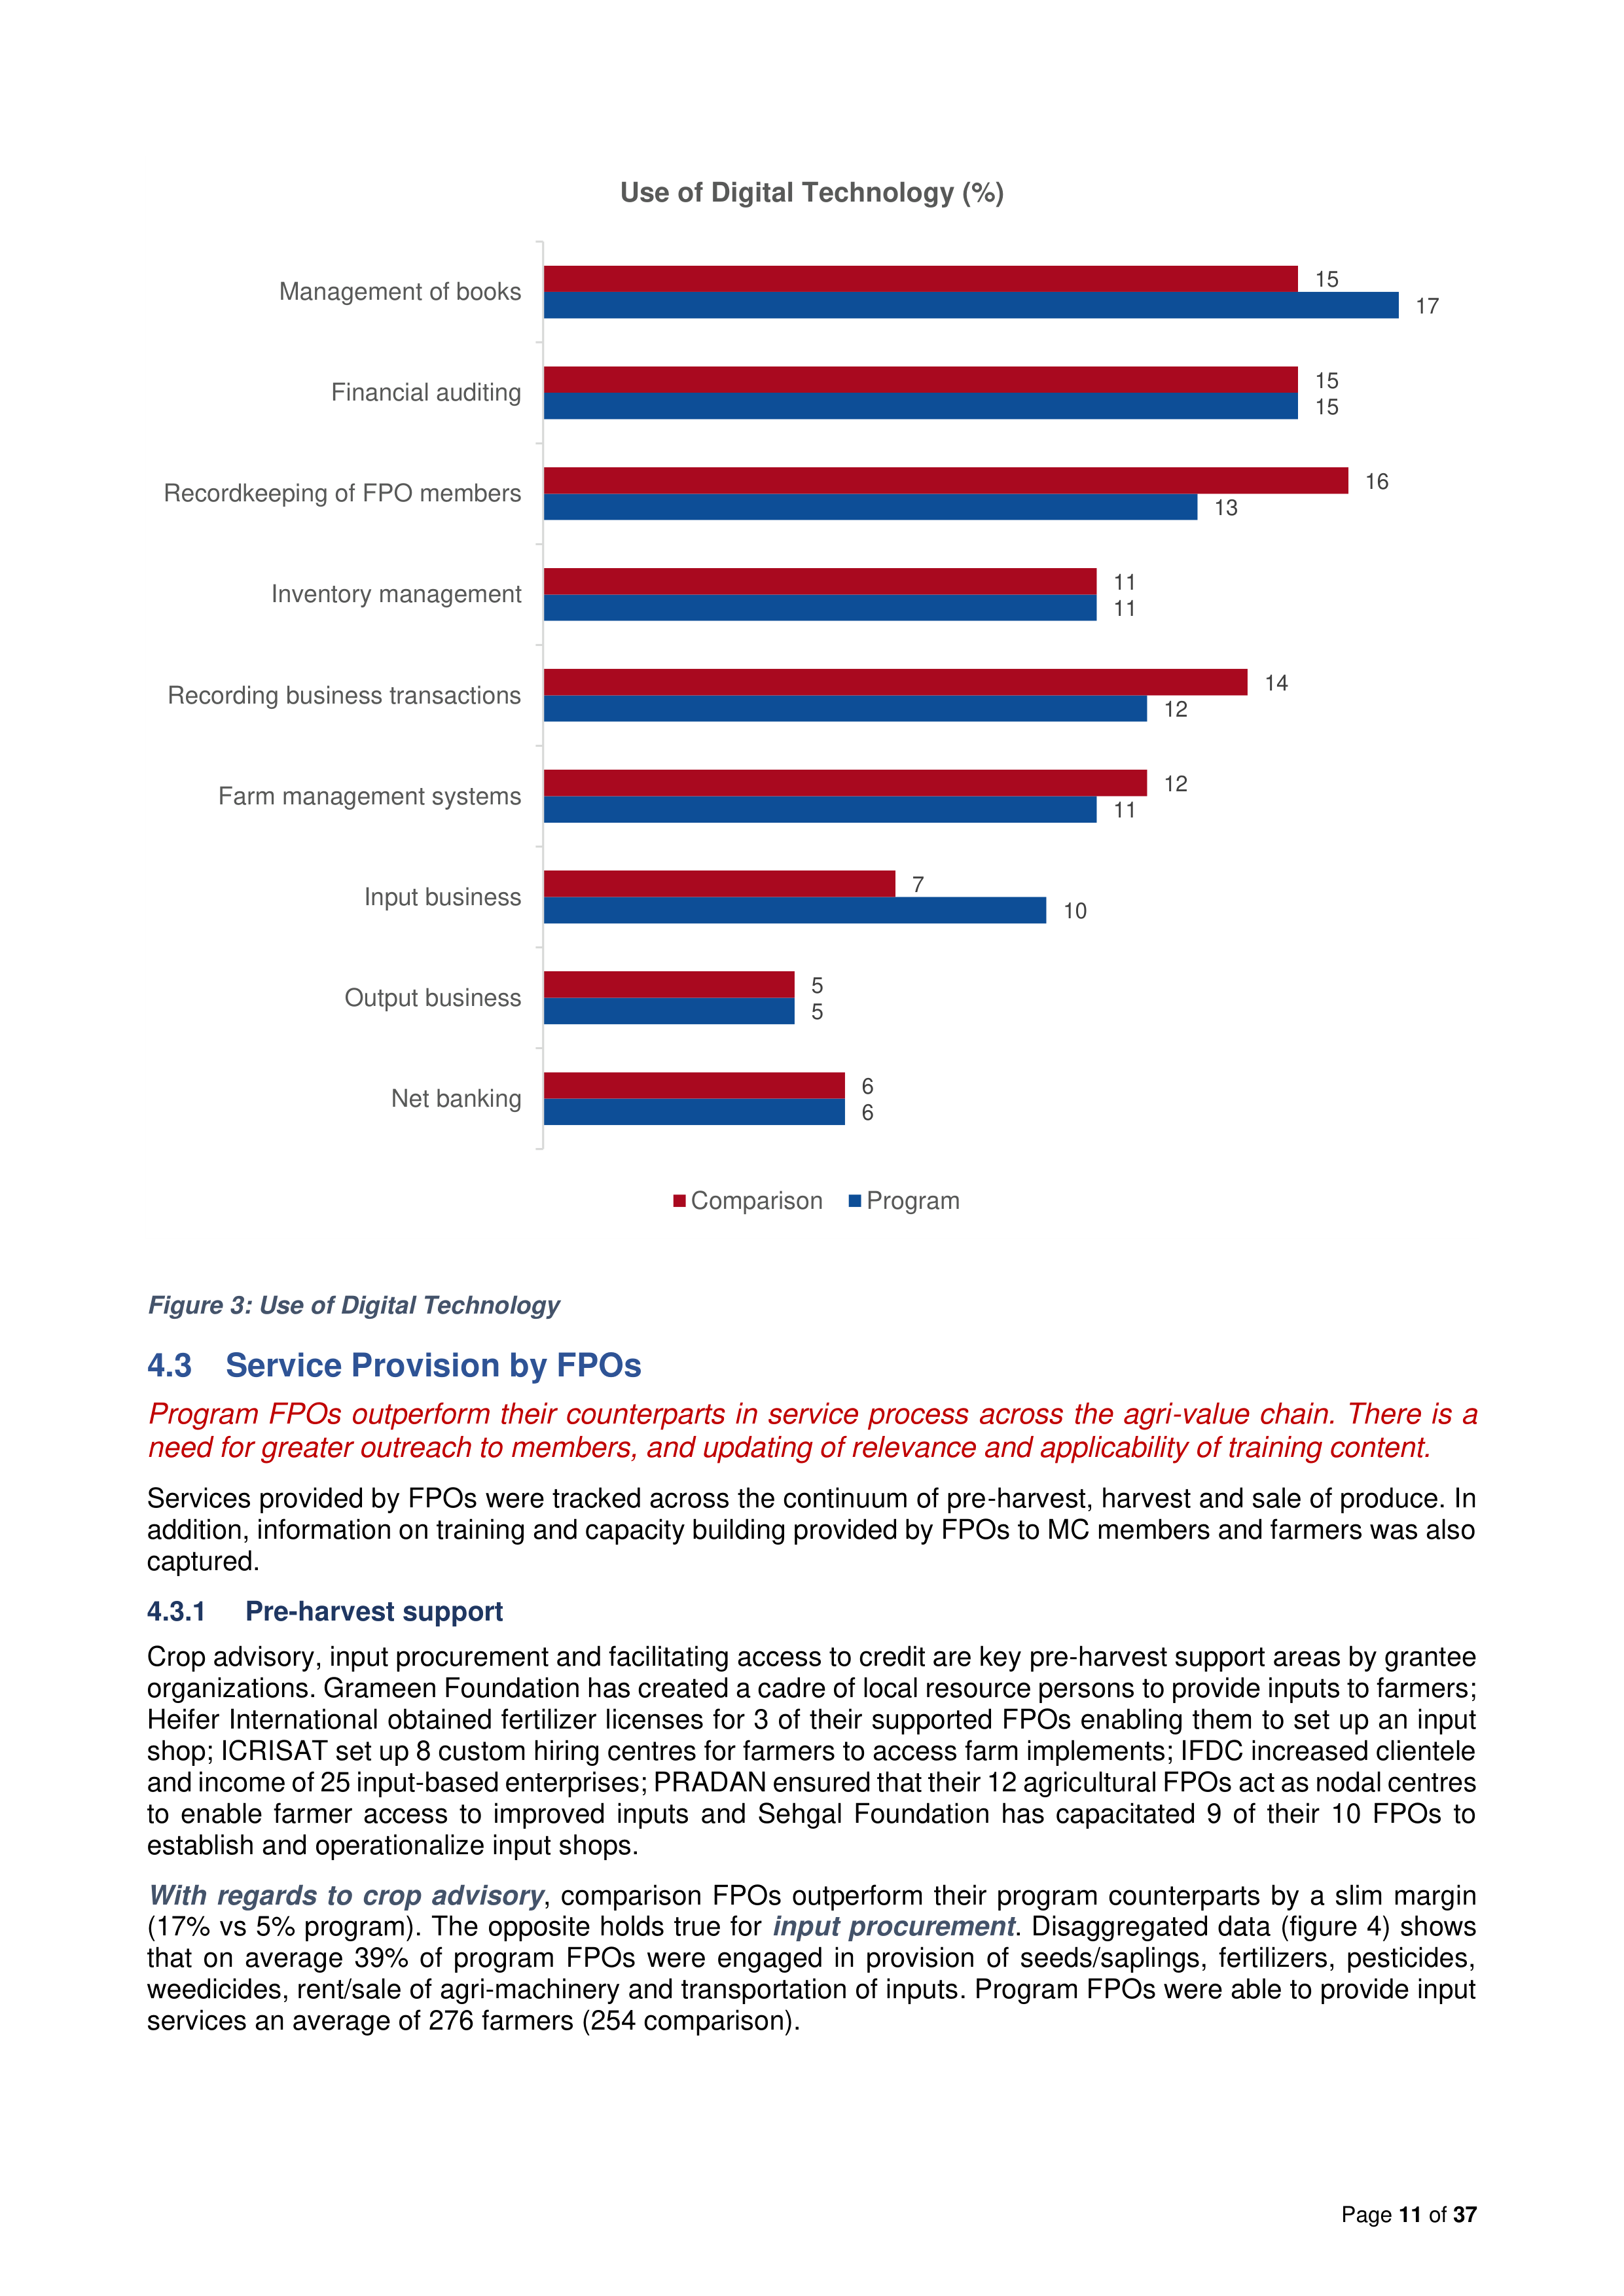
Findings show that a higher percentage of program FPOs (80%) use digital technology compared to comparison
FPOs (64%). As Figure 3 shows, top uses of technology by program FPOs were for management of books,
financial auditing, consolidating member information, and recording business transactions. However, about 40
percent of MC members continue to struggle using technology – with lack of network connectivity, paucity of
appropriate hardware and insufficient knowledge on how to operate hardware and software being some of the
challenges they faced.
31
22
33
3
45
13
4
0
4
11
0
5
0
0
0
10
20
30
40
50
President
Vice
President
Secretary
CEO
Treasurer
Accountant
Godown
Keeper
Positions Held by Women (%)
Program
Comparison
74
45
48
88
50
77
32
66
42
46
86
32
68
15
0
20
40
60
80
100
President
Vice
President
Secretary
CEO
Treasurer
Accountant
Godown
Keeper
FPOs with Filled Positions (%)
Program
Comparison
Page
11
of
37
Figure 3: Use of Digital Technology
4.3 Service Provision by FPOs
Program FPOs outperform their counterparts in service process across the agri-value chain. There is a
need for greater outreach to members, and updating of relevance and applicability of training content.
Services provided by FPOs were tracked across the continuum of pre-harvest, harvest and sale of produce. In
addition, information on training and capacity building provided by FPOs to MC members and farmers was also
captured.
4.3.1
Pre-harvest support
Crop advisory, input procurement and facilitating access to credit are key pre-harvest support areas by grantee
organizations. Grameen Foundation has created a cadre of local resource persons to provide inputs to farmers;
Heifer International obtained fertilizer licenses for 3 of their supported FPOs enabling them to set up an input
shop; ICRISAT set up 8 custom hiring centres for farmers to access farm implements; IFDC increased clientele
and income of 25 input-based enterprises; PRADAN ensured that their 12 agricultural FPOs act as nodal centres
to enable farmer access to improved inputs and Sehgal Foundation has capacitated 9 of their 10 FPOs to
establish and operationalize input shops.
With regards to crop advisory
, comparison FPOs outperform their program counterparts by a slim margin
(17% vs 5% program). The opposite holds true for
input procurement
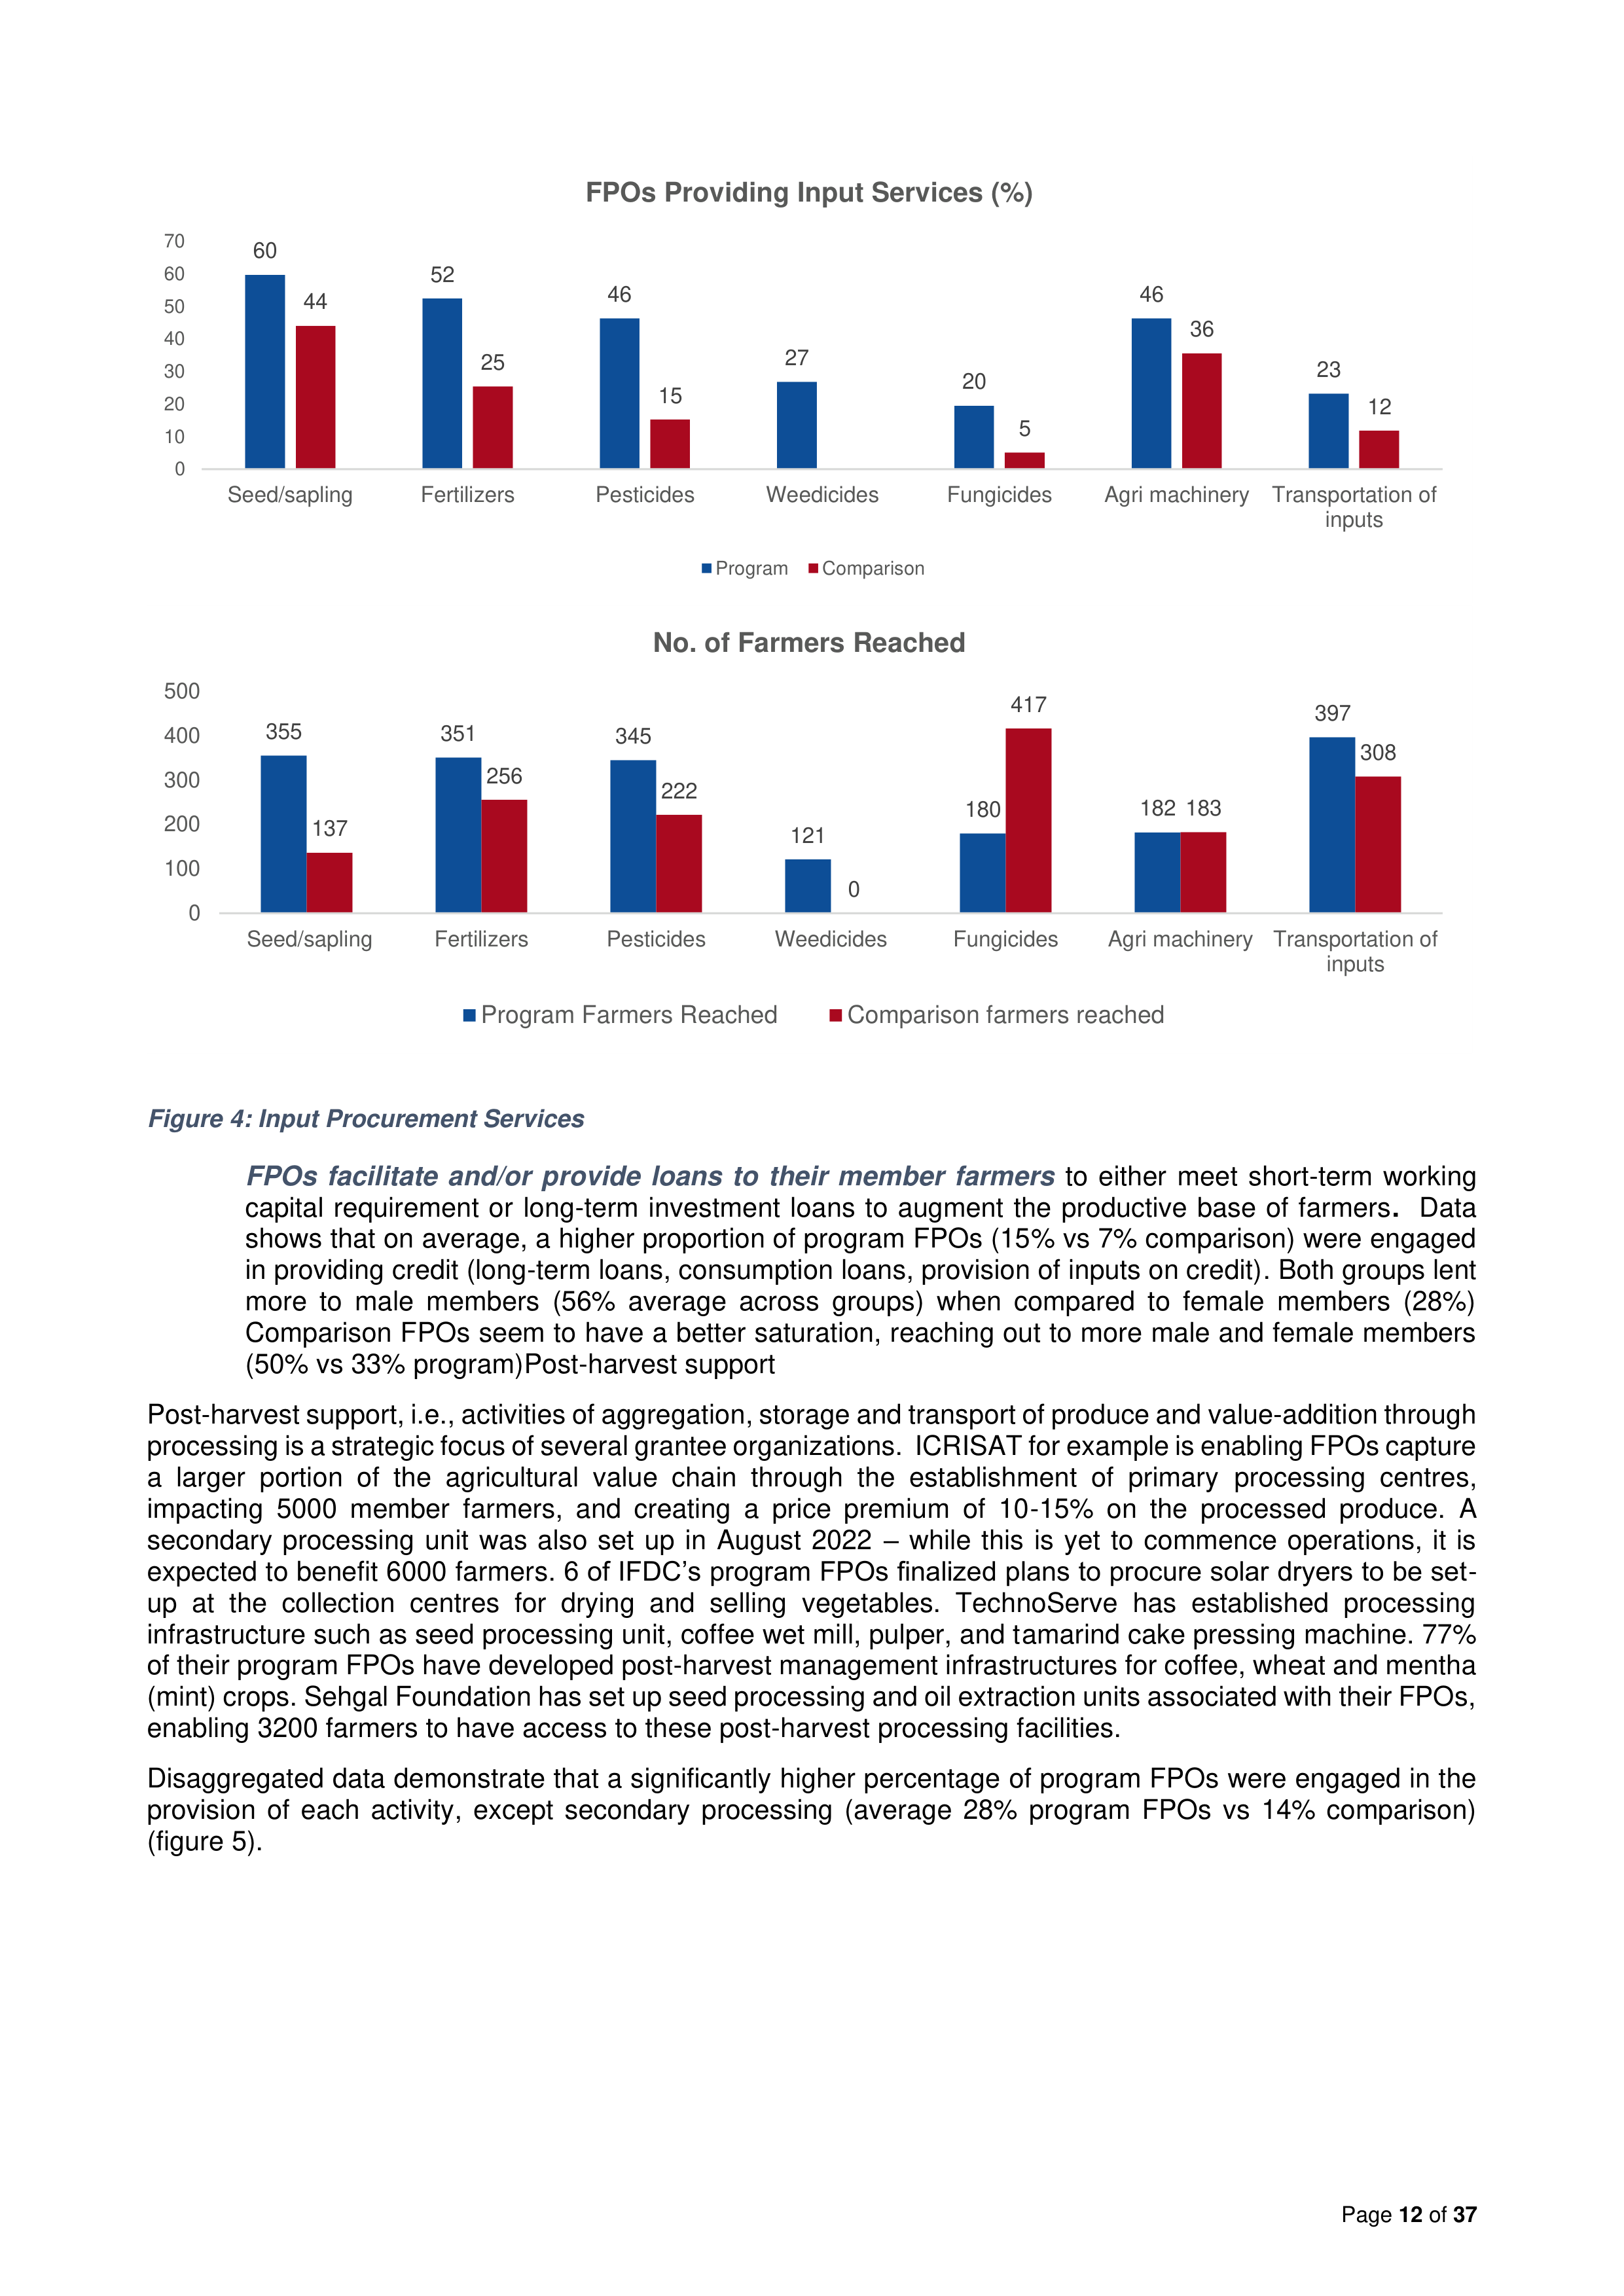
. Disaggregated data (figure 4) shows
that on average 39% of program FPOs were engaged in provision of seeds/saplings, fertilizers, pesticides,
weedicides, rent/sale of agri-machinery and transportation of inputs. Program FPOs were able to provide input
services an average of 276 farmers (254 comparison).
6
5
10
11
12
11
13
15
17
6
5
7
12
14
11
16
15
15
Net banking
Output business
Input business
Farm management systems
Recording business transactions
Inventory management
Recordkeeping of FPO members
Financial auditing
Management of books
Use of Digital Technology (%)
Comparison
Program
Page
12
of
37
Figure 4: Input Procurement Services
FPOs facilitate and/or provide loans to their member farmers
to either meet short-term working
capital requirement or long-term investment loans to augment the productive base of farmers
.
Data
shows that on average, a higher proportion of program FPOs (15% vs 7% comparison) were engaged
in providing credit (long-term loans, consumption loans, provision of inputs on credit). Both groups lent
more to male members (56% average across groups) when compared to female members (28%)
Comparison FPOs seem to have a better saturation, reaching out to more male and female members
(50% vs 33% program)Post-harvest support
Post-harvest support, i.e., activities of aggregation, storage and transport of produce and value-addition through
processing is a strategic focus of several grantee organizations. ICRISAT for example is enabling FPOs capture
a larger portion of the agricultural value chain through the establishment of primary processing centres,
impacting 5000 member farmers, and creating a price premium of 10-15% on the processed produce. A
secondary processing unit was also set up in August 2022 – while this is yet to commence operations, it is
expected to benefit 6000 farmers. 6 of IFDC’s program FPOs finalized plans to procure solar dryers to be set-
up at the collection centres for drying and selling vegetables. TechnoServe has established processing
infrastructure such as seed processing unit, coffee wet mill, pulper, and tamarind cake pressing machine. 77%
of their program FPOs have developed post-harvest management infrastructures for coffee, wheat and mentha
(mint) crops. Sehgal Foundation has set up seed processing and oil extraction units associated with their FPOs,
enabling 3200 farmers to have access to these post-harvest processing facilities.
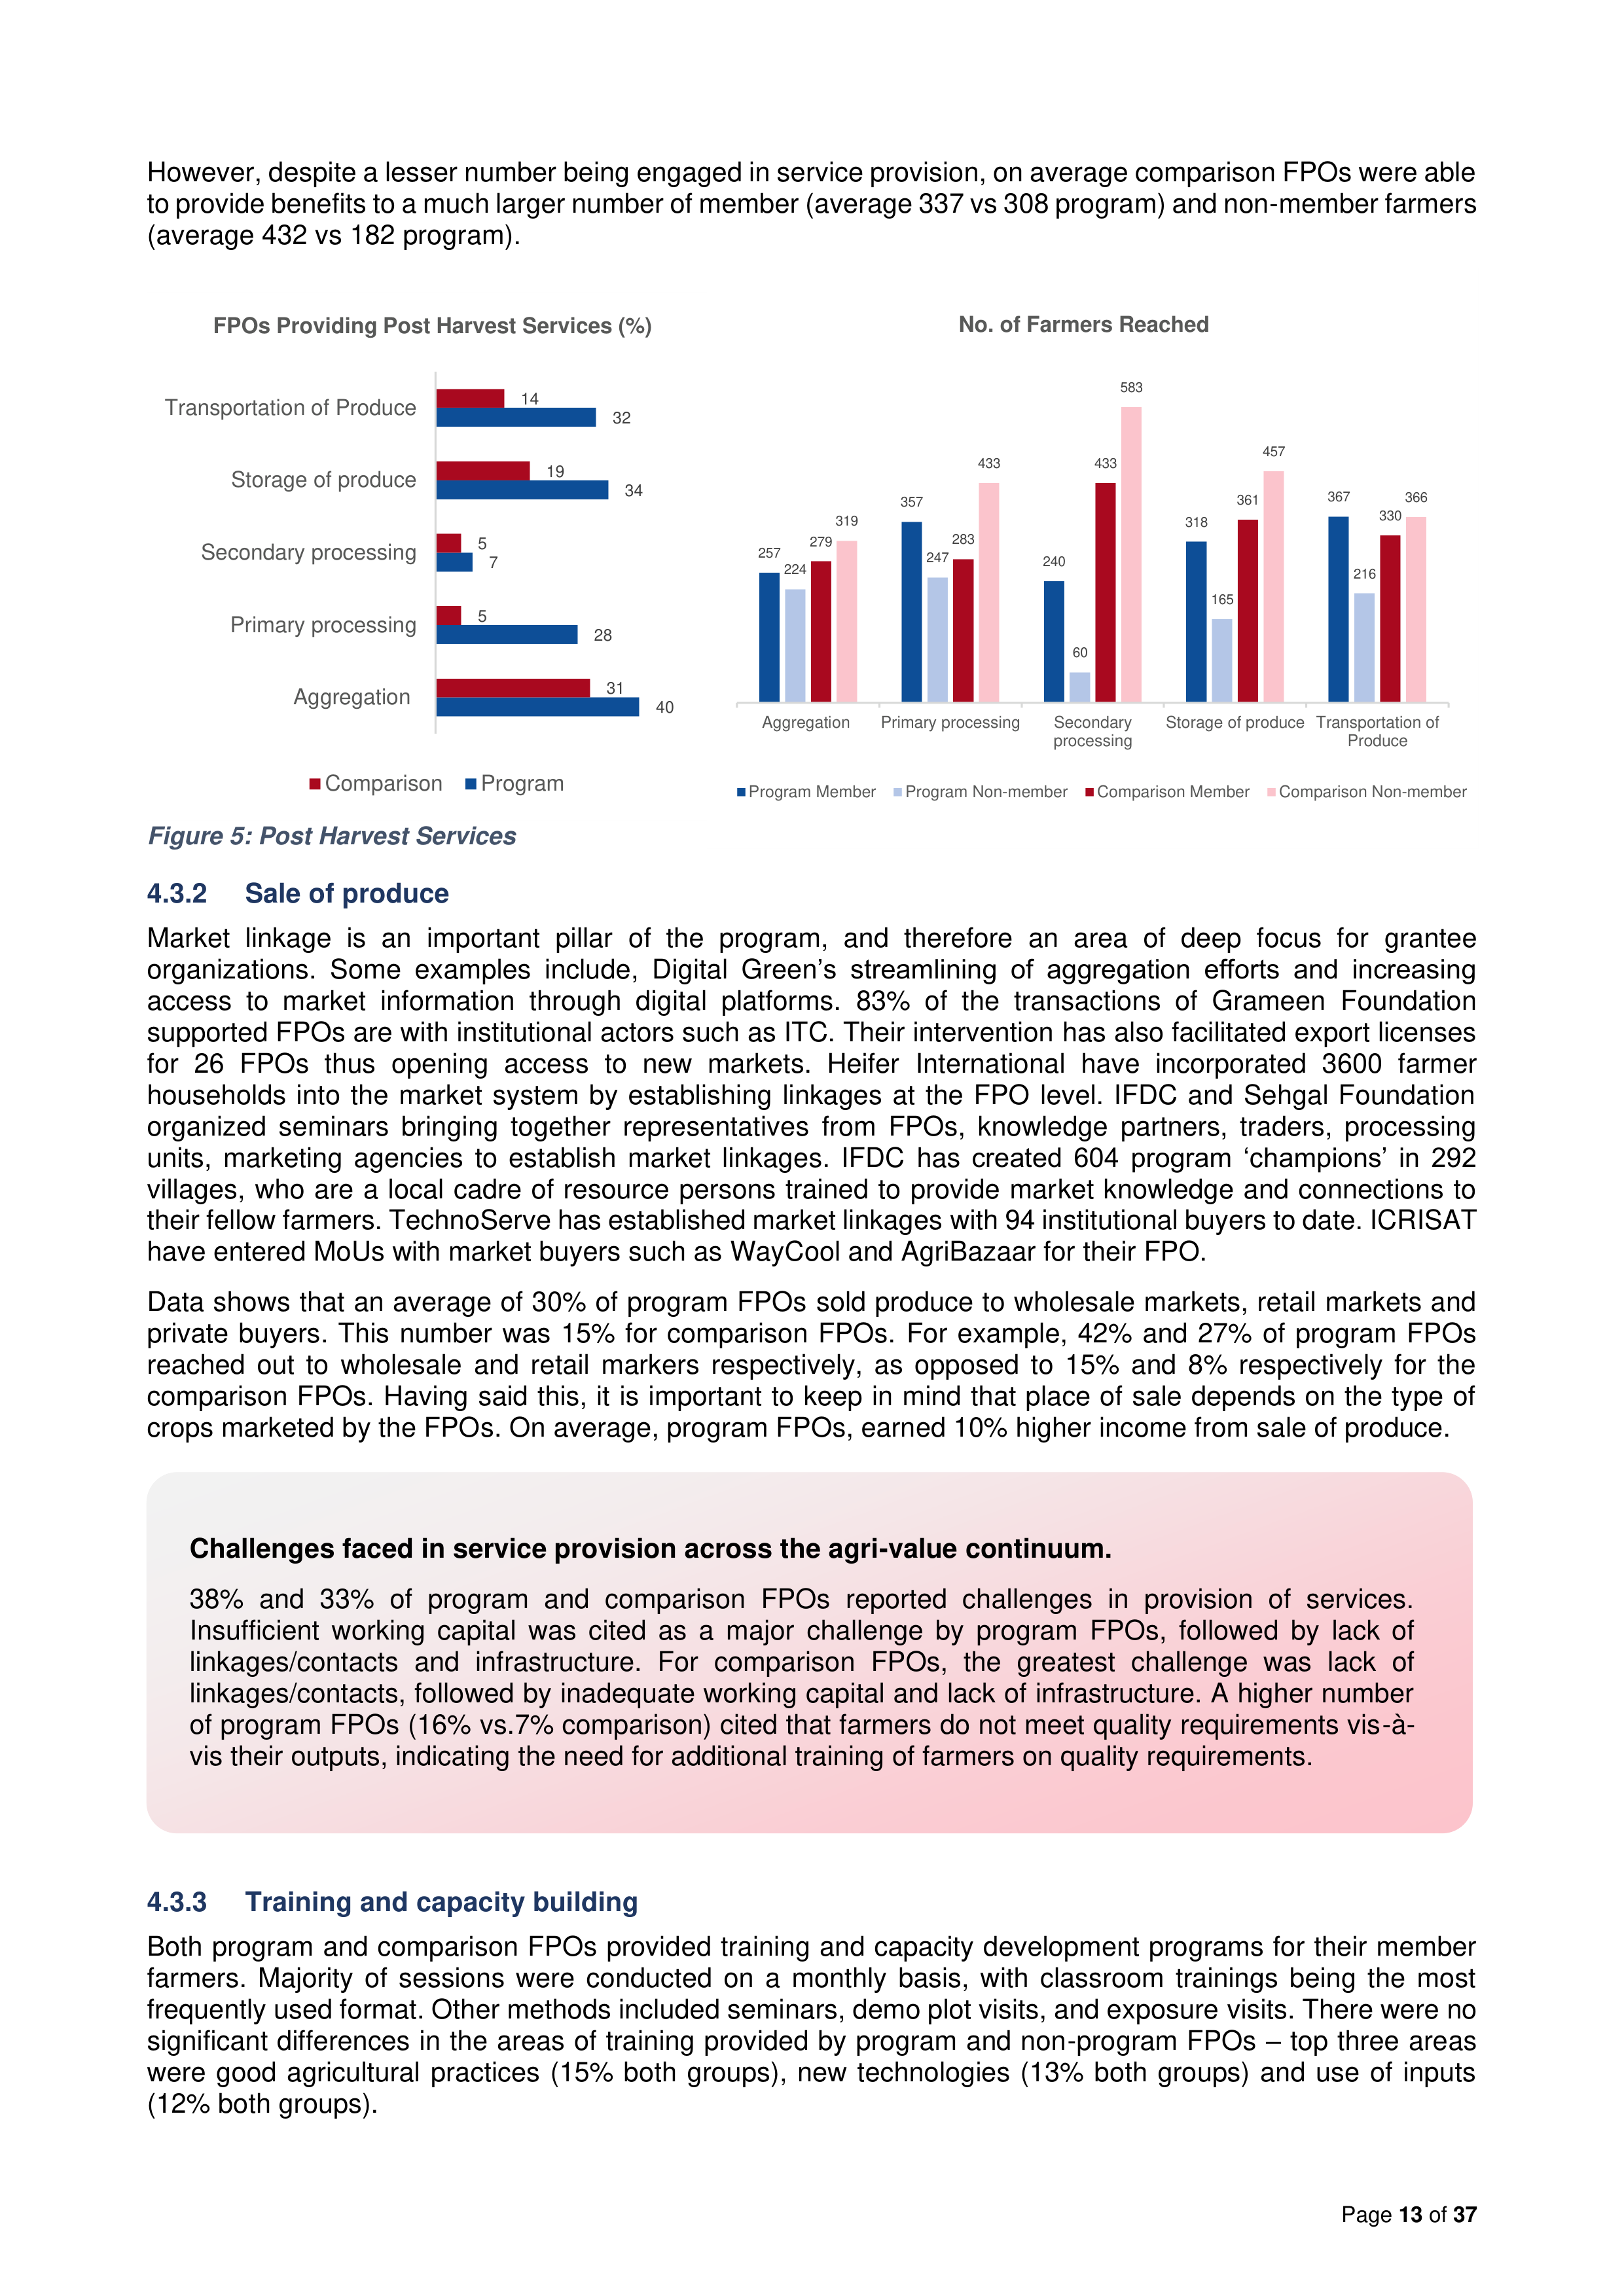
Disaggregated data demonstrate that a significantly higher percentage of program FPOs were engaged in the
provision of each activity, except secondary processing (average 28% program FPOs vs 14% comparison)
(figure 5).
60
52
46
27
20
46
23
44
25
15
5
36
12
0
10
20
30
40
50
60
70
Seed/sapling
Fertilizers
Pesticides
Weedicides
Fungicides
Agri machinery
Transportation of
inputs
FPOs Providing Input Services (%)
Program
Comparison
355
351
345
121
180
182
397
137
256
222
0
417
183
308
0
100
200
300
400
500
Seed/sapling
Fertilizers
Pesticides
Weedicides
Fungicides
Agri machinery
Transportation of
inputs
No. of Farmers Reached
Program Farmers Reached
Comparison farmers reached

Page
13
of
37
However, despite a lesser number being engaged in service provision, on average comparison FPOs were able
to provide benefits to a much larger number of member (average 337 vs 308 program) and non-member farmers
(average 432 vs 182 program).
Figure 5: Post Harvest Services
4.3.2
Sale of produce
Market linkage is an important pillar of the program, and therefore an area of deep focus for grantee
organizations. Some examples include, Digital Green’s streamlining of aggregation efforts and increasing
access to market information through digital platforms. 83% of the transactions of Grameen Foundation
supported FPOs are with institutional actors such as ITC. Their intervention has also facilitated export licenses
for 26 FPOs thus opening access to new markets. Heifer International have incorporated 3600 farmer
households into the market system by establishing linkages at the FPO level. IFDC and Sehgal Foundation
organized seminars bringing together representatives from FPOs, knowledge partners, traders, processing
units, marketing agencies to establish market linkages. IFDC has created 604 program ‘champions’ in 292
villages, who are a local cadre of resource persons trained to provide market knowledge and connections to
their fellow farmers. TechnoServe has established market linkages with 94 institutional buyers to date. ICRISAT
have entered MoUs with market buyers such as WayCool and AgriBazaar for their FPO.
Data shows that an average of 30% of program FPOs sold produce to wholesale markets, retail markets and
private buyers. This number was 15% for comparison FPOs. For example, 42% and 27% of program FPOs
reached out to wholesale and retail markers respectively, as opposed to 15% and 8% respectively for the
comparison FPOs. Having said this, it is important to keep in mind that place of sale depends on the type of
crops marketed by the FPOs. On average, program FPOs, earned 10% higher income from sale of produce.
4.3.3
Training and capacity building
Both program and comparison FPOs provided training and capacity development programs for their member
farmers. Majority of sessions were conducted on a monthly basis, with classroom trainings being the most
frequently used format. Other methods included seminars, demo plot visits, and exposure visits. There were no
significant differences in the areas of training provided by program and non-program FPOs – top three areas
were good agricultural practices (15% both groups), new technologies (13% both groups) and use of inputs
(12% both groups).
Challenges faced in service provision across the agri-value continuum.
38% and 33% of program and comparison FPOs reported challenges in provision of services.
Insufficient working capital was cited as a major challenge by program FPOs, followed by lack of
linkages/contacts and infrastructure. For comparison FPOs, the greatest challenge was lack of
linkages/contacts, followed by inadequate working capital and lack of infrastructure. A higher number
of program FPOs (16% vs.7% comparison) cited that farmers do not meet quality requirements vis-à-
vis their outputs, indicating the need for additional training of farmers on quality requirements.
257
357
240
318
367
224
247
60
165
216
279
283
433
361
330
319
433
583
457
366
Aggregation
Primary processing
Secondary
processing
Storage of produce
Transportation of
Produce
No. of Farmers Reached
Program Member
Program Non-member
Comparison Member
Comparison Non-member
40
28
7
34
32
31
5
5
19
14
Aggregation
Primary processing
Secondary processing
Storage of produce
Transportation of Produce
FPOs Providing Post Harvest Services (%)
Comparison
Program
Page
14
of
37
However, there were differences in the recipients of the training – while on average 71% of program FPOs
trained office bearers (63% comparison); more comparison FPOs (64% vs 52% program) trained member
farmers. In terms of attendance and adoption of training, a slightly higher proportion of comparison members
(66%) attended at least one training session compared to the program group (60%). More comparison attendees
applied the training in their day-to-day work (86% vs. 75% program). Overall, the data suggests that while both
program FPOs conduct training and capacity development sessions, there is room for improvement in terms of
directing more training towards member farmers and ensuring the adoption of the training provided.
4.4 Financial Viability of FPOs
Providing a spectrum of services to member farmers fuels diversity of income and capacity of program
FPOs to earn revenue through the year. A significantly higher number of program FPOs registered
profits (and higher profits) in the previous financial year. However, profit sharing is more equitable in
comparison FPOs.
The financial viability of FPOs is dependent on two main factors – operating model and capitalization
.
Operating
model
is dependent on produce/commodity and services/activities provided to support farmers in cultivating the
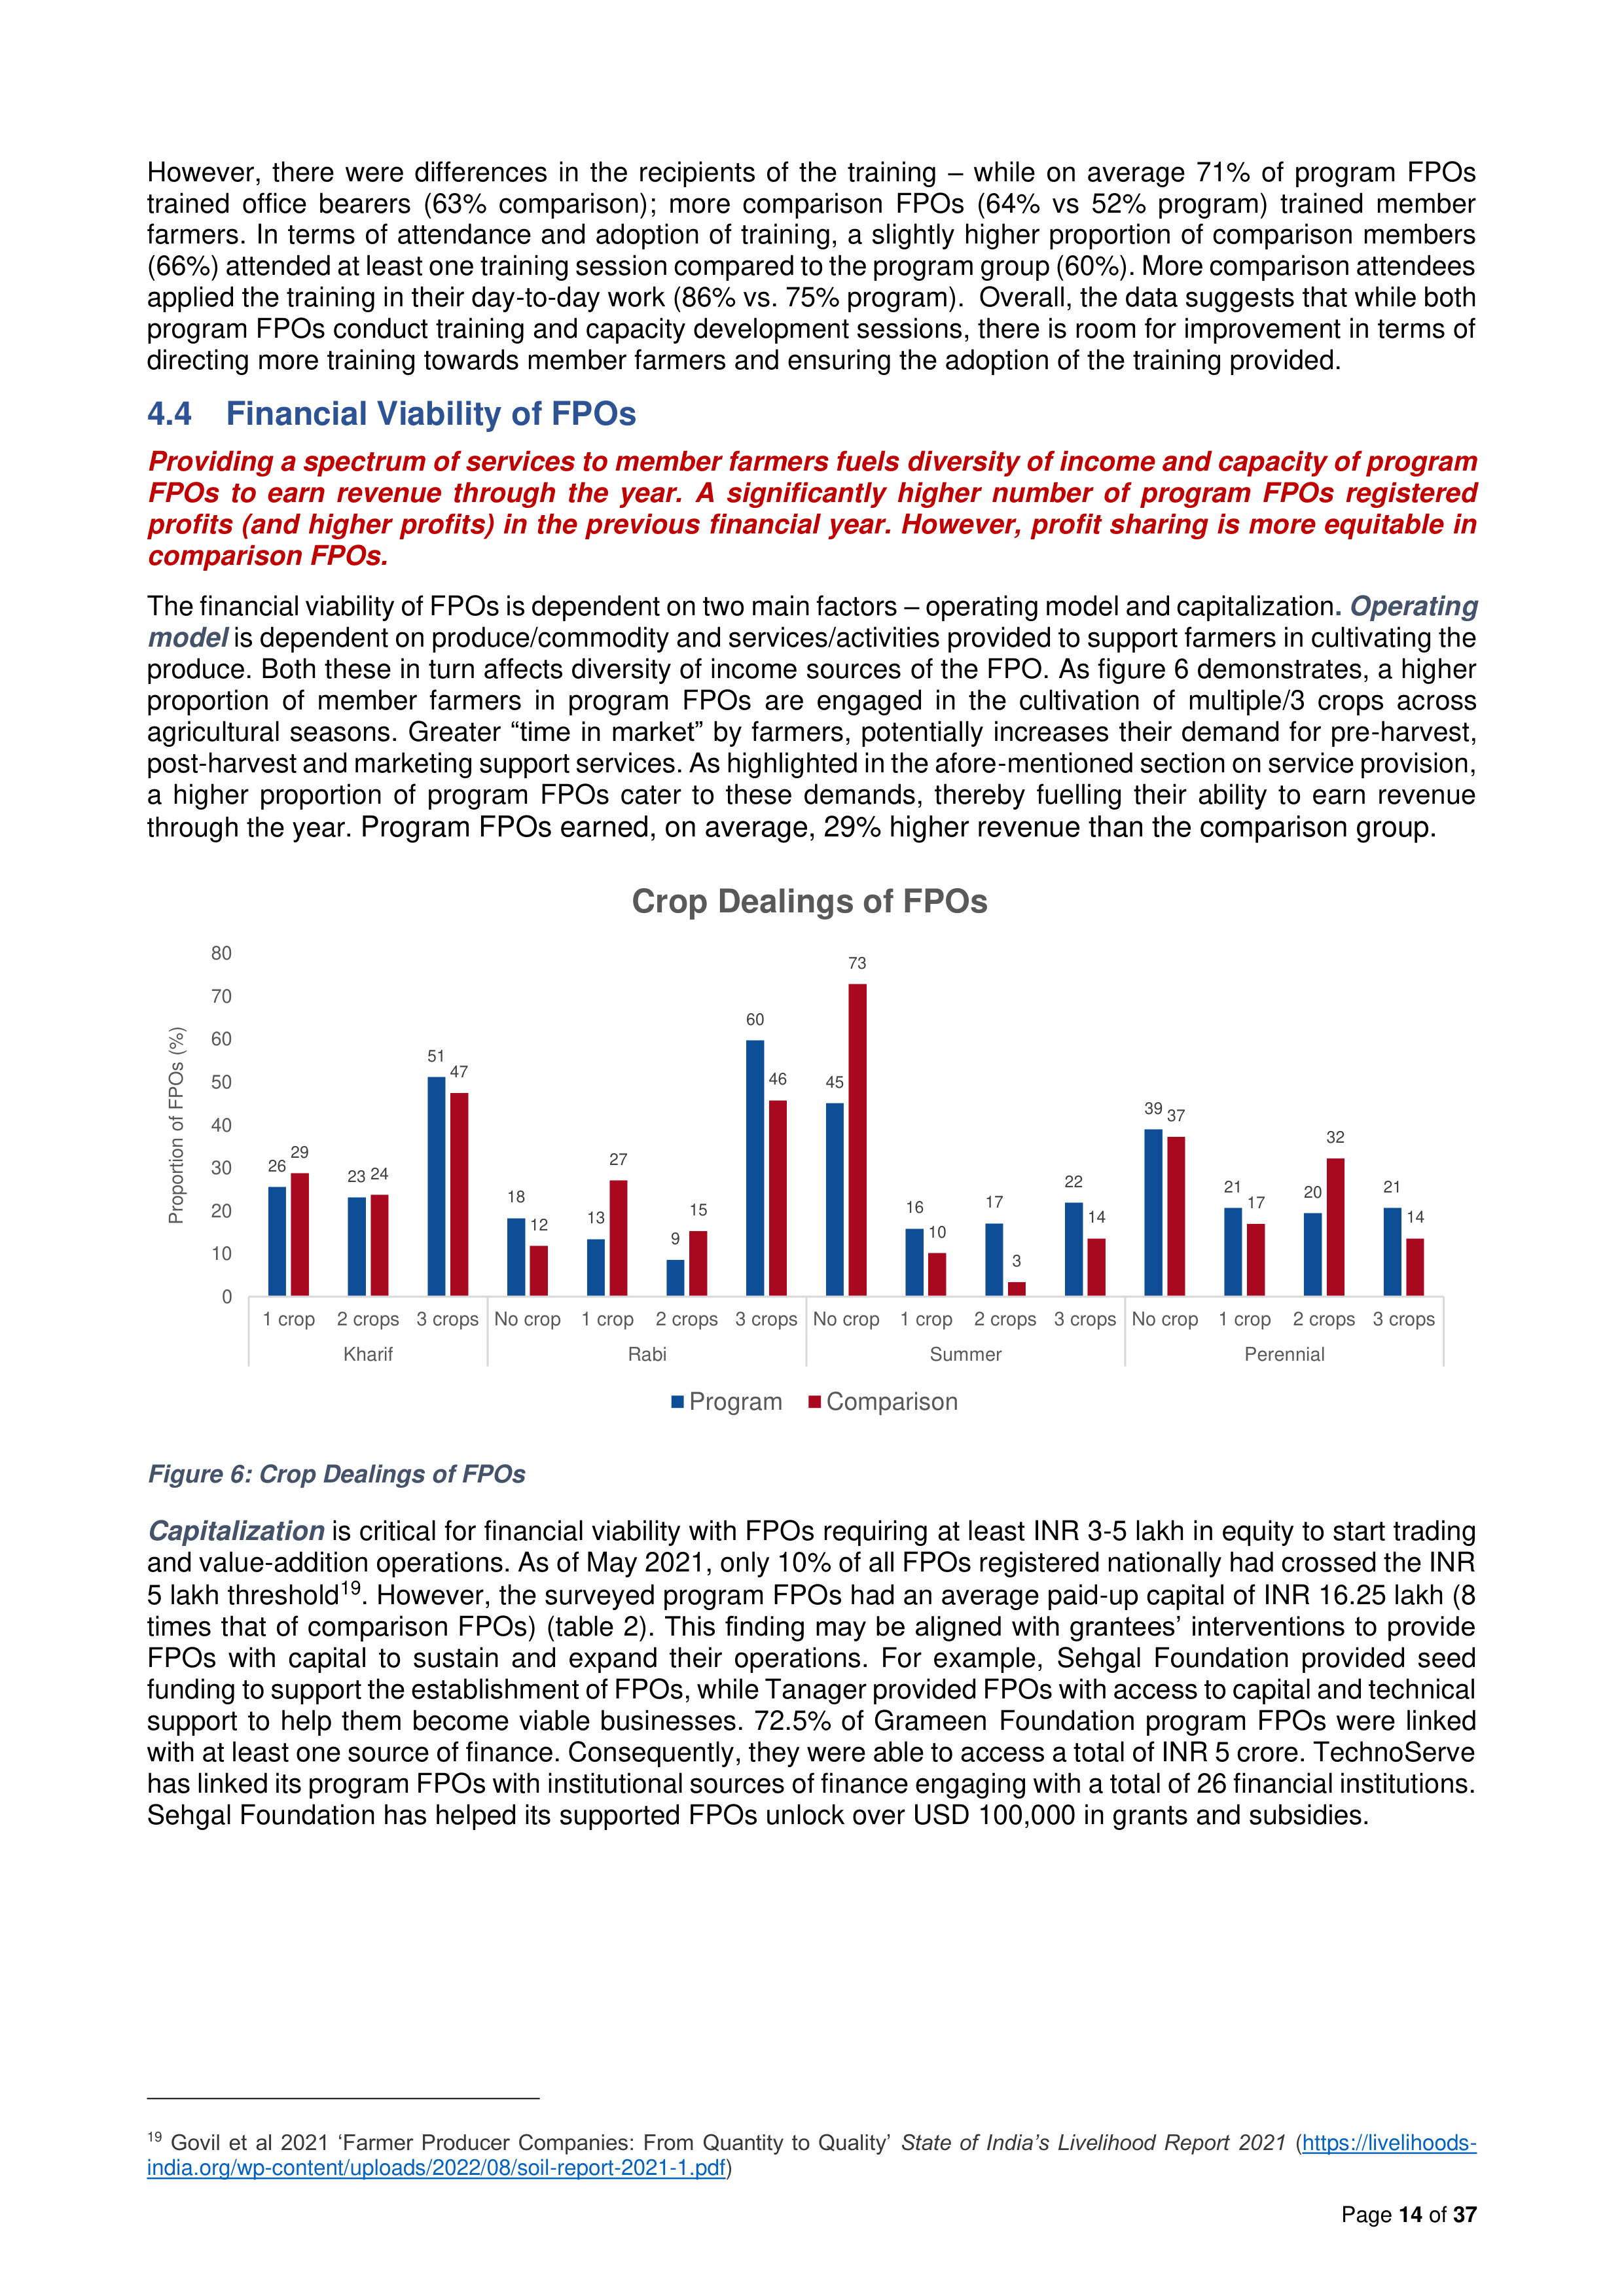
produce. Both these in turn affects diversity of income sources of the FPO. As figure 6 demonstrates, a higher
proportion of member farmers in program FPOs are engaged in the cultivation of multiple/3 crops across
agricultural seasons. Greater “time in market” by farmers, potentially increases their demand for pre-harvest,
post-harvest and marketing support services. As highlighted in the afore-mentioned section on service provision,
a higher proportion of program FPOs cater to these demands, thereby fuelling their ability to earn revenue
through the year.
Program FPOs earned, on average, 29% higher revenue than the comparison group.
Figure 6: Crop Dealings of FPOs
Capitalization
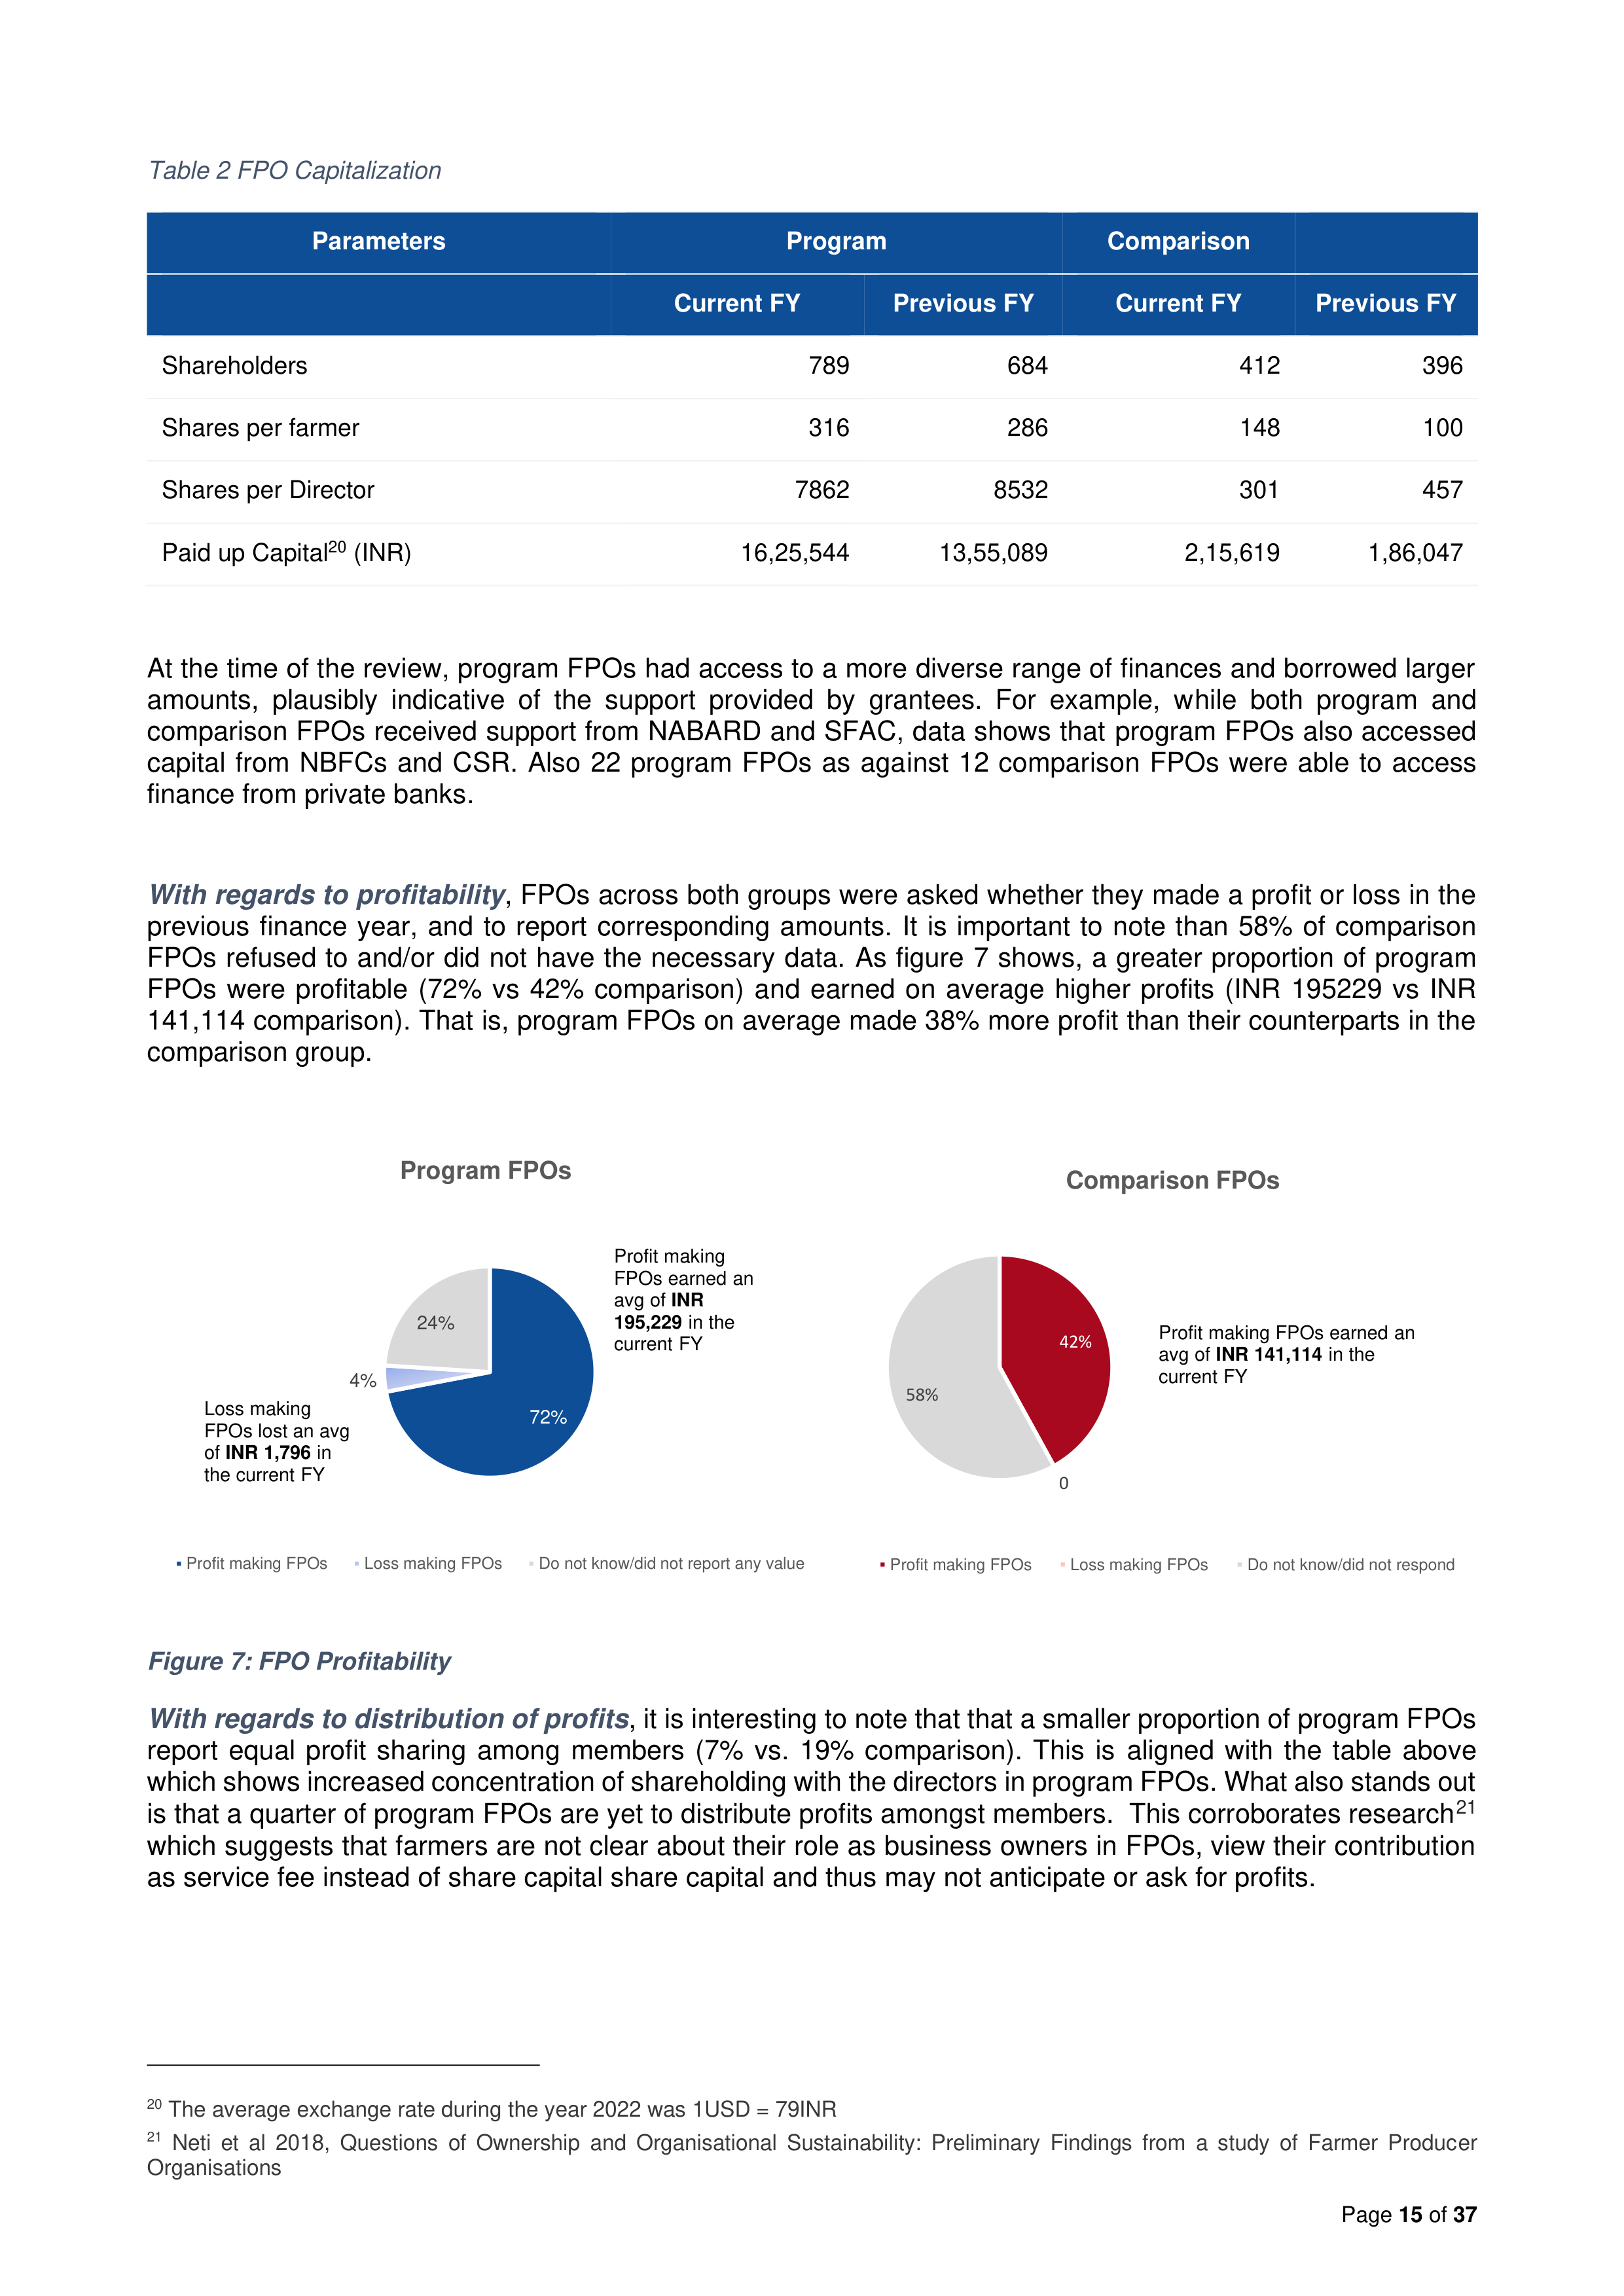
is critical for financial viability with FPOs requiring at least INR 3-5 lakh in equity to start trading
and value-addition operations. As of May 2021, only 10% of all FPOs registered nationally had crossed the INR
5 lakh threshold
19
. However, the surveyed program FPOs had an average paid-up capital of INR 16.25 lakh (8
times that of comparison FPOs) (table 2). This finding may be aligned with grantees’ interventions to provide
FPOs with capital to sustain and expand their operations. For example, Sehgal Foundation provided seed
funding to support the establishment of FPOs, while Tanager provided FPOs with access to capital and technical
support to help them become viable businesses. 72.5% of Grameen Foundation program FPOs were linked
with at least one source of finance. Consequently, they were able to access a total of INR 5 crore. TechnoServe
has linked its program FPOs with institutional sources of finance engaging with a total of 26 financial institutions.
Sehgal Foundation has helped its supported FPOs unlock over USD 100,000 in grants and subsidies.
19
Govil et al 2021 ‘Farmer Producer Companies: From Quantity to Quality’
State of India’s Livelihood Report 2021
(
https://livelihoods-
india.org/wp-content/uploads/2022/08/soil-report-2021-1.pdf
)
26
23
51
18
13
9
60
45
16
17
22
39
21
20
21
29
24
47
12
27
15
46
73
10
3
14
37
17
32
14
0
10
20
30
40
50
60
70
80
1 crop
2 crops
3 crops
No crop
1 crop
2 crops
3 crops
No crop
1 crop
2 crops
3 crops
No crop
1 crop
2 crops
3 crops
Kharif
Rabi
Summer
Perennial
Proportion of FPOs (%)
Crop Dealings of FPOs
Program
Comparison
Page
15
of
37
Table 2 FPO Capitalization
Parameters
Program
Comparison
Current FY
Previous FY
Current FY
Previous FY
Shareholders
789
684
412
396
Shares per farmer
316
286
148
100
Shares per Director
7862
8532
301
457
Paid up Capital
20
(INR)
16,25,544
13,55,089
2,15,619
1,86,047
At the time of the review, program FPOs had access to a more diverse range of finances and borrowed larger
amounts, plausibly indicative of the support provided by grantees. For example, while both program and
comparison FPOs received support from NABARD and SFAC, data shows that program FPOs also accessed
capital from NBFCs and CSR. Also 22 program FPOs as against 12 comparison FPOs were able to access
finance from private banks.
With regards to profitability
, FPOs across both groups were asked whether they made a profit or loss in the
previous finance year, and to report corresponding amounts. It is important to note than 58% of comparison
FPOs refused to and/or did not have the necessary data. As figure 7 shows, a greater proportion of program
FPOs were profitable (72% vs 42% comparison) and earned on average higher profits (INR 195229 vs INR
141,114 comparison). That is, program FPOs on average made 38% more profit than their counterparts in the
comparison group.
Figure 7: FPO Profitability
With regards to distribution of profits
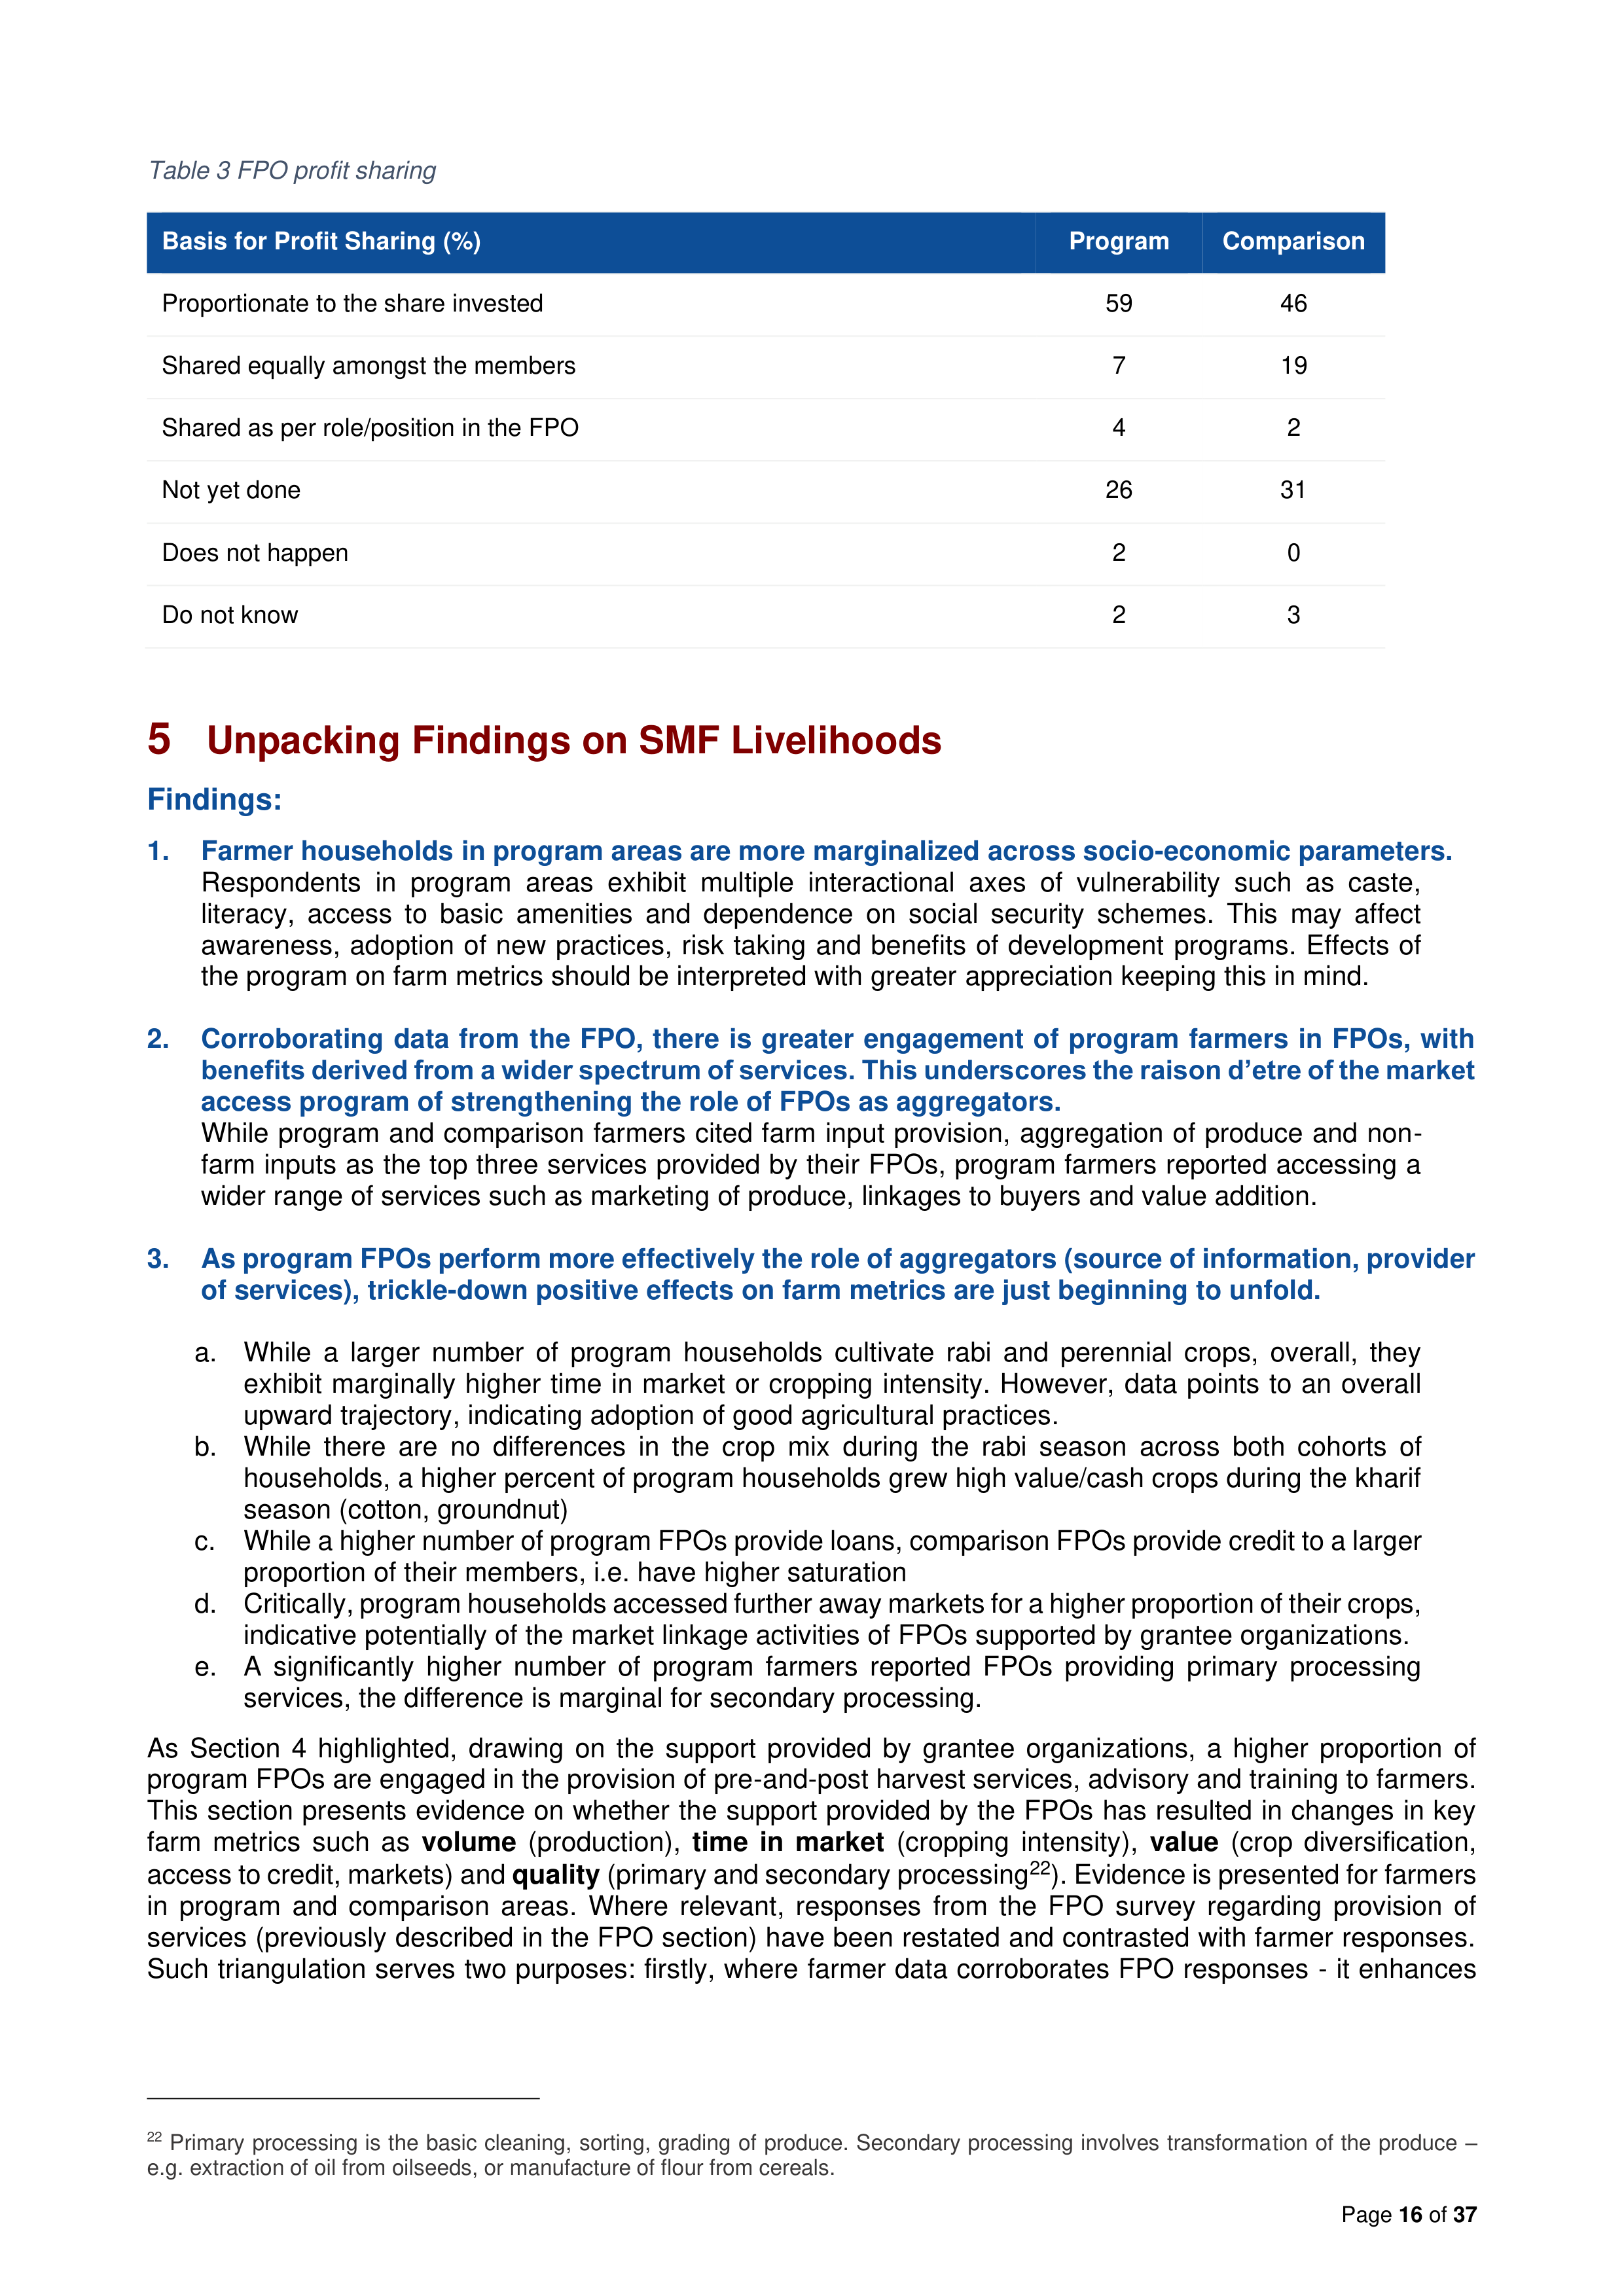
, it is interesting to note that that a smaller proportion of program FPOs
report equal profit sharing among members (7% vs. 19% comparison). This is aligned with the table above
which shows increased concentration of shareholding with the directors in program FPOs. What also stands out
is that a quarter of program FPOs are yet to distribute profits amongst members. This corroborates research
21
which suggests that farmers are not clear about their role as business owners in FPOs, view their contribution
as service fee instead of share capital share capital and thus may not anticipate or ask for profits.
20
The average exchange rate during the year 2022 was 1USD = 79INR
21
Neti et al 2018, Questions of Ownership and Organisational Sustainability: Preliminary Findings from a study of Farmer Producer
Organisations
72%
4%
24%
Program FPOs
Profit making FPOs
Loss making FPOs
Do not know/did not report any value
Profit making
FPOs earned an
avg of
INR
195,229
in the
current FY
Loss making
FPOs lost an avg
of
INR 1,796
in
the current FY
42%
0
58%
Comparison FPOs
Profit making FPOs
Loss making FPOs
Do not know/did not respond
Profit making FPOs earned an
avg of
INR 141,114
in the
current FY
Page
16
of
37
Table 3 FPO profit sharing
Basis for Profit Sharing (%)
Program
Comparison
Proportionate to the share invested
59
46
Shared equally amongst the members
7
19
Shared as per role/position in the FPO
4
2
Not yet done
26
31
Does not happen
2
0
Do not know
2
3
5
Unpacking Findings on SMF Livelihoods
Findings:
1.
Farmer households in program areas are more marginalized across socio-economic parameters.
Respondents in program areas exhibit multiple interactional axes of vulnerability such as caste,
literacy, access to basic amenities and dependence on social security schemes. This may affect
awareness, adoption of new practices, risk taking and benefits of development programs. Effects of
the program on farm metrics should be interpreted with greater appreciation keeping this in mind.
2.
Corroborating data from the FPO, there is greater engagement of program farmers in FPOs, with
benefits derived from a wider spectrum of services. This underscores the raison d’etre of the market
access program of strengthening the role of FPOs as aggregators.
While program and comparison farmers cited farm input provision, aggregation of produce and non-
farm inputs as the top three services provided by their FPOs, program farmers reported accessing a
wider range of services such as marketing of produce, linkages to buyers and value addition.
3.
As program FPOs perform more effectively the role of aggregators (source of information, provider
of services), trickle-down positive effects on farm metrics are just beginning to unfold.
a. While a larger number of program households cultivate rabi and perennial crops, overall, they
exhibit marginally higher time in market or cropping intensity. However, data points to an overall
upward trajectory, indicating adoption of good agricultural practices.
b. While there are no differences in the crop mix during the rabi season across both cohorts of
households, a higher percent of program households grew high value/cash crops during the kharif
season (cotton, groundnut)
c. While a higher number of program FPOs provide loans, comparison FPOs provide credit to a larger
proportion of their members, i.e. have higher saturation
d. Critically, program households accessed further away markets for a higher proportion of their crops,
indicative potentially of the market linkage activities of FPOs supported by grantee organizations.
e. A significantly higher number of program farmers reported FPOs providing primary processing
services, the difference is marginal for secondary processing.
As Section 4 highlighted, drawing on the support provided by grantee organizations, a higher proportion of
program FPOs are engaged in the provision of pre-and-post harvest services, advisory and training to farmers.
This section presents evidence on whether the support provided by the FPOs has resulted in changes in key
farm metrics such as
volume
(production),
time in market
(cropping intensity),
value
(crop diversification,
access to credit, markets) and
quality
(primary and secondary processing
22
). Evidence is presented for farmers
in program and comparison areas. Where relevant, responses from the FPO survey regarding provision of
services (previously described in the FPO section) have been restated and contrasted with farmer responses.
Such triangulation serves two purposes: firstly, where farmer data corroborates FPO responses - it enhances
22
Primary processing is the basic cleaning, sorting, grading of produce. Secondary processing involves transformation of the produce –
e.g. extraction of oil from oilseeds, or manufacture of flour from cereals.
Page
17
of
37
the credibility of the impact review; and secondly where the two sets of data differ - it highlights interesting
nuances and areas for further study.
5.1 Demographic and Socio-Economic Profile
The study findings show that households in the program areas are more socio-economically marginalized
compared to households in the comparison areas. While the program households were found to be similar in
terms of home assets (e.g. consumer and durable goods) and marginally better in terms of owning farms assets,
it was seen that program households had lower levels of literacy, access to basic amenities like drinking water
and toilets, and higher dependence on social security schemes, such as MGNREGA
23
for daily wage labour
income. A larger proportion of program farmers also belonged to disadvantaged groups (such as Other
Backward Castes, Scheduled Caste and Scheduled Tribes). Research points to how intersecting circles of
vulnerability impacts awareness, risk-taking ability, access to development programmes and adoption of new
practices. Accounting for this, effects of the program should be seen positively or with more appreciation than
what is presented by the numbers as comparison between program and non-program.
5.2 Sources of Household Income
Cultivation income
: Majority of farmers (77% program vs 74% comparison) engaged in cultivation activities
over 2021-2022. On average farmers across both cohorts owned 3 acres of land
24
. A key finding is that a higher
percent of program households leased in land for cultivation (6% vs 3% in comparison). This possibly points to
the fact that a higher number of program respondents felt that cultivation is profitable, and that they could move
further up the value chain. The fact that this is seen in comparison to a group that may be better off socio-
economically, may reflect early success for the program.
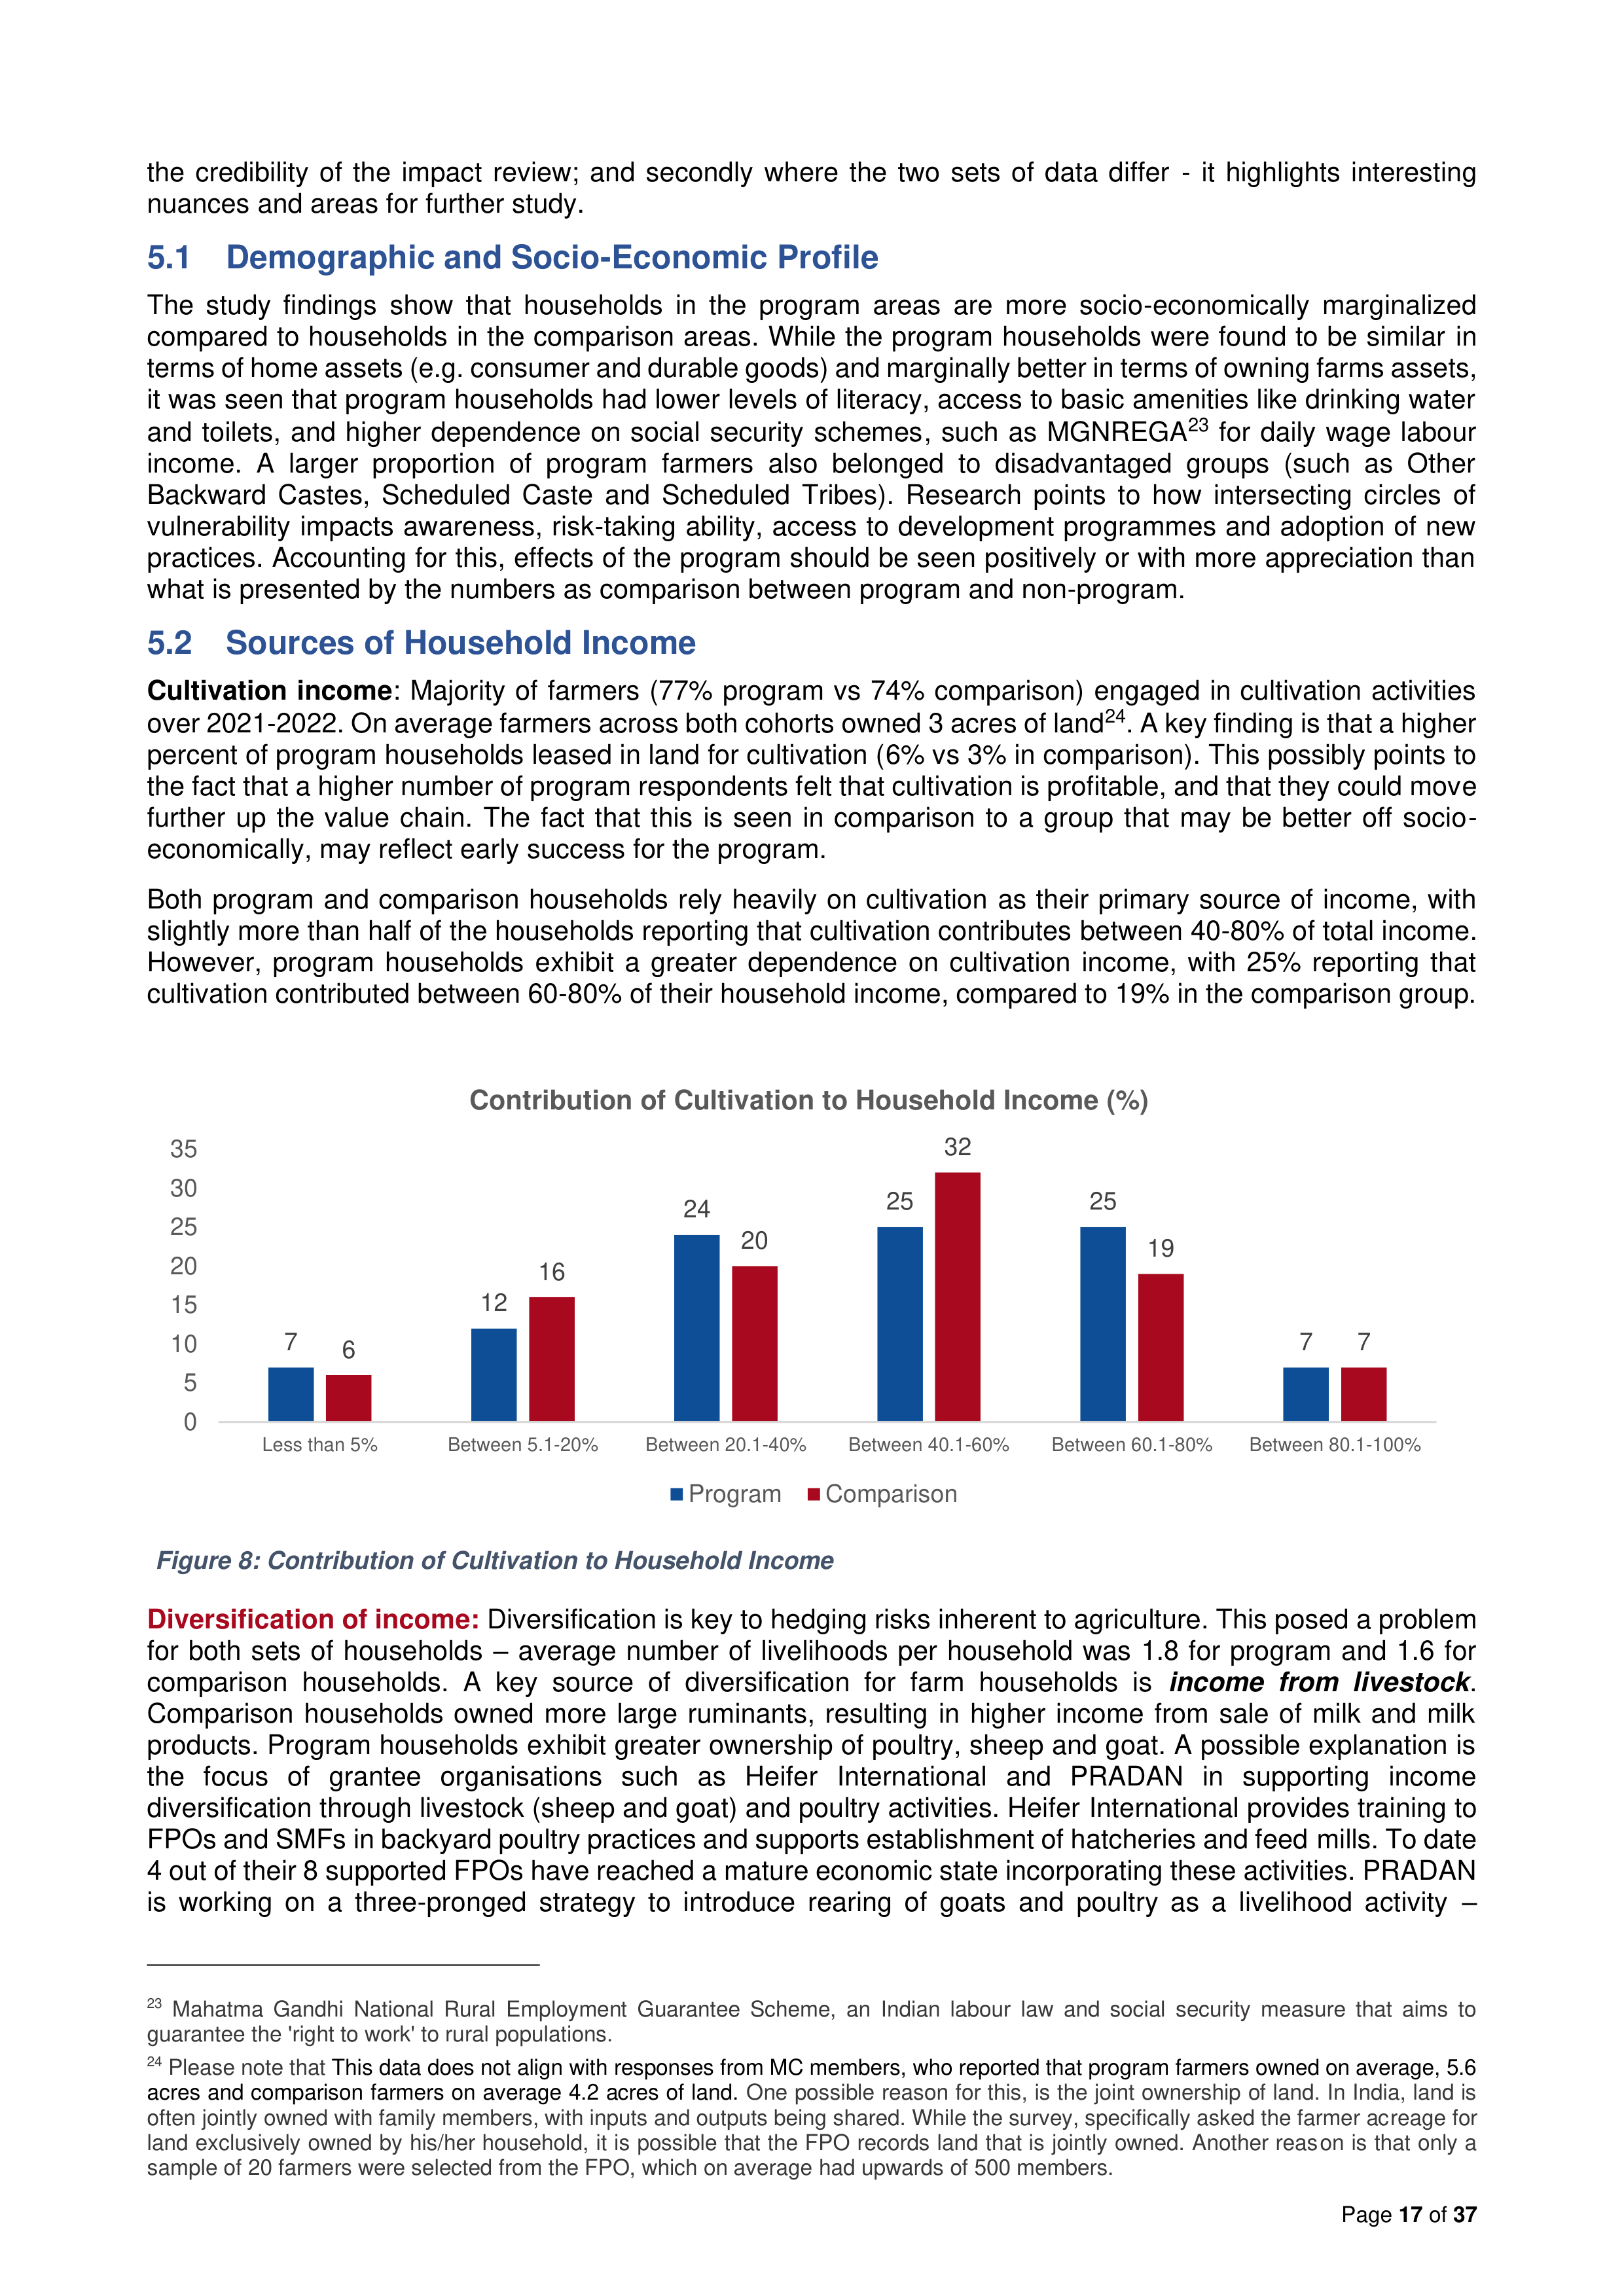
Both program and comparison households rely heavily on cultivation as their primary source of income, with
slightly more than half of the households reporting that cultivation contributes between 40-80% of total income.
However, program households exhibit a greater dependence on cultivation income, with 25% reporting that
cultivation contributed between 60-80% of their household income, compared to 19% in the comparison group.
Diversification of income:
Diversification is key to hedging risks inherent to agriculture. This posed a problem
for both sets of households – average number of livelihoods per household was 1.8 for program and 1.6 for
comparison households. A key source of diversification for farm households is
income from livestock
.
Comparison households owned more large ruminants, resulting in higher income from sale of milk and milk
products. Program households exhibit greater ownership of poultry, sheep and goat. A possible explanation is
the focus of grantee organisations such as Heifer International and PRADAN in supporting income
diversification through livestock (sheep and goat) and poultry activities. Heifer International provides training to
FPOs and SMFs in backyard poultry practices and supports establishment of hatcheries and feed mills. To date
4 out of their 8 supported FPOs have reached a mature economic state incorporating these activities. PRADAN
is working on a three-pronged strategy to introduce rearing of goats and poultry as a livelihood activity –
23
Mahatma Gandhi National Rural Employment Guarantee Scheme, an Indian labour law and social security measure that aims to
guarantee the 'right to work' to rural populations.
24
Please note that
This data does not align with responses from MC members, who reported that program farmers owned on average, 5.6
acres and comparison farmers on average 4.2 acres of land.
One possible reason for this, is the joint ownership of land. In India, land is
often jointly owned with family members, with inputs and outputs being shared. While the survey, specifically asked the farmer acreage for
land exclusively owned by his/her household, it is possible that the FPO records land that is jointly owned. Another reason is that only a
sample of 20 farmers were selected from the FPO, which on average had upwards of 500 members.
Figure 8: Contribution of Cultivation to Household Income
7
12
24
25
25
7
6
16
20
32
19
7
0
5
10
15
20
25
30
35
Less than 5%
Between 5.1-20%
Between 20.1-40%
Between 40.1-60%
Between 60.1-80%
Between 80.1-100%
Contribution of Cultivation to Household Income (%)
Program
Comparison
Page
18
of
37
provision of trainers to build technical capacity; awareness and channelizing of vaccines and feed management
and construction/renovation of sheds.
Other key sources of income
for both groups include agricultural labour,
MGNREGA and non-agricultural labour. While contribution from non-agricultural labour to total income is
similar for both groups, program households exhibit a higher dependence on agricultural labour and MGNREGA.
Gender disaggregated data shows that men in comparison households engage in agricultural and non-
agricultural labour and salaried employment to a greater extent than men in program households, Women in
program households engage in agricultural and non-agricultural work to a greater extent than women in
comparison households.
5.3 SMF Engagement with FPOs
In terms of
membership
, a significantly larger percent of program households (94% vs 79% comparison) were
members of FPOs. There was no difference in the amount of time program and non-program farmers had been
members in the FPO. Program farmers belonged to FPOs with a higher number of members (on average 551
vs 418 in comparison).
In terms of
FPO engagement
, responses from FPOs regarding
provision
of services were triangulated against
the farmer responses regarding
access
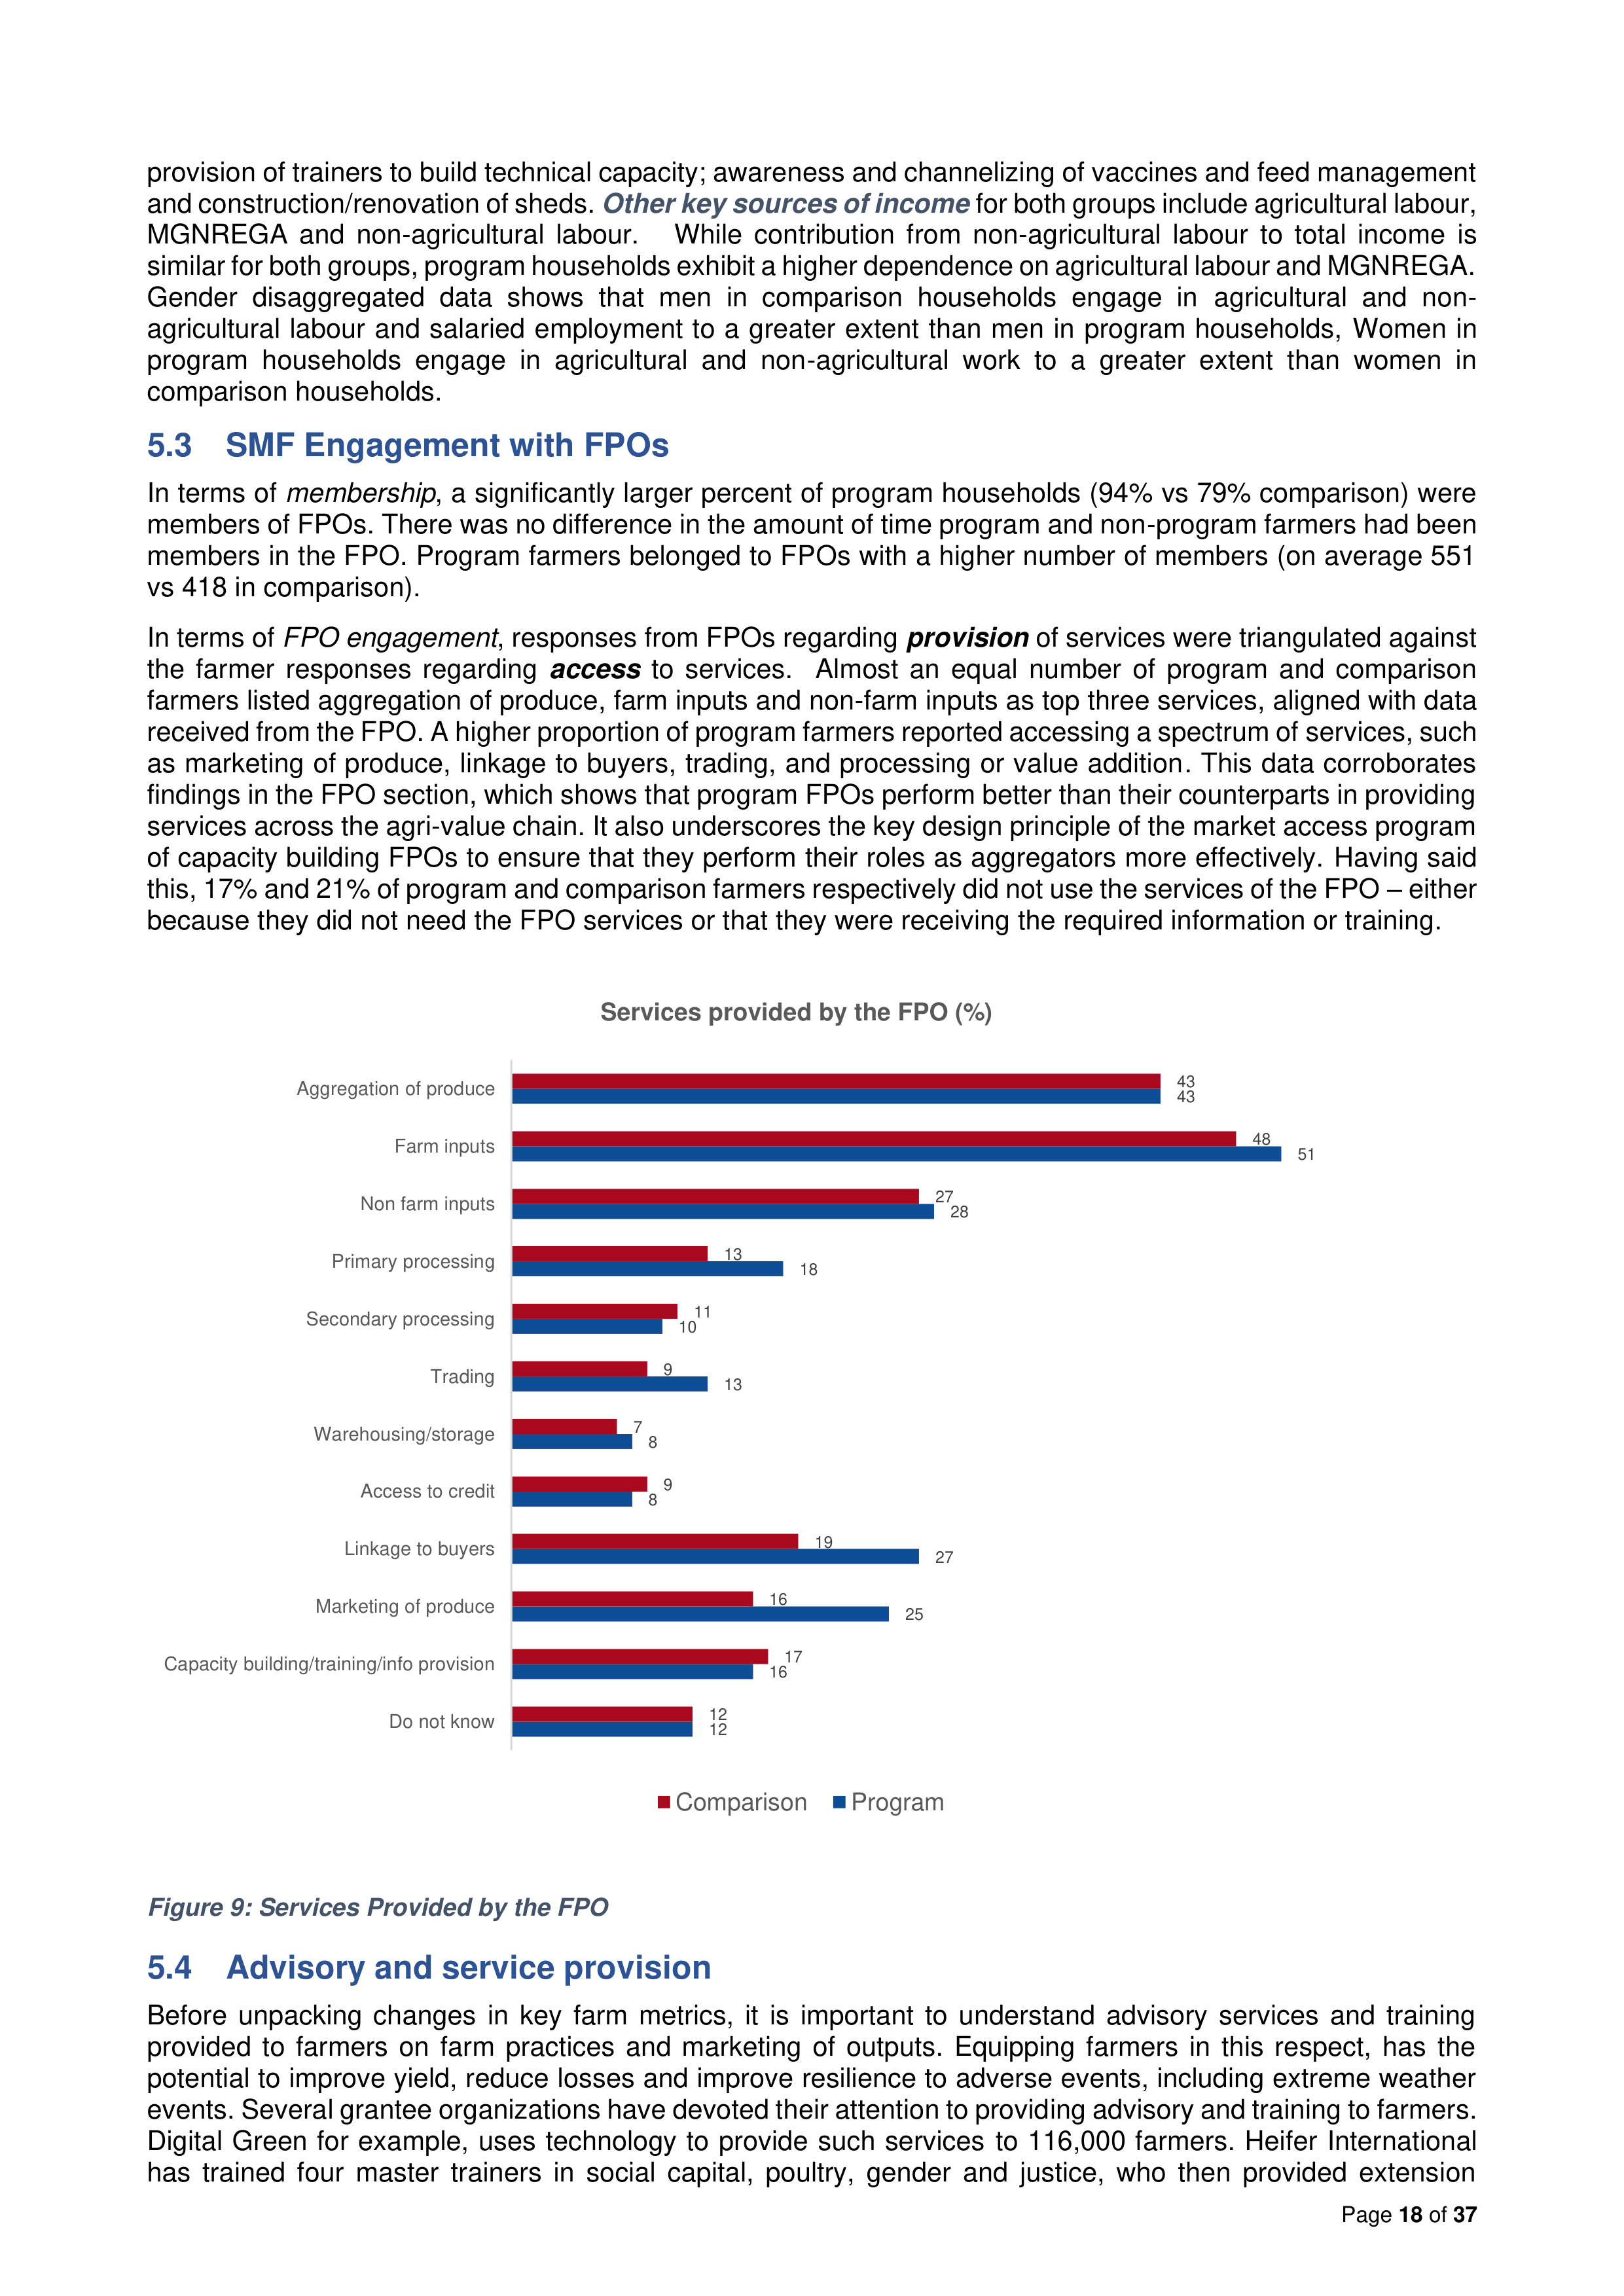
to services. Almost an equal number of program and comparison
farmers listed aggregation of produce, farm inputs and non-farm inputs as top three services, aligned with data
received from the FPO. A higher proportion of program farmers reported accessing a spectrum of services, such
as marketing of produce, linkage to buyers, trading, and processing or value addition. This data corroborates
findings in the FPO section, which shows that program FPOs perform better than their counterparts in providing
services across the agri-value chain. It also underscores the key design principle of the market access program
of capacity building FPOs to ensure that they perform their roles as aggregators more effectively. Having said
this, 17% and 21% of program and comparison farmers respectively did not use the services of the FPO – either
because they did not need the FPO services or that they were receiving the required information or training.
Figure 9: Services Provided by the FPO
5.4 Advisory and service provision
Before unpacking changes in key farm metrics, it is important to understand advisory services and training
provided to farmers on farm practices and marketing of outputs. Equipping farmers in this respect, has the
potential to improve yield, reduce losses and improve resilience to adverse events, including extreme weather
events. Several grantee organizations have devoted their attention to providing advisory and training to farmers.
Digital Green for example, uses technology to provide such services to 116,000 farmers. Heifer International
has trained four master trainers in social capital, poultry, gender and justice, who then provided extension
12
16
25
27
8
8
13
10
18
28
51
43
12
17
16
19
9
7
9
11
13
27
48
43
Do not know
Capacity building/training/info provision
Marketing of produce
Linkage to buyers
Access to credit
Warehousing/storage
Trading
Secondary processing
Primary processing
Non farm inputs
Farm inputs
Aggregation of produce
Services provided by the FPO (%)
Comparison
Program
Page
19
of
37
services to 2,555 FPO farmers. ICRISAT has conducted demonstration of farm pond lining in 7 farmer fields
through which farmers stored rainwater and protected crops during dry spells. PRADAN trained women farmers
on adoption of sustainable agriculture practices and modern animal husbandry. Tanager has trained farmers
on good agricultural practices, of whom 99% adopted at least one recommended practice. Techno Serve has
trained 1,313 smallholder coffee-growing farmers across 29 villages on better agronomic practices to improve
yield and quality of produce. Precision Development also set up a digital technology solution with the aim to
provide customised digital extension services such as timely information on coffee cultivation. Trickle Up
targeted women and with smartphones and developed a Package of Practices app in five local languages that
helps participants access information related to crop selection.
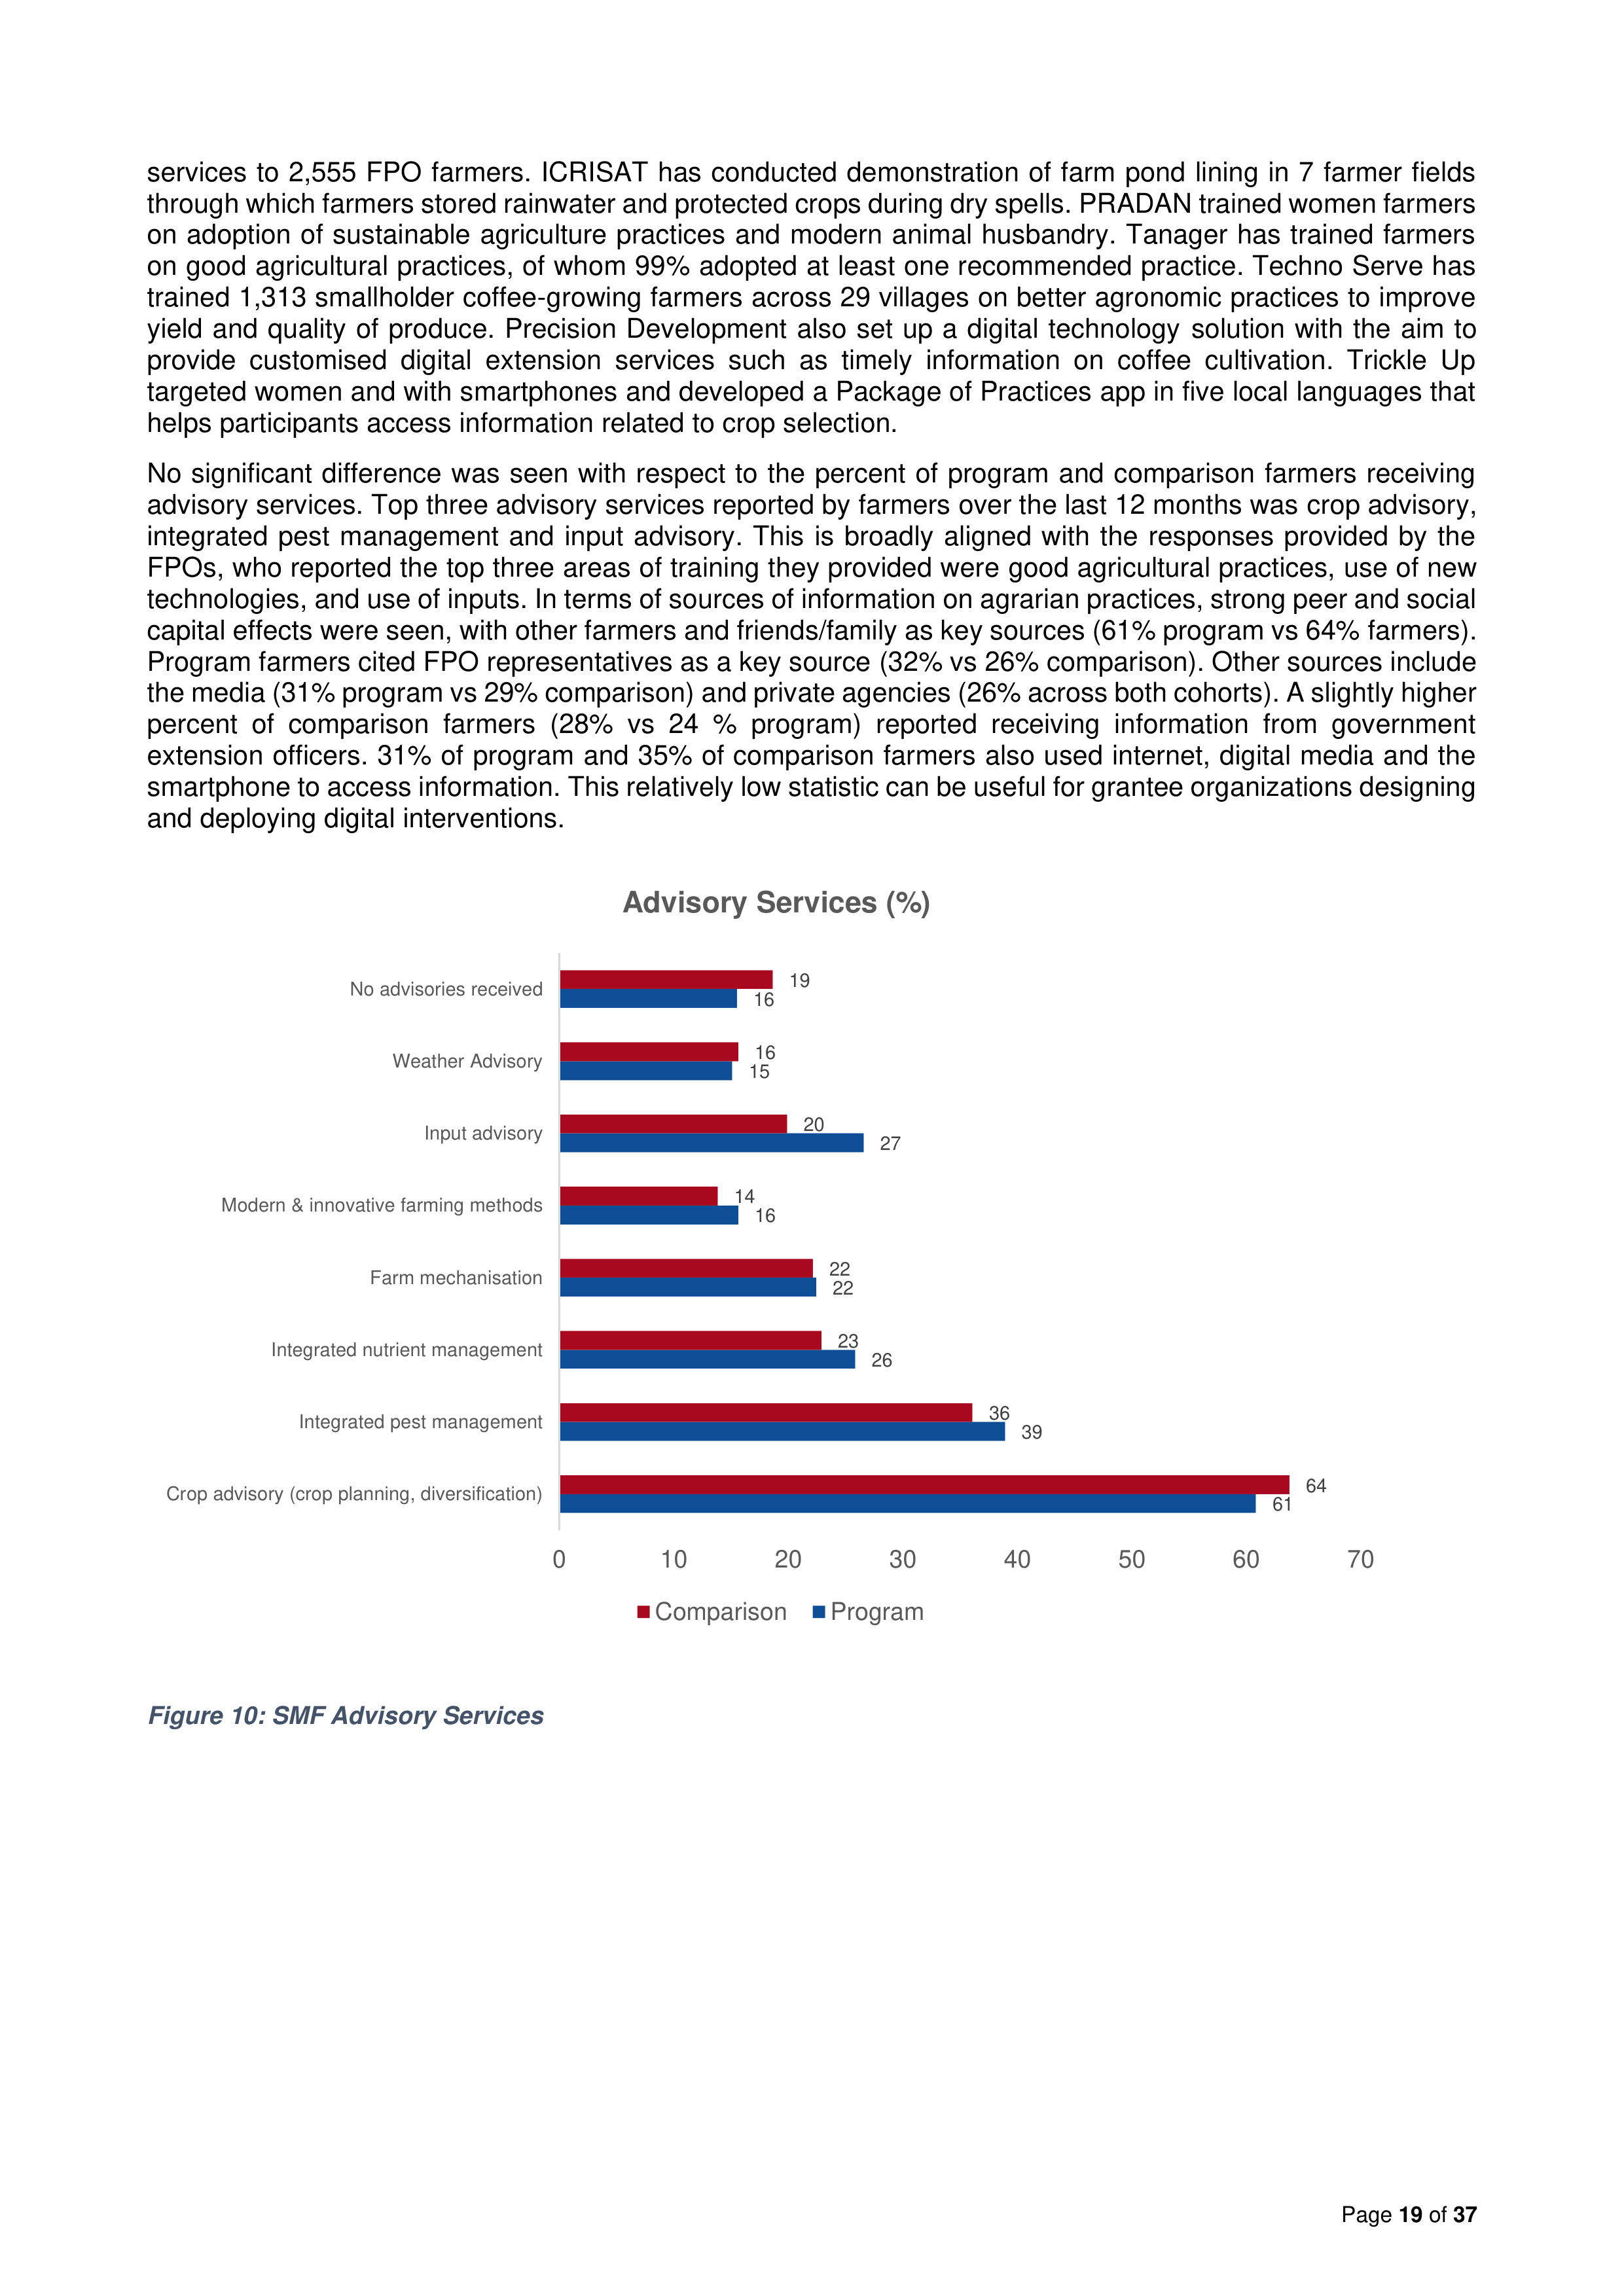
No significant difference was seen with respect to the percent of program and comparison farmers receiving
advisory services. Top three advisory services reported by farmers over the last 12 months was crop advisory,
integrated pest management and input advisory. This is broadly aligned with the responses provided by the
FPOs, who reported the top three areas of training they provided were good agricultural practices, use of new
technologies, and use of inputs. In terms of sources of information on agrarian practices, strong peer and social
capital effects were seen, with other farmers and friends/family as key sources (61% program vs 64% farmers).
Program farmers cited FPO representatives as a key source (32% vs 26% comparison). Other sources include
the media (31% program vs 29% comparison) and private agencies (26% across both cohorts). A slightly higher
percent of comparison farmers (28% vs 24 % program) reported receiving information from government
extension officers. 31% of program and 35% of comparison farmers also used internet, digital media and the
smartphone to access information. This relatively low statistic can be useful for grantee organizations designing
and deploying digital interventions.
Figure 10: SMF Advisory Services
61
39
26
22
16
27
15
16
64
36
23
22
14
20
16
19
0
10
20
30
40
50
60
70
Crop advisory (crop planning, diversification)
Integrated pest management
Integrated nutrient management
Farm mechanisation
Modern & innovative farming methods
Input advisory
Weather Advisory
No advisories received
Advisory Services (%)
Comparison
Program
Page
20
of
37
5.5 Farm metrics
This section explores whether farmer use of support services and advisory provided by the FPO led to
changes in farm metrics. First is the metric,
time in market
or cropping intensity
25
, which captures
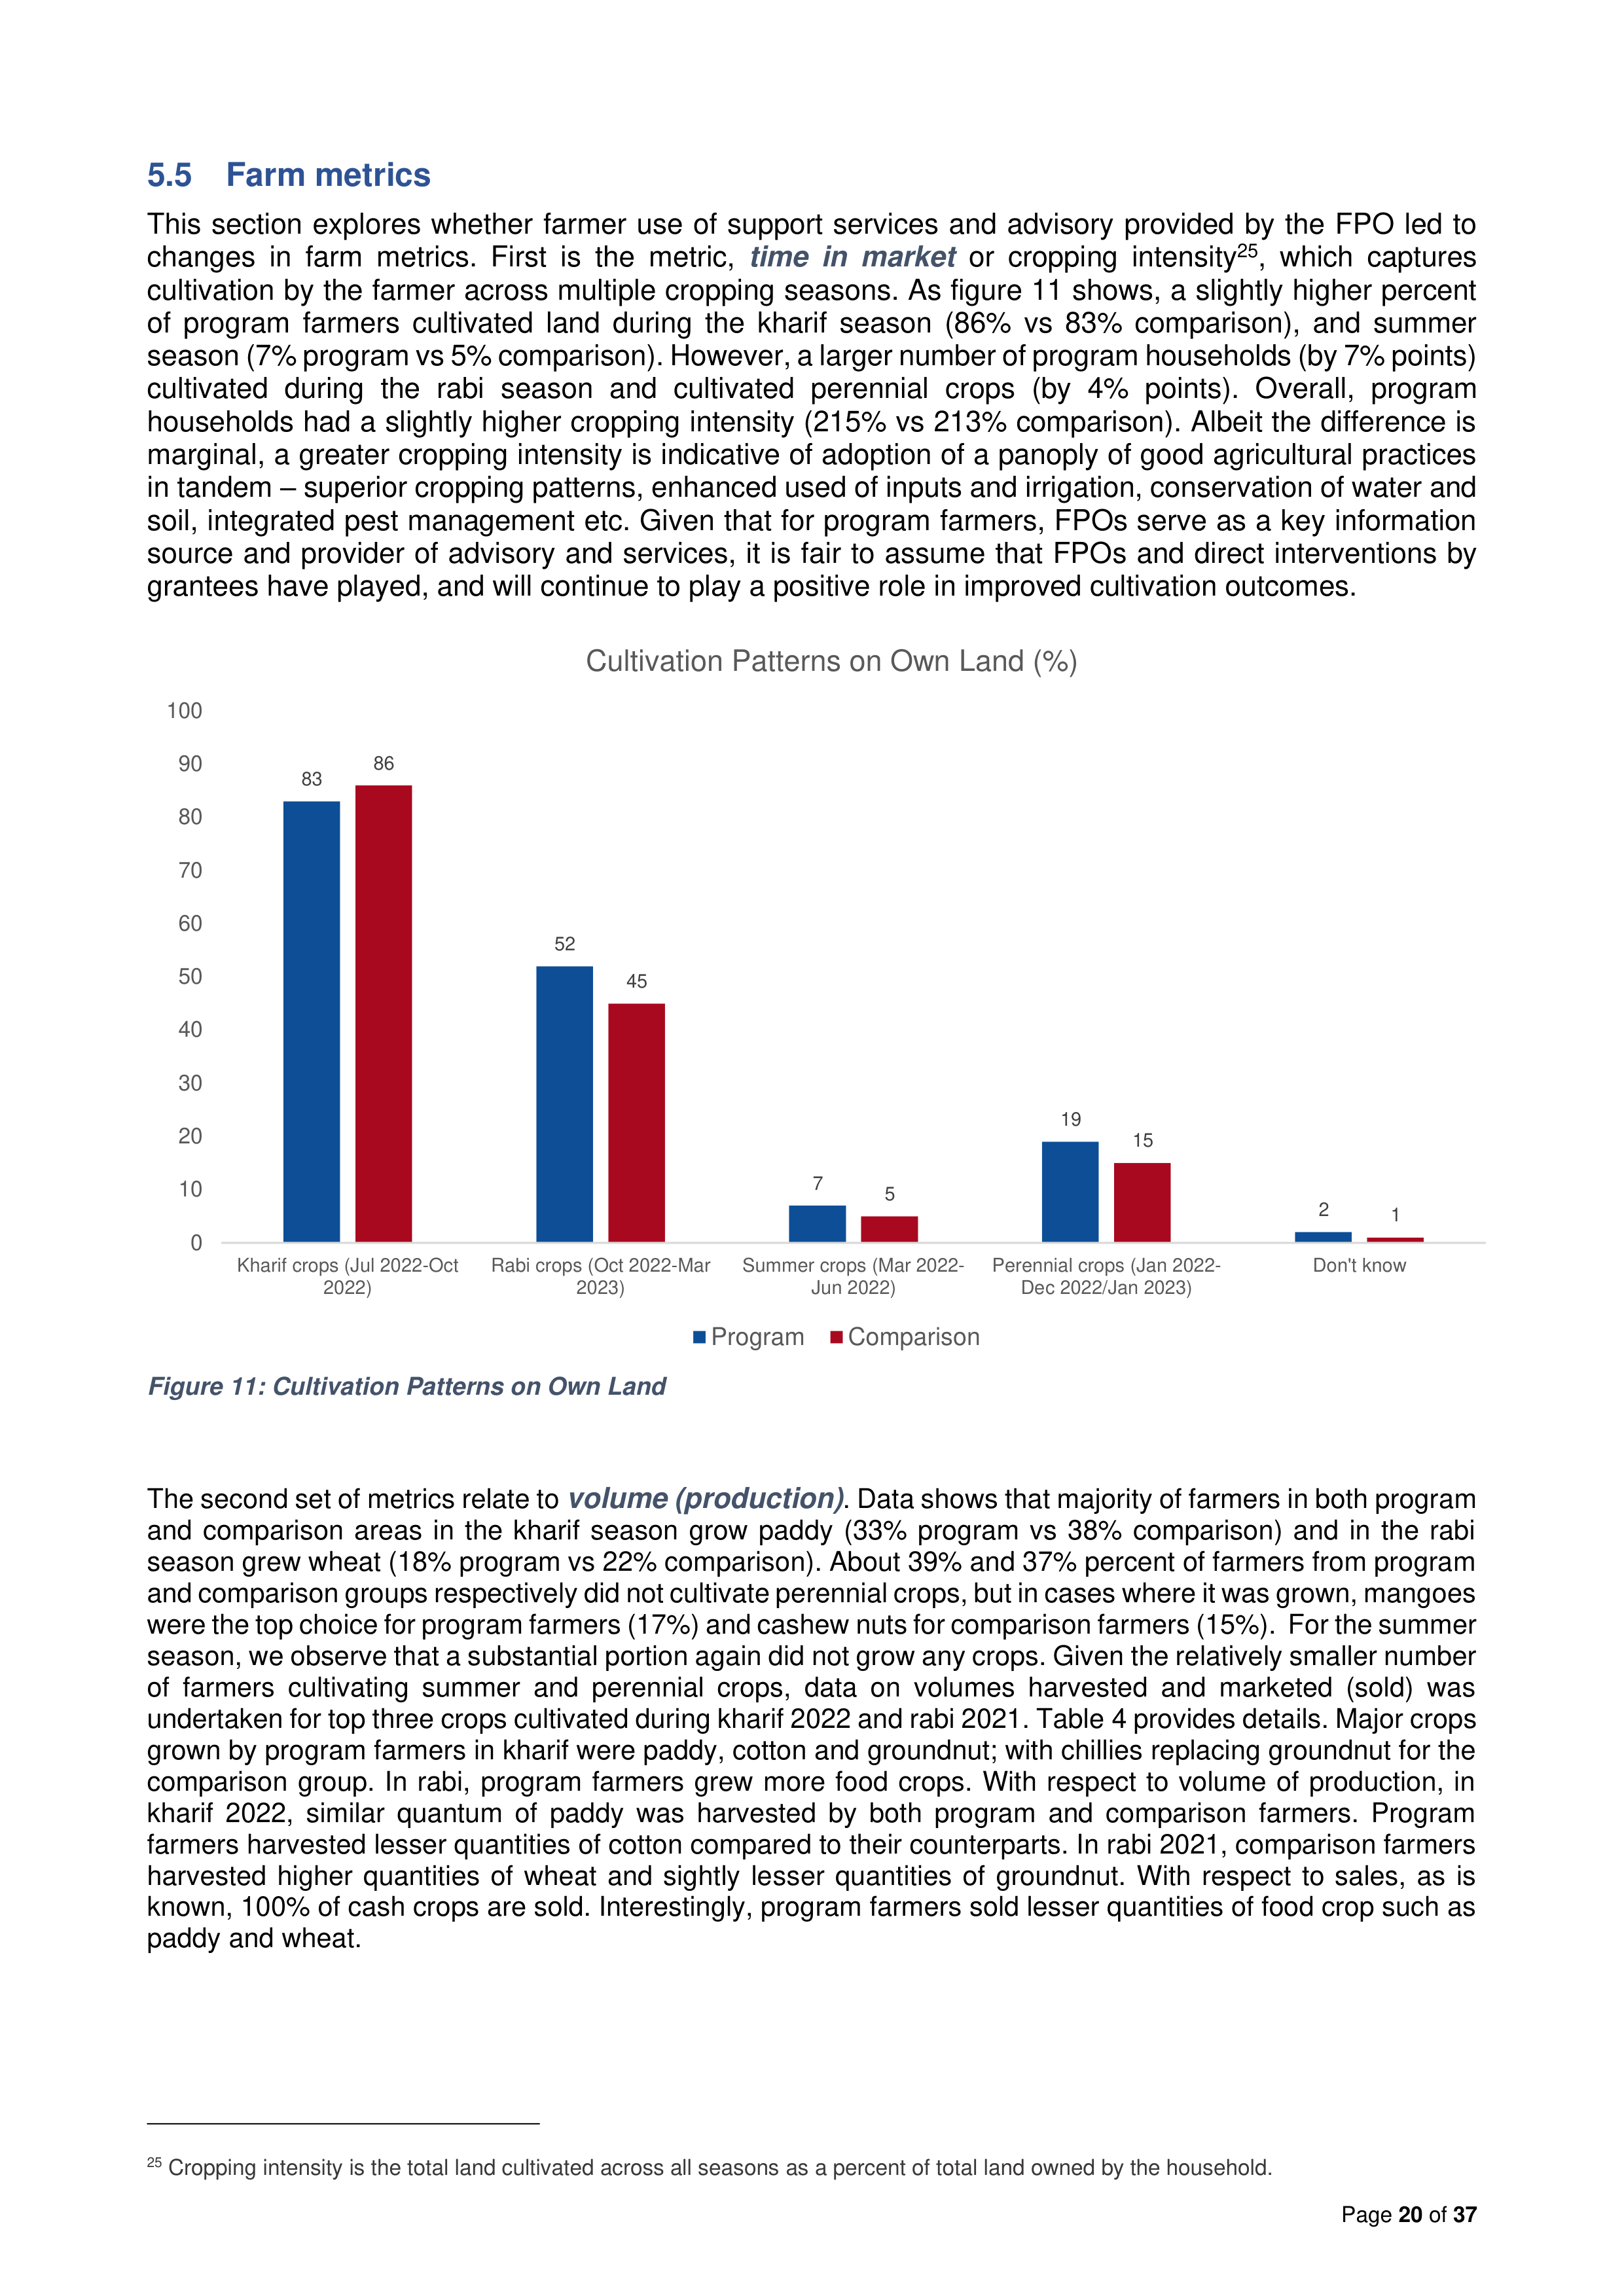
cultivation by the farmer across multiple cropping seasons. As figure 11 shows, a slightly higher percent
of program farmers cultivated land during the kharif season (86% vs 83% comparison), and summer
season (7% program vs 5% comparison). However, a larger number of program households (by 7% points)
cultivated during the rabi season and cultivated perennial crops (by 4% points). Overall, program
households had a slightly higher cropping intensity (215% vs 213% comparison). Albeit the difference is
marginal, a greater cropping intensity is indicative of adoption of a panoply of good agricultural practices
in tandem – superior cropping patterns, enhanced used of inputs and irrigation, conservation of water and
soil, integrated pest management etc. Given that for program farmers, FPOs serve as a key information
source and provider of advisory and services, it is fair to assume that FPOs and direct interventions by
grantees have played, and will continue to play a positive role in improved cultivation outcomes.
The second set of metrics relate to
volume (production)
. Data shows that majority of farmers in both program
and comparison areas in the kharif season grow paddy (33% program vs 38% comparison) and in the rabi
season grew wheat (18% program vs 22% comparison). About 39% and 37% percent of farmers from program
and comparison groups respectively did not cultivate perennial crops, but in cases where it was grown, mangoes
were the top choice for program farmers (17%) and cashew nuts for comparison farmers (15%). For the summer
season, we observe that a substantial portion again did not grow any crops. Given the relatively smaller number
of farmers cultivating summer and perennial crops, data on volumes harvested and marketed (sold) was
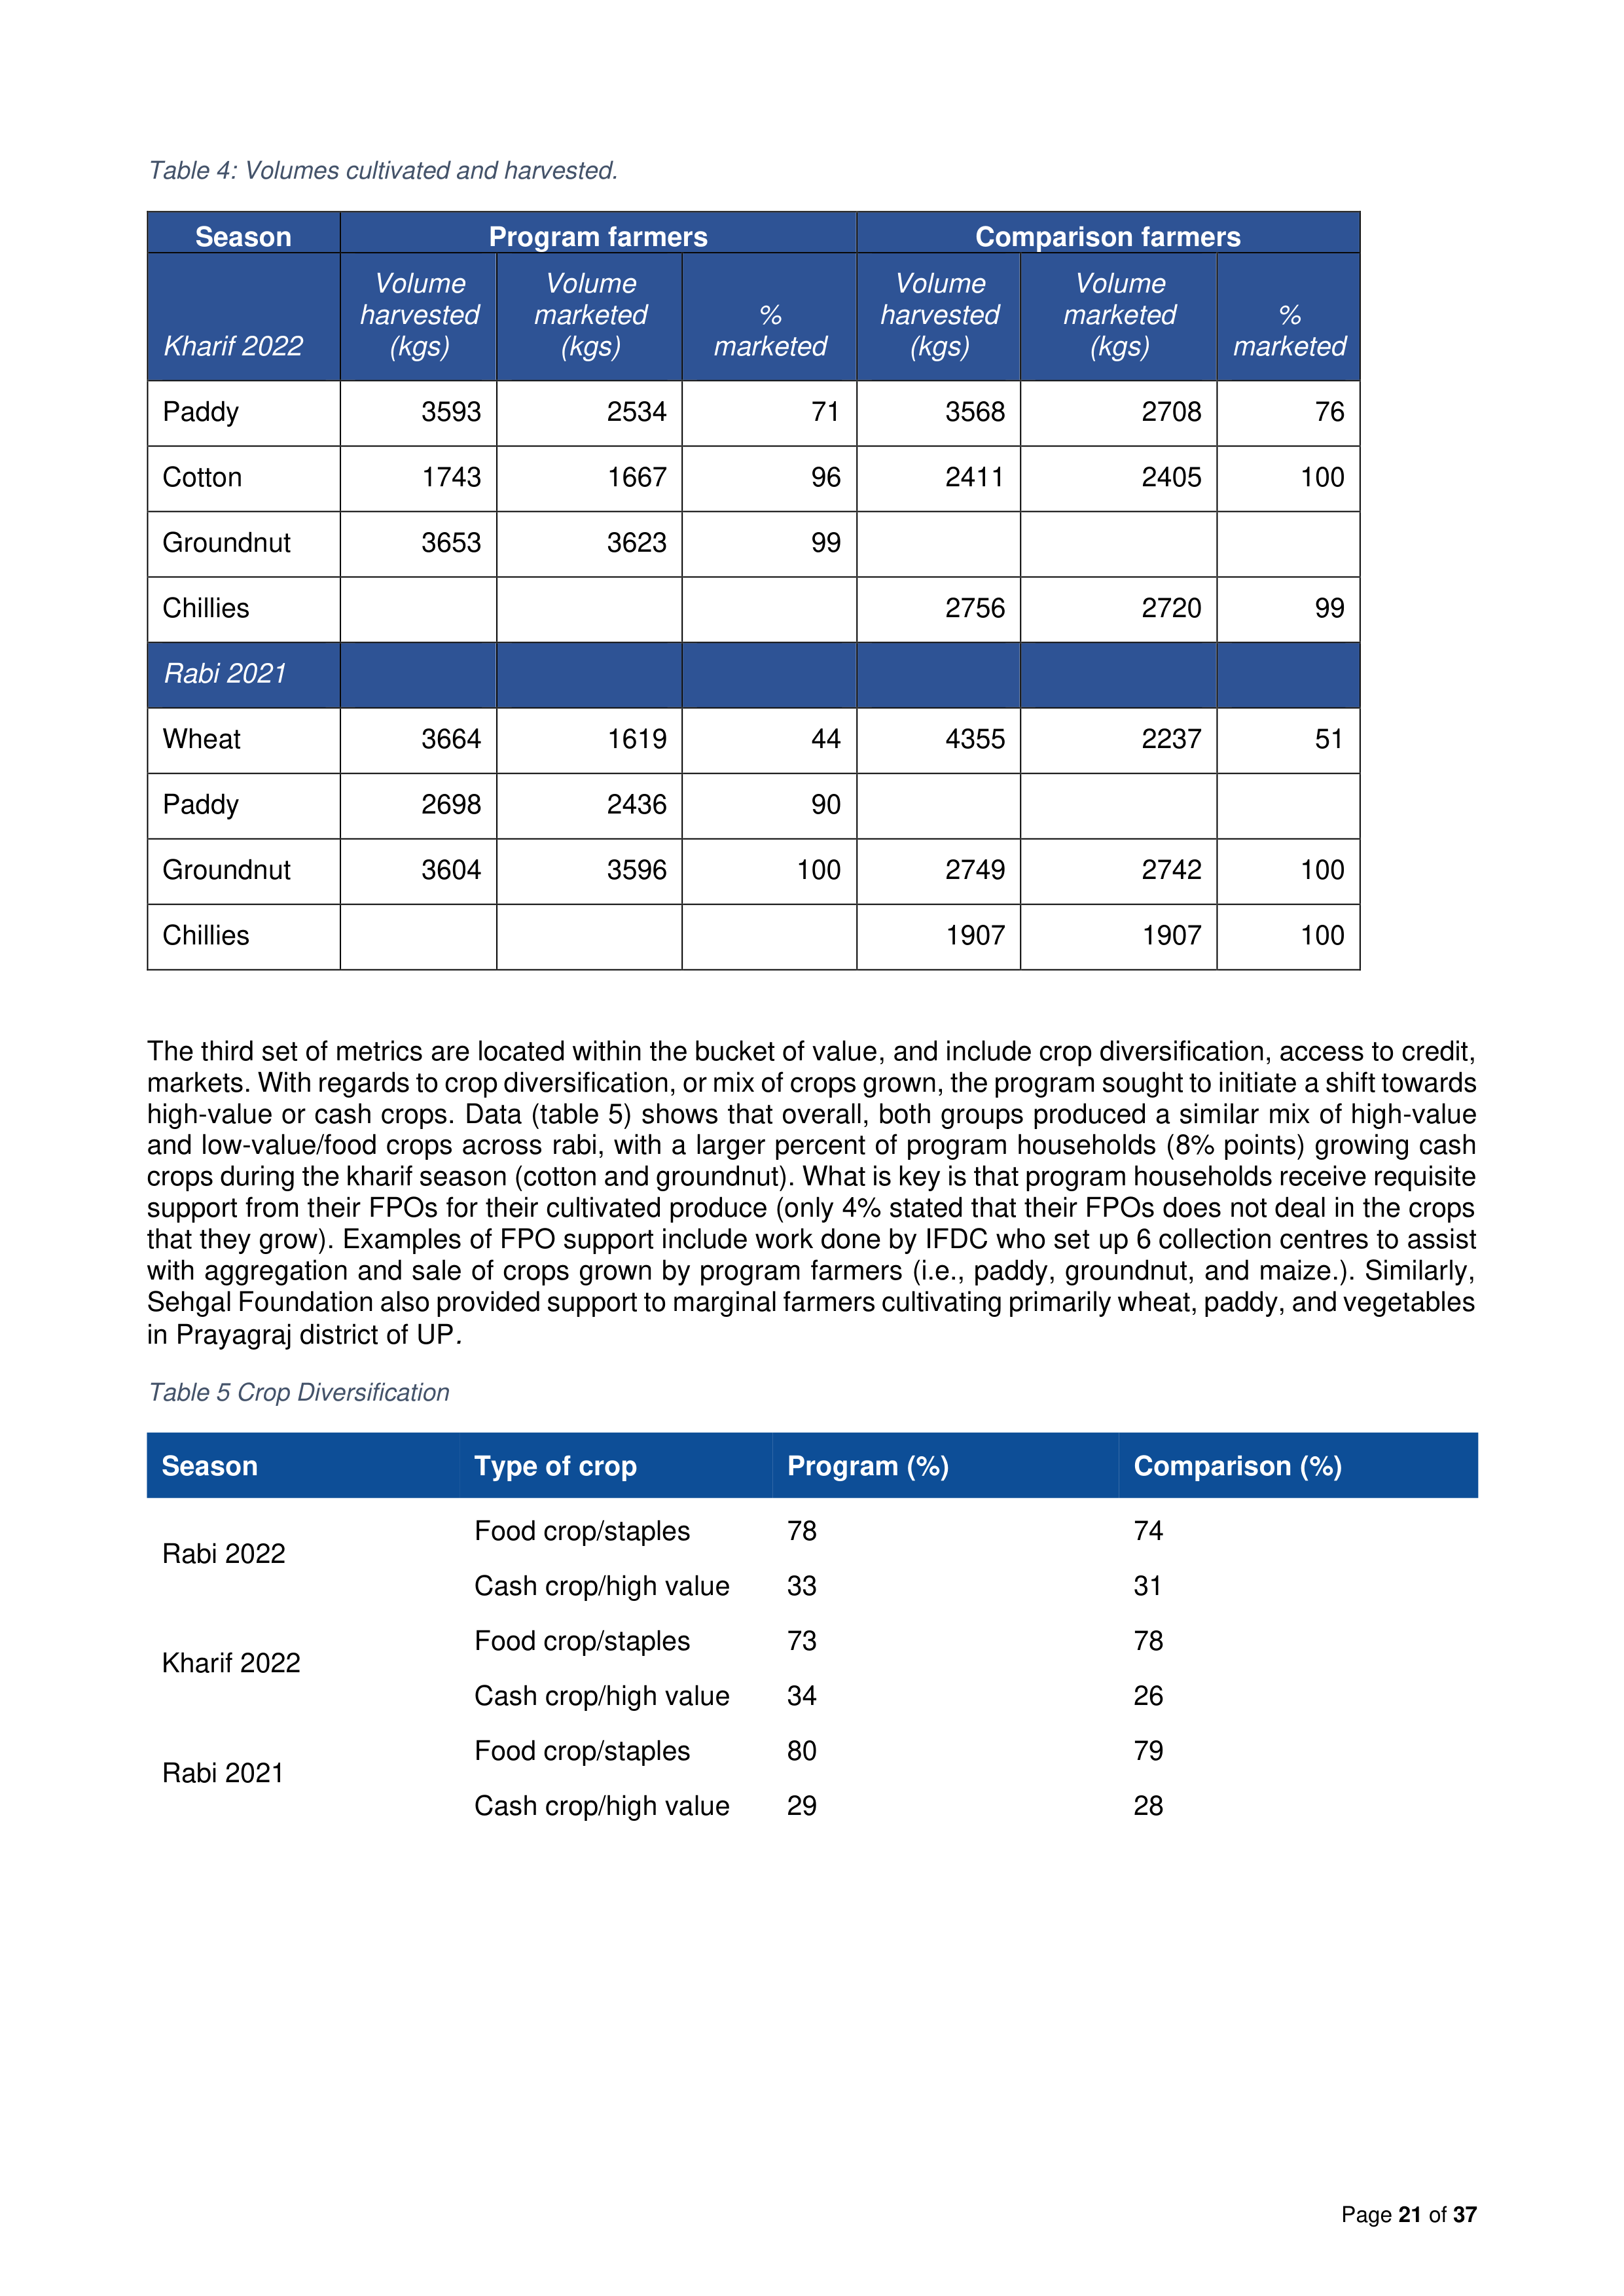
undertaken for top three crops cultivated during kharif 2022 and rabi 2021. Table 4 provides details. Major crops
grown by program farmers in kharif were paddy, cotton and groundnut; with chillies replacing groundnut for the
comparison group. In rabi, program farmers grew more food crops. With respect to volume of production, in
kharif 2022, similar quantum of paddy was harvested by both program and comparison farmers. Program
farmers harvested lesser quantities of cotton compared to their counterparts. In rabi 2021, comparison farmers
harvested higher quantities of wheat and sightly lesser quantities of groundnut. With respect to sales, as is
known, 100% of cash crops are sold. Interestingly, program farmers sold lesser quantities of food crop such as
paddy and wheat.
25
Cropping intensity is the total land cultivated across all seasons as a percent of total land owned by the household.
Figure 11: Cultivation Patterns on Own Land
83
52
7
19
2
86
45
5
15
1
0
10
20
30
40
50
60
70
80
90
100
Kharif crops (Jul 2022-Oct
2022)
Rabi crops (Oct 2022-Mar
2023)
Summer crops (Mar 2022-
Jun 2022)
Perennial crops (Jan 2022-
Dec 2022/Jan 2023)
Don't know
Cultivation Patterns on Own Land (%)
Program
Comparison
Page
21
of
37
Table 4: Volumes cultivated and harvested.
Season
Program farmers
Comparison farmers
Kharif 2022
Volume
harvested
(kgs)
Volume
marketed
(kgs)
%
marketed
Volume
harvested
(kgs)
Volume
marketed
(kgs)
%
marketed
Paddy
3593
2534
71
3568
2708
76
Cotton
1743
1667
96
2411
2405
100
Groundnut
3653
3623
99
Chillies
2756
2720
99
Rabi 2021
Wheat
3664
1619
44
4355
2237
51
Paddy
2698
2436
90
Groundnut
3604
3596
100
2749
2742
100
Chillies
1907
1907
100
The third set of metrics are located within the bucket of value, and include crop diversification, access to credit,
markets. With regards to crop diversification, or mix of crops grown, the program sought to initiate a shift towards
high-value or cash crops. Data (table 5) shows that overall, both groups produced a similar mix of high-value
and low-value/food crops across rabi, with a larger percent of program households (8% points) growing cash
crops during the kharif season (cotton and groundnut). What is key is that program households receive requisite
support from their FPOs for their cultivated produce (only 4% stated that their FPOs does not deal in the crops
that they grow). Examples of FPO support include work done by IFDC who set up 6 collection centres to assist
with aggregation and sale of crops grown by program farmers (i.e., paddy, groundnut, and maize.). Similarly,
Sehgal Foundation also provided support to marginal farmers cultivating primarily wheat, paddy, and vegetables
in Prayagraj district of UP
.
Table 5 Crop Diversification
Season
Type of crop
Program (%)
Comparison (%)
Rabi 2022
Food crop/staples
78
74
Cash crop/high value
33
31
Kharif 2022
Food crop/staples
73
78
Cash crop/high value
34
26
Rabi 2021
Food crop/staples
80
79
Cash crop/high value
29
28
Page
22
of
37
With regards to
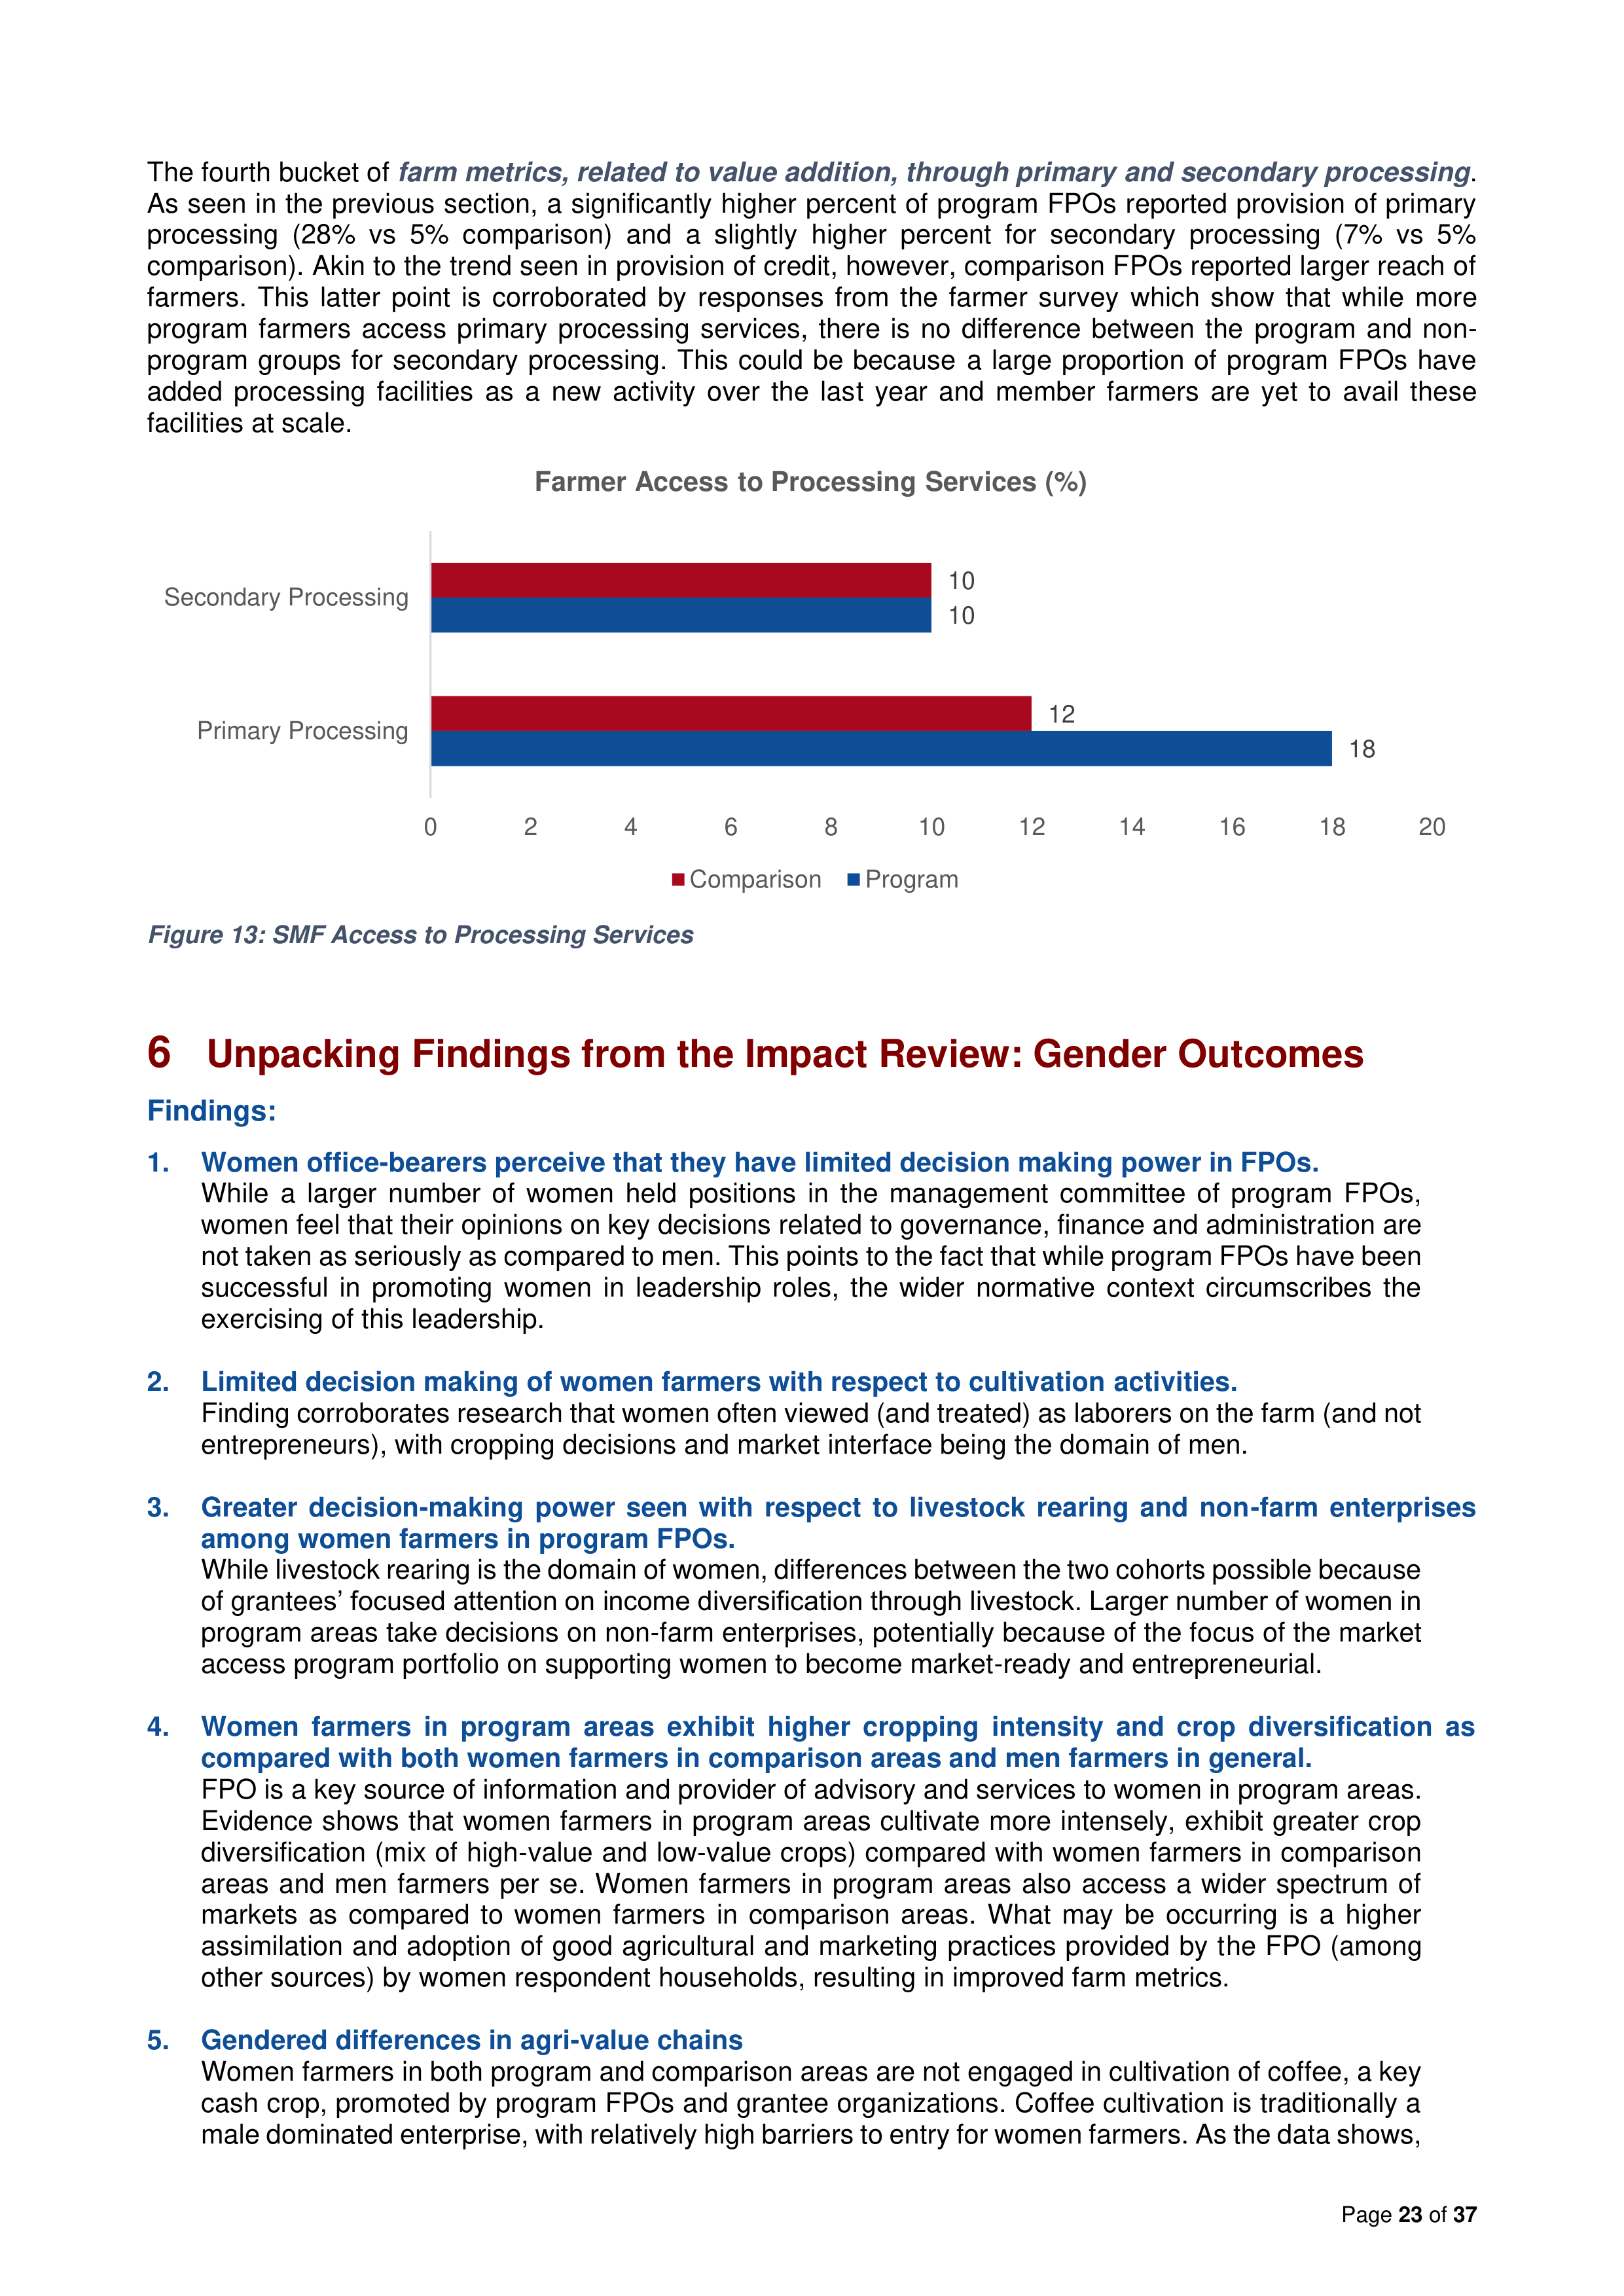
access to credit
, there are several program interventions that enable credit provision to farmers.
For example, Digital Green supported FPOs provide advance credit for cultivation to tribal belts in Andhra
Pradesh, and Heifer International have ensured financial linkages for 7576 farmer households (1352 of whom
have used these linkages to access credit). As seen in the FPO section, a higher proportion of program FPOs
(15%) provided credit in relation to comparison FPOs (7%). But comparison FPOs seem to have a better
saturation, reaching out to more male and female members (50% vs 33% comparison). The latter finding is
corroborated by farmer responses, wherein a higher percentage of comparison farmer members reported that
their FPOs provided loans (21% vs 17% in program FPOs). Therefore, while a higher
number
of program FPOs
provide loans, comparison FPOs provide credit to a larger
proportion
of their members. One reason for this
could be that program FPOs are currently in the process of being capacitated by the program - so while these
FPOs have started adding credit provision to their list of services, the corresponding uptake from member
farmers may be yet to commence. As figure 12 demonstrates, crop loans (cash or in kind) are the predominant
type of loan provided, followed by investment loans. Interestingly, 15% of program farmers stated that the FPO
provided and/or facilitated access to consumption loans, while very few comparison farmers (3%) reported the
same. However, overall, there is scope for improvement in facilitating access to credit to farmers.
Figure 12: Loans Accessed by SMFs
With regards to
access to markets
, program households accessed further away markets for a higher proportion
of their crops (60% vs. 50% for comparison). Improved access to different and far away markets have a positive
impact on farmers income as it enables diversification of risks. This improves the probability of securing a steady
income for the farmer. This data aligns with the efforts of the program with respect to improving market linkage
activities of FPOs.
37
18
27
15
2
1
58
8
29
3
3
0
10
20
30
40
50
60
70
Crop loan as cash
Crop loan as kind (inputs or cash kind)
Investment loan
Consumption loan
Warehouse receipt loan
Others
Types of Loans Accessed by farmers (%)
Comparison
Program
Page
23
of
37
The fourth bucket of
farm metrics, related to value addition, through primary and secondary processing
.
As seen in the previous section, a significantly higher percent of program FPOs reported provision of primary
processing (28% vs 5% comparison) and a slightly higher percent for secondary processing (7% vs 5%
comparison). Akin to the trend seen in provision of credit, however, comparison FPOs reported larger reach of
farmers. This latter point is corroborated by responses from the farmer survey which show that while more
program farmers access primary processing services, there is no difference between the program and non-
program groups for secondary processing. This could be because a large proportion of program FPOs have
added processing facilities as a new activity over the last year and member farmers are yet to avail these
facilities at scale.
Figure 13: SMF Access to Processing Services
6
Unpacking Findings from the Impact Review: Gender Outcomes
Findings:
1.
Women office-bearers perceive that they have limited decision making power in FPOs.
While a larger number of women held positions in the management committee of program FPOs,
women feel that their opinions on key decisions related to governance, finance and administration are
not taken as seriously as compared to men. This points to the fact that while program FPOs have been
successful in promoting women in leadership roles, the wider normative context circumscribes the
exercising of this leadership.
2.
Limited decision making of women farmers with respect to cultivation activities.
Finding corroborates research that women often viewed (and treated) as laborers on the farm (and not
entrepreneurs), with cropping decisions and market interface being the domain of men.
3.
Greater decision-making power seen with respect to livestock rearing and non-farm enterprises
among women farmers in program FPOs.
While livestock rearing is the domain of women, differences between the two cohorts possible because
of grantees’ focused attention on income diversification through livestock. Larger number of women in
program areas take decisions on non-farm enterprises, potentially because of the focus of the market
access program portfolio on supporting women to become market-ready and entrepreneurial.
4.
Women farmers in program areas exhibit higher cropping intensity and crop diversification as
compared with both women farmers in comparison areas and men farmers in general.
FPO is a key source of information and provider of advisory and services to women in program areas.
Evidence shows that women farmers in program areas cultivate more intensely, exhibit greater crop
diversification (mix of high-value and low-value crops) compared with women farmers in comparison
areas and men farmers per se. Women farmers in program areas also access a wider spectrum of
markets as compared to women farmers in comparison areas. What may be occurring is a higher
assimilation and adoption of good agricultural and marketing practices provided by the FPO (among
other sources) by women respondent households, resulting in improved farm metrics.
5.
Gendered differences in agri-value chains
Women farmers in both program and comparison areas are not engaged in cultivation of coffee, a key
cash crop, promoted by program FPOs and grantee organizations. Coffee cultivation is traditionally a
male dominated enterprise, with relatively high barriers to entry for women farmers. As the data shows,
18
10
12
10
0
2
4
6
8
10
12
14
16
18
20
Primary Processing
Secondary Processing
Farmer Access to Processing Services (%)
Comparison
Program
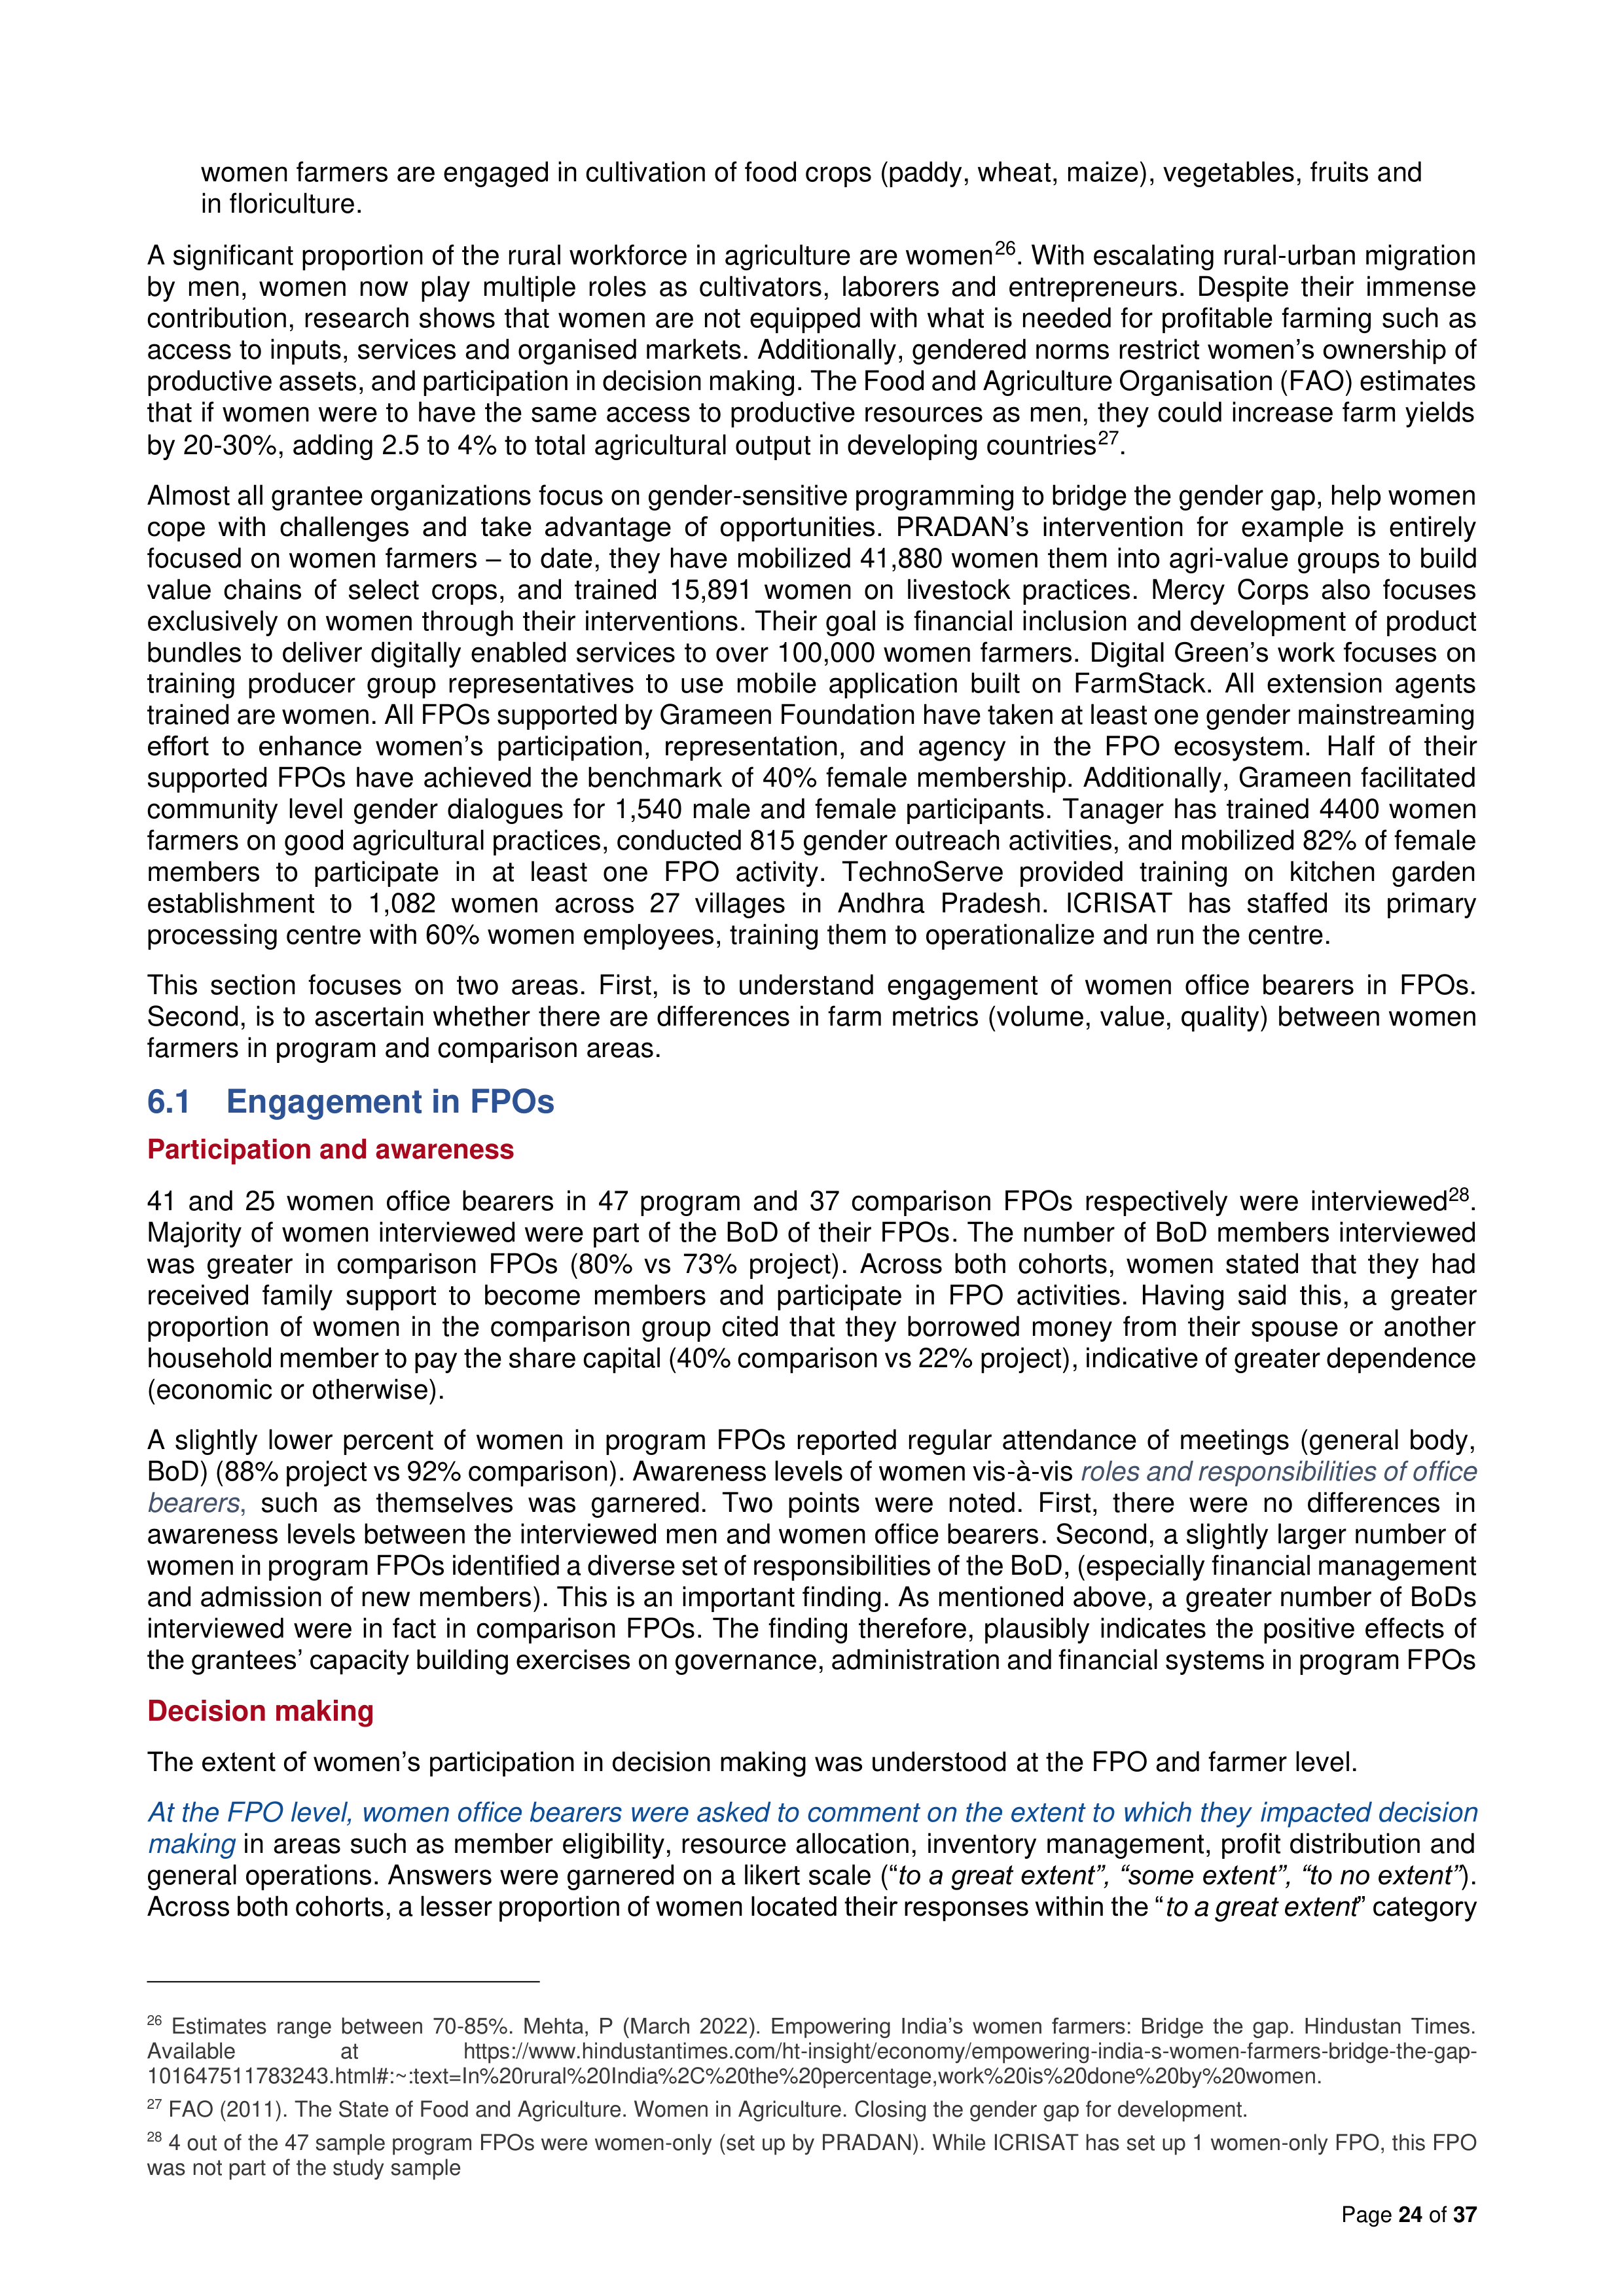
Page
24
of
37
women farmers are engaged in cultivation of food crops (paddy, wheat, maize), vegetables, fruits and
in floriculture.
A significant proportion of the rural workforce in agriculture are women
26
. With escalating rural-urban migration
by men, women now play multiple roles as cultivators, laborers and entrepreneurs. Despite their immense
contribution, research shows that women are not equipped with what is needed for profitable farming such as
access to inputs, services and organised markets. Additionally, gendered norms restrict women’s ownership of
productive assets, and participation in decision making. The Food and Agriculture Organisation (FAO) estimates
that if women were to have the same access to productive resources as men, they could increase farm yields
by 20-30%, adding 2.5 to 4% to total agricultural output in developing countries
27
.
Almost all grantee organizations focus on gender-sensitive programming to bridge the gender gap, help women
cope with challenges and take advantage of opportunities. PRADAN’s intervention for example is entirely
focused on women farmers – to date, they have mobilized 41,880 women them into agri-value groups to build
value chains of select crops, and trained 15,891 women on livestock practices. Mercy Corps also focuses
exclusively on women through their interventions. Their goal is financial inclusion and development of product
bundles to deliver digitally enabled services to over 100,000 women farmers. Digital Green’s work focuses on
training producer group representatives to use mobile application built on FarmStack. All extension agents
trained are women. All FPOs supported by Grameen Foundation have taken at least one gender mainstreaming
effort to enhance women’s participation, representation, and agency in the FPO ecosystem. Half of their
supported FPOs have achieved the benchmark of 40% female membership. Additionally, Grameen facilitated
community level gender dialogues for 1,540 male and female participants. Tanager has trained 4400 women
farmers on good agricultural practices, conducted 815 gender outreach activities, and mobilized 82% of female
members to participate in at least one FPO activity. TechnoServe provided training on kitchen garden
establishment to 1,082 women across 27 villages in Andhra Pradesh. ICRISAT has staffed its primary
processing centre with 60% women employees, training them to operationalize and run the centre.
This section focuses on two areas. First, is to understand engagement of women office bearers in FPOs.
Second, is to ascertain whether there are differences in farm metrics (volume, value, quality) between women
farmers in program and comparison areas.
6.1 Engagement in FPOs
Participation and awareness
41 and 25 women office bearers in 47 program and 37 comparison FPOs respectively were interviewed
28
.
Majority of women interviewed were part of the BoD of their FPOs. The number of BoD members interviewed
was greater in comparison FPOs (80% vs 73% project). Across both cohorts, women stated that they had
received family support to become members and participate in FPO activities. Having said this, a greater
proportion of women in the comparison group cited that they borrowed money from their spouse or another
household member to pay the share capital (40% comparison vs 22% project), indicative of greater dependence
(economic or otherwise).
A slightly lower percent of women in program FPOs reported regular attendance of meetings (general body,
BoD) (88% project vs 92% comparison). Awareness levels of women vis-à-vis
roles and responsibilities of office
bearers
,
such as themselves was garnered. Two points were noted. First, there were no differences in
awareness levels between the interviewed men and women office bearers. Second, a slightly larger number of
women in program FPOs identified a diverse set of responsibilities of the BoD, (especially financial management
and admission of new members). This is an important finding. As mentioned above, a greater number of BoDs
interviewed were in fact in comparison FPOs. The finding therefore, plausibly indicates the positive effects of
the grantees’ capacity building exercises on governance, administration and financial systems in program FPOs
Decision making
The extent of women’s participation in decision making was understood at the FPO and farmer level.
At the FPO level, women office bearers were asked to comment on the extent to which they impacted decision
making
in areas such as member eligibility, resource allocation, inventory management, profit distribution and
general operations. Answers were garnered on a likert scale (“
to a great extent”, “some extent”, “to no extent”
).
Across both cohorts, a lesser proportion of women located their responses within the “
to a great extent
” category
26
Estimates range between 70-85%. Mehta, P (March 2022). Empowering India’s women farmers: Bridge the gap. Hindustan Times.
Available
at
https://www.hindustantimes.com/ht-insight/economy/empowering-india-s-women-farmers-bridge-the-gap-
101647511783243.html#:~:text=In%20rural%20India%2C%20the%20percentage,work%20is%20done%20by%20women.
27
FAO (2011). The State of Food and Agriculture. Women in Agriculture. Closing the gender gap for development.
28
4 out of the 47 sample program FPOs were women-only (set up by PRADAN). While ICRISAT has set up 1 women-only FPO, this FPO
was not part of the study sample
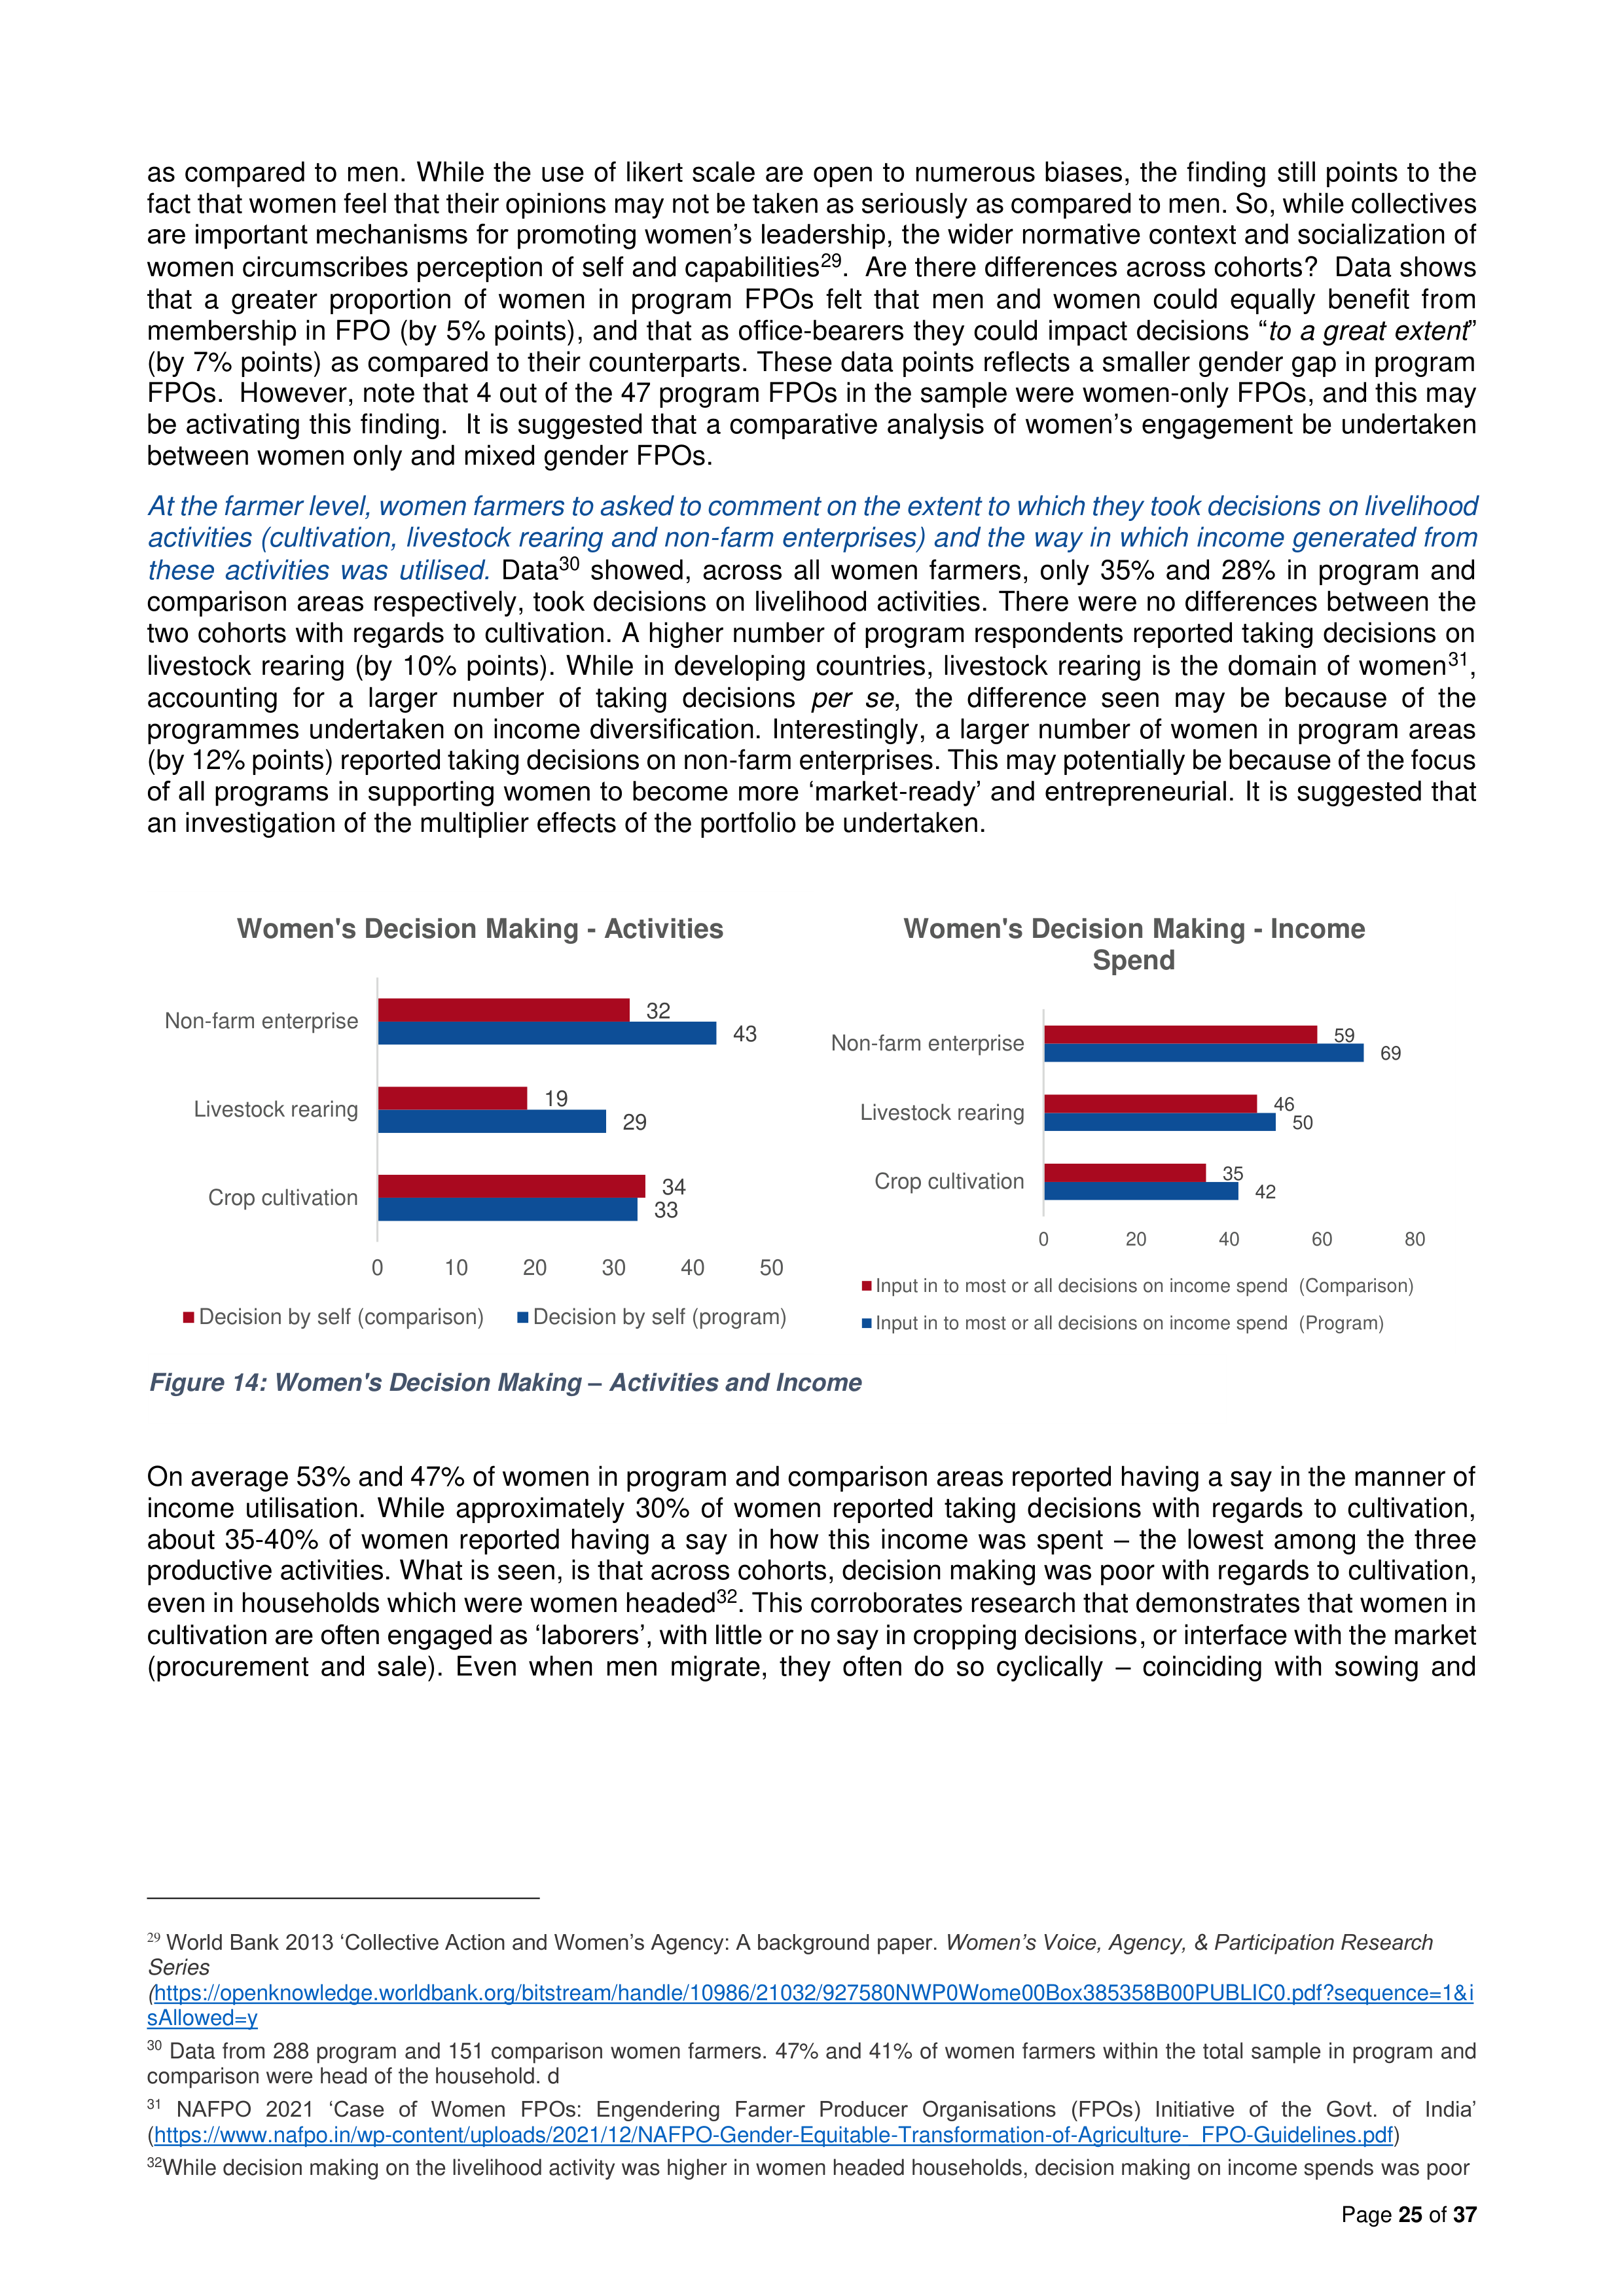
Page
25
of
37
as compared to men. While the use of likert scale are open to numerous biases, the finding still points to the
fact that women feel that their opinions may not be taken as seriously as compared to men. So, while collectives
are important mechanisms for promoting women’s leadership, the wider normative context and socialization of
women circumscribes perception of self and capabilities
29
. Are there differences across cohorts? Data shows
that a greater proportion of women in program FPOs felt that men and women could equally benefit from
membership in FPO (by 5% points), and that as office-bearers they could impact decisions “
to a great extent
”
(by 7% points) as compared to their counterparts. These data points reflects a smaller gender gap in program
FPOs. However, note that 4 out of the 47 program FPOs in the sample were women-only FPOs, and this may
be activating this finding. It is suggested that a comparative analysis of women’s engagement be undertaken
between women only and mixed gender FPOs.
At the farmer level, women farmers to asked to comment on the extent to which they took decisions on livelihood
activities (cultivation, livestock rearing and non-farm enterprises) and the way in which income generated from
these activities was utilised.
Data
30
showed, across all women farmers, only 35% and 28% in program and
comparison areas respectively, took decisions on livelihood activities. There were no differences between the
two cohorts with regards to cultivation. A higher number of program respondents reported taking decisions on
livestock rearing (by 10% points). While in developing countries, livestock rearing is the domain of women
31
,
accounting for a larger number of taking decisions
per se
, the difference seen may be because of the
programmes undertaken on income diversification. Interestingly, a larger number of women in program areas
(by 12% points) reported taking decisions on non-farm enterprises. This may potentially be because of the focus
of all programs in supporting women to become more ‘market-ready’ and entrepreneurial. It is suggested that
an investigation of the multiplier effects of the portfolio be undertaken.
On average 53% and 47% of women in program and comparison areas reported having a say in the manner of
income utilisation. While approximately 30% of women reported taking decisions with regards to cultivation,
about 35-40% of women reported having a say in how this income was spent – the lowest among the three
productive activities. What is seen, is that across cohorts, decision making was poor with regards to cultivation,
even in households which were women headed
32
. This corroborates research that demonstrates that women in
cultivation are often engaged as ‘laborers’, with little or no say in cropping decisions, or interface with the market
(procurement and sale). Even when men migrate, they often do so cyclically – coinciding with sowing and
29
World Bank 2013 ‘Collective Action and Women’s Agency: A background paper.
Women’s Voice, Agency, & Participation Research
Series
(
https://openknowledge.worldbank.org/bitstream/handle/10986/21032/927580NWP0Wome00Box385358B00PUBLIC0.pdf?sequence=1&i
sAllowed=y
30
Data from 288 program and 151 comparison women farmers. 47% and 41% of women farmers within the total sample in program and
comparison were head of the household. d
31
NAFPO 2021 ‘Case of Women FPOs: Engendering Farmer Producer Organisations (FPOs) Initiative of the Govt. of India’
(
https://www.nafpo.in/wp-content/uploads/2021/12/NAFPO-Gender-Equitable-Transformation-of-Agriculture-_FPO-Guidelines.pdf
)
32
While decision making on the livelihood activity was higher in women headed households, decision making on income spends was poor
33
29
43
34
19
32
0
10
20
30
40
50
Crop cultivation
Livestock rearing
Non-farm enterprise
Women's Decision Making - Activities
Decision by self (comparison)
Decision by self (program)
42
50
69
35
46
59
0
20
40
60
80
Crop cultivation
Livestock rearing
Non-farm enterprise
Women's Decision Making - Income
Spend
Input in to most or all decisions on income spend (Comparison)
Input in to most or all decisions on income spend (Program)
Figure 14: Women's Decision Making – Activities and Income
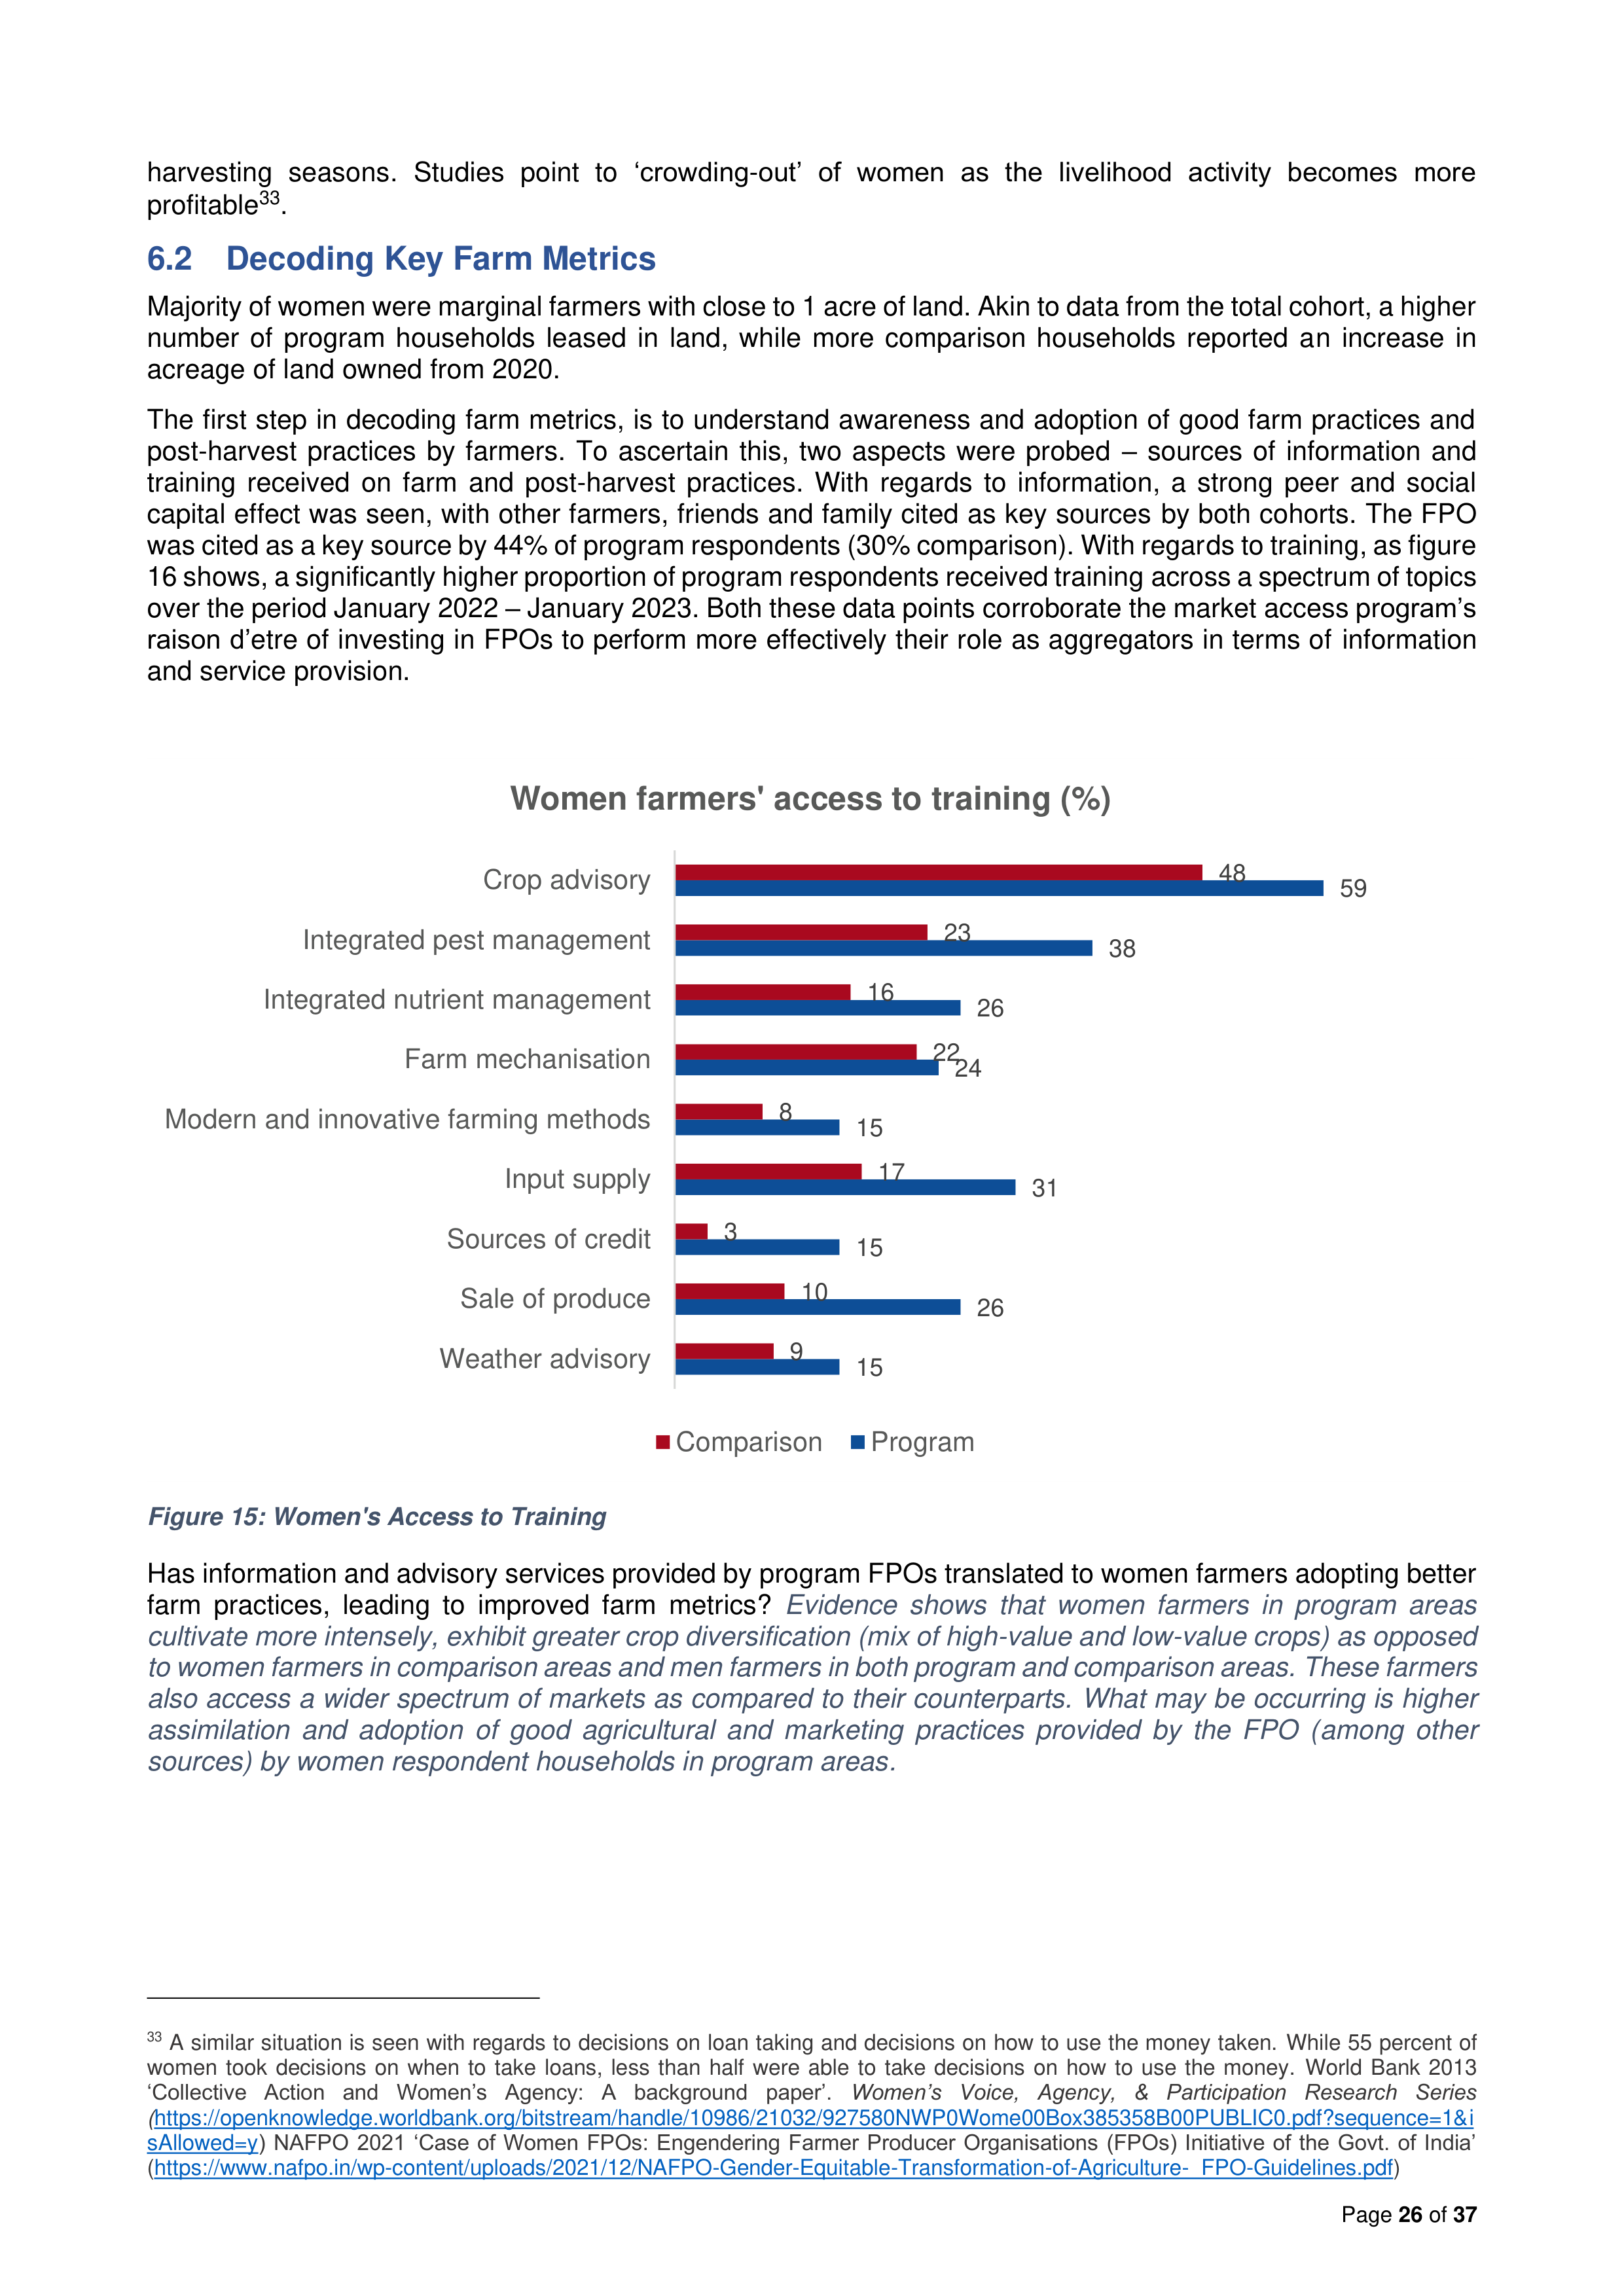
Page
26
of
37
harvesting seasons. Studies point to ‘crowding-out’ of women as the livelihood activity becomes more
profitable
33
.
6.2 Decoding Key Farm Metrics
Majority of women were marginal farmers with close to 1 acre of land. Akin to data from the total cohort, a higher
number of program households leased in land, while more comparison households reported an increase in
acreage of land owned from 2020.
The first step in decoding farm metrics, is to understand awareness and adoption of good farm practices and
post-harvest practices by farmers. To ascertain this, two aspects were probed – sources of information and
training received on farm and post-harvest practices. With regards to information, a strong peer and social
capital effect was seen, with other farmers, friends and family cited as key sources by both cohorts. The FPO
was cited as a key source by 44% of program respondents (30% comparison). With regards to training, as figure
16 shows, a significantly higher proportion of program respondents received training across a spectrum of topics
over the period January 2022 – January 2023. Both these data points corroborate the market access program’s
raison d’etre of investing in FPOs to perform more effectively their role as aggregators in terms of information
and service provision.
Figure 15: Women's Access to Training
Has information and advisory services provided by program FPOs translated to women farmers adopting better
farm practices, leading to improved farm metrics?
Evidence shows that women farmers in program areas
cultivate more intensely, exhibit greater crop diversification (mix of high-value and low-value crops) as opposed
to women farmers in comparison areas and men farmers in both program and comparison areas. These farmers
also access a wider spectrum of markets as compared to their counterparts. What may be occurring is higher
assimilation and adoption of good agricultural and marketing practices provided by the FPO (among other
sources) by women respondent households in program areas.
33
A similar situation is seen with regards to decisions on loan taking and decisions on how to use the money taken. While 55 percent of
women took decisions on when to take loans, less than half were able to take decisions on how to use the money. World Bank 2013
‘Collective Action and Women’s Agency: A background paper’.
Women’s Voice, Agency, & Participation Research Series
(
https://openknowledge.worldbank.org/bitstream/handle/10986/21032/927580NWP0Wome00Box385358B00PUBLIC0.pdf?sequence=1&i
sAllowed=y
) NAFPO 2021 ‘Case of Women FPOs: Engendering Farmer Producer Organisations (FPOs) Initiative of the Govt. of India’
(
https://www.nafpo.in/wp-content/uploads/2021/12/NAFPO-Gender-Equitable-Transformation-of-Agriculture-_FPO-Guidelines.pdf
)
15
26
15
31
15
24
26
38
59
9
10
3
17
8
22
16
23
48
Weather advisory
Sale of produce
Sources of credit
Input supply
Modern and innovative farming methods
Farm mechanisation
Integrated nutrient management
Integrated pest management
Crop advisory
Women farmers' access to training (%)
Comparison
Program
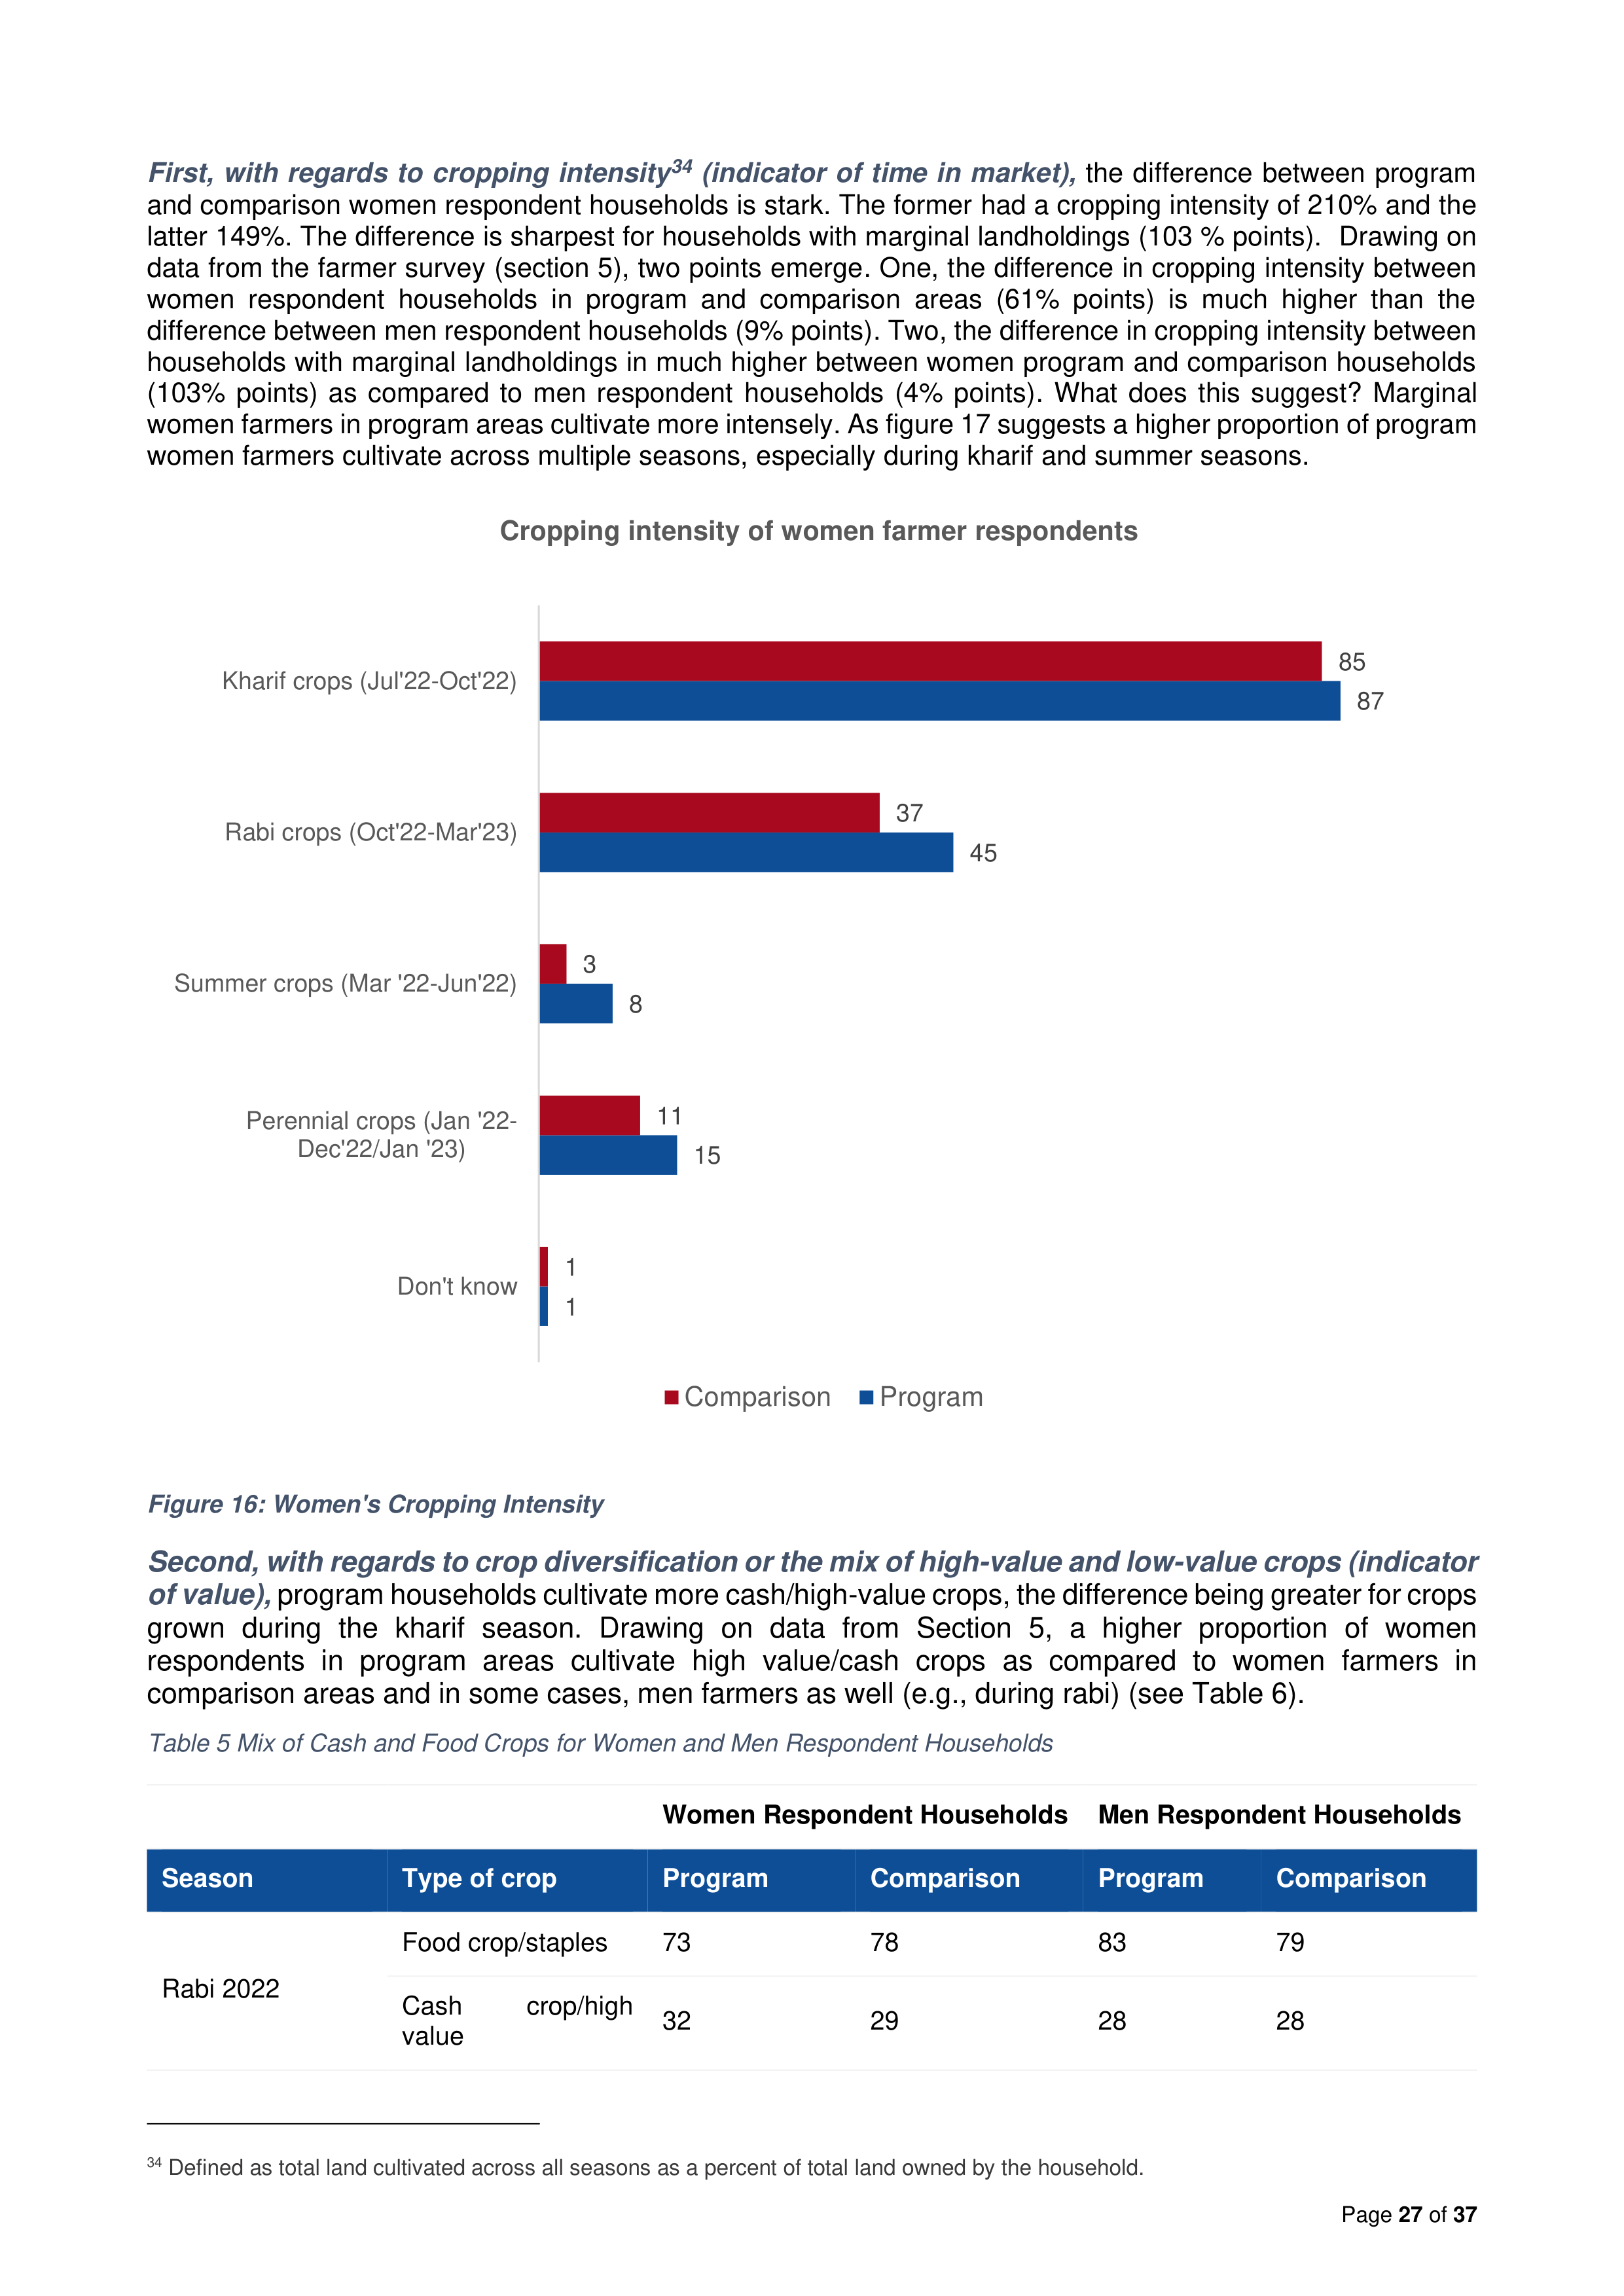
Page
27
of
37
First, with regards to cropping intensity
34
(indicator of time in market),
the difference between program
and comparison women respondent households is stark. The former had a cropping intensity of 210% and the
latter 149%. The difference is sharpest for households with marginal landholdings (103 % points). Drawing on
data from the farmer survey (section 5), two points emerge. One, the difference in cropping intensity between
women respondent households in program and comparison areas (61% points) is much higher than the
difference between men respondent households (9% points). Two, the difference in cropping intensity between
households with marginal landholdings in much higher between women program and comparison households
(103% points) as compared to men respondent households (4% points). What does this suggest? Marginal
women farmers in program areas cultivate more intensely. As figure 17 suggests a higher proportion of program
women farmers cultivate across multiple seasons, especially during kharif and summer seasons.
Figure 16: Women's Cropping Intensity
Second, with regards to crop diversification or the mix of high-value and low-value crops (indicator
of value),
program households cultivate more cash/high-value crops, the difference being greater for crops
grown during the kharif season. Drawing on data from Section 5, a higher proportion of women
respondents in program areas cultivate high value/cash crops as compared to women farmers in
comparison areas and in some cases, men farmers as well (e.g., during rabi) (see Table 6).
Table 5 Mix of Cash and Food Crops for Women and Men Respondent Households
Women Respondent Households
Men Respondent Households
Season
Type of crop
Program
Comparison
Program
Comparison
Rabi 2022
Food crop/staples
73
78
83
79
Cash
crop/high
value
32
29
28
28
34
Defined as total land cultivated across all seasons as a percent of total land owned by the household.
1
15
8
45
87
1
11
3
37
85
Don't know
Perennial crops (Jan '22-
Dec'22/Jan '23)
Summer crops (Mar '22-Jun'22)
Rabi crops (Oct'22-Mar'23)
Kharif crops (Jul'22-Oct'22)
Cropping intensity of women farmer respondents
Comparison
Program
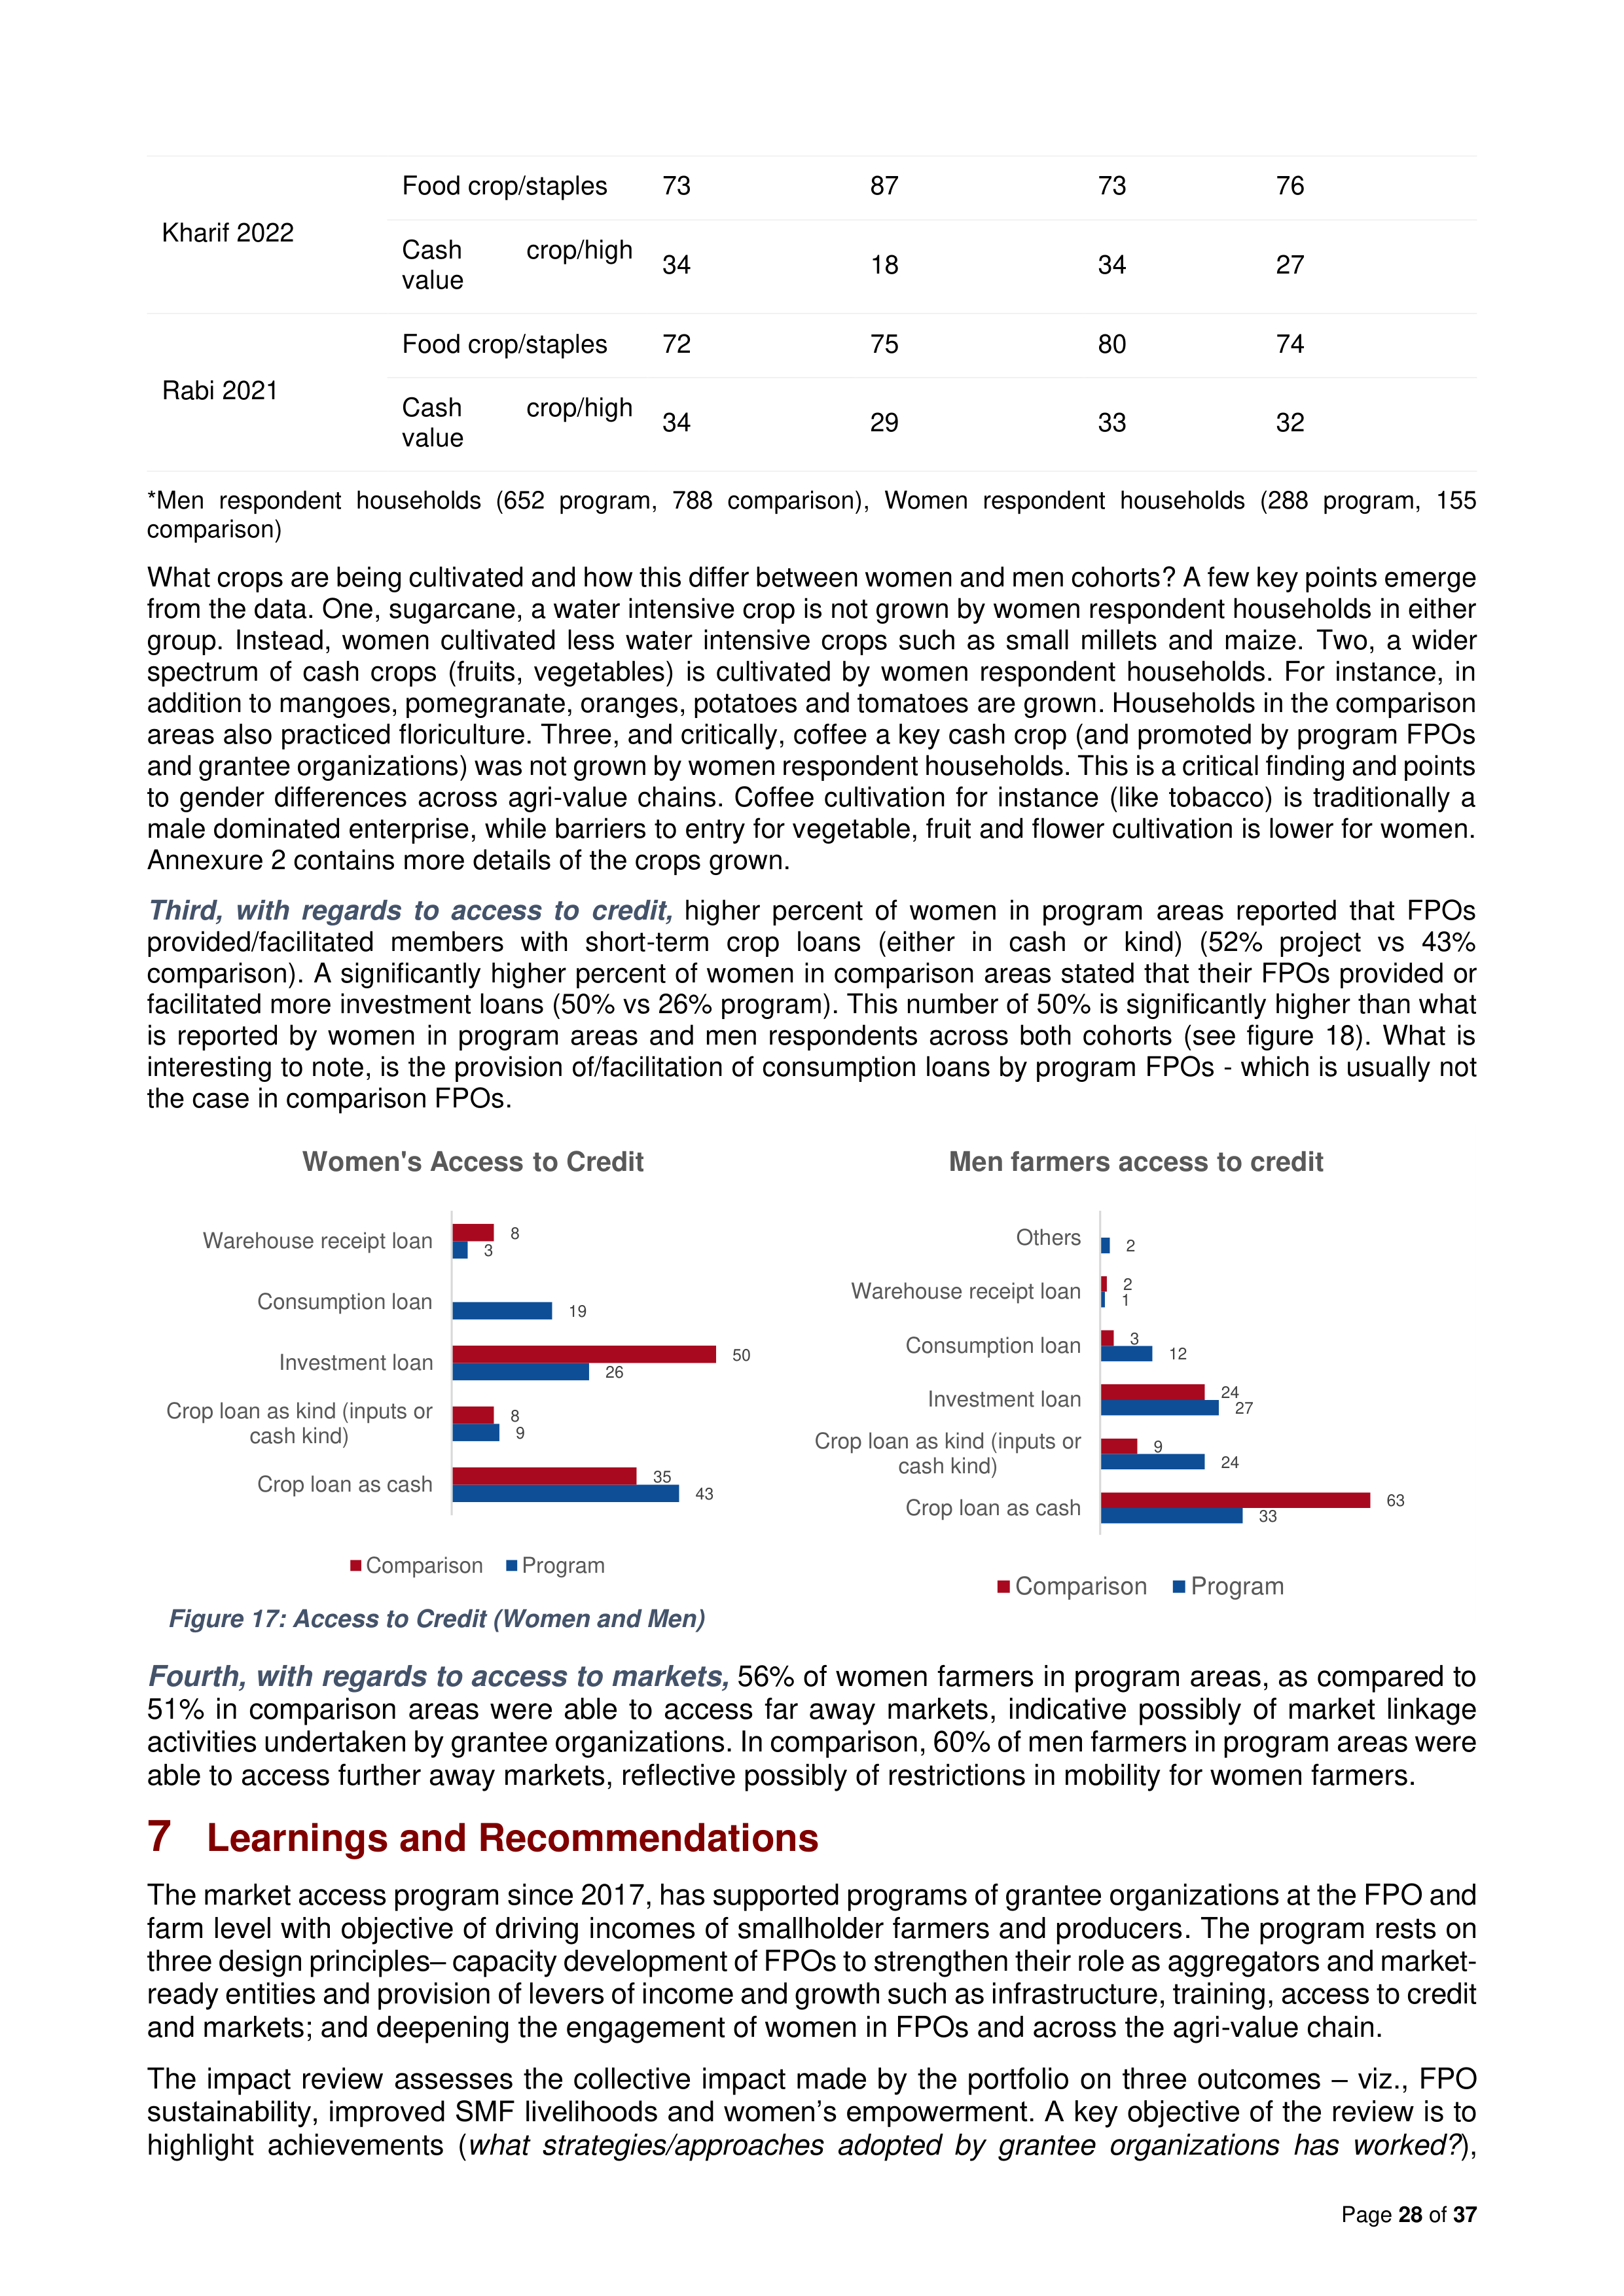
Page
28
of
37
Kharif 2022
Food crop/staples
73
87
73
76
Cash
crop/high
value
34
18
34
27
Rabi 2021
Food crop/staples
72
75
80
74
Cash
crop/high
value
34
29
33
32
*Men respondent households (652 program, 788 comparison), Women respondent households (288 program, 155
comparison)
What crops are being cultivated and how this differ between women and men cohorts? A few key points emerge
from the data. One, sugarcane, a water intensive crop is not grown by women respondent households in either
group. Instead, women cultivated less water intensive crops such as small millets and maize. Two, a wider
spectrum of cash crops (fruits, vegetables) is cultivated by women respondent households. For instance, in
addition to mangoes, pomegranate, oranges, potatoes and tomatoes are grown. Households in the comparison
areas also practiced floriculture. Three, and critically, coffee a key cash crop (and promoted by program FPOs
and grantee organizations) was not grown by women respondent households. This is a critical finding and points
to gender differences across agri-value chains. Coffee cultivation for instance (like tobacco) is traditionally a
male dominated enterprise, while barriers to entry for vegetable, fruit and flower cultivation is lower for women.
Annexure 2 contains more details of the crops grown.
Third, with regards to access to credit,
higher percent of women in program areas reported that FPOs
provided/facilitated members with short-term crop loans (either in cash or kind) (52% project vs 43%
comparison). A significantly higher percent of women in comparison areas stated that their FPOs provided or
facilitated more investment loans (50% vs 26% program). This number of 50% is significantly higher than what
is reported by women in program areas and men respondents across both cohorts (see figure 18). What is
interesting to note, is the provision of/facilitation of consumption loans by program FPOs - which is usually not
the case in comparison FPOs.
Figure 17: Access to Credit (Women and Men)
Fourth, with regards to access to markets,
56% of women farmers in program areas, as compared to
51% in comparison areas were able to access far away markets, indicative possibly of market linkage
activities undertaken by grantee organizations. In comparison, 60% of men farmers in program areas were
able to access further away markets, reflective possibly of restrictions in mobility for women farmers.
7
Learnings and Recommendations
The market access program since 2017, has supported programs of grantee organizations at the FPO and
farm level with objective of driving incomes of smallholder farmers and producers. The program rests on
three design principles– capacity development of FPOs to strengthen their role as aggregators and market-
ready entities and provision of levers of income and growth such as infrastructure, training, access to credit
and markets; and deepening the engagement of women in FPOs and across the agri-value chain.
The impact review assesses the collective impact made by the portfolio on three outcomes – viz., FPO
sustainability, improved SMF livelihoods and women’s empowerment. A key objective of the review is to
highlight achievements (
what strategies/approaches adopted by grantee organizations has worked?
),
43
9
26
19
3
35
8
50
8
Crop loan as cash
Crop loan as kind (inputs or
cash kind)
Investment loan
Consumption loan
Warehouse receipt loan
Women's Access to Credit
Comparison
Program
33
24
27
12
1
2
63
9
24
3
2
Crop loan as cash
Crop loan as kind (inputs or
cash kind)
Investment loan
Consumption loan
Warehouse receipt loan
Others
Men farmers access to credit
Comparison
Program

Page
29
of
37
gaps (
what requires further attention and strengthening?
) and provide recommendations to strengthen
future programming. This section provides a summary of learnings and recommendations across the three
stated outcomes of the program. Insights from qualitative interviews with grantee organizations are
introduced and considered alongside field data to generate more meaningful recommendations. A final
concluding section steps back from programmatic learnings and offers suggestions for future strategic
design of the Market Access Program.
7.1 FPO Sustainability
Learnings and Recommendations
1.
Focus on equity
– There is a need to direct training and capacity building exercises to member farmers
(and not just office bearers). Likewise, as the supported FPOs start demonstrating improvements on
various health parameters such as organizational capacity, operational effectiveness, and financial
viability, it is important that these benefits are fairly distributed among member farmers. The study has
shown that there is scope to ensure more equity in terms of concentration of shareholdings, and
distribution of profits. Also, there is a need to direct training and capacity building exercises to member
farmers (and not office bearers)
2.
Continued handholding
– Grantee organizations have conducted several and varied interventions in
the effort to ensure sustainability of their supported FPOs. While these are starting to bear fruit, there
is also a need for continued handholding of FPOs to navigate any new challenges which may come
up. Two such areas surfaced by the impact review were the usage of digital technologies and the
ability to meet the requirements of larger buyers of produce. It is recommended that grantees
periodically assess FPO knowledge of digital tools and continue to provide additional training on
quality/quantity thresholds set by institutional buyers.
3.
Saturation of membership base
– In a promising sign for the program, it was seen that high proportions
of FPOs undertook provision of various new services in the last 12 months such as setting up of post-
harvest infrastructure and advancing different types of loans to farmers. The next area of focus should
now be to ensure that members are aware of these services and encourage uptake across the
membership base. Like the previous point, this will also contribute to more widespread and uniform
benefits accruing to members.
4.
Member engagement
– In a corollary to the above, nearly a fifth of existing FPO member farmers
reported not participating in any FPO activities. The main reason cited for this was that farmers did
not feel the need for FPO services. This is surprising given the focus of grantee organizations to
increase awareness and engagement of member farmers. Further study is required here to ascertain
Key Achievements
The impact review viewed FPO sustainability across the three axes of organizational capacity, service
provision to farmers and financial viability. The impact review has shown that grantee organizations
interventions such as design and roll out of proprietary FPO capacity assessment tools and training of
office bearers has contributed to strengthened systems and processes. Program FPOs have improved
metrices across key parameters such as governance, administration, business planning, financial
management and use of technology to ensure transparency and accountability of operations. Critically,
these efforts have resulted in greater representation of women as office bearers and reduced the
gender gap in terms of differences in decision-making power between men and women. Grantee
organizations’ efforts in facilitating pre-harvest, post-harvest and sales support has resulted in FPOs
providing a wide spectrum of advisory and services to farmers and greater connectivity to markets,
underscoring the key design principle of the program investing in FPOs to strengthen their role as
aggregators. Through this, FPOs have developed a larger base for revenue generation and are on the
way to emerging as profitable entities.

Page
30
of
37
whether participation can be improved through more robust outreach and enhanced FPO services, or
if any broader systemic factors are hindering engagement.
5.
Building talent in FPOs
– Qualitative interviews with grantees revealed high attrition and lack of
appropriate talent pool in FPOs. It is recommended that program interventions continue building out a
leadership pipeline in FPOs and focus on more broad-based training of FPO office members to ensure
long term organizational sustainability.
7.2 SMF Livelihoods
Learnings and Recommendations
1.
Building trust in target communities
- An important behavioural factor to consider in rural development
programs is that it takes time to build trust with farmer communities. Qualitative interviews with
grantees revealed that this is an almost unanimous challenge. Especially in recent times, Indian
farmers are often approached by multiple agencies (government agencies, CSOs, private sector
stakeholders) to undertake new activities towards diversification of income or adoption of new
methods, leading to informational overload. Given their economic distress, SMFs are particularly risk
averse and hesitant to adopt new practices, for example, moving away from non-remunerative (but
“safe”) crops to more high value cultivation which could be deemed “risky”. Targeted approaches such
as setting up of demonstration farms to showcase success stories and assuring farmers of markets
are recommended to be continued. It is also suggested to consider the extent of grantee presence on
ground when finalizing timelines for an intervention. Ultimately, implementing partners with
longstanding presence and demonstrated success in a community will have an easier path to
convincing farmers to adopt new practices.
2.
Enhancing market readiness of SMFs
– The program relies on market linkages as a key lever to
increase SMF income. While a few issues regarding ability to meet market requirements have been
highlighted above with a call to action for FPOs, this section focuses on SMF characteristics which
may impede their ability to effectively transacts with markets. Qualitative interviews with grantees
surfaced several challenges in this regard -
Firstly
, it is often difficult to convince farmers to move away
from long standing relationships with local buyers, who may advance credit against inputs and thus
oblige SMFs to sell their produce to them.
Secondly
, where farmers are willing to engage with FPOs
for sale of produce, remote project locations and lack of last mile transportation facilities makes
aggregation challenging. There is a lack of allied facilities such as last mile financial access and SMF
ability to engage in digital transactions. Insufficient irrigation facilities could also limit SMF ability to
engage with the FPO year-round. Some recommendations here include conducting baseline
landscape analyses on social dynamics in the community; and not targeting market linkage activities
in isolation but supplementing them with allied interventions such as provision of credit and allied
infrastructure.
Key Achievements
Despite program households being more socio-economically disadvantaged than their counterparts,
the group seems to be imbued with a greater sense of optimism with regards to cultivation being a
viable occupation and their own abilities in moving up the value chain. Leasing in land for example is
reflective of this. Grantee organizations’ efforts to provide services to farmers, both through the FPO
and through direct engagement such as conducting demonstrations on sustainable agricultural
practices, digital technology solutions for crop advisory, training and deploying master trainers is just
beginning to reap benefits – program farmers for example are beginning to exhibit greater time in
market and crop diversification and accessing further away markets for a higher proportion of crops.

Page
31
of
37
3.
Focus on training and advisory
– Continuing on the earlier theme of member engagement, it is
recommended that grantees consider fine-tuning their training content. Survey data revealed that
40% of farmers said their FPO does not provide training. Of those who did attend training sessions, a
third reported that content does not cover the activities/crops that relevant to the FPO, while a fourth
said that they do not need any training. It may be that low literacy or digital savviness of farmers
impedes training efforts, but there is an opportunity here to enhance grantee outreach to farmer
communities, understand their specific needs, utilize these findings to develop appropriate training
content, and showcase success stories which resulted from use of the content.
7.3 Women’s Empowerment
Learnings and Recommendations
1.
Understand gendered differences in agri-value chains
– Evidence shows that women farmers cultivate
differently. They cultivate a wider spectrum of cash crops (fruits, vegetables) and grow more climate-
resilient crops such as millets. They also do not engage in cultivation of crops such as coffee, which are
traditionally male dominated enterprises, where the perceived barriers to entry are high. Grantee
organizations must keep these differences in mind while designing interventions for women farmers.
2.
Deeper focus on power relations, underlying socio-cultural-political discrimination faced by women
–
Grantee organizations’ efforts have resulted in greater participation of women as office bearers in FPOs.
Farm metrics for women respondents are also on an upward trajectory. However, overall, there is limited
decision making of women across the roles they perform – as cultivators, office-bearers or farm
entrepreneurs. So, while grantee interventions have been successful, the wider normative context
circumscribes women from reaching their true potential. If the momentum that has been garnered through
the market access program is to be maintained and accelerated, there is a need for single-minded focus
on mainstreaming women’s needs and concerns as a central and resourced element in planning,
implementation and capacity building. This implies looking beyond purely economic and market concerns
to issues of non-market work and activities.
3.
Research into potential multiplier effects of the market access program
– A larger number of women in
program areas reported taking decisions on non-farm enterprises and had a greater say on how income
generated from these enterprises were utilised. This may potentially be because of the portfolio’s focus on
supporting women to become more market-facing and entrepreneurial. It is suggested that a deeper
investigation of these positive multiplier effects of the portfolio on rural livelihoods be examined.
7.4 Portfolio Strategy
Taking a step back from programmatic findings, we also look at suggestions which could inform strategic
decisions for the Market Access Program as a whole.
Firstly
, the impact review of the various interventions
under the umbrella of the wider program has highlighted the variability and lack of coordination in data
systems amongst grantees. The absence of a standardized baseline metrics for example has hindered the
measurement of progress along impact pathways towards intended outcomes. For future iterations of the
program, it is recommended that the portfolio establishes standardized methods of capturing, reporting,
and analysing data.
Secondly
, grantees should be encouraged to collaborate. This could be done basis
Key Achievements
A significantly higher number of women farmers in program areas cite FPOs are a key source of
information and provider of advisory and training. Evidence shows that women farmers in program
areas cultivate more intensely and exhibit greater crop diversification as opposed to women farmers in
comparison areas and men farmers in program and comparison areas. What may be occurring is a
higher assimilation and adoption of good agricultural and marketing practices by women respondent
households in program areas. To understand differentiated impacts of the market access program, it
is suggested that a deep-dive into understanding women’s awareness, assimilation and adoption of
training be undertaken, to better understand the dynamics

Page
32
of
37
geographical area of operation (e.g., grantees working in a specific state could approach local stakeholders
collectively), type of intervention (e.g., grantees working to provide digital knowledge management
platforms could swap notes), or stage of agri value chain (e.g., partners with a focus on post-harvest
management facilities could share best practices). Another path to collaboration could be overlapping
partner interventions for the same target communities.
In conclusion, the Market Access Program has shown promising results for FPOs as well as SMFs across
various parameters. It is hoped that the above recommendations will be useful for the Walmart Foundation,
their grantee organizations, and other stakeholders in India's agricultural development to aid in their
continued contribution towards a more inclusive and sustainable agricultural sector.
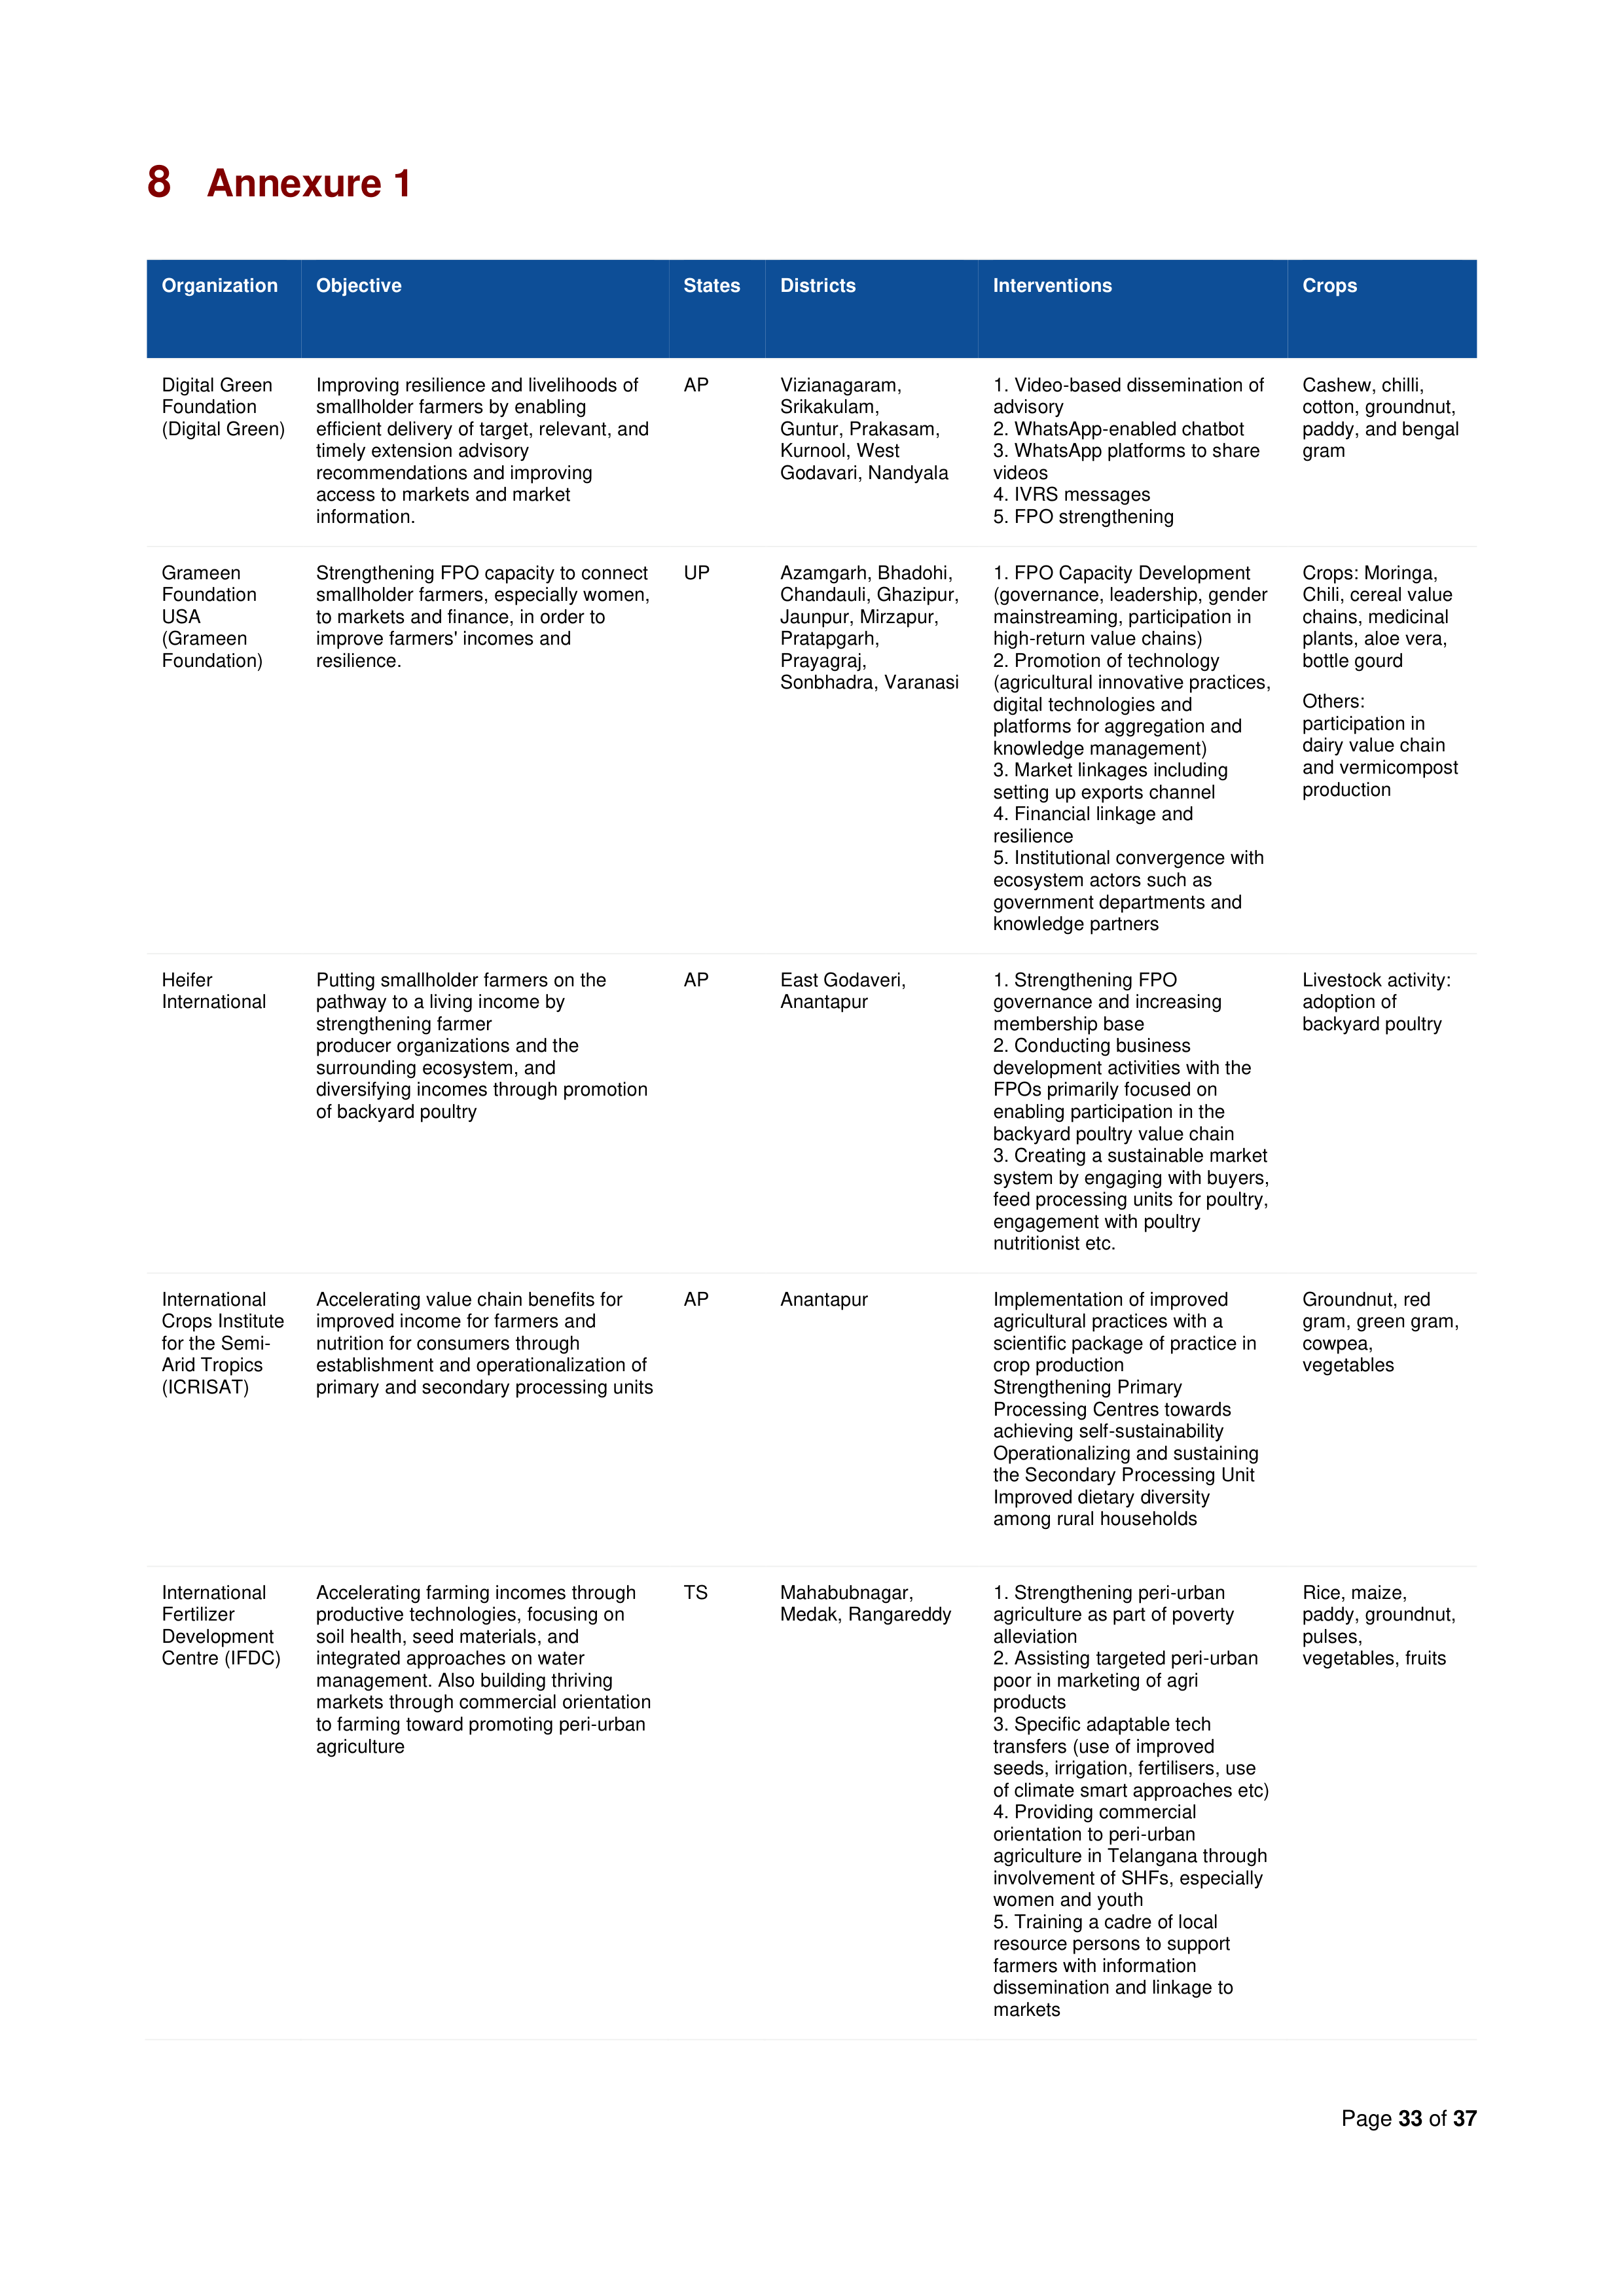
Page
33
of
37
8
Annexure 1
Organization
Objective
States
Districts
Interventions
Crops
Digital Green
Foundation
(Digital Green)
Improving resilience and livelihoods of
smallholder farmers by enabling
efficient delivery of target, relevant, and
timely extension advisory
recommendations and improving
access to markets and market
information.
AP
Vizianagaram,
Srikakulam,
Guntur, Prakasam,
Kurnool, West
Godavari, Nandyala
1. Video-based dissemination of
advisory
2. WhatsApp-enabled chatbot
3. WhatsApp platforms to share
videos
4. IVRS messages
5. FPO strengthening
Cashew, chilli,
cotton, groundnut,
paddy, and bengal
gram
Grameen
Foundation
USA
(Grameen
Foundation)
Strengthening FPO capacity to connect
smallholder farmers, especially women,
to markets and finance, in order to
improve farmers' incomes and
resilience.
UP
Azamgarh, Bhadohi,
Chandauli, Ghazipur,
Jaunpur, Mirzapur,
Pratapgarh,
Prayagraj,
Sonbhadra, Varanasi
1. FPO Capacity Development
(governance, leadership, gender
mainstreaming, participation in
high-return value chains)
2. Promotion of technology
(agricultural innovative practices,
digital technologies and
platforms for aggregation and
knowledge management)
3. Market linkages including
setting up exports channel
4. Financial linkage and
resilience
5. Institutional convergence with
ecosystem actors such as
government departments and
knowledge partners
Crops: Moringa,
Chili, cereal value
chains, medicinal
plants, aloe vera,
bottle gourd
Others:
participation in
dairy value chain
and vermicompost
production
Heifer
International
Putting smallholder farmers on the
pathway to a living income by
strengthening farmer
producer organizations and the
surrounding ecosystem, and
diversifying incomes through promotion
of backyard poultry
AP
East Godaveri,
Anantapur
1. Strengthening FPO
governance and increasing
membership base
2. Conducting business
development activities with the
FPOs primarily focused on
enabling participation in the
backyard poultry value chain
3. Creating a sustainable market
system by engaging with buyers,
feed processing units for poultry,
engagement with poultry
nutritionist etc.
Livestock activity:
adoption of
backyard poultry
International
Crops Institute
for the Semi-
Arid Tropics
(ICRISAT)
Accelerating value chain benefits for
improved income for farmers and
nutrition for consumers through
establishment and operationalization of
primary and secondary processing units
AP
Anantapur
Implementation of improved
agricultural practices with a
scientific package of practice in
crop production
Strengthening Primary
Processing Centres towards
achieving self-sustainability
Operationalizing and sustaining
the Secondary Processing Unit
Improved dietary diversity
among rural households
Groundnut, red
gram, green gram,
cowpea,
vegetables
International
Fertilizer
Development
Centre (IFDC)
Accelerating farming incomes through
productive technologies, focusing on
soil health, seed materials, and
integrated approaches on water
management. Also building thriving
markets through commercial orientation
to farming toward promoting peri-urban
agriculture
TS
Mahabubnagar,
Medak, Rangareddy
1. Strengthening peri-urban
agriculture as part of poverty
alleviation
2. Assisting targeted peri-urban
poor in marketing of agri
products
3. Specific adaptable tech
transfers (use of improved
seeds, irrigation, fertilisers, use
of climate smart approaches etc)
4. Providing commercial
orientation to peri-urban
agriculture in Telangana through
involvement of SHFs, especially
women and youth
5. Training a cadre of local
resource persons to support
farmers with information
dissemination and linkage to
markets
Rice, maize,
paddy, groundnut,
pulses,
vegetables, fruits
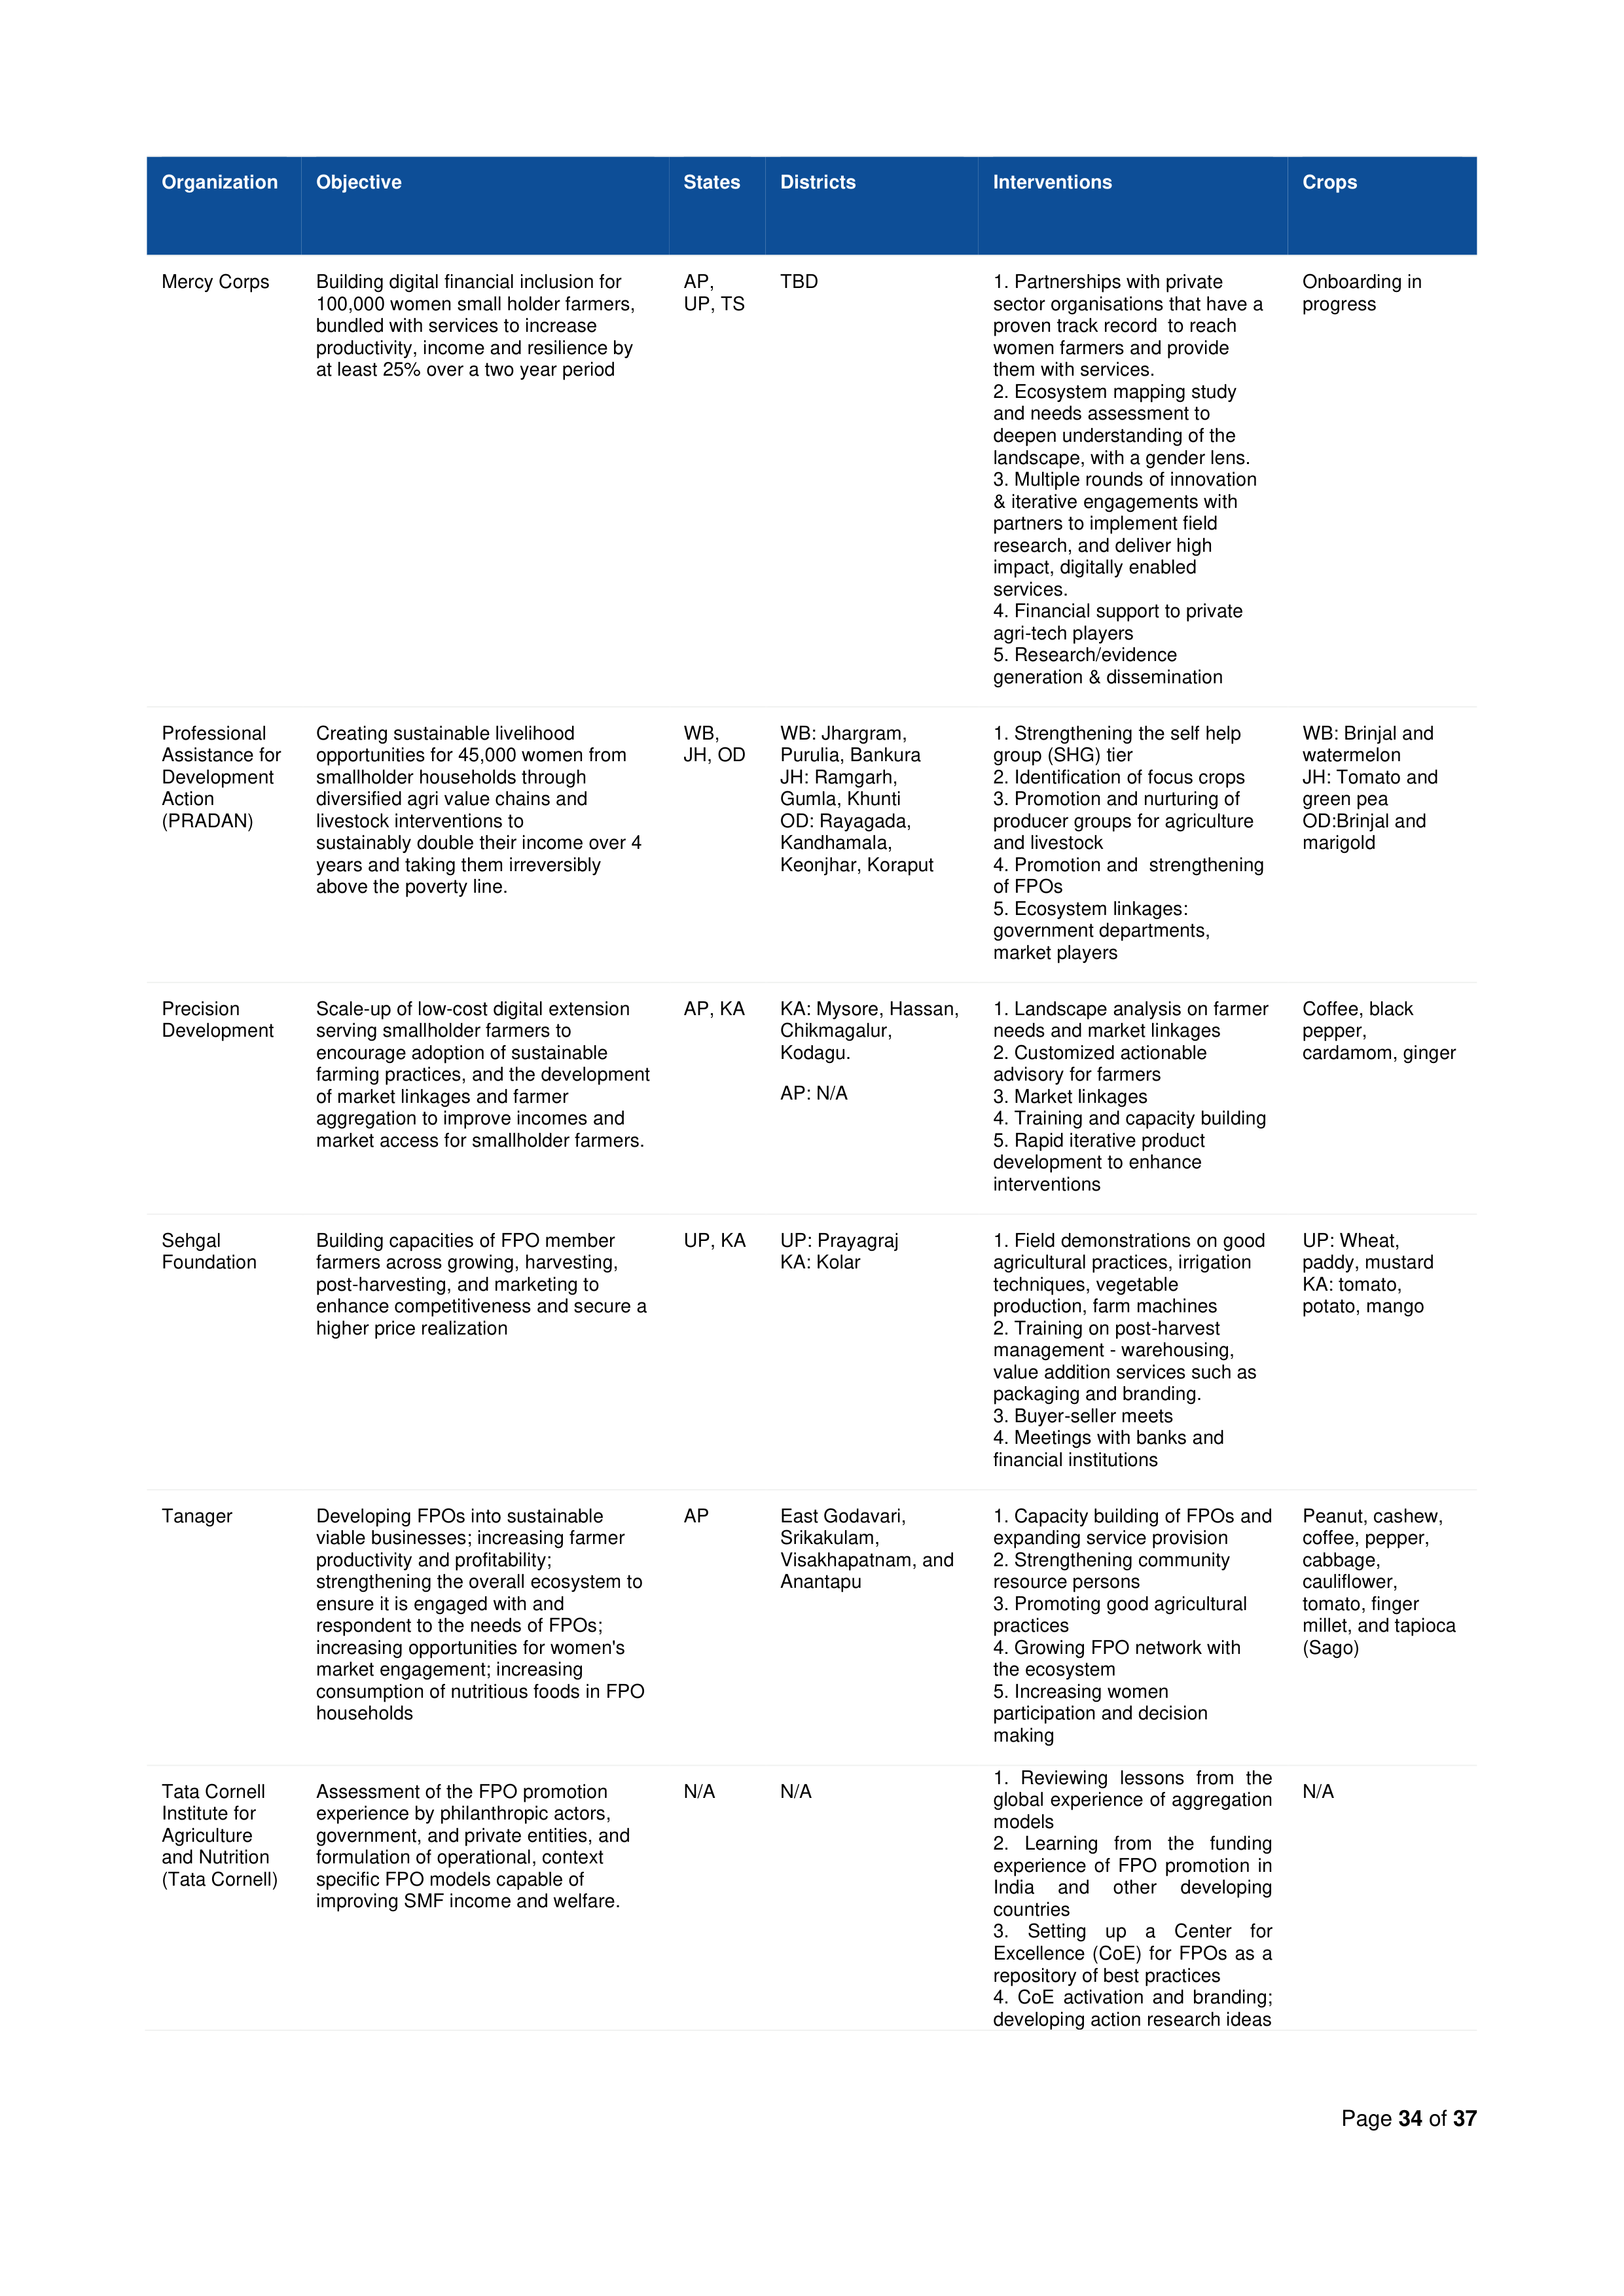
Page
34
of
37
Organization
Objective
States
Districts
Interventions
Crops
Mercy Corps
Building digital financial inclusion for
100,000 women small holder farmers,
bundled with services to increase
productivity, income and resilience by
at least 25% over a two year period
AP,
UP, TS
TBD
1. Partnerships with private
sector organisations that have a
proven track record to reach
women farmers and provide
them with services.
2. Ecosystem mapping study
and needs assessment to
deepen understanding of the
landscape, with a gender lens.
3. Multiple rounds of innovation
& iterative engagements with
partners to implement field
research, and deliver high
impact, digitally enabled
services.
4. Financial support to private
agri-tech players
5. Research/evidence
generation & dissemination
Onboarding in
progress
Professional
Assistance for
Development
Action
(PRADAN)
Creating sustainable livelihood
opportunities for 45,000 women from
smallholder households through
diversified agri value chains and
livestock interventions to
sustainably double their income over 4
years and taking them irreversibly
above the poverty line.
WB,
JH, OD
WB: Jhargram,
Purulia, Bankura
JH: Ramgarh,
Gumla, Khunti
OD: Rayagada,
Kandhamala,
Keonjhar, Koraput
1. Strengthening the self help
group (SHG) tier
2. Identification of focus crops
3. Promotion and nurturing of
producer groups for agriculture
and livestock
4. Promotion and strengthening
of FPOs
5. Ecosystem linkages:
government departments,
market players
WB: Brinjal and
watermelon
JH: Tomato and
green pea
OD:Brinjal and
marigold
Precision
Development
Scale-up of low-cost digital extension
serving smallholder farmers to
encourage adoption of sustainable
farming practices, and the development
of market linkages and farmer
aggregation to improve incomes and
market access for smallholder farmers.
AP, KA
KA: Mysore, Hassan,
Chikmagalur,
Kodagu.
AP: N/A
1. Landscape analysis on farmer
needs and market linkages
2. Customized actionable
advisory for farmers
3. Market linkages
4. Training and capacity building
5. Rapid iterative product
development to enhance
interventions
Coffee, black
pepper,
cardamom, ginger
Sehgal
Foundation
Building capacities of FPO member
farmers across growing, harvesting,
post-harvesting, and marketing to
enhance competitiveness and secure a
higher price realization
UP, KA
UP: Prayagraj
KA: Kolar
1. Field demonstrations on good
agricultural practices, irrigation
techniques, vegetable
production, farm machines
2. Training on post-harvest
management - warehousing,
value addition services such as
packaging and branding.
3. Buyer-seller meets
4. Meetings with banks and
financial institutions
UP: Wheat,
paddy, mustard
KA: tomato,
potato, mango
Tanager
Developing FPOs into sustainable
viable businesses; increasing farmer
productivity and profitability;
strengthening the overall ecosystem to
ensure it is engaged with and
respondent to the needs of FPOs;
increasing opportunities for women's
market engagement; increasing
consumption of nutritious foods in FPO
households
AP
East Godavari,
Srikakulam,
Visakhapatnam, and
Anantapu
1. Capacity building of FPOs and
expanding service provision
2. Strengthening community
resource persons
3. Promoting good agricultural
practices
4. Growing FPO network with
the ecosystem
5. Increasing women
participation and decision
making
Peanut, cashew,
coffee, pepper,
cabbage,
cauliflower,
tomato, finger
millet, and tapioca
(Sago)
Tata Cornell
Institute for
Agriculture
and Nutrition
(Tata Cornell)
Assessment of the FPO promotion
experience by philanthropic actors,
government, and private entities, and
formulation of operational, context
specific FPO models capable of
improving SMF income and welfare.
N/A
N/A
1. Reviewing lessons from the
global experience of aggregation
models
2. Learning from the funding
experience of FPO promotion in
India
and
other
developing
countries
3. Setting up a Center for
Excellence (CoE) for FPOs as a
repository of best practices
4. CoE activation and branding;
developing action research ideas
N/A
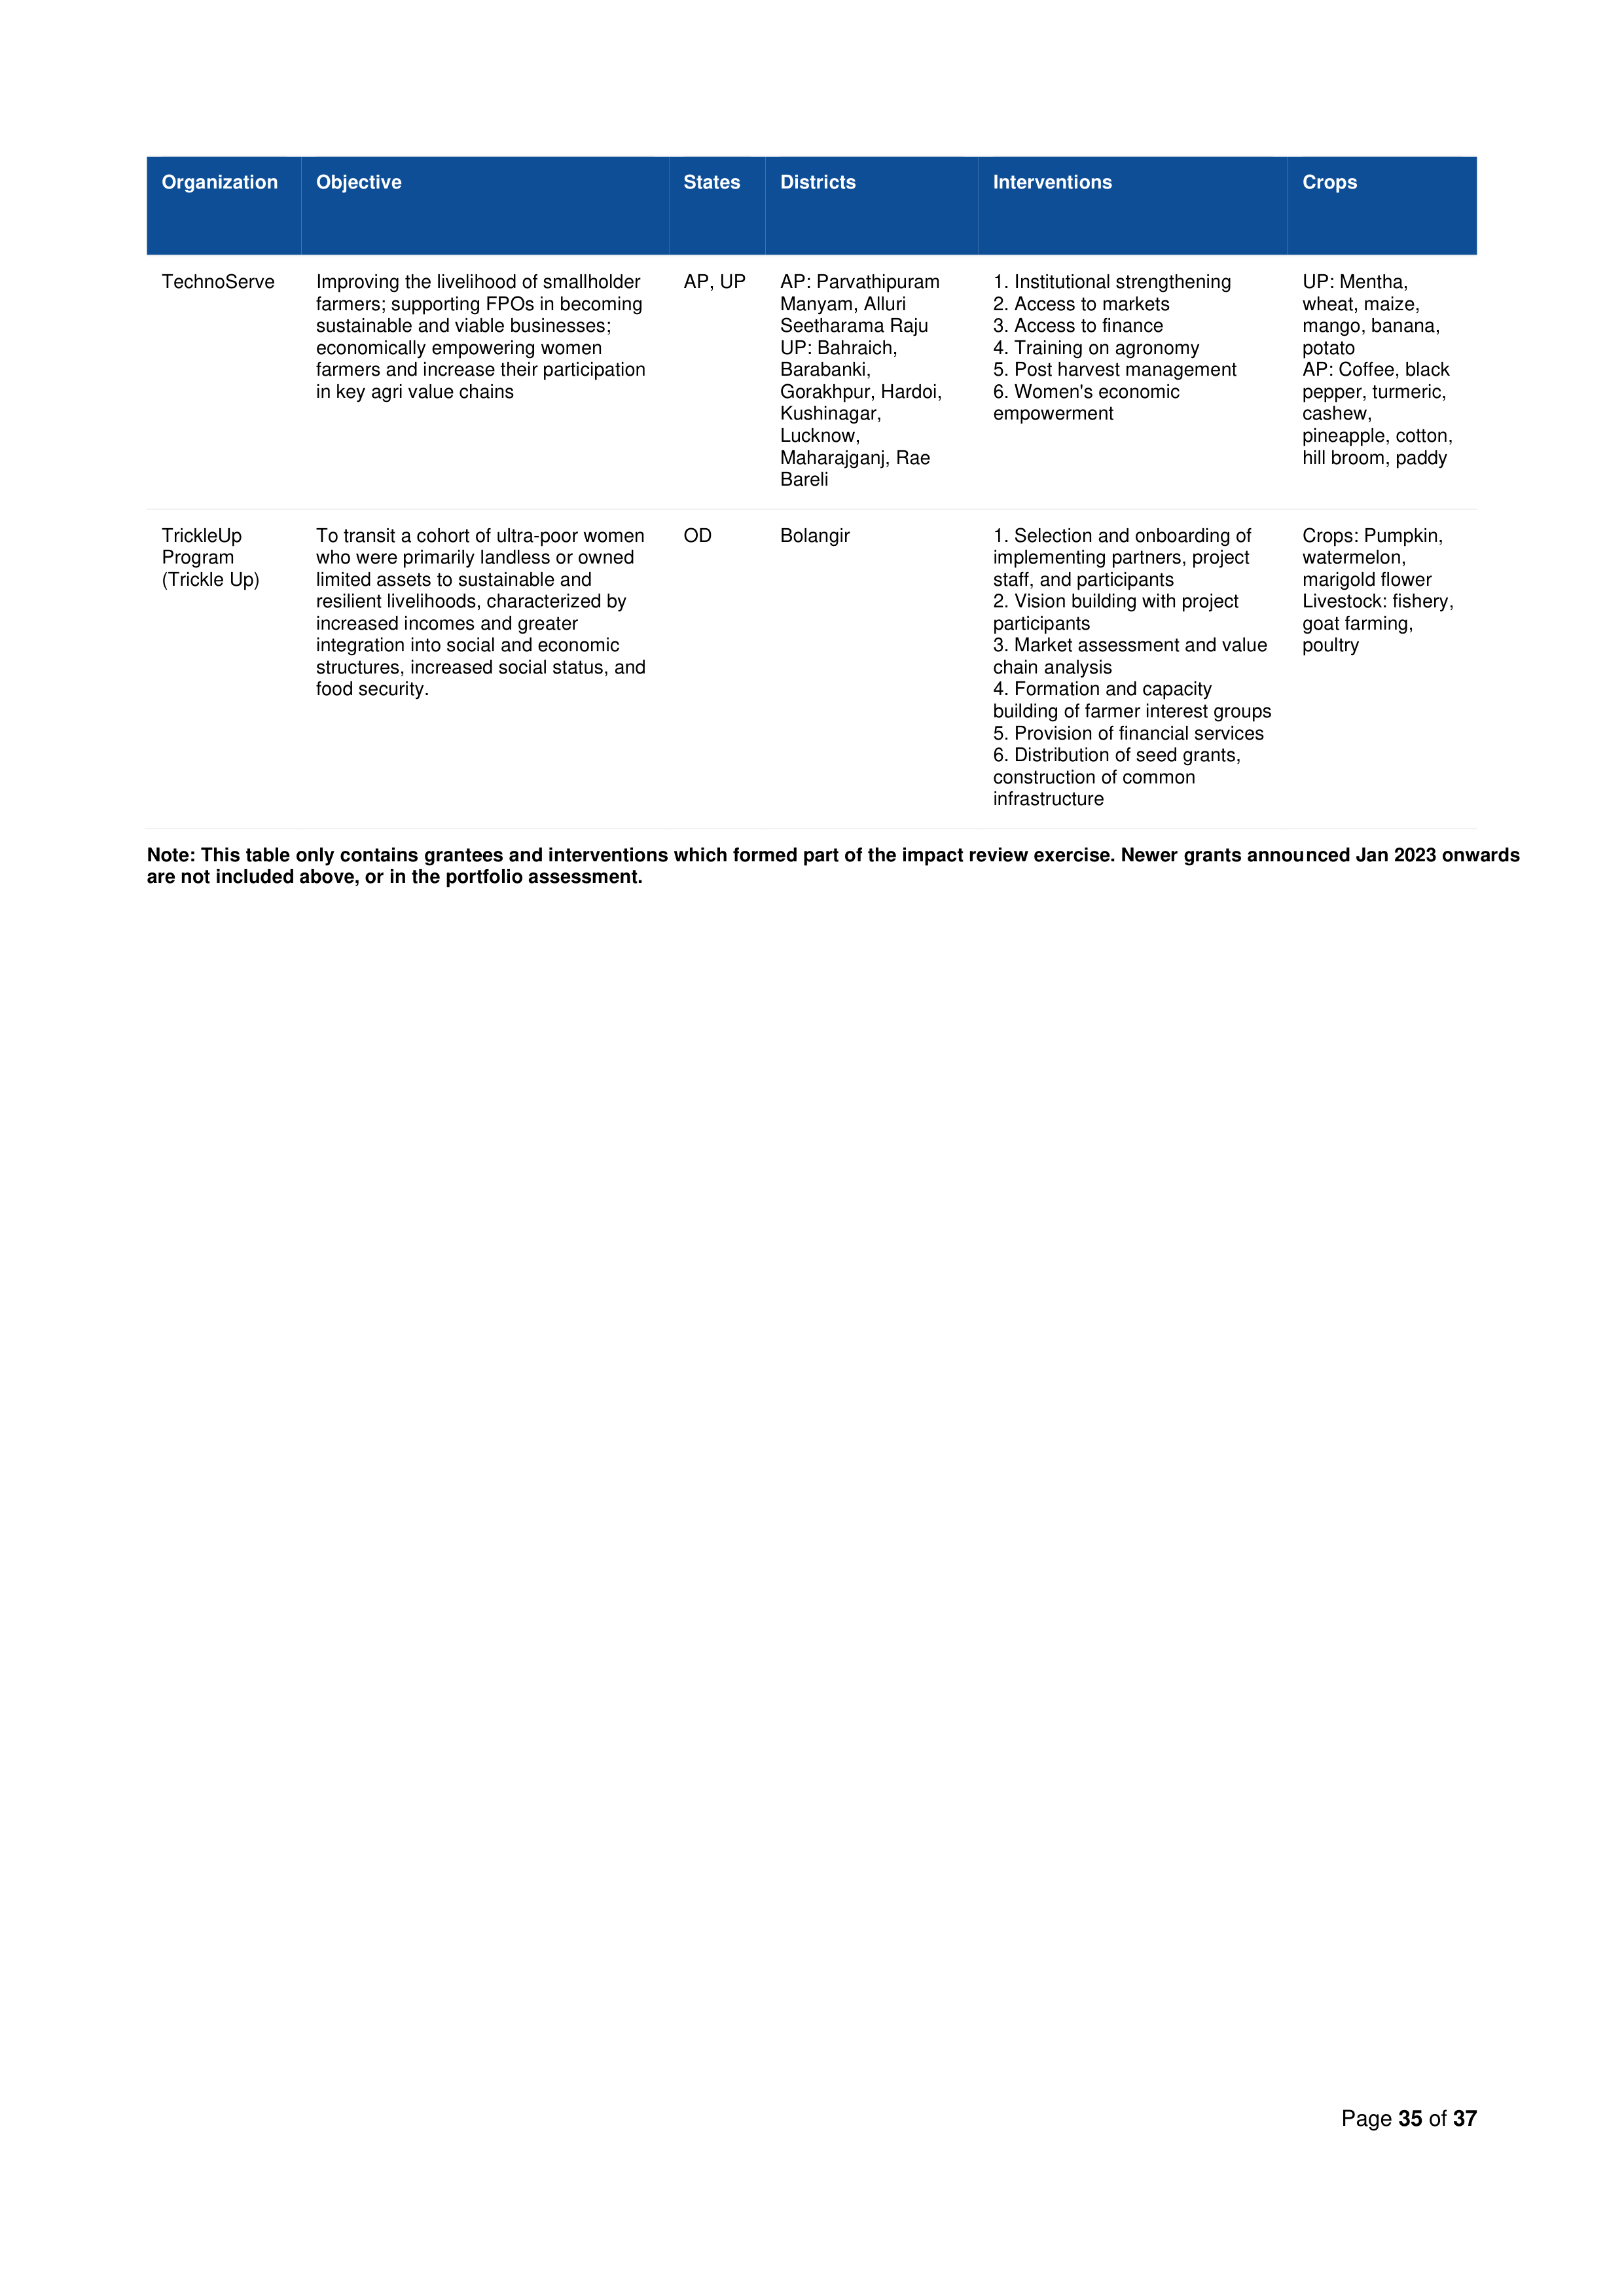
Page
35
of
37
Organization
Objective
States
Districts
Interventions
Crops
TechnoServe
Improving the livelihood of smallholder
farmers; supporting FPOs in becoming
sustainable and viable businesses;
economically empowering women
farmers and increase their participation
in key agri value chains
AP, UP
AP: Parvathipuram
Manyam, Alluri
Seetharama Raju
UP: Bahraich,
Barabanki,
Gorakhpur, Hardoi,
Kushinagar,
Lucknow,
Maharajganj, Rae
Bareli
1. Institutional strengthening
2. Access to markets
3. Access to finance
4. Training on agronomy
5. Post harvest management
6. Women's economic
empowerment
UP: Mentha,
wheat, maize,
mango, banana,
potato
AP: Coffee, black
pepper, turmeric,
cashew,
pineapple, cotton,
hill broom, paddy
TrickleUp
Program
(Trickle Up)
To transit a cohort of ultra-poor women
who were primarily landless or owned
limited assets to sustainable and
resilient livelihoods, characterized by
increased incomes and greater
integration into social and economic
structures, increased social status, and
food security.
OD
Bolangir
1. Selection and onboarding of
implementing partners, project
staff, and participants
2. Vision building with project
participants
3. Market assessment and value
chain analysis
4. Formation and capacity
building of farmer interest groups
5. Provision of financial services
6. Distribution of seed grants,
construction of common
infrastructure
Crops: Pumpkin,
watermelon,
marigold flower
Livestock: fishery,
goat farming,
poultry
Note: This table only contains grantees and interventions which formed part of the impact review exercise. Newer grants announced Jan 2023 onwards
are not included above, or in the portfolio assessment.
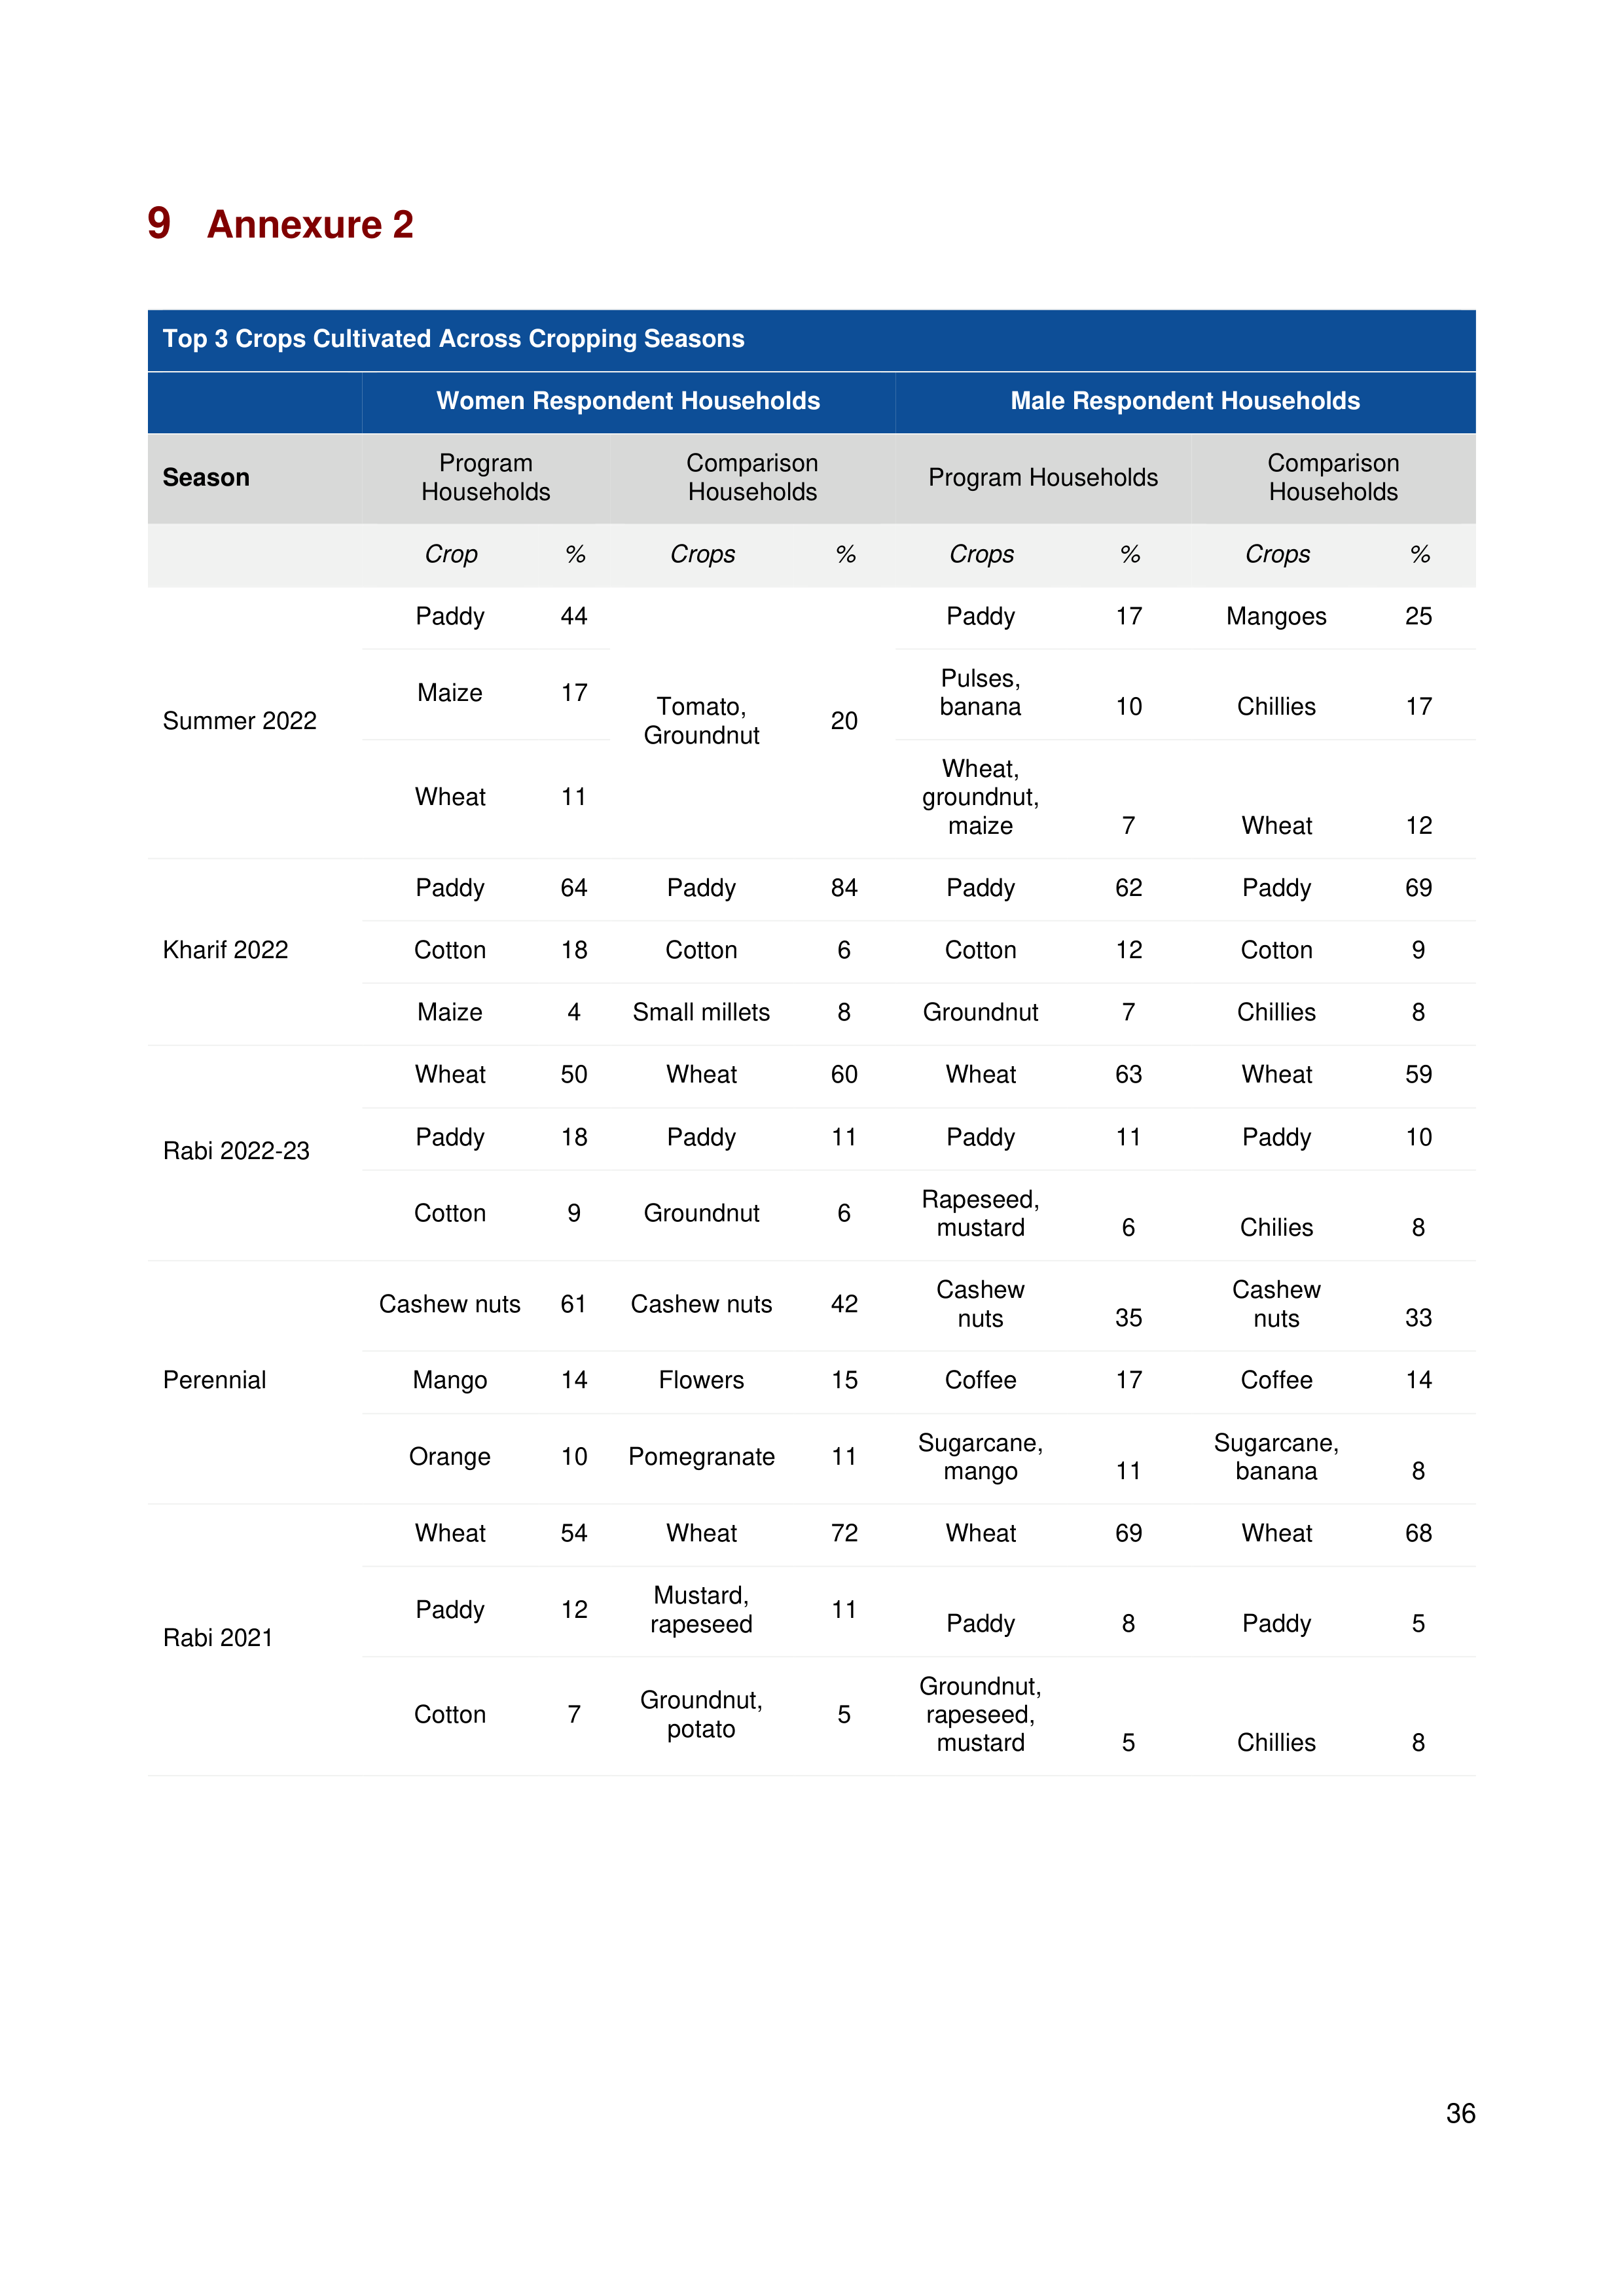
36
9
Annexure 2
Top 3 Crops Cultivated Across Cropping Seasons
Women Respondent Households
Male Respondent Households
Season
Program
Households
Comparison
Households
Program Households
Comparison
Households
Crop
%
Crops
%
Crops
%
Crops
%
Summer 2022
Paddy
44
Tomato,
Groundnut
20
Paddy
17
Mangoes
25
Maize
17
Pulses,
banana
10
Chillies
17
Wheat
11
Wheat,
groundnut,
maize
7
Wheat
12
Kharif 2022
Paddy
64
Paddy
84
Paddy
62
Paddy
69
Cotton
18
Cotton
6
Cotton
12
Cotton
9
Maize
4
Small millets
8
Groundnut
7
Chillies
8
Rabi 2022-23
Wheat
50
Wheat
60
Wheat
63
Wheat
59
Paddy
18
Paddy
11
Paddy
11
Paddy
10
Cotton
9
Groundnut
6
Rapeseed,
mustard
6
Chilies
8
Perennial
Cashew nuts
61
Cashew nuts
42
Cashew
nuts
35
Cashew
nuts
33
Mango
14
Flowers
15
Coffee
17
Coffee
14
Orange
10
Pomegranate
11
Sugarcane,
mango
11
Sugarcane,
banana
8
Rabi 2021
Wheat
54
Wheat
72
Wheat
69
Wheat
68
Paddy
12
Mustard,
rapeseed
11
Paddy
8
Paddy
5
Cotton
7
Groundnut,
potato
5
Groundnut,
rapeseed,
mustard
5
Chillies
8




37