
2025 Annual Report
Providing the
critical infrastructure
for the AI era
Our Differentiation
Trusted brand, unrivalled go-to-market, and loyal customers
y
37,000+ trusted partners in global partner ecosystem
y
1M+ customers across 150 countries
y
99% of Fortune 500
y
>82,000 government organizations
y
40+ years of customer trust
Broad portfolio and platform advantage
y
>50% of customers buy both campus networking and data center networking platforms
y
Unique ability to fuse security with networking
y
Unmatched data and insights
y
Agentic led customer experience
Favorable secular trends
y
AI, Cybersecurity, Connectivity
Our Strategy
We Securely Connect Everything to Make Anything Possible
Our Purpose
To Power an Inclusive Future for All
We can do good for the world and do good for business when we
combine our technology, our people and our broader networks.
Nasdaq: CSCO
Discover more at
thenetwork.cisco.com
Follow us on X at
@Cisco
About Cisco
1
Cisco Annual Report 2025
Contents
Letter to stockholders
2
Fiscal 2025 highlights
4
Cisco strategy and priorities
6
Leadership
7
Corporate governance
8
Our Purpose
12
Forward-Looking Statements
This Summary Report and our Annual Report on Form 10-K (“Annual Report”) contain projections and other
forward-looking statements regarding future events or the future financial performance of Cisco, including future
operating results. These projections, goals and statements are only predictions. Actual events or results may differ
materially from those in the projections, goals or other forward-looking statements. See Cisco’s filing with the
Securities and Exchange Commission, including its most recent Annual Report for a discussion of important risk
factors that could cause actual events or results to differ materially from those in the projections, goals or other
forward-looking statements.
Introduction to
summary report
This summary provides an overview
of Cisco. It does not contain all the
information you should consider. Please
refer to our latest Annual Report on
Form 10-K, our Proxy Statement for our
2025 Annual Meeting of Stockholders,
and our Purpose Report which are all
available on our website at
www.cisco.com

2
Cisco Annual Report 2025
Fiscal 2025 represented a defining moment in Cisco’s
history. Against the backdrop of a complex environment,
we delivered strong financial results and completed the
successful integration of Splunk, while delivering world-
class innovation at unprecedented speed. Our teams
executed with precision, further deepening relationships
with customers and partners, while positioning Cisco at the
heart of the most significant technology transition of our
lifetime – Artificial Intelligence.
Having refreshed almost our entire product portfolio
with industry-leading networking systems powered
by Cisco Silicon One, AI-native security solutions, and
software operating systems, I am incredibly proud of our
accomplishments and more confident than ever in our ability
to provide the critical infrastructure needed for the AI era.
Strong business execution and
financial discipline
Our financial performance this past year reflects the strength
of our portfolio and the value we continue to deliver for
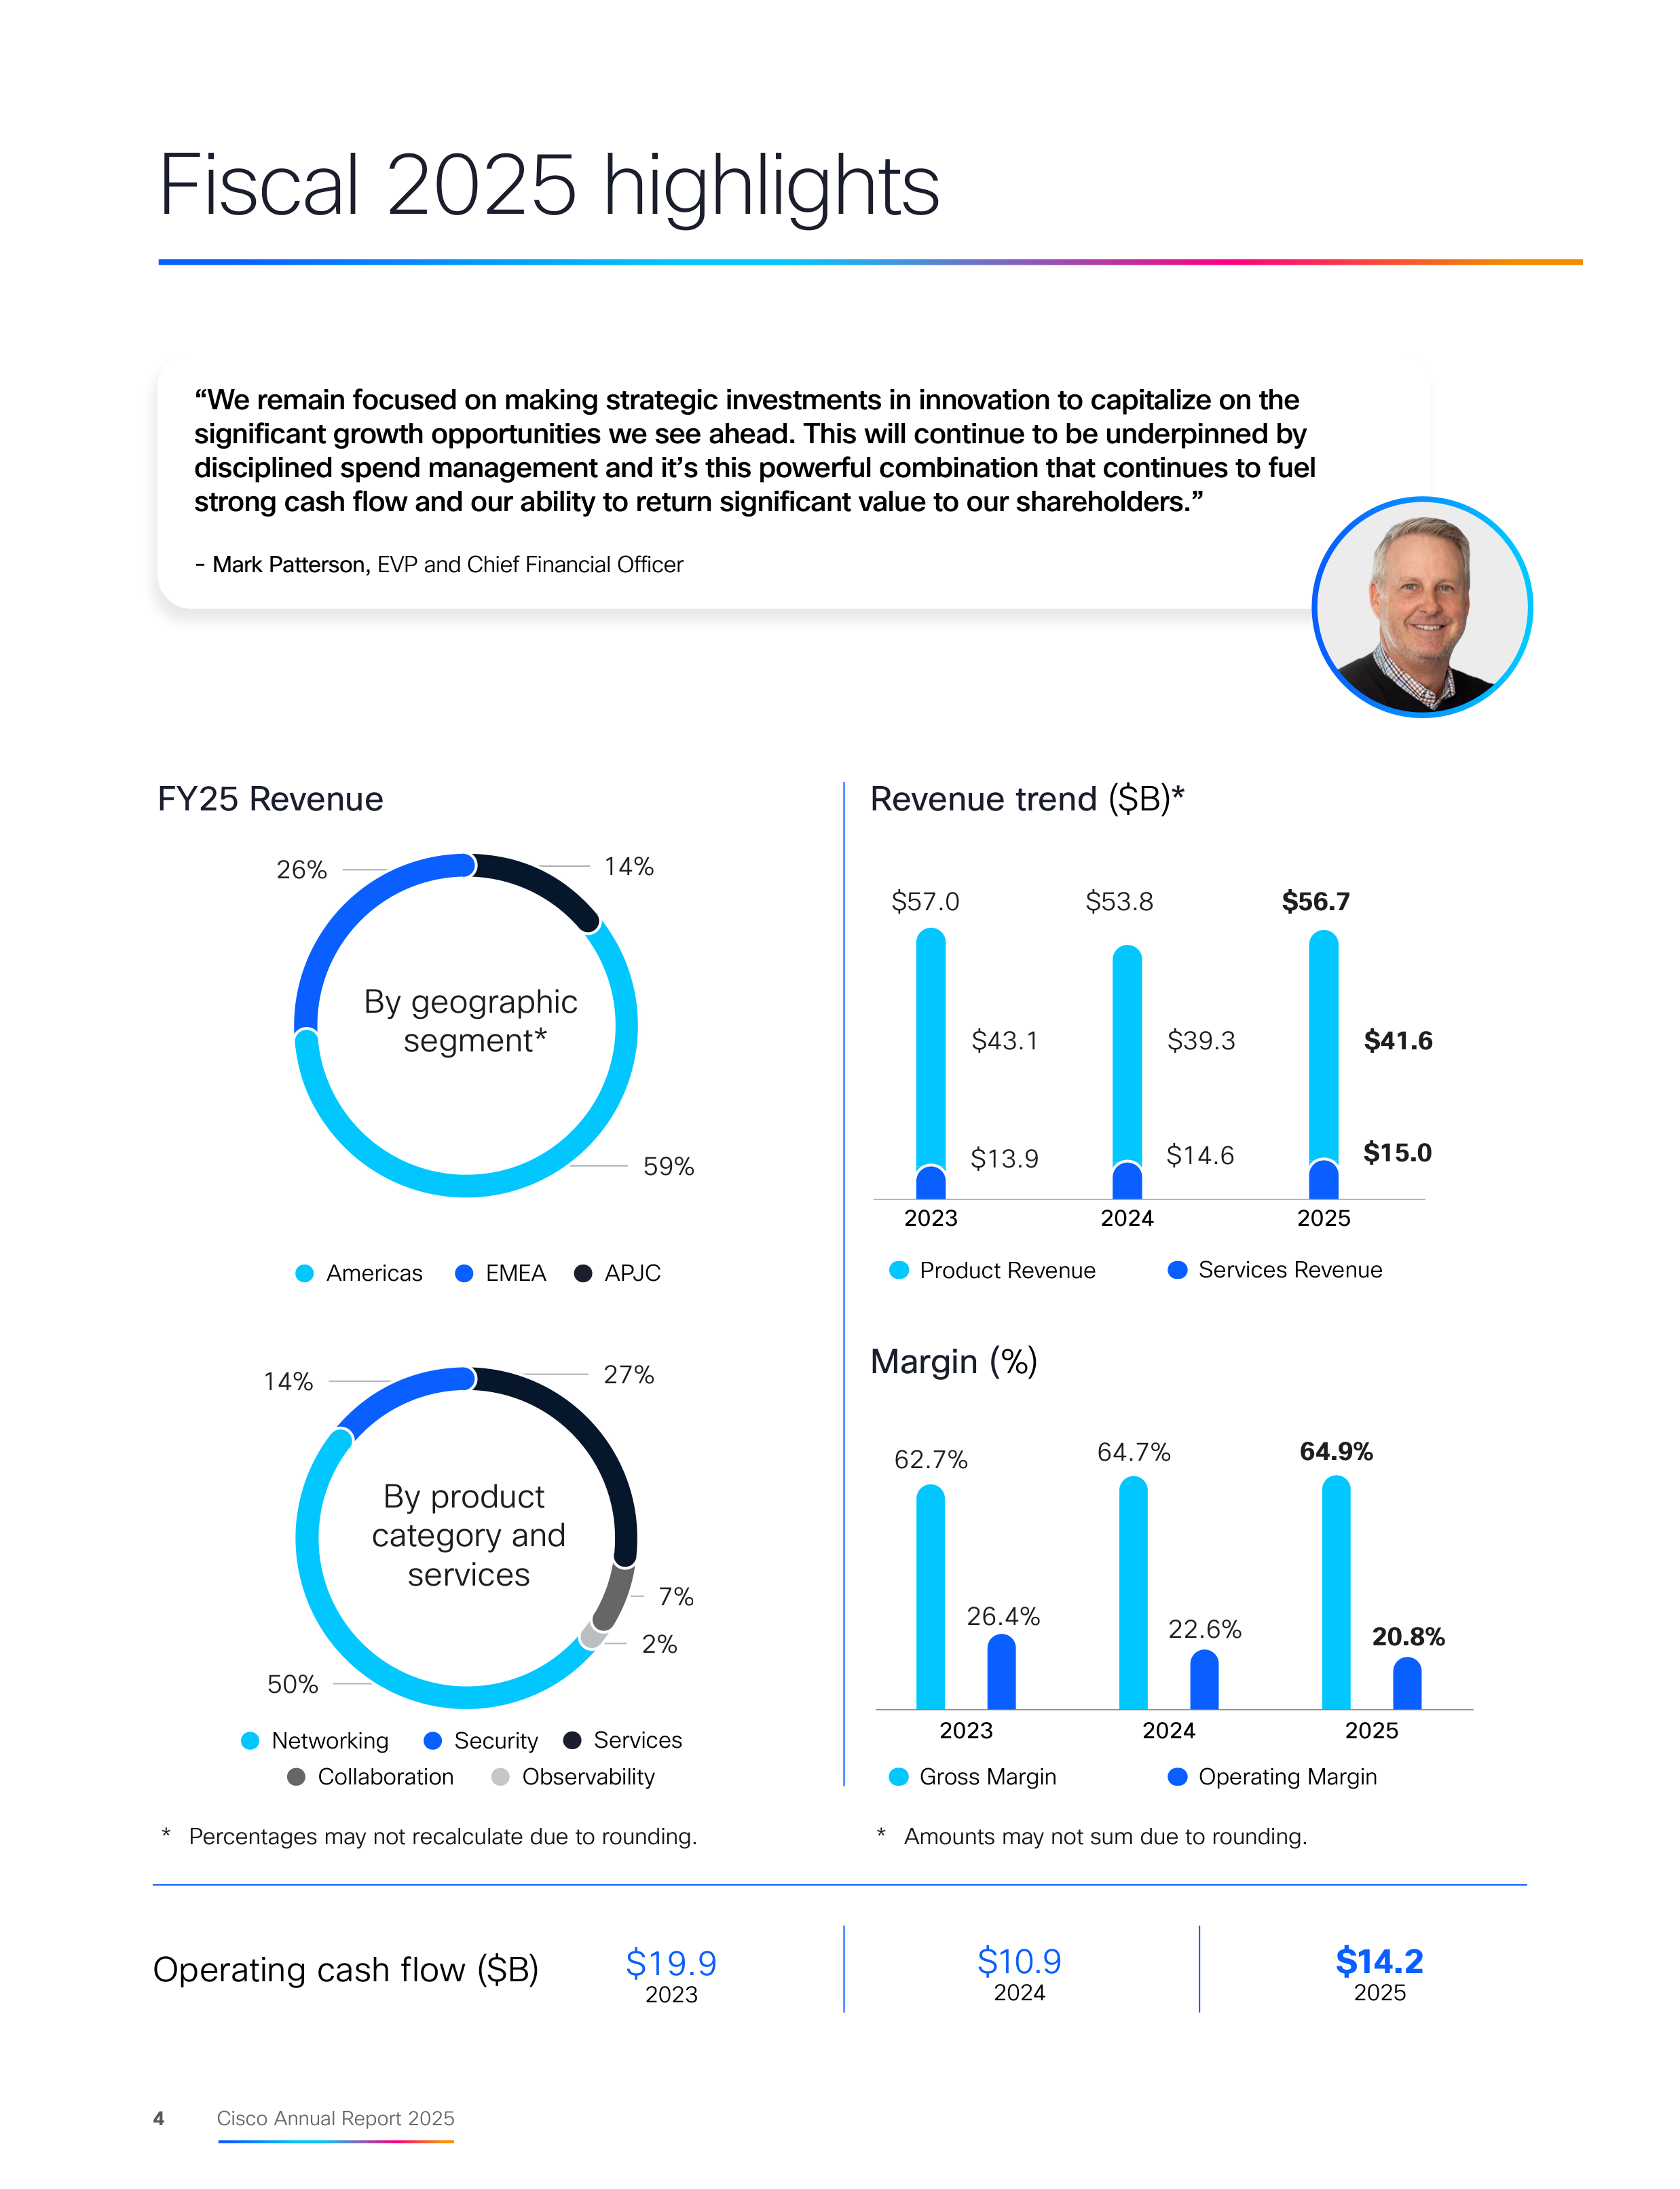
customers. We ended the year with revenue up 5% year
over year at $56.7 billion and solid growth in annualized
recurring revenue and remaining performance obligations
which provide the foundation for our future performance.
We also delivered strong profitability for the full fiscal
year, fueled by Splunk and the strength of our recurring
revenue streams which now make up more than half of our
total revenue.
Once again, we were able to return significant value to our
stockholders through dividends and share repurchases in
fiscal 2025, returning a total of $12.4 billion, or 94% of our
free cash flow.
Providing the critical infrastructure
for the AI era
AI is a tailwind for our business today as well as a multi-year
opportunity ahead. As a trusted partner for our customers
across every industry and geography, Cisco is ideally
positioned to lead this generational transition and provide
the valuable outcomes our customers need to succeed.
We received more than $2 billion of AI infrastructure orders
from webscale customers in fiscal 2025, more than double
our initial target. Our momentum is a testament to the agility
of our teams and demonstrates the undeniable capability
and relevance of our technology, particularly our Silicon One
Letter to stockholders
To our stockholders,
architecture, for multiple back-end use cases with the most
technologically advanced customers.
While Enterprises are still in early stages of AI deployment,
our expanding collaboration with NVIDIA enables us to
deliver simple, scalable and secure solutions needed
for their environments. Together, we are committed to
combining Cisco’s and NVIDIA’s respective strengths in
networking and AI computing to provide customers with a
holistic solution to implement and scale AI technologies.
In fiscal 2025, we forged new alliances with global partners,
including HUMAIN in Saudi Arabia, G42 in the UAE, and the
AI Infrastructure Partnership (AIP), further positioning Cisco
as a preferred technology partner for the development of
sovereign AI clouds worldwide. We believe Cisco will be a
core system provider for these significant AI training and
inference cluster buildouts and integral to their development
and eventual hyper-scaling.
Laser-focused on security
While AI remains one of the largest opportunities, it cannot
be at the expense of security. As we move into the next
phase of AI, with agents autonomously conducting tasks
alongside humans, the capacity requirements of the
network will be compounded to accommodate increased
network traffic, bringing with it new vulnerabilities and more
sophisticated threats.
By combining Splunk’s powerful data analytics and Security
Information and Event Management (SIEM) capabilities with
Cisco’s extensive networking and security portfolio, we
are creating a unified platform for enhanced visibility and
3
Cisco Annual Report 2025
“The next phase of AI, driven
by autonomous agents in
constant interaction, will create
unprecedented demand for faster,
more intelligent, and more secure
networks. With the powerful and
unique combination of silicon,
networking and security, Cisco
is ideally positioned and fully
equipped to meet this demand.”
security across an organization’s entire digital footprint. To
date, we have completed over a dozen data integrations,
helping organizations move beyond threat detection to
prediction and prevention and enabling them to leverage AI
for innovation while protecting critical assets.
Our new and refreshed security products, including Secure
Access, XDR, Hypershield, Firewalls, and AI Defense,
continued to ramp in fiscal 2025, ending the year with over
2,000 customers collectively. The vast majority of our new
Hypershield Enterprise customers are bundling with our new
N9300 Smart Switch, embedding security directly into the
fabric of the network – a necessary capability for Agentic AI,
and one that only Cisco can deliver.
Accelerated pace of innovation
We also delivered our largest innovation payload to date
in fiscal 2025, announcing more than 20 new offerings
to help customers build AI-ready data centers and
future-proof their workplaces with a foundational layer of
digital resilience.
We introduced new Smart Switches for the data center and
campus powered by Silicon One, which deliver enhanced
performance, quantum-secure networking and simplified
cloud-native and AI-driven operations. The launch of these
switches, along with highly secure routers, wireless access
points, and IoT devices, marks the beginning of a major,
multi-year product refresh opportunity for Cisco.
To help organizations confidently develop, deploy and
secure AI applications, we introduced Cisco AI Defense,
a powerful tool to identify AI assets being used across
customer environments and detect misconfigurations and
vulnerabilities, while protecting applications against evolving
threats. We also launched Cisco AI Canvas, a revolutionary,
generative user interface for real-time collaboration between
network and security operations teams. Powered by Cisco’s
advanced Deep Network Model, AI Canvas unifies real-time
telemetry across various platforms to simplify IT operations
and accelerate troubleshooting.
All our new offerings, spanning core networking products,
advanced security solutions, and unified management tools,
are designed with a foundation of AI, further strengthening
Cisco’s platform advantage, where every added technology
compounds the value of a customer’s existing investment.
I’m also proud of how our teams continue to lead by
example, with nearly every organization using AI to enhance
productivity and collaboration internally and with customers.
For example, Cisco Customer Experience has deployed AI
agents for in-product support, adoption and renewals, with
over two-thirds of support cases now addressed using AI.
Additionally, we saw increased usage of our proprietary AI
application, Circuit. Launched this past year, Circuit is now
adopted by over 85,000 employees with nearly 100,000
interactions per workday.
Confidence in our future
Overall, our strong performance in fiscal 2025 has
established a solid foundation for durable, profitable growth
as we turn our focus to delivering Cisco’s strongest year yet
in fiscal 2026. The next phase of AI, driven by autonomous
agents in constant interaction, will create unprecedented
demand for faster, more intelligent, and more secure
networks. With the powerful and unique combination of
silicon, networking and security, Cisco is ideally positioned
and fully equipped to meet this demand.
I’d like to close by extending my deepest gratitude to our
teams. Their dedication to our business and unwavering
commitment to our Purpose—to Power an Inclusive Future
for All—paired with urgency in execution, are what fuel all
our achievements. Additionally, the unparalleled strength
and reach of our partner ecosystem amplifies our success
and allows us to continue delivering greater value for our
customers in the AI era.
Finally, to you, our stockholders, thank you for your
continued support and belief in Cisco. We are excited about
the journey ahead and are committed to building on our
achievements in fiscal year 2026 to create even greater
long-term value for you.
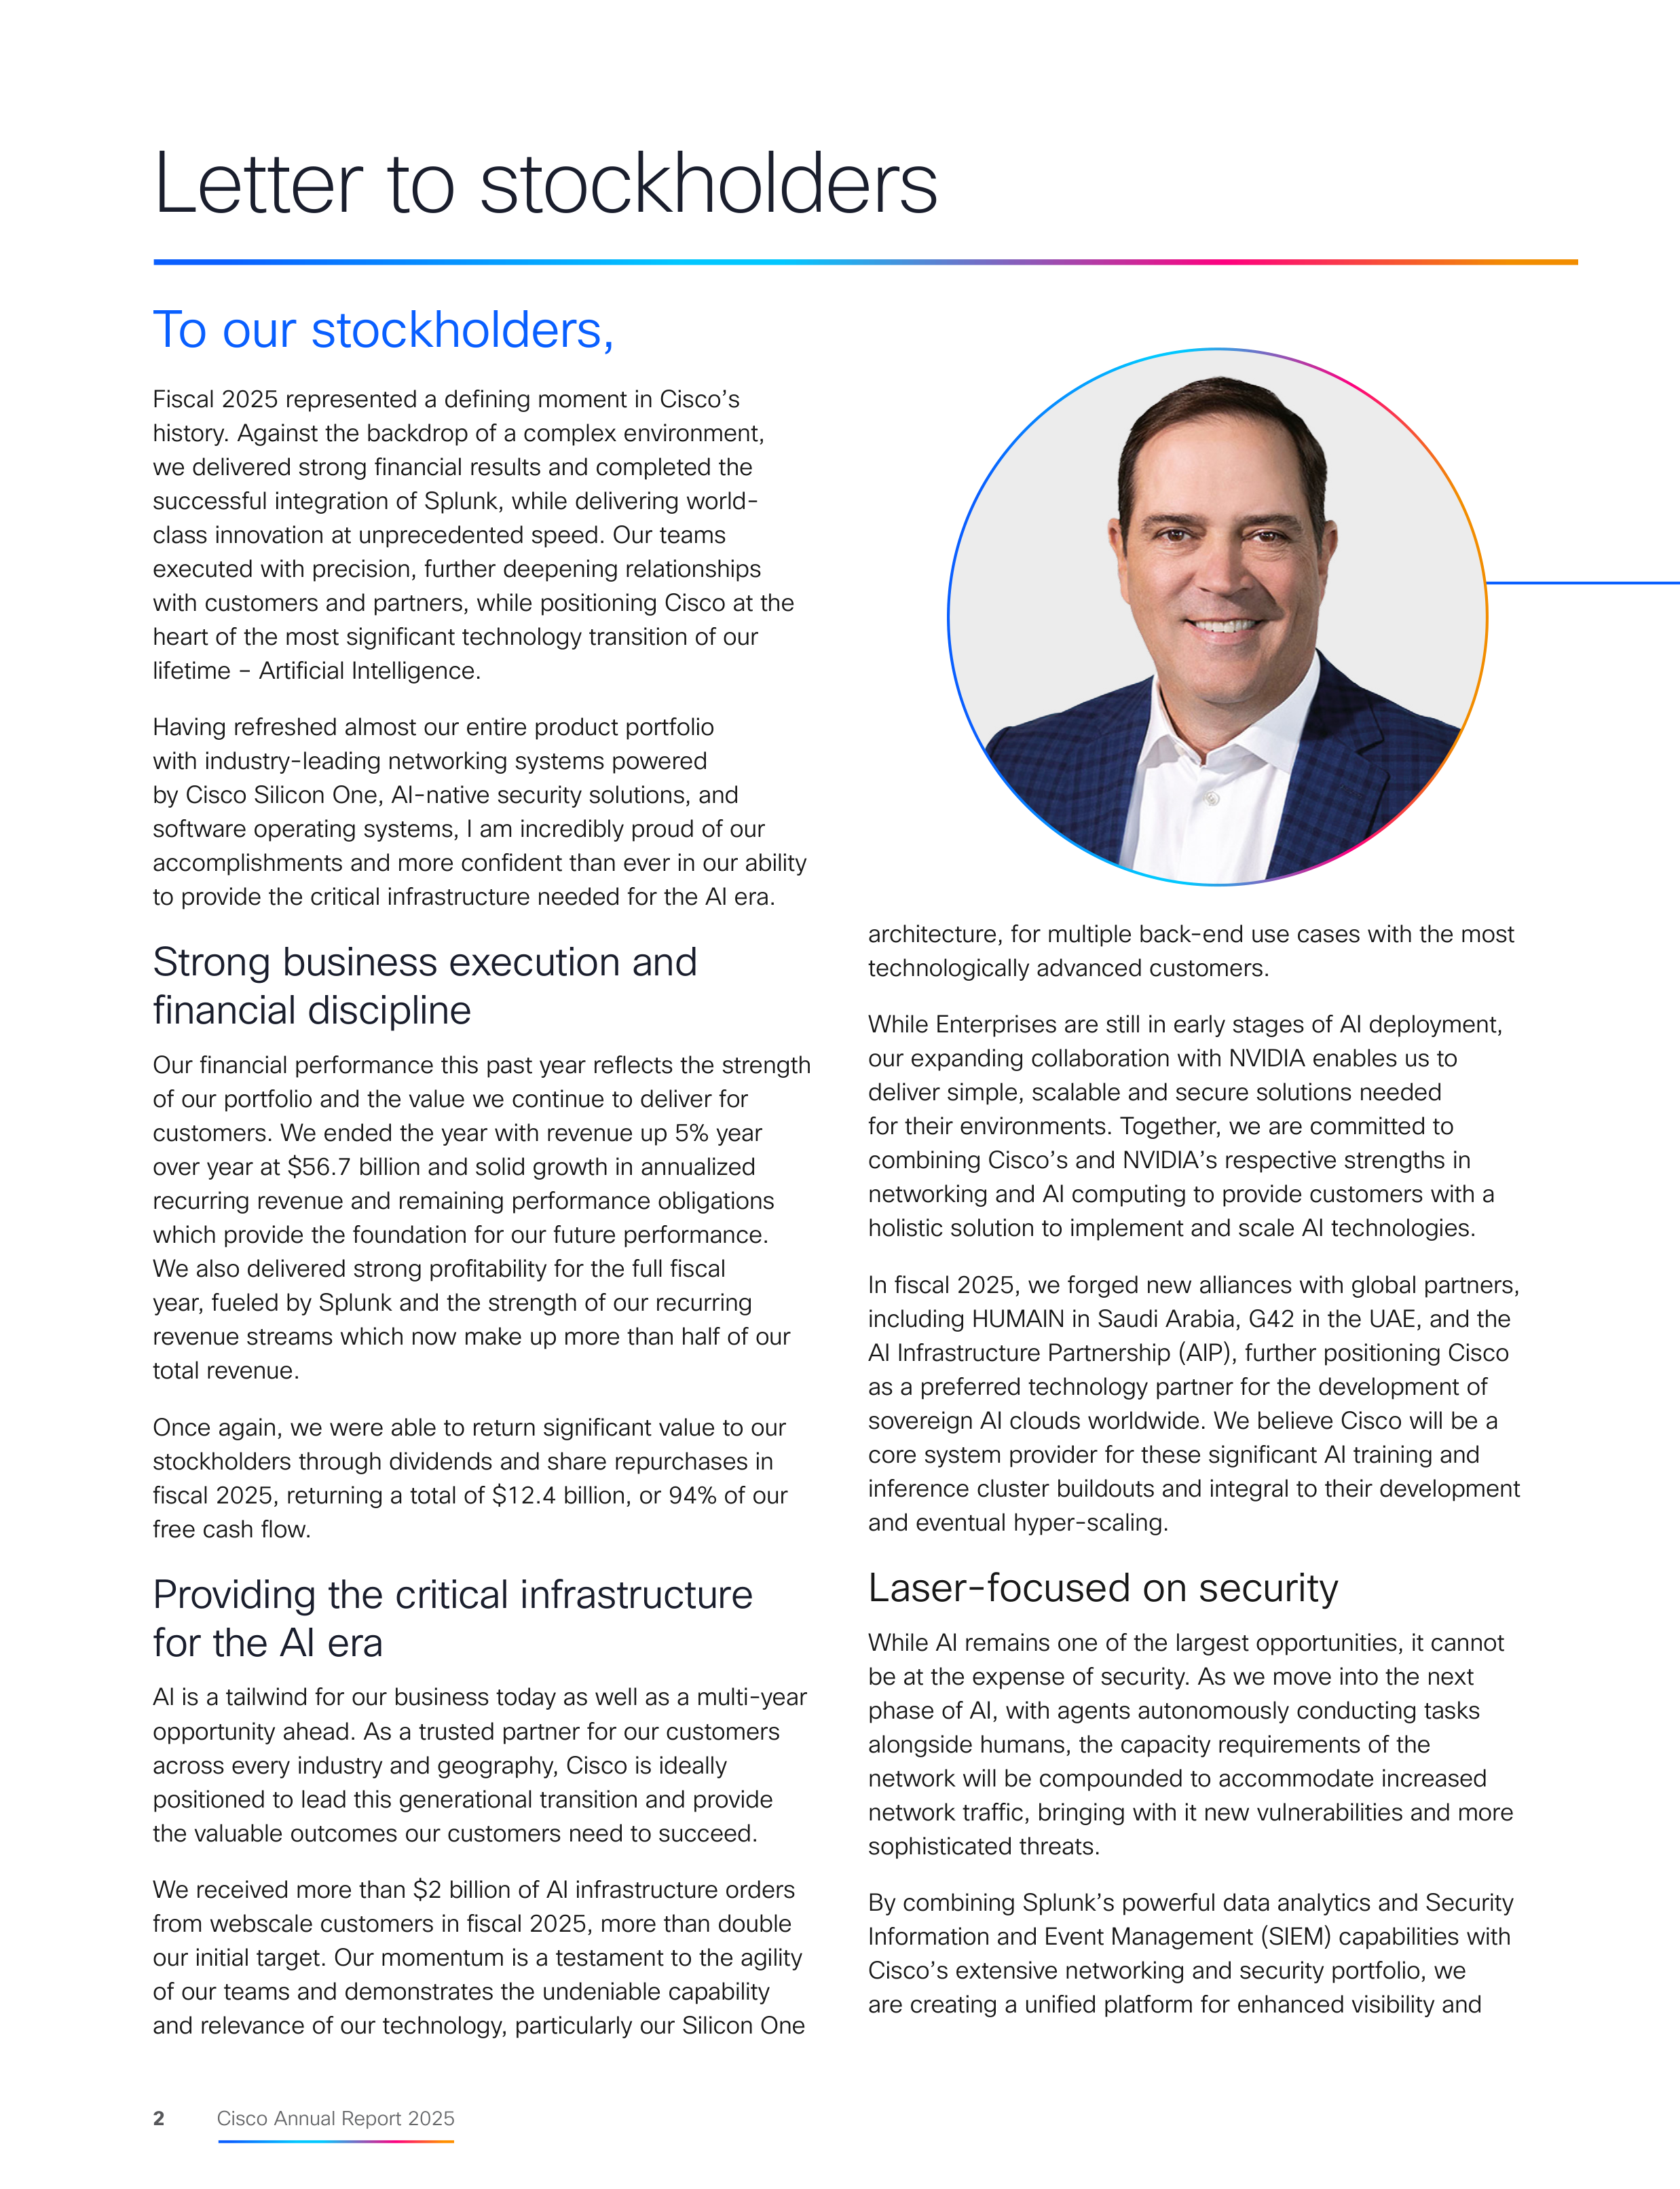
Chuck Robbins
Chair and Chief Executive Officer

4
Cisco Annual Report 2025
Services Revenue
Product Revenue
Gross Margin
Operating Margin
Fiscal 2025 highlights
“We remain focused on making strategic investments in innovation to capitalize on the
significant growth opportunities we see ahead. This will continue to be underpinned by
disciplined spend management and it’s this powerful combination that continues to fuel
strong cash flow and our ability to return significant value to our shareholders.”
- Mark Patterson,
EVP and Chief Financial Officer
FY25 Revenue
Revenue trend
($B)
*
Margin (
%)
26%
59%
14%
By geographic
segment*
2%
7%
50%
27%
By product
category and
services
14%
EMEA
APJC
Americas
Operating cash flow ($B)
$19.9
2023
$10.9
2024
$14.2
2025
*
Percentages may not recalculate due to rounding.
$39.3
$57.0
$56.7
$53.8
2025
2024
2023
$14.6
$41.6
$15.0
$43.1
$13.9
62.7%
26.4%
64.7%
22.6%
2025
2024
2023
64.9%
20.8%
Observability
Services
Security
Collaboration
Networking
*
Amounts may not sum due to rounding.
5
Cisco Annual Report 2025
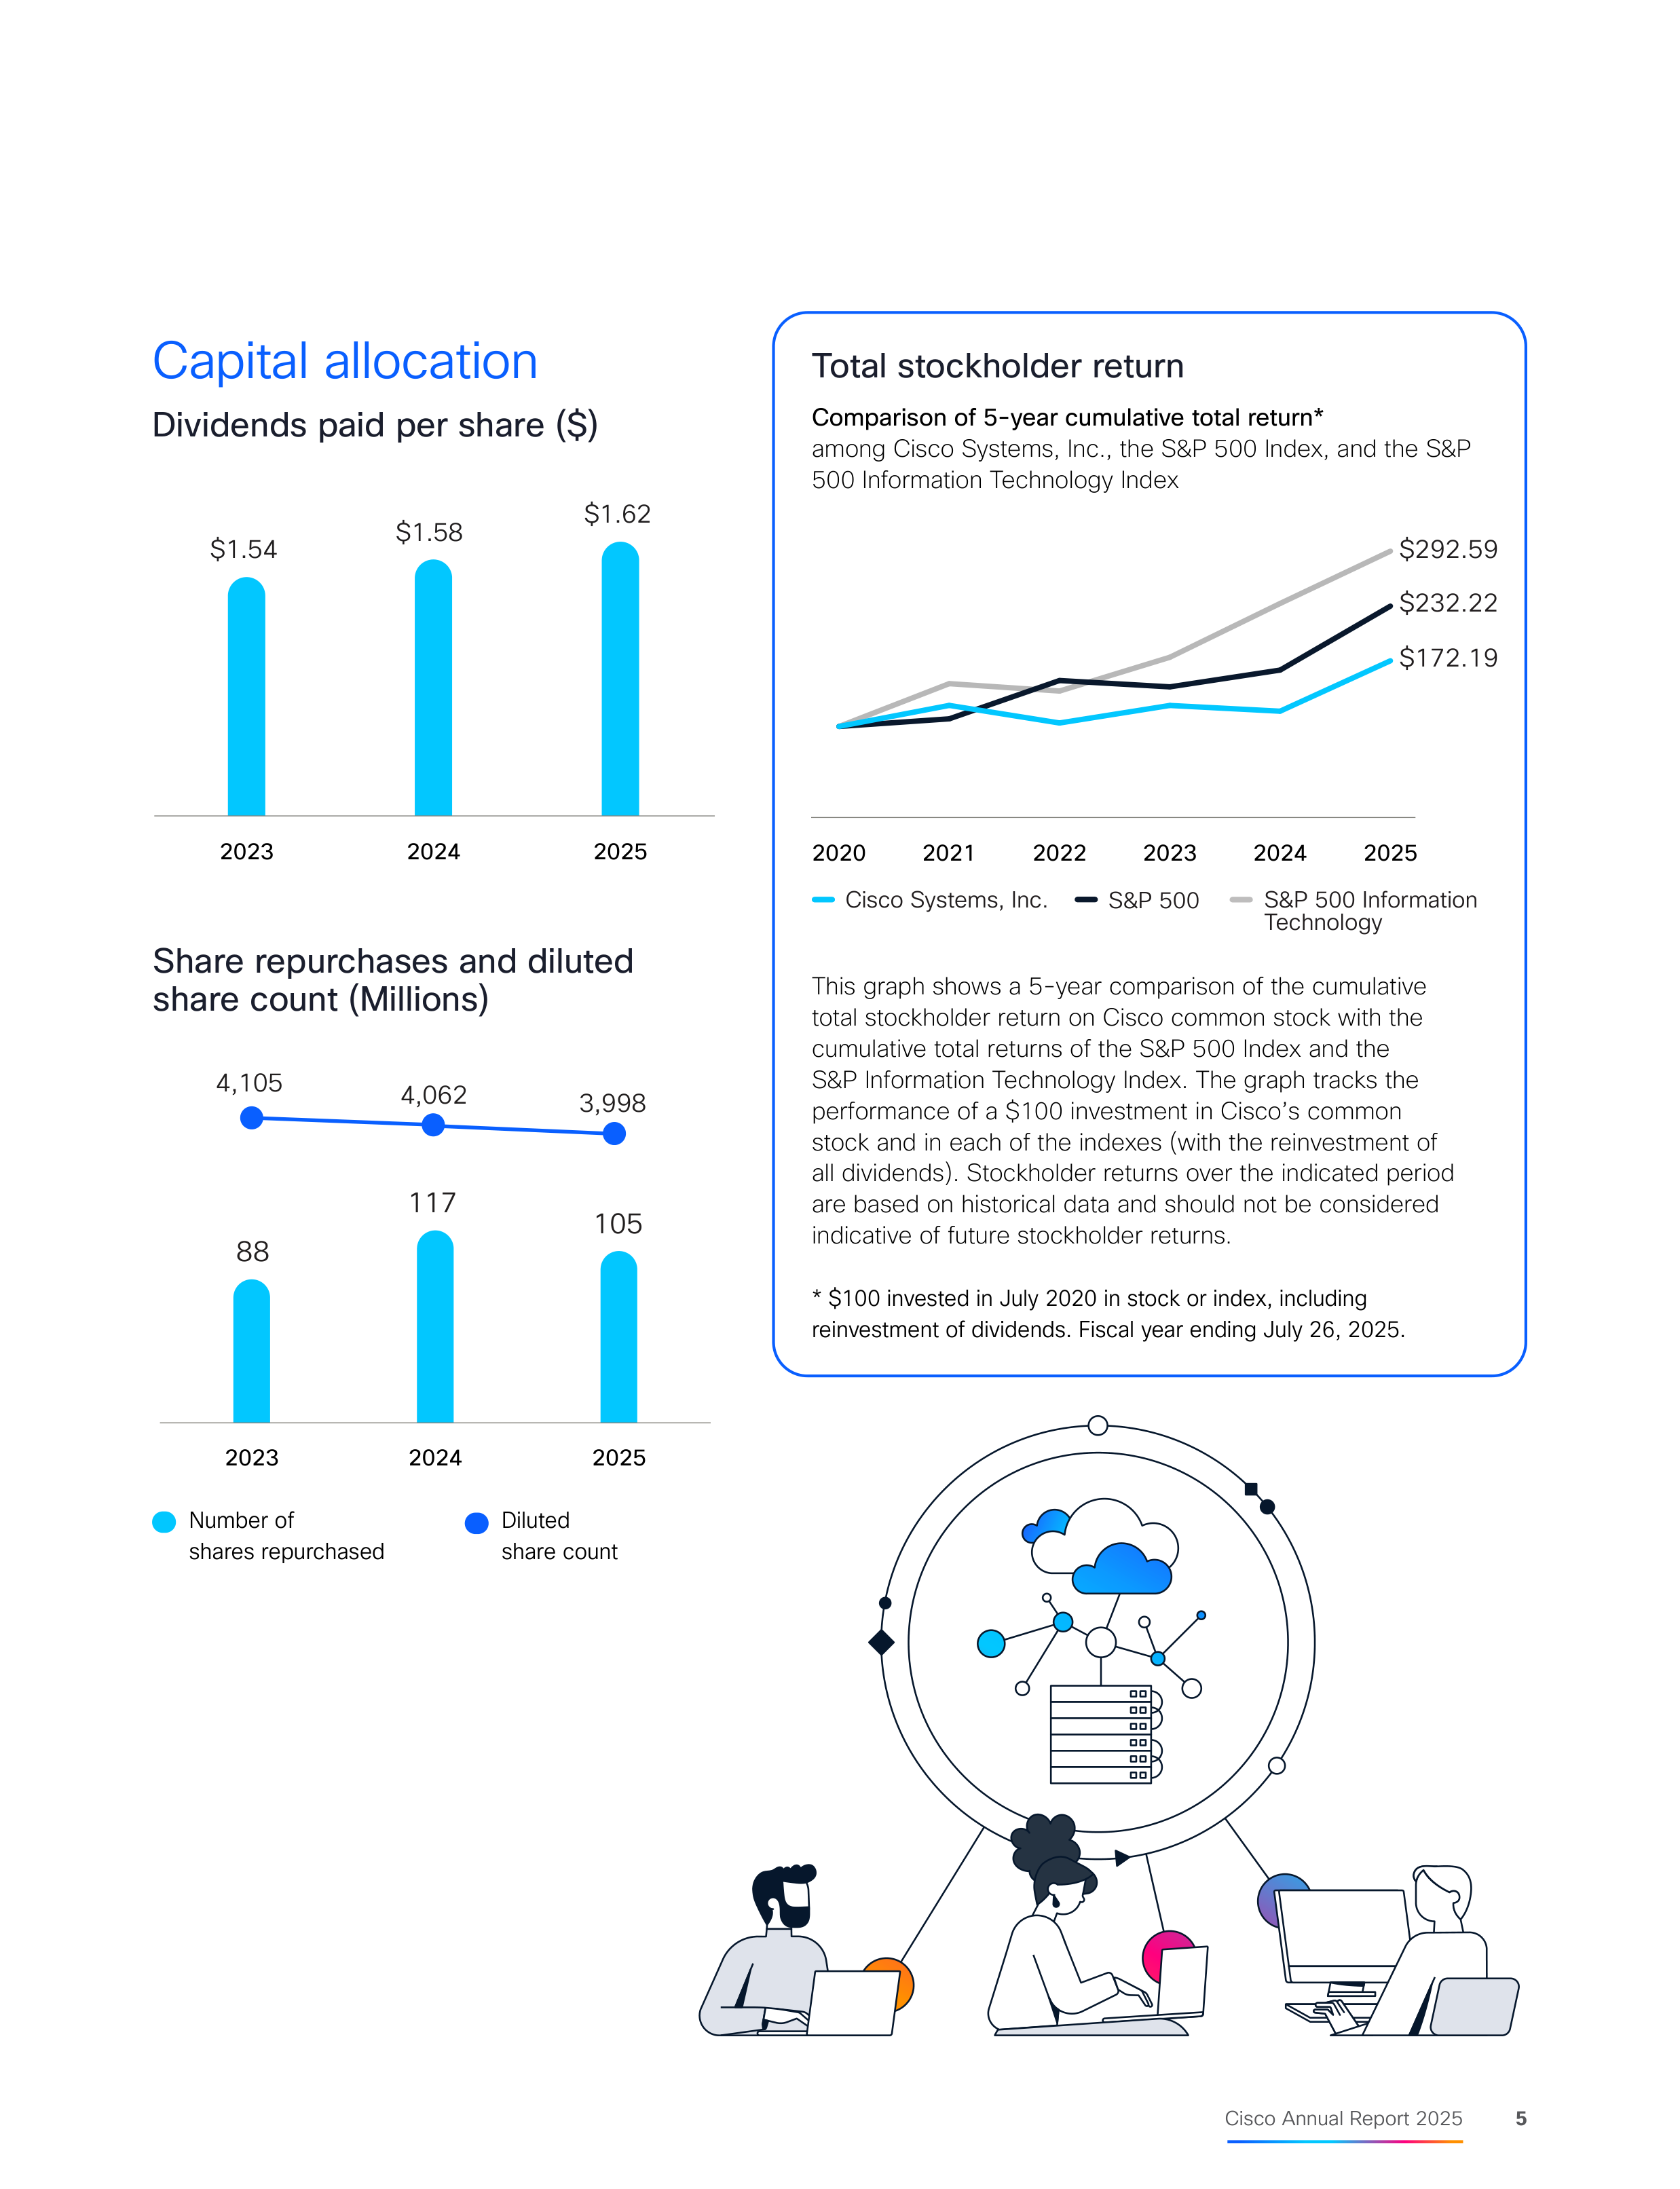
Capital allocation
Dividends paid per share ($)
Share repurchases and diluted
share count (Millions)
2025
2024
2023
$1.54
$1.58
$1.62
Number of
shares repurchased
Diluted
share count
4,105
4,062
2025
2024
2023
88
117
105
3,998
Total stockholder return
Comparison of 5-year cumulative total return*
among Cisco Systems, Inc., the S&P 500 Index, and the S&P
500 Information Technology Index
Cisco Systems, Inc.
S&P 500
S&P 500 Information
Technology
2025
2024
2023
2022
2021
2020
$292.59
$232.22
$172.19
This graph shows a 5-year comparison of the cumulative
total stockholder return on Cisco common stock with the
cumulative total returns of the S&P 500 Index and the
S&P Information Technology Index. The graph tracks the
performance of a $100 investment in Cisco’s common
stock and in each of the indexes (with the reinvestment of
all dividends). Stockholder returns over the indicated period
are based on historical data and should not be considered
indicative of future stockholder returns.
* $100 invested in July 2020 in stock or index, including
reinvestment of dividends. Fiscal year ending July 26, 2025.
6
Cisco Annual Report 2025
Cisco strategy and priorities
In today's digital-first world, businesses and organizations everywhere are deploying technology
to pursue their strategic objectives, from accelerating growth to enhancing operational efficiency
and fostering innovation. Our strategy is to securely connect everything to make those desired
outcomes possible.
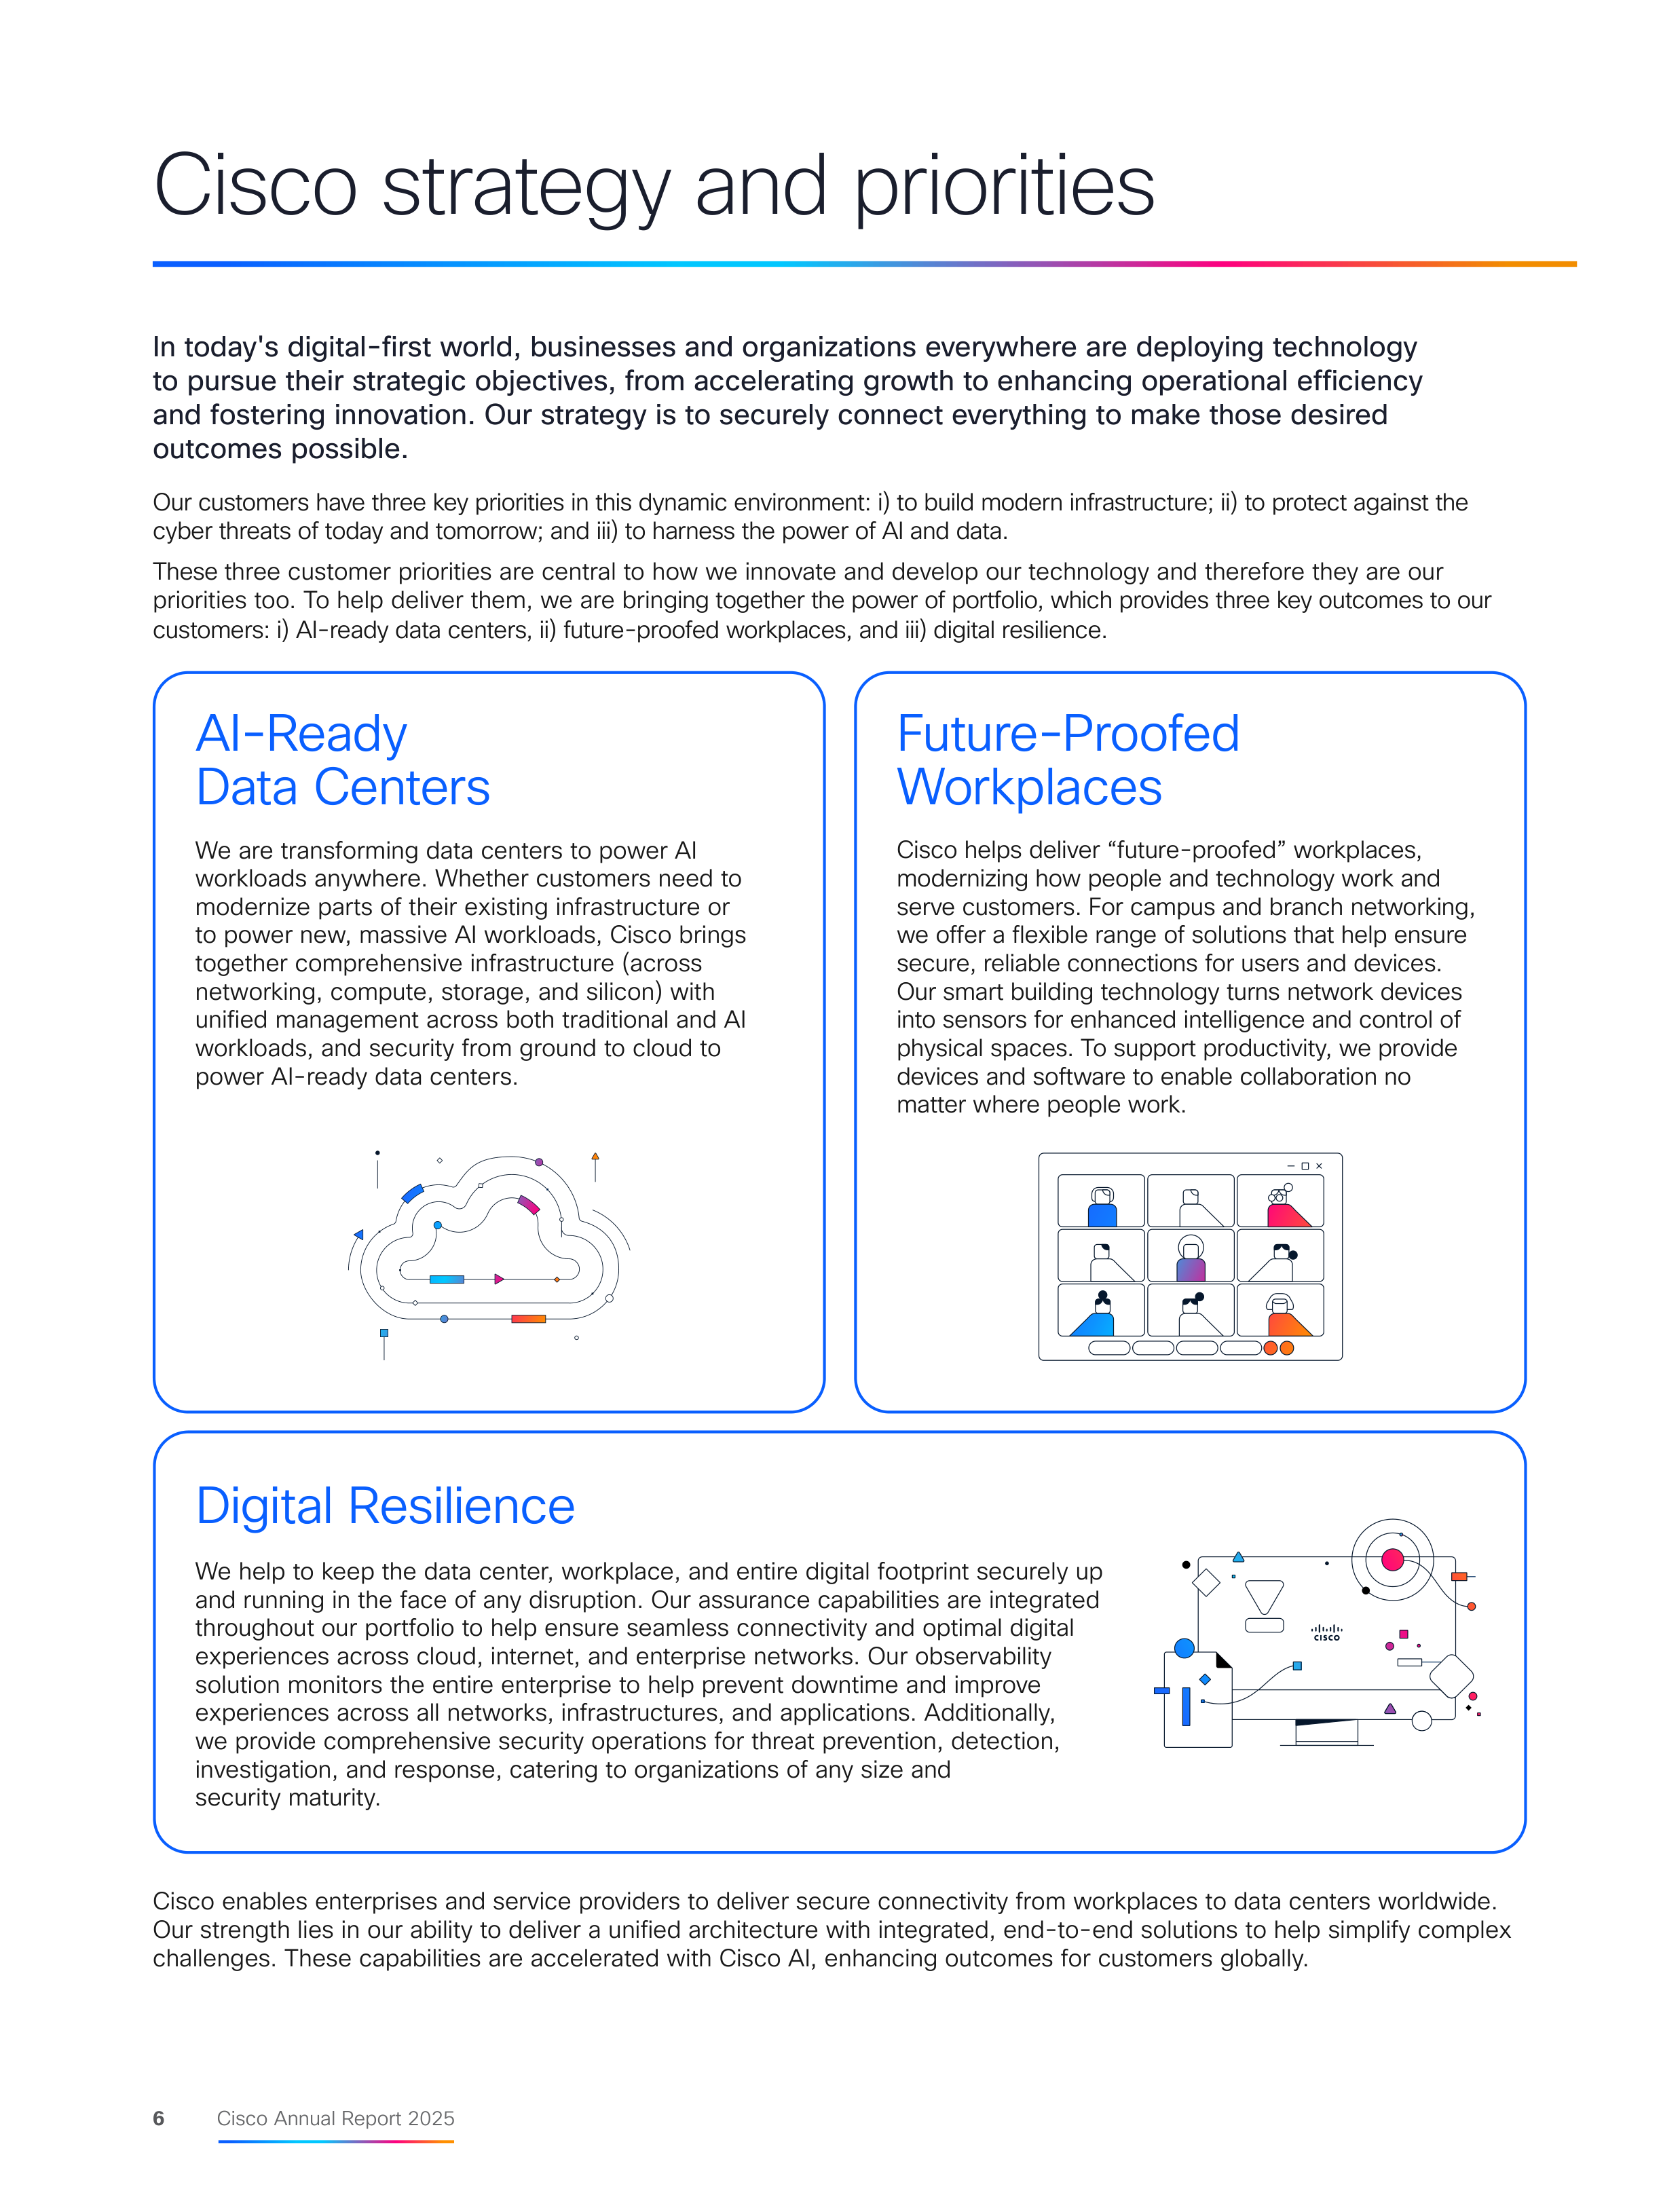
Our customers have three key priorities in this dynamic environment: i) to build modern infrastructure; ii) to protect against the
cyber threats of today and tomorrow; and iii) to harness the power of AI and data.
These three customer priorities are central to how we innovate and develop our technology and therefore they are our
priorities too. To help deliver them, we are bringing together the power of portfolio, which provides three key outcomes to our
customers: i) AI-ready data centers, ii) future-proofed workplaces, and iii) digital resilience.
AI-Ready
Data Centers
Future-Proofed
Workplaces
We are transforming data centers to power AI
workloads anywhere. Whether customers need to
modernize parts of their existing infrastructure or
to power new, massive AI workloads, Cisco brings
together comprehensive infrastructure (across
networking, compute, storage, and silicon) with
unified management across both traditional and AI
workloads, and security from ground to cloud to
power AI-ready data centers.
Cisco helps deliver “future-proofed” workplaces,
modernizing how people and technology work and
serve customers. For campus and branch networking,
we offer a flexible range of solutions that help ensure
secure, reliable connections for users and devices.
Our smart building technology turns network devices
into sensors for enhanced intelligence and control of
physical spaces. To support productivity, we provide
devices and software to enable collaboration no
matter where people work.
Digital Resilience
We help to keep the data center, workplace, and entire digital footprint securely up
and running in the face of any disruption. Our assurance capabilities are integrated
throughout our portfolio to help ensure seamless connectivity and optimal digital
experiences across cloud, internet, and enterprise networks. Our observability
solution monitors the entire enterprise to help prevent downtime and improve
experiences across all networks, infrastructures, and applications. Additionally,
we provide comprehensive security operations for threat prevention, detection,
investigation, and response, catering to organizations of any size and
security maturity.
Cisco enables enterprises and service providers to deliver secure connectivity from workplaces to data centers worldwide.
Our strength lies in our ability to deliver a unified architecture with integrated, end-to-end solutions to help simplify complex
challenges. These capabilities are accelerated with Cisco AI, enhancing outcomes for customers globally.














7
Cisco Annual Report 2025
Leadership
Cisco’s executive leadership team
Liz Centoni
EVP and Chief Customer
Experience Officer
Ammar Maraqa
SVP and Chief
Strategy Officer
Martin Lund
EVP, Common
Hardware Group
Eyal Dagan
EVP, Strategic Projects
Dev Stahlkopf
EVP and Chief
Legal Officer
Francine Katsoudas
EVP and Chief People,
Policy & Purpose Officer
Chuck Robbins
Chair and Chief Executive
Officer
Leadership@Cisco
Learn more about Cisco’s executive leadership team at
https://newsroom.cisco.com/c/r/newsroom/en/us/executives.html
Carrie Palin
SVP and Chief
Marketing Officer
Jeetu Patel
President and Chief
Product Officer
Mark Patterson
EVP and Chief
Financial Officer
Maria Poveromo
SVP and Chief
Communications Officer
Thimaya Subaiya
EVP, Operations
Oliver Tuszik
EVP, Global Sales and
Chief Sales Officer
8
Cisco Annual Report 2025
directly and through its committees, is responsible for the
oversight of our risk management. With the oversight of the
Board, our management team has implemented practices,
processes and programs designed to help manage the risks to
which we are exposed in our business and to align risk-taking
appropriately with our efforts to increase stockholder value.
Policies and practices
We have adopted policies, guidelines, and practices that are
consistent with our commitment to transparency and best-in-
class practices, as well as to ensure compliance with the rules
and regulations of the Securities and Exchange Commission
(“SEC”), the listing requirements of Nasdaq, and applicable
corporate governance requirements.
●
Stockholder proxy access
●
Annual election of all directors (since IPO)
●
Majority voting (since 2007)
●
Robust Lead Independent Director role
●
Recoupment (“Clawback”) policy
●
Stock ownership guidelines for directors and executive
officers
●
Stockholder recommendations for director candidates to
the Board
●
Stockholder right to act by written consent (since IPO)
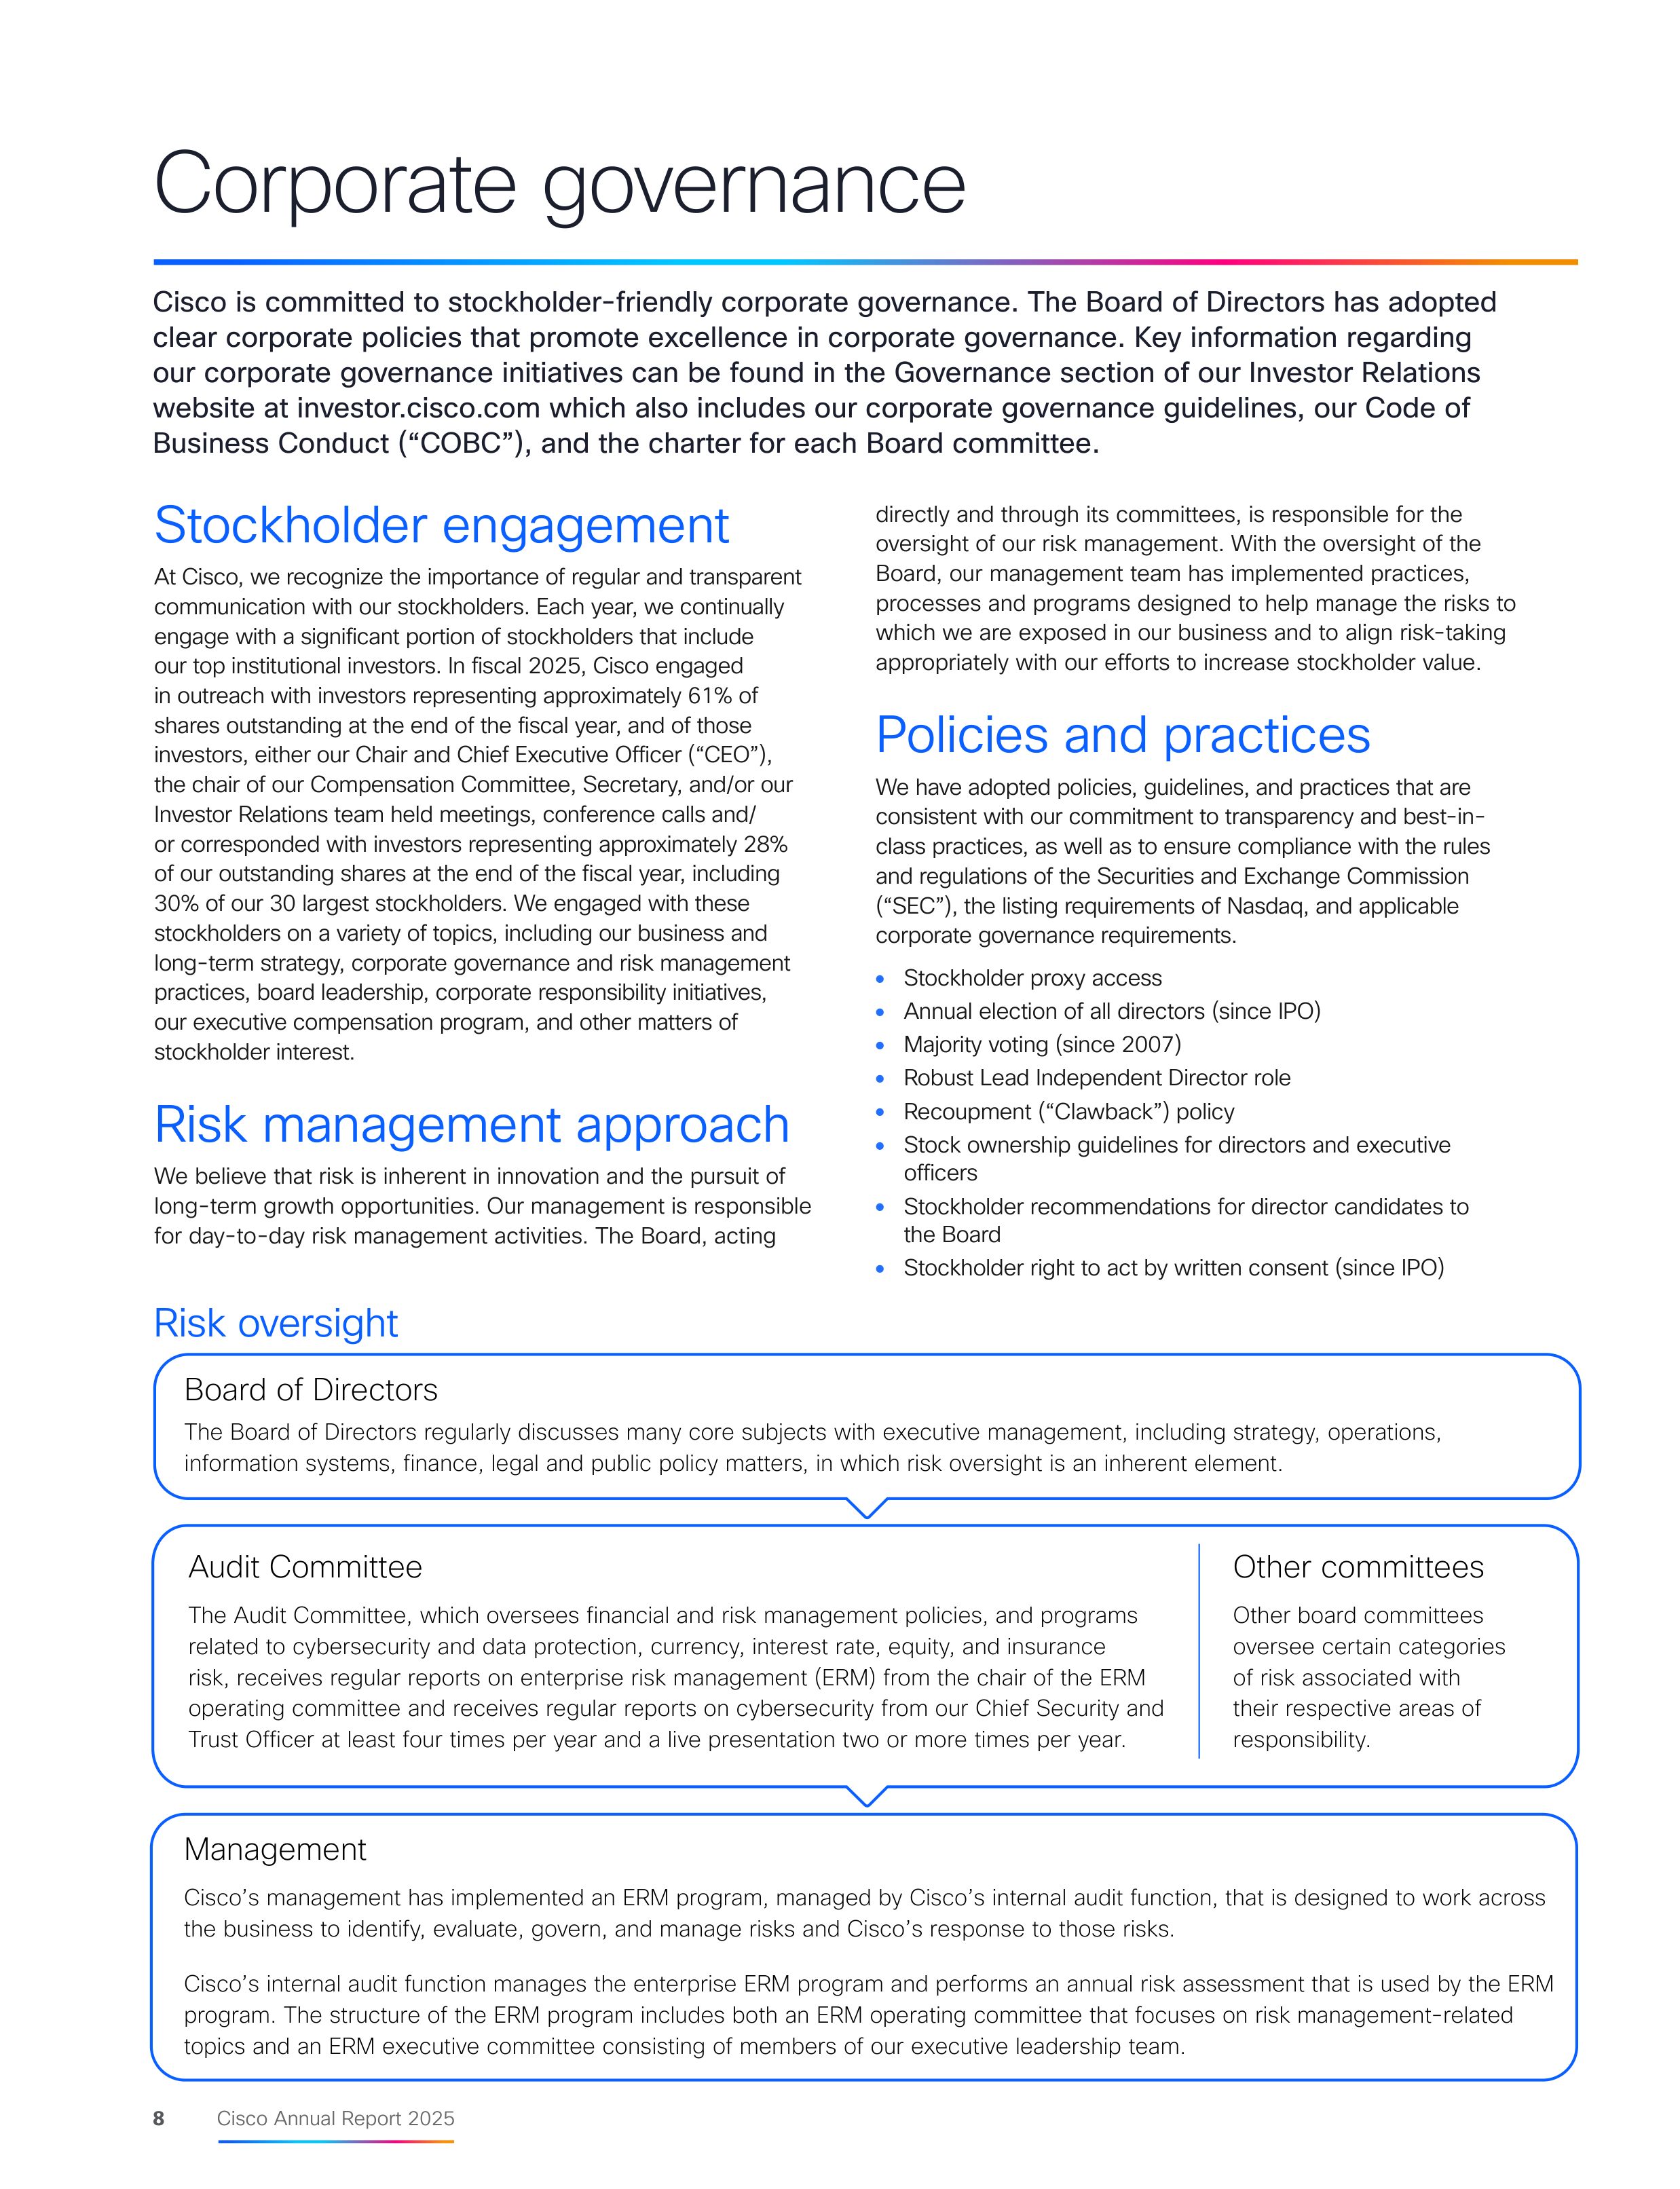
Cisco is committed to stockholder-friendly corporate governance. The Board of Directors has adopted
clear corporate policies that promote excellence in corporate governance. Key information regarding
our corporate governance initiatives can be found in the Governance section of our Investor Relations
website at investor.cisco.com which also includes our corporate governance guidelines, our Code of
Business Conduct (“COBC”), and the charter for each Board committee.
Stockholder engagement
At Cisco, we recognize the importance of regular and transparent
communication with our stockholders. Each year, we continually
engage with a significant portion of stockholders that include
our top institutional investors. In fiscal 2025, Cisco engaged
in outreach with investors representing approximately 61% of
shares outstanding at the end of the fiscal year, and of those
investors, either our Chair and Chief Executive Officer (“CEO”),
the chair of our Compensation Committee, Secretary, and/or our
Investor Relations team held meetings, conference calls and/
or corresponded with investors representing approximately 28%
of our outstanding shares at the end of the fiscal year, including
30% of our 30 largest stockholders. We engaged with these
stockholders on a variety of topics, including our business and
long-term strategy, corporate governance and risk management
practices, board leadership, corporate responsibility initiatives,
our executive compensation program, and other matters of
stockholder interest.
Risk management approach
We believe that risk is inherent in innovation and the pursuit of
long-term growth opportunities. Our management is responsible
for day-to-day risk management activities. The Board, acting
Corporate governance
Board of Directors
The Board of Directors regularly discusses many core subjects with executive management, including strategy, operations,
information systems, finance, legal and public policy matters, in which risk oversight is an inherent element.
Management
Cisco’s management has implemented an ERM program, managed by Cisco’s internal audit function, that is designed to work across
the business to identify, evaluate, govern, and manage risks and Cisco’s response to those risks.
Cisco’s internal audit function manages the enterprise ERM program and performs an annual risk assessment that is used by the ERM
program. The structure of the ERM program includes both an ERM operating committee that focuses on risk management-related
topics and an ERM executive committee consisting of members of our executive leadership team.
Audit Committee
The Audit Committee, which oversees financial and risk management policies, and programs
related to cybersecurity and data protection, currency, interest rate, equity, and insurance
risk, receives regular reports on enterprise risk management (ERM) from the chair of the ERM
operating committee and receives regular reports on cybersecurity from our Chief Security and
Trust Officer at least four times per year and a live presentation two or more times per year.
Other committees
Other board committees
oversee certain categories
of risk associated with
their respective areas of
responsibility.
Risk oversight
Executive compensation
The core of Cisco’s executive compensation philosophy and
practice continues to align real pay delivery with performance.
Cisco’s executive officers are compensated in a manner
consistent with Cisco’s business strategy, competitive practice,
sound corporate governance principles, and stockholder
interests and concerns. We believe our compensation
program is strongly aligned with the long-term interests of our
stockholders.
Our Compensation Committee relies on our regular stockholder
outreach and engagement activities, as well as more formal
channels to communicate with stockholders, including the
opportunity for our stockholders to cast a non-binding advisory
vote regarding executive compensation at Cisco’s annual
meeting of stockholders.
We continued our robust engagement with stockholders to
consider enhancements to our compensation program in fiscal
2025. In response to feedback received from stockholders
during our engagements, we introduced:
●
a three-year operating goal rather than annual performance
goals under the long-term incentive program,
●
a cap on our Total Shareholder Return (TSR) modifier
at target, in the event that our absolute TSR during the
three-year performance period is negative, and
●
a holding requirement to our stock ownership guidelines, to
further align NEO’s long-term interests with the creation of
long-term stockholder value.
The Compensation Committee will continue to seek out and
consider stockholder feedback in the future.
Our executive compensation program rewards performance
We apply leading executive compensation practices
%
Independent compensation
committee
%
Independent compensation
consultant
%
Comprehensive annual
compensation program
risk assessment
%
Annual compensation peer group
review
%
Caps on incentive compensation
%
Performance on specific initiatives
considered in the variable cash
incentive program for executive
officers
%
No employment, severance, or
change in control agreements for
our executive officers
%
Stock ownership guidelines and
holding requirements
%
Recoupment (“Clawback”) policy
%
Limited perquisites
%
No single-trigger vesting of equity
award grants
%
No stock option repricing or cash-
out of underwater equity awards
%
No supplemental executive
retirement plan or executive-
defined benefit pension plan
%
No golden parachute tax gross-ups
%
Broad anti-pledging and anti-
hedging policies
%
Compensation philosophy is
designed to attract and retain,
motivate performance, and
reward achievement
%
Performance measures are aligned
with stockholder interests
%
Majority of annual total
direct compensation is
performance-based
%
No dividends or dividend
equivalents are paid or settled on
unvested awards
1
As defined in our Proxy Statement for our 2025 Annual Meeting of Stockholders
9
Cisco Annual Report 2025
CEO
NEOs
other
than CEO
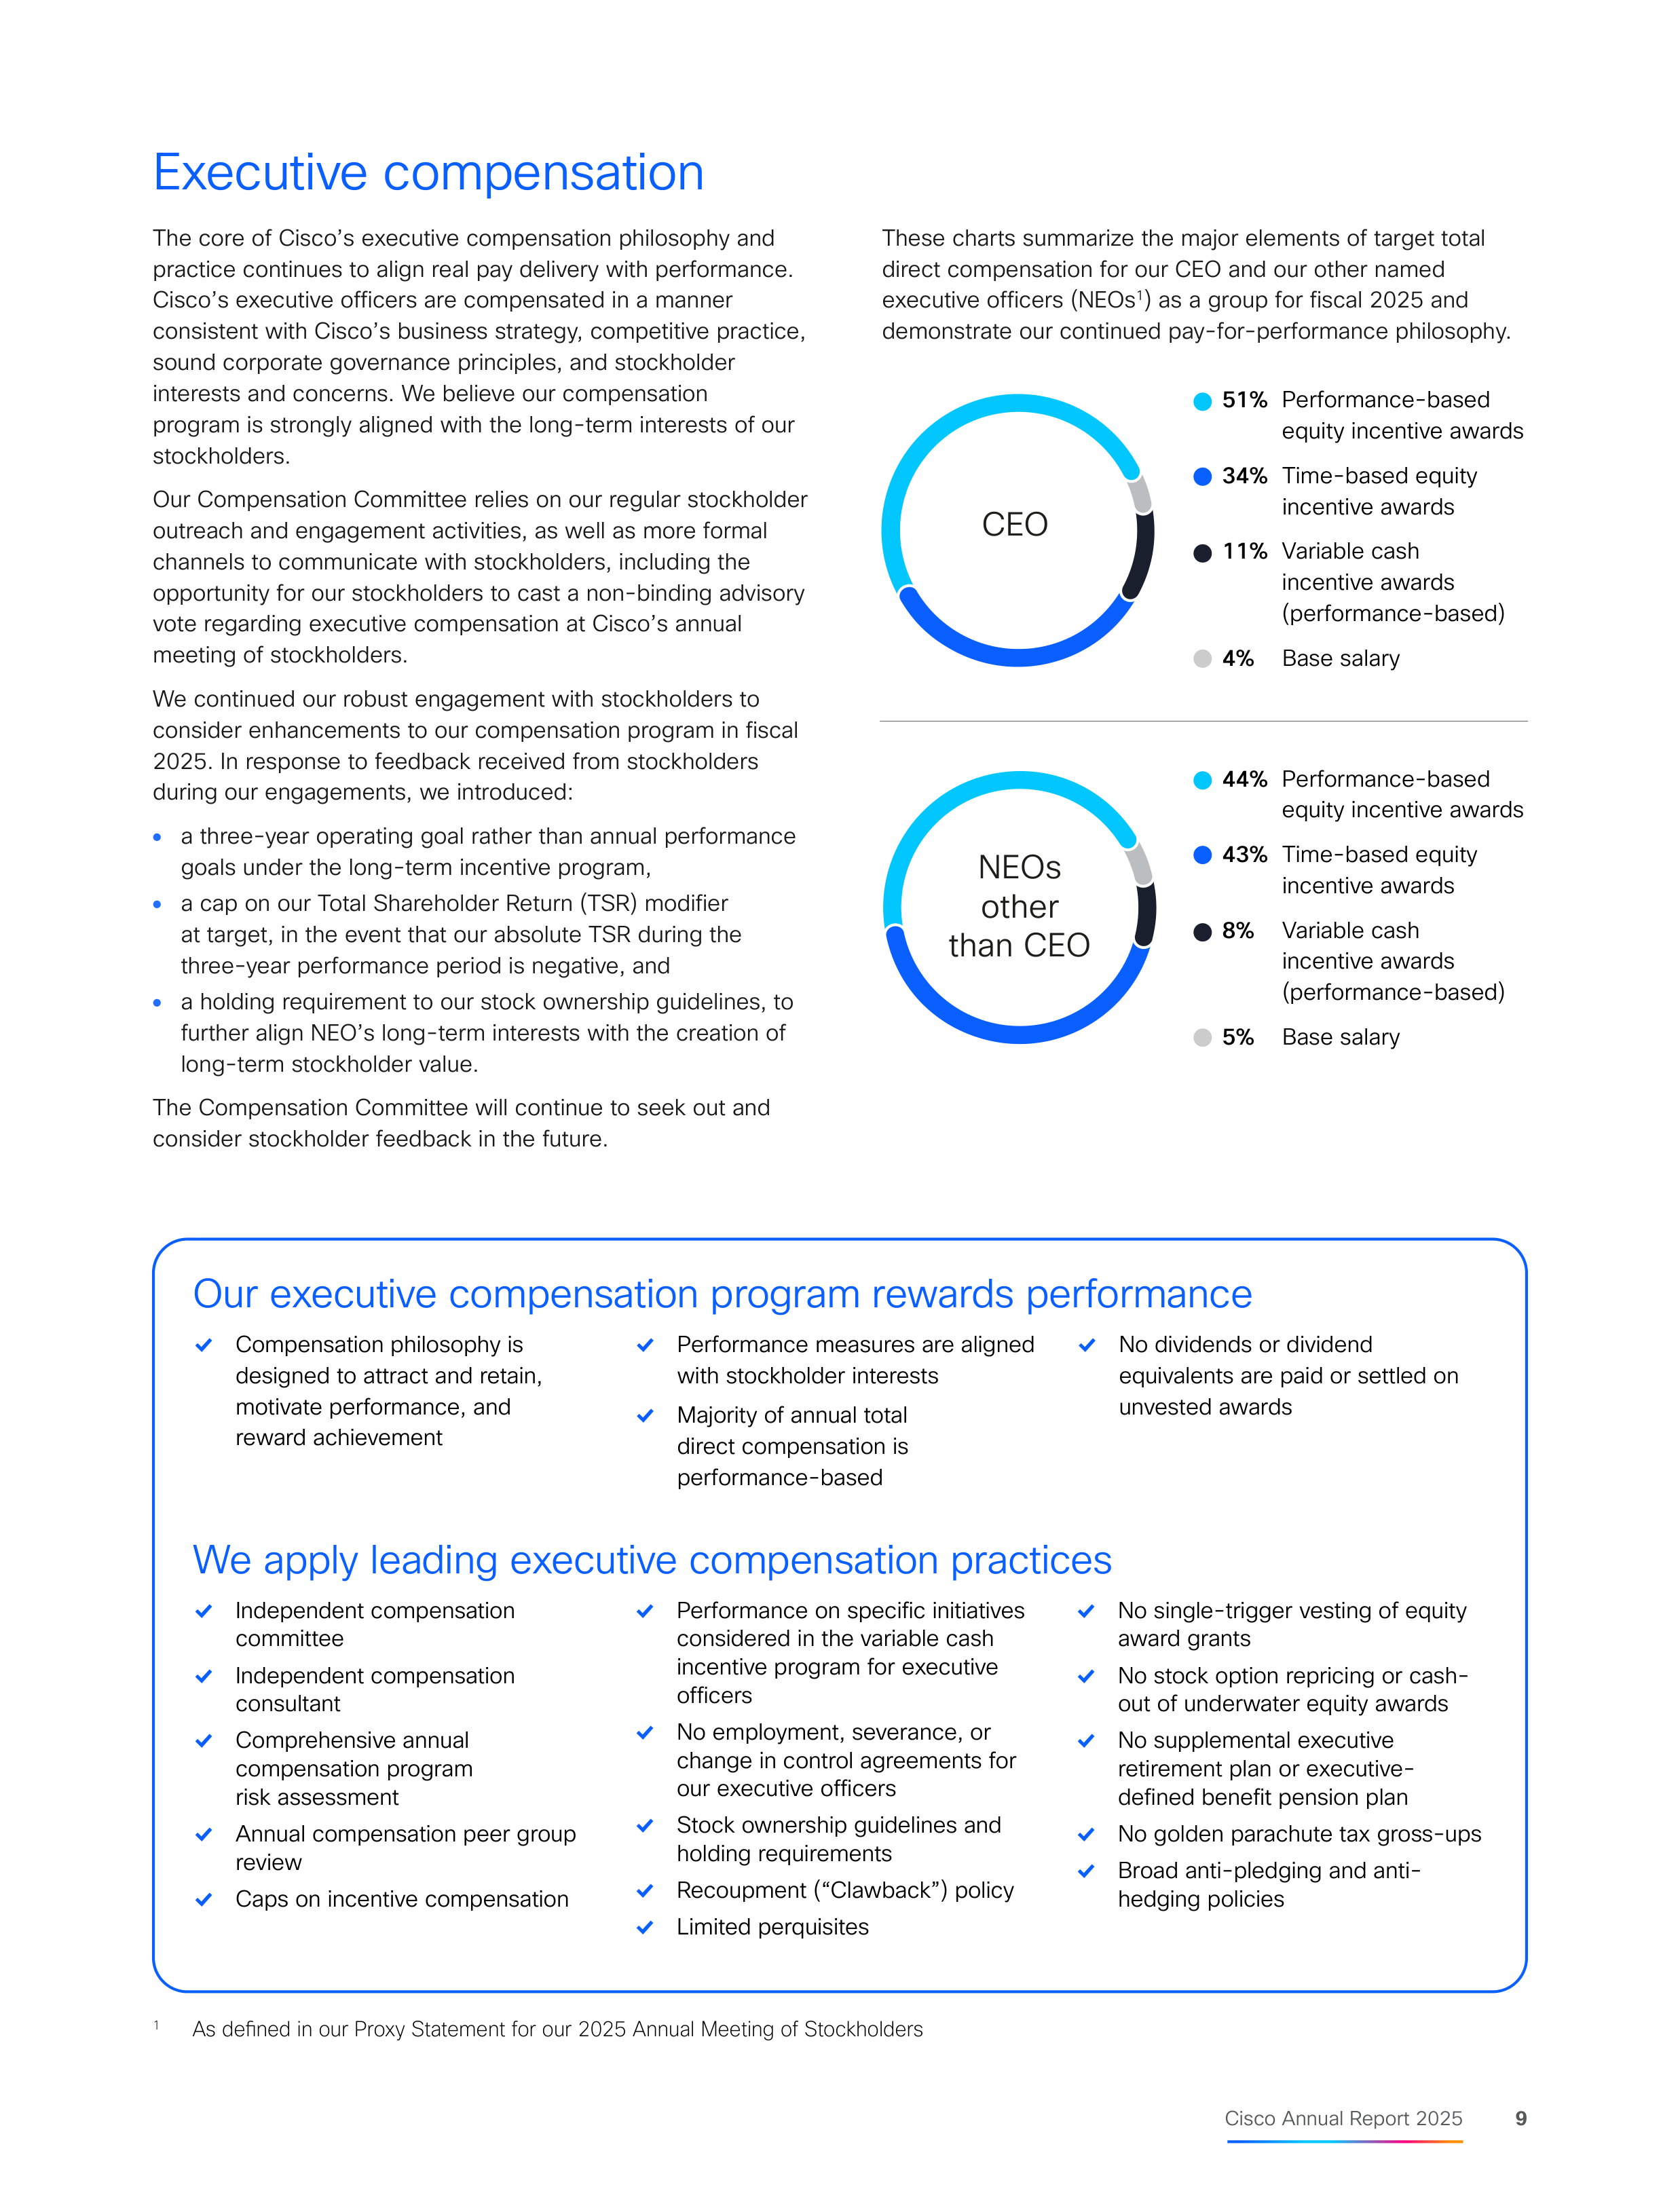
These charts summarize the major elements of target total
direct compensation for our CEO and our other named
executive officers (NEOs
1
) as a group for fiscal 2025 and
demonstrate our continued pay-for-performance philosophy.
11%
Variable cash
incentive awards
(performance-based)
8%
Variable cash
incentive awards
(performance-based)
4%
Base salary
5%
Base salary
34%
Time-based equity
incentive awards
Performance-based
equity incentive awards
51%
43%
Time-based equity
incentive awards
Performance-based
equity incentive awards
44%










10
Cisco Annual Report 2025
Committees
Age
Director
Since
Independent
Audit
Comp &
Mgmt Dev
Nom &
Gov
Public
Policy
Wesley G. Bush
Former Chair and Chief Executive Officer,
Northrop Grumman Corporation
64
2019
Michael D. Capellas
LEAD INDEPENDENT DIRECTOR
Founder and Chief Executive Officer,
Capellas Strategic Partners
71
2006
Mark Garrett
Former Chief Financial Officer,
Adobe Systems Incorporated
67
2018
John D. Harris II
Former Vice President of Business
Development, Raytheon Company
64
2021
Dr. Kristina M. Johnson
Former President,
The Ohio State University
68
2012
Sarah Rae Murphy
Former Chief Procurement Officer
and Senior Vice President of Global
Sourcing, United Airlines Holdings, Inc.
42
2022
Charles H. Robbins
CHAIR
Chief Executive Officer, Cisco
59
2015
Daniel H. Schulman
Chief Executive Officer,
Verizon Communications, Inc.
67
2023
Marianna Tessel
Executive Vice President and
General Manager, Small Business
Group, Intuit Inc.
57
2021
Kevin Weil
Vice President, OpenAI for Science,
OpenAI
42
2025
Board of Directors
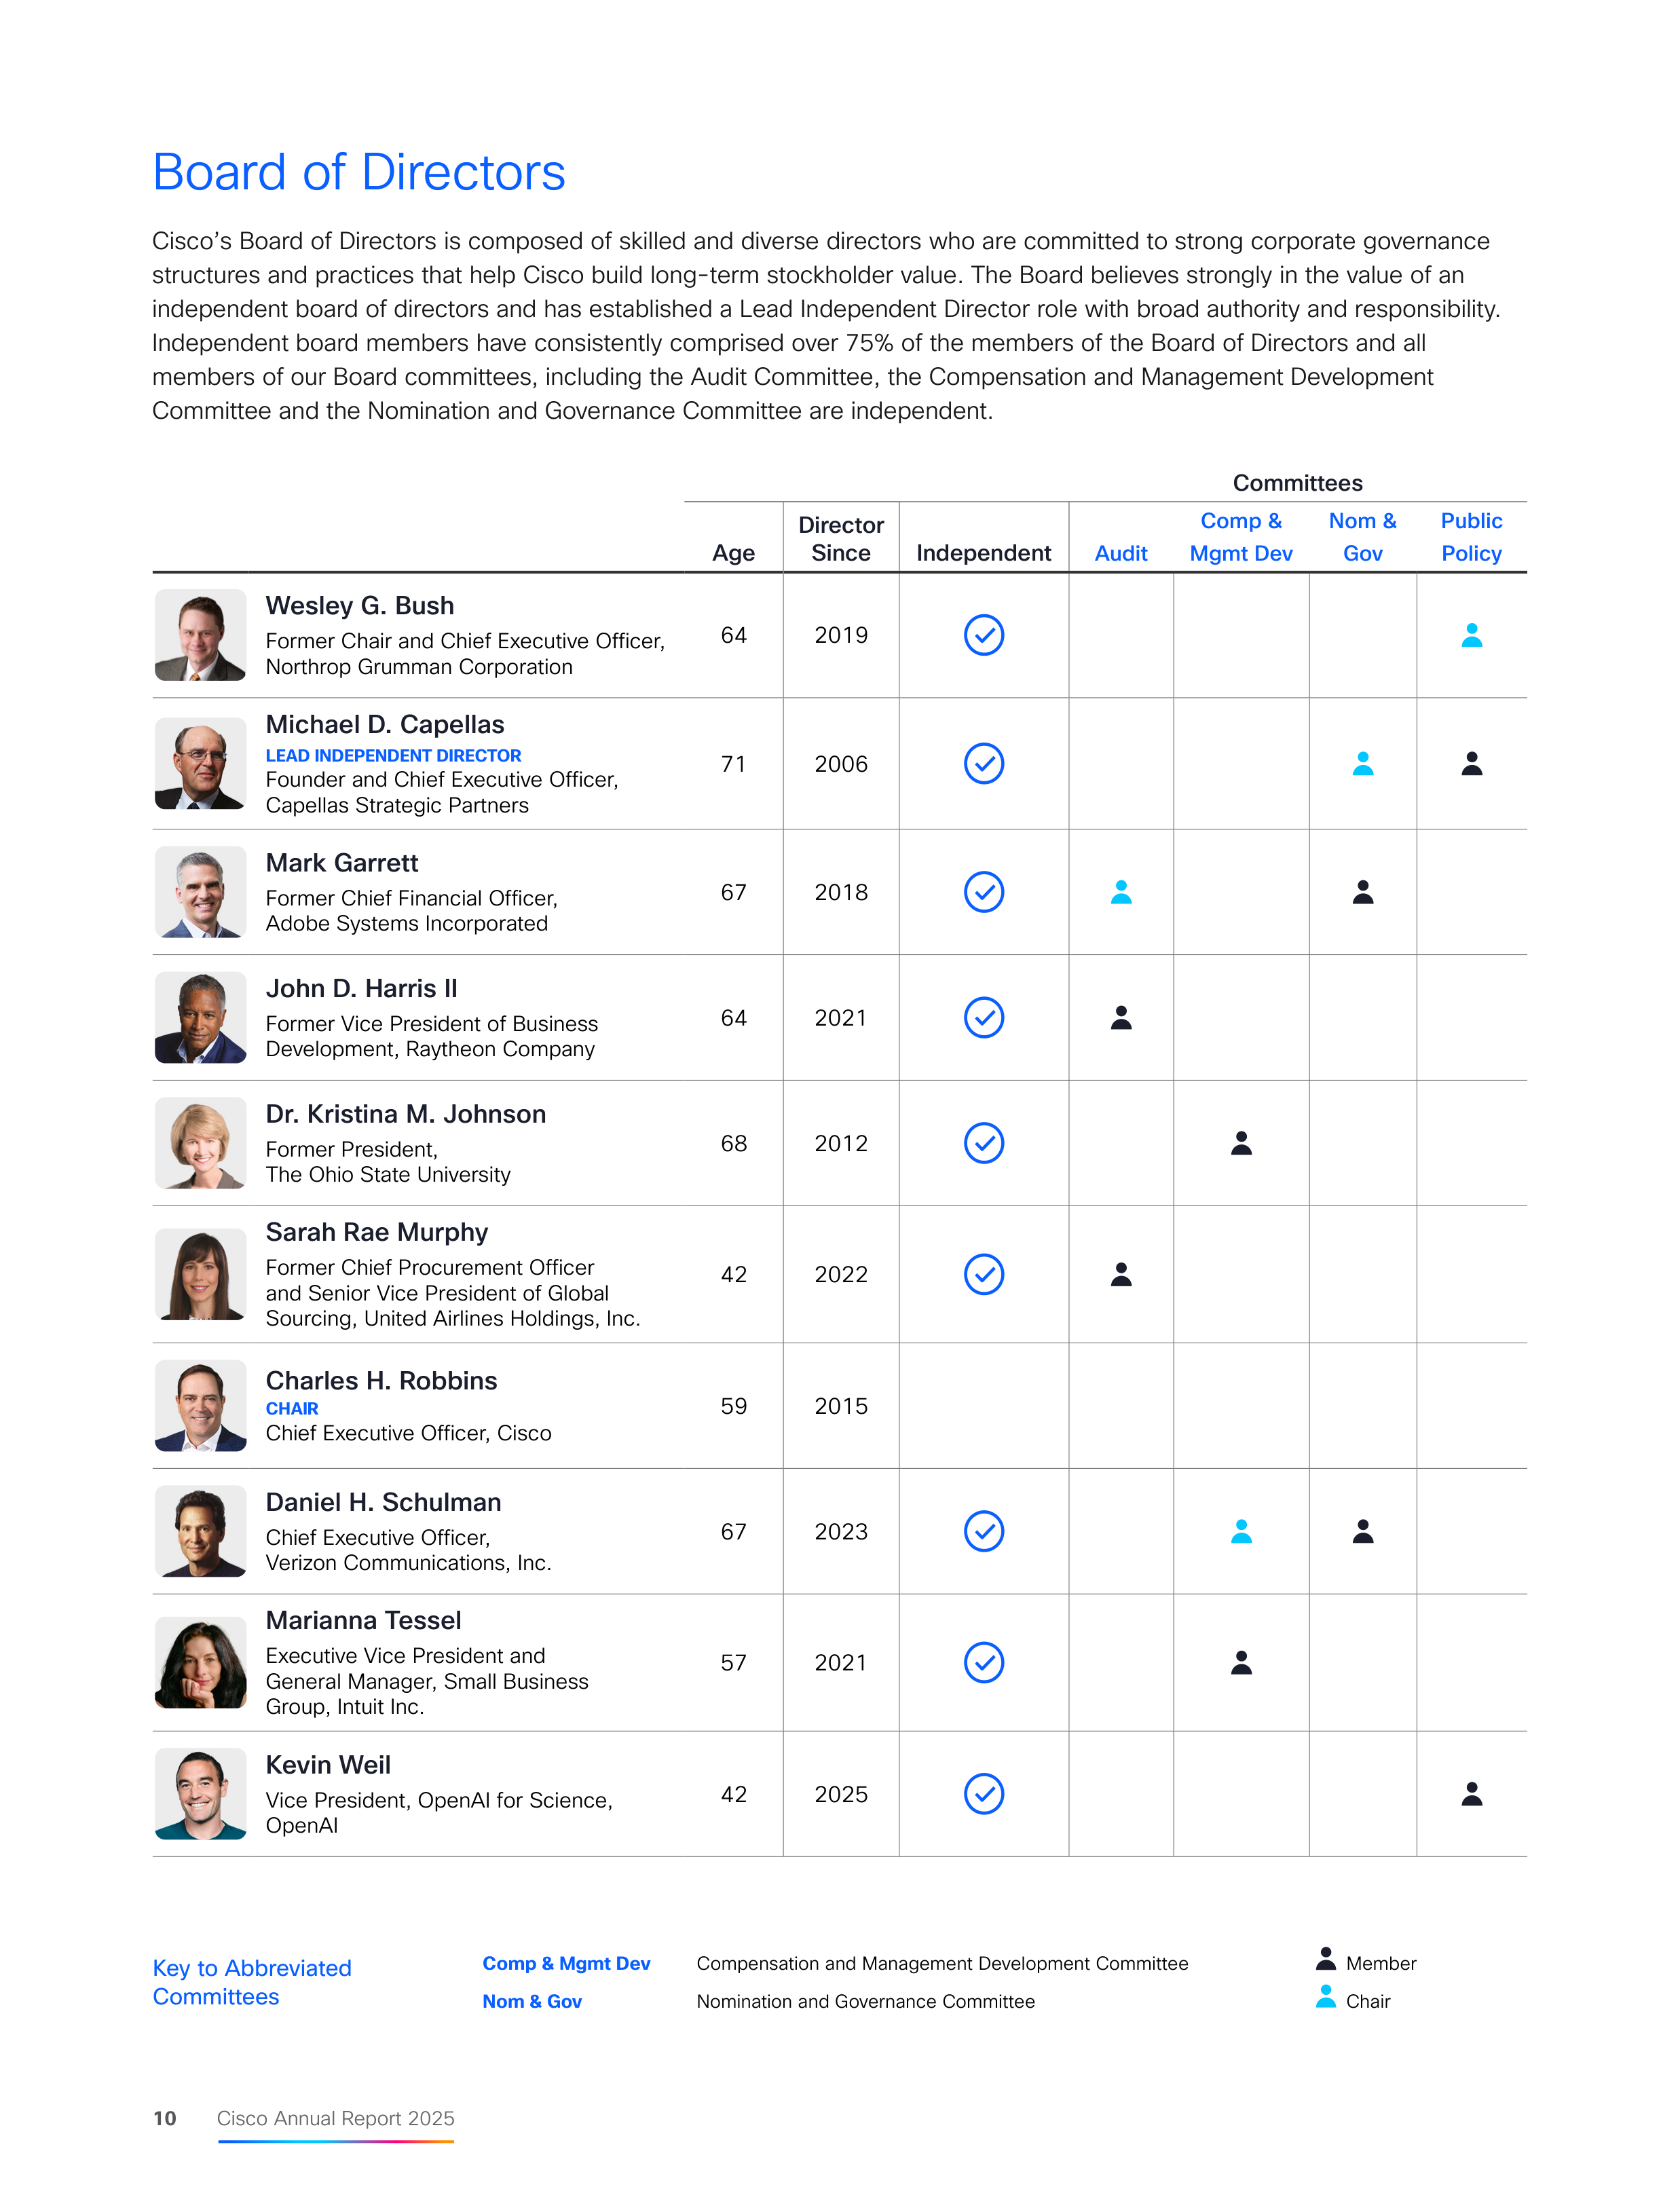
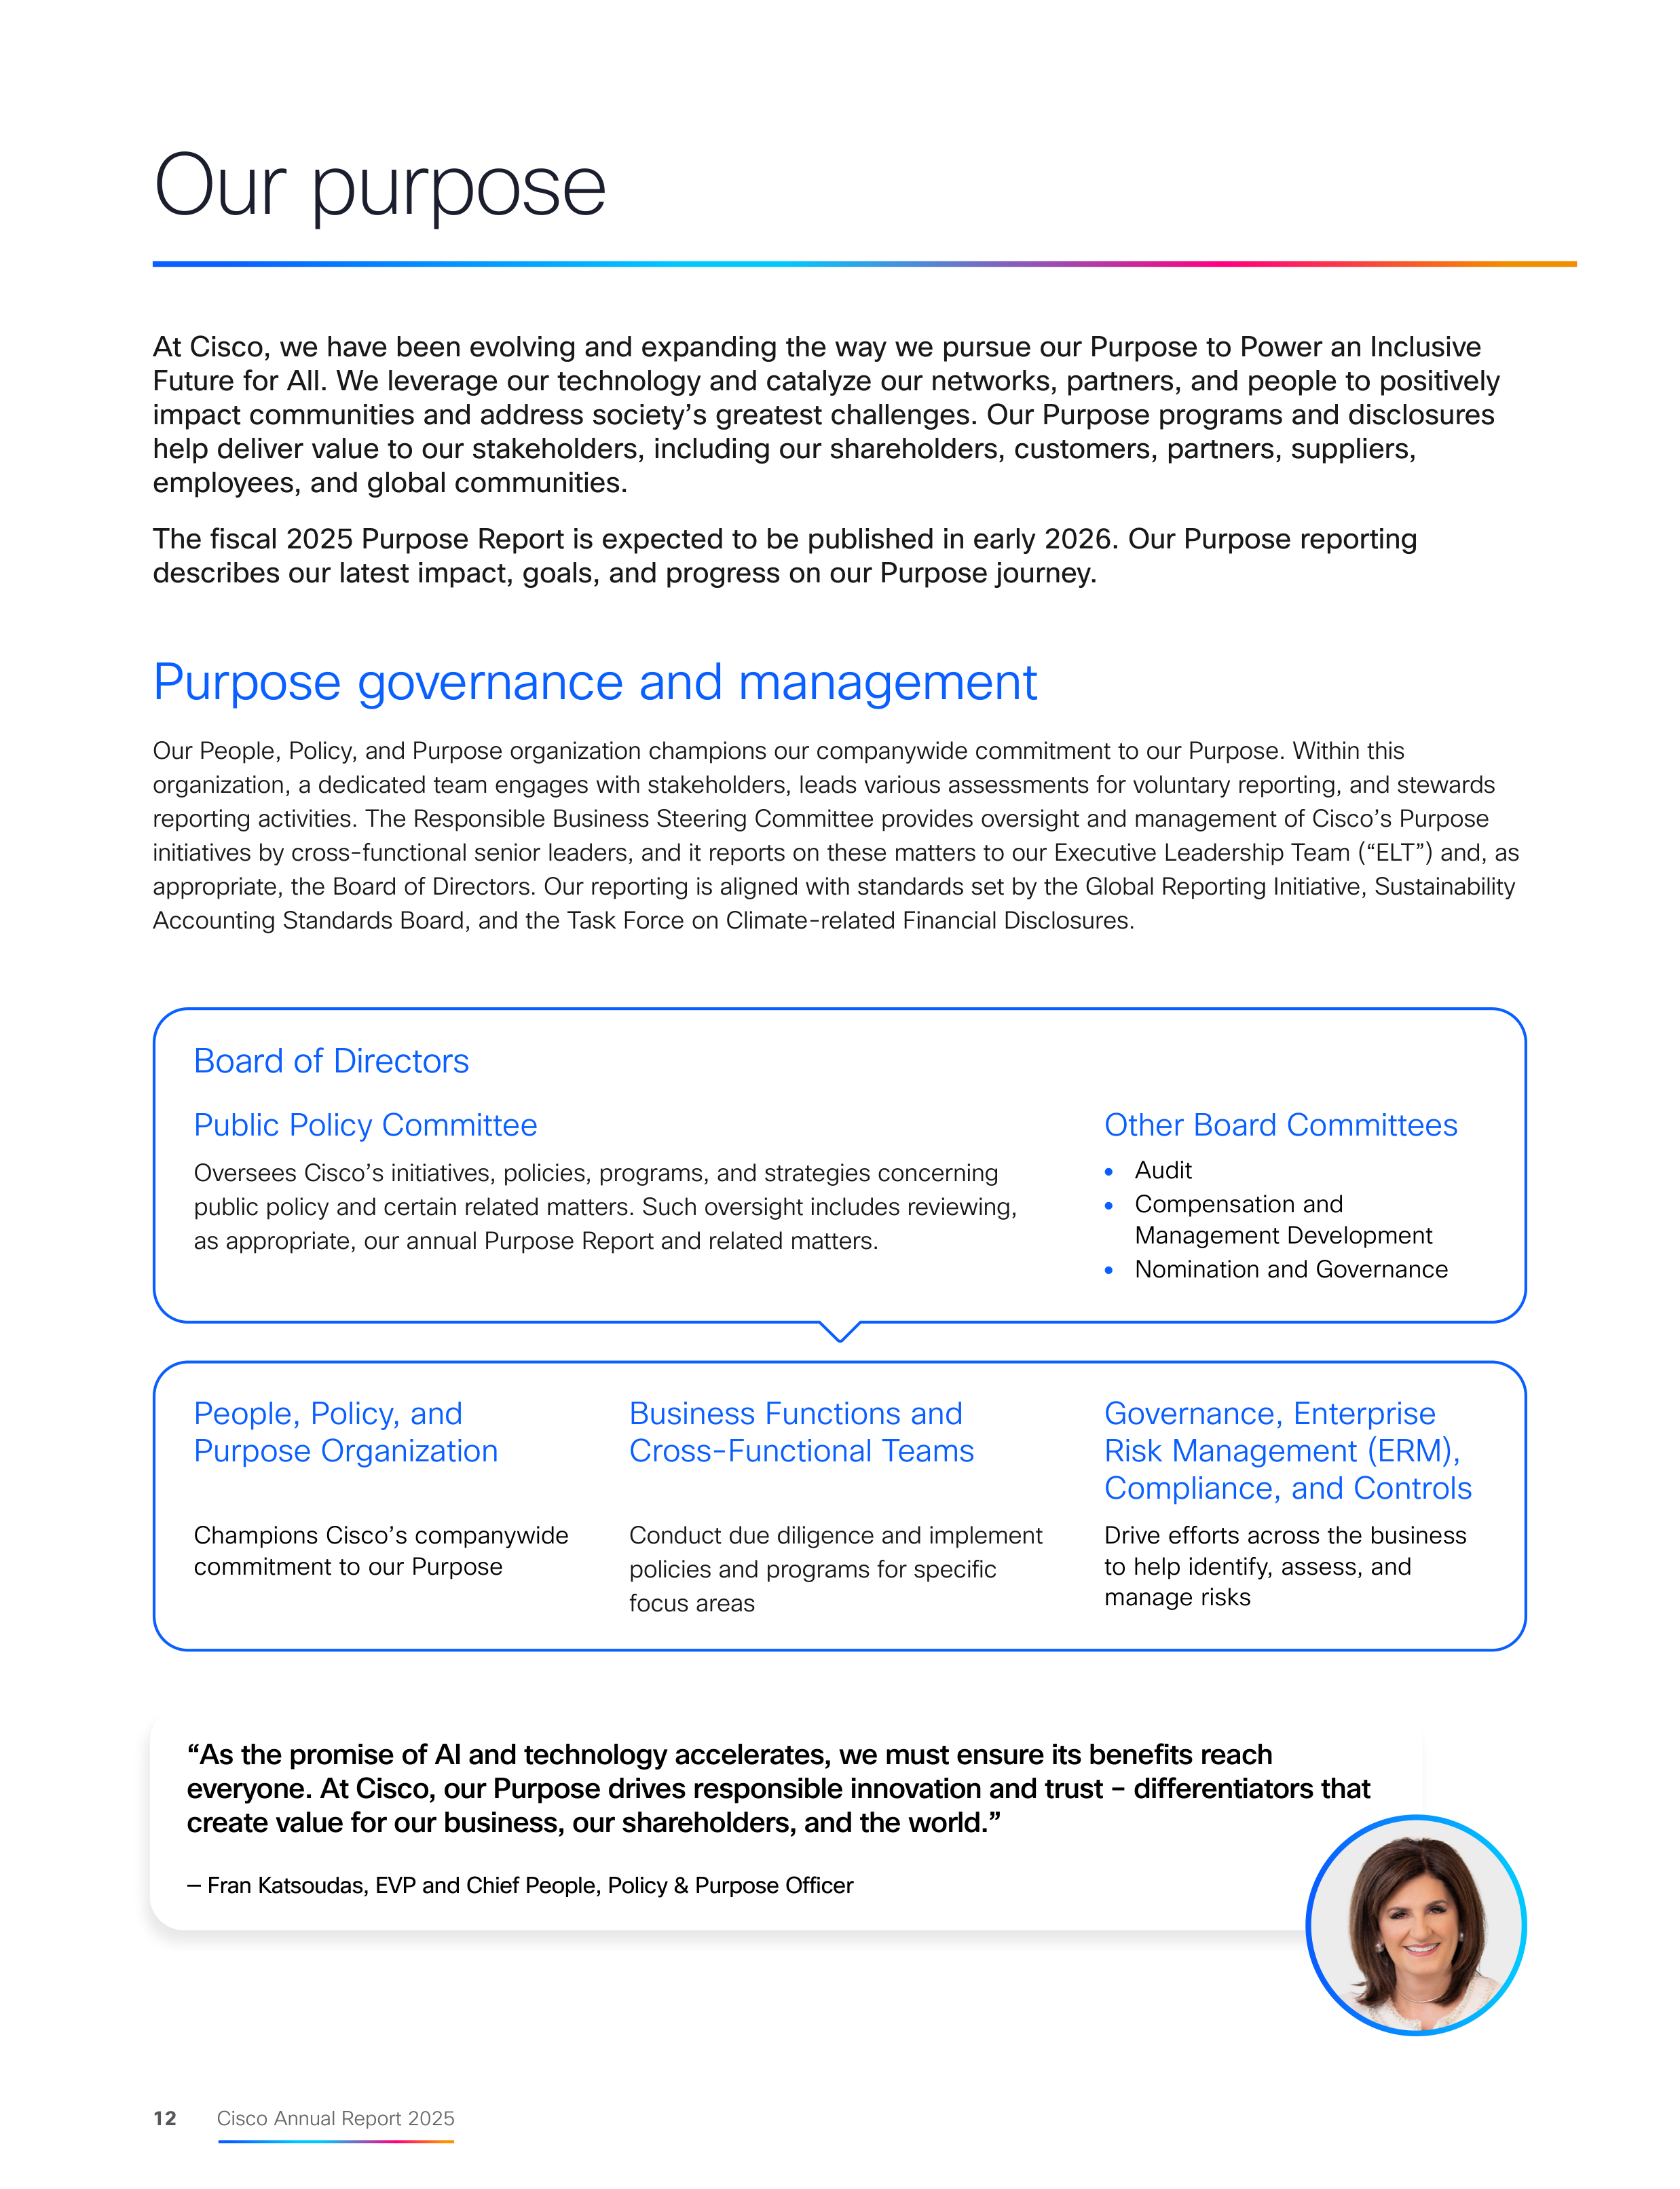
Cisco’s Board of Directors is composed of skilled and diverse directors who are committed to strong corporate governance
structures and practices that help Cisco build long-term stockholder value. The Board believes strongly in the value of an
independent board of directors and has established a Lead Independent Director role with broad authority and responsibility.
Independent board members have consistently comprised over 75% of the members of the Board of Directors and all
members of our Board committees, including the Audit Committee, the Compensation and Management Development
Committee and the Nomination and Governance Committee are independent.
Nom & Gov
Key to Abbreviated
Committees
Member
Chair
Comp & Mgmt Dev
Compensation and Management Development Committee
Nomination and Governance Committee
11
Cisco Annual Report 2025
The role of the Board of Directors in strategy
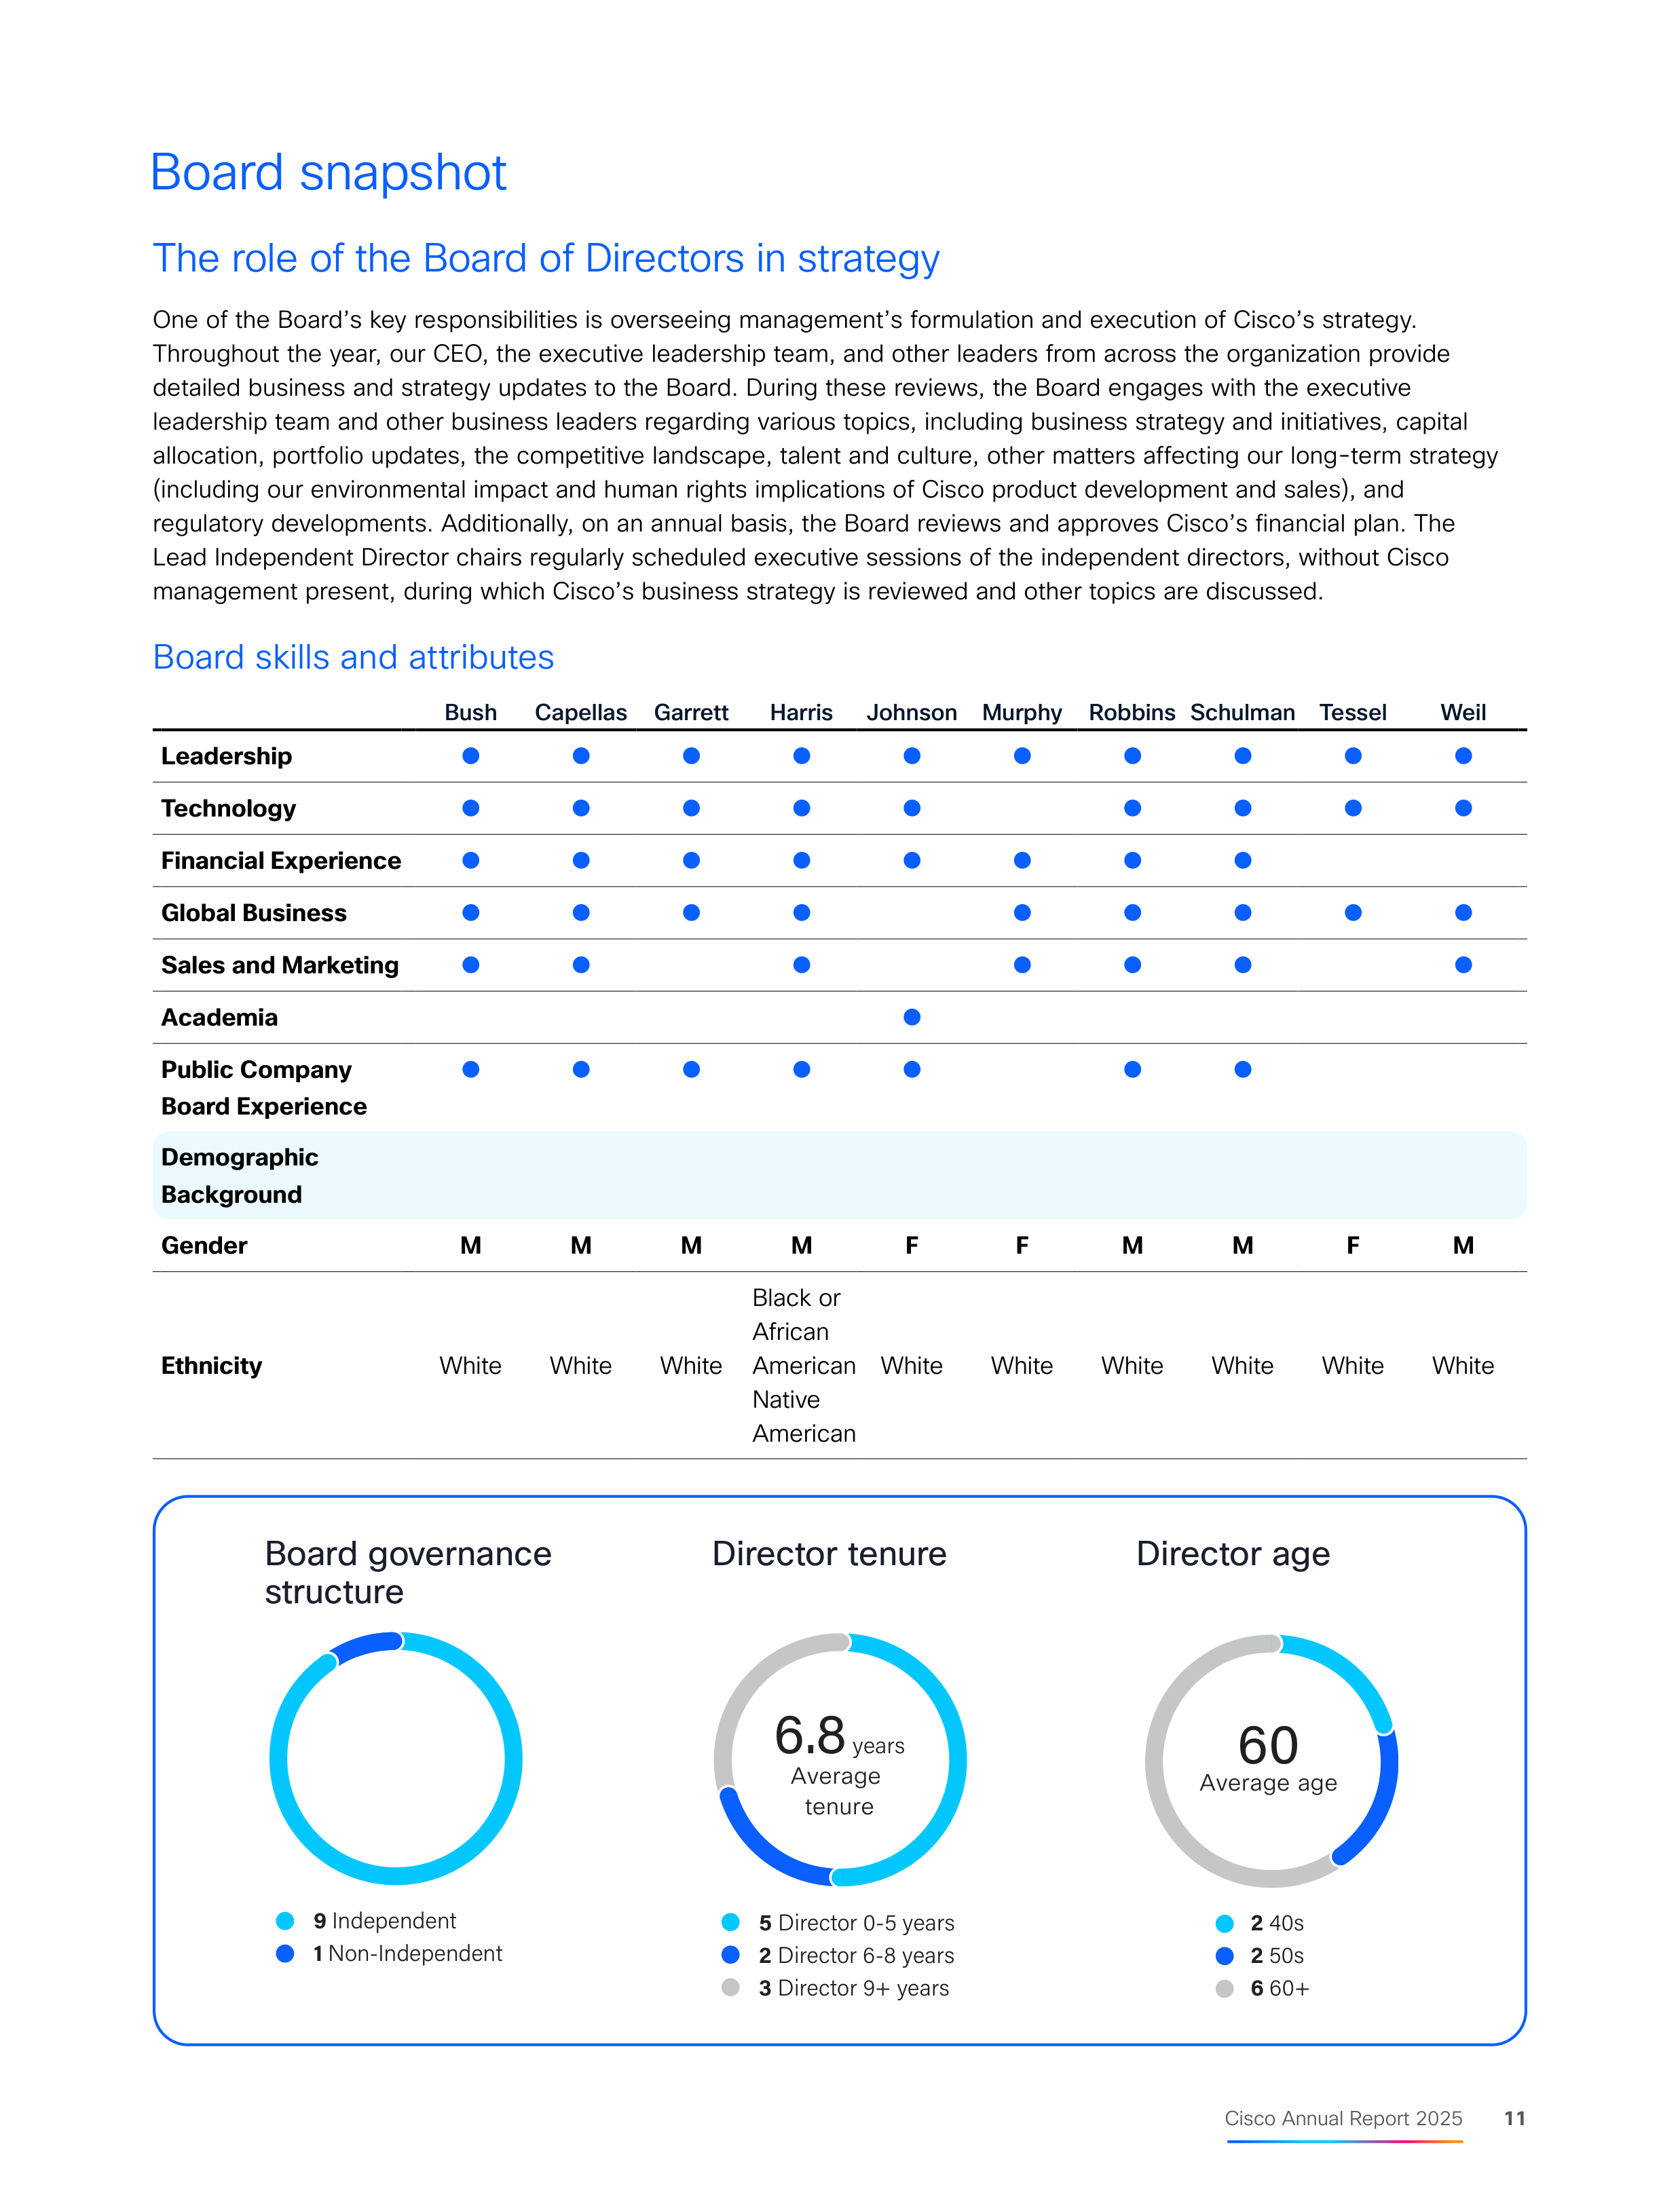
One of the Board’s key responsibilities is overseeing management’s formulation and execution of Cisco’s strategy.
Throughout the year, our CEO, the executive leadership team, and other leaders from across the organization provide
detailed business and strategy updates to the Board. During these reviews, the Board engages with the executive
leadership team and other business leaders regarding various topics, including business strategy and initiatives, capital
allocation, portfolio updates, the competitive landscape, talent and culture, other matters affecting our long-term strategy
(including our environmental impact and human rights implications of Cisco product development and sales), and
regulatory developments. Additionally, on an annual basis, the Board reviews and approves Cisco’s financial plan. The
Lead Independent Director chairs regularly scheduled executive sessions of the independent directors, without Cisco
management present, during which Cisco’s business strategy is reviewed and other topics are discussed.
Board skills and attributes
Bush
Capellas
Garrett
Harris
Johnson
Murphy
Robbins
Schulman
Tessel
Weil
Leadership
Technology
Financial Experience
Global Business
Sales and Marketing
Academia
Public Company
Board Experience
Demographic
Background
Gender
M
M
M
M
F
F
M
M
F
M
Ethnicity
White
White
White
Black or
African
American
Native
American
White
White
White
White
White
White
Board governance
structure
Director tenure
Director age
Average
tenure
Average age
Board snapshot

12
Cisco Annual Report 2025
People, Policy, and
Purpose Organization
Business Functions and
Cross-Functional Teams
Governance, Enterprise
Risk Management (ERM),
Compliance, and Controls
Champions Cisco’s companywide
commitment to our Purpose
Conduct due diligence and implement
policies and programs for specific
focus areas
Drive efforts across the business
to help identify, assess, and
manage risks
Our purpose
Board of Directors
Public Policy Committee
Oversees Cisco’s initiatives, policies, programs, and strategies concerning
public policy and certain related matters. Such oversight includes reviewing,
as appropriate, our annual Purpose Report and related matters.
Other Board Committees
●
Audit
●
Compensation and
Management Development
●
Nomination and Governance
At Cisco, we have been evolving and expanding the way we pursue our Purpose to Power an Inclusive
Future for All. We leverage our technology and catalyze our networks, partners, and people to positively
impact communities and address society’s greatest challenges. Our Purpose programs and disclosures
help deliver value to our stakeholders, including our shareholders, customers, partners, suppliers,
employees, and global communities.
The fiscal 2025 Purpose Report is expected to be published in early 2026. Our Purpose reporting
describes our latest impact, goals, and progress on our Purpose journey.
Purpose governance and management
Our People, Policy, and Purpose organization champions our companywide commitment to our Purpose. Within this
organization, a dedicated team engages with stakeholders, leads various assessments for voluntary reporting, and stewards
reporting activities. The Responsible Business Steering Committee provides oversight and management of Cisco’s Purpose
initiatives by cross-functional senior leaders, and it reports on these matters to our Executive Leadership Team (“ELT”) and, as
appropriate, the Board of Directors. Our reporting is aligned with standards set by the Global Reporting Initiative, Sustainability
Accounting Standards Board, and the Task Force on Climate-related Financial Disclosures.
“As the promise of AI and technology accelerates, we must ensure its benefits reach
everyone. At Cisco, our Purpose drives responsible innovation and trust – differentiators that
create value for our business, our shareholders, and the world.”
— Fran Katsoudas, EVP and Chief People, Policy & Purpose Officer
13
Cisco Annual Report 2025
Our people
Our people fuel our business and our award-winning culture
through their commitment to learning, connection, and
collaboration. Our relationship with our employees is one of
mutual benefit. Our employees bring talent and ingenuity to
everything we do, and in turn, we provide employees with
meaningful careers and development opportunities.
Our values and expectations are laid out in the Cisco
Code of Business Conduct. Every employee must certify
compliance with the code every year to help uphold
integrity in the workplace, to ensure ethical use of data and
resources, and to help prevent conflicts of interest.
We support our people by fostering a culture where all Cisco
employees feel safe and can thrive. Our three new Guiding
Principles – Think Really Big, Play to Win, and Drive Durable
Growth – are foundational to the ways we lead, learn, and
work in the AI era. We believe there is a direct connection
between the culture and principles we embody and how we
drive success for Cisco, our customers, and communities.
When people are encouraged to seek balance between
work and personal life, we believe they are more productive
and successful in their jobs and able to give their best to
their families and communities. In fiscal 2016, we set a goal
to achieve 80% employee participation in community impact
by 2020. We achieved that goal in 2020, and we have
exceeded 80% employee participation every year since then.
Power an inclusive
future for all
At Cisco, our Purpose to Power an Inclusive
Future for All is increasingly a differentiator for
our business. We can do good for the world
and do good for business when we combine
our technology, our people, and our broader
networks. Our Purpose is core to who we are
and what we do, and it comes to life across four
interconnected pillars: community resilience,
our people, responsible innovation, and energy
and sustainability.
Community resilience
We believe we have the opportunity to help strengthen the
communities where we live, work, and play. We empower
communities to adapt and thrive in the face of change
through digital readiness, strategic investments, and
crisis response.
In fiscal 2025, we set our next big ambition: 40 Communities.
Over the next 10 years, we intend to engage, support, and
invest in 40 communities around the world. To do so, we plan
to leverage our offerings and contributions, including funding,
technology, and expertise, in both communities where Cisco
is currently engaged, as well as newly identified communities.
Cisco Networking Academy, one of the world’s longest
running skills-to-jobs programs, prepares learners with digital
skills. Through this program, we have reached 28 million
learners across 195 countries since 1997. We have also
announced an ambitious next-phase goal: to provide digital
and cybersecurity skills training to an additional 25 million
people through Cisco Networking Academy from fiscal 2023
through fiscal 2032.
14
Cisco Annual Report 2025
Responsible innovation
Cisco technology connects and protects in the AI era. We
prioritize security, privacy, trust, and ethics in what we build
and how we build it.
We are committed to securing our value chain and work
to instill trust by operating with transparency, fairness,
accountability, and integrity. This applies to how we build
and design our products and solutions, our cyber-resilience
strategies that we share openly with organizations around
the world, our financial transparency and high standards of
responsible conduct, and more.
We are committed to respecting human rights throughout
our supply chain by creating our products and solutions
responsibly. This commitment extends to our manufacturing
partners and suppliers, including the standards they uphold
for labor practices, health and safety, the environment,
and human rights. We are a founding and active member
of the Responsible Business Alliance (RBA) and have long
adopted the RBA Code of Conduct as our Supplier Code
of Conduct. We evaluate our suppliers’ conformance to
the Supplier Code of Conduct and other Cisco policies by
requesting self-assessments, conducting third-party audits,
and driving collaborative solutions. We also work across the
Information and Communications Technology (ICT) industry
through initiatives to develop supplier capacity to align with
industry standards.
We believe everyone deserves to experience and utilize
the full potential of technology. We recognize international
standards when assessing and documenting the accessibility
of our products, services, and websites. We adopt the Web
Content Accessibility Guidelines (WCAG) 2.2, Level A and
AA published by the World Wide Web Consortium (W3C)
and the Information and Communication Technology (ICT)
Accessibility 508 Standards issued by the U.S. Access
Board. Our Government Affairs team develops and advocates
for pro-technology policies that support Cisco, its partners,
its customers, and our Purpose.
Energy & sustainability
Through our products, solutions, and operations, we drive
energy efficiency and resilience – helping advance sustainability
for Cisco, our customers, and communities around the
world. Our environmental sustainability strategy, The Plan for
Possible, includes how we are driving access to clean energy,
transforming our business towards a circular model, and
supporting resilient ecosystems.
Learn more about how we
pursue our Purpose — to Power
an Inclusive Future for All — by
visiting our Purpose Reporting
Hub on our website.
Clean energy
As data center and AI usage surges, so does the need for
cleaner, more efficient energy solutions. We are addressing
these needs by:
●
Adopting clean energy and collaborating with our
customers, partners, and suppliers to increase access to
clean energy
●
Innovating for energy efficiency in our products
and solutions
●
Leveraging Cisco products to help digitize, modernize, and
secure electric grids and increase energy availability
A fundamental component of our clean energy strategy is
our goal to reach net-zero greenhouse gas (GHG) emissions
across our value chain by 2040, by prioritizing reductions
across all scopes of emissions. In 2022, our net-zero goal
was approved by the Science Based Targets initiative (SBTi)
Net-Zero Standard. One way we are driving towards this
goal is by adopting clean energy in our own operations. In
fiscal 2025, we sourced renewable energy through a variety
of methods, including new long-term Power Purchase
Agreements (PPAs) in India and Texas.
Circular transformation
We are focused on evolving from a linear economy that
extracts resources and eventually wastes them, to a circular
one that finds new uses for products and their inputs. We
aim to transform our business to extend the useful life of
our products and provide ongoing services, and we take a
holistic approach by:
●
Applying circular design principles to our products and
packaging and extending the life cycle of our products
●
Enabling customers and partners to adopt circularity
through our portfolio of offerings
●
Recovering and redeploying hardware to advance a circular
life cycle and extend the lifespan of products
Resilient ecosystems
Our value chains benefit from resilient ecosystems, both
financially and ecologically. We help communities address
climate realities through technology-driven solutions,
develop skills and talent for the economy, and access
innovations that support better management and protection
of natural resources. In 2021, the Cisco Foundation
committed US$100 million over ten years through grant
funding to nonprofits and impact investing into early-stage
companies that are building innovative climate solutions.
Additionally, Cisco Investments, our venture capital arm,
invests in early-stage companies that can help Cisco and
our customers further their sustainability goals.
UNITED STATES SECURITIES AND EXCHANGE COMMISSION
WASHINGTON, D.C. 20549
_____________________________________
FORM 10-K
(Mark One)
☒
ANNUAL REPORT PURSUANT TO SECTION 13 OR 15(d) OF THE SECURITIES EXCHANGE ACT OF
1934
For the fiscal year ended July 26, 2025
or
☐
TRANSITION REPORT PURSUANT TO SECTION 13 OR 15(d) OF THE SECURITIES EXCHANGE
ACT OF 1934
For the transition period from ____ to ____
Commission file number 001-39940
_____________________________________
CISCO SYSTEMS, INC.
(Exact name of registrant as specified in its charter)
Delaware
77-0059951
(State or other jurisdiction of
incorporation or organization)
(IRS Employer
Identification No.)
170 West Tasman Drive
95134-1706
San Jose, California
(Address of principal executive offices)
(Zip Code)
Registrant’s telephone number, including area code: (408) 526-4000
Securities registered pursuant to Section 12(b) of the Act:
Title of each class:
Trading Symbol(s)
Name of each exchange on which registered
Common Stock, par value $0.001 per share
CSCO
The Nasdaq Stock Market LLC
Securities registered pursuant to Section 12(g) of the Act: None
_____________________________________
Indicate by check mark if the registrant is a well-known seasoned issuer, as defined in Rule 405 of the Securities Act.
☒
Yes
☐
No
Indicate by check mark if the registrant is not required to file reports pursuant to Section 13 or Section 15(d) of the Act.
☐
Yes
☒
No
Indicate by check mark whether the registrant (1) has filed all reports required to be filed by Section 13 or 15(d) of the Securities Exchange Act of 1934 during the
preceding 12 months (or for such shorter period that the registrant was required to file such reports), and (2) has been subject to such filing requirements for the past 90
days
.
☒
Yes
☐
No
Indicate by check mark whether the registrant has submitted electronically every Interactive Data File required to be submitted pursuant to Rule 405 of Regulation S-T
(§232.405 of this chapter) during the preceding 12 months (or for such shorter period that the registrant was required to submit such files).
☒
Yes
☐
No
Indicate by check mark whether the registrant is a large accelerated filer, an accelerated filer, a non-accelerated filer, a smaller reporting company, or an emerging growth
company. See the definitions of “large accelerated filer,” “accelerated filer,” “smaller reporting company,” and “emerging growth company” in Rule 12b-2 of the
Exchange Act.
Large accelerated filer
☒
Accelerated filer
☐
Non-accelerated filer
☐
Smaller reporting company
☐
Emerging growth company
☐
If an emerging growth company, indicate by check mark if the registrant has elected not to use the extended transition period for complying with any new or revised
financial accounting standards provided pursuant to Section 13(a) of the Exchange Act.
☐
Indicate by check mark whether the registrant has filed a report on and attestation to its management’s assessment of the effectiveness of its internal control over financial
reporting under Section 404(b) of the Sarbanes-Oxley Act (15 U.S.C. 7262(b)) by the registered public accounting firm that prepared or issued its audit report.
☒
If securities are registered pursuant to Section 12(b) of the Act, indicate by check mark whether the financial statements of the registrant included in the filing reflect the
correction of an error to previously issued financial statements.
☐
Indicate by check mark whether any of those error corrections are restatements that required a recovery analysis of incentive-based compensation received by any of the
registrant’s executive officers during the relevant recovery period pursuant to §240.10D-1(b).
☐
Indicate by check mark whether the registrant is a shell company (as defined in Rule 12b-2 of the Act).
☐
Yes
☒
No
Aggregate market value of registrant’s common stock held by non-affiliates of the registrant, based upon the closing price of a share of the registrant’s common stock on
January 24, 2025 as reported by the Nasdaq Global Select Market on that date: $247.5 billion
Number of shares of the registrant’s common stock outstanding as of August 28, 2025: 3,953,196,953
____________________________________
DOCUMENTS INCORPORATED BY REFERENCE
Portions of the registrant’s definitive Proxy Statement relating to the 2025 Annual Meeting of Stockholders, to be held on December 16, 2025, are incorporated by
reference into Part III of this Annual Report on Form 10-K where indicated.
PART I
Item 1.
Business
.....................................................................................................................................................
1
Item 1A.
Risk Factors
...............................................................................................................................................
11
Item 1B.
Unresolved Staff Comments
.....................................................................................................................
25
Item 1C.
Cybersecurity
.............................................................................................................................................
26
Item 2.
Properties
...................................................................................................................................................
27
Item 3.
Legal Proceedings
.....................................................................................................................................
27
Item 4.
Mine Safety Disclosures
............................................................................................................................
27
PART II
Item 5.
Market for Registrant’s Common Equity, Related Stockholder Matters, and Issuer Purchases of
Equity Securities
........................................................................................................................................
28
Item 6.
[Reserved]
.................................................................................................................................................
29
Item 7.
Management’s Discussion and Analysis of Financial Condition and Results of Operations
30
Item 7A.
Quantitative and Qualitative Disclosures About Market Risk
50
Item 8.
Financial Statements and Supplementary Data
52
Item 9.
Changes in and Disagreements with Accountants on Accounting and Financial Disclosure
102
Item 9A.
Controls and Procedures
............................................................................................................................
102
Item 9B.
Other Information
......................................................................................................................................
102
Item 9C.
Disclosure Regarding Foreign Jurisdictions that Prevent Inspections
102
PART III
Item 10.
Directors, Executive Officers and Corporate Governance
........................................................................
103
Item 11.
Executive Compensation
...........................................................................................................................
103
Item 12.
Security Ownership of Certain Beneficial Owners and Management and Related Stockholder Matters
.
103
Item 13.
Certain Relationships and Related Transactions, and Director Independence
103
Item 14.
Principal Accountant Fees and Services
....................................................................................................
103
PART IV
Item 15.
Exhibits and Financial Statement Schedules
103
Item 16.
Form 10-K Summary
.................................................................................................................................
106
Signatures
..................................................................................................................................................
107
..........................
..........................
......................................................................
............................................................................................
...........................................................
..
...............................................
.............................................................................................
Item 1.
Business
General
Cisco designs and sells a broad range of technologies that help to power, secure, and draw insights from the Internet. We are
incorporating artificial intelligence (AI) into our product portfolios across networking, security, collaboration and observability
as well as integrating our products more tightly together. We are simplifying how our technology is delivered, managed and
optimized and helping customers maximize the business value of their technology investments.
We conduct our business globally and manage our business by geography. Our business is organized into the following three
geographic segments: Americas; Europe, Middle East, and Africa (EMEA); and Asia Pacific, Japan, and China (APJC).
Our products and technologies are grouped into the following categories: Networking, Security, Collaboration and
Observability. In addition to our product offerings, we provide a broad range of services over the lifecycle of our products,
including technical support services and advanced services. Our customers include businesses of all sizes, public institutions,
governments, and service providers, including large webscale providers. These customers often look to us as a strategic partner
to help them use information technology (IT) to differentiate themselves and drive positive business outcomes.
We were incorporated in California in 1984 and reincorporated in Delaware in 2021. Our headquarters are in San Jose,
California. The mailing address of our headquarters is 170 West Tasman Drive, San Jose, California 95134-1706, and our
telephone number at that location is (408) 526-4000. Our website is www.cisco.com. Through a link on the Investor Relations
section of our website, we make available the following filings as soon as reasonably practicable after they are electronically
filed with or furnished to the Securities and Exchange Commission (SEC) at sec.gov: our Annual Report on Form 10-K,
Quarterly Reports on Form 10-Q, Current Reports on Form 8-K, and any amendments to those reports filed or furnished
pursuant to Section 13(a) or 15(d) of the Exchange Act. All such filings are available free of charge. The information published
on our website, or any other website referenced herein, is not incorporated into this report.
Strategy and Priorities
In today's digital-first world, businesses and organizations globally are deploying technology to pursue their strategic
objectives, from accelerating growth to enhancing operational efficiency and fostering innovation. Our strategy is to securely
connect everything to make those desired outcomes possible.
Our customers have three key priorities in this dynamic environment: i) to build modern infrastructure; ii) to protect against the
cyber threats of today and tomorrow; and iii) to harness the power of AI and data. Cisco is at the forefront of this evolution,
developing innovative solutions that leverage advanced AI to deliver more valuable outcomes for our customers.
Modern Infrastructure
In an increasingly digital and connected world, where each new connection to the Internet puts more demand on the
network, our customers are investing in resilient, adaptable infrastructure to quickly respond to market changes and the
demands of their own customers. Now more than ever it is crucial for businesses to remain competitive while managing
resource constraints. Our customers continue to focus on modernizing their infrastructure with a focus on speed, agility,
productivity, innovation and energy efficiency.
This Annual Report on Form 10-K, including the “Management’s Discussion and Analysis of Financial Condition and Results
of Operations,” contains forward-looking statements regarding future events and our future results that are subject to the safe
harbors created under the Securities Act of 1933, as amended (the “Securities Act”), and the Securities Exchange Act of 1934,
as amended (the “Exchange Act”). All statements other than statements of historical facts are statements that could be deemed
forward-looking statements. These statements are based on current expectations, estimates, forecasts, and projections about the
industries in which we operate and the beliefs and assumptions of our management. Words such as “expects,” “anticipates,”
“targets,” “goals,” “projects,” “intends,” “plans,” “believes,” “momentum,” “seeks,” “estimates,” “continues,”
“endeavors,” “strives,” “may,” variations of such words, and similar expressions are intended to identify such forward-
looking statements. In addition, any statements that refer to projections of our future financial performance, our anticipated
growth and trends in our businesses, and other characterizations of future events or circumstances are forward-looking
statements. Readers are cautioned that these forward-looking statements are only predictions and are subject to risks,
uncertainties, and assumptions that are difficult to predict, including those identified below, under “Item 1A. Risk Factors,”
and elsewhere herein. Therefore, actual results may differ materially and adversely from those expressed in any forward-
looking statements. We undertake no obligation to revise or update any forward-looking statements for any reason.
PART I
1
Cybersecurity
With the rapid growth in AI, modern applications, hyper-distributed architecture and increasingly sophisticated
cyberattacks, customers see cybersecurity as a top priority. Our differentiated security strategy is based on three pillars:
moving from point solutions to a platform comprehensively integrated with the infrastructure; infusing security into the
fabric of the network; and harnessing the depth and breadth of telemetry data from Cisco and with our acquisition of
Splunk Inc. (“Splunk”) to prevent, detect, and respond to sophisticated attacks.
AI and Data
AI represents a generational shift in technology and the advent of AI agents is driving an order of magnitude higher
requirement for network connectivity. We provide network infrastructure to power AI training and inference workloads for
both webscale providers and enterprises. We help to scale our customers’ network infrastructure with high-density routers
and switches, improved network management, and high-performance optics. We are reinventing data center operations for
our customers by simplifying the configuration, monitoring, and maintenance of fabrics, compute, networking and storage.
We can help give customers visibility across the network, security solutions, applications and their own business data. With
this breadth and scale of data, we can help deliver differentiated insights and context to customers, leading them to more
informed proactive decisions and better business results.
These three customer priorities drive our innovation and technology, making them our priorities as well. To help deliver on
them, we are bringing together the power of our portfolio, which we refer to as One Cisco, which provides three key outcomes
to our customers: i) AI-ready data centers, ii) future-proofed workplaces, and iii) digital resilience.
AI-Ready Data Centers
We are transforming data centers to power AI workloads anywhere. Whether customers need to modernize parts of their
existing infrastructure or power new, massive AI workloads, Cisco brings together a wide array of infrastructure (across
networking, compute, storage, and silicon) with unified management across traditional and AI workloads, and security
from on-premise to cloud to power AI-ready data centers.
Future-Proofed Workplaces
Cisco helps deliver "future-proofed" workplaces, modernizing how people and technology work and serve their customers.
This includes environments ranging from factory floors with plant workers and robots to hospitals with healthcare workers,
as well as to social workers and salespeople on the move. For secure campus and branch networking, we offer a flexible
range of solutions that help ensure secure, reliable connections for users and devices. Our smart building technology turns
network devices into sensors for enhanced intelligence and control of physical spaces. To support productivity, we provide
collaboration devices and software to enable collaboration no matter where people work.
Digital Resilience
We help to keep the data center, workplace, and entire IT environment securely up and running in the face of any
disruption. Our network assurance capabilities, powered by ThousandEyes, are integrated throughout our portfolio. This
technology helps ensure seamless connectivity and optimal digital experiences across cloud, Internet, and enterprise
networks, for the delivery of applications and services. Our observability solution monitors the entire enterprise to help
prevent downtime and improve experiences across networks, infrastructures, and applications. Additionally, Cisco provides
robust security measures for threat prevention, detection, investigation, and response for organizations of any size and
security maturity.
Cisco enables enterprises and service providers to deliver highly secure connectivity from workplaces to data centers
worldwide. Our strength lies in our ability to deliver unified architecture with integrated, end-to-end solutions to help simplify
complex challenges. These capabilities are accelerated with Cisco AI, enhancing outcomes for customers globally.
For a discussion of the risks associated with our Strategy and Priorities, see “Item 1A. Risk Factors,” including the risk factor
entitled “We depend upon the development of new products and services, and enhancements to existing products and services,
and if we fail to predict and respond to emerging technological trends and customers’ changing needs, our operating results and
market share may suffer.” For information regarding sales of our major products and services, see Note 19 to the Consolidated
Financial Statements.
2
Products and Services
Our products and services are grouped into the following categories:
Networking
Our networking business is built on a foundation of industry-leading technologies, including switching, routing, wireless, and
servers, offered through a comprehensive suite of both hardware and software solutions. This portfolio, which features software
licenses and software-as-a-service (SaaS) offerings, empowers customers to build, automate, modernize, and transform their
network infrastructure to meet the demands of a rapidly evolving digital landscape. A central pillar of our networking strategy
is the
seamless convergence of our on-premise solutions with our cloud-managed offerings. By integrating these capabilities
across our networking portfolio, we aim to deliver continuous value to our customers through enhanced flexibility, scalability,
and operational efficiency. This unified approach positions us to address the diverse needs of businesses as they transition to
hybrid and cloud-first environments.
Our switching portfolio encompasses campus switching as well as data center switching offerings. Our campus switching
offerings provide the foundation for converged data, voice, video, and Internet of Things (IoT) services. These switches offer
enhanced security and reliability and are
designed to scale efficiently as our customers grow. Within campus switching, our
Catalyst 9000 family of switches includes hardware with embedded software, along with a software subscription referred to as
Cisco DNA. Cisco DNA provides automation, analytics and security features which can be centrally monitored, managed, and
configured. Also, within campus switching we have a range of Meraki cloud-managed switches for customers who prefer ease
of management in lean-IT environments. Our switching portfolio now also includes the newly launched Cisco Smart Switches
— Cisco 9350 and Cisco 9610— which represent the next generation of enterprise networking. These
switches are AI-ready
with advanced telemetry and assurance
capabilities. They are
built on Cisco Silicon One (which is our single, unified, and
scalable networking silicon architecture) and are equipped with quantum-resistant security and post-quantum cryptography to
protect against future threats. They also offer flexibility for one hardware to be managed via either the Cisco Catalyst Center or
Meraki Dashboard user interface.
Our data center switching offerings, led by the Nexus 9000 series, provide the foundation for mission critical data centers with
high availability, scalability, and security across traditional data centers and private and public cloud data centers. We continue
to add greater visibility and analytics across our networks and applications, enabling us to deliver better experiences for our
customers. During fiscal 2025, we introduced the Cisco N9300 Series Smart Switches with a
new class of intelligent
networking silicon alongside embedded Data Processing Units (DPUs), representing our new vision for AI data center designs.
Complex data processing tasks can be offloaded to the DPUs on the switch to improve both network architecture and the
security posture. Cisco Hypershield, our cloud-native and AI-powered approach to highly distributed security for AI-scale data
centers that is built into the fabric of the network, is the first service offering available embedded on these new switches. This
helps to narrow the gap between security and networking layers by converging them into a single solution.
The Internet Infrastructure portion of this portfolio includes AI Infrastructure solutions for service provider customers,
including our webscale customers. We are focused on transforming connectivity to the Internet and the cloud environment by
efficiently meeting the growing demand for low-latency and higher speeds. Our routed optical networking systems and our
pluggable optic solutions allow us to transform the economics of building and operating networks for our service provider
customers. Our Cisco 8000 series routers, which are based on Cisco Silicon One, provide broad capacity in high-density
designs, allowing our customers to reduce operational footprints, lower carbon emissions, and transition to more efficient
network architectures.
We also have enterprise routing solutions which interconnect public and private wireline
and mobile networks, delivering
highly secure and reliable
connectivity to campus, data center and branch networks. These offerings are designed to meet
the
scale, reliability, and security needs of customers of any size.
Our wireless solutions deliver robust indoor and outdoor coverage, supporting seamless roaming for voice, video, and data
applications. With a product portfolio that includes both on-premises and cloud-managed wireless access points and controllers,
we provide customers with a powerful and intuitive converged access solution when paired with our switching portfolio.
Security
Security is at the core of our business strategy, reflecting our commitment to addressing the evolving needs of organizations of
every size across industries. Our security portfolio spans Network Security, Identity and Access Management, Secure Access
Service
Edge
(SASE), and Threat
Intelligence, Detection, and Response (TIDR) solutions. We are dedicated to continuous
innovation, with significant investments in cloud-based security, AI-driven threat detection, and end-to-end security
architectures designed to help customers proactively safeguard their most critical assets. In the third quarter of fiscal 2024, we
acquired Splunk, a recognized leader in security analytics and observability. The Splunk platform and security offerings
significantly strengthen our TIDR capabilities. We have been integrating Cisco Extended Detection and Response (XDR) with
3
Splunk Enterprise Security, to create a unified and highly effective solution to help prevent, detect, and respond to sophisticated
cyber threats. We are also accelerating the expansion of our SASE architecture, delivering a seamless combination of network
and security functionality through a single, cloud-native platform. Our security offerings also include Cisco Hypershield, our
cloud-native, AI-powered approach to highly distributed security for AI-scale data
centers that
is built
into the fabric of the
network. Our security strategy positions us well to capture growing market demand for comprehensive, scalable, and integrated
security solutions.
Collaboration
Our Collaboration portfolio consists of our Webex suite, collaboration devices, Contact Center and Communication Platform as
a Service (CPaaS) offerings. These offerings consist of software, including perpetual licenses and subscription arrangements, as
well as hardware. Our objective is to create more inclusive and engaging employee and customer experiences by providing
technology that enables distributed teams to collaborate effortlessly. We offer end-to-end collaboration solutions that can be
delivered on-premises, from the cloud, or within hybrid cloud environments. AI and machine learning capabilities are
embedded across the Webex portfolio to help improve productivity. Our CPaaS is a cloud communications platform
that
integrates communication channels and existing back-end business systems to help enable the orchestration and automation of
all customer and employee interactions.
Observability
Observability consists of our network assurance, monitoring and analytics and observability suite offerings. These offerings are
designed to bring together and provide end-to-end visibility of our customers' owned and unowned environments—including
applications, networks, multi-cloud infrastructures and the Internet. With AI-driven insights at their core, our observability
solutions help organizations see, understand and improve every digital experience, and help to ensure seamless connectivity and
proactive issue resolution across complex, modern environments. ThousandEyes, our network assurance offering, deliver deep
visibility and intelligence across network organizations, spanning both their internal infrastructure and external dependencies.
Our Observability Suite—including Splunk Observability and AppDynamics—provides full-stack insights from infrastructure
to application performance to digital experience, helping teams take decisive action to maintain service health and performance.
Services
In addition to our product offerings, we provide a broad range of technical support and professional services for our customers.
We are incorporating AI into our services offerings, to enable customers to derive greater business value from their technology
investments.
Cisco Technical Support provides customers with comprehensive assistance, including issue resolution, software support and
hardware replacement, to help ensure Cisco products and networks operate efficiently and remain highly available. These
services help customers protect their network investments, manage risk, and minimize downtime for systems running mission-
critical applications.
We also offer a portfolio of professional services which includes planning, design, and implementation services, as well as
high-value consulting services focused on aligning technology investments with business outcomes. We continually invest in
our support and professional services by integrating AI and automation, and expanding beyond core networking to cover the
areas of security and analytics in line with our strategy.
Customers and Markets
Many factors influence the IT, collaboration, and networking requirements of our customers. These include
the
size of the
organization, number and types of technology systems, geographic location, and business applications deployed throughout the
customer’s network. Our customer base is not limited to any specific industry, geography, or market segment. Our customers
primarily operate in the following markets: enterprise, public sector and service provider and cloud.
Enterprise
Enterprise includes businesses that are large regional, national, or global organizations with multiple locations or branch offices,
or mid-market and small businesses. Many enterprise businesses have unique IT, collaboration, and networking needs within a
multi-vendor environment. Our mid-market and small business customers typically require the latest advanced technologies, but
with less complexity. We offer service and support packages, financing, and managed network services, primarily through our
service provider partners. We sell
these products through a network of third-party application and technology vendors and
channel partners, as well as selling directly to these customers.
Public Sector
Public Sector includes federal, state
and local governments, as well as educational institution customers. Many public sector
customers have unique IT, collaboration, and networking needs within a multi-vendor environment. We sell to public sector
4
customers through a network of third-party application and technology vendors and channel partners, as well as through direct
sales.
Service Provider and Cloud
Service Provider and Cloud includes regional, national, and international wireline
carriers and webscale providers, as well as
Internet, cable, and wireless providers. We also include media, broadcast, and content providers within this customer market, as
the lines in the telecommunications industry continue to blur between traditional network-based, content-based and application-
based services. This customer market offers data, voice, video, and mobile/wireless services to businesses, governments,
utilities, and consumers worldwide. Service provider and cloud businesses use a variety of our products and services for their
own networks. In addition, many service providers use Cisco data center, virtualization, and collaboration technologies to offer
managed or Internet-based services to their business customers. Compared with other customers, service providers are more
likely to require network design, deployment, and support services because of the greater scale and higher complexity of their
networks, whose requirements are addressed, we believe, by our architectural approach.
Sales Overview
As of the end of fiscal 2025, our worldwide sales and marketing functions consisted of approximately 25,600 employees,
including managers, sales representatives, and technical support personnel. We sell our products and services both directly and
indirectly through a variety of channels with support from our sales workforce. A substantial portion of our products and
services is sold indirectly through channel partners, and the remainder is sold through direct sales. Channel partners include
systems integrators, service providers, other third-party resellers, and distributors.
Systems integrators and service providers typically sell directly to end users and often provide system installation, technical
support, professional services, and other support services in addition to network equipment sales. Systems integrators also
typically integrate our products into an overall solution. Some service providers are also systems integrators.
Distributors may hold inventory and sell to systems integrators, service providers, and other third-party resellers. We refer to
sales through distributors as our two-tier system of sales to the end customer. Revenue from two-tier distributors is recognized
based on a sell-in method. These distributors may be given business terms that allow them to return a limited portion of
inventory, receive credits for changes in selling prices, receive certain rebates, and participate in various cooperative marketing
programs.
Our service offerings complement our products through a range of consulting, technical, project, quality, and software
maintenance services, including 24-hour online and telephone support through technical assistance centers.
For information regarding risks related to our sales channels, see “Item 1A. Risk Factors,” including the risk factors entitled
“Disruption of or changes in our distribution model could harm our sales and margins” and “Inventory management relating to
our sales to our two-tier distribution channel is complex, and excess inventory may harm our gross margins.”
For information regarding risks relating to our international operations, see “Item 1A. Risk Factors,” including the risk factors
entitled “Our operating results may be negatively impacted by unfavorable economic and market conditions and the uncertain
geopolitical
environment;”
“Entrance into new or developing markets exposes us to additional competition and will
likely
increase demands on our service and support operations;” “Due to the global nature of our operations, political or economic
changes or other factors in a specific country or region could harm our operating results and financial condition;”
“We
are
exposed to fluctuations in currency exchange rates that
could negatively impact our financial results and cash flows;” and
“Cyber attacks, data breaches or other incidents impacting our solutions and IT environment may disrupt our operations, harm
our operating results and financial condition, and damage our reputation or otherwise materially harm our business; and cyber
attacks, data breaches or other incidents on our customers’ or third-party providers’ networks, or in third-party products we use,
could result in claims of liability against us, give rise to legal and/or regulatory action, damage our reputation or otherwise
materially harm our business,” among others.
Financing Arrangements
We provide financing arrangements for certain qualified customers to build, maintain, and upgrade their networks. We believe
customer financing is a competitive
advantage in obtaining business, particularly for those customers involved in significant
infrastructure projects. Our financing arrangements include loans, leases (sales-type, direct financing and operating) and
channel financing arrangements.
Acquisitions, Investments, and Alliances
The markets in which we compete require a wide variety of technologies, products, and capabilities. We continue to evaluate
opportunities to acquire and invest in businesses and technologies that complement
and enable further investment in our key
priority areas.
5
Acquisitions
We
acquire companies in order to gain access to talent, technology, products and features, operational capabilities or new
markets. The risks associated with acquisitions are more fully discussed in “Item 1A. Risk Factors,” including the risk factor
entitled “We have made and expect to continue to make acquisitions that could disrupt our operations and harm our operating
results.”
Investments in Privately Held Companies
We make investments in privately held companies that develop technology or provide services that are complementary to our
products or that provide insights into emerging technologies that may become relevant to our businesses. The risks associated
with these investments are more fully discussed in “Item 1A. Risk Factors,” including the risk factor entitled “We are exposed
to fluctuations in the market values of our portfolio investments and in interest rates; impairment of our investments could harm
our earnings.”
Strategic Alliances
We pursue strategic
alliances with other companies in areas where collaboration can produce industry advancement and
accelerate new markets. The objectives and goals of a strategic alliance can include one or more of the following: technology
exchange, product development, joint sales and marketing, or new market creation.
The risks associated with our strategic alliances are more fully discussed in “Item 1A. Risk Factors,” including the risk factor
entitled “If we do not successfully manage our strategic alliances, we may not realize the expected benefits from such alliances
and we may experience increased competition or delays in product development.”
Competition
We compete in the networking and communications equipment markets, providing products and services designed to transport,
and help secure data, voice, and video traffic across cloud, private and public networks and the Internet. We
compete
with
numerous vendors in each product category. The overall number of our competitors providing niche product solutions may
increase. Also, the identity and composition of competitors may change as we increase our activity in newer product areas, and
in key priority areas. As we continue to expand globally, we may see
new competition in different geographic regions. In
particular, we have experienced price-focused competition from competitors in Asia, especially from China, and we anticipate
this will continue.
Our competitors (in each case
relative to only some of our products or services) include: Amazon Web Services LLC;
Arista
Networks, Inc.; Broadcom Inc.; Ciena Corporation; CrowdStrike Holdings, Inc.; Datadog Inc.; Dell Technologies Inc.;
Dynatrace Inc.; Fortinet, Inc.; Hewlett-Packard Enterprise Company; Huawei Technologies Co., Ltd.; Microsoft Corporation;
New Relic, Inc.; Nokia Corporation; Nvidia Corporation; Palo Alto Networks, Inc.; RingCentral, Inc.; Zoom Video
Communications, Inc.; and Zscaler, Inc.; among others.
Some of our competitors compete across many of our product lines, while others are primarily focused in a specific product
area. Barriers to entry are
relatively low, and new ventures to create products that do or could compete with our products are
regularly formed. In addition, some of our competitors may have greater resources, including technical and engineering
resources, than we do. As we expand into new markets, we will
face
competition not only from our existing competitors but
also from other competitors, including existing companies with strong technological, marketing, and sales positions in those
markets. We also sometimes face competition from resellers and distributors of our products. Companies with which we have
strategic
alliances in some
areas may be competitors in other areas, and this trend may increase. For example, the enterprise
data center is undergoing a fundamental transformation arising from the convergence of technologies, including computing,
networking, storage, and software, that previously were segregated. Additionally, companies that are strategic alliance partners
in some areas of our business may acquire or form alliances with our competitors, thereby reducing their business with us.
The
principal
competitive factors in the markets in which we presently compete
and may compete
in the future include
the
ability to sell successful business outcomes; the ability to provide a broad range of networking and communications products
and services; product performance; price; the ability to introduce new products, including providing continuous new customer
value and products with price-performance advantages; the ability to reduce production costs; the ability to provide value-added
features such as security, reliability, and investment
protection; conformance to standards; market
presence;
the
ability to
provide financing; and disruptive technology shifts and new business models.
We
also face
competition from customers to which we license or supply technology and suppliers from which we transfer
technology. The inherent nature of networking requires interoperability. As such, we must cooperate and, at the
same
time,
compete with many companies. Any inability to effectively manage these complicated relationships with customers, suppliers,
and strategic
alliance
partners could materially harm our business, operating results, and financial condition and accordingly
affect our chances of success.
6
Research and Development
We regularly introduce new products and features to address the requirements of our markets. We allocate our research and
development budget among our product categories, which consist of Networking, Security, Collaboration, and Observability
technologies. Our research and development expenditures are applied generally to all product areas, with specific areas of focus
being identified from time to time. Our expenditures for research and development costs were expensed as incurred.
The industry in which we compete
is subject
to rapid technological developments, evolving standards, changes in customer
requirements, and new product introductions and enhancements. As a result, our success depends, in part, on our ability, on a
cost-effective
and timely basis, to continue
to enhance our existing products and to develop and introduce new products that
improve performance and reduce total cost of ownership. To achieve these
objectives, our management and engineering
personnel work with customers to identify and respond to customer needs, as well as with other innovators of Internet
networking products, including universities, laboratories, and corporations. We also expect to continue to make acquisitions and
strategic investments, where appropriate, to provide us with access to new technologies. Nonetheless, there can be no assurance
that we will be able to successfully develop products to address new customer requirements and technological changes or that
those products will achieve market acceptance.
Manufacturing
We rely on contract manufacturers for our manufacturing needs. We presently use a variety of independent third-party
companies to provide services related to printed-circuit board assembly, in-circuit test, product repair, and product assembly.
Proprietary software in electronically programmable memory chips is used to configure products that meet
customer
requirements and to maintain quality control and security. The manufacturing process enables us to configure the hardware and
software in unique combinations to meet a wide variety of individual customer requirements. The manufacturing process also
uses automated testing equipment and burn-in procedures, as well as comprehensive inspection, testing, and statistical process
controls, which are designed to help ensure the quality and reliability of our products. The manufacturing processes and
procedures are generally certified to International Organization for Standardization 9001 standards.
Our arrangements with contract manufacturers generally provide for quality, cost, and delivery requirements, as well as
manufacturing process terms, such as inventory management; flexibility regarding capacity, quality, and cost
management;
oversight of manufacturing; and conditions for use of our intellectual property. We have not entered into any significant long-
term
contracts with any contract manufacturers. We generally have
the option to renew arrangements on an as-needed basis.
These
arrangements with contract manufacturers generally do not commit us to purchase any particular amount or any
quantities beyond amounts covered by orders or forecasts that we submit covering discrete periods of time.
Patents, Intellectual Property, and Licensing
We seek to establish and maintain our proprietary rights in our technology and products through the use of patents, copyrights,
trademarks, and trade secret laws. We have a program to file applications for and obtain patents, copyrights, and trademarks in
the United States and in selected foreign countries where we believe filing for such protection is appropriate. We also seek to
maintain our trade
secrets and confidential information by nondisclosure policies and through the use of appropriate
confidentiality agreements. We have obtained a substantial number of patents and trademarks in the United States and in other
countries. There can be no assurance, however, that the rights obtained can be successfully enforced against infringing products
in every jurisdiction. Although we believe the protection afforded by our patents, copyrights, trademarks, and trade secrets has
value, the rapidly changing technology in the networking industry and uncertainties in the legal process make our future success
dependent primarily on the innovative skills, technological expertise, and management abilities of our employees rather than on
the protection afforded by patent, copyright, trademark, and trade secret laws.
Many of our products are designed to include software or other intellectual property licensed from third parties. While it may be
necessary in the future to seek or renew licenses relating to various aspects of our products, we believe, based upon past
experience and standard industry practice, that such licenses generally could be obtained on commercially reasonable
terms.
Nonetheless, there can be no assurance that the necessary licenses would be available on acceptable terms, if at all. Our inability
to obtain certain licenses or other rights or to obtain such licenses or rights on favorable terms, or the need to engage in
litigation regarding these
matters, could materially harm our business, operating results, and financial condition. Moreover,
inclusion in our products of software or other intellectual property licensed from third parties on a nonexclusive basis can limit
our ability to protect our proprietary rights in our products.
The industry in which we compete is characterized by rapidly changing technology, a large number of patents, and frequent
claims and related litigation regarding patent and other intellectual property rights. There can be no assurance that our patents
and other proprietary rights will not be challenged, invalidated, or circumvented; that others will not assert intellectual property
rights to technologies that are
relevant to us; or that our rights will give us a competitive advantage. Further, some U.S.
governmental entities and courts have expressed a position that U.S. copyright and patent protection should be limited to
7
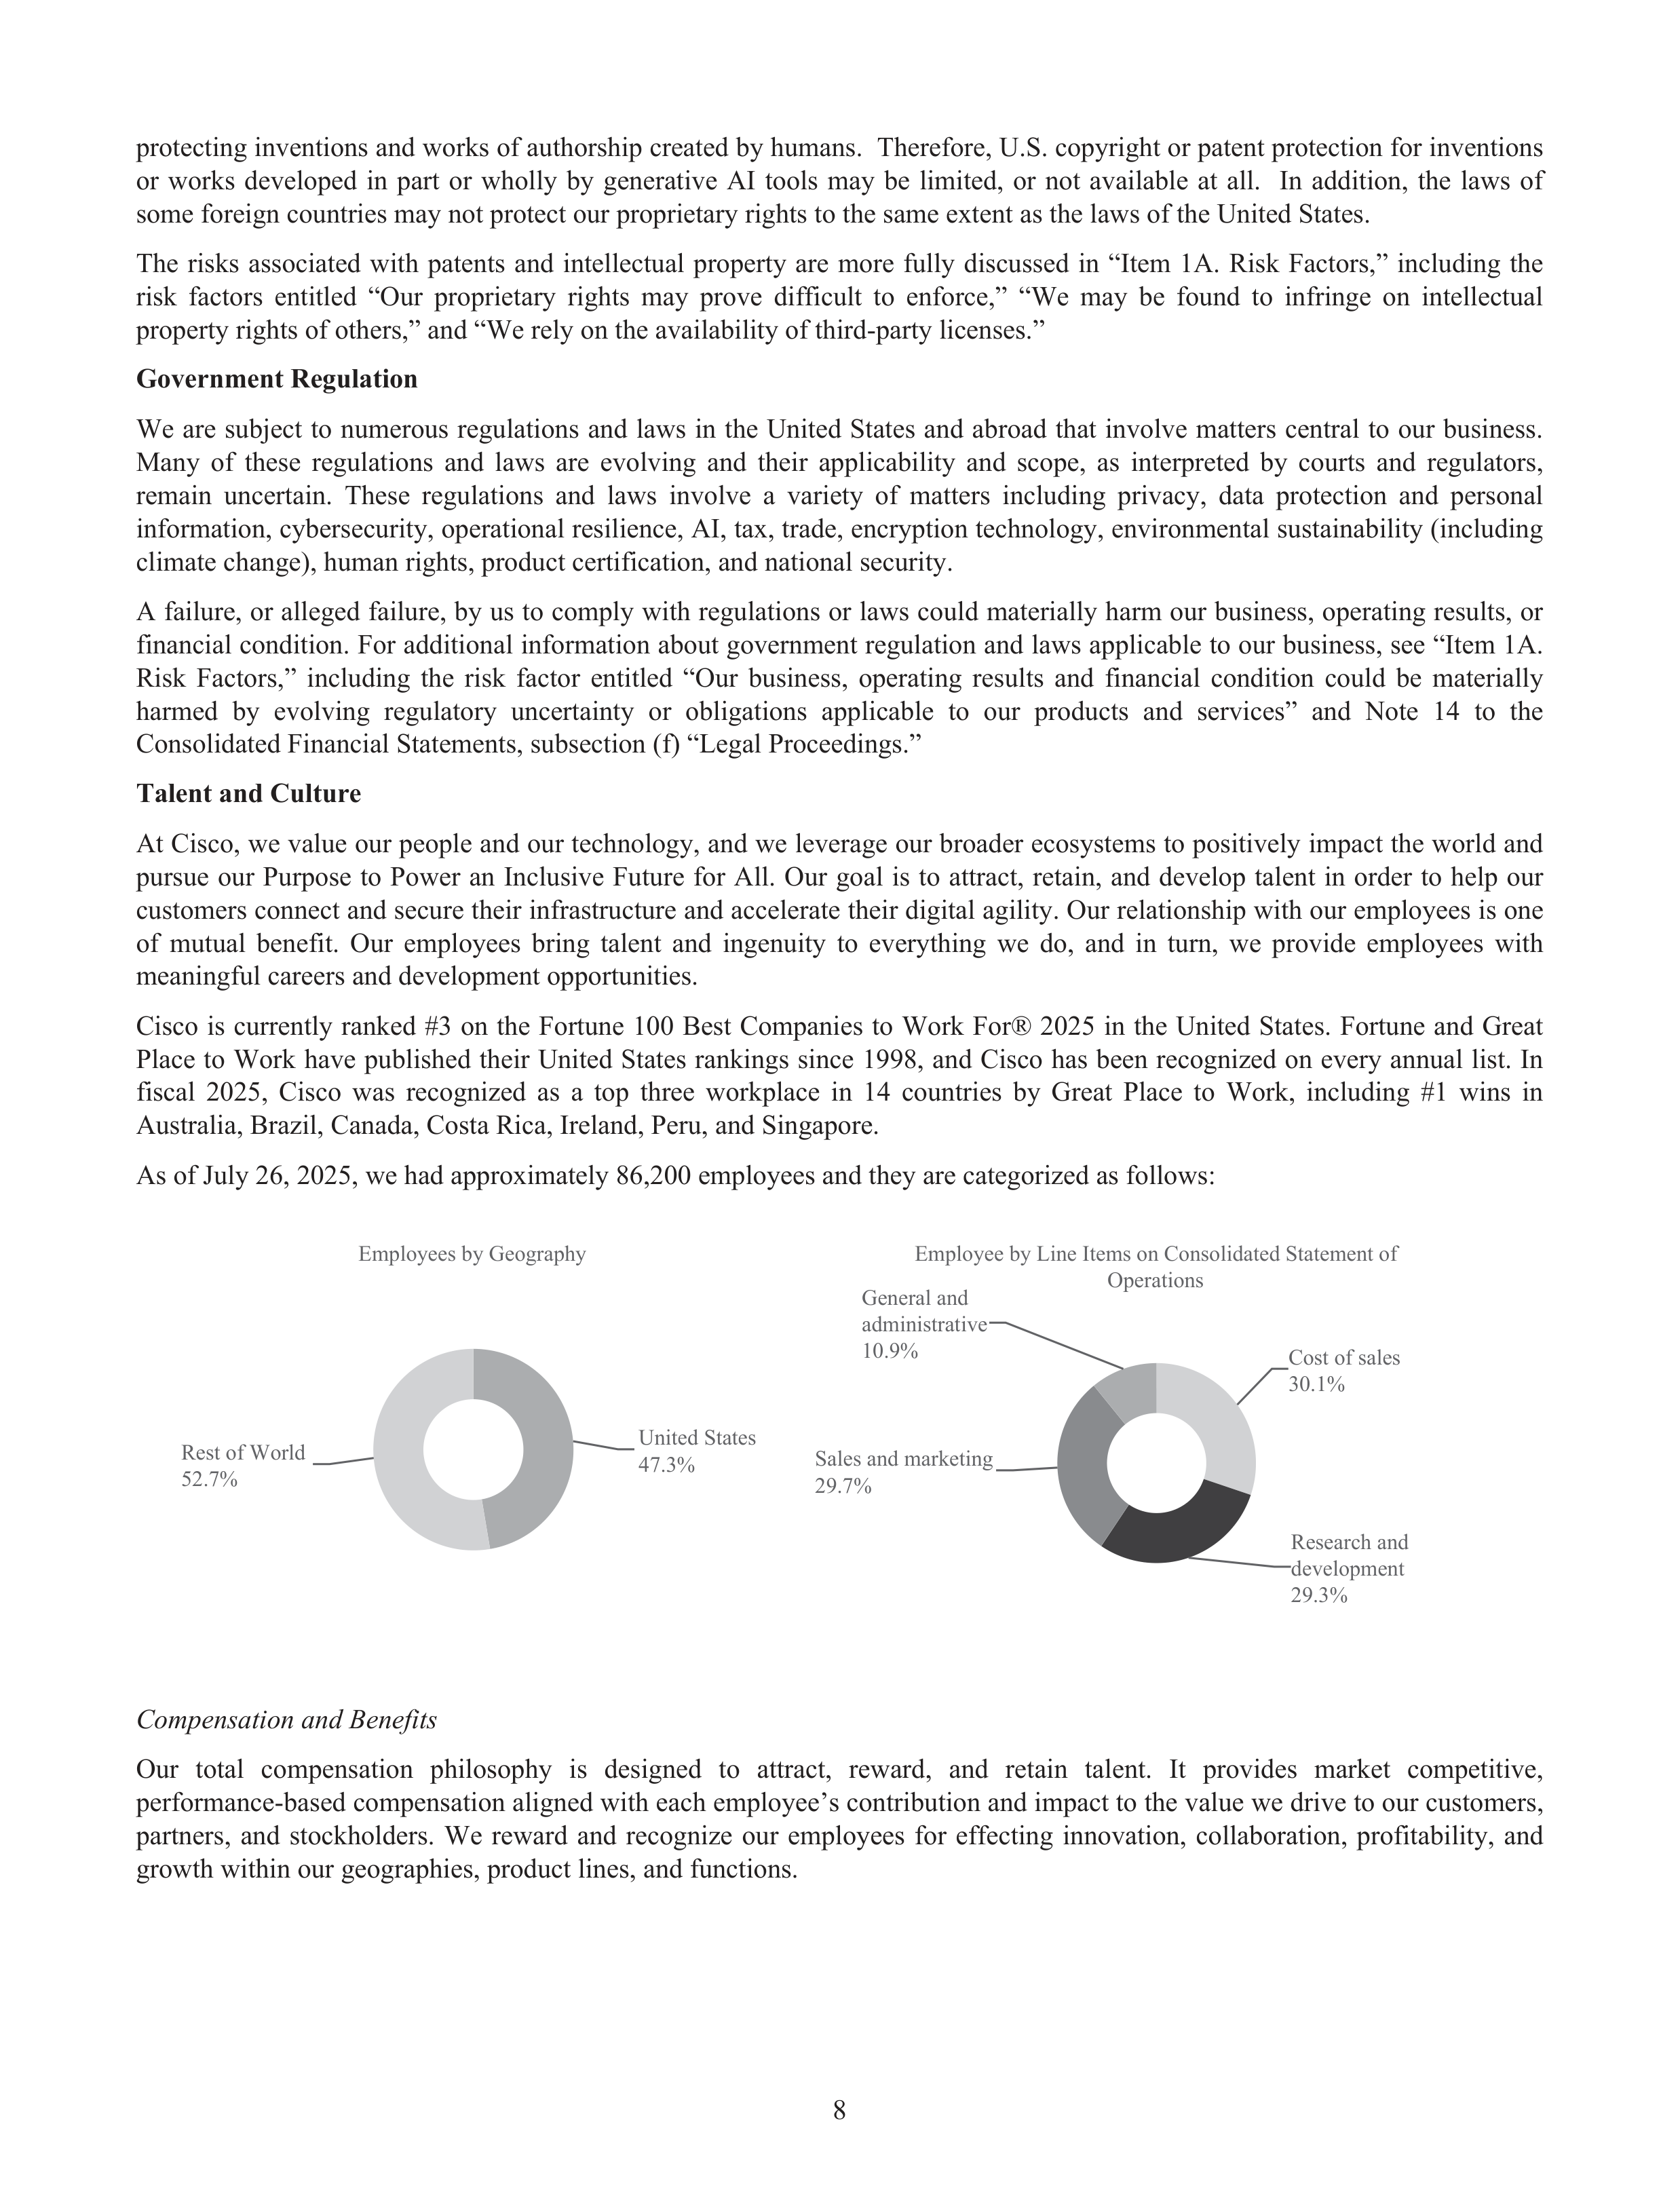
Employees by Geography
United States
47.3%
Rest of World
52.7%
Employee by Line Items on Consolidated Statement of
Operations
Cost of sales
30.1%
Research and
development
29.3%
Sales and marketing
29.7%
General and
administrative
10.9%
Compensation and Benefits
Our total compensation philosophy is designed to attract, reward, and retain talent. It provides market competitive,
performance-based compensation aligned with each employee’s contribution and impact to the value we drive to our customers,
partners, and stockholders. We reward and recognize our employees for effecting innovation, collaboration, profitability, and
growth within our geographies, product lines, and functions.
protecting inventions and works of authorship created by humans. Therefore, U.S. copyright or patent protection for inventions
or works developed in part or wholly by generative AI tools may be limited, or not
available
at
all. In addition, the laws of
some foreign countries may not protect our proprietary rights to the same extent as the laws of the United States.
The
risks associated with patents and intellectual property are more fully discussed in “Item 1A. Risk Factors,” including the
risk factors entitled “Our proprietary rights may prove difficult to enforce,” “We
may be found to infringe on intellectual
property rights of others,” and “We rely on the availability of third-party licenses.”
Government Regulation
We are subject to numerous regulations and laws in the United States and abroad that involve matters central to our business.
Many of these regulations and laws are evolving and their applicability and scope, as interpreted by courts and regulators,
remain uncertain. These regulations and laws involve a variety of matters including privacy, data protection and personal
information, cybersecurity, operational resilience, AI, tax, trade, encryption technology, environmental sustainability (including
climate change), human rights, product certification, and national security.
A failure, or alleged failure, by us to comply with regulations or laws could materially harm our business, operating results, or
financial condition. For additional information about government regulation and laws applicable to our business, see “Item 1A.
Risk Factors,” including the risk factor entitled “Our business, operating results and financial condition could be materially
harmed by evolving regulatory uncertainty or obligations applicable to our products and services” and Note 14 to the
Consolidated Financial Statements, subsection (f) “Legal Proceedings.”
Talent and Culture
At Cisco, we value our people and our technology, and we leverage our broader ecosystems to positively impact the world and
pursue our Purpose to Power an Inclusive Future for All. Our goal is to attract, retain, and develop talent in order to help our
customers connect and secure their infrastructure and accelerate their digital agility. Our relationship with our employees is one
of mutual benefit. Our employees bring talent and ingenuity to everything we do, and in turn, we provide employees with
meaningful careers and development opportunities.
Cisco is currently ranked #3 on the Fortune 100 Best Companies to Work For® 2025 in the United States. Fortune and Great
Place to Work have published their United States rankings since 1998, and Cisco has been recognized on every annual list. In
fiscal 2025, Cisco was recognized as a top three workplace in 14 countries by Great Place to Work, including #1 wins in
Australia, Brazil, Canada, Costa Rica, Ireland, Peru, and Singapore.
As of July 26, 2025, we had approximately 86,200 employees and they are categorized as follows:
8
Health & Well-being
We have an ongoing commitment to focus on the health, safety, and well-being of our employees. We seek to provide our
employees and their families with high-quality, flexible, and convenient benefits and resources for their physical, mental, and
financial
well-being. We strive to support our employees as they balance careers and personal lives, as well as their own
physical, emotional, and financial health. We continue to emphasize a focus on both physical and mental health, recognizing the
need to create an environment where employees can speak openly about mental health and other matters.
We offer mindfulness courses, employee assistance program offerings, and out-of-network provider benefits for substance
abuse and mental
health treatment, and more. In fiscal 2025, we continued to offer employees “A Day for Me,” which were
paid days off that allowed for each individual to recharge and rest. We employ a hybrid work model in certain countries, giving
our employees the flexibility to work offsite or at onsite Cisco locations.
Employee Development
Cisco is advancing new approaches to leading, learning, and working in the age of AI. We invest in developing strategic
capabilities that drive business growth, while enabling employees’ personal and professional development. By aligning skilling
with our Guiding Principles and business priorities, we put learning at the center of innovation.
Recognizing that
each career is unique, we provide personalized learning opportunities in multiple
formats that
fit
into
employees’ daily work. We are also unifying our leadership development approach to offer a full range of programs for
employees at
all
levels, reflecting our belief that you lead from every seat. The
principle of “one company, many careers”
guides us, and we are using data insights from skills intelligence to match people and opportunities. Learning and development
are reinforced in our performance processes. Success at Cisco depends on both what is achieved and how it is achieved, with
leaders supporting ongoing development through regular feedback and check-ins.
Employee Engagement
We believe that strong communication is key in our Conscious Culture. These communications include the Cisco Beat, which
are regular all-hands meetings, and Cisco Check-Ins, which are ad-hoc meetings for important conversations, and weekly team
leader check-ins, which we refer to as a “Team
Space Check-In.” In fiscal 2025, we have seen a
high level
of employee
engagement. As an example, there were approximately 2 million Team
Space Check-Ins by our employees in fiscal 2025,
reflecting approximately 65,700 employees (excludes certain of the employees who joined Cisco during fiscal 2024 through the
Splunk acquisition) submitting Team Space Check-Ins. Employees also participate in our global Engagement Pulse Survey and
the
Real
Deal Survey. These surveys allow our employees to provide confidential feedback on our culture, company strategy
and trust in their direct leaders.
9
Name
Age
Position with the Company
Charles H. Robbins
............
59
Chair and Chief Executive Officer
Mark Patterson
.................
55
Executive Vice President and Chief Financial Officer
Jeetendra Patel
...................
54
President, Chief Product Officer
Deborah L. Stahlkopf
........
55
Executive Vice President and Chief Legal Officer
Thimaya Subaiya
...............
47
Executive Vice President, Operations
Oliver Tuszik
.....................
57
Executive Vice President, Global Sales
Mr. Robbins
serves as our Chief Executive Officer since July 2015, as a member of the Board of Directors since May 2015,
and as Chair of the Board since December 2017. Mr. Robbins joined Cisco in December 1997, from which time until March
2002 he held a number of managerial positions within Cisco’s sales organization. Mr. Robbins was promoted to Vice President
in March 2002, assuming leadership of Cisco’s U.S. channel sales organization. Additionally, in July 2005, Mr. Robbins
assumed leadership of Cisco’s Canada channel sales organization. In December 2007, Mr. Robbins was promoted to Senior
Vice President, U.S. Commercial, and, in August 2009 he was appointed Senior Vice President, U.S. Enterprise, Commercial
and Canada. In July 2011, Mr. Robbins was named Senior Vice President, Americas. In October 2012, Mr. Robbins was
promoted to Senior Vice President, Worldwide Field Operations, in which position he served until assuming the role of Chief
Executive Officer. Mr. Robbins is also a member of the board of directors of BlackRock, Inc. (since 2017).
Mr. Patterson
joined Cisco in September 2000 and serves as our Executive Vice President and Chief Financial Officer since
July 2025. Previously, Mr. Patterson served as Cisco’s Executive Vice President and Chief Strategy Officer from March 2024
to July 2025, as Senior Vice President, Chief of Staff to the Chair and CEO from October 2018 to March 2024, as Senior Vice
President, Strategy, Planning, and Operations for Worldwide Sales and Marketing from July 2015 to October 2018, and in
various other leadership and finance roles at Cisco since 2000.
Mr. Patel
joined Cisco in July 2020 and serves as our President and Chief Product Officer since May 2025. Previously, Mr.
Patel served as Cisco’s Executive Vice President and Chief Product Officer from August 2024 to May 2025, as Executive Vice
President and General Manager, Security and Collaboration from June 2021 to August 2024, and as Senior Vice President and
General Manager, Security and Collaboration from July 2020 to June 2021. Prior to joining Cisco, Mr. Patel served as the Chief
Product Officer and Chief Strategy Officer at Box, Inc. (“Box”) from September 2017 to July 2020, and as Senior Vice
President of Platform and Chief Strategy Officer from August 2015 to September 2017. Prior to joining Box, Mr. Patel served
as General Manager and Chief Executive of the Syncplicity business unit of EMC Corporation (now part of Dell Technologies
Inc.). Mr. Patel is a member of the board of directors of Jones Lang LaSalle Incorporated (since 2019).
Ms. Stahlkopf
joined Cisco in August 2021 and serves as our Executive Vice President and Chief Legal Officer. Prior to
joining Cisco, Ms. Stahlkopf spent 14 years at Microsoft, where she served most recently as Corporate Vice President, General
Counsel and Corporate Secretary, Corporate, External and Legal Affairs from April 2018 to July 2021. Ms. Stahlkopf also
served in other leadership roles at Microsoft, including as Vice President and Deputy General Counsel from December 2015 to
April 2018 and as Associate General Counsel from December 2010 to December 2015. Prior to joining Microsoft, Ms.
Stahlkopf practiced law at Perkins Coie LLP and Cooley Godward LLP. Ms. Stahlkopf is a member of the board of directors of
NextEra Energy, Inc. (since 2023).
Mr. Subaiya
joined Cisco in July 2018 and serves as our Executive Vice President of Operations since March 2024. Previously,
Mr. Subaiya served as Cisco’s Senior Vice President, Chief Transformation Officer from March 2023 to March 2024, as Senior
Vice President and General Manager, Customer Experience from November 2021 to March 2023, and as Senior Vice President,
Customer Experience Operations and Renewals from July 2018 to November 2021. Prior to joining Cisco, Mr. Subaiya spent 8
years at Salesforce, Inc. (“Salesforce”) where he served in a variety of leadership roles, including most recently as its Chief
Operating Officer of Customer Success. Before joining Salesforce, Mr. Subaiya held various leadership roles in business
development and global planning and strategy at Oracle Corporation. Mr. Subaiya is a member of the board of directors of
Genpact Limited (since 2025).
Mr. Tuszik
joined Cisco in July 2013 and serves as our Executive Vice President of Global Sales since April 2025. Previously,
Mr. Tuszik served as Cisco’s Senior Vice President, EMEA Sales from August 2023 to April 2025, as Senior Vice President,
Global Partner and GM Routes to Market Sales from December 2020 to August 2023, as Senior Vice President, Worldwide
Partner Organization from July 2018 to December 2020, and as Vice President, Country Leader Germany from July 2013 to
July 2018. Prior to joining Cisco, Mr. Tuszik spent over 10 years at Computacenter AG & Co. oHG, most recently serving as
Chief Executive Officer Germany.
Information about our Executive Officers
The following table shows the name, age, and position as of August 31, 2025 of each of our executive officers:
10
Item 1A.
Risk Factors
Set forth below and elsewhere in this report and in other documents we file with the SEC are descriptions of the risks and
uncertainties that could cause our actual results to differ materially from the results contemplated by the forward-looking
statements contained in this report.
Risks Related to our Business and Industry
Our operations can be difficult to predict because our operating results may fluctuate in future periods.
Our operating results have been in the past, and will continue to be, subject to quarterly and annual fluctuations as a result of
numerous factors, some of which may contribute to more pronounced fluctuations in an uncertain global economic
environment. These factors include:
•
Fluctuations in demand for our products and services, especially with respect to service providers and Internet
businesses, in part due to changes in the global economic environment
•
Changes in sales and implementation cycles for our products and reduced visibility into our customers’ spending
plans and associated revenue
•
Our ability to maintain appropriate inventory levels and purchase commitments
•
Price and product competition in the communications and networking industries, which can change rapidly due to
technological innovation and different business models from various geographic regions
•
The overall movement toward industry consolidation among both our competitors and our customers
•
The introduction and market acceptance of new technologies and products, and our success in new and evolving
markets, and in emerging technologies, including AI, as well as the adoption of new standards
•
Variations in sales channels, product costs, mix of products sold, or mix of direct sales and indirect sales
•
The timing, size, and mix of orders from customers
•
Manufacturing and customer lead times
•
Fluctuations in our gross margins, and the factors that contribute to such fluctuations
•
The ability of our direct sale customers, channel partners, contract manufacturers and suppliers to obtain financing
or to fund capital expenditures, especially in the event of direct sale customers, channel partner, contract
manufacturer or supplier financial problems
•
Actual events, circumstances, outcomes, and amounts differing from judgments, assumptions, and estimates used in
determining the values of certain assets (including the amounts of related valuation allowances), liabilities, and other
items reflected in our Consolidated Financial Statements
•
How well we execute on our strategy and operating plans and the impact of changes in our business model that
could result in significant restructuring charges
•
Our ability to achieve targeted cost reductions
•
Benefits anticipated from our investments
•
Changes in tax laws or accounting rules, or interpretations thereof
As a consequence, operating results for a particular future period are difficult to predict, and, therefore, prior results are not
necessarily indicative of results to be expected in future periods. Any of the foregoing factors, or any other factors discussed
elsewhere herein, could materially harm our business, results of operations, and financial condition.
Our operating results may be negatively impacted by unfavorable economic and market conditions and the uncertain
geopolitical environment.
Challenging global economic conditions, including tariffs or other trade barriers, rising inflation, or other changes, have from
time to time contributed, and may continue to contribute, to slowdowns in the communications and networking industries at
large, as well as in specific segments and markets in which we operate, resulting in: reduced demand for our products as a result
of continued constraints on IT-related capital spending by our customers, particularly service provider and cloud as well as
enterprise and other customer markets; increased price competition for our products, not only from our competitors but also as a
consequence of customers disposing of unutilized products; risk of excess and obsolete inventories; risk of supply constraints;
risk of excess facilities and manufacturing capacity; and higher overhead costs as a percentage of revenue and higher interest
expense.
The global macroeconomic environment can be challenging and uncertain. For example, the impact of uncertainty regarding
global central bank monetary policy, the instability in the geopolitical environment in many parts of the world (including as a
11
result of the on-going Russia and Ukraine war, Middle East conflicts and wars, and China-Taiwan relations), and other
disruptions may continue to put pressure on global economic conditions. If global economic
and market conditions were to
deteriorate, we may experience material harm to our business, operating results, and financial condition.
Our operating results in one or more segments may also be affected by uncertain or changing economic conditions particularly
germane
to that
segment
or to particular customer markets within that segment. In addition, previous reports of certain
intelligence gathering methods of the U.S. government could affect customers’ perception of the products of IT companies
which design and manufacture products in the United States.
Our revenue for a particular period is difficult to predict, and a shortfall in revenue may harm our operating results.
As a result of a variety of factors discussed in this report, our revenue for a particular quarter is difficult to predict, which can be
exacerbated during periods when the global macroenvironment is challenging and can result in market uncertainty. Our revenue
may grow at a slower rate than in past periods, or decline as it did in certain prior periods on a year-over-year basis. Our ability
to meet financial expectations could also be negatively impacted if the nonlinear sales pattern seen in some of our past quarters
recurs in future periods. We have also experienced periods of time during which shipments have exceeded net bookings or
manufacturing issues have delayed shipments, leading to nonlinearity in shipping patterns. In addition to making it difficult to
predict revenue for a particular period, nonlinearity in shipping can increase costs, because irregular shipment patterns result in
periods of underutilized capacity and periods in which overtime expenses may be incurred, as well as in potential
additional
inventory management-related costs. In addition, to the extent that manufacturing issues and any related component shortages
result in delayed shipments in the future, and particularly in periods in which our contract manufacturers are operating at higher
levels of capacity, it is possible that revenue for a quarter could be negatively impacted if such matters occur and are not
remediated within the same quarter.
The
timing of large orders can also have a significant
impact on our business and operating results from quarter to quarter.
From time to time, we receive large orders that have a significant effect on our operating results in the period in which the order
is recognized as revenue. The timing of such orders is difficult to predict, and the timing of revenue recognition from such
orders may affect period to period changes in revenue. As a result, our operating results could vary materially from quarter to
quarter based on the receipt of such orders and their ultimate recognition as revenue. Longer than normal manufacturing lead
times in the past have caused, and in the future could cause, some customers to place the same or a similar order multiple times
within our various sales channels and to cancel the duplicative orders upon shipment or receipt of the product, or to also place
orders with other vendors with shorter manufacturing lead times. Such multiple ordering (along with other factors) or risk of
order cancellation may cause difficulty in predicting our revenue. Further, our efforts to improve manufacturing lead-time
performance may result in more variability and less predictability in our revenue and operating results. In addition, when facing
component supply-related challenges, we have in the past and may in the future increase our efforts in procuring components in
order to meet customer expectations, which in turn contributes to an increase in inventory and purchase commitments. These
increases in our inventory and purchase commitments to shorten lead times could also lead to potential
material excess and
obsolete inventory charges or other negative impacts to our product gross margin in future periods if product demand
significantly decreases for a sustained duration, we are unable to generate demand for certain products planned for
development, or we are unable to continue to mitigate
the remaining supply chain exposures. Product demand conditions for
future periods can be difficult
to predict or may persist longer than anticipated. We plan our operating expense levels based
primarily on forecasted revenue levels. These expenses and the impact of long-term commitments are
relatively fixed in the
short term. A shortfall in revenue could lead to operating results being below expectations because we may not be able
to
quickly reduce these fixed expenses in response to short-term business changes. Any of the above factors could materially harm
our operations and financial results. For additional information and a further discussion of impacts and risks related to our
inventory commitments and our purchase commitments with contract manufacturers and suppliers, see “Results of Operations
—Product Gross Margin—Supply Chain Impacts and Risks”, “Liquidity and Capital Resources—Inventory Supply Chain”
under Item 7 and Note 14 to the Consolidated Financial Statements of this report.
Supply chain issues, including financial problems of contract manufacturers or component suppliers, or a shortage of
adequate component supply or manufacturing capacity that increase our costs or cause a delay in our ability to fulfill
orders, could have an adverse impact on our business and operating results, and our failure to estimate customer demand
properly may result in excess or obsolete component supply, which could negatively impact our gross margins.
The fact that we do not own or operate the bulk of our manufacturing facilities and that we are reliant on our extended supply
chain could have an adverse impact on the supply of our products and on our business and operating results. Financial problems
of either contract manufacturers or component suppliers, reservation of manufacturing capacity at our contract manufacturers
by other companies, and industry consolidation occurring within one or more component supplier markets, such as the
semiconductor market, in each case, could either limit supply or increase costs.
12
A reduction or interruption in supply, including disruptions on our global supply chain, caused in part by public health
emergencies, geopolitical tensions (including as a result of China-Taiwan relations, increasing tariffs or any other trade
tensions) or a significant natural disaster (including as a result of climate change); a significant increase in the price of one or
more components (including as a result of inflation); a failure to adequately authorize procurement of inventory by our contract
manufacturers; a failure by suppliers to deliver on our contracts; a failure to appropriately cancel, reschedule, or adjust our
requirements based on our business needs; or a decrease in demand for our products could materially harm our business,
operating results, and financial condition and could materially damage customer relationships. Furthermore, as a result of
binding price or purchase commitments with suppliers, we may be obligated to purchase components at prices that are higher
than those available in the current market. In the event that we become committed to purchase components at prices in excess of
the current market price when the components are actually used, our gross margins could decrease. In addition, vendors may be
under pressure to allocate product to certain customers for business, regulatory or political reasons, and/or demand changes in
agreed pricing as a condition of supply. Although we have generally secured additional supply or taken other mitigation actions
when significant disruptions have occurred, if similar situations occur in the future, they could materially harm our business,
results of operations, and financial condition.
Our growth and ability to meet customer demands depend in part on our ability to obtain timely deliveries of parts from our
suppliers and contract manufacturers. We have experienced component shortages in the past, including shortages caused by
manufacturing process issues, that have affected our operations, including longer than normal lead times. Additionally, we may
in the future experience a shortage of certain component parts as a result of our own manufacturing issues, manufacturing issues
at our suppliers or contract manufacturers, capacity problems experienced by our suppliers or contract manufacturers including
capacity or cost problems resulting from industry consolidation, or strong demand for those parts. Growth in the economy is
likely to create greater pressures on us and our suppliers to accurately project component demand and to establish optimal
component levels and manufacturing capacity, especially for labor-intensive components, components for which we purchase a
substantial portion of the supply, or the re-ramping of manufacturing capacity for highly complex products. During periods of
shortages or delays the price of components may increase, or the components may not be available
at
all, and we
may also
encounter shortages if we do not accurately anticipate our needs. We may not be able to secure enough components at
reasonable prices or of acceptable quality to build new products in a timely manner in the quantities or configurations needed.
Accordingly, our revenue and gross margins could suffer until other sources can be developed.
Although in many cases we use standard parts and components for our products, certain components are presently available
only from a single source or limited sources, and a global economic downturn and related market uncertainty could negatively
impact
the availability of components from one or more of these sources, especially during times when there are supplier
constraints based on labor and other actions taken during economic downturns. We may not be able to diversify sources in a
timely manner, which could harm our ability to deliver products to customers and seriously impact present and future sales.
We believe that we may be faced with the following challenges in the future: new markets in which we participate may grow
quickly, which may make it
difficult to quickly obtain significant component capacity; as we acquire companies and new
technologies, we may be dependent on unfamiliar supply chains or relatively small supply partners; and we face competition for
certain components that are supply-constrained from existing competitors and companies in other markets.
Manufacturing capacity and component supply constraints could be significant issues for us as they have been in certain prior
periods. We purchase components from a variety of suppliers and use several contract manufacturers to provide manufacturing
services for our products. During the normal course of business, in order to improve manufacturing lead-time performance and
to help ensure adequate component supply, we enter into agreements with contract manufacturers and suppliers that either allow
them to procure inventory based upon criteria as defined by us or that establish the parameters defining our requirements. In
certain instances, these agreements allow us the option to cancel, reschedule, and adjust our requirements based on our business
needs prior to firm orders being placed. When facing component supply-related challenges, we have increased our efforts in
procuring components in order to meet customer expectations, such as we have done in past periods due to supply constraints,
which in turn contributes to an increase in inventory and purchase commitments. In fiscal 2025, we entered into additional
purchase commitments with contract manufacturers and suppliers related to manufacturing Cisco Silicon One and other
products to meet demand from webscale and other customers. We expect to continue entering into these
additional purchase
commitments in fiscal 2026. These past efforts and additional purchase commitments significantly increased our supply chain
exposure, which resulted in negative impacts to our product gross margin in recent periods and may result in further negative
impacts in future periods. On August 26, 2025, we settled a legal dispute with a supplier relating to purchase obligations arising
under long-term supply arrangements, which resulted in a charge to product cost of sales, which is described in Note 21 to the
Consolidated Financial
Statements. The remaining and new supply chain exposures include potential
material excess and
obsolete or other charges if product demand significantly decreases for a sustained duration, we are unable to generate demand
for certain products planned for development, or we are otherwise unable to mitigate
these supply chain exposures. Product
demand conditions for future periods can be difficult to predict or may persist longer than anticipated.
13
•
Changes in customer, geographic, or product mix, including the mix of hardware and software
•
Introduction of new products, including products with price-performance advantages, and new business models
(including continuing to increase the use of business models where revenue is recognized over multiple periods)
•
Our ability to reduce production costs
•
Entry into new markets or growth in lower margin markets, including markets with different pricing and cost
structures, through acquisitions or internal development
•
Sales discounts
•
Increases in material, labor or other manufacturing-related costs (i.e. component costs, broker fees, expedited freight
and overtime) or higher supply chain logistics costs, any of which could be significant, especially during periods of
supply constraints for certain costs, such as those that have impacted the market for components, including
semiconductors and memory in past periods, and which costs have in the past and may continue to be exacerbated
by inflation
•
Excess inventory, inventory holding charges, and obsolescence charges
•
Changes in shipment volume
•
The timing of revenue recognition and revenue deferrals
•
Increased costs (including those caused by tariffs or economic conditions, including inflation), loss of cost savings
or dilution of savings due to changes in component pricing or charges incurred due to inventory holding periods if
parts ordering does not correctly anticipate product demand or if the financial health of either contract manufacturers
or suppliers deteriorates
•
Lower than expected benefits from value engineering
•
Increased price competition, including competitors from Asia, especially from China
•
Changes in distribution channels
•
Increased warranty or royalty costs
•
Increased amortization of purchased intangible assets, especially from acquisitions
•
How well we execute on our strategy and operating plans
Changes in service gross margin may result from various factors such as changes in the mix between technical support services
and advanced services, as well as the timing of technical support service contract initiations and renewals, the addition of
personnel and other related costs, and other resources to support higher levels of service business in future periods.
Sales to the service provider and cloud market are especially volatile, and weakness in orders from this industry may harm
our operating results and financial condition.
Sales to the service provider and cloud market have been characterized by large and sporadic purchases, especially relating to
our router sales and sales of certain other Networking and Collaboration products, in addition to longer sales cycles. Although
service provider and cloud product orders increased during fiscal 2025, service provider and cloud market product orders
decreased in fiscal 2024, and at various times in the past we have experienced significant weakness in product orders from the
service provider and cloud market. Product orders from the service provider and cloud market could decline in the future and,
as has been the case in the past, such weakness could persist over extended periods of time given fluctuating market conditions.
Products in the service provider and cloud market could also face a high degree of customer concentration, with bespoke
product designs and features that would be difficult to sell to alternate customers should the primary customer reduce its
product orders with Cisco. Sales activity in this industry depends upon the stage of completion of expanding network
infrastructures; the availability of funding; and the extent to which service provider and cloud customers are affected by
regulatory, economic, and business conditions in the country of operations. Weakness in orders from this industry, including as
a result of any slowdown in capital expenditures by service providers (which may be more prevalent during a global economic
downturn, or periods of economic, political or regulatory uncertainty), could materially harm our business, operating results,
and financial condition. Such slowdowns may continue or recur in future periods. Orders from this industry could decline for
many reasons other than the competitiveness of our products and services within their respective markets. For example, in the
past, many of our service provider and cloud customers have been negatively impacted by slowdowns in the general economy,
by overcapacity, by changes in the service provider and cloud market, by regulatory developments, and by constraints on
capital availability, resulting in business failures and substantial reductions in spending and expansion plans. These conditions
have negatively impacted our business and operating results in the past, and could materially harm our business and operating
We expect gross margin to vary over time, and our level of product gross margin may not be sustainable.
Although our product gross margin increased in fiscal 2025, our level of product gross margins has declined in certain prior
periods, and could decline in future periods due to adverse impacts from various factors, including:
14
results in any future period. Finally, service provider and cloud customers typically have longer implementation cycles; require
a broader range of services, including design services; demand that vendors take on a larger share of risks; often require
acceptance provisions, which can lead to a delay in revenue recognition; and expect financing from vendors. All these factors
can add further risk to business conducted with service providers.
Disruption of or changes in our distribution model could harm our sales and margins.
If we fail to manage distribution of our products and services properly, or if our distributors’ financial condition or operations
weaken, our revenue and gross margins could be negatively impacted. A substantial portion of our products and services is sold
through our channel partners, and the remainder is sold through direct sales. Our channel partners include systems integrators,
service providers, other third-party resellers, and distributors. Systems integrators and service providers typically sell directly to
end users and often provide system installation, technical support, professional services, and other support services in addition
to network equipment sales. Systems integrators also typically integrate our products into an overall solution, and a number of
service providers are also systems integrators. Distributors stock inventory and typically sell to systems integrators, service
providers, and other third-party resellers. We refer to sales through distributors as our two-tier system of sales to the end user. If
sales through indirect channels increase, this may lead to greater difficulty in forecasting the mix of our products and, to a
degree, the timing of orders from our customers.
Historically, we have seen fluctuations in our gross margins based on changes in the balance of our distribution channels. There
can be no assurance that changes in the balance of our distribution model in future periods would not have an adverse effect on
our gross margins and profitability. Some factors could result in disruption of or changes in our distribution model, which could
harm our sales and margins, including the following: competition with some of our channel partners, including through our
direct
sales, which may lead these
channel partners to use other suppliers that do not directly sell their own products or
otherwise compete with them; some of our channel partners may demand that we absorb a greater share of the risks that their
customers may ask them to bear; some of our channel partners may have insufficient financial resources and may not be able to
withstand changes and challenges in business conditions; and revenue from indirect sales could suffer if our distributors’
financial condition or operations weaken. In addition, we depend on our channel partners globally to comply with applicable
regulatory requirements. To the extent
that
they fail to do so, that could materially harm our business, operating results, and
financial condition. Further, sales of our products outside of agreed territories can result in disruption to our distribution
channels.
The markets in which we compete are intensely competitive, which could negatively impact our achievement of revenue
growth.
The markets in which we compete are characterized by rapid change, converging technologies, and a migration to networking
and communications solutions that offer relative advantages. These market factors represent a competitive
threat to us. We
compete with numerous vendors in each product category. The overall number of our competitors providing niche product
solutions may increase. Also, the identity and composition of competitors may change as we increase
our activity in newer
product areas, and in key priority areas. For example, as products related to network programmability, such as software defined
networking (SDN) products, have become more prevalent, we have faced increased competition from companies that develop
networking products based on commoditized hardware, referred to as “white box” hardware, to the extent customers decide to
purchase those product offerings instead of ours. In addition, the growth in demand for technology delivered as a service
enables new competitors to enter the market. As we continue to expand globally, we may see
new competition in different
geographic regions. In particular, we have experienced price-focused competition from competitors in Asia, especially from
China, and we anticipate this will continue. For information regarding our competitors, see the section entitled “Competition”
contained in “Item 1. Business” of this report.
Some of our competitors compete across many of our product lines, while others are primarily focused in a specific product
area. Barriers to entry are
relatively low, and new ventures to create products that do or could compete with our products are
regularly formed. In addition, some of our competitors may have greater resources, including technical and engineering
resources, than we do. As we expand into new markets, we will
face
competition not only from our existing competitors but
also from other competitors, including existing companies with strong technological, marketing, and sales positions in those
markets. We also sometimes face competition from resellers and distributors of our products. Companies with which we have
strategic
alliances in some
areas may be competitors in other areas, and this trend may increase. For example, the enterprise
data center is undergoing a fundamental transformation arising from the convergence of technologies, including computing,
networking, storage, and software, that previously were segregated. Due to several factors, including the availability of highly
scalable and general purpose microprocessors, application specific integrated circuits offering advanced services, standards
based protocols, cloud computing and virtualization, the convergence of technologies within the enterprise data
center is
spanning multiple, previously independent, technology segments. Also, some of our current and potential competitors for
enterprise data center business have made acquisitions, or announced new strategic alliances, designed to position them
to
provide end-to-end technology solutions for the enterprise data center. As a result of all of these developments, we face greater
15
In recent years, we have shifted our business model to deliver more recurring software and subscription offerings. This shift in
our business model was accelerated by recent acquisitions, including our acquisition of Splunk in the third quarter of fiscal
2024. Market acceptance of our software subscription offerings, which includes our as-a-service solutions, can be affected by a
variety of factors, including: security, reliability, performance, terms of service, support terms, customer preference, community
engagement, concerns regarding data privacy or data protection, and the enactment of laws or regulations in jurisdictions in
which we operate. To generate sales growth for our software subscription offerings, we need to convince potential customers to
purchase new licenses or subscriptions and generate timely renewals and additional purchases from existing customers. Any
failure to do so could result in decreased revenue, reduced sales, increased churn or otherwise negatively impact our results of
operations and financial condition. Further, growth of our software subscription offerings depends, in part, on the ability of
customers to use and access these solutions. We have experienced, and may in the future experience, interruptions in service,
storage failures, and other performance-related problems due to a variety of factors, such as infrastructure and software
competition in the
development
and sale of enterprise data
center technologies, including competition from
entities that
are
among our long-term strategic
alliance partners. Companies that are
strategic
alliance partners in some areas of our business
may acquire or form alliances with our competitors, thereby reducing their business with us.
We
also face
competition from customers to which we license or supply technology and suppliers from which we transfer
technology. The inherent nature of networking requires interoperability. As such, we must cooperate
and at
the
same
time
compete with many companies. Any inability to effectively manage these complicated relationships with customers, suppliers,
and strategic
alliance
partners could materially harm our business, operating results, and financial condition and accordingly
affect our chances of success.
Inventory management relating to our sales to our two-tier distribution channel is complex, and excess inventory may harm
our gross margins.
We must manage inventory relating to sales to our distributors effectively, because inventory held by them could affect our
results of operations. Our distributors may increase orders during periods of product shortages, cancel orders if their inventory
is too high, or delay orders in anticipation of new products. They also may adjust their orders in response to the supply of our
products and the products of our competitors that are
available to them, and in response to seasonal fluctuations in end-user
demand. Our distributors are generally given business terms that allow them to return a portion of inventory, receive credits for
changes in selling price, and participate in various cooperative marketing programs. Inventory management remains an area of
focus as we balance the need to maintain strategic inventory levels to ensure competitive lead times against the risk of inventory
obsolescence because of rapidly changing technology and customer requirements. When facing component supply-related
challenges, we have in the past and may in the future increase our efforts in procuring components or enter additional purchase
commitments with contract manufacturers and suppliers in order to meet customer expectations. If we ultimately determine that
we have excess inventory, we may have to reduce our prices and write down inventory, which in turn could result in lower
gross margins.
Issues related to the development and use of artificial intelligence (AI could give rise to legal and/or regulatory action,
damage our reputation or otherwise materially harm our business.
We currently incorporate AI technology in certain of our commercial offerings and in our business operations. Our research and
development of AI technology remains ongoing. AI presents risks and challenges and may result in unintended consequences,
including inadvertent disclosure or misuse of intellectual property, confidential, personal, and/or competitive information, that
could affect our reputation, our further AI development or our and our customers’ adoption and use of this technology. AI
algorithms and training methodologies may be flawed. Additionally, AI technologies are complex and rapidly evolving, and we
face significant competition in the market and from other companies regarding such technologies. Leveraging AI capabilities to
potentially improve our internal functions and operations also presents risks, costs, and challenges. While we aim to develop
and use AI responsibly and attempt to identify and mitigate ethical and legal issues and risks presented by its use, we may be
unsuccessful in identifying or resolving issues and risks before they arise. The
AI-related legal and regulatory landscape is
constantly evolving and therefore remains uncertain and may be inconsistent from jurisdiction to jurisdiction. Our obligations to
comply with the evolving legal and regulatory landscape could entail significant costs or limit our ability to incorporate certain
AI capabilities into our offerings. AI-related issues, deficiencies and/or failures could also give rise to legal and/or regulatory
action (including with respect to proposed legislation regulating AI in jurisdictions such as the European Union and others, and
as a result of new and different applications of existing and new data protection, privacy, intellectual property, and other laws);
damage our reputation; or otherwise materially harm our business.
Our financial performance may be negatively
impacted by demand for, and costs to deliver, our software subscription
offerings; and interruptions or performance problems associated with these offerings, including interruptions or
performance problems caused by third-party providers on which we rely, may negatively impact our business and financial
results.
16
changes, human or software errors, capacity constraints, unauthorized access, denial of service or other cyber attacks. In some
instances, we may not be able
to timely identify the
cause or causes of these performance problems and, even if timely
identified, we
may be unable to timely remediate
the underlying cause. It may become
increasingly difficult
to maintain and
improve our performance for our software subscription offerings, especially during peak usage times and as our solutions
become more complex and our user traffic increases. Performance-related issues of our software subscription offerings may
result in increased operational costs, delays in new feature rollouts, customer loss, reputational damage, and legal or regulatory
liability, including liability under customer contracts or for losses suffered by our customers.
To deliver our software subscription offerings, we have incurred and will continue to incur substantial costs to implement and
maintain this business. We
make
significant
investments to increase
or maintain capacity and to develop and implement new
technologies in our infrastructure and operations, including those provided by third-party providers on which we rely. We may
not be successful in developing or implementing these technologies. To the extent
that we do not effectively scale our
operations to meet the needs of our customers and to maintain performance as our customers expand their use of our solutions,
we may not be able to grow this business as quickly as we anticipate, our customers may reduce or cancel use of our solutions,
and we may be unable to compete as effectively and our business and results of operations may be harmed. Additionally, if our
costs associated with our software subscription offerings were to significantly increase, our business, results of operations and
financial condition may be negatively impacted. We are also subject to the risk of performance-related problems or interruption
of the services provided by third-party providers on which we rely, which could cause revenues for software subscription
offerings to decline, damage to our reputation, legal liability exposure, and/or increased expenses, all of which could negatively
impact our business, results of operations, and financial condition.
We depend upon the development of new products and services, and enhancements to existing products and services, and if
we fail to predict and respond to emerging technological trends and customers’ changing needs, our operating results and
market share may suffer.
The markets for our products and services are characterized by rapidly changing technology, evolving industry standards, new
product and service introductions, and evolving methods of building and operating networks. Our operating results depend on
our ability to develop and introduce new products and services into existing and emerging markets and to reduce the production
costs of existing products. If customers do not purchase and/or renew our offerings our business could be harmed.
The process of developing new technology, including more programmable, flexible and virtual networks, and technology
related to other market transitions— such as AI, security, observability, and cloud— is complex and uncertain, and if we fail to
accurately predict customers’ changing needs and emerging technological trends our business could be harmed. We
must
commit
significant resources, including the investments we have been making in our strategic priorities to developing new
products and services before knowing whether our investments will result in products and services the market
will
accept. In
particular, if our model of the evolution of networking, security, or observability does not emerge as we believe it will, or these
industries do not evolve as we believe they will, or if our strategy for addressing this evolution is not successful, many of our
strategic initiatives and investments may be of no or limited value. For example, if we do not timely introduce products related
to these markets, or if such products or offerings that ultimately succeed in these
markets are based on technology, or an
approach to technology, that differs from ours, our business could be harmed. In addition, our business could be negatively
impacted in periods surrounding our new product introductions if customers delay purchasing decisions to qualify or otherwise
evaluate the new product offerings. We have also been seeking to meet the evolving needs of customers which include offering
our products and solutions in the manner in which customers wish to consume them. As a part of these efforts, we continue to
make changes to how we are organized and how we build and deliver our technology, including changes in our business models
with customers. If our strategy for addressing our customer needs, or the architectures and solutions we develop do not meet
those needs, or the changes we are making in how we are organized and how we build and deliver or technology is incorrect or
ineffective, our business could be harmed.
Furthermore, we may not execute successfully on our vision or strategy because of challenges with regard to product planning
and timing, technical hurdles that we fail to overcome in a timely fashion, or a lack of appropriate resources. This could result
in competitors, some of which may also be our strategic alliance partners, providing those solutions before we do and loss of
market share, revenue, and earnings. In addition, the growth in demand for technology delivered as a service
enables new
competitors to enter the
market. The success of new products and services depends on several factors, including proper new
product and service definition, component costs, timely completion and introduction of these products and services,
differentiation of new products and services from those of our competitors, and market acceptance of these products and
services. There can be no assurance that we will successfully identify new product and services opportunities, develop and
bring new products and services to market in a
timely manner, or achieve
market
acceptance of our products and services or
that products, services and technologies developed by others will not render our products, services or technologies obsolete or
noncompetitive. The products and technologies in our other product categories and key priority areas may not prove to have the
market success we anticipate, and we may not successfully identify and invest in other emerging or new products and services.
17
•
Difficulties or delays in integrating the operations (including IT security), systems, technologies, products, and
personnel of the acquired companies, particularly with companies that have large and widespread operations and/or
complex products (such as Splunk)
•
Diversion of management’s attention from normal daily operations of the business and the challenges of managing
larger and more widespread operations resulting from acquisitions
•
Potential difficulties in completing projects associated with in-process research and development intangibles
•
Difficulties in entering markets in which we have no or limited direct prior experience and where competitors in
such markets have stronger market positions
•
Initial dependence on unfamiliar supply chains or relatively small supply partners
•
Insufficient revenue to offset increased expenses associated with acquisitions
•
The potential loss of key employees, customers, distributors, vendors and other business partners of the companies
we acquire following and continuing after announcement of acquisition plans
Acquisitions have in the past and may in the future also cause us to:
•
Issue common stock that would dilute our current stockholders’ percentage ownership
•
Use a substantial portion of our cash resources, or incur debt
•
Significantly increase our interest expense, leverage and debt service requirements if we incur additional debt to pay
for an acquisition
•
Assume liabilities
Changes in industry structure and market conditions could lead to charges related to discontinuances of certain of our
products or businesses, asset impairments and workforce reductions or restructurings.
In response to changes in industry and market conditions, we may be required to strategically realign our resources and to
consider restructuring, disposing of, or otherwise exiting businesses. Any resource realignment, or decision to limit investment
in or dispose of or otherwise exit businesses, may result in the recording of special charges, such as inventory and technology-
related write-offs, workforce reduction or restructuring costs, charges relating to consolidation of excess facilities, or claims
from third parties who were resellers or users of discontinued products. Our estimates with respect to the useful life or ultimate
recoverability of our carrying basis of assets, including purchased intangible assets, could change as a result of such
assessments and decisions. Although in certain instances our supply agreements allow us the option to cancel, reschedule, and
adjust our requirements based on our business needs prior to firm orders being placed, our loss contingencies may include
liabilities for contracts that we cannot cancel
with contract manufacturers and suppliers. Further, our estimates relating to the
liabilities for excess facilities are affected by changes in real estate market conditions. Additionally, we are required to perform
goodwill impairment tests on an annual basis and between annual tests in certain circumstances, and future goodwill
impairment tests may result in a charge to earnings. From time to time we initiate restructuring plans. Our business may not be
more efficient or effective than prior to implementation of such plans. Our restructuring activities, including any related charges
and the impact of the related headcount restructurings, could materially harm our business, operating results, and financial
condition.
Over the long term we intend to invest in engineering, sales, service and marketing activities, and in key priority areas, and
these investments may achieve delayed, or lower than expected, benefits which could harm our operating results.
While we intend to focus on managing our costs and expenses, over the long term, we also intend to invest in personnel and
other resources related to our engineering, sales, service and marketing functions as we realign and dedicate resources on key
priority areas, such as AI, cloud, and cybersecurity. We also intend to focus on maintaining leadership in core networking and
services. We
are
likely to recognize
the
costs associated with these
investments earlier than some of the anticipated benefits,
and the return on these investments may be lower, or may develop more slowly, than we expect. If we do not achieve
the
benefits anticipated from these investments (including if our selection of areas for investment does not play out as we expect),
or if the achievement of these benefits is delayed, our operating results may be negatively impacted.
We have made and expect to continue to make acquisitions that could disrupt our operations and harm our operating
results.
Our growth depends upon market growth, our ability to enhance our existing products, and our ability to introduce new
products on a timely basis. We intend to continue to address the need to develop new products and enhance existing products
through acquisitions of other companies, product lines, technologies, and personnel. Acquisitions involve numerous risks,
including the following:
18
•
Record goodwill and intangible assets that are subject to impairment testing on a regular basis and potential periodic
impairment charges
•
Incur amortization expenses related to certain intangible assets
•
Incur tax expenses related to the effect of acquisitions on our legal structure
•
Incur large write-offs and restructuring and other related expenses
•
Become subject to intellectual property or other litigation
Mergers and acquisitions of high-technology companies are inherently risky and subject to many factors outside of our control,
and no assurance can be given that our previous or future acquisitions will be successful and will not materially harm our
business, operating results, or financial condition. Failure to manage and successfully integrate acquisitions could materially
harm our business and operating results. Prior acquisitions have resulted in a wide range of outcomes, from successful
introduction of new products and technologies to a failure to do so. Even when an acquired company has already developed and
marketed products, there can be no assurance that product enhancements will be made in a timely fashion or that pre-acquisition
due diligence will have identified all possible issues that might arise with respect to such products. In addition, our effective tax
rate for future periods is uncertain and could be impacted by mergers and acquisitions. Risks described with respect to new
product development also apply to acquisitions.
Entrance into new or developing markets exposes us to additional competition and will likely increase demands on our
service and support operations.
As we focus on new market opportunities and key priority areas, such as AI, cloud, and cybersecurity, we compete with
companies of all sizes. Several of our competitors may have greater resources, including technical and engineering resources,
than we do. Additionally, as customers complete infrastructure deployments, they may require greater levels of service, support,
and financing than we have provided in the past, especially in emerging countries. Demand for these types of service, support,
or financing contracts may increase in the future. There can be no assurance that we can provide products, service, support, and
financing to effectively compete for these market opportunities. Further, entry into other markets has subjected and will subject
us to additional risks, particularly to those markets, including the effects of general market conditions and reduced consumer
confidence. For example, as we add direct selling capabilities globally to meet changing customer demands, we will face
increased legal and regulatory requirements.
If we do not successfully manage our strategic alliances, we may not realize the expected benefits from such alliances, and
we may experience increased competition or delays in product development.
We have several strategic alliances with large and complex organizations and other companies with which we work to offer
complementary products and services. These arrangements are generally limited to specific projects, the goal of which is
generally to facilitate product compatibility and adoption of industry standards. There can be no assurance we will realize the
expected benefits from these strategic alliances or from joint ventures. If successful, these relationships may be mutually
beneficial and result in industry growth. However, alliances carry an element of risk because, in most cases, we must compete
in some business areas with a company with which we have a strategic alliance and, at the same time, cooperate with that
company in other business areas. Also, if these companies fail to perform or if these relationships fail to materialize as
expected, we could suffer delays in product development or other operational difficulties. Joint ventures can be difficult to
manage, given the potentially different interests of joint venture partners.
Product quality problems could lead to reduced revenue, gross margins, and net income.
We produce highly complex products that incorporate leading-edge technology, including both hardware and software.
Software typically contains bugs or other quality or reliability problems that can unexpectedly interfere with its intended
operations or the intended operation of the systems in which our software is installed. There can be no assurance that our pre-
shipment or pre-release testing programs will be adequate to detect all defects, either ones in individual products or ones that
could affect numerous shipments, which might interfere with customer satisfaction, reduce sales opportunities, or affect gross
margins. From time to time, we have had to replace certain components and provide remediation in response to the discovery of
defects or bugs in products that we had shipped. There can be no assurance that such remediation, depending on the product
involved, would not have a material impact. An inability to cure a product defect or bug could result in the failure of a product
line, temporary or permanent withdrawal from a product or market, damage to our reputation, inventory costs, product
reengineering expenses or legal liability, any of which could materially harm our revenue, margins, and net income.
Due to the global nature of our operations, political or economic changes or other factors in a specific country or region
could harm our operating results and financial condition.
We conduct significant sales and customer support operations in countries around the world. As such, our growth depends in
part on our increasing sales into emerging countries. We also depend on non-U.S. operations of our contract manufacturers,
19
component suppliers and distribution partners. Our business in emerging countries in the aggregate
experienced a
decline
in
orders in certain prior periods. We continue to assess the sustainability of any improvements in our business in these countries
and there can be no assurance that our investments in these countries will be successful. Our future results could be negatively
impacted by a variety of political, economic or other factors relating to our operations inside and outside the United States, any
or all
of which could materially harm our operating results and financial condition, including the following: impacts from
global central bank monetary policy; issues related to the
political
relationship between the United States and other countries
that can affect regulatory matters, affect the willingness of customers in those countries to purchase products from companies
headquartered in the United States or affect our ability to procure components if a government body were to deny us access to
those components; government-related disruptions or shutdowns; the challenging and inconsistent global macroeconomic
environment; foreign currency exchange rates;
geopolitical tensions (including China-Taiwan relations); political
or social
unrest; economic instability or weakness or natural disasters in a specific country or region, including economic challenges in
China and global economic ramifications of Chinese economic difficulties; environmental protection regulations (including new
laws and regulations related to climate change); trade protection measures, such as tariffs; other legal and regulatory
requirements, some of which may affect our ability to import our products to, export our products from, or sell our products in
various countries or affect our ability to procure components; political considerations that affect
service provider and
government spending patterns; health or similar issues, including pandemics or epidemics; difficulties in staffing and managing
international operations; and adverse tax consequences, including imposition of withholding or other taxes on our global
operations.
We are exposed to the credit risk of some of our customers and to credit exposures in weakened markets, which could result
in material losses.
Most of our sales are on an open credit basis, with typical payment terms of 30 days in the United States, and, because of local
customs or conditions, longer in some markets outside the United States. Beyond our open credit arrangements, we have also
experienced demands for customer financing and facilitation of leasing arrangements. Our loan financing arrangements may
include not only financing the acquisition of our products and services but also providing additional funds for other costs
associated with network installation and integration of our products and services. Our exposure to the credit risks relating to our
financing activities may increase if our customers are negatively impacted by a global economic downturn or periods of
economic
uncertainty. There
can be no assurance that programs we have in place
to monitor and mitigate
credit risks will be
effective. In the past, there have been significant bankruptcies among customers both on open credit and with loan or lease
financing arrangements, particularly among Internet businesses and service providers, causing us to incur economic or financial
losses. There can be no assurance that
additional losses will not be incurred. Although these losses have not been material
to
date, future losses, if incurred, could materially harm our business, operating results, or financial condition. Additionally, to the
degree that
turmoil
in the
credit
markets makes it more difficult for some customers to obtain financing, those customers’
ability to pay could be
adversely impacted, which in turn could materially harm our business, operating results, and financial
condition.
We are exposed to fluctuations in the market values of our portfolio investments and in interest rates; impairment of our
investments could harm our earnings.
We
maintain an investment portfolio of various holdings, types, and maturities. Our portfolio includes available-for-sale debt
investments and equity investments, the values of which are subject to market price volatility. If such investments suffer market
price declines, as we experienced with some of our investments in the past, we may recognize in earnings the decline in the fair
value of our investments below their cost basis. Our privately held investments are subject to risk of loss of investment capital.
These investments are inherently risky because the markets for the technologies or products they have under development are
typically in the
early stages and may never materialize. We could lose our entire investment
in these companies. For
information regarding the market risks associated with the fair value of portfolio investments and interest rates, refer to the
section titled “Quantitative and Qualitative Disclosures About Market Risk.”
We are exposed to fluctuations in currency exchange rates that could negatively impact our financial results and cash flows.
Because a significant portion of our business is conducted outside the United States, we face exposure to adverse movements in
foreign currency exchange rates, including emerging market currencies which can have extreme currency volatility. An increase
in the value of the dollar could increase the real cost to our customers of our products in those markets outside the United States
where we sell in dollars and a weakened dollar could increase
the cost of local operating expenses and procurement of raw
materials to the
extent
that we must purchase components in foreign currencies. These exposures may change over time
as
business practices evolve, and they could materially harm our financial results and cash flows.
Failure to retain and recruit key personnel would harm our ability to meet key objectives.
Our success has always depended in large part on our ability to attract and retain highly skilled technical, managerial, sales, and
marketing personnel. Competition for such personnel is intense, especially in the Silicon Valley area of Northern California and
20
other major United States locations. Stock incentive plans are designed to reward employees for their long-term contributions
and provide incentives for them
to remain with us. Volatility or lack of positive performance in our stock price or equity
incentive awards, or changes to our overall compensation program, including our stock incentive program, resulting from the
management of share dilution and share-based compensation expense or otherwise, may also negatively impact
our ability to
retain key employees. As a result of one or more of these factors, we may increase our hiring in geographic areas outside the
United States, which could subject us to additional geopolitical and exchange rate risk. The loss of services of any of our key
personnel; the inability to retain and attract qualified personnel in the future; or delays in hiring required personnel, particularly
in engineering and sales fields, could make it
difficult
to meet
key objectives, such as timely and effective product
introductions. In addition, companies in our industry whose employees accept positions with competitors frequently claim that
competitors have engaged in improper hiring practices. We have received these
claims in the past and may receive
additional
claims in the future.
Adverse resolution of claims, litigation or governmental investigations may harm our operating results or financial
condition.
We are a party to a variety of claims, litigation and governmental investigations in the normal course of our business. Claims,
litigation and governmental investigations may arise from a wide variety of business practices and initiatives, including major
new product releases, significant business transactions, warranty or product claims, employment practices, and regulation. Any
claim, litigation or governmental
investigation can be costly, lengthy, and disruptive to normal business operations. For
example, on August 26, 2025, we settled a legal dispute with a supplier relating to purchase obligations arising under long-term
supply arrangements, which resulted in a charge to product cost of sales, which is described in Note 21 to the Consolidated
Financial Statements. Moreover, the results of complex legal proceedings are difficult to predict, and management's view of
these
matters may change
in the future. An unfavorable resolution of claims, litigation or governmental investigations could
materially harm our business, operating results, or financial condition. For additional information regarding certain of the
matters in which we are involved, see Note 14 to the Consolidated Financial Statements, subsection (f) “Legal Proceedings.”
Our operating results may be negatively impacted and damage to our reputation may occur due to the production and sale of
counterfeit versions of our products.
As is the case with leading products around the world, our products are subject to efforts by third parties to produce counterfeit
versions of our products. While we work diligently with law enforcement authorities in various countries to block the
manufacture of counterfeit goods and to interdict their sale, and to detect counterfeit products in customer networks, and have
succeeded in prosecuting counterfeiters and their distributors, resulting in fines, imprisonment and restitution to us, there can be
no guarantee that such efforts will succeed. While
counterfeiters often aim
their sales at customers who might not have
otherwise purchased our products due to lack of verifiability of origin and service, such counterfeit sales, to the
extent
they
replace otherwise legitimate sales, could negatively impact our operating results.
Changes in our provision for income taxes or adverse outcomes resulting from examination of our income tax returns could
negatively impact our results.
Our provision for income taxes is subject
to volatility and could be
negatively impacted by earnings being lower than
anticipated in countries that have lower tax rates and higher than anticipated in countries that have higher tax rates; by changes
in the
valuation of our deferred tax assets and liabilities; by changes to foreign-derived intangible income, global
intangible
low-tax income and base erosion and anti-abuse tax, research and development capitalization and amortization, and corporate
alternative
minimum tax laws, regulations, or interpretations thereof; by expiration of or lapses in tax incentives; by transfer
pricing adjustments, including the effect of acquisitions on our legal structure; by tax effects of nondeductible compensation; by
tax costs related to intercompany realignments; by changes in accounting principles; or by changes in tax laws and regulations,
treaties, or interpretations thereof, including changes to the taxation of earnings of our foreign subsidiaries, the deductibility of
expenses attributable to foreign income, and the foreign tax credit rules. Significant judgment is required to determine
the
recognition and measurement attribute prescribed in the accounting guidance for uncertainty in income taxes. The Organisation
for Economic Co-operation and Development (OECD), an international association comprised of 38 countries, including the
United States, has made changes, including a Pillar Two framework that imposes a minimum
tax rate of 15% in each taxing
jurisdiction, and is contemplating additional changes to numerous long-standing tax principles. There can be no assurance that
these
changes and any contemplated changes if finalized, once adopted by countries, will not have an adverse impact on our
provision for income taxes. Further, as a result of certain of our ongoing employment and capital
investment
actions and
commitments, our income
in certain countries was subject to reduced tax rates. Our failure to meet
these
commitments could
adversely impact our provision for income taxes. In addition, we are subject to the continuous examination of our income tax
returns by the Internal Revenue
Service
and other tax authorities. We regularly assess the likelihood of adverse outcomes
resulting from these examinations to determine the adequacy of our provision for income taxes. There can be no assurance that
the outcomes from these continuous examinations will not have an adverse effect on our operating results and financial
condition.
21
Our business and operations are especially subject to the risks of earthquakes, floods, and other natural catastrophic events
(including as a result of global climate change.
Our corporate headquarters, including certain of our research and development operations are located in the Silicon Valley area
of Northern California, a region known for seismic activity. Additionally, a
certain number of our facilities are
located near
rivers that have experienced flooding in the past. Also certain of our customers, suppliers and logistics centers are located in
regions that have been or may be affected by earthquake, tsunami and flooding or other weather-related activity which in the
past has disrupted, and in the future could disrupt, the flow of supply chain components and delivery of products. In addition,
global climate change may result in significant natural disasters occurring more frequently and/or with greater intensity, such as
drought, wildfires, storms, sea-level rise, changing precipitation, and flooding. We have not to date experienced a material event
as a result of these kinds of natural disasters; however, the occurrence of any such event in the future could materially harm our
business, operating results, and financial condition.
Terrorism, war, and other events may harm our business, operating results and financial condition.
The continued threat of terrorism and heightened security and military action in response thereto, or any other current or future
acts of terrorism, war (such as the on-going Russia-Ukraine war and Middle East conflicts and wars), and other events (such as
economic sanctions, trade restrictions and reactions of the governments, markets and the general public, including the sanctions
and restrictions related to the on-going Russia-Ukraine war) may cause further disruptions to the economies of the United States
and other countries and create further uncertainties or could otherwise negatively impact our business, operating results, and
financial condition. Likewise, events such as loss of infrastructure and utilities services such as energy, transportation, or
telecommunications could have similar negative impacts. To the extent that such disruptions or uncertainties result in delays or
cancellations of customer orders or the manufacture or shipment of our products, our business, operating results, and financial
condition could be materially harmed.
There can be no assurance that our operating results and financial condition will not be negatively impacted by our
incurrence of debt.
As of the end of fiscal 2025, we have senior unsecured notes outstanding in an aggregate principal amount of $24.8 billion that
mature
at
specific dates from calendar year 2026 through 2064. We have also established a
commercial paper program under
which we may issue short-term, unsecured commercial paper notes on a private
placement basis up to a maximum
aggregate
amount outstanding at any time of $15.0 billion, and we had $3.5 billion in commercial paper notes outstanding under this
program as of July 26, 2025. There can be no assurance that our incurrence of this debt or any future debt, including any
additional debt to refinance maturing debt, will be a better means of providing liquidity to us than would our use of our existing
cash resources. Further, we cannot be assured that our maintenance of this indebtedness or incurrence of future indebtedness
will not negatively impact our operating results or financial condition. In addition, changes by any rating agency to our credit
rating can negatively impact the value and liquidity of both our debt and equity securities, as well as the terms upon which we
may borrow under our commercial paper program or future debt issuances.
Our reputation and/or business could be negatively impacted by matters relating to environmental, social, and governance
and/or our reporting of such matters.
We
are
subject to evolving and sometimes conflicting, laws, regulations, policies, and investor and other stakeholder
expectations concerning environmental, social, and governance matters, such as environmental
sustainability and climate
change, both in the United States and internationally. Any initiatives, goals, or commitments we disclose in this regard involve
risks and uncertainties and could be difficult
to achieve and costly to implement. For example, in September 2021, we
announced our goal to achieve net zero across all scopes of greenhouse gas emissions by 2040, the achievement of which relies,
in large part, on the accuracy of our estimates and assumptions around the enhanced power efficiency of our products, the
adoption of renewable energy at customer and supplier sites, and the adoption of certain of our products and services by our
customers. We could fail to achieve, or be perceived to fail to achieve, our 2040 net zero goal or other initiatives, goals, or
commitments. In addition, in a climate where there are changing and increasingly divergent views on where our focus should be
on these matters, our initiatives, goals, or commitments, or any revisions to them, are often criticized and the
accuracy,
adequacy, or completeness of such disclosures challenged. Our actual or perceived failure to achieve our initiatives, goals, or
commitments, or otherwise successfully manage investor or other stakeholder expectations on these matters, could negatively
impact our reputation or otherwise harm our business.
Risks Related to Intellectual Property
Our proprietary rights may prove difficult to enforce.
We generally rely on patents, copyrights, trademarks, and trade secret laws to establish and maintain proprietary rights in our
technology and products. Although we have been issued numerous patents and other patent applications are currently pending,
there
can be no assurance that any of these patents or other proprietary rights will not be challenged, invalidated, or
22
circumvented or that our rights will, in fact, provide competitive advantages to us. Furthermore, many key aspects of our
technology are governed by industry-wide standards, which are usable by all
market entrants. In addition, there can be no
assurance that patents will be issued from pending applications or that claims allowed on any patents will be sufficiently broad
to protect our technology. Additionally, some U.S. governmental entities and courts have expressed a position that U.S.
copyright and patent protection should be limited to protecting inventions and works of authorship created by humans.
Therefore, U.S. copyright or patent protection for inventions or works developed in part or wholly by generative AI tools may
be limited, or not available at all. In addition, the laws of some foreign countries may not protect our proprietary rights to the
same extent as do the laws of the United States. The outcome of any actions taken in these foreign countries may be different
than if such actions were determined under the laws of the United States. Although we are not dependent on any individual
patents or group of patents for particular segments of the business in which we compete, if we
are unable to protect our
proprietary rights to the totality of the features (including aspects of products protected other than by patent rights) in a market,
we may find ourselves at a competitive disadvantage to others who need not incur the substantial expense, time, and effort
required to create innovative products that have enabled us to be successful.
We may be found to infringe on intellectual property rights of others.
Third parties, including customers, have in the past and may in the future assert claims or initiate litigation related to exclusive
patent, copyright, trademark, and other intellectual property rights to technologies and related standards that are relevant to us.
These assertions have increased over time
as a result of our growth and the general
increase
in the
pace of patent claims
assertions, particularly in the United States. Because of the existence of a large number of patents in the information technology
field, the secrecy of some pending patents, and the rapid rate of issuance of new patents, it is not economically practical or even
possible to determine
in advance whether a product or any of its components infringes or will infringe on the patent rights of
others. The asserted claims and/or initiated litigation can include
claims against us or our manufacturers, suppliers, or
customers, alleging infringement of their proprietary rights with respect to our existing or future products or components of
those products. Regardless of the merit of these claims, they can be time-consuming, result in costly litigation and diversion of
technical
and management personnel, or require us to develop a non-infringing technology or enter into license agreements.
Where claims are made by customers, resistance even to unmeritorious claims could damage customer relationships. There can
be no assurance that licenses will be available on acceptable terms and conditions, if at all, or that our indemnification by our
suppliers will be adequate to cover our costs if a claim were brought directly against us or our customers. Furthermore, because
of the potential for high court awards, including injunctive relief, that
are not necessarily predictable, it is not unusual to find
even arguably unmeritorious claims settled for significant amounts. If any infringement or other intellectual
property claim
made against us by any third party is successful, if we are required to indemnify a customer with respect to a claim against the
customer, or if we fail to develop non-infringing technology or license the proprietary rights on commercially reasonable terms
and conditions, our business, operating results, and financial condition could be materially harmed. For additional information
regarding our indemnification obligations, see Note 14(e) to the Consolidated Financial Statements contained in this report. Our
exposure to risks associated with the use of intellectual property may be increased as a result of acquisitions, as we have a lower
level
of visibility into the
development process with respect to such technology or the care taken to safeguard against
infringement risks. Further, in the past, third parties have made infringement and similar claims after we have acquired
technology that had not been asserted prior to our acquisition.
We rely on the availability of third-party licenses.
Many of our commercial offerings are designed to include software or other intellectual property licensed from third parties. It
may be necessary in the future to seek or renew licenses relating to various aspects of these products. There can be no assurance
that
the necessary licenses would be available
on acceptable
terms, if at
all. The
inability to obtain certain licenses or other
rights or to obtain such licenses or rights on favorable terms, or the need to engage in litigation regarding these matters, could
materially harm our business, operating results, and financial condition. Moreover, the inclusion in our commercial offerings of
software or other intellectual property licensed from third parties on a nonexclusive basis could limit our ability to protect our
proprietary rights in our products.
Risks Related to Cybersecurity, Privacy, and Regulatory Requirements
Cyber attacks, data breaches or other incidents impacting our solutions and IT environment
may disrupt our operations,
harm our operating results and financial condition, and damage our reputation or otherwise materially harm our business;
and cyber attacks, data breaches or other incidents on our customers’ or third-party providers’ networks, or in third-party
products we use, could result in claims of liability against us, give rise to legal and/or regulatory action, damage our
reputation or otherwise materially harm our business.
We experience cyber attacks and other attempts to gain unauthorized access on a regular basis to (i) our products and services
(together, our “solutions”) and (ii) the servers, data centers, networks, systems, and cloud-based services operated or enabled by
us, or by third parties upon which we rely, on or through which our and third-party data are stored, processed, or can be
23
accessed (collectively, our “IT environment”). We anticipate continuing to be increasingly subject
to such attempts as cyber
attacks become more sophisticated and difficult
to predict and protect against. Furthermore, the emergence and maturation of
AI capabilities has led to new and/or more
effective methods of cyber attacks. Despite our active
implementation of security
and other measures, our solutions and IT environment have been, and continue to be, vulnerable to cyber attacks, incidents, data
breaches, malware, inadvertent error, disruptions, failures, physical security breaches, tampering or other theft or misuse,
including by employees, contingent workers, and malicious actors. Additionally, nation-state actors or their agents have in the
past successfully attacked our IT environment and have also exploited vulnerabilities in our solutions to carry out attacks, and
we anticipate
that
these
attacks and the exploitation of vulnerabilities in our solutions will continue and may intensify during
periods of diplomatic or armed conflict or other geopolitical tensions. Further, a cyber attack, vulnerability exploitation, or other
incident could go undetected and persist in our environments, or those of our customers or third-party providers upon which we
rely, for extended periods. Cyber-related events have caused, and in the future could result in, compromise to, or the disruption
of access to, the operation of our solutions and IT environment or those of our customers or third-party providers upon which
we rely, or result in confidential information stored on our systems or our customers’ or other third-party systems being
improperly accessed, processed, disclosed now (or in the future), or being lost or stolen. Efforts to limit the ability of malicious
actors to disrupt the operations of the Internet or undermine our security efforts are costly to implement and may not be
successful. Breaches of security in our IT environment, our customers’ or third-party providers’ networks, or in third-party
products we use, regardless of whether the breach is attributable
to a vulnerability in our solutions, a failure
by us to timely
mitigate or apply a security fix for products we use that
are found vulnerable, or a failure
to maintain the
digital
security
infrastructure or security tools that protect
the integrity of our solutions and IT environment, could, in each case, result in
claims of legal and/or regulatory action against us, damage our reputation or otherwise materially harm our business. The
occurrence of a cyber attack, data breach or other incident could subject us to direct or indirect liability to our customers, data
subjects, suppliers, business partners, employees, and others, give rise to legal and/or regulatory action, could damage our
reputation or could otherwise negatively impact our business, any of which could materially harm our business, operating
results, and financial condition.
Vulnerabilities and critical
security defects, prioritization decisions regarding remedying vulnerabilities or security defects,
failure of third-party providers to remedy vulnerabilities or security defects, or customers not deploying security updates in a
timely manner or deciding not to upgrade our solutions to those with security updates or security enhancements applied
could result in claims of liability against us, damage our reputation, or otherwise materially harm our business.
The products and services (together, our “solutions”) we sell to customers, and the cloud-based services operated or enabled by
us, or by third parties upon which we rely, inevitably contain vulnerabilities or security defects (despite our efforts to prevent
and detect
them through secure development
lifecycle practices, testing, or other means), which have not been remedied or
cannot be disclosed without compromising security. We also make prioritization decisions in determining which vulnerabilities
or security defects to fix and the timing of these
fixes. Even when we
prioritize a vulnerability or security defect, in certain
instances it has taken, and in the future could take, time for us to develop and test a remedy and the remedy may ultimately be
insufficient to fully fix the issue or may be found to create other issues. In addition, workarounds or other mitigation efforts in
certain instances have not been, and in the future may not be, available or sufficient to protect customers prior to a security
update being made available. Vulnerabilities can persist even after we have issued security updates if we have not identified and
addressed the root cause of a particular vulnerability, if customers have not installed the most recent updates, if the attackers
exploited the
vulnerabilities before a security update is applied (such as to install
additional
malware to further compromise
customers’ systems), or if a previously patched vulnerability is inadvertently reintroduced due to a security regression during
future development or a changed deployment. Additionally, customers may also desire to test security updates before they can
be deployed which can delay implementation. When customers do not deploy security updates in a timely manner, use solutions
that
are end of life and no longer receive security updates, decide not to upgrade to the
latest versions of our solutions
containing security updates or security enhancements, configure our solutions in insecure ways, or fail to sufficiently monitor
activity on those solutions, they are left vulnerable. In addition, we rely on third-party providers of software (including open
source) and cloud-based services on which our and third-party data is stored or processed, and we cannot control the timing at
which third-party providers remedy vulnerabilities, which could leave us vulnerable. Failure to comply with internal
security
policies and standards, including secure development lifecycle practices, failure to prevent or promptly mitigate vulnerabilities
and security defects, prioritization errors in remedying vulnerabilities or security defects, failure of third-party providers to
remedy vulnerabilities or security defects, or customers not deploying security updates in a timely manner, deciding not
to
upgrade solutions, or configuring our solutions in insecure ways could, in each case, result in claims of legal and/or regulatory
action against us, damage our reputation, or otherwise materially harm our business.
Our actual or perceived failure to adequately protect and appropriately use data could result in claims of legal and/or
regulatory action against us, damage our reputation, or otherwise materially harm our business.
Global privacy and data protection-related laws and regulations, including cybersecurity laws, are evolving, extensive, and
complex. Compliance with these laws and regulations is difficult and costly. In addition, evolving legal requirements restricting
24
Item 1B.
Unresolved Staff Comments
None.
or controlling the collection, processing, use or cross-border transmission of data, including regulation of cloud-based services,
could materially affect our customers’ ability to use, and our ability to sell, our products and services. The interpretation and
application of these laws in some instances is uncertain, and our legal and regulatory obligations are subject to frequent
changes. For example, the European Union’s (“EU”) General
Data
Protection Regulation (“GDPR”) applies to our activities
conducted from an establishment
in the
EU or related to products and services offered in the
EU and imposes a range of
compliance obligations regarding the handling of personal data for both ourselves and our customers. Additionally, we are
subject to California’s Consumer Privacy Act, Singapore’s Personal Data Protection Act, and other laws, regulations, and
obligations around the world that govern the handling of personal data. Our actual or perceived failure to comply with
applicable laws and regulations or other obligations relating to the use of data and protecting data from unauthorized access,
use, or other processing, could subject us to claims of liability, or give rise to legal and/or regulatory action, damage our
reputation, and/ or otherwise negatively impact our business, any of which could materially harm our operating results and
financial condition.
Our business, operating results, and financial condition could be materially harmed by evolving regulatory uncertainty or
obligations applicable to our products and services.
Changes in regulatory requirements applicable
to the industries and sectors in which we operate, in the
United States and in
other countries, could materially affect
the sales and use of our products and services. In particular, economic sanctions and
changes to export and import control requirements have impacted and may continue to impact our ability to sell and support our
products and services in certain jurisdictions. In addition, changes in telecommunications regulations could impact our service
provider customers’ purchase of our products and services, and they could also impact sales of our own regulated offerings.
Government and other customers' procurement policies, priorities, regulations, technology initiatives and/or other obligations
often give rise to evolving privacy, cybersecurity, operational resilience, data governance, or other requirements; the failure or
delay in meeting and maintaining compliance
with such requirements could negatively impact our business, including by
limiting our ability to sell products and services, directly or indirectly, to public sector, critical infrastructure, and other
customers. Additional areas of uncertainty that
could impact sales of our products and services include laws, regulations, or
customer procurement requirements related to encryption technology, data, AI, privacy, cybersecurity, operational resilience,
environmental
sustainability (including climate change), human rights, product certification, product
and digital
accessibility,
country of origin, and national security and other security controls applicable to our offerings and supply chain. Changes in
regulatory requirements or our actual or perceived failure to comply (or to enable our customers to comply when using our
offerings) with applicable laws, regulations, or other obligations could materially harm our business, operating results, and
financial condition.
Risks Related to Ownership of Our Stock
Our stock price may be volatile.
Historically, our common stock has experienced substantial price
volatility, particularly as a result of variations between our
actual financial results and the published expectations of analysts and as a result of announcements by our competitors and us.
Furthermore, speculation in the press or investment community about our strategic position, financial condition, results of
operations, business, security of our products, or significant transactions can cause changes in our stock price. In addition, the
stock market
has experienced extreme
price and volume fluctuations that have affected the
market
price of many technology
companies, in particular, and that have often been unrelated to the operating performance of these companies. These factors, as
well
as general
economic
and political conditions and the announcement of proposed and completed acquisitions or other
significant transactions, or any difficulties associated with such transactions, by us or our current or potential competitors, may
materially harm the market price of our common stock in the future. Additionally, volatility, lack of positive performance in our
stock price or changes to our overall compensation program, including our stock incentive program, may negatively impact our
ability to retain key employees, virtually all of whom are compensated, in part, based on the performance of our stock price.
25
Item 1C.
Cybersecurity
We recognize the critical importance of maintaining the trust and confidence of our customers, employees, and other
stakeholders. To help mitigate the cybersecurity risks that we face, we maintain processes for identifying, assessing, and
managing such risks.
Our incident response functions, which include our Security and Trust Organization (“S&TO”) under the leadership of our
Chief Security and Trust Officer, have established internal policies, processes, and procedures to monitor, detect, investigate,
respond to, and escalate management of internal and external cybersecurity threats and incidents. We maintain policies and
procedures for the escalation of cybersecurity incidents, assessed as potentially being or becoming material, to designated
members of our senior management for further assessment. We also, as necessary, inform our independent registered public
accounting firm of significant cybersecurity matters and any relevant developments.
To help identify, assess, and mitigate cybersecurity threats that we face to our business, S&TO, in addition to its own
capabilities, partners with Cisco’s Talos Threat Intelligence Group and third parties, including governments and peer
companies, to share and receive threat intelligence and other information. S&TO actively monitors for and evaluates
cybersecurity vulnerabilities, threats, and incidents observable on the Internet and the dark web. In addition to monitoring risks
from threats to our own business, we operate third-party risk management programs to help identify and manage risks from
cybersecurity threats arising from third-party suppliers and service providers on which we rely. These programs leverage on-
going security-focused risk assessments based on industry practices, audits, and contractual requirements.
We strive to embed security into our products and services through the Cisco Secure Development Lifecycle (CSDL). The
CSDL introduces security and privacy considerations throughout the lifecycle of our products and services. In addition, S&TO
advises business units and functional areas on addressing cybersecurity risks and monitors initiatives to mitigate and manage
such risks over time. Our business units or functional areas are responsible for managing risks and ensuring that security
policies and standards are implemented within the respective business unit or function. S&TO also conducts mandatory
cybersecurity training for our employees and provides employees with tools to report suspected incidents.
S&TO engages third parties in connection with our cybersecurity risk management processes, including cybersecurity
consultants and auditors, to conduct evaluations of our IT security controls and provide certifications for industry-standard
security frameworks. In addition, we maintain a global privacy program to assess and manage privacy risks related to how we
are collecting, using, sharing, and storing personal data, which is subject to assessment by an independent, third-party privacy
assessor.
Our Chief Security and Trust Officer, who reports to our Executive Vice President, Operations, works collaboratively across
our business to implement policies and procedures designed to protect our IT environment and our products and services from
cybersecurity threats, and to promptly respond to cybersecurity incidents in accordance with our incident response policies and
procedures. Our Chief Security and Trust Officer has extensive cybersecurity experience and has served in various roles in
information technology and information security for over 25 years.
The Chief Security and Trust Officer provides regular reports on the status of cybersecurity risks, priorities, and focus areas to
our executive leadership team. In addition, information on cybersecurity risks is further integrated into our broader enterprise
risk management program through our internal audit function, which incorporates such information in regular audits of our
cybersecurity and data protection controls and processes.
Our Board of Directors oversees risks related to cybersecurity threats to our business directly and through its Audit Committee.
The Audit Committee receives regular reports on cybersecurity risks, priorities, and focus areas from our Chief Security and
Trust Officer at least four times a year and receives a live presentation at least twice a year. Our Board of Directors also
regularly receives updates from the Audit Committee on its oversight activities and, on occasion, receives updates directly from
our Chief Security and Trust Officer. Additionally, the Chief Security and Trust Officer provides more frequent updates to the
Board of Directors and Audit Committee if necessary due to a cybersecurity threat, incident, or other development.
As of the date of this Annual Report on Form 10-K, we do not believe our business, operating results, or financial condition
have been materially affected by cybersecurity risks, including as a result of previously identified cybersecurity incidents. For
more information on our cybersecurity related risks, see “Item 1A. Risk Factors” of this Annual Report on Form 10-K.
26
Item 2.
Properties
Our corporate headquarters are located at an owned site in San Jose, California, in the United States of America. The locations
of our headquarters by geographic segment are as follows:
Americas
EMEA
APJC
San Jose, California, USA
Amsterdam, Netherlands
Singapore
In addition to our headquarters site, we own additional sites in the United States, which include facilities in the surrounding
areas of San Jose, California; Research Triangle Park, North Carolina; and Richardson, Texas. In addition, we lease office
space in many U.S. locations.
Outside the United States our operations are conducted primarily in leased sites. Other significant sites (in addition to the two
non-U.S. headquarters locations) are located in Australia, Belgium, Canada, China, Germany, India, Israel, Norway, Poland,
and the United Kingdom.
We believe that our existing facilities, including both owned and leased, are in good condition and suitable for the conduct of
our business.
Item 3.
Legal Proceedings
For a description of pending legal proceedings in which we are involved, see Note 14 “Commitments and Contingencies - (f)
Legal Proceedings” of the Notes to Consolidated Financial Statements included in Item 8 of this Annual Report on Form 10-K,
which is incorporated herein by reference.
Item 4.
Mine Safety Disclosures
Not applicable.
27
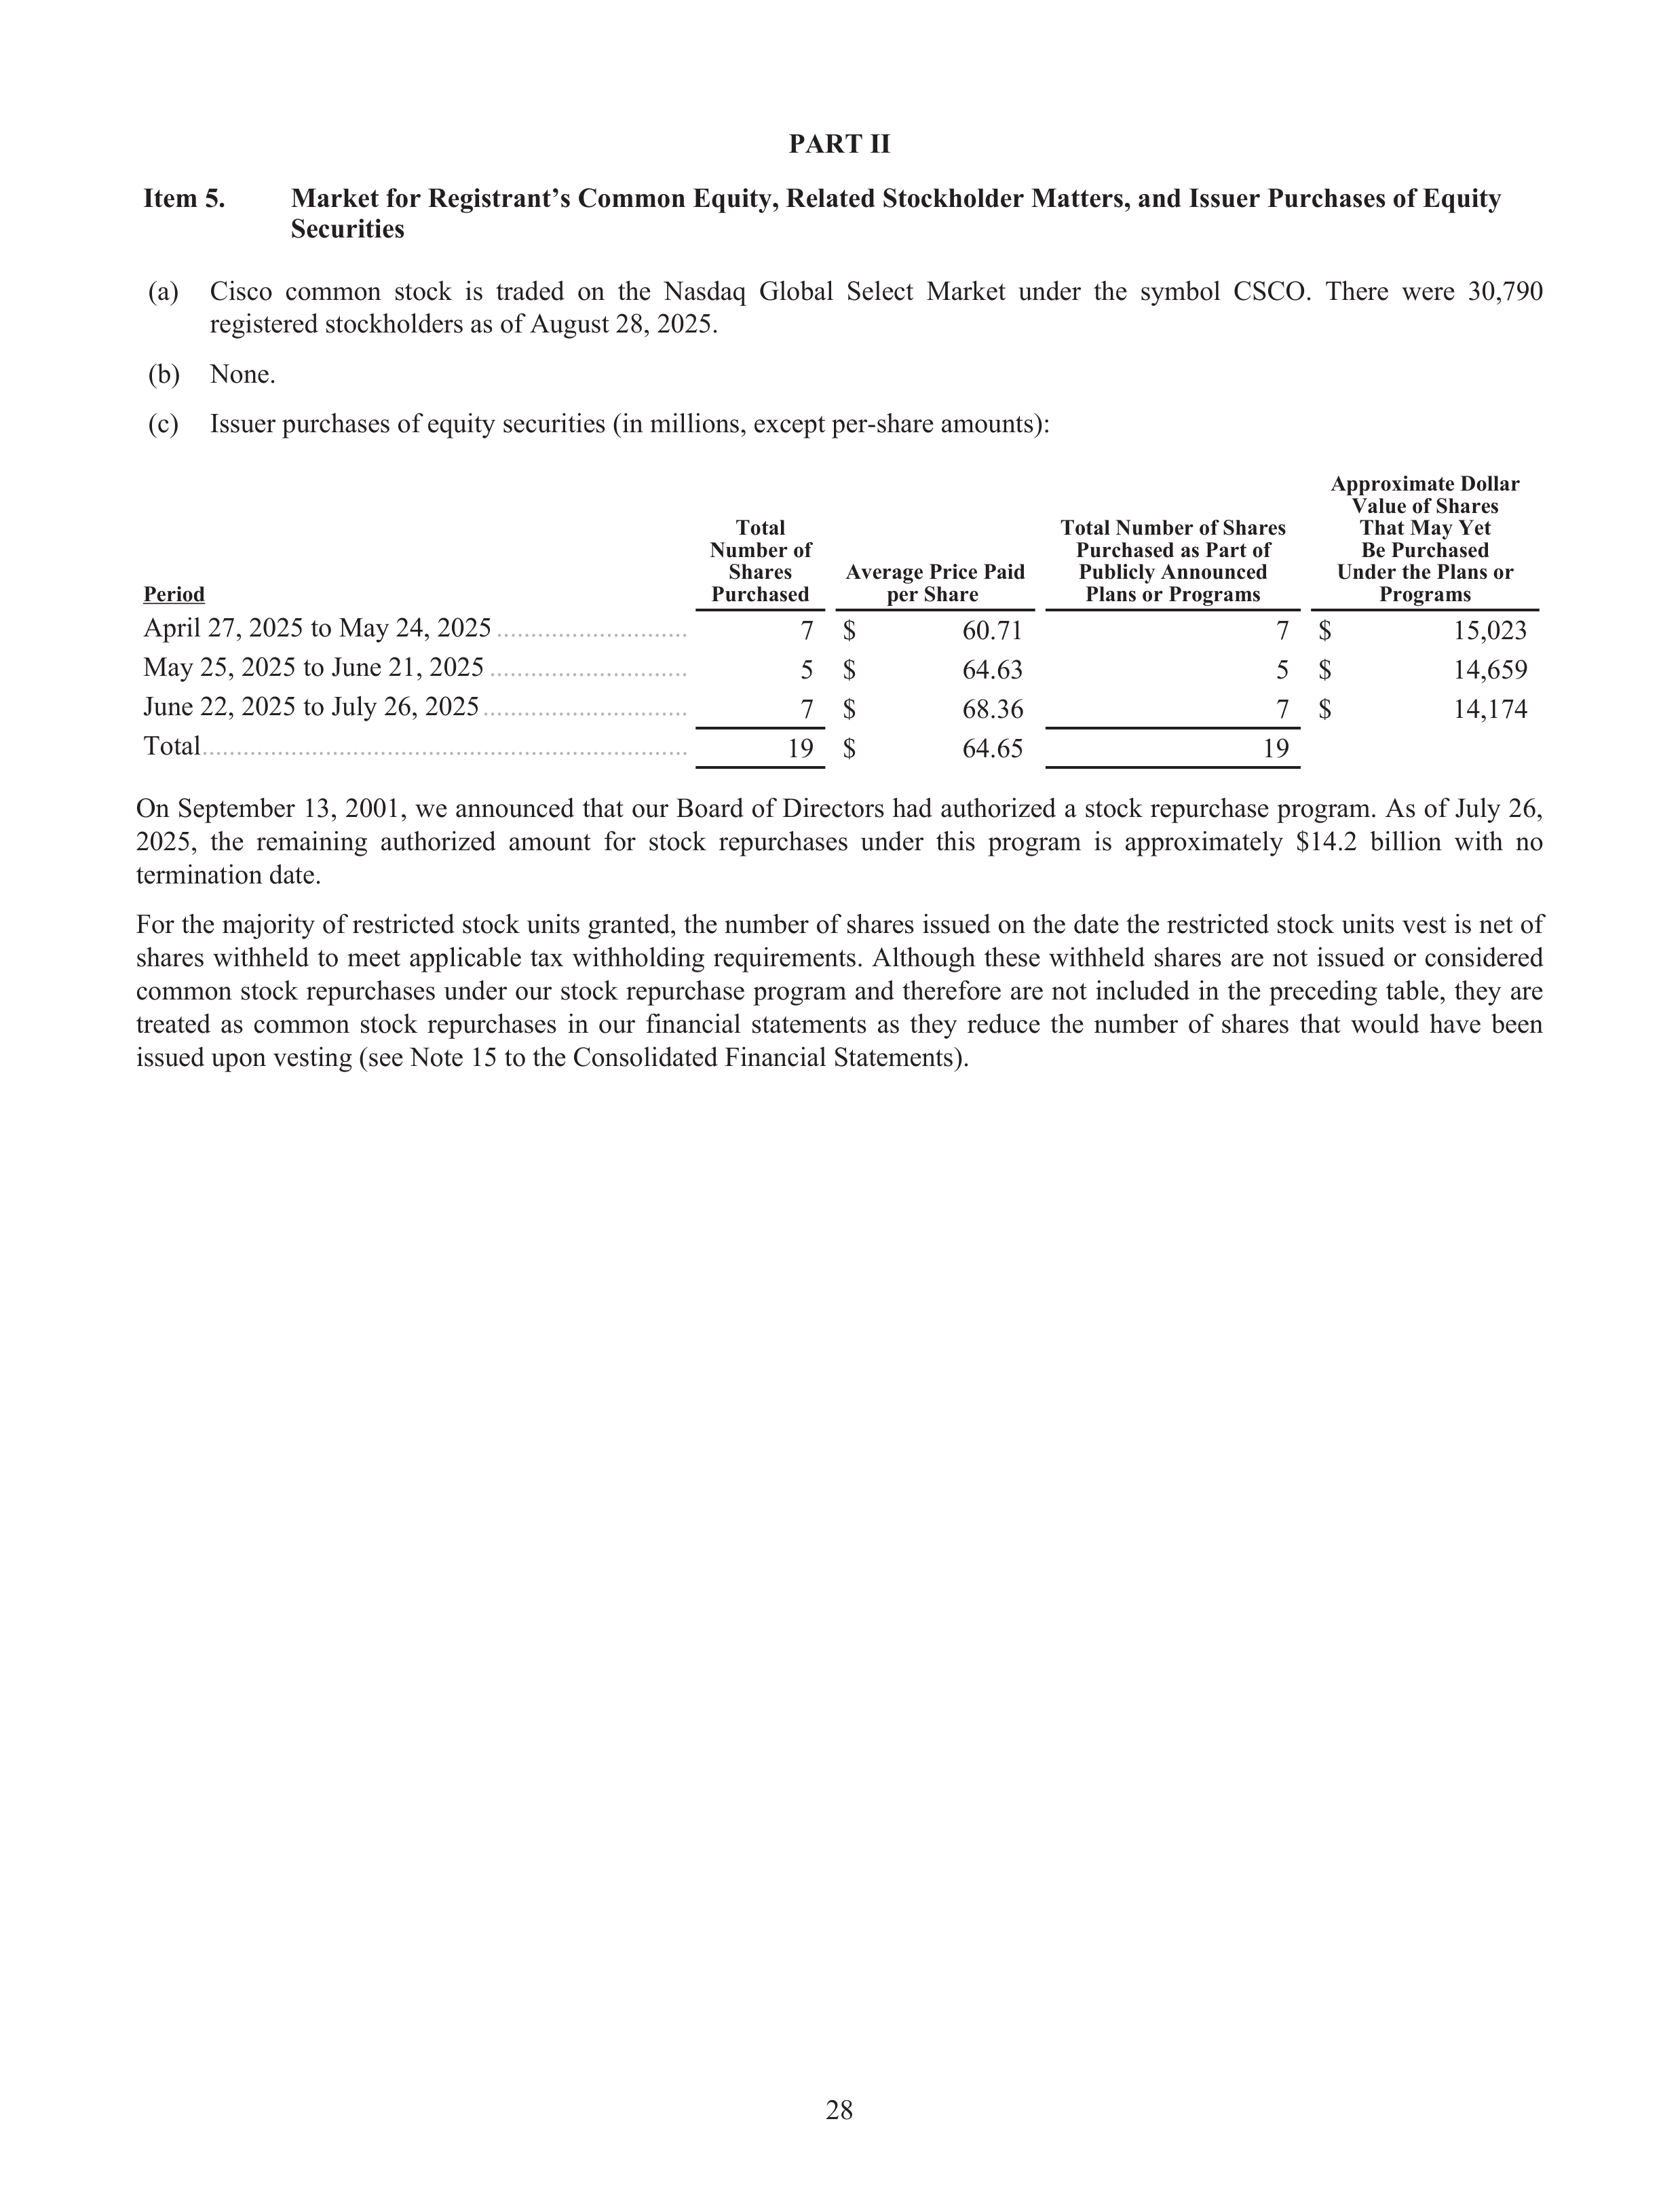
Securities
(a)
Cisco common stock is traded on the Nasdaq Global Select Market under the symbol CSCO. There were 30,790
registered stockholders as of August 28, 2025.
(b)
None.
(c)
Issuer purchases of equity securities (in millions, except per-share amounts):
Period
Total
Number of
Shares
Purchased
Average Price Paid
per Share
Total Number of Shares
Purchased as Part of
Publicly Announced
Plans or Programs
Approximate Dollar
Value of Shares
That May Yet
Be Purchased
Under the Plans or
Programs
April 27, 2025 to May 24, 2025
............................
7 $
60.71
7 $
15,023
May 25, 2025 to June 21, 2025
.............................
5 $
64.63
5 $
14,659
June 22, 2025 to July 26, 2025
..............................
7 $
68.36
7 $
14,174
Total
.......................................................................
19 $
64.65
19
On September 13, 2001, we announced that our Board of Directors had authorized a stock repurchase program. As of July 26,
2025, the remaining authorized amount for stock repurchases under this program is approximately $14.2 billion with no
termination date.
For the majority of restricted stock units granted, the number of shares issued on the date the restricted stock units vest is net of
shares withheld to meet applicable tax withholding requirements. Although these withheld shares are not issued or considered
common stock repurchases under our stock repurchase program and therefore are not included in the preceding table, they are
treated as common stock repurchases in our financial statements as they reduce the number of shares that would have been
issued upon vesting (see Note 15 to the Consolidated Financial Statements).
PART II
Item 5.
Market for Registrant’s Common Equity, Related Stockholder Matters, and Issuer Purchases of Equity
28
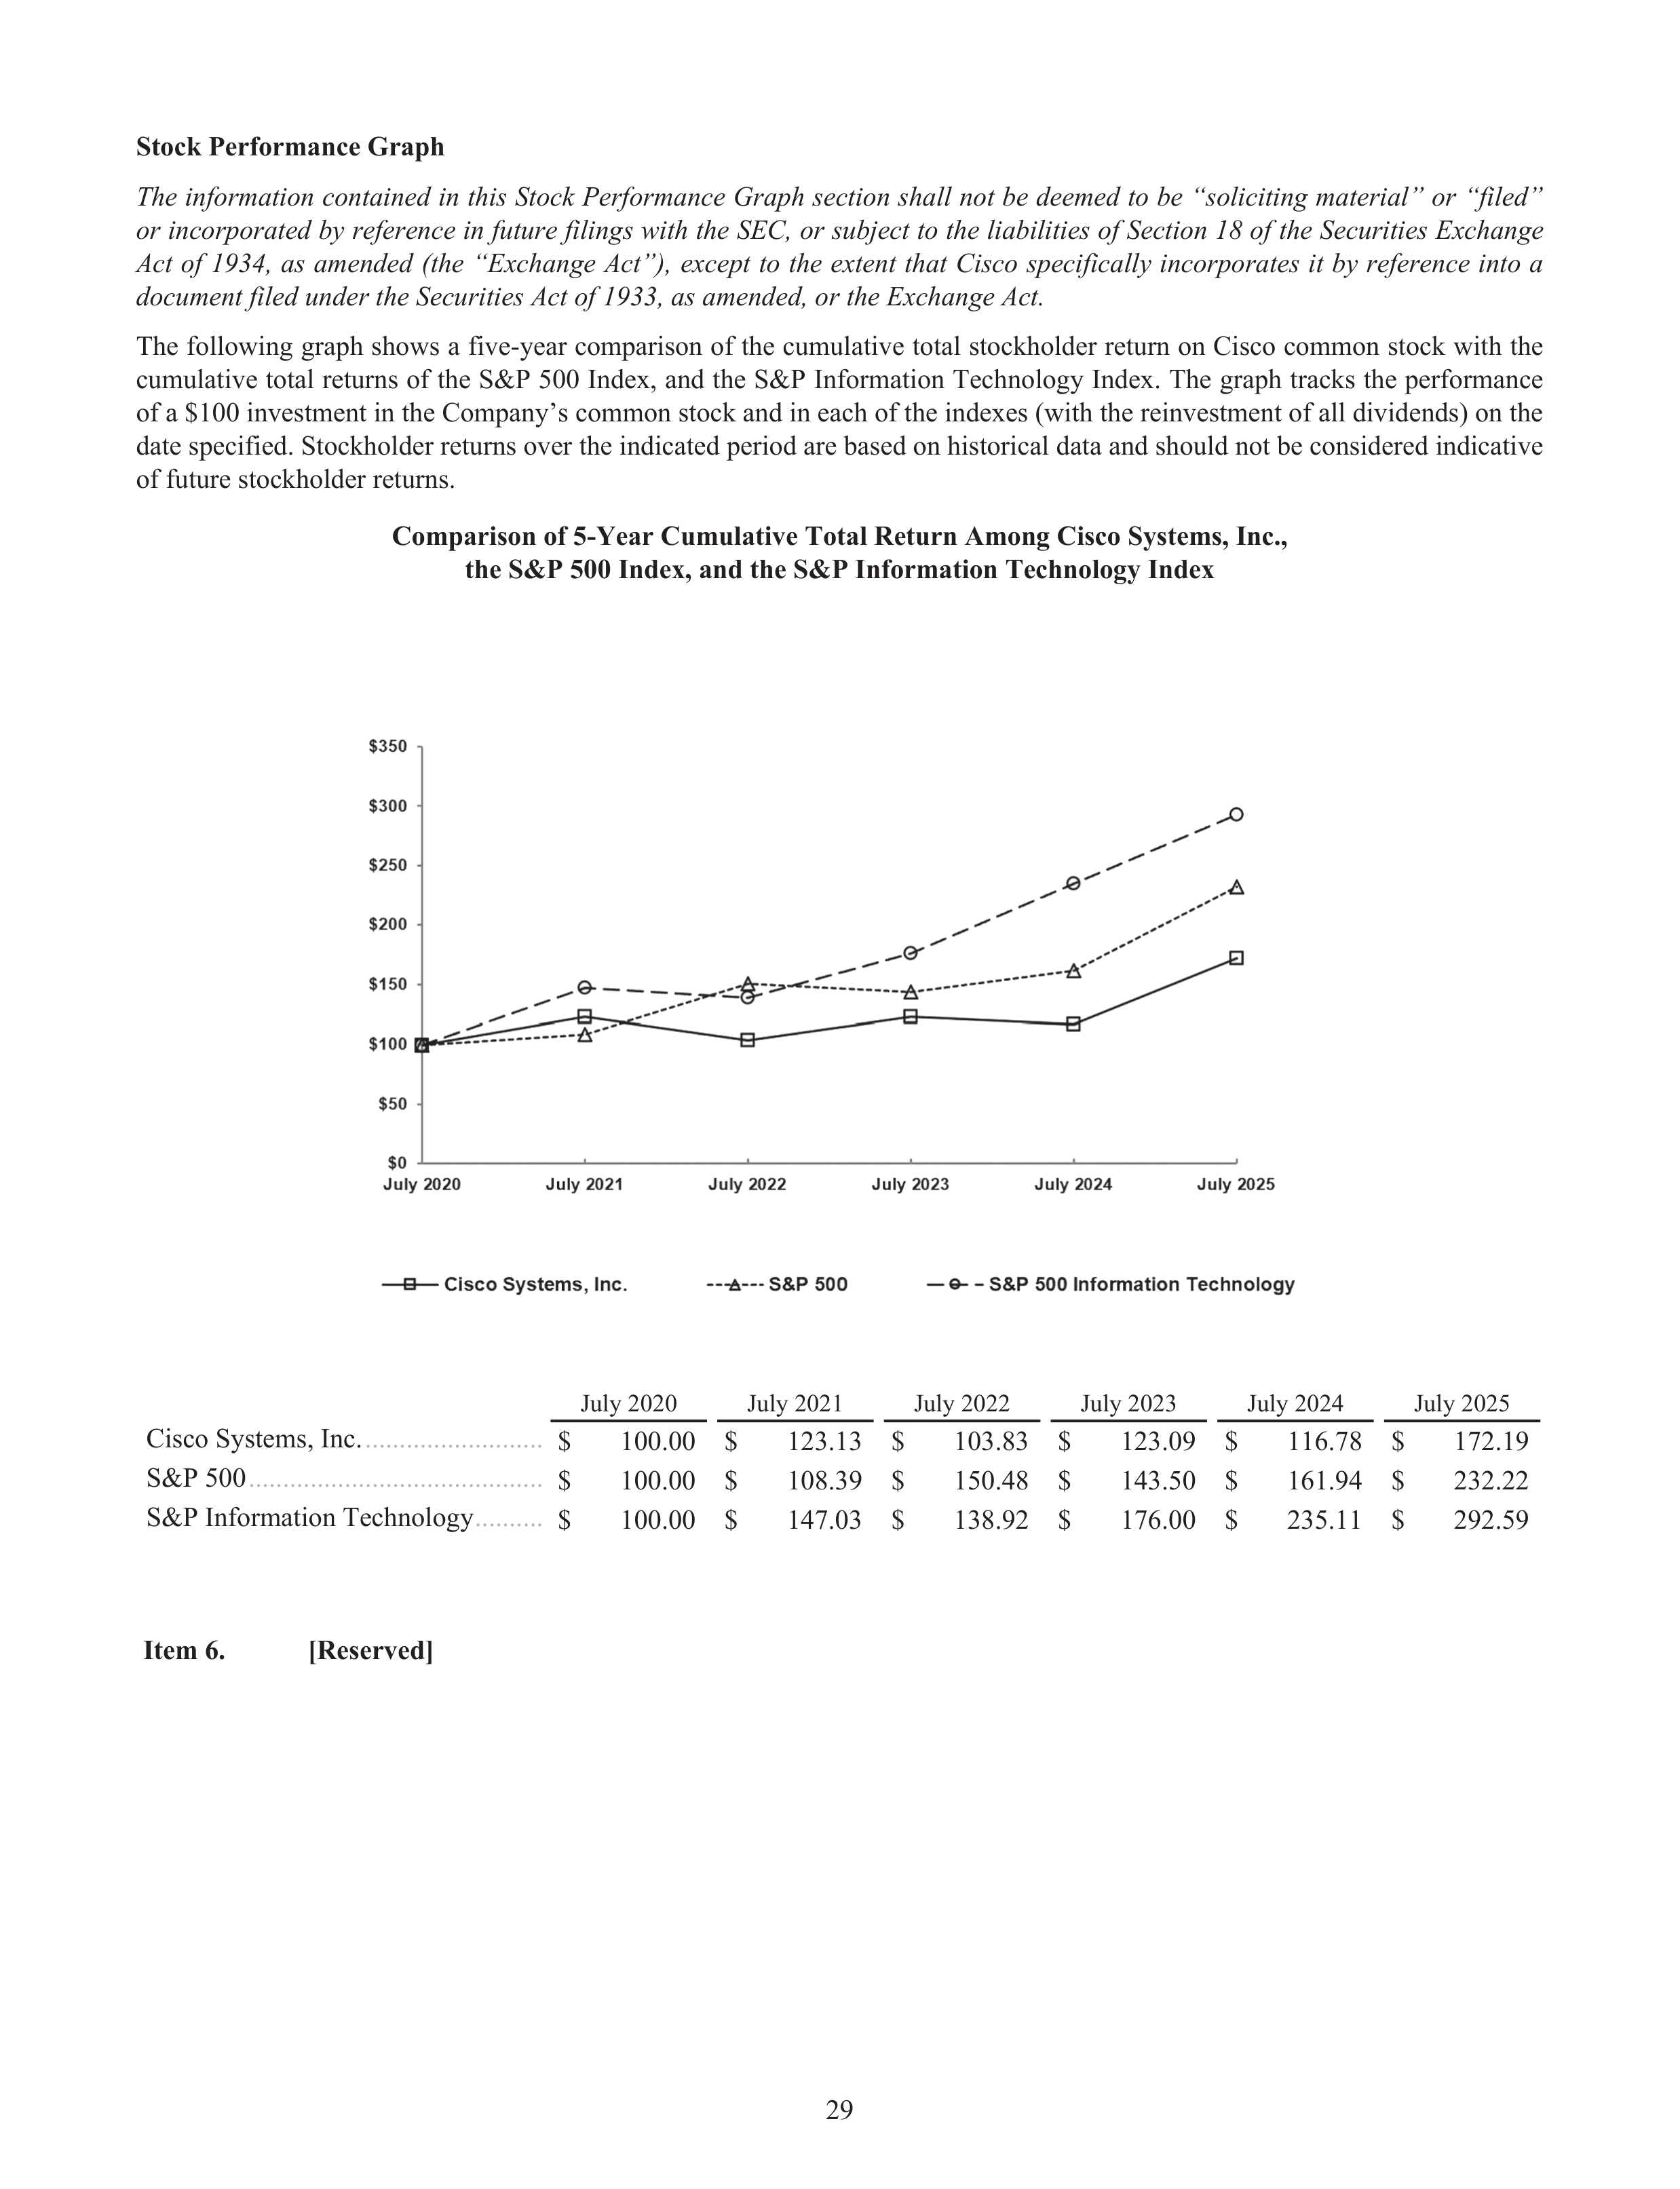
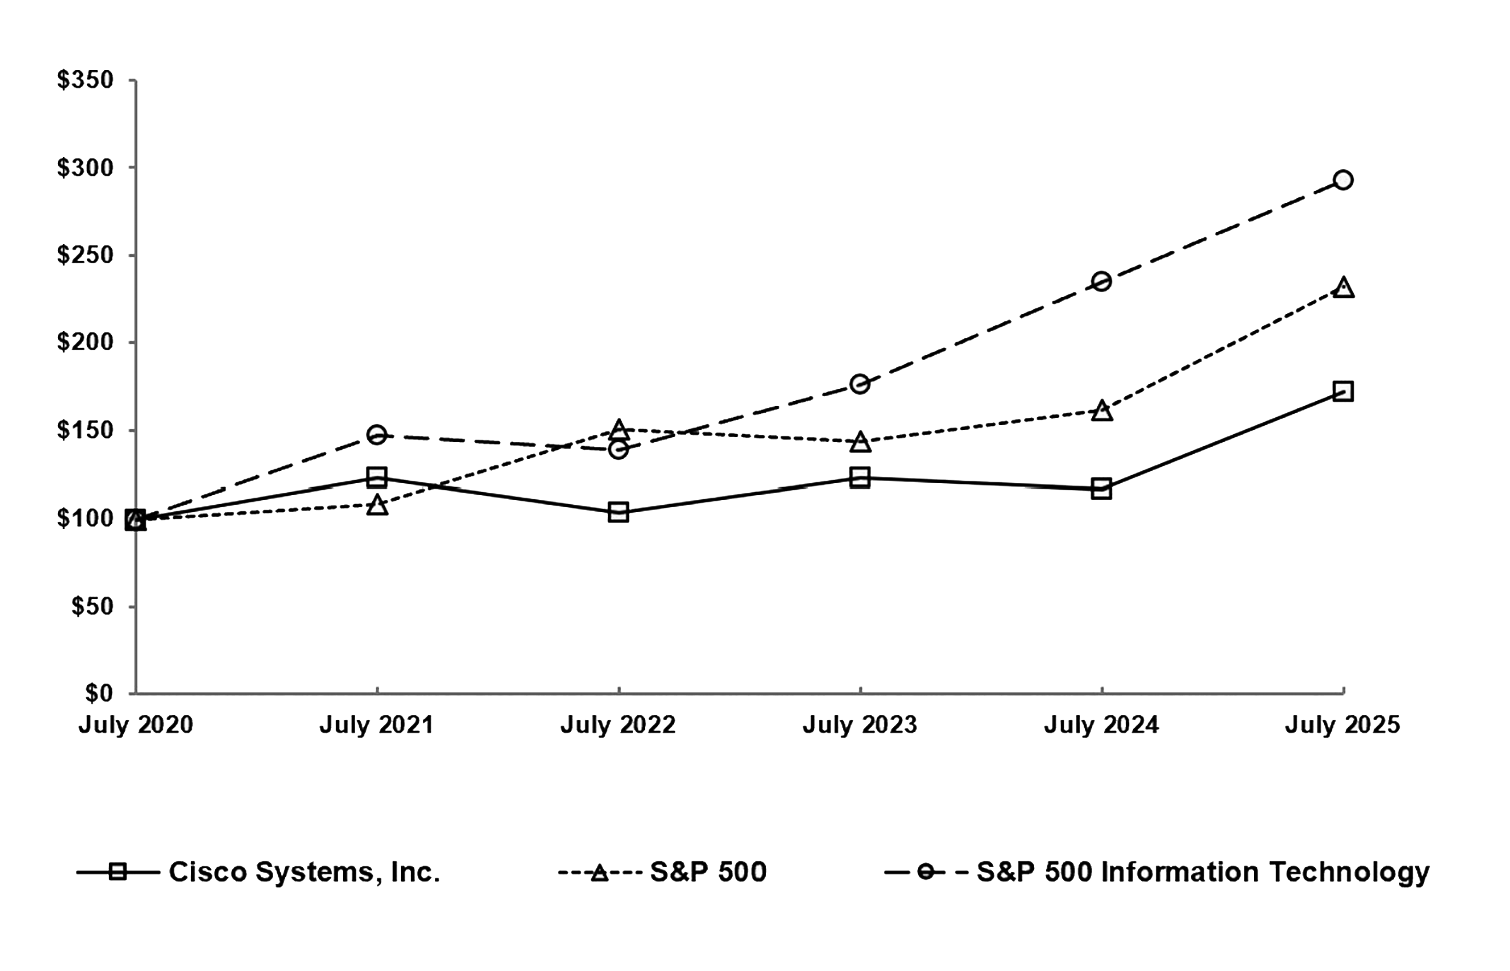
July 2020
July 2021
July 2022
July 2023
July 2024
July 2025
Cisco Systems, Inc.
..........................
$
100.00 $
123.13 $
103.83 $
123.09 $
116.78 $
172.19
S&P 500
...........................................
$
100.00 $
108.39 $
150.48 $
143.50 $
161.94 $
232.22
S&P Information Technology
..........
$
100.00 $
147.03 $
138.92 $
176.00 $
235.11 $
292.59
Item 6.
[Reserved]
Stock Performance Graph
The information contained in this Stock Performance Graph section shall not be deemed to be “soliciting material” or “filed”
or incorporated by reference in future filings with the SEC, or subject to the liabilities of Section 18 of the Securities Exchange
Act of 1934, as amended (the “Exchange Act”), except to the extent that Cisco specifically incorporates it by reference into a
document filed under the Securities Act of 1933, as amended, or the Exchange Act.
The following graph shows a five-year comparison of the cumulative total stockholder return on Cisco common stock with the
cumulative total returns of the S&P 500 Index, and the S&P Information Technology Index. The graph tracks the performance
of a $100 investment in the Company’s common stock and in each of the indexes (with the reinvestment of all dividends) on the
date specified. Stockholder returns over the indicated period are based on historical data and should not be considered indicative
of future stockholder returns.
Comparison of 5-Year Cumulative Total Return Among Cisco Systems, Inc.,
the S&P 500 Index, and the S&P Information Technology Index
29
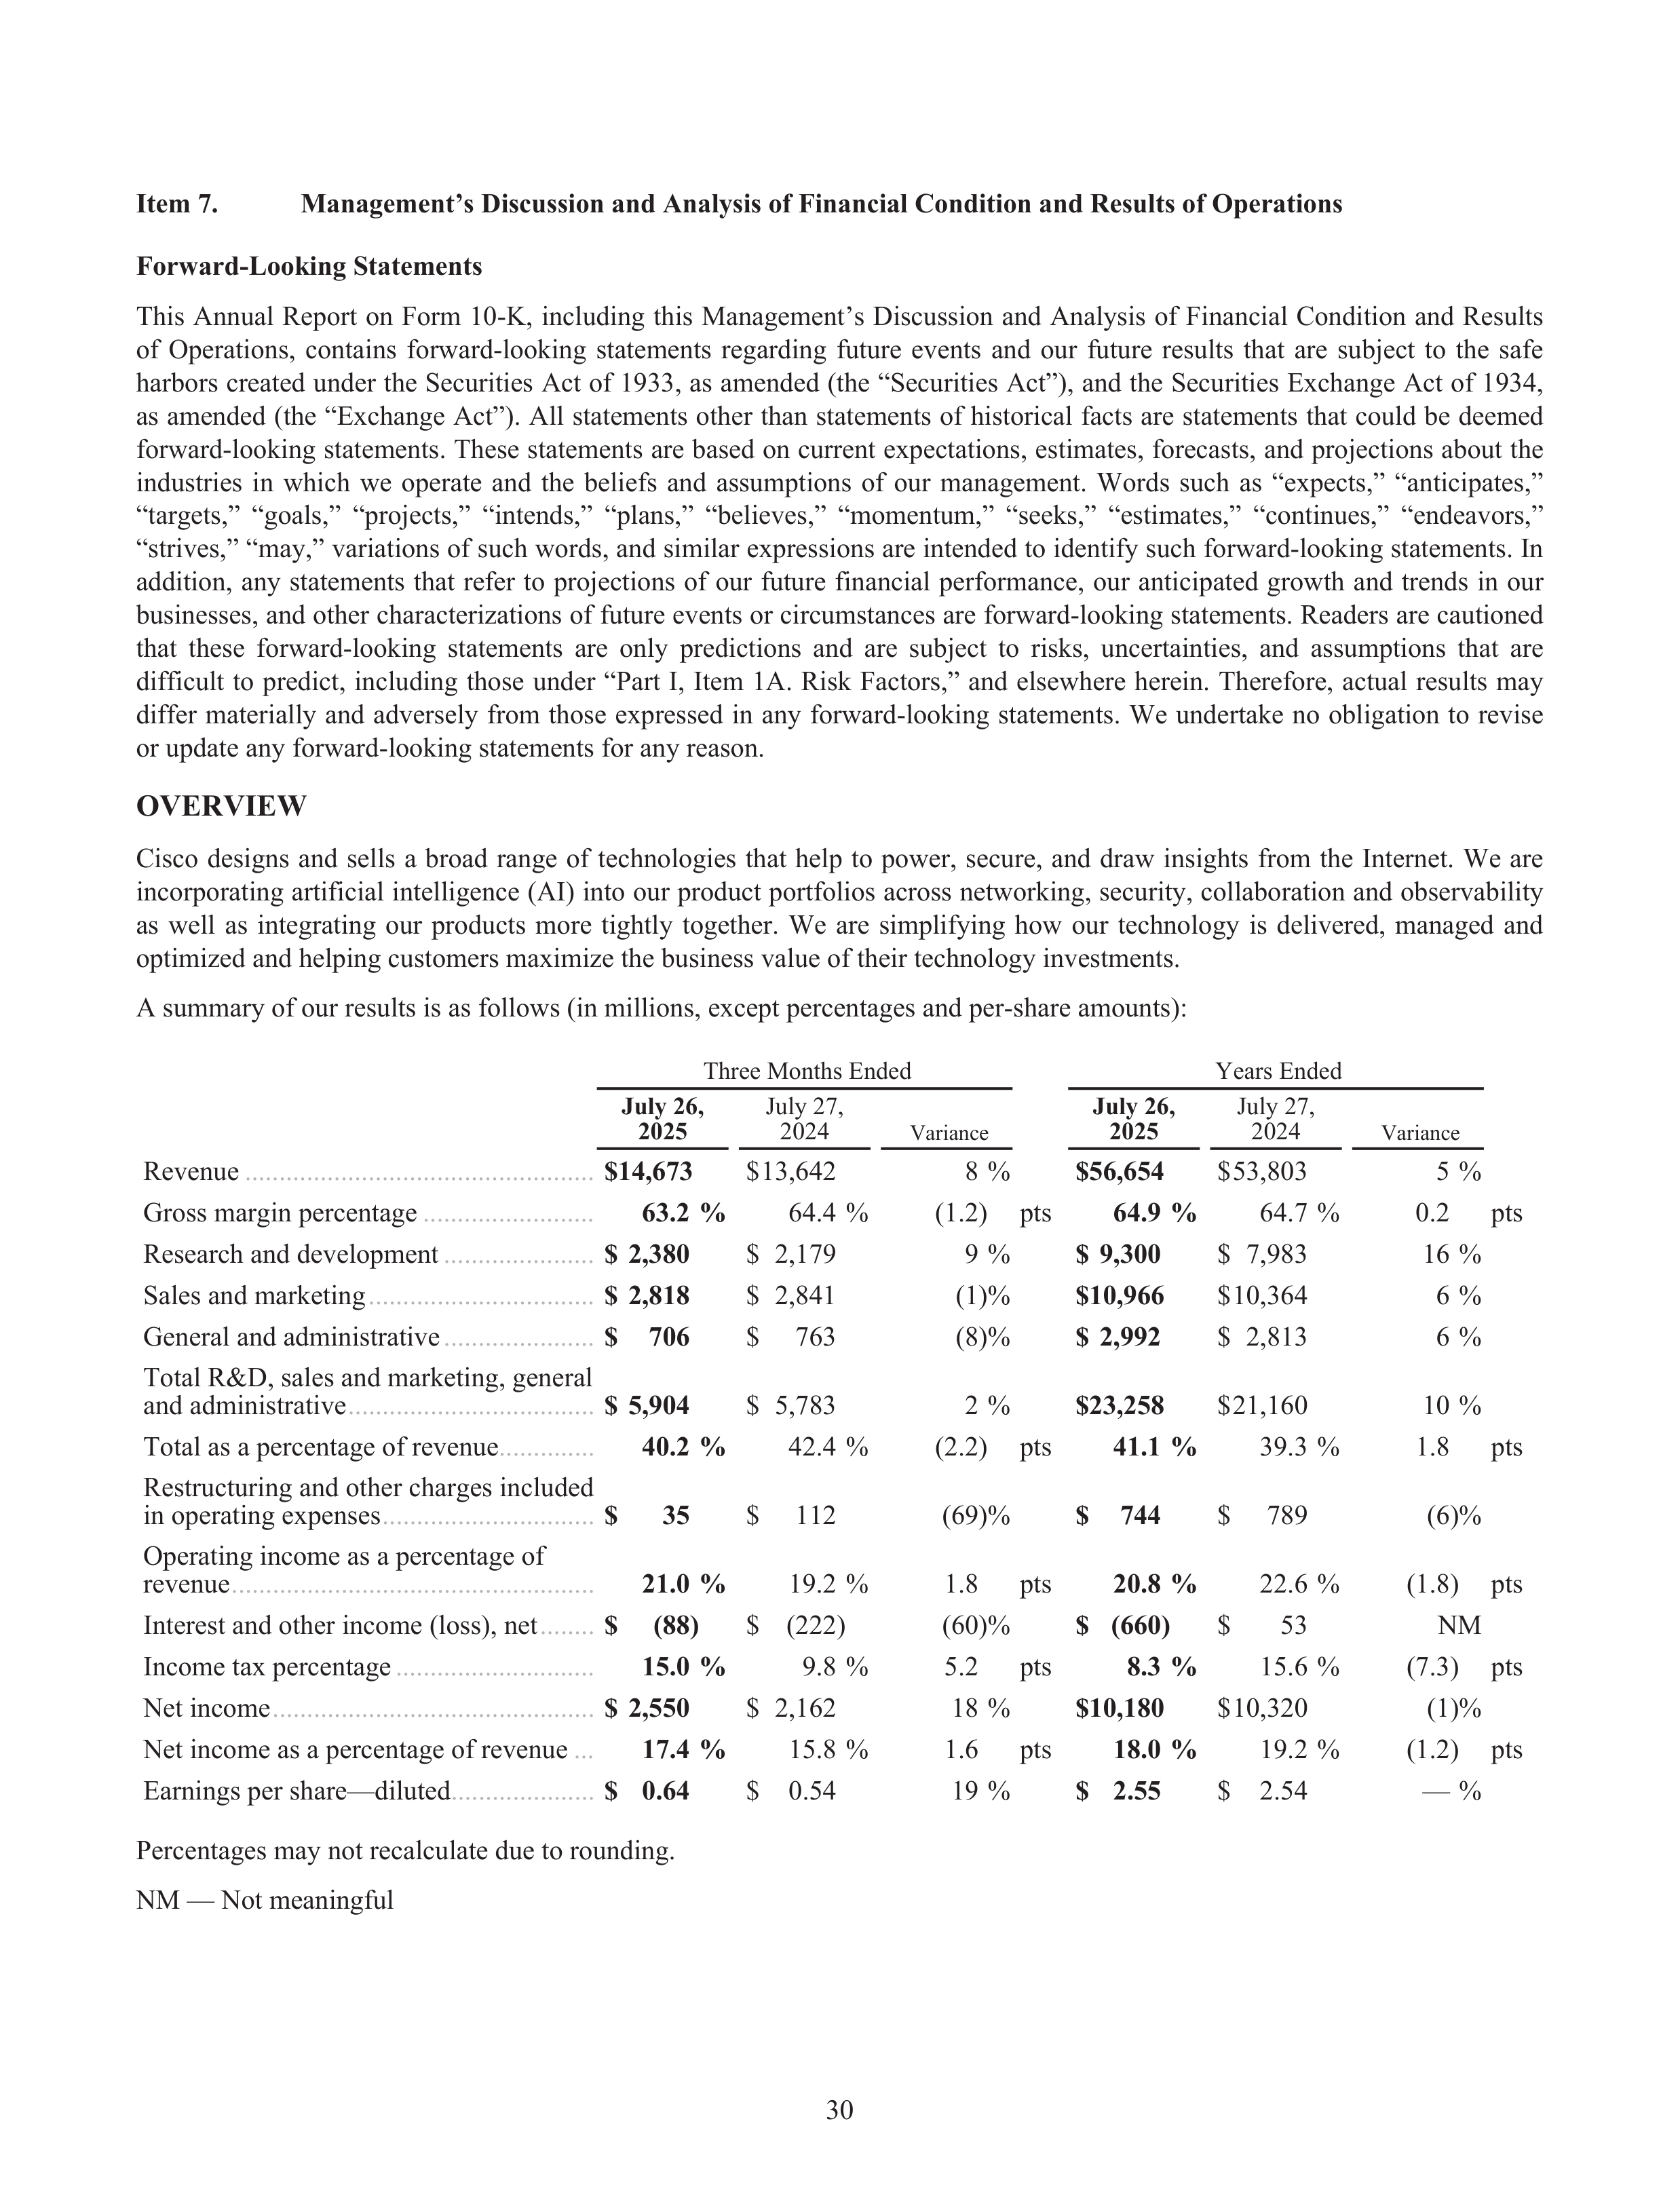
Item 7.
Management’s Discussion and Analysis of Financial Condition and Results of Operations
Forward-Looking Statements
This Annual Report on Form 10-K, including this Management’s Discussion and Analysis of Financial Condition and Results
of Operations, contains forward-looking statements regarding future events and our future results that are subject to the safe
harbors created under the Securities Act of 1933, as amended (the “Securities Act”), and the Securities Exchange Act of 1934,
as amended (the “Exchange Act”). All statements other than statements of historical facts are statements that could be deemed
forward-looking statements. These statements are based on current expectations, estimates, forecasts, and projections about the
industries in which we operate and the beliefs and assumptions of our management. Words such as “expects,” “anticipates,”
“targets,” “goals,” “projects,” “intends,” “plans,” “believes,” “momentum,” “seeks,” “estimates,” “continues,” “endeavors,”
“strives,” “may,” variations of such words, and similar expressions are intended to identify such forward-looking statements. In
addition, any statements that refer to projections of our future financial performance, our anticipated growth and trends in our
businesses, and other characterizations of future events or circumstances are forward-looking statements. Readers are cautioned
that these forward-looking statements are only predictions and are subject to risks, uncertainties, and assumptions that are
difficult to predict, including those under “Part I, Item 1A. Risk Factors,” and elsewhere herein. Therefore, actual results may
differ materially and adversely from those expressed in any forward-looking statements. We undertake no obligation to revise
or update any forward-looking statements for any reason.
OVERVIEW
Cisco designs and sells a broad range of technologies that help to power, secure, and draw insights from the Internet. We are
incorporating artificial intelligence (AI) into our product portfolios across networking, security, collaboration and observability
as well as integrating our products more tightly together. We are simplifying how our technology is delivered, managed and
optimized and helping customers maximize the business value of their technology investments.
A summary of our results is as follows (in millions, except percentages and per-share amounts):
Three Months Ended
Years Ended
July 26,
2025
July 27,
2024
Variance
July 26,
2025
July 27,
2024
Variance
Revenue
...................................................
$ 14,673
$ 13,642
8 %
$ 56,654
$ 53,803
5 %
Gross margin percentage
.........................
63.2 %
64.4 %
(1.2)
pts
64.9 %
64.7 %
0.2
pts
Research and development
......................
$ 2,380
$ 2,179
9 %
$ 9,300
$ 7,983
16 %
Sales and marketing
.................................
$ 2,818
$ 2,841
(1) %
$ 10,966
$ 10,364
6 %
General and administrative
......................
$
706
$
763
(8) %
$ 2,992
$ 2,813
6 %
Total R&D, sales and marketing, general
and administrative
....................................
$ 5,904
$ 5,783
2 %
$ 23,258
$ 21,160
10 %
Total as a percentage of revenue
..............
40.2 %
42.4 %
(2.2)
pts
41.1 %
39.3 %
1.8
pts
Restructuring and other charges included
in operating expenses
...............................
$
35
$
112
(69) %
$
744
$
789
(6) %
Operating income as a percentage of
revenue
.....................................................
21.0 %
19.2 %
1.8
pts
20.8 %
22.6 %
(1.8)
pts
Interest and other income (loss), net
........
$
(88)
$ (222)
(60) %
$ (660)
$
53
NM
Income tax percentage
.............................
15.0 %
9.8 %
5.2
pts
8.3 %
15.6 %
(7.3)
pts
Net income
...............................................
$ 2,550
$ 2,162
18 %
$ 10,180
$ 10,320
(1) %
Net income as a percentage of revenue
...
17.4 %
15.8 %
1.6
pts
18.0 %
19.2 %
(1.2)
pts
Earnings per share—diluted
.....................
$ 0.64
$ 0.54
19 %
$ 2.55
$ 2.54
— %
Percentages may not recalculate due to rounding.
NM — Not meaningful
30
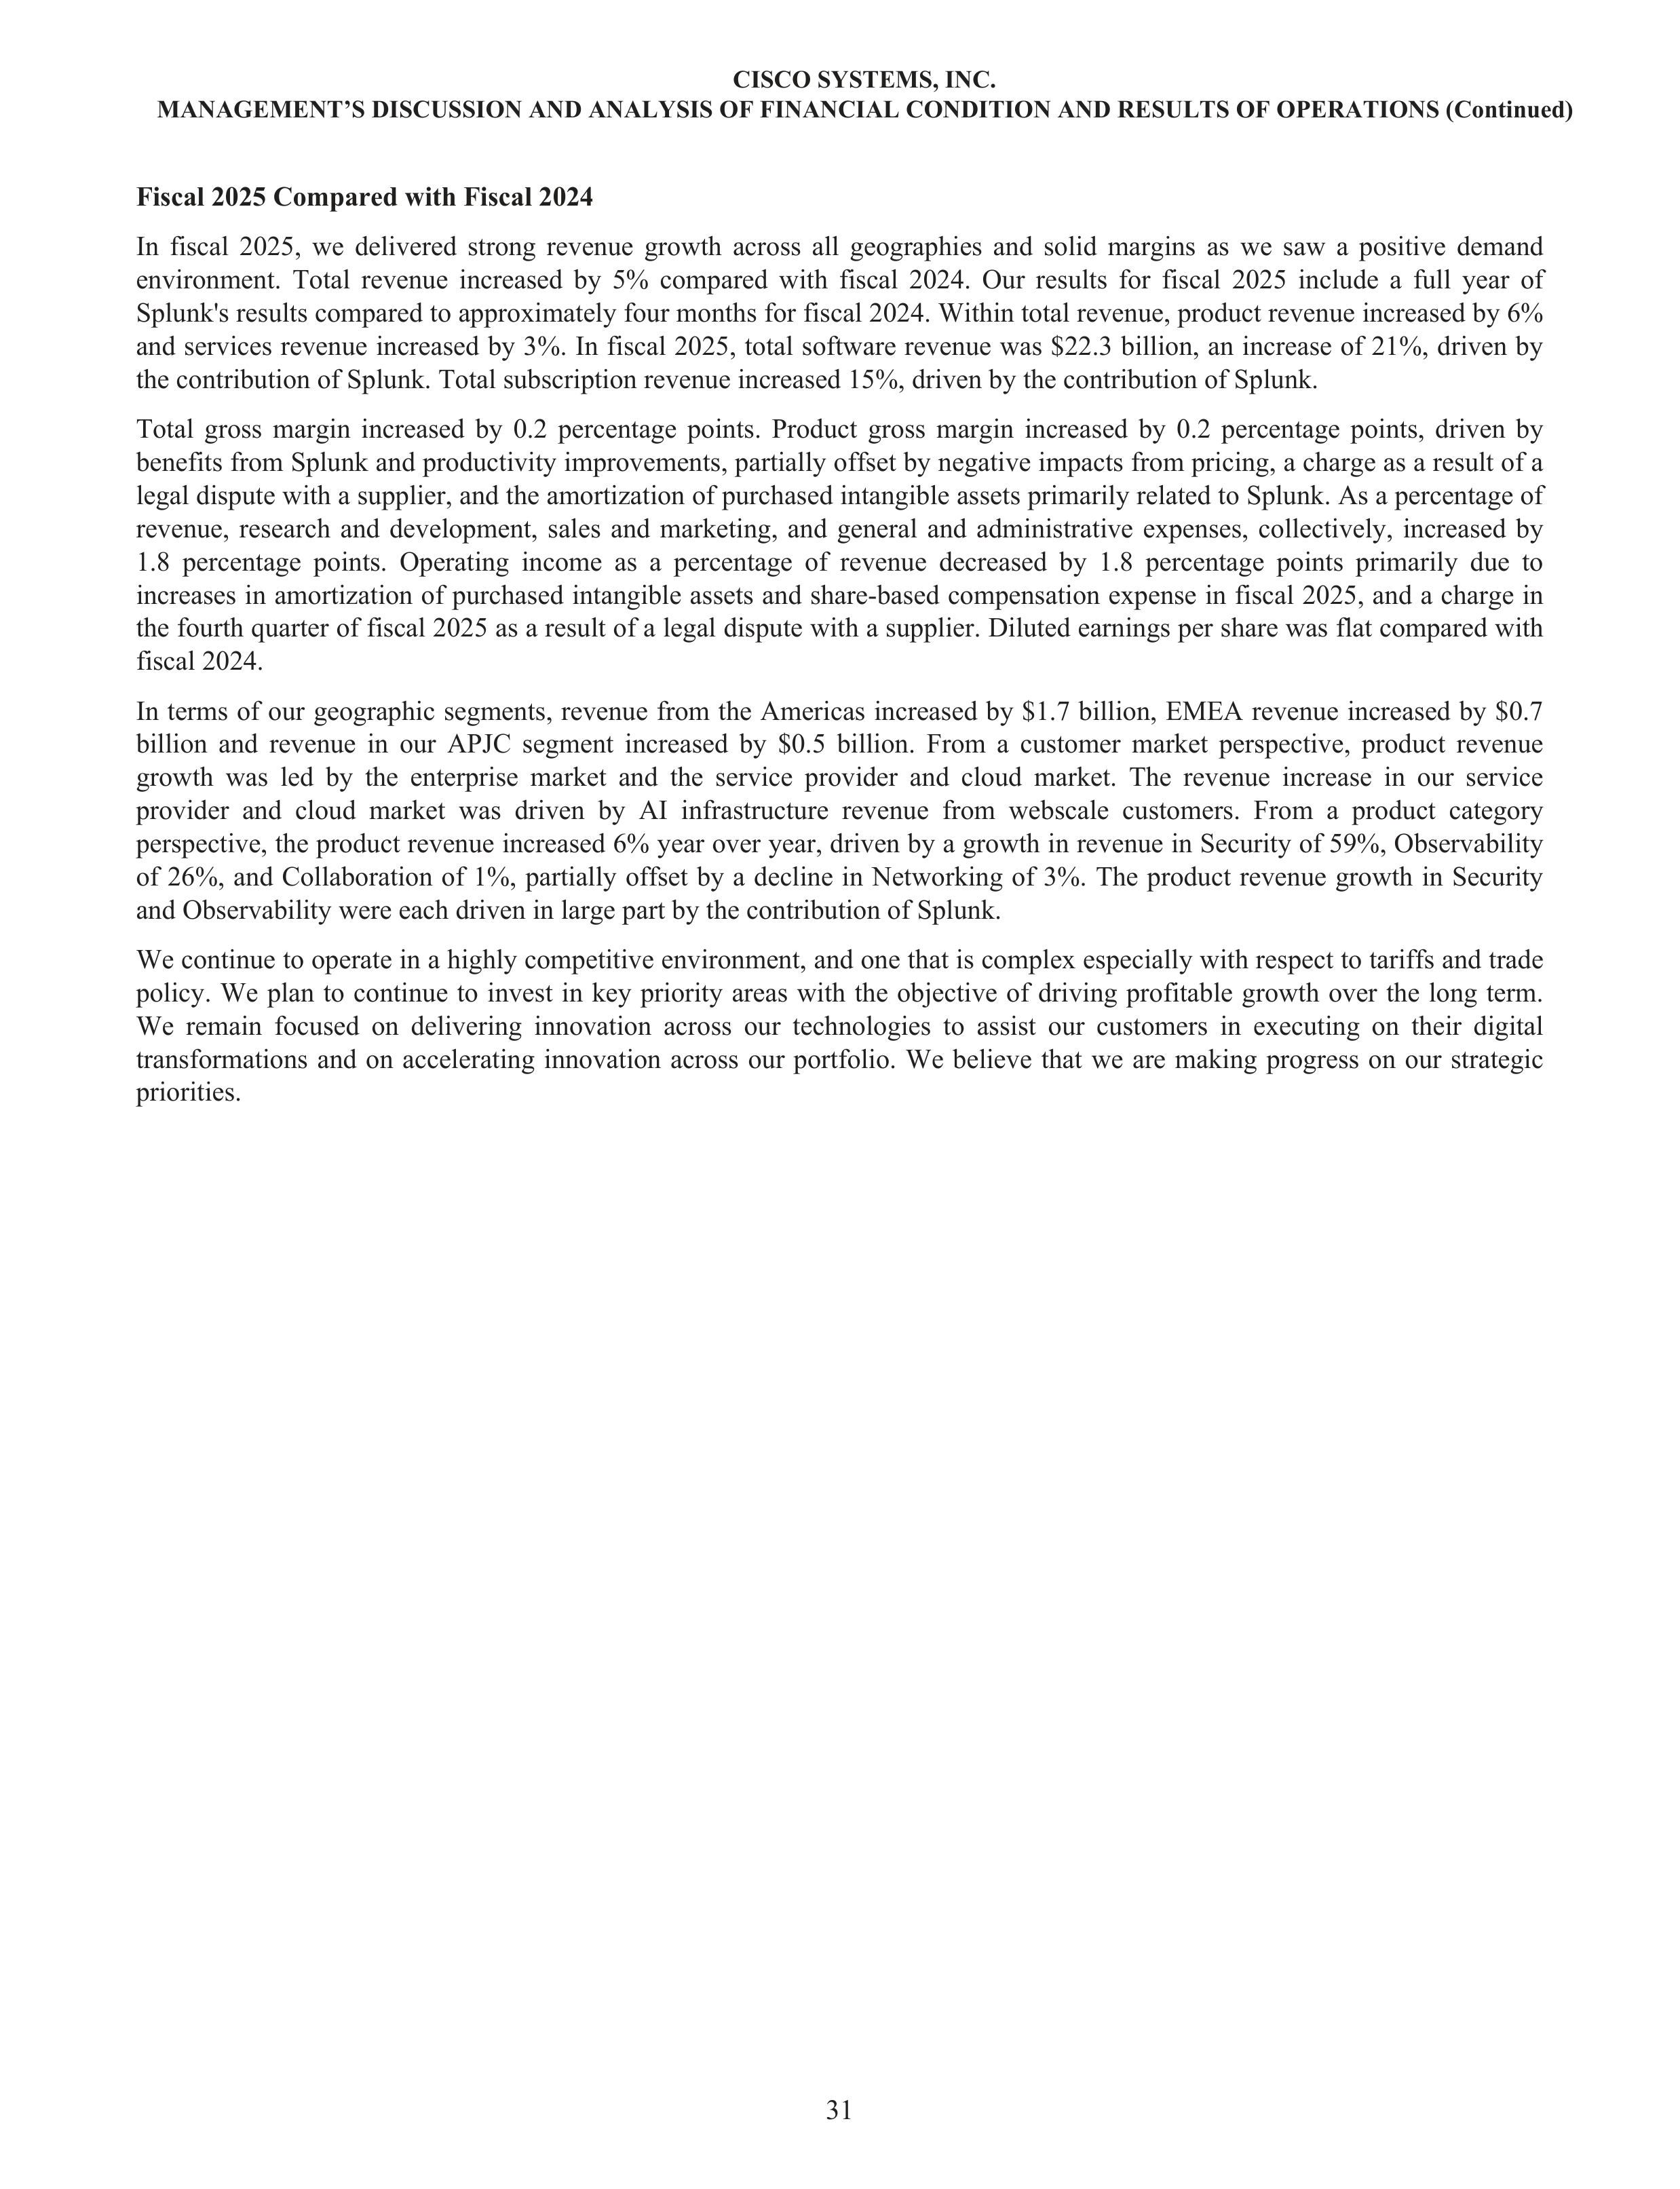
Fiscal 2025 Compared with Fiscal 2024
In fiscal 2025, we delivered strong revenue growth across all geographies and solid margins as we saw a positive demand
environment. Total revenue increased by 5% compared with fiscal 2024. Our results for fiscal 2025 include a full year of
Splunk's results compared to approximately four months for fiscal 2024. Within total revenue, product revenue increased by 6%
and services revenue increased by 3%. In fiscal 2025, total software revenue was $22.3 billion, an increase of 21%, driven by
the contribution of Splunk. Total subscription revenue increased 15%, driven by the contribution of Splunk.
Total gross margin increased by 0.2 percentage points. Product gross margin increased by 0.2 percentage points, driven by
benefits from Splunk and productivity improvements, partially offset by negative impacts from pricing, a charge as a result of a
legal dispute with a supplier, and the amortization of purchased intangible assets primarily related to Splunk. As a percentage of
revenue, research and development, sales and marketing, and general and administrative expenses, collectively, increased by
1.8 percentage points. Operating income as a percentage of revenue decreased by 1.8 percentage points primarily due to
increases in amortization of purchased intangible assets and share-based compensation expense in fiscal 2025, and a charge in
the fourth quarter of fiscal 2025 as a result of a legal dispute with a supplier. Diluted earnings per share was flat compared with
fiscal 2024.
In terms of our geographic segments, revenue from the Americas increased by $1.7 billion, EMEA revenue increased by $0.7
billion and revenue in our APJC segment increased by $0.5 billion. From a customer market perspective, product revenue
growth was led by the enterprise market and the service provider and cloud market. The revenue increase in our service
provider and cloud market was driven by AI infrastructure revenue from webscale customers. From a product category
perspective, the product revenue increased 6% year over year, driven by a growth in revenue in Security of 59%, Observability
of 26%, and Collaboration of 1%, partially offset by a decline in Networking of 3%. The product revenue growth in Security
and Observability were each driven in large part by the contribution of Splunk.
We continue to operate in a highly competitive environment, and one that is complex especially with respect to tariffs and trade
policy. We plan to continue to invest in key priority areas with the objective of driving profitable growth over the long term.
We remain focused on delivering innovation across our technologies to assist our customers in executing on their digital
transformations and on accelerating innovation across our portfolio. We believe that we are making progress on our strategic
priorities.
CISCO SYSTEMS, INC.
MANAGEMENT’S DISCUSSION AND ANALYSIS OF FINANCIAL CONDITION AND RESULTS OF OPERATIONS (Continued)
31
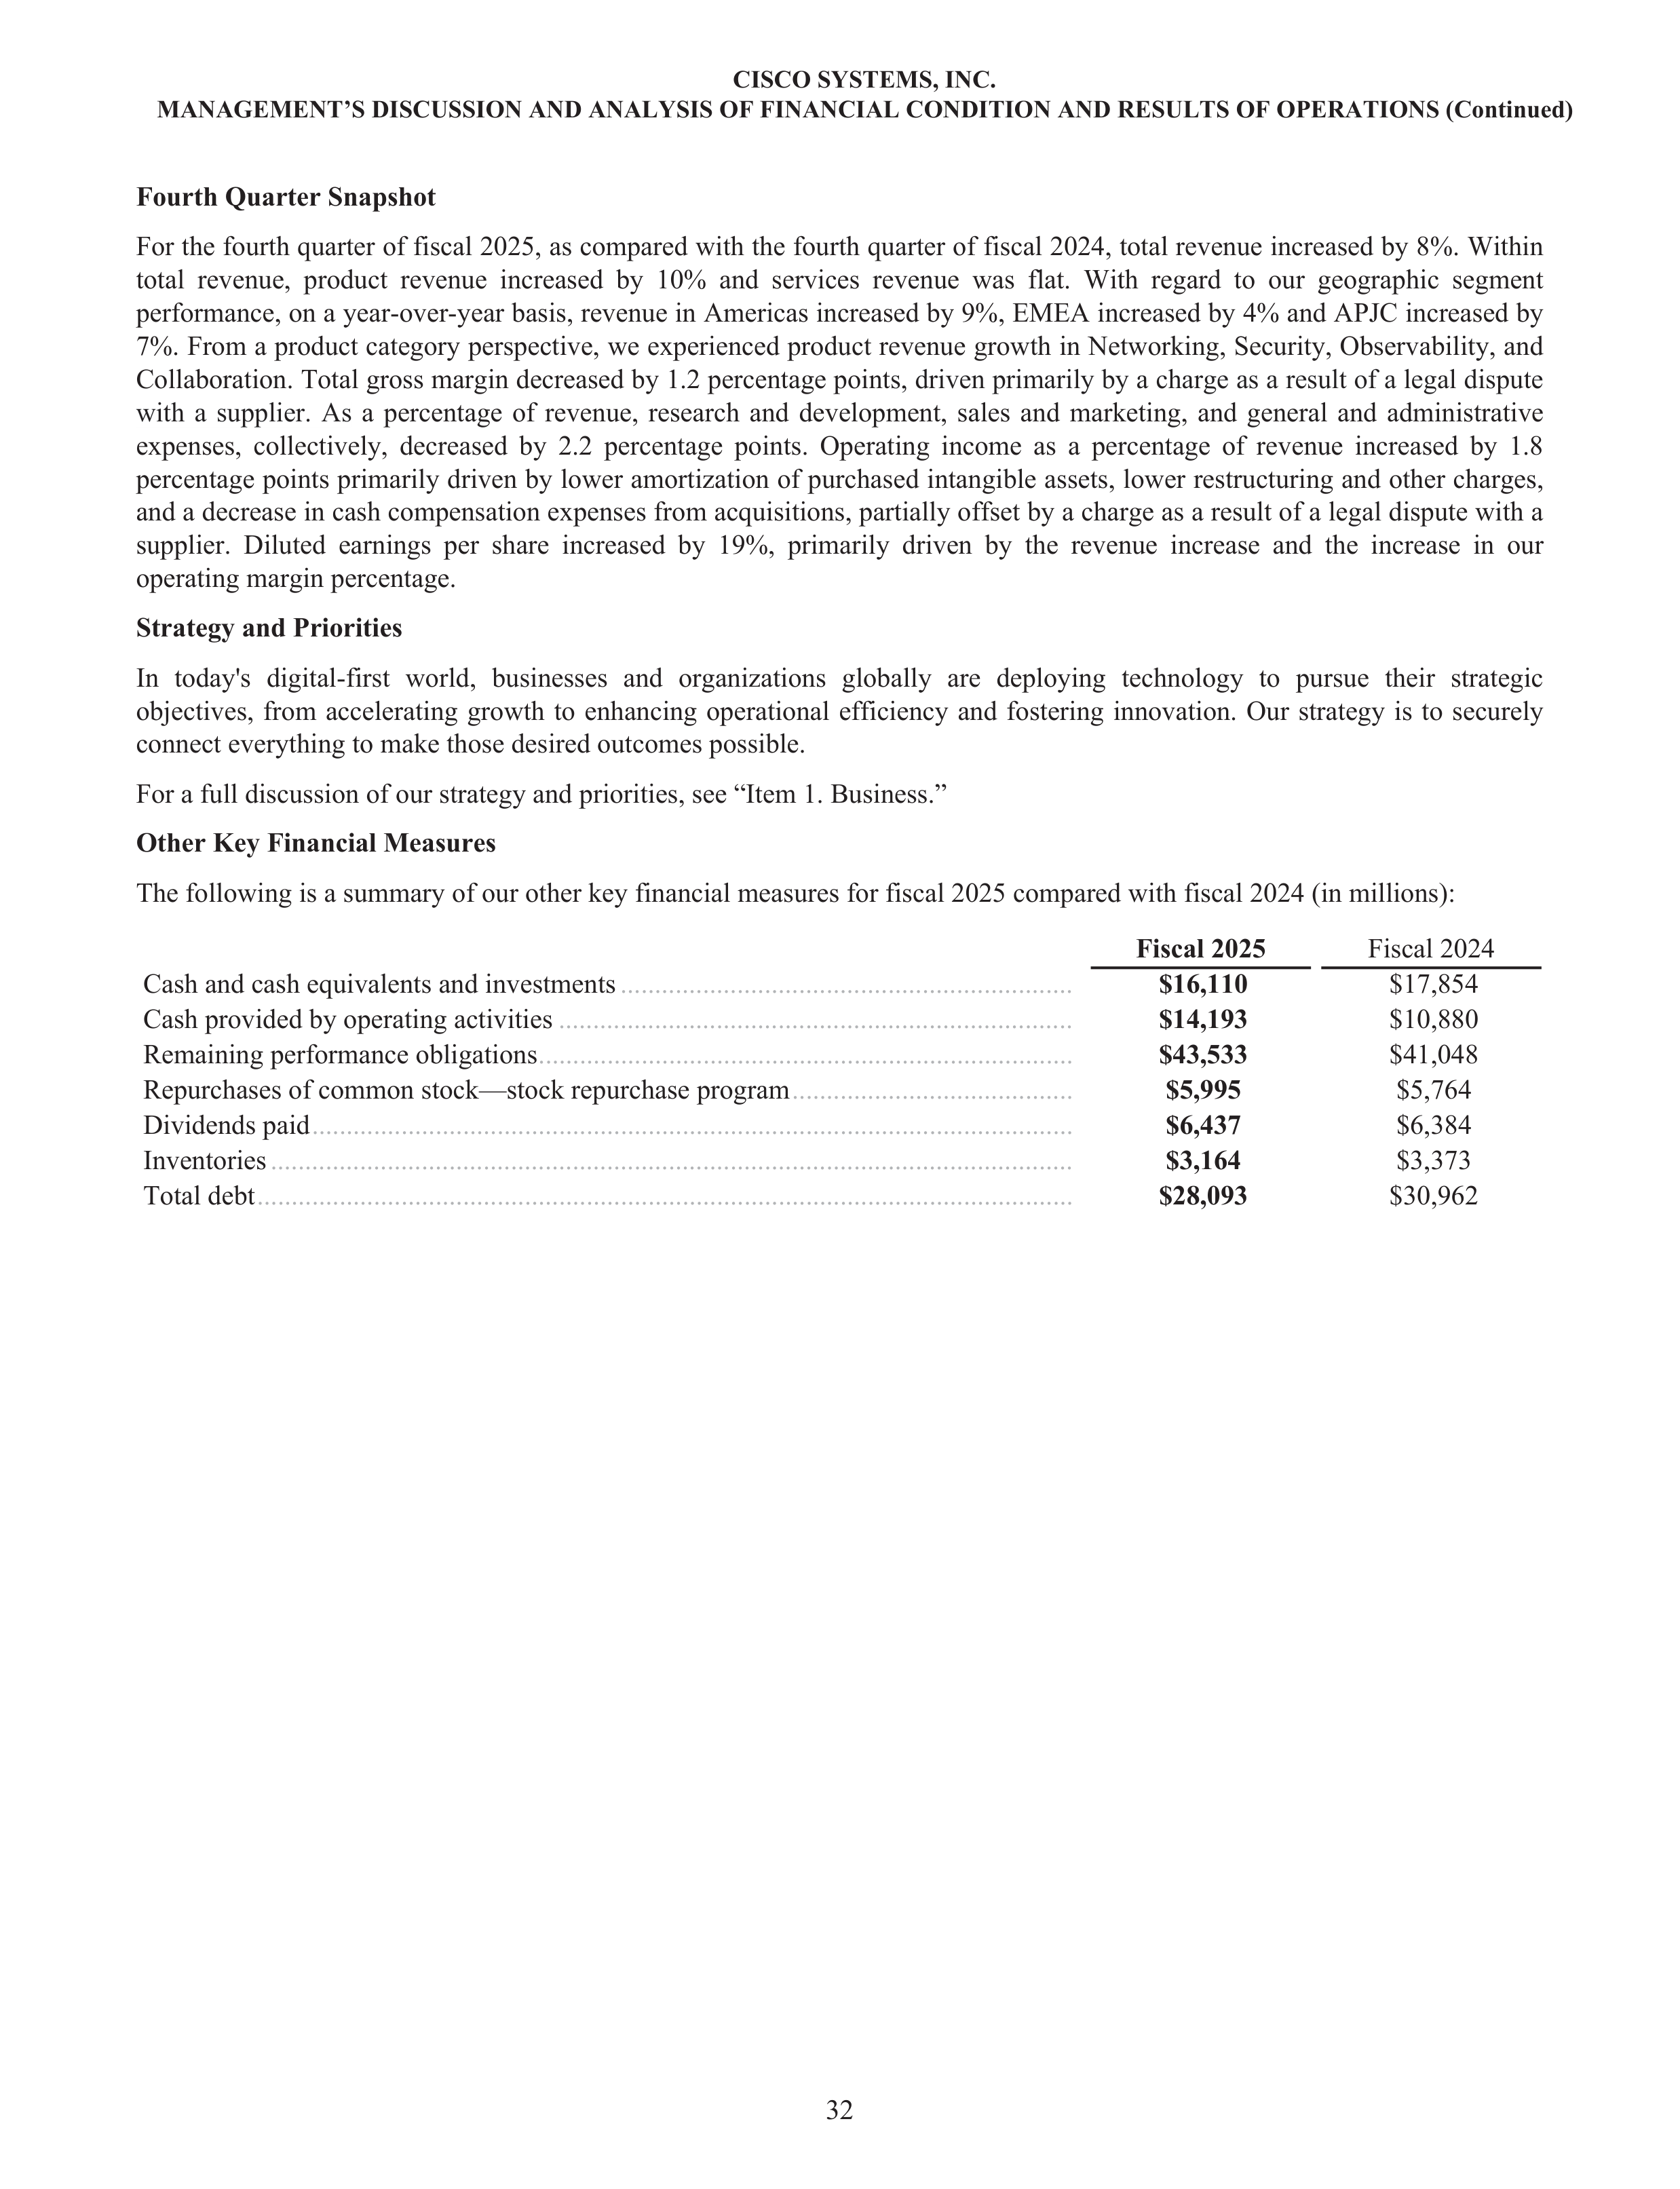
Fourth Quarter Snapshot
For the fourth quarter of fiscal 2025, as compared with the fourth quarter of fiscal 2024, total revenue increased by 8%. Within
total revenue, product revenue increased by 10% and services revenue was flat. With regard to our geographic segment
performance, on a year-over-year basis, revenue in Americas increased by 9%, EMEA increased by 4% and APJC increased by
7%. From a product category perspective, we experienced product revenue growth in Networking, Security, Observability, and
Collaboration. Total gross margin decreased by 1.2 percentage points, driven primarily by a charge as a result of a legal dispute
with a supplier. As a percentage of revenue, research and development, sales and marketing, and general and administrative
expenses, collectively, decreased by 2.2 percentage points. Operating income as a percentage of revenue increased by 1.8
percentage points primarily driven by lower amortization of purchased intangible assets, lower restructuring and other charges,
and a decrease in cash compensation expenses from acquisitions, partially offset by a charge as a result of a legal dispute with a
supplier. Diluted earnings per share increased by 19%, primarily driven by the revenue increase and the increase in our
operating margin percentage.
Strategy and Priorities
In today's digital-first world, businesses and organizations globally are deploying technology to pursue their strategic
objectives, from accelerating growth to enhancing operational efficiency and fostering innovation. Our strategy is to securely
connect everything to make those desired outcomes possible.
For a full discussion of our strategy and priorities, see “Item 1. Business.”
Other Key Financial Measures
The following is a summary of our other key financial measures for fiscal 2025 compared with fiscal 2024 (in millions):
Fiscal 2025
Fiscal 2024
Cash and cash equivalents and investments
..................................................................
$16,110
$17,854
Cash provided by operating activities
...........................................................................
$14,193
$10,880
Remaining performance obligations
..............................................................................
$43,533
$41,048
Repurchases of common stock—stock repurchase program
.........................................
$5,995
$5,764
Dividends paid
...............................................................................................................
$6,437
$6,384
Inventories
.....................................................................................................................
$3,164
$3,373
Total debt
.......................................................................................................................
$28,093
$30,962
CISCO SYSTEMS, INC.
MANAGEMENT’S DISCUSSION AND ANALYSIS OF FINANCIAL CONDITION AND RESULTS OF OPERATIONS (Continued)
32
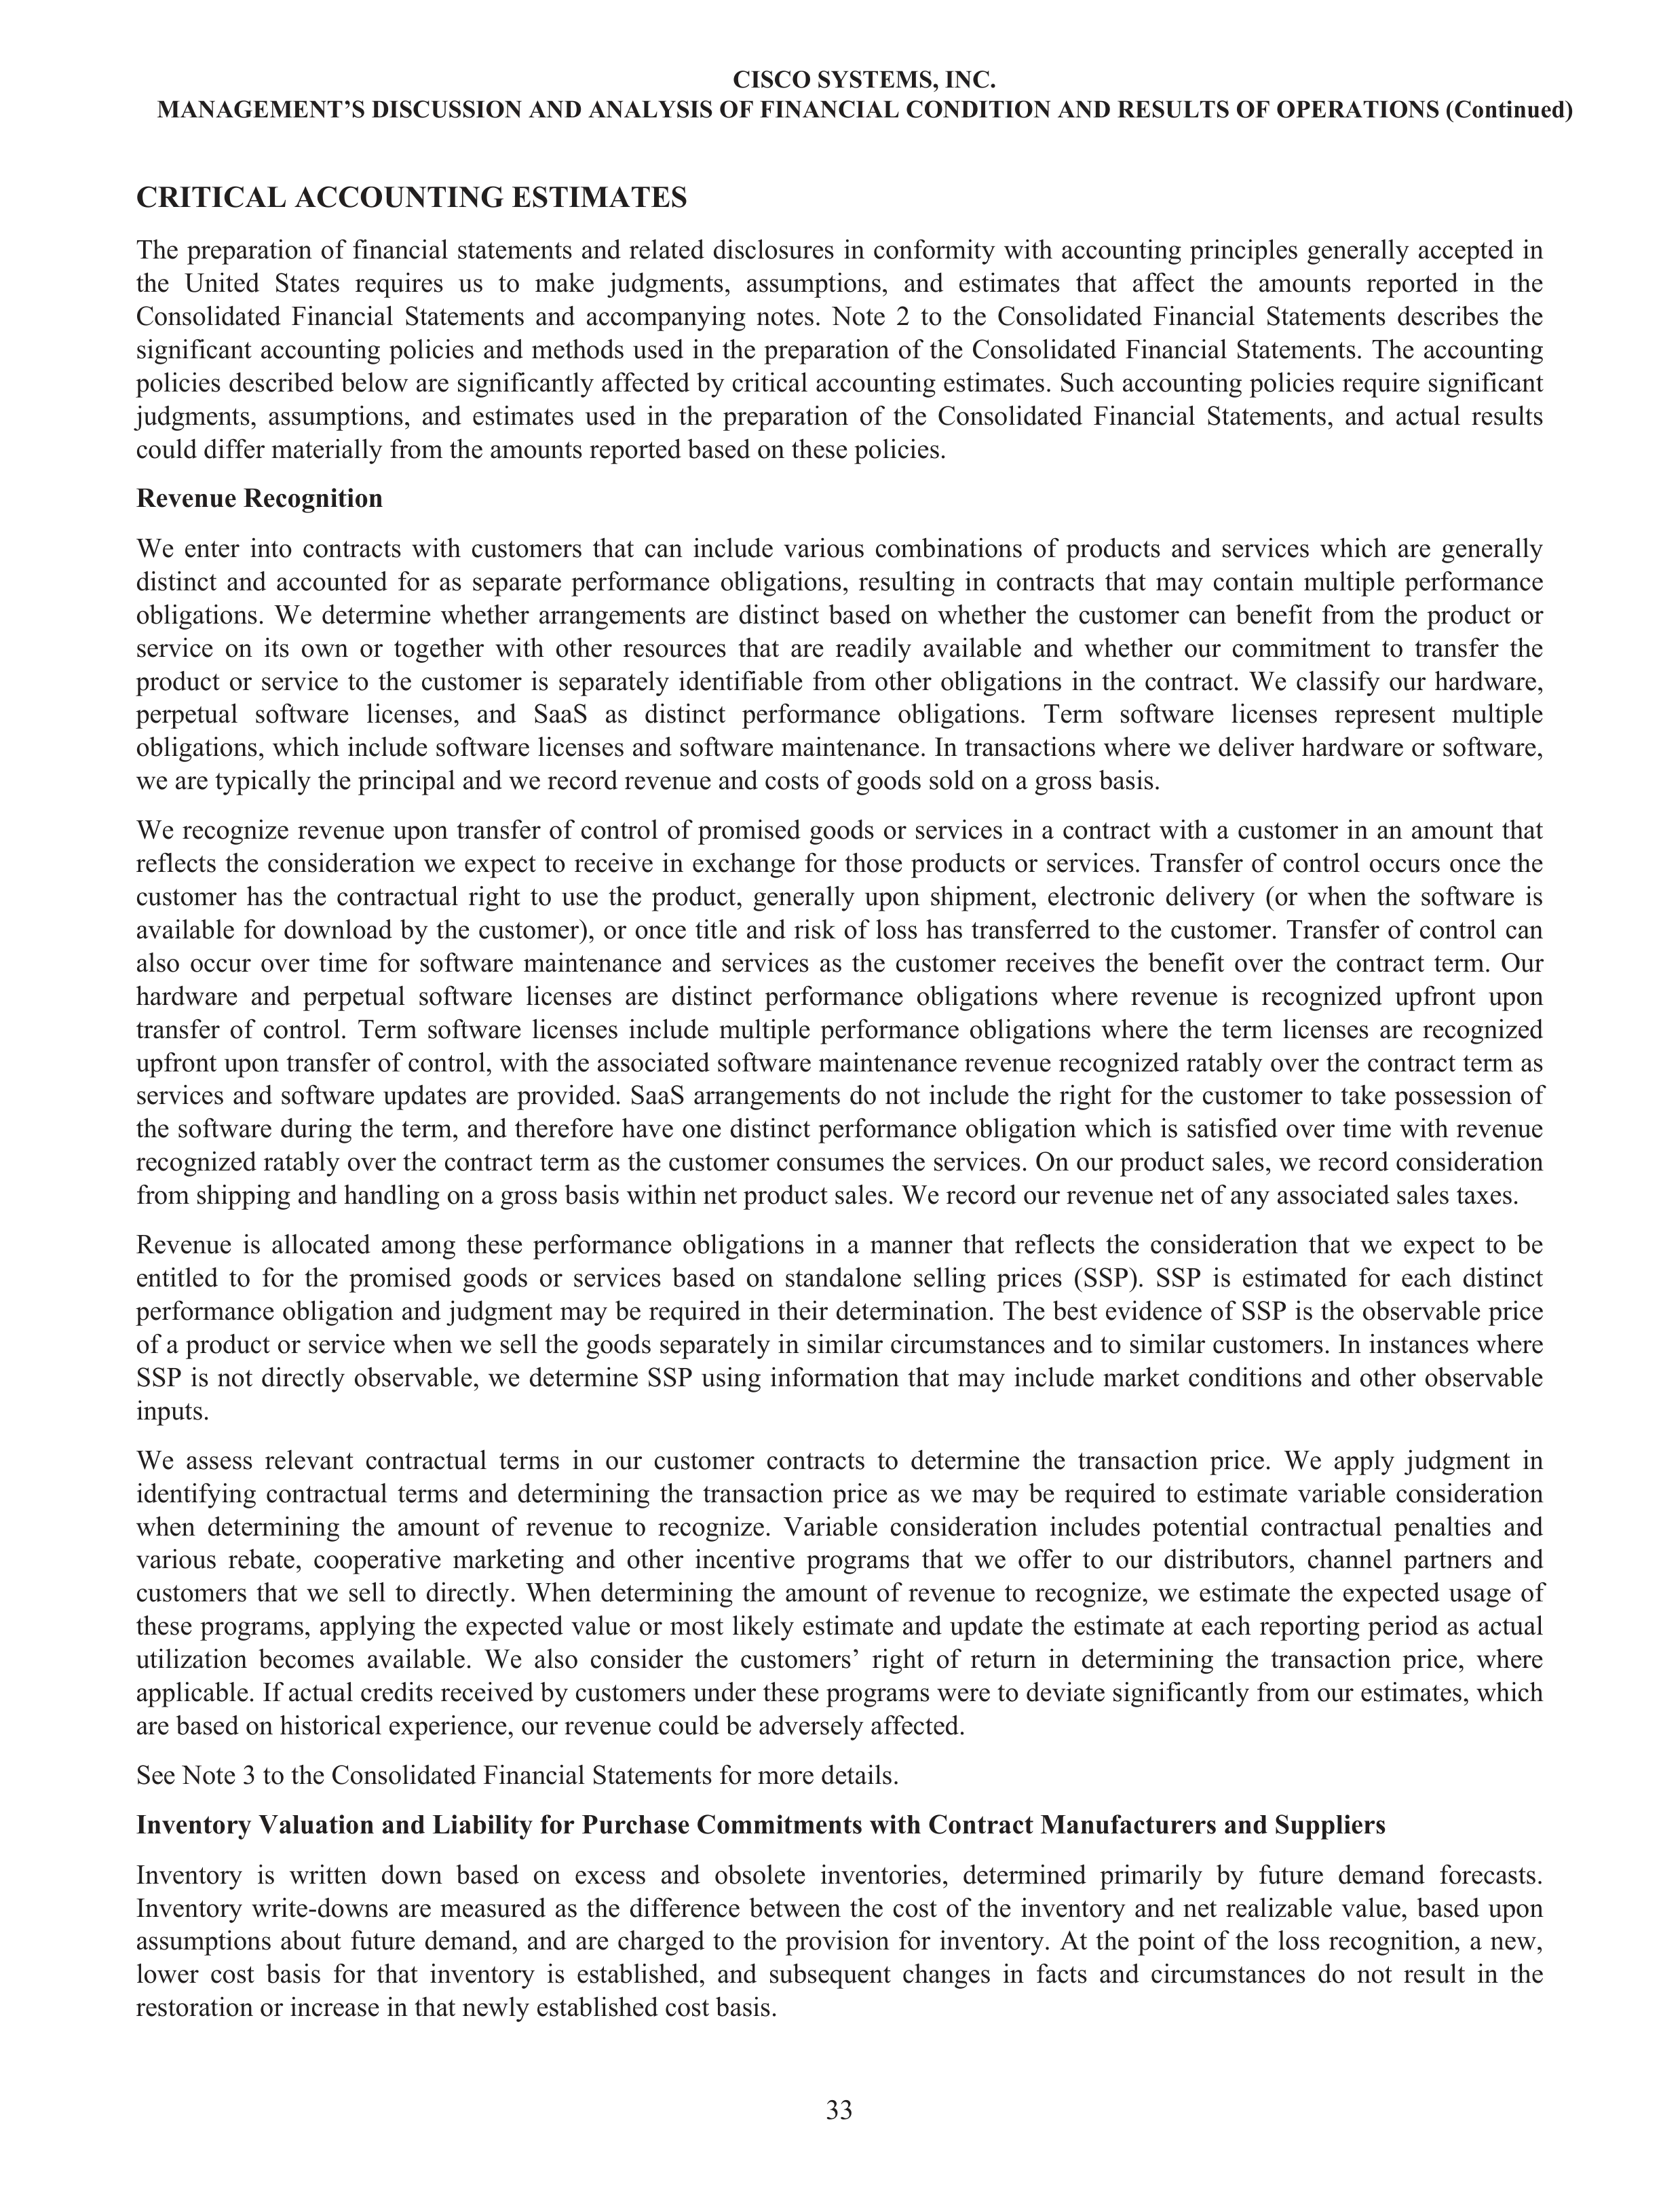
CRITICAL ACCOUNTING ESTIMATES
The preparation of financial statements and related disclosures in conformity with accounting principles generally accepted in
the United States requires us to make judgments, assumptions, and estimates that affect the amounts reported in the
Consolidated Financial Statements and accompanying notes. Note 2 to the Consolidated Financial Statements describes the
significant accounting policies and methods used in the preparation of the Consolidated Financial Statements. The accounting
policies described below are significantly affected by critical accounting estimates. Such accounting policies require significant
judgments, assumptions, and estimates used in the preparation of the Consolidated Financial Statements, and actual results
could differ materially from the amounts reported based on these policies.
Revenue Recognition
We enter into contracts with customers that can include various combinations of products and services which are generally
distinct and accounted for as separate performance obligations, resulting in contracts that may contain multiple performance
obligations. We determine whether arrangements are distinct based on whether the customer can benefit from the product or
service on its own or together with other resources that are readily available and whether our commitment to transfer the
product or service to the customer is separately identifiable from other obligations in the contract. We classify our hardware,
perpetual software licenses, and SaaS as distinct performance obligations. Term software licenses represent multiple
obligations, which include software licenses and software maintenance. In transactions where we deliver hardware or software,
we are typically the principal and we record revenue and costs of goods sold on a gross basis.
We recognize revenue upon transfer of control of promised goods or services in a contract with a customer in an amount that
reflects the consideration we expect to receive in exchange for those products or services. Transfer of control occurs once the
customer has the contractual right to use the product, generally upon shipment, electronic delivery (or when the software is
available for download by the customer), or once title and risk of loss has transferred to the customer. Transfer of control can
also occur over time for software maintenance and services as the customer receives the benefit over the contract term. Our
hardware and perpetual software licenses are distinct performance obligations where revenue is recognized upfront upon
transfer of control. Term software licenses include multiple performance obligations where the term licenses are recognized
upfront upon transfer of control, with the associated software maintenance revenue recognized ratably over the contract term as
services and software updates are provided. SaaS arrangements do not include the right for the customer to take possession of
the software during the term, and therefore have one distinct performance obligation which is satisfied over time with revenue
recognized ratably over the contract term as the customer consumes the services. On our product sales, we record consideration
from shipping and handling on a gross basis within net product sales. We record our revenue net of any associated sales taxes.
Revenue is allocated among these performance obligations in a manner that reflects the consideration that we expect to be
entitled to for the promised goods or services based on standalone selling prices (SSP). SSP is estimated for each distinct
performance obligation and judgment may be required in their determination. The best evidence of SSP is the observable price
of a product or service when we sell the goods separately in similar circumstances and to similar customers. In instances where
SSP is not directly observable, we determine SSP using information that may include market conditions and other observable
inputs.
We assess relevant contractual terms in our customer contracts to determine the transaction price. We apply judgment in
identifying contractual terms and determining the transaction price as we may be required to estimate variable consideration
when determining the amount of revenue to recognize. Variable consideration includes potential contractual penalties and
various rebate, cooperative marketing and other incentive programs that we offer to our distributors, channel partners and
customers that we sell to directly. When determining the amount of revenue to recognize, we estimate the expected usage of
these programs, applying the expected value or most likely estimate and update the estimate at each reporting period as actual
utilization becomes available. We also consider the customers’ right of return in determining the transaction price, where
applicable. If actual credits received by customers under these programs were to deviate significantly from our estimates, which
are based on historical experience, our revenue could be adversely affected.
See Note 3 to the Consolidated Financial Statements for more details.
Inventory Valuation and Liability for Purchase Commitments with Contract Manufacturers and Suppliers
Inventory is written down based on excess and obsolete inventories, determined primarily by future demand forecasts.
Inventory write-downs are measured as the difference between the cost of the inventory and net realizable value, based upon
assumptions about future demand, and are charged to the provision for inventory. At the point of the loss recognition, a new,
lower cost basis for that inventory is established, and subsequent changes in facts and circumstances do not result in the
restoration or increase in that newly established cost basis.
CISCO SYSTEMS, INC.
MANAGEMENT’S DISCUSSION AND ANALYSIS OF FINANCIAL CONDITION AND RESULTS OF OPERATIONS (Continued)
33
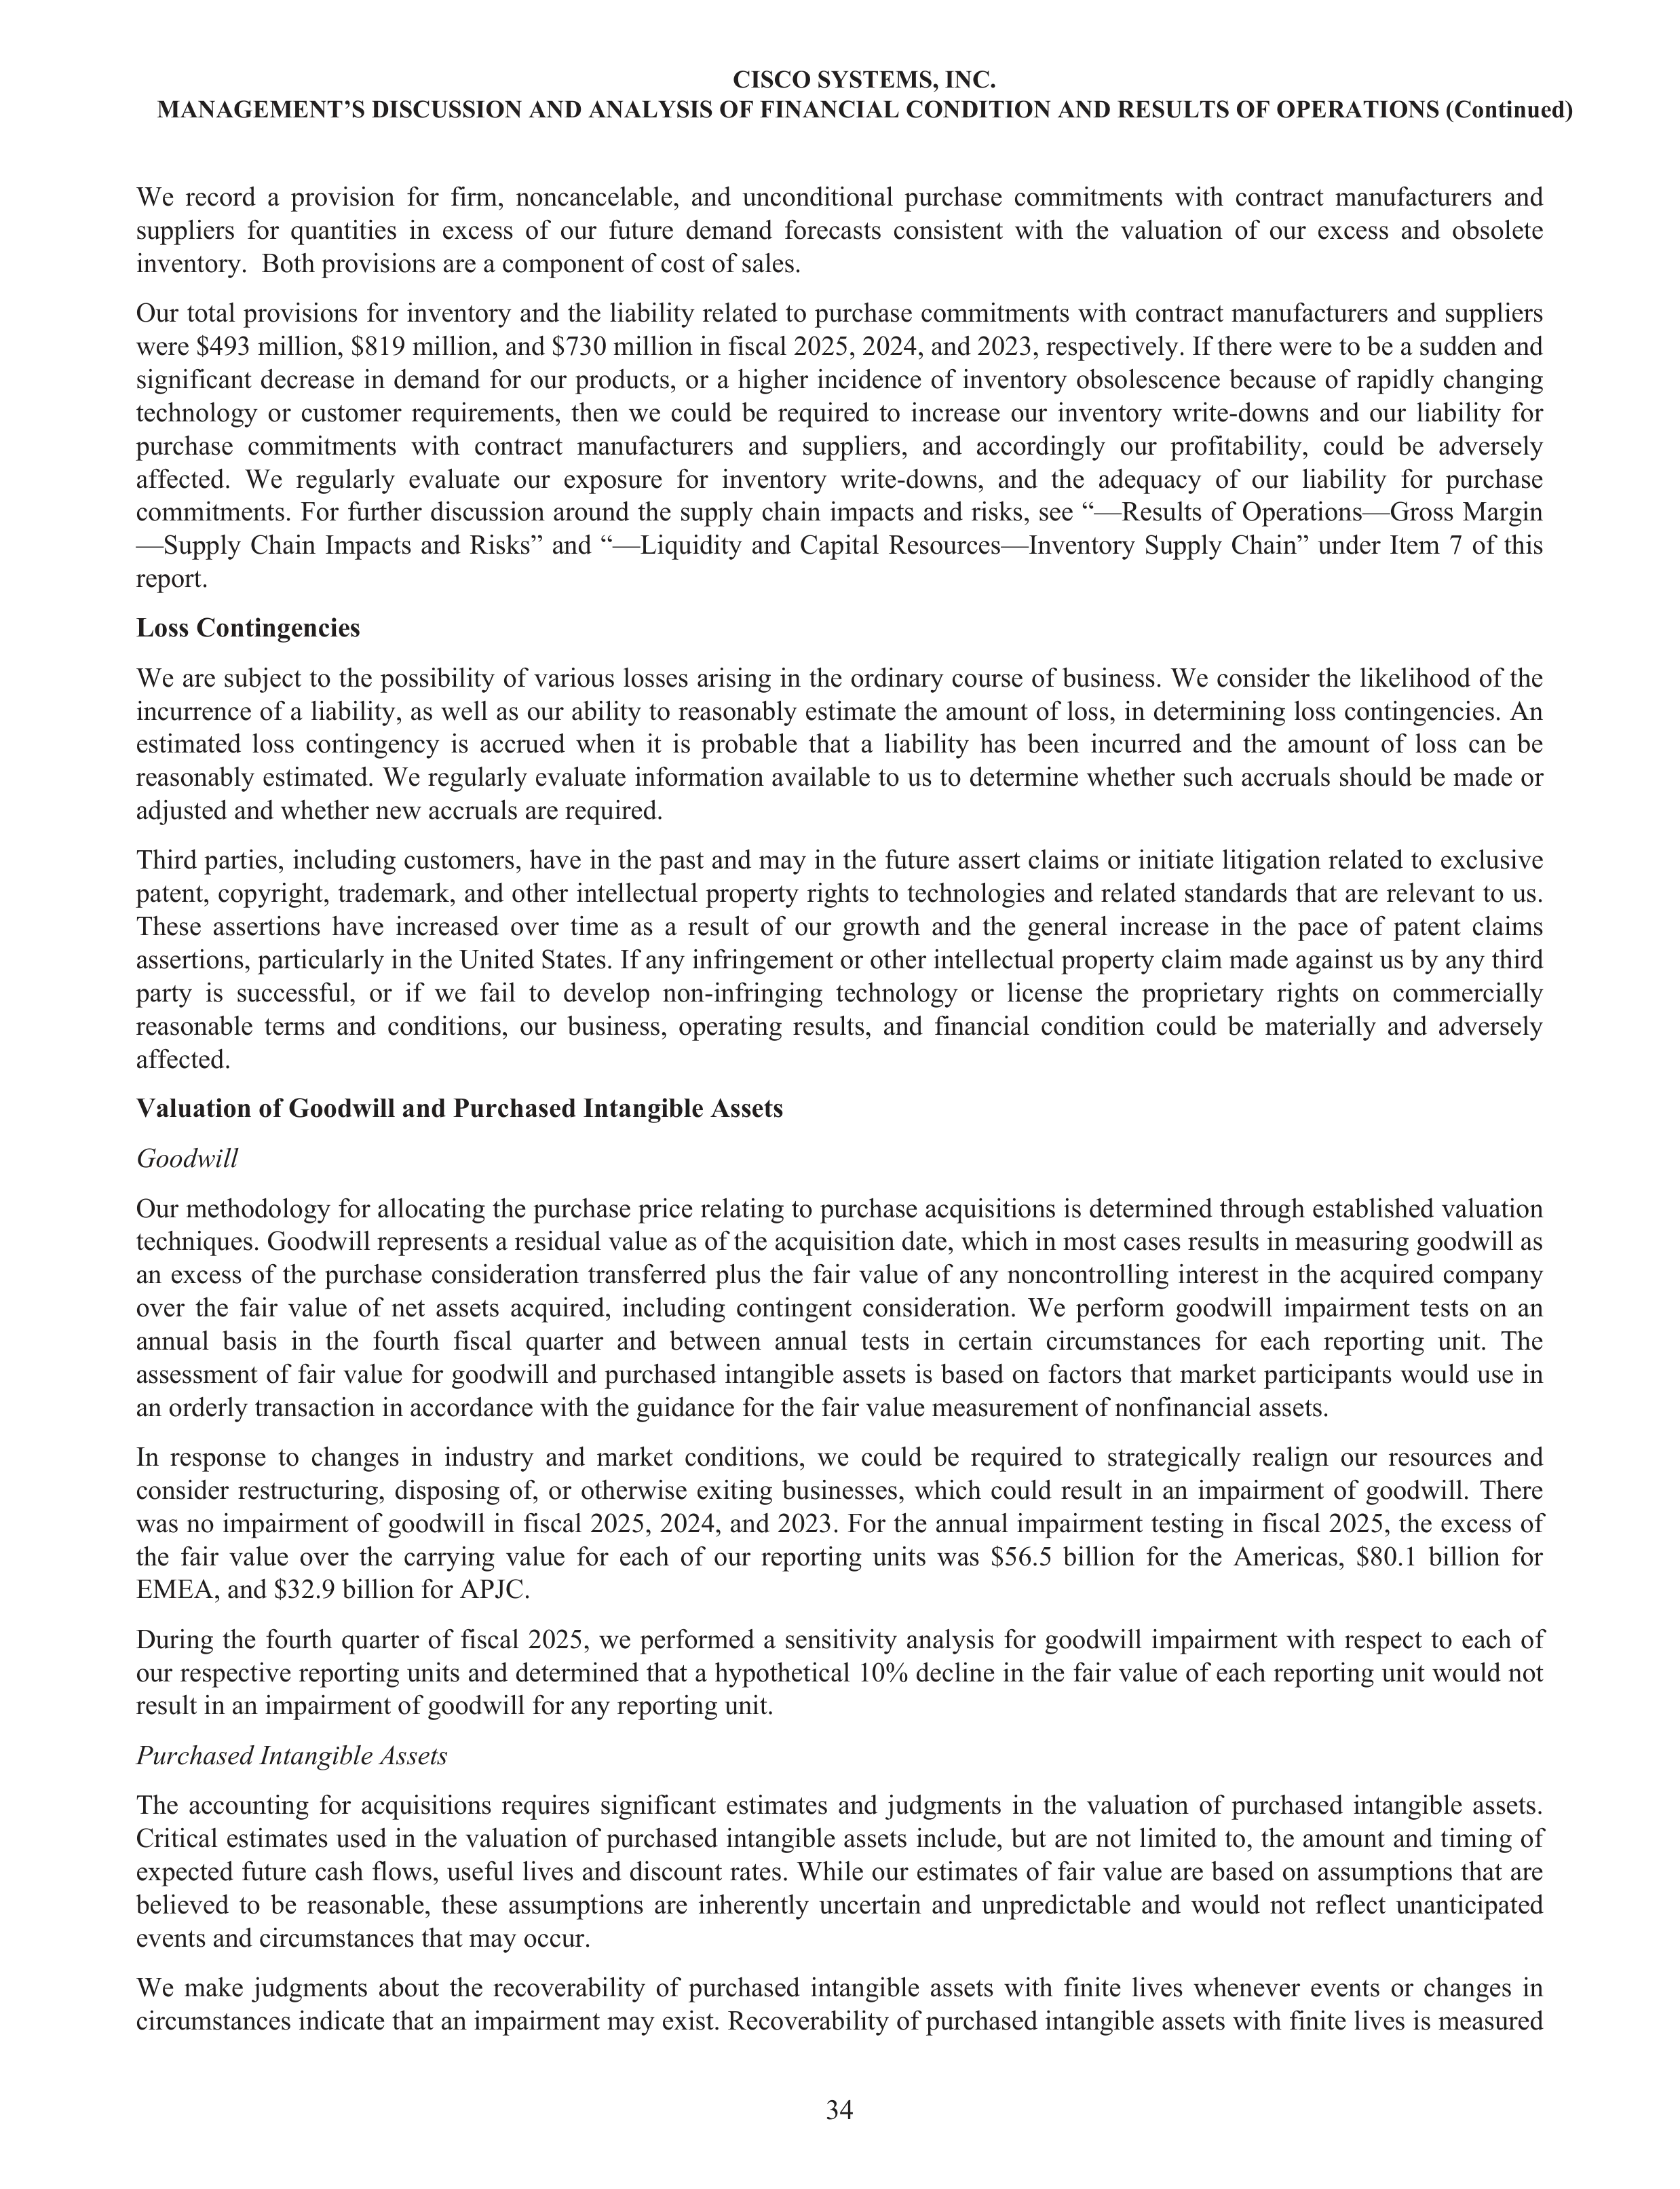
We record a provision for firm, noncancelable, and unconditional purchase commitments with contract manufacturers and
suppliers for quantities in excess of our future demand forecasts consistent with the valuation of our excess and obsolete
inventory. Both provisions are a component of cost of sales.
Our total provisions for inventory and the liability related to purchase commitments with contract manufacturers and suppliers
were $493 million, $819 million, and $730 million in fiscal 2025, 2024, and 2023, respectively. If there were to be a sudden and
significant decrease in demand for our products, or a higher incidence of inventory obsolescence because of rapidly changing
technology or customer requirements, then we could be required to increase our inventory write-downs and our liability for
purchase commitments with contract manufacturers and suppliers, and accordingly our profitability, could be adversely
affected. We regularly evaluate our exposure for inventory write-downs, and the adequacy of our liability for purchase
commitments. For further discussion around the supply chain impacts and risks, see “—Results of Operations—Gross Margin
—Supply Chain Impacts and Risks” and “—Liquidity and Capital Resources—Inventory Supply Chain” under Item 7 of this
report.
Loss Contingencies
We are subject to the possibility of various losses arising in the ordinary course of business. We consider the likelihood of the
incurrence of a liability, as well as our ability to reasonably estimate the amount of loss, in determining loss contingencies. An
estimated loss contingency is accrued when it is probable that a liability has been incurred and the amount of loss can be
reasonably estimated. We regularly evaluate information available to us to determine whether such accruals should be made or
adjusted and whether new accruals are required.
Third parties, including customers, have in the past and may in the future assert claims or initiate litigation related to exclusive
patent, copyright, trademark, and other intellectual property rights to technologies and related standards that are relevant to us.
These assertions have increased over time as a result of our growth and the general increase in the pace of patent claims
assertions, particularly in the United States. If any infringement or other intellectual property claim made against us by any third
party is successful, or if we fail to develop non-infringing technology or license the proprietary rights on commercially
reasonable terms and conditions, our business, operating results, and financial condition could be materially and adversely
affected.
Valuation of Goodwill and Purchased Intangible Assets
Goodwill
Our methodology for allocating the purchase price relating to purchase acquisitions is determined through established valuation
techniques. Goodwill represents a residual value as of the acquisition date, which in most cases results in measuring goodwill as
an excess of the purchase consideration transferred plus the fair value of any noncontrolling interest in the acquired company
over the fair value of net assets acquired, including contingent consideration. We perform goodwill impairment tests on an
annual basis in the fourth fiscal quarter and between annual tests in certain circumstances for each reporting unit. The
assessment of fair value for goodwill and purchased intangible assets is based on factors that market participants would use in
an orderly transaction in accordance with the guidance for the fair value measurement of nonfinancial assets.
In response to changes in industry and market conditions, we could be required to strategically realign our resources and
consider restructuring, disposing of, or otherwise exiting businesses, which could result in an impairment of goodwill. There
was no impairment of goodwill in fiscal 2025, 2024, and 2023. For the annual impairment testing in fiscal 2025, the excess of
the fair value over the carrying value for each of our reporting units was $56.5 billion for the Americas, $80.1 billion for
EMEA, and $32.9 billion for APJC.
During the fourth quarter of fiscal 2025, we performed a sensitivity analysis for goodwill impairment with respect to each of
our respective reporting units and determined that a hypothetical 10% decline in the fair value of each reporting unit would not
result in an impairment of goodwill for any reporting unit.
Purchased Intangible Assets
The accounting for acquisitions requires significant estimates and judgments in the valuation of purchased intangible assets.
Critical estimates used in the valuation of purchased intangible assets include, but are not limited to, the amount and timing of
expected future cash flows, useful lives and discount rates. While our estimates of fair value are based on assumptions that are
believed to be reasonable, these assumptions are inherently uncertain and unpredictable and would not reflect unanticipated
events and circumstances that may occur.
We make judgments about the recoverability of purchased intangible assets with finite lives whenever events or changes in
circumstances indicate that an impairment may exist. Recoverability of purchased intangible assets with finite lives is measured
CISCO SYSTEMS, INC.
MANAGEMENT’S DISCUSSION AND ANALYSIS OF FINANCIAL CONDITION AND RESULTS OF OPERATIONS (Continued)
34
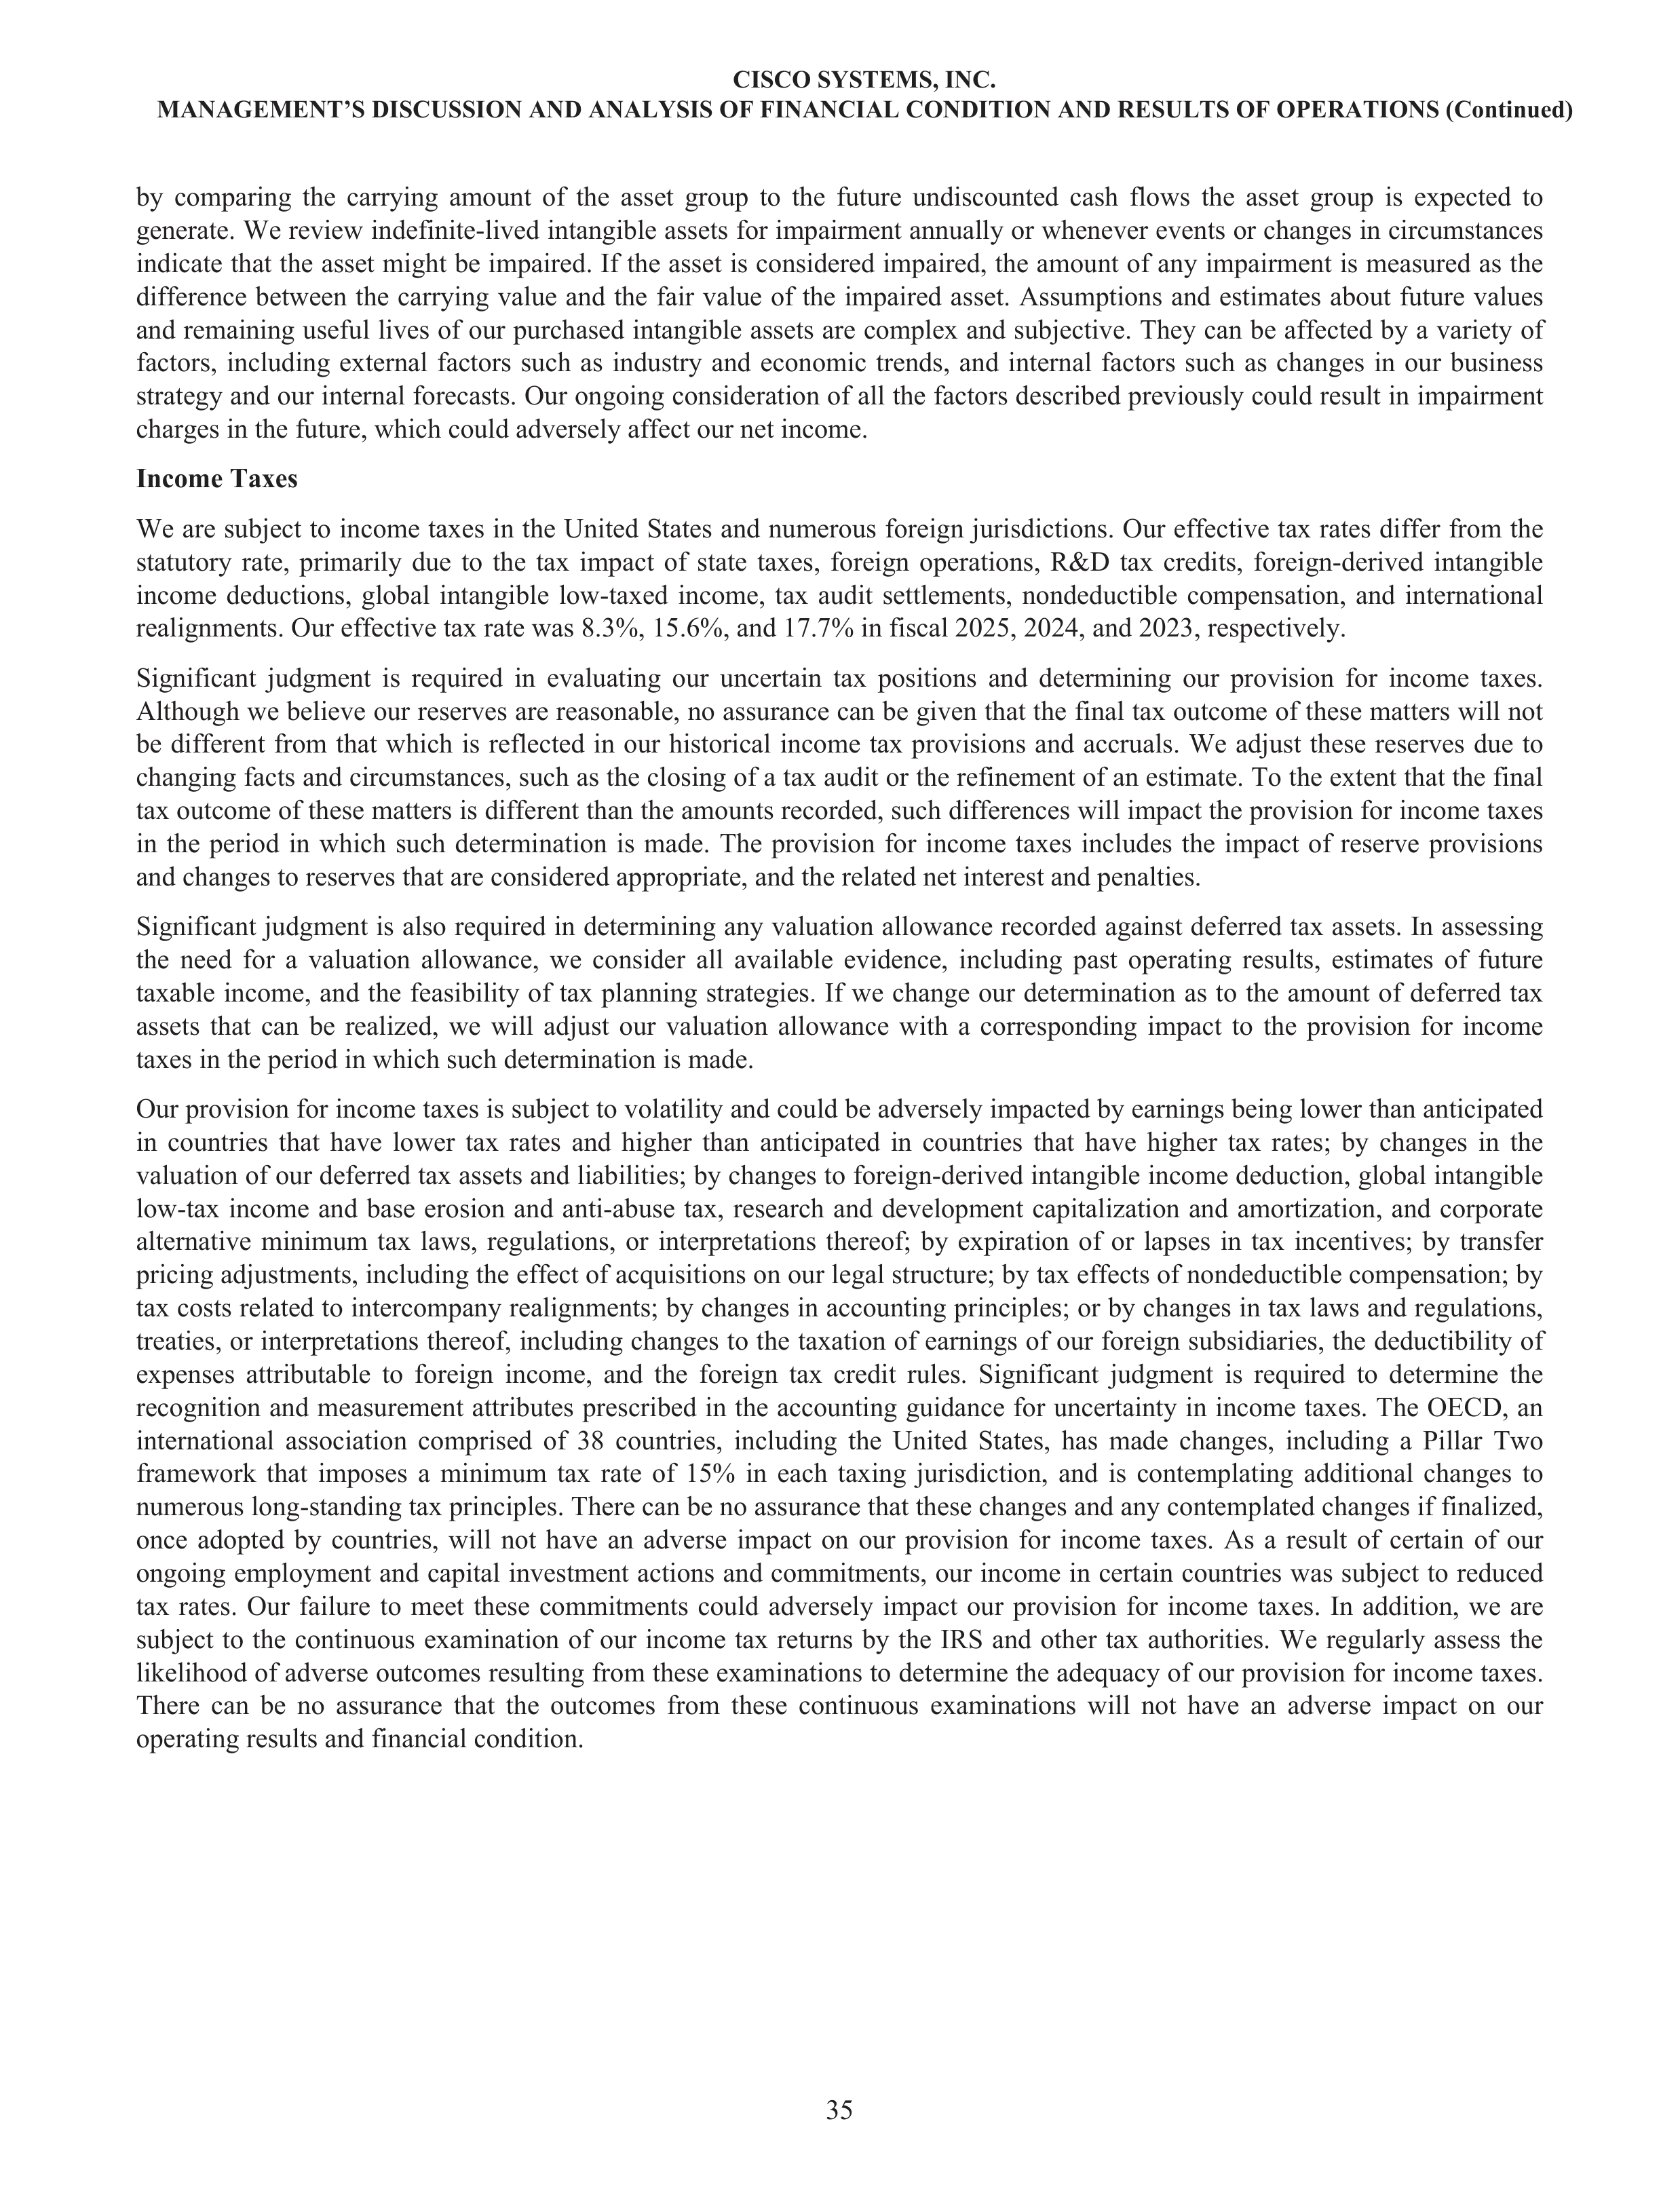
by comparing the carrying amount of the asset group to the future undiscounted cash flows the asset group is expected to
generate. We review indefinite-lived intangible assets for impairment annually or whenever events or changes in circumstances
indicate that the asset might be impaired. If the asset is considered impaired, the amount of any impairment is measured as the
difference between the carrying value and the fair value of the impaired asset. Assumptions and estimates about future values
and remaining useful lives of our purchased intangible assets are complex and subjective. They can be affected by a variety of
factors, including external factors such as industry and economic trends, and internal factors such as changes in our business
strategy and our internal forecasts. Our ongoing consideration of all the factors described previously could result in impairment
charges in the future, which could adversely affect our net income.
Income Taxes
We are subject to income taxes in the United States and numerous foreign jurisdictions. Our effective tax rates differ from the
statutory rate, primarily due to the tax impact of state taxes, foreign operations, R&D tax credits, foreign-derived intangible
income deductions, global intangible low-taxed income, tax audit settlements, nondeductible compensation, and international
realignments. Our effective tax rate was 8.3%, 15.6%, and 17.7% in fiscal 2025, 2024, and 2023, respectively.
Significant judgment is required in evaluating our uncertain tax positions and determining our provision for income taxes.
Although we believe our reserves are reasonable, no assurance can be given that the final tax outcome of these matters will not
be different from that which is reflected in our historical income tax provisions and accruals. We adjust these reserves due to
changing facts and circumstances, such as the closing of a tax audit or the refinement of an estimate. To the extent that the final
tax outcome of these matters is different than the amounts recorded, such differences will impact the provision for income taxes
in the period in which such determination is made. The provision for income taxes includes the impact of reserve provisions
and changes to reserves that are considered appropriate, and the related net interest and penalties.
Significant judgment is also required in determining any valuation allowance recorded against deferred tax assets. In assessing
the need for a valuation allowance, we consider all available evidence, including past operating results, estimates of future
taxable income, and the feasibility of tax planning strategies. If we change our determination as to the amount of deferred tax
assets that can be realized, we will adjust our valuation allowance with a corresponding impact to the provision for income
taxes in the period in which such determination is made.
Our provision for income taxes is subject to volatility and could be adversely impacted by earnings being lower than anticipated
in countries that have lower tax rates and higher than anticipated in countries that have higher tax rates; by changes in the
valuation of our deferred tax assets and liabilities; by changes to foreign-derived intangible income deduction, global intangible
low-tax income and base erosion and anti-abuse tax, research and development capitalization and amortization, and corporate
alternative minimum tax laws, regulations, or interpretations thereof; by expiration of or lapses in tax incentives; by transfer
pricing adjustments, including the effect of acquisitions on our legal structure; by tax effects of nondeductible compensation; by
tax costs related to intercompany realignments; by changes in accounting principles; or by changes in tax laws and regulations,
treaties, or interpretations thereof, including changes to the taxation of earnings of our foreign subsidiaries, the deductibility of
expenses attributable to foreign income, and the foreign tax credit rules. Significant judgment is required to determine the
recognition and measurement attributes prescribed in the accounting guidance for uncertainty in income taxes. The OECD, an
international association comprised of 38 countries, including the United States, has made changes, including a Pillar Two
framework that imposes a minimum tax rate of 15% in each taxing jurisdiction, and is contemplating additional changes to
numerous long-standing tax principles. There can be no assurance that these changes and any contemplated changes if finalized,
once adopted by countries, will not have an adverse impact on our provision for income taxes. As a result of certain of our
ongoing employment and capital investment actions and commitments, our income in certain countries was subject to reduced
tax rates. Our failure to meet these commitments could adversely impact our provision for income taxes. In addition, we are
subject to the continuous examination of our income tax returns by the IRS and other tax authorities. We regularly assess the
likelihood of adverse outcomes resulting from these examinations to determine the adequacy of our provision for income taxes.
There can be no assurance that the outcomes from these continuous examinations will not have an adverse impact on our
operating results and financial condition.
CISCO SYSTEMS, INC.
MANAGEMENT’S DISCUSSION AND ANALYSIS OF FINANCIAL CONDITION AND RESULTS OF OPERATIONS (Continued)
35
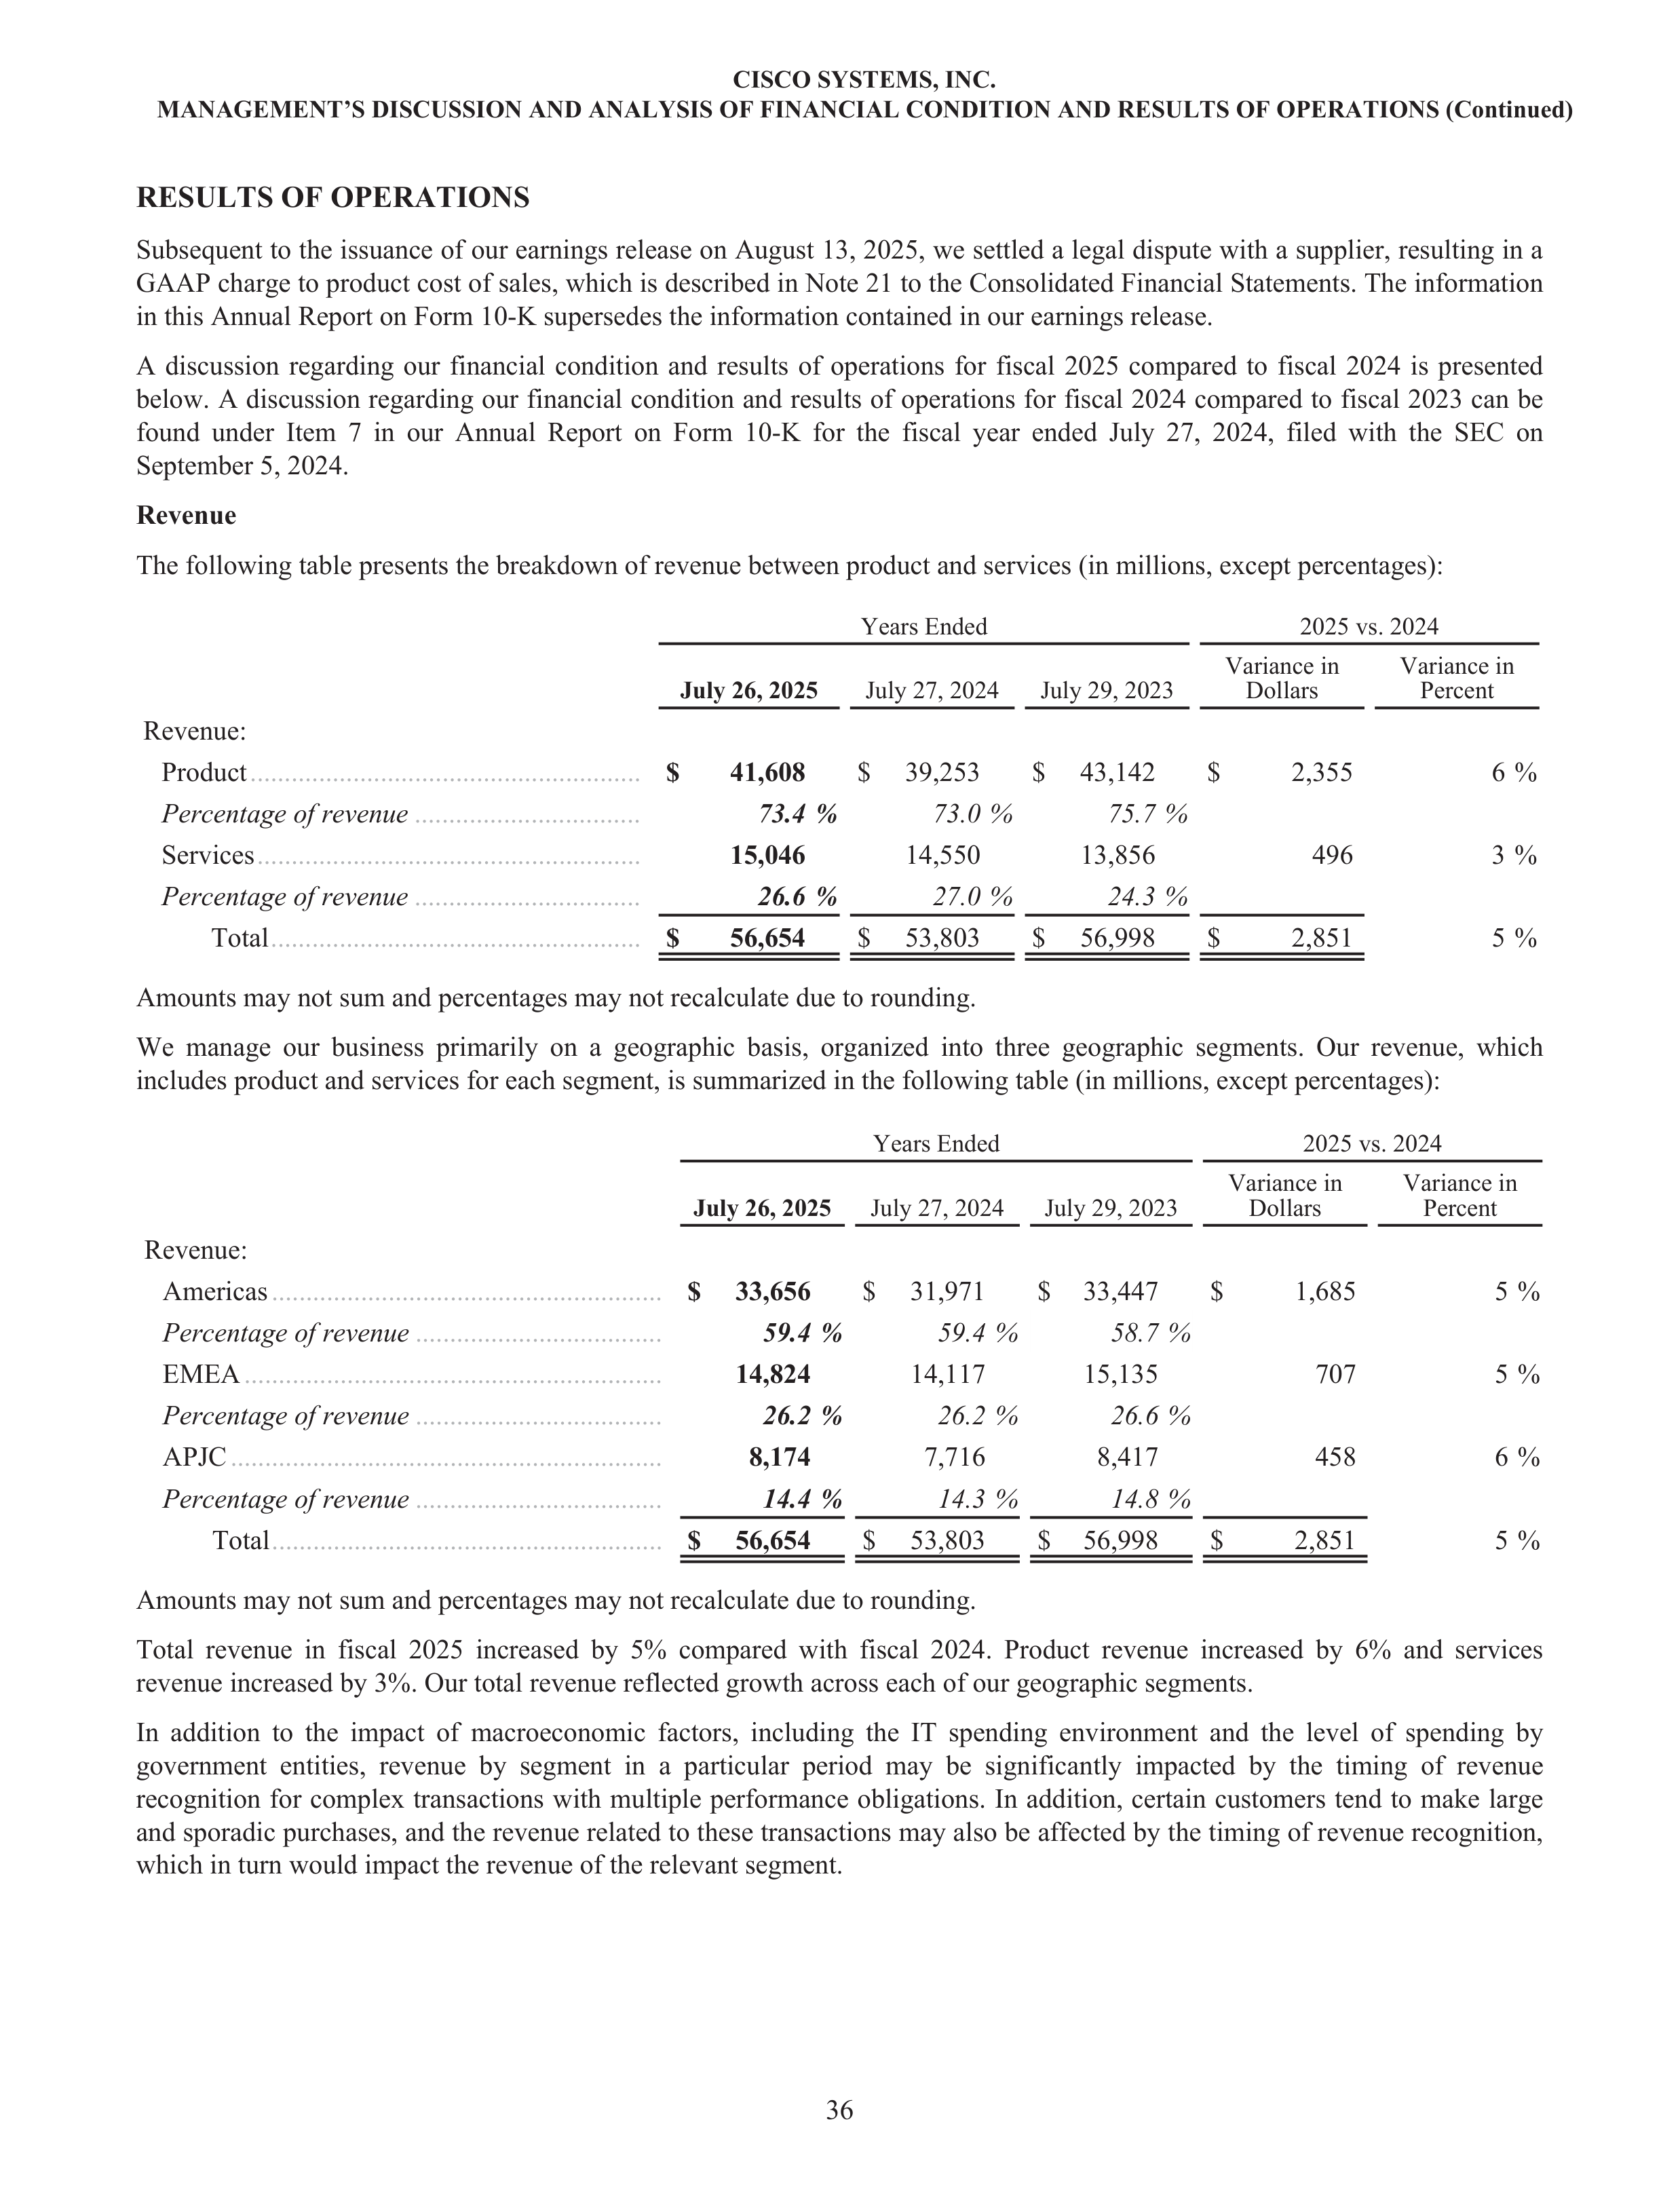
RESULTS OF OPERATIONS
Subsequent to the issuance of our earnings release on August 13, 2025, we settled a legal dispute with a supplier, resulting in a
GAAP charge to product cost of sales, which is described in Note 21 to the Consolidated Financial Statements. The information
in this Annual Report on Form 10-K supersedes the information contained in our earnings release.
A discussion regarding our financial condition and results of operations for fiscal 2025 compared to fiscal 2024 is presented
below. A discussion regarding our financial condition and results of operations for fiscal 2024 compared to fiscal 2023 can be
found under Item 7 in our Annual Report on Form 10-K for the fiscal year ended July 27, 2024, filed with the SEC on
September 5, 2024.
Revenue
The following table presents the breakdown of revenue between product and services (in millions, except percentages):
Years Ended
2025 vs. 2024
July 26, 2025
July 27, 2024
July 29, 2023
Variance in
Dollars
Variance in
Percent
Revenue:
Product
.........................................................
$
41,608
$
39,253
$
43,142
$
2,355
6 %
Percentage of revenue
.................................
73.4 %
73.0 %
75.7 %
Services
........................................................
15,046
14,550
13,856
496
3 %
Percentage of revenue
.................................
26.6 %
27.0 %
24.3 %
Total
......................................................
$
56,654
$
53,803
$
56,998
$
2,851
5 %
Amounts may not sum and percentages may not recalculate due to rounding.
We manage our business primarily on a geographic basis, organized into three geographic segments. Our revenue, which
includes product and services for each segment, is summarized in the following table (in millions, except percentages):
Years Ended
2025 vs. 2024
July 26, 2025
July 27, 2024
July 29, 2023
Variance in
Dollars
Variance in
Percent
Revenue:
Americas
.........................................................
$
33,656
$
31,971
$
33,447
$
1,685
5 %
Percentage of revenue
....................................
59.4 %
59.4 %
58.7 %
EMEA
.............................................................
14,824
14,117
15,135
707
5 %
Percentage of revenue
....................................
26.2 %
26.2 %
26.6 %
APJC
...............................................................
8,174
7,716
8,417
458
6 %
Percentage of revenue
....................................
14.4 %
14.3 %
14.8 %
Total
.........................................................
$
56,654
$
53,803
$
56,998
$
2,851
5 %
Amounts may not sum and percentages may not recalculate due to rounding.
Total revenue in fiscal 2025 increased by 5% compared with fiscal 2024. Product revenue increased by 6% and services
revenue increased by 3%. Our total revenue reflected growth across each of our geographic segments.
In addition to the impact of macroeconomic factors, including the IT spending environment and the level of spending by
government entities, revenue by segment in a particular period may be significantly impacted by the timing of revenue
recognition for complex transactions with multiple performance obligations. In addition, certain customers tend to make large
and sporadic purchases, and the revenue related to these transactions may also be affected by the timing of revenue recognition,
which in turn would impact the revenue of the relevant segment.
CISCO SYSTEMS, INC.
MANAGEMENT’S DISCUSSION AND ANALYSIS OF FINANCIAL CONDITION AND RESULTS OF OPERATIONS (Continued)
36
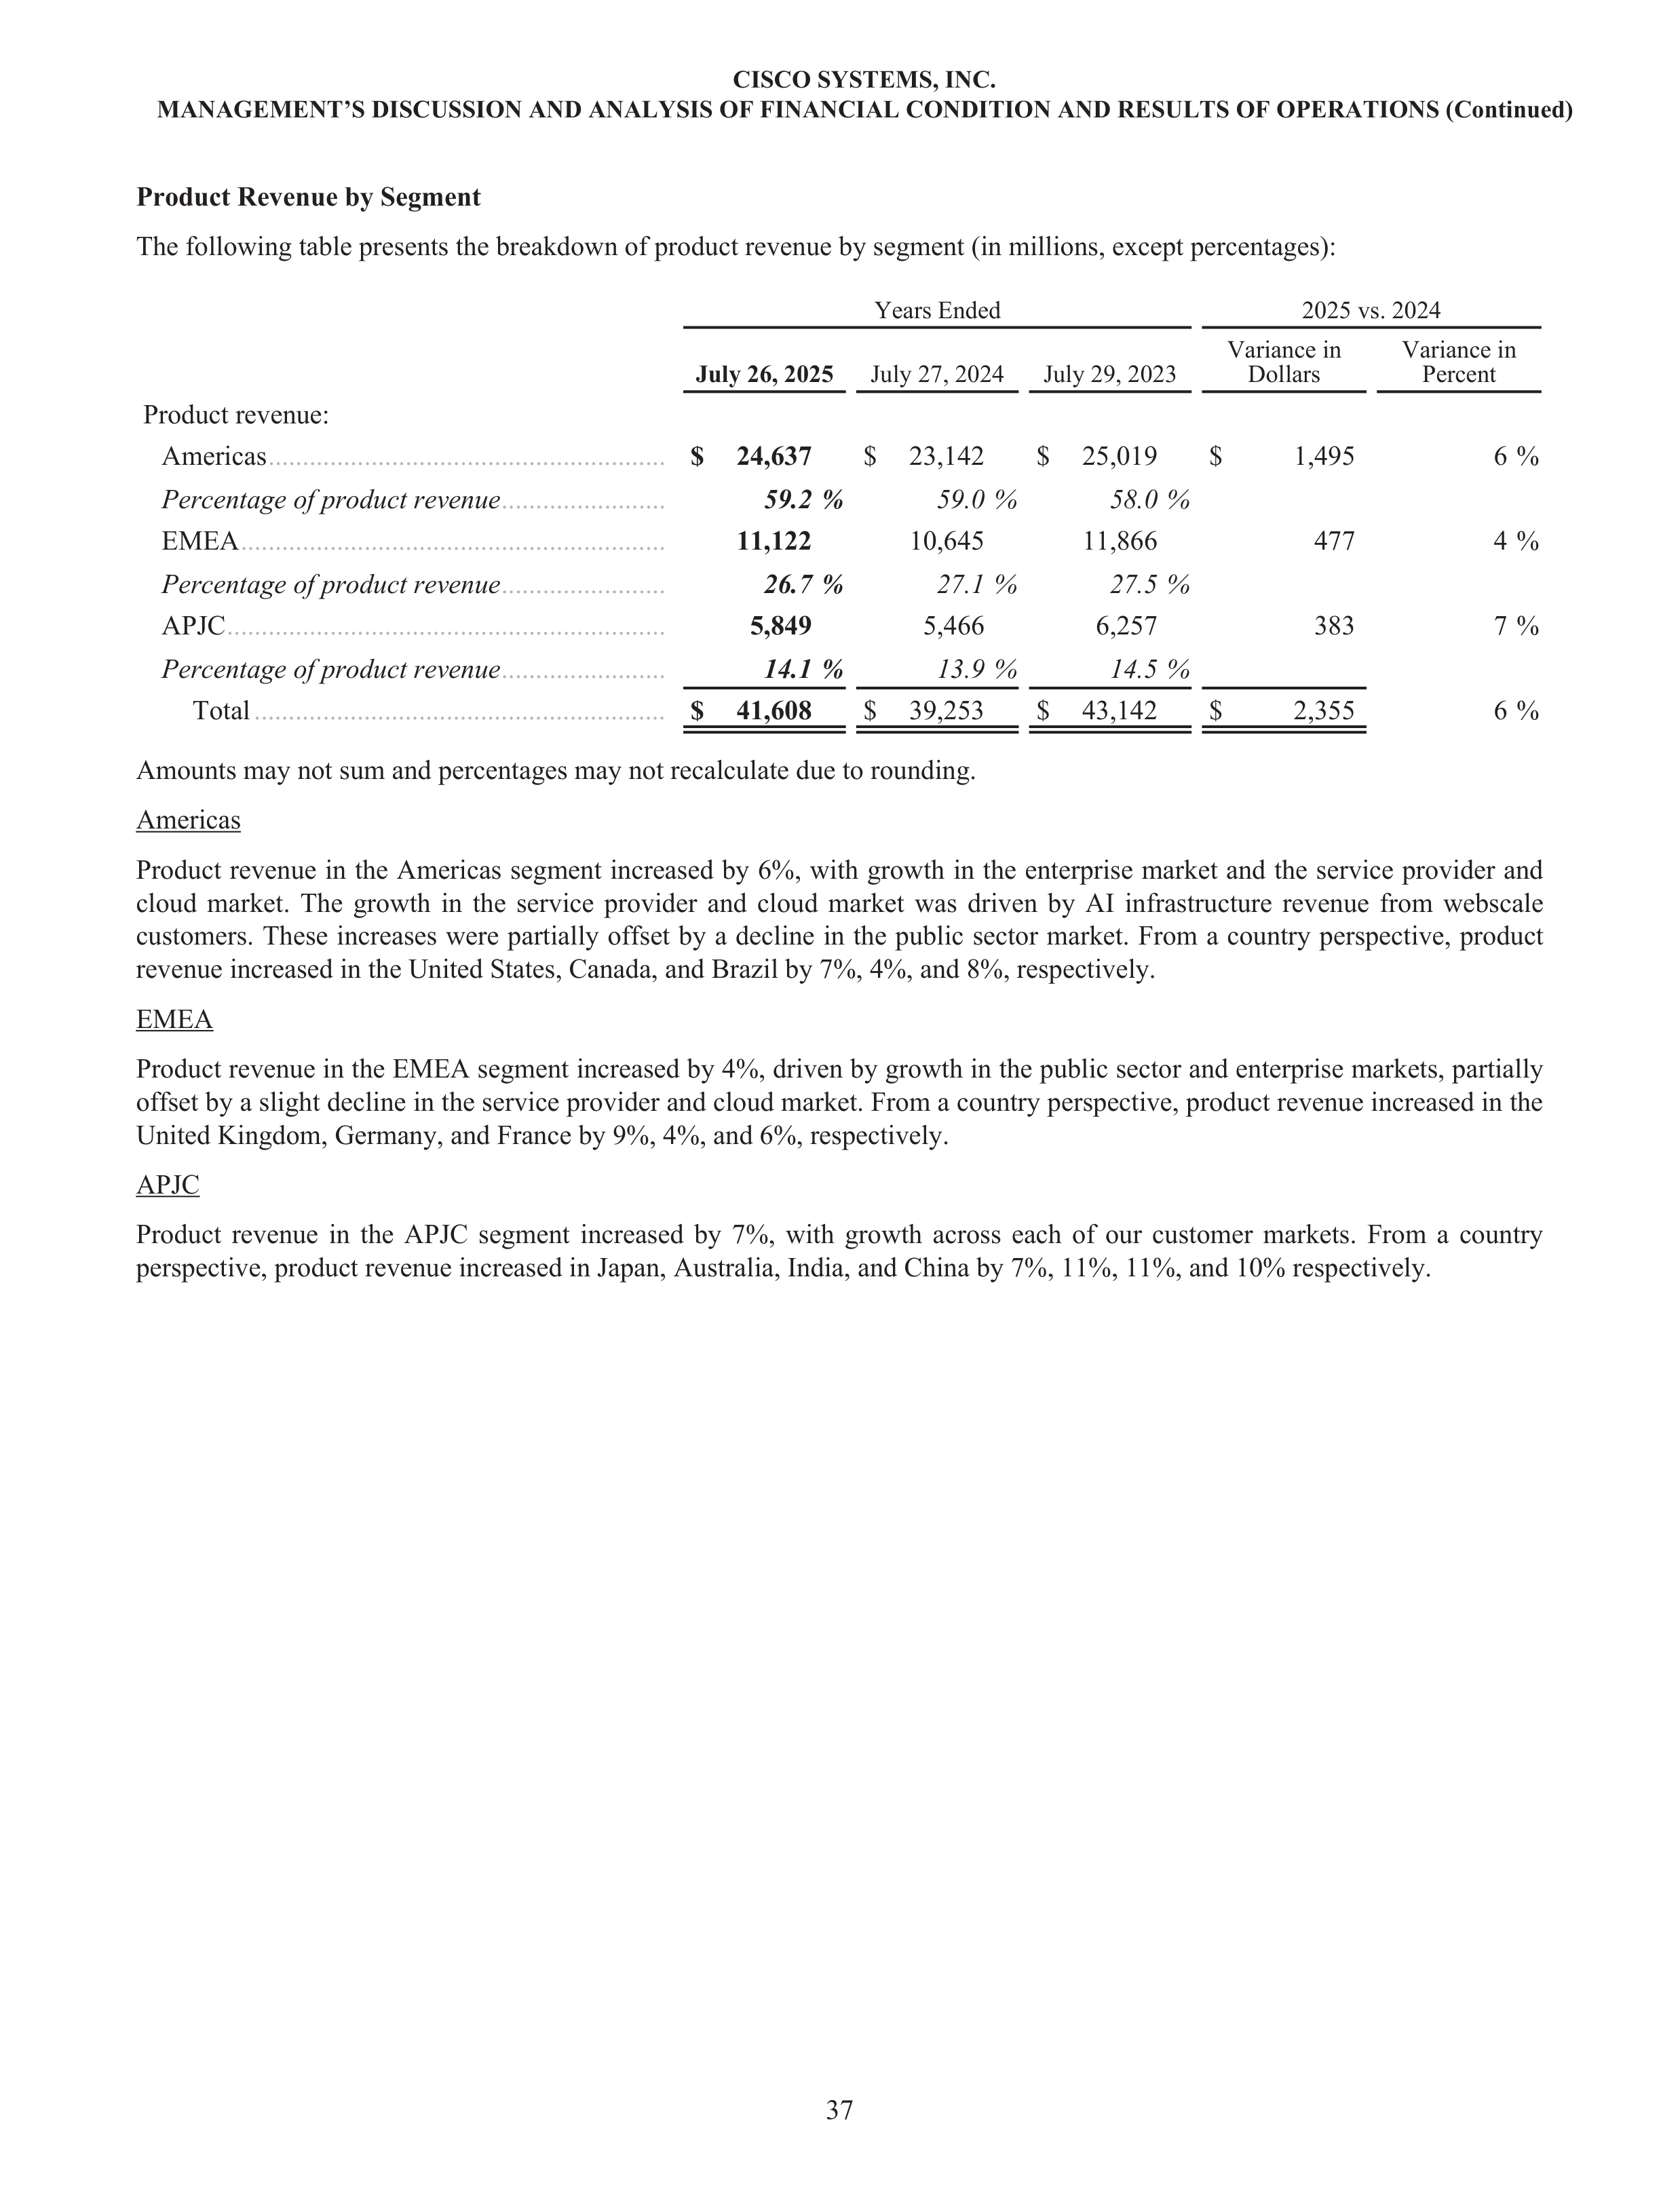
Product Revenue by Segment
The following table presents the breakdown of product revenue by segment (in millions, except percentages):
July 26, 2025
July 27, 2024
July 29, 2023
Variance in
Dollars
Variance in
Percent
Product revenue:
Americas
..........................................................
$
24,637
$
23,142
$
25,019
$
1,495
6 %
Percentage of product revenue
........................
59.2 %
59.0 %
58.0 %
EMEA
..............................................................
11,122
10,645
11,866
477
4 %
Percentage of product revenue
........................
26.7 %
27.1 %
27.5 %
APJC
................................................................
5,849
5,466
6,257
383
7 %
Percentage of product revenue
........................
14.1 %
13.9 %
14.5 %
Total
............................................................
$
41,608
$
39,253
$
43,142
$
2,355
6 %
Years Ended
2025 vs. 2024
Amounts may not sum and percentages may not recalculate due to rounding.
Americas
Product revenue in the Americas segment increased by 6%, with growth in the enterprise market and the service provider and
cloud market. The growth in the service provider and cloud market was driven by AI infrastructure revenue from webscale
customers. These increases were partially offset by a decline in the public sector market. From a country perspective, product
revenue increased in the United States, Canada, and Brazil by 7%, 4%, and 8%, respectively.
EMEA
Product revenue in the EMEA segment increased by 4%, driven by growth in the public sector and enterprise markets, partially
offset by a slight decline in the service provider and cloud market. From a country perspective, product revenue increased in the
United Kingdom, Germany, and France by 9%, 4%, and 6%, respectively.
APJC
Product revenue in the APJC segment increased by 7%,
with growth across each of our customer markets. From a country
perspective, product revenue increased in Japan, Australia, India, and China by 7%, 11%, 11%, and 10% respectively.
CISCO SYSTEMS, INC.
MANAGEMENT’S DISCUSSION AND ANALYSIS OF FINANCIAL CONDITION AND RESULTS OF OPERATIONS (Continued)
37
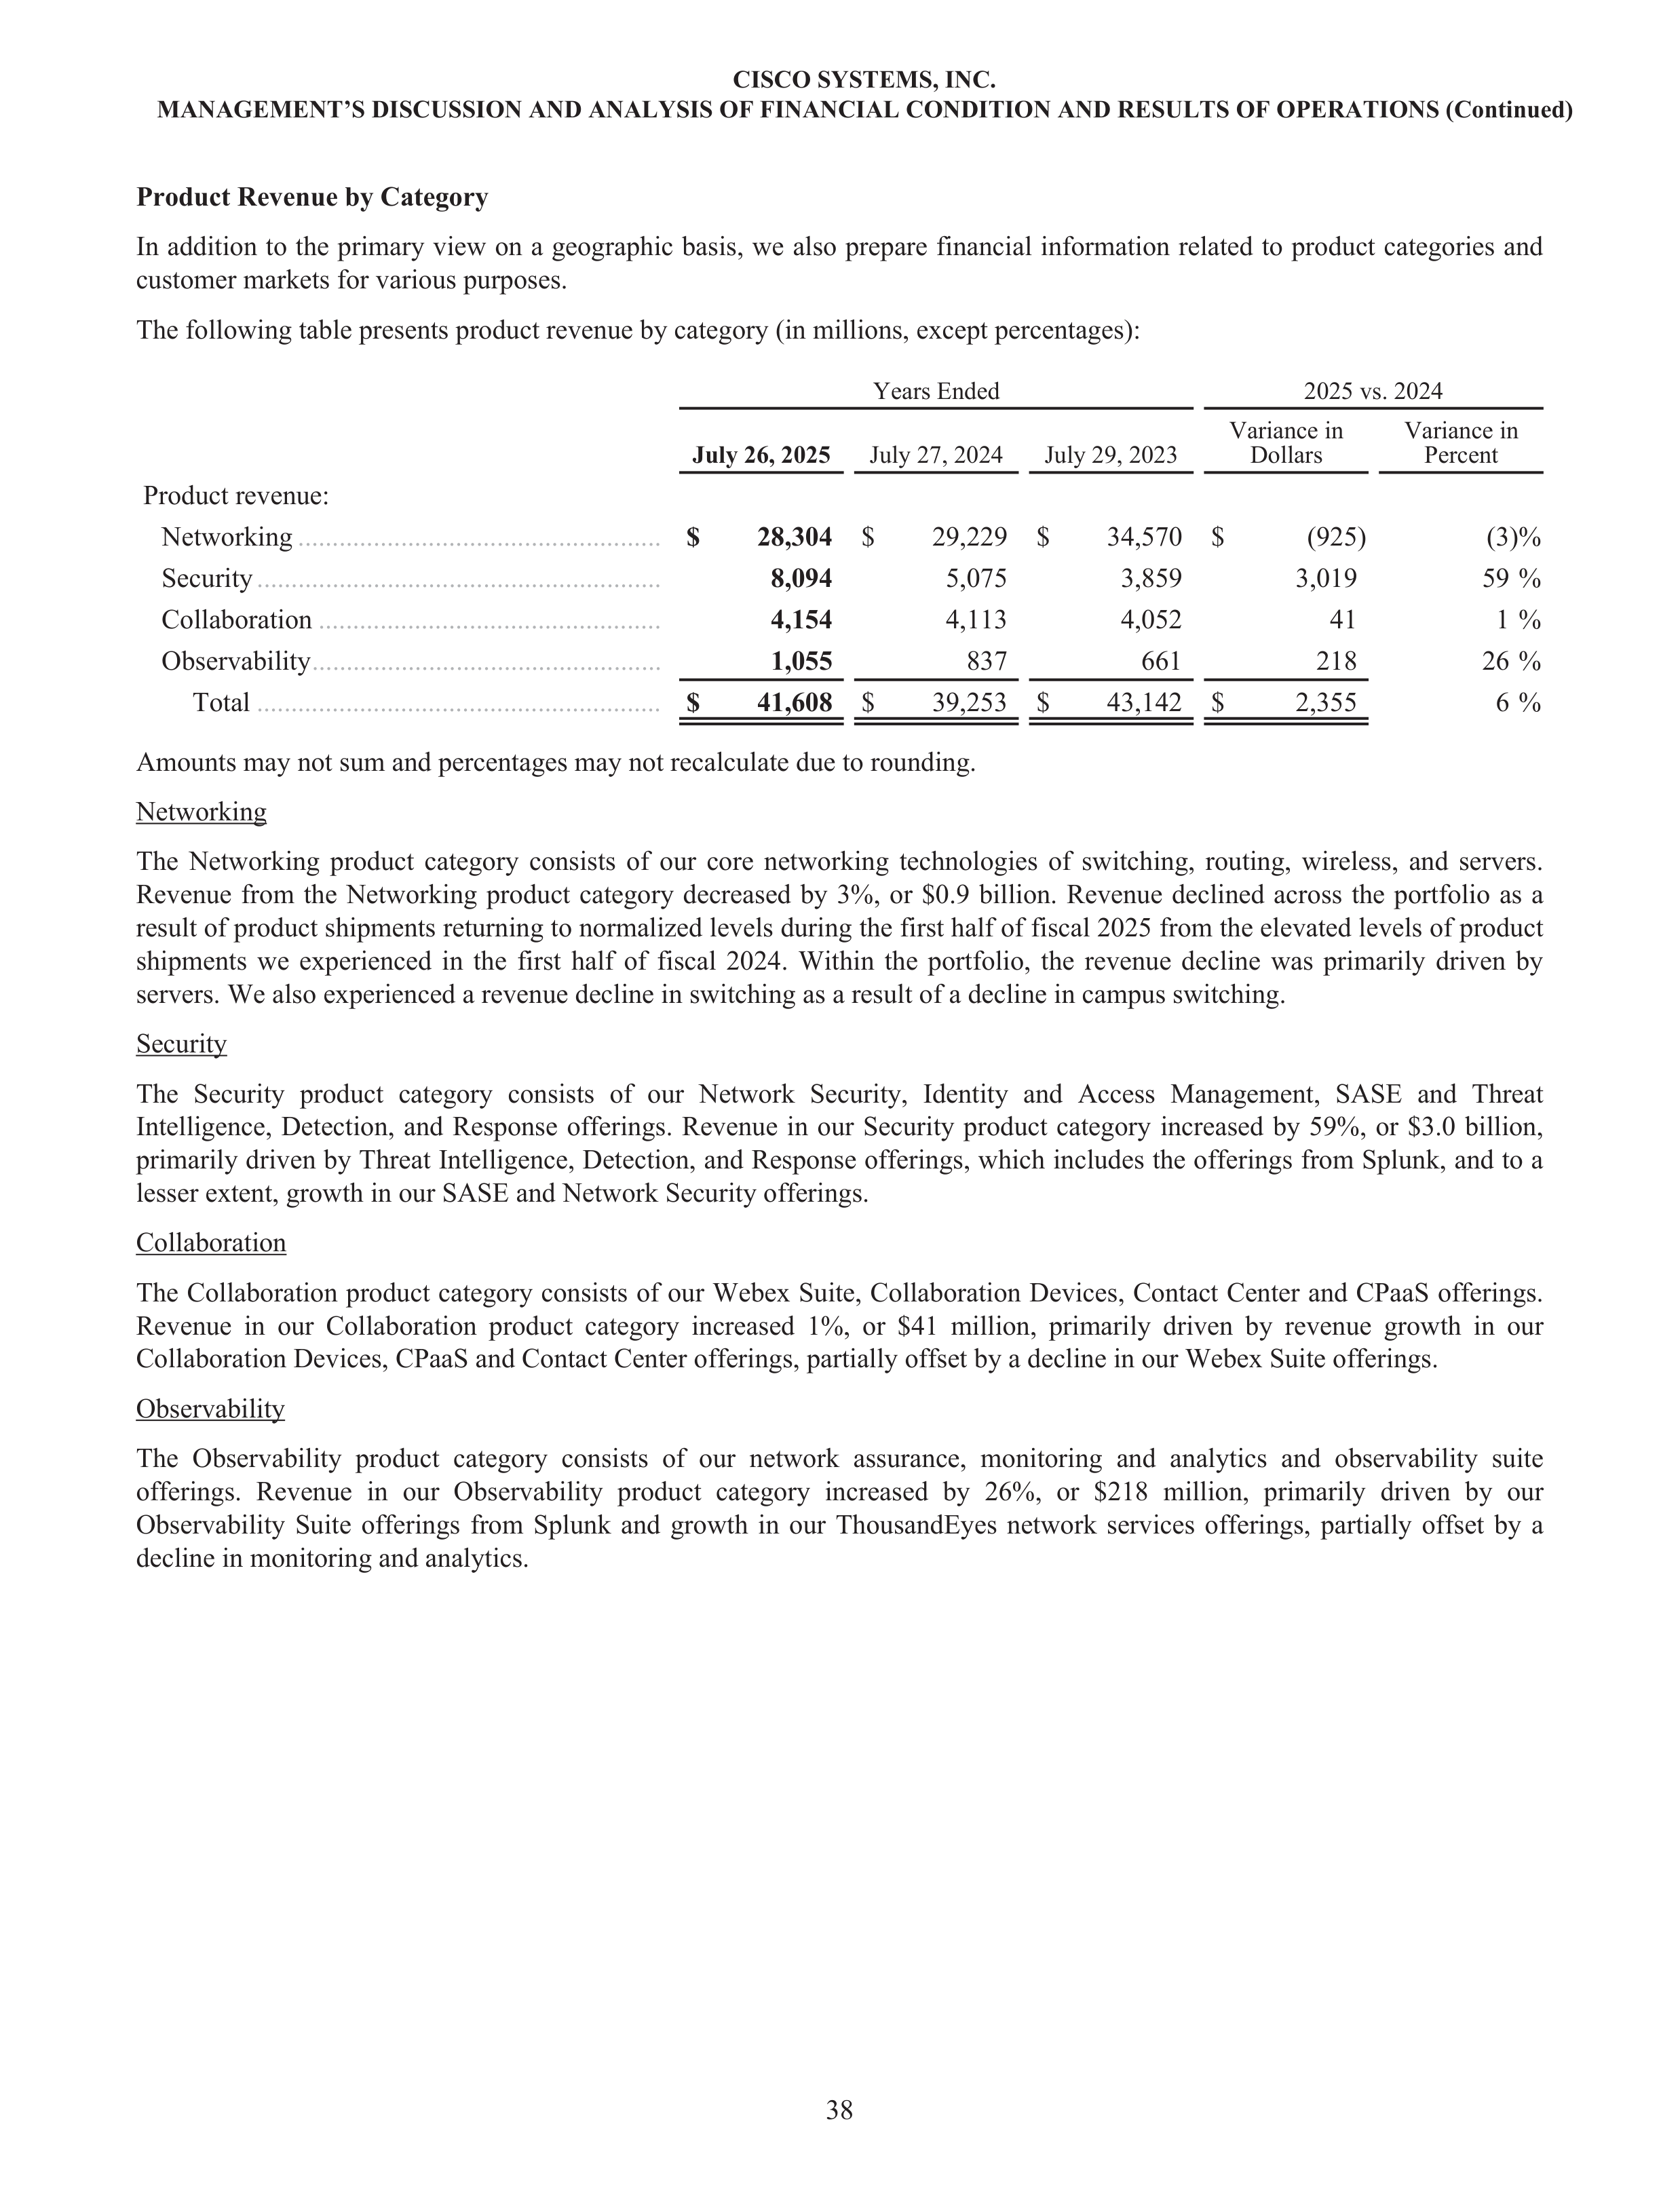
Product Revenue by Category
In addition to the primary view on a geographic basis, we also prepare financial information related to product categories and
customer markets for various purposes.
The following table presents product revenue by category (in millions, except percentages):
Years Ended
2025 vs. 2024
July 26, 2025
July 27, 2024
July 29, 2023
Variance in
Dollars
Variance in
Percent
Product revenue:
Networking
.....................................................
$
28,304
$
29,229 $
34,570 $
(925)
(3) %
Security
...........................................................
8,094
5,075
3,859
3,019
59 %
Collaboration
..................................................
4,154
4,113
4,052
41
1 %
Observability
...................................................
1,055
837
661
218
26 %
Total
...........................................................
$
41,608
$
39,253 $
43,142 $
2,355
6 %
Amounts may not sum and percentages may not recalculate due to rounding.
Networking
The Networking product category consists of our core networking technologies of switching, routing, wireless, and servers.
Revenue from the Networking product category decreased by 3%, or $0.9 billion. Revenue declined across the portfolio as a
result of product shipments returning to normalized levels during the first half of fiscal 2025 from the elevated levels of product
shipments we experienced in the first half of fiscal 2024. Within the portfolio, the revenue decline was primarily driven by
servers. We also experienced a revenue decline in switching as a result of a decline in campus switching.
Security
The Security product category consists of our Network Security, Identity and Access Management, SASE and Threat
Intelligence, Detection, and Response offerings. Revenue in our Security product category increased by 59%, or $3.0 billion,
primarily driven by Threat Intelligence, Detection, and Response offerings, which includes the offerings from Splunk, and to a
lesser extent, growth in our SASE and Network Security offerings.
Collaboration
The Collaboration product category consists of our Webex Suite, Collaboration Devices, Contact Center and CPaaS offerings.
Revenue in our Collaboration product category increased 1%, or $41 million, primarily driven by revenue growth in our
Collaboration Devices, CPaaS and Contact Center offerings, partially offset by a decline in our Webex Suite offerings.
Observability
The Observability product category consists of our network assurance, monitoring and analytics and observability suite
offerings. Revenue in our Observability product category
increased by 26%, or $218 million,
primarily
driven by our
Observability Suite offerings from Splunk and growth in our ThousandEyes network services offerings, partially offset by a
decline in monitoring and analytics.
CISCO SYSTEMS, INC.
MANAGEMENT’S DISCUSSION AND ANALYSIS OF FINANCIAL CONDITION AND RESULTS OF OPERATIONS (Continued)
38
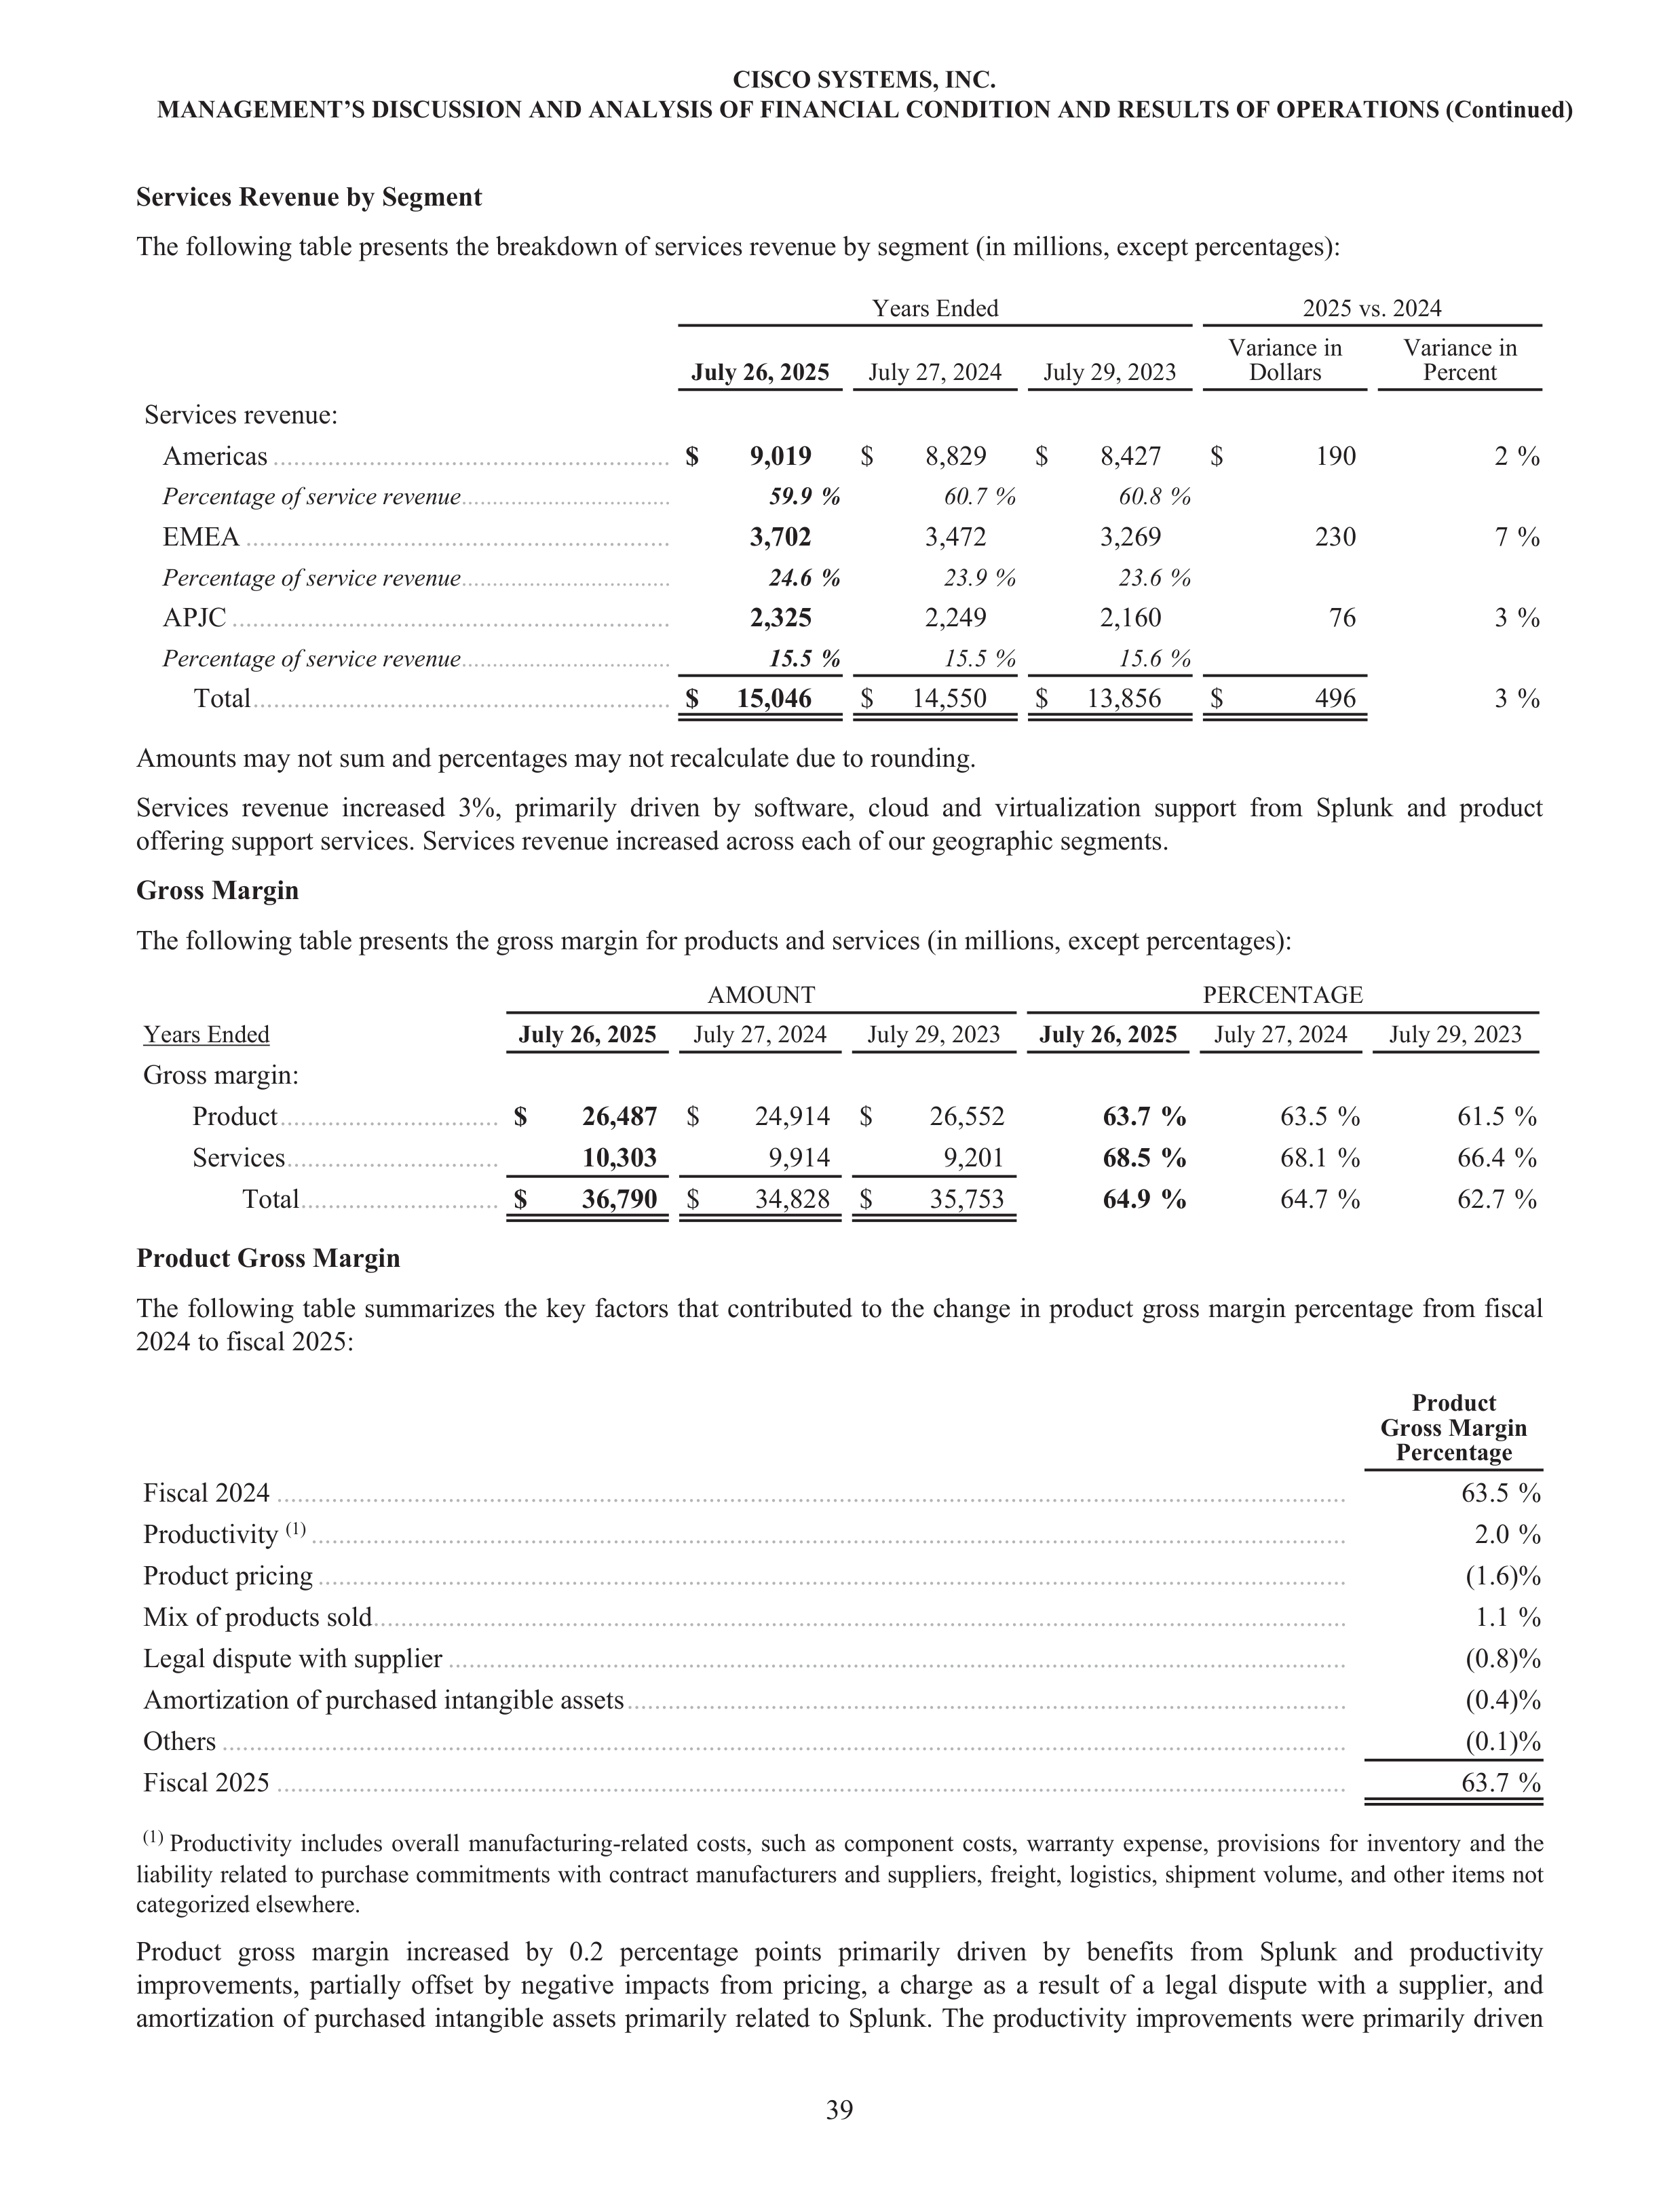
Services Revenue by Segment
The following table presents the breakdown of services revenue by segment (in millions, except percentages):
Years Ended
2025 vs. 2024
July 26, 2025
July 27, 2024
July 29, 2023
Variance in
Dollars
Variance in
Percent
Services revenue:
Americas
..........................................................
$
9,019
$
8,829
$
8,427
$
190
2 %
Percentage of service revenue
..................................
59.9 %
60.7 %
60.8 %
EMEA
..............................................................
3,702
3,472
3,269
230
7 %
Percentage of service revenue
..................................
24.6 %
23.9 %
23.6 %
APJC
................................................................
2,325
2,249
2,160
76
3 %
Percentage of service revenue
..................................
15.5 %
15.5 %
15.6 %
Total
.............................................................
$
15,046
$
14,550
$
13,856
$
496
3 %
Amounts may not sum and percentages may not recalculate due to rounding.
Services revenue increased 3%, primarily driven by software, cloud and virtualization support from Splunk and product
offering support services. Services revenue increased across each of our geographic segments.
Gross Margin
The following table presents the gross margin for products and services (in millions, except percentages):
AMOUNT
PERCENTAGE
Years Ended
July 26, 2025
July 27, 2024
July 29, 2023
July 26, 2025
July 27, 2024
July 29, 2023
Gross margin:
Product
................................
$
26,487
$
24,914 $
26,552
63.7 %
63.5 %
61.5 %
Services
...............................
10,303
9,914
9,201
68.5 %
68.1 %
66.4 %
Total
.............................
$
36,790
$
34,828 $
35,753
64.9 %
64.7 %
62.7 %
Product Gross Margin
The following table summarizes the key factors that contributed to the change in product gross margin percentage from fiscal
2024 to fiscal 2025:
Product
Gross Margin
Percentage
Fiscal 2024
............................................................................................................................................................
63.5 %
Productivity
(1)
.......................................................................................................................................................
2.0 %
Product pricing
......................................................................................................................................................
(1.6) %
Mix of products sold
..............................................................................................................................................
1.1 %
Legal dispute with supplier
...................................................................................................................................
(0.8) %
Amortization of purchased intangible assets
.........................................................................................................
(0.4) %
Others
....................................................................................................................................................................
(0.1) %
Fiscal 2025
............................................................................................................................................................
63.7 %
(1)
Productivity includes overall manufacturing-related costs, such as component costs, warranty expense, provisions for inventory and the
liability related to purchase commitments with contract manufacturers and suppliers, freight, logistics, shipment volume, and other items not
categorized elsewhere.
Product gross margin increased by 0.2 percentage points primarily driven by benefits from Splunk and productivity
improvements, partially offset by negative impacts from pricing, a charge as a result of a legal dispute with a supplier, and
amortization of purchased intangible assets primarily related to Splunk. The productivity improvements were primarily driven
CISCO SYSTEMS, INC.
MANAGEMENT’S DISCUSSION AND ANALYSIS OF FINANCIAL CONDITION AND RESULTS OF OPERATIONS (Continued)
39
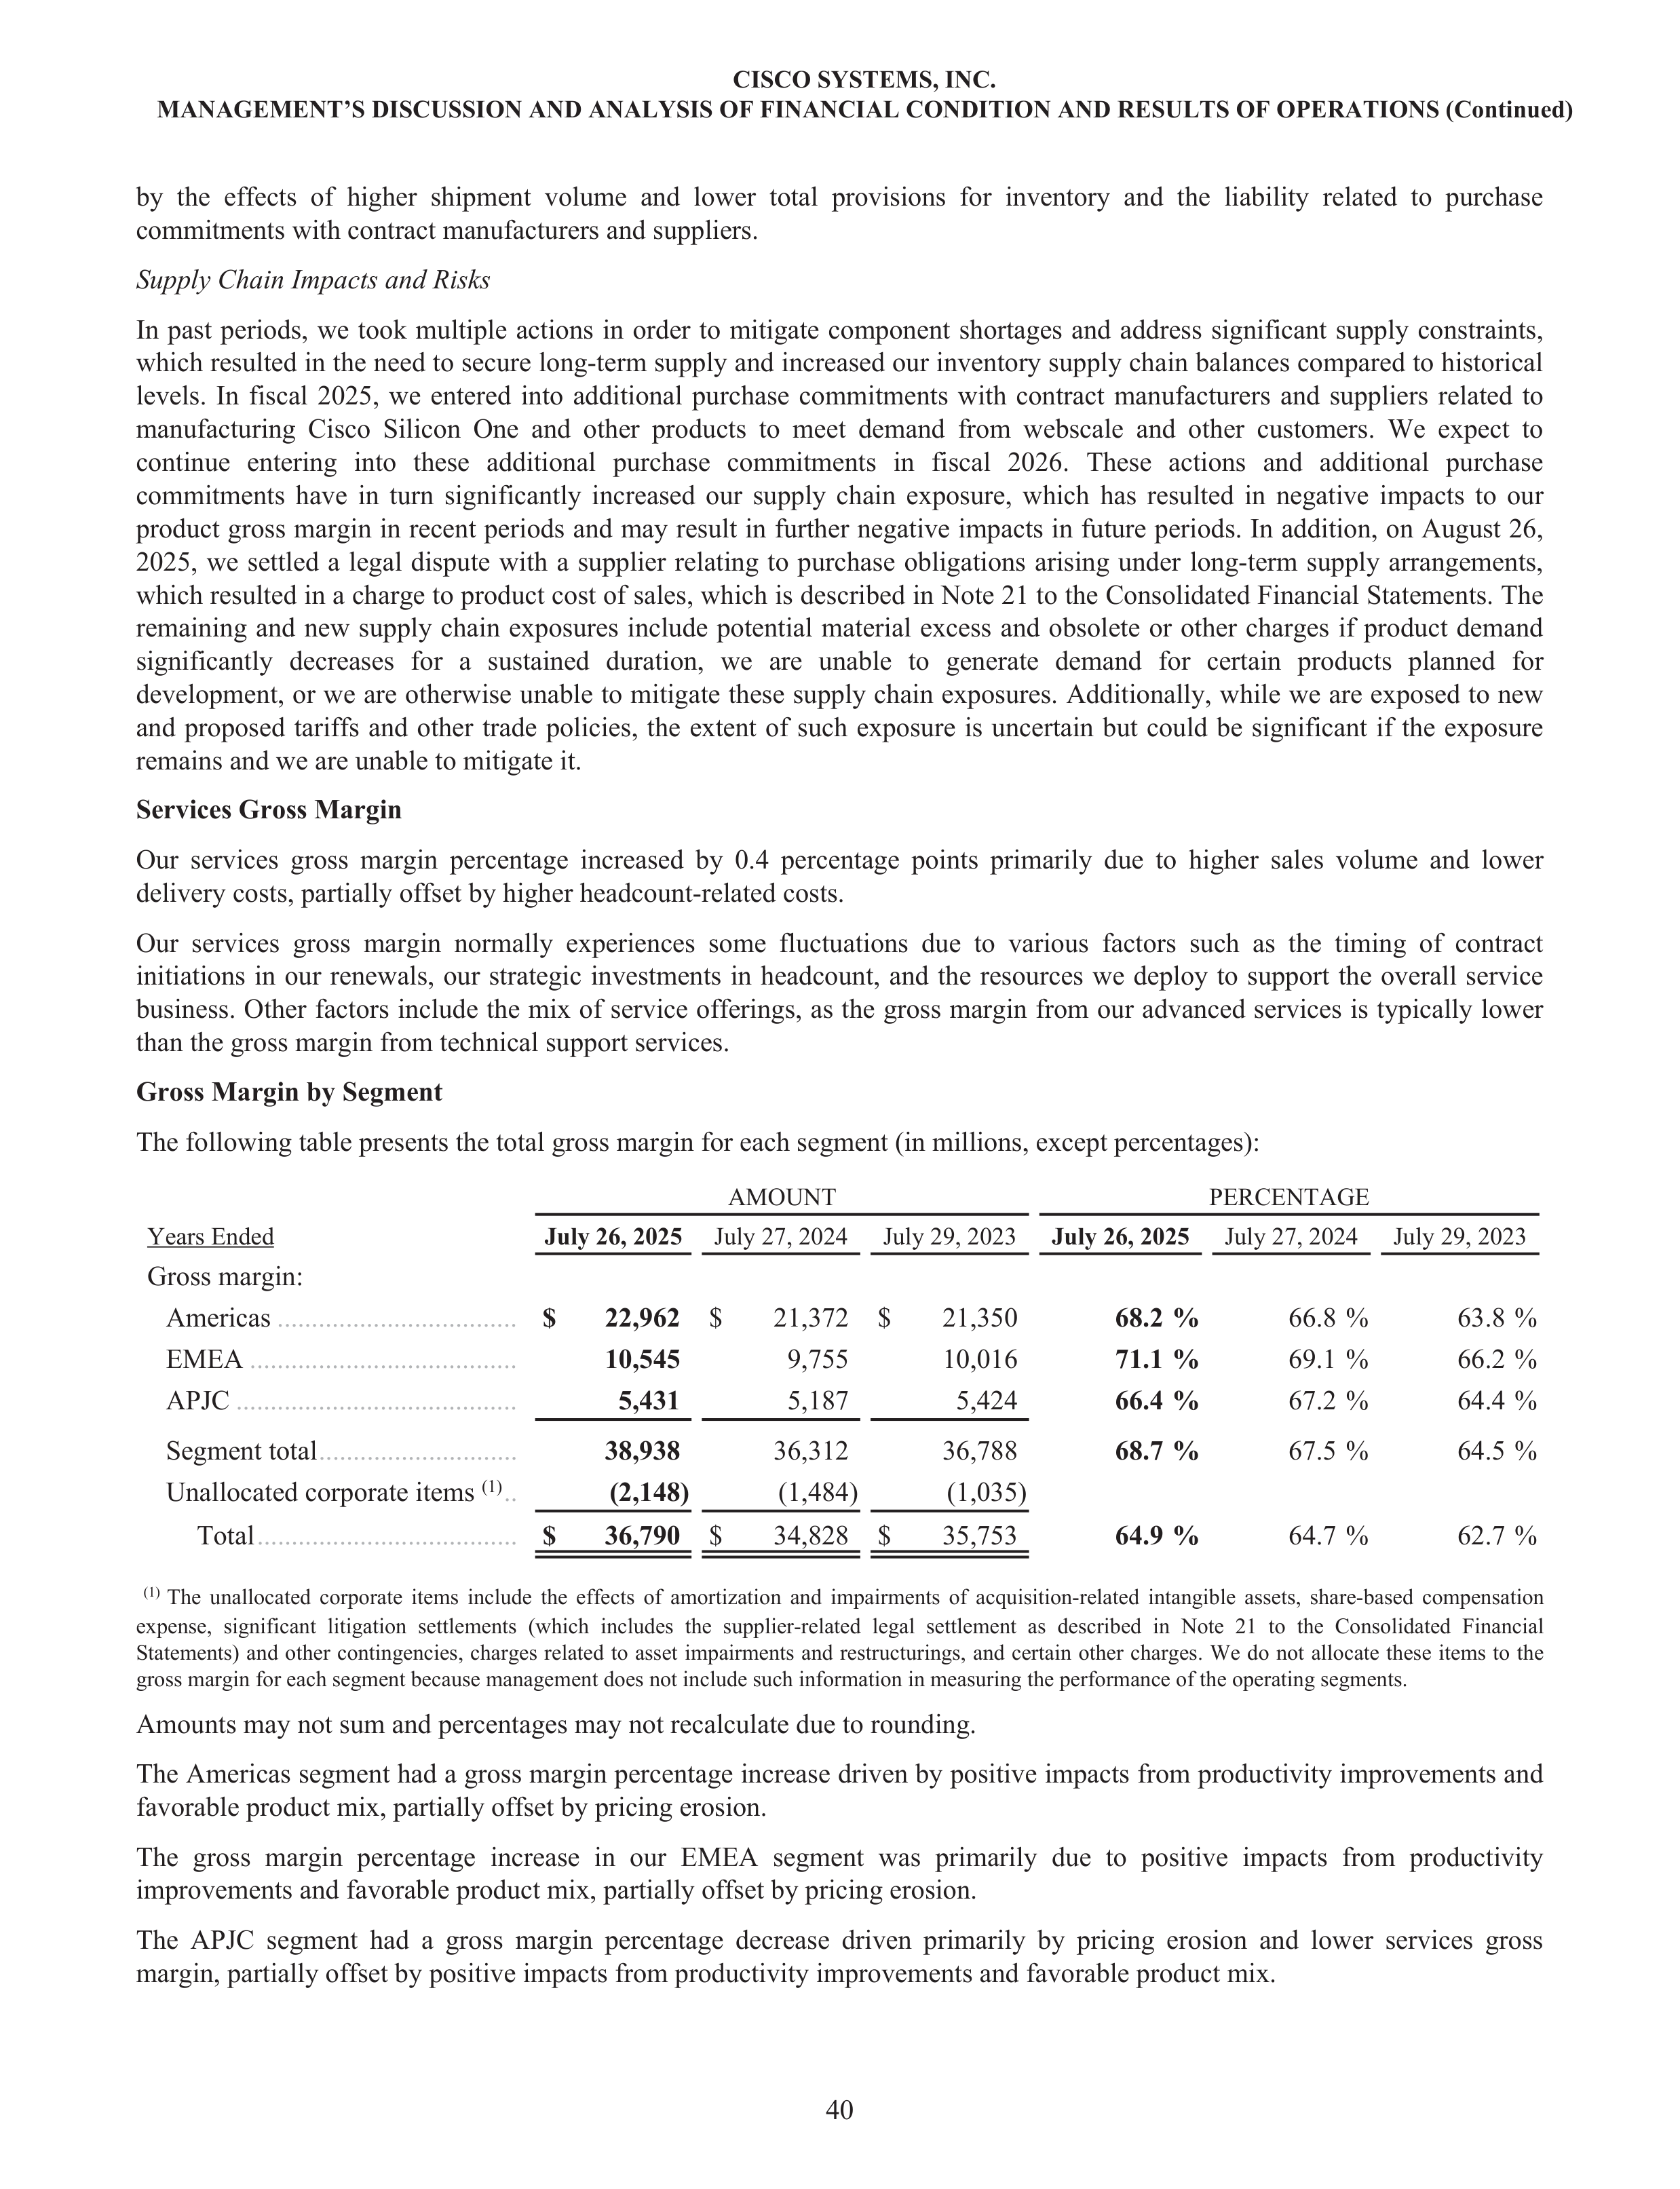
by the effects of higher shipment volume and lower total provisions for inventory and the liability related to purchase
commitments with contract manufacturers and suppliers.
Supply Chain Impacts and Risks
In past periods, we took multiple actions in order to mitigate component shortages and address significant supply constraints,
which resulted in the need to secure long-term supply and increased our inventory supply chain balances compared to historical
levels. In fiscal 2025, we entered into additional purchase commitments with contract manufacturers and suppliers related to
manufacturing Cisco Silicon One and other products to meet demand from webscale and other customers. We expect to
continue entering into these additional purchase commitments in fiscal 2026. These actions and additional purchase
commitments have in turn significantly increased our supply chain exposure, which has resulted in negative impacts to our
product gross margin in recent periods and may result in further negative impacts in future periods. In addition, on August 26,
2025, we settled a legal dispute with a supplier relating to purchase obligations arising under long-term supply arrangements,
which resulted in a charge to product cost of sales, which is described in Note 21 to the Consolidated Financial Statements. The
remaining and new supply chain exposures include potential material excess and obsolete or other charges if product demand
significantly decreases for a sustained duration, we are unable to generate demand for certain products planned for
development, or we are otherwise unable to mitigate these supply chain exposures. Additionally, while we are exposed to new
and proposed tariffs and other trade policies, the extent of such exposure is uncertain but could be significant if the exposure
remains and we are unable to mitigate it.
Services Gross Margin
Our services gross margin percentage increased by 0.4 percentage points primarily due to higher sales volume and lower
delivery costs, partially offset by higher headcount-related costs.
Our services gross margin normally experiences some fluctuations due to various factors such as the timing of contract
initiations in our renewals, our strategic investments in headcount, and the resources we deploy to support the overall service
business. Other factors include the mix of service offerings, as the gross margin from our advanced services is typically lower
than the gross margin from technical support services.
Gross Margin by Segment
The following table presents the total gross margin for each segment (in millions, except percentages):
AMOUNT
PERCENTAGE
Years Ended
July 26, 2025
July 27, 2024
July 29, 2023
July 26, 2025
July 27, 2024
July 29, 2023
Gross margin:
Americas
...................................
$
22,962
$
21,372 $
21,350
68.2 %
66.8 %
63.8 %
EMEA
.......................................
10,545
9,755
10,016
71.1 %
69.1 %
66.2 %
APJC
.........................................
5,431
5,187
5,424
66.4 %
67.2 %
64.4 %
Segment total
.............................
38,938
36,312
36,788
68.7 %
67.5 %
64.5 %
Unallocated corporate items
(1)
..
(2,148)
(1,484)
(1,035)
Total
......................................
$
36,790
$
34,828 $
35,753
64.9 %
64.7 %
62.7 %
(1)
The unallocated corporate items
include the effects of amortization and impairments of acquisition-related intangible assets, share-based compensation
expense, significant litigation settlements (which includes the supplier-related legal settlement as described in Note 21 to the Consolidated Financial
Statements) and other contingencies, charges related to asset impairments and restructurings, and certain other charges. We do not allocate these items to the
gross margin for each segment because management does not include such information in measuring the performance of the operating segments.
Amounts may not sum and percentages may not recalculate due to rounding.
The Americas segment had a gross margin percentage increase driven by positive impacts from productivity improvements and
favorable product mix, partially offset by pricing erosion.
The gross margin percentage increase in our EMEA segment was primarily due to positive impacts from productivity
improvements and favorable product mix, partially offset by pricing erosion.
The APJC segment had a
gross margin percentage decrease driven primarily by pricing erosion and lower services gross
margin, partially offset by positive impacts from productivity improvements and favorable product mix.
CISCO SYSTEMS, INC.
MANAGEMENT’S DISCUSSION AND ANALYSIS OF FINANCIAL CONDITION AND RESULTS OF OPERATIONS (Continued)
40
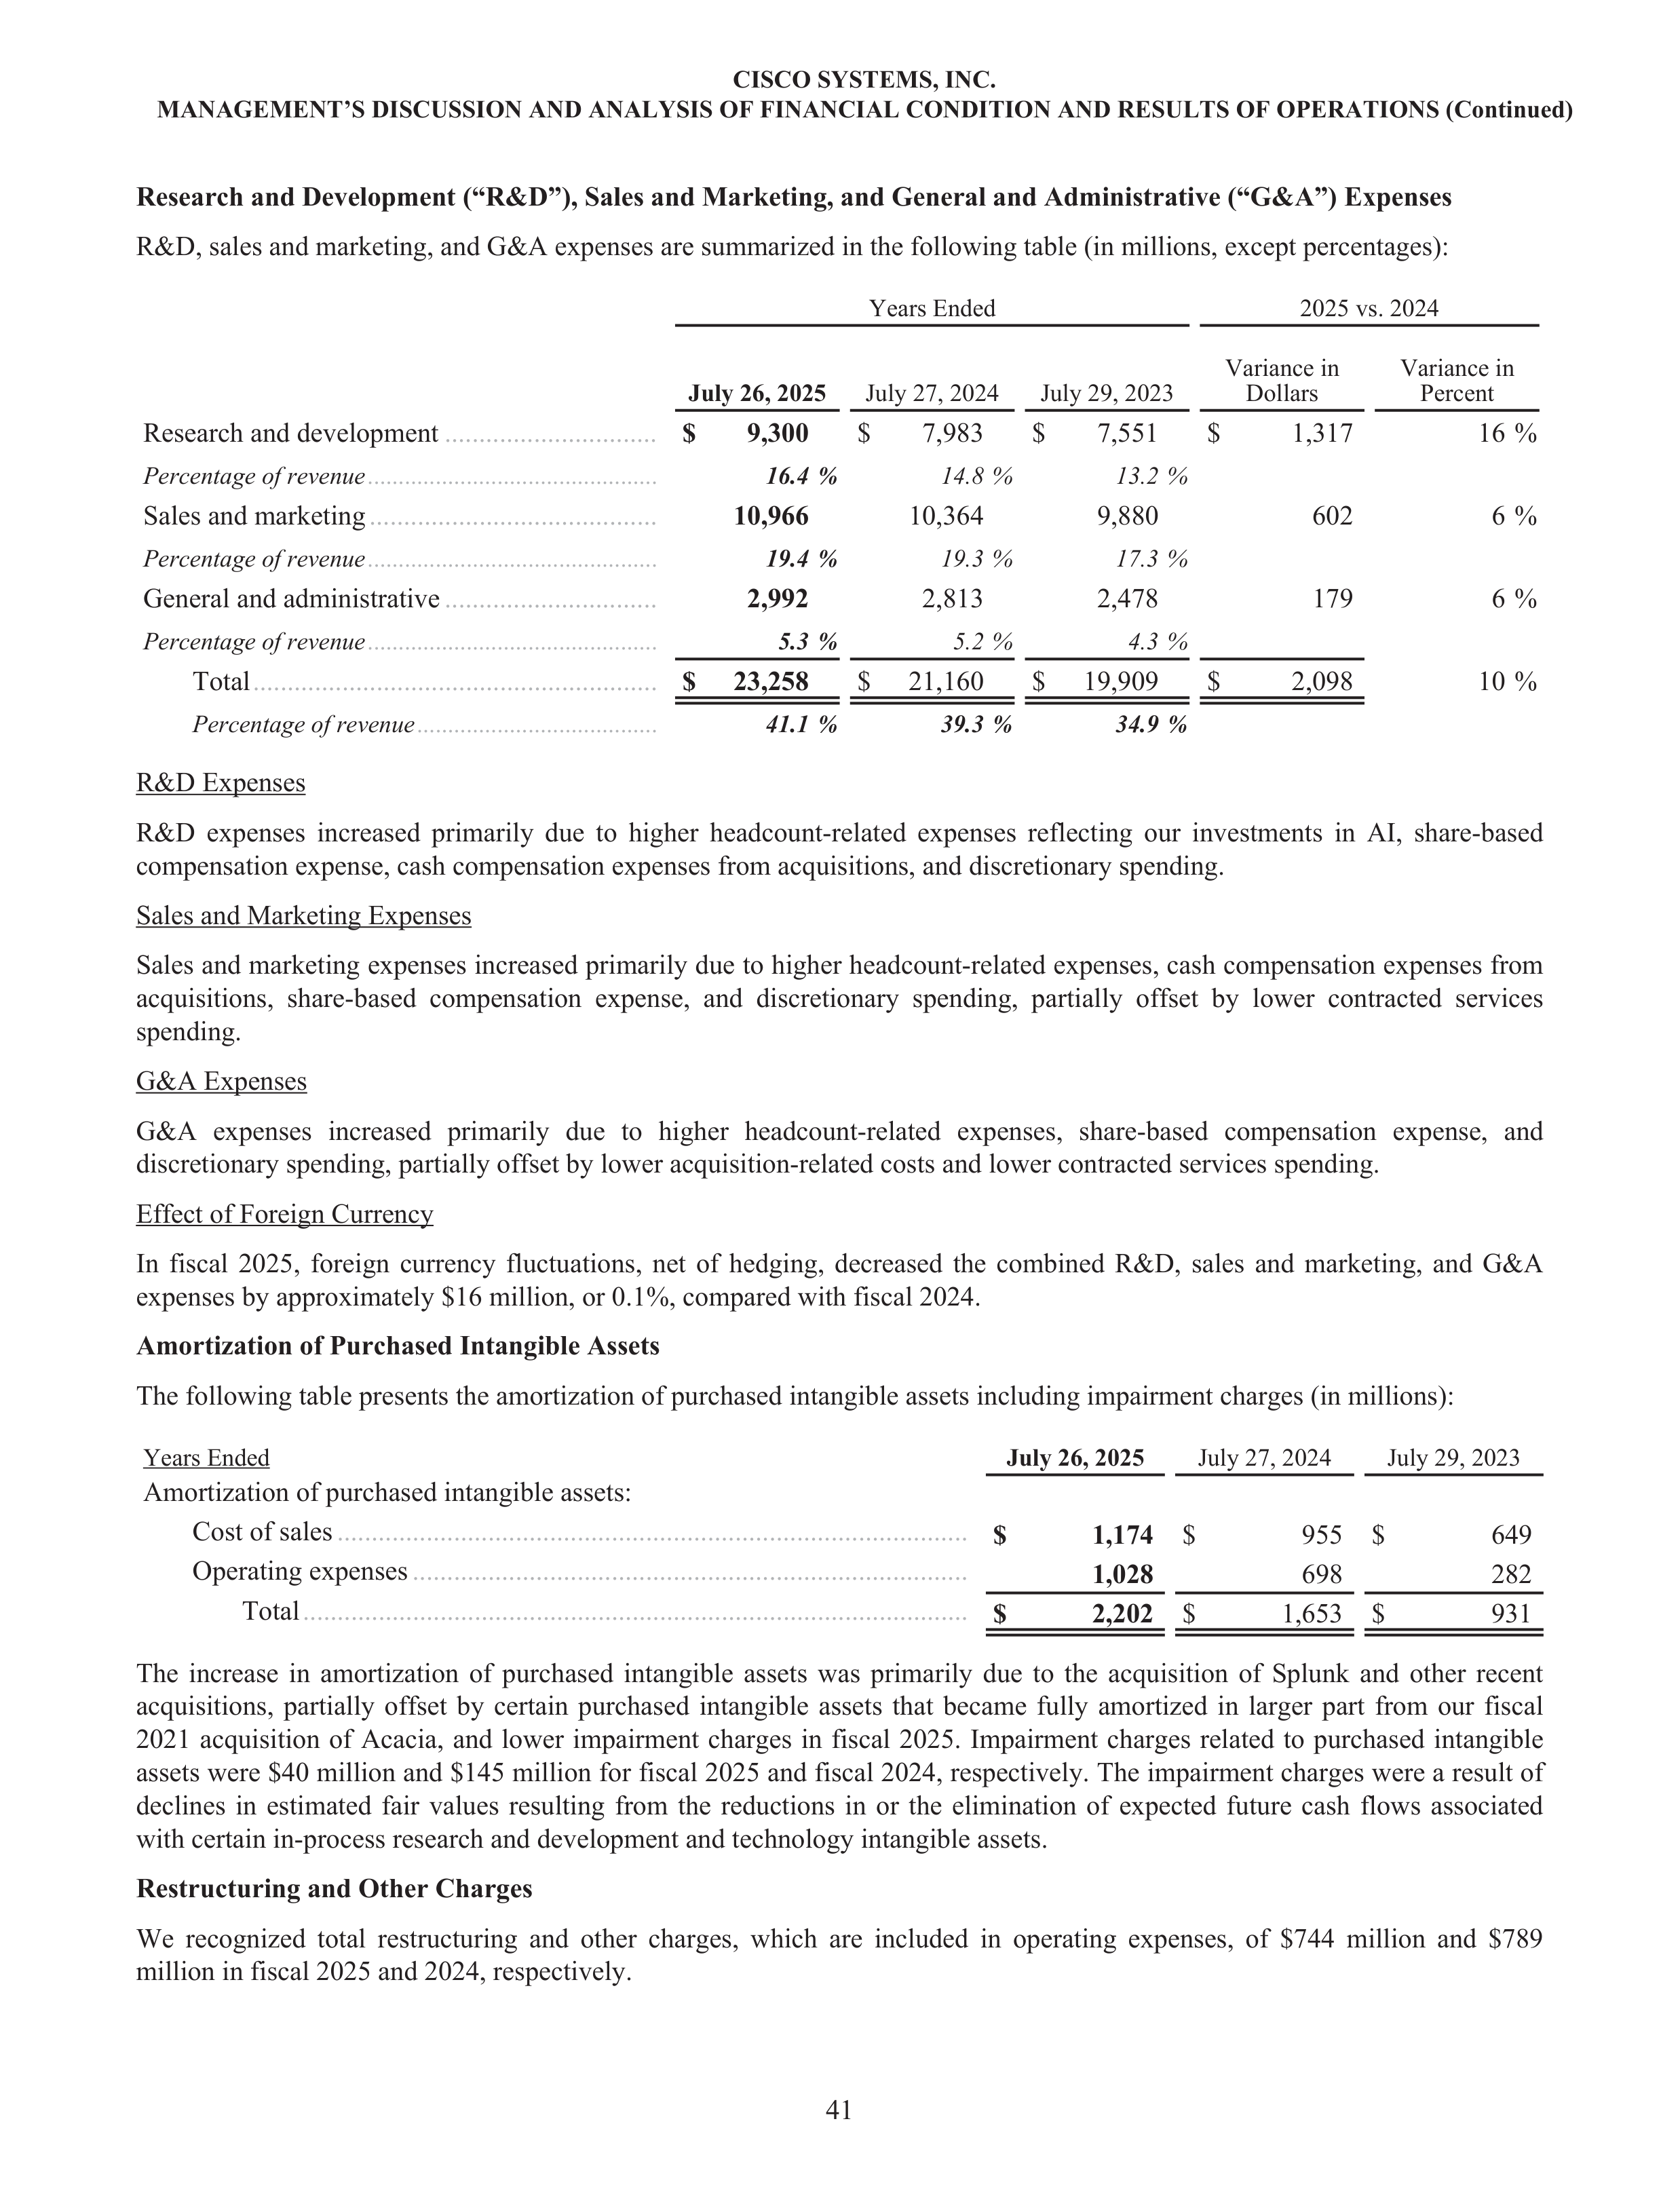
Research and Development (“R&D”), Sales and Marketing, and General and Administrative (“G&A”) Expenses
R&D, sales and marketing, and G&A expenses are summarized in the following table (in millions, except percentages):
Years Ended
2025 vs. 2024
July 26, 2025
July 27, 2024
July 29, 2023
Variance in
Dollars
Variance in
Percent
Research and development
...............................
$
9,300
$
7,983
$
7,551
$
1,317
16 %
Percentage of revenue
...............................................
16.4 %
14.8 %
13.2 %
Sales and marketing
..........................................
10,966
10,364
9,880
602
6 %
Percentage of revenue
...............................................
19.4 %
19.3 %
17.3 %
General and administrative
...............................
2,992
2,813
2,478
179
6 %
Percentage of revenue
...............................................
5.3 %
5.2 %
4.3 %
Total
...........................................................
$
23,258
$
21,160
$
19,909
$
2,098
10 %
Percentage of revenue
.......................................
41.1 %
39.3 %
34.9 %
R&D Expenses
R&D expenses increased primarily due to higher headcount-related expenses reflecting our investments in AI, share-based
compensation expense, cash compensation expenses from acquisitions, and discretionary spending.
Sales and Marketing Expenses
Sales and marketing expenses increased primarily due to higher headcount-related expenses, cash compensation expenses from
acquisitions, share-based compensation expense, and discretionary spending, partially offset by lower contracted services
spending.
G&A Expenses
G&A expenses increased primarily due to higher headcount-related expenses, share-based compensation expense, and
discretionary spending, partially offset by lower acquisition-related costs and lower contracted services spending.
Effect of Foreign Currency
In fiscal 2025, foreign currency fluctuations, net of hedging, decreased the combined R&D, sales and marketing, and G&A
expenses by approximately $16 million, or 0.1%, compared with fiscal 2024.
Amortization of Purchased Intangible Assets
The following table presents the amortization of purchased intangible assets including impairment charges (in millions):
Years Ended
July 26, 2025
July 27, 2024
July 29, 2023
Amortization of purchased intangible assets:
Cost of sales
............................................................................................
$
1,174
$
955 $
649
Operating expenses
.................................................................................
1,028
698
282
Total
.................................................................................................
$
2,202
$
1,653 $
931
The increase in amortization of purchased intangible assets was primarily due to the acquisition of Splunk and other recent
acquisitions, partially offset by certain purchased intangible assets that became fully amortized in larger part from our fiscal
2021 acquisition of Acacia, and lower impairment charges in fiscal 2025. Impairment charges related to purchased intangible
assets were $40 million and $145 million for fiscal 2025 and fiscal 2024, respectively. The impairment charges were a result of
declines in estimated fair values resulting from the reductions in or the elimination of expected future cash flows associated
with certain in-process research and development and technology intangible assets.
Restructuring and Other Charges
We recognized total restructuring and other charges, which are included in operating expenses, of $744 million and $789
million in fiscal 2025 and 2024, respectively.
CISCO SYSTEMS, INC.
MANAGEMENT’S DISCUSSION AND ANALYSIS OF FINANCIAL CONDITION AND RESULTS OF OPERATIONS (Continued)
41
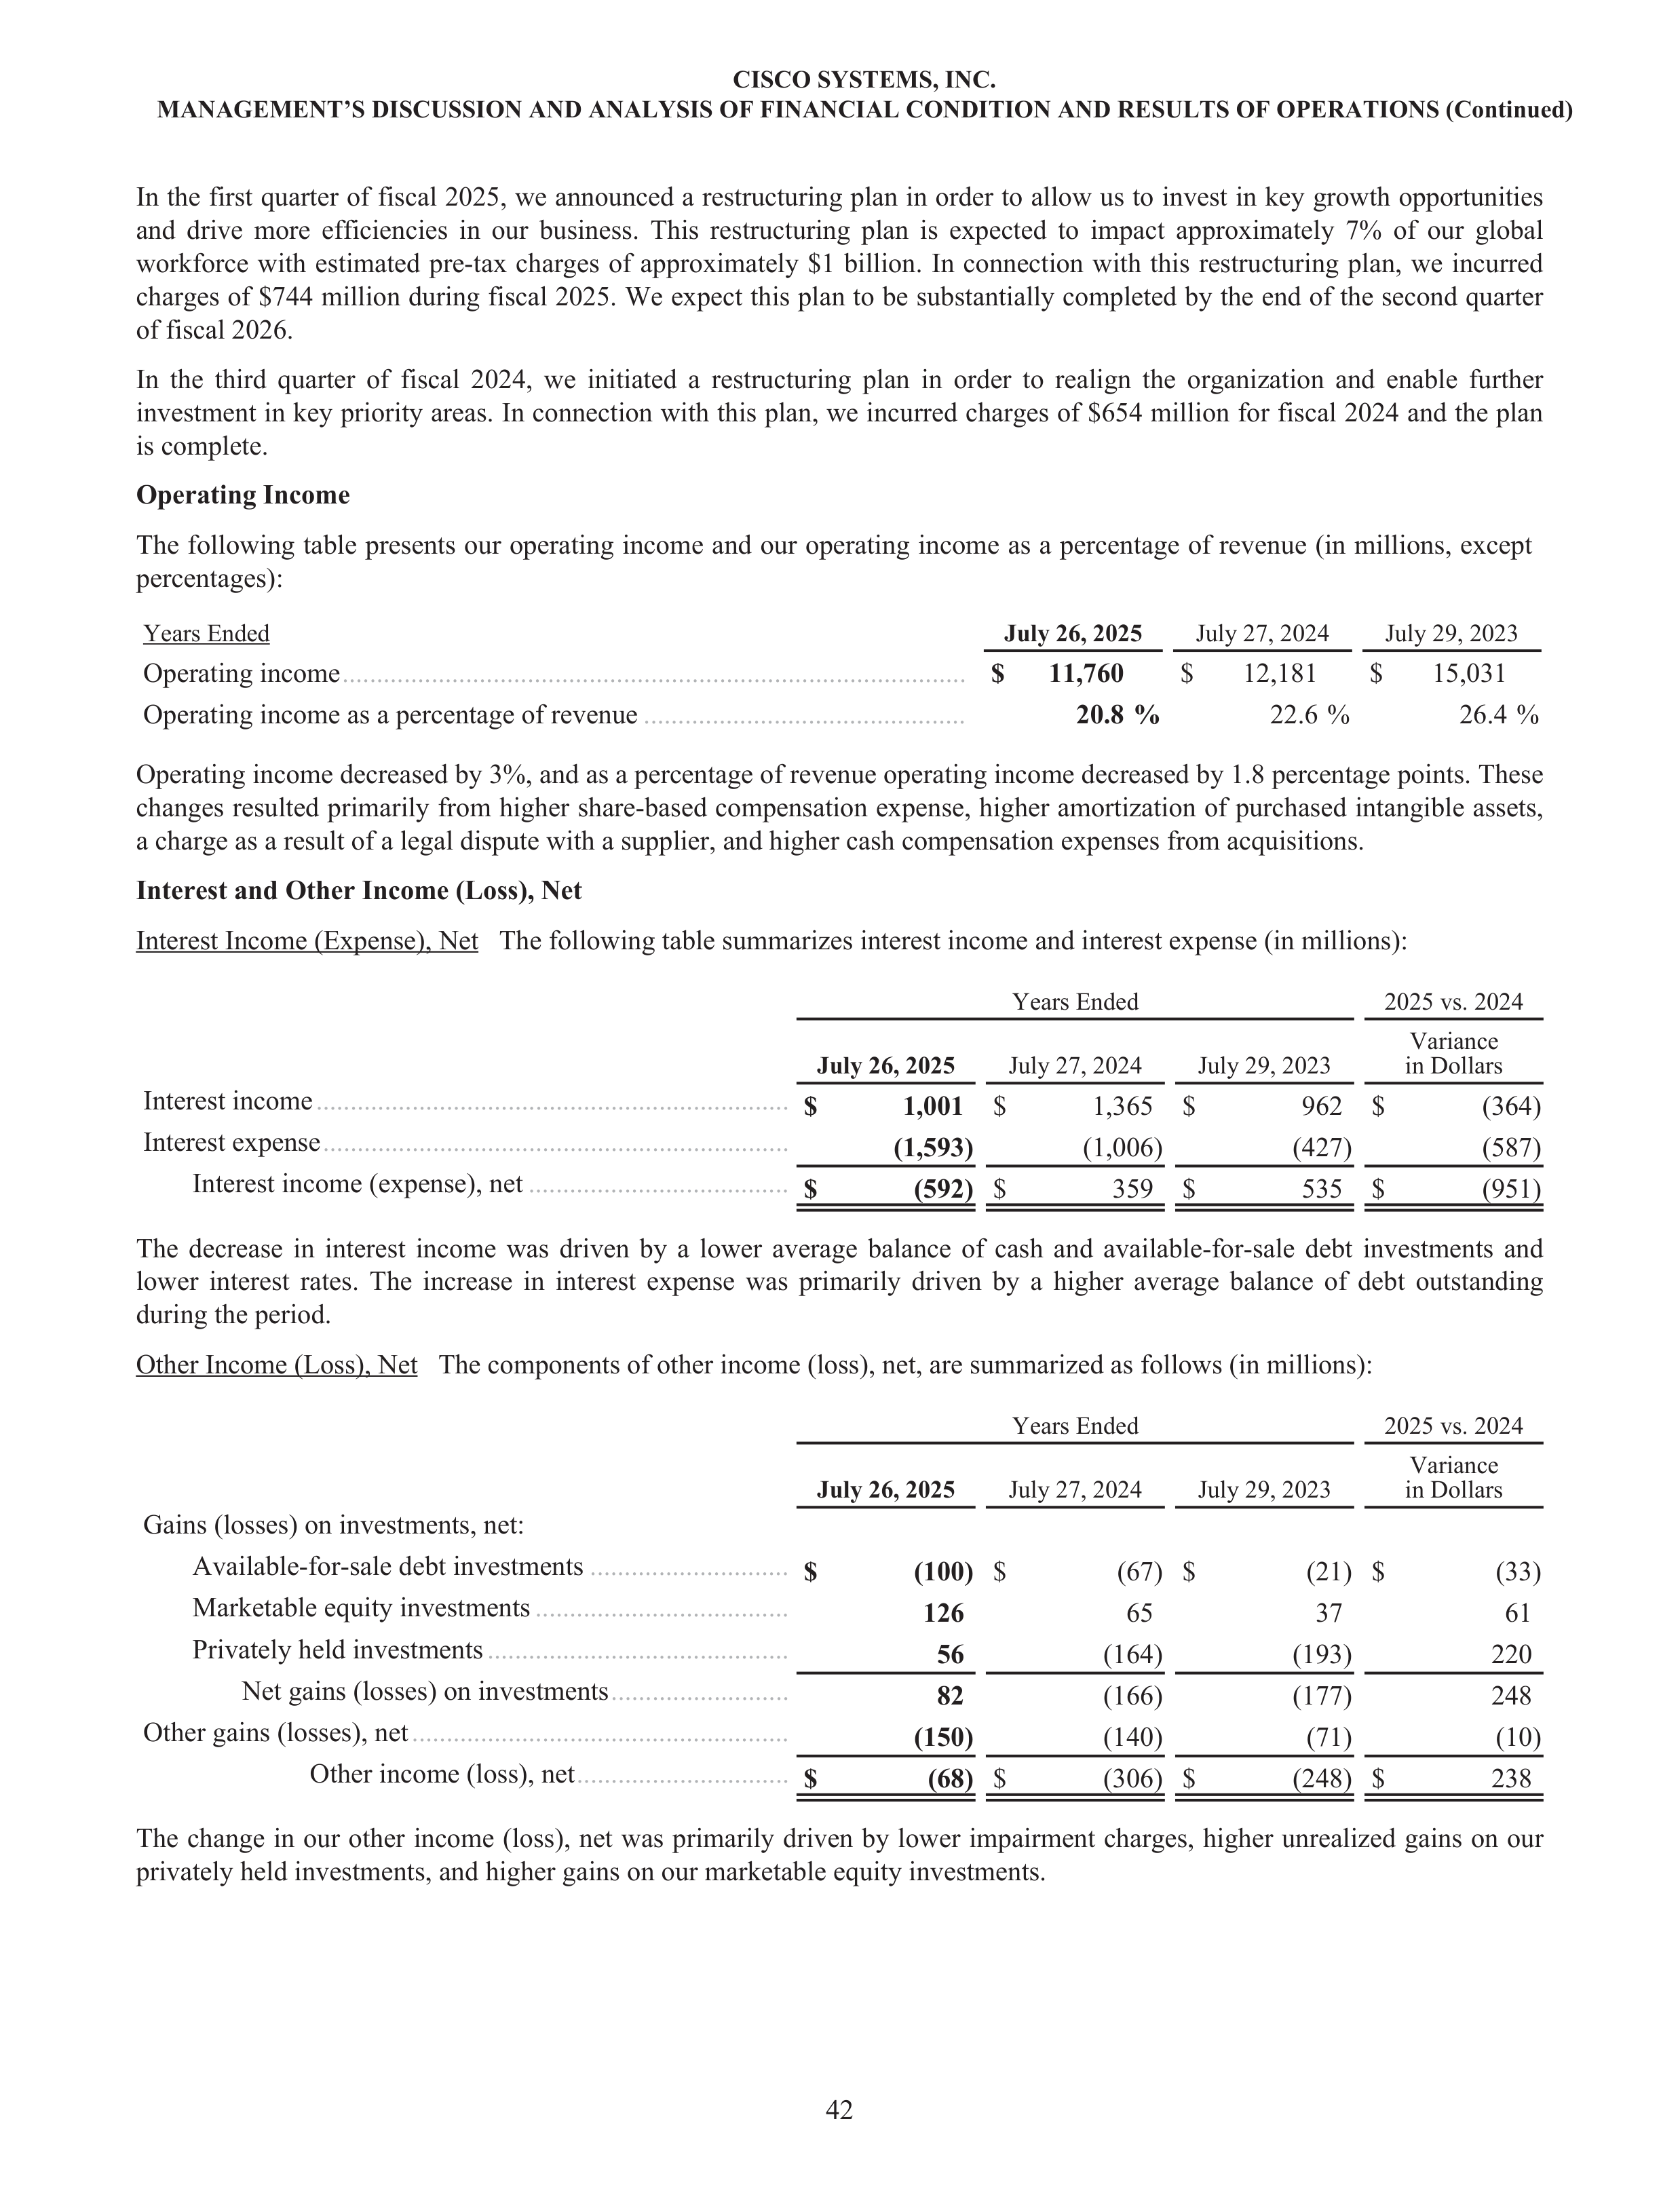
In the first quarter of fiscal 2025, we announced a restructuring plan in order to allow us to invest in key growth opportunities
and drive more efficiencies in our business. This restructuring plan is expected to impact approximately 7% of our global
workforce with estimated pre-tax charges of approximately $1 billion. In connection with this restructuring plan, we incurred
charges of $744 million during fiscal 2025. We expect this plan to be substantially completed by the end of the second quarter
of fiscal 2026.
In the third quarter of fiscal 2024, we initiated a restructuring plan in order to realign the organization and enable further
investment in key priority areas. In connection with this plan, we incurred charges of $654 million for fiscal 2024 and the plan
is complete.
Operating Income
Years Ended
July 26, 2025
July 27, 2024
July 29, 2023
Operating income
...........................................................................................
$
11,760
$
12,181
$
15,031
Operating income as a percentage of revenue
...............................................
20.8 %
22.6 %
26.4 %
Operating income decreased by 3%, and as a percentage of revenue operating income decreased by 1.8 percentage points. These
changes resulted primarily from higher share-based compensation expense, higher amortization of purchased intangible assets,
a charge as a result of a legal dispute with a supplier, and higher cash compensation expenses from acquisitions.
Interest and Other Income (Loss), Net
Interest Income (Expense), Net The following table summarizes interest income and interest expense (in millions):
Years Ended
2025 vs. 2024
July 26, 2025
July 27, 2024
July 29, 2023
Variance
in Dollars
Interest income
.....................................................................
$
1,001
$
1,365 $
962 $
(364)
Interest expense
....................................................................
(1,593)
(1,006)
(427)
(587)
Interest income (expense), net
......................................
$
(592)
$
359 $
535 $
(951)
The decrease in interest income was driven by a lower average balance of cash and available-for-sale debt investments and
lower interest rates. The increase in interest expense was primarily driven by a higher average balance of debt outstanding
during the period.
Other Income (Loss), Net The components of other income (loss), net, are summarized as follows (in millions):
Years Ended
2025 vs. 2024
July 26, 2025
July 27, 2024
July 29, 2023
Variance
in Dollars
Gains (losses) on investments, net:
Available-for-sale debt investments
.............................
$
(100)
$
(67)
$
(21)
$
(33)
Marketable equity investments
.....................................
126
65
37
61
Privately held investments
............................................
56
(164)
(193)
220
Net gains (losses) on investments
..........................
82
(166)
(177)
248
Other gains (losses), net
.......................................................
(150)
(140)
(71)
(10)
Other income (loss), net
...............................
$
(68)
$
(306)
$
(248)
$
238
The change in our other income (loss), net was primarily driven by lower impairment charges, higher unrealized gains on our
privately held investments, and higher gains on our marketable equity investments.
CISCO SYSTEMS, INC.
MANAGEMENT’S DISCUSSION AND ANALYSIS OF FINANCIAL CONDITION AND RESULTS OF OPERATIONS (Continued)
42
The following table presents our operating income and our operating income as a percentage of revenue (in millions, except
percentages):

Provision for Income Taxes
The provision for income taxes resulted in an effective tax rate of 8.3% for fiscal 2025, compared with 15.6% for fiscal 2024.
The net 7.3 percentage points decrease in the effective tax rate was primarily due to a $720 million tax benefit related to the
U.S. Tax Court opinion issued during the first quarter of fiscal 2025 regarding the U.S. taxation of deemed foreign dividends in
the transition year of the Tax Cut and Job Act ("Tax Act") (our fiscal 2018) and an increase in stock-based compensation
windfall.
For a full reconciliation of our effective tax rate to the U.S. federal statutory rate of 21% and for further explanation of our
provision for income taxes, see Note 18 to the Consolidated Financial Statements.
CISCO SYSTEMS, INC.
MANAGEMENT’S DISCUSSION AND ANALYSIS OF FINANCIAL CONDITION AND RESULTS OF OPERATIONS (Continued)
43
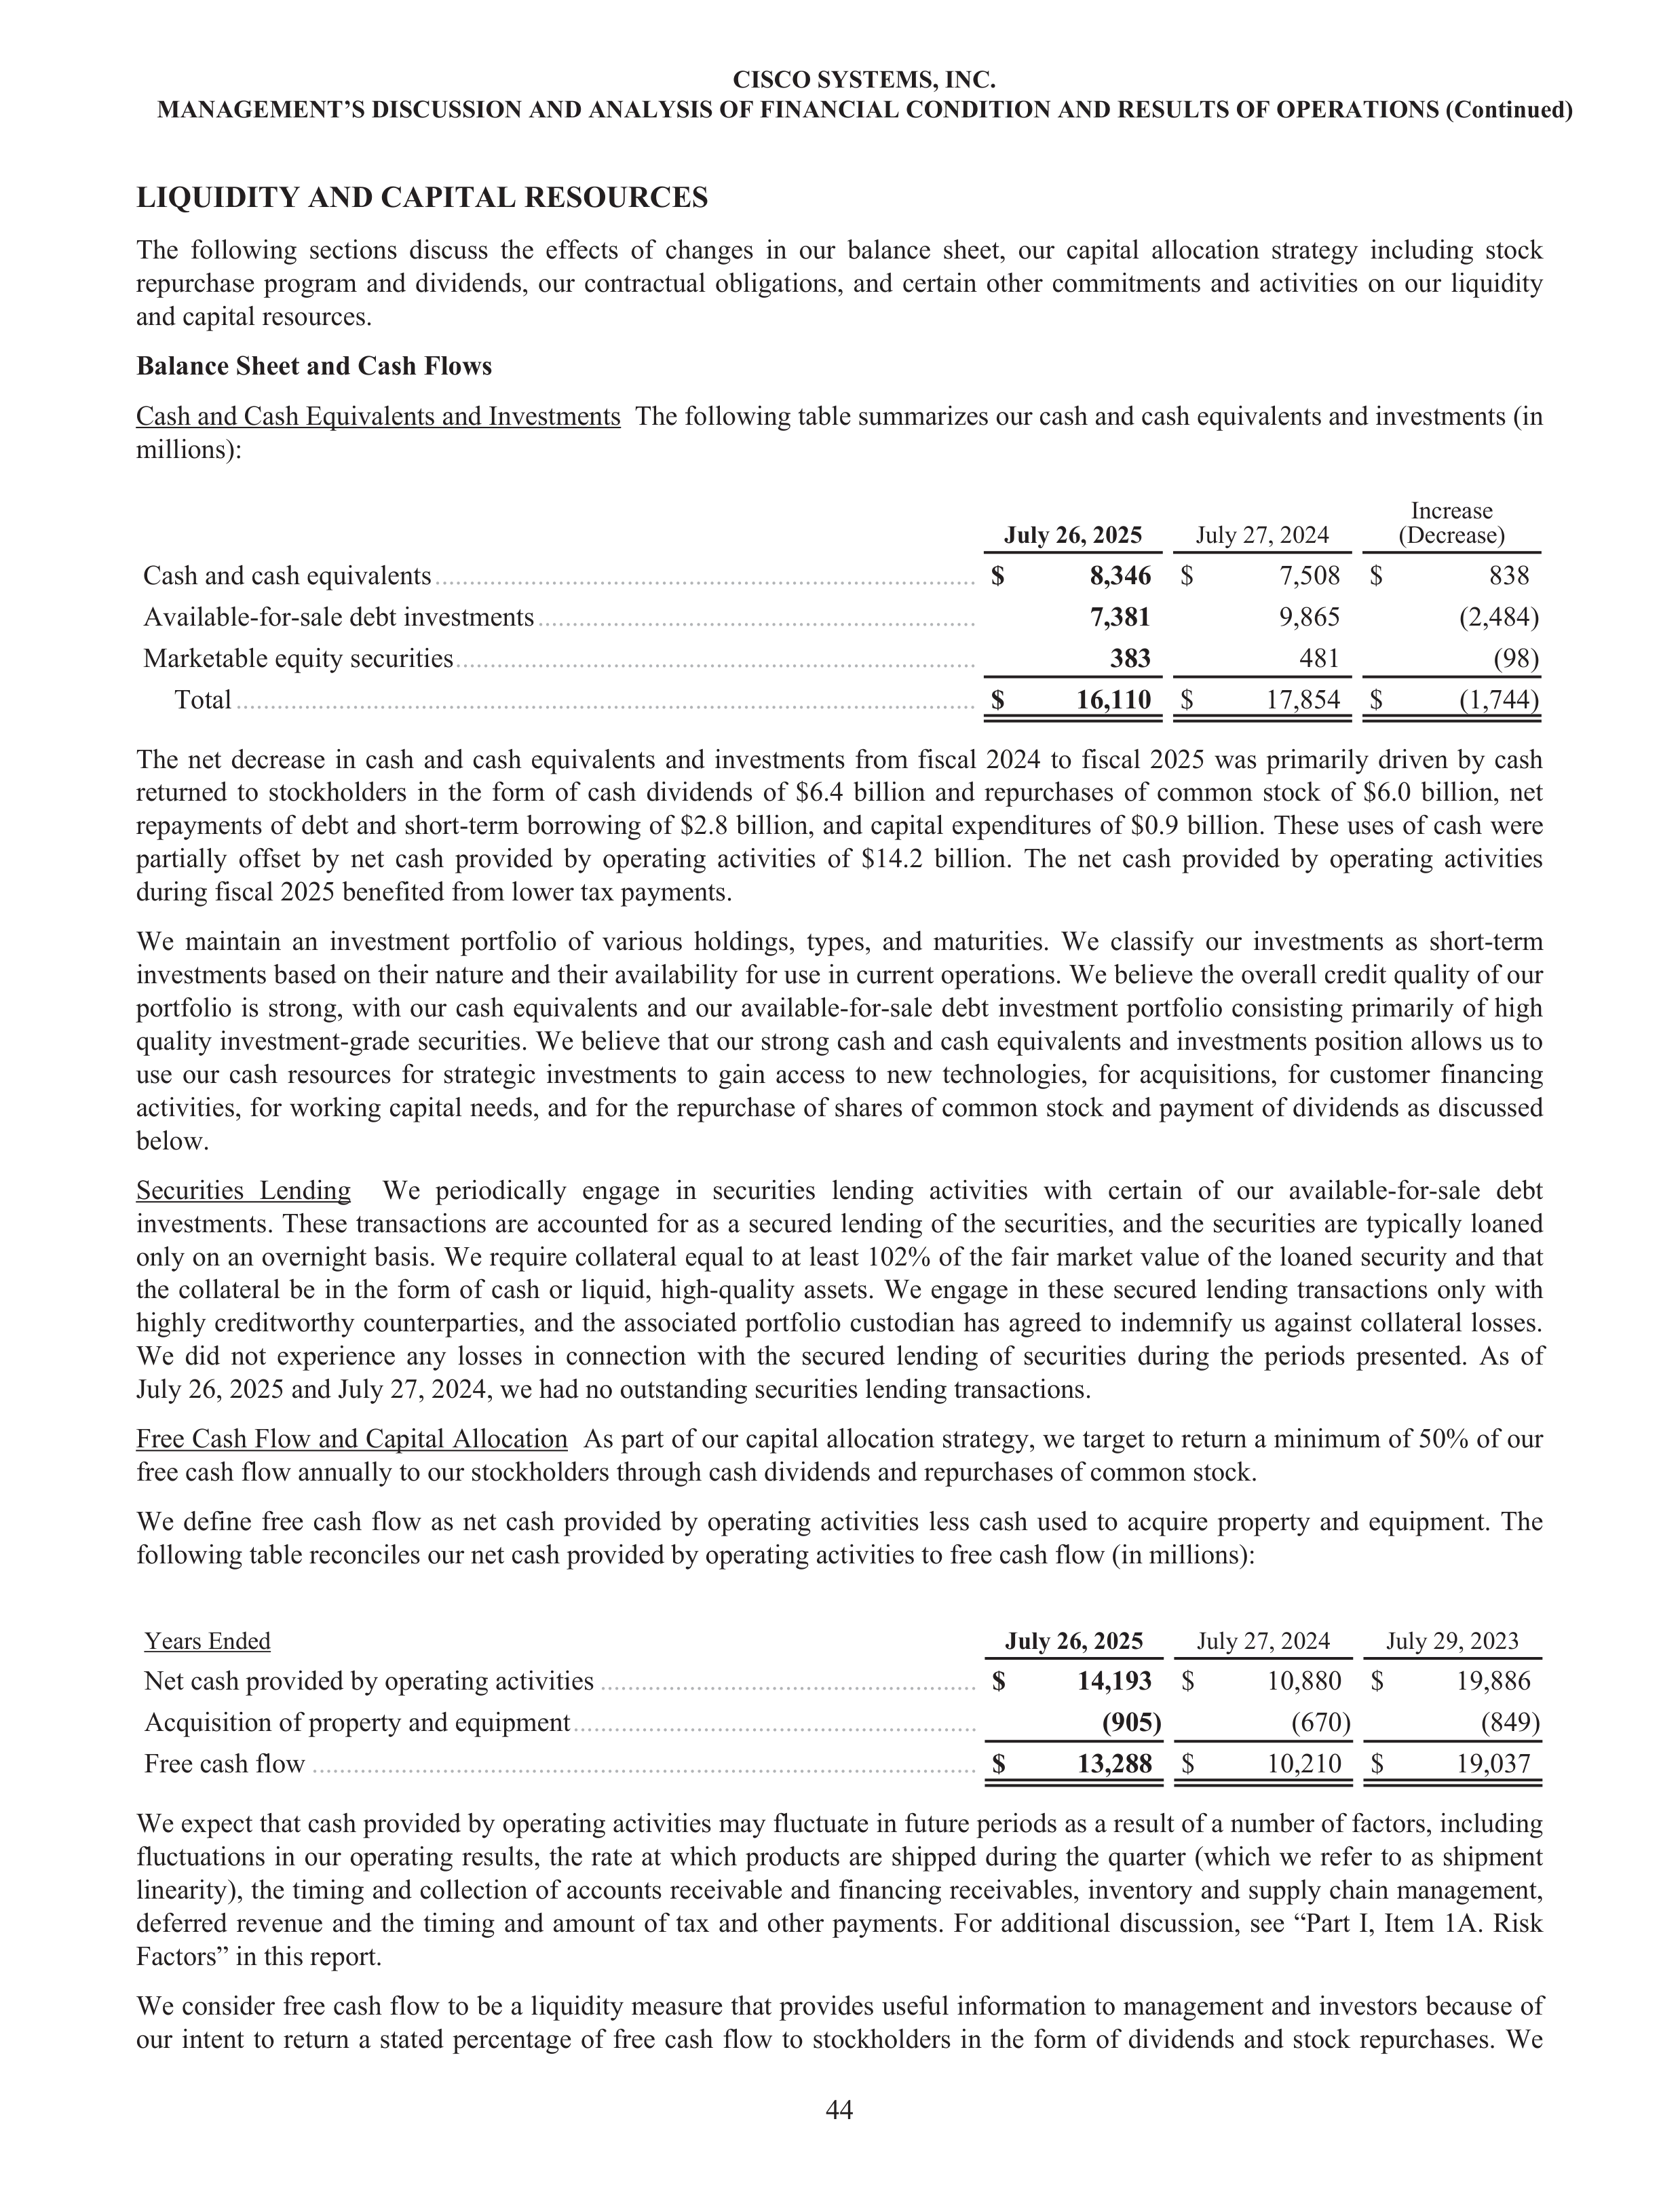
LIQUIDITY AND CAPITAL RESOURCES
The following sections discuss the effects of changes in our balance sheet, our capital allocation strategy including stock
repurchase program and dividends, our contractual obligations, and certain other commitments and activities on our liquidity
and capital resources.
Balance Sheet and Cash Flows
Cash and Cash Equivalents and Investments The following table summarizes our cash and cash equivalents and investments (in
millions):
July 26, 2025
July 27, 2024
Increase
(Decrease)
Cash and cash equivalents
...............................................................................
$
8,346
$
7,508 $
838
Available-for-sale debt investments
................................................................
7,381
9,865
(2,484)
Marketable equity securities
............................................................................
383
481
(98)
Total
............................................................................................................
$
16,110
$
17,854 $
(1,744)
The net decrease in cash and cash equivalents and investments from fiscal 2024 to fiscal 2025 was primarily driven by cash
returned to stockholders in the form of cash dividends of $6.4 billion and repurchases of common stock of $6.0 billion, net
repayments of debt and short-term borrowing of $2.8 billion, and capital expenditures of $0.9 billion. These uses of cash were
partially offset by net cash provided by operating activities of $14.2 billion. The net cash provided by operating activities
during fiscal 2025 benefited from lower tax payments.
We maintain an investment portfolio of various holdings, types, and maturities. We classify our investments as short-term
investments based on their nature and their availability for use in current operations. We believe the overall credit quality of our
portfolio is strong, with our cash equivalents and our available-for-sale debt investment portfolio consisting primarily of high
quality investment-grade securities. We believe that our strong cash and cash equivalents and investments position allows us to
use our cash resources for strategic investments to gain access to new technologies, for acquisitions, for customer financing
activities, for working capital needs, and for the repurchase of shares of common stock and payment of dividends as discussed
below.
Securities Lending We periodically engage in securities lending activities with certain of our available-for-sale debt
investments. These transactions are accounted for as a secured lending of the securities, and the securities are typically loaned
only on an overnight basis. We require collateral equal to at least 102% of the fair market value of the loaned security and that
the collateral be in the form of cash or liquid, high-quality assets. We engage in these secured lending transactions only with
highly creditworthy counterparties, and the associated portfolio custodian has agreed to indemnify us against collateral losses.
We did not experience any losses in connection with the secured lending of securities during the periods presented. As of
July 26, 2025 and July 27, 2024, we had no outstanding securities lending transactions.
Free Cash Flow and Capital Allocation As part of our capital allocation strategy, we target to return a minimum of 50% of our
free cash flow annually to our stockholders through cash dividends and repurchases of common stock.
We define free cash flow as net cash provided by operating activities less cash used to acquire property and equipment. The
following table reconciles our net cash provided by operating activities to free cash flow (in millions):
Years Ended
July 26, 2025
July 27, 2024
July 29, 2023
Net cash provided by operating activities
.......................................................
$
14,193
$
10,880 $
19,886
Acquisition of property and equipment
...........................................................
(905)
(670)
(849)
Free cash flow
.................................................................................................
$
13,288
$
10,210 $
19,037
We expect that cash provided by operating activities may fluctuate in future periods as a result of a number of factors, including
fluctuations in our operating results, the rate at which products are shipped during the quarter (which we refer to as shipment
linearity), the timing and collection of accounts receivable and financing receivables, inventory and supply chain management,
deferred revenue and the timing and amount of tax and other payments. For additional discussion, see “Part I, Item 1A. Risk
Factors” in this report.
We consider free cash flow to be a liquidity measure that provides useful information to management and investors because of
our intent to return a stated percentage of free cash flow to stockholders in the form of dividends and stock repurchases. We
CISCO SYSTEMS, INC.
MANAGEMENT’S DISCUSSION AND ANALYSIS OF FINANCIAL CONDITION AND RESULTS OF OPERATIONS (Continued)
44
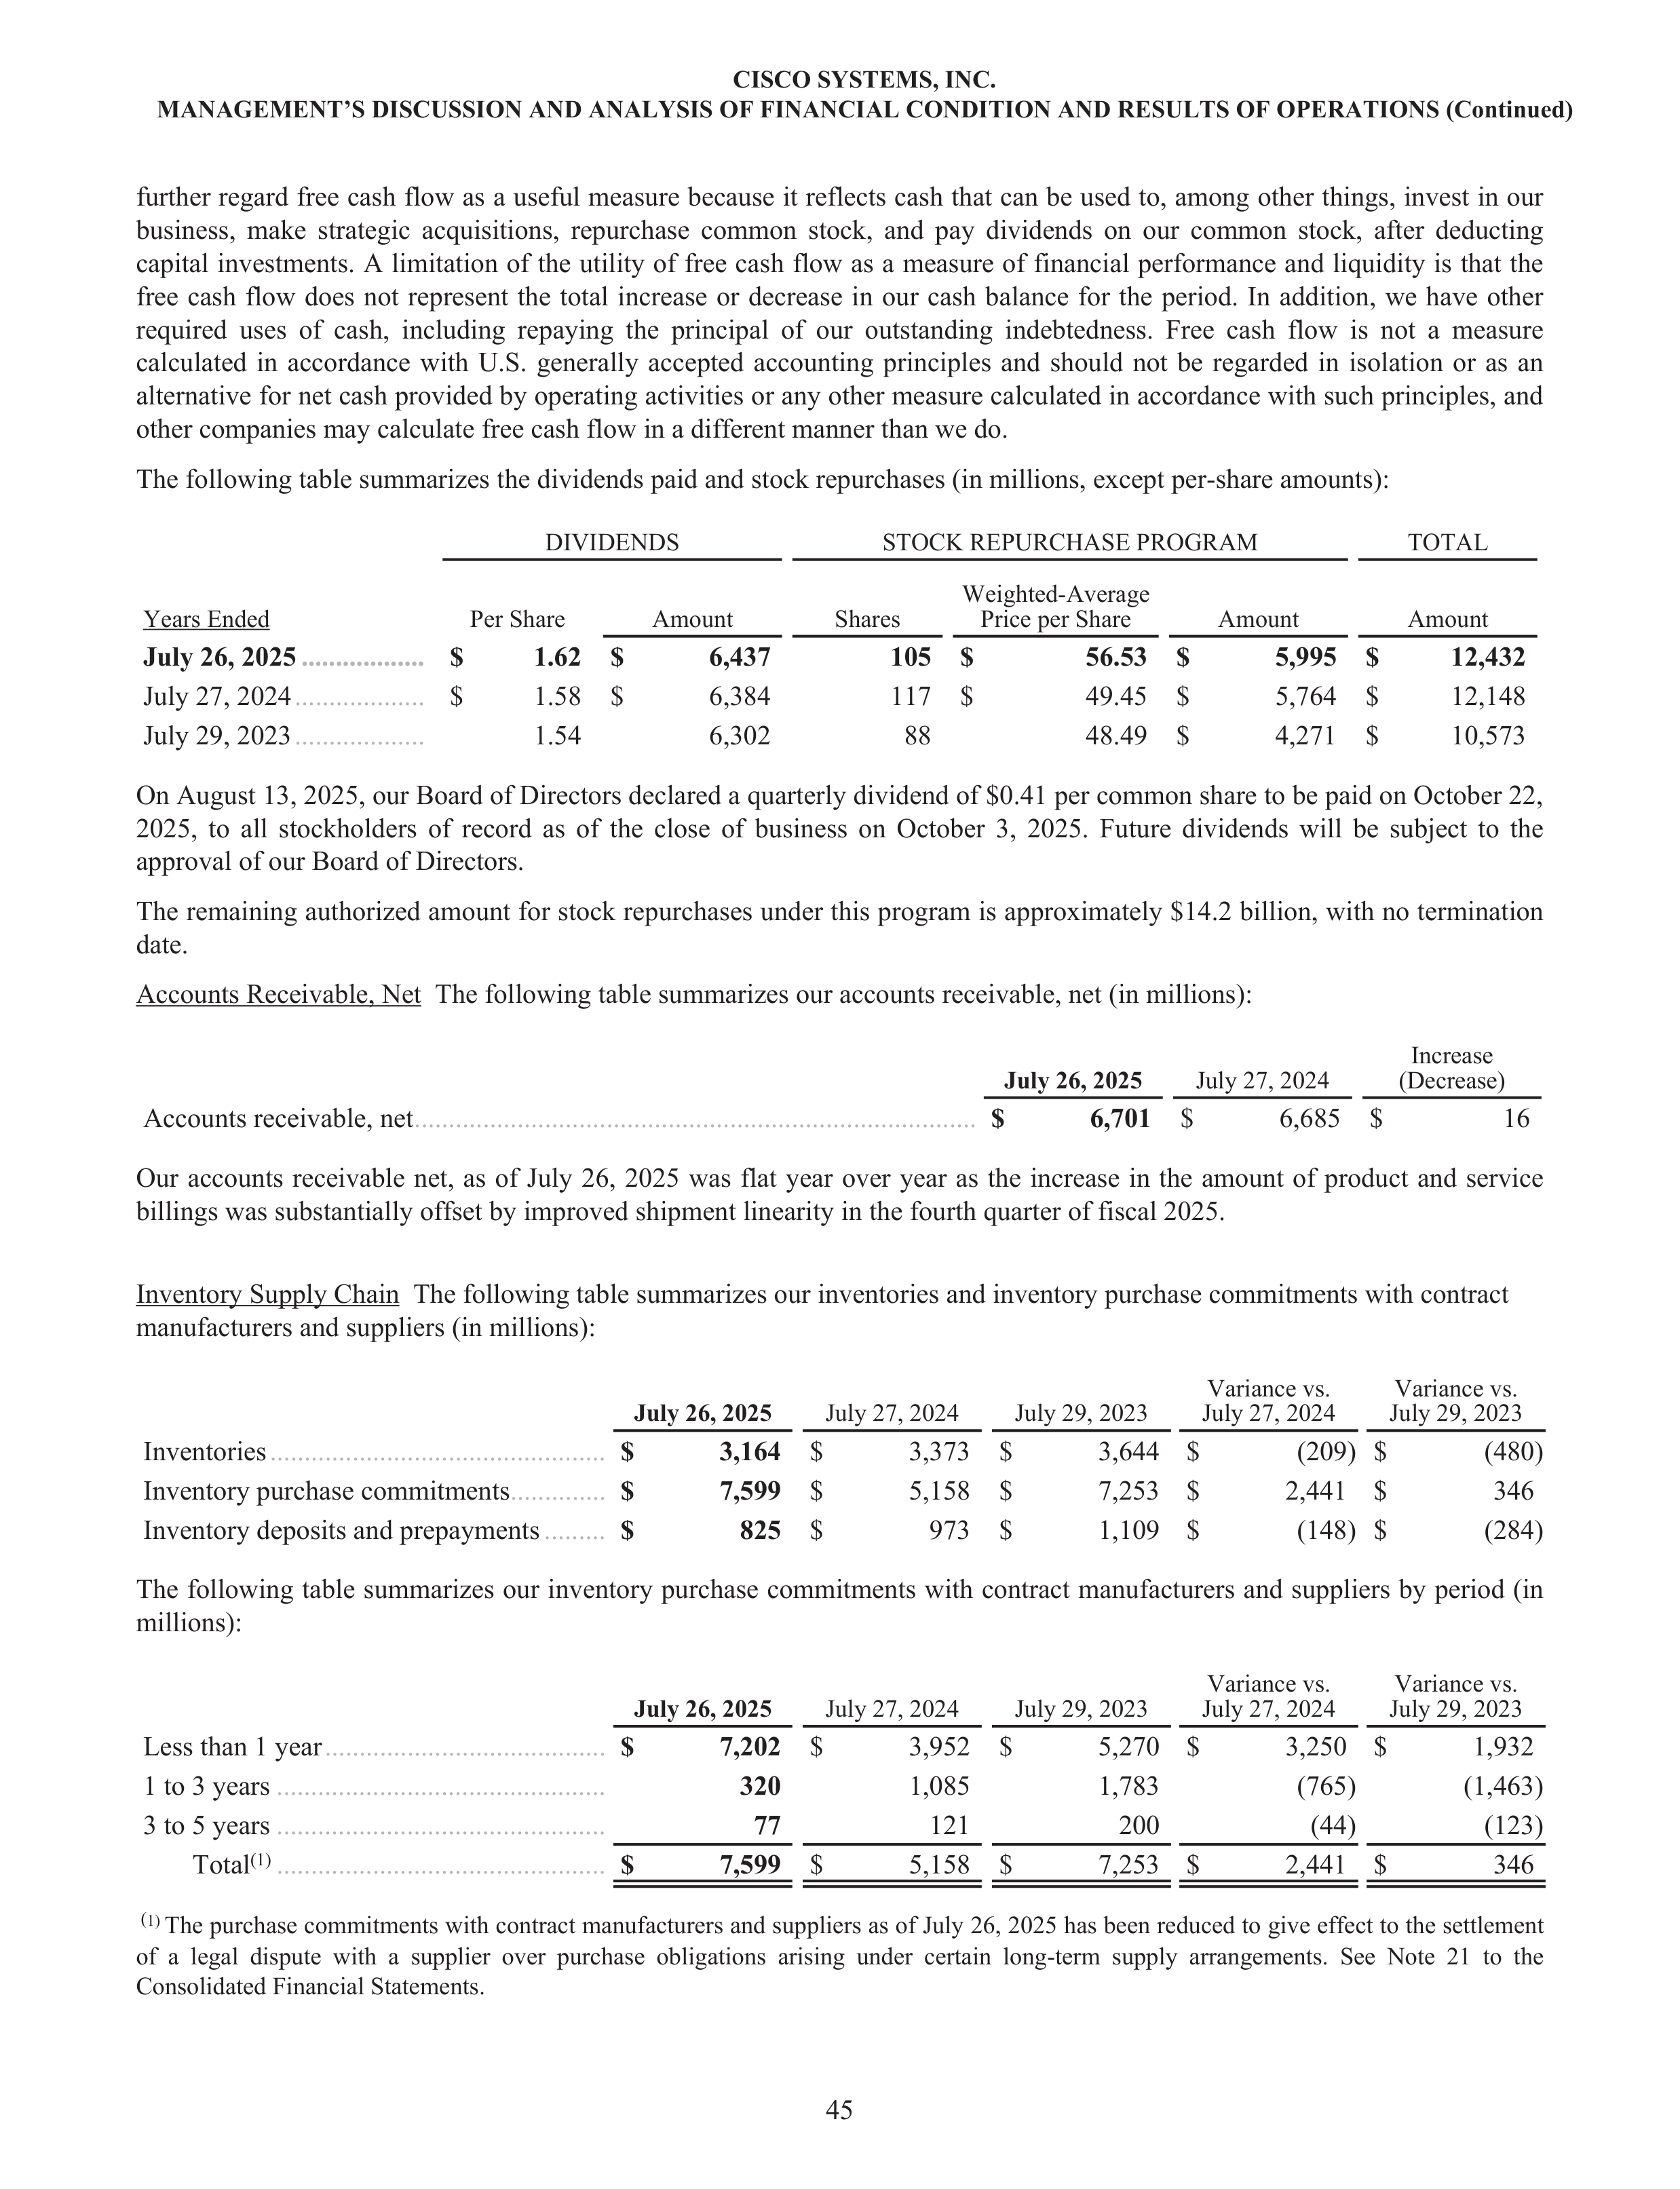
further regard free cash flow as a useful measure because it reflects cash that can be used to, among other things, invest in our
business, make strategic acquisitions, repurchase common stock, and pay dividends on our common stock, after deducting
capital investments. A limitation of the utility of free cash flow as a measure of financial performance and liquidity is that the
free cash flow does not represent the total increase or decrease in our cash balance for the period. In addition, we have other
required uses of cash, including repaying the principal of our outstanding indebtedness. Free cash flow is not a measure
calculated in accordance with U.S. generally accepted accounting principles and should not be regarded in isolation or as an
alternative for net cash provided by operating activities or any other measure calculated in accordance with such principles, and
other companies may calculate free cash flow in a different manner than we do.
The following table summarizes the dividends paid and stock repurchases (in millions, except per-share amounts):
DIVIDENDS
STOCK REPURCHASE PROGRAM
TOTAL
Years Ended
Per Share
Amount
Shares
Weighted-Average
Price per Share
Amount
Amount
July 26, 2025
..................
$
1.62 $
6,437
105 $
56.53 $
5,995 $
12,432
July 27, 2024
...................
$
1.58 $
6,384
117 $
49.45 $
5,764 $
12,148
July 29, 2023
...................
1.54
6,302
88
48.49 $
4,271 $
10,573
On August 13, 2025, our Board of Directors declared a quarterly dividend of $0.41 per common share to be paid on October 22,
2025, to all stockholders of record as of the close of business on October 3, 2025. Future dividends will be subject to the
approval of our Board of Directors.
The remaining authorized amount for stock repurchases under this program is approximately $14.2 billion, with no termination
date.
Accounts Receivable, Net The following table summarizes our accounts receivable, net (in millions):
July 26, 2025
July 27, 2024
Increase
(Decrease)
Accounts receivable, net
..................................................................................
$
6,701
$
6,685 $
16
Our accounts receivable net, as of July 26, 2025 was flat year over year as the increase in the amount of product and service
billings was substantially offset by improved shipment linearity in the fourth quarter of fiscal 2025.
Inventory Supply Chain The following table summarizes our inventories and inventory purchase commitments with contract
manufacturers and suppliers (in millions):
July 26, 2025
July 27, 2024
July 29, 2023
Variance vs.
July 27, 2024
Variance vs.
July 29, 2023
Inventories
.................................................
$
3,164
$
3,373 $
3,644 $
(209)
$
(480)
Inventory purchase commitments
..............
$
7,599
$
5,158 $
7,253 $
2,441 $
346
Inventory deposits and prepayments
.........
$
825
$
973 $
1,109 $
(148)
$
(284)
The following table summarizes our inventory purchase commitments with contract manufacturers and suppliers by period (in
millions):
July 26, 2025
July 27, 2024
July 29, 2023
Variance vs.
July 27, 2024
Variance vs.
July 29, 2023
Less than 1 year
.........................................
$
7,202
$
3,952 $
5,270 $
3,250 $
1,932
1 to 3 years
................................................
320
1,085
1,783
(765)
(1,463)
3 to 5 years
................................................
77
121
200
(44)
(123)
Total
(1)
................................................
$
7,599
$
5,158 $
7,253 $
2,441 $
346
(
1)
The purchase commitments with contract manufacturers and suppliers as of July 26, 2025 has been reduced to give effect to the settlement
of a legal dispute with a supplier over purchase obligations arising under certain long-term supply arrangements. See Note 21 to the
Consolidated Financial Statements.
CISCO SYSTEMS, INC.
MANAGEMENT’S DISCUSSION AND ANALYSIS OF FINANCIAL CONDITION AND RESULTS OF OPERATIONS (Continued)
45
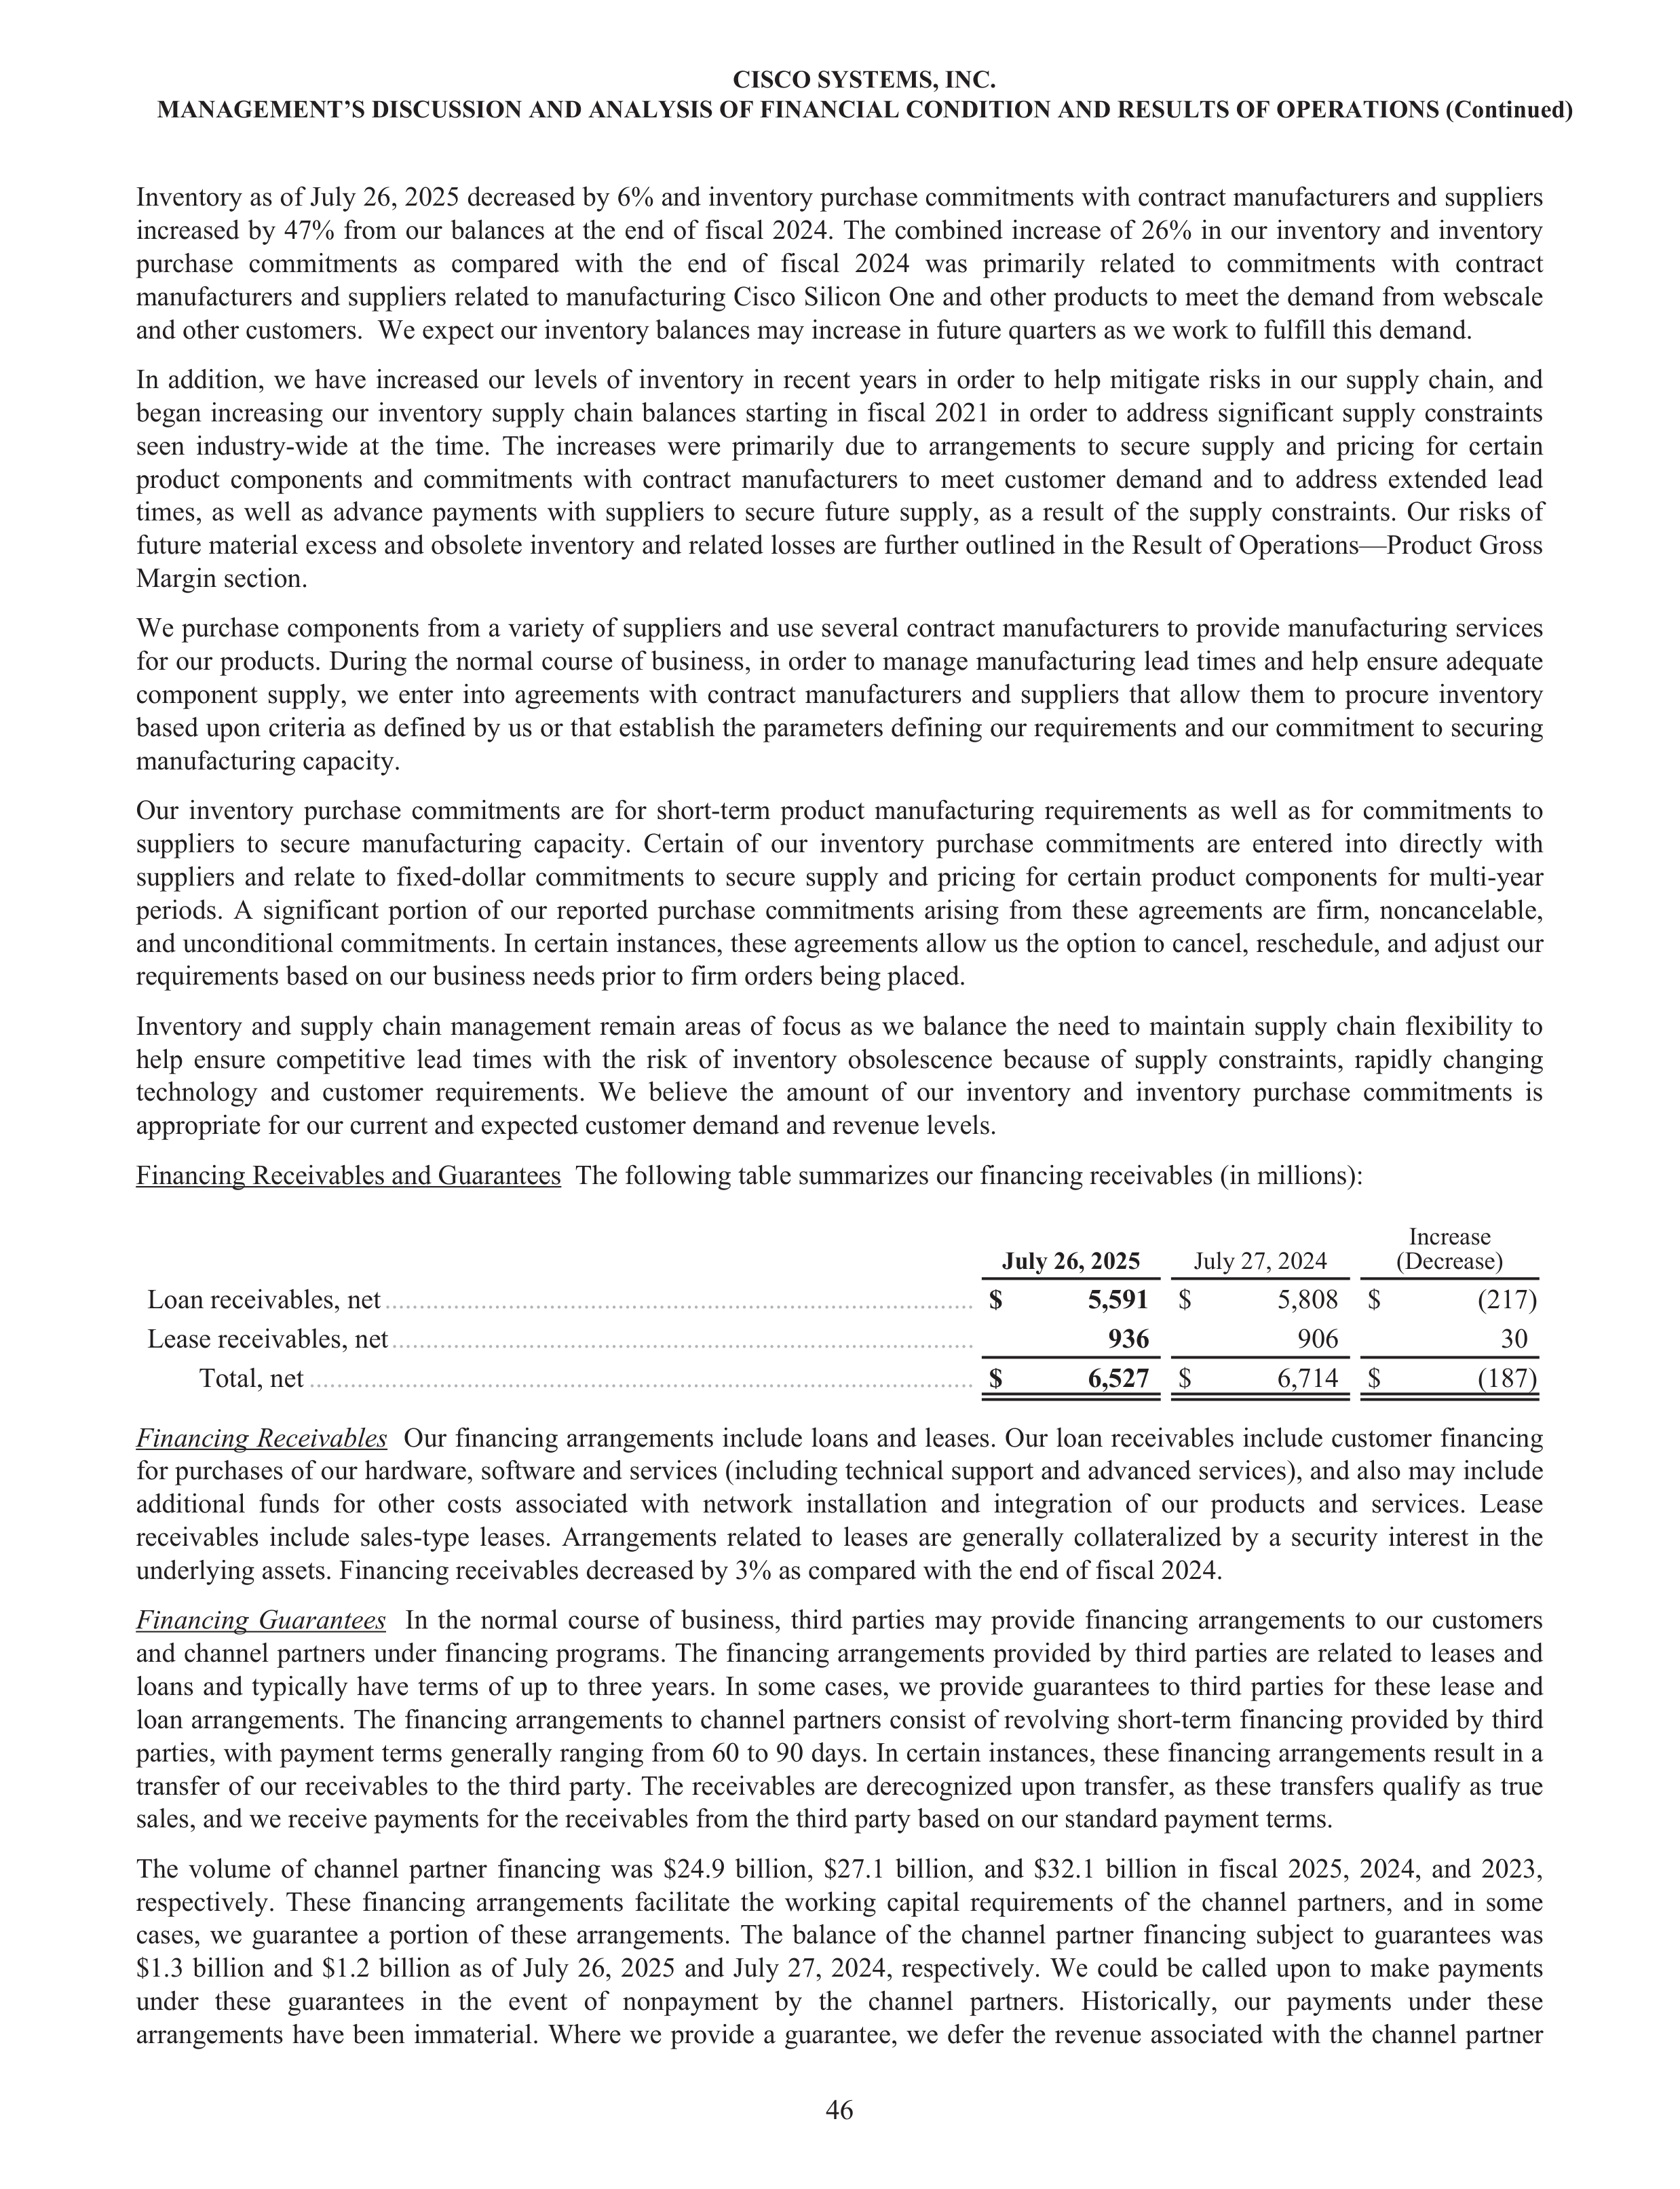
Inventory as of July 26, 2025 decreased by 6% and inventory purchase commitments with contract manufacturers and suppliers
increased by 47% from our balances at the end of fiscal 2024. The combined increase of 26% in our inventory and inventory
purchase commitments as compared with the end of fiscal 2024 was primarily related to commitments with contract
manufacturers and suppliers related to manufacturing Cisco Silicon One and other products to meet the demand from webscale
and other customers. We expect our inventory balances may increase in future quarters as we work to fulfill this demand.
In addition, we have increased our levels of inventory in recent years in order to help mitigate risks in our supply chain, and
began increasing our inventory supply chain balances starting in fiscal 2021 in order to address significant supply constraints
seen industry-wide at the time. The increases were primarily due to arrangements to secure supply and pricing for certain
product components and commitments with contract manufacturers to meet customer demand and to address extended lead
times, as well as advance payments with suppliers to secure future supply, as a result of the supply constraints. Our risks of
future material excess and obsolete inventory and related losses are further outlined in the Result of Operations—Product Gross
Margin section.
We purchase components from a variety of suppliers and use several contract manufacturers to provide manufacturing services
for our products. During the normal course of business, in order to manage manufacturing lead times and help ensure adequate
component supply, we enter into agreements with contract manufacturers and suppliers that allow them to procure inventory
based upon criteria as defined by us or that establish the parameters defining our requirements and our commitment to securing
manufacturing capacity.
Our inventory purchase commitments are for short-term product manufacturing requirements as well as for commitments to
suppliers to secure manufacturing capacity. Certain of our inventory purchase commitments are entered into directly with
suppliers and relate to fixed-dollar commitments to secure supply and pricing for certain product components for multi-year
periods. A significant portion of our reported purchase commitments arising from these agreements are firm, noncancelable,
and unconditional commitments. In certain instances, these agreements allow us the option to cancel, reschedule, and adjust our
requirements based on our business needs prior to firm orders being placed.
Inventory and supply chain management remain areas of focus as we balance the need to maintain supply chain flexibility to
help ensure competitive lead times with the risk of inventory obsolescence because of supply constraints, rapidly changing
technology and customer requirements. We believe the amount of our inventory and inventory purchase commitments is
appropriate for our current and expected customer demand and revenue levels.
Financing Receivables and Guarantees The following table summarizes our financing receivables (in millions):
July 26, 2025
July 27, 2024
Increase
(Decrease)
Loan receivables, net
......................................................................................
$
5,591
$
5,808 $
(217)
Lease receivables, net
.....................................................................................
936
906
30
Total, net
.................................................................................................
$
6,527
$
6,714 $
(187)
Financing Receivables
Our financing arrangements include loans and leases. Our loan receivables include customer financing
for purchases of our hardware, software and services (including technical support and advanced services), and also may include
additional funds for other costs associated with network installation and integration of our products and services. Lease
receivables include sales-type leases. Arrangements related to leases are generally collateralized by a security interest in the
underlying assets. Financing receivables decreased by 3% as compared with the end of fiscal 2024.
Financing Guarantees
In the normal course of business, third parties may provide financing arrangements to our customers
and channel partners under financing programs. The financing arrangements provided by third parties are related to leases and
loans and typically have terms of up to three years. In some cases, we provide guarantees to third parties for these lease and
loan arrangements. The financing arrangements to channel partners consist of revolving short-term financing provided by third
parties, with payment terms generally ranging from 60 to 90 days. In certain instances, these financing arrangements result in a
transfer of our receivables to the third party. The receivables are derecognized upon transfer, as these transfers qualify as true
sales, and we receive payments for the receivables from the third party based on our standard payment terms.
The volume of channel partner financing was $24.9 billion, $27.1 billion, and $32.1 billion in fiscal 2025, 2024, and 2023,
respectively. These financing arrangements facilitate the working capital requirements of the channel partners, and in some
cases, we guarantee a portion of these arrangements. The balance of the channel partner financing subject to guarantees was
$1.3 billion and $1.2 billion as of July 26, 2025 and July 27, 2024, respectively. We could be called upon to make payments
under these guarantees in the event of nonpayment by the channel partners. Historically, our payments under these
arrangements have been immaterial. Where we provide a guarantee, we defer the revenue associated with the channel partner
CISCO SYSTEMS, INC.
MANAGEMENT’S DISCUSSION AND ANALYSIS OF FINANCIAL CONDITION AND RESULTS OF OPERATIONS (Continued)
46
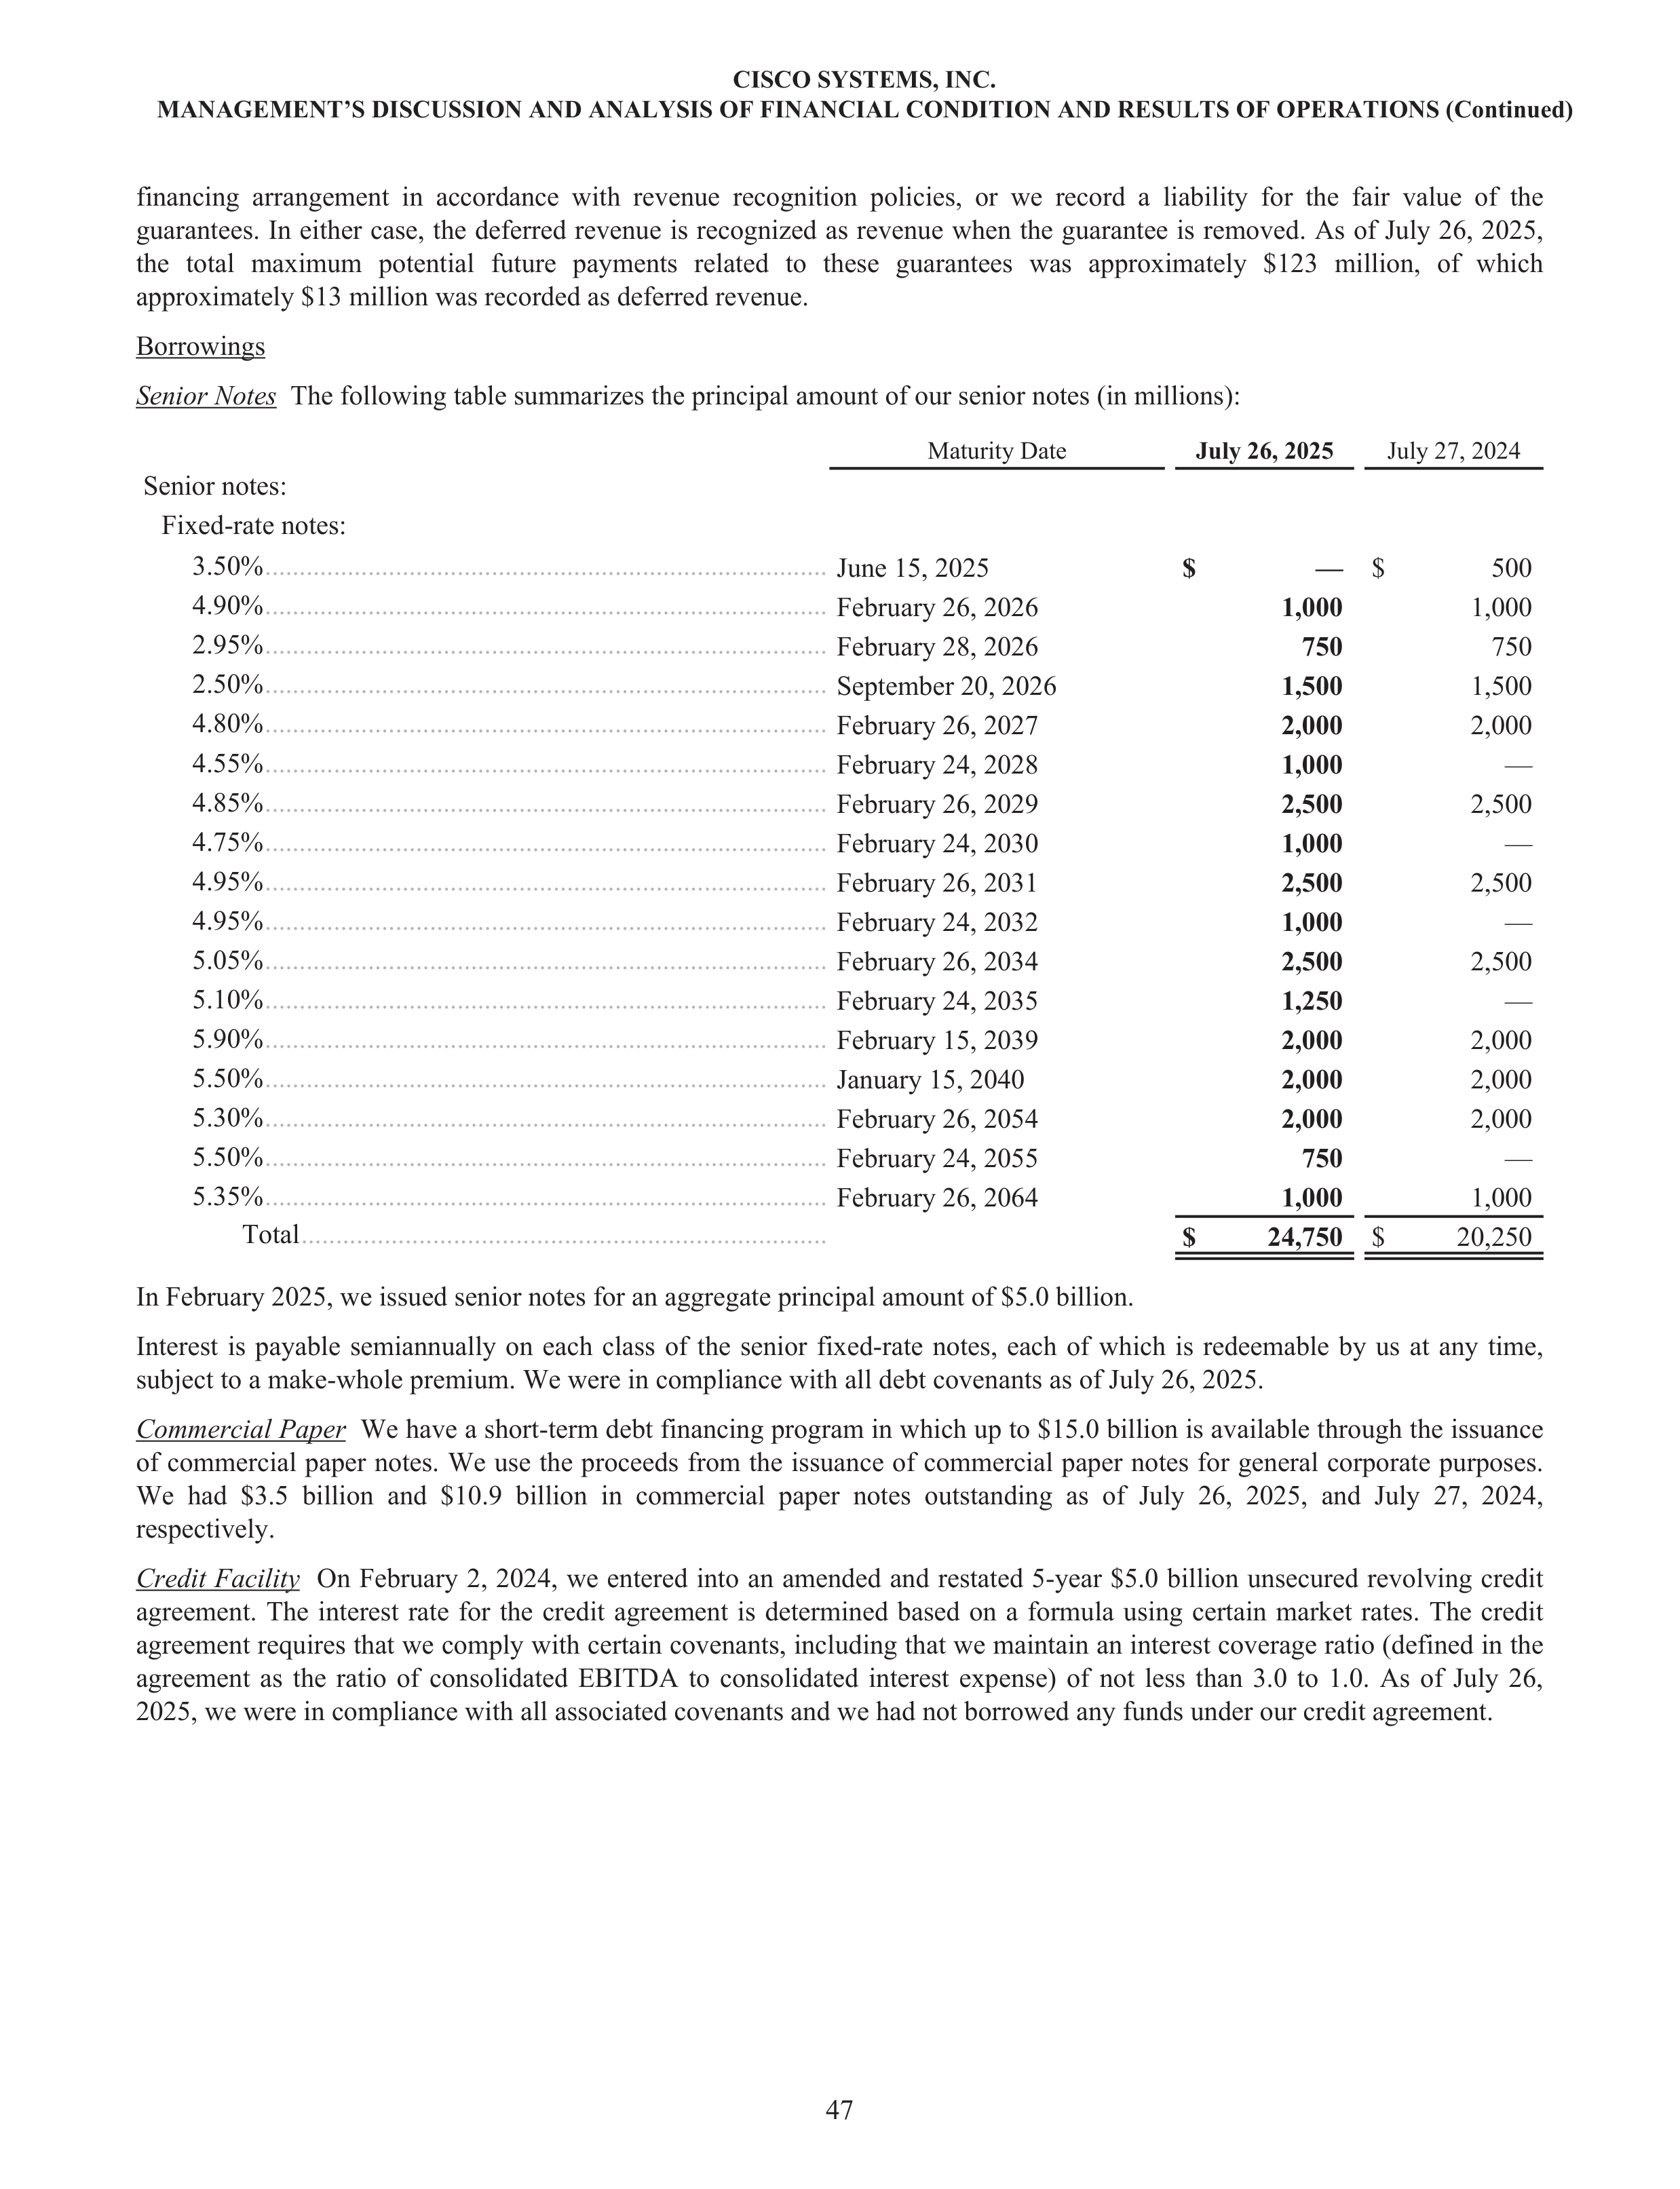
financing arrangement in accordance with revenue recognition policies, or we record a liability for the fair value of the
guarantees. In either case, the deferred revenue is recognized as revenue when the guarantee is removed. As of July 26, 2025,
the total maximum potential future payments related to these guarantees was approximately $123 million, of which
approximately $13 million was recorded as deferred revenue.
Borrowings
Senior Notes
The following table summarizes the principal amount of our senior notes (in millions):
Maturity Date
July 26, 2025
July 27, 2024
Senior notes:
Fixed-rate notes:
3.50%
..................................................................................
June 15, 2025
$
—
$
500
4.90%
..................................................................................
February 26, 2026
1,000
1,000
2.95%
..................................................................................
February 28, 2026
750
750
2.50%
..................................................................................
September 20, 2026
1,500
1,500
4.80%
..................................................................................
February 26, 2027
2,000
2,000
4.55%
..................................................................................
February 24, 2028
1,000
—
4.85%
..................................................................................
February 26, 2029
2,500
2,500
4.75%
..................................................................................
February 24, 2030
1,000
—
4.95%
..................................................................................
February 26, 2031
2,500
2,500
4.95%
..................................................................................
February 24, 2032
1,000
—
5.05%
..................................................................................
February 26, 2034
2,500
2,500
5.10%
..................................................................................
February 24, 2035
1,250
—
5.90%
..................................................................................
February 15, 2039
2,000
2,000
5.50%
..................................................................................
January 15, 2040
2,000
2,000
5.30%
..................................................................................
February 26, 2054
2,000
2,000
5.50%
..................................................................................
February 24, 2055
750
—
5.35%
..................................................................................
February 26, 2064
1,000
1,000
Total
............................................................................
$
24,750
$
20,250
In February 2025, we issued senior notes for an aggregate principal amount of $5.0 billion.
Interest is payable semiannually on each class of the senior fixed-rate notes, each of which is redeemable by us at any time,
subject to a make-whole premium. We were in compliance with all debt covenants as of July 26, 2025.
Commercial Paper
We have a short-term debt financing program in which up to $15.0 billion is available through the issuance
of commercial paper notes. We use the proceeds from the issuance of commercial paper notes for general corporate purposes.
We had $3.5 billion and $10.9 billion in commercial paper notes outstanding as of July 26, 2025, and July 27, 2024,
respectively.
Credit Facility
On February 2, 2024, we entered into an amended and restated 5-year $5.0 billion unsecured revolving credit
agreement. The interest rate for the credit agreement is determined based on a formula using certain market rates. The credit
agreement requires that we comply with certain covenants, including that we maintain an interest coverage ratio (defined in the
agreement as the ratio of consolidated EBITDA to consolidated interest expense) of not less than 3.0 to 1.0. As of July 26,
2025, we were in compliance with all associated covenants and we had not borrowed any funds under our credit agreement.
CISCO SYSTEMS, INC.
MANAGEMENT’S DISCUSSION AND ANALYSIS OF FINANCIAL CONDITION AND RESULTS OF OPERATIONS (Continued)
47
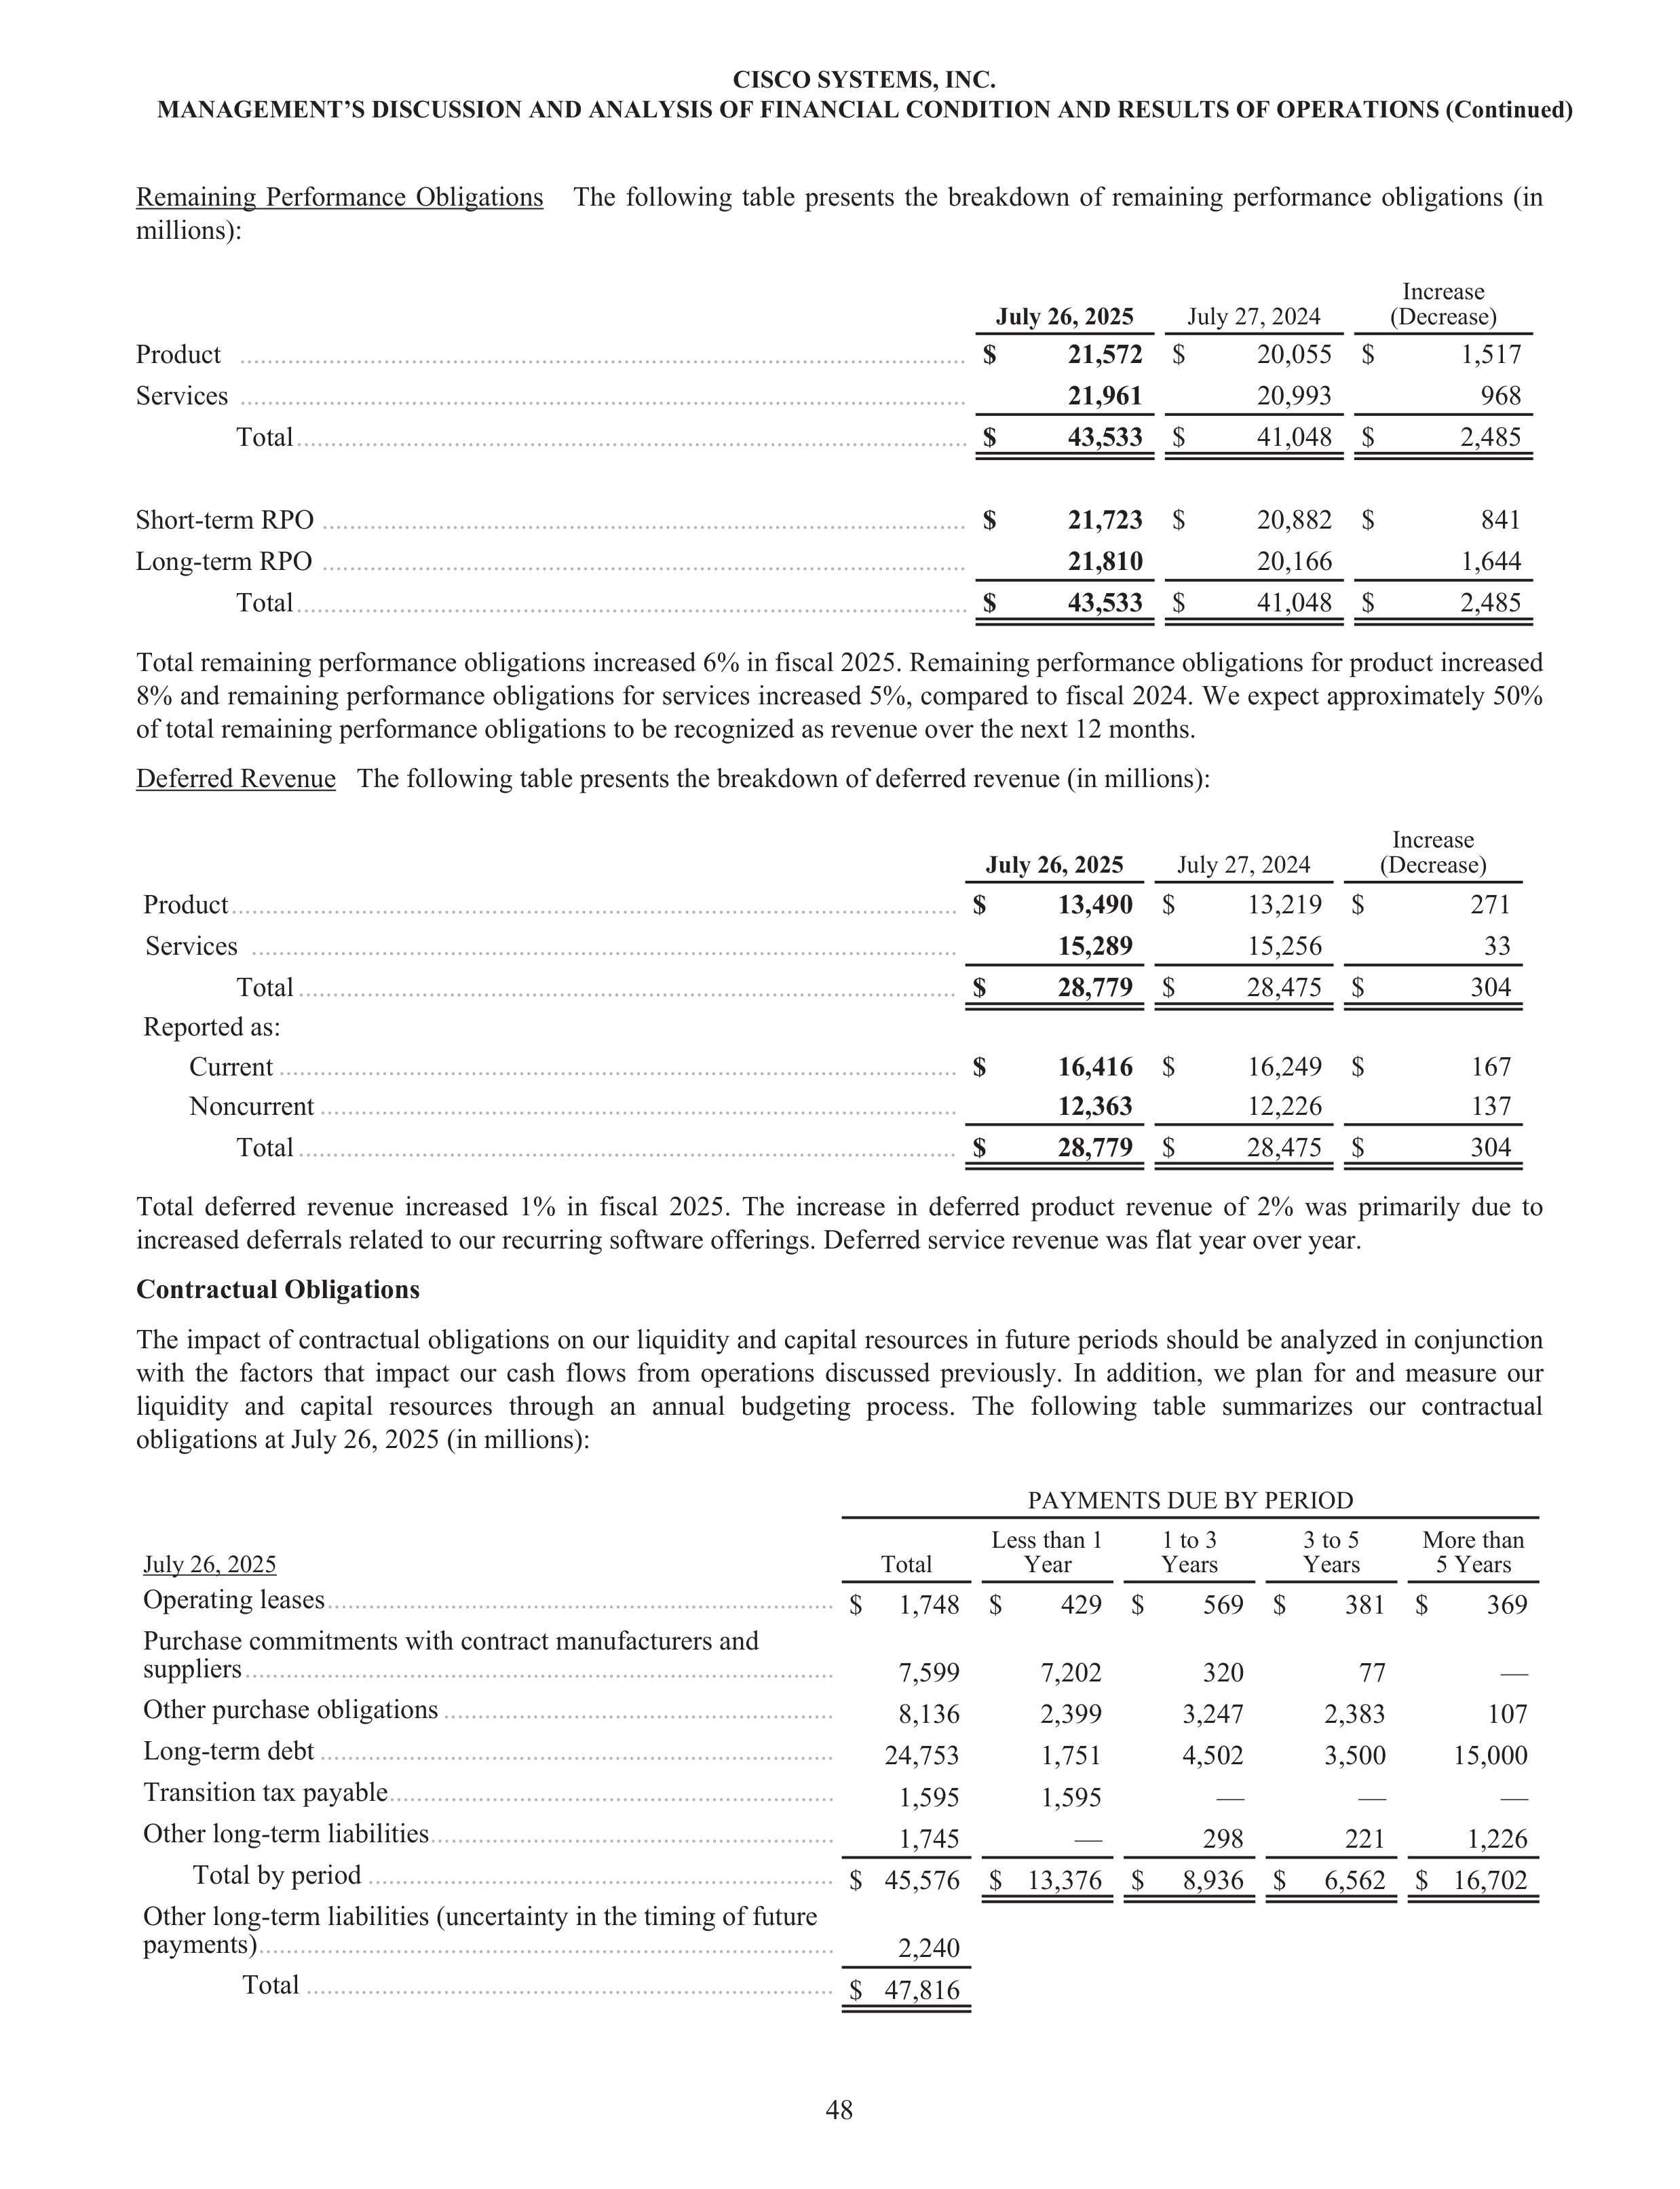
Remaining Performance Obligations The following table presents the breakdown of remaining performance obligations (in
millions):
July 26, 2025
July 27, 2024
Increase
(Decrease)
Product
$
21,572
$
20,055 $
1,517
Services
21,961
20,993
968
Total
$
43,533
$
41,048 $
2,485
Short-term RPO
$
21,723
$
20,882 $
841
Long-term RPO
21,810
20,166
1,644
$
43,533
$
41,048 $
2,485
Total remaining performance obligations increased 6% in fiscal 2025. Remaining performance obligations for product increased
8% and remaining performance obligations for services increased 5%, compared to fiscal 2024. We expect approximately 50%
of total remaining performance obligations to be recognized as revenue over the next 12 months.
Deferred Revenue The following table presents the breakdown of deferred revenue (in millions):
July 26, 2025
July 27, 2024
Increase
(Decrease)
Product
..........................................................................................................
$
13,490
$
13,219 $
271
Services
.......................................................................................................
15,289
15,256
33
Total
................................................................................................
$
28,779
$
28,475 $
304
Reported as:
Current
...................................................................................................
$
16,416
$
16,249 $
167
Noncurrent
.............................................................................................
12,363
12,226
137
Total
................................................................................................
$
28,779
$
28,475 $
304
Total deferred revenue increased 1% in fiscal 2025. The increase in deferred product revenue of 2% was primarily due to
increased deferrals related to our recurring software offerings. Deferred service revenue was flat year over year.
Contractual Obligations
The impact of contractual obligations on our liquidity and capital resources in future periods should be analyzed in conjunction
with the factors that impact our cash flows from operations discussed previously. In addition, we plan for and measure our
liquidity and capital resources through an annual budgeting process. The following table summarizes our contractual
obligations at July 26, 2025 (in millions):
PAYMENTS DUE BY PERIOD
July 26, 2025
Total
Less than 1
Year
1 to 3
Years
3 to 5
Years
More than
5 Years
Operating leases
..........................................................................
$
1,748 $
429 $
569 $
381 $
369
Purchase commitments with contract manufacturers and
suppliers
......................................................................................
7,599
7,202
320
77
—
Other purchase obligations
.........................................................
8,136
2,399
3,247
2,383
107
Long-term debt
...........................................................................
24,753
1,751
4,502
3,500
15,000
Transition tax payable
.................................................................
1,595
1,595
—
—
—
Other long-term liabilities
...........................................................
1,745
—
298
221
1,226
Total by period
....................................................................
$ 45,576 $ 13,376 $
8,936 $
6,562 $ 16,702
Other long-term liabilities (uncertainty in the timing of future
payments)
....................................................................................
2,240
Total
.............................................................................
$ 47,816
CISCO SYSTEMS, INC.
MANAGEMENT’S DISCUSSION AND ANALYSIS OF FINANCIAL CONDITION AND RESULTS OF OPERATIONS (Continued)
48
..................................................................................................
Total
..................................................................................................
..........................................................................................................
..........................................................................................................
..............................................................................................
..............................................................................................
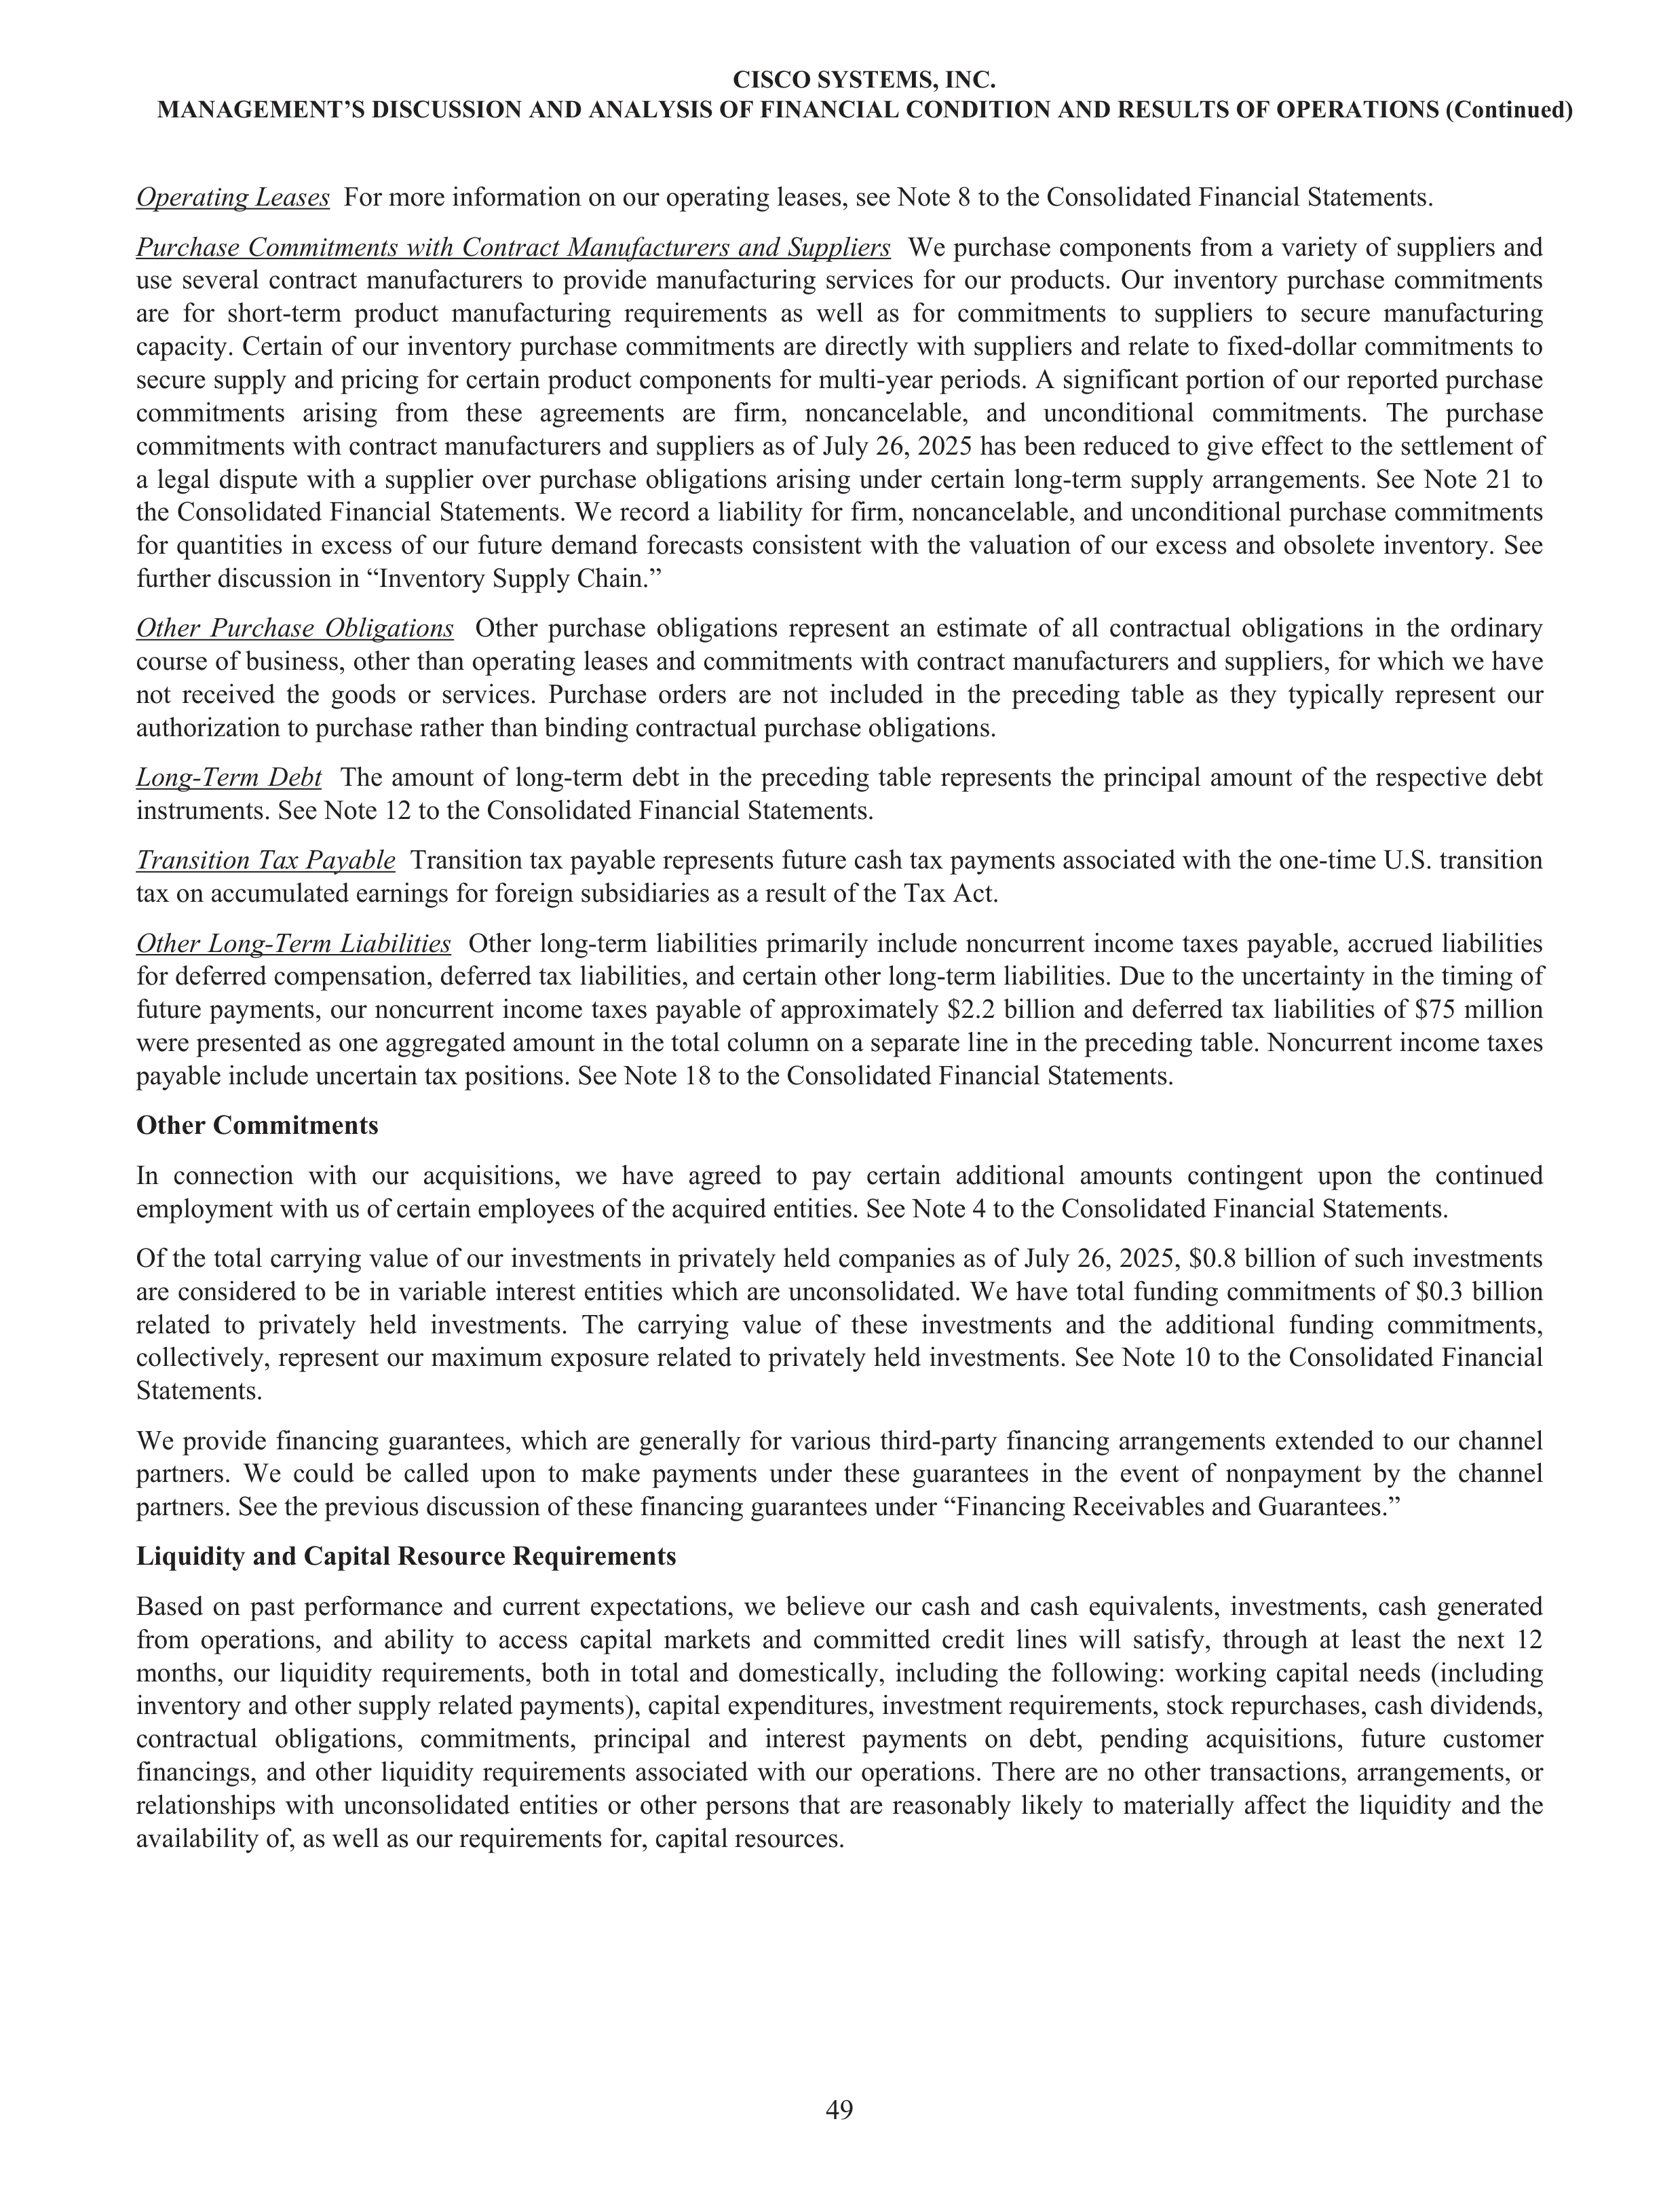
Operating Leases
For more information on our operating leases, see Note 8 to the Consolidated Financial Statements.
Purchase Commitments with Contract Manufacturers and Suppliers
We purchase components from a variety of suppliers and
use several contract manufacturers to provide manufacturing services for our products. Our inventory purchase commitments
are for short-term product manufacturing requirements as well as for commitments to suppliers to secure manufacturing
capacity. Certain of our inventory purchase commitments are directly with suppliers and relate to fixed-dollar commitments to
secure supply and pricing for certain product components for multi-year periods. A significant portion of our reported purchase
commitments arising from these agreements are firm, noncancelable, and unconditional commitments. The purchase
commitments with contract manufacturers and suppliers as of July 26, 2025 has been reduced to give effect to the settlement of
a legal dispute with a supplier over purchase obligations arising under certain long-term supply arrangements. See Note 21 to
the Consolidated Financial Statements. We record a liability for firm, noncancelable, and unconditional purchase commitments
for quantities in excess of our future demand forecasts consistent with the valuation of our excess and obsolete inventory. See
further discussion in “Inventory Supply Chain.”
Other Purchase Obligations
Other purchase obligations represent an estimate of all contractual obligations in the ordinary
course of business, other than operating leases and commitments with contract manufacturers and suppliers, for which we have
not received the goods or services. Purchase orders are not included in the preceding table as they typically represent our
authorization to purchase rather than binding contractual purchase obligations.
Long-Term Debt
The amount of long-term debt in the preceding table represents the principal amount of the respective debt
instruments. See Note 12 to the Consolidated Financial Statements.
Transition Tax Payable
Transition tax payable represents future cash tax payments associated with the one-time U.S. transition
tax on accumulated earnings for foreign subsidiaries as a result of the Tax Act.
Other Long-Term Liabilities
Other long-term liabilities primarily include noncurrent income taxes payable, accrued liabilities
for deferred compensation, deferred tax liabilities, and certain other long-term liabilities. Due to the uncertainty in the timing of
future payments, our noncurrent income taxes payable of approximately $2.2 billion and deferred tax liabilities of $75 million
were presented as one aggregated amount in the total column on a separate line in the preceding table. Noncurrent income taxes
payable include uncertain tax positions. See Note 18 to the Consolidated Financial Statements.
Other Commitments
In connection with our acquisitions, we have agreed to pay certain additional amounts contingent upon the continued
employment with us of certain employees of the acquired entities. See Note 4 to the Consolidated Financial Statements.
Of the total carrying value of our investments in privately held companies as of July 26, 2025, $0.8 billion of such investments
are considered to be in variable interest entities which are unconsolidated. We have total funding commitments of $0.3 billion
related to privately held investments. The carrying value of these investments and the additional funding commitments,
collectively, represent our maximum exposure related to privately held investments. See Note 10 to the Consolidated Financial
Statements.
We provide financing guarantees, which are generally for various third-party financing arrangements extended to our channel
partners. We could be called upon to make payments under these guarantees in the event of nonpayment by the channel
partners. See the previous discussion of these financing guarantees under “Financing Receivables and Guarantees.”
Liquidity and Capital Resource Requirements
Based on past performance and current expectations, we believe our cash and cash equivalents, investments, cash generated
from operations, and ability to access capital markets and committed credit lines will satisfy, through at least the next 12
months, our liquidity requirements, both in total and domestically, including the following: working capital needs (including
inventory and other supply related payments), capital expenditures, investment requirements, stock repurchases, cash dividends,
contractual obligations, commitments, principal and interest payments on debt, pending acquisitions, future customer
financings, and other liquidity requirements associated with our operations. There are no other transactions, arrangements, or
relationships with unconsolidated entities or other persons that are reasonably likely to materially affect the liquidity and the
availability of, as well as our requirements for, capital resources.
CISCO SYSTEMS, INC.
MANAGEMENT’S DISCUSSION AND ANALYSIS OF FINANCIAL CONDITION AND RESULTS OF OPERATIONS (Continued)
49
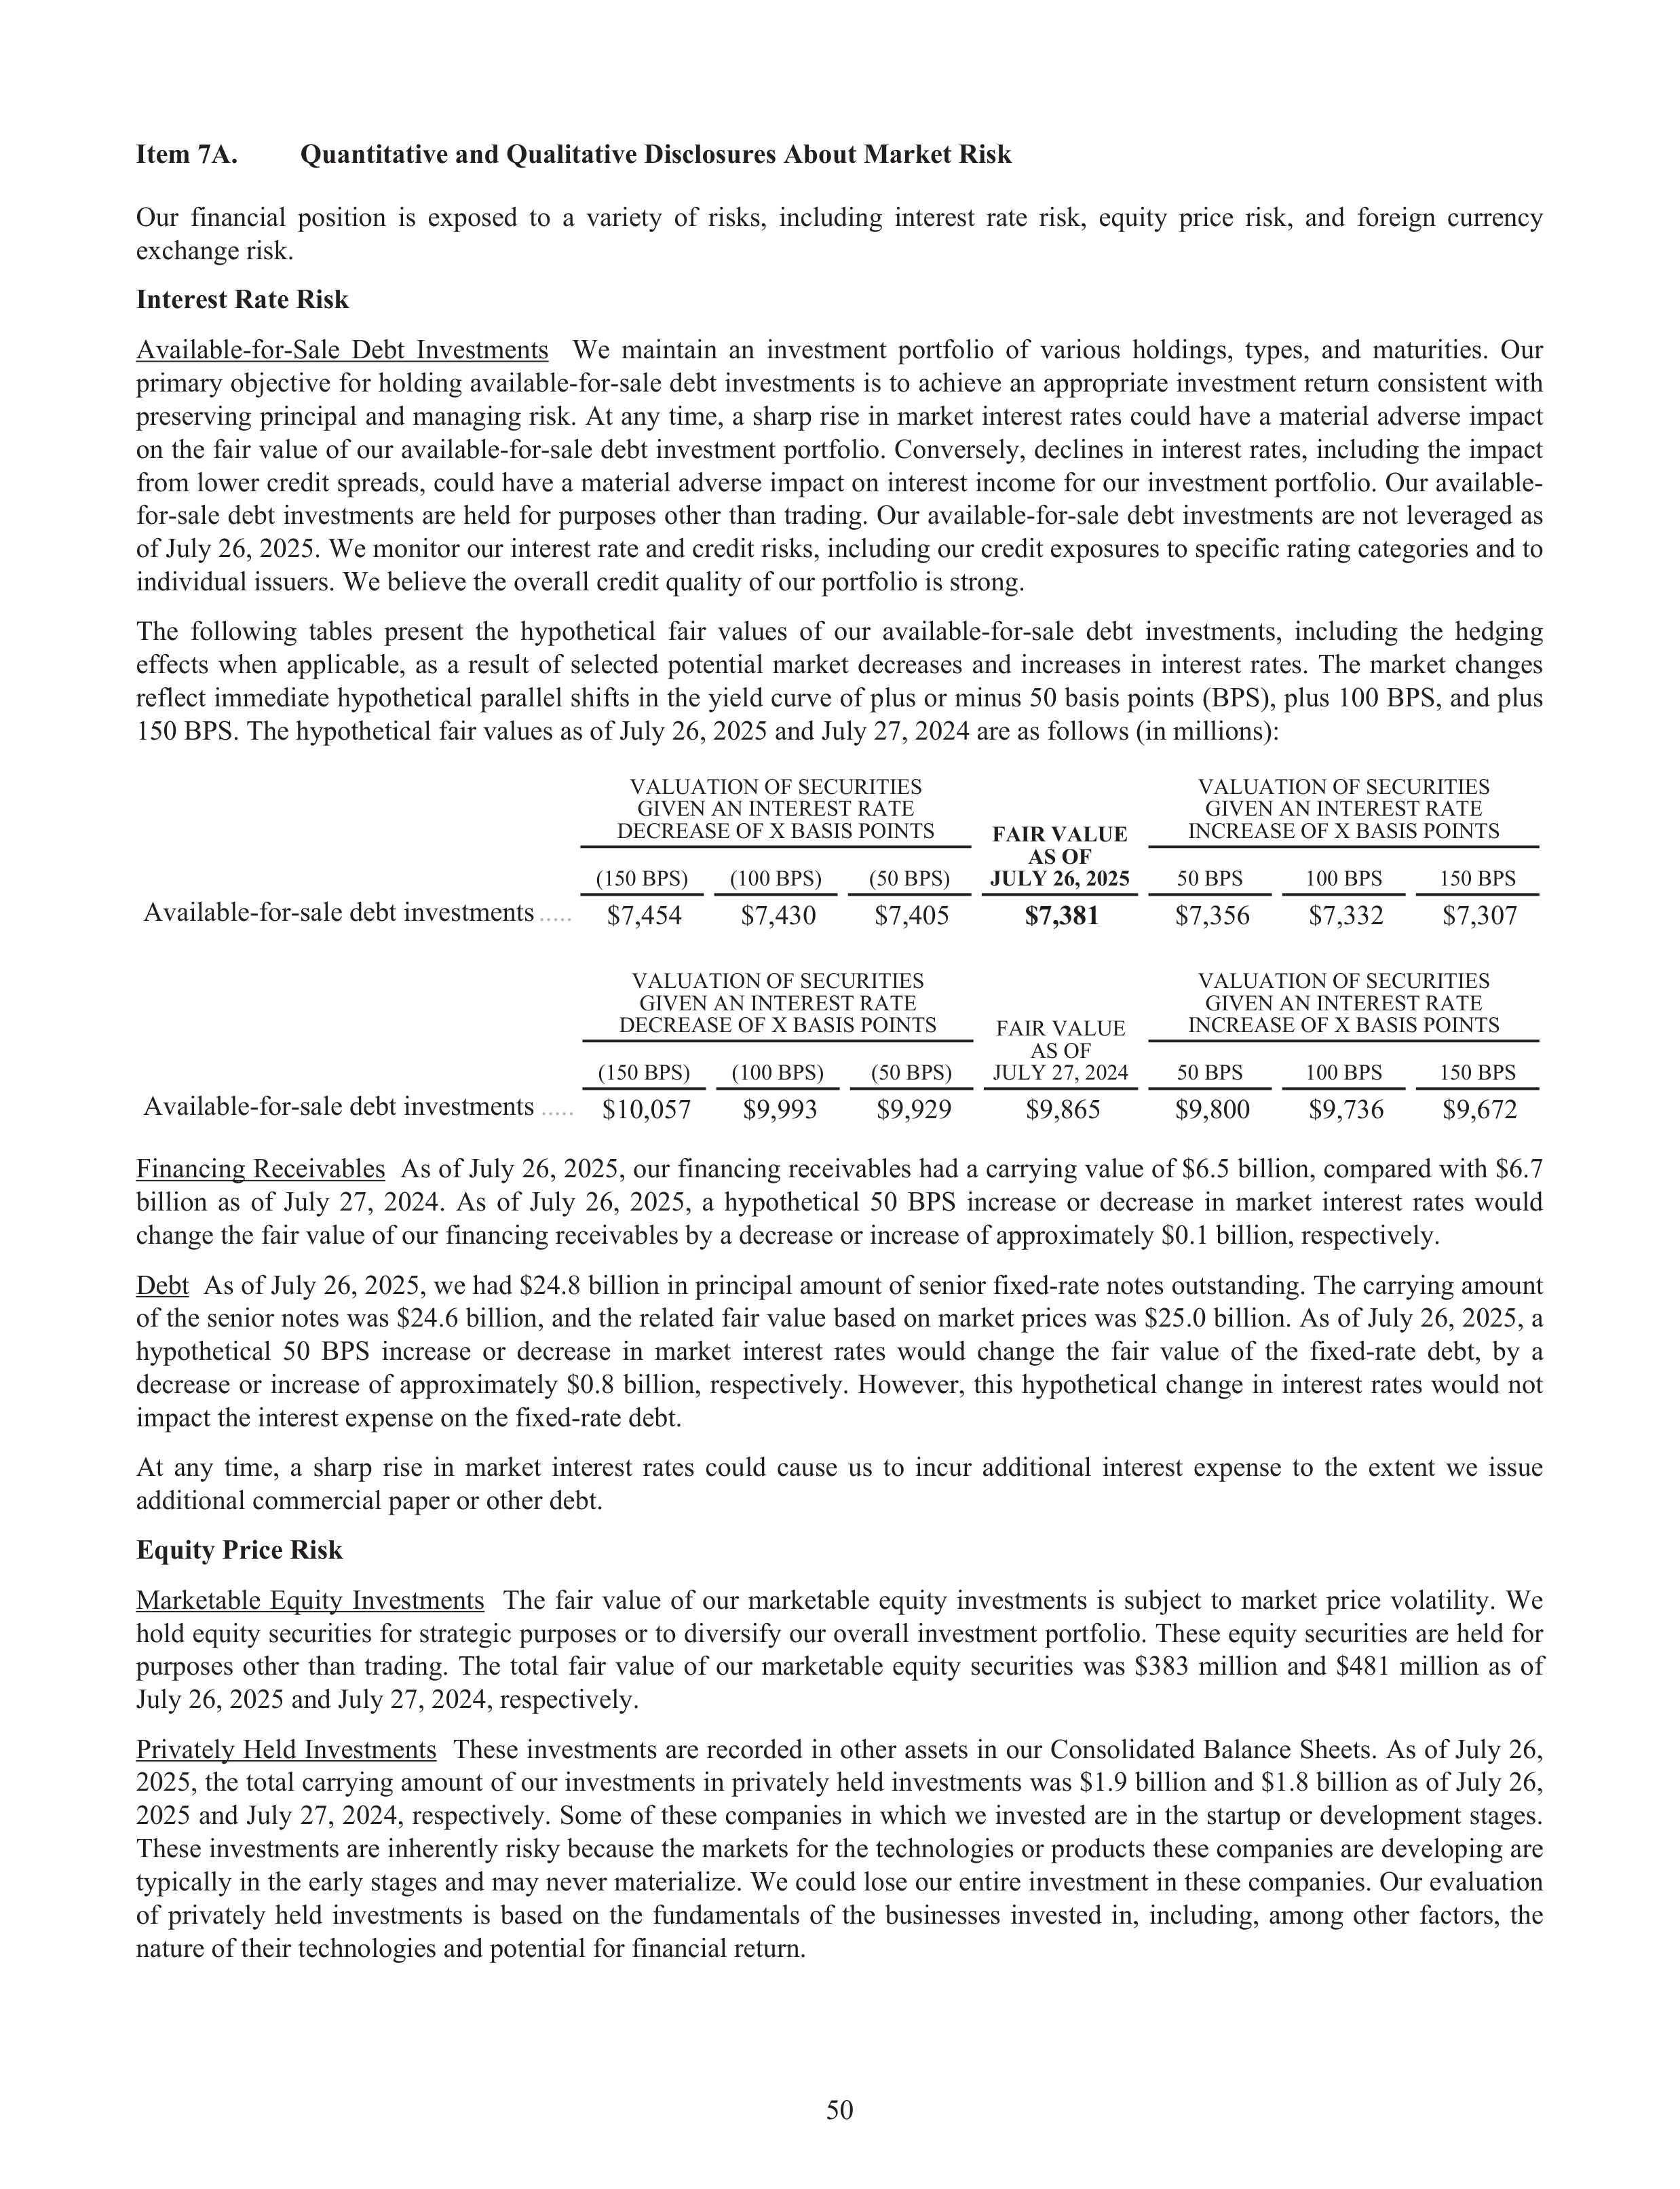
Item 7A.
Quantitative and Qualitative Disclosures About Market Risk
Our financial position is exposed to a variety of risks, including interest rate risk, equity price risk, and foreign currency
exchange risk.
Interest Rate Risk
Available-for-Sale Debt Investments We maintain an investment portfolio of various holdings, types, and maturities. Our
primary objective for holding available-for-sale debt investments is to achieve an appropriate investment return consistent with
preserving principal and managing risk. At any time, a sharp rise in market interest rates could have a material adverse impact
on the fair value of our available-for-sale debt investment portfolio. Conversely, declines in interest rates, including the impact
from lower credit spreads, could have a material adverse impact on interest income for our investment portfolio. Our available-
for-sale debt investments are held for purposes other than trading. Our available-for-sale debt investments are not leveraged as
of July 26, 2025. We monitor our interest rate and credit risks, including our credit exposures to specific rating categories and to
individual issuers. We believe the overall credit quality of our portfolio is strong.
The following tables present the hypothetical fair values of our available-for-sale debt investments, including the hedging
effects when applicable, as a result of selected potential market decreases and increases in interest rates. The market changes
reflect immediate hypothetical parallel shifts in the yield curve of plus or minus 50 basis points (BPS), plus 100 BPS, and plus
150 BPS. The hypothetical fair values as of July 26, 2025 and July 27, 2024 are as follows (in millions):
VALUATION OF SECURITIES
GIVEN AN INTEREST RATE
DECREASE OF X BASIS POINTS
FAIR VALUE
AS OF
JULY 26, 2025
VALUATION OF SECURITIES
GIVEN AN INTEREST RATE
INCREASE OF X BASIS POINTS
(150 BPS)
(100 BPS)
(50 BPS)
50 BPS
100 BPS
150 BPS
Available-for-sale debt investments
.....
$7,454
$7,430
$7,405
$7,381
$7,356
$7,332
$7,307
VALUATION OF SECURITIES
GIVEN AN INTEREST RATE
DECREASE OF X BASIS POINTS
FAIR VALUE
AS OF
JULY 27, 2024
VALUATION OF SECURITIES
GIVEN AN INTEREST RATE
INCREASE OF X BASIS POINTS
(150 BPS)
(100 BPS)
(50 BPS)
50 BPS
100 BPS
150 BPS
Available-for-sale debt investments
.....
$10,057
$9,993
$9,929
$9,865
$9,800
$9,736
$9,672
Financing Receivables As of July 26, 2025, our financing receivables had a carrying value of $6.5 billion, compared with $6.7
billion as of July 27, 2024. As of July 26, 2025, a hypothetical 50 BPS increase or decrease in market interest rates would
change the fair value of our financing receivables by a decrease or increase of approximately $0.1 billion, respectively.
Debt As of July 26, 2025, we had $24.8 billion in principal amount of senior fixed-rate notes outstanding. The carrying amount
of the senior notes was $24.6 billion, and the related fair value based on market prices was $25.0 billion. As of July 26, 2025, a
hypothetical 50 BPS increase or decrease in market interest rates would change the fair value of the fixed-rate debt,
by a
decrease or increase of approximately $0.8 billion, respectively. However, this hypothetical change in interest rates would not
impact the interest expense on the fixed-rate debt.
At any time, a sharp rise in market interest rates could cause us to incur additional interest expense to the extent we issue
additional commercial paper or other debt.
Equity Price Risk
Marketable Equity Investments The fair value of our marketable equity investments is subject to market price volatility. We
hold equity securities for strategic purposes or to diversify our overall investment portfolio. These equity securities are held for
purposes other than trading. The total fair value of our marketable equity securities was $383 million
and $481 million as of
July 26, 2025 and July 27, 2024, respectively.
Privately Held Investments These investments are recorded in other assets in our Consolidated Balance Sheets. As of July 26,
2025, the total carrying amount of our investments in privately held investments was $1.9 billion and $1.8 billion as of July 26,
2025 and July 27, 2024, respectively. Some of these companies in which we invested are in the startup or development stages.
These investments are inherently risky because the markets for the technologies or products these companies are developing are
typically in the early stages and may never materialize. We could lose our entire investment in these companies. Our evaluation
of privately held investments is based on the fundamentals of the businesses invested in, including, among other factors, the
nature of their technologies and potential for financial return.
50
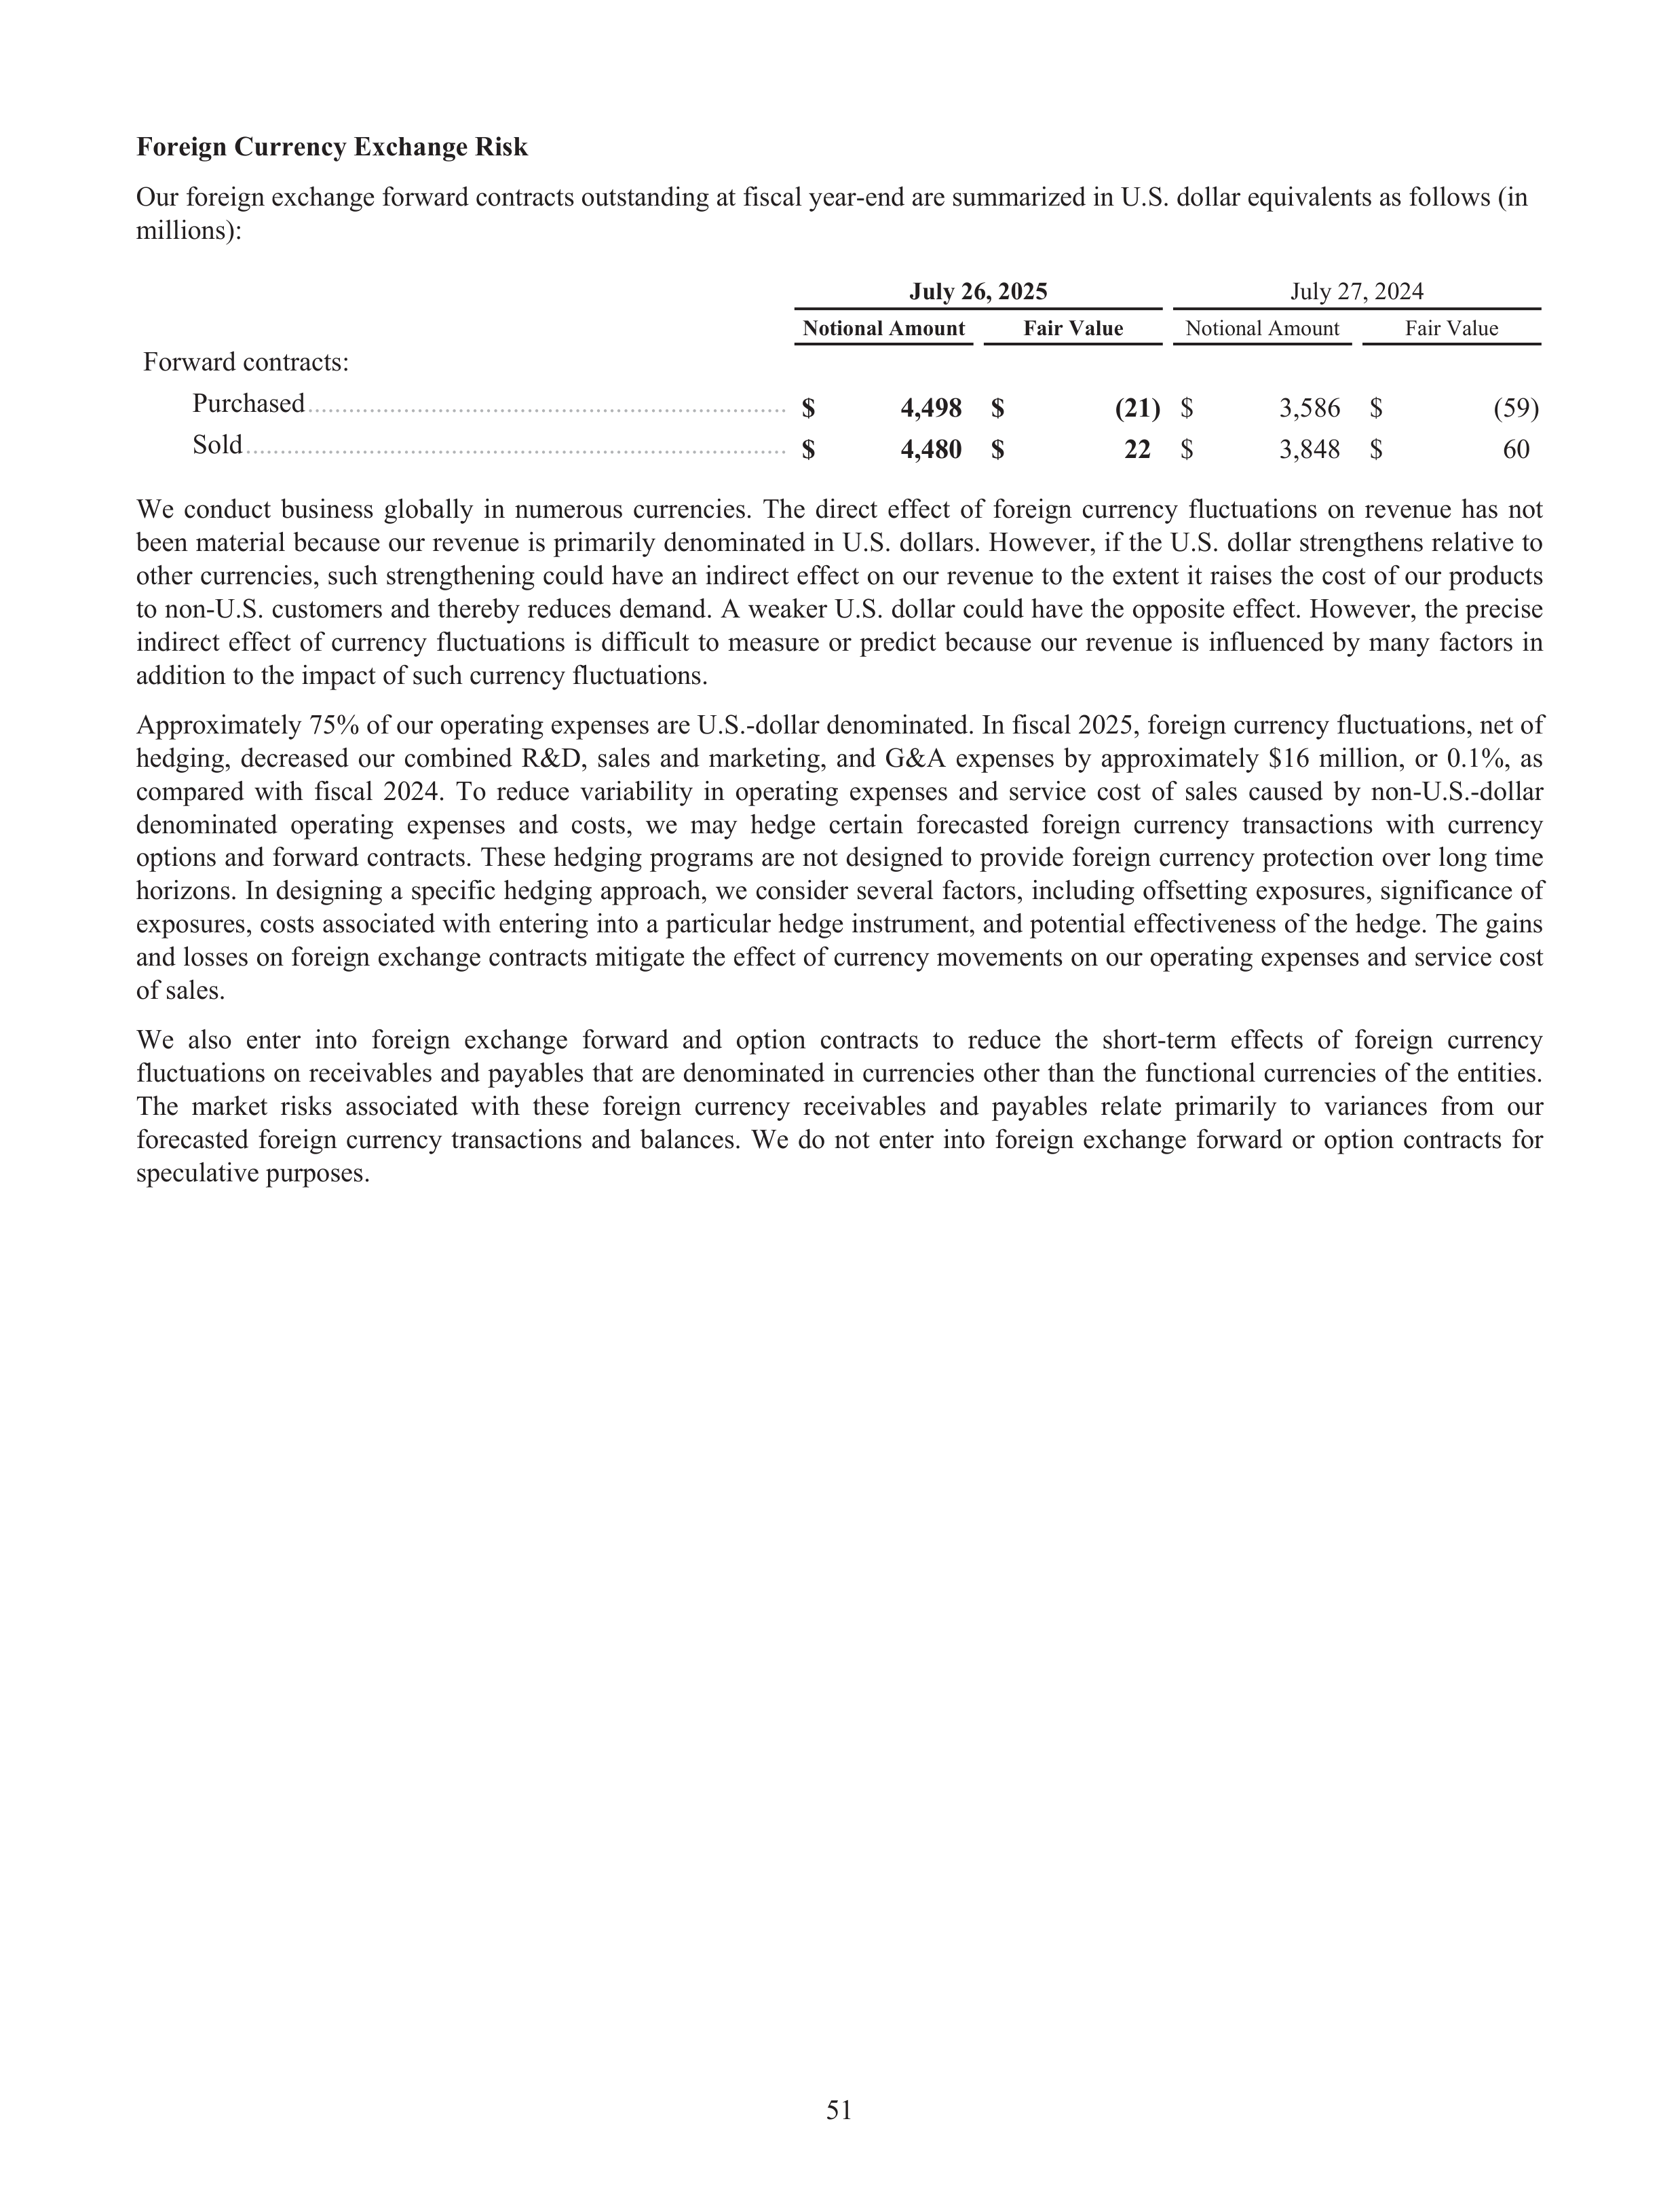
July 26, 2025
July 27, 2024
Notional Amount
Fair Value
Notional Amount
Fair Value
Forward contracts:
Purchased
......................................................................
$
4,498 $
(21)
$
3,586 $
(59)
Sold
...............................................................................
$
4,480 $
22
$
3,848 $
60
We conduct business globally in numerous currencies. The direct effect of foreign currency fluctuations on revenue has not
been material because our revenue is primarily denominated in U.S. dollars. However, if the U.S. dollar strengthens relative to
other currencies, such strengthening could have an indirect effect on our revenue to the extent it raises the cost of our products
to non-U.S. customers and thereby reduces demand. A weaker U.S. dollar could have the opposite effect. However, the precise
indirect effect of currency fluctuations is difficult to measure or predict because our revenue is influenced by many factors in
addition to the impact of such currency fluctuations.
Approximately 75% of our operating expenses are U.S.-dollar denominated. In fiscal 2025, foreign currency fluctuations, net of
hedging, decreased our combined R&D, sales and marketing, and G&A expenses by approximately $16 million, or 0.1%, as
compared with fiscal 2024. To reduce variability in operating expenses and service cost of sales caused by non-U.S.-dollar
denominated operating expenses and costs, we may hedge certain forecasted foreign currency transactions with currency
options and forward contracts. These hedging programs are not designed to provide foreign currency protection over long time
horizons. In designing a specific hedging approach, we consider several factors, including offsetting exposures, significance of
exposures, costs associated with entering into a particular hedge instrument, and potential effectiveness of the hedge. The gains
and losses on foreign exchange contracts mitigate the effect of currency movements on our operating expenses and service cost
of sales.
We also enter into foreign exchange forward and option contracts to reduce the short-term effects of foreign currency
fluctuations on receivables and payables that are denominated in currencies other than the functional currencies of the entities.
The market risks associated with these foreign currency receivables and payables relate primarily to variances from our
forecasted foreign currency transactions and balances. We do not enter into foreign exchange forward or option contracts for
speculative purposes.
Foreign Currency Exchange Risk
Our foreign exchange forward contracts outstanding at fiscal year-end are summarized in U.S. dollar equivalents as follows (in
millions):
51
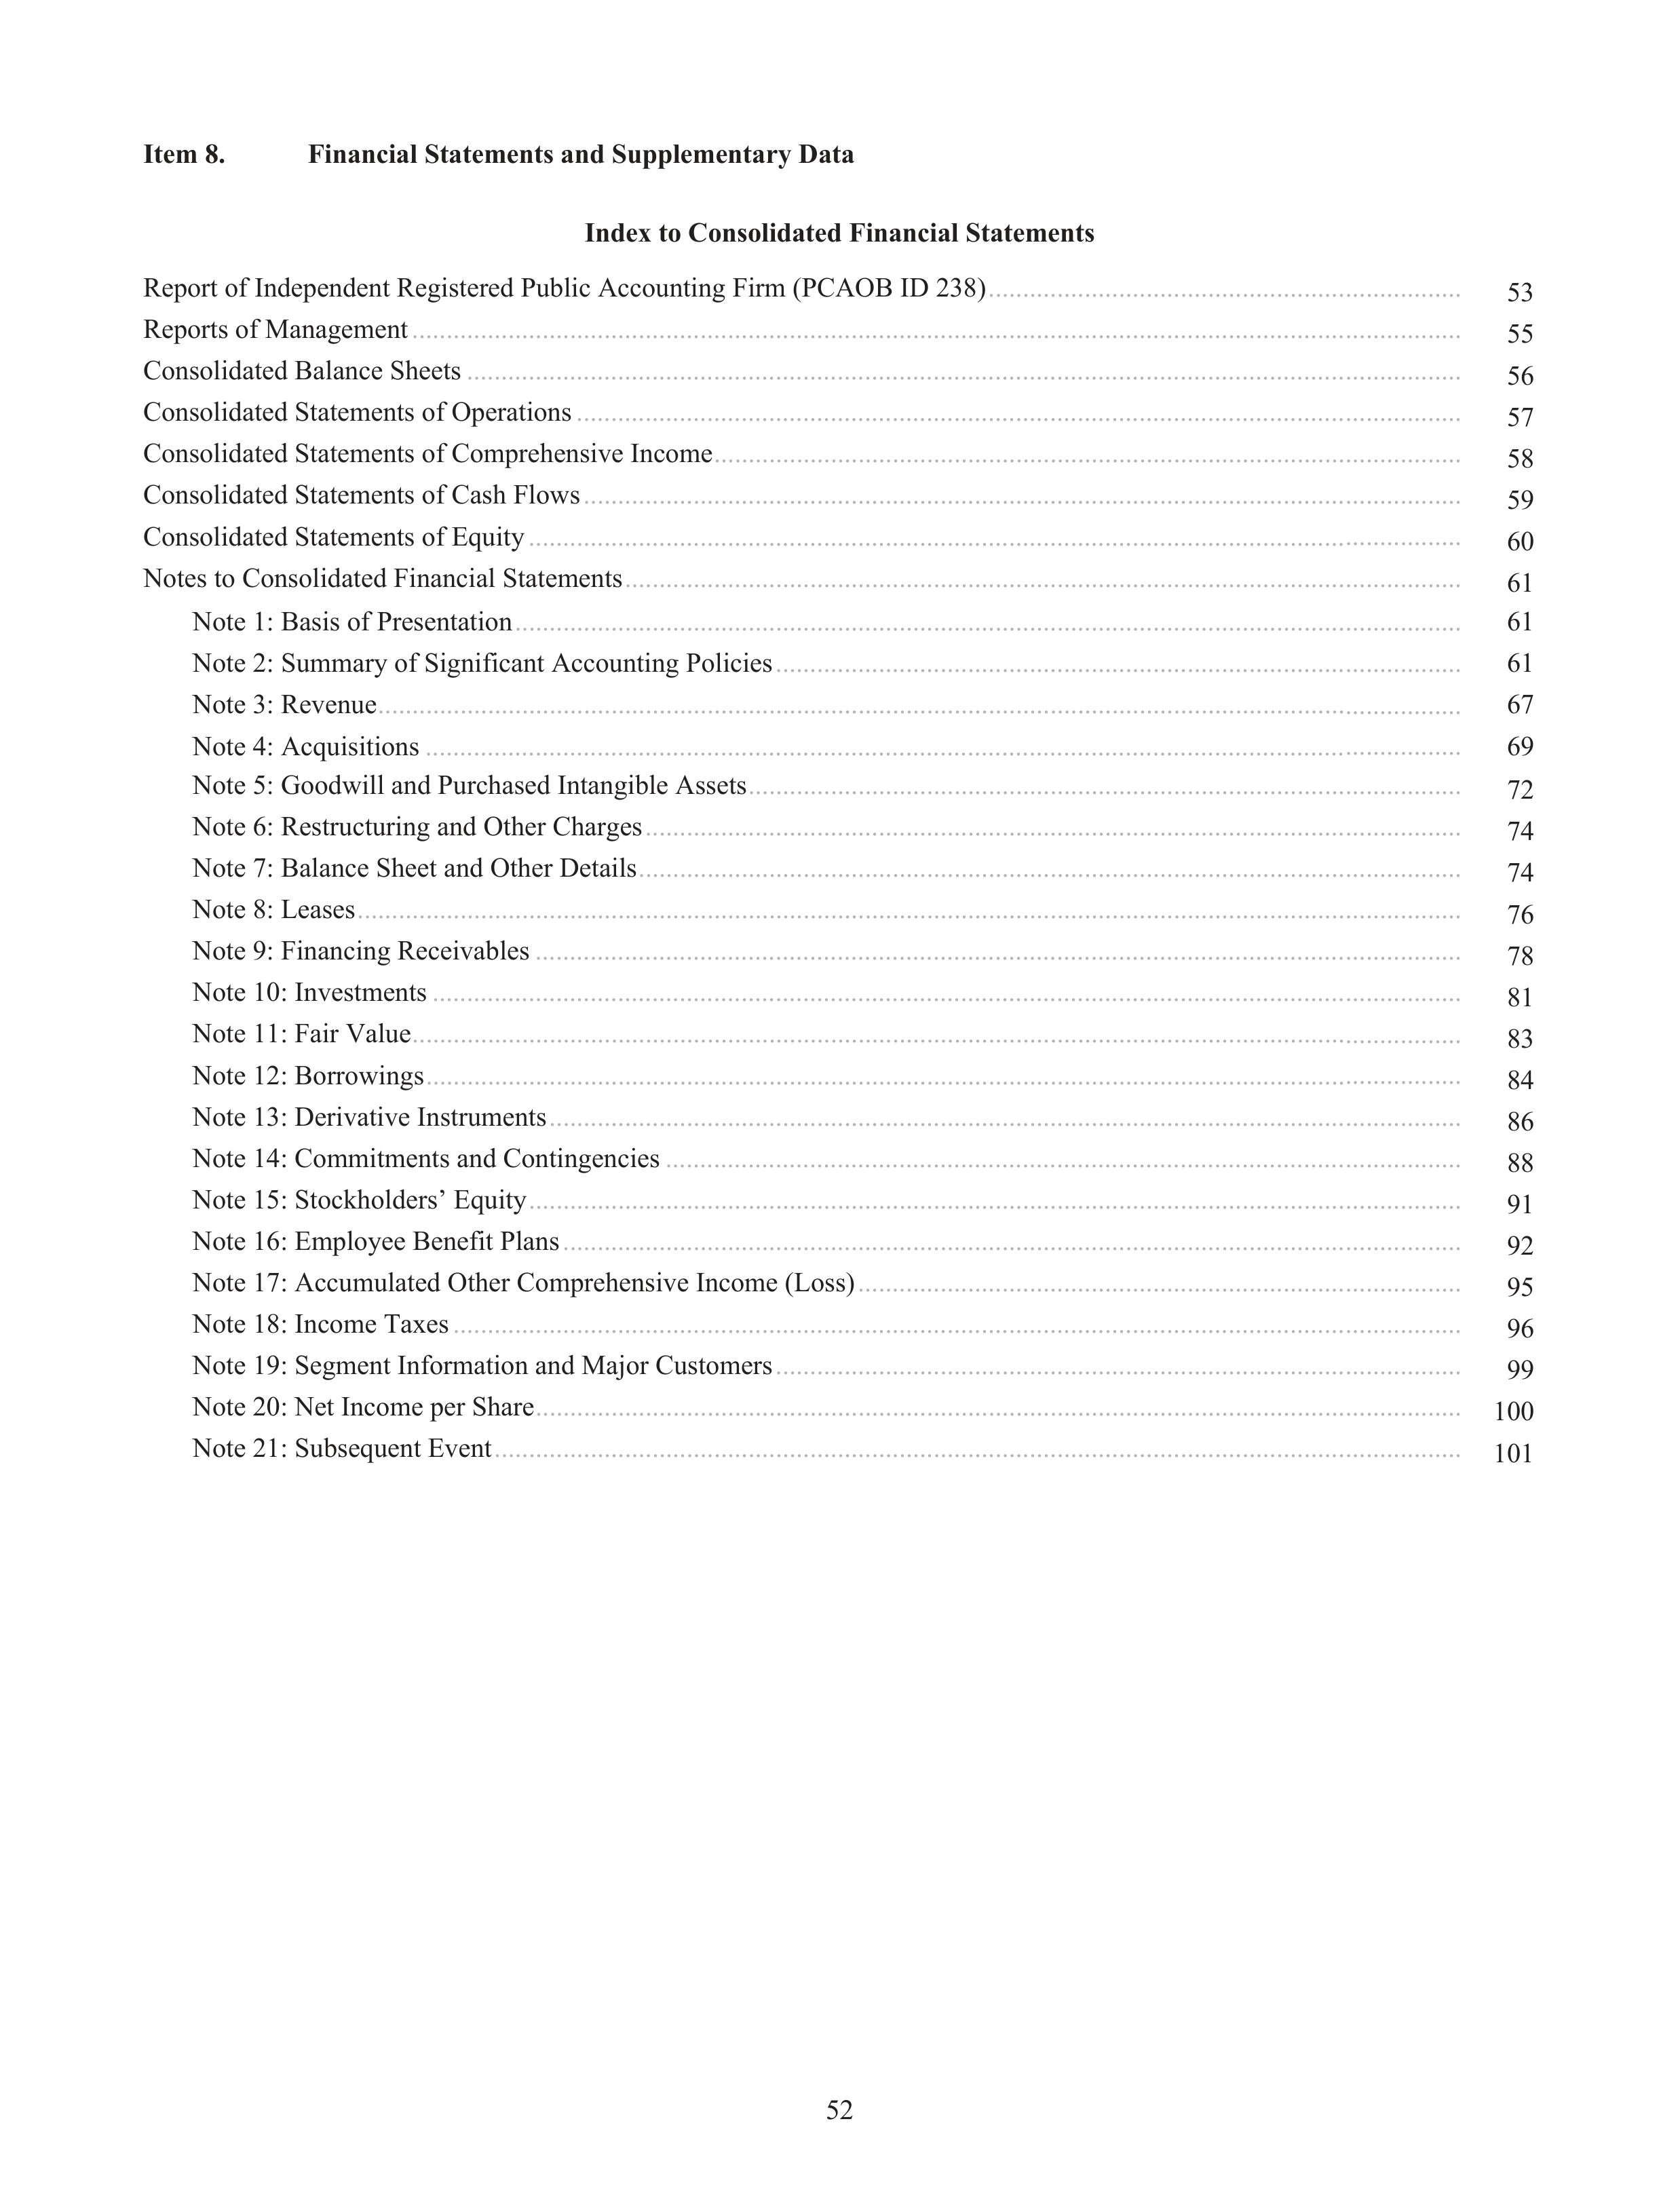
Item 8.
Financial Statements and Supplementary Data
Index to Consolidated Financial Statements
Report of Independent Registered Public Accounting Firm (PCAOB ID 238)
....................................................
53
Reports of Management
........................................................................................................................................
55
Consolidated Balance Sheets
................................................................................................................................
56
Consolidated Statements of Operations
................................................................................................................
57
Consolidated Statements of Comprehensive Income
............................................................................................
58
Consolidated Statements of Cash Flows
...............................................................................................................
59
Consolidated Statements of Equity
.......................................................................................................................
60
Notes to Consolidated Financial Statements
.........................................................................................................
61
Note 1: Basis of Presentation
.........................................................................................................................
61
Note 2: Summary of Significant Accounting Policies
...................................................................................
61
Note 3: Revenue
.............................................................................................................................................
67
Note 4: Acquisitions
......................................................................................................................................
69
Note 5: Goodwill and Purchased Intangible Assets
.......................................................................................
72
Note 6: Restructuring and Other Charges
......................................................................................................
74
Note 7: Balance Sheet and Other Details
.......................................................................................................
74
Note 8: Leases
................................................................................................................................................
76
Note 9: Financing Receivables
......................................................................................................................
78
Note 10: Investments
.....................................................................................................................................
81
Note 11: Fair Value
........................................................................................................................................
83
Note 12: Borrowings
......................................................................................................................................
84
Note 13: Derivative Instruments
....................................................................................................................
86
Note 14: Commitments and Contingencies
...................................................................................................
88
Note 15: Stockholders’ Equity
.......................................................................................................................
91
Note 16: Employee Benefit Plans
..................................................................................................................
92
Note 17: Accumulated Other Comprehensive Income (Loss)
.......................................................................
95
Note 18: Income Taxes
..................................................................................................................................
96
Note 19: Segment Information and Major Customers
...................................................................................
99
Note 20: Net Income per Share
......................................................................................................................
100
Note 21: Subsequent Event
............................................................................................................................
101
52
.................
.................
.................
.................
.................
.................
.................
.................
.................
.................
.................
.................
.................
.................
.................
.................
.................
.................
.................
.................
.................
.................
.................
.................
.................
.................
.................
.................
.................
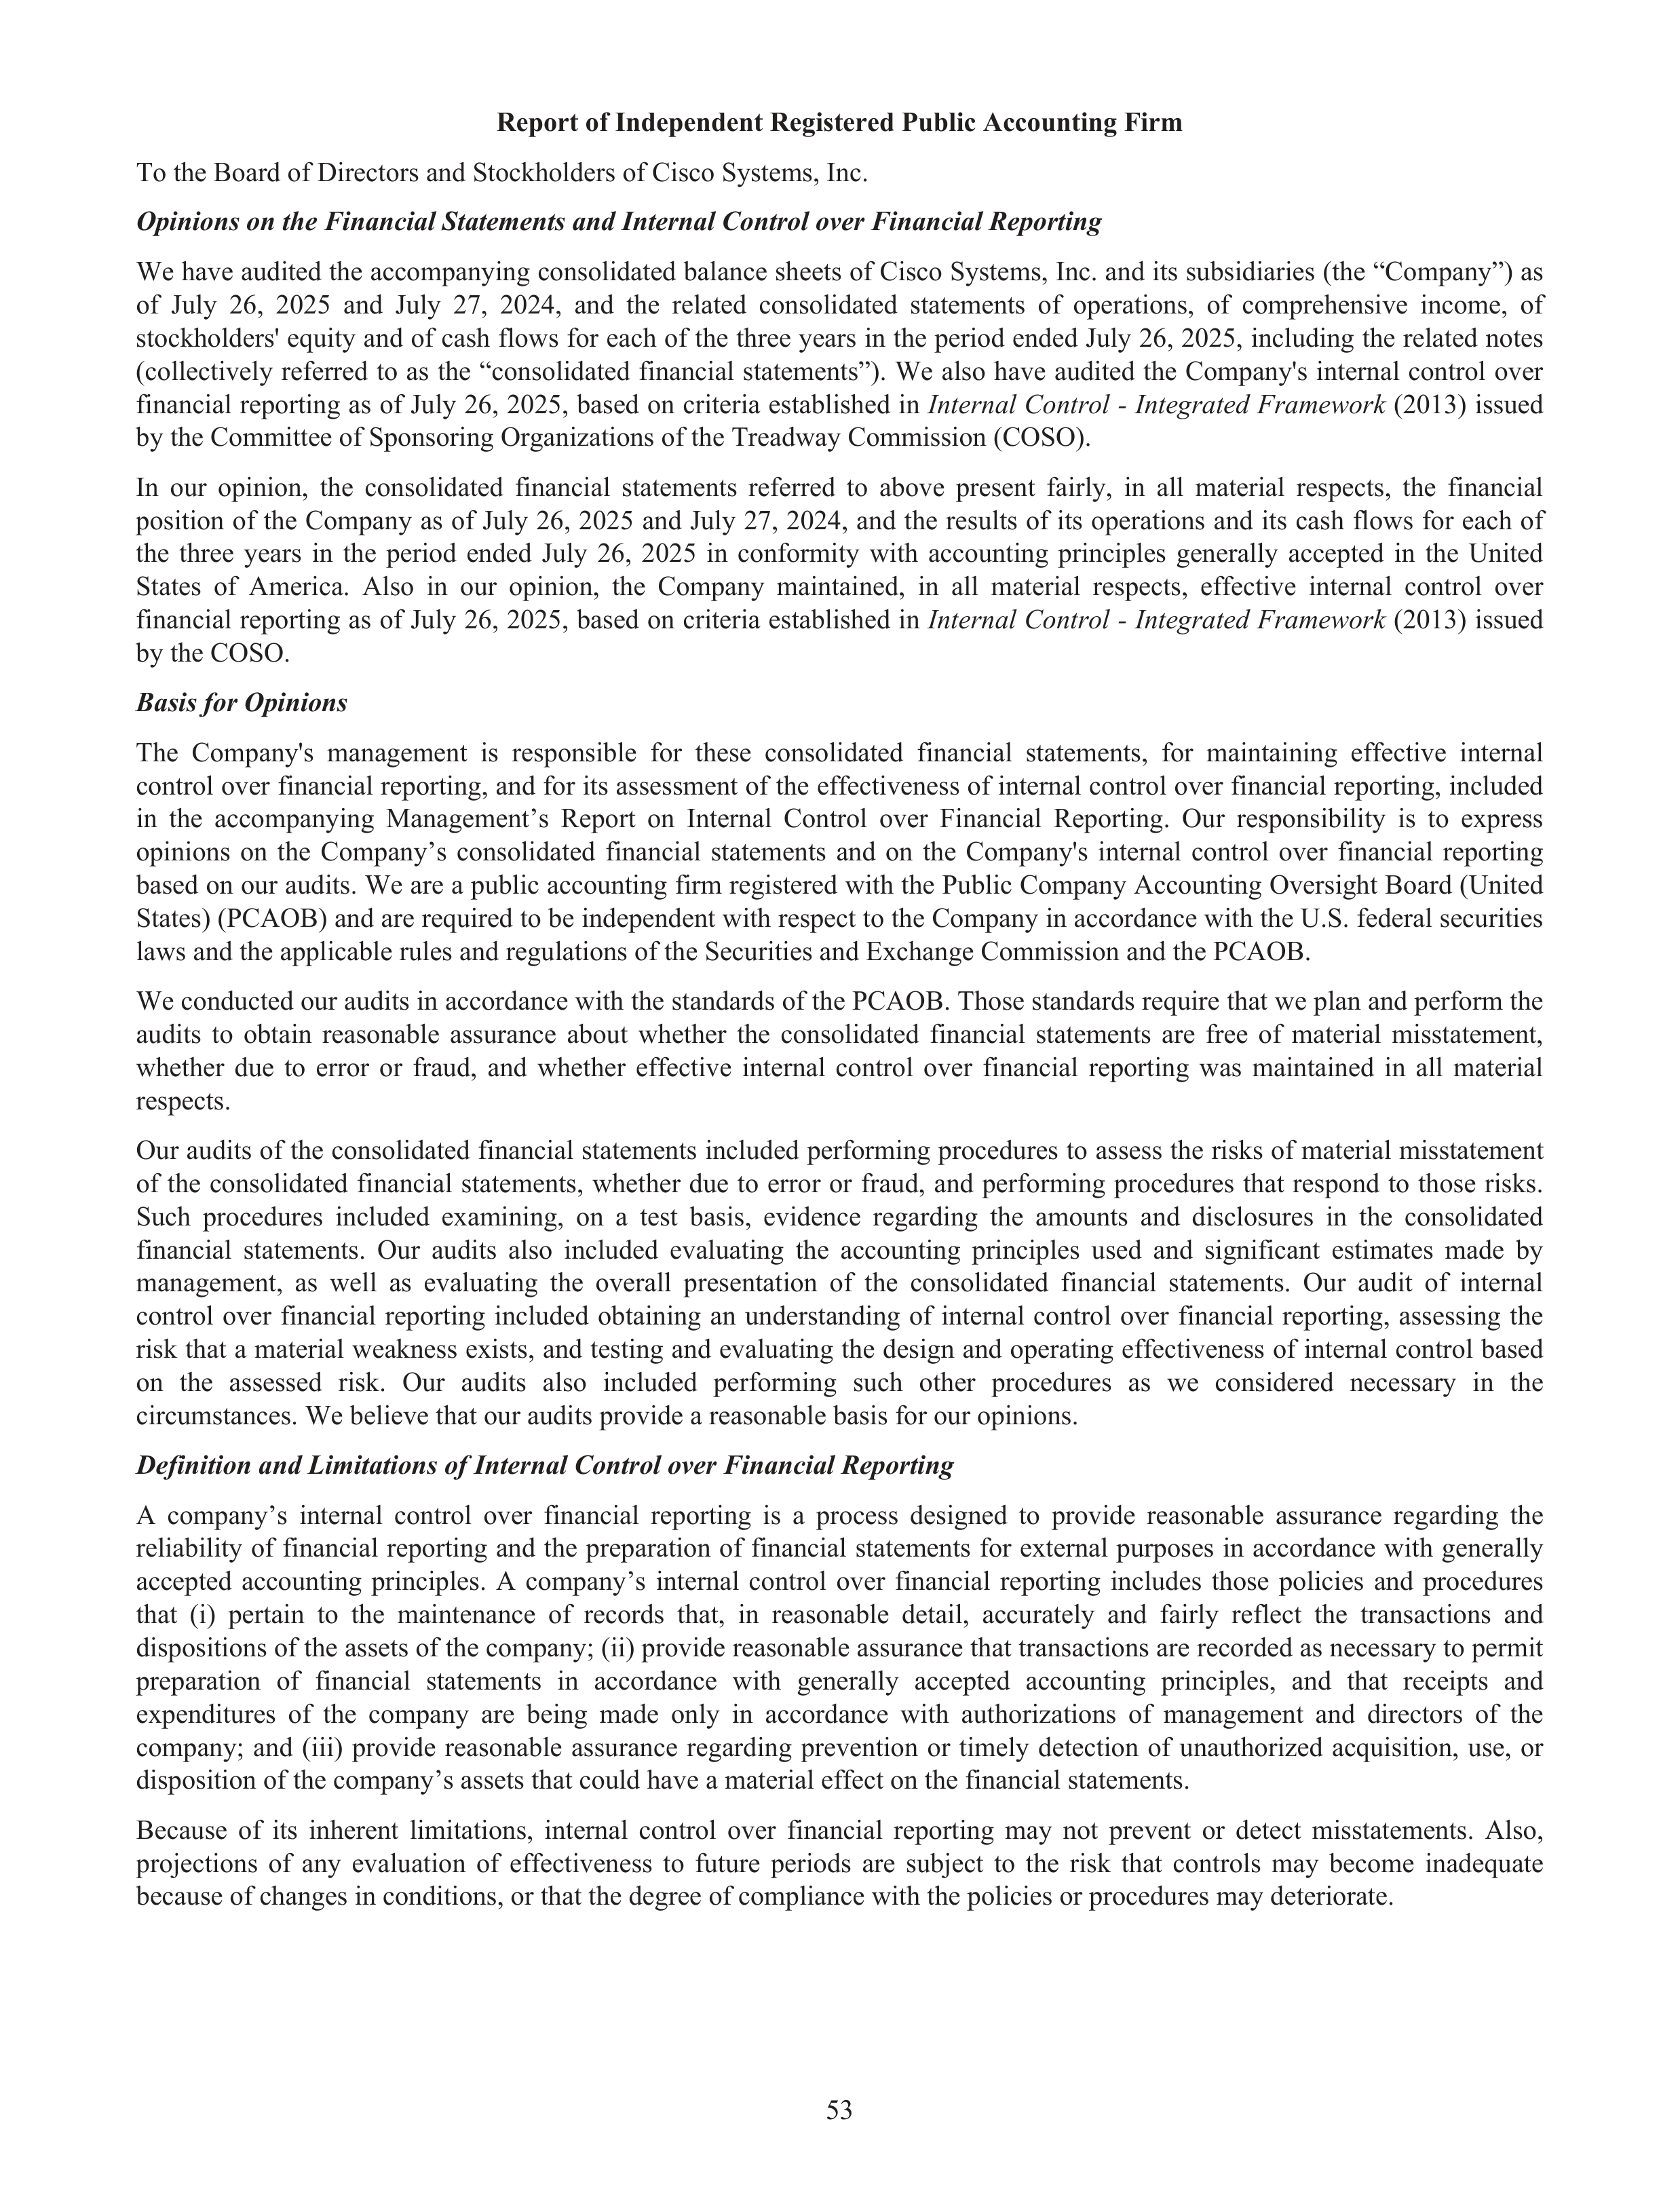
Report of Independent Registered Public Accounting Firm
To the Board of Directors and Stockholders of Cisco Systems, Inc.
Opinions on the Financial Statements and Internal Control over Financial Reporting
We have audited the accompanying consolidated balance sheets of Cisco Systems, Inc. and its subsidiaries (the “Company”) as
of July 26, 2025 and July 27, 2024, and the related consolidated statements of operations, of comprehensive income, of
stockholders' equity and of cash flows for each of the three years in the period ended July 26, 2025, including the related notes
(collectively referred to as the “consolidated financial statements”). We also have audited the Company's internal control over
financial reporting as of July 26, 2025, based on criteria established in
Internal Control - Integrated Framework
(2013) issued
by the Committee of Sponsoring Organizations of the Treadway Commission (COSO).
In our opinion, the consolidated financial
statements referred to above present fairly, in all
material respects, the financial
position of the Company as of July 26, 2025 and July 27, 2024, and the results of its operations and its cash flows for each of
the
three years in the period ended July 26, 2025 in conformity with accounting principles generally accepted in the United
States of America. Also in our opinion, the Company maintained, in all
material
respects, effective
internal control over
financial reporting as of July 26, 2025, based on criteria established in
Internal Control - Integrated Framework
(2013) issued
by the COSO.
Basis for Opinions
The
Company's management is responsible for these consolidated financial
statements, for maintaining effective
internal
control over financial reporting, and for its assessment of the effectiveness of internal control over financial reporting, included
in the accompanying Management’s Report on Internal Control over Financial Reporting. Our responsibility is to express
opinions on the Company’s consolidated financial statements and on the Company's internal control over financial reporting
based on our audits. We are a public accounting firm registered with the Public Company Accounting Oversight Board (United
States) (PCAOB) and are required to be independent with respect to the Company in accordance with the U.S. federal securities
laws and the applicable rules and regulations of the Securities and Exchange Commission and the PCAOB.
We conducted our audits in accordance with the standards of the PCAOB. Those standards require that we plan and perform the
audits to obtain reasonable assurance about whether the consolidated financial
statements are free of material
misstatement,
whether due to error or fraud, and whether effective internal control over financial
reporting was maintained in all
material
respects.
Our audits of the consolidated financial statements included performing procedures to assess the risks of material misstatement
of the consolidated financial statements, whether due to error or fraud, and performing procedures that respond to those risks.
Such procedures included examining, on a test basis, evidence regarding the amounts and disclosures in the consolidated
financial
statements. Our audits also included evaluating the accounting principles used and significant estimates made by
management, as well
as evaluating the
overall presentation of the consolidated financial
statements. Our audit
of internal
control over financial reporting included obtaining an understanding of internal control over financial reporting, assessing the
risk that a material weakness exists, and testing and evaluating the design and operating effectiveness of internal control based
on the assessed risk. Our audits also included performing such other procedures as we considered necessary in the
circumstances. We believe that our audits provide a reasonable basis for our opinions.
Definition and Limitations of Internal Control over Financial Reporting
A company’s internal control over financial reporting is a process designed to provide reasonable assurance regarding the
reliability of financial reporting and the preparation of financial statements for external purposes in accordance with generally
accepted accounting principles. A company’s internal control over financial reporting includes those policies and procedures
that
(i) pertain to the
maintenance of records that, in reasonable detail, accurately and fairly reflect
the transactions and
dispositions of the assets of the company; (ii) provide reasonable assurance that transactions are recorded as necessary to permit
preparation of financial statements in accordance
with generally accepted accounting principles, and that
receipts and
expenditures of the company are being made only in accordance with authorizations of management and directors of the
company; and (iii) provide reasonable assurance regarding prevention or timely detection of unauthorized acquisition, use, or
disposition of the company’s assets that could have a material effect on the financial statements.
Because of its inherent limitations, internal control over financial reporting may not prevent or detect
misstatements. Also,
projections of any evaluation of effectiveness to future periods are subject
to the risk that controls may become
inadequate
because of changes in conditions, or that the degree of compliance with the policies or procedures may deteriorate.
53
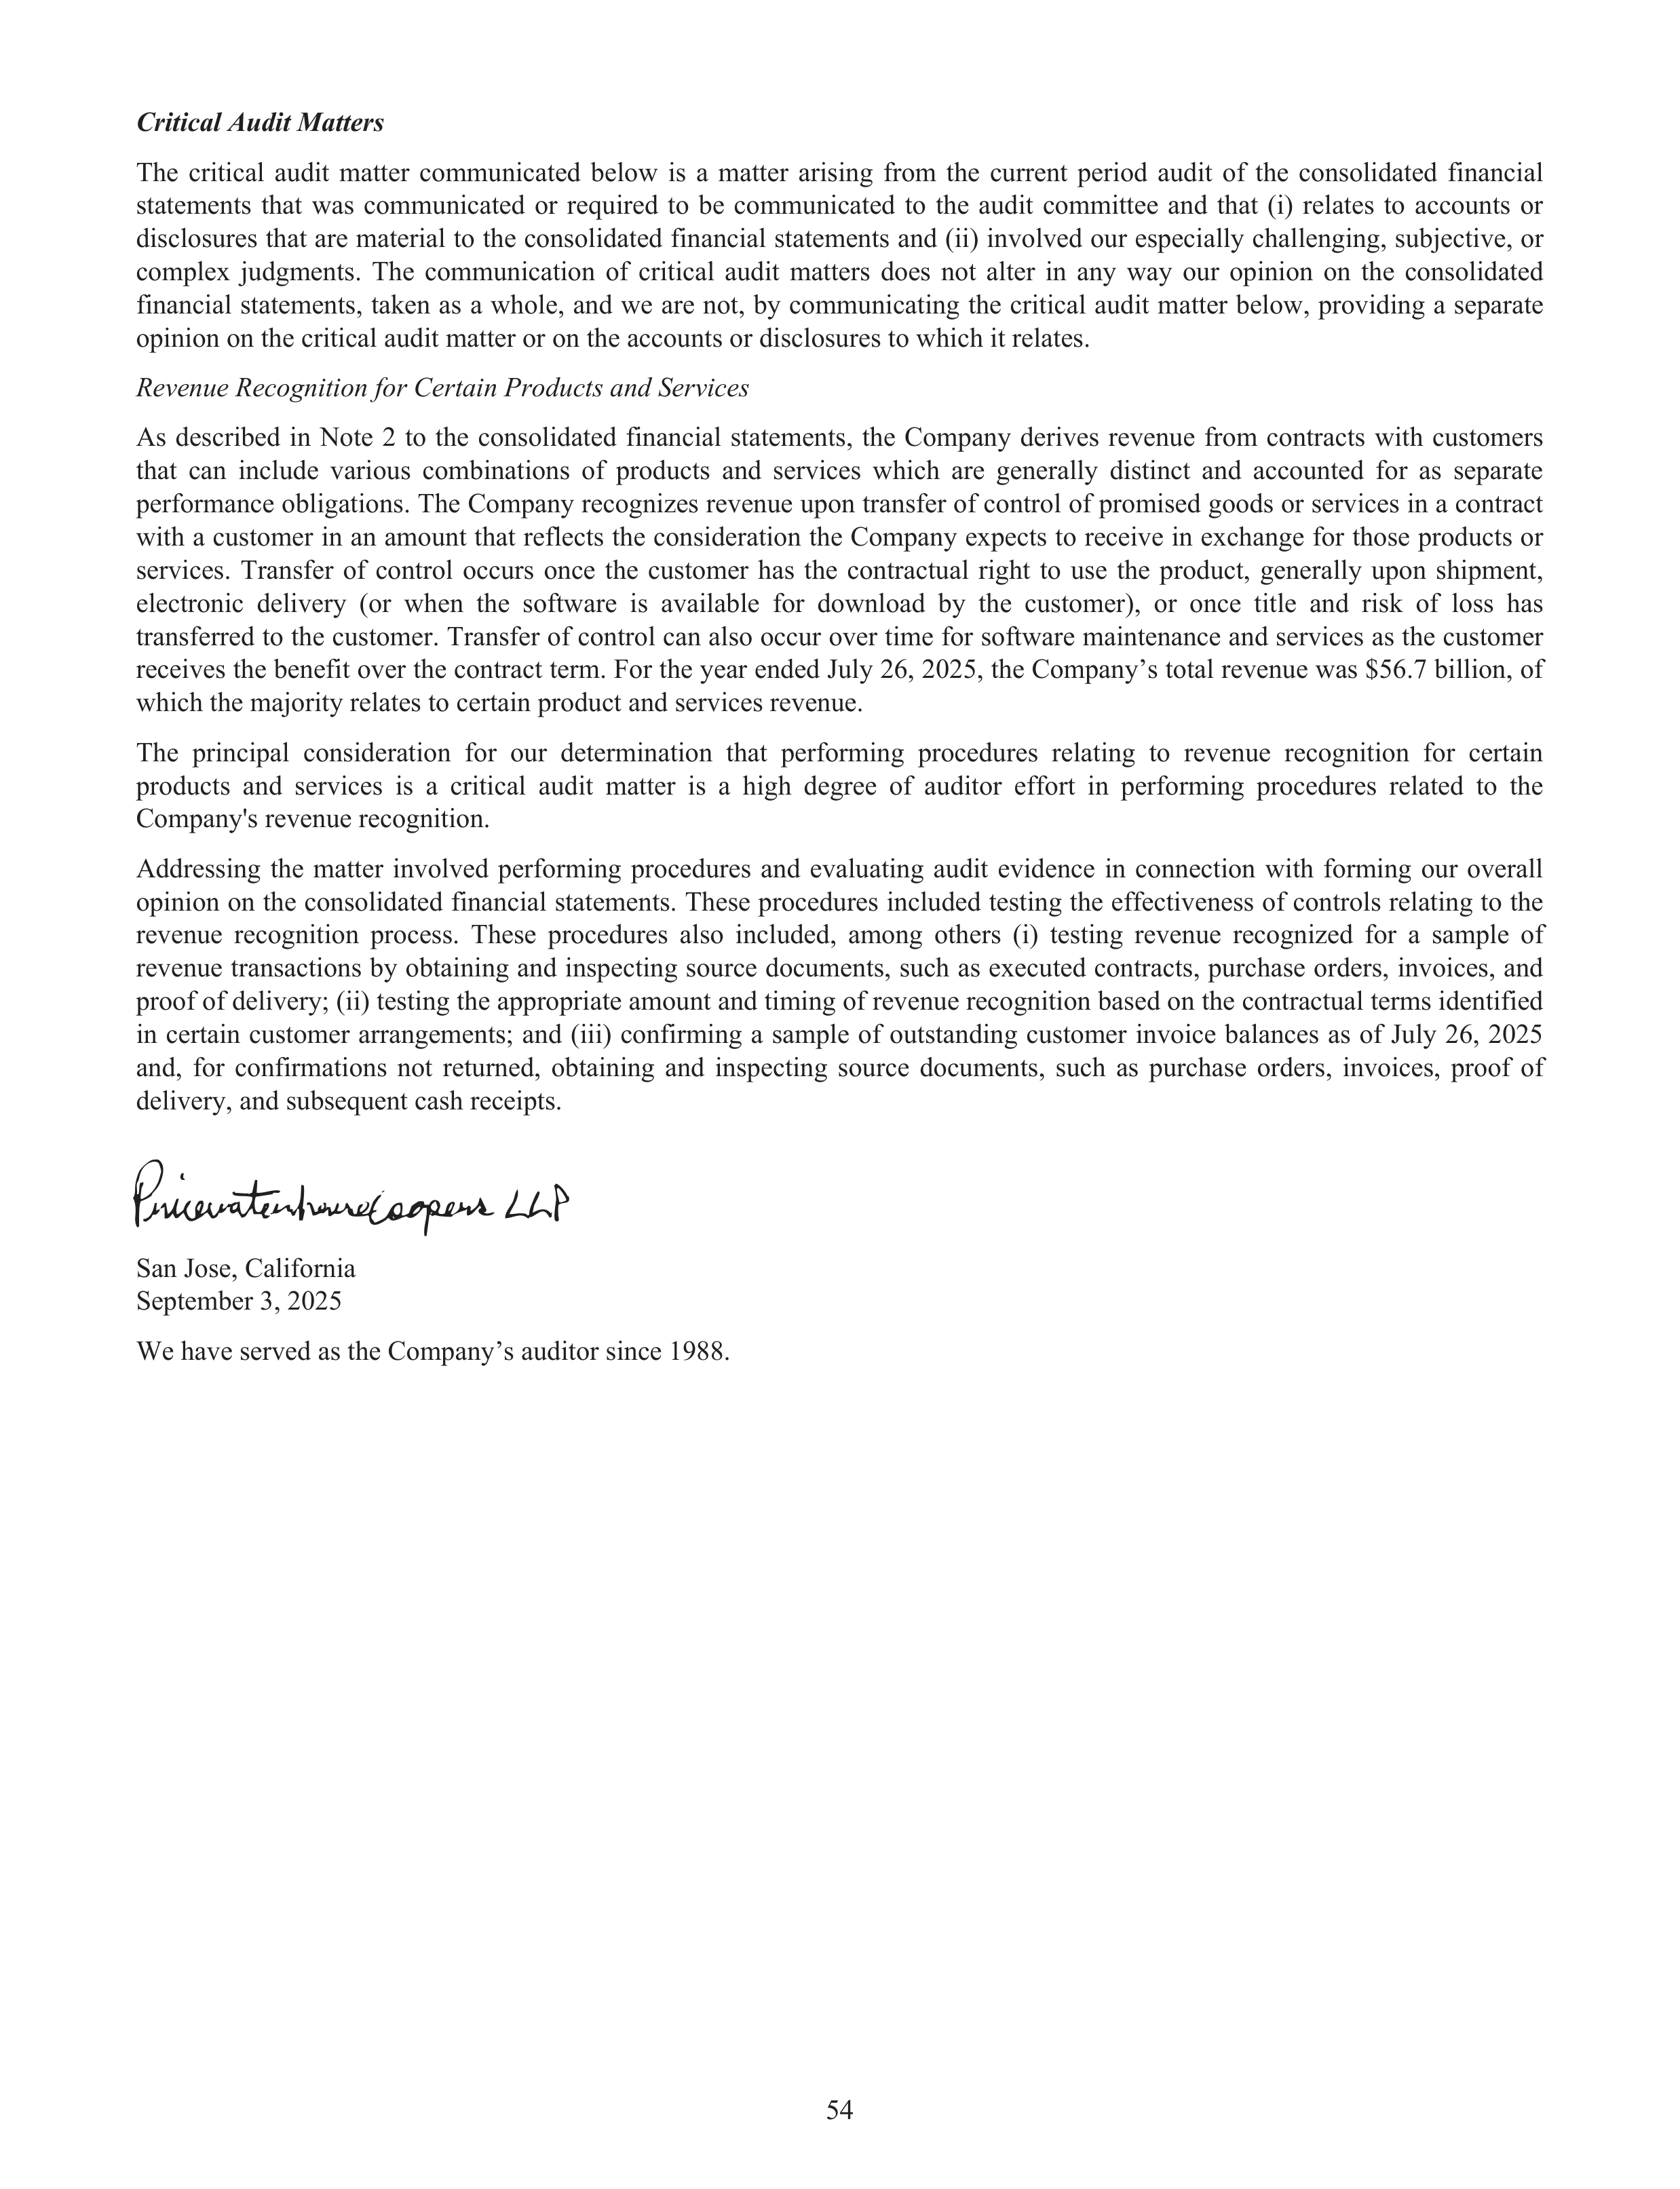
Company's revenue recognition.
Addressing the matter involved performing procedures and evaluating audit evidence in connection with forming our overall
opinion on the consolidated financial statements. These procedures included testing the effectiveness of controls relating to the
revenue recognition process. These procedures also included, among others (i) testing revenue recognized for a sample of
revenue transactions by obtaining and inspecting source documents, such as executed contracts, purchase orders, invoices, and
proof of delivery; (ii) testing the appropriate amount and timing of revenue recognition based on the contractual terms identified
in certain customer arrangements; and (iii) confirming a sample of outstanding customer invoice balances as of July 26, 2025
and, for confirmations not returned, obtaining and inspecting source documents, such as purchase orders, invoices, proof of
delivery, and subsequent cash receipts.
San Jose, California
September 3, 2025
We have served as the Company’s auditor since 1988.
Critical Audit Matters
The
critical
audit
matter communicated below is a
matter arising from
the current period audit of the consolidated financial
statements that was communicated or required to be communicated to the
audit
committee
and that
(i) relates to accounts or
disclosures that are material to the consolidated financial statements and (ii) involved our especially challenging, subjective, or
complex judgments. The communication of critical
audit matters does not alter in any way our opinion on the consolidated
financial statements, taken as a whole, and we are not, by communicating the critical audit matter below, providing a separate
opinion on the critical audit matter or on the accounts or disclosures to which it relates.
Revenue Recognition for Certain Products and Services
As described in Note 2 to the consolidated financial
statements, the Company derives revenue from contracts with customers
that
can include various combinations of products and services which are generally distinct and accounted for as separate
performance obligations. The Company recognizes revenue upon transfer of control of promised goods or services in a contract
with a customer in an amount that reflects the consideration the Company expects to receive in exchange for those products or
services. Transfer of control occurs once the customer has the contractual right to use the product, generally upon shipment,
electronic delivery (or when the software is available for download by the customer), or once title and risk of loss has
transferred to the customer. Transfer of control can also occur over time for software maintenance and services as the customer
receives the benefit over the contract term. For the year ended July 26, 2025, the Company’s total revenue was $56.7 billion, of
which the majority relates to certain product and services revenue.
The
principal consideration for our determination that performing procedures relating to revenue recognition for certain
products and services is a critical
audit
matter is a high degree of auditor effort in performing procedures related to the
54
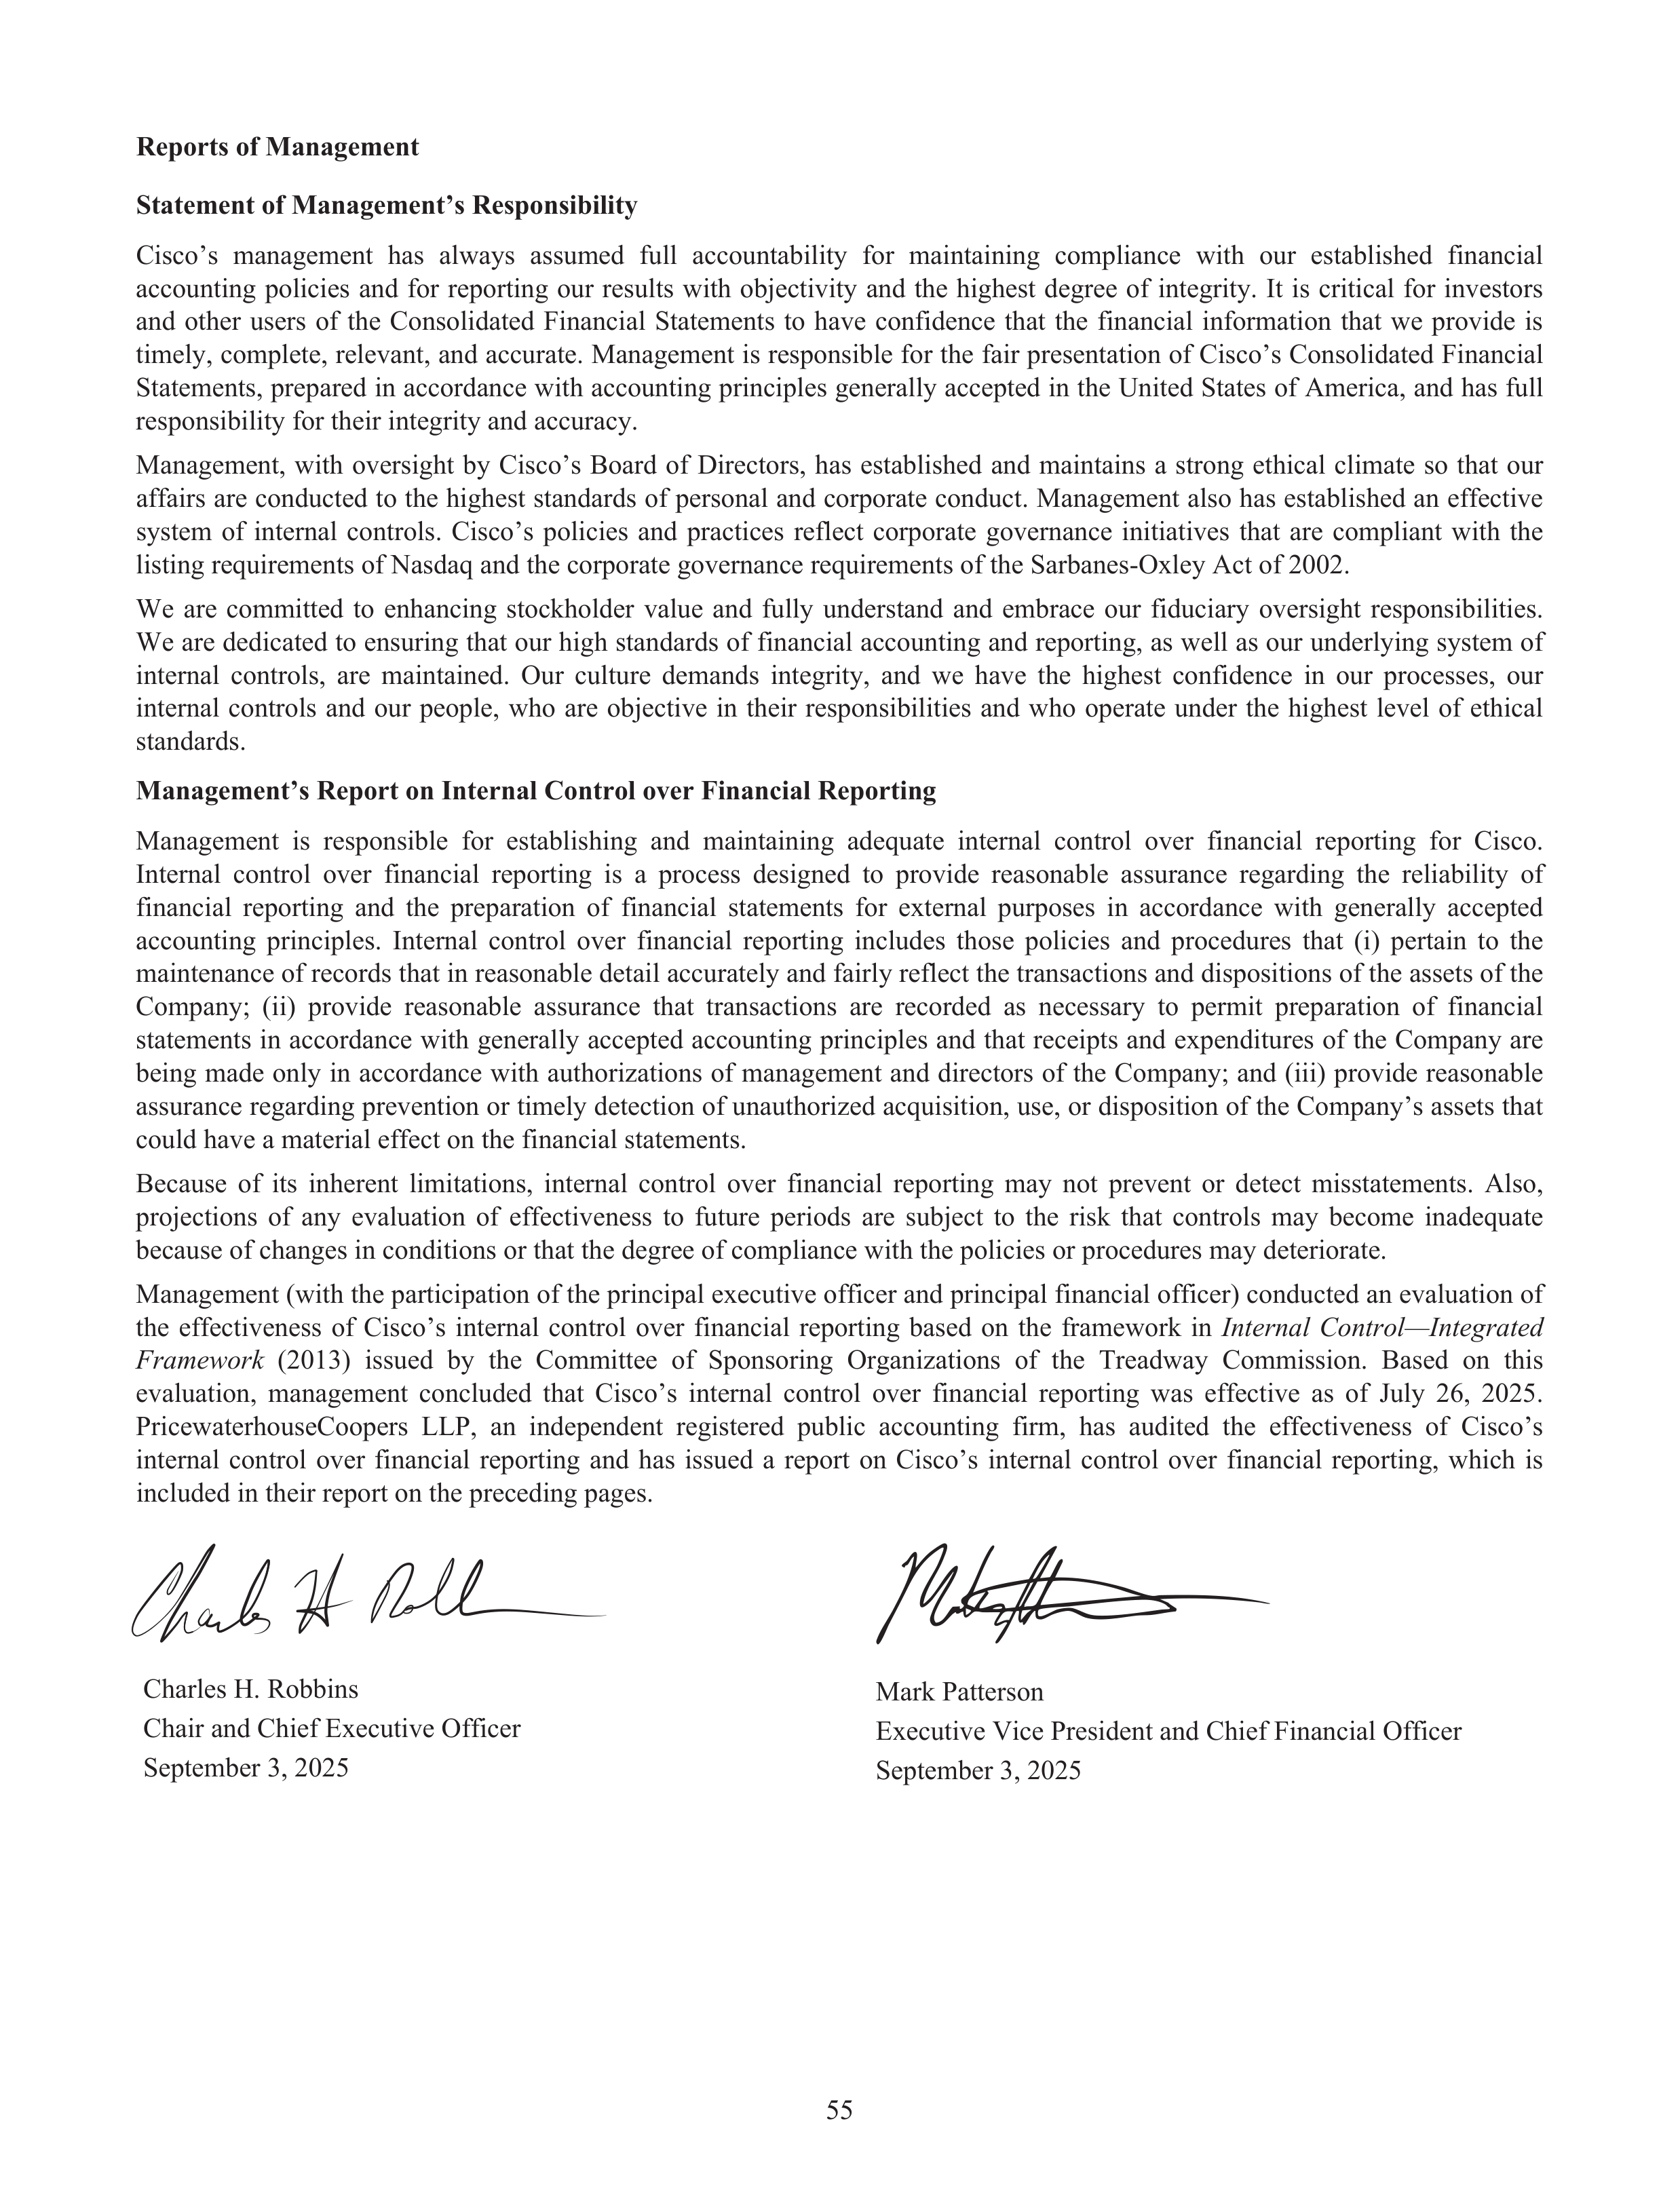
Charles H. Robbins
Mark Patterson
Chair and Chief Executive Officer
Executive Vice President and Chief Financial Officer
September 3, 2025
September 3, 2025
Reports of Management
Statement of Management’s Responsibility
Cisco’s management has always assumed full accountability for maintaining compliance
with our established financial
accounting policies and for reporting our results with objectivity and the highest degree of integrity. It is critical for investors
and other users of the Consolidated Financial
Statements to have confidence that
the
financial
information that we provide is
timely, complete, relevant, and accurate. Management is responsible for the fair presentation of Cisco’s Consolidated Financial
Statements, prepared in accordance with accounting principles generally accepted in the United States of America, and has full
responsibility for their integrity and accuracy.
Management, with oversight by Cisco’s Board of Directors, has established and maintains a strong ethical
climate so that our
affairs are conducted to the highest standards of personal and corporate conduct. Management also has established an effective
system of internal controls. Cisco’s policies and practices reflect corporate governance initiatives that
are
compliant
with the
listing requirements of Nasdaq and the corporate governance requirements of the Sarbanes-Oxley Act of 2002.
We
are
committed to enhancing stockholder value and fully understand and embrace our fiduciary oversight responsibilities.
We are dedicated to ensuring that our high standards of financial accounting and reporting, as well as our underlying system of
internal controls, are maintained. Our culture demands integrity, and we have the highest confidence in our processes, our
internal controls and our people, who are objective in their responsibilities and who operate under the highest level
of ethical
standards.
Management’s Report on Internal Control over Financial Reporting
Management is responsible for establishing and maintaining adequate
internal control over financial reporting for Cisco.
Internal control over financial reporting is a process designed to provide reasonable assurance regarding the reliability of
financial reporting and the preparation of financial statements for external purposes in accordance with generally accepted
accounting principles. Internal control over financial reporting includes those policies and procedures that (i) pertain to the
maintenance of records that in reasonable detail accurately and fairly reflect the transactions and dispositions of the assets of the
Company; (ii) provide reasonable assurance that
transactions are recorded as necessary to permit preparation of financial
statements in accordance with generally accepted accounting principles and that receipts and expenditures of the Company are
being made only in accordance with authorizations of management and directors of the Company; and (iii) provide reasonable
assurance regarding prevention or timely detection of unauthorized acquisition, use, or disposition of the Company’s assets that
could have a material effect on the financial statements.
Because of its inherent limitations, internal control over financial reporting may not prevent or detect
misstatements. Also,
projections of any evaluation of effectiveness to future periods are subject
to the risk that controls may become
inadequate
because of changes in conditions or that the degree of compliance with the policies or procedures may deteriorate.
Management (with the participation of the principal executive officer and principal financial officer) conducted an evaluation of
the effectiveness of Cisco’s internal control over financial reporting based on the framework in
Internal Control—Integrated
Framework
(2013) issued by the Committee of Sponsoring Organizations of the Treadway Commission. Based on this
evaluation, management
concluded that
Cisco’s internal control over financial reporting was effective as of July 26, 2025.
PricewaterhouseCoopers LLP, an independent registered public accounting firm, has audited the effectiveness of Cisco’s
internal control over financial reporting and has issued a report on Cisco’s internal control over financial reporting, which is
included in their report on the preceding pages.
55
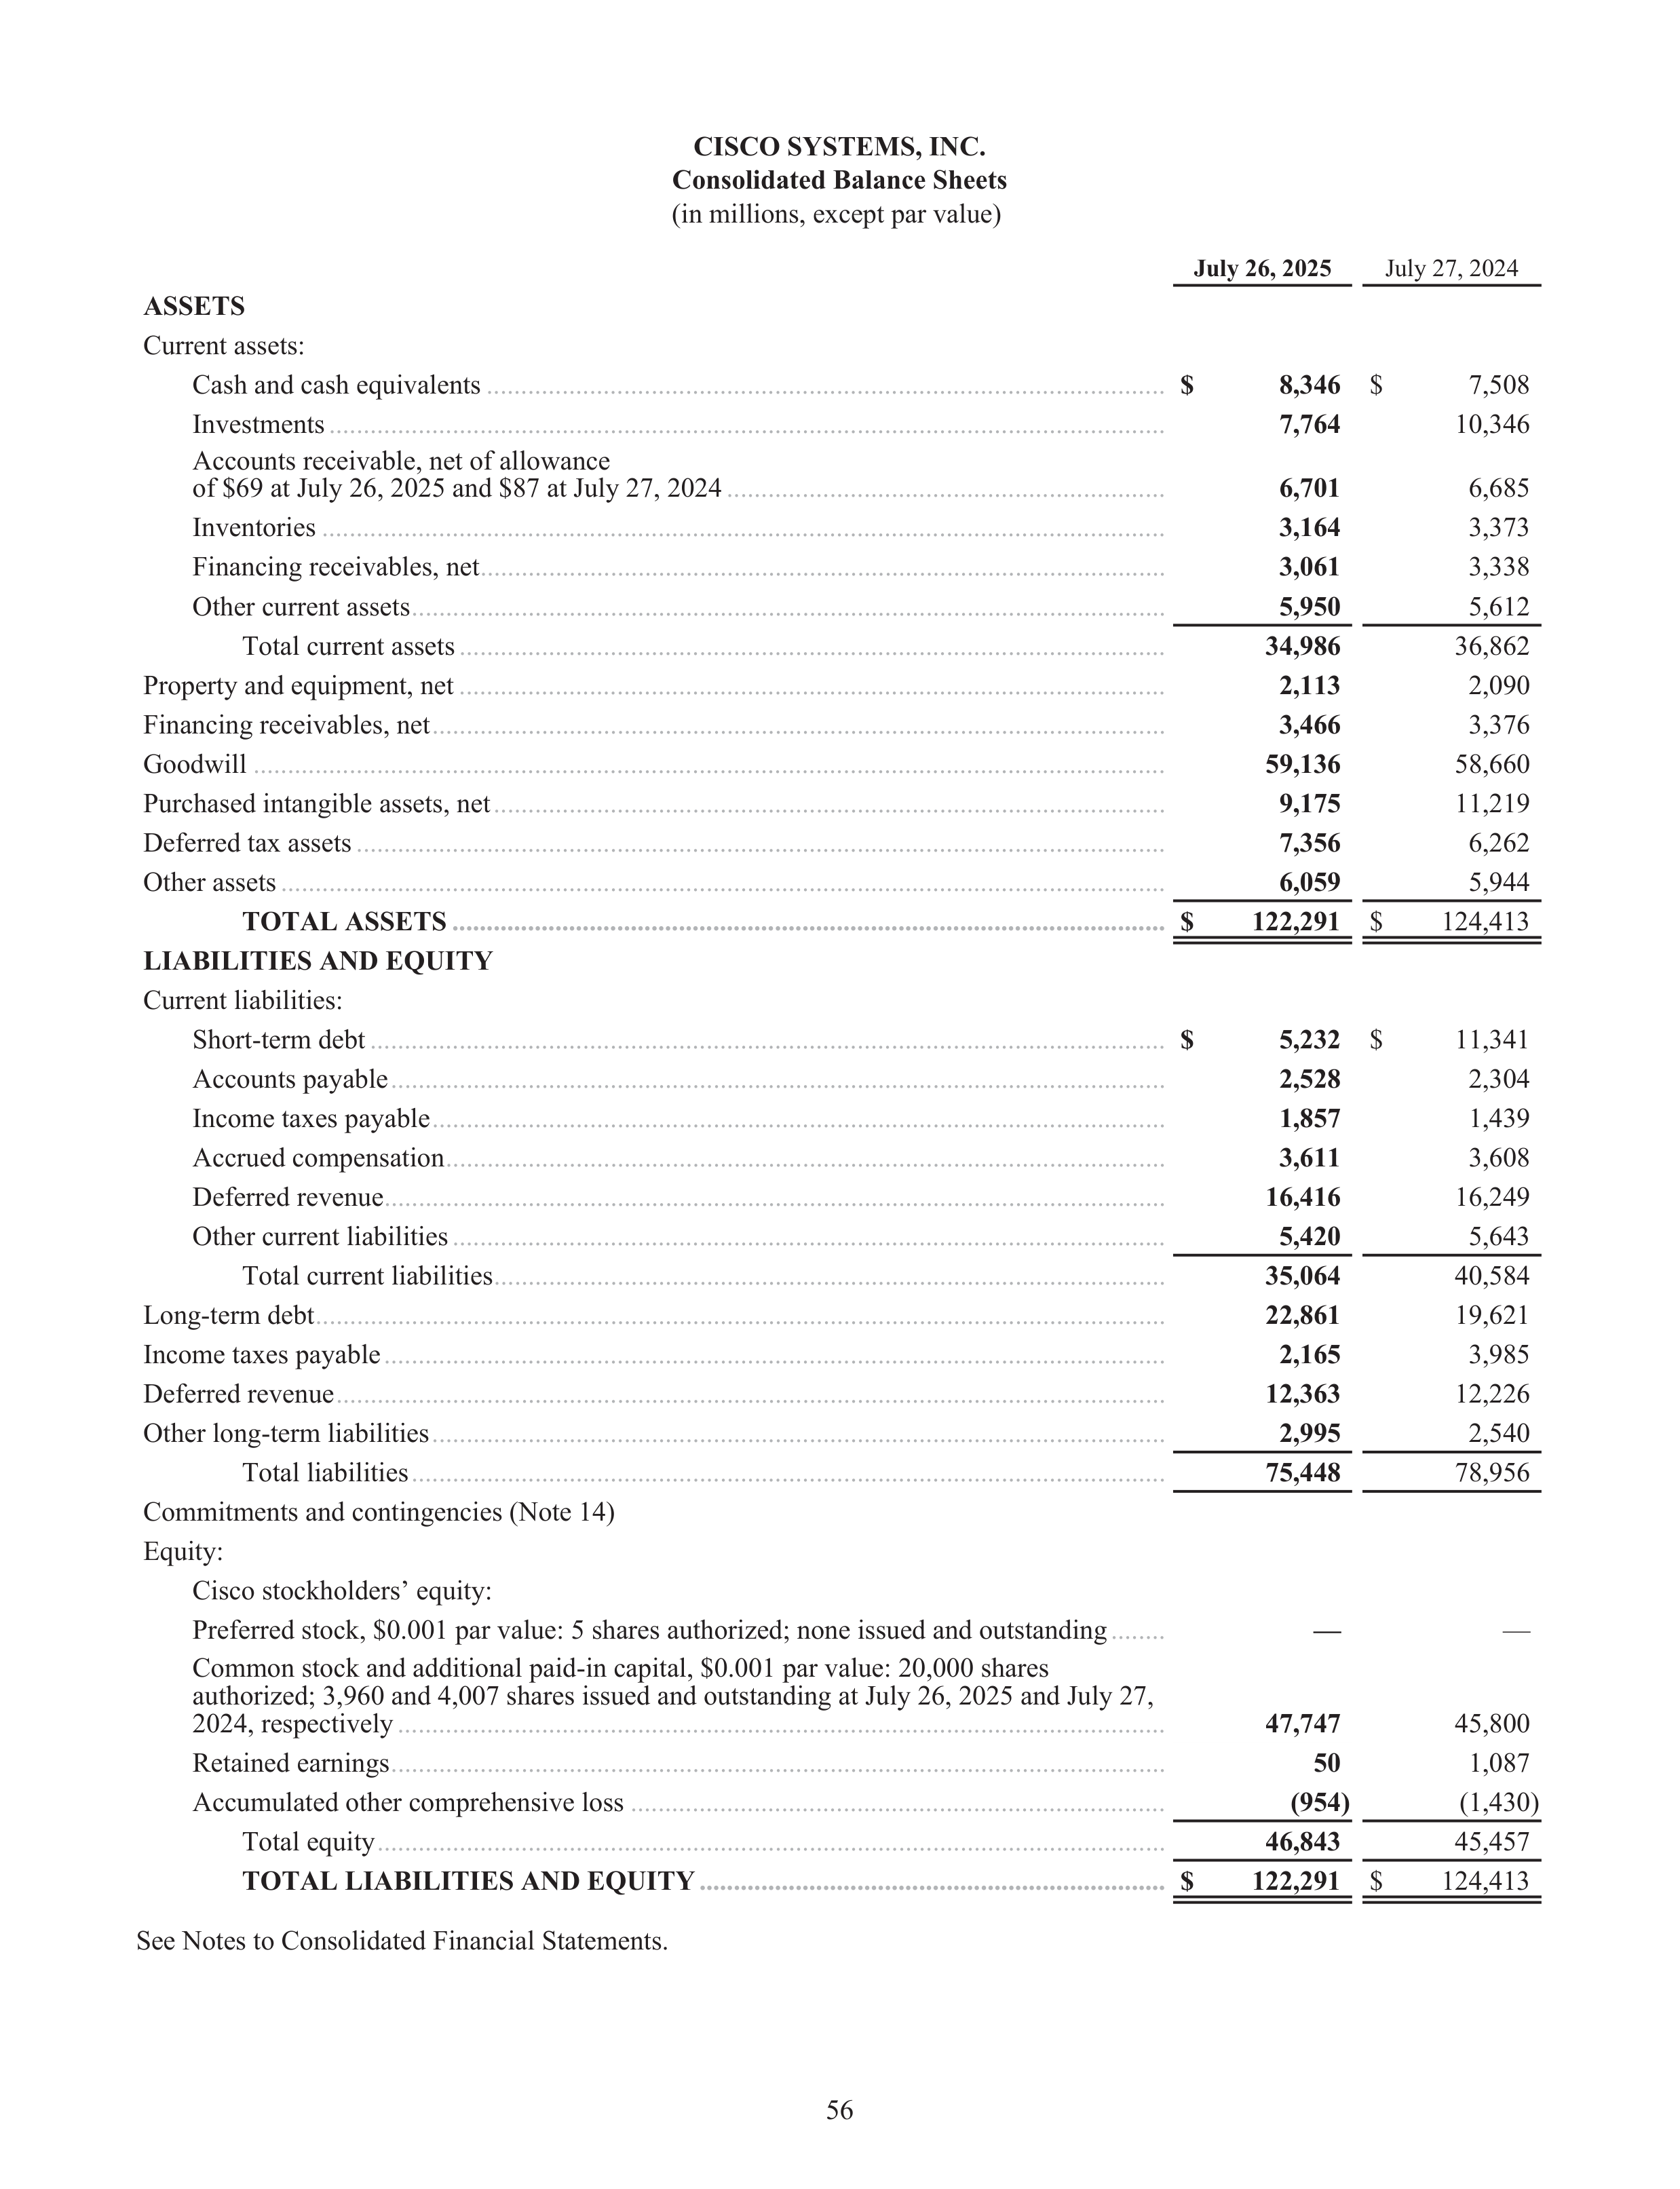
CISCO SYSTEMS, INC.
Consolidated Balance Sheets
(in millions, except par value)
July 26, 2025
July 27, 2024
ASSETS
Current assets:
Cash and cash equivalents
...................................................................................................
$
8,346
$
7,508
Investments
..........................................................................................................................
7,764
10,346
Accounts receivable, net of allowance
of $69 at July 26, 2025 and $87 at July 27, 2024
................................................................
6,701
6,685
Inventories
...........................................................................................................................
3,164
3,373
Financing receivables, net
....................................................................................................
3,061
3,338
Other current assets
..............................................................................................................
5,950
5,612
Total current assets
.......................................................................................................
34,986
36,862
Property and equipment, net
.......................................................................................................
2,113
2,090
Financing receivables, net
...........................................................................................................
3,466
3,376
Goodwill
.....................................................................................................................................
59,136
58,660
Purchased intangible assets, net
..................................................................................................
9,175
11,219
Deferred tax assets
......................................................................................................................
7,356
6,262
Other assets
.................................................................................................................................
6,059
5,944
TOTAL ASSETS
........................................................................................................
$
122,291
$
124,413
LIABILITIES AND EQUITY
Current liabilities:
Short-term debt
....................................................................................................................
$
5,232
$
11,341
Accounts payable
.................................................................................................................
2,528
2,304
Income taxes payable
...........................................................................................................
1,857
1,439
Accrued compensation
.........................................................................................................
3,611
3,608
Deferred revenue
..................................................................................................................
16,416
16,249
Other current liabilities
........................................................................................................
5,420
5,643
Total current liabilities
..................................................................................................
35,064
40,584
Long-term debt
............................................................................................................................
22,861
19,621
Income taxes payable
..................................................................................................................
2,165
3,985
Deferred revenue
.........................................................................................................................
12,363
12,226
Other long-term liabilities
...........................................................................................................
2,995
2,540
Total liabilities
..............................................................................................................
75,448
78,956
Commitments and contingencies (Note 14)
Equity:
Cisco stockholders’ equity:
Preferred stock, $0.001 par value: 5 shares authorized; none issued and outstanding
........
—
—
Common stock and additional paid-in capital, $0.001 par value: 20,000 shares
authorized; 3,960 and 4,007 shares issued and outstanding at July 26, 2025 and July 27,
2024, respectively
................................................................................................................
47,747
45,800
Retained earnings
.................................................................................................................
50
1,087
Accumulated other comprehensive loss
..............................................................................
(954)
(1,430)
Total equity
...................................................................................................................
46,843
45,457
TOTAL LIABILITIES AND EQUITY
....................................................................
$
122,291
$
124,413
See Notes to Consolidated Financial Statements.
56
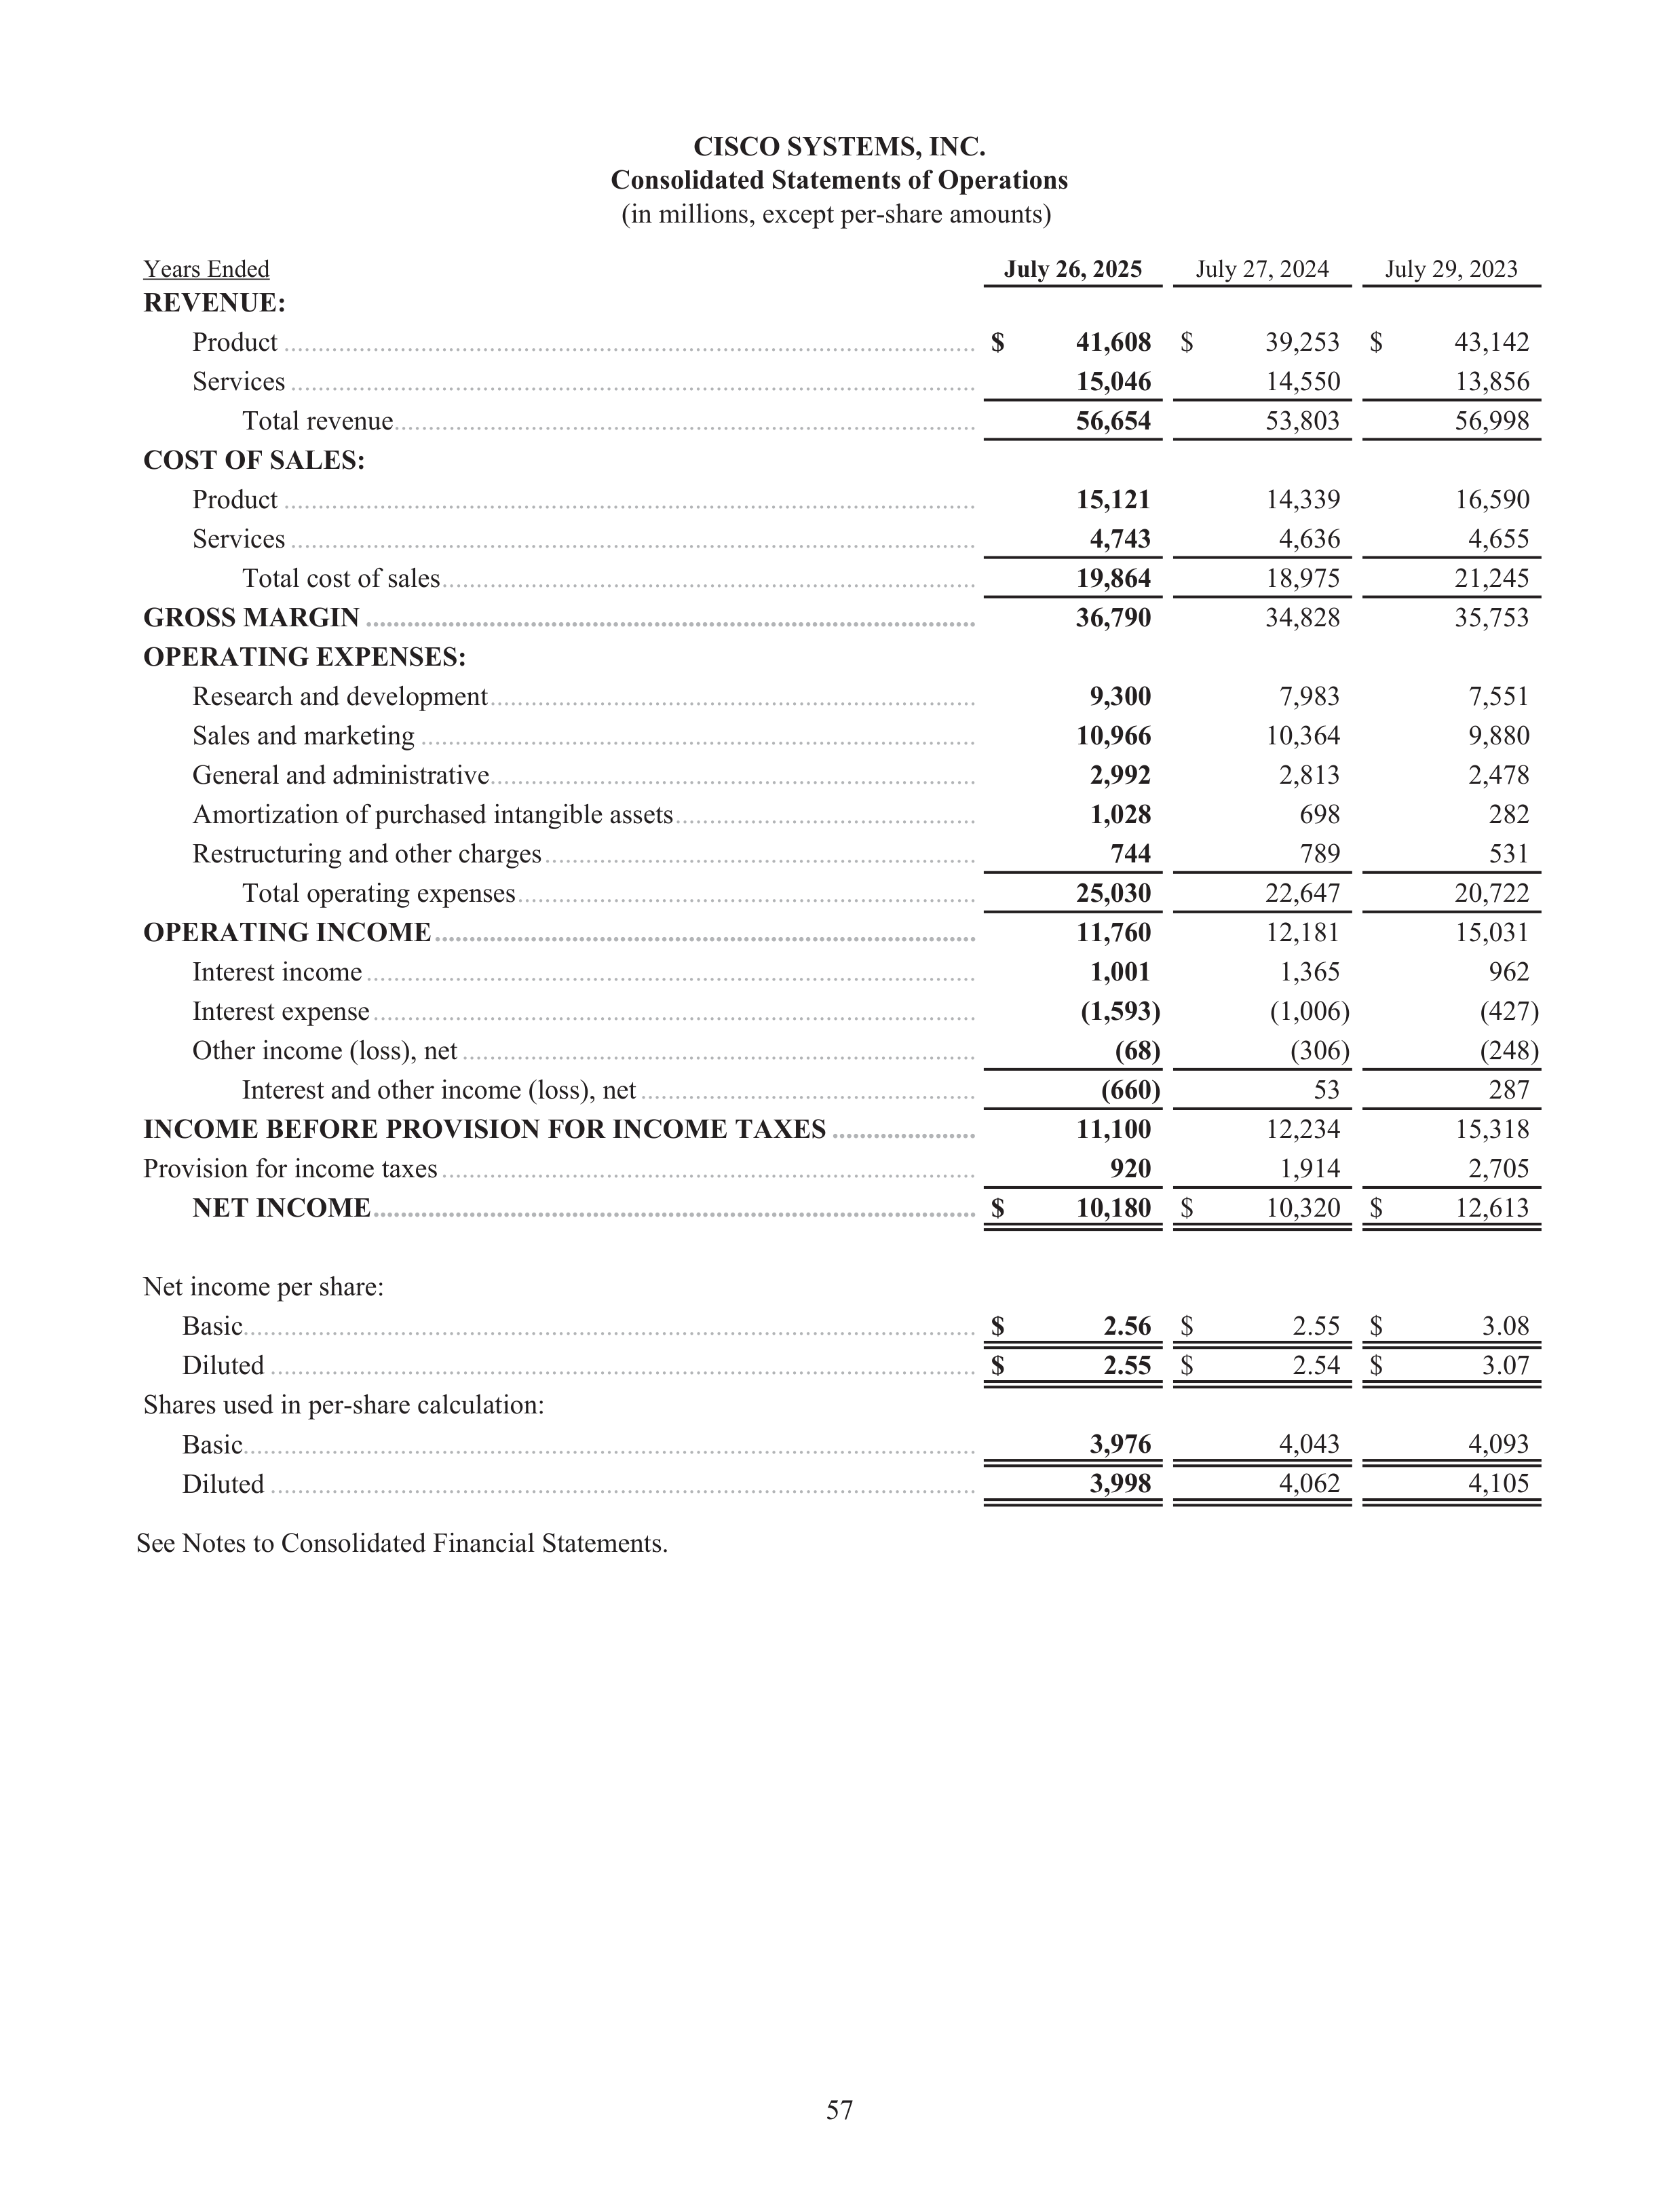
CISCO SYSTEMS, INC.
Consolidated Statements of Operations
(in millions, except per-share amounts)
Years Ended
July 26, 2025
July 27, 2024
July 29, 2023
REVENUE:
Product
.....................................................................................................
$
41,608
$
39,253 $
43,142
Services
....................................................................................................
15,046
14,550
13,856
Total revenue
.....................................................................................
56,654
53,803
56,998
COST OF SALES:
Product
.....................................................................................................
15,121
14,339
16,590
Services
....................................................................................................
4,743
4,636
4,655
Total cost of sales
..............................................................................
19,864
18,975
21,245
GROSS MARGIN
.........................................................................................
36,790
34,828
35,753
OPERATING EXPENSES:
Research and development
.......................................................................
9,300
7,983
7,551
Sales and marketing
.................................................................................
10,966
10,364
9,880
General and administrative
.......................................................................
2,992
2,813
2,478
Amortization of purchased intangible assets
............................................
1,028
698
282
Restructuring and other charges
...............................................................
744
789
531
Total operating expenses
...................................................................
25,030
22,647
20,722
OPERATING INCOME
...............................................................................
11,760
12,181
15,031
Interest income
.........................................................................................
1,001
1,365
962
Interest expense
........................................................................................
(1,593)
(1,006)
(427)
Other income (loss), net
...........................................................................
(68)
(306)
(248)
Interest and other income (loss), net
.................................................
(660)
53
287
INCOME BEFORE PROVISION FOR INCOME TAXES
.....................
11,100
12,234
15,318
Provision for income taxes
..............................................................................
920
1,914
2,705
NET INCOME
........................................................................................
$
10,180
$
10,320 $
12,613
Net income per share:
Basic
.........................................................................................................
$
2.56
$
2.55 $
3.08
Diluted
......................................................................................................
$
2.55
$
2.54 $
3.07
Shares used in per-share calculation:
3,976
4,043
4,093
3,998
4,062
4,105
See Notes to Consolidated Financial Statements.
57
..
.
Basic
.........................................................................................................
Diluted
......................................................................................................
..
.
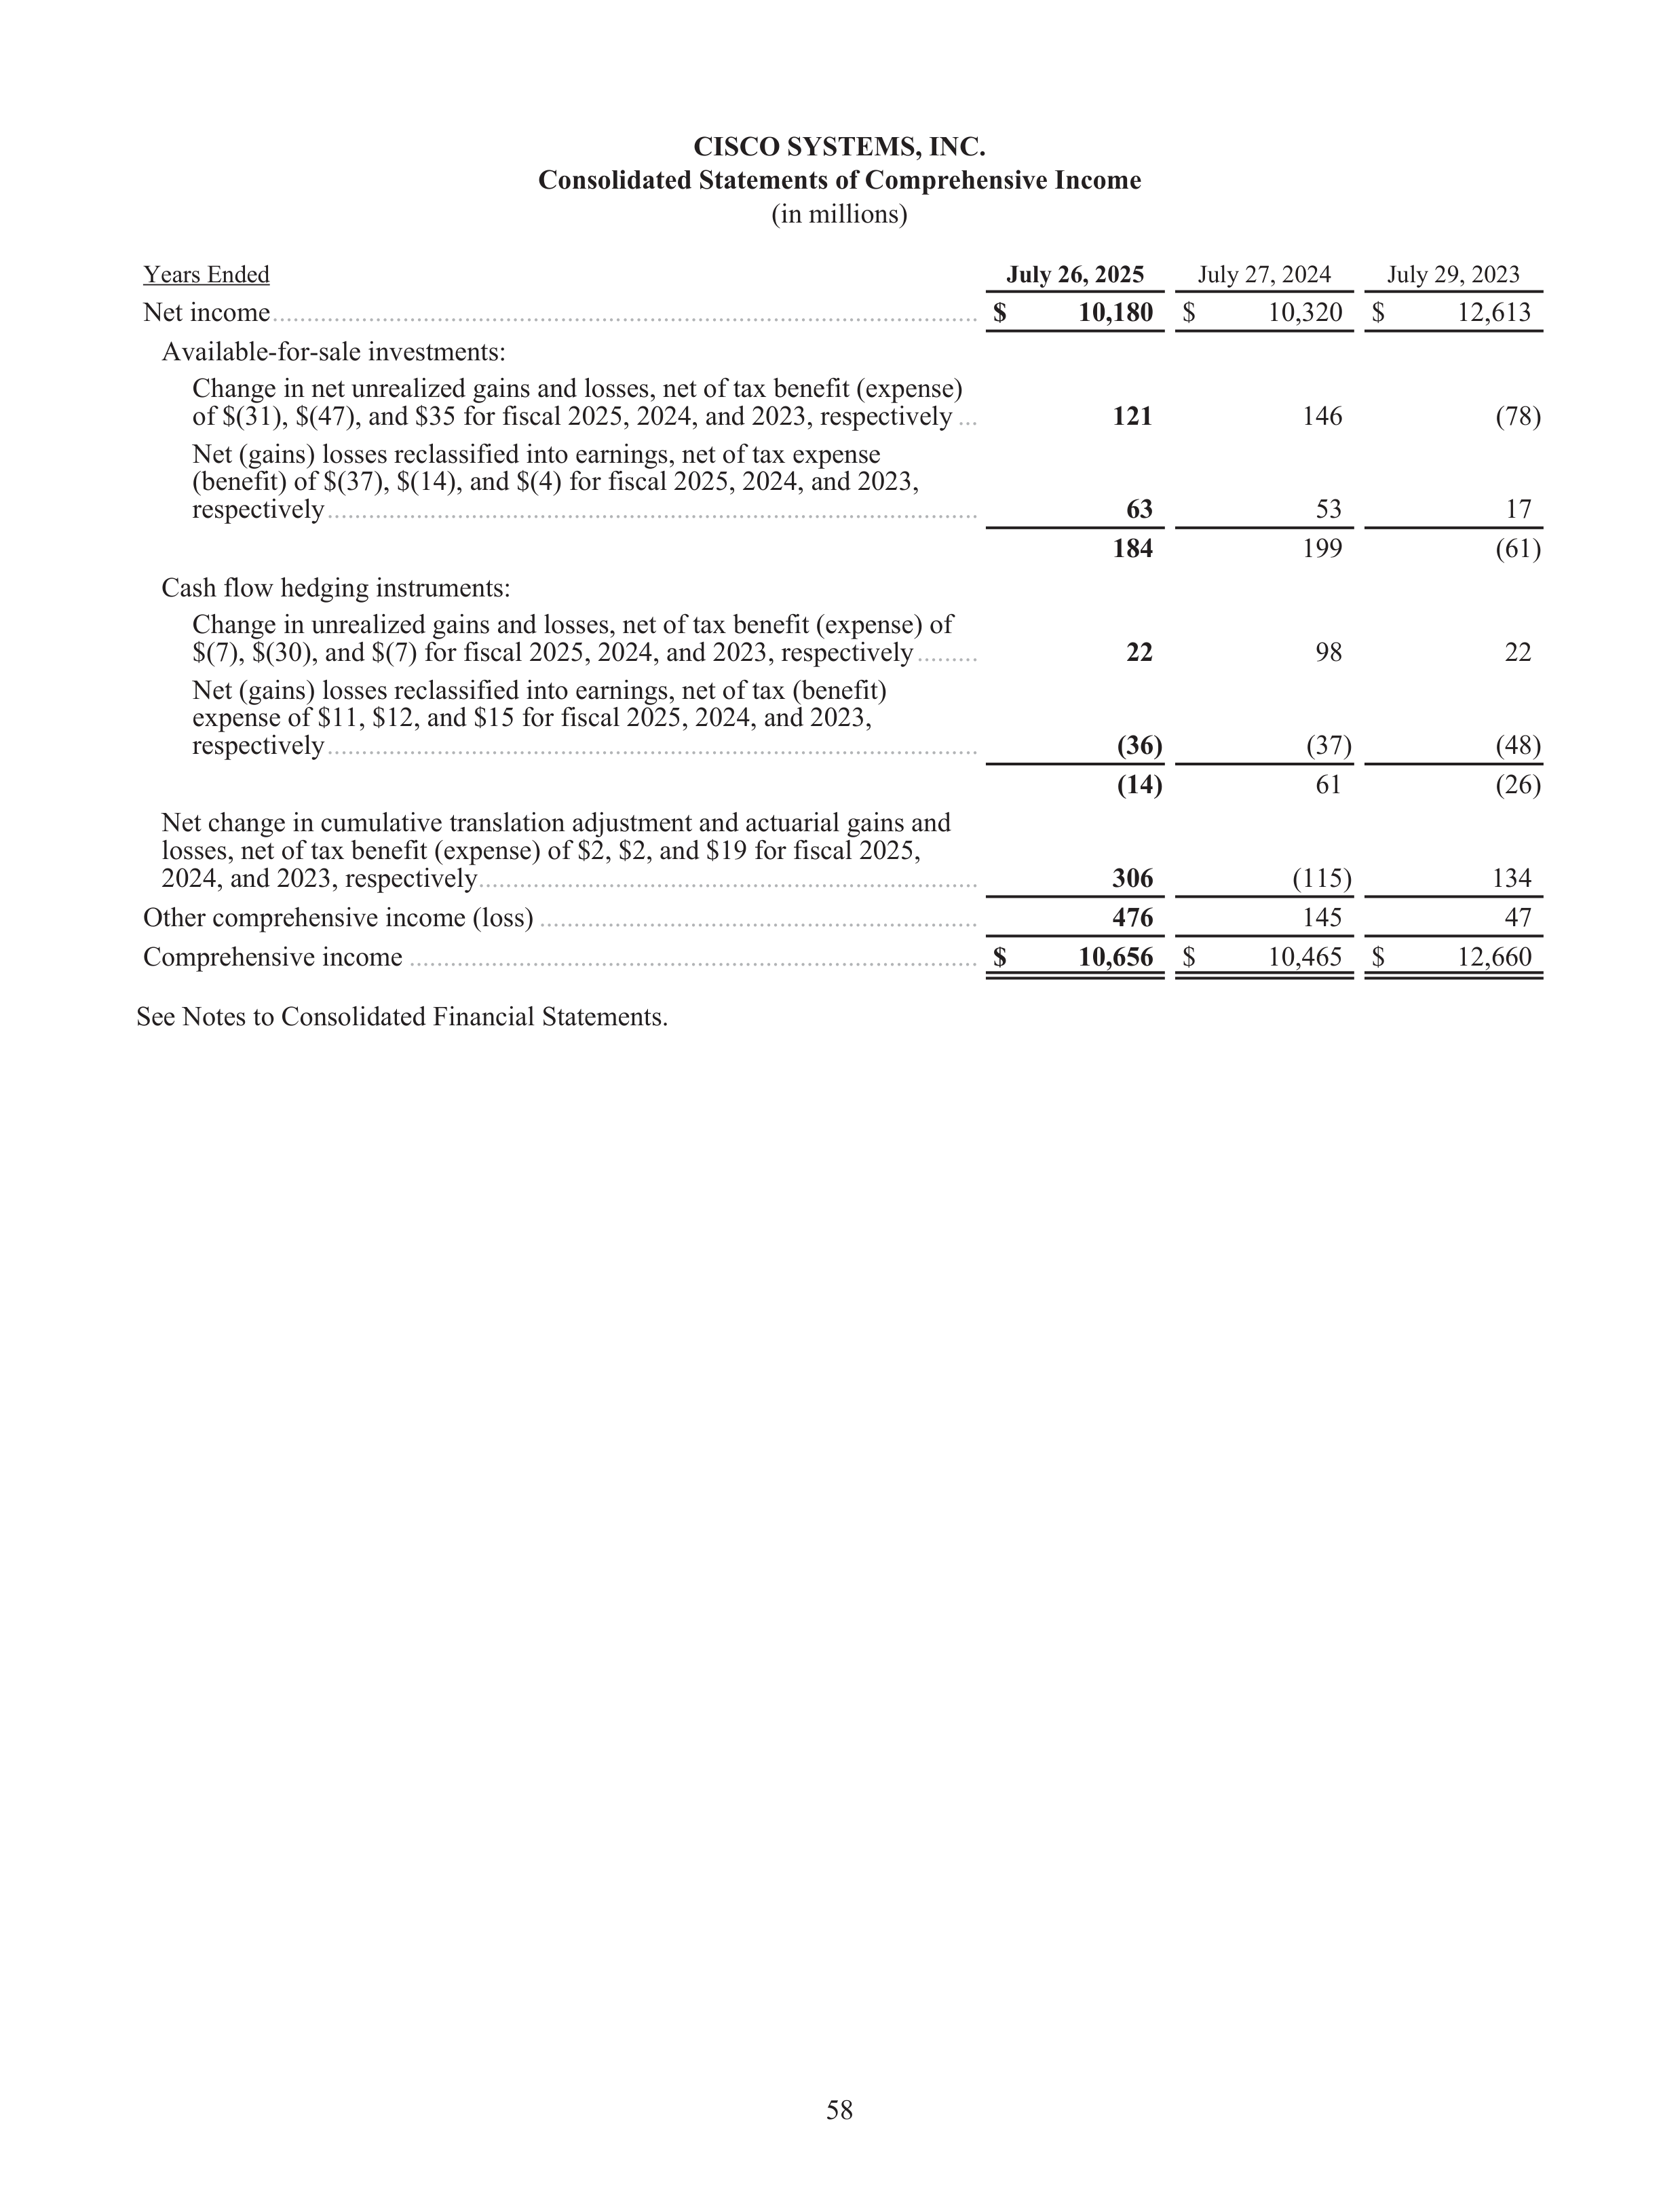
CISCO SYSTEMS, INC.
Consolidated Statements of Comprehensive Income
(in millions)
Years Ended
July 26, 2025
July 27, 2024
July 29, 2023
Net income
.......................................................................................................
$
10,180
$
10,320 $
12,613
Available-for-sale investments:
Change in net unrealized gains and losses, net of tax benefit (expense)
of $(31), $(47), and $35 for fiscal 2025, 2024, and 2023, respectively
...
121
146
(78)
Net (gains) losses reclassified into earnings, net of tax expense
(benefit) of $(37), $(14), and $(4) for fiscal 2025, 2024, and 2023,
respectively
...............................................................................................
63
53
17
184
199
(61)
Cash flow hedging instruments:
Change in unrealized gains and losses, net of tax benefit (expense) of
$(7), $(30), and $(7) for fiscal 2025, 2024, and 2023, respectively
.........
22
98
22
Net (gains) losses reclassified into earnings, net of tax (benefit)
expense of $11, $12, and $15 for fiscal 2025, 2024, and 2023,
respectively
...............................................................................................
(36)
(37)
(48)
(14)
61
(26)
Net change in cumulative translation adjustment and actuarial gains and
losses, net of tax benefit (expense) of $2, $2, and $19 for fiscal 2025,
2024, and 2023, respectively
.........................................................................
306
(115)
134
Other comprehensive income (loss)
................................................................
476
145
47
Comprehensive income
...................................................................................
$
10,656
$
10,465 $
12,660
See Notes to Consolidated Financial Statements.
58
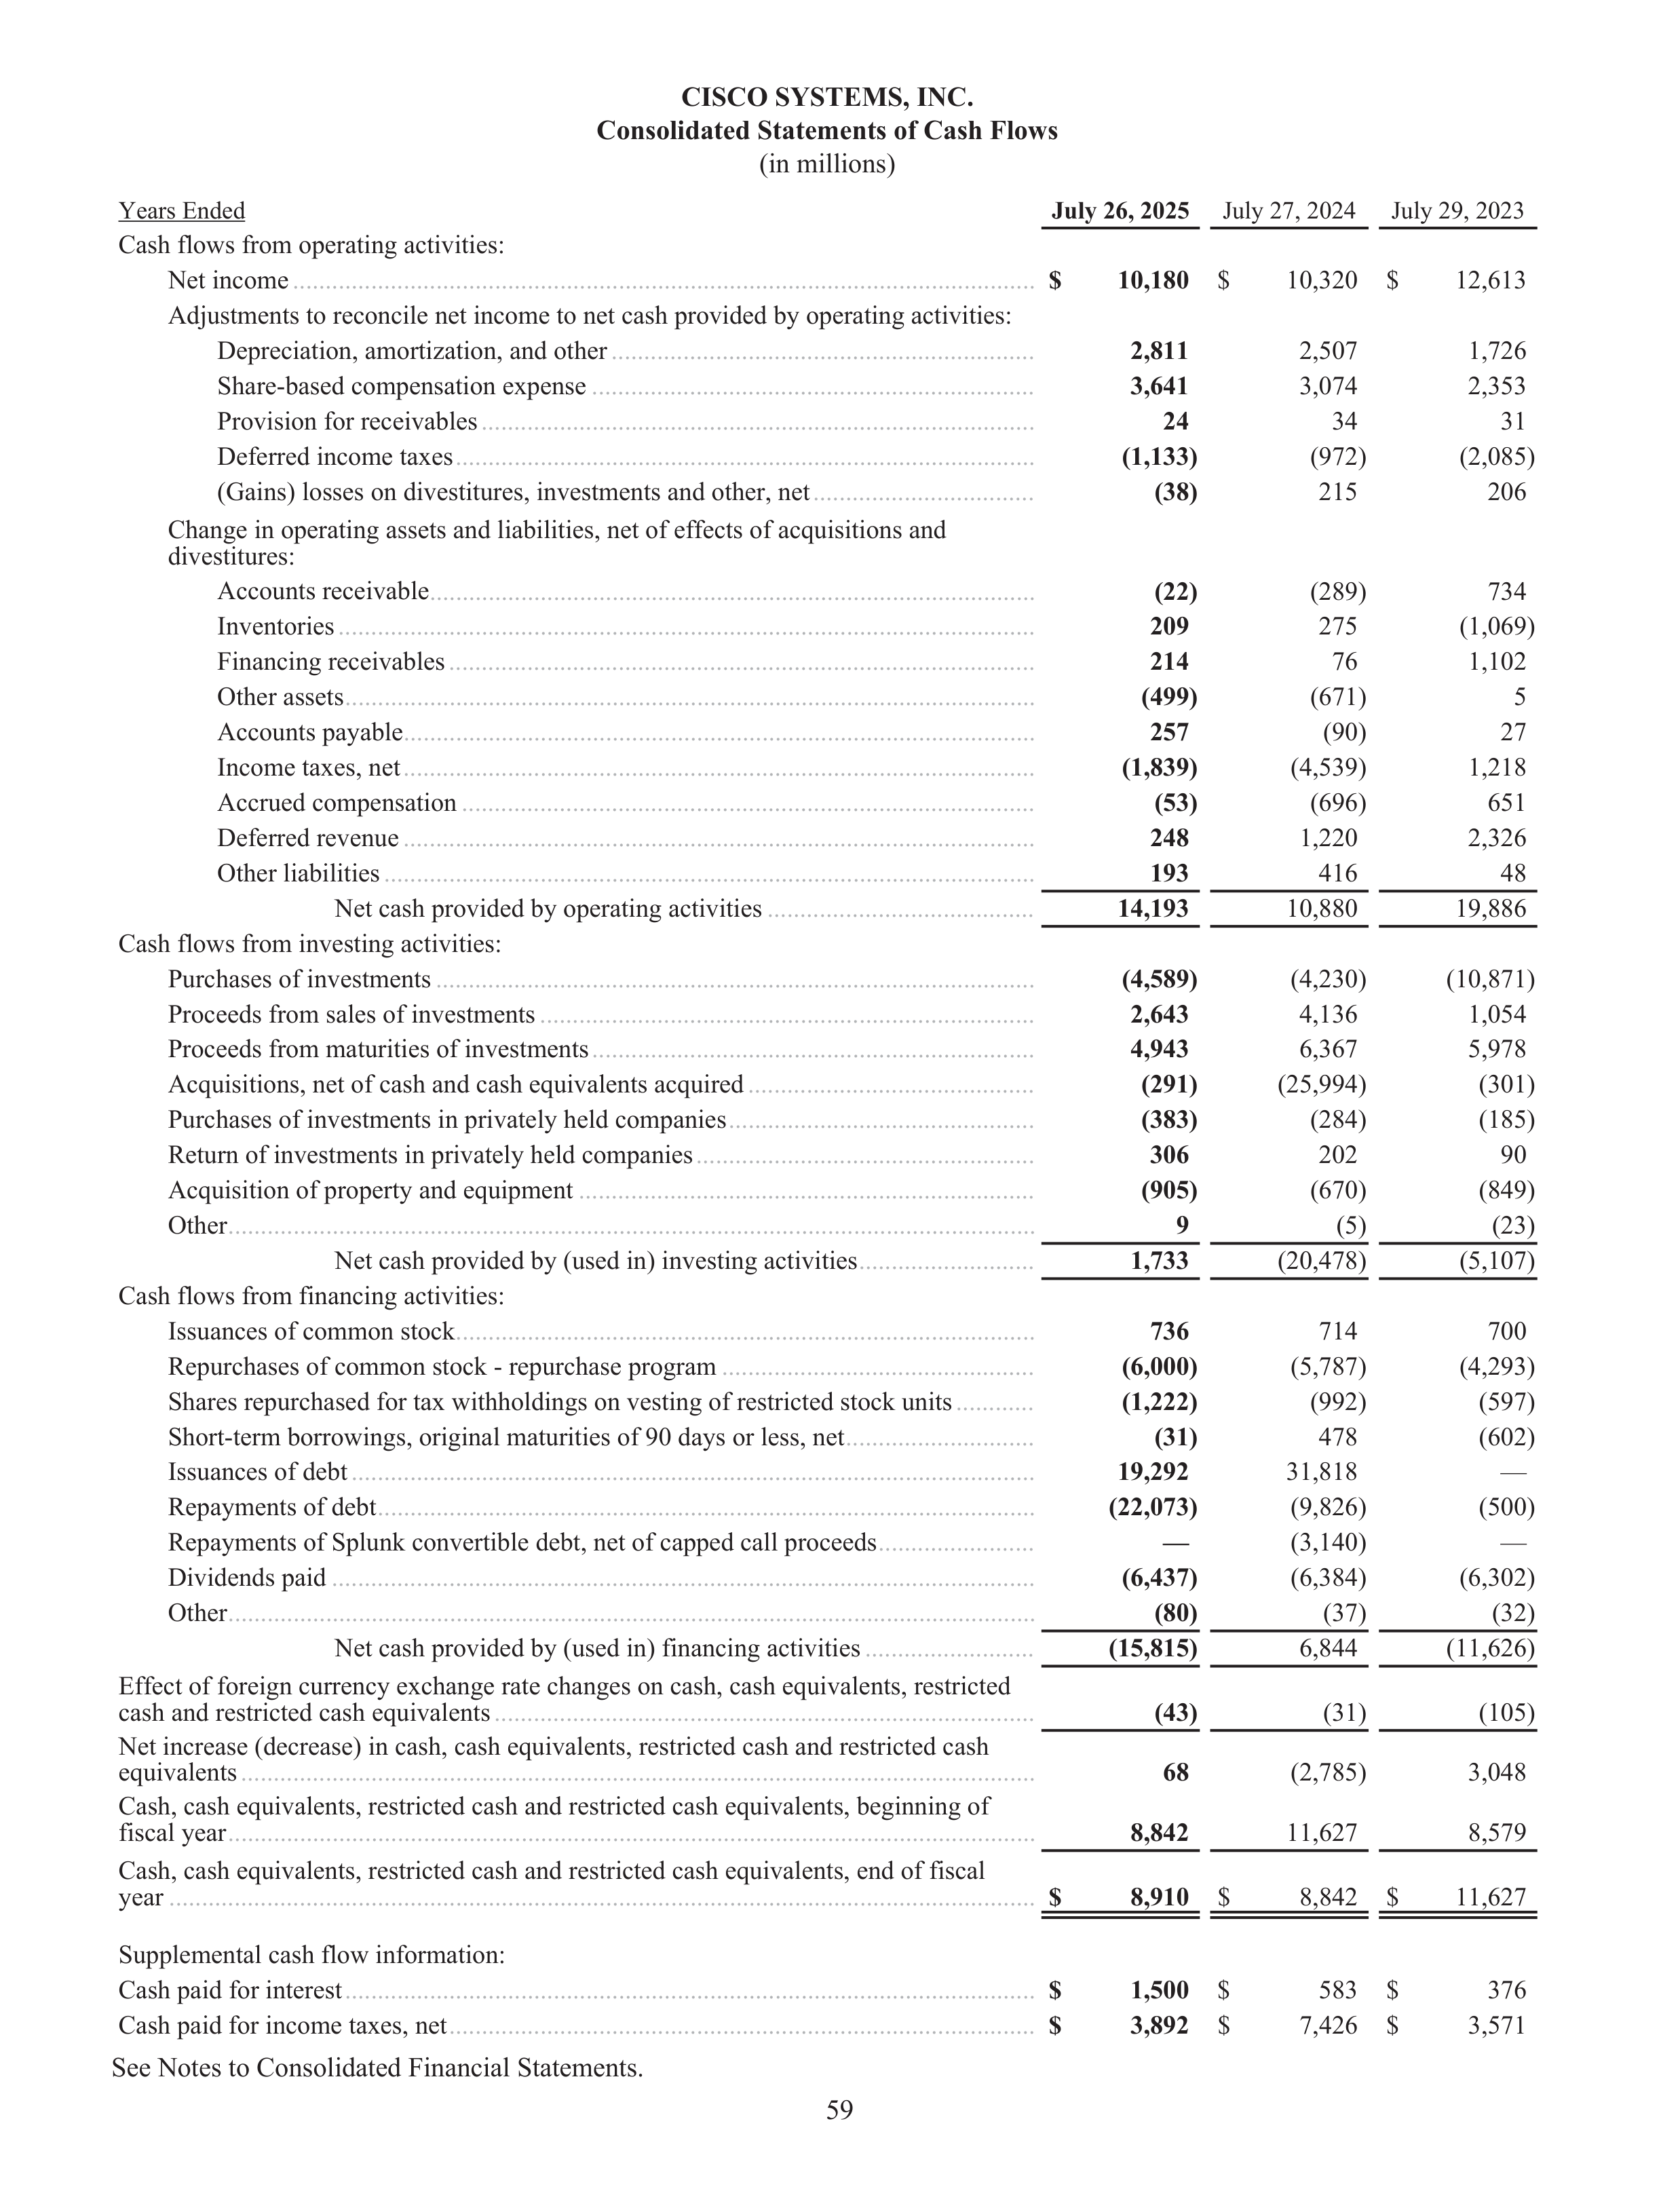
CISCO SYSTEMS, INC.
Consolidated Statements of Cash Flows
(in millions)
Years Ended
July 26, 2025
July 27, 2024
July 29, 2023
Cash flows from operating activities:
Net income
..................................................................................................................
$
10,180
$
10,320
$
12,613
Adjustments to reconcile net income to net cash provided by operating activities:
Depreciation, amortization, and other
.................................................................
2,811
2,507
1,726
Share-based compensation expense
....................................................................
3,641
3,074
2,353
Provision for receivables
.....................................................................................
24
34
31
Deferred income taxes
.........................................................................................
(1,133)
(972)
(2,085)
(Gains) losses on divestitures, investments and other, net
..................................
(38)
215
206
Change in operating assets and liabilities, net of effects of acquisitions and
divestitures:
Accounts receivable
.............................................................................................
(22)
(289)
734
Inventories
...........................................................................................................
209
275
(1,069)
Financing receivables
..........................................................................................
214
76
1,102
Other assets
..........................................................................................................
(499)
(671)
5
Accounts payable
.................................................................................................
257
(90)
27
Income taxes, net
.................................................................................................
(1,839)
(4,539)
1,218
Accrued compensation
........................................................................................
(53)
(696)
651
Deferred revenue
.................................................................................................
248
1,220
2,326
Other liabilities
....................................................................................................
193
416
48
Net cash provided by operating activities
.........................................
14,193
10,880
19,886
Cash flows from investing activities:
Purchases of investments
............................................................................................
(4,589)
(4,230)
(10,871)
Proceeds from sales of investments
............................................................................
2,643
4,136
1,054
Proceeds from maturities of investments
....................................................................
4,943
6,367
5,978
Acquisitions, net of cash and cash equivalents acquired
............................................
(291)
(25,994)
(301)
Purchases of investments in privately held companies
...............................................
(383)
(284)
(185)
Return of investments in privately held companies
....................................................
306
202
90
Acquisition of property and equipment
......................................................................
(905)
(670)
(849)
Other
............................................................................................................................
9
(5)
(23)
Net cash provided by (used in) investing activities
...........................
1,733
(20,478)
(5,107)
Cash flows from financing activities:
Issuances of common stock
.........................................................................................
736
714
700
Repurchases of common stock - repurchase program
................................................
(6,000)
(5,787)
(4,293)
Shares repurchased for tax withholdings on vesting of restricted stock units
............
(1,222)
(992)
(597)
Short-term borrowings, original maturities of 90 days or less, net
.............................
(31)
478
(602)
Issuances of debt
.........................................................................................................
19,292
31,818
—
Repayments of debt
.....................................................................................................
(22,073)
(9,826)
(500)
Repayments of Splunk convertible debt, net of capped call proceeds
........................
—
(3,140)
—
Dividends paid
............................................................................................................
(6,437)
(6,384)
(6,302)
Other
............................................................................................................................
(80)
(37)
(32)
Net cash provided by (used in) financing activities
..........................
(15,815)
6,844
(11,626)
Effect of foreign currency exchange rate changes on cash, cash equivalents, restricted
cash and restricted cash equivalents
...................................................................................
(43)
(31)
(105)
Net increase (decrease) in cash, cash equivalents, restricted cash and restricted cash
equivalents
..........................................................................................................................
68
(2,785)
3,048
Cash, cash equivalents, restricted cash and restricted cash equivalents, beginning of
fiscal year
............................................................................................................................
8,842
11,627
8,579
Cash, cash equivalents, restricted cash and restricted cash equivalents, end of fiscal
year
.....................................................................................................................................
$
8,910
$
8,842
$
11,627
Supplemental cash flow information:
Cash paid for interest
..........................................................................................................
$
1,500
$
583
$
376
Cash paid for income taxes, net
..........................................................................................
$
3,892
$
7,426
$
3,571
See Notes to Consolidated Financial Statements.
59
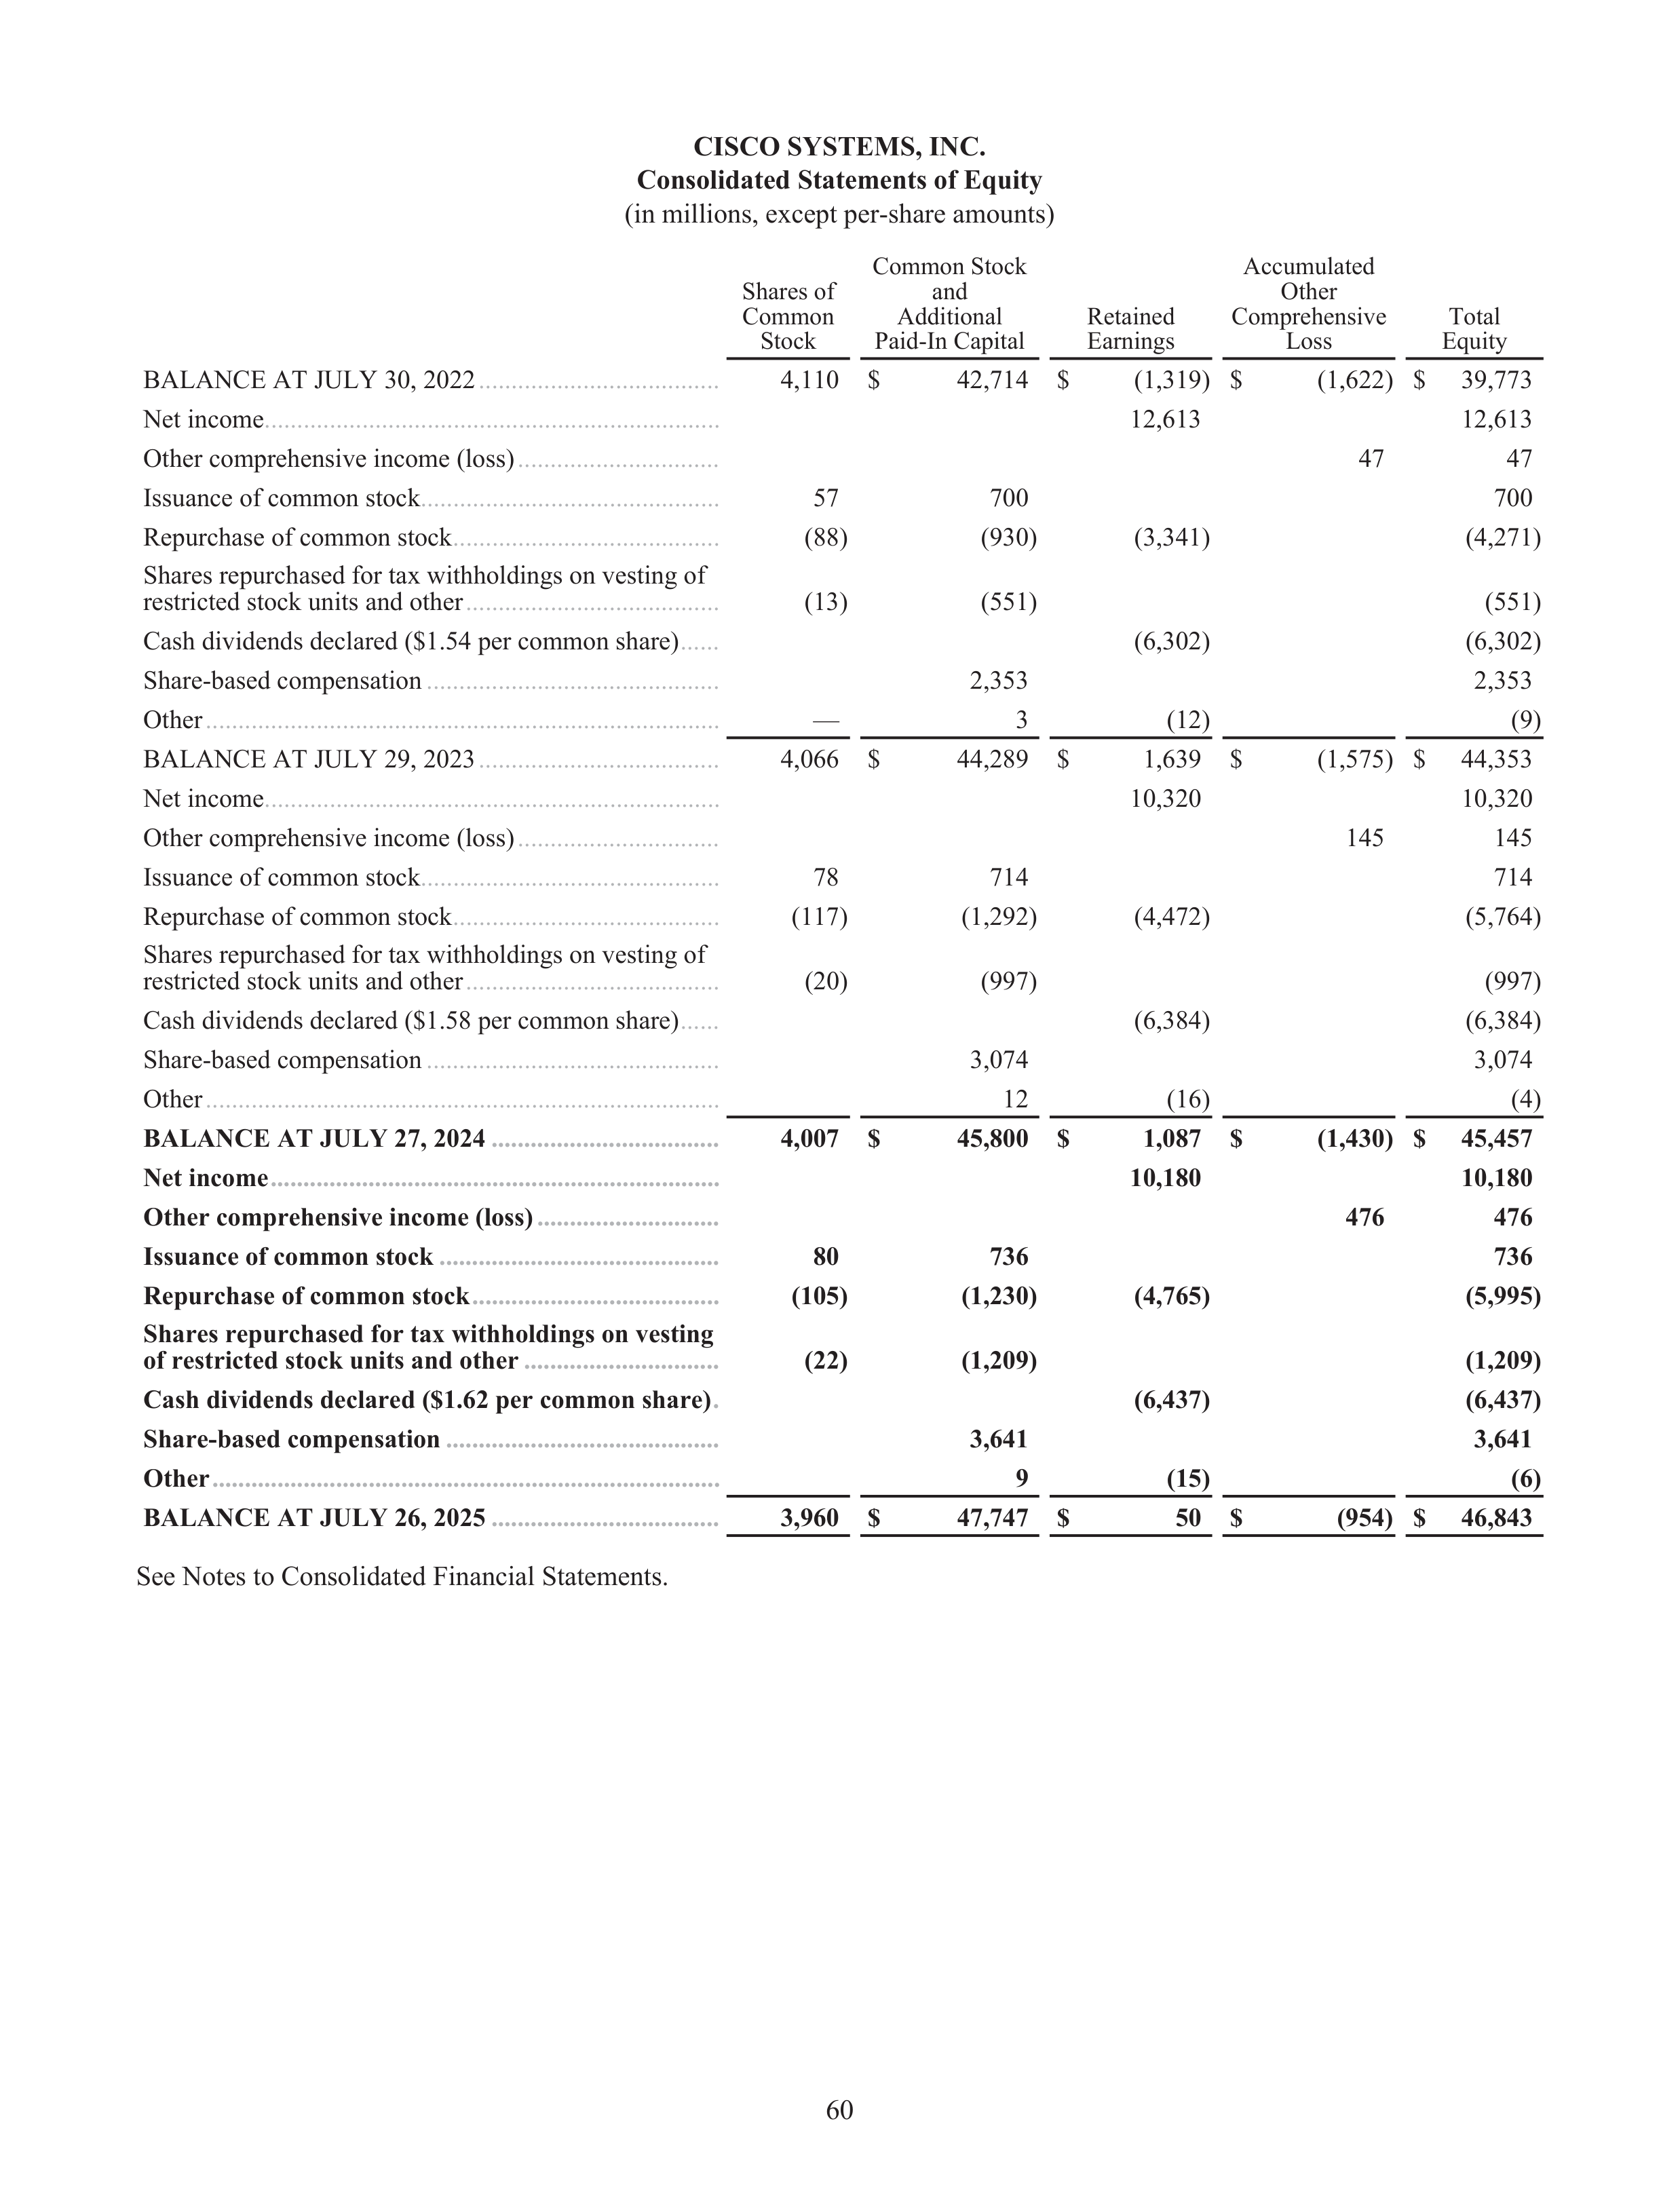
CISCO SYSTEMS, INC.
Consolidated Statements of Equity
(in millions, except per-share amounts)
Shares of
Common
Stock
Common Stock
and
Additional
Paid-In Capital
Retained
Earnings
Accumulated
Other
Comprehensive
Loss
Total
Equity
BALANCE AT JULY 30, 2022
.....................................
4,110
$
42,714
$
(1,319) $
(1,622) $
39,773
Net income
......................................................................
12,613
12,613
Other comprehensive income (loss)
...............................
47
47
Issuance of common stock
..............................................
57
700
700
Repurchase of common stock
.........................................
(88)
(930)
(3,341)
(4,271)
Shares repurchased for tax withholdings on vesting of
restricted stock units and other
.......................................
(13)
(551)
(551)
Cash dividends declared ($1.54 per common share)
......
(6,302)
(6,302)
Share-based compensation
.............................................
2,353
2,353
Other
...............................................................................
—
3
(12)
(9)
BALANCE AT JULY 29, 2023
.....................................
4,066
$
44,289
$
1,639
$
(1,575) $
44,353
Net income
......................................................................
10,320
10,320
Other comprehensive income (loss)
...............................
145
145
Issuance of common stock
..............................................
78
714
714
Repurchase of common stock
.........................................
(117)
(1,292)
(4,472)
(5,764)
Shares repurchased for tax withholdings on vesting of
restricted stock units and other
.......................................
(20)
(997)
(997)
Cash dividends declared ($1.58 per common share)
......
(6,384)
(6,384)
Share-based compensation
.............................................
3,074
3,074
Other
...............................................................................
12
(16)
(4)
BALANCE AT JULY 27, 2024
...................................
4,007
$
45,800
$
1,087
$
(1,430) $
45,457
Net income
.....................................................................
10,180
10,180
Other comprehensive income (loss)
............................
476
476
Issuance of common stock
...........................................
80
736
736
Repurchase of common stock
......................................
(105)
(1,230)
(4,765)
(5,995)
Shares repurchased for tax withholdings on vesting
of restricted stock units and other
..............................
(22)
(1,209)
(1,209)
Cash dividends declared ($1.62 per common share)
.
(6,437)
(6,437)
Share-based compensation
..........................................
3,641
3,641
Other
..............................................................................
9
(15)
(6)
BALANCE AT JULY 26, 2025
...................................
3,960
$
47,747
$
50
$
(954)
$
46,843
See Notes to Consolidated Financial Statements.
60
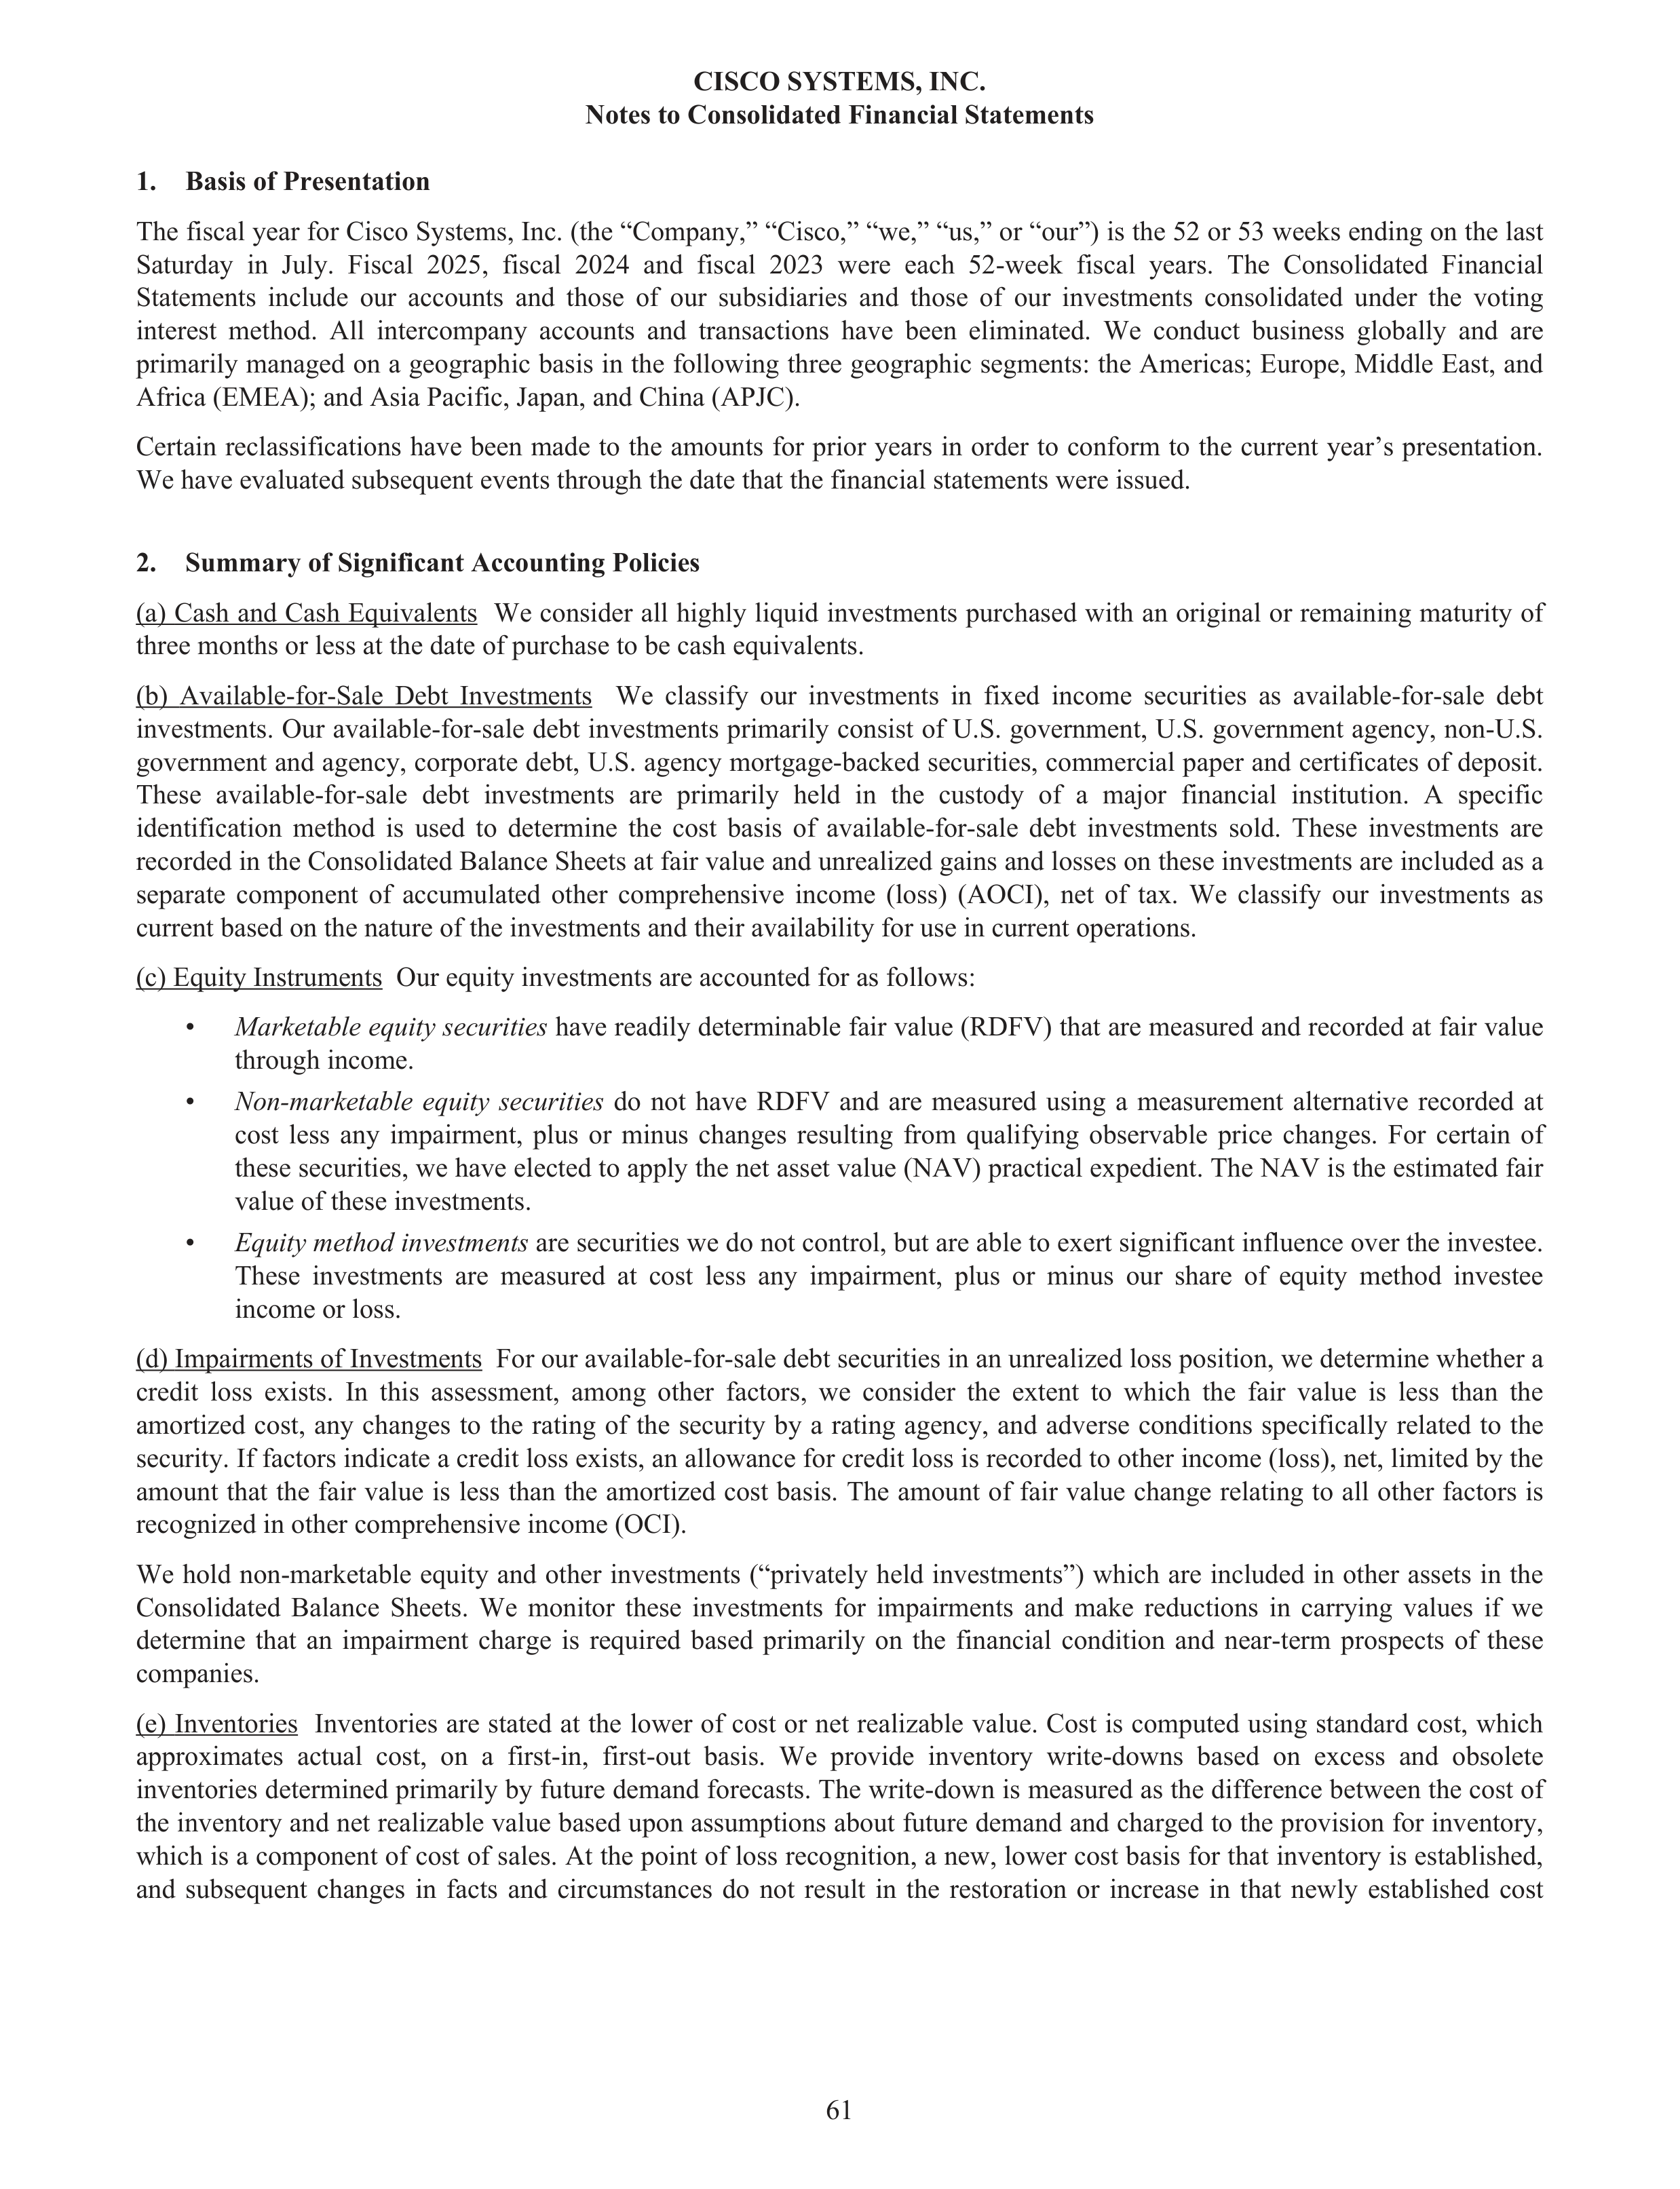
CISCO SYSTEMS, INC.
Notes to Consolidated Financial Statements
1.
Basis of Presentation
The fiscal year for Cisco Systems, Inc. (the “Company,” “Cisco,” “we,” “us,” or “our”) is the 52 or 53 weeks ending on the last
Saturday in July. Fiscal 2025, fiscal 2024 and fiscal 2023 were each 52-week fiscal years. The Consolidated Financial
Statements include our accounts and those of our subsidiaries and those of our investments consolidated under the voting
interest method. All intercompany accounts and transactions have been eliminated. We conduct business globally and are
primarily managed on a geographic basis in the following three geographic segments: the Americas; Europe, Middle East, and
Africa (EMEA); and Asia Pacific, Japan, and China (APJC).
Certain reclassifications have been made to the amounts for prior years in order to conform to the current year’s presentation.
We have evaluated subsequent events through the date that the financial statements were issued.
2.
Summary of Significant Accounting Policies
(a) Cash and Cash Equivalents We consider all highly liquid investments purchased with an original or remaining maturity of
three months or less at the date of purchase to be cash equivalents.
(b)
Available-for-Sale Debt Investments We classify our investments in fixed income securities as available-for-sale debt
investments. Our available-for-sale debt investments primarily consist of U.S. government, U.S. government agency, non-U.S.
government and agency, corporate debt, U.S. agency mortgage-backed securities, commercial paper and certificates of deposit.
These available-for-sale debt investments are primarily held in the custody of a major financial institution. A specific
identification method is used to determine the cost basis of available-for-sale debt investments sold. These investments are
recorded in the Consolidated Balance Sheets at fair value and unrealized gains and losses on these investments are included as a
separate component of accumulated other comprehensive income (loss) (AOCI), net of tax. We classify our investments as
current based on the nature of the investments and their availability for use in current operations.
(c) Equity Instruments Our equity investments are accounted for as follows:
•
Marketable equity securities
have readily determinable fair value (RDFV) that are measured and recorded at fair value
through income.
•
Non-marketable equity securities
do not have RDFV and are measured using a measurement alternative recorded at
cost less any impairment, plus or minus changes resulting from qualifying observable price changes. For certain of
these securities, we have elected to apply the net asset value (NAV) practical expedient. The NAV is the estimated fair
value of these investments.
•
Equity method investments
are securities we do not control, but are able to exert significant influence over the investee.
These investments are measured at cost less any impairment, plus or minus our share of equity method investee
income or loss.
(d) Impairments of Investments For our available-for-sale debt securities in an unrealized loss position, we determine whether a
credit loss exists. In this assessment, among other factors, we consider the extent to which the fair value is less than the
amortized cost, any changes to the rating of the security by a rating agency, and adverse conditions specifically related to the
security. If factors indicate a credit loss exists, an allowance for credit loss is recorded to other income (loss), net, limited by the
amount that the fair value is less than the amortized cost basis. The amount of fair value change relating to all other factors is
recognized in other comprehensive income (OCI).
We hold non-marketable equity and other investments (“privately held investments”) which are included in other assets in the
Consolidated Balance Sheets. We monitor these investments for impairments and make reductions in carrying values if we
determine that an impairment charge is required based primarily on the financial condition and near-term prospects of these
companies.
(e)
Inventories Inventories are stated at the lower of cost or net realizable value. Cost is computed using standard cost, which
approximates actual cost, on a first-in, first-out basis. We provide inventory write-downs based on excess and obsolete
inventories determined primarily by future demand forecasts. The write-down is measured as the difference between the cost of
the inventory and net realizable value based upon assumptions about future demand and charged to the provision for inventory,
which is a component of cost of sales. At the point of loss recognition, a new, lower cost basis for that inventory is established,
and subsequent changes in facts and circumstances do not result in the restoration or increase in that newly established cost
61
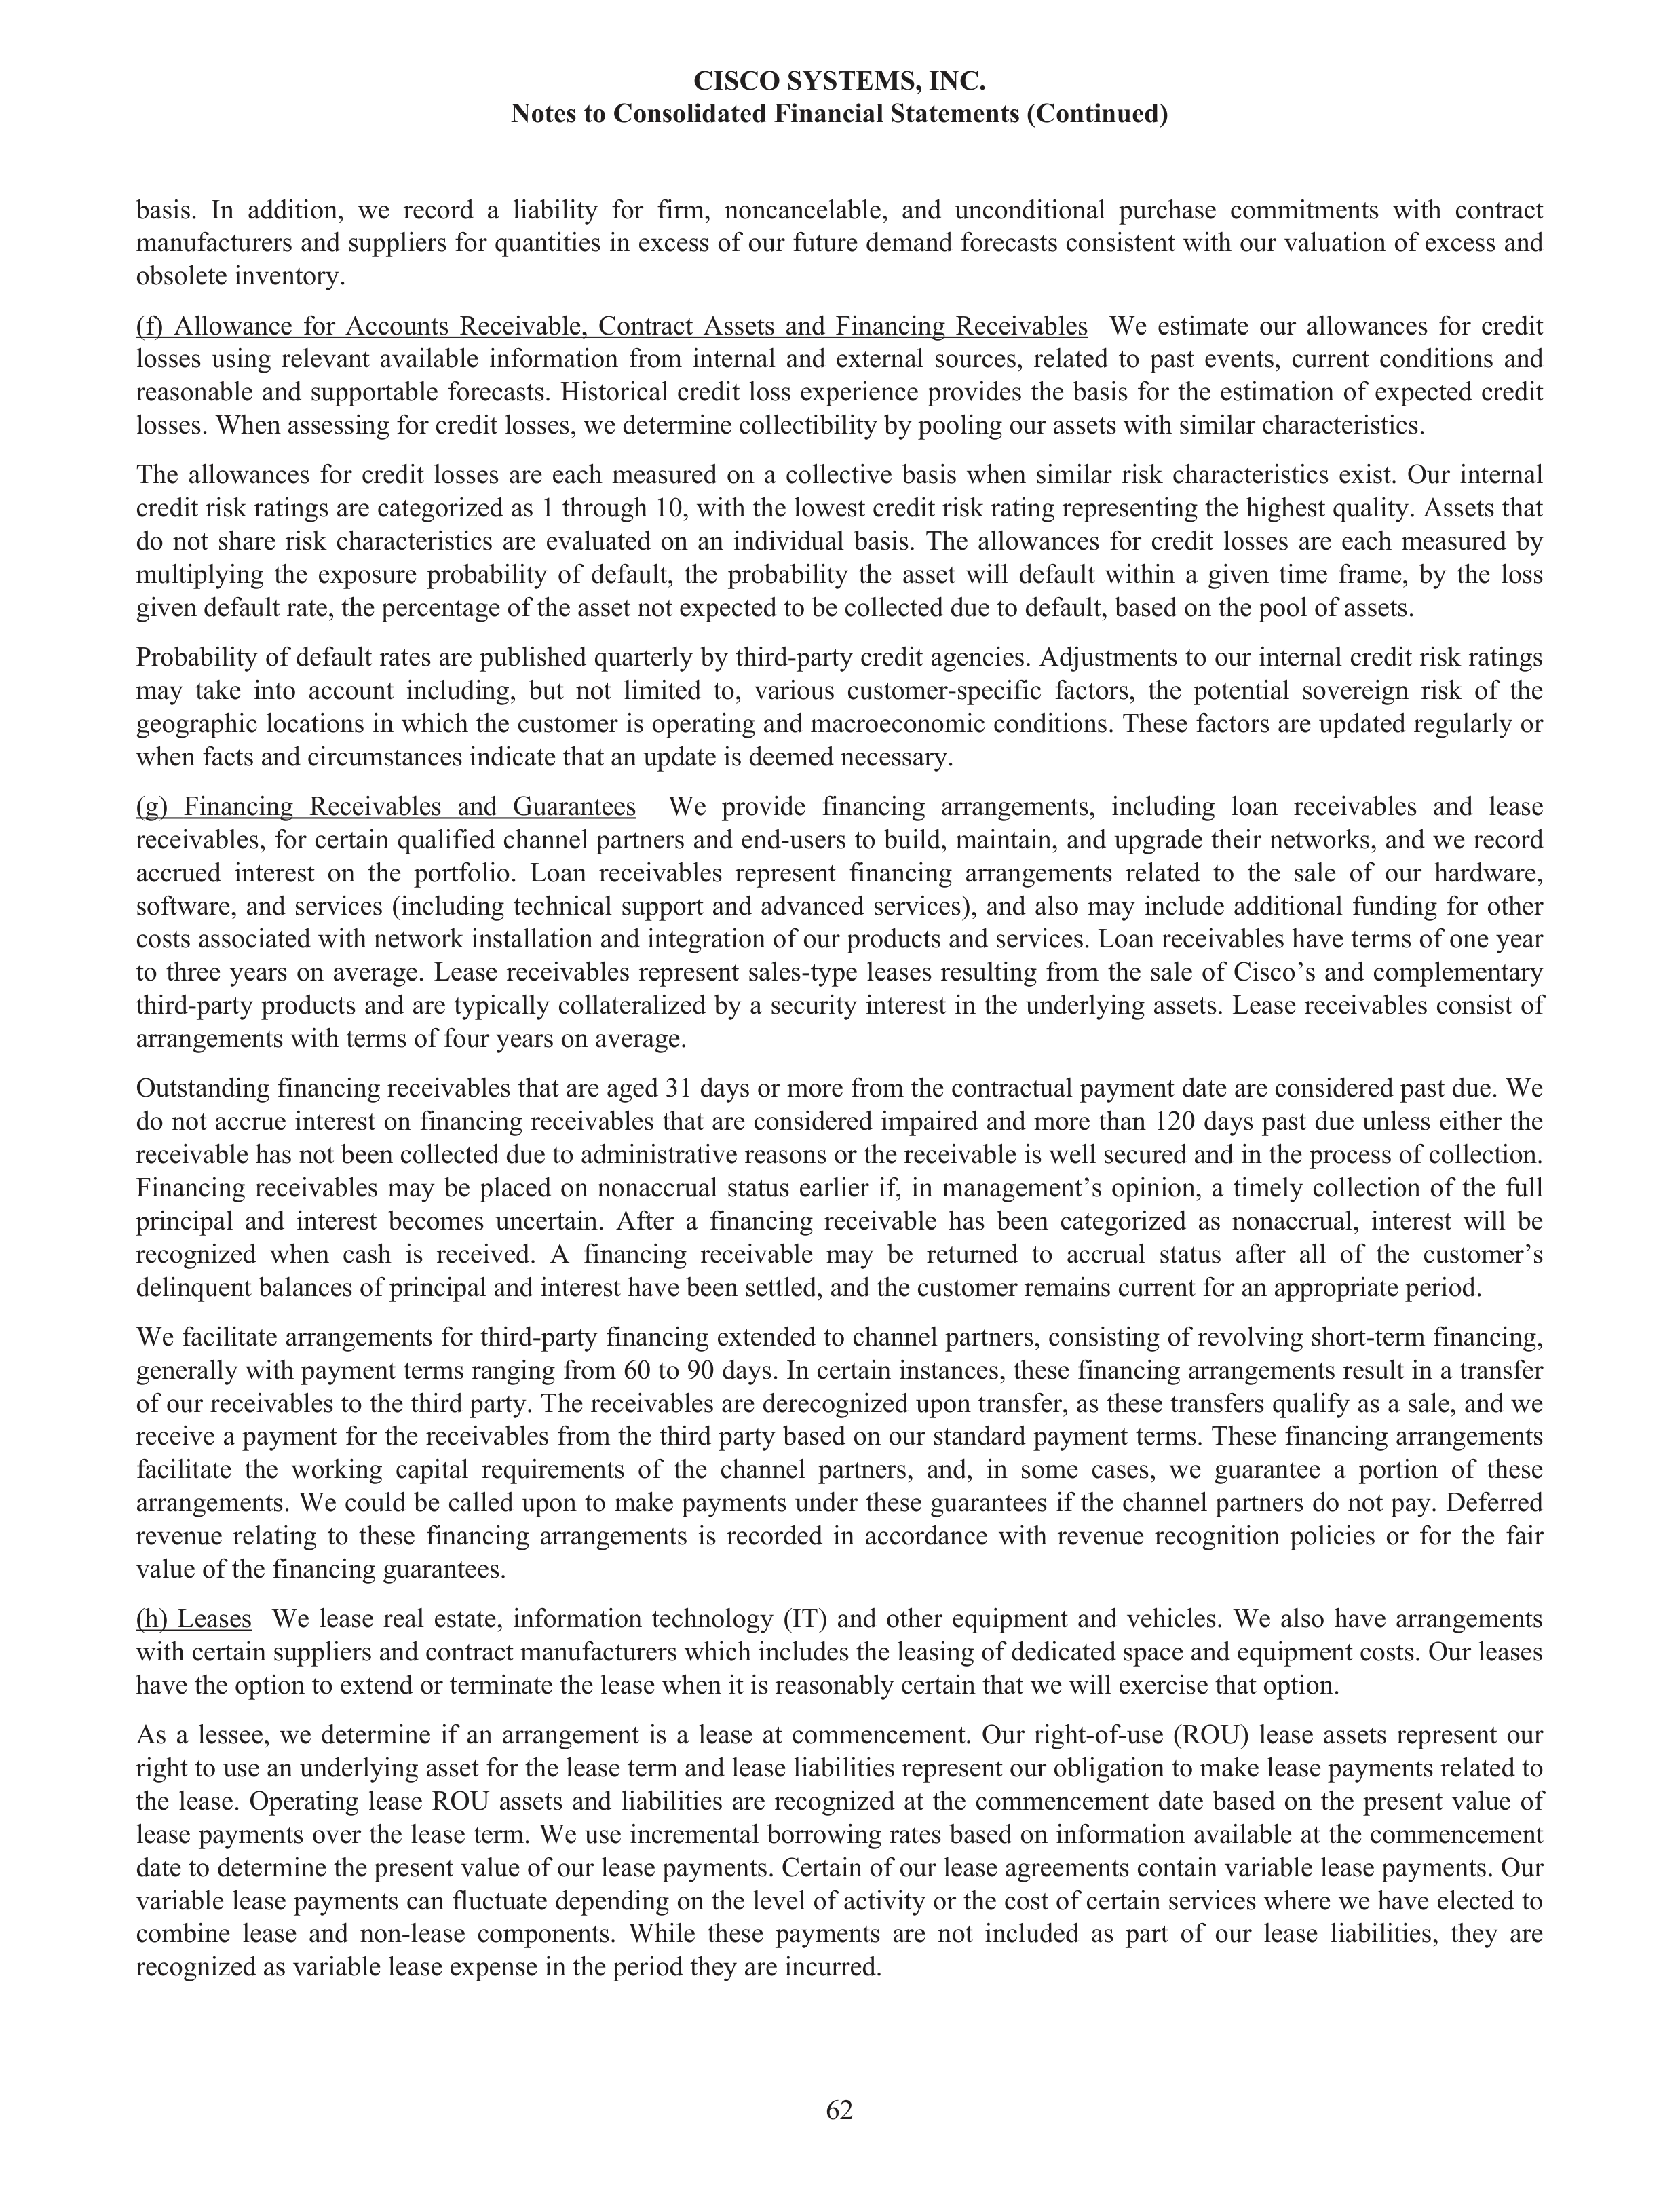
basis. In addition, we record a liability for firm, noncancelable, and unconditional purchase commitments with contract
manufacturers and suppliers for quantities in excess of our future demand forecasts consistent with our valuation of excess and
obsolete inventory.
(f)
Allowance for Accounts Receivable, Contract Assets and Financing Receivables We estimate our allowances for credit
losses using relevant available information from internal and external sources, related to past events, current conditions and
reasonable and supportable forecasts. Historical credit loss experience provides the basis for the estimation of expected credit
losses. When assessing for credit losses, we determine collectibility by pooling our assets with similar characteristics.
The allowances for credit losses are each measured on a collective basis when similar risk characteristics exist. Our internal
credit risk ratings are categorized as 1 through 10, with the lowest credit risk rating representing the highest quality. Assets that
do not share risk characteristics are evaluated on an individual basis. The allowances for credit losses are each measured by
multiplying the exposure probability of default, the probability the asset will default within a given time frame, by the loss
given default rate, the percentage of the asset not expected to be collected due to default, based on the pool of assets.
Probability of default rates are published quarterly by third-party credit agencies. Adjustments to our internal credit risk ratings
may take into account including, but not limited to, various customer-specific factors, the potential sovereign risk of the
geographic locations in which the customer is operating and macroeconomic conditions. These factors are updated regularly or
when facts and circumstances indicate that an update is deemed necessary.
(g)
Financing Receivables and Guarantees We provide financing arrangements, including loan receivables and lease
receivables, for certain qualified channel partners and end-users to build, maintain, and upgrade their networks, and we record
accrued interest on the portfolio. Loan receivables represent financing arrangements related to the sale of our hardware,
software, and services (including technical support and advanced services), and also may include additional funding for other
costs associated with network installation and integration of our products and services. Loan receivables have terms of one year
to three years on average. Lease receivables represent sales-type leases resulting from the sale of Cisco’s and complementary
third-party products and are typically collateralized by a security interest in the underlying assets. Lease receivables consist of
arrangements with terms of four years on average.
Outstanding financing receivables that are aged 31 days or more from the contractual payment date are considered past due. We
do not accrue interest on financing receivables that are considered impaired and more than 120 days past due unless either the
receivable has not been collected due to administrative reasons or the receivable is well secured and in the process of collection.
Financing receivables may be placed on nonaccrual status earlier if, in management’s opinion, a timely collection of the full
principal and interest becomes uncertain. After a financing receivable has been categorized as nonaccrual, interest will be
recognized when cash is received. A financing receivable may be returned to accrual status after all of the customer’s
delinquent balances of principal and interest have been settled, and the customer remains current for an appropriate period.
We facilitate arrangements for third-party financing extended to channel partners, consisting of revolving short-term financing,
generally with payment terms ranging from 60 to 90 days. In certain instances, these financing arrangements result in a transfer
of our receivables to the third party. The receivables are derecognized upon transfer, as these transfers qualify as a sale, and we
receive a payment for the receivables from the third party based on our standard payment terms. These financing arrangements
facilitate the working capital requirements of the channel partners, and, in some cases, we guarantee a portion of these
arrangements. We could be called upon to make payments under these guarantees if the channel partners do not pay. Deferred
revenue relating to these financing arrangements is recorded in accordance with revenue recognition policies or for the fair
value of the financing guarantees.
(h)
Leases We lease real estate, information technology (IT) and other equipment and vehicles. We also have arrangements
with certain suppliers and contract manufacturers which includes the leasing of dedicated space and equipment costs. Our leases
have the option to extend or terminate the lease when it is reasonably certain that we will exercise that option.
As a lessee, we determine if an arrangement is a lease at commencement. Our right-of-use (ROU) lease assets represent our
right to use an underlying asset for the lease term and lease liabilities represent our obligation to make lease payments related to
the lease. Operating lease ROU assets and liabilities are recognized at the commencement date based on the present value of
lease payments over the lease term. We use incremental borrowing rates based on information available at the commencement
date to determine the present value of our lease payments. Certain of our lease agreements contain variable lease payments. Our
variable lease payments can fluctuate depending on the level of activity or the cost of certain services where we have elected to
combine lease and non-lease components. While these payments are not included as part of our lease liabilities, they are
recognized as variable lease expense in the period they are incurred.
CISCO SYSTEMS, INC.
Notes to Consolidated Financial Statements (Continued)
62
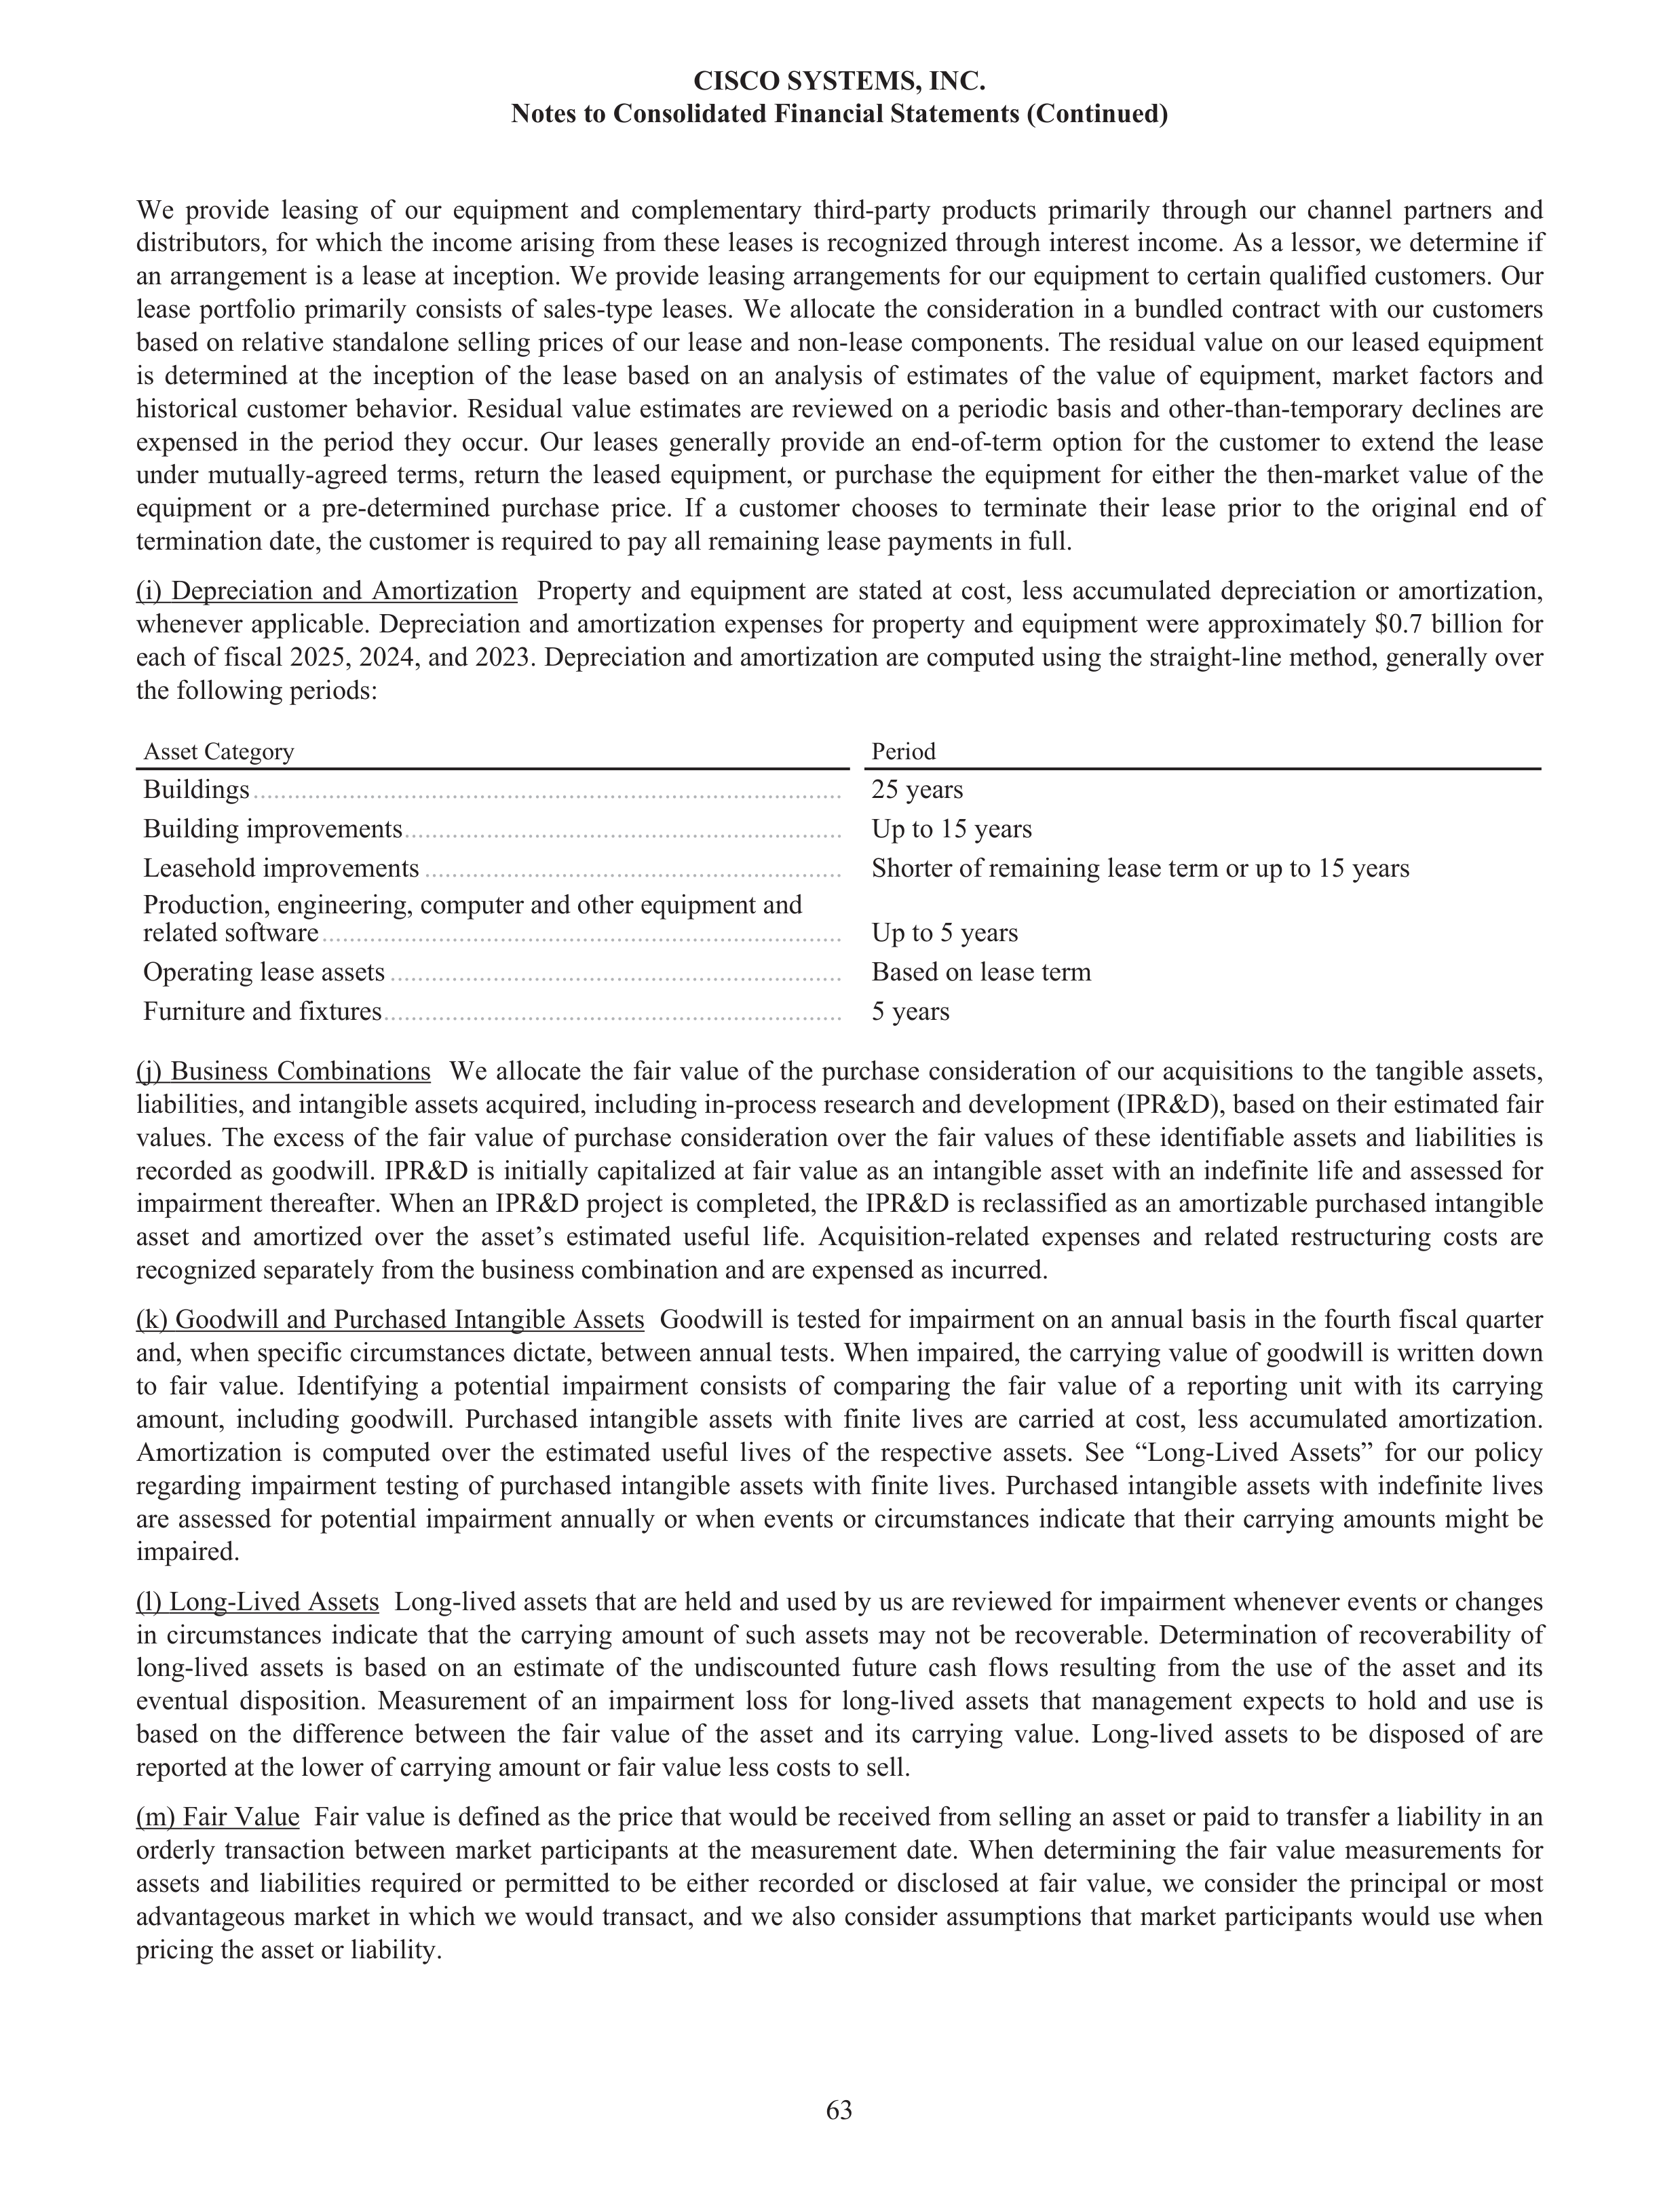
We provide leasing of our equipment and complementary third-party products primarily through our channel partners and
distributors, for which the income arising from these leases is recognized through interest income. As a lessor, we determine if
an arrangement is a lease at inception. We provide leasing arrangements for our equipment to certain qualified customers. Our
lease portfolio primarily consists of sales-type leases. We allocate the consideration in a bundled contract with our customers
based on relative standalone selling prices of our lease and non-lease components. The residual value on our leased equipment
is determined at the inception of the lease based on an analysis of estimates of the value of equipment, market factors and
historical customer behavior. Residual value estimates are reviewed on a periodic basis and other-than-temporary declines are
expensed in the period they occur. Our leases generally provide an end-of-term option for the customer to extend the lease
under mutually-agreed terms, return the leased equipment, or purchase the equipment for either the then-market value of the
equipment or a pre-determined purchase price. If a customer chooses to terminate their lease prior to the original end of
termination date, the customer is required to pay all remaining lease payments in full.
(i)
Depreciation and Amortization Property and equipment are stated at cost, less accumulated depreciation or amortization,
whenever applicable. Depreciation and amortization expenses for property and equipment were approximately $0.7 billion for
each of fiscal 2025, 2024, and 2023. Depreciation and amortization are computed using the straight-line method, generally over
the following periods:
Asset Category
Period
Buildings
......................................................................................
25 years
Building improvements
................................................................
Up to 15 years
Leasehold improvements
.............................................................
Shorter of remaining lease term or up to 15 years
Production, engineering, computer and other equipment and
related software
............................................................................
Up to 5 years
Operating lease assets
..................................................................
Based on lease term
Furniture and fixtures
...................................................................
5 years
(j)
Business Combinations We allocate the fair value of the purchase consideration of our acquisitions to the tangible assets,
liabilities, and intangible assets acquired, including in-process research and development (IPR&D), based on their estimated fair
values. The excess of the fair value of purchase consideration over the fair values of these identifiable assets and liabilities is
recorded as goodwill. IPR&D is initially capitalized at fair value as an intangible asset with an indefinite life and assessed for
impairment thereafter. When an IPR&D project is completed, the IPR&D is reclassified as an amortizable purchased intangible
asset and amortized over the asset’s estimated useful life. Acquisition-related expenses and related restructuring costs are
recognized separately from the business combination and are expensed as incurred.
(k) Goodwill and Purchased Intangible Assets Goodwill is tested for impairment on an annual basis in the fourth fiscal quarter
and, when specific circumstances dictate, between annual tests. When impaired, the carrying value of goodwill is written down
to fair value. Identifying a potential impairment consists of comparing the fair value of a reporting unit with its carrying
amount, including goodwill. Purchased intangible assets with finite lives are carried at cost, less accumulated amortization.
Amortization is computed over the estimated useful lives of the respective assets. See “Long-Lived Assets” for our policy
regarding impairment testing of purchased intangible assets with finite lives. Purchased intangible assets with indefinite lives
are assessed for potential impairment annually or when events or circumstances indicate that their carrying amounts might be
impaired.
(l) Long-Lived Assets Long-lived assets that are held and used by us are reviewed for impairment whenever events or changes
in circumstances indicate that the carrying amount of such assets may not be recoverable. Determination of recoverability of
long-lived assets is based on an estimate of the undiscounted future cash flows resulting from the use of the asset and its
eventual disposition. Measurement of an impairment loss for long-lived assets that management expects to hold and use is
based on the difference between the fair value of the asset and its carrying value. Long-lived assets to be disposed of are
reported at the lower of carrying amount or fair value less costs to sell.
(m) Fair Value Fair value is defined as the price that would be received from selling an asset or paid to transfer a liability in an
orderly transaction between market participants at the measurement date. When determining the fair value measurements for
assets and liabilities required or permitted to be either recorded or disclosed at fair value, we consider the principal or most
advantageous market in which we would transact, and we also consider assumptions that market participants would use when
pricing the asset or liability.
CISCO SYSTEMS, INC.
Notes to Consolidated Financial Statements (Continued)
63
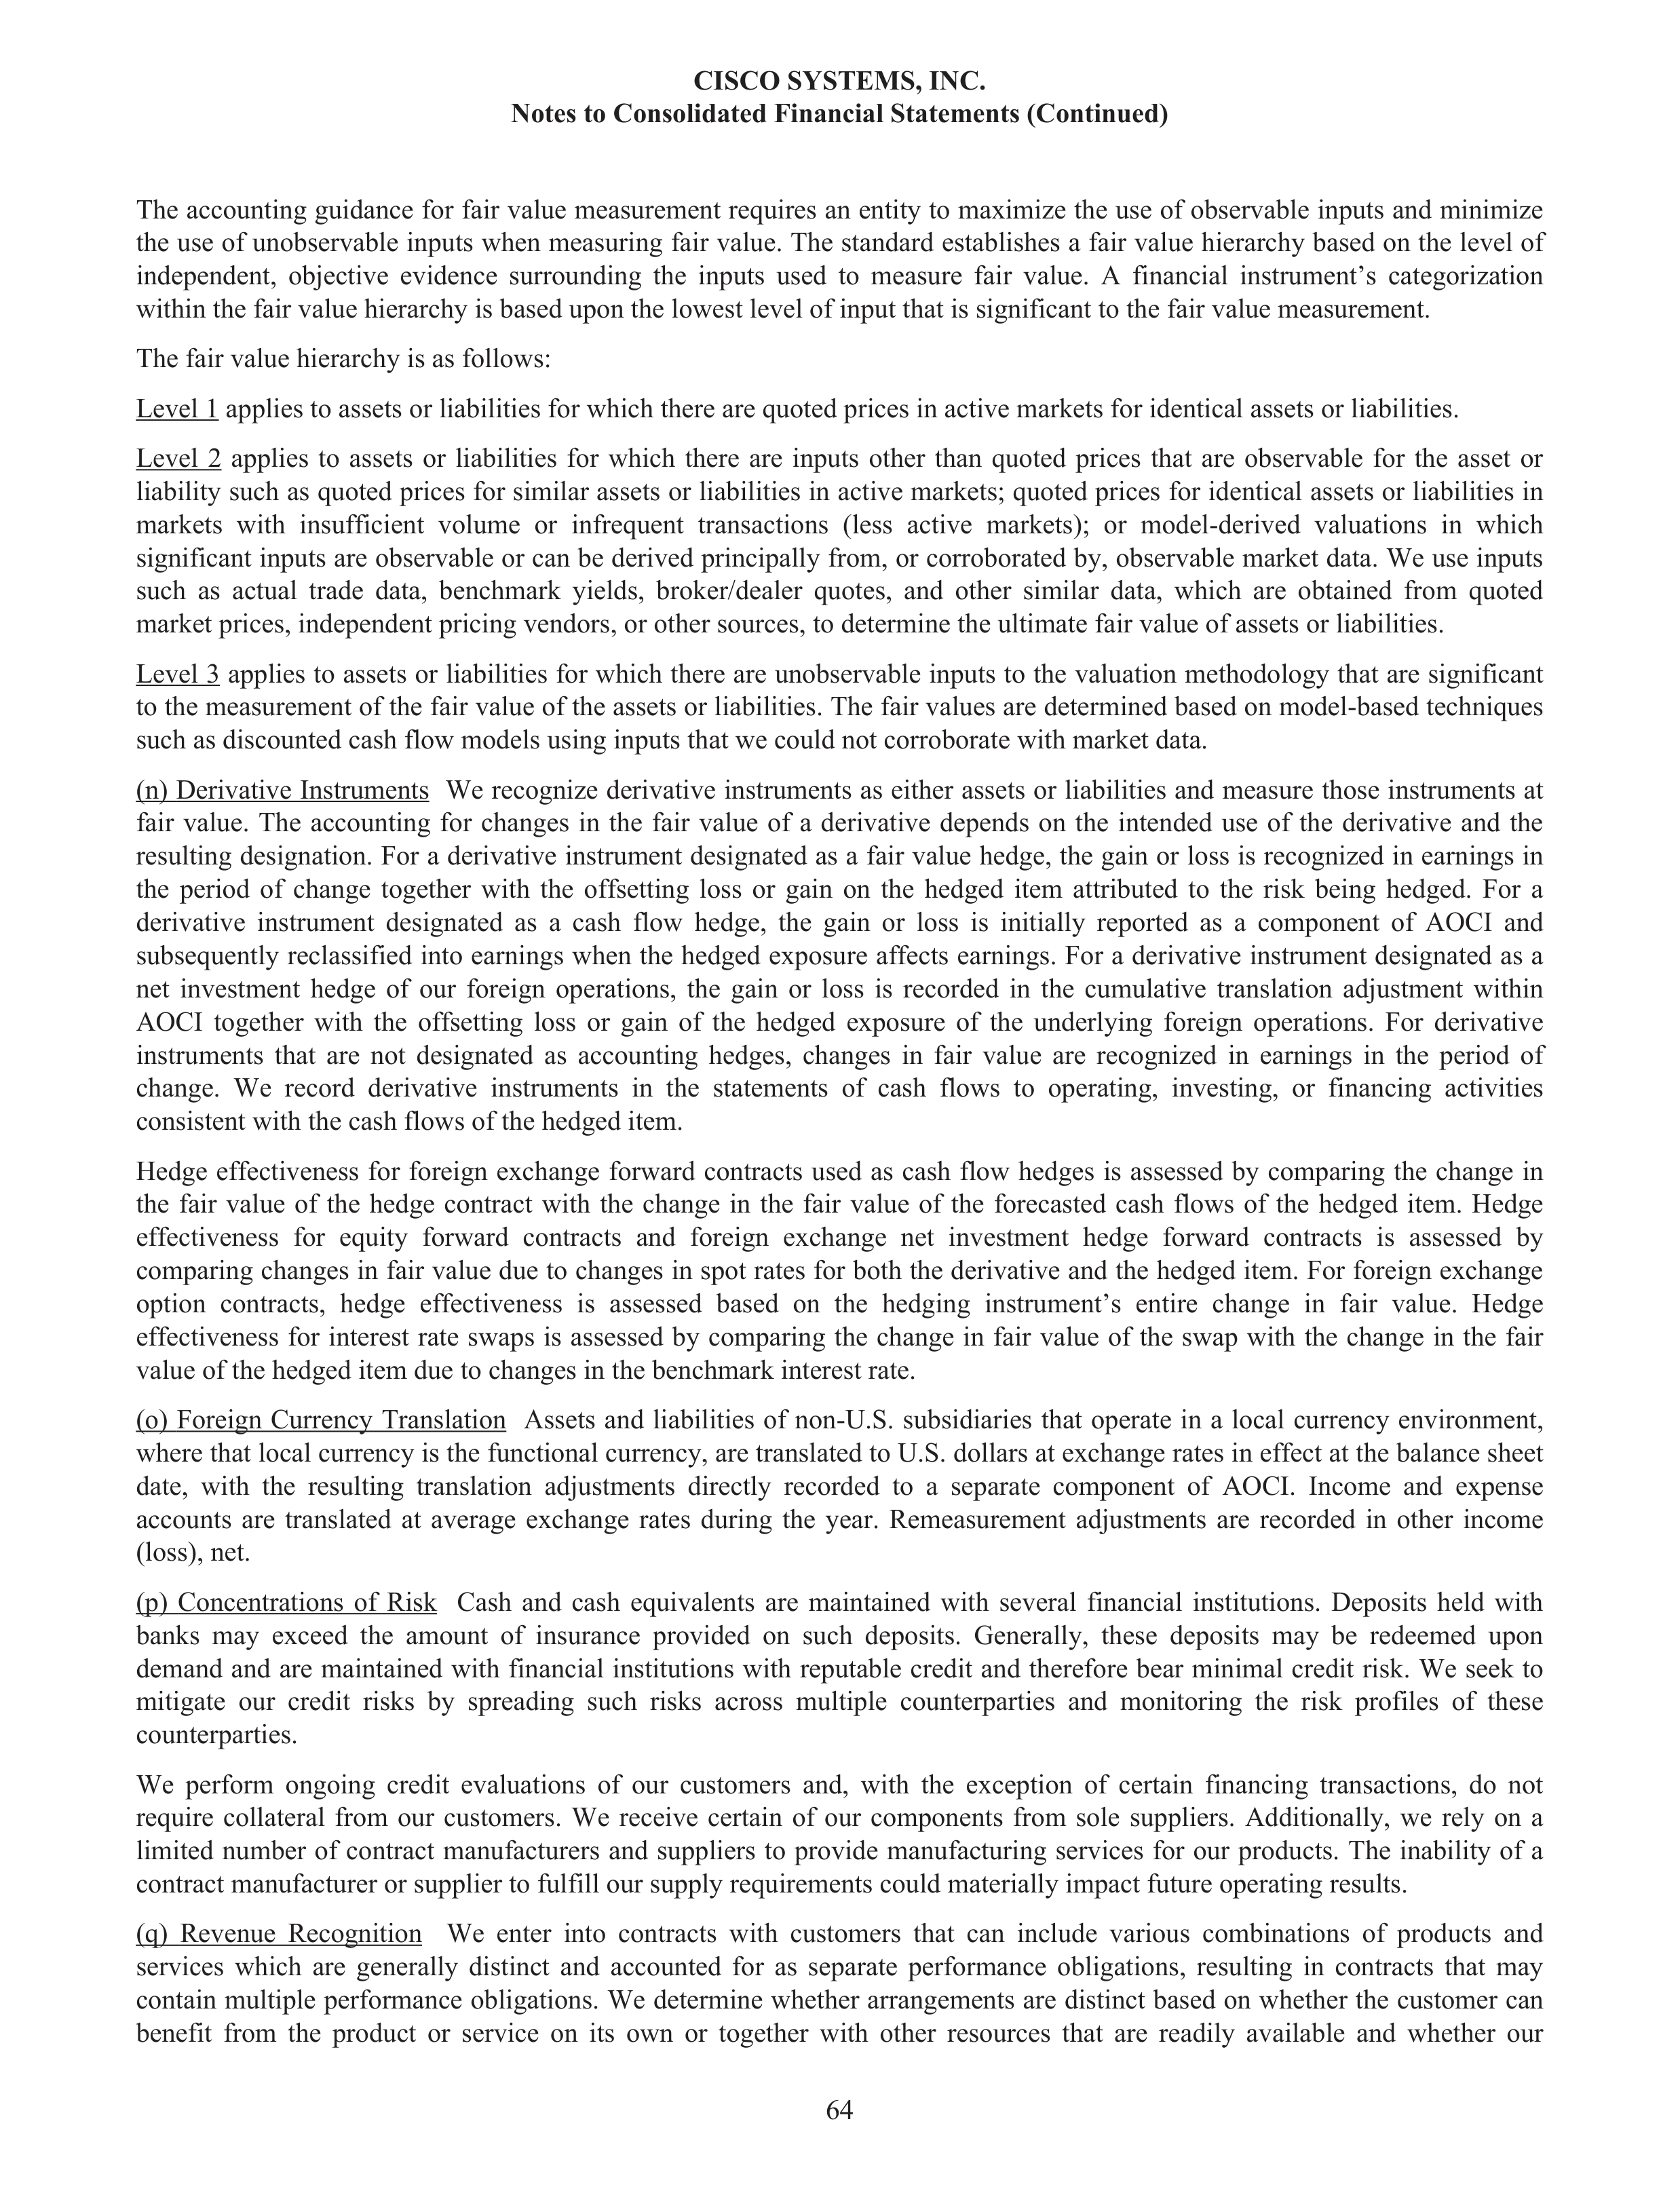
The accounting guidance for fair value measurement requires an entity to maximize the use of observable inputs and minimize
the use of unobservable inputs when measuring fair value. The standard establishes a fair value hierarchy based on the level of
independent, objective evidence surrounding the inputs used to measure fair value. A financial instrument’s categorization
within the fair value hierarchy is based upon the lowest level of input that is significant to the fair value measurement.
The fair value hierarchy is as follows:
Level 1 applies to assets or liabilities for which there are quoted prices in active markets for identical assets or liabilities.
Level 2 applies to assets or liabilities for which there are inputs other than quoted prices that are observable for the asset or
liability such as quoted prices for similar assets or liabilities in active markets; quoted prices for identical assets or liabilities in
markets with insufficient volume or infrequent transactions (less active markets); or model-derived valuations in which
significant inputs are observable or can be derived principally from, or corroborated by, observable market data. We use inputs
such as actual trade data, benchmark yields, broker/dealer quotes, and other similar data, which are obtained from quoted
market prices, independent pricing vendors, or other sources, to determine the ultimate fair value of assets or liabilities.
Level 3 applies to assets or liabilities for which there are unobservable inputs to the valuation methodology that are significant
to the measurement of the fair value of the assets or liabilities. The fair values are determined based on model-based techniques
such as discounted cash flow models using inputs that we could not corroborate with market data.
(n) Derivative Instruments We recognize derivative instruments as either assets or liabilities and measure those instruments at
fair value. The accounting for changes in the fair value of a derivative depends on the intended use of the derivative and the
resulting designation. For a derivative instrument designated as a fair value hedge, the gain or loss is recognized in earnings in
the period of change together with the offsetting loss or gain on the hedged item attributed to the risk being hedged. For a
derivative instrument designated as a cash flow hedge, the gain or loss is initially reported as a component of AOCI and
subsequently reclassified into earnings when the hedged exposure affects earnings. For a derivative instrument designated as a
net investment hedge of our foreign operations, the gain or loss is recorded in the cumulative translation adjustment within
AOCI together with the offsetting loss or gain of the hedged exposure of the underlying foreign operations. For derivative
instruments that are not designated as accounting hedges, changes in fair value are recognized in earnings in the period of
change. We record derivative instruments in the statements of cash flows to operating, investing, or financing activities
consistent with the cash flows of the hedged item.
Hedge effectiveness for foreign exchange forward contracts used as cash flow hedges is assessed by comparing the change in
the fair value of the hedge contract with the change in the fair value of the forecasted cash flows of the hedged item. Hedge
effectiveness for equity forward contracts and foreign exchange net investment hedge forward contracts is assessed by
comparing changes in fair value due to changes in spot rates for both the derivative and the hedged item. For foreign exchange
option contracts, hedge effectiveness is assessed based on the hedging instrument’s entire change in fair value. Hedge
effectiveness for interest rate swaps is assessed by comparing the change in fair value of the swap with the change in the fair
value of the hedged item due to changes in the benchmark interest rate.
(o)
Foreign Currency Translation Assets and liabilities of non-U.S. subsidiaries that operate in a local currency environment,
where that local currency is the functional currency, are translated to U.S. dollars at exchange rates in effect at the balance sheet
date, with the resulting translation adjustments directly recorded to a separate component of AOCI. Income and expense
accounts are translated at average exchange rates during the year. Remeasurement adjustments are recorded in other income
(loss), net.
(p)
Concentrations of Risk Cash and cash equivalents are maintained with several financial institutions. Deposits held with
banks may exceed the amount of insurance provided on such deposits. Generally, these deposits may be redeemed upon
demand and are maintained with financial institutions with reputable credit and therefore bear minimal credit risk. We seek to
mitigate our credit risks by spreading such risks across multiple counterparties and monitoring the risk profiles of these
counterparties.
We perform ongoing credit evaluations of our customers and, with the exception of certain financing transactions, do not
require collateral from our customers. We receive certain of our components from sole suppliers. Additionally, we rely on a
limited number of contract manufacturers and suppliers to provide manufacturing services for our products. The inability of a
contract manufacturer or supplier to fulfill our supply requirements could materially impact future operating results.
(q)
Revenue Recognition We enter into contracts with customers that can include various combinations of products and
services which are generally distinct and accounted for as separate performance obligations, resulting in contracts that may
contain multiple performance obligations. We determine whether arrangements are distinct based on whether the customer can
benefit from the product or service on its own or together with other resources that are readily available and whether our
CISCO SYSTEMS, INC.
Notes to Consolidated Financial Statements (Continued)
64
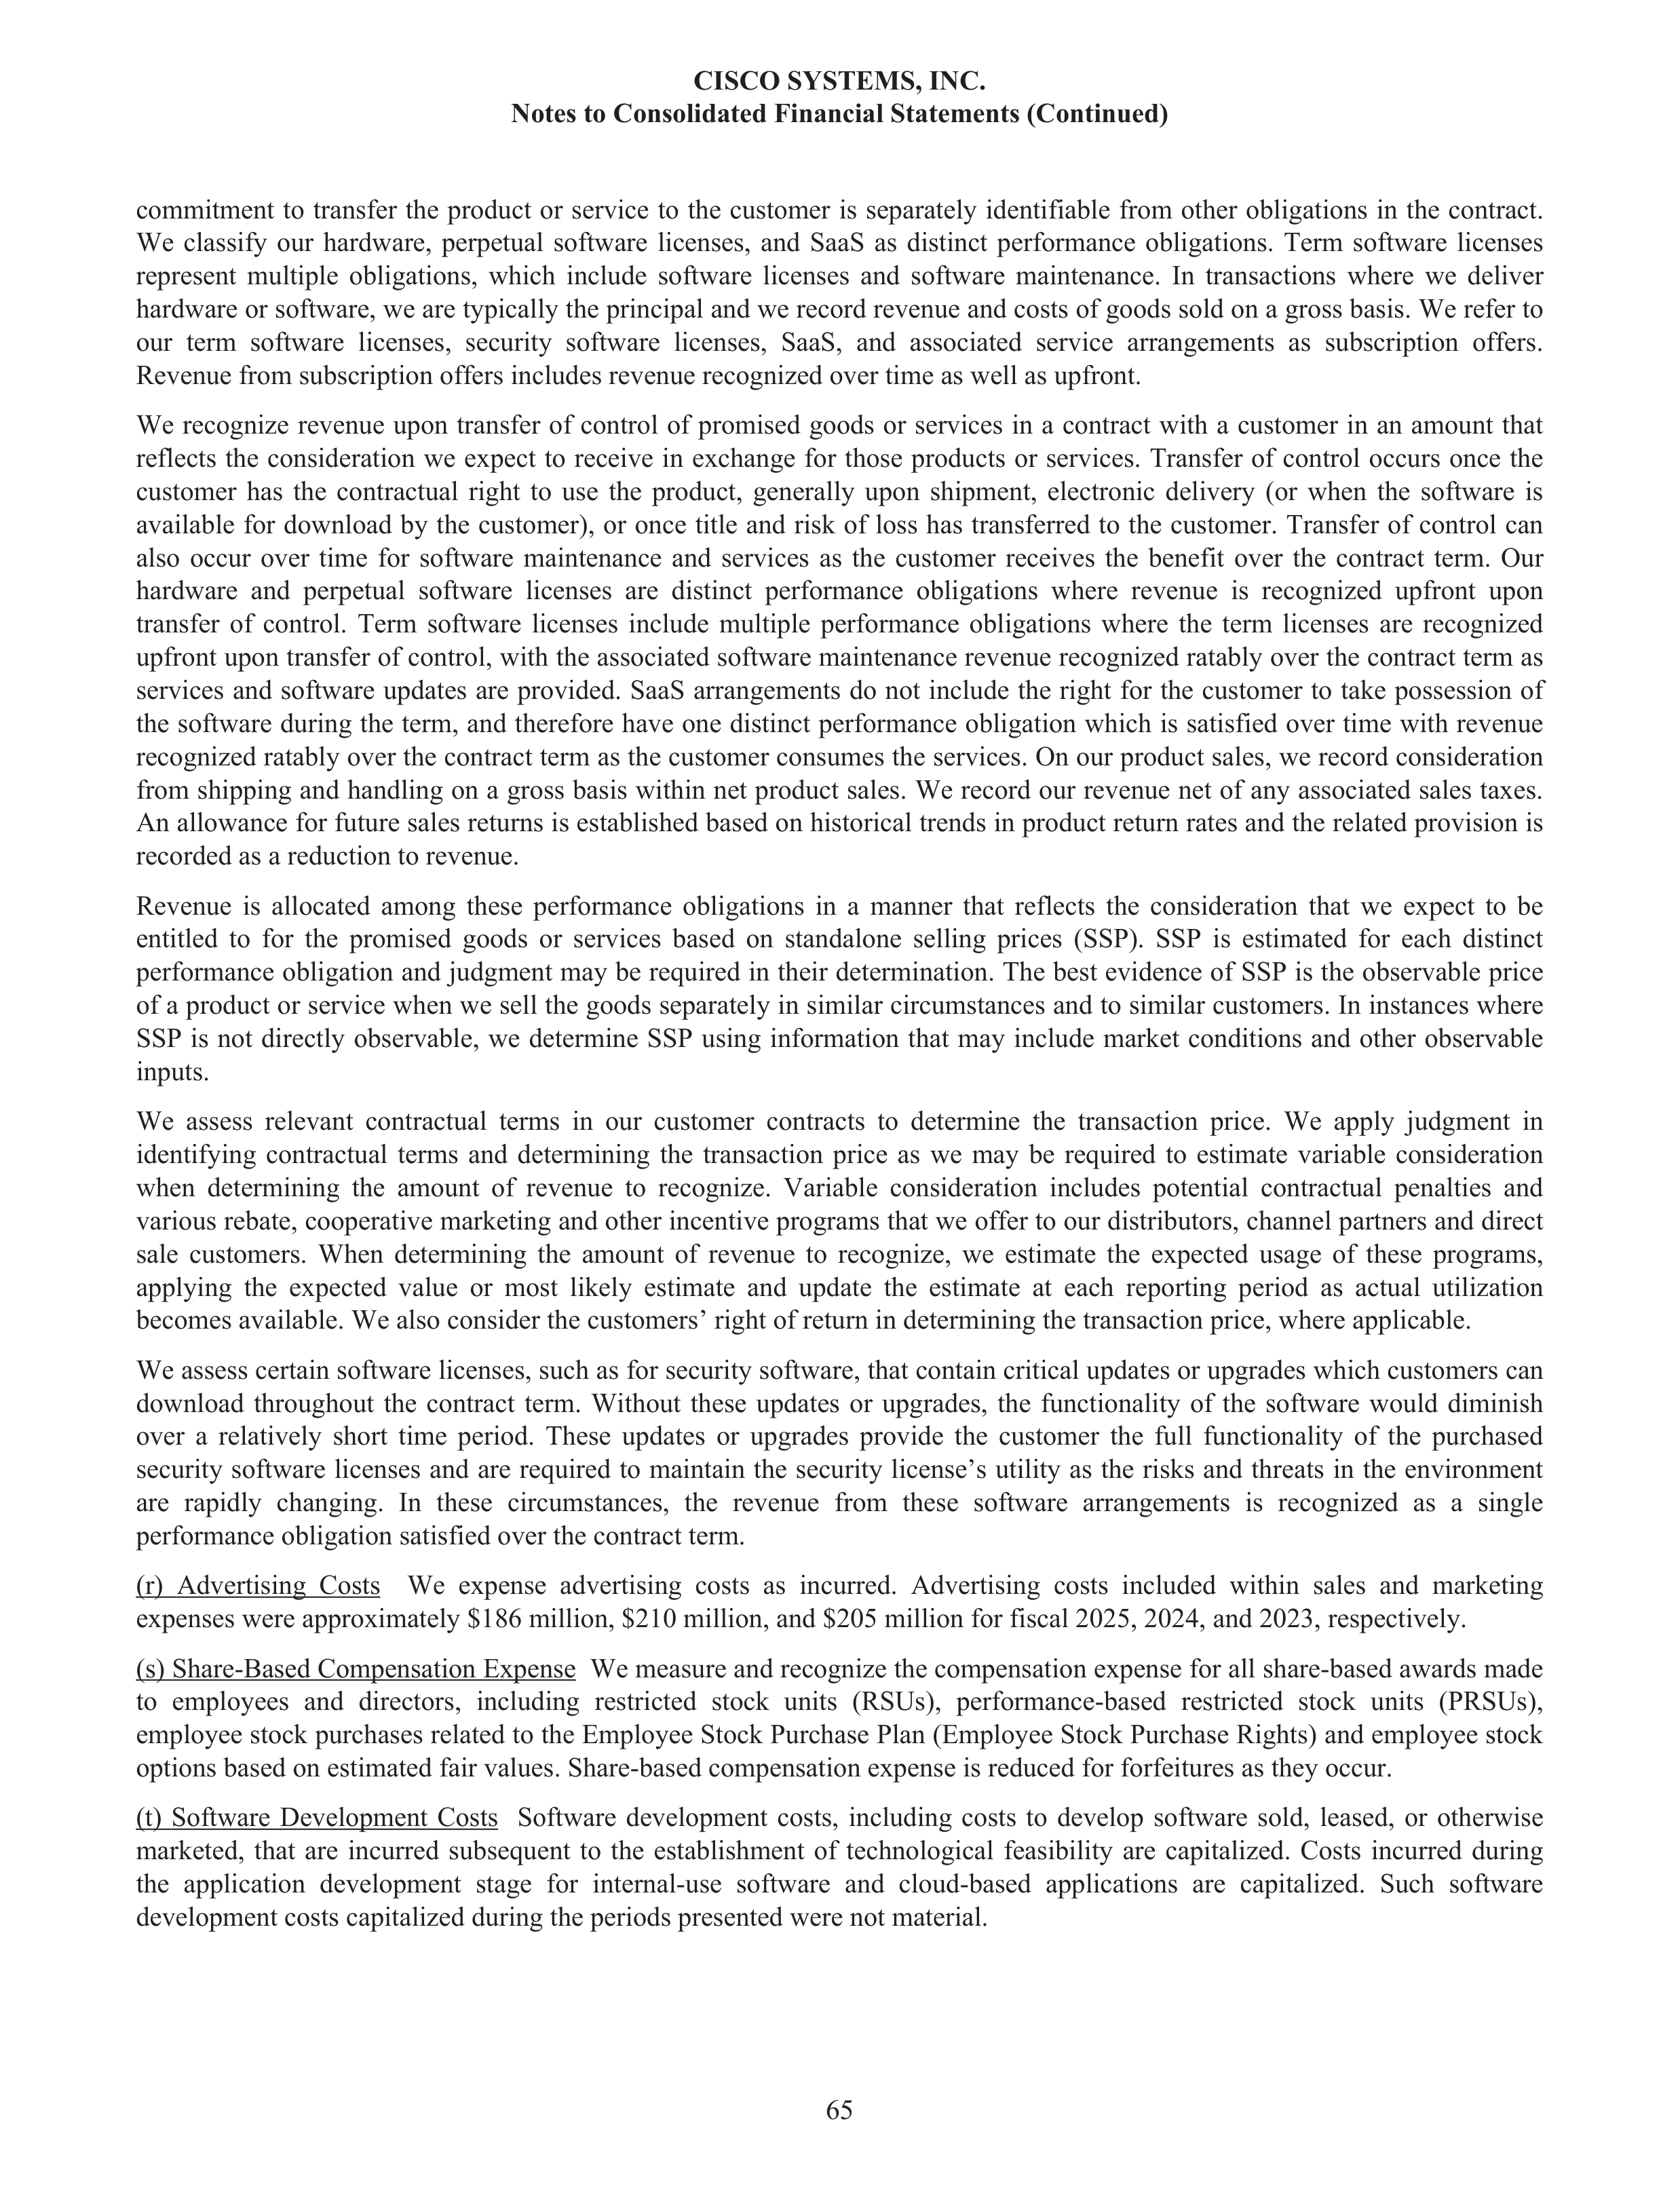
commitment to transfer the product or service to the customer is separately identifiable from other obligations in the contract.
We classify our hardware, perpetual software licenses, and SaaS as distinct performance obligations. Term software licenses
represent multiple obligations, which include software licenses and software maintenance. In transactions where we deliver
hardware or software, we are typically the principal and we record revenue and costs of goods sold on a gross basis. We refer to
our term software licenses, security software licenses, SaaS, and associated service arrangements as subscription offers.
Revenue from subscription offers includes revenue recognized over time as well as upfront.
We recognize revenue upon transfer of control of promised goods or services in a contract with a customer in an amount that
reflects the consideration we expect to receive in exchange for those products or services. Transfer of control occurs once the
customer has the contractual right to use the product, generally upon shipment, electronic delivery (or when the software is
available for download by the customer), or once title and risk of loss has transferred to the customer. Transfer of control can
also occur over time for software maintenance and services as the customer receives the benefit over the contract term. Our
hardware and perpetual software licenses are distinct performance obligations where revenue is recognized upfront upon
transfer of control. Term software licenses include multiple performance obligations where the term licenses are recognized
upfront upon transfer of control, with the associated software maintenance revenue recognized ratably over the contract term as
services and software updates are provided. SaaS arrangements do not include the right for the customer to take possession of
the software during the term, and therefore have one distinct performance obligation which is satisfied over time with revenue
recognized ratably over the contract term as the customer consumes the services. On our product sales, we record consideration
from shipping and handling on a gross basis within net product sales. We record our revenue net of any associated sales taxes.
An allowance for future sales returns is established based on historical trends in product return rates and the related provision is
recorded as a reduction to revenue.
Revenue is allocated among these performance obligations in a manner that reflects the consideration that we expect to be
entitled to for the promised goods or services based on standalone selling prices (SSP). SSP is estimated for each distinct
performance obligation and judgment may be required in their determination. The best evidence of SSP is the observable price
of a product or service when we sell the goods separately in similar circumstances and to similar customers. In instances where
SSP is not directly observable, we determine SSP using information that may include market conditions and other observable
inputs.
We assess relevant contractual terms in our customer contracts to determine the transaction price. We apply judgment in
identifying contractual terms and determining the transaction price as we may be required to estimate variable consideration
when determining the amount of revenue to recognize. Variable consideration includes potential contractual penalties and
various rebate, cooperative marketing and other incentive programs that we offer to our distributors, channel partners and direct
sale customers. When determining the amount of revenue to recognize, we estimate the expected usage of these programs,
applying the expected value or most likely estimate and update the estimate at each reporting period as actual utilization
becomes available. We also consider the customers’ right of return in determining the transaction price, where applicable.
We assess certain software licenses, such as for security software, that contain critical updates or upgrades which customers can
download throughout the contract term. Without these updates or upgrades, the functionality of the software would diminish
over a relatively short time period. These updates or upgrades provide the customer the full functionality of the purchased
security software licenses and are required to maintain the security license’s utility as the risks and threats in the environment
are rapidly changing. In these circumstances, the revenue from these software arrangements is recognized as a single
performance obligation satisfied over the contract term.
(r)
Advertising Costs We expense advertising costs as incurred. Advertising costs included within sales and marketing
expenses were approximately $186 million, $210 million, and $205 million for fiscal 2025, 2024, and 2023, respectively.
(s) Share-Based Compensation Expense We measure and recognize the compensation expense for all share-based awards made
to employees and directors, including restricted stock units (RSUs), performance-based restricted stock units (PRSUs),
employee stock purchases related to the Employee Stock Purchase Plan (Employee Stock Purchase Rights) and employee stock
options based on estimated fair values. Share-based compensation expense is reduced for forfeitures as they occur.
(t)
Software Development Costs Software development costs, including costs to develop software sold, leased, or otherwise
marketed, that are incurred subsequent to the establishment of technological feasibility are capitalized. Costs incurred during
the application development stage for internal-use software and cloud-based applications are capitalized. Such software
development costs capitalized during the periods presented were not material.
CISCO SYSTEMS, INC.
Notes to Consolidated Financial Statements (Continued)
65
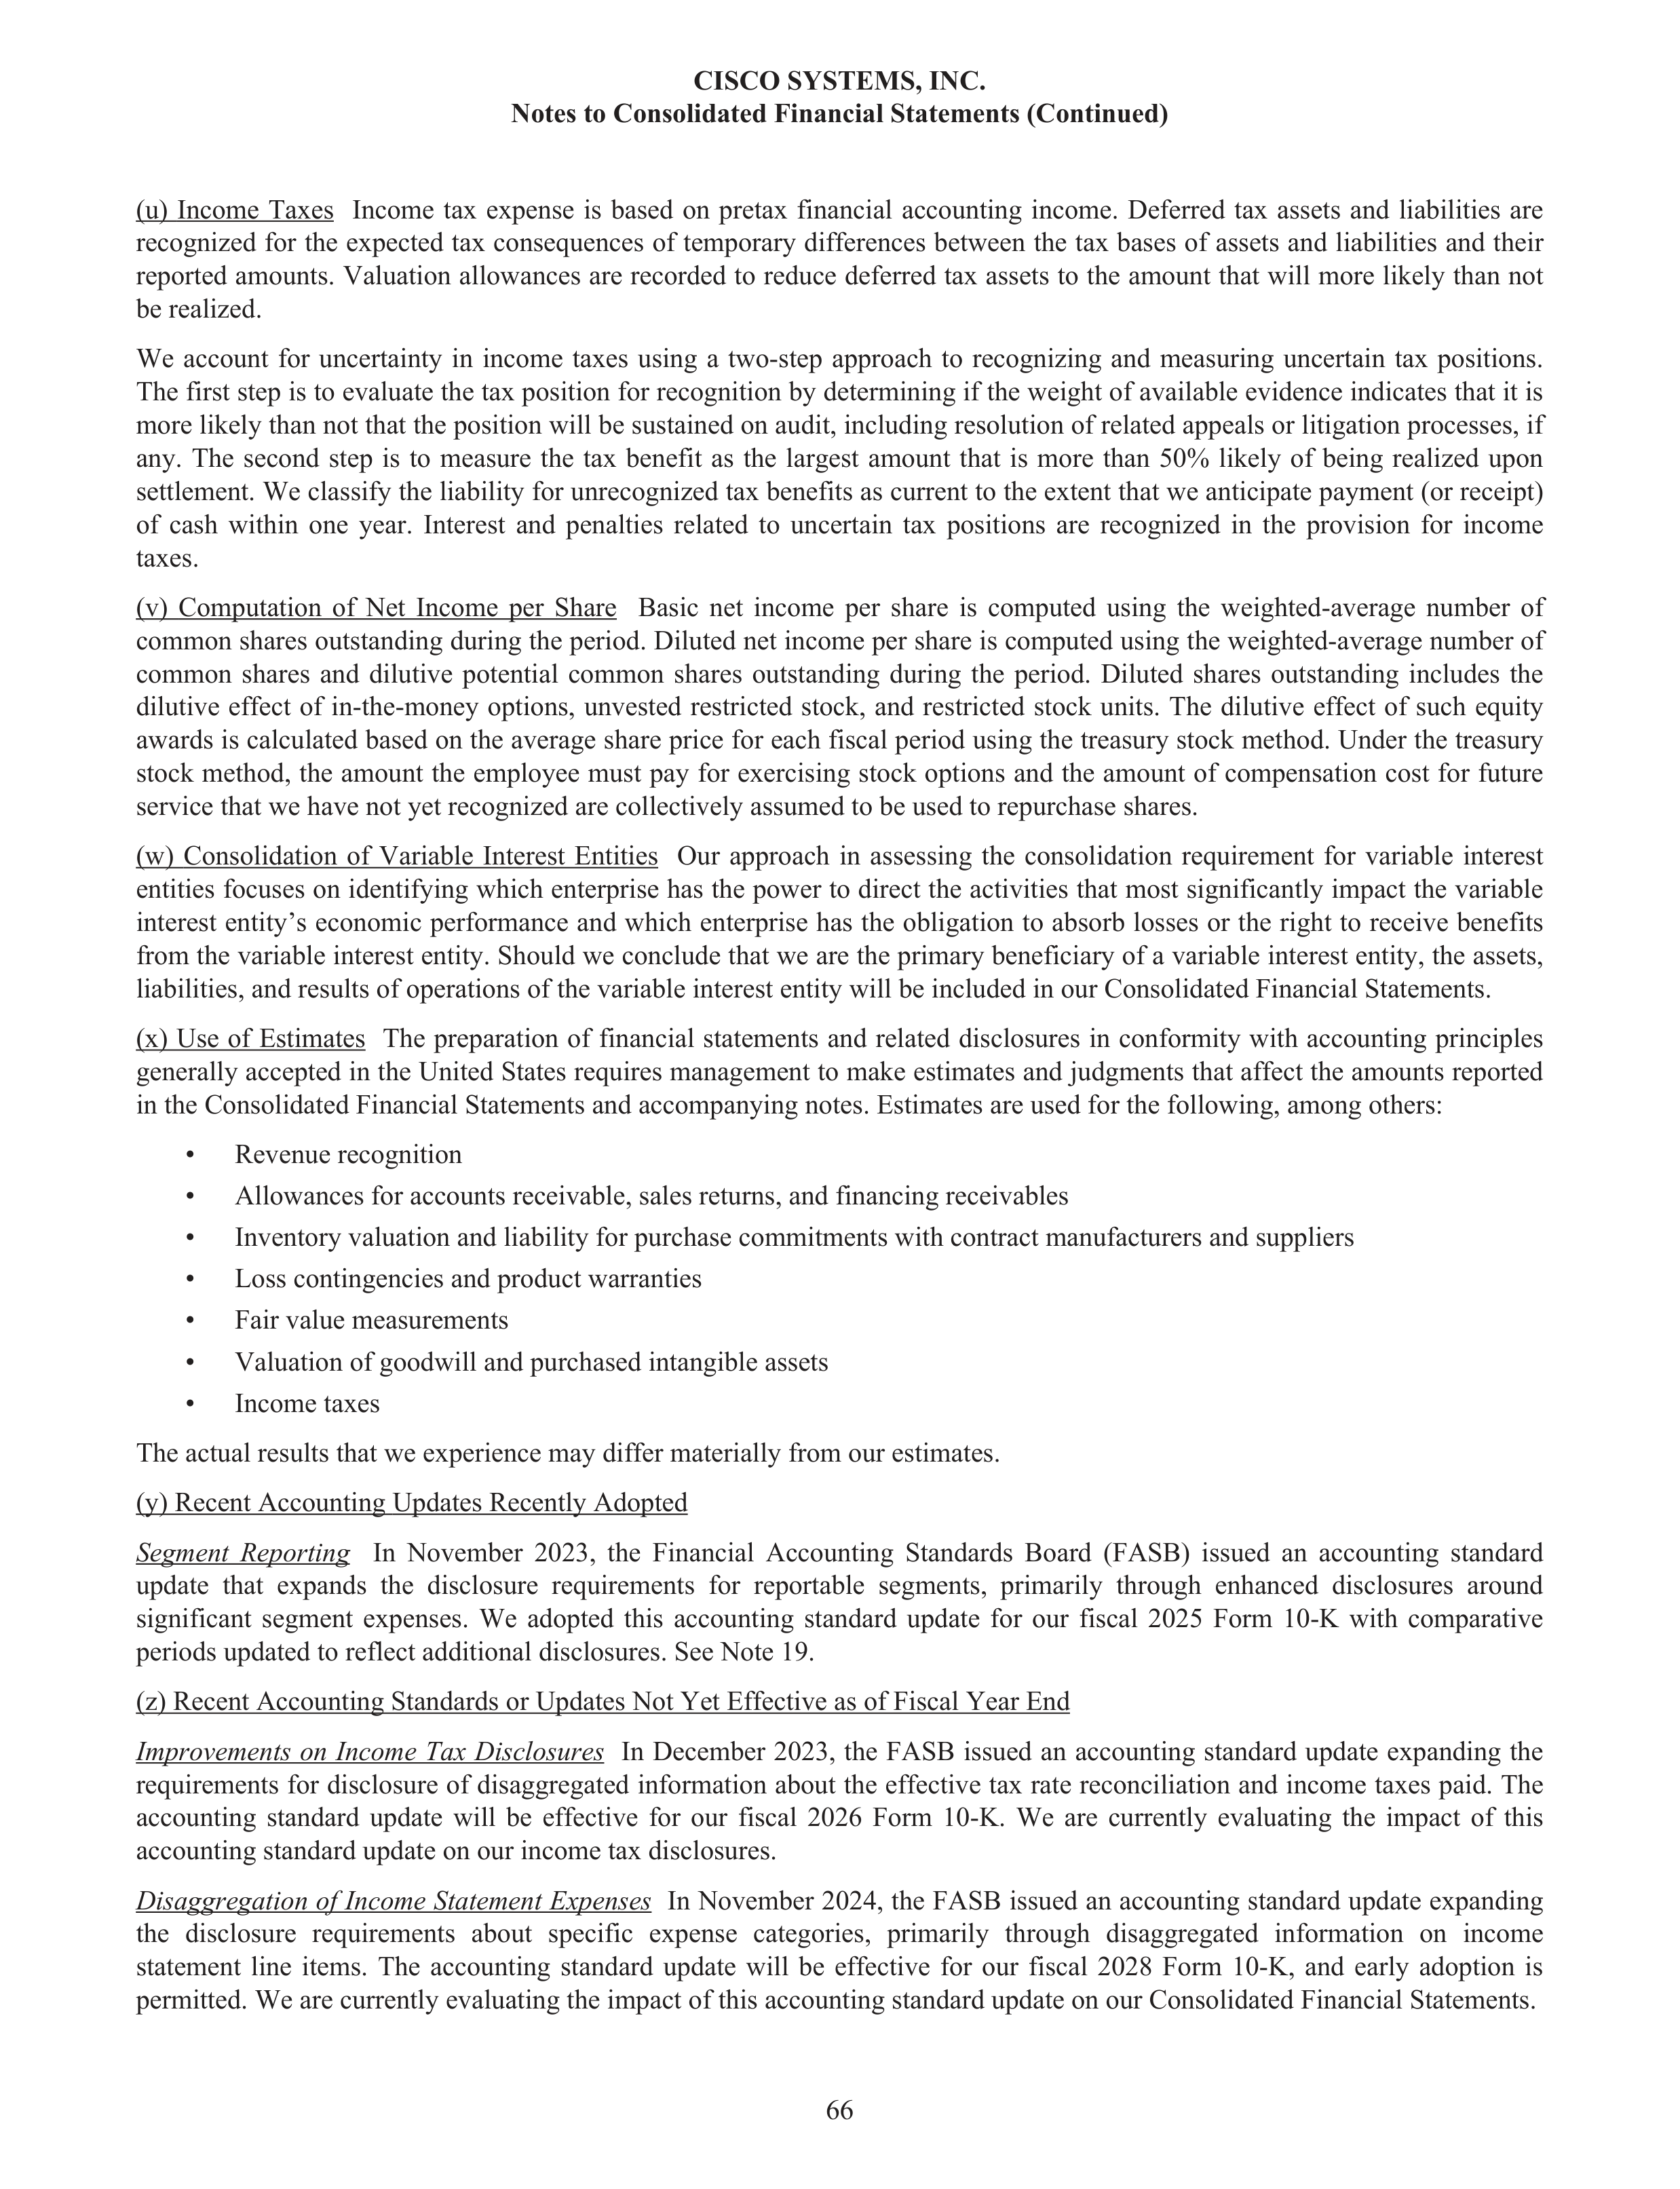
(u)
Income Taxes Income tax expense is based on pretax financial accounting income. Deferred tax assets and liabilities are
recognized for the expected tax consequences of temporary differences between the tax bases of assets and liabilities and their
reported amounts. Valuation allowances are recorded to reduce deferred tax assets to the amount that will more likely than not
be realized.
We account for uncertainty in income taxes using a two-step approach to recognizing and measuring uncertain tax positions.
The first step is to evaluate the tax position for recognition by determining if the weight of available evidence indicates that it is
more likely than not that the position will be sustained on audit, including resolution of related appeals or litigation processes, if
any. The second step is to measure the tax benefit as the largest amount that is more than 50% likely of being realized upon
settlement. We classify the liability for unrecognized tax benefits as current to the extent that we anticipate payment (or receipt)
of cash within one year. Interest and penalties related to uncertain tax positions are recognized in the provision for income
taxes.
(v)
Computation of Net Income per Share Basic net income per share is computed using the weighted-average number of
common shares outstanding during the period. Diluted net income per share is computed using the weighted-average number of
common shares and dilutive potential common shares outstanding during the period. Diluted shares outstanding includes the
dilutive effect of in-the-money options, unvested restricted stock, and restricted stock units. The dilutive effect of such equity
awards is calculated based on the average share price for each fiscal period using the treasury stock method. Under the treasury
stock method, the amount the employee must pay for exercising stock options and the amount of compensation cost for future
service that we have not yet recognized are collectively assumed to be used to repurchase shares.
(w)
Consolidation of Variable Interest Entities Our approach in assessing the consolidation requirement for variable interest
entities focuses on identifying which enterprise has the power to direct the activities that most significantly impact the variable
interest entity’s economic performance and which enterprise has the obligation to absorb losses or the right to receive benefits
from the variable interest entity. Should we conclude that we are the primary beneficiary of a variable interest entity, the assets,
liabilities, and results of operations of the variable interest entity will be included in our Consolidated Financial Statements.
(x)
Use of Estimates The preparation of financial statements and related disclosures in conformity with accounting principles
generally accepted in the United States requires management to make estimates and judgments that affect the amounts reported
in the Consolidated Financial Statements and accompanying notes. Estimates are used for the following, among others:
•
Revenue recognition
•
Allowances for accounts receivable, sales returns, and financing receivables
•
Inventory valuation and liability for purchase commitments with contract manufacturers and suppliers
•
Loss contingencies and product warranties
•
Fair value measurements
•
Valuation of goodwill and purchased intangible assets
•
Income taxes
The actual results that we experience may differ materially from our estimates.
(y) Recent Accounting Updates Recently Adopted
Segment Reporting
In November 2023, the Financial Accounting Standards Board (FASB) issued an accounting standard
update that expands the disclosure requirements for reportable segments, primarily through enhanced disclosures around
significant segment expenses. We adopted this accounting standard update for our fiscal 2025 Form 10-K with comparative
periods updated to reflect additional disclosures. See Note 19.
(z) Recent Accounting Standards or Updates Not Yet Effective as of Fiscal Year End
Improvements on Income Tax Disclosures
In December 2023, the FASB issued an accounting standard update expanding the
requirements for disclosure of disaggregated information about the effective tax rate reconciliation and income taxes paid. The
accounting standard update will be effective for our fiscal 2026 Form 10-K. We are currently evaluating the impact of this
accounting standard update on our income tax disclosures.
Disaggregation of Income Statement Expenses
In November 2024, the FASB issued an accounting standard update expanding
the disclosure requirements about specific expense categories, primarily through disaggregated information on income
statement line items. The accounting standard update will be effective for our fiscal 2028 Form 10-K, and early adoption is
permitted. We are currently evaluating the impact of this accounting standard update on our Consolidated Financial Statements.
CISCO SYSTEMS, INC.
Notes to Consolidated Financial Statements (Continued)
66
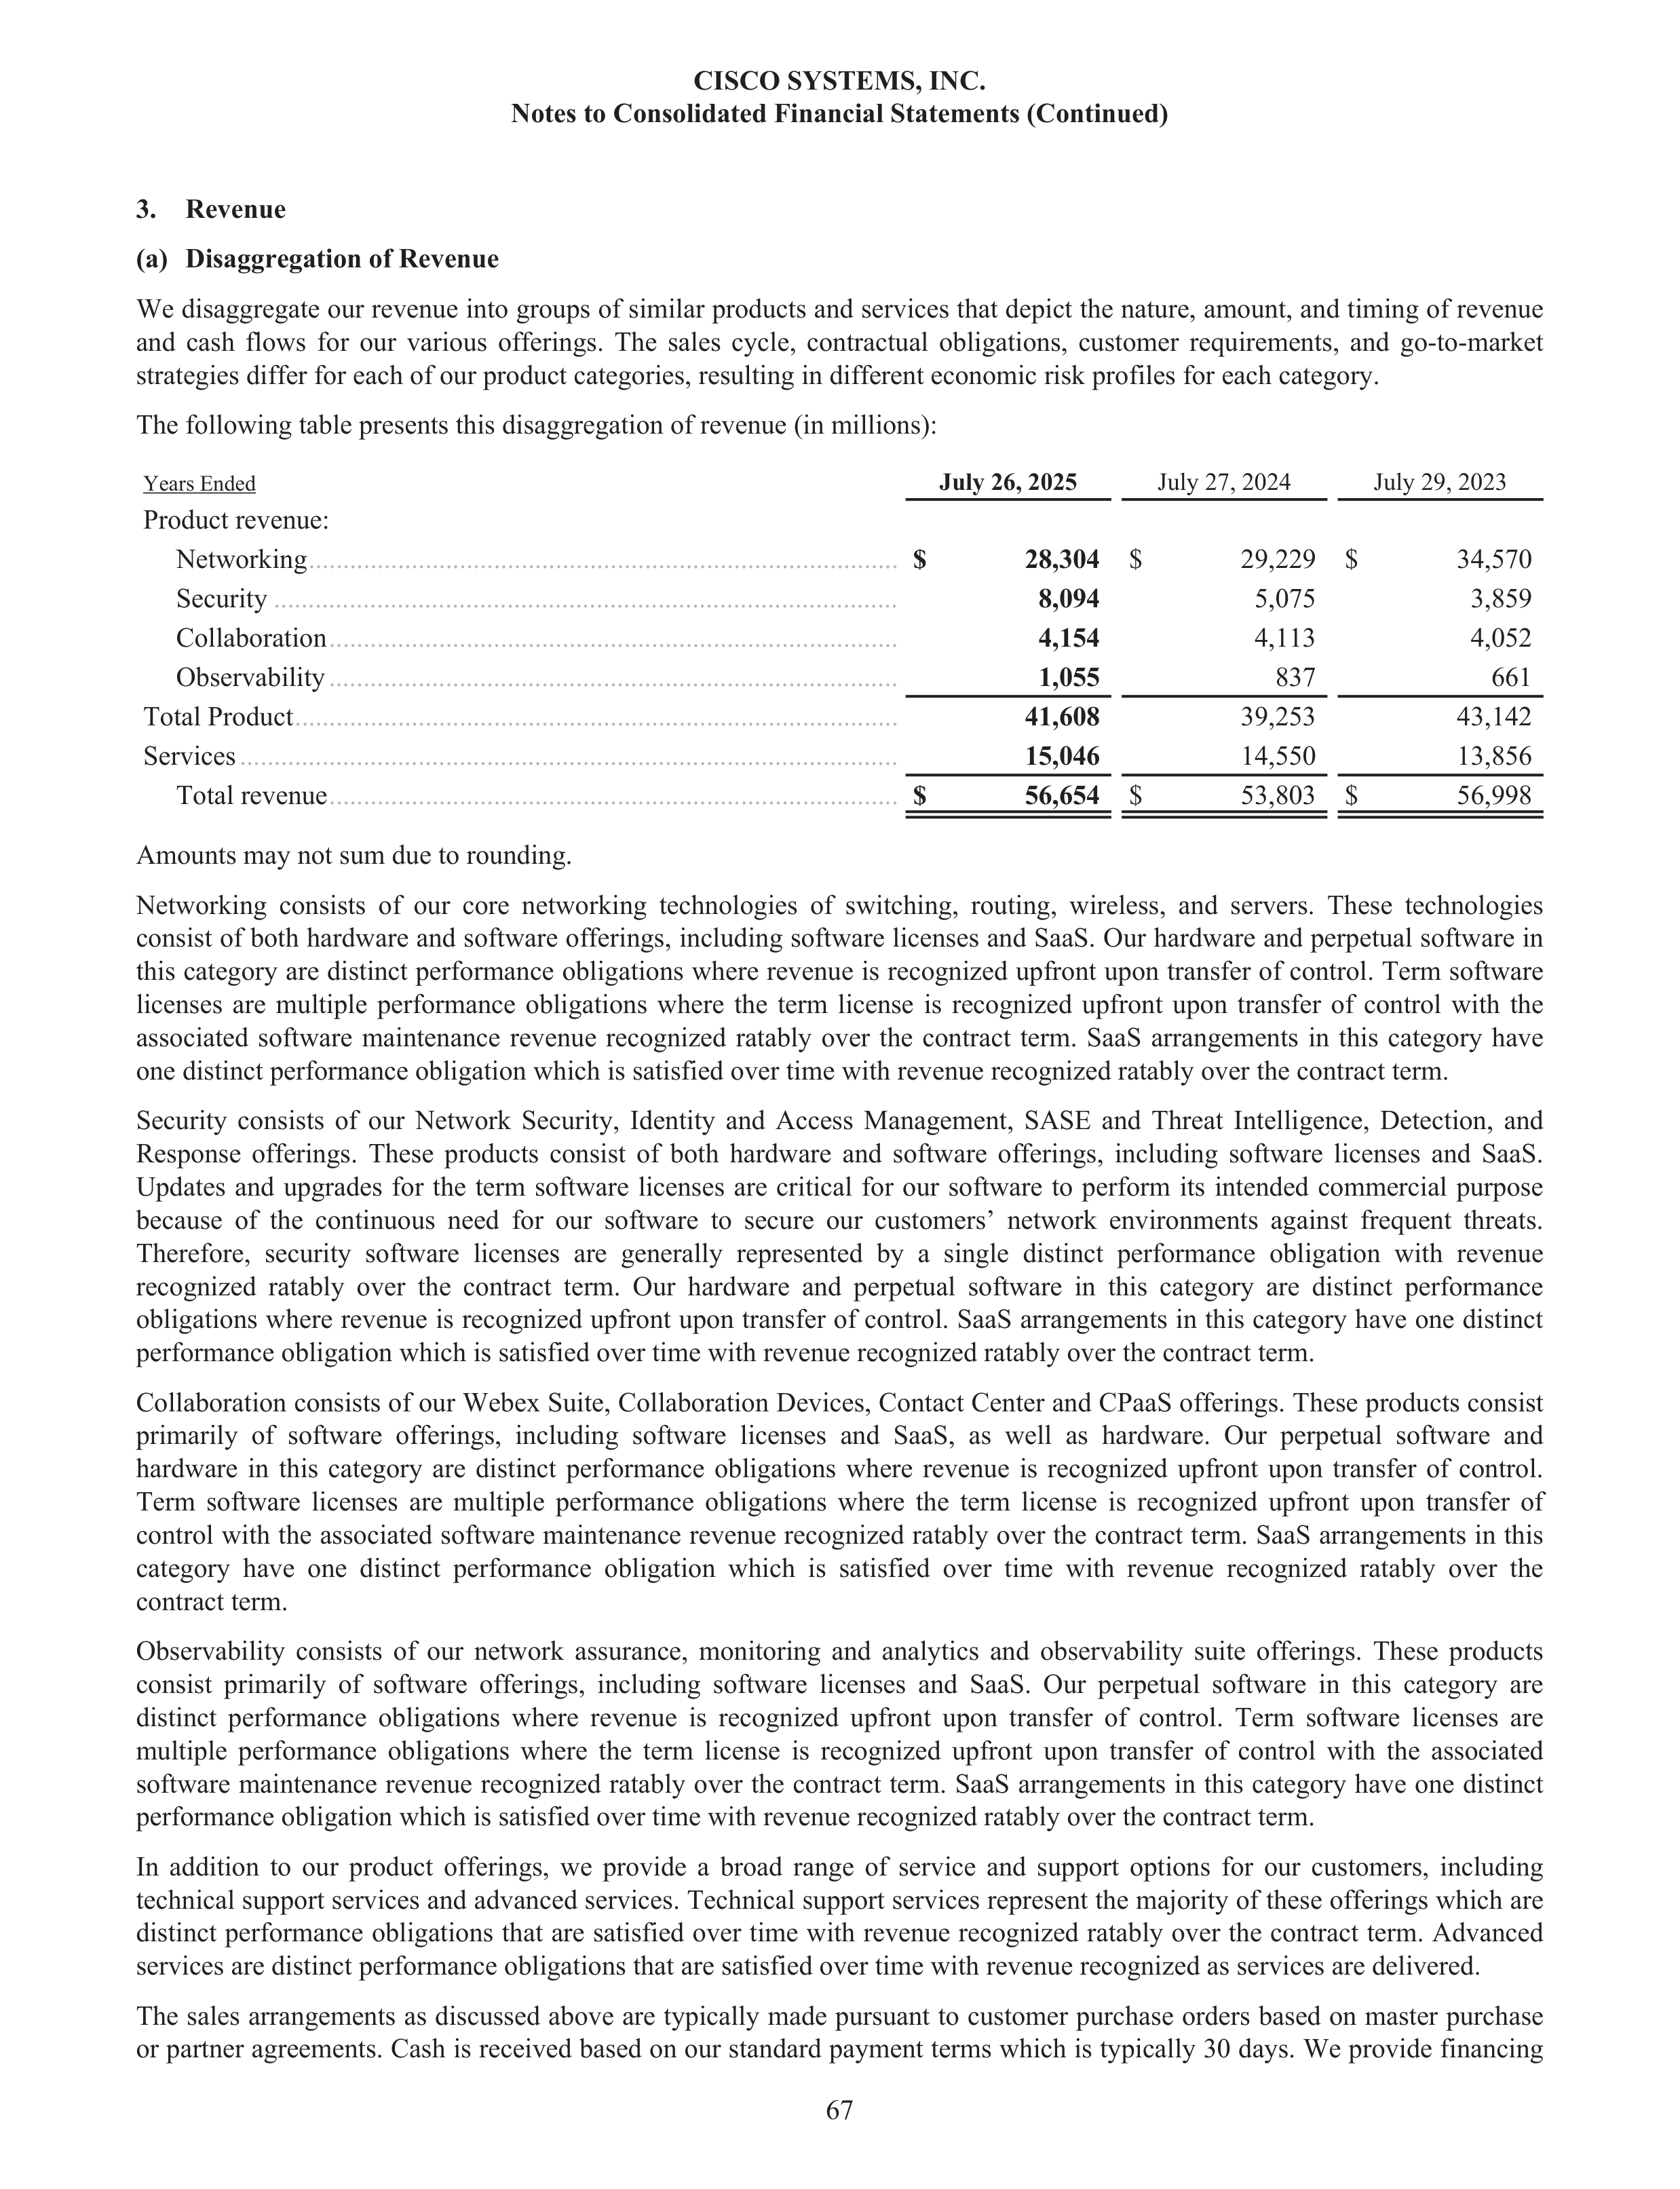
3.
Revenue
(a)
Disaggregation of Revenue
We disaggregate our revenue into groups of similar products and services that depict the nature, amount, and timing of revenue
and cash flows for our various offerings. The sales cycle, contractual obligations, customer requirements, and go-to-market
strategies differ for each of our product categories, resulting in different economic risk profiles for each category.
The following table presents this disaggregation of revenue (in millions):
Years Ended
July 26, 2025
July 27, 2024
July 29, 2023
Product revenue:
Networking
......................................................................................
$
28,304
$
29,229 $
34,570
Security
...........................................................................................
8,094
5,075
3,859
Collaboration
...................................................................................
4,154
4,113
4,052
Observability
...................................................................................
1,055
837
661
Total Product
........................................................................................
41,608
39,253
43,142
Services
................................................................................................
15,046
14,550
13,856
Total revenue
...................................................................................
$
56,654
$
53,803 $
56,998
Amounts may not sum due to rounding.
Networking consists of our core networking technologies of switching, routing, wireless, and servers. These technologies
consist of both hardware and software offerings, including software licenses and SaaS. Our hardware and perpetual software in
this category are distinct performance obligations where revenue is recognized upfront upon transfer of control. Term software
licenses are multiple performance obligations where the term license is recognized upfront upon transfer of control with the
associated software maintenance revenue recognized ratably over the contract term. SaaS arrangements in this category have
one distinct performance obligation which is satisfied over time with revenue recognized ratably over the contract term.
Security consists of our Network Security, Identity and Access Management, SASE and Threat Intelligence, Detection, and
Response offerings. These products consist of both hardware and software offerings, including software licenses and SaaS.
Updates and upgrades for the term software licenses are critical for our software to perform its intended commercial purpose
because of the continuous need for our software to secure our customers’ network environments against frequent threats.
Therefore, security software licenses are generally represented by a single distinct performance obligation with revenue
recognized ratably over the contract term. Our hardware and perpetual software in this category are distinct performance
obligations where revenue is recognized upfront upon transfer of control. SaaS arrangements in this category have one distinct
performance obligation which is satisfied over time with revenue recognized ratably over the contract term.
Collaboration consists of our Webex Suite, Collaboration Devices, Contact Center and CPaaS offerings. These products consist
primarily of software offerings, including software licenses and SaaS, as well as hardware. Our perpetual software and
hardware in this category are distinct performance obligations where revenue is recognized upfront upon transfer of control.
Term software licenses are multiple performance obligations where the term license is recognized upfront upon transfer of
control with the associated software maintenance revenue recognized ratably over the contract term. SaaS arrangements in this
category have one distinct performance obligation which is satisfied over time with revenue recognized ratably over the
contract term.
Observability consists of our network assurance, monitoring and analytics and observability suite offerings. These products
consist primarily of software offerings, including software licenses and SaaS. Our perpetual software in this category are
distinct performance obligations where revenue is recognized upfront upon transfer of control. Term software licenses are
multiple performance obligations where the term license is recognized upfront upon transfer of control with the associated
software maintenance revenue recognized ratably over the contract term. SaaS arrangements in this category have one distinct
performance obligation which is satisfied over time with revenue recognized ratably over the contract term.
In addition to our product offerings, we provide a broad range of service and support options for our customers, including
technical support services and advanced services. Technical support services represent the majority of these offerings which are
distinct performance obligations that are satisfied over time with revenue recognized ratably over the contract term. Advanced
services are distinct performance obligations that are satisfied over time with revenue recognized as services are delivered.
The sales arrangements as discussed above are typically made pursuant to customer purchase orders based on master purchase
or partner agreements. Cash is received based on our standard payment terms which is typically 30 days. We provide financing
CISCO SYSTEMS, INC.
Notes to Consolidated Financial Statements (Continued)
67
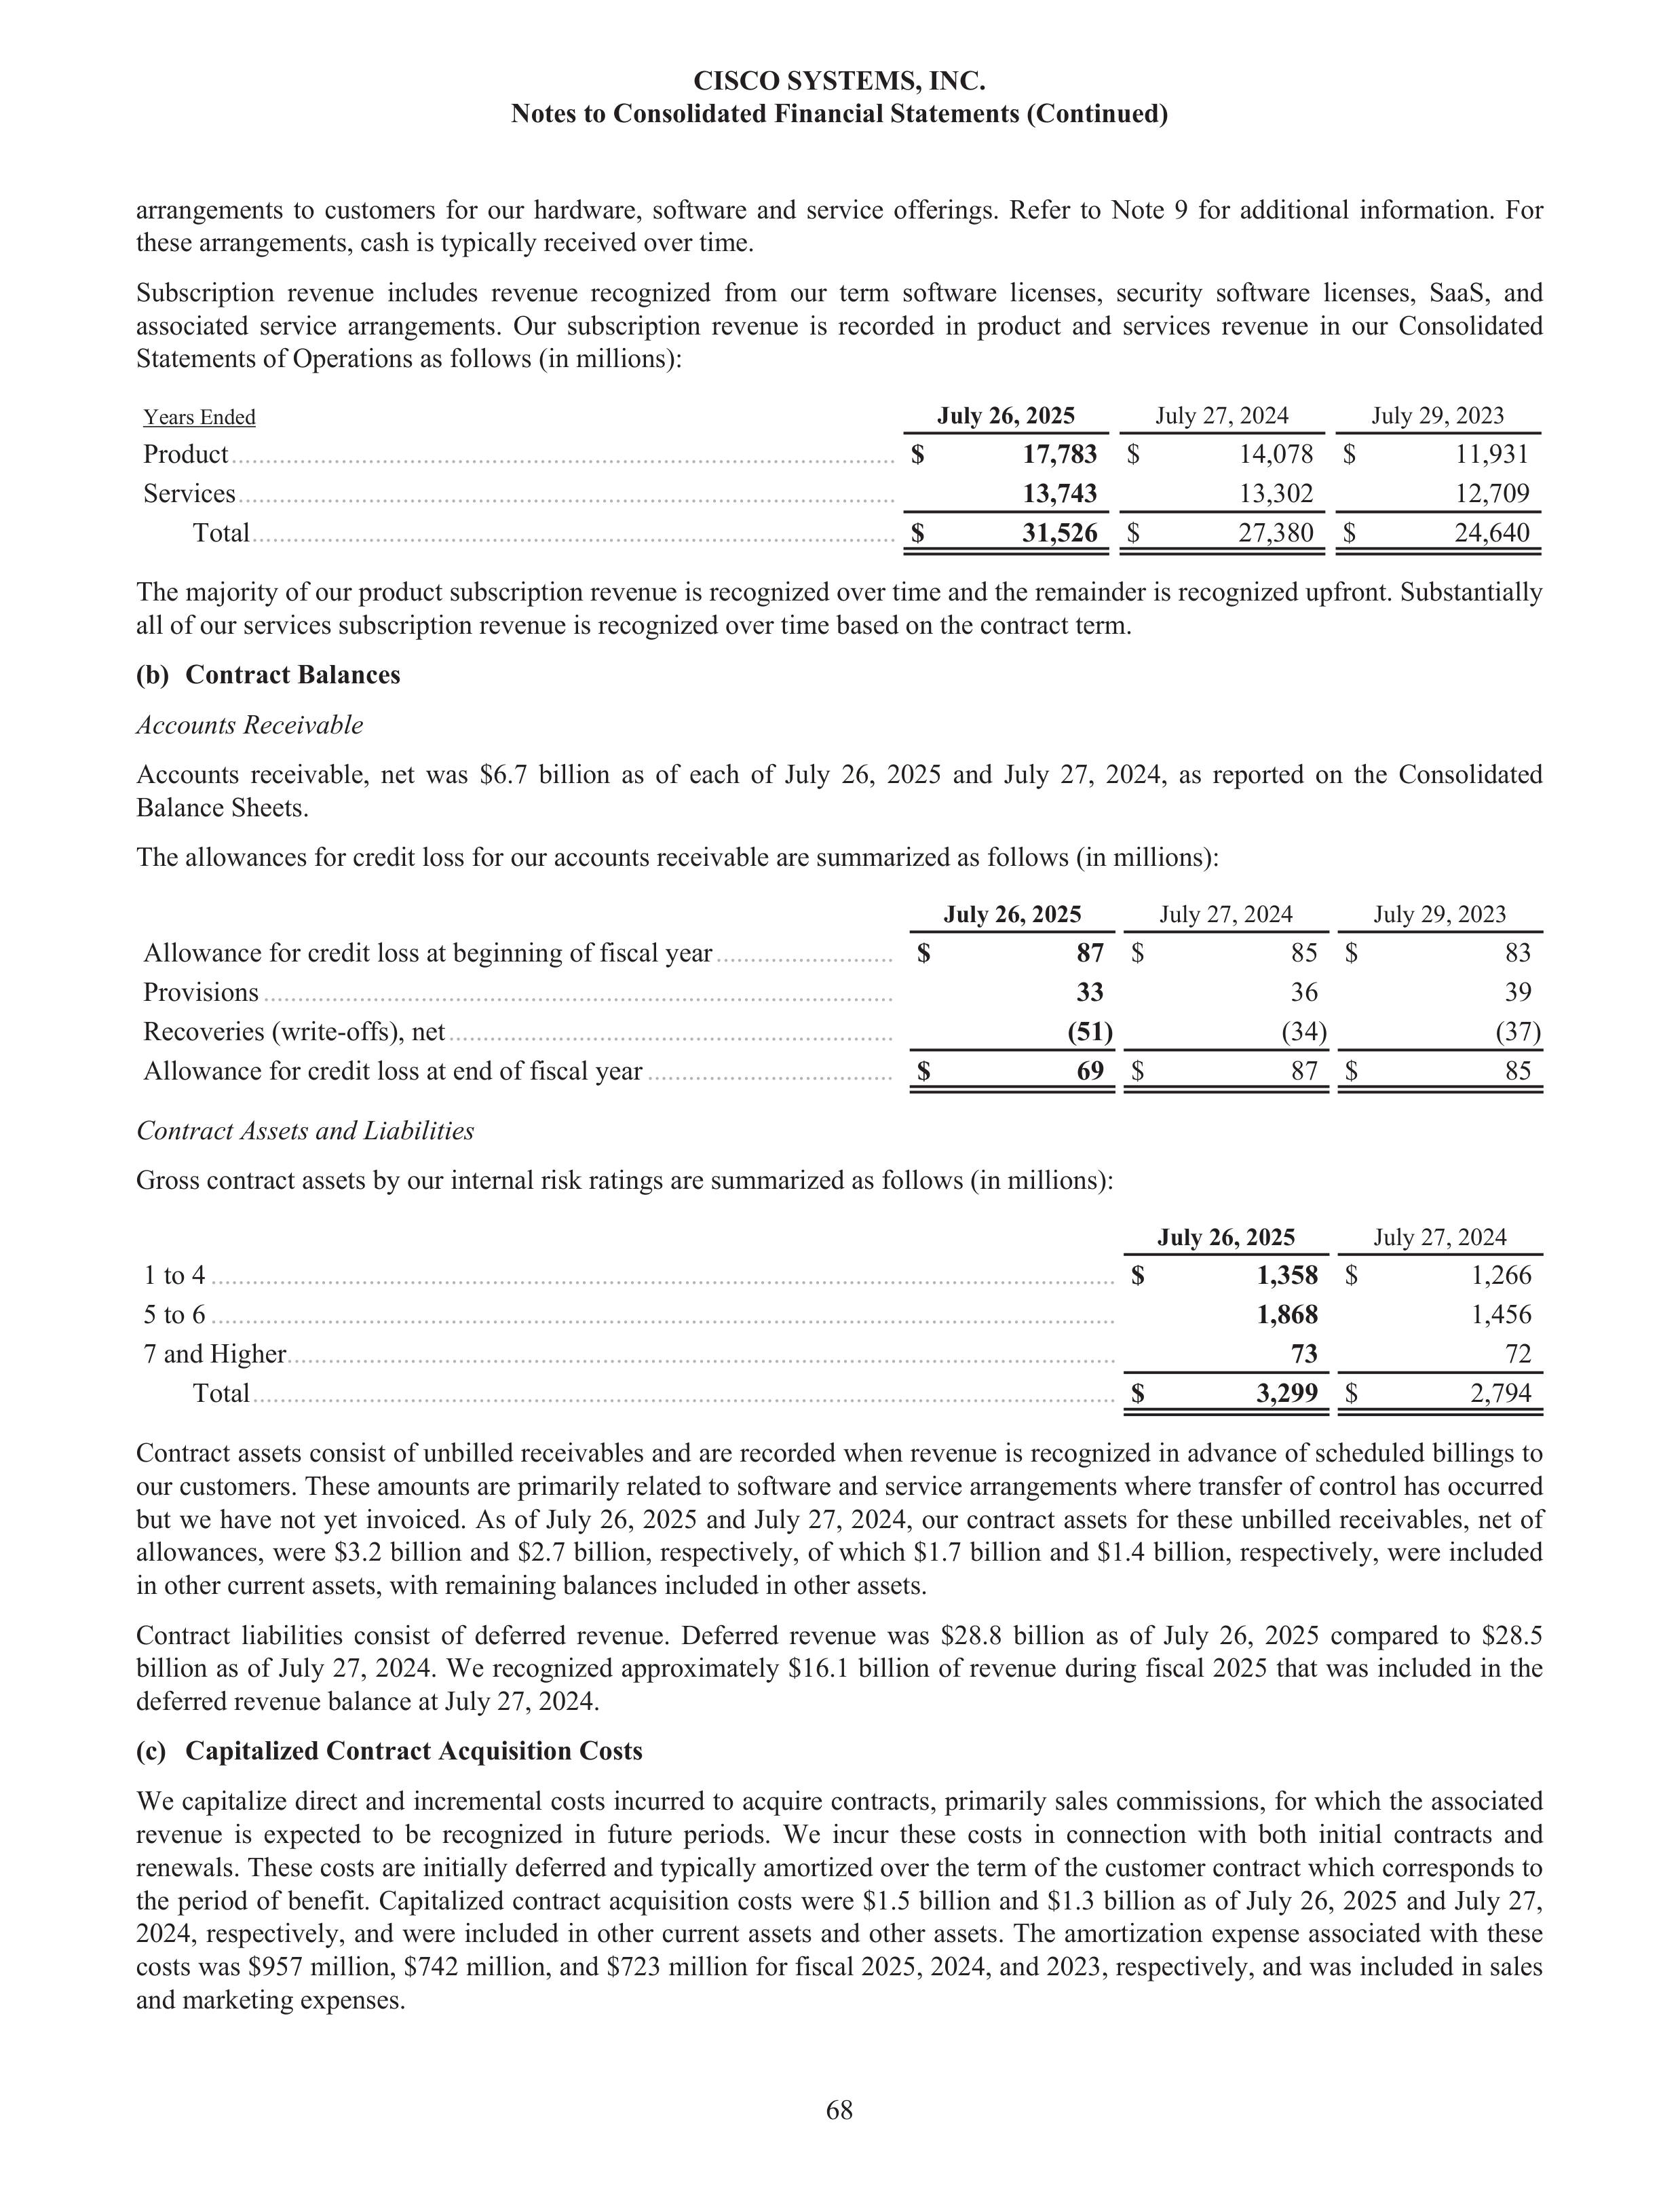
arrangements to customers for our hardware, software and service offerings. Refer to Note 9 for additional information. For
these arrangements, cash is typically received over time.
Subscription revenue includes revenue recognized from our term software licenses, security software licenses, SaaS, and
associated service arrangements. Our subscription revenue is recorded in product and services revenue in our Consolidated
Statements of Operations as follows (in millions):
Years Ended
July 26, 2025
July 27, 2024
July 29, 2023
Product
.................................................................................................
$
17,783
$
14,078 $
11,931
Services
................................................................................................
13,743
13,302
12,709
Total
..............................................................................................
$
31,526
$
27,380 $
24,640
The majority of our product subscription revenue is recognized over time and the remainder is recognized upfront. Substantially
all of our services subscription revenue is recognized over time based on the contract term.
(b)
Contract Balances
Accounts Receivable
Accounts receivable, net was $6.7 billion as of each of July 26, 2025 and July 27, 2024, as reported on the Consolidated
Balance Sheets.
The allowances for credit loss for our accounts receivable are summarized as follows (in millions):
July 26, 2025
July 27, 2024
July 29, 2023
Allowance for credit loss at beginning of fiscal year
..........................
$
87
$
85 $
83
Provisions
............................................................................................
33
36
39
Recoveries (write-offs), net
.................................................................
(51)
(34)
(37)
Allowance for credit loss at end of fiscal year
....................................
$
69
$
87 $
85
Contract Assets and Liabilities
Gross contract assets by our internal risk ratings are summarized as follows (in millions):
July 26, 2025
July 27, 2024
1 to 4
....................................................................................................................................
$
1,358
$
1,266
5 to 6
....................................................................................................................................
1,868
1,456
7 and Higher
.........................................................................................................................
73
72
Total
..............................................................................................................................
$
3,299
$
2,794
Contract assets consist of unbilled receivables and are recorded when revenue is recognized in advance of scheduled billings to
our customers. These amounts are primarily related to software and service arrangements where transfer of control has occurred
but we have not yet invoiced. As of July 26, 2025 and July 27, 2024, our contract assets for these unbilled receivables, net of
allowances, were $3.2 billion and $2.7 billion, respectively, of which $1.7 billion and $1.4 billion, respectively, were included
in other current assets, with remaining balances included in other assets.
Contract liabilities consist of deferred revenue. Deferred revenue was
$28.8 billion as of July 26, 2025 compared to $28.5
billion as of July 27, 2024. We recognized approximately $16.1 billion of revenue during fiscal 2025 that was included in the
deferred revenue balance at July 27, 2024.
(c)
Capitalized Contract Acquisition Costs
We capitalize direct and incremental costs incurred to acquire contracts, primarily sales commissions, for which the associated
revenue is expected to be recognized in future periods. We incur these costs in connection with both initial contracts and
renewals. These costs are initially deferred and typically amortized over the term of the customer contract which corresponds to
the period of benefit. Capitalized contract acquisition costs were $1.5 billion and $1.3 billion as of July 26, 2025 and July 27,
2024, respectively, and were included in other current assets and other assets. The amortization expense associated with these
costs was $957 million, $742 million, and $723 million for fiscal 2025, 2024, and 2023, respectively, and was included in sales
and marketing expenses.
CISCO SYSTEMS, INC.
Notes to Consolidated Financial Statements (Continued)
68
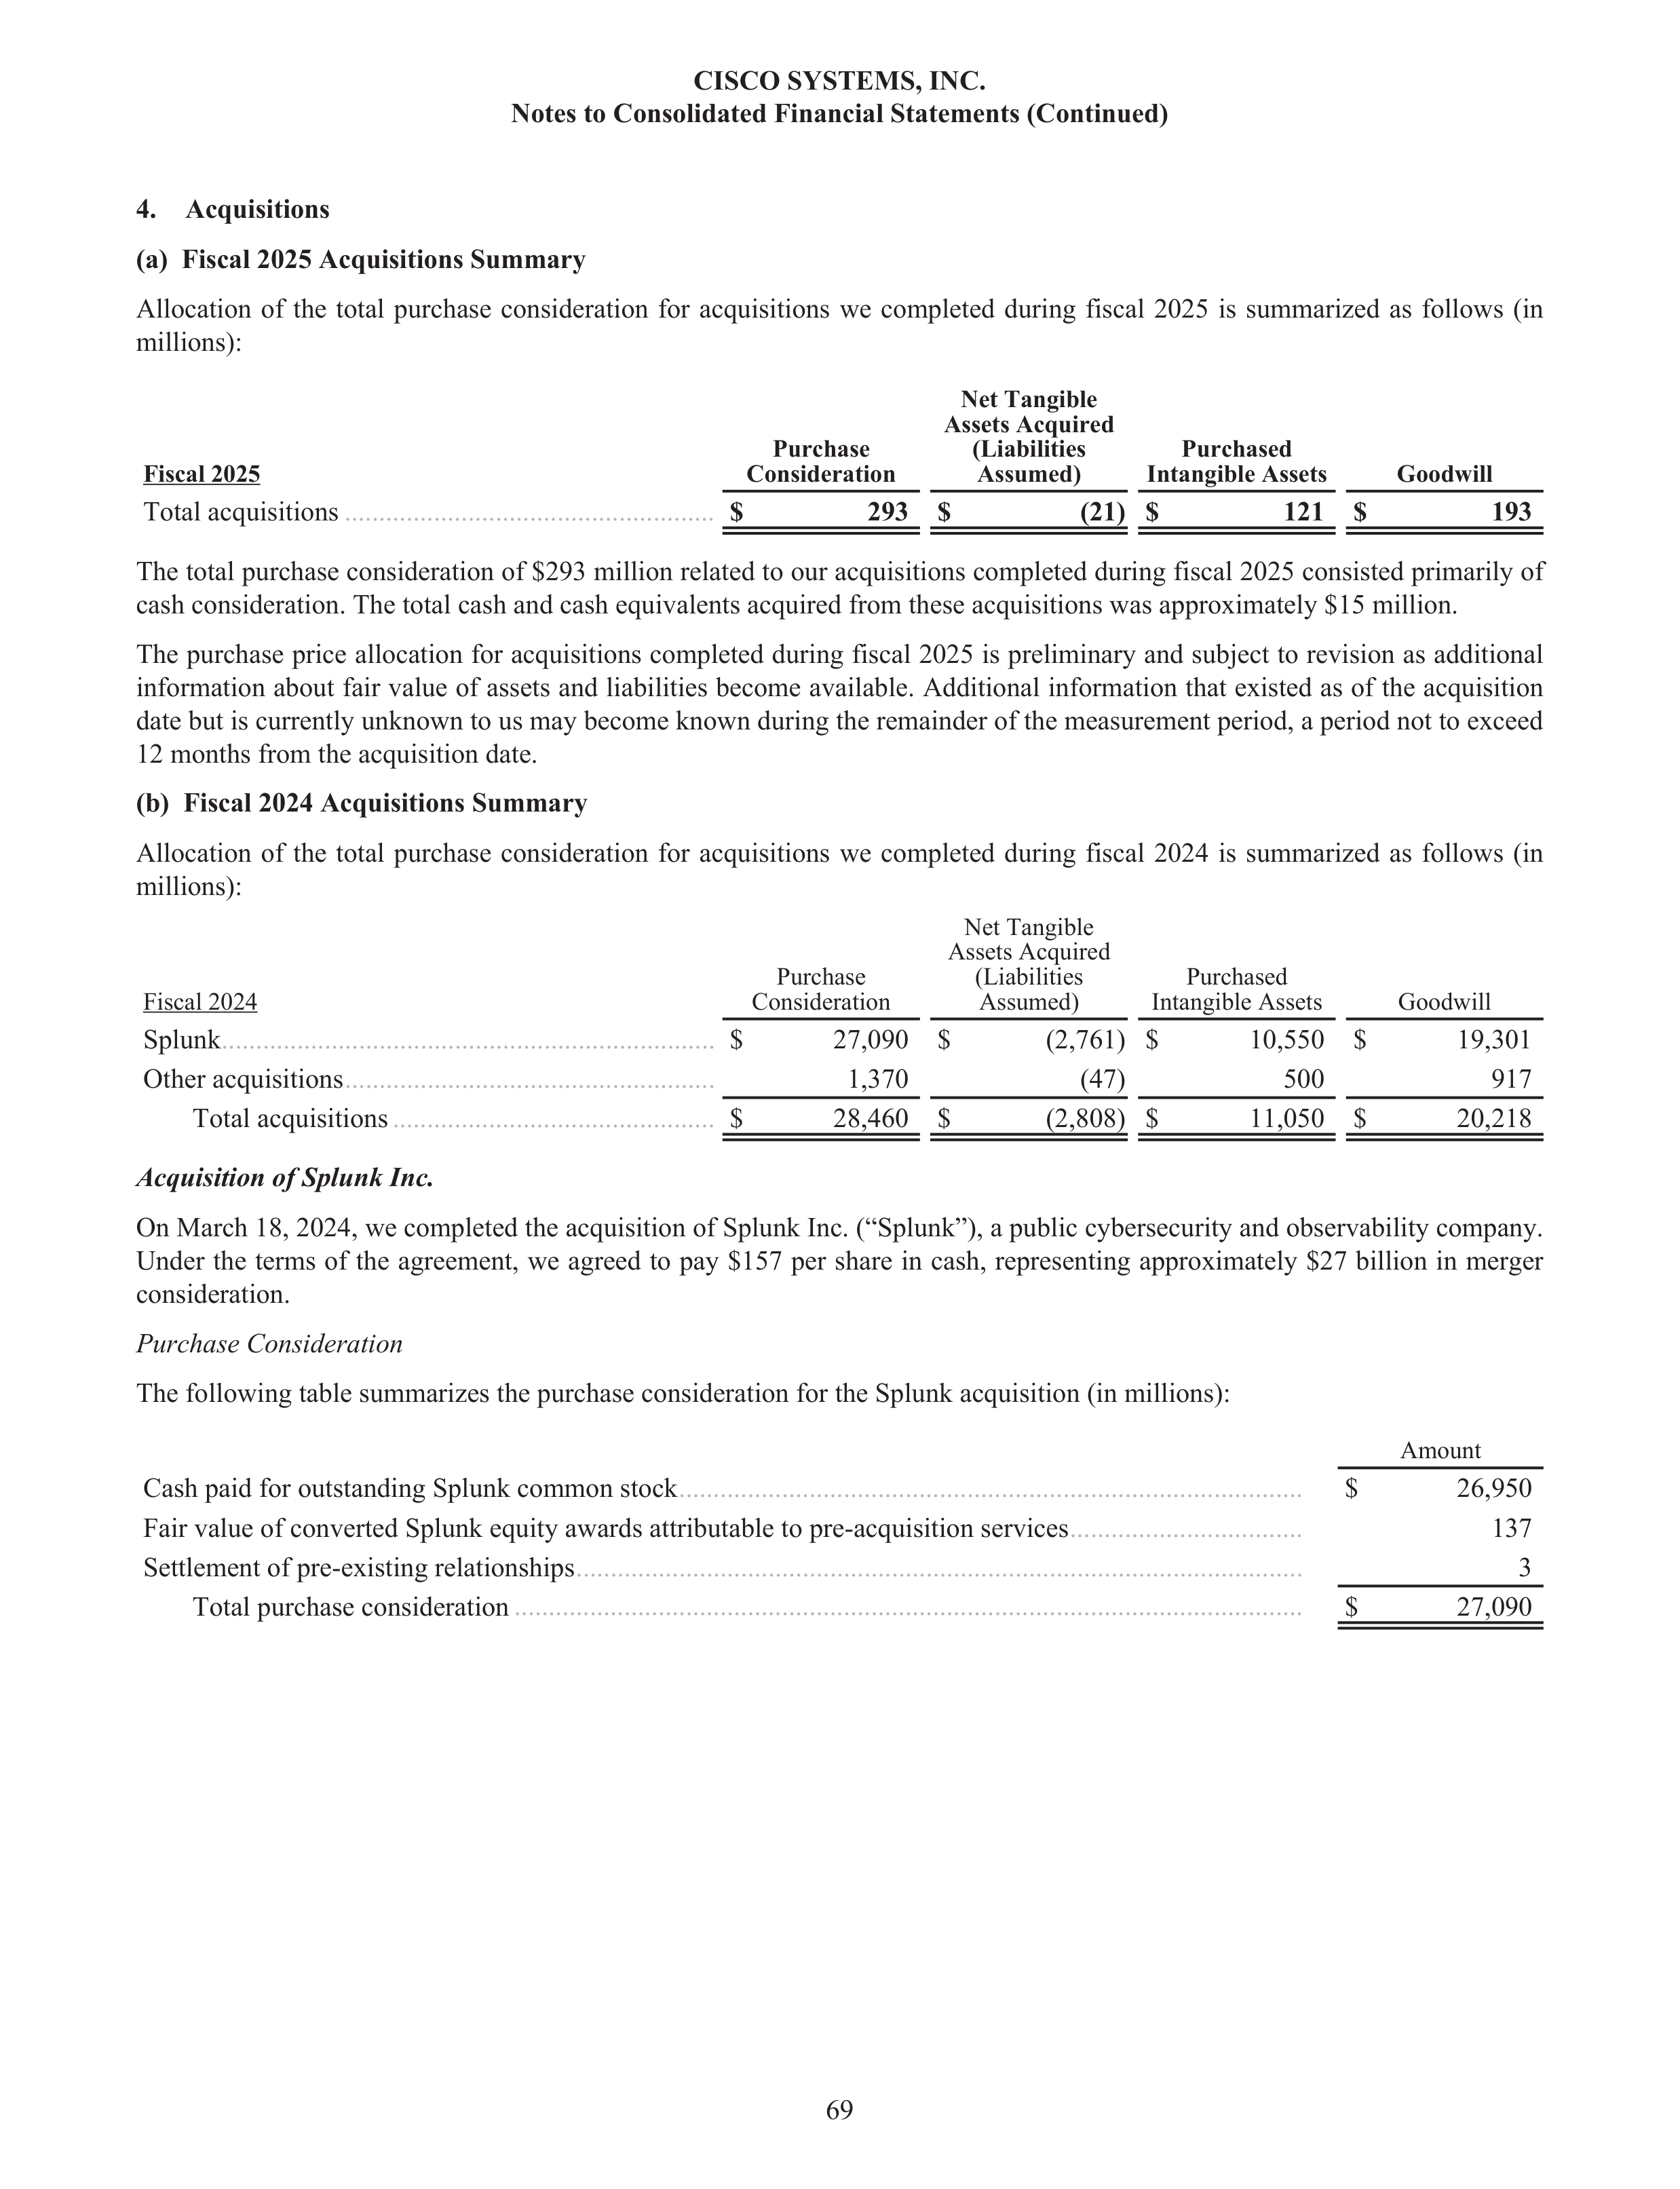
4.
Acquisitions
(a)
Fiscal 2025 Acquisitions Summary
Allocation of the total purchase consideration for acquisitions we completed during fiscal 2025 is summarized as follows (in
millions):
Fiscal 2025
Purchase
Consideration
Net Tangible
Assets Acquired
(Liabilities
Assumed)
Purchased
Intangible Assets
Goodwill
Total acquisitions
......................................................
$
293 $
(21)
$
121 $
193
The total purchase consideration of $293 million related to our acquisitions completed during fiscal 2025 consisted primarily of
cash consideration. The total cash and cash equivalents acquired from these acquisitions was approximately $15 million.
The purchase price allocation for acquisitions completed during fiscal 2025 is preliminary and subject to revision as additional
information about fair value of assets and liabilities become available. Additional information that existed as of the acquisition
date but is currently unknown to us may become known during the remainder of the measurement period, a period not to exceed
12 months from the acquisition date.
(b)
Fiscal 2024 Acquisitions Summary
Allocation of the total purchase consideration for acquisitions we completed during fiscal 2024 is summarized as follows (in
millions):
Fiscal 2024
Purchase
Consideration
Net Tangible
Assets Acquired
(Liabilities
Assumed)
Purchased
Intangible Assets
Goodwill
Splunk
........................................................................
$
27,090 $
(2,761) $
10,550 $
19,301
Other acquisitions
......................................................
1,370
(47)
500
917
Total acquisitions
...............................................
$
28,460 $
(2,808) $
11,050 $
20,218
Acquisition of Splunk Inc.
On March 18, 2024, we completed the acquisition of Splunk Inc. (“Splunk”), a public cybersecurity and observability company.
Under the terms of the agreement, we agreed to pay $157 per share in cash, representing approximately $27 billion in merger
consideration.
Purchase Consideration
The following table summarizes the purchase consideration for the Splunk acquisition (in millions):
Amount
Cash paid for outstanding Splunk common stock
$
26,950
Fair value of converted Splunk equity awards attributable to pre-acquisition services
137
Settlement of pre-existing relationships
3
Total purchase consideration
$
27,090
CISCO SYSTEMS, INC.
Notes to Consolidated Financial Statements (Continued)
69
...........................................................................................
..................................
..........................................................................................................
...................................................................................................................
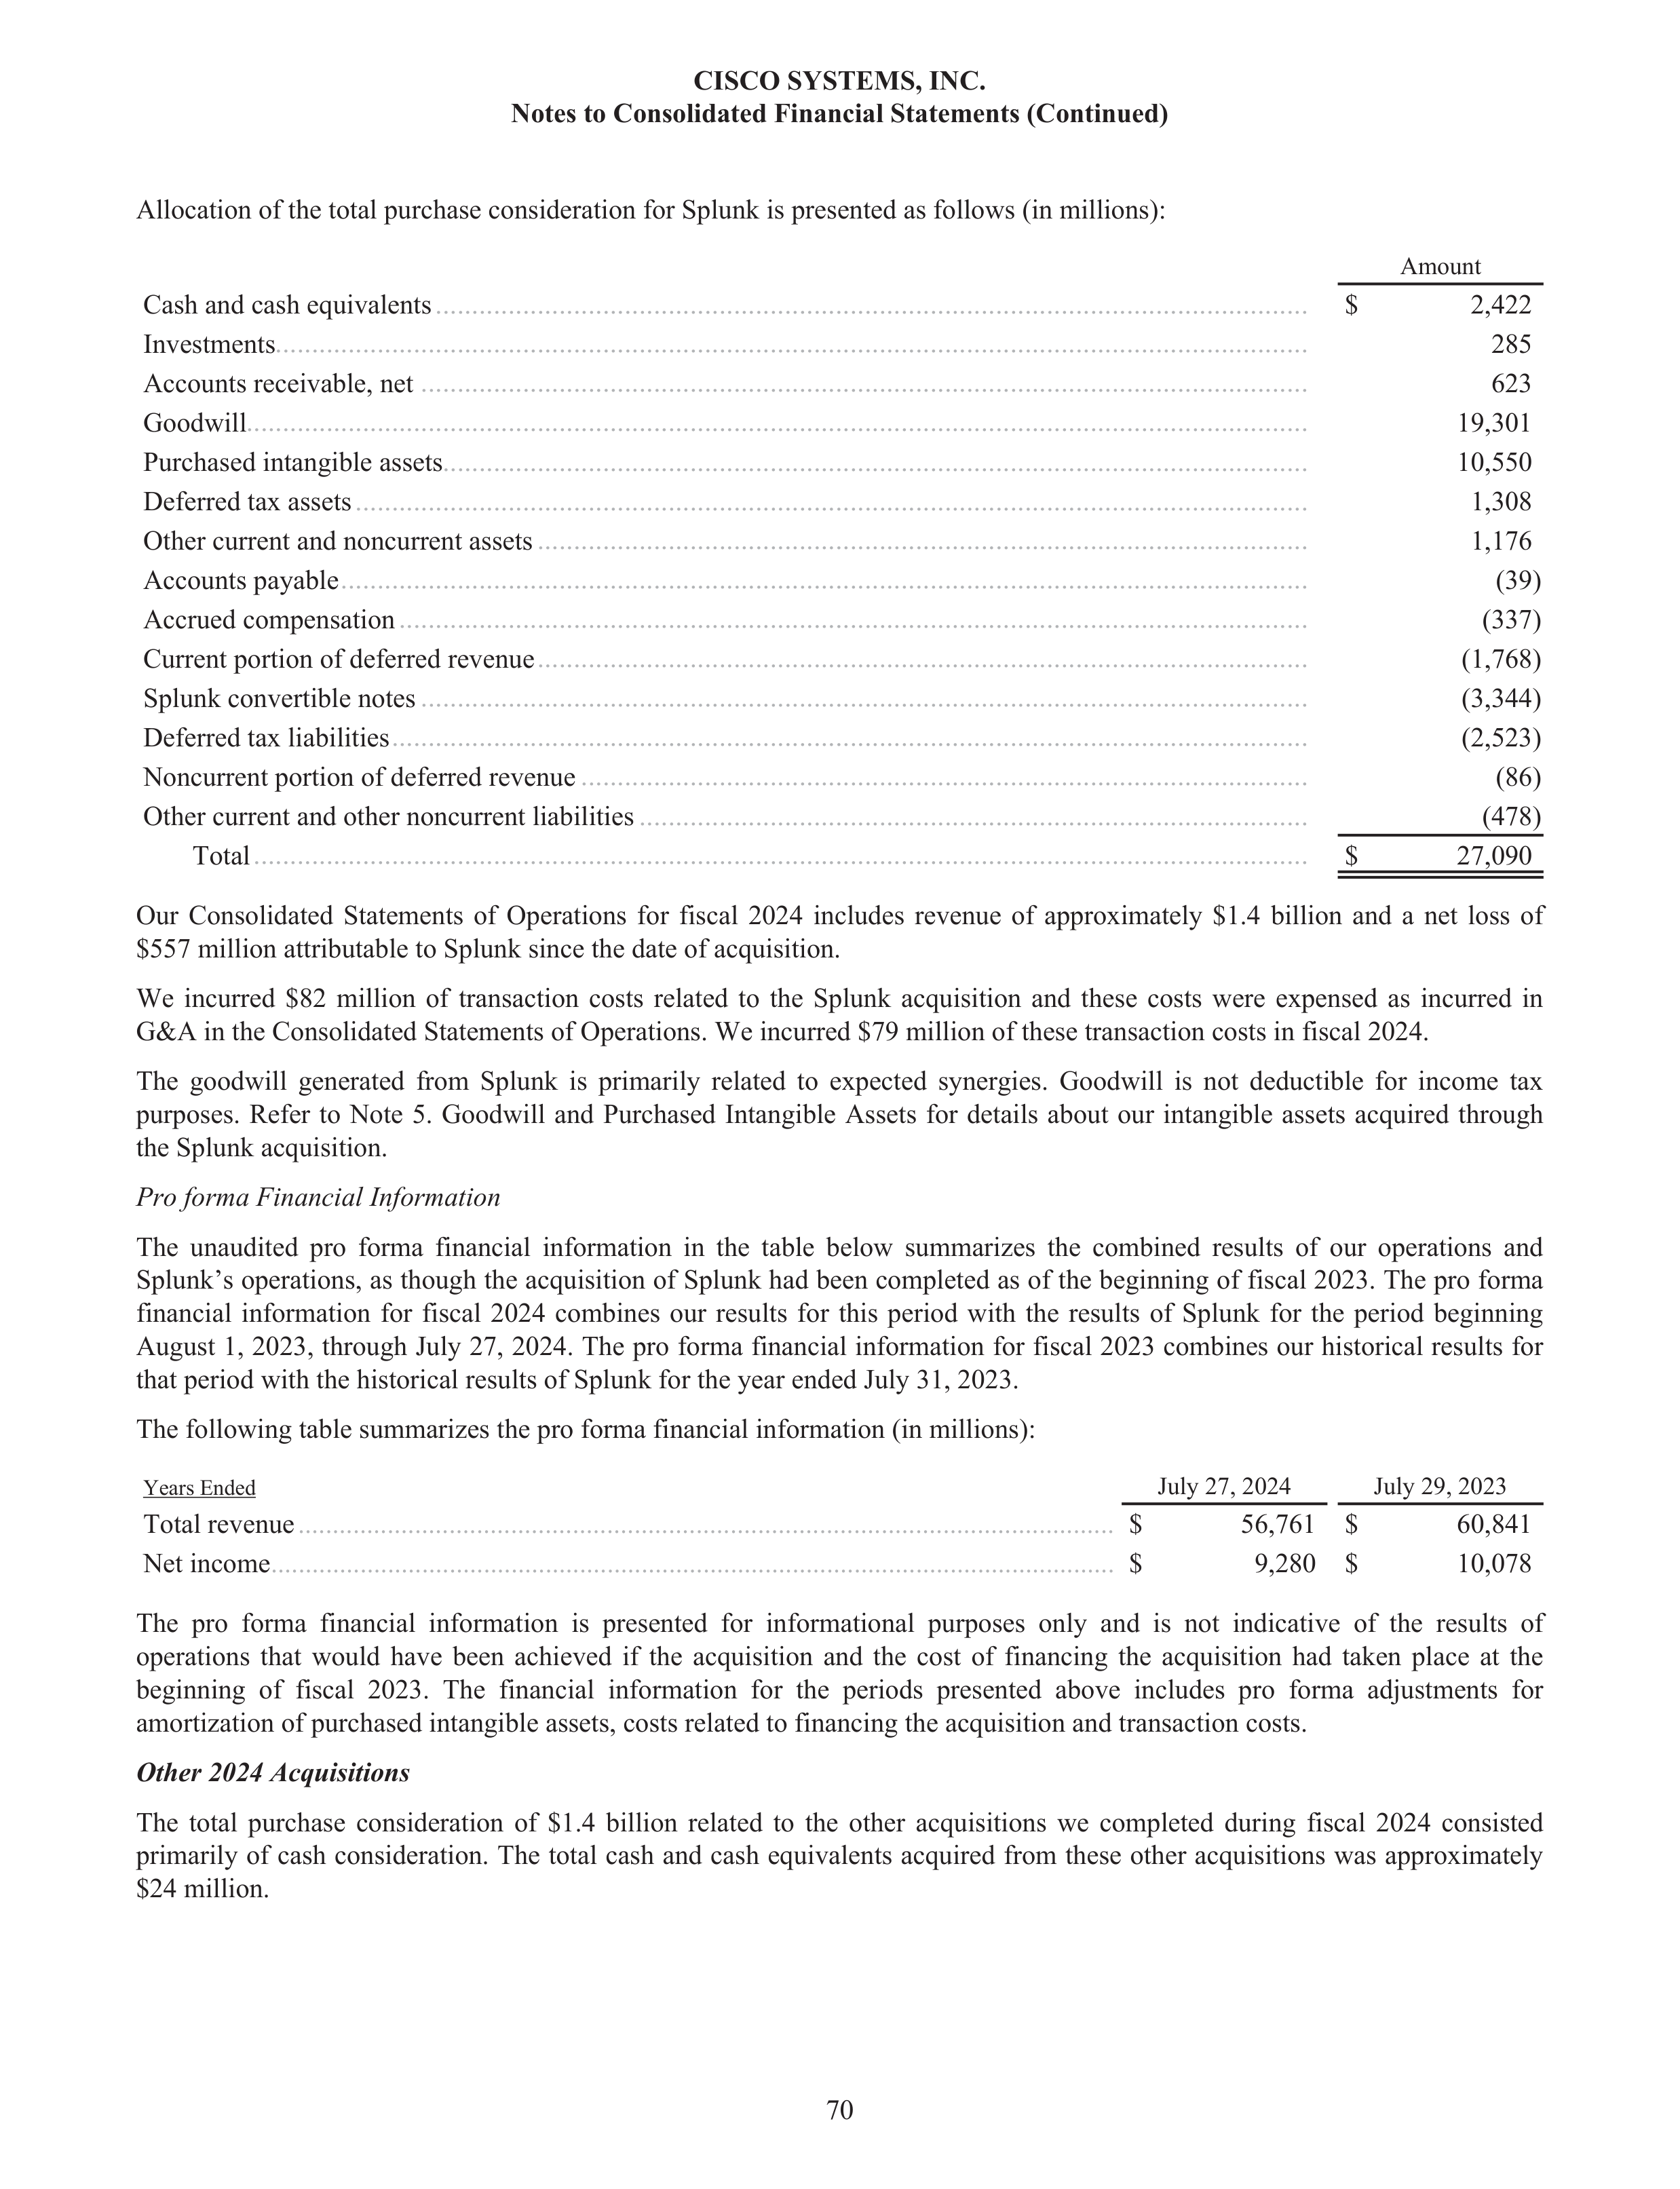
Allocation of the total purchase consideration for Splunk is presented as follows (in millions):
Amount
Cash and cash equivalents
$
2,422
Investments
285
Accounts receivable, net
623
Goodwill
19,301
Purchased intangible assets
10,550
Deferred tax assets
1,308
Other current and noncurrent assets
1,176
Accounts payable
(39)
Accrued compensation
(337)
Current portion of deferred revenue
(1,768)
Splunk convertible notes
(3,344)
Deferred tax liabilities
(2,523)
Noncurrent portion of deferred revenue
(86)
Other current and other noncurrent liabilities
(478)
Total
$
27,090
Our Consolidated Statements of Operations for fiscal 2024 includes revenue of approximately $1.4 billion and a net loss of
$557 million attributable to Splunk since the date of acquisition.
We incurred $82 million of transaction costs related to the Splunk acquisition and these costs were expensed as incurred in
G&A in the Consolidated Statements of Operations. We incurred $79 million of these transaction costs in fiscal 2024.
The goodwill generated from Splunk is primarily related to expected synergies. Goodwill is not deductible for income tax
purposes. Refer to Note 5. Goodwill and Purchased Intangible Assets
for details about our intangible assets acquired through
the Splunk acquisition.
Pro forma Financial Information
The unaudited pro forma financial information in the table below summarizes the combined results of our operations and
Splunk’s operations, as though the acquisition of Splunk had been completed as of the beginning of fiscal 2023. The pro forma
financial information for fiscal 2024 combines our results for this period with the results of Splunk for the period beginning
August 1, 2023, through July 27, 2024. The pro forma financial information for fiscal 2023 combines our historical results for
that period with the historical results of Splunk for the year ended July 31, 2023.
The following table summarizes the pro forma financial information (in millions):
Years Ended
July 27, 2024
July 29, 2023
Total revenue
.......................................................................................................................
$
56,761 $
60,841
Net income
...........................................................................................................................
$
9,280 $
10,078
The pro forma financial information is presented for informational purposes only and is not indicative of the results of
operations that would have been achieved if the acquisition and the cost of financing the acquisition had taken place at the
beginning of fiscal 2023. The financial information for the periods presented above includes pro forma adjustments for
amortization of purchased intangible assets, costs related to financing the acquisition and transaction costs.
Other 2024 Acquisitions
The total purchase consideration of $1.4 billion related to the other acquisitions we completed during fiscal 2024 consisted
primarily of cash consideration. The total cash and cash equivalents acquired from these other acquisitions was approximately
$24 million.
CISCO SYSTEMS, INC.
Notes to Consolidated Financial Statements (Continued)
70
........................................................................................................................
..............................................................................................................................................
..........................................................................................................................
..................................................................................................................................................
.......................................................................................................................
...................................................................................................................................
..........................................................................................................
.....................................................................................................................................
.............................................................................................................................
..........................................................................................................
..........................................................................................................................
..............................................................................................................................
....................................................................................................
............................................................................................
.................................................................................................................................................
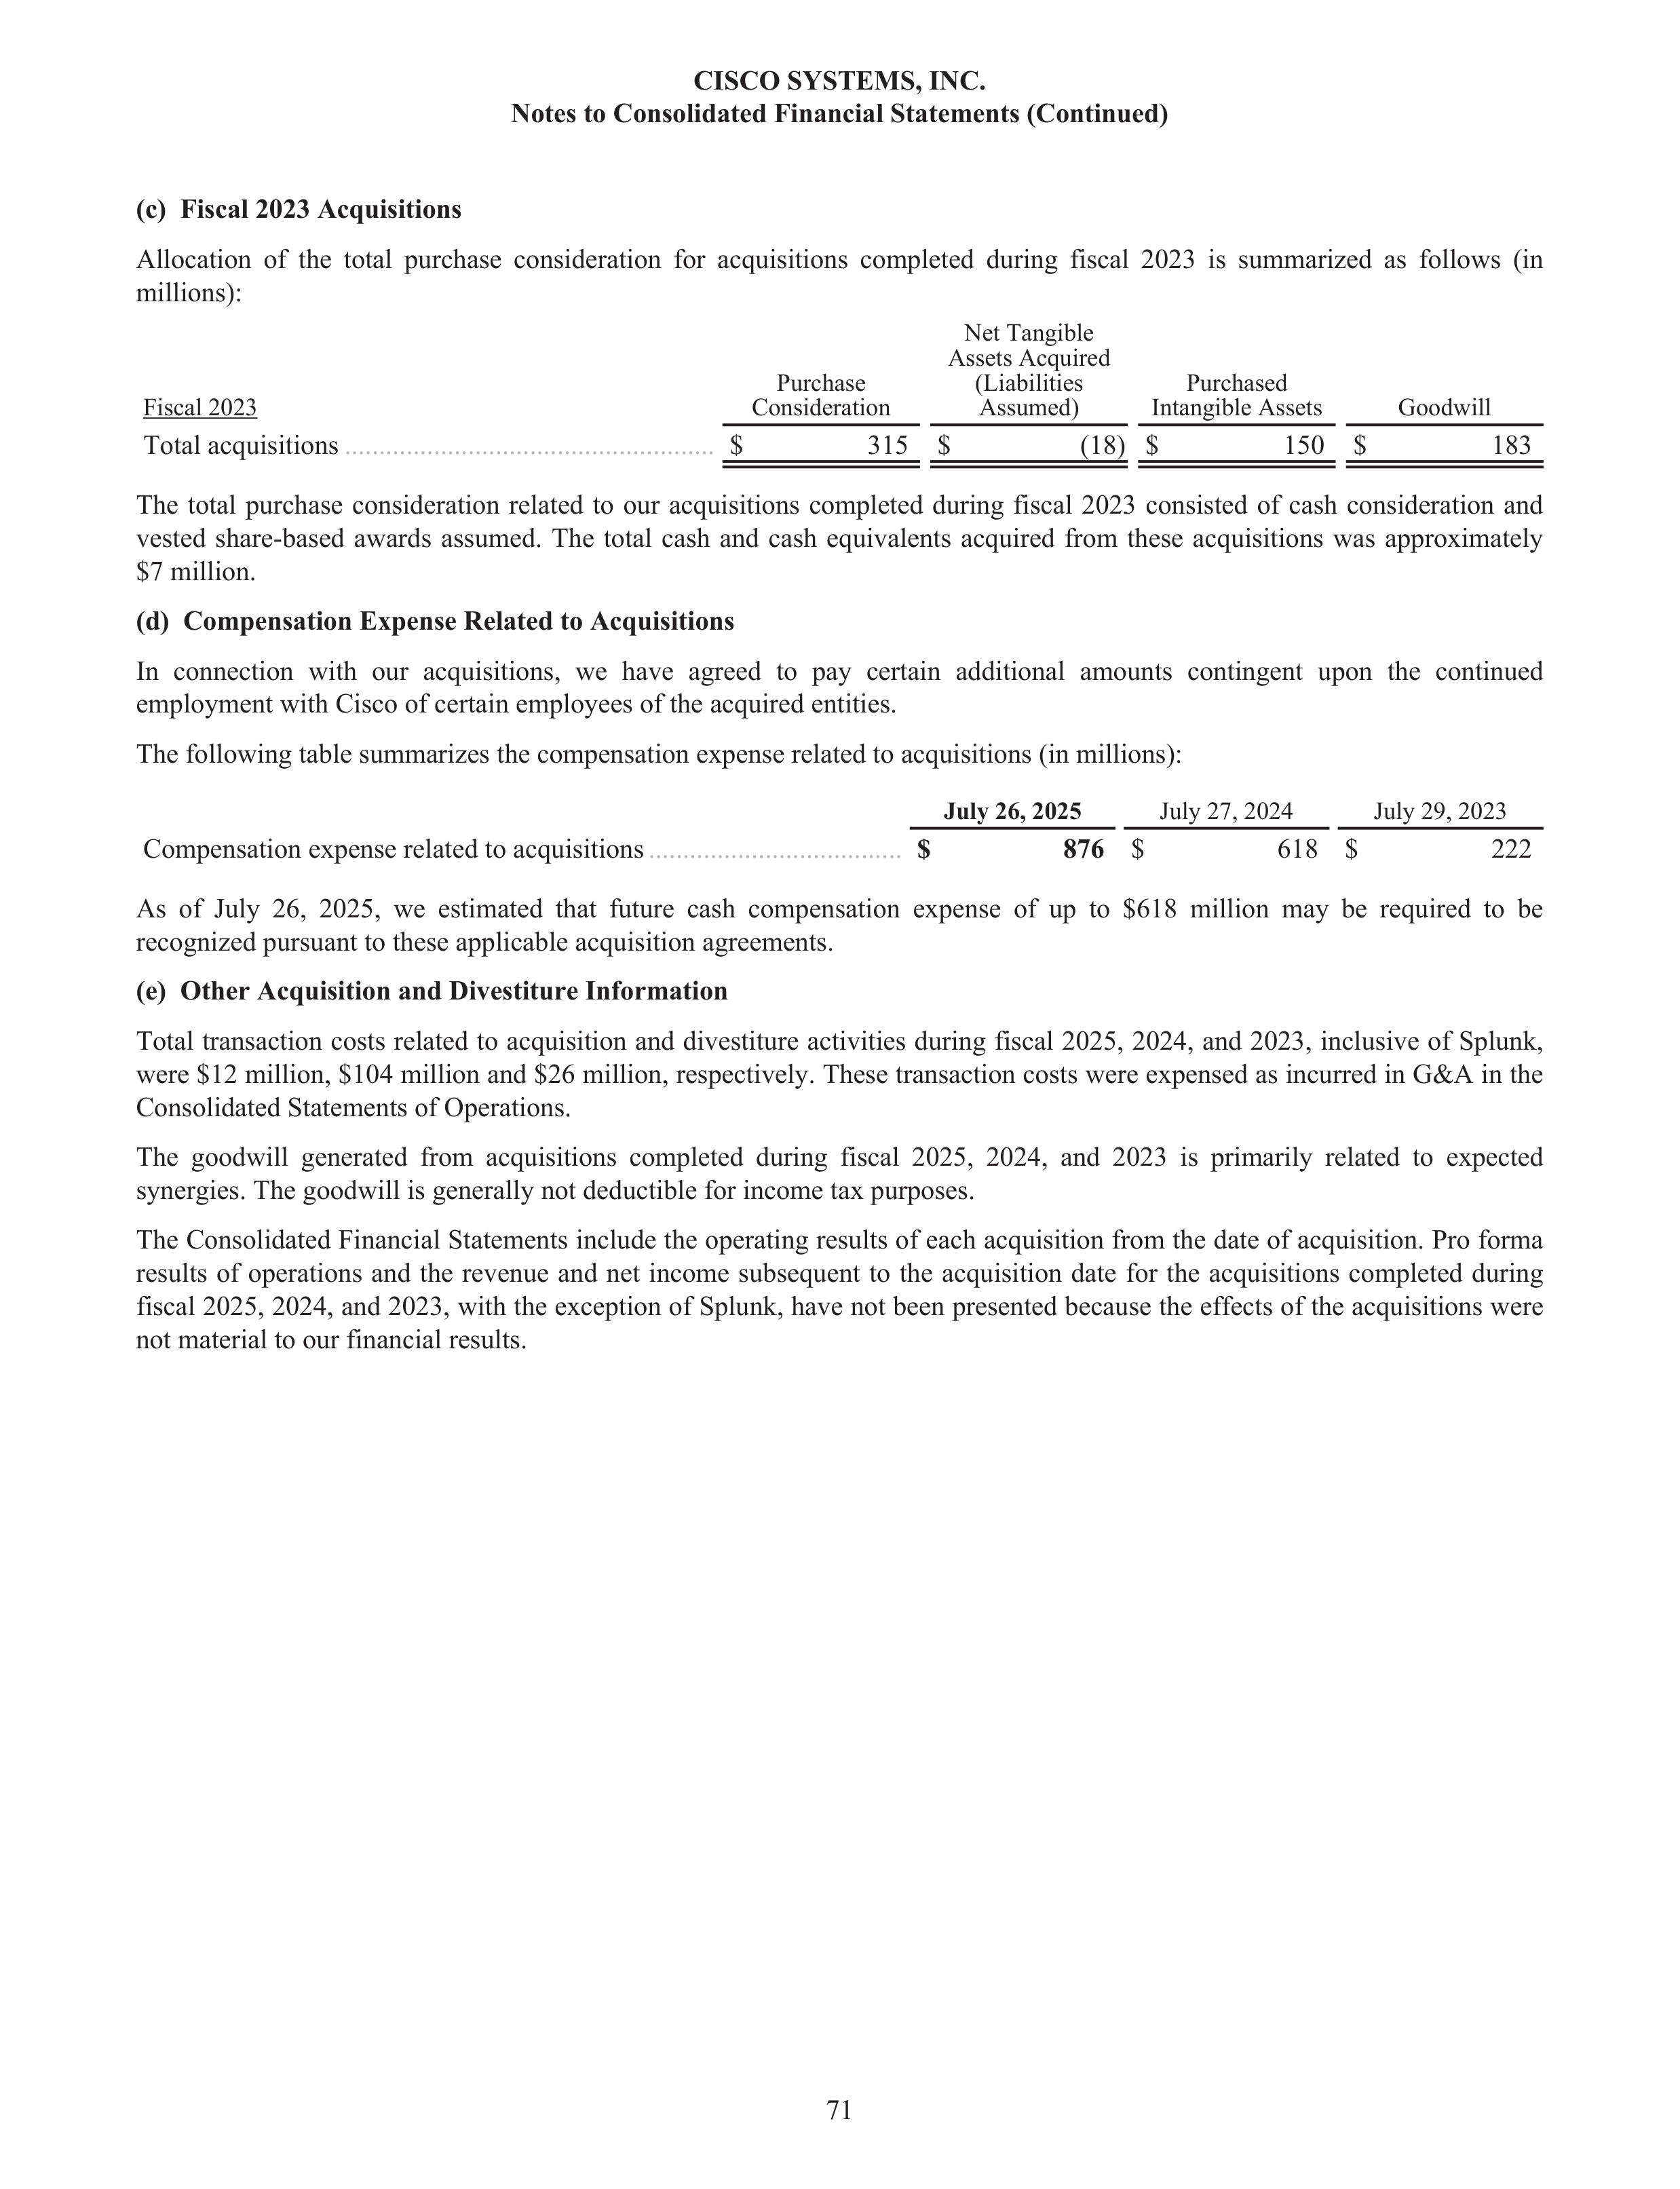
(c)
Fiscal 2023 Acquisitions
Allocation of the total purchase consideration for acquisitions completed during fiscal 2023 is summarized as follows (in
millions):
Fiscal 2023
Purchase
Consideration
Net Tangible
Assets Acquired
(Liabilities
Assumed)
Purchased
Intangible Assets
Goodwill
Total acquisitions
......................................................
$
315 $
(18)
$
150 $
183
The total purchase consideration related to our acquisitions completed during fiscal 2023 consisted of cash consideration and
vested share-based awards assumed. The total cash and cash equivalents acquired from these acquisitions was approximately
$7 million.
(d)
Compensation Expense Related to Acquisitions
In connection with our acquisitions, we have agreed to pay certain additional amounts contingent upon the continued
employment with Cisco of certain employees of the acquired entities.
The following table summarizes the compensation expense related to acquisitions (in millions):
July 26, 2025
July 27, 2024
July 29, 2023
Compensation expense related to acquisitions
.....................................
$
876
$
618 $
222
As of July 26, 2025, we estimated that future cash compensation expense of up to $618 million may be required to be
recognized pursuant to these applicable acquisition agreements.
(e)
Other Acquisition and Divestiture Information
Total transaction costs related to acquisition and divestiture activities during fiscal 2025, 2024, and 2023, inclusive of Splunk,
were $12 million, $104 million and $26 million, respectively. These transaction costs were expensed as incurred in G&A in the
Consolidated Statements of Operations.
The goodwill generated from acquisitions completed during fiscal 2025, 2024, and 2023 is primarily related to expected
synergies. The goodwill is generally not deductible for income tax purposes.
The Consolidated Financial Statements include the operating results of each acquisition from the date of acquisition. Pro forma
results of operations and the revenue and net income subsequent to the acquisition date for the acquisitions completed during
fiscal 2025, 2024, and 2023, with the exception of Splunk, have not been presented because the effects of the acquisitions were
not material to our financial results.
CISCO SYSTEMS, INC.
Notes to Consolidated Financial Statements (Continued)
71
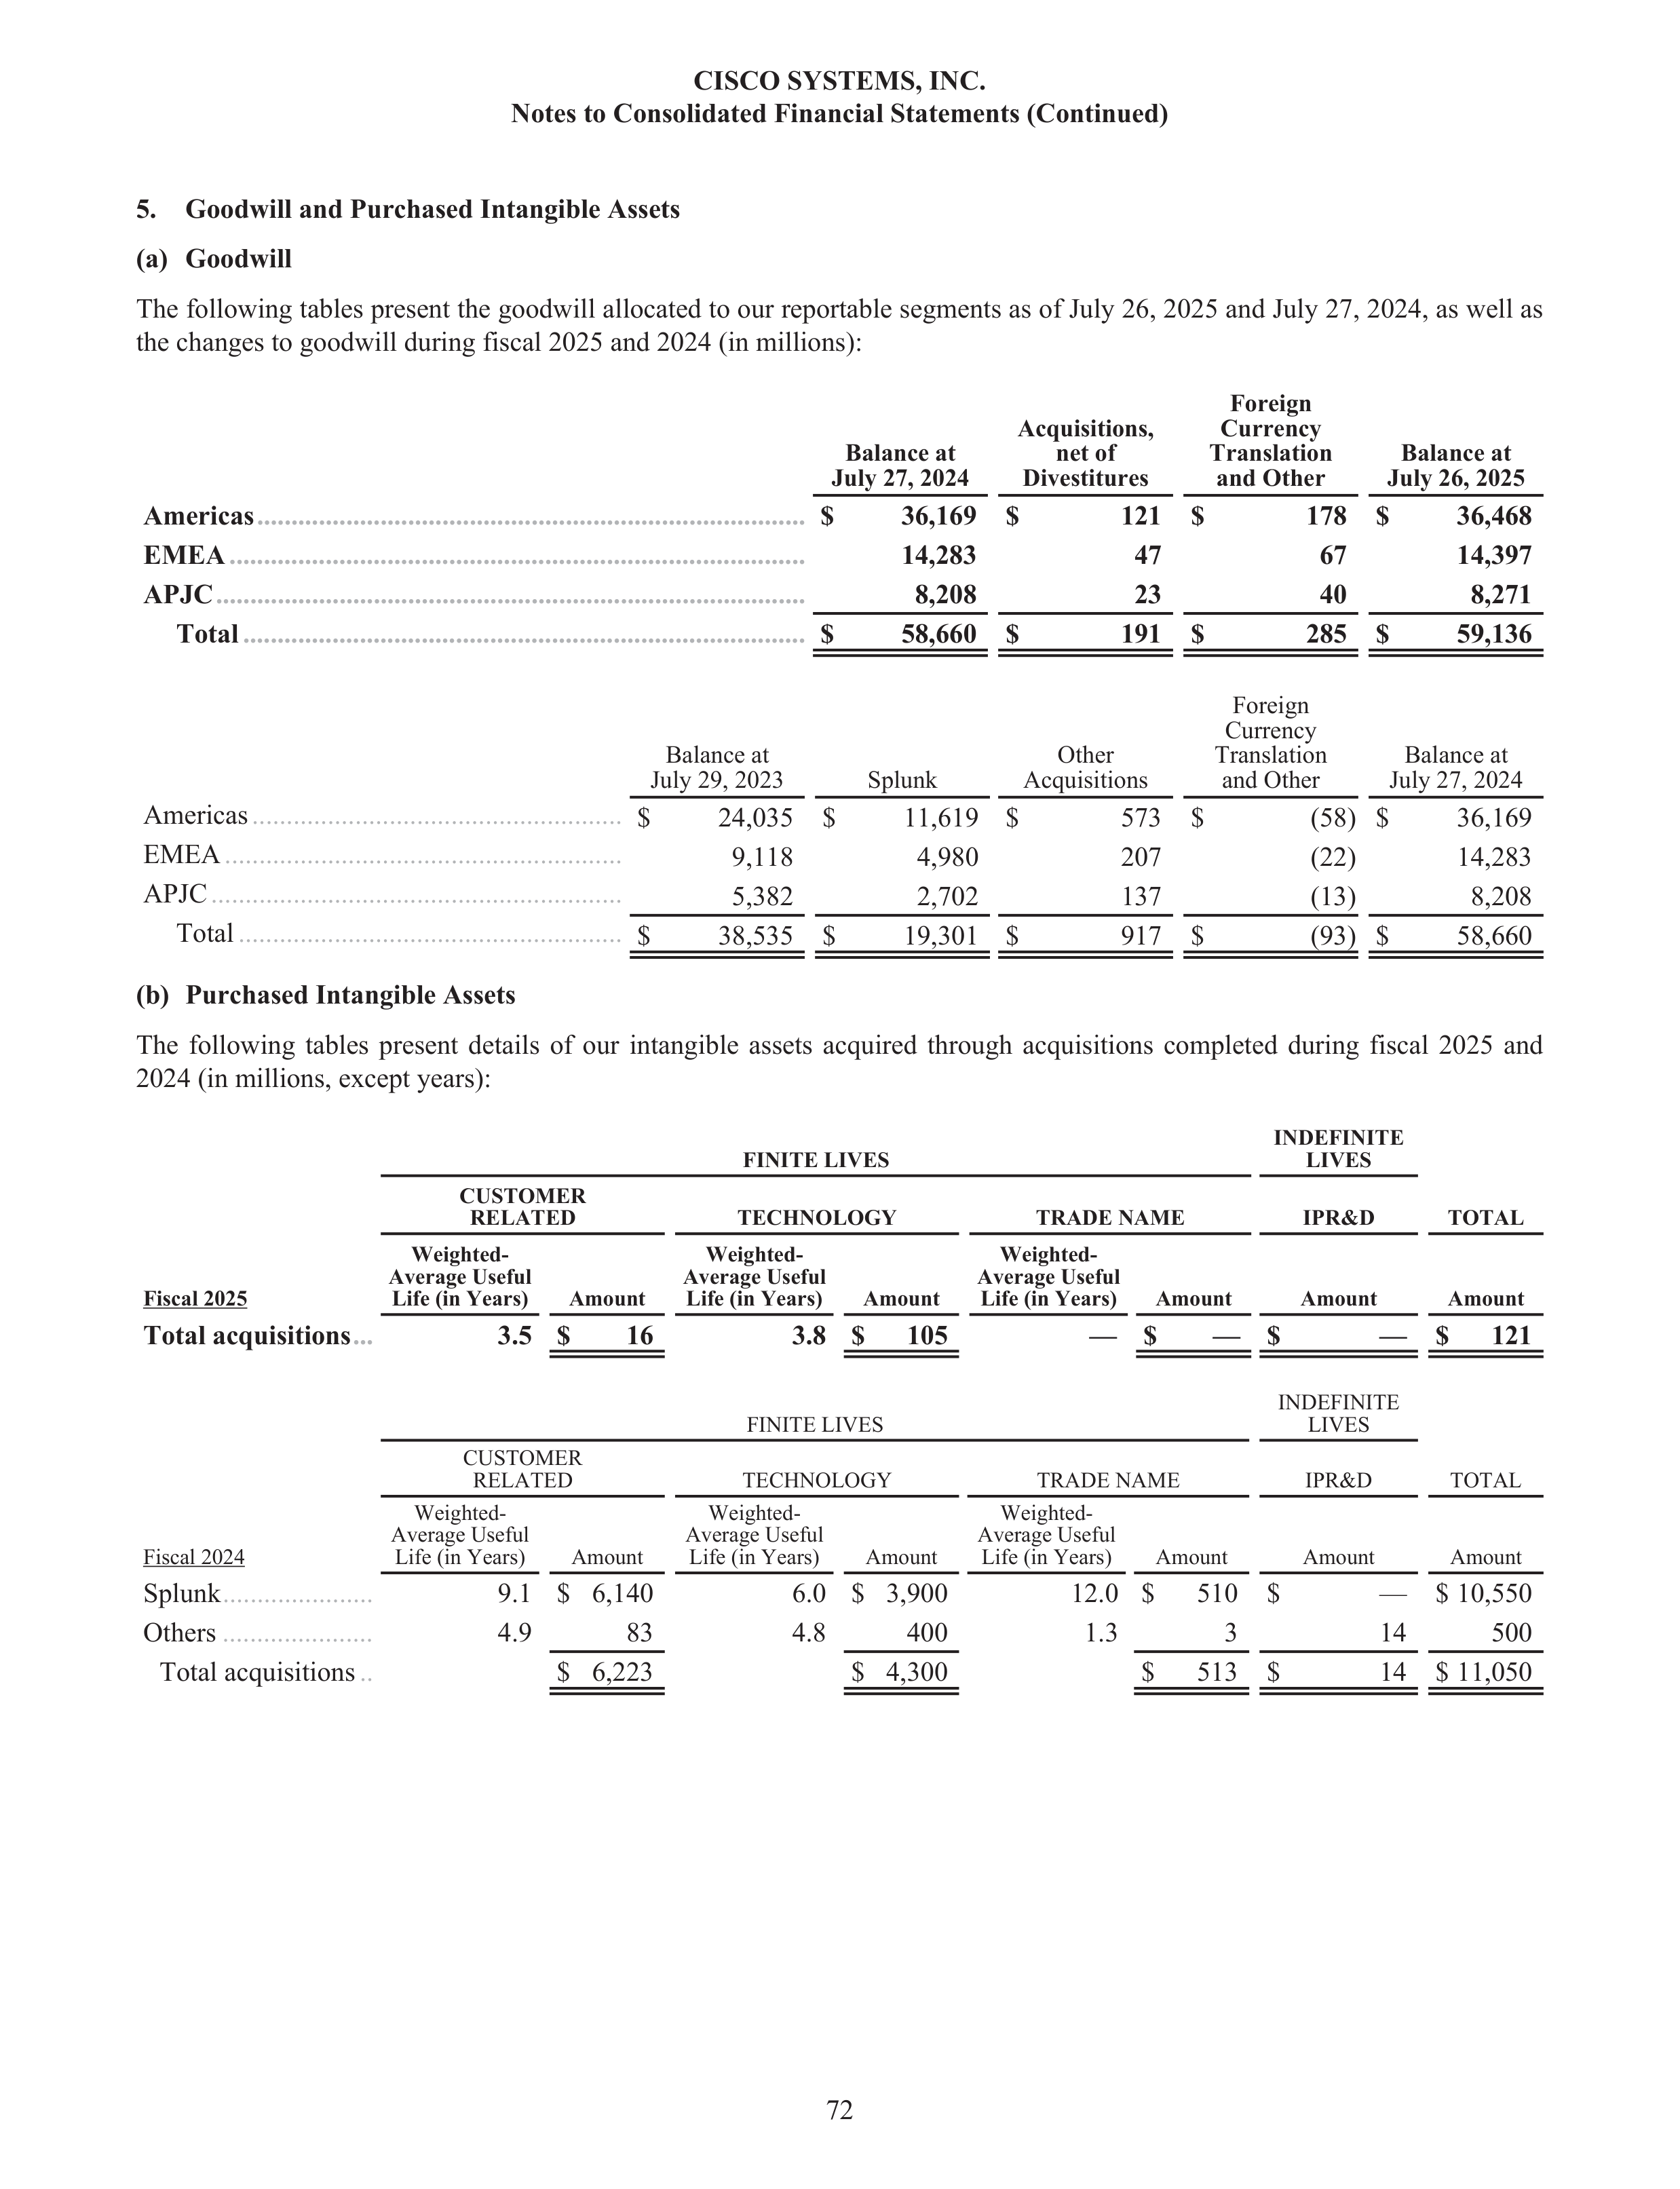
5.
Goodwill and Purchased Intangible Assets
(a)
Goodwill
The following tables present the goodwill allocated to our reportable segments as of July 26, 2025 and July 27, 2024, as well as
the changes to goodwill during fiscal 2025 and 2024 (in millions):
Balance at
July 27, 2024
Acquisitions,
net of
Divestitures
Foreign
Currency
Translation
and Other
Balance at
July 26, 2025
Americas
................................................................................
$
36,169 $
121 $
178 $
36,468
EMEA
....................................................................................
14,283
47
67
14,397
APJC
......................................................................................
8,208
23
40
8,271
Total
..................................................................................
$
58,660 $
191 $
285 $
59,136
Balance at
July 29, 2023
Splunk
Other
Acquisitions
Foreign
Currency
Translation
and Other
Balance at
July 27, 2024
Americas
......................................................
$
24,035 $
11,619 $
573 $
(58)
$
36,169
EMEA
..........................................................
9,118
4,980
207
(22)
14,283
APJC
............................................................
5,382
2,702
137
(13)
8,208
Total
........................................................
$
38,535 $
19,301 $
917 $
(93)
$
58,660
(b)
Purchased Intangible Assets
The following tables present details of our intangible assets acquired through acquisitions completed during fiscal 2025 and
2024 (in millions, except years):
FINITE LIVES
INDEFINITE
LIVES
TOTAL
CUSTOMER
RELATED
TECHNOLOGY
TRADE NAME
IPR&D
Fiscal 2025
Weighted-
Average Useful
Life (in Years)
Amount
Weighted-
Average Useful
Life (in Years)
Amount
Weighted-
Average Useful
Life (in Years)
Amount
Amount
Amount
Total acquisitions
...
3.5
$
16
3.8
$
105
— $
— $
— $
121
FINITE LIVES
INDEFINITE
LIVES
TOTAL
CUSTOMER
RELATED
TECHNOLOGY
TRADE NAME
IPR&D
Fiscal 2024
Weighted-
Average Useful
Life (in Years)
Amount
Weighted-
Average Useful
Life (in Years)
Amount
Weighted-
Average Useful
Life (in Years)
Amount
Amount
Amount
Splunk
......................
9.1
$ 6,140
6.0
$ 3,900
12.0
$
510 $
— $ 10,550
Others
......................
4.9
83
4.8
400
1.3
3
14
500
Total acquisitions
..
$ 6,223
$ 4,300
$
513 $
14 $ 11,050
CISCO SYSTEMS, INC.
Notes to Consolidated Financial Statements (Continued)
72
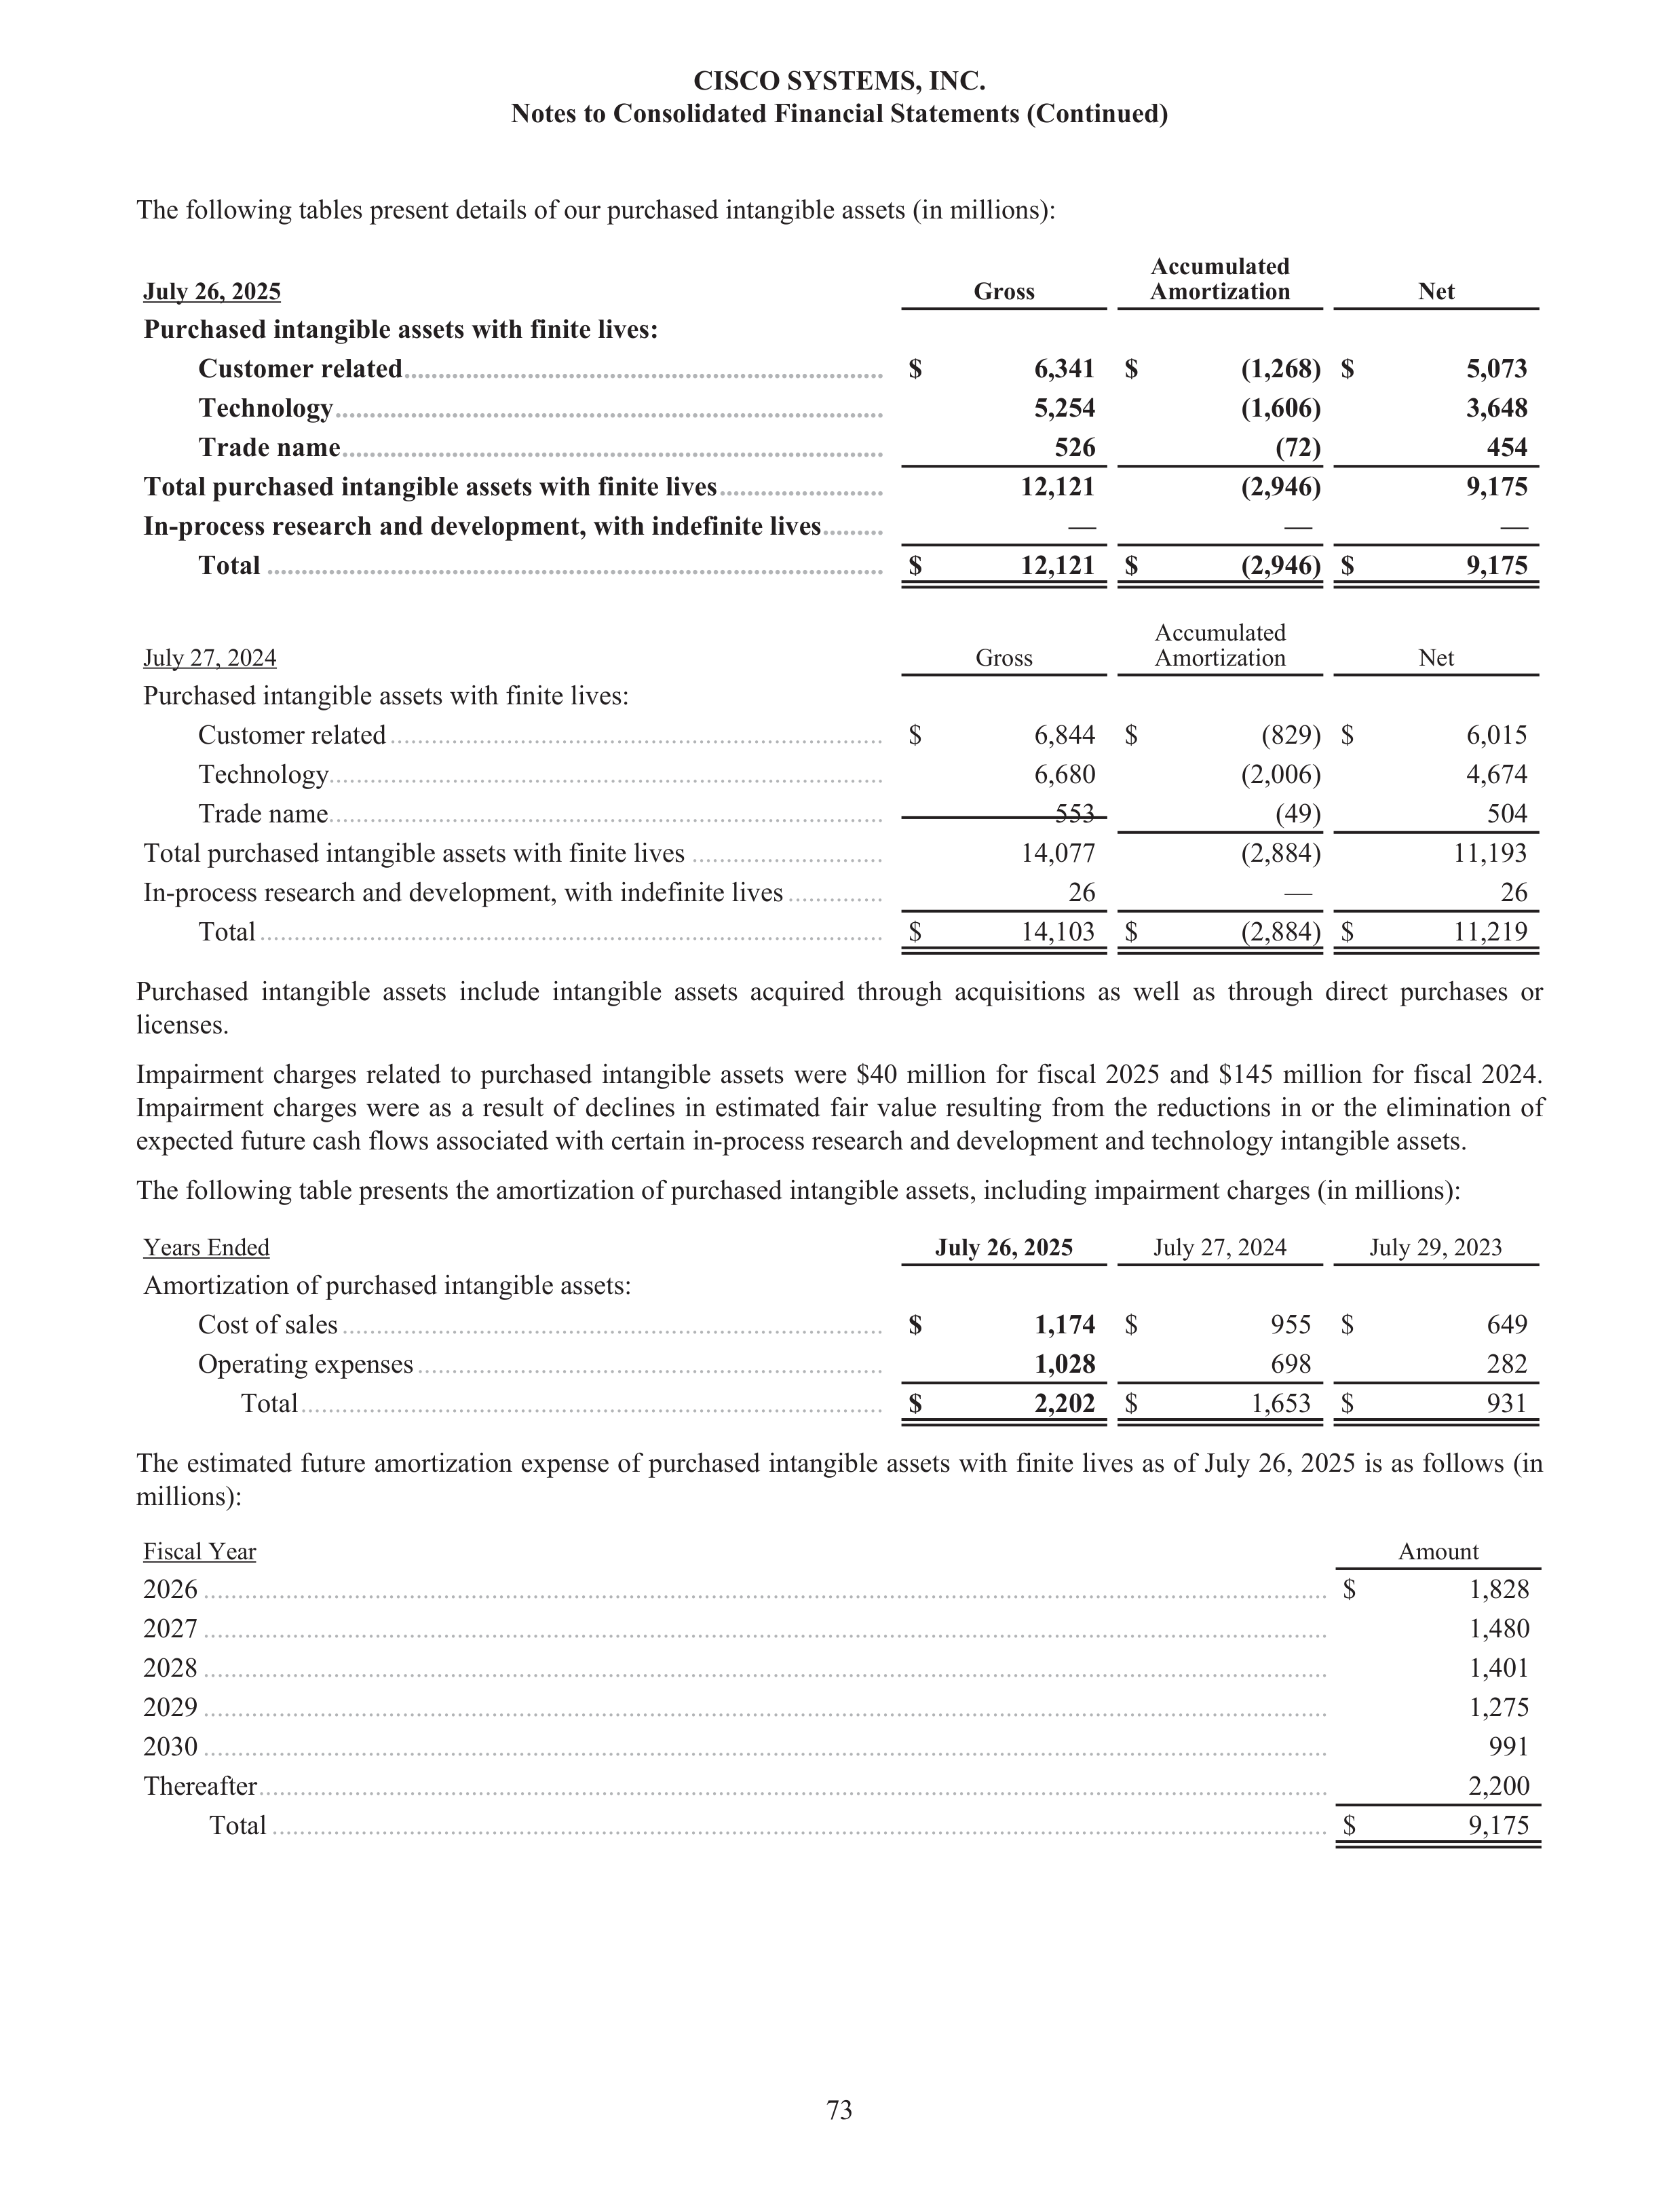
The following tables present details of our purchased intangible assets (in millions):
July 26, 2025
Gross
Accumulated
Amortization
Net
Purchased intangible assets with finite lives:
Customer related
......................................................................
$
6,341 $
(1,268) $
5,073
Technology
................................................................................
5,254
(1,606)
3,648
Trade name
...............................................................................
526
(72)
454
Total purchased intangible assets with finite lives
........................
12,121
(2,946)
9,175
In-process research and development, with indefinite lives
.........
—
—
—
Total
..........................................................................................
$
12,121 $
(2,946) $
9,175
July 27, 2024
Gross
Accumulated
Amortization
Net
Purchased intangible assets with finite lives:
Customer related
........................................................................
$
6,844 $
(829)
$
6,015
Technology
.................................................................................
6,680
(2,006)
4,674
Trade name
.................................................................................
553
(49)
504
Total purchased intangible assets with finite lives
............................
14,077
(2,884)
11,193
In-process research and development, with indefinite lives
..............
26
—
26
Total
...........................................................................................
$
14,103 $
(2,884) $
11,219
Purchased intangible assets include intangible assets acquired through acquisitions as well as through direct purchases or
licenses.
Impairment charges related to purchased intangible assets were $40 million for fiscal 2025 and $145 million for fiscal 2024.
Impairment charges were as a result of declines in estimated fair value resulting from the reductions in or the elimination of
expected future cash flows associated with certain in-process research and development and technology intangible assets.
The following table presents the amortization of purchased intangible assets, including impairment charges (in millions):
Years Ended
July 26, 2025
July 27, 2024
July 29, 2023
Amortization of purchased intangible assets:
Cost of sales
...............................................................................
$
1,174
$
955 $
649
Operating expenses
....................................................................
1,028
698
282
Total
.....................................................................................
$
2,202
$
1,653 $
931
The estimated future amortization expense of purchased intangible assets with finite lives as of July 26, 2025 is as follows (in
millions):
Fiscal Year
Amount
2026
....................................................................................................................................................................
$
1,828
2027
....................................................................................................................................................................
1,480
2028
....................................................................................................................................................................
1,401
2029
....................................................................................................................................................................
1,275
2030
....................................................................................................................................................................
991
Thereafter
............................................................................................................................................................
2,200
Total
..........................................................................................................................................................
$
9,175
CISCO SYSTEMS, INC.
Notes to Consolidated Financial Statements (Continued)
73
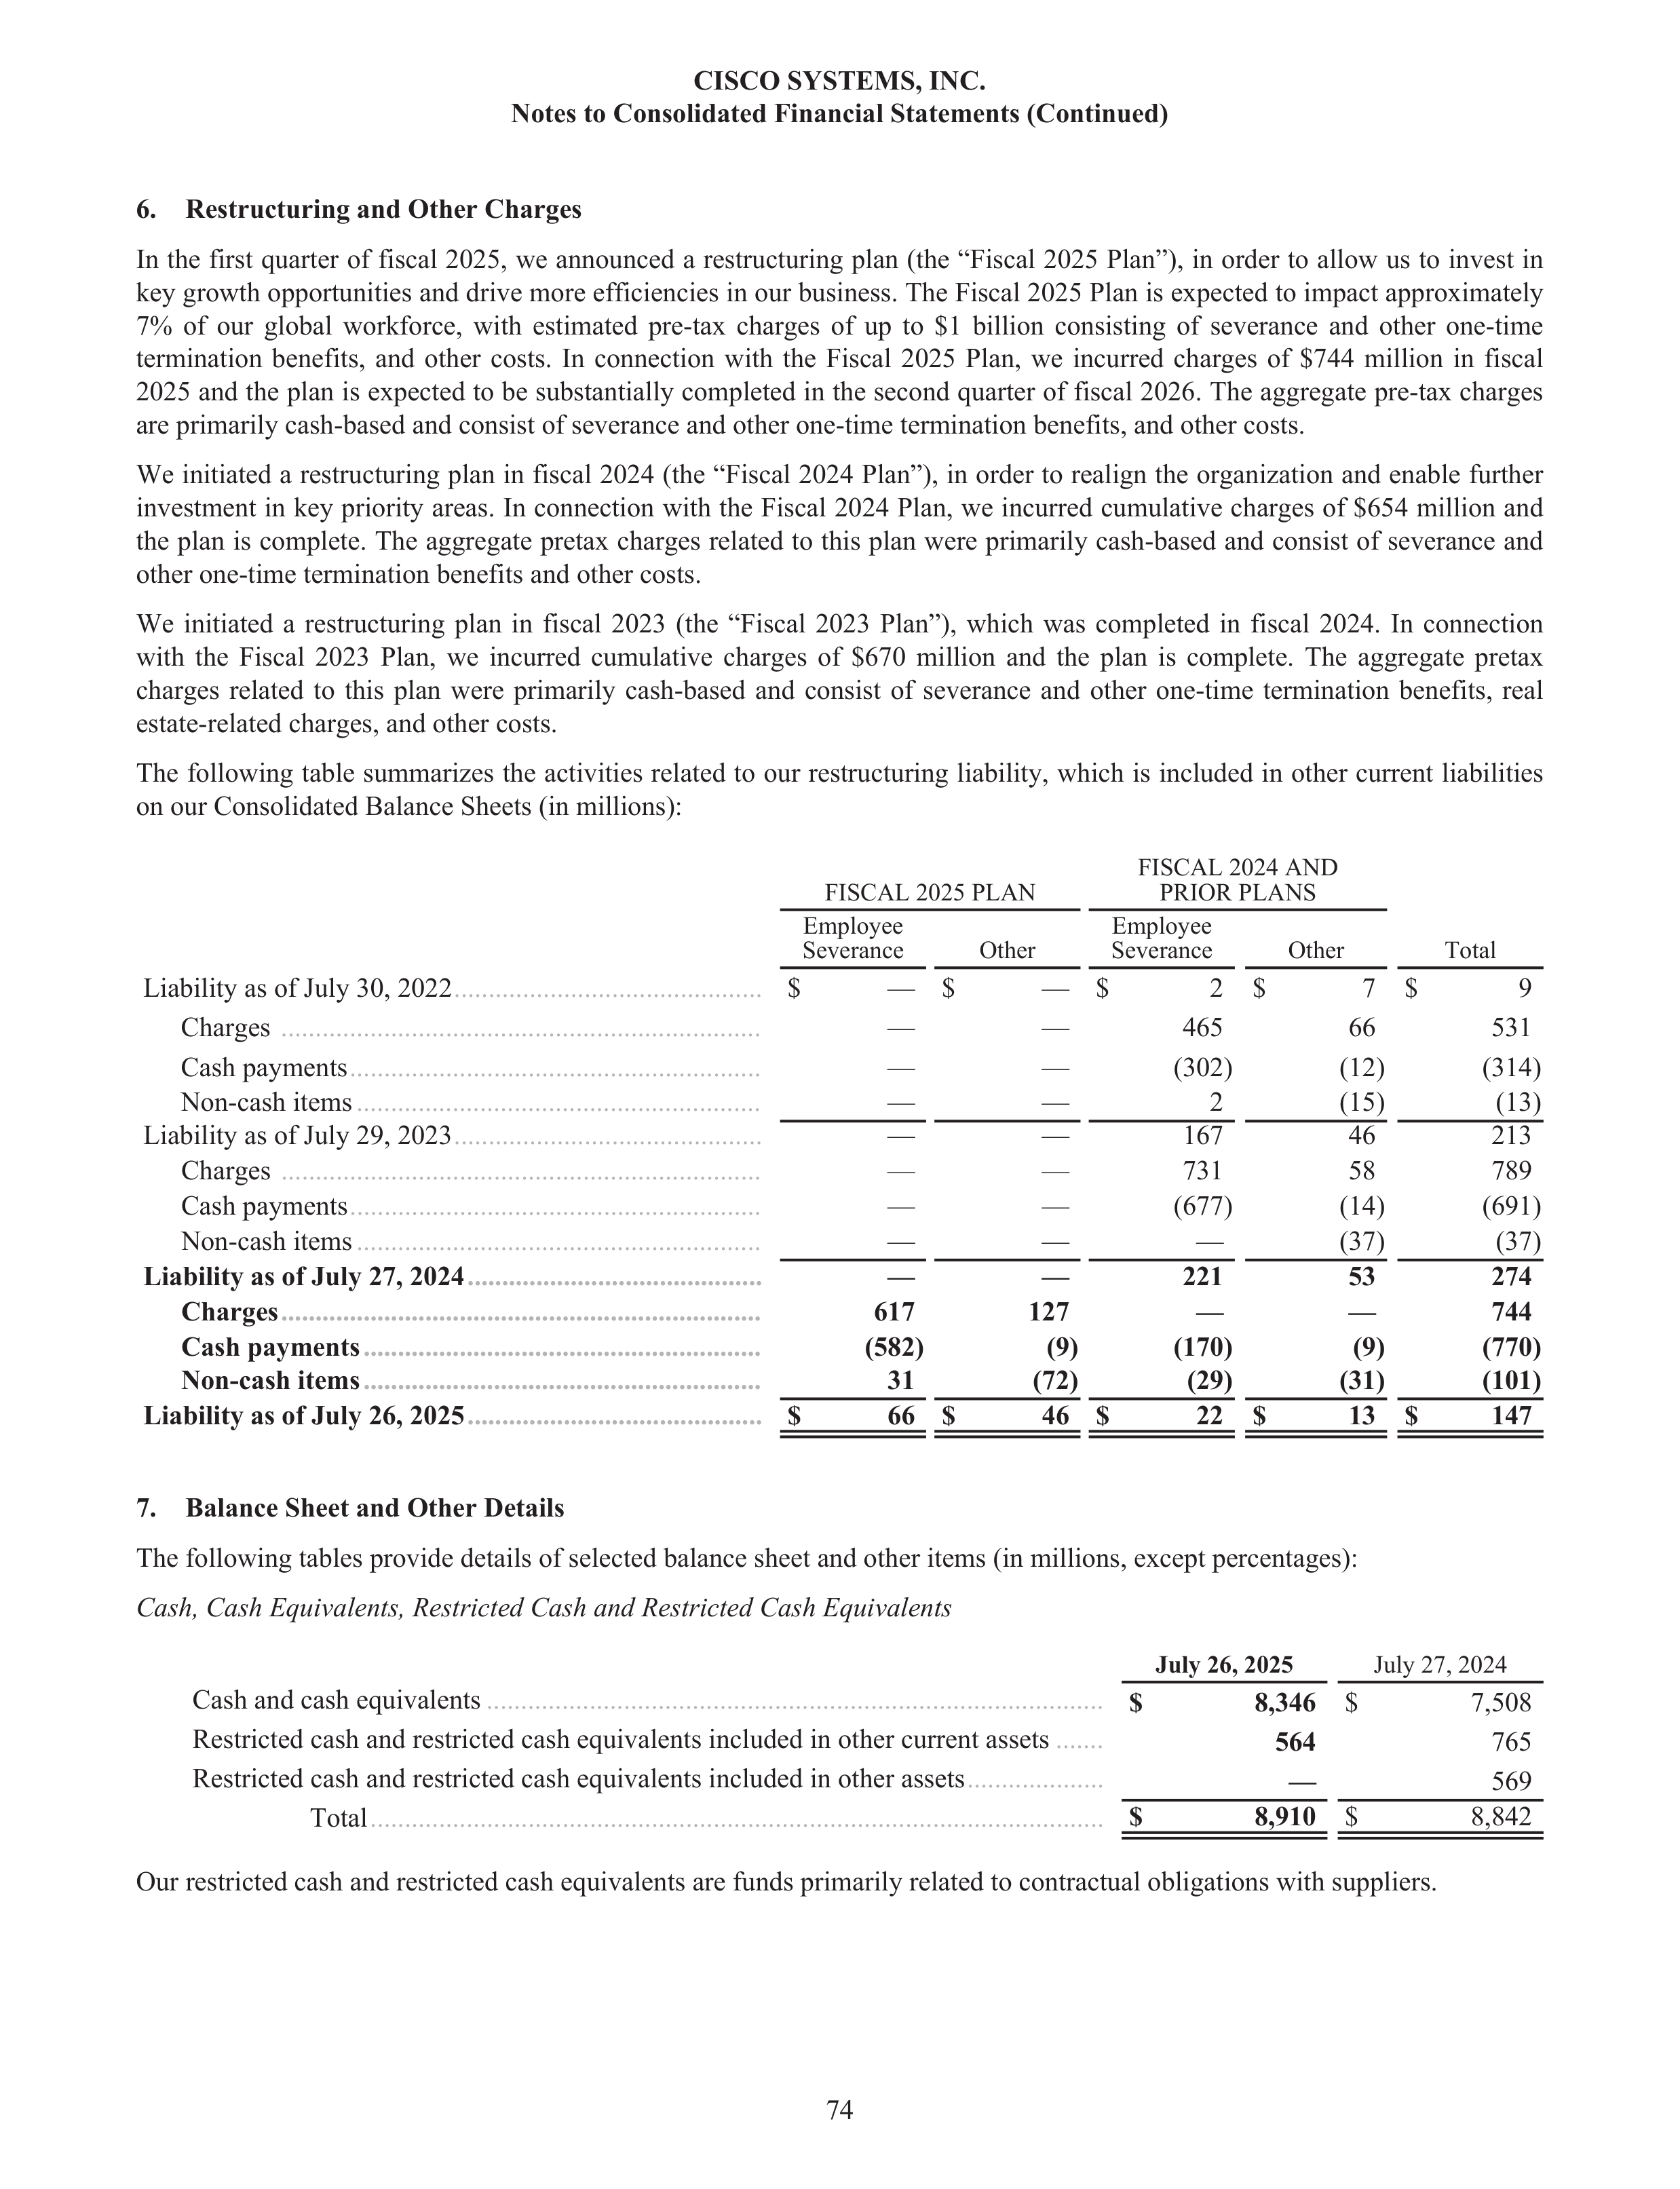
6.
Restructuring and Other Charges
In the first quarter of fiscal 2025, we announced a restructuring plan (the “Fiscal 2025 Plan”), in order to allow us to invest in
key growth opportunities and drive more efficiencies in our business. The Fiscal 2025 Plan is expected to impact approximately
7% of our global workforce, with estimated pre-tax charges of up to $1 billion consisting of severance and other one-time
termination benefits, and other costs. In connection with the Fiscal 2025 Plan, we incurred charges of $744 million in fiscal
2025 and the plan is expected to be substantially completed in the second quarter of fiscal 2026. The aggregate pre-tax charges
are primarily cash-based and consist of severance and other one-time termination benefits, and other costs.
We initiated a restructuring plan in fiscal 2024 (the “Fiscal 2024 Plan”), in order to realign the organization and enable further
investment in key priority areas. In connection with the Fiscal 2024 Plan, we incurred cumulative charges of $654 million and
the plan is complete. The aggregate pretax charges related to this plan were primarily cash-based and consist of severance and
other one-time termination benefits and other costs.
We initiated a restructuring plan in fiscal 2023 (the “Fiscal 2023 Plan”), which was completed in fiscal 2024. In connection
with the Fiscal 2023 Plan, we incurred cumulative charges of $670 million and the plan is complete. The aggregate pretax
charges related to this plan were primarily cash-based and consist of severance and other one-time termination benefits, real
estate-related charges, and other costs.
The following table summarizes the activities related to our restructuring liability, which is included in other current liabilities
on our Consolidated Balance Sheets (in millions):
FISCAL 2025 PLAN
FISCAL 2024 AND
PRIOR PLANS
Employee
Severance
Other
Employee
Severance
Other
Total
Liability as of July 30, 2022
.............................................
$
— $
— $
2 $
7 $
9
Charges
......................................................................
—
—
465
66
531
Cash payments
............................................................
—
—
(302)
(12)
(314)
Non-cash items
...........................................................
—
—
2
(15)
(13)
Liability as of July 29, 2023
.............................................
—
—
167
46
213
Charges
......................................................................
—
—
731
58
789
Cash payments
............................................................
—
—
(677)
(14)
(691)
Non-cash items
...........................................................
—
—
—
(37)
(37)
Liability as of July 27, 2024
...........................................
—
—
221
53
274
Charges
......................................................................
617
127
—
—
744
Cash payments
..........................................................
(582)
(9)
(170)
(9)
(770)
Non-cash items
..........................................................
31
(72)
(29)
(31)
(101)
Liability as of July 26, 2025
...........................................
$
66 $
46 $
22 $
13 $
147
7.
Balance Sheet and Other Details
The following tables provide details of selected balance sheet and other items (in millions, except percentages):
Cash, Cash Equivalents, Restricted Cash and Restricted Cash Equivalents
July 26, 2025
July 27, 2024
Cash and cash equivalents
..........................................................................................
$
8,346
$
7,508
Restricted cash and restricted cash equivalents included in other current assets
.......
564
765
Restricted cash and restricted cash equivalents included in other assets
....................
—
569
Total
...........................................................................................................
$
8,910
$
8,842
Our restricted cash and restricted cash equivalents are funds primarily related to contractual obligations with suppliers.
CISCO SYSTEMS, INC.
Notes to Consolidated Financial Statements (Continued)
74
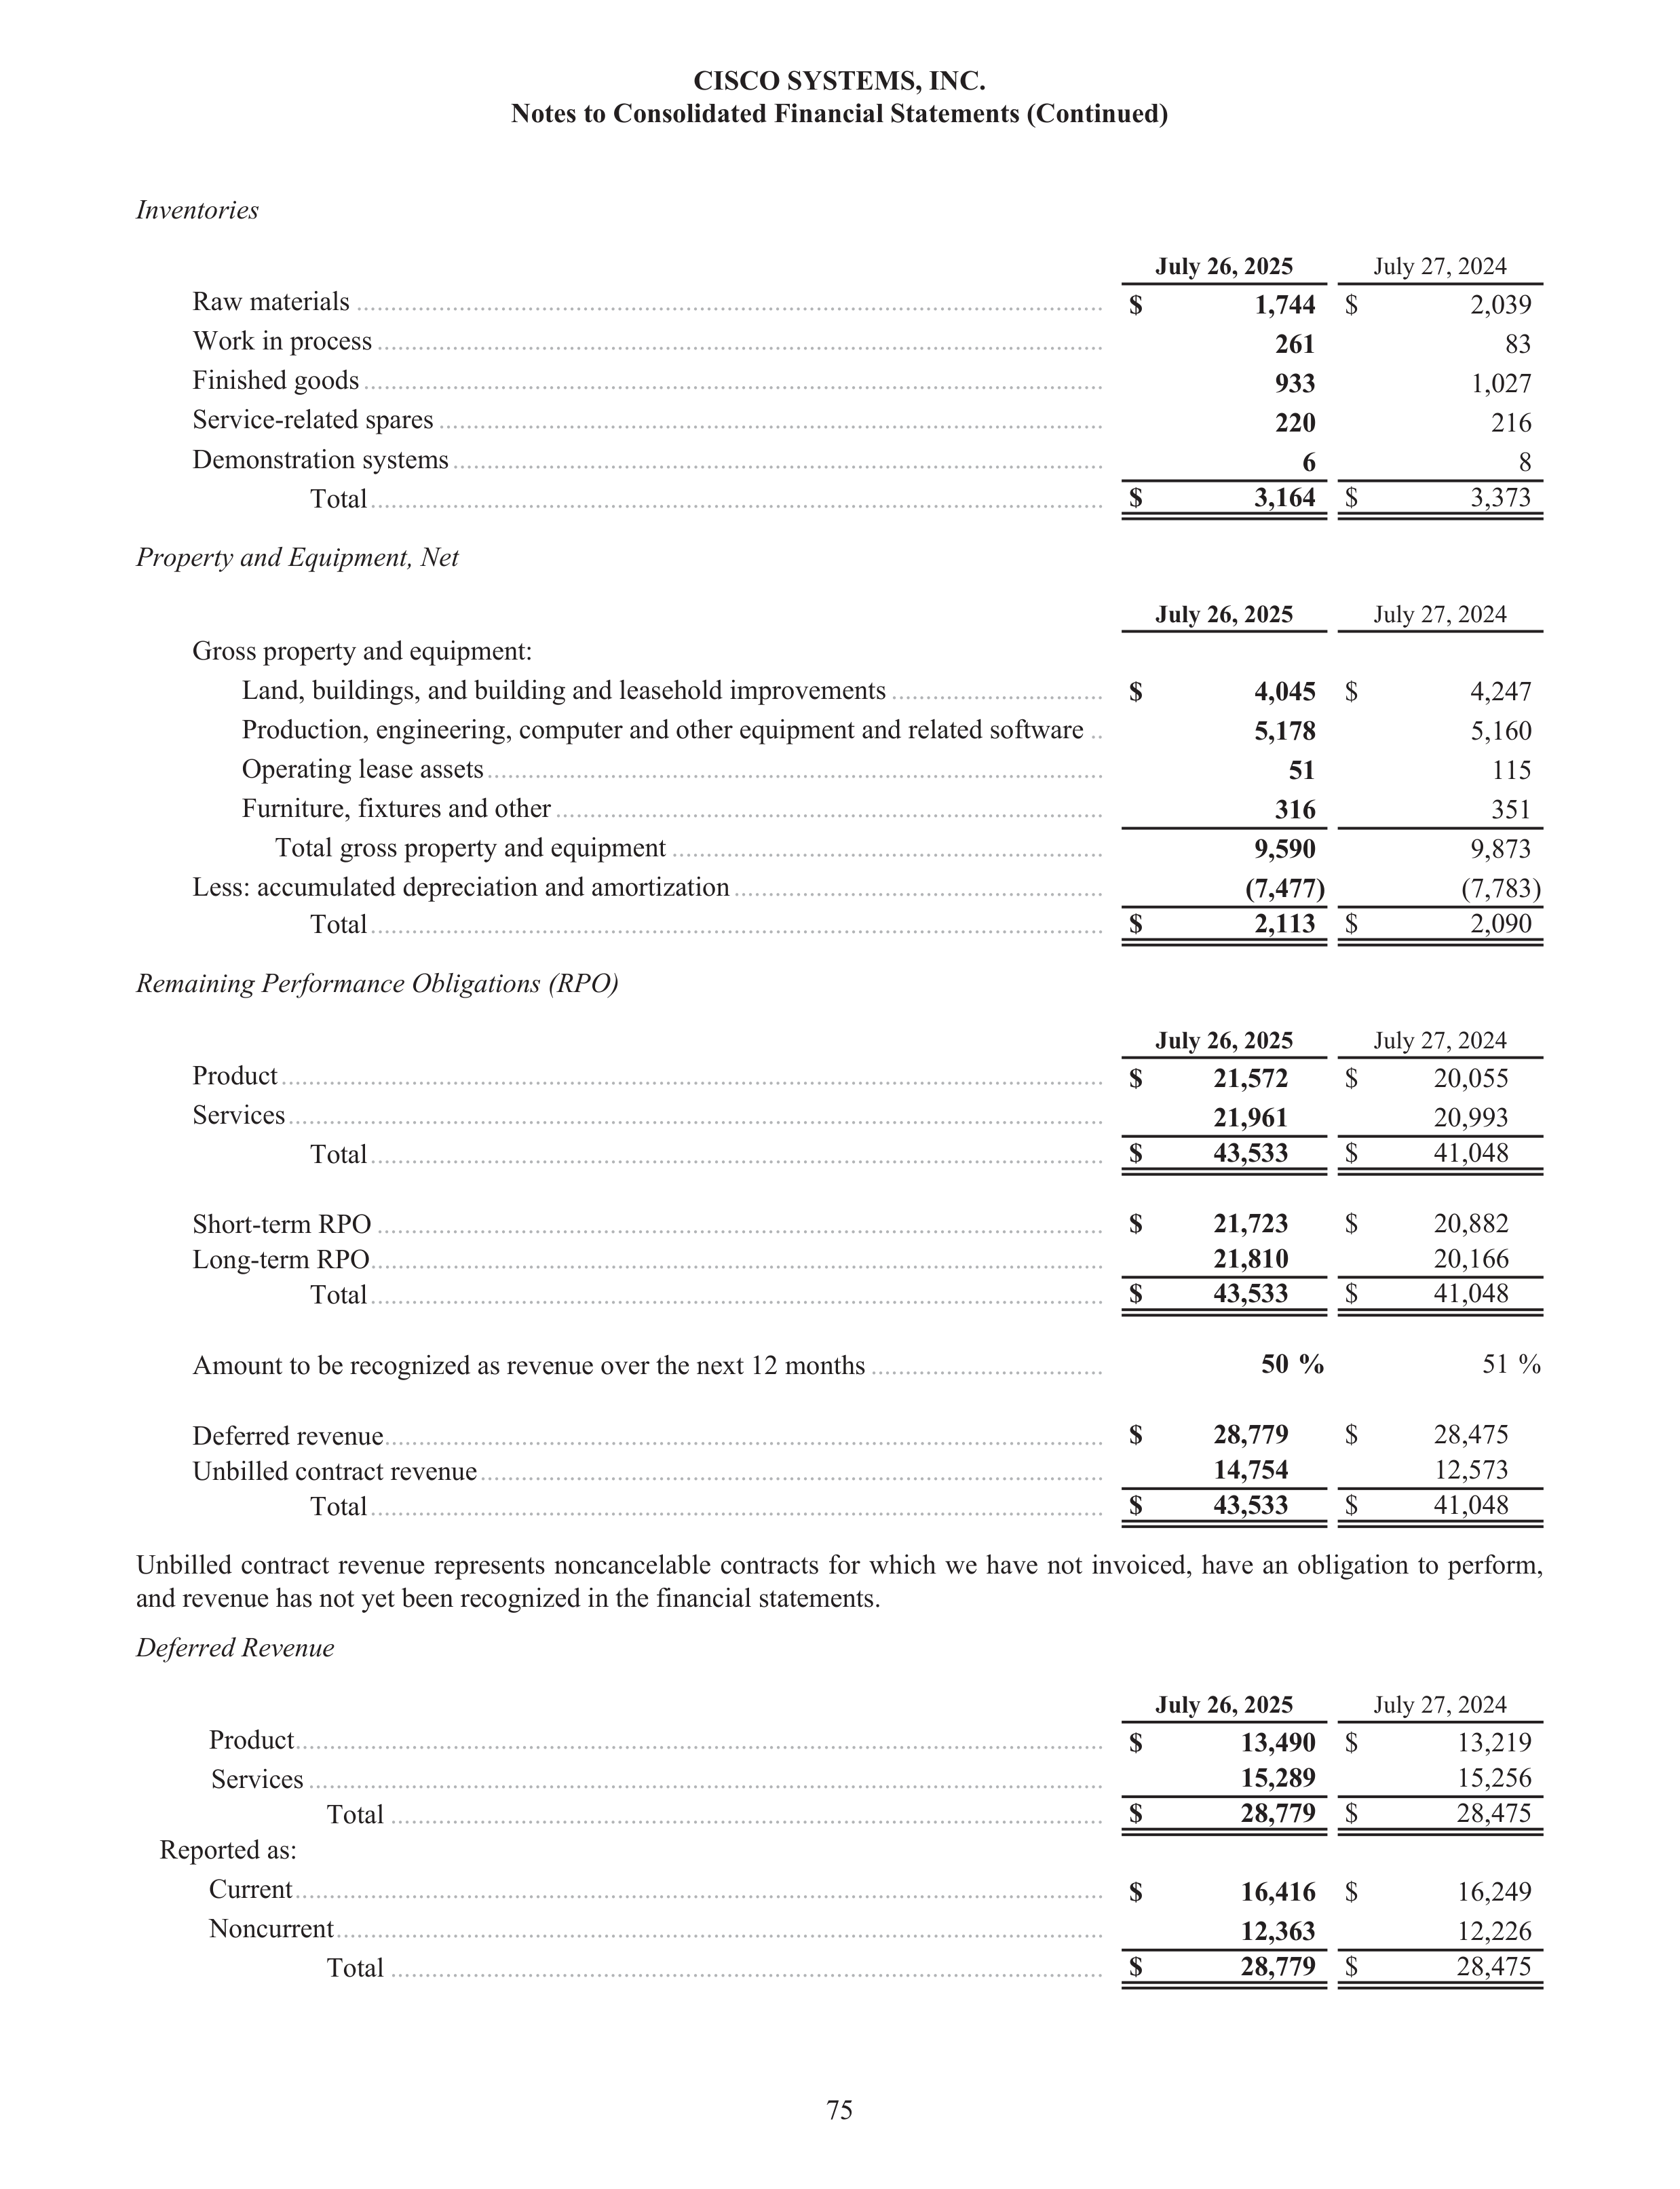
Inventories
July 26, 2025
July 27, 2024
Raw materials
.............................................................................................................
$
1,744
$
2,039
Work in process
..........................................................................................................
261
83
Finished goods
............................................................................................................
933
1,027
Service-related spares
.................................................................................................
220
216
Demonstration systems
...............................................................................................
6
8
Total
...........................................................................................................
$
3,164
$
3,373
Property and Equipment, Net
July 26, 2025
July 27, 2024
Gross property and equipment:
Land, buildings, and building and leasehold improvements
...............................
$
4,045
$
4,247
Production, engineering, computer and other equipment and related software
..
5,178
5,160
Operating lease assets
..........................................................................................
51
115
Furniture, fixtures and other
................................................................................
316
351
Total gross property and equipment
...............................................................
9,590
9,873
Less: accumulated depreciation and amortization
......................................................
(7,477)
(7,783)
Total
...........................................................................................................
$
2,113
$
2,090
Remaining Performance Obligations (RPO)
July 26, 2025
July 27, 2024
Product
........................................................................................................................
$
21,572
$
20,055
Services
.......................................................................................................................
21,961
20,993
Total
...........................................................................................................
$
43,533
$
41,048
Short-term RPO
..........................................................................................................
$
21,723
$
20,882
Long-term RPO
...........................................................................................................
21,810
20,166
Total
...........................................................................................................
$
43,533
$
41,048
Amount to be recognized as revenue over the next 12 months
..................................
50 %
51 %
Deferred revenue
.........................................................................................................
$
28,779
$
28,475
Unbilled contract revenue
...........................................................................................
14,754
12,573
Total
...........................................................................................................
$
43,533
$
41,048
Unbilled contract revenue represents noncancelable contracts for which we have not invoiced, have an obligation to perform,
and revenue has not yet been recognized in the financial statements.
Deferred Revenue
July 26, 2025
July 27, 2024
Product
......................................................................................................................
$
13,490
$
13,219
Services
....................................................................................................................
15,289
15,256
Total
........................................................................................................
$
28,779
$
28,475
Reported as:
Current
......................................................................................................................
$
16,416
$
16,249
Noncurrent
................................................................................................................
12,363
12,226
Total
........................................................................................................
$
28,779
$
28,475
CISCO SYSTEMS, INC.
Notes to Consolidated Financial Statements (Continued)
75
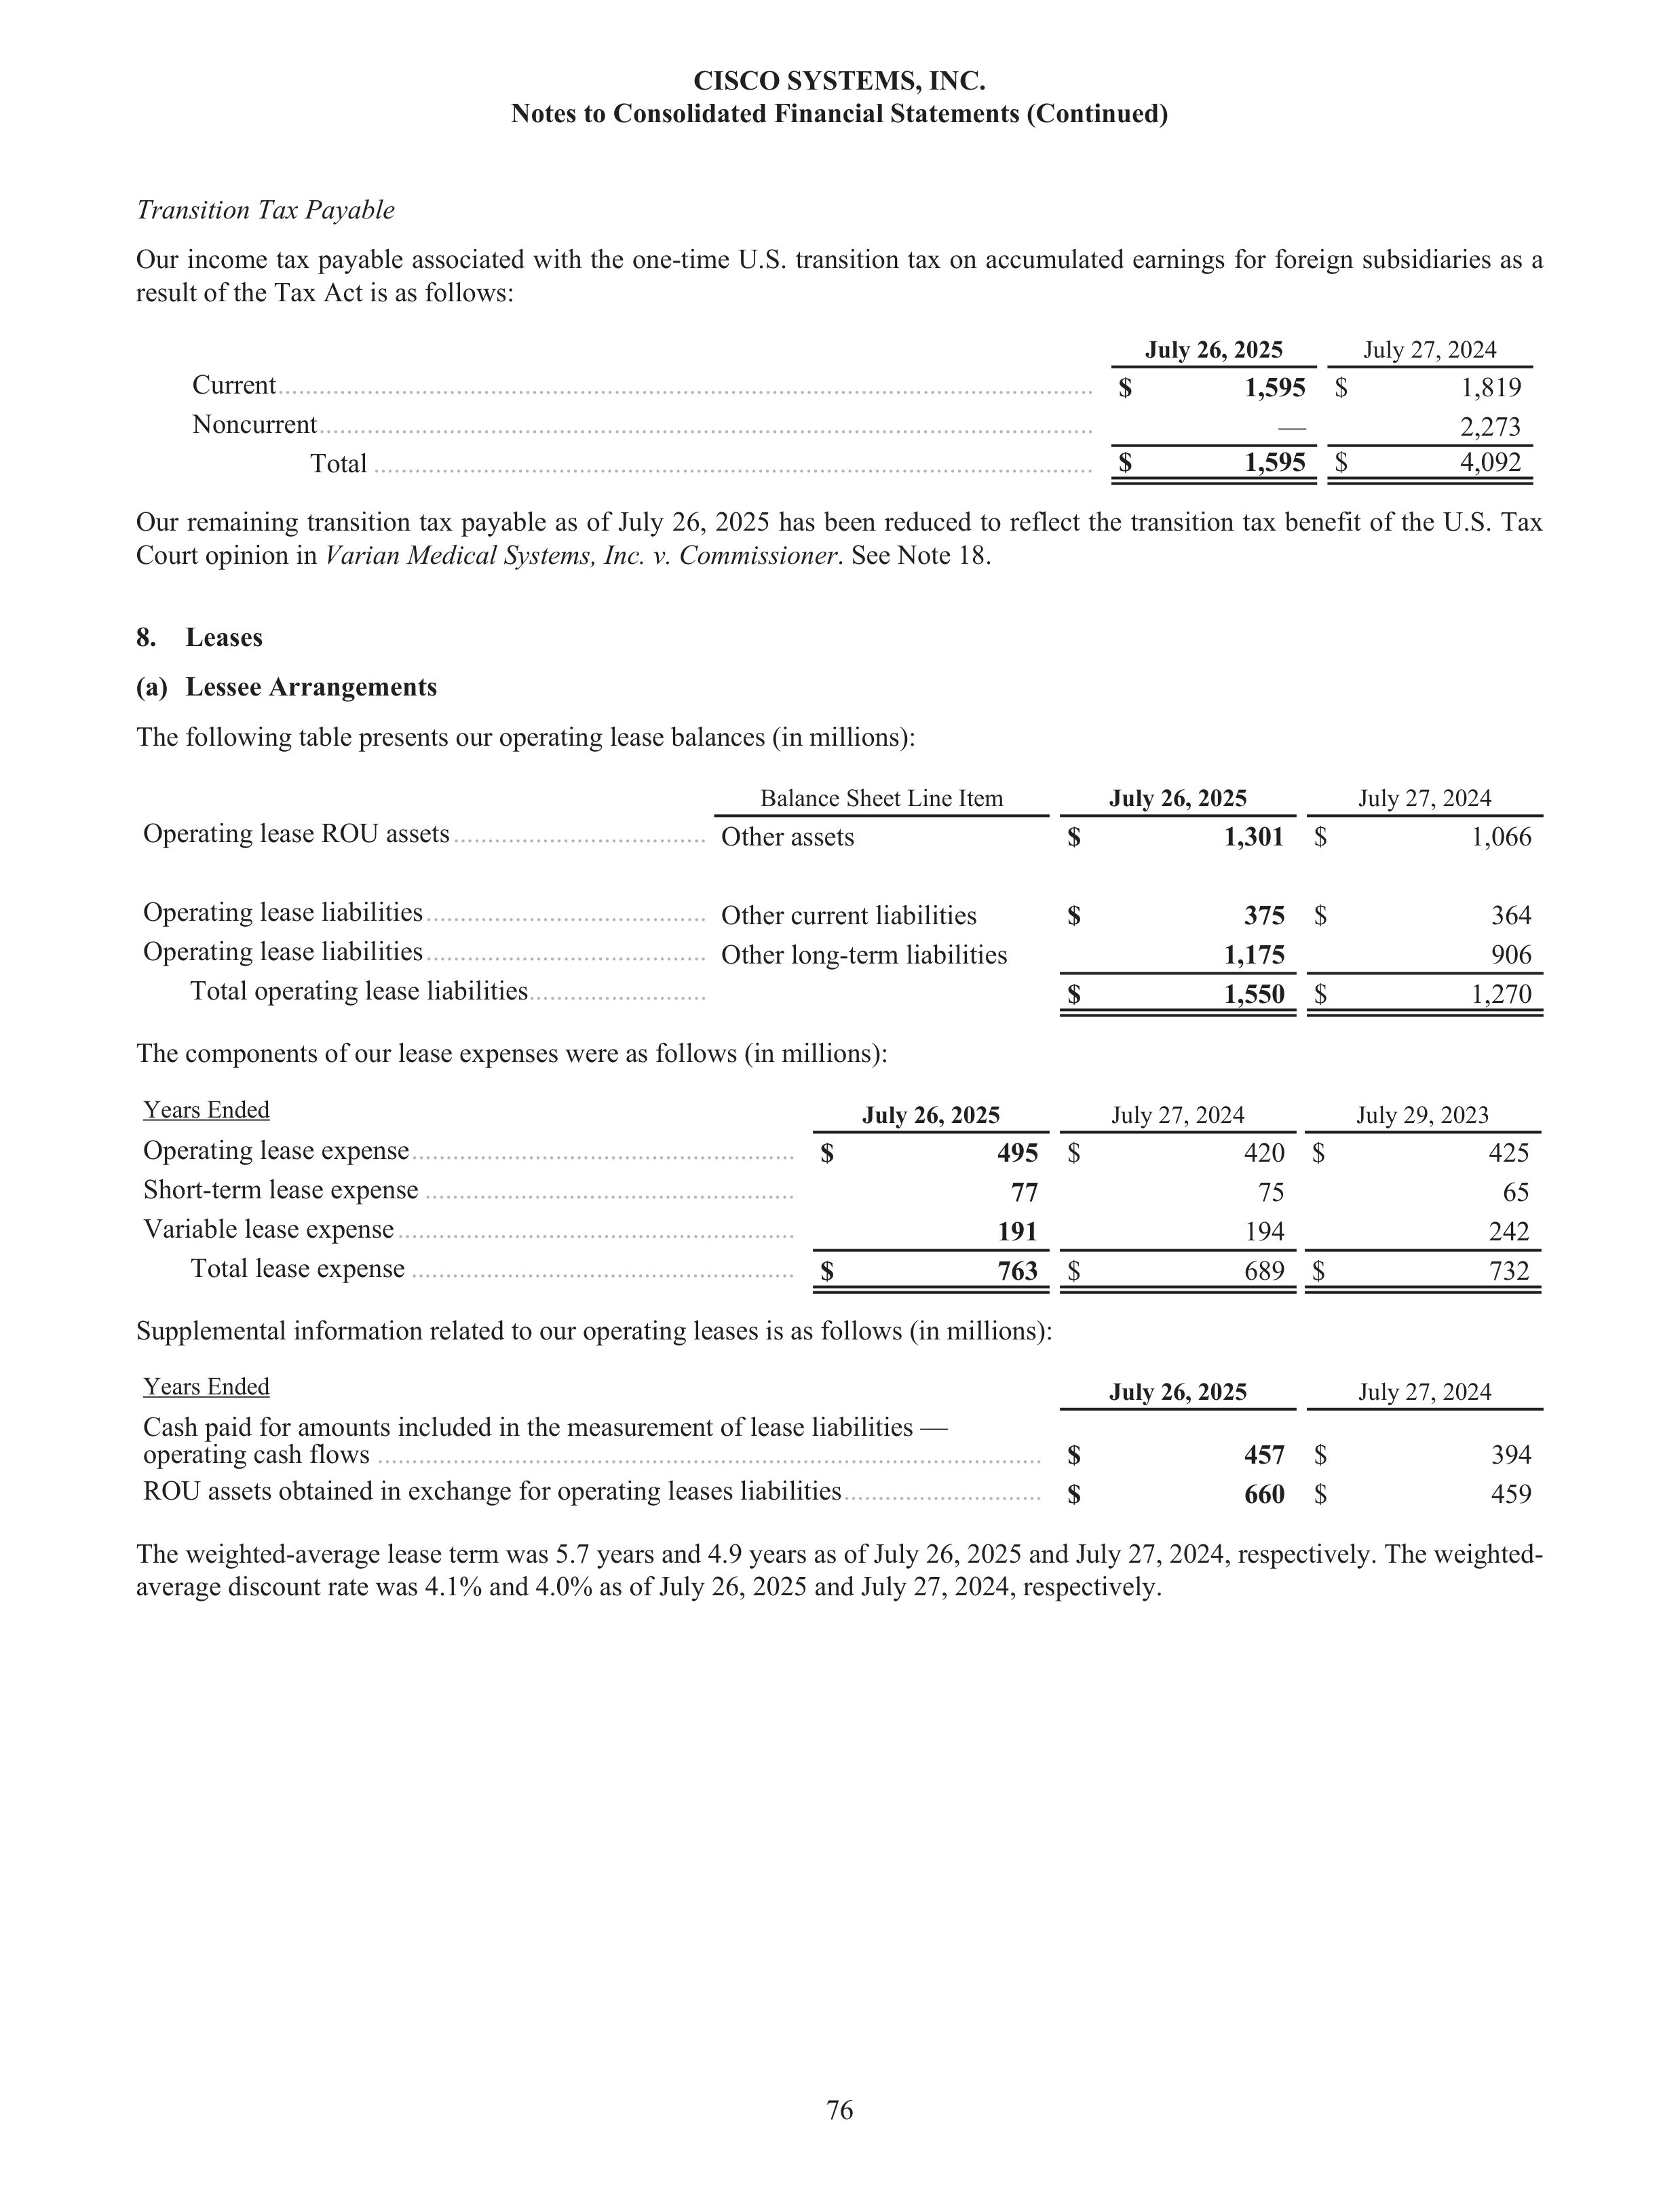
Transition Tax Payable
Our income tax payable associated with the one-time U.S. transition tax on accumulated earnings for foreign subsidiaries as a
result of the Tax Act is as follows:
July 26, 2025
July 27, 2024
Current
.......................................................................................................................
$
1,595
$
1,819
Noncurrent
.................................................................................................................
—
2,273
Total
.........................................................................................................
$
1,595
$
4,092
Our remaining transition tax payable as of July 26, 2025 has been reduced to reflect the transition tax benefit of the U.S. Tax
Court opinion in
Varian Medical Systems, Inc. v. Commissioner
. See Note 18.
8.
Leases
(a)
Lessee Arrangements
The following table presents our operating lease balances (in millions):
Balance Sheet Line Item
July 26, 2025
July 27, 2024
Operating lease ROU assets
.....................................
Other assets
$
1,301
$
1,066
Operating lease liabilities
.........................................
Other current liabilities
$
375
$
364
Operating lease liabilities
.........................................
Other long-term liabilities
1,175
906
Total operating lease liabilities
..........................
$
1,550
$
1,270
The components of our lease expenses were as follows (in millions):
Years Ended
July 26, 2025
July 27, 2024
July 29, 2023
Operating lease expense
........................................................
$
495
$
420 $
425
Short-term lease expense
......................................................
77
75
65
Variable lease expense
..........................................................
191
194
242
Total lease expense
........................................................
$
763
$
689 $
732
Supplemental information related to our operating leases is as follows (in millions):
Years Ended
July 26, 2025
July 27, 2024
Cash paid for amounts included in the measurement of lease liabilities —
operating cash flows
.................................................................................................
$
457
$
394
ROU assets obtained in exchange for operating leases liabilities
.............................
$
660
$
459
The weighted-average lease term was 5.7 years and 4.9 years as of July 26, 2025 and July 27, 2024, respectively. The weighted-
average discount rate was 4.1% and 4.0% as of July 26, 2025 and July 27, 2024, respectively.
CISCO SYSTEMS, INC.
Notes to Consolidated Financial Statements (Continued)
76
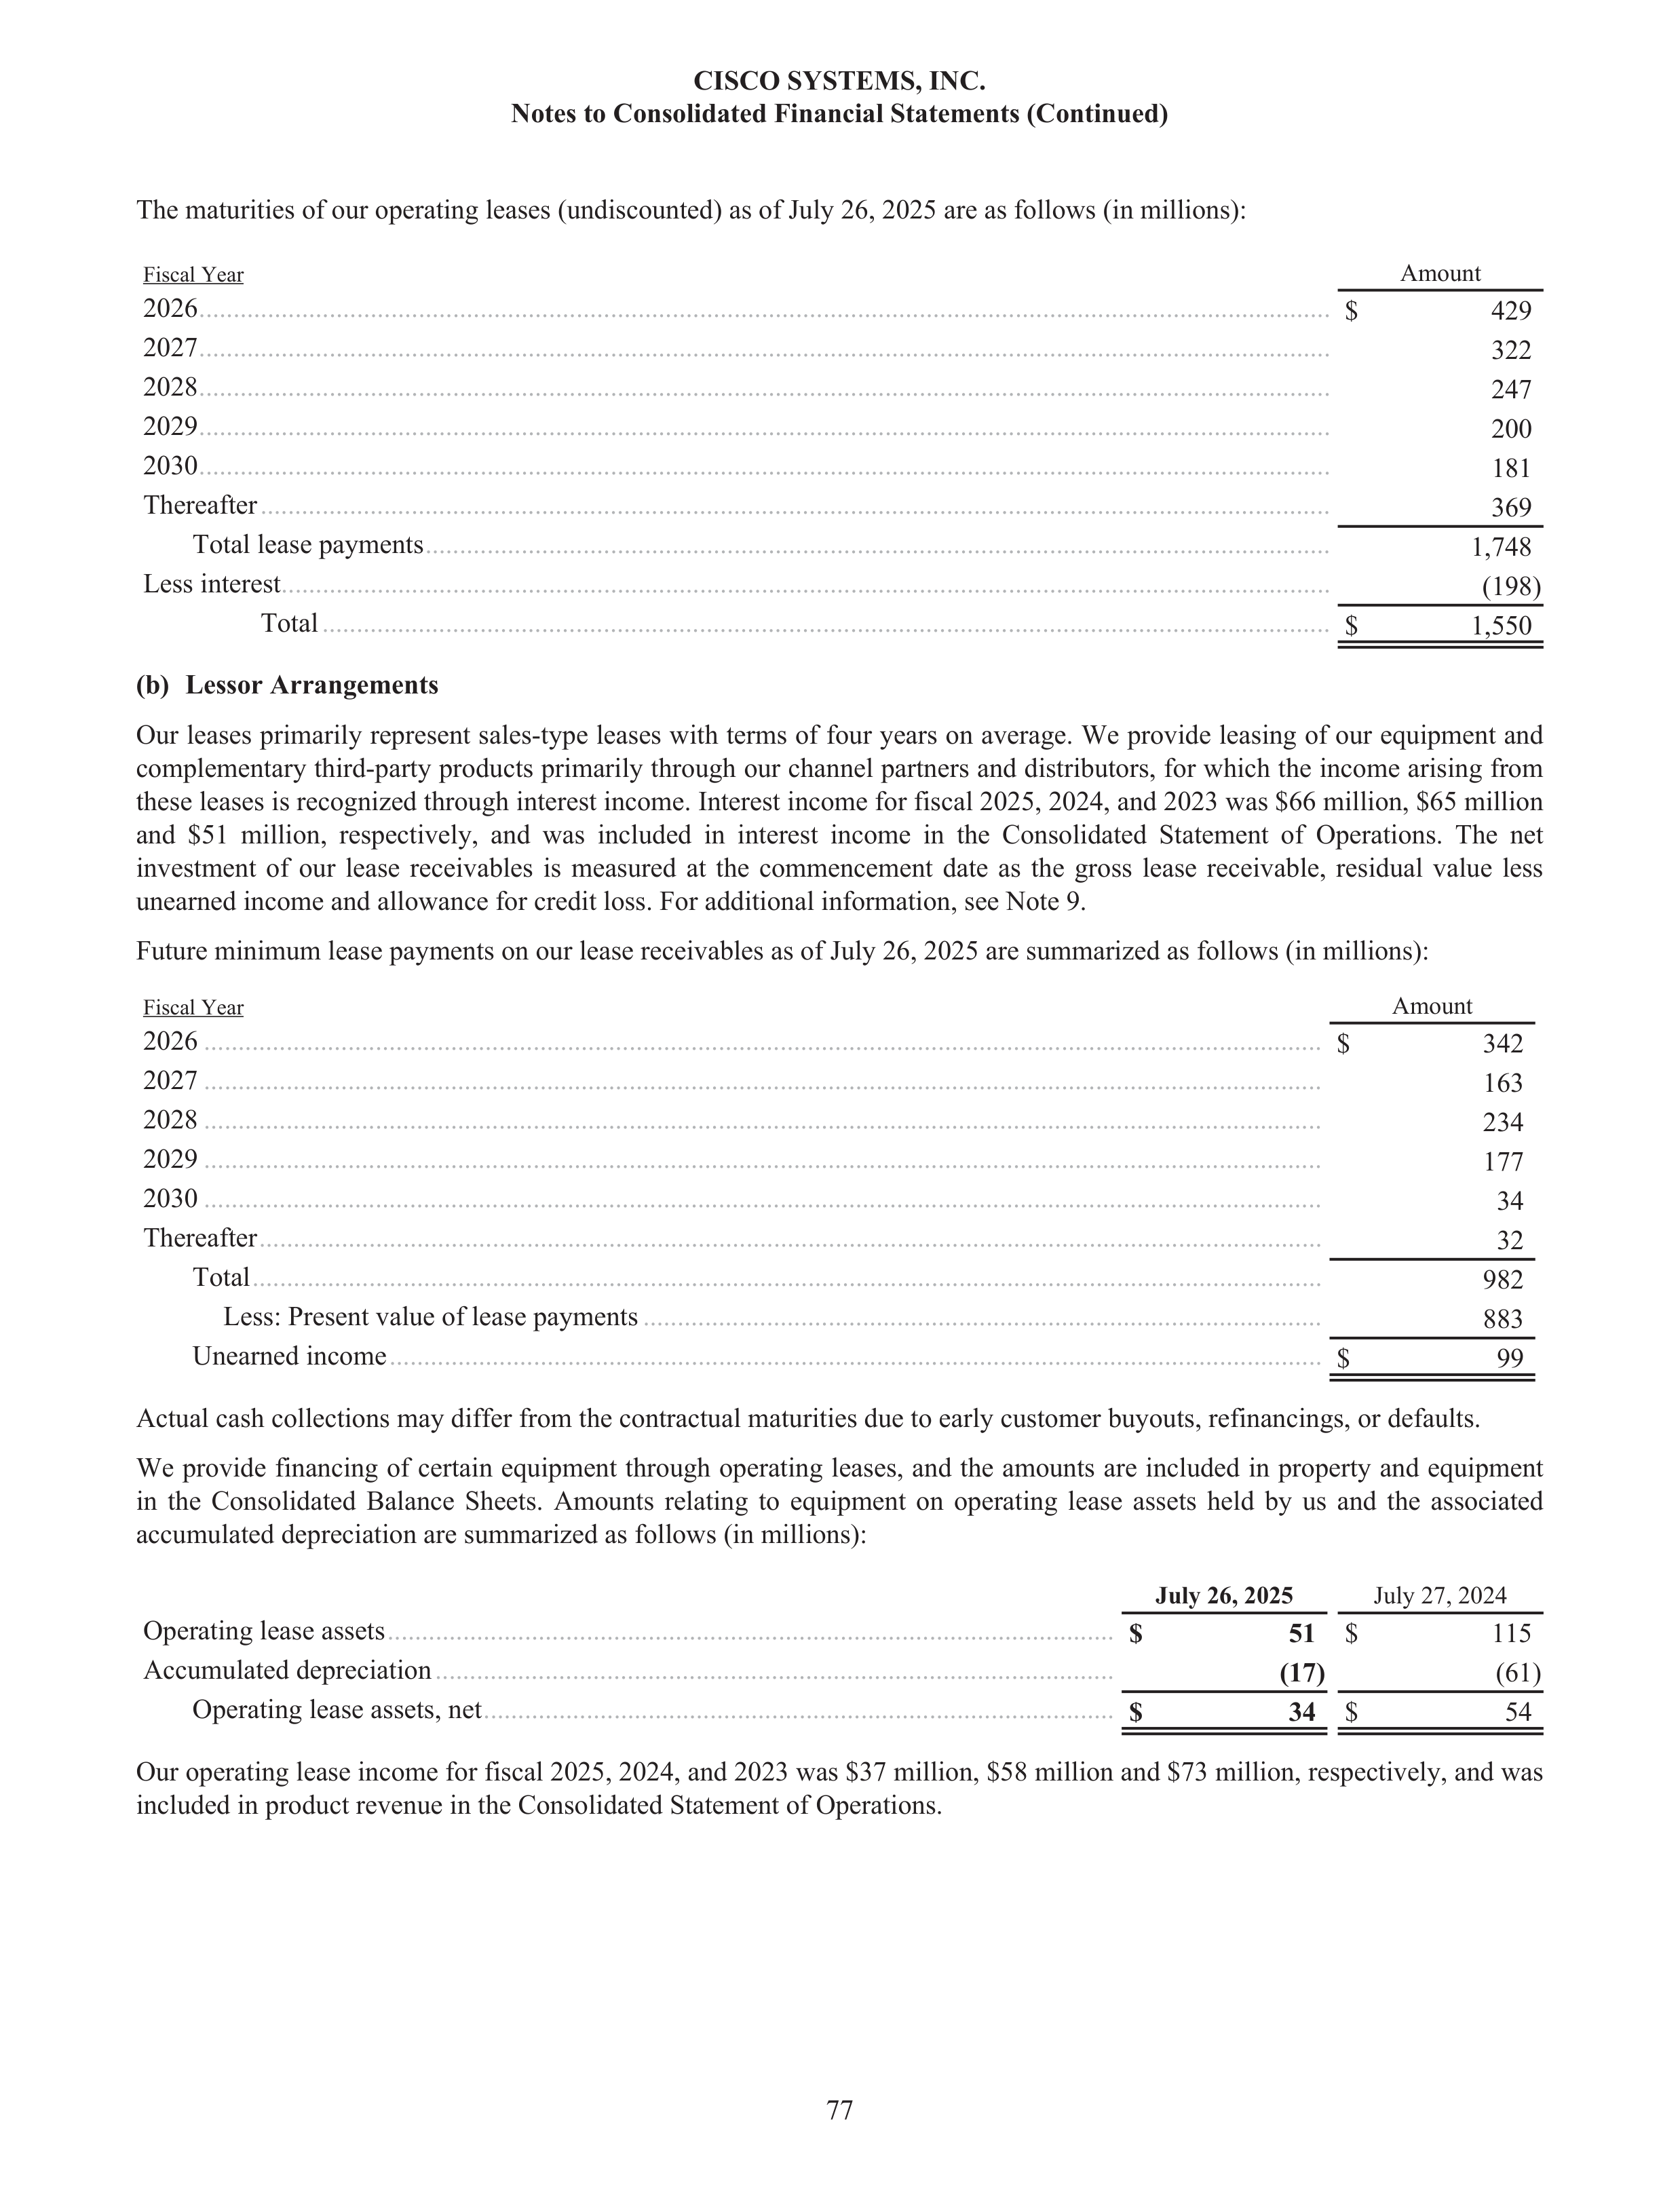
The maturities of our operating leases (undiscounted) as of July 26, 2025 are as follows (in millions):
Fiscal Year
Amount
2026
.....................................................................................................................................................................
$
429
2027
.....................................................................................................................................................................
322
2028
.....................................................................................................................................................................
247
2029
.....................................................................................................................................................................
200
2030
.....................................................................................................................................................................
181
Thereafter
............................................................................................................................................................
369
Total lease payments
....................................................................................................................................
1,748
Less interest
.........................................................................................................................................................
(198)
Total
...................................................................................................................................................
$
1,550
(b)
Lessor Arrangements
Our leases primarily represent sales-type leases with terms of four years on average. We provide leasing of our equipment and
complementary third-party products primarily through our channel partners and distributors, for which the income arising from
these leases is recognized through interest income. Interest income for fiscal 2025, 2024, and 2023 was $66 million, $65 million
and $51 million, respectively, and was included in interest income in the Consolidated Statement of Operations. The net
investment of our lease receivables is measured at the commencement date as the gross lease receivable, residual value less
unearned income and allowance for credit loss. For additional information, see Note 9.
Future minimum lease payments on our lease receivables as of July 26, 2025 are summarized as follows (in millions):
Fiscal Year
Amount
2026
...................................................................................................................................................................
$
342
2027
...................................................................................................................................................................
163
2028
...................................................................................................................................................................
234
2029
...................................................................................................................................................................
177
2030
...................................................................................................................................................................
34
Thereafter
...........................................................................................................................................................
32
Total
............................................................................................................................................................
982
Less: Present value of lease payments
...................................................................................................
883
Unearned income
........................................................................................................................................
$
99
Actual cash collections may differ from the contractual maturities due to early customer buyouts, refinancings, or defaults.
We provide financing of certain equipment through operating leases, and the amounts are included in property and equipment
in the Consolidated Balance Sheets. Amounts relating to equipment on operating lease assets held by us and the associated
accumulated depreciation are summarized as follows (in millions):
July 26, 2025
July 27, 2024
Operating lease assets
..........................................................................................................
$
51
$
115
Accumulated depreciation
...................................................................................................
(17)
(61)
Operating lease assets, net
............................................................................................
$
34
$
54
Our operating lease income for fiscal 2025, 2024, and 2023 was $37 million, $58 million and $73 million, respectively, and was
included in product revenue in the Consolidated Statement of Operations.
CISCO SYSTEMS, INC.
Notes to Consolidated Financial Statements (Continued)
77
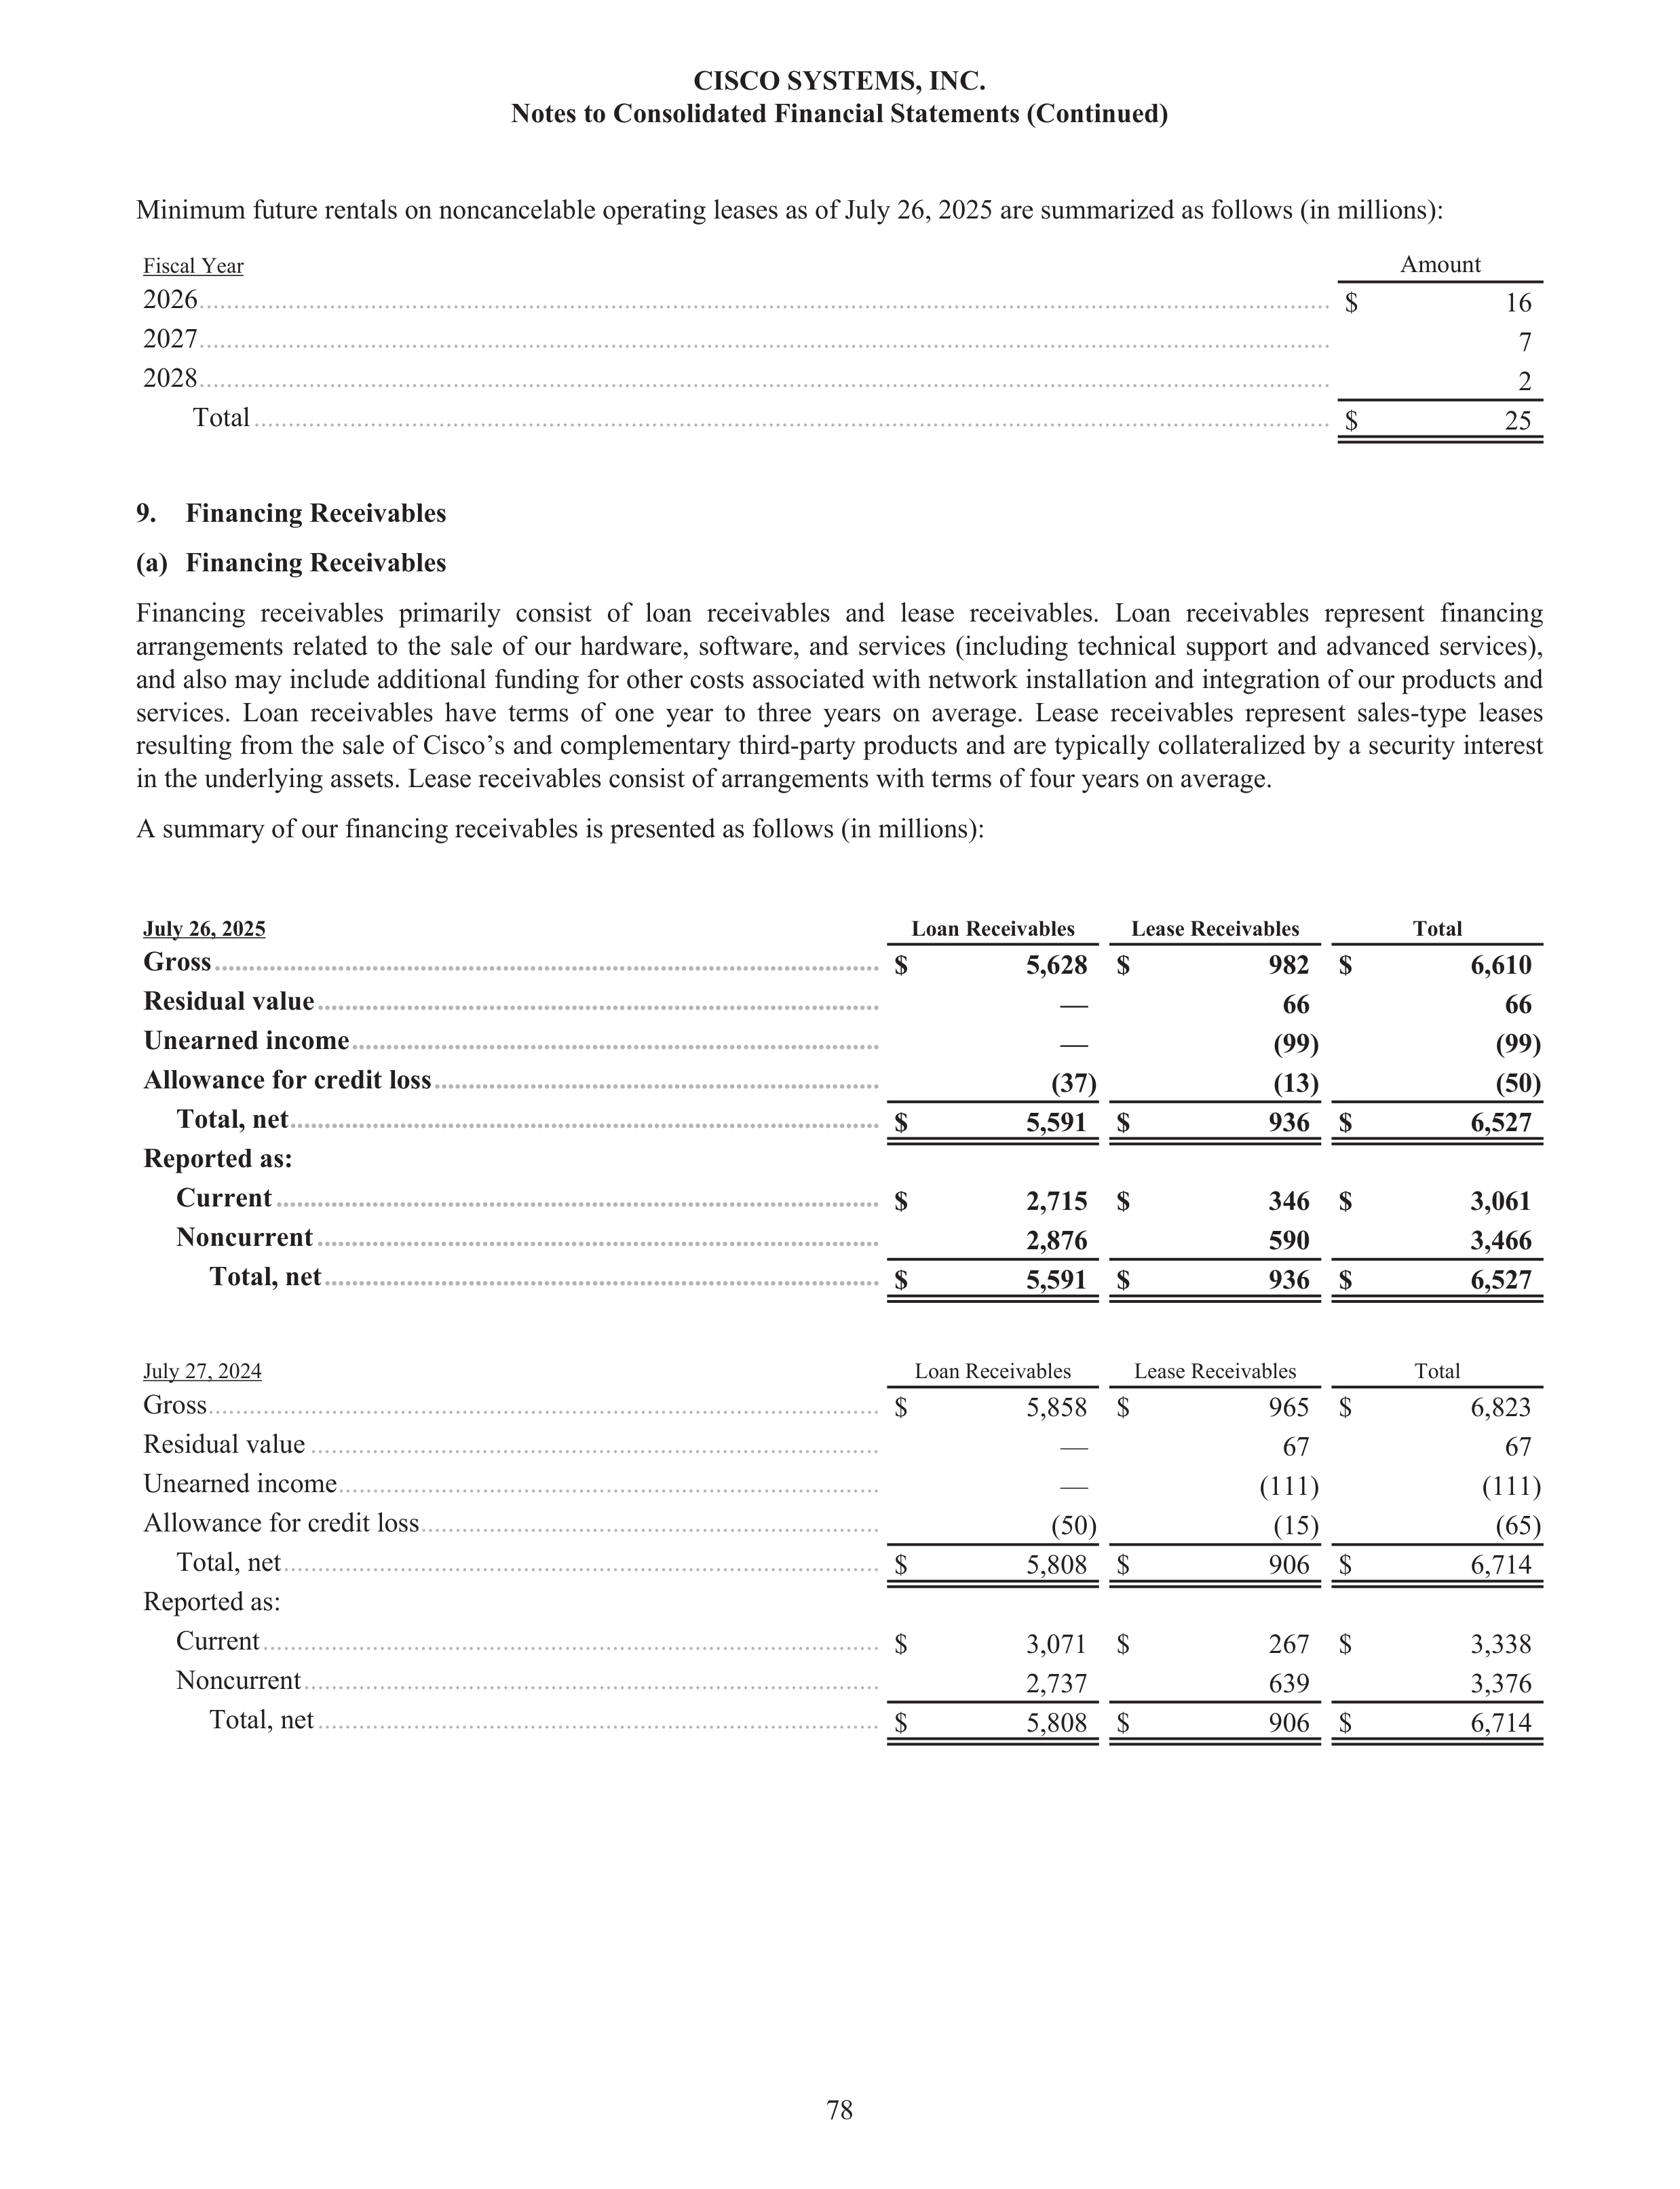
Minimum future rentals on noncancelable operating leases as of July 26, 2025 are summarized as follows (in millions):
Fiscal Year
Amount
2026
.....................................................................................................................................................................
$
16
2027
.....................................................................................................................................................................
7
2028
.....................................................................................................................................................................
2
Total
.............................................................................................................................................................
$
25
9.
Financing Receivables
(a)
Financing Receivables
Financing receivables primarily consist of loan receivables and lease receivables. Loan receivables represent financing
arrangements related to the sale of our hardware, software, and services (including technical support and advanced services),
and also may include additional funding for other costs associated with network installation and integration of our products and
services. Loan receivables have terms of one year to three years on average. Lease receivables represent sales-type leases
resulting from the sale of Cisco’s and complementary third-party products and are typically collateralized by a security interest
in the underlying assets. Lease receivables consist of arrangements with terms of four years on average.
A summary of our financing receivables is presented as follows (in millions):
July 26, 2025
Loan Receivables
Lease Receivables
Total
Gross
.................................................................................................
$
5,628 $
982 $
6,610
Residual value
..................................................................................
—
66
66
Unearned income
.............................................................................
—
(99)
(99)
Allowance for credit loss
.................................................................
(37)
(13)
(50)
Total, net
......................................................................................
$
5,591 $
936 $
6,527
Reported as:
Current
........................................................................................
$
2,715 $
346 $
3,061
Noncurrent
..................................................................................
2,876
590
3,466
Total, net
.................................................................................
$
5,591 $
936 $
6,527
July 27, 2024
Loan Receivables
Lease Receivables
Total
Gross
..................................................................................................
$
5,858 $
965 $
6,823
Residual value
...................................................................................
—
67
67
Unearned income
...............................................................................
—
(111)
(111)
Allowance for credit loss
...................................................................
(50)
(15)
(65)
Total, net
.......................................................................................
$
5,808 $
906 $
6,714
Reported as:
Current
..........................................................................................
$
3,071 $
267 $
3,338
Noncurrent
....................................................................................
2,737
639
3,376
Total, net
..................................................................................
$
5,808 $
906 $
6,714
CISCO SYSTEMS, INC.
Notes to Consolidated Financial Statements (Continued)
78
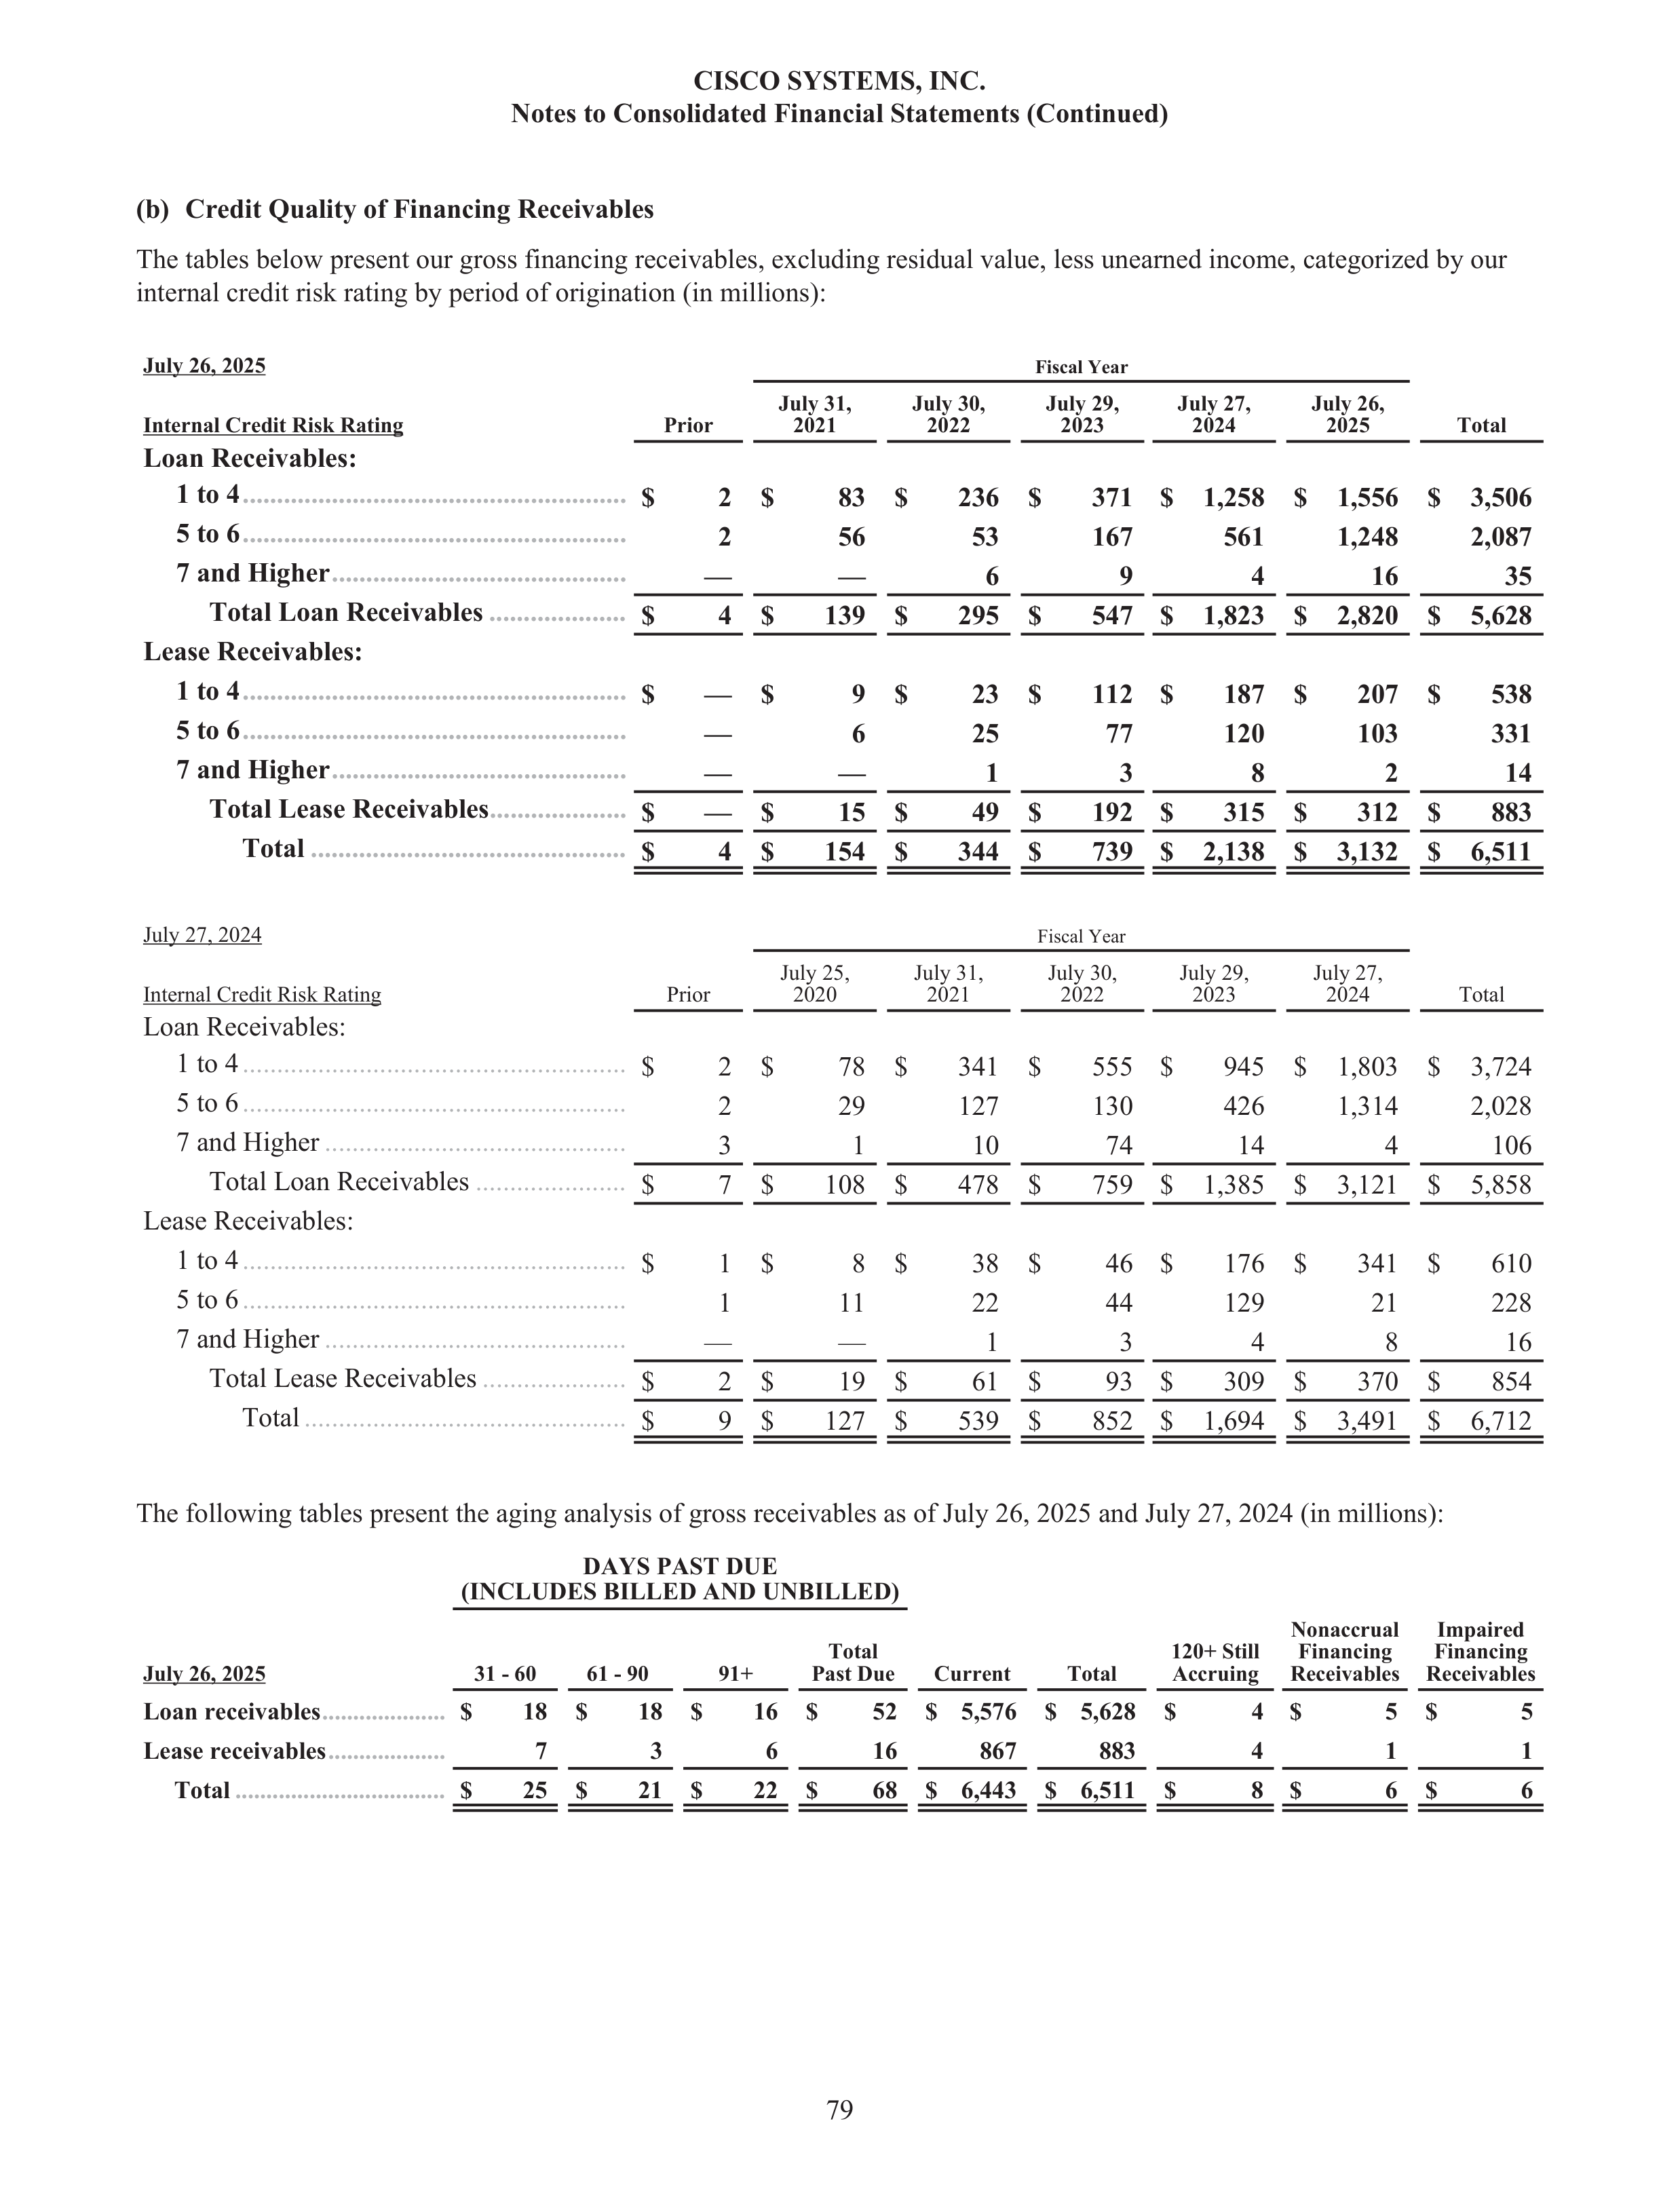
(b)
Credit Quality of Financing Receivables
The tables below present our gross financing receivables, excluding residual value, less unearned income, categorized by our
internal credit risk rating by period of origination (in millions):
July 26, 2025
Fiscal Year
Internal Credit Risk Rating
Prior
July 31,
2021
July 30,
2022
July 29,
2023
July 27,
2024
July 26,
2025
Total
Loan Receivables:
1 to 4
........................................................
$
2 $
83 $
236 $
371 $
1,258 $
1,556 $
3,506
5 to 6
........................................................
2
56
53
167
561
1,248
2,087
7 and Higher
...........................................
—
—
6
9
4
16
35
Total Loan Receivables
....................
$
4 $
139 $
295 $
547 $
1,823 $
2,820 $
5,628
Lease Receivables:
1 to 4
........................................................
$
— $
9 $
23 $
112 $
187 $
207 $
538
5 to 6
........................................................
—
6
25
77
120
103
331
7 and Higher
...........................................
—
—
1
3
8
2
14
Total Lease Receivables
....................
$
— $
15 $
49 $
192 $
315 $
312 $
883
Total
..............................................
$
4 $
154 $
344 $
739 $
2,138 $
3,132 $
6,511
July 27, 2024
Fiscal Year
Internal Credit Risk Rating
Prior
July 25,
2020
July 31,
2021
July 30,
2022
July 29,
2023
July 27,
2024
Total
Loan Receivables:
1 to 4
........................................................
$
2 $
78 $
341 $
555 $
945 $
1,803 $
3,724
5 to 6
........................................................
2
29
127
130
426
1,314
2,028
7 and Higher
............................................
3
1
10
74
14
4
106
Total Loan Receivables
......................
$
7 $
108 $
478 $
759 $
1,385 $
3,121 $
5,858
Lease Receivables:
1 to 4
........................................................
$
1 $
8 $
38 $
46 $
176 $
341 $
610
5 to 6
........................................................
1
11
22
44
129
21
228
7 and Higher
............................................
—
—
1
3
4
8
16
Total Lease Receivables
.....................
$
2 $
19 $
61 $
93 $
309 $
370 $
854
Total
...............................................
$
9 $
127 $
539 $
852 $
1,694 $
3,491 $
6,712
The following tables present the aging analysis of gross receivables as of July 26, 2025 and July 27, 2024 (in millions):
DAYS PAST DUE
(INCLUDES BILLED AND UNBILLED)
July 26, 2025
31 - 60
61 - 90
91+
Total
Past Due
Current
Total
120+ Still
Accruing
Nonaccrual
Financing
Receivables
Impaired
Financing
Receivables
Loan receivables
....................
$
18
$
18
$
16
$
52
$ 5,576
$ 5,628
$
4 $
5
$
5
Lease receivables
...................
7
3
6
16
867
883
4
1
1
Total
..................................
$
25
$
21
$
22
$
68
$ 6,443
$ 6,511
$
8 $
6
$
6
CISCO SYSTEMS, INC.
Notes to Consolidated Financial Statements (Continued)
79
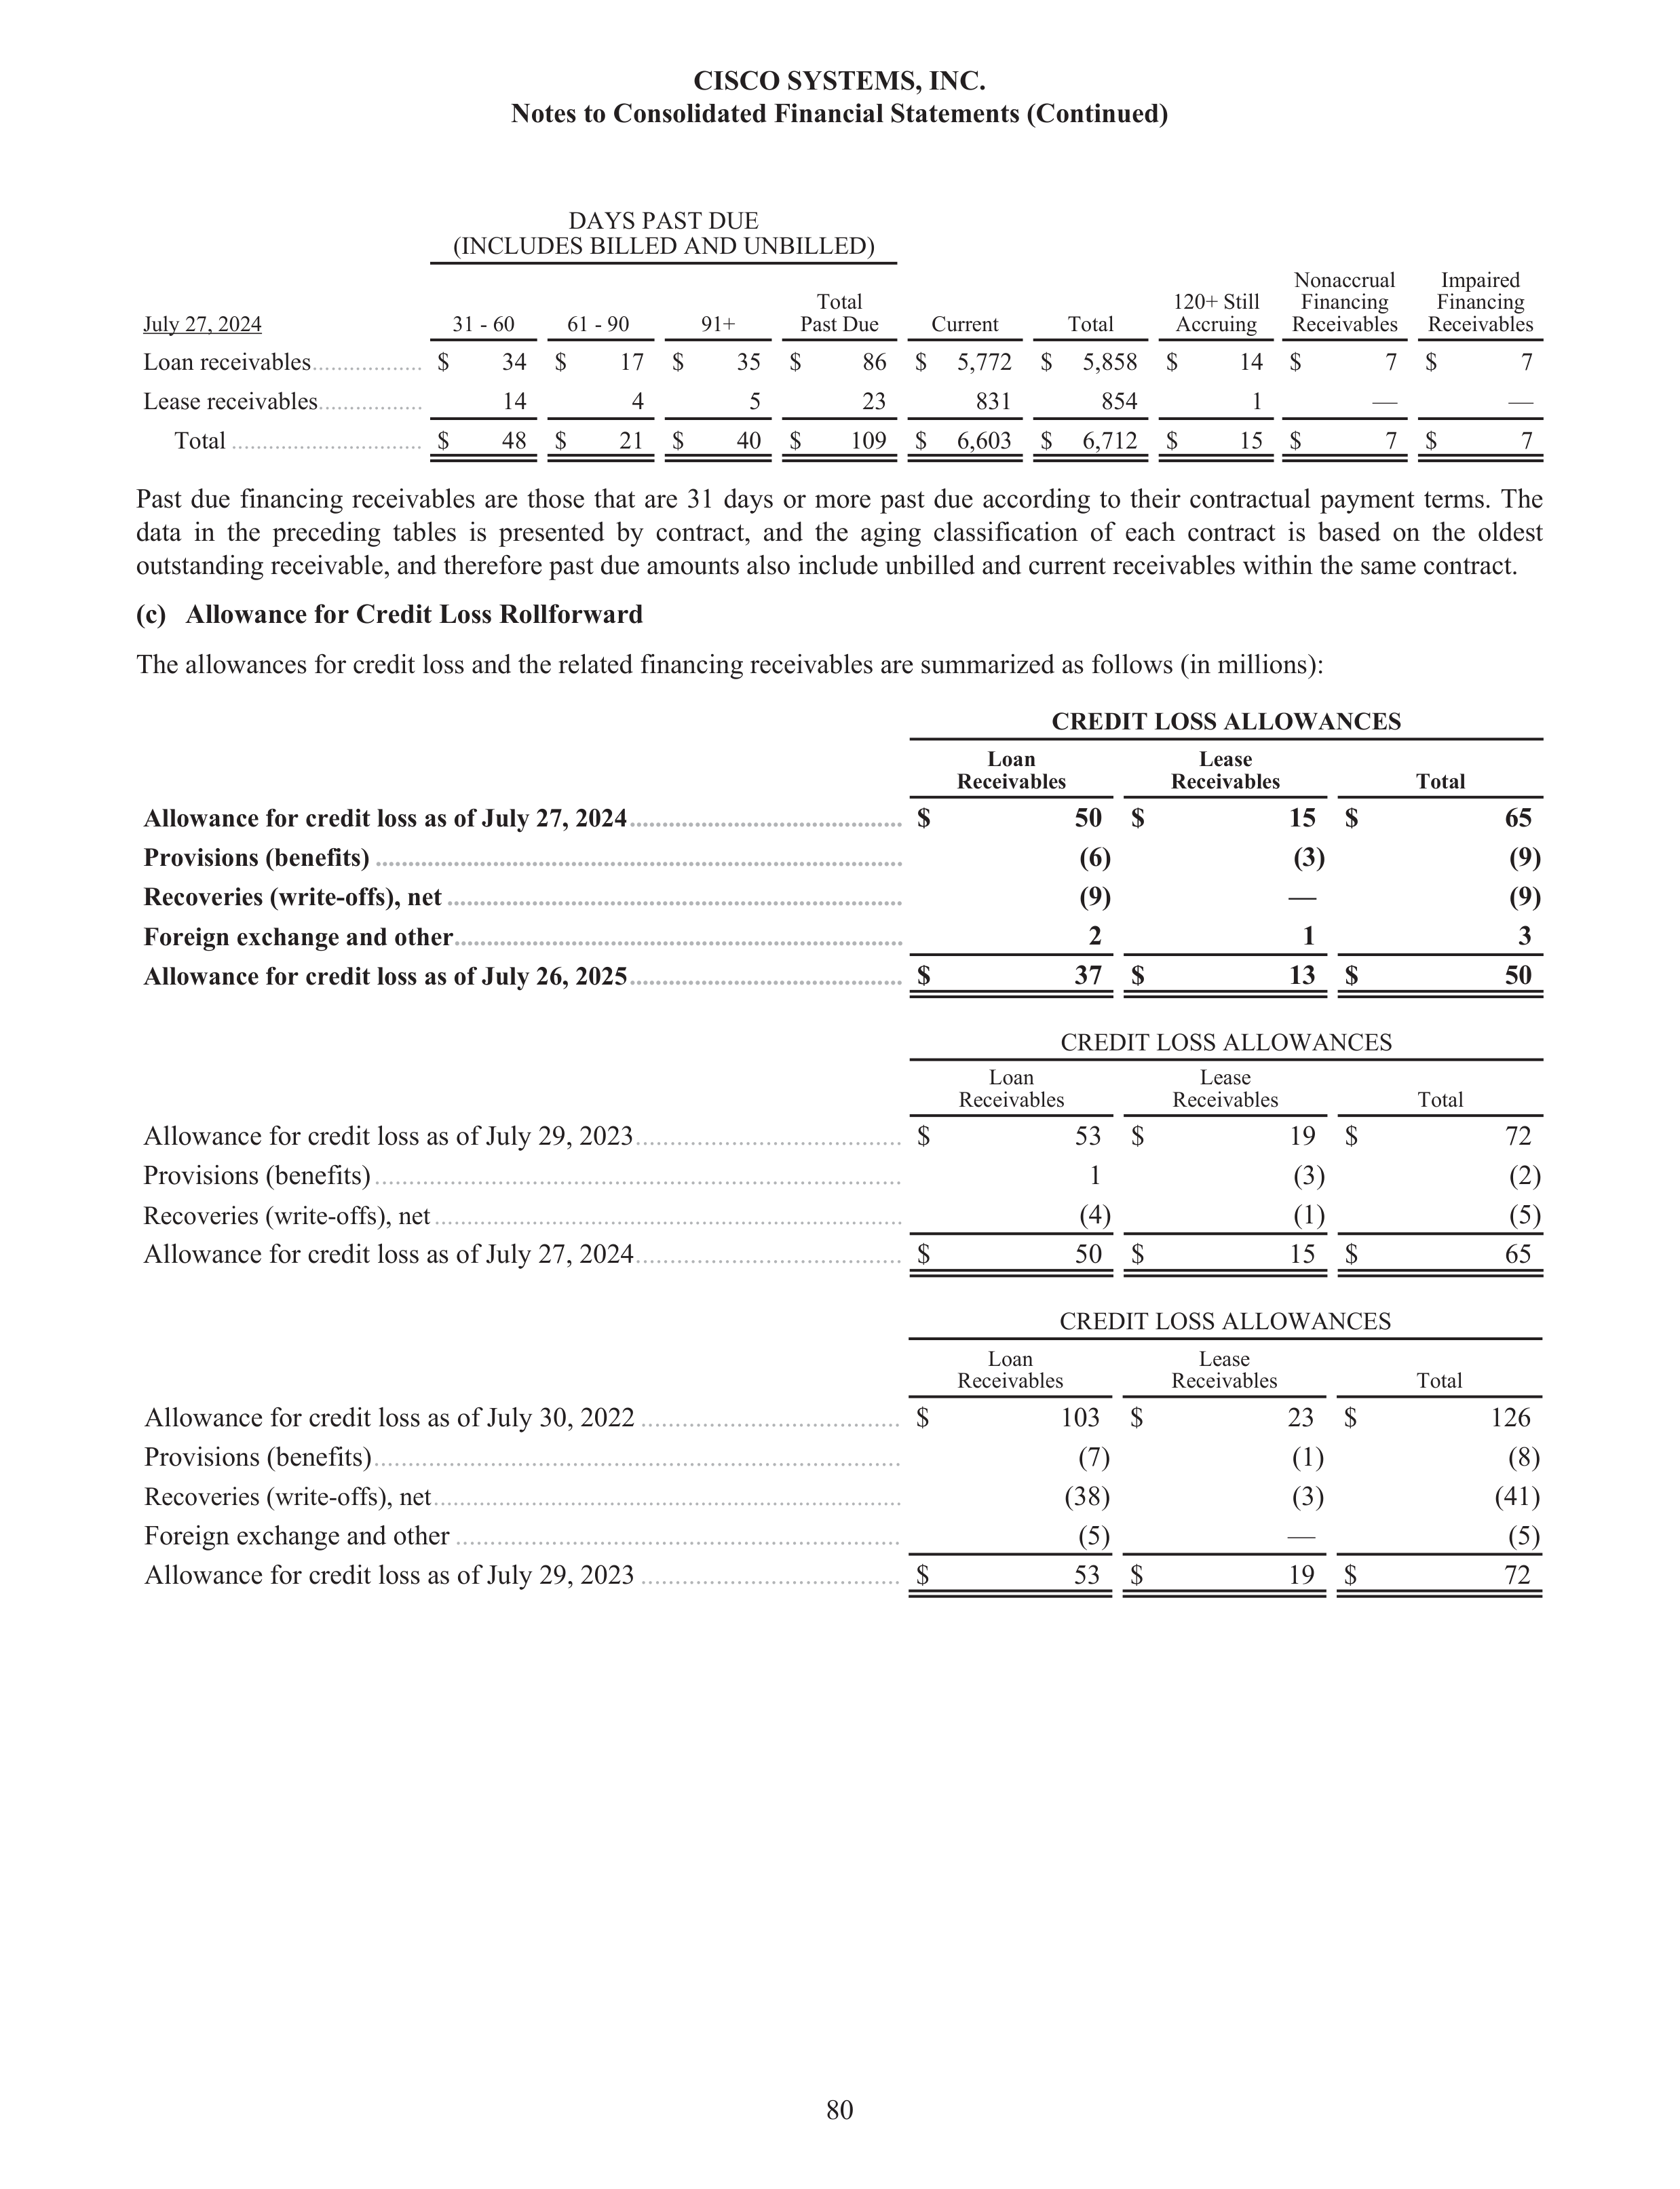
DAYS PAST DUE
(INCLUDES BILLED AND UNBILLED)
July 27, 2024
31 - 60
61 - 90
91+
Total
Past Due
Current
Total
120+ Still
Accruing
Nonaccrual
Financing
Receivables
Impaired
Financing
Receivables
Loan receivables
..................
$
34
$
17
$
35
$
86
$
5,772
$
5,858
$
14 $
7
$
7
Lease receivables
.................
14
4
5
23
831
854
1
—
—
Total
...............................
$
48
$
21
$
40
$
109
$
6,603
$
6,712
$
15 $
7
$
7
Past due financing receivables are those that are 31 days or more past due according to their contractual payment terms. The
data in the preceding tables is presented by contract, and the aging classification of each contract is based on the oldest
outstanding receivable, and therefore past due amounts also include unbilled and current receivables within the same contract.
(c)
Allowance for Credit Loss Rollforward
The allowances for credit loss and the related financing receivables are summarized as follows (in millions):
CREDIT LOSS ALLOWANCES
Loan
Receivables
Lease
Receivables
Total
Allowance for credit loss as of July 27, 2024
..........................................
$
50 $
15 $
65
Provisions (benefits)
.................................................................................
(6)
(3)
(9)
Recoveries (write-offs), net
......................................................................
(9)
—
(9)
Foreign exchange and other
.....................................................................
2
1
3
Allowance for credit loss as of July 26, 2025
..........................................
$
37 $
13 $
50
CREDIT LOSS ALLOWANCES
Loan
Receivables
Lease
Receivables
Total
Allowance for credit loss as of July 29, 2023
.......................................
$
53 $
19 $
72
Provisions (benefits)
.............................................................................
1
(3)
(2)
Recoveries (write-offs), net
........................................................................
(4)
(1)
(5)
Allowance for credit loss as of July 27, 2024
.......................................
$
50 $
15 $
65
CREDIT LOSS ALLOWANCES
Loan
Receivables
Lease
Receivables
Total
Allowance for credit loss as of July 30, 2022
......................................
$
103 $
23 $
126
Provisions (benefits)
.............................................................................
(7)
(1)
(8)
Recoveries (write-offs), net
........................................................................
(38)
(3)
(41)
Foreign exchange and other
.................................................................
(5)
—
(5)
Allowance for credit loss as of July 29, 2023
......................................
$
53 $
19 $
72
CISCO SYSTEMS, INC.
Notes to Consolidated Financial Statements (Continued)
80
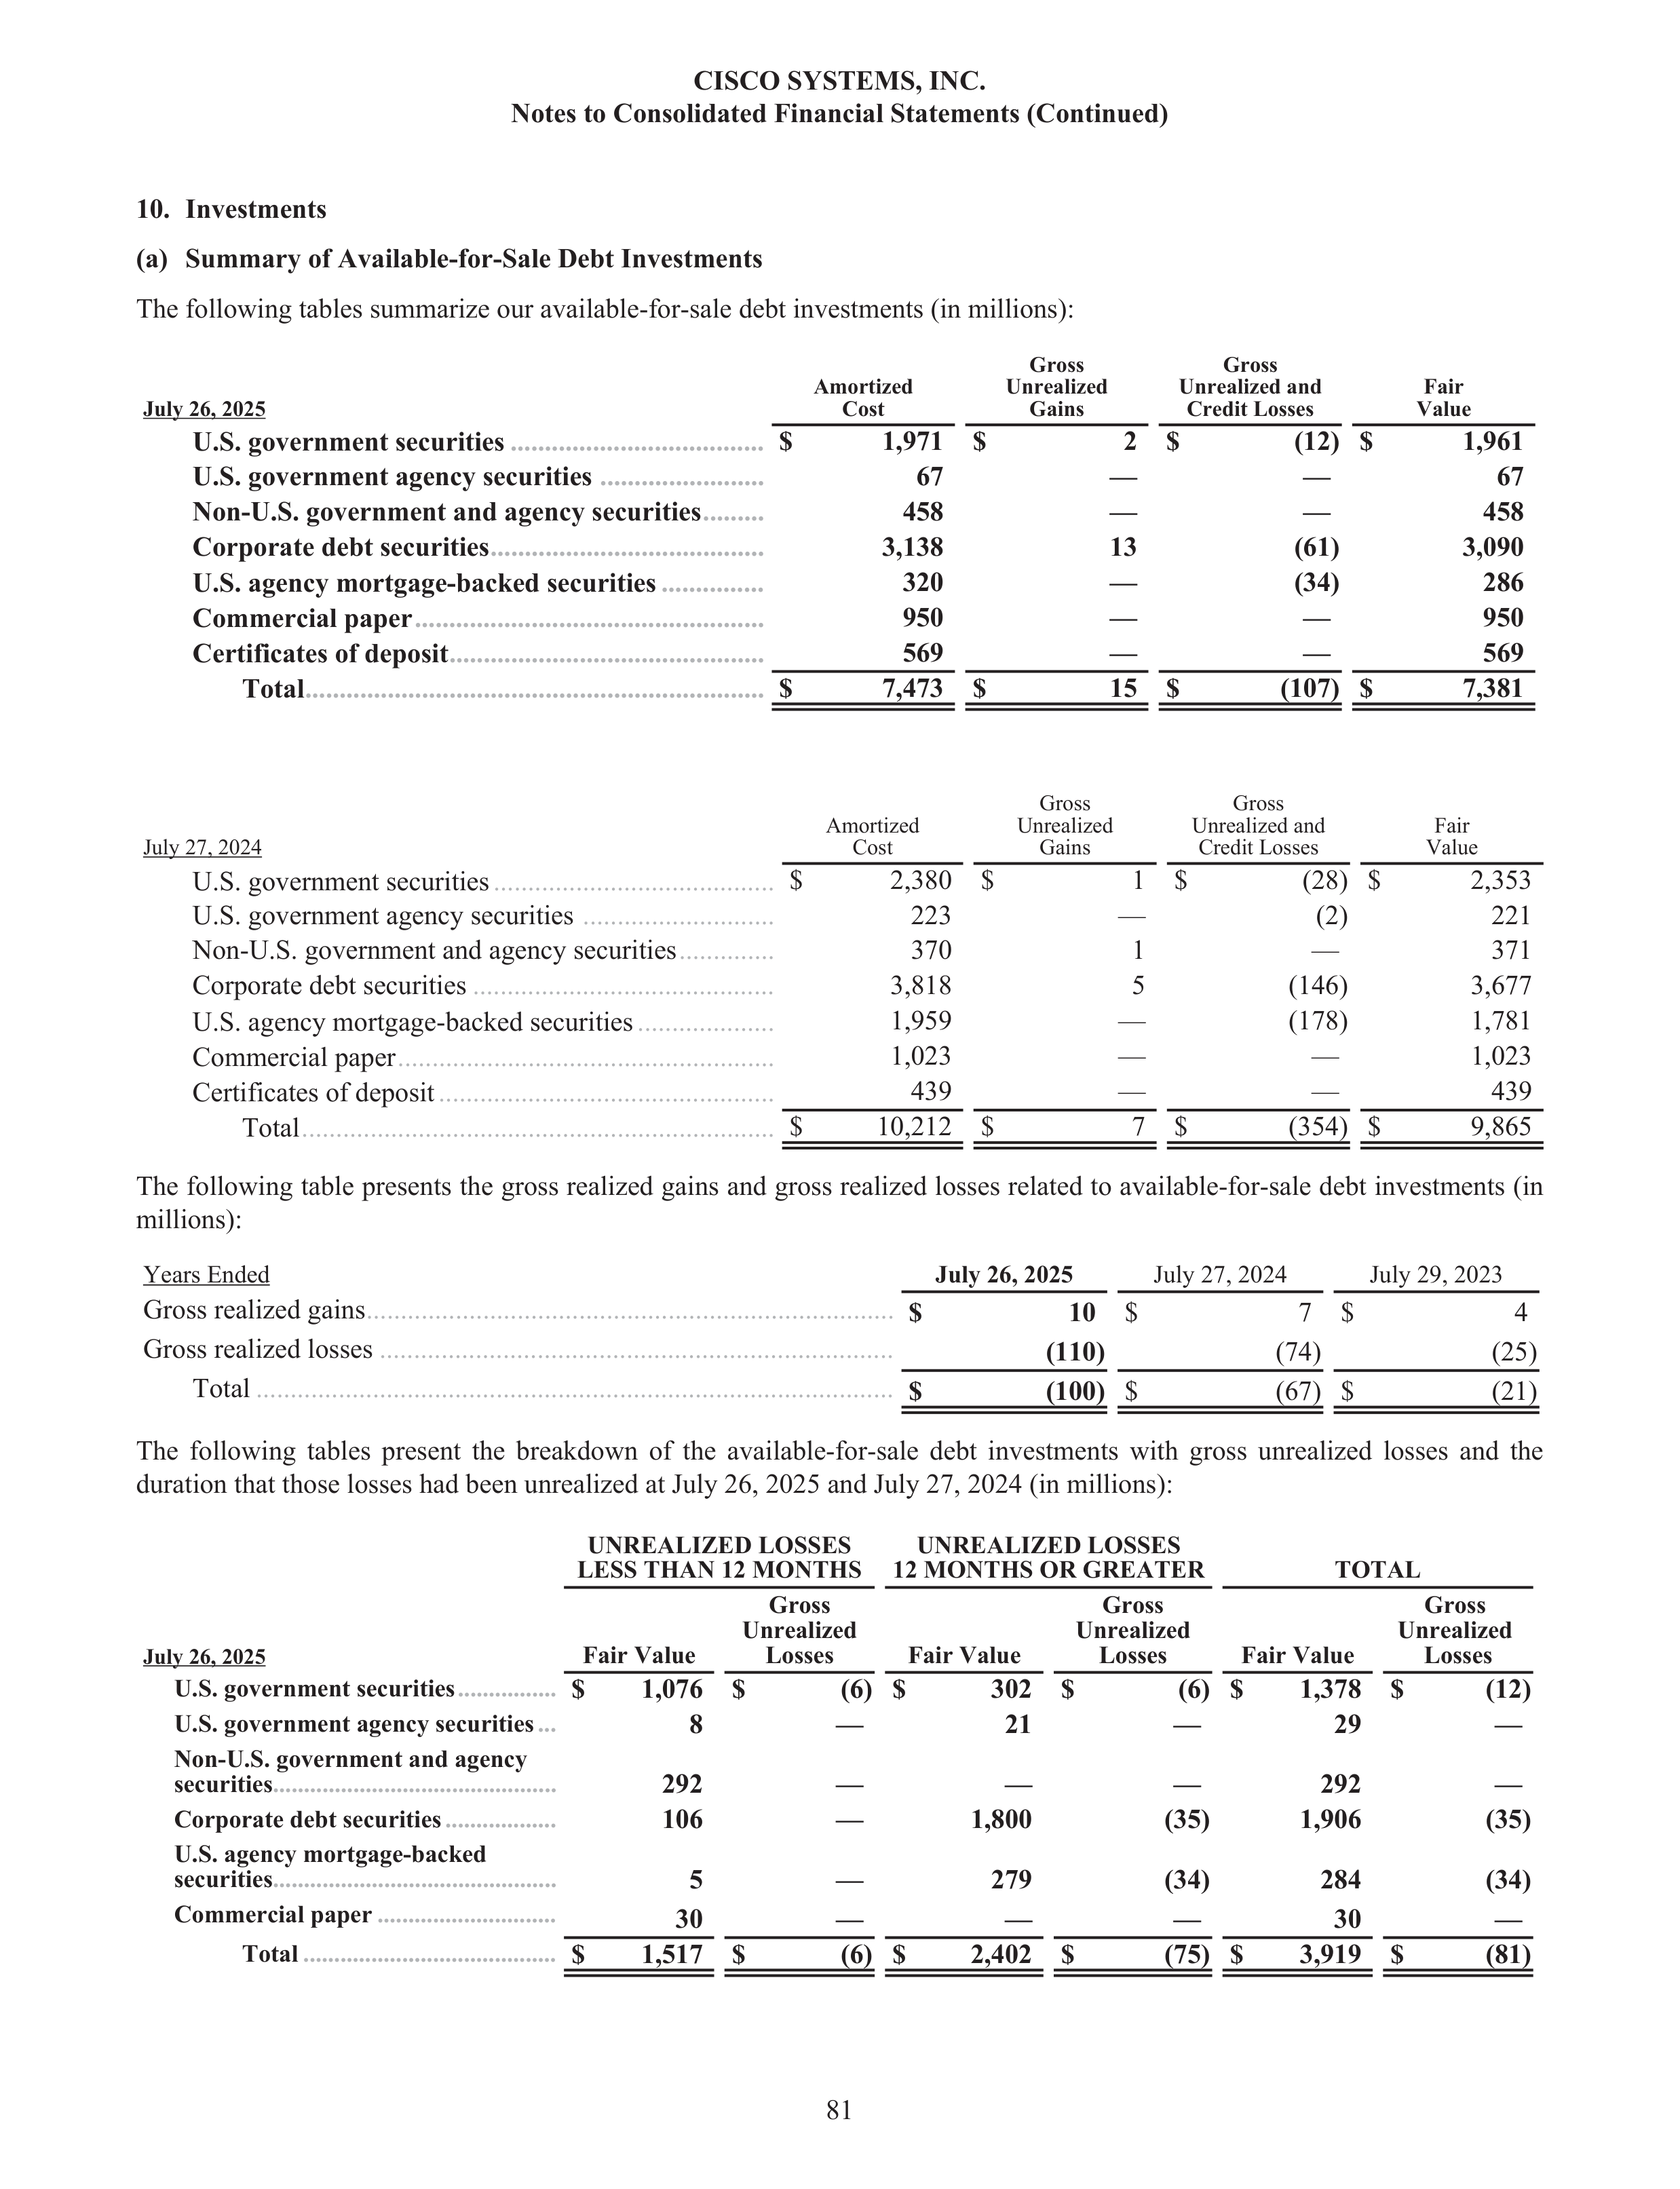
10.
Investments
(a)
Summary of Available-for-Sale Debt Investments
The following tables summarize our available-for-sale debt investments (in millions):
July 26, 2025
Amortized
Cost
Gross
Unrealized
Gains
Gross
Unrealized and
Credit Losses
Fair
Value
U.S. government securities
.....................................
$
1,971 $
2 $
(12)
$
1,961
U.S. government agency securities
........................
67
—
—
67
Non-U.S. government and agency securities
.........
458
—
—
458
Corporate debt securities
........................................
3,138
13
(61)
3,090
U.S. agency mortgage-backed securities
...............
320
—
(34)
286
Commercial paper
...................................................
950
—
—
950
Certificates of deposit
..............................................
569
—
—
569
Total
...................................................................
$
7,473 $
15 $
(107)
$
7,381
July 27, 2024
Amortized
Cost
Gross
Unrealized
Gains
Gross
Unrealized and
Credit Losses
Fair
Value
U.S. government securities
.........................................
$
2,380 $
1 $
(28)
$
2,353
U.S. government agency securities
............................
223
—
(2)
221
Non-U.S. government and agency securities
..............
370
1
—
371
Corporate debt securities
............................................
3,818
5
(146)
3,677
U.S. agency mortgage-backed securities
....................
1,959
—
(178)
1,781
Commercial paper
.......................................................
1,023
—
—
1,023
Certificates of deposit
.................................................
439
—
—
439
Total
.....................................................................
$
10,212 $
7 $
(354)
$
9,865
The following table presents the gross realized gains and gross realized losses related to available-for-sale debt investments (in
millions):
Years Ended
July 26, 2025
July 27, 2024
July 29, 2023
Gross realized gains
.............................................................................
$
10
$
7 $
4
Gross realized losses
...........................................................................
(110)
(74)
(25)
Total
.............................................................................................
$
(100)
$
(67)
$
(21)
The following tables present the breakdown of the available-for-sale debt investments with gross unrealized losses and the
duration that those losses had been unrealized at July 26, 2025 and July 27, 2024 (in millions):
UNREALIZED LOSSES
LESS THAN 12 MONTHS
UNREALIZED LOSSES
12 MONTHS OR GREATER
TOTAL
July 26, 2025
Fair Value
Gross
Unrealized
Losses
Fair Value
Gross
Unrealized
Losses
Fair Value
Gross
Unrealized
Losses
U.S. government securities
................
$
1,076 $
(6)
$
302 $
(6)
$
1,378 $
(12)
U.S. government agency securities
...
8
—
21
—
29
—
Non-U.S. government and agency
securities
..............................................
292
—
—
—
292
—
Corporate debt securities
..................
106
—
1,800
(35)
1,906
(35)
U.S. agency mortgage-backed
securities
..............................................
5
—
279
(34)
284
(34)
Commercial paper
.............................
30
—
—
—
30
—
Total
.........................................
$
1,517 $
(6)
$
2,402 $
(75)
$
3,919 $
(81)
CISCO SYSTEMS, INC.
Notes to Consolidated Financial Statements (Continued)
81
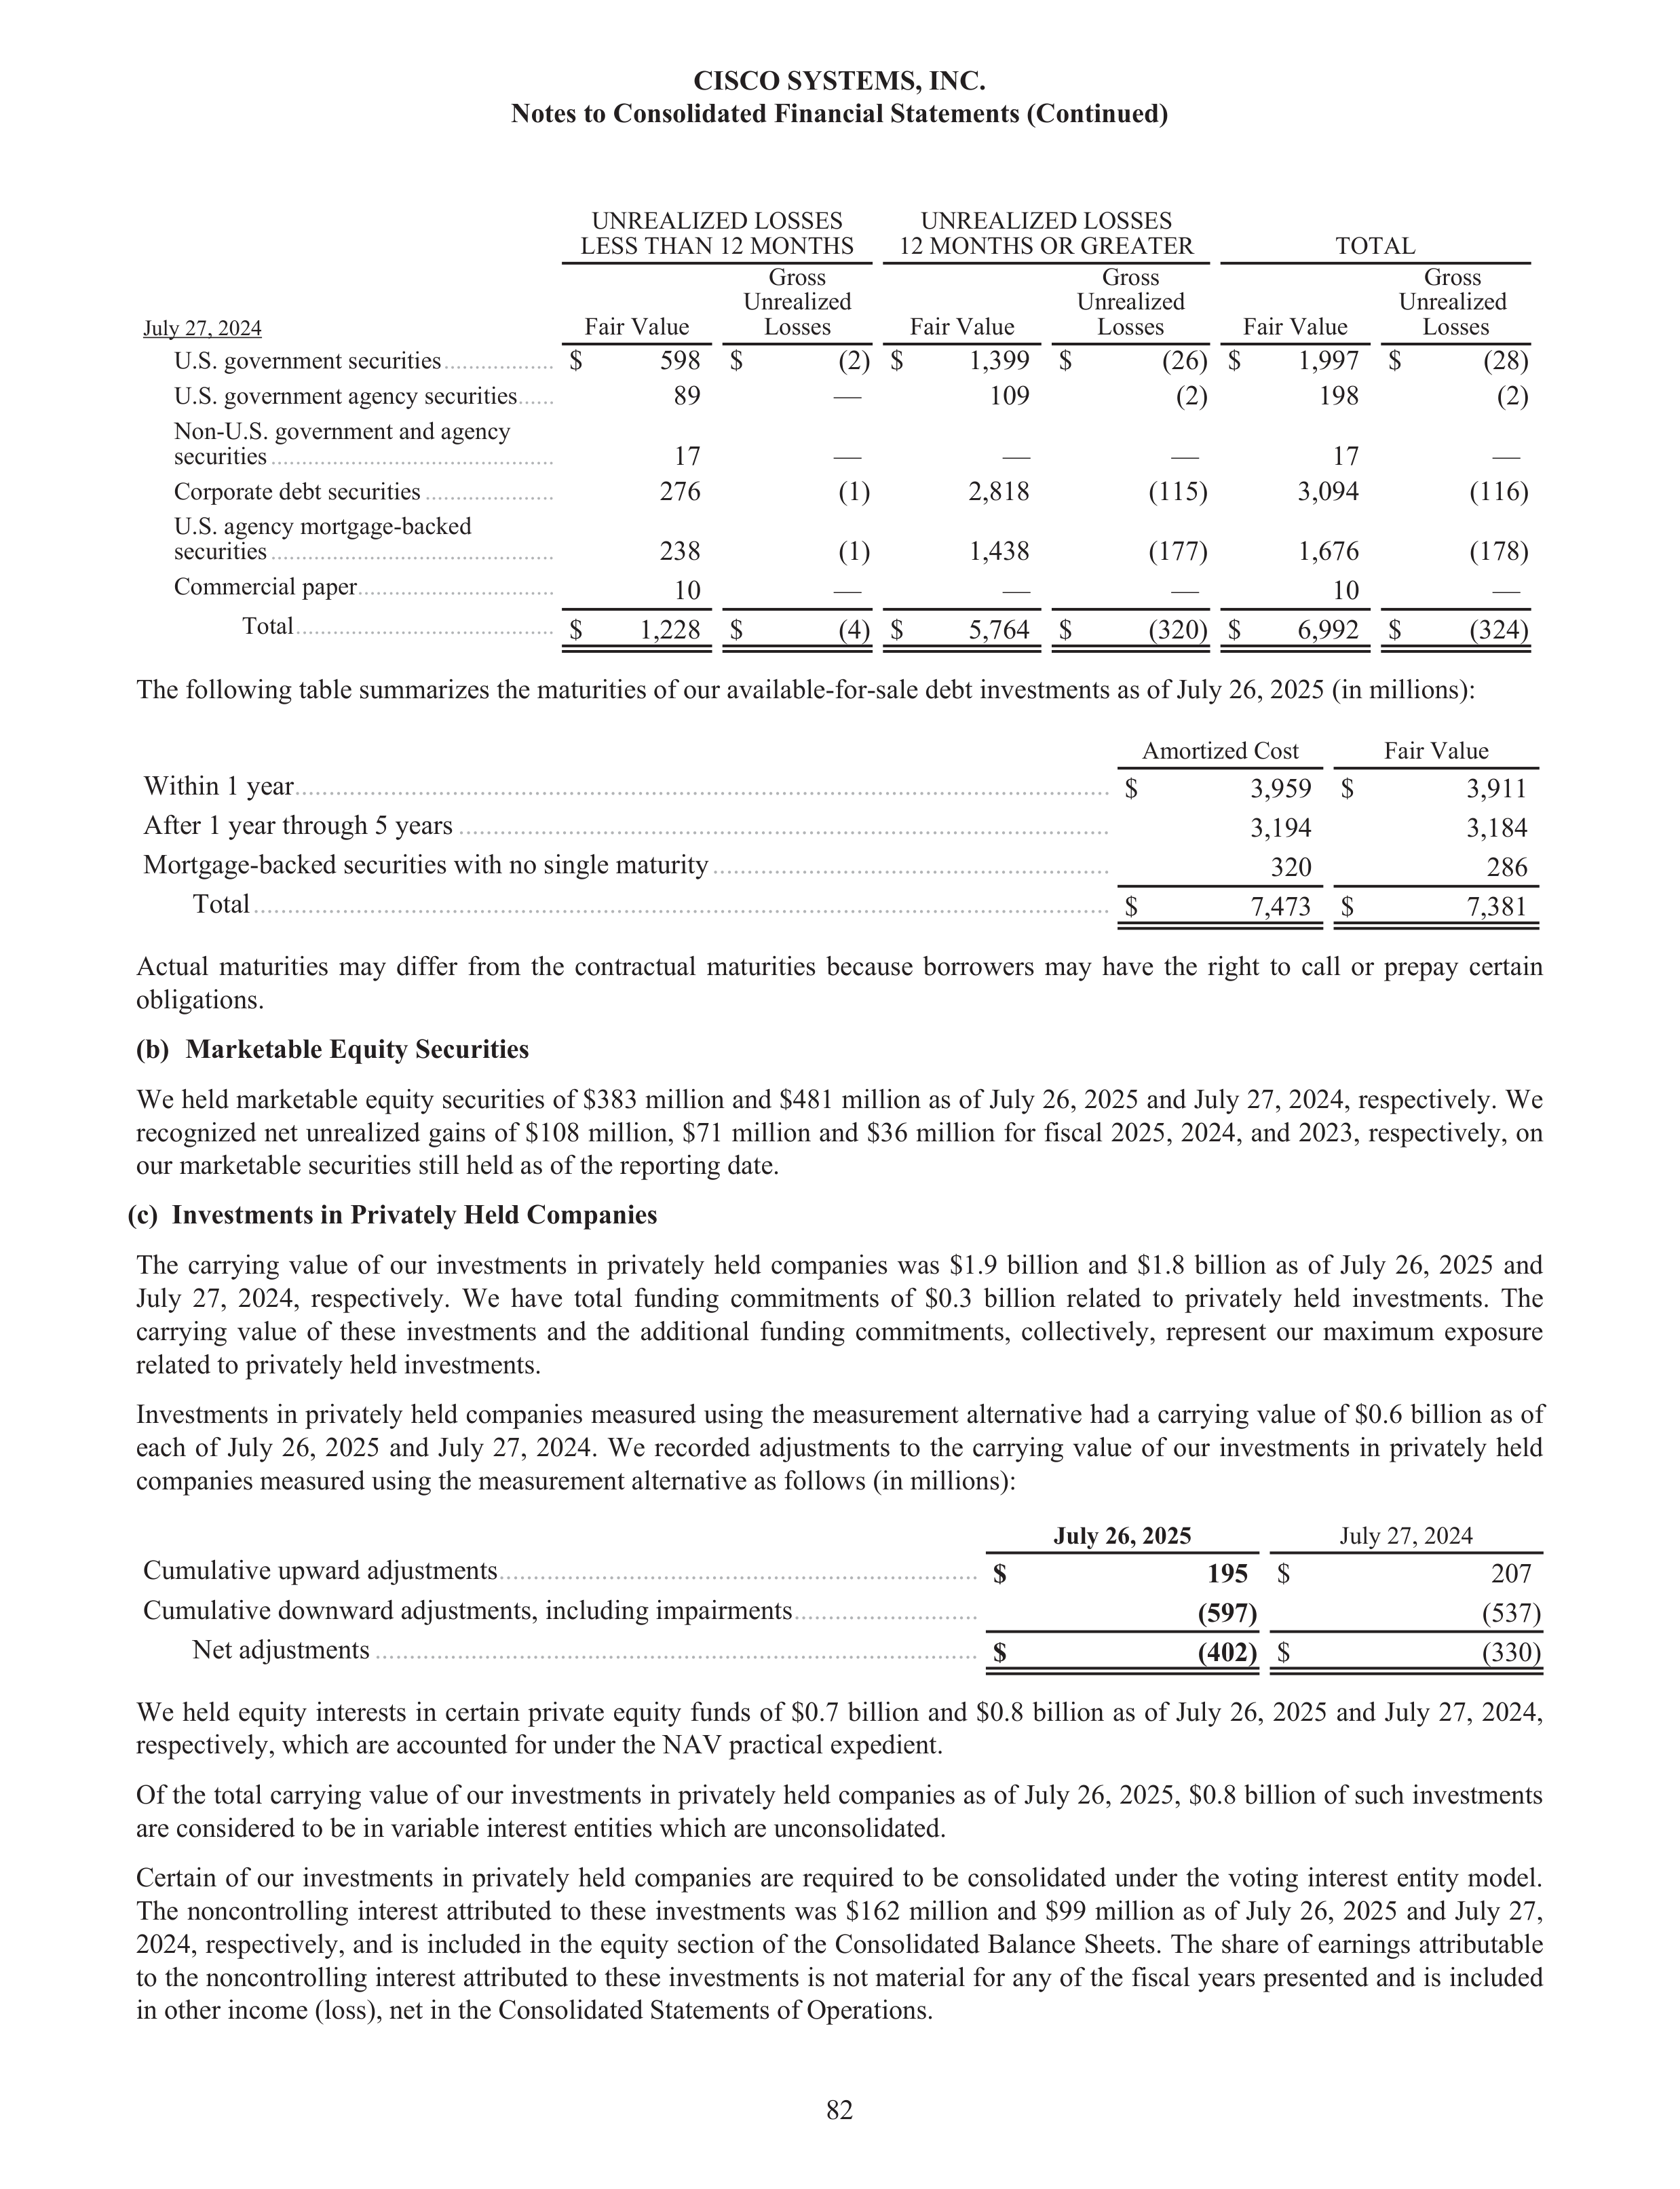
UNREALIZED LOSSES
LESS THAN 12 MONTHS
UNREALIZED LOSSES
12 MONTHS OR GREATER
TOTAL
July 27, 2024
Fair Value
Gross
Unrealized
Losses
Fair Value
Gross
Unrealized
Losses
Fair Value
Gross
Unrealized
Losses
U.S. government securities
..................
$
598 $
(2)
$
1,399 $
(26)
$
1,997 $
(28)
U.S. government agency securities
......
89
—
109
(2)
198
(2)
Non-U.S. government and agency
securities
..............................................
17
—
—
—
17
—
Corporate debt securities
.....................
276
(1)
2,818
(115)
3,094
(116)
U.S. agency mortgage-backed
securities
..............................................
238
(1)
1,438
(177)
1,676
(178)
Commercial paper
................................
10
—
—
—
10
—
Total
..........................................
$
1,228 $
(4)
$
5,764 $
(320)
$
6,992 $
(324)
The following table summarizes the maturities of our available-for-sale debt investments as of July 26, 2025 (in millions):
Amortized Cost
Fair Value
Within 1 year
.......................................................................................................................
$
3,959 $
3,911
After 1 year through 5 years
...............................................................................................
3,194
3,184
Mortgage-backed securities with no single maturity
..........................................................
320
286
Total
.............................................................................................................................
$
7,473 $
7,381
Actual maturities may differ from the contractual maturities because borrowers may have the right to call or prepay certain
obligations.
(b)
Marketable Equity Securities
We held marketable equity securities of $383 million and $481 million as of July 26, 2025 and July 27, 2024, respectively. We
recognized net unrealized gains of $108 million, $71 million and $36 million for fiscal 2025, 2024, and 2023, respectively, on
our marketable securities still held as of the reporting date.
(c)
Investments in Privately Held Companies
The carrying value of our investments in privately held companies was $1.9 billion and $1.8 billion as of July 26, 2025 and
July 27, 2024, respectively. We have total funding commitments of $0.3 billion related to privately held investments. The
carrying value of these investments and the additional funding commitments, collectively, represent our maximum exposure
related to privately held investments.
Investments in privately held companies measured using the measurement alternative had a carrying value of $0.6 billion as of
each of July 26, 2025 and July 27, 2024. We recorded adjustments to the carrying value of our investments in privately held
companies measured using the measurement alternative as follows (in millions):
July 26, 2025
July 27, 2024
Cumulative upward adjustments
......................................................................
$
195
$
207
Cumulative downward adjustments, including impairments
...........................
(597)
(537)
Net adjustments
........................................................................................
$
(402)
$
(330)
We held equity interests in certain private equity funds of $0.7 billion and $0.8 billion as of July 26, 2025 and July 27, 2024,
respectively, which are accounted for under the NAV practical expedient.
Of the total carrying value of our investments in privately held companies as of July 26, 2025, $0.8 billion of such investments
are considered to be in variable interest entities which are unconsolidated.
Certain of our investments in privately held companies are required to be consolidated under the voting interest entity model.
The noncontrolling interest attributed to these investments was $162 million and $99 million as of July 26, 2025 and July 27,
2024, respectively, and is included in the equity section of the Consolidated Balance Sheets. The share of earnings attributable
to the noncontrolling interest attributed to these investments is not material for any of the fiscal years presented and is included
in other income (loss), net in the Consolidated Statements of Operations.
CISCO SYSTEMS, INC.
Notes to Consolidated Financial Statements (Continued)
82
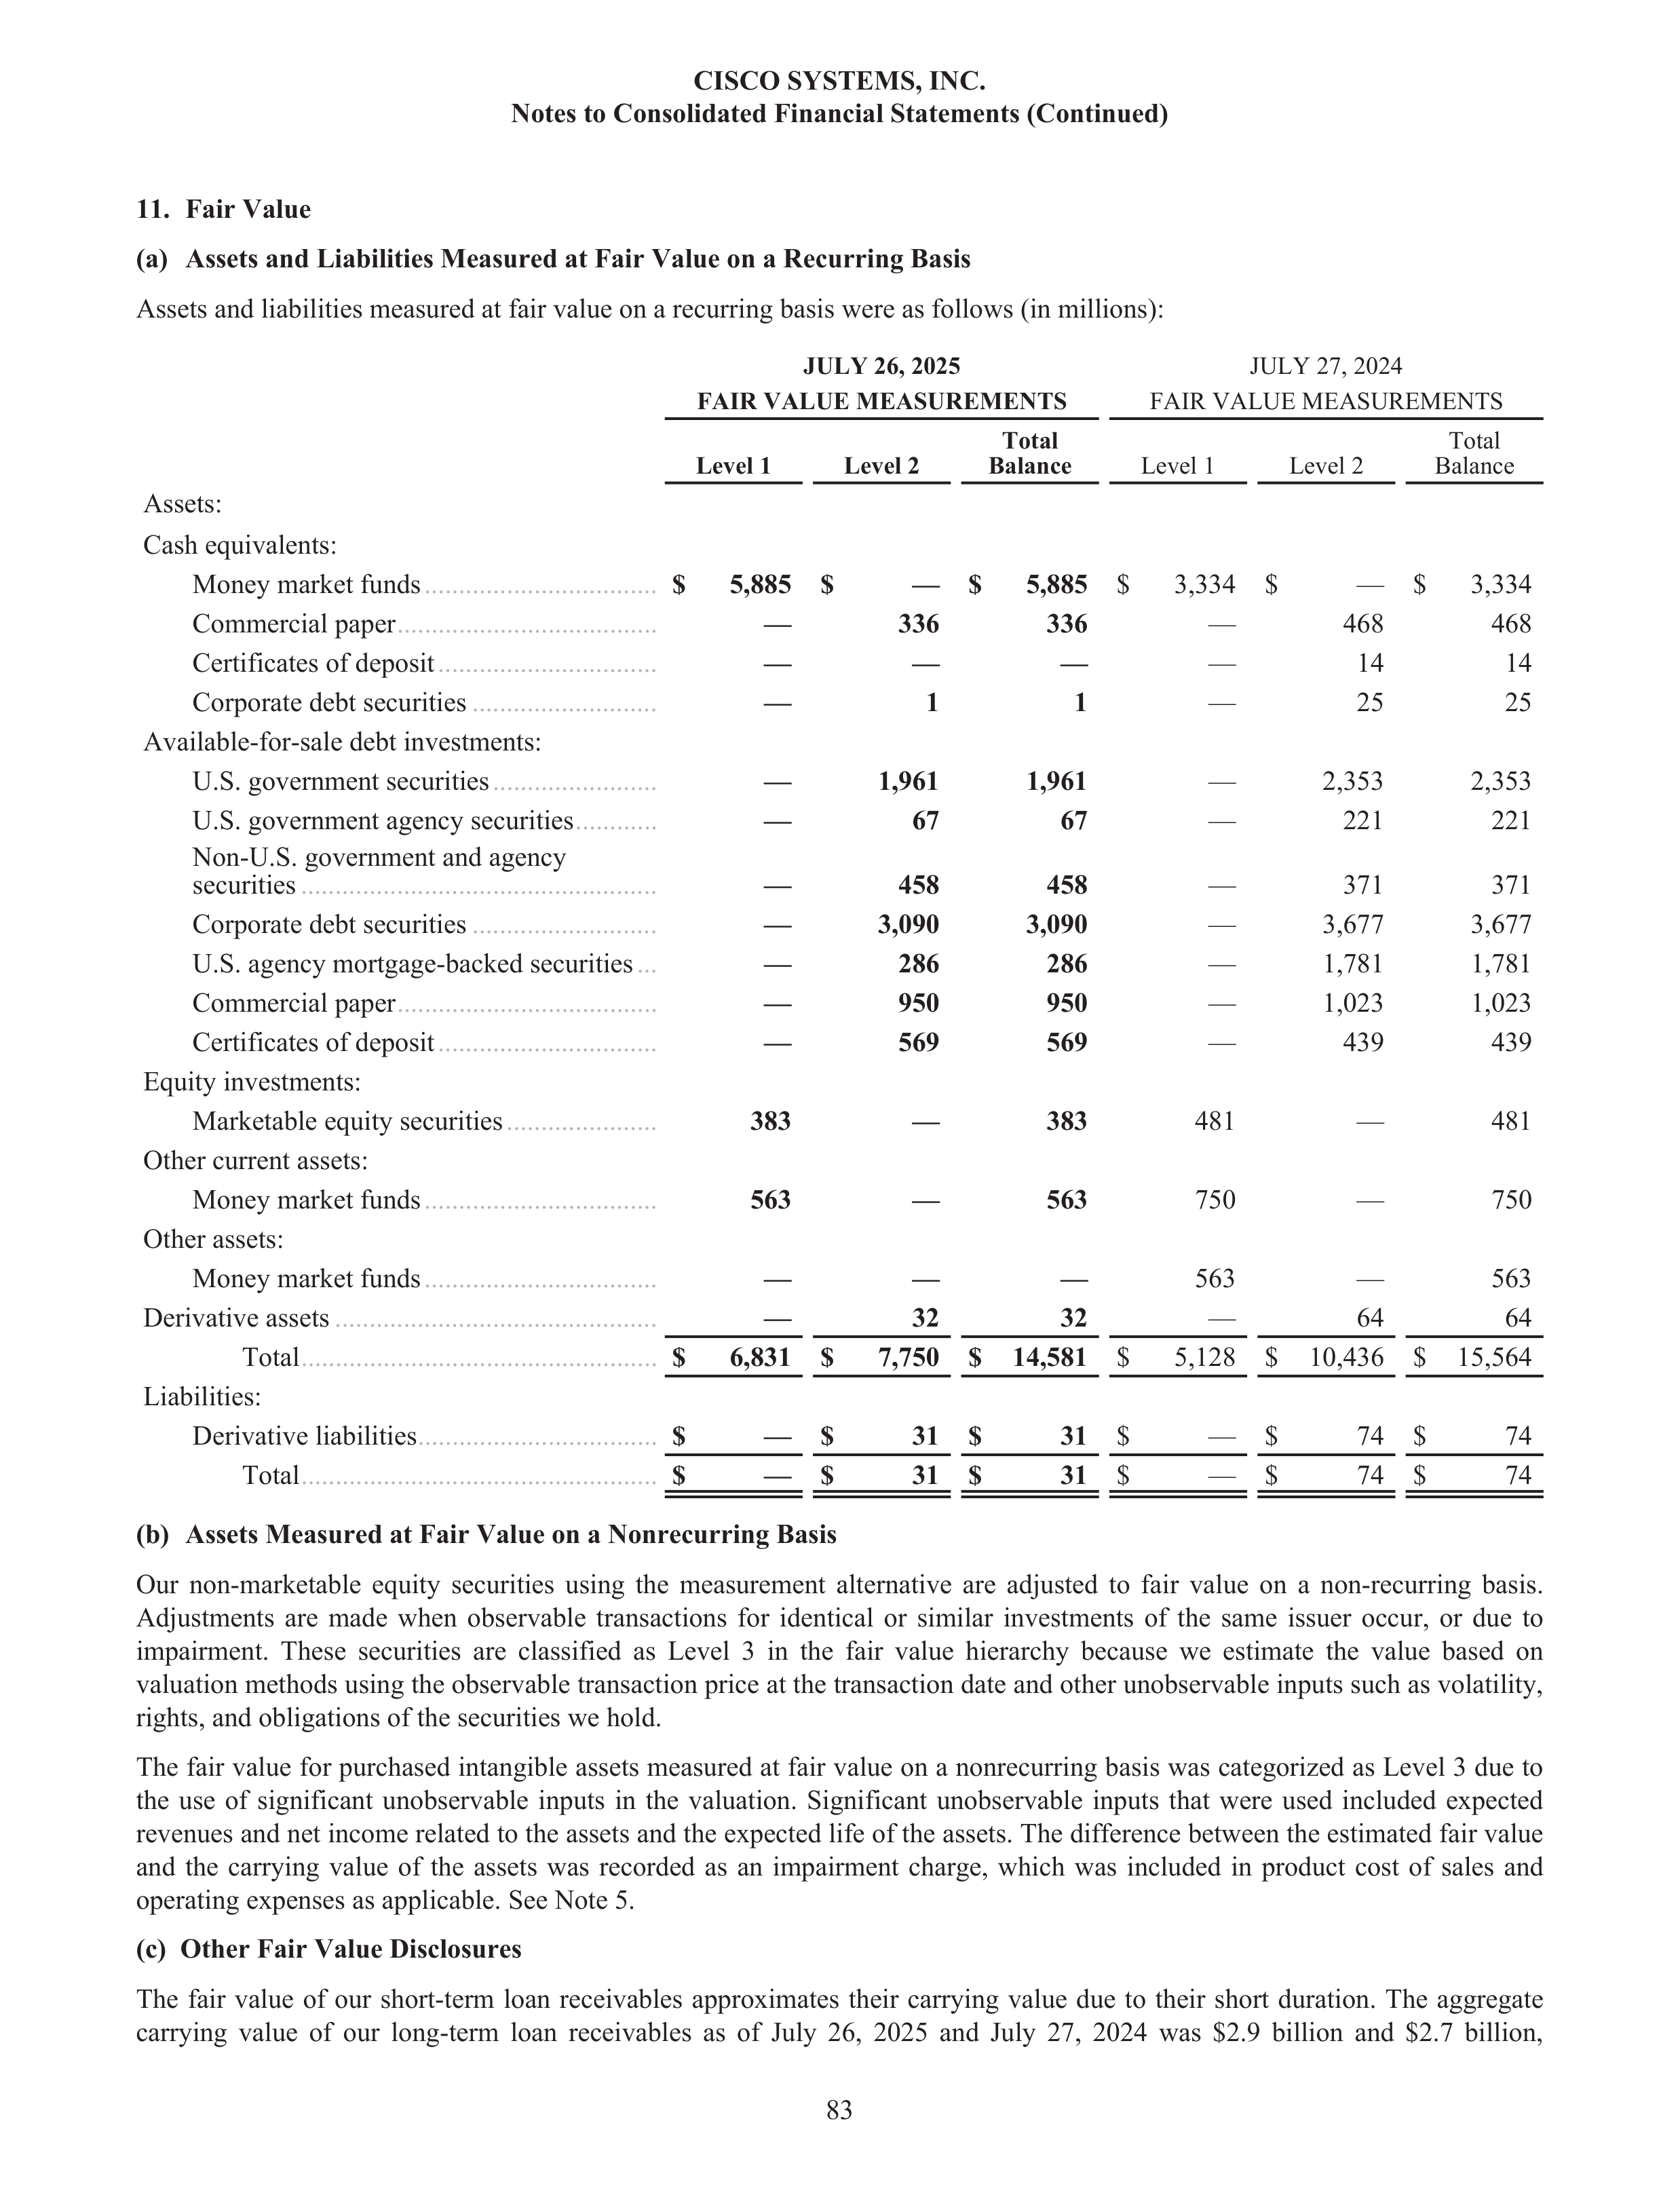
11.
Fair Value
(a)
Assets and Liabilities Measured at Fair Value on a Recurring Basis
Assets and liabilities measured at fair value on a recurring basis were as follows (in millions):
JULY 26, 2025
JULY 27, 2024
FAIR VALUE MEASUREMENTS
FAIR VALUE MEASUREMENTS
Level 1
Level 2
Total
Balance
Level 1
Level 2
Total
Balance
Assets:
Cash equivalents:
Money market funds
..................................
$
5,885 $
— $
5,885
$
3,334 $
— $
3,334
Commercial paper
......................................
—
336
336
—
468
468
Certificates of deposit
................................
—
—
—
—
14
14
Corporate debt securities
...........................
—
1
1
—
25
25
Available-for-sale debt investments:
U.S. government securities
........................
—
1,961
1,961
—
2,353
2,353
U.S. government agency securities
............
—
67
67
—
221
221
Non-U.S. government and agency
securities
....................................................
—
458
458
—
371
371
Corporate debt securities
...........................
—
3,090
3,090
—
3,677
3,677
U.S. agency mortgage-backed securities
...
—
286
286
—
1,781
1,781
Commercial paper
......................................
—
950
950
—
1,023
1,023
Certificates of deposit
................................
—
569
569
—
439
439
Equity investments:
Marketable equity securities
......................
383
—
383
481
—
481
Other current assets:
Money market funds
..................................
563
—
563
750
—
750
Other assets:
Money market funds
..................................
—
—
—
563
—
563
Derivative assets
...............................................
—
32
32
—
64
64
Total
....................................................
$
6,831 $
7,750 $
14,581
$
5,128 $
10,436 $
15,564
Liabilities:
Derivative liabilities
...................................
$
— $
31 $
31
$
— $
74 $
74
Total
....................................................
$
— $
31 $
31
$
— $
74 $
74
(b)
Assets Measured at Fair Value on a Nonrecurring Basis
Our non-marketable equity securities using the measurement alternative are adjusted to fair value on a non-recurring basis.
Adjustments are made when observable transactions for identical or similar investments of the same issuer occur, or due to
impairment. These securities are classified as Level 3 in the fair value hierarchy because we estimate the value based on
valuation methods using the observable transaction price at the transaction date and other unobservable inputs such as volatility,
rights, and obligations of the securities we hold.
The fair value for purchased intangible assets measured at fair value on a nonrecurring basis was categorized as Level 3 due to
the use of significant unobservable inputs in the valuation. Significant unobservable inputs that were used included expected
revenues and net income related to the assets and the expected life of the assets. The difference between the estimated fair value
and the carrying value of the assets was recorded as an impairment charge, which was included in product cost of sales and
operating expenses as applicable. See Note 5.
(c)
Other Fair Value Disclosures
The fair value of our short-term loan receivables approximates their carrying value due to their short duration. The aggregate
carrying value of our long-term loan receivables as of July 26, 2025 and July 27, 2024 was $2.9 billion and $2.7 billion,
CISCO SYSTEMS, INC.
Notes to Consolidated Financial Statements (Continued)
83
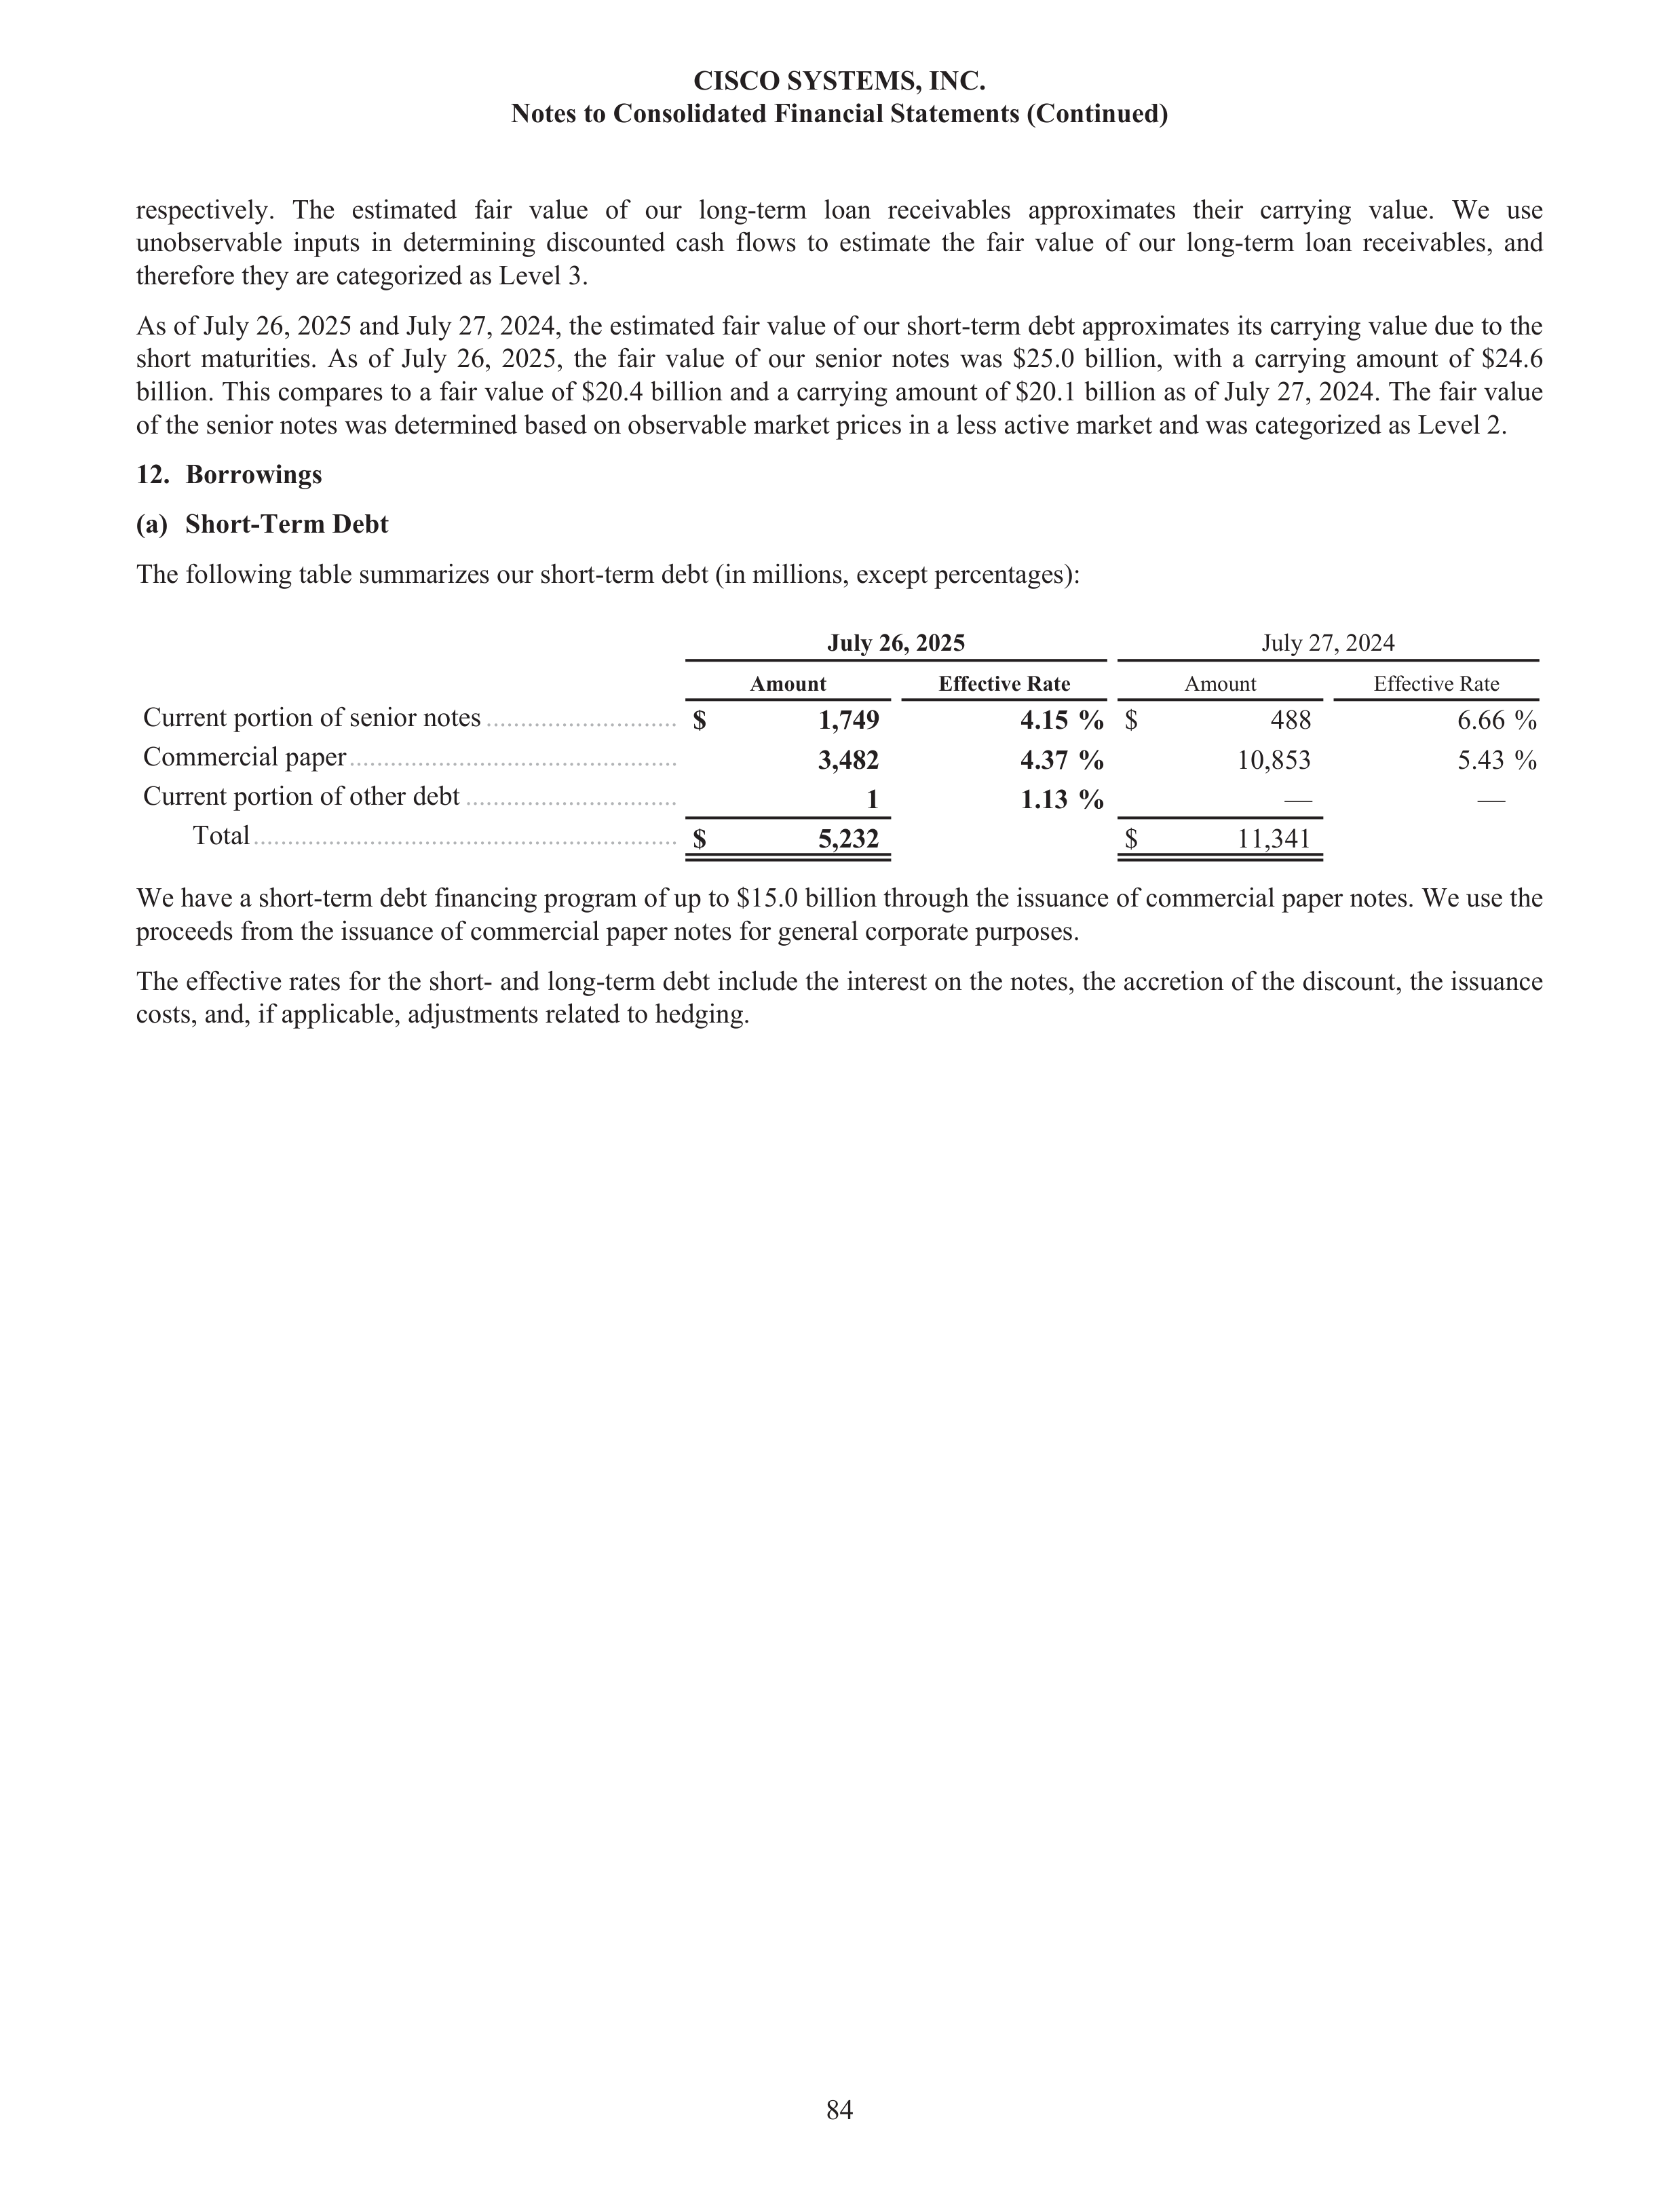
respectively. The estimated fair value of our long-term loan receivables approximates their carrying value. We use
unobservable inputs in determining discounted cash flows to estimate the fair value of our long-term loan receivables, and
therefore they are categorized as Level 3.
As of July 26, 2025 and July 27, 2024, the estimated fair value of our short-term debt approximates its carrying value due to the
short maturities. As of July 26, 2025, the fair value of our senior notes was $25.0 billion, with a carrying amount of $24.6
billion. This compares to a fair value of $20.4 billion and a carrying amount of $20.1 billion as of July 27, 2024. The fair value
of the senior notes was determined based on observable market prices in a less active market and was categorized as Level 2.
12.
Borrowings
(a)
Short-Term Debt
The following table summarizes our short-term debt (in millions, except percentages):
July 26, 2025
July 27, 2024
Amount
Effective Rate
Amount
Effective Rate
Current portion of senior notes
............................
$
1,749
4.15 %
$
488
6.66 %
Commercial paper
................................................
3,482
4.37 %
10,853
5.43 %
Current portion of other debt
...............................
1
1.13 %
—
—
Total
..............................................................
$
5,232
$
11,341
We have a short-term debt financing program of up to $15.0 billion through the issuance of commercial paper notes. We use the
proceeds from the issuance of commercial paper notes for general corporate purposes.
The effective rates for the short- and long-term debt include the interest on the notes, the accretion of the discount, the issuance
costs, and, if applicable, adjustments related to hedging.
CISCO SYSTEMS, INC.
Notes to Consolidated Financial Statements (Continued)
84
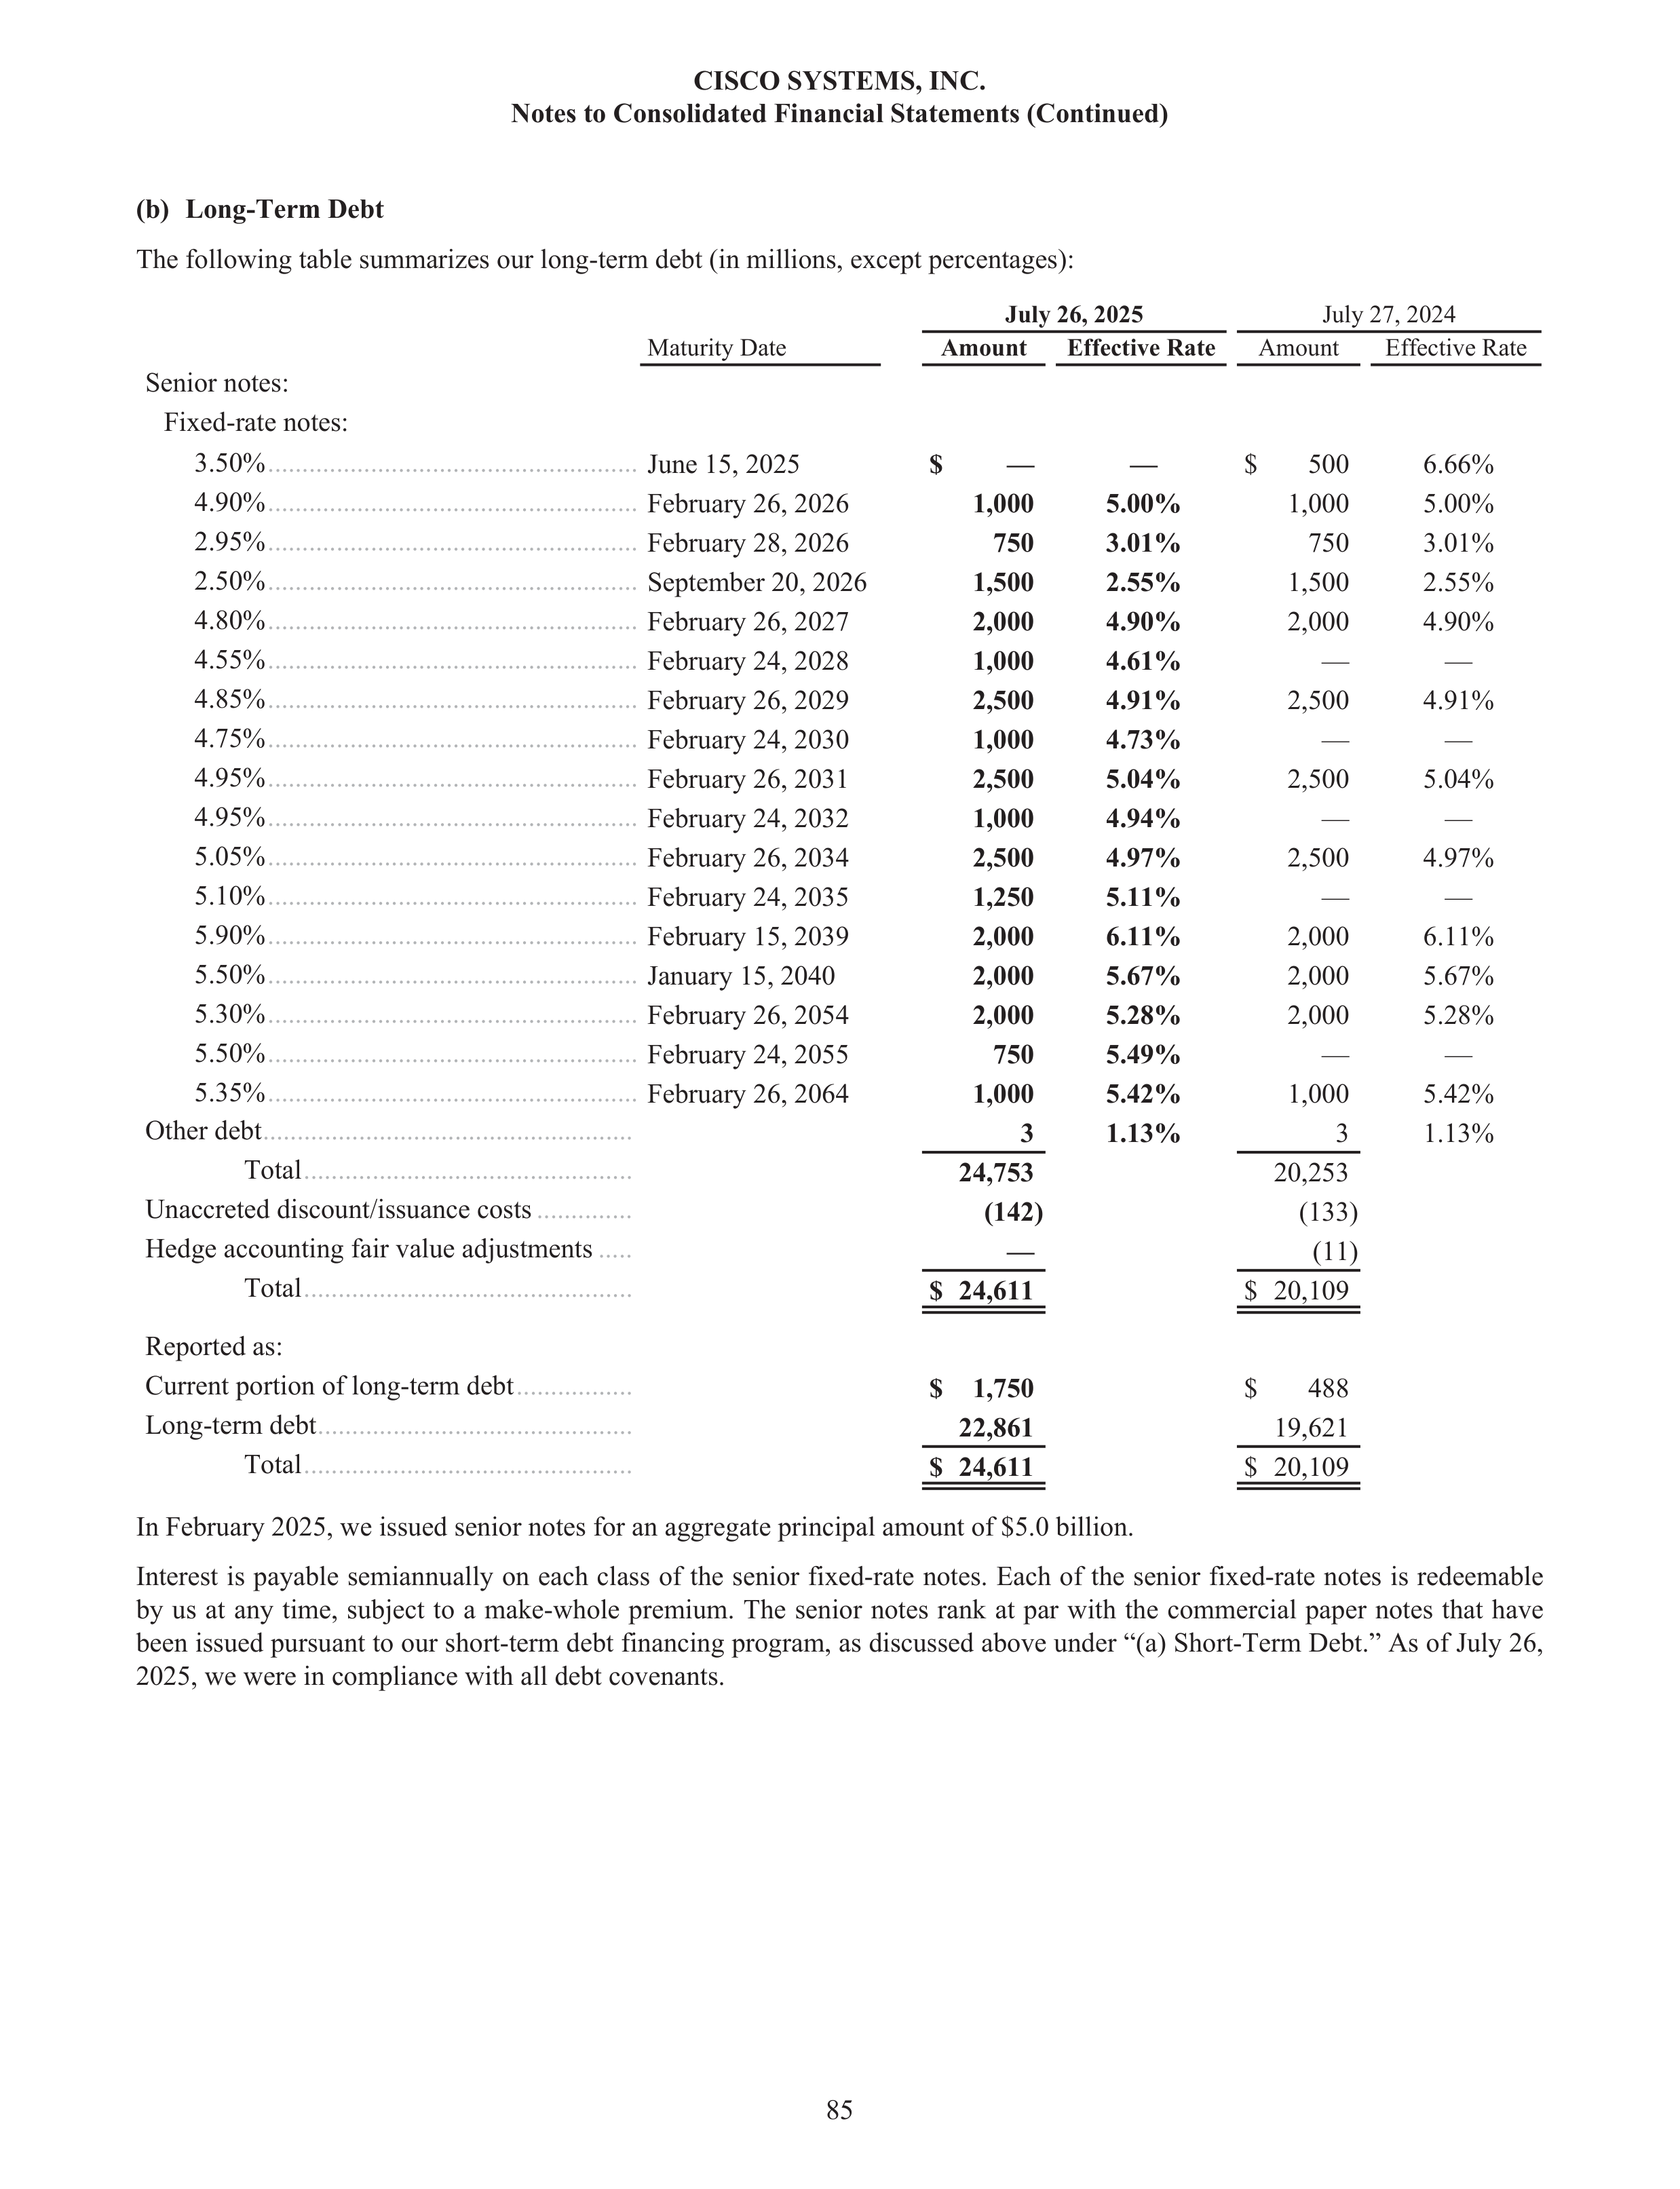
(b)
Long-Term Debt
The following table summarizes our long-term debt (in millions, except percentages):
July 26, 2025
July 27, 2024
Maturity Date
Amount
Effective Rate
Amount
Effective Rate
Senior notes:
Fixed-rate notes:
3.50%
......................................................
June 15, 2025
$
—
—
$
500
6.66%
4.90%
......................................................
February 26, 2026
1,000
5.00%
1,000
5.00%
2.95%
......................................................
February 28, 2026
750
3.01%
750
3.01%
2.50%
......................................................
September 20, 2026
1,500
2.55%
1,500
2.55%
4.80%
......................................................
February 26, 2027
2,000
4.90%
2,000
4.90%
4.55%
......................................................
February 24, 2028
1,000
4.61%
—
—
4.85%
......................................................
February 26, 2029
2,500
4.91%
2,500
4.91%
4.75%
......................................................
February 24, 2030
1,000
4.73%
—
—
4.95%
......................................................
February 26, 2031
2,500
5.04%
2,500
5.04%
4.95%
......................................................
February 24, 2032
1,000
4.94%
—
—
5.05%
......................................................
February 26, 2034
2,500
4.97%
2,500
4.97%
5.10%
......................................................
February 24, 2035
1,250
5.11%
—
—
5.90%
......................................................
February 15, 2039
2,000
6.11%
2,000
6.11%
5.50%
......................................................
January 15, 2040
2,000
5.67%
2,000
5.67%
5.30%
......................................................
February 26, 2054
2,000
5.28%
2,000
5.28%
5.50%
......................................................
February 24, 2055
750
5.49%
—
—
5.35%
......................................................
February 26, 2064
1,000
5.42%
1,000
5.42%
Other debt
......................................................
3
1.13%
3
1.13%
Total
................................................
24,753
20,253
Unaccreted discount/issuance costs
..............
(142)
(133)
Hedge accounting fair value adjustments
.....
—
(11)
Total
................................................
$ 24,611
$ 20,109
Reported as:
Current portion of long-term debt
.................
$
1,750
$
488
Long-term debt
..............................................
22,861
19,621
Total
................................................
$ 24,611
$ 20,109
In February 2025, we issued senior notes for an aggregate principal amount of $5.0 billion.
Interest is payable semiannually on each class of the senior fixed-rate notes. Each of the senior fixed-rate notes is redeemable
by us at any time, subject to a make-whole premium. The senior notes rank at par with the commercial paper notes that have
been issued pursuant to our short-term debt financing program, as discussed above under “(a) Short-Term Debt.” As of July 26,
2025, we were in compliance with all debt covenants.
CISCO SYSTEMS, INC.
Notes to Consolidated Financial Statements (Continued)
85
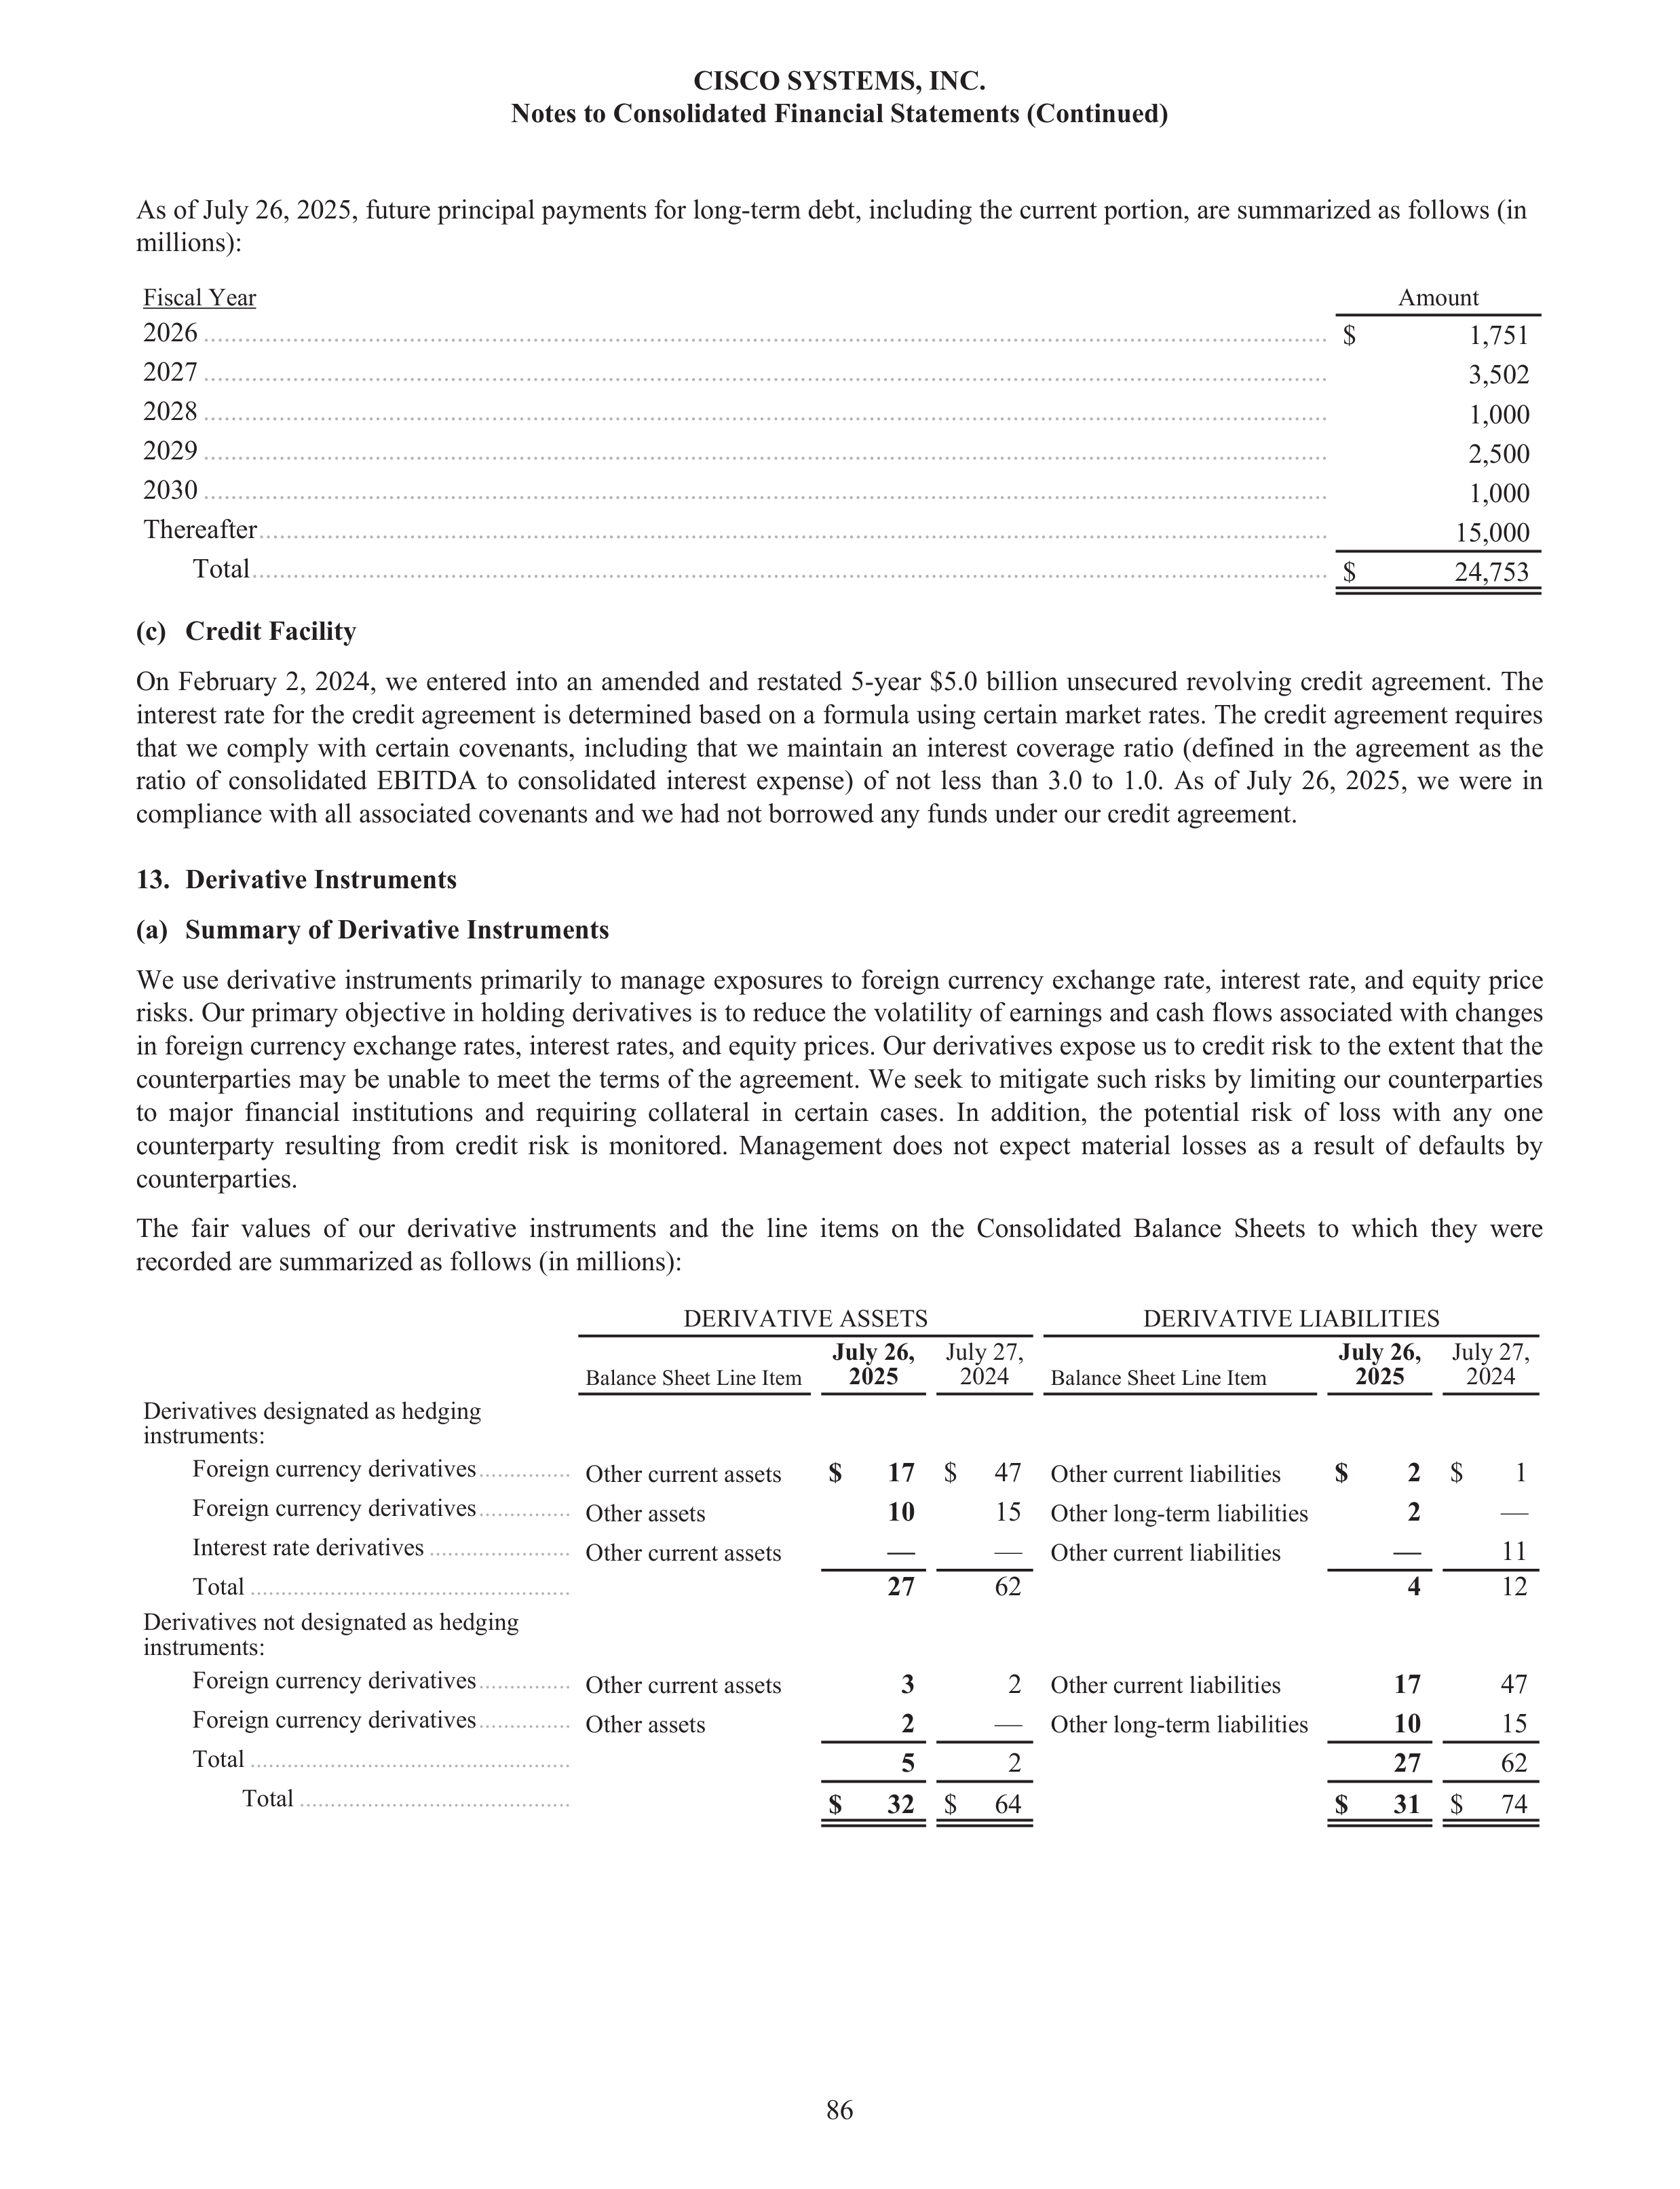
As of July 26, 2025, future principal payments for long-term debt, including the current portion, are summarized as follows (in
millions):
Fiscal Year
Amount
2026
....................................................................................................................................................................
$
1,751
2027
....................................................................................................................................................................
3,502
2028
....................................................................................................................................................................
1,000
2029
....................................................................................................................................................................
2,500
2030
....................................................................................................................................................................
1,000
Thereafter
............................................................................................................................................................
15,000
Total
.............................................................................................................................................................
$
24,753
(c)
Credit Facility
On February 2, 2024, we entered into an amended and restated 5-year $5.0 billion unsecured revolving credit agreement. The
interest rate for the credit agreement is determined based on a formula using certain market rates. The credit agreement requires
that we comply with certain covenants, including that we maintain an interest coverage ratio (defined in the agreement as the
ratio of consolidated EBITDA to consolidated interest expense) of not less than 3.0 to 1.0. As of July 26, 2025, we were in
compliance with all associated covenants and we had not borrowed any funds under our credit agreement.
13.
Derivative Instruments
(a)
Summary of Derivative Instruments
We use derivative instruments primarily to manage exposures to foreign currency exchange rate, interest rate, and equity price
risks. Our primary objective in holding derivatives is to reduce the volatility of earnings and cash flows associated with changes
in foreign currency exchange rates, interest rates, and equity prices. Our derivatives expose us to credit risk to the extent that the
counterparties may be unable to meet the terms of the agreement. We seek to mitigate such risks by limiting our counterparties
to major financial institutions and requiring collateral in certain cases. In addition, the potential risk of loss with any one
counterparty resulting from credit risk is monitored. Management does not expect material losses as a result of defaults by
counterparties.
The fair values of our derivative instruments and the line items on the Consolidated Balance Sheets to which they were
recorded are summarized as follows (in millions):
DERIVATIVE ASSETS
DERIVATIVE LIABILITIES
Balance Sheet Line Item
July 26,
2025
July 27,
2024
Balance Sheet Line Item
July 26,
2025
July 27,
2024
Derivatives designated as hedging
instruments:
Foreign currency derivatives
...............
Other current assets
$
17
$
47
Other current liabilities
$
2
$
1
Foreign currency derivatives
...............
Other assets
10
15
Other long-term liabilities
2
—
Interest rate derivatives
.......................
Other current assets
—
—
Other current liabilities
—
11
Total
....................................................
27
62
4
12
Derivatives not designated as hedging
instruments:
Foreign currency derivatives
...............
Other current assets
3
2
Other current liabilities
17
47
Foreign currency derivatives
...............
Other assets
2
—
Other long-term liabilities
10
15
Total
....................................................
5
2
27
62
Total
............................................
$
32
$
64
$
31
$
74
CISCO SYSTEMS, INC.
Notes to Consolidated Financial Statements (Continued)
86
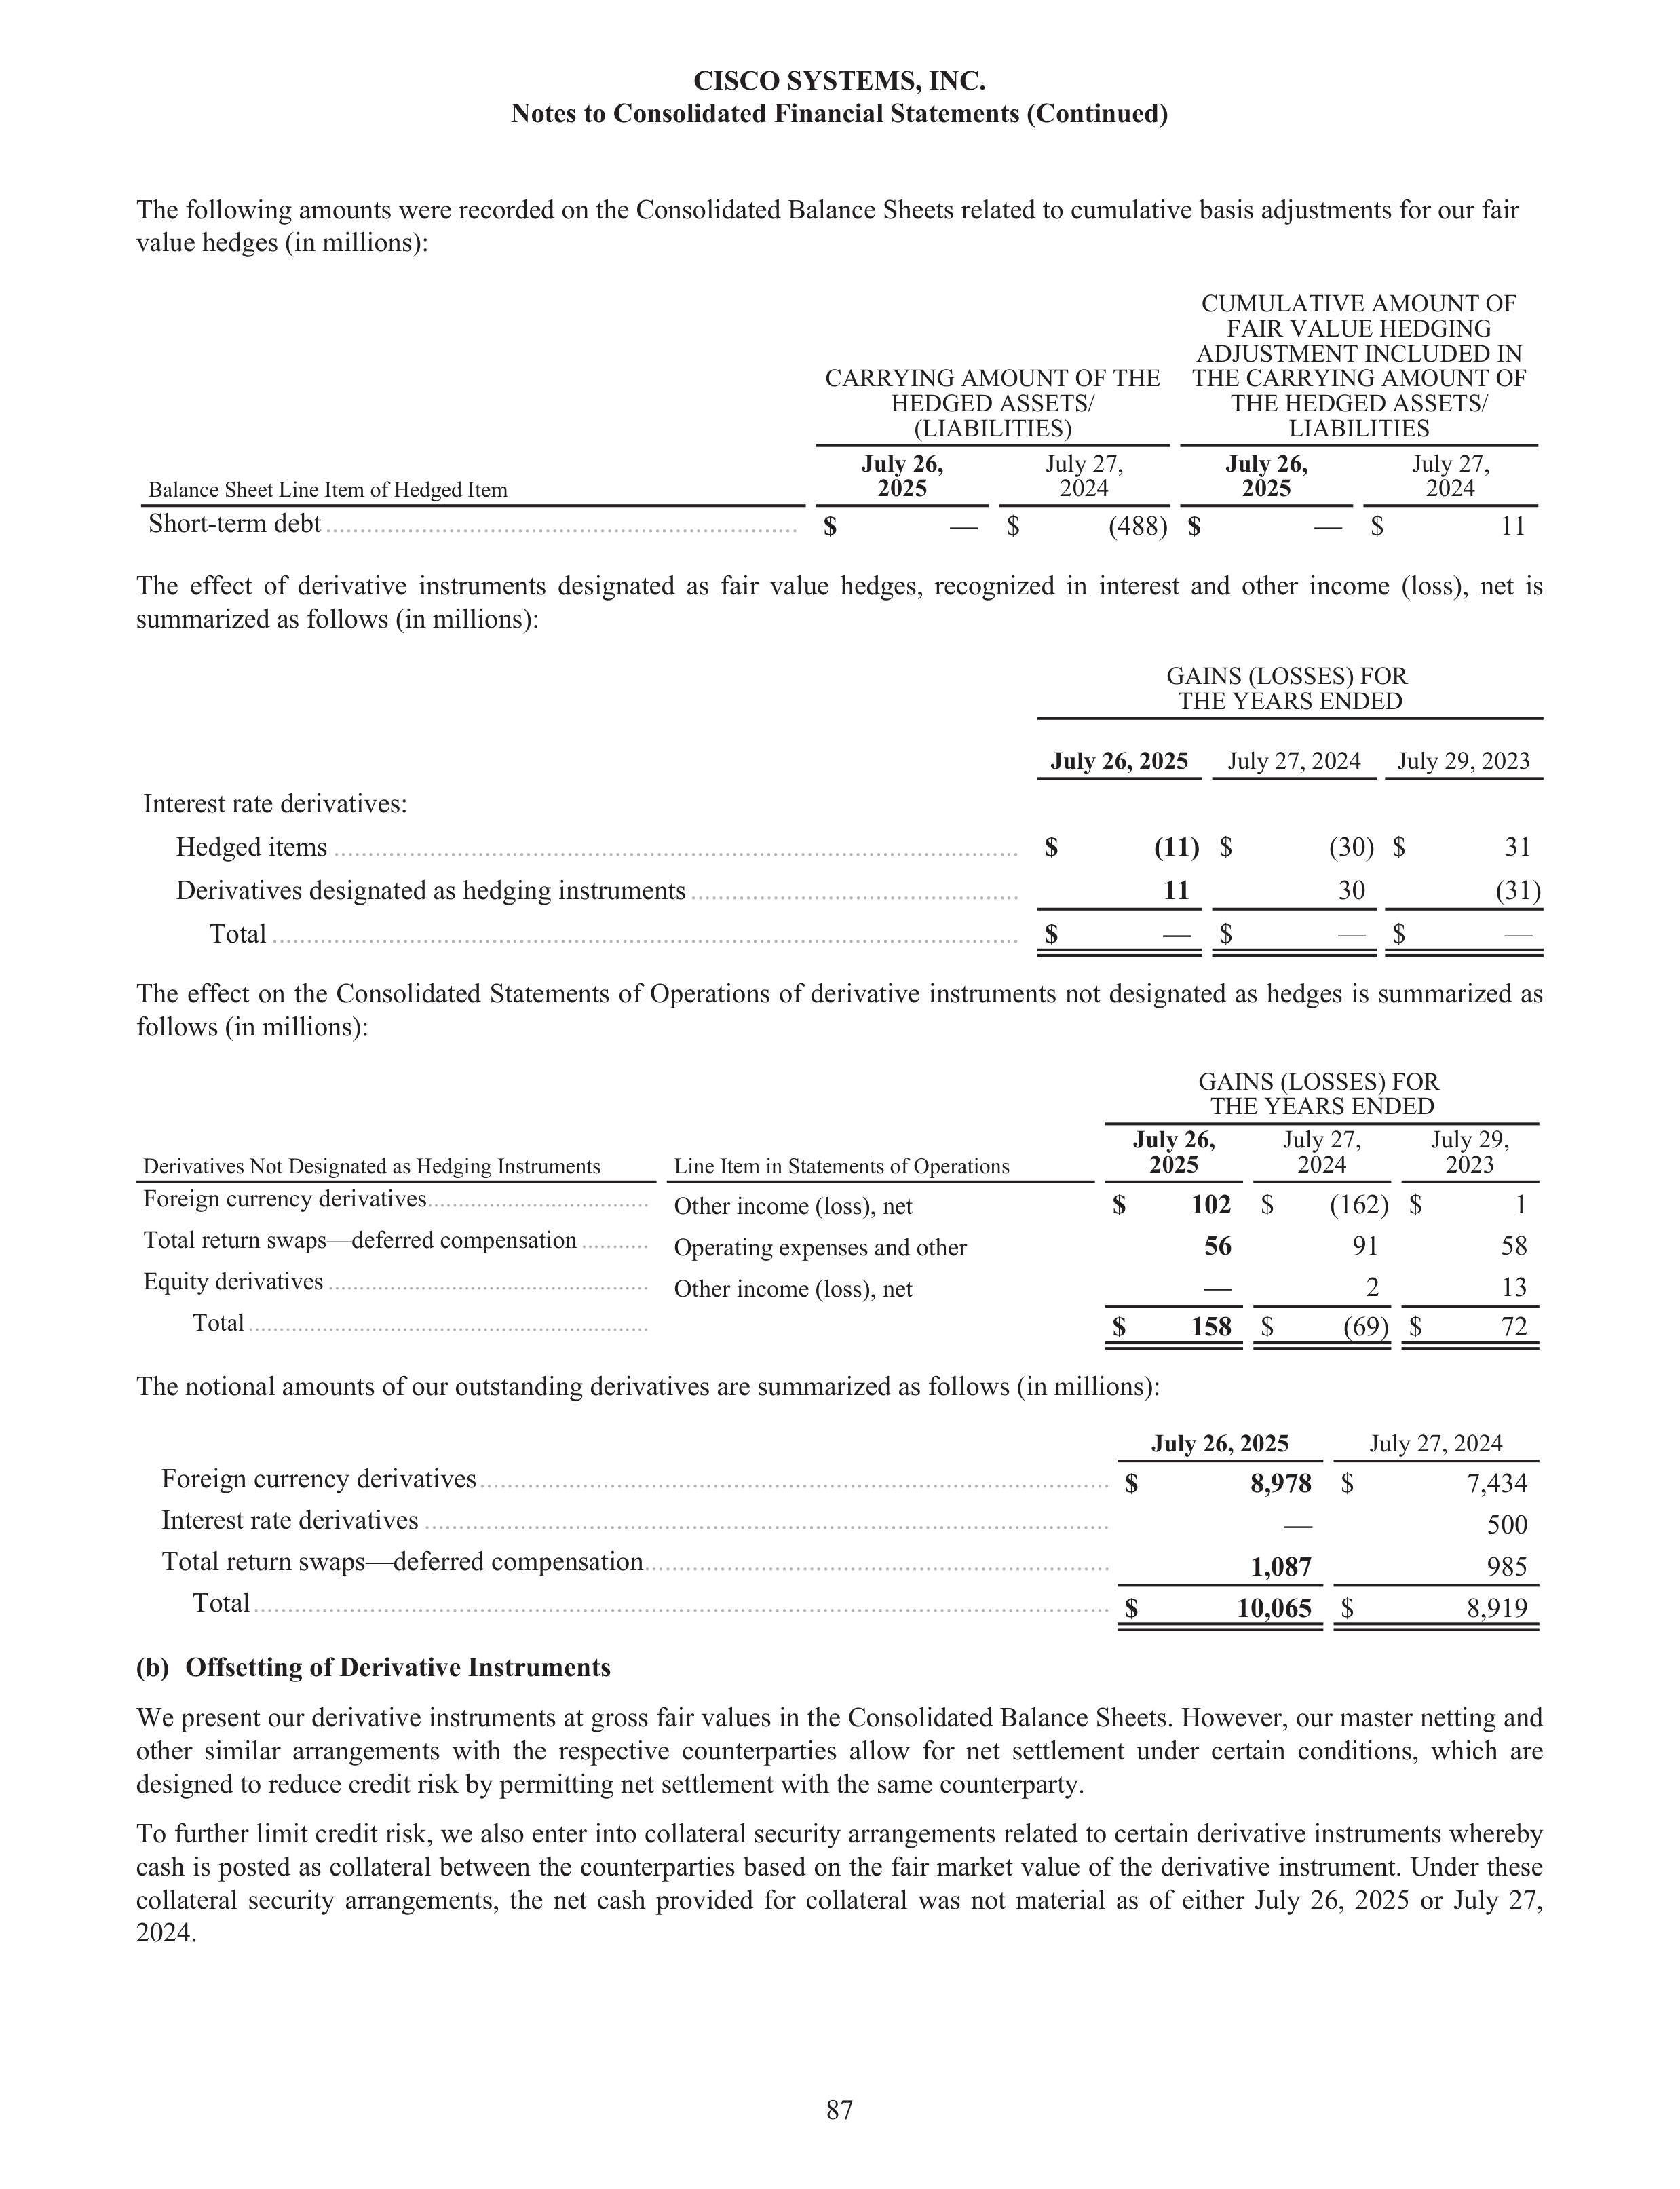
The following amounts were recorded on the Consolidated Balance Sheets related to cumulative basis adjustments for our fair
value hedges (in millions):
CARRYING AMOUNT OF THE
HEDGED ASSETS/
(LIABILITIES)
CUMULATIVE AMOUNT OF
FAIR VALUE HEDGING
ADJUSTMENT INCLUDED IN
THE CARRYING AMOUNT OF
THE HEDGED ASSETS/
LIABILITIES
Balance Sheet Line Item of Hedged Item
July 26,
2025
July 27,
2024
July 26,
2025
July 27,
2024
Short-term debt
.....................................................................
$
—
$
(488)
$
—
$
11
The effect of derivative instruments designated as fair value hedges, recognized in interest and other income (loss), net is
summarized as follows (in millions):
GAINS (LOSSES) FOR
THE YEARS ENDED
July 26, 2025
July 27, 2024
July 29, 2023
Interest rate derivatives:
Hedged items
....................................................................................................
$
(11)
$
(30)
$
31
Derivatives designated as hedging instruments
................................................
11
30
(31)
Total
.............................................................................................................
$
—
$
— $
—
The effect on the Consolidated Statements of Operations of derivative instruments not designated as hedges is summarized as
follows (in millions):
GAINS (LOSSES) FOR
THE YEARS ENDED
Derivatives Not Designated as Hedging Instruments
Line Item in Statements of Operations
July 26,
2025
July 27,
2024
July 29,
2023
Foreign currency derivatives
....................................
Other income (loss), net
$
102
$
(162)
$
1
Total return swaps—deferred compensation
...........
Operating expenses and other
56
91
58
Equity derivatives
....................................................
Other income (loss), net
—
2
13
Total
.................................................................
$
158
$
(69)
$
72
The notional amounts of our outstanding derivatives are summarized as follows (in millions):
July 26, 2025
July 27, 2024
Foreign currency derivatives
............................................................................................
$
8,978
$
7,434
Interest rate derivatives
....................................................................................................
—
500
Total return swaps—deferred compensation
....................................................................
1,087
985
Total
.............................................................................................................................
$
10,065
$
8,919
(b)
Offsetting of Derivative Instruments
We present our derivative instruments at gross fair values in the Consolidated Balance Sheets. However, our master netting and
other similar arrangements with the respective counterparties allow for net settlement under certain conditions, which are
designed to reduce credit risk by permitting net settlement with the same counterparty.
To further limit credit risk, we also enter into collateral security arrangements related to certain derivative instruments whereby
cash is posted as collateral between the counterparties based on the fair market value of the derivative instrument. Under these
collateral security arrangements, the net cash provided for collateral was not material as of either July 26, 2025 or July 27,
2024.
CISCO SYSTEMS, INC.
Notes to Consolidated Financial Statements (Continued)
87
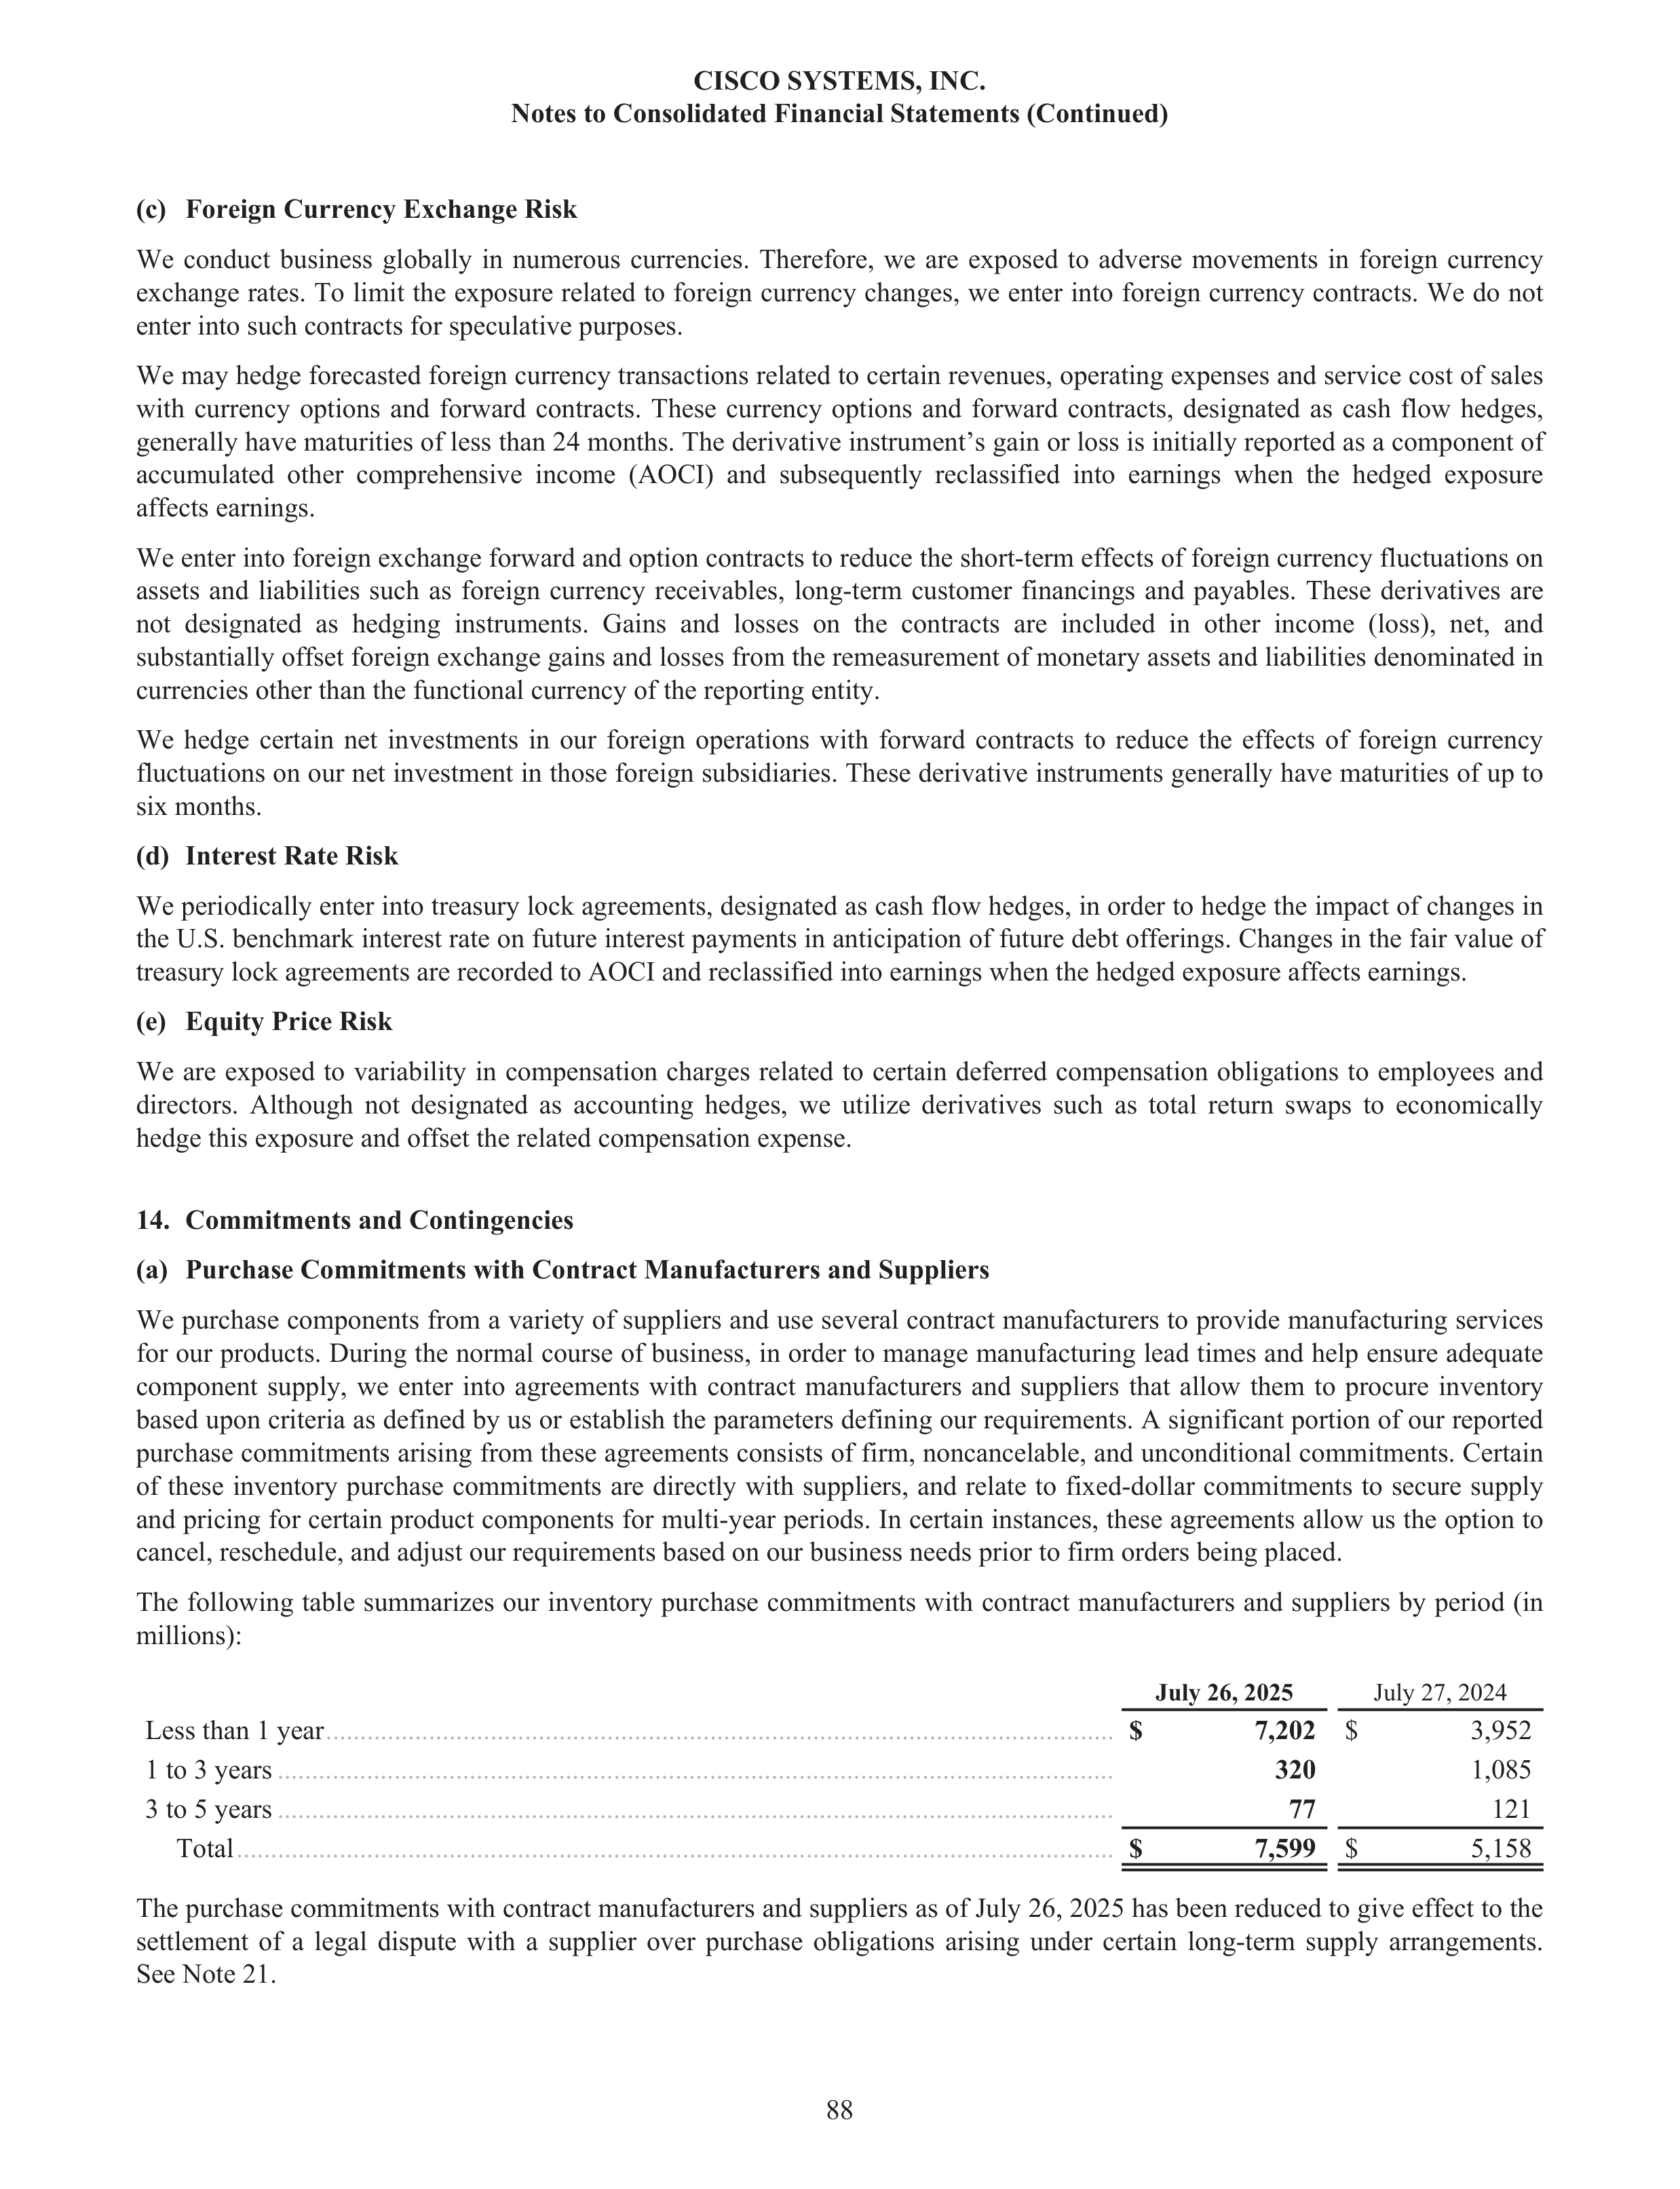
(c)
Foreign Currency Exchange Risk
We conduct business globally in numerous currencies. Therefore, we are exposed to adverse movements in foreign currency
exchange rates. To limit the exposure related to foreign currency changes, we enter into foreign currency contracts. We do not
enter into such contracts for speculative purposes.
We may hedge forecasted foreign currency transactions related to certain revenues, operating expenses and service cost of sales
with currency options and forward contracts. These currency options and forward contracts, designated as cash flow hedges,
generally have maturities of less than 24 months. The derivative instrument’s gain or loss is initially reported as a component of
accumulated other comprehensive income (AOCI) and subsequently reclassified into earnings when the hedged exposure
affects earnings.
We enter into foreign exchange forward and option contracts to reduce the short-term effects of foreign currency fluctuations on
assets and liabilities such as foreign currency receivables, long-term customer financings and payables. These derivatives are
not designated as hedging instruments. Gains and losses on the contracts are included in other income (loss), net, and
substantially offset foreign exchange gains and losses from the remeasurement of monetary assets and liabilities denominated in
currencies other than the functional currency of the reporting entity.
We hedge certain net investments in our foreign operations with forward contracts to reduce the effects of foreign currency
fluctuations on our net investment in those foreign subsidiaries. These derivative instruments generally have maturities of up to
six months.
(d)
Interest Rate Risk
We periodically enter into treasury lock agreements, designated as cash flow hedges, in order to hedge the impact of changes in
the U.S. benchmark interest rate on future interest payments in anticipation of future debt offerings. Changes in the fair value of
treasury lock agreements are recorded to AOCI and reclassified into earnings when the hedged exposure affects earnings.
(e)
Equity Price Risk
We are exposed to variability in compensation charges related to certain deferred compensation obligations to employees and
directors. Although not designated as accounting hedges, we utilize derivatives such as total return swaps to economically
hedge this exposure and offset the related compensation expense.
14.
Commitments and Contingencies
(a)
Purchase Commitments with Contract Manufacturers and Suppliers
We purchase components from a variety of suppliers and use several contract manufacturers to provide manufacturing services
for our products. During the normal course of business, in order to manage manufacturing lead times and help ensure adequate
component supply, we enter into agreements with contract manufacturers and suppliers that allow them to procure inventory
based upon criteria as defined by us or establish the parameters defining our requirements. A significant portion of our reported
purchase commitments arising from these agreements consists of firm, noncancelable, and unconditional commitments. Certain
of these inventory purchase commitments are directly with suppliers, and relate to fixed-dollar commitments to secure supply
and pricing for certain product components for multi-year periods. In certain instances, these agreements allow us the option to
cancel, reschedule, and adjust our requirements based on our business needs prior to firm orders being placed.
The following table summarizes our inventory purchase commitments with contract manufacturers and suppliers by period (in
millions):
July 26, 2025
July 27, 2024
Less than 1 year
...................................................................................................................
$
7,202
$
3,952
1 to 3 years
..........................................................................................................................
320
1,085
3 to 5 years
..........................................................................................................................
77
121
Total
................................................................................................................................
$
7,599
$
5,158
The purchase commitments with contract manufacturers and suppliers as of July 26, 2025 has been reduced to give effect to the
settlement of a legal dispute with a supplier over purchase obligations arising under certain long-term supply arrangements.
See Note 21.
CISCO SYSTEMS, INC.
Notes to Consolidated Financial Statements (Continued)
88
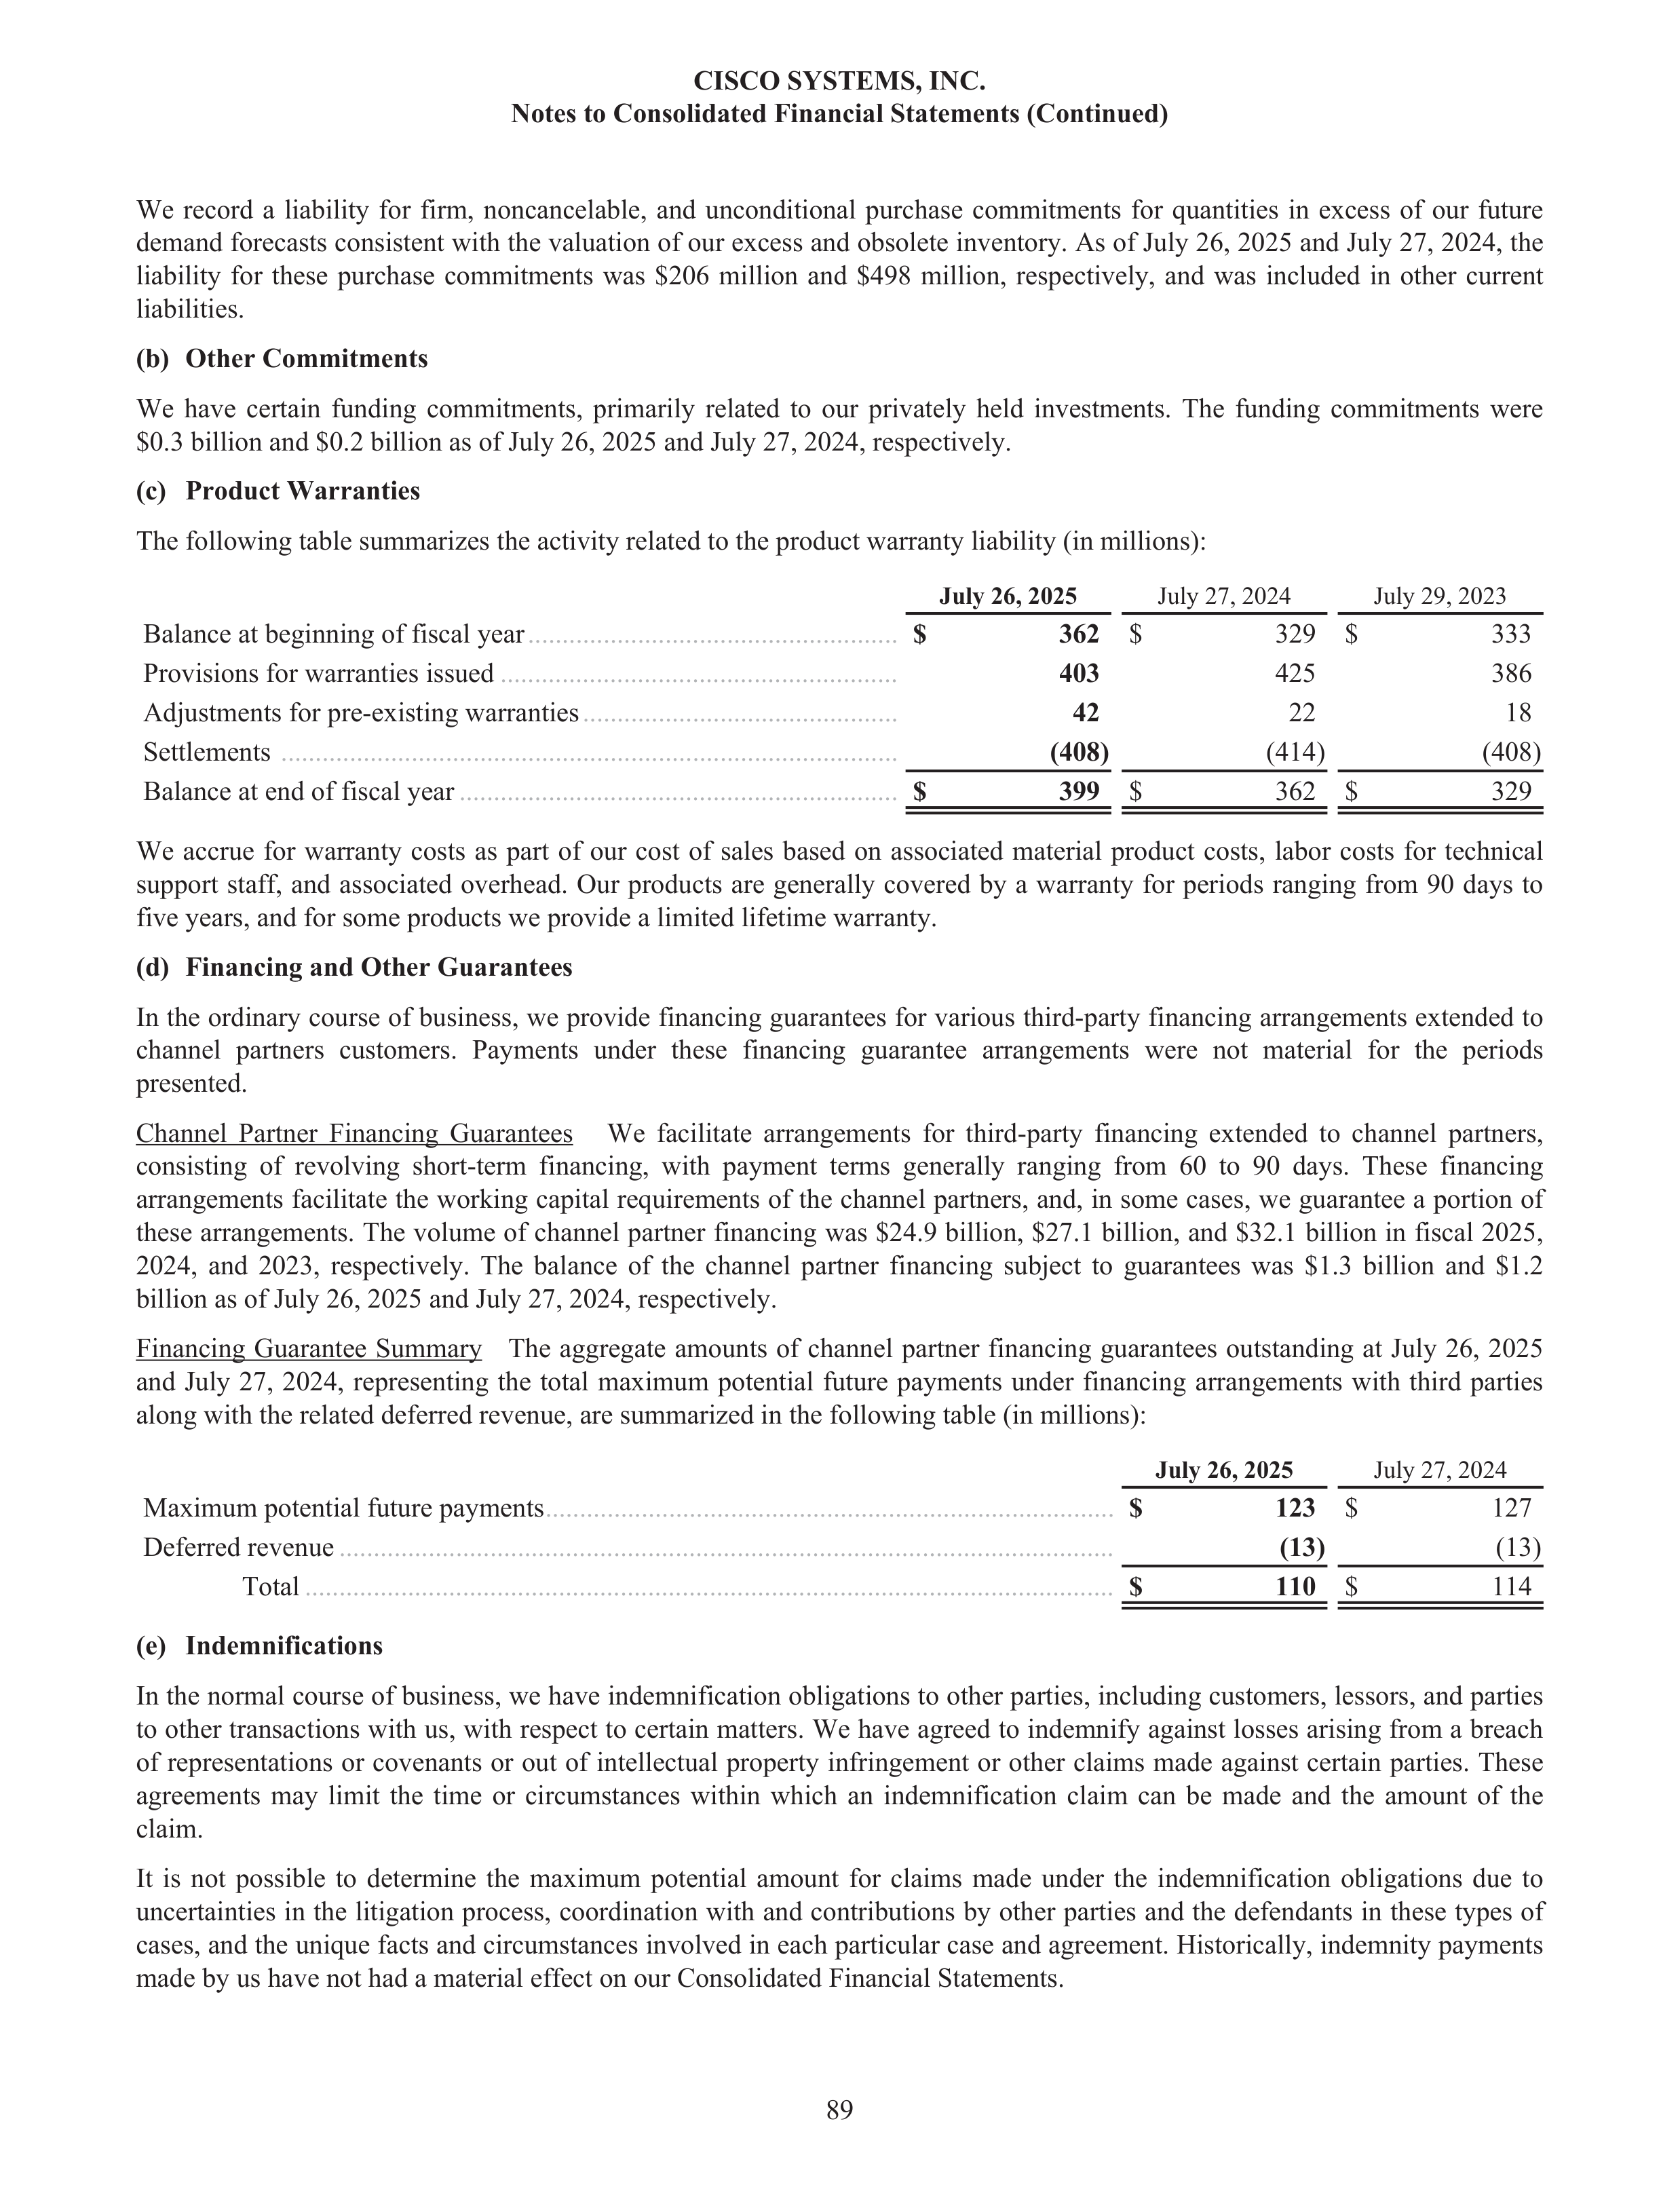
We record a liability for firm, noncancelable, and unconditional purchase commitments for quantities in excess of our future
demand forecasts consistent with the valuation of our excess and obsolete inventory. As of July 26, 2025 and July 27, 2024, the
liability for these purchase commitments was $206 million and $498 million, respectively, and was included in other current
liabilities.
(b)
Other Commitments
We have certain funding commitments, primarily related to our privately held investments. The funding commitments were
$0.3 billion and $0.2 billion as of July 26, 2025 and July 27, 2024, respectively.
(c)
Product Warranties
The following table summarizes the activity related to the product warranty liability (in millions):
July 26, 2025
July 27, 2024
July 29, 2023
Balance at beginning of fiscal year
......................................................
$
362
$
329 $
333
Provisions for warranties issued
..........................................................
403
425
386
Adjustments for pre-existing warranties
..............................................
42
22
18
Settlements
..........................................................................................
(408)
(414)
(408)
Balance at end of fiscal year
................................................................
$
399
$
362 $
329
We accrue for warranty costs as part of our cost of sales based on associated material product costs, labor costs for technical
support staff, and associated overhead. Our products are generally covered by a warranty for periods ranging from 90 days to
five years, and for some products we provide a limited lifetime warranty.
(d)
Financing and Other Guarantees
In the ordinary course of business, we provide financing guarantees for various third-party financing arrangements extended to
channel partners customers. Payments under these financing guarantee arrangements were not material for the periods
presented.
Channel Partner Financing Guarantees We facilitate arrangements for third-party financing extended to channel partners,
consisting of revolving short-term financing, with payment terms generally ranging from 60 to 90 days. These financing
arrangements facilitate the working capital requirements of the channel partners, and, in some cases, we guarantee a portion of
these arrangements. The volume of channel partner financing was $24.9 billion, $27.1 billion, and $32.1 billion in fiscal 2025,
2024, and 2023, respectively. The balance of the channel partner financing subject to guarantees was $1.3 billion and $1.2
billion as of July 26, 2025 and July 27, 2024, respectively.
Financing Guarantee Summary The aggregate amounts of channel partner financing guarantees outstanding at July 26, 2025
and July 27, 2024, representing the total maximum potential future payments under financing arrangements with third parties
along with the related deferred revenue, are summarized in the following table (in millions):
July 26, 2025
July 27, 2024
Maximum potential future payments
...................................................................................
$
123
$
127
Deferred revenue
.................................................................................................................
(13)
(13)
Total
......................................................................................................................
$
110
$
114
(e)
Indemnifications
In the normal course of business, we have indemnification obligations to other parties, including customers, lessors, and parties
to other transactions with us, with respect to certain matters. We have agreed to indemnify against losses arising from a breach
of representations or covenants or out of intellectual property infringement or other claims made against certain parties. These
agreements may limit the time or circumstances within which an indemnification claim can be made and the amount of the
claim.
It is not possible to determine the maximum potential amount for claims made under the indemnification obligations due to
uncertainties in the litigation process, coordination with and contributions by other parties and the defendants in these types of
cases, and the unique facts and circumstances involved in each particular case and agreement. Historically, indemnity payments
made by us have not had a material effect on our Consolidated Financial Statements.
CISCO SYSTEMS, INC.
Notes to Consolidated Financial Statements (Continued)
89
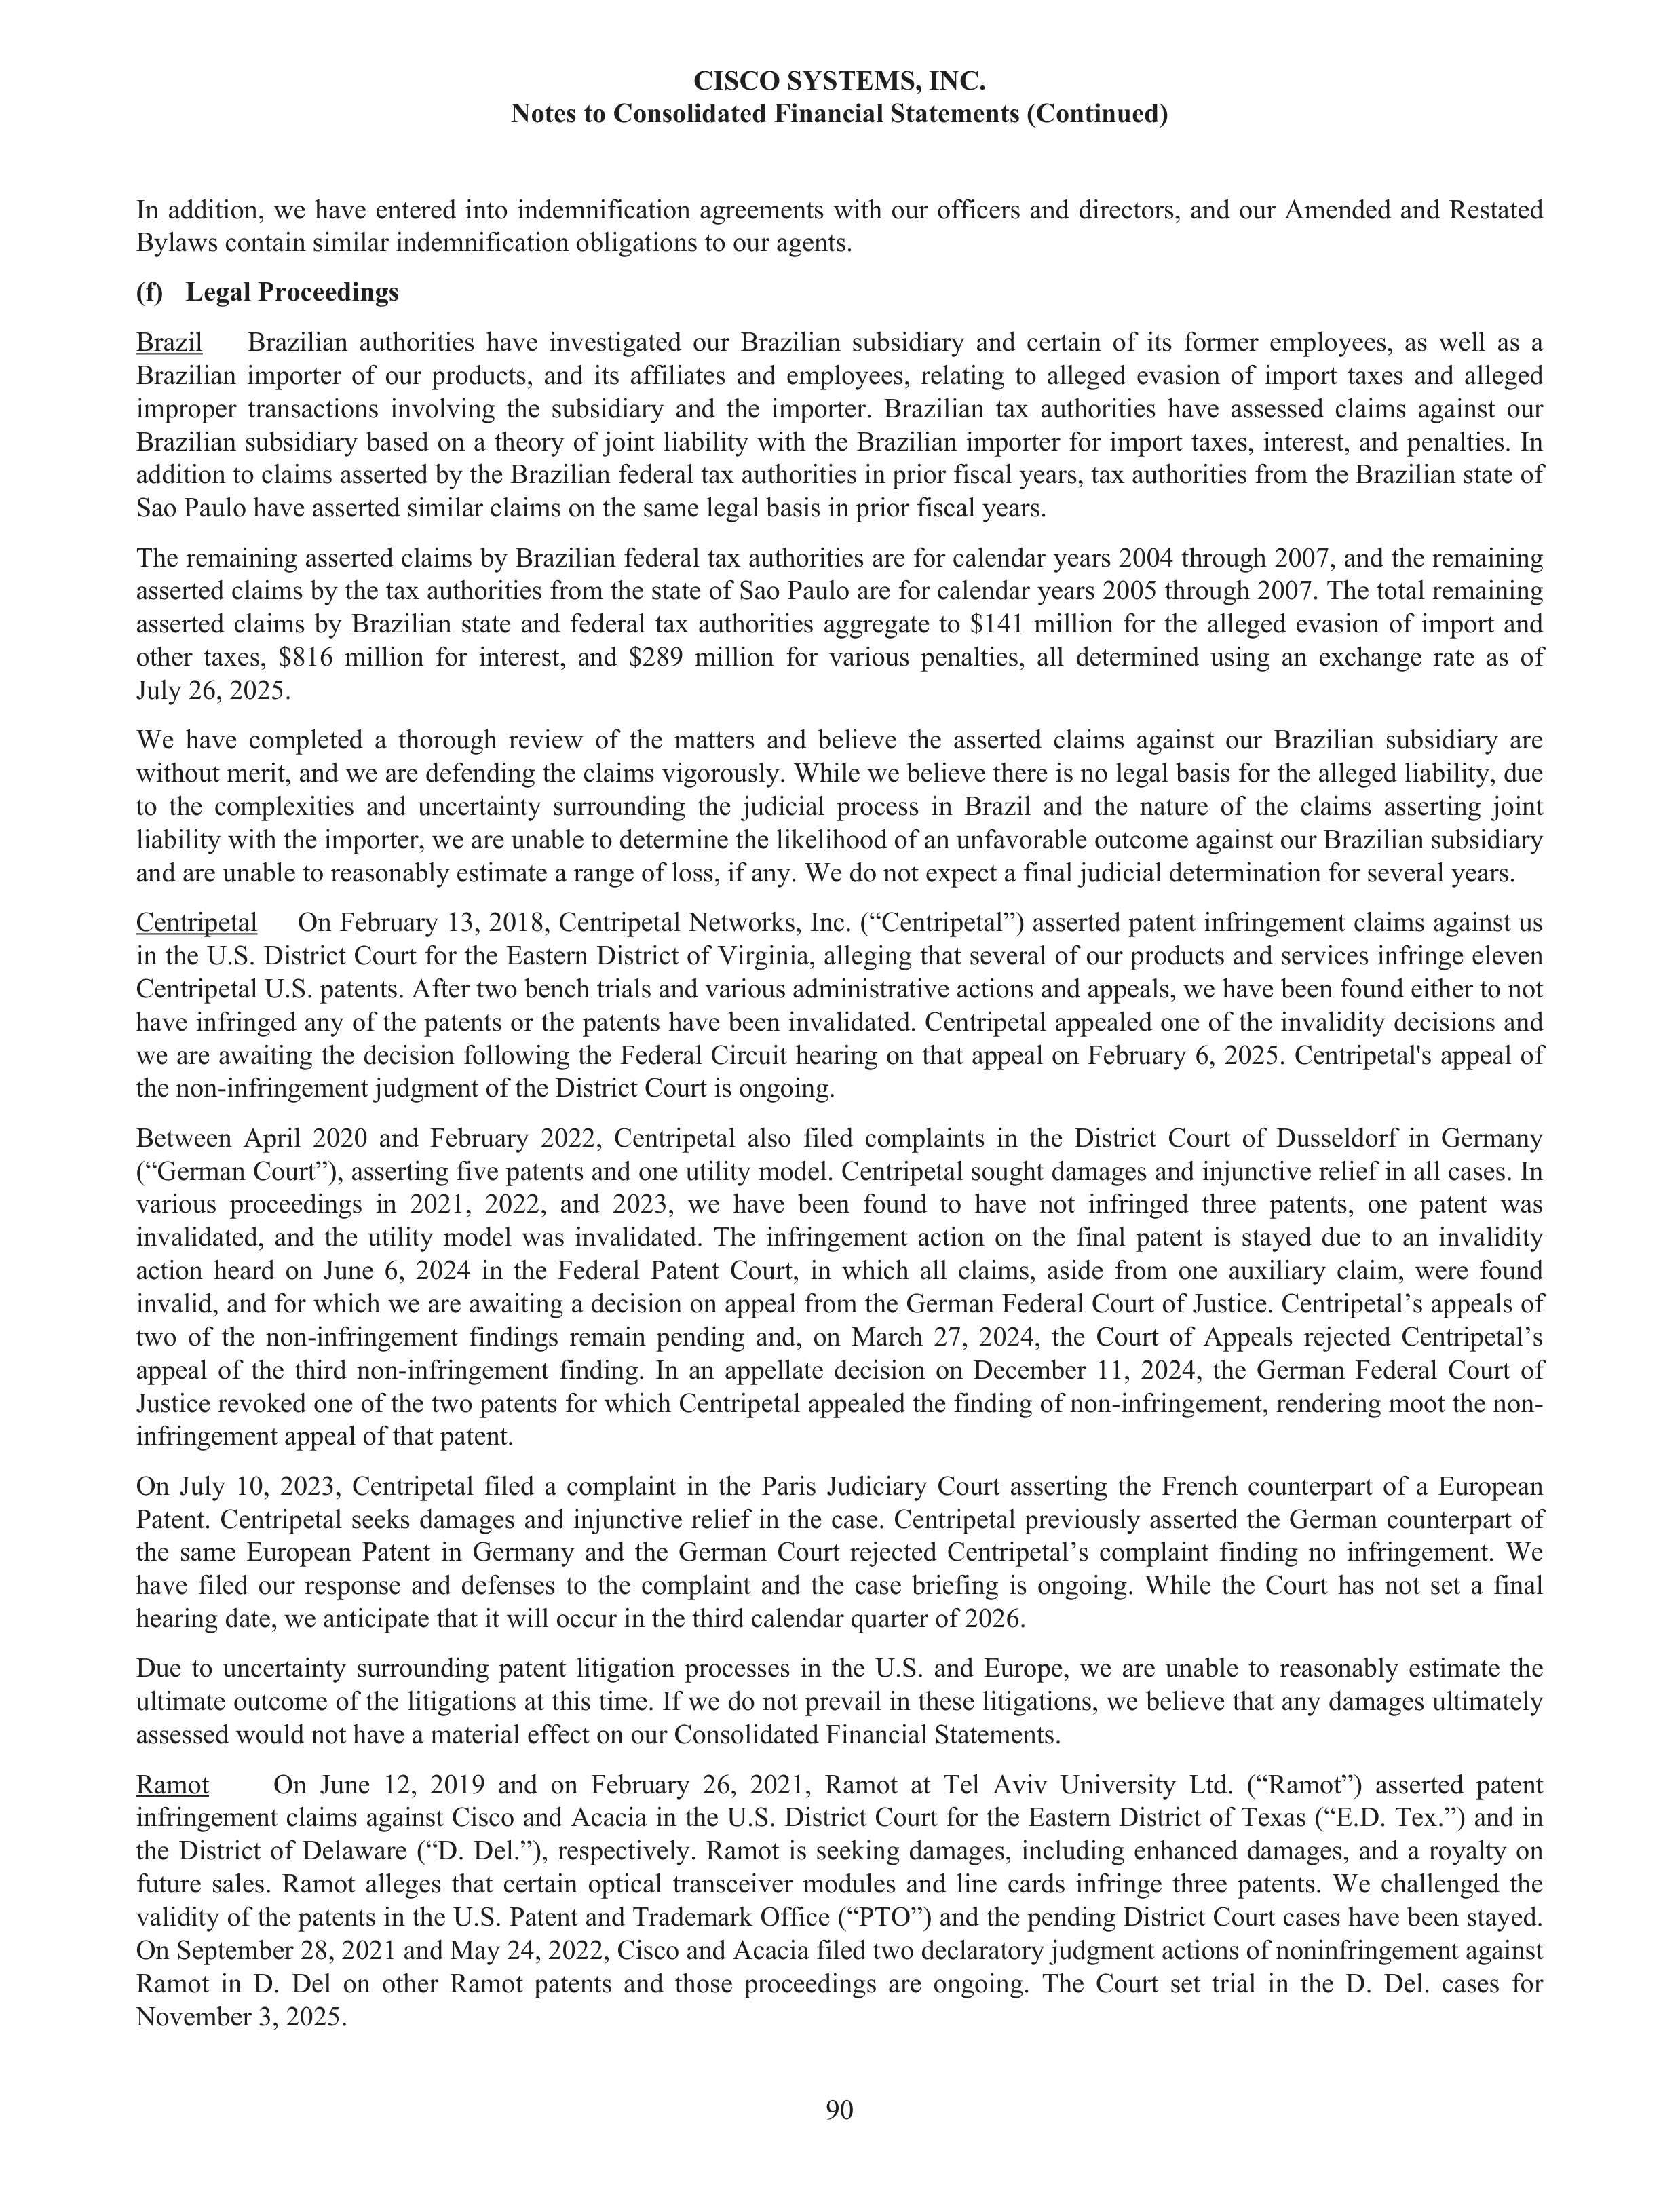
In addition, we have entered into indemnification agreements with our officers and directors, and our Amended and Restated
Bylaws contain similar indemnification obligations to our agents.
(f)
Legal Proceedings
Brazil
Brazilian authorities have investigated our Brazilian subsidiary and certain
of its former employees, as well as a
Brazilian importer of our products, and its affiliates and employees, relating to alleged evasion of import taxes and alleged
improper transactions involving the subsidiary and the importer. Brazilian tax authorities have assessed claims against our
Brazilian subsidiary based on a theory of joint liability with the Brazilian importer for import taxes, interest, and penalties. In
addition to claims asserted by the Brazilian federal tax authorities in prior fiscal years, tax authorities from the Brazilian state of
Sao Paulo have asserted similar claims on the same legal basis in prior fiscal years.
The remaining asserted claims by Brazilian federal tax authorities are for calendar years 2004 through 2007, and the remaining
asserted claims by the tax authorities from the state of Sao Paulo are for calendar years 2005 through 2007. The total remaining
asserted claims by Brazilian state and federal tax authorities aggregate to $141 million for the alleged evasion of import and
other taxes, $816 million for interest, and $289 million for various penalties, all determined using an exchange rate as of
July 26, 2025.
We have completed a thorough review of the matters and believe the asserted claims against our Brazilian subsidiary are
without merit, and we are defending the claims vigorously. While we believe there is no legal basis for the alleged liability, due
to the complexities and uncertainty surrounding the judicial process in Brazil and the nature of the claims asserting joint
liability with the importer, we are unable to determine the likelihood of an unfavorable outcome against our Brazilian subsidiary
and are unable to reasonably estimate a range of loss, if any. We do not expect a final judicial determination for several years.
Centripetal On February 13, 2018, Centripetal Networks, Inc. (“Centripetal”) asserted patent infringement claims against us
in the U.S. District Court for the Eastern District of Virginia, alleging that several of our products and services infringe eleven
Centripetal U.S. patents. After two bench trials and various administrative actions and appeals, we have been found either to not
have infringed any of the patents or the patents have been invalidated. Centripetal appealed one of the invalidity decisions and
we are awaiting the decision following the Federal Circuit hearing on that appeal on February 6, 2025. Centripetal's appeal of
the non-infringement judgment of the District Court is ongoing.
Between April 2020 and February 2022, Centripetal also filed complaints in the District Court of Dusseldorf in Germany
(“German Court”), asserting five patents and one utility model. Centripetal sought damages and injunctive relief in all cases. In
various proceedings in 2021, 2022, and 2023, we have been found to have not infringed three patents, one patent was
invalidated, and the utility model was invalidated. The infringement action on the final patent is stayed due to an invalidity
action heard on June 6, 2024 in the Federal Patent Court, in which all claims, aside from one auxiliary claim, were found
invalid, and for which we are awaiting a decision on appeal from the German Federal Court of Justice. Centripetal’s appeals of
two of the non-infringement findings remain pending and, on March 27, 2024, the Court of Appeals rejected Centripetal’s
appeal of the third non-infringement finding. In an appellate decision on December 11, 2024, the German Federal Court of
Justice revoked one of the two patents for which Centripetal appealed the finding of non-infringement, rendering moot the non-
infringement appeal of that patent.
On July 10, 2023, Centripetal filed a complaint in the Paris Judiciary Court asserting the French counterpart of a European
Patent. Centripetal seeks damages and injunctive relief in the case. Centripetal previously asserted the German counterpart of
the same European Patent in Germany and the German Court rejected Centripetal’s complaint finding no infringement. We
have filed our response and defenses to the complaint and the case briefing is ongoing. While the Court has not set a final
hearing date, we anticipate that it will occur in the third calendar quarter of 2026.
Due to uncertainty surrounding patent litigation processes in the U.S. and Europe, we are unable to reasonably estimate the
ultimate outcome of the litigations at this time. If we do not prevail in these litigations, we believe that any damages ultimately
assessed would not have a material effect on our Consolidated Financial Statements.
Ramot On June 12, 2019 and on February 26, 2021, Ramot at Tel Aviv University Ltd. (“Ramot”) asserted patent
infringement claims against Cisco and Acacia in the U.S. District Court for the Eastern District of Texas (“E.D. Tex.”) and in
the District of Delaware (“D. Del.”), respectively. Ramot is seeking damages, including enhanced damages, and a royalty on
future sales. Ramot alleges that certain optical transceiver modules and line cards infringe three patents. We challenged the
validity of the patents in the U.S. Patent and Trademark Office (“PTO”) and the pending District Court cases have been stayed.
On September 28, 2021 and May 24, 2022, Cisco and Acacia filed two declaratory judgment actions of noninfringement against
Ramot in D. Del on other Ramot patents and those proceedings are ongoing. The Court set trial in the D. Del. cases for
November 3, 2025.
CISCO SYSTEMS, INC.
Notes to Consolidated Financial Statements (Continued)
90
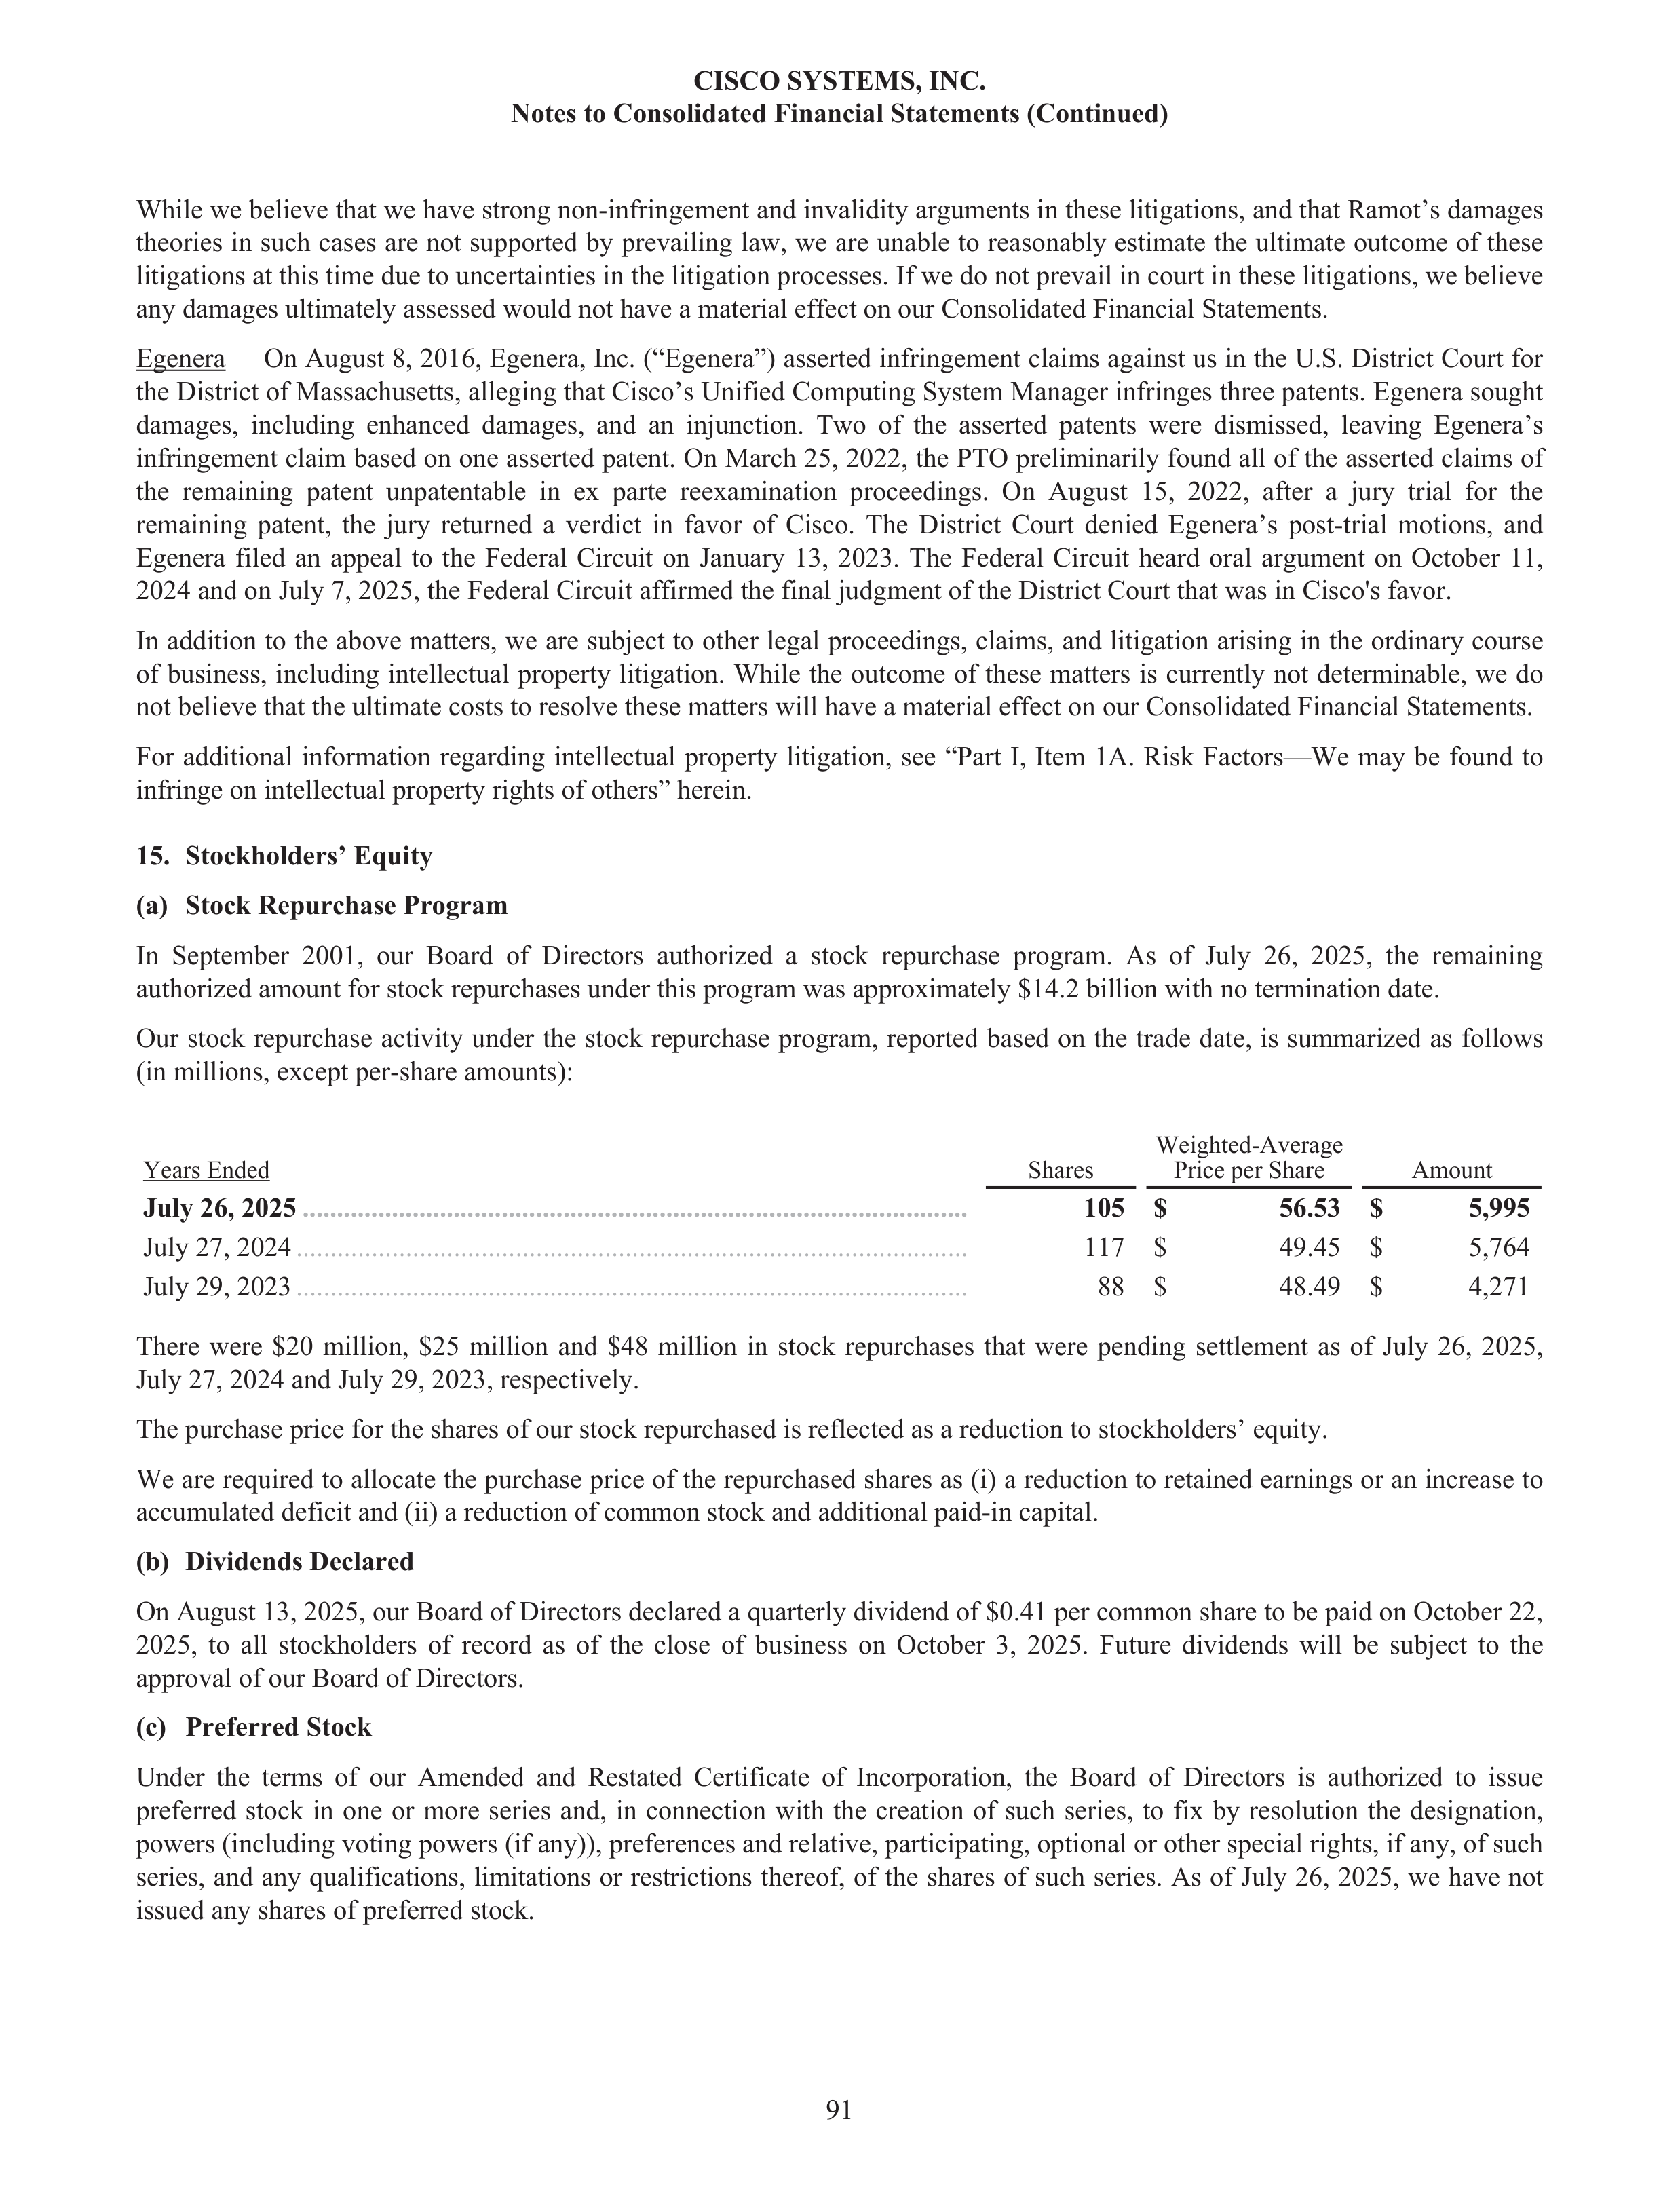
While we believe that we have strong non-infringement and invalidity arguments in these litigations, and that Ramot’s damages
theories in such cases are not supported by prevailing law, we are unable to reasonably estimate the ultimate outcome of these
litigations at this time due to uncertainties in the litigation processes. If we do not prevail in court in these litigations, we believe
any damages ultimately assessed would not have a material effect on our Consolidated Financial Statements.
Egenera On August 8, 2016, Egenera, Inc. (“Egenera”) asserted infringement claims against us in the U.S. District Court for
the District of Massachusetts, alleging that Cisco’s Unified Computing System Manager infringes three patents. Egenera sought
damages, including enhanced damages, and an injunction. Two of the asserted patents were dismissed, leaving Egenera’s
infringement claim based on one asserted patent. On March 25, 2022, the PTO preliminarily found all of the asserted claims of
the remaining patent unpatentable in ex parte reexamination proceedings. On August 15, 2022, after a jury trial for the
remaining patent, the jury returned a verdict in favor of Cisco. The District Court denied Egenera’s post-trial motions, and
Egenera filed an appeal to the Federal Circuit on January 13, 2023. The Federal Circuit heard oral argument on October 11,
2024 and on July 7, 2025, the Federal Circuit affirmed the final judgment of the District Court that was in Cisco's favor.
In addition to the above matters, we are subject to other legal proceedings, claims, and litigation arising in the ordinary course
of business, including intellectual property litigation. While the outcome of these matters is currently not determinable, we do
not believe that the ultimate costs to resolve these matters will have a material effect on our Consolidated Financial Statements.
For additional information regarding intellectual property litigation, see “Part I, Item 1A. Risk Factors—We may be found to
infringe on intellectual property rights of others” herein.
15.
Stockholders’ Equity
(a)
Stock Repurchase Program
In September 2001, our Board of Directors authorized a stock repurchase program. As of July 26, 2025, the remaining
authorized amount for stock repurchases under this program was approximately $14.2 billion with no termination date.
Our stock repurchase activity under the stock repurchase program, reported based on the trade date, is summarized as follows
(in millions, except per-share amounts):
Years Ended
Shares
Weighted-Average
Price per Share
Amount
July 26, 2025
.................................................................................................
105 $
56.53 $
5,995
July 27, 2024
..................................................................................................
117 $
49.45 $
5,764
July 29, 2023
..................................................................................................
88 $
48.49 $
4,271
There were $20 million,
$25 million and $48 million in stock repurchases that were pending settlement as of July 26, 2025,
July 27, 2024 and July 29, 2023, respectively.
The purchase price for the shares of our stock repurchased is reflected as a reduction to stockholders’ equity.
We are required to allocate the purchase price of the repurchased shares as (i) a reduction to retained earnings or an increase to
accumulated deficit and (ii) a reduction of common stock and additional paid-in capital.
(b)
Dividends Declared
On August 13, 2025, our Board of Directors declared a quarterly dividend of $0.41 per common share to be paid on October 22,
2025, to all stockholders of record as of the close of business on October 3, 2025. Future dividends will be subject to the
approval of our Board of Directors.
(c)
Preferred Stock
Under the terms of our Amended and Restated Certificate of Incorporation, the Board of Directors is authorized to issue
preferred stock in one or more series and, in connection with the creation of such series, to fix by resolution the designation,
powers (including voting powers (if any)), preferences and relative, participating, optional or other special rights, if any, of such
series, and any qualifications, limitations or restrictions thereof, of the shares of such series. As of July 26, 2025, we have not
issued any shares of preferred stock.
CISCO SYSTEMS, INC.
Notes to Consolidated Financial Statements (Continued)
91
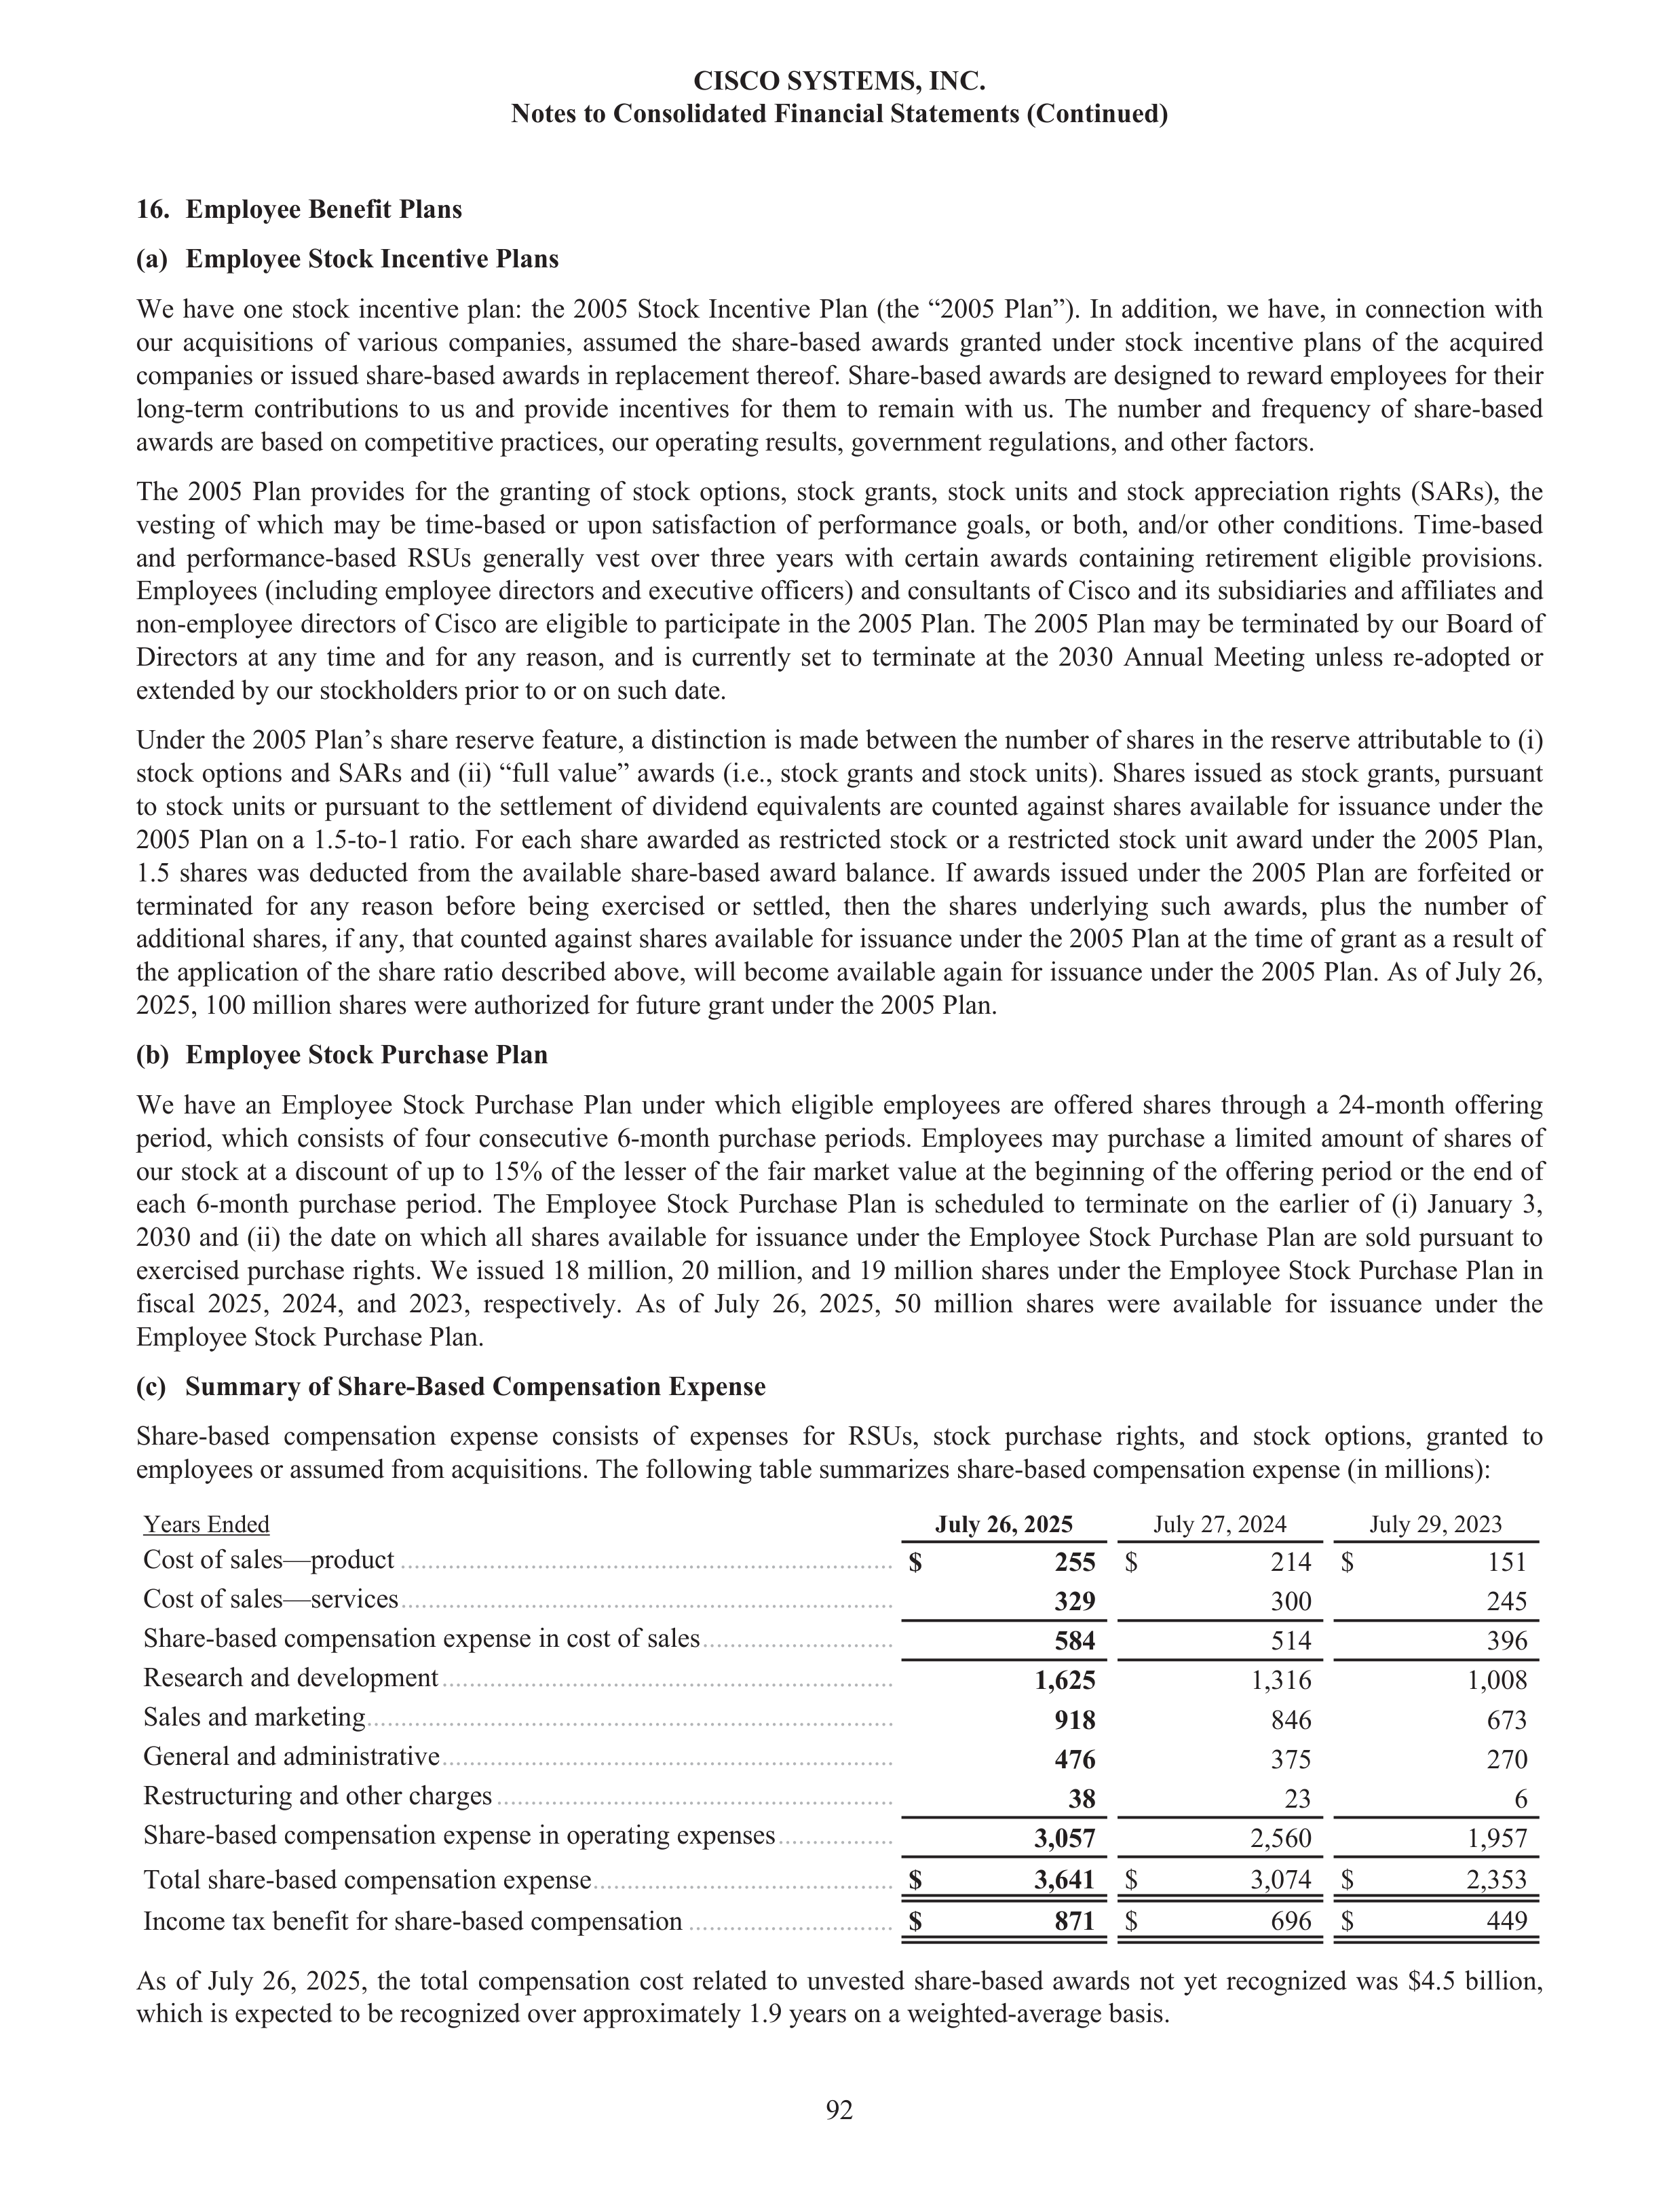
16.
Employee Benefit Plans
(a)
Employee Stock Incentive Plans
We have one stock incentive plan: the 2005 Stock Incentive Plan (the “2005 Plan”). In addition, we have, in connection with
our acquisitions of various companies, assumed the share-based awards granted under stock incentive plans of the acquired
companies or issued share-based awards in replacement thereof. Share-based awards are designed to reward employees for their
long-term contributions to us and provide incentives for them to remain with us. The number and frequency of share-based
awards are based on competitive practices, our operating results, government regulations, and other factors.
The 2005 Plan provides for the granting of stock options, stock grants, stock units and stock appreciation rights (SARs), the
vesting of which may be time-based or upon satisfaction of performance goals, or both, and/or other conditions. Time-based
and performance-based RSUs generally vest over three years with certain awards containing retirement eligible provisions.
Employees (including employee directors and executive officers) and consultants of Cisco and its subsidiaries and affiliates and
non-employee directors of Cisco are eligible to participate in the 2005 Plan. The 2005 Plan may be terminated by our Board of
Directors at any time and for any reason, and is currently set to terminate at the 2030 Annual Meeting unless re-adopted or
extended by our stockholders prior to or on such date.
Under the 2005 Plan’s share reserve feature, a distinction is made between the number of shares in the reserve attributable to (i)
stock options and SARs and (ii) “full value” awards (i.e., stock grants and stock units). Shares issued as stock grants, pursuant
to stock units or pursuant to the settlement of dividend equivalents are counted against shares available for issuance under the
2005 Plan on a 1.5-to-1 ratio. For each share awarded as restricted stock or a restricted stock unit award under the 2005 Plan,
1.5 shares was deducted from the available share-based award balance. If awards issued under the 2005 Plan are forfeited or
terminated for any reason before being exercised or settled, then the shares underlying such awards, plus the number of
additional shares, if any, that counted against shares available for issuance under the 2005 Plan at the time of grant as a result of
the application of the share ratio described above, will become available again for issuance under the 2005 Plan. As of July 26,
2025, 100 million shares were authorized for future grant under the 2005 Plan.
(b)
Employee Stock Purchase Plan
We have an Employee Stock Purchase Plan under which eligible employees are offered shares through a 24-month offering
period, which consists of four consecutive 6-month purchase periods. Employees may purchase a limited amount of shares of
our stock at a discount of up to 15% of the lesser of the fair market value at the beginning of the offering period or the end of
each 6-month purchase period. The Employee Stock Purchase Plan is scheduled to terminate on the earlier of (i) January 3,
2030 and (ii) the date on which all shares available for issuance under the Employee Stock Purchase Plan are sold pursuant to
exercised purchase rights. We issued 18 million, 20 million, and 19 million shares under the Employee Stock Purchase Plan in
fiscal 2025, 2024, and 2023, respectively. As of July 26, 2025, 50 million shares were available for issuance under the
Employee Stock Purchase Plan.
(c)
Summary of Share-Based Compensation Expense
Share-based compensation expense consists of expenses for RSUs, stock purchase rights, and stock options, granted to
employees or assumed from acquisitions. The following table summarizes share-based compensation expense (in millions):
Years Ended
July 26, 2025
July 27, 2024
July 29, 2023
Cost of sales—product
........................................................................
$
255
$
214 $
151
Cost of sales—services
........................................................................
329
300
245
Share-based compensation expense in cost of sales
............................
584
514
396
Research and development
..................................................................
1,625
1,316
1,008
Sales and marketing
.............................................................................
918
846
673
General and administrative
..................................................................
476
375
270
Restructuring and other charges
..........................................................
38
23
6
Share-based compensation expense in operating expenses
.................
3,057
2,560
1,957
Total share-based compensation expense
............................................
$
3,641
$
3,074 $
2,353
Income tax benefit for share-based compensation
..............................
$
871
$
696 $
449
As of July 26, 2025, the total compensation cost related to unvested share-based awards not yet recognized was $4.5 billion,
which is expected to be recognized over approximately 1.9 years on a weighted-average basis.
CISCO SYSTEMS, INC.
Notes to Consolidated Financial Statements (Continued)
92
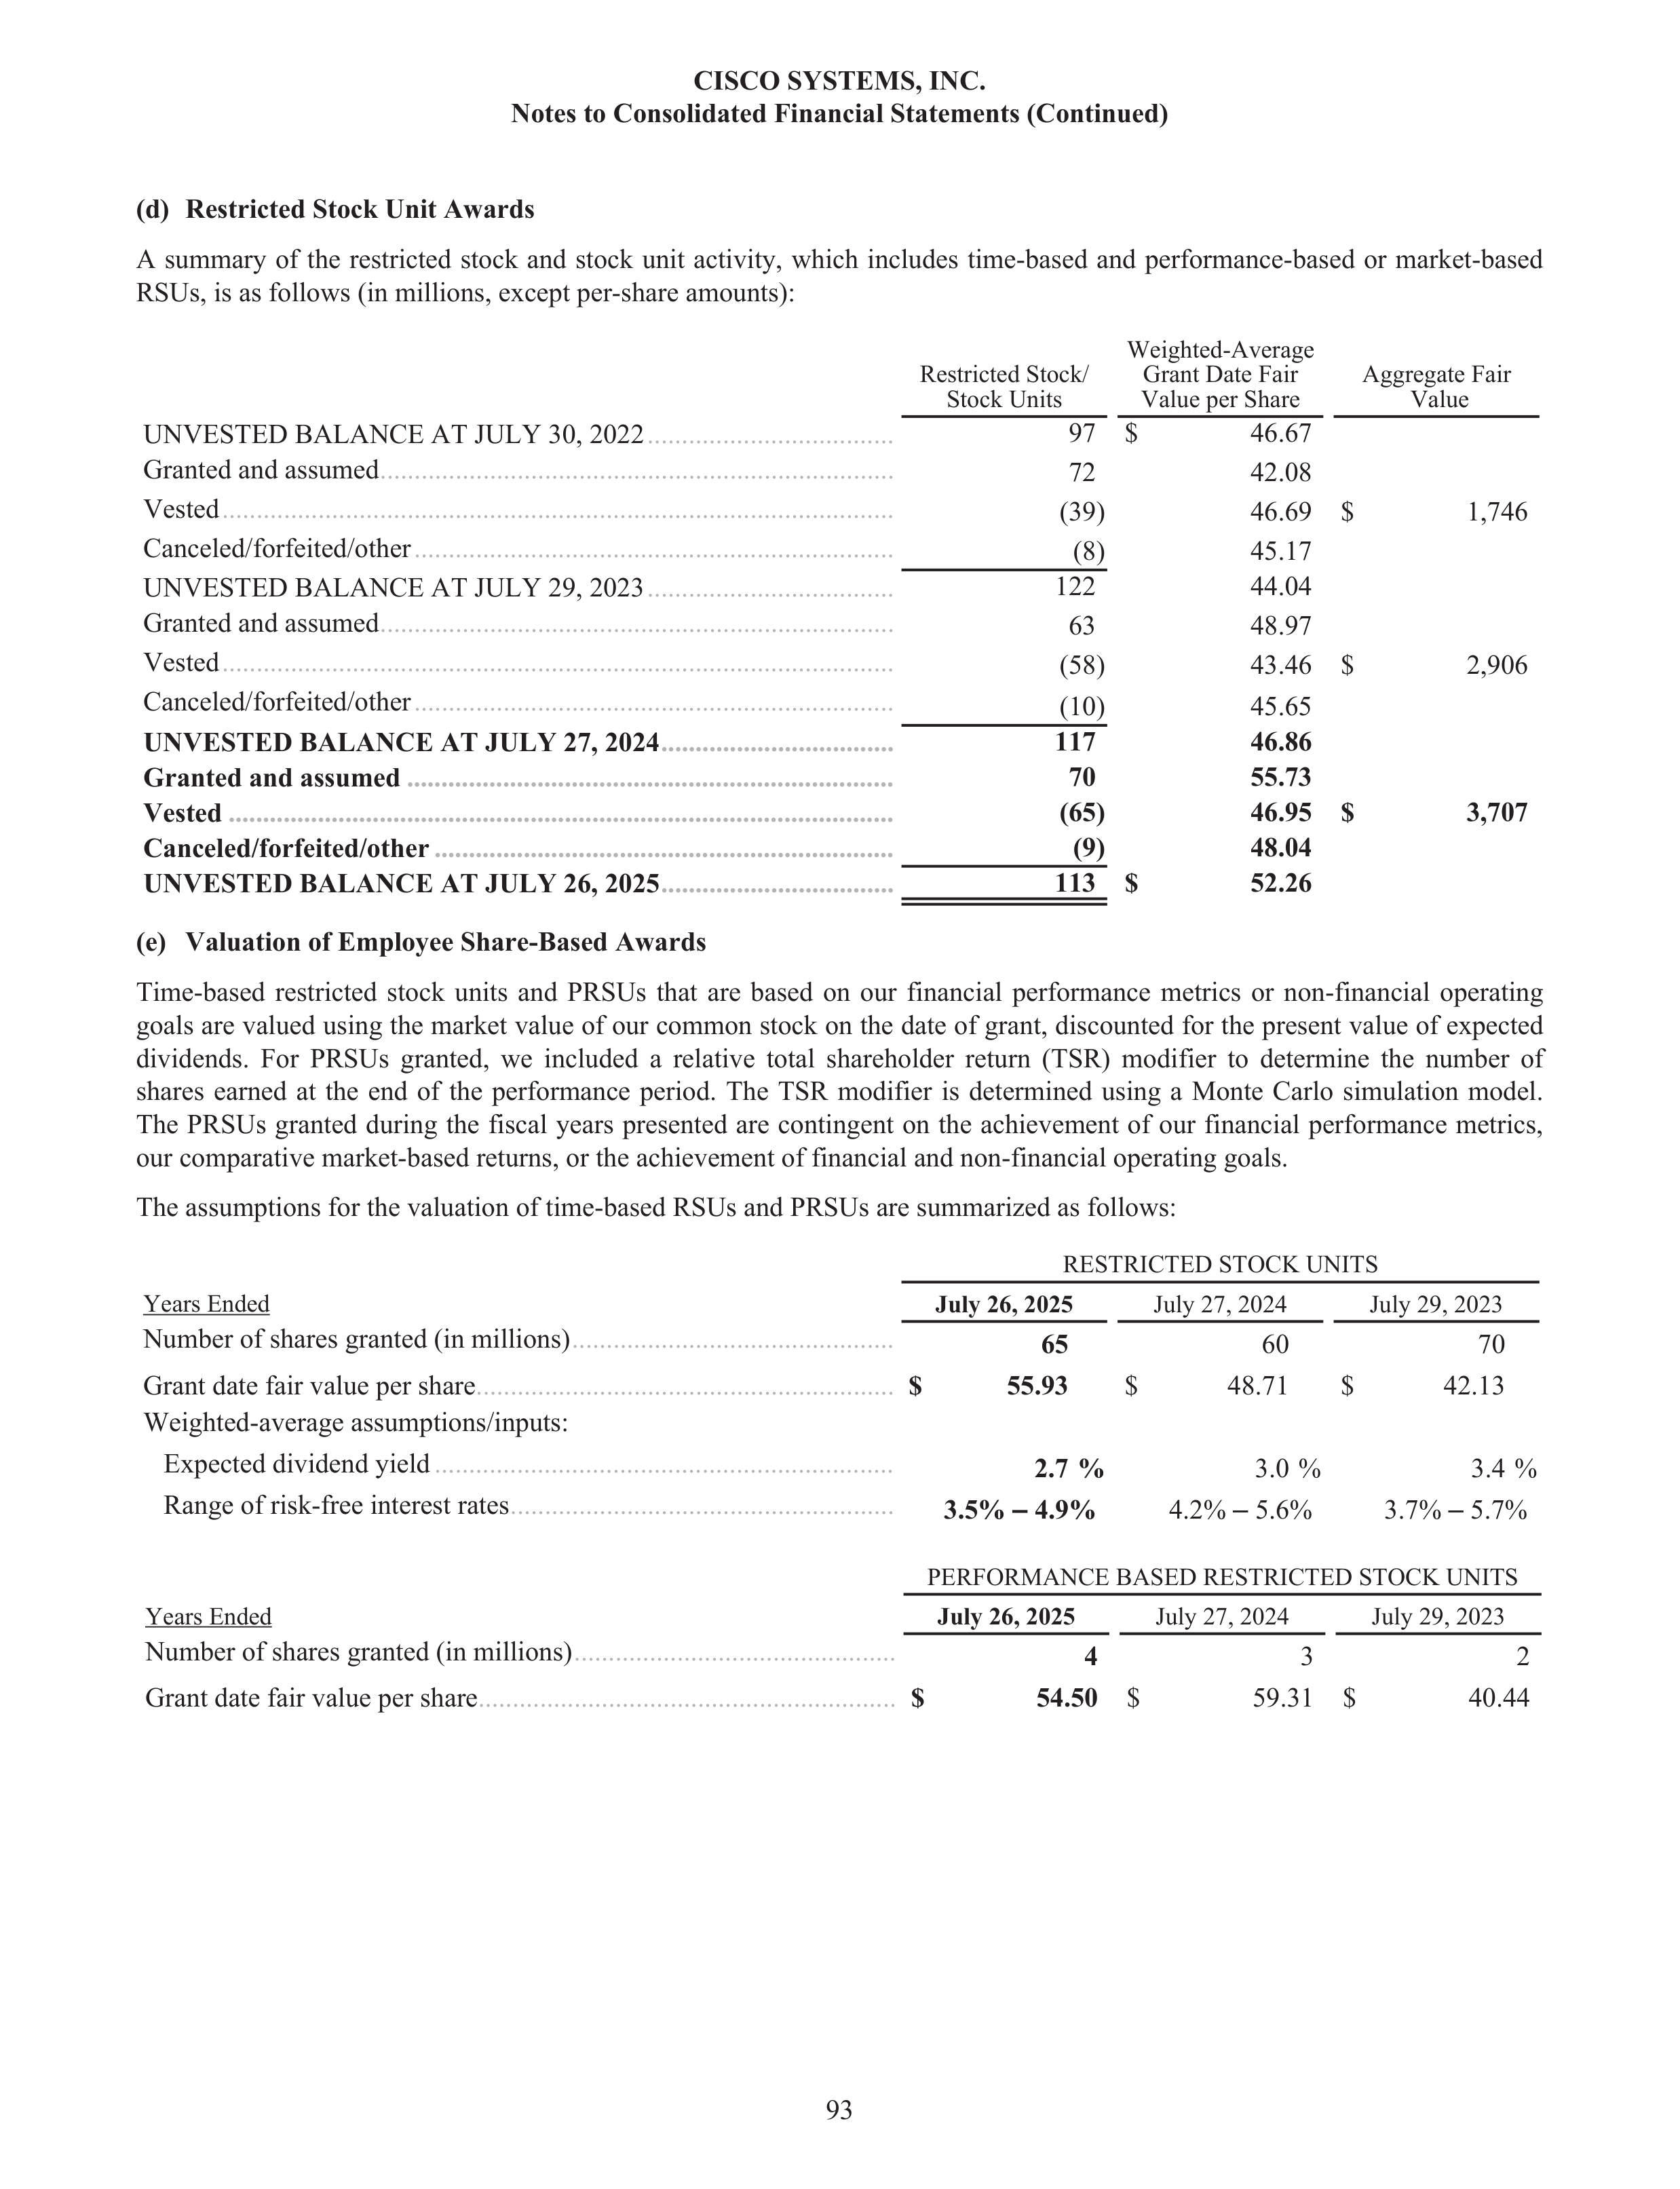
(d)
Restricted Stock Unit Awards
A summary of the restricted stock and stock unit activity, which includes time-based and performance-based or market-based
RSUs, is as follows (in millions, except per-share amounts):
Restricted Stock/
Stock Units
Weighted-Average
Grant Date Fair
Value per Share
Aggregate Fair
Value
UNVESTED BALANCE AT JULY 30, 2022
....................................
97 $
46.67
Granted and assumed
...........................................................................
72
42.08
Vested
..................................................................................................
(39)
46.69 $
1,746
Canceled/forfeited/other
......................................................................
(8)
45.17
UNVESTED BALANCE AT JULY 29, 2023
....................................
122
44.04
Granted and assumed
...........................................................................
63
48.97
Vested
..................................................................................................
(58)
43.46 $
2,906
Canceled/forfeited/other
......................................................................
(10)
45.65
UNVESTED BALANCE AT JULY 27, 2024
..................................
117
46.86
Granted and assumed
.......................................................................
70
55.73
Vested
.................................................................................................
(65)
46.95 $
3,707
Canceled/forfeited/other
...................................................................
(9)
48.04
UNVESTED BALANCE AT JULY 26, 2025
..................................
113 $
52.26
(e)
Valuation of Employee Share-Based Awards
Time-based restricted stock units and PRSUs that are based on our financial performance metrics or non-financial operating
goals are valued using the market value of our common stock on the date of grant, discounted for the present value of expected
dividends. For PRSUs granted, we included a relative total shareholder return (TSR) modifier to determine the number of
shares earned at the end of the performance period. The TSR modifier is determined using a Monte Carlo simulation model.
The PRSUs granted during the fiscal years presented are contingent on the achievement of our financial performance metrics,
our comparative market-based returns, or the achievement of financial and non-financial operating goals.
The assumptions for the valuation of time-based RSUs and PRSUs are summarized as follows:
RESTRICTED STOCK UNITS
Years Ended
July 26, 2025
July 27, 2024
July 29, 2023
Number of shares granted (in millions)
...............................................
65
60
70
Grant date fair value per share
.............................................................
$
55.93
$
48.71
$
42.13
Weighted-average assumptions/inputs:
Expected dividend yield
...................................................................
2.7 %
3.0 %
3.4 %
Range of risk-free interest rates
........................................................
3.5%
–
4.9%
4.2%
–
5.6%
3.7%
–
5.7%
PERFORMANCE BASED RESTRICTED STOCK UNITS
Years Ended
July 26, 2025
July 27, 2024
July 29, 2023
Number of shares granted (in millions)
...............................................
4
3
2
Grant date fair value per share
.............................................................
$
54.50
$
59.31 $
40.44
CISCO SYSTEMS, INC.
Notes to Consolidated Financial Statements (Continued)
93
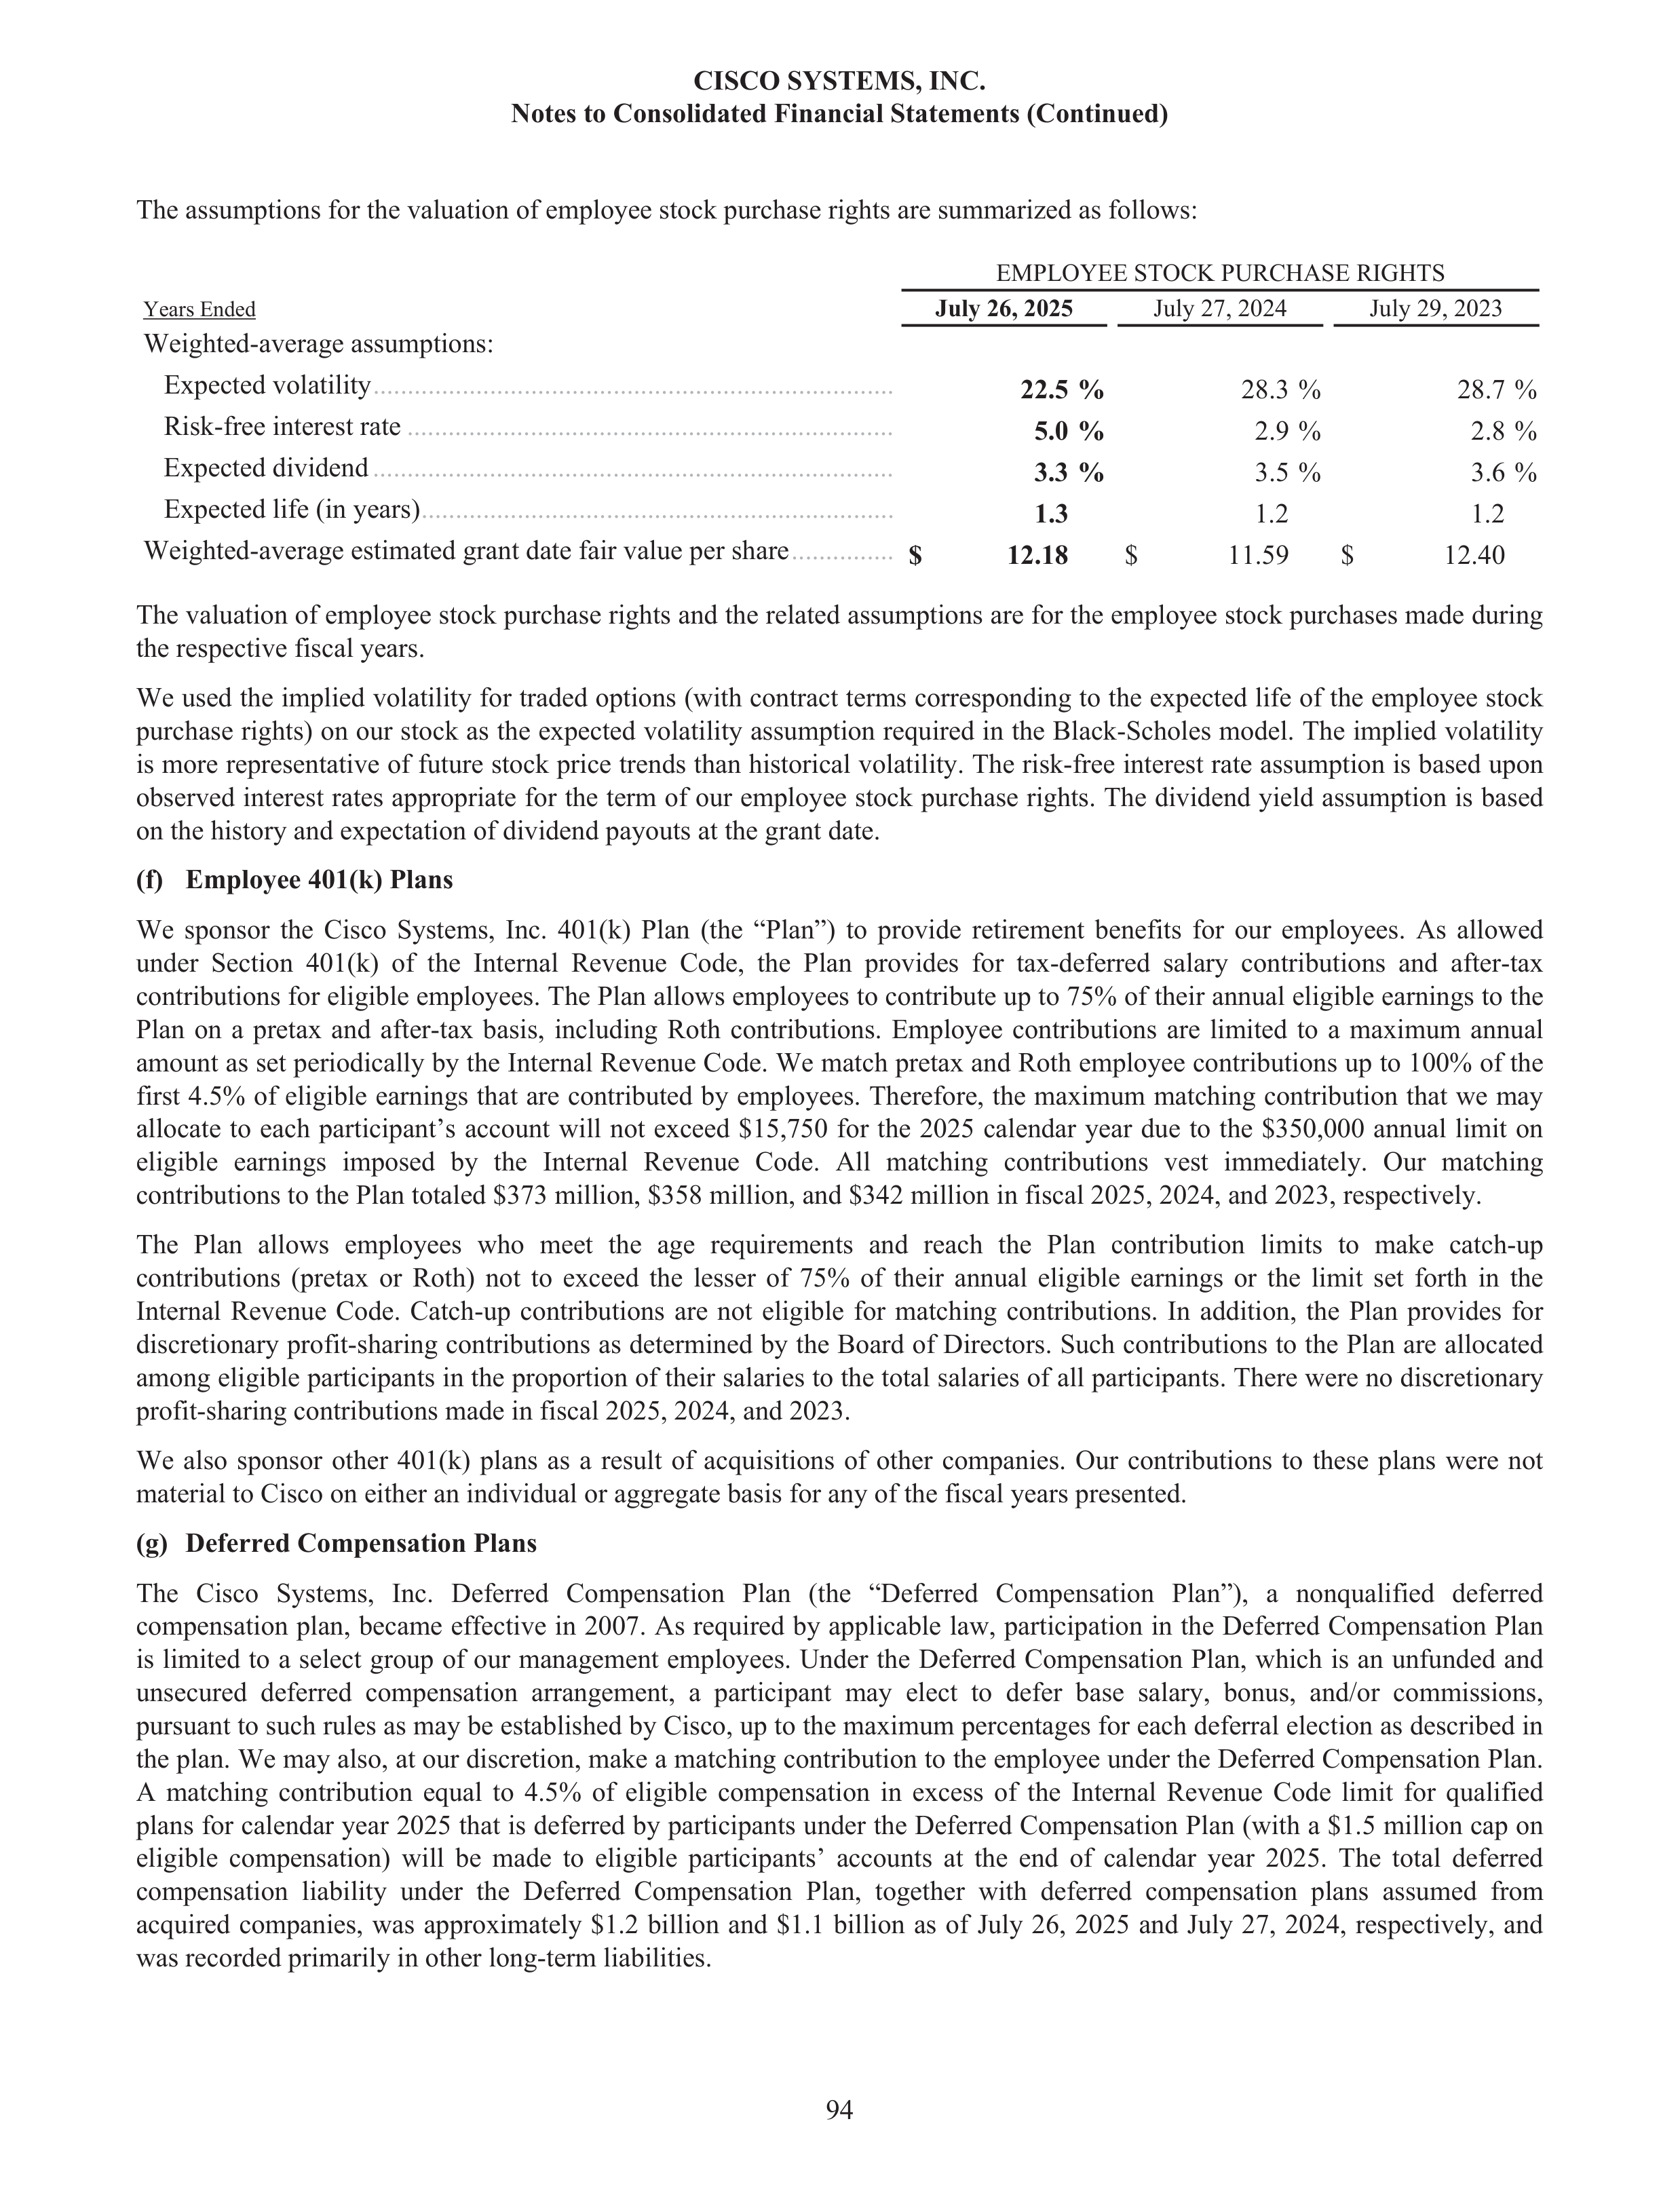
The assumptions for the valuation of employee stock purchase rights are summarized as follows:
EMPLOYEE STOCK PURCHASE RIGHTS
Years Ended
July 26, 2025
July 27, 2024
July 29, 2023
Weighted-average assumptions:
Expected volatility
............................................................................
22.5 %
28.3 %
28.7 %
Risk-free interest rate
.......................................................................
5.0 %
2.9 %
2.8 %
Expected dividend
............................................................................
3.3 %
3.5 %
3.6 %
Expected life (in years)
.....................................................................
1.3
1.2
1.2
Weighted-average estimated grant date fair value per share
...............
$
12.18
$
11.59
$
12.40
The valuation of employee stock purchase rights and the related assumptions are for the employee stock purchases made during
the respective fiscal years.
We used the implied volatility for traded options (with contract terms corresponding to the expected life of the employee stock
purchase rights) on our stock as the expected volatility assumption required in the Black-Scholes model. The implied volatility
is more representative of future stock price trends than historical volatility. The risk-free interest rate assumption is based upon
observed interest rates appropriate for the term of our employee stock purchase rights. The dividend yield assumption is based
on the history and expectation of dividend payouts at the grant date.
(f)
Employee 401(k) Plans
We sponsor the Cisco Systems, Inc. 401(k) Plan (the “Plan”) to provide retirement benefits for our employees. As allowed
under Section 401(k) of the Internal Revenue Code, the Plan provides for tax-deferred salary contributions and after-tax
contributions for eligible employees. The Plan allows employees to contribute up to 75% of their annual eligible earnings to the
Plan on a pretax and after-tax basis, including Roth contributions. Employee contributions are limited to a maximum annual
amount as set periodically by the Internal Revenue Code. We match pretax and Roth employee contributions up to 100% of the
first 4.5% of eligible earnings that are contributed by employees. Therefore, the maximum matching contribution that we may
allocate to each participant’s account will not exceed $15,750 for the 2025 calendar year due to the $350,000 annual limit on
eligible earnings imposed by the Internal Revenue Code. All matching contributions vest immediately. Our matching
contributions to the Plan totaled $373 million, $358 million, and $342 million in fiscal 2025, 2024, and 2023, respectively.
The Plan allows employees who meet the age requirements and reach the Plan contribution limits to make catch-up
contributions (pretax or Roth) not to exceed the lesser of 75% of their annual eligible earnings or the limit set forth in the
Internal Revenue Code. Catch-up contributions are not eligible for matching contributions. In addition, the Plan provides for
discretionary profit-sharing contributions as determined by the Board of Directors. Such contributions to the Plan are allocated
among eligible participants in the proportion of their salaries to the total salaries of all participants. There were no discretionary
profit-sharing contributions made in fiscal 2025, 2024, and 2023.
We also sponsor other 401(k) plans as a result of acquisitions of other companies. Our contributions to these plans were not
material to Cisco on either an individual or aggregate basis for any of the fiscal years presented.
(g)
Deferred Compensation Plans
The Cisco Systems, Inc. Deferred Compensation Plan (the “Deferred Compensation Plan”), a nonqualified deferred
compensation plan, became effective in 2007. As required by applicable law, participation in the Deferred Compensation Plan
is limited to a select group of our management employees. Under the Deferred Compensation Plan, which is an unfunded and
unsecured deferred compensation arrangement, a participant may elect to defer base salary, bonus, and/or commissions,
pursuant to such rules as may be established by Cisco, up to the maximum percentages for each deferral election as described in
the plan. We may also, at our discretion, make a matching contribution to the employee under the Deferred Compensation Plan.
A matching contribution equal to 4.5% of eligible compensation in excess of the Internal Revenue Code limit for qualified
plans for calendar year 2025 that is deferred by participants under the Deferred Compensation Plan (with a $1.5 million cap on
eligible compensation) will be made to eligible participants’ accounts at the end of calendar year 2025. The total deferred
compensation liability under the Deferred Compensation Plan, together with deferred compensation plans assumed from
acquired companies, was approximately $1.2 billion
and $1.1 billion as of July 26, 2025 and July 27, 2024, respectively, and
was recorded primarily in other long-term liabilities.
CISCO SYSTEMS, INC.
Notes to Consolidated Financial Statements (Continued)
94
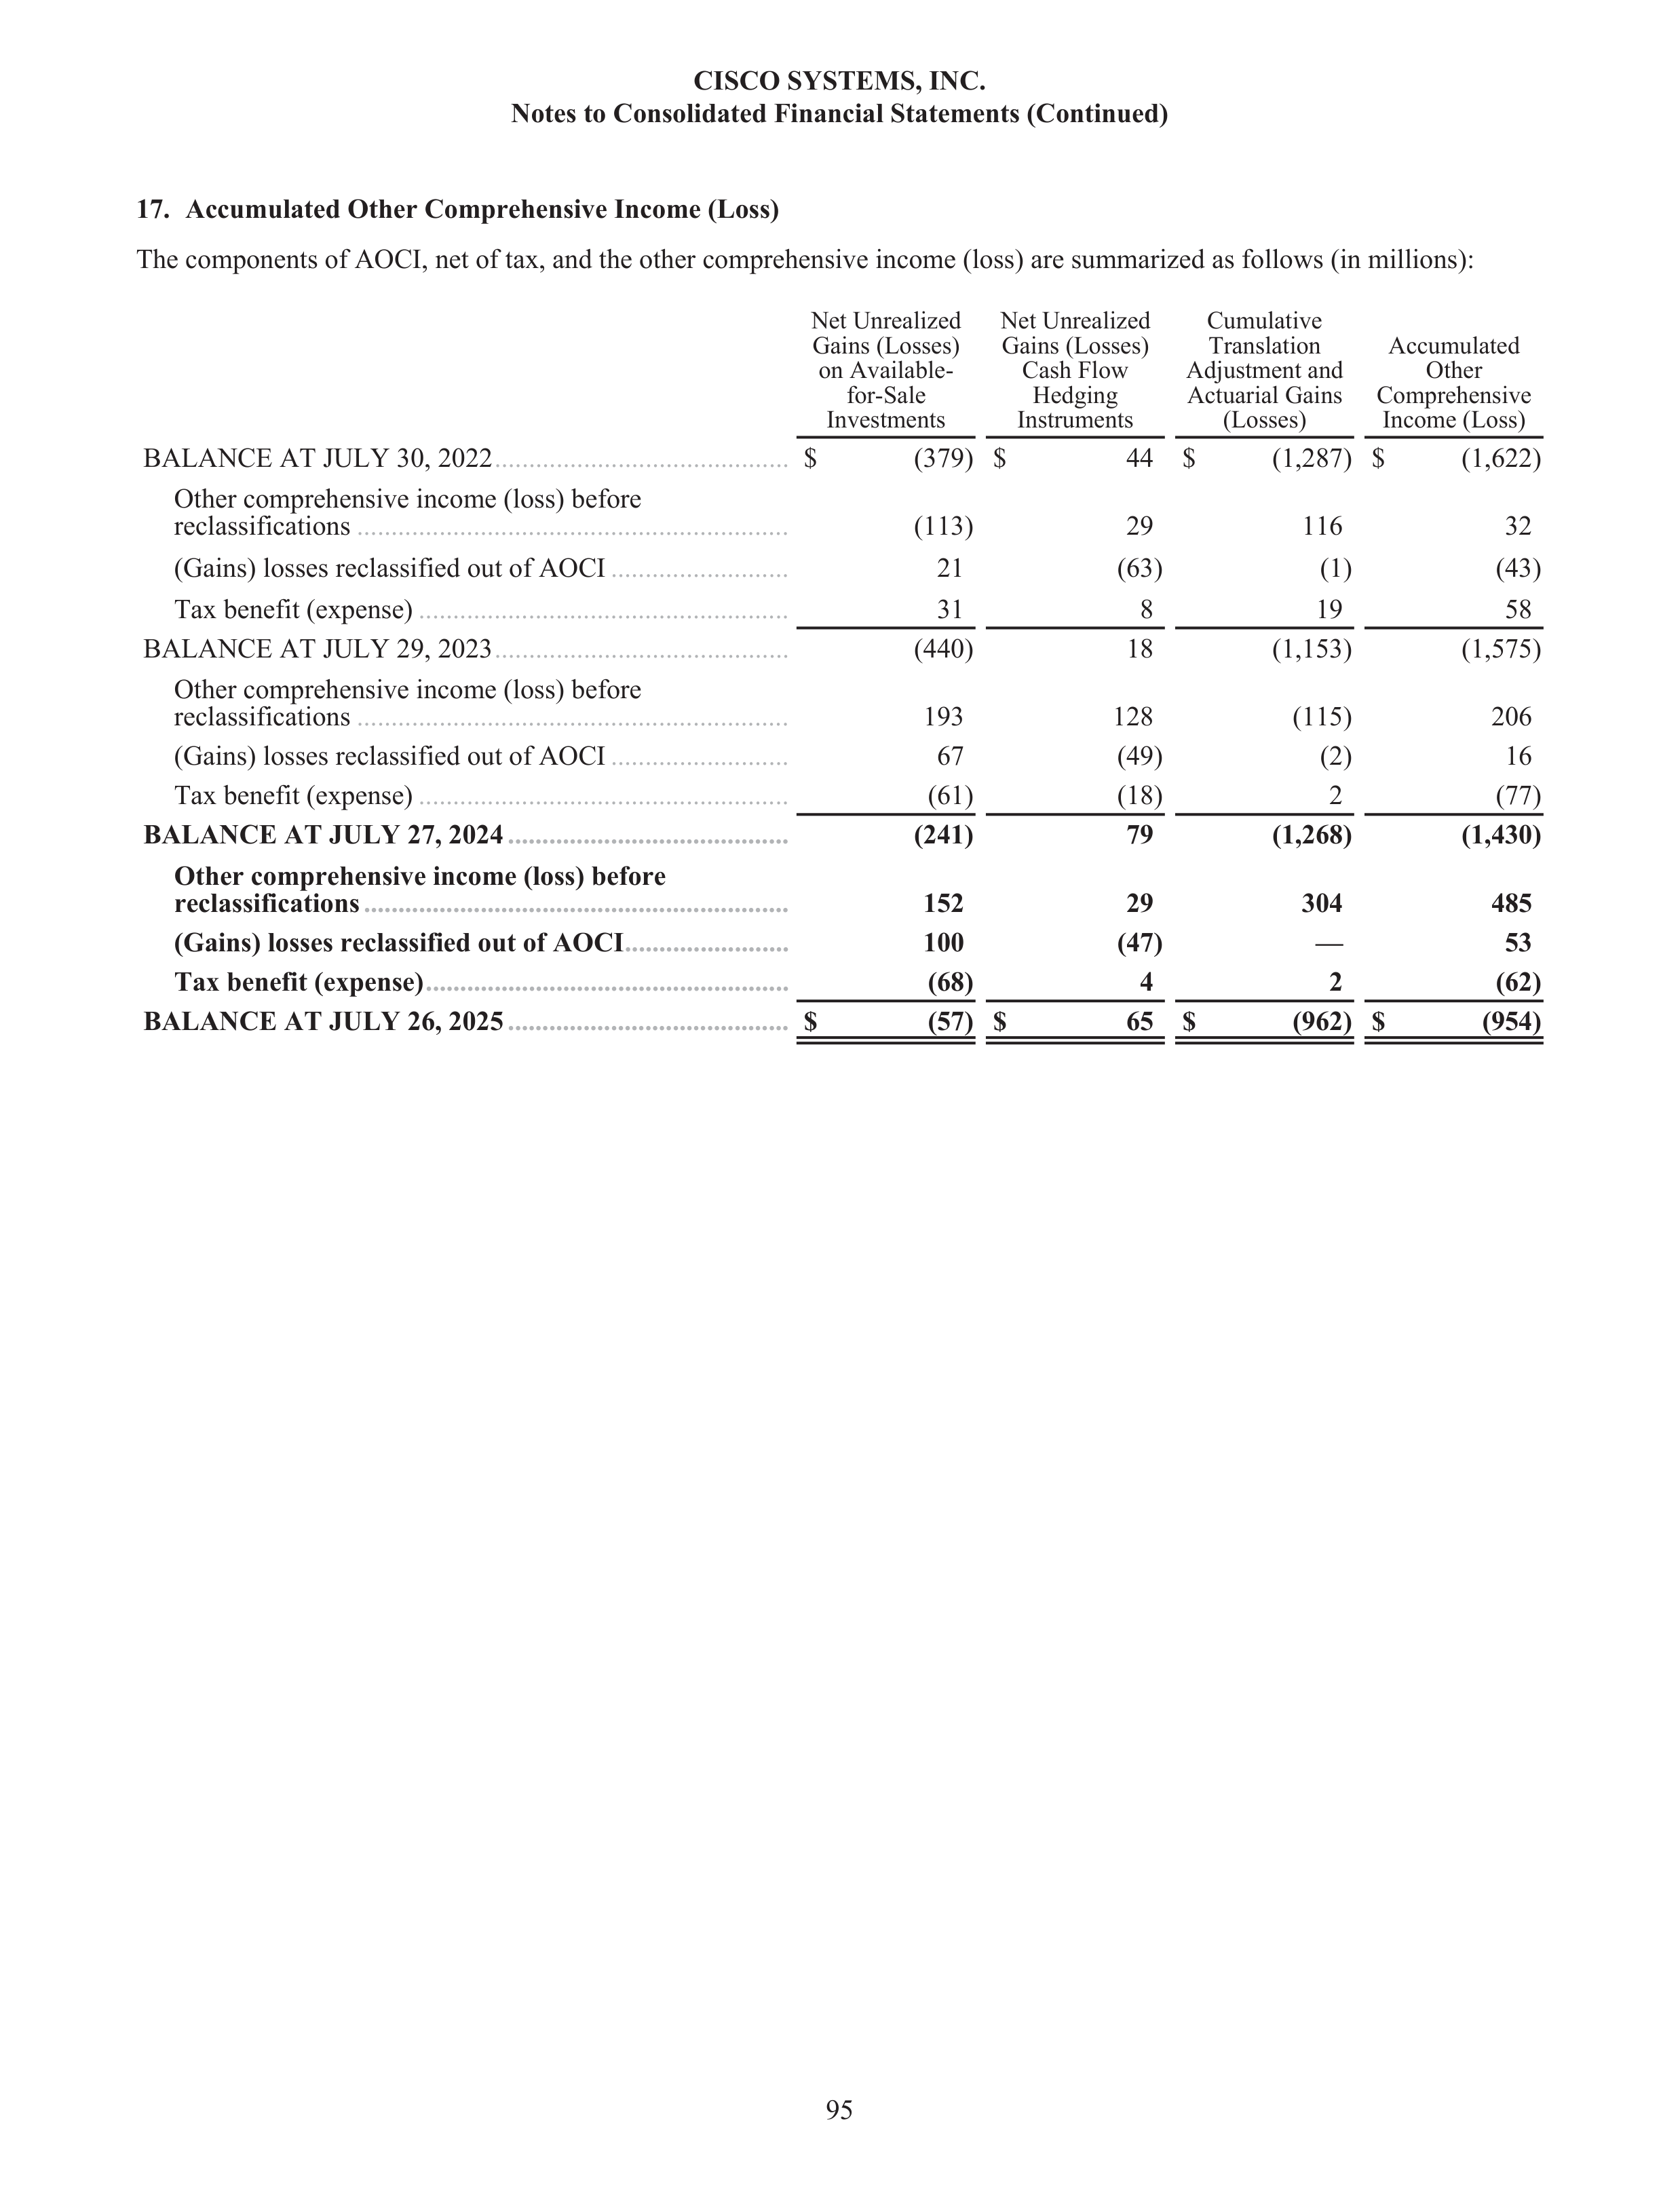
17.
Accumulated Other Comprehensive Income (Loss)
The components of AOCI, net of tax, and the other comprehensive income (loss) are summarized as follows (in millions):
Net Unrealized
Gains (Losses)
on Available-
for-Sale
Investments
Net Unrealized
Gains (Losses)
Cash Flow
Hedging
Instruments
Cumulative
Translation
Adjustment and
Actuarial Gains
(Losses)
Accumulated
Other
Comprehensive
Income (Loss)
BALANCE AT JULY 30, 2022
...........................................
$
(379)
$
44 $
(1,287) $
(1,622)
Other comprehensive income (loss) before
reclassifications
...............................................................
(113)
29
116
32
(Gains) losses reclassified out of AOCI
..........................
21
(63)
(1)
(43)
Tax benefit (expense)
......................................................
31
8
19
58
BALANCE AT JULY 29, 2023
...........................................
(440)
18
(1,153)
(1,575)
Other comprehensive income (loss) before
reclassifications
...............................................................
193
128
(115)
206
(Gains) losses reclassified out of AOCI
..........................
67
(49)
(2)
16
Tax benefit (expense)
......................................................
(61)
(18)
2
(77)
BALANCE AT JULY 27, 2024
.........................................
(241)
79
(1,268)
(1,430)
Other comprehensive income (loss) before
reclassifications
..............................................................
152
29
304
485
(Gains) losses reclassified out of AOCI
........................
100
(47)
—
53
Tax benefit (expense)
.....................................................
(68)
4
2
(62)
BALANCE AT JULY 26, 2025
.........................................
$
(57)
$
65 $
(962)
$
(954)
CISCO SYSTEMS, INC.
Notes to Consolidated Financial Statements (Continued)
95
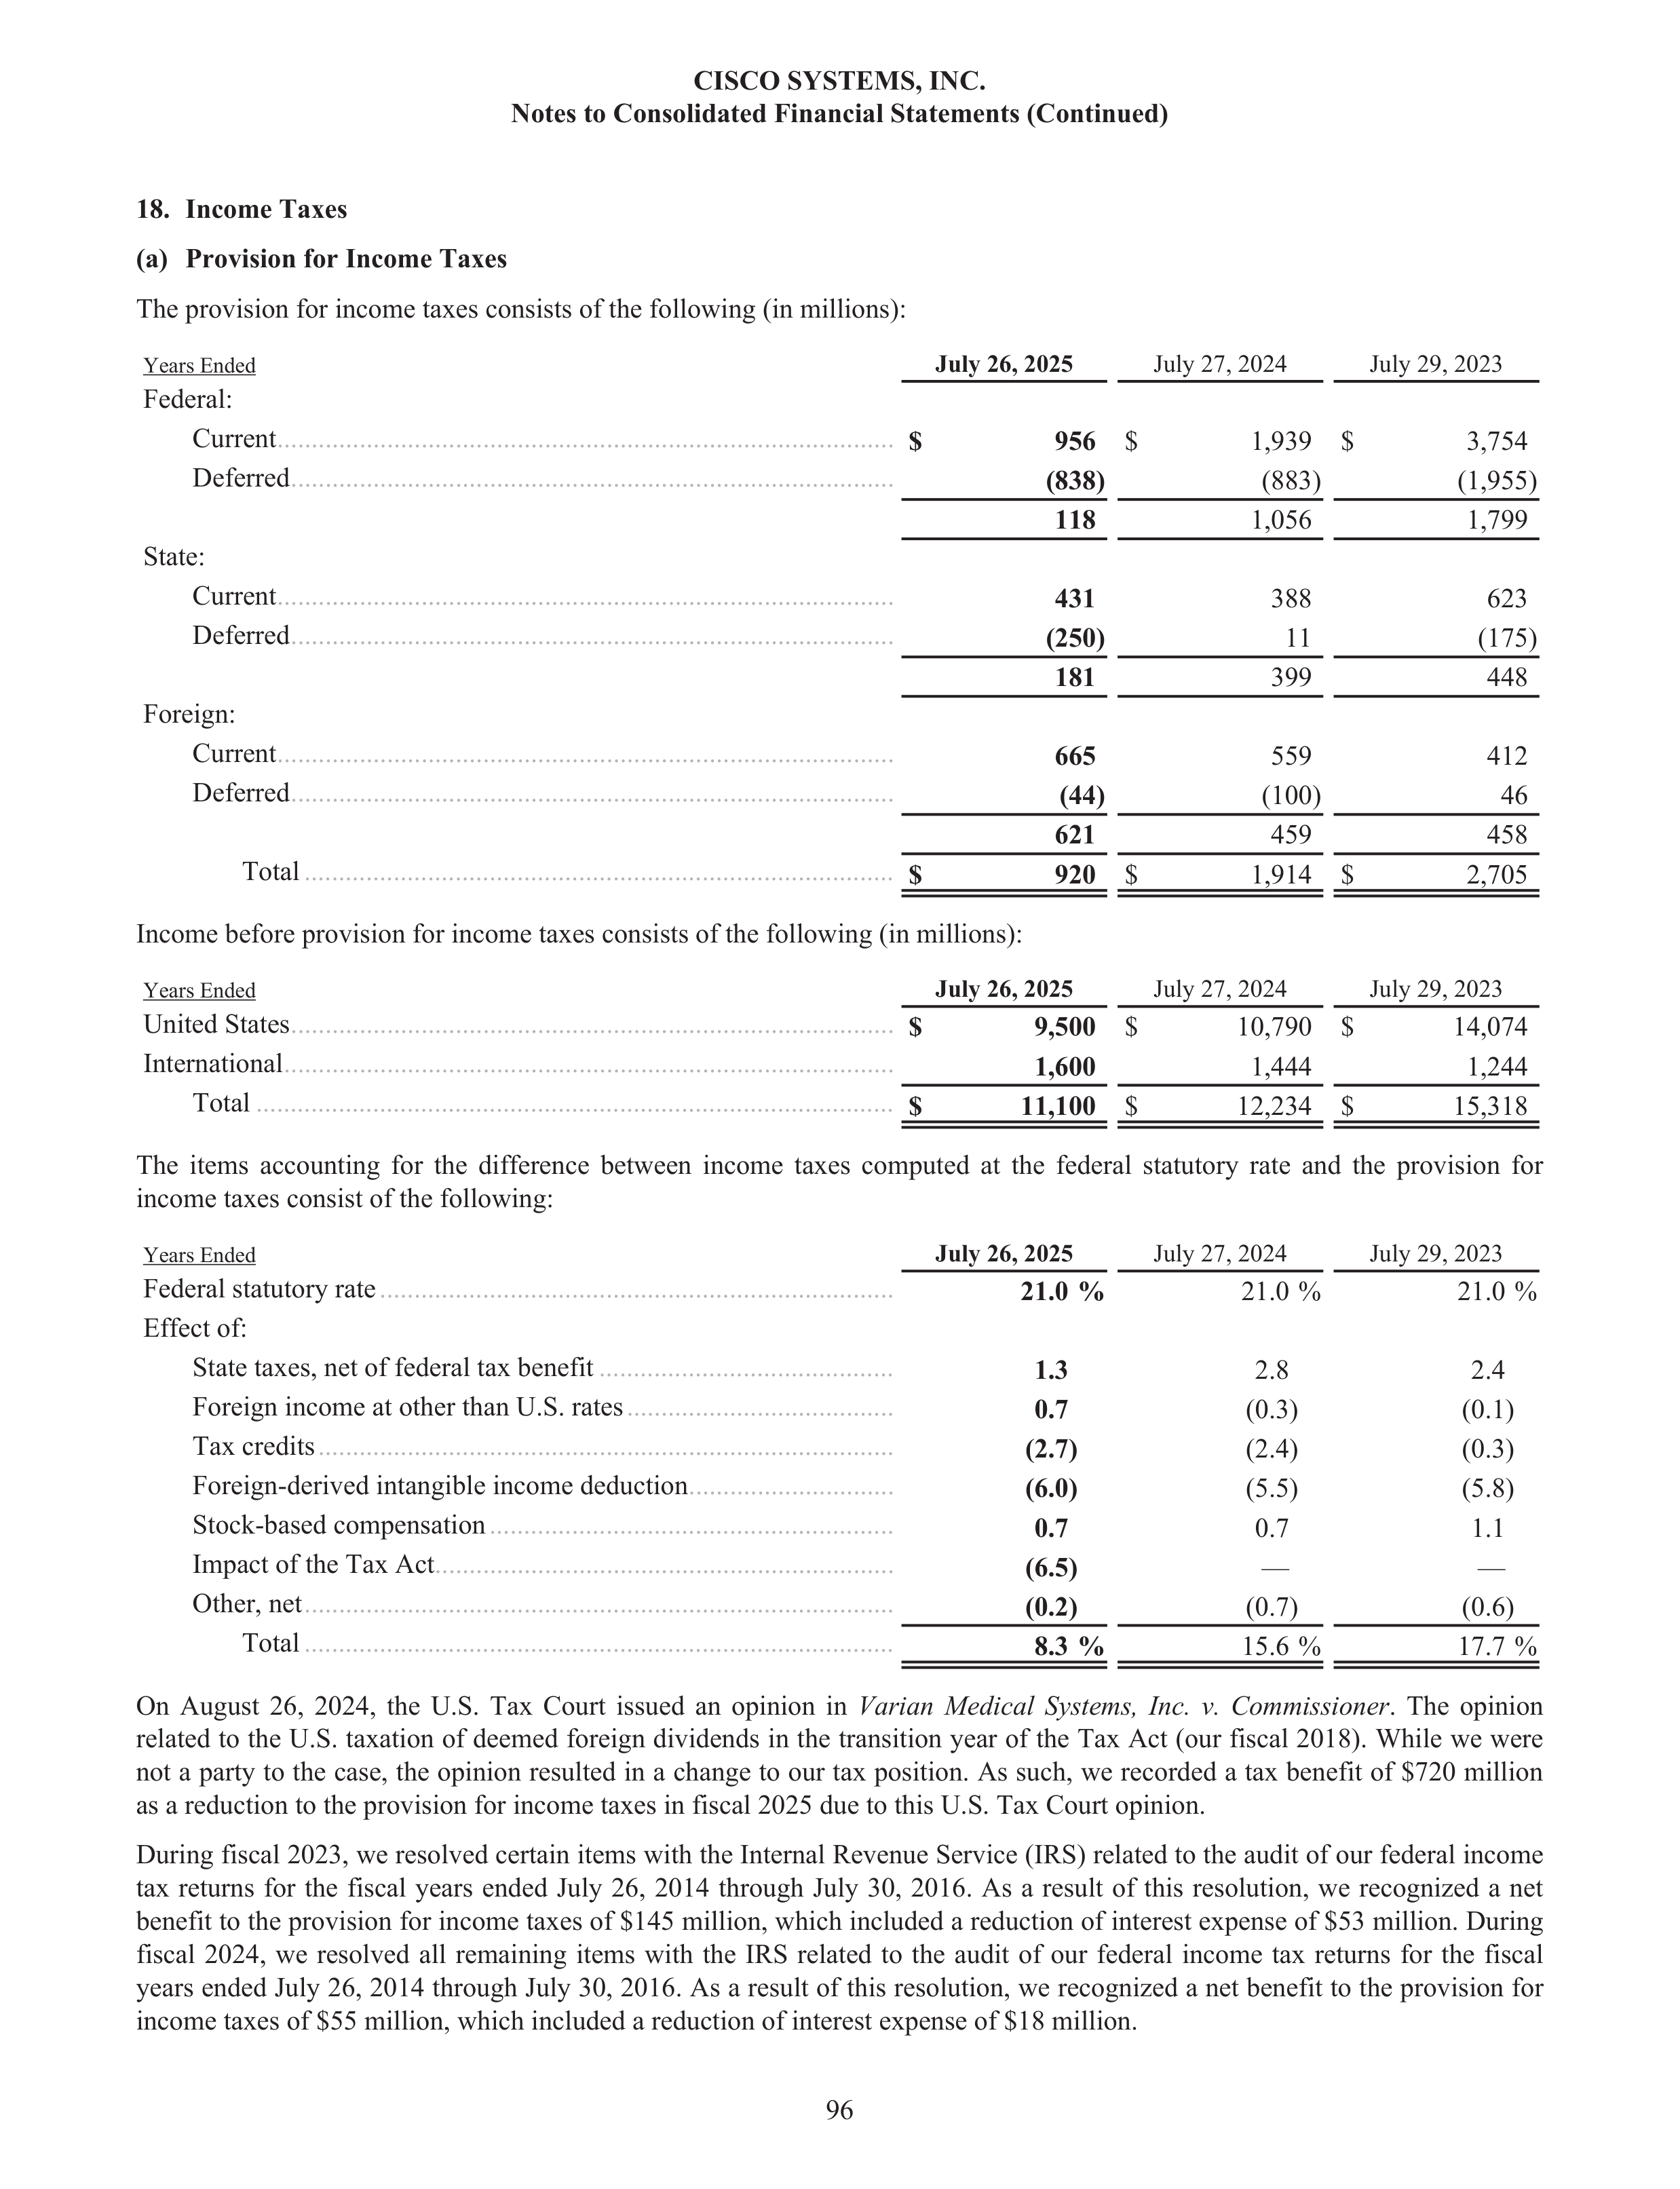
18.
Income Taxes
(a)
Provision for Income Taxes
The provision for income taxes consists of the following (in millions):
Years Ended
July 26, 2025
July 27, 2024
July 29, 2023
Federal:
Current
..........................................................................................
$
956
$
1,939 $
3,754
Deferred
........................................................................................
(838)
(883)
(1,955)
118
1,056
1,799
State:
Current
..........................................................................................
431
388
623
Deferred
........................................................................................
(250)
11
(175)
181
399
448
Foreign:
Current
..........................................................................................
665
559
412
Deferred
........................................................................................
(44)
(100)
46
621
459
458
Total
......................................................................................
$
920
$
1,914 $
2,705
Income before provision for income taxes consists of the following (in millions):
Years Ended
July 26, 2025
July 27, 2024
July 29, 2023
United States
........................................................................................
$
9,500
$
10,790 $
14,074
International
.........................................................................................
1,600
1,444
1,244
Total
.............................................................................................
$
11,100
$
12,234 $
15,318
The items accounting for the difference between income taxes computed at the federal statutory rate and the provision for
income taxes consist of the following:
Years Ended
July 26, 2025
July 27, 2024
July 29, 2023
Federal statutory rate
...........................................................................
21.0 %
21.0 %
21.0 %
Effect of:
State taxes, net of federal tax benefit
...........................................
1.3
2.8
2.4
Foreign income at other than U.S. rates
.......................................
0.7
(0.3)
(0.1)
Tax credits
....................................................................................
(2.7)
(2.4)
(0.3)
Foreign-derived intangible income deduction
..............................
(6.0)
(5.5)
(5.8)
Stock-based compensation
...........................................................
0.7
0.7
1.1
Impact of the Tax Act
...................................................................
(6.5)
—
—
Other, net
......................................................................................
(0.2)
(0.7)
(0.6)
Total
......................................................................................
8.3 %
15.6 %
17.7 %
On August 26, 2024, the U.S. Tax Court issued an opinion in
Varian Medical Systems, Inc. v. Commissioner
. The opinion
related to the U.S. taxation of deemed foreign dividends in the transition year of the Tax Act (our fiscal 2018). While we were
not a party to the case, the opinion resulted in a change to our tax position. As such, we recorded a tax benefit of $720 million
as a reduction to the provision for income taxes in fiscal 2025 due to this U.S. Tax Court opinion.
During fiscal 2023, we resolved certain items with the Internal Revenue Service (IRS) related to the audit of our federal income
tax returns for the fiscal years ended July 26, 2014 through July 30, 2016. As a result of this resolution, we recognized a net
benefit to the provision for income taxes of $145 million, which included a reduction of interest expense of $53 million. During
fiscal 2024, we resolved all remaining items with the IRS related to the audit of our federal income tax returns for the fiscal
years ended July 26, 2014 through July 30, 2016. As a result of this resolution, we recognized a net benefit to the provision for
income taxes of $55 million, which included a reduction of interest expense of $18 million.
CISCO SYSTEMS, INC.
Notes to Consolidated Financial Statements (Continued)
96
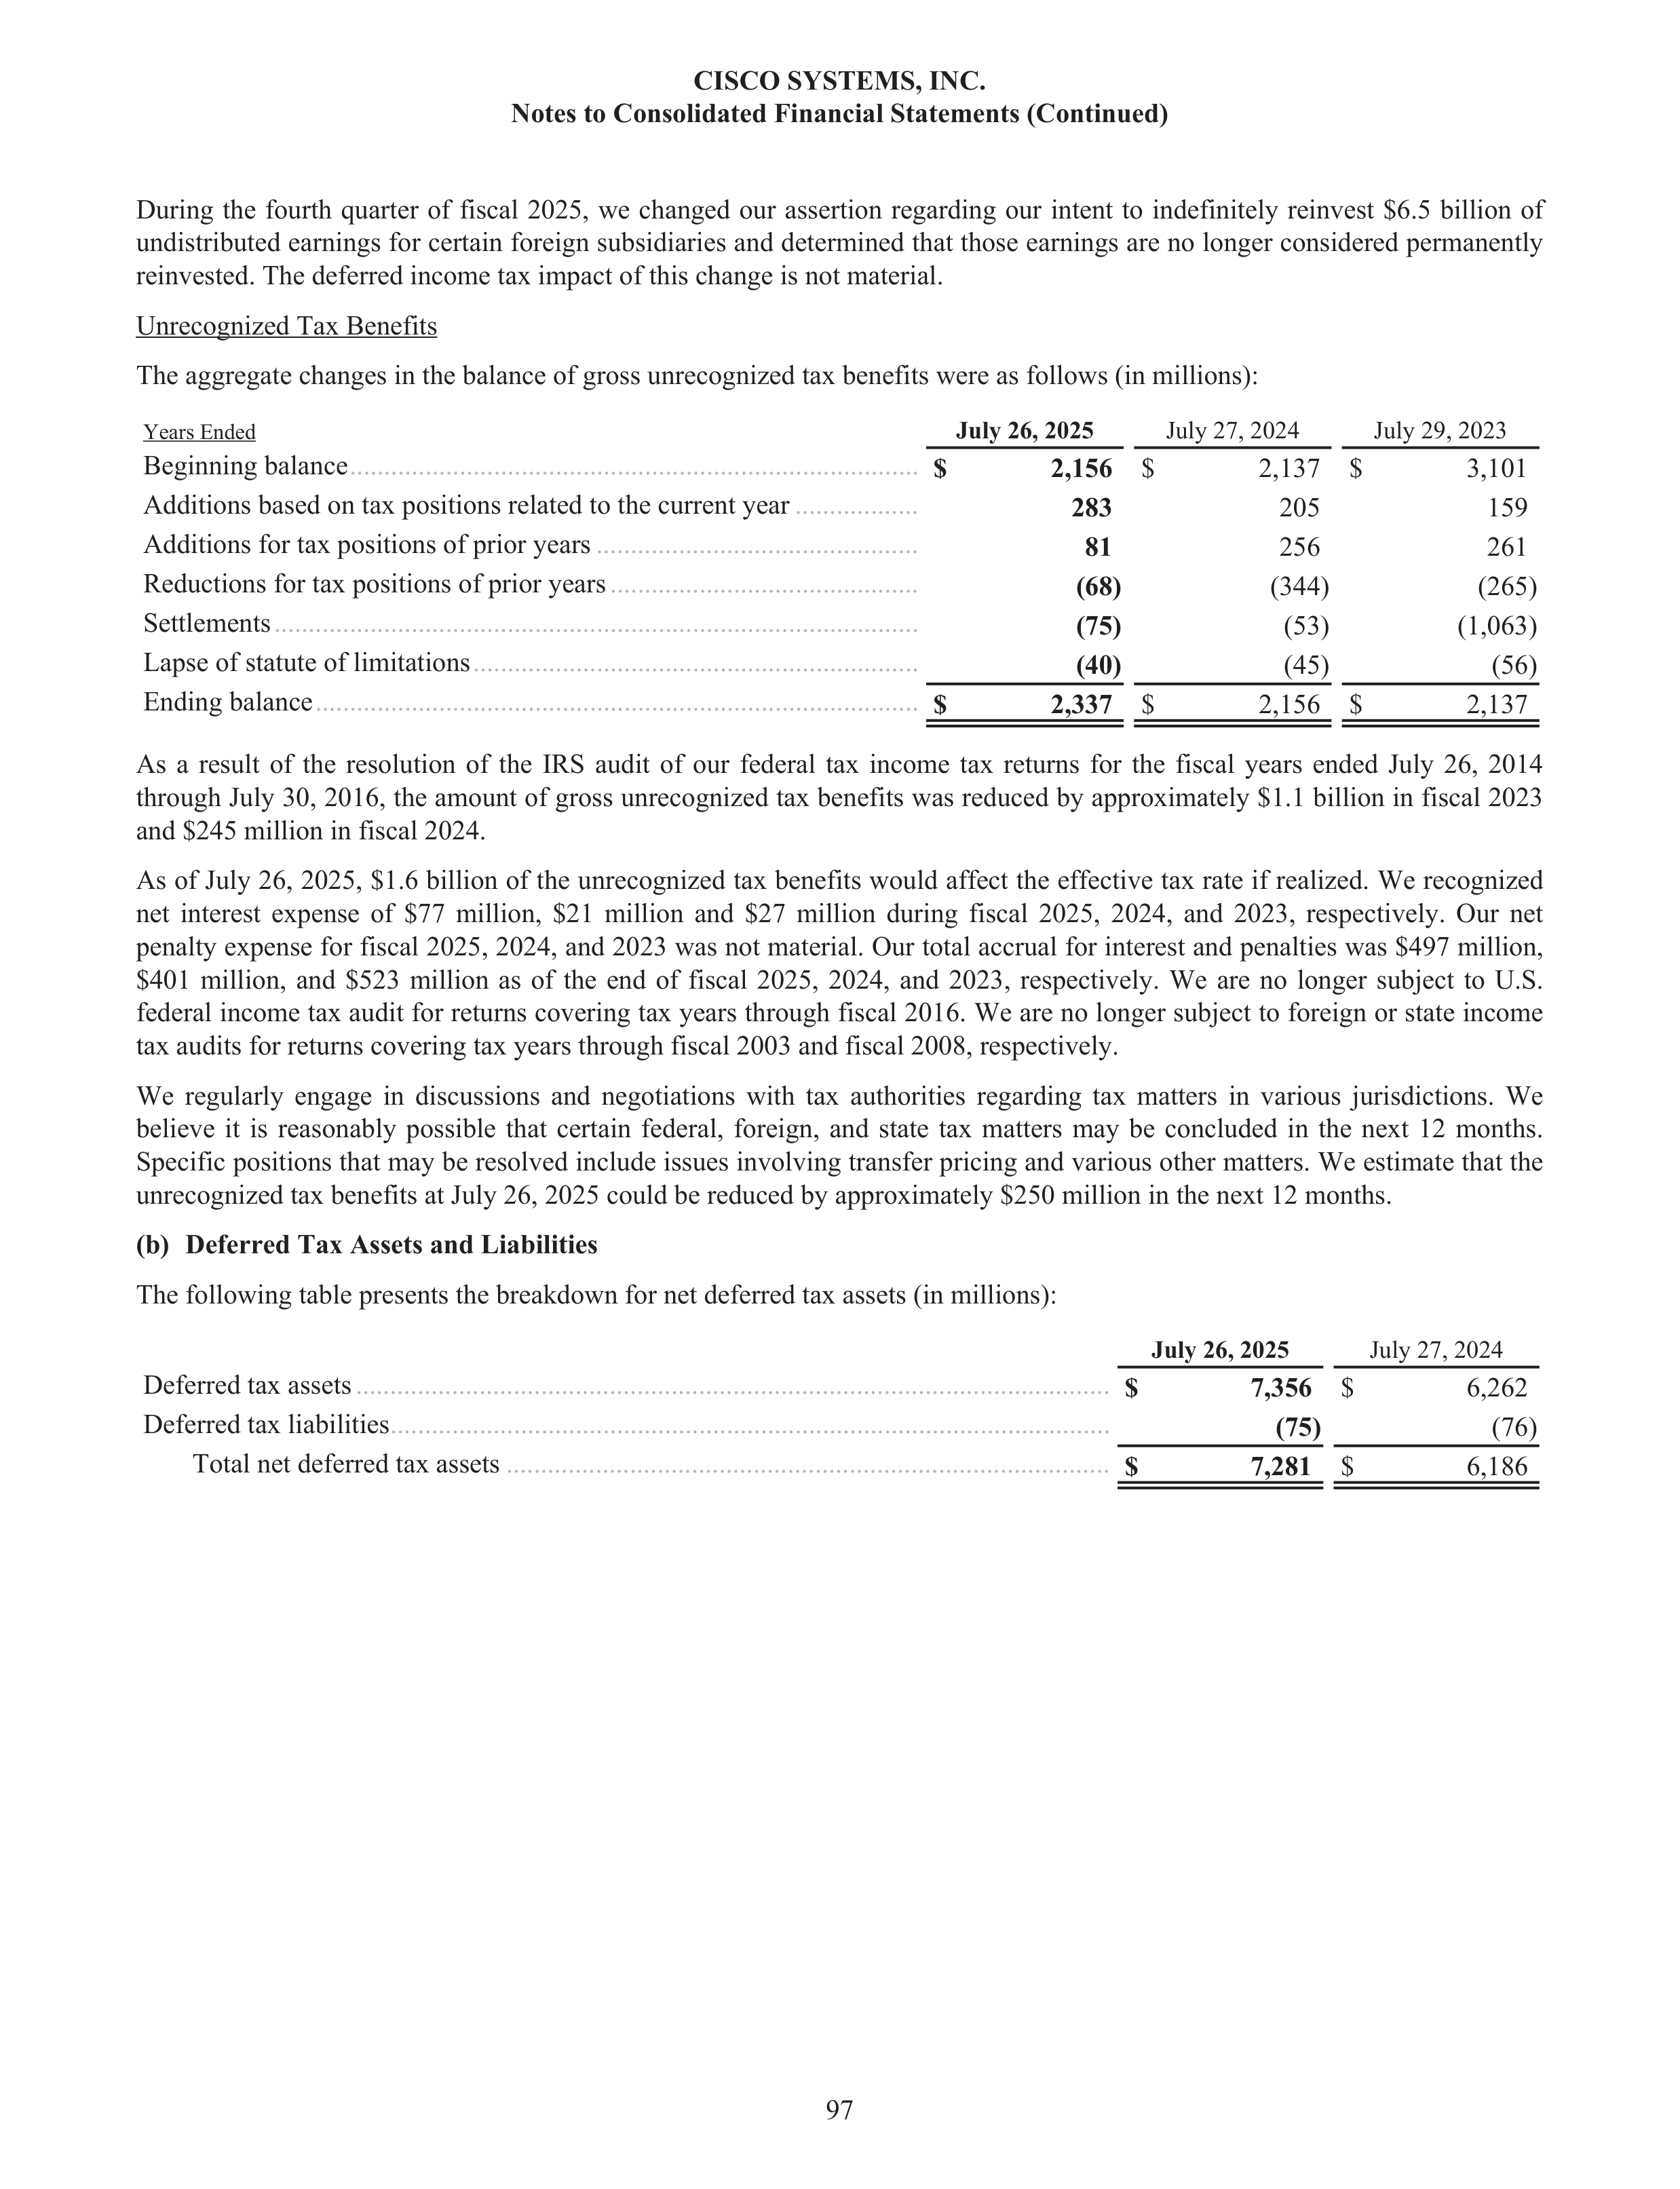
During the fourth quarter of fiscal 2025, we changed our assertion regarding our intent to indefinitely reinvest $6.5 billion of
undistributed earnings for certain foreign subsidiaries and determined that those earnings are no longer considered permanently
reinvested. The deferred income tax impact of this change is not material.
Unrecognized Tax Benefits
The aggregate changes in the balance of gross unrecognized tax benefits were as follows (in millions):
Years Ended
July 26, 2025
July 27, 2024
July 29, 2023
Beginning balance
...................................................................................
$
2,156
$
2,137 $
3,101
Additions based on tax positions related to the current year
..................
283
205
159
Additions for tax positions of prior years
...............................................
81
256
261
Reductions for tax positions of prior years
.............................................
(68)
(344)
(265)
Settlements
..............................................................................................
(75)
(53)
(1,063)
Lapse of statute of limitations
.................................................................
(40)
(45)
(56)
Ending balance
........................................................................................
$
2,337
$
2,156 $
2,137
As a result of the resolution of the IRS audit of our federal tax income tax returns for the fiscal years ended July 26, 2014
through July 30, 2016, the amount of gross unrecognized tax benefits was reduced by approximately $1.1 billion in fiscal 2023
and $245 million in fiscal 2024.
As of July 26, 2025, $1.6 billion of the unrecognized tax benefits would affect the effective tax rate if realized. We recognized
net interest expense of $77 million, $21 million and $27 million during fiscal 2025, 2024, and 2023, respectively. Our net
penalty expense for fiscal 2025, 2024, and 2023 was not material. Our total accrual for interest and penalties was $497 million,
$401 million, and $523 million as of the end of fiscal 2025, 2024, and 2023, respectively. We are no longer subject to U.S.
federal income tax audit for returns covering tax years through fiscal 2016. We are no longer subject to foreign or state income
tax audits for returns covering tax years through fiscal 2003 and fiscal 2008, respectively.
We regularly engage in discussions and negotiations with tax authorities regarding tax matters in various jurisdictions. We
believe it is reasonably possible that certain federal, foreign, and state tax matters may be concluded in the next 12 months.
Specific positions that may be resolved include issues involving transfer pricing and various other matters. We estimate that the
unrecognized tax benefits at July 26, 2025 could be reduced by approximately $250 million in the next 12 months.
(b)
Deferred Tax Assets and Liabilities
The following table presents the breakdown for net deferred tax assets (in millions):
July 26, 2025
July 27, 2024
Deferred tax assets
..............................................................................................................
$
7,356
$
6,262
Deferred tax liabilities
.........................................................................................................
(75)
(76)
Total net deferred tax assets
........................................................................................
$
7,281
$
6,186
CISCO SYSTEMS, INC.
Notes to Consolidated Financial Statements (Continued)
97
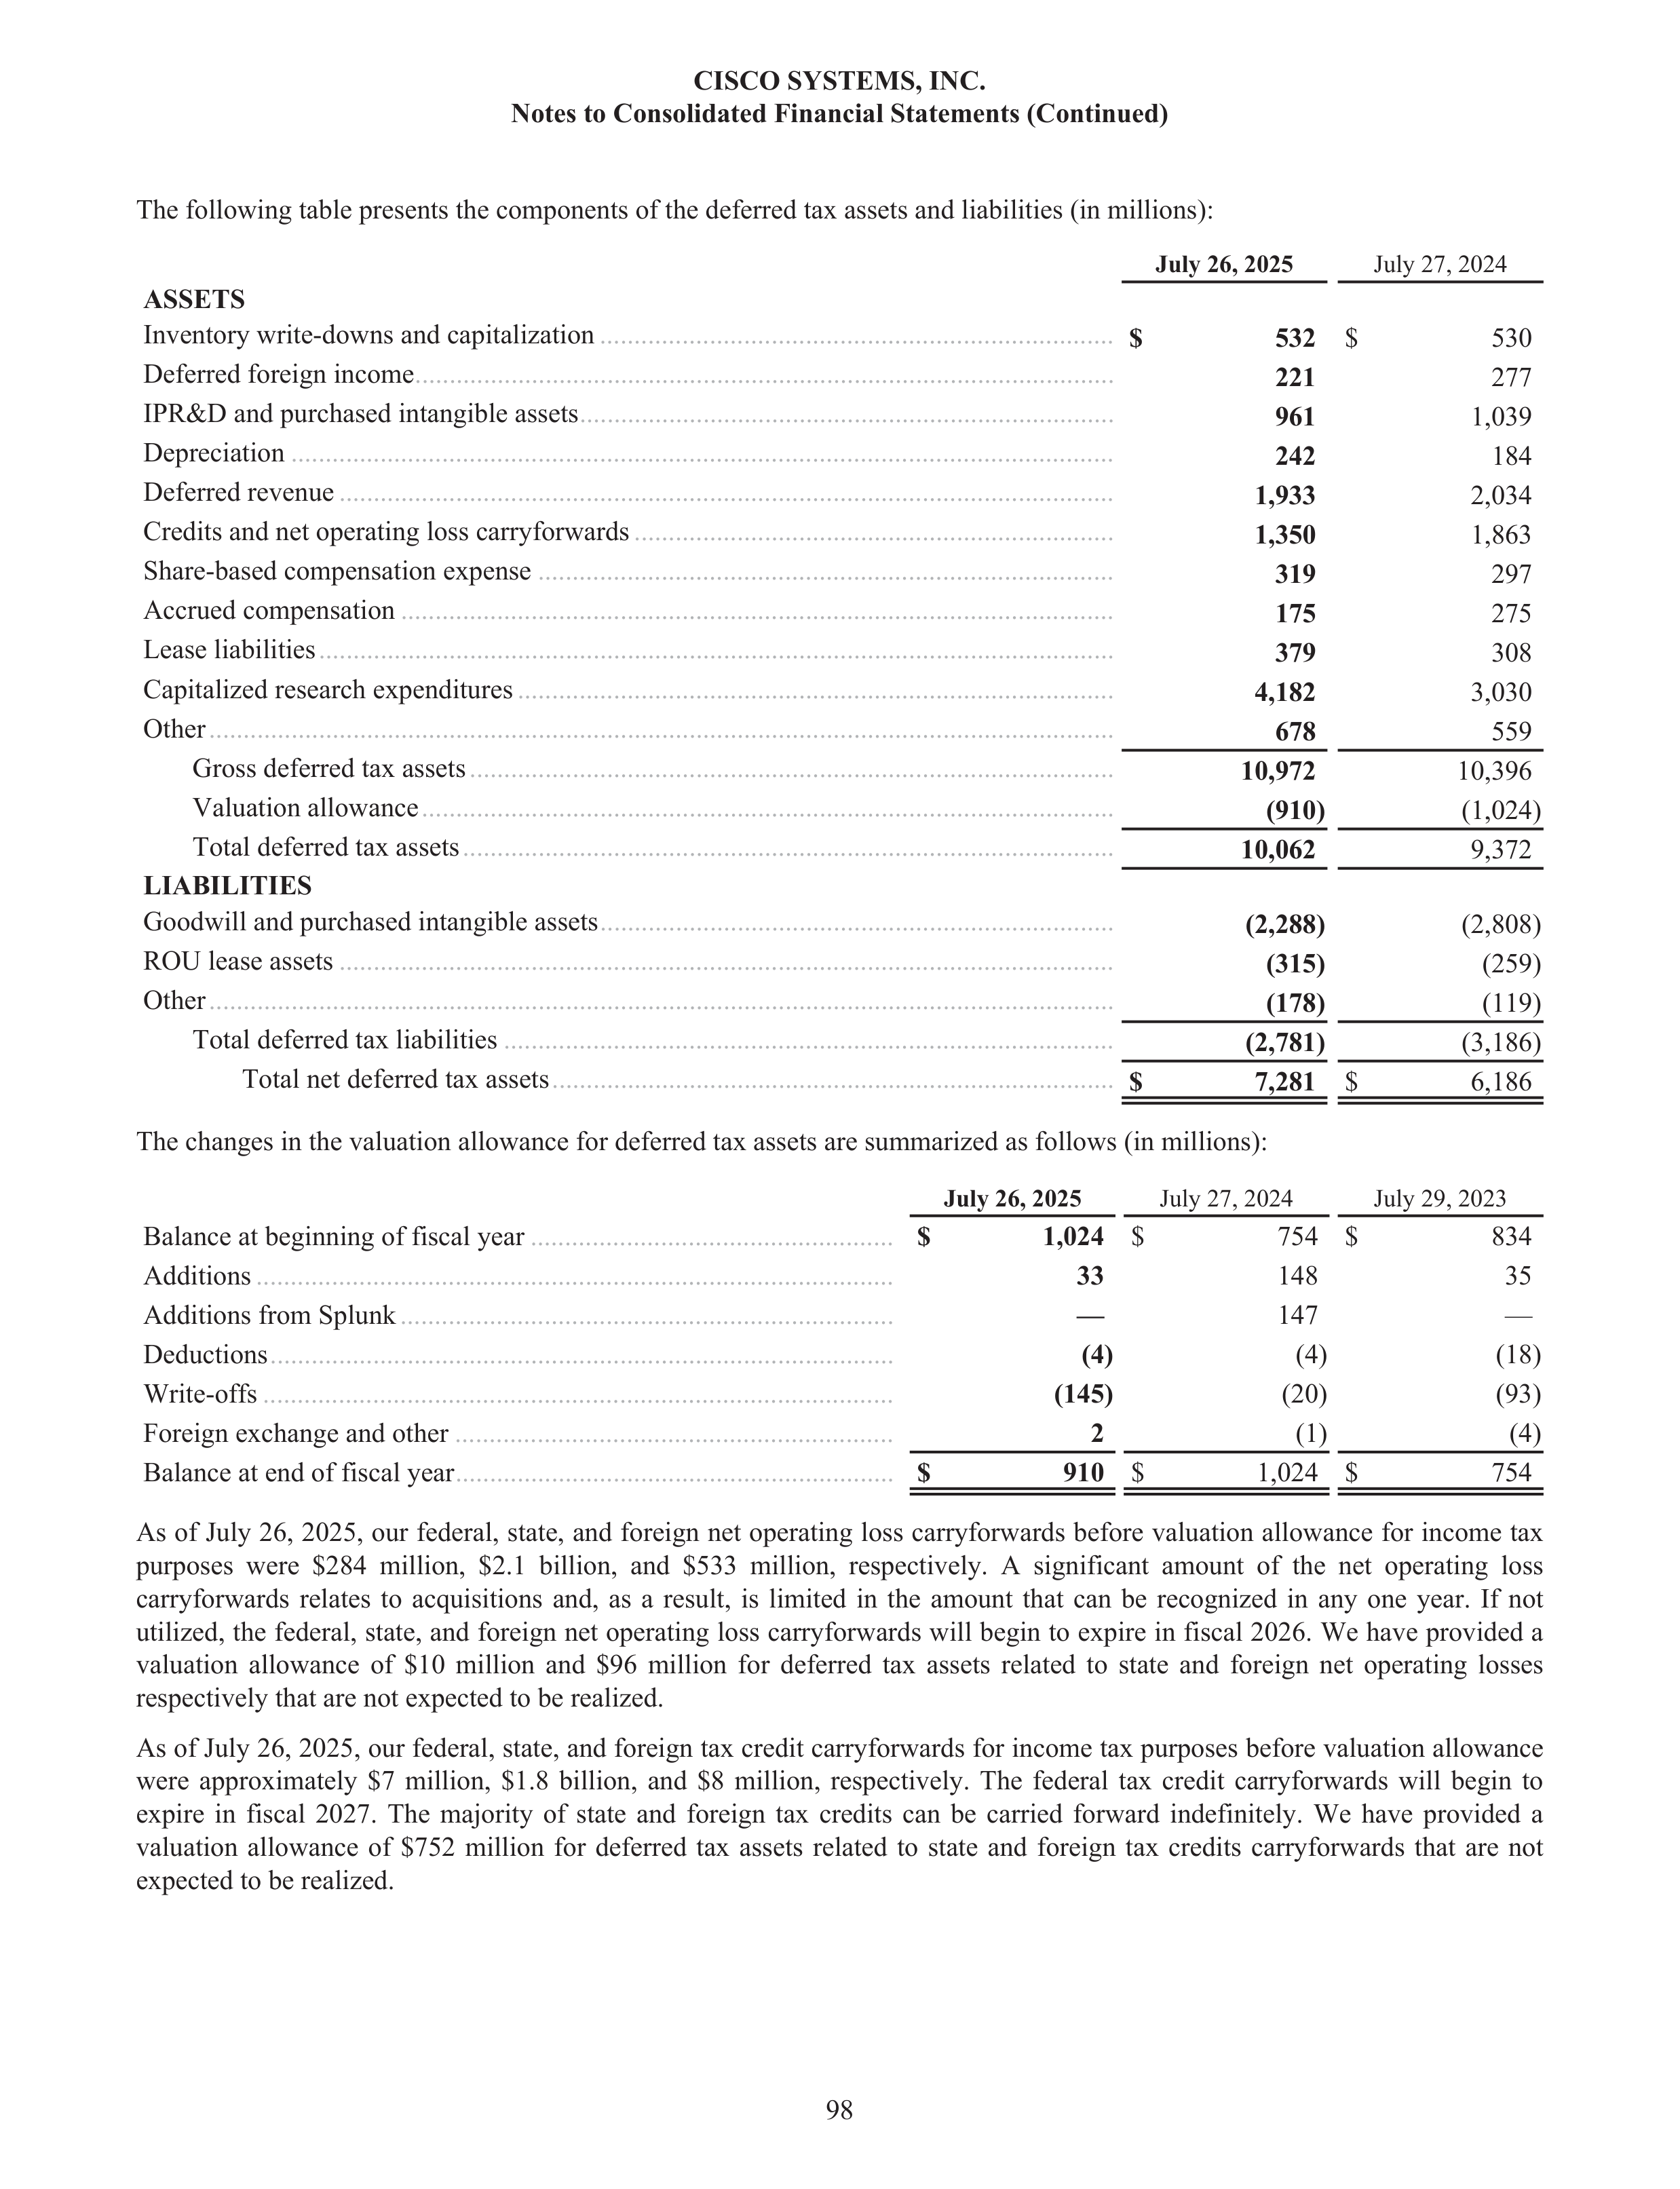
The following table presents the components of the deferred tax assets and liabilities (in millions):
July 26, 2025
July 27, 2024
ASSETS
Inventory write-downs and capitalization
...........................................................................
$
532
$
530
Deferred foreign income
......................................................................................................
221
277
IPR&D and purchased intangible assets
..............................................................................
961
1,039
Depreciation
........................................................................................................................
242
184
Deferred revenue
.................................................................................................................
1,933
2,034
Credits and net operating loss carryforwards
......................................................................
1,350
1,863
Share-based compensation expense
....................................................................................
319
297
Accrued compensation
........................................................................................................
175
275
Lease liabilities
....................................................................................................................
379
308
Capitalized research expenditures
.......................................................................................
4,182
3,030
Other
....................................................................................................................................
678
559
Gross deferred tax assets
..............................................................................................
10,972
10,396
Valuation allowance
.....................................................................................................
(910)
(1,024)
Total deferred tax assets
...............................................................................................
10,062
9,372
LIABILITIES
Goodwill and purchased intangible assets
...........................................................................
(2,288)
(2,808)
ROU lease assets
.................................................................................................................
(315)
(259)
Other
....................................................................................................................................
(178)
(119)
Total deferred tax liabilities
.........................................................................................
(2,781)
(3,186)
Total net deferred tax assets
..................................................................................
$
7,281
$
6,186
The changes in the valuation allowance for deferred tax assets are summarized as follows (in millions):
July 26, 2025
July 27, 2024
July 29, 2023
Balance at beginning of fiscal year
.....................................................
$
1,024
$
754 $
834
Additions
.............................................................................................
33
148
35
Additions from Splunk
........................................................................
—
147
—
Deductions
...........................................................................................
(4)
(4)
(18)
Write-offs
............................................................................................
(145)
(20)
(93)
Foreign exchange and other
................................................................
2
(1)
(4)
Balance at end of fiscal year
................................................................
$
910
$
1,024 $
754
As of July 26, 2025, our federal, state, and foreign net operating loss carryforwards before valuation allowance for income tax
purposes were $284 million, $2.1 billion, and $533 million, respectively. A significant amount of the net operating loss
carryforwards relates to acquisitions and, as a result, is limited in the amount that can be recognized in any one year. If not
utilized, the federal, state, and foreign net operating loss carryforwards will begin to expire in fiscal 2026. We have provided a
valuation allowance of $10 million and $96 million for deferred tax assets related to state and foreign net operating losses
respectively that are not expected to be realized.
As of July 26, 2025, our federal, state, and foreign tax credit carryforwards for income tax purposes before valuation allowance
were approximately $7 million, $1.8 billion, and $8 million, respectively. The federal tax credit carryforwards will begin to
expire in fiscal 2027. The majority of state and foreign tax credits can be carried forward indefinitely. We have provided a
valuation allowance of $752 million for deferred tax assets related to state and foreign tax credits carryforwards that are not
expected to be realized.
CISCO SYSTEMS, INC.
Notes to Consolidated Financial Statements (Continued)
98
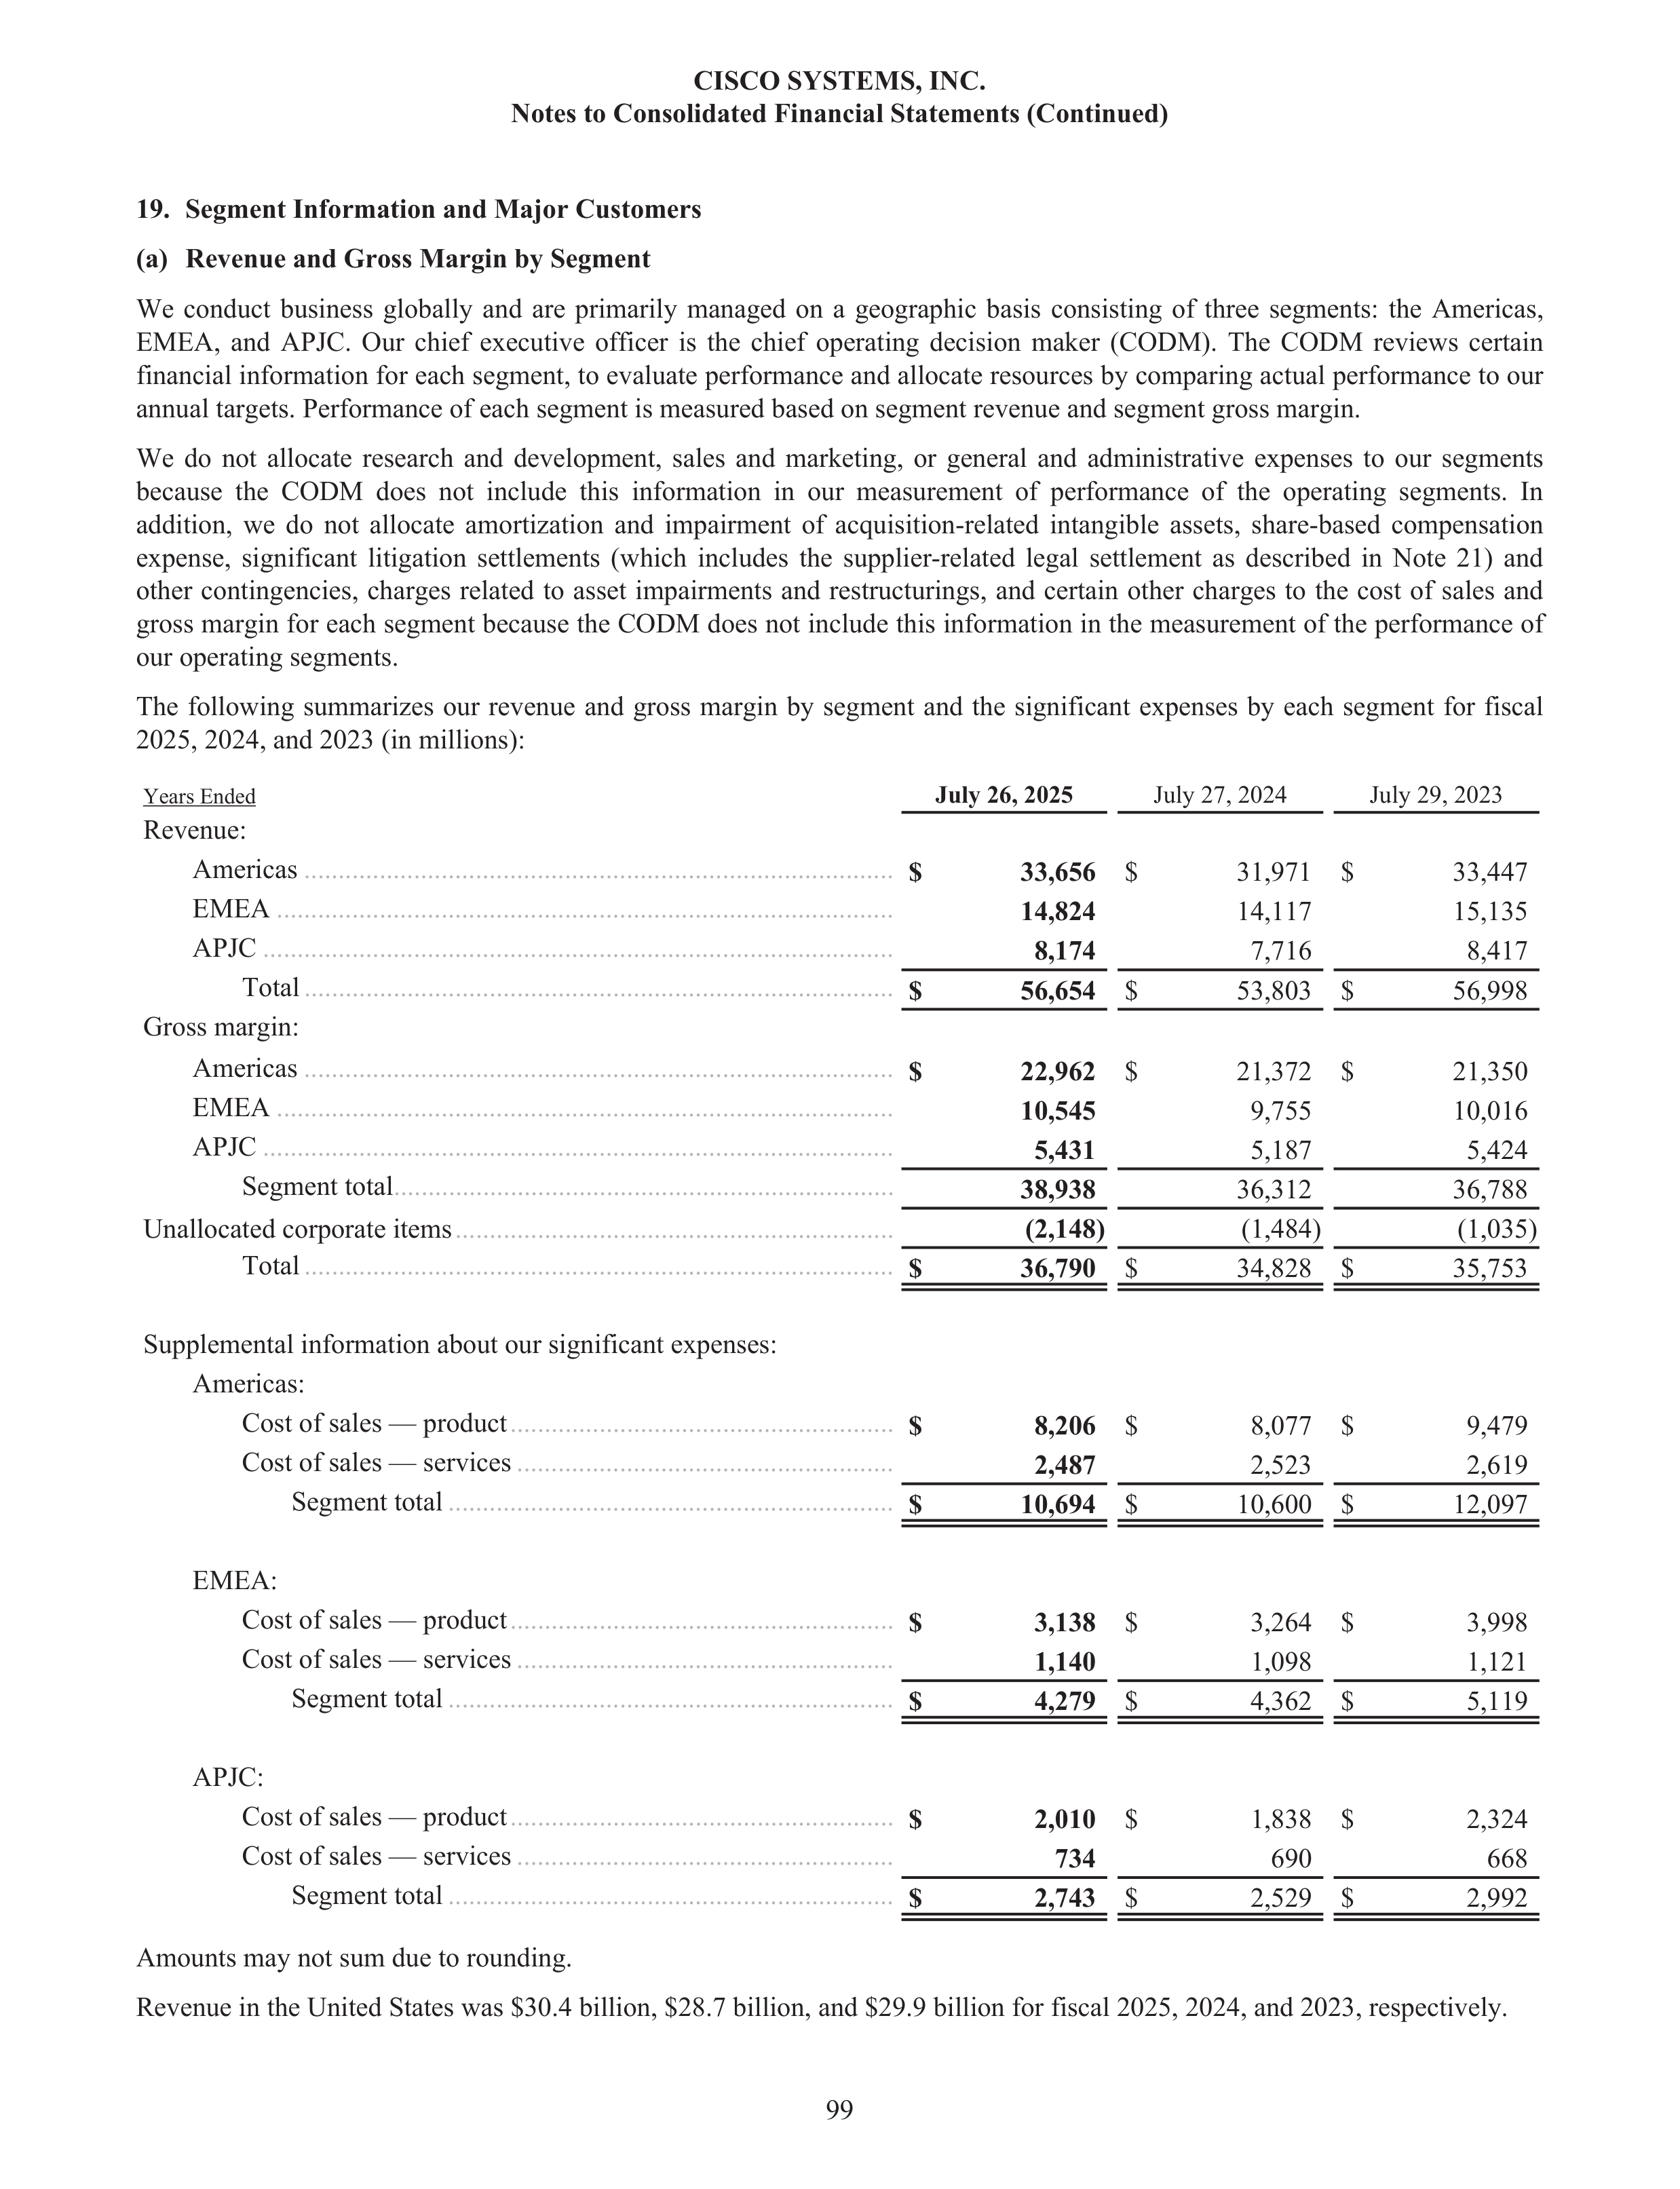
19.
Segment Information and Major Customers
(a)
Revenue and Gross Margin by Segment
We conduct business globally and are primarily managed on a geographic basis consisting of three segments: the Americas,
EMEA, and APJC. Our chief executive officer is the chief operating decision maker (CODM). The CODM reviews certain
financial information for each segment, to evaluate performance and allocate resources by comparing actual performance to our
annual targets. Performance of each segment is measured based on segment revenue and segment gross margin.
We do not allocate research and development, sales and marketing, or general and administrative expenses to our segments
because the CODM does not include this information in our measurement of performance of the operating segments. In
addition, we do not allocate amortization and impairment of acquisition-related intangible assets, share-based compensation
expense, significant litigation settlements (which includes the supplier-related legal settlement as described in Note 21) and
other contingencies, charges related to asset impairments and restructurings, and certain other charges to the cost of sales and
gross margin for each segment because the CODM does not include this information in the measurement of the performance of
our operating segments.
The following summarizes our revenue and gross margin by segment and the significant expenses by each segment for fiscal
2025, 2024, and 2023 (in millions):
Years Ended
July 26, 2025
July 27, 2024
July 29, 2023
Revenue:
Americas
......................................................................................
$
33,656
$
31,971 $
33,447
EMEA
..........................................................................................
14,824
14,117
15,135
APJC
............................................................................................
8,174
7,716
8,417
Total
......................................................................................
$
56,654
$
53,803 $
56,998
Gross margin:
Americas
......................................................................................
$
22,962
$
21,372 $
21,350
EMEA
..........................................................................................
10,545
9,755
10,016
APJC
............................................................................................
5,431
5,187
5,424
Segment total
.........................................................................
38,938
36,312
36,788
Unallocated corporate items
................................................................
(2,148)
(1,484)
(1,035)
Total
......................................................................................
$
36,790
$
34,828 $
35,753
Supplemental information about our significant expenses:
Americas:
Cost of sales — product
........................................................
$
8,206
$
8,077 $
9,479
Cost of sales — services
.......................................................
2,487
2,523
2,619
Segment total
.................................................................
$
10,694
$
10,600 $
12,097
EMEA:
Cost of sales — product
........................................................
$
3,138
$
3,264 $
3,998
Cost of sales — services
.......................................................
1,140
1,098
1,121
Segment total
.................................................................
$
4,279
$
4,362 $
5,119
APJC:
Cost of sales — product
........................................................
$
2,010
$
1,838 $
2,324
Cost of sales — services
.......................................................
734
690
668
Segment total
.................................................................
$
2,743
$
2,529 $
2,992
Amounts may not sum due to rounding.
Revenue in the United States was $30.4 billion, $28.7 billion, and $29.9 billion for fiscal 2025, 2024, and 2023, respectively.
CISCO SYSTEMS, INC.
Notes to Consolidated Financial Statements (Continued)
99
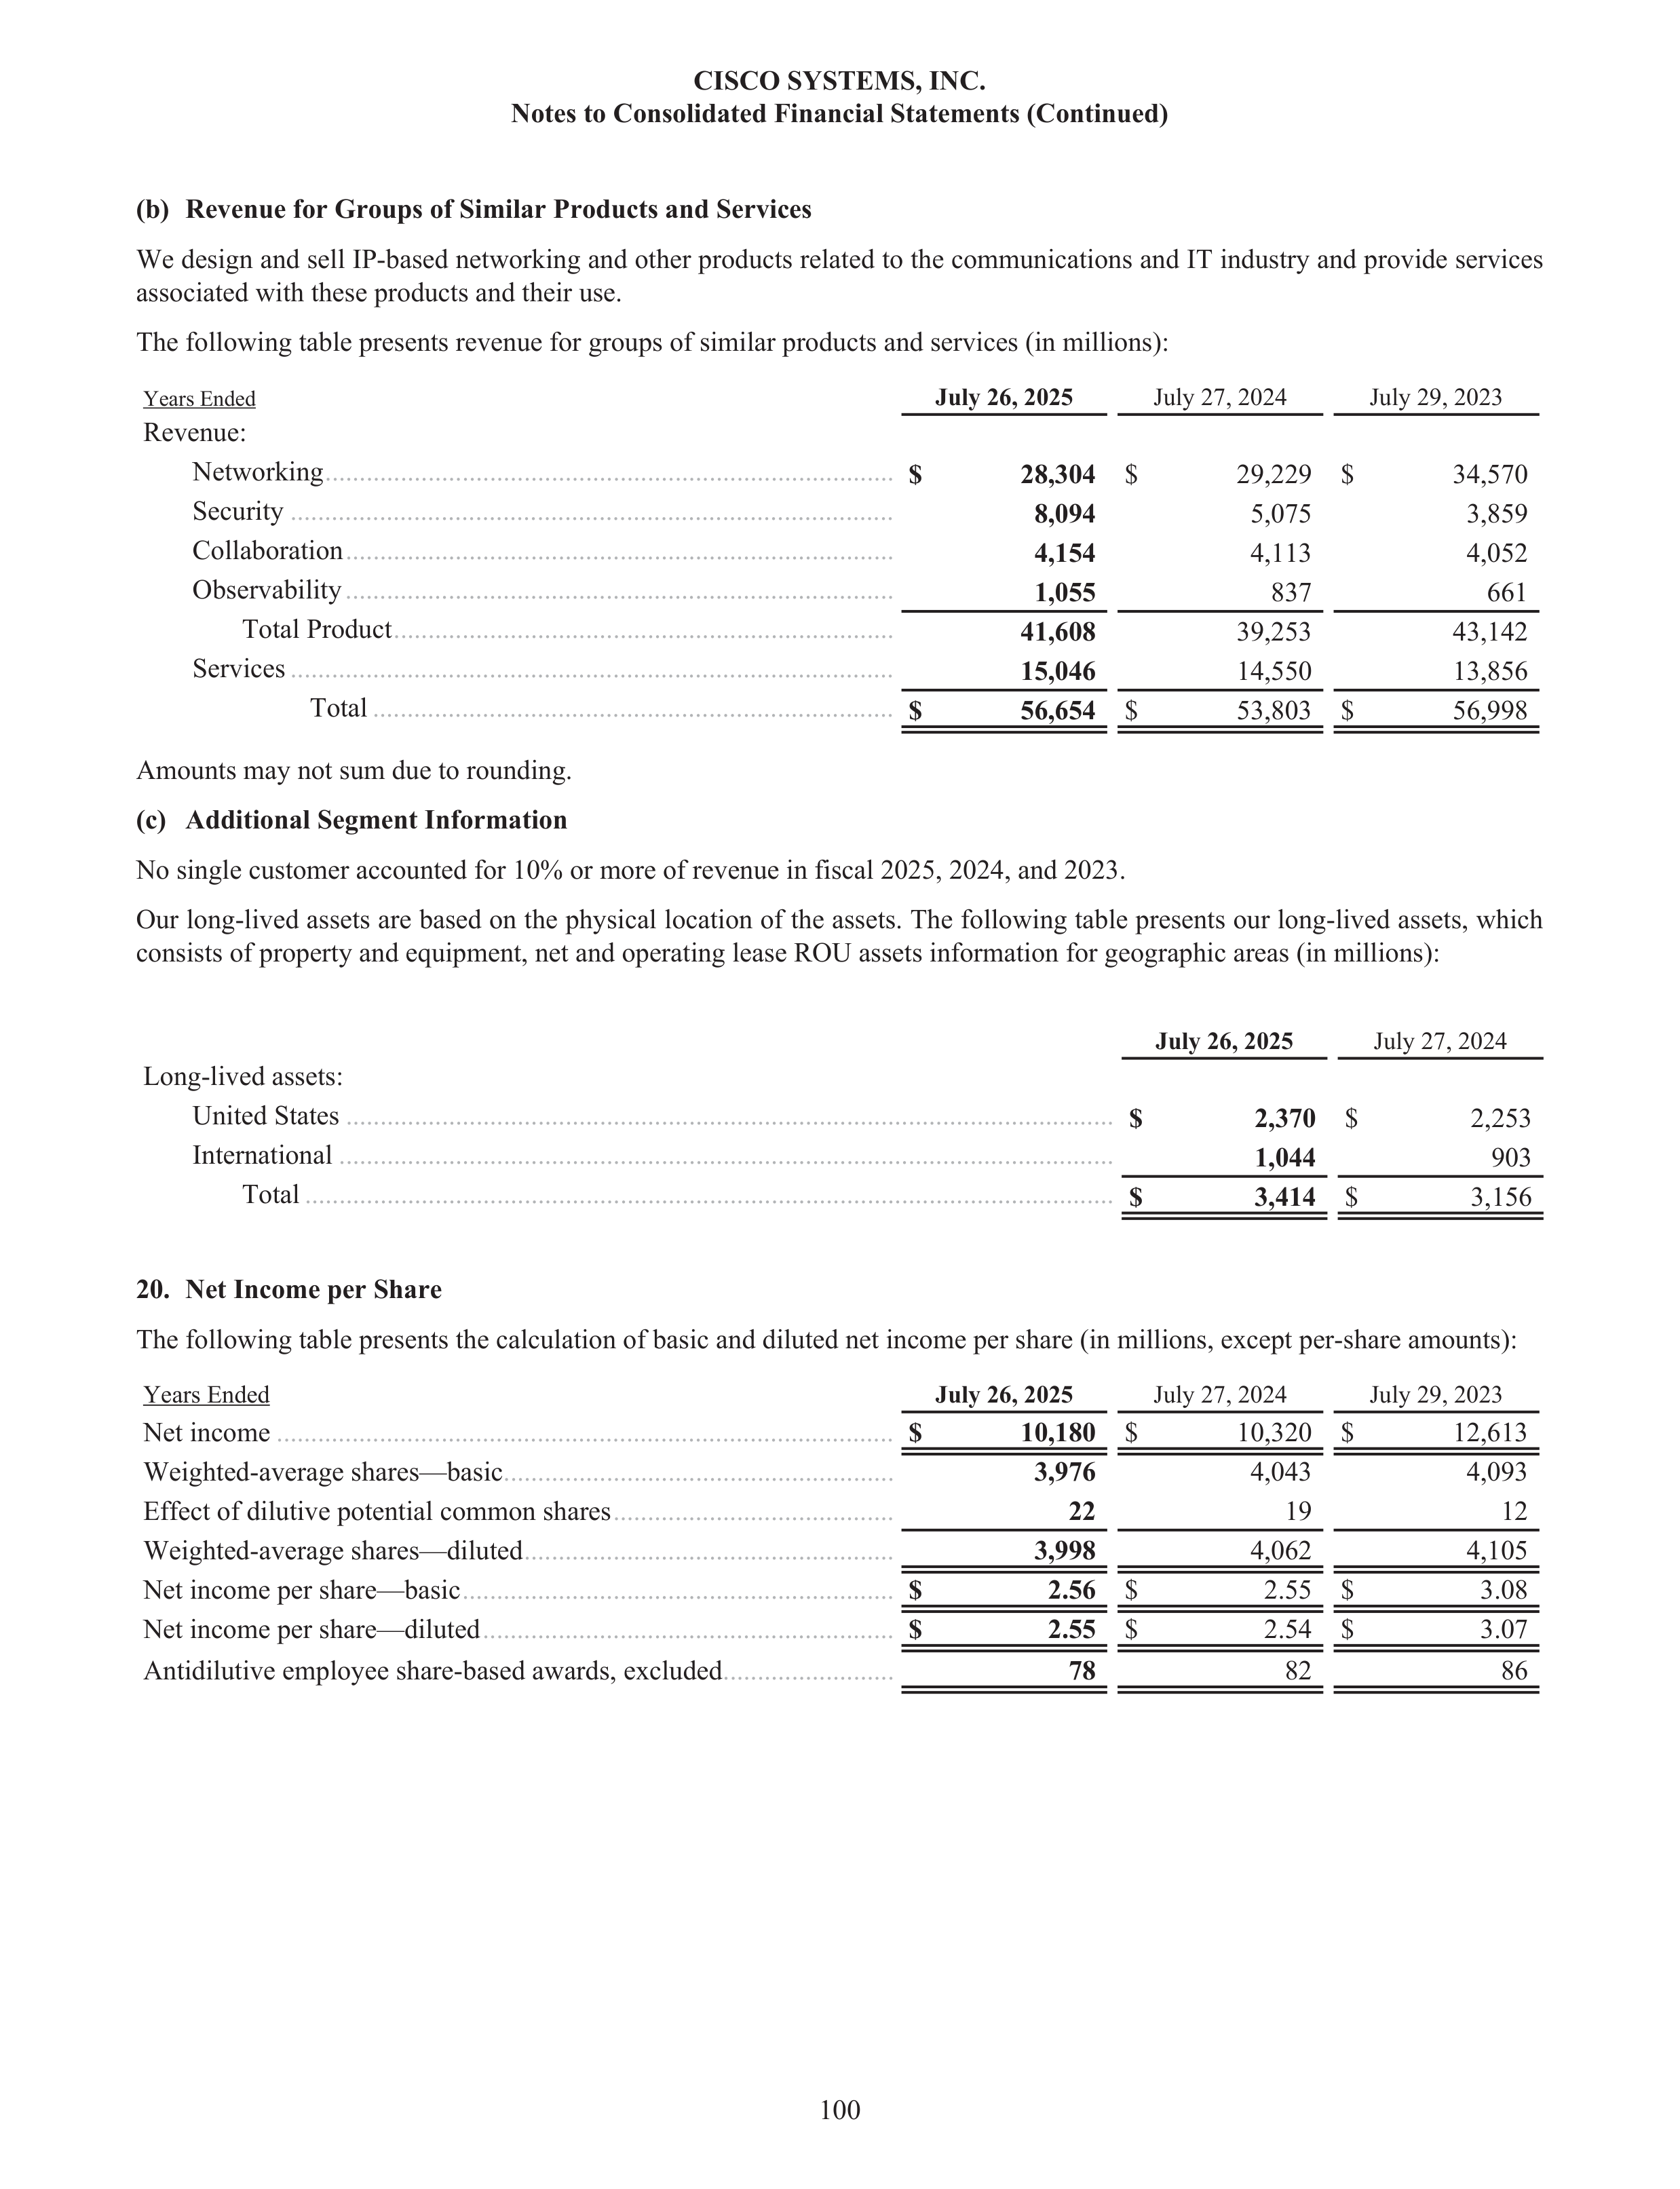
(b)
Revenue for Groups of Similar Products and Services
We design and sell IP-based networking and other products related to the communications and IT industry and provide services
associated with these products and their use.
The following table presents revenue for groups of similar products and services (in millions):
Years Ended
July 26, 2025
July 27, 2024
July 29, 2023
Revenue:
Networking
...................................................................................
$
28,304
$
29,229 $
34,570
Security
........................................................................................
8,094
5,075
3,859
Collaboration
................................................................................
4,154
4,113
4,052
Observability
................................................................................
1,055
837
661
Total Product
.........................................................................
41,608
39,253
43,142
Services
........................................................................................
15,046
14,550
13,856
Total
............................................................................
$
56,654
$
53,803 $
56,998
Amounts may not sum due to rounding.
(c)
Additional Segment Information
No single customer accounted for 10% or more of revenue in fiscal 2025, 2024, and 2023.
Our long-lived assets are based on the physical location of the assets. The following table presents our long-lived assets, which
consists of property and equipment, net and operating lease ROU assets information for geographic areas (in millions):
July 26, 2025
July 27, 2024
Long-lived assets:
United States
................................................................................................................
$
2,370
$
2,253
International
.................................................................................................................
1,044
903
Total
......................................................................................................................
$
3,414
$
3,156
20.
Net Income per Share
The following table presents the calculation of basic and diluted net income per share (in millions, except per-share amounts):
Years Ended
July 26, 2025
July 27, 2024
July 29, 2023
Net income
..........................................................................................
$
10,180
$
10,320 $
12,613
Weighted-average shares—basic
.........................................................
3,976
4,043
4,093
Effect of dilutive potential common shares
.........................................
22
19
12
Weighted-average shares—diluted
......................................................
3,998
4,062
4,105
Net income per share—basic
...............................................................
$
2.56
$
2.55 $
3.08
Net income per share—diluted
............................................................
$
2.55
$
2.54 $
3.07
Antidilutive employee share-based awards, excluded
.........................
78
82
86
CISCO SYSTEMS, INC.
Notes to Consolidated Financial Statements (Continued)
100

21.
Subsequent Event
On August 26, 2025, we settled a legal dispute with a supplier over purchase obligations arising under certain long-term supply
arrangements entered into to help us mitigate significant supply chain constraints seen in prior periods. Under the terms of the
settlement, the parties agreed to the dismissal of all pending actions in exchange for mutual releases of claims related to the
long-term supply arrangements with the supplier, the termination of such arrangements between the parties, the release back to
us of approximately $563 million held in escrow under the arrangements (which is reported as restricted cash within other
current assets), and the forfeiture by us of approximately $450 million in supplier-held prepayments, after giving effect to
certain amounts to be applied against such prepayments. No incremental cash consideration is to be paid in connection with the
settlement. As a result of this settlement, we recorded a charge in the fourth quarter of fiscal 2025 of approximately
$355 million to product cost of sales and a corresponding income tax benefit of approximately $82 million.
CISCO SYSTEMS, INC.
Notes to Consolidated Financial Statements (Continued)
101
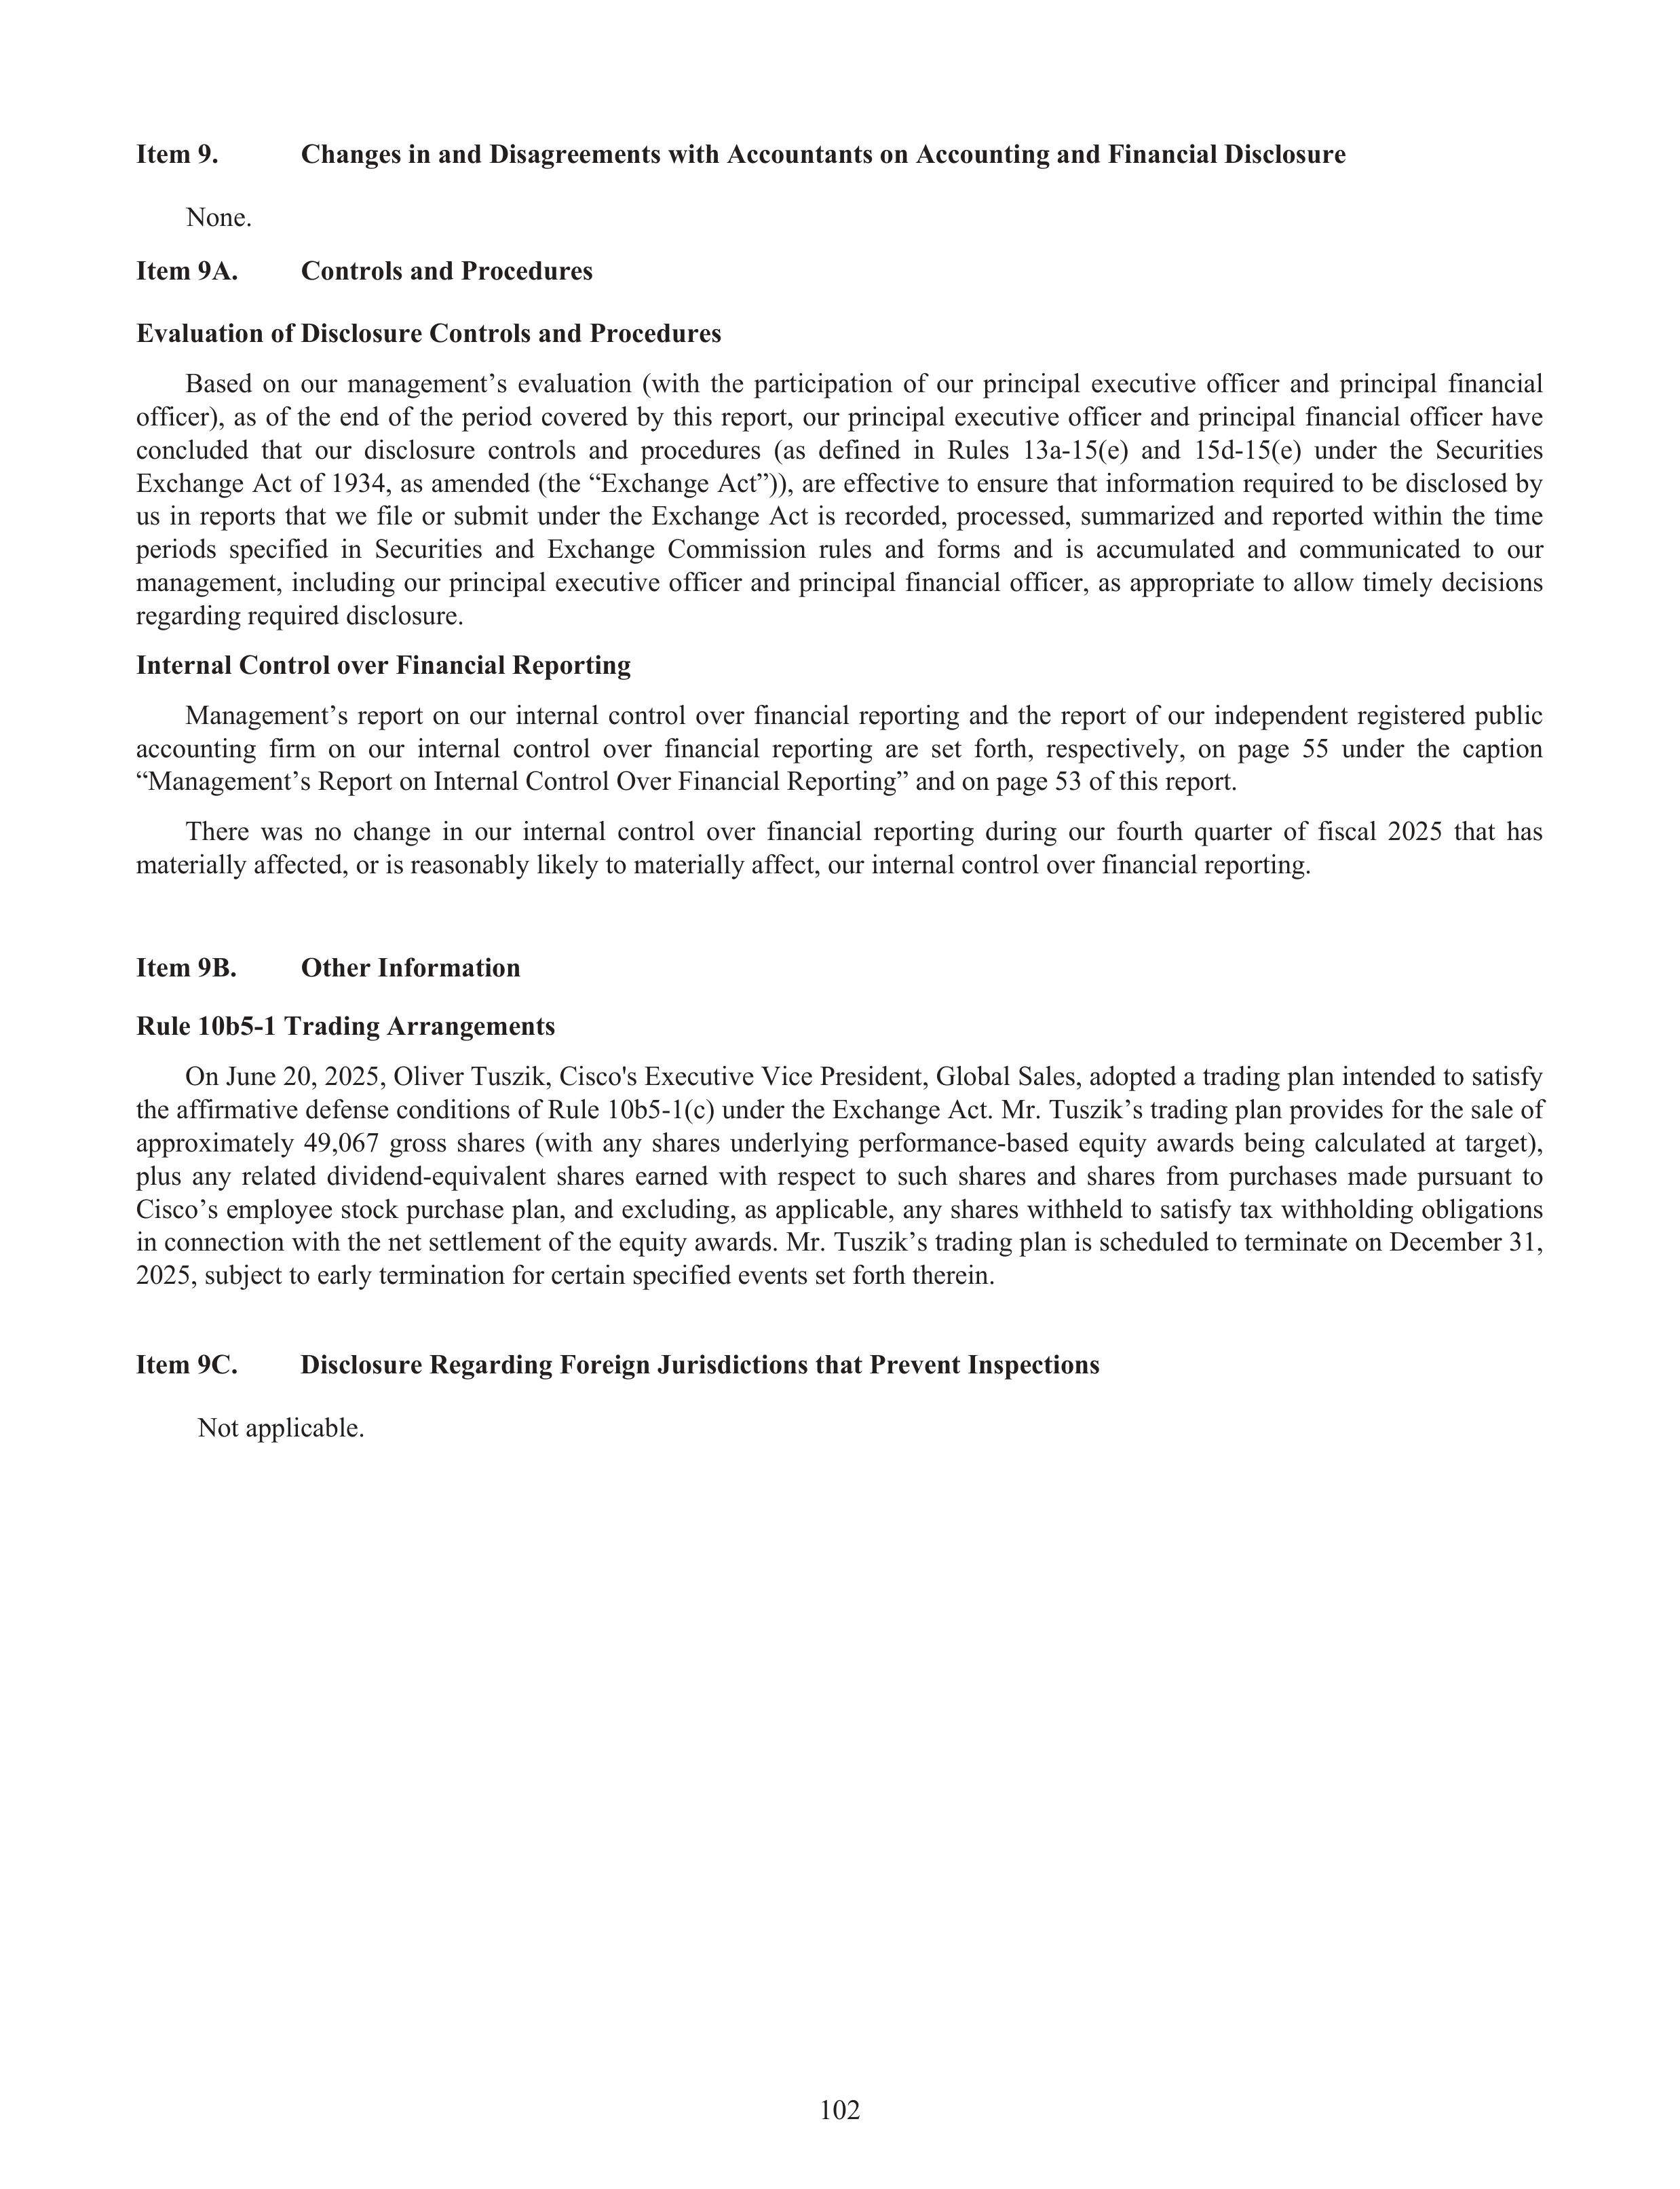
Item 9.
Changes in and Disagreements with Accountants on Accounting and Financial Disclosure
None.
Item 9A.
Controls and Procedures
Evaluation of Disclosure Controls and Procedures
Based on our management’s evaluation (with the participation of our principal executive officer and principal financial
officer), as of the end of the period covered by this report, our principal executive officer and principal financial officer have
concluded that our disclosure controls and procedures (as defined in Rules 13a-15(e) and 15d-15(e) under the Securities
Exchange Act of 1934, as amended (the “Exchange Act”)), are effective to ensure that information required to be disclosed by
us in reports that we file or submit under the Exchange Act is recorded, processed, summarized and reported within the time
periods specified in Securities and Exchange Commission rules and forms and is accumulated and communicated to our
management, including our principal executive officer and principal financial officer, as appropriate to allow timely decisions
regarding required disclosure.
Internal Control over Financial Reporting
Management’s report on our internal control over financial reporting and the report of our independent registered public
accounting firm on our internal control over financial reporting are set forth, respectively, on page 55 under the caption
“Management’s Report on Internal Control Over Financial Reporting” and on page 53 of this report.
There was no change in our internal control over financial reporting during our fourth quarter of fiscal 2025 that has
materially affected, or is reasonably likely to materially affect, our internal control over financial reporting.
Item 9B.
Other Information
Rule 10b5-1 Trading Arrangements
On June 20, 2025, Oliver Tuszik, Cisco's Executive Vice President, Global Sales, adopted a trading plan intended to satisfy
the affirmative defense conditions of Rule 10b5-1(c) under the Exchange Act. Mr. Tuszik’s trading plan provides for the sale of
approximately 49,067 gross shares (with any shares underlying performance-based equity awards being calculated at target),
plus any related dividend-equivalent shares earned with respect to such shares and shares from purchases made pursuant to
Cisco’s employee stock purchase plan, and excluding, as applicable, any shares withheld to satisfy tax withholding obligations
in connection with the net settlement of the equity awards. Mr. Tuszik’s trading plan is scheduled to terminate on December 31,
2025, subject to early termination for certain specified events set forth therein.
Item 9C.
Disclosure Regarding Foreign Jurisdictions that Prevent Inspections
Not applicable.
102
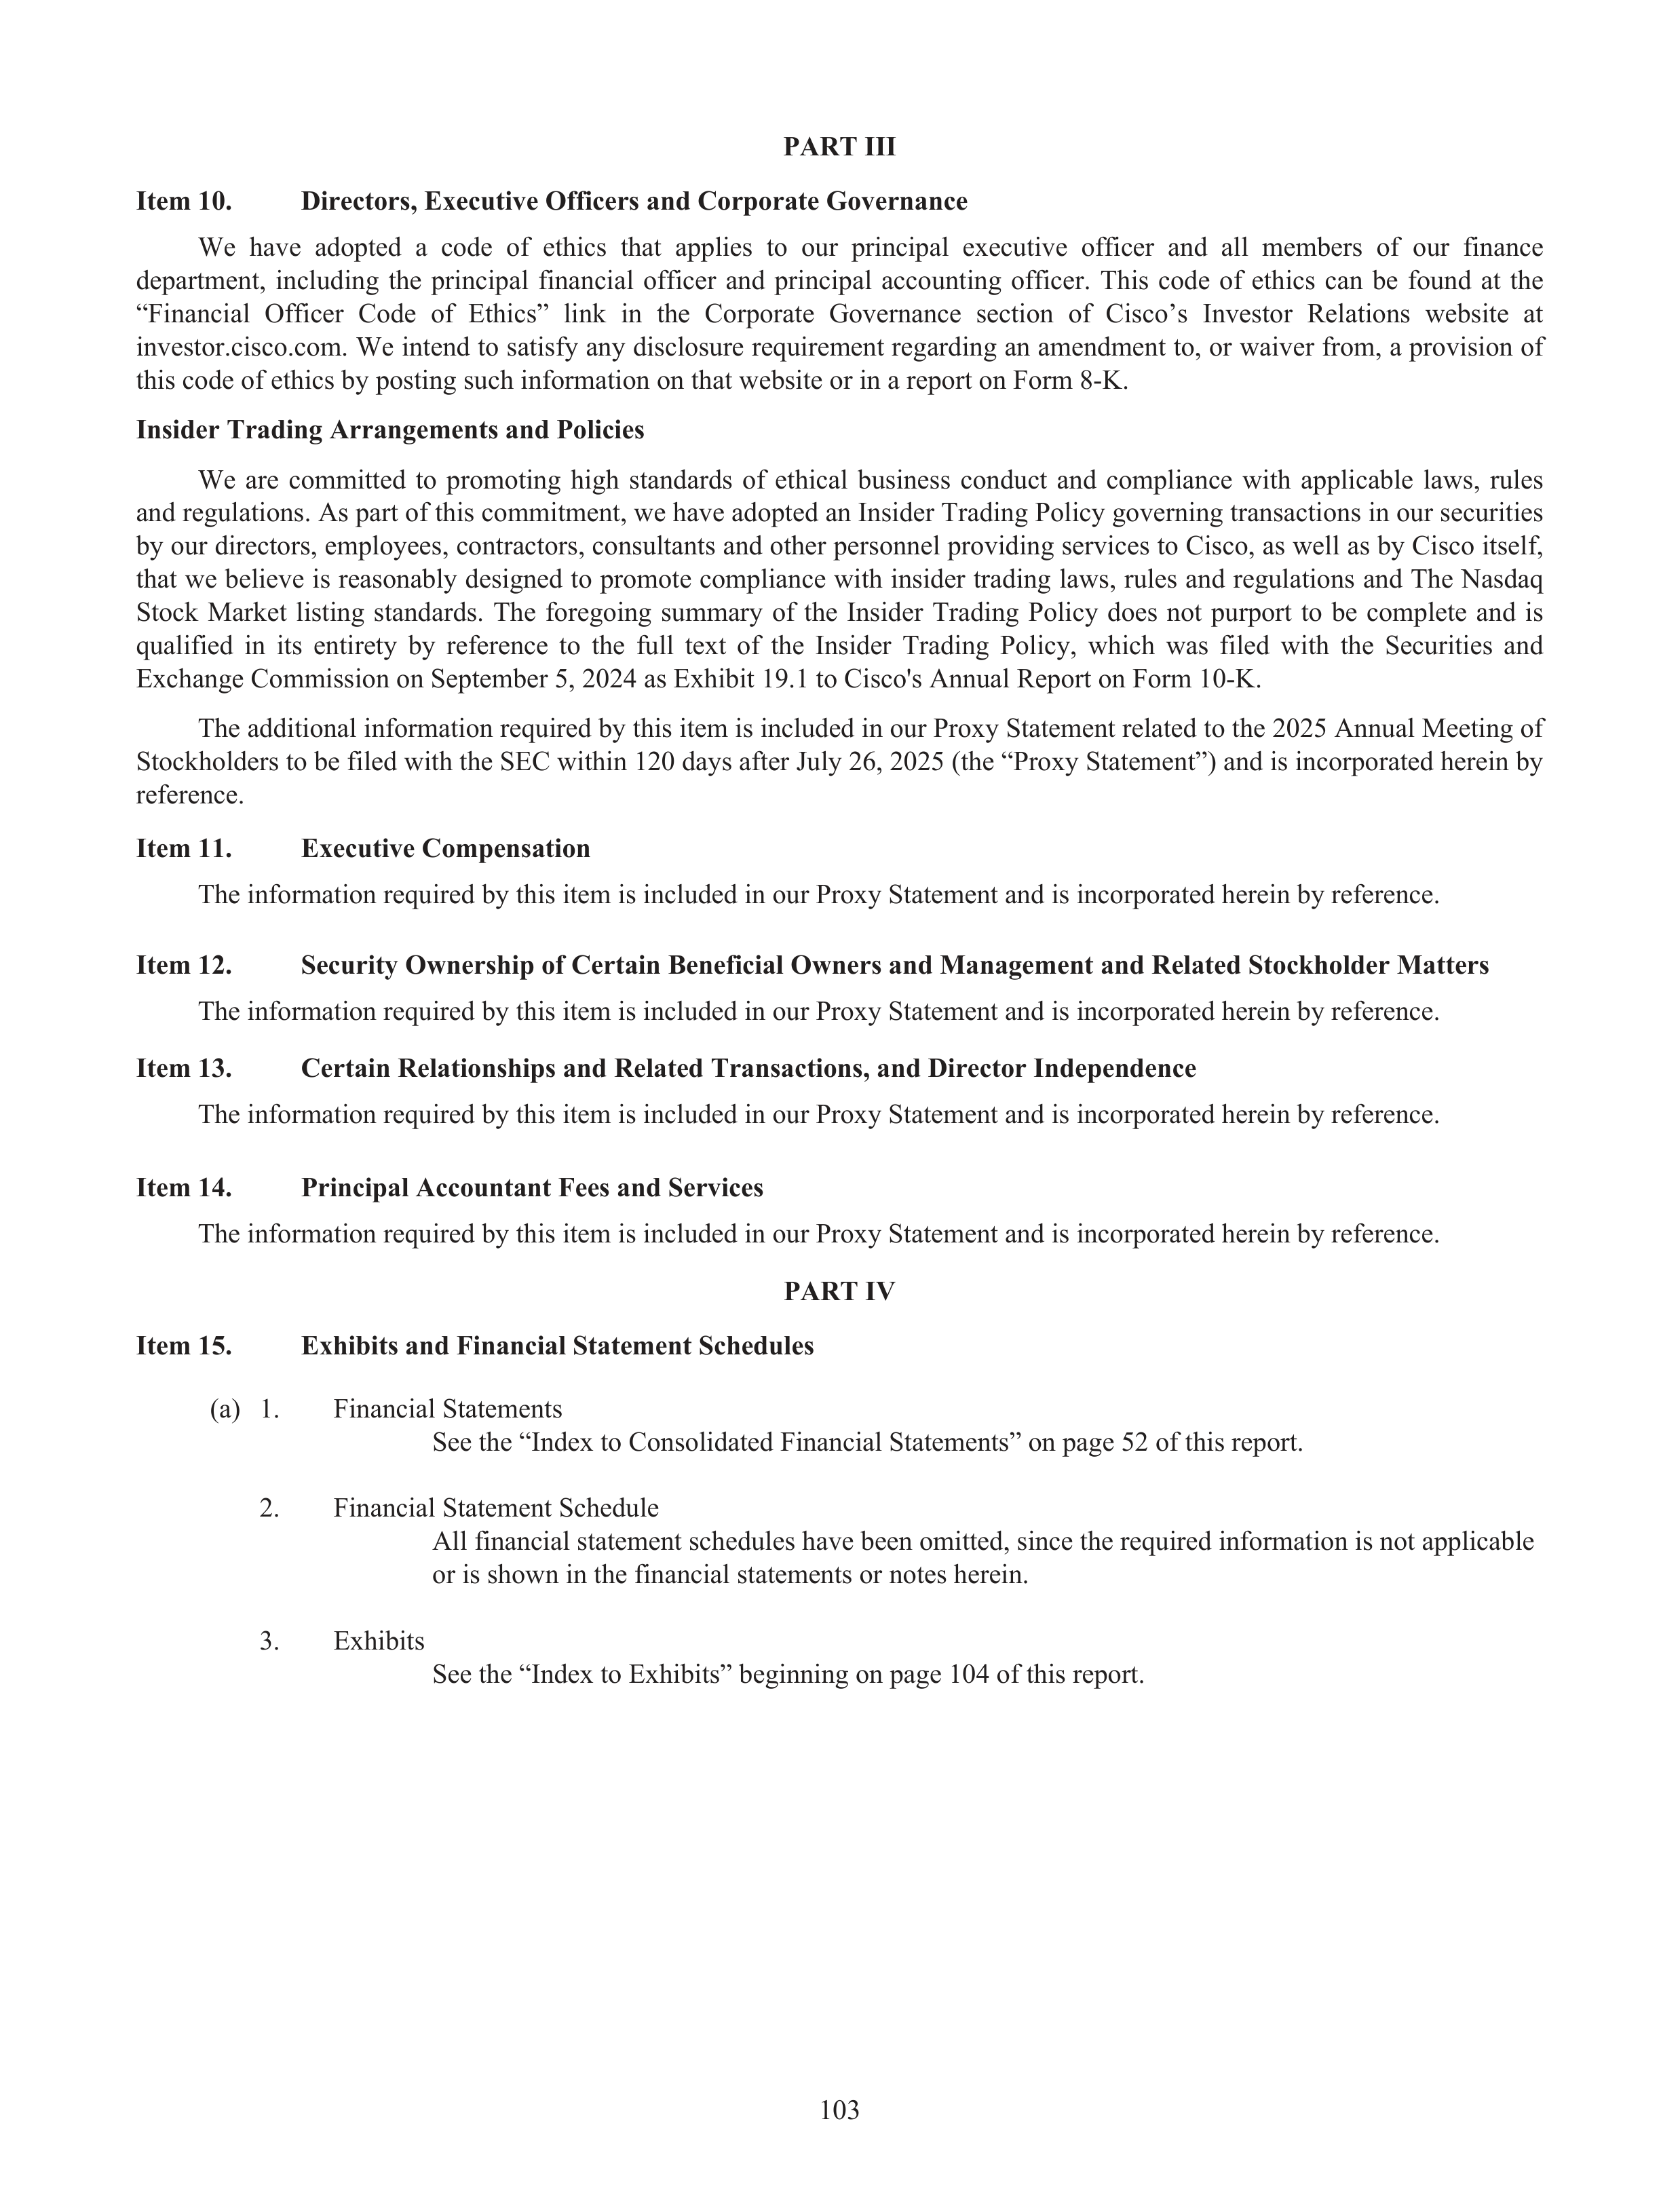
PART III
Item 10.
Directors, Executive Officers and Corporate Governance
We have adopted a code of ethics that applies to our principal executive officer and all members of our finance
department, including the principal financial officer and principal accounting officer. This code of ethics can be found at the
“Financial Officer Code of Ethics” link in the Corporate Governance section of Cisco’s Investor Relations website at
investor.cisco.com. We intend to satisfy any disclosure requirement regarding an amendment to, or waiver from, a provision of
this code of ethics by posting such information on that website or in a report on Form 8-K.
Insider Trading Arrangements and Policies
We are committed to promoting high standards of ethical business conduct and compliance with applicable laws, rules
and regulations. As part of this commitment, we have adopted an Insider Trading Policy governing transactions in our securities
by our directors, employees, contractors, consultants and other personnel providing services to Cisco, as well as by Cisco itself,
that we believe is reasonably designed to promote compliance with insider trading laws, rules and regulations and The Nasdaq
Stock Market listing standards. The foregoing summary of the Insider Trading Policy does not purport to be complete and is
qualified in its entirety by reference to the full text of the Insider Trading Policy, which was filed with the Securities and
Exchange Commission on September 5, 2024 as Exhibit 19.1 to Cisco's Annual Report on Form 10-K.
The additional information required by this item is included in our Proxy Statement related to the 2025 Annual Meeting of
Stockholders to be filed with the SEC within 120 days after July 26, 2025 (the “Proxy Statement”) and is incorporated herein by
reference.
Item 11.
Executive Compensation
The information required by this item is included in our Proxy Statement and is incorporated herein by reference.
Item 12.
Security Ownership of Certain Beneficial Owners and Management and Related Stockholder Matters
The information required by this item is included in our Proxy Statement and is incorporated herein by reference.
Item 13.
Certain Relationships and Related Transactions, and Director Independence
The information required by this item is included in our Proxy Statement and is incorporated herein by reference.
Item 14.
Principal Accountant Fees and Services
The information required by this item is included in our Proxy Statement and is incorporated herein by reference.
PART IV
Item 15.
Exhibits and Financial Statement Schedules
(a)
1.
Financial Statements
See the “Index to Consolidated Financial Statements” on page 52 of this report.
2.
Financial Statement Schedule
All financial statement schedules have been omitted, since the required information is not applicable
or is shown in the financial statements or notes herein.
3.
Exhibits
See the “Index to Exhibits” beginning on page 104 of this report.
103
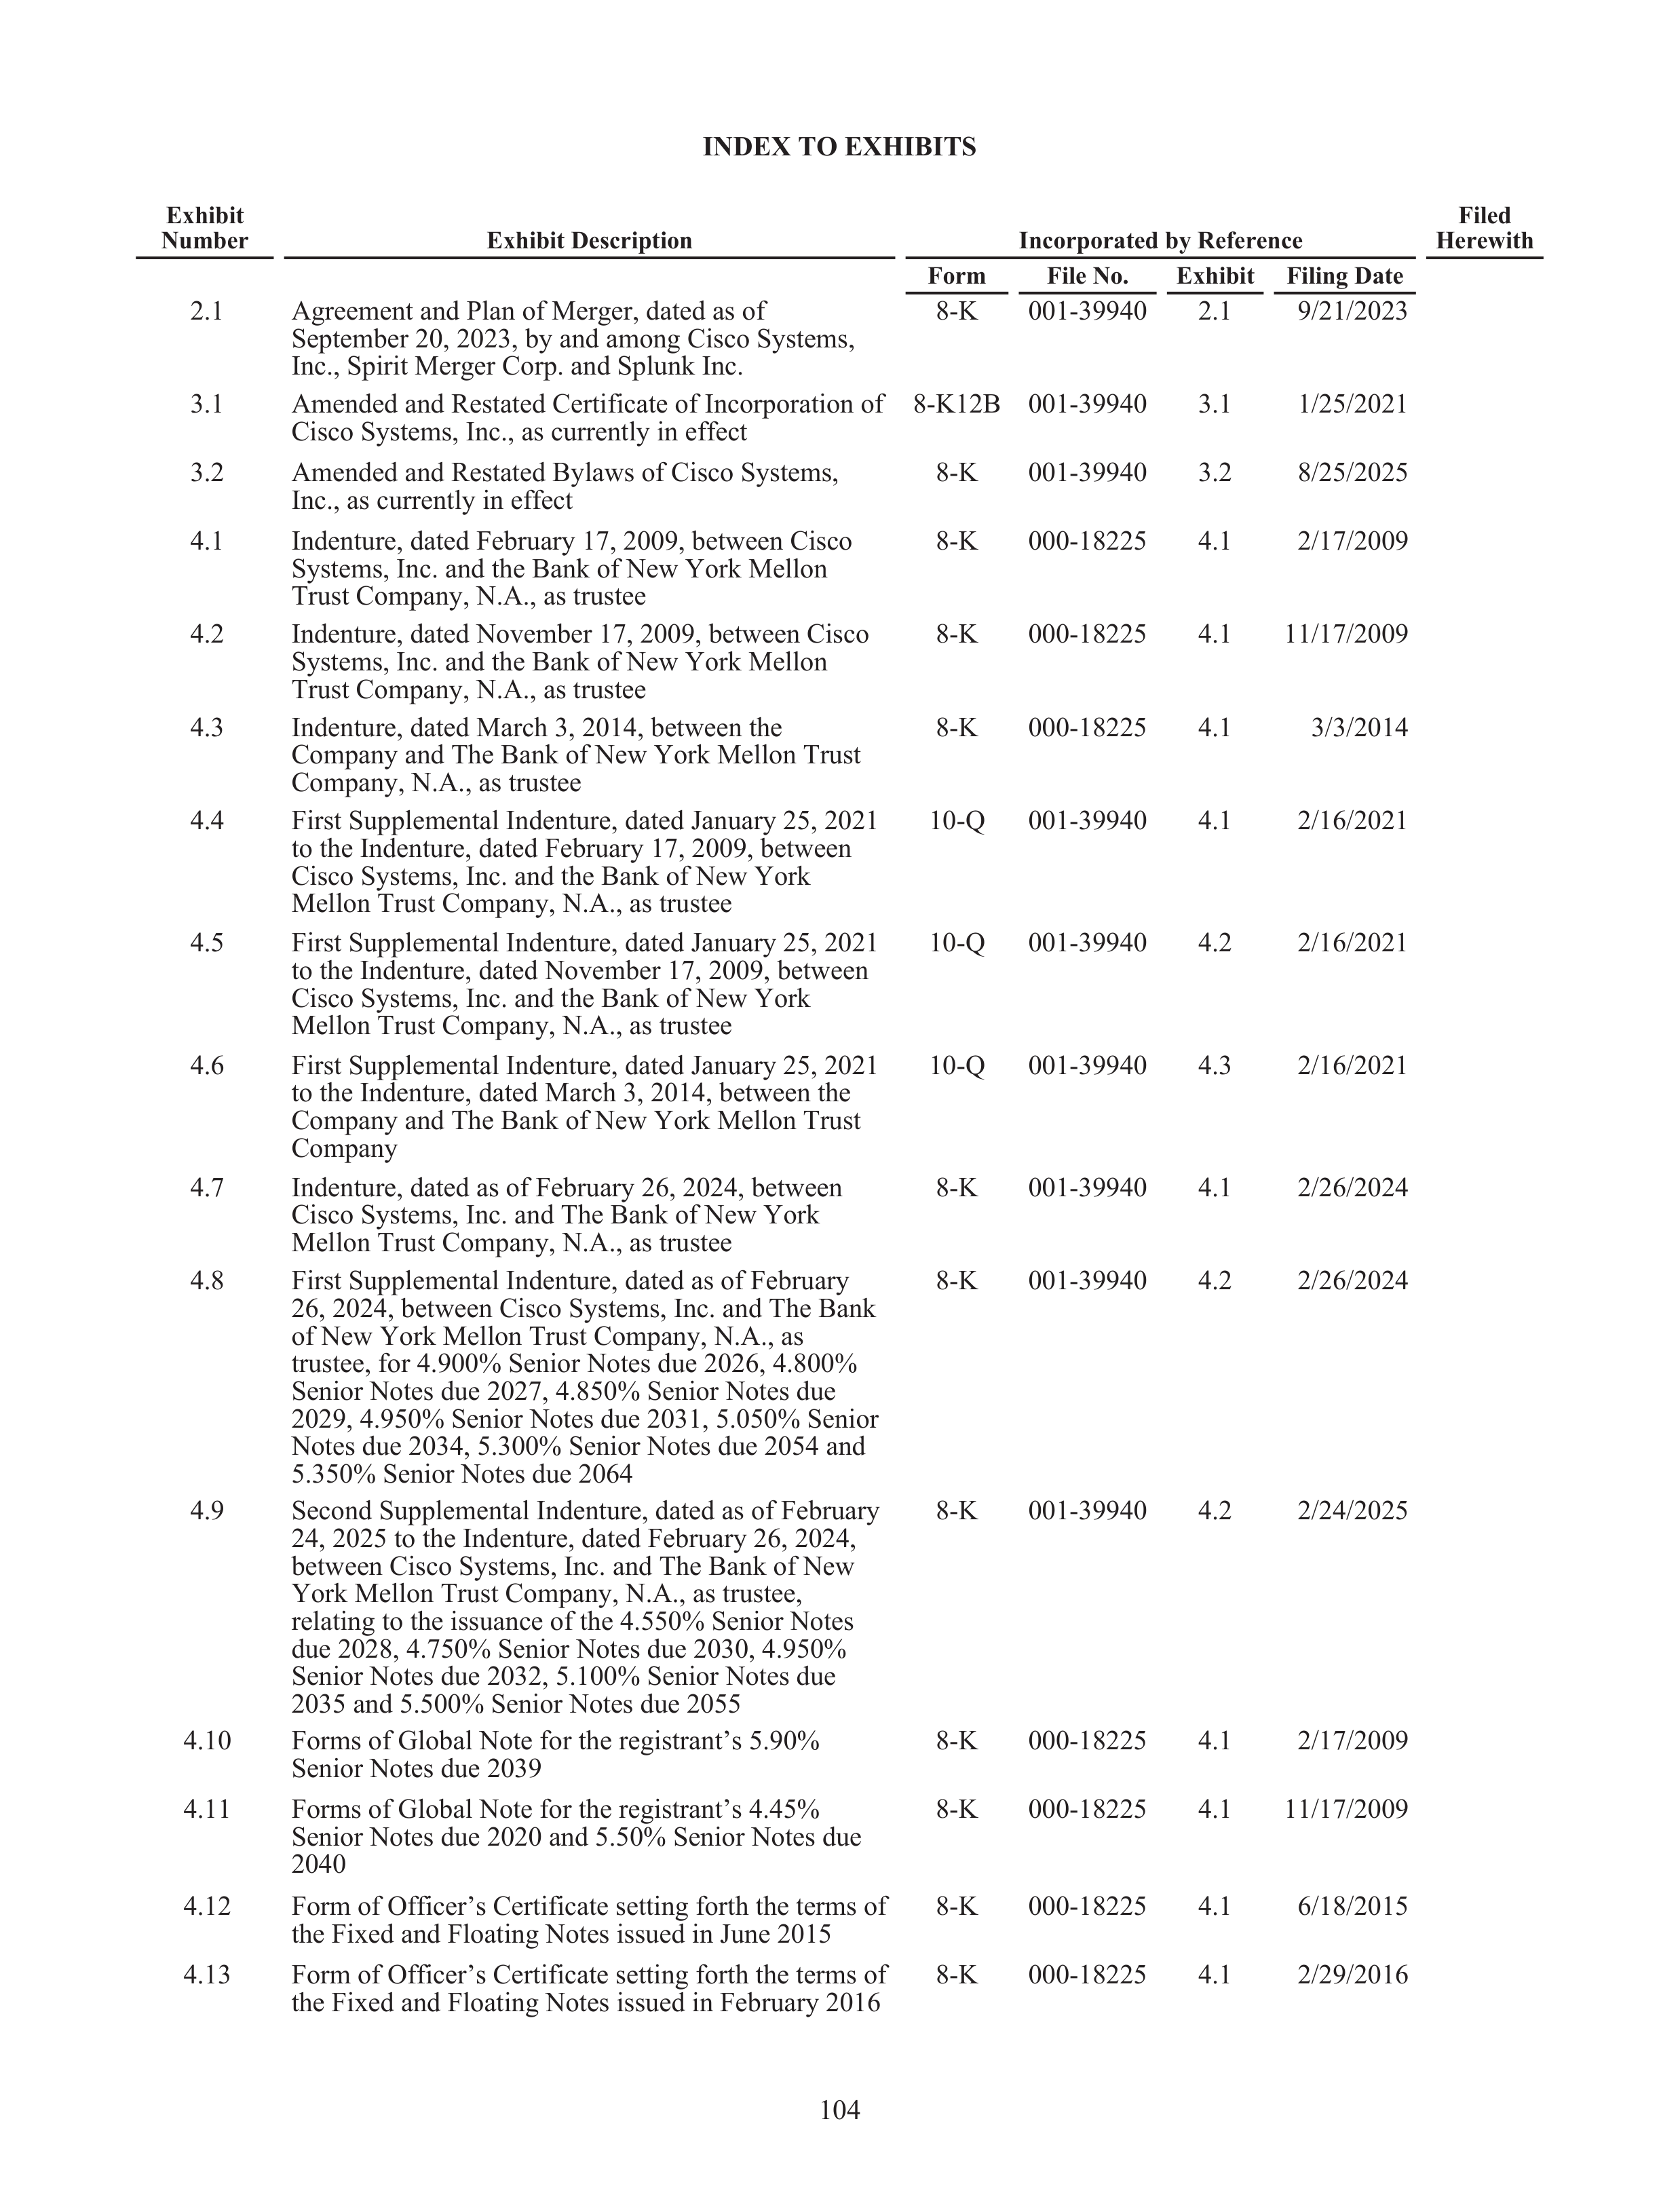
INDEX TO EXHIBITS
2.1
Agreement and Plan of Merger, dated as of
September 20, 2023, by and among Cisco Systems,
Inc., Spirit Merger Corp. and Splunk Inc.
8-K
001-39940
2.1
9/21/2023
3.1
Amended and Restated Certificate of Incorporation of
Cisco Systems, Inc., as currently in effect
8-K12B
001-39940
3.1
1/25/2021
3.2
Amended and Restated Bylaws of Cisco Systems,
Inc., as currently in effect
8-K
001-39940
3.2
8/25/2025
4.1
Indenture, dated February 17, 2009, between Cisco
Systems, Inc. and the Bank of New York Mellon
Trust Company, N.A., as trustee
8-K
000-18225
4.1
2/17/2009
4.2
Indenture, dated November 17, 2009, between Cisco
Systems, Inc. and the Bank of New York Mellon
Trust Company, N.A., as trustee
8-K
000-18225
4.1
11/17/2009
4.3
Indenture, dated March 3, 2014, between the
Company and The Bank of New York Mellon Trust
Company, N.A., as trustee
8-K
000-18225
4.1
3/3/2014
4.4
First Supplemental Indenture, dated January 25, 2021
to the Indenture, dated February 17, 2009, between
Cisco Systems, Inc. and the Bank of New York
Mellon Trust Company, N.A., as trustee
10-Q
001-39940
4.1
2/16/2021
4.5
First Supplemental Indenture, dated January 25, 2021
to the Indenture, dated November 17, 2009, between
Cisco Systems, Inc. and the Bank of New York
Mellon Trust Company, N.A., as trustee
10-Q
001-39940
4.2
2/16/2021
4.6
First Supplemental Indenture, dated January 25, 2021
to the Indenture, dated March 3, 2014, between the
Company and The Bank of New York Mellon Trust
Company
10-Q
001-39940
4.3
2/16/2021
4.7
Indenture, dated as of February 26, 2024, between
Cisco Systems, Inc. and The Bank of New York
Mellon Trust Company, N.A., as trustee
8-K
001-39940
4.1
2/26/2024
4.8
First Supplemental Indenture, dated as of February
26, 2024, between Cisco Systems, Inc. and The Bank
of New York Mellon Trust Company, N.A., as
trustee, for 4.900% Senior Notes due 2026, 4.800%
Senior Notes due 2027, 4.850% Senior Notes due
2029, 4.950% Senior Notes due 2031, 5.050% Senior
Notes due 2034, 5.300% Senior Notes due 2054 and
5.350% Senior Notes due 2064
8-K
001-39940
4.2
2/26/2024
4.9
Second Supplemental Indenture, dated as of February
24, 2025 to the Indenture, dated February 26, 2024,
between Cisco Systems, Inc. and The Bank of New
York Mellon Trust Company, N.A., as trustee,
relating to the issuance of the 4.550% Senior Notes
due 2028, 4.750% Senior Notes due 2030, 4.950%
Senior Notes due 2032, 5.100% Senior Notes due
2035 and 5.500% Senior Notes due 2055
8-K
001-39940
4.2
2/24/2025
4.10
Forms of Global Note for the registrant’s 5.90%
Senior Notes due 2039
8-K
000-18225
4.1
2/17/2009
4.11
Forms of Global Note for the registrant’s 4.45%
Senior Notes due 2020 and 5.50% Senior Notes due
2040
8-K
000-18225
4.1
11/17/2009
4.12
Form of Officer’s Certificate setting forth the terms of
the Fixed and Floating Notes issued in June 2015
8-K
000-18225
4.1
6/18/2015
4.13
Form of Officer’s Certificate setting forth the terms of
the Fixed and Floating Notes issued in February 2016
8-K
000-18225
4.1
2/29/2016
Exhibit
Number
Exhibit Description
Incorporated by Reference
Filed
Herewith
Form
File No.
Exhibit
Filing Date
104
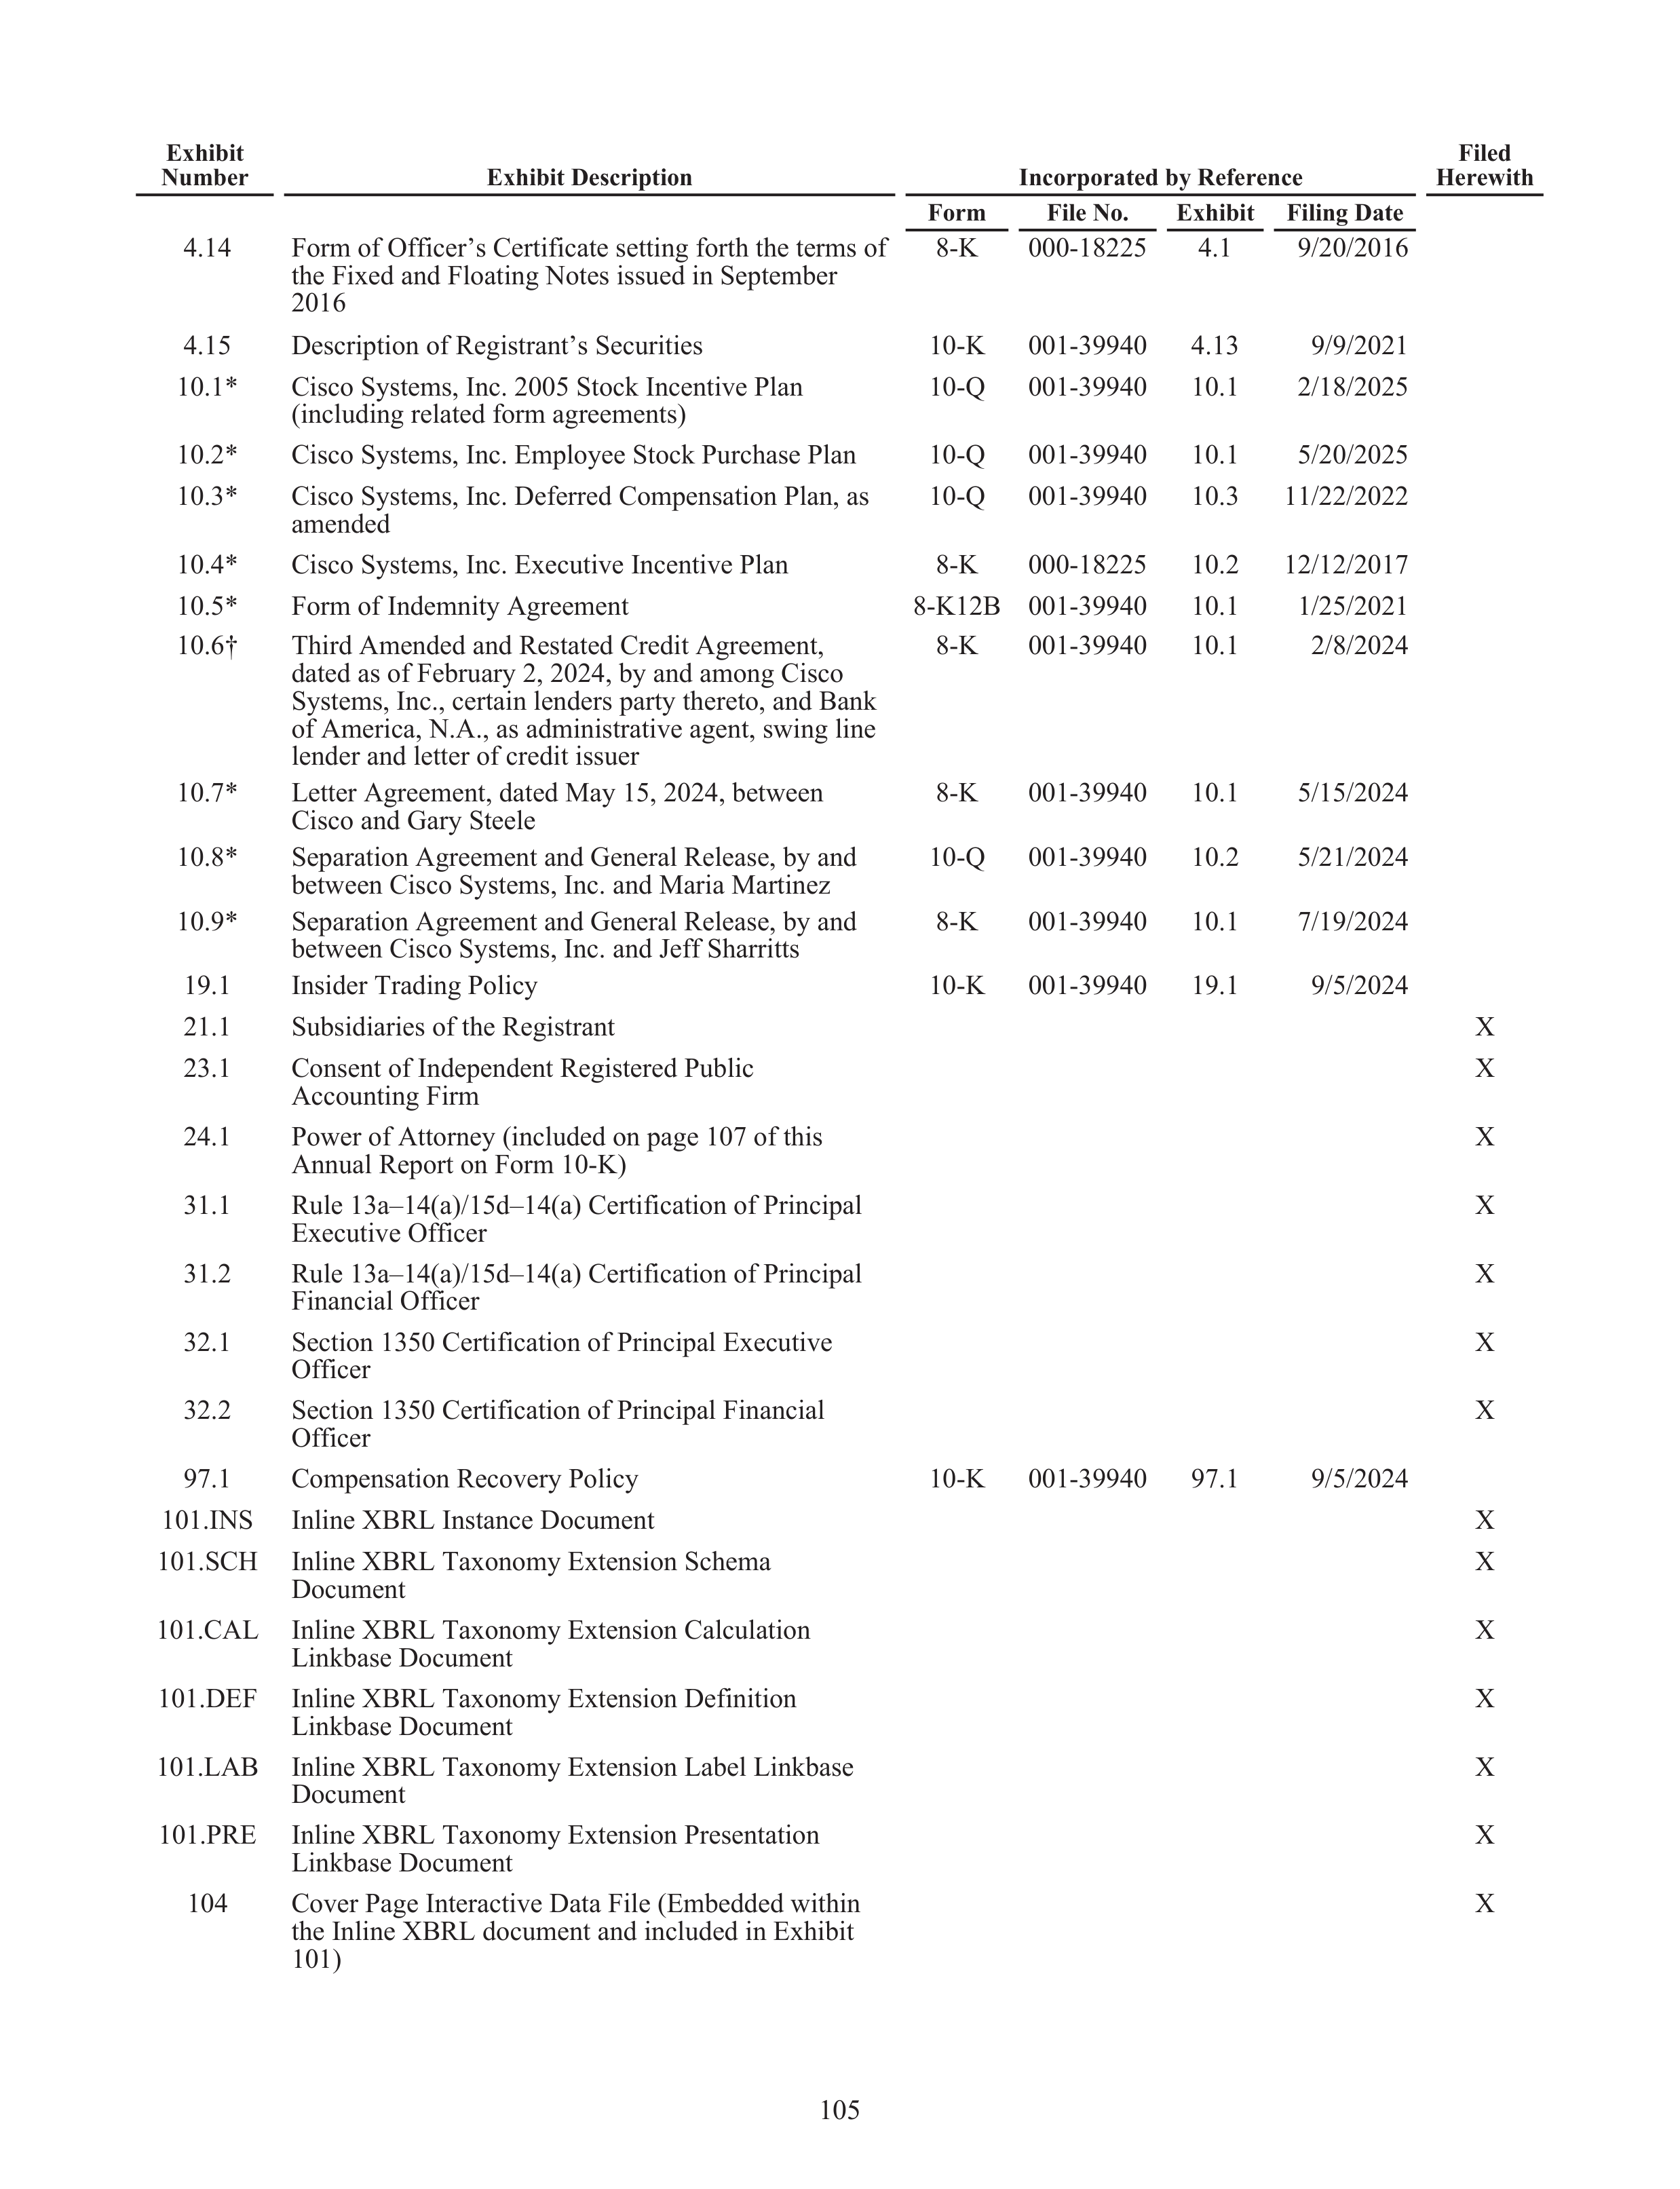
4.14
Form of Officer’s Certificate setting forth the terms of
the Fixed and Floating Notes issued in September
2016
8-K
000-18225
4.1
9/20/2016
4.15
Description of Registrant’s Securities
10-K
001-39940
4.13
9/9/2021
10.1*
Cisco Systems, Inc. 2005 Stock Incentive Plan
(including related form agreements)
10-Q
001-39940
10.1
2/18/2025
10.2*
Cisco Systems, Inc. Employee Stock Purchase Plan
10-Q
001-39940
10.1
5/20/2025
10.3*
Cisco Systems, Inc. Deferred Compensation Plan, as
amended
10-Q
001-39940
10.3
11/22/2022
10.4*
Cisco Systems, Inc. Executive Incentive Plan
8-K
000-18225
10.2
12/12/2017
10.5*
Form of Indemnity Agreement
8-K12B
001-39940
10.1
1/25/2021
10.6†
Third Amended and Restated Credit Agreement,
dated as of February 2, 2024, by and among Cisco
Systems, Inc., certain lenders party thereto, and Bank
of America, N.A., as administrative agent, swing line
lender and letter of credit issuer
8-K
001-39940
10.1
2/8/2024
10.7*
Letter Agreement, dated May 15, 2024, between
Cisco and Gary Steele
8-K
001-39940
10.1
5/15/2024
10.8*
Separation Agreement and General Release, by and
between Cisco Systems, Inc. and Maria Martinez
10-Q
001-39940
10.2
5/21/2024
10.9*
Separation Agreement and General Release, by and
between Cisco Systems, Inc. and Jeff Sharritts
8-K
001-39940
10.1
7/19/2024
19.1
Insider Trading Policy
10-K
001-39940
19.1
9/5/2024
21.1
Subsidiaries of the Registrant
X
23.1
Consent of Independent Registered Public
Accounting Firm
X
24.1
Power of Attorney (included on page 107 of this
Annual Report on Form 10-K)
X
31.1
Rule 13a–14(a)/15d–14(a) Certification of Principal
Executive Officer
X
31.2
Rule 13a–14(a)/15d–14(a) Certification of Principal
Financial Officer
X
32.1
Section 1350 Certification of Principal Executive
Officer
X
32.2
Section 1350 Certification of Principal Financial
Officer
X
97.1
Compensation Recovery Policy
10-K
001-39940
97.1
9/5/2024
101.INS
Inline XBRL Instance Document
X
101.SCH
Inline XBRL Taxonomy Extension Schema
Document
X
101.CAL
Inline XBRL Taxonomy Extension Calculation
Linkbase Document
X
101.DEF
Inline XBRL Taxonomy Extension Definition
Linkbase Document
X
101.LAB
Inline XBRL Taxonomy Extension Label Linkbase
Document
X
101.PRE
Inline XBRL Taxonomy Extension Presentation
Linkbase Document
X
104
Cover Page Interactive Data File (Embedded within
the Inline XBRL document and included in Exhibit
101)
X
Exhibit
Number
Exhibit Description
Incorporated by Reference
Filed
Herewith
Form
File No.
Exhibit
Filing Date
105

†
Certain of the exhibits and schedules to this Exhibit have been omitted in accordance with Regulation S-K Item
601(a)(5). Cisco agrees to furnish a copy of all omitted exhibits and schedules to the SEC upon its request.
*
Indicates a management contract or compensatory plan or arrangement.
Item 16.
Form 10-K Summary
None.
106
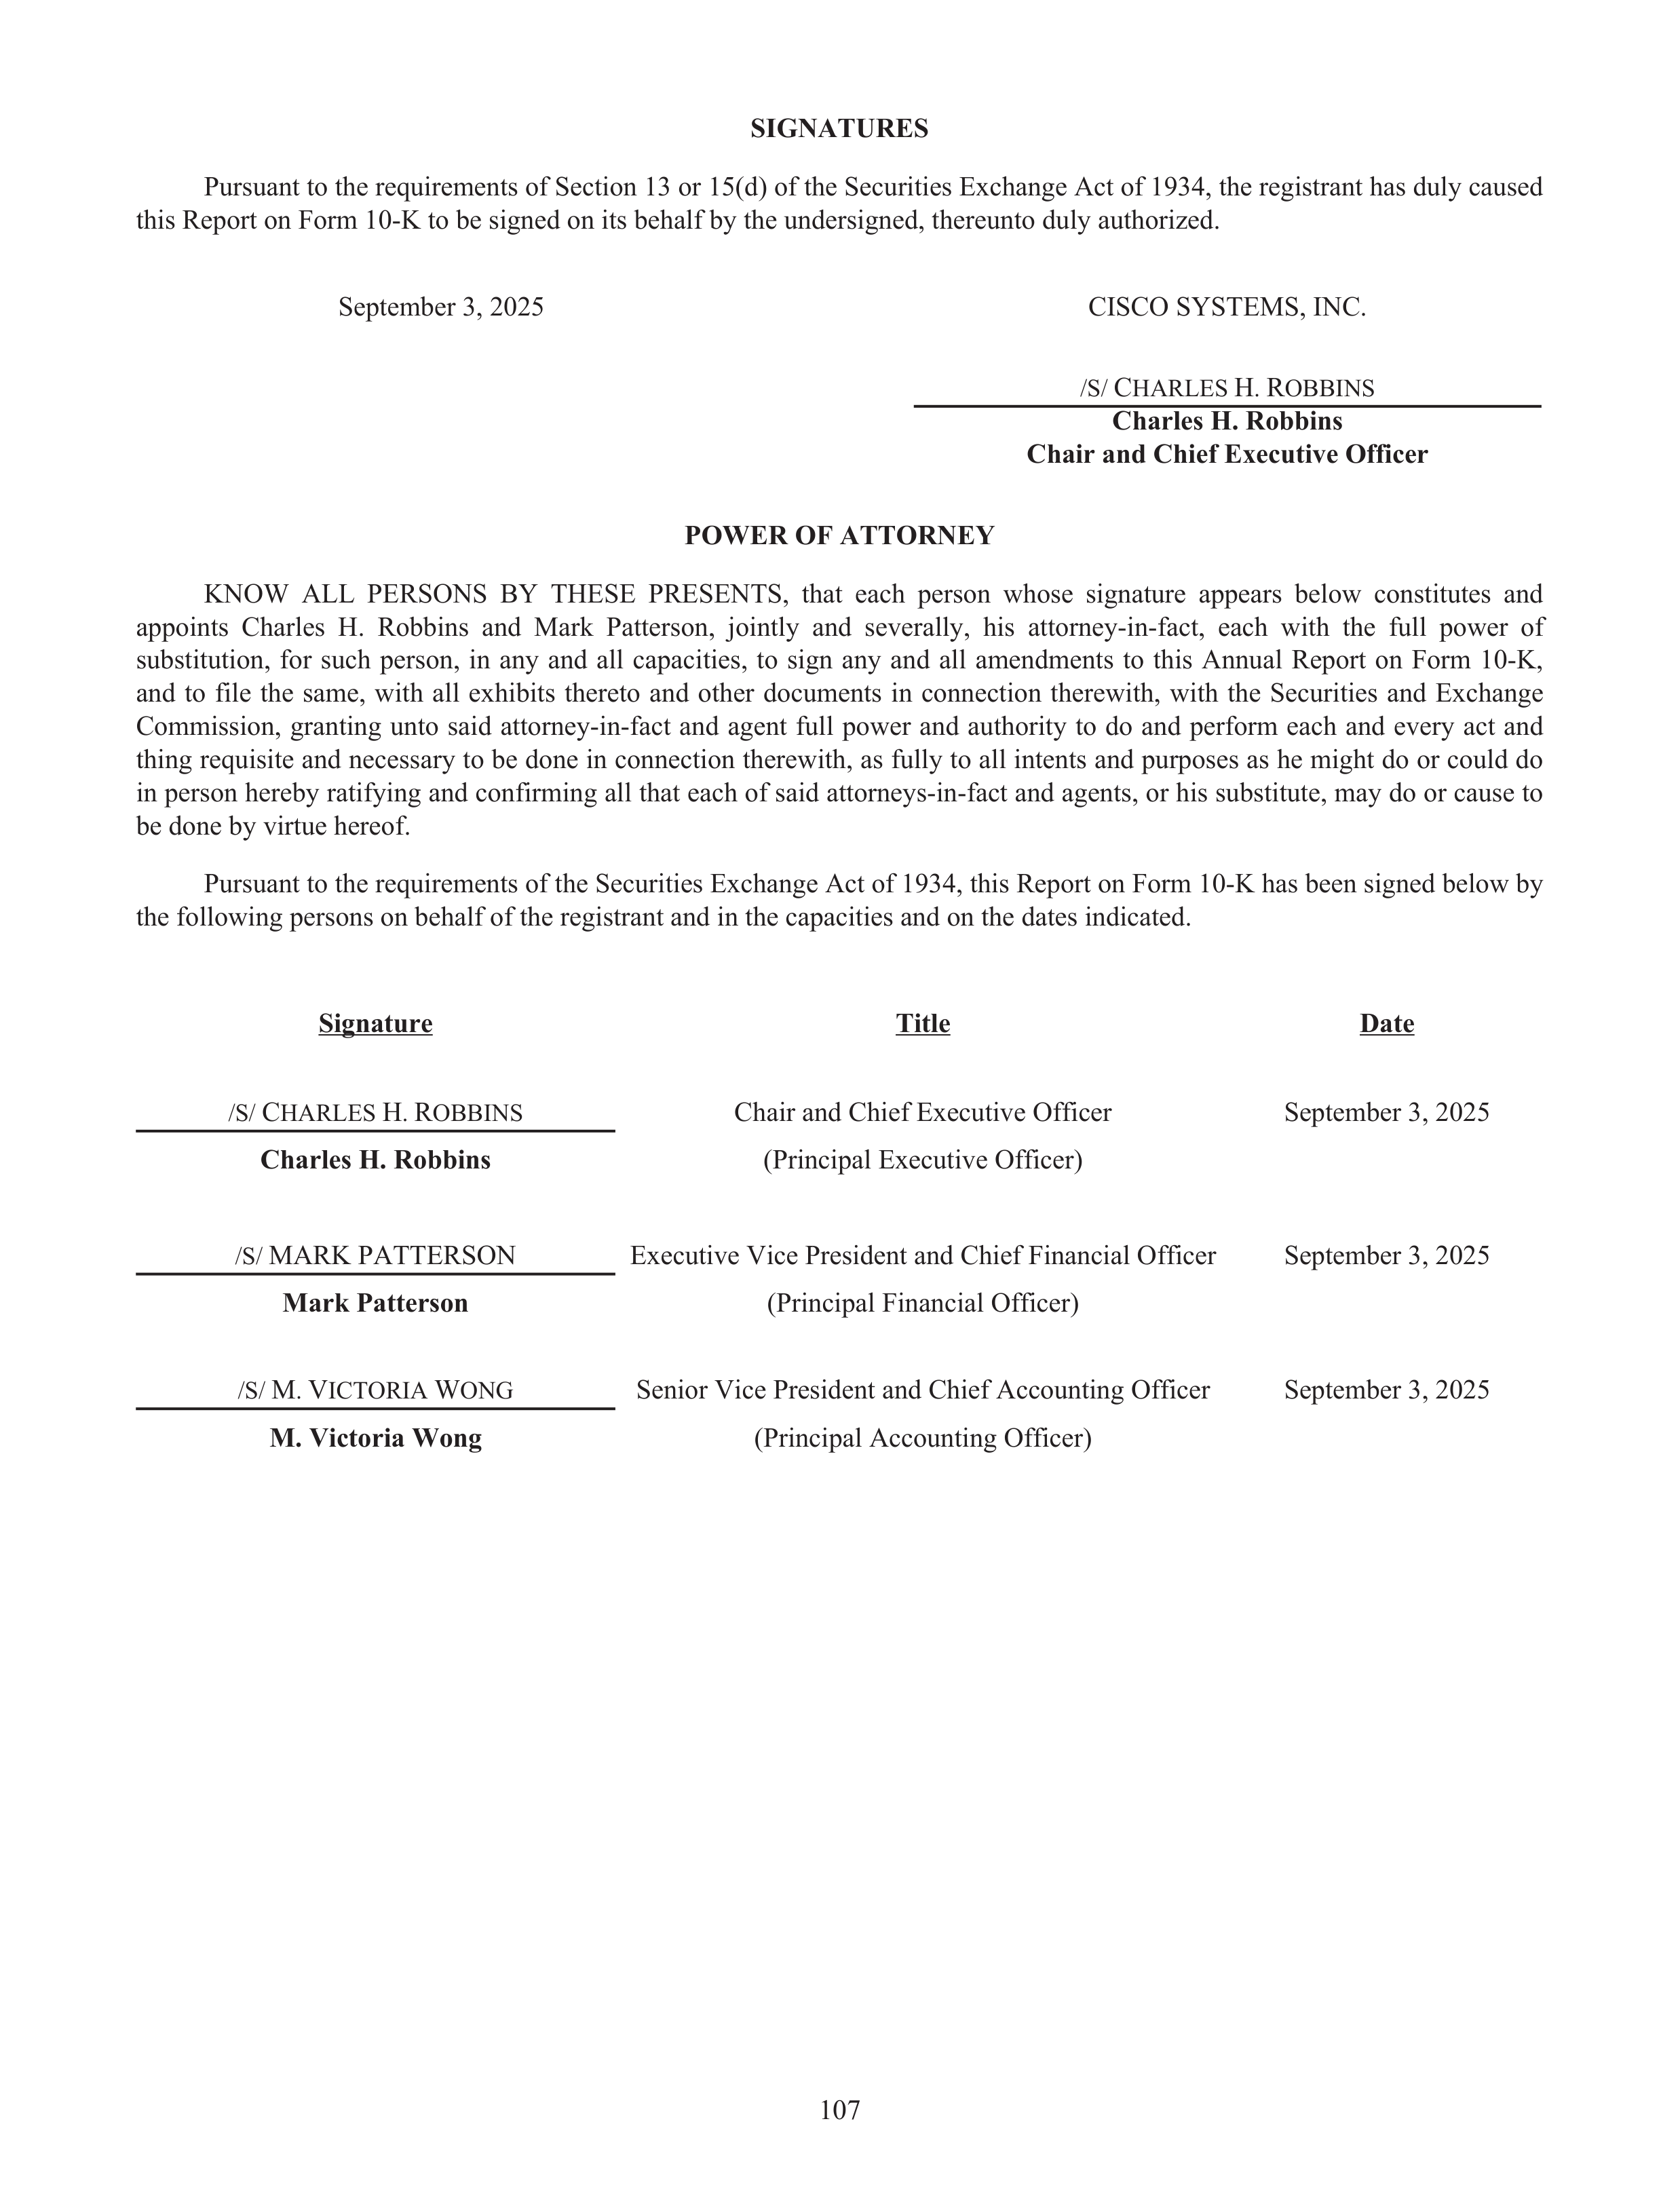
September 3, 2025
CISCO SYSTEMS, INC.
/S/
C
HARLES
H
.
R
OBBINS
Charles H. Robbins
Chair and Chief Executive Officer
POWER OF ATTORNEY
KNOW ALL PERSONS BY THESE PRESENTS, that each person whose signature appears below constitutes and
appoints Charles H. Robbins and Mark Patterson, jointly and severally, his attorney-in-fact, each with the full power of
substitution, for such person, in any and all capacities, to sign any and all amendments to this Annual Report on Form 10-K,
and to file the same, with all exhibits thereto and other documents in connection therewith, with the Securities and Exchange
Commission, granting unto said attorney-in-fact and agent full power and authority to do and perform each and every act and
thing requisite and necessary to be done in connection therewith, as fully to all intents and purposes as he might do or could do
in person hereby ratifying and confirming all that each of said attorneys-in-fact and agents, or his substitute, may do or cause to
be done by virtue hereof.
Pursuant to the requirements of the Securities Exchange Act of 1934, this Report on Form 10-K has been signed below by
the following persons on behalf of the registrant and in the capacities and on the dates indicated.
/S/
C
HARLES
H
.
R
OBBINS
Chair and Chief Executive Officer
September 3, 2025
Charles H. Robbins
(Principal Executive Officer)
/S/
MARK PATTERSON
Executive Vice President and Chief Financial Officer
September 3, 2025
Mark Patterson
(Principal Financial Officer)
/S/
M
.
V
ICTORIA
W
ONG
Senior Vice President and Chief Accounting Officer
September 3, 2025
M. Victoria Wong
(Principal Accounting Officer)
Signature
Title
Date
SIGNATURES
Pursuant to the requirements of Section 13 or 15(d) of the Securities Exchange Act of 1934, the registrant has duly caused
this Report on Form 10-K to be signed on its behalf by the undersigned, thereunto duly authorized.
107

Signature
Title
Date
/S/
W
ESLEY
G
.
B
USH
Director
September 3, 2025
Wesley G. Bush
/S/
M
ICHAEL
D
.
C
APELLAS
Lead Independent Director
September 3, 2025
Michael D. Capellas
/S/
M
ARK
G
ARRETT
Director
September 3, 2025
Mark Garrett
/S/
J
OHN
D. H
ARRIS
II
Director
September 3, 2025
John D. Harris II
/S/
K
RISTINA
M
.
J
OHNSON
Director
September 3, 2025
Dr. Kristina M. Johnson
/S/
S
ARAH
R
AE
M
URPHY
Director
September 3, 2025
Sarah Rae Murphy
/S/
D
ANIEL
H
.
S
CHULMAN
Director
September 3, 2025
Daniel H. Schulman
/S/
M
ARIANNA
T
ESSEL
Director
September 3, 2025
Marianna Tessel
Director
Kevin Weil
108
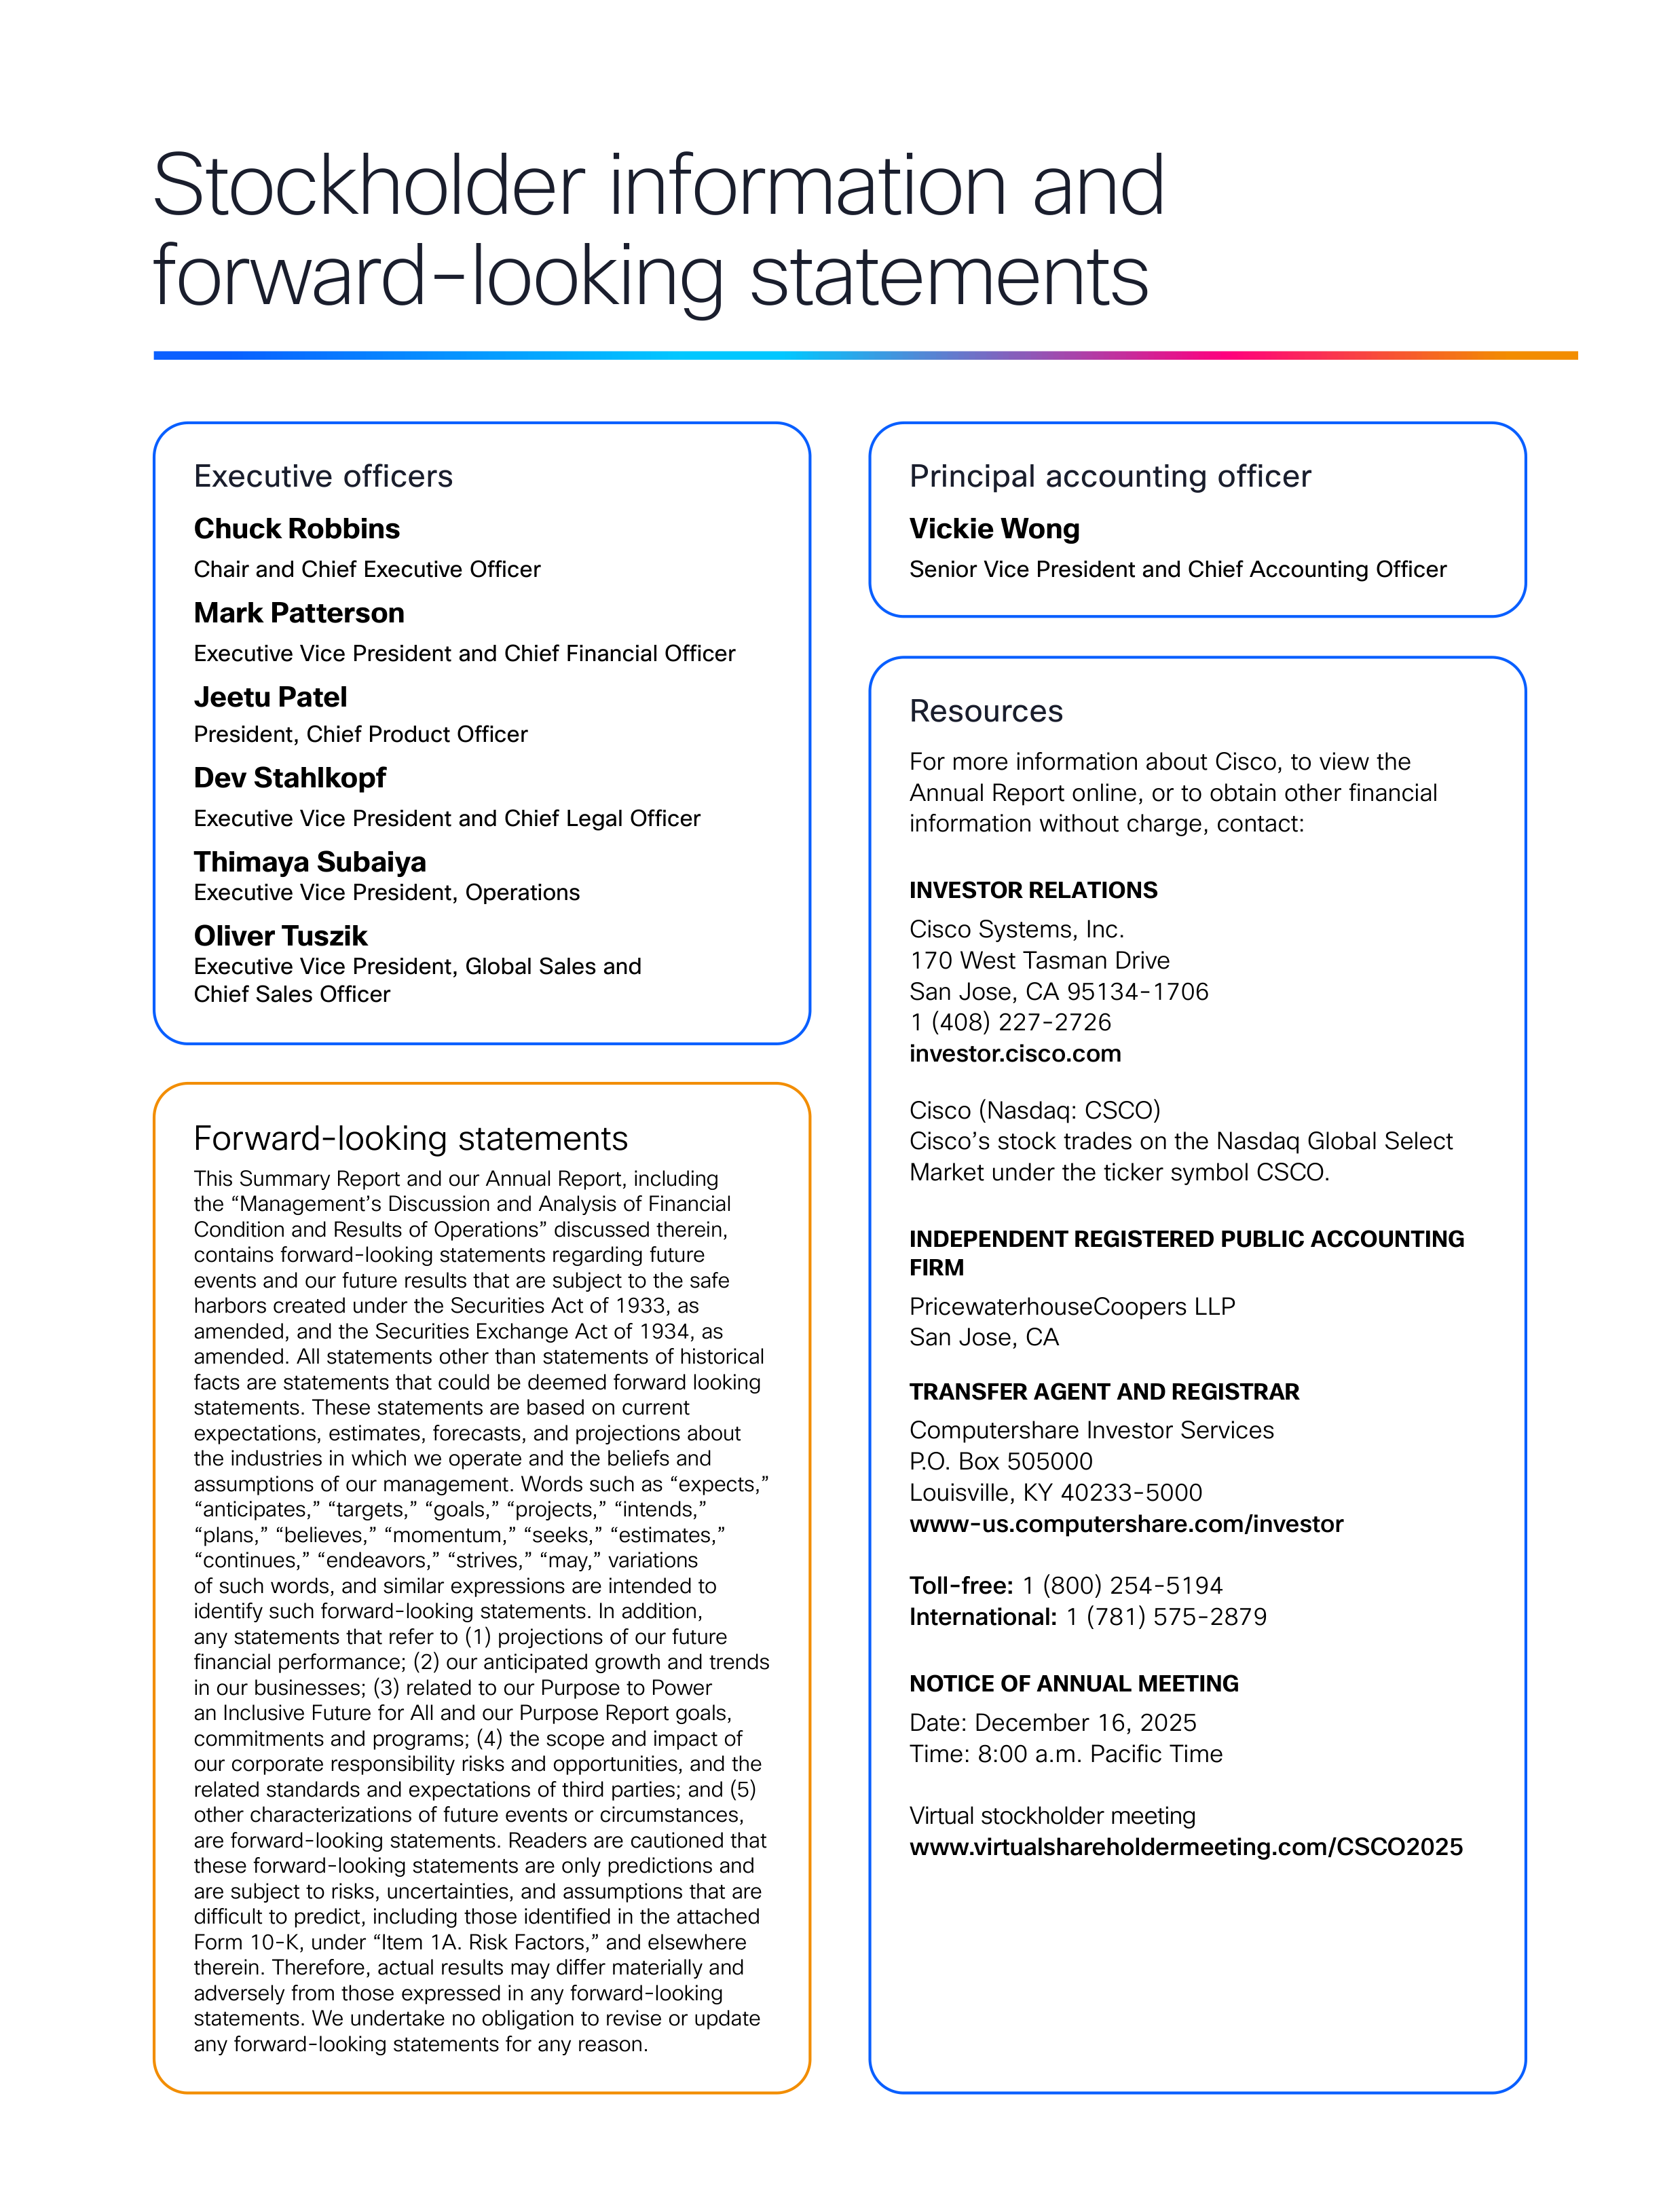
Stockholder information and
forward-looking statements
Resources
For more information about Cisco, to view the
Annual Report online, or to obtain other financial
information without charge, contact:
INVESTOR RELATIONS
Cisco Systems, Inc.
170 West Tasman Drive
San Jose, CA 95134-1706
1 (408) 227-2726
investor.cisco.com
Cisco (Nasdaq: CSCO)
Cisco’s stock trades on the Nasdaq Global Select
Market under the ticker symbol CSCO.
INDEPENDENT REGISTERED PUBLIC ACCOUNTING
FIRM
PricewaterhouseCoopers LLP
San Jose, CA
TRANSFER AGENT AND REGISTRAR
Computershare Investor Services
P.O. Box 505000
Louisville, KY 40233-5000
www-us.computershare.com/investor
Toll-free:
1 (800) 254-5194
International:
1 (781) 575-2879
NOTICE OF ANNUAL MEETING
Date: December 16, 2025
Time: 8:00 a.m. Pacific Time
Virtual stockholder meeting
www.virtualshareholdermeeting.com/CSCO2025
Principal accounting officer
Vickie Wong
Senior Vice President and Chief Accounting Officer
Executive officers
Chuck Robbins
Chair and Chief Executive Officer
Mark Patterson
Executive Vice President and Chief Financial Officer
Jeetu Patel
President, Chief Product Officer
Dev Stahlkopf
Executive Vice President and Chief Legal Officer
Thimaya Subaiya
Executive Vice President, Operations
Oliver Tuszik
Executive Vice President, Global Sales and
Chief Sales Officer
Forward-looking statements
This Summary Report and our Annual Report, including
the “Management’s Discussion and Analysis of Financial
Condition and Results of Operations” discussed therein,
contains forward-looking statements regarding future
events and our future results that are subject to the safe
harbors created under the Securities Act of 1933, as
amended, and the Securities Exchange Act of 1934, as
amended. All statements other than statements of historical
facts are statements that could be deemed forward looking
statements. These statements are based on current
expectations, estimates, forecasts, and projections about
the industries in which we operate and the beliefs and
assumptions of our management. Words such as “expects,”
“anticipates,” “targets,” “goals,” “projects,” “intends,”
“plans,” “believes,” “momentum,” “seeks,” “estimates,”
“continues,” “endeavors,” “strives,” “may,” variations
of such words, and similar expressions are intended to
identify such forward-looking statements. In addition,
any statements that refer to (1) projections of our future
financial performance; (2) our anticipated growth and trends
in our businesses; (3) related to our Purpose to Power
an Inclusive Future for All and our Purpose Report goals,
commitments and programs; (4) the scope and impact of
our corporate responsibility risks and opportunities, and the
related standards and expectations of third parties; and (5)
other characterizations of future events or circumstances,
are forward-looking statements. Readers are cautioned that
these forward-looking statements are only predictions and
are subject to risks, uncertainties, and assumptions that are
difficult to predict, including those identified in the attached
Form 10-K, under “Item 1A. Risk Factors,” and elsewhere
therein. Therefore, actual results may differ materially and
adversely from those expressed in any forward-looking
statements. We undertake no obligation to revise or update
any forward-looking statements for any reason.
Published October 2025
© 2025 Cisco and/or its affiliates. All rights reserved.
Cisco and the Cisco logo are trademarks or registered
trademarks of Cisco and/or its affiliates in the U.S. and
other countries. To view a list of Cisco trademarks, go
to this URL: www.cisco.com/go/trademarks. Third-
party trademarks mentioned are the property of their
respective owners. The use of the word “partner” does
not imply a partnership relationship between Cisco
and any other company. This document is Cisco public
information.
The papers used in the production of this Annual
Report are all certified for Forest Stewardship Council
(FSC®) standards, which promote environmentally
appropriate, socially beneficial, and economically
viable management of the world’s forests. This Annual
Report was printed by a facility in North America that
uses exclusively vegetable-based inks and 100%
renewable wind energy and releases zero VOCs into
the environment.
Americas Headquarters
San Jose, CA, USA
Asia Pacific Headquarters
Singapore
Europe Headquarters
Amsterdam, The Netherlands
Cisco has approximately 300 offices worldwide.
Addresses, phone numbers, and fax numbers are listed
on the Cisco website at www.cisco.com/go/offices.