

COVERING FISCAL YEAR 2025
Environmental
Progress
Report


Contents
Environmental
initiatives
Apple 2030
9
Approach
12
Design and materials
21
Electricity
31
Direct GHG emissions
34
Nature and carbon
Resources
39
Approach
41
Product longevity
46
Material recovery
51
Water
56
Zero waste
Smarter chemistry
61
Approach
63
Mapping
65
Assessment
67
Innovation
Introduction
3
Reflections
4
Report highlights
5
Goals and progress
Engagement and
advocacy
71
Learning with others
72
Collaborative impact
73
Supporting communities
Data
76
Greenhouse gas emissions
77
Carbon credits
78
Carbon footprints
80
Energy
81
Resources
82
Normalizing factors
Appendix
92
A: Corporate facilities
energy supplement
100
B: Apple’s life cycle
assessment methodology
101
C: Assurance and
review statements
109
D: Environment, Health
and Safety Policy
110
E: ISO 14001 certification
111
Report notes
112
End notes
Green Bond
Impact Report
84
Apple’s green bonds
85
Cumulative allocation:
2019 Green Bond
86
Featured projects
87
Sustainable Fitch
Annual Review
89
Ernst & Young LLP Use of
Proceeds Examination
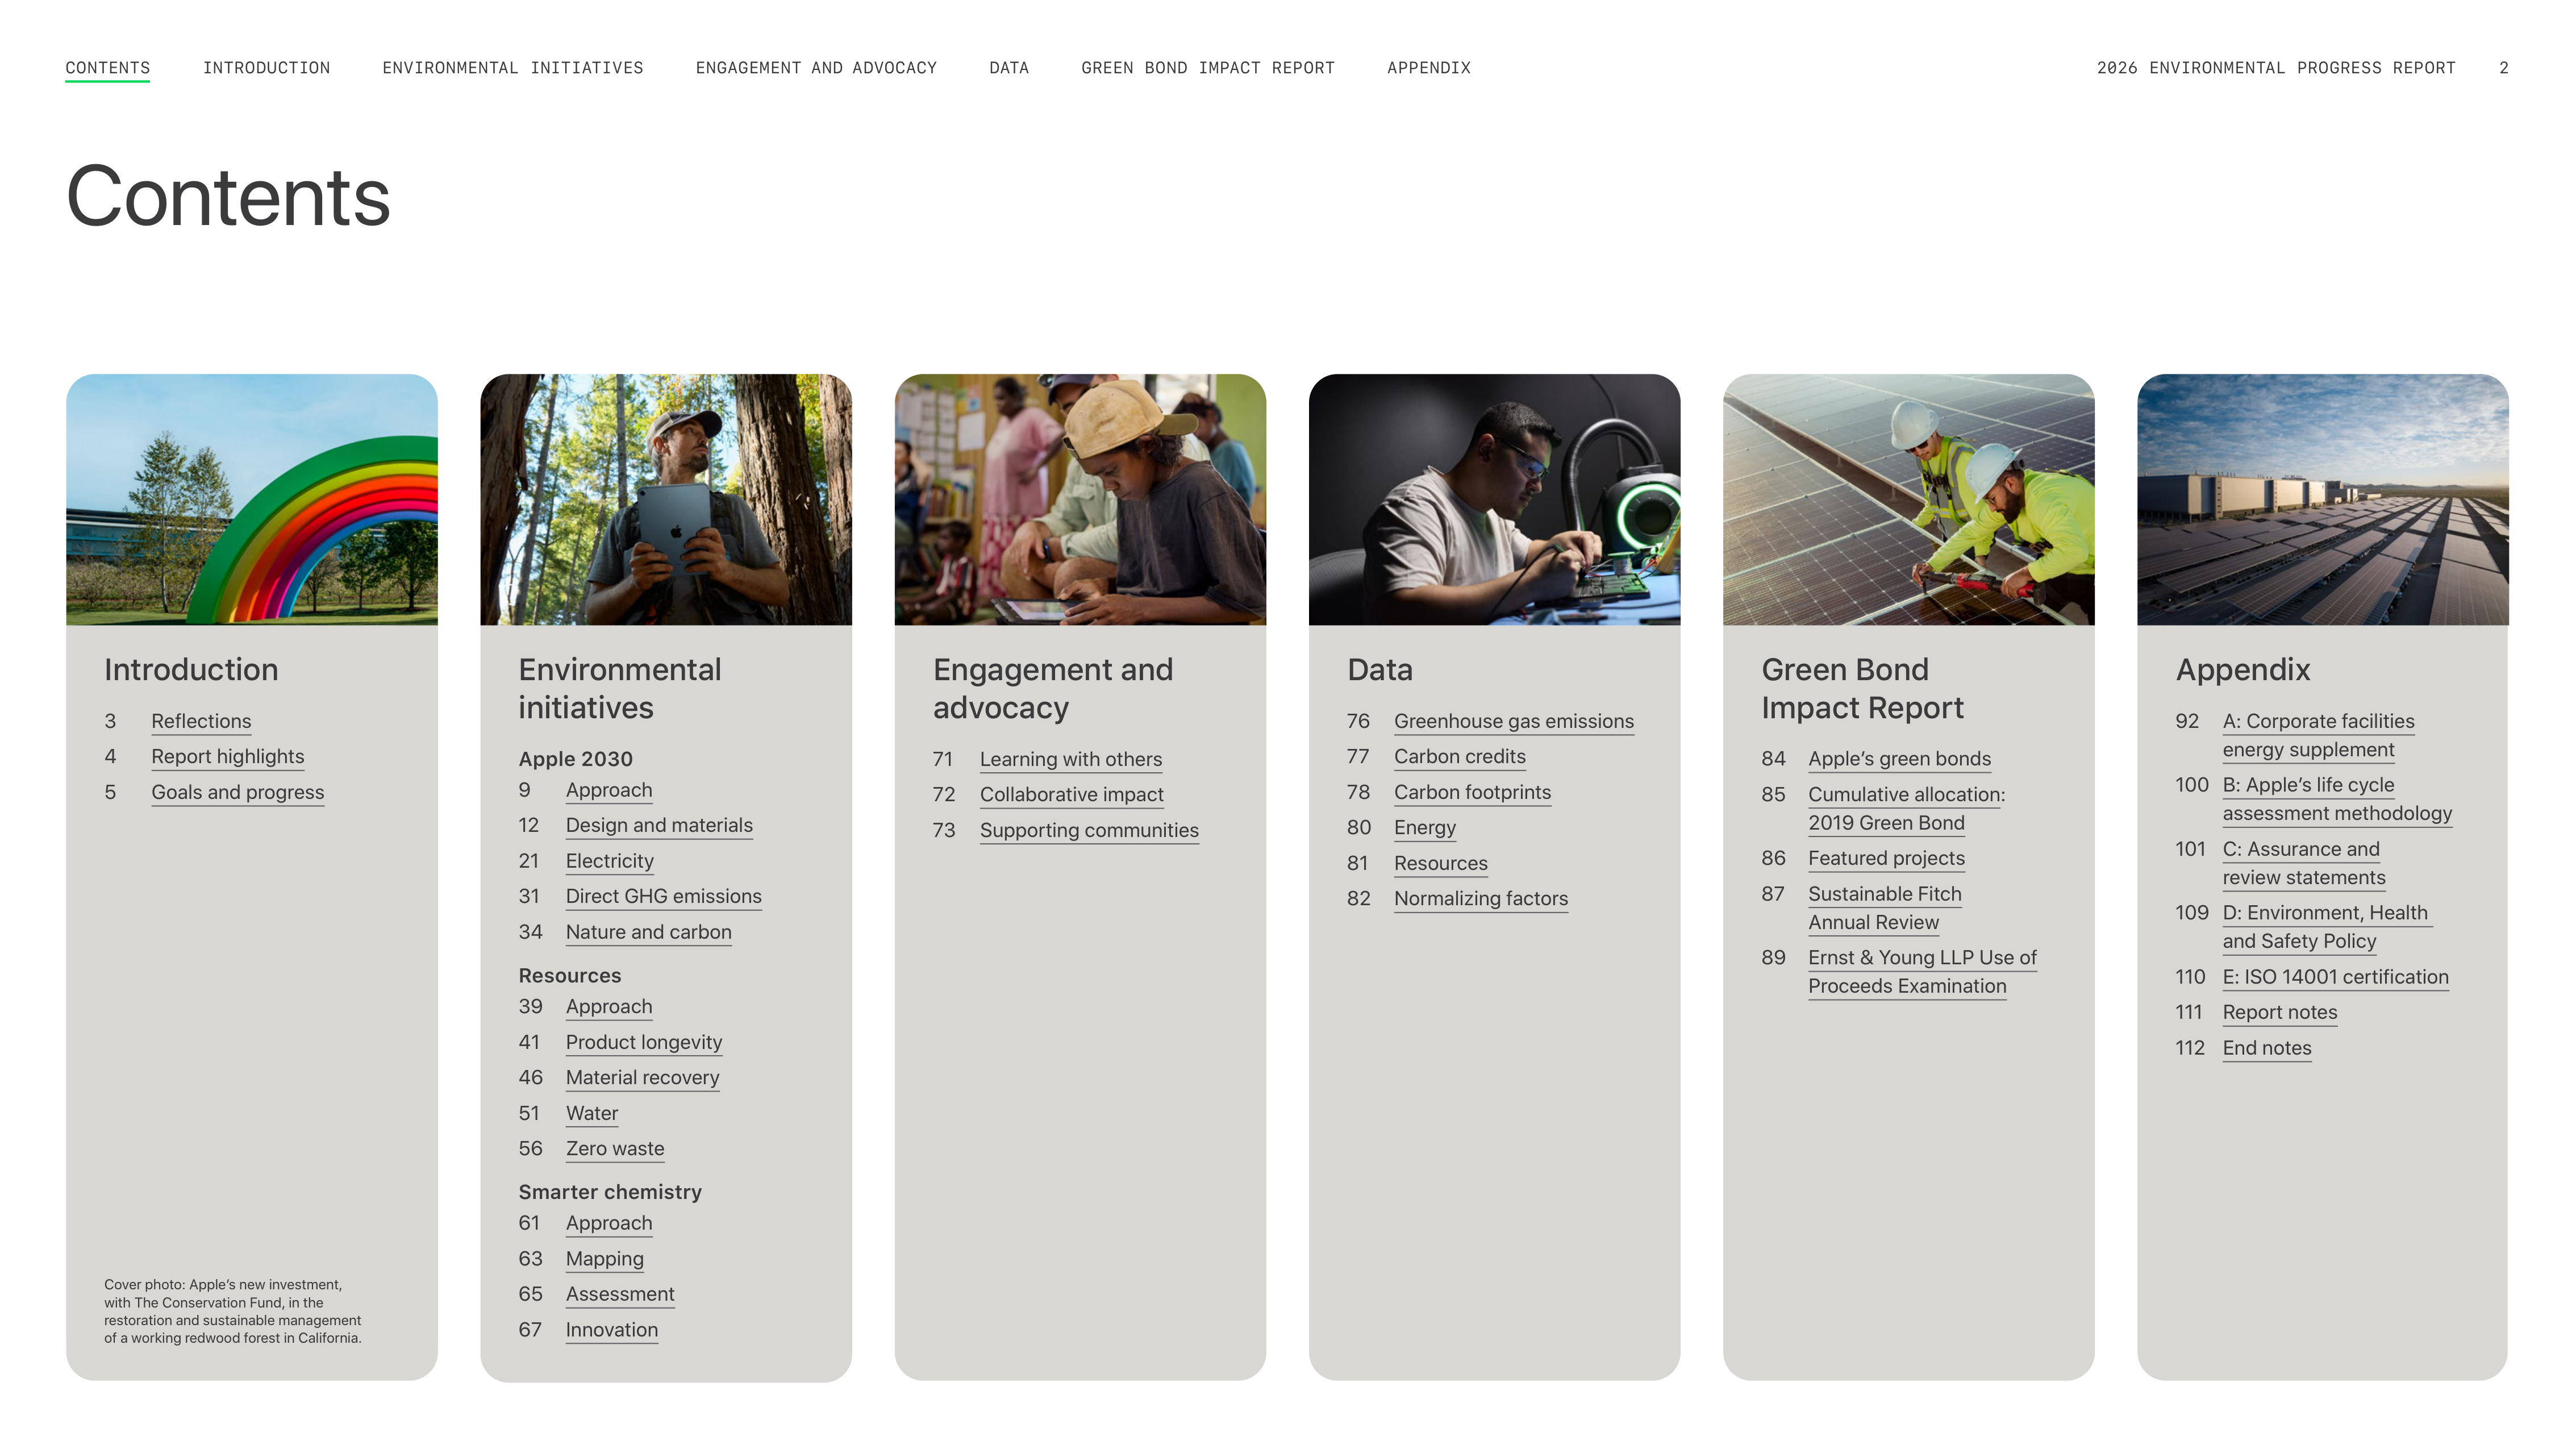
Cover photo: Apple’s new investment,
with The Conservation Fund, in the
restoration and sustainable management
of a working redwood forest in California.
ENGAGEMENT AND ADVOCACY
ENVIRONMENTAL INITIATIVES
INTRODUCTION
GREEN BOND IMPACT REPORT
DATA
APPENDIX
2026 ENVIRONMENTAL PROGRESS REPORT
2
CONTENTS

At Apple, we feel a deep sense of
responsibility to make the best products
and services for people and the planet.
That responsibility shapes every stage
of our work — from how we uphold high
standards for labor and human rights, to
how we source materials and design our
products, build our products to last, and
share them with the world.
With our Apple 2030 goal, we are working to become
carbon neutral across our entire footprint by the end of
this decade. That goal is ambitious by design — not only
because the challenge is urgent, but because innovation
is even more meaningful when it is guided by purpose.
This year, we achieved major environmental milestones
across materials, packaging, energy use, water
stewardship, and more. The launch of MacBook Neo was
an environmental milestone in itself, our lowest-carbon
MacBook with the highest recycled content of any Apple
device to date.
As we push our environmental work forward, we have
also expanded opportunities for our suppliersʼ employees
to learn new skills and advance in their careers. And we
continue to advance our important work to ensure that all
people in our supply chain understand their rights and are
treated with respect.
Weʼre making progress for people and the planet even as
weʼve grown our business — a reminder that doing whatʼs
right can also drive resilience, efficiency, and innovation
across our company. And, importantly, weʼre driving high
standards across our industry and bringing others along
with us in our journey — sharing what weʼve learned so
our positive impact can ripple beyond Apple.
To us, what matters most isnʼt any one project or
benchmark for progress. Itʼs how all these efforts come
together in a way that respects the dignity of people at
every level of our supply chain, and brings us closer to a
more sustainable future. And at every step, we continue
to raise the bar of ambition and accountability.
Weʼre moving with urgency and purpose to keep building
on everything weʼve achieved together, and weʼre so
inspired by everyone — across industries and around the
world — who is on this journey with us. With this report,
we hope to inspire even more progress in the years ahead.
Reflections
This year, we made exciting progress
toward our Apple 2030 goals by
focusing on the areas where we can
have the greatest impact: reducing
emissions, advancing clean electricity,
and increasing the use of recycled and
renewable materials in our products
and packaging.
Our greenhouse gas emissions continue to be more than
60 percent lower than 2015 levels, and we are proud to
keep this reduction steady even in a year of significant
business growth. Additionally, a record 30 percent of the
materials we shipped in our products last year came from
recycled sources — including recycled cobalt in every
battery we design, and recycled rare earth elements in
every magnet. And after a decade of innovation, weʼve
achieved our goal to remove plastic from our packaging,
with every Apple product now shipping in 100 percent
fiber-based packaging.
We also reached important environmental milestones
in conserving natural resources. Weʼve always believed
that protecting water resources is essential to the
health and resilience of our communities. Last year,
we worked with our suppliers to save 17 billion gallons of
freshwater across our supply chain, and we replenished
more than half of the freshwater we withdrew for our
corporate operations. These are powerful examples of our
commitment to upholding the highest standards when it
comes to the impact we make on our communities, and
everyone across our supply chain.
These incredible results were made possible by years
of engineering, design, and close collaboration across
Apple and our supply chain. Together, weʼve shown that
innovation can turn ambitious goals into measurable
progress — and demonstrated that businesses donʼt need
to choose between rapid growth and reducing emissions.
We all have a role to play in protecting our planet, and
Apple is committed to doing our part. Weʼll keep finding
partners who share this commitment, and keep charting
a course for others in our industry to follow. This is
a moment of enormous opportunity — and very high
stakes — and we have the power to help build a better
future together.
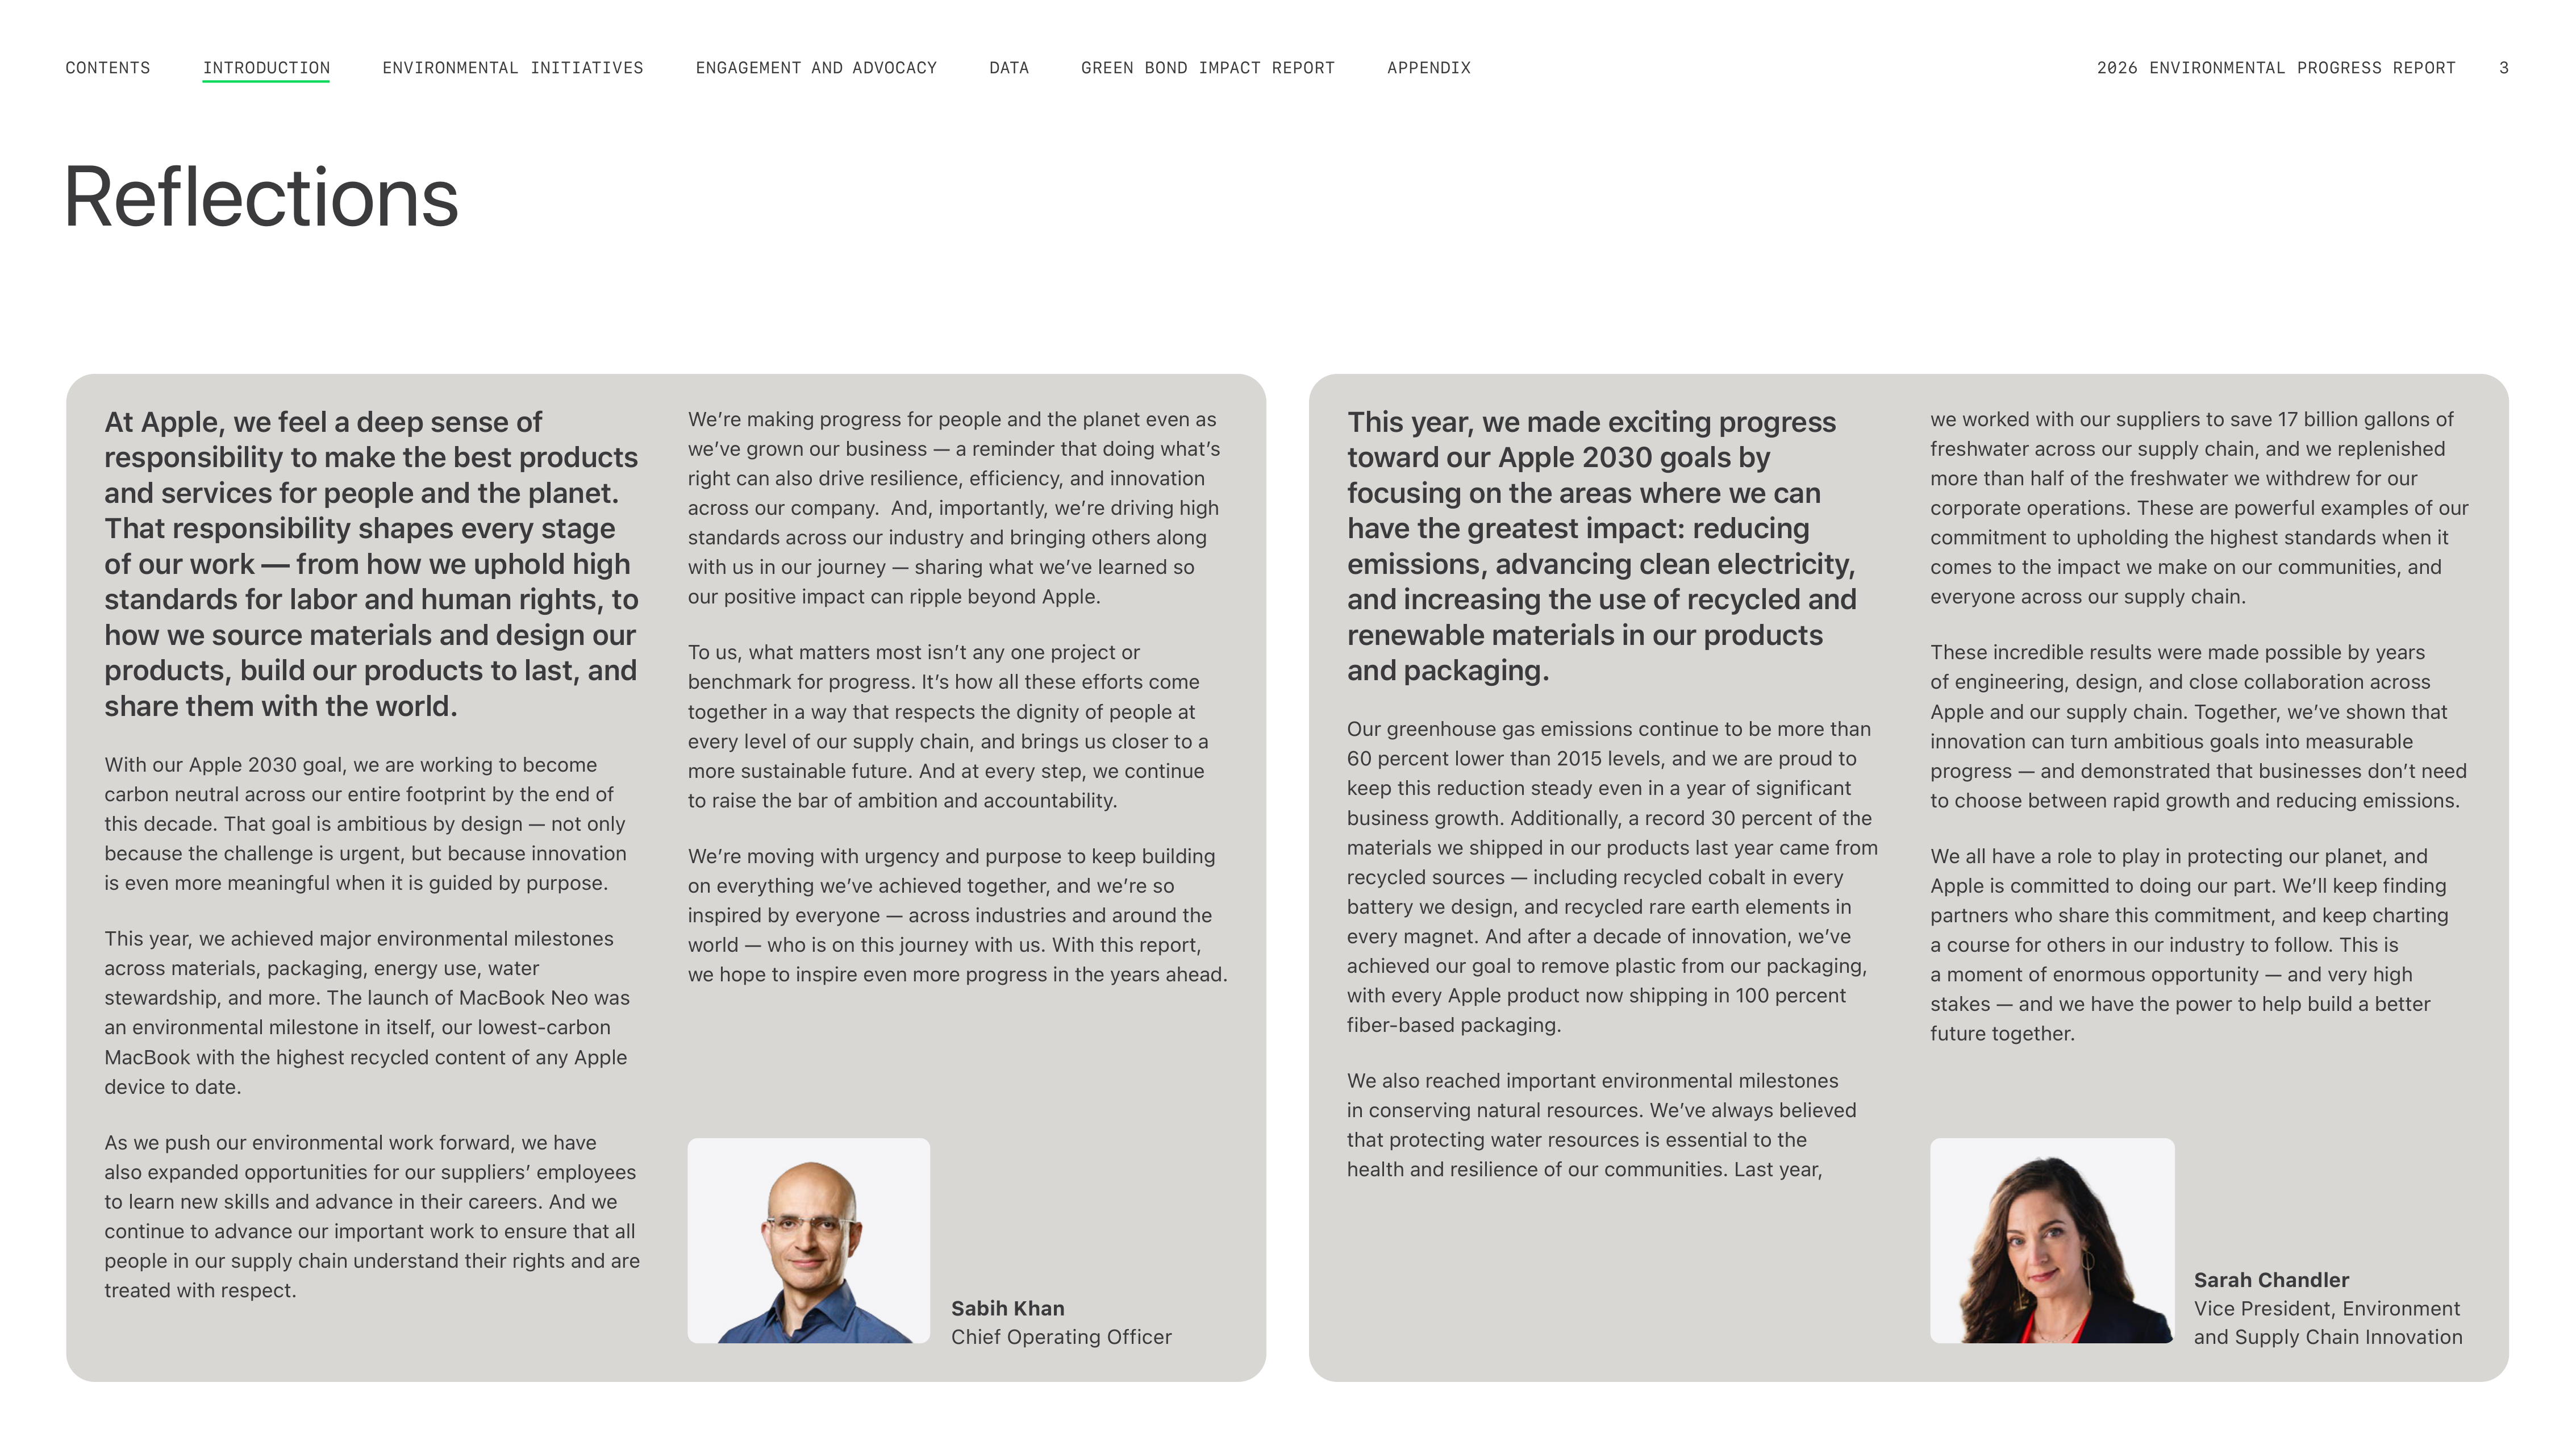
Sarah Chandler
Vice President, Environment
and Supply Chain Innovation
Sabih Khan
Chief Operating Officer
ENGAGEMENT AND ADVOCACY
ENVIRONMENTAL INITIATIVES
CONTENTS
GREEN BOND IMPACT REPORT
DATA
APPENDIX
2026 ENVIRONMENTAL PROGRESS REPORT
3
INTRODUCTION
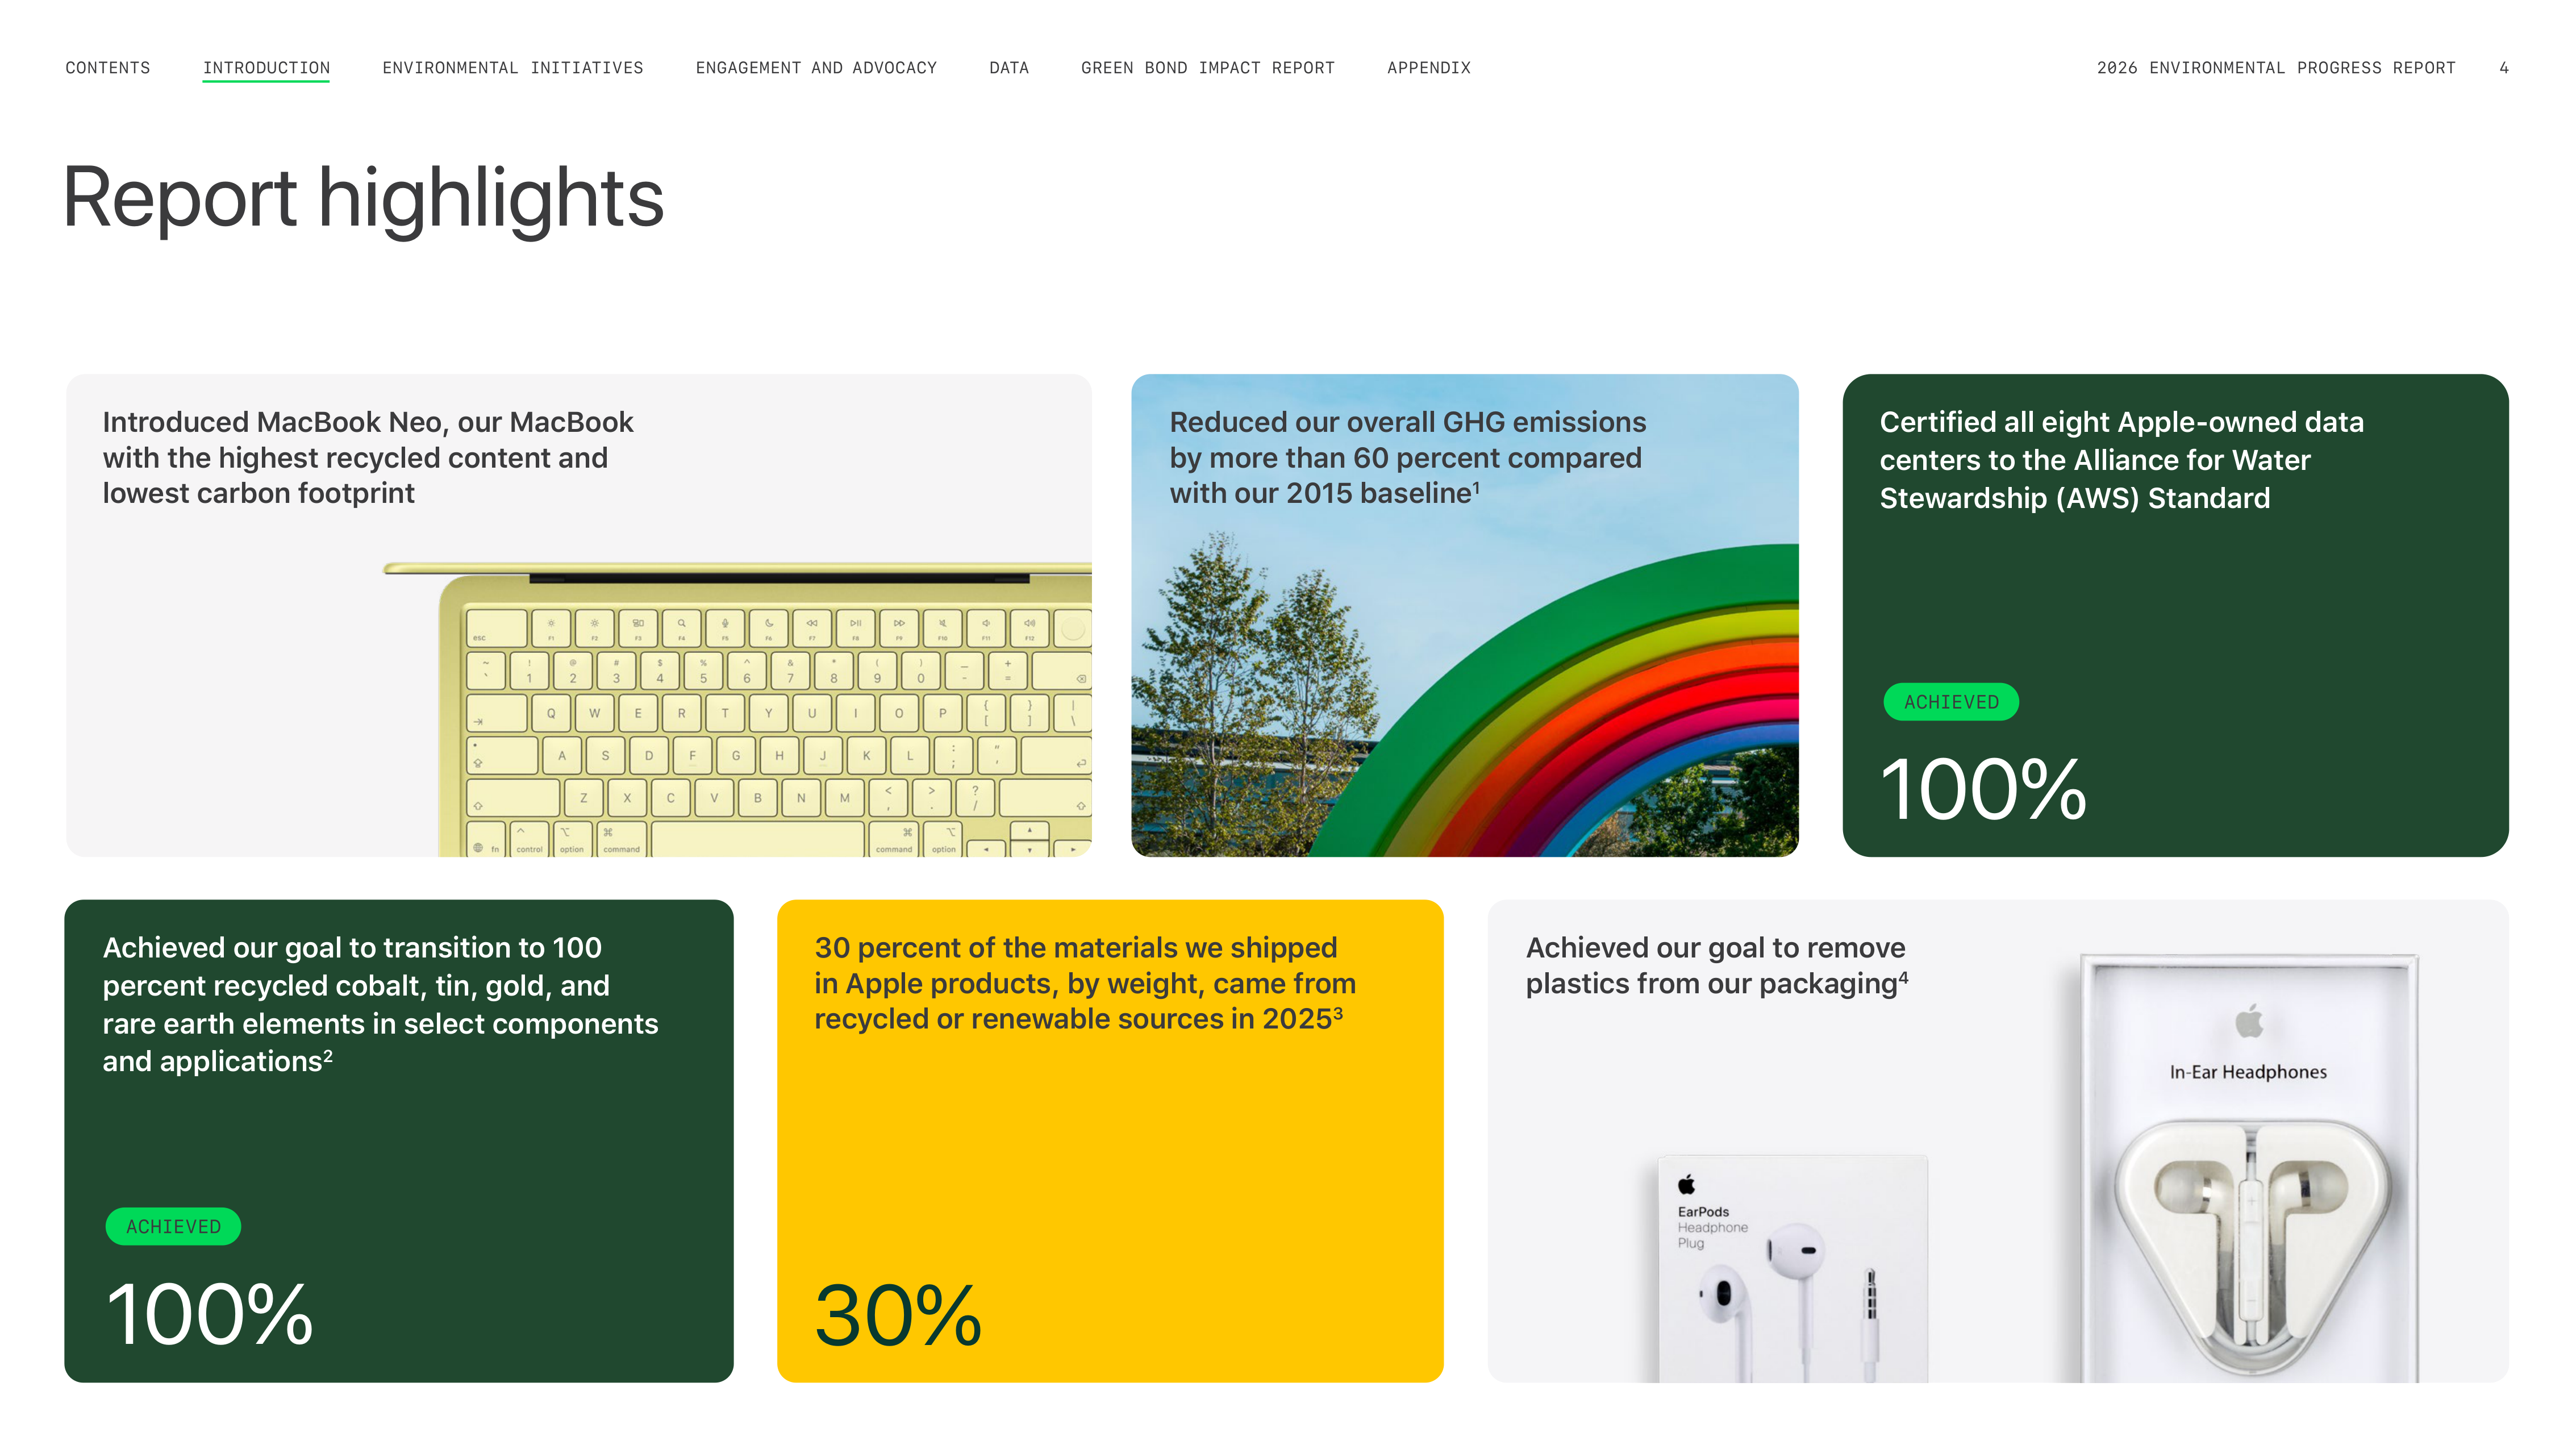




30%
100%
100%
Report highlights
Introduced MacBook Neo, our MacBook
with the highest recycled content and
lowest carbon footprint
30 percent of the materials we shipped
in Apple products, by weight, came from
recycled or renewable sources in 2025
3
Achieved our goal to transition to 100
percent recycled cobalt, tin, gold, and
rare earth elements in select components
and applications
2
Certified all eight Apple-owned data
centers to the Alliance for Water
Stewardship (AWS) Standard
Reduced our overall GHG emissions
by more than 60 percent compared
with our 2015 baseline
1
Achieved our goal to remove
plastics from our packaging
4
ENGAGEMENT AND ADVOCACY
ENVIRONMENTAL INITIATIVES
CONTENTS
GREEN BOND IMPACT REPORT
DATA
APPENDIX
2026 ENVIRONMENTAL PROGRESS REPORT
4
INTRODUCTION
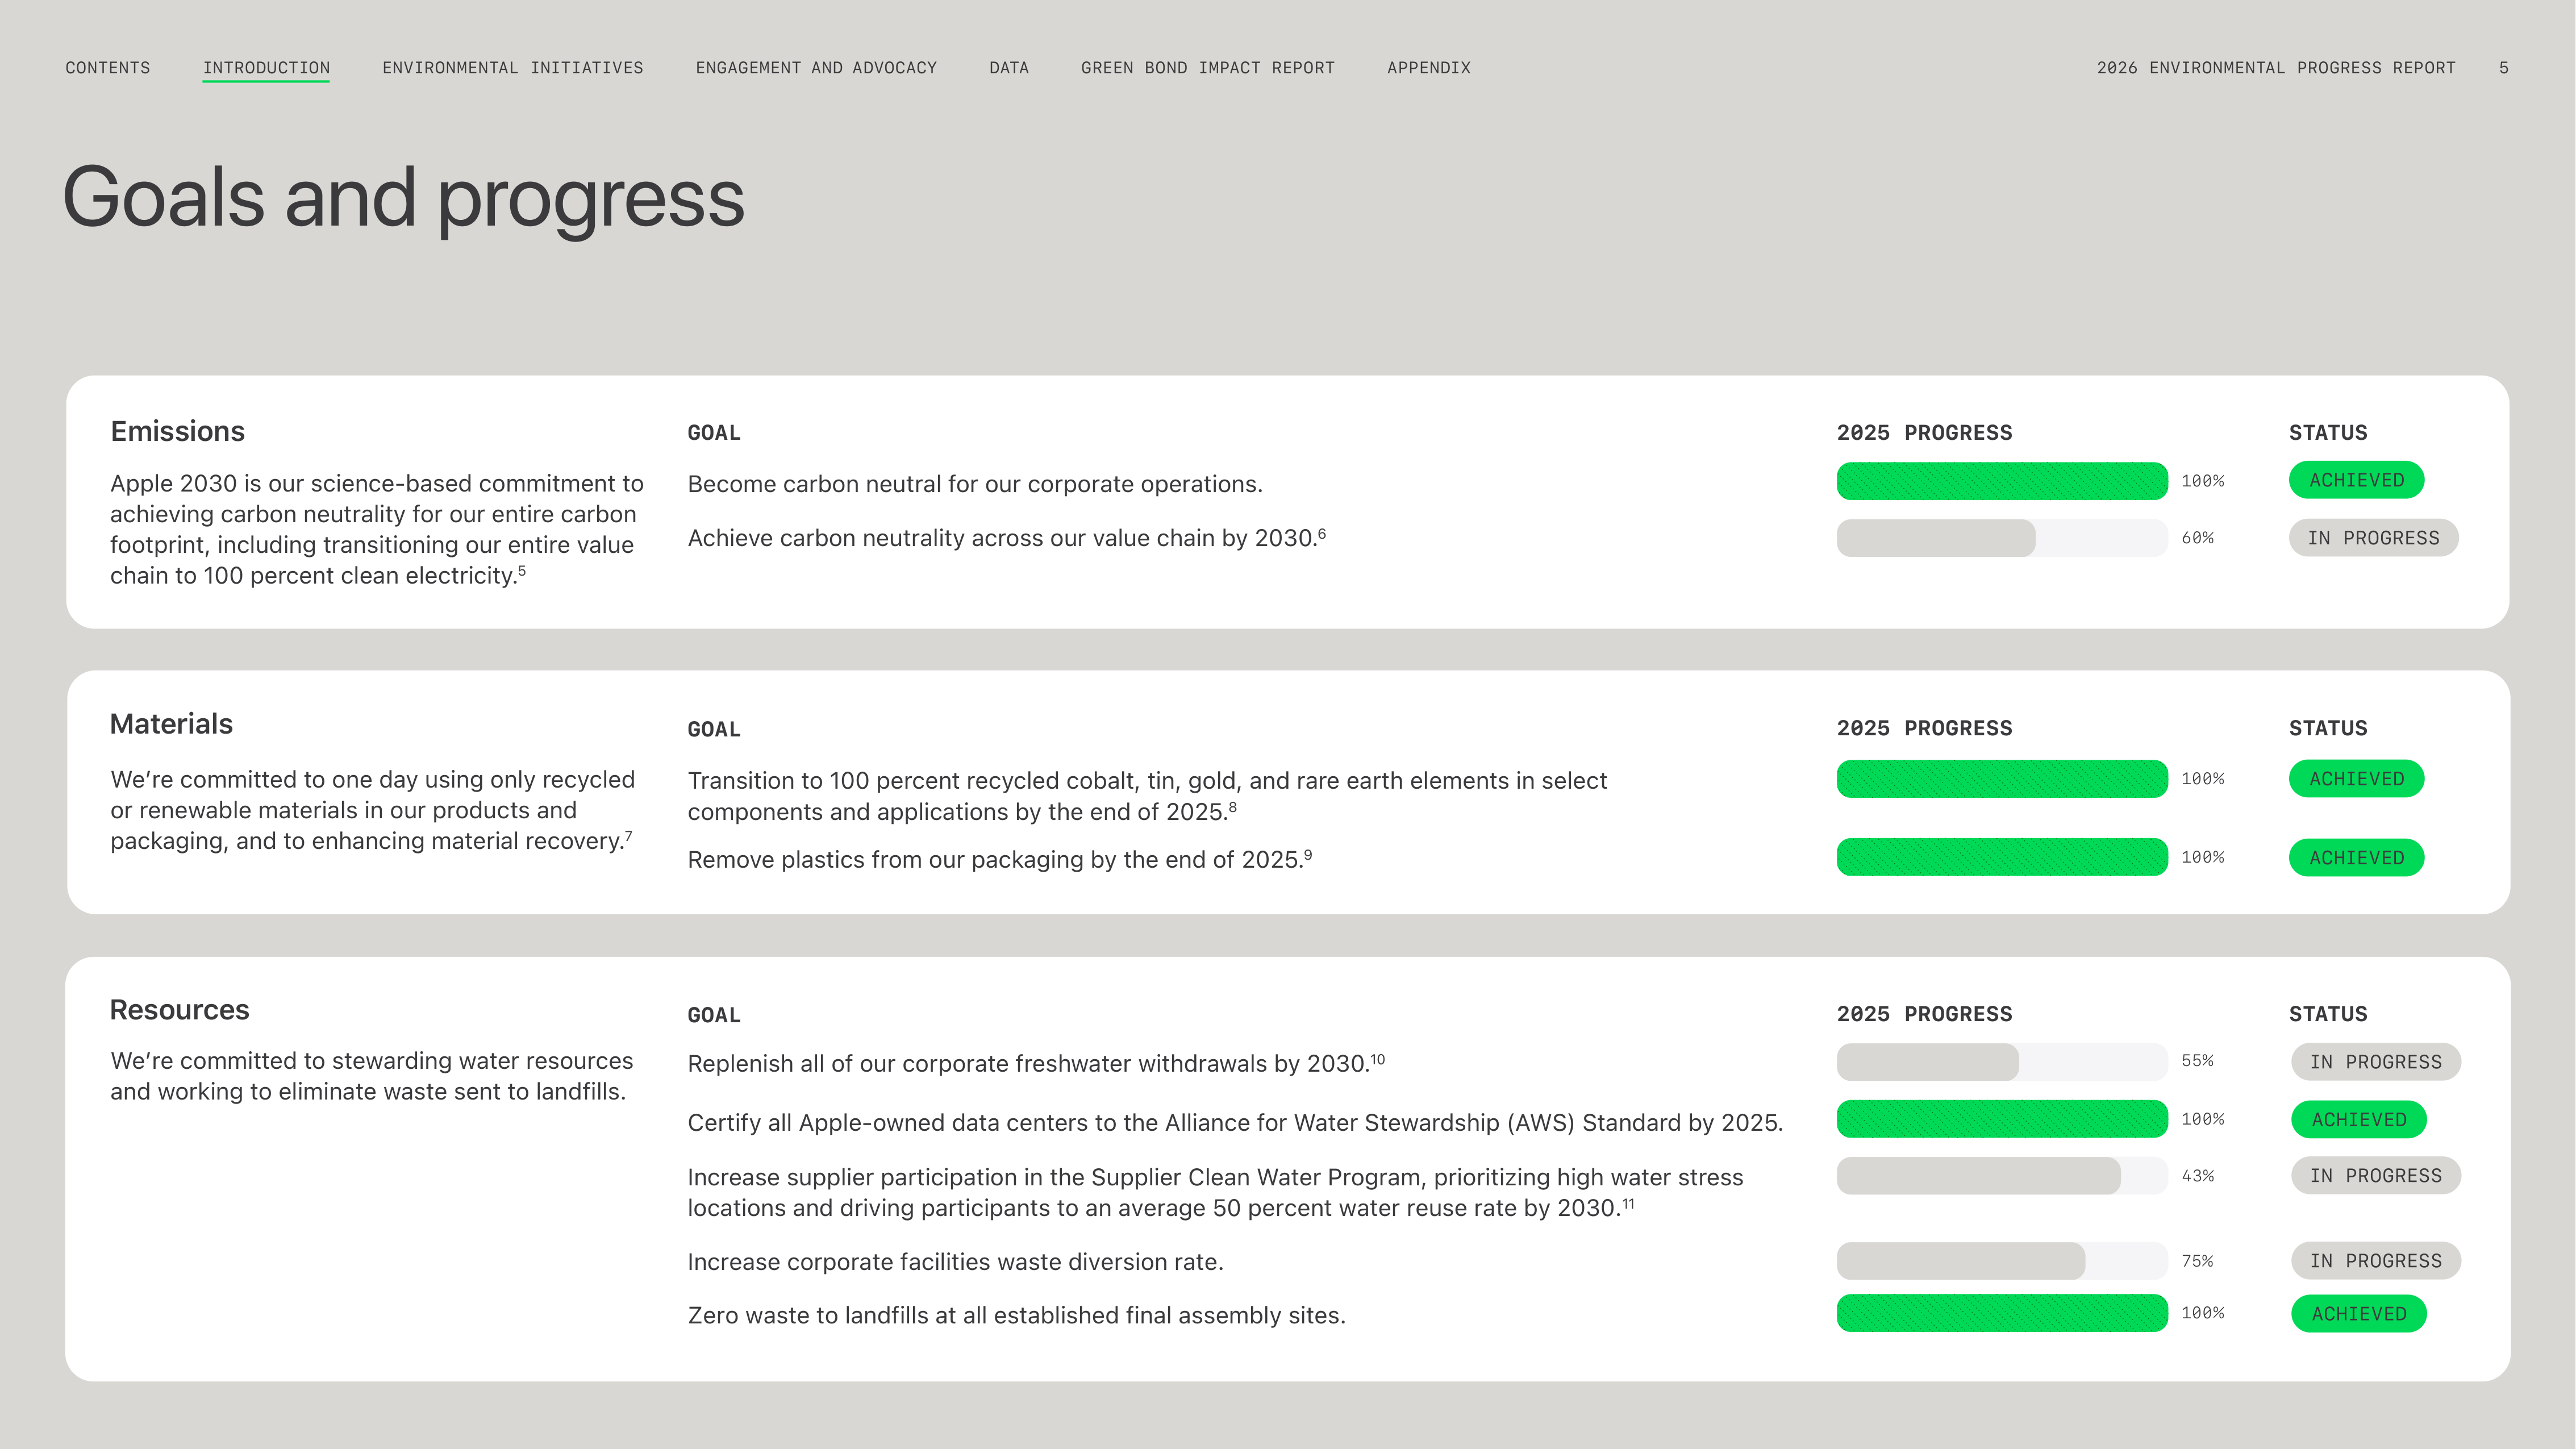
Goals and progress
100%
60%
55%
100%
43%
75%
100%
100%
100%
Resources
Materials
Emissions
2025 PROGRESS
2025 PROGRESS
2025 PROGRESS
STATUS
STATUS
STATUS
Apple 2030 is our science-based commitment to
achieving carbon neutrality for our entire carbon
footprint, including transitioning our entire value
chain to 100 percent clean electricity.
5
Weʼre committed to stewarding water resources
and working to eliminate waste sent to landfills.
Weʼre committed to one day using only recycled
or renewable materials in our products and
packaging, and to enhancing material recovery.
7
GOAL
Become carbon neutral for our corporate operations.
Achieve carbon neutrality across our value chain by 2030.
6
GOAL
Transition to 100 percent recycled cobalt, tin, gold, and rare earth elements in select
components and applications by the end of 2025.
8
Remove plastics from our packaging by the end of 2025.
9
GOAL
Replenish all of our corporate freshwater withdrawals by 2030.
10
Certify all Apple-owned data centers to the Alliance for Water Stewardship (AWS) Standard by 2025.
Increase supplier participation in the Supplier Clean Water Program, prioritizing high water stress
locations and driving participants to an average 50 percent water reuse rate by 2030.
11
Increase corporate facilities waste diversion rate.
Zero waste to landfills at all established final assembly sites.
ENGAGEMENT AND ADVOCACY
ENVIRONMENTAL INITIATIVES
CONTENTS
GREEN BOND IMPACT REPORT
DATA
APPENDIX
2026 ENVIRONMENTAL PROGRESS REPORT
5
INTRODUCTION
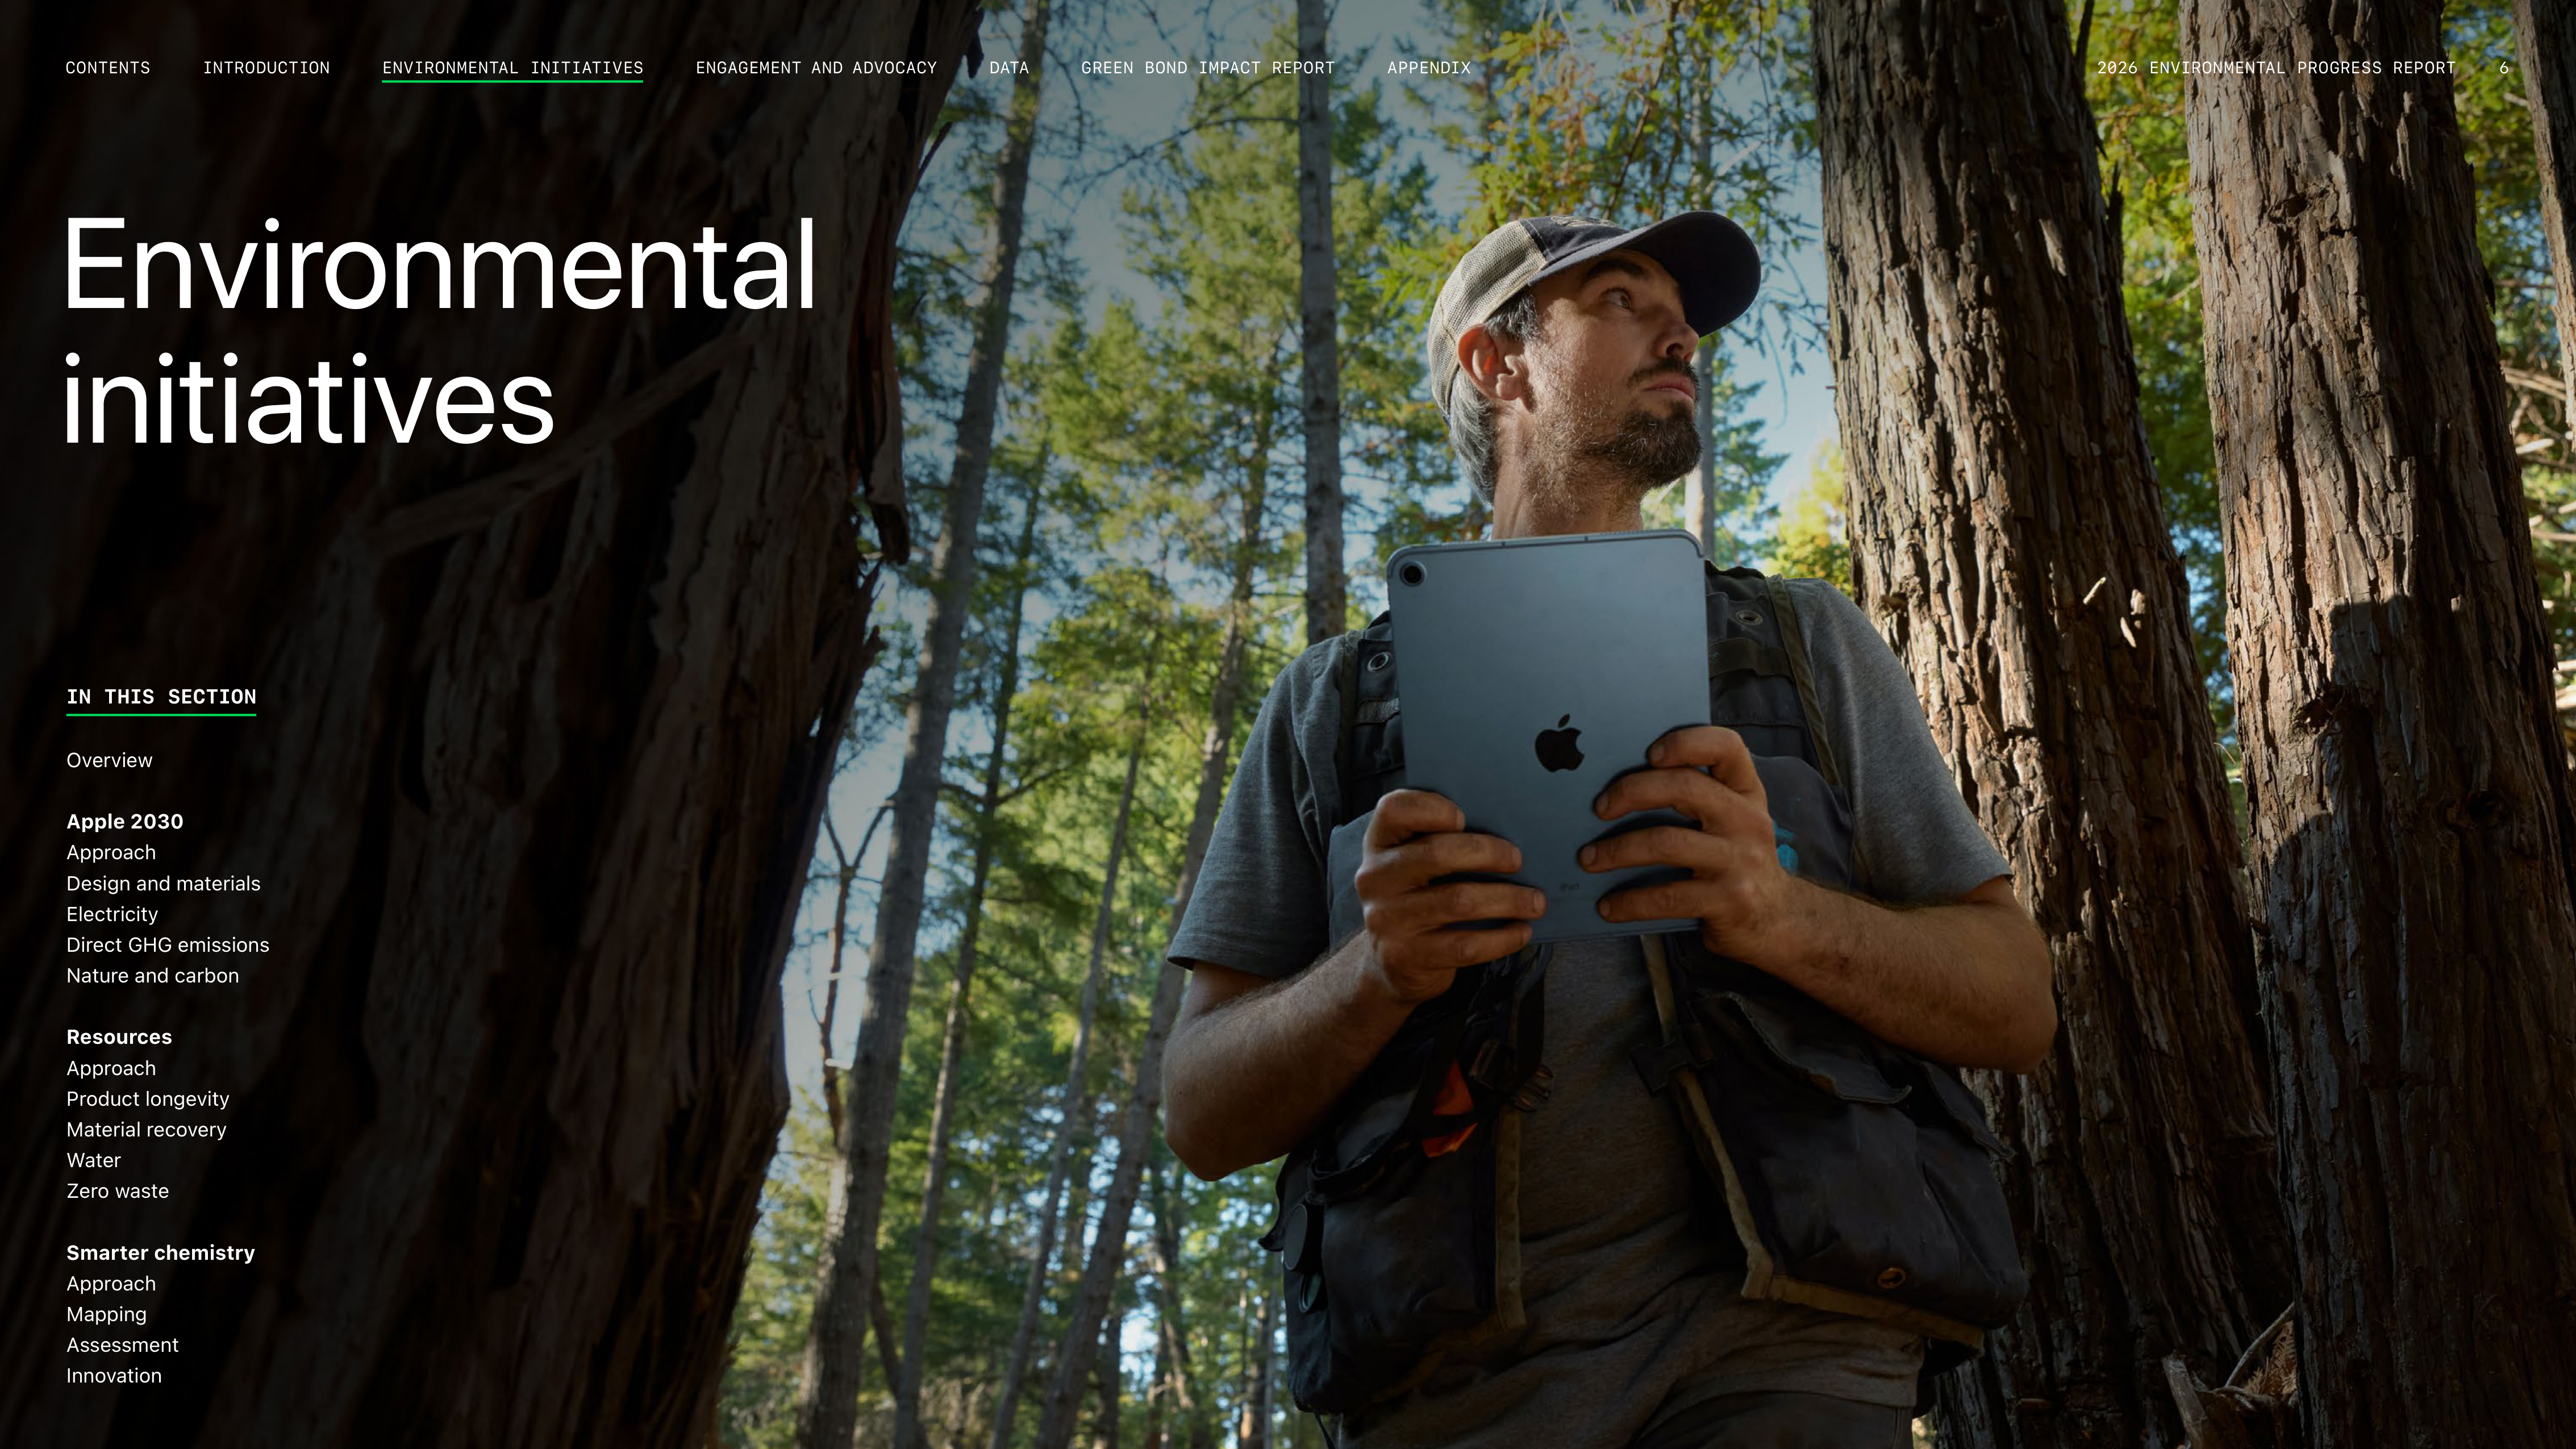

Environmental
initiatives
IN THIS SECTION
Overview
Apple 2030
Approach
Design and materials
Electricity
Direct GHG emissions
Nature and carbon
Resources
Approach
Product longevity
Material recovery
Water
Zero waste
Smarter chemistry
Approach
Mapping
Assessment
Innovation
2026 ENVIRONMENTAL PROGRESS REPORT
6
ENGAGEMENT AND ADVOCACY
INTRODUCTION
CONTENTS
APPENDIX
GREEN BOND IMPACT REPORT
DATA
ENVIRONMENTAL INITIATIVES
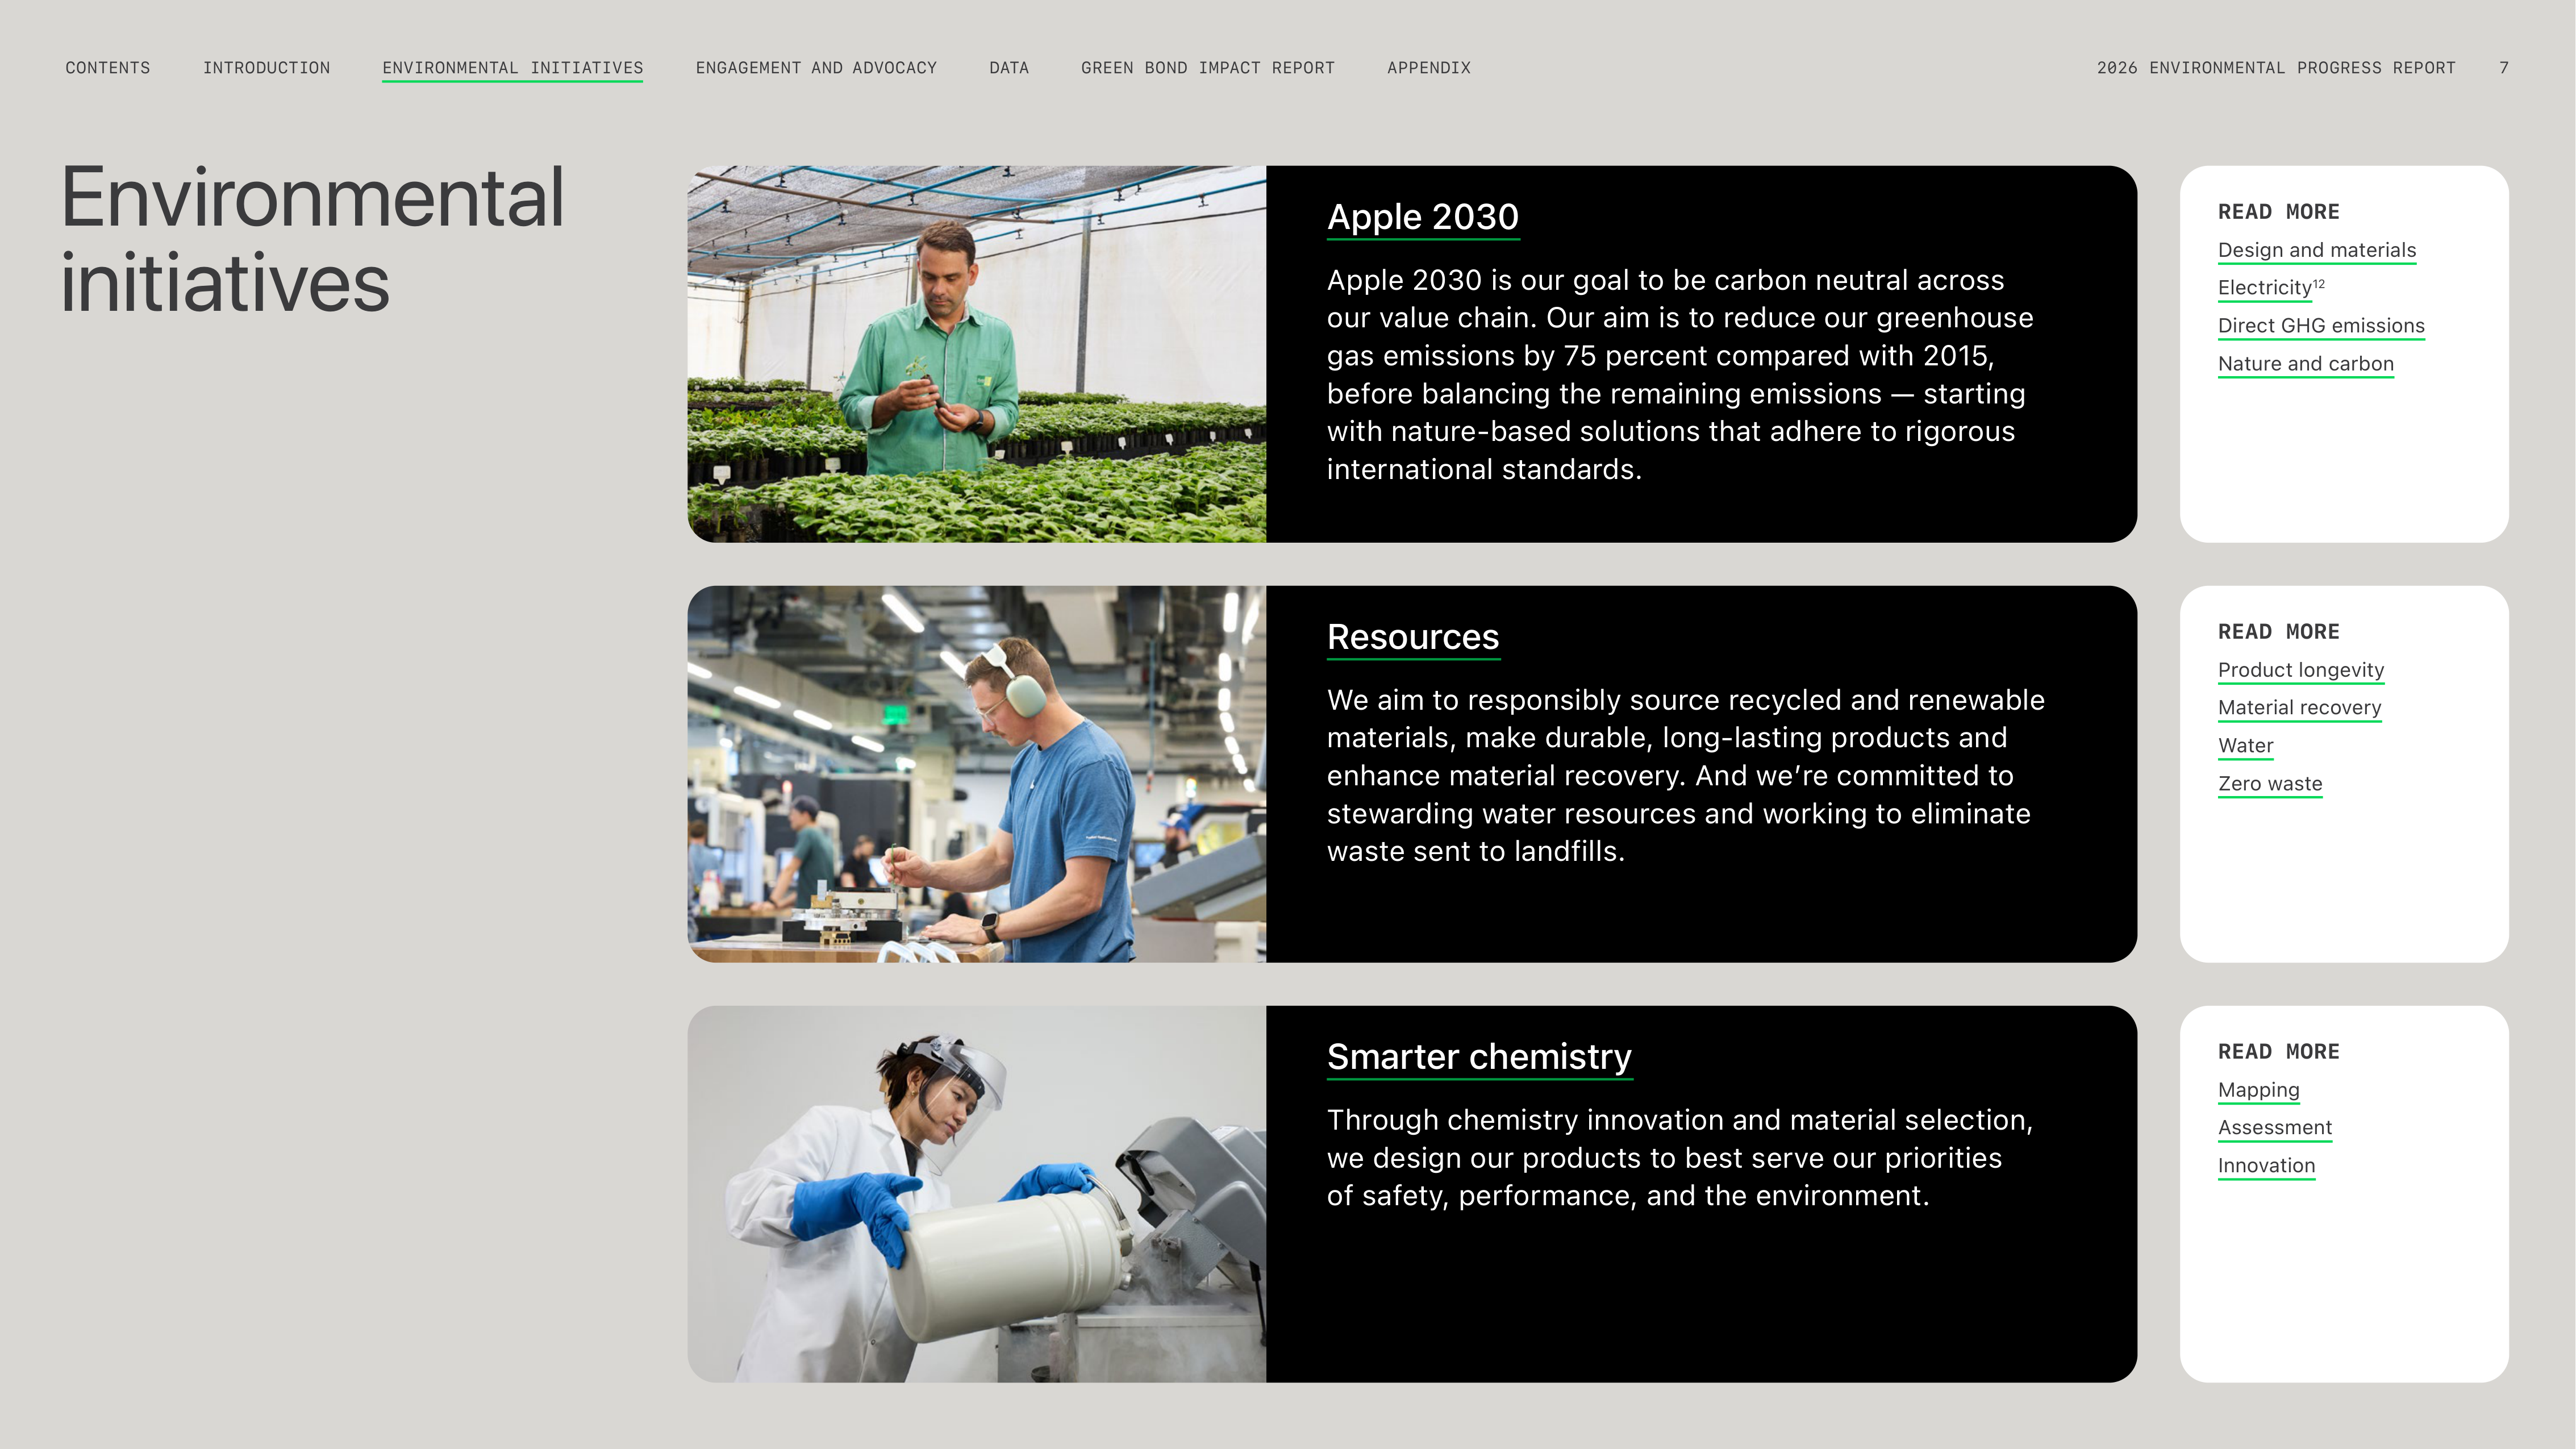
Environmental
initiatives
READ MORE
Product longevity
Material recovery
Water
Zero waste
Resources
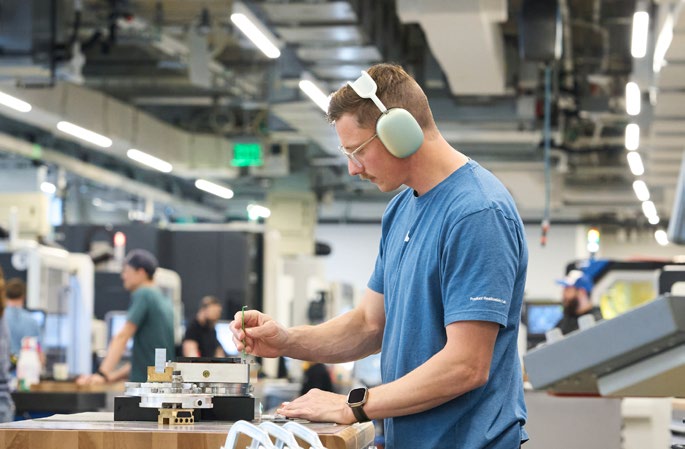
We aim to responsibly source recycled and renewable
materials, make durable, long-lasting products and
enhance material recovery. And weʼre committed to
stewarding water resources and working to eliminate
waste sent to landfills.
READ MORE
Mapping
Assessment
Innovation
Smarter chemistry
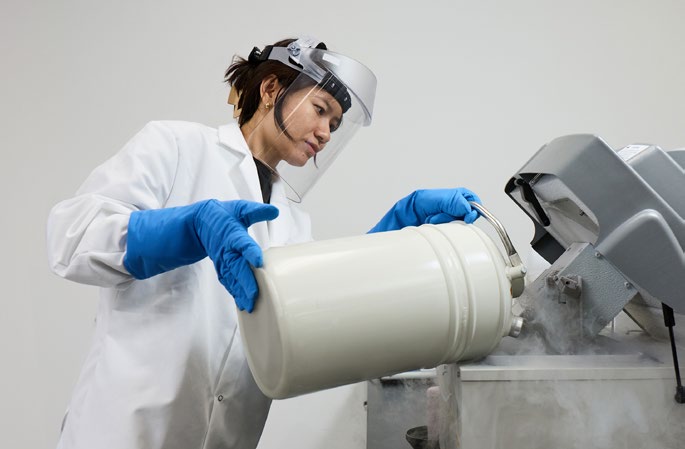
Through chemistry innovation and material selection,
we design our products to best serve our priorities
of safety, performance, and the environment.
READ MORE
Design and materials
Electricity
12
Direct GHG emissions
Nature and carbon
Apple 2030
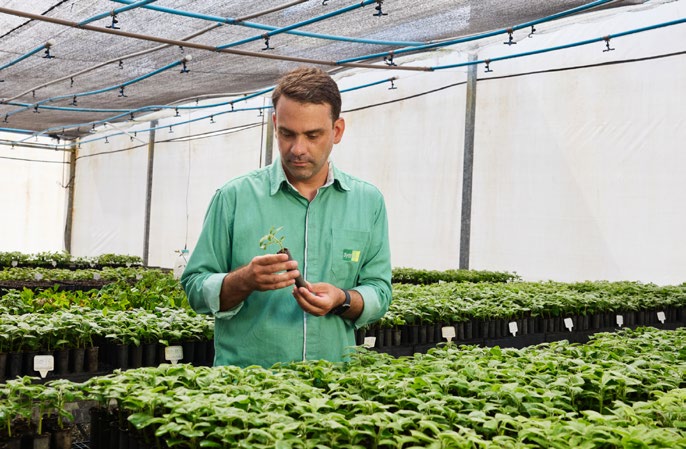
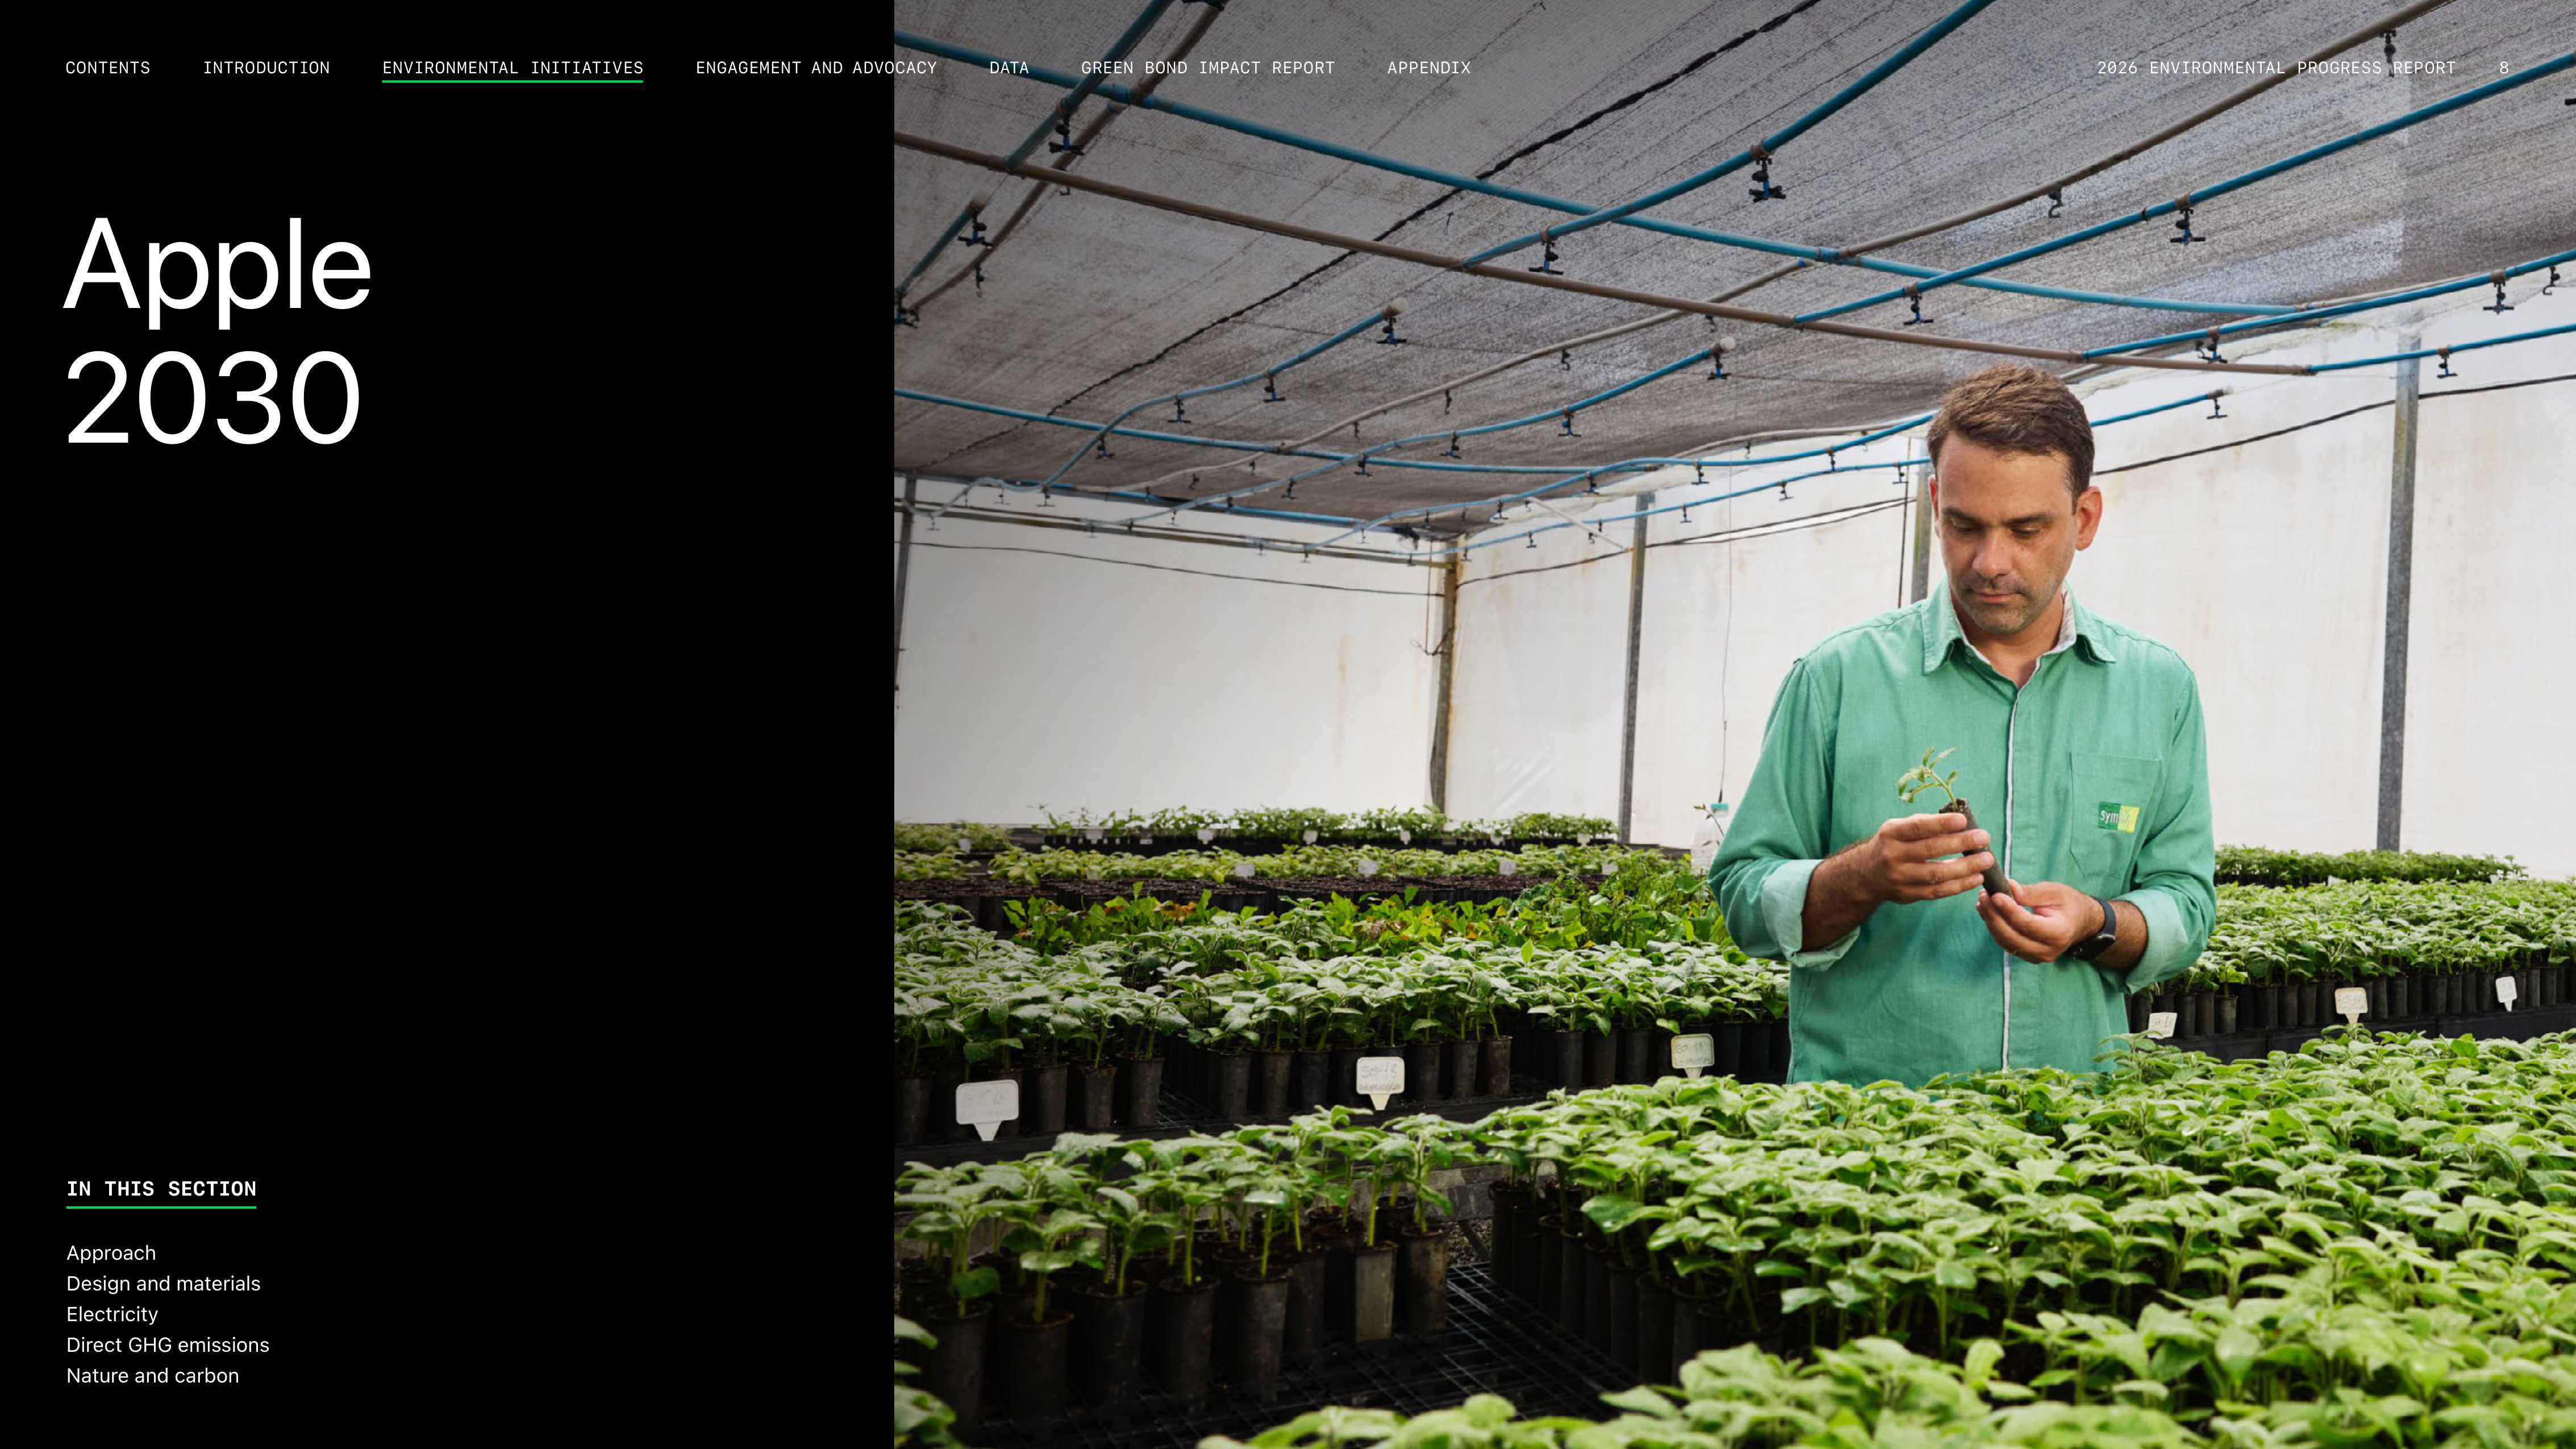
Apple 2030 is our goal to be carbon neutral across
our value chain. Our aim is to reduce our greenhouse
gas emissions by 75 percent compared with 2015,
before balancing the remaining emissions — starting
with nature-based solutions that adhere to rigorous
international standards.
ENGAGEMENT AND ADVOCACY
INTRODUCTION
CONTENTS
GREEN BOND IMPACT REPORT
DATA
APPENDIX
2026 ENVIRONMENTAL PROGRESS REPORT
7
ENVIRONMENTAL INITIATIVES
Apple
2030
IN THIS SECTION
Approach
Design and materials
Electricity
Direct GHG emissions
Nature and carbon
2026 ENVIRONMENTAL PROGRESS REPORT
8
ENGAGEMENT AND ADVOCACY
INTRODUCTION
CONTENTS
APPENDIX
GREEN BOND IMPACT REPORT
DATA
ENVIRONMENTAL INITIATIVES
DESIGN AND MATERIALS
Designing products and manufacturing
processes to be less carbon intensive
through thoughtful material selection,
increased material efficiency, greater
product energy efficiency, use of recycled
and renewable materials in our products and
packaging, and enhanced material recovery
ELECTRICITY
Increasing energy efficiency at both ours
and our suppliersʼ facilities and transitioning
the electricity throughout our entire value
chain — including manufacturing and our
customersʼ product use — to 100 percent
clean electricity by 2030
DIRECT GHG EMISSIONS
Reducing direct greenhouse gas emissions
across our facilities and supply chain
through process innovation, emissions
abatement, and shifting away from
fossil fuels
NATURE AND CARBON
In parallel with our emissions reduction
efforts, scaling up investments in
carbon removal projects, starting with
nature‑based solutions that can protect
and restore ecosystems
READ MORE
Framework Proposal for Science-aligned
Corporate Climate Action
Green Bond Impact Report
CDP Corporate 2025 Questionnaire Response
Product Environmental Reports
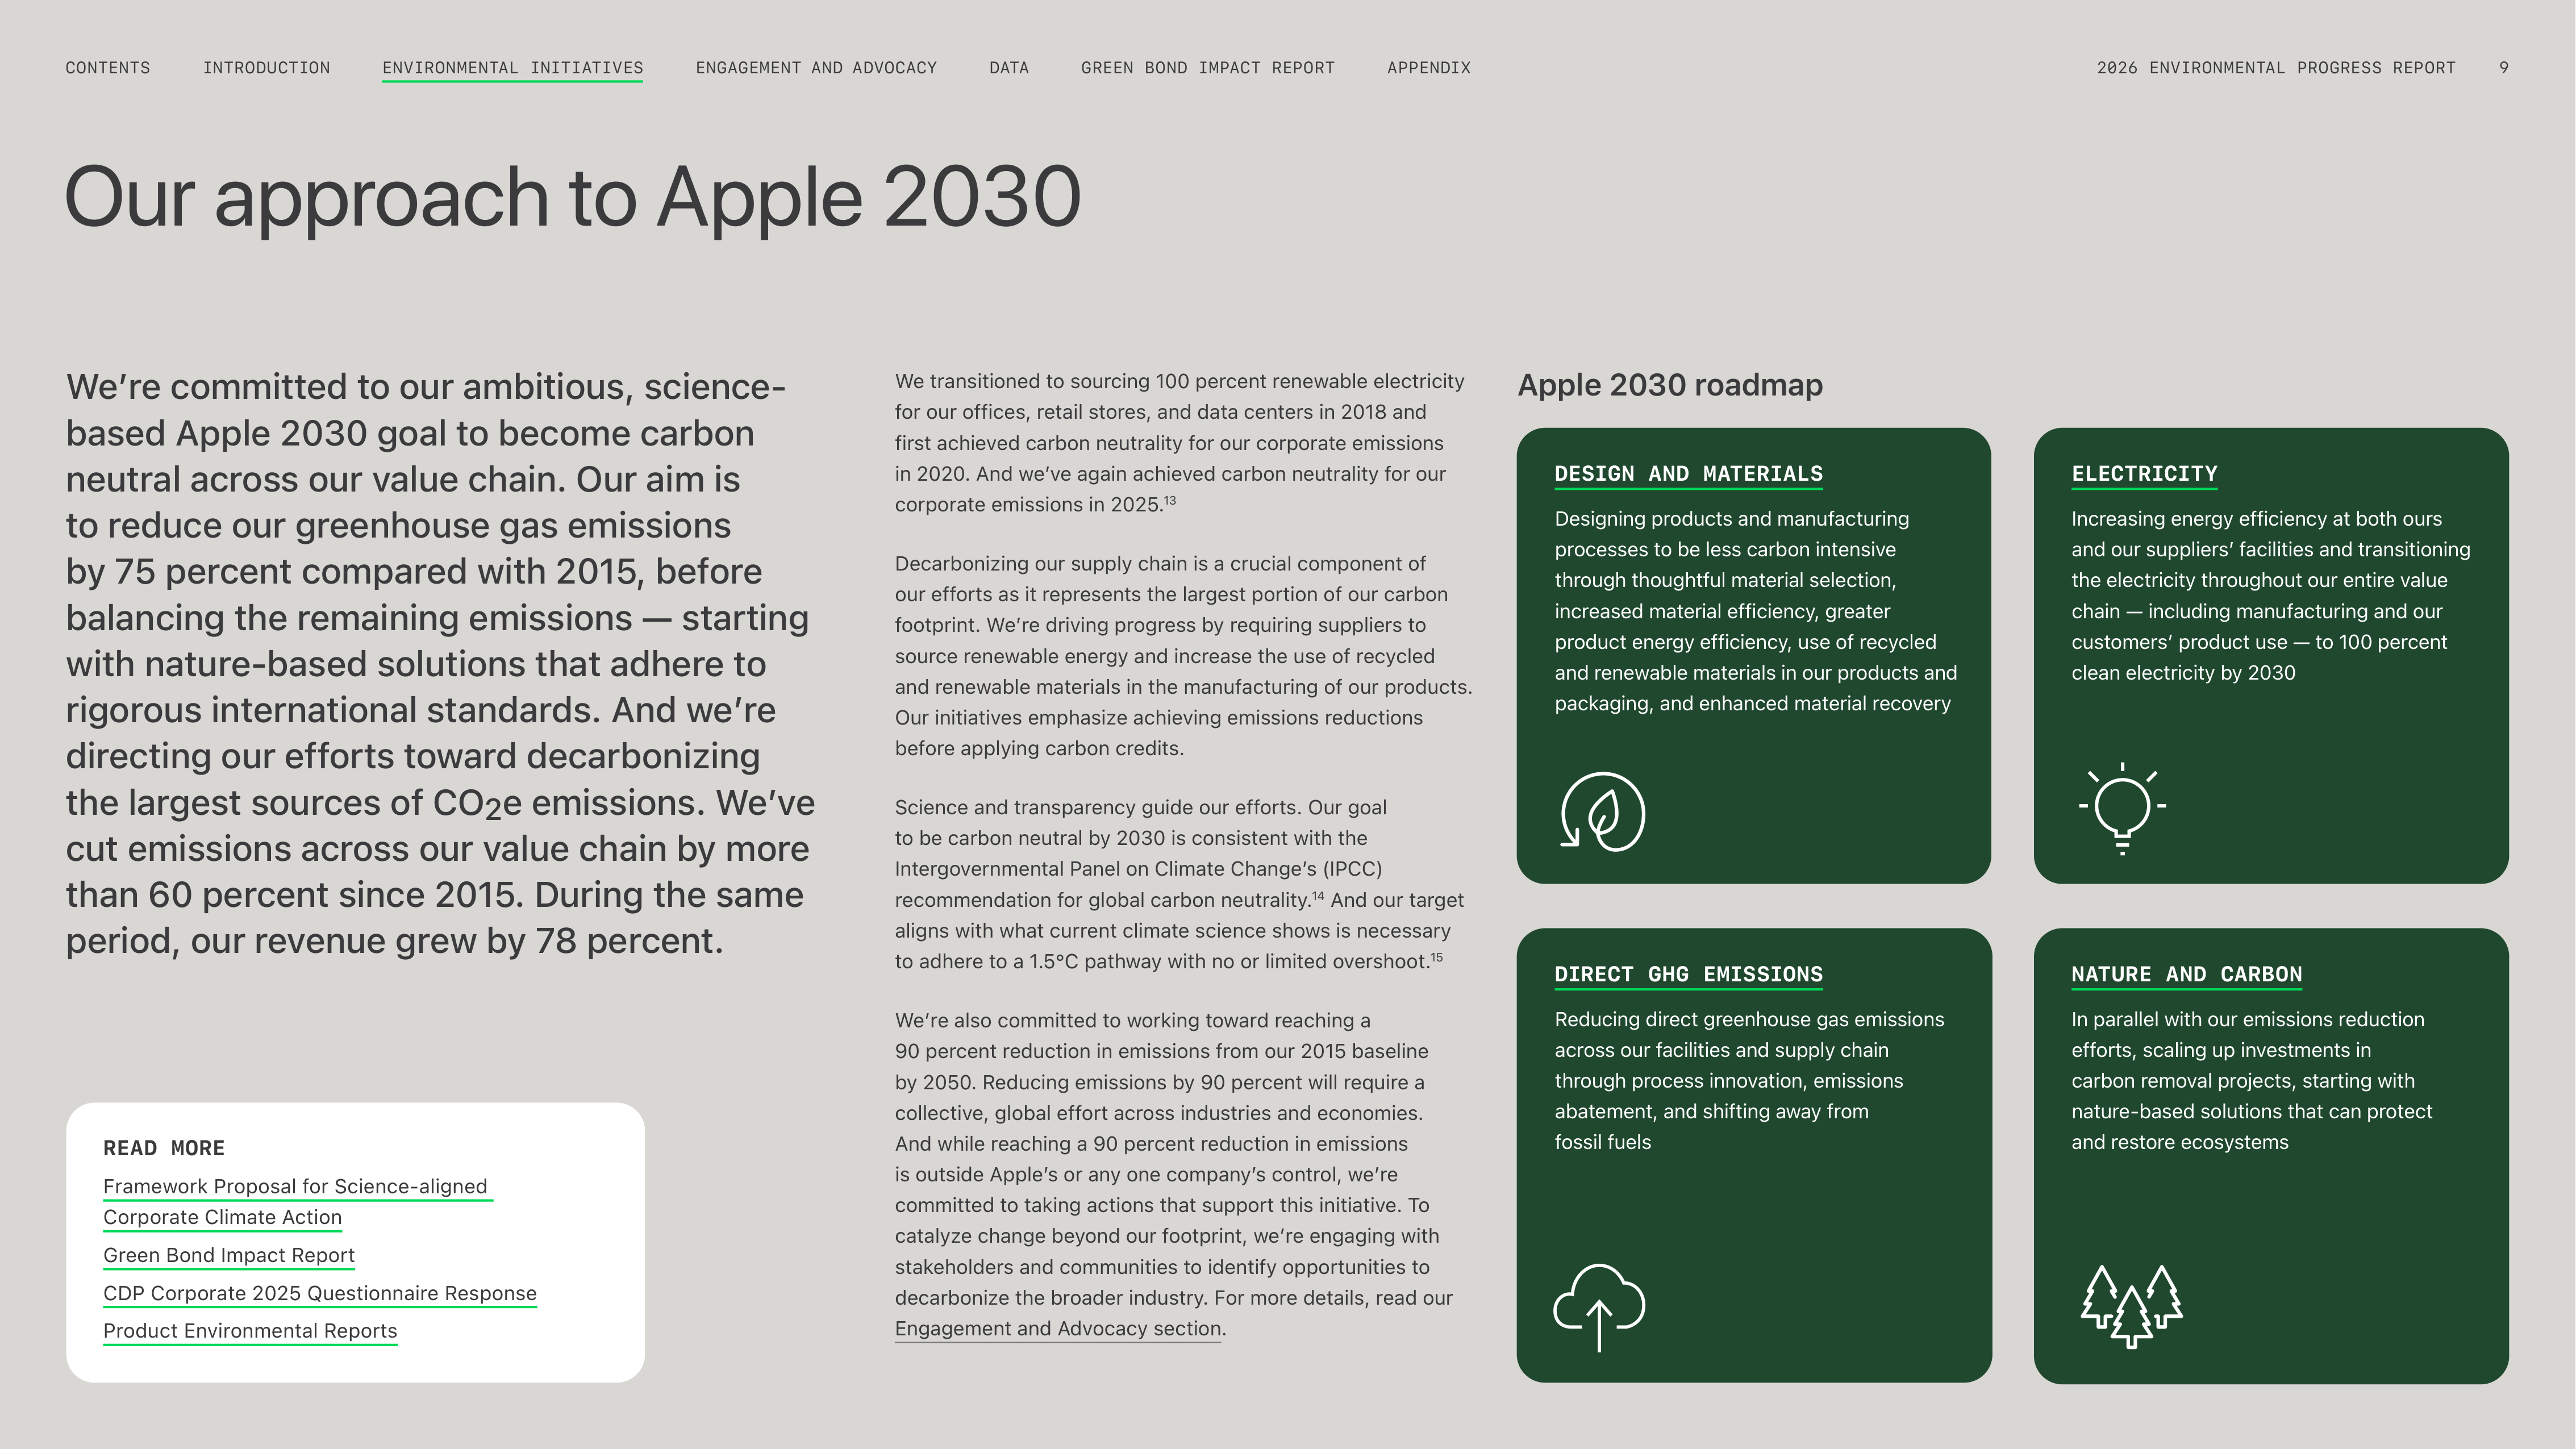
Our approach to Apple 2030
We’re committed to our ambitious, science-
based Apple 2030 goal to become carbon
neutral across our value chain. Our aim is
to reduce our greenhouse gas emissions
by 75 percent compared with 2015, before
balancing the remaining emissions — starting
with nature-based solutions that adhere to
rigorous international standards. And we’re
directing our efforts toward decarbonizing
the largest sources of CO
2
e emissions. We’ve
cut emissions across our value chain by more
than 60 percent since 2015. During the same
period, our revenue grew by 78 percent.
We transitioned to sourcing 100 percent renewable electricity
for our offices, retail stores, and data centers in 2018 and
first achieved carbon neutrality for our corporate emissions
in 2020. And weʼve again achieved carbon neutrality for our
corporate emissions in 2025.
13
Decarbonizing our supply chain is a crucial component of
our efforts as it represents the largest portion of our carbon
footprint. Weʼre driving progress by requiring suppliers to
source renewable energy and increase the use of recycled
and renewable materials in the manufacturing of our products.
Our initiatives emphasize achieving emissions reductions
before applying carbon credits.
Science and transparency guide our efforts. Our goal
to be carbon neutral by 2030 is consistent with the
Intergovernmental Panel on Climate Changeʼs (IPCC)
recommendation for global carbon neutrality.
14
And our target
aligns with what current climate science shows is necessary
to adhere to a 1.5°C pathway with no or limited overshoot.
15
Weʼre also committed to working toward reaching a
90 percent reduction in emissions from our 2015 baseline
by 2050. Reducing emissions by 90 percent will require a
collective, global effort across industries and economies.
And while reaching a 90 percent reduction in emissions
is outside Appleʼs or any one companyʼs control, weʼre
committed to taking actions that support this initiative. To
catalyze change beyond our footprint, weʼre engaging with
stakeholders and communities to identify opportunities to
decarbonize the broader industry. For more details, read our
Engagement and Advocacy section.
Apple 2030 roadmap
ENGAGEMENT AND ADVOCACY
INTRODUCTION
CONTENTS
GREEN BOND IMPACT REPORT
DATA
APPENDIX
2026 ENVIRONMENTAL PROGRESS REPORT
9
ENVIRONMENTAL INITIATIVES
40
60
20
0
Achieving progress that
benefits business
We underpin our climate strategy with strong business
principles and innovation, harnessing the power of markets
to replicate our solutions at scale — aiming to create the
impact necessary to meet global reduction targets. Weʼre
also working to accelerate the global transition toward
decarbonization, engaging with our supply chain partners to
explore the next generation of solutions, and advocating for
effective policies. These efforts include fostering new and
strengthened collaborations in public and private partnerships
and investing in technological advancements. Weʼve also
issued $4.7 billion in green bonds to model how businesses
can drive investments to reduce global emissions. To learn
more about this work, read our Green Bond Impact Report.
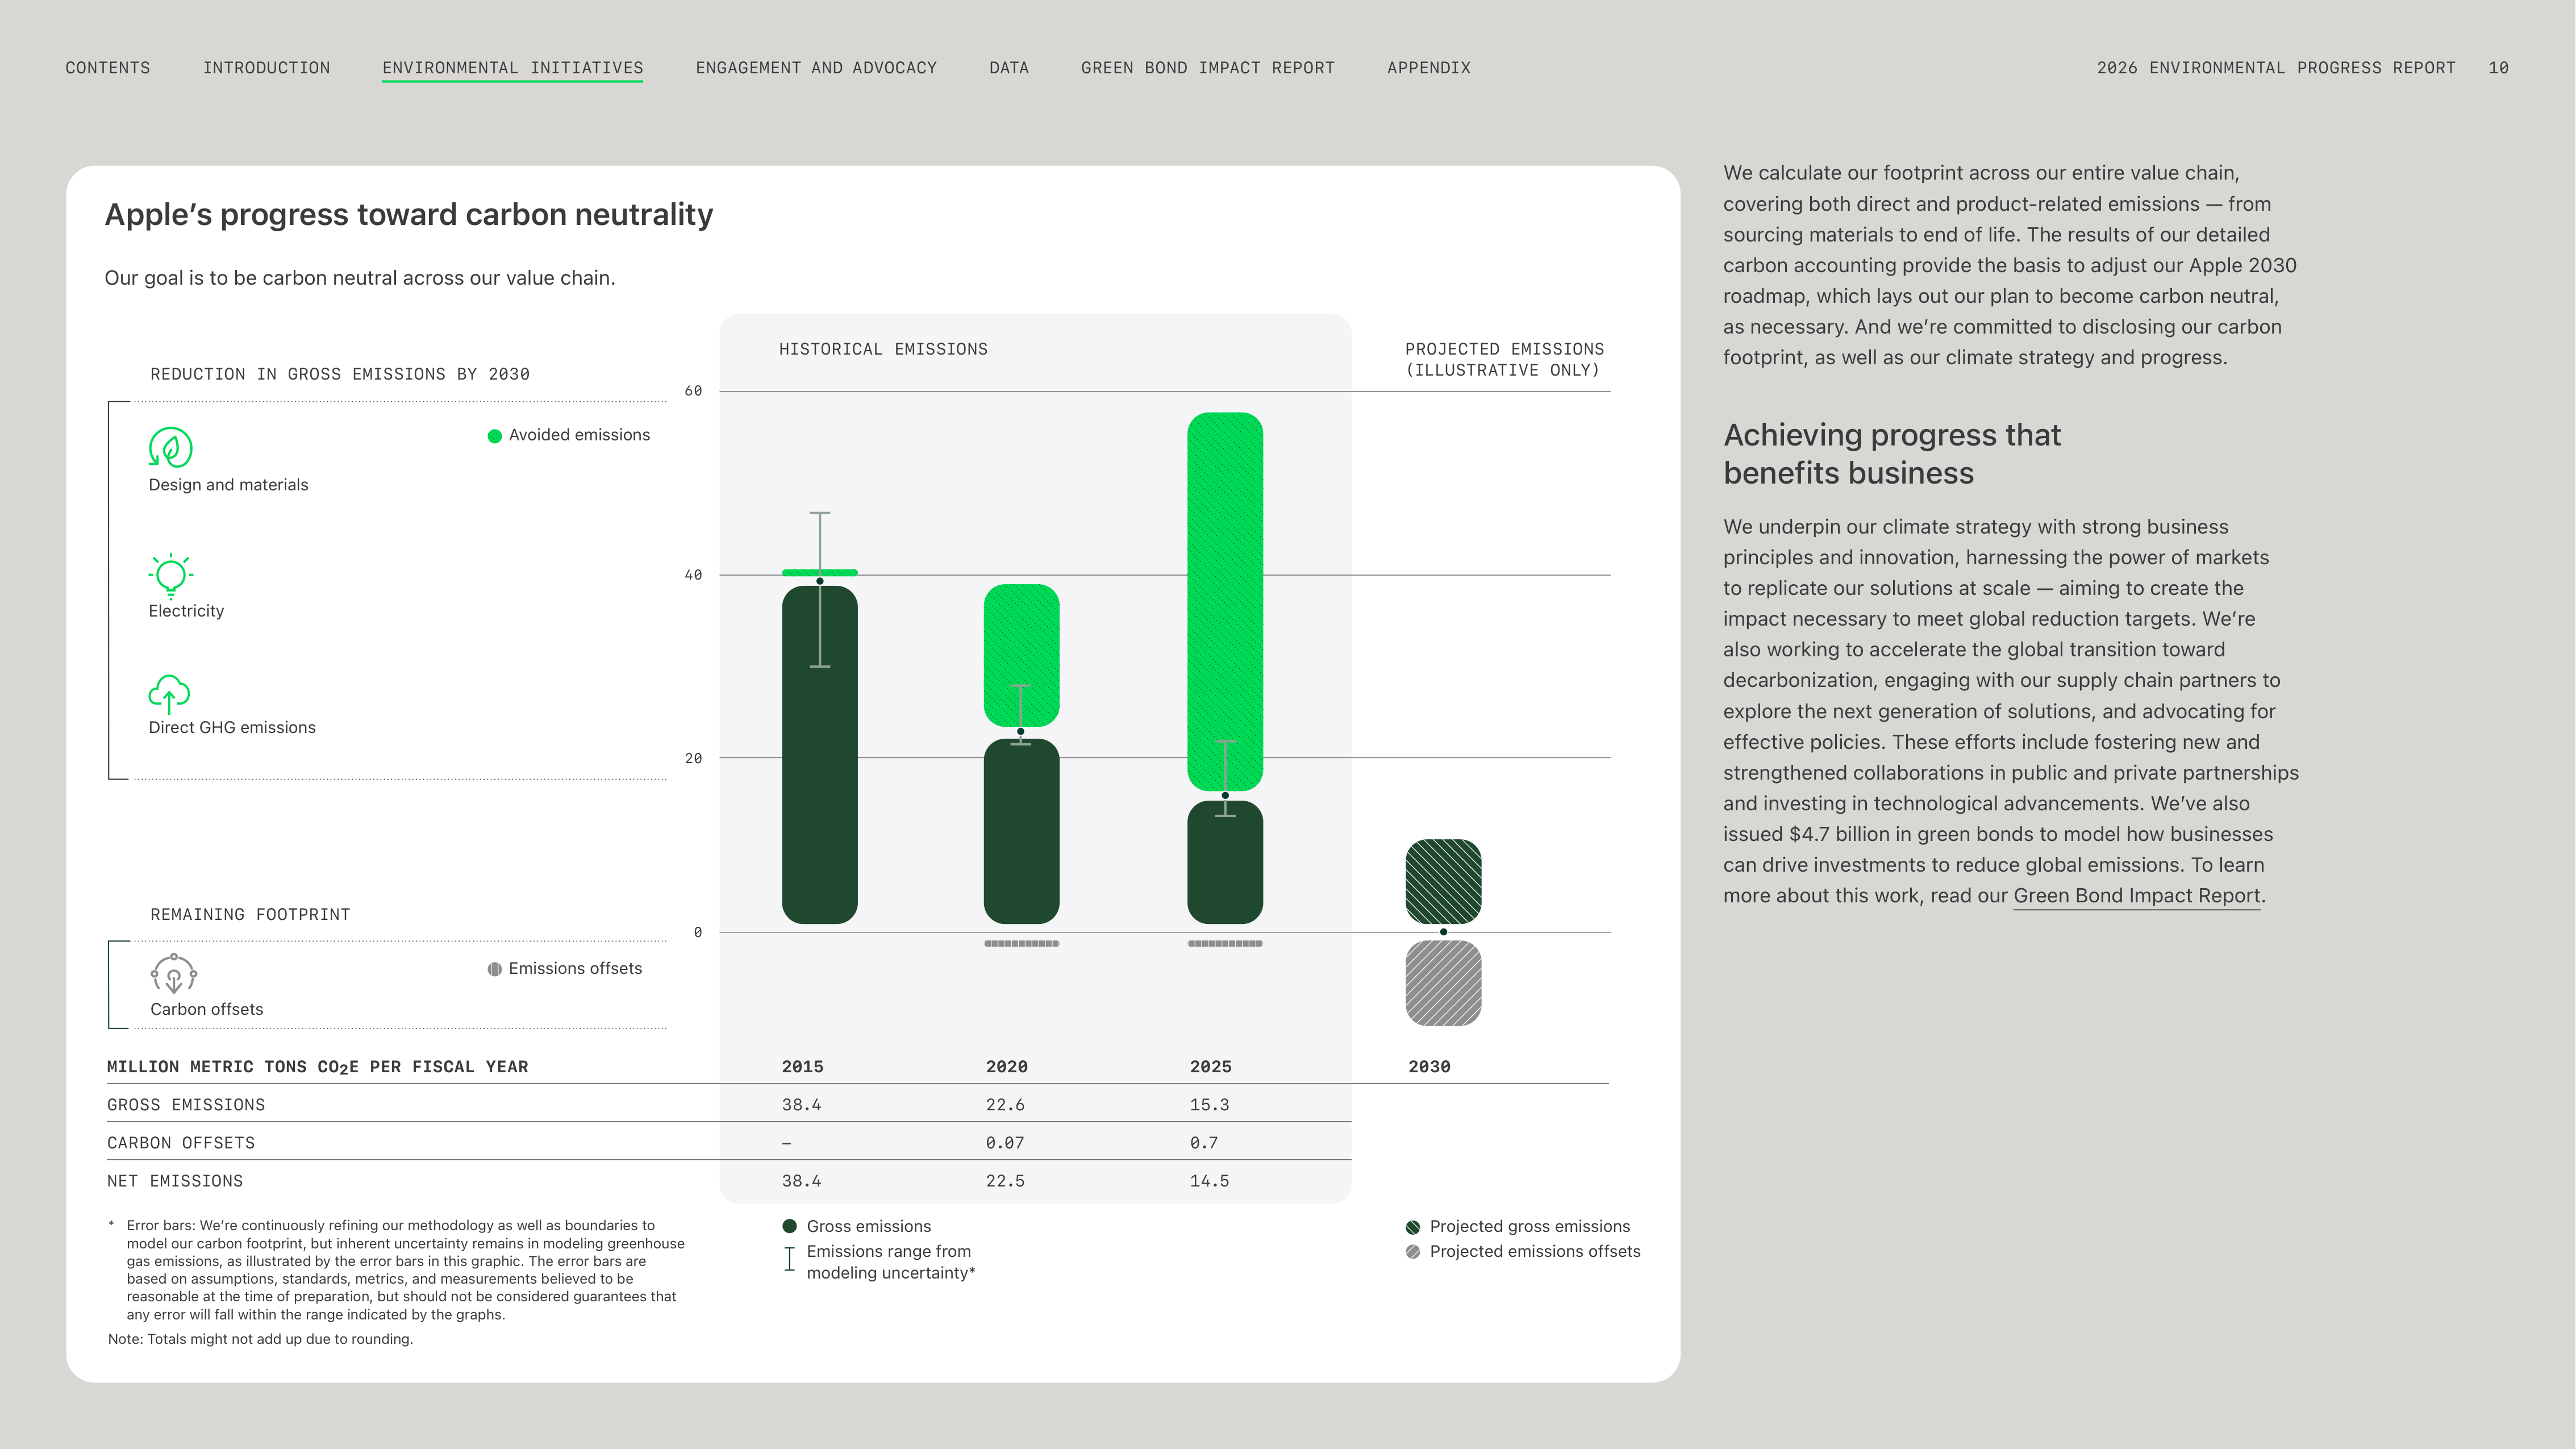
We calculate our footprint across our entire value chain,
covering both direct and product-related emissions — from
sourcing materials to end of life. The results of our detailed
carbon accounting provide the basis to adjust our Apple 2030
roadmap, which lays out our plan to become carbon neutral,
as necessary. And weʼre committed to disclosing our carbon
footprint, as well as our climate strategy and progress.
Apple’s progress toward carbon neutrality
Our goal is to be carbon neutral across our value chain.
*
Error bars: Weʼre continuously refining our methodology as well as boundaries to
model our carbon footprint, but inherent uncertainty remains in modeling greenhouse
gas emissions, as illustrated by the error bars in this graphic. The error bars are
based on assumptions, standards, metrics, and measurements believed to be
reasonable at the time of preparation, but should not be considered guarantees that
any error will fall within the range indicated by the graphs.
Note: Totals might not add up due to rounding.
PROJECTED EMISSIONS
(ILLUSTRATIVE ONLY)
HISTORICAL EMISSIONS
MILLION METRIC TONS CO
2
E PER FISCAL YEAR
2015
2020
2025
2030
GROSS EMISSIONS
38.4
22.6
15.3
CARBON OFFSETS
–
0.07
0.7
NET EMISSIONS
38.4
22.5
14.5
REDUCTION IN GROSS EMISSIONS BY 2030
Design and materials
Electricity
Direct GHG emissions
Carbon offsets
REMAINING FOOTPRINT
Avoided emissions
Emissions offsets
Gross emissions
Emissions range from
modeling uncertainty*
Projected gross emissions
Projected emissions offsets
ENGAGEMENT AND ADVOCACY
INTRODUCTION
CONTENTS
GREEN BOND IMPACT REPORT
DATA
APPENDIX
2026 ENVIRONMENTAL PROGRESS REPORT
10
ENVIRONMENTAL INITIATIVES
Apple’s comprehensive carbon footprint
*
Net greenhouse gas emissions represent our total gross footprint minus carbon
offsets. Percentages shown for each emissions category represent the share of
Appleʼs gross footprint. Annual avoided emissions may exceed the reduction in
emissions from our baseline footprint due to various factors, such as business
growth. Totals add up to more than 100 percent due to rounding.
** Low-carbon materials represent emissions savings from transitioning to recycled
materials in our products and using low-carbon aluminum. For details, see page 31.
†
Clean energy represents emissions savings from clean energy procured by Apple or
its suppliers.
‡
Business operations include business travel, employee commutes, working from
home, fuels and other energy-related activities, and the use of other cloud services.
‡‡ Direct abatement efforts include both F-GHG and N
2
O from our semiconductor and
display suppliers.
GOAL
Achieve carbon neutrality across our entire
value chain by 2030 — reducing related
emissions by 75 percent compared with 2015
60%
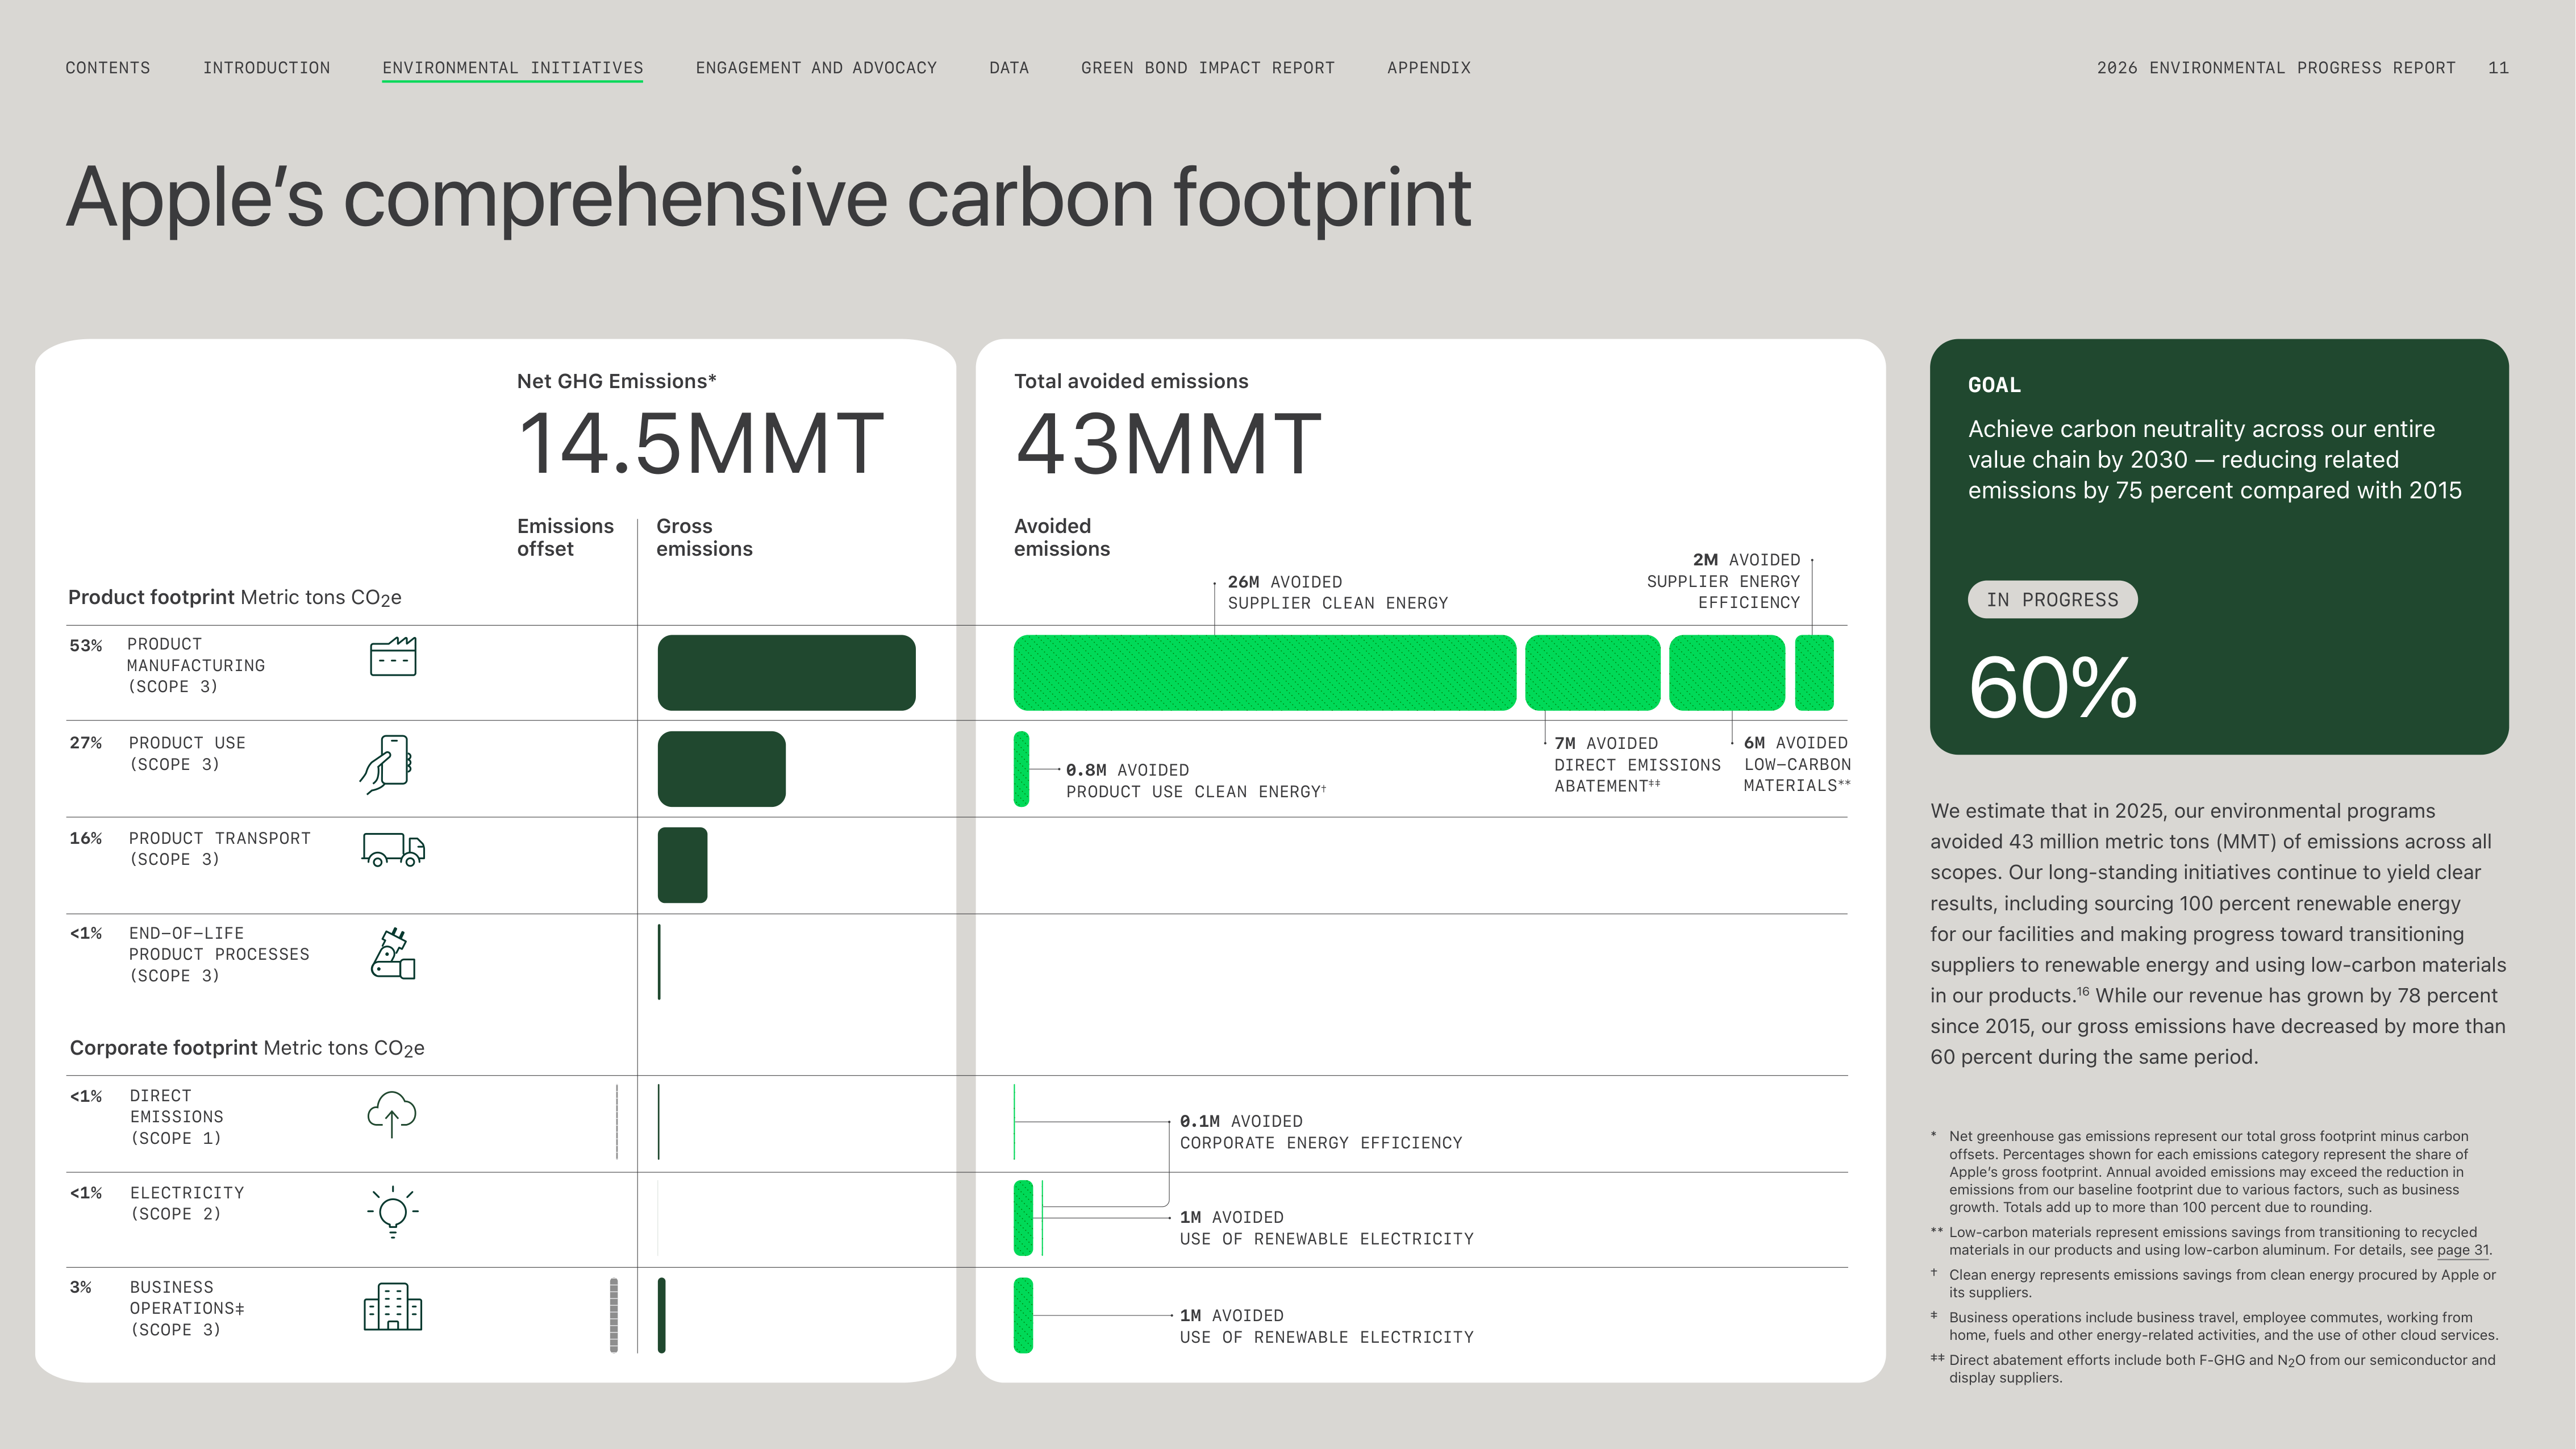
We estimate that in 2025, our environmental programs
avoided 43 million metric tons (MMT) of emissions across all
scopes. Our long-standing initiatives continue to yield clear
results, including sourcing 100 percent renewable energy
for our facilities and making progress toward transitioning
suppliers to renewable energy and using low-carbon materials
in our products.
16
While our revenue has grown by 78 percent
since 2015, our gross emissions have decreased by more than
60 percent during the same period.
Total avoided emissions
43MMT
Net GHG Emissions*
14.5MMT
Product footprint
Metric tons CO
2
e
Corporate footprint
Metric tons CO
2
e
PRODUCT
MANUFACTURING
(SCOPE 3)
DIRECT
EMISSIONS
(SCOPE 1)
PRODUCT USE
(SCOPE 3)
ELECTRICITY
(SCOPE 2)
PRODUCT TRANSPORT
(SCOPE 3)
BUSINESS
OPERATIONS‡
(SCOPE 3)
END-OF-LIFE
PRODUCT PROCESSES
(SCOPE 3)
53%
<1%
27%
<1%
16%
3%
<1%
2M
AVOIDED
SUPPLIER ENERGY
EFFICIENCY
6M
AVOIDED
LOW-CARBON
MATERIALS
**
7M
AVOIDED
DIRECT EMISSIONS
ABATEMENT
‡‡
26M
AVOIDED
SUPPLIER CLEAN ENERGY
0.8M
AVOIDED
PRODUCT USE CLEAN ENERGY
†
0.1M
AVOIDED
CORPORATE ENERGY EFFICIENCY
1M
AVOIDED
USE OF RENEWABLE ELECTRICITY
1M
AVOIDED
USE OF RENEWABLE ELECTRICITY
Emissions
offset
Avoided
emissions
Gross
emissions
ENGAGEMENT AND ADVOCACY
INTRODUCTION
CONTENTS
GREEN BOND IMPACT REPORT
DATA
APPENDIX
2026 ENVIRONMENTAL PROGRESS REPORT
11
ENVIRONMENTAL INITIATIVES


Design and materials
We design our products to be less
carbon intensive by prioritizing the use
of recycled and renewable content and
low-carbon materials while focusing on
the energy efficiency of our software and
hardware. We’re working toward a future
where every Apple product will be created
from and contribute to circular supply
chains. The design and material choices
we make across our products support
reducing our carbon footprint.
Product manufacturing
(Scope 3)
Product use
(Scope 3)
Design and materials address
emissions from:
iPhone Air uses 80 percent recycled titanium,
a first for iPhone.
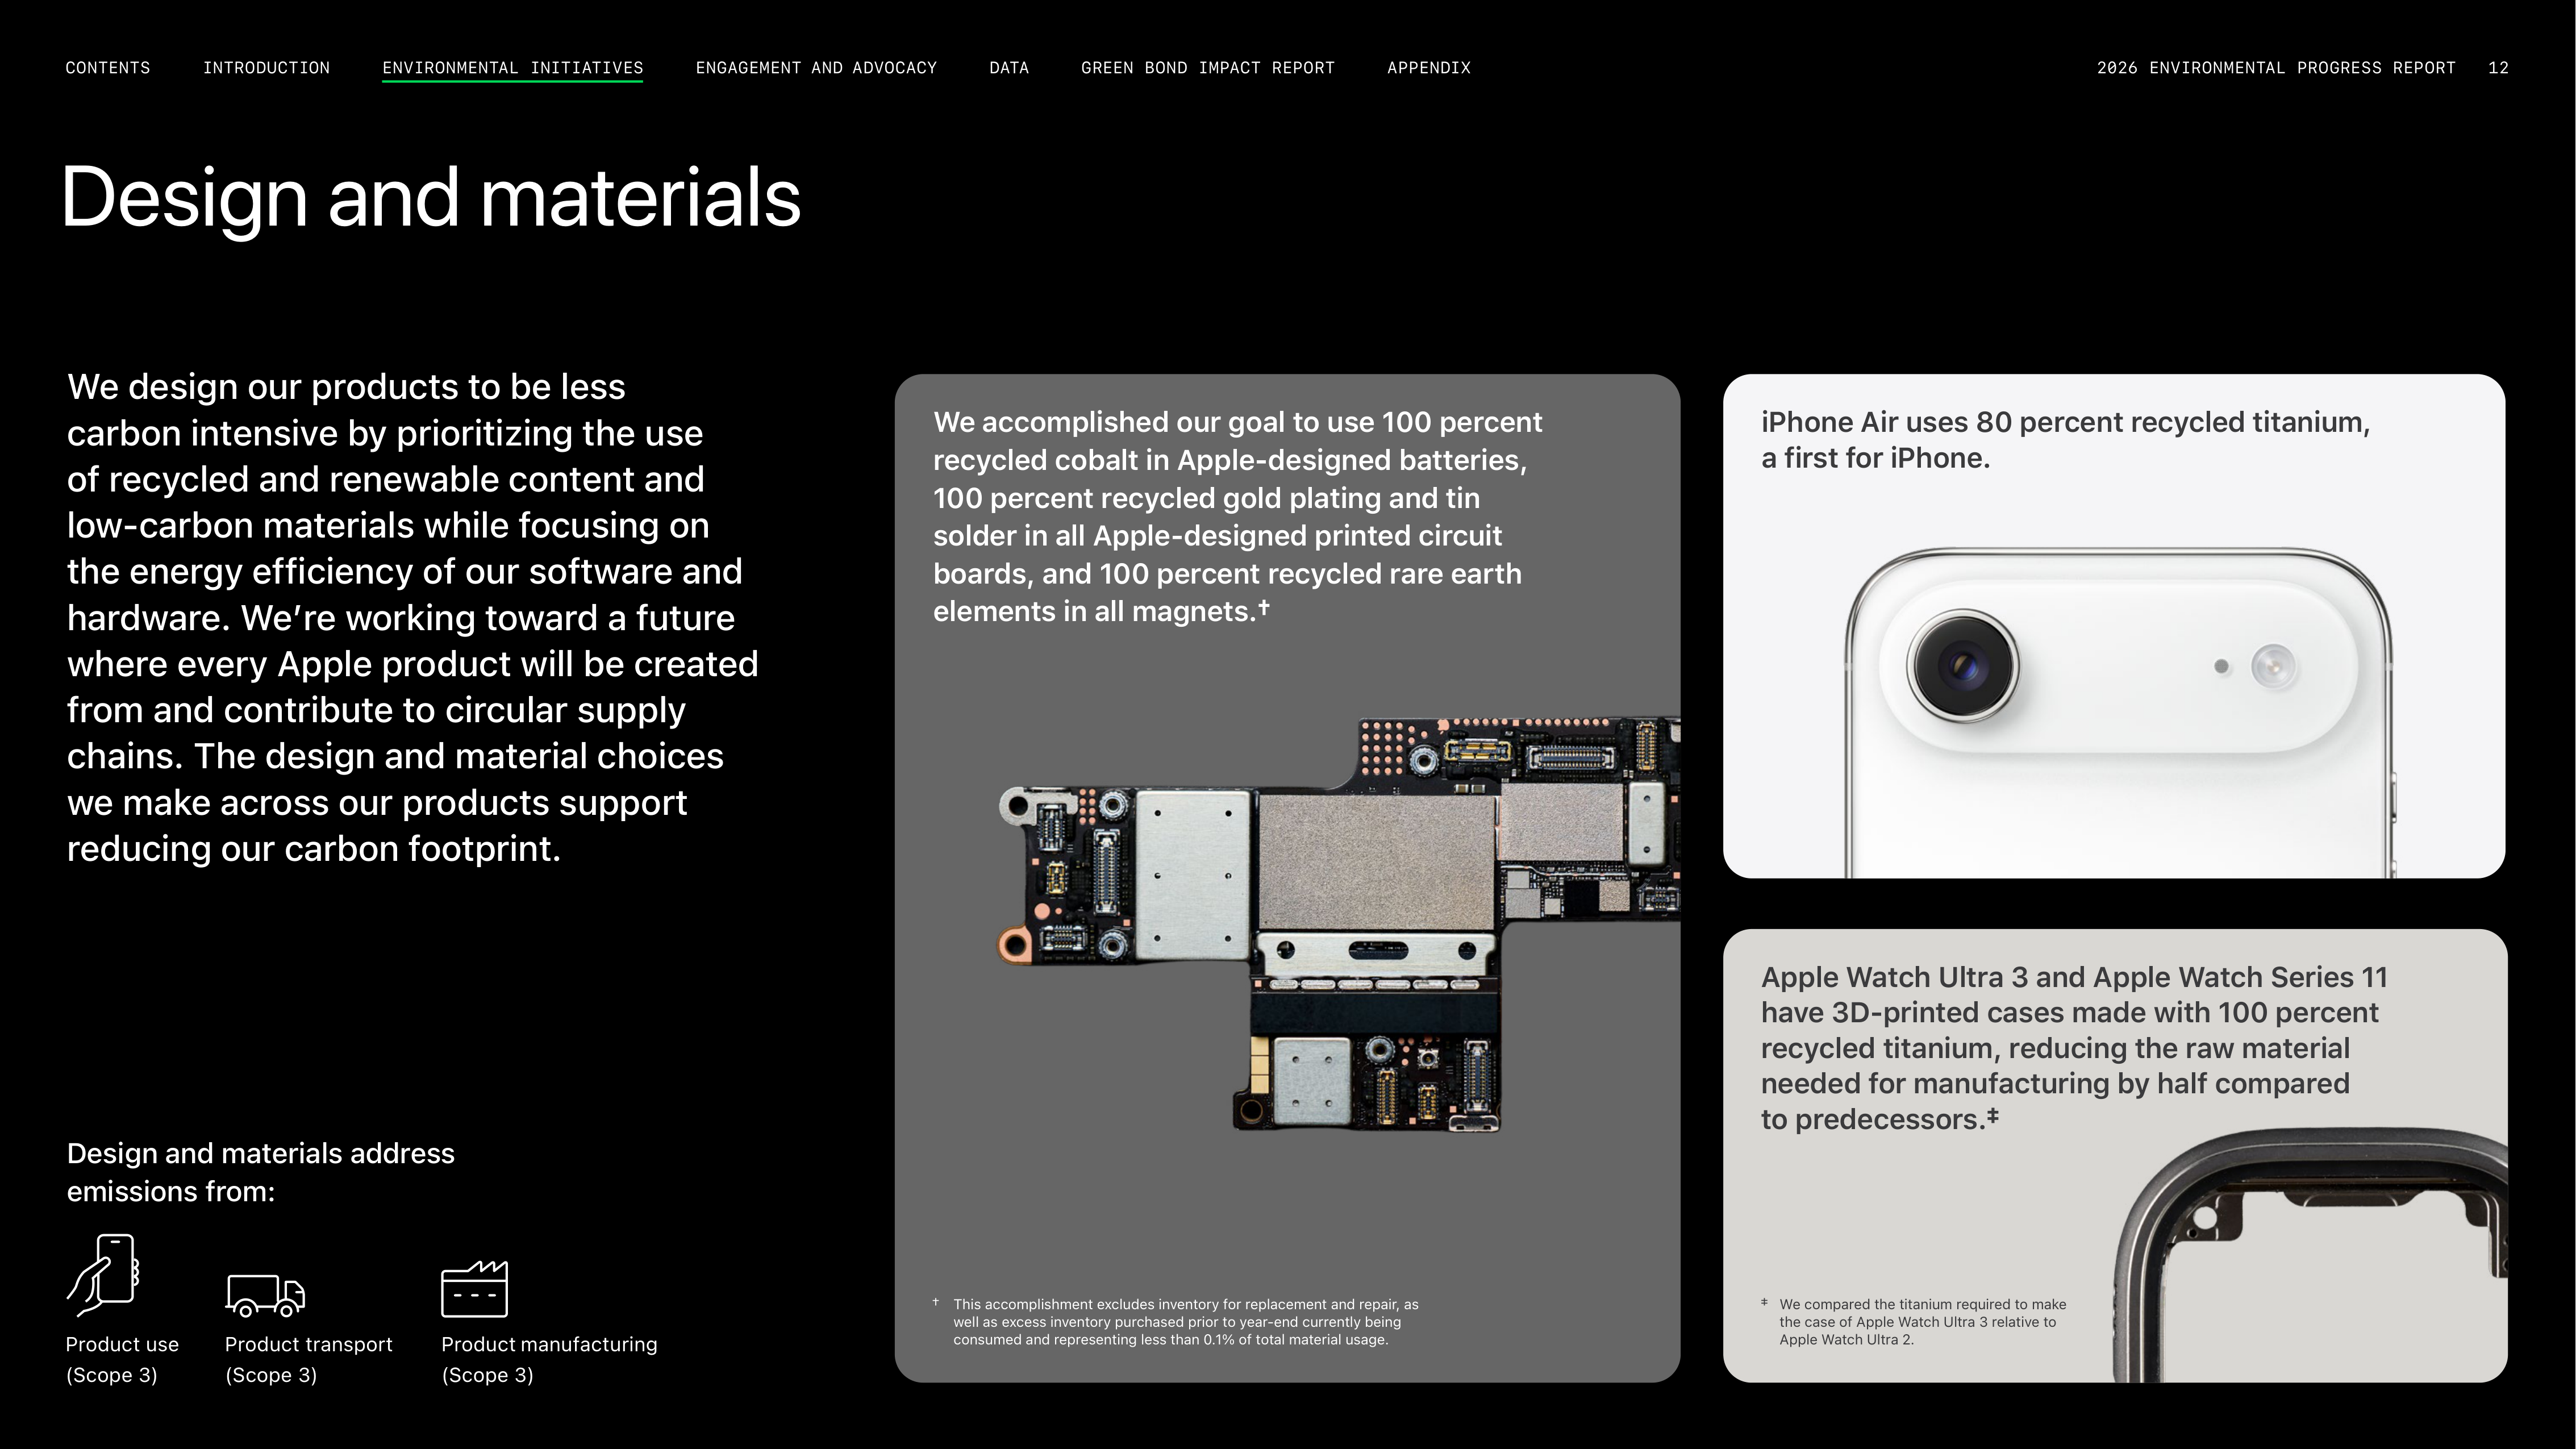
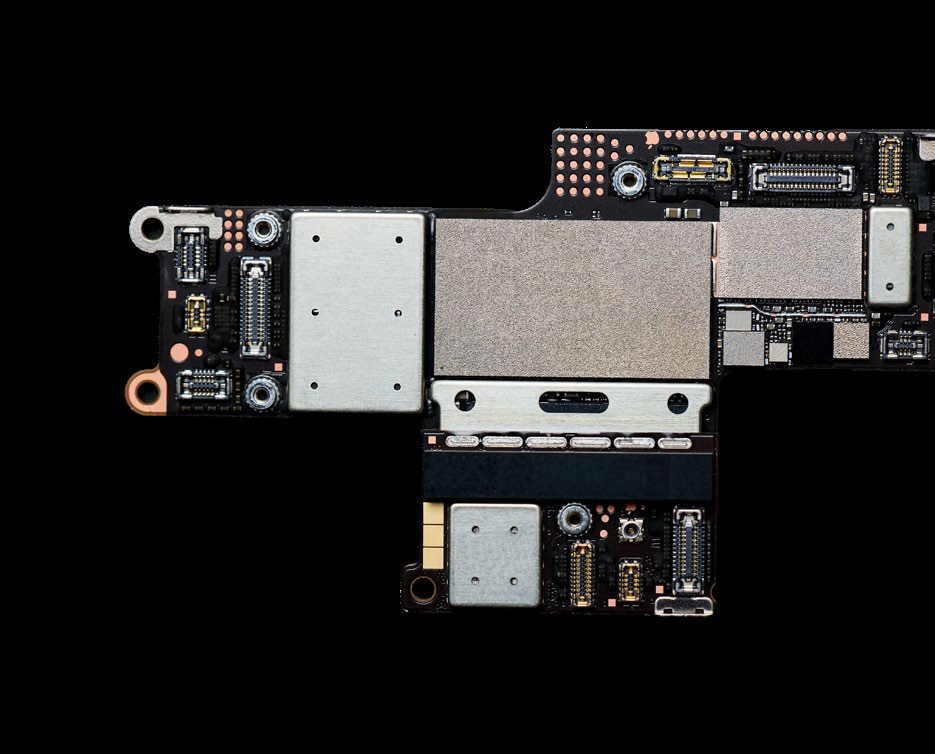
We accomplished our goal to use 100 percent
recycled cobalt in Apple-designed batteries,
100 percent recycled gold plating and tin
solder in all Apple-designed printed circuit
boards, and 100 percent recycled rare earth
elements in all magnets.†
Apple Watch Ultra 3 and Apple Watch Series 11
have 3D-printed cases made with 100 percent
recycled titanium, reducing the raw material
needed for manufacturing by half compared
to predecessors.‡
†
This accomplishment excludes inventory for replacement and repair, as
well as excess inventory purchased prior to year-end currently being
consumed and representing less than 0.1% of total material usage.
‡
We compared the titanium required to make
the case of Apple Watch Ultra 3 relative to
Apple Watch Ultra 2.
Product transport
(Scope 3)
2026 ENVIRONMENTAL PROGRESS REPORT
12
ENGAGEMENT AND ADVOCACY
INTRODUCTION
CONTENTS
APPENDIX
GREEN BOND IMPACT REPORT
DATA
ENVIRONMENTAL INITIATIVES
Innovation drives our efforts around circularity — from the
materials we source and the product design choices we
make to the recycling and recovery innovations we pursue.
We prioritize the materials and components that account for
significant portions of our greenhouse gas emissions. This
means that the choices we make product-by-product can
scale toward reducing our overall footprint. These priorities
inform our work to design for material efficiency and increase
our use of recycled and renewable materials.
We aim to create products that use circular supply chains
to one day end reliance on mined resources while meeting
our rigorous standards for quality, durability, performance,
and environmental and social protections. And weʼre making
progress in expanding our use of recycled content across
our products. We accomplished our goal to transition
to 100 percent recycled cobalt, tin, gold, and rare earth
elements in key components and applications with higher
concentrations — including 100 percent recycled content
cobalt in Apple-designed batteries, 100 percent recycled
gold plating and tin solder in all Apple-designed printed
circuit boards, and 100 percent recycled rare earth elements
in all magnets.
17
And we also maintain strict standards for
responsibly sourcing materials from primary, recycled, and
renewable sources. Our actions can inspire others to support
building circular supply chains.
Working to positively influence the markets where we work
and communities worldwide, advocating for policy that
enables circular supply chains, and inspiring others to follow
suit — these are the opportunities that drive us through the
challenging work of creating circular supply chains. Read
about our efforts in Engagement and Advocacy on page 69.
Using recycled materials to lower our
product carbon footprint
Weʼre reducing the carbon footprint of our products through
the materials we select. Our strategy is to transition to
materials that are manufactured using low-carbon energy
and recycled content.
18
Weʼre prioritizing the materials
and components that make up a large part of our products
to move us closer to our goal of carbon neutrality. And to
accelerate collective efforts, we signed on as a founding
member of First Movers Coalitionʼs near-zero emissions
primary aluminum commitment for 2030.
Our approach to design and materials
Our use of aluminum exemplifies Appleʼs approach: Weʼre
transitioning to recycled content, and where we havenʼt
yet, weʼre moving to low-carbon suppliers and supporting
technological innovations to decarbonize. Weʼve continued
to use 100 percent recycled aluminum in the enclosures of
many Apple products, including Apple Watch Series 11, iPad,
MacBook Air, and Mac Studio.
Our first priority is to tap into the potential of our own high-
quality scrap by exploring innovations to recover as much
as possible. Since recycled aluminum manufacturing emits
less carbon than newly mined materials, we look to other
post-industrial and post-consumer sources for high-quality
recycled aluminum, which requires new approaches. For
example, we repurpose some scrap material generated during
the fabrication of our enclosures to make our 7000 series
aluminum used in iPhone 17 and other products. Overall, our
efforts have reduced our aluminum-related emissions by more
than 70 percent since 2015.
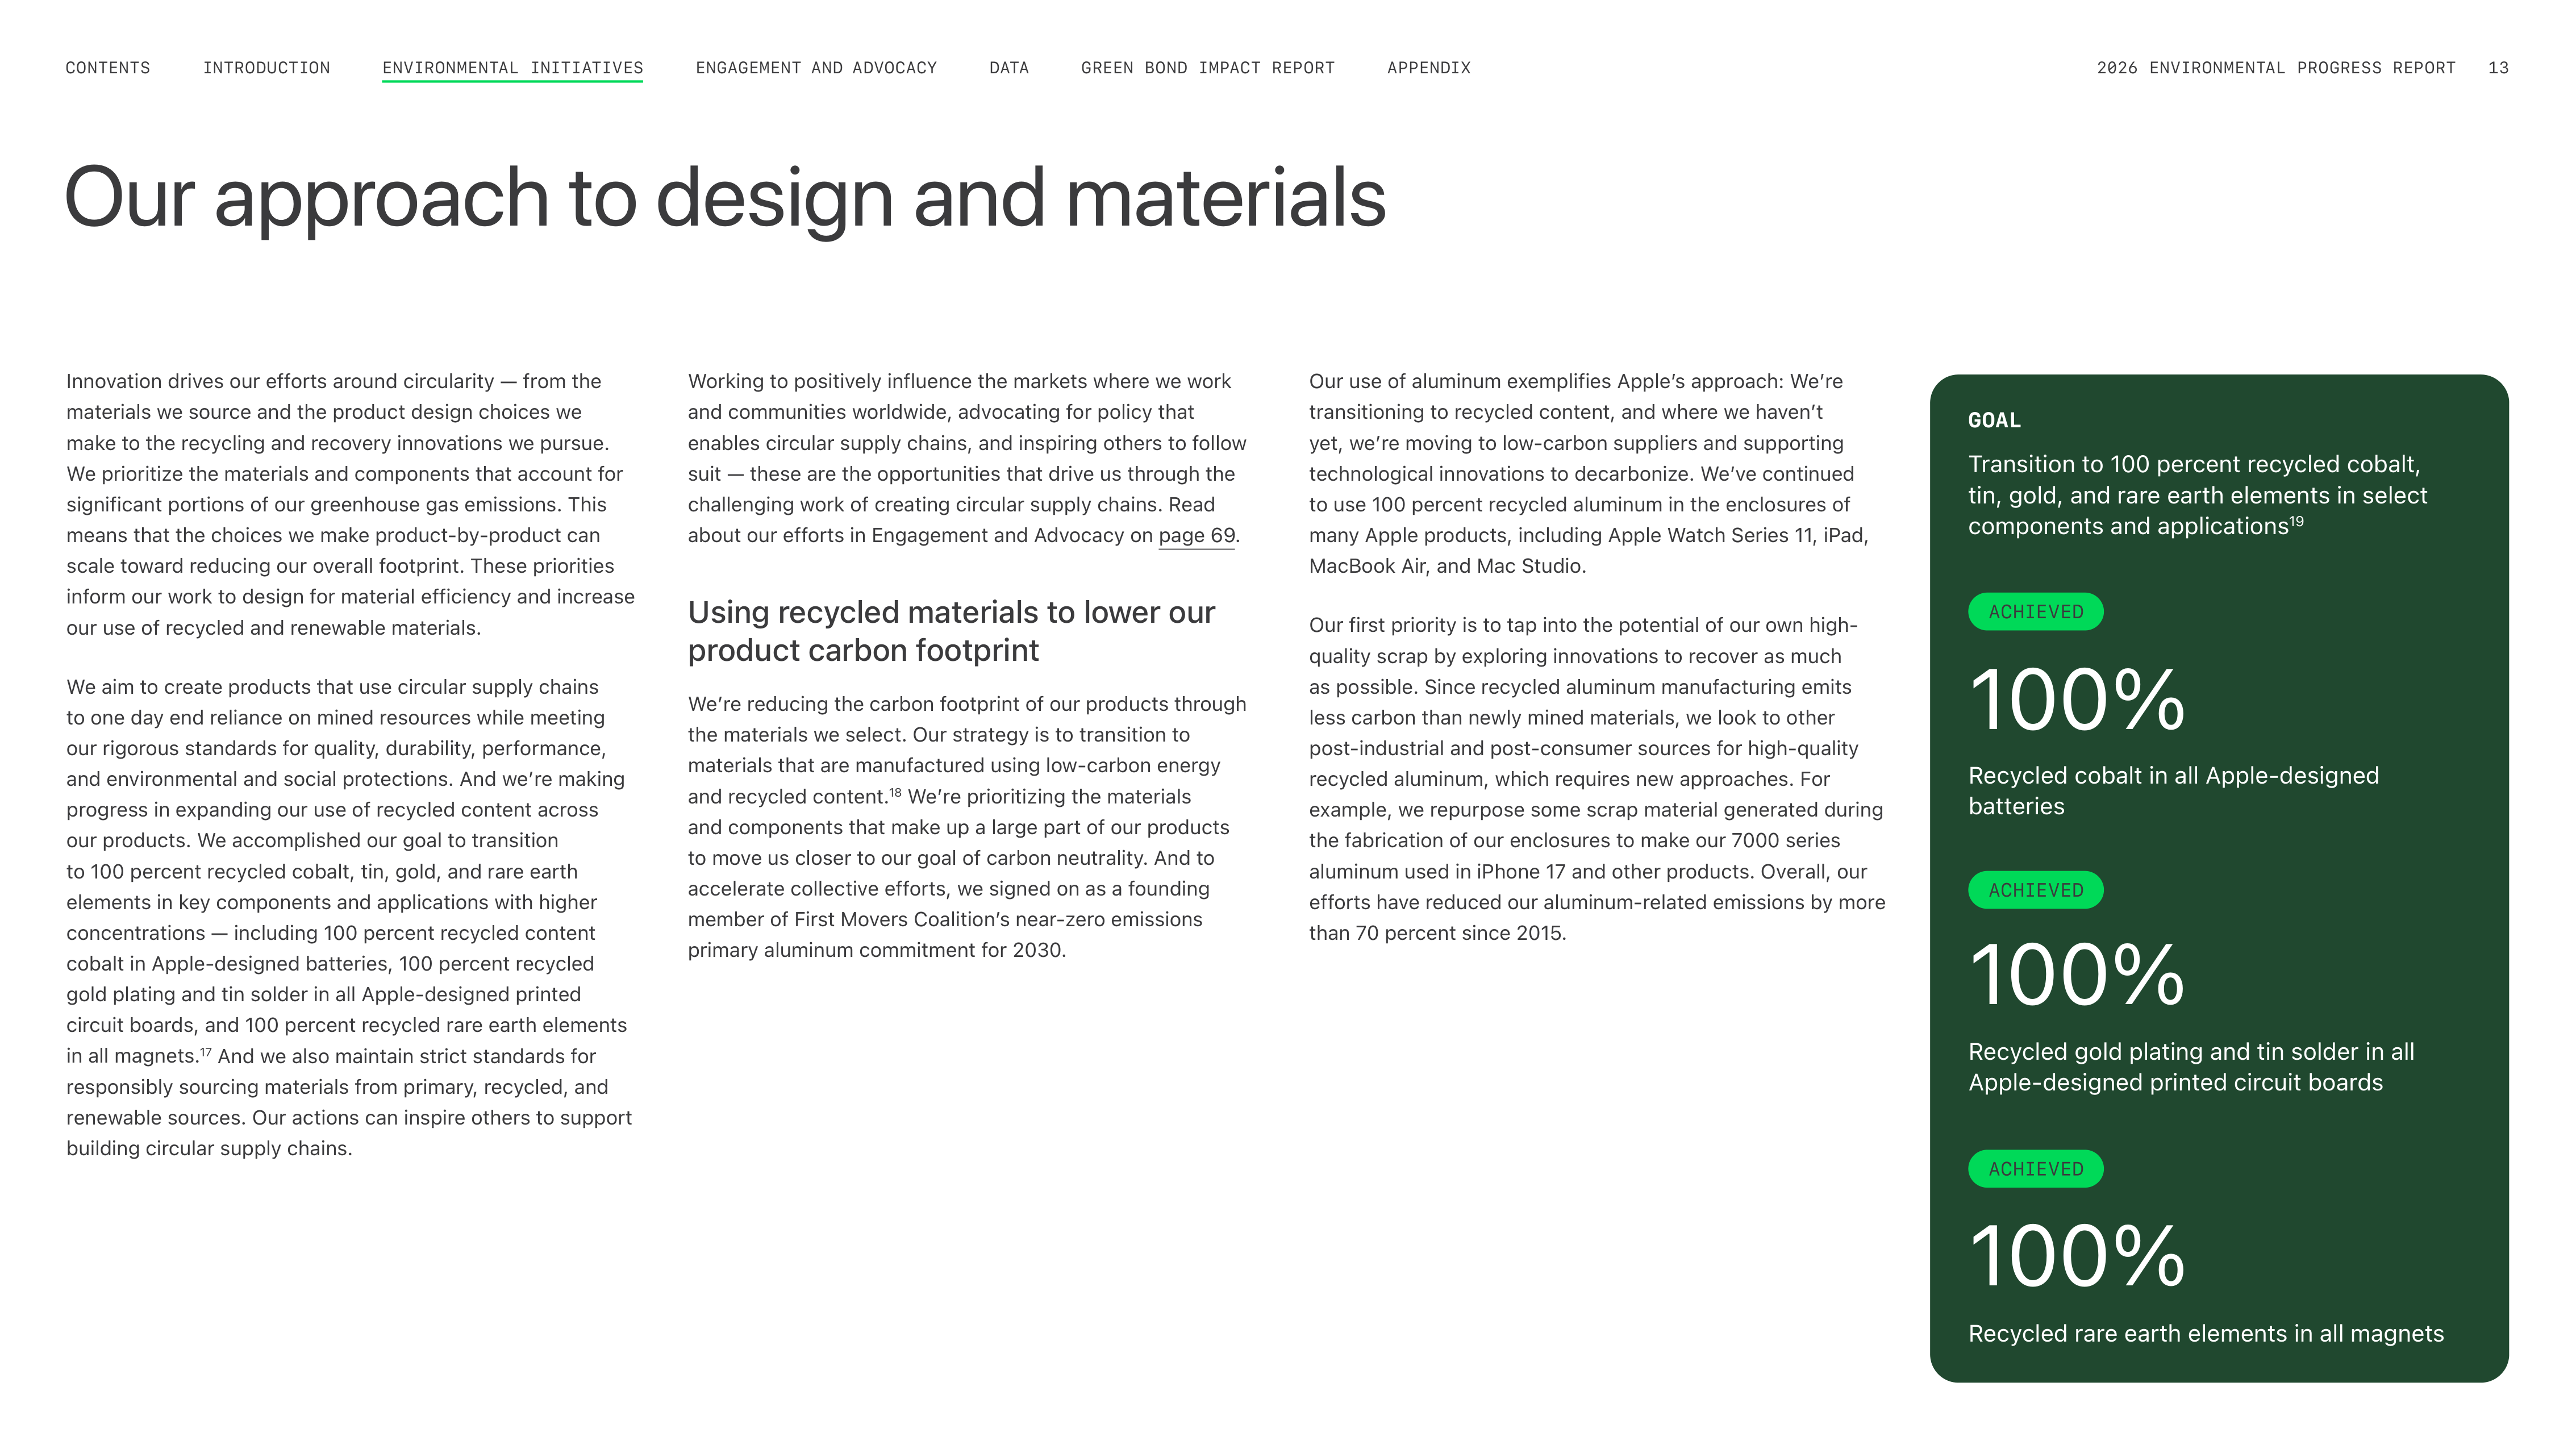
GOAL
Transition to 100 percent recycled cobalt,
tin, gold, and rare earth elements in select
components and applications
19
100%
Recycled cobalt in all Apple-designed
batteries
100%
Recycled rare earth elements in all magnets
100%
Recycled gold plating and tin solder in all
Apple-designed printed circuit boards
ENGAGEMENT AND ADVOCACY
INTRODUCTION
CONTENTS
GREEN BOND IMPACT REPORT
DATA
APPENDIX
2026 ENVIRONMENTAL PROGRESS REPORT
13
ENVIRONMENTAL INITIATIVES


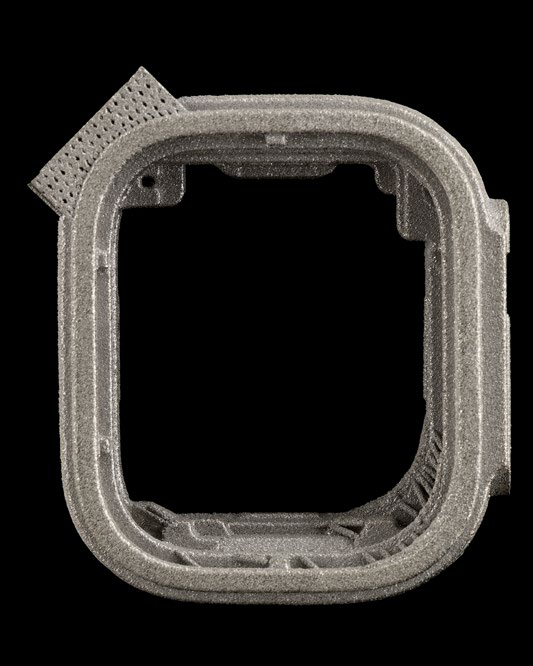

Hot off
the press
A novel idea transformed a
prototyping approach, 3D printing,
into a breakthrough production
process that yielded significant
savings in raw materials. This
year, all Apple Watch Ultra 3
and titanium Apple Watch Series
11 cases were 3D-printed with
100 percent recycled aerospace-
grade titanium powder, achieving
more than 400 metric tons in
raw titanium savings in 2025 and
50 percent less raw material used
than the previous generation.
2026 ENVIRONMENTAL PROGRESS REPORT
14
ENGAGEMENT AND ADVOCACY
INTRODUCTION
CONTENTS
APPENDIX
GREEN BOND IMPACT REPORT
DATA
ENVIRONMENTAL INITIATIVES
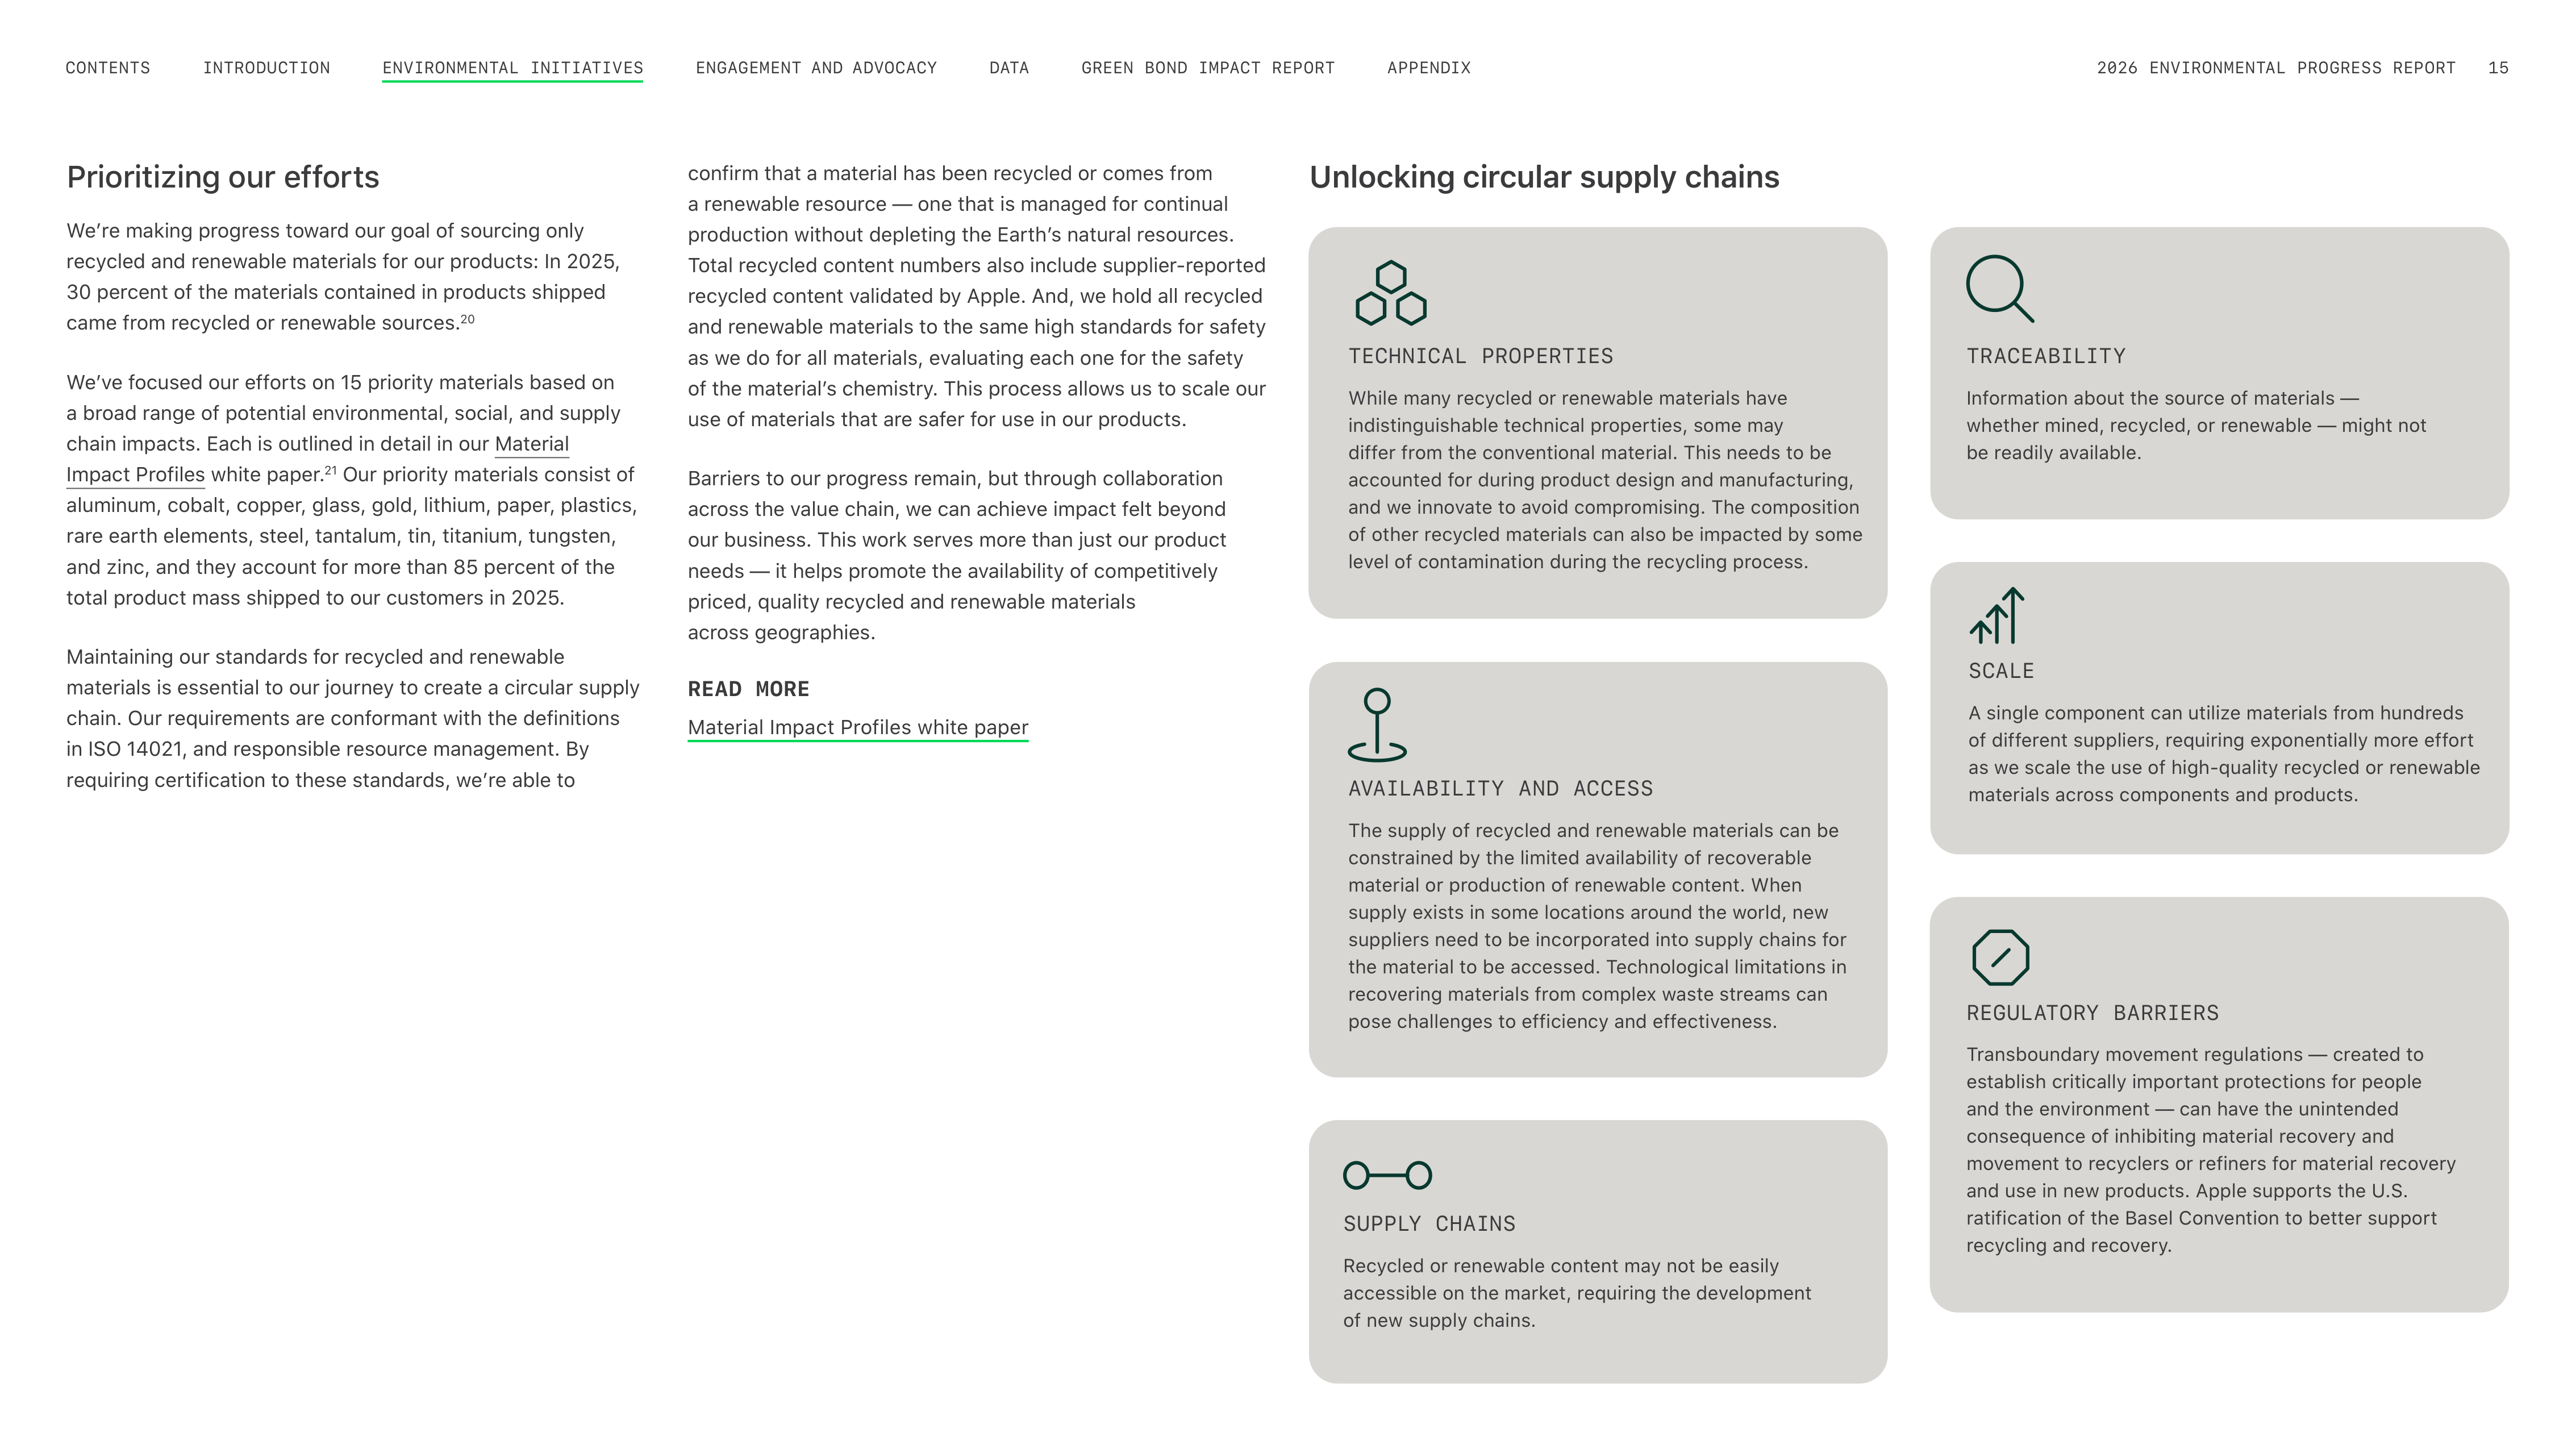
Prioritizing our efforts
We’re making progress toward our goal of sourcing only
recycled and renewable materials for our products: In 2025,
30 percent of the materials contained in products shipped
came from recycled or renewable sources.
20
We’ve focused our efforts on 15 priority materials based on
a broad range of potential environmental, social, and supply
chain impacts. Each is outlined in detail in our Material
Impact Profiles white paper.
21
Our priority materials consist of
aluminum, cobalt, copper, glass, gold, lithium, paper, plastics,
rare earth elements, steel, tantalum, tin, titanium, tungsten,
and zinc, and they account for more than 85 percent of the
total product mass shipped to our customers in 2025.
Maintaining our standards for recycled and renewable
materials is essential to our journey to create a circular supply
chain. Our requirements are conformant with the definitions
in ISO 14021, and responsible resource management. By
requiring certification to these standards, we’re able to
confirm that a material has been recycled or comes from
a renewable resource — one that is managed for continual
production without depleting the Earth’s natural resources.
Total recycled content numbers also include supplier-reported
recycled content validated by Apple. And, we hold all recycled
and renewable materials to the same high standards for safety
as we do for all materials, evaluating each one for the safety
of the material’s chemistry. This process allows us to scale our
use of materials that are safer for use in our products.
Barriers to our progress remain, but through collaboration
across the value chain, we can achieve impact felt beyond
our business. This work serves more than just our product
needs — it helps promote the availability of competitively
priced, quality recycled and renewable materials
across geographies.
READ MORE
Material Impact Profiles white paper
Unlocking circular supply chains
TECHNICAL PROPERTIES
While many recycled or renewable materials have
indistinguishable technical properties, some may
differ from the conventional material. This needs to be
accounted for during product design and manufacturing,
and we innovate to avoid compromising. The composition
of other recycled materials can also be impacted by some
level of contamination during the recycling process.
AVAILABILITY AND ACCESS
The supply of recycled and renewable materials can be
constrained by the limited availability of recoverable
material or production of renewable content. When
supply exists in some locations around the world, new
suppliers need to be incorporated into supply chains for
the material to be accessed. Technological limitations in
recovering materials from complex waste streams can
pose challenges to efficiency and effectiveness.
SUPPLY CHAINS
Recycled or renewable content may not be easily
accessible on the market, requiring the development
of new supply chains.
TRACEABILITY
Information about the source of materials —
whether mined, recycled, or renewable — might not
be readily available.
SCALE
A single component can utilize materials from hundreds
of different suppliers, requiring exponentially more effort
as we scale the use of high-quality recycled or renewable
materials across components and products.
REGULATORY BARRIERS
Transboundary movement regulations — created to
establish critically important protections for people
and the environment — can have the unintended
consequence of inhibiting material recovery and
movement to recyclers or refiners for material recovery
and use in new products. Apple supports the U.S.
ratification of the Basel Convention to better support
recycling and recovery.
ENGAGEMENT AND ADVOCACY
INTRODUCTION
CONTENTS
GREEN BOND IMPACT REPORT
DATA
APPENDIX
2026 ENVIRONMENTAL PROGRESS REPORT
15
ENVIRONMENTAL INITIATIVES
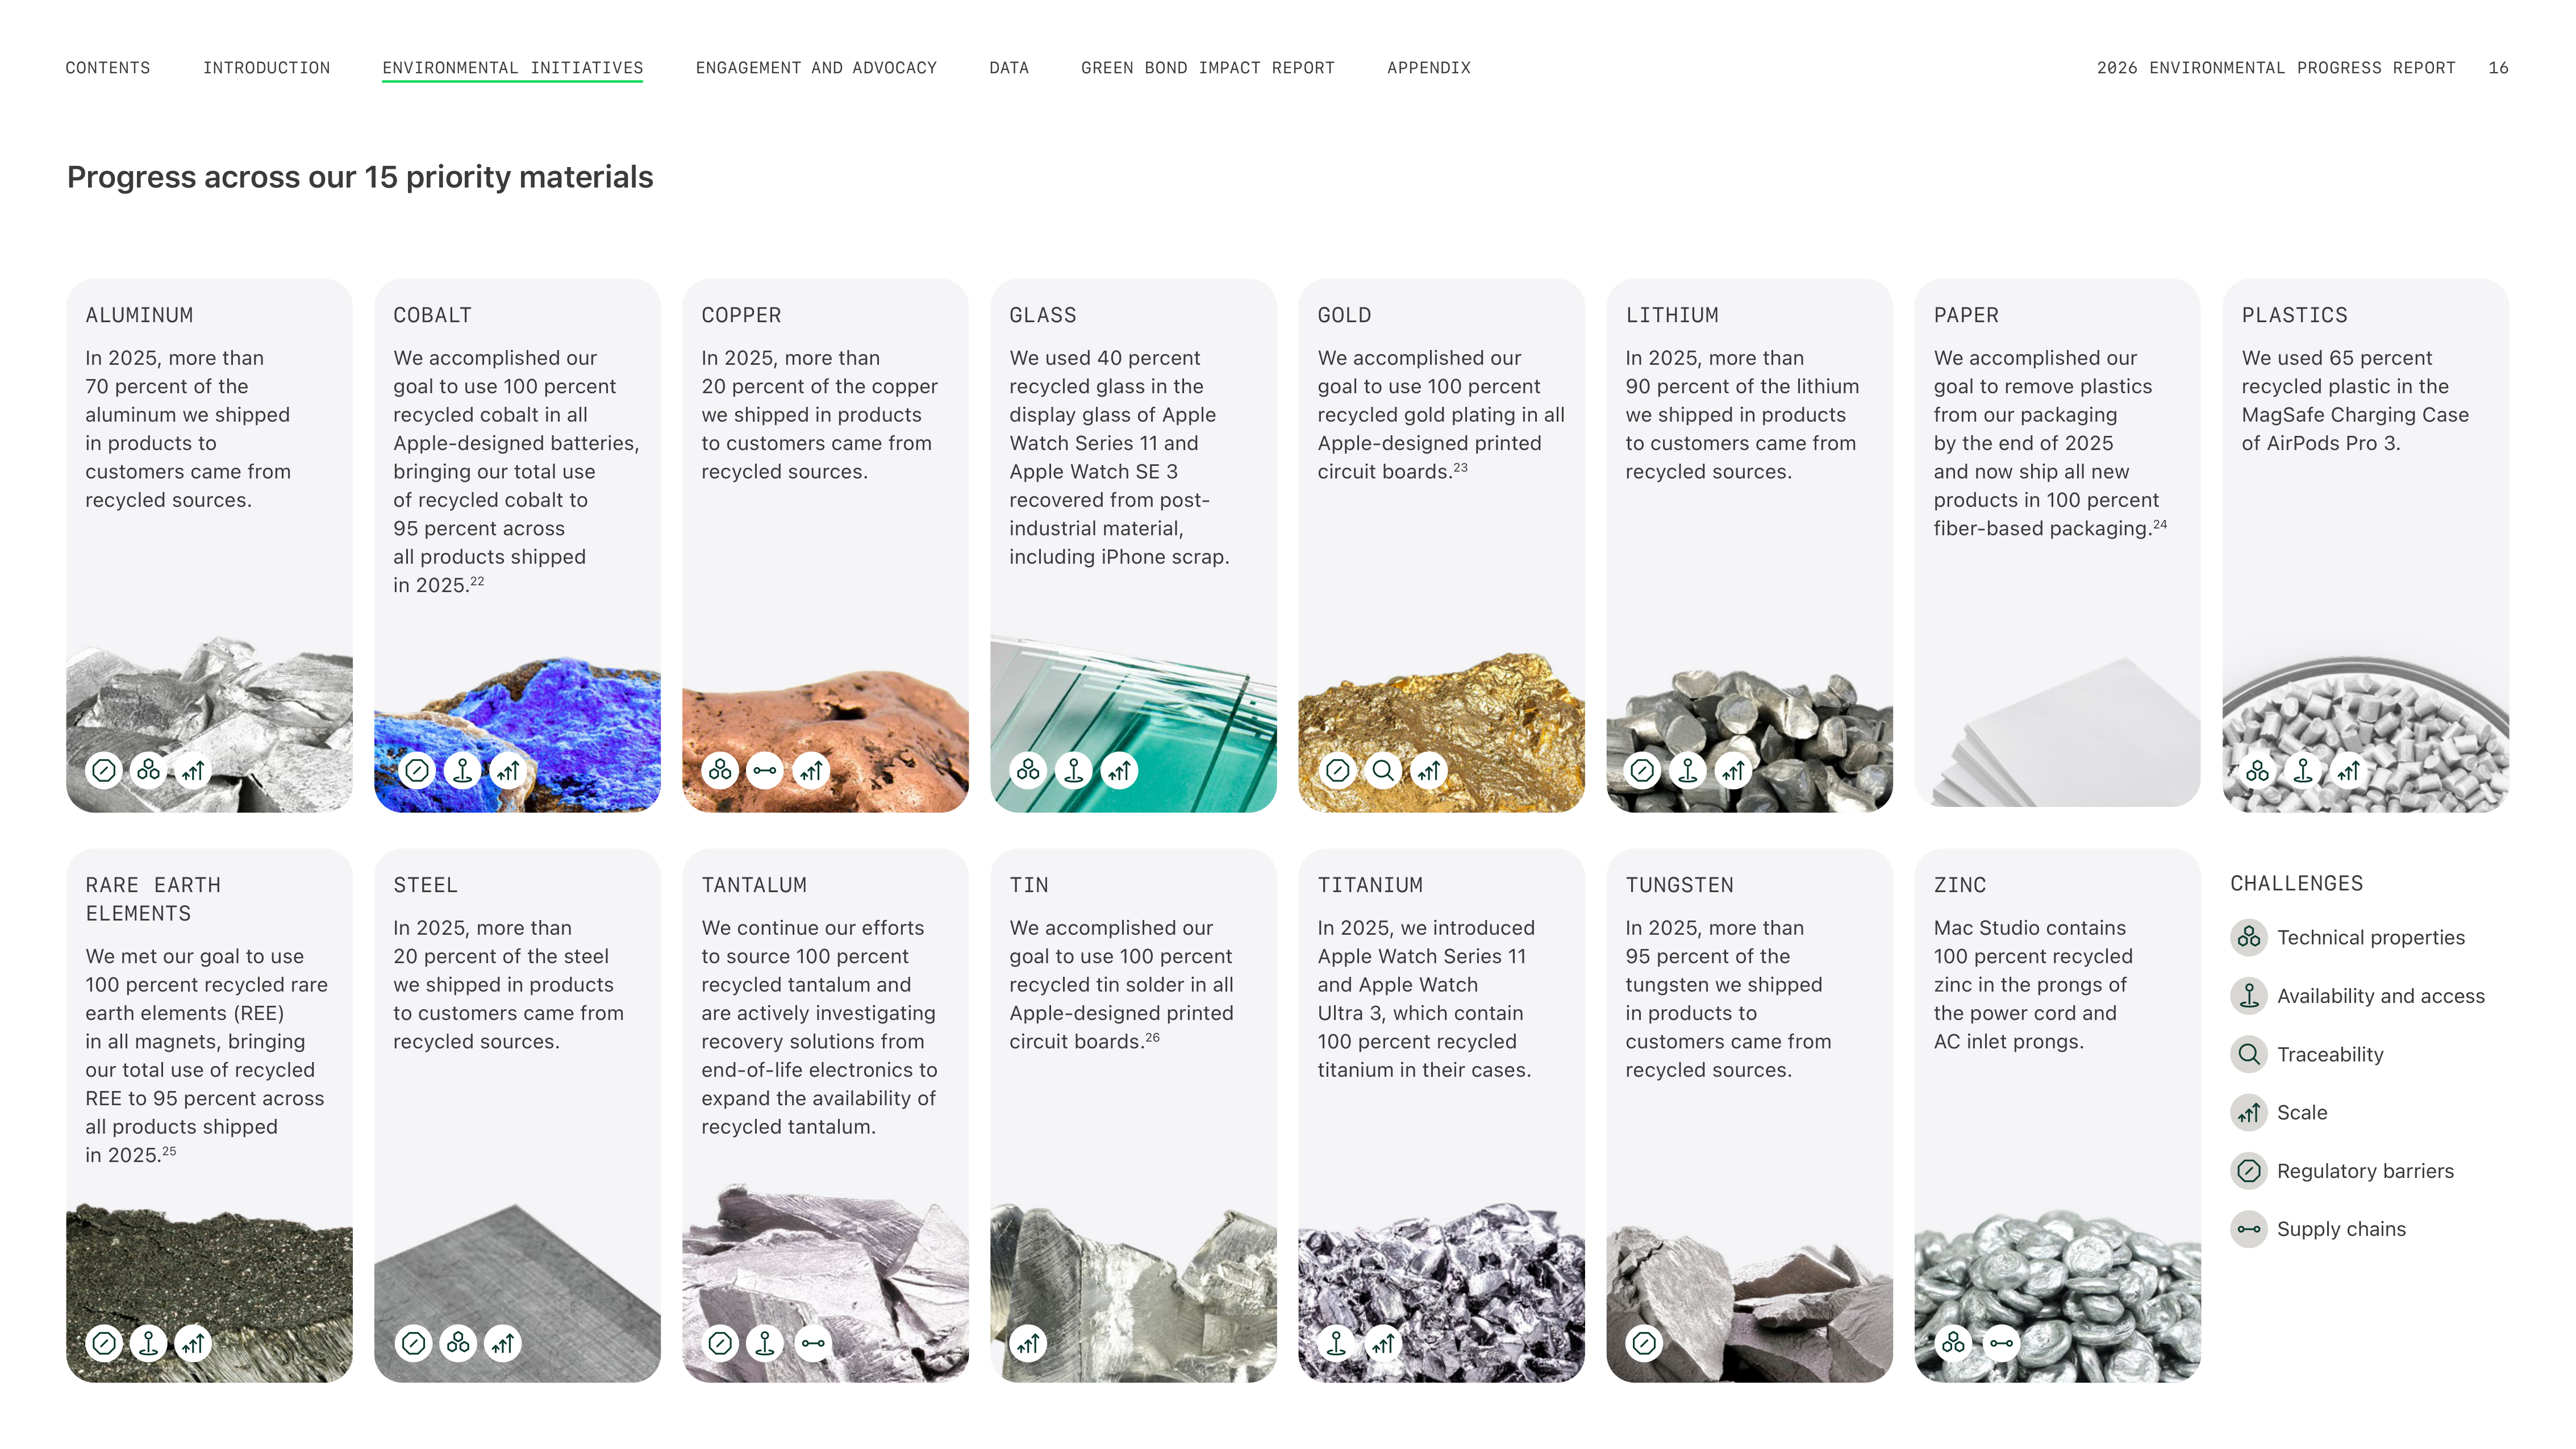

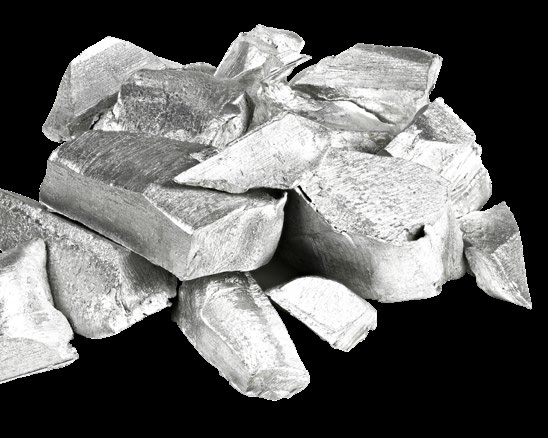

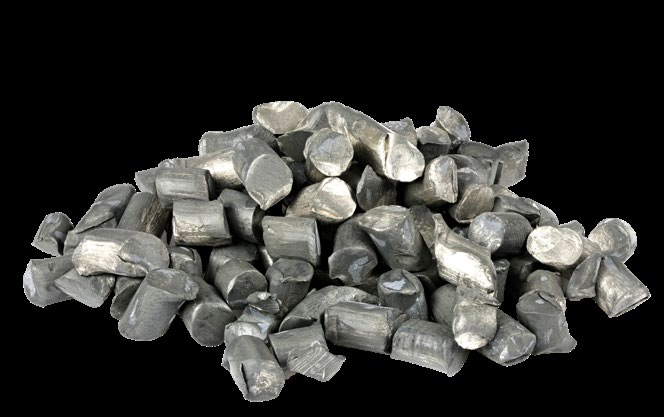
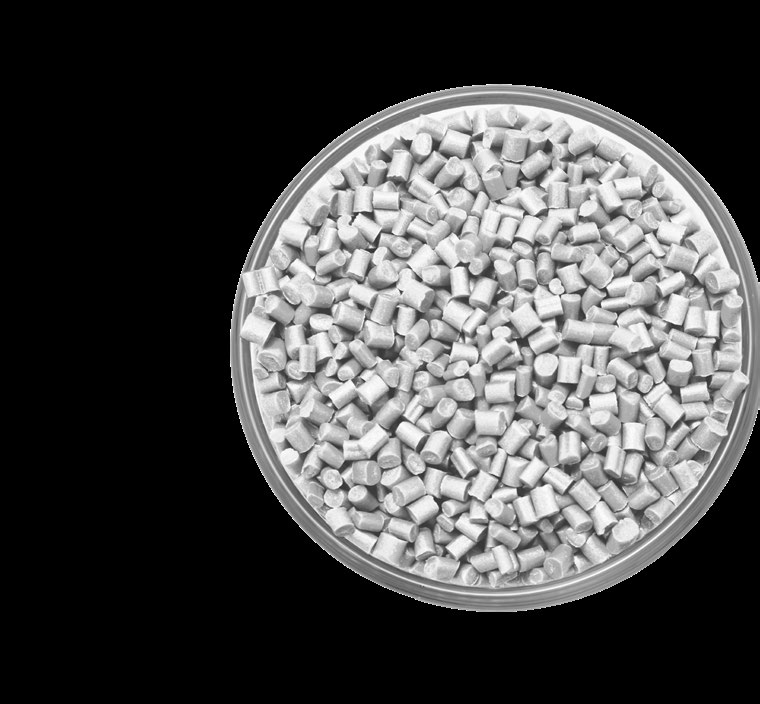

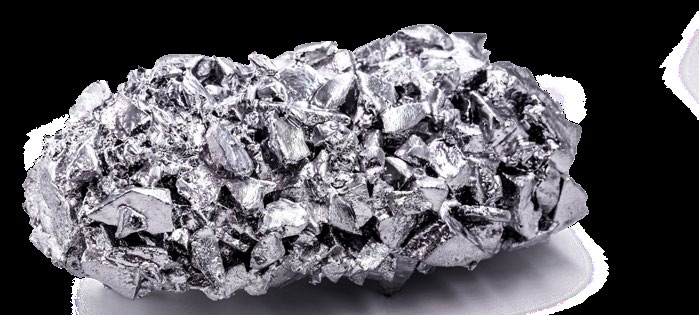
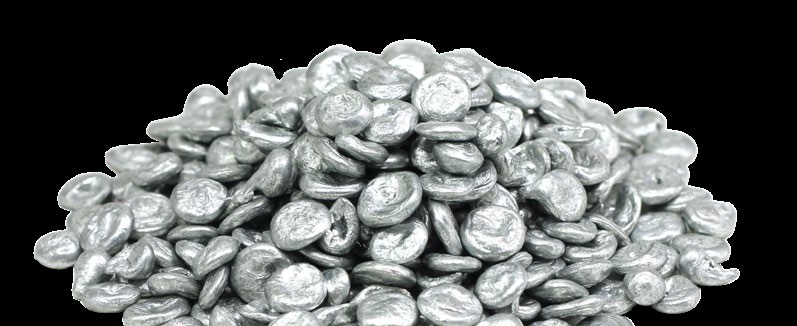




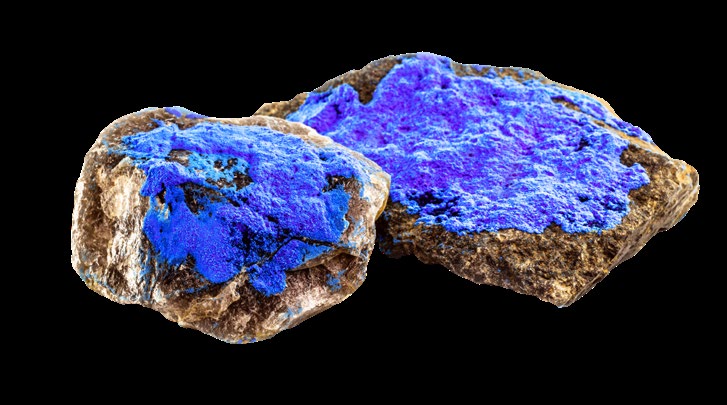

ALUMINUM
In 2025, more than
70 percent of the
aluminum we shipped
in products to
customers came from
recycled sources.
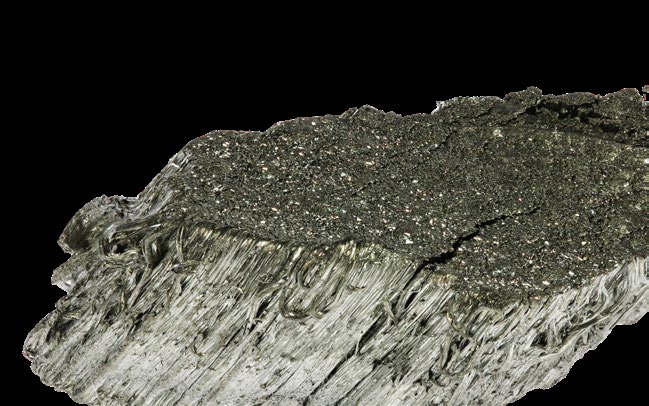
RARE EARTH
ELEMENTS
We met our goal to use
100 percent recycled rare
earth elements (REE)
in all magnets, bringing
our total use of recycled
REE to 95 percent across
all products shipped
in 2025.
25
COBALT
We accomplished our
goal to use 100 percent
recycled cobalt in all
Apple-designed batteries,
bringing our total use
of recycled cobalt to
95 percent across
all products shipped
in 2025.
22
STEEL
In 2025, more than
20 percent of the steel
we shipped in products
to customers came from
recycled sources.
COPPER
In 2025, more than
20 percent of the copper
we shipped in products
to customers came from
recycled sources.
TANTALUM
We continue our efforts
to source 100 percent
recycled tantalum and
are actively investigating
recovery solutions from
end-of-life electronics to
expand the availability of
recycled tantalum.
GLASS
We used 40 percent
recycled glass in the
display glass of Apple
Watch Series 11 and
Apple Watch SE 3
recovered from post-
industrial material,
including iPhone scrap.
TIN
We accomplished our
goal to use 100 percent
recycled tin solder in all
Apple-designed printed
circuit boards.
26
GOLD
We accomplished our
goal to use 100 percent
recycled gold plating in all
Apple-designed printed
circuit boards.
23
TITANIUM
In 2025, we introduced
Apple Watch Series 11
and Apple Watch
Ultra 3, which contain
100 percent recycled
titanium in their cases.
LITHIUM
In 2025, more than
90 percent of the lithium
we shipped in products
to customers came from
recycled sources.
TUNGSTEN
In 2025, more than
95 percent of the
tungsten we shipped
in products to
customers came from
recycled sources.
PAPER
We accomplished our
goal to remove plastics
from our packaging
by the end of 2025
and now ship all new
products in 100 percent
fiber-based packaging.
24
ZINC
Mac Studio contains
100 percent recycled
zinc in the prongs of
the power cord and
AC inlet prongs.
PLASTICS
We used 65 percent
recycled plastic in the
MagSafe Charging Case
of AirPods Pro 3.
Progress across our 15 priority materials
CHALLENGES
Availability and access
Scale
Regulatory barriers
Traceability
Technical properties
Supply chains
ENGAGEMENT AND ADVOCACY
INTRODUCTION
CONTENTS
GREEN BOND IMPACT REPORT
DATA
APPENDIX
2026 ENVIRONMENTAL PROGRESS REPORT
16
ENVIRONMENTAL INITIATIVES
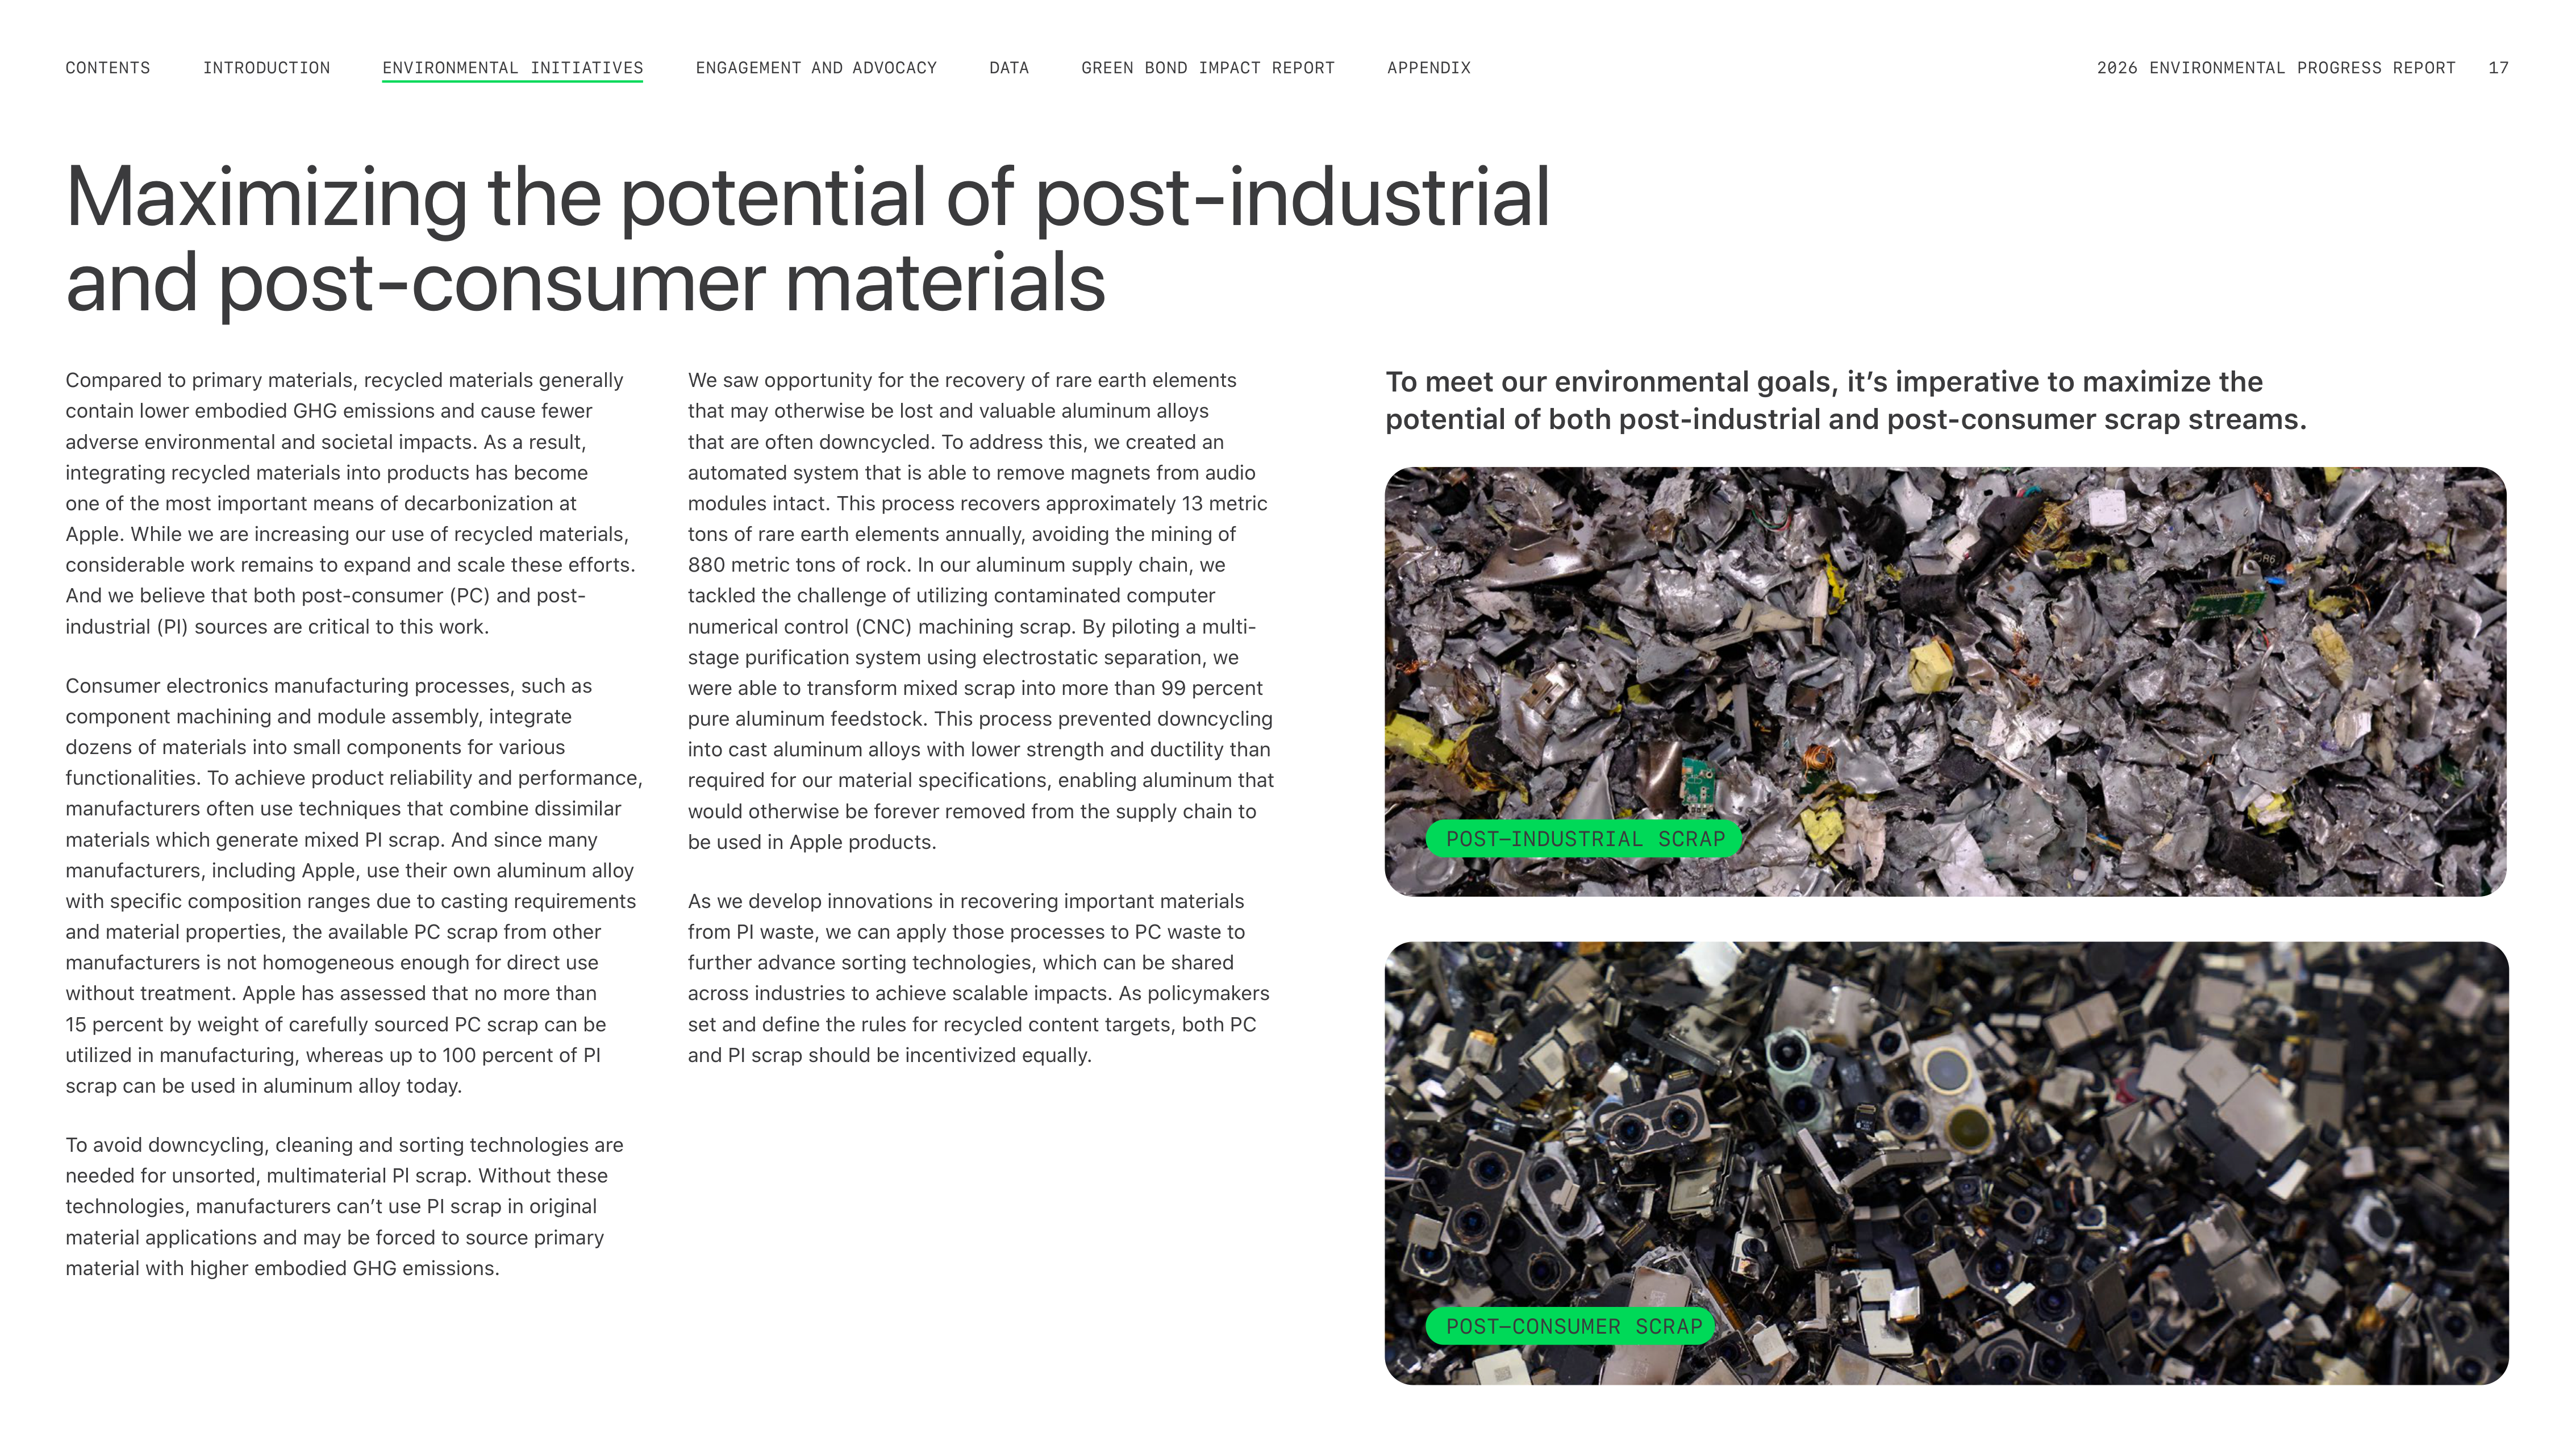
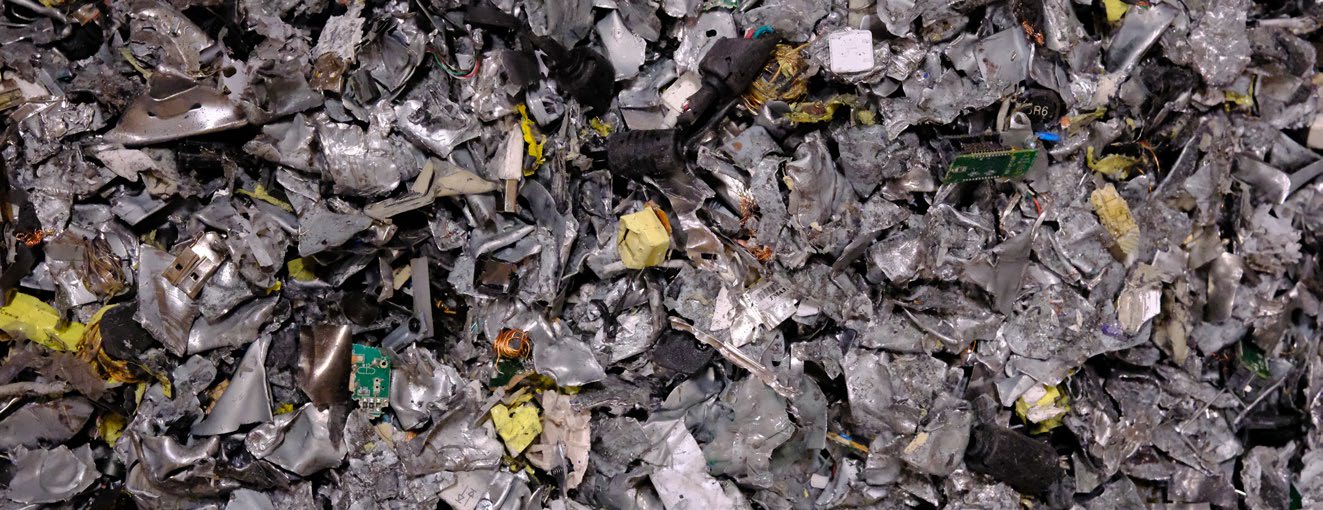
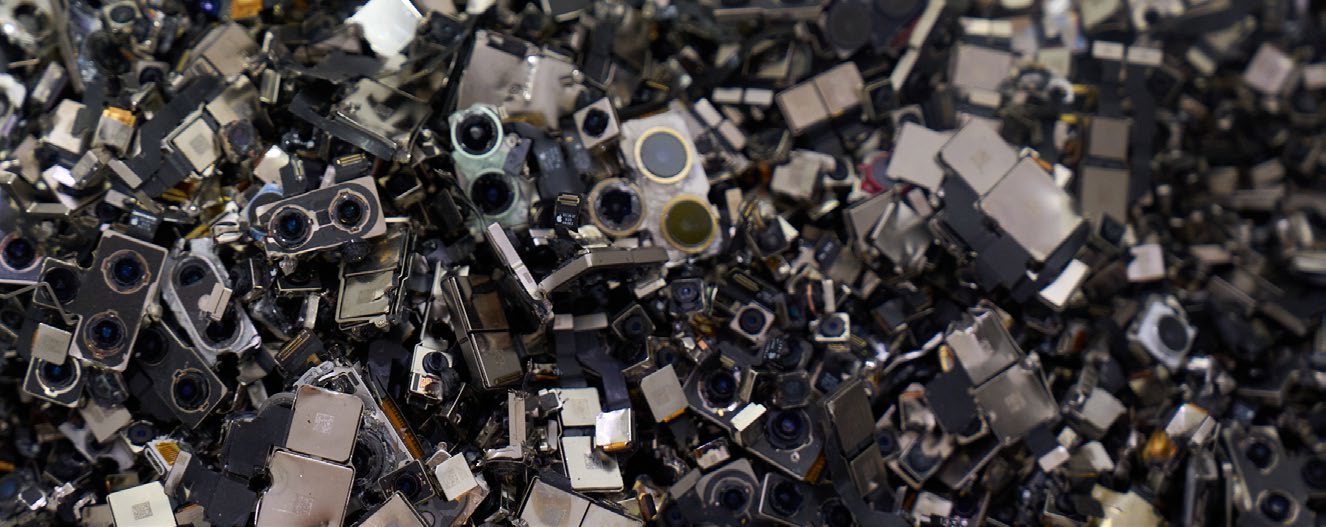
To meet our environmental goals, it’s imperative to maximize the
potential of both post-industrial and post-consumer scrap streams.
Maximizing the potential of post-industrial
and post-consumer materials
Compared to primary materials, recycled materials generally
contain lower embodied GHG emissions and cause fewer
adverse environmental and societal impacts. As a result,
integrating recycled materials into products has become
one of the most important means of decarbonization at
Apple. While we are increasing our use of recycled materials,
considerable work remains to expand and scale these efforts.
And we believe that both post-consumer (PC) and post-
industrial (PI) sources are critical to this work.
Consumer electronics manufacturing processes, such as
component machining and module assembly, integrate
dozens of materials into small components for various
functionalities. To achieve product reliability and performance,
manufacturers often use techniques that combine dissimilar
materials which generate mixed PI scrap. And since many
manufacturers, including Apple, use their own aluminum alloy
with specific composition ranges due to casting requirements
and material properties, the available PC scrap from other
manufacturers is not homogeneous enough for direct use
without treatment. Apple has assessed that no more than
15 percent by weight of carefully sourced PC scrap can be
utilized in manufacturing, whereas up to 100 percent of PI
scrap can be used in aluminum alloy today.
To avoid downcycling, cleaning and sorting technologies are
needed for unsorted, multimaterial Pl scrap. Without these
technologies, manufacturers can’t use PI scrap in original
material applications and may be forced to source primary
material with higher embodied GHG emissions.
We saw opportunity for the recovery of rare earth elements
that may otherwise be lost and valuable aluminum alloys
that are often downcycled. To address this, we created an
automated system that is able to remove magnets from audio
modules intact. This process recovers approximately 13 metric
tons of rare earth elements annually, avoiding the mining of
880 metric tons of rock. In our aluminum supply chain, we
tackled the challenge of utilizing contaminated computer
numerical control (CNC) machining scrap. By piloting a multi-
stage purification system using electrostatic separation, we
were able to transform mixed scrap into more than 99 percent
pure aluminum feedstock. This process prevented downcycling
into cast aluminum alloys with lower strength and ductility than
required for our material specifications, enabling aluminum that
would otherwise be forever removed from the supply chain to
be used in Apple products.
As we develop innovations in recovering important materials
from PI waste, we can apply those processes to PC waste to
further advance sorting technologies, which can be shared
across industries to achieve scalable impacts. As policymakers
set and define the rules for recycled content targets, both PC
and PI scrap should be incentivized equally.
POST-CONSUMER SCRAP
POST-INDUSTRIAL SCRAP
ENGAGEMENT AND ADVOCACY
INTRODUCTION
CONTENTS
GREEN BOND IMPACT REPORT
DATA
APPENDIX
2026 ENVIRONMENTAL PROGRESS REPORT
17
ENVIRONMENTAL INITIATIVES
Industry collaboration
We continue to drive progress in our broader industry through
multiple initiatives. For example, we worked directly with
the World Business Council for Sustainable Development
(WBCSD) to create the Critical Materials Collective, a cross-
industry partnership working to realize the opportunity of
circularity to help meet overall critical material demand
through pilots that can be replicated and scaled. This initiative
is focused on demonstrating action, starting with a focus on
supply chain solutions and materials that have immediate
policy, investment, and collaboration opportunities: aluminum,
rare earth elements, and copper. Weʼre also on the steering
committee of the Responsible Minerals Initiative (RMI) — one
of the most commonly engaged associations for companies
working to source minerals responsibly in their supply chains.
Weʼre a supporter of the First Movers Coalition for Aluminum,
whose focus is to aggregate demand signals for low-carbon
technologies and materials.
Integrated circuits are at the core of technology products
and have been carbon intensive to create. Weʼve prioritized
improving the carbon footprint of integrated circuits and
continued our work with the sustainable semiconductor
technologies and systems research program of imec, a
world-leading research and innovation hub in nanoelectronics
and digital technologies in Belgium. We have two goals
in this collaboration: to improve the carbon footprint
models associated with leading nodes of integrated circuit
production, and to use these models to identify carbon
reduction opportunities for the entire integrated circuits
industry. We aim to apply similar carbon footprint model
improvements to other components to support our Apple
2030 journey.
Using recycled and renewable materials helps lower our
carbon footprint, moving us closer to our climate goals. To
fulfill the transition to these materials, weʼre working with
policymakers to support international standards that enable
the use of these materials globally.
Responsible sourcing of materials
We require our suppliers to responsibly source both primary
and recycled materials. Our Responsible Sourcing of Primary,
Recycled, and Renewable Materials Standard is based on
leading international guidance, including the United Nations
Guiding Principles on Business and Human Rights and the
Organization for Economic Co-operation and Development
(OECD) Due Diligence Guidance for Responsible Supply
Chains of Minerals from Conflict-Affected and High-Risk
Areas. One hundred percent of tin, tungsten, tantalum, gold,
cobalt, and lithium smelters and refiners identified in Appleʼs
supply chain are required to participate in an independent
third-party audit annually. If smelters/refiners are unable
or unwilling to meet our standards, we take necessary
actions, through our suppliers, to terminate the applicable
business relationships.
We require our suppliers to review reported incidents and
public allegations involving their materialsʼ supply chains,
and to mitigate identified risks. In addition, suppliers must
use or source key materials in our supply chain only from
smelters, refiners, and recyclers who have completed, or
demonstrated progress toward completion of, third-party
audits. We also map the smelters and refiners suppliers use
for other materials in our products — such as mica, copper,
graphite, and nickel — and we evaluate suppliersʼ supply chain
due diligence for compliance with our requirements. As we
build supply chains for recycled materials, we partner with
the smelters and refiners that are able to meet and maintain
our standards.
READ MORE
People and Environment in Our Supply Chain Annual Update
Improving material and
manufacturing efficiency
Making our manufacturing processes more efficient creates
less waste and helps us make the most of the materials
that we use. Weʼre also working to design our products and
packaging so that they require less material, helping reduce
emissions from transporting and processing materials.
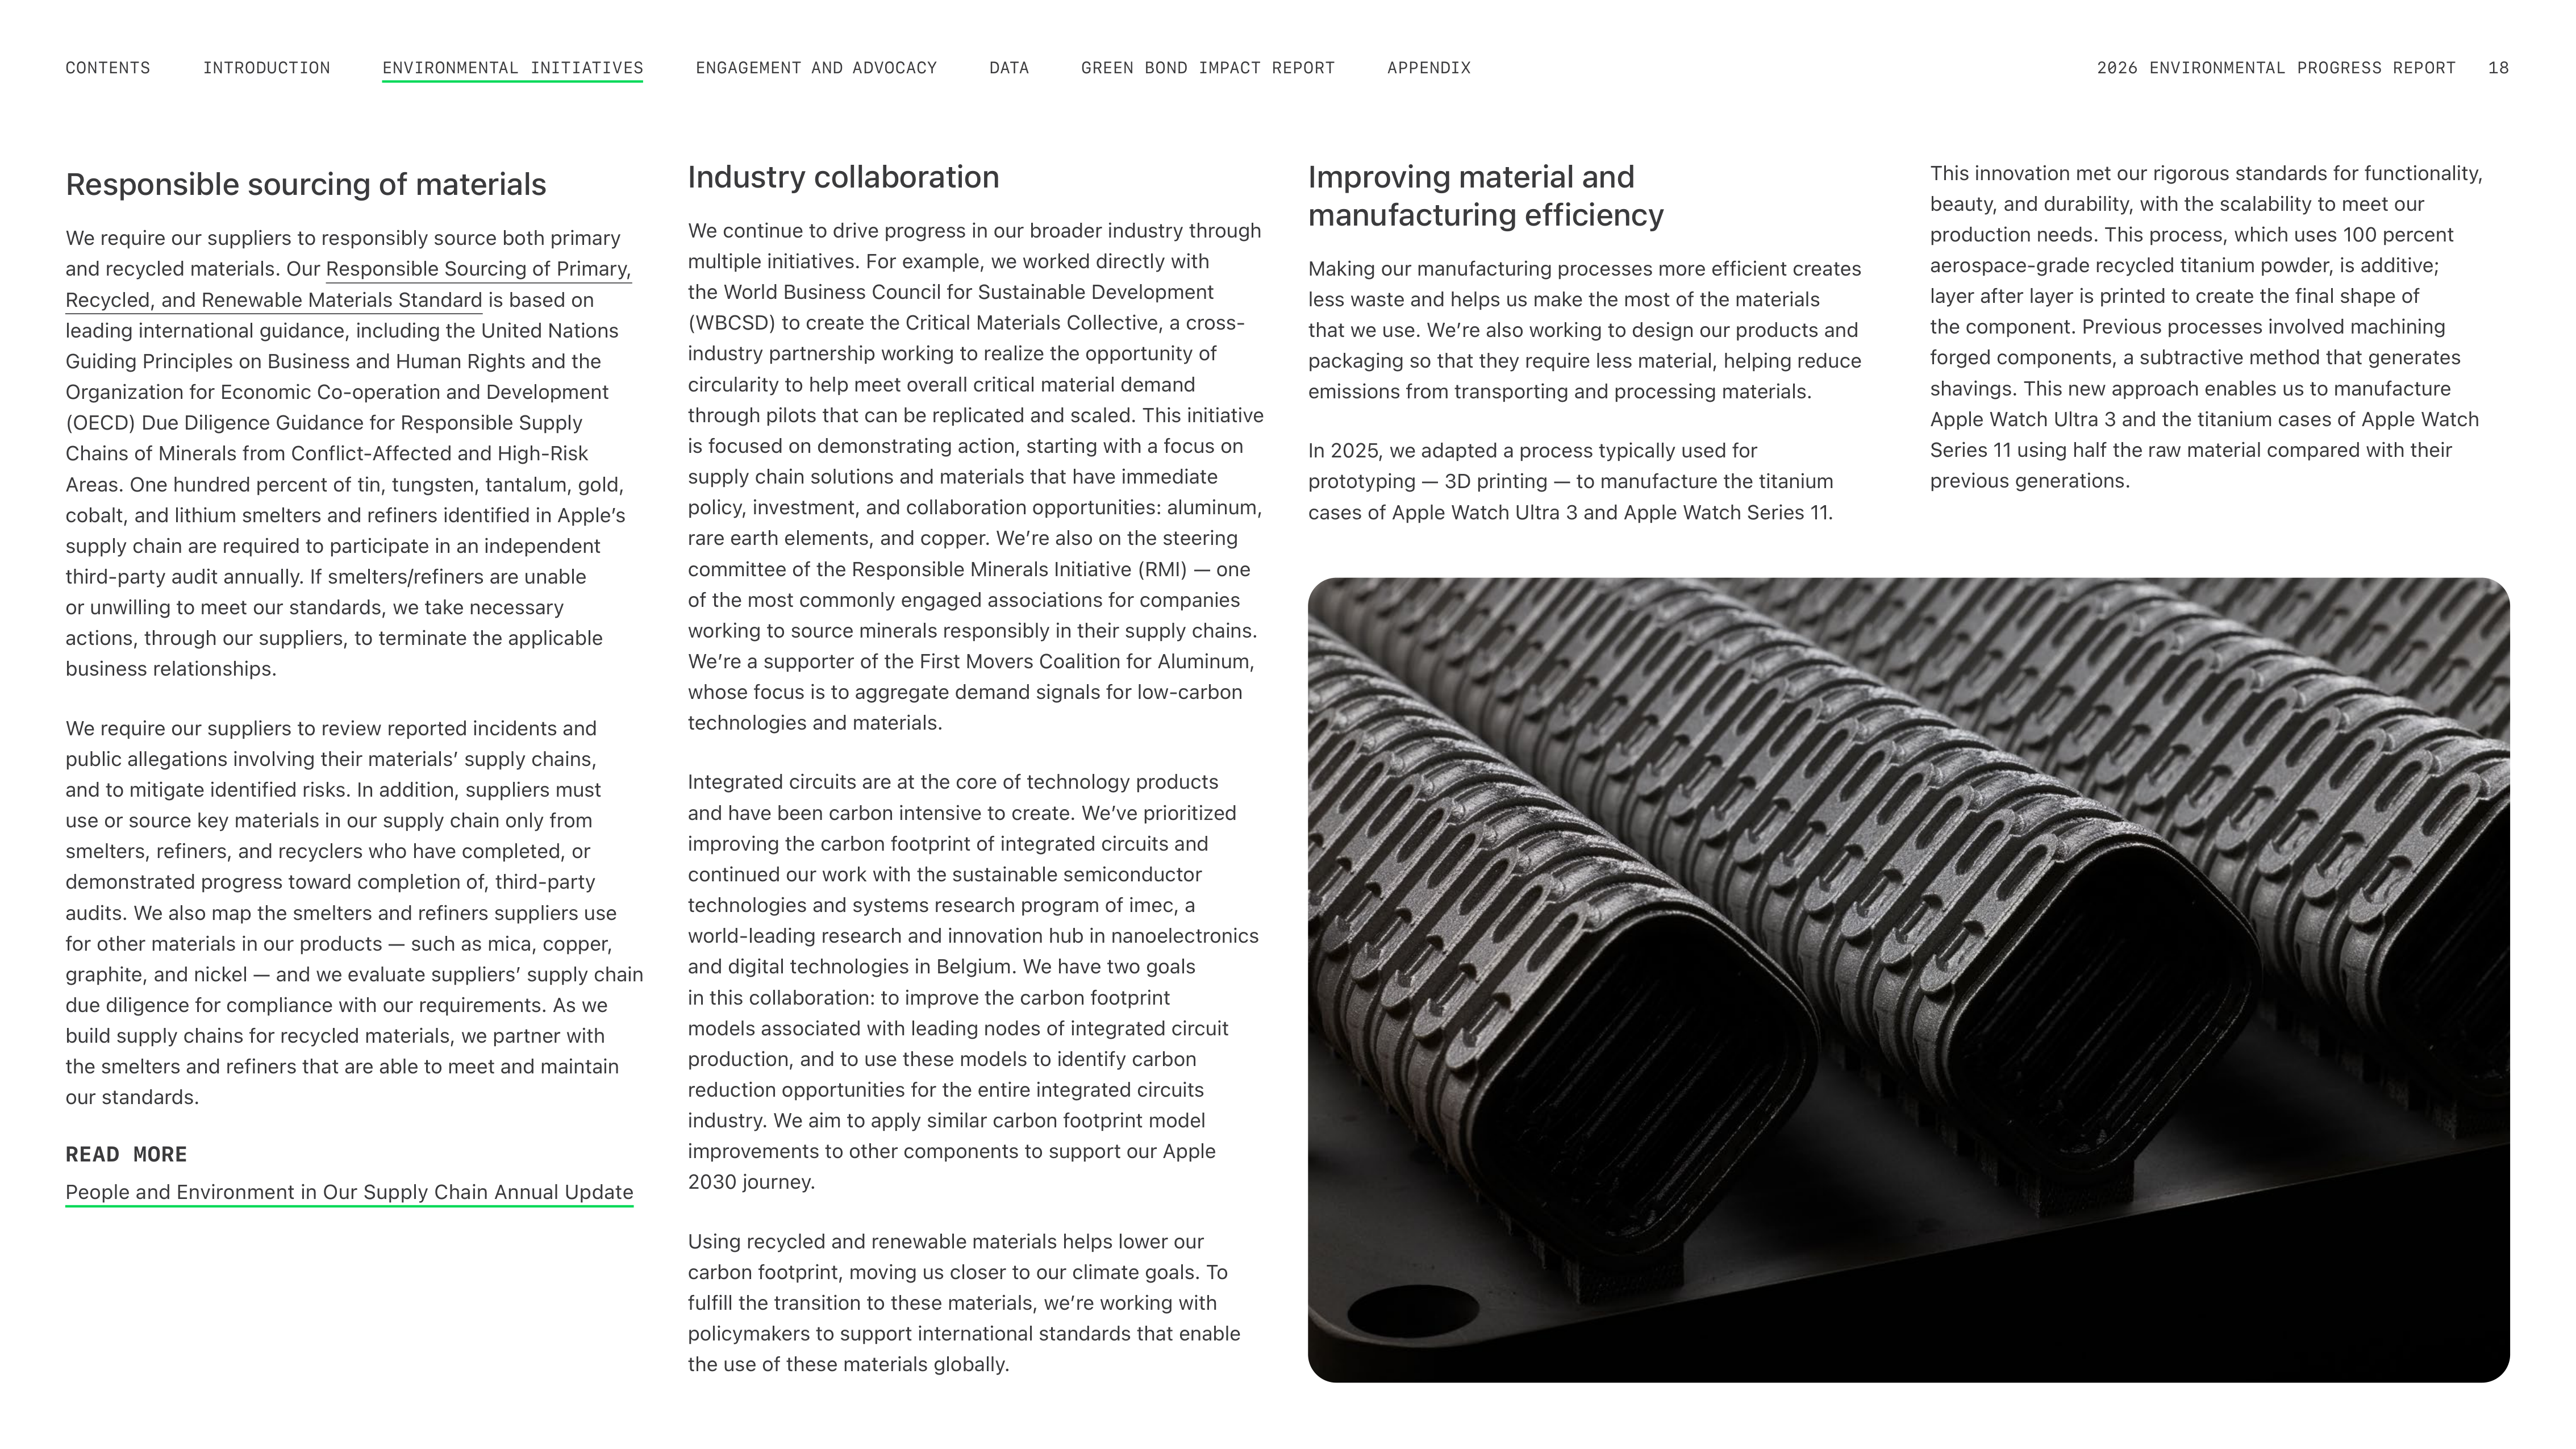
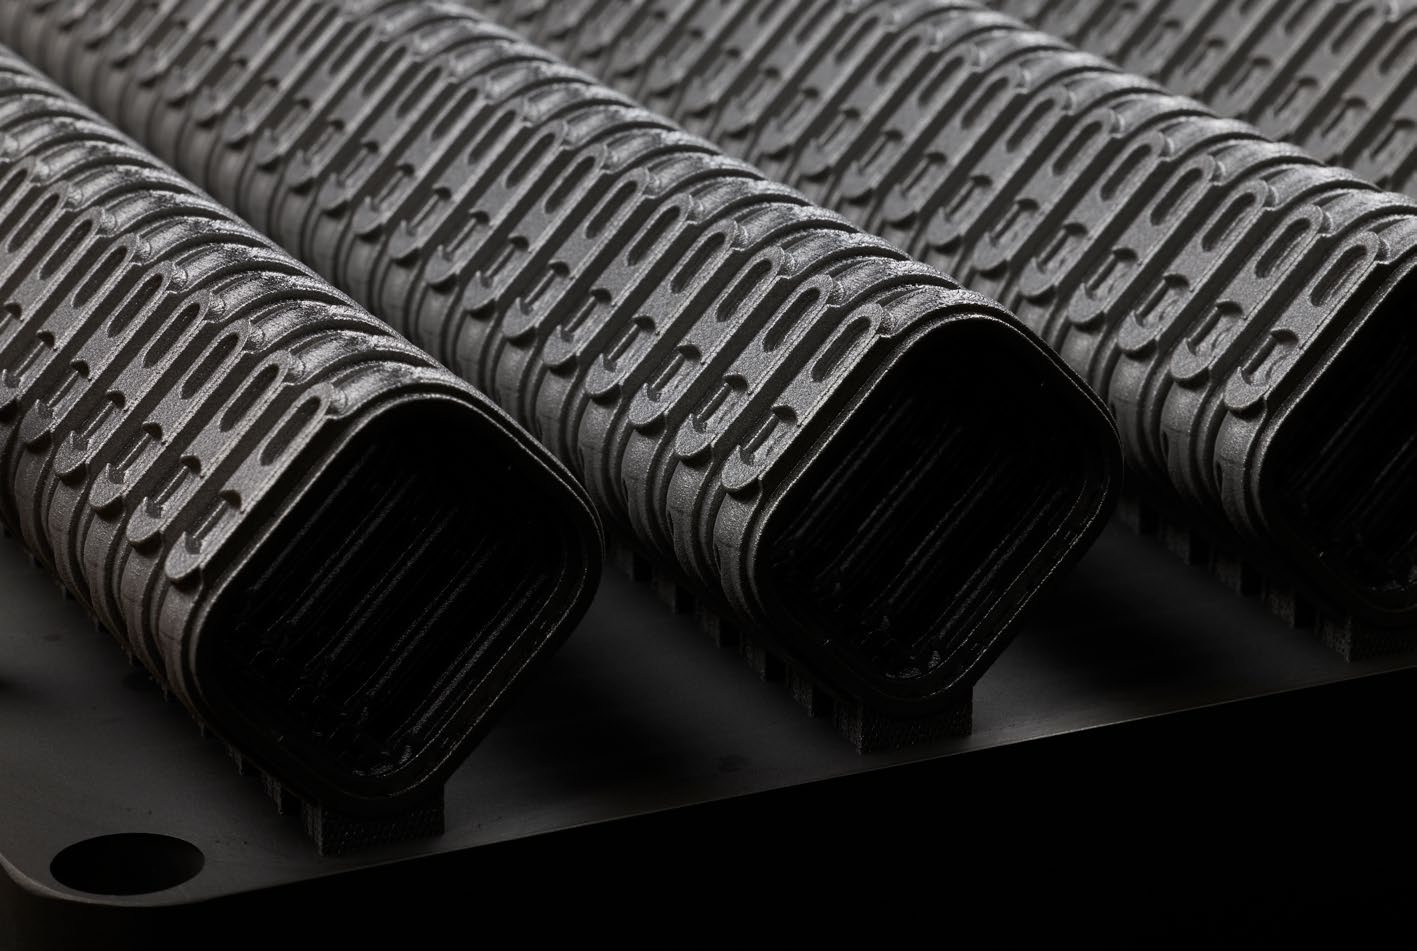
In 2025, we adapted a process typically used for
prototyping — 3D printing — to manufacture the titanium
cases of Apple Watch Ultra 3 and Apple Watch Series 11.
This innovation met our rigorous standards for functionality,
beauty, and durability, with the scalability to meet our
production needs. This process, which uses 100 percent
aerospace-grade recycled titanium powder, is additive;
layer after layer is printed to create the final shape of
the component. Previous processes involved machining
forged components, a subtractive method that generates
shavings. This new approach enables us to manufacture
Apple Watch Ultra 3 and the titanium cases of Apple Watch
Series 11 using half the raw material compared with their
previous generations.
ENGAGEMENT AND ADVOCACY
INTRODUCTION
CONTENTS
GREEN BOND IMPACT REPORT
DATA
APPENDIX
2026 ENVIRONMENTAL PROGRESS REPORT
18
ENVIRONMENTAL INITIATIVES
Nearly 10 years ago, we pledged to eliminate plastic waste.
As part of our pledge, we set the goal to remove plastic from
our packaging by 2025, which has the additional benefit of
improving the recyclability of our packaging. After a decade of
innovative work, weʼve met our commitment. This year, each
new Apple product shipped will come in 100 percent fiber-
based packaging.
27
To meet our commitment, our designers and engineers
developed packaging innovations that utilize fiber-based
alternatives for each component — from replacing foam
cushioning with molded fiber structures and corrugate spring
cushions for our Mac computers to removing the outer
plastic wrap from iPhone boxes. The alternative components
are recyclable and sourced from recycled materials or
responsibly managed forests as defined in our Responsible
Fiber Specification.
Our teams also supported the transition to fiber-based
packaging alternatives among our vendors. And second-
and third-party vendors have removed plastic from their
packaging, enabling them to deliver fiber-based packaging to
their customers across retail categories.
Over the past decade, governing bodies around the world
have regulated single-use plastics, including those used
in packaging. Our proactive approach to seeking plastic
alternatives has positioned us and many of our suppliers to
meet emerging regulatory requirements.
The impact of this work is measurable. In the past five years
alone, weʼve avoided the use of more than 15,000 metric tons
of plastic, the equivalent of approximately 500 million plastic
water bottles.
28
The majority of the materials weʼve used in
its place contribute to circular supply chains, as well. As we
develop our packaging, weʼll continue to utilize both recycled
and renewable materials, guided by the priority to make the
best use of resources.
Achieving a new vision for packaging
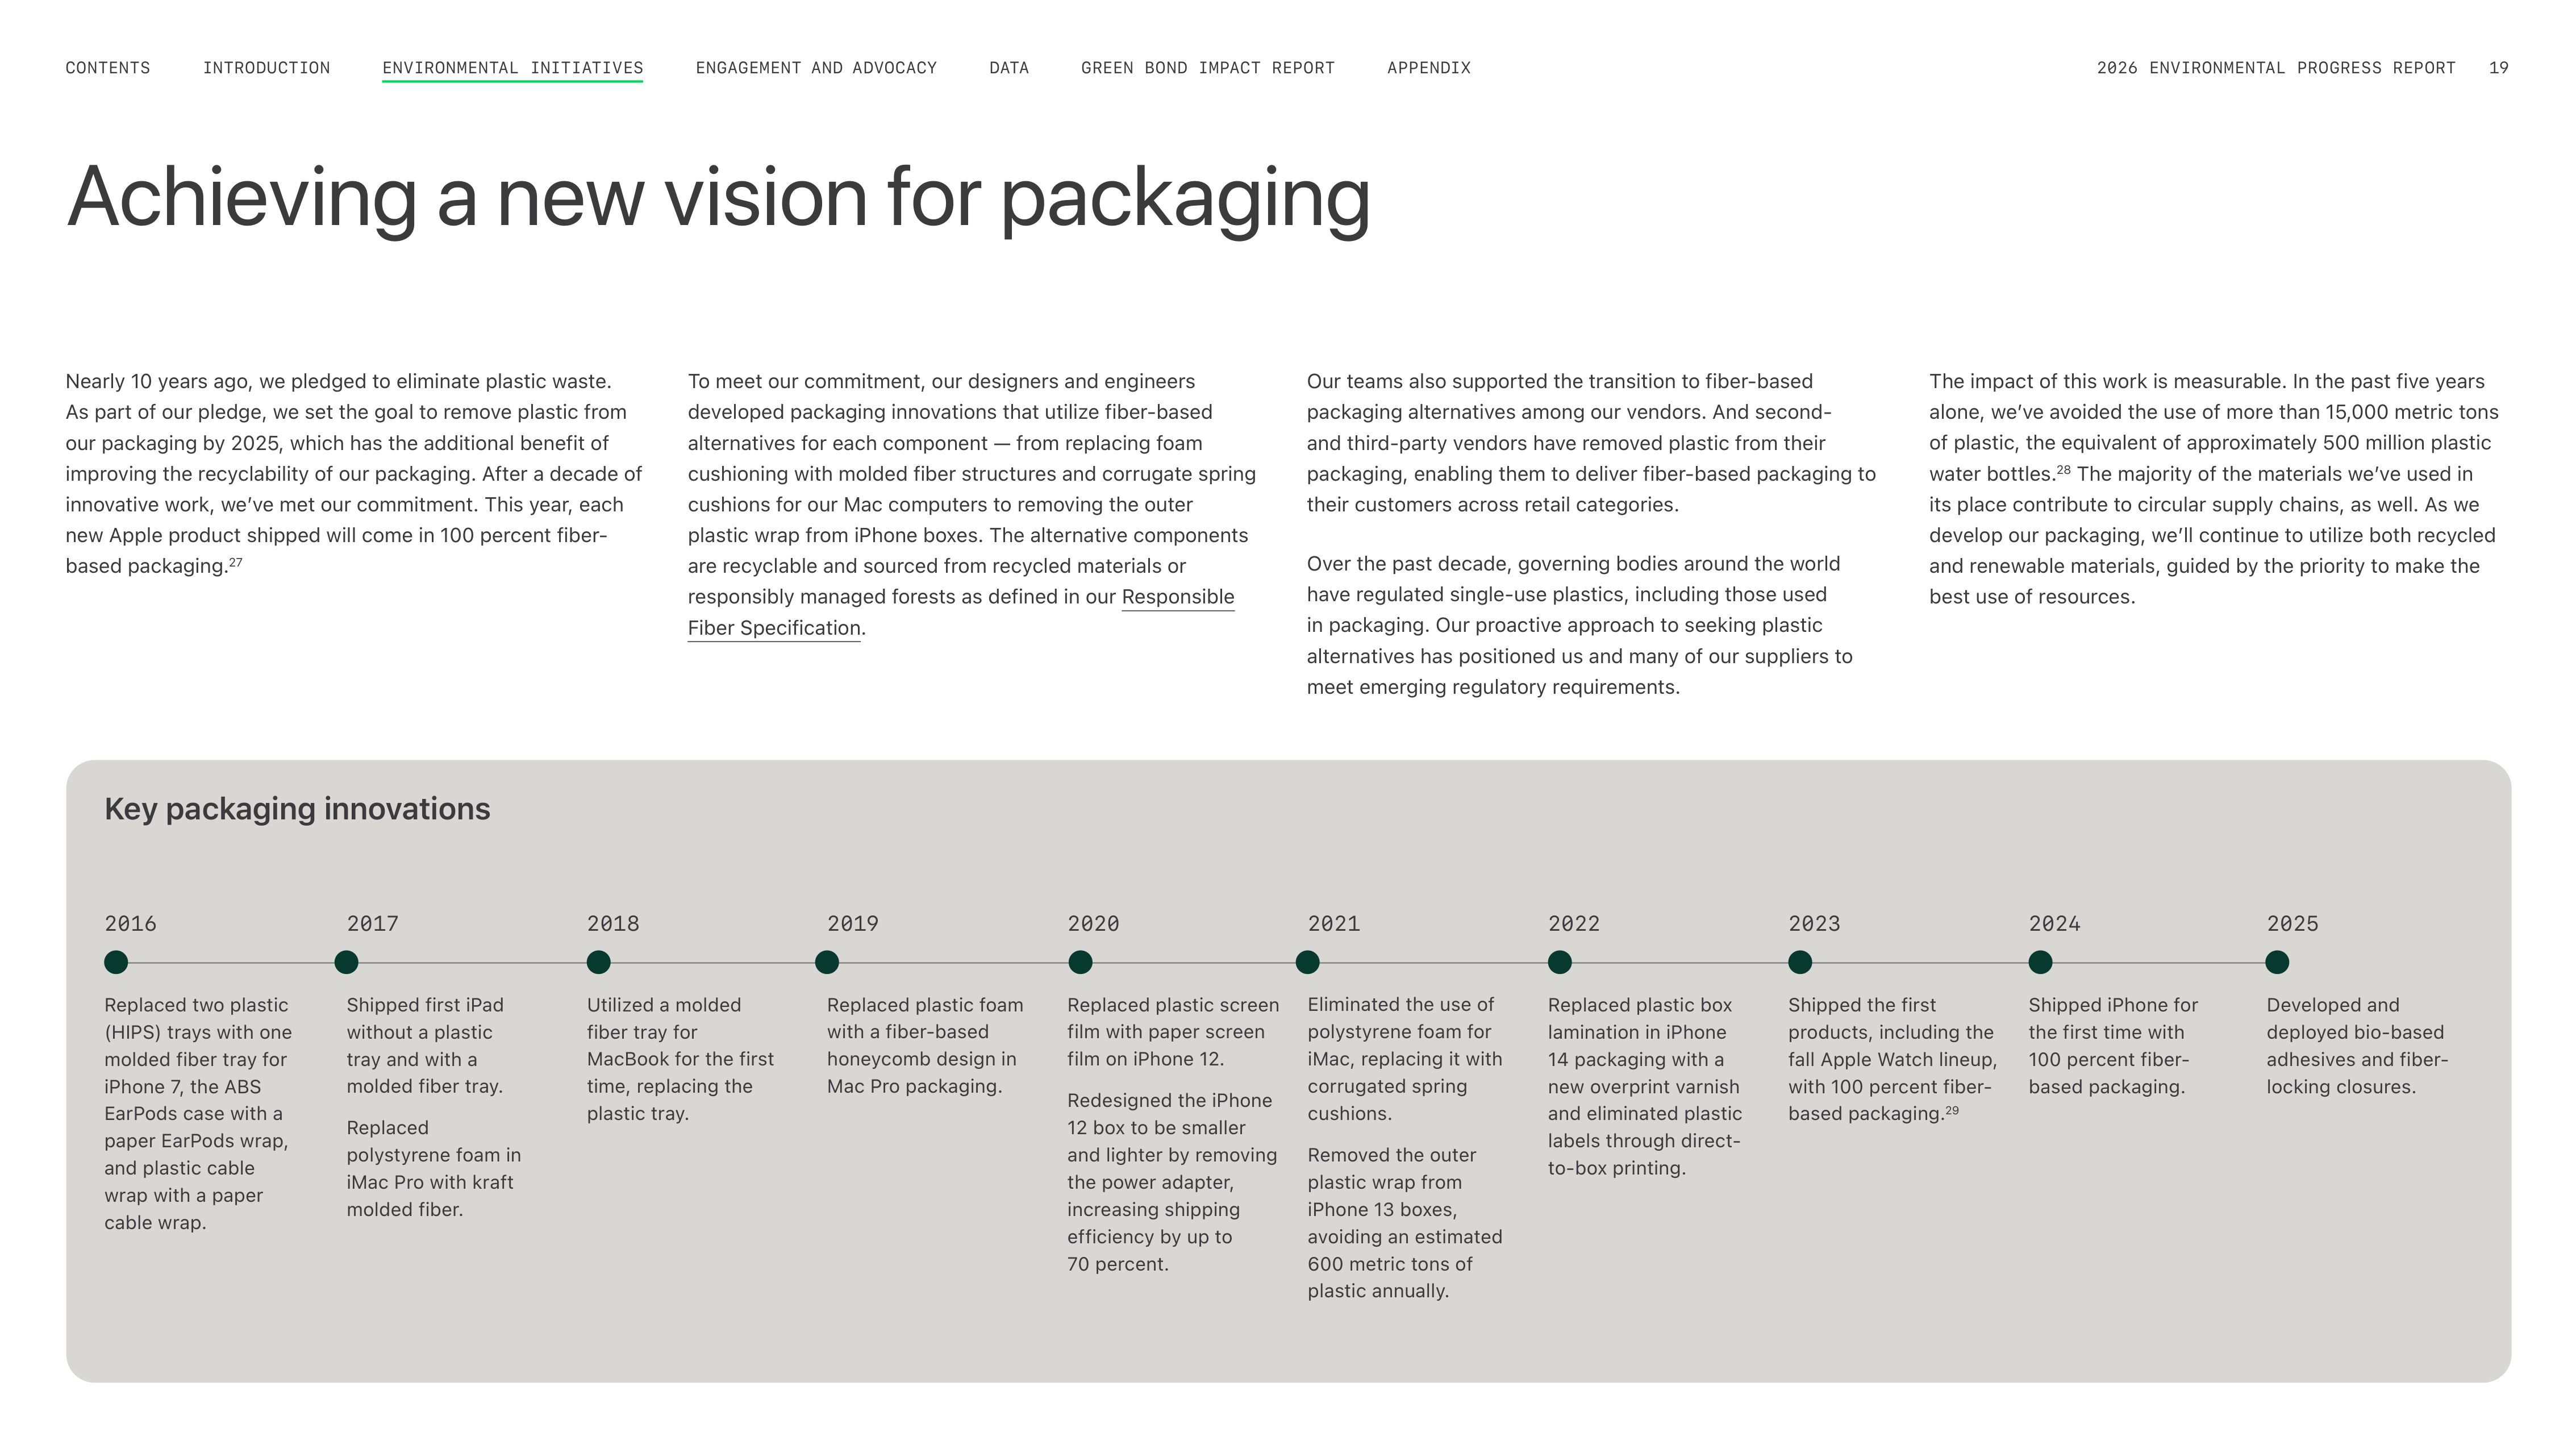
Key packaging innovations
Replaced two plastic
(HIPS) trays with one
molded fiber tray for
iPhone 7, the ABS
EarPods case with a
paper EarPods wrap,
and plastic cable
wrap with a paper
cable wrap.
Shipped first iPad
without a plastic
tray and with a
molded fiber tray.
Replaced
polystyrene foam in
iMac Pro with kraft
molded fiber.
Utilized a molded
fiber tray for
MacBook for the first
time, replacing the
plastic tray.
Replaced plastic foam
with a fiber-based
honeycomb design in
Mac Pro packaging.
Replaced plastic screen
film with paper screen
film on iPhone 12.
Redesigned the iPhone
12 box to be smaller
and lighter by removing
the power adapter,
increasing shipping
efficiency by up to
70 percent.
Eliminated the use of
polystyrene foam for
iMac, replacing it with
corrugated spring
cushions.
Removed the outer
plastic wrap from
iPhone 13 boxes,
avoiding an estimated
600 metric tons of
plastic annually.
2016
2017
2018
2019
2020
2021
2022
Replaced plastic box
lamination in iPhone
14 packaging with a
new overprint varnish
and eliminated plastic
labels through direct-
to-box printing.
2023
Shipped the first
products, including the
fall Apple Watch lineup,
with 100 percent fiber-
based packaging.
29
2024
Shipped iPhone for
the first time with
100 percent fiber-
based packaging.
2025
Developed and
deployed bio-based
adhesives and fiber-
locking closures.
ENGAGEMENT AND ADVOCACY
INTRODUCTION
CONTENTS
GREEN BOND IMPACT REPORT
DATA
APPENDIX
2026 ENVIRONMENTAL PROGRESS REPORT
19
ENVIRONMENTAL INITIATIVES

Powered by progress
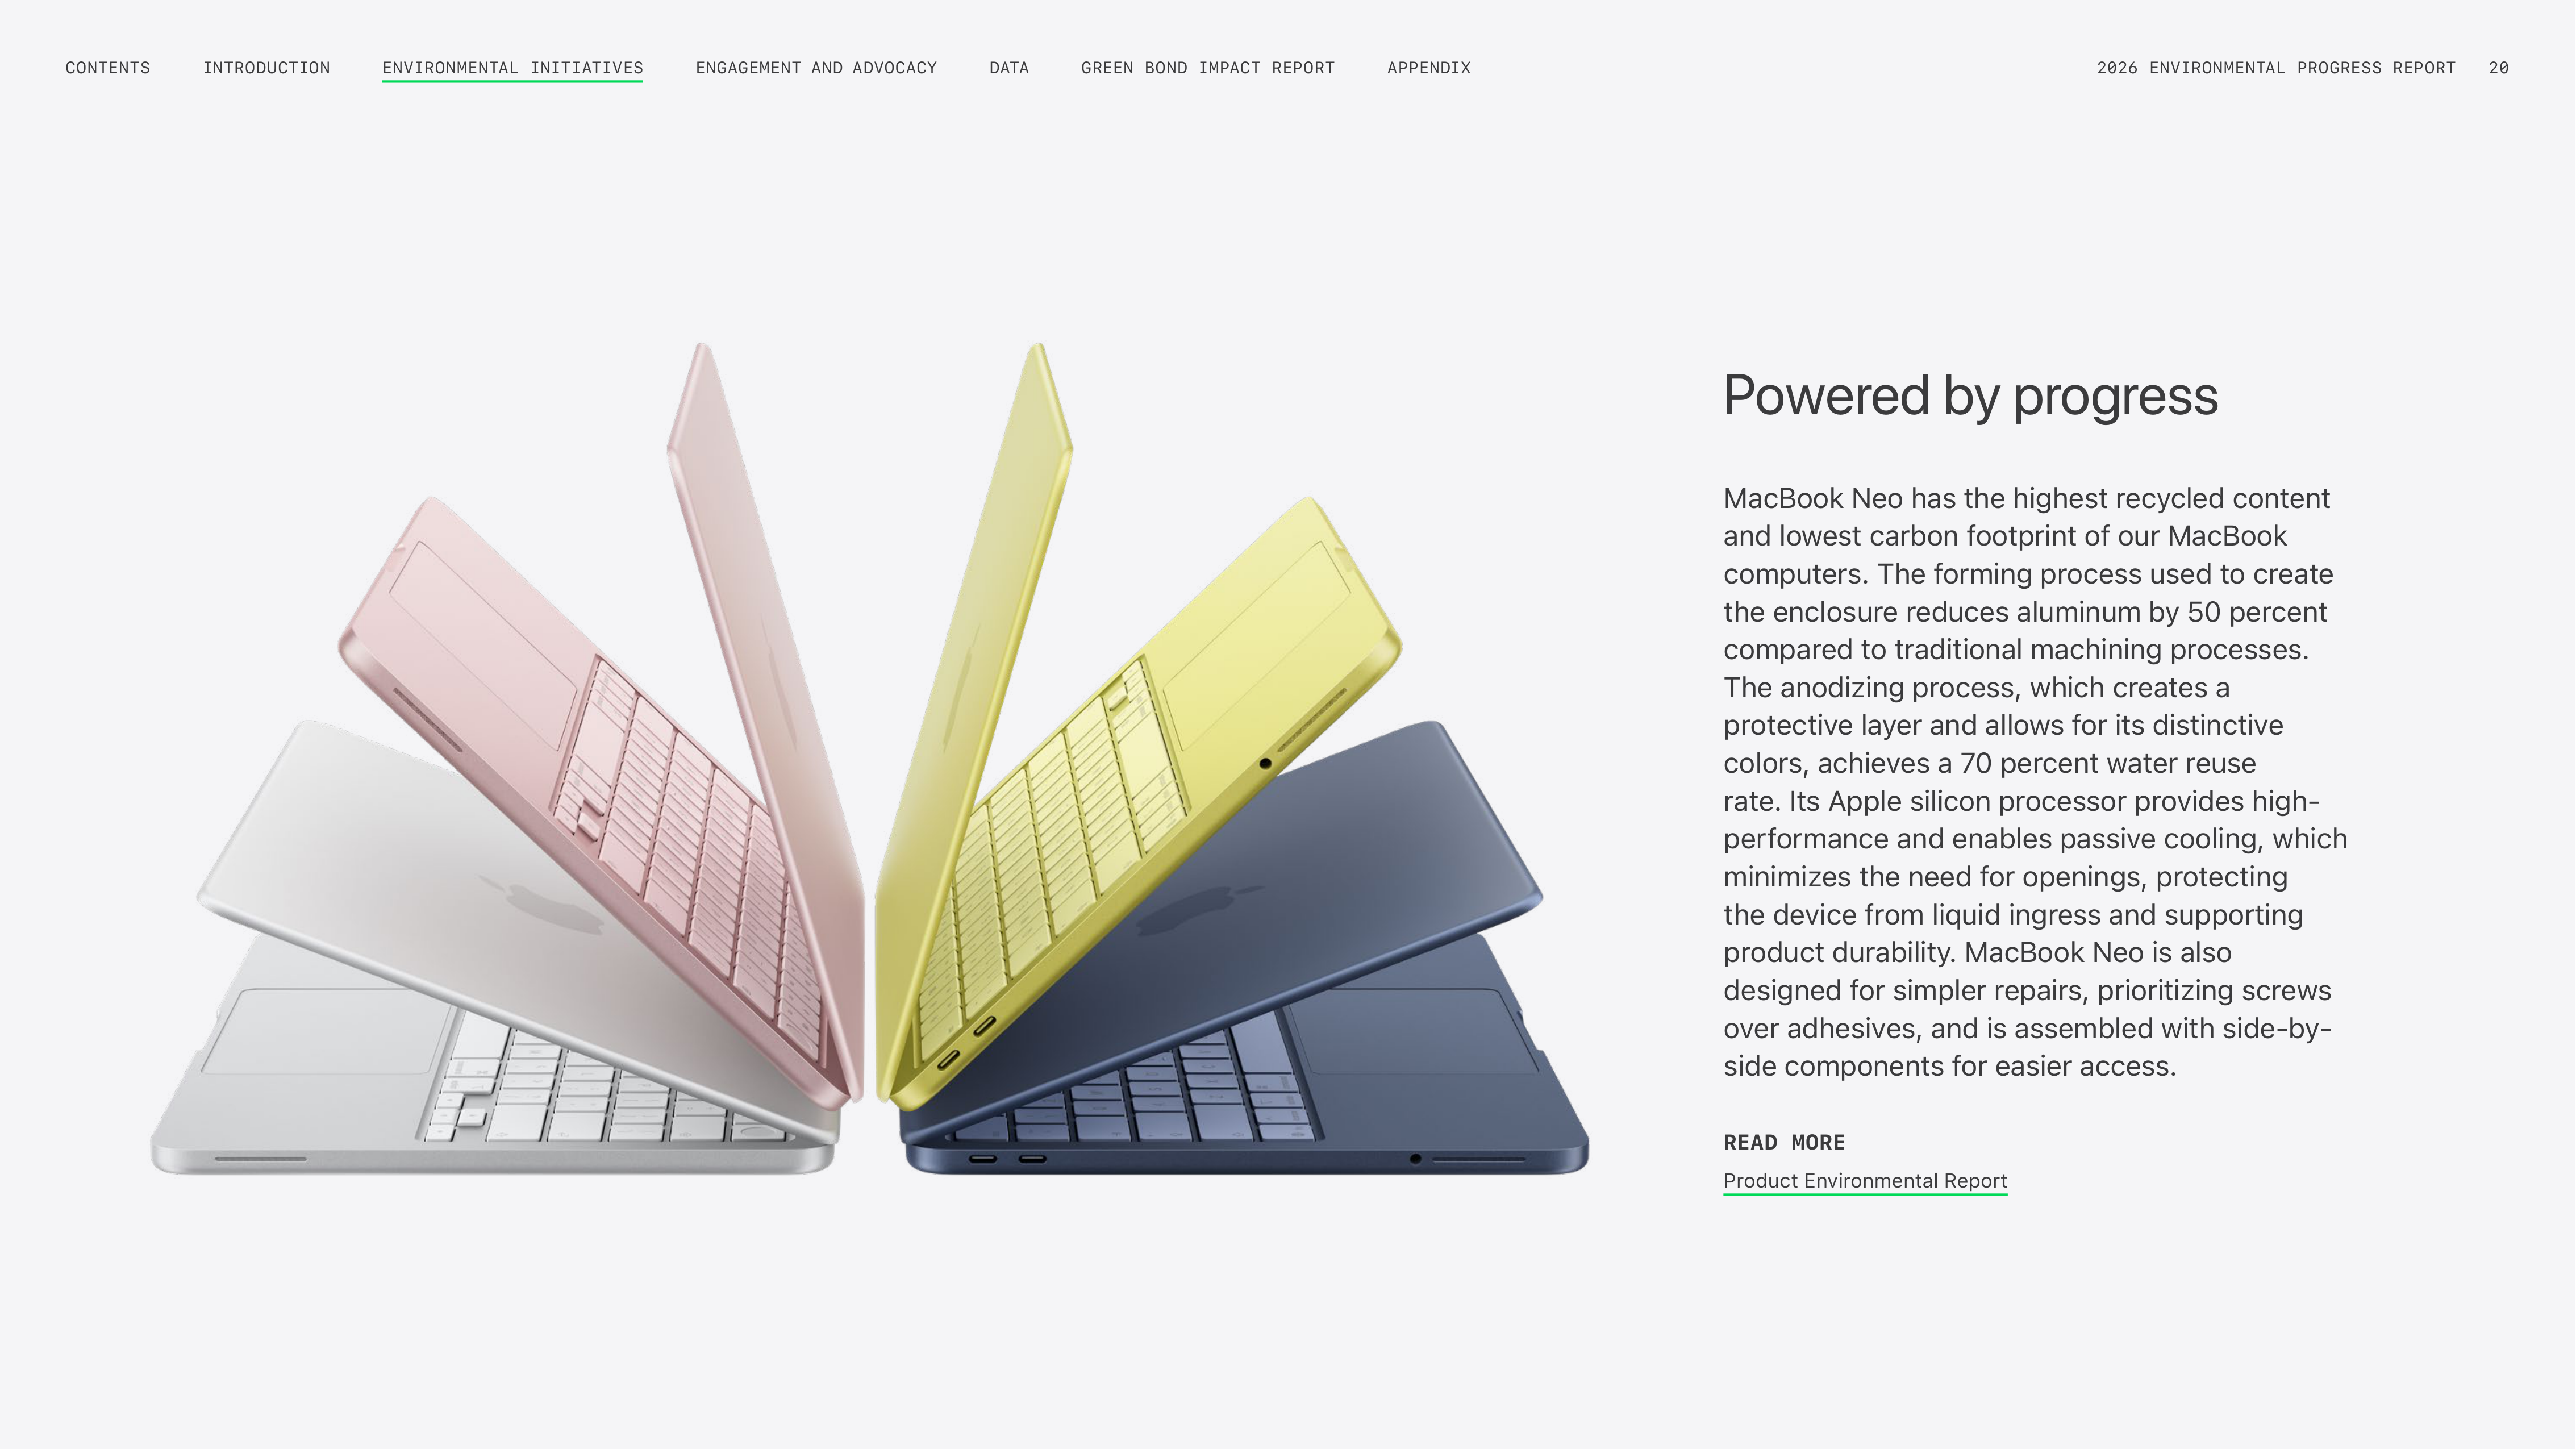
MacBook Neo has the highest recycled content
and lowest carbon footprint of our MacBook
computers. The forming process used to create
the enclosure reduces aluminum by 50 percent
compared to traditional machining processes.
The anodizing process, which creates a
protective layer and allows for its distinctive
colors, achieves a 70 percent water reuse
rate. Its Apple silicon processor provides high-
performance and enables passive cooling, which
minimizes the need for openings, protecting
the device from liquid ingress and supporting
product durability. MacBook Neo is also
designed for simpler repairs, prioritizing screws
over adhesives, and is assembled with side-by-
side components for easier access.
READ MORE
Product Environmental Report
ENGAGEMENT AND ADVOCACY
INTRODUCTION
CONTENTS
GREEN BOND IMPACT REPORT
DATA
APPENDIX
2026 ENVIRONMENTAL PROGRESS REPORT
20
ENVIRONMENTAL INITIATIVES
Electricity
We prioritize energy efficiency in each
stage of our work, from initial design
through manufacturing and beyond.
Achieving maximum efficiency across our
footprint is essential to meeting our 2030
carbon neutrality goal. We’ve achieved
100 percent clean electricity across our
operations, and we’re working toward the
same for our manufacturing supply chain
and use of Apple products. By using clean
electricity in place of fossil fuels, we’re
contributing to cleaner air and lowering
greenhouse gas emissions.
Energy efficiency and renewable
electricity address emissions from:
Indirect emissions
(Scope 2)
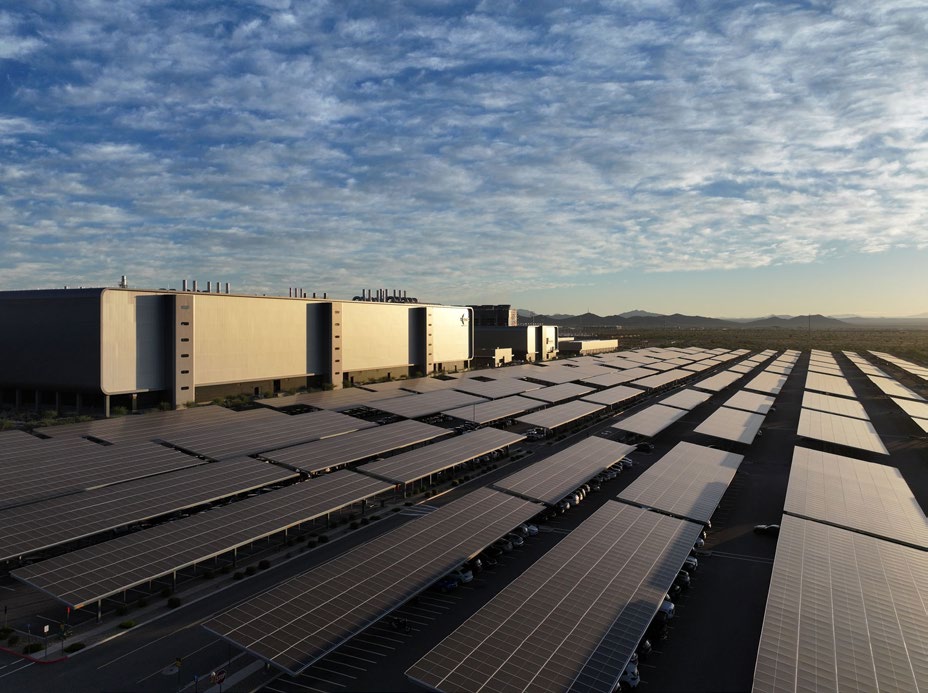
We avoided more than 2 million metric tons of
carbon dioxide, with more than 240 supplier
facilities participating in our Supplier Energy
Efficiency Program.
In 2025, more than 20 gigawatts
of renewable energy procured by
suppliers and online in Apple’s supply
chain generated more than 38 million
megawatt-hours of clean energy.
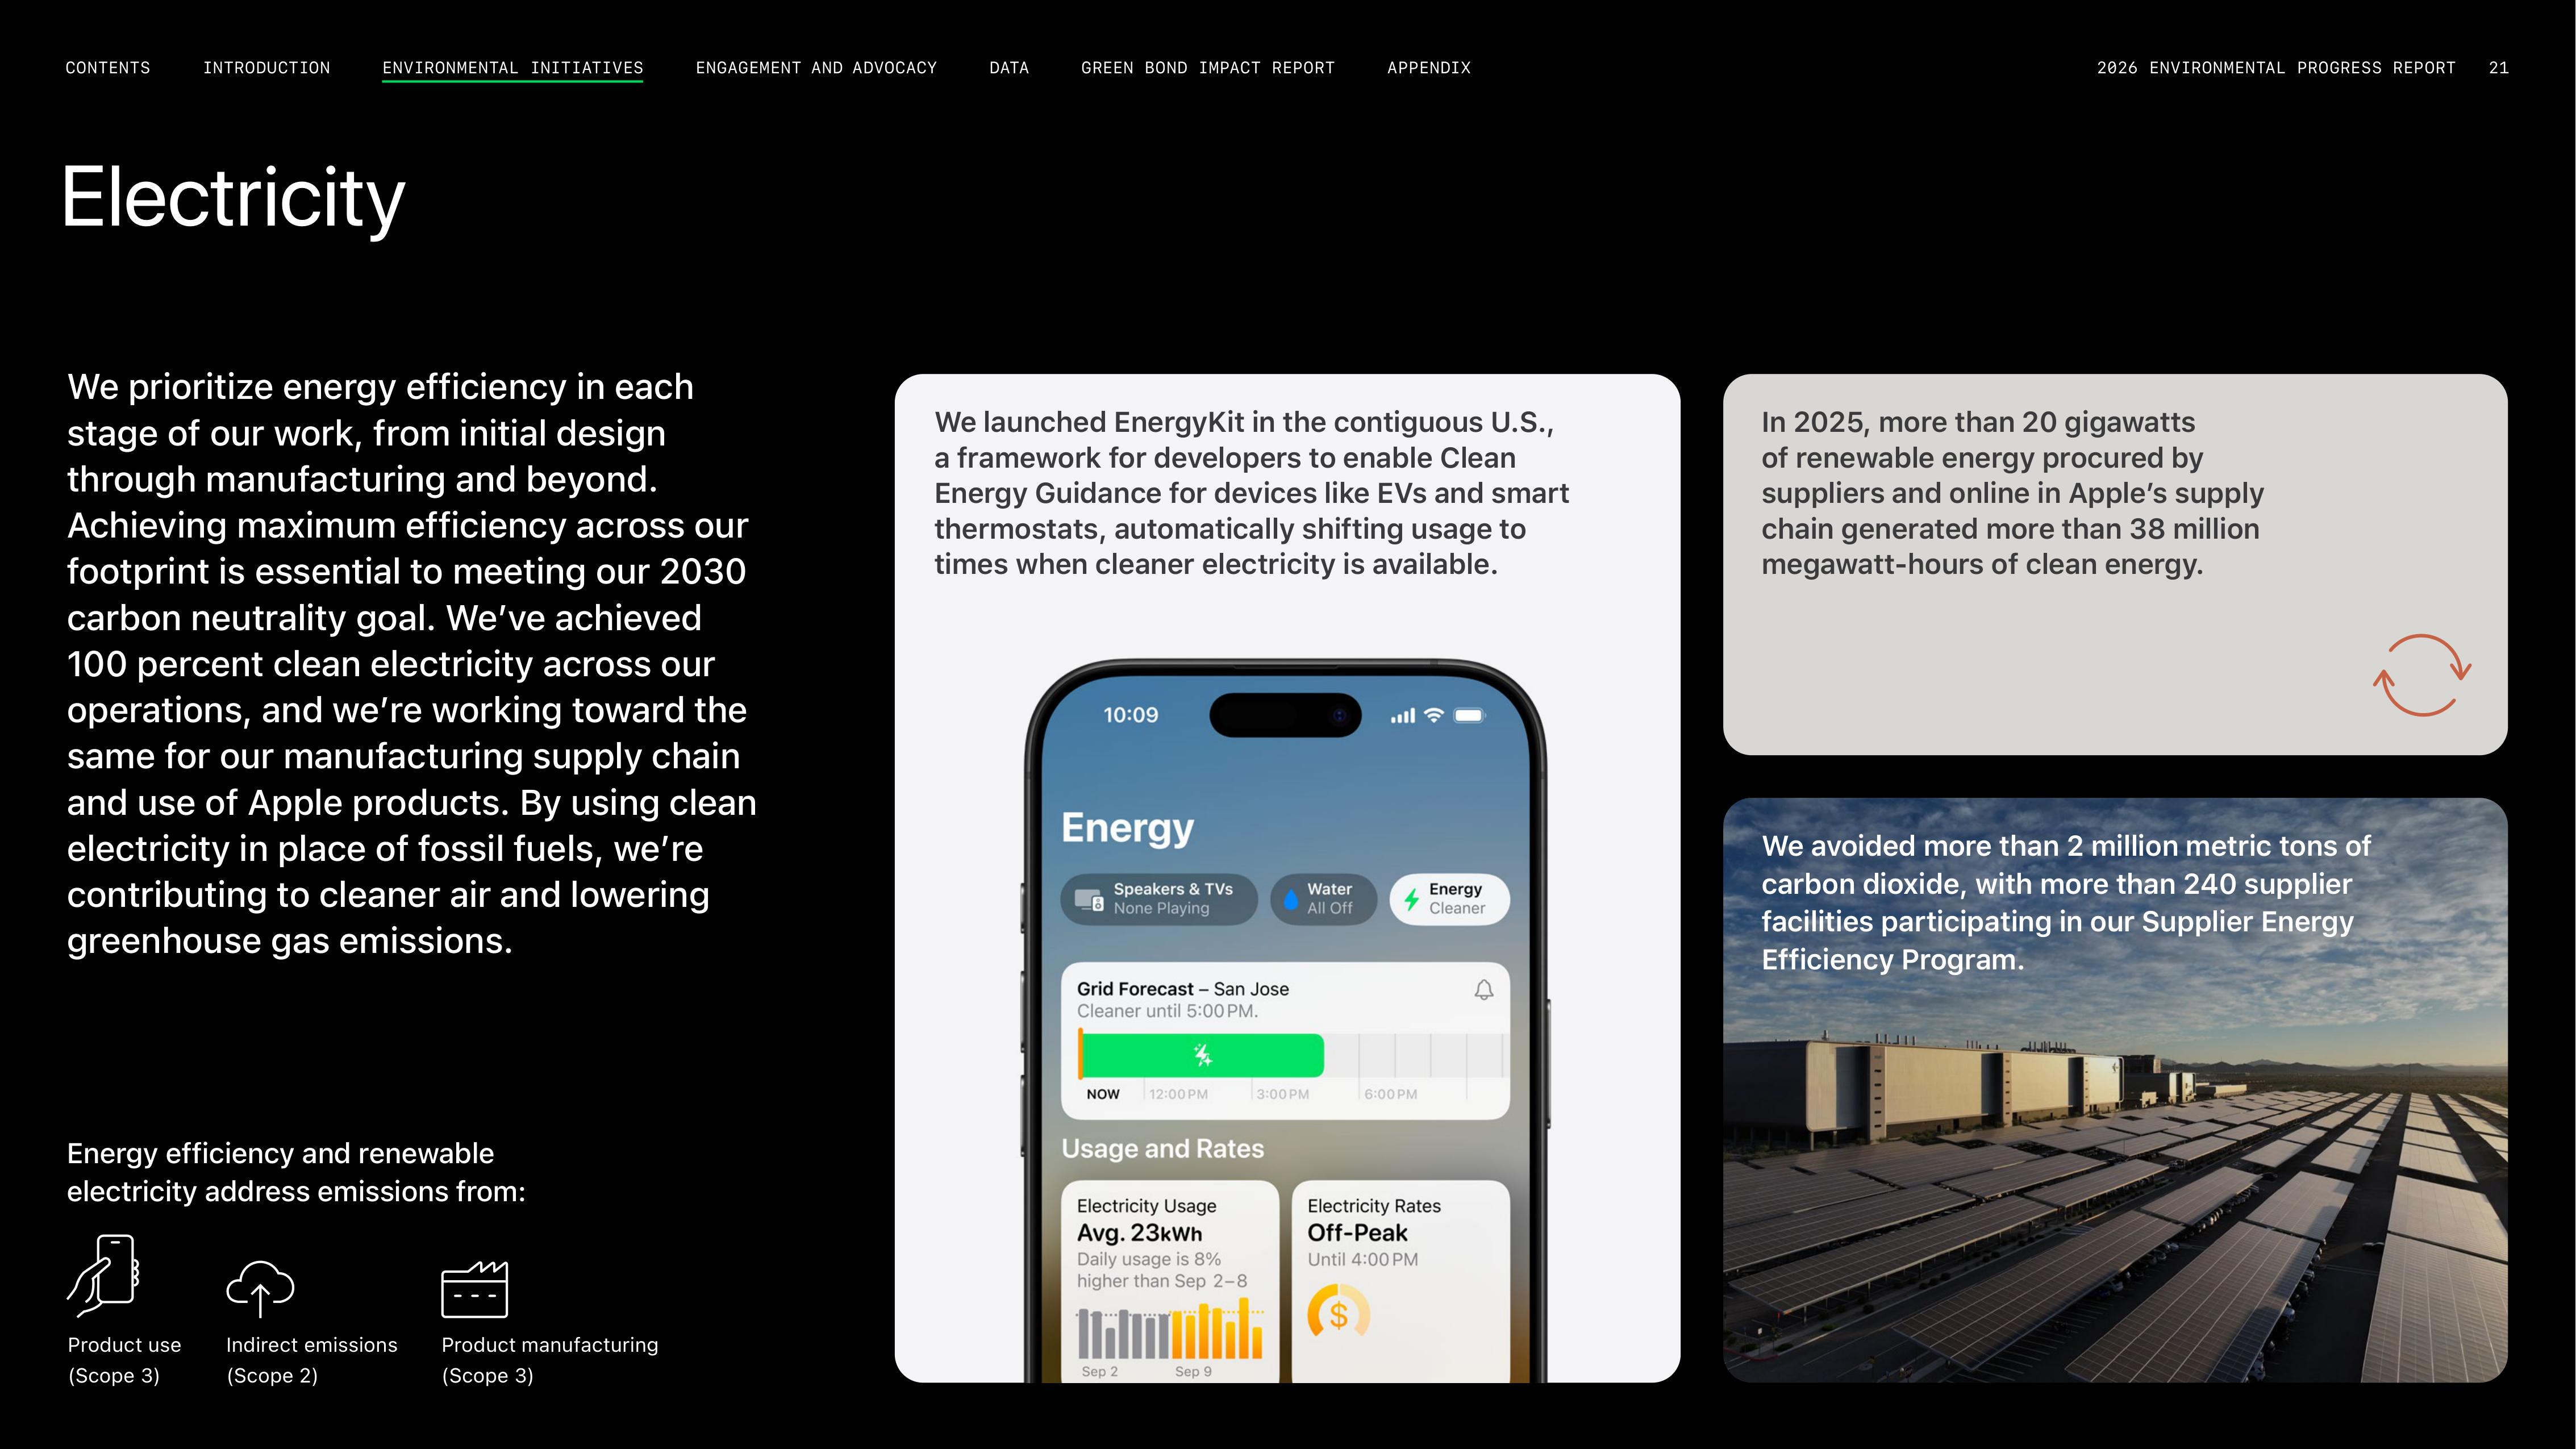
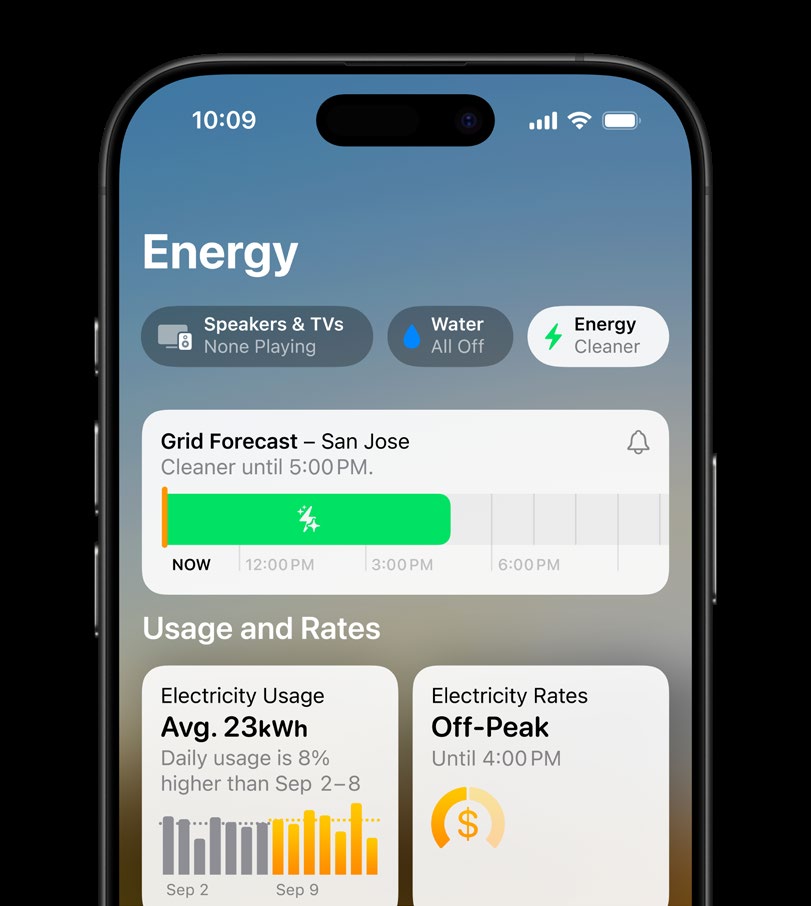
We launched EnergyKit in the contiguous U.S.,
a framework for developers to enable Clean
Energy Guidance for devices like EVs and smart
thermostats, automatically shifting usage to
times when cleaner electricity is available.
Product manufacturing
(Scope 3)
Product use
(Scope 3)
2026 ENVIRONMENTAL PROGRESS REPORT
21
ENGAGEMENT AND ADVOCACY
INTRODUCTION
CONTENTS
APPENDIX
GREEN BOND IMPACT REPORT
DATA
ENVIRONMENTAL INITIATIVES
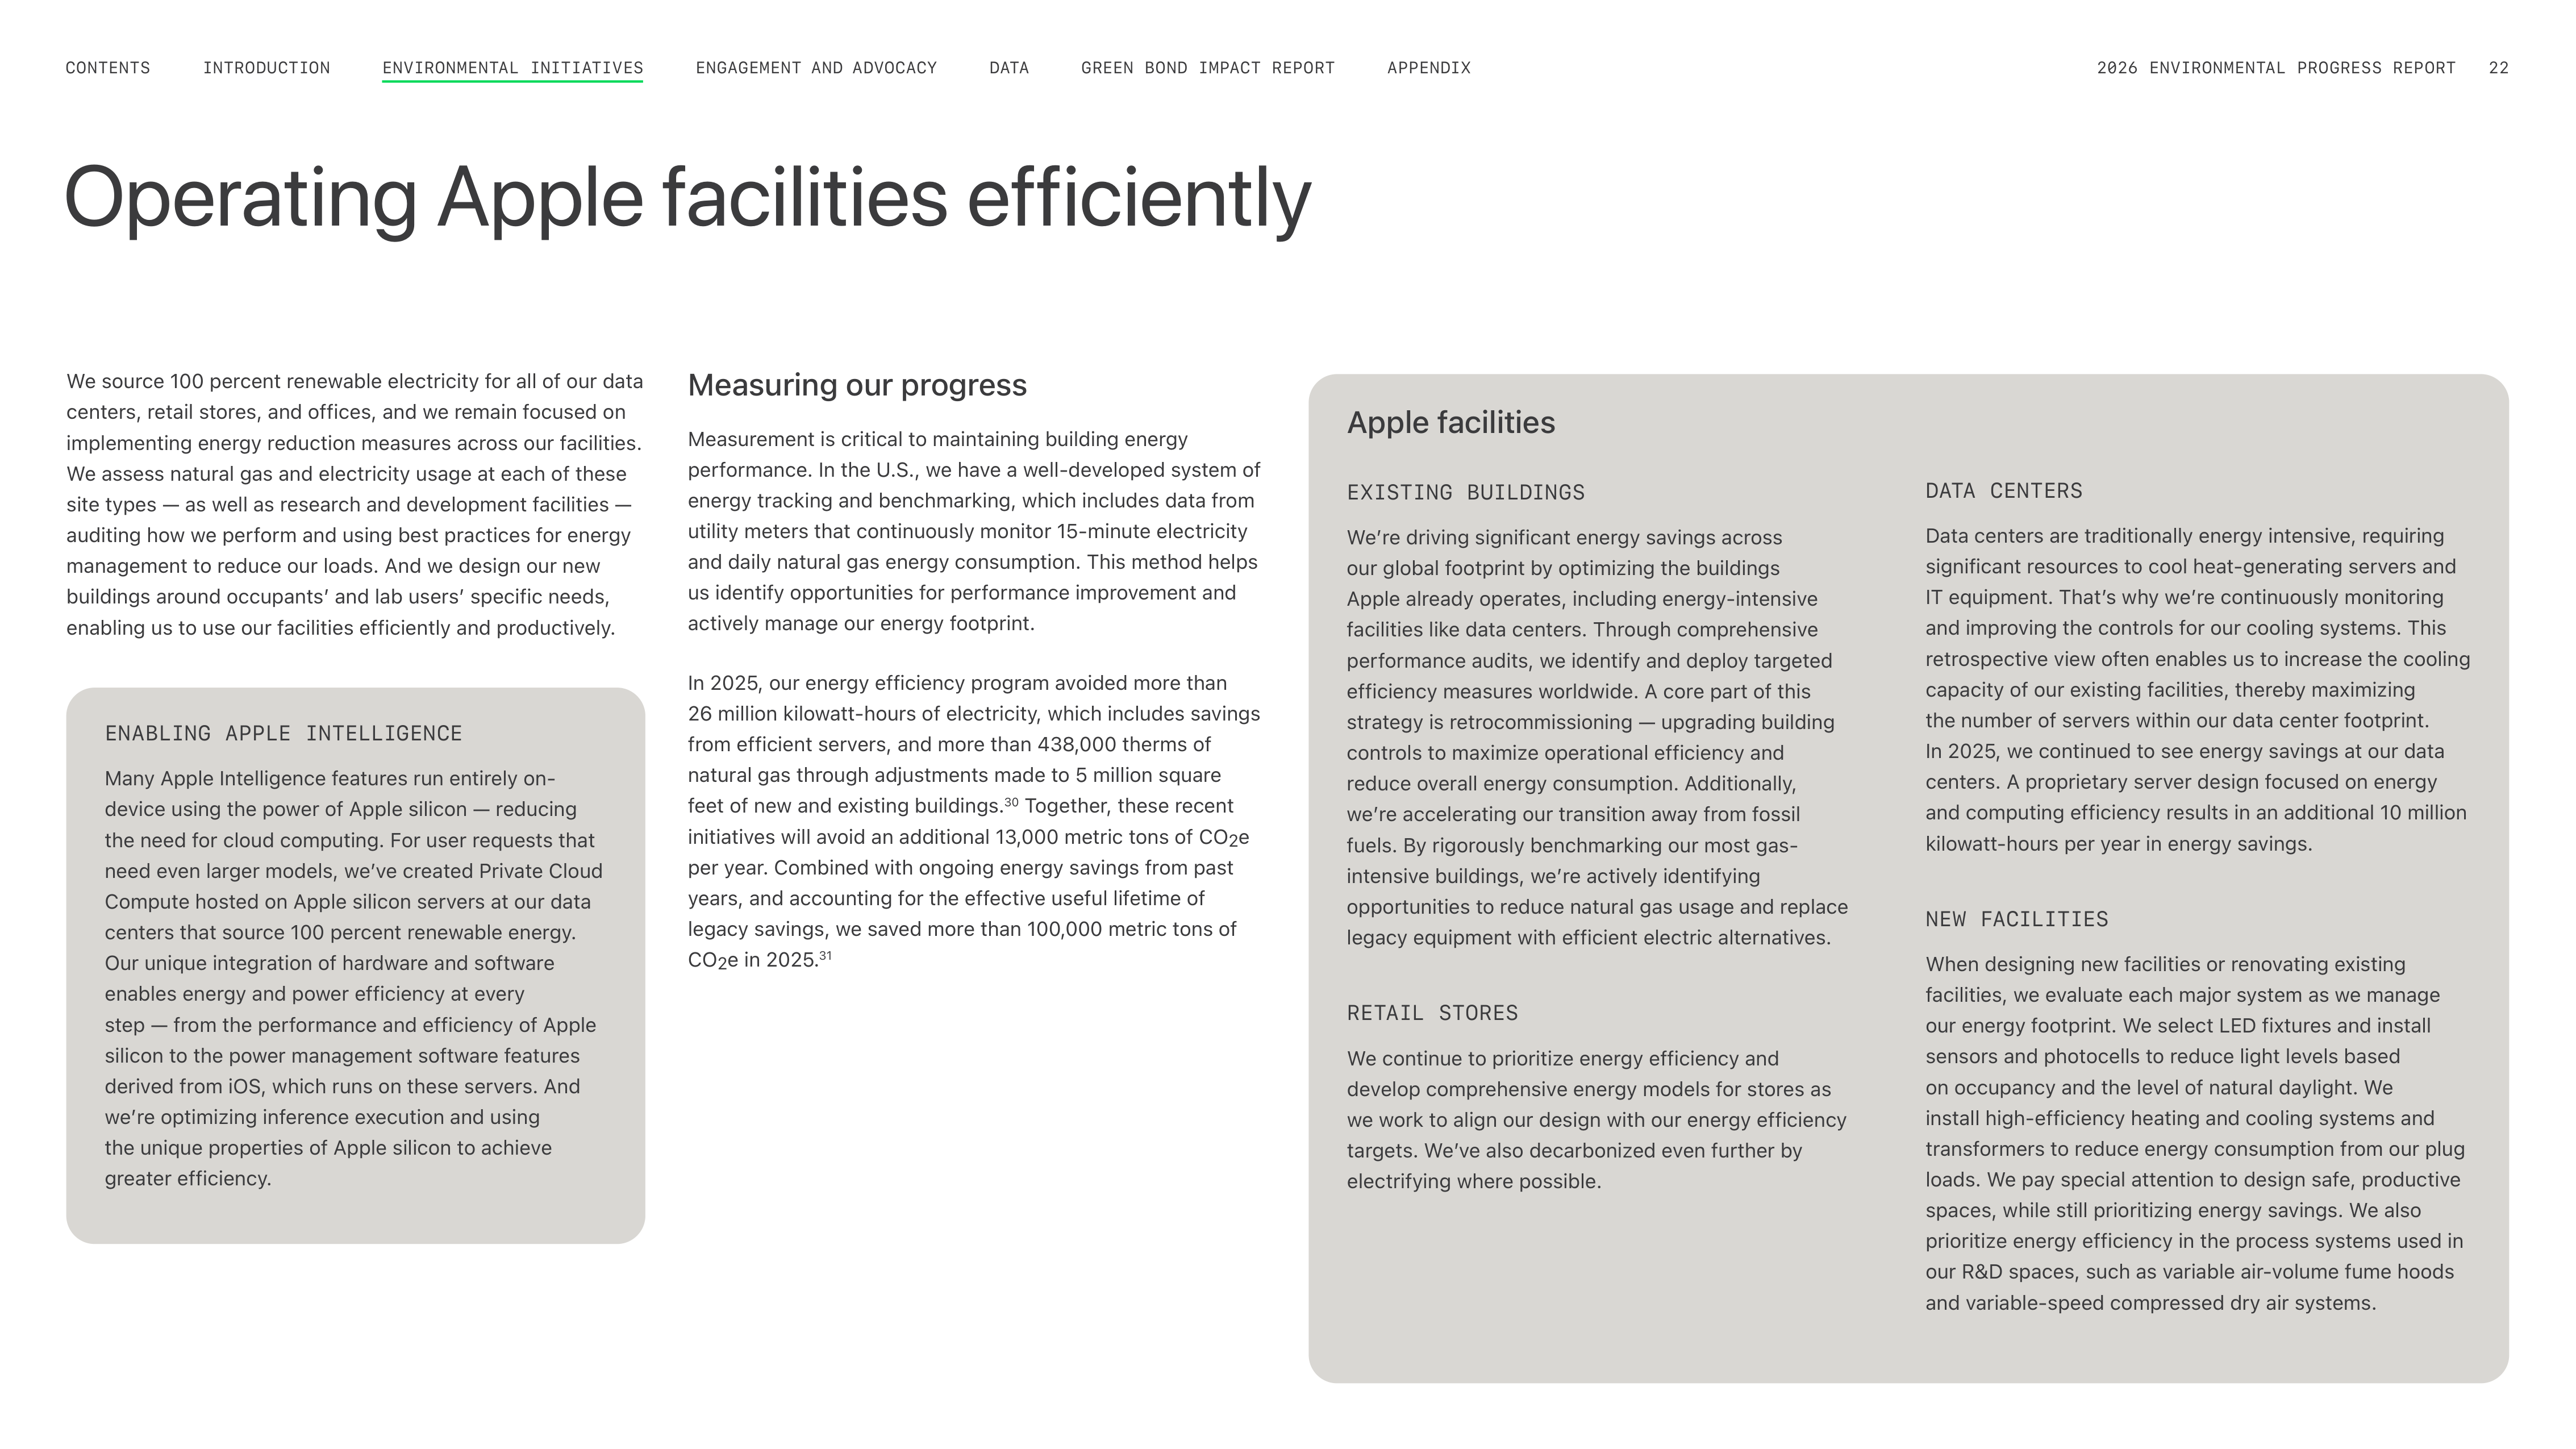
We source 100 percent renewable electricity for all of our data
centers, retail stores, and offices, and we remain focused on
implementing energy reduction measures across our facilities.
We assess natural gas and electricity usage at each of these
site types — as well as research and development facilities —
auditing how we perform and using best practices for energy
management to reduce our loads. And we design our new
buildings around occupantsʼ and lab usersʼ specific needs,
enabling us to use our facilities efficiently and productively.
Operating Apple facilities efficiently
Measuring our progress
Measurement is critical to maintaining building energy
performance. In the U.S., we have a well-developed system of
energy tracking and benchmarking, which includes data from
utility meters that continuously monitor 15-minute electricity
and daily natural gas energy consumption. This method helps
us identify opportunities for performance improvement and
actively manage our energy footprint.
In 2025, our energy efficiency program avoided more than
26 million kilowatt-hours of electricity, which includes savings
from efficient servers, and more than 438,000 therms of
natural gas through adjustments made to 5 million square
feet of new and existing buildings.
30
Together, these recent
initiatives will avoid an additional 13,000 metric tons of CO
2
e
per year. Combined with ongoing energy savings from past
years, and accounting for the effective useful lifetime of
legacy savings, we saved more than 100,000 metric tons of
CO
2
e in 2025.
31
ENABLING APPLE INTELLIGENCE
Many Apple Intelligence features run entirely on-
device using the power of Apple silicon — reducing
the need for cloud computing. For user requests that
need even larger models, weʼve created Private Cloud
Compute hosted on Apple silicon servers at our data
centers that source 100 percent renewable energy.
Our unique integration of hardware and software
enables energy and power efficiency at every
step — from the performance and efficiency of Apple
silicon to the power management software features
derived from iOS, which runs on these servers. And
weʼre optimizing inference execution and using
the unique properties of Apple silicon to achieve
greater efficiency.
Apple facilities
EXISTING BUILDINGS
Weʼre driving significant energy savings across
our global footprint by optimizing the buildings
Apple already operates, including energy-intensive
facilities like data centers. Through comprehensive
performance audits, we identify and deploy targeted
efficiency measures worldwide. A core part of this
strategy is retrocommissioning — upgrading building
controls to maximize operational efficiency and
reduce overall energy consumption. Additionally,
weʼre accelerating our transition away from fossil
fuels. By rigorously benchmarking our most gas-
intensive buildings, weʼre actively identifying
opportunities to reduce natural gas usage and replace
legacy equipment with efficient electric alternatives.
DATA CENTERS
Data centers are traditionally energy intensive, requiring
significant resources to cool heat-generating servers and
IT equipment. Thatʼs why weʼre continuously monitoring
and improving the controls for our cooling systems. This
retrospective view often enables us to increase the cooling
capacity of our existing facilities, thereby maximizing
the number of servers within our data center footprint.
In 2025, we continued to see energy savings at our data
centers. A proprietary server design focused on energy
and computing efficiency results in an additional 10 million
kilowatt-hours per year in energy savings.
NEW FACILITIES
When designing new facilities or renovating existing
facilities, we evaluate each major system as we manage
our energy footprint. We select LED fixtures and install
sensors and photocells to reduce light levels based
on occupancy and the level of natural daylight. We
install high-efficiency heating and cooling systems and
transformers to reduce energy consumption from our plug
loads. We pay special attention to design safe, productive
spaces, while still prioritizing energy savings. We also
prioritize energy efficiency in the process systems used in
our R&D spaces, such as variable air-volume fume hoods
and variable-speed compressed dry air systems.
RETAIL STORES
We continue to prioritize energy efficiency and
develop comprehensive energy models for stores as
we work to align our design with our energy efficiency
targets. Weʼve also decarbonized even further by
electrifying where possible.
ENGAGEMENT AND ADVOCACY
INTRODUCTION
CONTENTS
GREEN BOND IMPACT REPORT
DATA
APPENDIX
2026 ENVIRONMENTAL PROGRESS REPORT
22
ENVIRONMENTAL INITIATIVES
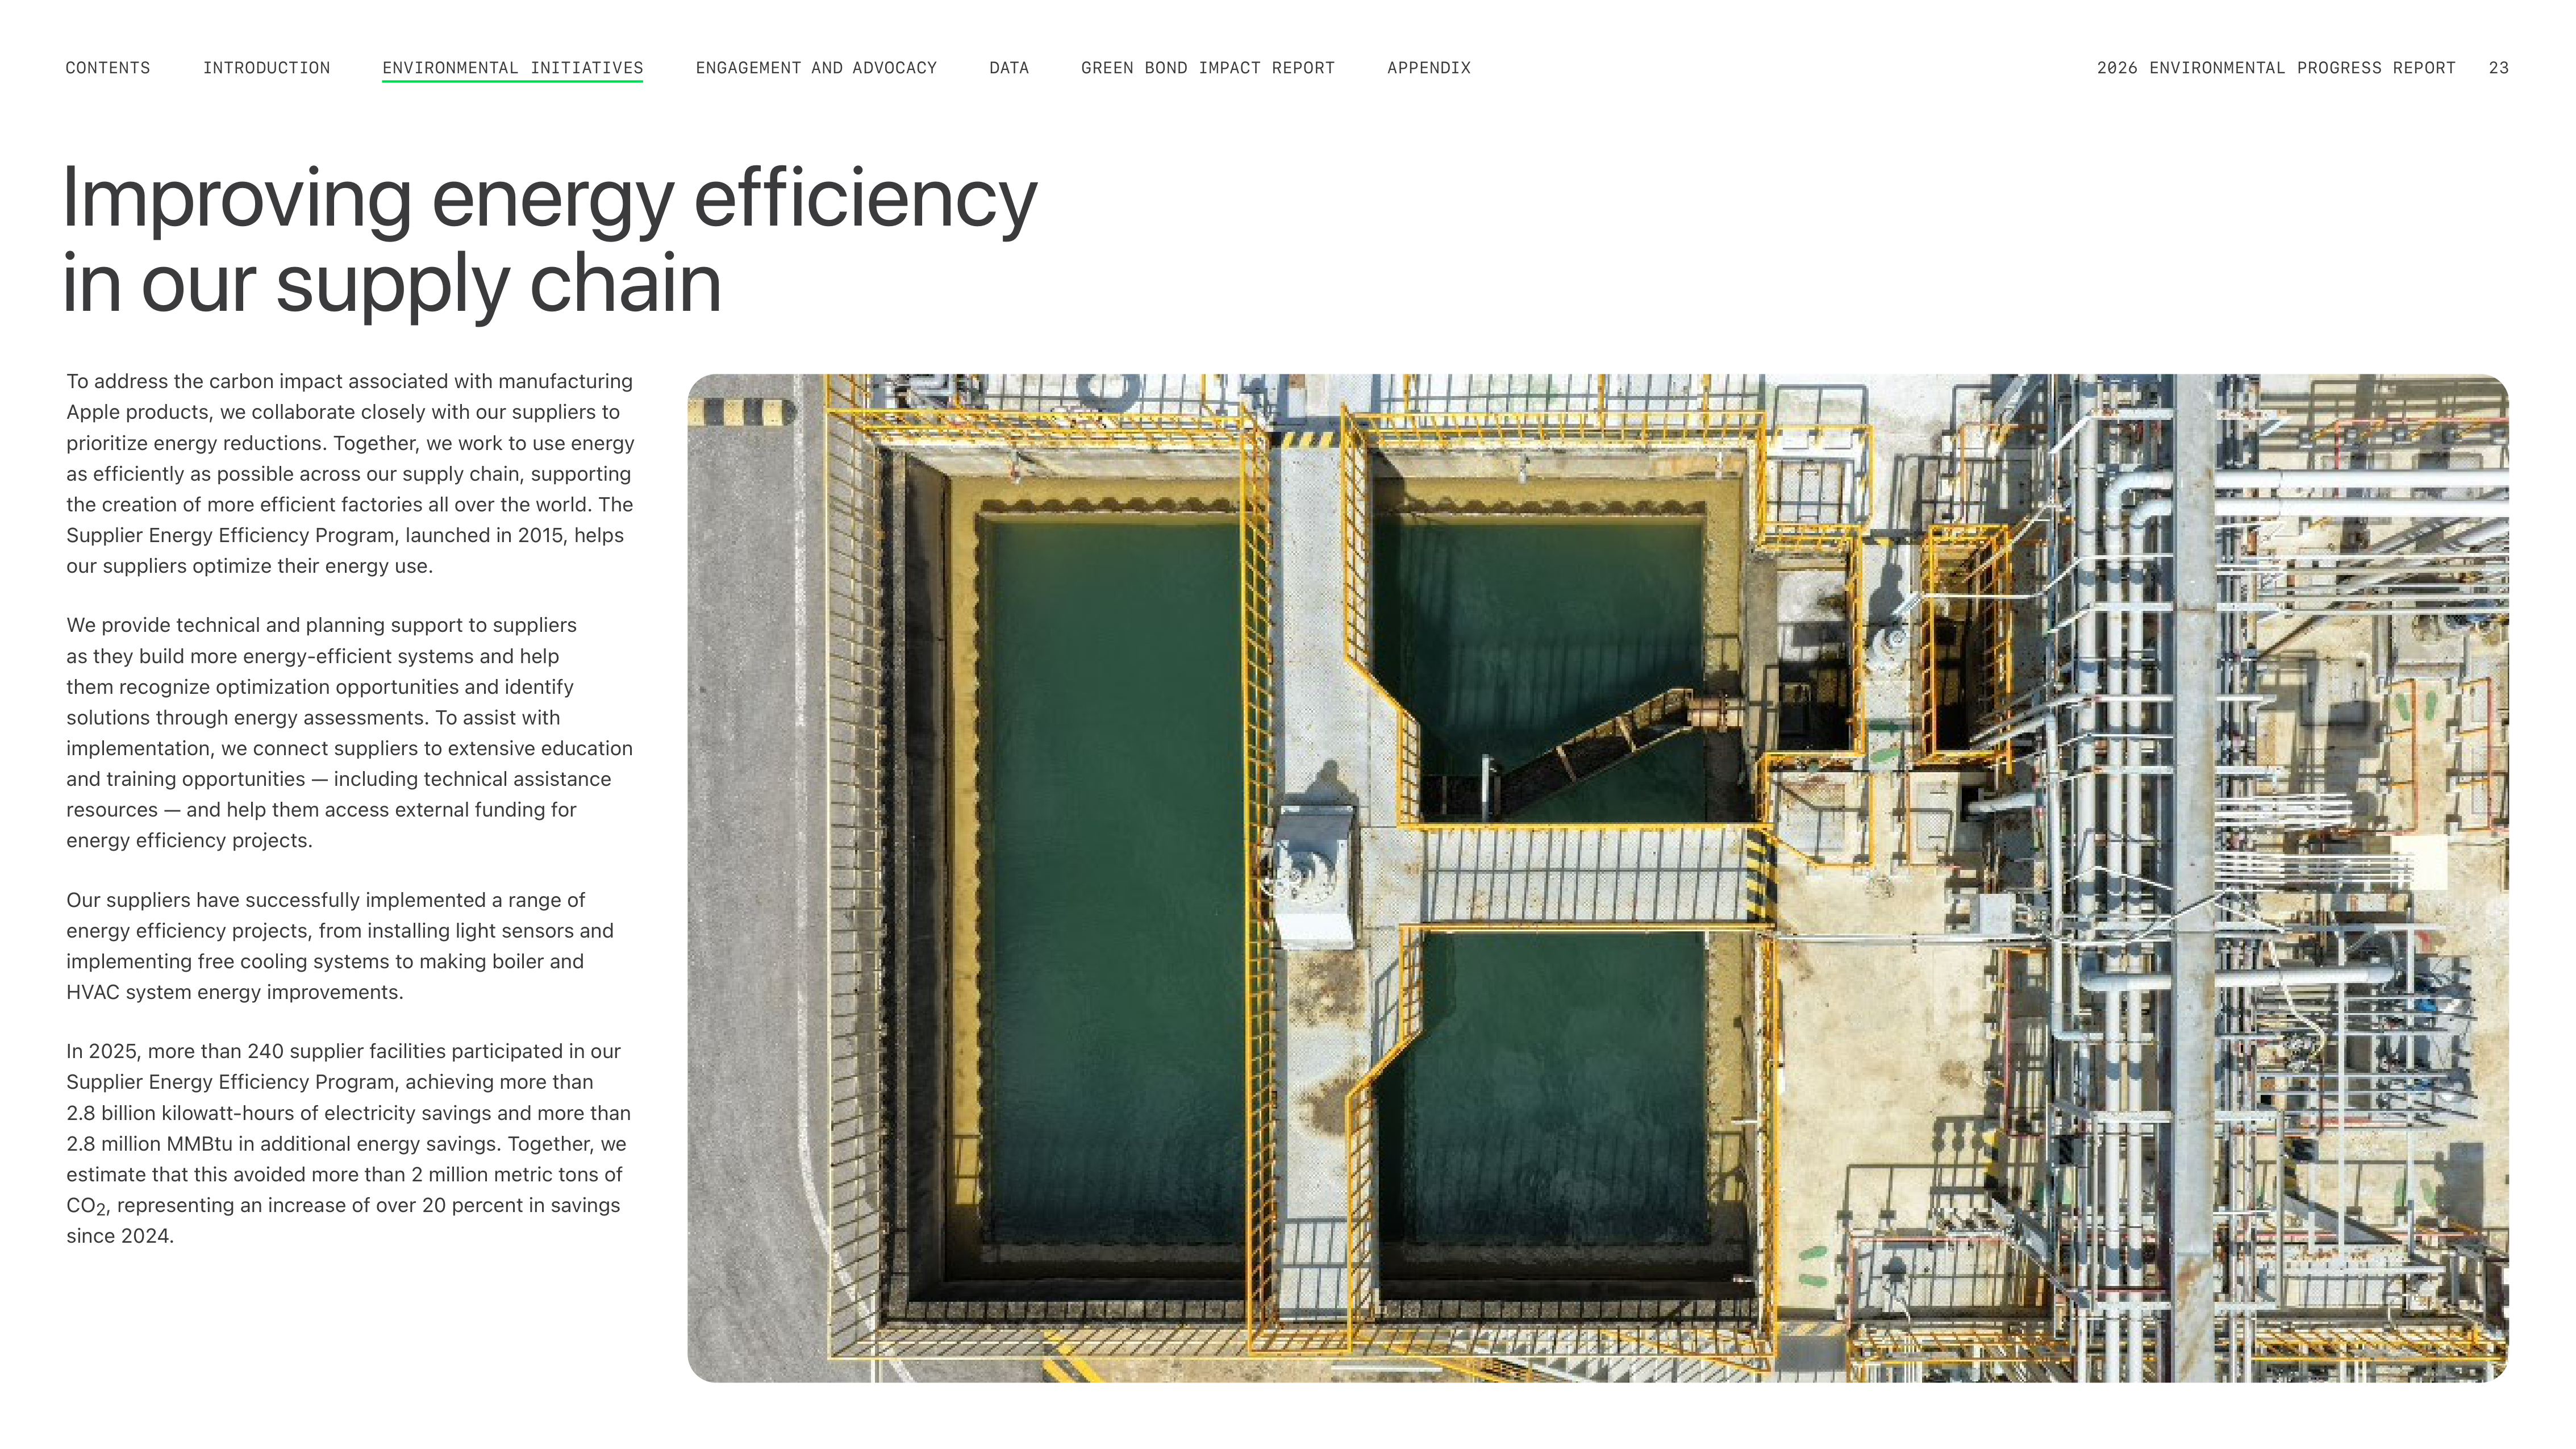
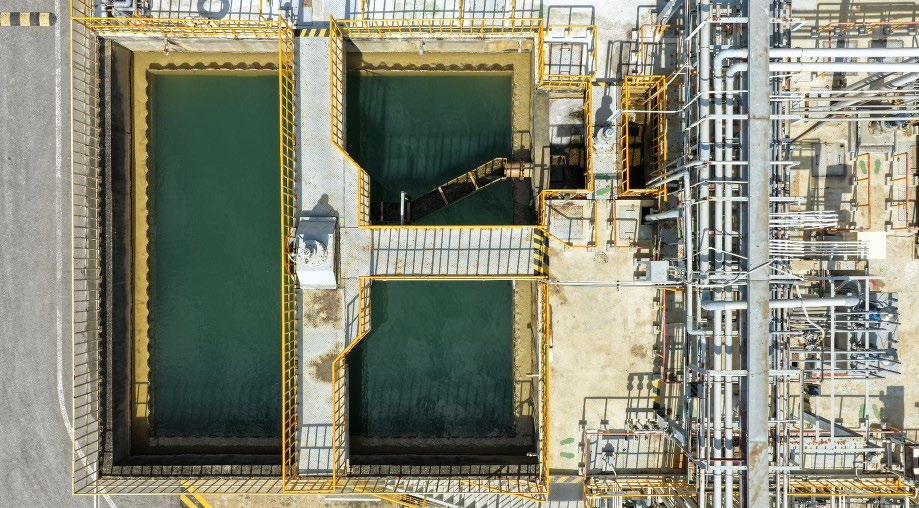
To address the carbon impact associated with manufacturing
Apple products, we collaborate closely with our suppliers to
prioritize energy reductions. Together, we work to use energy
as efficiently as possible across our supply chain, supporting
the creation of more efficient factories all over the world. The
Supplier Energy Efficiency Program, launched in 2015, helps
our suppliers optimize their energy use.
We provide technical and planning support to suppliers
as they build more energy-efficient systems and help
them recognize optimization opportunities and identify
solutions through energy assessments. To assist with
implementation, we connect suppliers to extensive education
and training opportunities — including technical assistance
resources — and help them access external funding for
energy efficiency projects.
Our suppliers have successfully implemented a range of
energy efficiency projects, from installing light sensors and
implementing free cooling systems to making boiler and
HVAC system energy improvements.
In 2025, more than 240 supplier facilities participated in our
Supplier Energy Efficiency Program, achieving more than
2.8 billion kilowatt-hours of electricity savings and more than
2.8 million MMBtu in additional energy savings. Together, we
estimate that this avoided more than 2 million metric tons of
CO
2
, representing an increase of over 20 percent in savings
since 2024.
Improving energy efficiency
in our supply chain
ENGAGEMENT AND ADVOCACY
INTRODUCTION
CONTENTS
GREEN BOND IMPACT REPORT
DATA
APPENDIX
2026 ENVIRONMENTAL PROGRESS REPORT
23
ENVIRONMENTAL INITIATIVES
Clean electricity
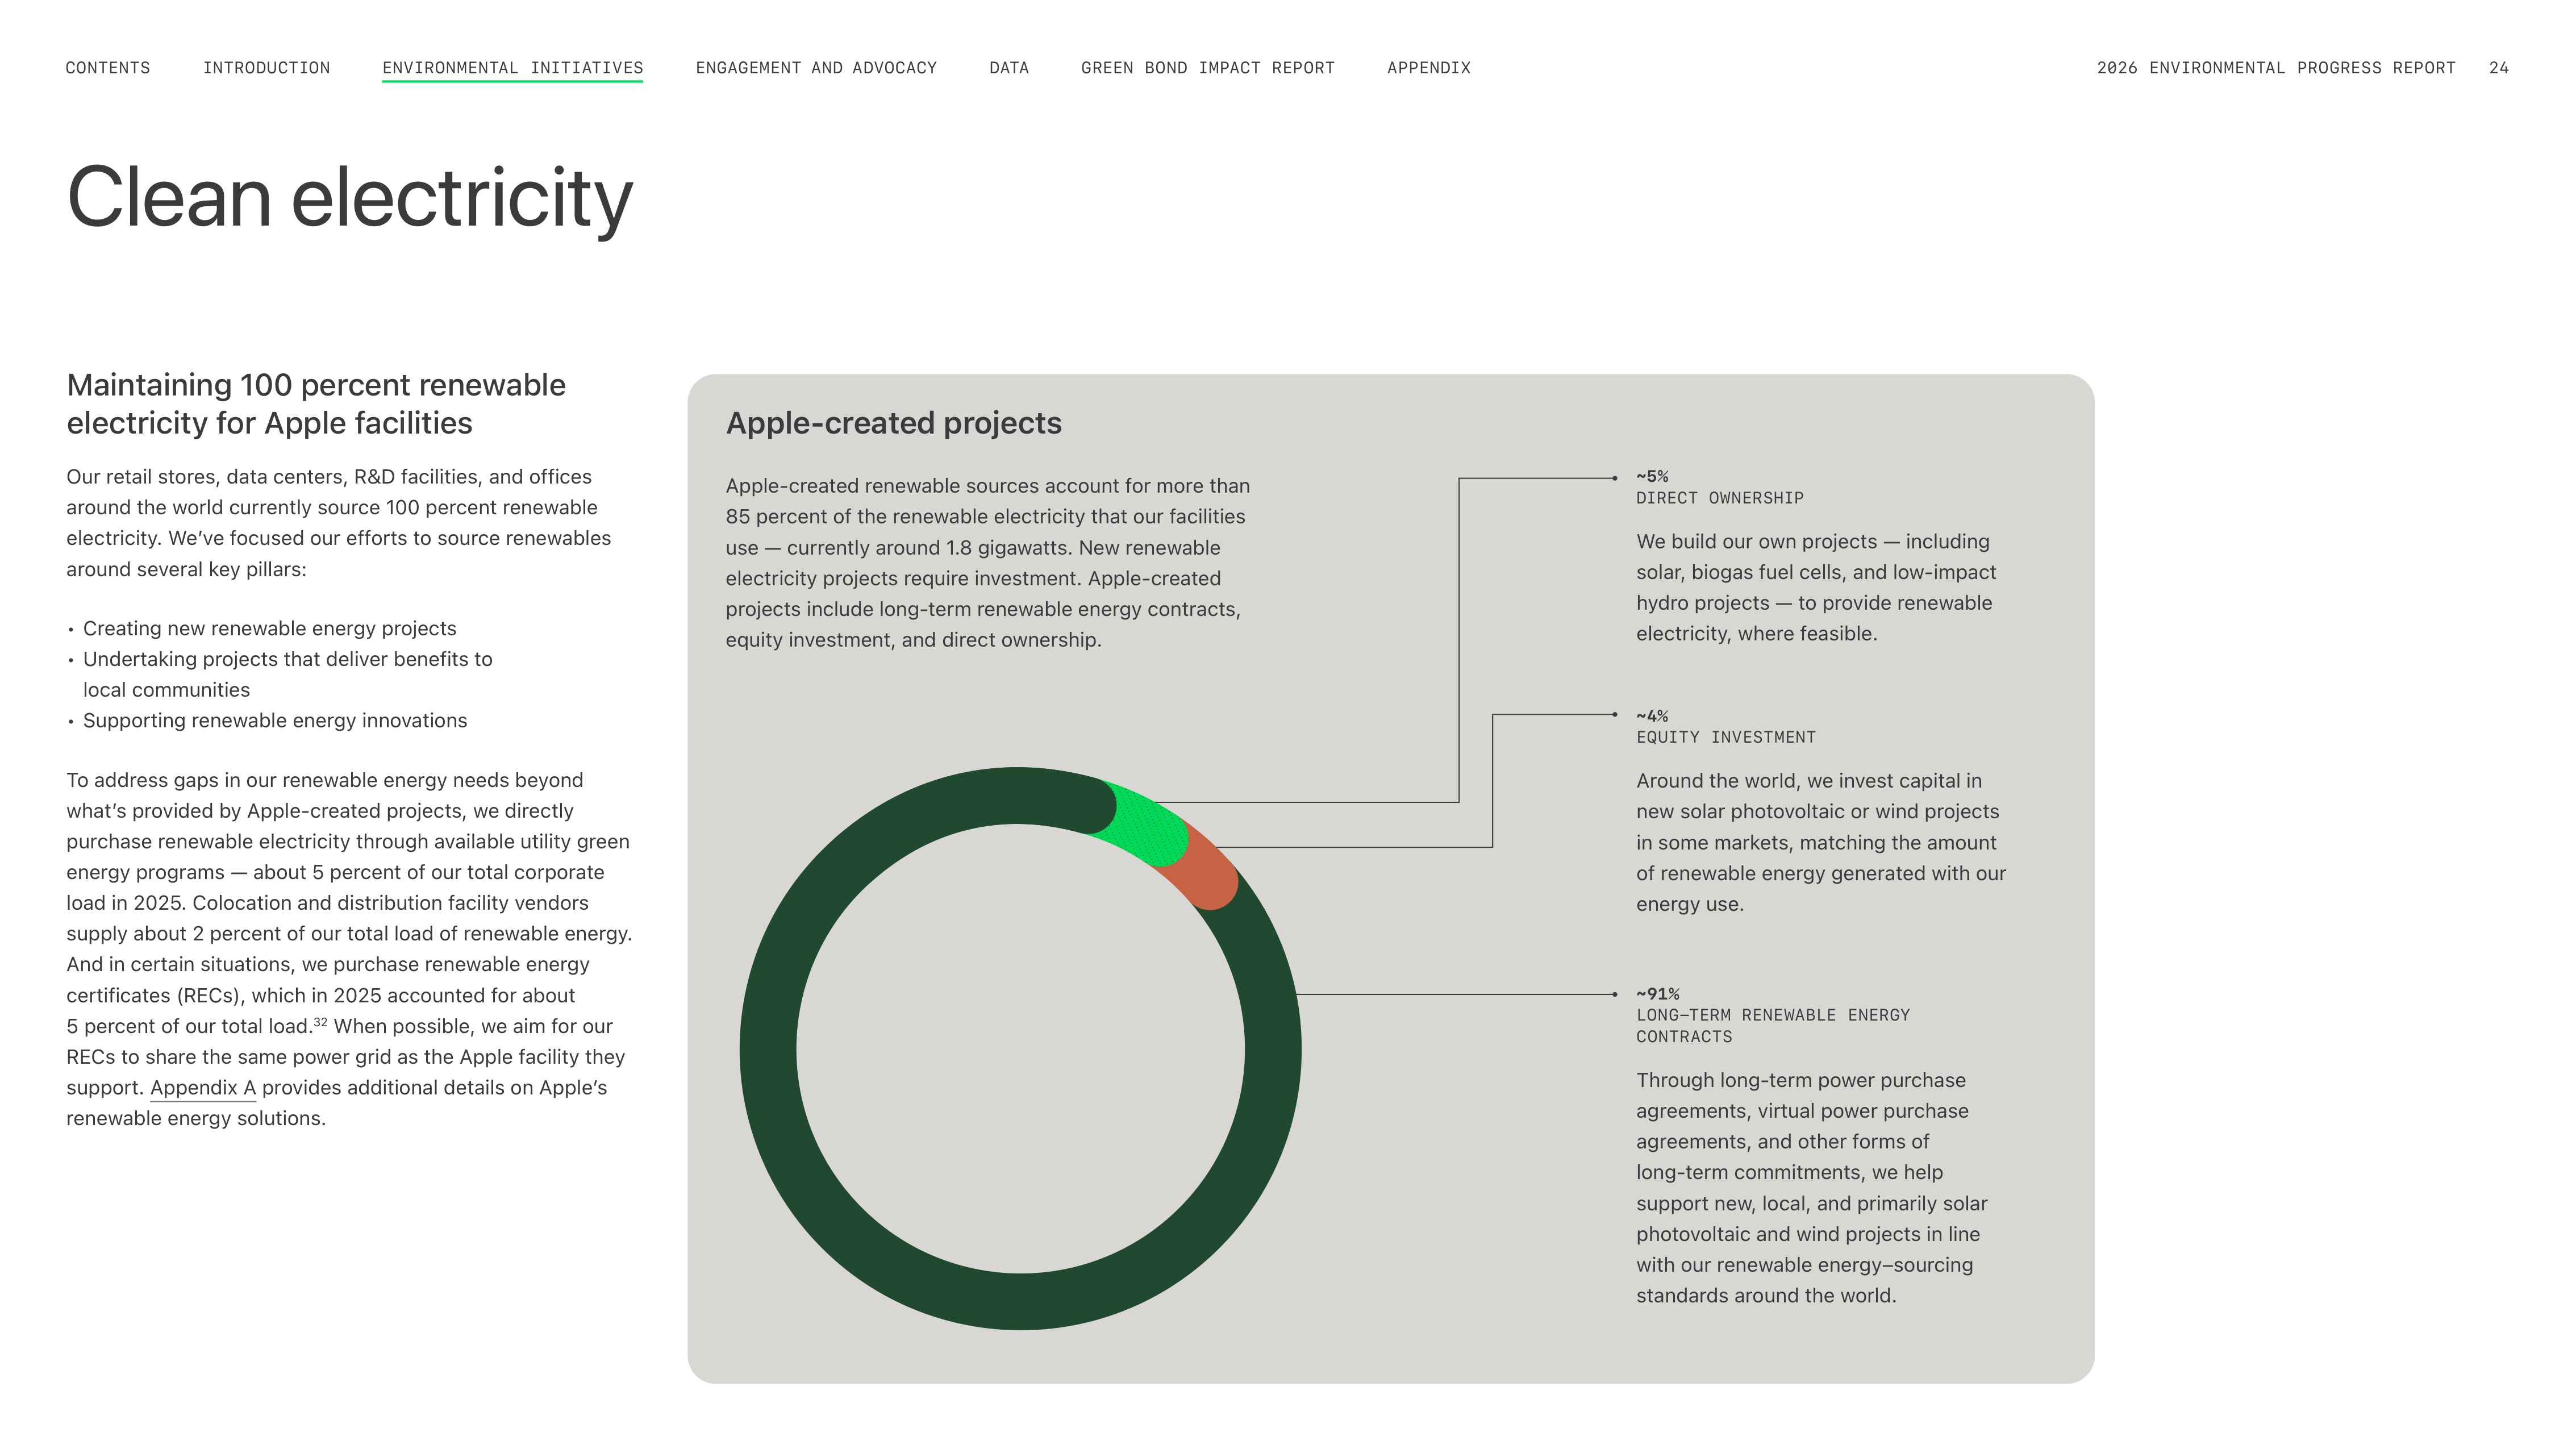
Apple-created projects
Apple-created renewable sources account for more than
85 percent of the renewable electricity that our facilities
use — currently around 1.8 gigawatts. New renewable
electricity projects require investment. Apple-created
projects include long-term renewable energy contracts,
equity investment, and direct ownership.
~4%
EQUITY INVESTMENT
Around the world, we invest capital in
new solar photovoltaic or wind projects
in some markets, matching the amount
of renewable energy generated with our
energy use.
~5%
DIRECT OWNERSHIP
We build our own projects — including
solar, biogas fuel cells, and low-impact
hydro projects — to provide renewable
electricity, where feasible.
~91%
LONG-TERM RENEWABLE ENERGY
CONTRACTS
Through long-term power purchase
agreements, virtual power purchase
agreements, and other forms of
long-term commitments, we help
support new, local, and primarily solar
photovoltaic and wind projects in line
with our renewable energy–sourcing
standards around the world.
Maintaining 100 percent renewable
electricity for Apple facilities
Our retail stores, data centers, R&D facilities, and offices
around the world currently source 100 percent renewable
electricity. Weʼve focused our efforts to source renewables
around several key pillars:
• Creating new renewable energy projects
• Undertaking projects that deliver benefits to
local communities
• Supporting renewable energy innovations
To address gaps in our renewable energy needs beyond
whatʼs provided by Apple-created projects, we directly
purchase renewable electricity through available utility green
energy programs — about 5 percent of our total corporate
load in 2025. Colocation and distribution facility vendors
supply about 2 percent of our total load of renewable energy.
And in certain situations, we purchase renewable energy
certificates (RECs), which in 2025 accounted for about
5 percent of our total load.
32
When possible, we aim for our
RECs to share the same power grid as the Apple facility they
support. Appendix A provides additional details on Appleʼs
renewable energy solutions.
ENGAGEMENT AND ADVOCACY
INTRODUCTION
CONTENTS
GREEN BOND IMPACT REPORT
DATA
APPENDIX
2026 ENVIRONMENTAL PROGRESS REPORT
24
ENVIRONMENTAL INITIATIVES
Transitioning our suppliers
to renewable electricity
The largest single source of greenhouse gas emissions
throughout our supply chain results from electricity that our
manufacturing suppliers use. Thatʼs why transitioning our
entire supply chain to 100 percent renewable electricity is
essential to reaching our 2030 carbon neutrality goal.
Our Supplier Clean Energy Program (CEP) helps enable
suppliersʼ transition to renewable electricity by advocating
for policy changes, providing information and access to
renewable energy procurement options, and creating
engagement opportunities with renewable energy experts. By
engaging in this program, our suppliers can implement best
practices in advocating for and procuring renewable energy
across their corporate operations, including those associated
with Apple production. The program also equips them to
share lessons learned with other partners throughout their
value chains, extending benefits beyond the scope of Apple.
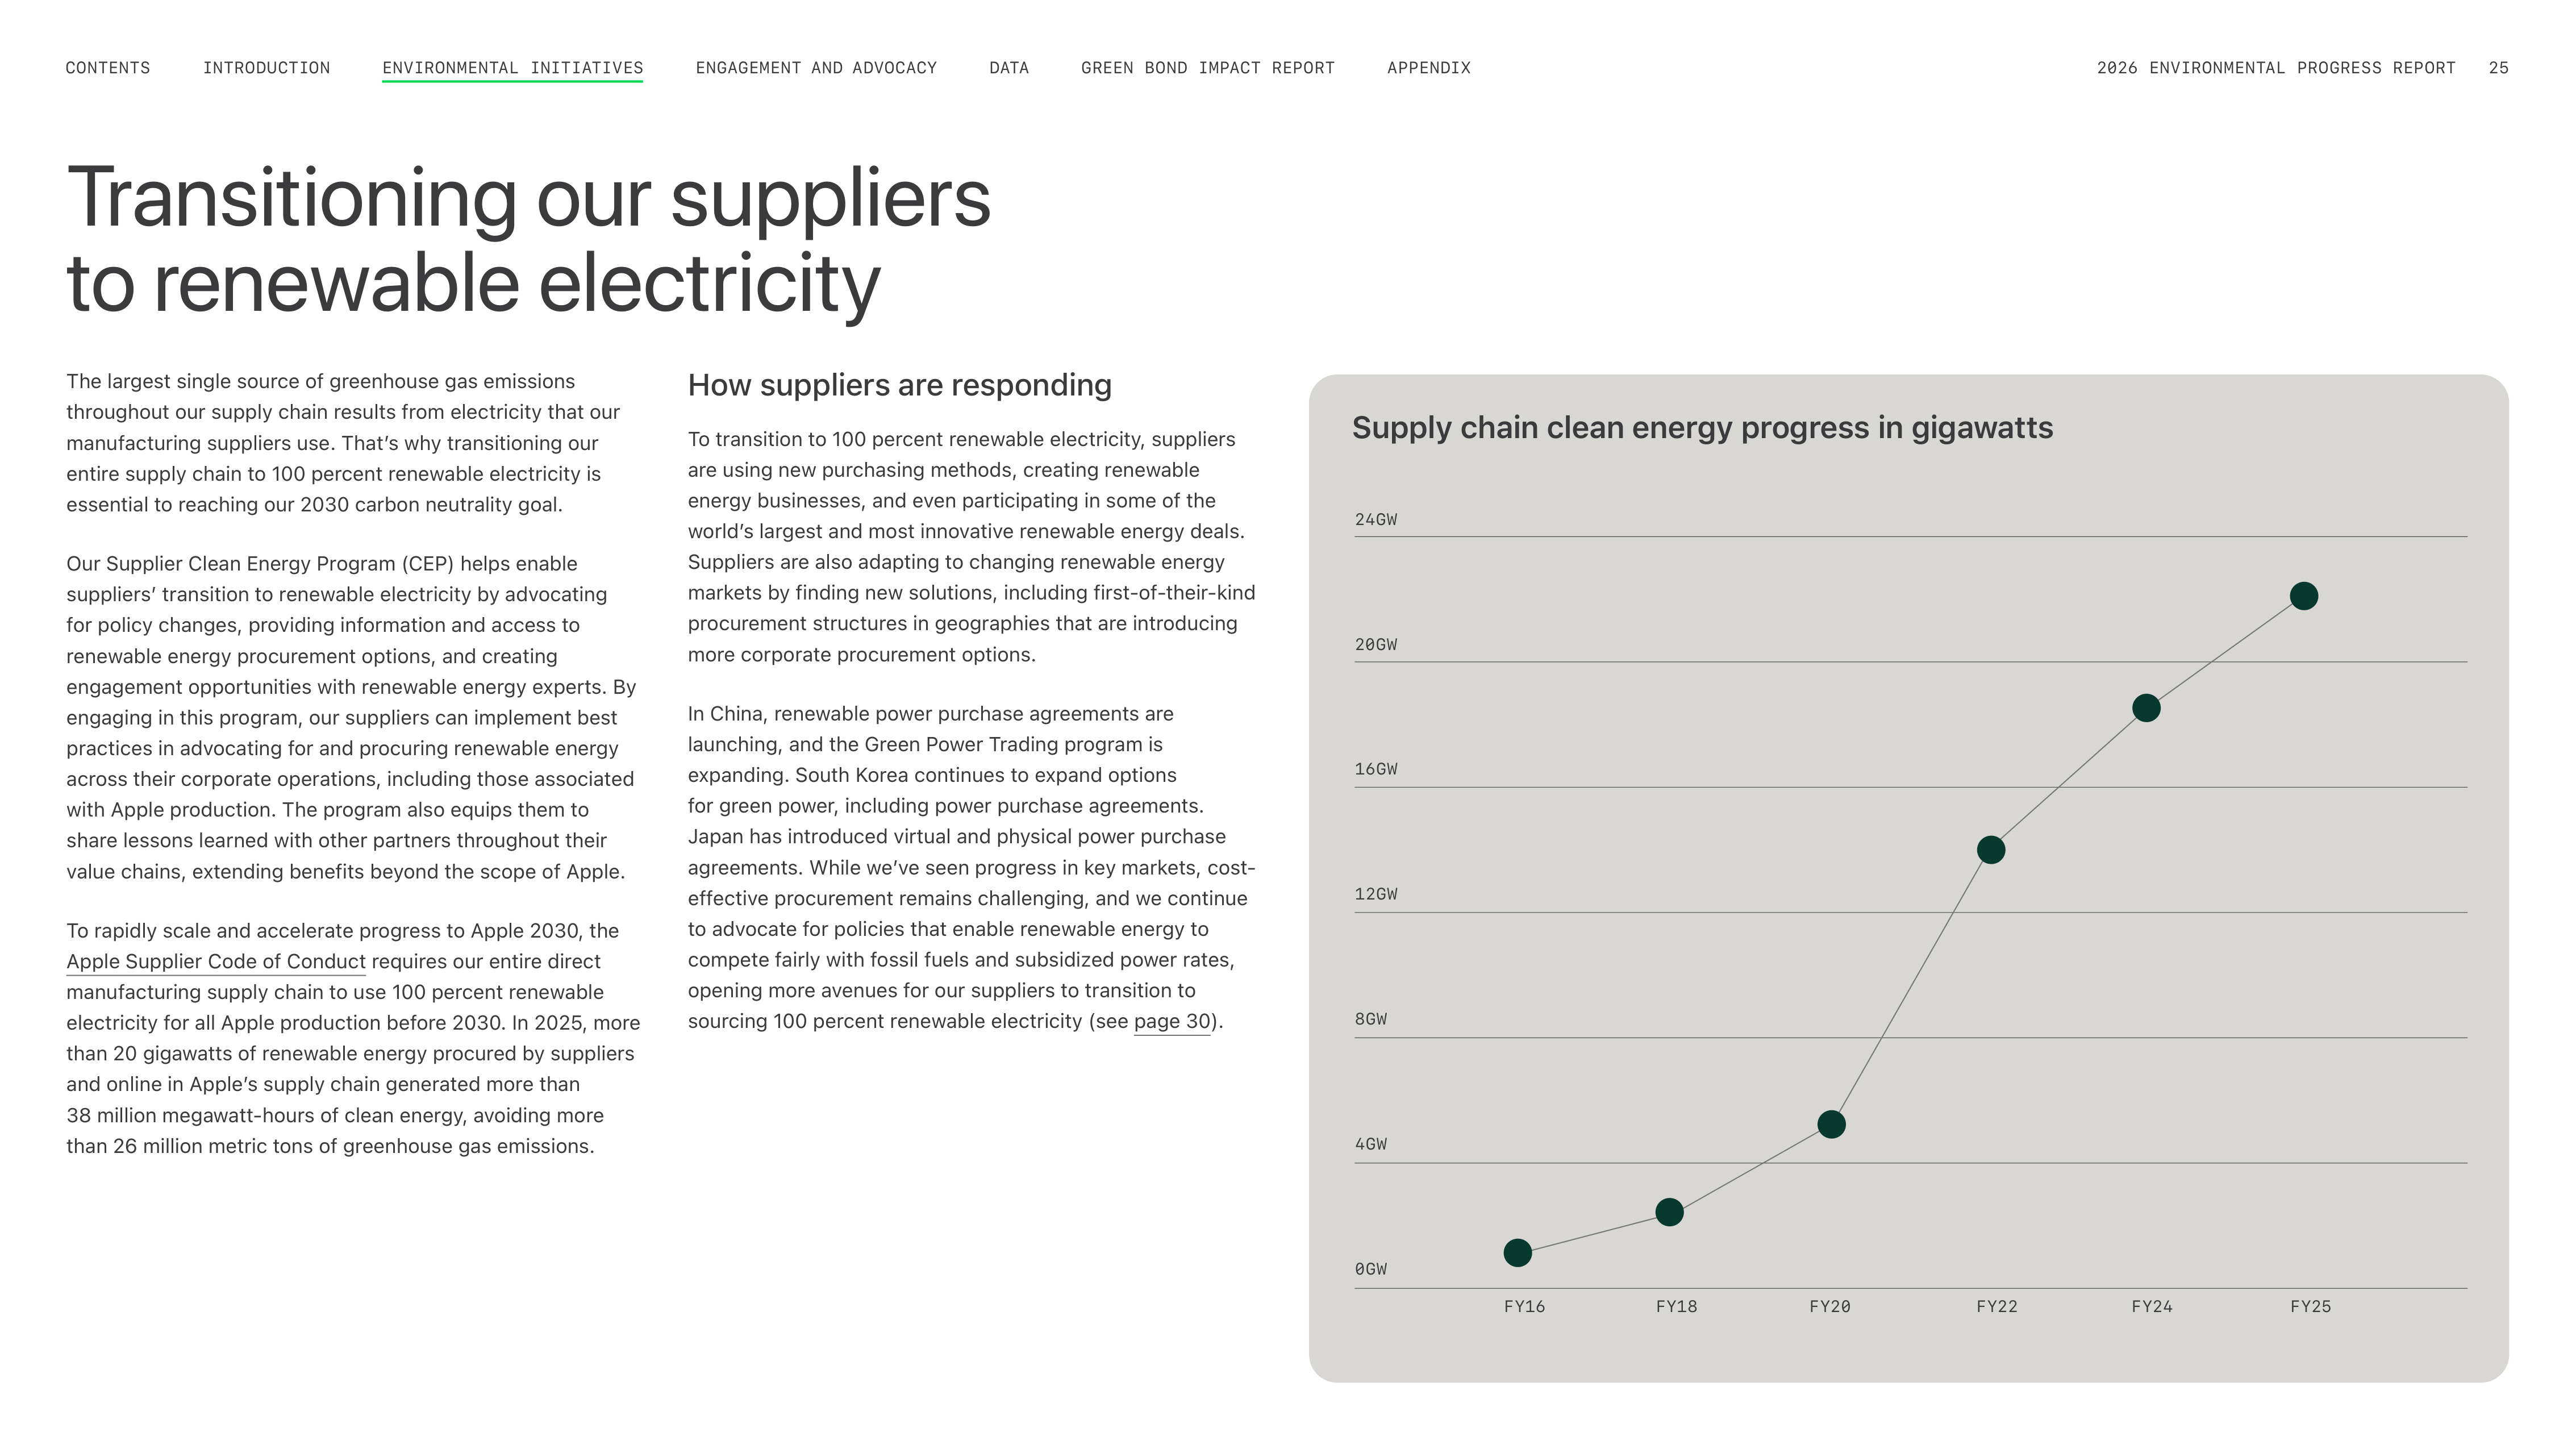
To rapidly scale and accelerate progress to Apple 2030, the
Apple Supplier Code of Conduct requires our entire direct
manufacturing supply chain to use 100 percent renewable
electricity for all Apple production before 2030. In 2025, more
than 20 gigawatts of renewable energy procured by suppliers
and online in Appleʼs supply chain generated more than
38 million megawatt-hours of clean energy, avoiding more
than 26 million metric tons of greenhouse gas emissions.
How suppliers are responding
To transition to 100 percent renewable electricity, suppliers
are using new purchasing methods, creating renewable
energy businesses, and even participating in some of the
worldʼs largest and most innovative renewable energy deals.
Suppliers are also adapting to changing renewable energy
markets by finding new solutions, including first-of-their-kind
procurement structures in geographies that are introducing
more corporate procurement options.
In China, renewable power purchase agreements are
launching, and the Green Power Trading program is
expanding. South Korea continues to expand options
for green power, including power purchase agreements.
Japan has introduced virtual and physical power purchase
agreements. While weʼve seen progress in key markets, cost-
effective procurement remains challenging, and we continue
to advocate for policies that enable renewable energy to
compete fairly with fossil fuels and subsidized power rates,
opening more avenues for our suppliers to transition to
sourcing 100 percent renewable electricity (see page 30).
24GW
16GW
20GW
8GW
12GW
4GW
0GW
FY20
FY22
FY25
FY24
FY18
FY16
Supply chain clean energy progress in gigawatts
ENGAGEMENT AND ADVOCACY
INTRODUCTION
CONTENTS
GREEN BOND IMPACT REPORT
DATA
APPENDIX
2026 ENVIRONMENTAL PROGRESS REPORT
25
ENVIRONMENTAL INITIATIVES
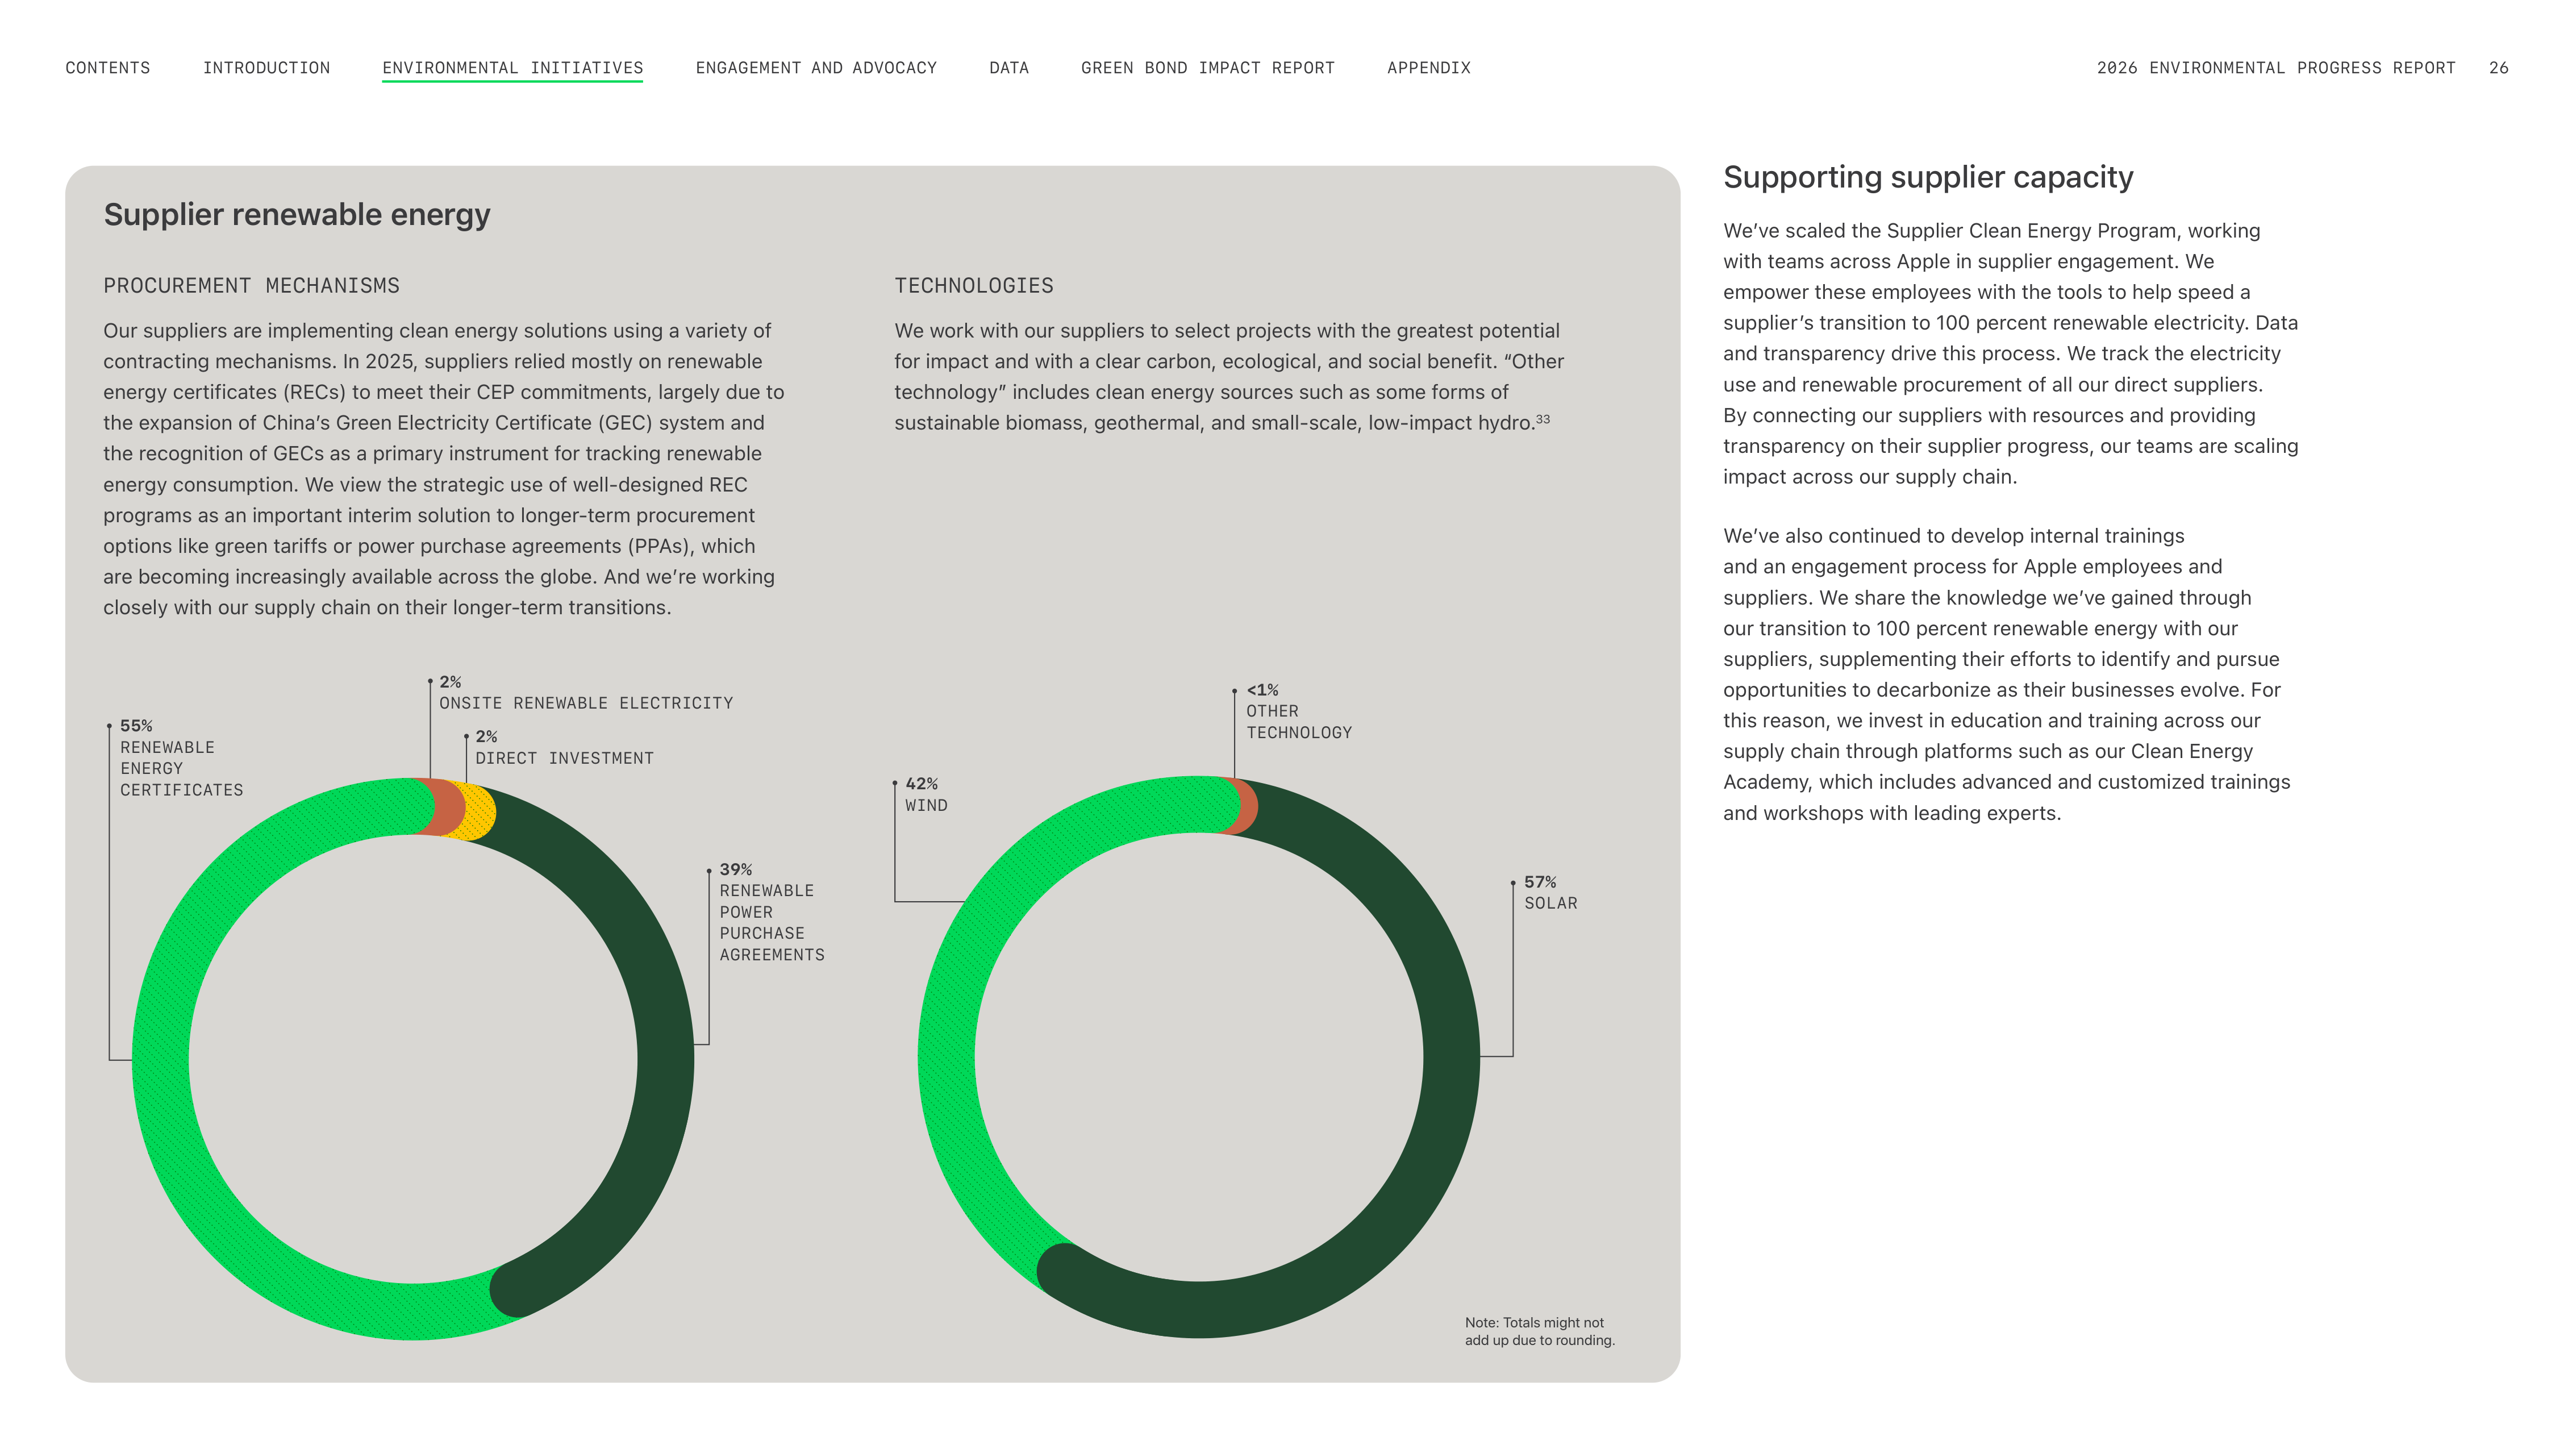
Supplier renewable energy
PROCUREMENT MECHANISMS
Our suppliers are implementing clean energy solutions using a variety of
contracting mechanisms. In 2025, suppliers relied mostly on renewable
energy certificates (RECs) to meet their CEP commitments, largely due to
the expansion of Chinaʼs Green Electricity Certificate (GEC) system and
the recognition of GECs as a primary instrument for tracking renewable
energy consumption. We view the strategic use of well-designed REC
programs as an important interim solution to longer-term procurement
options like green tariffs or power purchase agreements (PPAs), which
are becoming increasingly available across the globe. And weʼre working
closely with our supply chain on their longer-term transitions.
TECHNOLOGIES
We work with our suppliers to select projects with the greatest potential
for impact and with a clear carbon, ecological, and social benefit. “Other
technology” includes clean energy sources such as some forms of
sustainable biomass, geothermal, and small-scale, low-impact hydro.
33
2%
ONSITE RENEWABLE ELECTRICITY
55%
RENEWABLE
ENERGY
CERTIFICATES
2%
DIRECT INVESTMENT
39%
RENEWABLE
POWER
PURCHASE
AGREEMENTS
57%
SOLAR
42%
WIND
<1%
OTHER
TECHNOLOGY
Supporting supplier capacity
Weʼve scaled the Supplier Clean Energy Program, working
with teams across Apple in supplier engagement. We
empower these employees with the tools to help speed a
supplierʼs transition to 100 percent renewable electricity. Data
and transparency drive this process. We track the electricity
use and renewable procurement of all our direct suppliers.
By connecting our suppliers with resources and providing
transparency on their supplier progress, our teams are scaling
impact across our supply chain.
Weʼve also continued to develop internal trainings
and an engagement process for Apple employees and
suppliers. We share the knowledge weʼve gained through
our transition to 100 percent renewable energy with our
suppliers, supplementing their efforts to identify and pursue
opportunities to decarbonize as their businesses evolve. For
this reason, we invest in education and training across our
supply chain through platforms such as our Clean Energy
Academy, which includes advanced and customized trainings
and workshops with leading experts.
Note: Totals might not
add up due to rounding.
ENGAGEMENT AND ADVOCACY
INTRODUCTION
CONTENTS
GREEN BOND IMPACT REPORT
DATA
APPENDIX
2026 ENVIRONMENTAL PROGRESS REPORT
26
ENVIRONMENTAL INITIATIVES
The Academy offers updates on available energy procurement
options in suppliersʼ markets, helps suppliers prepare to
participate in upcoming renewable energy pilots, and provides
implementation guidance from local experts. This program
supplements our Clean Energy Portal, available to all supplier
facilities, which provides training materials, resources, and
country-specific information to guide suppliers in their
transition to 100 percent renewable electricity.
Weʼve continued to support the creation of a first-of-its-kind
public training platform that will be available to businesses
across many different industries, giving companies of all
sizes — in Appleʼs supply chain and beyond — access to
the resources and advocacy networks weʼve cultivated for
nearly a decade. Weʼve partnered with the Clean Energy
Buyers Institute (CEBI) and other corporations to launch the
inaugural Clean Energy Procurement Academy — a shared
training curriculum and delivery process — which has begun
hosting workshops in key markets to equip companies with
the technical readiness to advance clean energy procurement,
address scope 3 emissions, and decarbonize global
supply chains.
Additionally, we support the creation and growth of renewable
energy industry associations that include buyers, and that
our suppliers can join to learn about local opportunities, such
as the Asia Clean Energy Coalition (ACEC) and Clean Energy
Buyers Association (CEBA).
Expanding access to
renewable electricity
To support our suppliersʼ transition to renewable electricity,
we help them find solutions so they can decide how best to
address their specific needs.
•
China Clean Energy:
In 2025, with Appleʼs help CICC
Capital and Huaneng Investment formed an Apple supplier-
led investment fund of more than $150 million to invest in
wind and solar power generation projects in China. The
China Renewable Power Infrastructure LPF aims to add 1
million megawatt-hours to Chinaʼs grid by 2030. Like our
two China Clean Energy Funds, this supplier-led fund will
finance renewable energy projects in China, including those
in the early stages of development.
•
Power purchase agreements (PPAs):
We continue to
support the global development of high-quality programs
for generating and trading renewable energy certificates.
We also connect suppliers with opportunities to buy
renewable energy directly from project developers and
utilities as those models emerge around the globe.
•
Direct investments:
To cover emissions from suppliers
we donʼt contract with directly, we invest in additional
renewable electricity projects.
Collaborating with groups like the Asia Clean Energy Coalition
and RE100 — which bring together influential businesses
through commitments to use renewable electricity — weʼve
identified country-level policy barriers to procuring renewable
electricity. In Japan and South Korea, for example, we
collaborated with other renewable energy users and called for
enhancing the transparency in renewable energy certificates
and increasing the supply of renewable energy.
Advocating for policy change
We engage with policymakers to support renewable energy
thatʼs cost-effective, accessible to companies, and sourced
from high-quality projects with a benefit to local markets.
These efforts include encouraging governments not to
subsidize or expand carbon-intensive infrastructure. We also
encourage them to keep pace with the speed of technological
innovation, consider the life cycle emissions of energy
solutions, and support new energy solutions that effectively
reduce global emissions. Additionally, we support government
efforts in beneficial electrification and the build-out of
necessary transmission infrastructure, all while considering
cost-effectiveness. Public investments in decarbonization
should be properly supported by funds generated from
establishing a price on carbon pollution.
ENGAGEMENT AND ADVOCACY
INTRODUCTION
CONTENTS
GREEN BOND IMPACT REPORT
DATA
APPENDIX
2026 ENVIRONMENTAL PROGRESS REPORT
27
ENVIRONMENTAL INITIATIVES
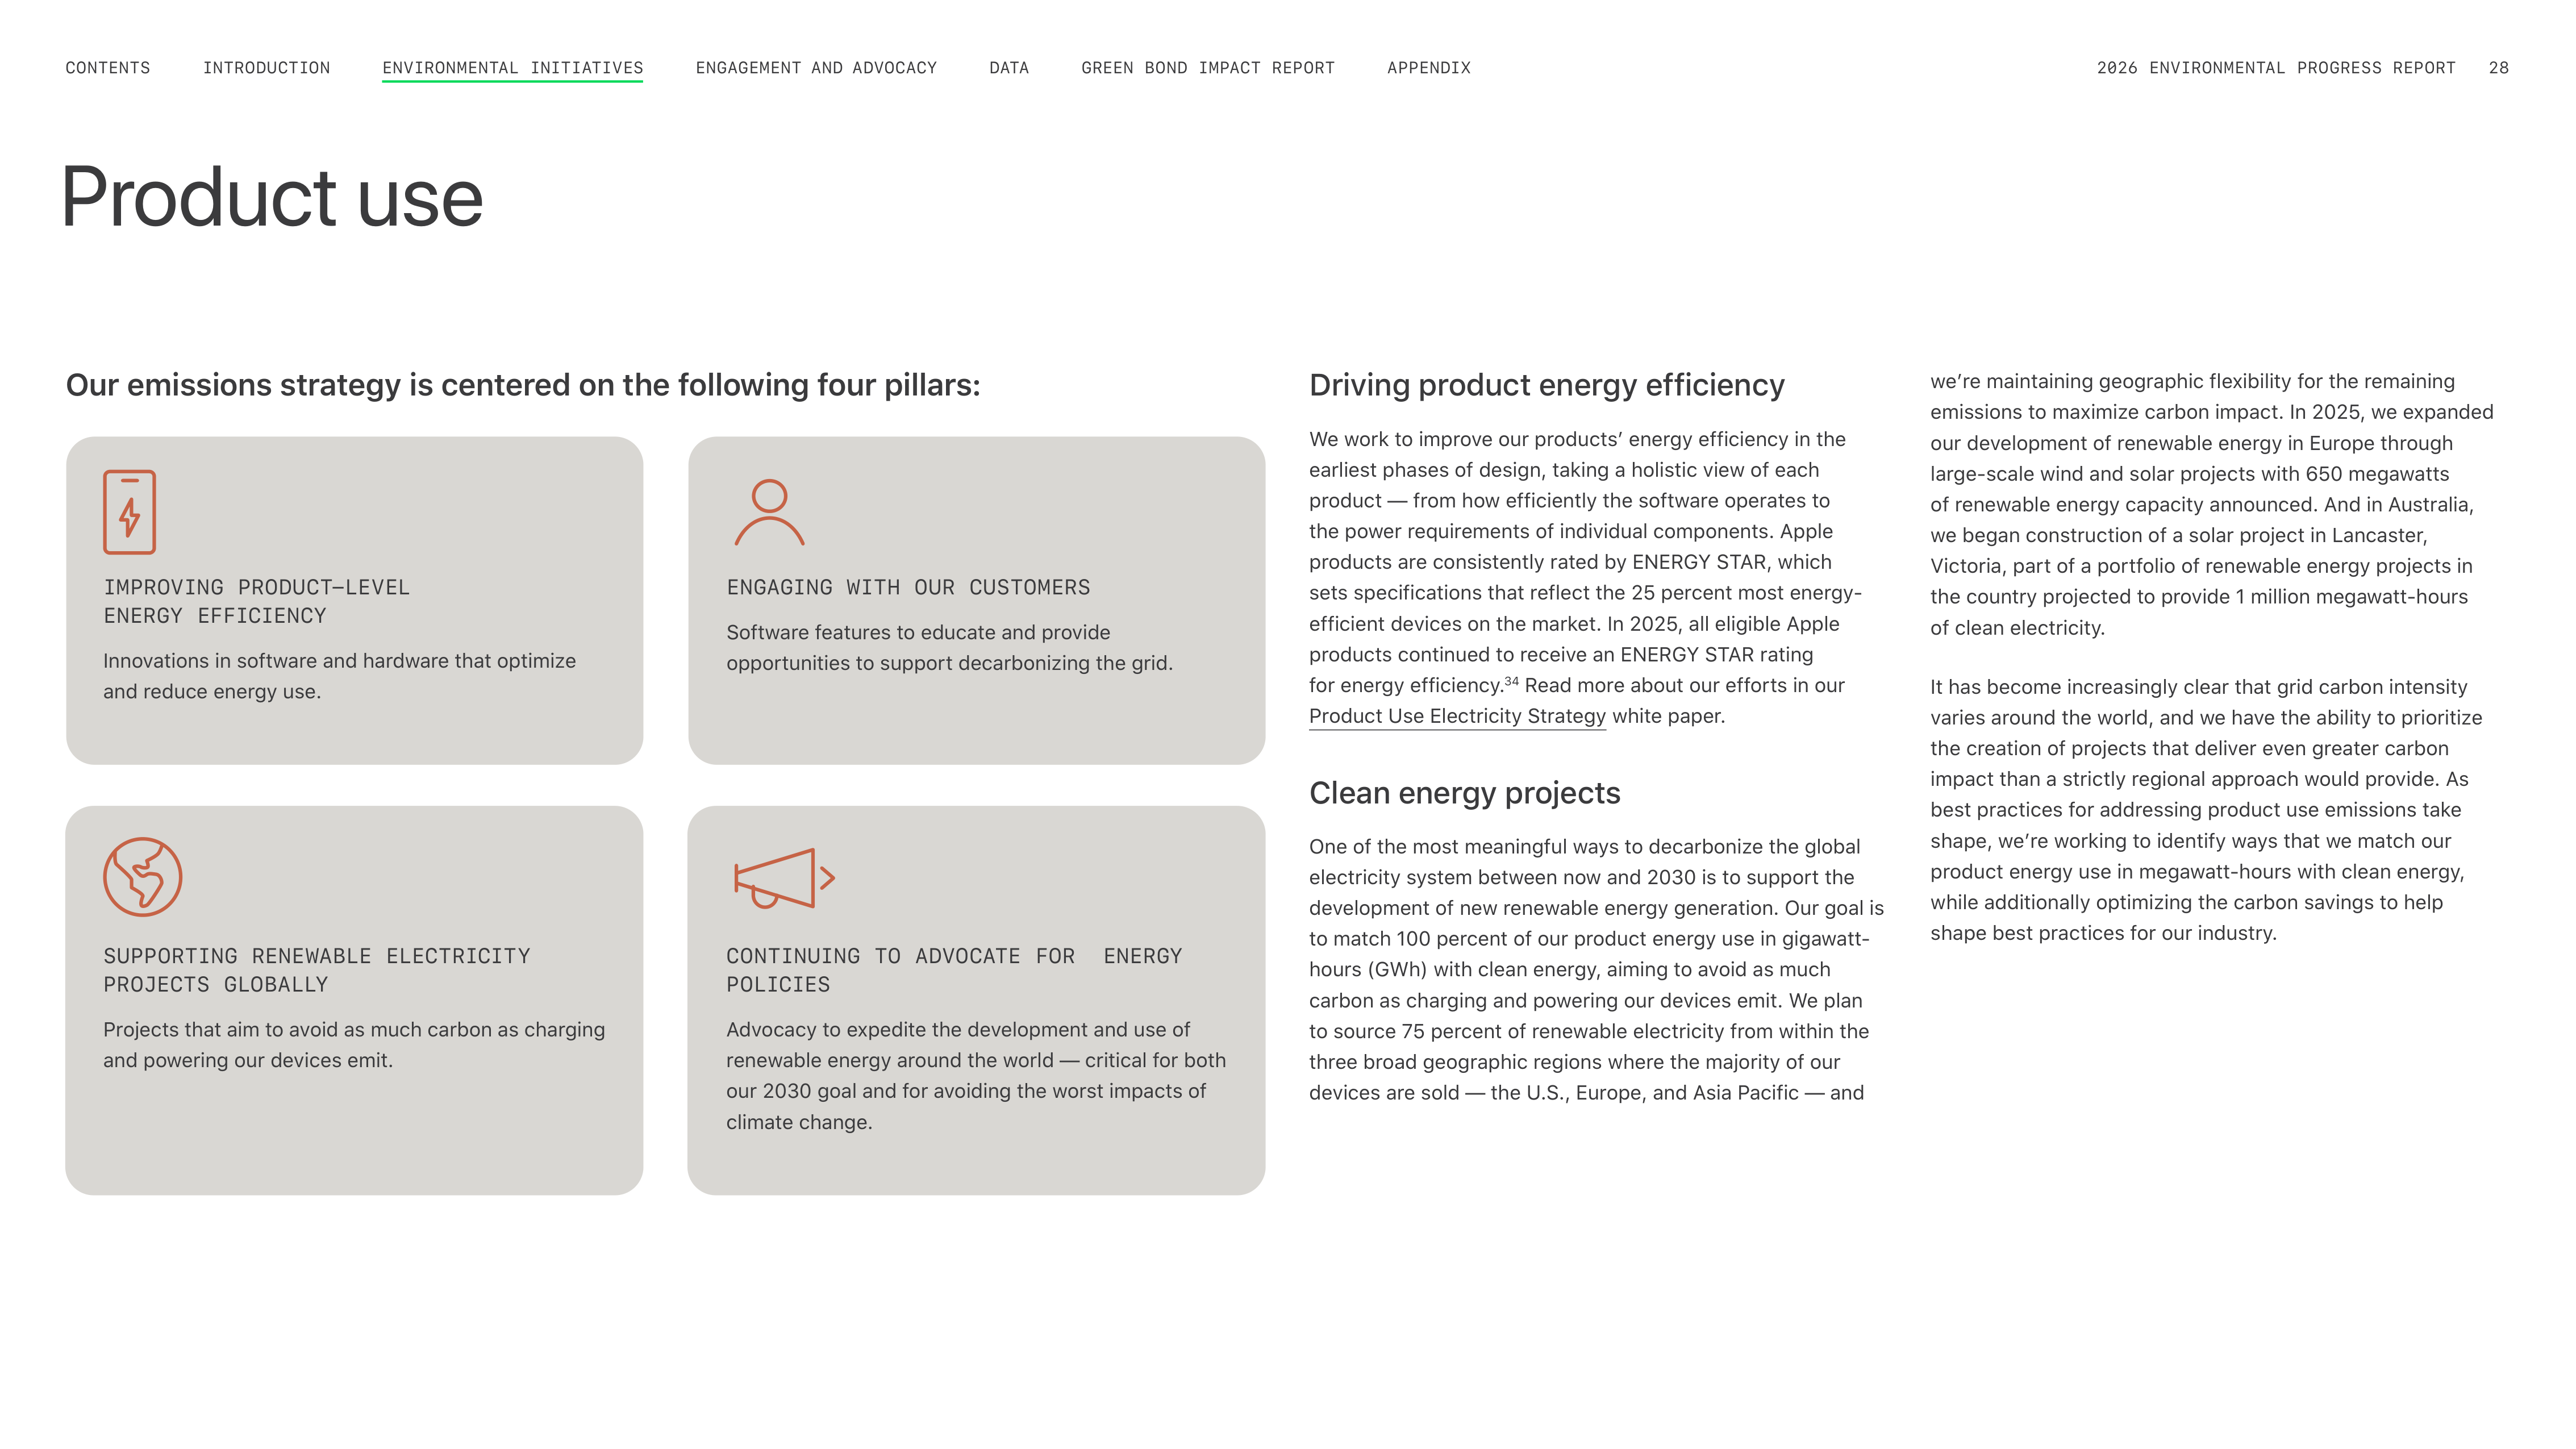
Product use
Our emissions strategy is centered on the following four pillars:
IMPROVING PRODUCT-LEVEL
ENERGY EFFICIENCY
Innovations in software and hardware that optimize
and reduce energy use.
SUPPORTING RENEWABLE ELECTRICITY
PROJECTS GLOBALLY
Projects that aim to avoid as much carbon as charging
and powering our devices emit.
ENGAGING WITH OUR CUSTOMERS
Software features to educate and provide
opportunities to support decarbonizing the grid.
CONTINUING TO ADVOCATE FOR ENERGY
POLICIES
Advocacy to expedite the development and use of
renewable energy around the world — critical for both
our 2030 goal and for avoiding the worst impacts of
climate change.
Driving product energy efficiency
We work to improve our products’ energy efficiency in the
earliest phases of design, taking a holistic view of each
product — from how efficiently the software operates to
the power requirements of individual components. Apple
products are consistently rated by ENERGY STAR, which
sets specifications that reflect the 25 percent most energy-
efficient devices on the market. In 2025, all eligible Apple
products continued to receive an ENERGY STAR rating
for energy efficiency.
34
Read more about our efforts in our
Product Use Electricity Strategy white paper.
Clean energy projects
One of the most meaningful ways to decarbonize the global
electricity system between now and 2030 is to support the
development of new renewable energy generation. Our goal is
to match 100 percent of our product energy use in gigawatt-
hours (GWh) with clean energy, aiming to avoid as much
carbon as charging and powering our devices emit. We plan
to source 75 percent of renewable electricity from within the
three broad geographic regions where the majority of our
devices are sold — the U.S., Europe, and Asia Pacific — and
we’re maintaining geographic flexibility for the remaining
emissions to maximize carbon impact. In 2025, we expanded
our development of renewable energy in Europe through
large-scale wind and solar projects with 650 megawatts
of renewable energy capacity announced. And in Australia,
we began construction of a solar project in Lancaster,
Victoria, part of a portfolio of renewable energy projects in
the country projected to provide 1 million megawatt-hours
of clean electricity.
It has become increasingly clear that grid carbon intensity
varies around the world, and we have the ability to prioritize
the creation of projects that deliver even greater carbon
impact than a strictly regional approach would provide. As
best practices for addressing product use emissions take
shape, we’re working to identify ways that we match our
product energy use in megawatt-hours with clean energy,
while additionally optimizing the carbon savings to help
shape best practices for our industry.
ENGAGEMENT AND ADVOCACY
INTRODUCTION
CONTENTS
GREEN BOND IMPACT REPORT
DATA
APPENDIX
2026 ENVIRONMENTAL PROGRESS REPORT
28
ENVIRONMENTAL INITIATIVES
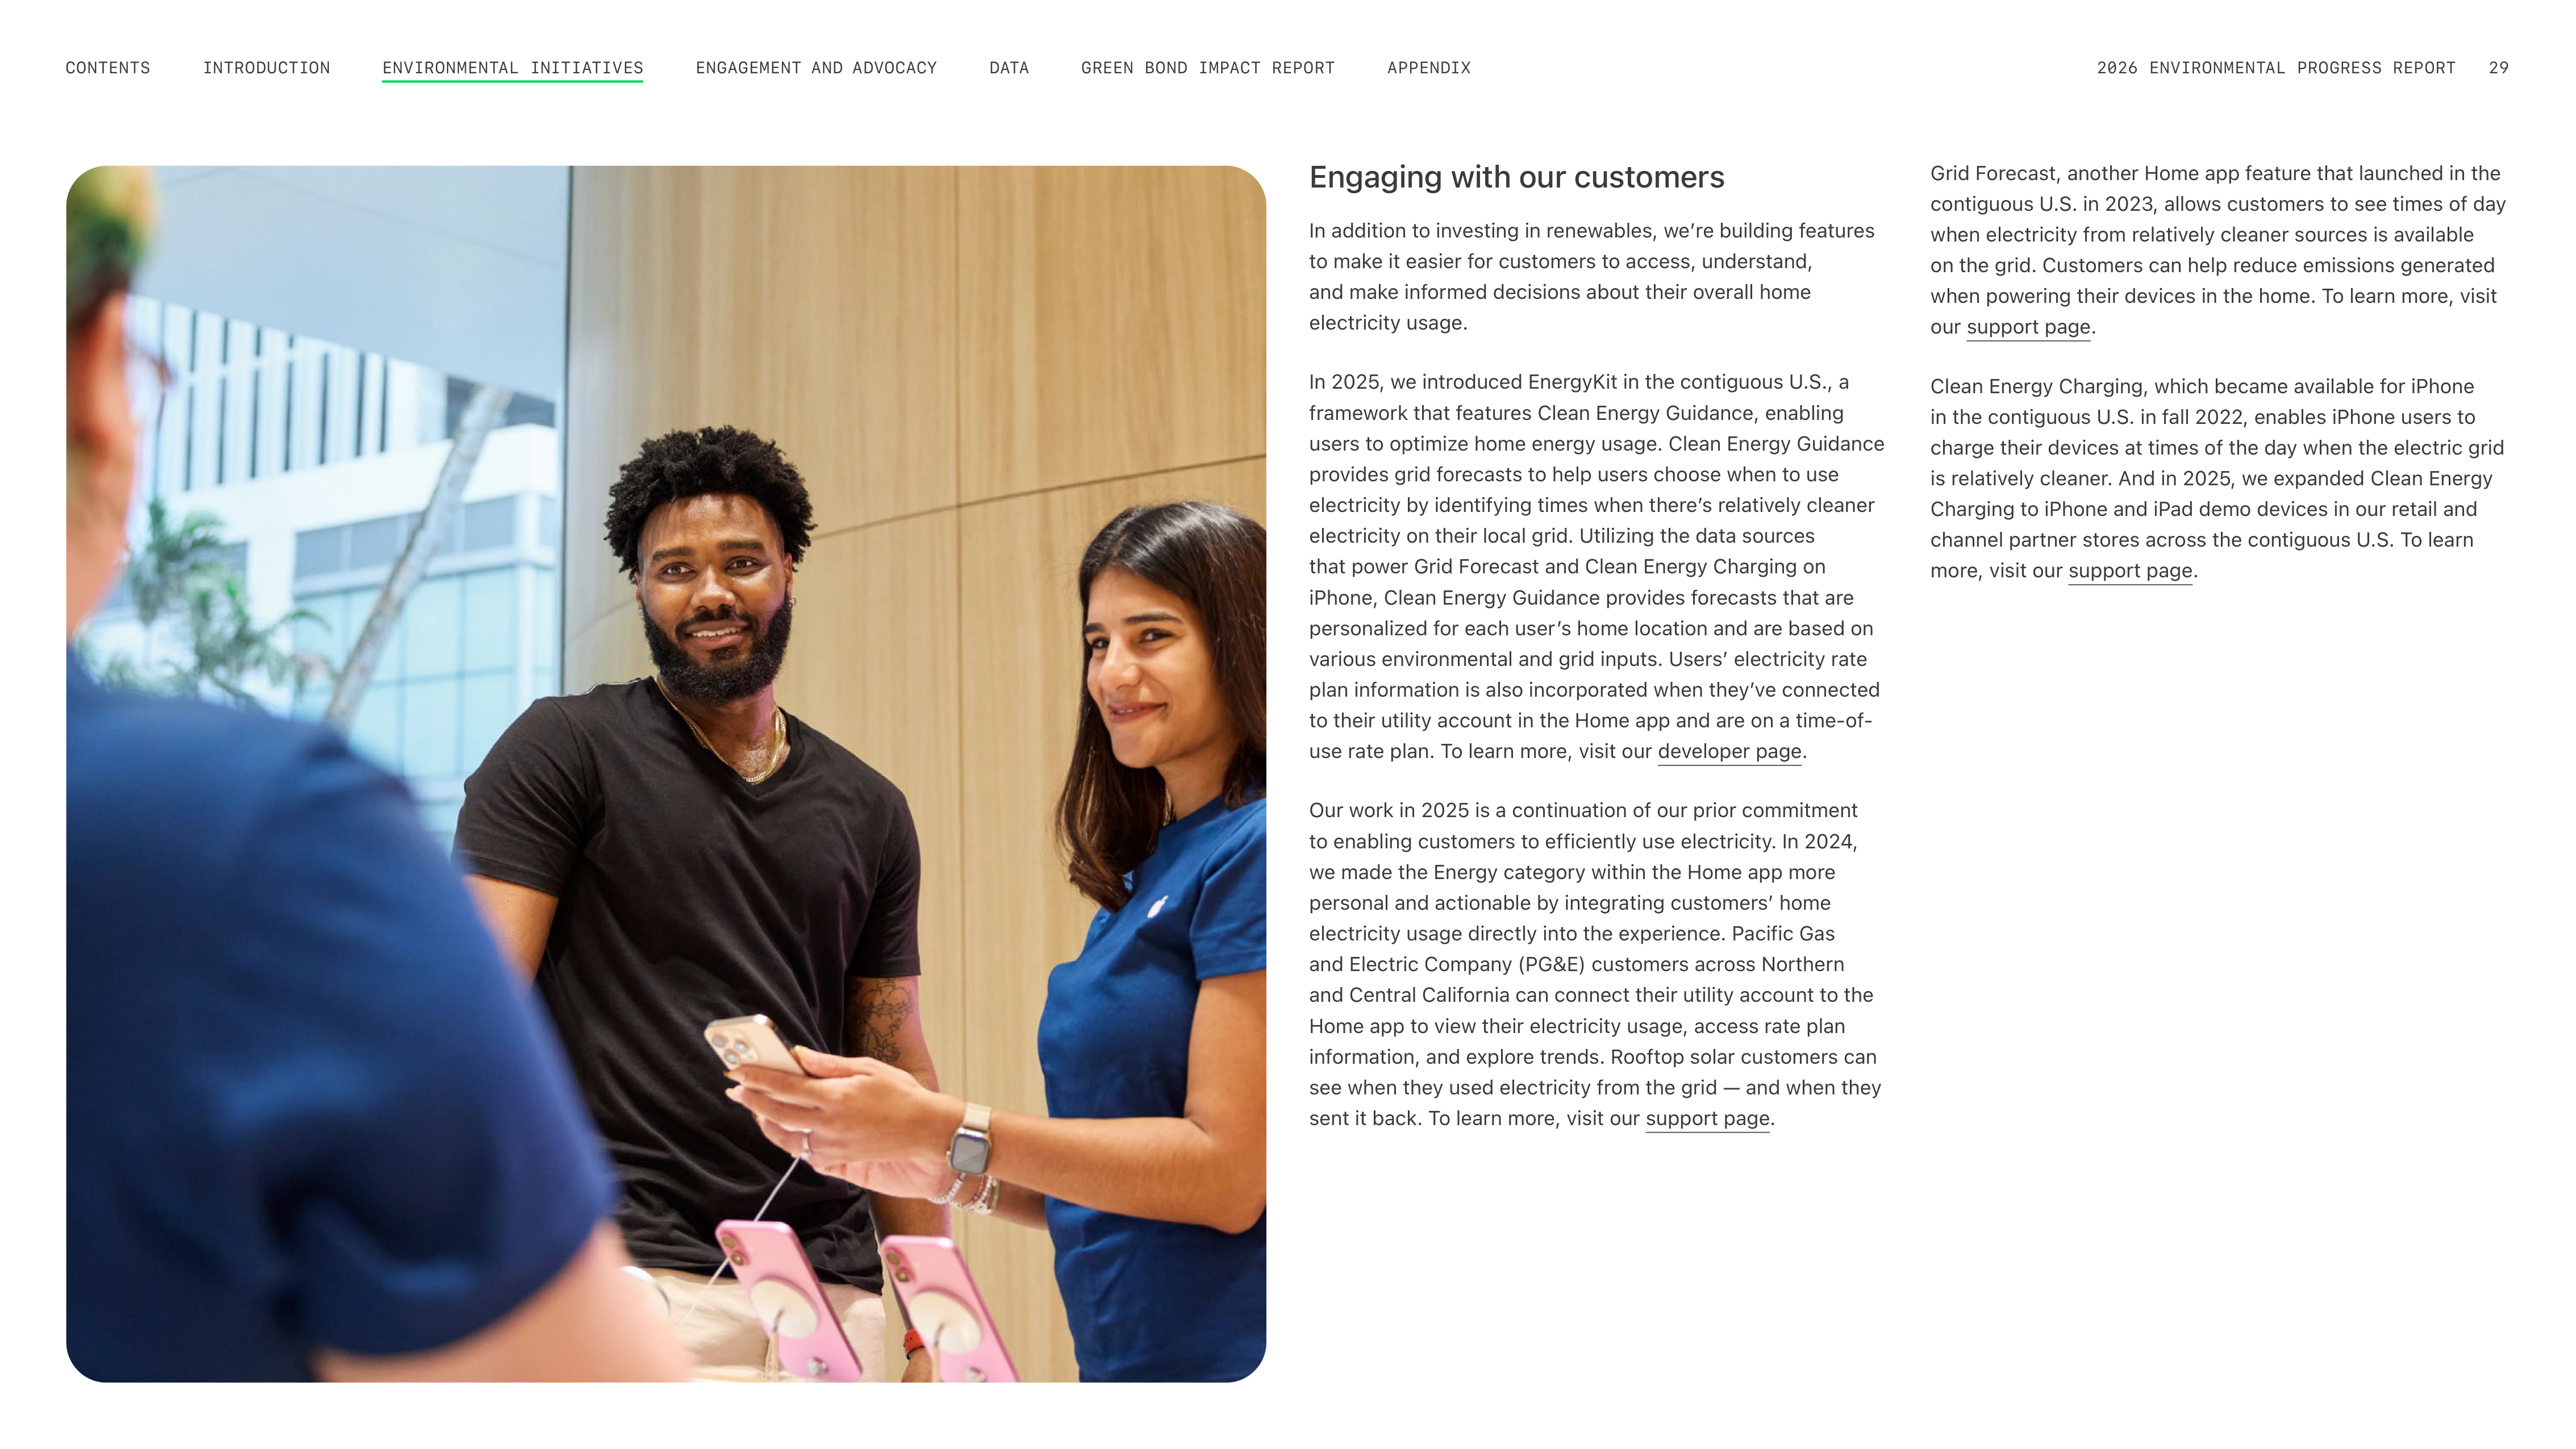

Engaging with our customers
In addition to investing in renewables, weʼre building features
to make it easier for customers to access, understand,
and make informed decisions about their overall home
electricity usage.
In 2025, we introduced EnergyKit in the contiguous U.S., a
framework that features Clean Energy Guidance, enabling
users to optimize home energy usage. Clean Energy Guidance
provides grid forecasts to help users choose when to use
electricity by identifying times when thereʼs relatively cleaner
electricity on their local grid. Utilizing the data sources
that power Grid Forecast and Clean Energy Charging on
iPhone, Clean Energy Guidance provides forecasts that are
personalized for each userʼs home location and are based on
various environmental and grid inputs. Usersʼ electricity rate
plan information is also incorporated when theyʼve connected
to their utility account in the Home app and are on a time-of-
use rate plan. To learn more, visit our developer page.
Our work in 2025 is a continuation of our prior commitment
to enabling customers to efficiently use electricity. In 2024,
we made the Energy category within the Home app more
personal and actionable by integrating customersʼ home
electricity usage directly into the experience. Pacific Gas
and Electric Company (PG&E) customers across Northern
and Central California can connect their utility account to the
Home app to view their electricity usage, access rate plan
information, and explore trends. Rooftop solar customers can
see when they used electricity from the grid — and when they
sent it back. To learn more, visit our support page.
Grid Forecast, another Home app feature that launched in the
contiguous U.S. in 2023, allows customers to see times of day
when electricity from relatively cleaner sources is available
on the grid. Customers can help reduce emissions generated
when powering their devices in the home. To learn more, visit
our support page.
Clean Energy Charging, which became available for iPhone
in the contiguous U.S. in fall 2022, enables iPhone users to
charge their devices at times of the day when the electric grid
is relatively cleaner. And in 2025, we expanded Clean Energy
Charging to iPhone and iPad demo devices in our retail and
channel partner stores across the contiguous U.S. To learn
more, visit our support page.
ENGAGEMENT AND ADVOCACY
INTRODUCTION
CONTENTS
GREEN BOND IMPACT REPORT
DATA
APPENDIX
2026 ENVIRONMENTAL PROGRESS REPORT
29
ENVIRONMENTAL INITIATIVES
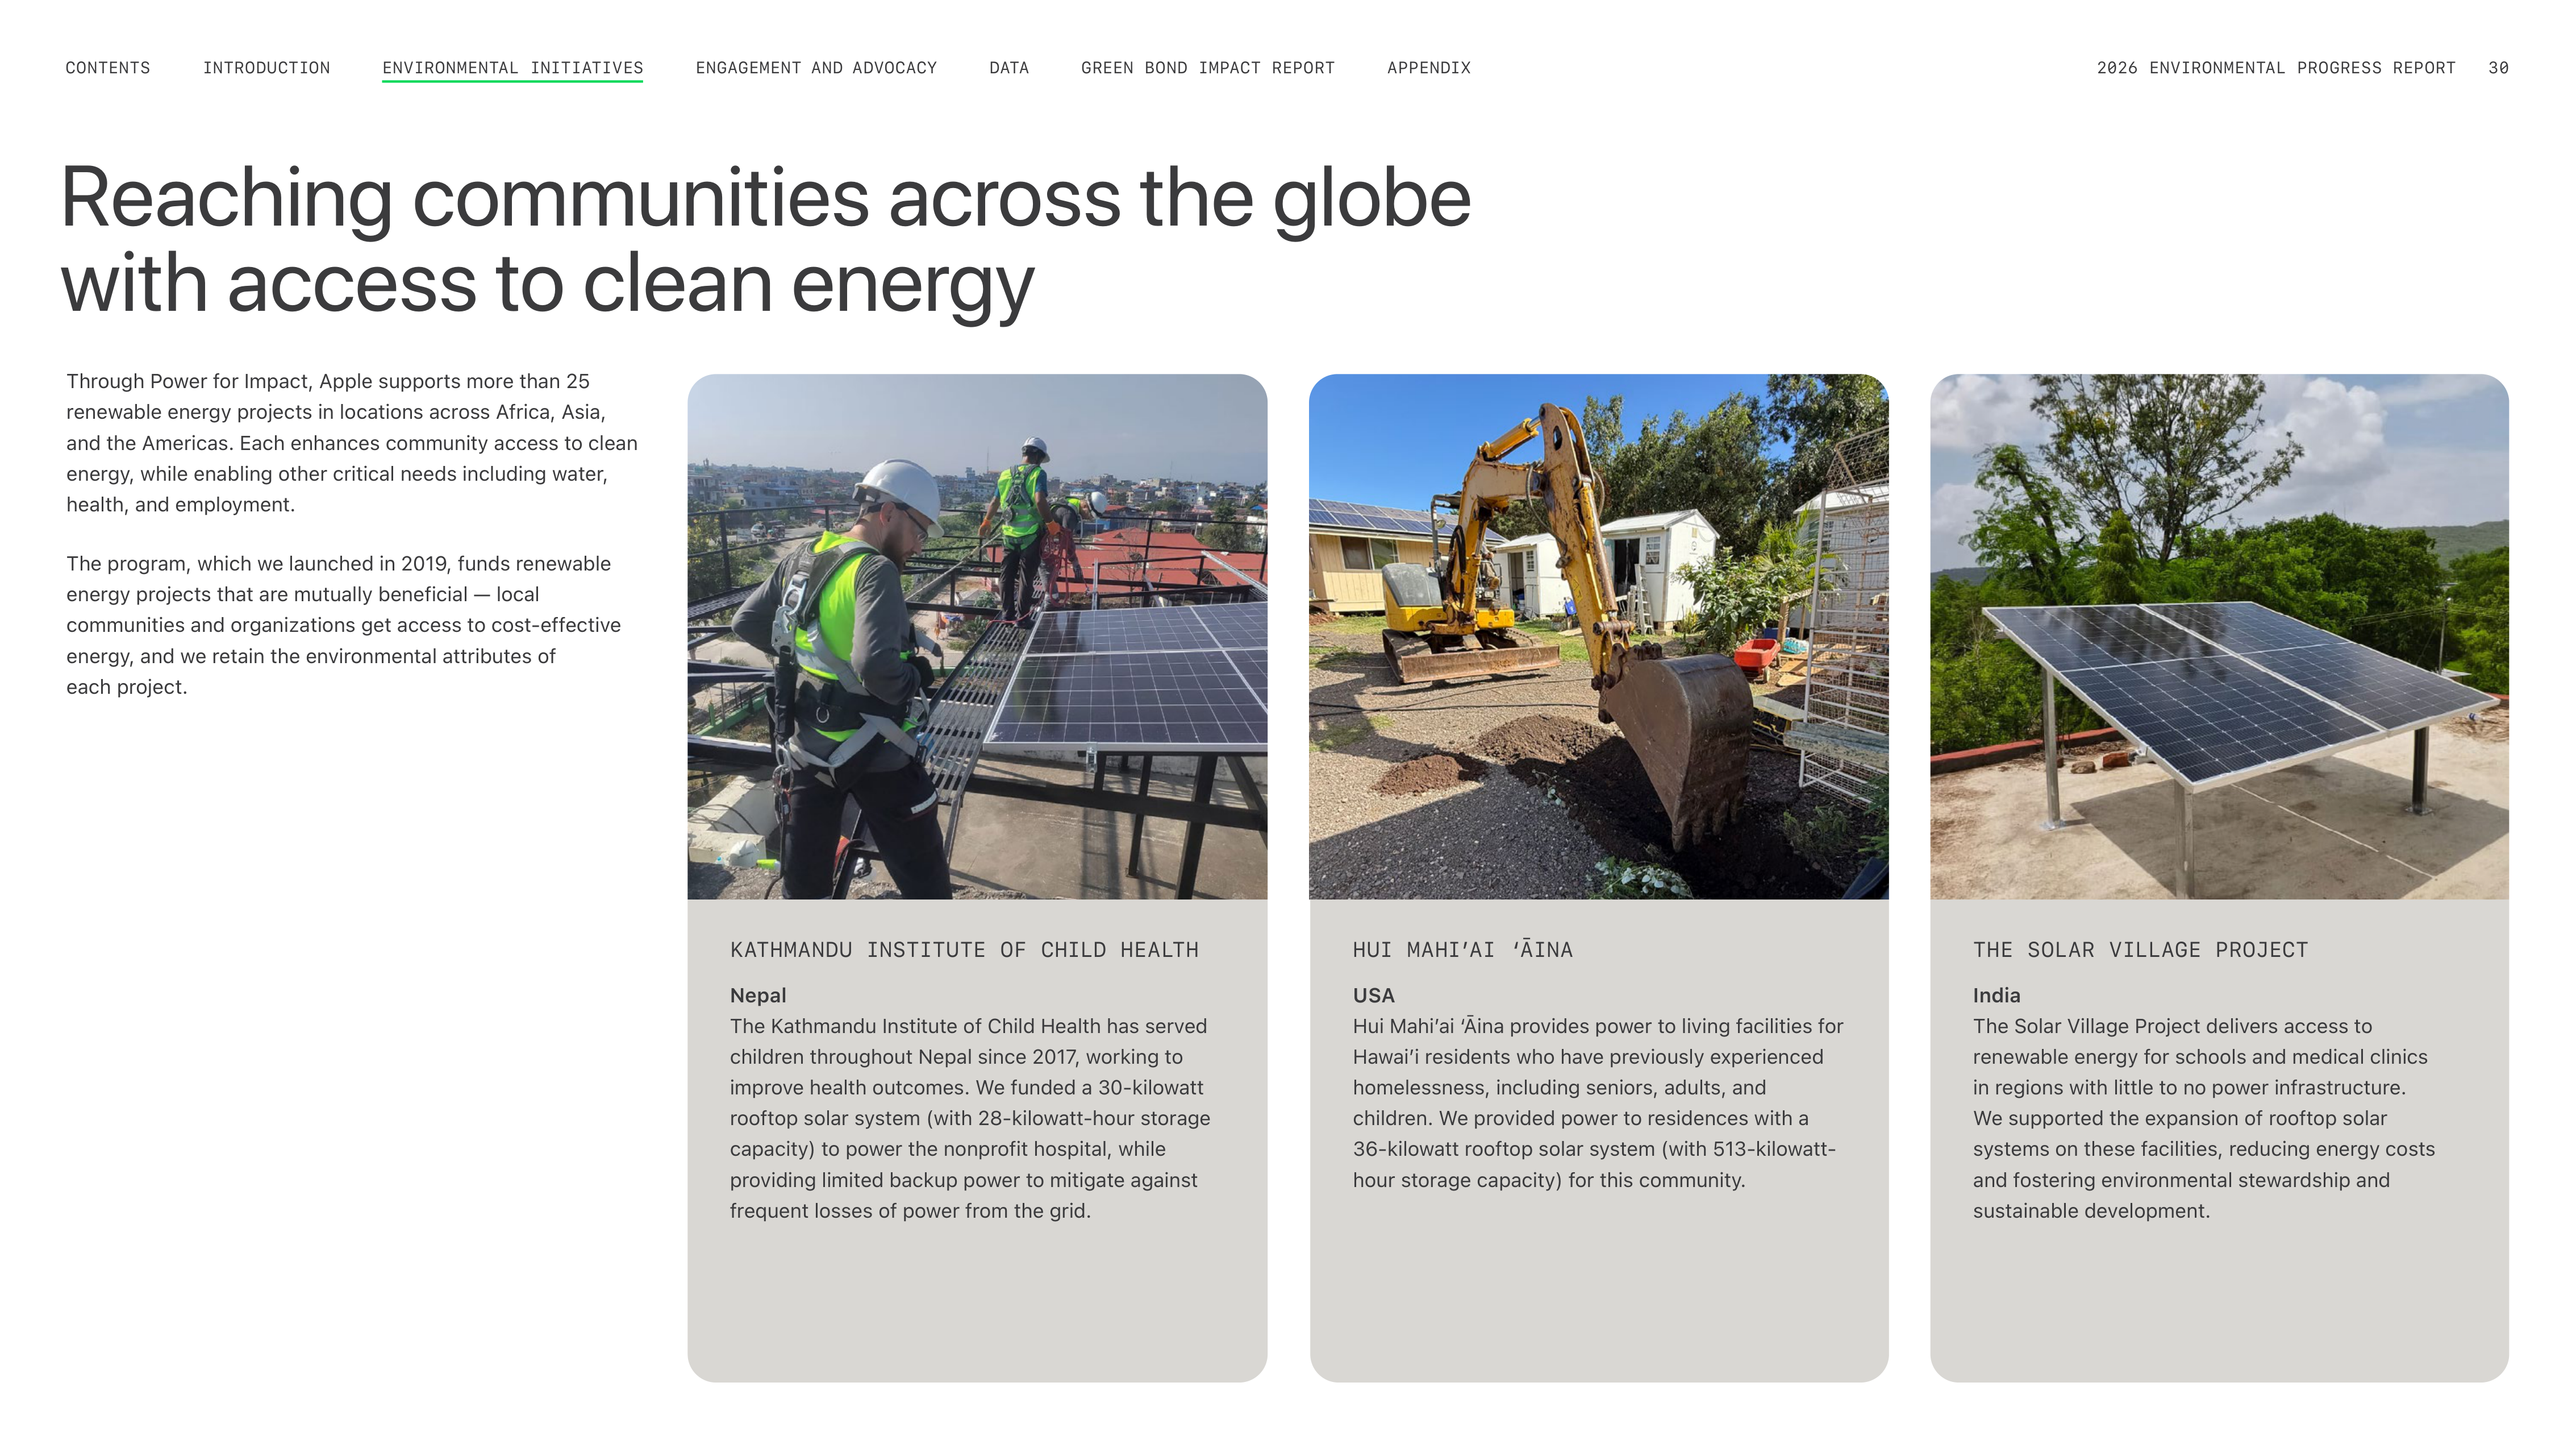
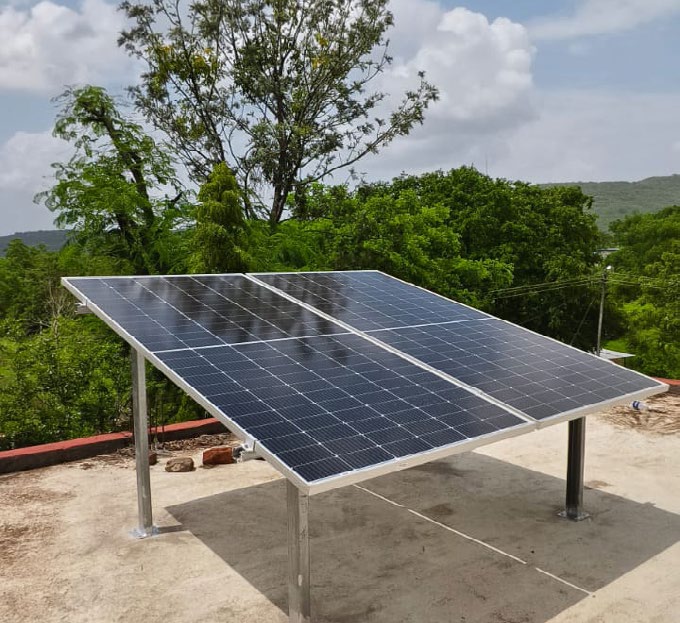
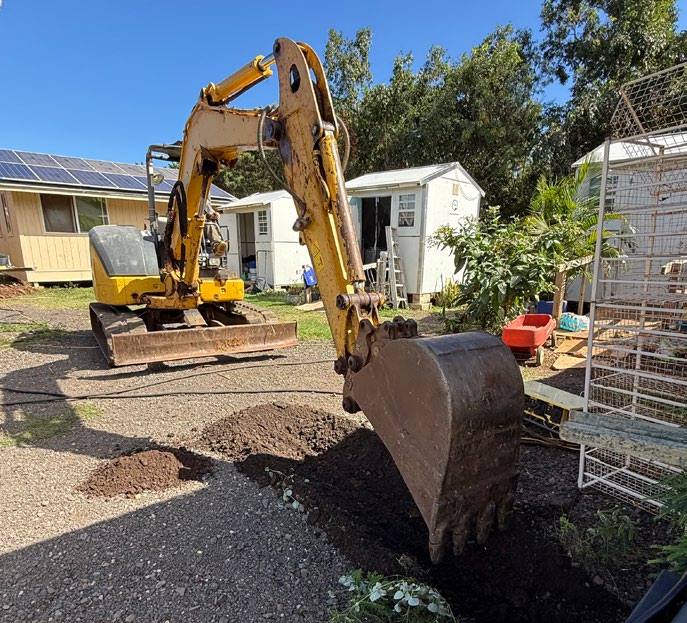
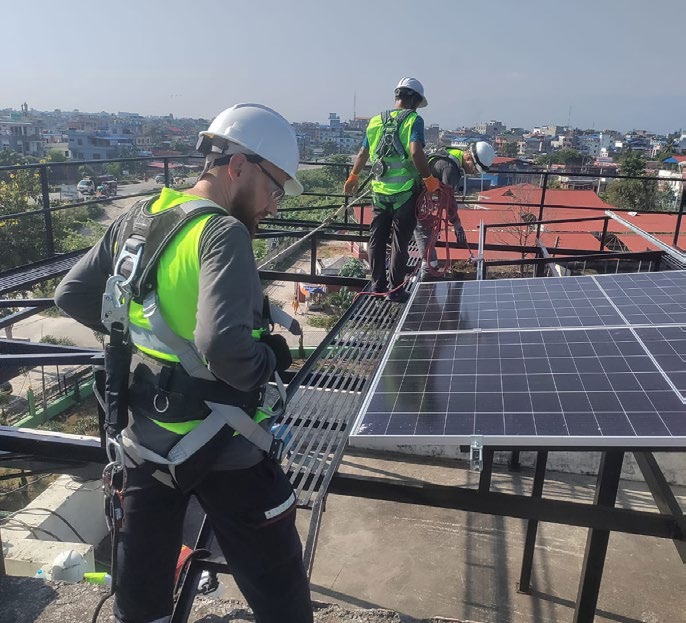
Reaching communities across the globe
with access to clean energy
Through Power for Impact, Apple supports more than 25
renewable energy projects in locations across Africa, Asia,
and the Americas. Each enhances community access to clean
energy, while enabling other critical needs including water,
health, and employment.
The program, which we launched in 2019, funds renewable
energy projects that are mutually beneficial — local
communities and organizations get access to cost-effective
energy, and we retain the environmental attributes of
each project.
THE SOLAR VILLAGE PROJECT
India
The Solar Village Project delivers access to
renewable energy for schools and medical clinics
in regions with little to no power infrastructure.
We supported the expansion of rooftop solar
systems on these facilities, reducing energy costs
and fostering environmental stewardship and
sustainable development.
HUI MAHI’AI ‘ĀINA
USA
Hui Mahiʼai ‘Āina provides power to living facilities for
Hawaiʼi residents who have previously experienced
homelessness, including seniors, adults, and
children. We provided power to residences with a
36-kilowatt rooftop solar system (with 513-kilowatt-
hour storage capacity) for this community.
KATHMANDU INSTITUTE OF CHILD HEALTH
Nepal
The Kathmandu Institute of Child Health has served
children throughout Nepal since 2017, working to
improve health outcomes. We funded a 30-kilowatt
rooftop solar system (with 28-kilowatt-hour storage
capacity) to power the nonprofit hospital, while
providing limited backup power to mitigate against
frequent losses of power from the grid.
ENGAGEMENT AND ADVOCACY
INTRODUCTION
CONTENTS
GREEN BOND IMPACT REPORT
DATA
APPENDIX
2026 ENVIRONMENTAL PROGRESS REPORT
30
ENVIRONMENTAL INITIATIVES
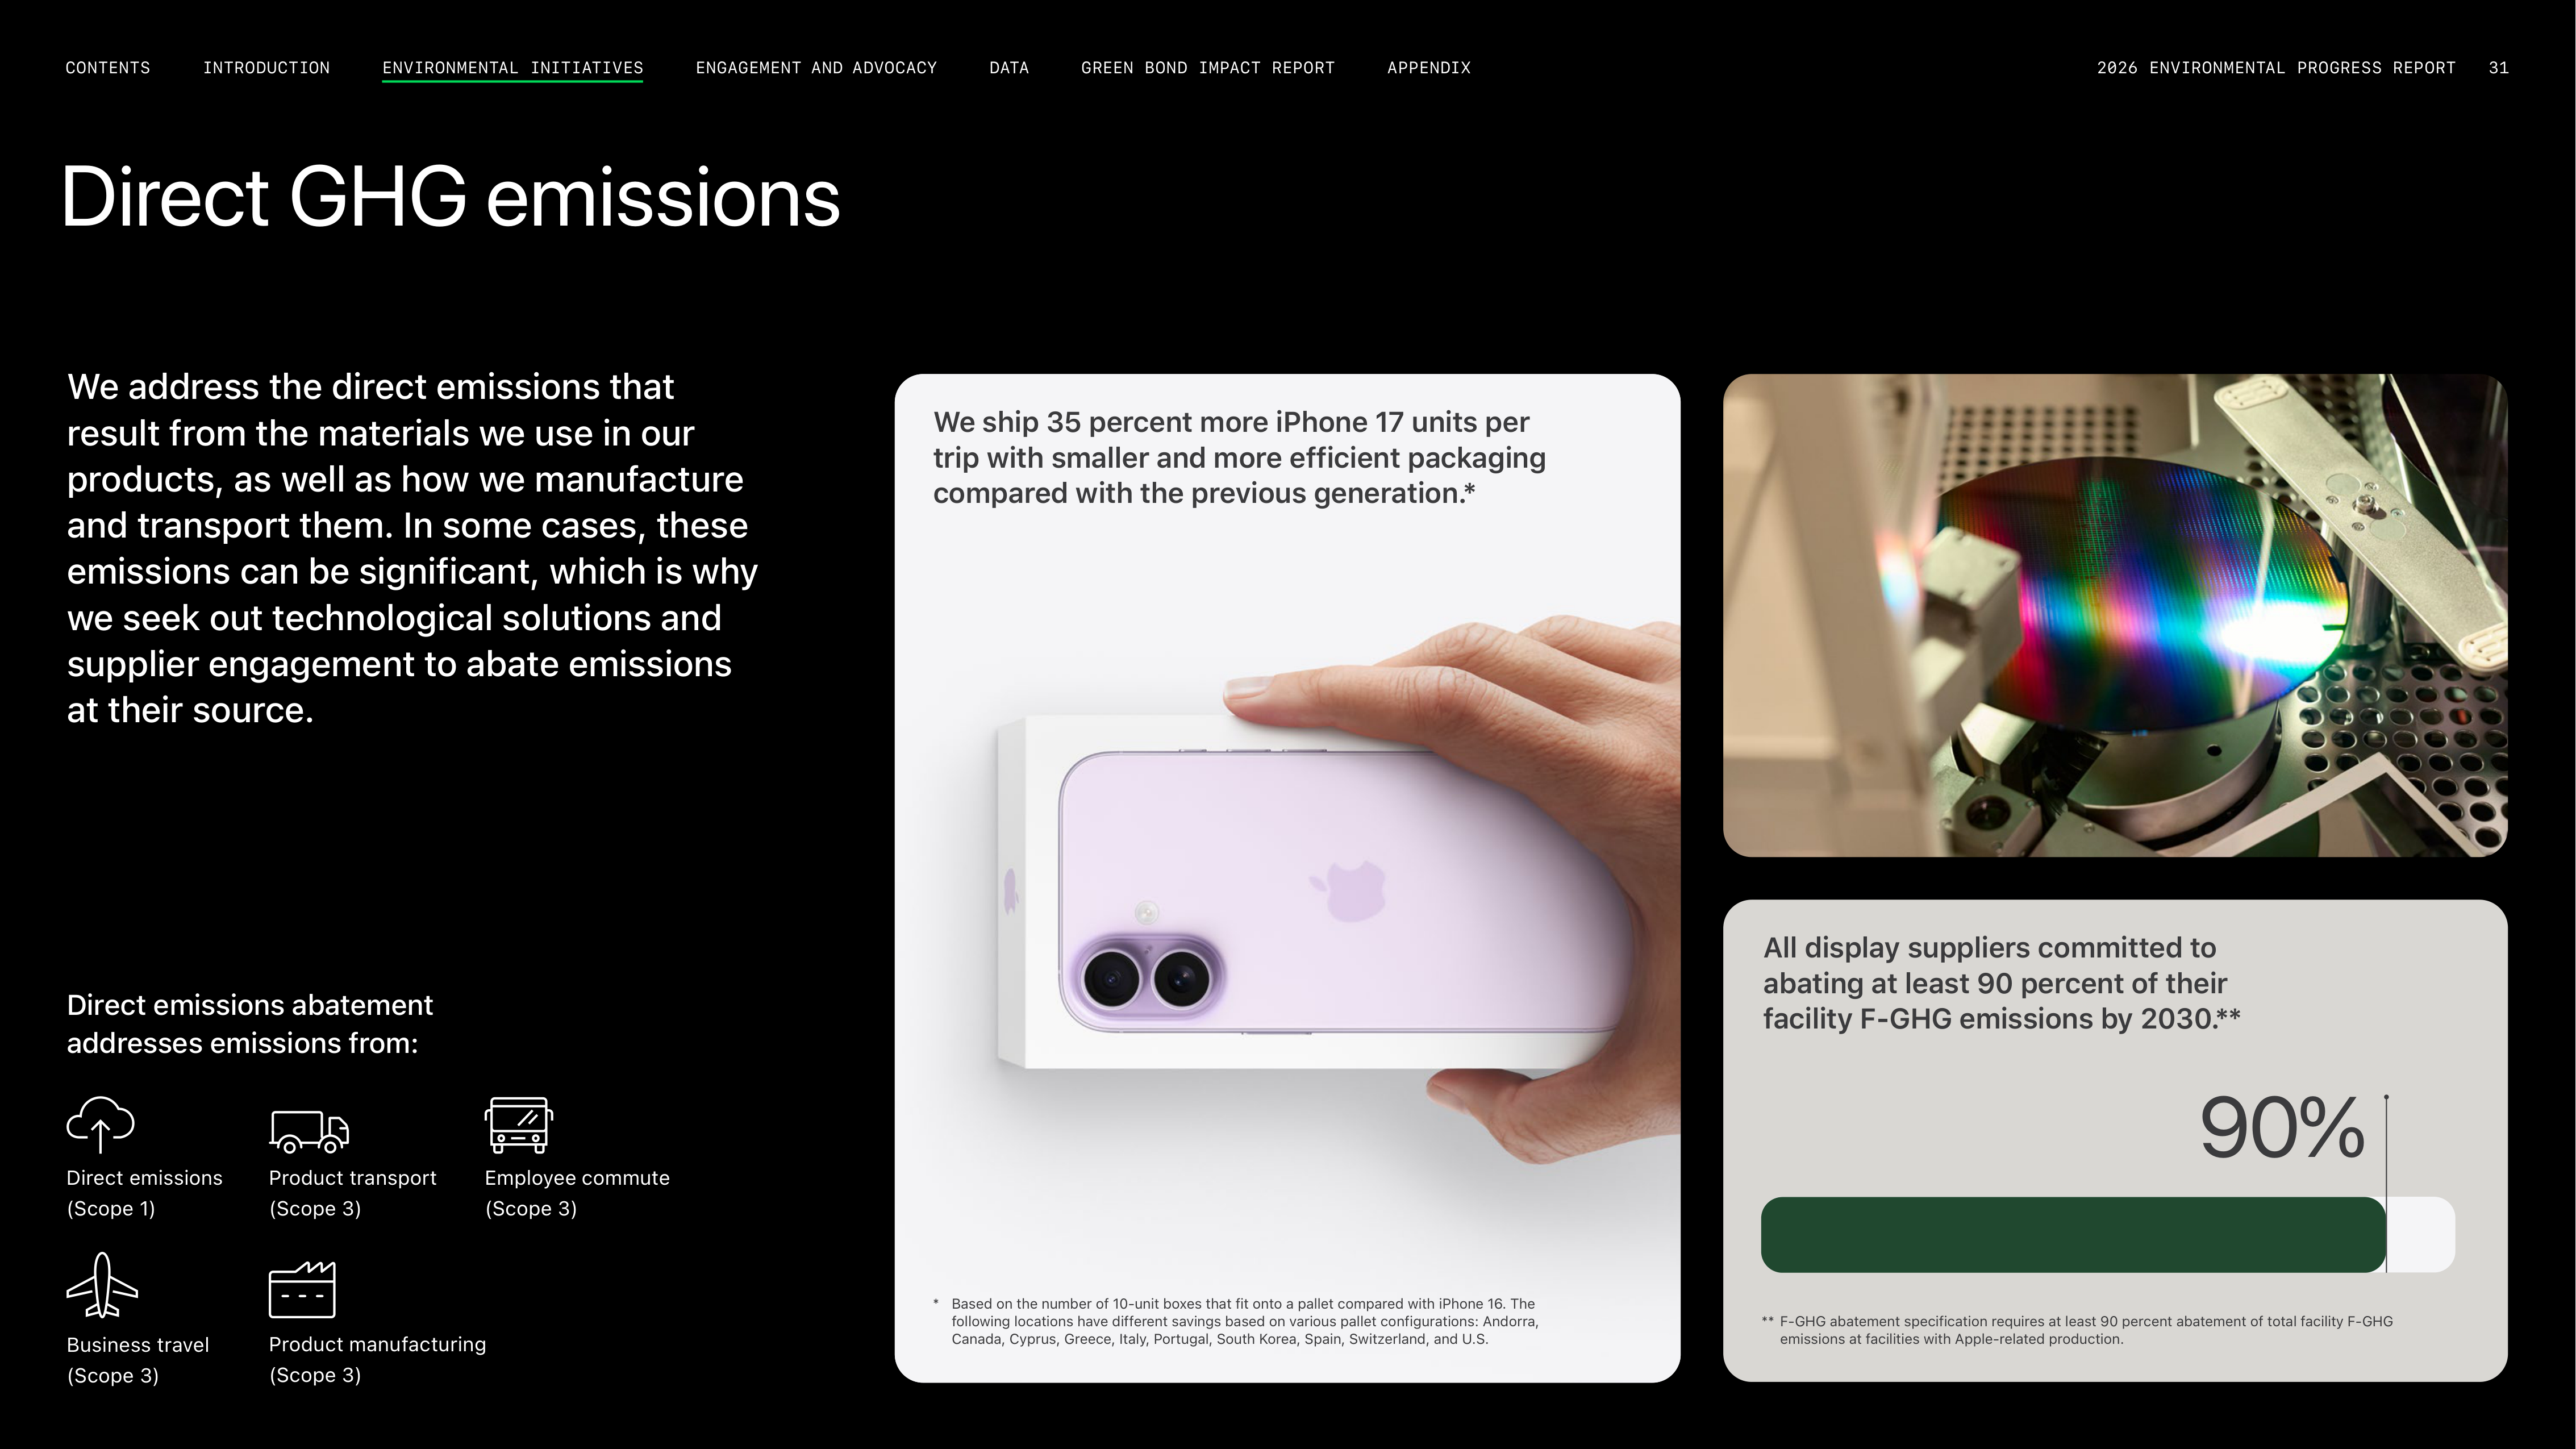
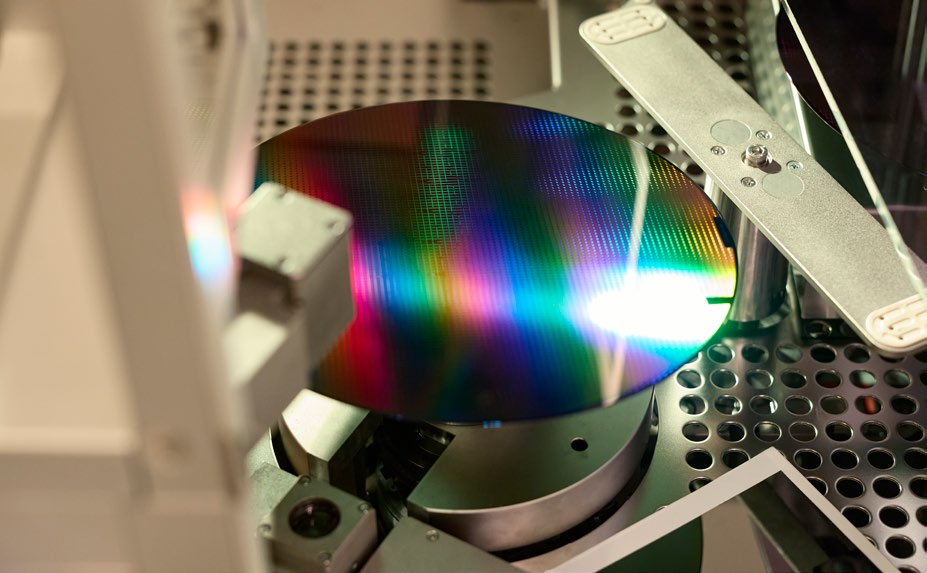

90%
Direct GHG emissions
We address the direct emissions that
result from the materials we use in our
products, as well as how we manufacture
and transport them. In some cases, these
emissions can be significant, which is why
we seek out technological solutions and
supplier engagement to abate emissions
at their source.
Direct emissions abatement
addresses emissions from:
Direct emissions
(Scope 1)
Business travel
(Scope 3)
Product transport
(Scope 3)
Employee commute
(Scope 3)
Product manufacturing
(Scope 3)
We ship 35 percent more iPhone 17 units per
trip with smaller and more efficient packaging
compared with the previous generation.*
*
Based on the number of 10-unit boxes that fit onto a pallet compared with iPhone 16. The
following locations have different savings based on various pallet configurations: Andorra,
Canada, Cyprus, Greece, Italy, Portugal, South Korea, Spain, Switzerland, and U.S.
All display suppliers committed to
abating at least 90 percent of their
facility F-GHG emissions by 2030.**
** F-GHG abatement specification requires at least 90 percent abatement of total facility F-GHG
emissions at facilities with Apple-related production.
2026 ENVIRONMENTAL PROGRESS REPORT
31
ENGAGEMENT AND ADVOCACY
INTRODUCTION
CONTENTS
APPENDIX
GREEN BOND IMPACT REPORT
DATA
ENVIRONMENTAL INITIATIVES
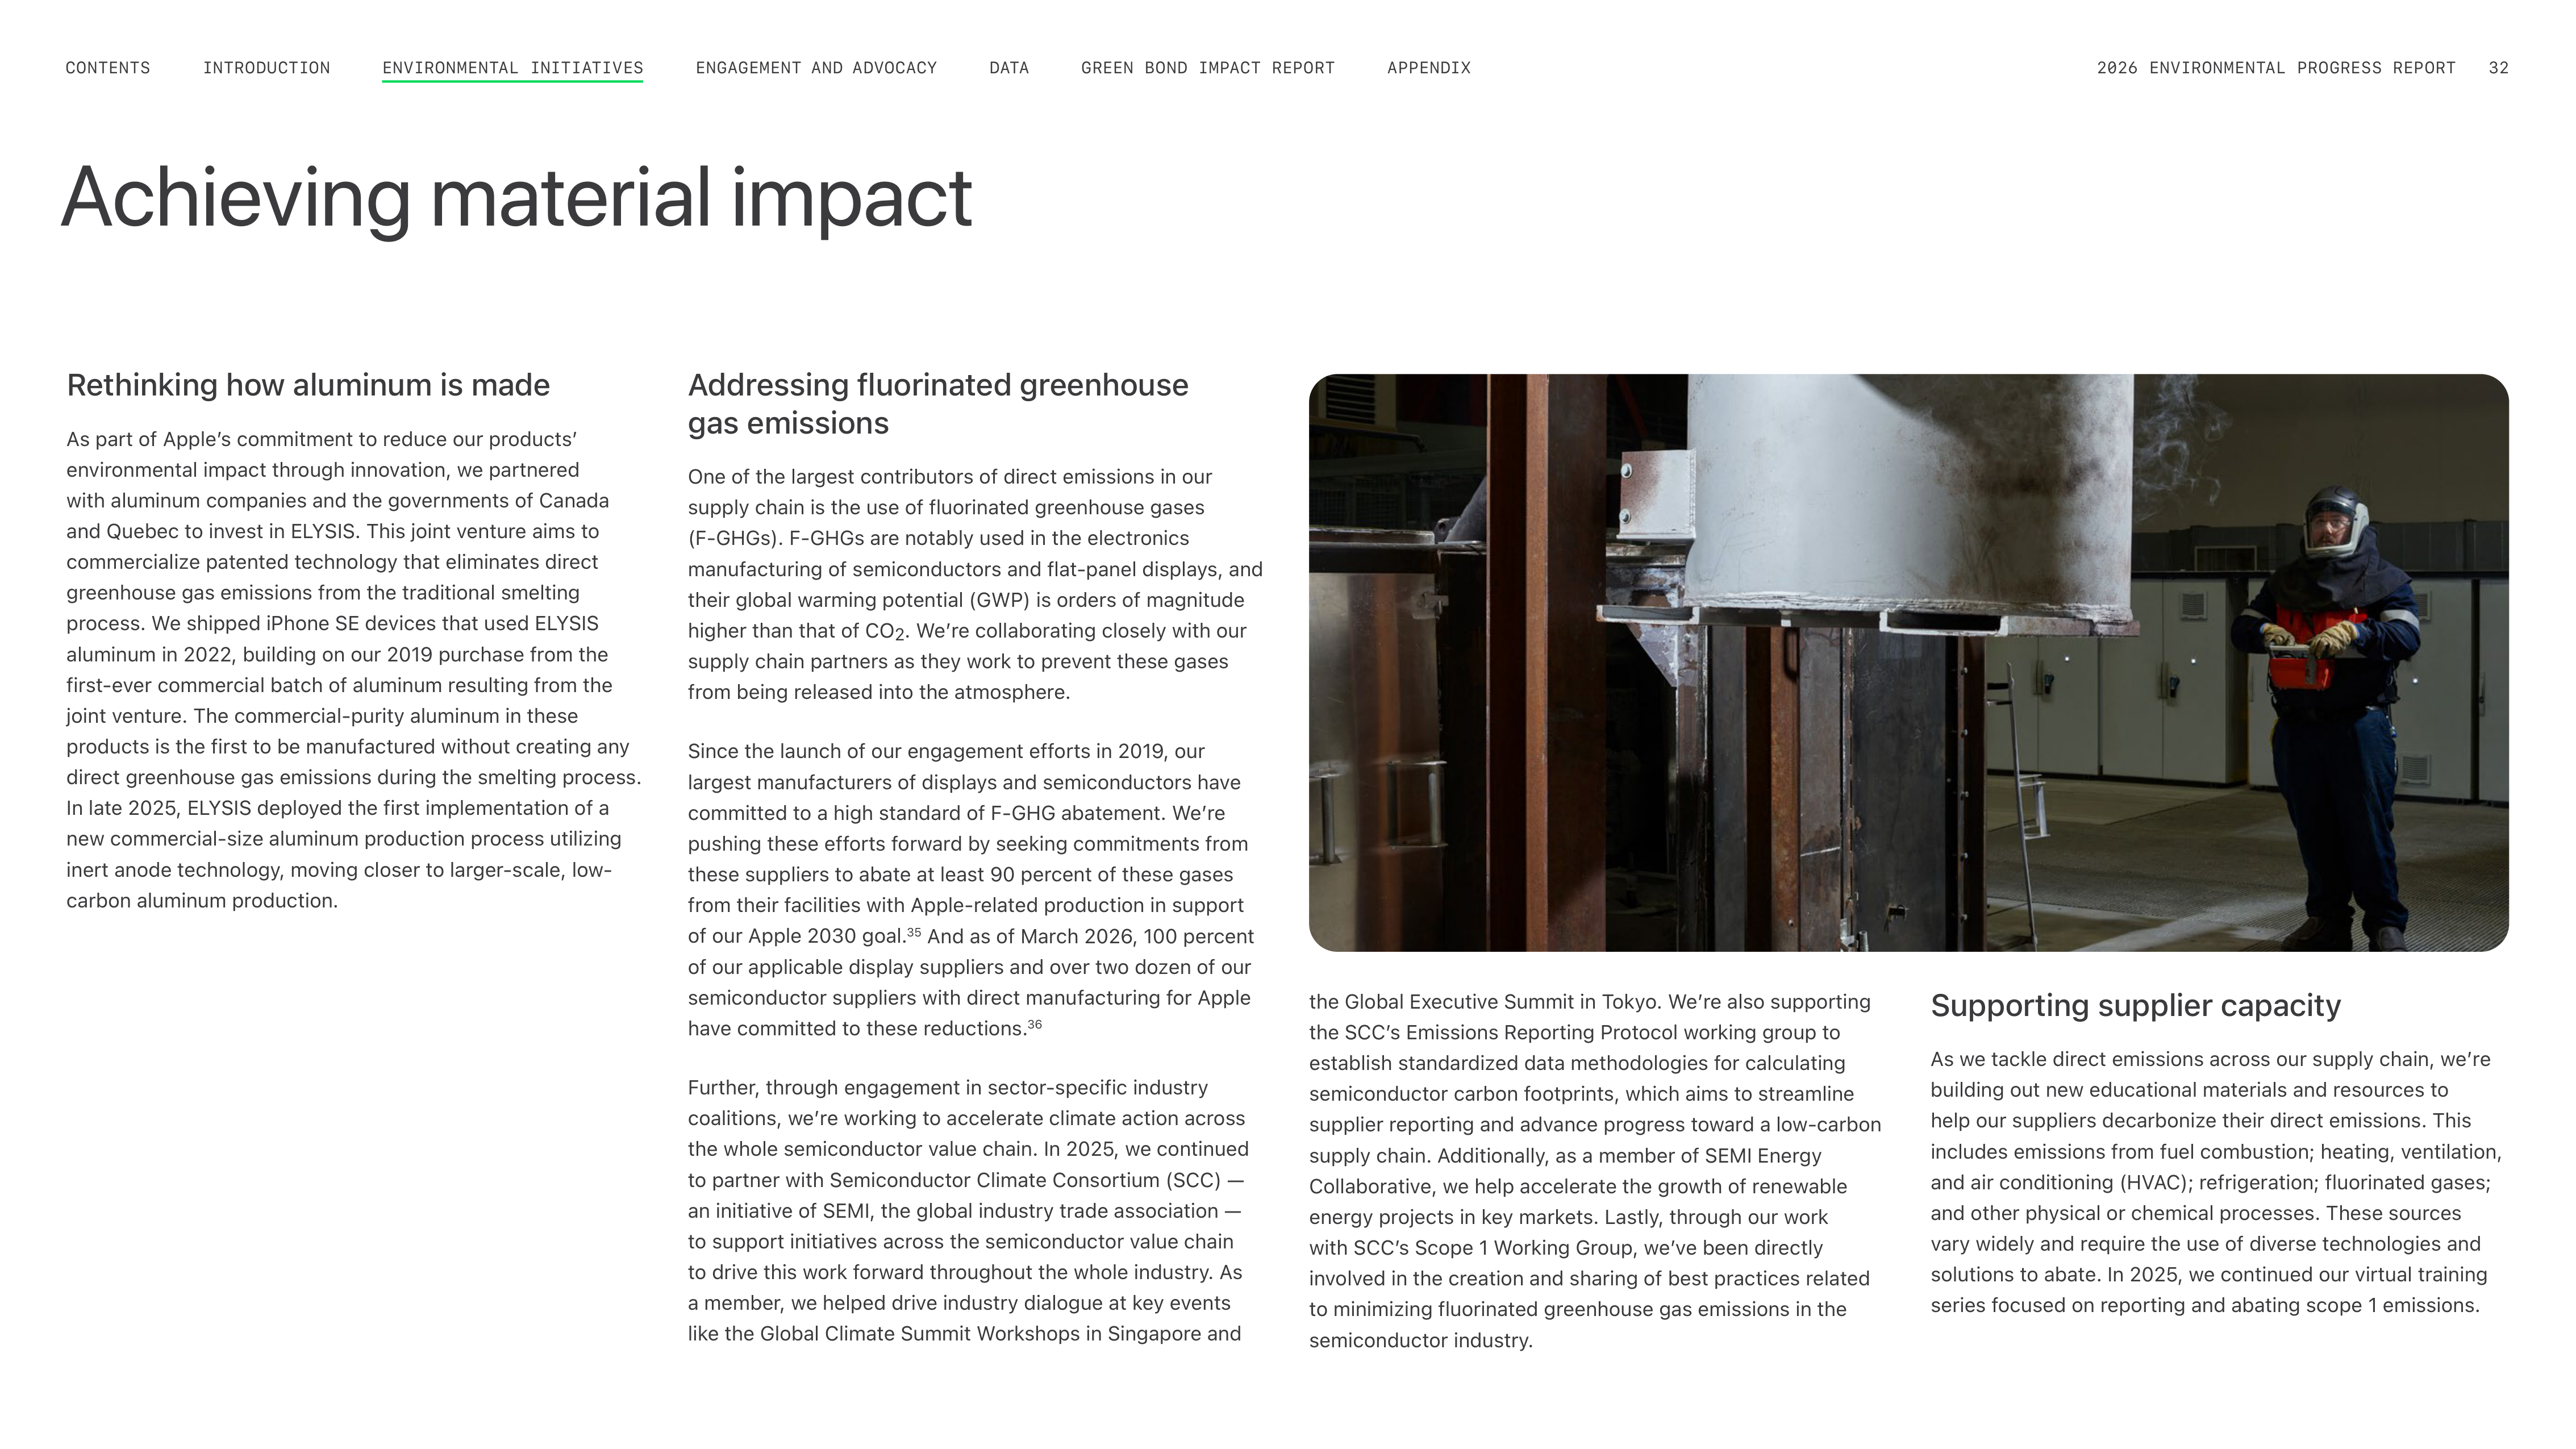

Rethinking how aluminum is made
As part of Appleʼs commitment to reduce our productsʼ
environmental impact through innovation, we partnered
with aluminum companies and the governments of Canada
and Quebec to invest in ELYSIS. This joint venture aims to
commercialize patented technology that eliminates direct
greenhouse gas emissions from the traditional smelting
process. We shipped iPhone SE devices that used ELYSIS
aluminum in 2022, building on our 2019 purchase from the
first-ever commercial batch of aluminum resulting from the
joint venture. The commercial-purity aluminum in these
products is the first to be manufactured without creating any
direct greenhouse gas emissions during the smelting process.
In late 2025, ELYSIS deployed the first implementation of a
new commercial-size aluminum production process utilizing
inert anode technology, moving closer to larger-scale, low-
carbon aluminum production.
Supporting supplier capacity
As we tackle direct emissions across our supply chain, weʼre
building out new educational materials and resources to
help our suppliers decarbonize their direct emissions. This
includes emissions from fuel combustion; heating, ventilation,
and air conditioning (HVAC); refrigeration; fluorinated gases;
and other physical or chemical processes. These sources
vary widely and require the use of diverse technologies and
solutions to abate. In 2025, we continued our virtual training
series focused on reporting and abating scope 1 emissions.
Achieving material impact
Addressing fluorinated greenhouse
gas emissions
One of the largest contributors of direct emissions in our
supply chain is the use of fluorinated greenhouse gases
(F-GHGs). F-GHGs are notably used in the electronics
manufacturing of semiconductors and flat-panel displays, and
their global warming potential (GWP) is orders of magnitude
higher than that of CO
2
. Weʼre collaborating closely with our
supply chain partners as they work to prevent these gases
from being released into the atmosphere.
Since the launch of our engagement efforts in 2019, our
largest manufacturers of displays and semiconductors have
committed to a high standard of F-GHG abatement. Weʼre
pushing these efforts forward by seeking commitments from
these suppliers to abate at least 90 percent of these gases
from their facilities with Apple-related production in support
of our Apple 2030 goal.
35
And as of March 2026, 100 percent
of our applicable display suppliers and over two dozen of our
semiconductor suppliers with direct manufacturing for Apple
have committed to these reductions.
36
Further, through engagement in sector-specific industry
coalitions, weʼre working to accelerate climate action across
the whole semiconductor value chain. In 2025, we continued
to partner with Semiconductor Climate Consortium (SCC) —
an initiative of SEMI, the global industry trade association —
to support initiatives across the semiconductor value chain
to drive this work forward throughout the whole industry. As
a member, we helped drive industry dialogue at key events
like the Global Climate Summit Workshops in Singapore and
the Global Executive Summit in Tokyo. Weʼre also supporting
the SCCʼs Emissions Reporting Protocol working group to
establish standardized data methodologies for calculating
semiconductor carbon footprints, which aims to streamline
supplier reporting and advance progress toward a low-carbon
supply chain. Additionally, as a member of SEMI Energy
Collaborative, we help accelerate the growth of renewable
energy projects in key markets. Lastly, through our work
with SCCʼs Scope 1 Working Group, weʼve been directly
involved in the creation and sharing of best practices related
to minimizing fluorinated greenhouse gas emissions in the
semiconductor industry.
ENGAGEMENT AND ADVOCACY
INTRODUCTION
CONTENTS
GREEN BOND IMPACT REPORT
DATA
APPENDIX
2026 ENVIRONMENTAL PROGRESS REPORT
32
ENVIRONMENTAL INITIATIVES
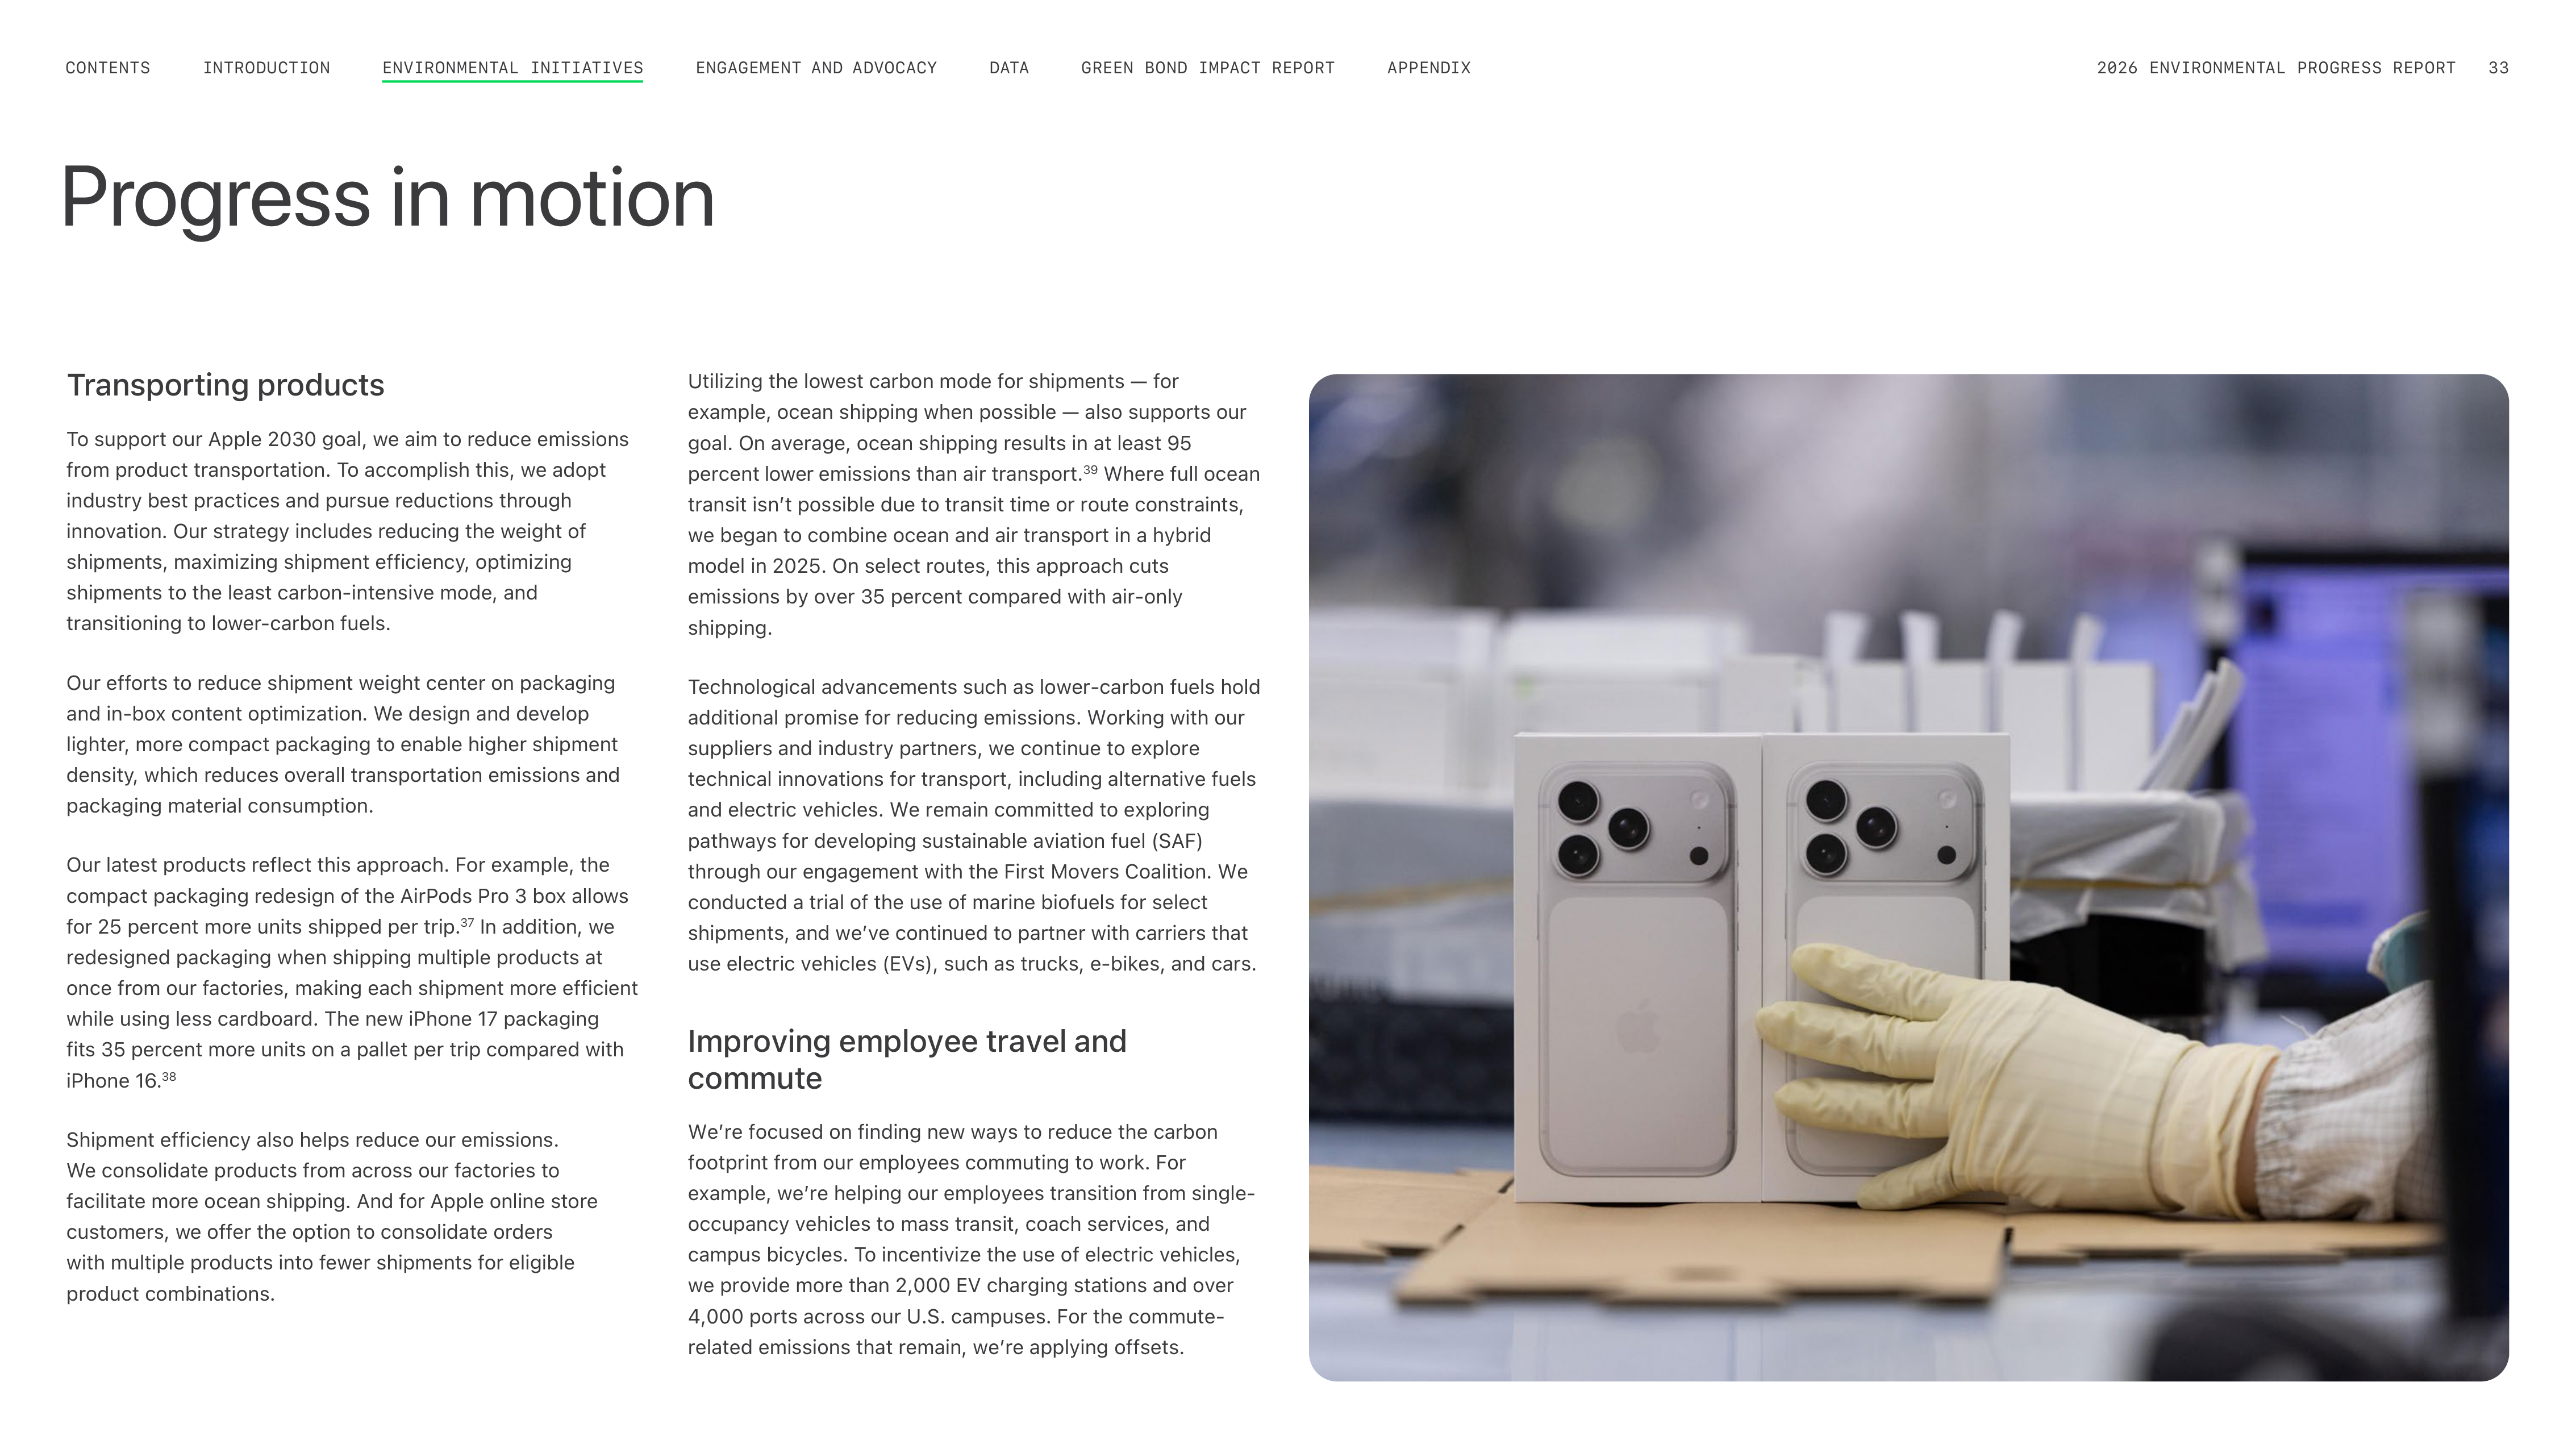

Progress in motion
Transporting products
To support our Apple 2030 goal, we aim to reduce emissions
from product transportation. To accomplish this, we adopt
industry best practices and pursue reductions through
innovation. Our strategy includes reducing the weight of
shipments, maximizing shipment efficiency, optimizing
shipments to the least carbon-intensive mode, and
transitioning to lower-carbon fuels.
Our efforts to reduce shipment weight center on packaging
and in-box content optimization. We design and develop
lighter, more compact packaging to enable higher shipment
density, which reduces overall transportation emissions and
packaging material consumption.
Our latest products reflect this approach. For example, the
compact packaging redesign of the AirPods Pro 3 box allows
for 25 percent more units shipped per trip.
37
In addition, we
redesigned packaging when shipping multiple products at
once from our factories, making each shipment more efficient
while using less cardboard. The new iPhone 17 packaging
fits 35 percent more units on a pallet per trip compared with
iPhone 16.
38
Shipment efficiency also helps reduce our emissions.
We consolidate products from across our factories to
facilitate more ocean shipping. And for Apple online store
customers, we offer the option to consolidate orders
with multiple products into fewer shipments for eligible
product combinations.
Utilizing the lowest carbon mode for shipments — for
example, ocean shipping when possible — also supports our
goal. On average, ocean shipping results in at least 95
percent lower emissions than air transport.
39
Where full ocean
transit isnʼt possible due to transit time or route constraints,
we began to combine ocean and air transport in a hybrid
model in 2025. On select routes, this approach cuts
emissions by over 35 percent compared with air-only
shipping.
Technological advancements such as lower-carbon fuels hold
additional promise for reducing emissions. Working with our
suppliers and industry partners, we continue to explore
technical innovations for transport, including alternative fuels
and electric vehicles. We remain committed to exploring
pathways for developing sustainable aviation fuel (SAF)
through our engagement with the First Movers Coalition. We
conducted a trial of the use of marine biofuels for select
shipments, and weʼve continued to partner with carriers that
use electric vehicles (EVs), such as trucks, e-bikes, and cars.
Improving employee travel and
commute
Weʼre focused on finding new ways to reduce the carbon
footprint from our employees commuting to work. For
example, weʼre helping our employees transition from single-
occupancy vehicles to mass transit, coach services, and
campus bicycles. To incentivize the use of electric vehicles,
we provide more than 2,000 EV charging stations and over
4,000 ports across our U.S. campuses. For the commute-
related emissions that remain, weʼre applying offsets.
ENGAGEMENT AND ADVOCACY
INTRODUCTION
CONTENTS
GREEN BOND IMPACT REPORT
DATA
APPENDIX
2026 ENVIRONMENTAL PROGRESS REPORT
33
ENVIRONMENTAL INITIATIVES
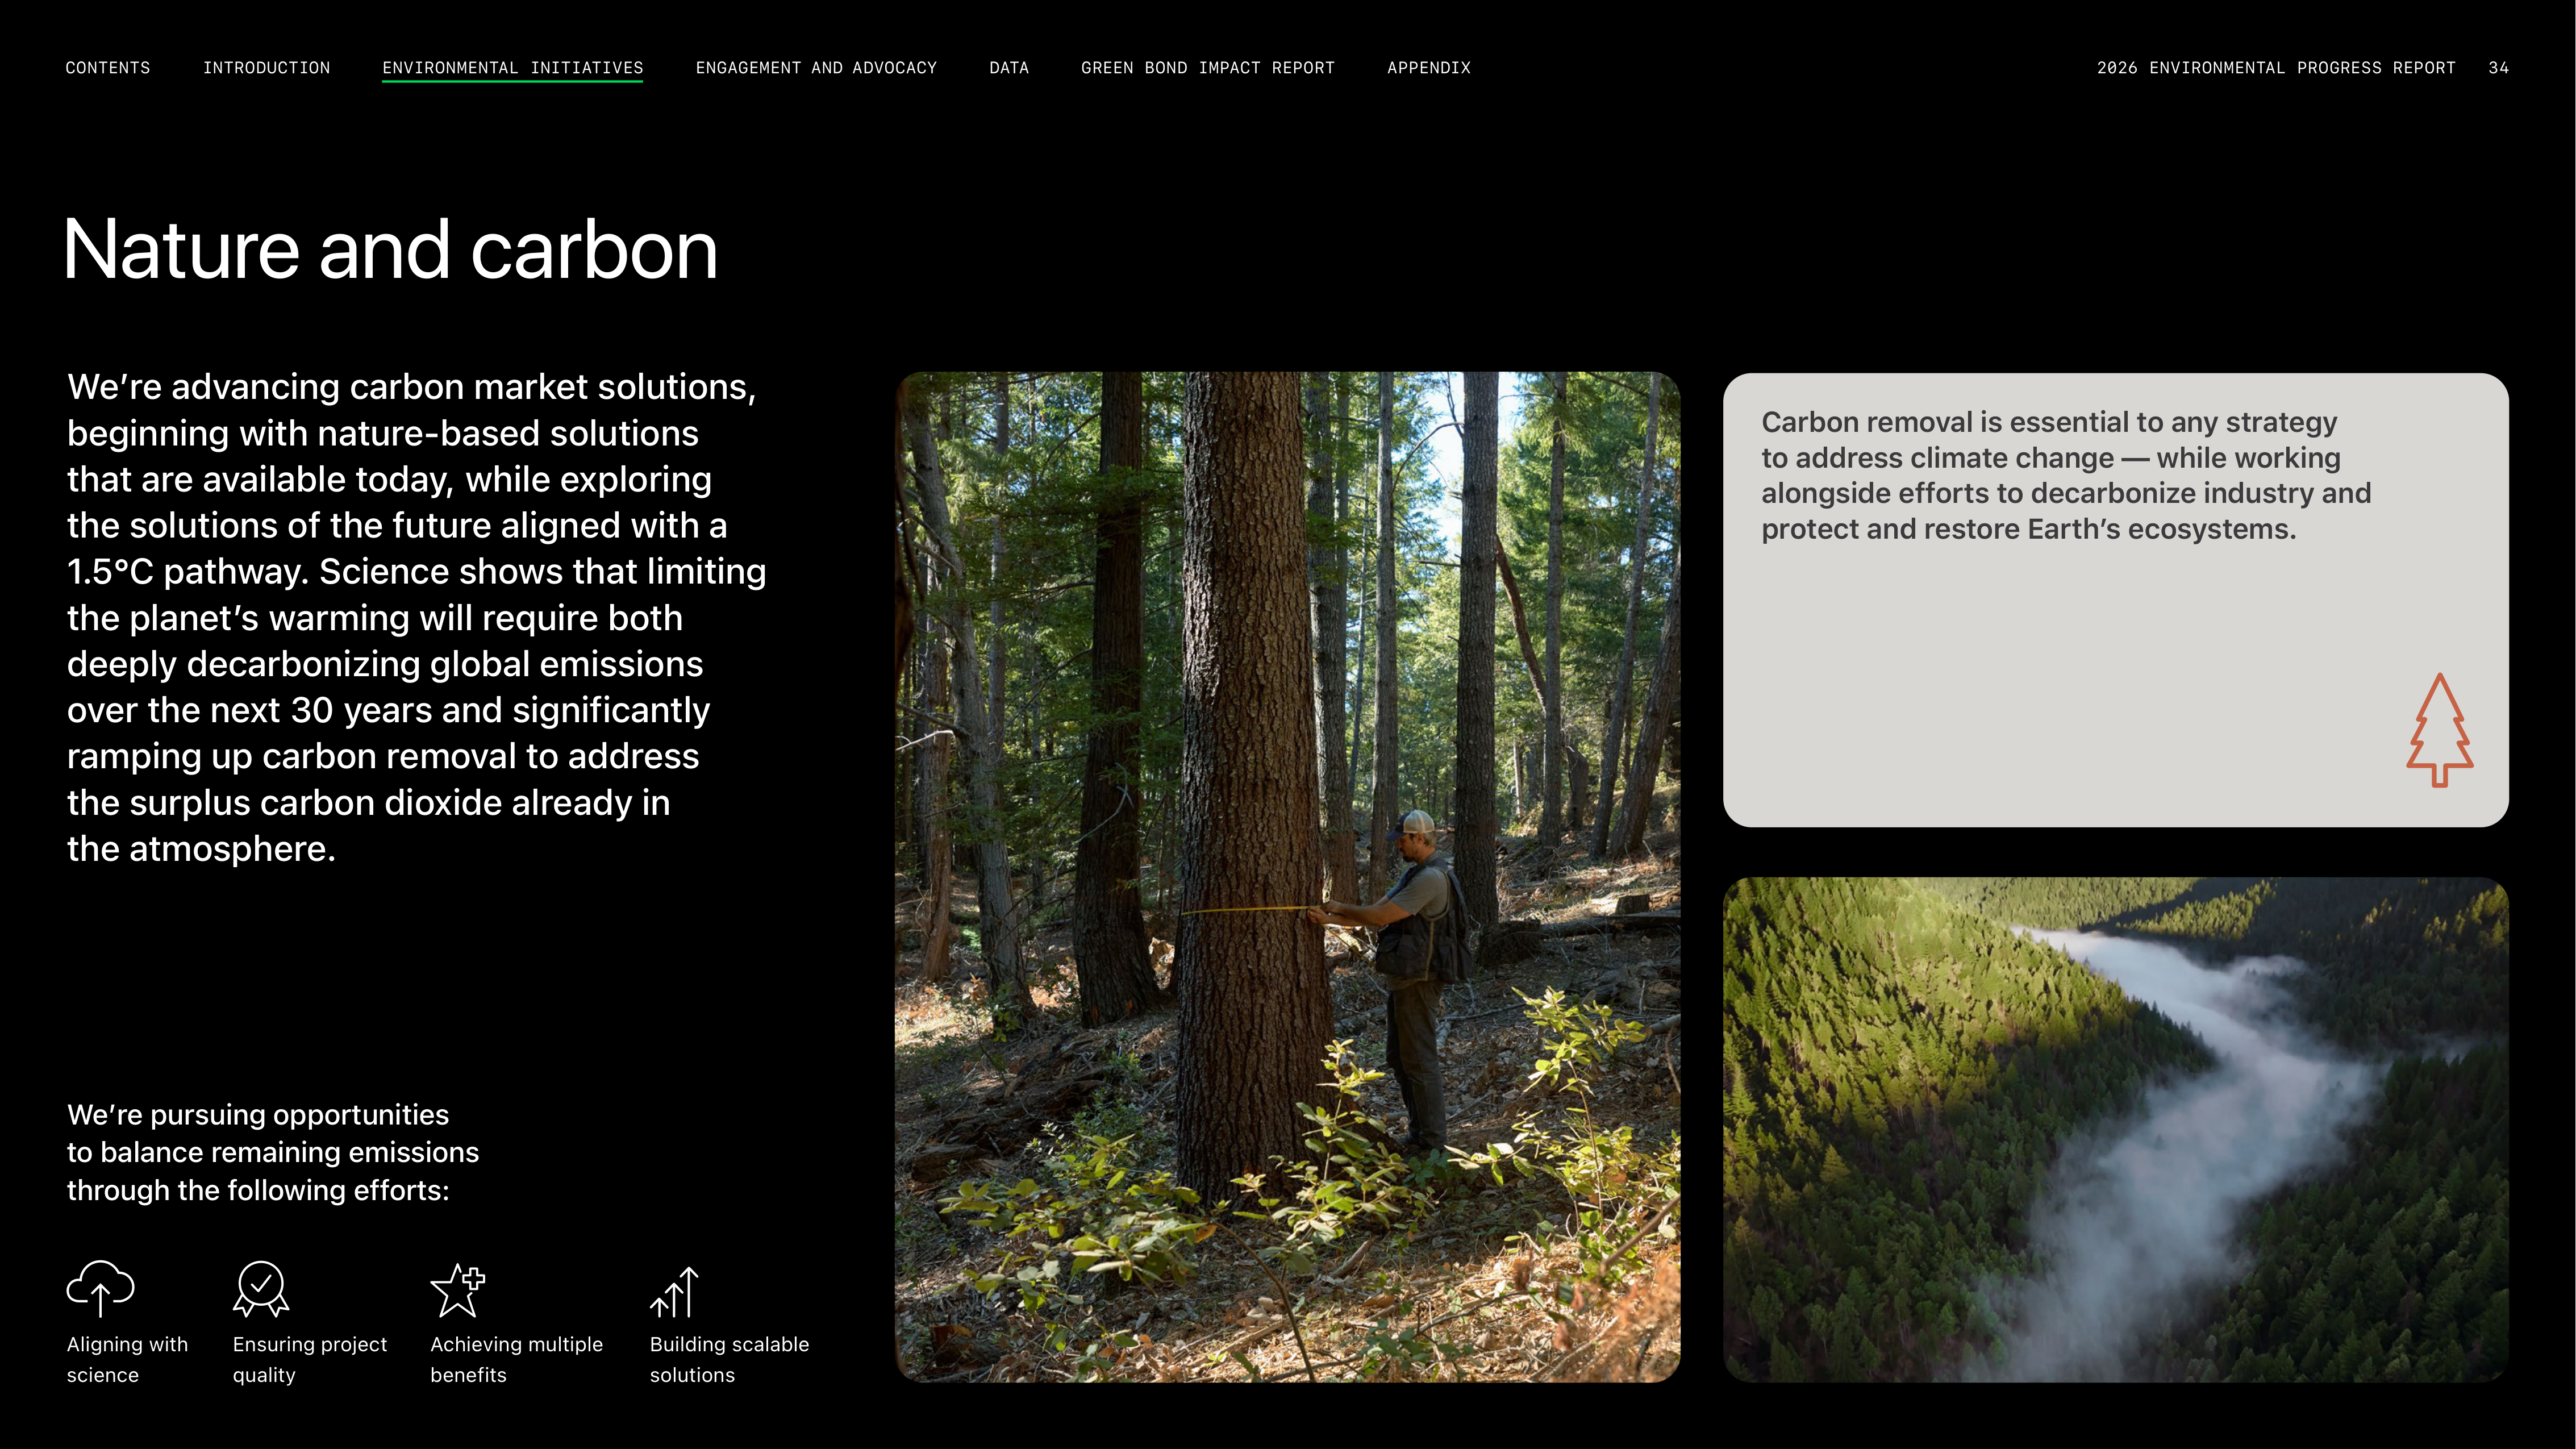

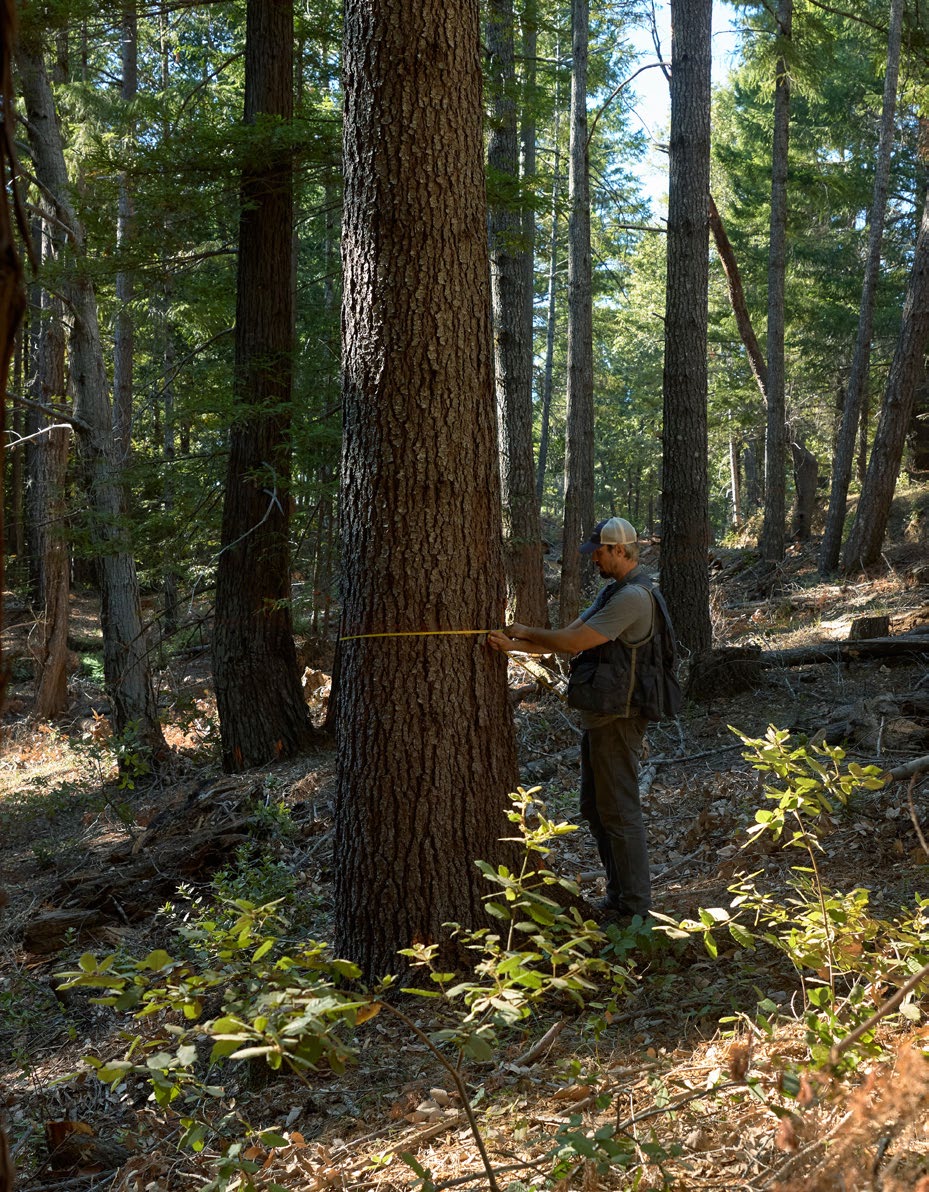
Nature and carbon
We’re advancing carbon market solutions,
beginning with nature-based solutions
that are available today, while exploring
the solutions of the future aligned with a
1.5°C pathway. Science shows that limiting
the planet’s warming will require both
deeply decarbonizing global emissions
over the next 30 years and significantly
ramping up carbon removal to address
the surplus carbon dioxide already in
the atmosphere.
We’re pursuing opportunities
to balance remaining emissions
through the following efforts:
Aligning with
science
Ensuring project
quality
Achieving multiple
benefits
Building scalable
solutions
Carbon removal is essential to any strategy
to address climate change — while working
alongside efforts to decarbonize industry and
protect and restore Earth’s ecosystems.
2026 ENVIRONMENTAL PROGRESS REPORT
34
ENGAGEMENT AND ADVOCACY
INTRODUCTION
CONTENTS
APPENDIX
GREEN BOND IMPACT REPORT
DATA
ENVIRONMENTAL INITIATIVES
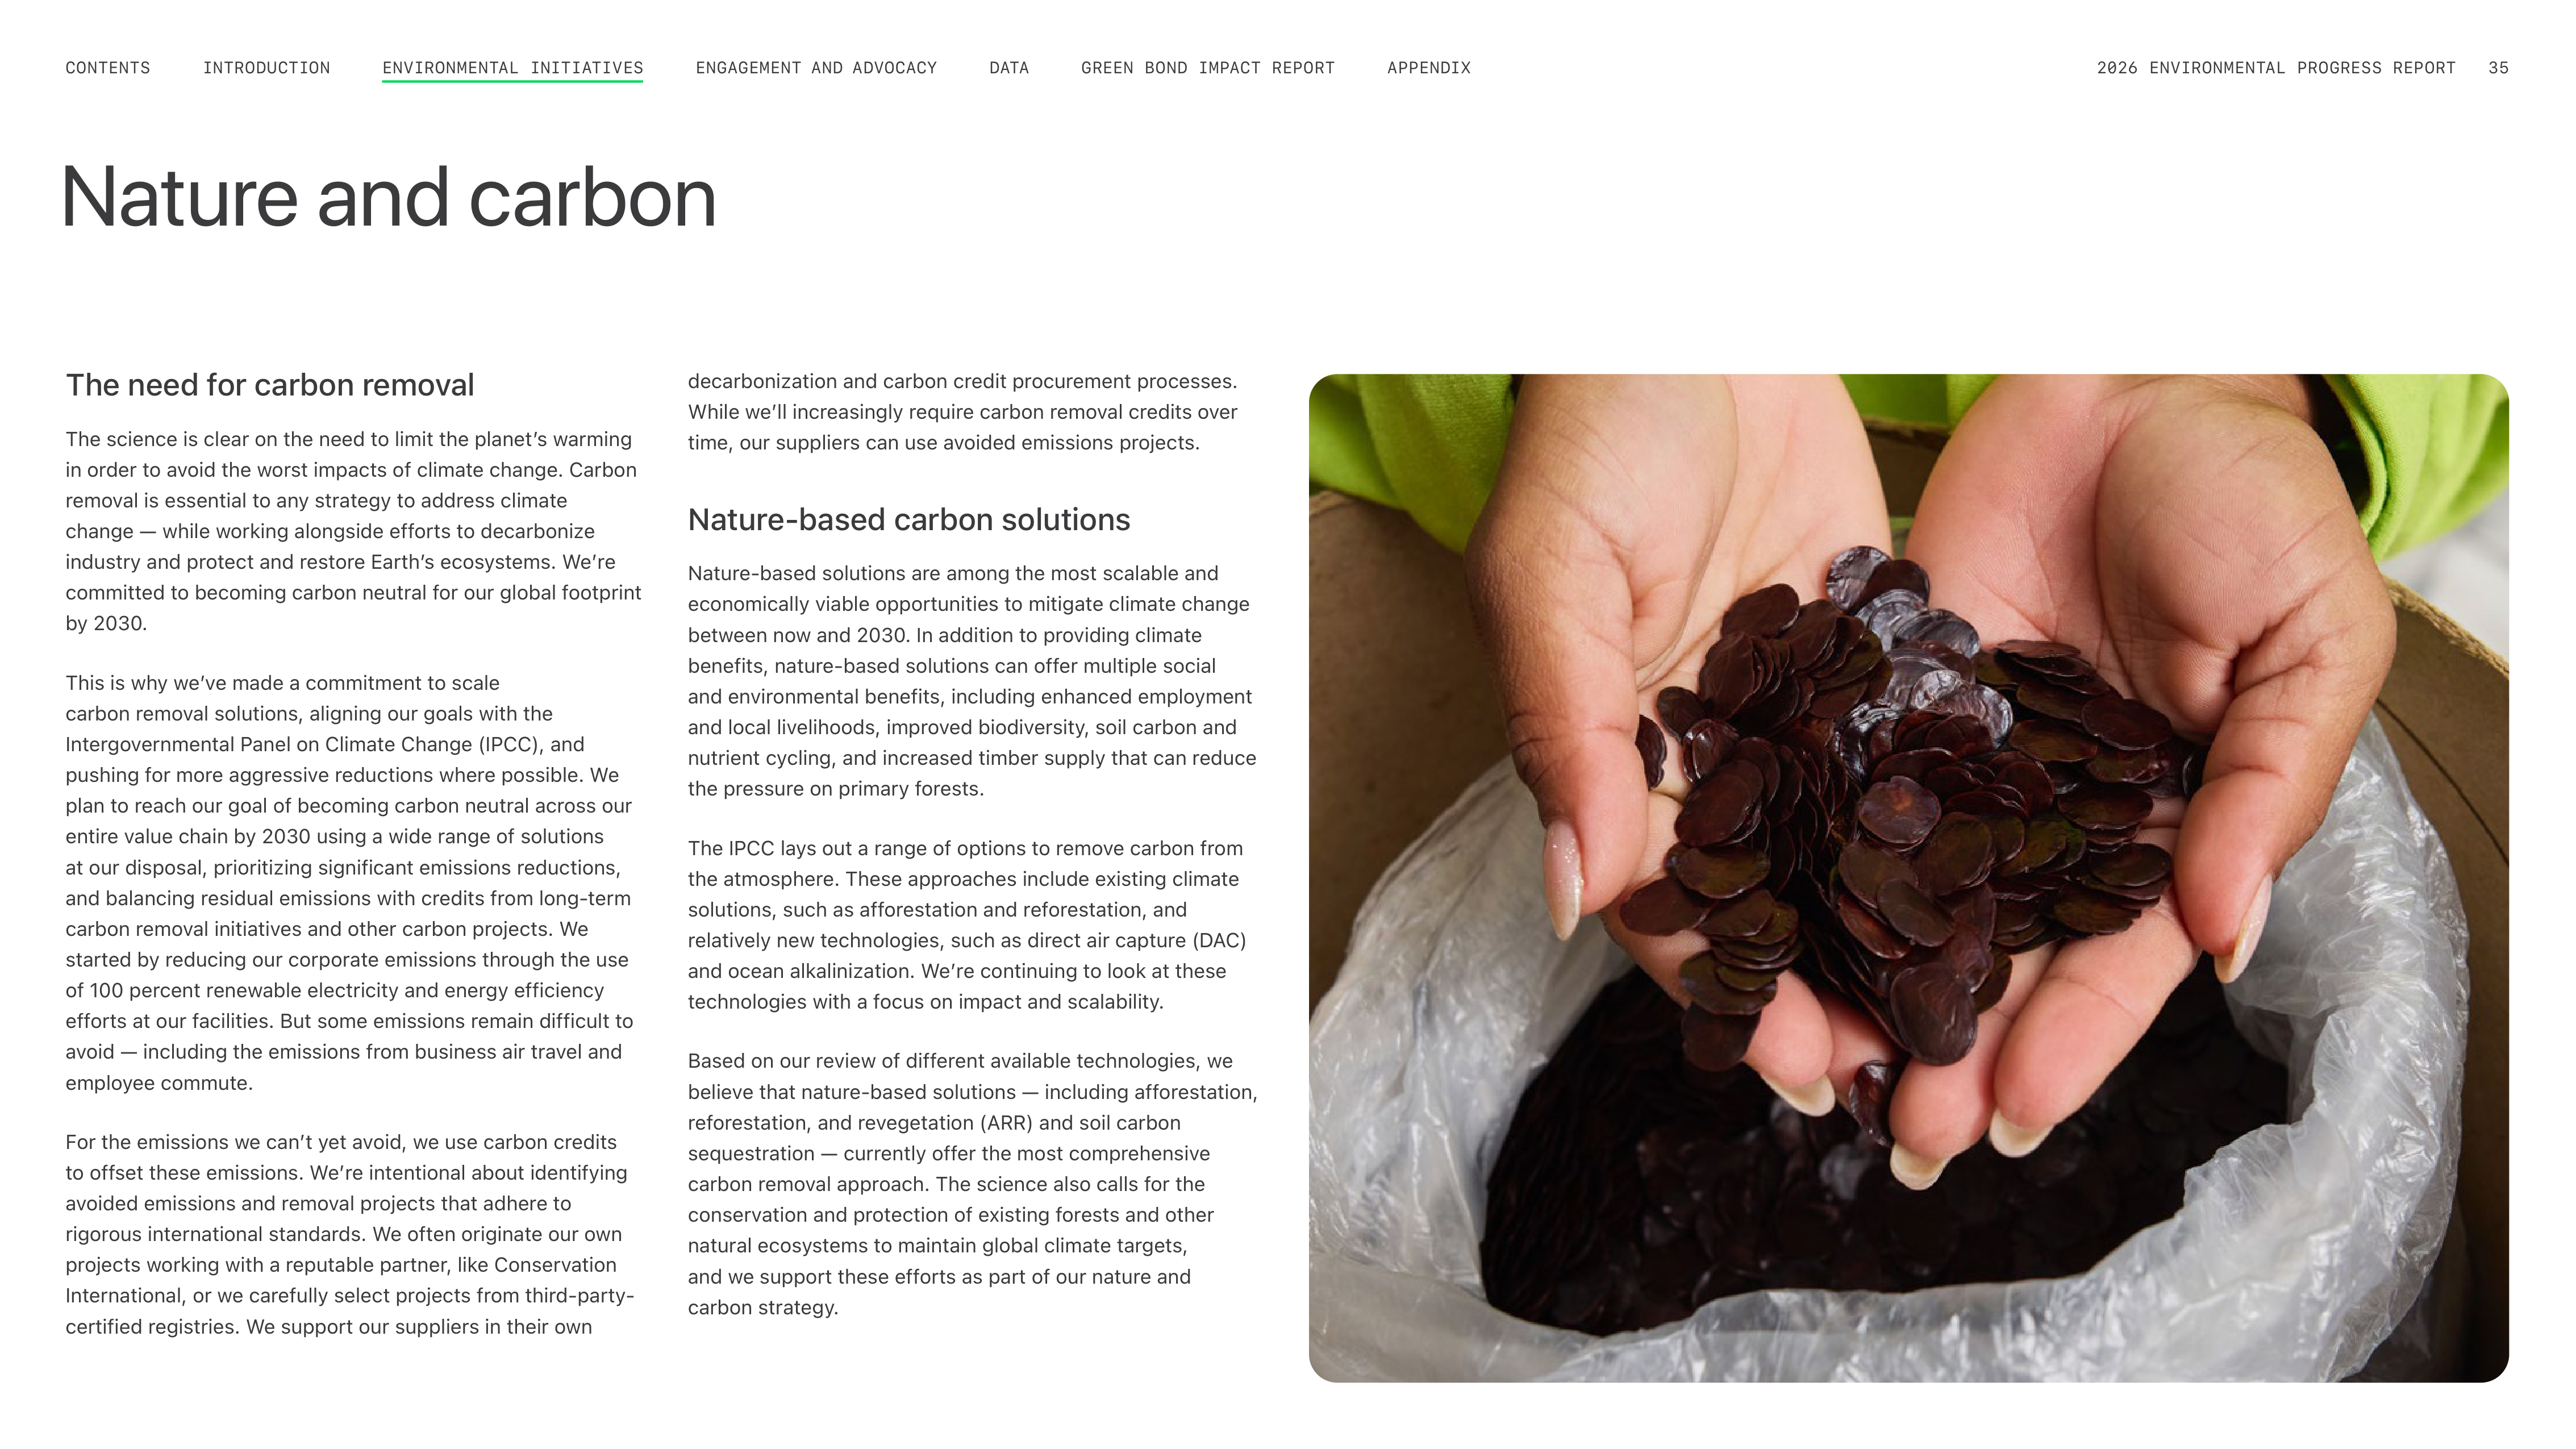
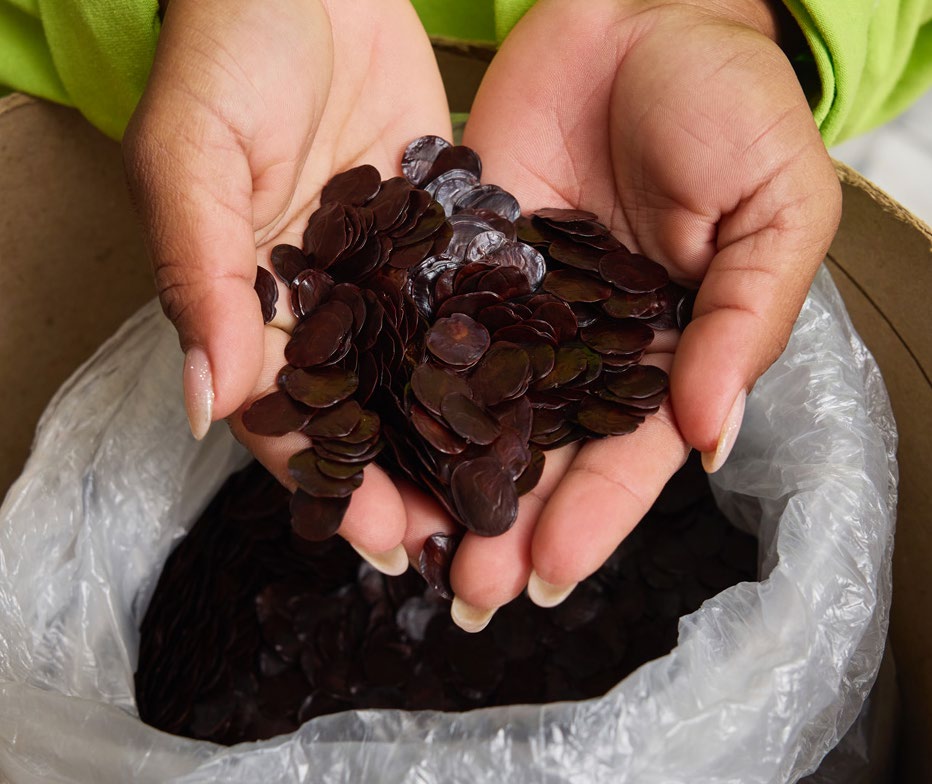
Nature and carbon
The need for carbon removal
The science is clear on the need to limit the planetʼs warming
in order to avoid the worst impacts of climate change. Carbon
removal is essential to any strategy to address climate
change — while working alongside efforts to decarbonize
industry and protect and restore Earthʼs ecosystems. Weʼre
committed to becoming carbon neutral for our global footprint
by 2030.
This is why weʼve made a commitment to scale
carbon removal solutions, aligning our goals with the
Intergovernmental Panel on Climate Change (IPCC), and
pushing for more aggressive reductions where possible. We
plan to reach our goal of becoming carbon neutral across our
entire value chain by 2030 using a wide range of solutions
at our disposal, prioritizing significant emissions reductions,
and balancing residual emissions with credits from long-term
carbon removal initiatives and other carbon projects. We
started by reducing our corporate emissions through the use
of 100 percent renewable electricity and energy efficiency
efforts at our facilities. But some emissions remain difficult to
avoid — including the emissions from business air travel and
employee commute.
For the emissions we canʼt yet avoid, we use carbon credits
to offset these emissions. Weʼre intentional about identifying
avoided emissions and removal projects that adhere to
rigorous international standards. We often originate our own
projects working with a reputable partner, like Conservation
International, or we carefully select projects from third-party-
certified registries. We support our suppliers in their own
decarbonization and carbon credit procurement processes.
While weʼll increasingly require carbon removal credits over
time, our suppliers can use avoided emissions projects.
Nature-based carbon solutions
Nature-based solutions are among the most scalable and
economically viable opportunities to mitigate climate change
between now and 2030. In addition to providing climate
benefits, nature-based solutions can offer multiple social
and environmental benefits, including enhanced employment
and local livelihoods, improved biodiversity, soil carbon and
nutrient cycling, and increased timber supply that can reduce
the pressure on primary forests.
The IPCC lays out a range of options to remove carbon from
the atmosphere. These approaches include existing climate
solutions, such as afforestation and reforestation, and
relatively new technologies, such as direct air capture (DAC)
and ocean alkalinization. Weʼre continuing to look at these
technologies with a focus on impact and scalability.
Based on our review of different available technologies, we
believe that nature-based solutions — including afforestation,
reforestation, and revegetation (ARR) and soil carbon
sequestration — currently offer the most comprehensive
carbon removal approach. The science also calls for the
conservation and protection of existing forests and other
natural ecosystems to maintain global climate targets,
and we support these efforts as part of our nature and
carbon strategy.
ENGAGEMENT AND ADVOCACY
INTRODUCTION
CONTENTS
GREEN BOND IMPACT REPORT
DATA
APPENDIX
2026 ENVIRONMENTAL PROGRESS REPORT
35
ENVIRONMENTAL INITIATIVES
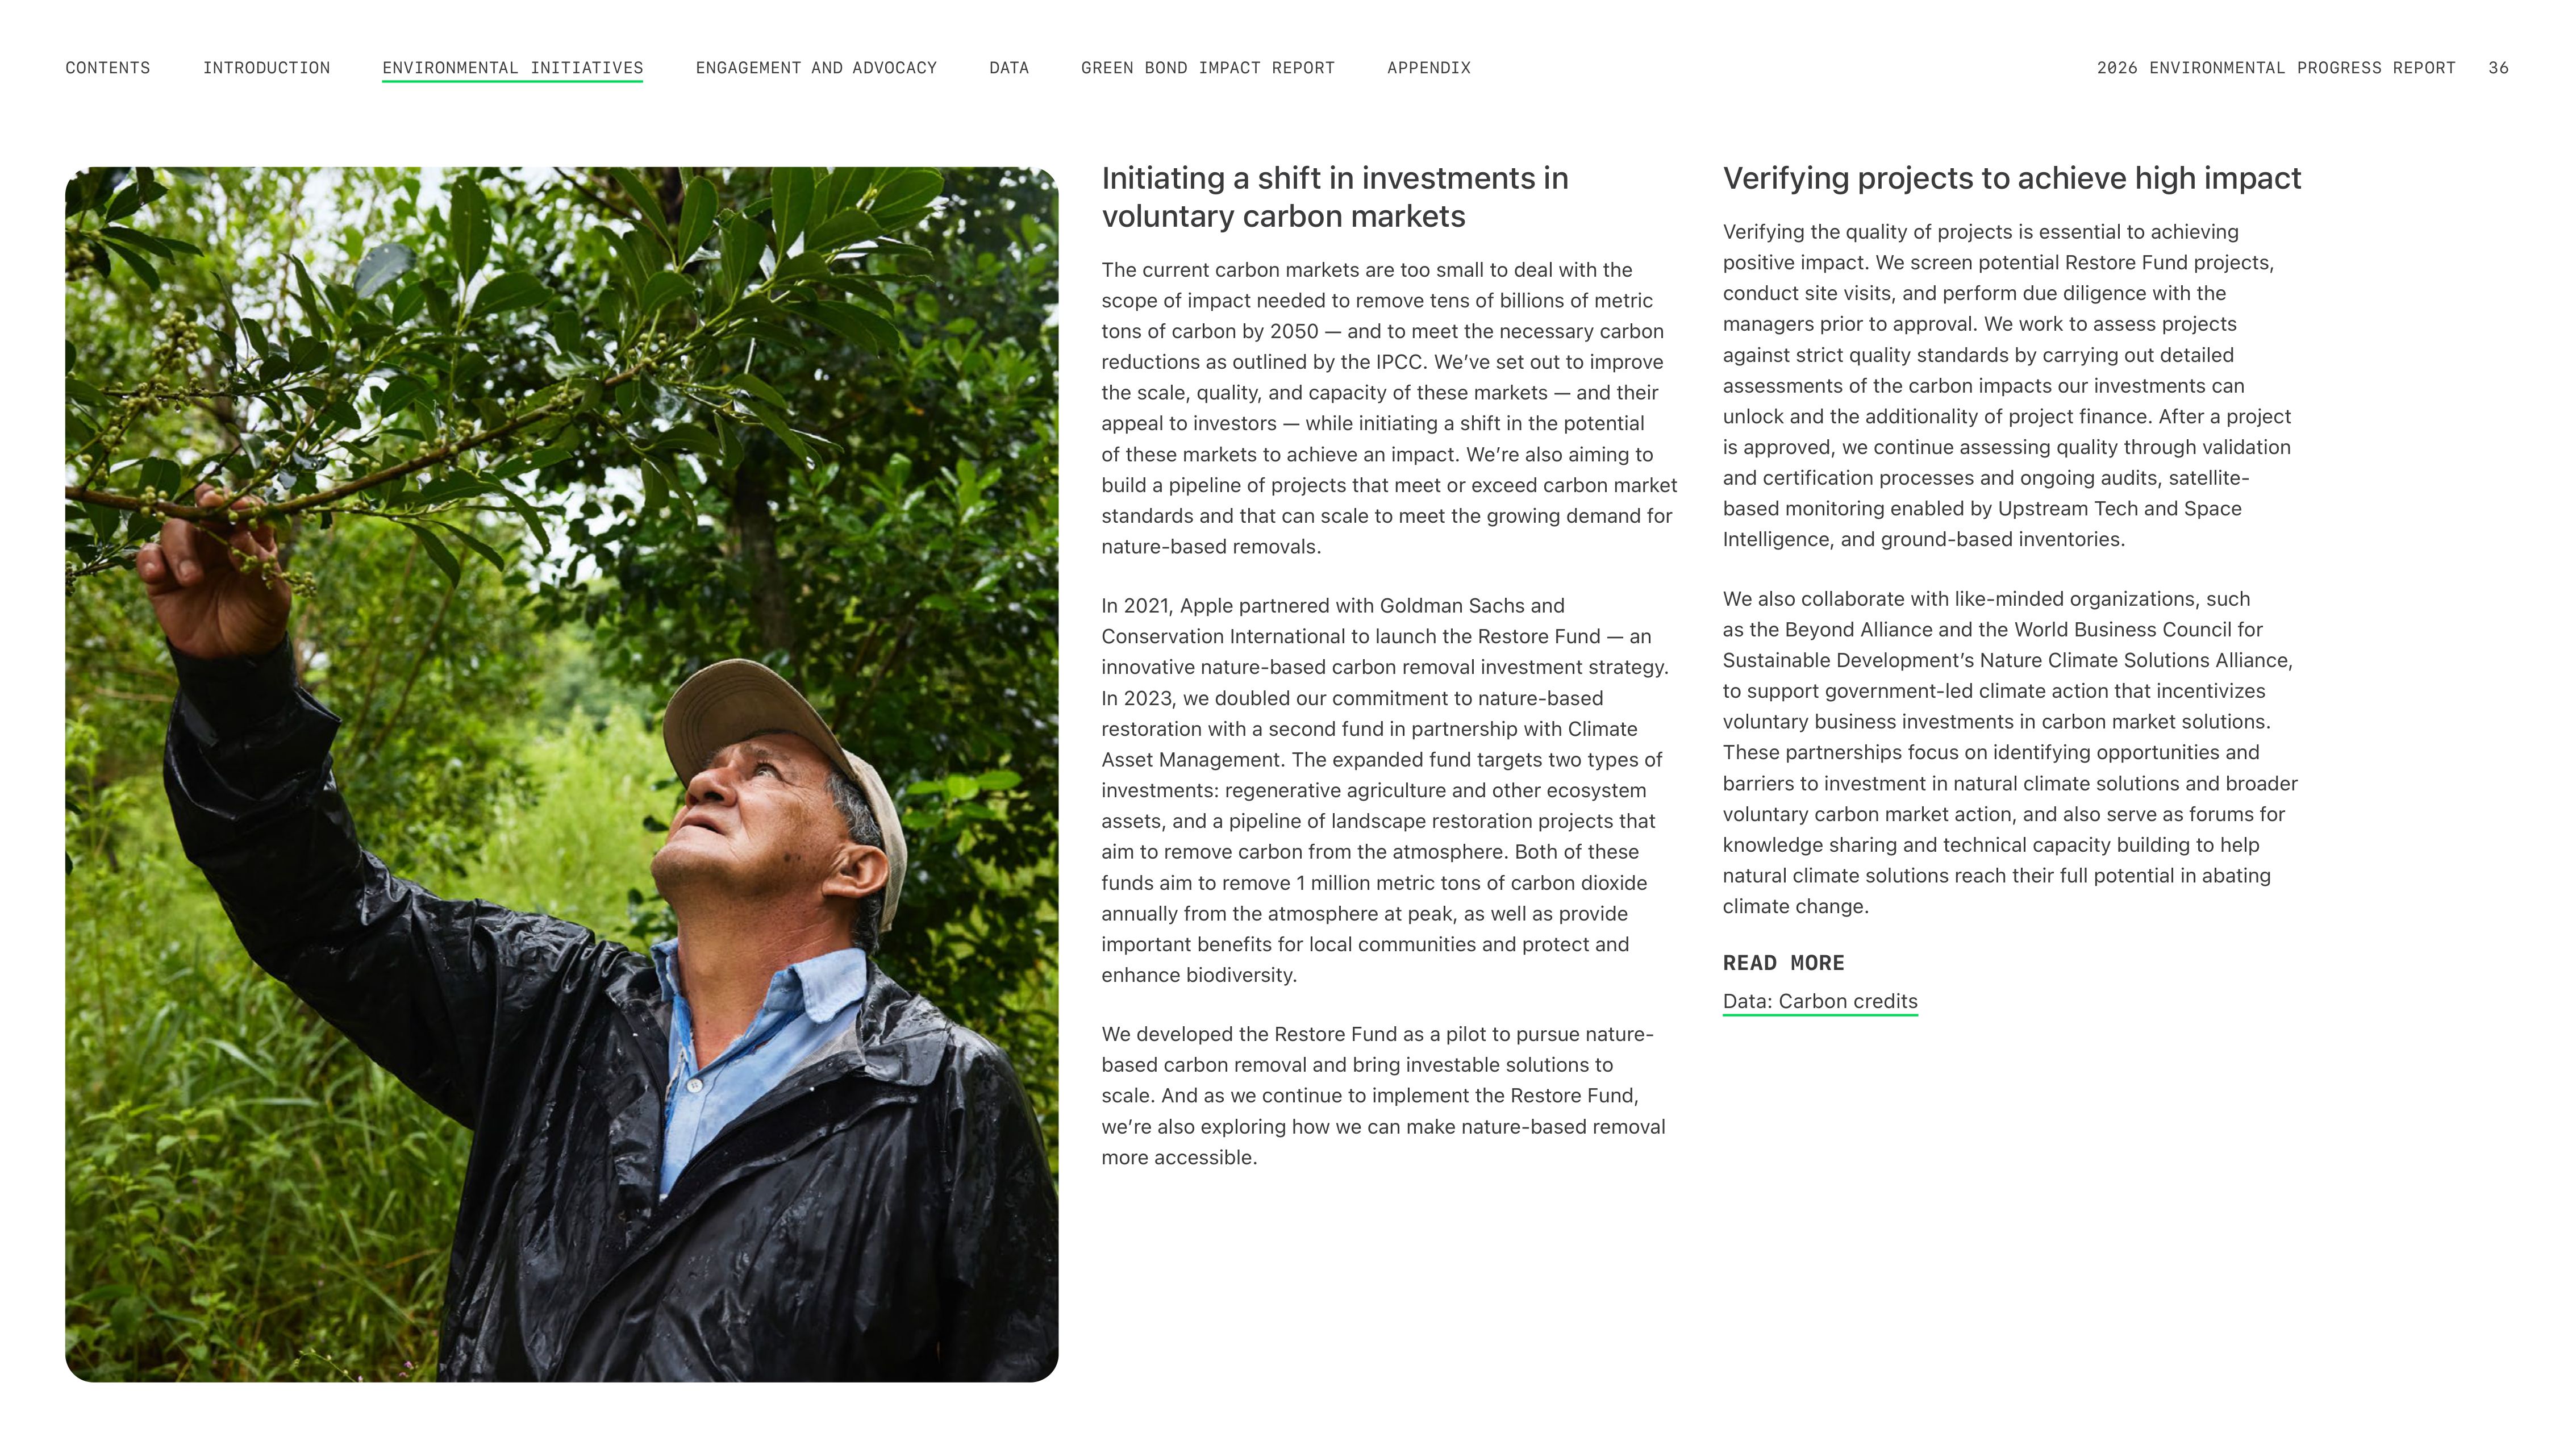
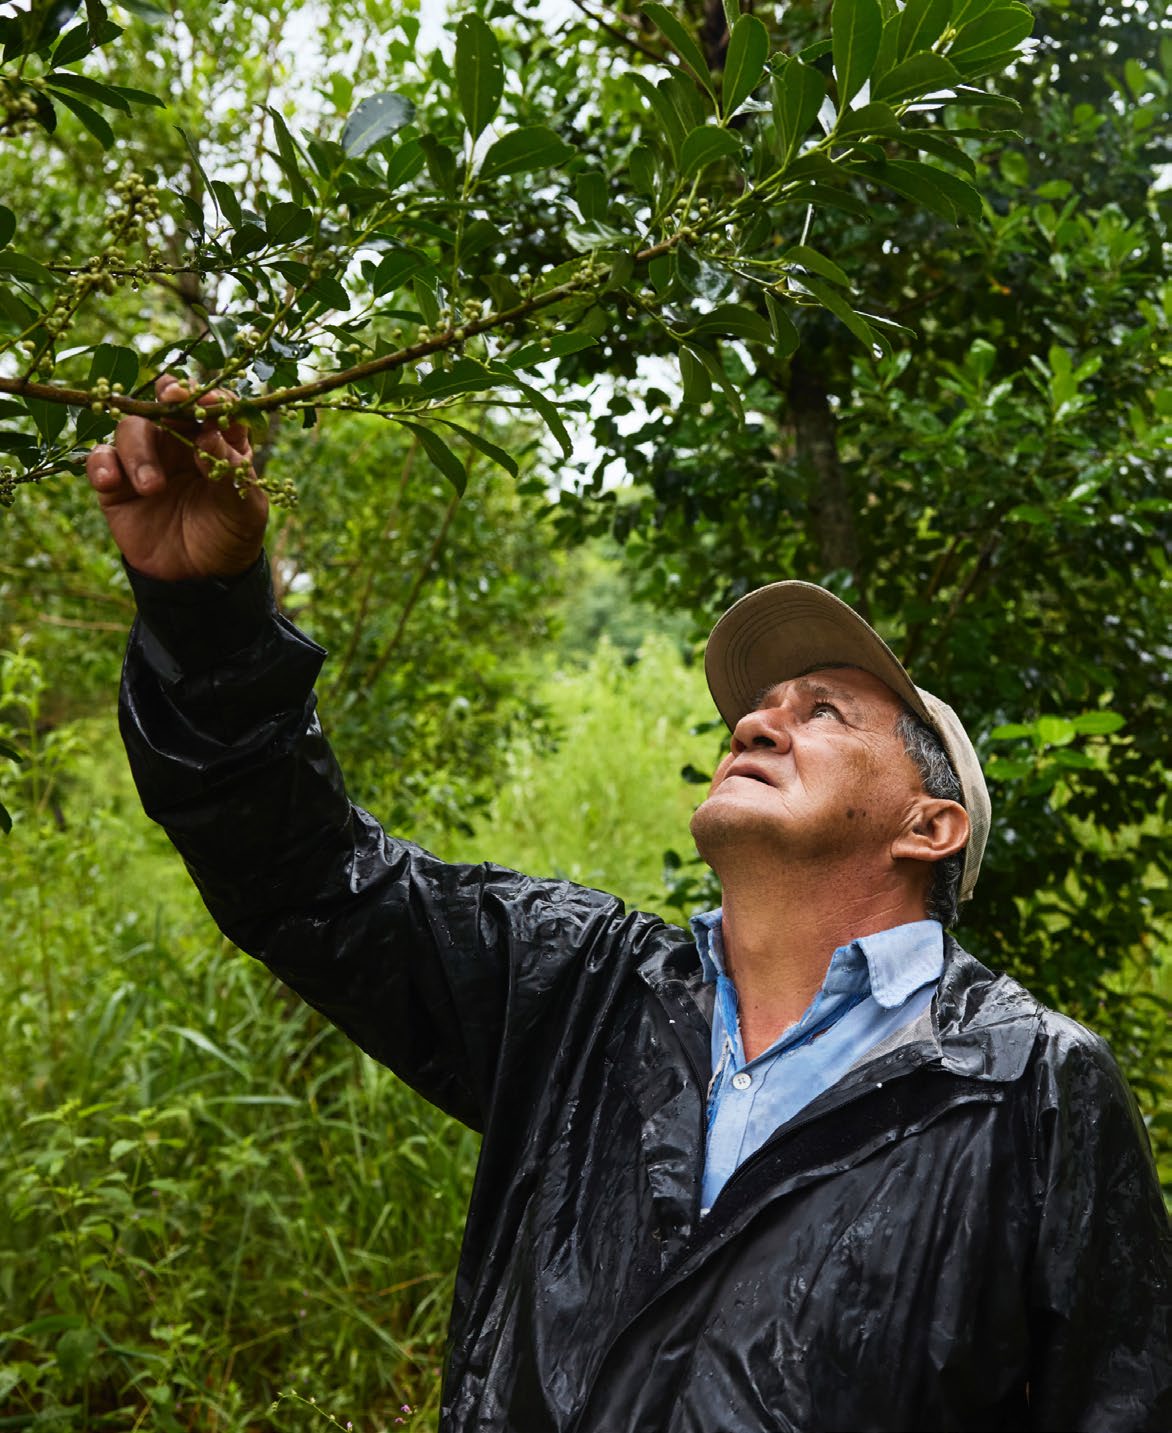
Initiating a shift in investments in
voluntary carbon markets
The current carbon markets are too small to deal with the
scope of impact needed to remove tens of billions of metric
tons of carbon by 2050 — and to meet the necessary carbon
reductions as outlined by the IPCC. Weʼve set out to improve
the scale, quality, and capacity of these markets — and their
appeal to investors — while initiating a shift in the potential
of these markets to achieve an impact. Weʼre also aiming to
build a pipeline of projects that meet or exceed carbon market
standards and that can scale to meet the growing demand for
nature-based removals.
In 2021, Apple partnered with Goldman Sachs and
Conservation International to launch the Restore Fund — an
innovative nature-based carbon removal investment strategy.
In 2023, we doubled our commitment to nature-based
restoration with a second fund in partnership with Climate
Asset Management. The expanded fund targets two types of
investments: regenerative agriculture and other ecosystem
assets, and a pipeline of landscape restoration projects that
aim to remove carbon from the atmosphere. Both of these
funds aim to remove 1 million metric tons of carbon dioxide
annually from the atmosphere at peak, as well as provide
important benefits for local communities and protect and
enhance biodiversity.
We developed the Restore Fund as a pilot to pursue nature-
based carbon removal and bring investable solutions to
scale. And as we continue to implement the Restore Fund,
weʼre also exploring how we can make nature-based removal
more accessible.
Verifying projects to achieve high impact
Verifying the quality of projects is essential to achieving
positive impact. We screen potential Restore Fund projects,
conduct site visits, and perform due diligence with the
managers prior to approval. We work to assess projects
against strict quality standards by carrying out detailed
assessments of the carbon impacts our investments can
unlock and the additionality of project finance. After a project
is approved, we continue assessing quality through validation
and certification processes and ongoing audits, satellite-
based monitoring enabled by Upstream Tech and Space
Intelligence, and ground-based inventories.
We also collaborate with like-minded organizations, such
as the Beyond Alliance and the World Business Council for
Sustainable Developmentʼs Nature Climate Solutions Alliance,
to support government-led climate action that incentivizes
voluntary business investments in carbon market solutions.
These partnerships focus on identifying opportunities and
barriers to investment in natural climate solutions and broader
voluntary carbon market action, and also serve as forums for
knowledge sharing and technical capacity building to help
natural climate solutions reach their full potential in abating
climate change.
READ MORE
Data: Carbon credits
ENGAGEMENT AND ADVOCACY
INTRODUCTION
CONTENTS
GREEN BOND IMPACT REPORT
DATA
APPENDIX
2026 ENVIRONMENTAL PROGRESS REPORT
36
ENVIRONMENTAL INITIATIVES
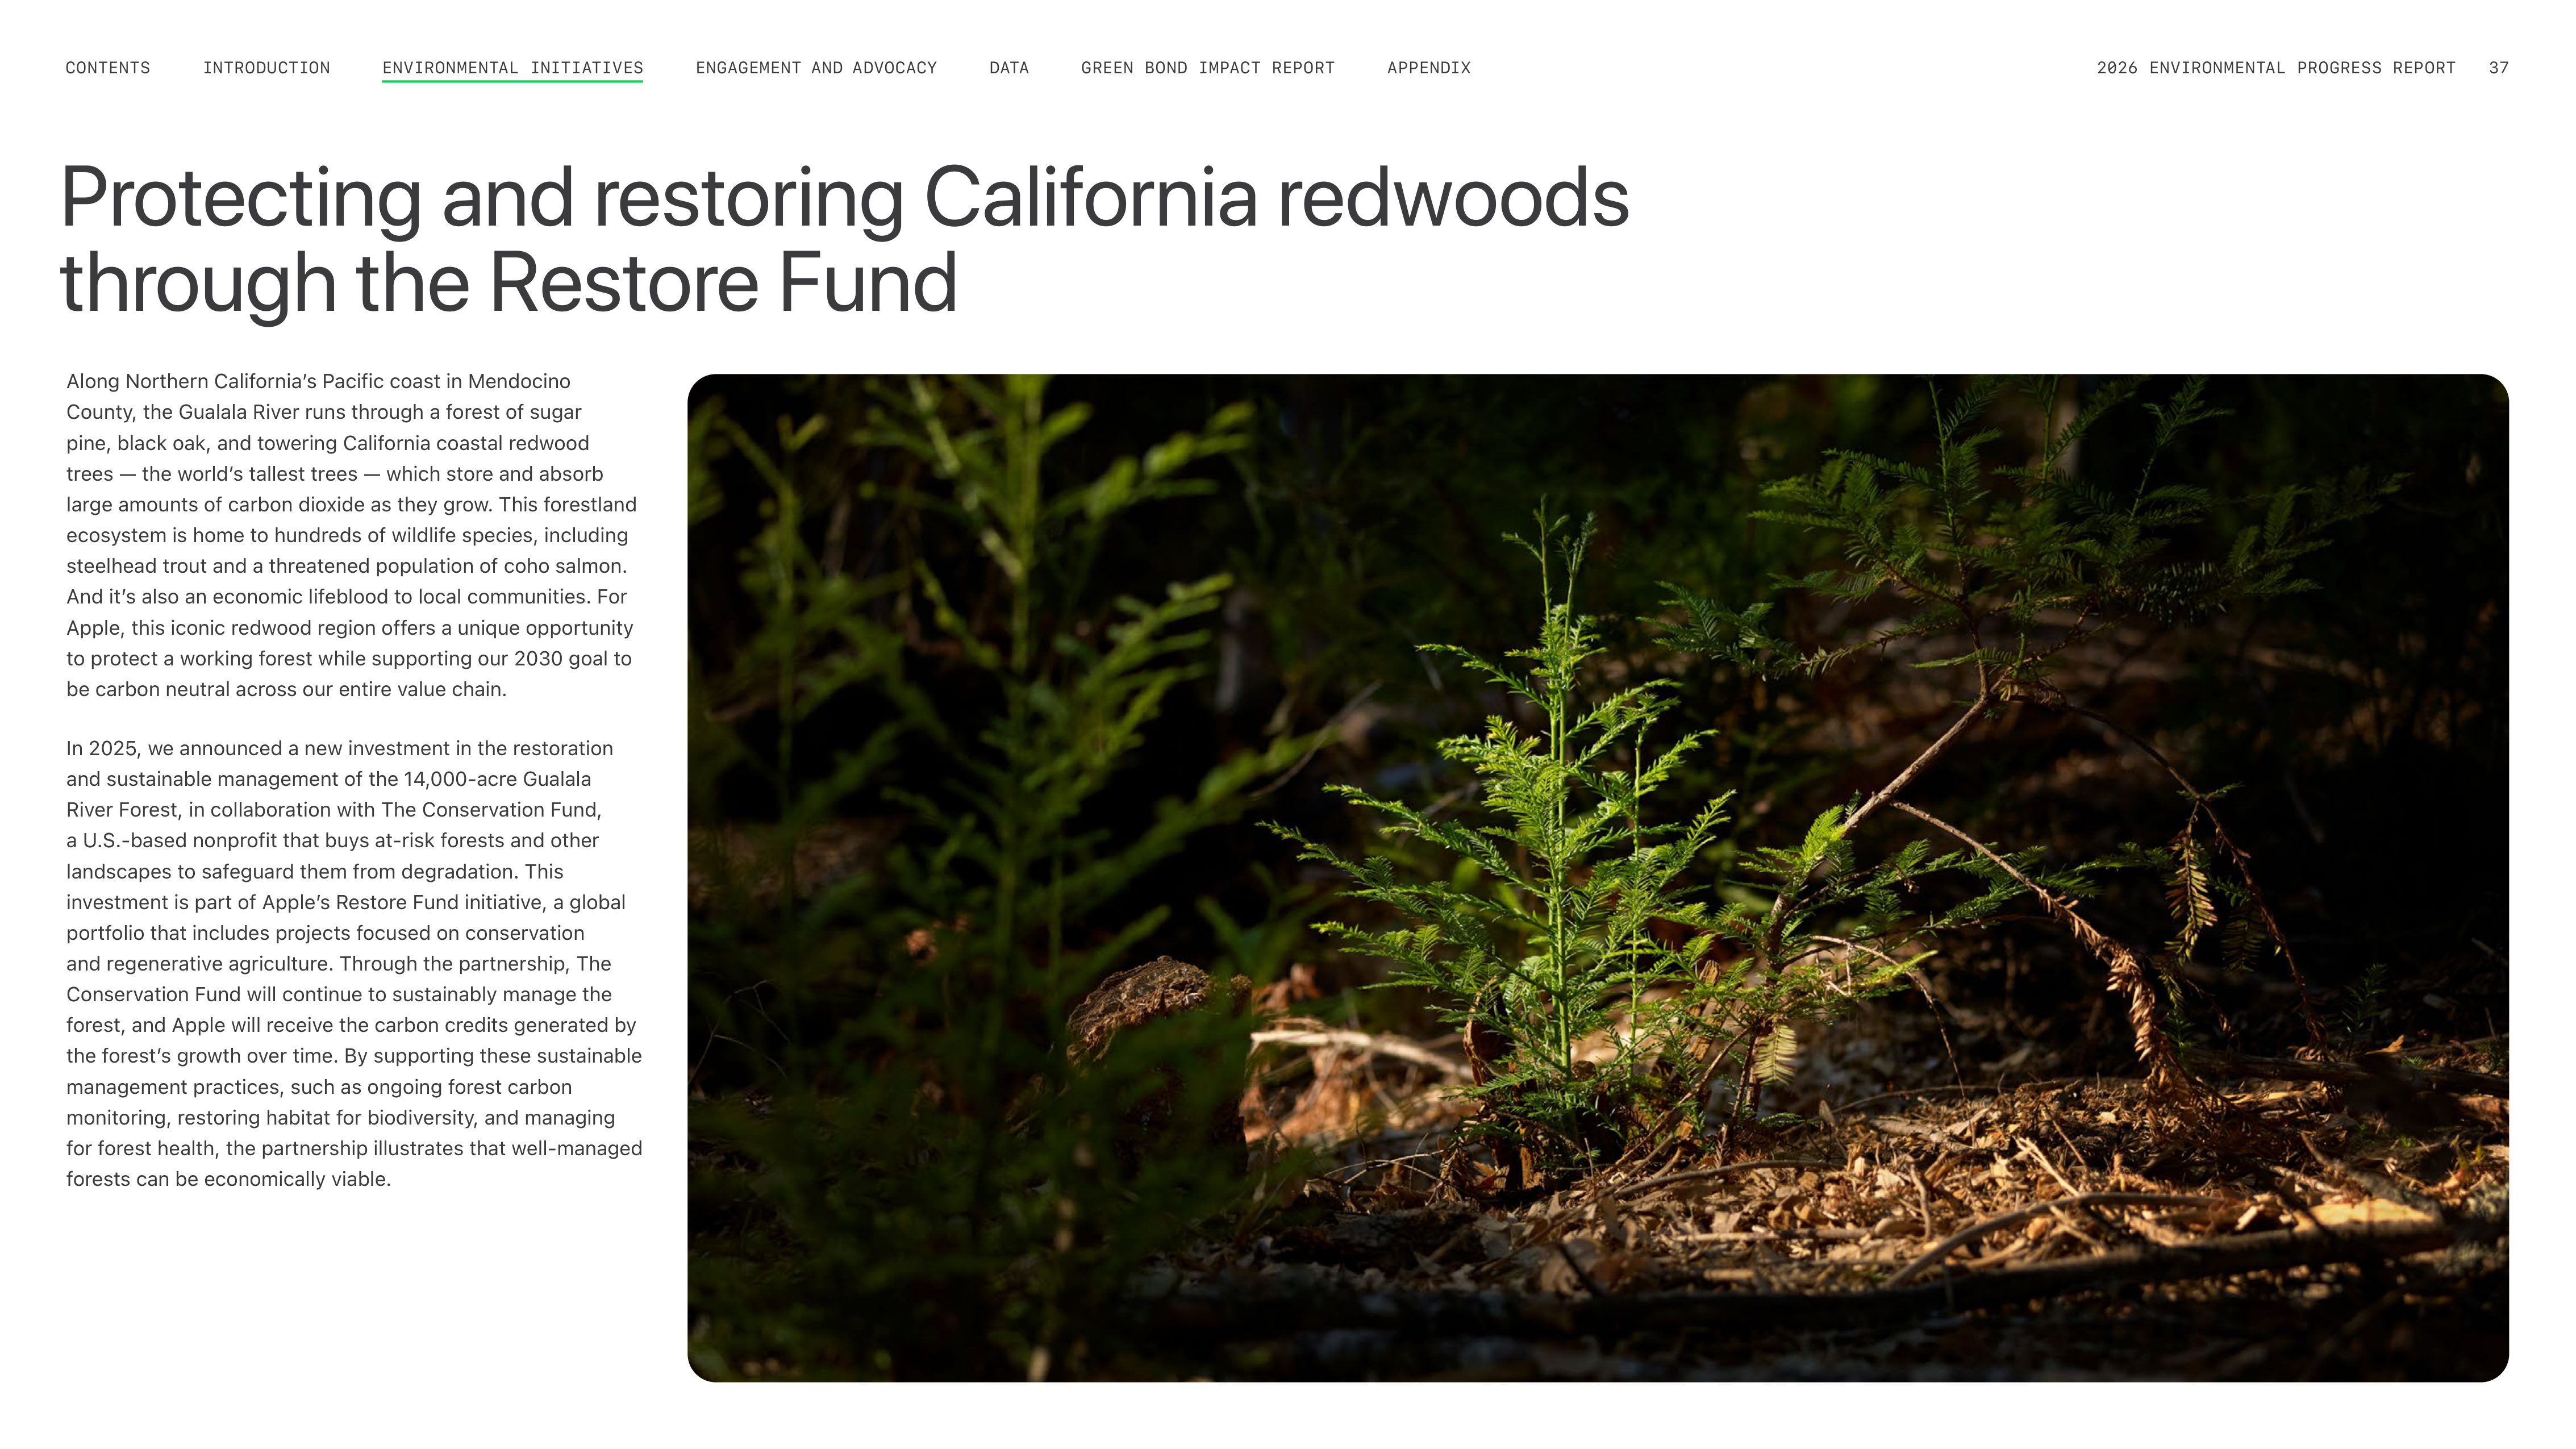

Protecting and restoring California redwoods
through the Restore Fund
Along Northern Californiaʼs Pacific coast in Mendocino
County, the Gualala River runs through a forest of sugar
pine, black oak, and towering California coastal redwood
trees — the worldʼs tallest trees — which store and absorb
large amounts of carbon dioxide as they grow. This forestland
ecosystem is home to hundreds of wildlife species, including
steelhead trout and a threatened population of coho salmon.
And itʼs also an economic lifeblood to local communities. For
Apple, this iconic redwood region offers a unique opportunity
to protect a working forest while supporting our 2030 goal to
be carbon neutral across our entire value chain.
In 2025, we announced a new investment in the restoration
and sustainable management of the 14,000-acre Gualala
River Forest, in collaboration with The Conservation Fund,
a U.S.-based nonprofit that buys at-risk forests and other
landscapes to safeguard them from degradation. This
investment is part of Appleʼs Restore Fund initiative, a global
portfolio that includes projects focused on conservation
and regenerative agriculture. Through the partnership, The
Conservation Fund will continue to sustainably manage the
forest, and Apple will receive the carbon credits generated by
the forestʼs growth over time. By supporting these sustainable
management practices, such as ongoing forest carbon
monitoring, restoring habitat for biodiversity, and managing
for forest health, the partnership illustrates that well-managed
forests can be economically viable.
ENGAGEMENT AND ADVOCACY
INTRODUCTION
CONTENTS
GREEN BOND IMPACT REPORT
DATA
APPENDIX
2026 ENVIRONMENTAL PROGRESS REPORT
37
ENVIRONMENTAL INITIATIVES
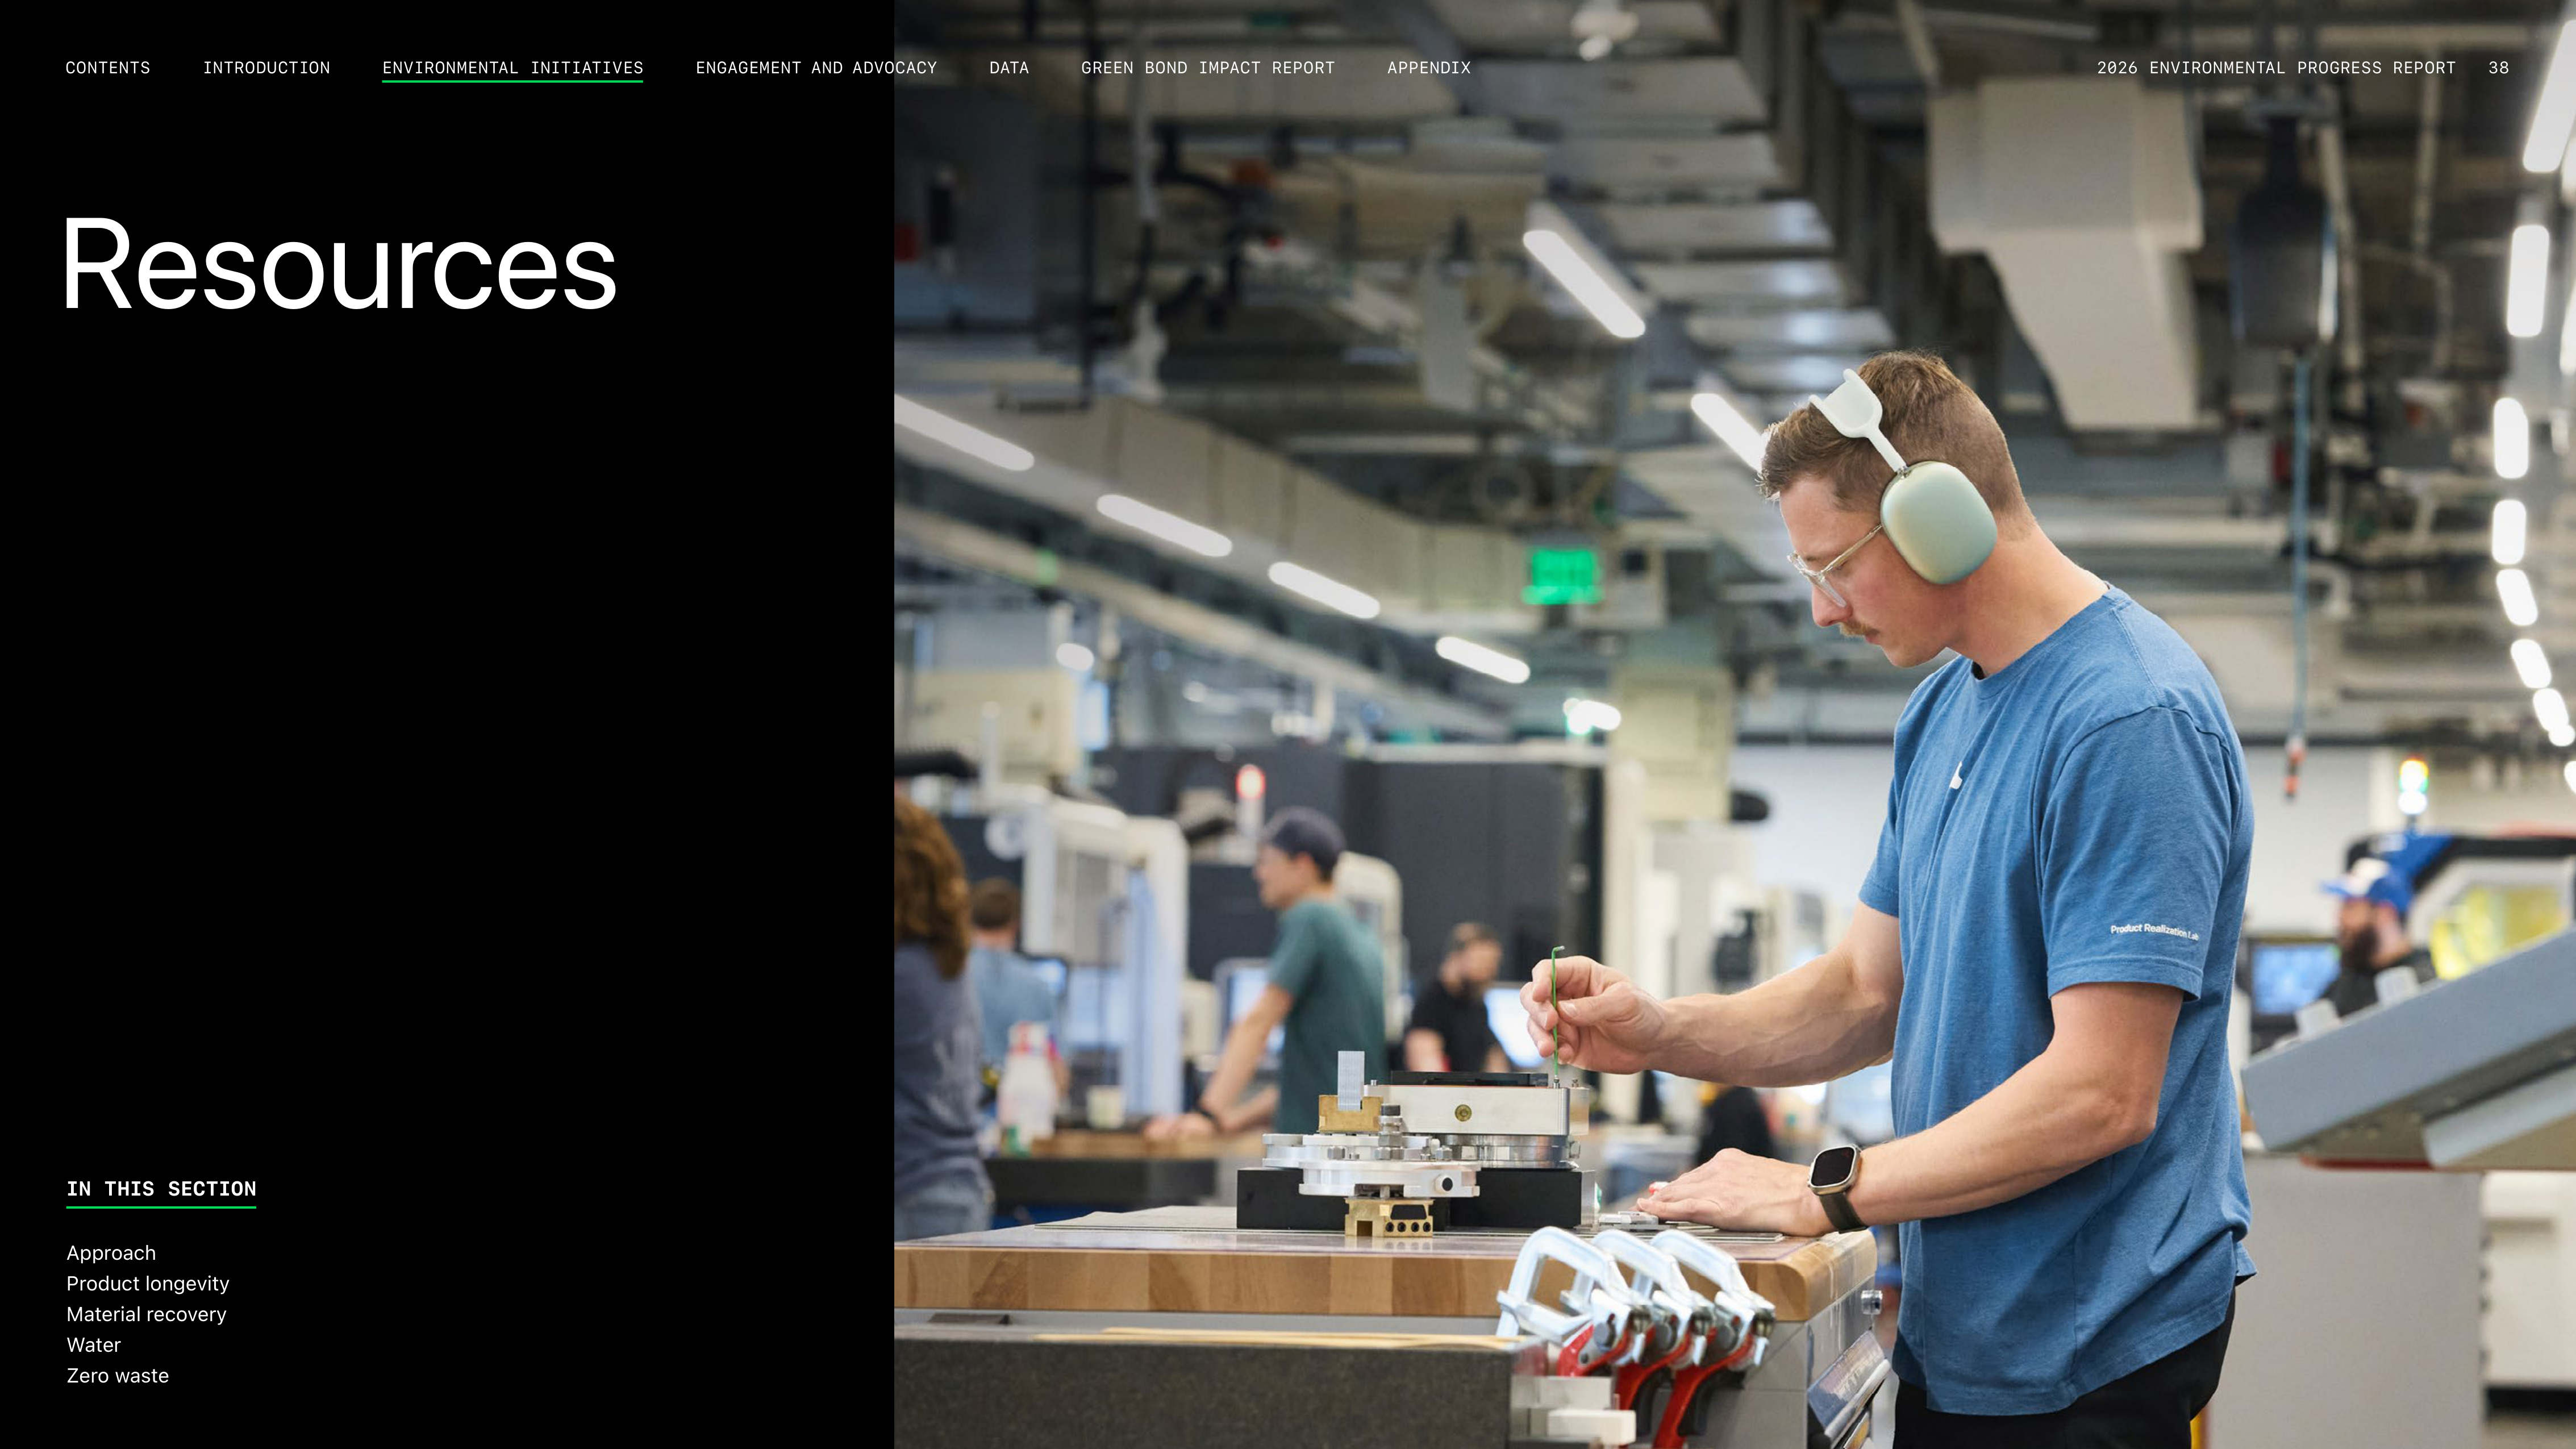
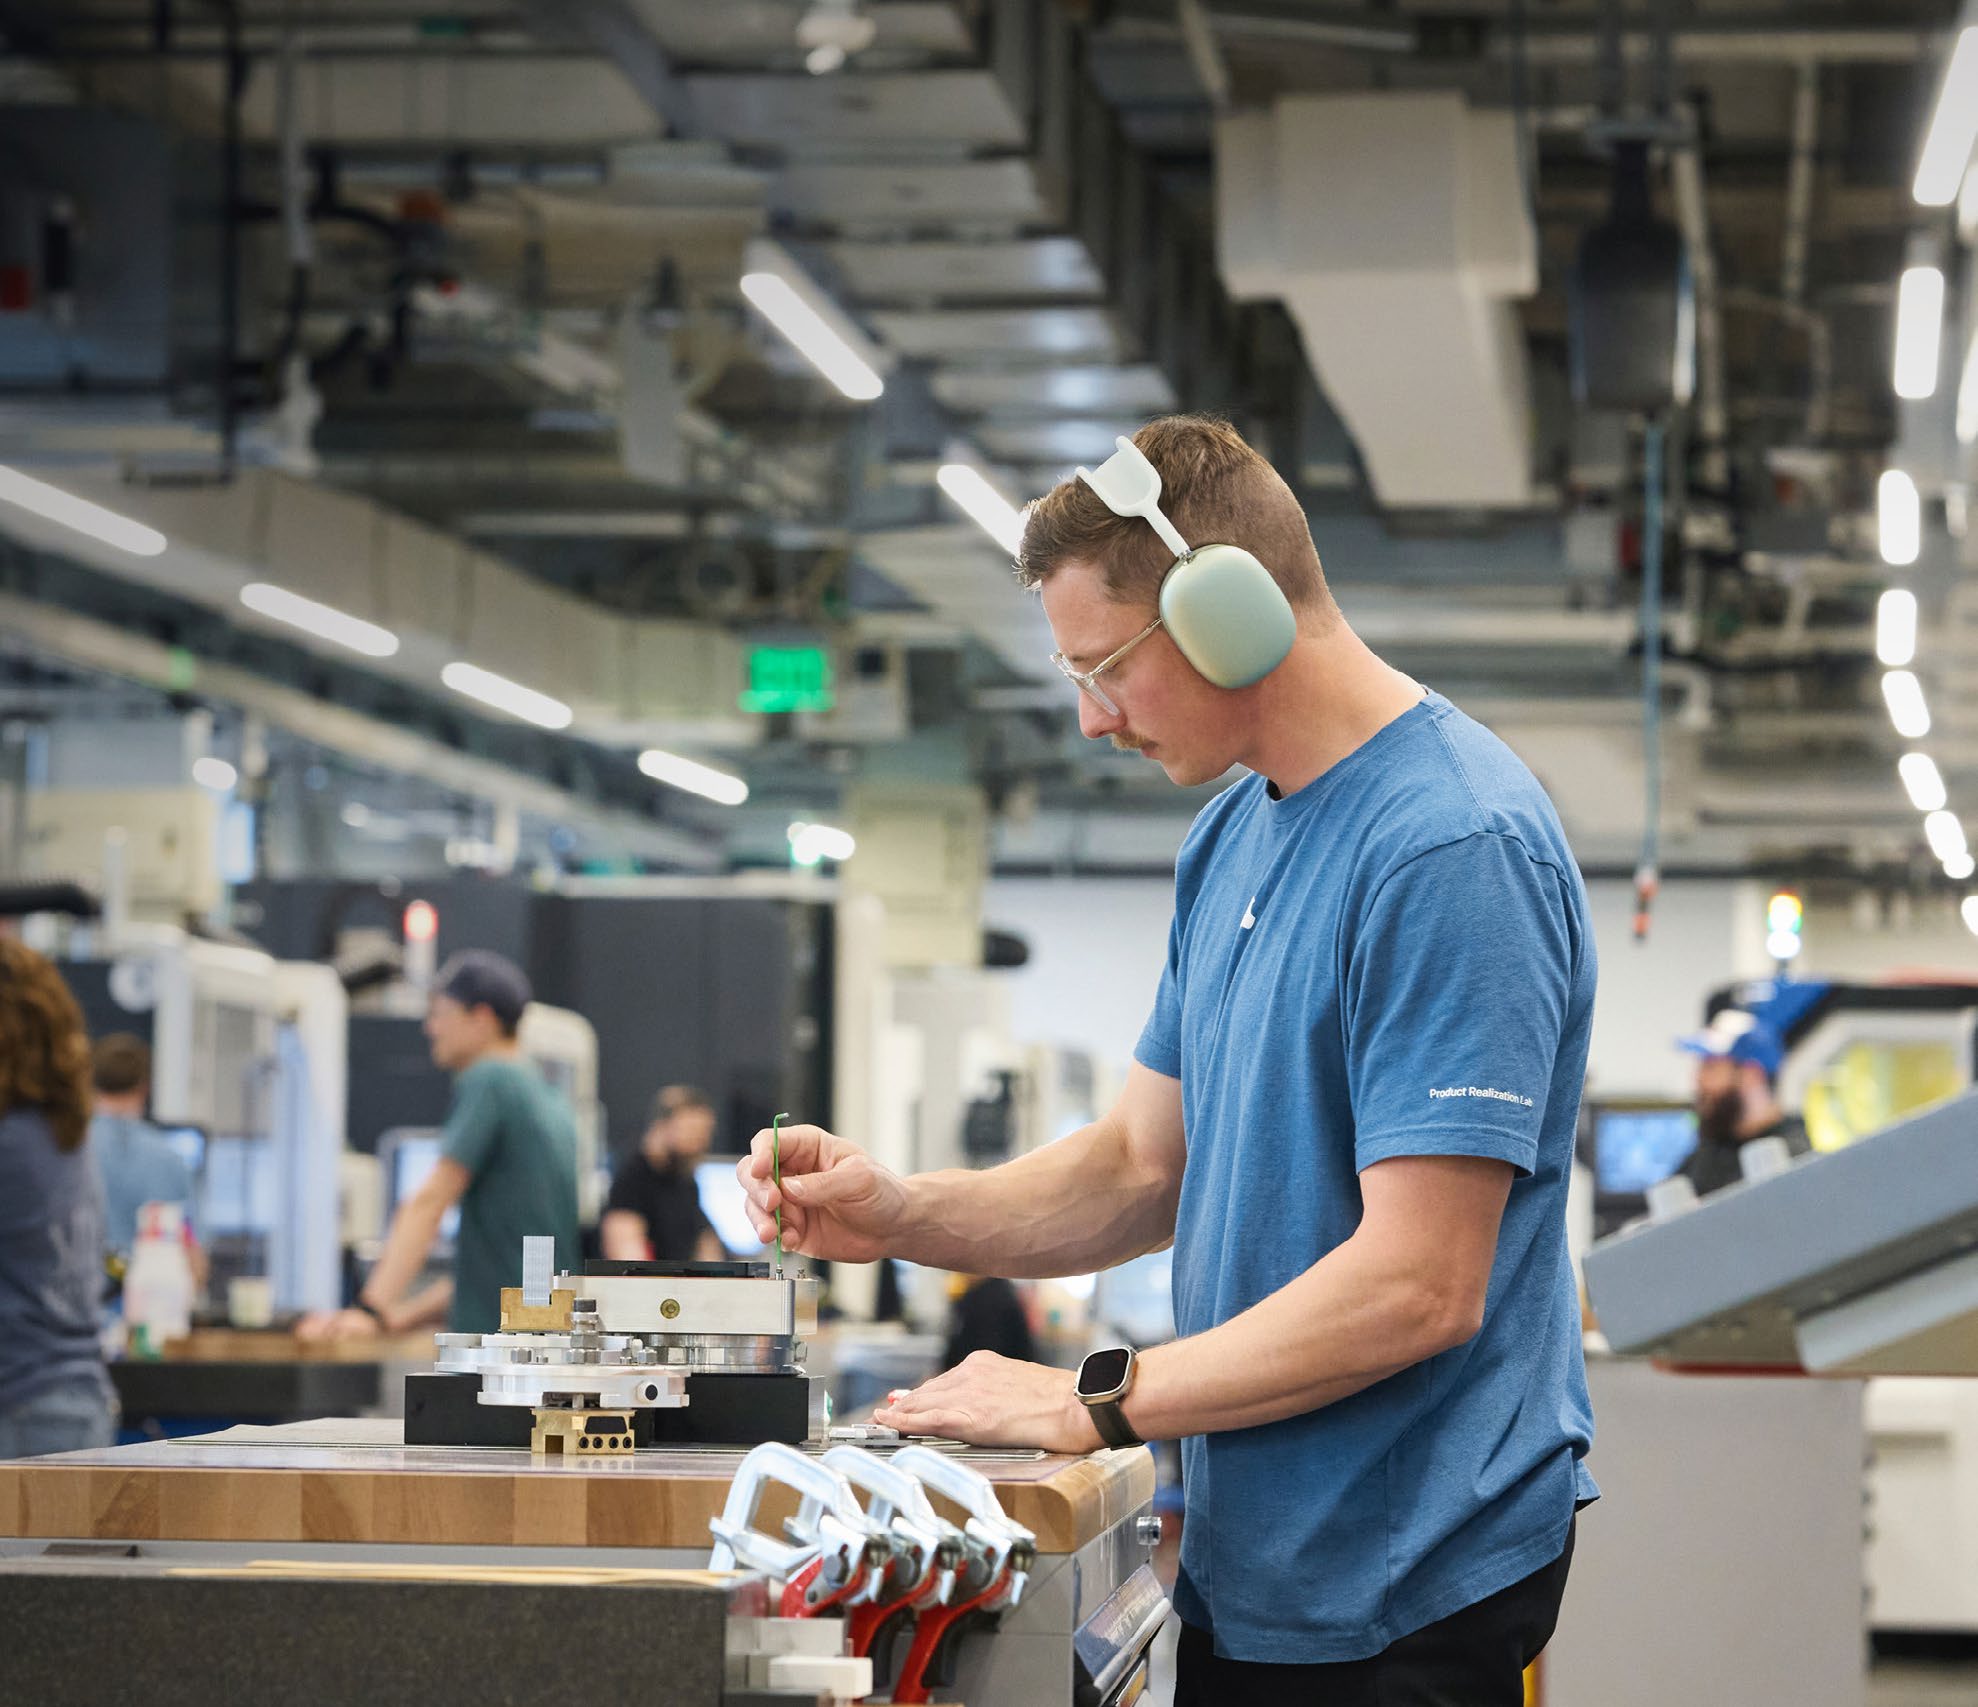
Resources
IN THIS SECTION
Approach
Product longevity
Material recovery
Water
Zero waste
2026 ENVIRONMENTAL PROGRESS REPORT
38
ENGAGEMENT AND ADVOCACY
INTRODUCTION
CONTENTS
APPENDIX
GREEN BOND IMPACT REPORT
DATA
ENVIRONMENTAL INITIATIVES
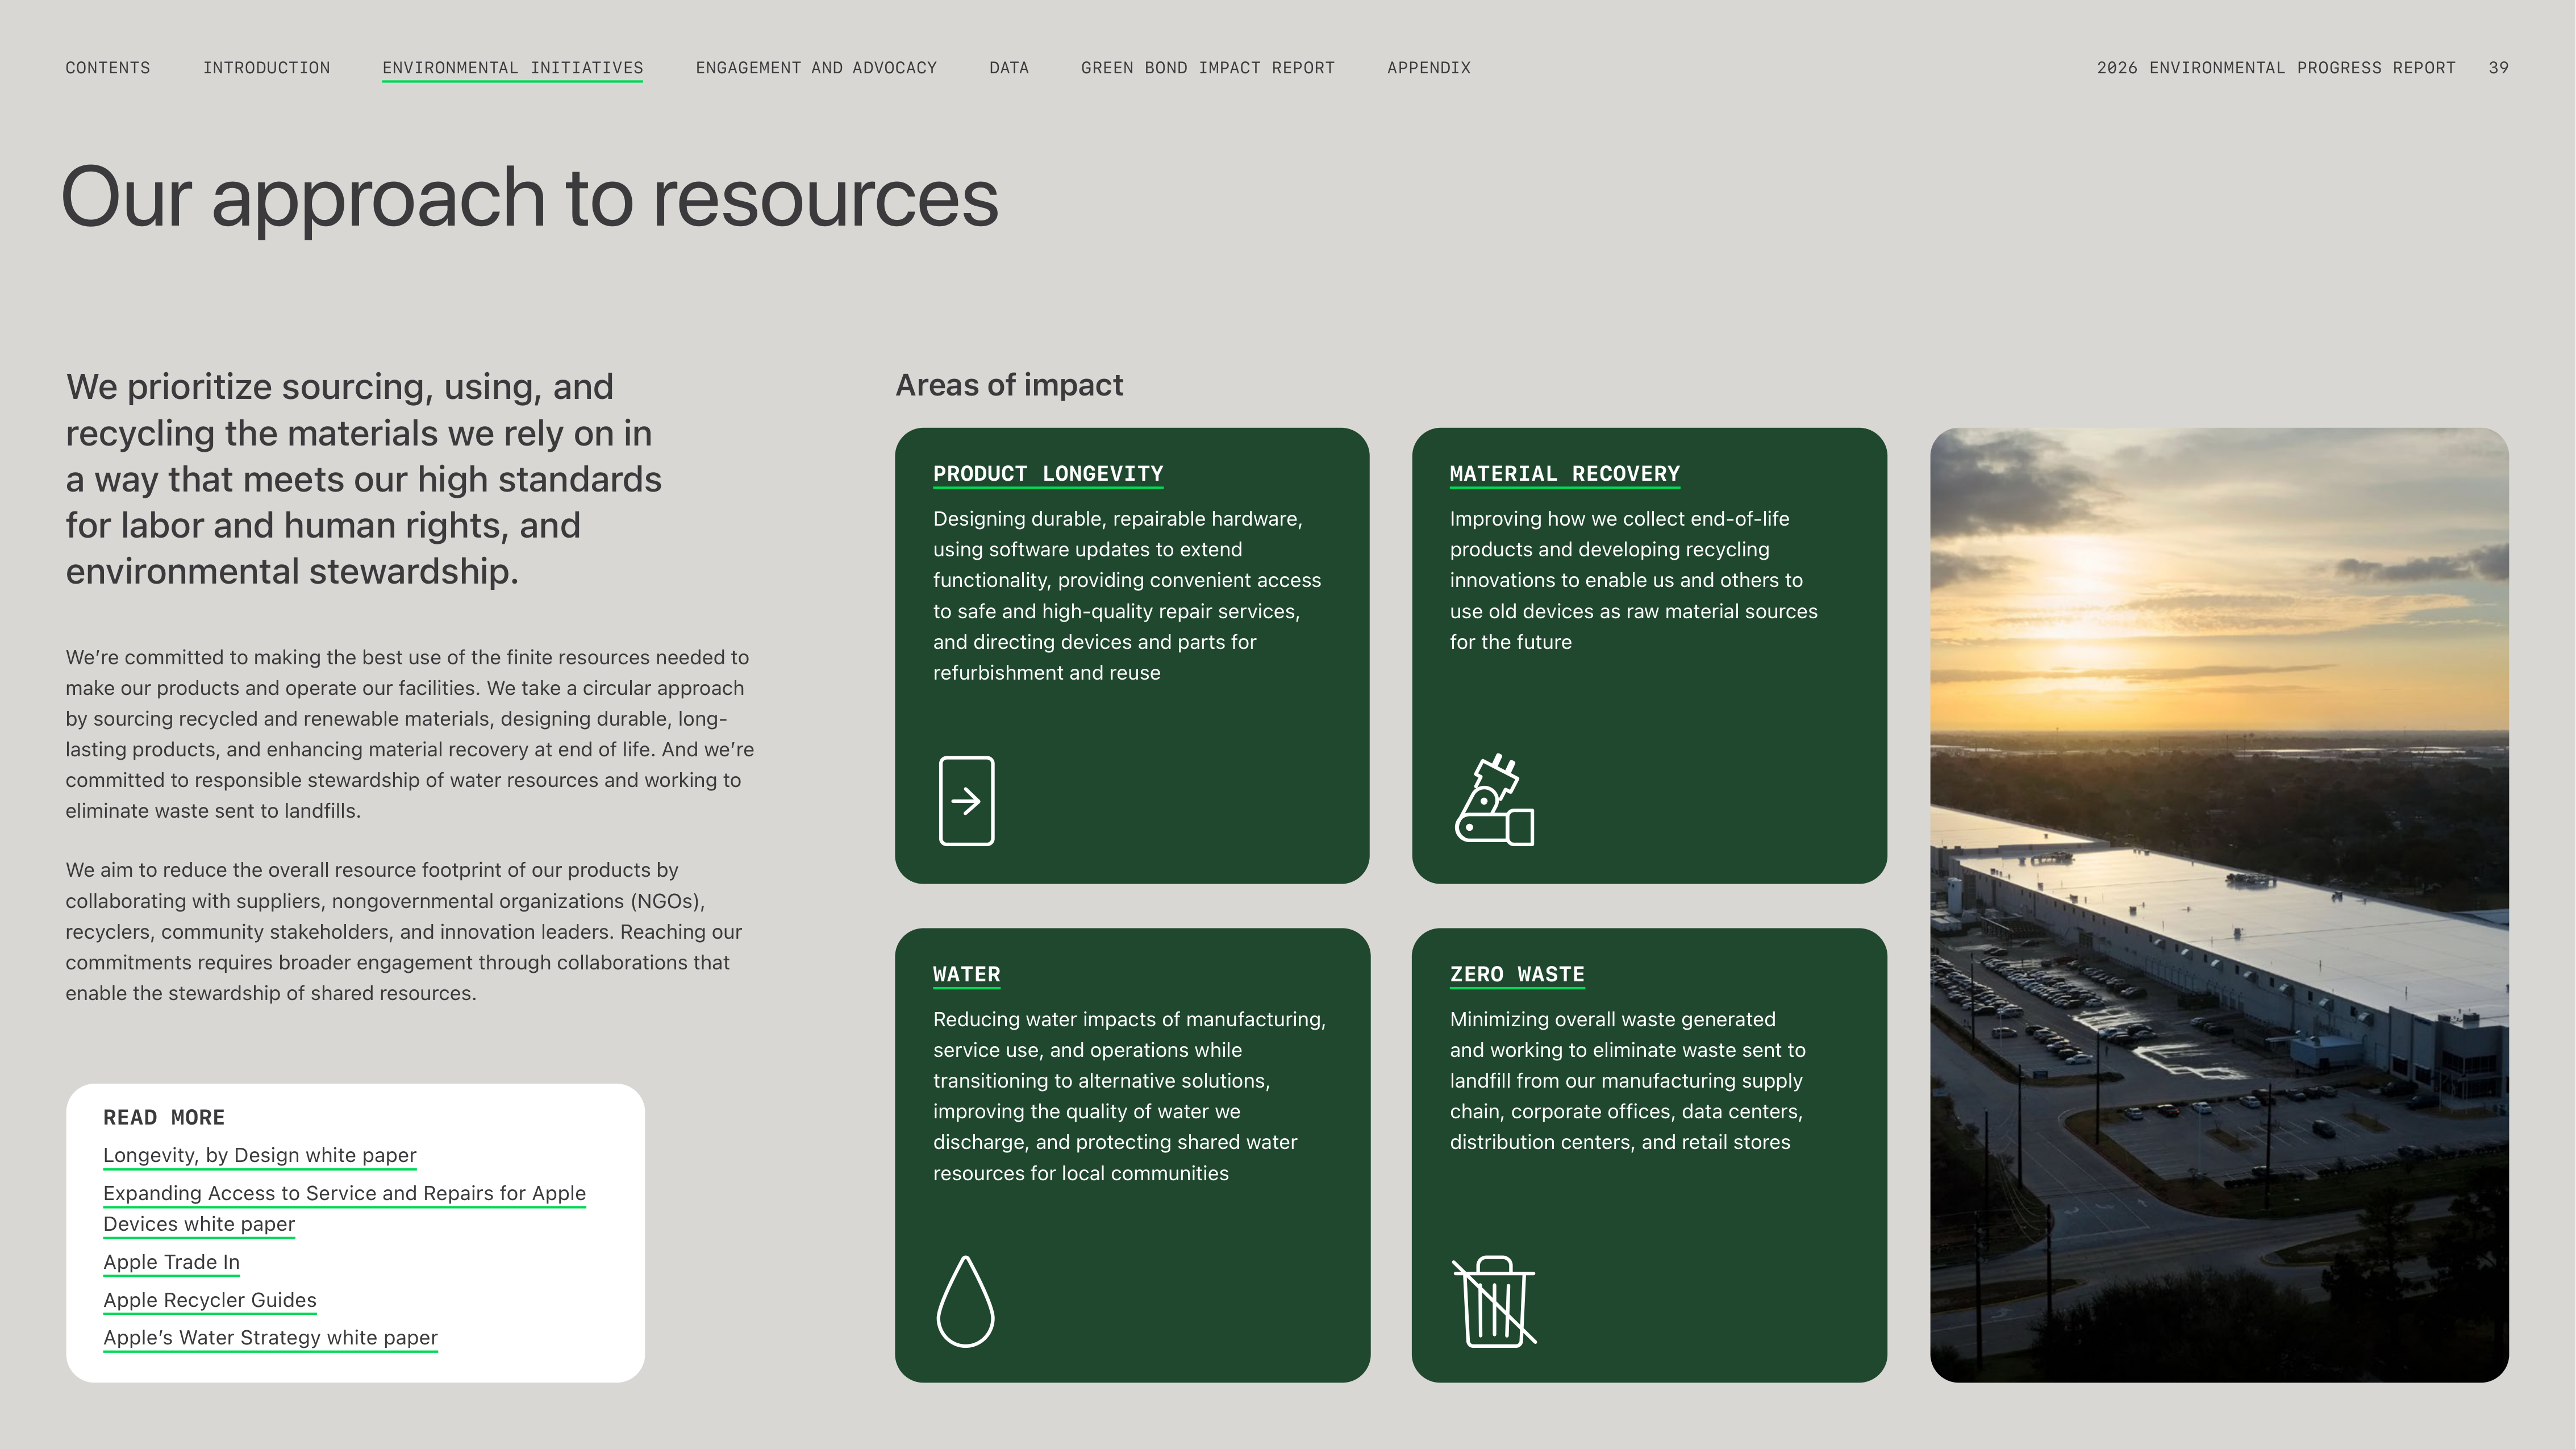
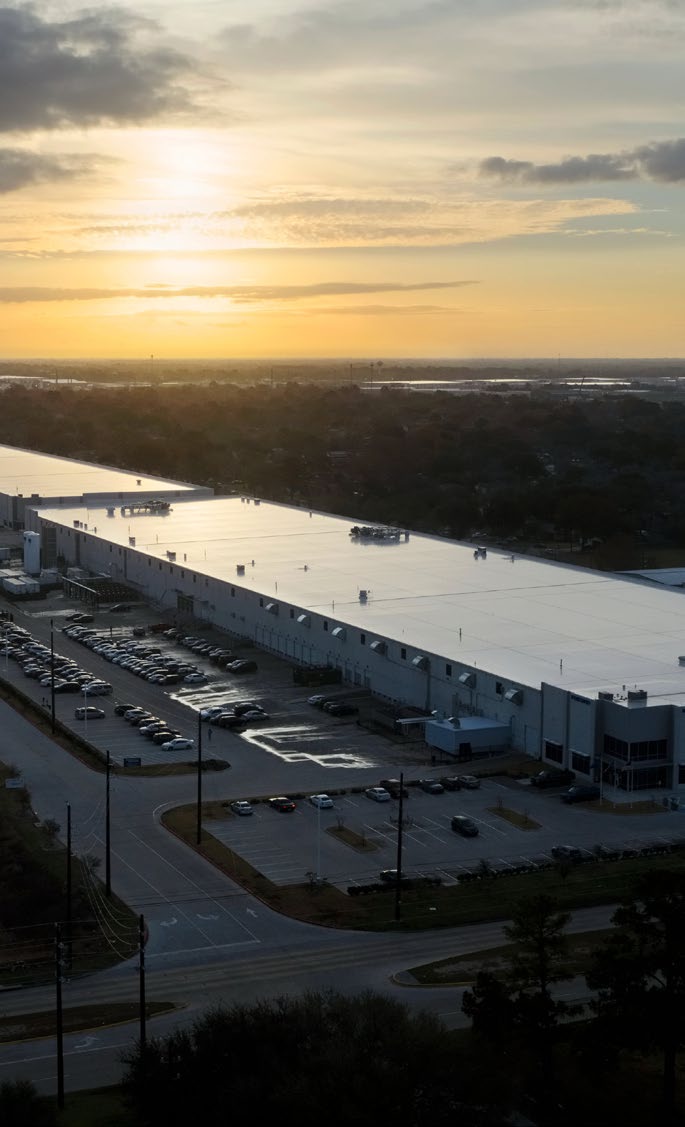
Our approach to resources
We prioritize sourcing, using, and
recycling the materials we rely on in
a way that meets our high standards
for labor and human rights, and
environmental stewardship.
Weʼre committed to making the best use of the finite resources needed to
make our products and operate our facilities. We take a circular approach
by sourcing recycled and renewable materials, designing durable, long-
lasting products, and enhancing material recovery at end of life. And weʼre
committed to responsible stewardship of water resources and working to
eliminate waste sent to landfills.
We aim to reduce the overall resource footprint of our products by
collaborating with suppliers, nongovernmental organizations (NGOs),
recyclers, community stakeholders, and innovation leaders. Reaching our
commitments requires broader engagement through collaborations that
enable the stewardship of shared resources.
READ MORE
Longevity, by Design white paper
Expanding Access to Service and Repairs for Apple
Devices white paper
Apple Trade In
Apple Recycler Guides
Appleʼs Water Strategy white paper
PRODUCT LONGEVITY
Designing durable, repairable hardware,
using software updates to extend
functionality, providing convenient access
to safe and high-quality repair services,
and directing devices and parts for
refurbishment and reuse
WATER
Reducing water impacts of manufacturing,
service use, and operations while
transitioning to alternative solutions,
improving the quality of water we
discharge, and protecting shared water
resources for local communities
ZERO WASTE
Minimizing overall waste generated
and working to eliminate waste sent to
landfill from our manufacturing supply
chain, corporate offices, data centers,
distribution centers, and retail stores
MATERIAL RECOVERY
Improving how we collect end-of-life
products and developing recycling
innovations to enable us and others to
use old devices as raw material sources
for the future
Areas of impact
ENGAGEMENT AND ADVOCACY
INTRODUCTION
CONTENTS
GREEN BOND IMPACT REPORT
DATA
APPENDIX
2026 ENVIRONMENTAL PROGRESS REPORT
39
ENVIRONMENTAL INITIATIVES
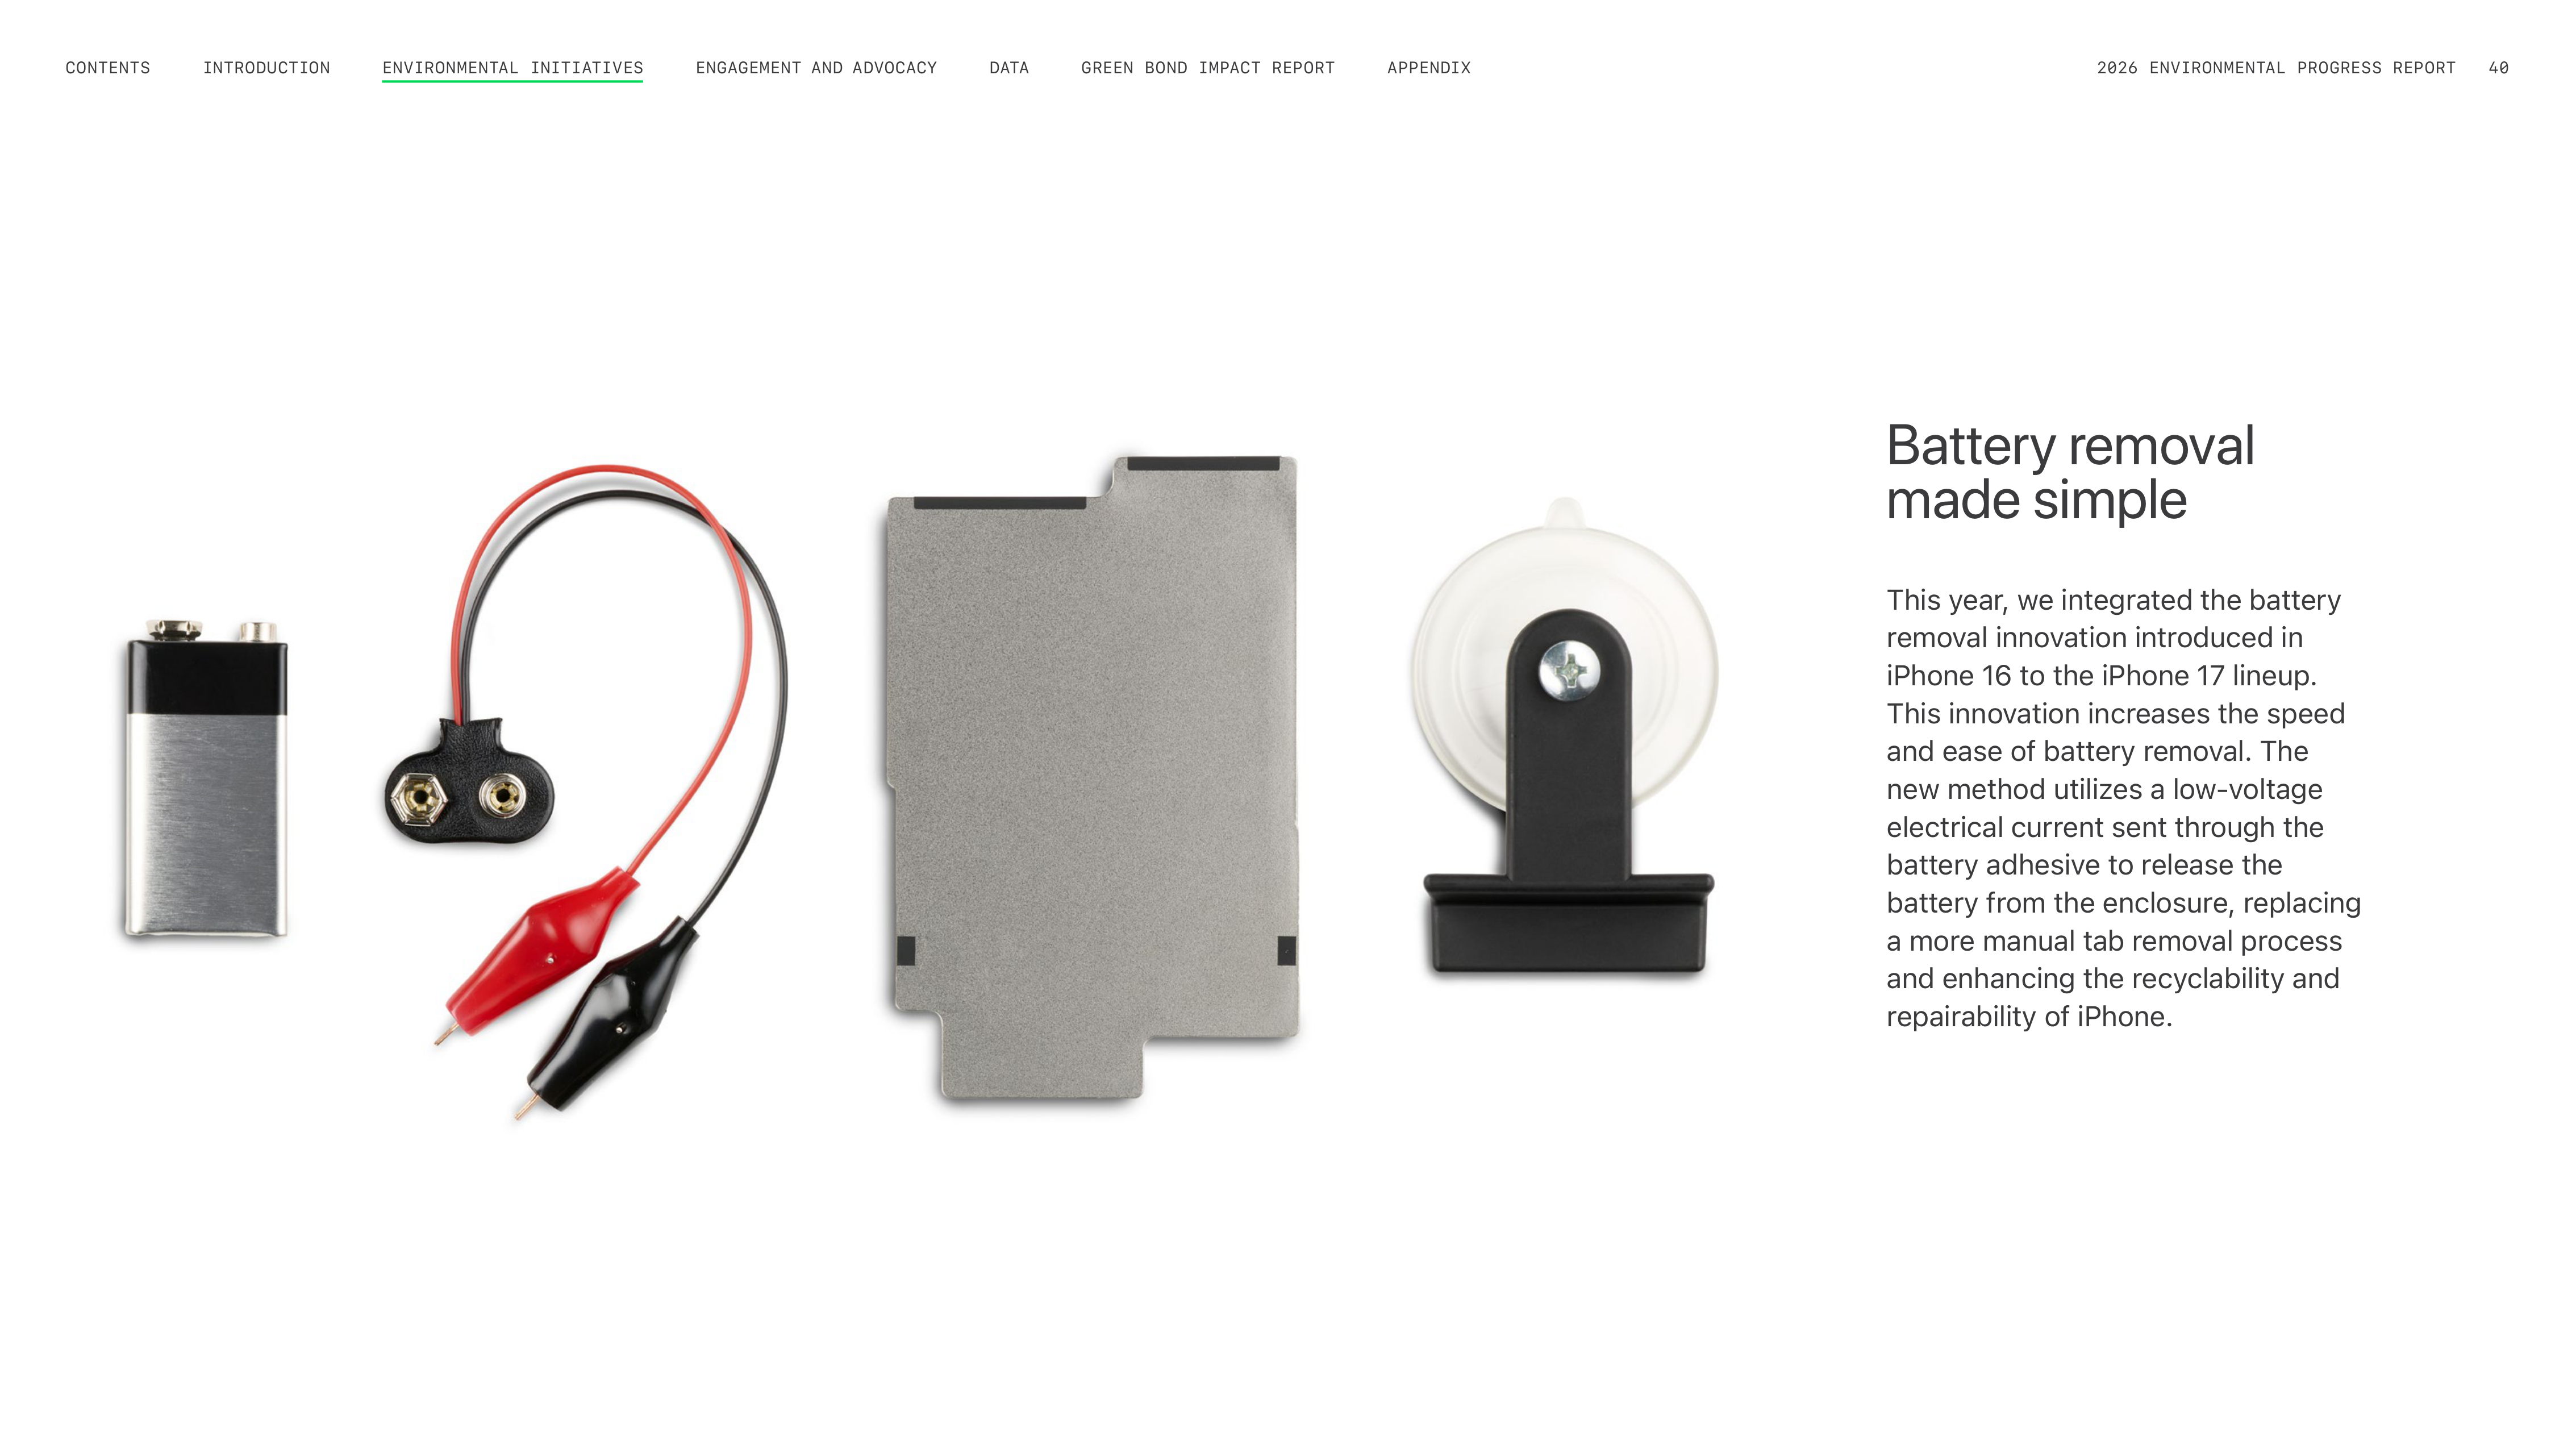
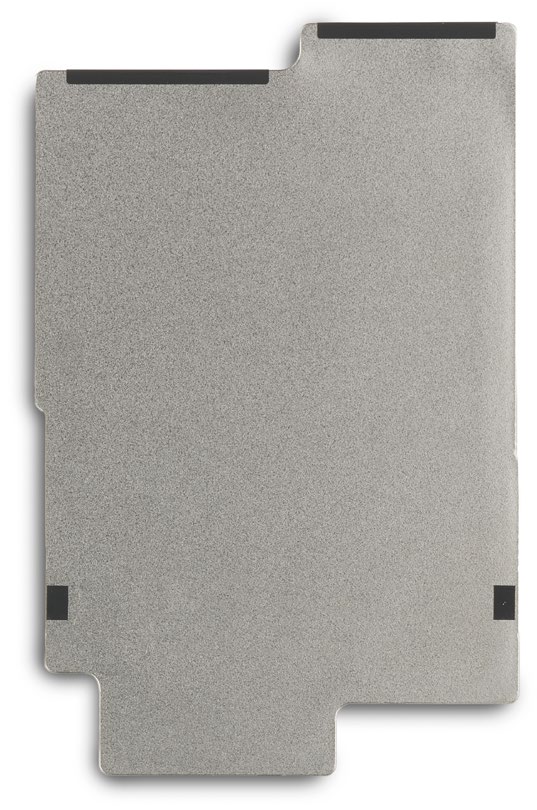
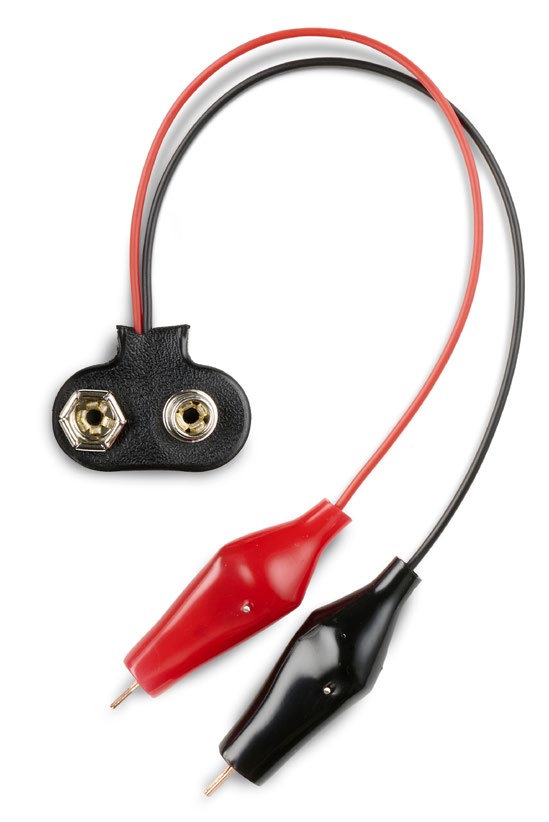

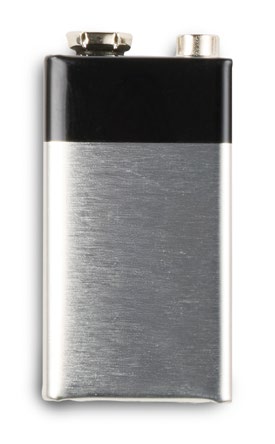
Battery removal
made simple
This year, we integrated the battery
removal innovation introduced in
iPhone 16 to the iPhone 17 lineup.
This innovation increases the speed
and ease of battery removal. The
new method utilizes a low-voltage
electrical current sent through the
battery adhesive to release the
battery from the enclosure, replacing
a more manual tab removal process
and enhancing the recyclability and
repairability of iPhone.
ENGAGEMENT AND ADVOCACY
INTRODUCTION
CONTENTS
GREEN BOND IMPACT REPORT
DATA
APPENDIX
2026 ENVIRONMENTAL PROGRESS REPORT
40
ENVIRONMENTAL INITIATIVES
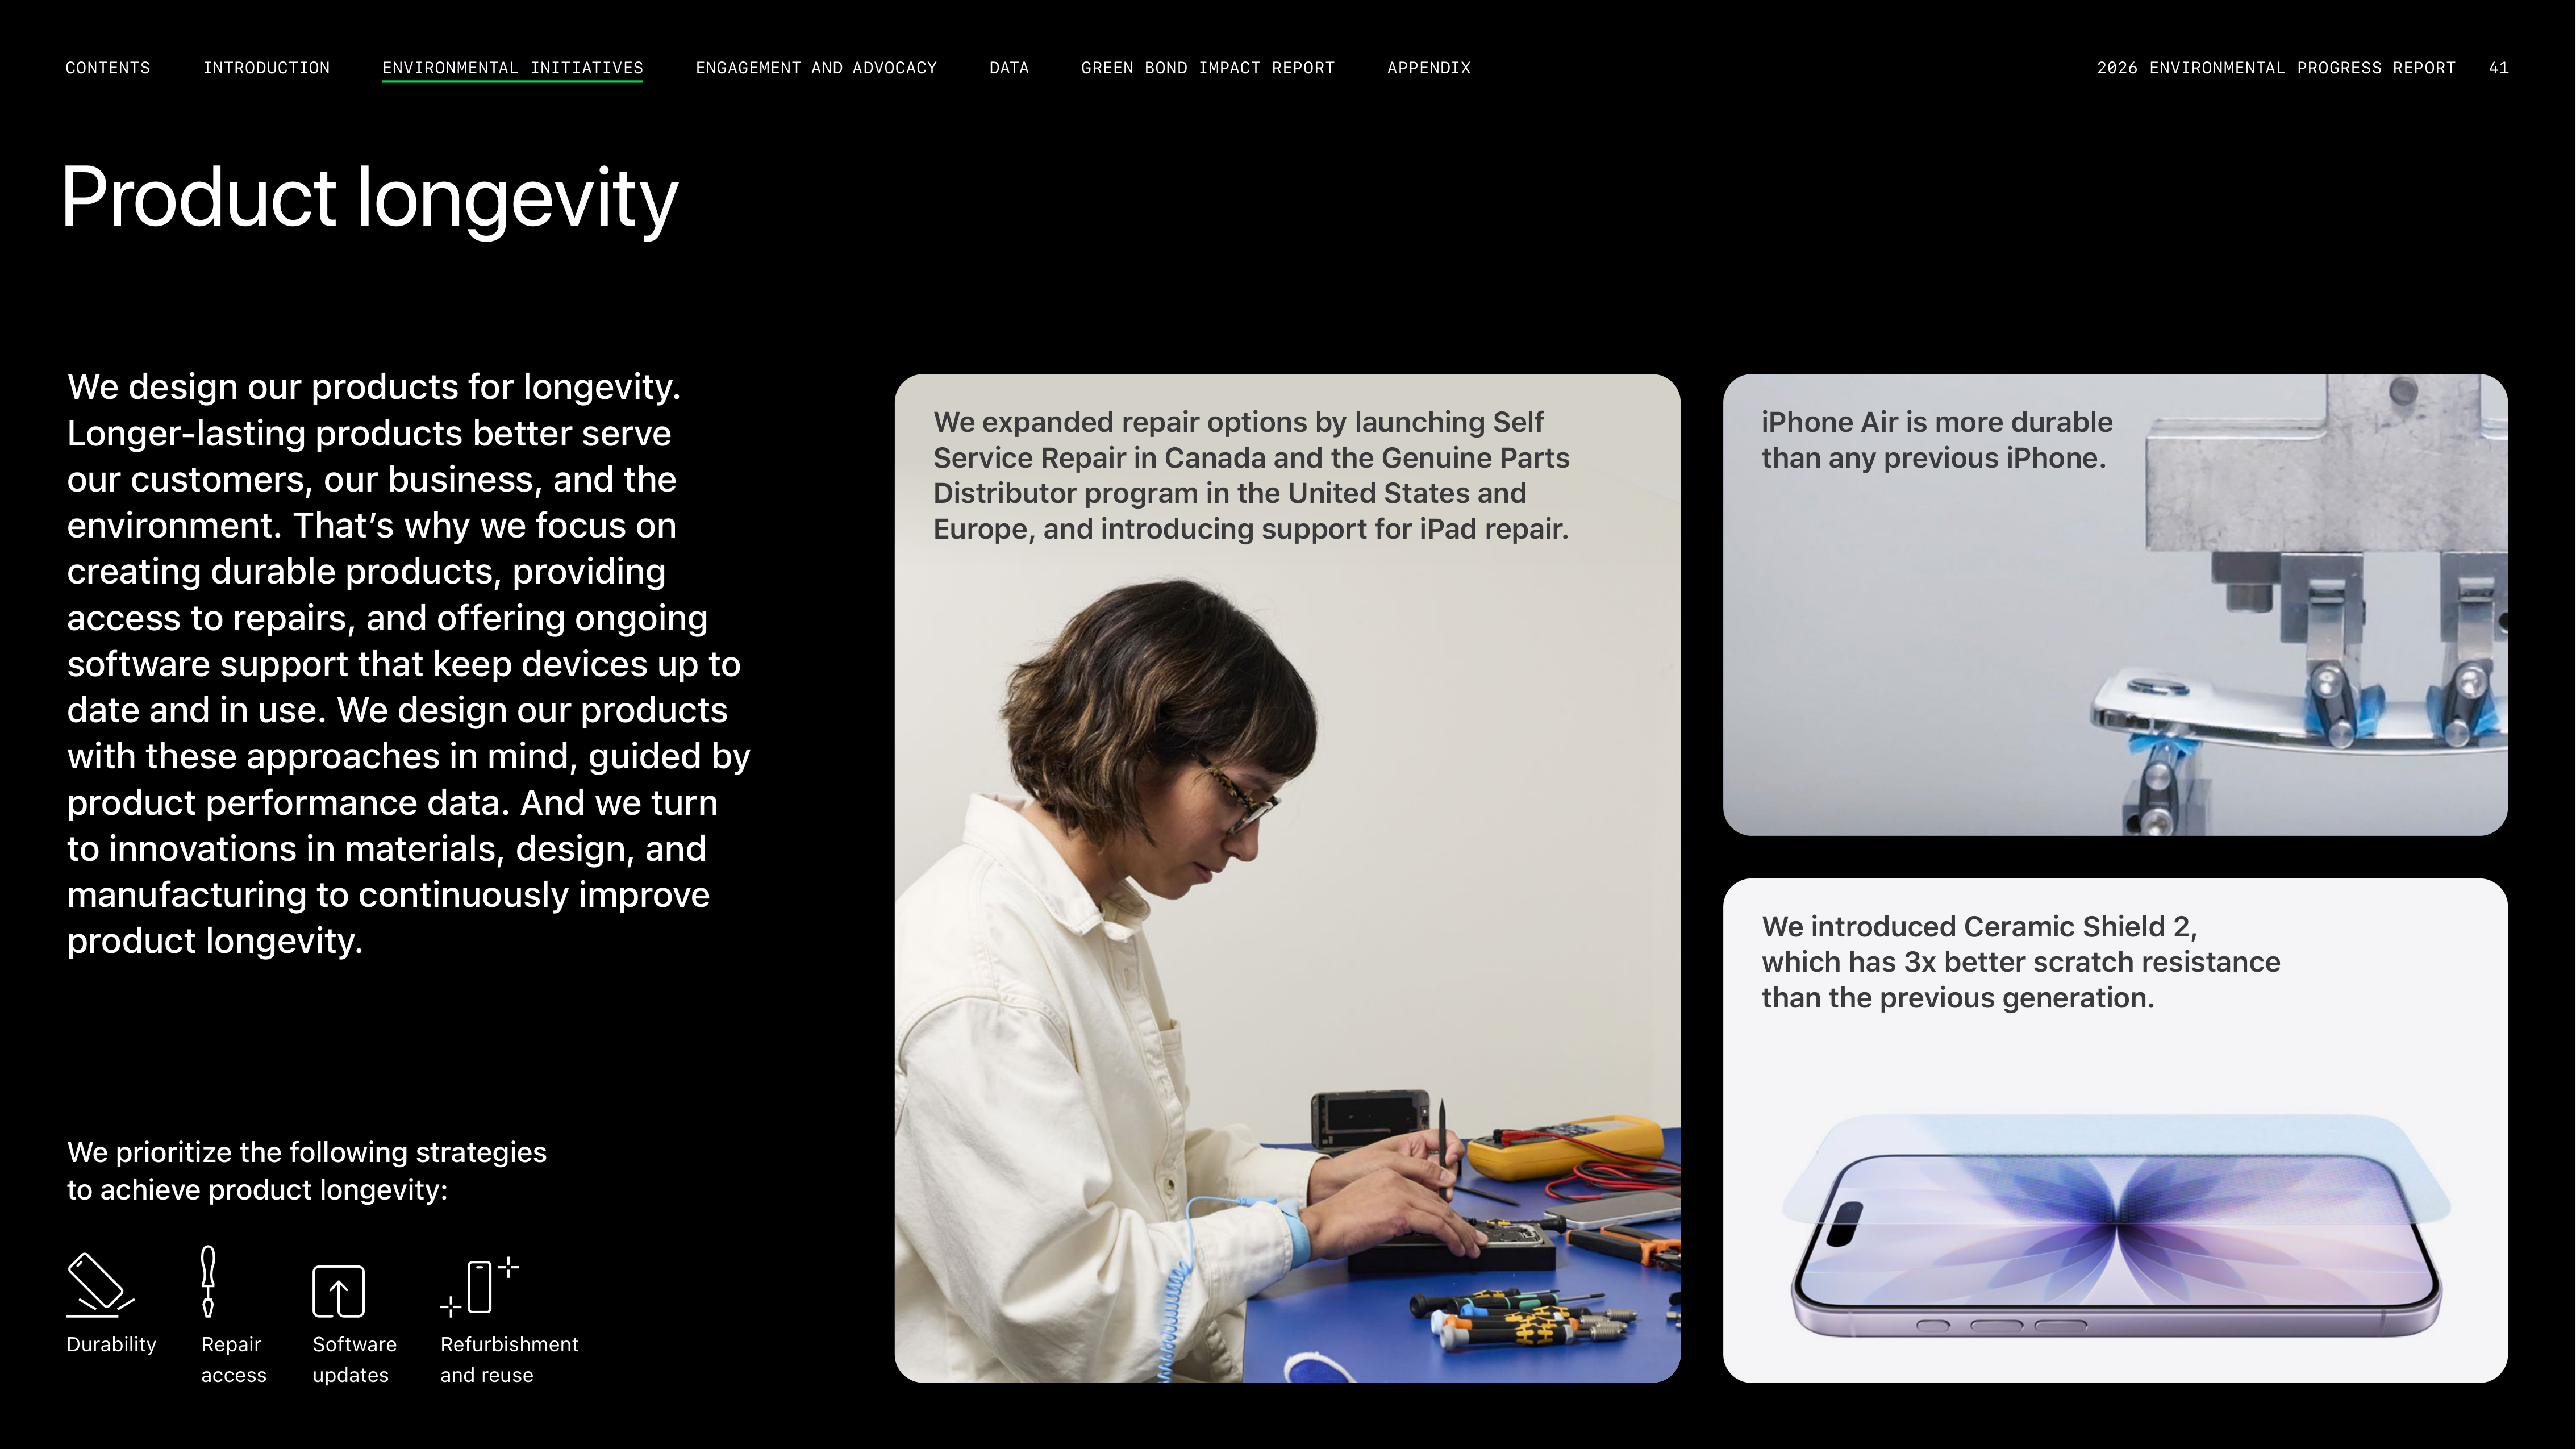



Product longevity
We design our products for longevity.
Longer-lasting products better serve
our customers, our business, and the
environment. That’s why we focus on
creating durable products, providing
access to repairs, and offering ongoing
software support that keep devices up to
date and in use. We design our products
with these approaches in mind, guided by
product performance data. And we turn
to innovations in materials, design, and
manufacturing to continuously improve
product longevity.
We prioritize the following strategies
to achieve product longevity:
Durability
Repair
access
Software
updates
Refurbishment
and reuse
We expanded repair options by launching Self
Service Repair in Canada and the Genuine Parts
Distributor program in the United States and
Europe, and introducing support for iPad repair.
iPhone Air is more durable
than any previous iPhone.
We introduced Ceramic Shield 2,
which has 3x better scratch resistance
than the previous generation.
2026 ENVIRONMENTAL PROGRESS REPORT
41
ENGAGEMENT AND ADVOCACY
INTRODUCTION
CONTENTS
APPENDIX
GREEN BOND IMPACT REPORT
DATA
ENVIRONMENTAL INITIATIVES
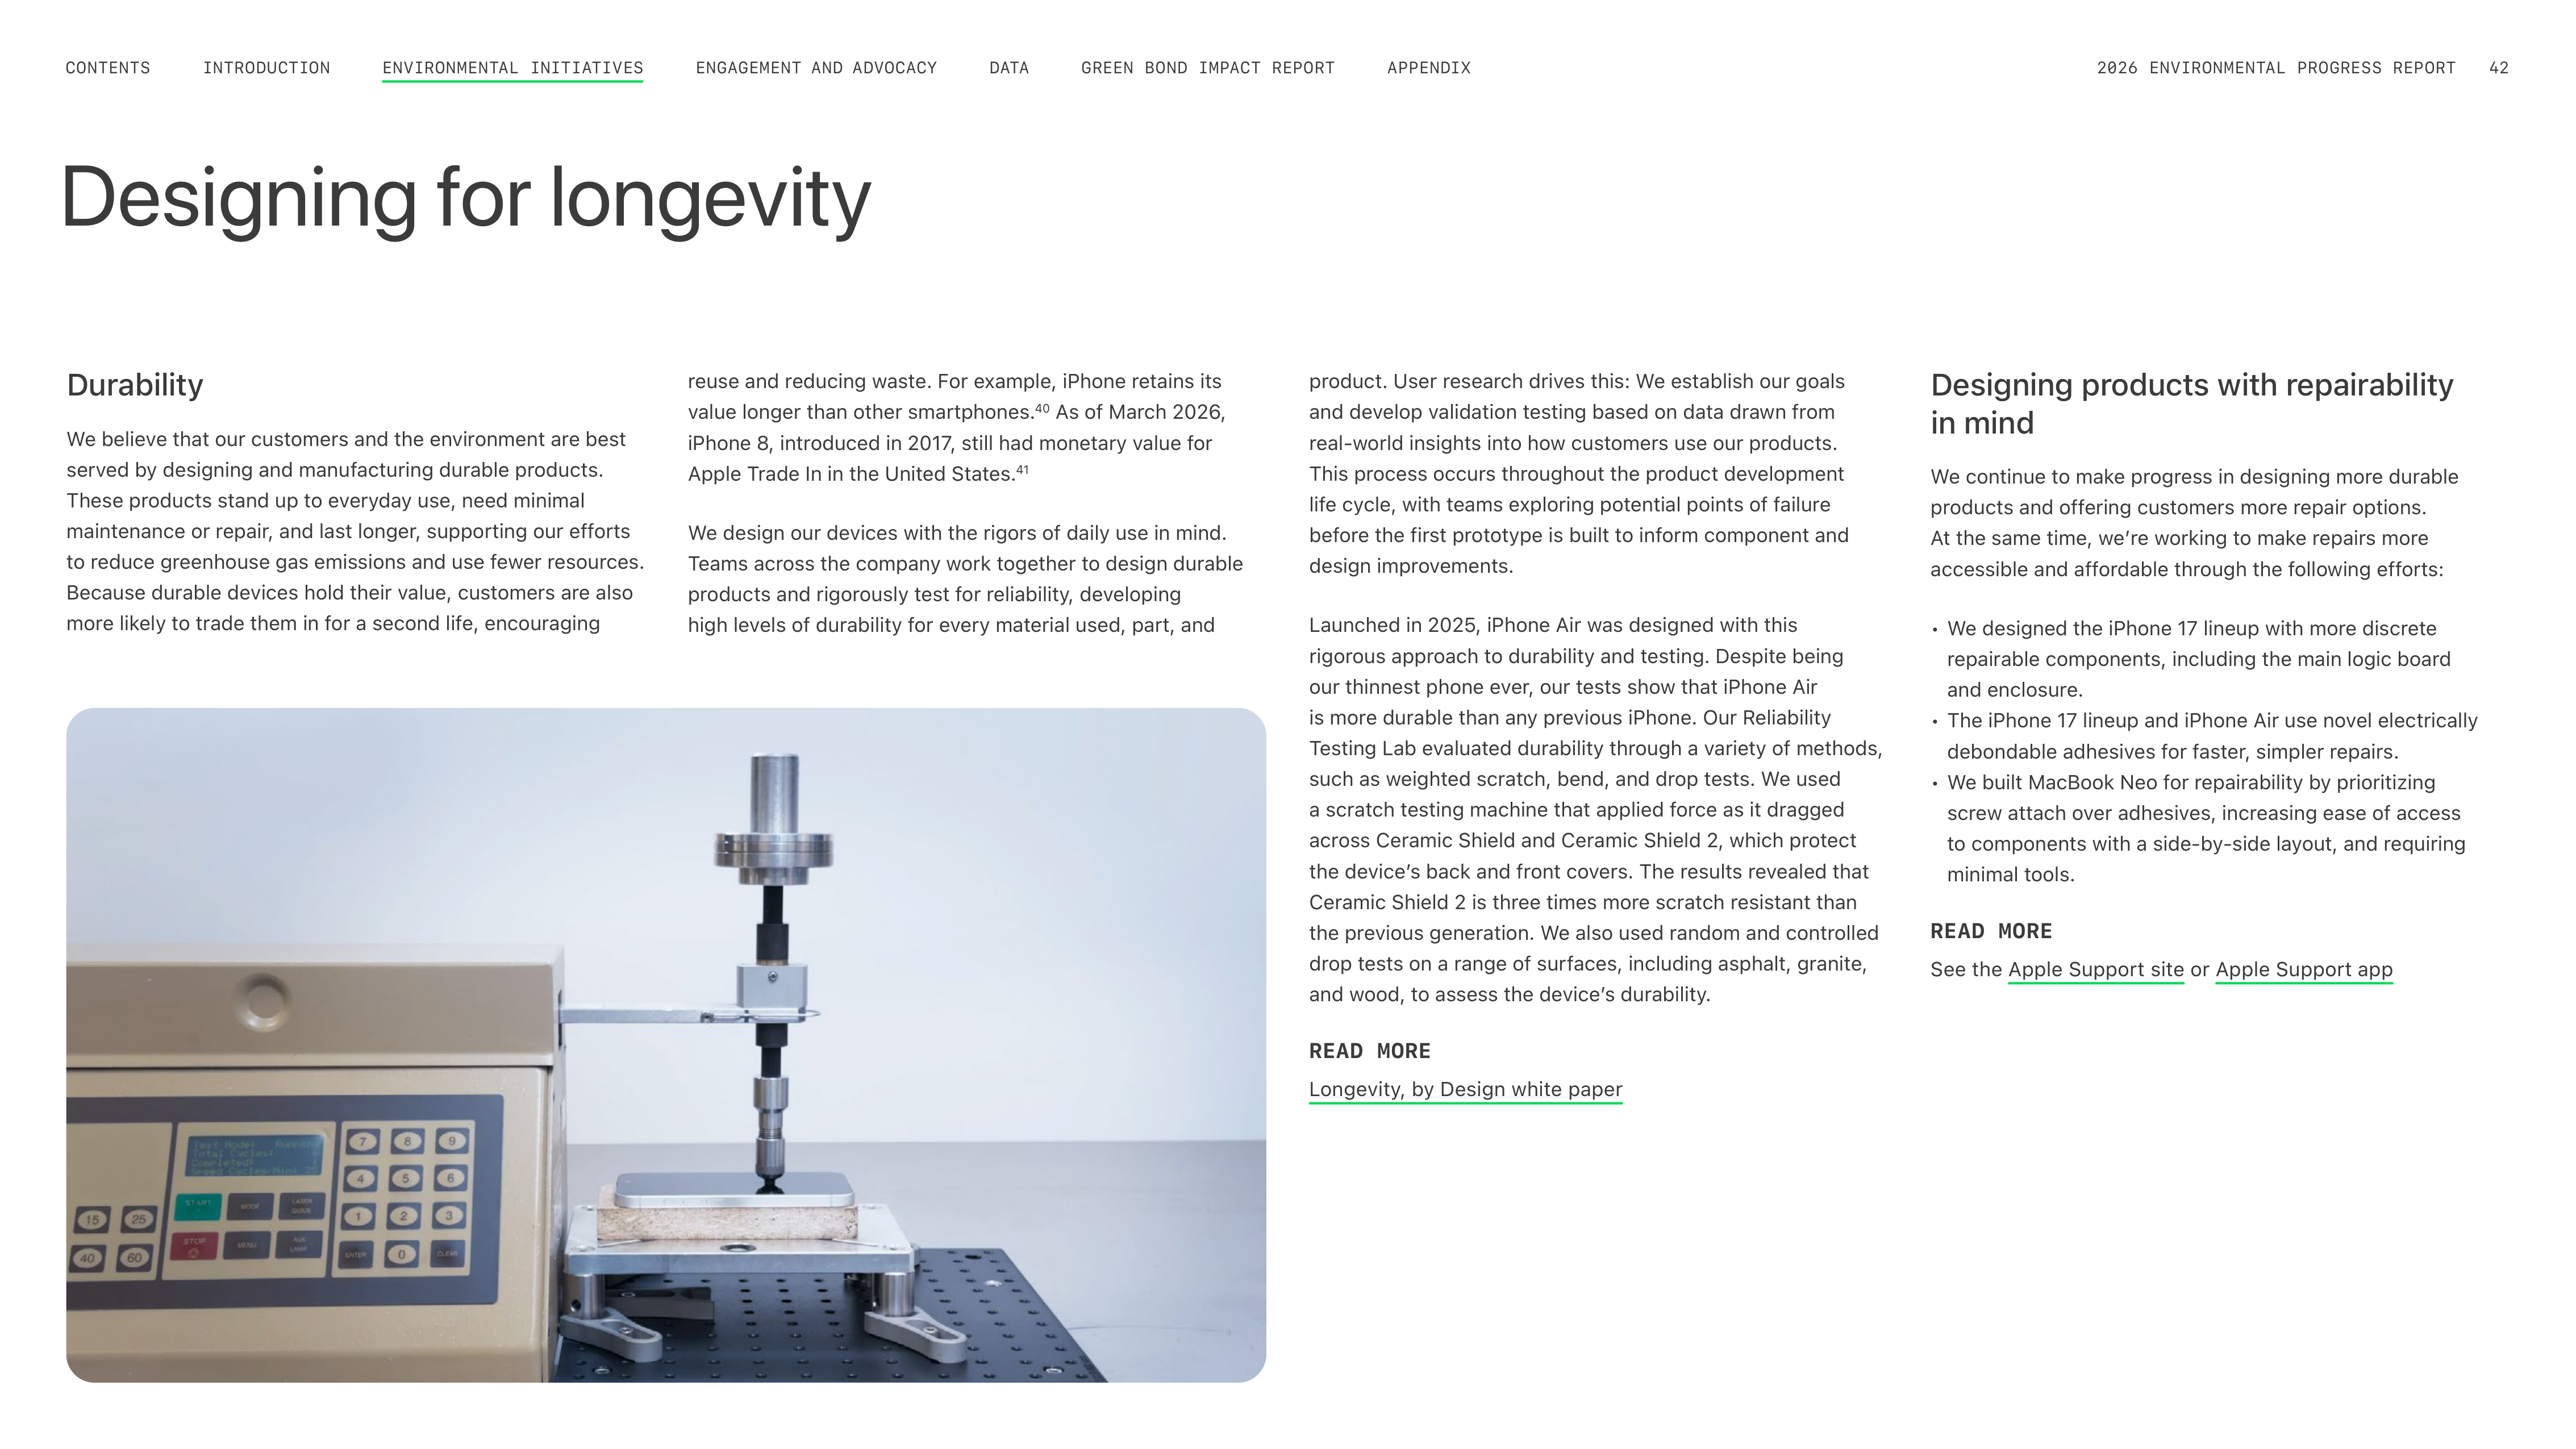

Durability
We believe that our customers and the environment are best
served by designing and manufacturing durable products.
These products stand up to everyday use, need minimal
maintenance or repair, and last longer, supporting our efforts
to reduce greenhouse gas emissions and use fewer resources.
Because durable devices hold their value, customers are also
more likely to trade them in for a second life, encouraging
product. User research drives this: We establish our goals
and develop validation testing based on data drawn from
real-world insights into how customers use our products.
This process occurs throughout the product development
life cycle, with teams exploring potential points of failure
before the first prototype is built to inform component and
design improvements.
Launched in 2025, iPhone Air was designed with this
rigorous approach to durability and testing. Despite being
our thinnest phone ever, our tests show that iPhone Air
is more durable than any previous iPhone. Our Reliability
Testing Lab evaluated durability through a variety of methods,
such as weighted scratch, bend, and drop tests. We used
a scratch testing machine that applied force as it dragged
across Ceramic Shield and Ceramic Shield 2, which protect
the deviceʼs back and front covers. The results revealed that
Ceramic Shield 2 is three times more scratch resistant than
the previous generation. We also used random and controlled
drop tests on a range of surfaces, including asphalt, granite,
and wood, to assess the deviceʼs durability.
READ MORE
Longevity, by Design white paper
reuse and reducing waste. For example, iPhone retains its
value longer than other smartphones.
40
As of March 2026,
iPhone 8, introduced in 2017, still had monetary value for
Apple Trade In in the United States.
41
We design our devices with the rigors of daily use in mind.
Teams across the company work together to design durable
products and rigorously test for reliability, developing
high levels of durability for every material used, part, and
Designing for longevity
Designing products with repairability
in mind
We continue to make progress in designing more durable
products and offering customers more repair options.
At the same time, weʼre working to make repairs more
accessible and affordable through the following efforts:
• We designed the iPhone 17 lineup with more discrete
repairable components, including the main logic board
and enclosure.
• The iPhone 17 lineup and iPhone Air use novel electrically
debondable adhesives for faster, simpler repairs.
• We built MacBook Neo for repairability by prioritizing
screw attach over adhesives, increasing ease of access
to components with a side-by-side layout, and requiring
minimal tools.
READ MORE
See the Apple Support site or Apple Support app
ENGAGEMENT AND ADVOCACY
INTRODUCTION
CONTENTS
GREEN BOND IMPACT REPORT
DATA
APPENDIX
2026 ENVIRONMENTAL PROGRESS REPORT
42
ENVIRONMENTAL INITIATIVES
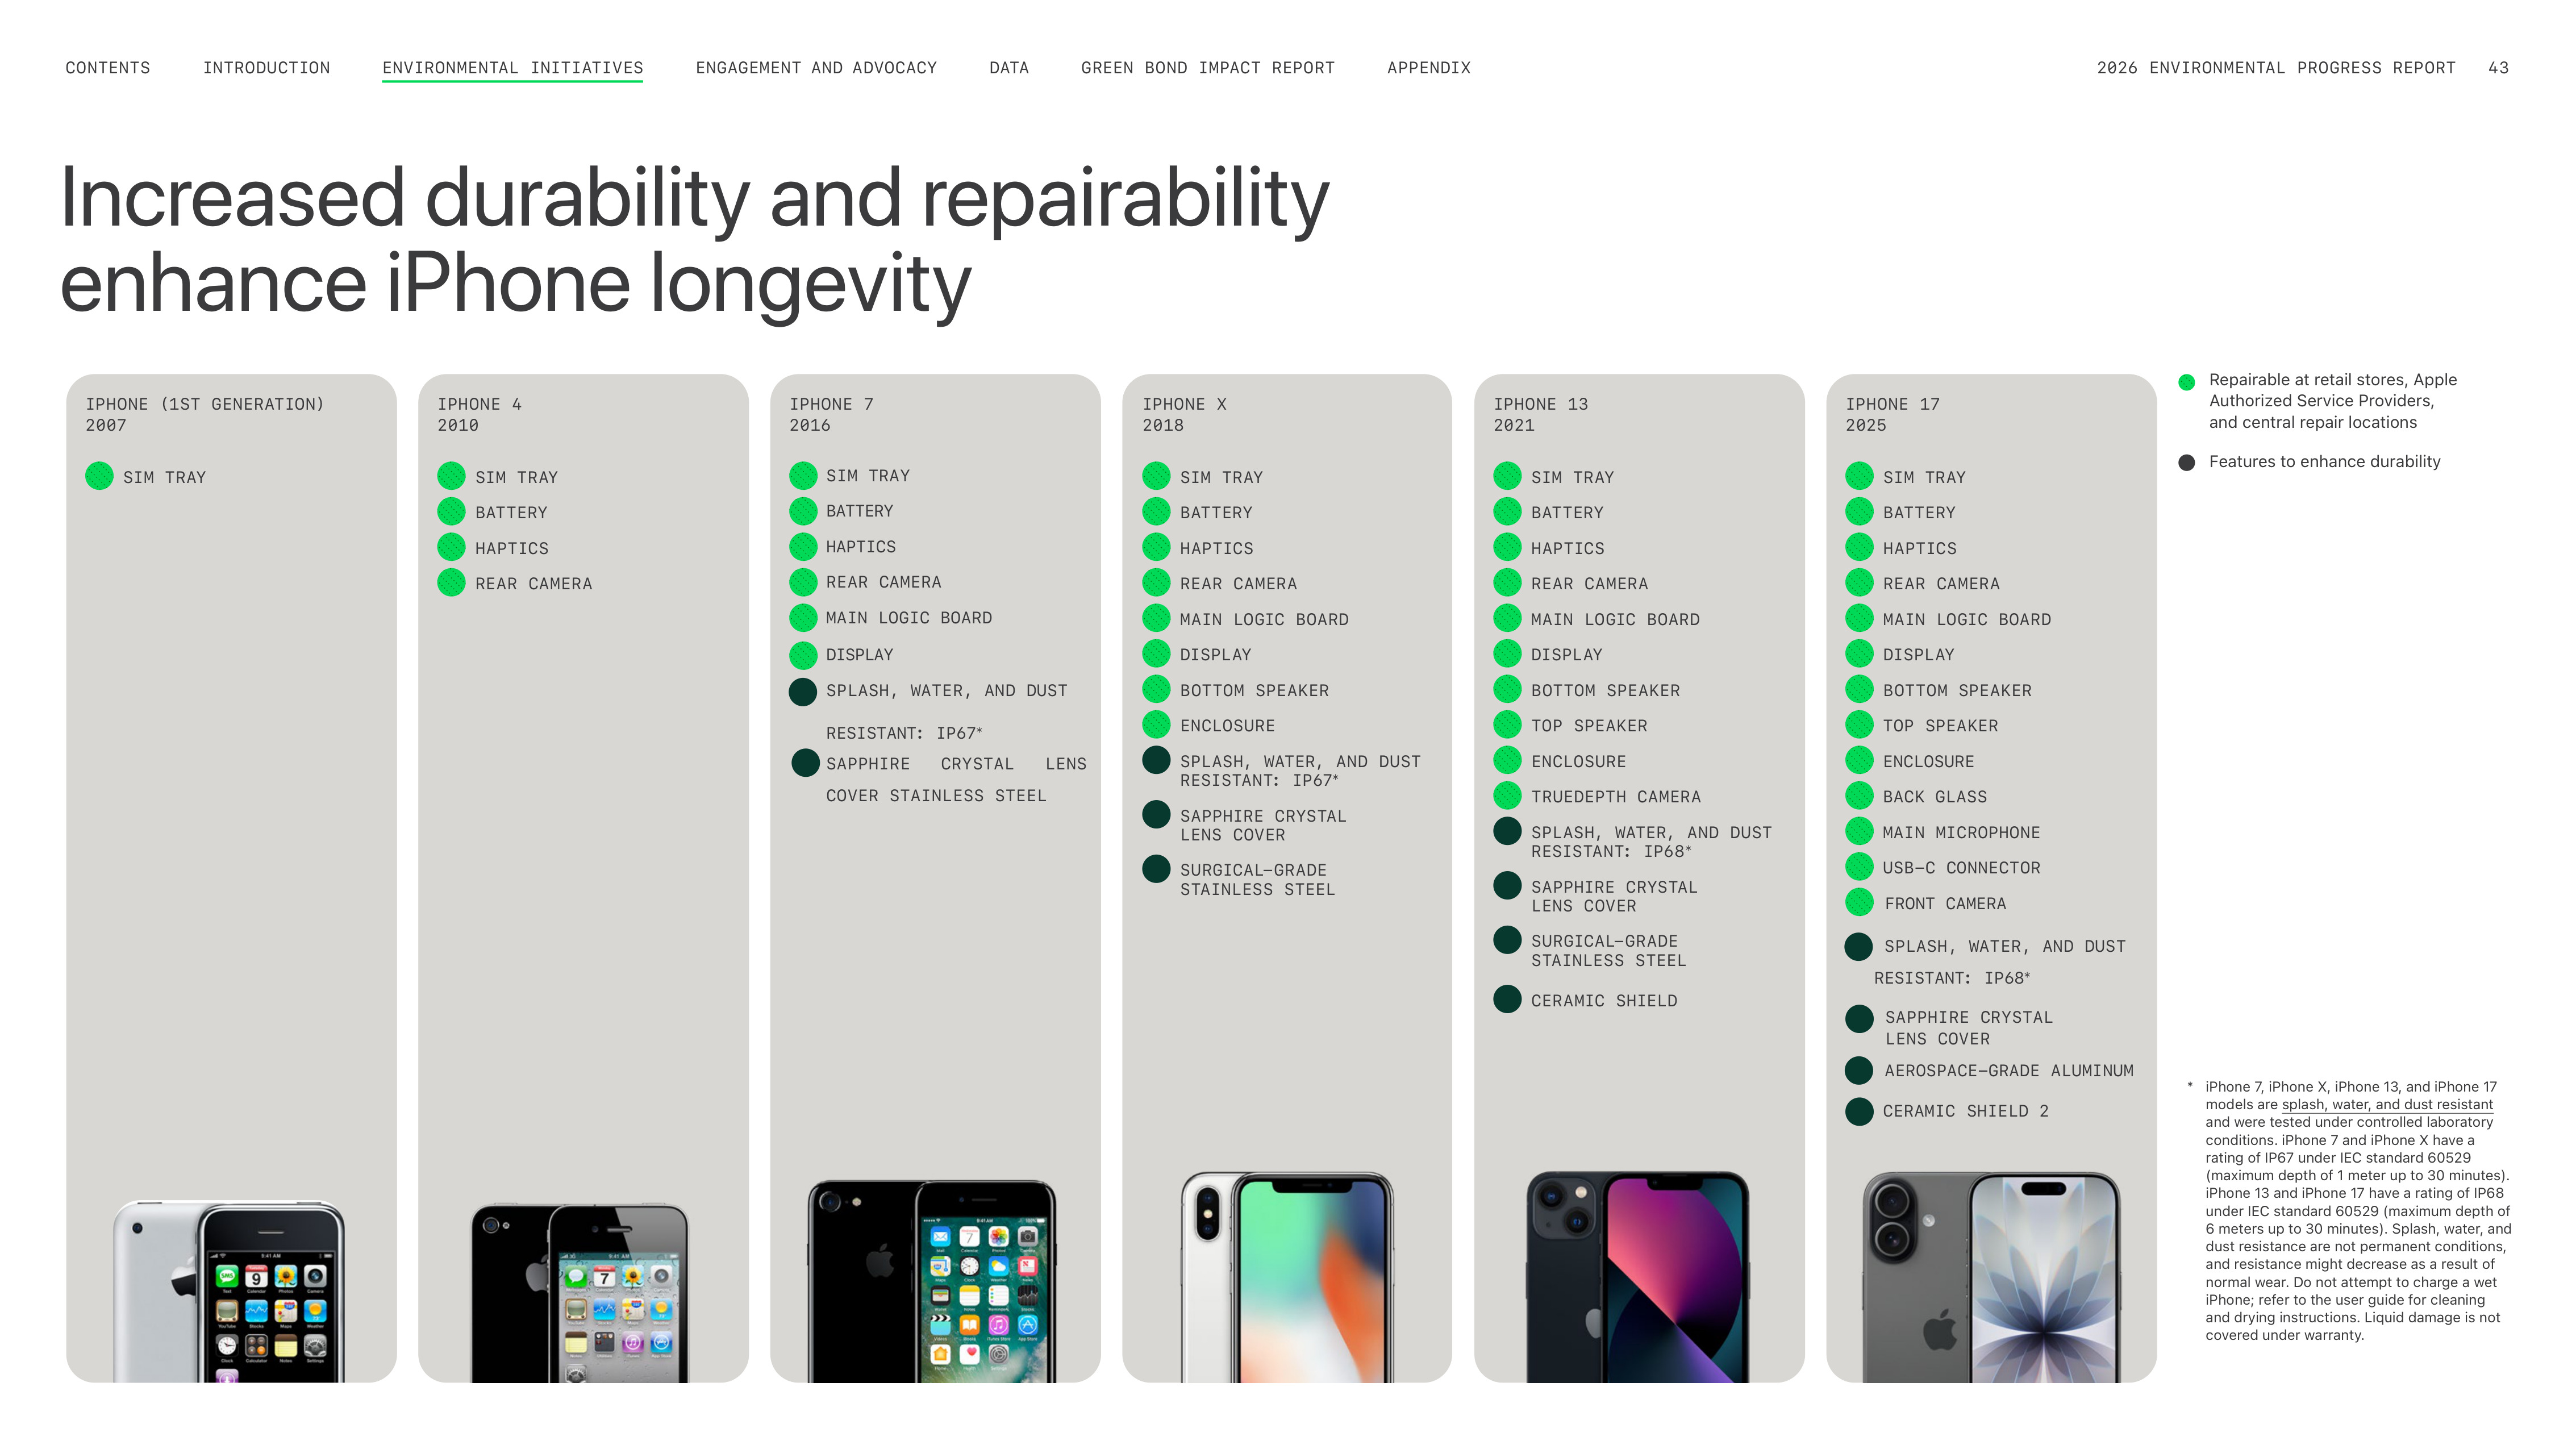






Increased durability and repairability
enhance iPhone longevity
IPHONE (1ST GENERATION)
2007
SIM TRAY
IPHONE 4
2010
SIM TRAY
BATTERY
HAPTICS
REAR CAMERA
IPHONE 7
2016
IPHONE X
2018
SIM TRAY
BATTERY
HAPTICS
REAR CAMERA
MAIN LOGIC BOARD
DISPLAY
BOTTOM SPEAKER
ENCLOSURE
SPLASH, WATER, AND DUST
RESISTANT: IP67
*
SAPPHIRE CRYSTAL
LENS COVER
SURGICAL-GRADE
STAINLESS STEEL
IPHONE 13
2021
SIM TRAY
BATTERY
HAPTICS
REAR CAMERA
MAIN LOGIC BOARD
DISPLAY
BOTTOM SPEAKER
TOP SPEAKER
ENCLOSURE
TRUEDEPTH CAMERA
SPLASH, WATER, AND DUST
RESISTANT: IP68
*
SAPPHIRE CRYSTAL
LENS COVER
SURGICAL-GRADE
STAINLESS STEEL
CERAMIC SHIELD
IPHONE 17
2025
SIM TRAY
BATTERY
HAPTICS
REAR CAMERA
MAIN LOGIC BOARD
DISPLAY
BOTTOM SPEAKER
TOP SPEAKER
ENCLOSURE
BACK GLASS
MAIN MICROPHONE
USB-C CONNECTOR
FRONT CAMERA
SPLASH, WATER, AND DUST
RESISTANT: IP68
*
AEROSPACE-GRADE ALUMINUM
CERAMIC SHIELD 2
Repairable at retail stores, Apple
Authorized Service Providers,
and central repair locations
Features to enhance durability
*
iPhone 7, iPhone X, iPhone 13, and iPhone 17
models are splash, water, and dust resistant
and were tested under controlled laboratory
conditions. iPhone 7 and iPhone X have a
rating of IP67 under IEC standard 60529
(maximum depth of 1 meter up to 30 minutes).
iPhone 13 and iPhone 17 have a rating of IP68
under IEC standard 60529 (maximum depth of
6 meters up to 30 minutes). Splash, water, and
dust resistance are not permanent conditions,
and resistance might decrease as a result of
normal wear. Do not attempt to charge a wet
iPhone; refer to the user guide for cleaning
and drying instructions. Liquid damage is not
covered under warranty.
ENGAGEMENT AND ADVOCACY
INTRODUCTION
CONTENTS
GREEN BOND IMPACT REPORT
DATA
APPENDIX
2026 ENVIRONMENTAL PROGRESS REPORT
43
ENVIRONMENTAL INITIATIVES
SIM TRAY
BATTERY
HAPTICS
REAR CAMERA
MAIN LOGIC BOARD
DISPLAY
SPLASH, WATER, AND DUST
RESISTANT: IP67
*
SAPPHIRE
CRYSTAL
LENS
COVER STAINLESS STEEL
SAPPHIRE CRYSTAL
LENS COVER
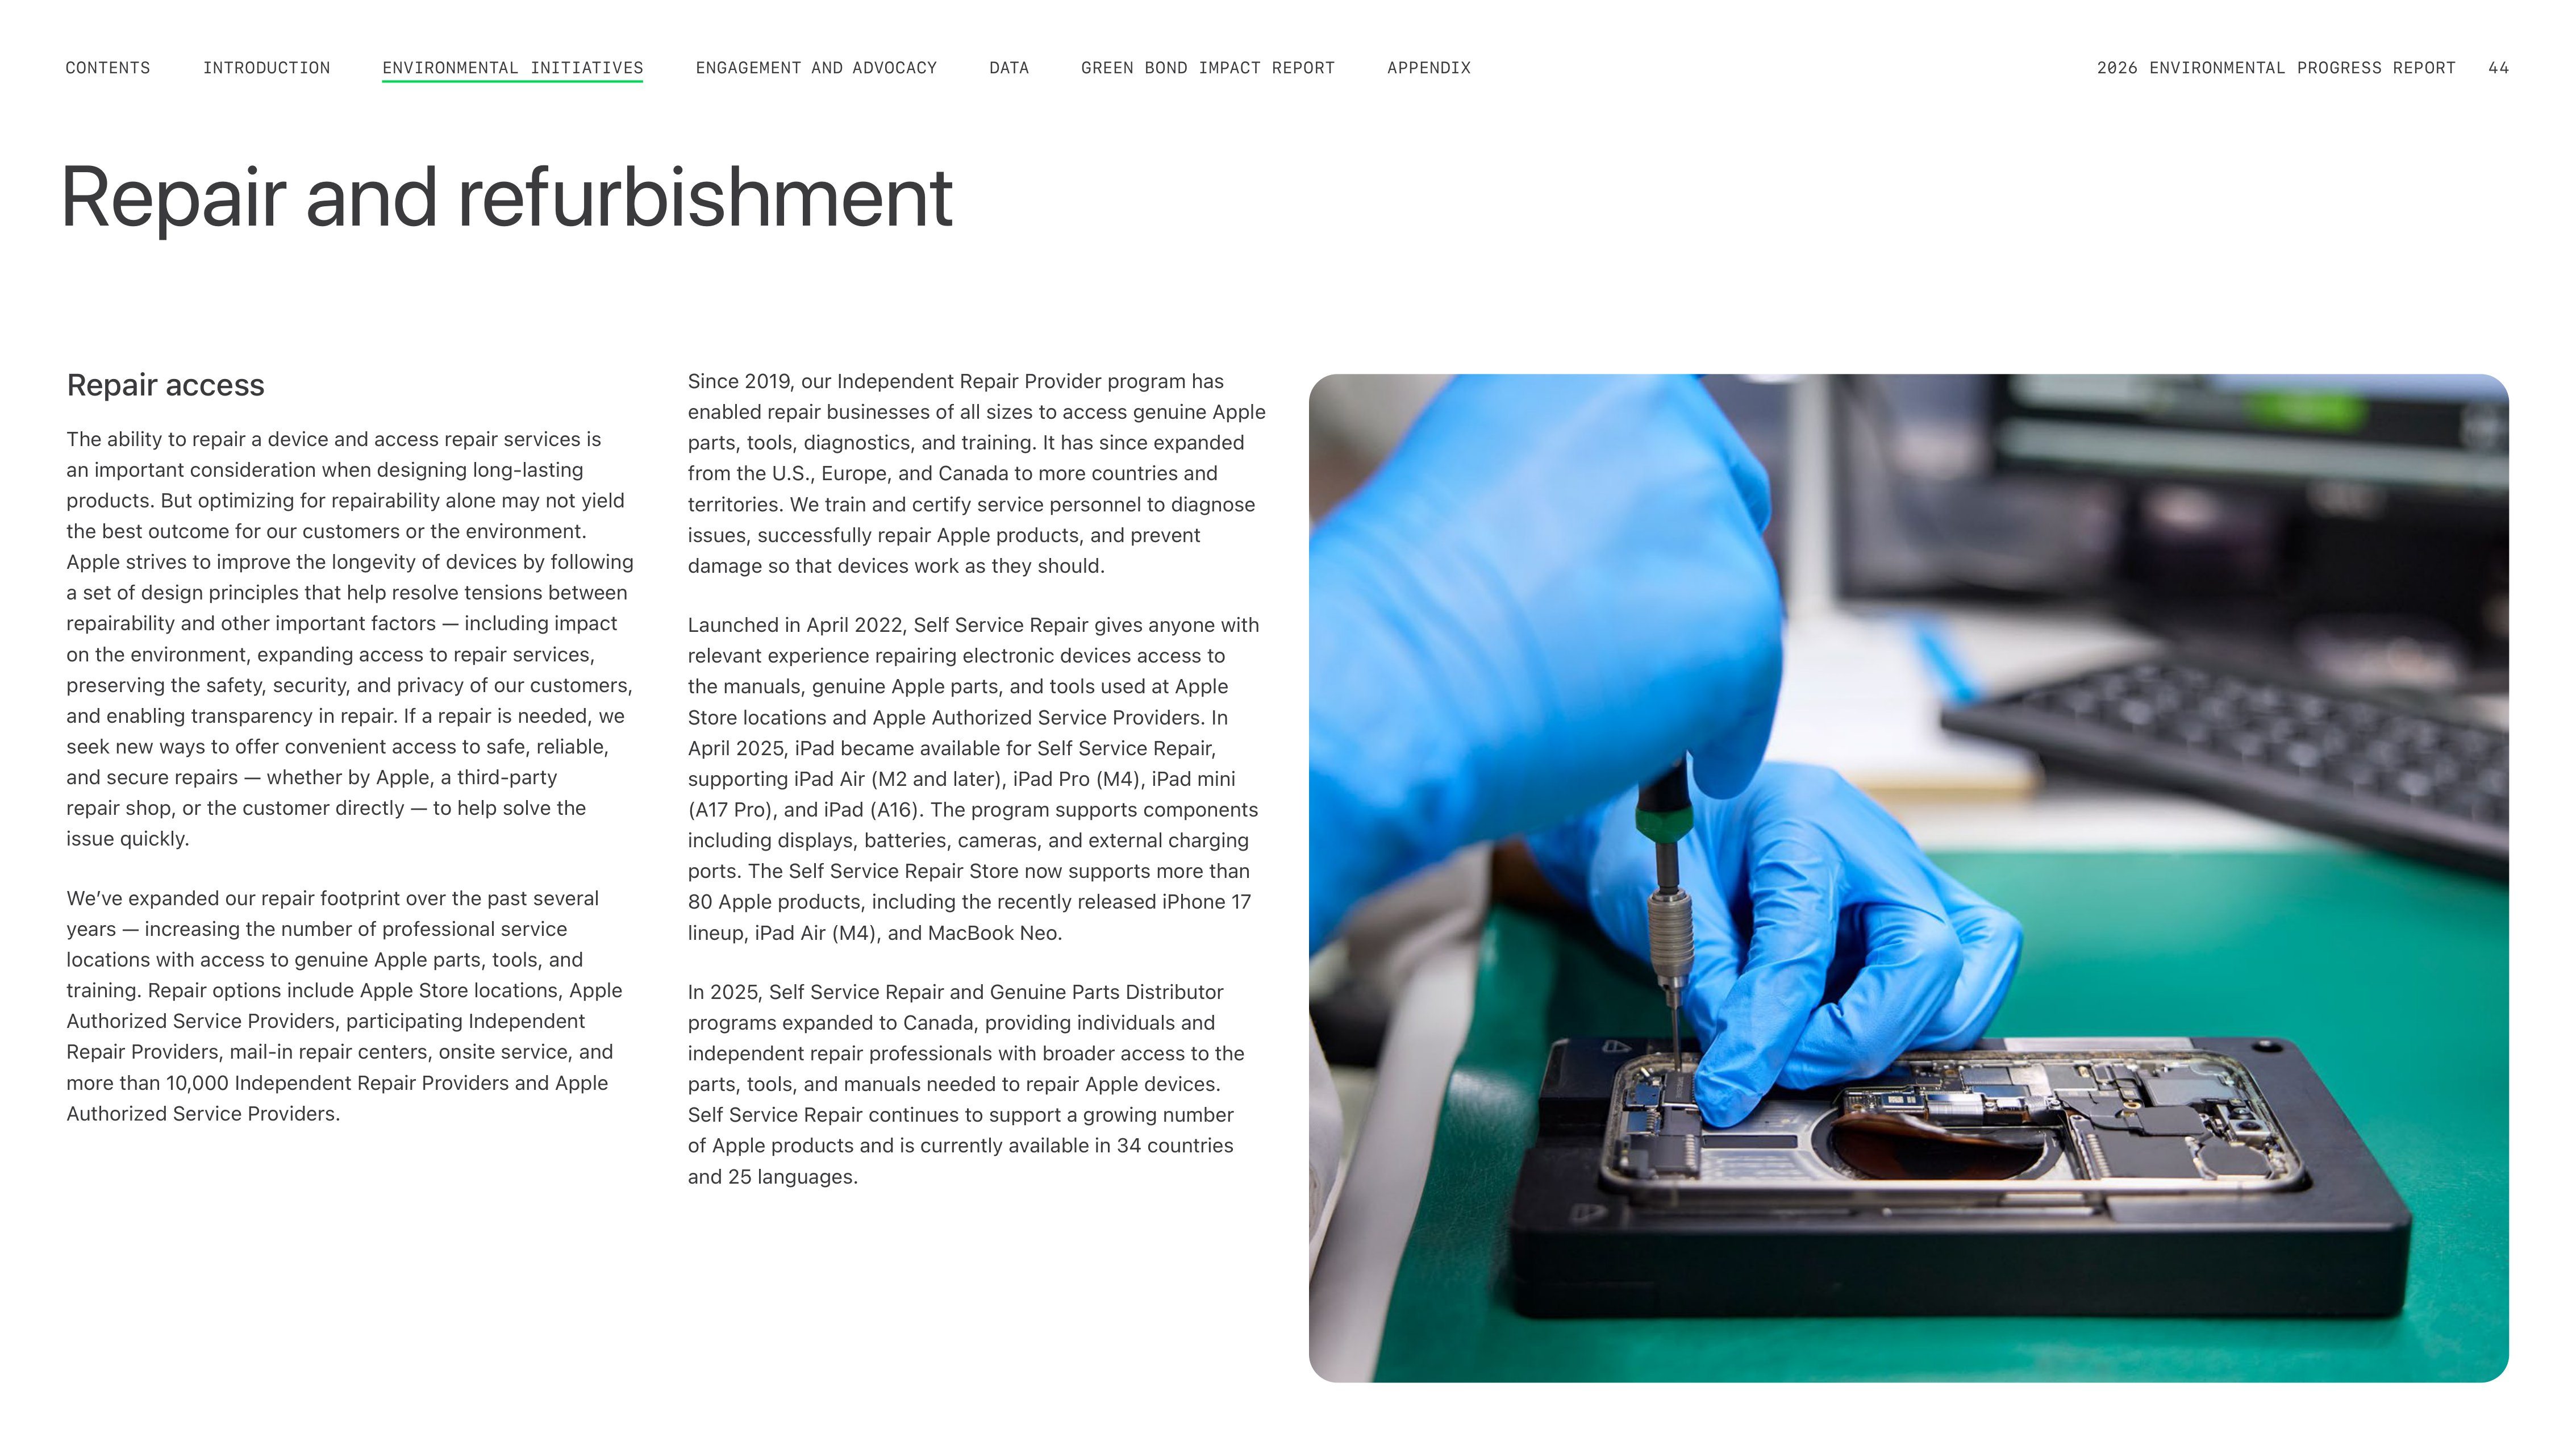
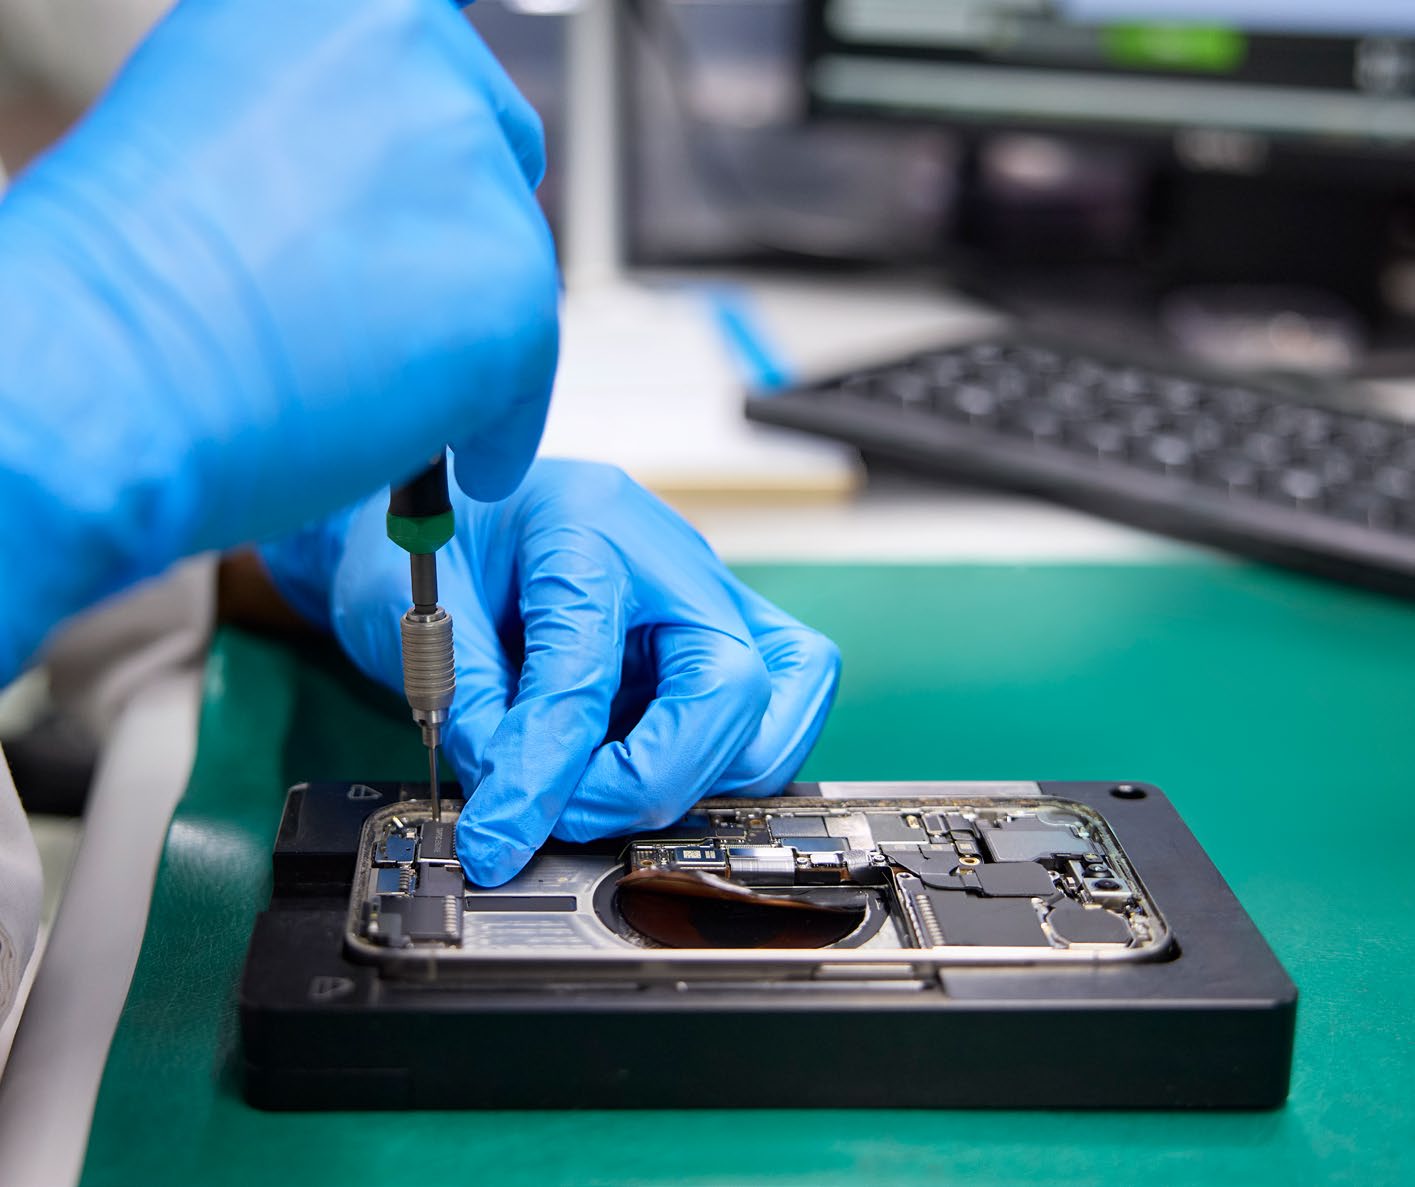
Repair access
The ability to repair a device and access repair services is
an important consideration when designing long-lasting
products. But optimizing for repairability alone may not yield
the best outcome for our customers or the environment.
Apple strives to improve the longevity of devices by following
a set of design principles that help resolve tensions between
repairability and other important factors — including impact
on the environment, expanding access to repair services,
preserving the safety, security, and privacy of our customers,
and enabling transparency in repair. If a repair is needed, we
seek new ways to offer convenient access to safe, reliable,
and secure repairs — whether by Apple, a third-party
repair shop, or the customer directly — to help solve the
issue quickly.
Weʼve expanded our repair footprint over the past several
years — increasing the number of professional service
locations with access to genuine Apple parts, tools, and
training. Repair options include Apple Store locations, Apple
Authorized Service Providers, participating Independent
Repair Providers, mail-in repair centers, onsite service, and
more than 10,000 Independent Repair Providers and Apple
Authorized Service Providers.
Since 2019, our Independent Repair Provider program has
enabled repair businesses of all sizes to access genuine Apple
parts, tools, diagnostics, and training. It has since expanded
from the U.S., Europe, and Canada to more countries and
territories. We train and certify service personnel to diagnose
issues, successfully repair Apple products, and prevent
damage so that devices work as they should.
Launched in April 2022, Self Service Repair gives anyone with
relevant experience repairing electronic devices access to
the manuals, genuine Apple parts, and tools used at Apple
Store locations and Apple Authorized Service Providers. In
April 2025, iPad became available for Self Service Repair,
supporting iPad Air (M2 and later), iPad Pro (M4), iPad mini
(A17 Pro), and iPad (A16). The program supports components
including displays, batteries, cameras, and external charging
ports. The Self Service Repair Store now supports more than
80 Apple products, including the recently released iPhone 17
lineup, iPad Air (M4), and MacBook Neo.
In 2025, Self Service Repair and Genuine Parts Distributor
programs expanded to Canada, providing individuals and
independent repair professionals with broader access to the
parts, tools, and manuals needed to repair Apple devices.
Self Service Repair continues to support a growing number
of Apple products and is currently available in 34 countries
and 25 languages.
Repair and refurbishment
ENGAGEMENT AND ADVOCACY
INTRODUCTION
CONTENTS
GREEN BOND IMPACT REPORT
DATA
APPENDIX
2026 ENVIRONMENTAL PROGRESS REPORT
44
ENVIRONMENTAL INITIATIVES
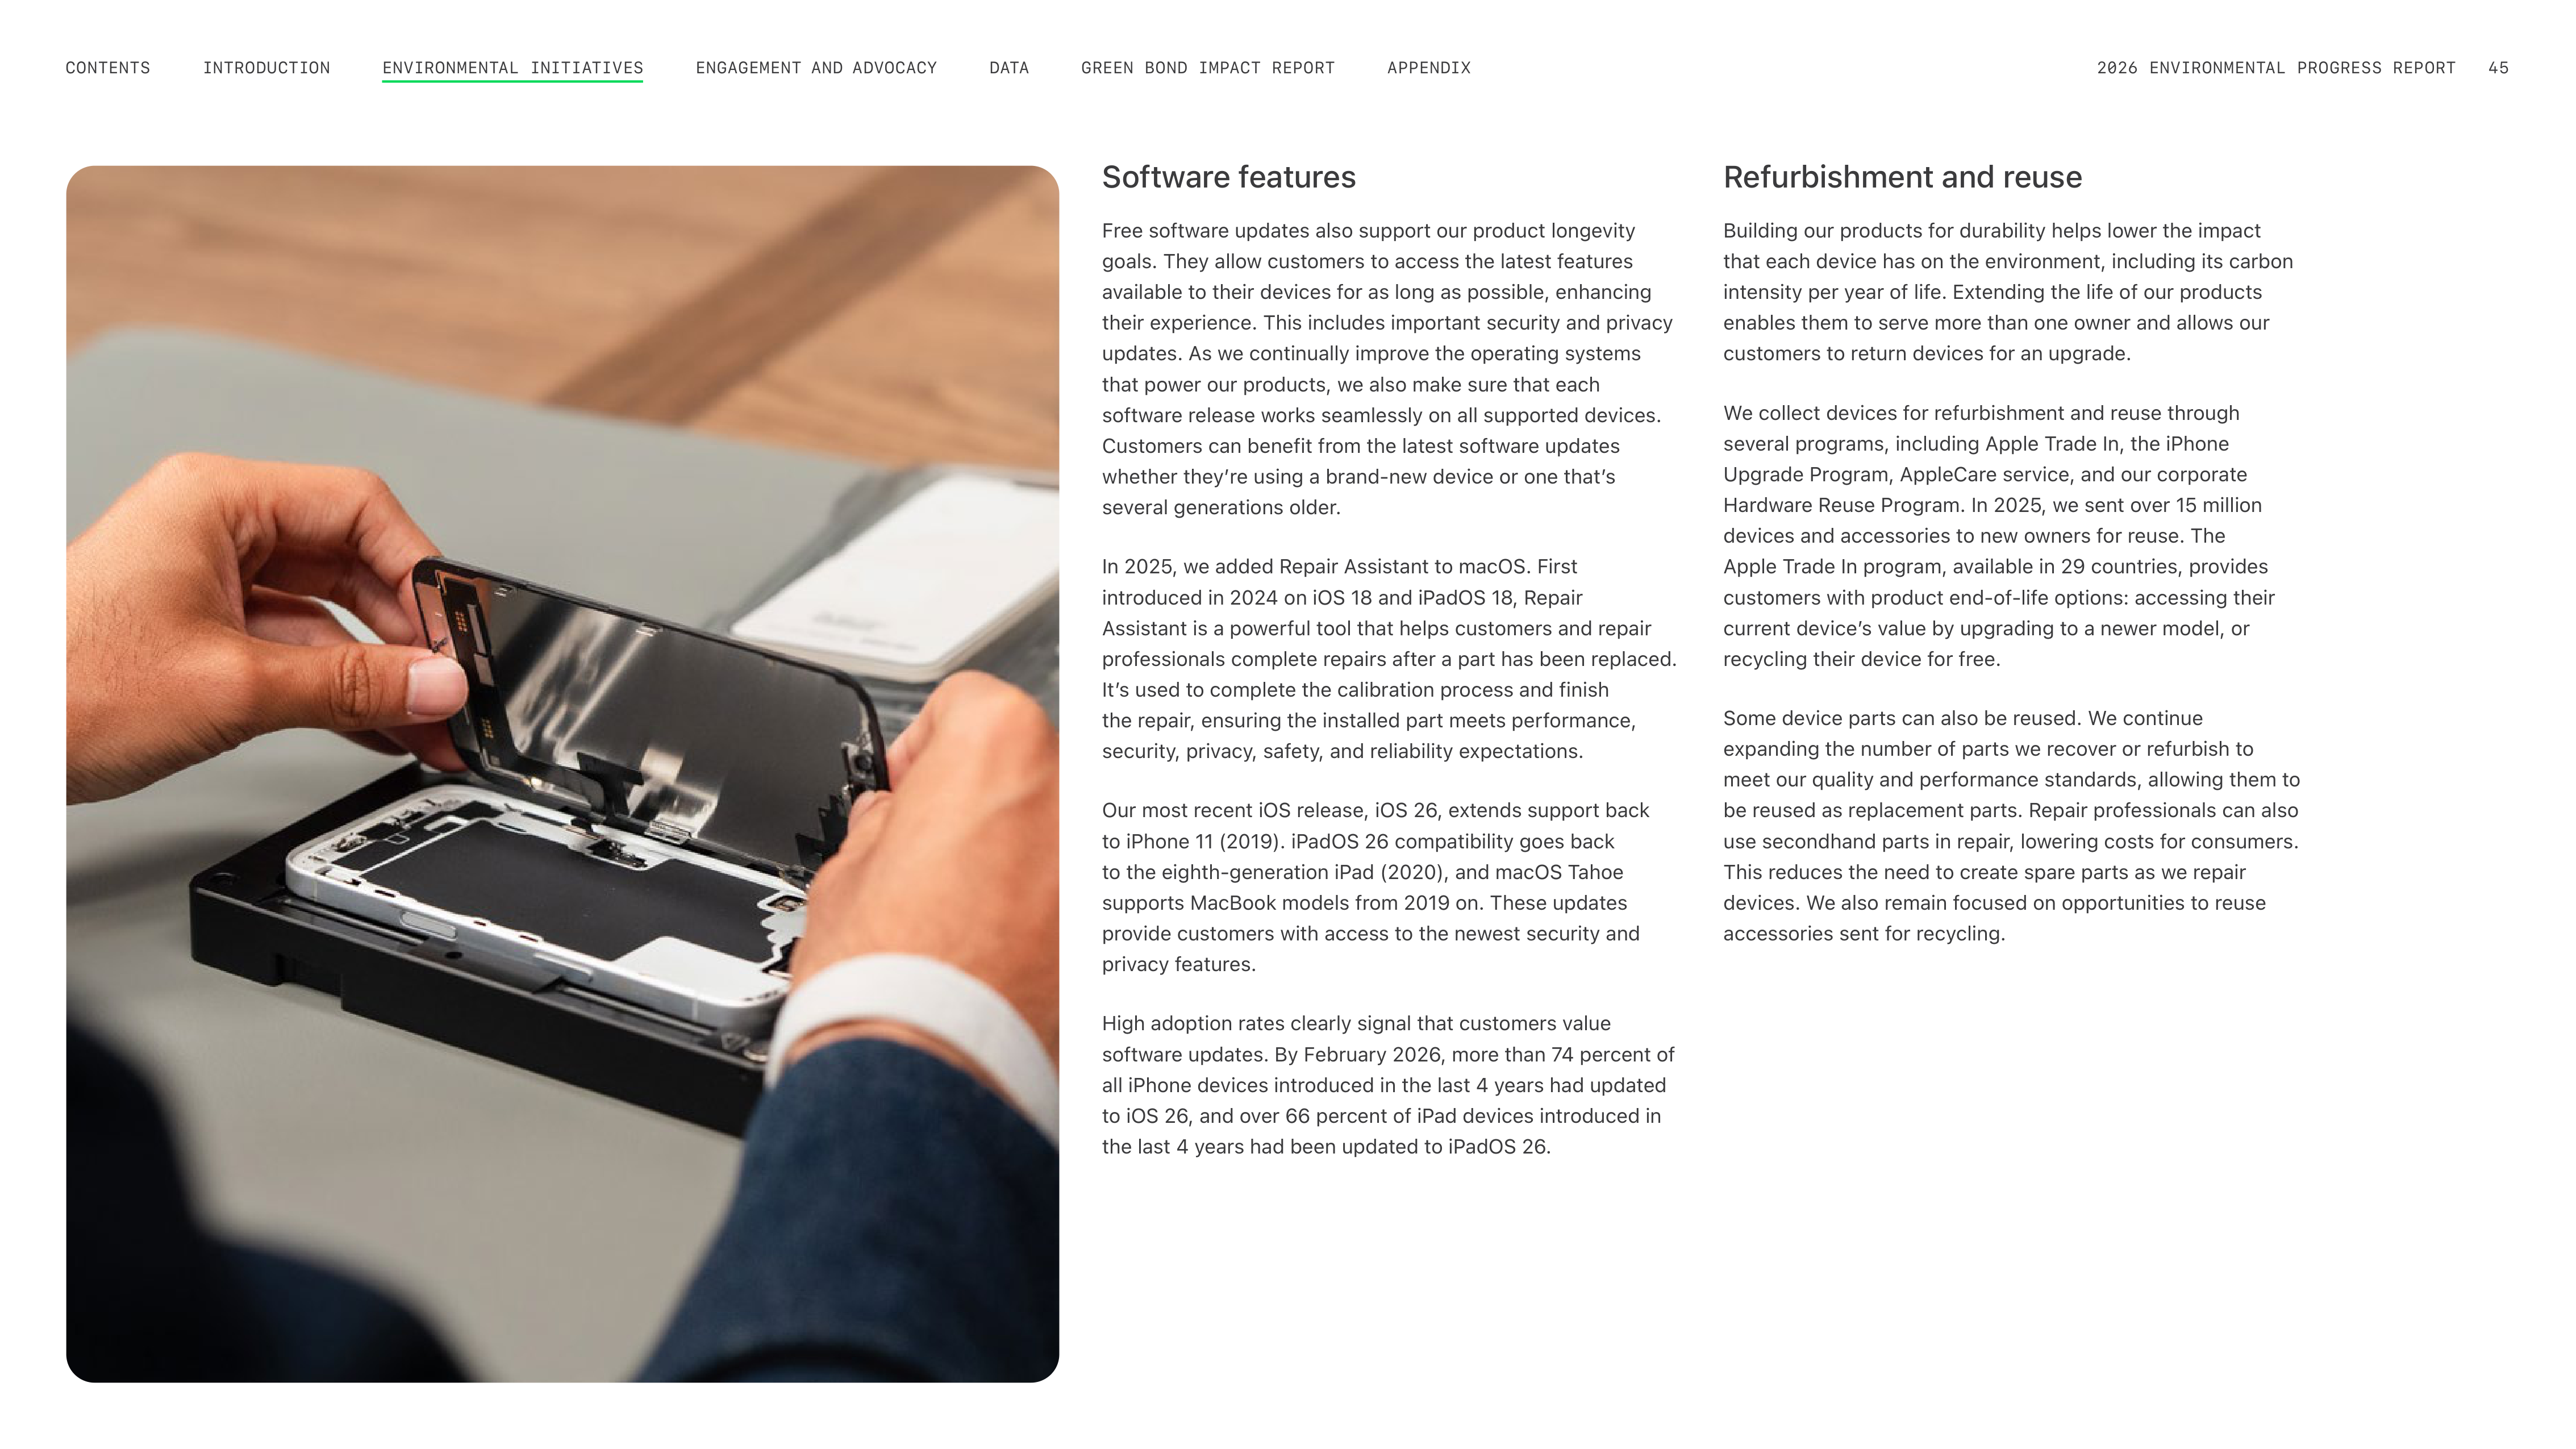
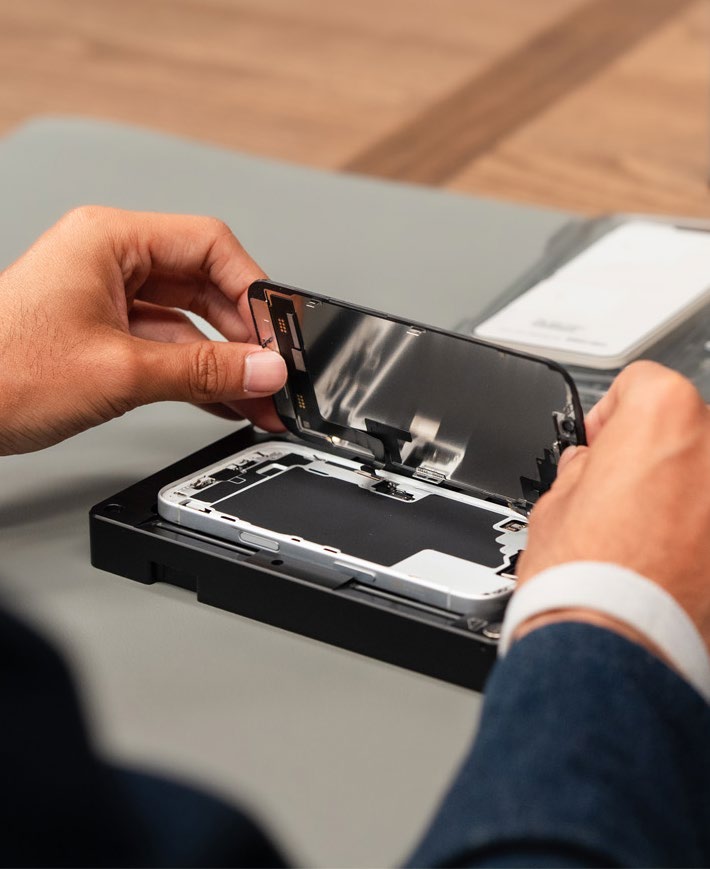
Software features
Free software updates also support our product longevity
goals. They allow customers to access the latest features
available to their devices for as long as possible, enhancing
their experience. This includes important security and privacy
updates. As we continually improve the operating systems
that power our products, we also make sure that each
software release works seamlessly on all supported devices.
Customers can benefit from the latest software updates
whether theyʼre using a brand-new device or one thatʼs
several generations older.
In 2025, we added Repair Assistant to macOS. First
introduced in 2024 on iOS 18 and iPadOS 18, Repair
Assistant is a powerful tool that helps customers and repair
professionals complete repairs after a part has been replaced.
Itʼs used to complete the calibration process and finish
the repair, ensuring the installed part meets performance,
security, privacy, safety, and reliability expectations.
Our most recent iOS release, iOS 26, extends support back
to iPhone 11 (2019). iPadOS 26 compatibility goes back
to the eighth-generation iPad (2020), and macOS Tahoe
supports MacBook models from 2019 on. These updates
provide customers with access to the newest security and
privacy features.
High adoption rates clearly signal that customers value
software updates. By February 2026, more than 74 percent of
all iPhone devices introduced in the last 4 years had updated
to iOS 26, and over 66 percent of iPad devices introduced in
the last 4 years had been updated to iPadOS 26.
Refurbishment and reuse
Building our products for durability helps lower the impact
that each device has on the environment, including its carbon
intensity per year of life. Extending the life of our products
enables them to serve more than one owner and allows our
customers to return devices for an upgrade.
We collect devices for refurbishment and reuse through
several programs, including Apple Trade In, the iPhone
Upgrade Program, AppleCare service, and our corporate
Hardware Reuse Program. In 2025, we sent over 15 million
devices and accessories to new owners for reuse. The
Apple Trade In program, available in 29 countries, provides
customers with product end-of-life options: accessing their
current deviceʼs value by upgrading to a newer model, or
recycling their device for free.
Some device parts can also be reused. We continue
expanding the number of parts we recover or refurbish to
meet our quality and performance standards, allowing them to
be reused as replacement parts. Repair professionals can also
use secondhand parts in repair, lowering costs for consumers.
This reduces the need to create spare parts as we repair
devices. We also remain focused on opportunities to reuse
accessories sent for recycling.
ENGAGEMENT AND ADVOCACY
INTRODUCTION
CONTENTS
GREEN BOND IMPACT REPORT
DATA
APPENDIX
2026 ENVIRONMENTAL PROGRESS REPORT
45
ENVIRONMENTAL INITIATIVES
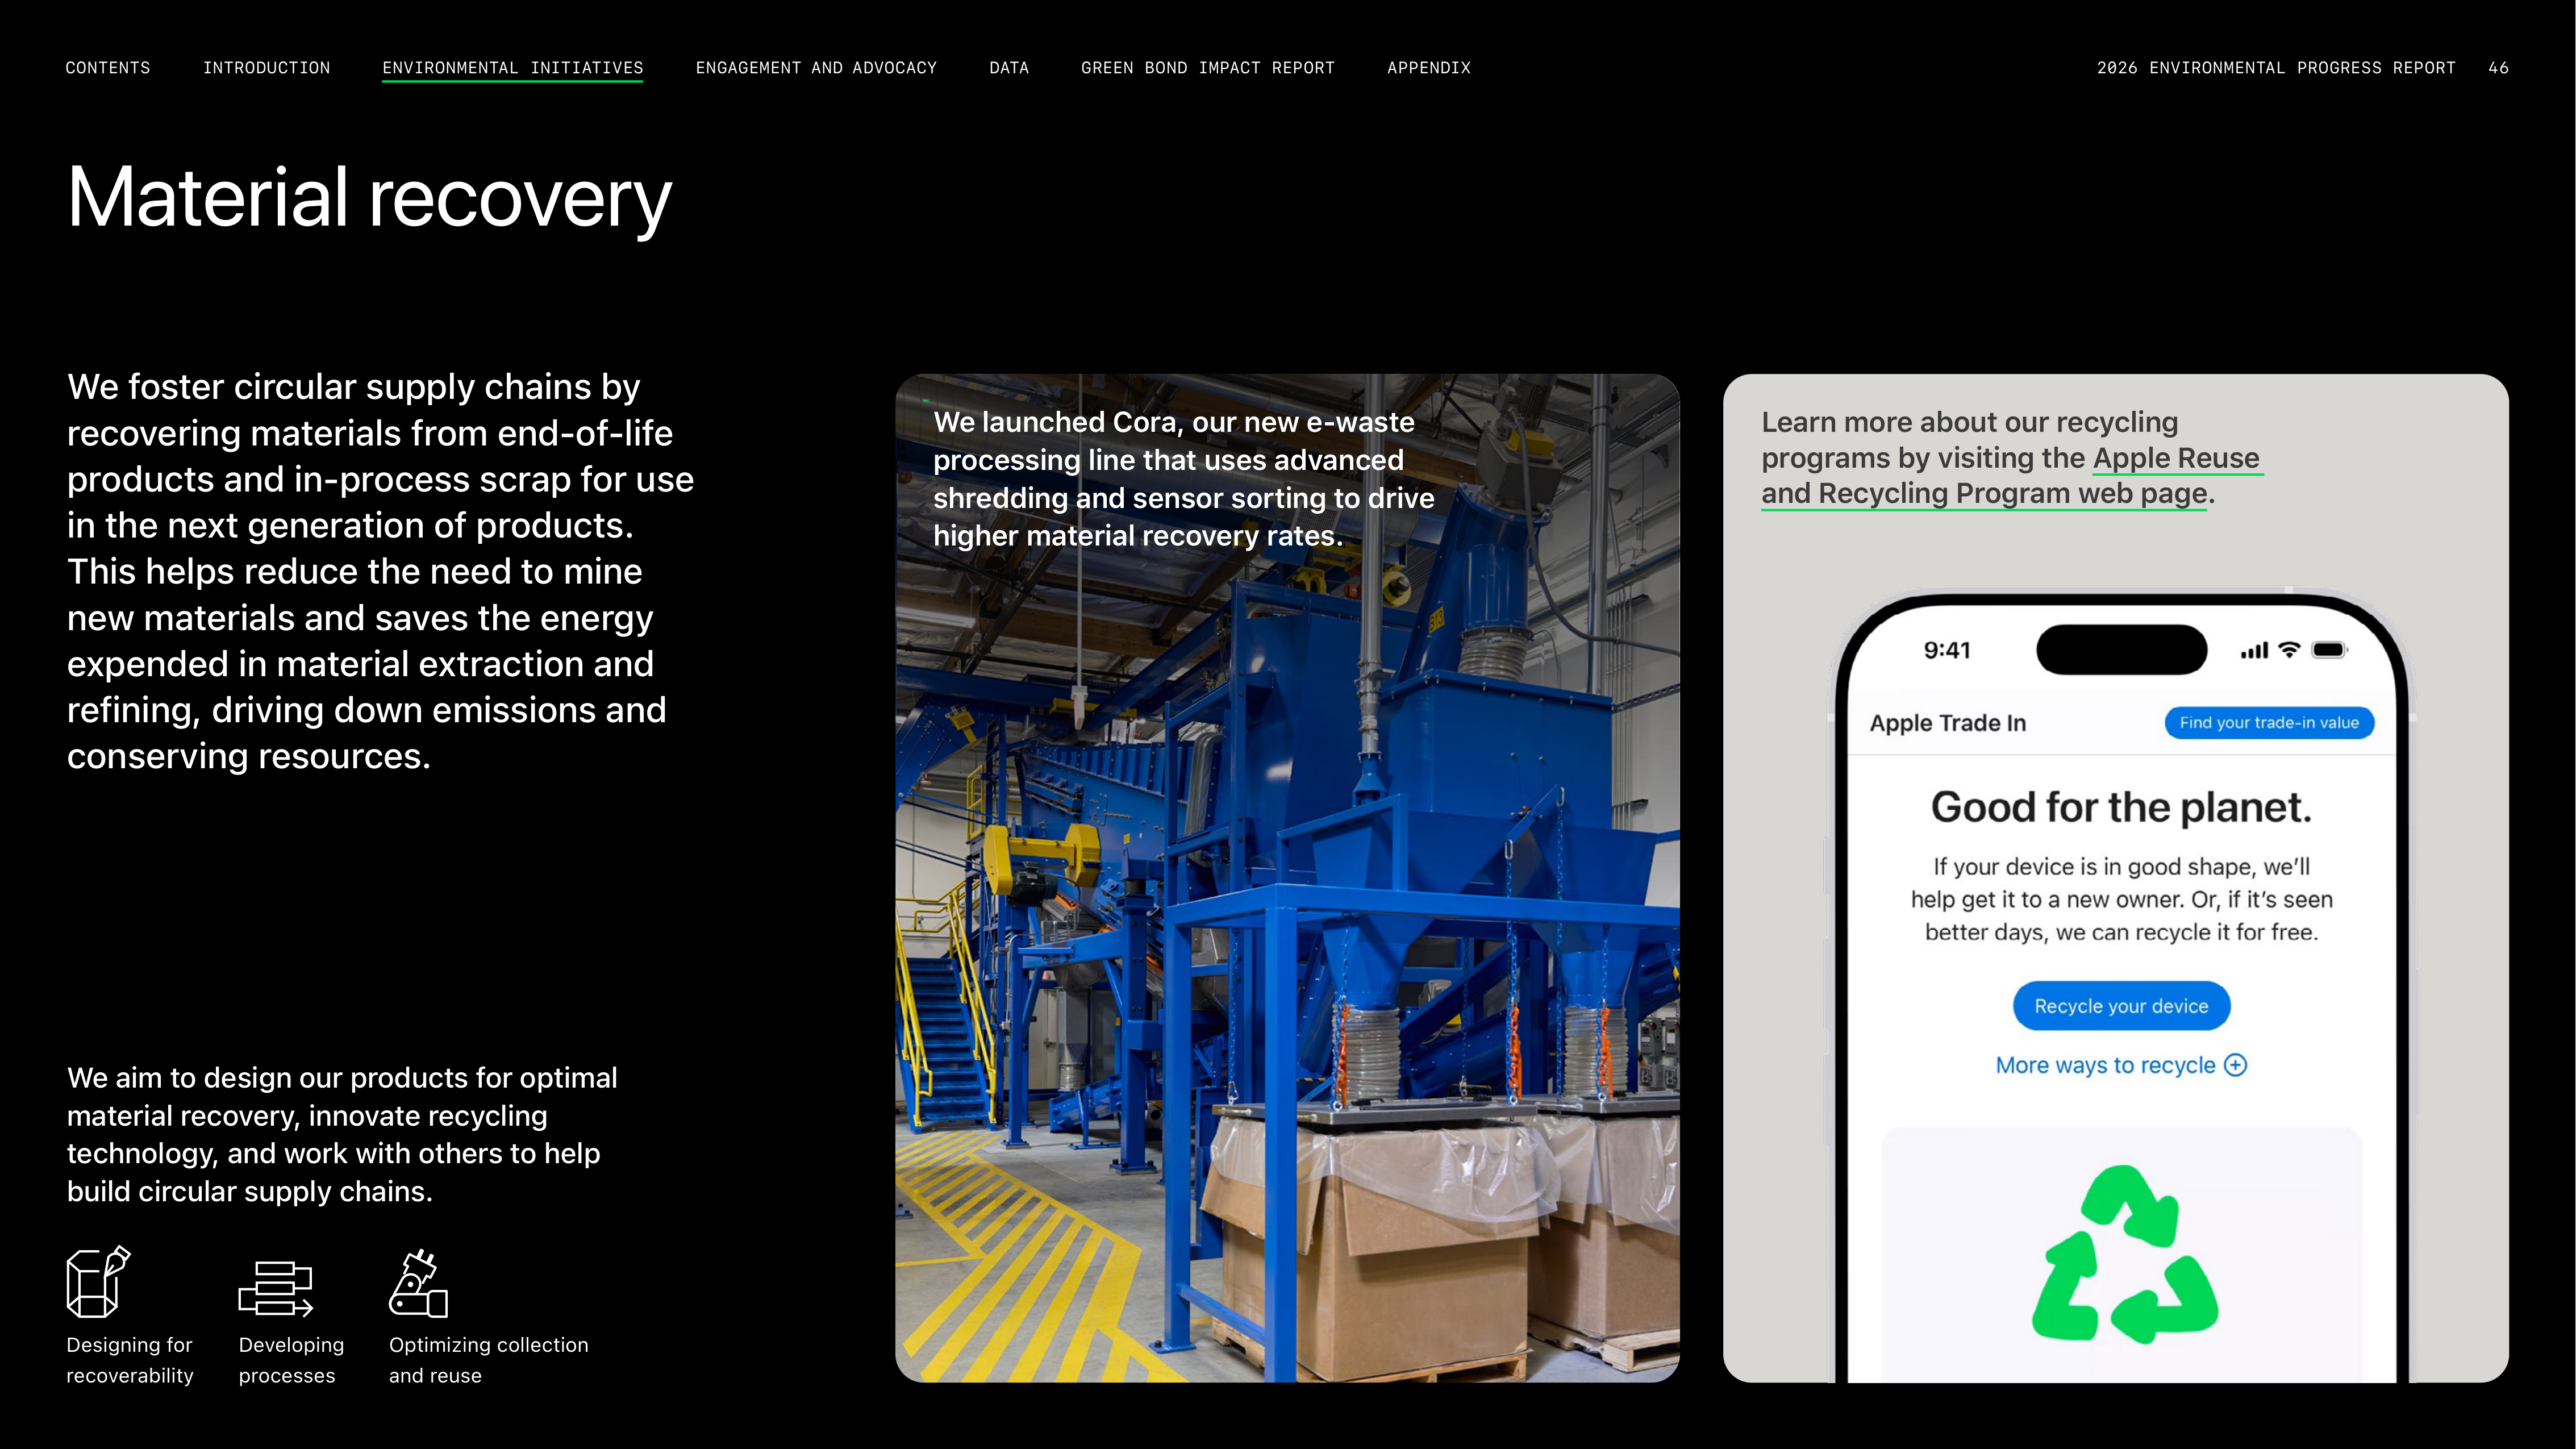
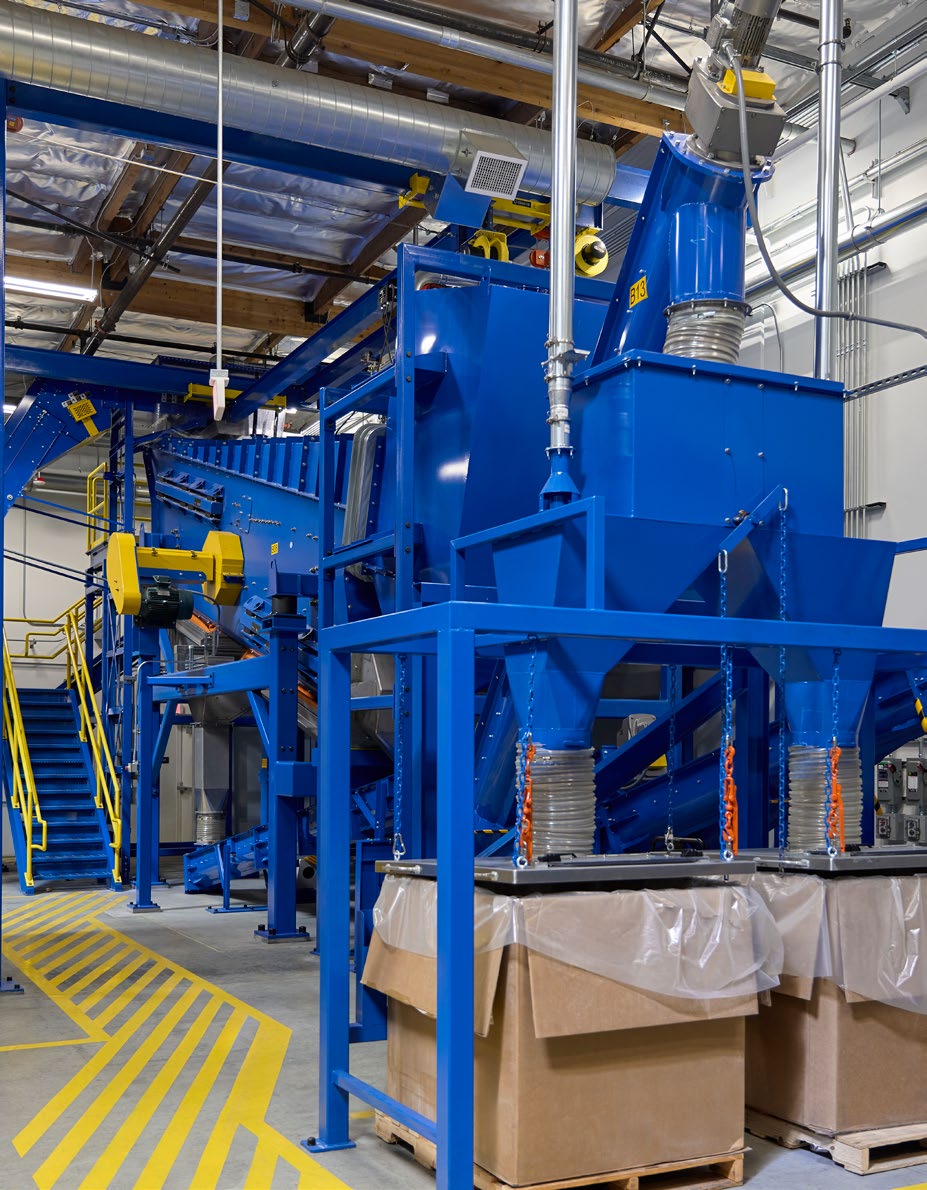
Material recovery
We foster circular supply chains by
recovering materials from end-of-life
products and in-process scrap for use
in the next generation of products.
This helps reduce the need to mine
new materials and saves the energy
expended in material extraction and
refining, driving down emissions and
conserving resources.
We aim to design our products for optimal
material recovery, innovate recycling
technology, and work with others to help
build circular supply chains.
Designing for
recoverability
Optimizing collection
and reuse
Developing
processes
We launched Cora, our new e-waste
processing line that uses advanced
shredding and sensor sorting to drive
higher material recovery rates.
Learn more about our recycling
programs by visiting the Apple Reuse
and Recycling Program web page.
2026 ENVIRONMENTAL PROGRESS REPORT
46
ENGAGEMENT AND ADVOCACY
INTRODUCTION
CONTENTS
APPENDIX
GREEN BOND IMPACT REPORT
DATA
ENVIRONMENTAL INITIATIVES
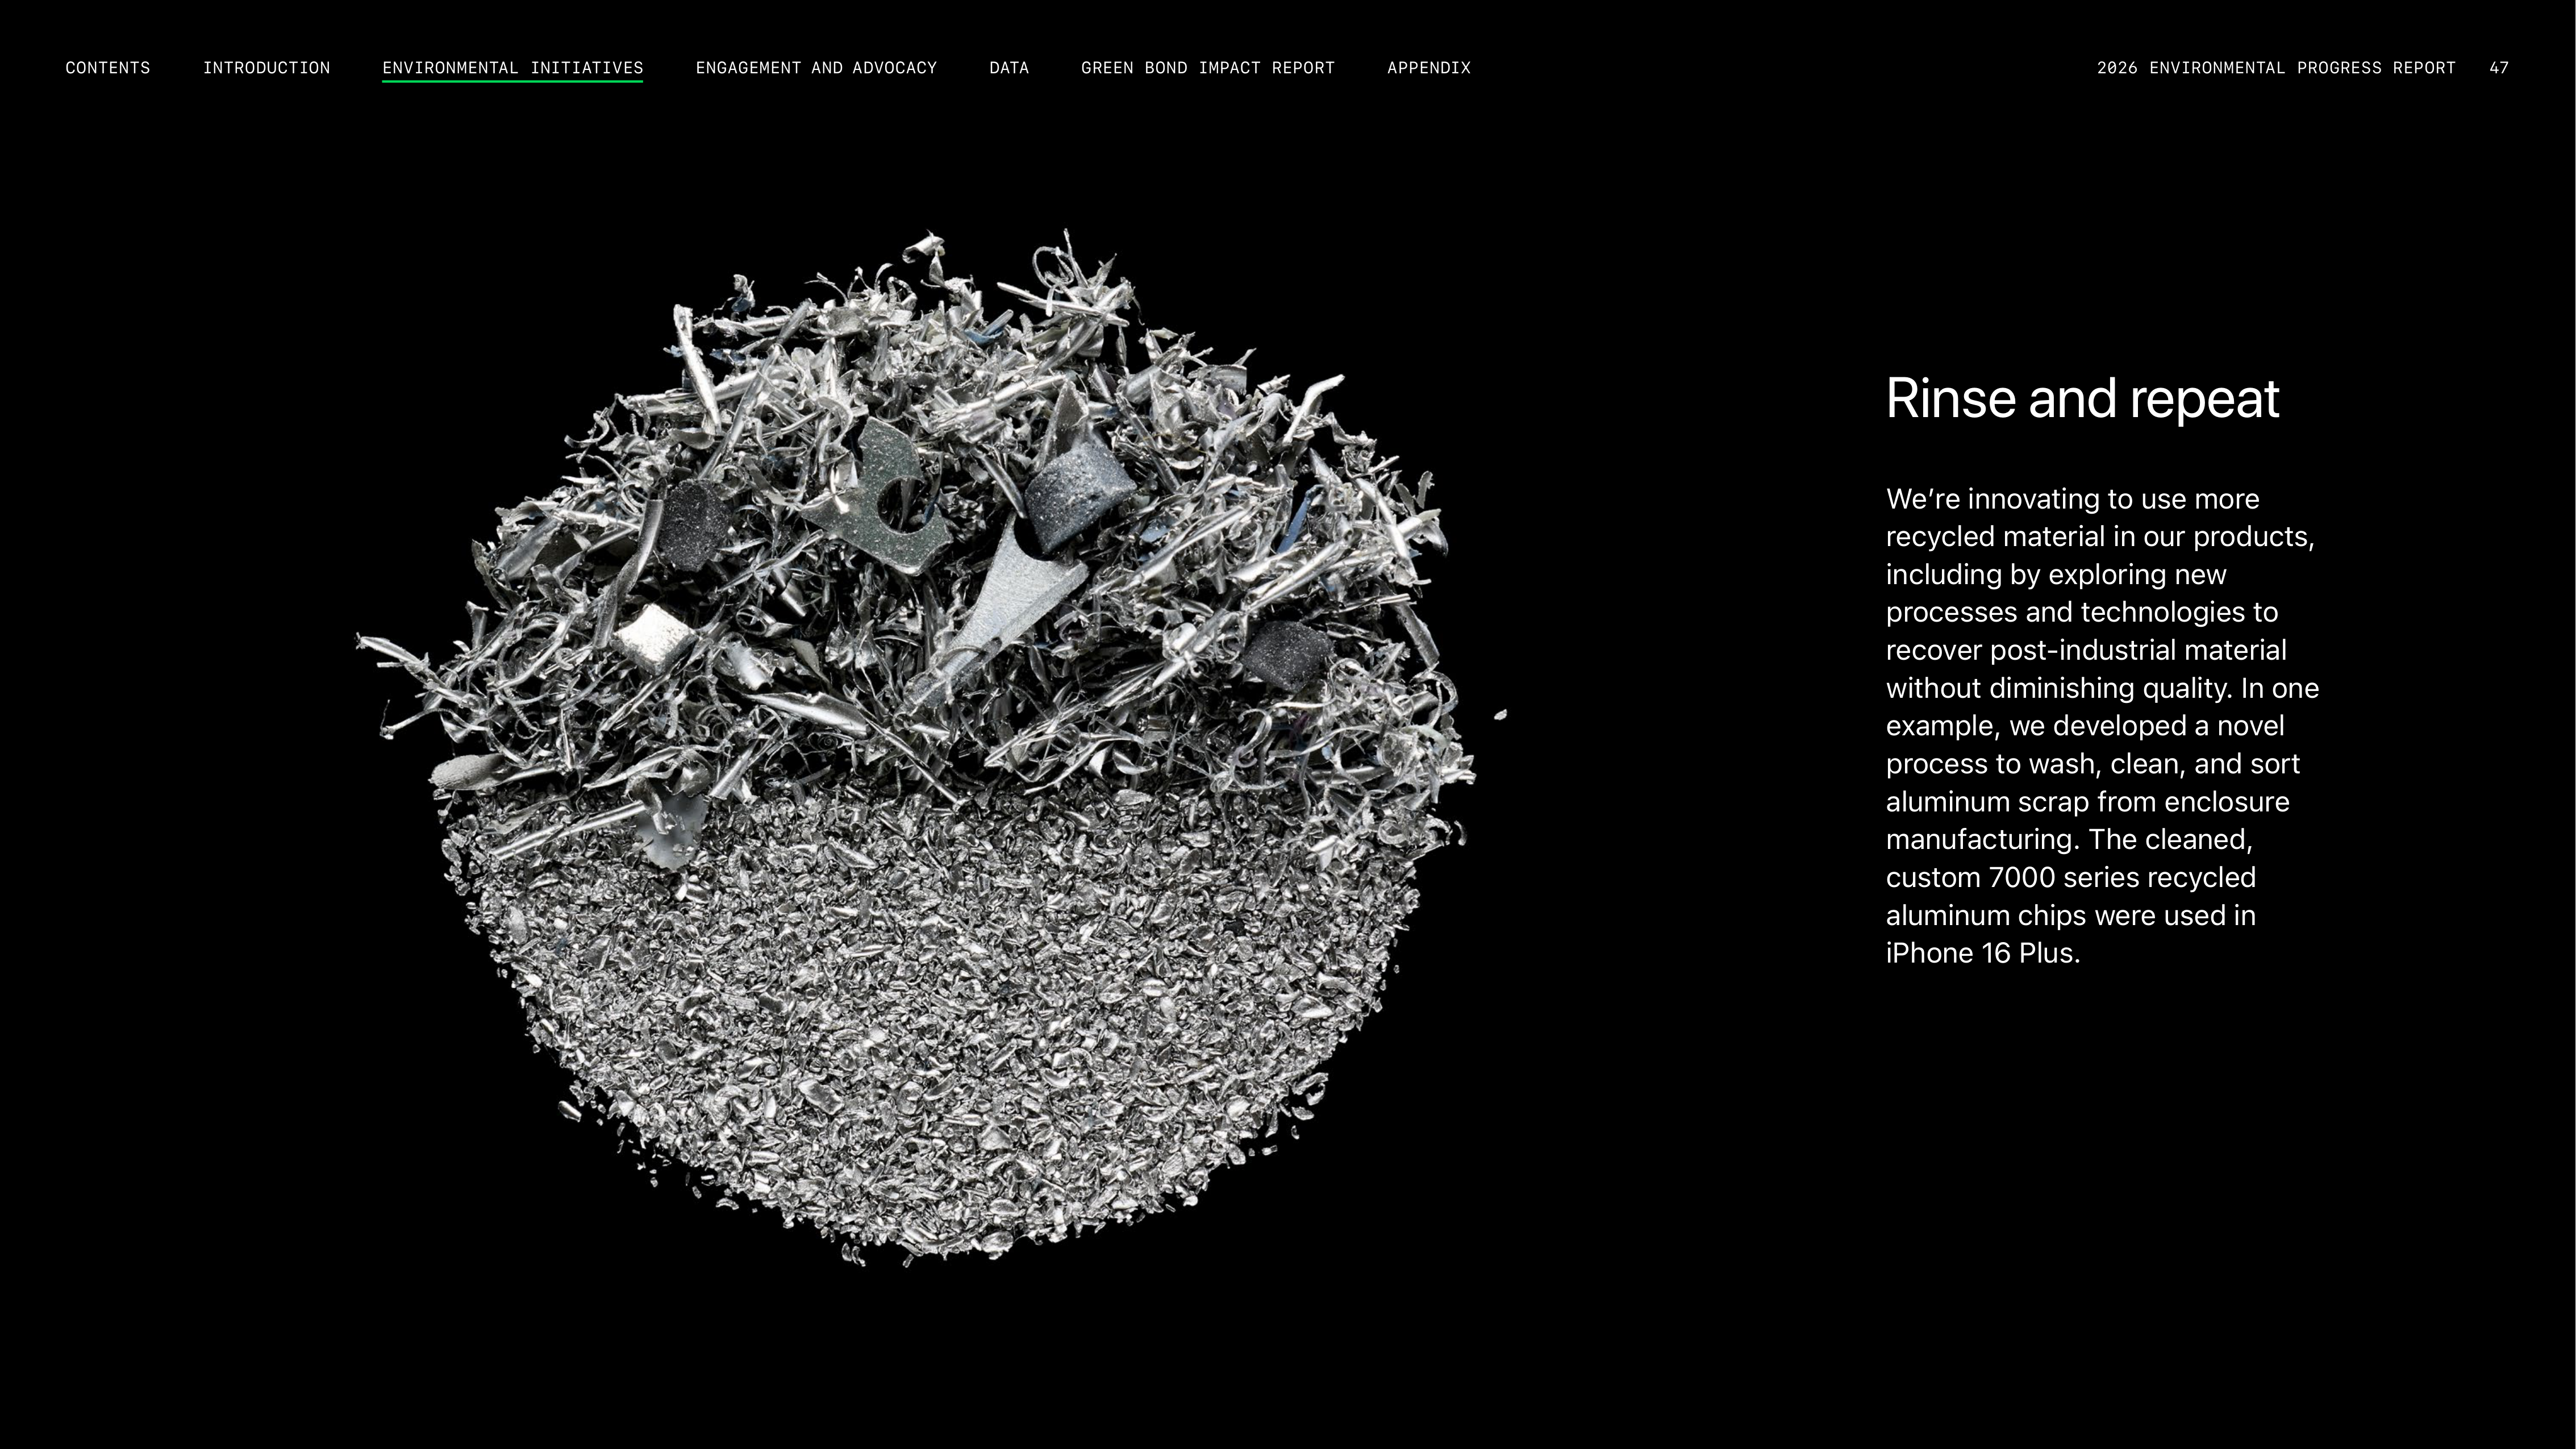

Rinse and repeat
Weʼre innovating to use more
recycled material in our products,
including by exploring new
processes and technologies to
recover post-industrial material
without diminishing quality. In one
example, we developed a novel
process to wash, clean, and sort
aluminum scrap from enclosure
manufacturing. The cleaned,
custom 7000 series recycled
aluminum chips were used in
iPhone 16 Plus.
2026 ENVIRONMENTAL PROGRESS REPORT
47
ENGAGEMENT AND ADVOCACY
INTRODUCTION
CONTENTS
APPENDIX
GREEN BOND IMPACT REPORT
DATA
ENVIRONMENTAL INITIATIVES
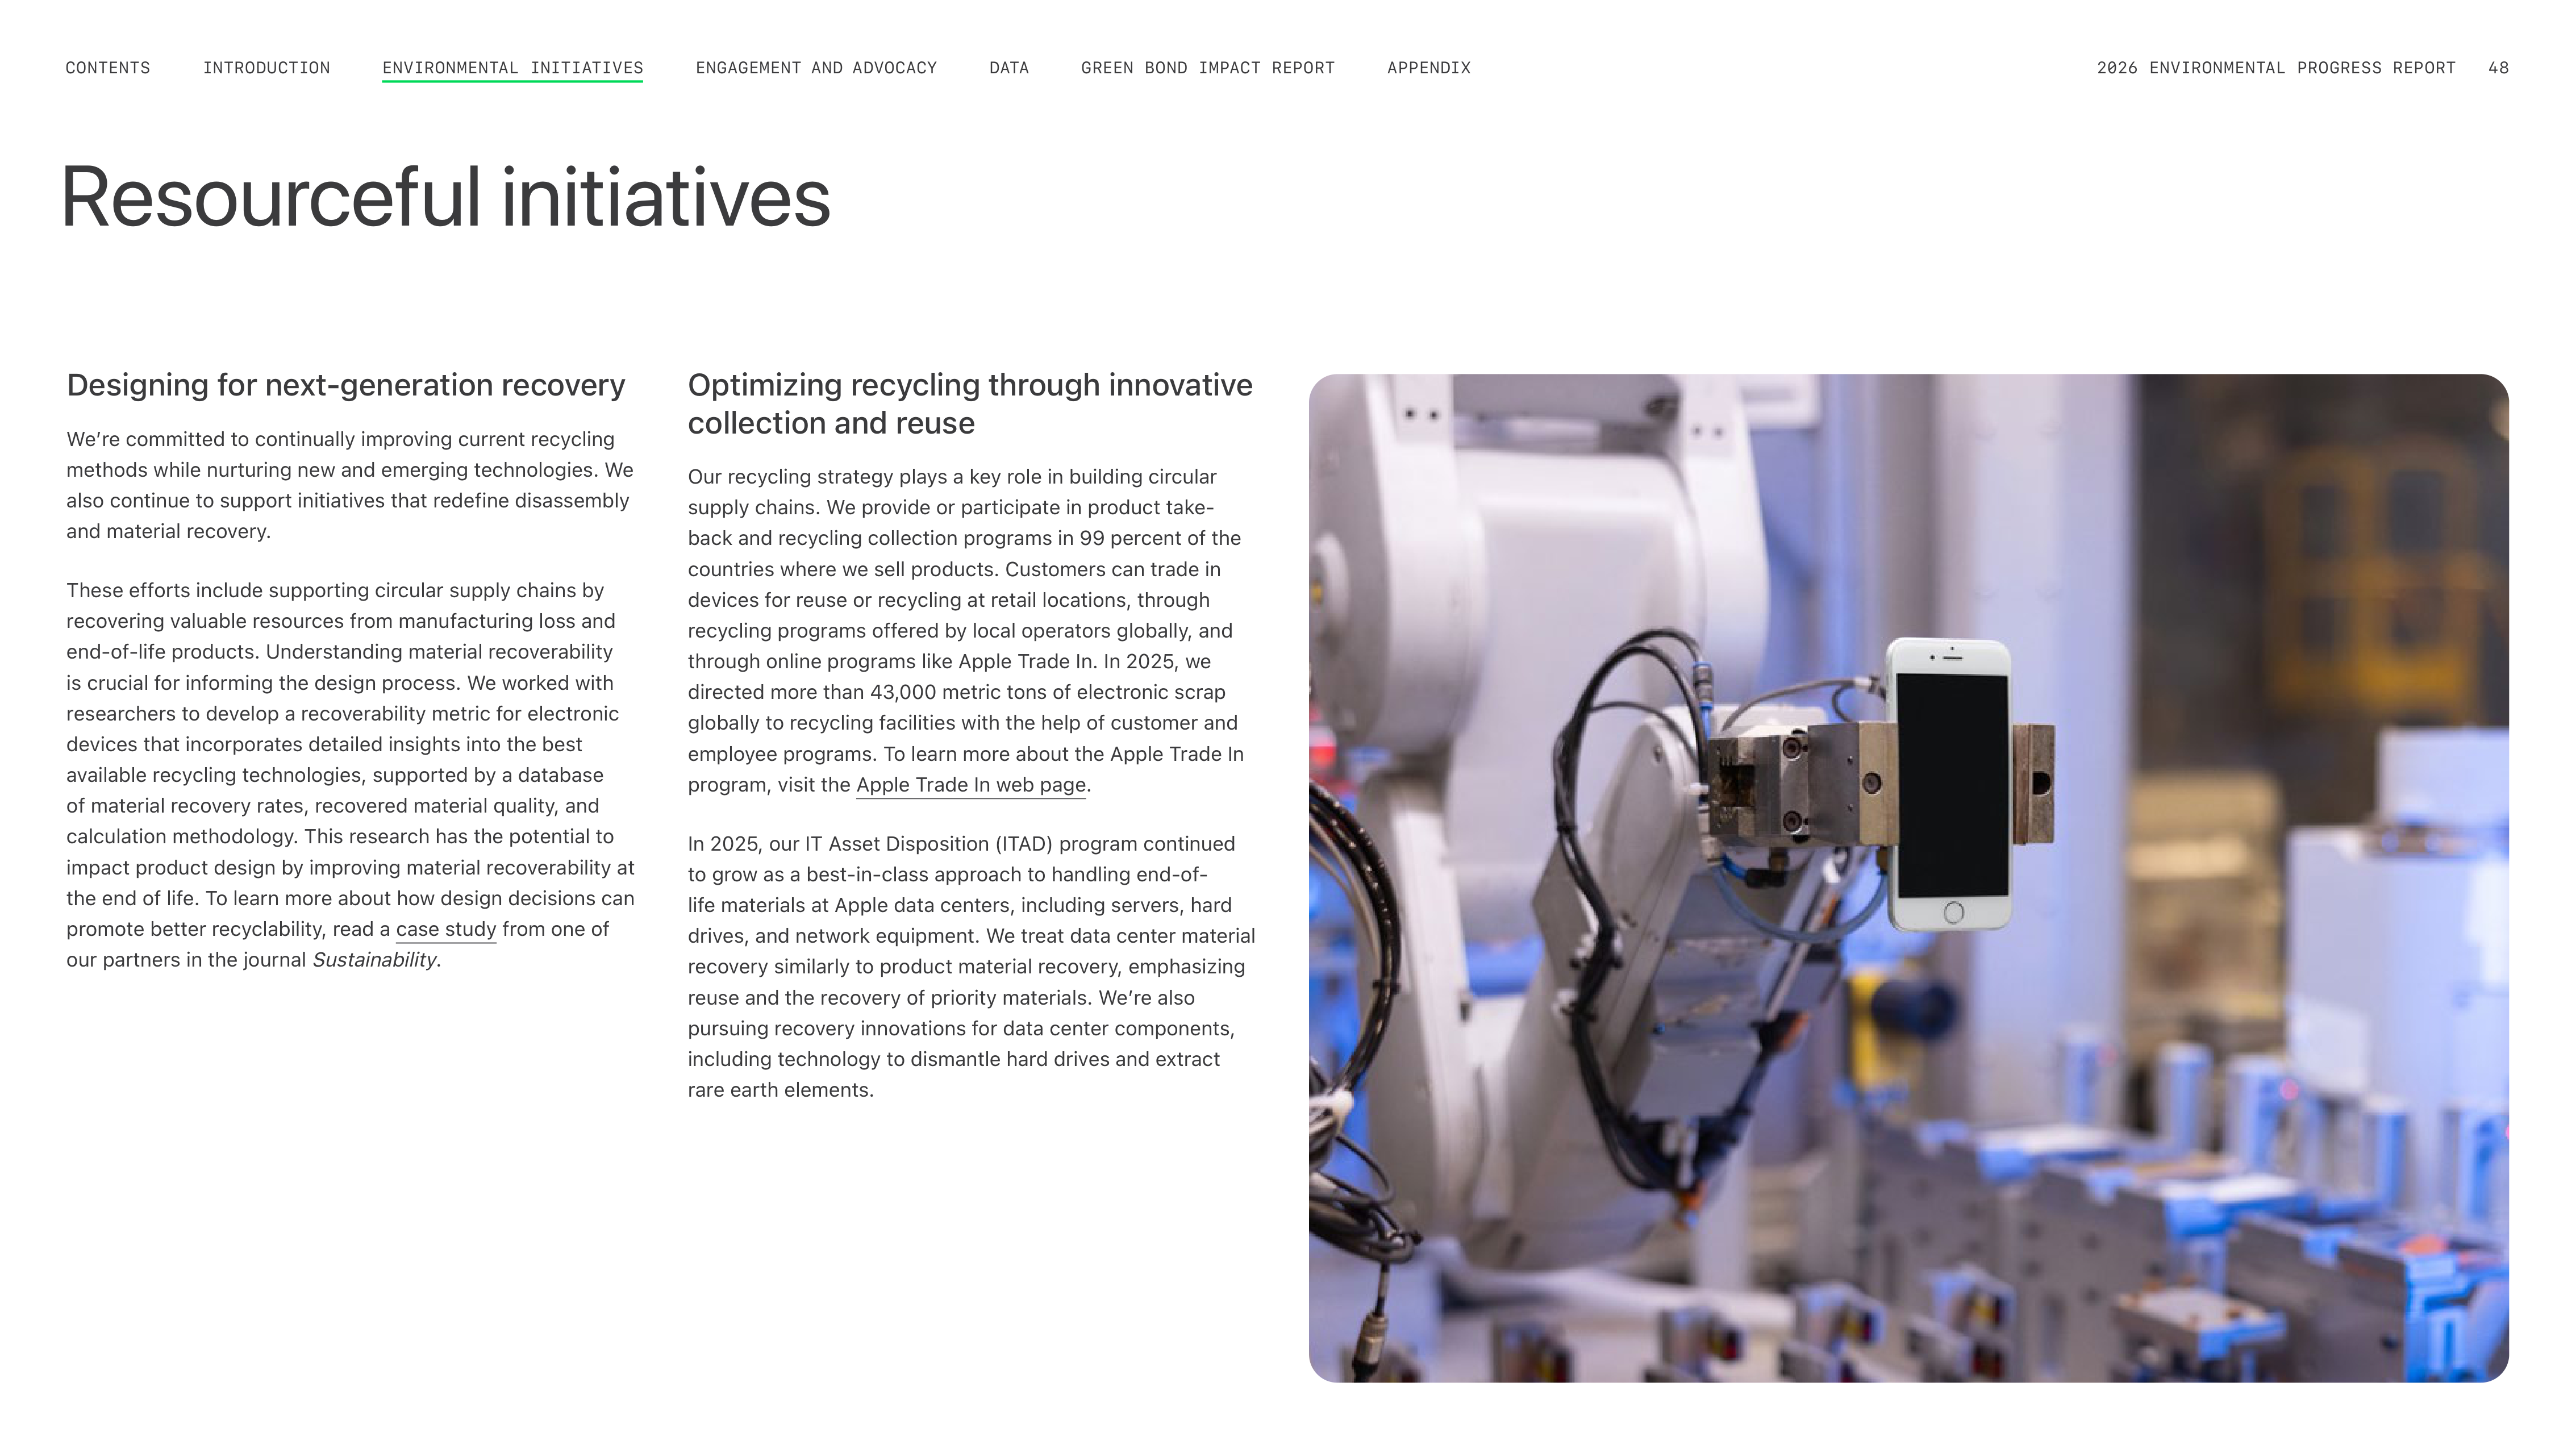
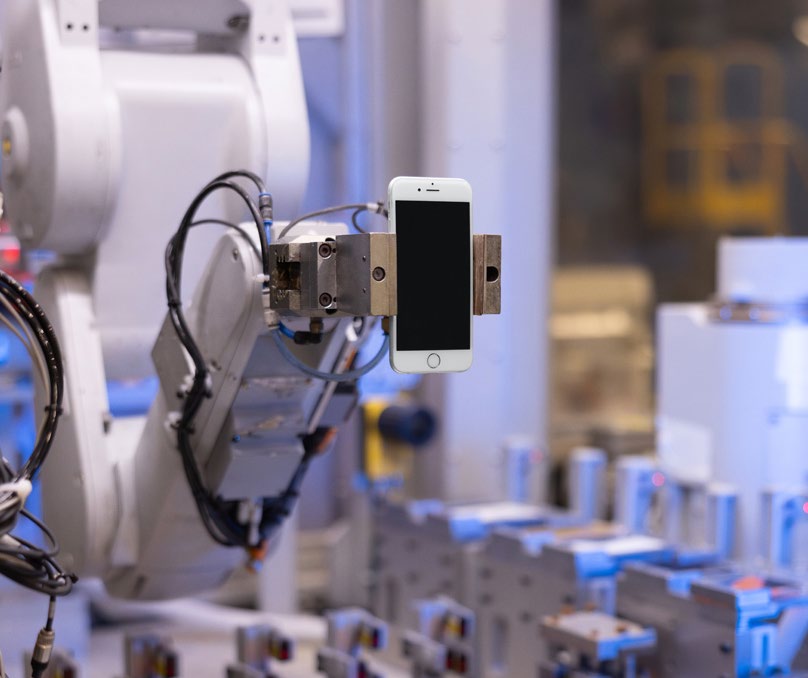
Designing for next-generation recovery
Weʼre committed to continually improving current recycling
methods while nurturing new and emerging technologies. We
also continue to support initiatives that redefine disassembly
and material recovery.
These efforts include supporting circular supply chains by
recovering valuable resources from manufacturing loss and
end-of-life products. Understanding material recoverability
is crucial for informing the design process. We worked with
researchers to develop a recoverability metric for electronic
devices that incorporates detailed insights into the best
available recycling technologies, supported by a database
of material recovery rates, recovered material quality, and
calculation methodology. This research has the potential to
impact product design by improving material recoverability at
the end of life. To learn more about how design decisions can
promote better recyclability, read a case study from one of
our partners in the journal Sustainability.
Optimizing recycling through innovative
collection and reuse
Our recycling strategy plays a key role in building circular
supply chains. We provide or participate in product take-
back and recycling collection programs in 99 percent of the
countries where we sell products. Customers can trade in
devices for reuse or recycling at retail locations, through
recycling programs offered by local operators globally, and
through online programs like Apple Trade In. In 2025, we
directed more than 43,000 metric tons of electronic scrap
globally to recycling facilities with the help of customer and
employee programs. To learn more about the Apple Trade In
program, visit the Apple Trade In web page.
In 2025, our IT Asset Disposition (ITAD) program continued
to grow as a best-in-class approach to handling end-of-
life materials at Apple data centers, including servers, hard
drives, and network equipment. We treat data center material
recovery similarly to product material recovery, emphasizing
reuse and the recovery of priority materials. Weʼre also
pursuing recovery innovations for data center components,
including technology to dismantle hard drives and extract
rare earth elements.
Resourceful initiatives
ENGAGEMENT AND ADVOCACY
INTRODUCTION
CONTENTS
GREEN BOND IMPACT REPORT
DATA
APPENDIX
2026 ENVIRONMENTAL PROGRESS REPORT
48
ENVIRONMENTAL INITIATIVES
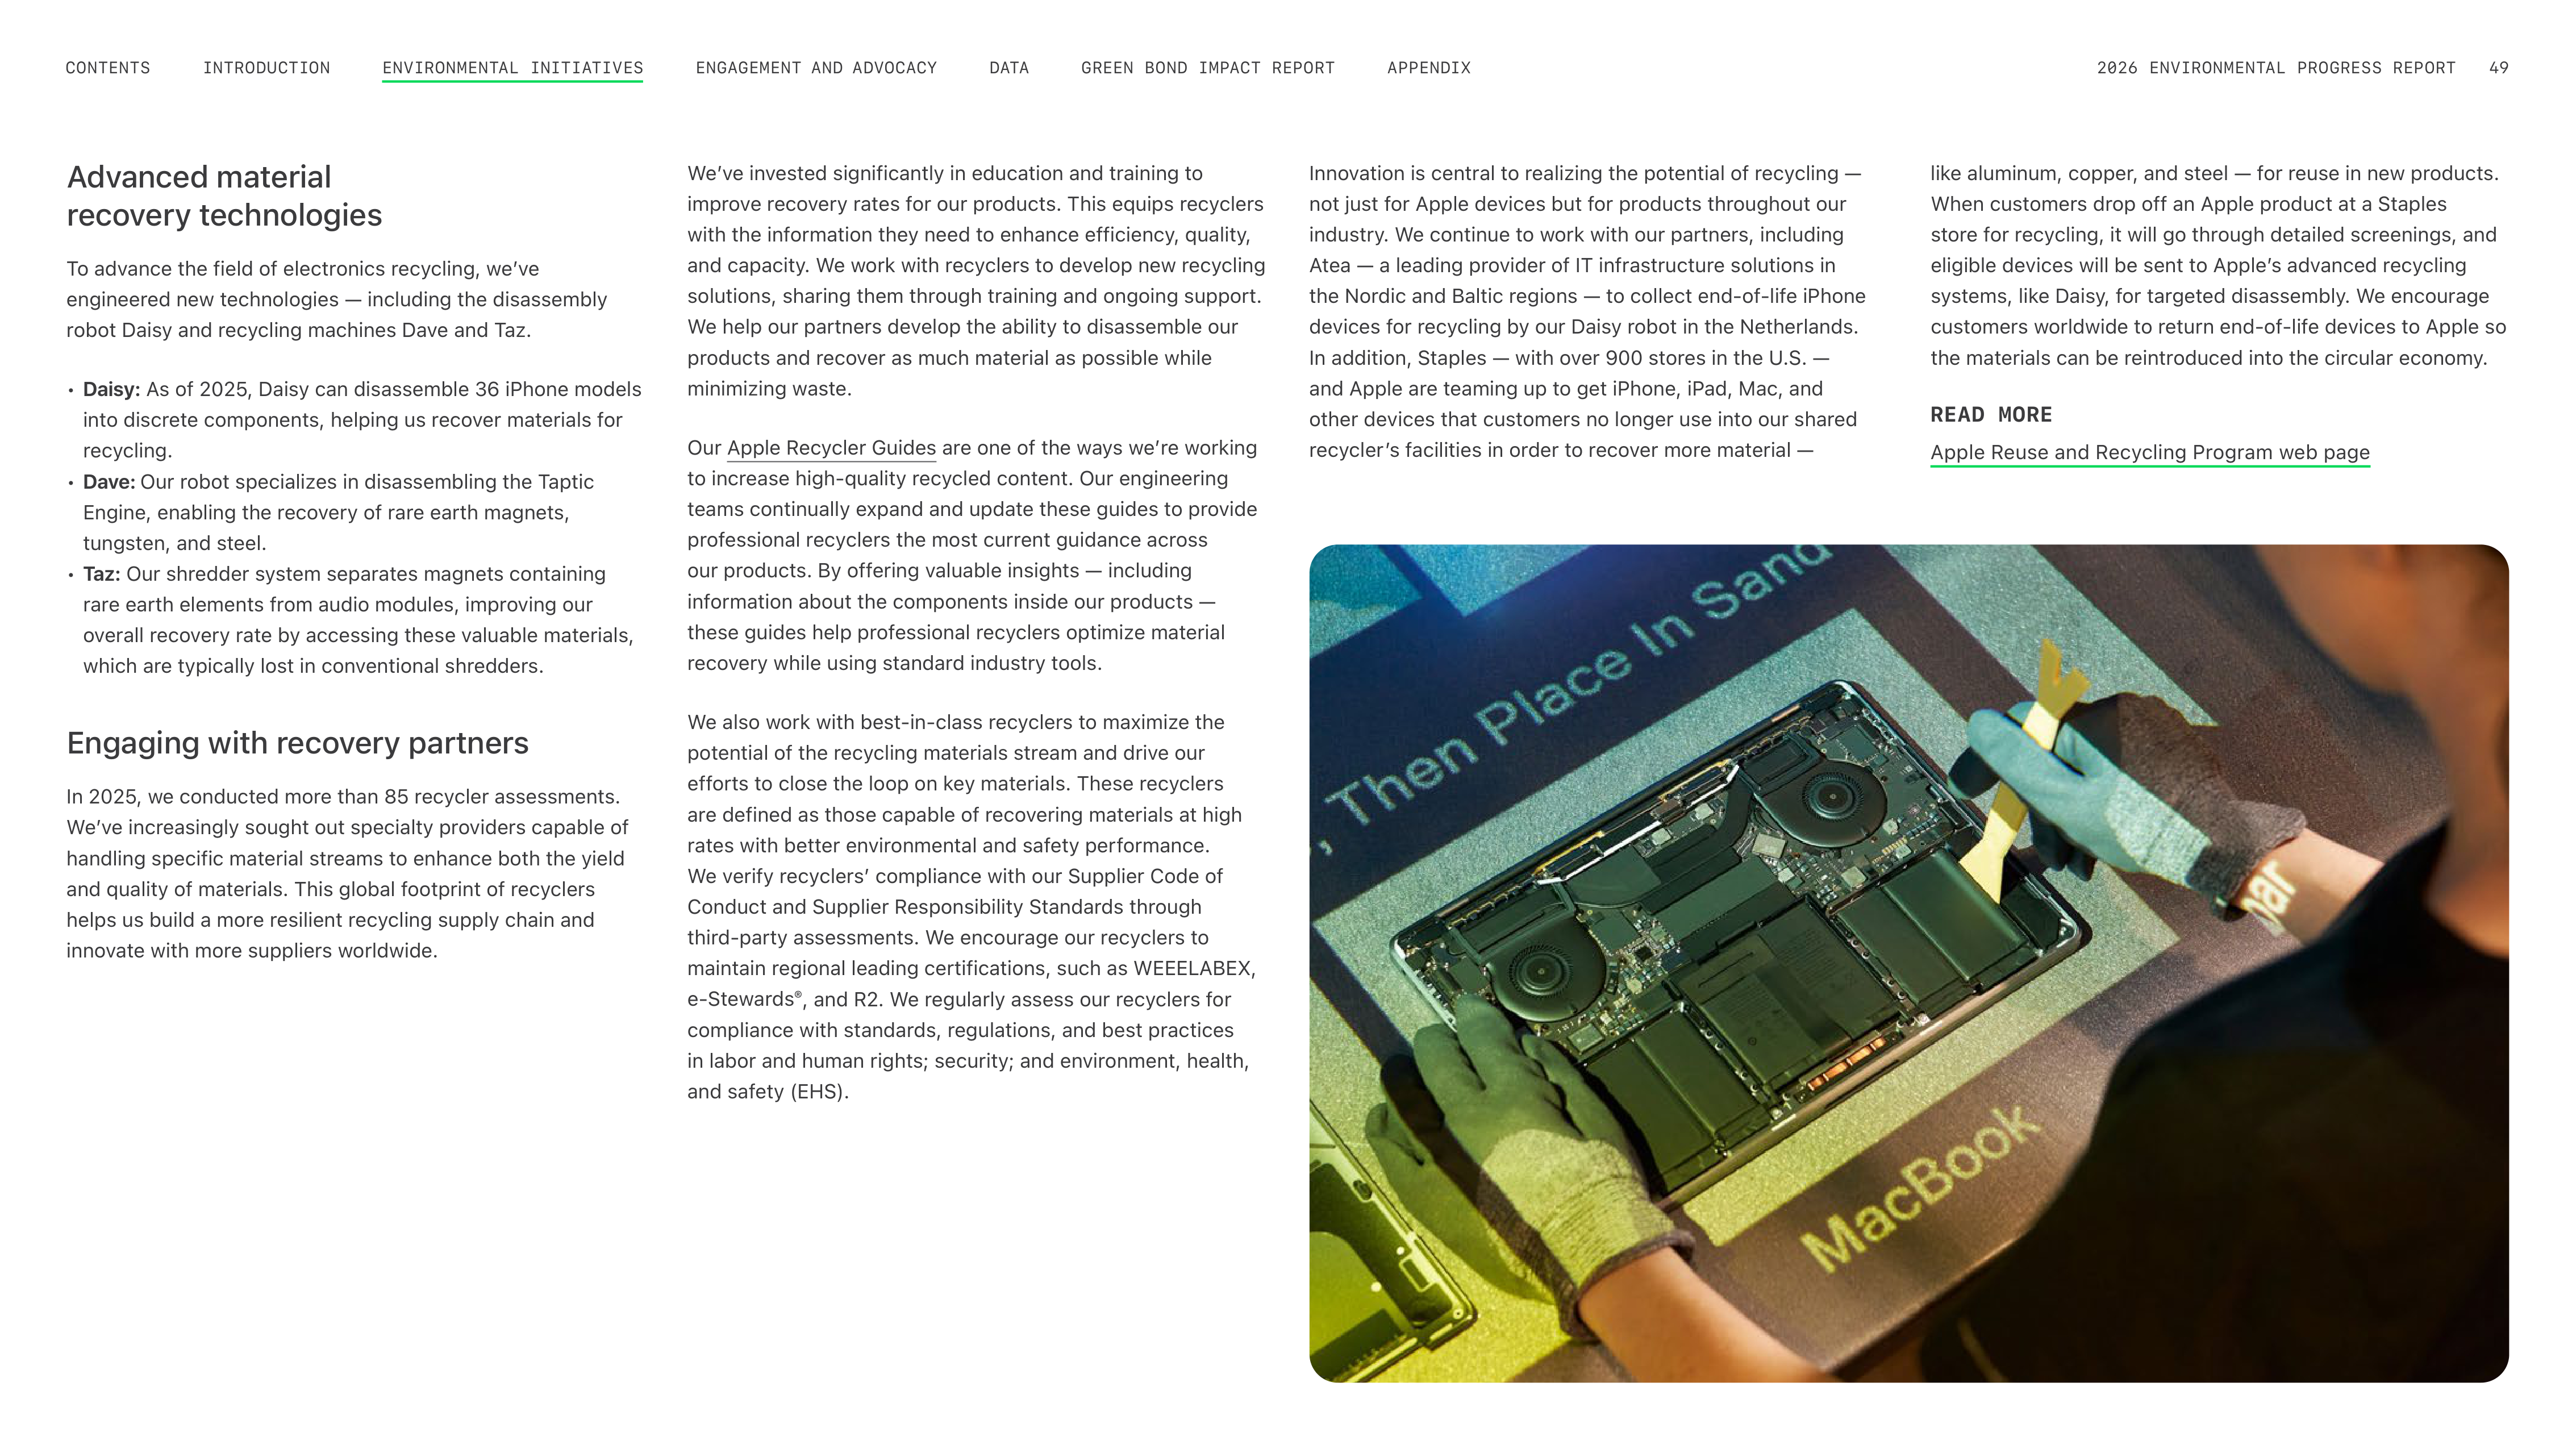
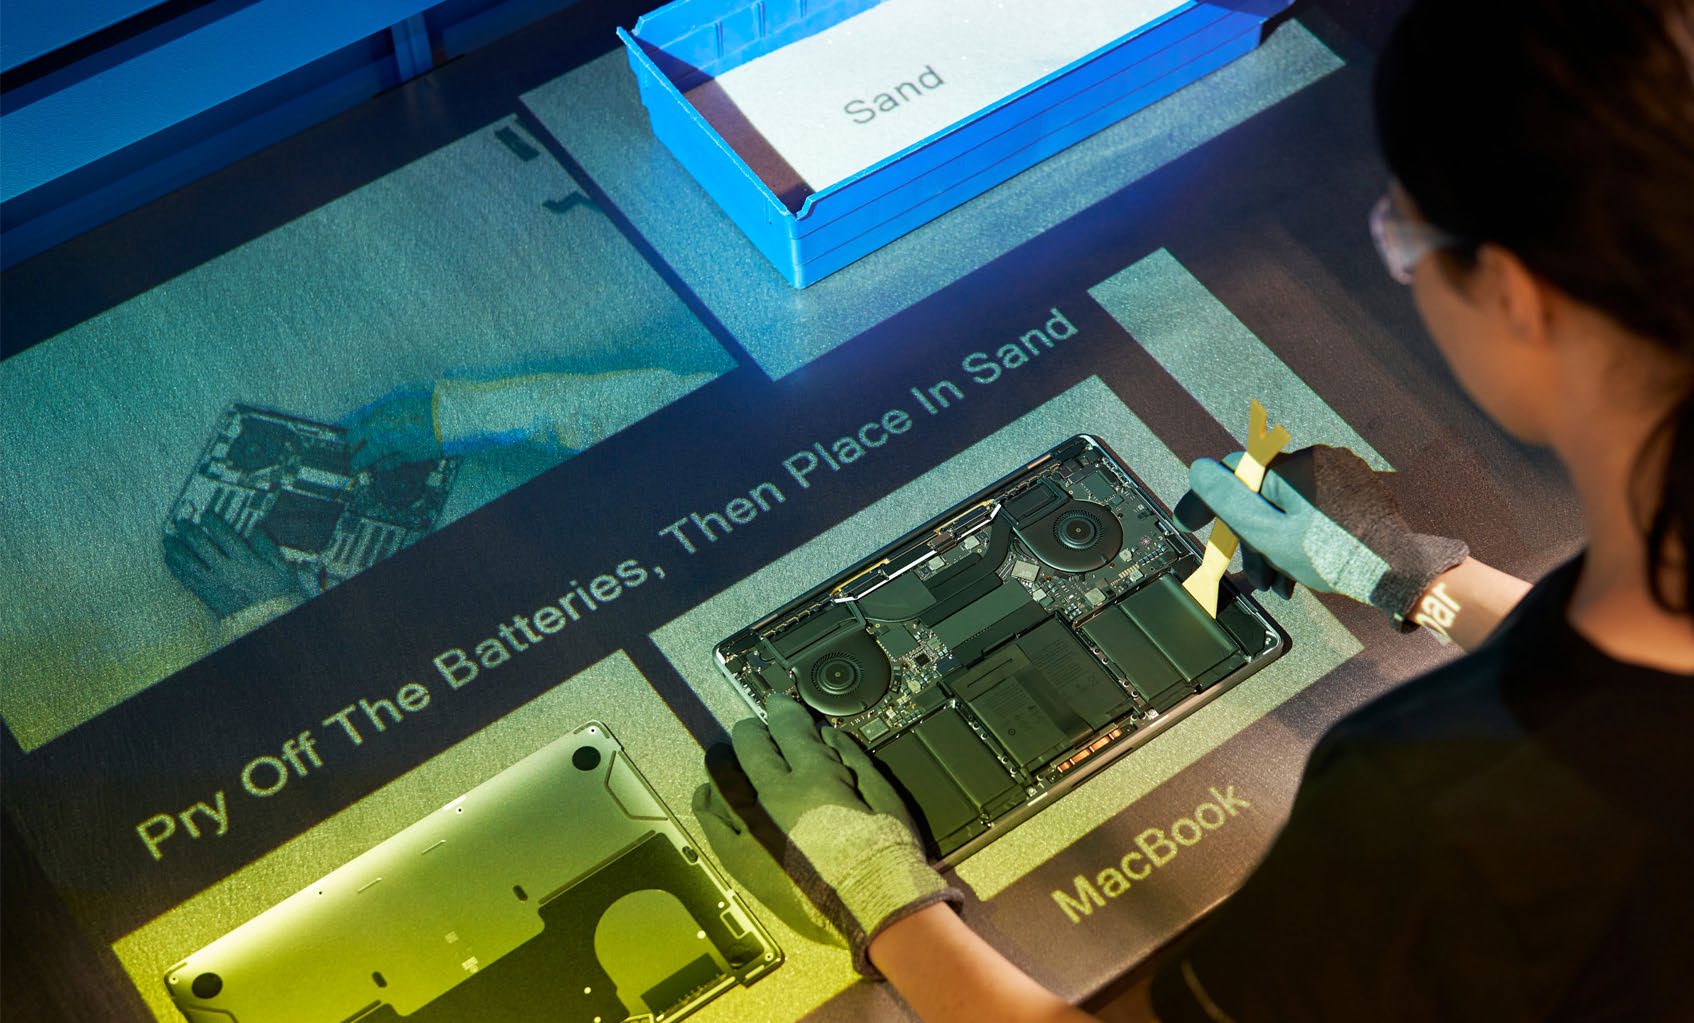
Innovation is central to realizing the potential of recycling —
not just for Apple devices but for products throughout our
industry. We continue to work with our partners, including
Atea — a leading provider of IT infrastructure solutions in
the Nordic and Baltic regions — to collect end-of-life iPhone
devices for recycling by our Daisy robot in the Netherlands.
In addition, Staples — with over 900 stores in the U.S. —
and Apple are teaming up to get iPhone, iPad, Mac, and
other devices that customers no longer use into our shared
recyclerʼs facilities in order to recover more material —
like aluminum, copper, and steel — for reuse in new products.
When customers drop off an Apple product at a Staples
store for recycling, it will go through detailed screenings, and
eligible devices will be sent to Appleʼs advanced recycling
systems, like Daisy, for targeted disassembly. We encourage
customers worldwide to return end-of-life devices to Apple so
the materials can be reintroduced into the circular economy.
READ MORE
Apple Reuse and Recycling Program web page
Advanced material
recovery technologies
To advance the field of electronics recycling, weʼve
engineered new technologies — including the disassembly
robot Daisy and recycling machines Dave and Taz.
•
Daisy:
As of 2025, Daisy can disassemble 36 iPhone models
into discrete components, helping us recover materials for
recycling.
•
Dave:
Our robot specializes in disassembling the Taptic
Engine, enabling the recovery of rare earth magnets,
tungsten, and steel.
•
Taz:
Our shredder system separates magnets containing
rare earth elements from audio modules, improving our
overall recovery rate by accessing these valuable materials,
which are typically lost in conventional shredders.
Engaging with recovery partners
In 2025, we conducted more than 85 recycler assessments.
Weʼve increasingly sought out specialty providers capable of
handling specific material streams to enhance both the yield
and quality of materials. This global footprint of recyclers
helps us build a more resilient recycling supply chain and
innovate with more suppliers worldwide.
Weʼve invested significantly in education and training to
improve recovery rates for our products. This equips recyclers
with the information they need to enhance efficiency, quality,
and capacity. We work with recyclers to develop new recycling
solutions, sharing them through training and ongoing support.
We help our partners develop the ability to disassemble our
products and recover as much material as possible while
minimizing waste.
Our Apple Recycler Guides are one of the ways weʼre working
to increase high-quality recycled content. Our engineering
teams continually expand and update these guides to provide
professional recyclers the most current guidance across
our products. By offering valuable insights — including
information about the components inside our products —
these guides help professional recyclers optimize material
recovery while using standard industry tools.
We also work with best-in-class recyclers to maximize the
potential of the recycling materials stream and drive our
efforts to close the loop on key materials. These recyclers
are defined as those capable of recovering materials at high
rates with better environmental and safety performance.
We verify recyclersʼ compliance with our Supplier Code of
Conduct and Supplier Responsibility Standards through
third-party assessments. We encourage our recyclers to
maintain regional leading certifications, such as WEEELABEX,
e-Stewards
®
, and R2. We regularly assess our recyclers for
compliance with standards, regulations, and best practices
in labor and human rights; security; and environment, health,
and safety (EHS).
ENGAGEMENT AND ADVOCACY
INTRODUCTION
CONTENTS
GREEN BOND IMPACT REPORT
DATA
APPENDIX
2026 ENVIRONMENTAL PROGRESS REPORT
49
ENVIRONMENTAL INITIATIVES
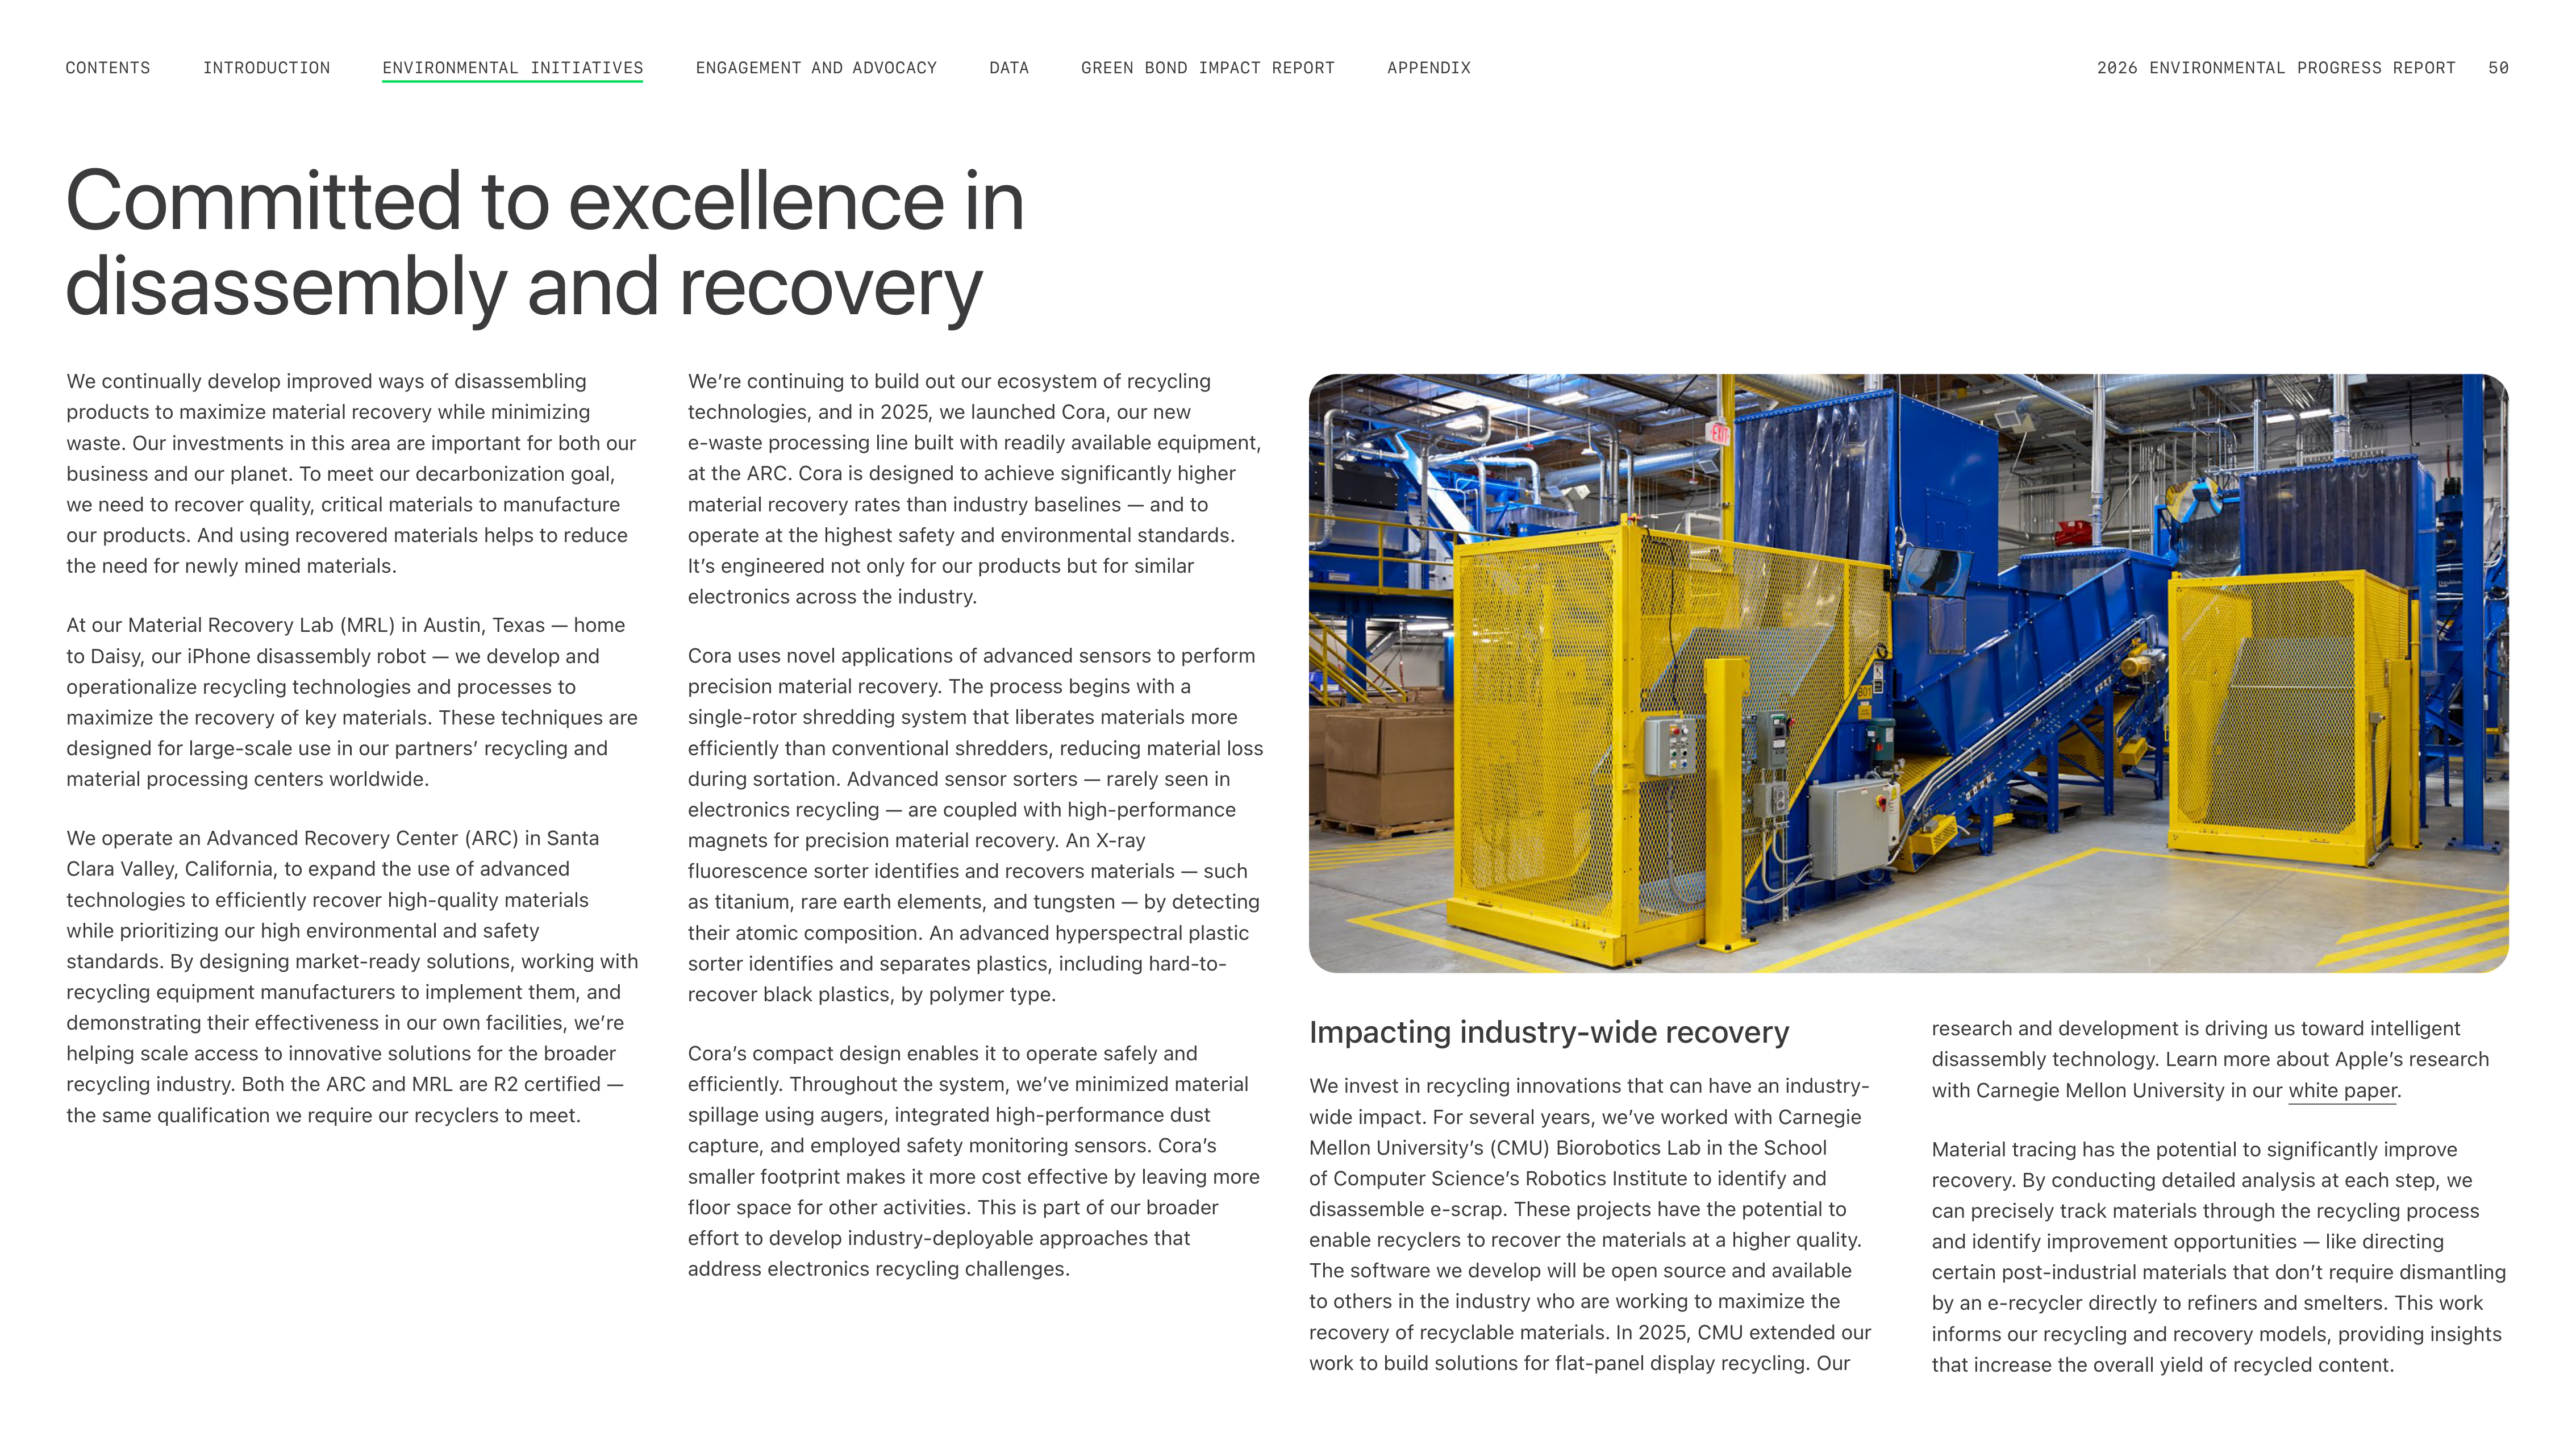
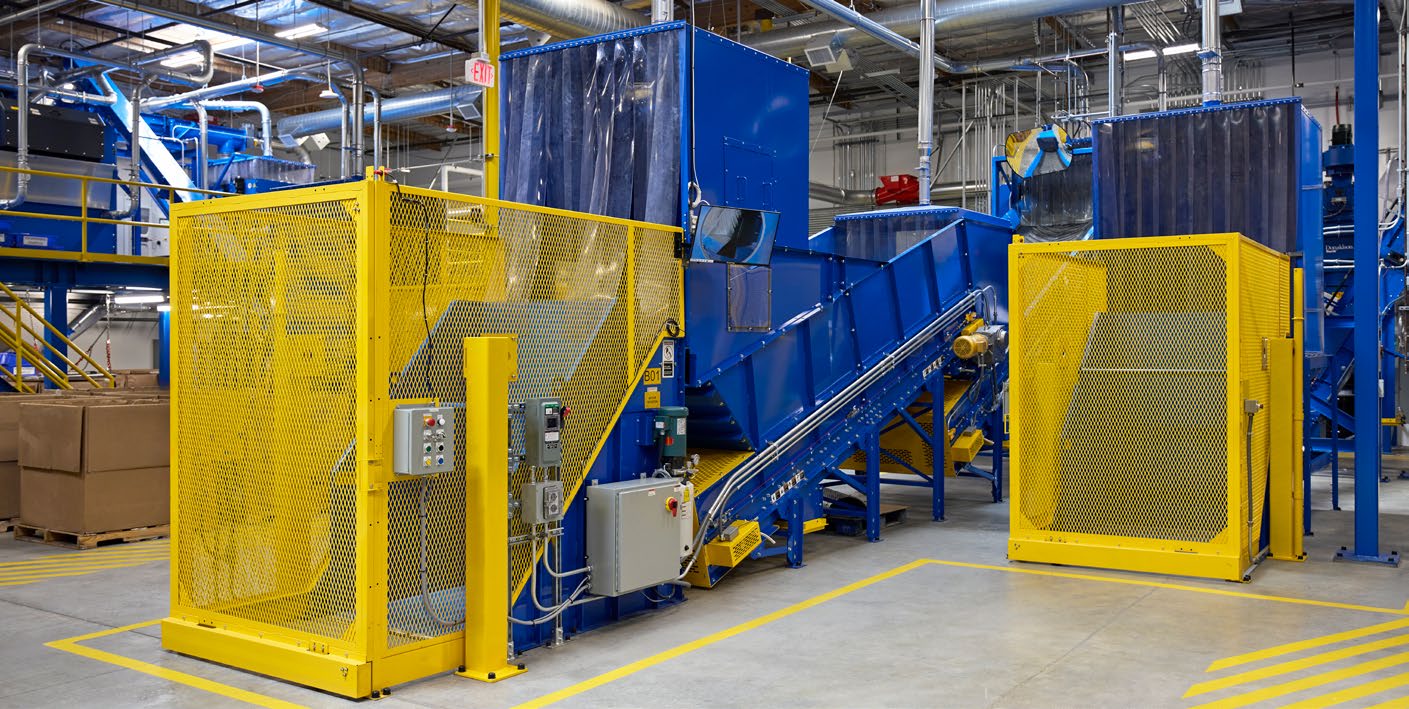
Committed to excellence in
disassembly and recovery
We continually develop improved ways of disassembling
products to maximize material recovery while minimizing
waste. Our investments in this area are important for both our
business and our planet. To meet our decarbonization goal,
we need to recover quality, critical materials to manufacture
our products. And using recovered materials helps to reduce
the need for newly mined materials.
At our Material Recovery Lab (MRL) in Austin, Texas — home
to Daisy, our iPhone disassembly robot — we develop and
operationalize recycling technologies and processes to
maximize the recovery of key materials. These techniques are
designed for large-scale use in our partnersʼ recycling and
material processing centers worldwide.
We operate an Advanced Recovery Center (ARC) in Santa
Clara Valley, California, to expand the use of advanced
technologies to efficiently recover high-quality materials
while prioritizing our high environmental and safety
standards. By designing market-ready solutions, working with
recycling equipment manufacturers to implement them, and
demonstrating their effectiveness in our own facilities, weʼre
helping scale access to innovative solutions for the broader
recycling industry. Both the ARC and MRL are R2 certified —
the same qualification we require our recyclers to meet.
Weʼre continuing to build out our ecosystem of recycling
technologies, and in 2025, we launched Cora, our new
e-waste processing line built with readily available equipment,
at the ARC. Cora is designed to achieve significantly higher
material recovery rates than industry baselines — and to
operate at the highest safety and environmental standards.
Itʼs engineered not only for our products but for similar
electronics across the industry.
Cora uses novel applications of advanced sensors to perform
precision material recovery. The process begins with a
single-rotor shredding system that liberates materials more
efficiently than conventional shredders, reducing material loss
during sortation. Advanced sensor sorters — rarely seen in
electronics recycling — are coupled with high-performance
magnets for precision material recovery. An X-ray
fluorescence sorter identifies and recovers materials — such
as titanium, rare earth elements, and tungsten — by detecting
their atomic composition. An advanced hyperspectral plastic
sorter identifies and separates plastics, including hard-to-
recover black plastics, by polymer type.
Coraʼs compact design enables it to operate safely and
efficiently. Throughout the system, weʼve minimized material
spillage using augers, integrated high-performance dust
capture, and employed safety monitoring sensors. Coraʼs
smaller footprint makes it more cost effective by leaving more
floor space for other activities. This is part of our broader
effort to develop industry-deployable approaches that
address electronics recycling challenges.
Impacting industry-wide recovery
We invest in recycling innovations that can have an industry-
wide impact. For several years, weʼve worked with Carnegie
Mellon Universityʼs (CMU) Biorobotics Lab in the School
of Computer Scienceʼs Robotics Institute to identify and
disassemble e-scrap. These projects have the potential to
enable recyclers to recover the materials at a higher quality.
The software we develop will be open source and available
to others in the industry who are working to maximize the
recovery of recyclable materials. In 2025, CMU extended our
work to build solutions for flat-panel display recycling. Our
research and development is driving us toward intelligent
disassembly technology. Learn more about Appleʼs research
with Carnegie Mellon University in our white paper.
Material tracing has the potential to significantly improve
recovery. By conducting detailed analysis at each step, we
can precisely track materials through the recycling process
and identify improvement opportunities — like directing
certain post-industrial materials that donʼt require dismantling
by an e-recycler directly to refiners and smelters. This work
informs our recycling and recovery models, providing insights
that increase the overall yield of recycled content.
ENGAGEMENT AND ADVOCACY
INTRODUCTION
CONTENTS
GREEN BOND IMPACT REPORT
DATA
APPENDIX
2026 ENVIRONMENTAL PROGRESS REPORT
50
ENVIRONMENTAL INITIATIVES
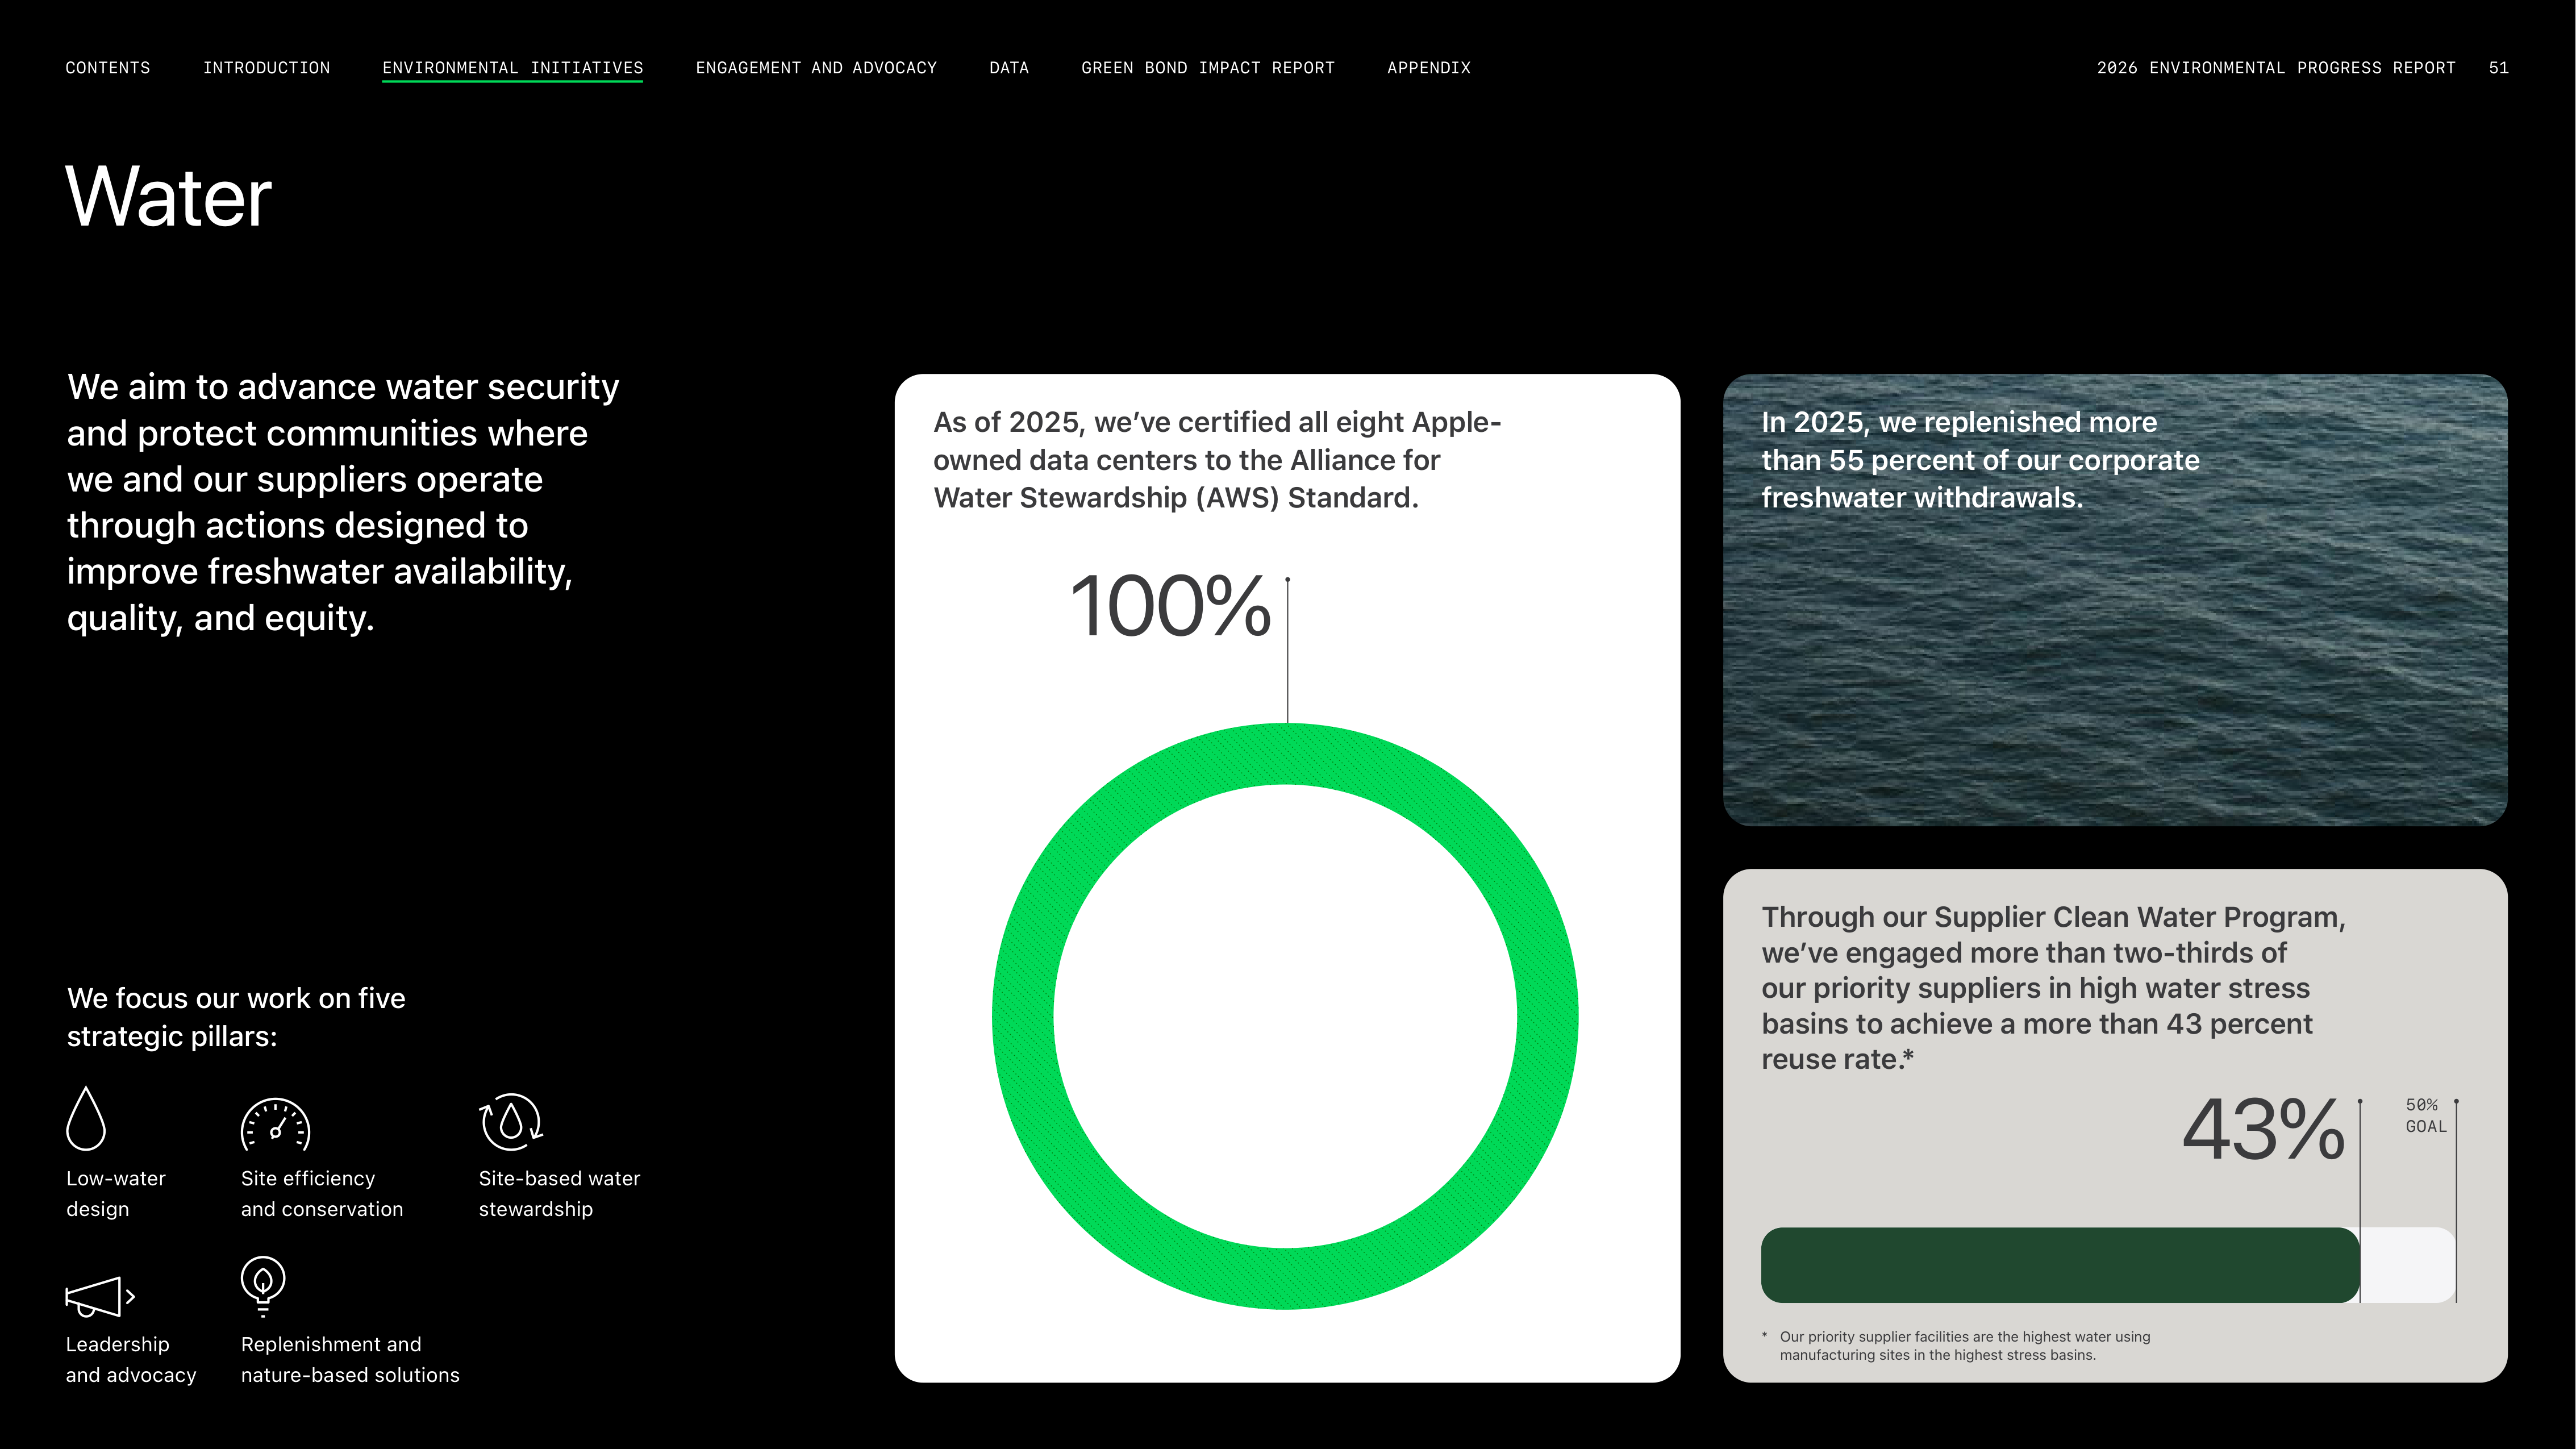

Water
We aim to advance water security
and protect communities where
we and our suppliers operate
through actions designed to
improve freshwater availability,
quality, and equity.
We focus our work on five
strategic pillars:
Low-water
design
Leadership
and advocacy
In 2025, we replenished more
than 55 percent of our corporate
freshwater withdrawals.
As of 2025, we’ve certified all eight Apple-
owned data centers to the Alliance for
Water Stewardship (AWS) Standard.
Through our Supplier Clean Water Program,
we’ve engaged more than two-thirds of
our priority suppliers in high water stress
basins to achieve a more than 43 percent
reuse rate.*
Site efficiency
and conservation
Site-based water
stewardship
Replenishment and
nature-based solutions
43%
100%
50%
GOAL
*
Our priority supplier facilities are the highest water using
manufacturing sites in the highest stress basins.
2026 ENVIRONMENTAL PROGRESS REPORT
51
ENGAGEMENT AND ADVOCACY
INTRODUCTION
CONTENTS
APPENDIX
GREEN BOND IMPACT REPORT
DATA
ENVIRONMENTAL INITIATIVES
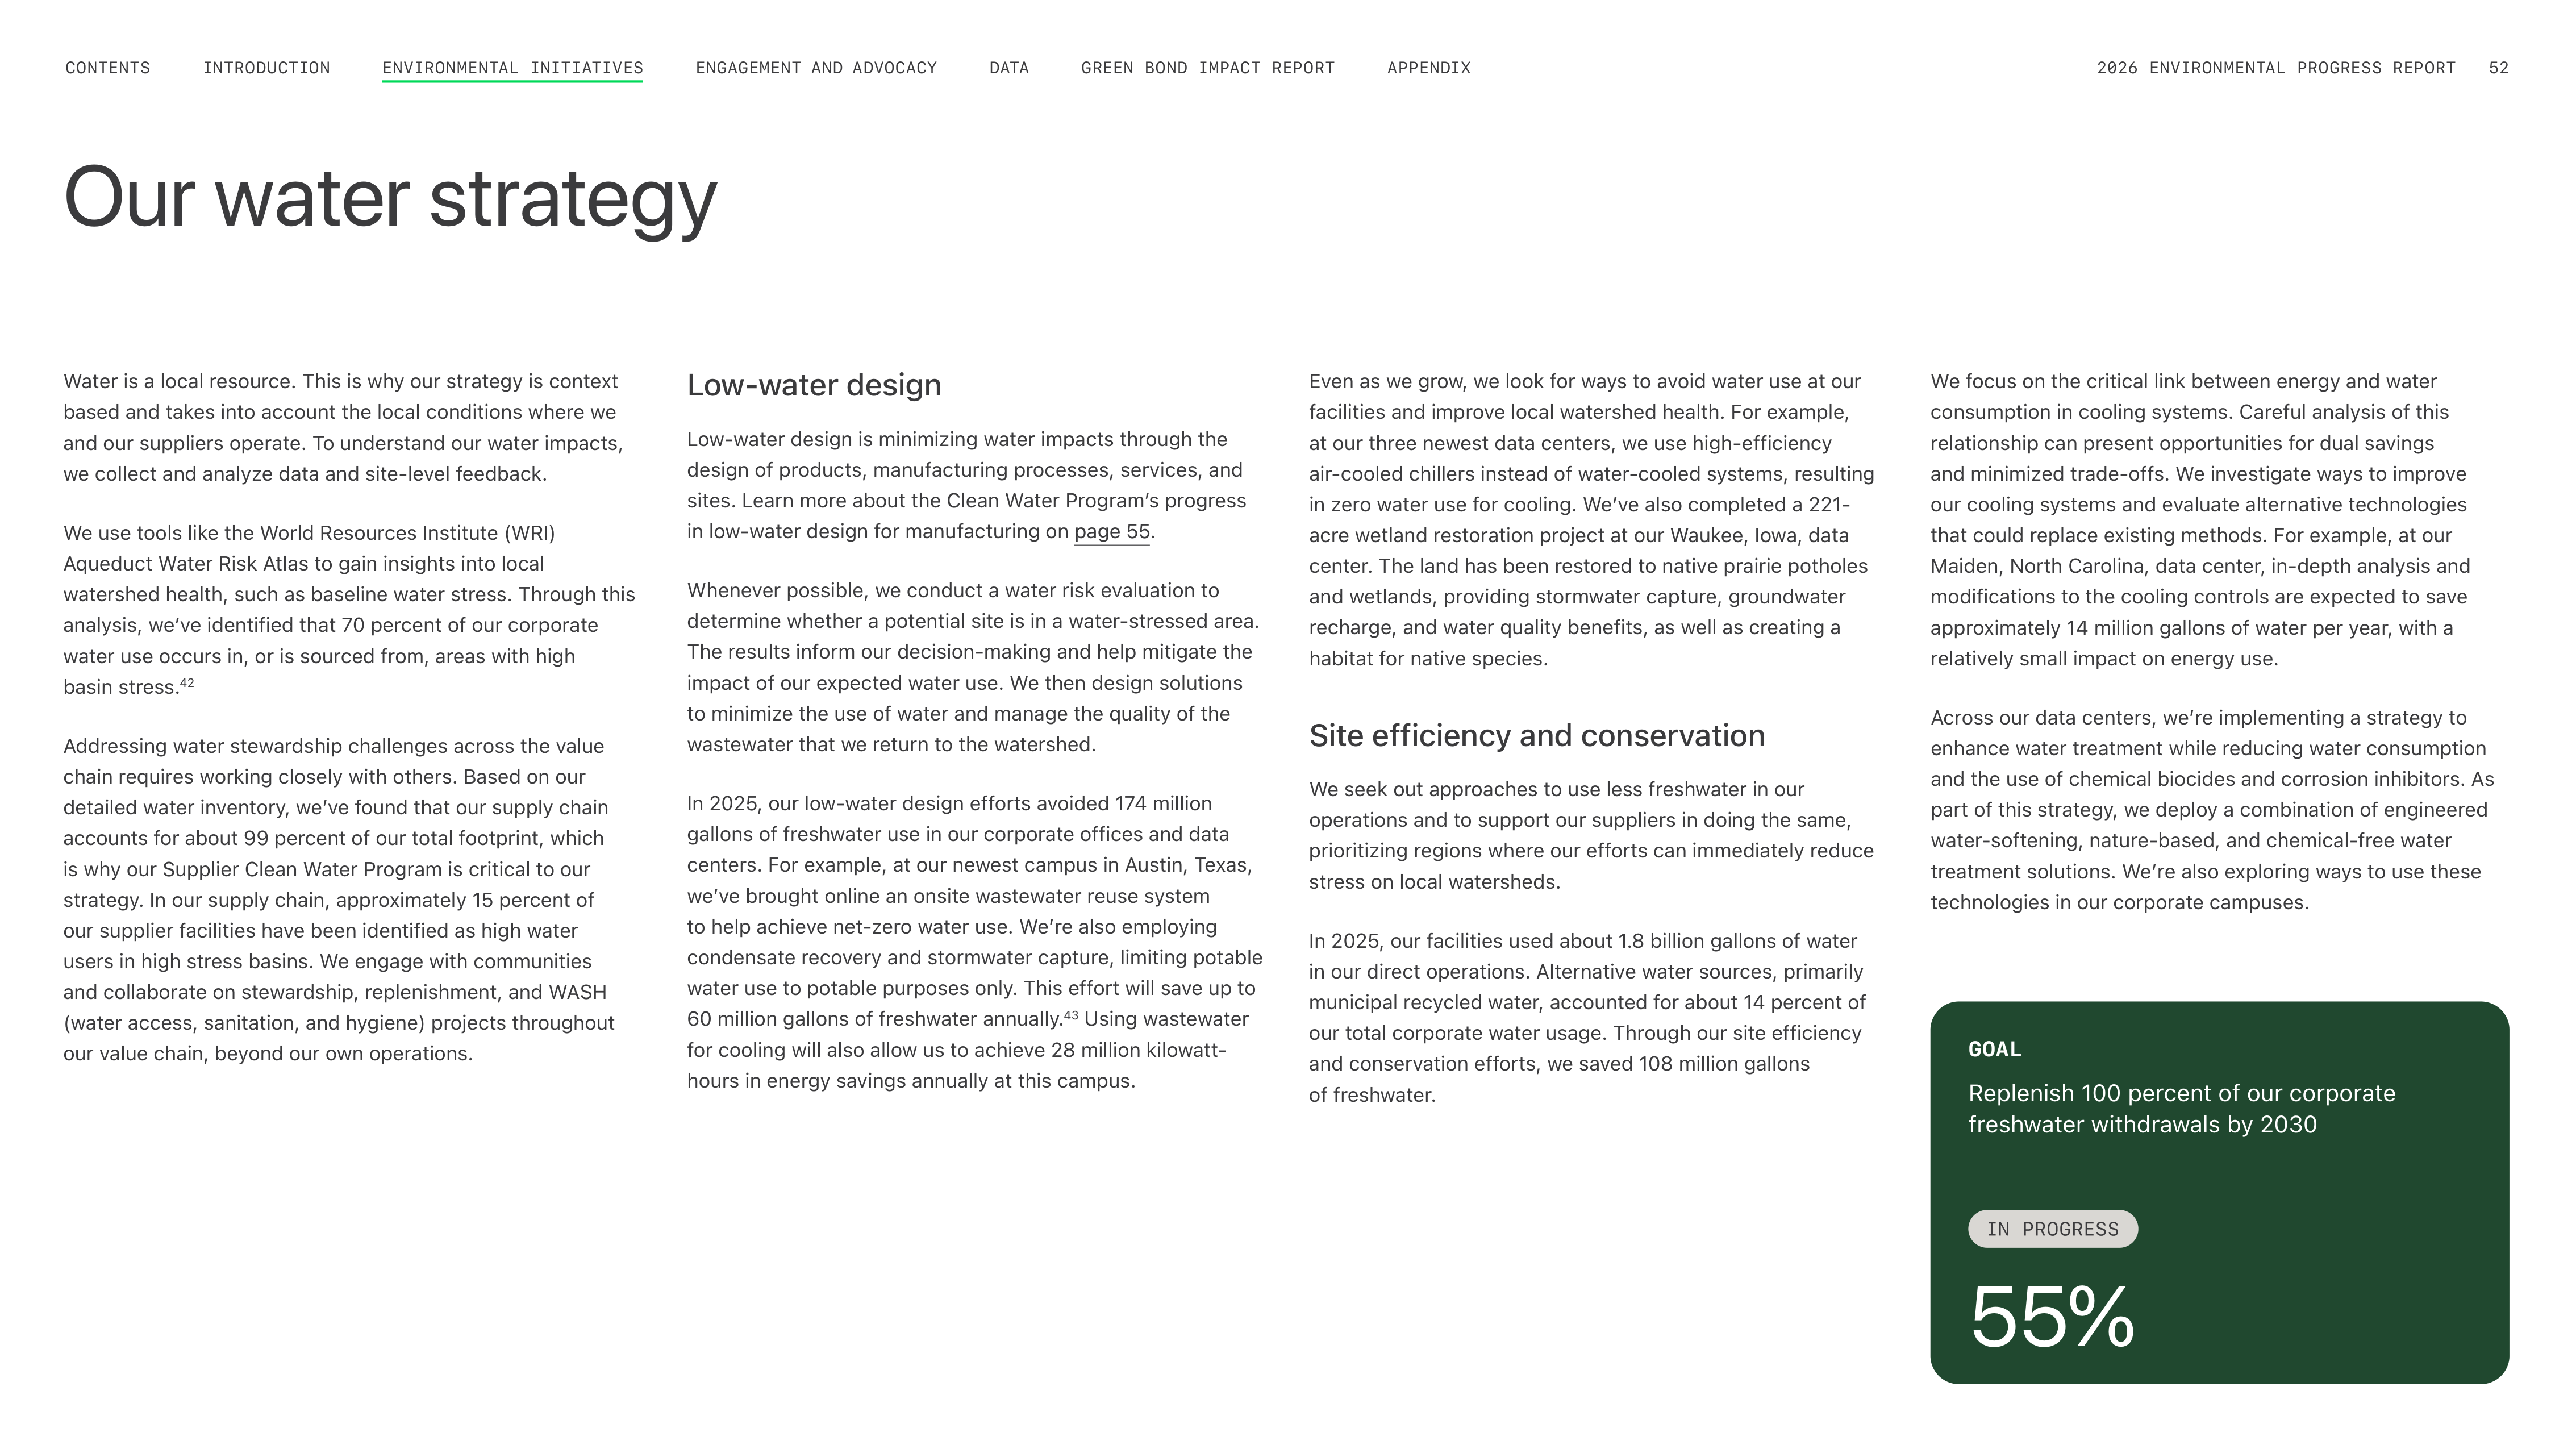
Water is a local resource. This is why our strategy is context
based and takes into account the local conditions where we
and our suppliers operate. To understand our water impacts,
we collect and analyze data and site-level feedback.
We use tools like the World Resources Institute (WRI)
Aqueduct Water Risk Atlas to gain insights into local
watershed health, such as baseline water stress. Through this
analysis, weʼve identified that 70 percent of our corporate
water use occurs in, or is sourced from, areas with high
basin stress.
42
Addressing water stewardship challenges across the value
chain requires working closely with others. Based on our
detailed water inventory, weʼve found that our supply chain
accounts for about 99 percent of our total footprint, which
is why our Supplier Clean Water Program is critical to our
strategy. In our supply chain, approximately 15 percent of
our supplier facilities have been identified as high water
users in high stress basins. We engage with communities
and collaborate on stewardship, replenishment, and WASH
(water access, sanitation, and hygiene) projects throughout
our value chain, beyond our own operations.
Our water strategy
GOAL
Replenish 100 percent of our corporate
freshwater withdrawals by 2030
55%
We focus on the critical link between energy and water
consumption in cooling systems. Careful analysis of this
relationship can present opportunities for dual savings
and minimized trade-offs. We investigate ways to improve
our cooling systems and evaluate alternative technologies
that could replace existing methods. For example, at our
Maiden, North Carolina, data center, in-depth analysis and
modifications to the cooling controls are expected to save
approximately 14 million gallons of water per year, with a
relatively small impact on energy use.
Across our data centers, weʼre implementing a strategy to
enhance water treatment while reducing water consumption
and the use of chemical biocides and corrosion inhibitors. As
part of this strategy, we deploy a combination of engineered
water-softening, nature-based, and chemical-free water
treatment solutions. Weʼre also exploring ways to use these
technologies in our corporate campuses.
Low-water design
Low-water design is minimizing water impacts through the
design of products, manufacturing processes, services, and
sites. Learn more about the Clean Water Programʼs progress
in low-water design for manufacturing on page 55.
Whenever possible, we conduct a water risk evaluation to
determine whether a potential site is in a water-stressed area.
The results inform our decision-making and help mitigate the
impact of our expected water use. We then design solutions
to minimize the use of water and manage the quality of the
wastewater that we return to the watershed.
In 2025, our low-water design efforts avoided 174 million
gallons of freshwater use in our corporate offices and data
centers. For example, at our newest campus in Austin, Texas,
weʼve brought online an onsite wastewater reuse system
to help achieve net-zero water use. Weʼre also employing
condensate recovery and stormwater capture, limiting potable
water use to potable purposes only. This effort will save up to
60 million gallons of freshwater annually.
43
Using wastewater
for cooling will also allow us to achieve 28 million kilowatt-
hours in energy savings annually at this campus.
Even as we grow, we look for ways to avoid water use at our
facilities and improve local watershed health. For example,
at our three newest data centers, we use high-efficiency
air-cooled chillers instead of water-cooled systems, resulting
in zero water use for cooling. Weʼve also completed a 221-
acre wetland restoration project at our Waukee, Iowa, data
center. The land has been restored to native prairie potholes
and wetlands, providing stormwater capture, groundwater
recharge, and water quality benefits, as well as creating a
habitat for native species.
Site efficiency and conservation
We seek out approaches to use less freshwater in our
operations and to support our suppliers in doing the same,
prioritizing regions where our efforts can immediately reduce
stress on local watersheds.
In 2025, our facilities used about 1.8 billion gallons of water
in our direct operations. Alternative water sources, primarily
municipal recycled water, accounted for about 14 percent of
our total corporate water usage. Through our site efficiency
and conservation efforts, we saved 108 million gallons
of freshwater.
ENGAGEMENT AND ADVOCACY
INTRODUCTION
CONTENTS
GREEN BOND IMPACT REPORT
DATA
APPENDIX
2026 ENVIRONMENTAL PROGRESS REPORT
52
ENVIRONMENTAL INITIATIVES
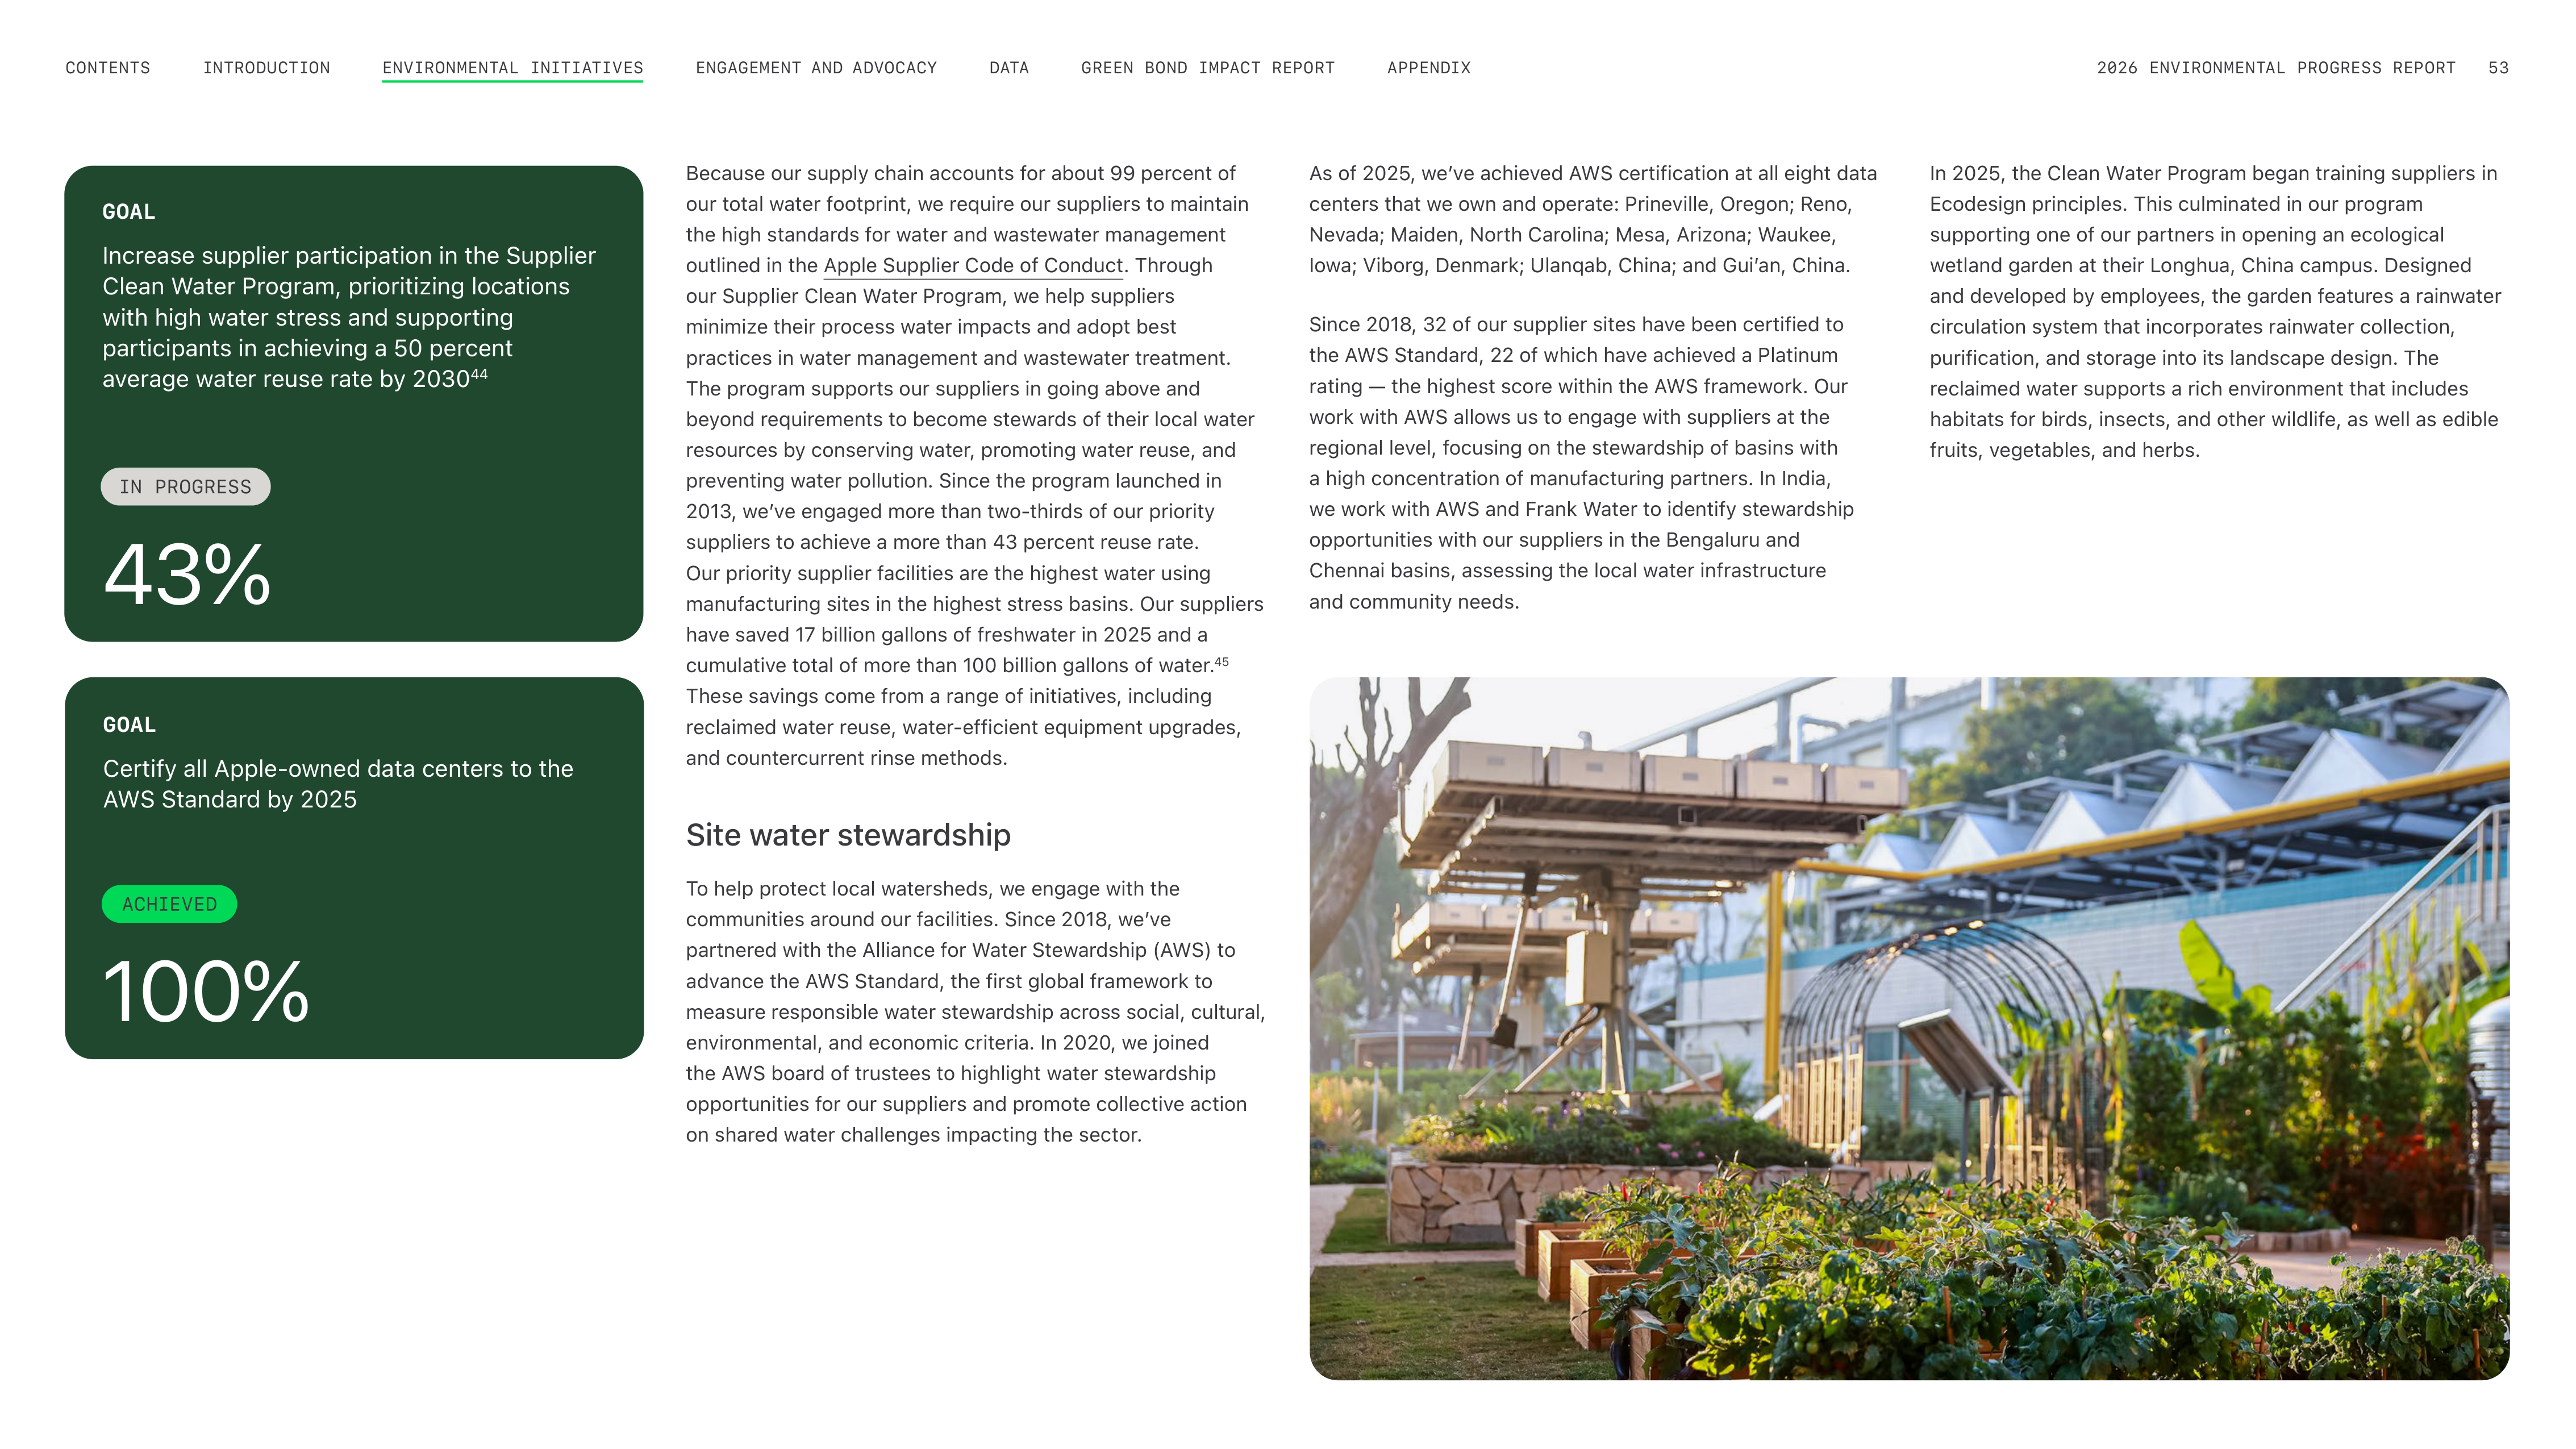
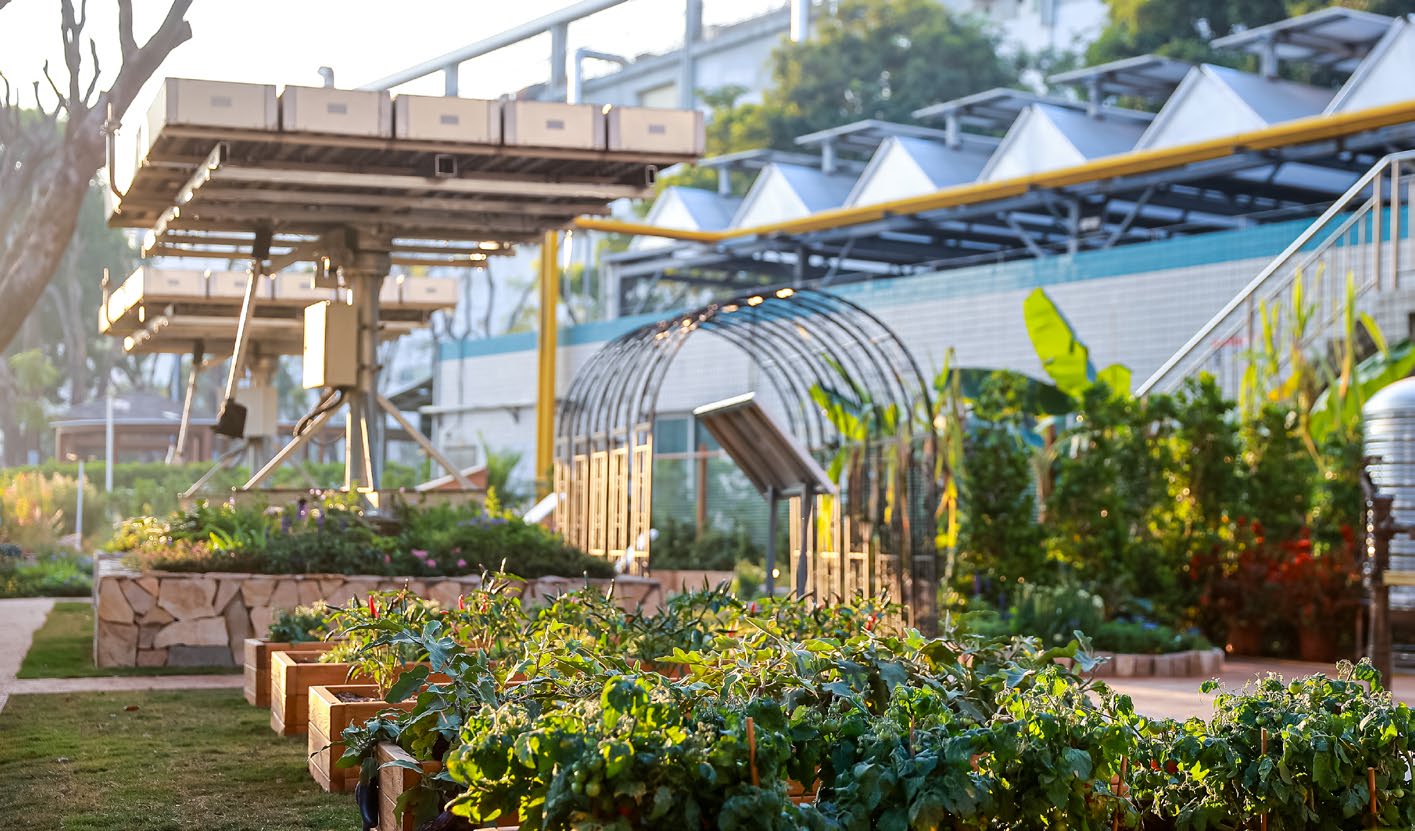
GOAL
Increase supplier participation in the Supplier
Clean Water Program, prioritizing locations
with high water stress and supporting
participants in achieving a 50 percent
average water reuse rate by 2030
44
43%
As of 2025, weʼve achieved AWS certification at all eight data
centers that we own and operate: Prineville, Oregon; Reno,
Nevada; Maiden, North Carolina; Mesa, Arizona; Waukee,
Iowa; Viborg, Denmark; Ulanqab, China; and Guiʼan, China.
Since 2018, 32 of our supplier sites have been certified to
the AWS Standard, 22 of which have achieved a Platinum
rating — the highest score within the AWS framework. Our
work with AWS allows us to engage with suppliers at the
regional level, focusing on the stewardship of basins with
a high concentration of manufacturing partners. In India,
we work with AWS and Frank Water to identify stewardship
opportunities with our suppliers in the Bengaluru and
Chennai basins, assessing the local water infrastructure
and community needs.
In 2025, the Clean Water Program began training suppliers in
Ecodesign principles. This culminated in our program
supporting one of our partners in opening an ecological
wetland garden at their Longhua, China campus. Designed
and developed by employees, the garden features a rainwater
circulation system that incorporates rainwater collection,
purification, and storage into its landscape design. The
reclaimed water supports a rich environment that includes
habitats for birds, insects, and other wildlife, as well as edible
fruits, vegetables, and herbs.
GOAL
Certify all Apple-owned data centers to the
AWS Standard by 2025
100%
Because our supply chain accounts for about 99 percent of
our total water footprint, we require our suppliers to maintain
the high standards for water and wastewater management
outlined in the Apple Supplier Code of Conduct. Through
our Supplier Clean Water Program, we help suppliers
minimize their process water impacts and adopt best
practices in water management and wastewater treatment.
The program supports our suppliers in going above and
beyond requirements to become stewards of their local water
resources by conserving water, promoting water reuse, and
preventing water pollution. Since the program launched in
2013, weʼve engaged more than two-thirds of our priority
suppliers to achieve a more than 43 percent reuse rate.
Our priority supplier facilities are the highest water using
manufacturing sites in the highest stress basins. Our suppliers
have saved 17 billion gallons of freshwater in 2025 and a
cumulative total of more than 100 billion gallons of water.
45
These savings come from a range of initiatives, including
reclaimed water reuse, water-efficient equipment upgrades,
and countercurrent rinse methods.
Site water stewardship
To help protect local watersheds, we engage with the
communities around our facilities. Since 2018, weʼve
partnered with the Alliance for Water Stewardship (AWS) to
advance the AWS Standard, the first global framework to
measure responsible water stewardship across social, cultural,
environmental, and economic criteria. In 2020, we joined
the AWS board of trustees to highlight water stewardship
opportunities for our suppliers and promote collective action
on shared water challenges impacting the sector.
ENGAGEMENT AND ADVOCACY
INTRODUCTION
CONTENTS
GREEN BOND IMPACT REPORT
DATA
APPENDIX
2026 ENVIRONMENTAL PROGRESS REPORT
53
ENVIRONMENTAL INITIATIVES
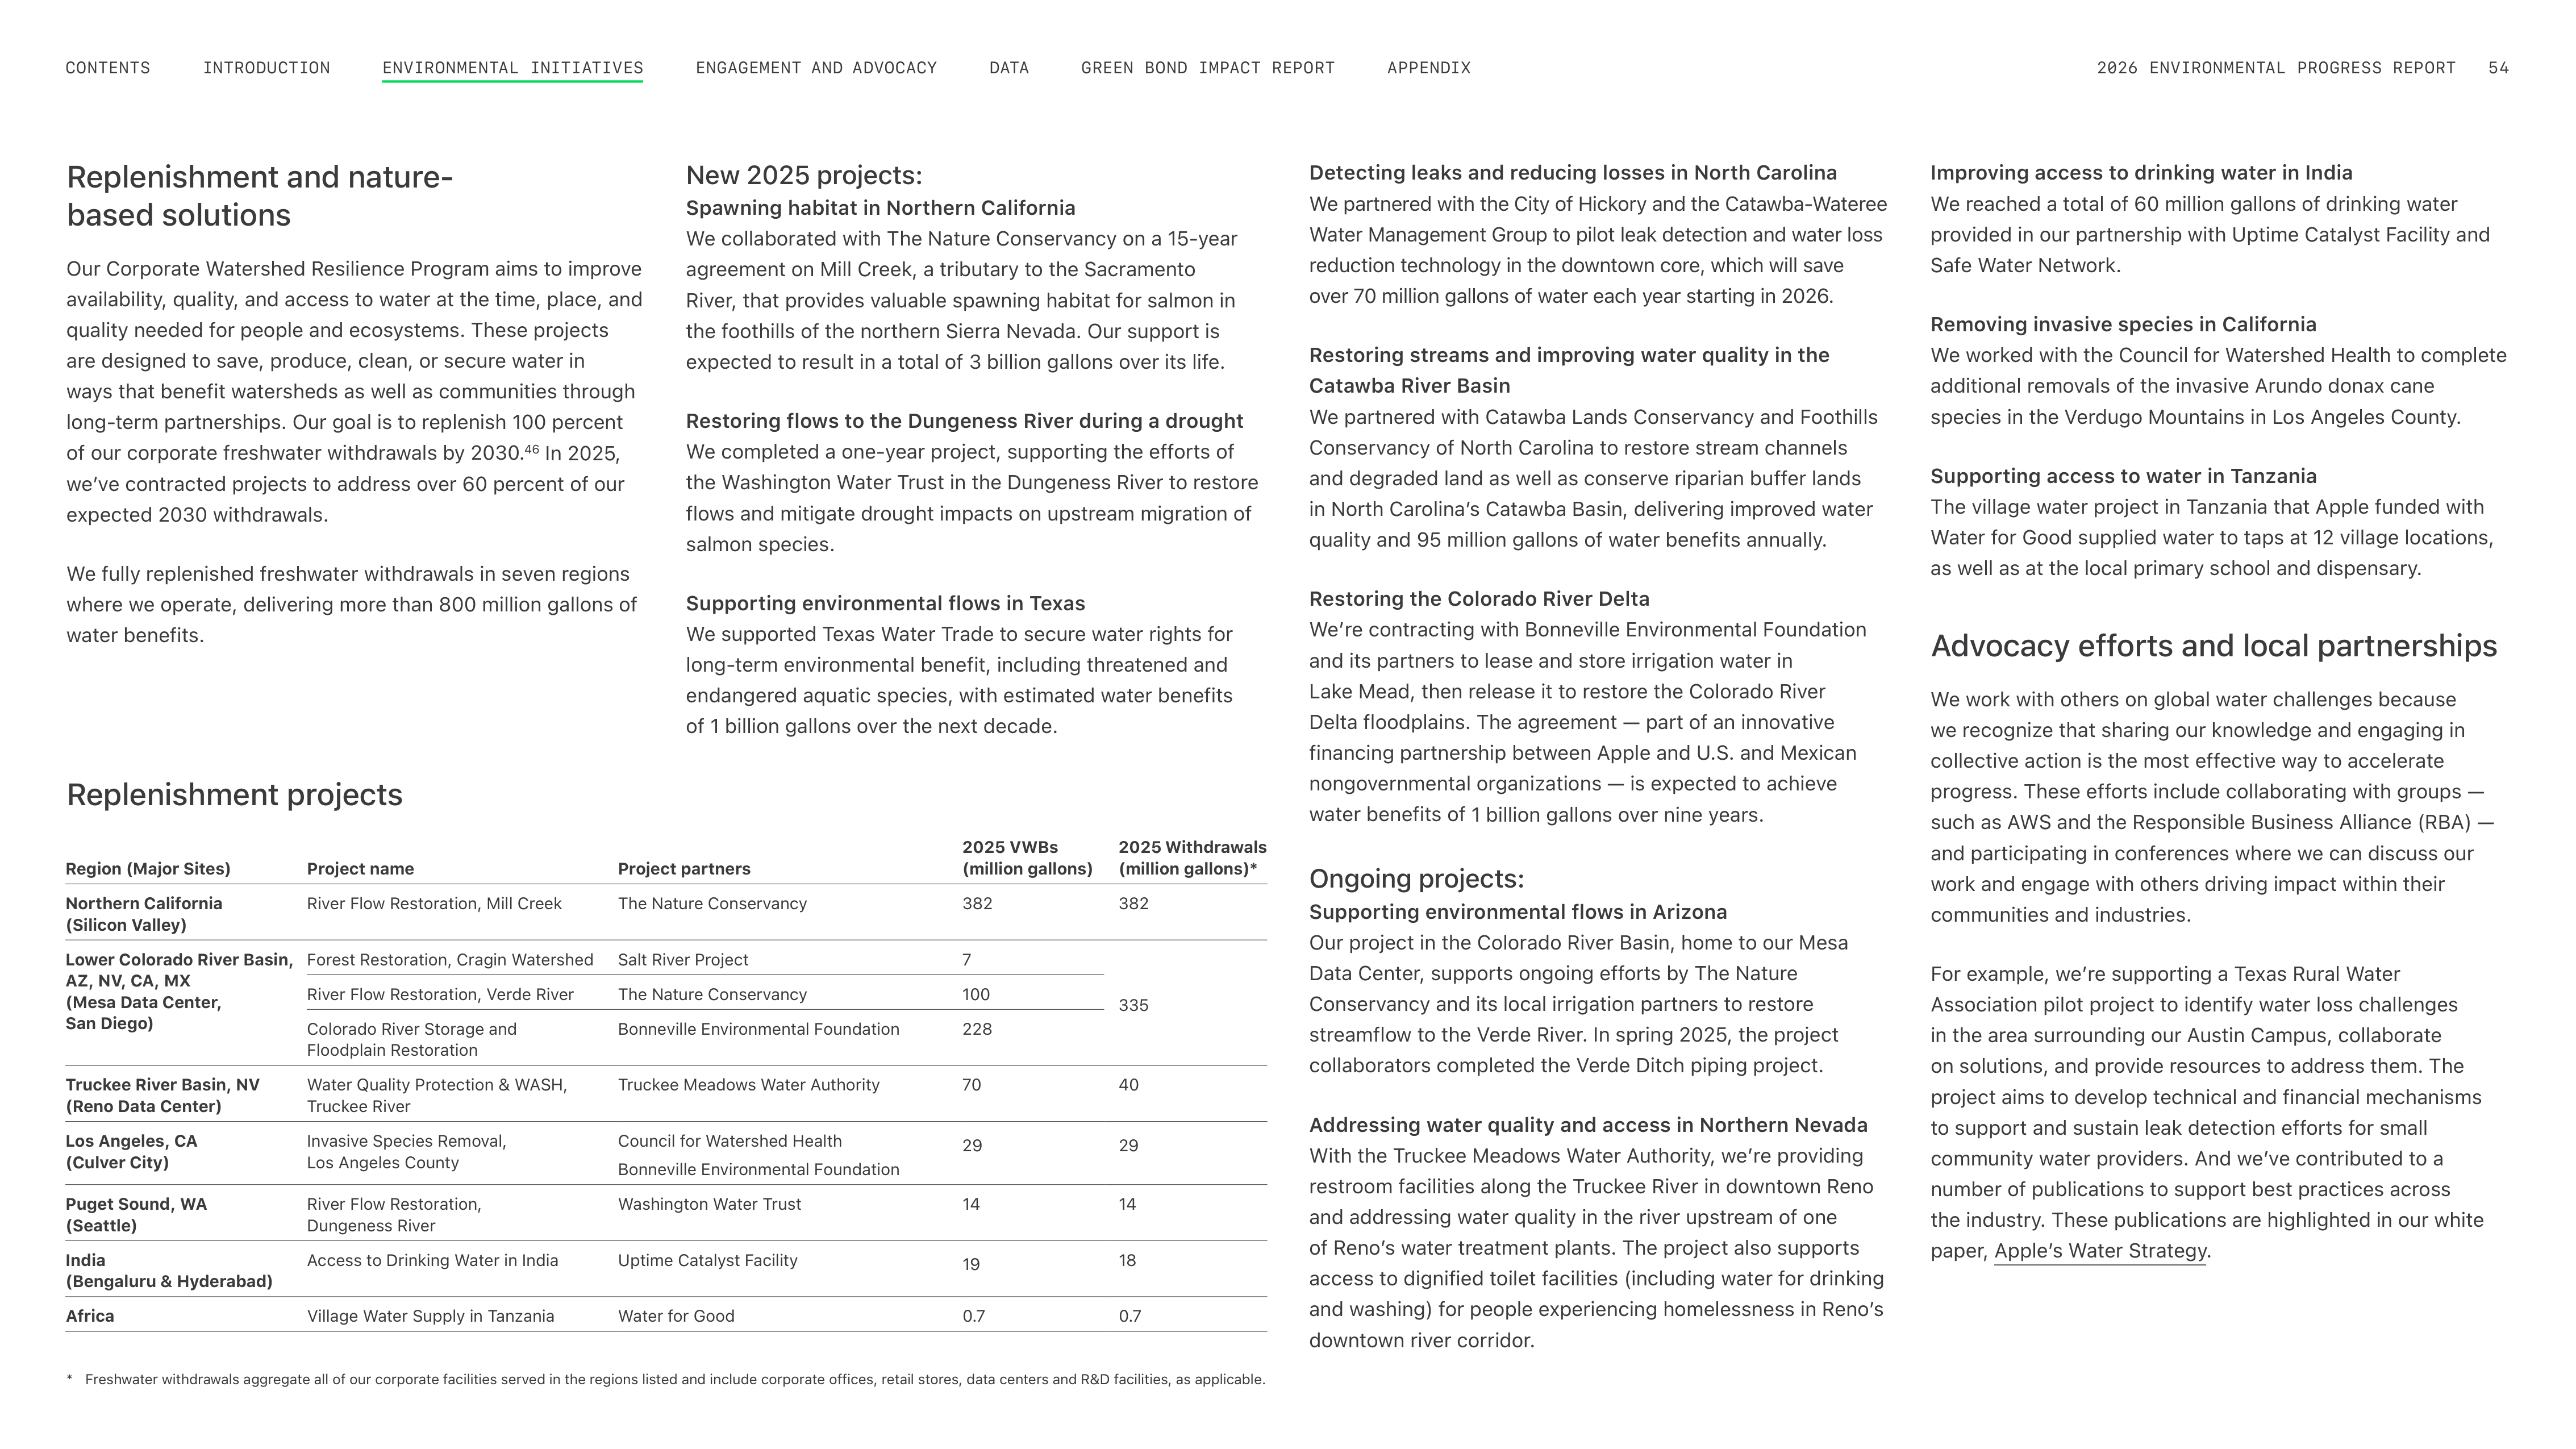
Replenishment and nature-
based solutions
Our Corporate Watershed Resilience Program aims to improve
availability, quality, and access to water at the time, place, and
quality needed for people and ecosystems. These projects
are designed to save, produce, clean, or secure water in
ways that benefit watersheds as well as communities through
long-term partnerships. Our goal is to replenish 100 percent
of our corporate freshwater withdrawals by 2030.
46
In 2025,
weʼve contracted projects to address over 60 percent of our
expected 2030 withdrawals.
We fully replenished freshwater withdrawals in seven regions
where we operate, delivering more than 800 million gallons of
water benefits.
Advocacy efforts and local partnerships
We work with others on global water challenges because
we recognize that sharing our knowledge and engaging in
collective action is the most effective way to accelerate
progress. These efforts include collaborating with groups —
such as AWS and the Responsible Business Alliance (RBA) —
and participating in conferences where we can discuss our
work and engage with others driving impact within their
communities and industries.
For example, weʼre supporting a Texas Rural Water
Association pilot project to identify water loss challenges
in the area surrounding our Austin Campus, collaborate
on solutions, and provide resources to address them. The
project aims to develop technical and financial mechanisms
to support and sustain leak detection efforts for small
community water providers. And weʼve contributed to a
number of publications to support best practices across
the industry. These publications are highlighted in our white
paper, Appleʼs Water Strategy.
Region (Major Sites)
Project name
Project partners
2025 VWBs
(million gallons)
2025 Withdrawals
(million gallons)*
Northern California
(Silicon Valley)
River Flow Restoration, Mill Creek
The Nature Conservancy
382
382
Lower Colorado River Basin,
AZ, NV, CA, MX
(Mesa Data Center,
San Diego)
Forest Restoration, Cragin Watershed
Salt River Project
7
335
River Flow Restoration, Verde River
The Nature Conservancy
100
Colorado River Storage and
Floodplain Restoration
Bonneville Environmental Foundation
228
Truckee River Basin, NV
(Reno Data Center)
Water Quality Protection & WASH,
Truckee River
Truckee Meadows Water Authority
70
40
Los Angeles, CA
(Culver City)
Invasive Species Removal,
Los Angeles County
Council for Watershed Health
Bonneville Environmental Foundation
29
29
Puget Sound, WA
(Seattle)
River Flow Restoration,
Dungeness River
Washington Water Trust
14
14
India
(Bengaluru & Hyderabad)
Access to Drinking Water in India
Uptime Catalyst Facility
19
18
Africa
Village Water Supply in Tanzania
Water for Good
0.7
0.7
New 2025 projects:
Spawning habitat in Northern California
We collaborated with The Nature Conservancy on a 15-year
agreement on Mill Creek, a tributary to the Sacramento
River, that provides valuable spawning habitat for salmon in
the foothills of the northern Sierra Nevada. Our support is
expected to result in a total of 3 billion gallons over its life.
Restoring flows to the Dungeness River during a drought
We completed a one-year project, supporting the efforts of
the Washington Water Trust in the Dungeness River to restore
flows and mitigate drought impacts on upstream migration of
salmon species.
Supporting environmental flows in Texas
We supported Texas Water Trade to secure water rights for
long-term environmental benefit, including threatened and
endangered aquatic species, with estimated water benefits
of 1 billion gallons over the next decade.
Detecting leaks and reducing losses in North Carolina
We partnered with the City of Hickory and the Catawba-Wateree
Water Management Group to pilot leak detection and water loss
reduction technology in the downtown core, which will save
over 70 million gallons of water each year starting in 2026.
Restoring streams and improving water quality in the
Catawba River Basin
We partnered with Catawba Lands Conservancy and Foothills
Conservancy of North Carolina to restore stream channels
and degraded land as well as conserve riparian buffer lands
in North Carolinaʼs Catawba Basin, delivering improved water
quality and 95 million gallons of water benefits annually.
Restoring the Colorado River Delta
Weʼre contracting with Bonneville Environmental Foundation
and its partners to lease and store irrigation water in
Lake Mead, then release it to restore the Colorado River
Delta floodplains. The agreement — part of an innovative
financing partnership between Apple and U.S. and Mexican
nongovernmental organizations — is expected to achieve
water benefits of 1 billion gallons over nine years.
Ongoing projects:
Supporting environmental flows in Arizona
Our project in the Colorado River Basin, home to our Mesa
Data Center, supports ongoing efforts by The Nature
Conservancy and its local irrigation partners to restore
streamflow to the Verde River. In spring 2025, the project
collaborators completed the Verde Ditch piping project.
Addressing water quality and access in Northern Nevada
With the Truckee Meadows Water Authority, weʼre providing
restroom facilities along the Truckee River in downtown Reno
and addressing water quality in the river upstream of one
of Renoʼs water treatment plants. The project also supports
access to dignified toilet facilities (including water for drinking
and washing) for people experiencing homelessness in Renoʼs
downtown river corridor.
Improving access to drinking water in India
We reached a total of 60 million gallons of drinking water
provided in our partnership with Uptime Catalyst Facility and
Safe Water Network.
Removing invasive species in California
We worked with the Council for Watershed Health to complete
additional removals of the invasive Arundo donax cane
species in the Verdugo Mountains in Los Angeles County.
Supporting access to water in Tanzania
The village water project in Tanzania that Apple funded with
Water for Good supplied water to taps at 12 village locations,
as well as at the local primary school and dispensary.
*
Freshwater withdrawals aggregate all of our corporate facilities served in the regions listed and include corporate offices, retail stores, data centers and R&D facilities, as applicable.
Replenishment projects
ENGAGEMENT AND ADVOCACY
INTRODUCTION
CONTENTS
GREEN BOND IMPACT REPORT
DATA
APPENDIX
2026 ENVIRONMENTAL PROGRESS REPORT
54
ENVIRONMENTAL INITIATIVES
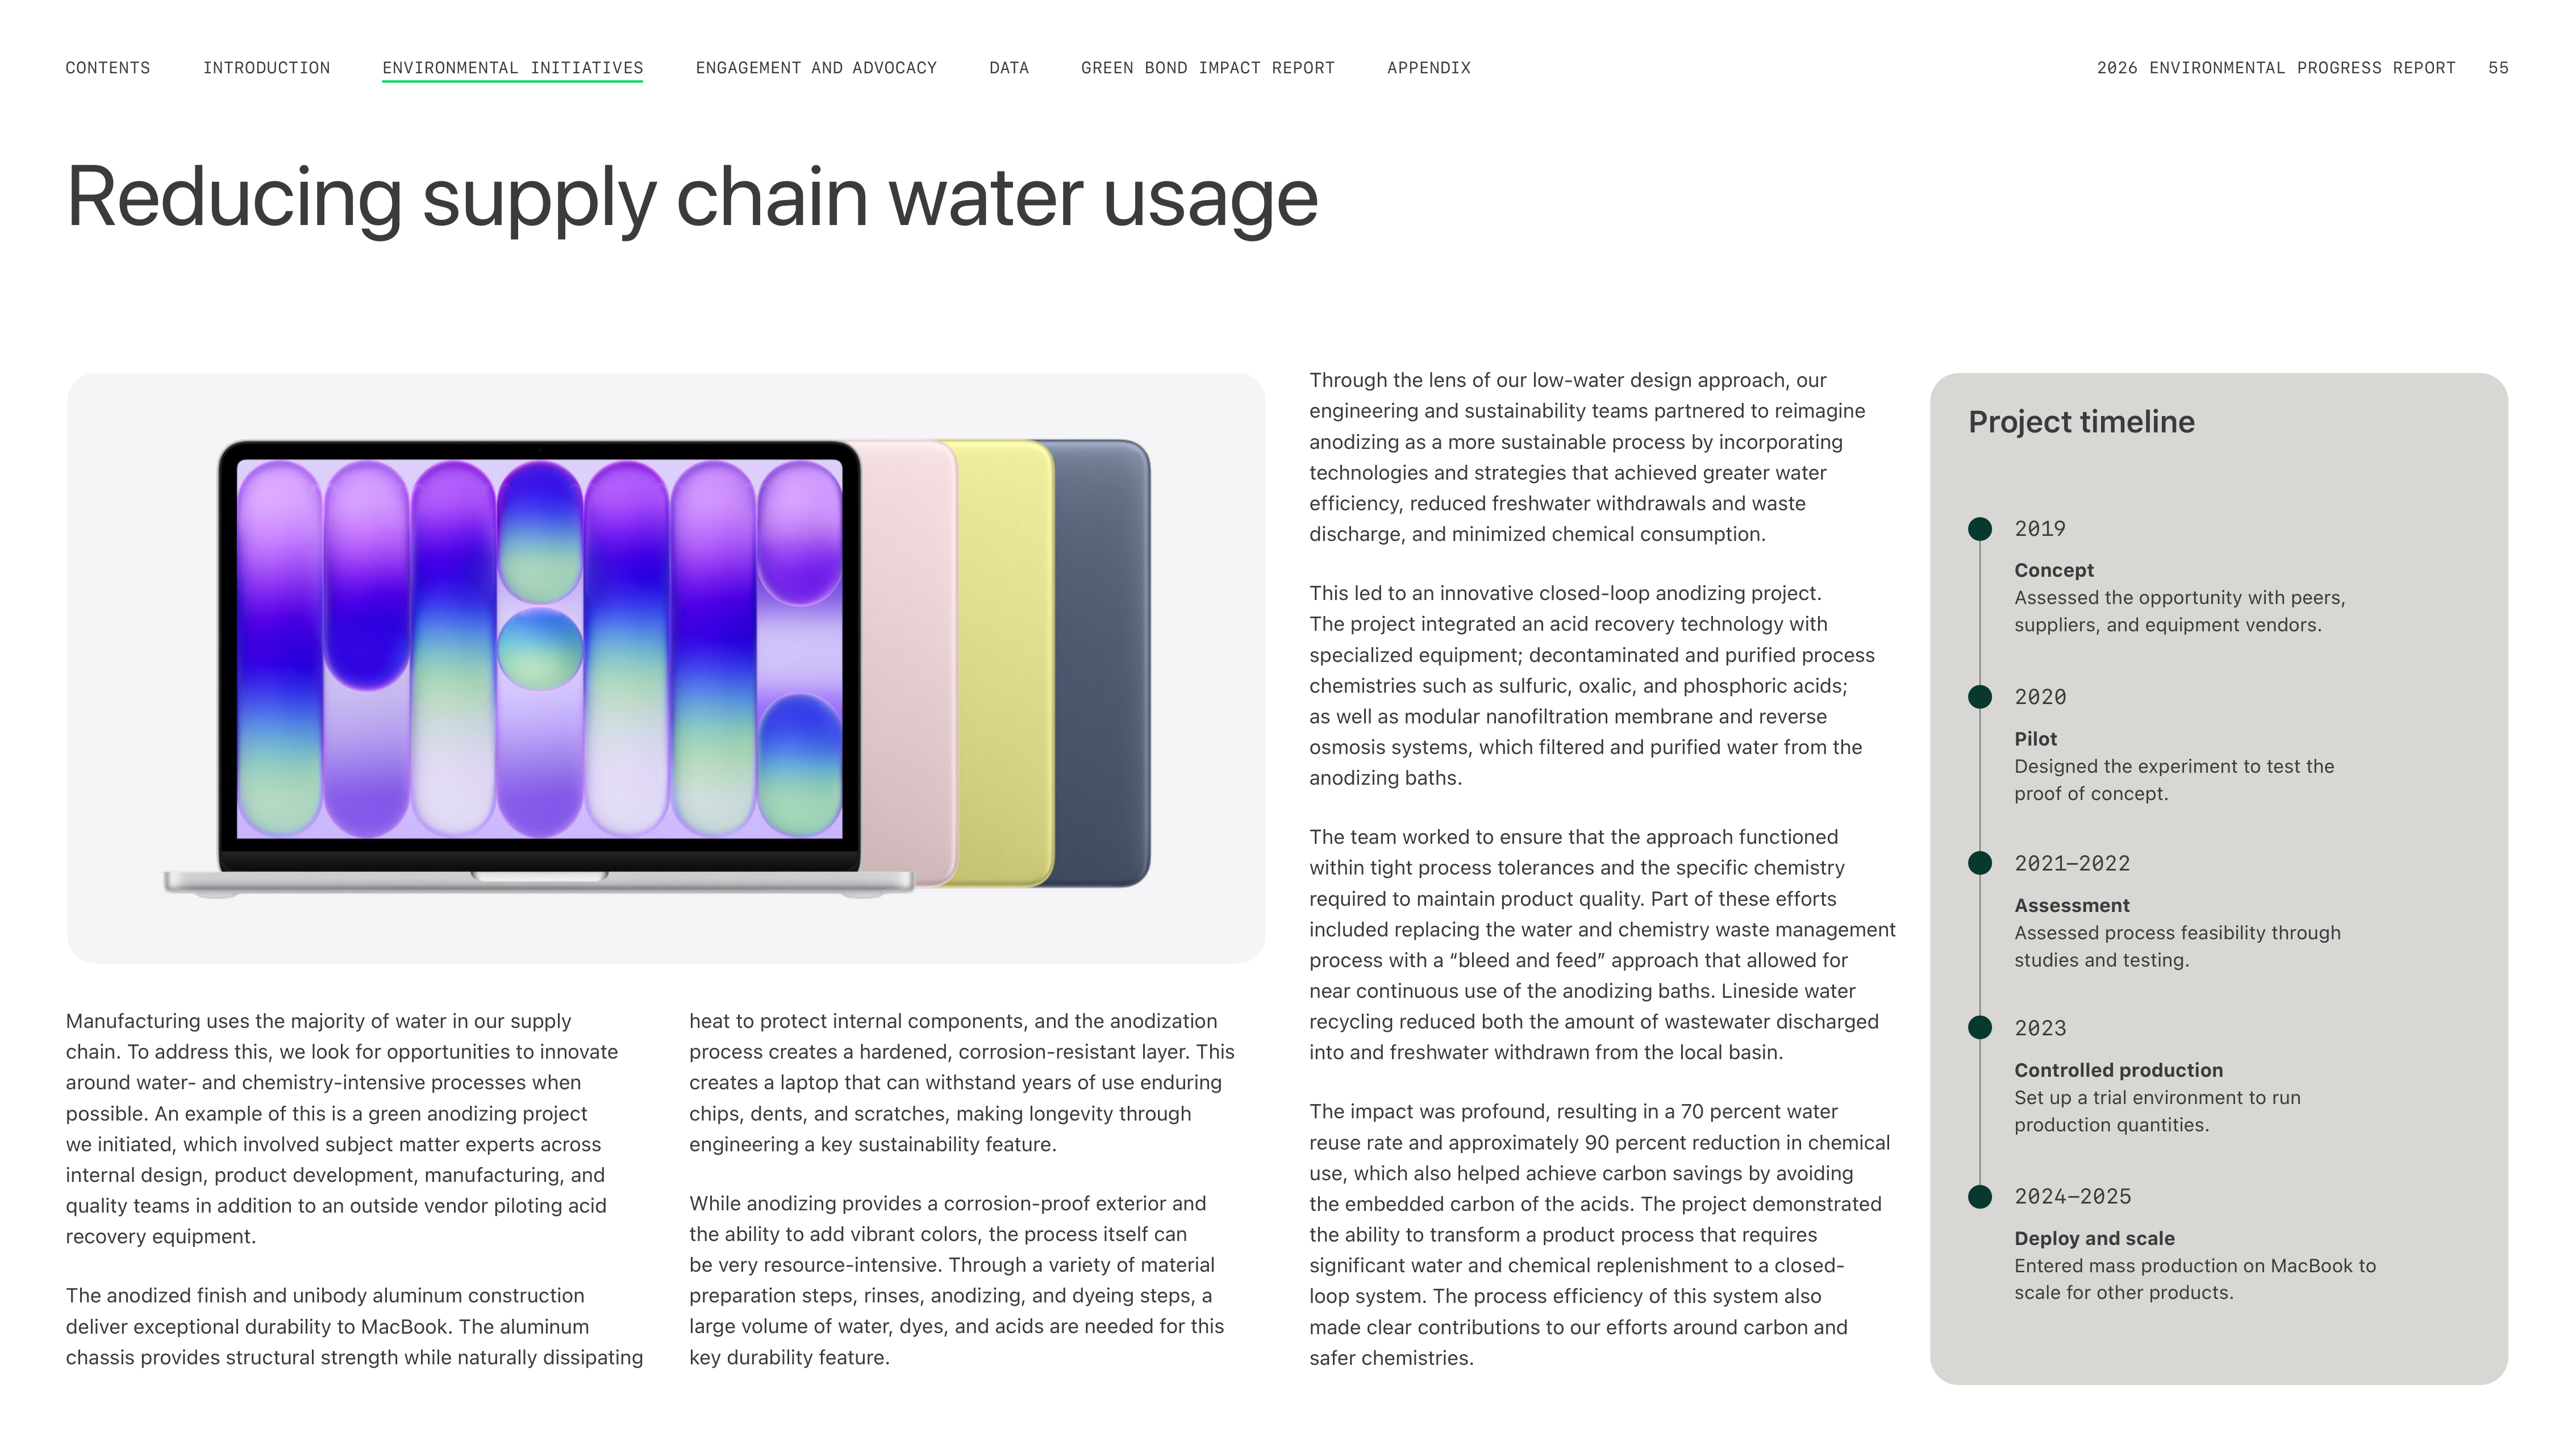

Manufacturing uses the majority of water in our supply
chain. To address this, we look for opportunities to innovate
around water- and chemistry-intensive processes when
possible. An example of this is a green anodizing project
we initiated, which involved subject matter experts across
internal design, product development, manufacturing, and
quality teams in addition to an outside vendor piloting acid
recovery equipment.
The anodized finish and unibody aluminum construction
deliver exceptional durability to MacBook. The aluminum
chassis provides structural strength while naturally dissipating
heat to protect internal components, and the anodization
process creates a hardened, corrosion-resistant layer. This
creates a laptop that can withstand years of use enduring
chips, dents, and scratches, making longevity through
engineering a key sustainability feature.
While anodizing provides a corrosion-proof exterior and
the ability to add vibrant colors, the process itself can
be very resource-intensive. Through a variety of material
preparation steps, rinses, anodizing, and dyeing steps, a
large volume of water, dyes, and acids are needed for this
key durability feature.
Through the lens of our low-water design approach, our
engineering and sustainability teams partnered to reimagine
anodizing as a more sustainable process by incorporating
technologies and strategies that achieved greater water
efficiency, reduced freshwater withdrawals and waste
discharge, and minimized chemical consumption.
This led to an innovative closed-loop anodizing project.
The project integrated an acid recovery technology with
specialized equipment; decontaminated and purified process
chemistries such as sulfuric, oxalic, and phosphoric acids;
as well as modular nanofiltration membrane and reverse
osmosis systems, which filtered and purified water from the
anodizing baths.
The team worked to ensure that the approach functioned
within tight process tolerances and the specific chemistry
required to maintain product quality. Part of these efforts
included replacing the water and chemistry waste management
process with a “bleed and feed” approach that allowed for
near continuous use of the anodizing baths. Lineside water
recycling reduced both the amount of wastewater discharged
into and freshwater withdrawn from the local basin.
The impact was profound, resulting in a 70 percent water
reuse rate and approximately 90 percent reduction in chemical
use, which also helped achieve carbon savings by avoiding
the embedded carbon of the acids. The project demonstrated
the ability to transform a product process that requires
significant water and chemical replenishment to a closed-
loop system. The process efficiency of this system also
made clear contributions to our efforts around carbon and
safer chemistries.
Project timeline
2019
Concept
Assessed the opportunity with peers,
suppliers, and equipment vendors.
Reducing supply chain water usage
2020
Pilot
Designed the experiment to test the
proof of concept.
2021-2022
Assessment
Assessed process feasibility through
studies and testing.
2023
Controlled production
Set up a trial environment to run
production quantities.
2024-2025
Deploy and scale
Entered mass production on MacBook to
scale for other products.
ENGAGEMENT AND ADVOCACY
INTRODUCTION
CONTENTS
GREEN BOND IMPACT REPORT
DATA
APPENDIX
2026 ENVIRONMENTAL PROGRESS REPORT
55
ENVIRONMENTAL INITIATIVES
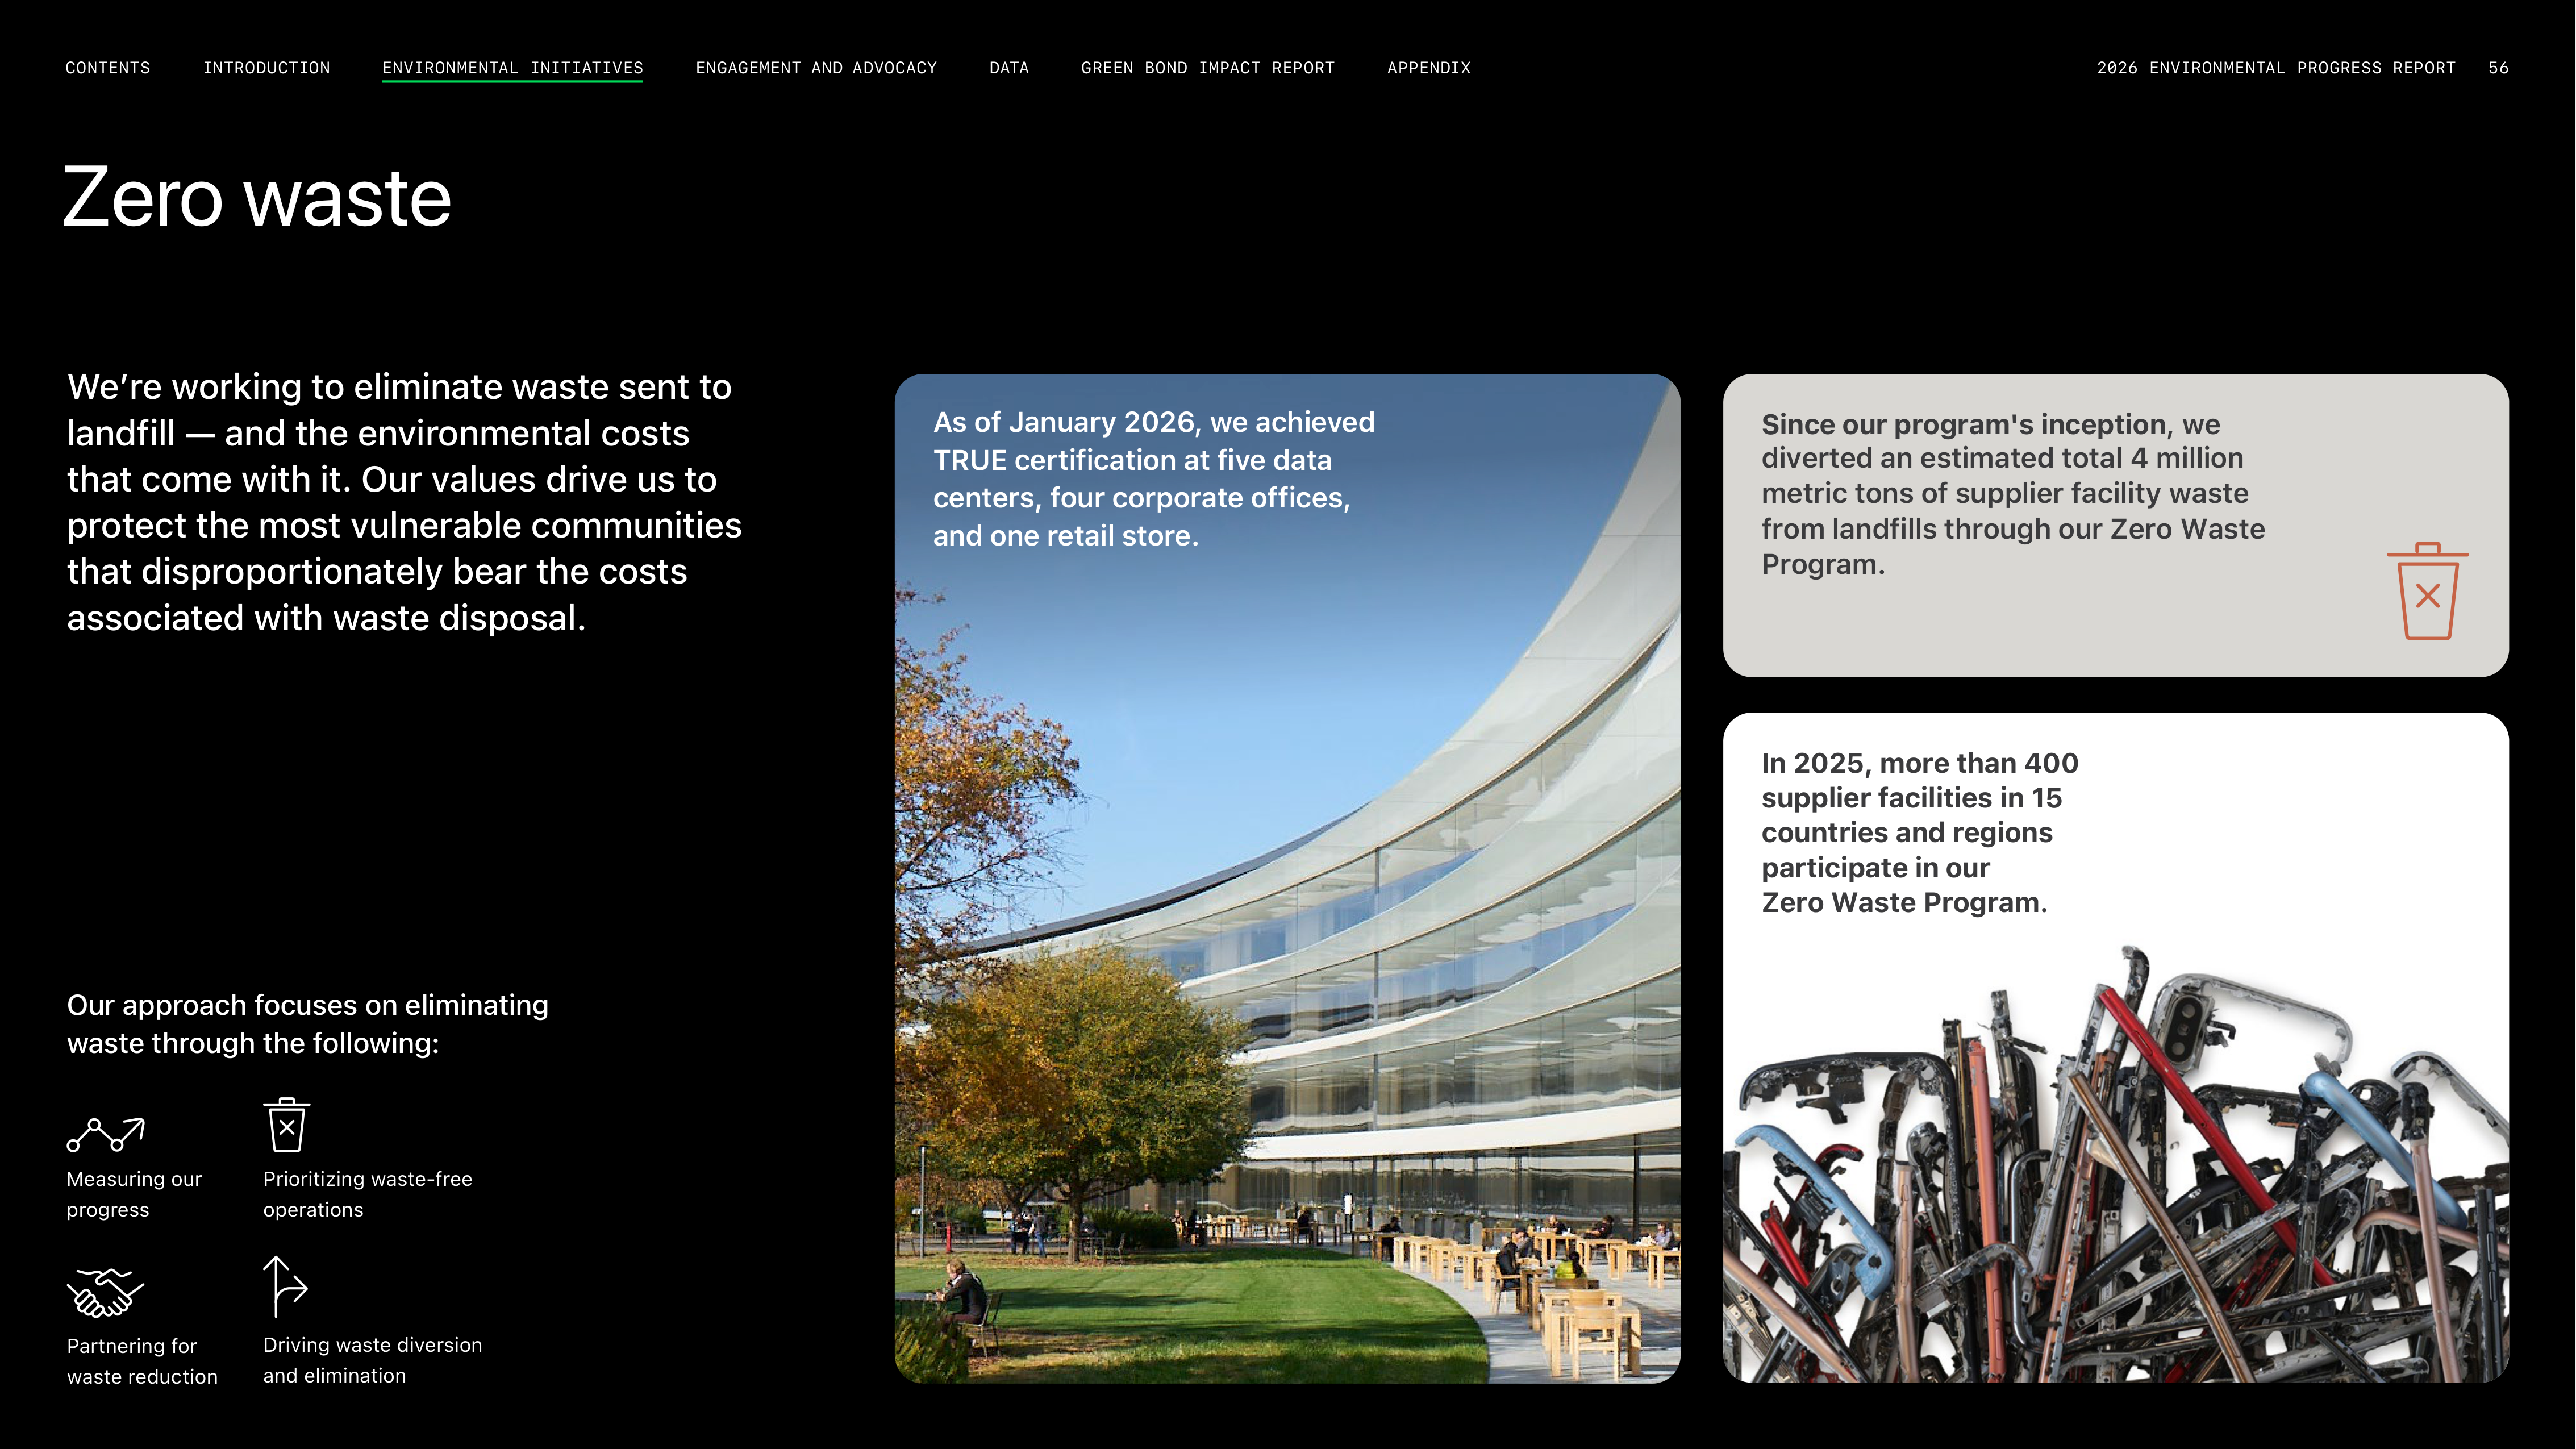

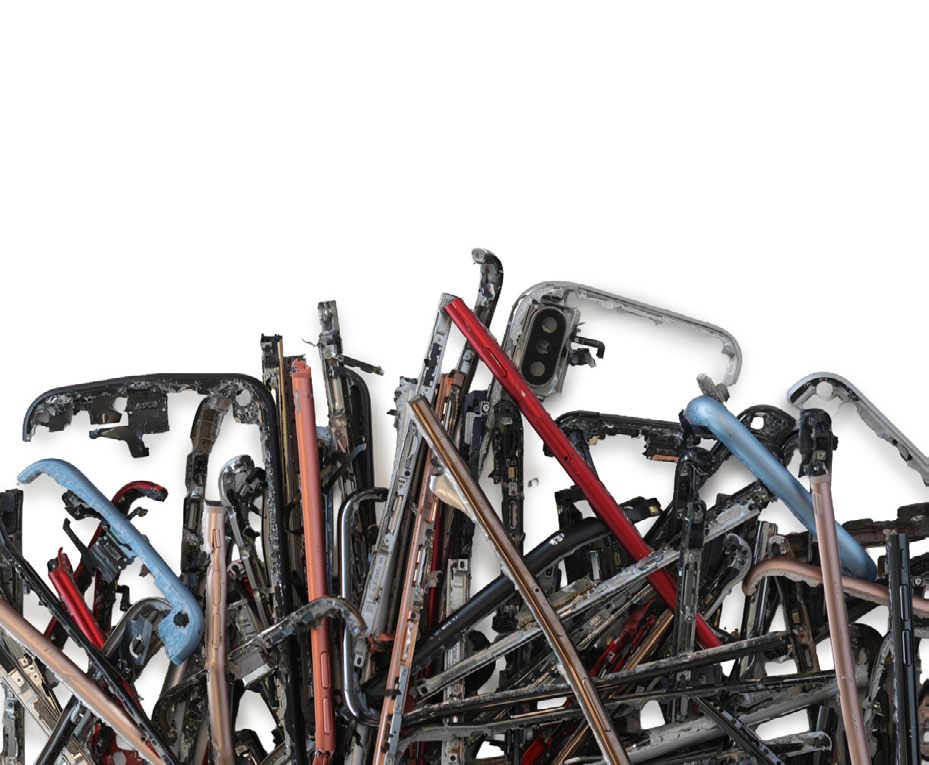
Zero waste
We’re working to eliminate waste sent to
landfill — and the environmental costs
that come with it. Our values drive us to
protect the most vulnerable communities
that disproportionately bear the costs
associated with waste disposal.
Our approach focuses on eliminating
waste through the following:
Measuring our
progress
Prioritizing waste-free
operations
Driving waste diversion
and elimination
As of January 2026, we achieved
TRUE certification at five data
centers, four corporate offices,
and one retail store.
Since our program's inception
,
we
diverted an estimated total 4 million
metric tons of supplier facility waste
from landfills through our Zero Waste
Program.
In 2025, more than
400
supplier facilities in 15
countries and regions
participate in our
Zero
Waste
Program
.
Partnering for
waste reduction
2026 ENVIRONMENTAL PROGRESS REPORT
56
ENGAGEMENT AND ADVOCACY
INTRODUCTION
CONTENTS
APPENDIX
GREEN BOND IMPACT REPORT
DATA
ENVIRONMENTAL INITIATIVES
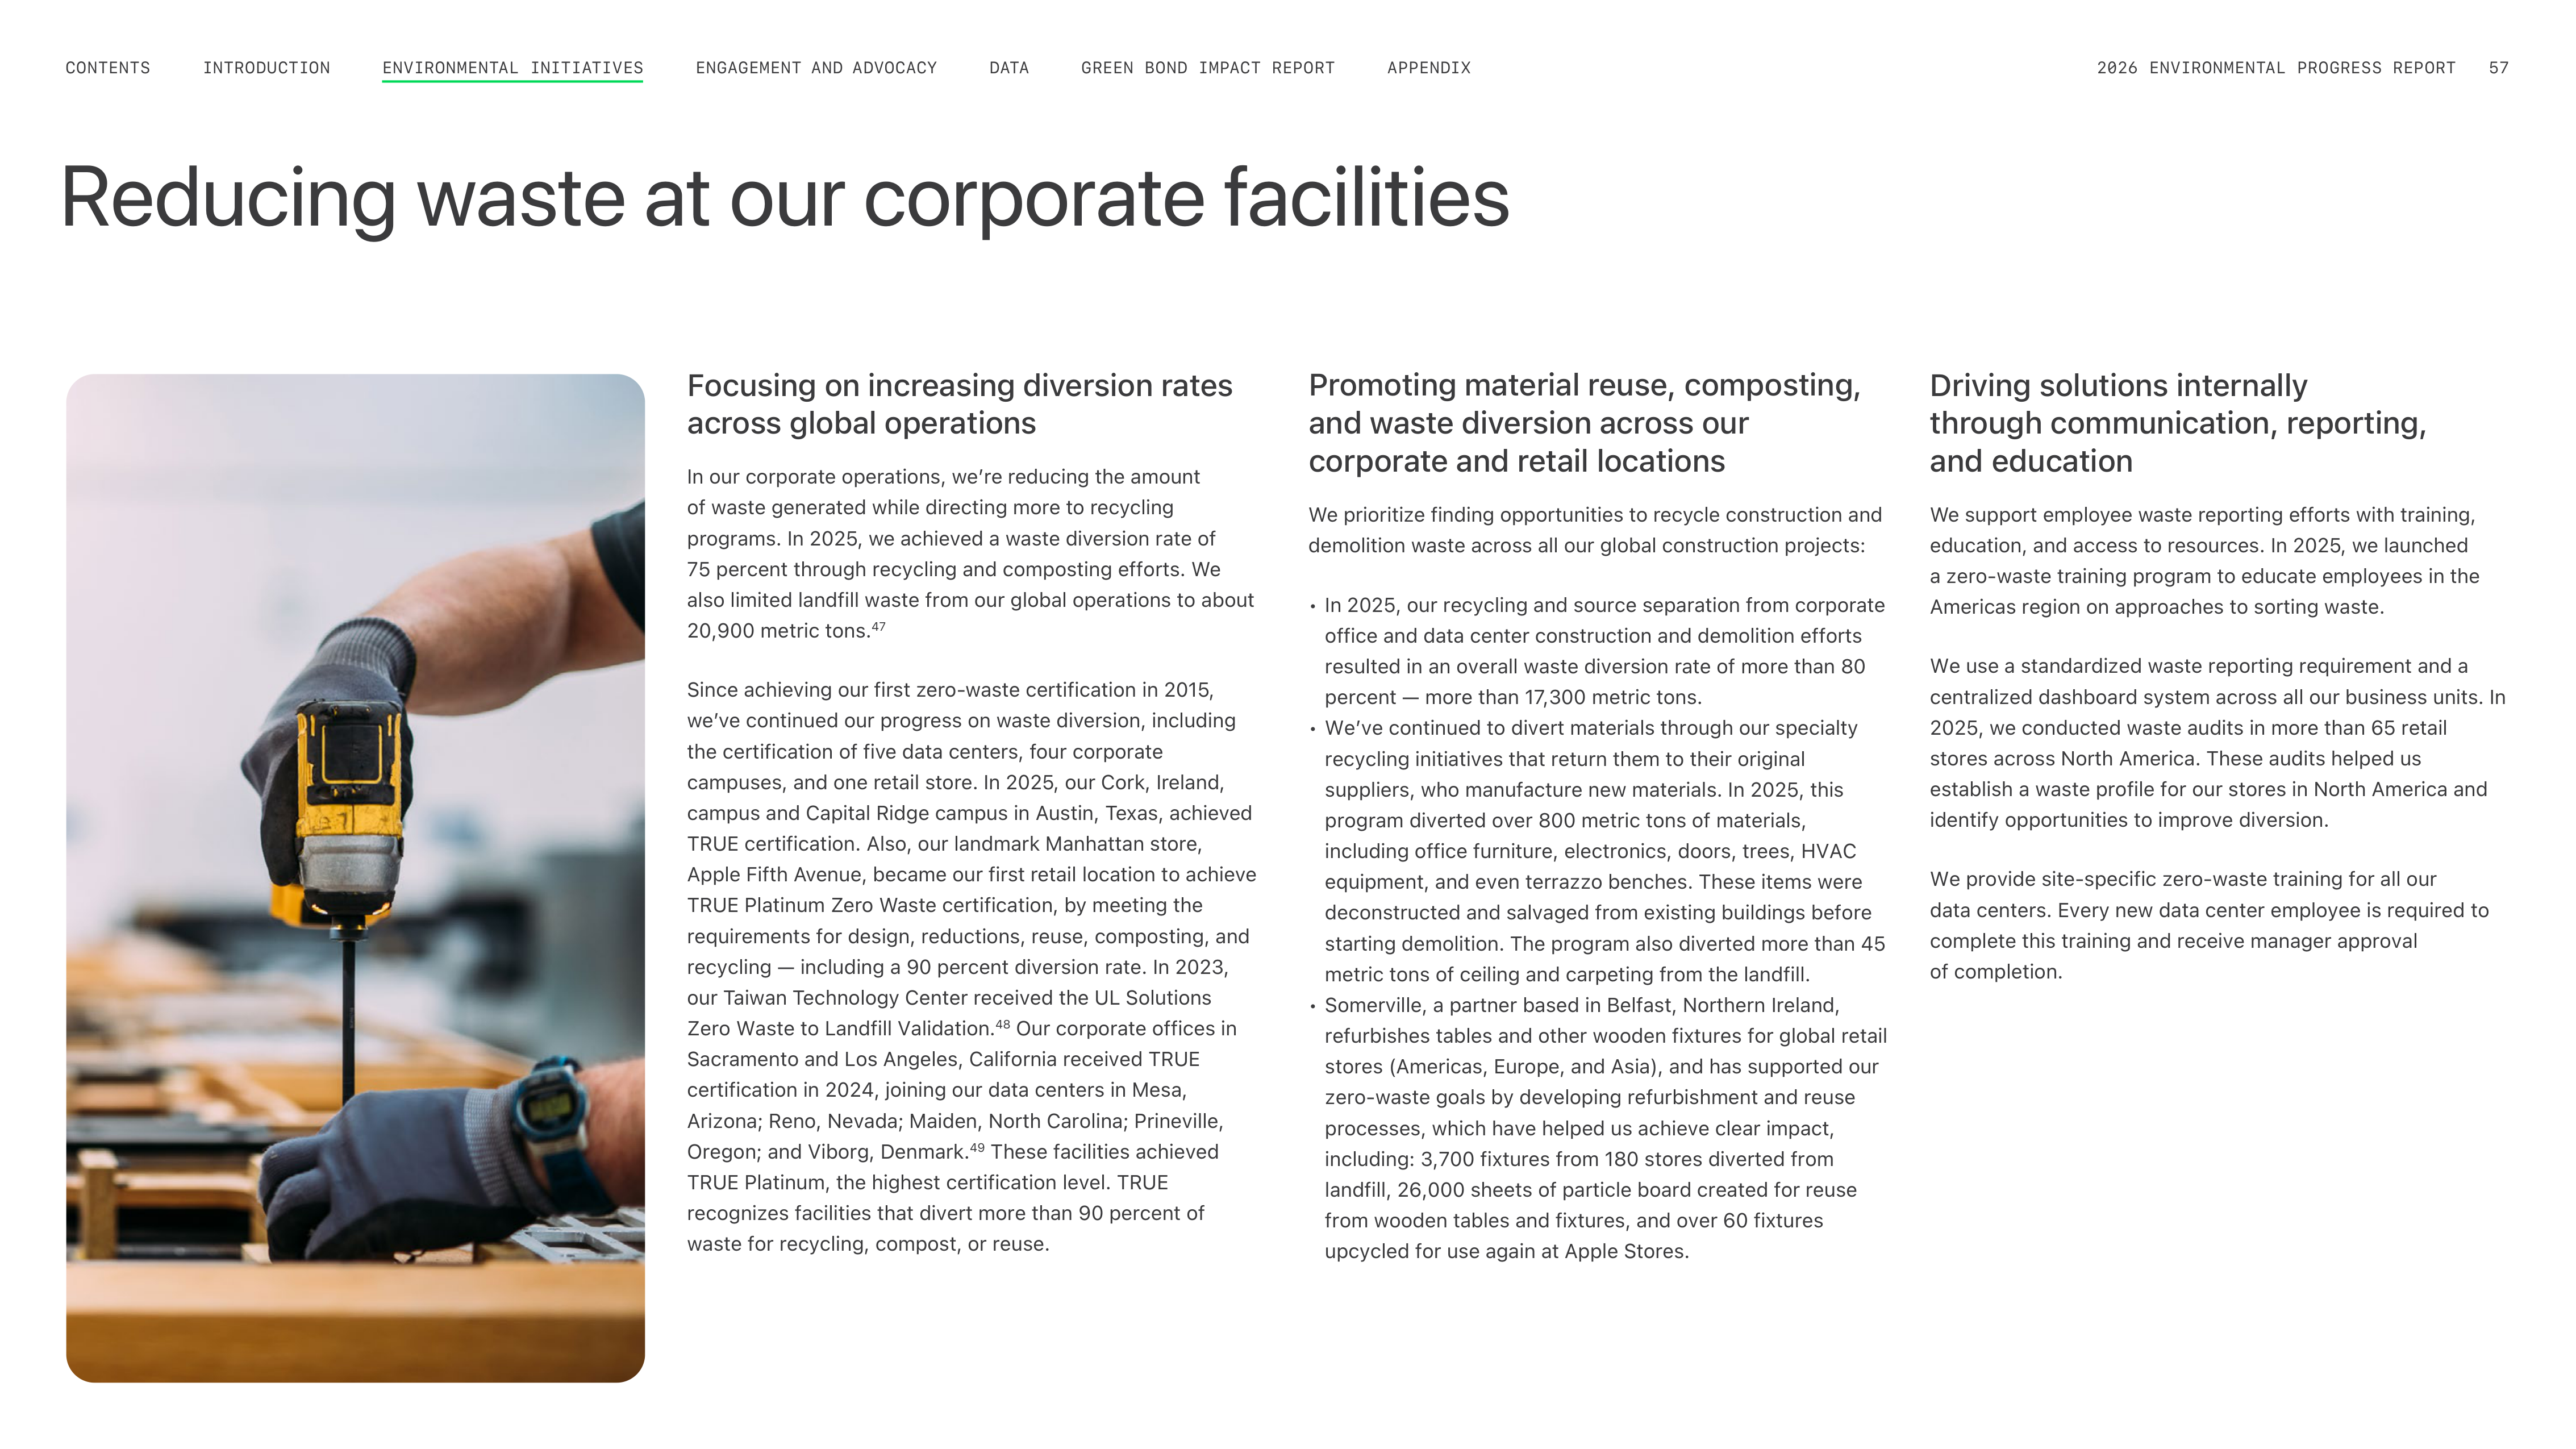

Reducing waste at our corporate facilities
Focusing on increasing diversion rates
across global operations
In our corporate operations, weʼre reducing the amount
of waste generated while directing more to recycling
programs. In 2025, we achieved a waste diversion rate of
75 percent through recycling and composting efforts. We
also limited landfill waste from our global operations to about
20,900 metric tons.
47
Since achieving our first zero-waste certification in 2015,
weʼve continued our progress on waste diversion, including
the certification of five data centers, four corporate
campuses, and one retail store. In 2025, our Cork, Ireland,
campus and Capital Ridge campus in Austin, Texas, achieved
TRUE certification. Also, our landmark Manhattan store,
Apple Fifth Avenue, became our first retail location to achieve
TRUE Platinum Zero Waste certification, by meeting the
requirements for design, reductions, reuse, composting, and
recycling — including a 90 percent diversion rate. In 2023,
our Taiwan Technology Center received the UL Solutions
Zero Waste to Landfill Validation.
48
Our corporate offices in
Sacramento and Los Angeles, California received TRUE
certification in 2024, joining our data centers in Mesa,
Arizona; Reno, Nevada; Maiden, North Carolina; Prineville,
Oregon; and Viborg, Denmark.
49
These facilities achieved
TRUE Platinum, the highest certification level. TRUE
recognizes facilities that divert more than 90 percent of
waste for recycling, compost, or reuse.
Promoting material reuse, composting,
and waste diversion across our
corporate and retail locations
We prioritize finding opportunities to recycle construction and
demolition waste across all our global construction projects:
•
In 2025, our recycling and source separation from corporate
office and data center construction and demolition efforts
resulted in an overall waste diversion rate of more than 80
percent — more than 17,300 metric tons.
•
Weʼve continued to divert materials through our specialty
recycling initiatives that return them to their original
suppliers, who manufacture new materials. In 2025, this
program diverted over 800 metric tons of materials,
including office furniture, electronics, doors, trees, HVAC
equipment, and even terrazzo benches. These items were
deconstructed and salvaged from existing buildings before
starting demolition. The program also diverted more than 45
metric tons of ceiling and carpeting from the landfill.
•
Somerville, a partner based in Belfast, Northern Ireland,
refurbishes tables and other wooden fixtures for global retail
stores (Americas, Europe, and Asia), and has supported our
zero-waste goals by developing refurbishment and reuse
processes, which have helped us achieve clear impact,
including: 3,700 fixtures from 180 stores diverted from
landfill, 26,000 sheets of particle board created for reuse
from wooden tables and fixtures, and over 60 fixtures
upcycled for use again at Apple Stores.
Driving solutions internally
through communication, reporting,
and education
We support employee waste reporting efforts with training,
education, and access to resources. In 2025, we launched
a zero-waste training program to educate employees in the
Americas region on approaches to sorting waste.
We use a standardized waste reporting requirement and a
centralized dashboard system across all our business units. In
2025, we conducted waste audits in more than 65 retail
stores across North America. These audits helped us
establish a waste profile for our stores in North America and
identify opportunities to improve diversion.
We provide site-specific zero-waste training for all our
data centers. Every new data center employee is required to
complete this training and receive manager approval
of completion.
ENGAGEMENT AND ADVOCACY
INTRODUCTION
CONTENTS
GREEN BOND IMPACT REPORT
DATA
APPENDIX
2026 ENVIRONMENTAL PROGRESS REPORT
57
ENVIRONMENTAL INITIATIVES
GOAL
Achieve zero waste to landfills at all
established final assembly sites
We launched the Zero Waste Program for our manufacturing
partners in 2015 and require our suppliers to participate in
our Zero Waste Program as part of our Supplier Code of
Conduct. Suppliers must implement a systematic approach
that includes: identifying all waste sources and characterizing
each stream in the waste inventory; developing a program
or solution to quantify and monitor their waste-to-landfill
diversion rate; setting waste minimization goals; and
maintaining progress toward achieving zero waste to landfill.
Our Zero Waste Program provides resources, training, and
tools to help suppliers meet these requirements. These
include guidance on reducing waste and reusing materials,
recycling, or composting waste and tools to improve waste
management and, in some cases, onsite support. Facilities
have also received training and templates to record and
correctly classify waste data and document the visible
diversion rate.
Taking a zero-waste approach
with our suppliers
To verify suppliersʼ waste data quality, we partner with third-
party auditors to conduct sample evaluations, focusing on
waste classifications, waste data recordkeeping and reporting,
and reasonable waste treatment methods.
The program continues to make an impact: In 2025, suppliers
redirected more than 600,000 metric tons of waste from
landfills, bringing the total to over 4 million metric tons since
the programʼs inception. Throughout 2025, 100 percent of
established final assembly sites maintained zero-waste-to-
landfill operations.
50
More than 400 supplier facilities across
15 countries and regions participate in this program.
Building supplier capability
The UL 2799 Zero Waste to Landfill Environmental Claim
Validation Procedure (ECVP) is foundational to the Zero
Waste Program. It requires at least 90 percent diversion
through methods other than waste-to-energy and allows our
supplier facilities to validate against clear benchmarks for
waste diversion. Weʼve spent nearly the last decade
expanding this program throughout our supply chain, with
suppliers in China mainland, India, and Vietnam becoming UL
validated. Since we switched from individual site verification
to system-level verification, suppliers participating in the
assurance program can easily apply the verification
statements from UL Solutions to demonstrate their
conformance with the UL2799 criteria. This streamlined
approach has helped bring suppliers into our program, with
230 facilities assured by UL Solutions in 2025.
51
100%
To address the challenge of waste classification for suppliers
across countries and regions, weʼve created the Apple
Recommended Waste Category List to provide standardized
guidance on classifying different types of waste. This list
has been widely implemented and used by suppliers in the
Zero Waste Program. Suppliers have also received access to
training and coaching on waste classification to support their
efforts in separating waste while promoting waste reduction,
reuse, and recycling.
Weʼve organized a series of webinars with suppliers,
policymakers, and industrial leaders to share their experiences
in the Zero Waste Program with participating suppliers and
those who plan to join. These sessions provide an opportunity
to discuss the lessons learned from implementing the Zero
Waste Program, best practices around the compliance
requirements of waste management, and emerging recycling
and waste reduction technologies.
Weʼre focused on expanding the impact of the Zero Waste
Program in our supply chain and beyond through our Supplier
Employee Development Fund. In India, weʼve implemented
a zero-waste education initiative for supplier leadership,
employees, and local community members since 2023. In
2025, thousands of supplier employees participated in our
community-based online learning courses, equipping them
with fundamental waste management skills. Globally, more
than 150 manufacturing sites participated in an online course
developed to help suppliers understand and implement zero-
waste programs, focusing on trends, the UL 2799 standard,
implementation systems, and best practices.
Pushing toward zero-waste innovation
We use novel recycling approaches to divert greater quantities
of waste from landfill in our supplier facilities at higher
rates. We also pursue material solutions to impact the waste
streams entering these facilities to simplify and maximize the
recyclable content that our suppliers work with.
Waste film elimination and plastic tray reuse
To reduce plastic waste, weʼve developed recyclable
protective films (RPFs) designed to protect products during
the manufacturing phase and reusable trays, which allow for
secure transportation of modules across various assembly
locations. During 2025, we eliminated more than 5,000 metric
tons of plastic films and achieved the reuse of approximately
40,000 metric tons of plastic trays across different sites in our
supply chain.
Waste coolant recycling
To avoid sending coolant-containing waste to landfills or
incinerators, we promoted reuse through a specific recycling
practice and expanded it to more applicable facilities. In 2025,
this work reduced coolant-containing waste by more than
38,000 metric tons through fine filtration, sterilization, and
internal circulation of the equipment.
ENGAGEMENT AND ADVOCACY
INTRODUCTION
CONTENTS
GREEN BOND IMPACT REPORT
DATA
APPENDIX
2026 ENVIRONMENTAL PROGRESS REPORT
58
ENVIRONMENTAL INITIATIVES
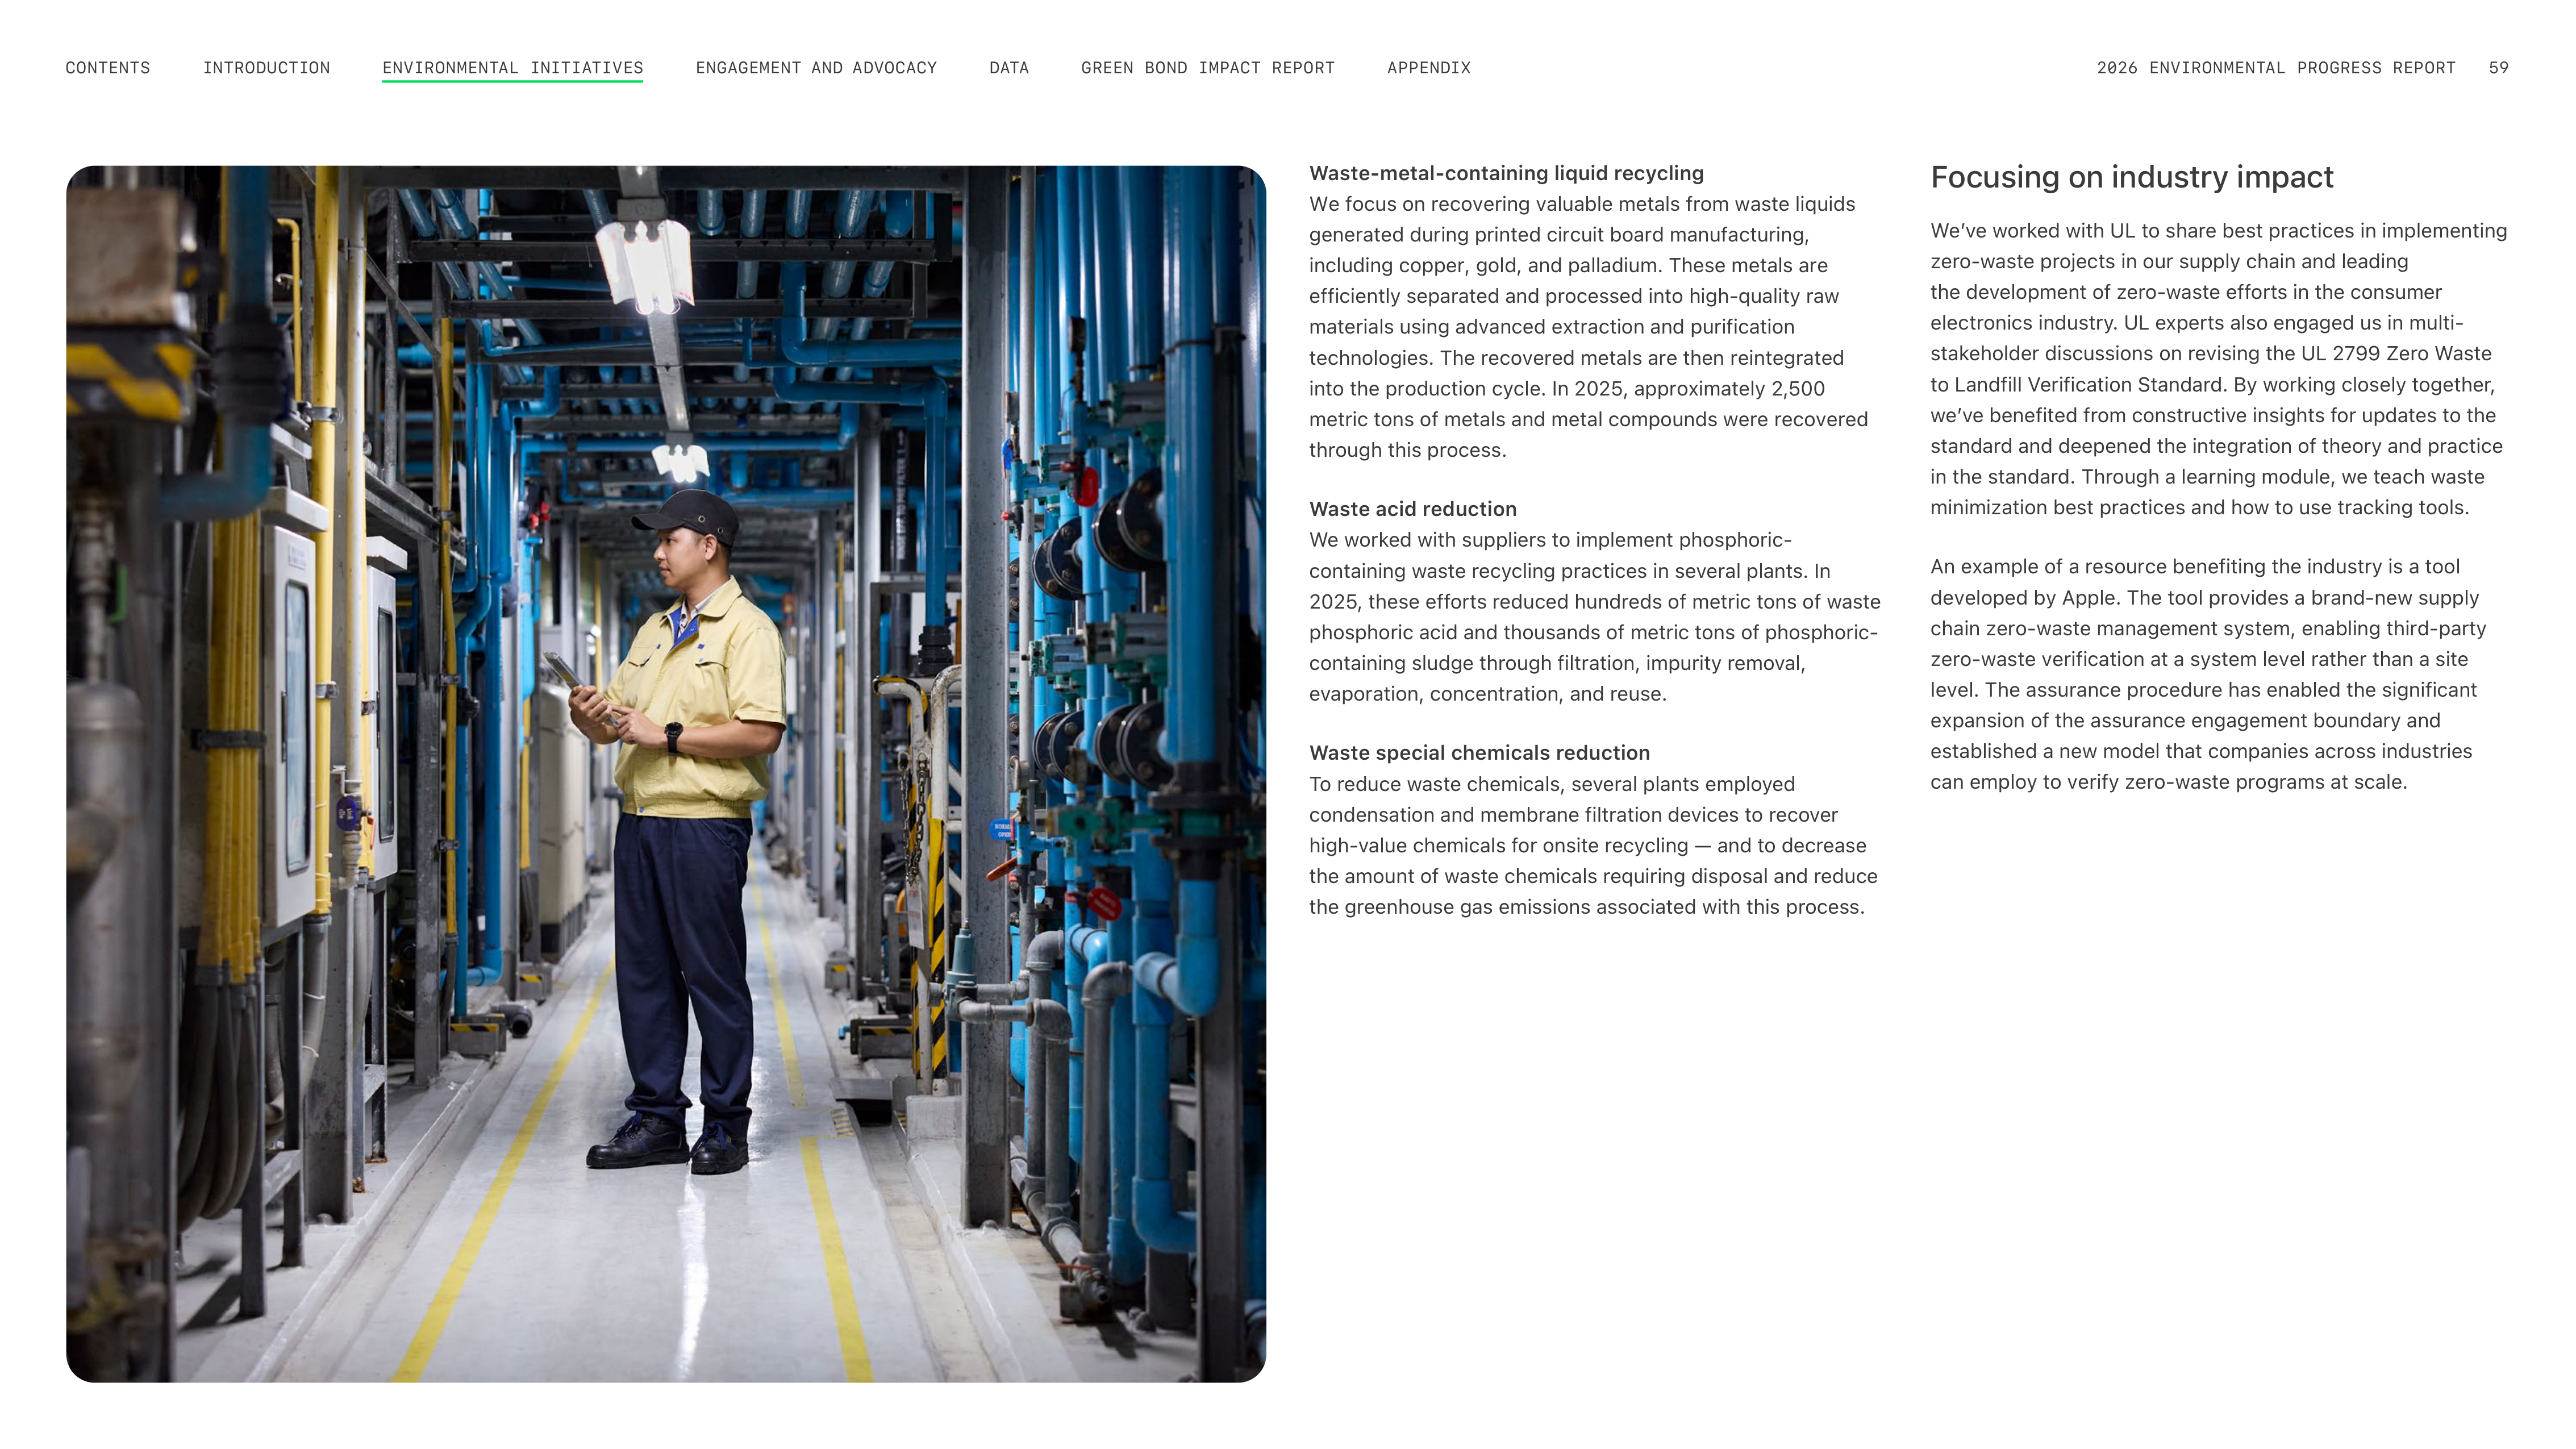
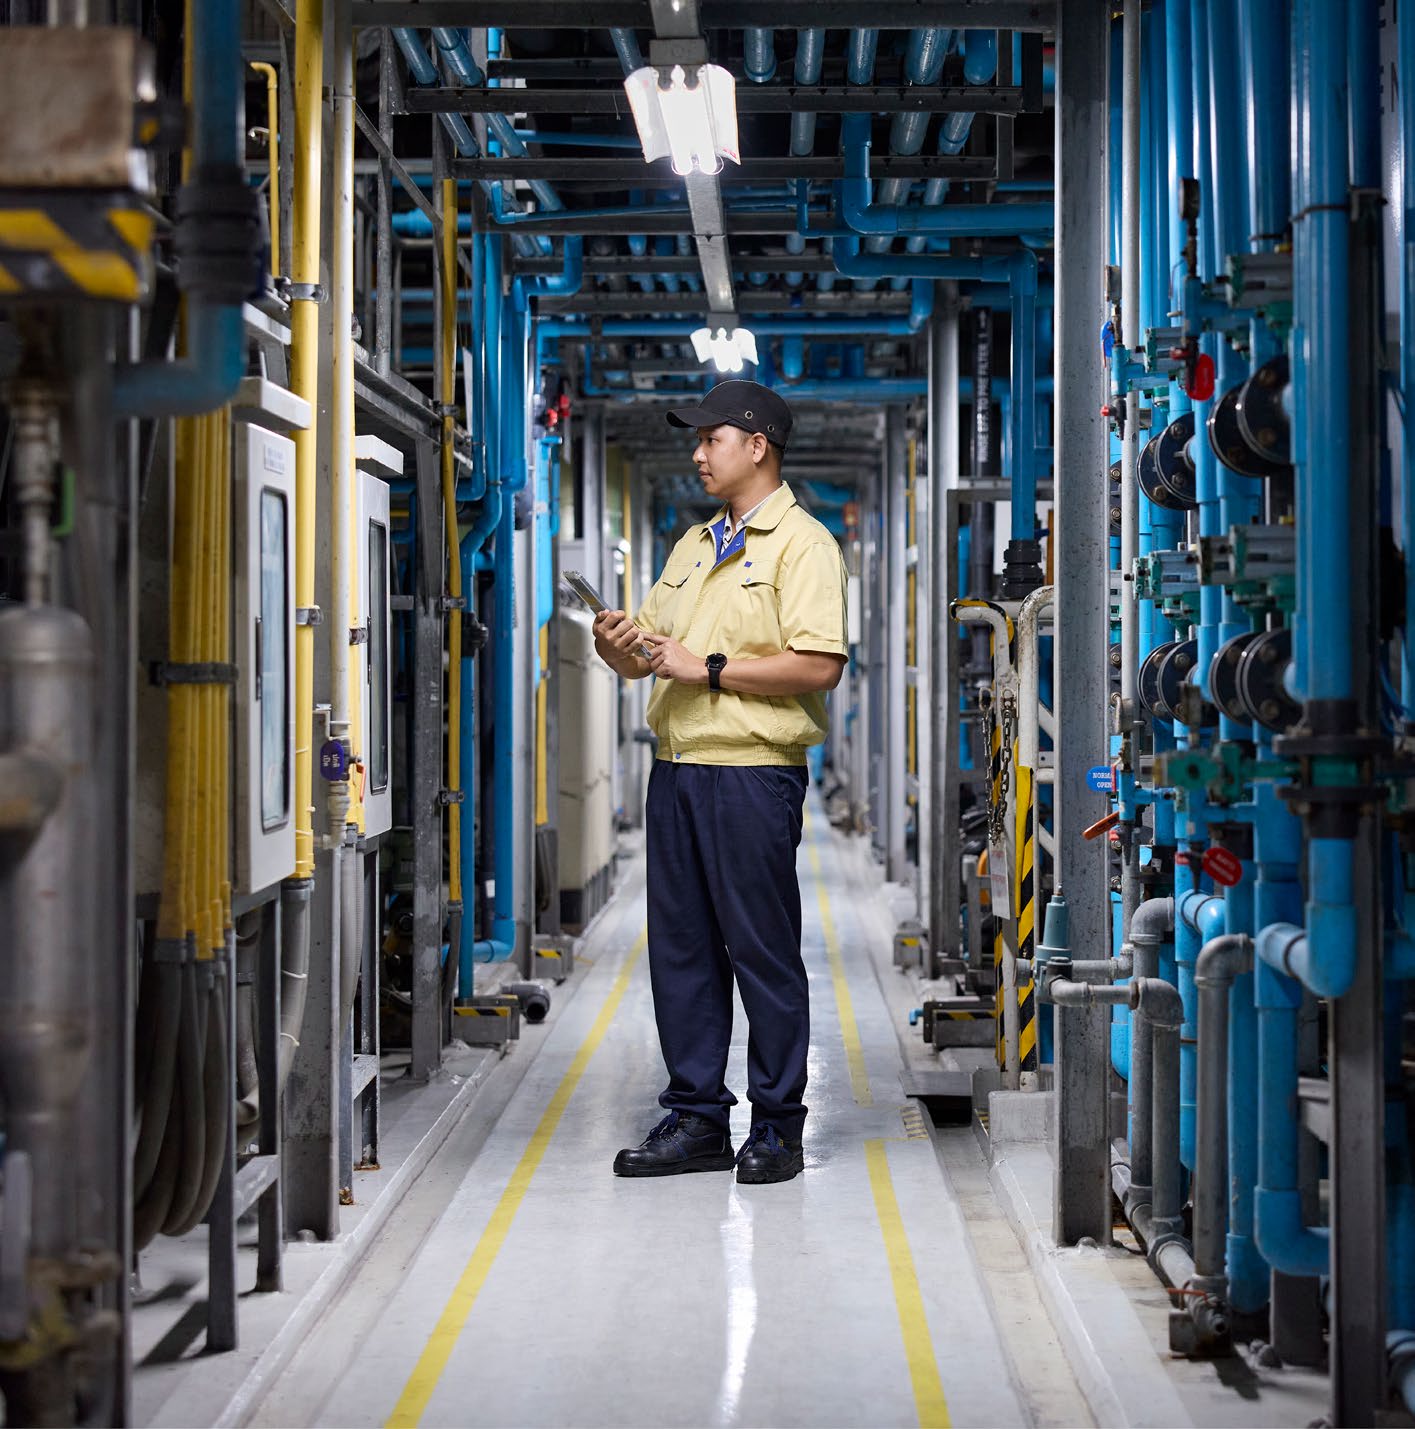
Waste-metal-containing liquid recycling
We focus on recovering valuable metals from waste liquids
generated during printed circuit board manufacturing,
including copper, gold, and palladium. These metals are
efficiently separated and processed into high-quality raw
materials using advanced extraction and purification
technologies. The recovered metals are then reintegrated
into the production cycle. In 2025, approximately 2,500
metric tons of metals and metal compounds were recovered
through this process.
Waste acid reduction
We worked with suppliers to implement phosphoric-
containing waste recycling practices in several plants. In
2025, these efforts reduced hundreds of metric tons of waste
phosphoric acid and thousands of metric tons of phosphoric-
containing sludge through filtration, impurity removal,
evaporation, concentration, and reuse.
Waste special chemicals reduction
To reduce waste chemicals, several plants employed
condensation and membrane filtration devices to recover
high-value chemicals for onsite recycling — and to decrease
the amount of waste chemicals requiring disposal and reduce
the greenhouse gas emissions associated with this process.
Focusing on industry impact
Weʼve worked with UL to share best practices in implementing
zero-waste projects in our supply chain and leading
the development of zero-waste efforts in the consumer
electronics industry. UL experts also engaged us in multi-
stakeholder discussions on revising the UL 2799 Zero Waste
to Landfill Verification Standard. By working closely together,
weʼve benefited from constructive insights for updates to the
standard and deepened the integration of theory and practice
in the standard. Through a learning module, we teach waste
minimization best practices and how to use tracking tools.
An example of a resource benefiting the industry is a tool
developed by Apple. The tool provides a brand-new supply
chain zero-waste management system, enabling third-party
zero-waste verification at a system level rather than a site
level. The assurance procedure has enabled the significant
expansion of the assurance engagement boundary and
established a new model that companies across industries
can employ to verify zero-waste programs at scale.
ENGAGEMENT AND ADVOCACY
INTRODUCTION
CONTENTS
GREEN BOND IMPACT REPORT
DATA
APPENDIX
2026 ENVIRONMENTAL PROGRESS REPORT
59
ENVIRONMENTAL INITIATIVES
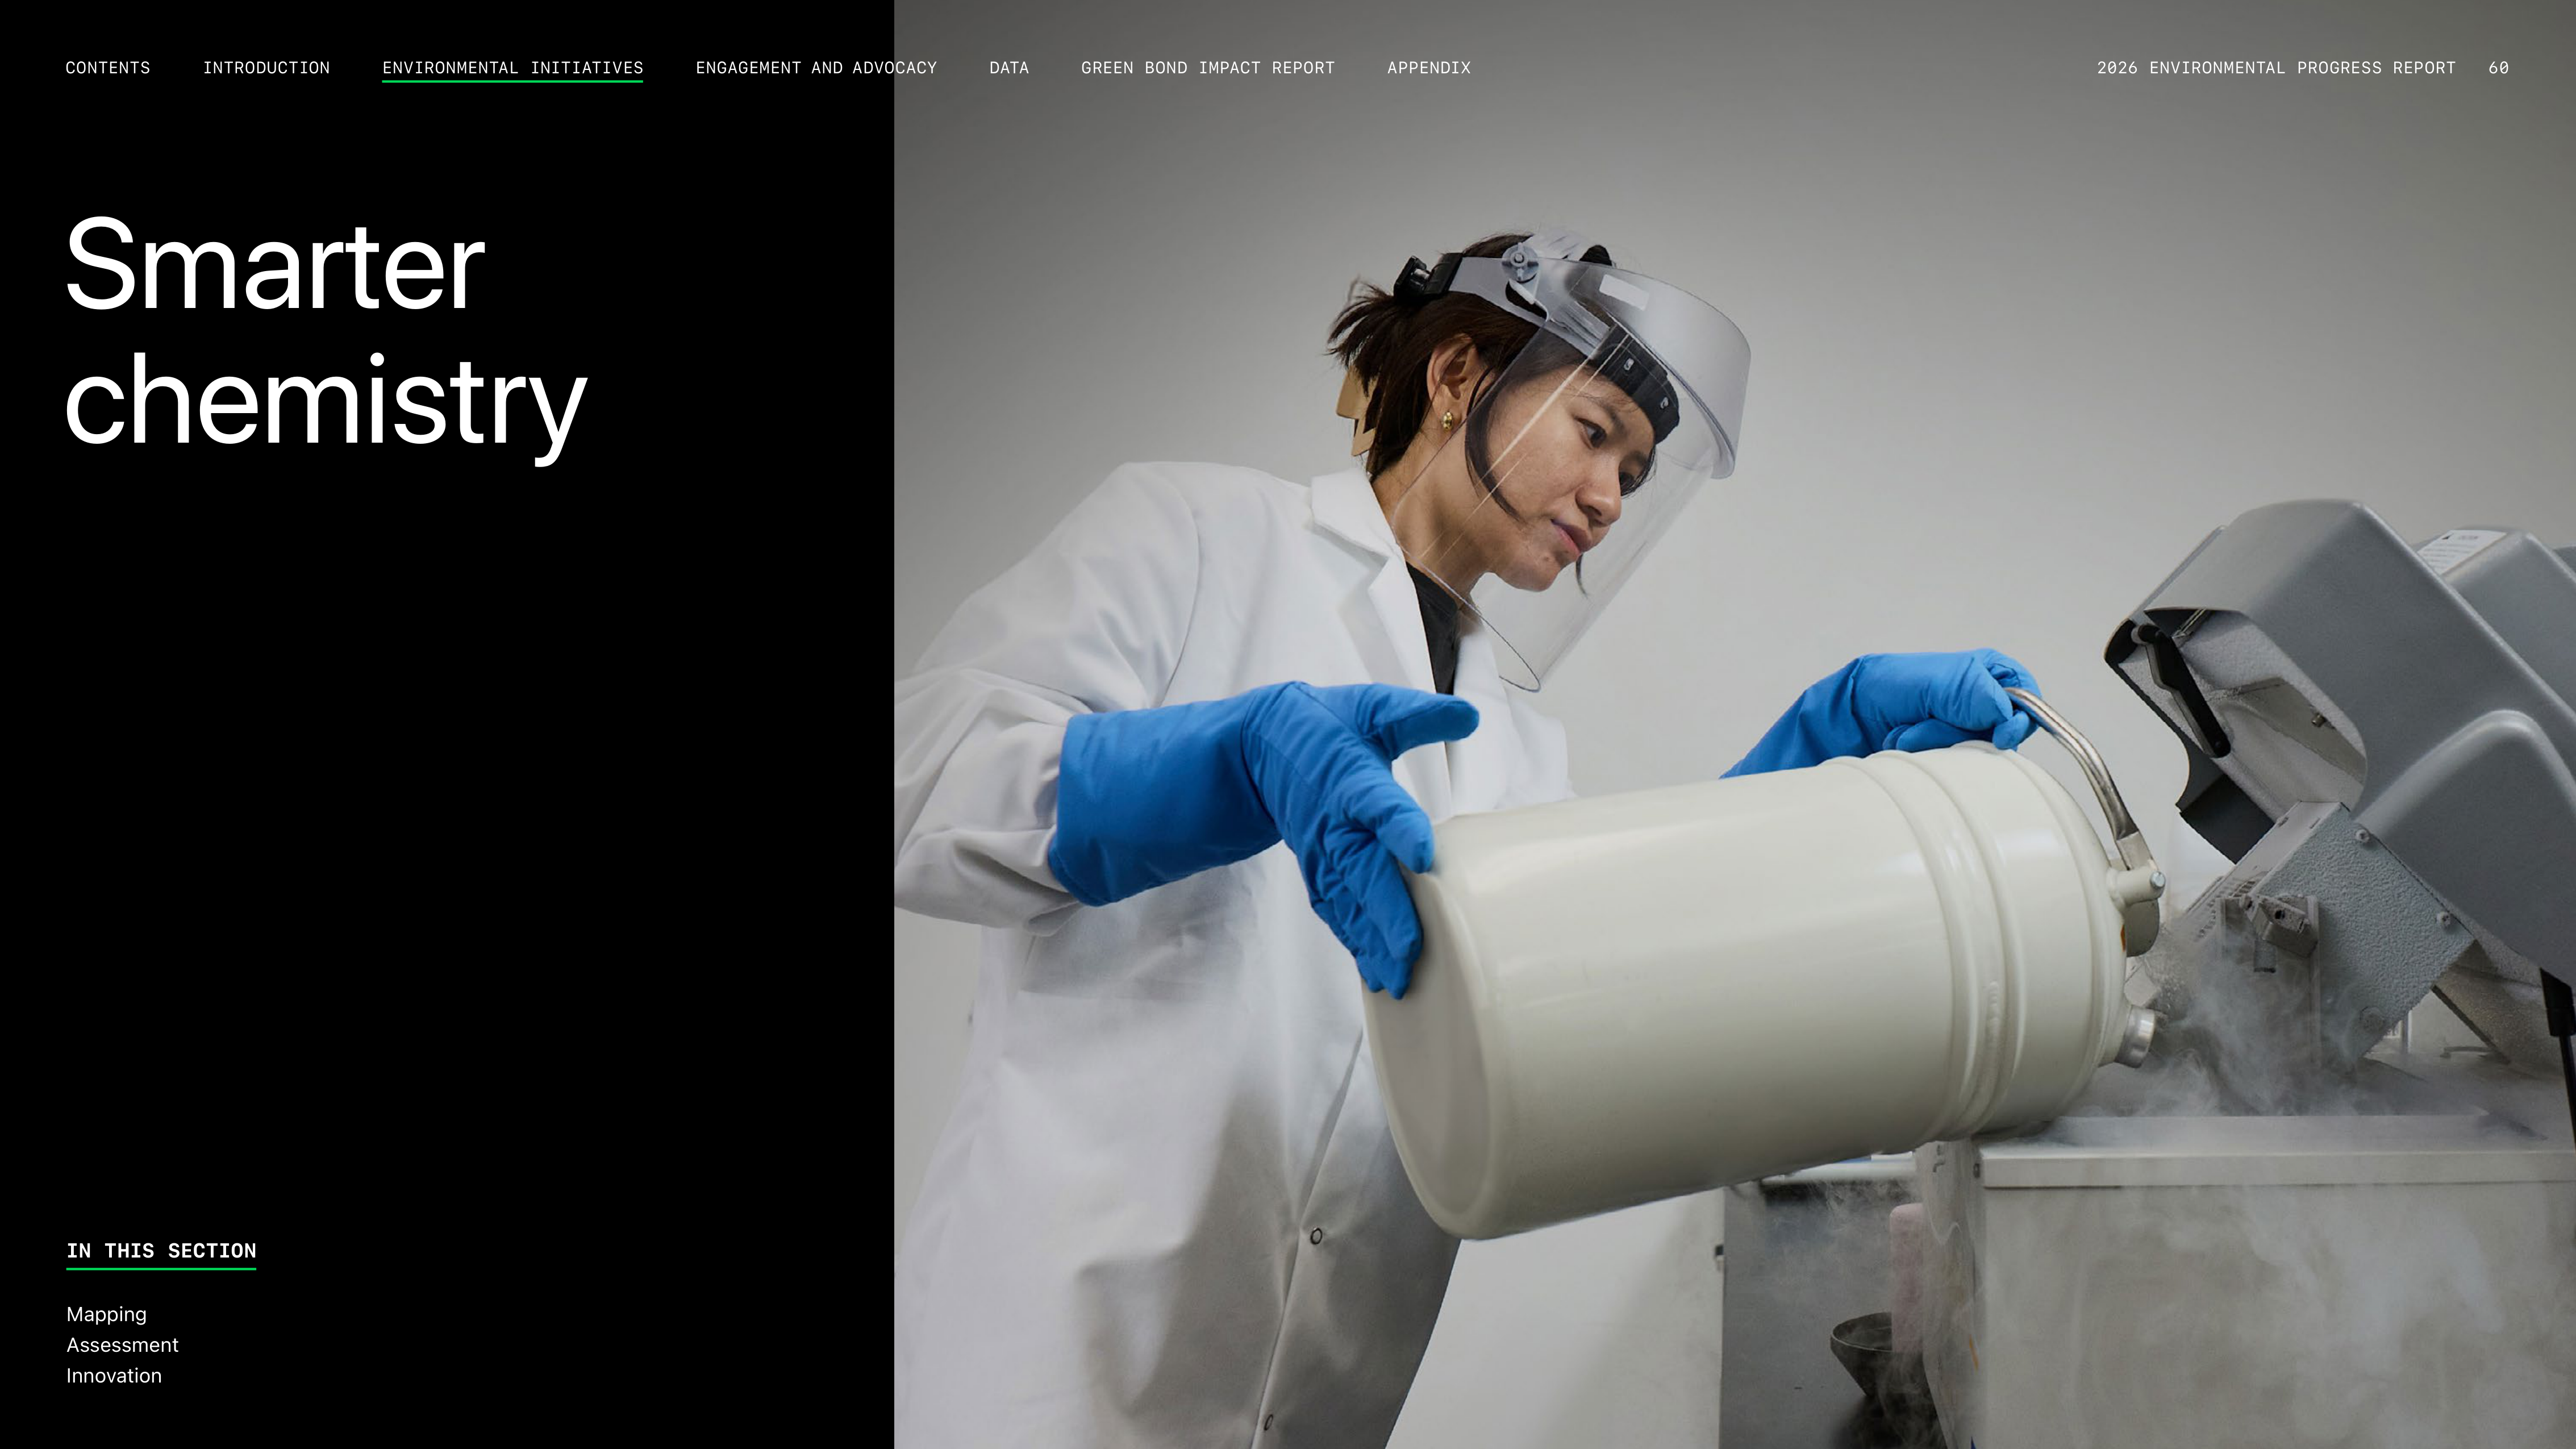
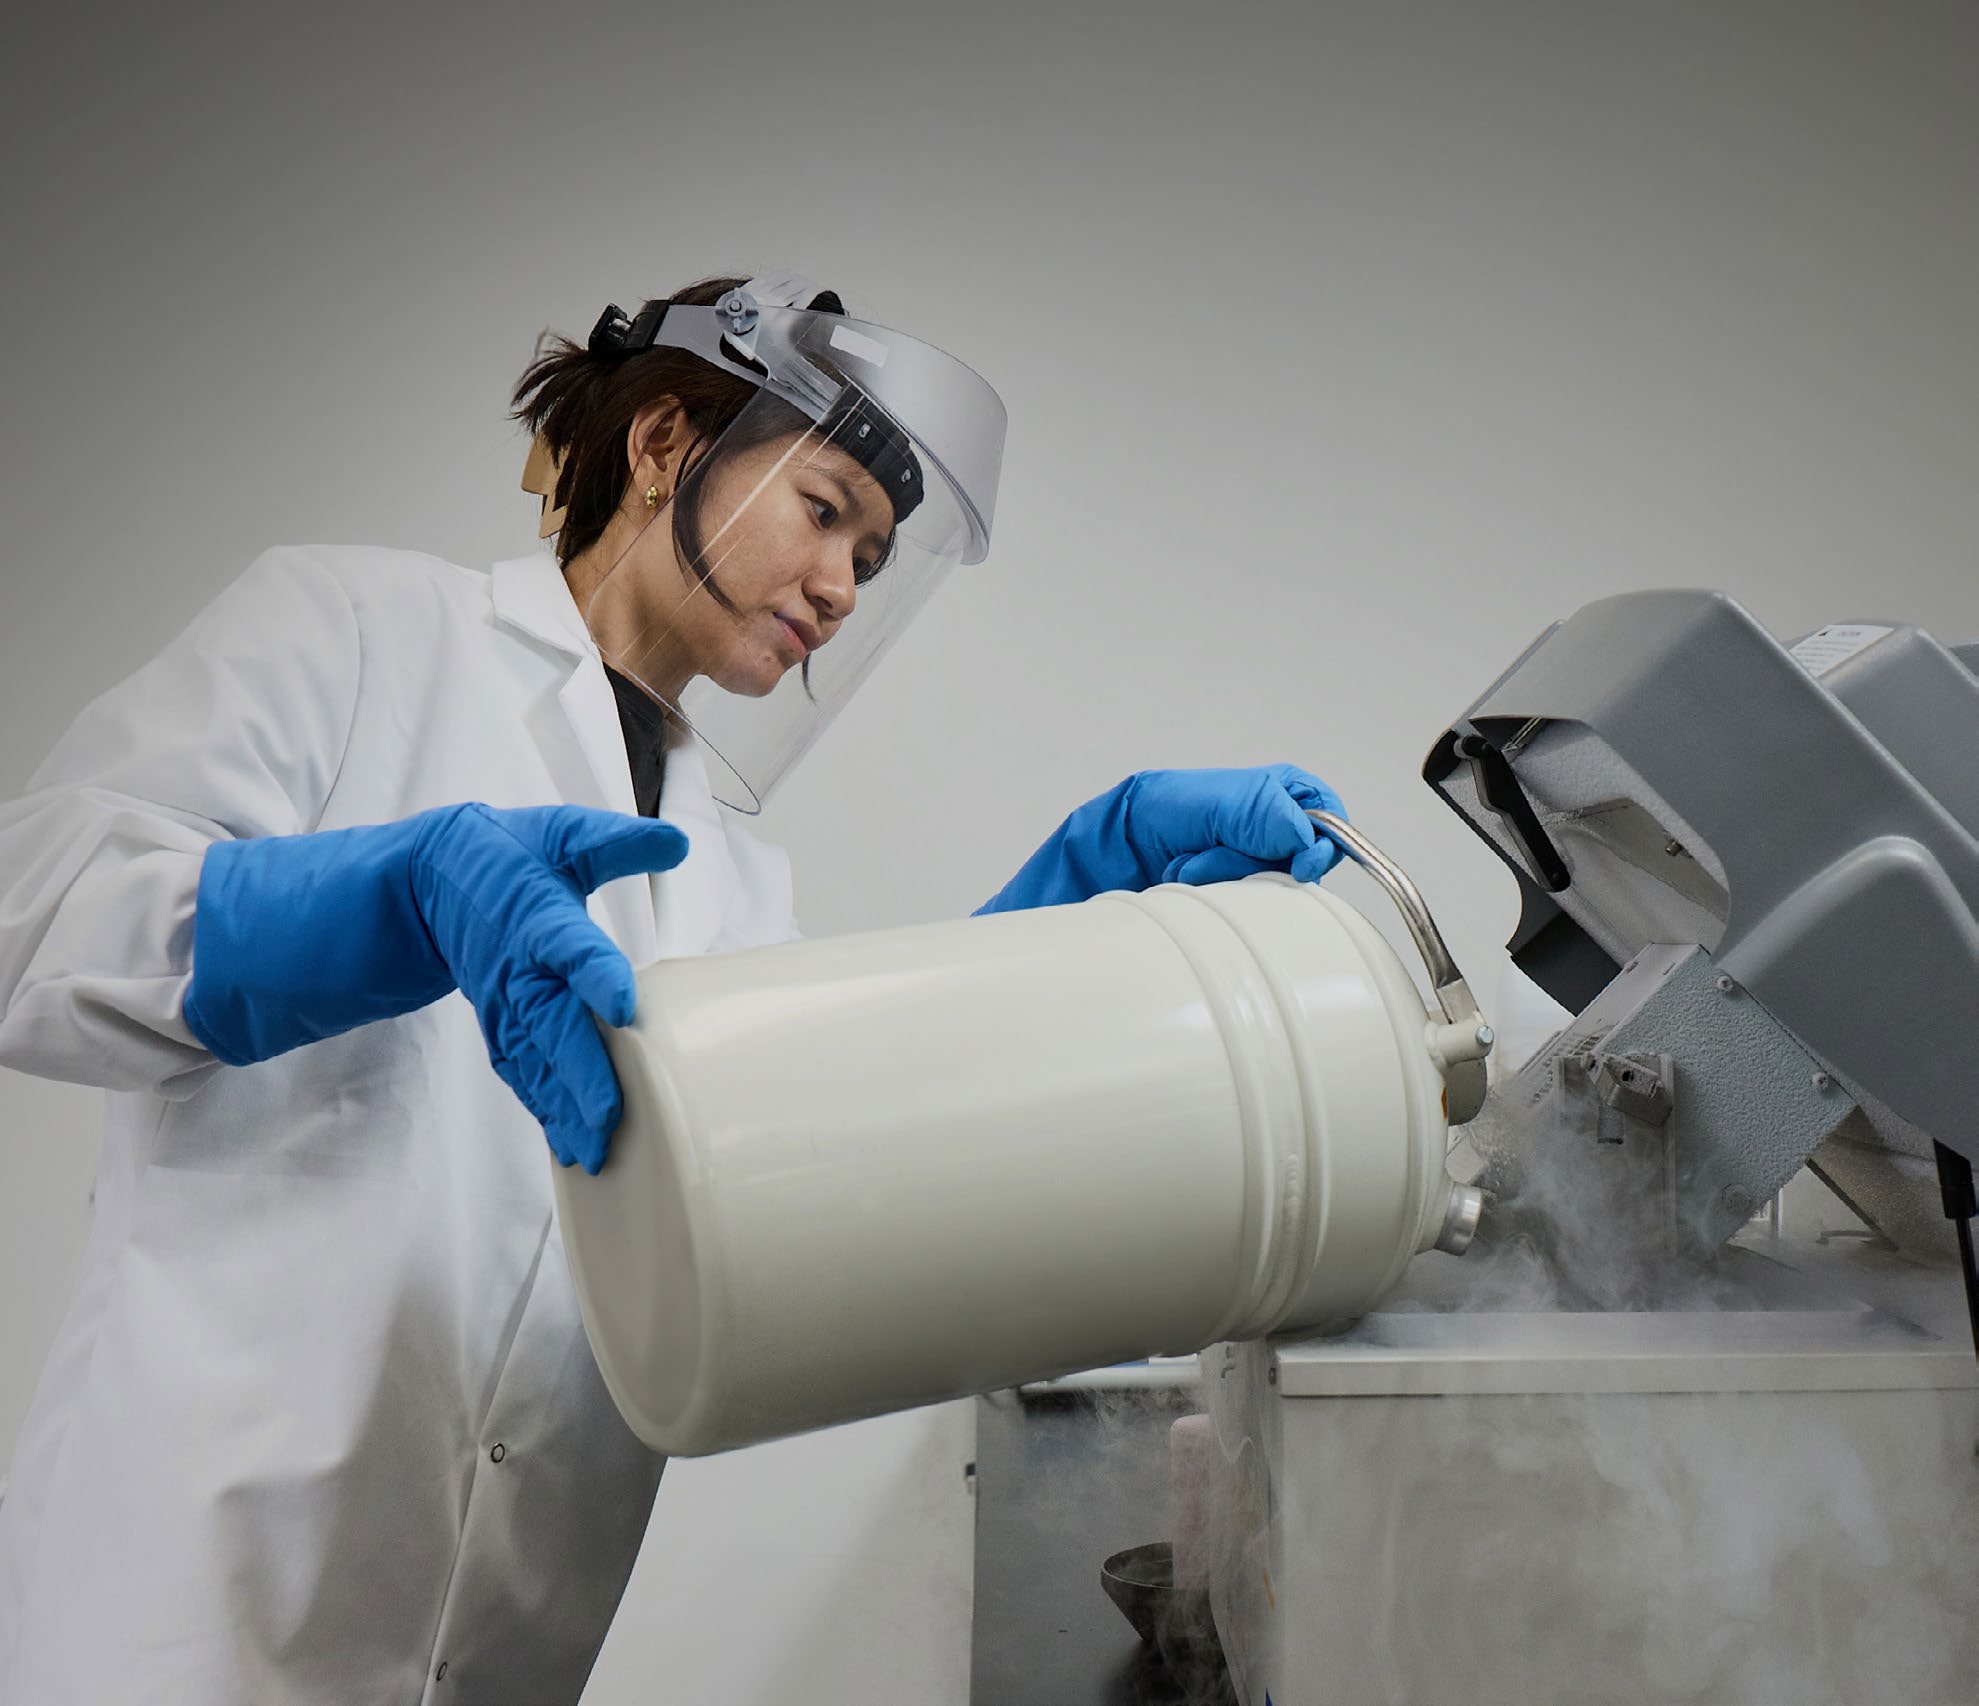
Smarter
chemistry
IN THIS SECTION
Mapping
Assessment
Innovation
2026 ENVIRONMENTAL PROGRESS REPORT
60
ENGAGEMENT AND ADVOCACY
INTRODUCTION
CONTENTS
APPENDIX
GREEN BOND IMPACT REPORT
DATA
ENVIRONMENTAL INITIATIVES
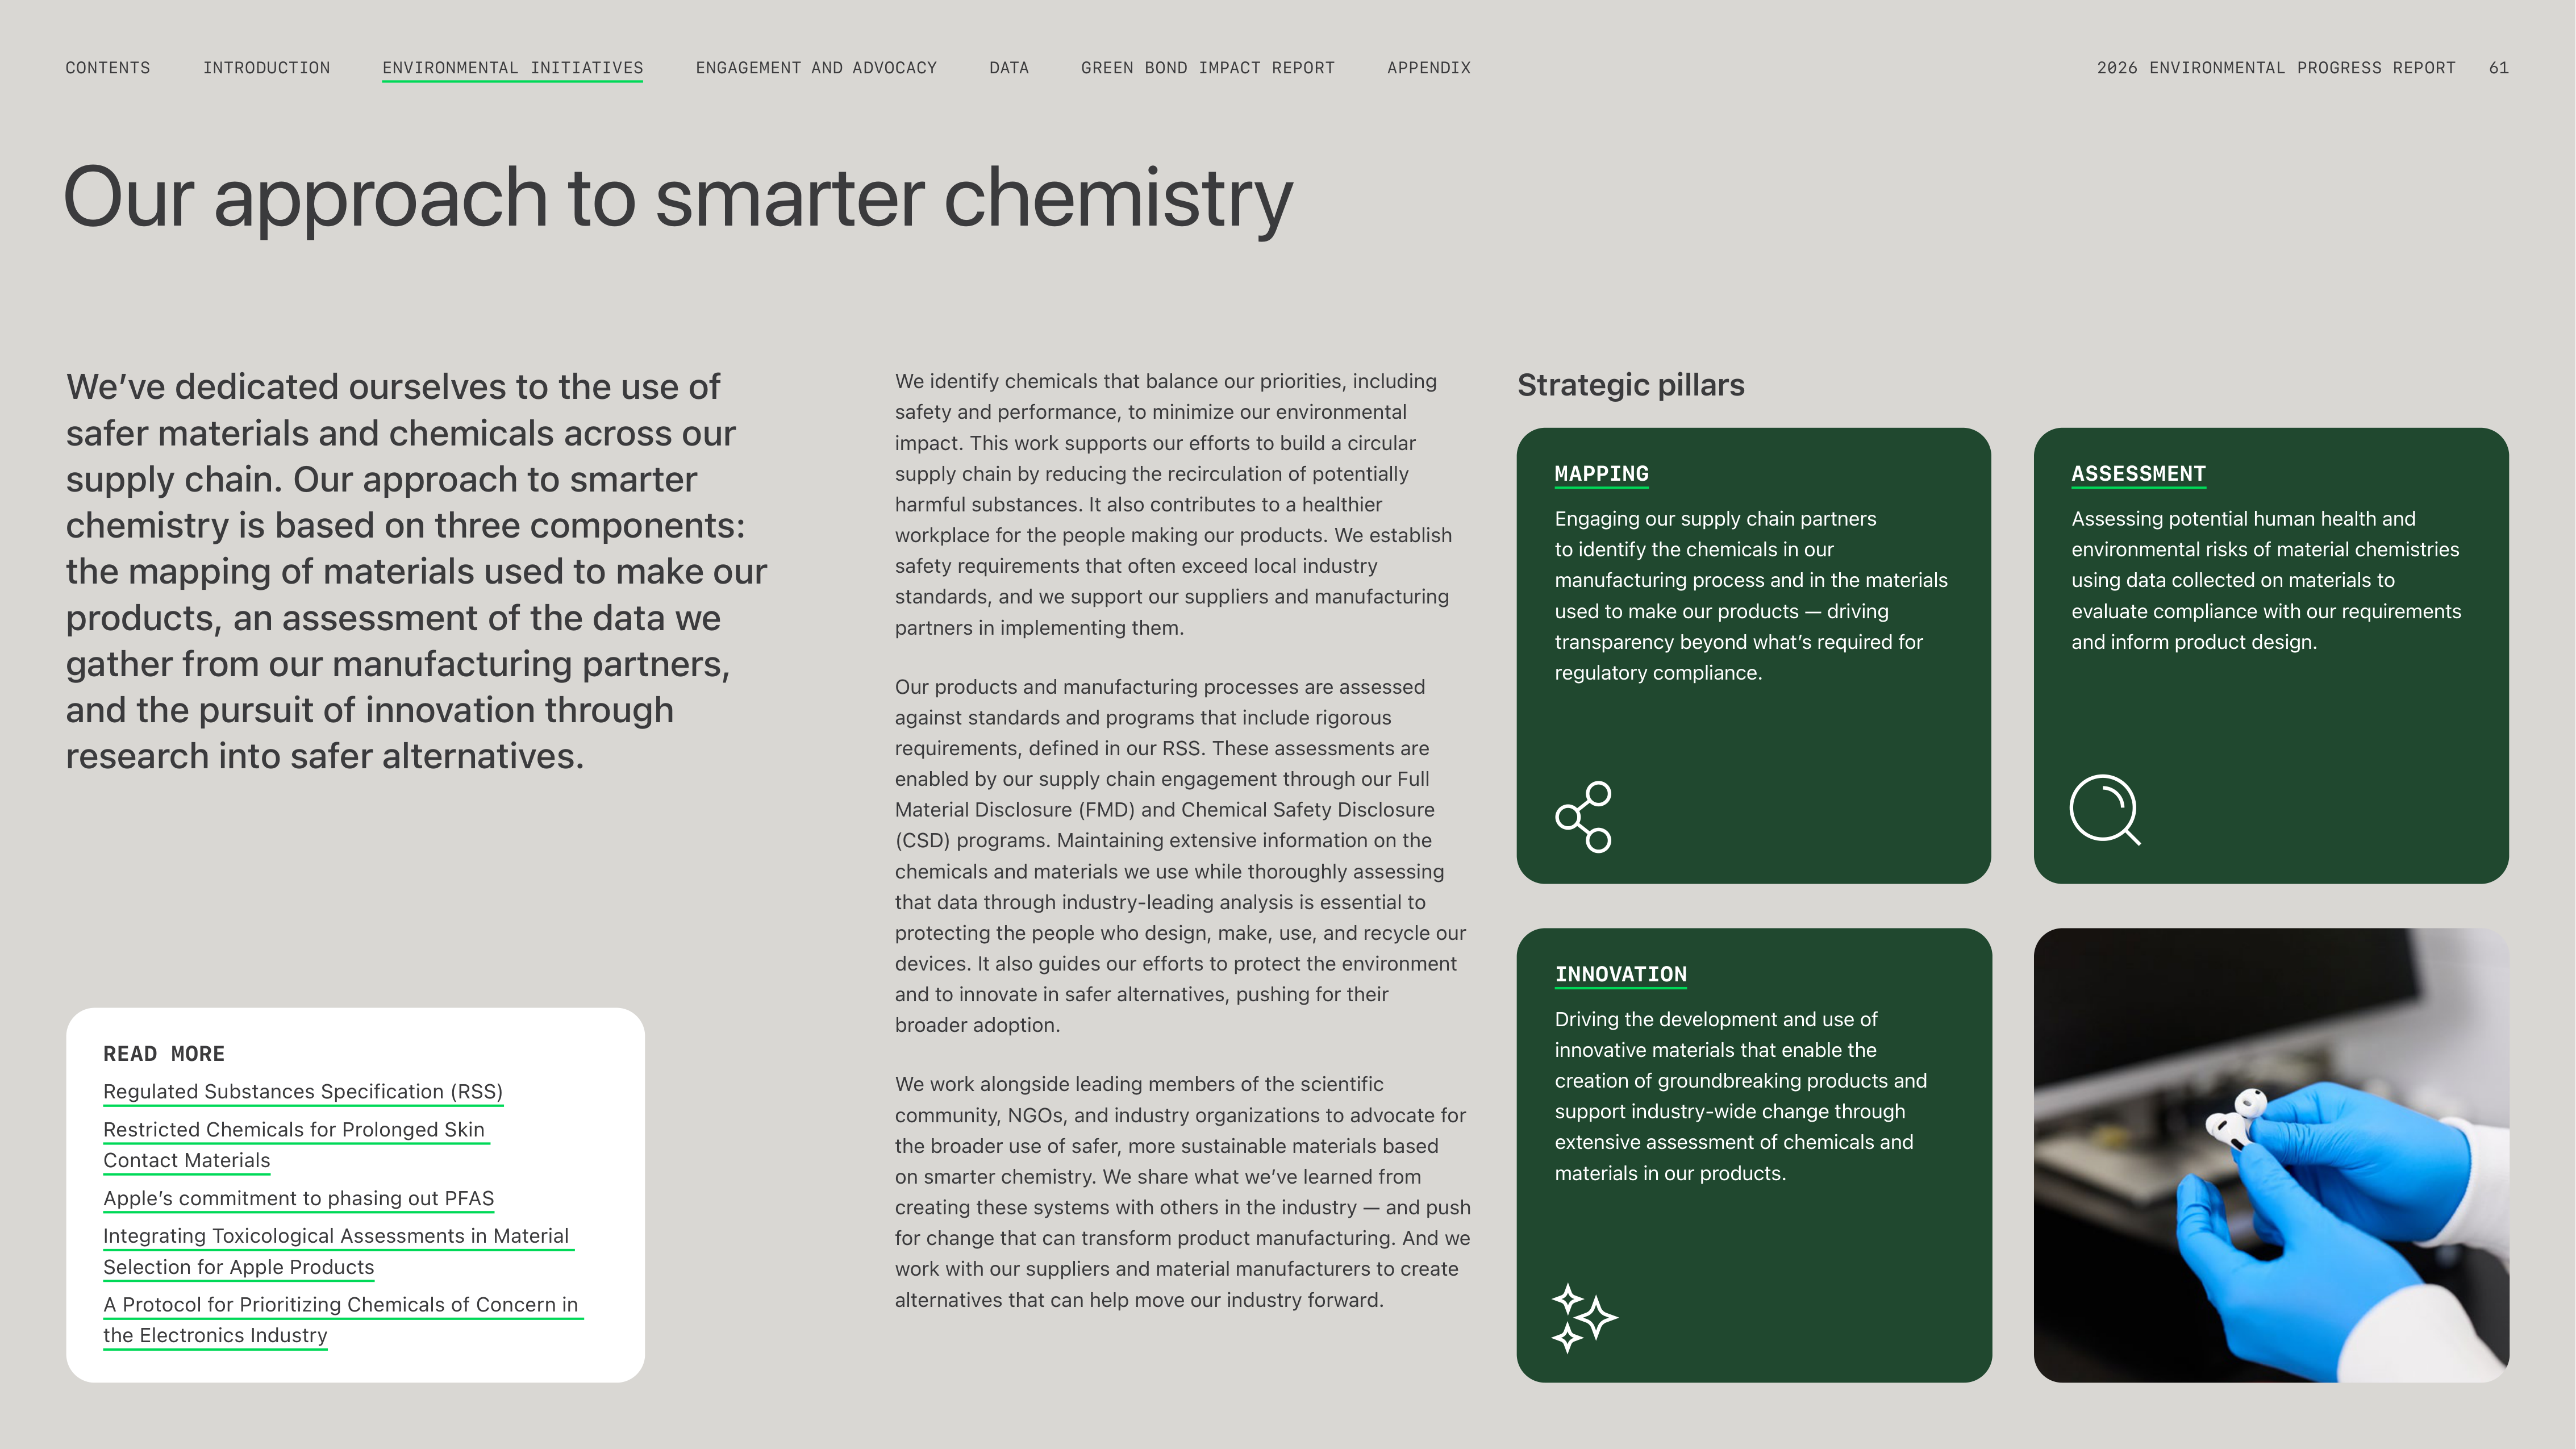
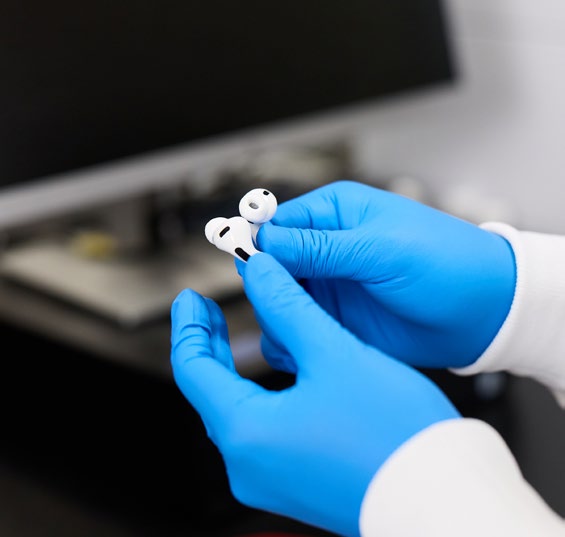
Our approach to smarter chemistry
We’ve dedicated ourselves to the use of
safer materials and chemicals across our
supply chain. Our approach to smarter
chemistry is based on three components:
the mapping of materials used to make our
products, an assessment of the data we
gather from our manufacturing partners,
and the pursuit of innovation through
research into safer alternatives.
We identify chemicals that balance our priorities, including
safety and performance, to minimize our environmental
impact. This work supports our efforts to build a circular
supply chain by reducing the recirculation of potentially
harmful substances. It also contributes to a healthier
workplace for the people making our products. We establish
safety requirements that often exceed local industry
standards, and we support our suppliers and manufacturing
partners in implementing them.
Our products and manufacturing processes are assessed
against standards and programs that include rigorous
requirements, defined in our RSS. These assessments are
enabled by our supply chain engagement through our Full
Material Disclosure (FMD) and Chemical Safety Disclosure
(CSD) programs. Maintaining extensive information on the
chemicals and materials we use while thoroughly assessing
that data through industry-leading analysis is essential to
protecting the people who design, make, use, and recycle our
devices. It also guides our efforts to protect the environment
and to innovate in safer alternatives, pushing for their
broader adoption.
We work alongside leading members of the scientific
community, NGOs, and industry organizations to advocate for
the broader use of safer, more sustainable materials based
on smarter chemistry. We share what weʼve learned from
creating these systems with others in the industry — and push
for change that can transform product manufacturing. And we
work with our suppliers and material manufacturers to create
alternatives that can help move our industry forward.
READ MORE
Regulated Substances Specification (RSS)
Restricted Chemicals for Prolonged Skin
Contact Materials
Appleʼs commitment to phasing out PFAS
Integrating Toxicological Assessments in Material
Selection for Apple Products
A Protocol for Prioritizing Chemicals of Concern in
the Electronics Industry
MAPPING
Engaging our supply chain partners
to identify the chemicals in our
manufacturing process and in the materials
used to make our products — driving
transparency beyond whatʼs required for
regulatory compliance.
INNOVATION
Driving the development and use of
innovative materials that enable the
creation of groundbreaking products and
support industry-wide change through
extensive assessment of chemicals and
materials in our products.
ASSESSMENT
Assessing potential human health and
environmental risks of material chemistries
using data collected on materials to
evaluate compliance with our requirements
and inform product design.
Strategic pillars
ENGAGEMENT AND ADVOCACY
INTRODUCTION
CONTENTS
GREEN BOND IMPACT REPORT
DATA
APPENDIX
2026 ENVIRONMENTAL PROGRESS REPORT
61
ENVIRONMENTAL INITIATIVES
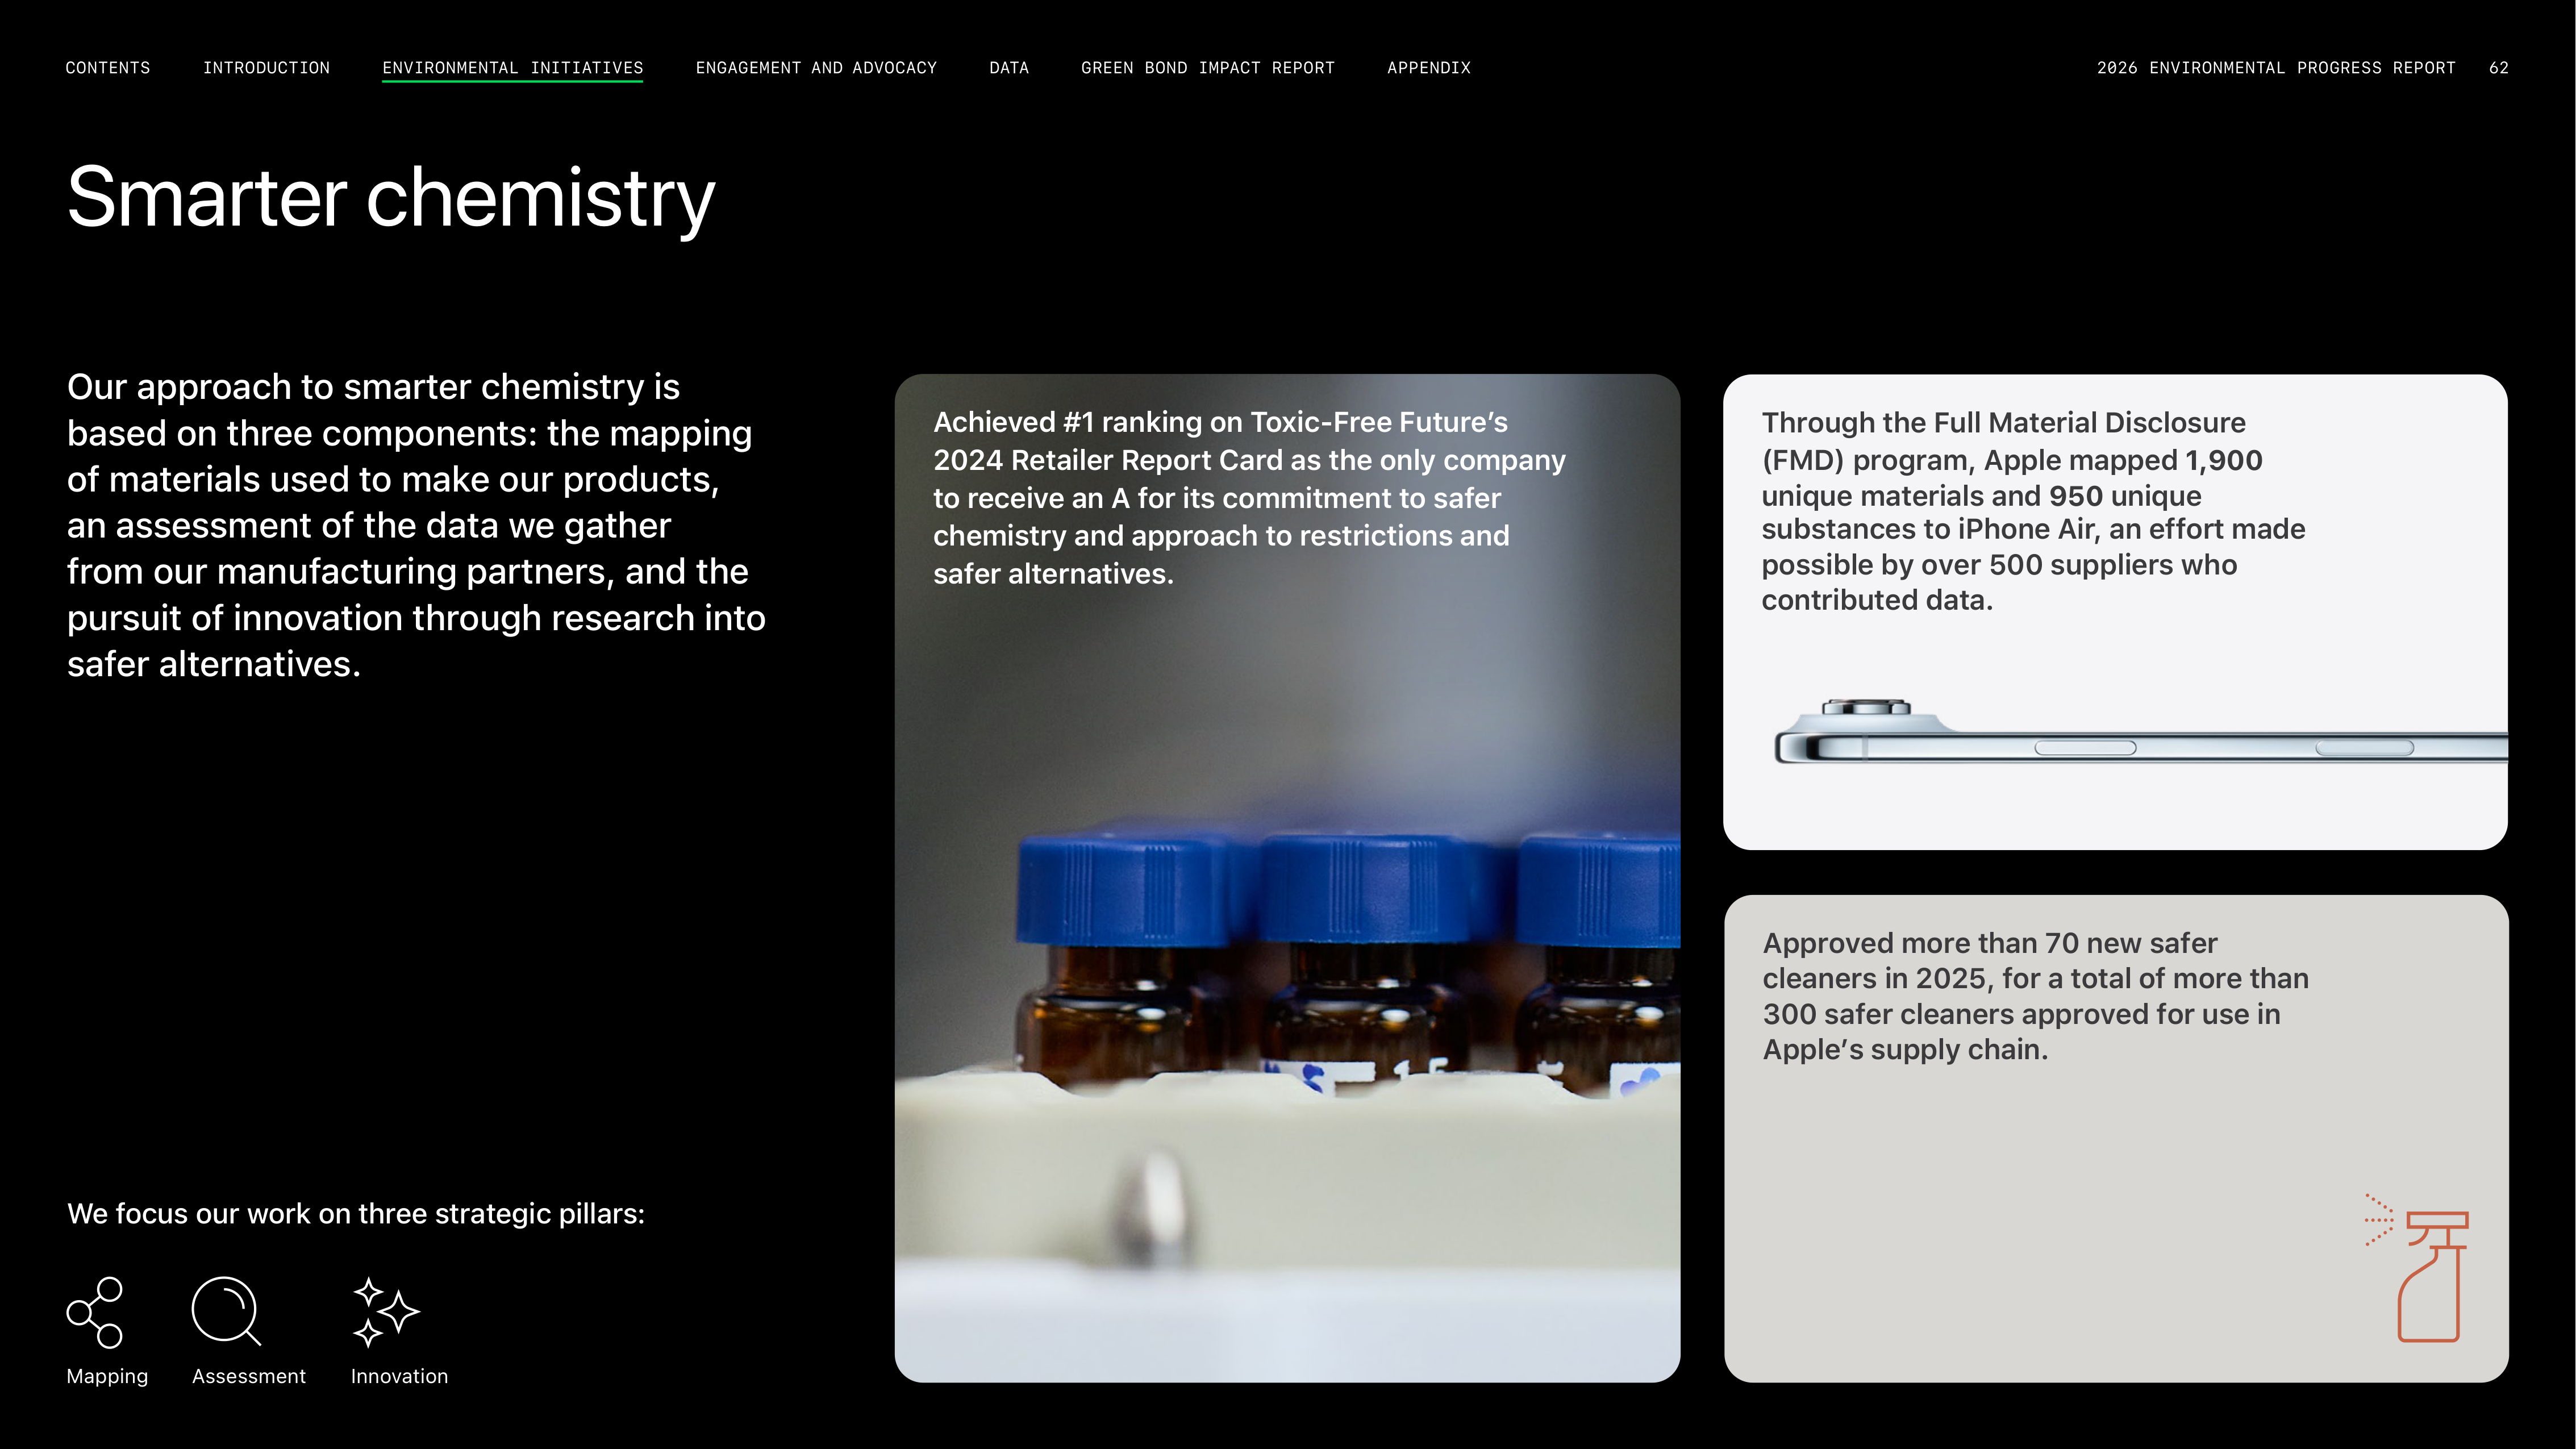

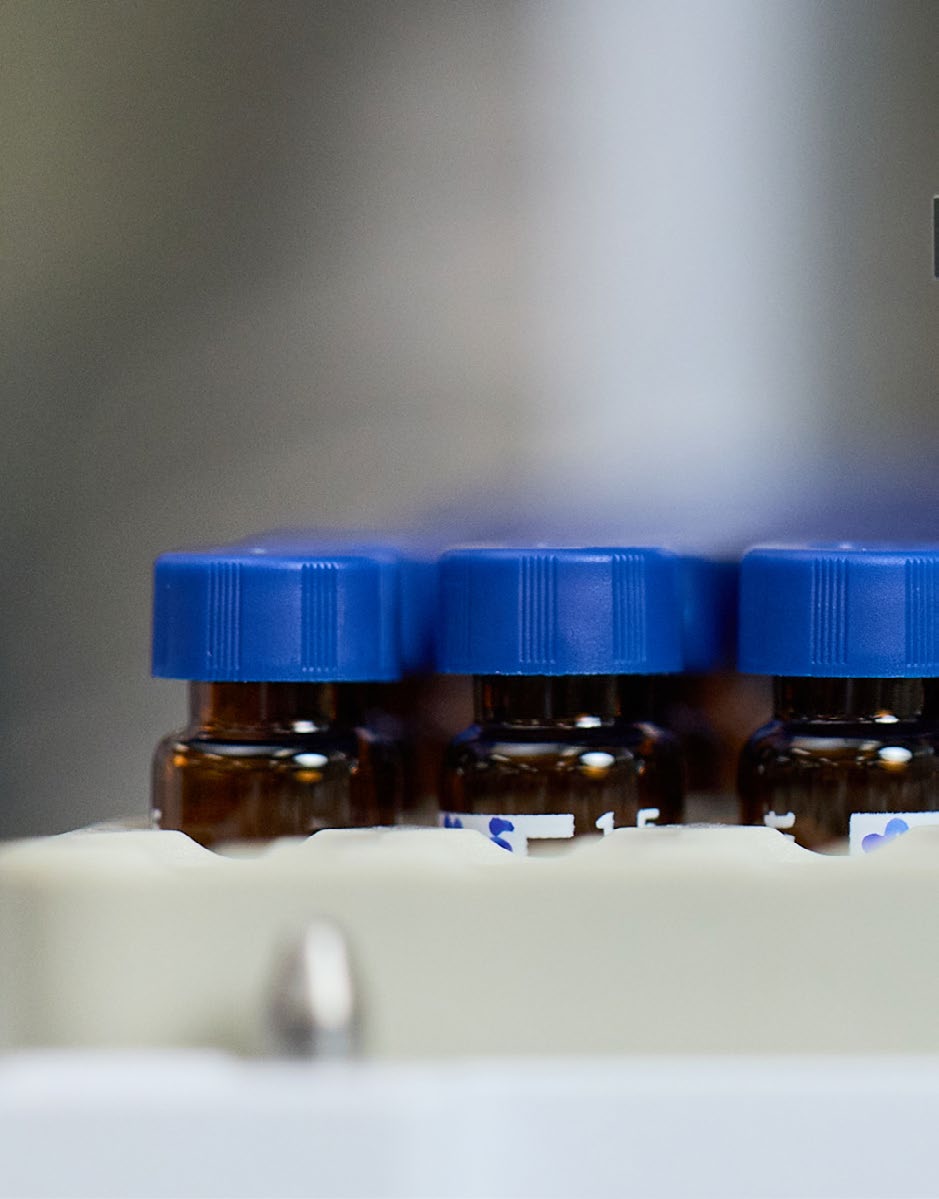
Through the Full Material Disclosure
(FMD) program, Apple mapped
1,900
unique materials and
950
unique
substances to iPhone Air, an effort made
possible by over 500 suppliers who
contributed data.
Approved more than 70 new safer
cleaners in 2025, for a total of more than
300 safer cleaners approved for use in
Apple’s supply chain.
Achieved #1 ranking on Toxic-Free Future’s
2024 Retailer Report Card as the only company
to receive an A for its commitment to safer
chemistry and approach to restrictions and
safer alternatives.
We focus our work on three strategic pillars:
Mapping
Assessment
Innovation
Smarter chemistry
Our approach to smarter chemistry is
based on three components: the mapping
of materials used to make our products,
an assessment of the data we gather
from our manufacturing partners, and the
pursuit of innovation through research into
safer alternatives.
2026 ENVIRONMENTAL PROGRESS REPORT
62
ENGAGEMENT AND ADVOCACY
INTRODUCTION
CONTENTS
APPENDIX
GREEN BOND IMPACT REPORT
DATA
ENVIRONMENTAL INITIATIVES
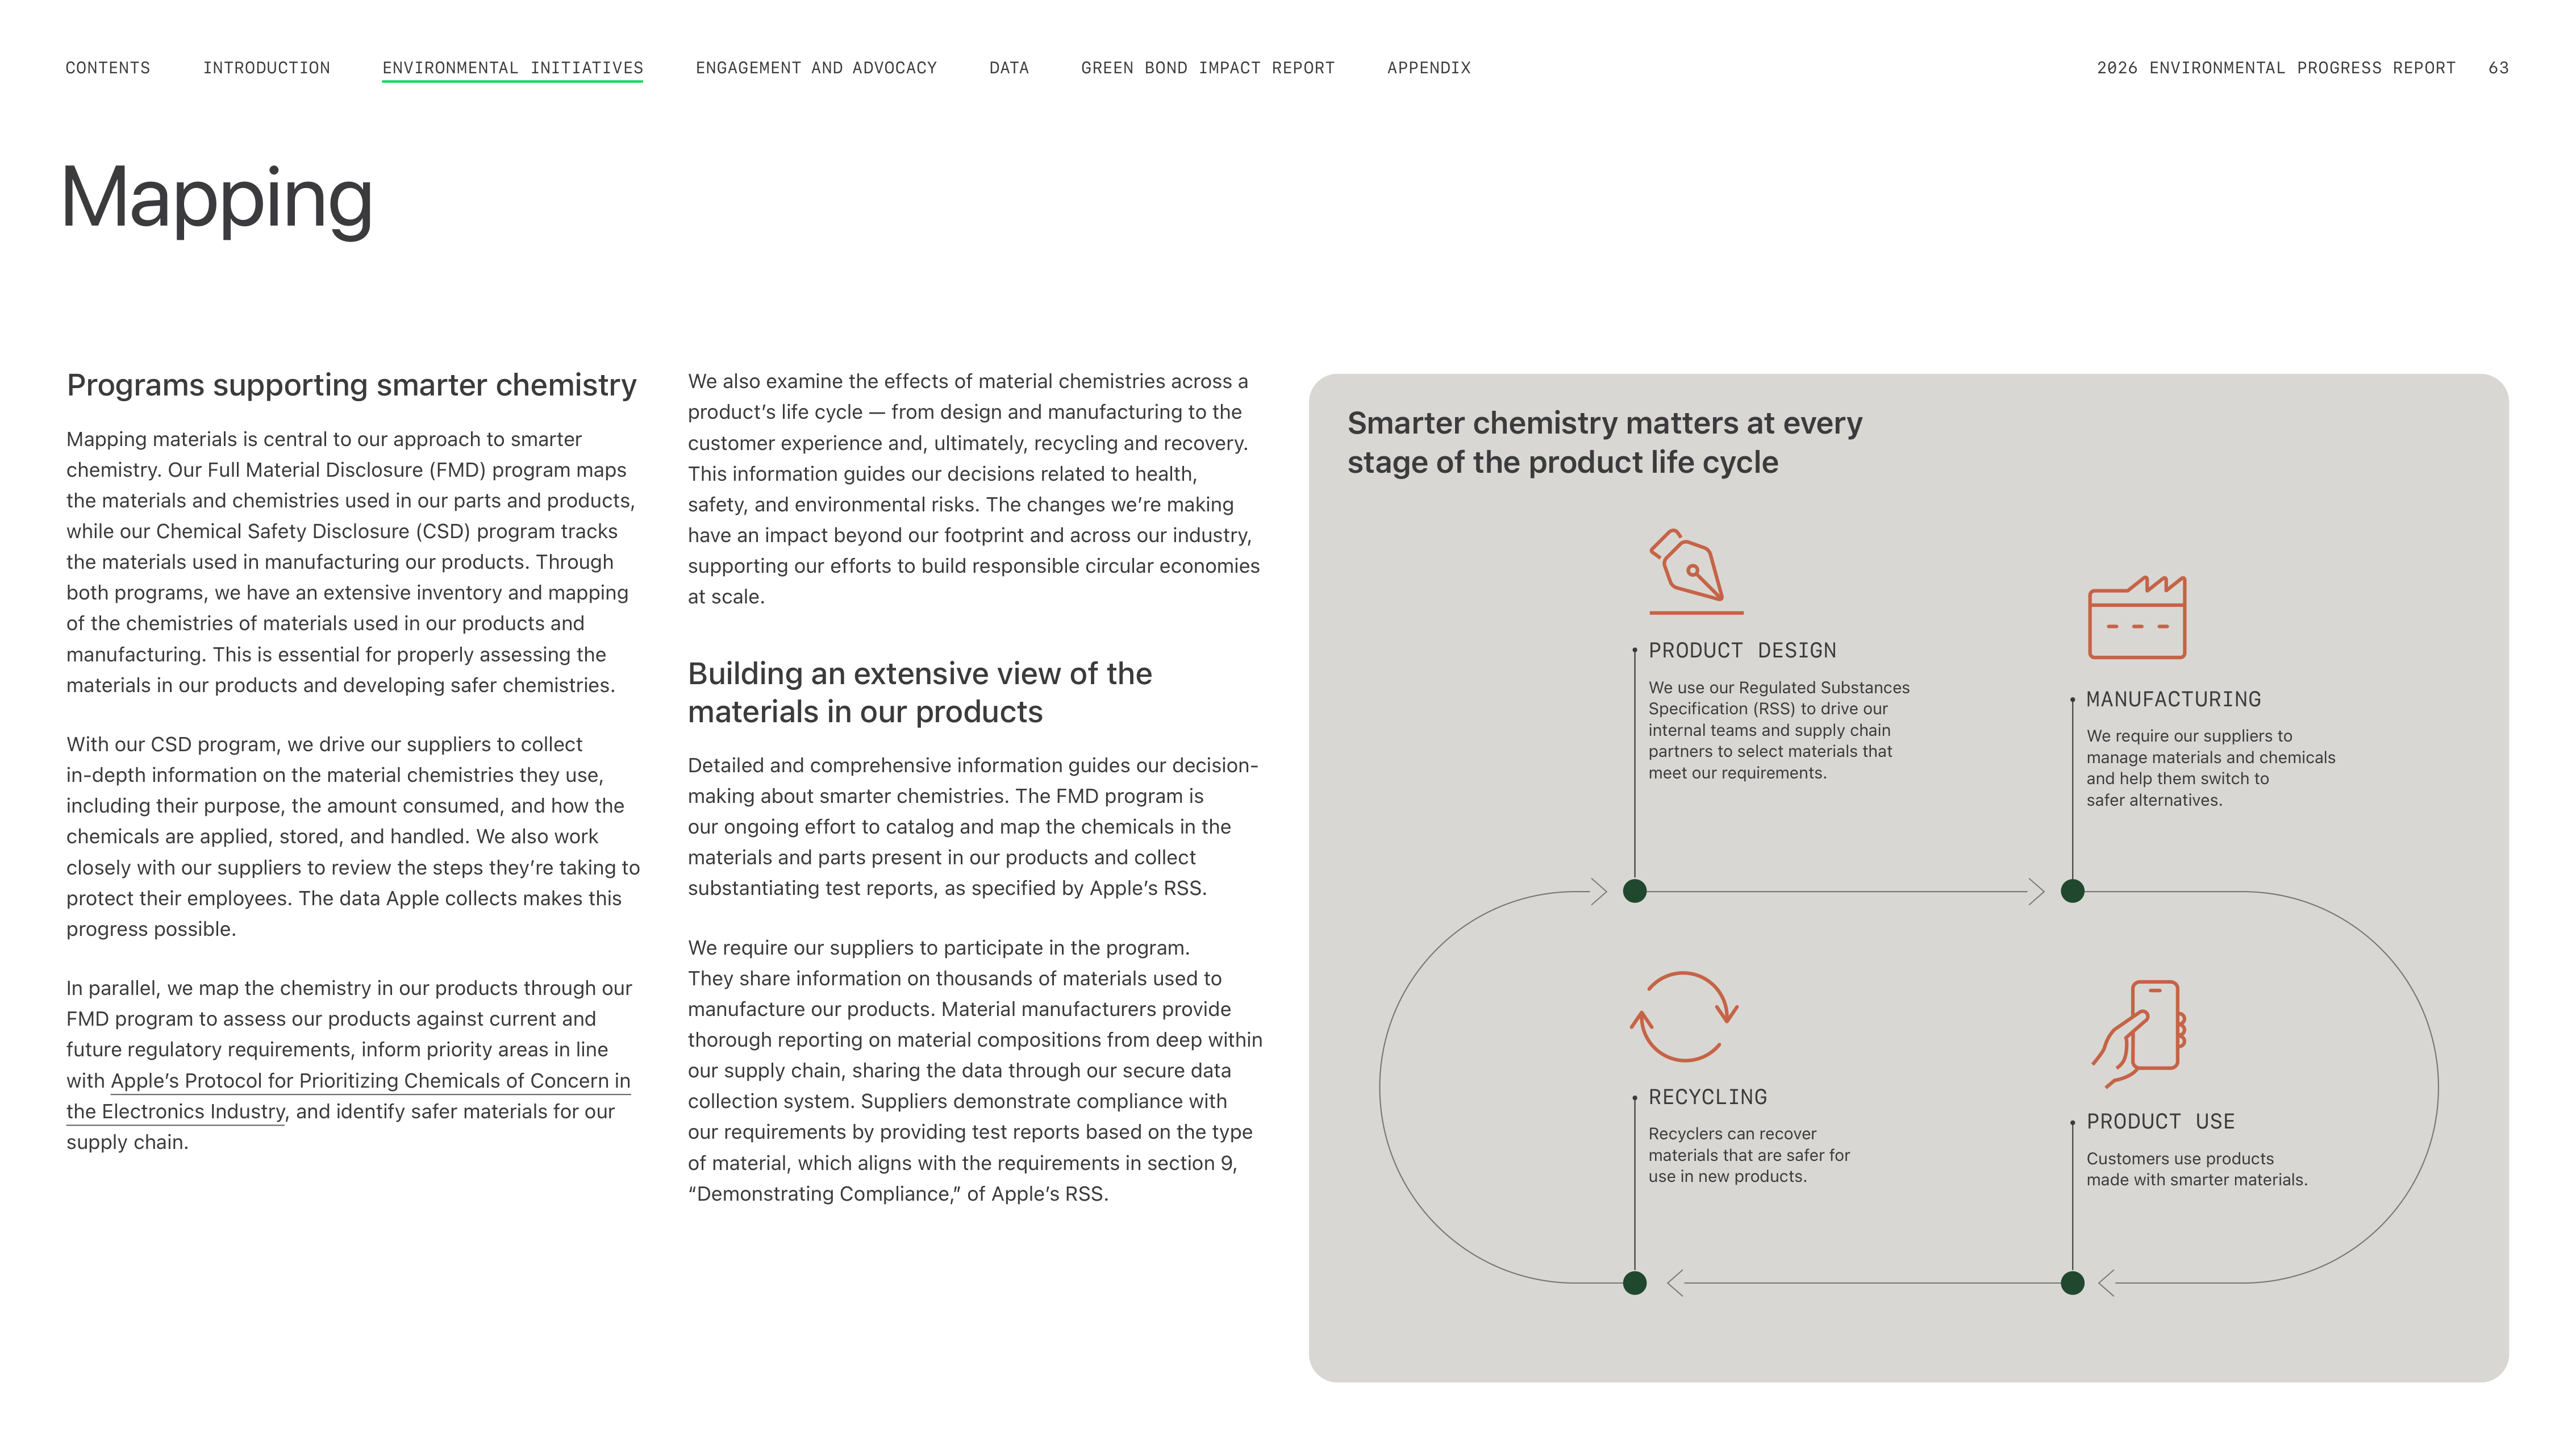
Programs supporting smarter chemistry
Mapping materials is central to our approach to smarter
chemistry. Our Full Material Disclosure (FMD) program maps
the materials and chemistries used in our parts and products,
while our Chemical Safety Disclosure (CSD) program tracks
the materials used in manufacturing our products. Through
both programs, we have an extensive inventory and mapping
of the chemistries of materials used in our products and
manufacturing. This is essential for properly assessing the
materials in our products and developing safer chemistries.
With our CSD program, we drive our suppliers to collect
in-depth information on the material chemistries they use,
including their purpose, the amount consumed, and how the
chemicals are applied, stored, and handled. We also work
closely with our suppliers to review the steps theyʼre taking to
protect their employees. The data Apple collects makes this
progress possible.
In parallel, we map the chemistry in our products through our
FMD program to assess our products against current and
future regulatory requirements, inform priority areas in line
with Appleʼs Protocol for Prioritizing Chemicals of Concern in
the Electronics Industry, and identify safer materials for our
supply chain.
We also examine the effects of material chemistries across a
productʼs life cycle — from design and manufacturing to the
customer experience and, ultimately, recycling and recovery.
This information guides our decisions related to health,
safety, and environmental risks. The changes weʼre making
have an impact beyond our footprint and across our industry,
supporting our efforts to build responsible circular economies
at scale.
Building an extensive view of the
materials in our products
Detailed and comprehensive information guides our decision-
making about smarter chemistries. The FMD program is
our ongoing effort to catalog and map the chemicals in the
materials and parts present in our products and collect
substantiating test reports, as specified by Appleʼs RSS.
We require our suppliers to participate in the program.
They share information on thousands of materials used to
manufacture our products. Material manufacturers provide
thorough reporting on material compositions from deep within
our supply chain, sharing the data through our secure data
collection system. Suppliers demonstrate compliance with
our requirements by providing test reports based on the type
of material, which aligns with the requirements in section 9,
“Demonstrating Compliance,” of Appleʼs RSS.
Mapping
Smarter chemistry matters at every
stage of the product life cycle
PRODUCT DESIGN
We use our Regulated Substances
Specification (RSS) to drive our
internal teams and supply chain
partners to select materials that
meet our requirements.
RECYCLING
Recyclers can recover
materials that are safer for
use in new products.
MANUFACTURING
We require our suppliers to
manage materials and chemicals
and help them switch to
safer alternatives.
PRODUCT USE
Customers use products
made with smarter materials.
ENGAGEMENT AND ADVOCACY
INTRODUCTION
CONTENTS
GREEN BOND IMPACT REPORT
DATA
APPENDIX
2026 ENVIRONMENTAL PROGRESS REPORT
63
ENVIRONMENTAL INITIATIVES
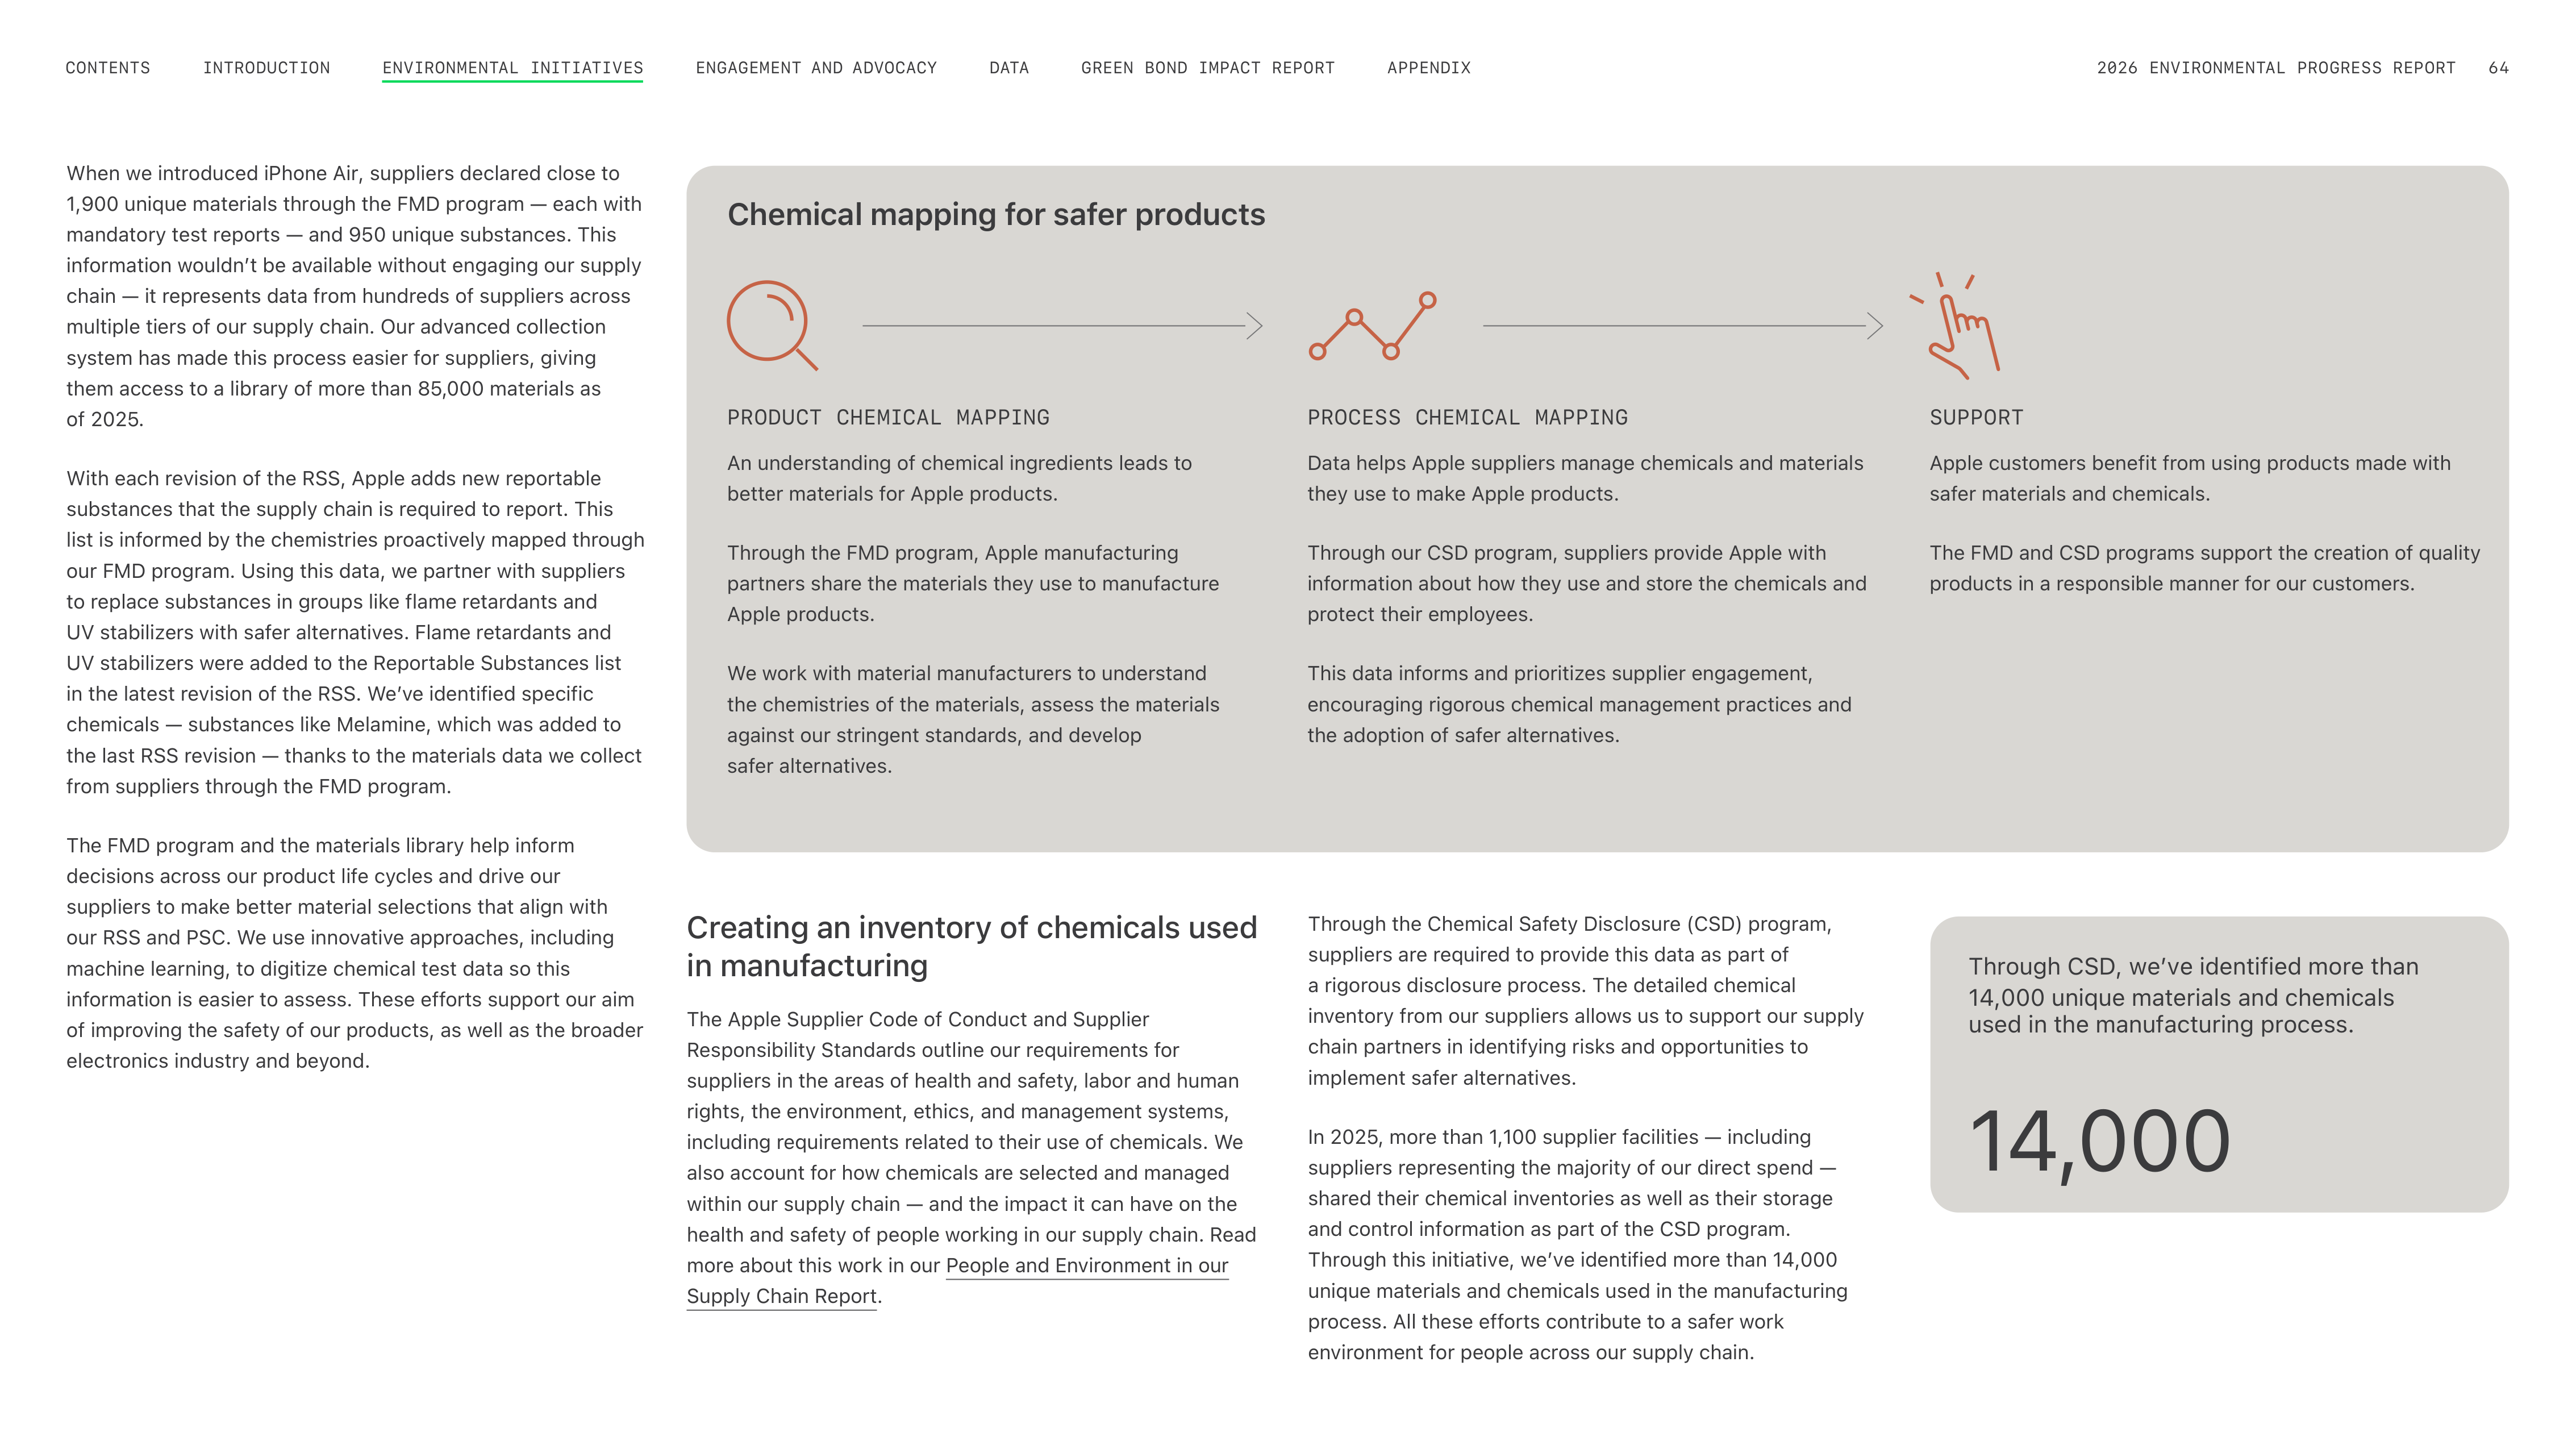
When we introduced iPhone Air, suppliers declared close to
1,900 unique materials through the FMD program — each with
mandatory test reports — and 950 unique substances. This
information wouldnʼt be available without engaging our supply
chain — it represents data from hundreds of suppliers across
multiple tiers of our supply chain. Our advanced collection
system has made this process easier for suppliers, giving
them access to a library of more than 85,000 materials as
of 2025.
With each revision of the RSS, Apple adds new reportable
substances that the supply chain is required to report. This
list is informed by the chemistries proactively mapped through
our FMD program. Using this data, we partner with suppliers
to replace substances in groups like flame retardants and
UV stabilizers with safer alternatives. Flame retardants and
UV stabilizers were added to the Reportable Substances list
in the latest revision of the RSS. Weʼve identified specific
chemicals — substances like Melamine, which was added to
the last RSS revision — thanks to the materials data we collect
from suppliers through the FMD program.
The FMD program and the materials library help inform
decisions across our product life cycles and drive our
suppliers to make better material selections that align with
our RSS and PSC. We use innovative approaches, including
machine learning, to digitize chemical test data so this
information is easier to assess. These efforts support our aim
of improving the safety of our products, as well as the broader
electronics industry and beyond.
Creating an inventory of chemicals used
in manufacturing
The Apple Supplier Code of Conduct and Supplier
Responsibility Standards outline our requirements for
suppliers in the areas of health and safety, labor and human
rights, the environment, ethics, and management systems,
including requirements related to their use of chemicals. We
also account for how chemicals are selected and managed
within our supply chain — and the impact it can have on the
health and safety of people working in our supply chain. Read
more about this work in our People and Environment in our
Supply Chain Report.
Chemical mapping for safer products
PRODUCT CHEMICAL MAPPING
An understanding of chemical ingredients leads to
better materials for Apple products.
Through the FMD program, Apple manufacturing
partners share the materials they use to manufacture
Apple products.
We work with material manufacturers to understand
the chemistries of the materials, assess the materials
against our stringent standards, and develop
safer alternatives.
SUPPORT
Apple customers benefit from using products made with
safer materials and chemicals.
The FMD and CSD programs support the creation of quality
products in a responsible manner for our customers.
Through CSD, weʼve identified more than
14,000 unique materials and chemicals
used in the manufacturing process.
14,000
PROCESS CHEMICAL MAPPING
Data helps Apple suppliers manage chemicals and materials
they use to make Apple products.
Through our CSD program, suppliers provide Apple with
information about how they use and store the chemicals and
protect their employees.
This data informs and prioritizes supplier engagement,
encouraging rigorous chemical management practices and
the adoption of safer alternatives.
Through the Chemical Safety Disclosure (CSD) program,
suppliers are required to provide this data as part of
a rigorous disclosure process. The detailed chemical
inventory from our suppliers allows us to support our supply
chain partners in identifying risks and opportunities to
implement safer alternatives.
In 2025, more than 1,100 supplier facilities — including
suppliers representing the majority of our direct spend —
shared their chemical inventories as well as their storage
and control information as part of the CSD program.
Through this initiative, weʼve identified more than 14,000
unique materials and chemicals used in the manufacturing
process. All these efforts contribute to a safer work
environment for people across our supply chain.
ENGAGEMENT AND ADVOCACY
INTRODUCTION
CONTENTS
GREEN BOND IMPACT REPORT
DATA
APPENDIX
2026 ENVIRONMENTAL PROGRESS REPORT
64
ENVIRONMENTAL INITIATIVES
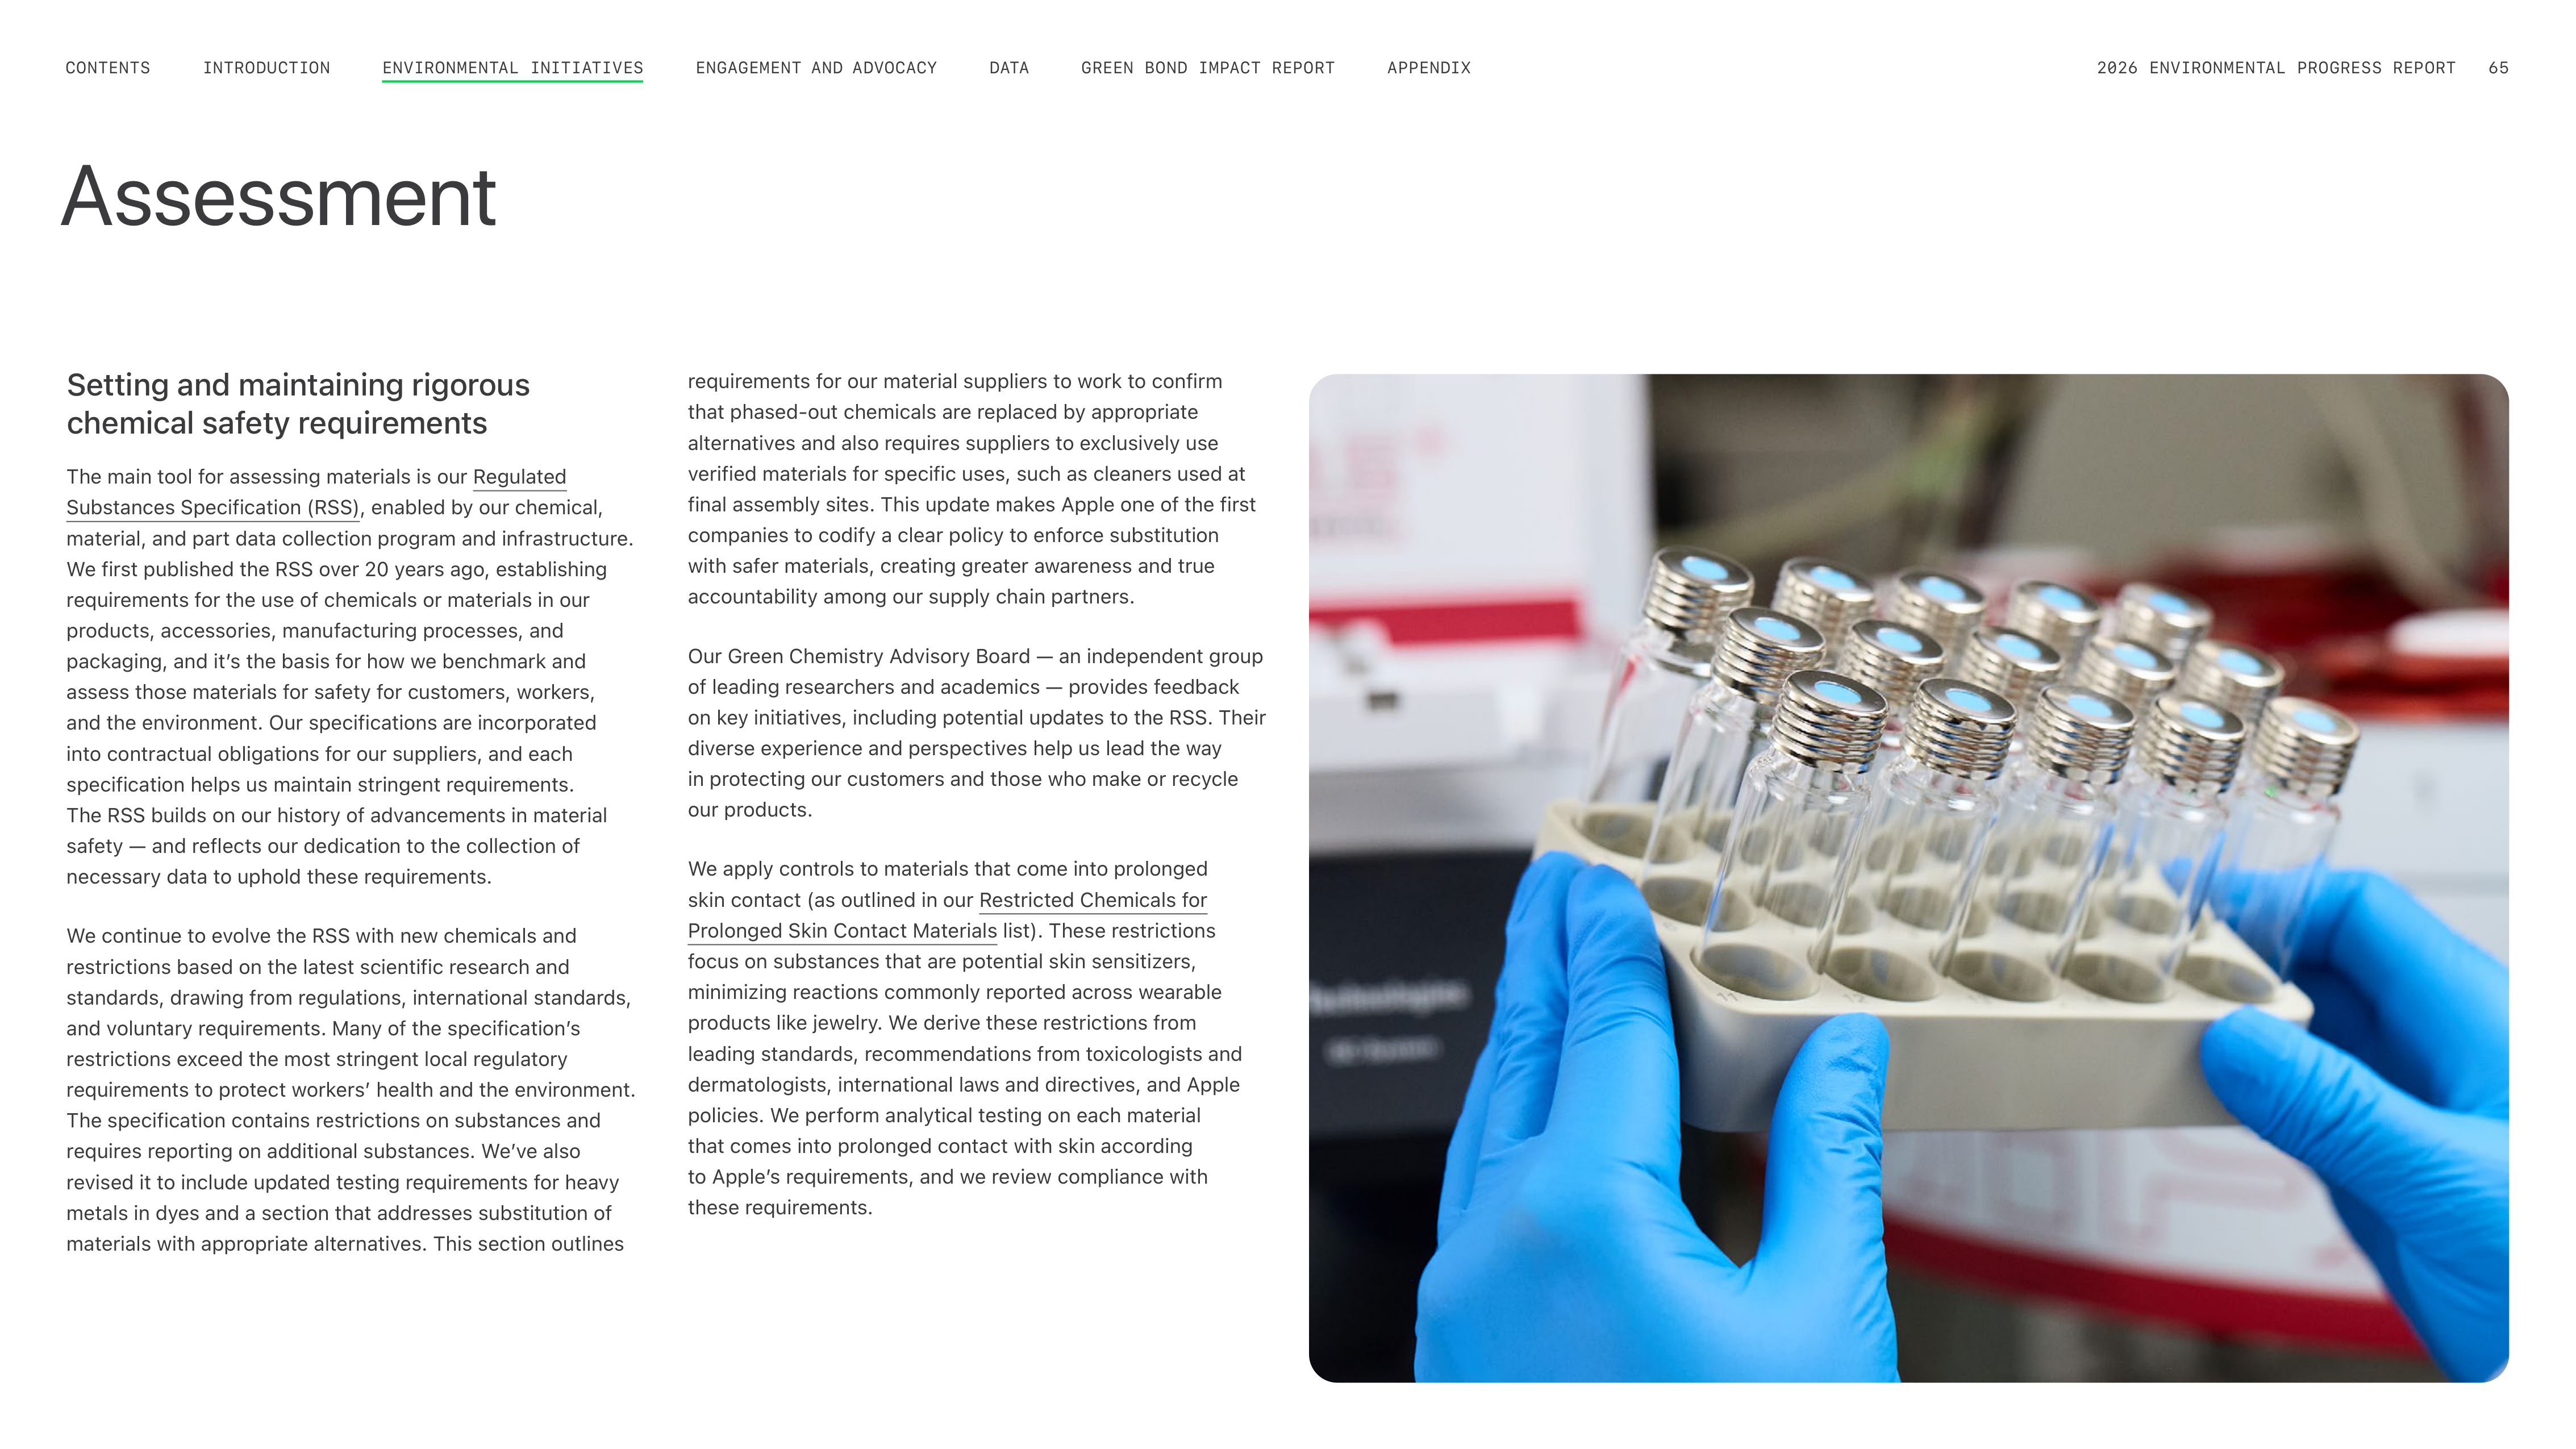
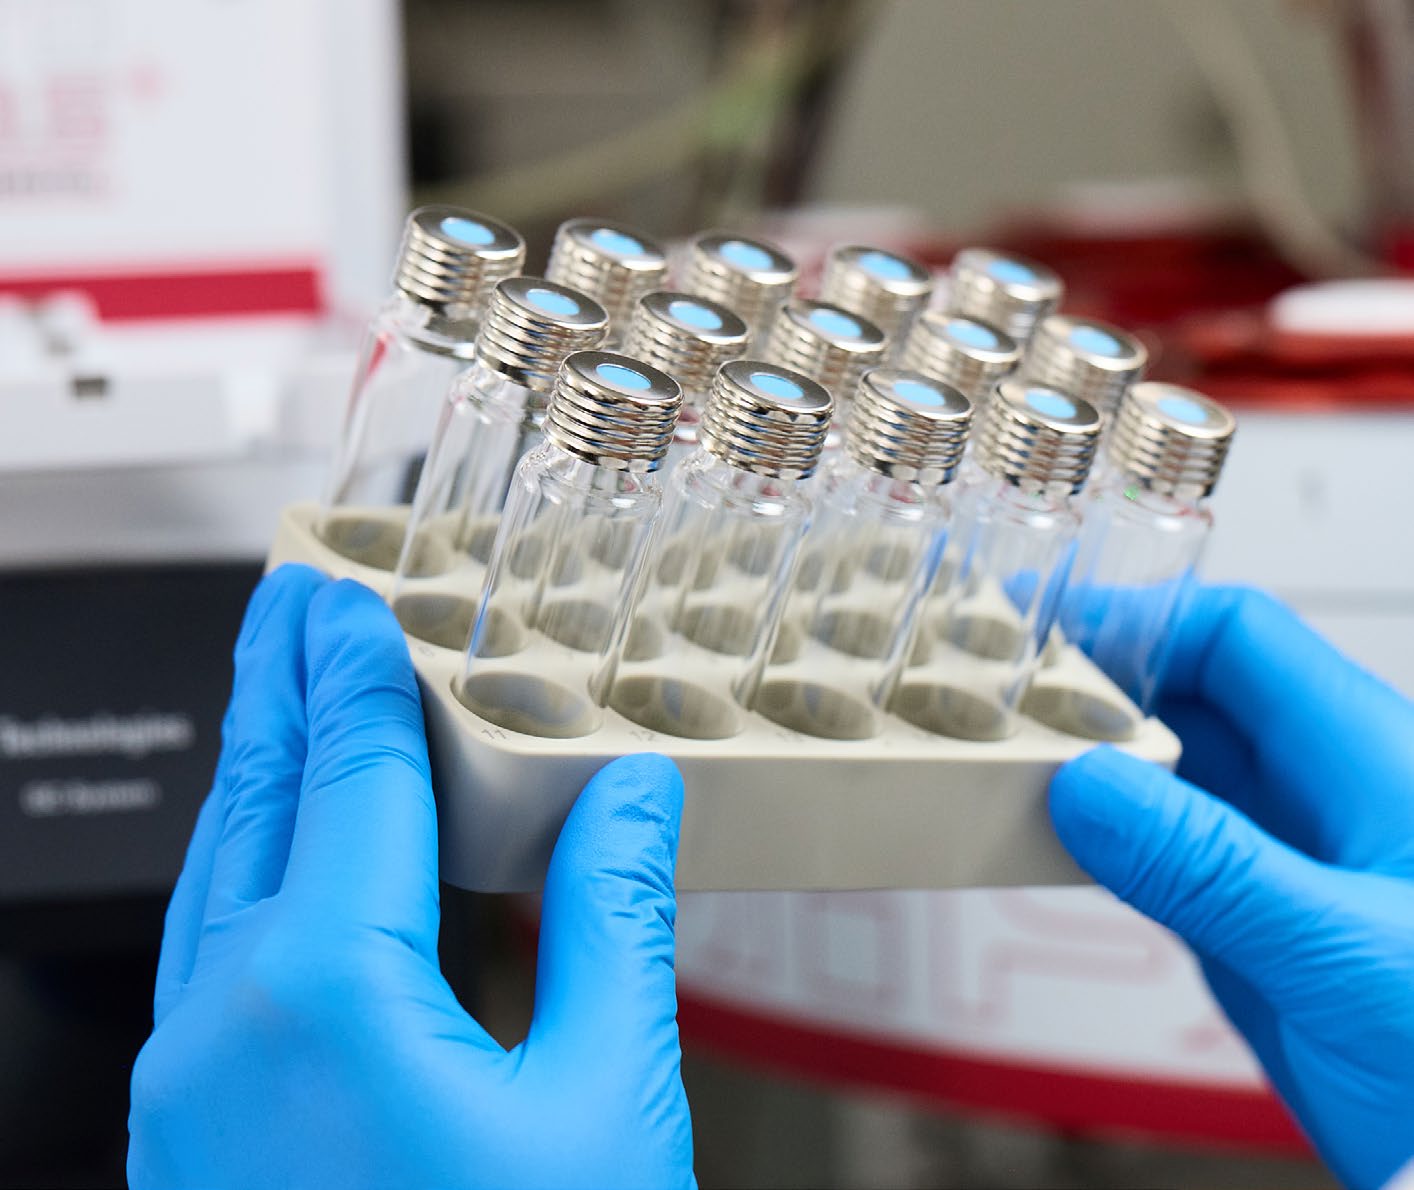
Setting and maintaining rigorous
chemical safety requirements
The main tool for assessing materials is our Regulated
Substances Specification (RSS), enabled by our chemical,
material, and part data collection program and infrastructure.
We first published the RSS over 20 years ago, establishing
requirements for the use of chemicals or materials in our
products, accessories, manufacturing processes, and
packaging, and itʼs the basis for how we benchmark and
assess those materials for safety for customers, workers,
and the environment. Our specifications are incorporated
into contractual obligations for our suppliers, and each
specification helps us maintain stringent requirements.
The RSS builds on our history of advancements in material
safety — and reflects our dedication to the collection of
necessary data to uphold these requirements.
We continue to evolve the RSS with new chemicals and
restrictions based on the latest scientific research and
standards, drawing from regulations, international standards,
and voluntary requirements. Many of the specificationʼs
restrictions exceed the most stringent local regulatory
requirements to protect workersʼ health and the environment.
The specification contains restrictions on substances and
requires reporting on additional substances. Weʼve also
revised it to include updated testing requirements for heavy
metals in dyes and a section that addresses substitution of
materials with appropriate alternatives. This section outlines
requirements for our material suppliers to work to confirm
that phased-out chemicals are replaced by appropriate
alternatives and also requires suppliers to exclusively use
verified materials for specific uses, such as cleaners used at
final assembly sites. This update makes Apple one of the first
companies to codify a clear policy to enforce substitution
with safer materials, creating greater awareness and true
accountability among our supply chain partners.
Our Green Chemistry Advisory Board — an independent group
of leading researchers and academics — provides feedback
on key initiatives, including potential updates to the RSS. Their
diverse experience and perspectives help us lead the way
in protecting our customers and those who make or recycle
our products.
We apply controls to materials that come into prolonged
skin contact (as outlined in our Restricted Chemicals for
Prolonged Skin Contact Materials list). These restrictions
focus on substances that are potential skin sensitizers,
minimizing reactions commonly reported across wearable
products like jewelry. We derive these restrictions from
leading standards, recommendations from toxicologists and
dermatologists, international laws and directives, and Apple
policies. We perform analytical testing on each material
that comes into prolonged contact with skin according
to Appleʼs requirements, and we review compliance with
these requirements.
Assessment
ENGAGEMENT AND ADVOCACY
INTRODUCTION
CONTENTS
GREEN BOND IMPACT REPORT
DATA
APPENDIX
2026 ENVIRONMENTAL PROGRESS REPORT
65
ENVIRONMENTAL INITIATIVES
Working with suppliers to meet
global requirements
Weʼve created systems to help our suppliers learn about our
material specifications, track and assess the materials they
use, and regularly communicate their material usage. This
helps our suppliers meet global standards and regulations
governing their operations. The FMD and CSD programs
require suppliers to gather, understand, and share information
on the materials they use, beyond regulatory requirements.
We support suppliersʼ engagement with these programs —
and the RSS — through ongoing training, which is central
to our partnership and shared efforts to promote smarter
chemistry in our products and processes. The RSS describes
Appleʼs global requirements and restrictions on the use
of certain chemical substances or materials in Apple
products, accessories packaging, ingredient formulations,
and manufacturing processes. We provide supplemental
support to our suppliers through training and workshops
on our specifications. Weʼre also working with our suppliers
to identify and develop alternative materials that meet the
regulatory requirements for complex per- and polyfluoroalkyl
substances (PFAS).
Our suppliers in China mainland have been working since
2020 under regulations governing the use of materials
containing volatile organic compounds (VOCs). In 2025,
we continued providing additional support to suppliers
through trainings on regulations, attended by more than
2,200 participants. These attendees helped validate over
400 materials for low-VOC compliance. By deploying a VOC
specification worldwide, weʼre also helping drive the global
adoption of low-VOC alternatives.
Creating a list of safer cleaners
Our efforts are making an immediate and lasting impact in
protecting workers and the environment through our approach
to the application of cleaners and degreasers — some of
the highest-use materials at final assembly sites. Regulators
and environmental health and safety organizations have
focused considerable attention on the chemistries of cleaners
and degreasers.
Weʼve restricted the use of cleaners that contain known
carcinogens, mutagens, reproductive toxicants, strong
sensitizers, and persistent bioaccumulative toxins from
cleaners and degreasers used at our supplier final assembly
sites.
52
This work was guided by globally recognized
standards (such as EPA Safer Choice, GreenScreen Certified
®
,
and ToxFMD
®
) — standards that are based on chemical hazard
assessments, a more rigorous and robust hazard approach
than eliminating individual substances of concern.
Over the past several years, weʼve evaluated hundreds of
cleaner formulations for specific manufacturing uses, holding
each to rigorous disclosure requirements and low-hazard
criteria consistent with those leading standards. In 2025, we
approved more than 70 additional safer cleaners for use in
our supply chain, bringing the total number of safer cleaners
weʼve approved over the past three years to more than 300.
We also took the next step of compiling a carefully vetted
list of approved cleaning products, all of which satisfy the
requirements of the Apple RSS, and sharing this list directly
with Apple suppliers for their own proactive use.
These efforts have had a direct impact on health and safety —
and have the potential to transform how our industry operates.
Weʼre promoting the use of safer cleaners across our
supply chain by making it easier for suppliers to select safer
alternatives at the outset. Weʼve consistently expanded this
work deeper into our supply chain to suppliers and processes
beyond final assembly, helping them identify and implement
opportunities to use safer alternatives in their operations.
We also look outside our supply chain to promote a broader
transition to safer chemicals across our industry. See page 68
for more information on how weʼre advocating for safer
cleaners and degreasers.
Shaping the industry through innovative
PFAS assessment methods
Weʼve advanced testing methodologies in our Environmental
Testing Lab, including testing that enables the detection
of PFAS. Our lab developed a more sensitive and accurate
testing protocol to detect fluorine in polymeric samples
through calibration methods that use standardized
polycarbonate samples. We published the results of our work
in a study, sharing improved methods for detecting PFAS in
polymeric materials (such as plastics), which allows other
electronics manufacturers to more accurately assess whether
their products may contain PFAS.
Verifying and developing in the
Environmental Testing Lab
We evaluate the safety of our products and materials through
chemical analyses at our Environmental Testing Lab and
third-party laboratories. We establish material specifications
that suppliers are required to meet, and we conduct targeted
testing as part of our compliance processes. The lab
continues to grow in its mission and capacity — expanding its
testing facilities with new technologies to conduct chemical
analysis. Our teams also review test reports from suppliers
to evaluate substances against the Regulated Substances
Specification and Restricted Chemicals for Prolonged Skin
Contact Materials specification. In 2025, we performed
toxicological assessments on more than 1,900 new materials
to proactively evaluate and eliminate potentially harmful
substances from our products.
The data we collect from our disclosure programs drives
our assessments. We develop toxicological profiles for new
chemicals using scientific literature and internal assessments.
These profiles detail the potential health impacts of each
chemical, enabling us to evaluate the safety of using a
substance in a specific product. We also continue to expand
the scope of biocompatibility testing beyond individual
materials to include modules and whole products. Through
this work, we have an extensive view of our products. The
information we share through material specifications benefits
our suppliers and those we collaborate with in the industry.
ENGAGEMENT AND ADVOCACY
INTRODUCTION
CONTENTS
GREEN BOND IMPACT REPORT
DATA
APPENDIX
2026 ENVIRONMENTAL PROGRESS REPORT
66
ENVIRONMENTAL INITIATIVES
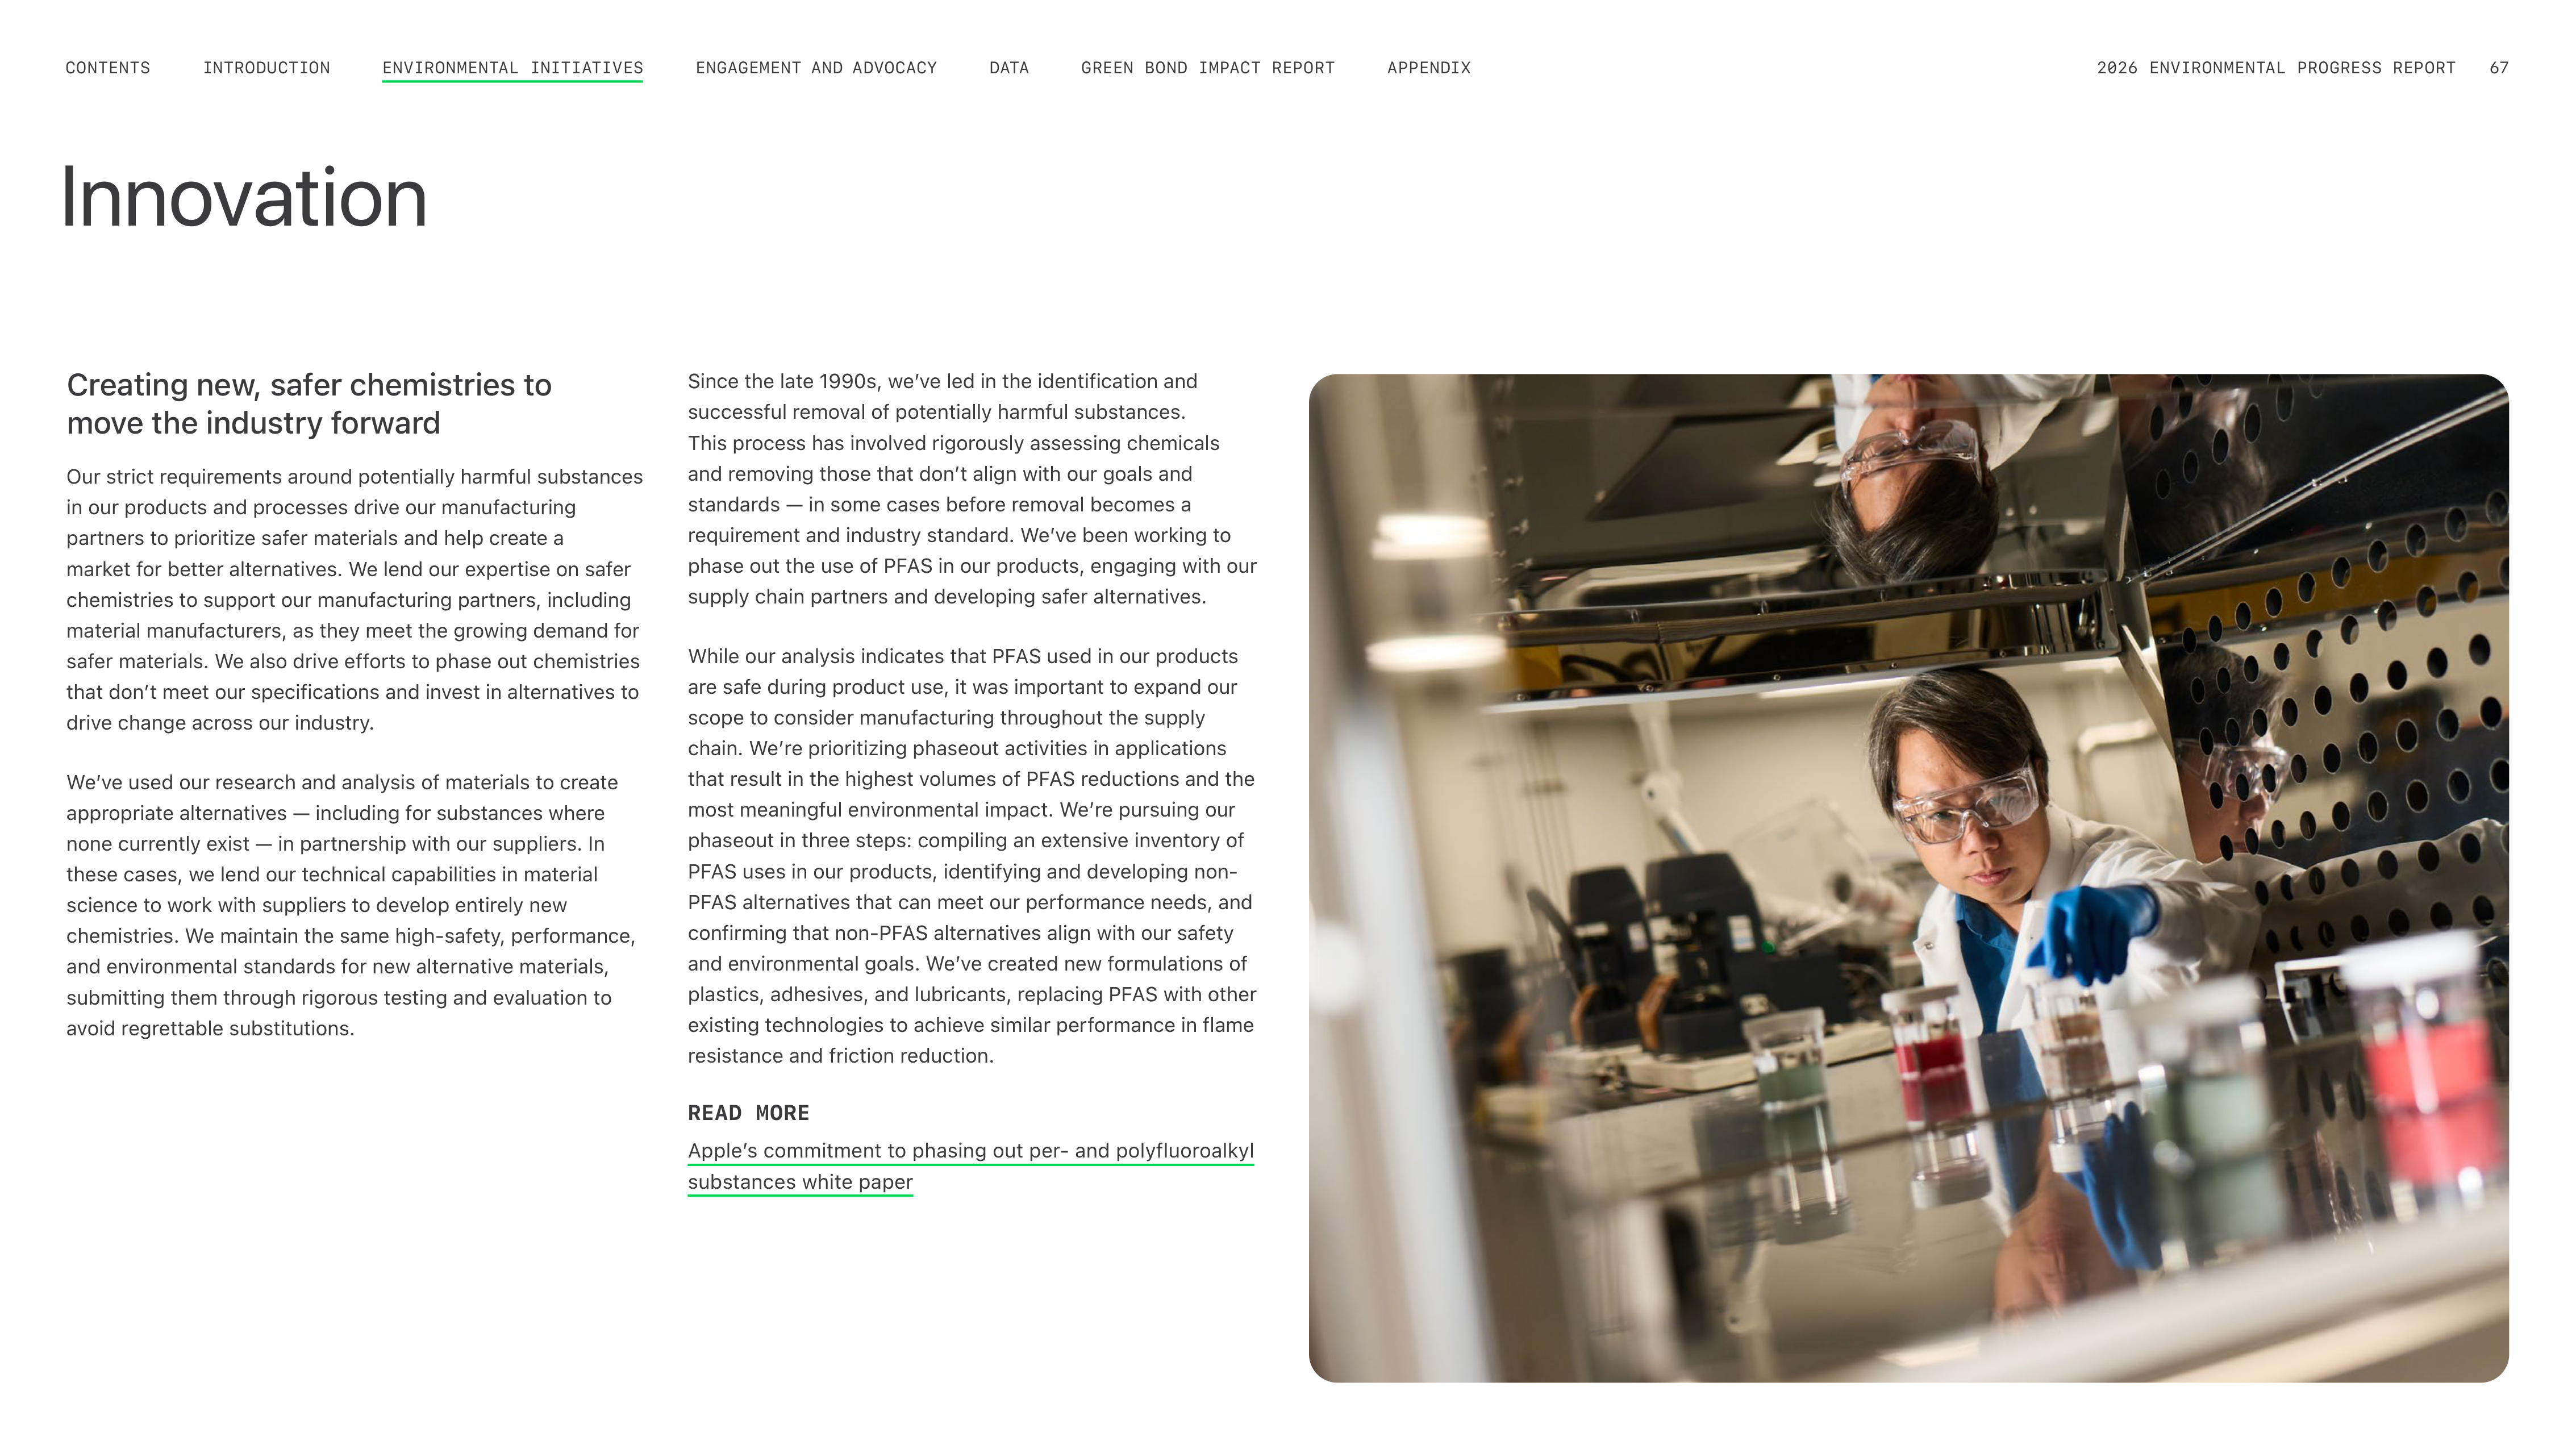
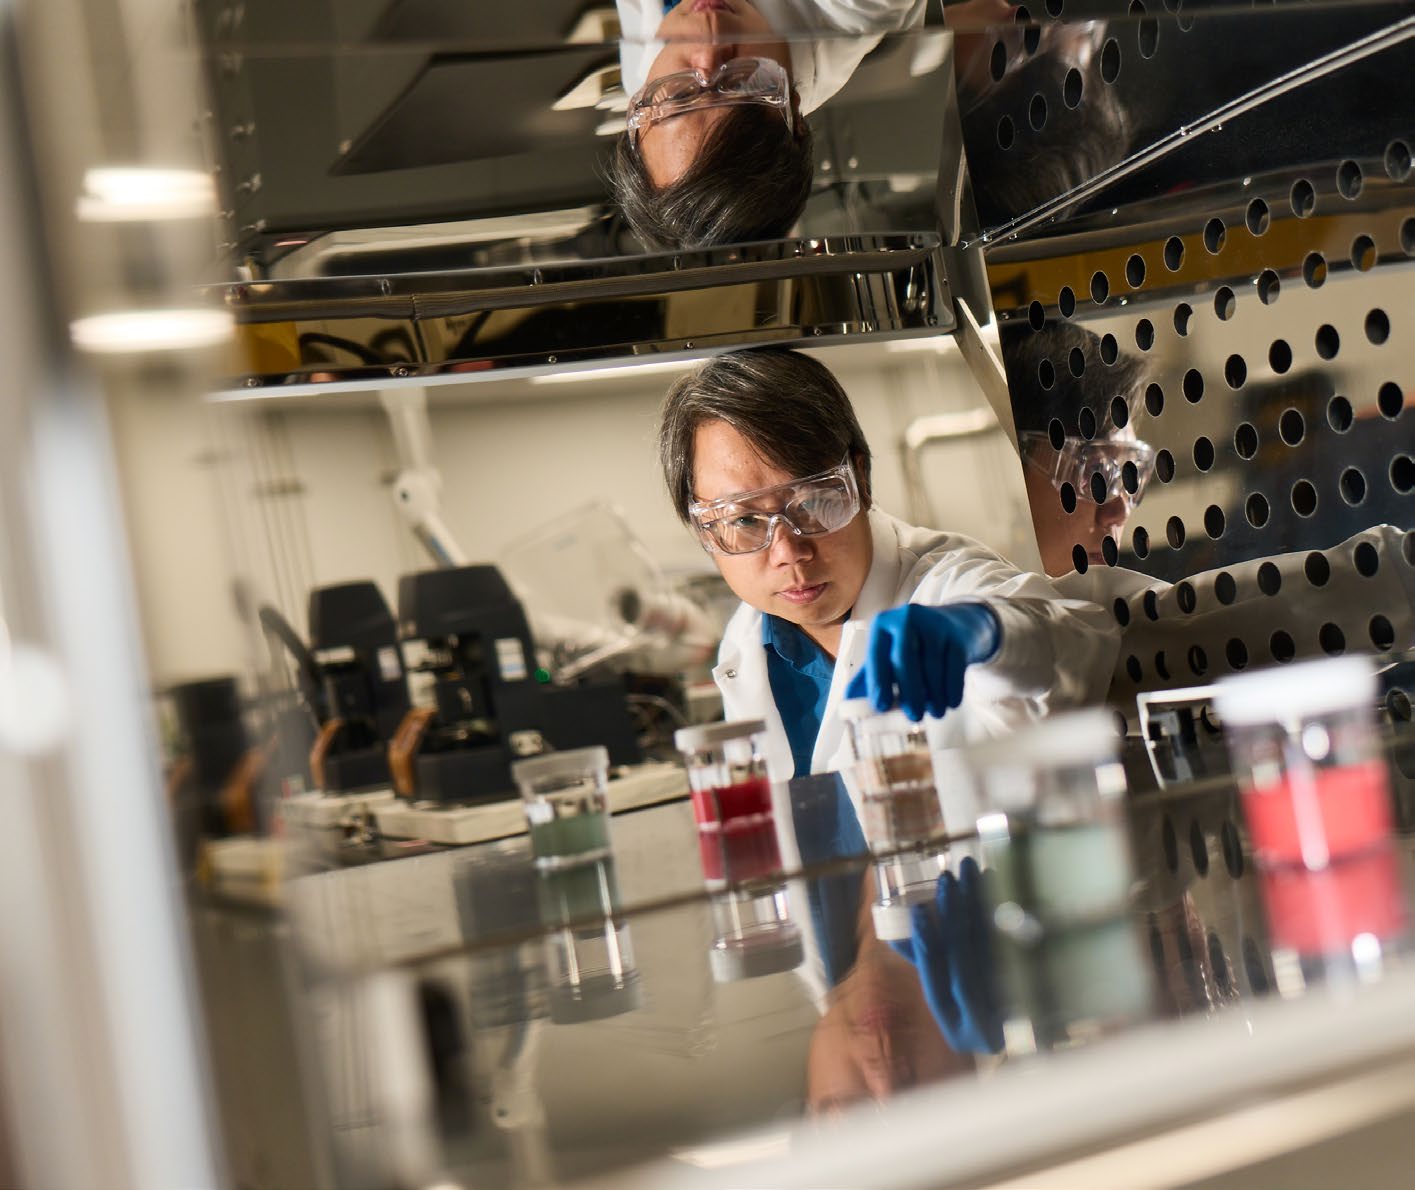
Creating new, safer chemistries to
move the industry forward
Our strict requirements around potentially harmful substances
in our products and processes drive our manufacturing
partners to prioritize safer materials and help create a
market for better alternatives. We lend our expertise on safer
chemistries to support our manufacturing partners, including
material manufacturers, as they meet the growing demand for
safer materials. We also drive efforts to phase out chemistries
that donʼt meet our specifications and invest in alternatives to
drive change across our industry.
Weʼve used our research and analysis of materials to create
appropriate alternatives — including for substances where
none currently exist — in partnership with our suppliers. In
these cases, we lend our technical capabilities in material
science to work with suppliers to develop entirely new
chemistries. We maintain the same high-safety, performance,
and environmental standards for new alternative materials,
submitting them through rigorous testing and evaluation to
avoid regrettable substitutions.
Since the late 1990s, weʼve led in the identification and
successful removal of potentially harmful substances.
This process has involved rigorously assessing chemicals
and removing those that donʼt align with our goals and
standards — in some cases before removal becomes a
requirement and industry standard. Weʼve been working to
phase out the use of PFAS in our products, engaging with our
supply chain partners and developing safer alternatives.
While our analysis indicates that PFAS used in our products
are safe during product use, it was important to expand our
scope to consider manufacturing throughout the supply
chain. Weʼre prioritizing phaseout activities in applications
that result in the highest volumes of PFAS reductions and the
most meaningful environmental impact. Weʼre pursuing our
phaseout in three steps: compiling an extensive inventory of
PFAS uses in our products, identifying and developing non-
PFAS alternatives that can meet our performance needs, and
confirming that non-PFAS alternatives align with our safety
and environmental goals. Weʼve created new formulations of
plastics, adhesives, and lubricants, replacing PFAS with other
existing technologies to achieve similar performance in flame
resistance and friction reduction.
READ MORE
Appleʼs commitment to phasing out per- and polyfluoroalkyl
substances white paper
Innovation
ENGAGEMENT AND ADVOCACY
INTRODUCTION
CONTENTS
GREEN BOND IMPACT REPORT
DATA
APPENDIX
2026 ENVIRONMENTAL PROGRESS REPORT
67
ENVIRONMENTAL INITIATIVES
Advocating for safer alternatives across
our industry
We continually push for safer alternatives to be accessible to
others in our industry. Our work in smarter chemistry helps
facilitate this important transition. Identifying and promoting
the use of safer cleaners beyond Apple is a way to increase
the impact of safer alternatives. The criteria we set for
chemicals in materials — and how our suppliers use them —
help establish even more stringent standards around health
and safety across the electronics industry. We set criteria for
alternatives in our recent publication of the RSS. Across many
substance groups — including cleaners, flame retardants, and
photoinitiators — our suppliers are required to ensure that
when replacing a chemistry, the alternative is safer.
We also collaborate with standards-setting bodies, trade
associations, and NGOs to achieve this, developing tools,
standards, and mechanisms to drive the identification and
adoption of smarter chemistries throughout our supply chain.
With our focus on cleaners and degreasers, weʼve built
multiple pathways to advance industry innovation in safer
cleaners. Our efforts to use safer cleaners in our supply
chain have been central to our advocacy for greater industry
collaboration and instrumental to our participation as a
founding signatory of the Toward Zero Exposure program led
by the Clean Electronics Production Network (CEPN).
RECYCLING
Brominated and chlorinated
flame retardants
Weʼve replaced brominated and chlorinated
flame retardants, which reduce the
recyclability of plastics and limit material
circularity, with safer metal hydroxides and
phosphorous compounds. Incineration of
waste plastics containing brominated and
chlorinated flame retardants can release toxic
chemicals such as dioxins and furans.
MATERIALS SELECTION
Per- and polyfluoroalkyl substances (PFAS)
We proactively removed PFOA and PFOS from
our products in 2010 and 2013, respectively,
far ahead of global requirements. In addition,
we were ahead of our industry peers in making
a commitment to completely eliminate PFAS
from our products. We plan to do this by
developing or selecting non-PFAS alternatives
that do not result in regrettable substitutions.
PRODUCT USE
PVC and phthalates
Weʼve replaced PVC and phthalates
with safer thermoplastic elastomers.*
Some phthalates have been identified as
endocrine disruptors that can migrate
out of PVC over time. Both are still used
by other companies in power cords and
headphone cables.
MANUFACTURING
Safer cleaners and degreasers
Weʼve restricted the use of cleaners and
degreasers that contain known carcinogens,
mutagens, reproductive toxicants, strong
sensitizers, and persistent bioaccumulative
toxins from those used at our supplier final
assembly sites. We did this by using globally
recognized standards (such as EPA Safer
Choice, GreenScreen Certified
®
, and ToxFMD
®
)
based on full formulation-level (or material-
level) chemical hazard assessments because
this approach is more extensive and robust
than simply eliminating individual substances
of concern.
Apple’s regulated substances
*
We broadly restrict the use of PVC and phthalates
in our products, except for AC power cords in a
limited number of countries, where we continue
to seek government approval for our PVC and
phthalates replacement.
ENGAGEMENT AND ADVOCACY
INTRODUCTION
CONTENTS
GREEN BOND IMPACT REPORT
DATA
APPENDIX
2026 ENVIRONMENTAL PROGRESS REPORT
68
ENVIRONMENTAL INITIATIVES

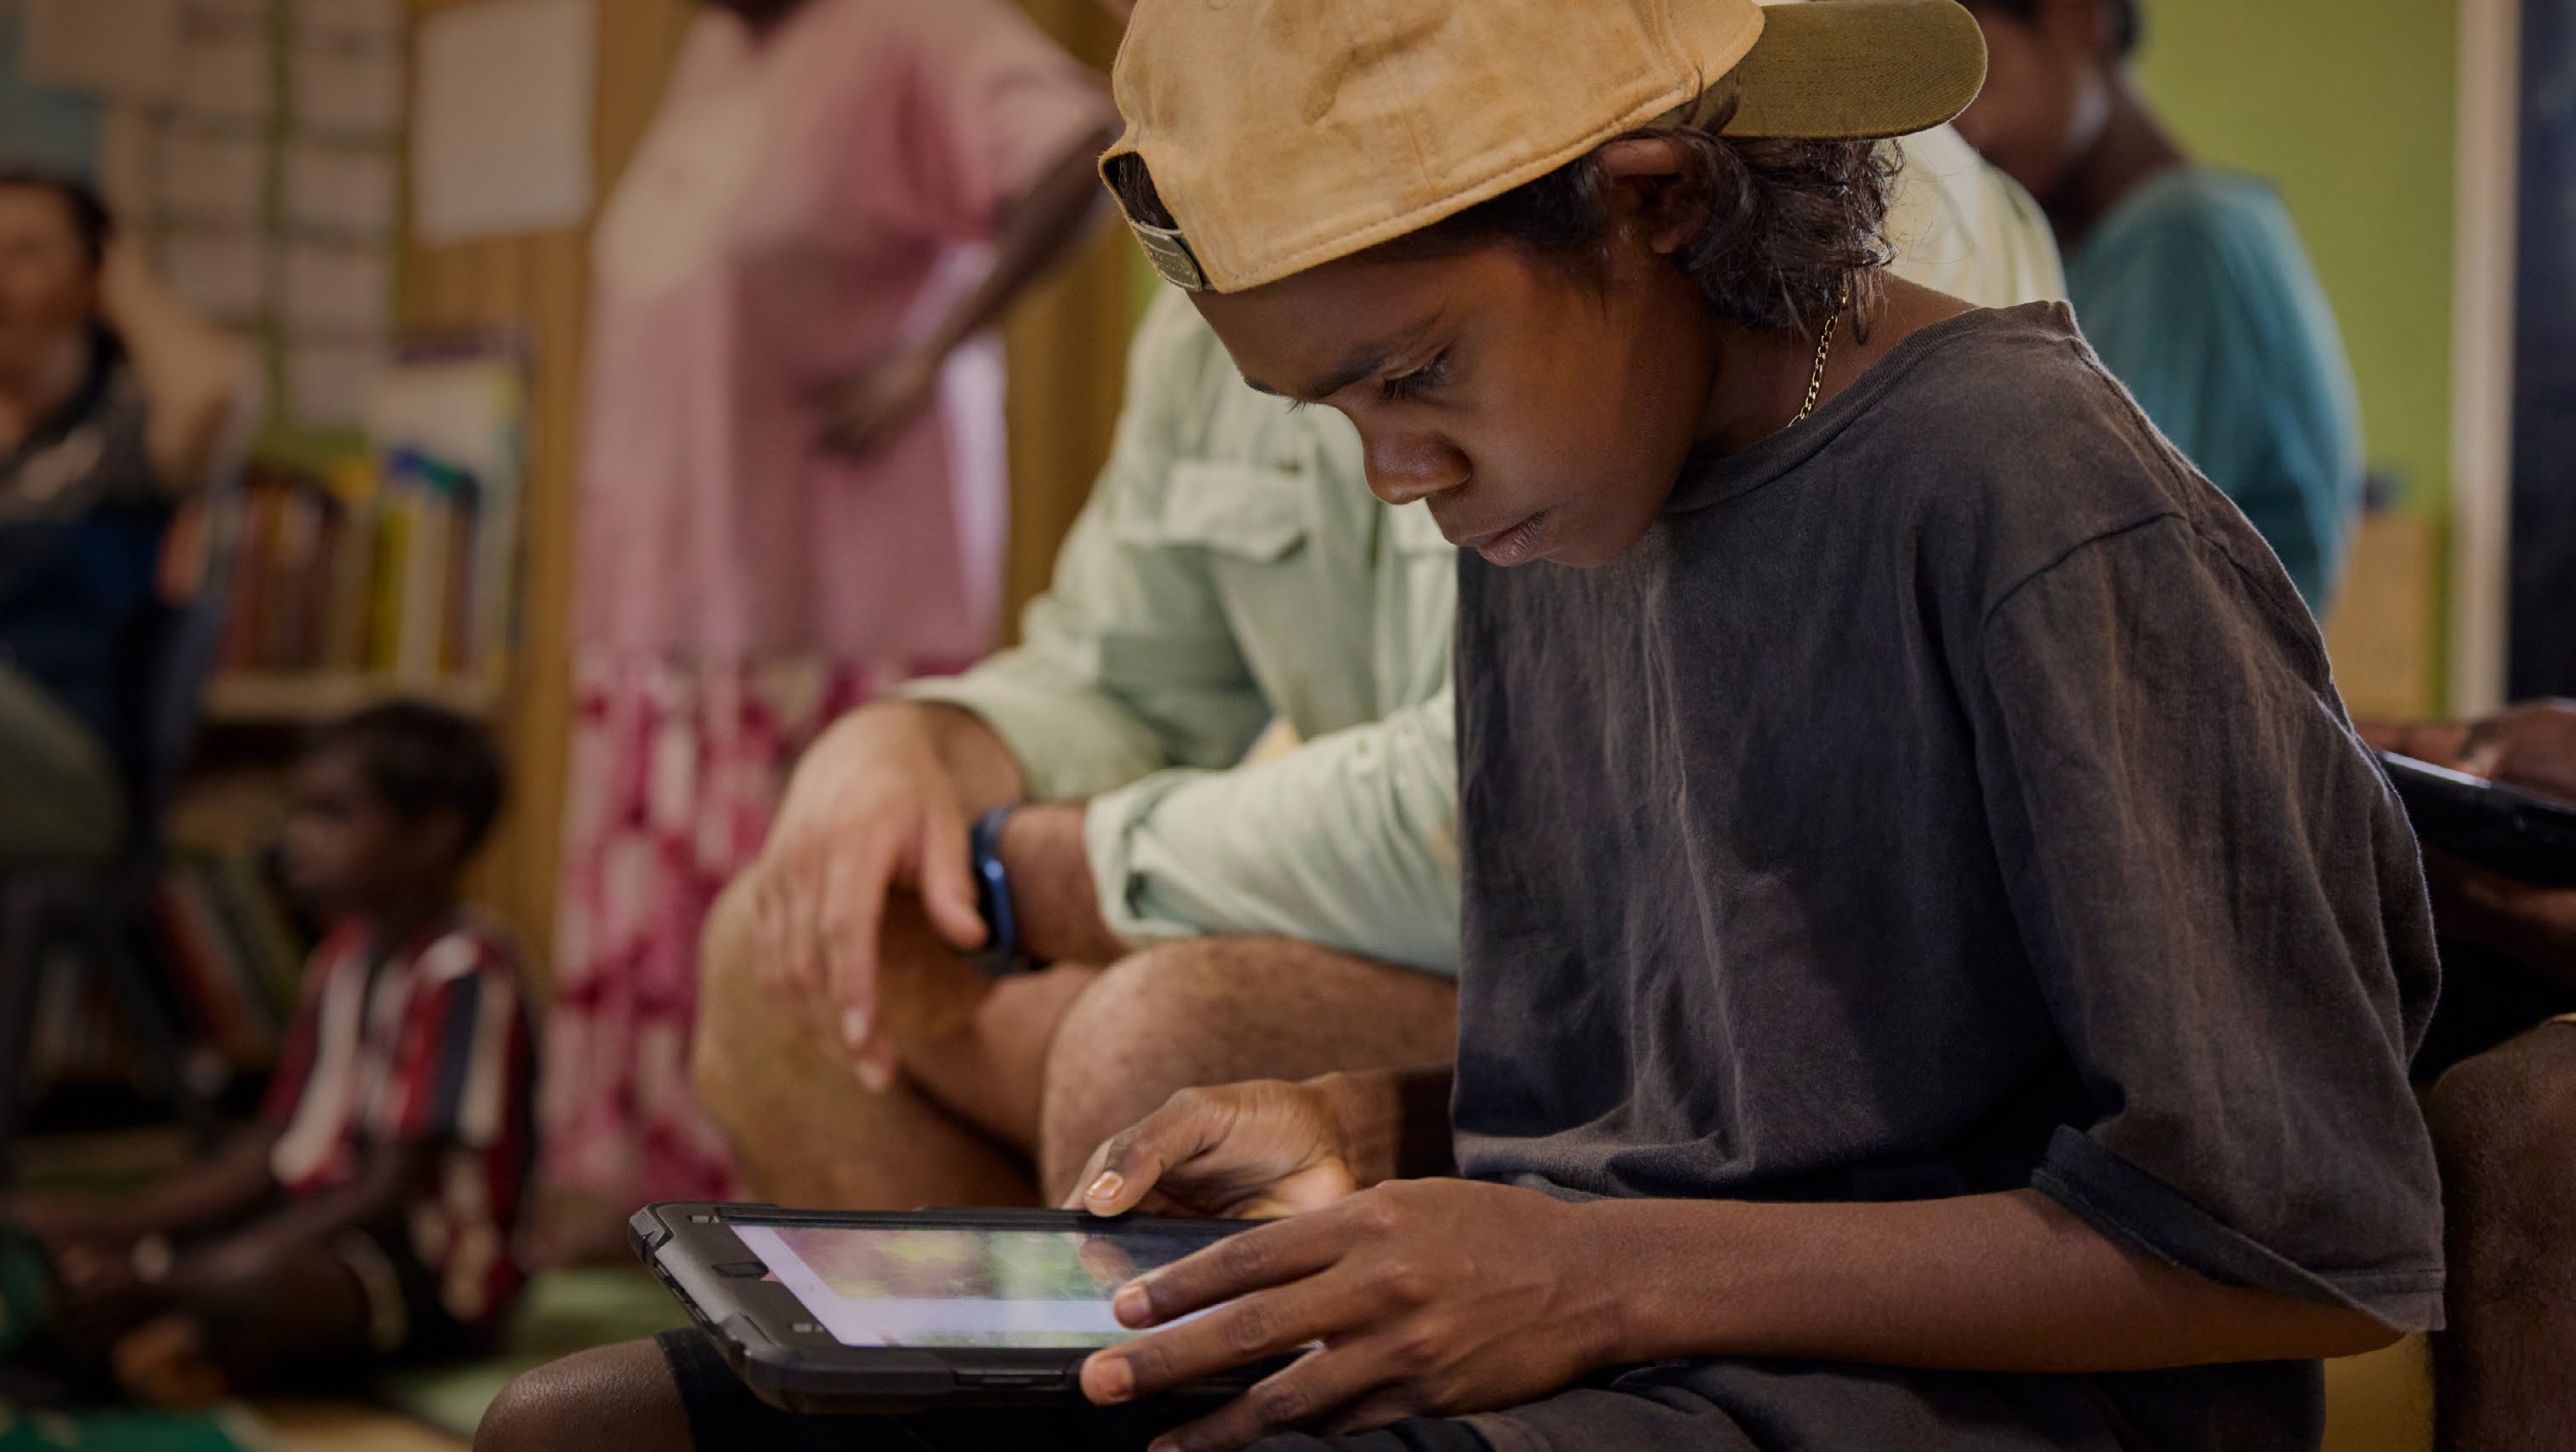
Engagement
and advocacy
IN THIS SECTION
Learning with others
Collaborative impact
Supporting communities
2026 ENVIRONMENTAL PROGRESS REPORT
69
ENVIRONMENTAL INITIATIVES
INTRODUCTION
CONTENTS
APPENDIX
GREEN BOND IMPACT REPORT
DATA
ENGAGEMENT AND ADVOCACY
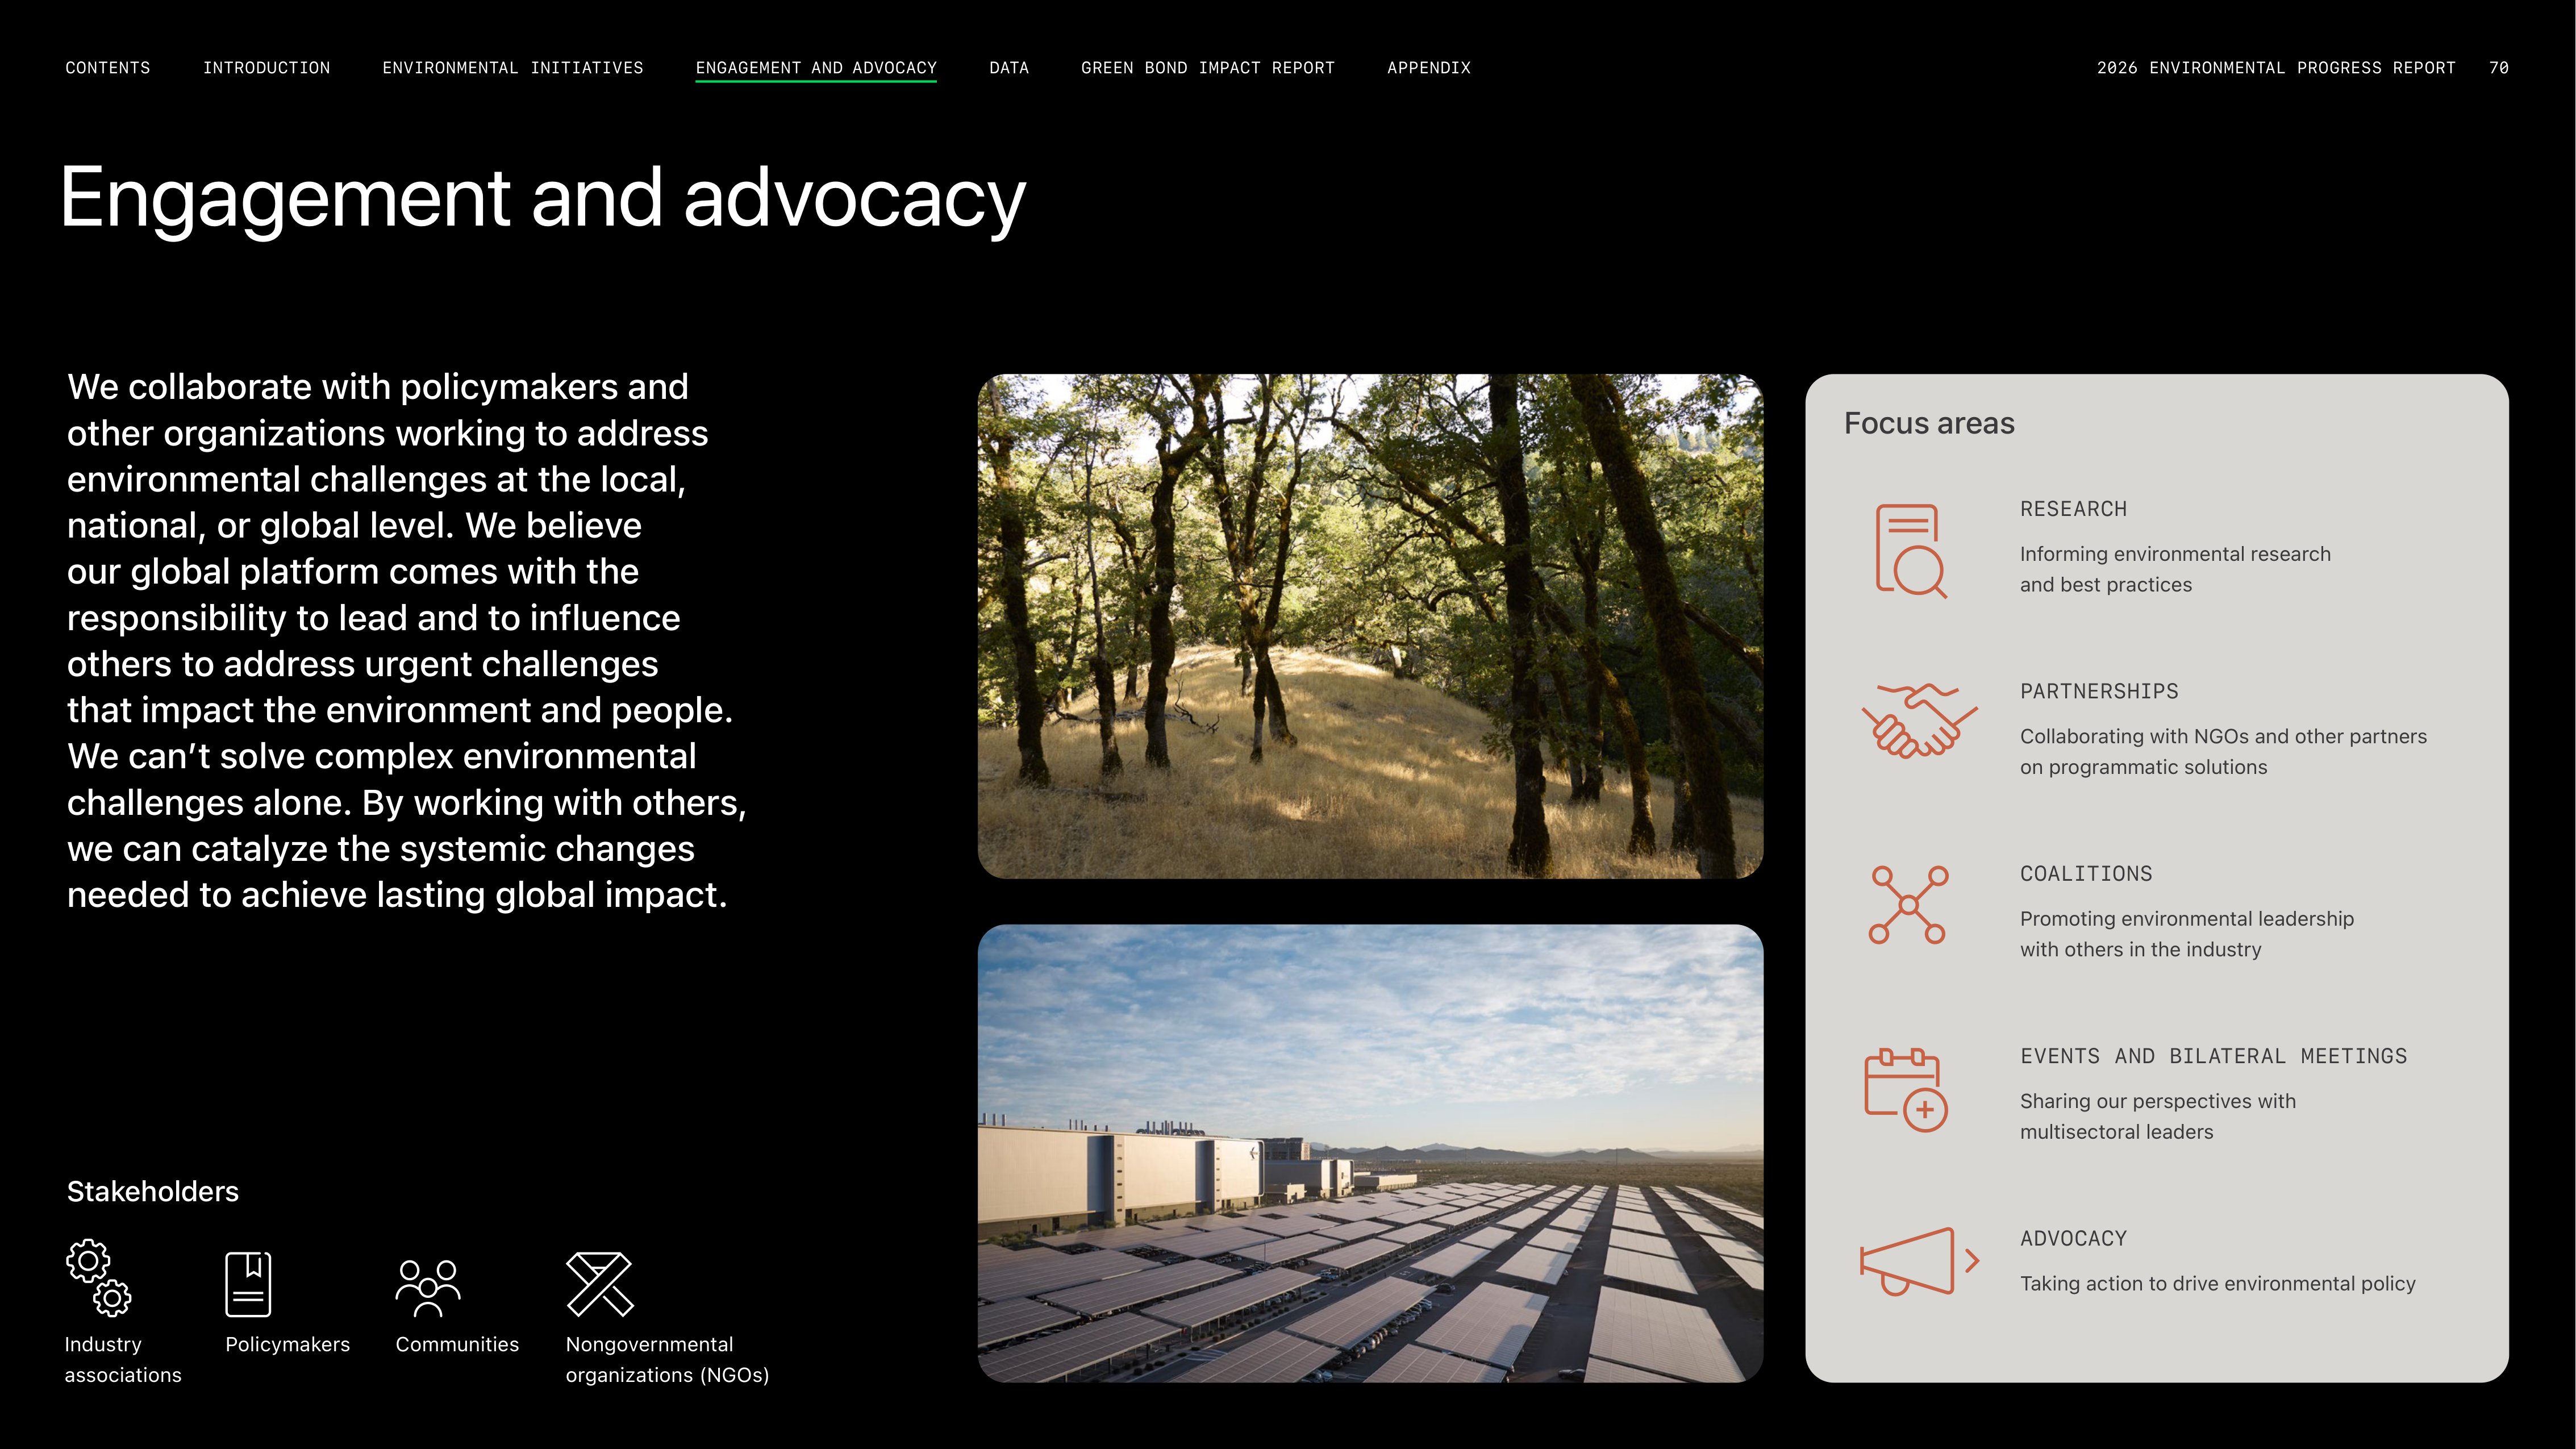
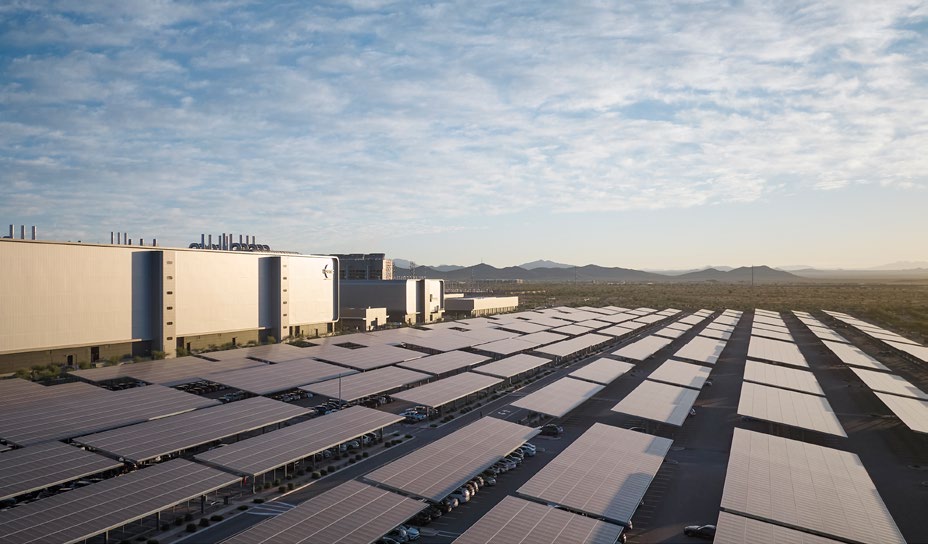

We collaborate with policymakers and
other organizations working to address
environmental challenges at the local,
national, or global level. We believe
our global platform comes with the
responsibility to lead and to influence
others to address urgent challenges
that impact the environment and people.
We can’t solve complex environmental
challenges alone. By working with others,
we can catalyze the systemic changes
needed to achieve lasting global impact.
RESEARCH
Informing environmental research
and best practices
PARTNERSHIPS
Collaborating with NGOs and other partners
on programmatic solutions
EVENTS AND BILATERAL MEETINGS
Sharing our perspectives with
multisectoral leaders
COALITIONS
Promoting environmental leadership
with others in the industry
ADVOCACY
Taking action to drive environmental policy
Focus areas
Stakeholders
Nongovernmental
organizations (NGOs)
Industry
associations
Policymakers
Communities
Engagement and advocacy
2026 ENVIRONMENTAL PROGRESS REPORT
70
ENVIRONMENTAL INITIATIVES
INTRODUCTION
CONTENTS
APPENDIX
GREEN BOND IMPACT REPORT
DATA
ENGAGEMENT AND ADVOCACY
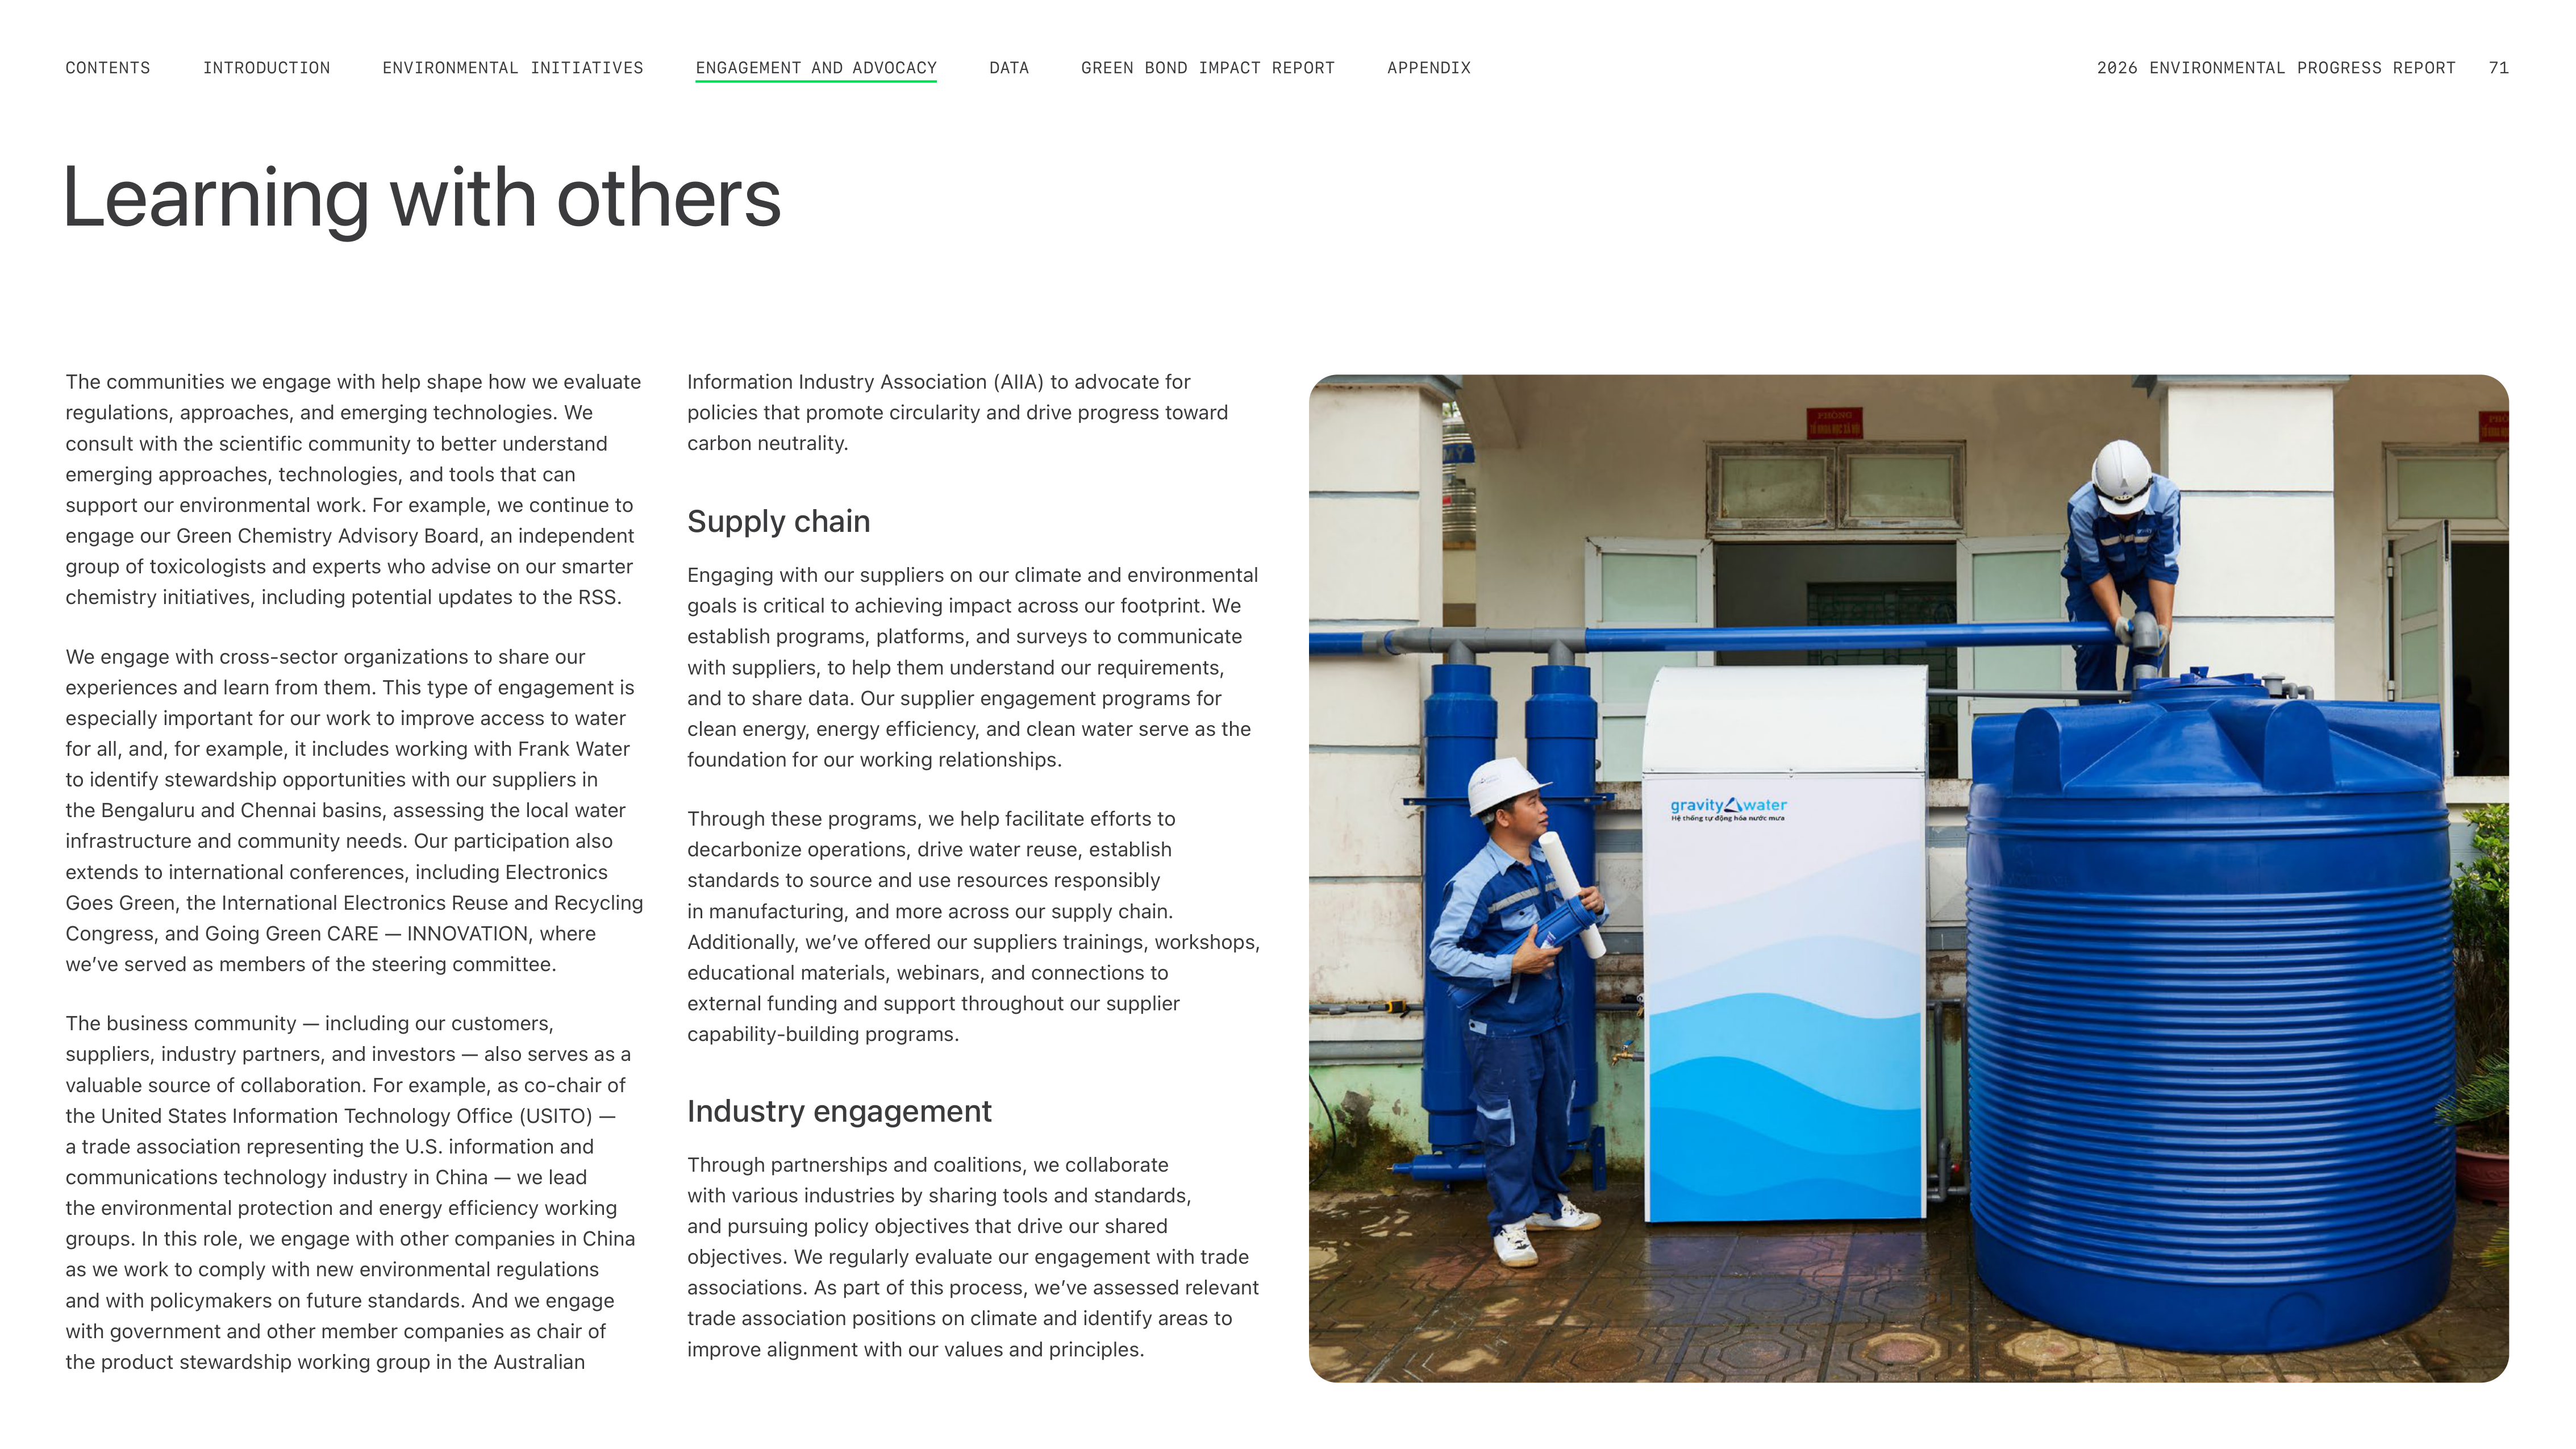
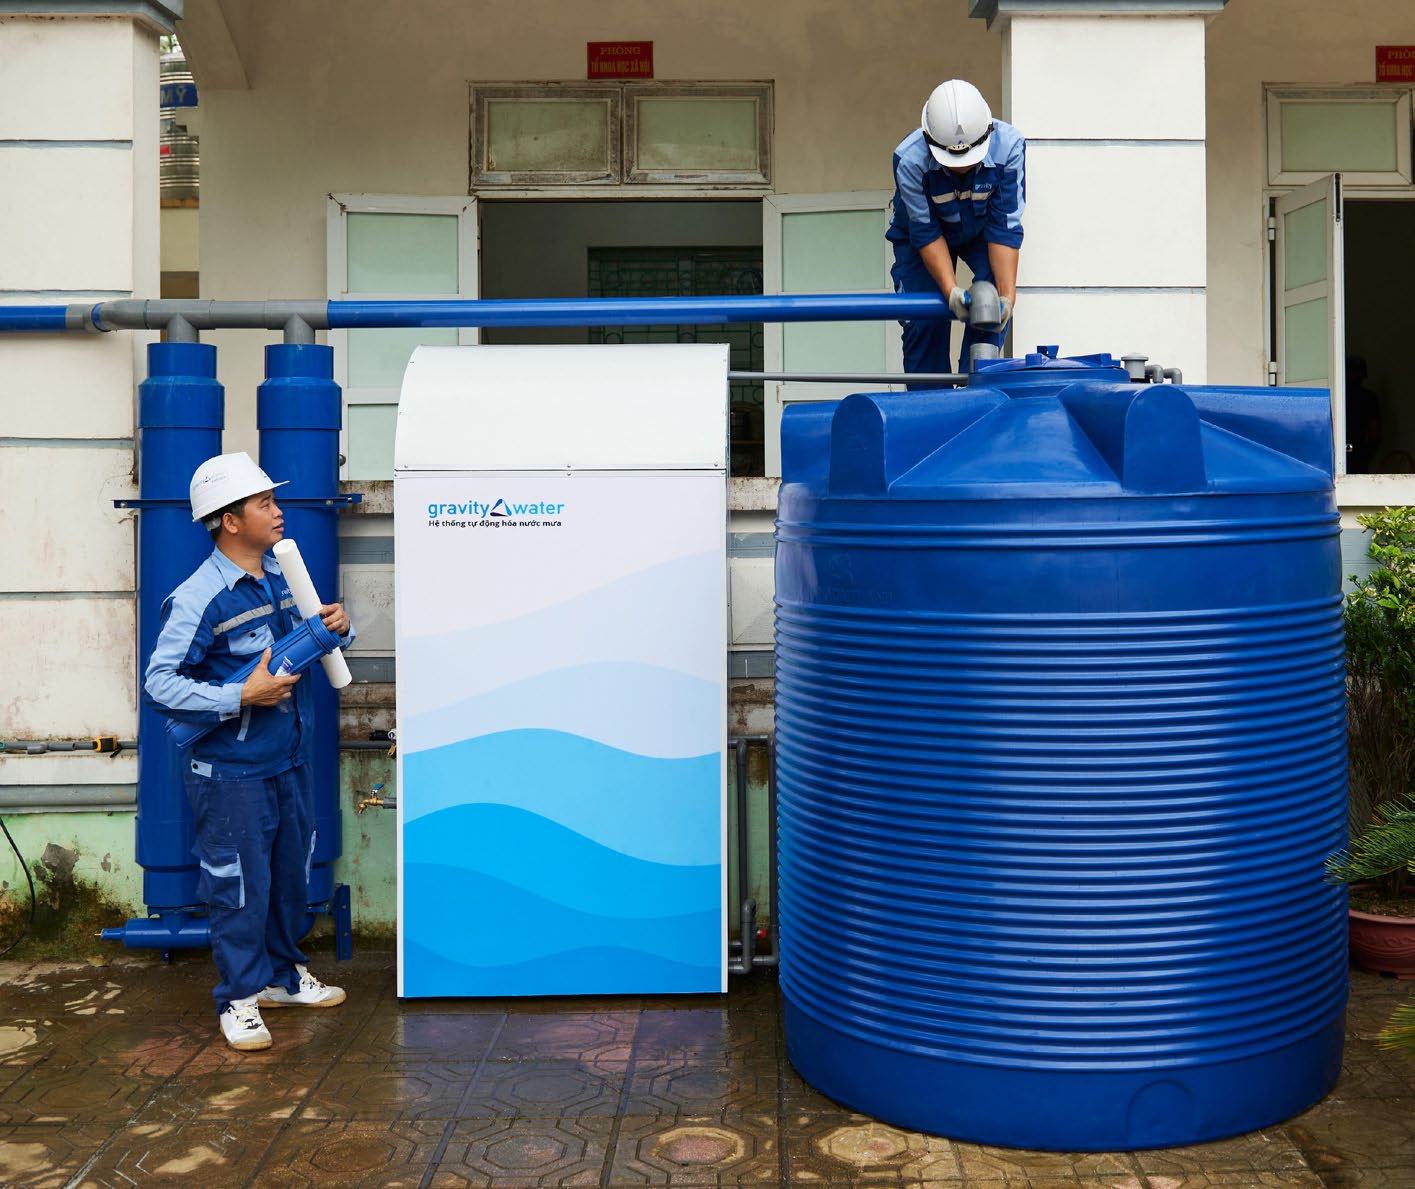
Supply chain
Engaging with our suppliers on our climate and environmental
goals is critical to achieving impact across our footprint. We
establish programs, platforms, and surveys to communicate
with suppliers, to help them understand our requirements,
and to share data. Our supplier engagement programs for
clean energy, energy efficiency, and clean water serve as the
foundation for our working relationships.
Through these programs, we help facilitate efforts to
decarbonize operations, drive water reuse, establish
standards to source and use resources responsibly
in manufacturing, and more across our supply chain.
Additionally, weʼve offered our suppliers trainings, workshops,
educational materials, webinars, and connections to
external funding and support throughout our supplier
capability-building programs.
Industry engagement
Through partnerships and coalitions, we collaborate
with various industries by sharing tools and standards,
and pursuing policy objectives that drive our shared
objectives. We regularly evaluate our engagement with trade
associations. As part of this process, weʼve assessed relevant
trade association positions on climate and identify areas to
improve alignment with our values and principles.
Learning with others
The communities we engage with help shape how we evaluate
regulations, approaches, and emerging technologies. We
consult with the scientific community to better understand
emerging approaches, technologies, and tools that can
support our environmental work. For example, we continue to
engage our Green Chemistry Advisory Board, an independent
group of toxicologists and experts who advise on our smarter
chemistry initiatives, including potential updates to the RSS.
We engage with cross-sector organizations to share our
experiences and learn from them. This type of engagement is
especially important for our work to improve access to water
for all, and, for example, it includes working with Frank Water
to identify stewardship opportunities with our suppliers in
the Bengaluru and Chennai basins, assessing the local water
infrastructure and community needs. Our participation also
extends to international conferences, including Electronics
Goes Green, the International Electronics Reuse and Recycling
Congress, and Going Green CARE — INNOVATION, where
weʼve served as members of the steering committee.
The business community — including our customers,
suppliers, industry partners, and investors — also serves as a
valuable source of collaboration. For example, as co-chair of
the United States Information Technology Office (USITO) —
a trade association representing the U.S. information and
communications technology industry in China — we lead
the environmental protection and energy efficiency working
groups. In this role, we engage with other companies in China
as we work to comply with new environmental regulations
and with policymakers on future standards. And we engage
with government and other member companies as chair of
the product stewardship working group in the Australian
Information Industry Association (AIIA) to advocate for
policies that promote circularity and drive progress toward
carbon neutrality.
ENVIRONMENTAL INITIATIVES
INTRODUCTION
CONTENTS
GREEN BOND IMPACT REPORT
DATA
APPENDIX
2026 ENVIRONMENTAL PROGRESS REPORT
71
ENGAGEMENT AND ADVOCACY
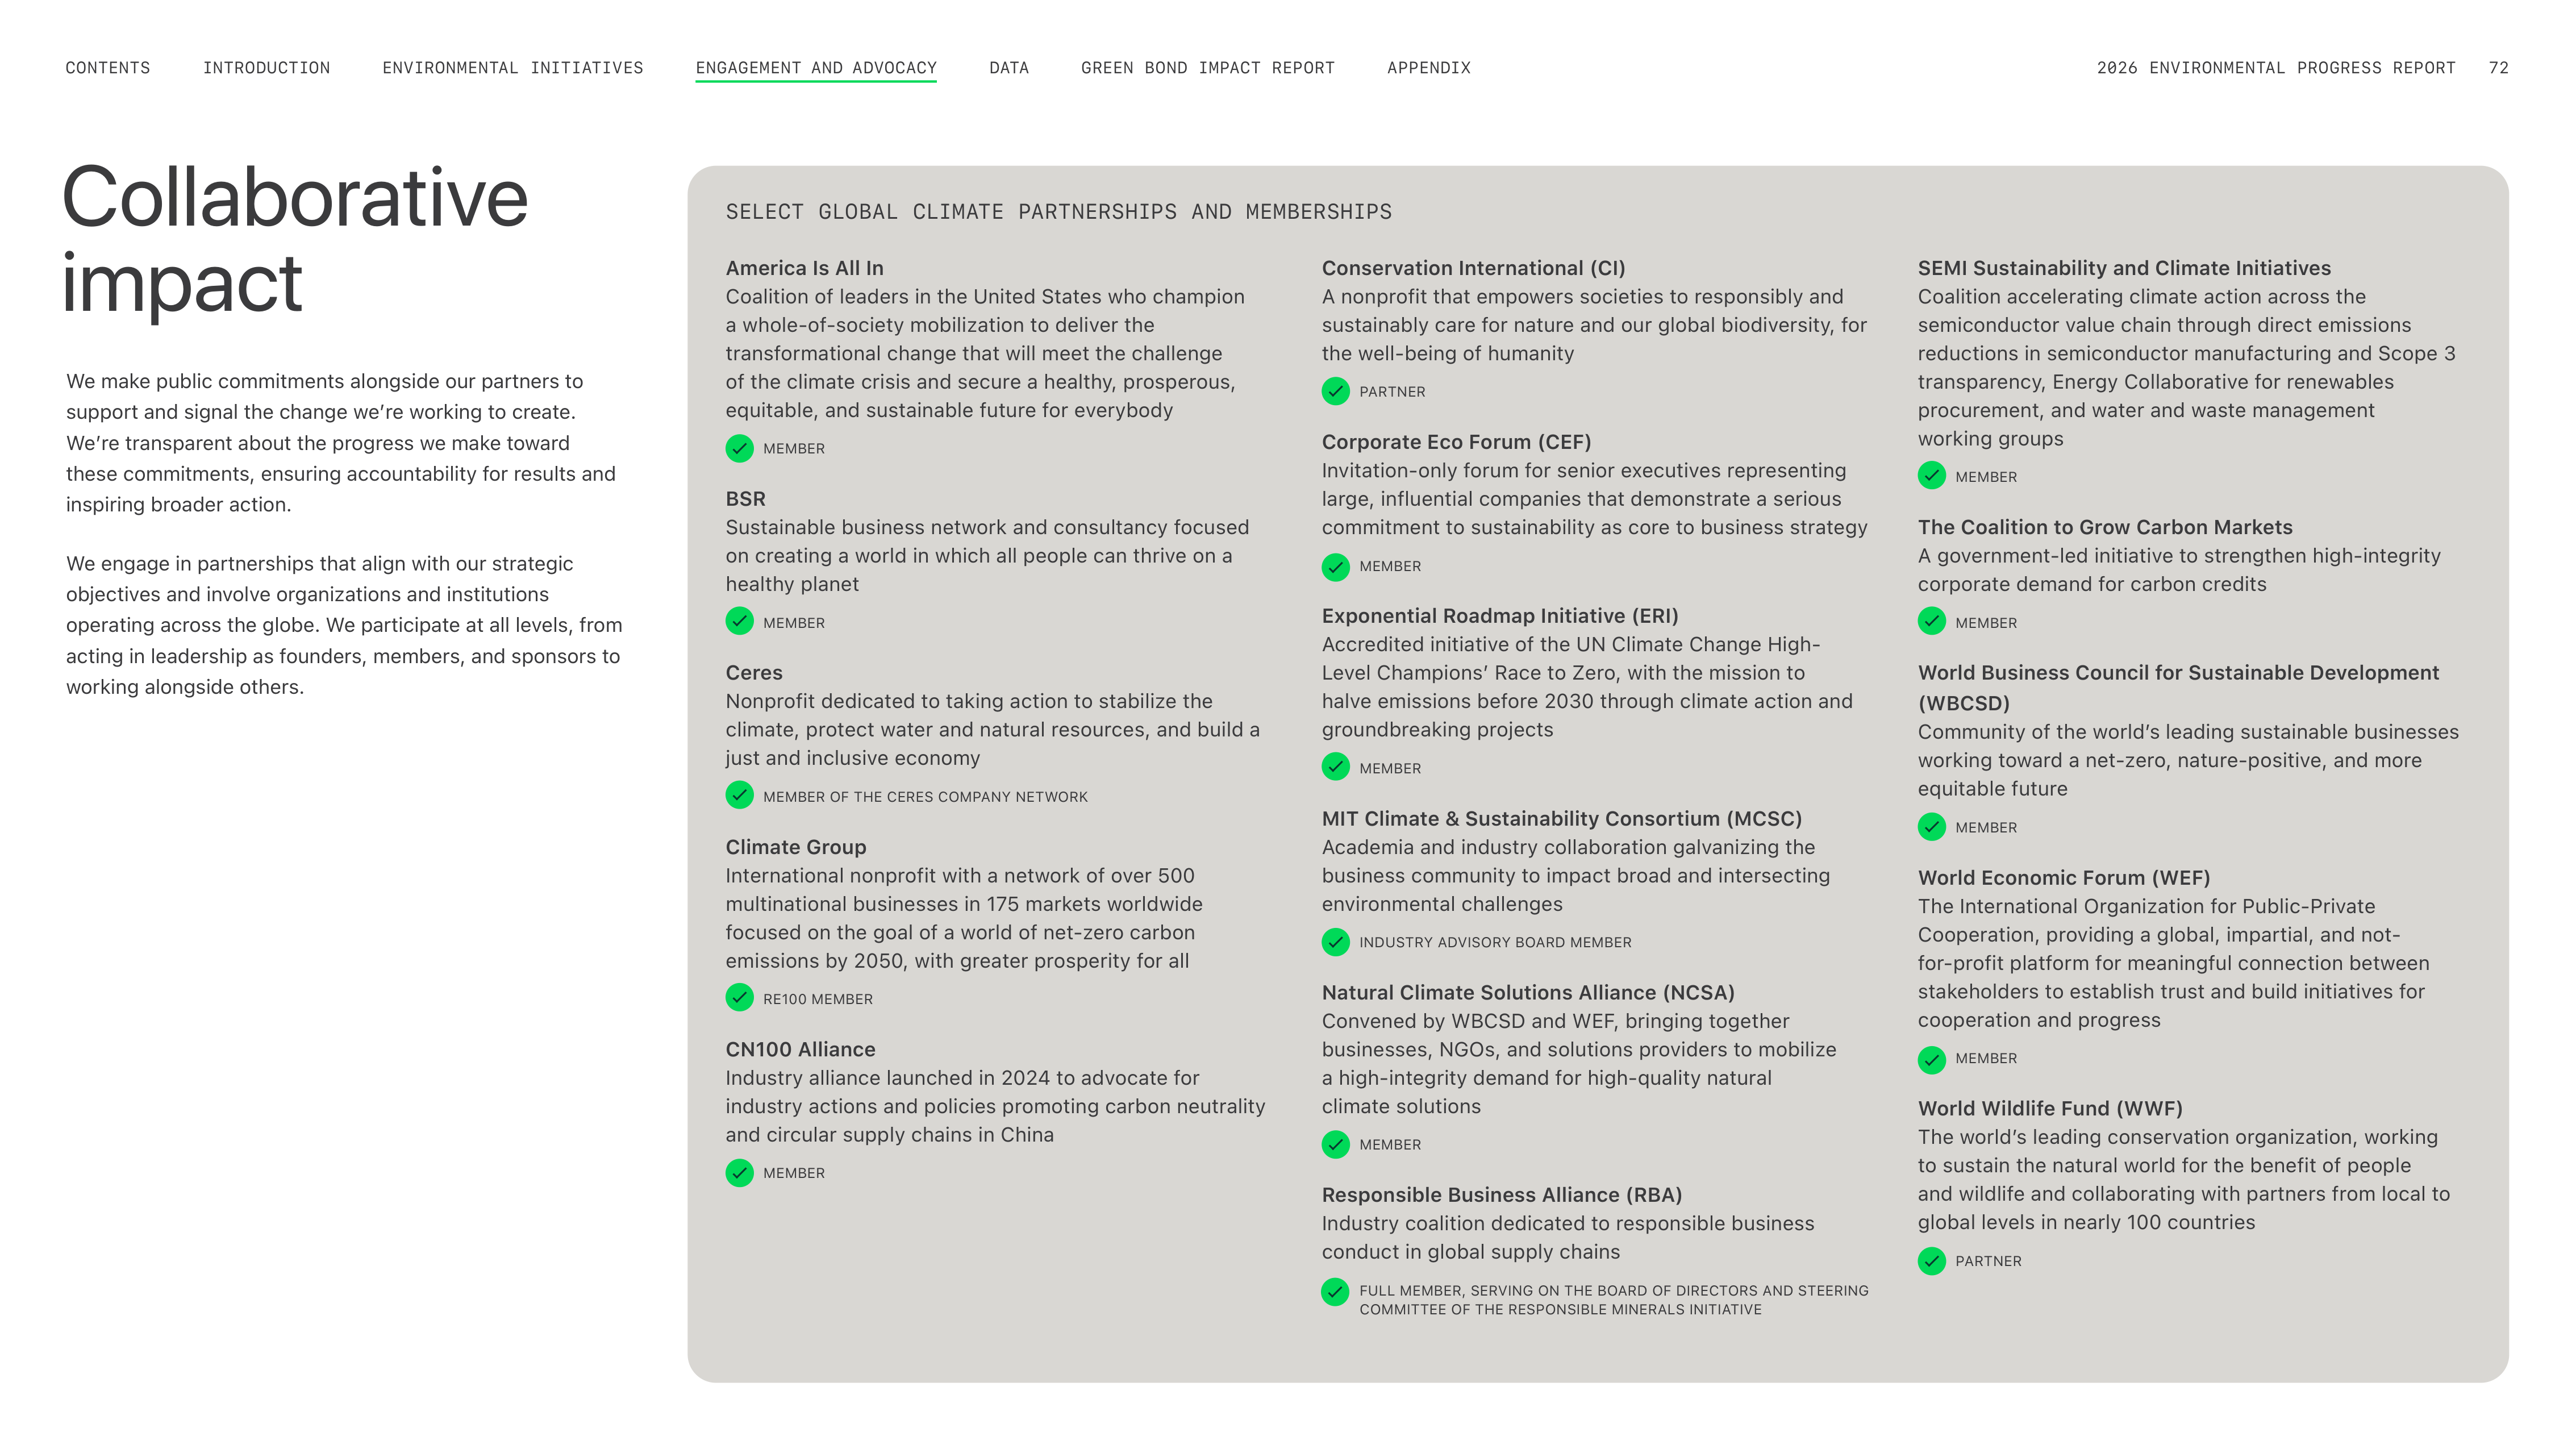
Collaborative
impact
We make public commitments alongside our partners to
support and signal the change weʼre working to create.
Weʼre transparent about the progress we make toward
these commitments, ensuring accountability for results and
inspiring broader action.
We engage in partnerships that align with our strategic
objectives and involve organizations and institutions
operating across the globe. We participate at all levels, from
acting in leadership as founders, members, and sponsors to
working alongside others.
SEMI Sustainability and Climate Initiatives
Coalition accelerating climate action across the
semiconductor value chain through direct emissions
reductions in semiconductor manufacturing and Scope 3
transparency, Energy Collaborative for renewables
procurement, and water and waste management
working groups
MEMBER
The Coalition to Grow Carbon Markets
A government-led initiative to strengthen high-integrity
corporate demand for carbon credits
MEMBER
World Business Council for Sustainable Development
(WBCSD)
Community of the worldʼs leading sustainable businesses
working toward a net-zero, nature-positive, and more
equitable future
MEMBER
World Economic Forum (WEF)
The International Organization for Public-Private
Cooperation, providing a global, impartial, and not-
for-profit platform for meaningful connection between
stakeholders to establish trust and build initiatives for
cooperation and progress
MEMBER
World Wildlife Fund (WWF)
The worldʼs leading conservation organization, working
to sustain the natural world for the benefit of people
and wildlife and collaborating with partners from local to
global levels in nearly 100 countries
PARTNER
SELECT GLOBAL CLIMATE PARTNERSHIPS AND MEMBERSHIPS
America Is All In
Coalition of leaders in the United States who champion
a whole-of-society mobilization to deliver the
transformational change that will meet the challenge
of the climate crisis and secure a healthy, prosperous,
equitable, and sustainable future for everybody
MEMBER
BSR
Sustainable business network and consultancy focused
on creating a world in which all people can thrive on a
healthy planet
MEMBER
Ceres
Nonprofit dedicated to taking action to stabilize the
climate, protect water and natural resources, and build a
just and inclusive economy
MEMBER OF THE CERES COMPANY NETWORK
Climate Group
International nonprofit with a network of over 500
multinational businesses in 175 markets worldwide
focused on the goal of a world of net-zero carbon
emissions by 2050, with greater prosperity for all
RE100 MEMBER
CN100 Alliance
Industry alliance launched in 2024 to advocate for
industry actions and policies promoting carbon neutrality
and circular supply chains in China
MEMBER
Conservation International (CI)
A nonprofit that empowers societies to responsibly and
sustainably care for nature and our global biodiversity, for
the well-being of humanity
PARTNER
Corporate Eco Forum (CEF)
Invitation-only forum for senior executives representing
large, influential companies that demonstrate a serious
commitment to sustainability as core to business strategy
MEMBER
Exponential Roadmap Initiative (ERI)
Accredited initiative of the UN Climate Change High-
Level Championsʼ Race to Zero, with the mission to
halve emissions before 2030 through climate action and
groundbreaking projects
MEMBER
MIT Climate & Sustainability Consortium (MCSC)
Academia and industry collaboration galvanizing the
business community to impact broad and intersecting
environmental challenges
INDUSTRY ADVISORY BOARD MEMBER
Natural Climate Solutions Alliance (NCSA)
Convened by WBCSD and WEF, bringing together
businesses, NGOs, and solutions providers to mobilize
a high-integrity demand for high-quality natural
climate solutions
MEMBER
Responsible Business Alliance (RBA)
Industry coalition dedicated to responsible business
conduct in global supply chains
FULL MEMBER, SERVING ON THE BOARD OF DIRECTORS AND STEERING
COMMITTEE OF THE RESPONSIBLE MINERALS INITIATIVE
ENVIRONMENTAL INITIATIVES
INTRODUCTION
CONTENTS
GREEN BOND IMPACT REPORT
DATA
APPENDIX
2026 ENVIRONMENTAL PROGRESS REPORT
72
ENGAGEMENT AND ADVOCACY
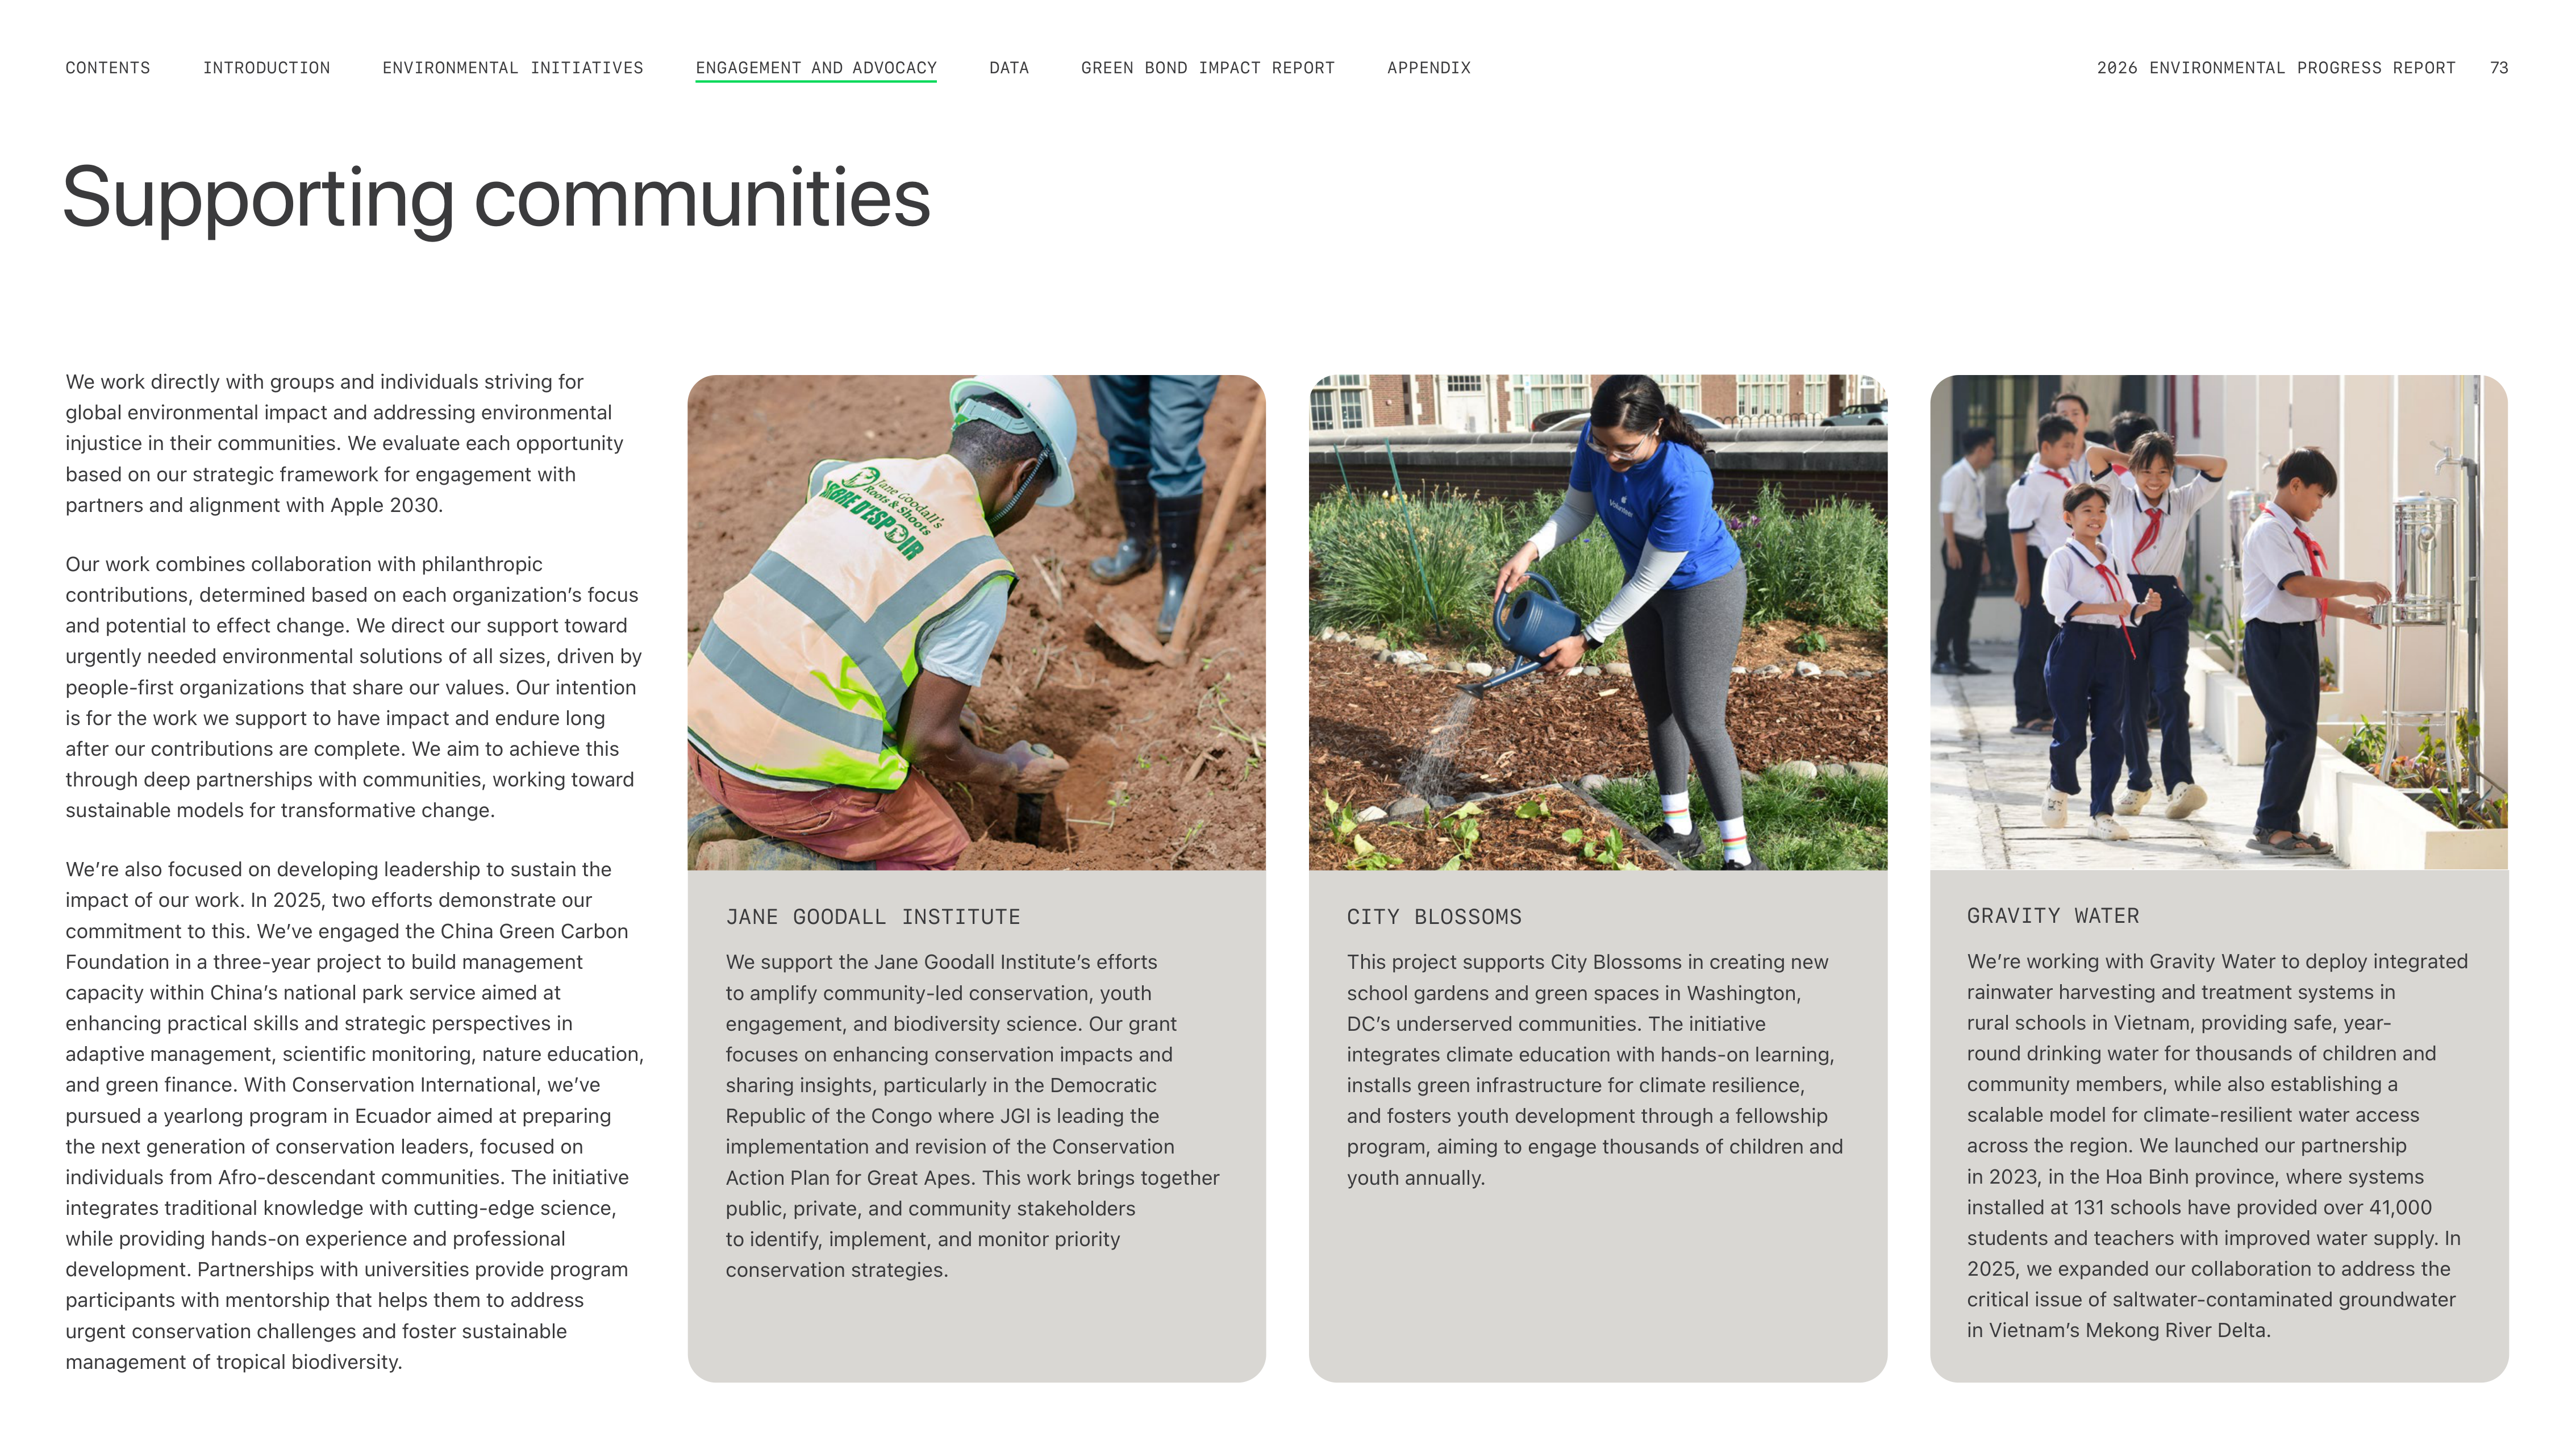
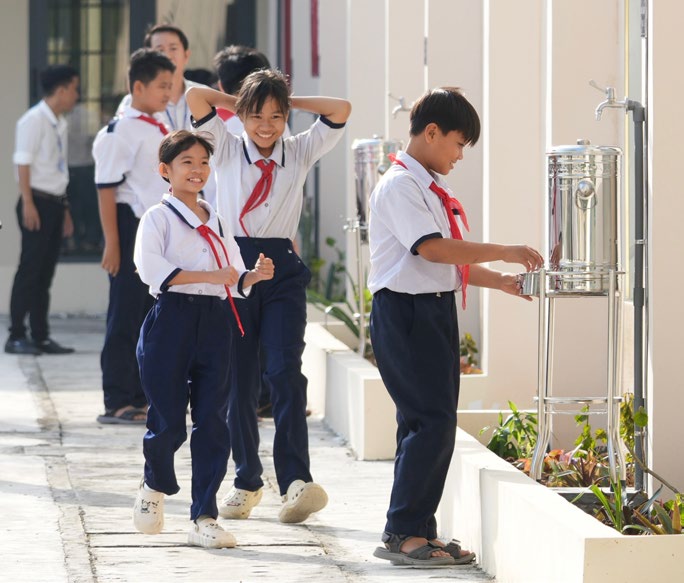

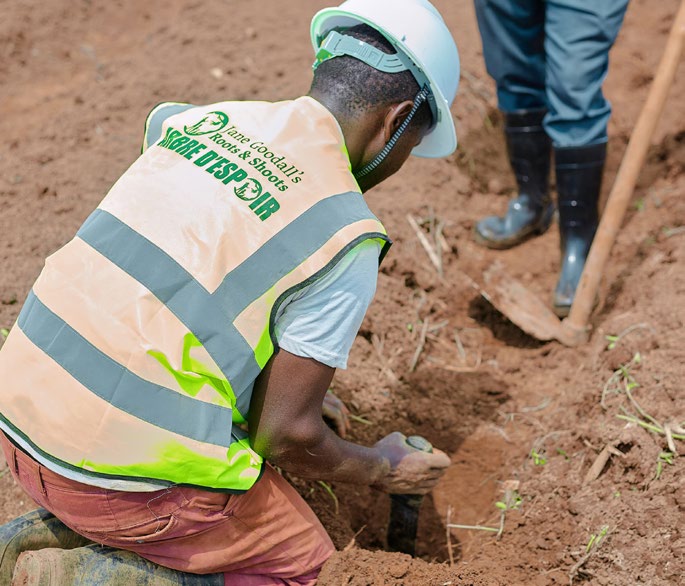
Supporting communities
JANE GOODALL INSTITUTE
We support the Jane Goodall Instituteʼs efforts
to amplify community-led conservation, youth
engagement, and biodiversity science. Our grant
focuses on enhancing conservation impacts and
sharing insights, particularly in the Democratic
Republic of the Congo where JGI is leading the
implementation and revision of the Conservation
Action Plan for Great Apes. This work brings together
public, private, and community stakeholders
to identify, implement, and monitor priority
conservation strategies.
CITY BLOSSOMS
This project supports City Blossoms in creating new
school gardens and green spaces in Washington,
DCʼs underserved communities. The initiative
integrates climate education with hands-on learning,
installs green infrastructure for climate resilience,
and fosters youth development through a fellowship
program, aiming to engage thousands of children and
youth annually.
GRAVITY WATER
Weʼre working with Gravity Water to deploy integrated
rainwater harvesting and treatment systems in
rural schools in Vietnam, providing safe, year-
round drinking water for thousands of children and
community members, while also establishing a
scalable model for climate-resilient water access
across the region. We launched our partnership
in 2023, in the Hoa Binh province, where systems
installed at 131 schools have provided over 41,000
students and teachers with improved water supply. In
2025, we expanded our collaboration to address the
critical issue of saltwater-contaminated groundwater
in Vietnamʼs Mekong River Delta.
We work directly with groups and individuals striving for
global environmental impact and addressing environmental
injustice in their communities. We evaluate each opportunity
based on our strategic framework for engagement with
partners and alignment with Apple 2030.
Our work combines collaboration with philanthropic
contributions, determined based on each organizationʼs focus
and potential to effect change. We direct our support toward
urgently needed environmental solutions of all sizes, driven by
people-first organizations that share our values. Our intention
is for the work we support to have impact and endure long
after our contributions are complete. We aim to achieve this
through deep partnerships with communities, working toward
sustainable models for transformative change.
Weʼre also focused on developing leadership to sustain the
impact of our work. In 2025, two efforts demonstrate our
commitment to this. Weʼve engaged the China Green Carbon
Foundation in a three-year project to build management
capacity within Chinaʼs national park service aimed at
enhancing practical skills and strategic perspectives in
adaptive management, scientific monitoring, nature education,
and green finance. With Conservation International, weʼve
pursued a yearlong program in Ecuador aimed at preparing
the next generation of conservation leaders, focused on
individuals from Afro-descendant communities. The initiative
integrates traditional knowledge with cutting-edge science,
while providing hands-on experience and professional
development. Partnerships with universities provide program
participants with mentorship that helps them to address
urgent conservation challenges and foster sustainable
management of tropical biodiversity.
ENVIRONMENTAL INITIATIVES
INTRODUCTION
CONTENTS
GREEN BOND IMPACT REPORT
DATA
APPENDIX
2026 ENVIRONMENTAL PROGRESS REPORT
73
ENGAGEMENT AND ADVOCACY
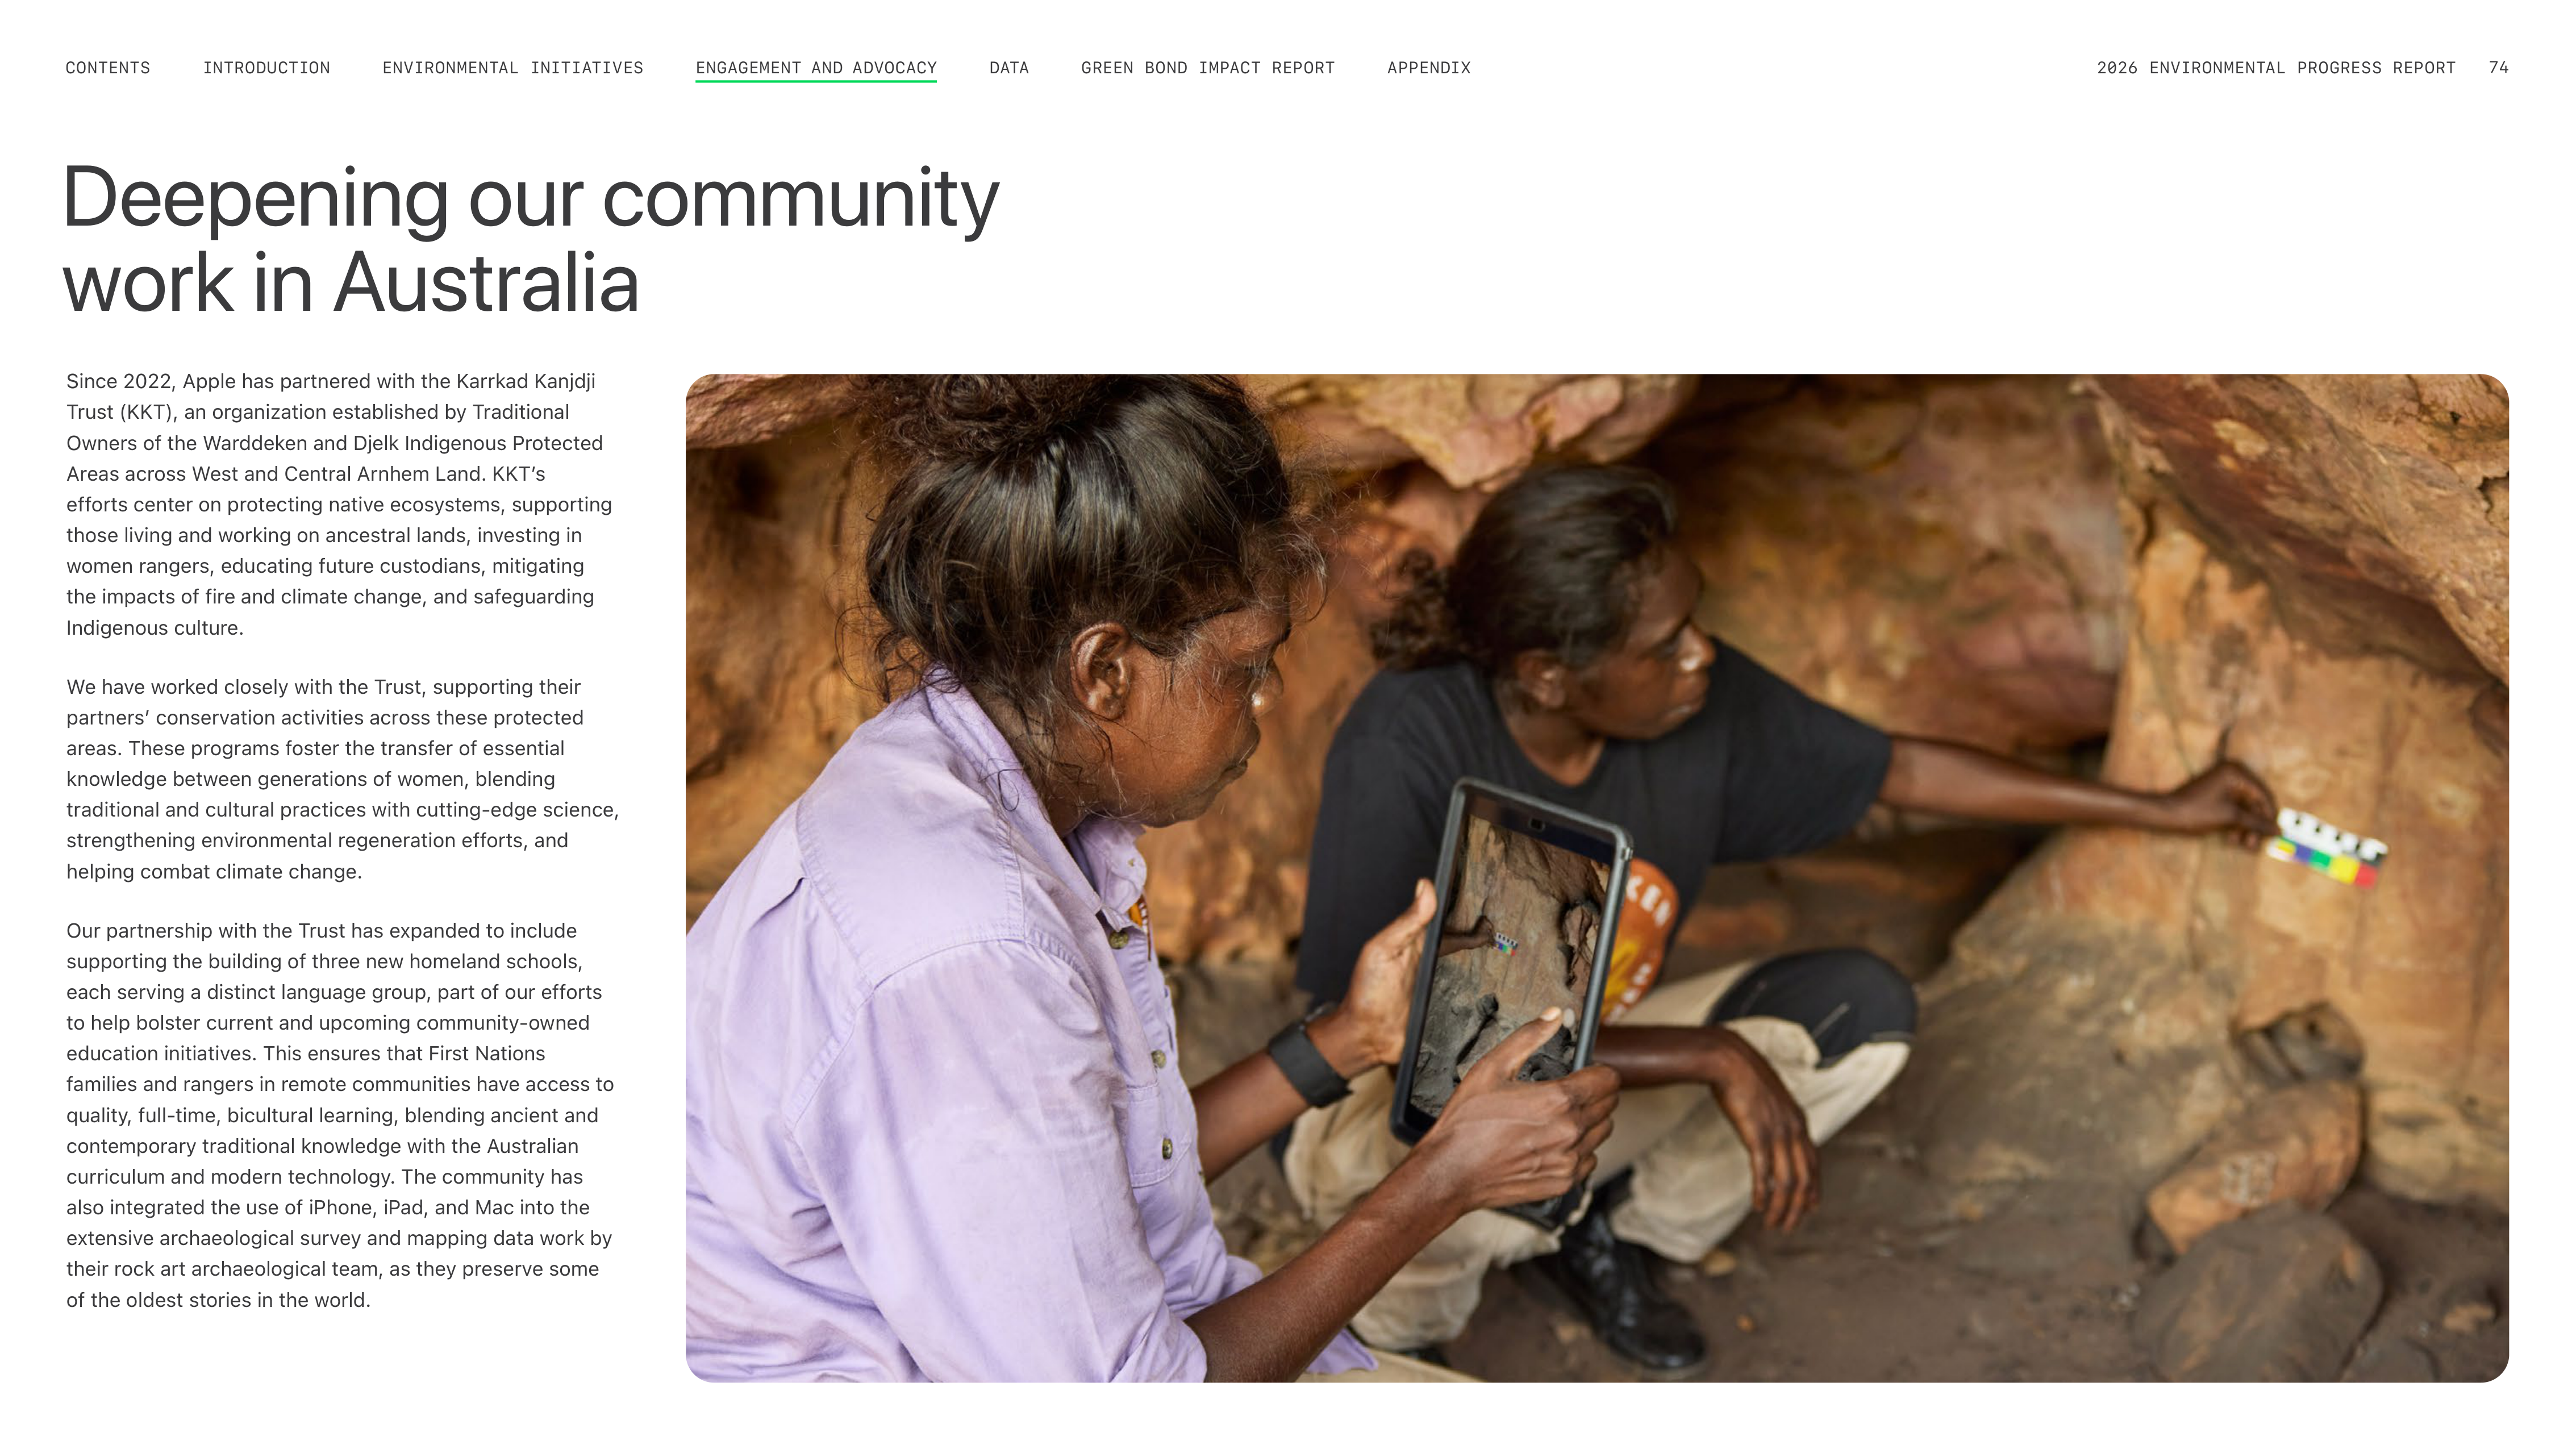
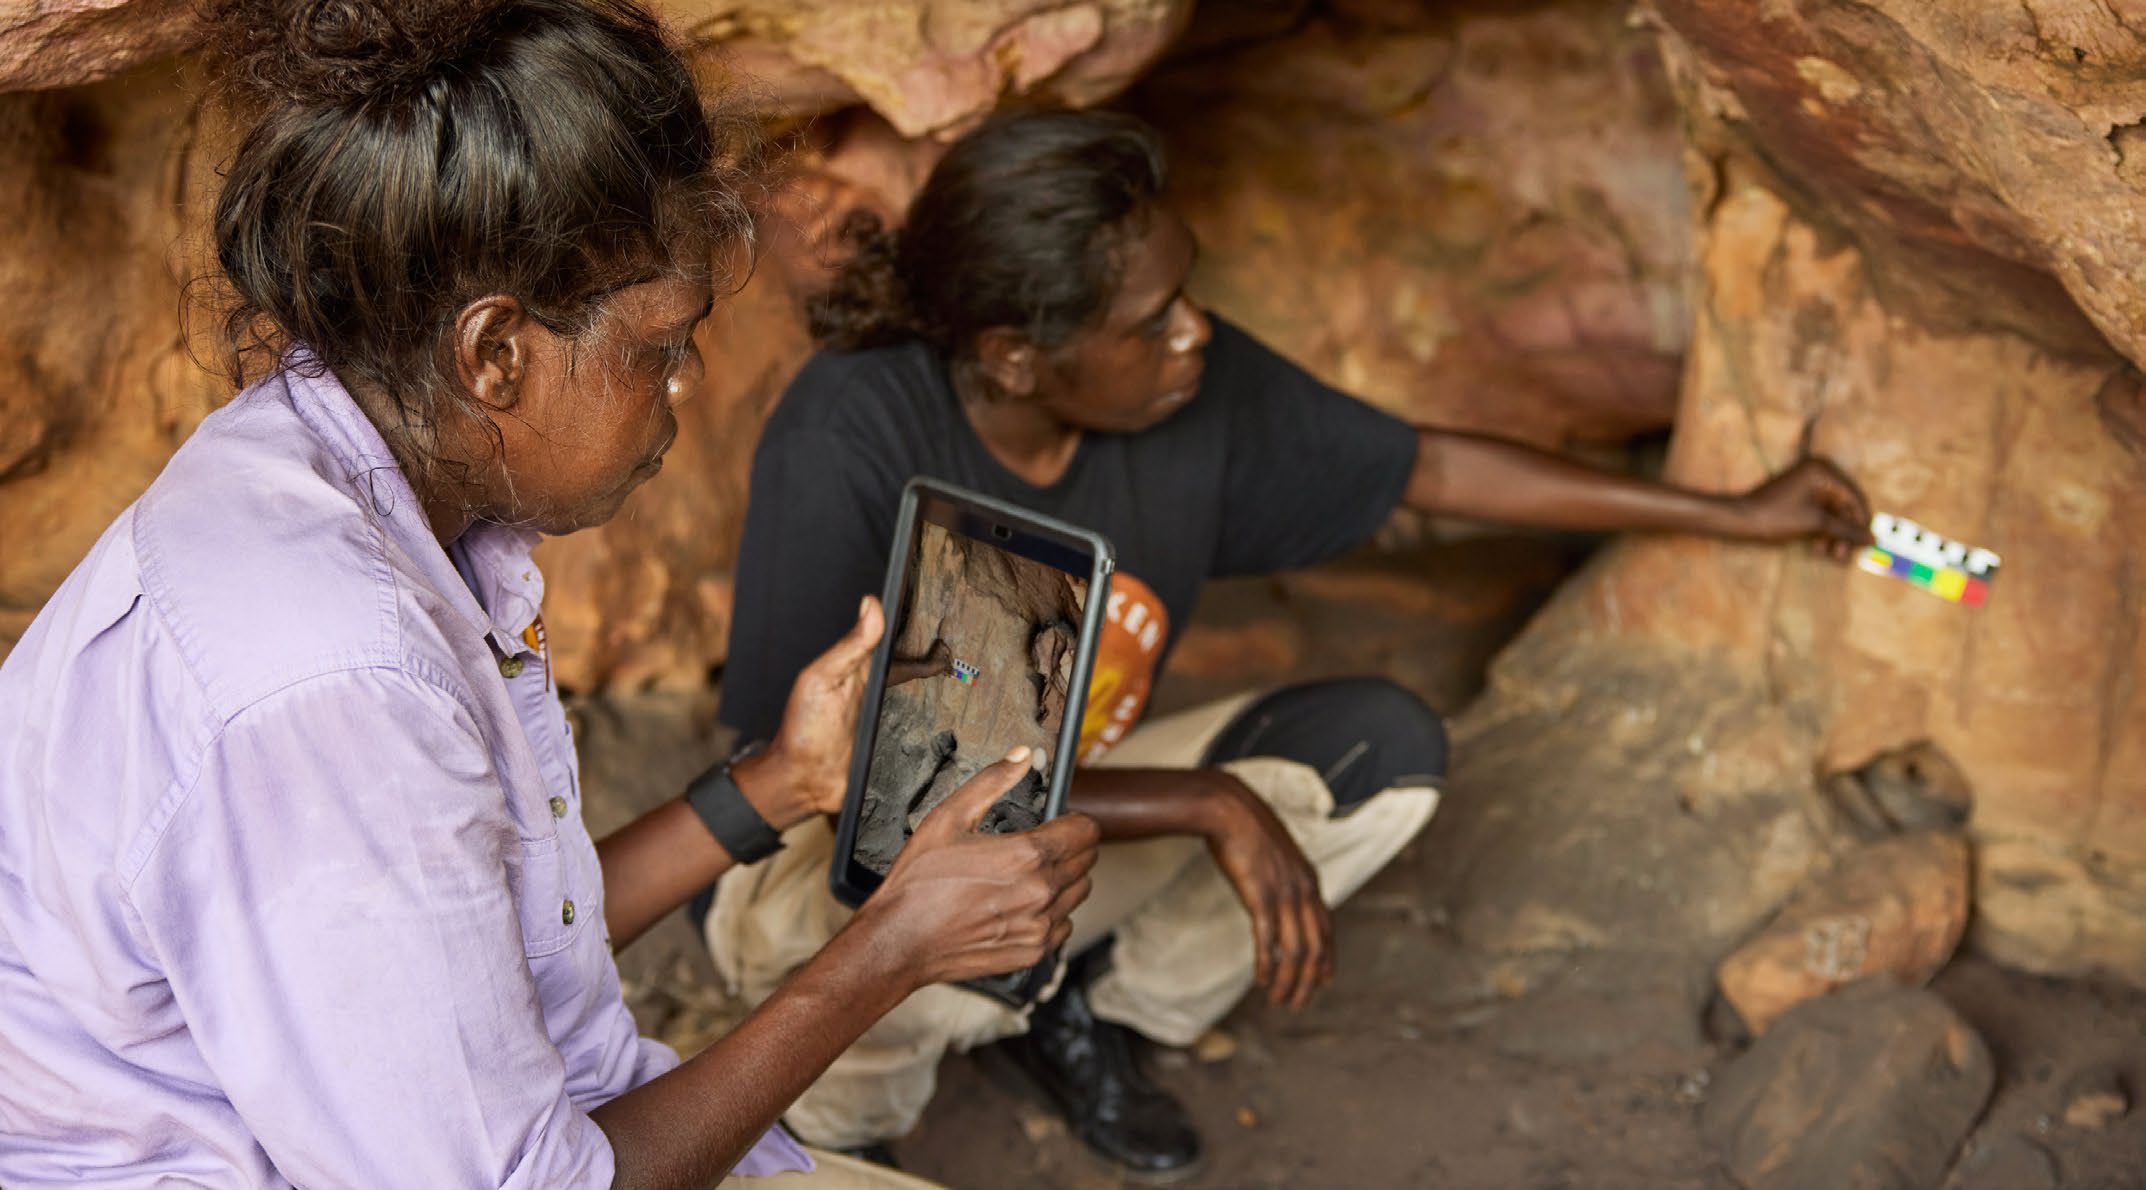
Deepening our community
work in Australia
Since 2022, Apple has partnered with the Karrkad Kanjdji
Trust (KKT), an organization established by Traditional
Owners of the Warddeken and Djelk Indigenous Protected
Areas across West and Central Arnhem Land. KKTʼs
efforts center on protecting native ecosystems, supporting
those living and working on ancestral lands, investing in
women rangers, educating future custodians, mitigating
the impacts of fire and climate change, and safeguarding
Indigenous culture.
We have worked closely with the Trust, supporting their
partnersʼ conservation activities across these protected
areas. These programs foster the transfer of essential
knowledge between generations of women, blending
traditional and cultural practices with cutting-edge science,
strengthening environmental regeneration efforts, and
helping combat climate change.
Our partnership with the Trust has expanded to include
supporting the building of three new homeland schools,
each serving a distinct language group, part of our efforts
to help bolster current and upcoming community-owned
education initiatives. This ensures that First Nations
families and rangers in remote communities have access to
quality, full-time, bicultural learning, blending ancient and
contemporary traditional knowledge with the Australian
curriculum and modern technology. The community has
also integrated the use of iPhone, iPad, and Mac into the
extensive archaeological survey and mapping data work by
their rock art archaeological team, as they preserve some
of the oldest stories in the world.
ENVIRONMENTAL INITIATIVES
INTRODUCTION
CONTENTS
GREEN BOND IMPACT REPORT
DATA
APPENDIX
2026 ENVIRONMENTAL PROGRESS REPORT
74
ENGAGEMENT AND ADVOCACY


Data
IN THIS SECTION
Greenhouse gas emissions
Carbon credits
Carbon footprints
Energy
Resources
Normalizing factors
2026 ENVIRONMENTAL PROGRESS REPORT
75
ENGAGEMENT AND ADVOCACY
ENVIRONMENTAL INITIATIVES
INTRODUCTION
CONTENTS
APPENDIX
GREEN BOND IMPACT REPORT
DATA
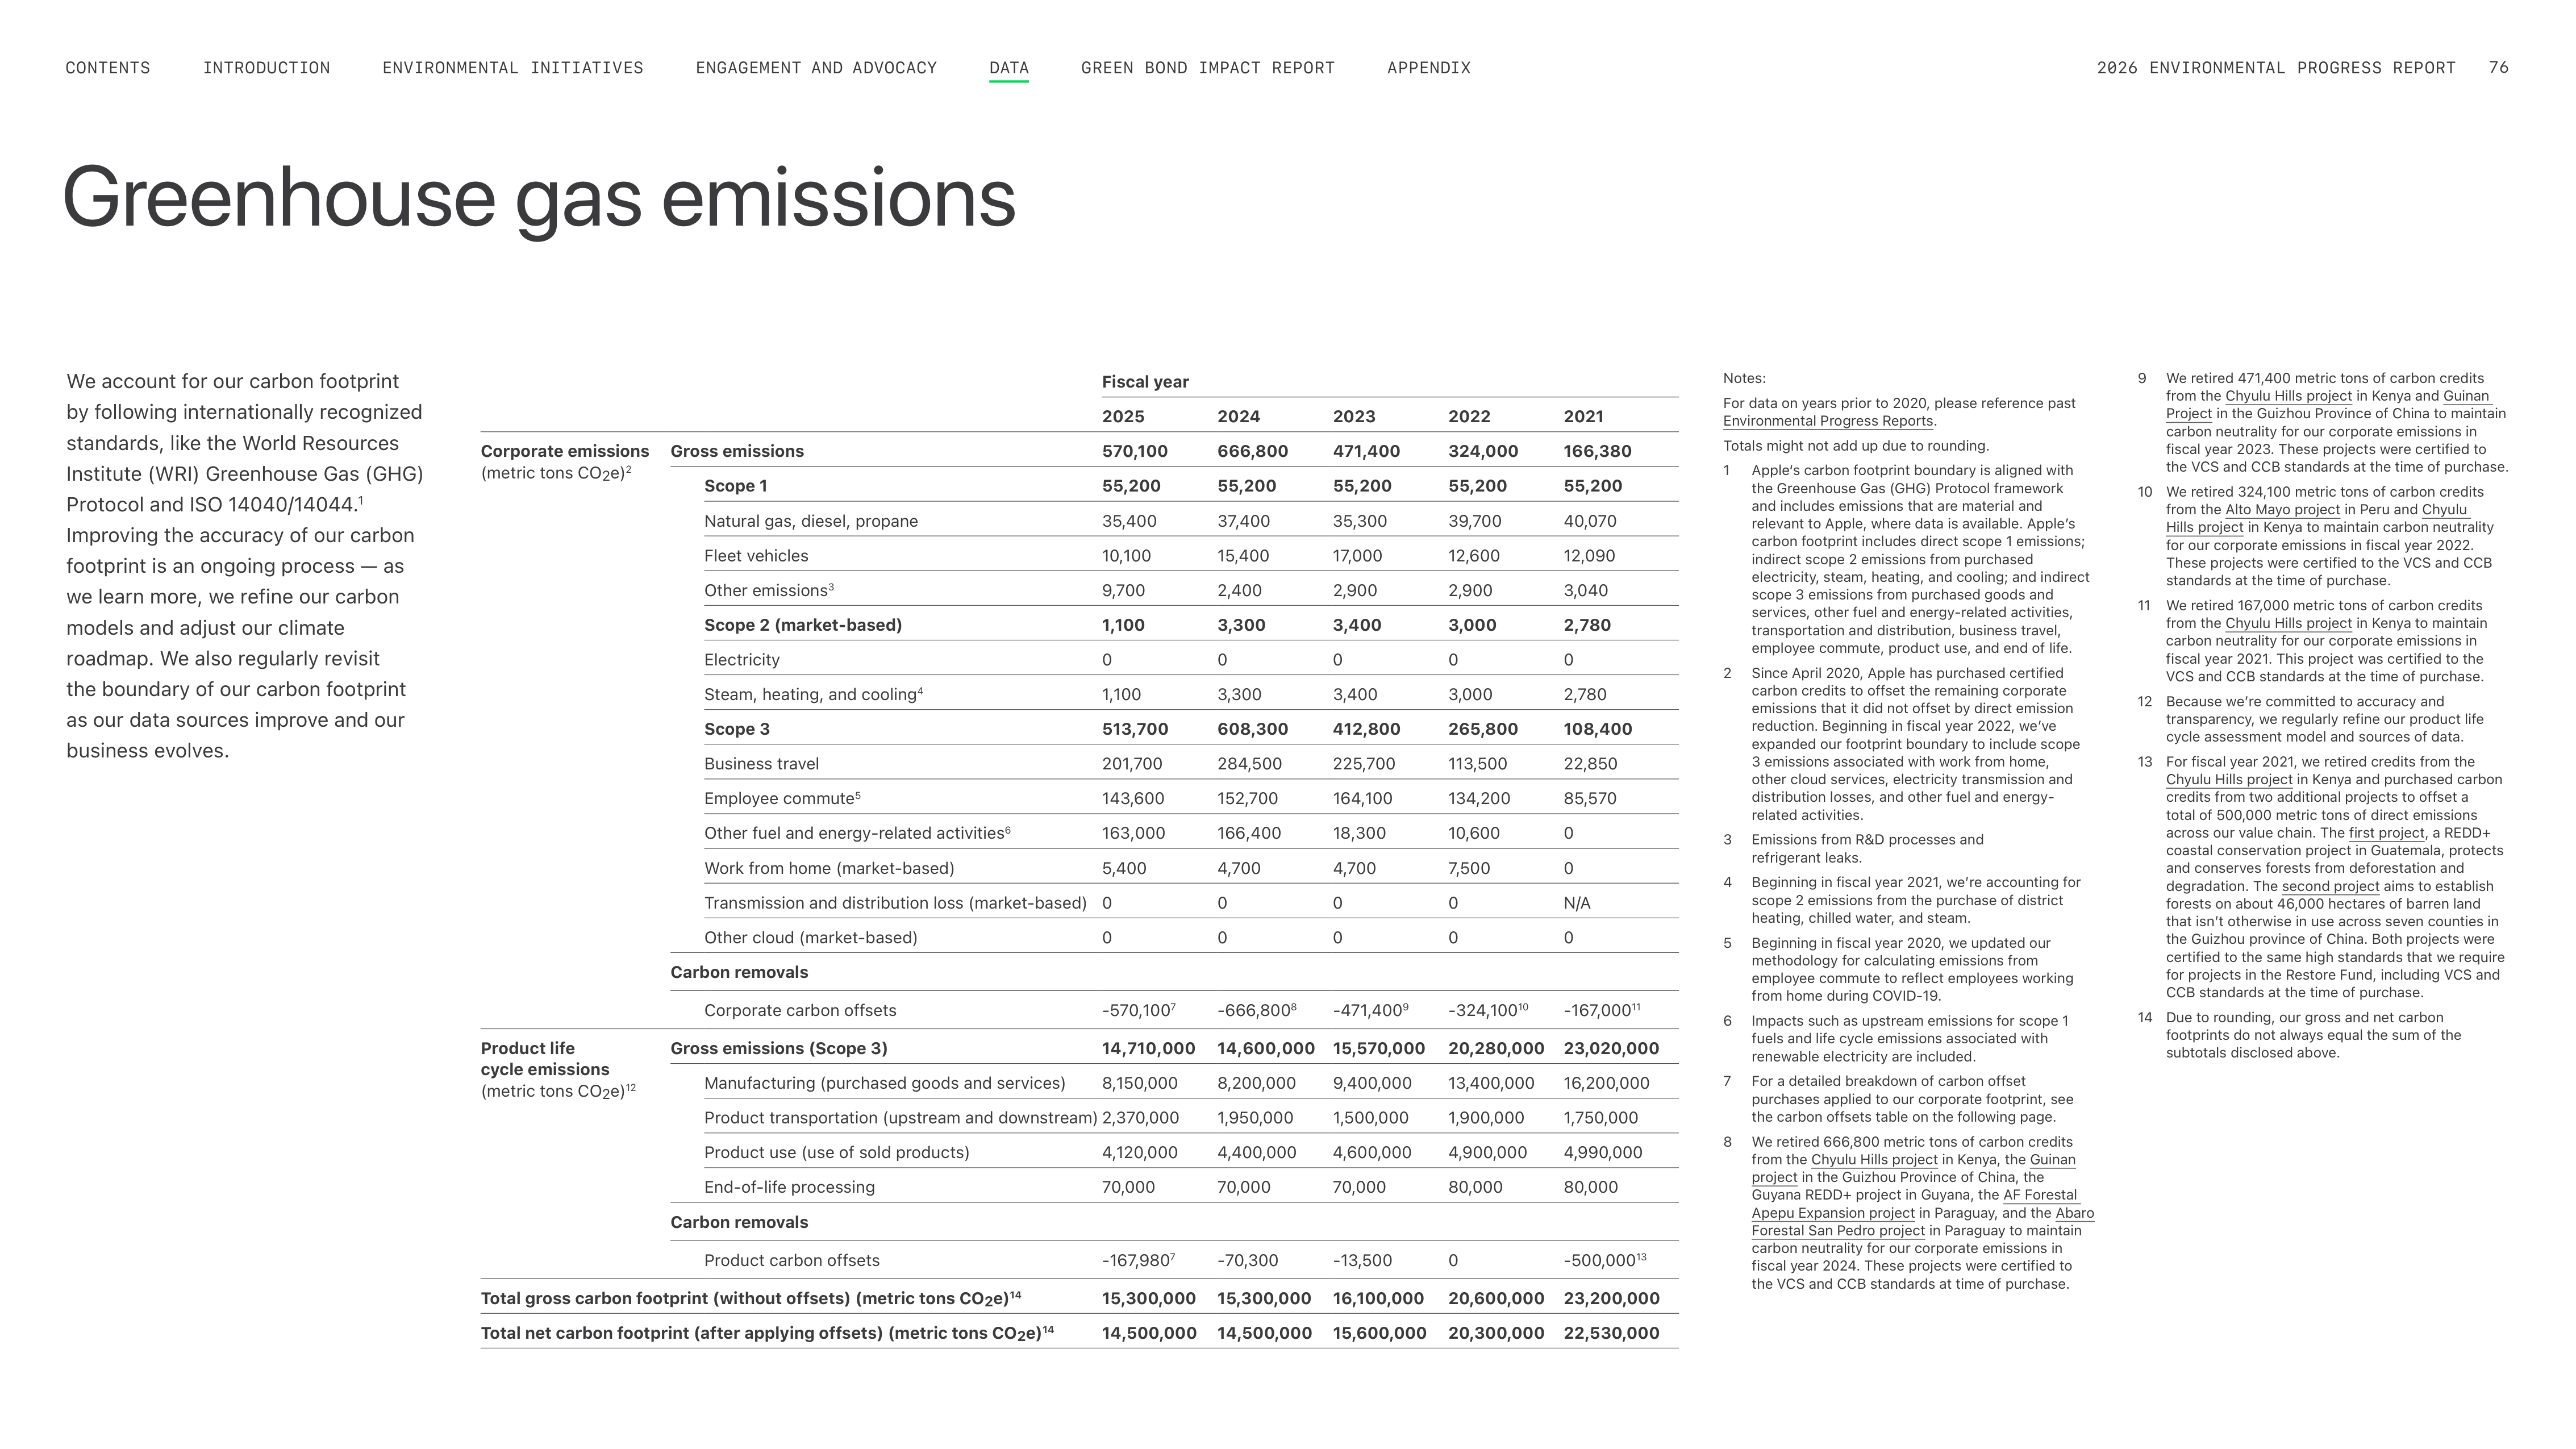
Greenhouse gas emissions
We account for our carbon footprint
by following internationally recognized
standards, like the World Resources
Institute (WRI) Greenhouse Gas (GHG)
Protocol and ISO 14040/14044.
1
Improving the accuracy of our carbon
footprint is an ongoing process — as
we learn more, we refine our carbon
models and adjust our climate
roadmap. We also regularly revisit
the boundary of our carbon footprint
as our data sources improve and our
business evolves.
Fiscal year
2025
2024
2023
2022
2021
Corporate emissions
(metric tons CO
2
e)
2
Gross emissions
570,100
666,800
471,400
324,000
166,380
Scope 1
55,200
55,200
55,200
55,200
55,200
Natural gas, diesel, propane
35,400
37,400
35,300
39,700
40,070
Fleet vehicles
10,100
15,400
17,000
12,600
12,090
Other emissions
3
9,700
2,400
2,900
2,900
3,040
Scope 2 (market-based)
1,100
3,300
3,400
3,000
2,780
Electricity
0
0
0
0
0
Steam, heating, and cooling
4
1,100
3,300
3,400
3,000
2,780
Scope 3
513,700
608,300
412,800
265,800
108,400
Business travel
201,700
284,500
225,700
113,500
22,850
Employee commute
5
143,600
152,700
164,100
134,200
85,570
Other fuel and energy-related activities
6
163,000
166,400
18,300
10,600
0
Work from home (market-based)
5,400
4,700
4,700
7,500
0
Transmission and distribution loss (market-based)
0
0
0
0
N/A
Other cloud (market-based)
0
0
0
0
0
Carbon removals
Corporate carbon offsets
-570,100
7
-666,800
8
-471,400
9
-324,100
10
-167,000
11
Product life
cycle emissions
(metric tons CO
2
e)
12
Gross emissions (Scope 3)
14,710,000
14,600,000
15,570,000
20,280,000
23,020,000
Manufacturing (purchased goods and services)
8,150,000
8,200,000
9,400,000
13,400,000
16,200,000
Product transportation (upstream and downstream) 2,370,000
1,950,000
1,500,000
1,900,000
1,750,000
Product use (use of sold products)
4,120,000
4,400,000
4,600,000
4,900,000
4,990,000
End-of-life processing
70,000
70,000
70,000
80,000
80,000
Carbon removals
Product carbon offsets
-167,980
7
-70,300
-13,500
0
-500,000
13
Total gross carbon footprint (without offsets) (metric tons CO
2
e)
14
15,300,000
15,300,000
16,100,000
20,600,000
23,200,000
Total net carbon footprint (after applying offsets) (metric tons CO
2
e)
14
14,500,000
14,500,000
15,600,000
20,300,000
22,530,000
Notes:
For data on years prior to 2020, please reference past
Environmental Progress Reports.
Totals might not add up due to rounding.
1
Apple‘s carbon footprint boundary is aligned with
the Greenhouse Gas (GHG) Protocol framework
and includes emissions that are material and
relevant to Apple, where data is available. Appleʼs
carbon footprint includes direct scope 1 emissions;
indirect scope 2 emissions from purchased
electricity, steam, heating, and cooling; and indirect
scope 3 emissions from purchased goods and
services, other fuel and energy-related activities,
transportation and distribution, business travel,
employee commute, product use, and end of life.
2
Since April 2020, Apple has purchased certified
carbon credits to offset the remaining corporate
emissions that it did not offset by direct emission
reduction. Beginning in fiscal year 2022, weʼve
expanded our footprint boundary to include scope
3 emissions associated with work from home,
other cloud services, electricity transmission and
distribution losses, and other fuel and energy-
related activities.
3
Emissions from R&D processes and
refrigerant leaks.
4
Beginning in fiscal year 2021, weʼre accounting for
scope 2 emissions from the purchase of district
heating, chilled water, and steam.
5
Beginning in fiscal year 2020, we updated our
methodology for calculating emissions from
employee commute to reflect employees working
from home during COVID-19.
6
Impacts such as upstream emissions for scope 1
fuels and life cycle emissions associated with
renewable electricity are included.
7
For a detailed breakdown of carbon offset
purchases applied to our corporate footprint, see
the carbon offsets table on the following page.
8
We retired 666,800 metric tons of carbon credits
from the Chyulu Hills project in Kenya, the Guinan
project in the Guizhou Province of China, the
Guyana REDD+ project in Guyana, the AF Forestal
Apepu Expansion project in Paraguay, and the Abaro
Forestal San Pedro project in Paraguay to maintain
carbon neutrality for our corporate emissions in
fiscal year 2024. These projects were certified to
the VCS and CCB standards at time of purchase.
9
We retired 471,400 metric tons of carbon credits
from the Chyulu Hills project in Kenya and Guinan
Project in the Guizhou Province of China to maintain
carbon neutrality for our corporate emissions in
fiscal year 2023. These projects were certified to
the VCS and CCB standards at the time of purchase.
10 We retired 324,100 metric tons of carbon credits
from the Alto Mayo project in Peru and Chyulu
Hills project in Kenya to maintain carbon neutrality
for our corporate emissions in fiscal year 2022.
These projects were certified to the VCS and CCB
standards at the time of purchase.
11 We retired 167,000 metric tons of carbon credits
from the Chyulu Hills project in Kenya to maintain
carbon neutrality for our corporate emissions in
fiscal year 2021. This project was certified to the
VCS and CCB standards at the time of purchase.
12
Because weʼre committed to accuracy and
transparency, we regularly refine our product life
cycle assessment model and sources of data.
13
For fiscal year 2021, we retired credits from the
Chyulu Hills project in Kenya and purchased carbon
credits from two additional projects to offset a
total of 500,000 metric tons of direct emissions
across our value chain. The first project, a REDD+
coastal conservation project in Guatemala, protects
and conserves forests from deforestation and
degradation. The second project aims to establish
forests on about 46,000 hectares of barren land
that isnʼt otherwise in use across seven counties in
the Guizhou province of China. Both projects were
certified to the same high standards that we require
for projects in the Restore Fund, including VCS and
CCB standards at the time of purchase.
14
Due to rounding, our gross and net carbon
footprints do not always equal the sum of the
subtotals disclosed above.
ENGAGEMENT AND ADVOCACY
ENVIRONMENTAL INITIATIVES
INTRODUCTION
CONTENTS
GREEN BOND IMPACT REPORT
APPENDIX
2026 ENVIRONMENTAL PROGRESS REPORT
76
DATA
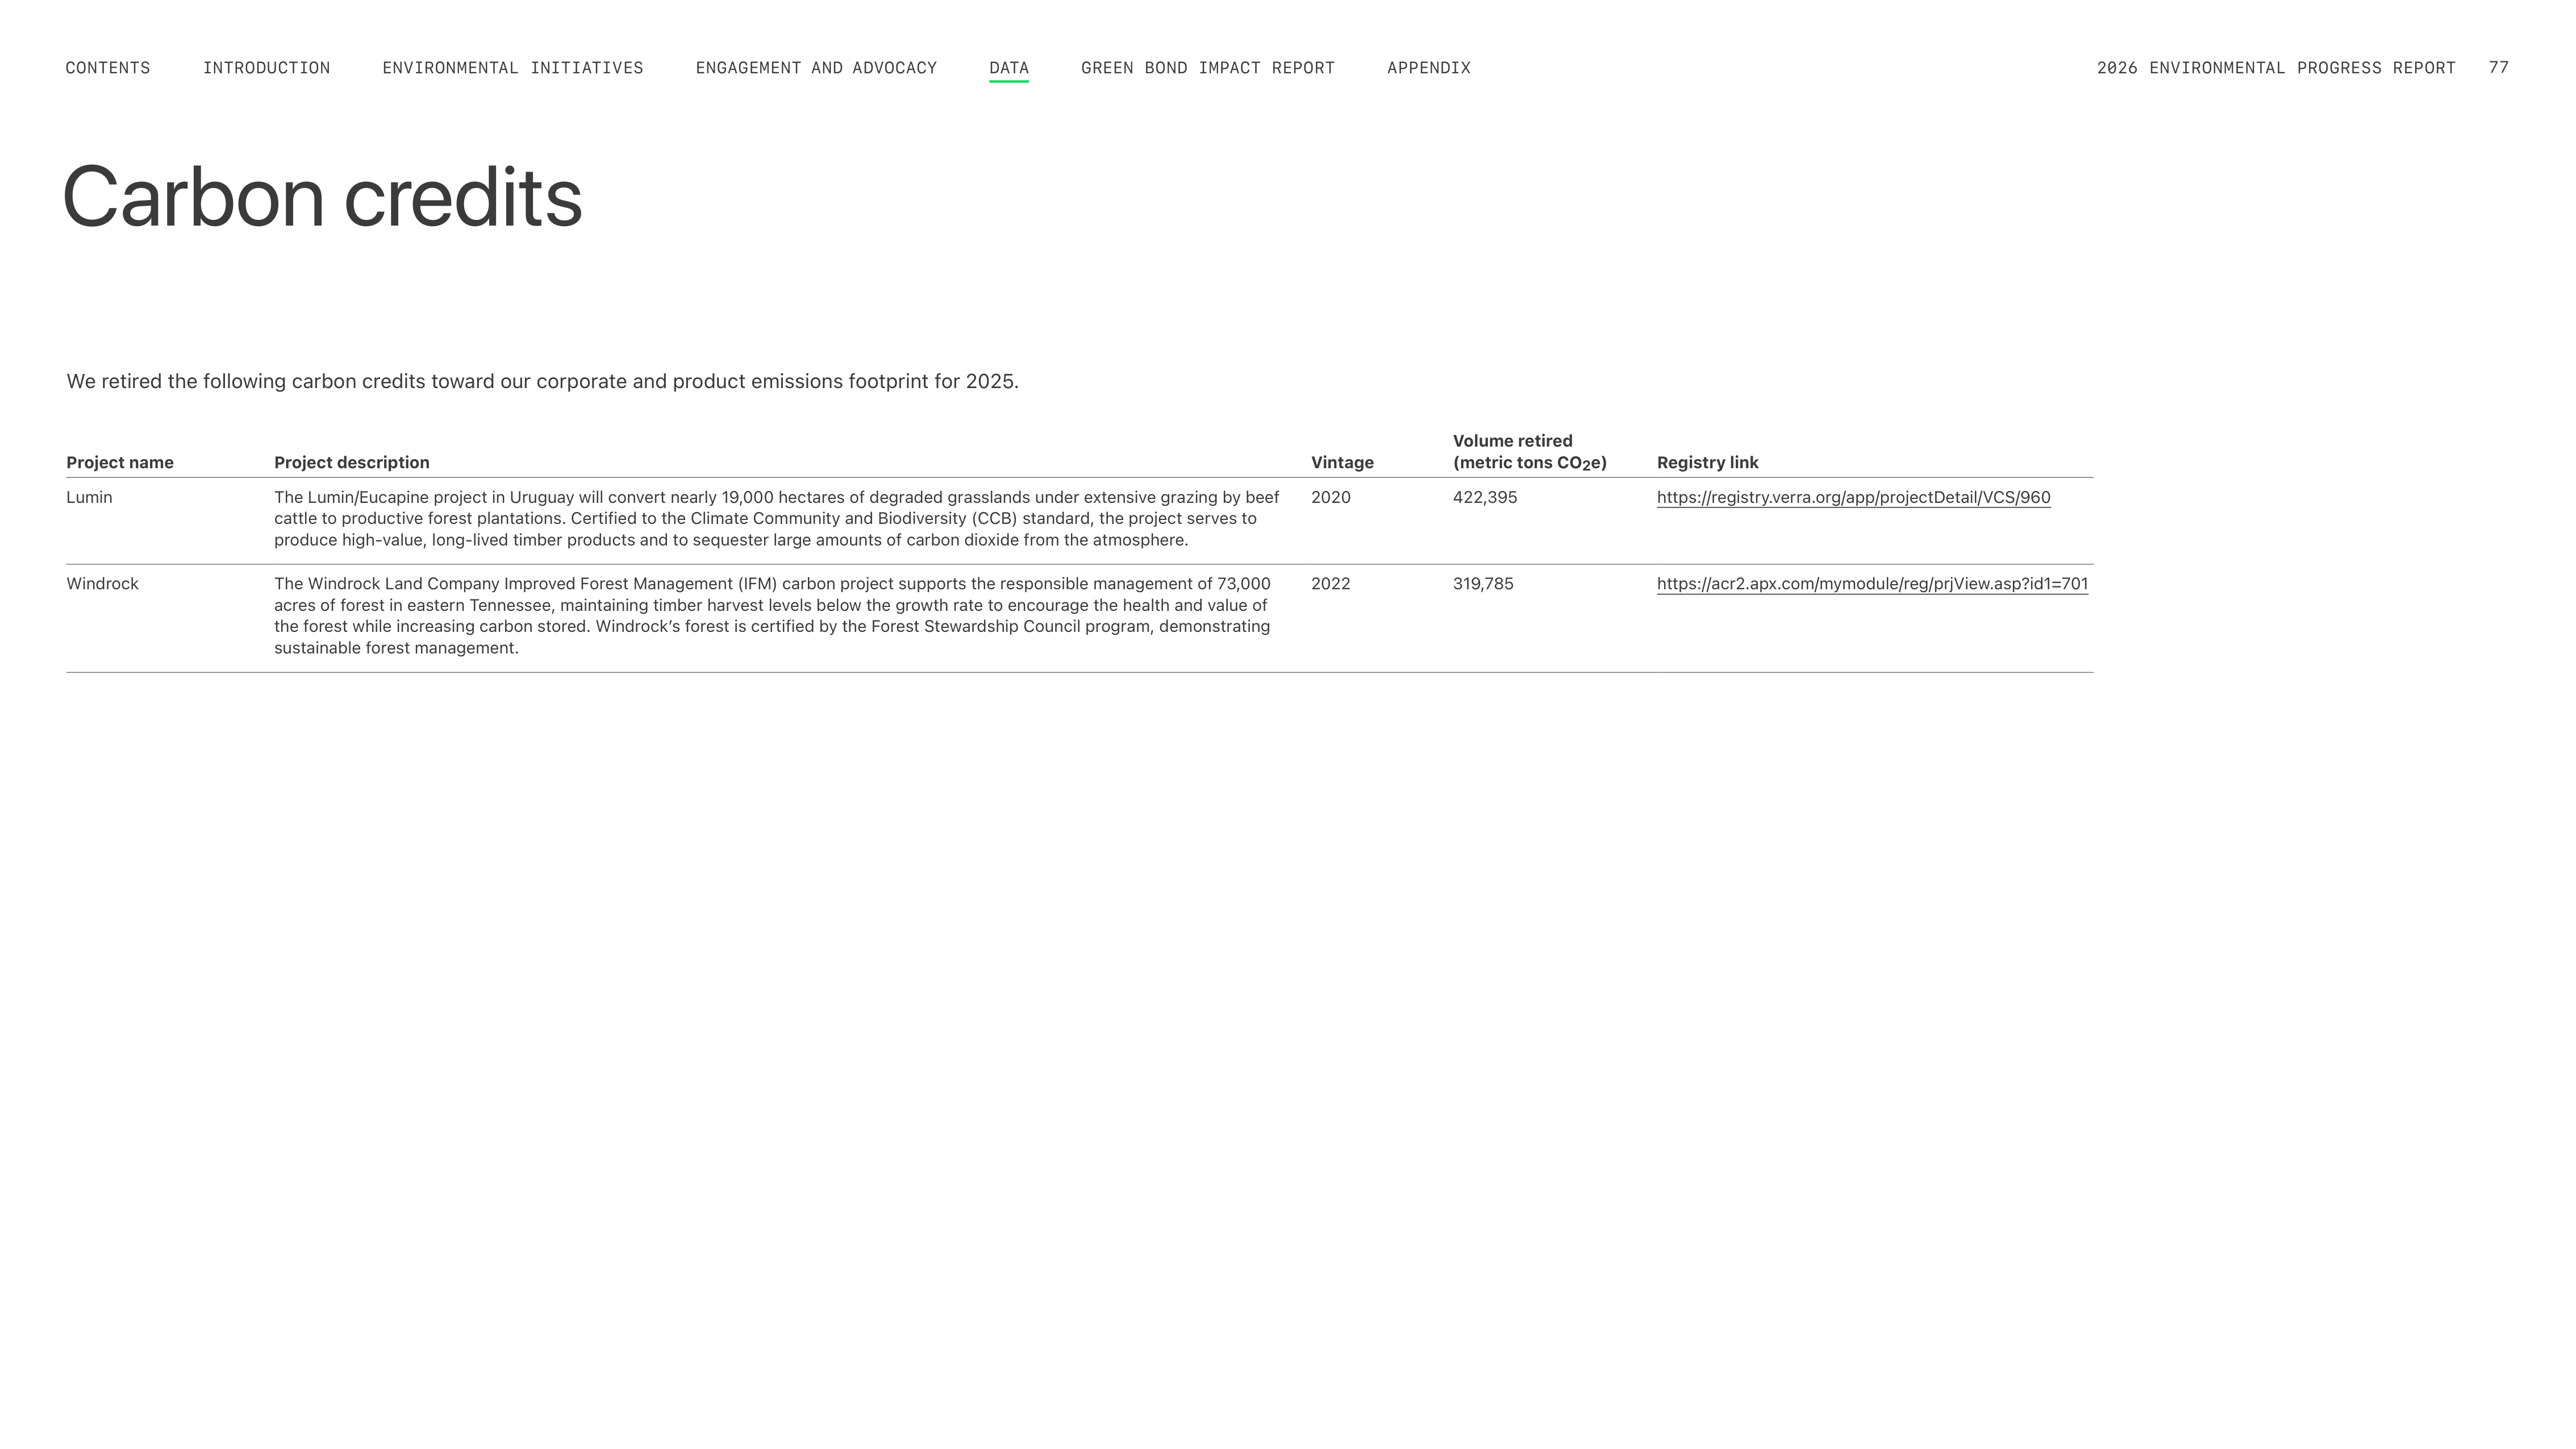
Carbon credits
We retired the following carbon credits toward our corporate and product emissions footprint for 2025.
Project name
Project description
Vintage
Volume retired
(metric tons CO
2
e)
Registry link
Lumin
The Lumin/Eucapine project in Uruguay will convert nearly 19,000 hectares of degraded grasslands under extensive grazing by beef
cattle to productive forest plantations. Certified to the Climate Community and Biodiversity (CCB) standard, the project serves to
produce high-value, long-lived timber products and to sequester large amounts of carbon dioxide from the atmosphere.
2020
422,395
https://registry.verra.org/app/projectDetail/VCS/960
Windrock
The Windrock Land Company Improved Forest Management (IFM) carbon project supports the responsible management of 73,000
acres of forest in eastern Tennessee, maintaining timber harvest levels below the growth rate to encourage the health and value of
the forest while increasing carbon stored. Windrockʼs forest is certified by the Forest Stewardship Council program, demonstrating
sustainable forest management.
2022
319,785
https://acr2.apx.com/mymodule/reg/prjView.asp?id1=701
ENGAGEMENT AND ADVOCACY
ENVIRONMENTAL INITIATIVES
INTRODUCTION
CONTENTS
GREEN BOND IMPACT REPORT
APPENDIX
2026 ENVIRONMENTAL PROGRESS REPORT
77
DATA
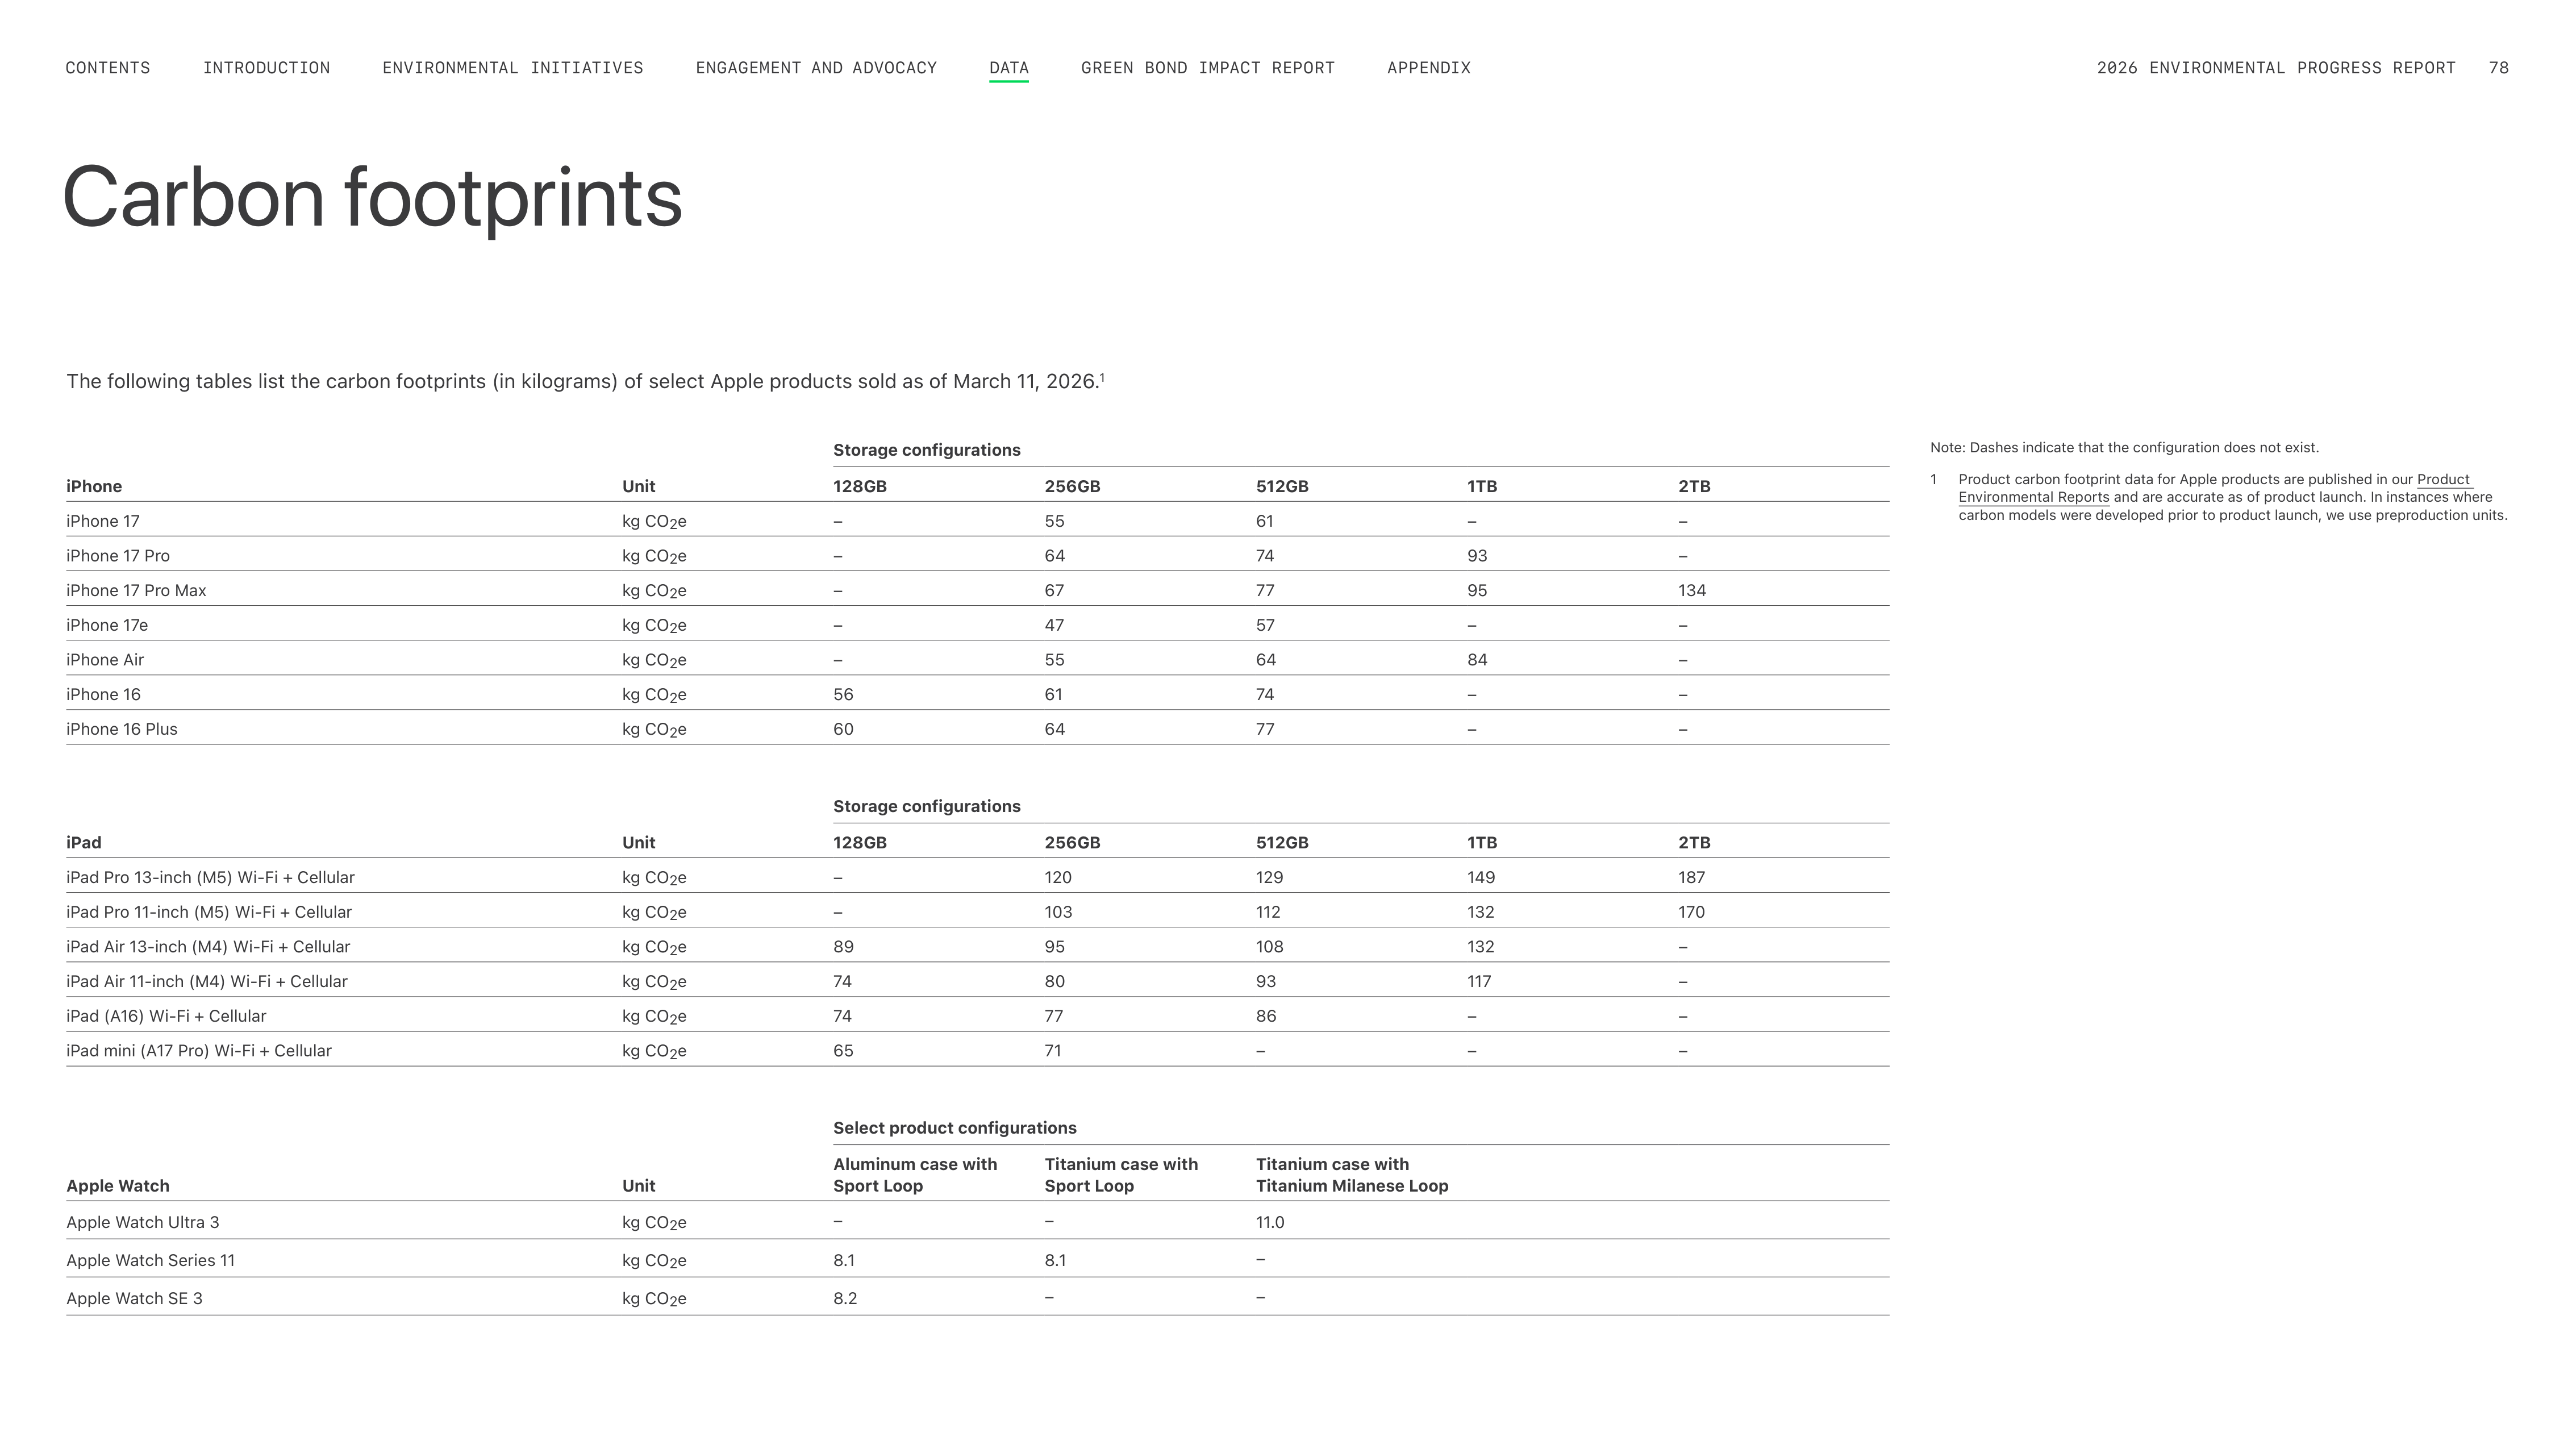
Carbon footprints
The following tables list the carbon footprints (in kilograms) of select Apple products sold as of March 11, 2026.
1
Storage configurations
iPhone
Unit
128GB
256GB
512GB
1TB
2TB
iPhone 17
kg CO
2
e
–
55
61
–
–
iPhone 17 Pro
kg CO
2
e
–
64
74
93
–
iPhone 17 Pro Max
kg CO
2
e
–
67
77
95
134
iPhone 17e
kg CO
2
e
–
47
57
–
–
iPhone Air
kg CO
2
e
–
55
64
84
–
iPhone 16
kg CO
2
e
56
61
74
–
–
iPhone 16 Plus
kg CO
2
e
60
64
77
–
–
Storage configurations
iPad
Unit
128GB
256GB
512GB
1TB
2TB
iPad Pro 13-inch (M5) Wi-Fi + Cellular
kg CO
2
e
–
120
129
149
187
iPad Pro 11-inch (M5) Wi-Fi + Cellular
kg CO
2
e
–
103
112
132
170
iPad Air 13-inch (M4) Wi-Fi + Cellular
kg CO
2
e
89
95
108
132
–
iPad Air 11-inch (M4) Wi-Fi + Cellular
kg CO
2
e
74
80
93
117
–
iPad (A16) Wi-Fi + Cellular
kg CO
2
e
74
77
86
–
–
iPad mini (A17 Pro) Wi-Fi + Cellular
kg CO
2
e
65
71
–
–
–
Select product configurations
Apple Watch
Unit
Aluminum case with
Sport Loop
Titanium case with
Sport Loop
Titanium case with
Titanium Milanese Loop
Apple Watch Ultra 3
kg CO
2
e
–
–
11.0
Apple Watch Series 11
kg CO
2
e
8.1
8.1
–
Apple Watch SE 3
kg CO
2
e
8.2
–
–
Note: Dashes indicate that the configuration does not exist.
1
Product carbon footprint data for Apple products are published in our Product
Environmental Reports and are accurate as of product launch. In instances where
carbon models were developed prior to product launch, we use preproduction units.
ENGAGEMENT AND ADVOCACY
ENVIRONMENTAL INITIATIVES
INTRODUCTION
CONTENTS
GREEN BOND IMPACT REPORT
APPENDIX
2026 ENVIRONMENTAL PROGRESS REPORT
78
DATA
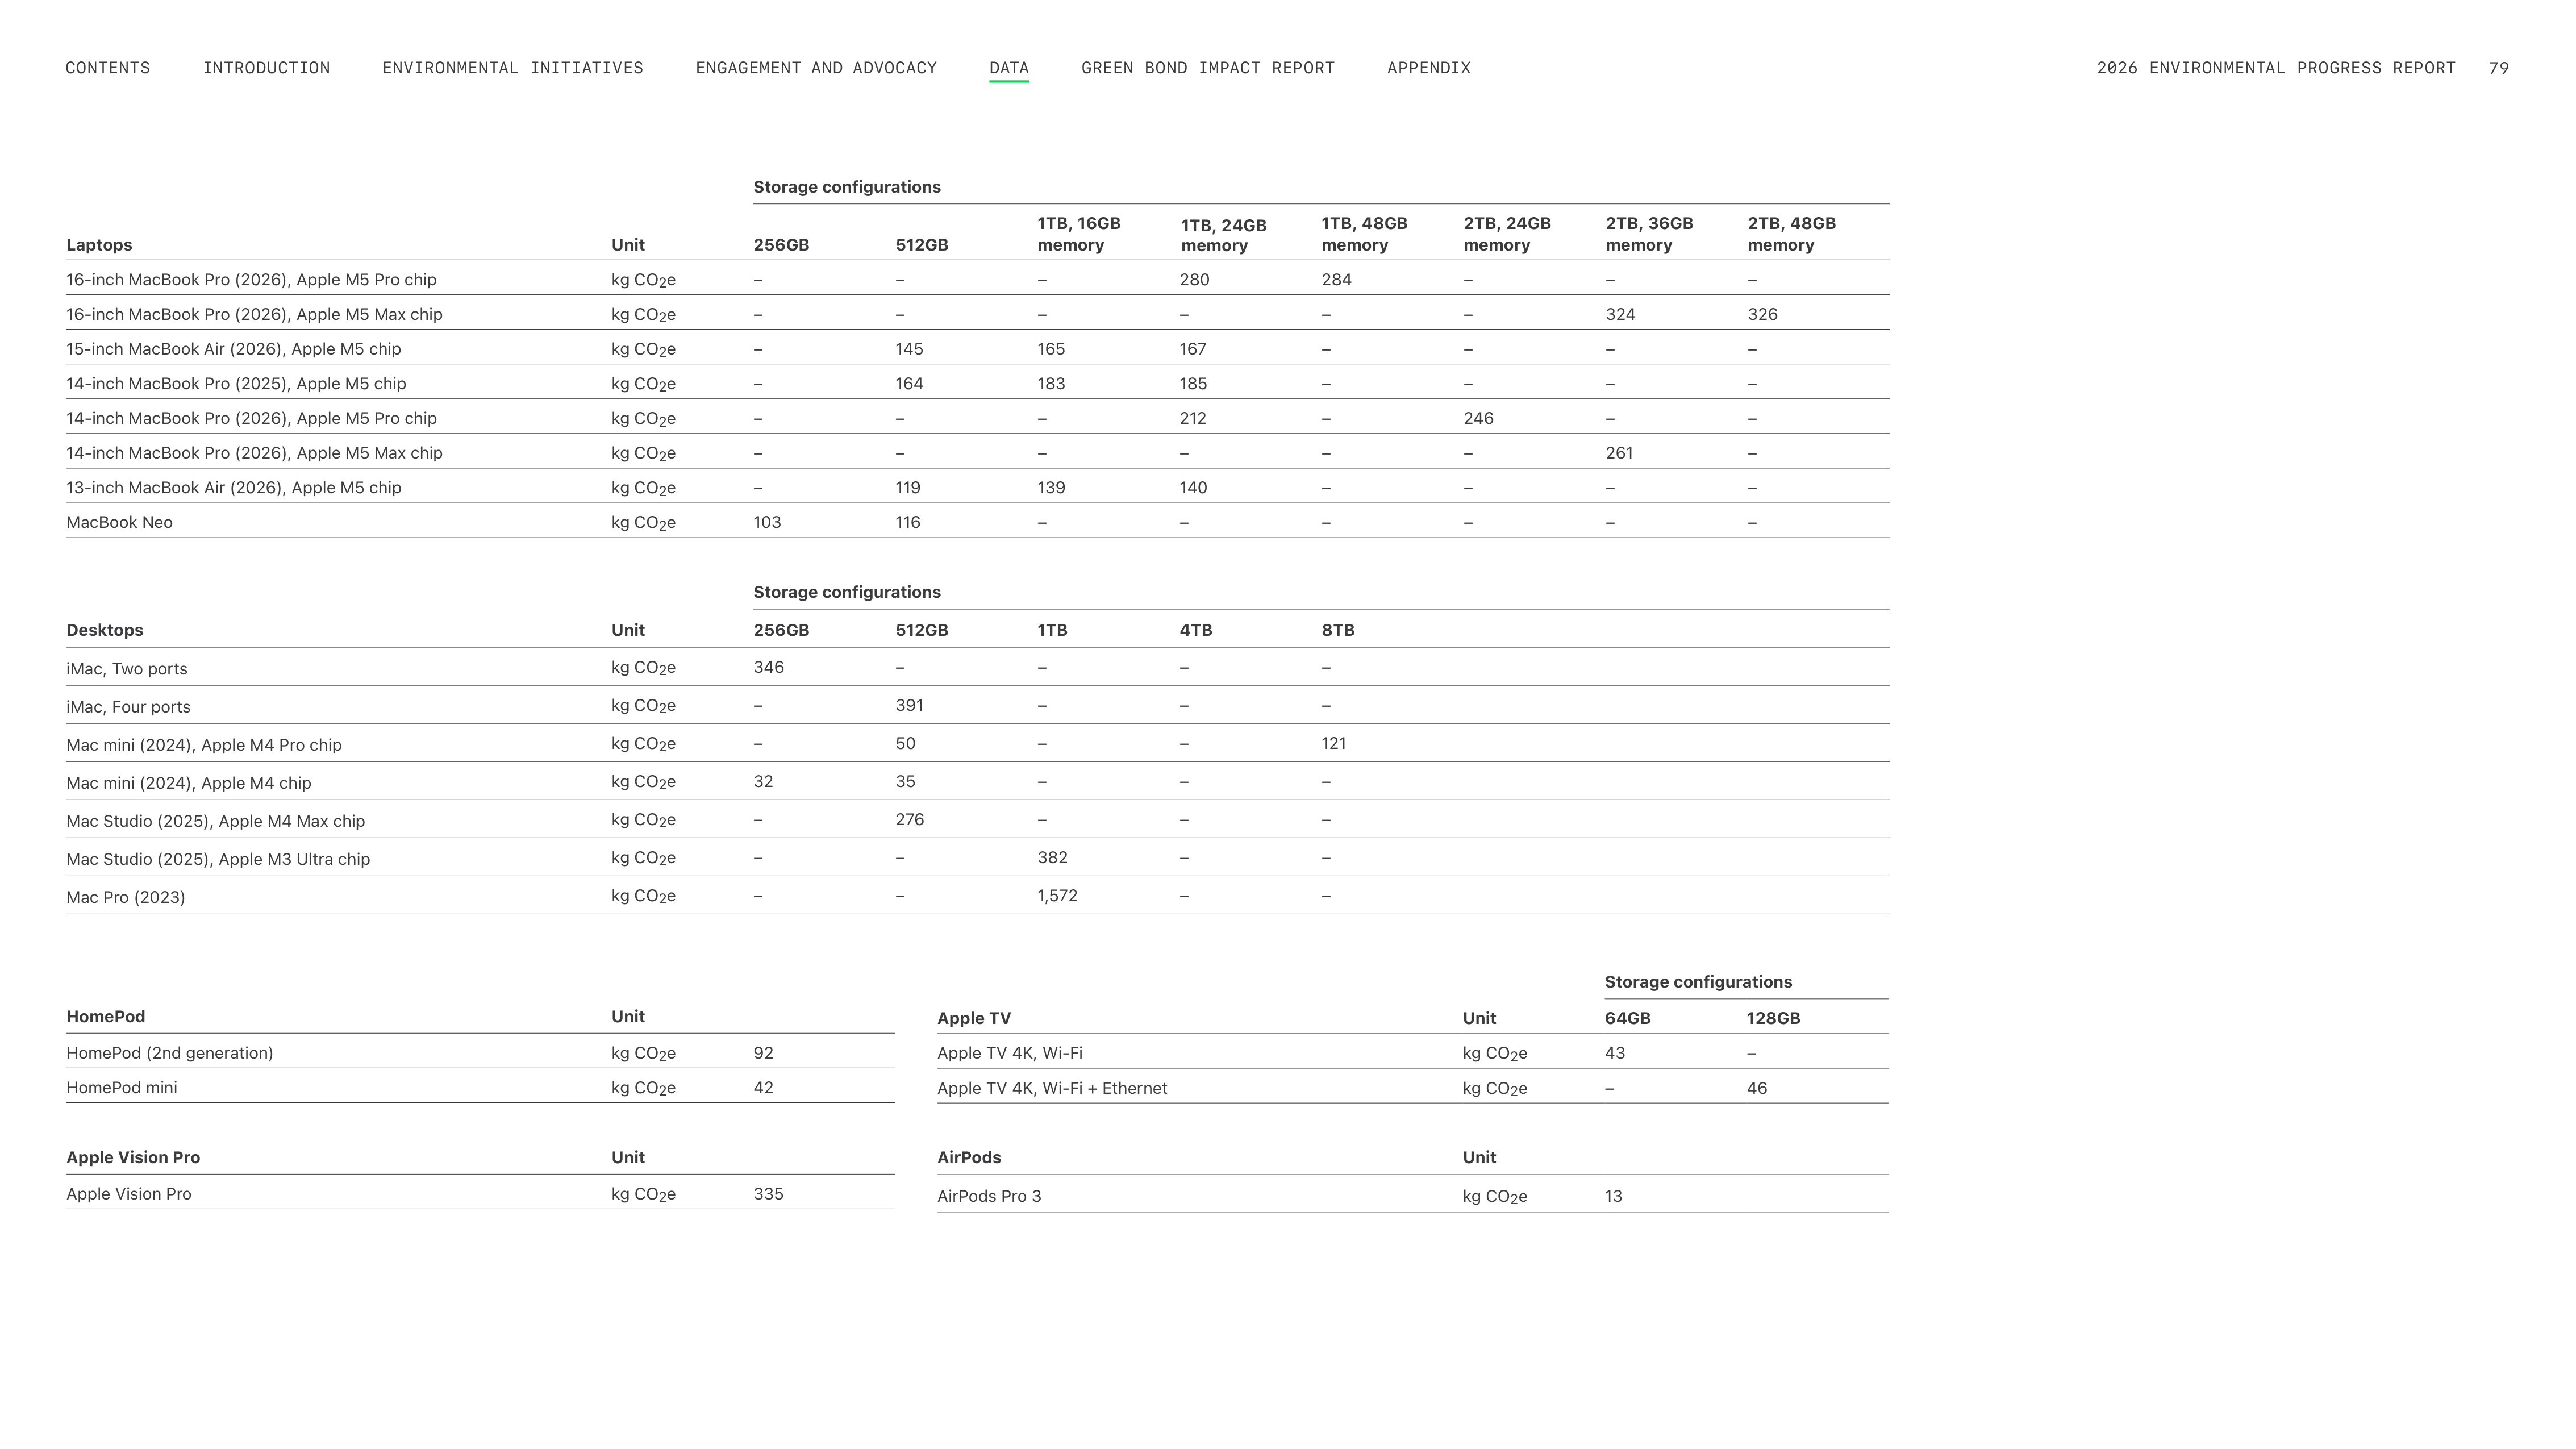
Storage configurations
Laptops
Unit
256GB
512GB
1TB, 16GB
memory
1TB, 24GB
memory
1TB, 48GB
memory
2TB, 24GB
memory
2TB, 36GB
memory
2TB, 48GB
memory
16-inch MacBook Pro (2026), Apple M5 Pro chip
kg CO
2
e
–
–
–
280
284
–
–
–
16-inch MacBook Pro (2026), Apple M5 Max chip
kg CO
2
e
–
–
–
–
–
–
324
326
15-inch MacBook Air (2026), Apple M5 chip
kg CO
2
e
–
145
165
167
–
–
–
–
14-inch MacBook Pro (2025), Apple M5 chip
kg CO
2
e
–
164
183
185
–
–
–
–
14-inch MacBook Pro (2026), Apple M5 Pro chip
kg CO
2
e
–
–
–
212
–
246
–
–
14-inch MacBook Pro (2026), Apple M5 Max chip
kg CO
2
e
–
–
–
–
–
–
261
–
13-inch MacBook Air (2026), Apple M5 chip
kg CO
2
e
–
119
139
140
–
–
–
–
MacBook Neo
kg CO
2
e
103
116
–
–
–
–
–
–
Storage configurations
Desktops
Unit
256GB
512GB
1TB
4TB
8TB
iMac, Two ports
kg CO
2
e
346
–
–
–
–
iMac, Four ports
kg CO
2
e
–
391
–
–
–
Mac mini (2024), Apple M4 Pro chip
kg CO
2
e
–
50
–
–
121
Mac mini (2024), Apple M4 chip
kg CO
2
e
32
35
–
–
–
Mac Studio (2025), Apple M4 Max chip
kg CO
2
e
–
276
–
–
–
Mac Studio (2025), Apple M3 Ultra chip
kg CO
2
e
–
–
382
–
–
Mac Pro (2023)
kg CO
2
e
–
–
1,572
–
–
Storage configurations
Apple TV
Unit
64GB
128GB
Apple TV 4K, Wi-Fi
kg CO
2
e
43
–
Apple TV 4K, Wi-Fi + Ethernet
kg CO
2
e
–
46
AirPods
Unit
AirPods Pro 3
kg CO
2
e
13
HomePod
Unit
HomePod (2nd generation)
kg CO
2
e
92
HomePod mini
kg CO
2
e
42
Apple Vision Pro
Unit
Apple Vision Pro
kg CO
2
e
335
ENGAGEMENT AND ADVOCACY
ENVIRONMENTAL INITIATIVES
INTRODUCTION
CONTENTS
GREEN BOND IMPACT REPORT
APPENDIX
2026 ENVIRONMENTAL PROGRESS REPORT
79
DATA
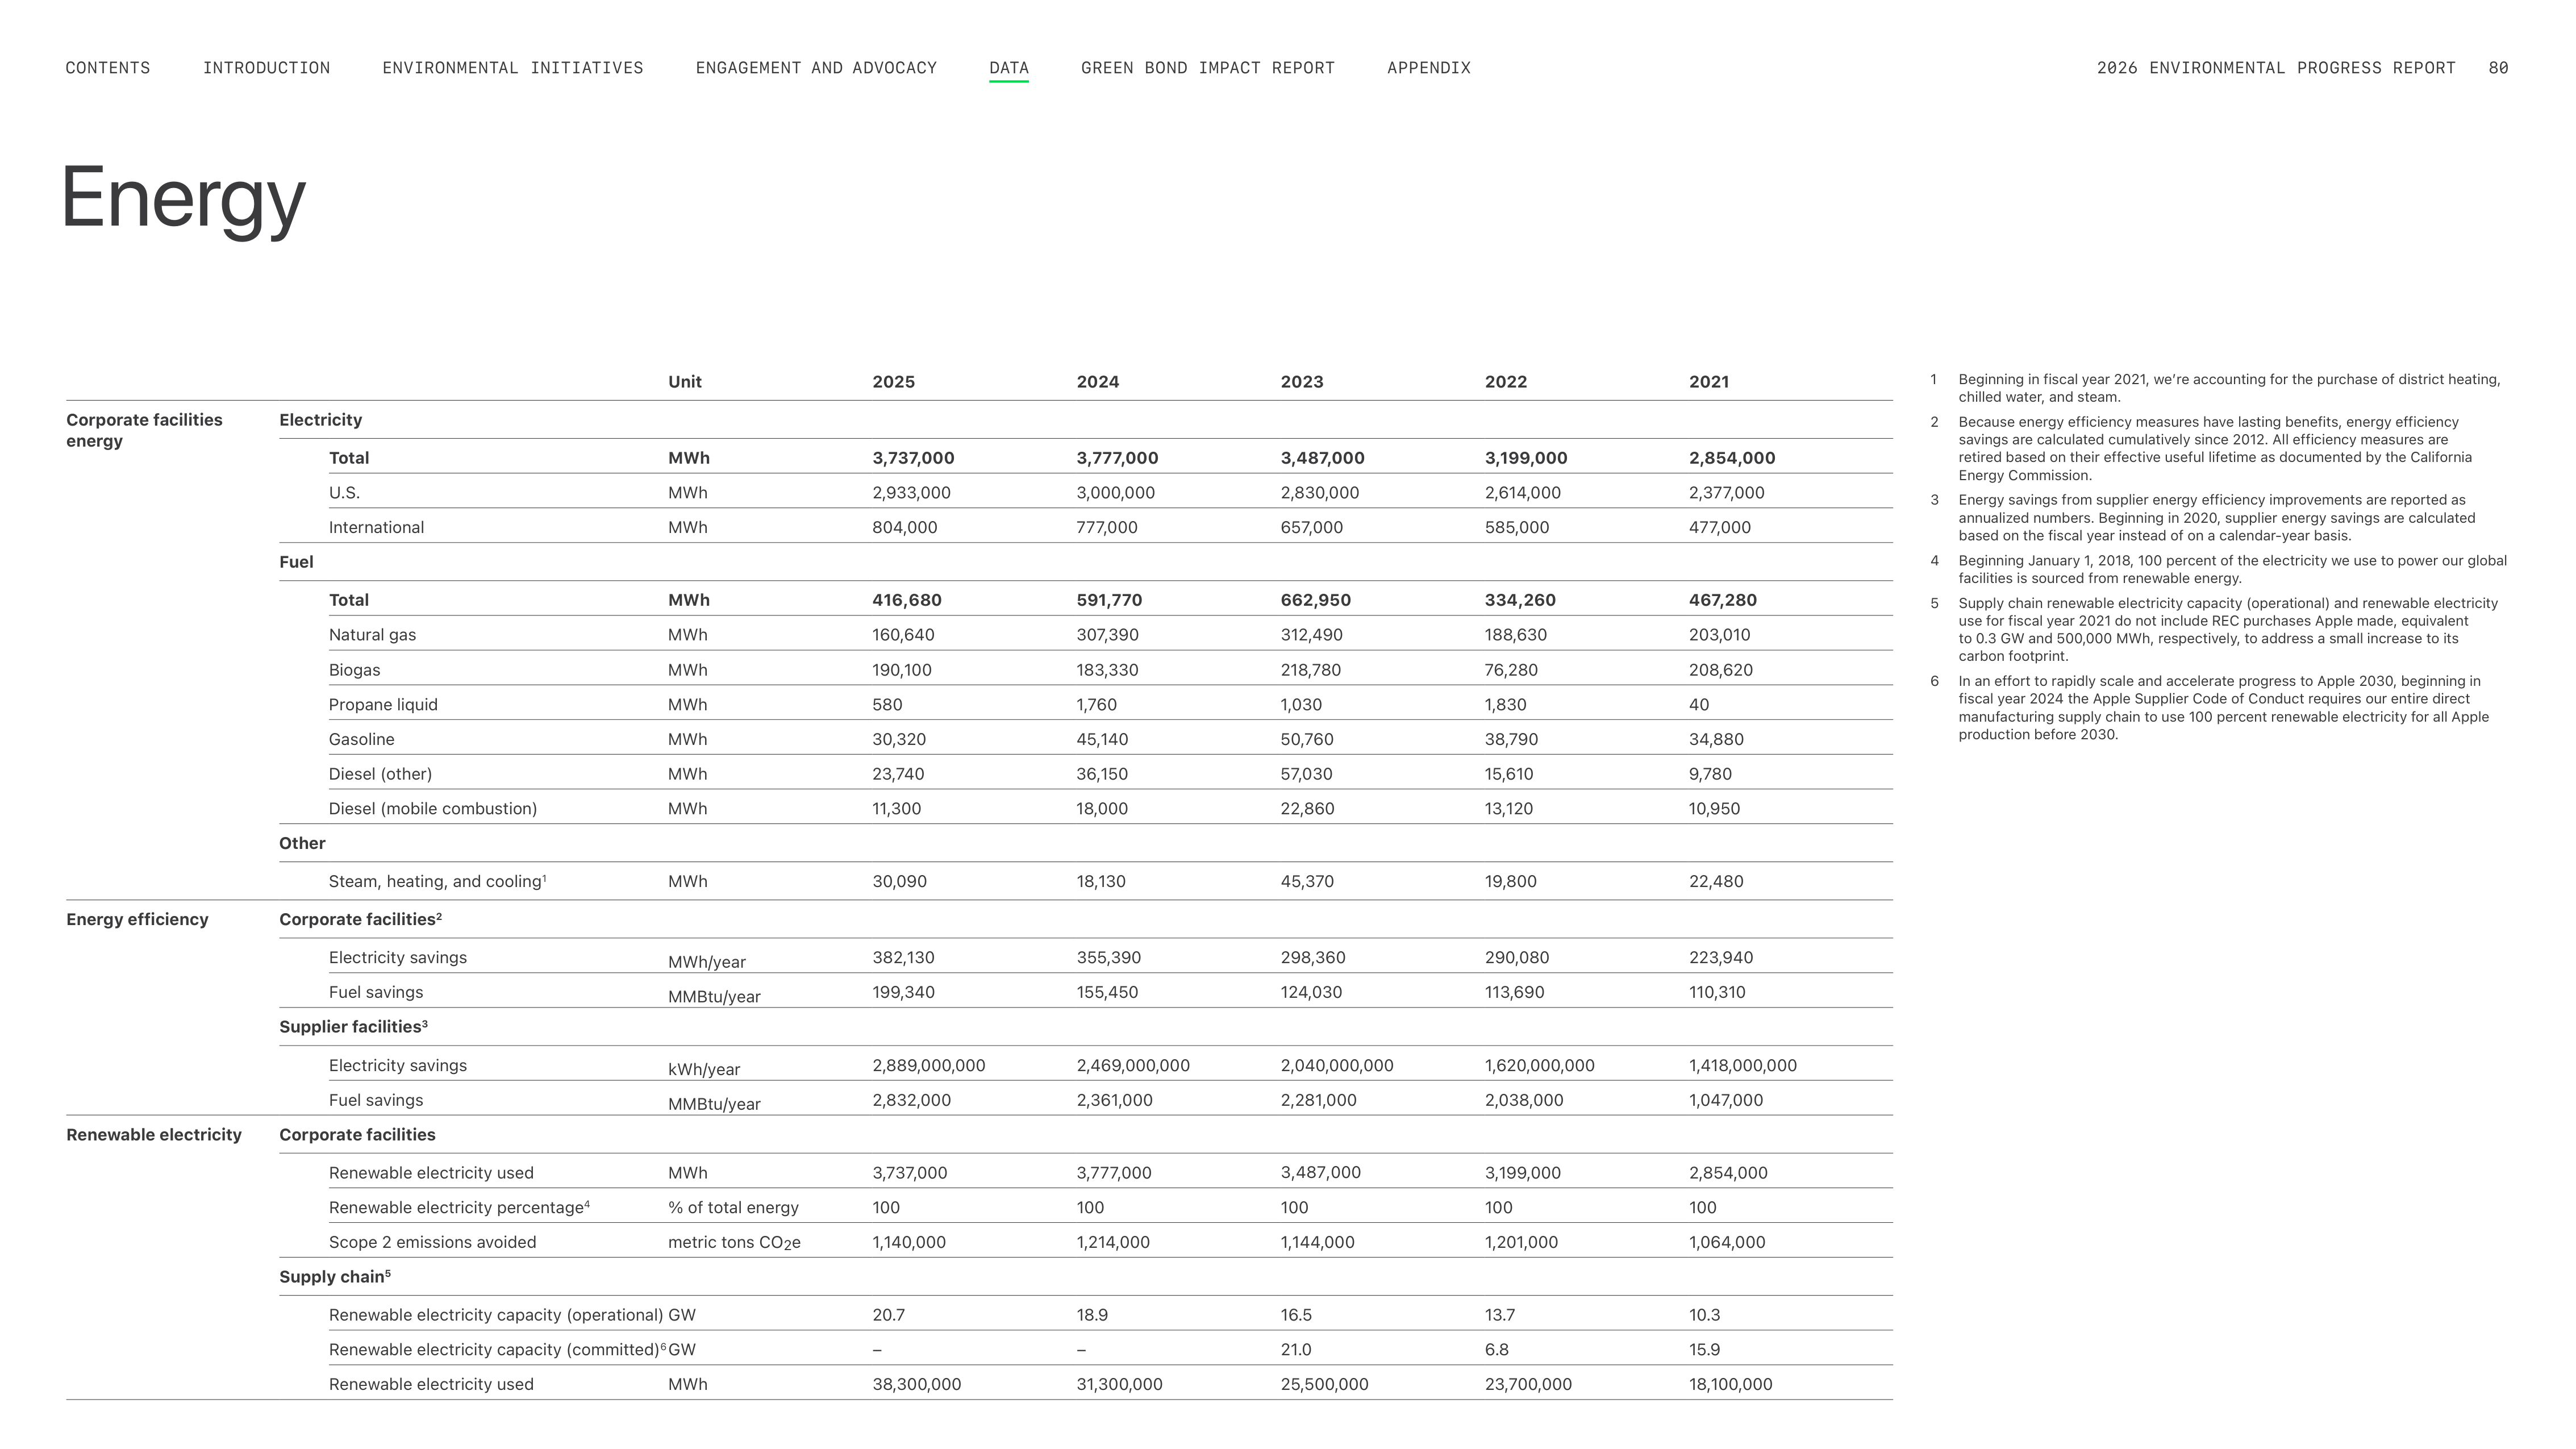
Energy
Unit
2025
2024
2023
2022
2021
Corporate facilities
energy
Electricity
Total
MWh
3,737,000
3,777,000
3,487,000
3,199,000
2,854,000
U.S.
MWh
2,933,000
3,000,000
2,830,000
2,614,000
2,377,000
International
MWh
804,000
777,000
657,000
585,000
477,000
Fuel
Total
MWh
416,680
591,770
662,950
334,260
467,280
Natural gas
MWh
160,640
307,390
312,490
188,630
203,010
Biogas
MWh
190,100
183,330
218,780
76,280
208,620
Propane liquid
MWh
580
1,760
1,030
1,830
40
Gasoline
MWh
30,320
45,140
50,760
38,790
34,880
Diesel (other)
MWh
23,740
36,150
57,030
15,610
9,780
Diesel (mobile combustion)
MWh
11,300
18,000
22,860
13,120
10,950
Other
Steam, heating, and cooling
1
MWh
30,090
18,130
45,370
19,800
22,480
Energy efficiency
Corporate facilities
2
Electricity savings
MWh/year
382,130
355,390
298,360
290,080
223,940
Fuel savings
MMBtu/year
199,340
155,450
124,030
113,690
110,310
Supplier facilities
3
Electricity savings
kWh/year
2,889,000,000
2,469,000,000
2,040,000,000
1,620,000,000
1,418,000,000
Fuel savings
MMBtu/year
2,832,000
2,361,000
2,281,000
2,038,000
1,047,000
Renewable electricity
Corporate facilities
Renewable electricity used
MWh
3,737,000
3,777,000
3,487,000
3,199,000
2,854,000
Renewable electricity percentage
4
% of total energy
100
100
100
100
100
Scope 2 emissions avoided
metric tons CO
2
e
1,140,000
1,214,000
1,144,000
1,201,000
1,064,000
Supply chain
5
Renewable electricity capacity (operational) GW
20.7
18.9
16.5
13.7
10.3
Renewable electricity capacity (committed)
6
GW
–
–
21.0
6.8
15.9
Renewable electricity used
MWh
38,300,000
31,300,000
25,500,000
23,700,000
18,100,000
1
Beginning in fiscal year 2021, weʼre accounting for the purchase of district heating,
chilled water, and steam.
2
Because energy efficiency measures have lasting benefits, energy efficiency
savings are calculated cumulatively since 2012. All efficiency measures are
retired based on their effective useful lifetime as documented by the California
Energy Commission.
3
Energy savings from supplier energy efficiency improvements are reported as
annualized numbers. Beginning in 2020, supplier energy savings are calculated
based on the fiscal year instead of on a calendar-year basis.
4
Beginning January 1, 2018, 100 percent of the electricity we use to power our global
facilities is sourced from renewable energy.
5
Supply chain renewable electricity capacity (operational) and renewable electricity
use for fiscal year 2021 do not include REC purchases Apple made, equivalent
to 0.3 GW and 500,000 MWh, respectively, to address a small increase to its
carbon footprint.
6
In an effort to rapidly scale and accelerate progress to Apple 2030, beginning in
fiscal year 2024 the Apple Supplier Code of Conduct requires our entire direct
manufacturing supply chain to use 100 percent renewable electricity for all Apple
production before 2030.
ENGAGEMENT AND ADVOCACY
ENVIRONMENTAL INITIATIVES
INTRODUCTION
CONTENTS
GREEN BOND IMPACT REPORT
APPENDIX
2026 ENVIRONMENTAL PROGRESS REPORT
80
DATA
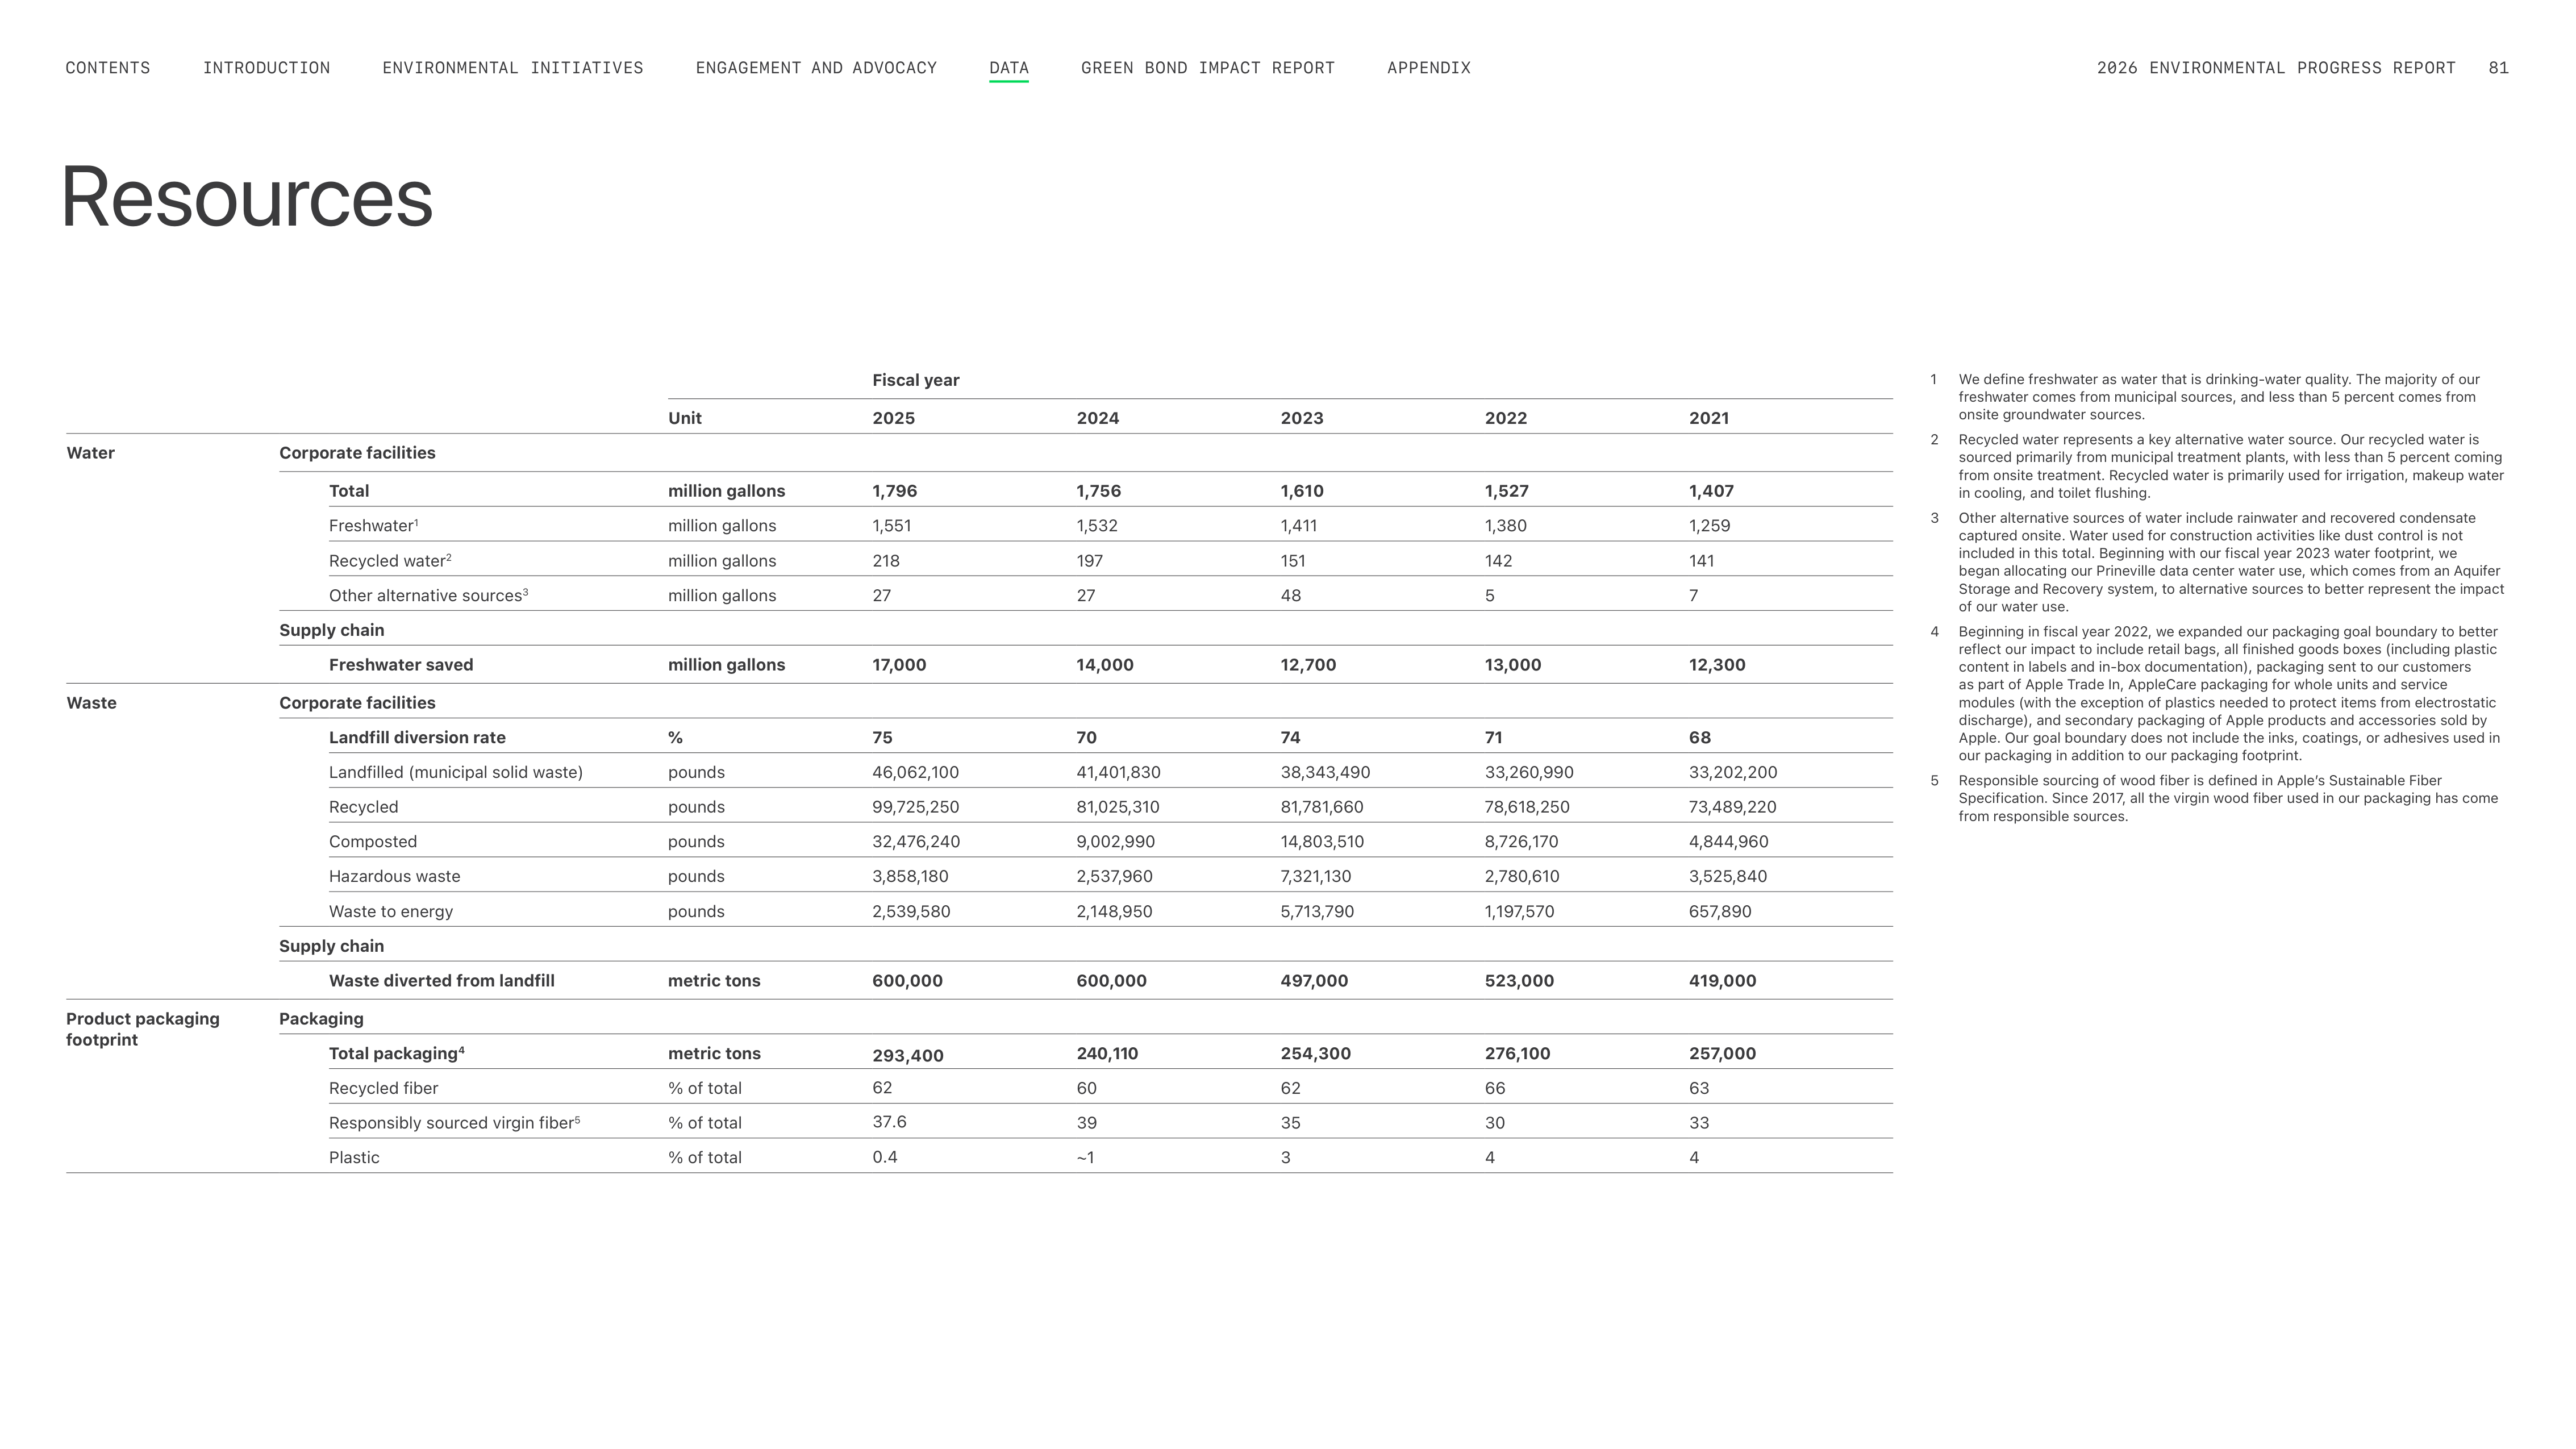
Resources
Fiscal year
Unit
2025
2024
2023
2022
2021
Water
Corporate facilities
Total
million gallons
1,796
1,756
1,610
1,527
1,407
Freshwater
1
million gallons
1,551
1,532
1,411
1,380
1,259
Recycled water
2
million gallons
218
197
151
142
141
Other alternative sources
3
million gallons
27
27
48
5
7
Supply chain
Freshwater saved
million gallons
17,000
14,000
12,700
13,000
12,300
Waste
Corporate facilities
Landfill diversion rate
%
75
70
74
71
68
Landfilled (municipal solid waste)
pounds
46,062,100
41,401,830
38,343,490
33,260,990
33,202,200
Recycled
pounds
99,725,250
81,025,310
81,781,660
78,618,250
73,489,220
Composted
pounds
32,476,240
9,002,990
14,803,510
8,726,170
4,844,960
Hazardous waste
pounds
3,858,180
2,537,960
7,321,130
2,780,610
3,525,840
Waste to energy
pounds
2,539,580
2,148,950
5,713,790
1,197,570
657,890
Supply chain
Waste diverted from landfill
metric tons
600,000
600,000
497,000
523,000
419,000
Product packaging
footprint
Packaging
Total packaging
4
metric tons
293,400
240,110
254,300
276,100
257,000
Recycled fiber
% of total
62
60
62
66
63
Responsibly sourced virgin fiber
5
% of total
37.6
39
35
30
33
Plastic
% of total
0.4
~1
3
4
4
1
We define freshwater as water that is drinking-water quality. The majority of our
freshwater comes from municipal sources, and less than 5 percent comes from
onsite groundwater sources.
2
Recycled water represents a key alternative water source. Our recycled water is
sourced primarily from municipal treatment plants, with less than 5 percent coming
from onsite treatment. Recycled water is primarily used for irrigation, makeup water
in cooling, and toilet flushing.
3
Other alternative sources of water include rainwater and recovered condensate
captured onsite. Water used for construction activities like dust control is not
included in this total. Beginning with our fiscal year 2023 water footprint, we
began allocating our Prineville data center water use, which comes from an Aquifer
Storage and Recovery system, to alternative sources to better represent the impact
of our water use.
4
Beginning in fiscal year 2022, we expanded our packaging goal boundary to better
reflect our impact to include retail bags, all finished goods boxes (including plastic
content in labels and in-box documentation), packaging sent to our customers
as part of Apple Trade In, AppleCare packaging for whole units and service
modules (with the exception of plastics needed to protect items from electrostatic
discharge), and secondary packaging of Apple products and accessories sold by
Apple. Our goal boundary does not include the inks, coatings, or adhesives used in
our packaging in addition to our packaging footprint.
5
Responsible sourcing of wood fiber is defined in Appleʼs Sustainable Fiber
Specification. Since 2017, all the virgin wood fiber used in our packaging has come
from responsible sources.
ENGAGEMENT AND ADVOCACY
ENVIRONMENTAL INITIATIVES
INTRODUCTION
CONTENTS
GREEN BOND IMPACT REPORT
APPENDIX
2026 ENVIRONMENTAL PROGRESS REPORT
81
DATA
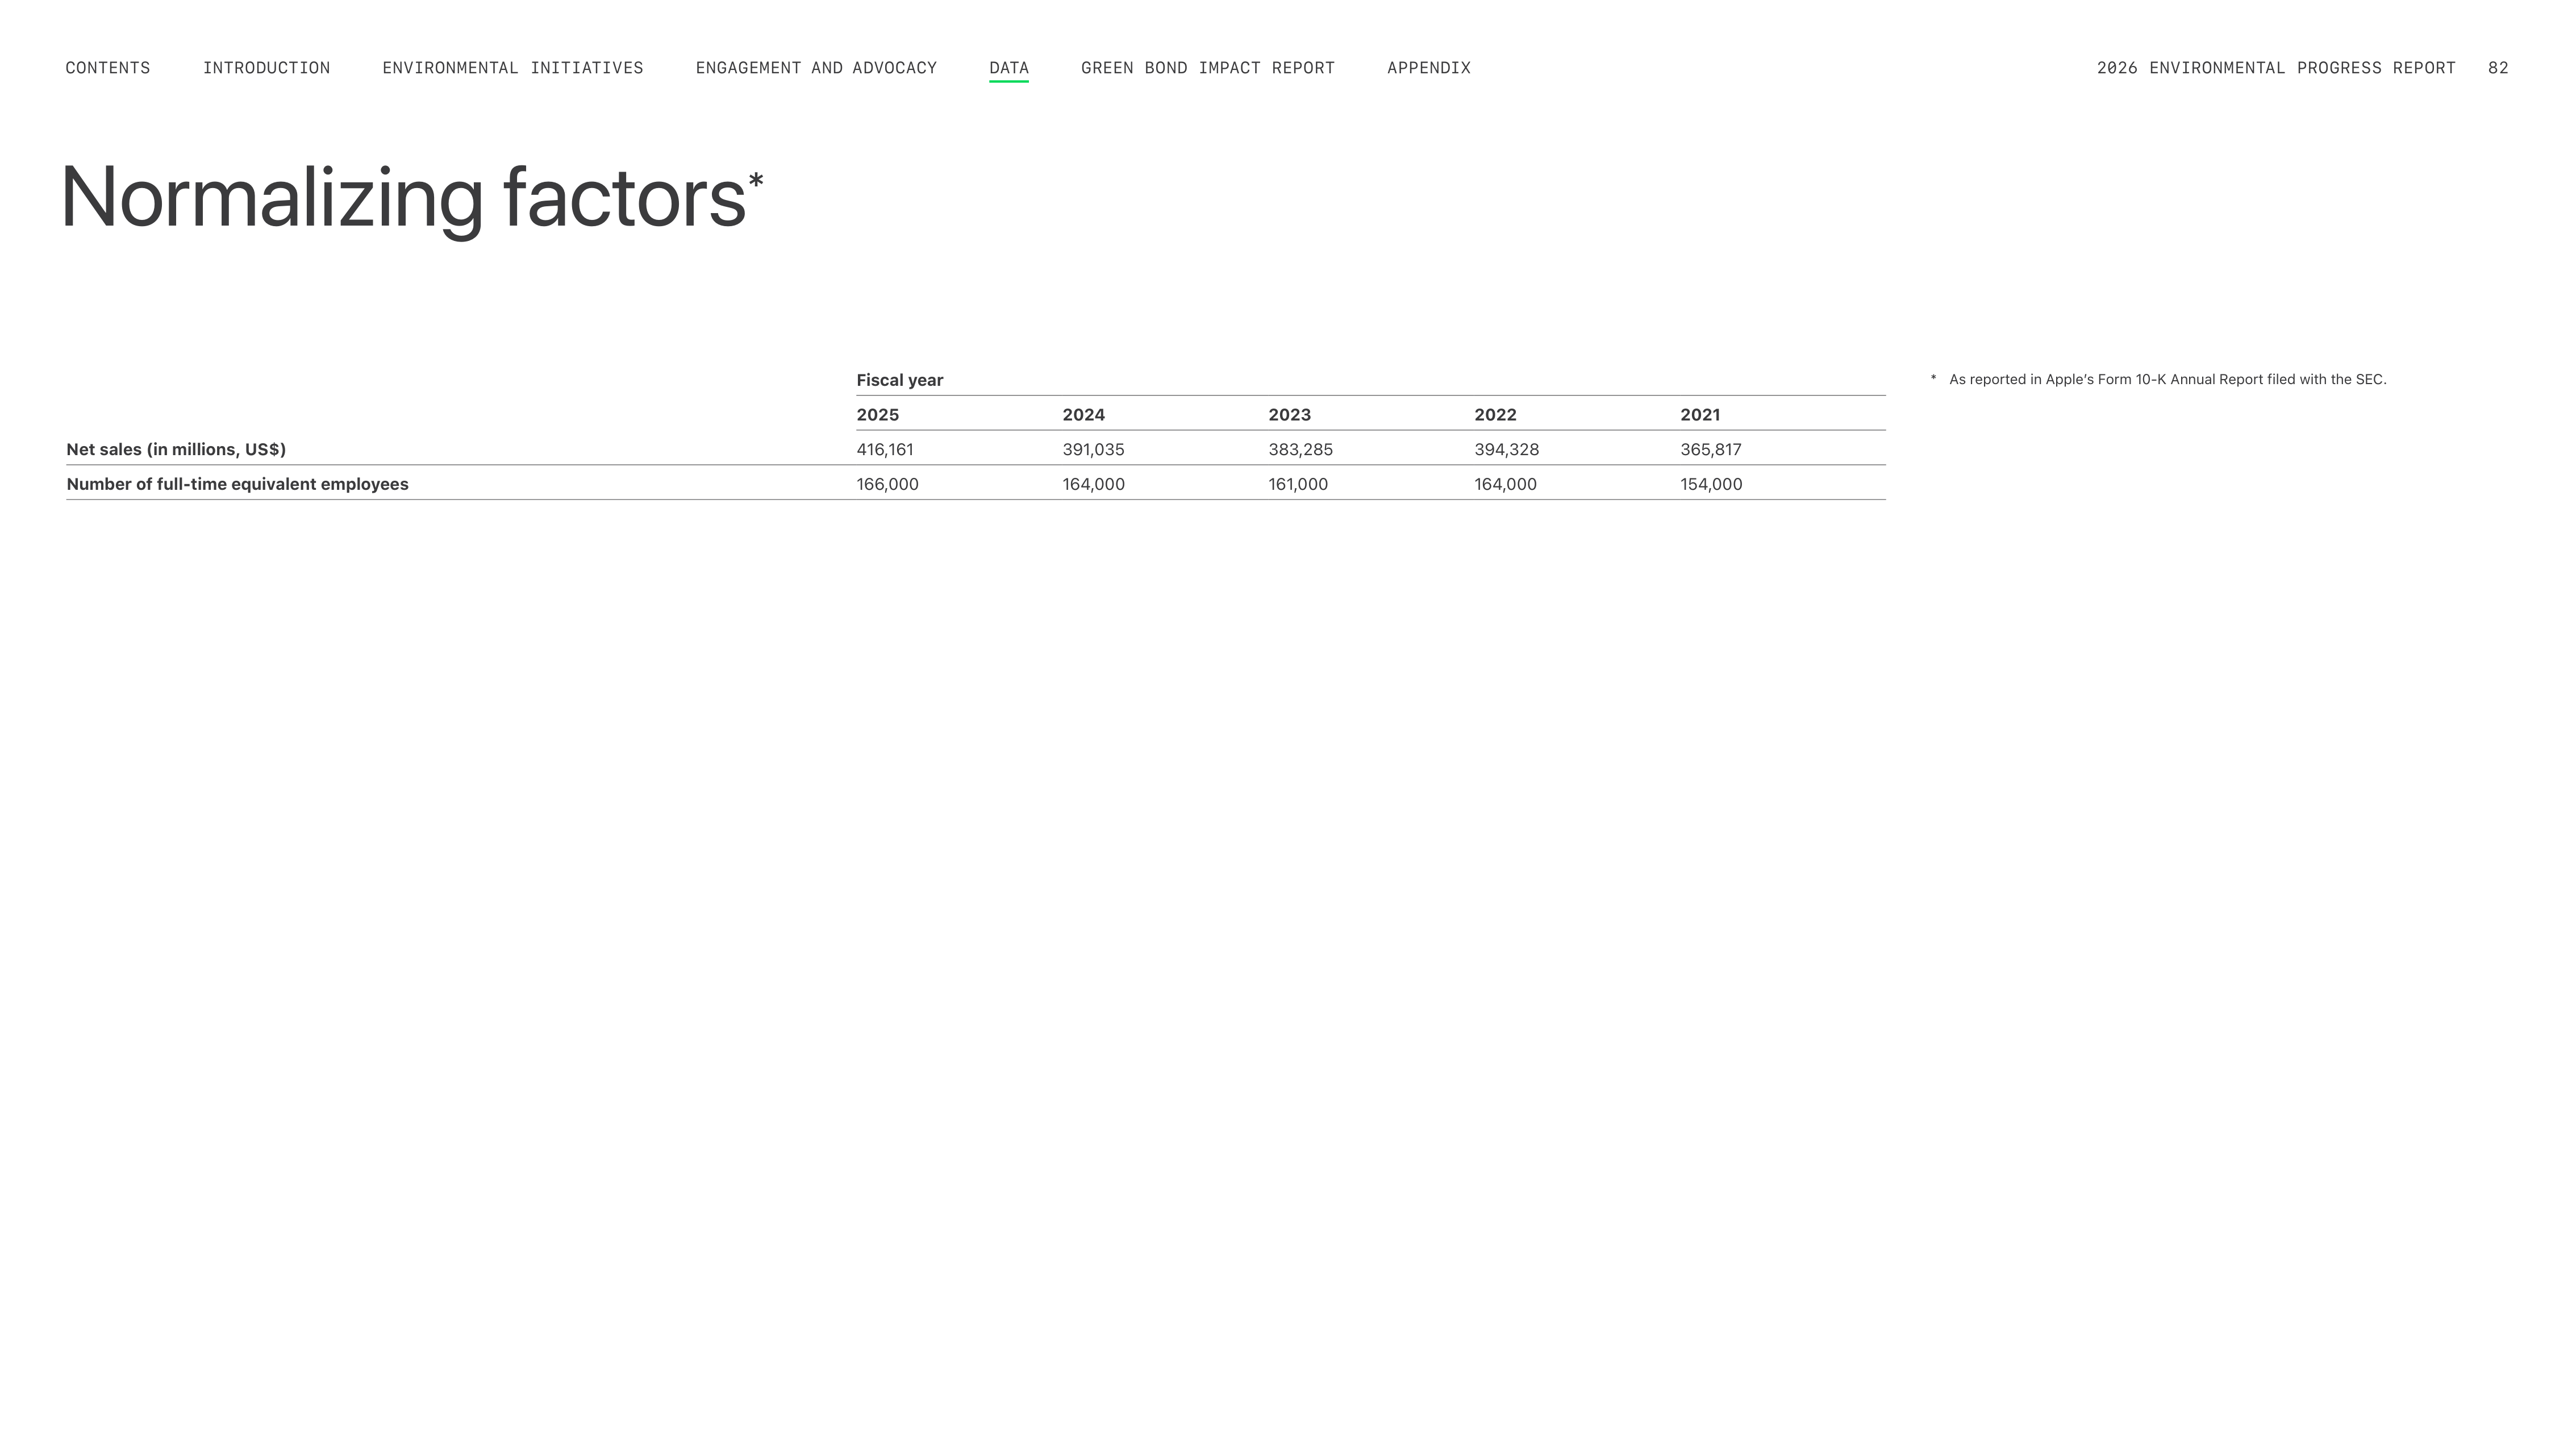
Normalizing factors
*
Fiscal year
2025
2024
2023
2022
2021
Net sales (in millions, US$)
416,161
391,035
383,285
394,328
365,817
Number of full-time equivalent employees
166,000
164,000
161,000
164,000
154,000
*
As reported in Appleʼs Form 10-K Annual Report filed with the SEC.
ENGAGEMENT AND ADVOCACY
ENVIRONMENTAL INITIATIVES
INTRODUCTION
CONTENTS
GREEN BOND IMPACT REPORT
APPENDIX
2026 ENVIRONMENTAL PROGRESS REPORT
82
DATA
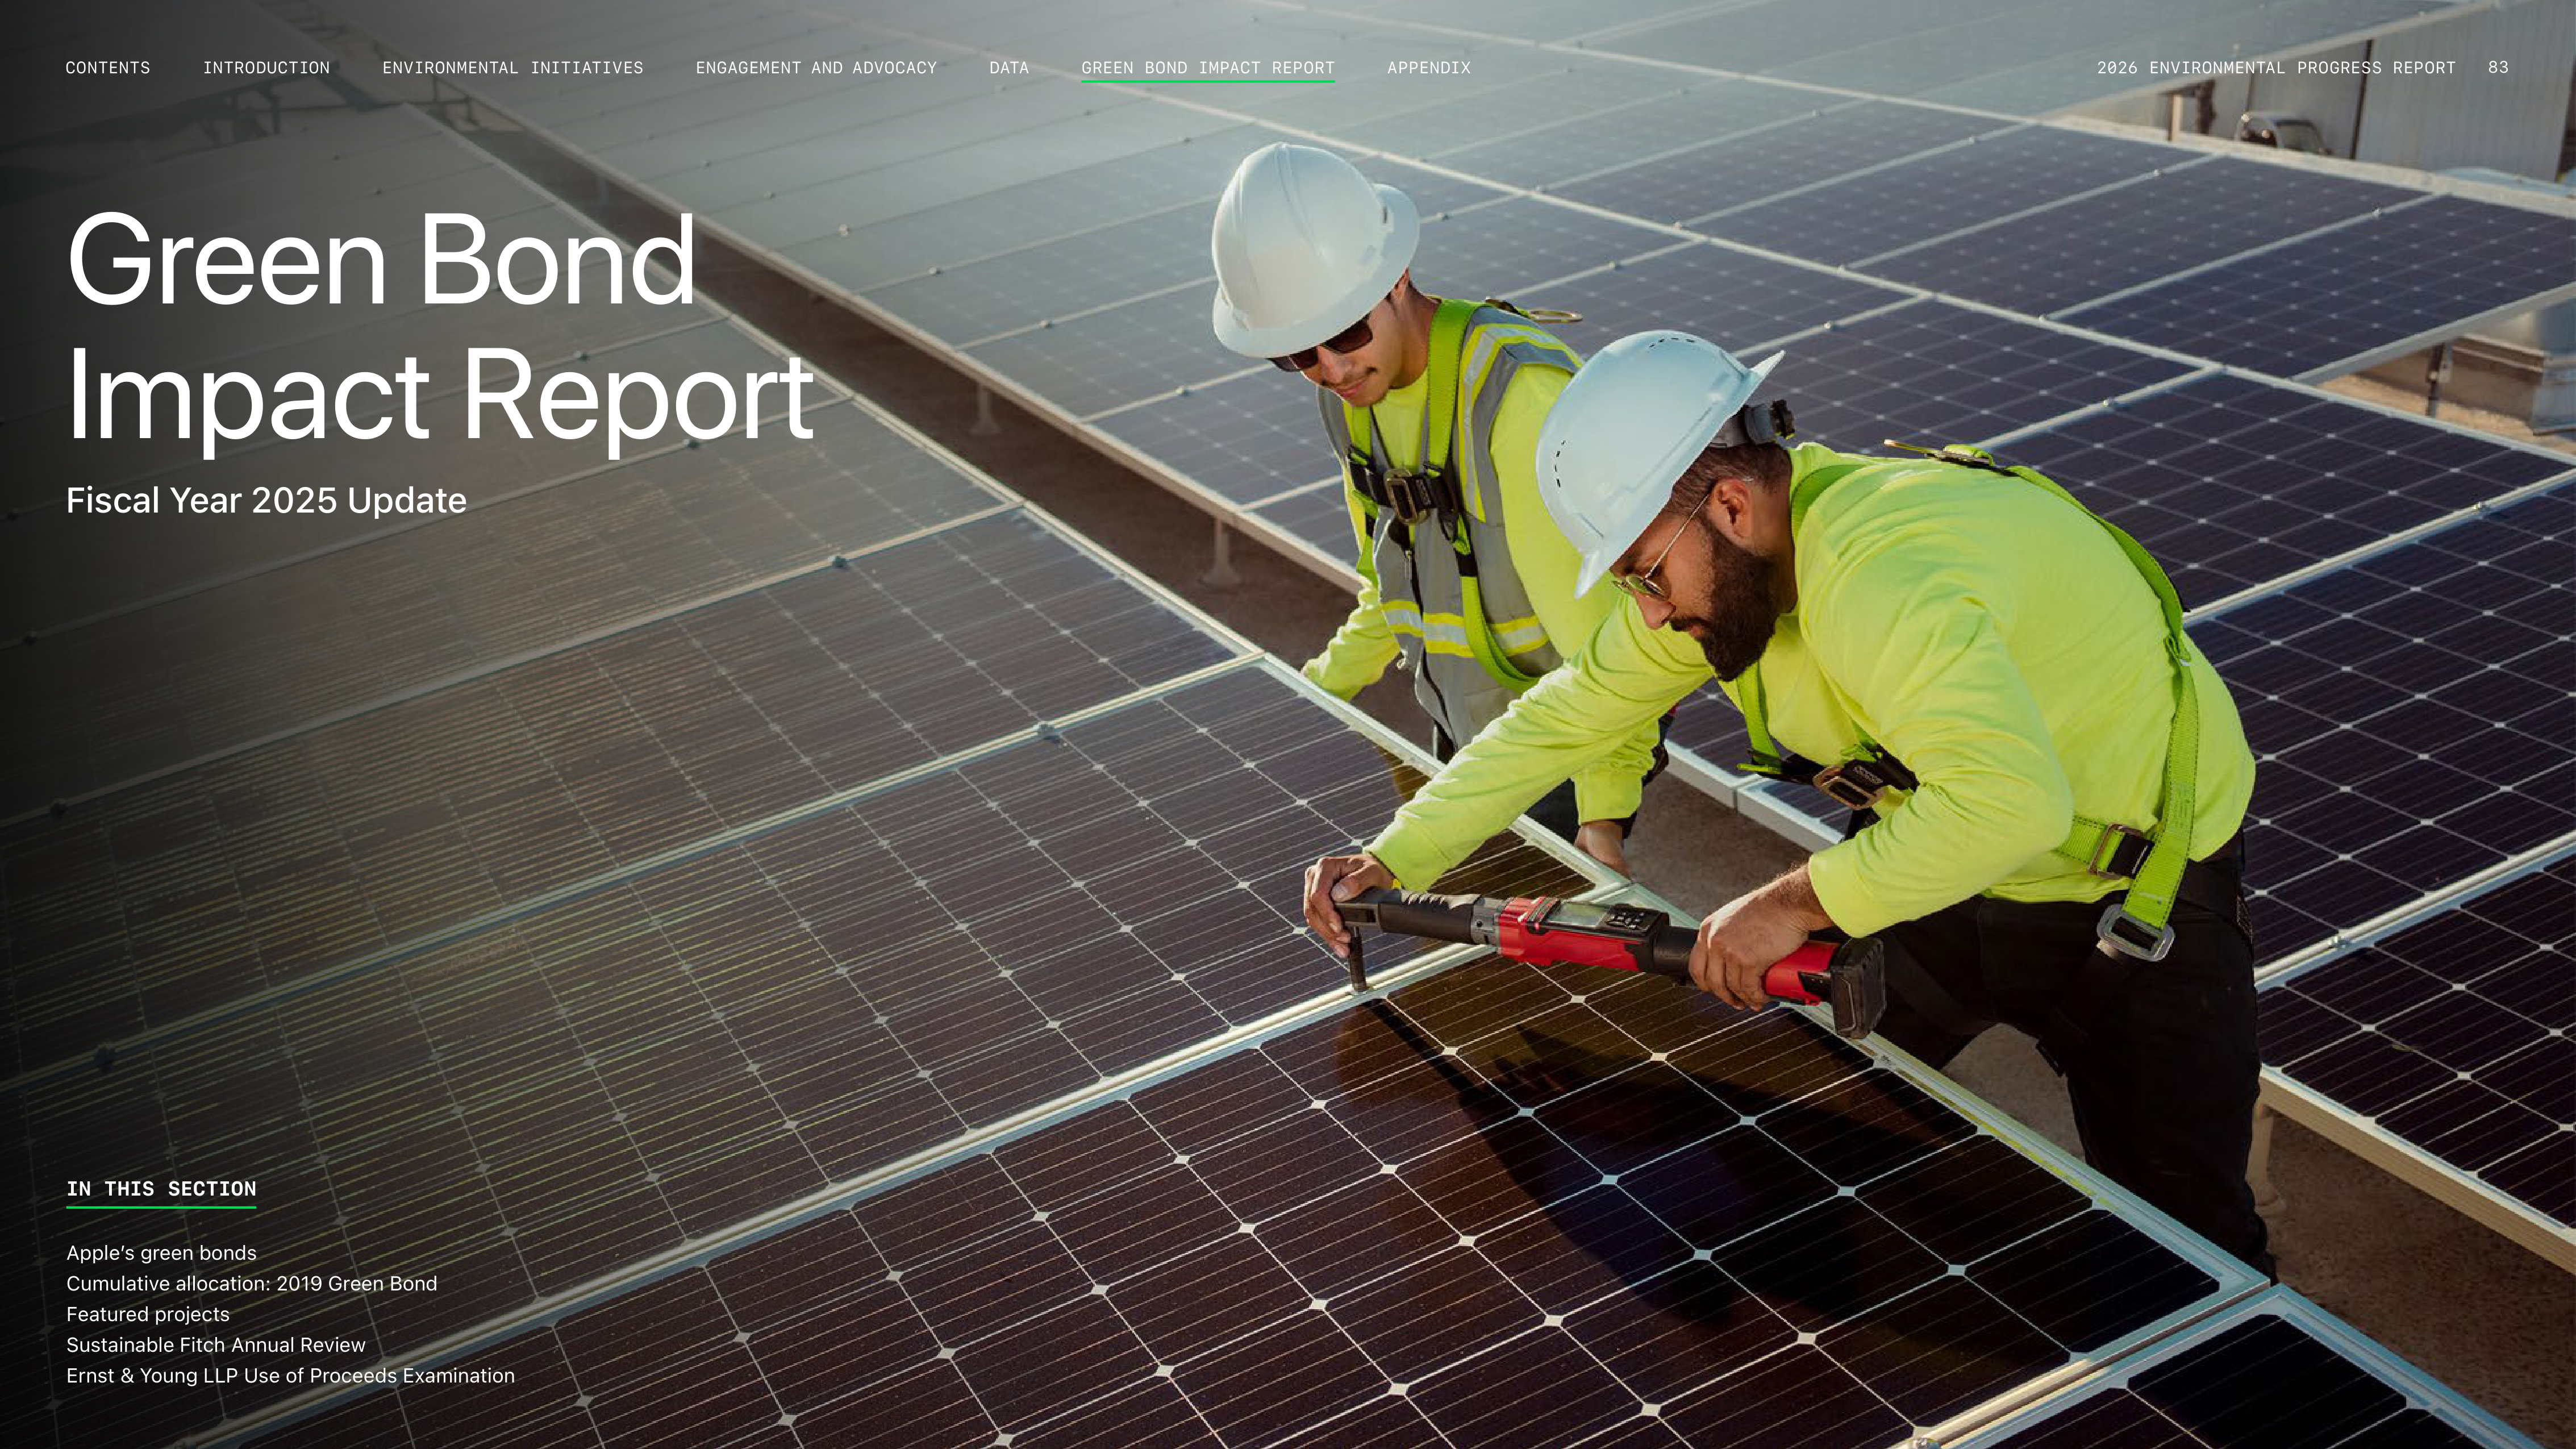
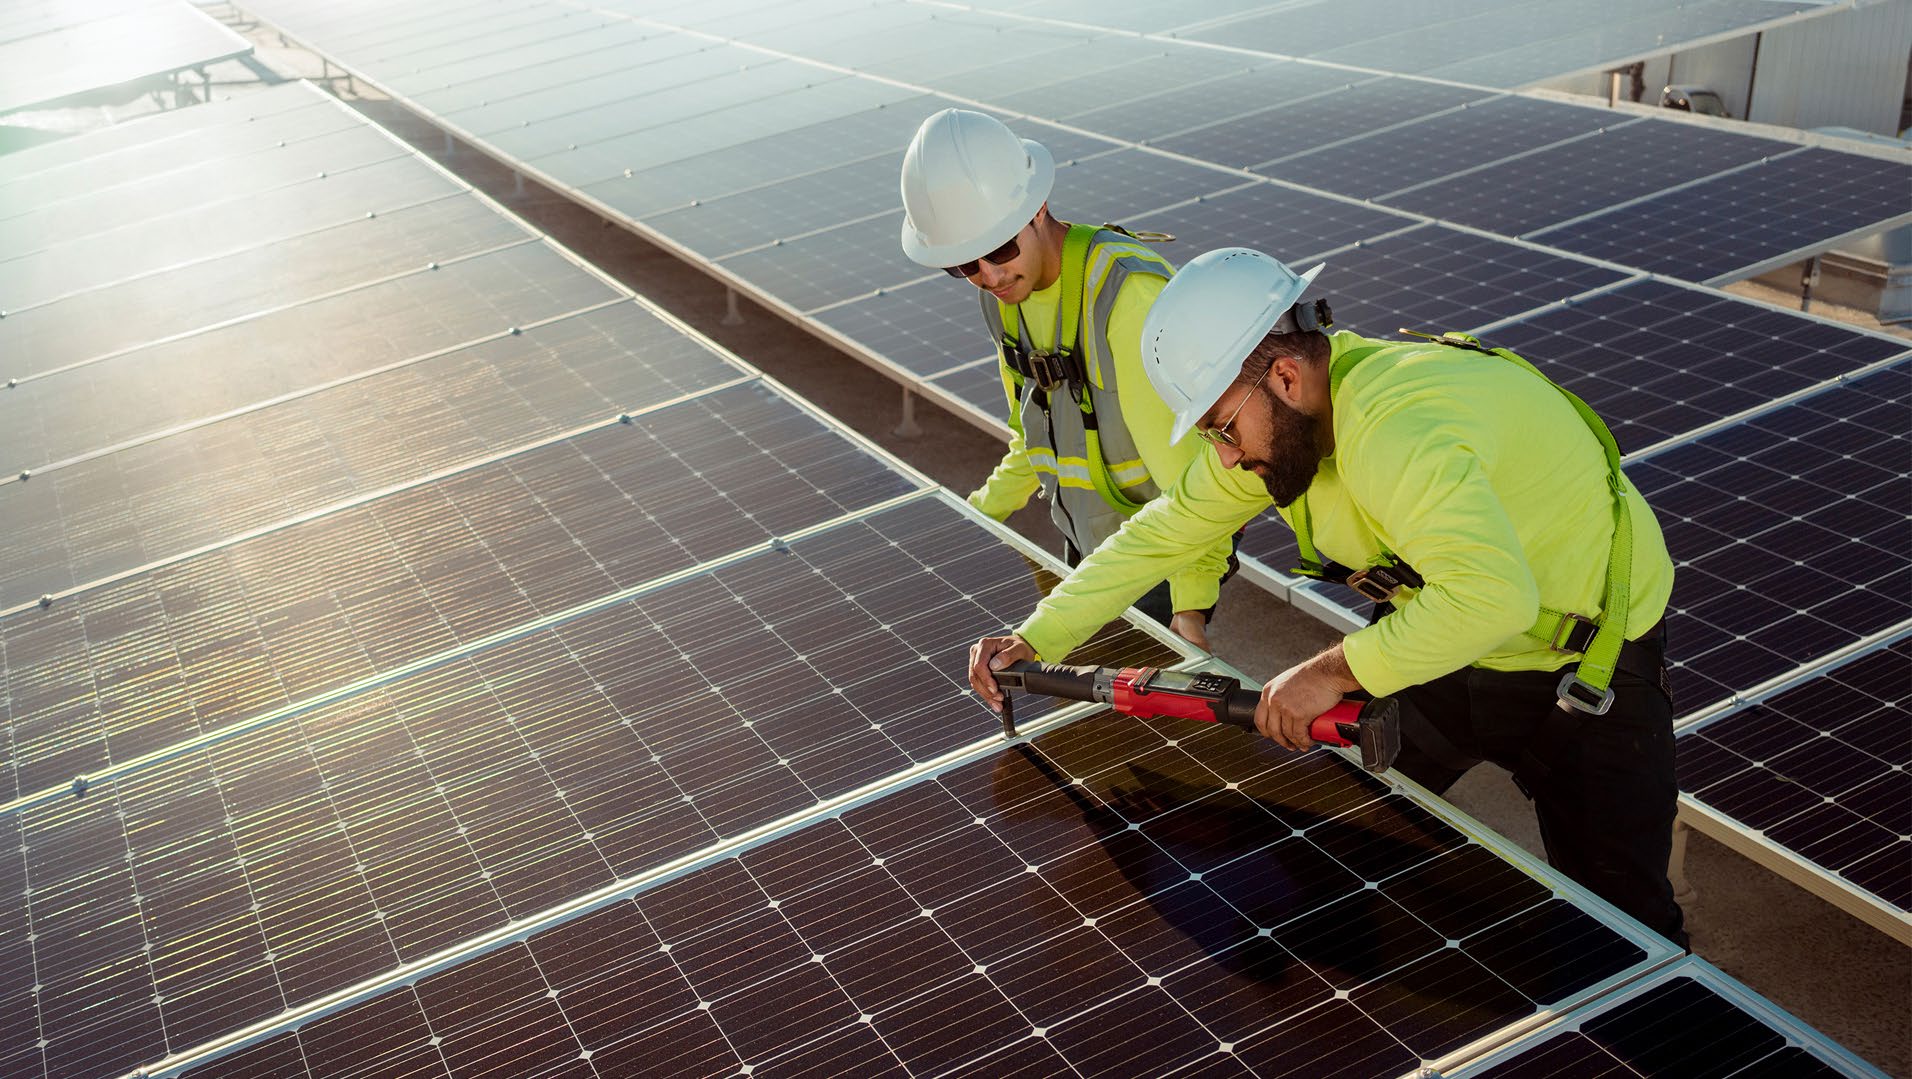
Green Bond
Impact Report
Fiscal Year 2025 Update
IN THIS SECTION
Appleʼs green bonds
Cumulative allocation: 2019 Green Bond
Featured projects
Sustainable Fitch Annual Review
Ernst & Young LLP Use of Proceeds Examination
2026 ENVIRONMENTAL PROGRESS REPORT
83
ENGAGEMENT AND ADVOCACY
ENVIRONMENTAL INITIATIVES
INTRODUCTION
CONTENTS
APPENDIX
DATA
GREEN BOND IMPACT REPORT
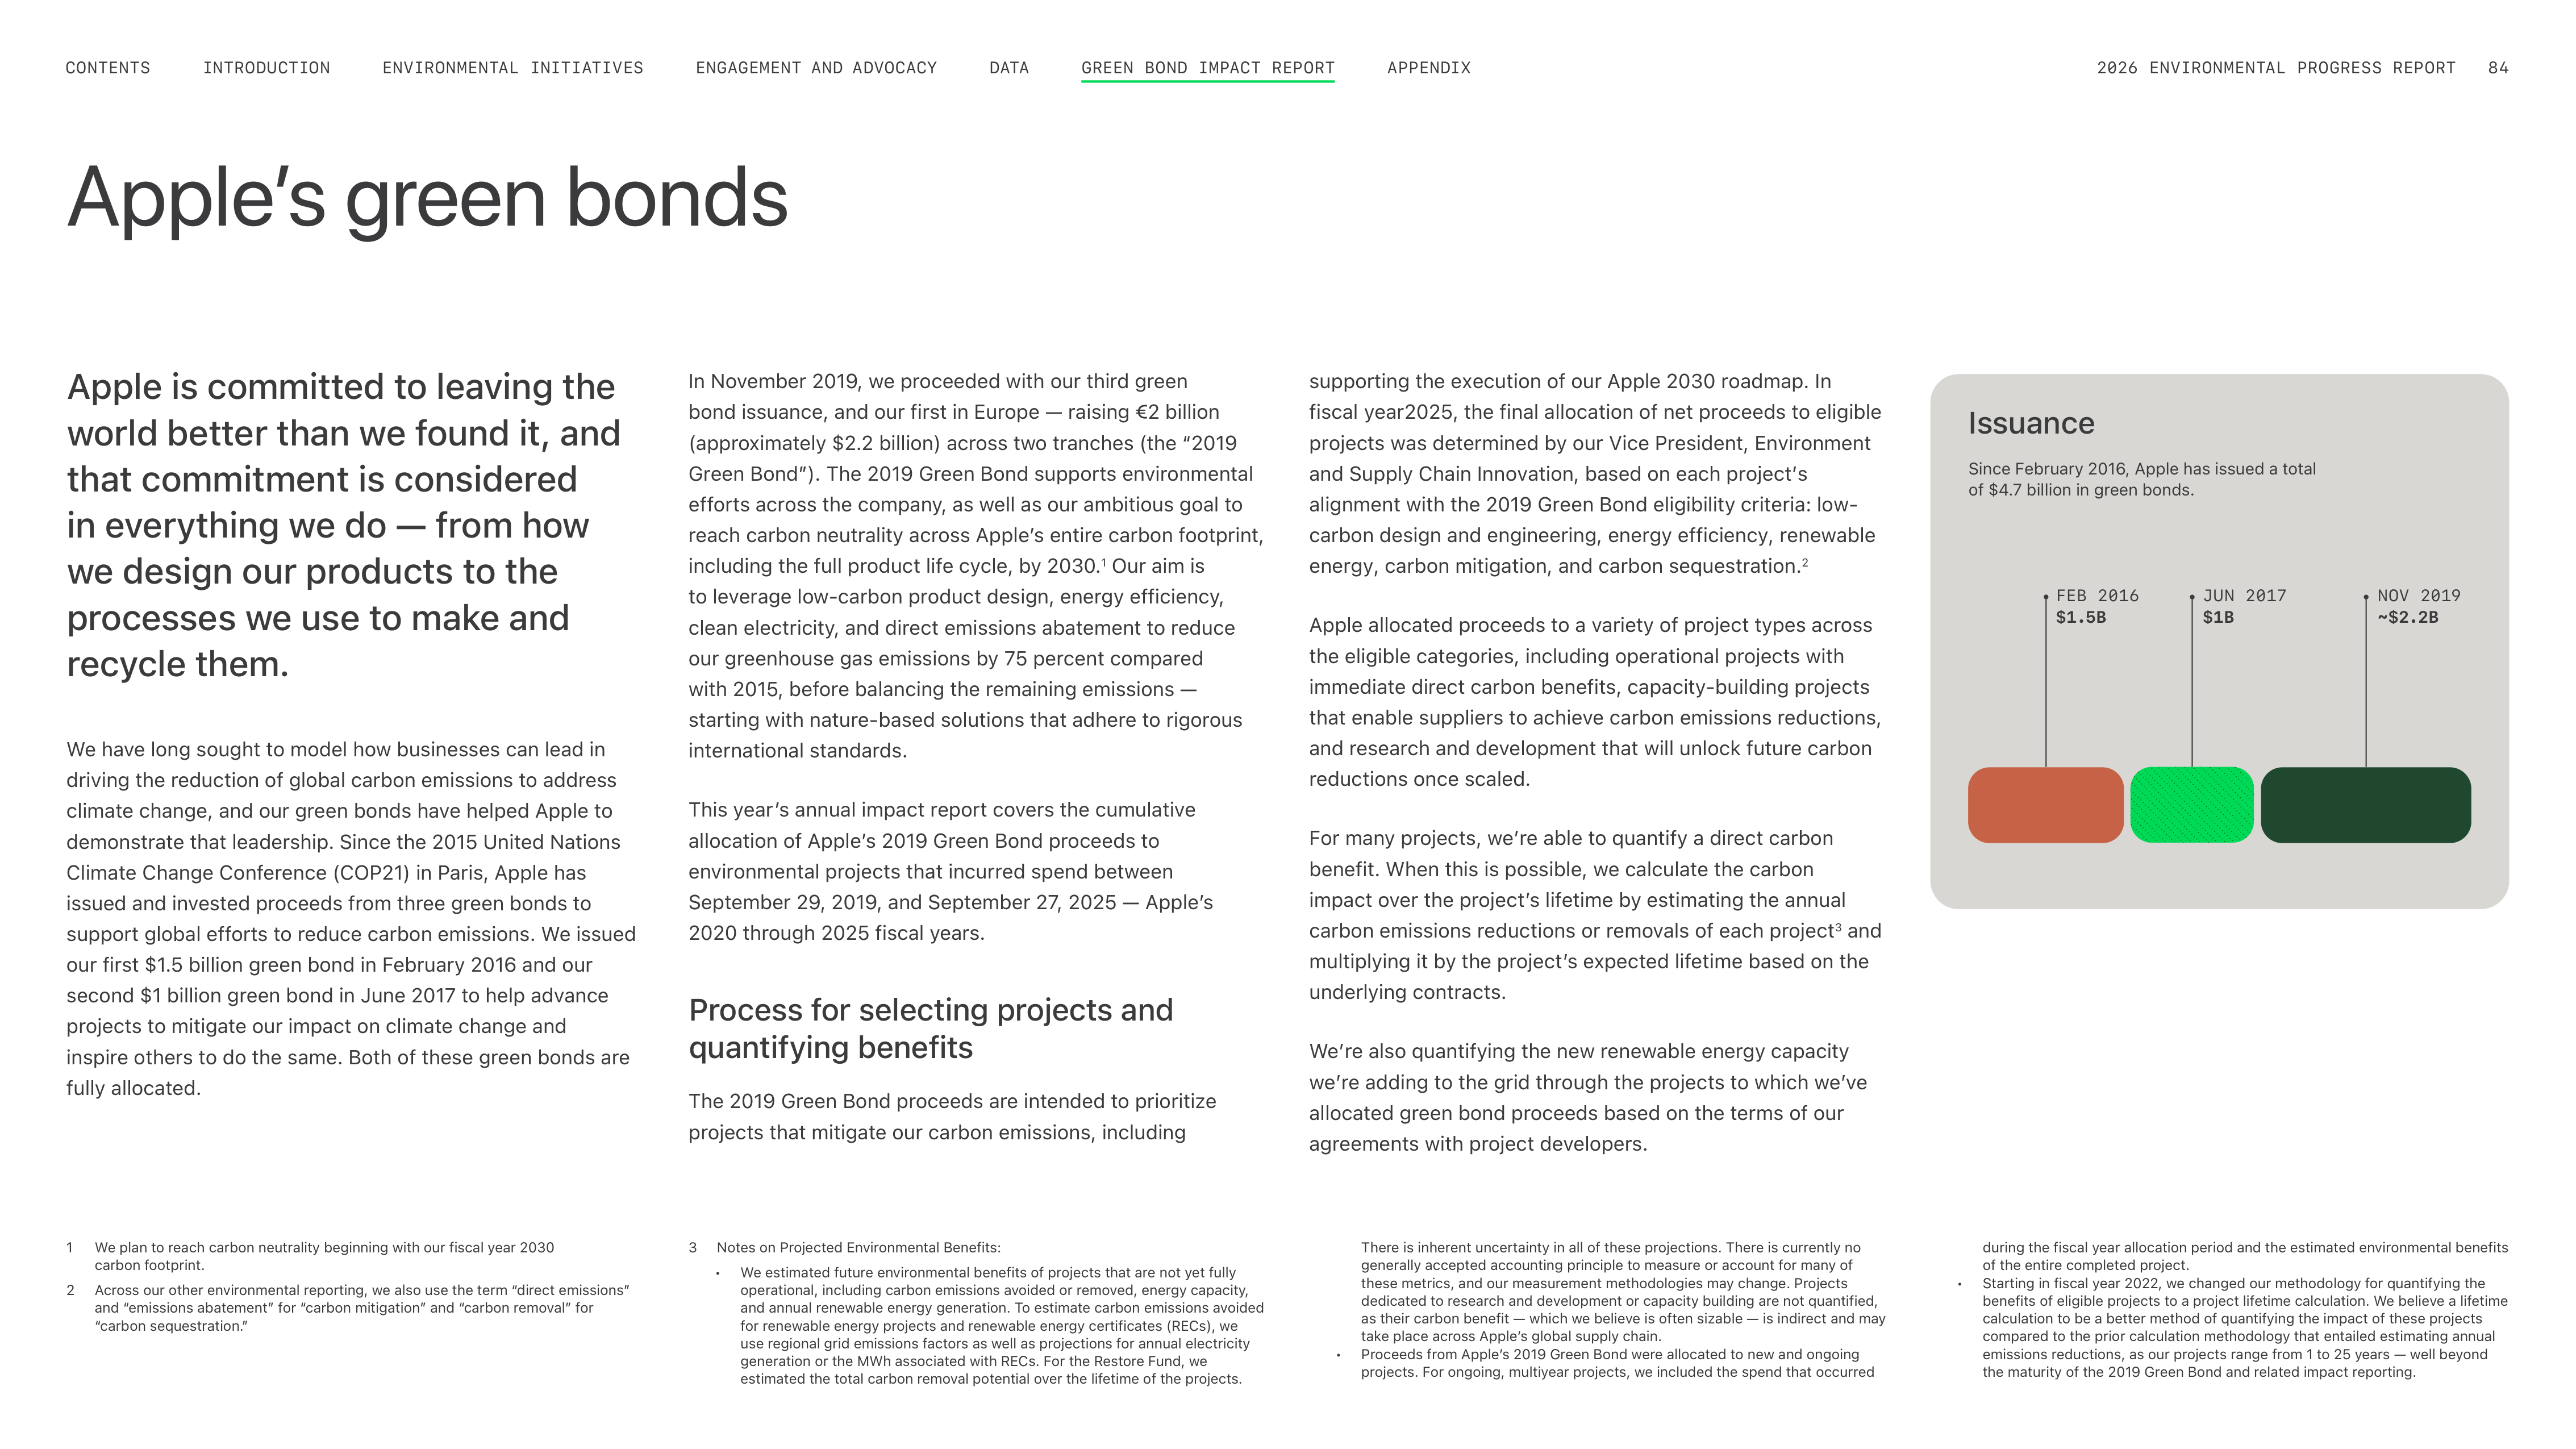
Apple is committed to leaving the
world better than we found it, and
that commitment is considered
in everything we do — from how
we design our products to the
processes we use to make and
recycle them.
We have long sought to model how businesses can lead in
driving the reduction of global carbon emissions to address
climate change, and our green bonds have helped Apple to
demonstrate that leadership. Since the 2015 United Nations
Climate Change Conference (COP21) in Paris, Apple has
issued and invested proceeds from three green bonds to
support global efforts to reduce carbon emissions. We issued
our first $1.5 billion green bond in February 2016 and our
second $1 billion green bond in June 2017 to help advance
projects to mitigate our impact on climate change and
inspire others to do the same. Both of these green bonds are
fully allocated.
Apple’s green bonds
In November 2019, we proceeded with our third green
bond issuance, and our first in Europe — raising €2 billion
(approximately $2.2 billion) across two tranches (the “2019
Green Bond”). The 2019 Green Bond supports environmental
efforts across the company, as well as our ambitious goal to
reach carbon neutrality across Appleʼs entire carbon footprint,
including the full product life cycle, by 2030.
1
Our aim is
to leverage low-carbon product design, energy efficiency,
clean electricity, and direct emissions abatement to reduce
our greenhouse gas emissions by 75 percent compared
with 2015, before balancing the remaining emissions —
starting with nature-based solutions that adhere to rigorous
international standards.
This yearʼs annual impact report covers the cumulative
allocation of Appleʼs 2019 Green Bond proceeds to
environmental projects that incurred spend between
September 29, 2019, and September 27, 2025 — Appleʼs
2020 through 2025 fiscal years.
Process for selecting projects and
quantifying benefits
The 2019 Green Bond proceeds are intended to prioritize
projects that mitigate our carbon emissions, including
1
We plan to reach carbon neutrality beginning with our fiscal year 2030
carbon footprint.
2
Across our other environmental reporting, we also use the term “direct emissions”
and “emissions abatement” for “carbon mitigation” and “carbon removal” for
“carbon sequestration.”
Issuance
Since February 2016, Apple has issued a total
of $4.7 billion in green bonds.
supporting the execution of our Apple 2030 roadmap. In
fiscal year2025, the final allocation of net proceeds to eligible
projects was determined by our Vice President, Environment
and Supply Chain Innovation, based on each projectʼs
alignment with the 2019 Green Bond eligibility criteria: low-
carbon design and engineering, energy efficiency, renewable
energy, carbon mitigation, and carbon sequestration.
2
Apple allocated proceeds to a variety of project types across
the eligible categories, including operational projects with
immediate direct carbon benefits, capacity-building projects
that enable suppliers to achieve carbon emissions reductions,
and research and development that will unlock future carbon
reductions once scaled.
For many projects, weʼre able to quantify a direct carbon
benefit. When this is possible, we calculate the carbon
impact over the projectʼs lifetime by estimating the annual
carbon emissions reductions or removals of each project
3
and
multiplying it by the projectʼs expected lifetime based on the
underlying contracts.
Weʼre also quantifying the new renewable energy capacity
weʼre adding to the grid through the projects to which weʼve
allocated green bond proceeds based on the terms of our
agreements with project developers.
3
Notes on Projected Environmental Benefits:
•
We estimated future environmental benefits of projects that are not yet fully
operational, including carbon emissions avoided or removed, energy capacity,
and annual renewable energy generation. To estimate carbon emissions avoided
for renewable energy projects and renewable energy certificates (RECs), we
use regional grid emissions factors as well as projections for annual electricity
generation or the MWh associated with RECs. For the Restore Fund, we
estimated the total carbon removal potential over the lifetime of the projects.
There is inherent uncertainty in all of these projections. There is currently no
generally accepted accounting principle to measure or account for many of
these metrics, and our measurement methodologies may change. Projects
dedicated to research and development or capacity building are not quantified,
as their carbon benefit — which we believe is often sizable — is indirect and may
take place across Appleʼs global supply chain.
•
Proceeds from Appleʼs 2019 Green Bond were allocated to new and ongoing
projects. For ongoing, multiyear projects, we included the spend that occurred
during the fiscal year allocation period and the estimated environmental benefits
of the entire completed project.
•
Starting in fiscal year 2022, we changed our methodology for quantifying the
benefits of eligible projects to a project lifetime calculation. We believe a lifetime
calculation to be a better method of quantifying the impact of these projects
compared to the prior calculation methodology that entailed estimating annual
emissions reductions, as our projects range from 1 to 25 years — well beyond
the maturity of the 2019 Green Bond and related impact reporting.
FEB 2016
$1.5B
JUN 2017
$1B
NOV 2019
~$2.2B
ENGAGEMENT AND ADVOCACY
ENVIRONMENTAL INITIATIVES
INTRODUCTION
CONTENTS
DATA
APPENDIX
2026 ENVIRONMENTAL PROGRESS REPORT
84
GREEN BOND IMPACT REPORT
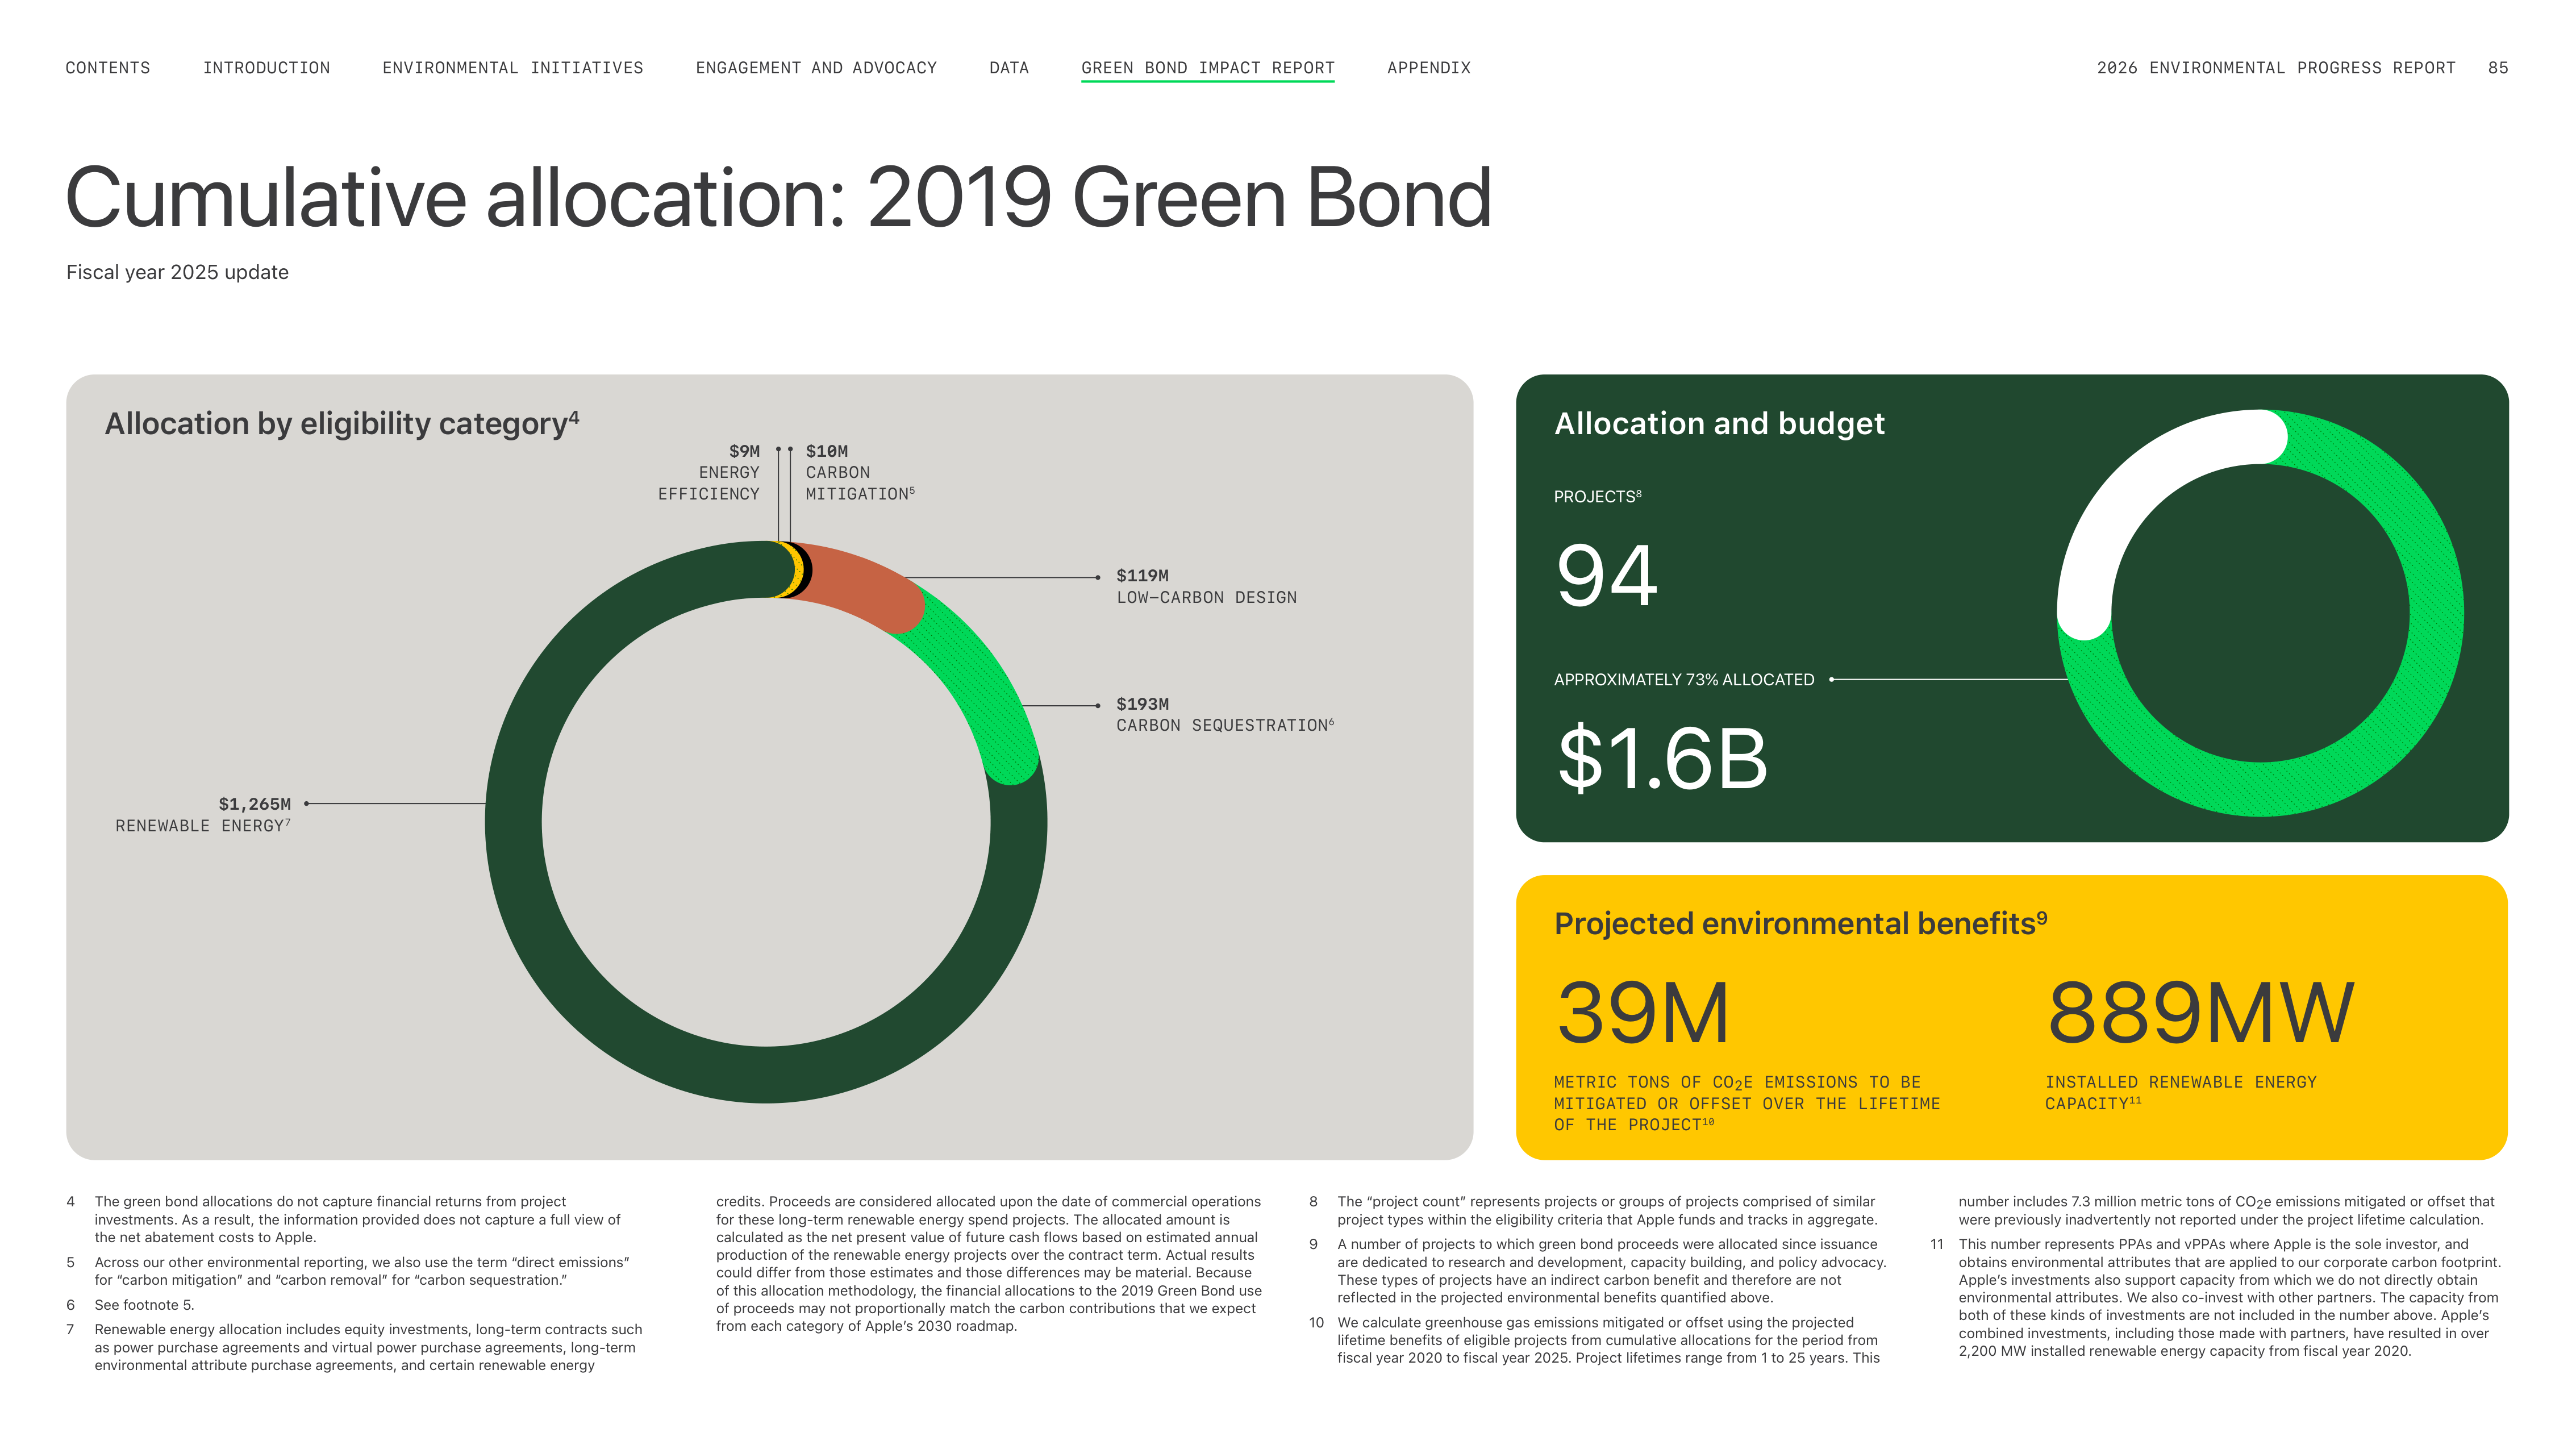
4
The green bond allocations do not capture financial returns from project
investments. As a result, the information provided does not capture a full view of
the net abatement costs to Apple.
5
Across our other environmental reporting, we also use the term “direct emissions”
for “carbon mitigation” and “carbon removal” for “carbon sequestration.”
6
See footnote 5.
7
Renewable energy allocation includes equity investments, long-term contracts such
as power purchase agreements and virtual power purchase agreements, long-term
environmental attribute purchase agreements, and certain renewable energy
Fiscal year 2025 update
Cumulative allocation: 2019 Green Bond
PROJECTS
8
Allocation and budget
$1.6B
APPROXIMATELY 73% ALLOCATED
Projected environmental benefits
9
Allocation by eligibility category
4
credits. Proceeds are considered allocated upon the date of commercial operations
for these long-term renewable energy spend projects. The allocated amount is
calculated as the net present value of future cash flows based on estimated annual
production of the renewable energy projects over the contract term. Actual results
could differ from those estimates and those differences may be material. Because
of this allocation methodology, the financial allocations to the 2019 Green Bond use
of proceeds may not proportionally match the carbon contributions that we expect
from each category of Appleʼs 2030 roadmap.
8
The “project count” represents projects or groups of projects comprised of similar
project types within the eligibility criteria that Apple funds and tracks in aggregate.
9
A number of projects to which green bond proceeds were allocated since issuance
are dedicated to research and development, capacity building, and policy advocacy.
These types of projects have an indirect carbon benefit and therefore are not
reflected in the projected environmental benefits quantified above.
10
We calculate greenhouse gas emissions mitigated or offset using the projected
lifetime benefits of eligible projects from cumulative allocations for the period from
fiscal year 2020 to fiscal year 2025. Project lifetimes range from 1 to 25 years. This
number includes 7.3 million metric tons of CO
2
e emissions mitigated or offset that
were previously inadvertently not reported under the project lifetime calculation.
11
This number represents PPAs and vPPAs where Apple is the sole investor, and
obtains environmental attributes that are applied to our corporate carbon footprint.
Appleʼs investments also support capacity from which we do not directly obtain
environmental attributes. We also co-invest with other partners. The capacity from
both of these kinds of investments are not included in the number above. Appleʼs
combined investments, including those made with partners, have resulted in over
2,200 MW installed renewable energy capacity from fiscal year 2020.
$193M
CARBON SEQUESTRATION
6
$119M
LOW-CARBON DESIGN
$10M
CARBON
MITIGATION
5
$9M
ENERGY
EFFICIENCY
$1,265M
RENEWABLE ENERGY
7
94
39M
METRIC TONS OF CO
2
E EMISSIONS TO BE
MITIGATED OR OFFSET OVER THE LIFETIME
OF THE PROJECT
10
889MW
INSTALLED RENEWABLE ENERGY
CAPACITY
11
ENGAGEMENT AND ADVOCACY
ENVIRONMENTAL INITIATIVES
INTRODUCTION
CONTENTS
DATA
APPENDIX
2026 ENVIRONMENTAL PROGRESS REPORT
85
GREEN BOND IMPACT REPORT
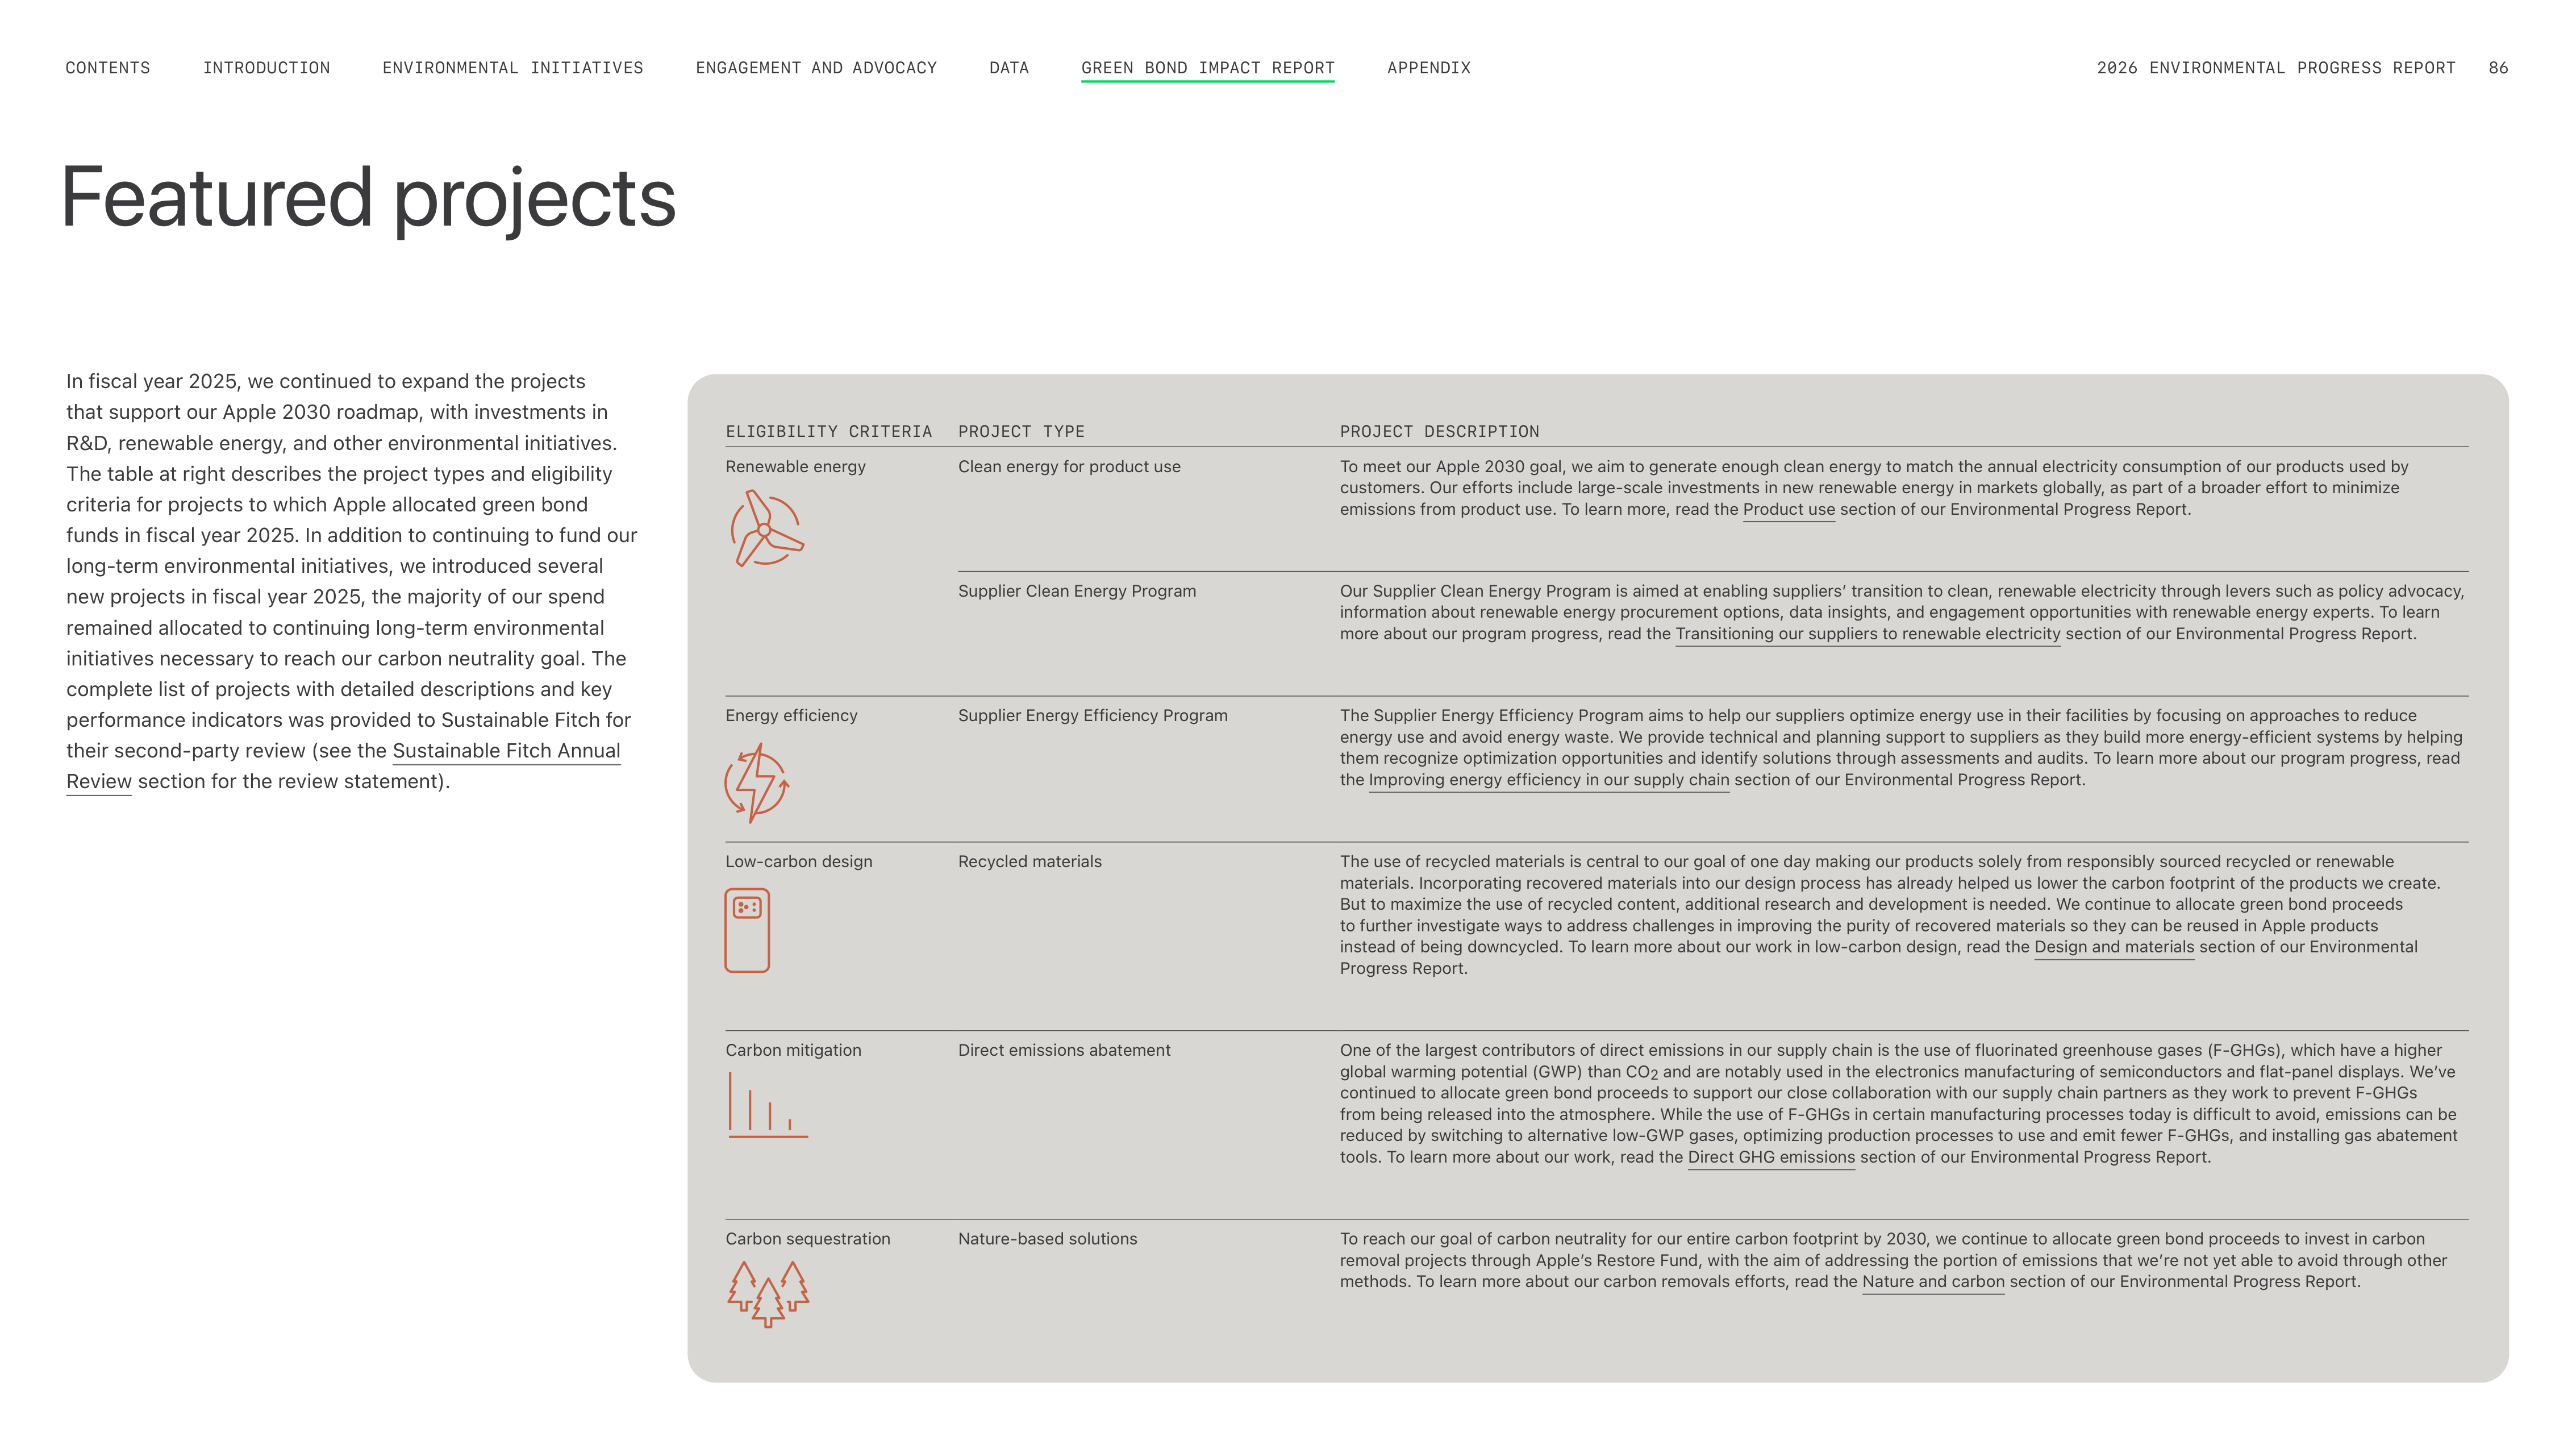
ELIGIBILITY CRITERIA
PROJECT TYPE
PROJECT DESCRIPTION
Renewable energy
Clean energy for product use
To meet our Apple 2030 goal, we aim to generate enough clean energy to match the annual electricity consumption of our products used by
customers. Our efforts include large-scale investments in new renewable energy in markets globally, as part of a broader effort to minimize
emissions from product use. To learn more, read the Product use section of our Environmental Progress Report.
Supplier Clean Energy Program
Our Supplier Clean Energy Program is aimed at enabling suppliersʼ transition to clean, renewable electricity through levers such as policy advocacy,
information about renewable energy procurement options, data insights, and engagement opportunities with renewable energy experts. To learn
more about our program progress, read the Transitioning our suppliers to renewable electricity section of our Environmental Progress Report.
Energy efficiency
Supplier Energy Efficiency Program
The Supplier Energy Efficiency Program aims to help our suppliers optimize energy use in their facilities by focusing on approaches to reduce
energy use and avoid energy waste. We provide technical and planning support to suppliers as they build more energy-efficient systems by helping
them recognize optimization opportunities and identify solutions through assessments and audits. To learn more about our program progress, read
the Improving energy efficiency in our supply chain section of our Environmental Progress Report.
Low-carbon design
Recycled materials
The use of recycled materials is central to our goal of one day making our products solely from responsibly sourced recycled or renewable
materials. Incorporating recovered materials into our design process has already helped us lower the carbon footprint of the products we create.
But to maximize the use of recycled content, additional research and development is needed. We continue to allocate green bond proceeds
to further investigate ways to address challenges in improving the purity of recovered materials so they can be reused in Apple products
instead of being downcycled. To learn more about our work in low-carbon design, read the Design and materials section of our Environmental
Progress Report.
Carbon mitigation
Direct emissions abatement
One of the largest contributors of direct emissions in our supply chain is the use of fluorinated greenhouse gases (F-GHGs), which have a higher
global warming potential (GWP) than CO
2
and are notably used in the electronics manufacturing of semiconductors and flat-panel displays. Weʼve
continued to allocate green bond proceeds to support our close collaboration with our supply chain partners as they work to prevent F-GHGs
from being released into the atmosphere. While the use of F-GHGs in certain manufacturing processes today is difficult to avoid, emissions can be
reduced by switching to alternative low-GWP gases, optimizing production processes to use and emit fewer F-GHGs, and installing gas abatement
tools. To learn more about our work, read the Direct GHG emissions section of our Environmental Progress Report.
Carbon sequestration
Nature-based solutions
To reach our goal of carbon neutrality for our entire carbon footprint by 2030, we continue to allocate green bond proceeds to invest in carbon
removal projects through Appleʼs Restore Fund, with the aim of addressing the portion of emissions that weʼre not yet able to avoid through other
methods. To learn more about our carbon removals efforts, read the Nature and carbon section of our Environmental Progress Report.
In fiscal year 2025, we continued to expand the projects
that support our Apple 2030 roadmap, with investments in
R&D, renewable energy, and other environmental initiatives.
The table at right describes the project types and eligibility
criteria for projects to which Apple allocated green bond
funds in fiscal year 2025. In addition to continuing to fund our
long-term environmental initiatives, we introduced several
new projects in fiscal year 2025, the majority of our spend
remained allocated to continuing long-term environmental
initiatives necessary to reach our carbon neutrality goal. The
complete list of projects with detailed descriptions and key
performance indicators was provided to Sustainable Fitch for
their second-party review (see the Sustainable Fitch Annual
Review section for the review statement).
Featured projects
ENGAGEMENT AND ADVOCACY
ENVIRONMENTAL INITIATIVES
INTRODUCTION
CONTENTS
DATA
APPENDIX
2026 ENVIRONMENTAL PROGRESS REPORT
86
GREEN BOND IMPACT REPORT
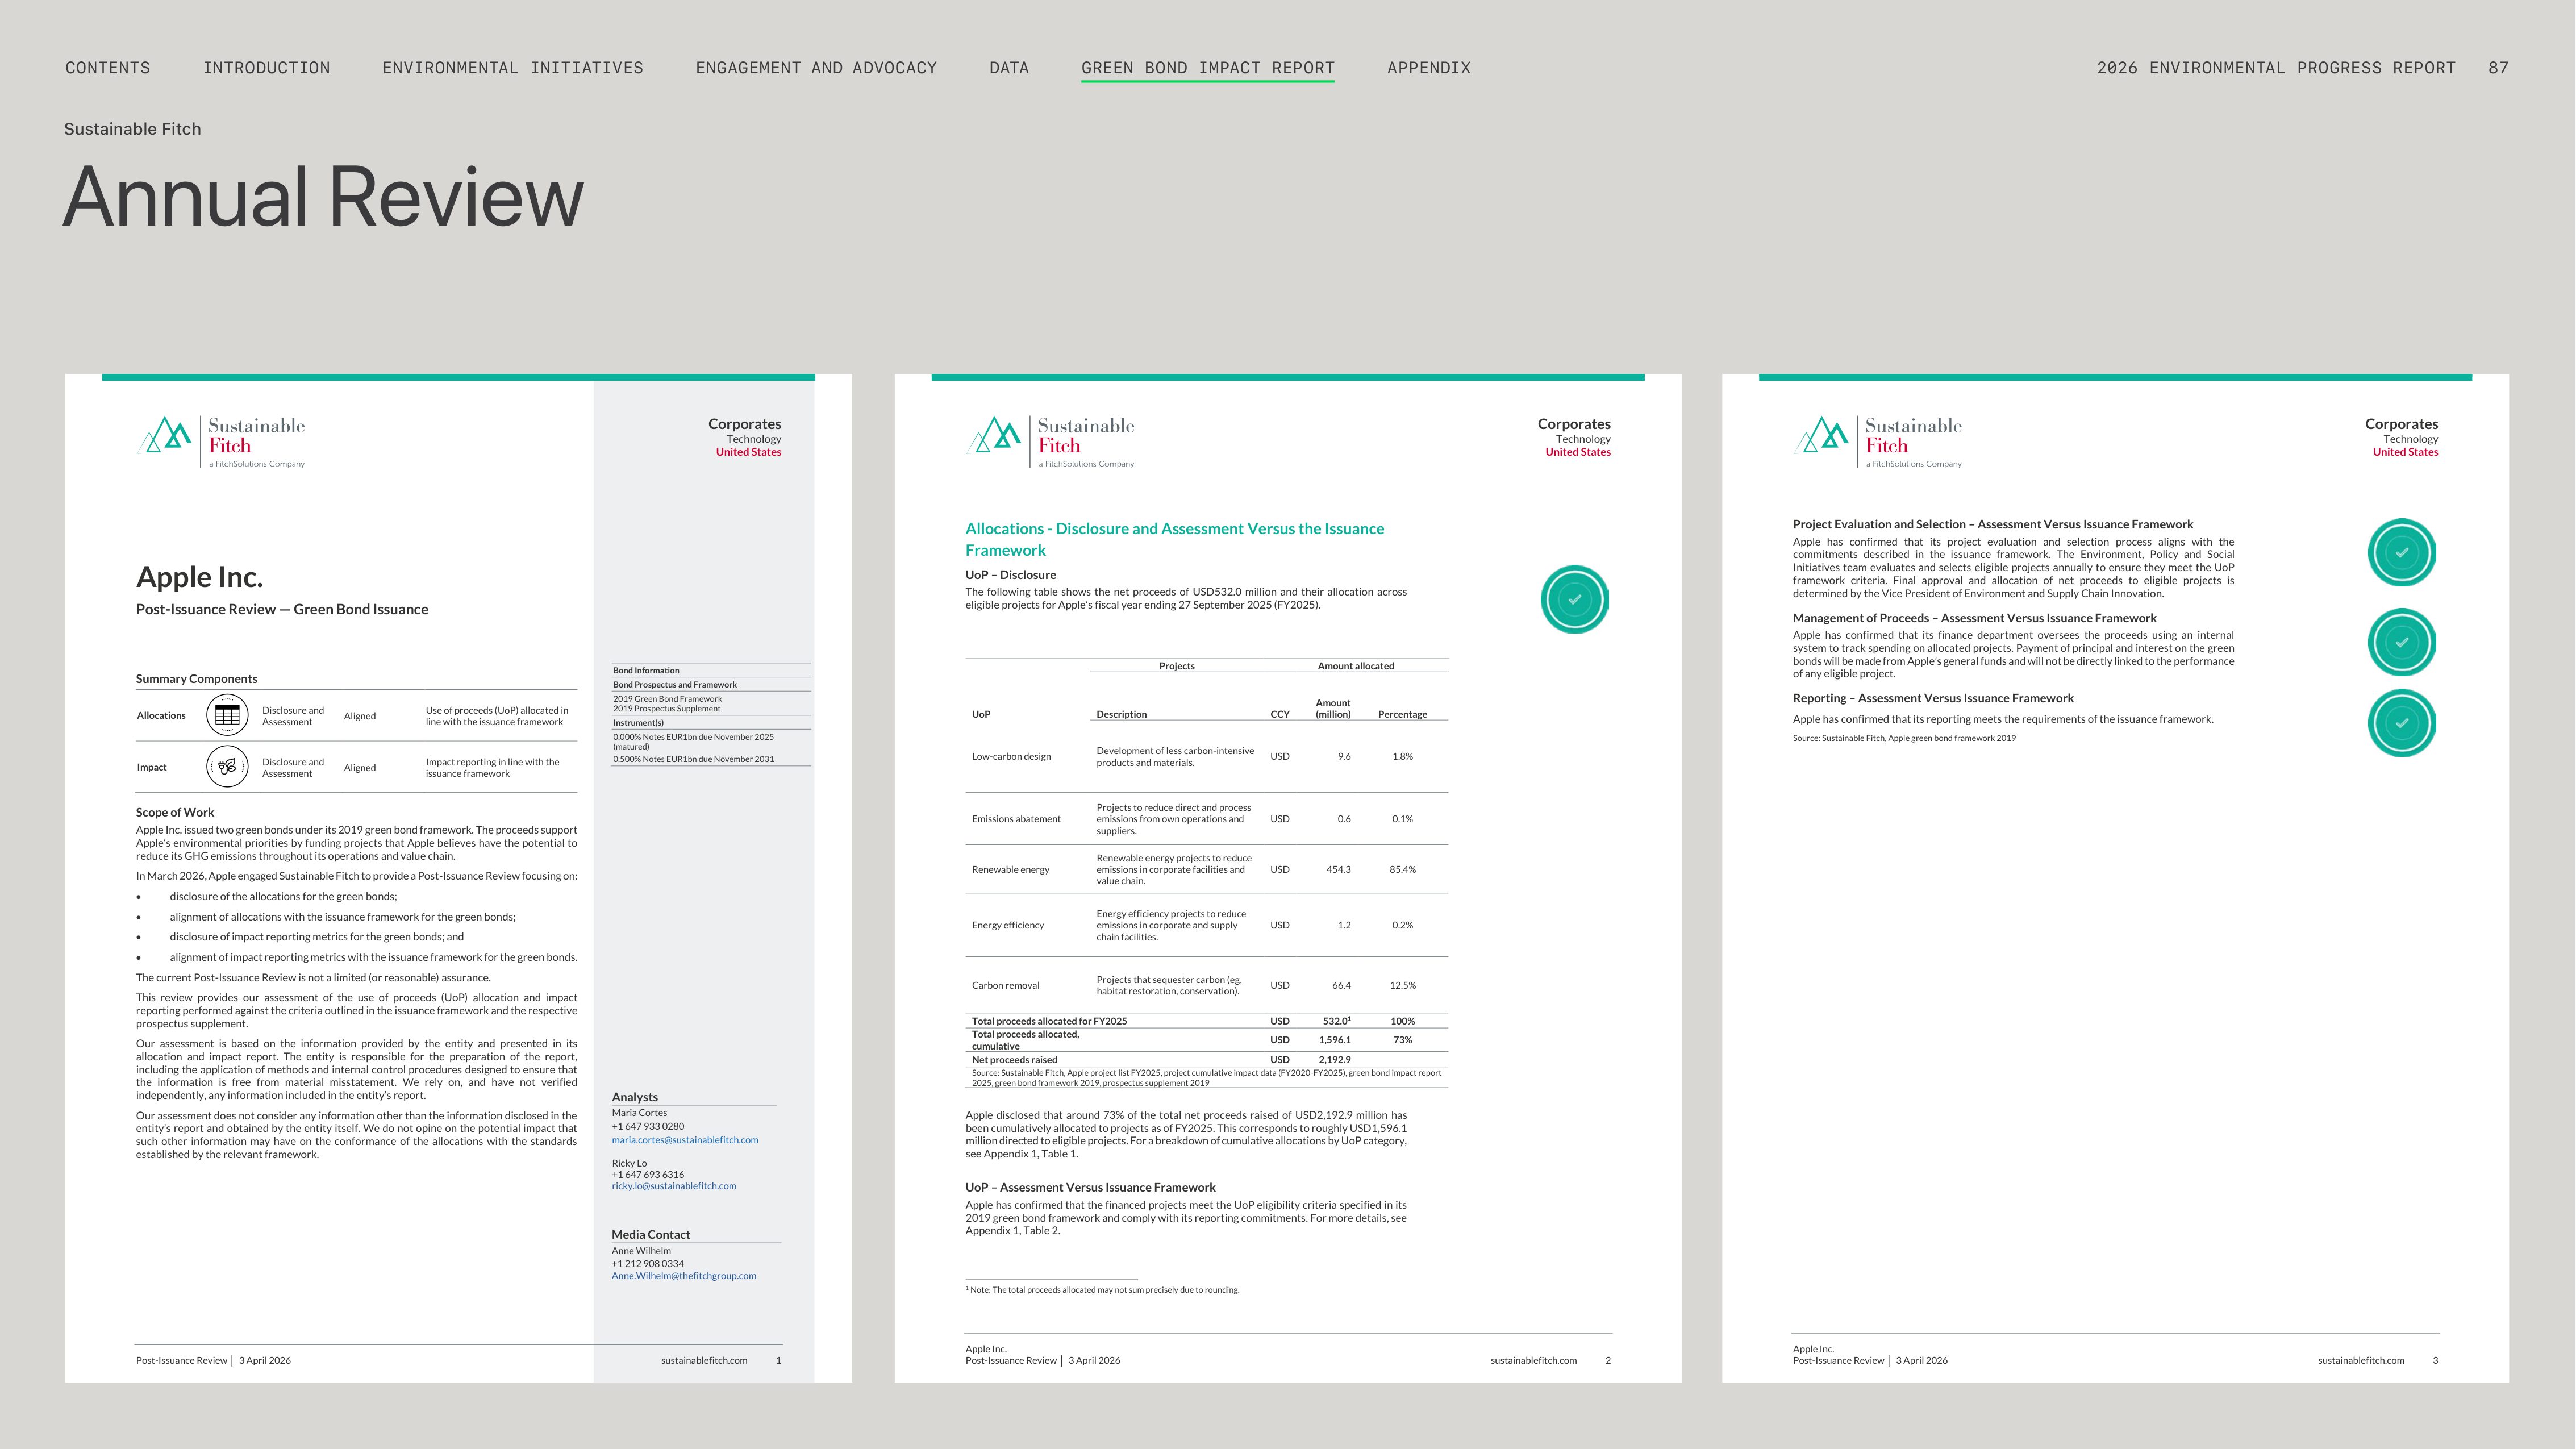


Post-Issuance Review
│
3 April 2026
sustainablefitch.com
1
Corporates
Technology
United States
Apple Inc.
Post-Issuance Review — Green Bond Issuance
Summary Components
Allocations
Disclosure and
Assessment
Aligned
Use of proceeds (UoP) allocated in
line with the issuance framework
Impact
Disclosure and
Assessment
Aligned
Impact reporting in line with the
issuance framework
Scope of Work
Apple Inc. issued two green bonds under its 2019 green bond framework. The proceeds support
Apple’s environmental priorities by funding projects that Apple believes have the potential to
reduce its GHG emissions throughout its operations and value chain.
In March 2026, Apple engaged Sustainable Fitch to provide a Post-Issuance Review focusing on:
•
disclosure of the allocations for the green bonds;
•
alignment of allocations with the issuance framework for the green bonds;
•
disclosure of impact reporting metrics for the green bonds; and
•
alignment of impact reporting metrics with the issuance framework for the green bonds.
The current Post-Issuance Review is not a limited (or reasonable) assurance.
This review provides our assessment of the use of proceeds (UoP) allocation and impact
reporting performed against the criteria outlined in the issuance framework and the respective
prospectus supplement.
Our assessment is based on the information provided by the entity and presented in its
allocation and impact report. The entity is responsible for the preparation of the report,
including the application of methods and internal control procedures designed to ensure that
the information is free from material misstatement. We rely on, and have not verified
independently, any information included in the entity’s report.
Our assessment does not consider any information other than the information disclosed in the
entity’s report and obtained by the entity itself. We do not opine on the potential impact that
such other information may have on the conformance of the allocations with the standards
established by the relevant framework.
Analysts
Maria Cortes
+1 647 933 0280
maria.cortes@sustainablefitch.com
Ricky Lo
+1 647 693 6316
ricky.lo@sustainablefitch.com
Media Contact
Anne Wilhelm
+1 212 908 0334
Anne.Wilhelm@thefitchgroup.com
Bond Information
Bond Prospectus and Framework
2019 Green Bond Framework
2019 Prospectus Supplement
Instrument(s)
0.000% Notes EUR1bn due November 2025
(matured)
0.500% Notes EUR1bn due November 2031
Apple Inc.
Post-Issuance Review
│
3 April 2026
sustainablefitch.com
2
Corporates
Technology
United States
2
Allocations - Disclosure and Assessment Versus the Issuance
Framework
UoP – Disclosure
The following table shows the net proceeds of USD532.0 million and their allocation across
eligible projects for Apple’s fiscal year ending 27 September 2025 (FY2025).
UoP
Projects
Amount allocated
Description
CCY
Amount
(million)
Percentage
Low-carbon design
Development of less carbon-intensive
products and materials.
USD
9.6
1.8%
Emissions abatement
Projects to reduce direct and process
emissions from own operations and
suppliers.
USD
0.6
0.1%
Renewable energy
Renewable energy projects to reduce
emissions in corporate facilities and
value chain.
USD
454.3
85.4%
Energy efficiency
Energy efficiency projects to reduce
emissions in corporate and supply
chain facilities.
USD
1.2
0.2%
Carbon removal
Projects that sequester carbon (eg,
habitat restoration, conservation).
USD
66.4
12.5%
Total proceeds allocated for FY2025
USD
532.0
1
100%
Total proceeds allocated,
cumulative
USD
1,596.1
73%
Net proceeds raised
USD
2,192.9
Source: Sustainable Fitch, Apple project list FY2025, project cumulative impact data (FY2020-FY2025), green bond impact report
2025, green bond framework 2019, prospectus supplement 2019
Apple disclosed that around 73% of the total net proceeds raised of USD2,192.9 million has
been cumulatively allocated to projects as of FY2025. This corresponds to roughly USD1,596.1
million directed to eligible projects. For a breakdown of cumulative allocations by UoP category,
see Appendix 1, Table 1.
UoP – Assessment Versus Issuance Framework
Apple has confirmed that the financed projects meet the UoP eligibility criteria specified in its
2019 green bond framework and comply with its reporting commitments. For more details, see
Appendix 1, Table 2.
1
Note: The total proceeds allocated may not sum precisely due to rounding.
Apple Inc.
Post-Issuance Review
│
3 April 2026
sustainablefitch.com
3
Corporates
Technology
United States
3
Project Evaluation and Selection – Assessment Versus Issuance Framework
Apple has confirmed that its project evaluation and selection process aligns with the
commitments described in the issuance framework. The Environment, Policy and Social
Initiatives team evaluates and selects eligible projects annually to ensure they meet the UoP
framework criteria. Final approval and allocation of net proceeds to eligible projects is
determined by the Vice President of Environment and Supply Chain Innovation.
Management of Proceeds – Assessment Versus Issuance Framework
Apple has confirmed that its finance department oversees the proceeds using an internal
system to track spending on allocated projects. Payment of principal and interest on the green
bonds will be made from Apple’s general funds and will not be directly linked to the performance
of any eligible project.
Reporting – Assessment Versus Issuance Framework
Apple has confirmed that its reporting meets the requirements of the issuance framework.
Source: Sustainable Fitch, Apple green bond framework 2019
Annual Review
Sustainable Fitch
ENGAGEMENT AND ADVOCACY
ENVIRONMENTAL INITIATIVES
INTRODUCTION
CONTENTS
DATA
APPENDIX
2026 ENVIRONMENTAL PROGRESS REPORT
87
GREEN BOND IMPACT REPORT
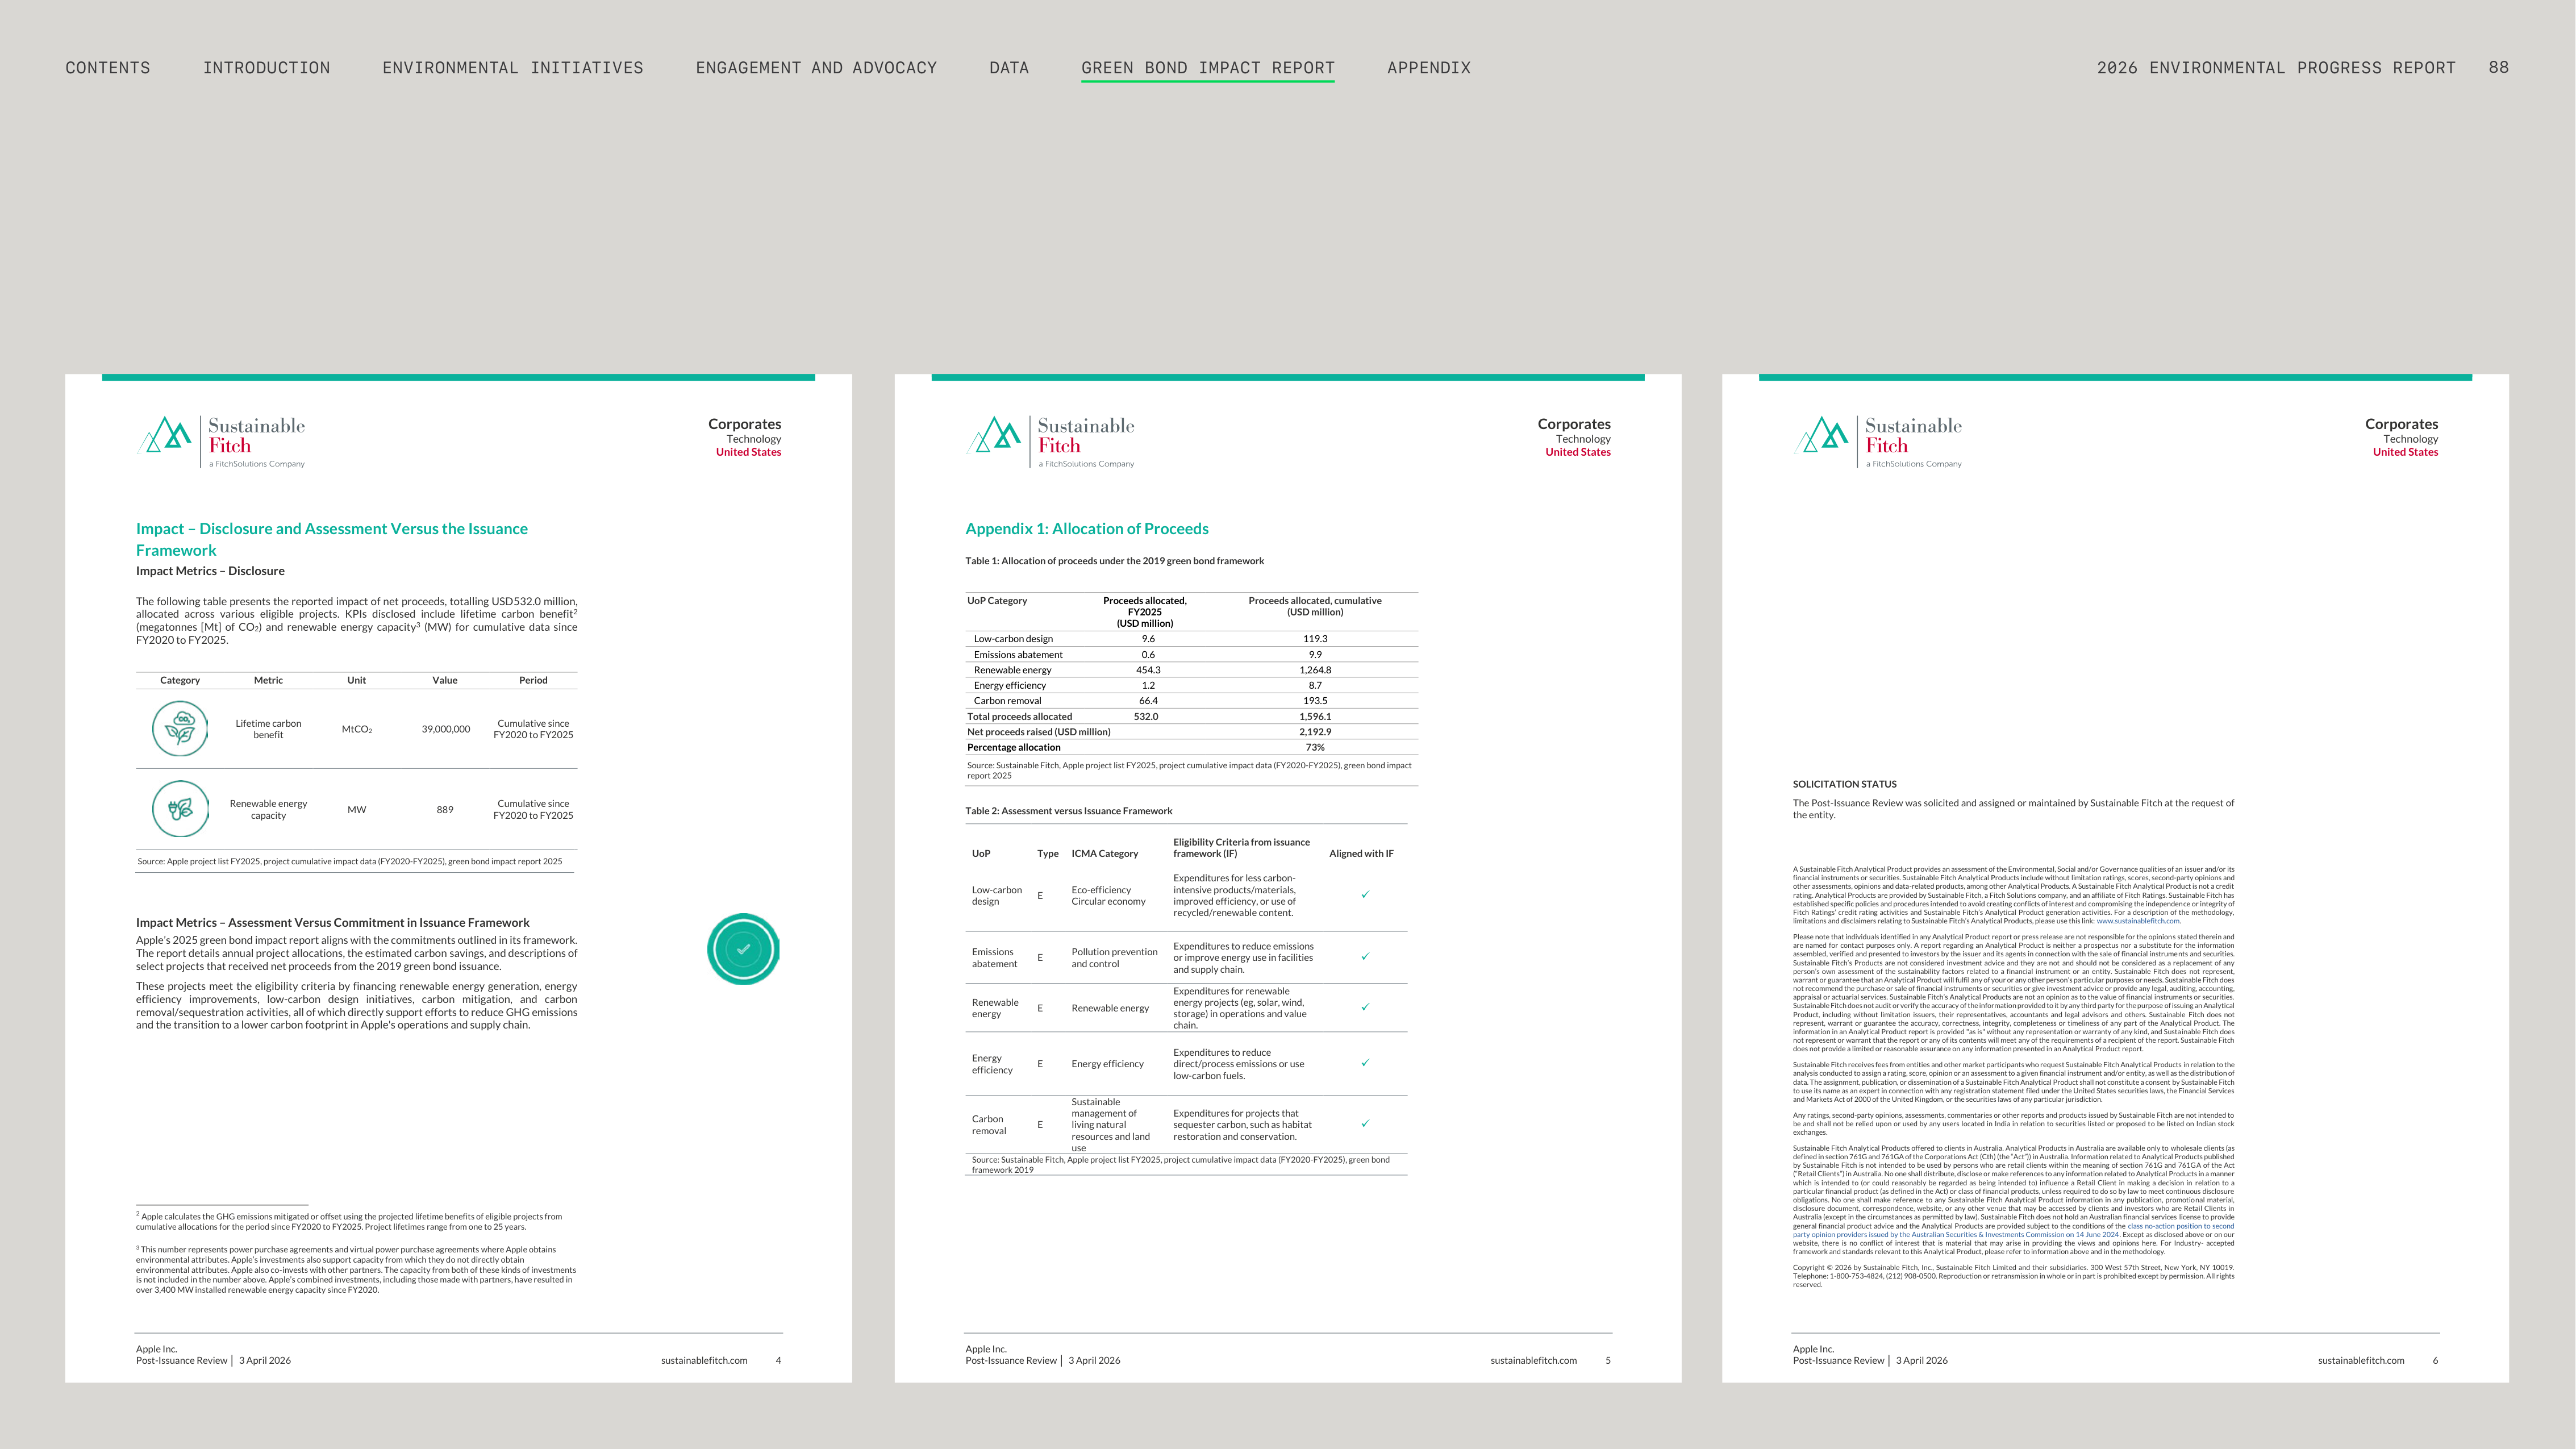


Apple Inc.
Post-Issuance Review
│
3 April 2026
sustainablefitch.com
4
Corporates
Technology
United States
4
Impact – Disclosure and Assessment Versus the Issuance
Framework
Impact Metrics – Disclosure
The following table presents the reported impact of net proceeds, totalling USD532.0 million,
allocated across various eligible projects. KPIs disclosed include lifetime carbon benefit
2
(megatonnes [Mt] of CO
2
) and renewable energy capacity
3
(MW) for cumulative data since
FY2020 to FY2025.
Category
Metric
Unit
Value
Period
Lifetime carbon
benefit
MtCO
2
39,000,000
Cumulative since
FY2020 to FY2025
Renewable energy
capacity
MW
889
Cumulative since
FY2020 to FY2025
Source: Apple project list FY2025, project cumulative impact data (FY2020-FY2025), green bond impact report 2025
Impact Metrics – Assessment Versus Commitment in Issuance Framework
Apple’s 2025 green bond impact report aligns with the commitments outlined in its framework.
The report details annual project allocations, the estimated carbon savings, and descriptions of
select projects that received net proceeds from the 2019 green bond issuance.
These projects meet the eligibility criteria by financing renewable energy generation, energy
efficiency improvements, low-carbon design initiatives, carbon mitigation, and carbon
removal/sequestration activities, all of which directly support efforts to reduce GHG emissions
and the transition to a lower carbon footprint in Apple's operations and supply chain.
2
Apple calculates the GHG emissions mitigated or offset using the projected lifetime benefits of eligible projects from
cumulative allocations for the period since FY2020 to FY2025. Project lifetimes range from one to 25 years.
3
This number represents power purchase agreements and virtual power purchase agreements where Apple obtains
environmental attributes. Apple’s investments also support capacity from which they do not directly obtain
environmental attributes. Apple also co-invests with other partners. The capacity from both of these kinds of investments
is not included in the number above. Apple’s combined investments, including those made with partners, have resulted in
over 3,400 MW installed renewable energy capacity since FY2020.
Apple Inc.
Post-Issuance Review
│
3 April 2026
sustainablefitch.com
5
Corporates
Technology
United States
5
Appendix 1: Allocation of Proceeds
Table 1: Allocation of proceeds under the 2019 green bond framework
UoP Category
Proceeds allocated,
FY2025
(USD million)
Proceeds allocated, cumulative
(USD million)
Low-carbon design
9.6
119.3
Emissions abatement
0.6
9.9
Renewable energy
454.3
1,264.8
Energy efficiency
1.2
8.7
Carbon removal
66.4
193.5
Total proceeds allocated
532.0
1,596.1
Net proceeds raised (USD million)
2,192.9
Percentage allocation
73%
Source: Sustainable Fitch, Apple project list FY2025, project cumulative impact data (FY2020-FY2025), green bond impact
report 2025
Table 2: Assessment versus Issuance Framework
UoP
Type
ICMA Category
Eligibility Criteria from issuance
framework (IF)
Aligned with IF
Low-carbon
design
E
Eco-efficiency
Circular economy
Expenditures for less carbon-
intensive products/materials,
improved efficiency, or use of
recycled/renewable content.
✓
Emissions
abatement
E
Pollution prevention
and control
Expenditures to reduce emissions
or improve energy use in facilities
and supply chain.
✓
Renewable
energy
E
Renewable energy
Expenditures for renewable
energy projects (eg, solar, wind,
storage) in operations and value
chain.
✓
Energy
efficiency
E
Energy efficiency
Expenditures to reduce
direct/process emissions or use
low-carbon fuels.
✓
Carbon
removal
E
Sustainable
management of
living natural
resources and land
use
Expenditures for projects that
sequester carbon, such as habitat
restoration and conservation.
✓
Source: Sustainable Fitch, Apple project list FY2025, project cumulative impact data (FY2020-FY2025), green bond
framework 2019
Apple Inc.
Post-Issuance Review
│
3 April 2026
sustainablefitch.com
6
Corporates
Technology
United States
6
SOLICITATION STATUS
The Post-Issuance Review was solicited and assigned or maintained by Sustainable Fitch at the request of
the entity.
A Sustainable Fitch Analytical Product provides an assessment of the Environmental, Social and/or Governance qualities of an issuer and/or its
financial instruments or securities. Sustainable Fitch Analytical Products include without limitation ratings, scores, second-party opinions and
other assessments, opinions and data-related products, among other Analytical Products. A Sustainable Fitch Analytical Product is not a credit
rating. Analytical Products are provided by Sustainable Fitch, a Fitch Solutions company, and an affiliate of Fitch Ratings. Sustainable Fitch has
established specific policies and procedures intended to avoid creating conflicts of interest and compromising the independence or integrity of
Fitch Ratings’ credit rating activities and Sustainable Fitch’s Analytical Product generation activities. For a description of the methodology,
limitations and disclaimers relating to Sustainable Fitch’s Analytical Products, please use this link:
www.sustainablefitch.com
.
Please note that individuals identified in any Analytical Product report or press release are not responsible for the opinions stated therein and
are named for contact purposes only. A report regarding an Analytical Product is neither a prospectus nor a substitute for the information
assembled, verified and presented to investors by the issuer and its agents in connection with the sale of financial instruments and securities.
Sustainable Fitch’s Products are not considered investment advice and they are not
and should not be considered as a replacement of any
person’s own assessment of the sustainability factors
related
to a
financial instrument or
an entity. Sustainable Fitch does
not represent,
warrant or guarantee that an Analytical Product will fulfil any of your or any other person’s particular purposes or needs. Sustainable Fitch does
not recommend the purchase or sale of financial instruments or securities or give investment advice or provide any legal, auditing, accounting,
appraisal or actuarial services. Sustainable Fitch’s Analytical Products are not an opinion as to the value of financial instruments or securities.
Sustainable Fitch doesnot audit orverify the accuracy of the information provided to it by anythird party for the purpose of issuing an Analytical
Product, including without limitation issuers,
their
representatives, accountants and
legal advisors
and
others. Sustainable
Fitch does not
represent, warrant or guarantee the accuracy, correctness, integrity, completeness or timeliness of any part of the Analytical Product. The
information in an Analytical Product report is provided "as is" without any representation or warranty of any kind, and Sustainable Fitch does
not represent or warrant that the report or any of its contents will meet any of the requirements of a recipient of the report. Sustainable Fitch
does not provide a limited or reasonable assurance on any information presented in an Analytical Product report.
Sustainable Fitch receives fees from entities and other market participants who request Sustainable Fitch Analytical Products in relation to the
analysis conducted to assign a rating, score, opinion or an assessment to a given financial instrument and/or entity, as well as the distribution of
data. The assignment, publication, or dissemination of a Sustainable Fitch Analytical Product shall not constitute a consent by Sustainable Fitch
to use its name as an expert in connection with any registration statement filed under the United States securities laws, the Financial Services
and Markets Act of 2000 of the United Kingdom, or the securities laws of any particular jurisdiction.
Any ratings, second-party opinions, assessments, commentaries or other reports and products issued by Sustainable Fitch are not intended to
be and shall not be relied upon or used by any users located in India in relation to securities listed or proposed to be listed on Indian stock
exchanges.
Sustainable Fitch Analytical Products offered to clients in Australia. Analytical Products in Australia are available only to wholesale clients (as
defined in section 761G and 761GA of the Corporations Act (Cth) (the “Act”)) in Australia. Information related to Analytical Products published
by Sustainable Fitch is not intended to be used by persons who are retail clients within the meaning of section 761G and 761GA of the Act
(“Retail Clients”) in Australia. No one shall distribute, disclose or make references to any information related to Analytical Products in a manner
which is intended
to (or
could
reasonably be regarded
as being intended
to) influence a Retail Client in making a decision in
relation to a
particular financial product (as defined in the Act) or class of financial products, unless required to do so by law to meet continuous disclosure
obligations. No one shall make reference to any
Sustainable Fitch Analytical Product
information in any
publication, promotional material,
disclosure document,
correspondence, website, or any other venue that may be accessed by clients and investors who are Retail Clients in
Australia (except in the circumstances as permitted by law). Sustainable Fitch does not hold an Australian financial services
license to provide
general financial product advice and the Analytical Products are provided subject to the conditions of the
class no-action position to second
party opinion providers issued by the Australian Securities & Investments Commission on 14 June 2024
. Except as disclosed above or on our
website,
there is no conflict of interest
that
is material that may arise in providing the views and
opinions here. For Industry-
accepted
framework and standards relevant to this Analytical Product, please refer to information above and in the methodology.
Copyright © 2026 by Sustainable Fitch, Inc., Sustainable Fitch Limited and their subsidiaries. 300 West 57th Street, New York, NY 10019.
Telephone: 1-800-753-4824, (212) 908-0500. Reproduction or retransmission in whole or in part is prohibited except by permission. All rights
reserved.
ENGAGEMENT AND ADVOCACY
ENVIRONMENTAL INITIATIVES
INTRODUCTION
CONTENTS
DATA
APPENDIX
2026 ENVIRONMENTAL PROGRESS REPORT
88
GREEN BOND IMPACT REPORT
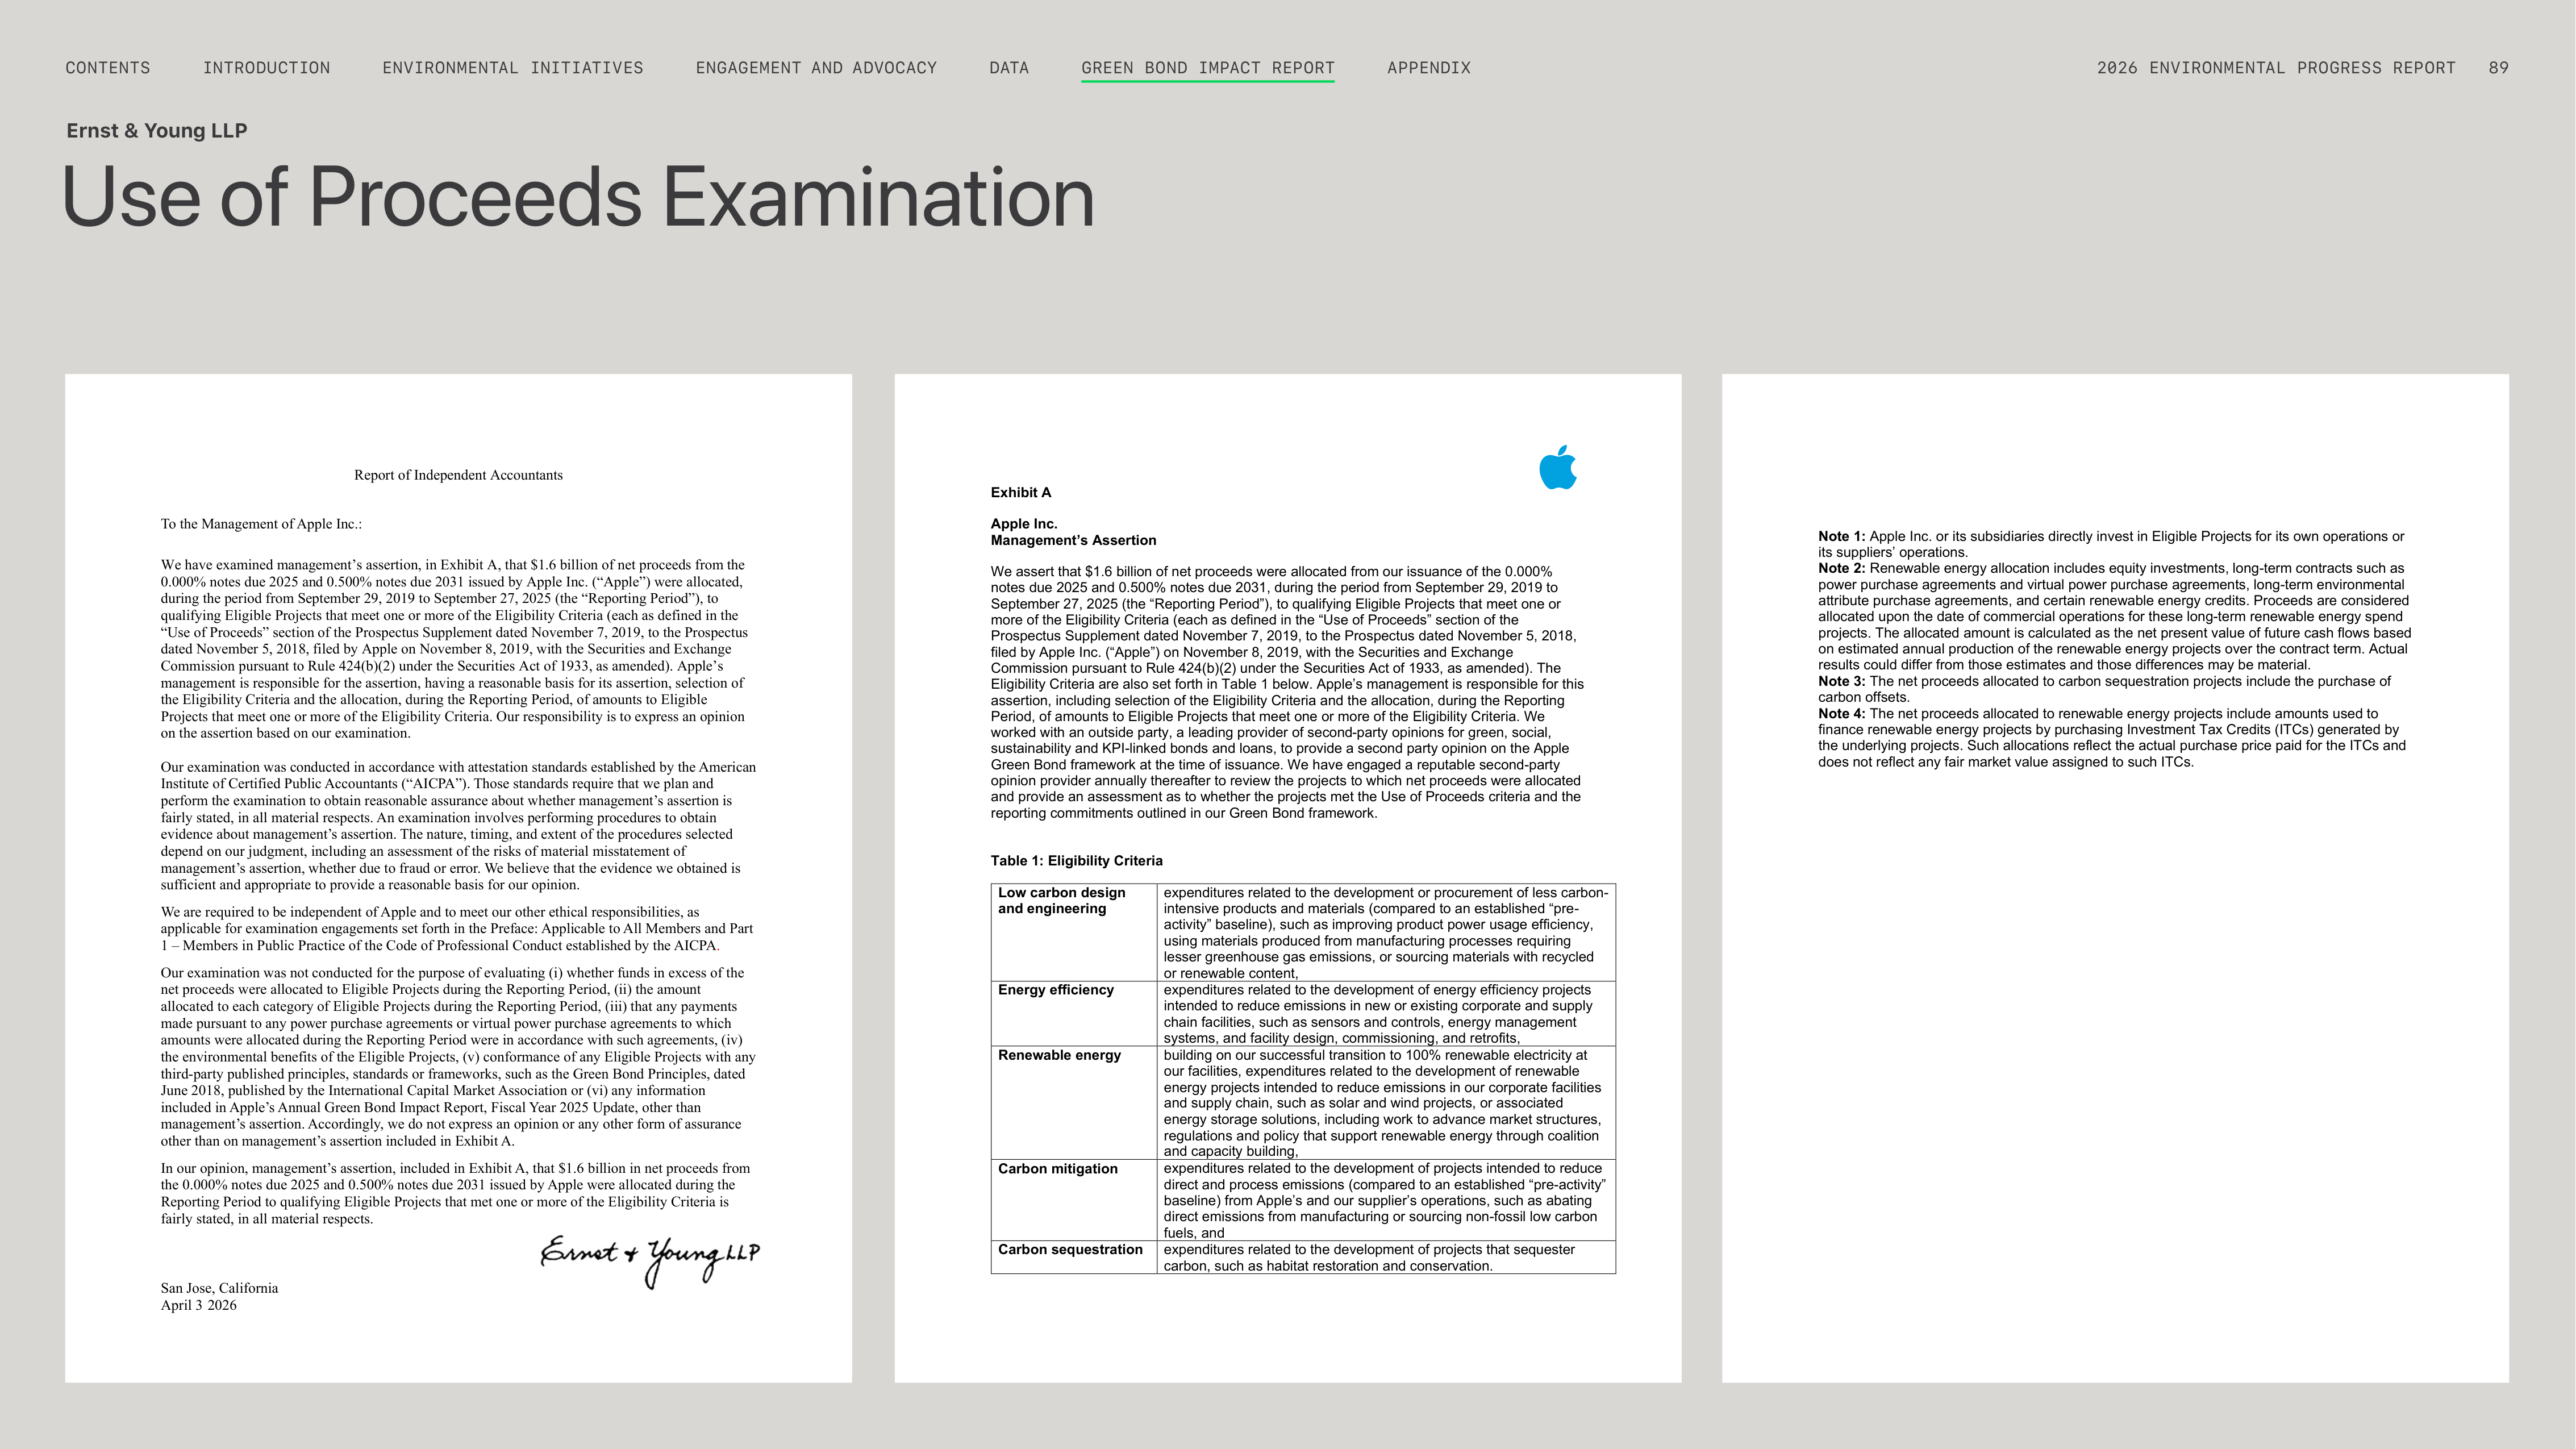

Report of Independent Accountants
To the Management of Apple Inc.:
We have examined management’s assertion, in Exhibit A, that $1.6 billion of net proceeds from the
0.000% notes due 2025 and 0.500% notes due 2031 issued by Apple Inc. (“Apple”) were allocated,
during the period from September 29, 2019 to September 27, 2025 (the “Reporting Period”), to
qualifying Eligible Projects that meet one or more of the Eligibility Criteria (each as defined in the
“Use of Proceeds” section of the Prospectus Supplement dated November 7, 2019, to the Prospectus
dated November 5, 2018, filed by Apple on November 8, 2019, with the Securities and Exchange
Commission pursuant to Rule 424(b)(2) under the Securities Act of 1933, as amended). Apple’s
management is responsible for the assertion, having a reasonable basis for its assertion, selection of
the Eligibility Criteria and the allocation, during the Reporting Period, of amounts to Eligible
Projects that meet one or more of the Eligibility Criteria. Our responsibility is to express an opinion
on the assertion based on our examination.
Our examination was conducted in accordance with attestation standards established by the American
Institute of Certified Public Accountants (“AICPA”). Those standards require that we plan and
perform the examination to obtain reasonable assurance about whether management’s assertion is
fairly stated, in all material respects. An examination involves performing procedures to obtain
evidence about management’s assertion. The nature, timing, and extent of the procedures selected
depend on our judgment, including an assessment of the risks of material misstatement of
management’s assertion, whether due to fraud or error. We believe that the evidence we obtained is
sufficient and appropriate to provide a reasonable basis for our opinion.
We are required to be independent of Apple and to meet our other ethical responsibilities, as
applicable for examination engagements set forth in the Preface: Applicable to All Members and Part
1 – Members in Public Practice of the Code of Professional Conduct established by the AICPA
.
Our examination was not conducted for the purpose of evaluating (i) whether funds in excess of the
net proceeds were allocated to Eligible Projects during the Reporting Period, (ii) the amount
allocated to each category of Eligible Projects during the Reporting Period, (iii) that any payments
made pursuant to any power purchase agreements or virtual power purchase agreements to which
amounts were allocated during the Reporting Period were in accordance with such agreements, (iv)
the environmental benefits of the Eligible Projects, (v) conformance of any Eligible Projects with any
third-party published principles, standards or frameworks, such as the Green Bond Principles, dated
June 2018, published by the International Capital Market Association or (vi) any information
included in Apple’s Annual Green Bond Impact Report, Fiscal Year 2025 Update, other than
management’s assertion. Accordingly, we do not express an opinion or any other form of assurance
other than on management’s assertion included in Exhibit A.
In our opinion, management’s assertion, included in Exhibit A, that $1.6 billion in net proceeds from
the 0.000% notes due 2025 and 0.500% notes due 2031 issued by Apple were allocated during the
Reporting Period to qualifying Eligible Projects that met one or more of the Eligibility Criteria is
fairly stated, in all material respects.
San Jose, California
April 3
,
2026
4
Exhibit A
Apple Inc.
Management’s Assertion
We assert that $1.6 billion of net proceeds were allocated from our issuance of the 0.000%
notes due 2025 and 0.500% notes due 2031, during the period from September 29, 2019 to
September 27, 2025 (the “Reporting Period”), to qualifying Eligible Projects that meet one or
more of the Eligibility Criteria (each as defined in the “Use of Proceeds” section of the
Prospectus Supplement dated November 7, 2019, to the Prospectus dated November 5, 2018,
filed by Apple Inc. (“Apple”) on November 8, 2019, with the Securities and Exchange
Commission pursuant to Rule 424(b)(2) under the Securities Act of 1933, as amended). The
Eligibility Criteria are also set forth in Table 1 below. Apple’s management is responsible for this
assertion, including selection of the Eligibility Criteria and the allocation, during the Reporting
Period, of amounts to Eligible Projects that meet one or more of the Eligibility Criteria. We
worked with an outside party, a leading provider of second-party opinions for green, social,
sustainability and KPI-linked bonds and loans, to provide a second party opinion on the Apple
Green Bond framework at the time of issuance. We have engaged a reputable second-party
opinion provider annually thereafter to review the projects to which net proceeds were allocated
and provide an assessment as to whether the projects met the Use of Proceeds criteria and the
reporting commitments outlined in our Green Bond framework.
Table 1: Eligibility Criteria
Low carbon design
and engineering
expenditures related to the development or procurement of less carbon-
intensive products and materials (compared to an established “pre-
activity” baseline), such as improving product power usage efficiency,
using materials produced from manufacturing processes requiring
lesser greenhouse gas emissions, or sourcing materials with recycled
or renewable content,
Energy efficiency
expenditures related to the development of energy efficiency projects
intended to reduce emissions in new or existing corporate and supply
chain facilities, such as sensors and controls, energy management
systems, and facility design, commissioning, and retrofits,
Renewable energy
building on our successful transition to 100% renewable electricity at
our facilities, expenditures related to the development of renewable
energy projects intended to reduce emissions in our corporate facilities
and supply chain, such as solar and wind projects, or associated
energy storage solutions, including work to advance market structures,
regulations and policy that support renewable energy through coalition
and capacity building,
Carbon mitigation
expenditures related to the development of projects intended to reduce
direct and process emissions (compared to an established “pre-activity”
baseline) from Apple’s and our supplier’s operations, such as abating
direct emissions from manufacturing or sourcing non-fossil low carbon
fuels, and
Carbon sequestration
expenditures related to the development of projects that sequester
carbon, such as habitat restoration and conservation.
5
Note 1:
Apple Inc. or its subsidiaries directly invest in Eligible Projects for its own operations or
its suppliers’ operations.
Note 2:
Renewable energy allocation includes equity investments, long-term contracts such as
power purchase agreements and virtual power purchase agreements, long-term environmental
attribute purchase agreements, and certain renewable energy credits. Proceeds are considered
allocated upon the date of commercial operations for these long-term renewable energy spend
projects. The allocated amount is calculated as the net present value of future cash flows based
on estimated annual production of the renewable energy projects over the contract term. Actual
results could differ from those estimates and those differences may be material.
Note 3:
The net proceeds allocated to carbon sequestration projects include the purchase of
carbon offsets.
Note 4:
The net proceeds allocated to renewable energy projects include amounts used to
finance renewable energy projects by purchasing Investment Tax Credits (ITCs) generated by
the underlying projects. Such allocations reflect the actual purchase price paid for the ITCs and
does not reflect any fair market value assigned to such ITCs.
Use of Proceeds Examination
Ernst & Young LLP
ENGAGEMENT AND ADVOCACY
ENVIRONMENTAL INITIATIVES
INTRODUCTION
CONTENTS
DATA
APPENDIX
2026 ENVIRONMENTAL PROGRESS REPORT
89
GREEN BOND IMPACT REPORT

End notes
This Green Bond Report (the “Report”) contains forward-looking
statements, within the meaning of the Private Securities Litigation
Reform Act of 1995, that involve risks and uncertainties. Such forward-
looking statements provide current expectations of future events based
on certain assumptions and include any statement that does not directly
relate to any historical or current fact. For example, statements in this
Report regarding the potential future impact of allocated projects are
forward-looking statements. Forward-looking statements can also be
identified by words such as “future,” “goal,” “anticipates,” “believes,”
“estimates,” “expects,” “intends,” “aims,” “plans,” “predicts,”
“projected,” “will,” “would,” “could,” “can,” “may,” and similar terms.
Forward-looking statements are not guarantees of future performance
and Apple’s actual results may differ significantly from the results
discussed in the forward-looking statements. Factors that might cause
such differences include, but are not limited to, those discussed in the
“Risk Factors” sections of Apple’s most recently filed periodic reports
on Form 10-K and Form 10-Q and subsequent filings as filed with the
Securities and Exchange Commission. Apple assumes no obligation to
revise or update any forward-looking statements for any reason, except
as required by law. This Report has been prepared for information
purposes only. Apple does not make any warranties or representations
as to the completeness or reliability of the information, opinions or
conclusions expressed herein. This Report is not intended to provide
the basis for the evaluation of any securities issued by Apple. This
Report should not be construed and does not constitute an invitation,
recommendation or offer to subscribe for or purchase any of Apple’s
securities. Under no circumstances shall Apple or its affiliates be liable
for any loss, damage, liability or expense incurred or suffered which is
claimed to have resulted from use of this Report.
©2026 Apple Inc. All rights reserved. Apple and the Apple logo are
trademarks of Apple Inc., registered in the U.S. and other countries.
ENGAGEMENT AND ADVOCACY
ENVIRONMENTAL INITIATIVES
INTRODUCTION
CONTENTS
DATA
APPENDIX
2026 ENVIRONMENTAL PROGRESS REPORT
90
GREEN BOND IMPACT REPORT
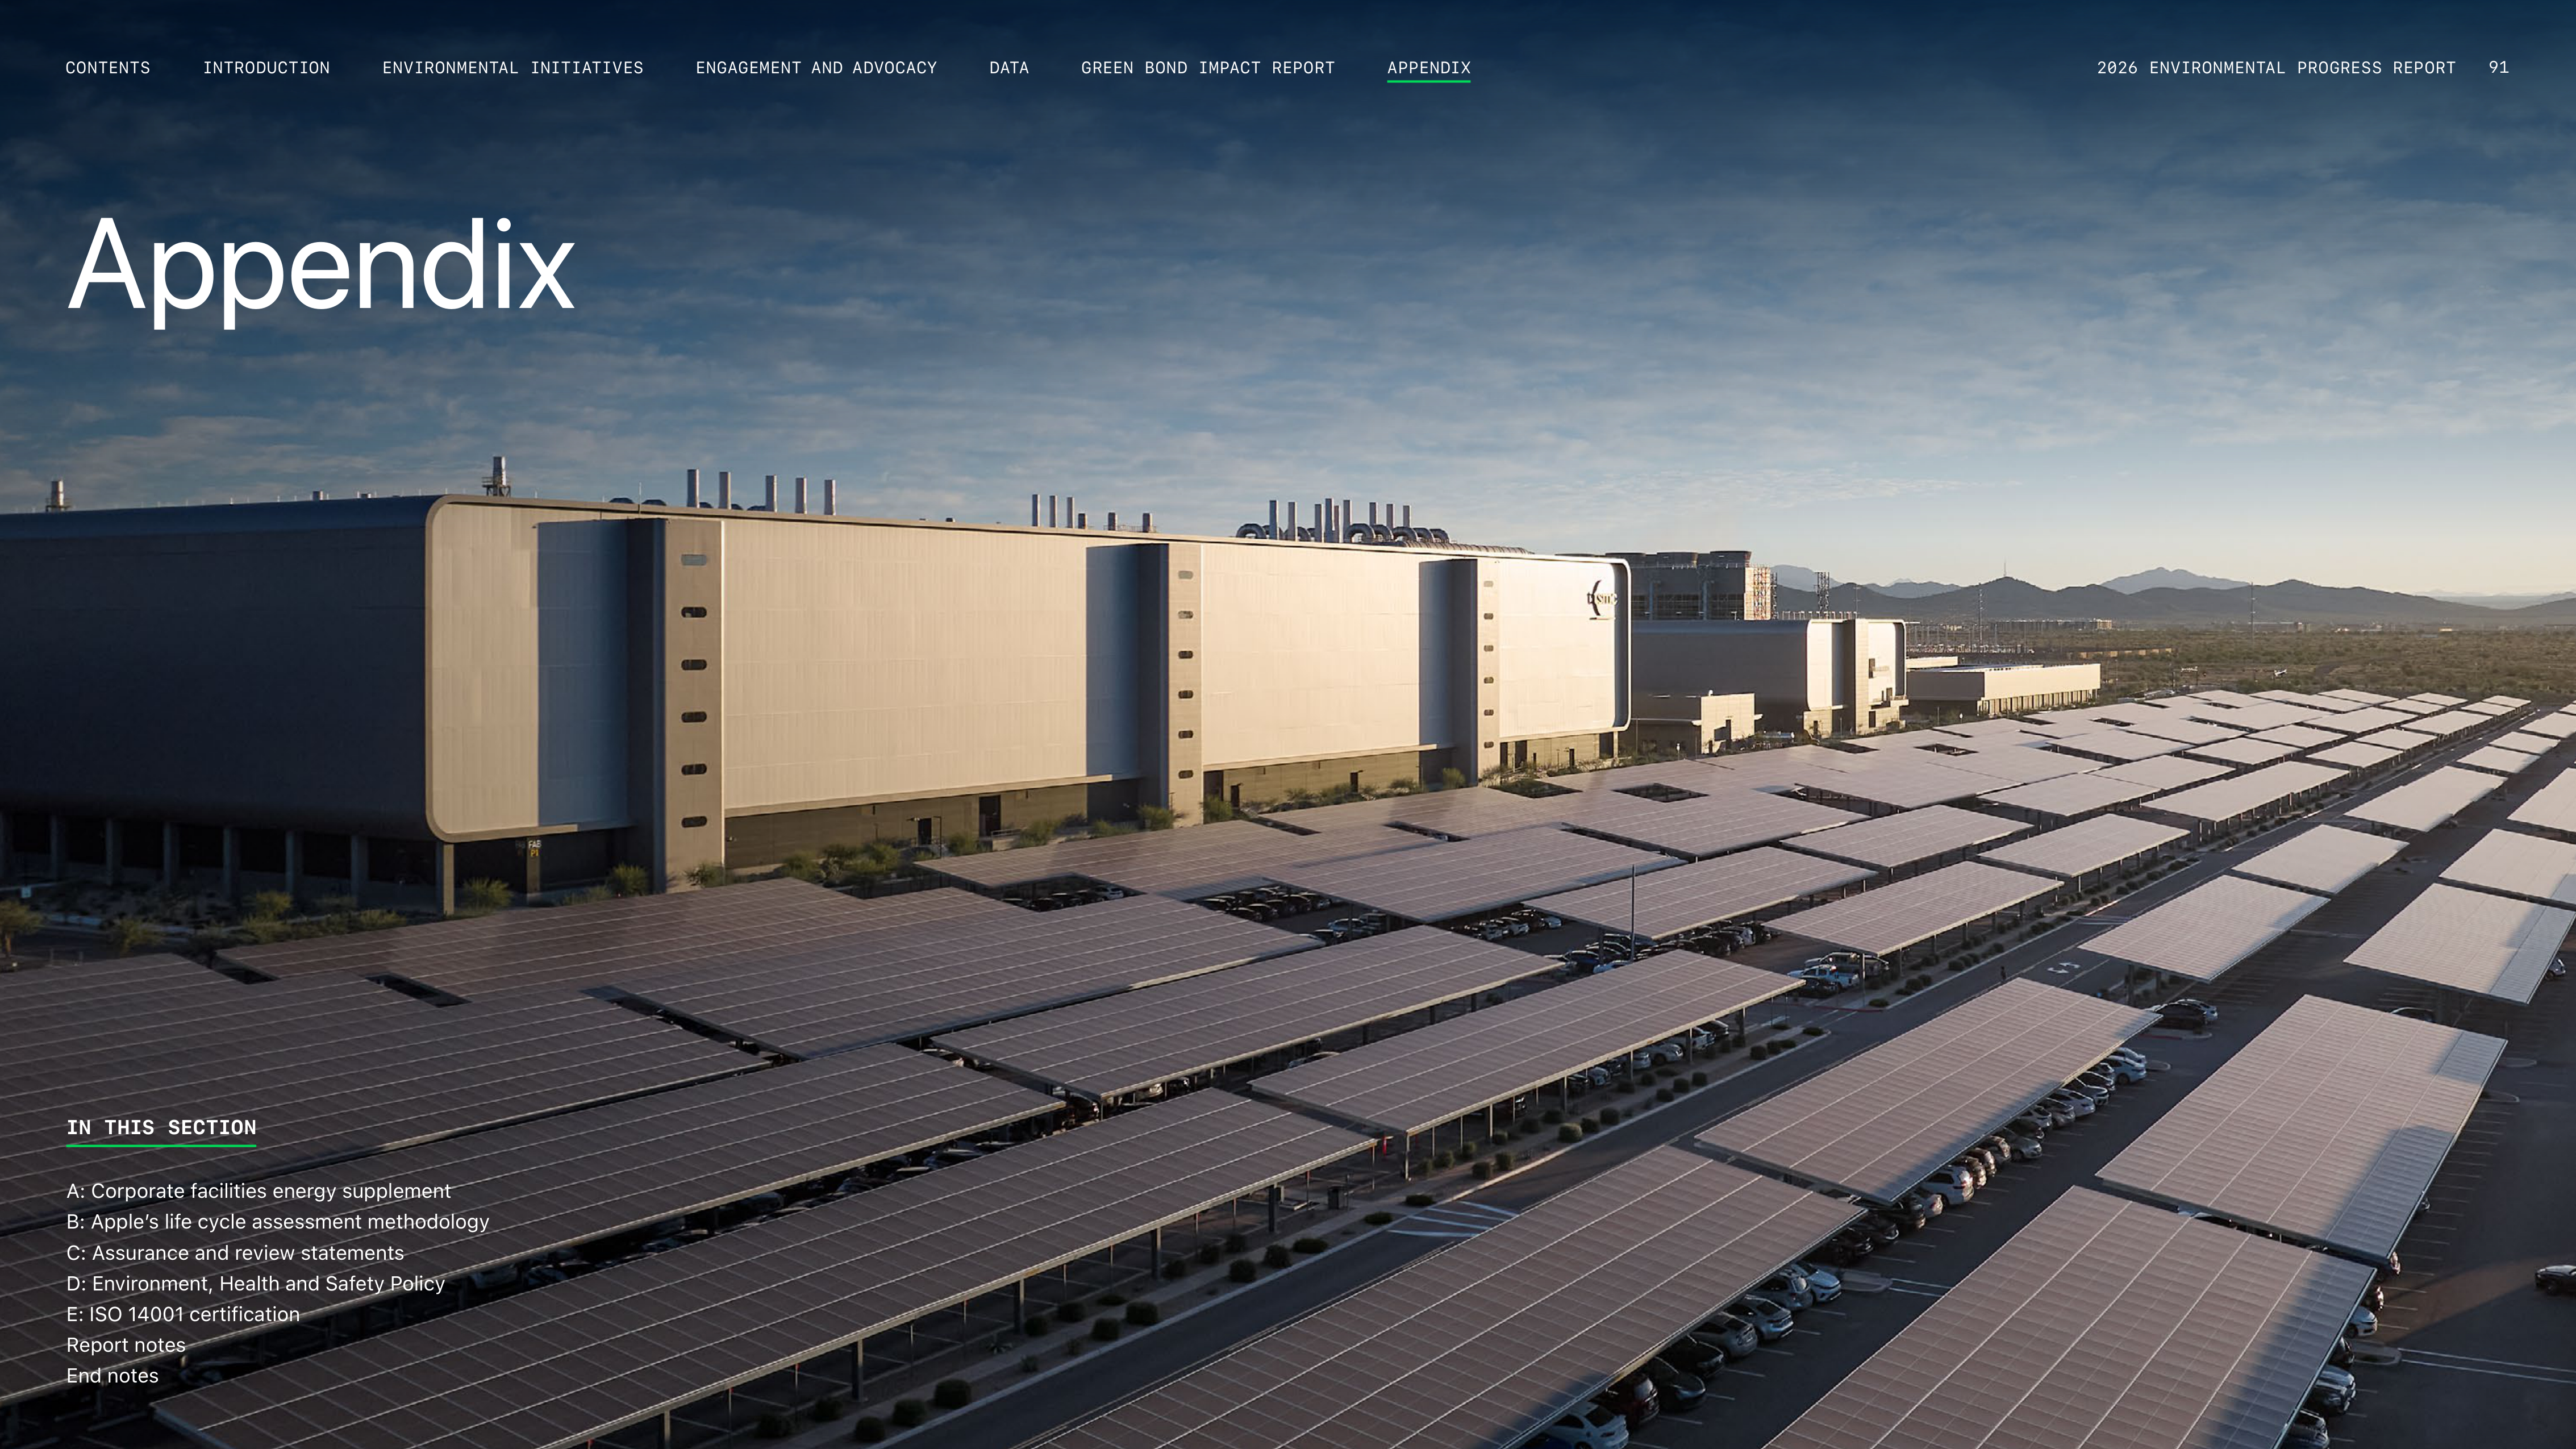
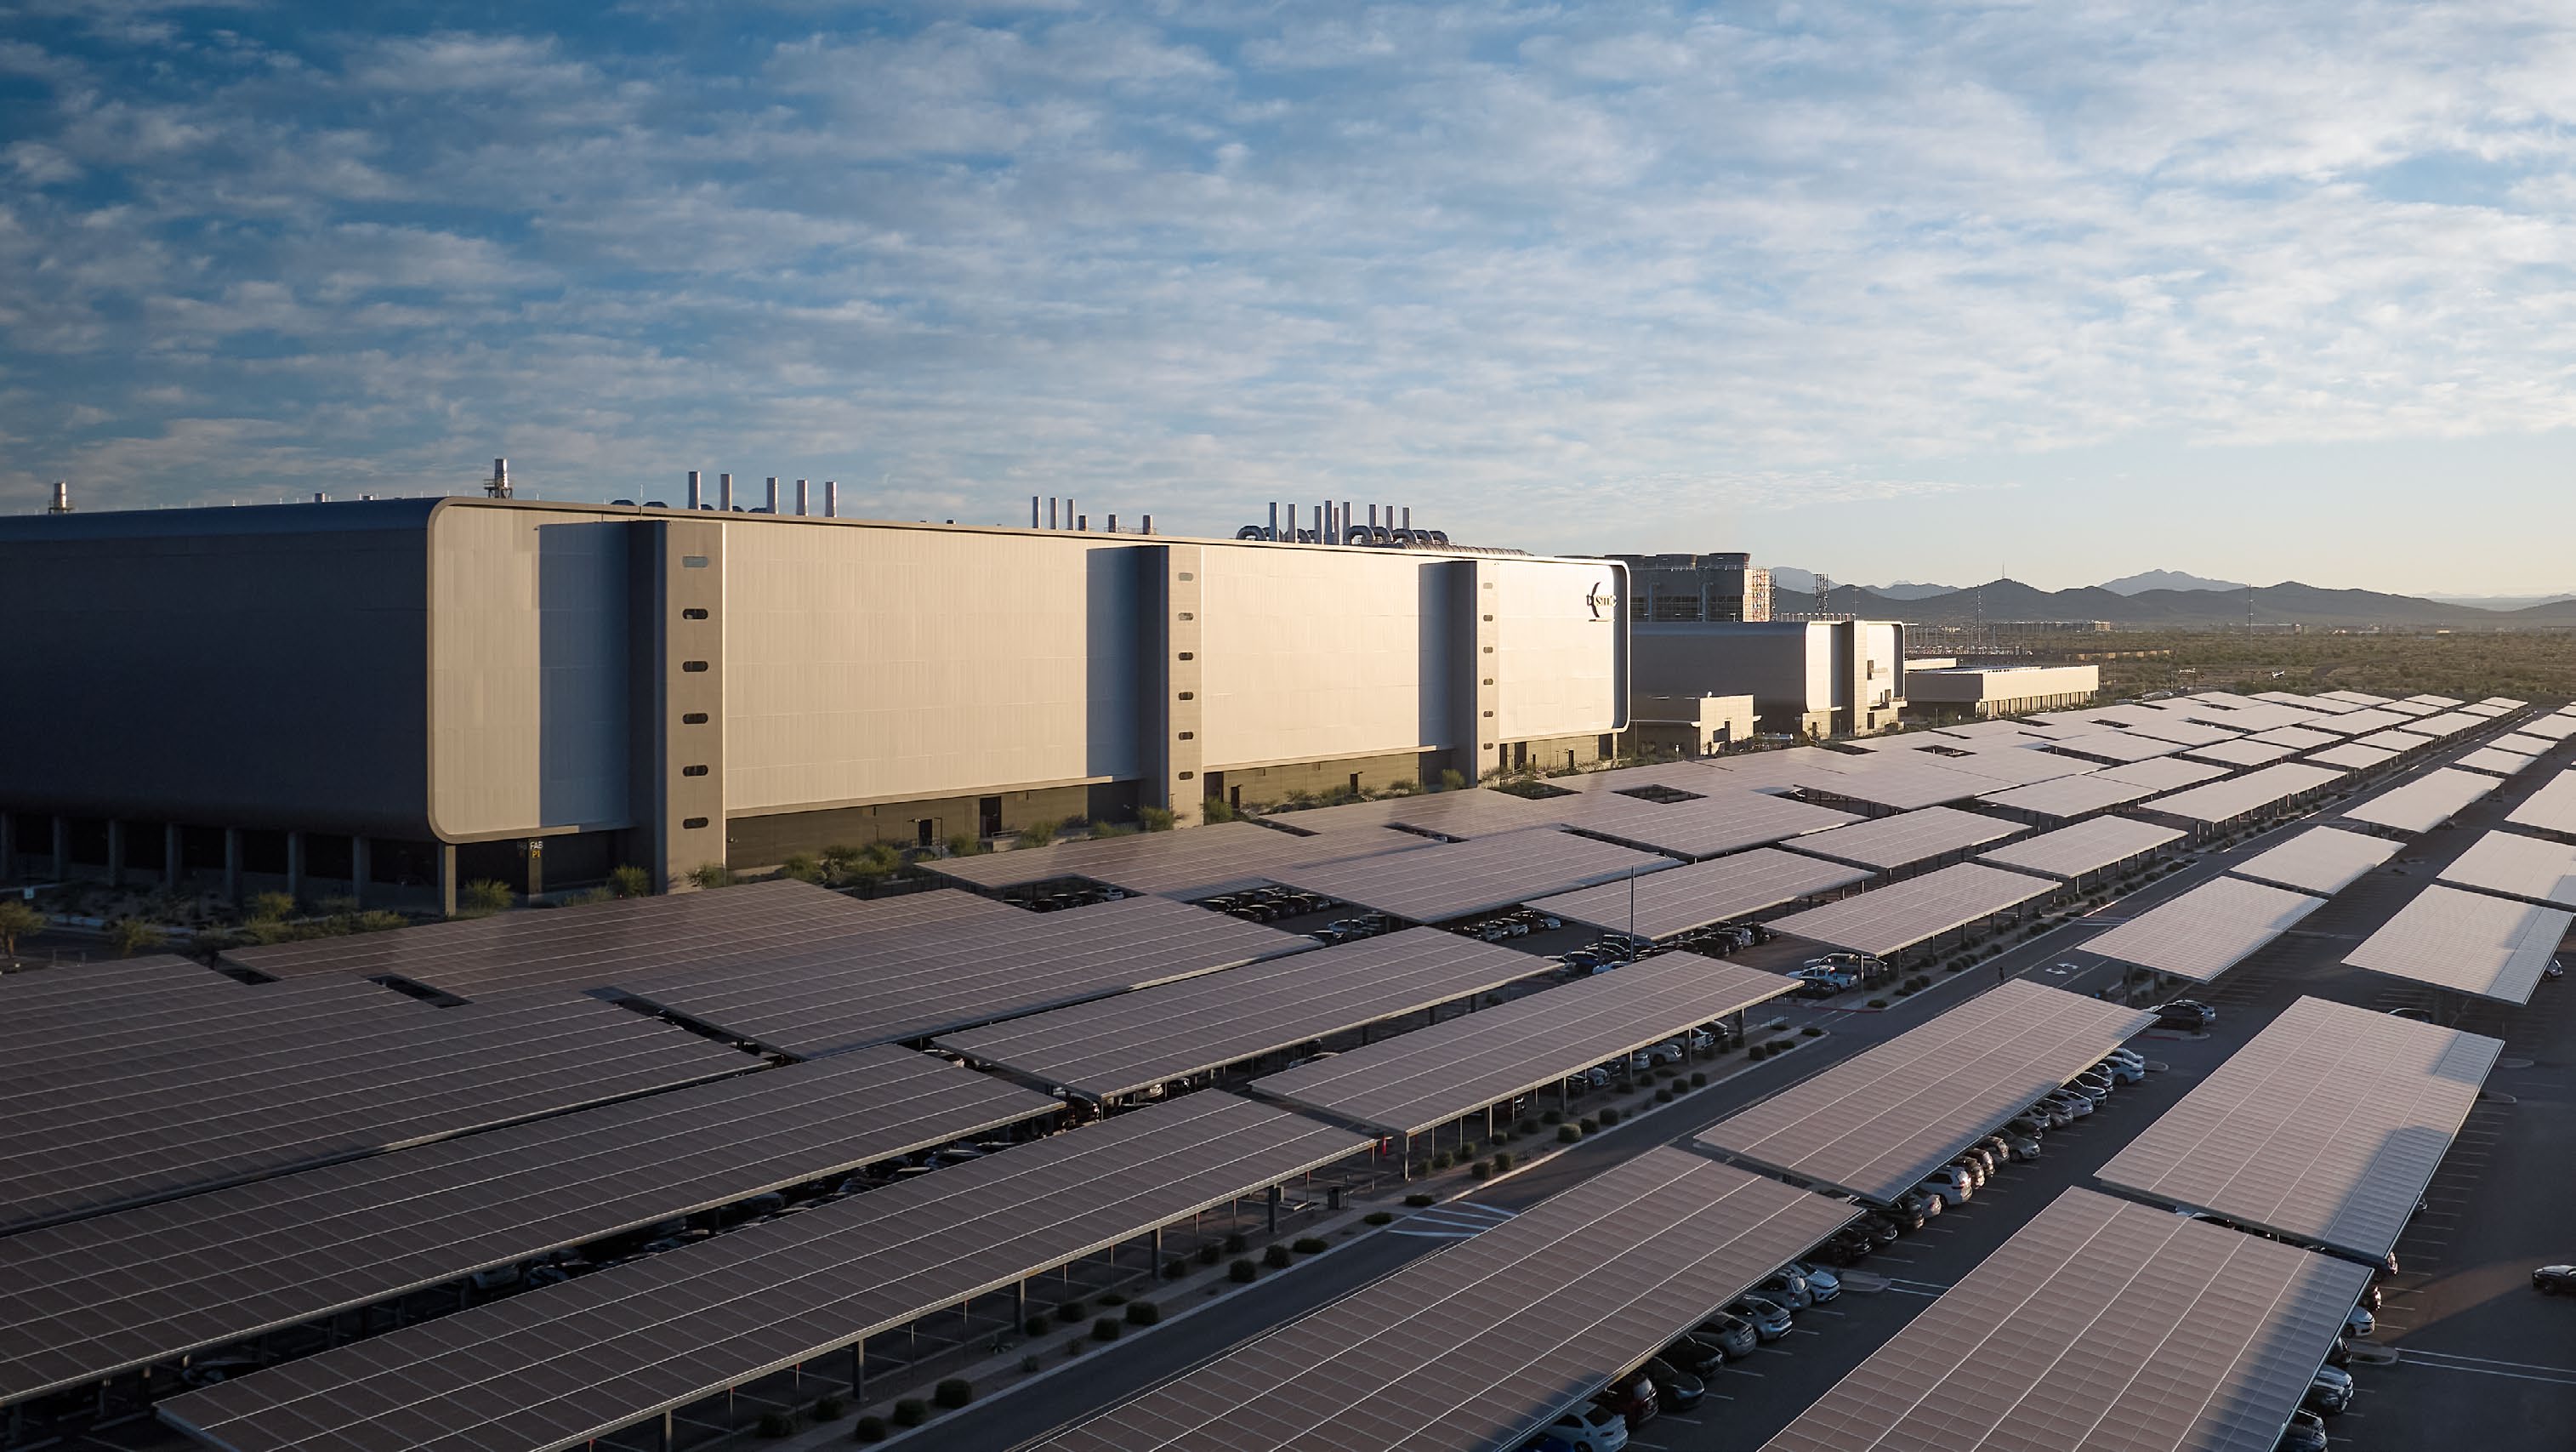
Appendix
IN THIS SECTION
A: Corporate facilities energy supplement
B: Appleʼs life cycle assessment methodology
C: Assurance and review statements
D: Environment, Health and Safety Policy
E: ISO 14001 certification
Report notes
End notes
2026 ENVIRONMENTAL PROGRESS REPORT
91
ENGAGEMENT AND ADVOCACY
ENVIRONMENTAL INITIATIVES
INTRODUCTION
CONTENTS
GREEN BOND IMPACT REPORT
DATA
APPENDIX
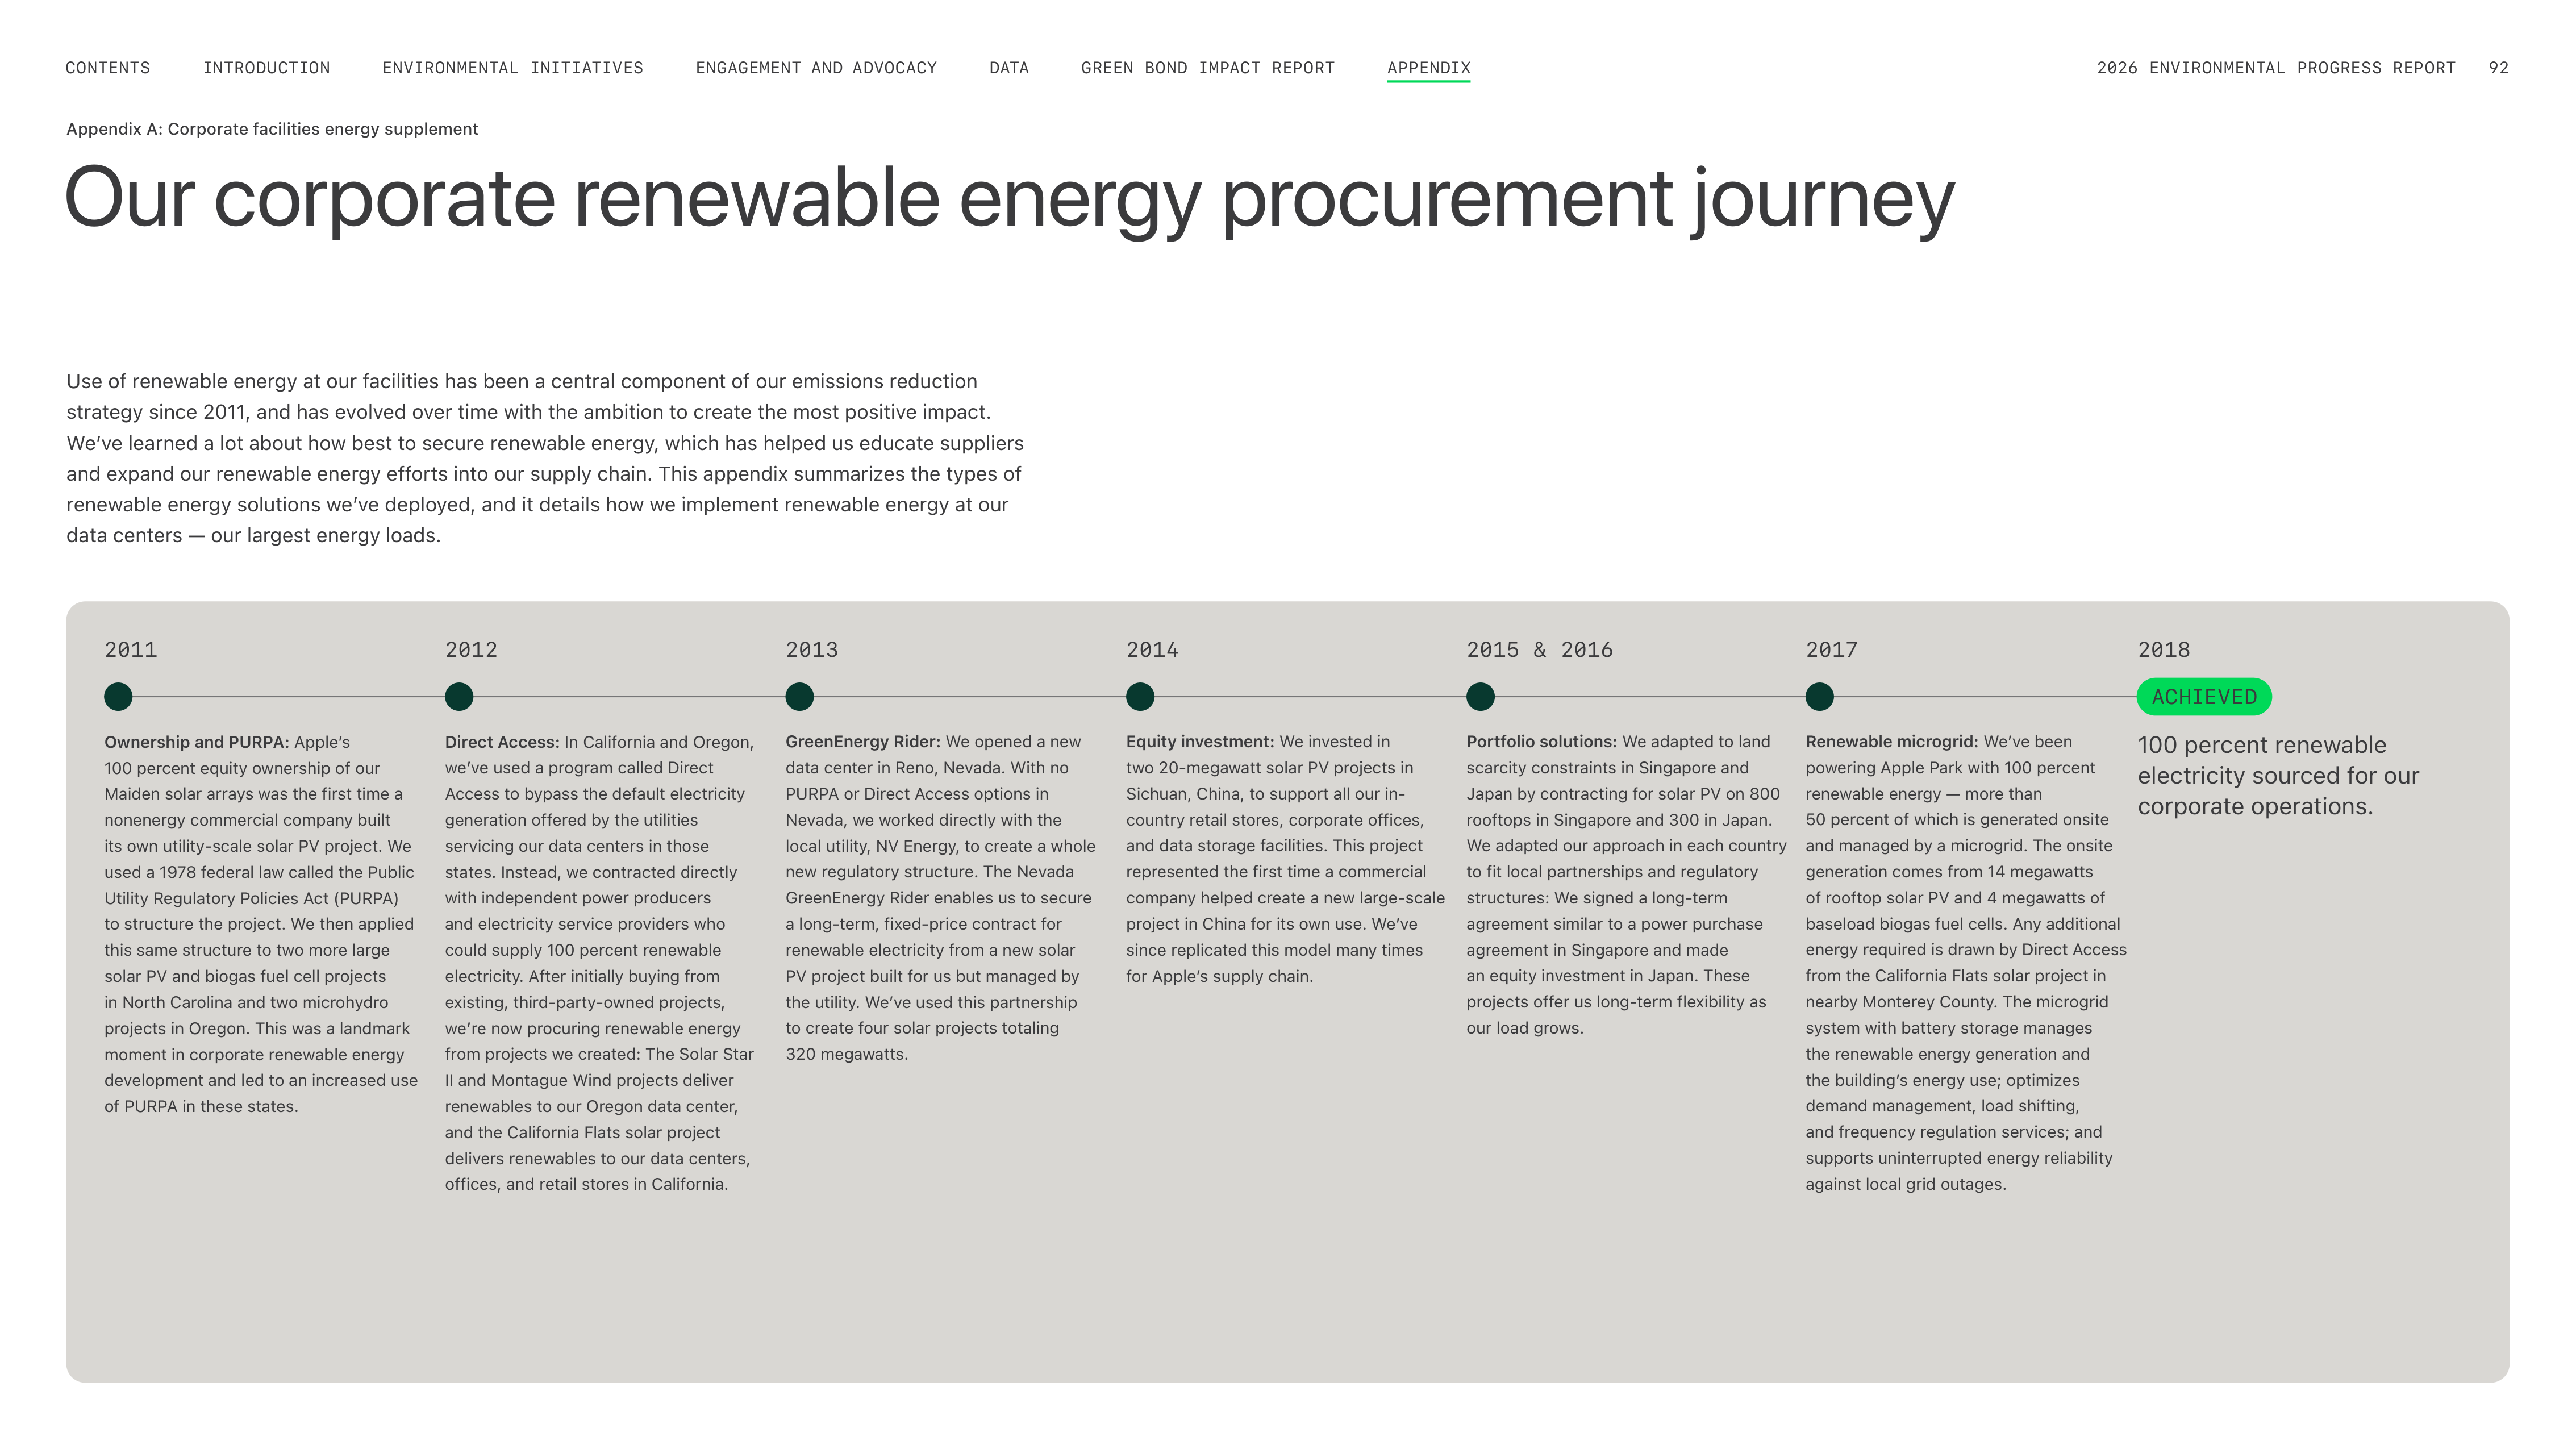
Use of renewable energy at our facilities has been a central component of our emissions reduction
strategy since 2011, and has evolved over time with the ambition to create the most positive impact.
Weʼve learned a lot about how best to secure renewable energy, which has helped us educate suppliers
and expand our renewable energy efforts into our supply chain. This appendix summarizes the types of
renewable energy solutions weʼve deployed, and it details how we implement renewable energy at our
data centers — our largest energy loads.
Our corporate renewable energy procurement journey
Ownership and PURPA:
Appleʼs
100 percent equity ownership of our
Maiden solar arrays was the first time a
nonenergy commercial company built
its own utility-scale solar PV project. We
used a 1978 federal law called the Public
Utility Regulatory Policies Act (PURPA)
to structure the project. We then applied
this same structure to two more large
solar PV and biogas fuel cell projects
in North Carolina and two microhydro
projects in Oregon. This was a landmark
moment in corporate renewable energy
development and led to an increased use
of PURPA in these states.
Direct Access:
In California and Oregon,
weʼve used a program called Direct
Access to bypass the default electricity
generation offered by the utilities
servicing our data centers in those
states. Instead, we contracted directly
with independent power producers
and electricity service providers who
could supply 100 percent renewable
electricity. After initially buying from
existing, third-party-owned projects,
weʼre now procuring renewable energy
from projects we created: The Solar Star
II and Montague Wind projects deliver
renewables to our Oregon data center,
and the California Flats solar project
delivers renewables to our data centers,
offices, and retail stores in California.
GreenEnergy Rider:
We opened a new
data center in Reno, Nevada. With no
PURPA or Direct Access options in
Nevada, we worked directly with the
local utility, NV Energy, to create a whole
new regulatory structure. The Nevada
GreenEnergy Rider enables us to secure
a long-term, fixed-price contract for
renewable electricity from a new solar
PV project built for us but managed by
the utility. Weʼve used this partnership
to create four solar projects totaling
320 megawatts.
Equity investment:
We invested in
two 20-megawatt solar PV projects in
Sichuan, China, to support all our in-
country retail stores, corporate offices,
and data storage facilities. This project
represented the first time a commercial
company helped create a new large-scale
project in China for its own use. Weʼve
since replicated this model many times
for Appleʼs supply chain.
Portfolio solutions:
We adapted to land
scarcity constraints in Singapore and
Japan by contracting for solar PV on 800
rooftops in Singapore and 300 in Japan.
We adapted our approach in each country
to fit local partnerships and regulatory
structures: We signed a long-term
agreement similar to a power purchase
agreement in Singapore and made
an equity investment in Japan. These
projects offer us long-term flexibility as
our load grows.
Renewable microgrid:
Weʼve been
powering Apple Park with 100 percent
renewable energy — more than
50 percent of which is generated onsite
and managed by a microgrid. The onsite
generation comes from 14 megawatts
of rooftop solar PV and 4 megawatts of
baseload biogas fuel cells. Any additional
energy required is drawn by Direct Access
from the California Flats solar project in
nearby Monterey County. The microgrid
system with battery storage manages
the renewable energy generation and
the buildingʼs energy use; optimizes
demand management, load shifting,
and frequency regulation services; and
supports uninterrupted energy reliability
against local grid outages.
100 percent renewable
electricity sourced for our
corporate operations.
2011
2012
2013
2014
2015 & 2016
2017
2018
Appendix A: Corporate facilities energy supplement
ACHIEVED
ENGAGEMENT AND ADVOCACY
ENVIRONMENTAL INITIATIVES
INTRODUCTION
CONTENTS
GREEN BOND IMPACT REPORT
DATA
2026 ENVIRONMENTAL PROGRESS REPORT
92
APPENDIX
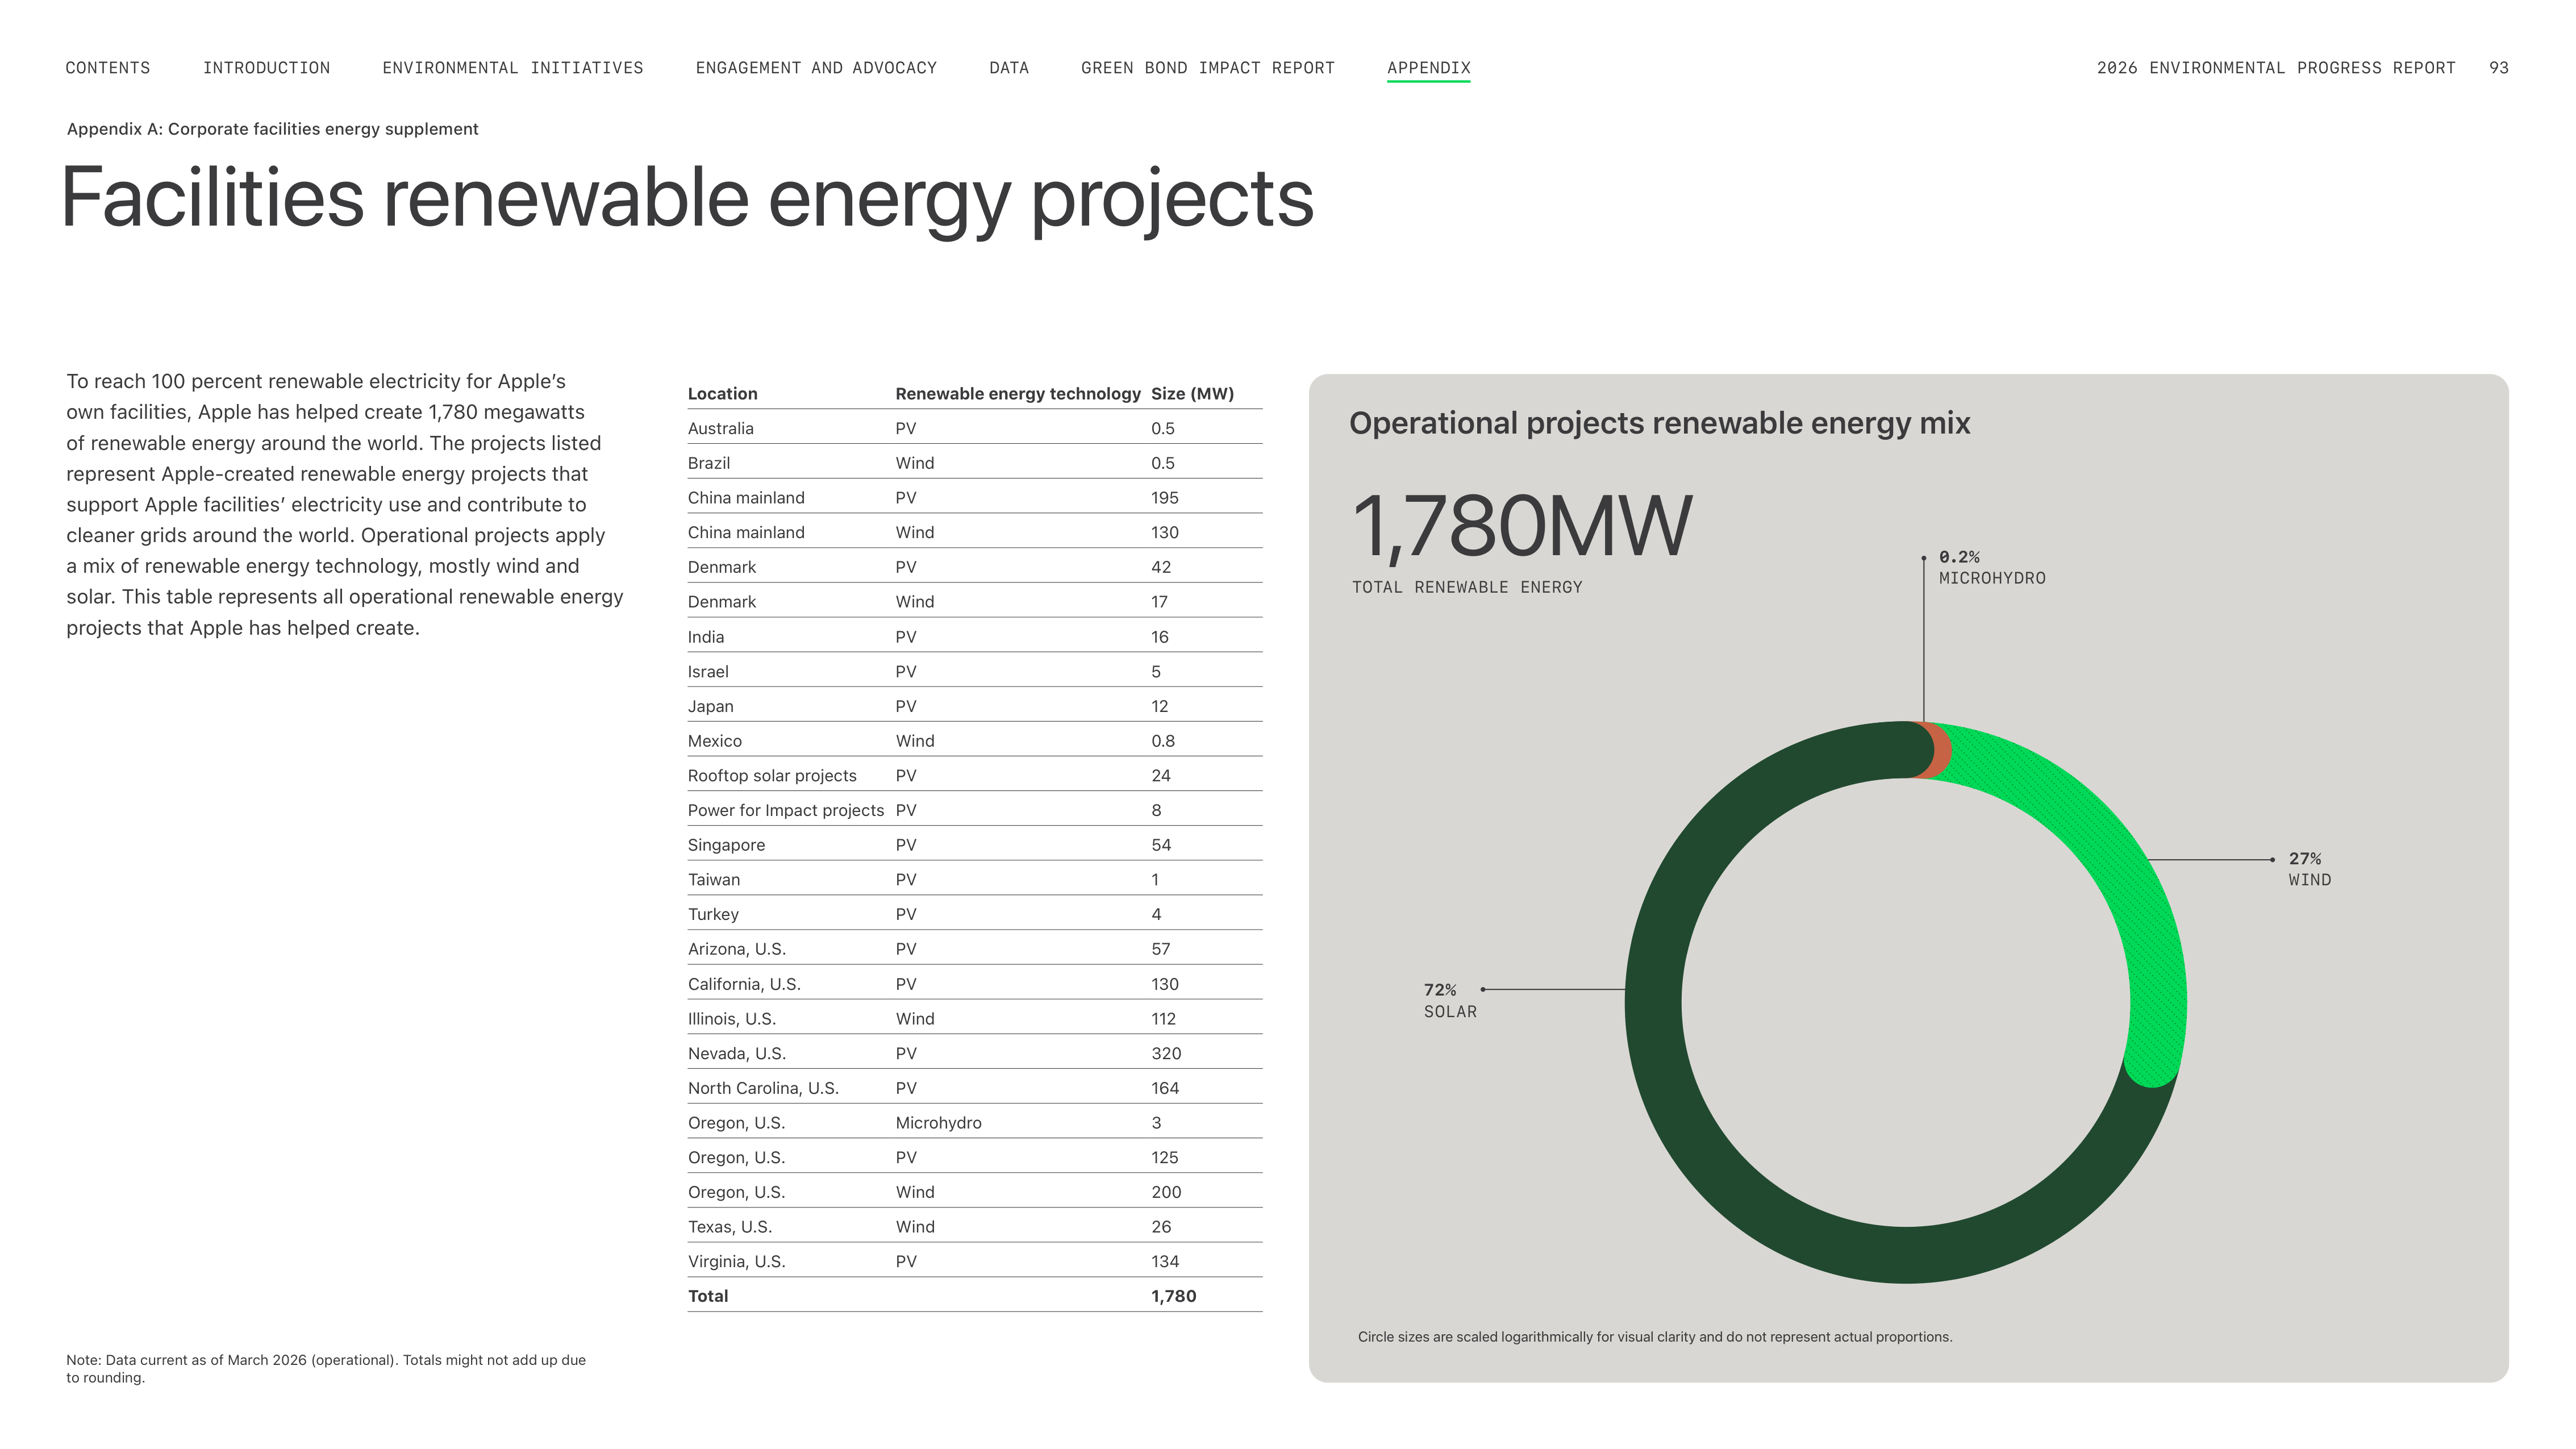
Facilities renewable energy projects
To reach 100 percent renewable electricity for Appleʼs
own facilities, Apple has helped create 1,780 megawatts
of renewable energy around the world. The projects listed
represent Apple-created renewable energy projects that
support Apple facilitiesʼ electricity use and contribute to
cleaner grids around the world. Operational projects apply
a mix of renewable energy technology, mostly wind and
solar. This table represents all operational renewable energy
projects that Apple has helped create.
Location
Renewable energy technology
Size (MW)
Australia
PV
0.5
Brazil
Wind
0.5
China mainland
PV
195
China mainland
Wind
130
Denmark
PV
42
Denmark
Wind
17
India
PV
16
Israel
PV
5
Japan
PV
12
Mexico
Wind
0.8
Rooftop solar projects
PV
24
Power for Impact projects PV
8
Singapore
PV
54
Taiwan
PV
1
Turkey
PV
4
Arizona, U.S.
PV
57
California, U.S.
PV
130
Illinois, U.S.
Wind
112
Nevada, U.S.
PV
320
North Carolina, U.S.
PV
164
Oregon, U.S.
Microhydro
3
Oregon, U.S.
PV
125
Oregon, U.S.
Wind
200
Texas, U.S.
Wind
26
Virginia, U.S.
PV
134
Total
1,780
Appendix A: Corporate facilities energy supplement
Note: Data current as of March 2026 (operational). Totals might not add up due
to rounding.
Circle sizes are scaled logarithmically for visual clarity and do not represent actual proportions.
Operational projects renewable energy mix
72%
SOLAR
27%
WIND
0.2%
MICROHYDRO
1,780MW
TOTAL RENEWABLE ENERGY
ENGAGEMENT AND ADVOCACY
ENVIRONMENTAL INITIATIVES
INTRODUCTION
CONTENTS
GREEN BOND IMPACT REPORT
DATA
2026 ENVIRONMENTAL PROGRESS REPORT
93
APPENDIX
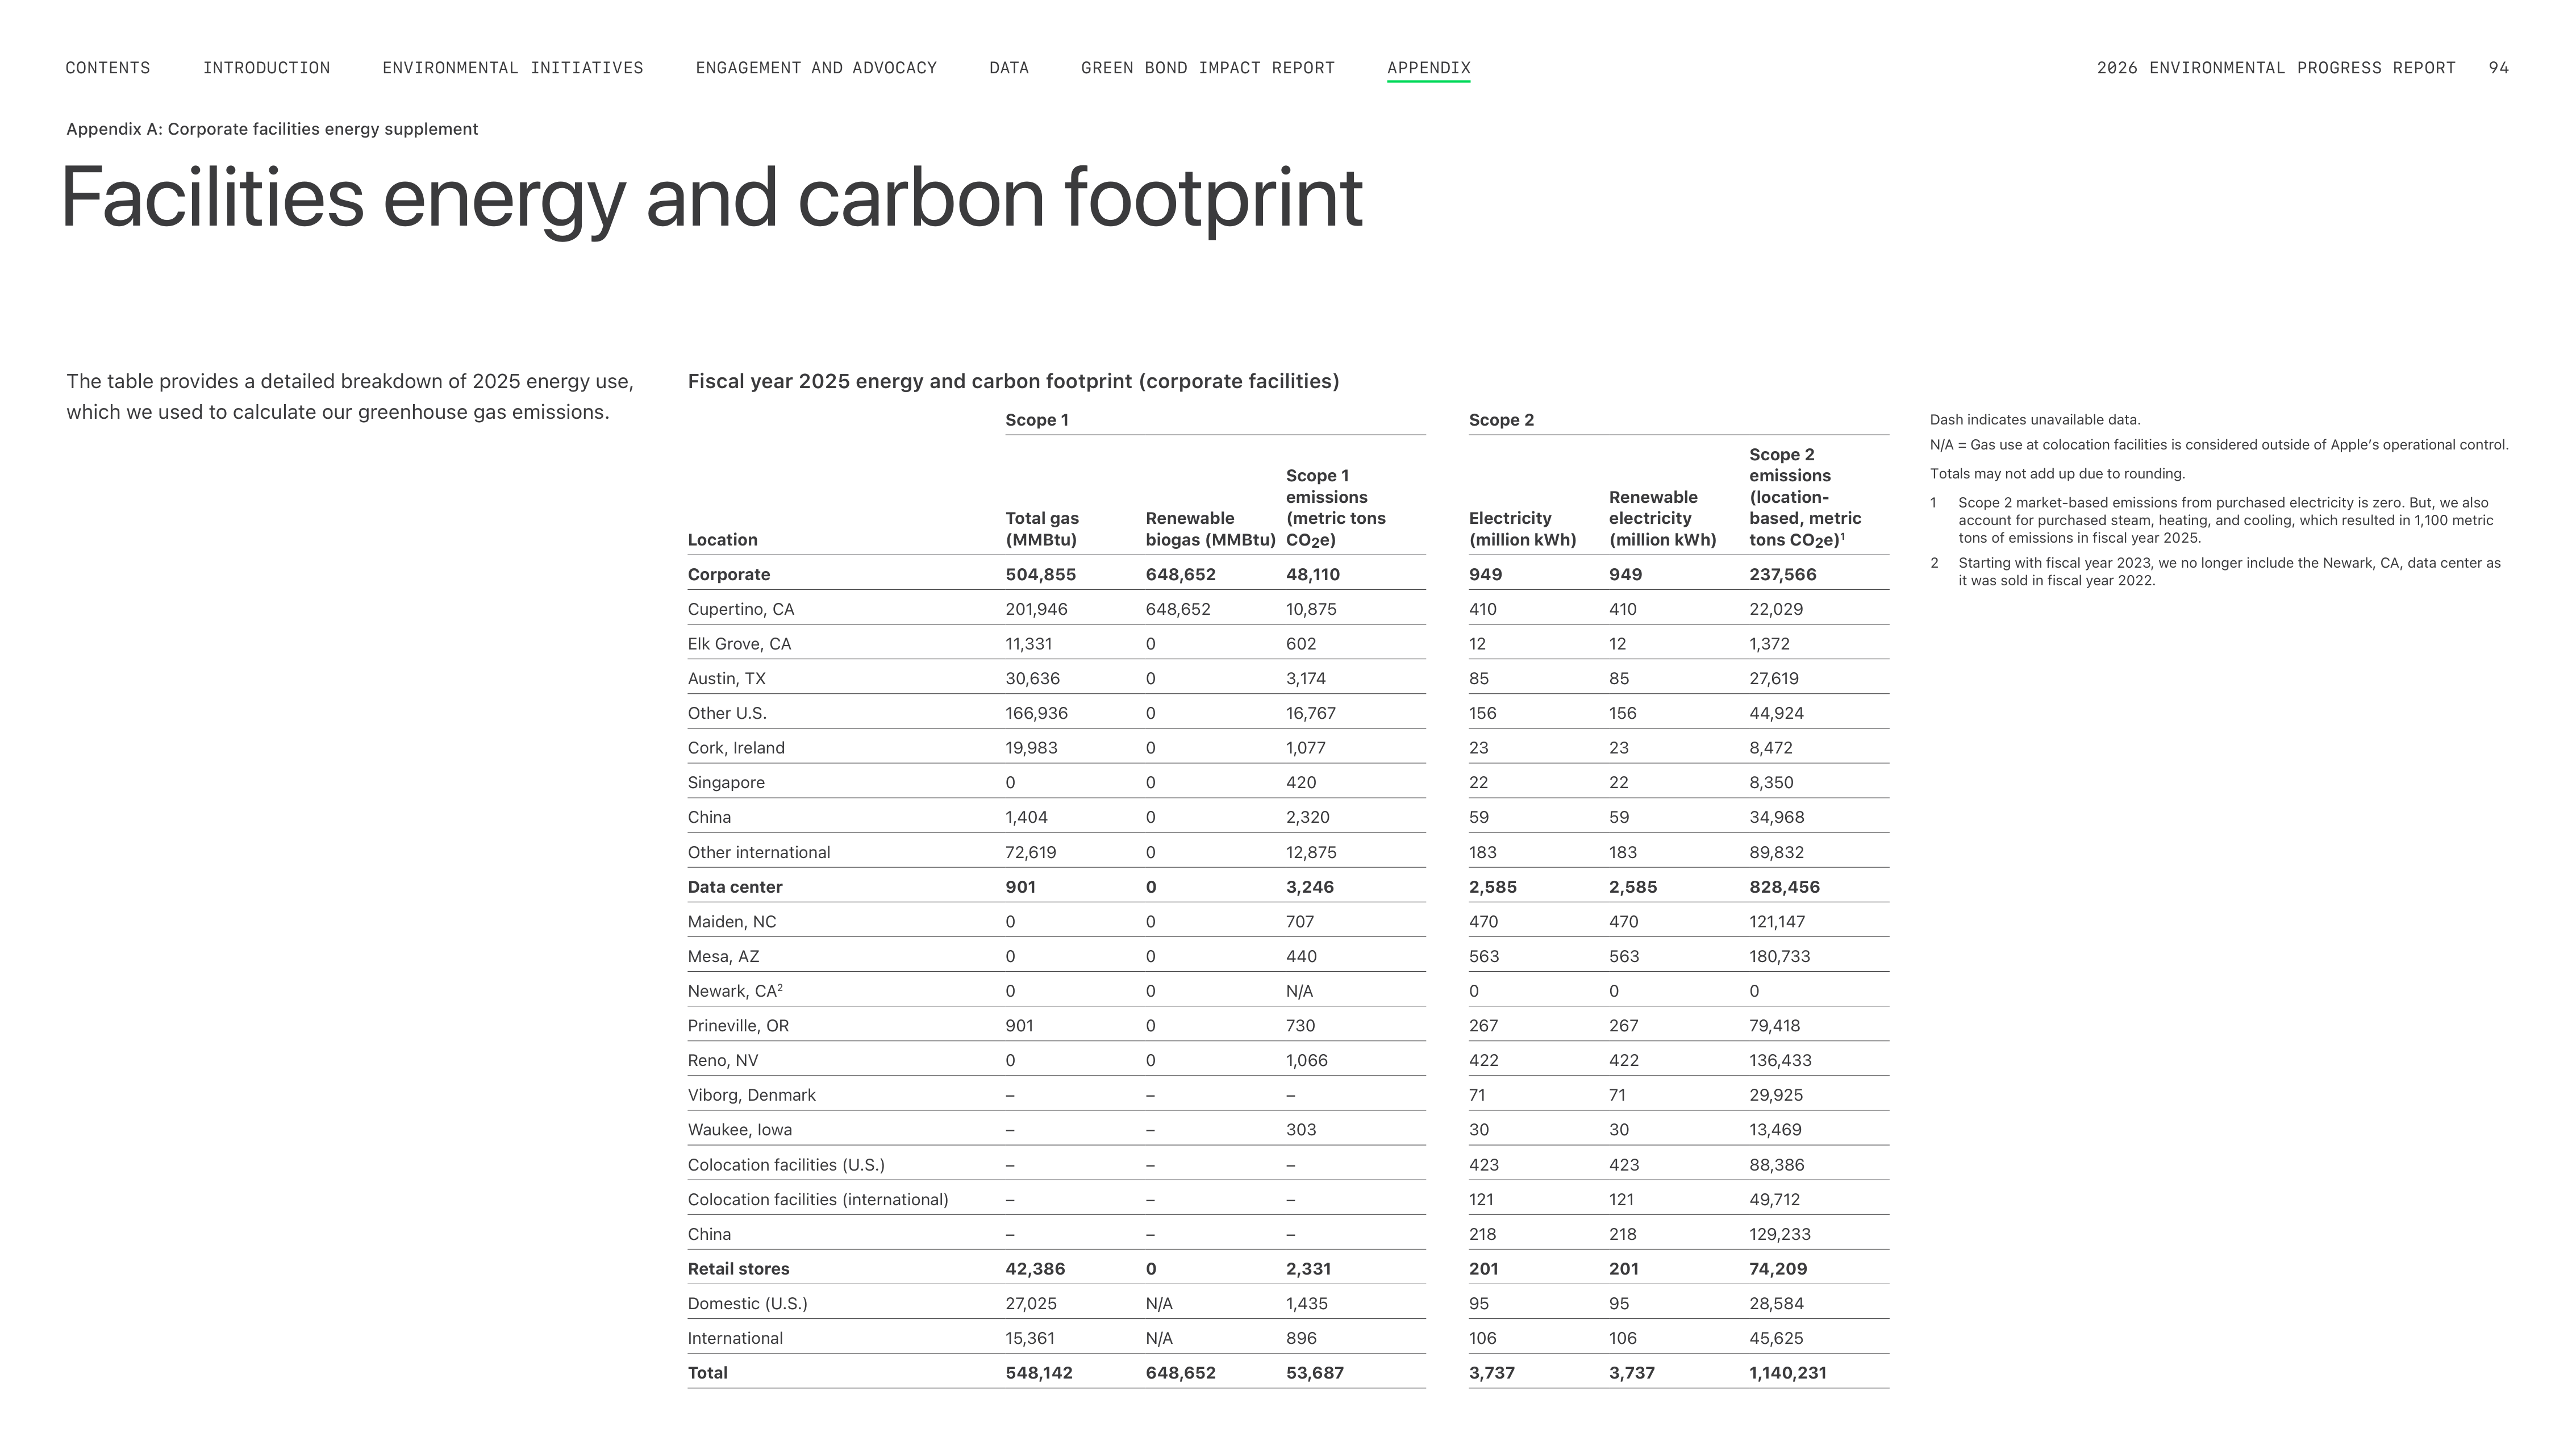
Facilities energy and carbon footprint
The table provides a detailed breakdown of
2025
energy use,
which we used to calculate our greenhouse gas emissions.
Fiscal year 2025 energy and carbon footprint (corporate facilities)
Location
Scope 1
Scope 2
Total gas
(MMBtu)
Renewable
biogas (MMBtu)
Scope 1
emissions
(metric tons
CO
2
e)
Electricity
(million kWh)
Renewable
electricity
(million kWh)
Scope 2
emissions
(location-
based, metric
tons CO
2
e)
1
Corporate
504,855
648,652
48,110
949
949
237,566
Cupertino, CA
201,946
648,652
10,875
410
410
22,029
Elk Grove, CA
11,331
0
602
12
12
1,372
Austin, TX
30,636
0
3,174
85
85
27,619
Other U.S.
166,936
0
16,767
156
156
44,924
Cork, Ireland
19,983
0
1,077
23
23
8,472
Singapore
0
0
420
22
22
8,350
China
1,404
0
2,320
59
59
34,968
Other international
72,619
0
12,875
183
183
89,832
Data center
901
0
3,246
2,585
2,585
828,456
Maiden, NC
0
0
707
470
470
121,147
Mesa, AZ
0
0
440
563
563
180,733
Newark, CA
2
0
0
N/A
0
0
0
Prineville, OR
901
0
730
267
267
79,418
Reno, NV
0
0
1,066
422
422
136,433
Viborg, Denmark
–
–
–
71
71
29,925
Waukee, Iowa
–
–
303
30
30
13,469
Colocation facilities (U.S.)
–
–
–
423
423
88,386
Colocation facilities (international)
–
–
–
121
121
49,712
China
–
–
–
218
218
129,233
Retail stores
42,386
0
2,331
201
201
74,209
Domestic (U.S.)
27,025
N/A
1,435
95
95
28,584
International
15,361
N/A
896
106
106
45,625
Total
548,142
648,652
53,687
3,737
3,737
1,140,231
Appendix A: Corporate facilities energy supplement
Dash indicates unavailable data.
N/A = Gas use at colocation facilities is considered outside of Appleʼs operational control.
Totals may not add up due to rounding.
1
Scope 2 market-based emissions from purchased electricity is zero. But, we also
account for purchased steam, heating, and cooling, which resulted in 1,100 metric
tons of emissions in fiscal year 2025.
2
Starting with fiscal year 2023, we no longer include the Newark, CA, data center as
it was sold in fiscal year 2022.
ENGAGEMENT AND ADVOCACY
ENVIRONMENTAL INITIATIVES
INTRODUCTION
CONTENTS
GREEN BOND IMPACT REPORT
DATA
2026 ENVIRONMENTAL PROGRESS REPORT
94
APPENDIX
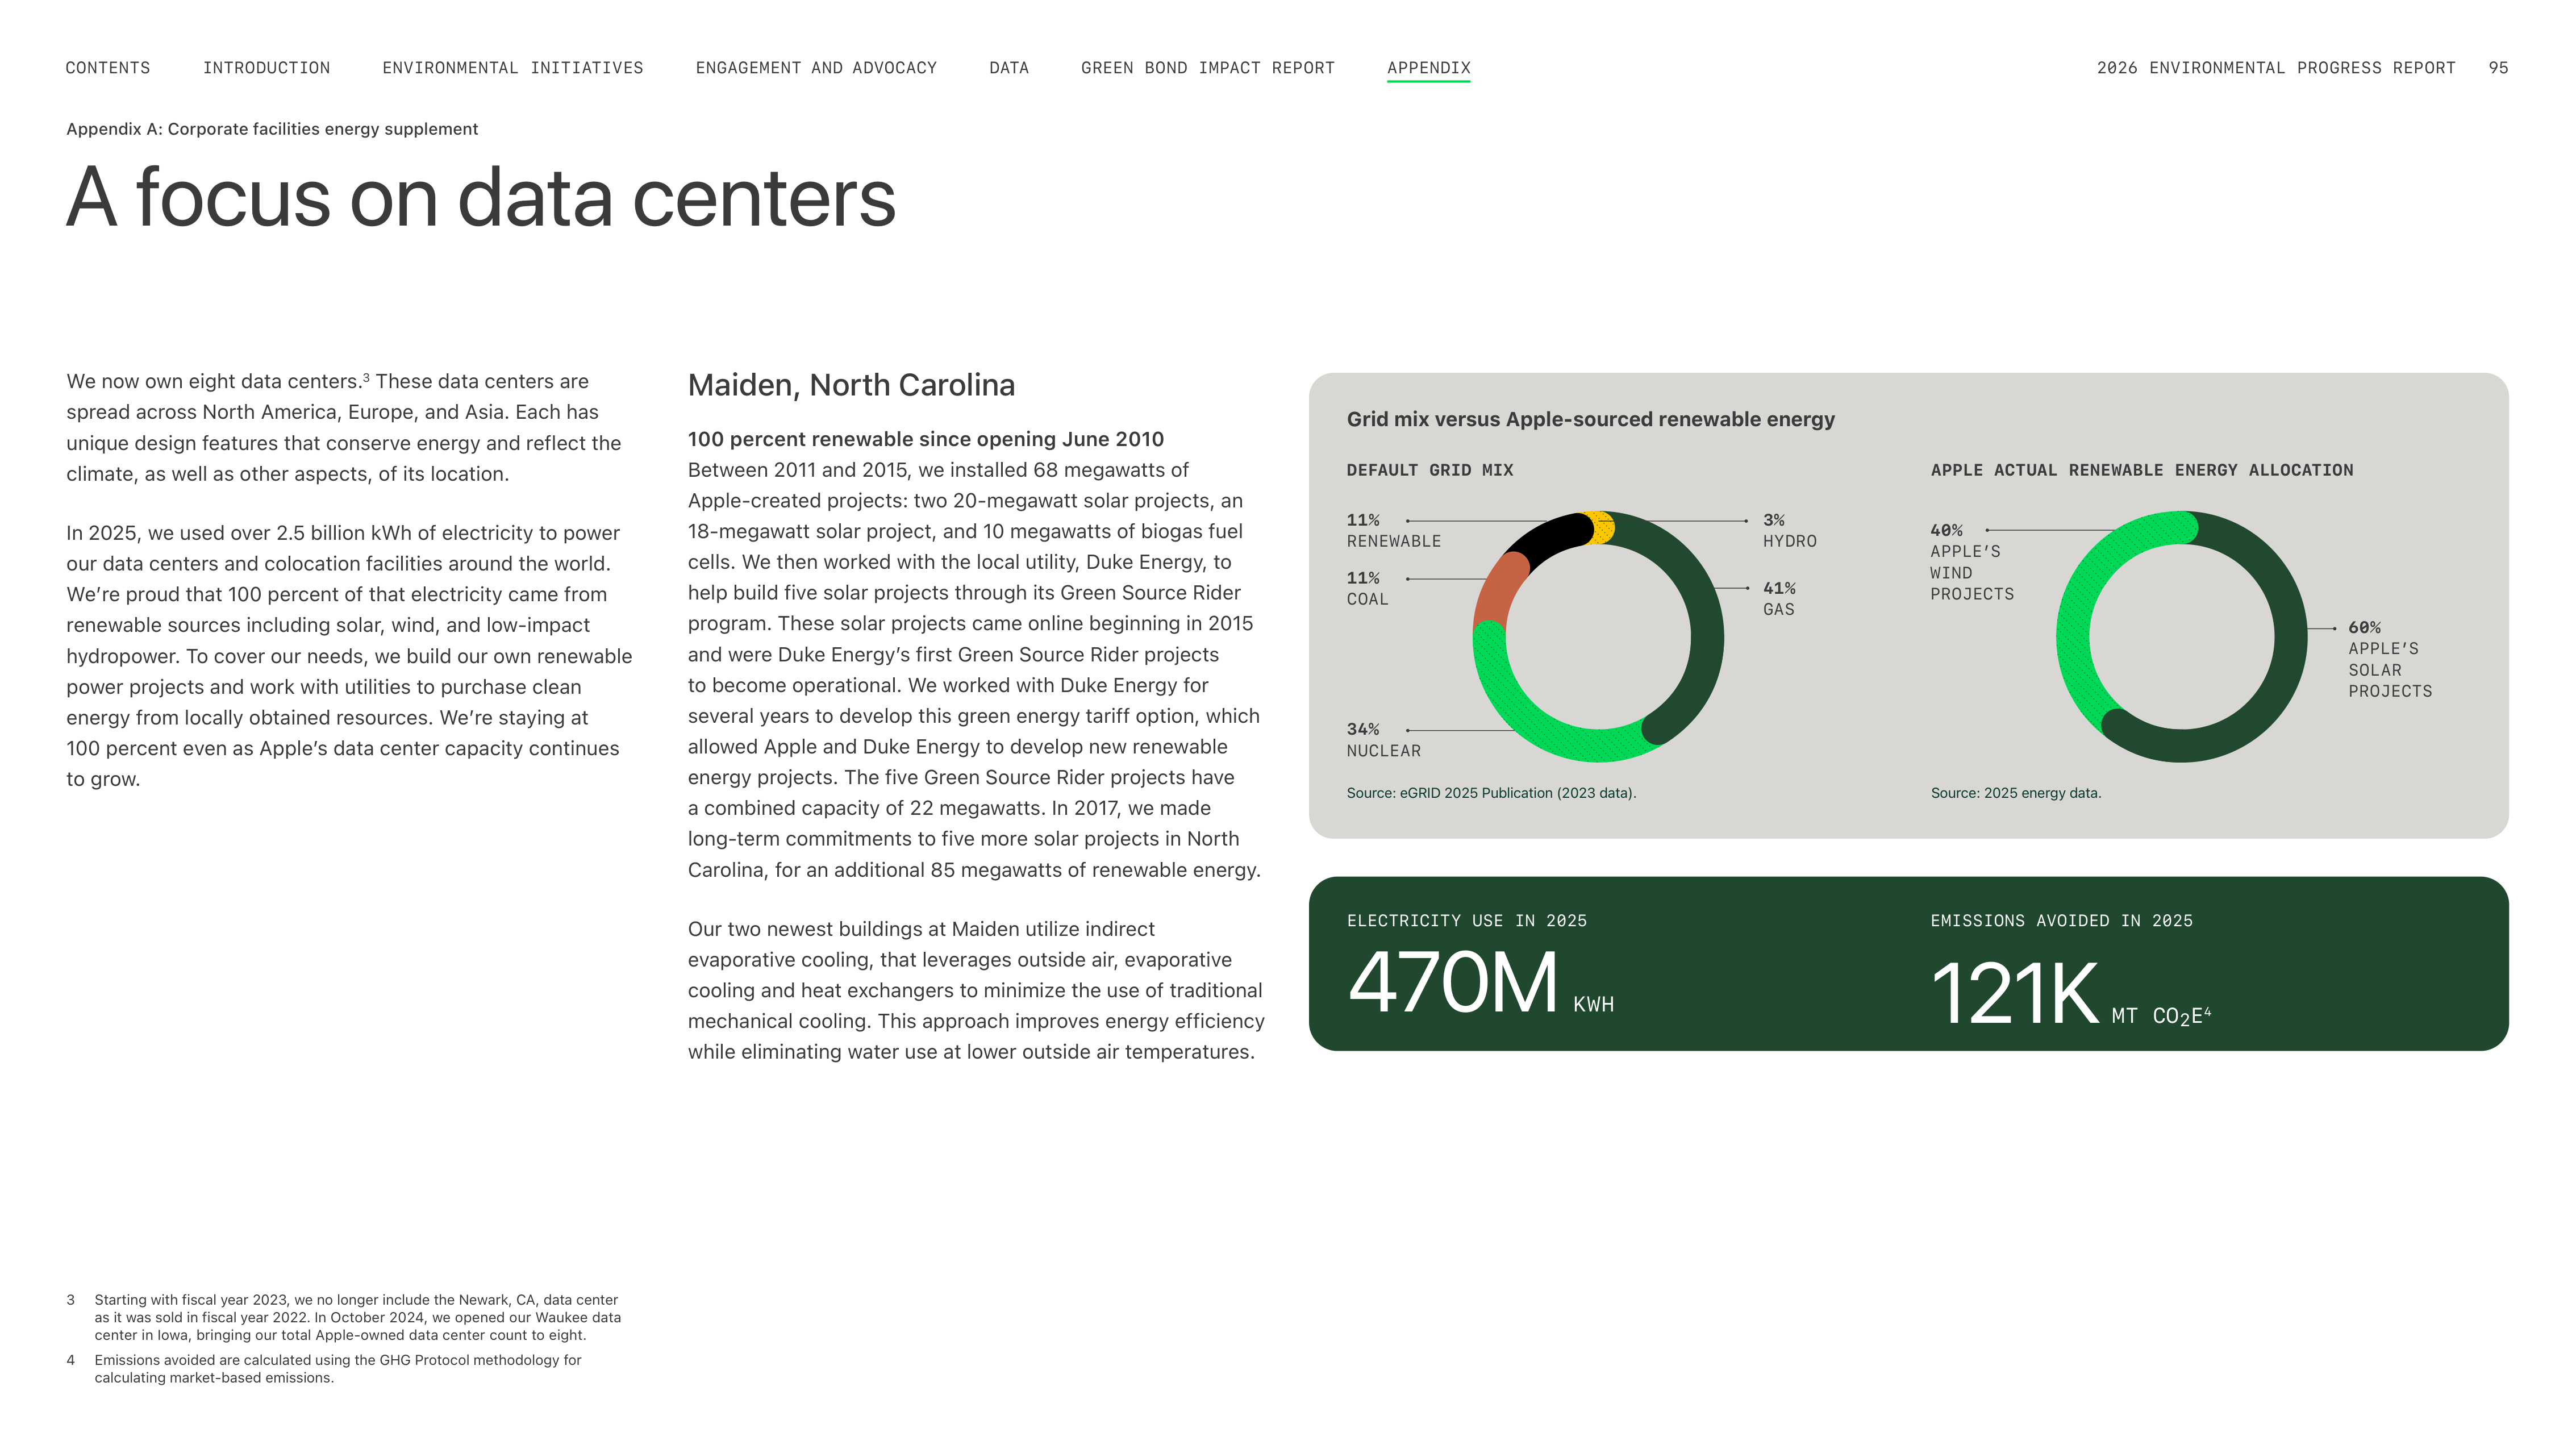
A focus on data centers
We now own eight data centers.
3
These data centers are
spread across North America, Europe, and Asia. Each has
unique design features that conserve energy and reflect the
climate, as well as other aspects, of its location.
In
2025
, we used over 2.5 billion kWh of electricity to power
our data centers and colocation facilities around the world.
Weʼre proud that 100 percent of that electricity came from
renewable sources including solar, wind, and low-impact
hydropower. To cover our needs, we build our own renewable
power projects and work with utilities to purchase clean
energy from locally obtained resources. Weʼre staying at
100 percent even as Appleʼs data center capacity continues
to grow.
3
Starting with fiscal year 2023, we no longer include the Newark, CA, data center
as it was sold in fiscal year 2022. In October 2024, we opened our Waukee data
center in Iowa, bringing our total Apple-owned data center count to eight.
4
Emissions avoided are calculated using the GHG Protocol methodology for
calculating market-based emissions.
Maiden, North Carolina
100 percent renewable since opening June 2010
Between 2011 and 2015, we installed 68 megawatts of
Apple-created projects: two 20-megawatt solar projects, an
18-megawatt solar project, and 10 megawatts of biogas fuel
cells. We then worked with the local utility, Duke Energy, to
help build five solar projects through its Green Source Rider
program. These solar projects came online beginning in 2015
and were Duke Energyʼs first Green Source Rider projects
to become operational. We worked with Duke Energy for
several years to develop this green energy tariff option, which
allowed Apple and Duke Energy to develop new renewable
energy projects. The five Green Source Rider projects have
a combined capacity of 22 megawatts. In 2017, we made
long-term commitments to five more solar projects in North
Carolina, for an additional 85 megawatts of renewable energy.
Our two newest buildings at Maiden utilize indirect
evaporative cooling, that leverages outside air, evaporative
cooling and heat exchangers to minimize the use of traditional
mechanical cooling. This approach improves energy efficiency
while eliminating water use at lower outside air temperatures.
Appendix A: Corporate facilities energy supplement
Grid mix versus Apple-sourced renewable energy
DEFAULT GRID MIX
APPLE ACTUAL RENEWABLE ENERGY ALLOCATION
Source: eGRID 2025 Publication (2023 data).
34%
NUCLEAR
40%
APPLE’S
WIND
PROJECTS
60%
APPLE’S
SOLAR
PROJECTS
41%
GAS
11%
RENEWABLE
11%
COAL
3%
HYDRO
ELECTRICITY USE IN 2025
470M
KWH
Source: 2025 energy data.
EMISSIONS AVOIDED IN 2025
121K
MT CO
2
E
4
ENGAGEMENT AND ADVOCACY
ENVIRONMENTAL INITIATIVES
INTRODUCTION
CONTENTS
GREEN BOND IMPACT REPORT
DATA
2026 ENVIRONMENTAL PROGRESS REPORT
95
APPENDIX
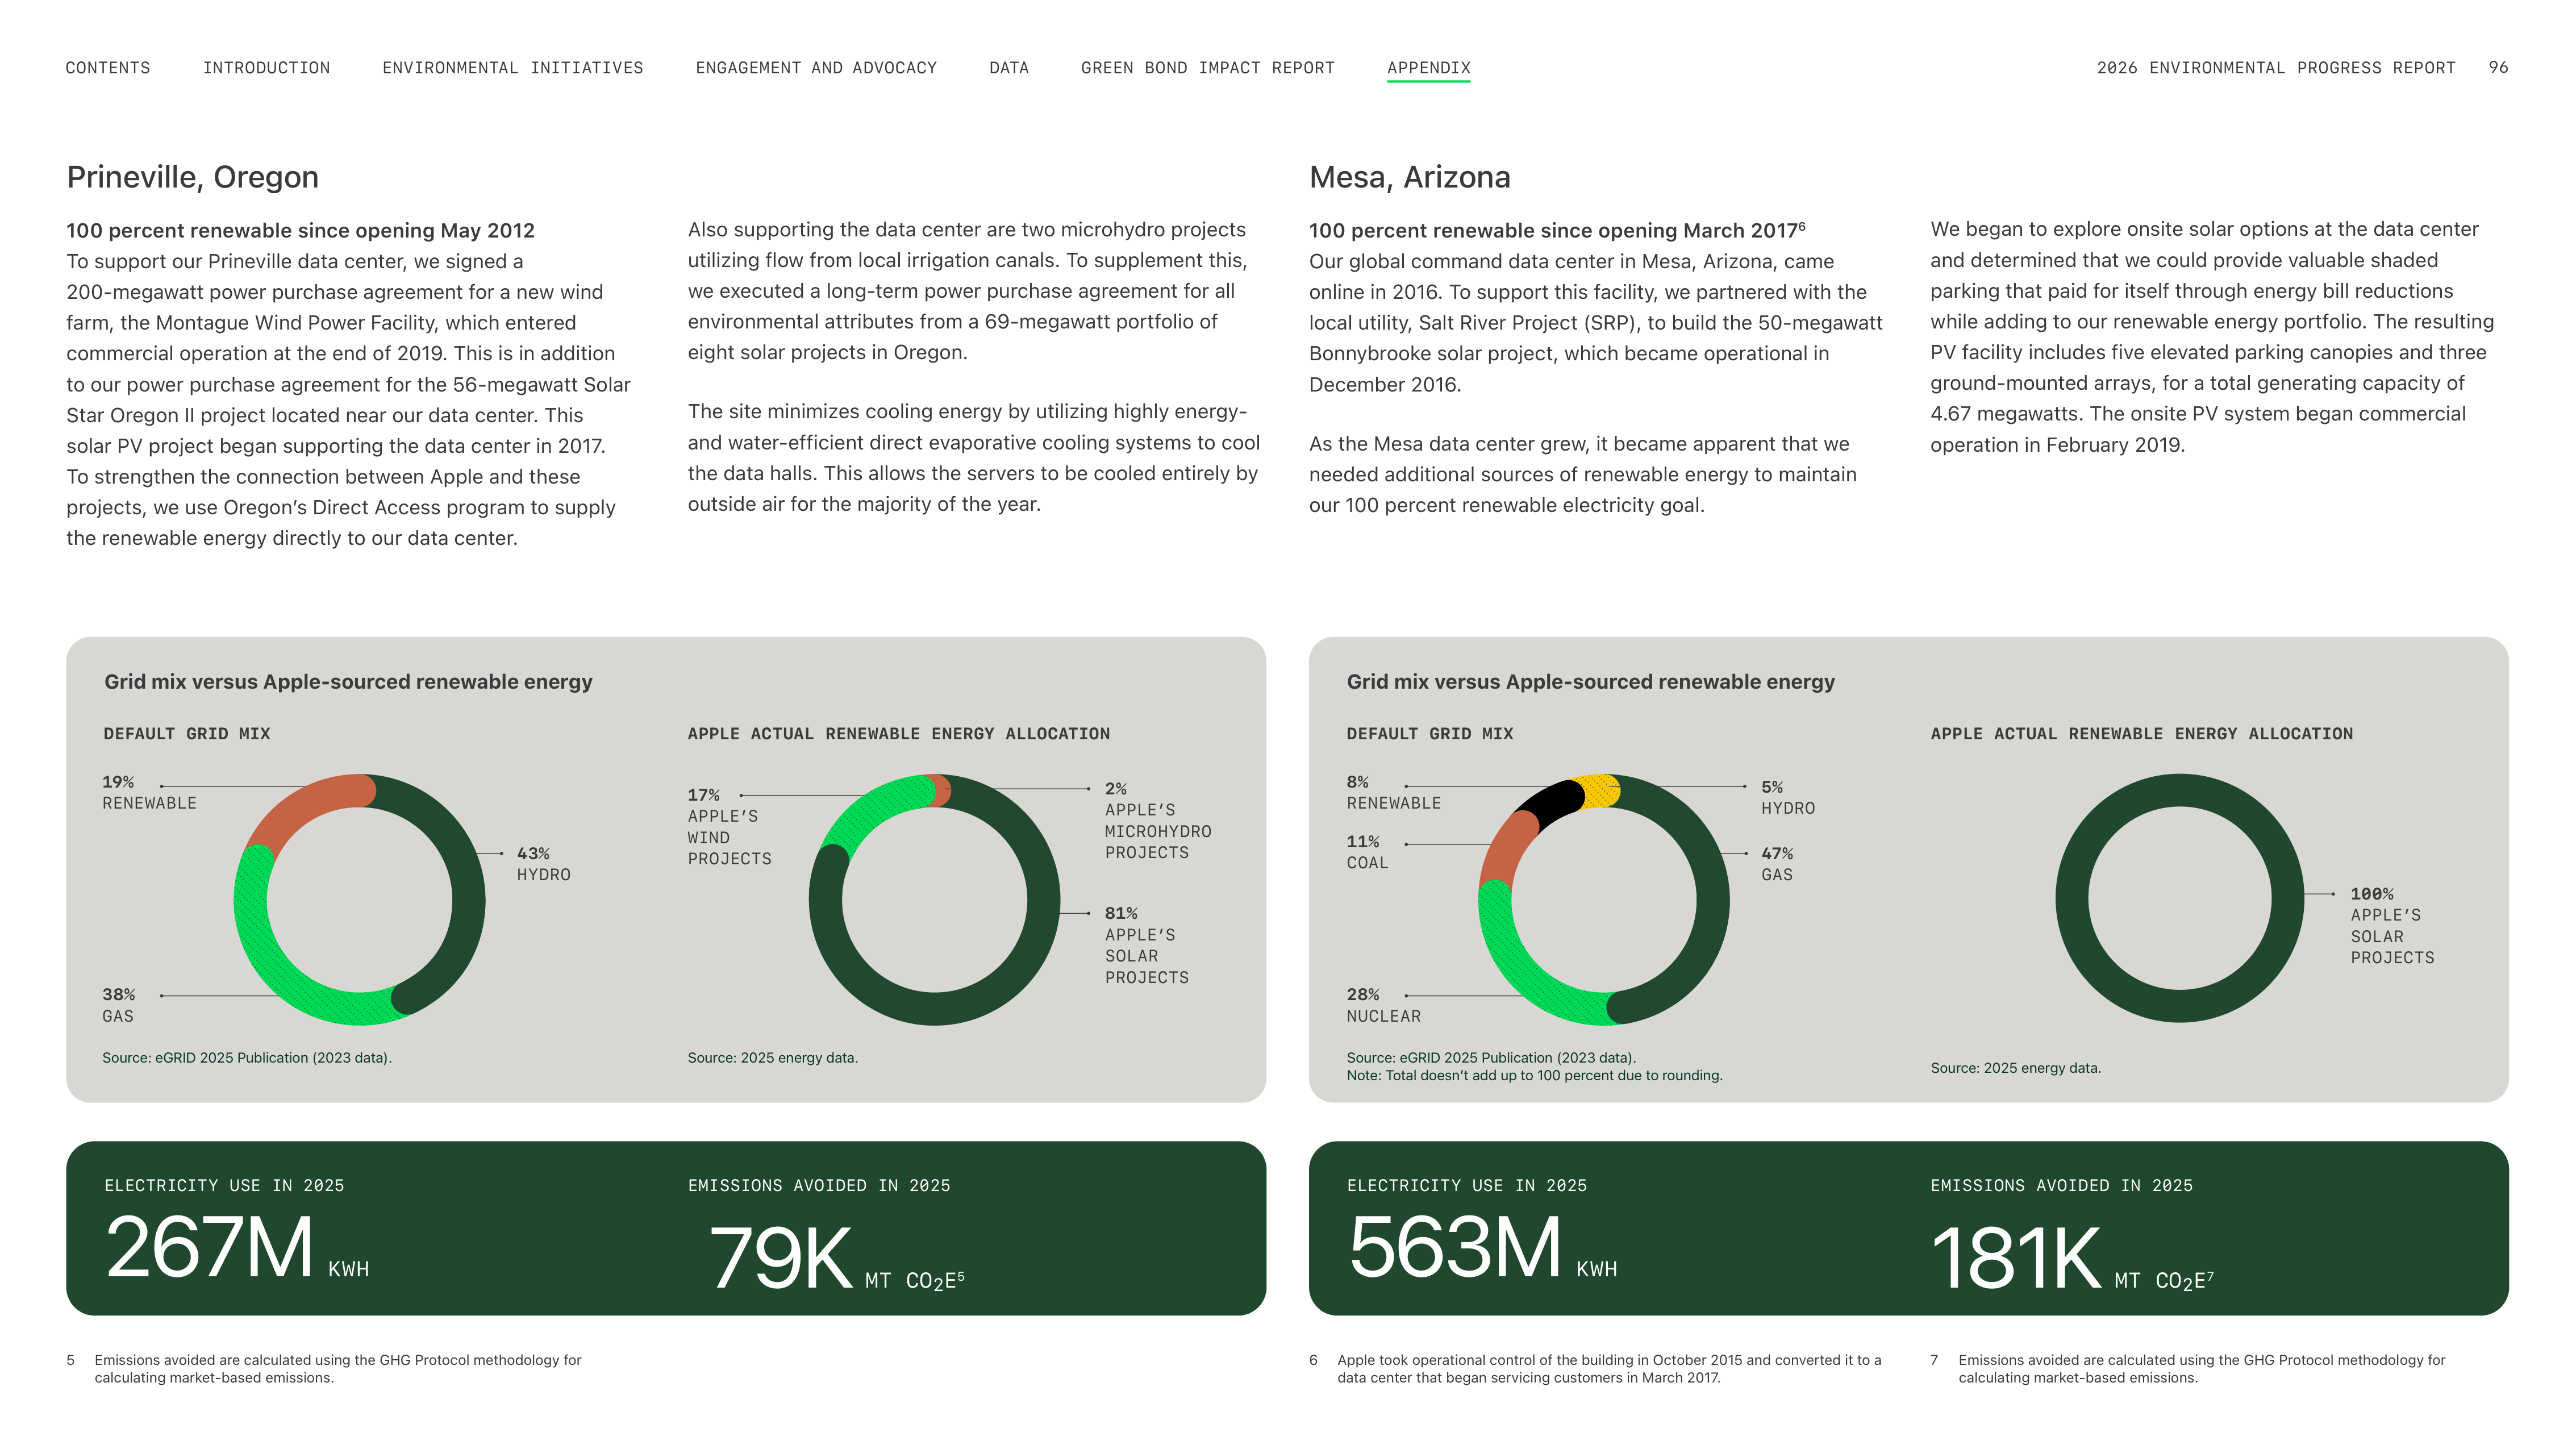
Prineville, Oregon
100 percent renewable since opening May 2012
To support our Prineville data center, we signed a
200-megawatt power purchase agreement for a new wind
farm, the Montague Wind Power Facility, which entered
commercial operation at the end of 2019. This is in addition
to our power purchase agreement for the 56-megawatt Solar
Star Oregon II project located near our data center. This
solar PV project began supporting the data center in 2017.
To strengthen the connection between Apple and these
projects, we use Oregonʼs Direct Access program to supply
the renewable energy directly to our data center.
Mesa, Arizona
100 percent renewable since opening March 2017
6
Our global command data center in Mesa, Arizona, came
online in 2016. To support this facility, we partnered with the
local utility, Salt River Project (SRP), to build the 50-megawatt
Bonnybrooke solar project, which became operational in
December 2016.
As the Mesa data center grew, it became apparent that we
needed additional sources of renewable energy to maintain
our 100 percent renewable electricity goal.
5
Emissions avoided are calculated using the GHG Protocol methodology for
calculating market-based emissions.
6
Apple took operational control of the building in October 2015 and converted it to a
data center that began servicing customers in March 2017.
calculating market-based emissions.
Also supporting the data center are two microhydro projects
utilizing flow from local irrigation canals. To supplement this,
we executed a long-term power purchase agreement for all
environmental attributes from a 69-megawatt portfolio of
eight solar projects in Oregon.
The site minimizes cooling energy by utilizing highly energy-
and water-efficient direct evaporative cooling systems to cool
the data halls. This allows the servers to be cooled entirely by
outside air for the majority of the year.
We began to explore onsite solar options at the data center
and determined that we could provide valuable shaded
parking that paid for itself through energy bill reductions
while adding to our renewable energy portfolio. The resulting
PV facility includes five elevated parking canopies and three
ground-mounted arrays, for a total generating capacity of
4.67 megawatts. The onsite PV system began commercial
operation in February 2019.
Grid mix versus Apple-sourced renewable energy
DEFAULT GRID MIX
DEFAULT GRID MIX
APPLE ACTUAL RENEWABLE ENERGY ALLOCATION
APPLE ACTUAL RENEWABLE ENERGY ALLOCATION
Source: eGRID 2025 Publication (2023 data).
38%
GAS
28%
NUCLEAR
81%
APPLE’S
SOLAR
PROJECTS
2%
APPLE’S
MICROHYDRO
PROJECTS
17%
APPLE’S
WIND
PROJECTS
100%
APPLE’S
SOLAR
PROJECTS
43%
HYDRO
47%
GAS
19%
RENEWABLE
8%
RENEWABLE
11%
COAL
5%
HYDRO
Source: eGRID 2025 Publication (2023 data).
Note: Total doesnʼt add up to 100 percent due to rounding.
Grid mix versus Apple-sourced renewable energy
ELECTRICITY USE IN 2025
267M
KWH
Source: 2025 energy data.
EMISSIONS AVOIDED IN 2025
79K
MT CO
2
E
5
ELECTRICITY USE IN 2025
563M
KWH
Source: 2025 energy data.
EMISSIONS AVOIDED IN 2025
181K
MT CO
2
E
7
7
Emissions avoided are calculated using the GHG Protocol methodology for
ENGAGEMENT AND ADVOCACY
ENVIRONMENTAL INITIATIVES
INTRODUCTION
CONTENTS
GREEN BOND IMPACT REPORT
DATA
2026 ENVIRONMENTAL PROGRESS REPORT
96
APPENDIX
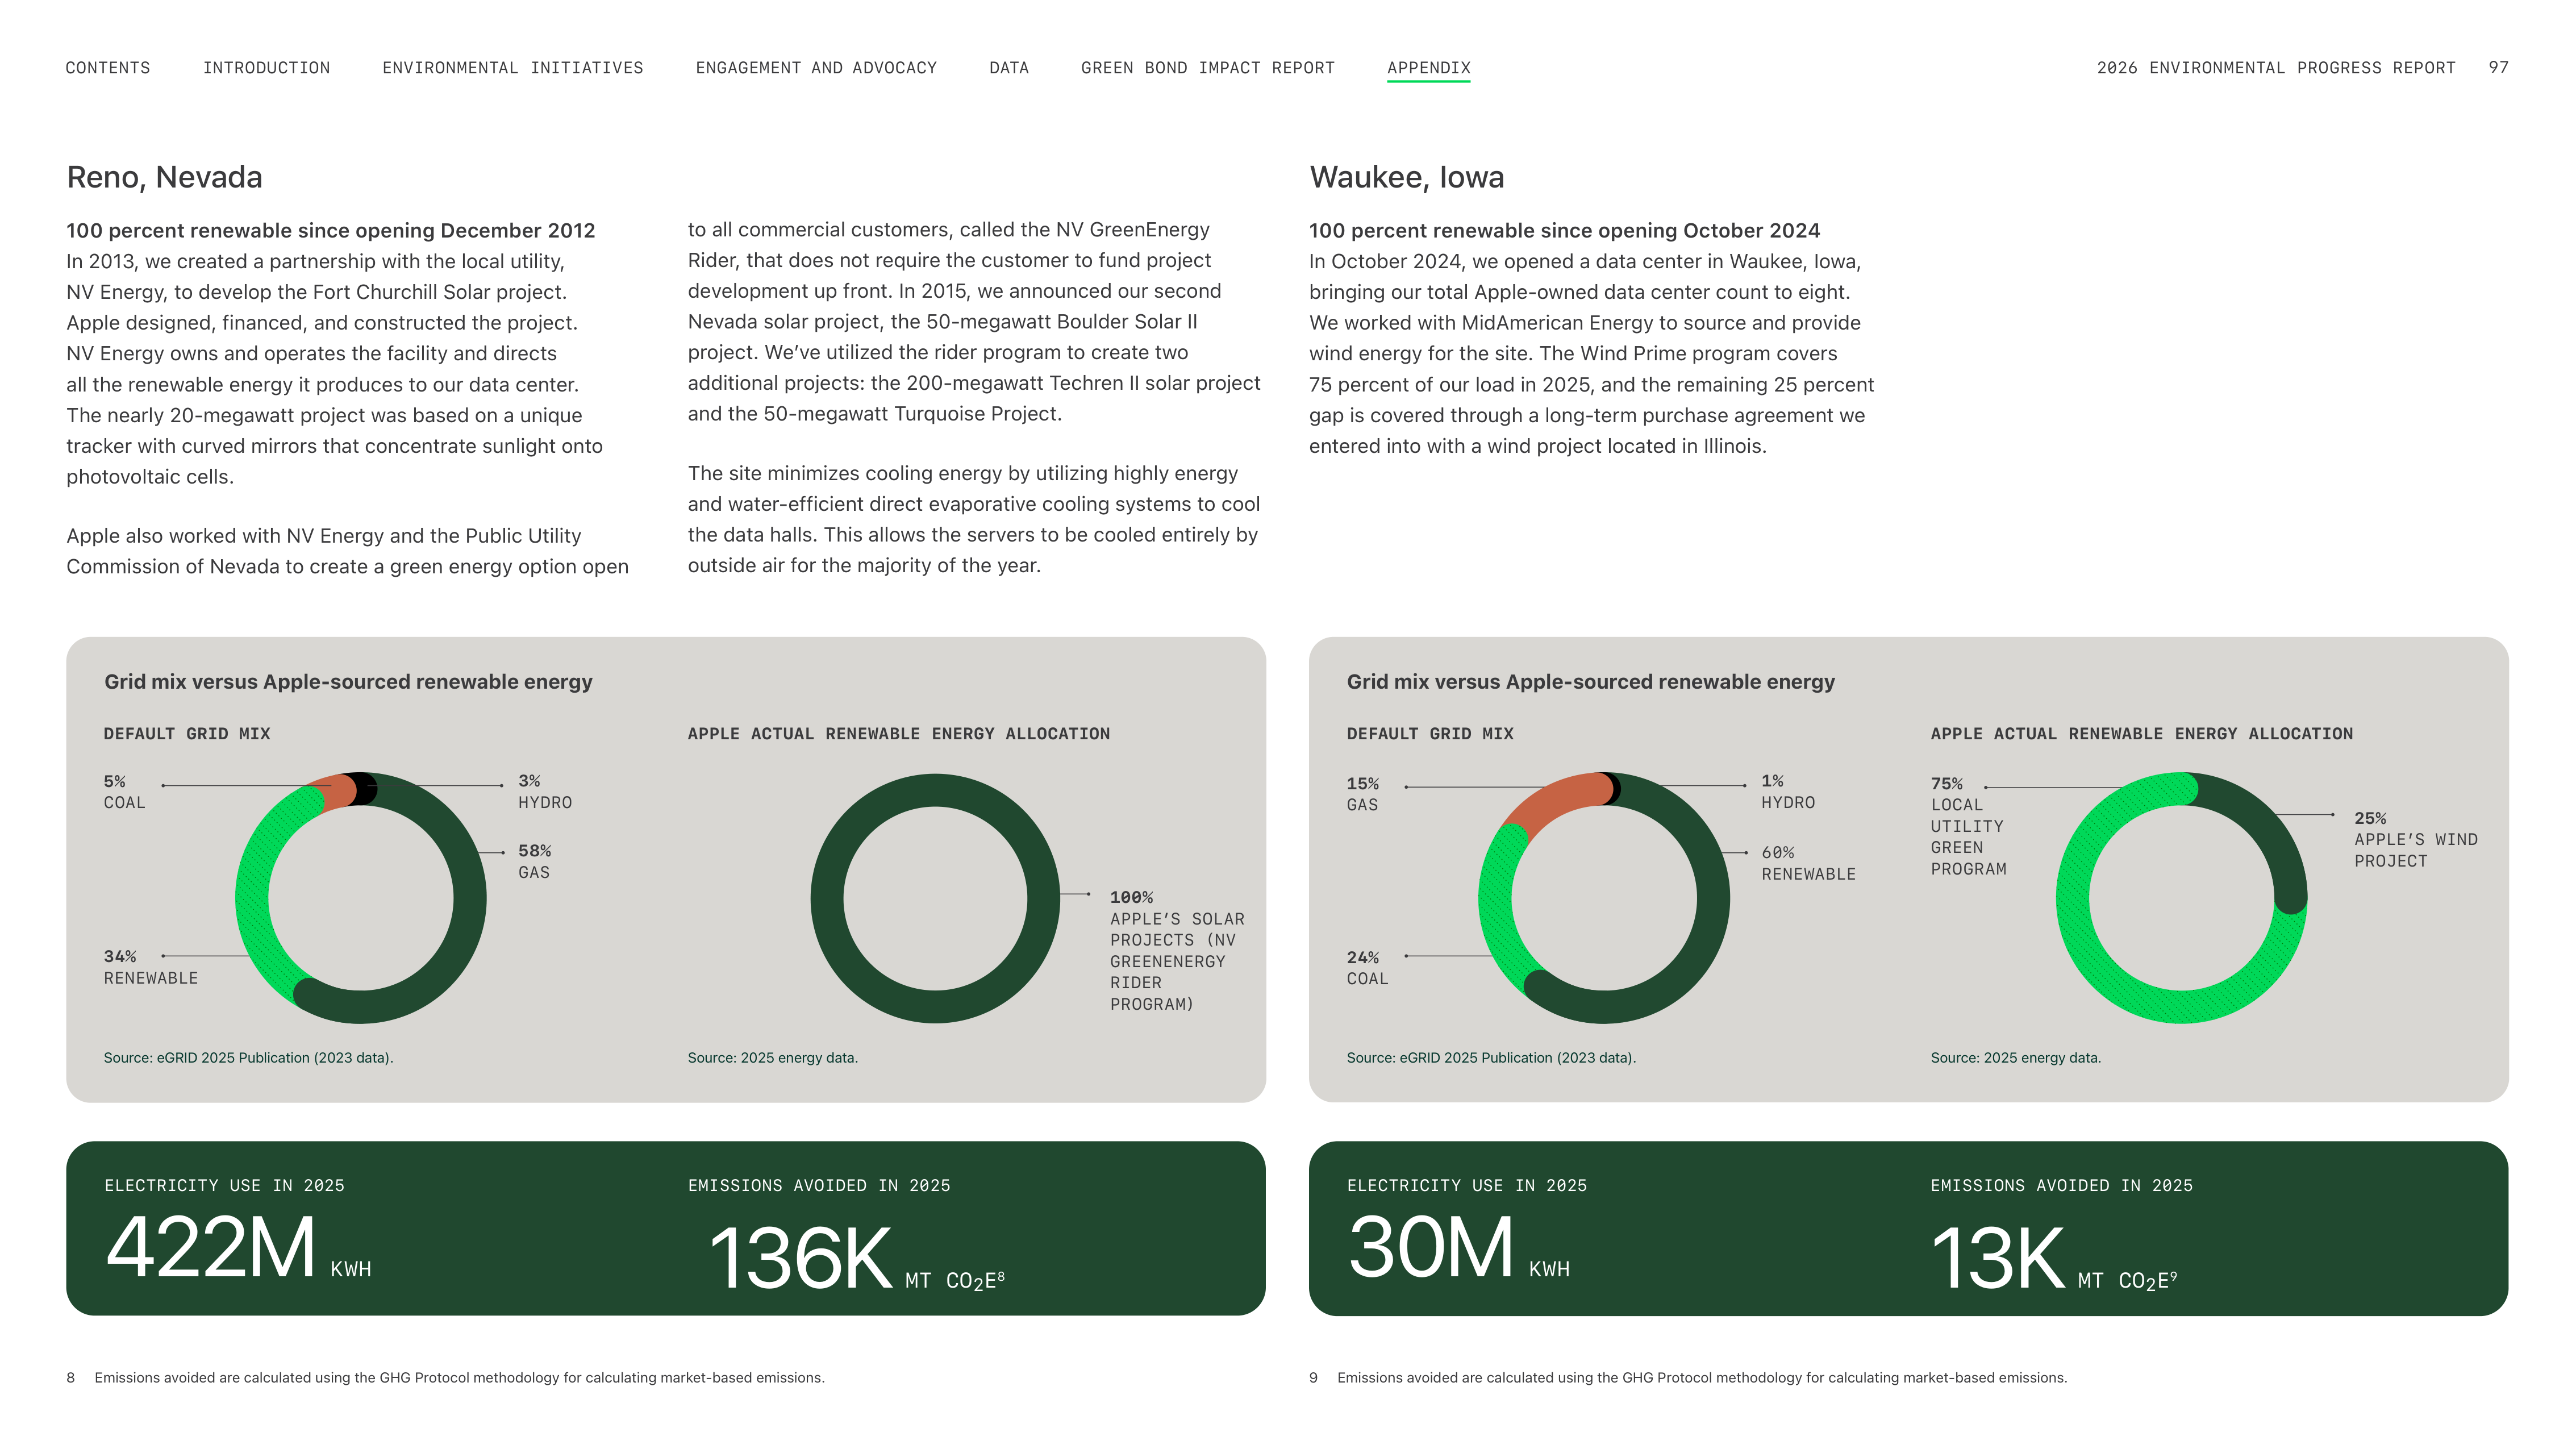
Reno, Nevada
100 percent renewable since opening December 2012
In 2013, we created a partnership with the local utility,
NV Energy, to develop the Fort Churchill Solar project.
Apple designed, financed, and constructed the project.
NV Energy owns and operates the facility and directs
all the renewable energy it produces to our data center.
The nearly 20-megawatt project was based on a unique
tracker with curved mirrors that concentrate sunlight onto
photovoltaic cells.
Apple also worked with NV Energy and the Public Utility
Commission of Nevada to create a green energy option open
Waukee, Iowa
100 percent renewable since opening October 2024
In October 2024, we opened a data center in Waukee, Iowa,
bringing our total Apple-owned data center count to eight.
We worked with MidAmerican Energy to source and provide
wind energy for the site. The Wind Prime program covers
75 percent of our load in 2025, and the remaining 25 percent
gap is covered through a long-term purchase agreement we
entered into with a wind project located in Illinois.
8
Emissions avoided are calculated using the GHG Protocol methodology for calculating market-based emissions.
9
Emissions avoided are calculated using the GHG Protocol methodology for calculating market-based emissions.
to all commercial customers, called the NV GreenEnergy
Rider, that does not require the customer to fund project
development up front. In 2015, we announced our second
Nevada solar project, the 50-megawatt Boulder Solar II
project. Weʼve utilized the rider program to create two
additional projects: the 200-megawatt Techren II solar project
and the 50-megawatt Turquoise Project.
The site minimizes cooling energy by utilizing highly energy
and water-efficient direct evaporative cooling systems to cool
the data halls. This allows the servers to be cooled entirely by
outside air for the majority of the year.
34%
RENEWABLE
60%
RENEWABLE
75%
LOCAL
UTILITY
GREEN
PROGRAM
58%
GAS
15%
GAS
5%
COAL
24%
COAL
3%
HYDRO
1%
HYDRO
Source: eGRID 2025 Publication (2023 data).
Source: eGRID 2025 Publication (2023 data).
DEFAULT GRID MIX
DEFAULT GRID MIX
APPLE ACTUAL RENEWABLE ENERGY ALLOCATION
APPLE ACTUAL RENEWABLE ENERGY ALLOCATION
Grid mix versus Apple-sourced renewable energy
Grid mix versus Apple-sourced renewable energy
ELECTRICITY USE IN 2025
422M
KWH
Source: 2025 energy data.
EMISSIONS AVOIDED IN 2025
136K
MT CO
2
E
8
100%
APPLEʼS SOLAR
PROJECTS (NV
GREENENERGY
RIDER
PROGRAM)
25%
APPLE’S WIND
PROJECT
ELECTRICITY USE IN 2025
30M
KWH
Source: 2025 energy data.
EMISSIONS AVOIDED IN 2025
13K
MT CO
2
E
9
ENGAGEMENT AND ADVOCACY
ENVIRONMENTAL INITIATIVES
INTRODUCTION
CONTENTS
GREEN BOND IMPACT REPORT
DATA
2026 ENVIRONMENTAL PROGRESS REPORT
97
APPENDIX
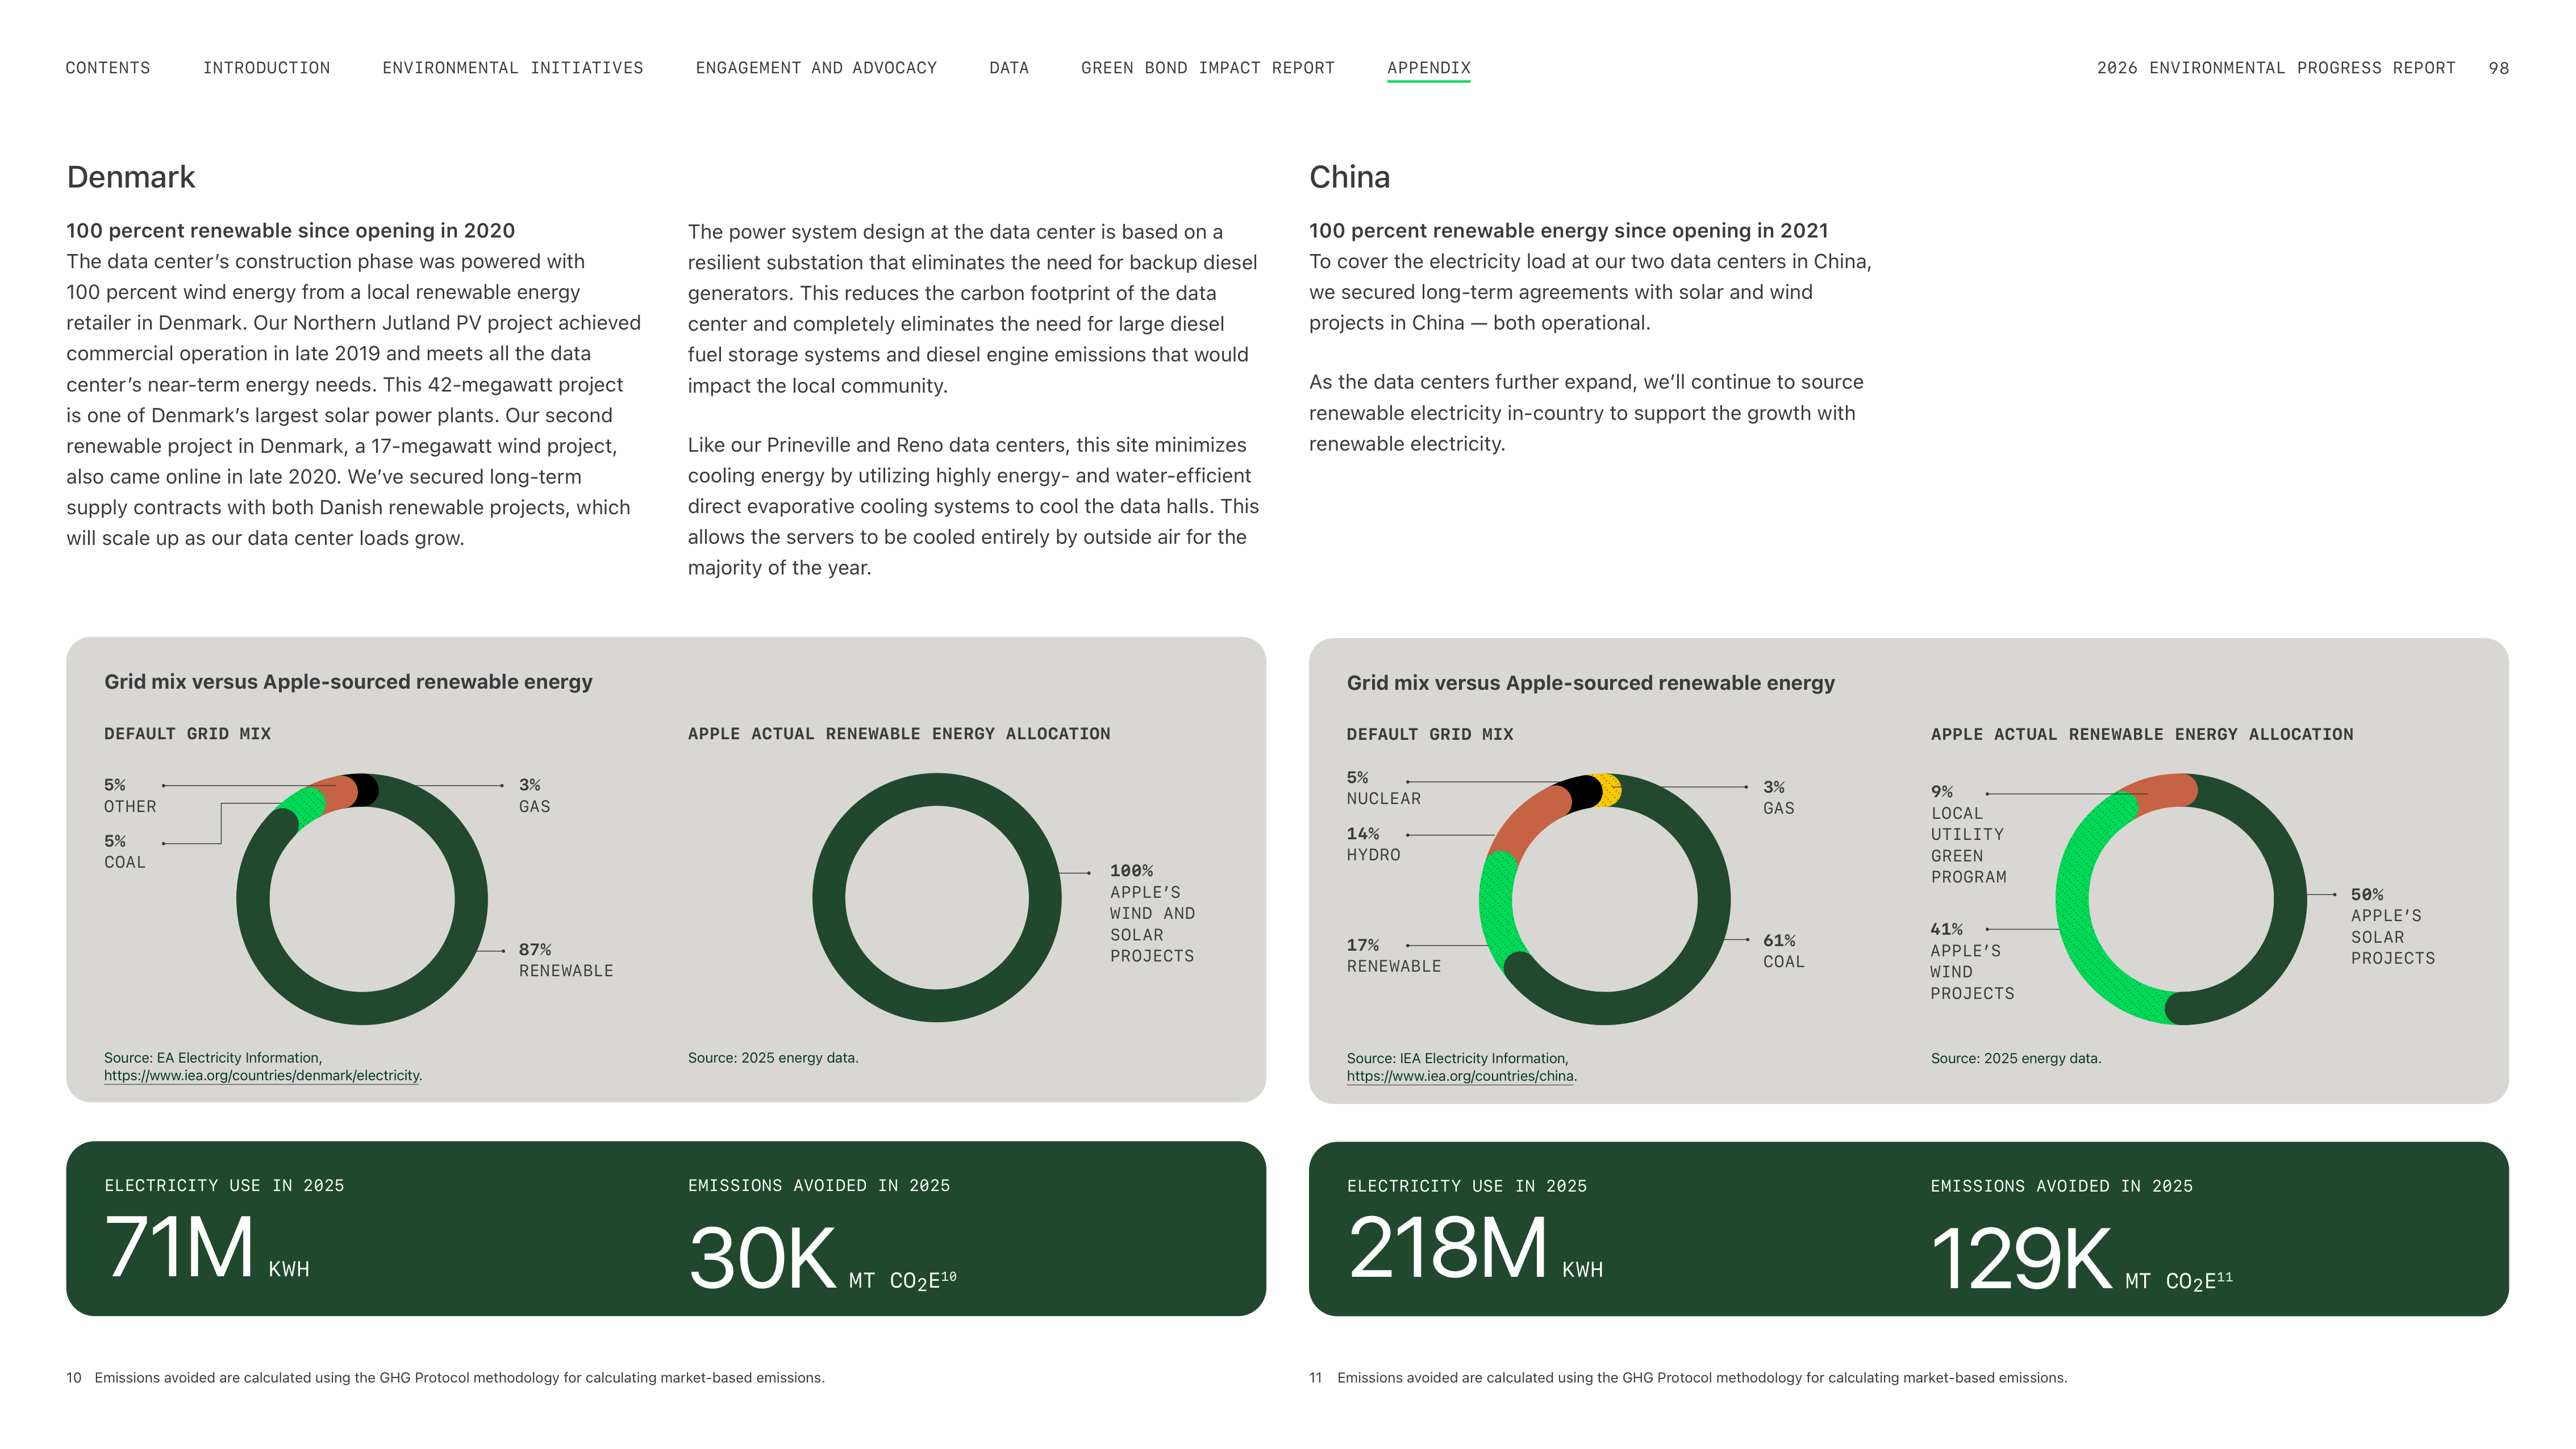
Denmark
100 percent renewable since opening in 2020
The data centerʼs construction phase was powered with
100 percent wind energy from a local renewable energy
retailer in Denmark. Our Northern Jutland PV project achieved
commercial operation in late 2019 and meets all the data
centerʼs near-term energy needs. This 42-megawatt project
is one of Denmarkʼs largest solar power plants. Our second
renewable project in Denmark, a 17-megawatt wind project,
also came online in late 2020. Weʼve secured long-term
supply contracts with both Danish renewable projects, which
will scale up as our data center loads grow.
10
Emissions avoided are calculated using the GHG Protocol methodology for calculating market-based emissions.
The power system design at the data center is based on a
resilient substation that eliminates the need for backup diesel
generators. This reduces the carbon footprint of the data
center and completely eliminates the need for large diesel
fuel storage systems and diesel engine emissions that would
impact the local community.
Like our Prineville and Reno data centers, this site minimizes
cooling energy by utilizing highly energy- and water-efficient
direct evaporative cooling systems to cool the data halls. This
allows the servers to be cooled entirely by outside air for the
majority of the year.
Grid mix versus Apple-sourced renewable energy
Source: IEA Electricity Information,
https://www.iea.org/countries/china.
DEFAULT GRID MIX
APPLE ACTUAL RENEWABLE ENERGY ALLOCATION
5%
NUCLEAR
41%
APPLE’S
WIND
PROJECTS
9%
LOCAL
UTILITY
GREEN
PROGRAM
50%
APPLE’S
SOLAR
PROJECTS
3%
GAS
17%
RENEWABLE
61%
COAL
14%
HYDRO
5%
OTHER
100%
APPLE’S
WIND AND
SOLAR
PROJECTS
3%
GAS
87%
RENEWABLE
5%
COAL
Source: EA Electricity Information,
https://www.iea.org/countries/denmark/electricity.
DEFAULT GRID MIX
APPLE ACTUAL RENEWABLE ENERGY ALLOCATION
Grid mix versus Apple-sourced renewable energy
China
100 percent renewable energy since opening in 2021
To cover the electricity load at our two data centers in China,
we secured long-term agreements with solar and wind
projects in China — both operational.
As the data centers further expand, weʼll continue to source
renewable electricity in-country to support the growth with
renewable electricity.
11
Emissions avoided are calculated using the GHG Protocol methodology for calculating market-based emissions.
ELECTRICITY USE IN 2025
218M
KWH
Source: 2025 energy data.
EMISSIONS AVOIDED IN 2025
129K
MT CO
2
E
11
ELECTRICITY USE IN 2025
71M
KWH
Source: 2025 energy data.
EMISSIONS AVOIDED IN 2025
30K
MT CO
2
E
10
ENGAGEMENT AND ADVOCACY
ENVIRONMENTAL INITIATIVES
INTRODUCTION
CONTENTS
GREEN BOND IMPACT REPORT
DATA
2026 ENVIRONMENTAL PROGRESS REPORT
98
APPENDIX
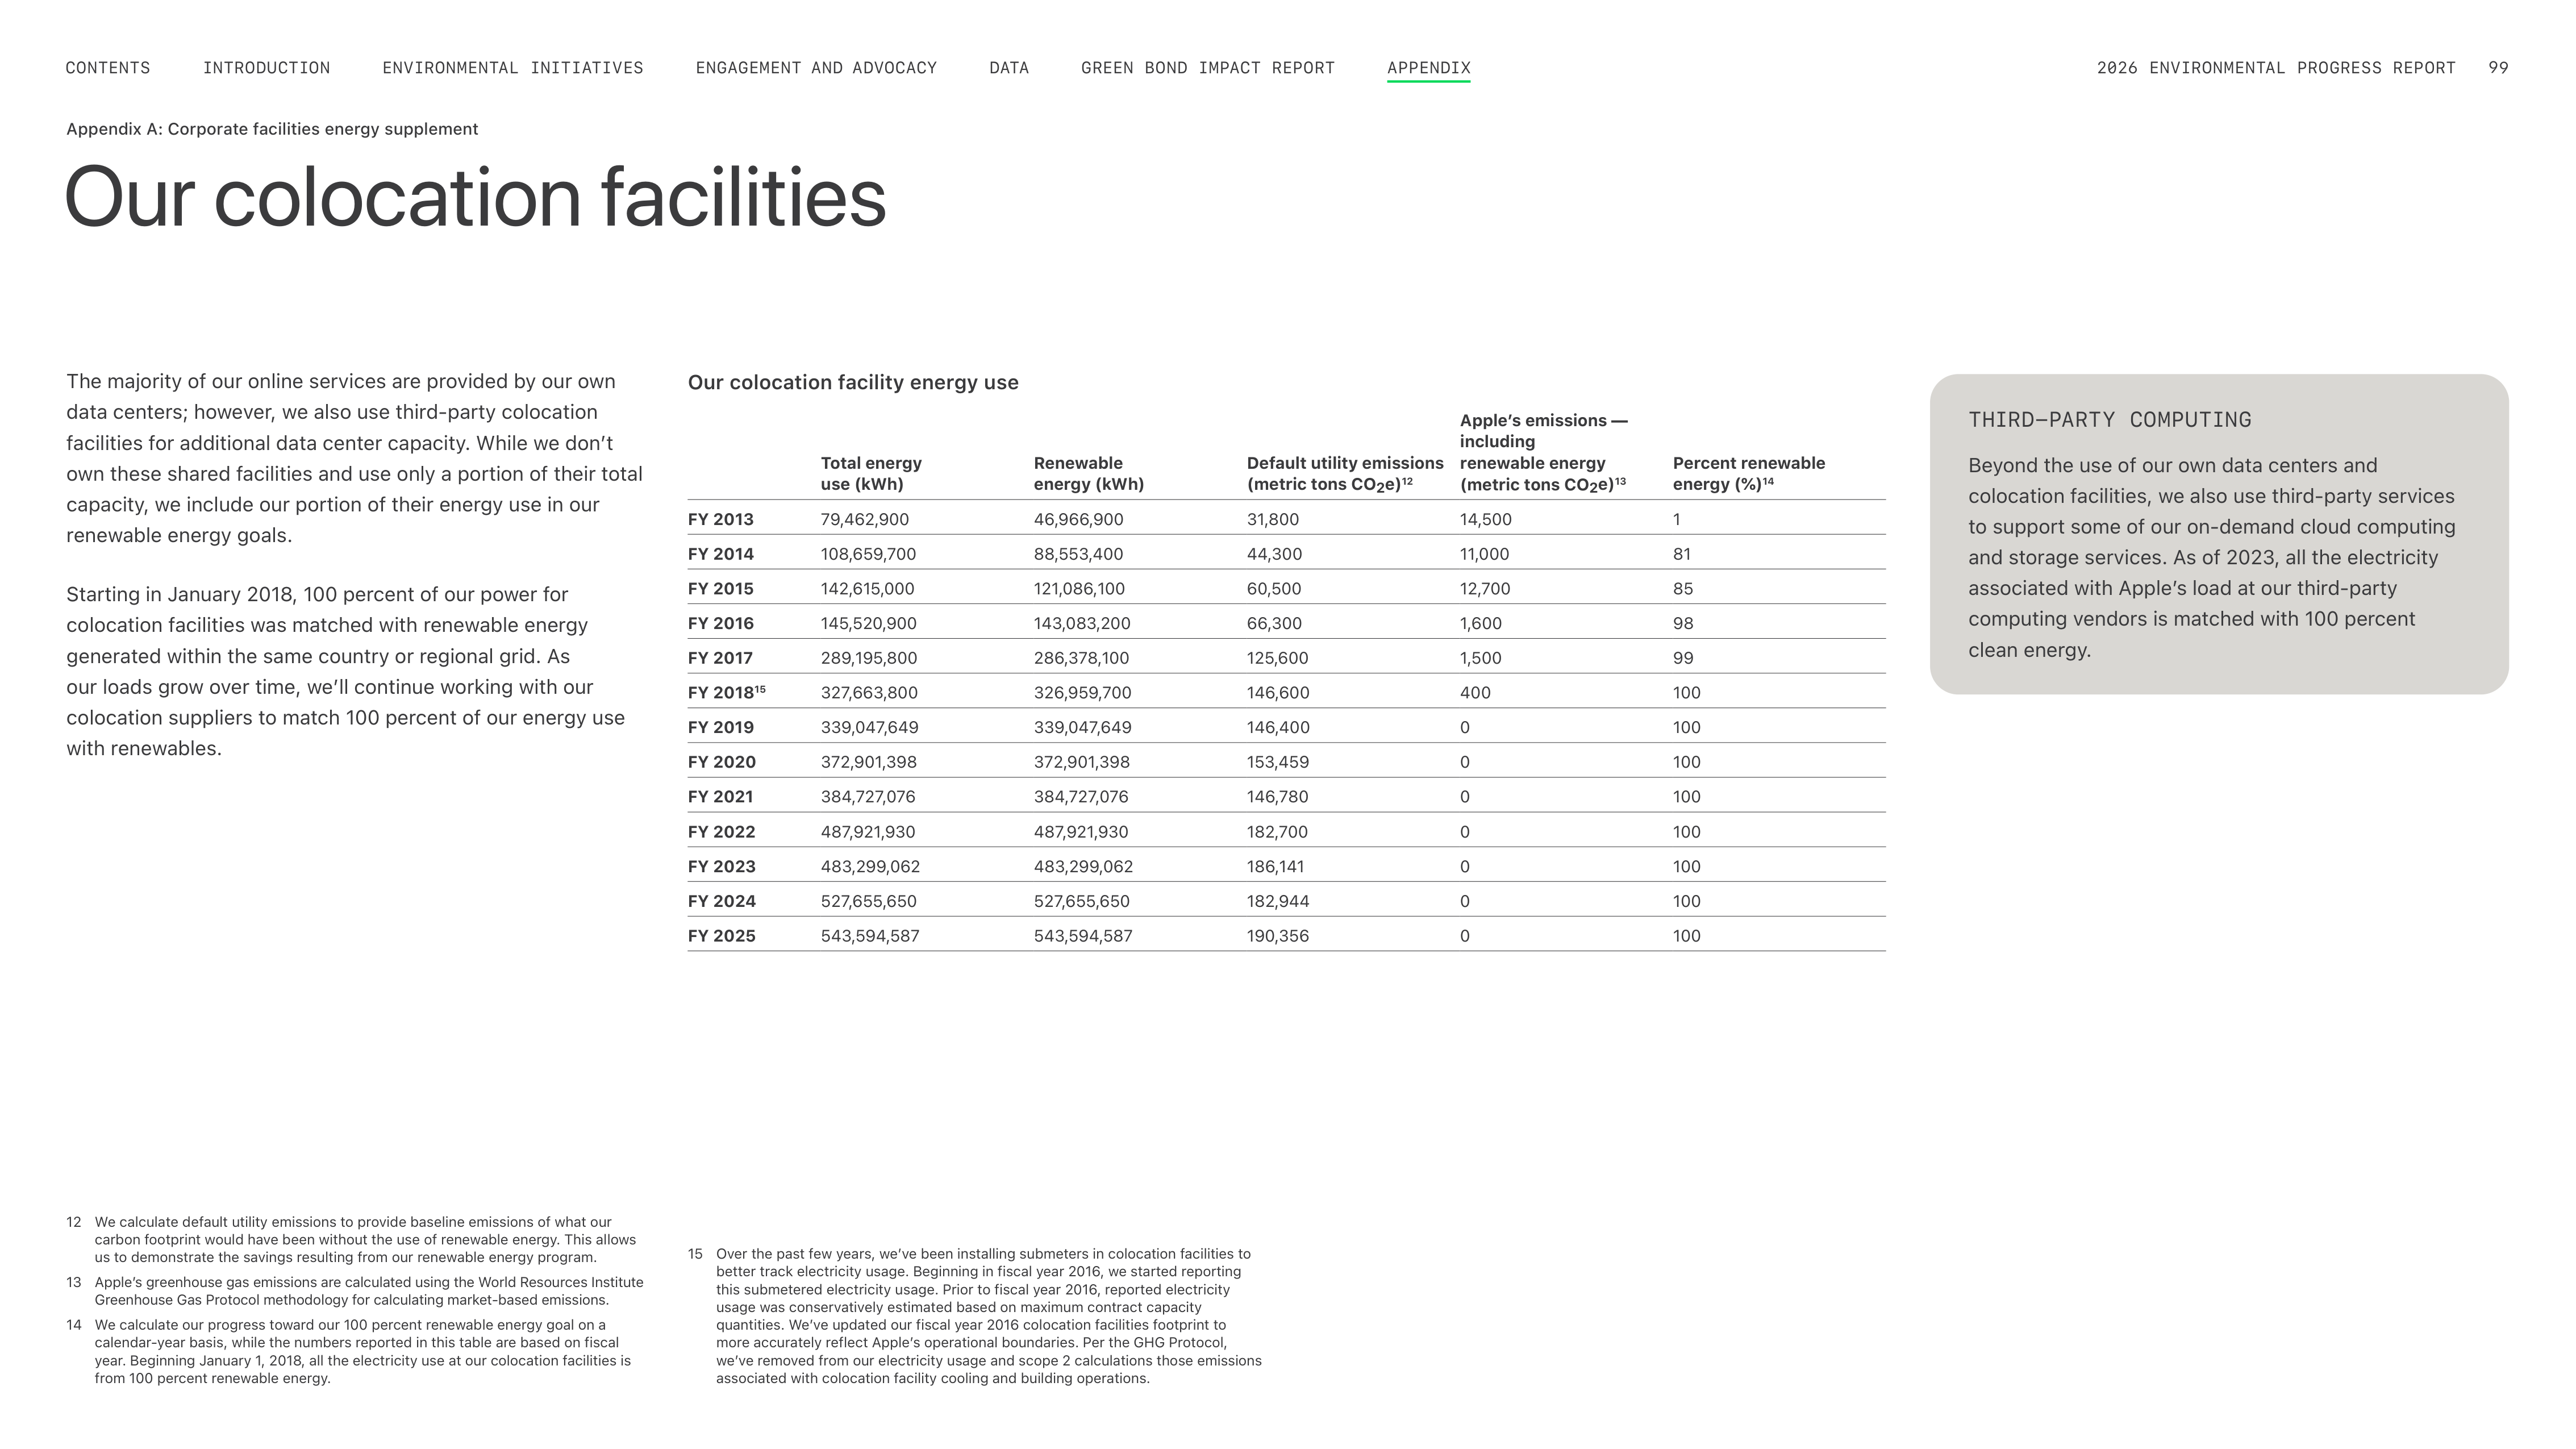
Our colocation facilities
The majority of our online services are provided by our own
data centers; however, we also use third-party colocation
facilities for additional data center capacity. While we donʼt
own these shared facilities and use only a portion of their total
capacity, we include our portion of their energy use in our
renewable energy goals.
Starting in January 2018, 100 percent of our power for
colocation facilities was matched with renewable energy
generated within the same country or regional grid. As
our loads grow over time, weʼll continue working with our
colocation suppliers to match 100 percent of our energy use
with renewables.
12
We calculate default utility emissions to provide baseline emissions of what our
carbon footprint would have been without the use of renewable energy. This allows
us to demonstrate the savings resulting from our renewable energy program.
13
Appleʼs greenhouse gas emissions are calculated using the World Resources Institute
Greenhouse Gas Protocol methodology for calculating market-based emissions.
14
We calculate our progress toward our 100 percent renewable energy goal on a
calendar-year basis, while the numbers reported in this table are based on fiscal
year. Beginning January 1, 2018, all the electricity use at our colocation facilities is
from 100 percent renewable energy.
15
Over the past few years, weʼve been installing submeters in colocation facilities to
better track electricity usage. Beginning in fiscal year 2016, we started reporting
this submetered electricity usage. Prior to fiscal year 2016, reported electricity
usage was conservatively estimated based on maximum contract capacity
quantities. Weʼve updated our fiscal year 2016 colocation facilities footprint to
more accurately reflect Appleʼs operational boundaries. Per the GHG Protocol,
weʼve removed from our electricity usage and scope 2 calculations those emissions
associated with colocation facility cooling and building operations.
Our colocation facility energy use
Total energy
use (kWh)
Renewable
energy (kWh)
Default utility emissions
(metric tons CO
2
e)
12
Apple’s emissions —
including
renewable energy
(metric tons CO
2
e)
13
Percent renewable
energy (%)
14
FY 2013
79,462,900
46,966,900
31,800
14,500
1
FY 2014
108,659,700
88,553,400
44,300
11,000
81
FY 2015
142,615,000
121,086,100
60,500
12,700
85
FY 2016
145,520,900
143,083,200
66,300
1,600
98
FY 2017
289,195,800
286,378,100
125,600
1,500
99
FY 2018
15
327,663,800
326,959,700
146,600
400
100
FY 2019
339,047,649
339,047,649
146,400
0
100
FY 2020
372,901,398
372,901,398
153,459
0
100
FY 2021
384,727,076
384,727,076
146,780
0
100
FY 2022
487,921,930
487,921,930
182,700
0
100
FY 2023
483,299,062
483,299,062
186,141
0
100
FY 2024
527,655,650
527,655,650
182,944
0
100
FY 2025
543,594,587
543,594,587
190,356
0
100
Appendix A: Corporate facilities energy supplement
THIRD-PARTY COMPUTING
Beyond the use of our own data centers and
colocation facilities, we also use third-party services
to support some of our on-demand cloud computing
and storage services. As of 2023, all the electricity
associated with Appleʼs load at our third-party
computing vendors is matched with 100 percent
clean energy.
ENGAGEMENT AND ADVOCACY
ENVIRONMENTAL INITIATIVES
INTRODUCTION
CONTENTS
GREEN BOND IMPACT REPORT
DATA
2026 ENVIRONMENTAL PROGRESS REPORT
99
APPENDIX
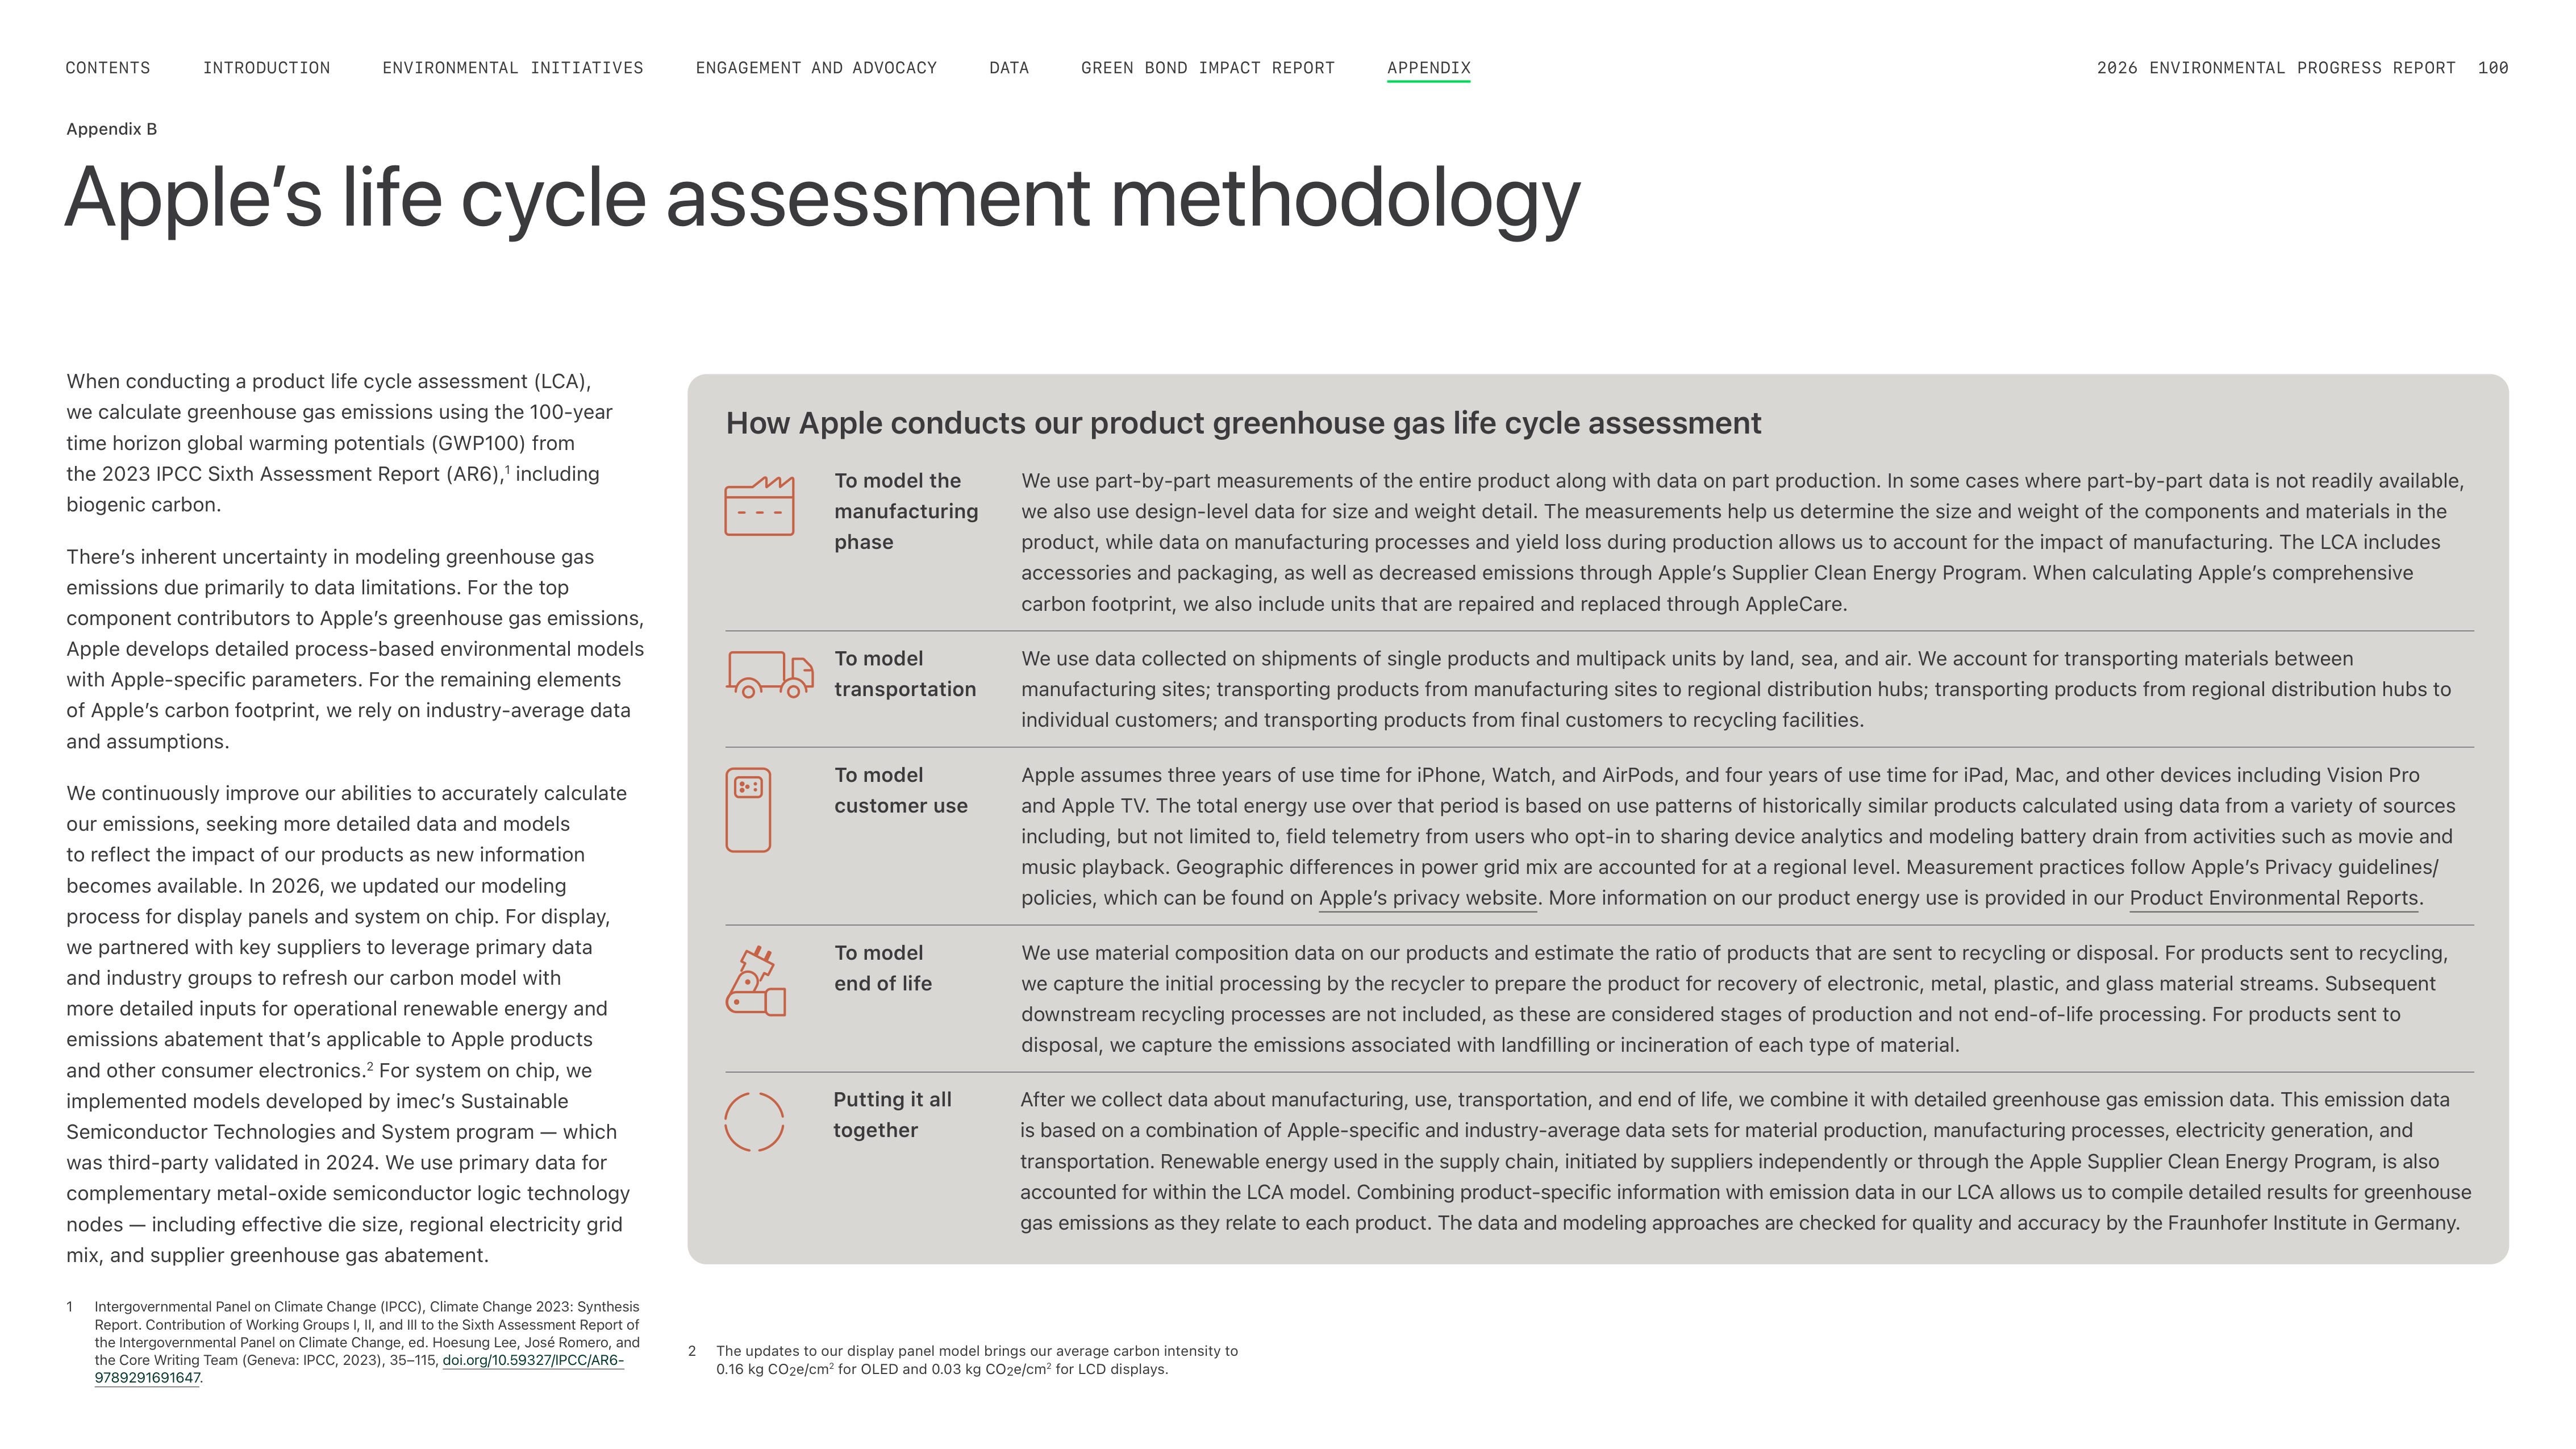
Apple’s life cycle assessment methodology
When conducting a product life cycle assessment (LCA),
we calculate greenhouse gas emissions using the 100-year
time horizon global warming potentials (GWP100) from
the 2023 IPCC Sixth Assessment Report (AR6),
1
including
biogenic carbon.
Thereʼs inherent uncertainty in modeling greenhouse gas
emissions due primarily to data limitations. For the top
component contributors to Appleʼs greenhouse gas emissions,
Apple develops detailed process-based environmental models
with Apple-specific parameters. For the remaining elements
of Appleʼs carbon footprint, we rely on industry-average data
and assumptions.
We continuously improve our abilities to accurately calculate
our emissions, seeking more detailed data and models
to reflect the impact of our products as new information
becomes available. In 2026, we updated our modeling
process for display panels and system on chip. For display,
we partnered with key suppliers to leverage primary data
and industry groups to refresh our carbon model with
more detailed inputs for operational renewable energy and
emissions abatement thatʼs applicable to Apple products
and other consumer electronics.
2
For system on chip, we
implemented models developed by imecʼs Sustainable
Semiconductor Technologies and System program — which
was third-party validated in 2024. We use primary data for
complementary metal-oxide semiconductor logic technology
nodes — including effective die size, regional electricity grid
mix, and supplier greenhouse gas abatement.
Appendix B
How Apple conducts our product greenhouse gas life cycle assessment
To model
transportation
We use data collected on shipments of single products and multipack units by land, sea, and air. We account for transporting materials between
manufacturing sites; transporting products from manufacturing sites to regional distribution hubs; transporting products from regional distribution hubs to
individual customers; and transporting products from final customers to recycling facilities.
To model
customer use
Apple assumes three years of use time for iPhone, Watch, and AirPods, and four years of use time for iPad, Mac, and other devices including Vision Pro
and Apple TV. The total energy use over that period is based on use patterns of historically similar products calculated using data from a variety of sources
including, but not limited to, field telemetry from users who opt-in to sharing device analytics and modeling battery drain from activities such as movie and
music playback. Geographic differences in power grid mix are accounted for at a regional level. Measurement practices follow Appleʼs Privacy guidelines/
policies, which can be found on Appleʼs privacy website. More information on our product energy use is provided in our Product Environmental Reports.
To model
end of life
We use material composition data on our products and estimate the ratio of products that are sent to recycling or disposal. For products sent to recycling,
we capture the initial processing by the recycler to prepare the product for recovery of electronic, metal, plastic, and glass material streams. Subsequent
downstream recycling processes are not included, as these are considered stages of production and not end-of-life processing. For products sent to
disposal, we capture the emissions associated with landfilling or incineration of each type of material.
Putting it all
together
After we collect data about manufacturing, use, transportation, and end of life, we combine it with detailed greenhouse gas emission data. This emission data
is based on a combination of Apple-specific and industry-average data sets for material production, manufacturing processes, electricity generation, and
transportation. Renewable energy used in the supply chain, initiated by suppliers independently or through the Apple Supplier Clean Energy Program, is also
accounted for within the LCA model. Combining product-specific information with emission data in our LCA allows us to compile detailed results for greenhouse
gas emissions as they relate to each product. The data and modeling approaches are checked for quality and accuracy by the Fraunhofer Institute in Germany.
To model the
manufacturing
phase
We use part-by-part measurements of the entire product along with data on part production. In some cases where part-by-part data is not readily available,
we also use design-level data for size and weight detail. The measurements help us determine the size and weight of the components and materials in the
product, while data on manufacturing processes and yield loss during production allows us to account for the impact of manufacturing. The LCA includes
accessories and packaging, as well as decreased emissions through Appleʼs Supplier Clean Energy Program. When calculating Appleʼs comprehensive
carbon footprint, we also include units that are repaired and replaced through AppleCare.
1
Intergovernmental Panel on Climate Change (IPCC), Climate Change 2023: Synthesis
Report. Contribution of Working Groups I, II, and III to the Sixth Assessment Report of
the Intergovernmental Panel on Climate Change, ed. Hoesung Lee, José Romero, and
the Core Writing Team (Geneva: IPCC, 2023), 35–115,
doi.org/10.59327/IPCC/AR6-
9789291691647
.
2
The updates to our display panel model brings our average carbon intensity to
0.16 kg CO
2
e/cm
2
for OLED and 0.03 kg CO
2
e/cm
2
for LCD displays.
ENGAGEMENT AND ADVOCACY
ENVIRONMENTAL INITIATIVES
INTRODUCTION
CONTENTS
GREEN BOND IMPACT REPORT
DATA
2026 ENVIRONMENTAL PROGRESS REPORT
100
APPENDIX
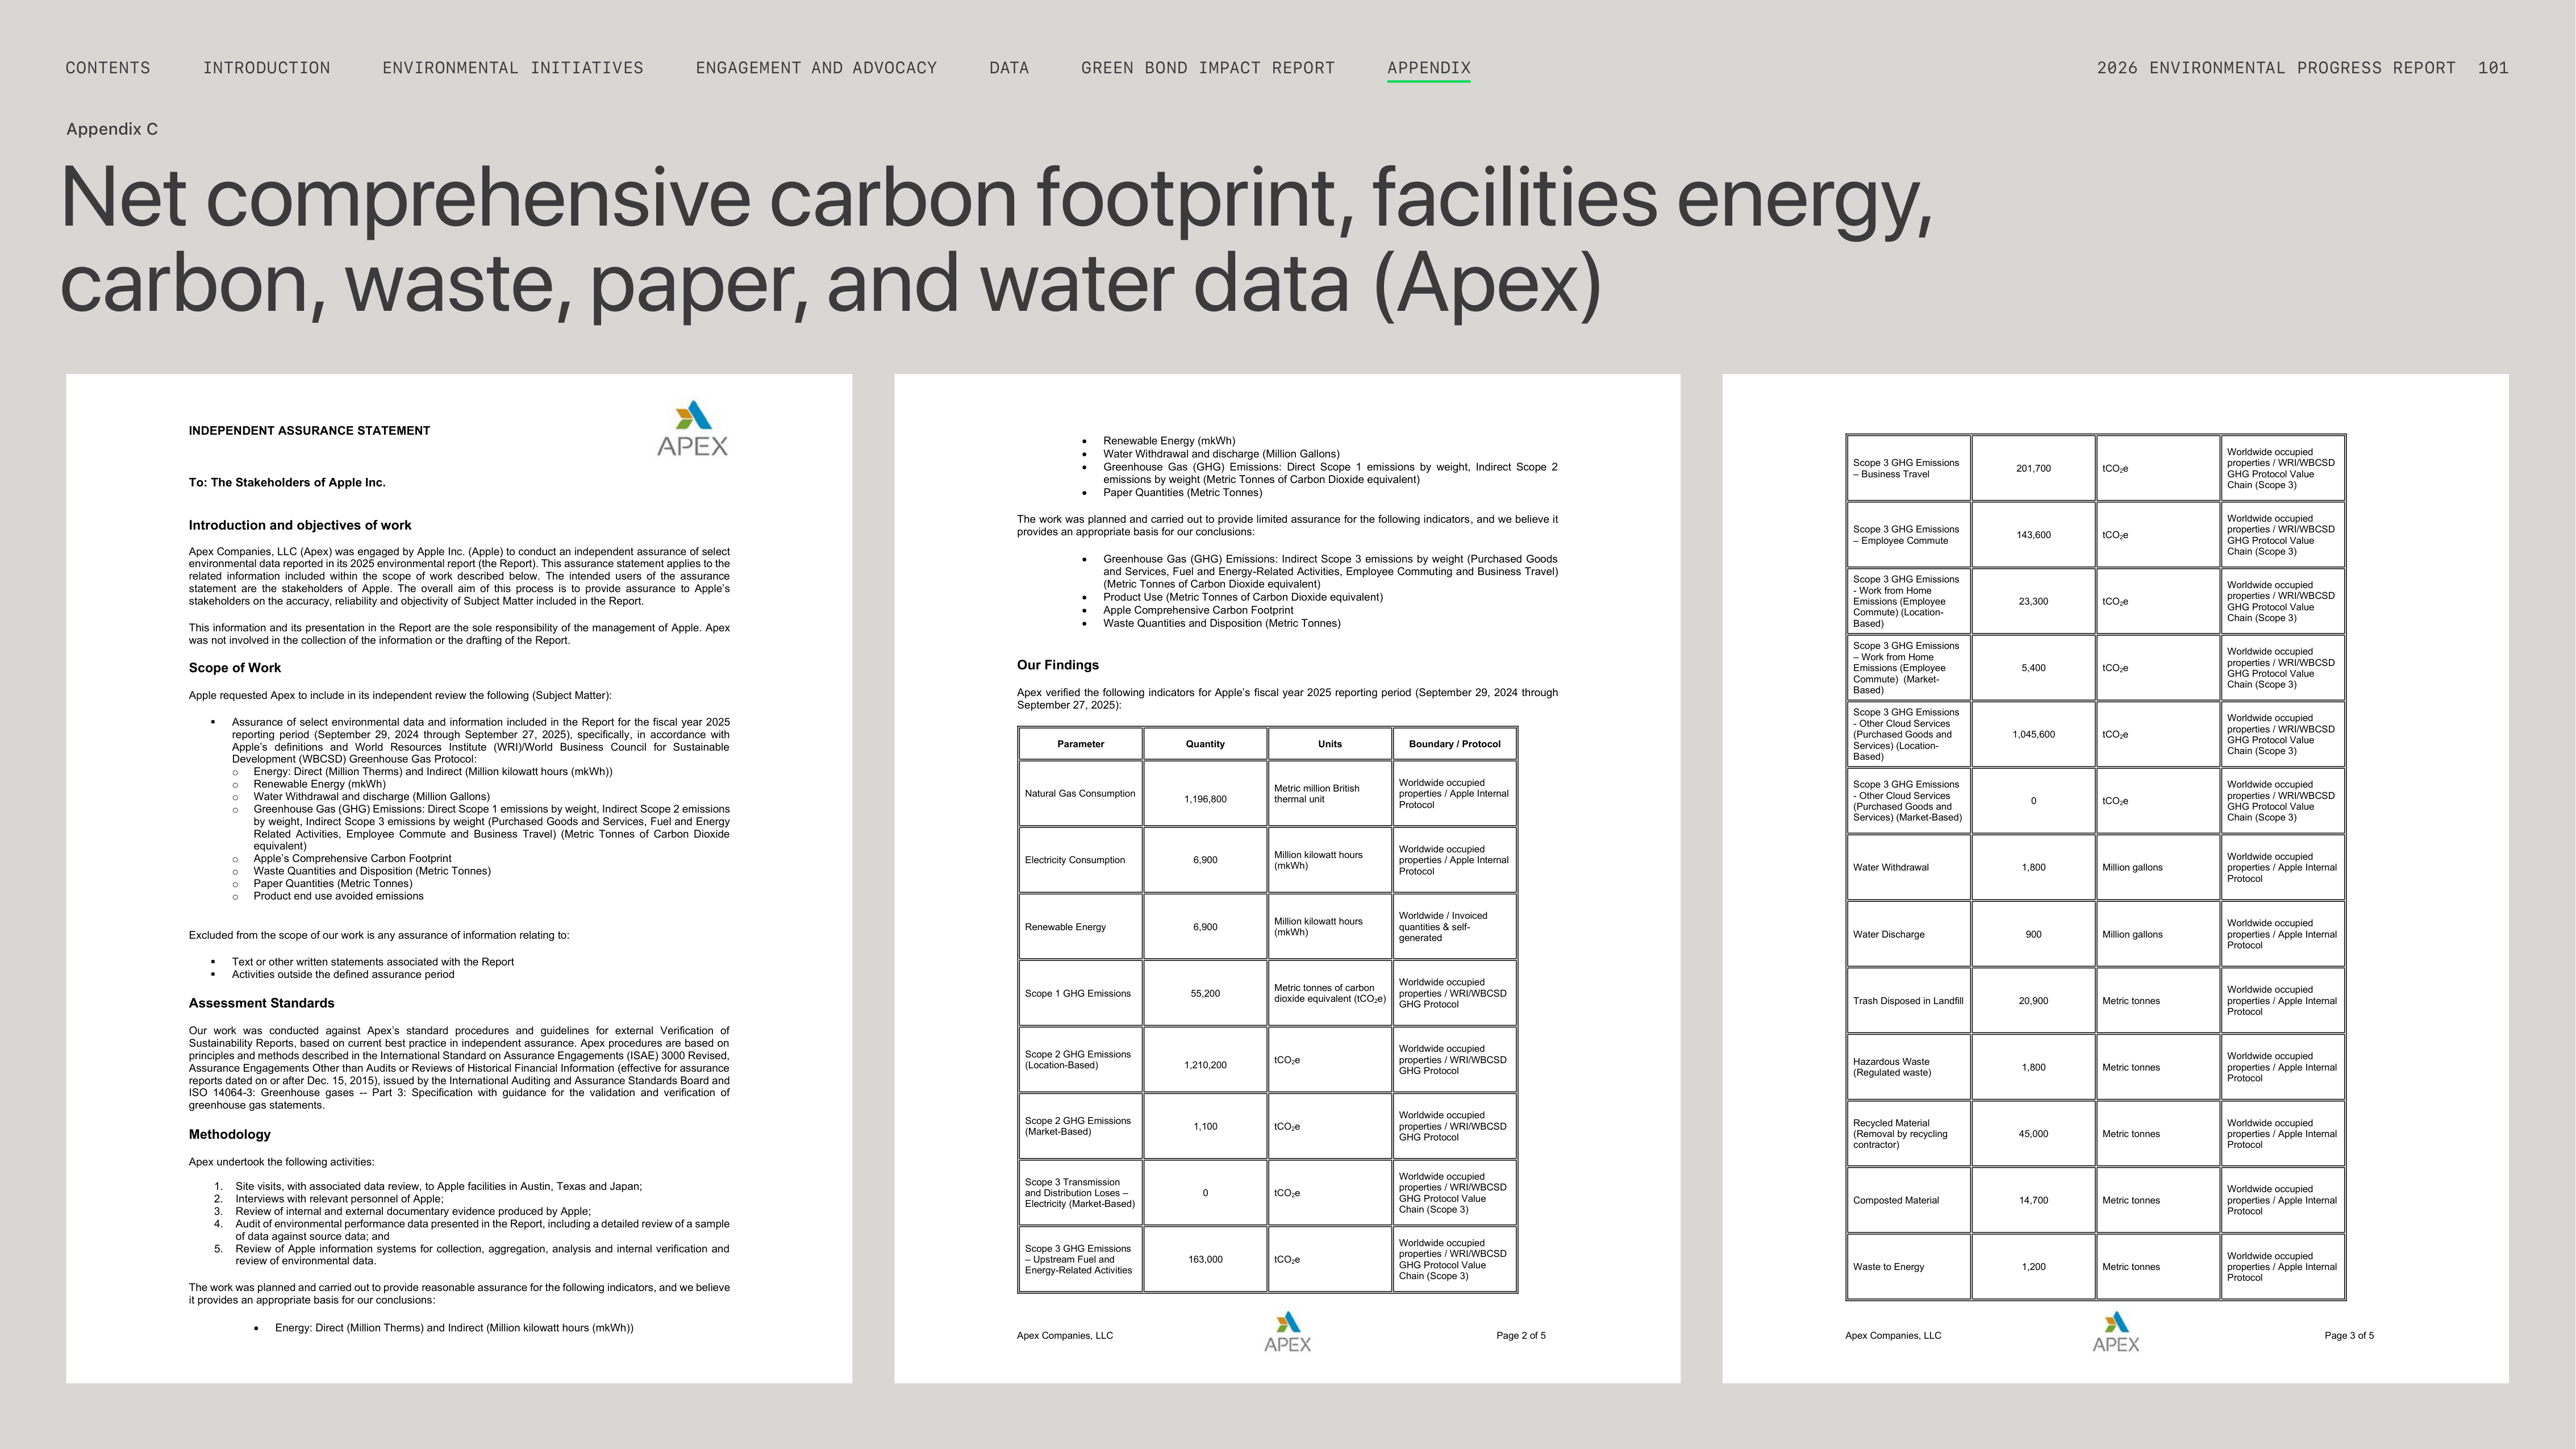


Net comprehensive carbon footprint, facilities energy,
carbon, waste, paper, and water data (Apex)
Appendix C
INDEPENDENT ASSURANCE STATEMENT
To: The Stakeholders of Apple Inc.
Introduction and objectives of work
Apex Companies, LLC (Apex) was engaged by Apple Inc. (Apple) to conduct an independent assurance of select
environmental data reported in its 2025 environmental report (the Report). This assurance statement applies to the
related information included within the scope of work described below. The intended users of the assurance
statement are the stakeholders of Apple. The overall aim of this process is to provide assurance to Apple’s
stakeholders on the accuracy, reliability and objectivity of Subject Matter included in the Report.
This information and its presentation in the Report are the sole responsibility of the management of Apple. Apex
was not involved in the collection of the information or the drafting of the Report.
Scope of Work
Apple requested Apex to include in its independent review the following (Subject Matter):
▪
Assurance of select environmental data and information included in the Report for
the fiscal year 2025
reporting period (September 29, 2024 through September 27, 2025), specifically, in accordance with
Apple’s definitions and World Resources Institute (WRI)/World Business Council for Sustainable
Development (WBCSD) Greenhouse Gas Protocol:
o
Energy: Direct (Million Therms) and Indirect (Million kilowatt hours (mkWh))
o
Renewable Energy (mkWh)
o
Water Withdrawal and discharge (Million Gallons)
o
Greenhouse Gas (GHG) Emissions: Direct Scope 1 emissions by weight, Indirect Scope 2 emissions
by weight, Indirect Scope 3 emissions by weight (Purchased Goods and Services, Fuel and Energy
Related Activities, Employee Commute and Business Travel) (Metric Tonnes of Carbon Dioxide
equivalent)
o
Apple’s Comprehensive Carbon Footprint
o
Waste Quantities and Disposition (Metric Tonnes)
o
Paper Quantities (Metric Tonnes)
o
Product end use avoided emissions
Excluded from the scope of our work is any assurance of information relating to:
▪
Text or other written statements associated with the Report
▪
Activities outside the defined assurance period
Assessment Standards
Our work was conducted against Apex’s standard procedures and guidelines for external Verification of
Sustainability Reports, based on current best practice in independent assurance. Apex procedures are based on
principles and methods described in the International Standard on Assurance Engagements (ISAE) 3000 Revised,
Assurance Engagements Other than Audits or Reviews of Historical Financial Information (effective for assurance
reports dated on or after Dec. 15, 2015), issued by the International Auditing and Assurance Standards Board and
ISO 14064-3: Greenhouse gases -- Part 3: Specification with guidance for the validation and verification of
greenhouse gas statements.
Methodology
Apex undertook the following activities:
1.
Site visits, with associated data review, to Apple facilities in Austin, Texas and Japan;
2.
Interviews with relevant personnel of Apple;
3.
Review of internal and external documentary evidence produced by Apple;
4.
Audit of environmental performance data presented in the Report, including a detailed review of a sample
of data against source data; and
5.
Review of Apple information systems for collection, aggregation, analysis and internal verification and
review of environmental data.
The work was planned and carried out to provide reasonable assurance for the following indicators, and we believe
it provides an appropriate basis for our conclusions:
•
Energy: Direct (Million Therms) and Indirect (Million kilowatt hours (mkWh))
Apex Companies, LLC
Page 2 of 5
•
Renewable Energy (mkWh)
•
Water Withdrawal and discharge (Million Gallons)
•
Greenhouse Gas (GHG) Emissions: Direct Scope 1 emissions by weight, Indirect Scope 2
emissions by weight (Metric Tonnes of Carbon Dioxide equivalent)
•
Paper Quantities (Metric Tonnes)
The work was planned and carried out to provide limited assurance for the following indicators, and we believe it
provides an appropriate basis for our conclusions:
•
Greenhouse Gas (GHG) Emissions: Indirect Scope 3 emissions by weight (Purchased Goods
and Services, Fuel and Energy-Related Activities, Employee Commuting and Business Travel)
(Metric Tonnes of Carbon Dioxide equivalent)
•
Product Use (Metric Tonnes of Carbon Dioxide equivalent)
•
Apple Comprehensive Carbon Footprint
•
Waste Quantities and Disposition (Metric Tonnes)
Our Findings
Apex verified the following indicators for Apple’s fiscal year 2025 reporting period (September 29, 2024 through
September 27, 2025):
Parameter
Quantity
Units
Boundary / Protocol
Natural Gas Consumption
1,196,800
Metric million British
thermal unit
Worldwide occupied
properties / Apple Internal
Protocol
Electricity Consumption
6,900
Million kilowatt hours
(mkWh)
Worldwide occupied
properties / Apple Internal
Protocol
Renewable Energy
6,900
Million kilowatt hours
(mkWh)
Worldwide / Invoiced
quantities & self-
generated
Scope 1 GHG Emissions
55,200
Metric tonnes of carbon
dioxide equivalent (tCO
2
e)
Worldwide occupied
properties / WRI/WBCSD
GHG Protocol
Scope 2 GHG Emissions
(Location-Based)
1,210,200
tCO
2
e
Worldwide occupied
properties / WRI/WBCSD
GHG Protocol
Scope 2 GHG Emissions
(Market-Based)
1,100
tCO
2
e
Worldwide occupied
properties / WRI/WBCSD
GHG Protocol
Scope 3 Transmission
and Distribution Loses –
Electricity (Market-Based)
0
tCO
2
e
Worldwide occupied
properties / WRI/WBCSD
GHG Protocol Value
Chain (Scope 3)
Scope 3 GHG Emissions
– Upstream Fuel and
Energy-Related Activities
163,000
tCO
2
e
Worldwide occupied
properties / WRI/WBCSD
GHG Protocol Value
Chain (Scope 3)
Apex Companies, LLC
Page 3 of 5
Scope 3 GHG Emissions
– Business Travel
201,700
tCO
2
e
Worldwide occupied
properties / WRI/WBCSD
GHG Protocol Value
Chain (Scope 3)
Scope 3 GHG Emissions
– Employee Commute
143,600
tCO
2
e
Worldwide occupied
properties / WRI/WBCSD
GHG Protocol Value
Chain (Scope 3)
Scope 3 GHG Emissions
- Work from Home
Emissions (Employee
Commute) (Location-
Based)
23,300
tCO
2
e
Worldwide occupied
properties / WRI/WBCSD
GHG Protocol Value
Chain (Scope 3)
Scope 3 GHG Emissions
– Work from Home
Emissions (Employee
Commute)
(Market-
Based)
5,400
tCO
2
e
Worldwide occupied
properties / WRI/WBCSD
GHG Protocol Value
Chain (Scope 3)
Scope 3 GHG Emissions
- Other Cloud Services
(Purchased Goods and
Services) (Location-
Based)
1,045,600
tCO
2
e
Worldwide occupied
properties / WRI/WBCSD
GHG Protocol Value
Chain (Scope 3)
Scope 3 GHG Emissions
- Other Cloud Services
(Purchased Goods and
Services) (Market-Based)
0
tCO
2
e
Worldwide occupied
properties / WRI/WBCSD
GHG Protocol Value
Chain (Scope 3)
Water Withdrawal
1,800
Million gallons
Worldwide occupied
properties / Apple Internal
Protocol
Water Discharge
900
Million gallons
Worldwide occupied
properties / Apple Internal
Protocol
Trash Disposed in Landfill
20,900
Metric tonnes
Worldwide occupied
properties / Apple Internal
Protocol
Hazardous Waste
(Regulated waste)
1,800
Metric tonnes
Worldwide occupied
properties / Apple Internal
Protocol
Recycled Material
(Removal by recycling
contractor)
45,000
Metric tonnes
Worldwide occupied
properties / Apple Internal
Protocol
Composted Material
14,700
Metric tonnes
Worldwide occupied
properties / Apple Internal
Protocol
Waste to Energy
1,200
Metric tonnes
Worldwide occupied
properties / Apple Internal
Protocol
ENGAGEMENT AND ADVOCACY
ENVIRONMENTAL INITIATIVES
INTRODUCTION
CONTENTS
GREEN BOND IMPACT REPORT
DATA
2026 ENVIRONMENTAL PROGRESS REPORT
101
APPENDIX
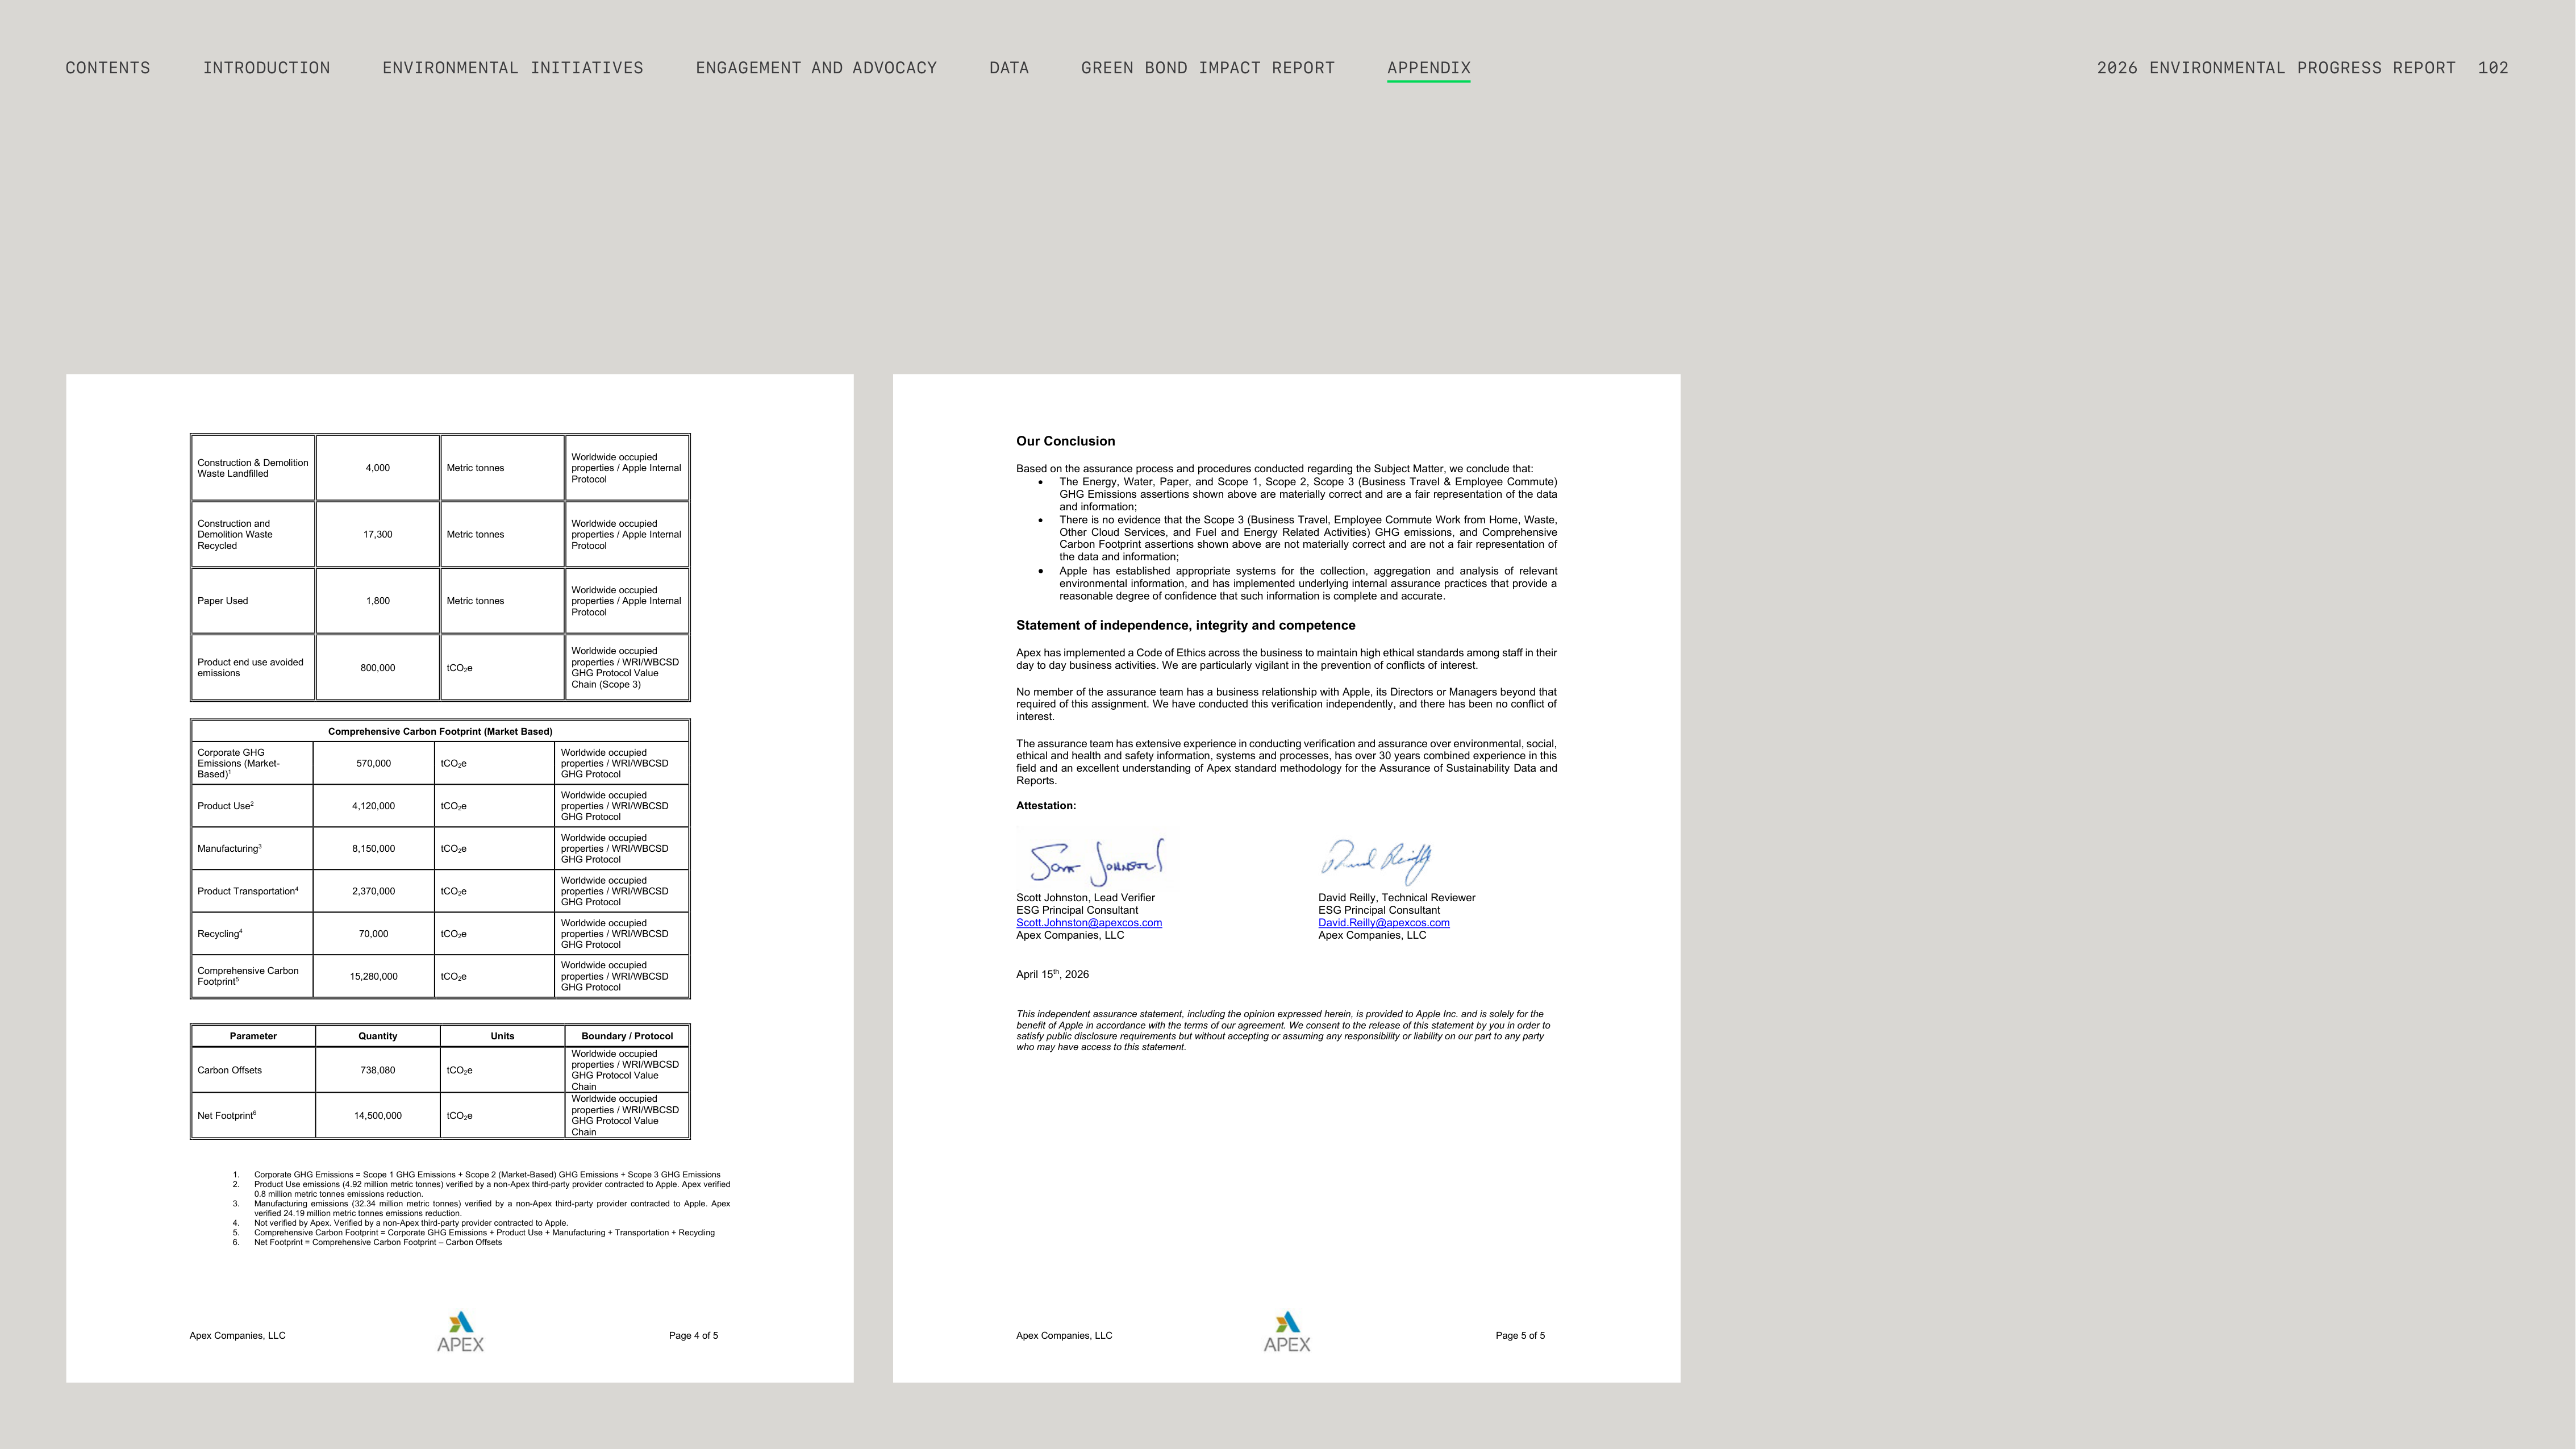



Apex Companies, LLC
Page 5 of 5
Our Conclusion
Based on the assurance process and procedures conducted regarding the Subject Matter, we conclude that:
•
The Energy, Water, Paper, and Scope 1, Scope 2, Scope 3 (Business Travel & Employee Commute)
GHG Emissions assertions shown above are materially correct and are a fair representation of the data
and information;
•
There is no evidence that the Scope 3 (Business Travel, Employee Commute Work from Home, Waste,
Other Cloud Services, and Fuel and Energy Related Activities) GHG emissions, and Comprehensive
Carbon Footprint assertions shown above are not materially correct and are not a fair representation of
the data and information;
•
Apple has established appropriate systems for the collection, aggregation and analysis of relevant
environmental information, and has implemented underlying internal assurance practices that provide a
reasonable degree of confidence that such information is complete and accurate.
Statement of independence, integrity and competence
Apex has implemented a Code of Ethics across the business to maintain high ethical standards among staff in their
day to day business activities. We are particularly vigilant in the prevention of conflicts of interest.
No member of the assurance team has a business relationship with Apple, its Directors or Managers beyond that
required of this assignment. We have conducted this verification independently, and there has been no conflict of
interest.
The assurance team has extensive experience in conducting verification and assurance over environmental, social,
ethical and health and safety information, systems and processes, has over 30 years combined experience in this
field and an excellent understanding of Apex standard methodology for the Assurance of Sustainability Data and
Reports.
Attestation:
Scott Johnston, Lead Verifier
David Reilly, Technical Reviewer
ESG Principal Consultant
ESG Principal Consultant
Scott.Johnston@apexcos.com
David.Reilly@apexcos.com
Apex Companies, LLC
Apex Companies, LLC
April 15
th
, 2026
This independent assurance statement, including the opinion expressed herein, is provided to Apple Inc. and is solely for the
benefit of Apple in accordance with the terms of our agreement. We consent to the release of this
statement by you in order to
satisfy public disclosure requirements but without accepting or assuming any responsibility or liability on our part to any party
who may have access to this statement.
Apex Companies, LLC
Page 4 of 5
Construction & Demolition
Waste Landfilled
4,000
Metric tonnes
Worldwide occupied
properties / Apple Internal
Protocol
Construction and
Demolition Waste
Recycled
17,300
Metric tonnes
Worldwide occupied
properties / Apple Internal
Protocol
Paper Used
1,800
Metric tonnes
Worldwide occupied
properties / Apple Internal
Protocol
Product end use avoided
emissions
800,000
tCO
2
e
Worldwide occupied
properties / WRI/WBCSD
GHG Protocol Value
Chain (Scope 3)
Comprehensive Carbon Footprint (Market Based)
Corporate GHG
Emissions (Market-
Based)
1
570,000
tCO
2
e
Worldwide occupied
properties / WRI/WBCSD
GHG Protocol
Product Use
2
4,120,000
tCO
2
e
Worldwide occupied
properties / WRI/WBCSD
GHG Protocol
Manufacturing
3
8,150,000
tCO
2
e
Worldwide occupied
properties / WRI/WBCSD
GHG Protocol
Product Transportation
4
2,370,000
tCO
2
e
Worldwide occupied
properties / WRI/WBCSD
GHG Protocol
Recycling
4
70,000
tCO
2
e
Worldwide occupied
properties / WRI/WBCSD
GHG Protocol
Comprehensive Carbon
Footprint
5
15,280,000
tCO
2
e
Worldwide occupied
properties / WRI/WBCSD
GHG Protocol
Parameter
Quantity
Units
Boundary / Protocol
Carbon Offsets
738,080
tCO
2
e
Worldwide occupied
properties / WRI/WBCSD
GHG Protocol Value
Chain
Net Footprint
6
14,500,000
tCO
2
e
Worldwide occupied
properties / WRI/WBCSD
GHG Protocol Value
Chain
1.
Corporate GHG Emissions = Scope 1 GHG Emissions + Scope 2 (Market-Based) GHG Emissions + Scope 3 GHG Emissions
2.
Product Use emissions (4.92 million metric tonnes) verified by a non-Apex third-party provider contracted to Apple. Apex verified
0.8 million metric tonnes
emissions reduction.
3.
Manufacturing emissions (32.34 million metric tonnes) verified by a non-Apex third-party provider contracted to Apple. Apex
verified 24.19 million metric tonnes emissions reduction.
4.
Not verified by Apex. Verified by a non-Apex third-party provider contracted to Apple.
5.
Comprehensive Carbon Footprint = Corporate GHG Emissions + Product Use + Manufacturing + Transportation + Recycling
6.
Net Footprint = Comprehensive Carbon Footprint – Carbon Offsets
ENGAGEMENT AND ADVOCACY
ENVIRONMENTAL INITIATIVES
INTRODUCTION
CONTENTS
GREEN BOND IMPACT REPORT
DATA
2026 ENVIRONMENTAL PROGRESS REPORT
102
APPENDIX
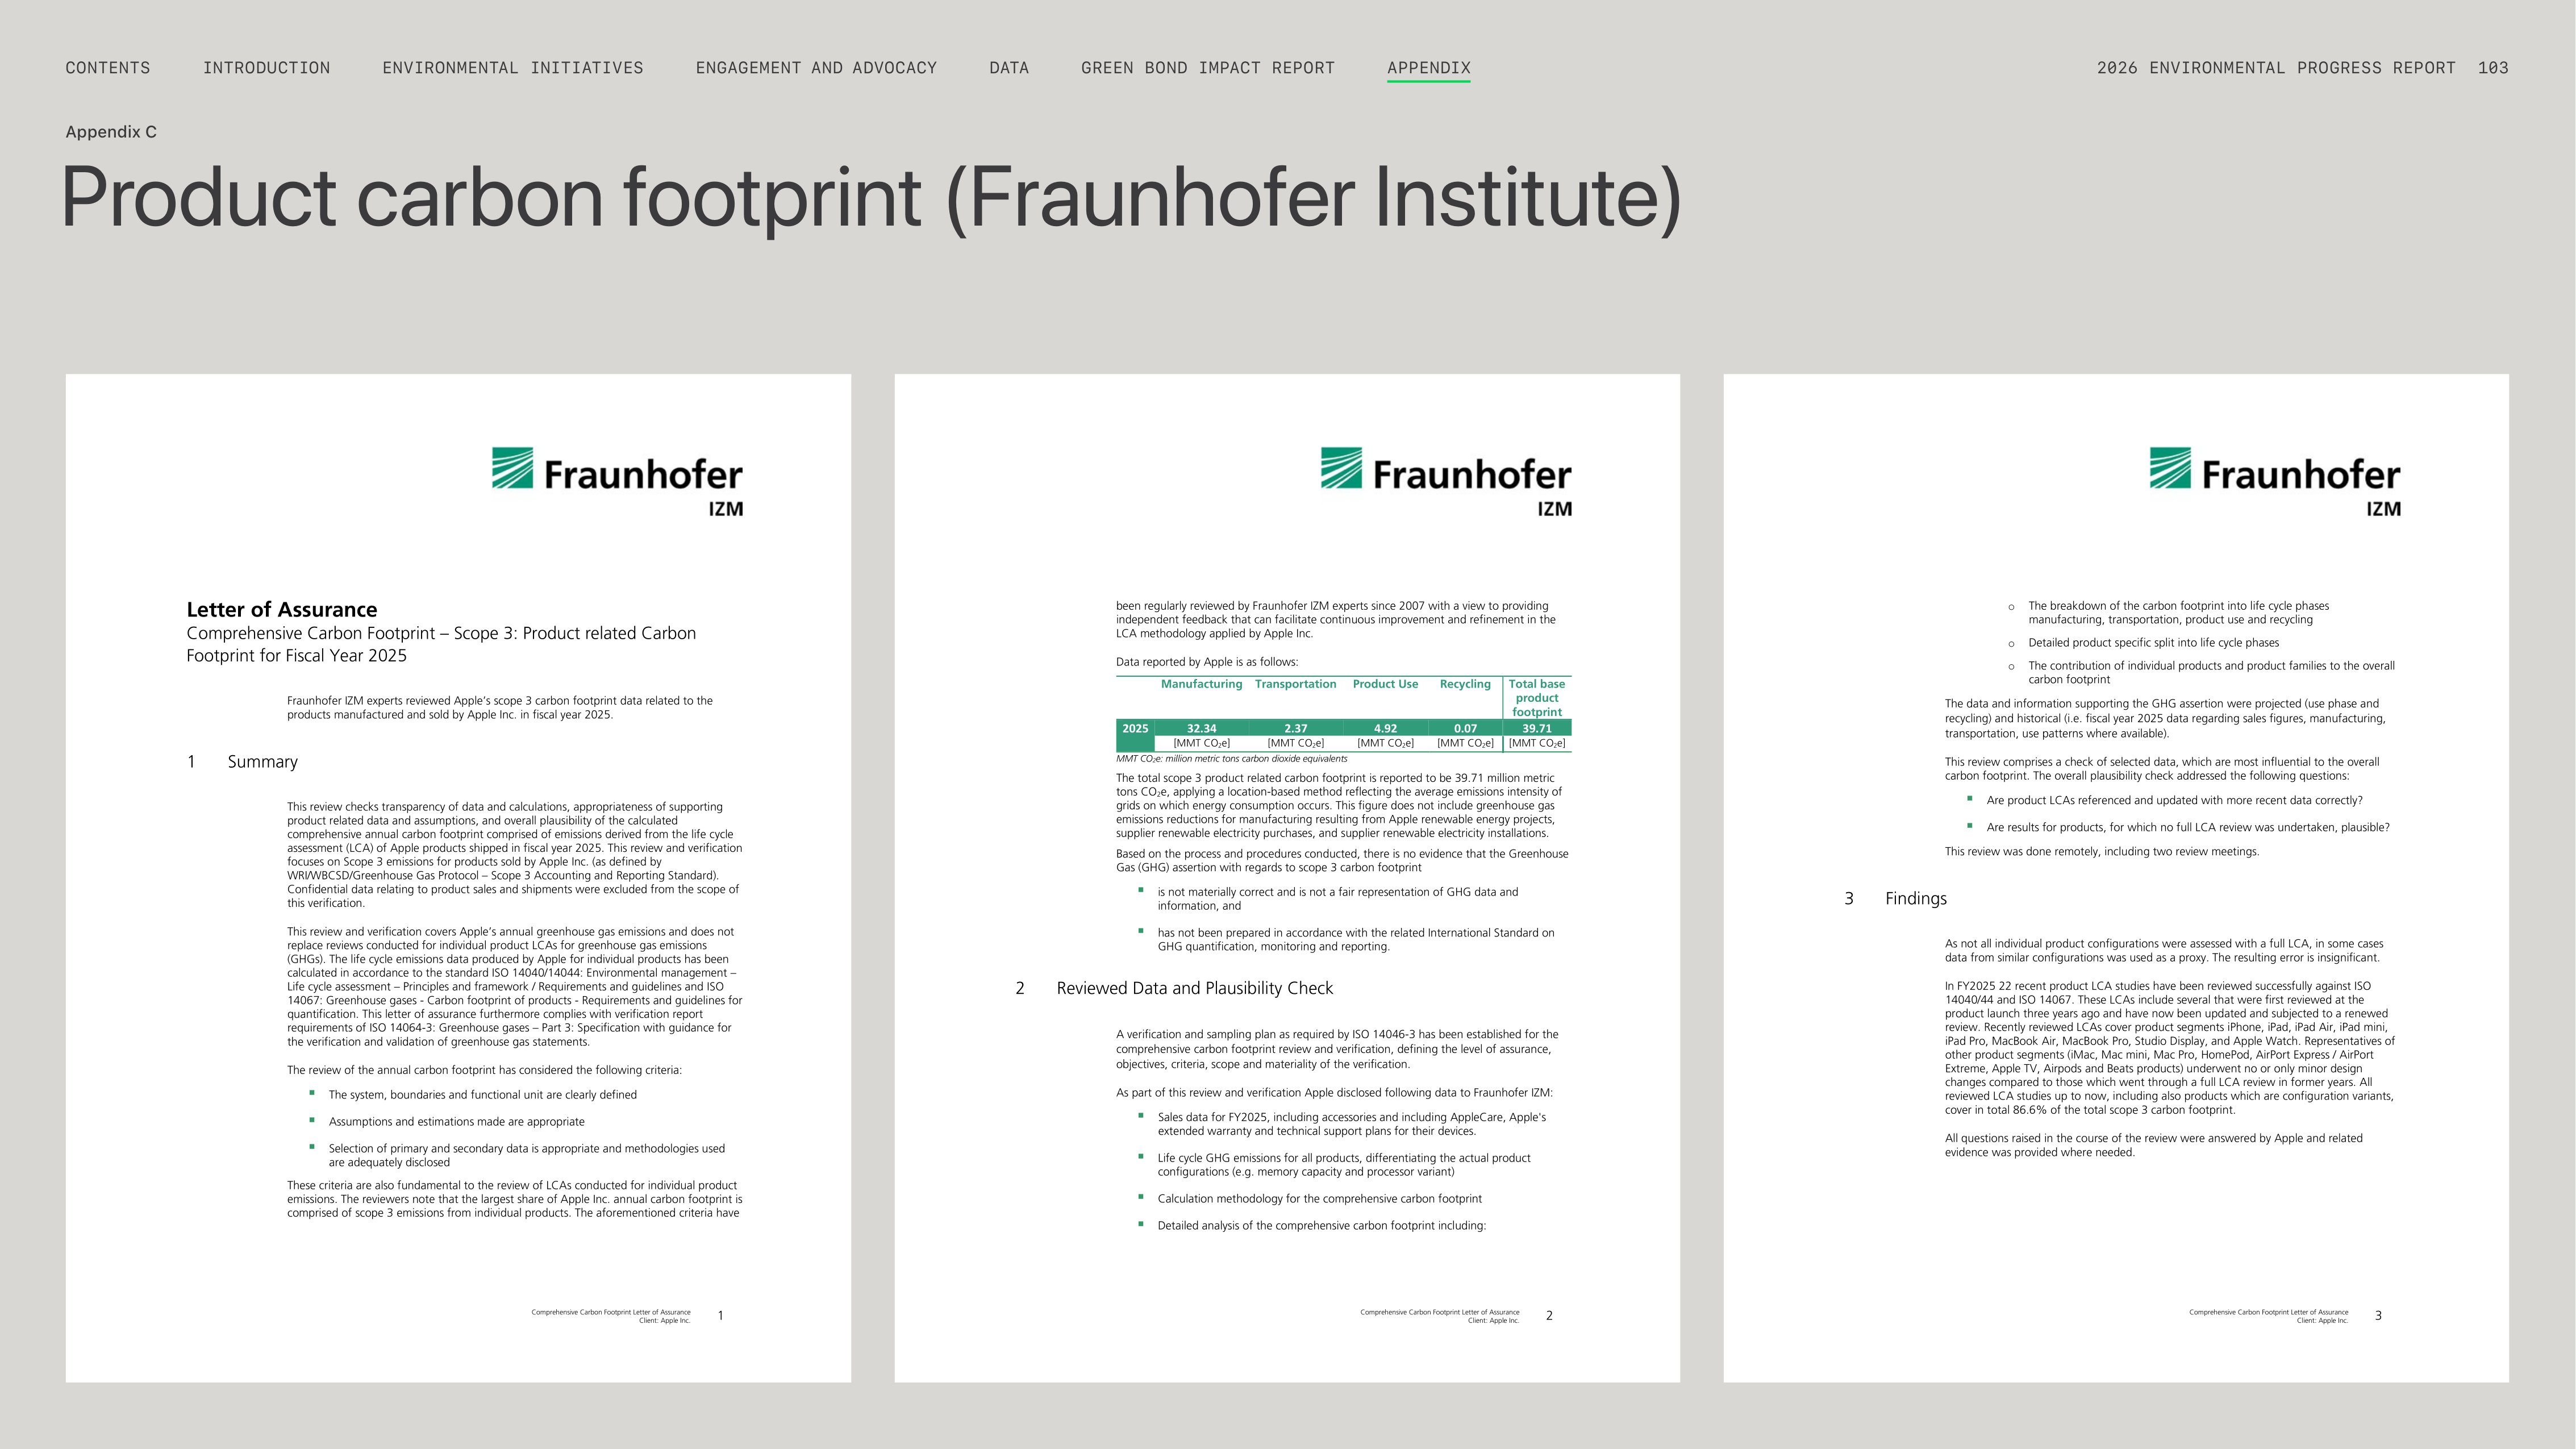

Product carbon footprint (Fraunhofer Institute)
Appendix C
2025
32.34
2.37
4.92
0.07
39.71
o
o
o
ENGAGEMENT AND ADVOCACY
ENVIRONMENTAL INITIATIVES
INTRODUCTION
CONTENTS
GREEN BOND IMPACT REPORT
DATA
2026 ENVIRONMENTAL PROGRESS REPORT
103
APPENDIX
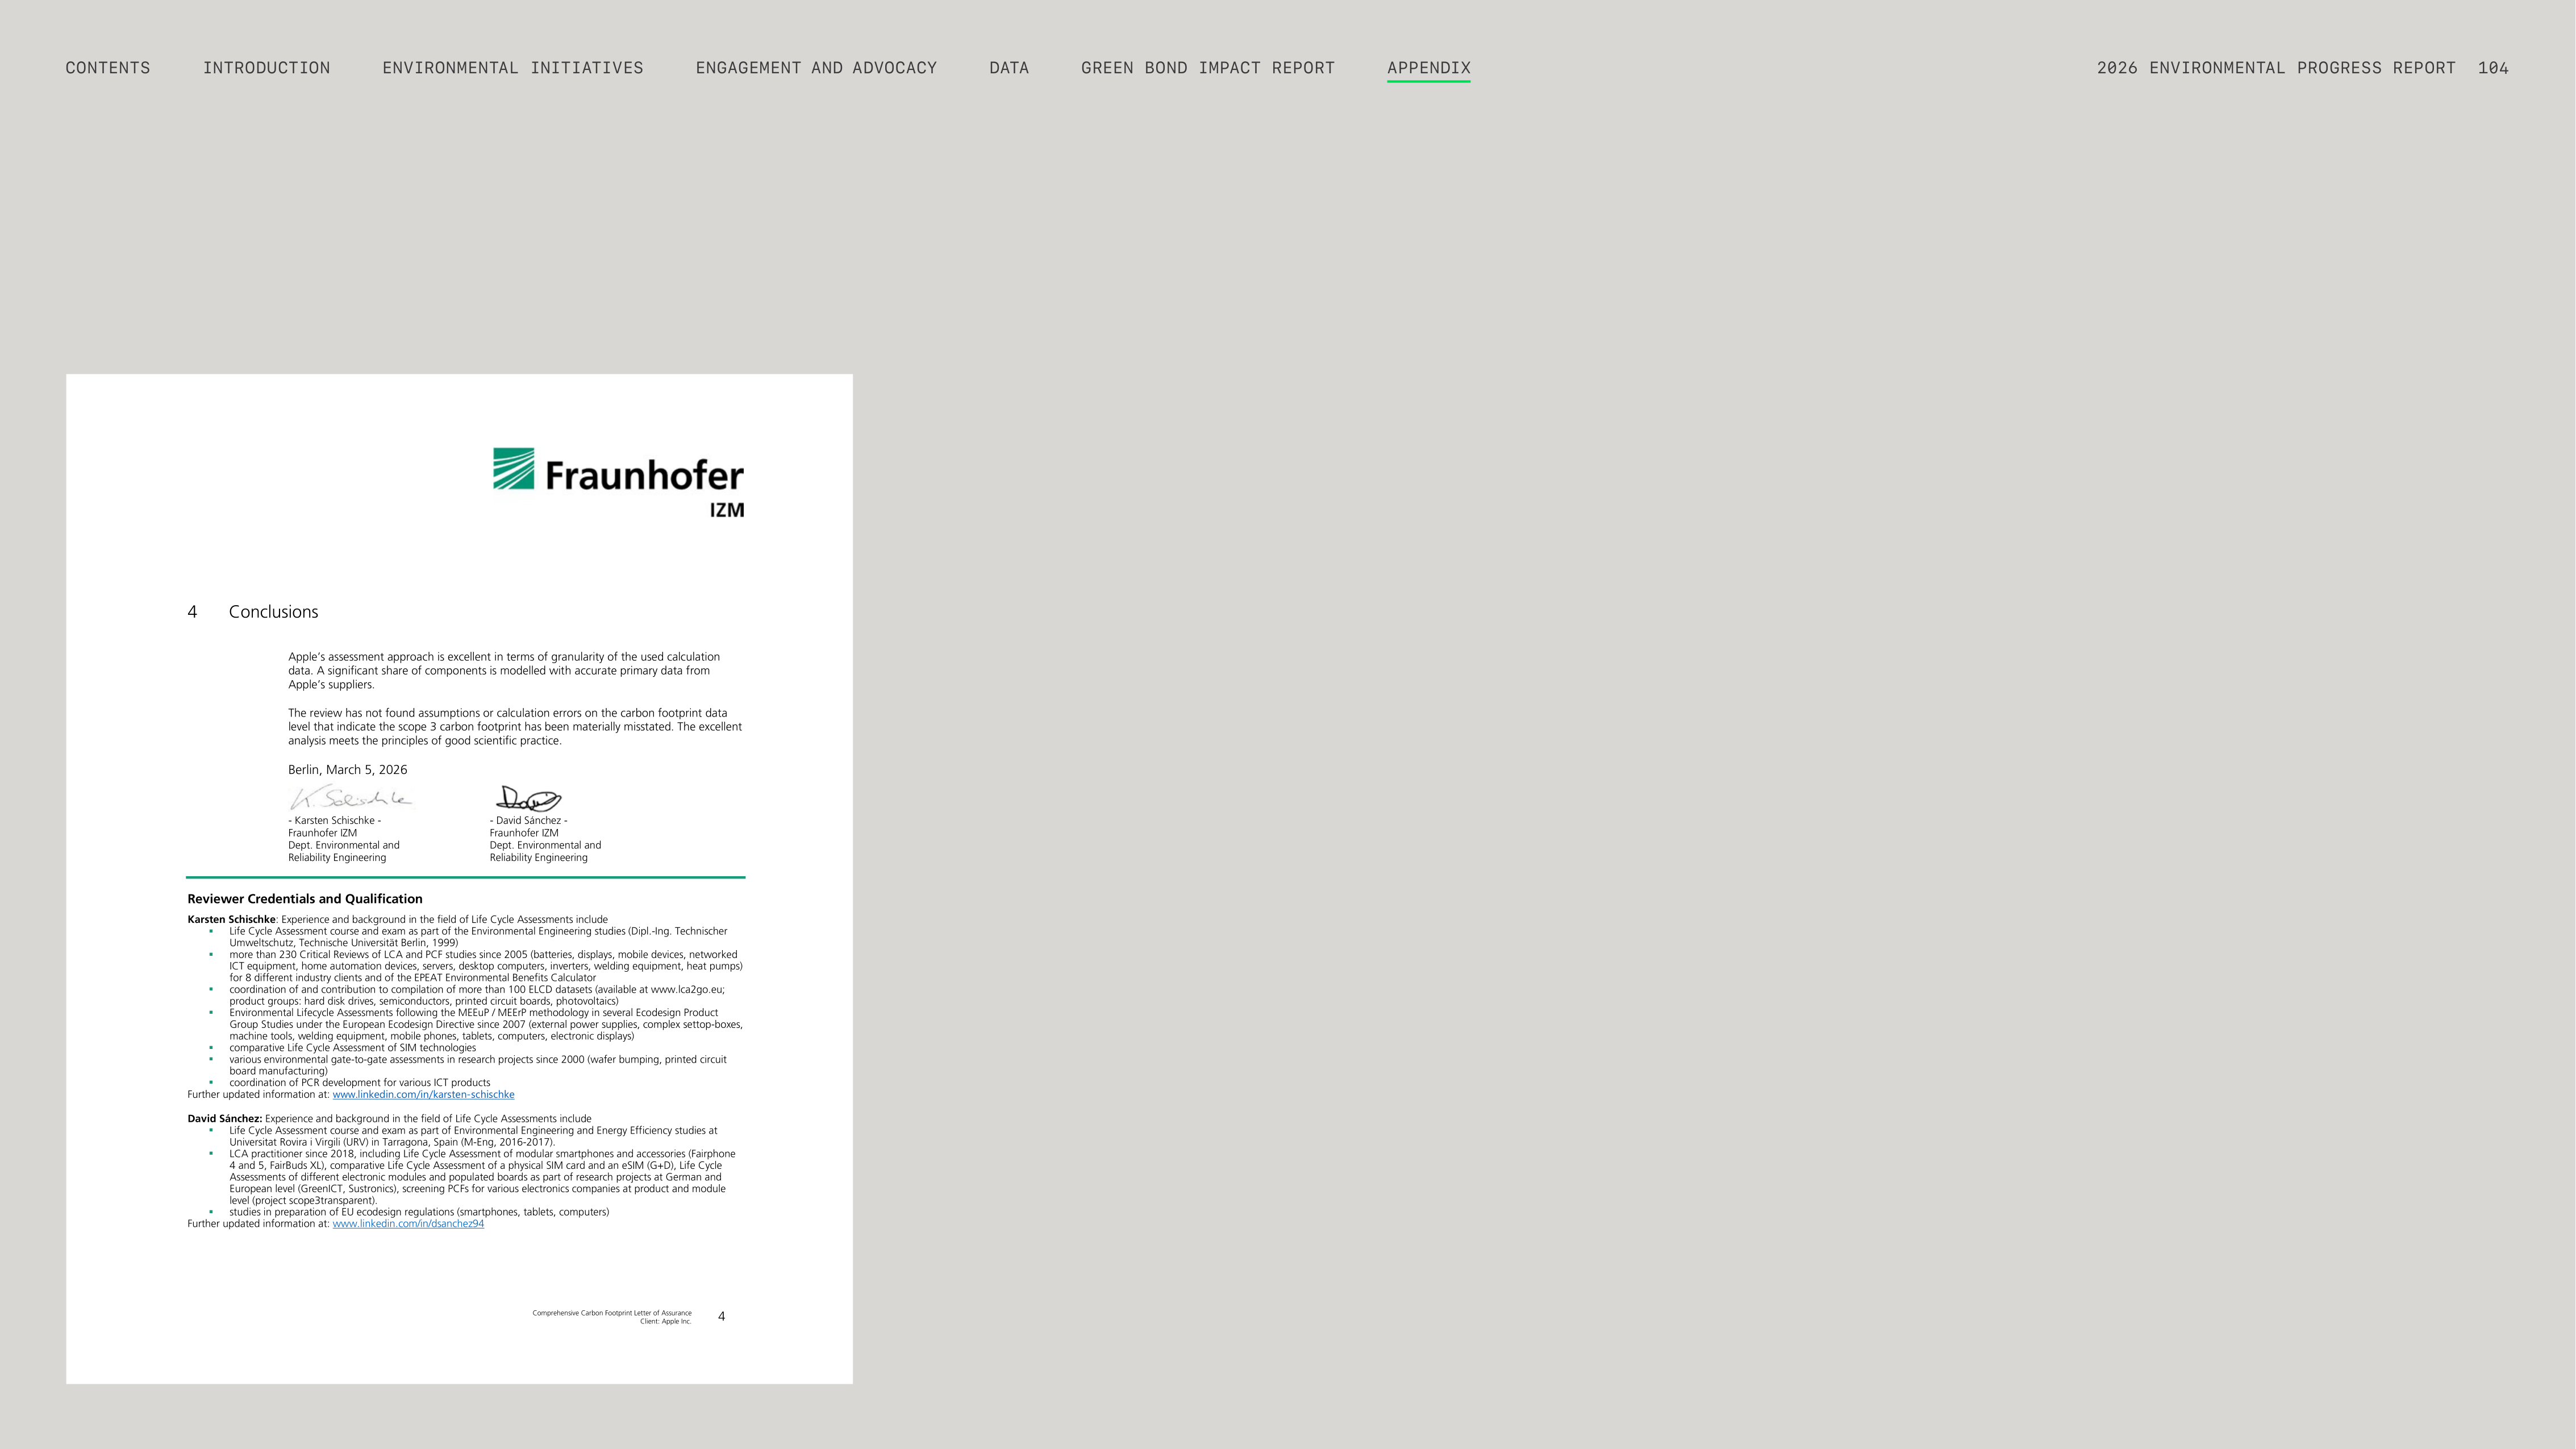



www.linkedin.com/in/karsten-schischke
ENGAGEMENT AND ADVOCACY
ENVIRONMENTAL INITIATIVES
INTRODUCTION
CONTENTS
GREEN BOND IMPACT REPORT
DATA
2026 ENVIRONMENTAL PROGRESS REPORT
104
APPENDIX
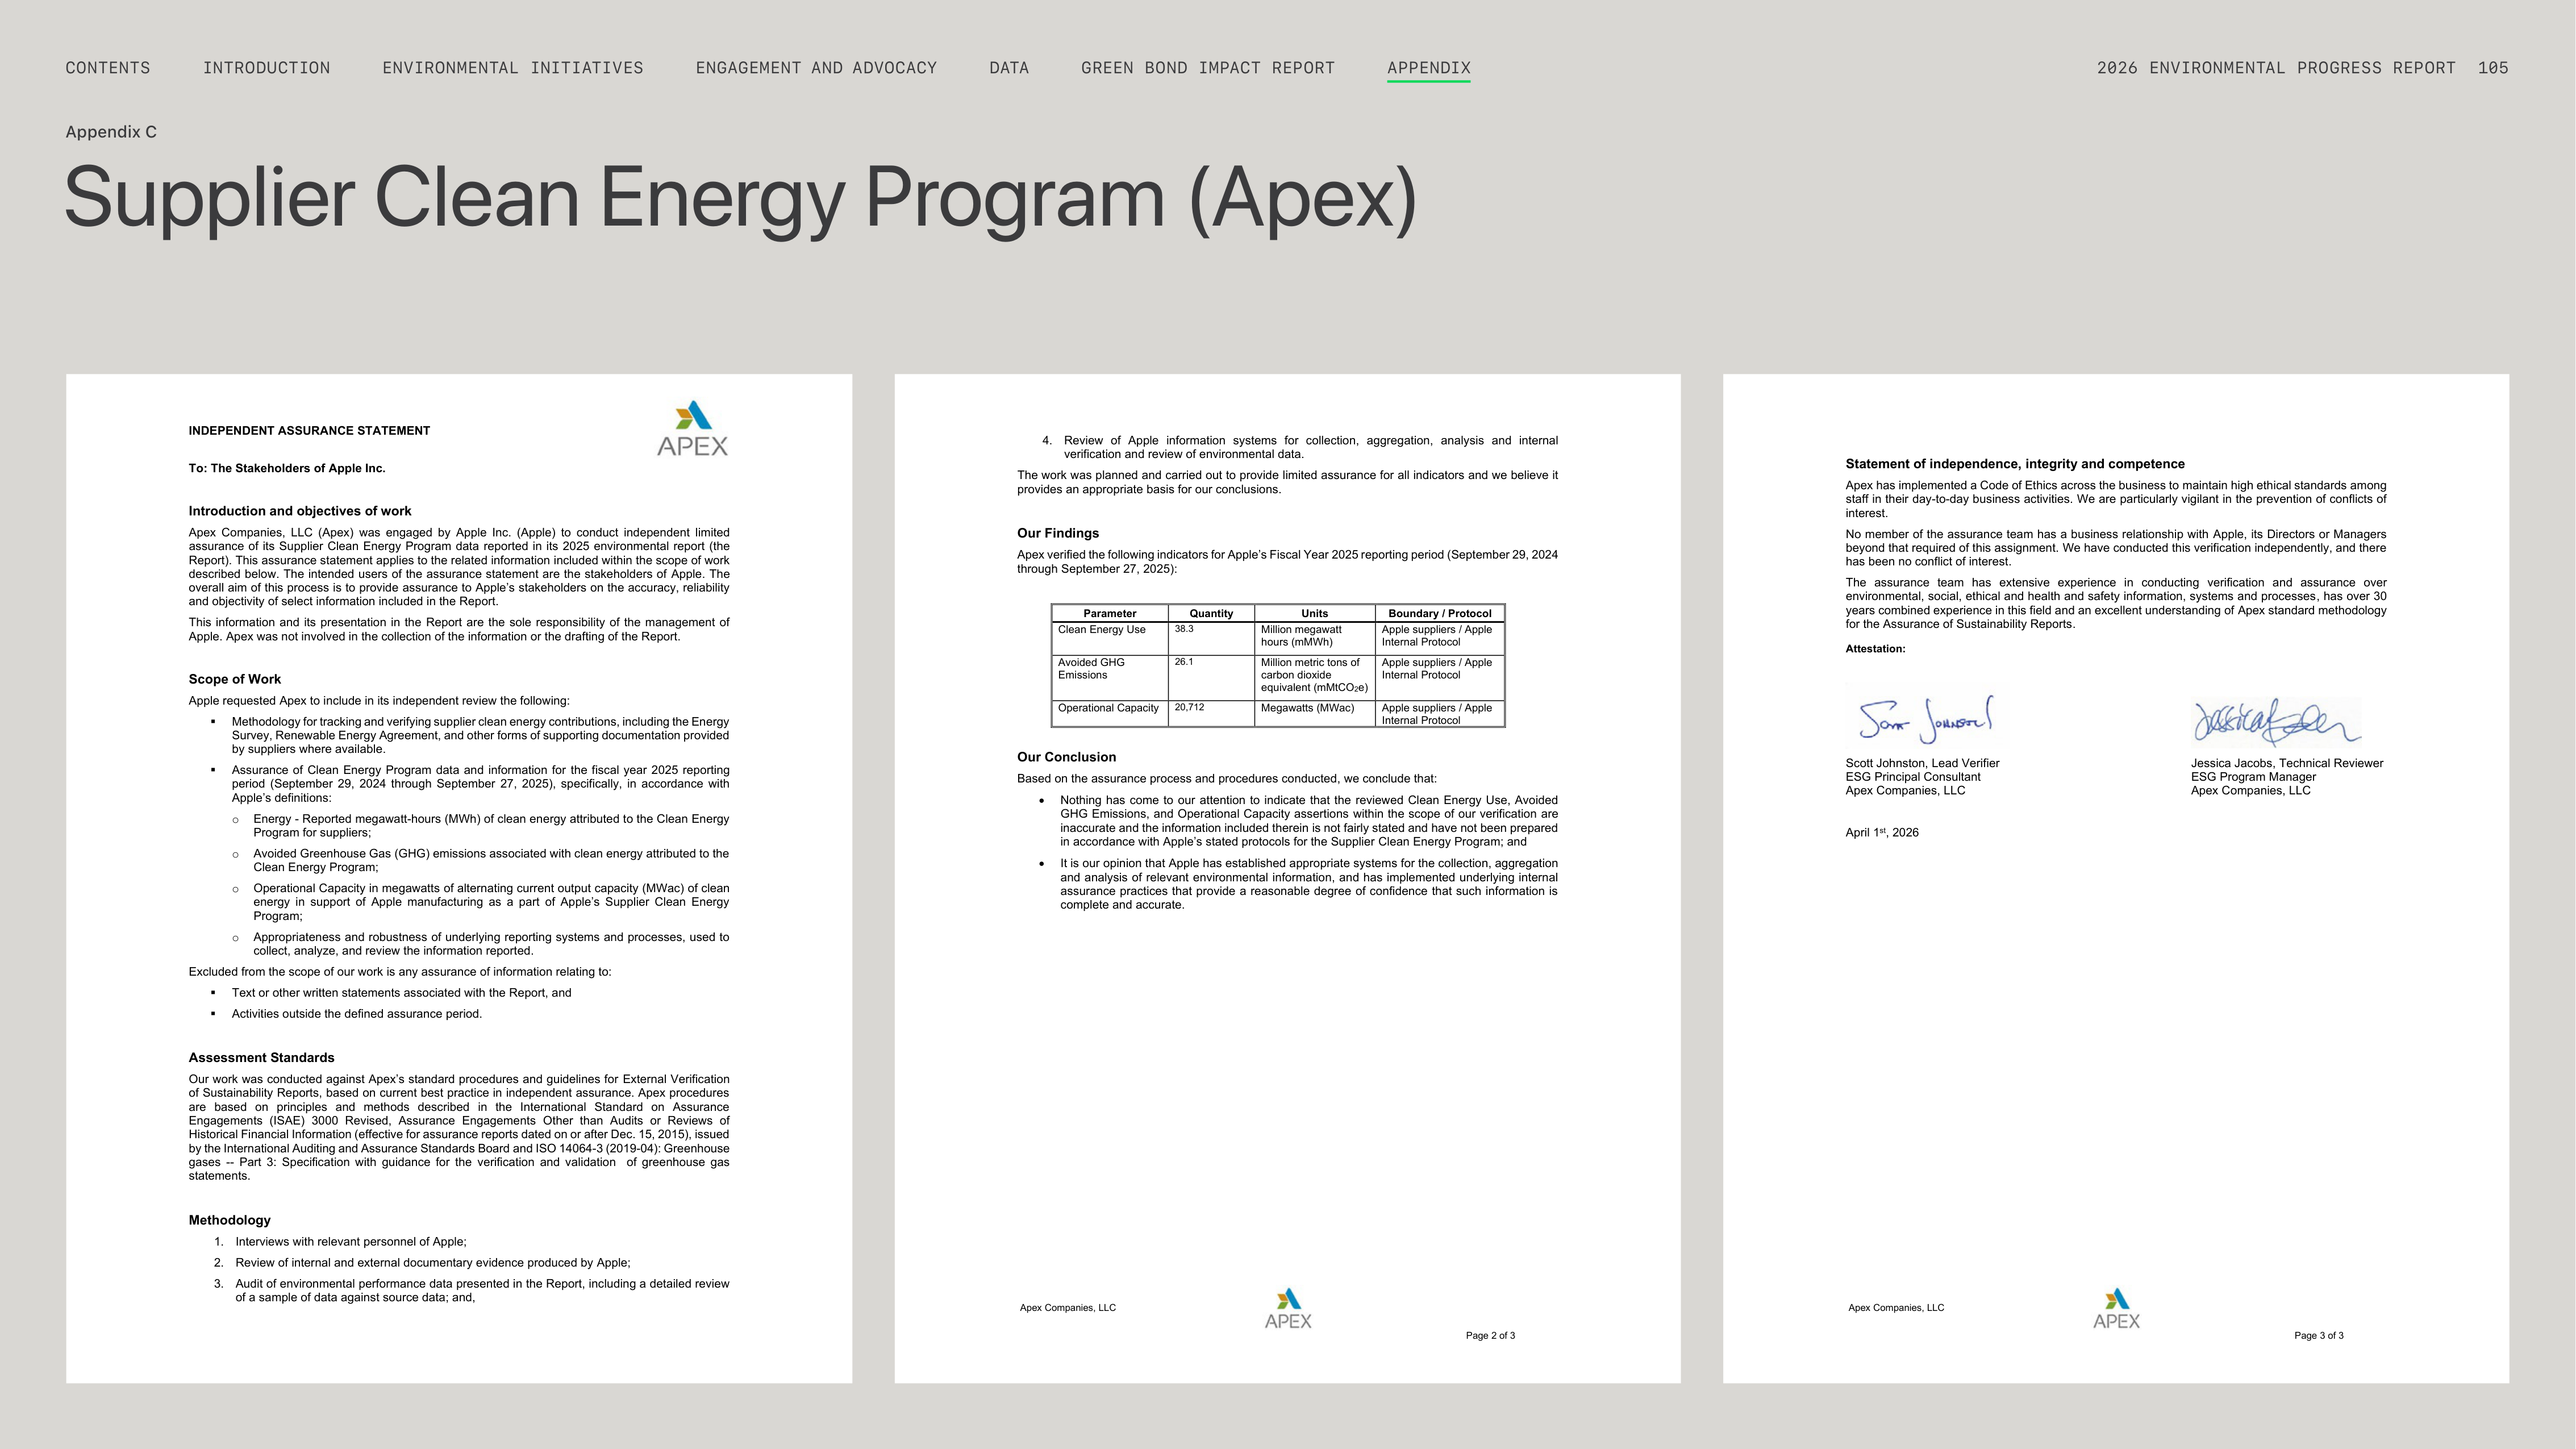




Supplier Clean Energy Program (Apex)
Appendix C
INDEPENDENT ASSURANCE STATEMENT
To: The Stakeholders of Apple Inc.
Introduction and objectives of work
Apex Companies, LLC (Apex) was engaged by Apple Inc. (Apple) to conduct independent limited
assurance of its Supplier Clean Energy Program data reported in its 2025 environmental report (the
Report). This assurance statement applies to the related information included within the scope of work
described below. The intended users of the assurance statement are the stakeholders of Apple. The
overall aim of this process is to provide assurance to Apple’s stakeholders on the accuracy, reliability
and objectivity of select information included in the Report.
This information and its presentation in the Report are the sole responsibility of the management of
Apple. Apex was not involved in the collection of the information or the drafting of the Report.
Scope of Work
Apple requested Apex to include in its independent review the following:
▪
Methodology for tracking and verifying supplier clean energy contributions, including the Energy
Survey, Renewable Energy Agreement, and other forms of supporting documentation provided
by suppliers where available.
▪
Assurance of Clean Energy Program data and information for the fiscal year 2025 reporting
period (September 29, 2024 through September 27, 2025), specifically, in accordance with
Apple’s definitions:
o
Energy - Reported megawatt-hours (MWh) of clean energy attributed to the Clean Energy
Program for suppliers;
o
Avoided Greenhouse Gas (GHG) emissions associated with clean energy attributed to the
Clean Energy Program;
o
Operational Capacity in megawatts of alternating current output capacity (MWac) of clean
energy in support of Apple manufacturing as a part of Apple’s Supplier Clean Energy
Program;
o
Appropriateness and robustness of underlying reporting systems and processes, used to
collect, analyze, and review the information reported.
Excluded from the scope of our work is any assurance of information relating to:
▪
Text or other written statements associated with the Report, and
▪
Activities outside the defined assurance period.
Assessment Standards
Our work was conducted against Apex’s standard procedures and guidelines for External Verification
of Sustainability Reports, based on current best practice in independent assurance. Apex procedures
are based on principles and methods described in the International Standard on Assurance
Engagements (ISAE) 3000 Revised, Assurance Engagements Other than Audits or Reviews of
Historical Financial Information (effective for assurance reports dated on or after Dec. 15, 2015), issued
by the International Auditing and Assurance Standards Board and ISO 14064-3 (2019-04): Greenhouse
gases -- Part 3: Specification with guidance for the verification and validation of greenhouse gas
statements.
Methodology
1. Interviews with relevant personnel of Apple;
2. Review of internal and external documentary evidence produced by Apple;
3. Audit of environmental performance data presented in the Report, including a detailed review
of a sample of data against source data; and,
Apex Companies, LLC
Page 2 of 3
4. Review of Apple information systems for collection, aggregation, analysis and internal
verification and review of environmental data.
The work was planned and carried out to provide limited assurance for all indicators and we believe it
provides an appropriate basis for our conclusions.
Our Findings
Apex verified the following indicators for Apple’s Fiscal Year 2025 reporting period (September 29, 2024
through September 27, 2025):
Parameter
Quantity
Units
Boundary / Protocol
Clean Energy Use
38.3
Million megawatt
hours (mMWh)
Apple suppliers / Apple
Internal Protocol
Avoided GHG
Emissions
26.1
Million metric tons of
carbon dioxide
equivalent (mMtCO
2
e)
Apple suppliers / Apple
Internal Protocol
Operational Capacity
20,712
Megawatts (MWac)
Apple suppliers / Apple
Internal Protocol
Our Conclusion
Based on the assurance process and procedures conducted, we conclude that:
•
Nothing has come to our attention to indicate that the reviewed Clean Energy Use, Avoided
GHG Emissions, and Operational Capacity assertions within the scope of our verification
are
inaccurate and the information included therein is not fairly stated and have not been prepared
in accordance with Apple’s stated protocols for the Supplier Clean Energy Program; and
•
It is our opinion that Apple has established appropriate systems for the collection, aggregation
and analysis of relevant environmental information, and has implemented underlying internal
assurance practices that provide a reasonable degree of confidence that such information is
complete and accurate.
Apex Companies, LLC
Page 3 of 3
Statement of independence, integrity and competence
Apex has implemented a Code of Ethics across the business to maintain high ethical standards among
staff in their day-to-day business activities. We are particularly vigilant in the prevention of conflicts of
interest.
No member of the assurance team has a business relationship with Apple, its Directors or Managers
beyond that required of this assignment. We have conducted this verification independently, and there
has been no conflict of interest.
The assurance team has extensive experience in conducting verification and assurance over
environmental, social, ethical and health and safety information, systems and processes, has over 30
years combined experience in this field and an excellent understanding of Apex standard methodology
for the Assurance of Sustainability Reports.
Attestation:
Scott Johnston, Lead Verifier
Jessica Jacobs, Technical Reviewer
ESG Principal Consultant
ESG Program Manager
Apex Companies, LLC
Apex Companies, LLC
April 1
st
, 2026
ENGAGEMENT AND ADVOCACY
ENVIRONMENTAL INITIATIVES
INTRODUCTION
CONTENTS
GREEN BOND IMPACT REPORT
DATA
2026 ENVIRONMENTAL PROGRESS REPORT
105
APPENDIX
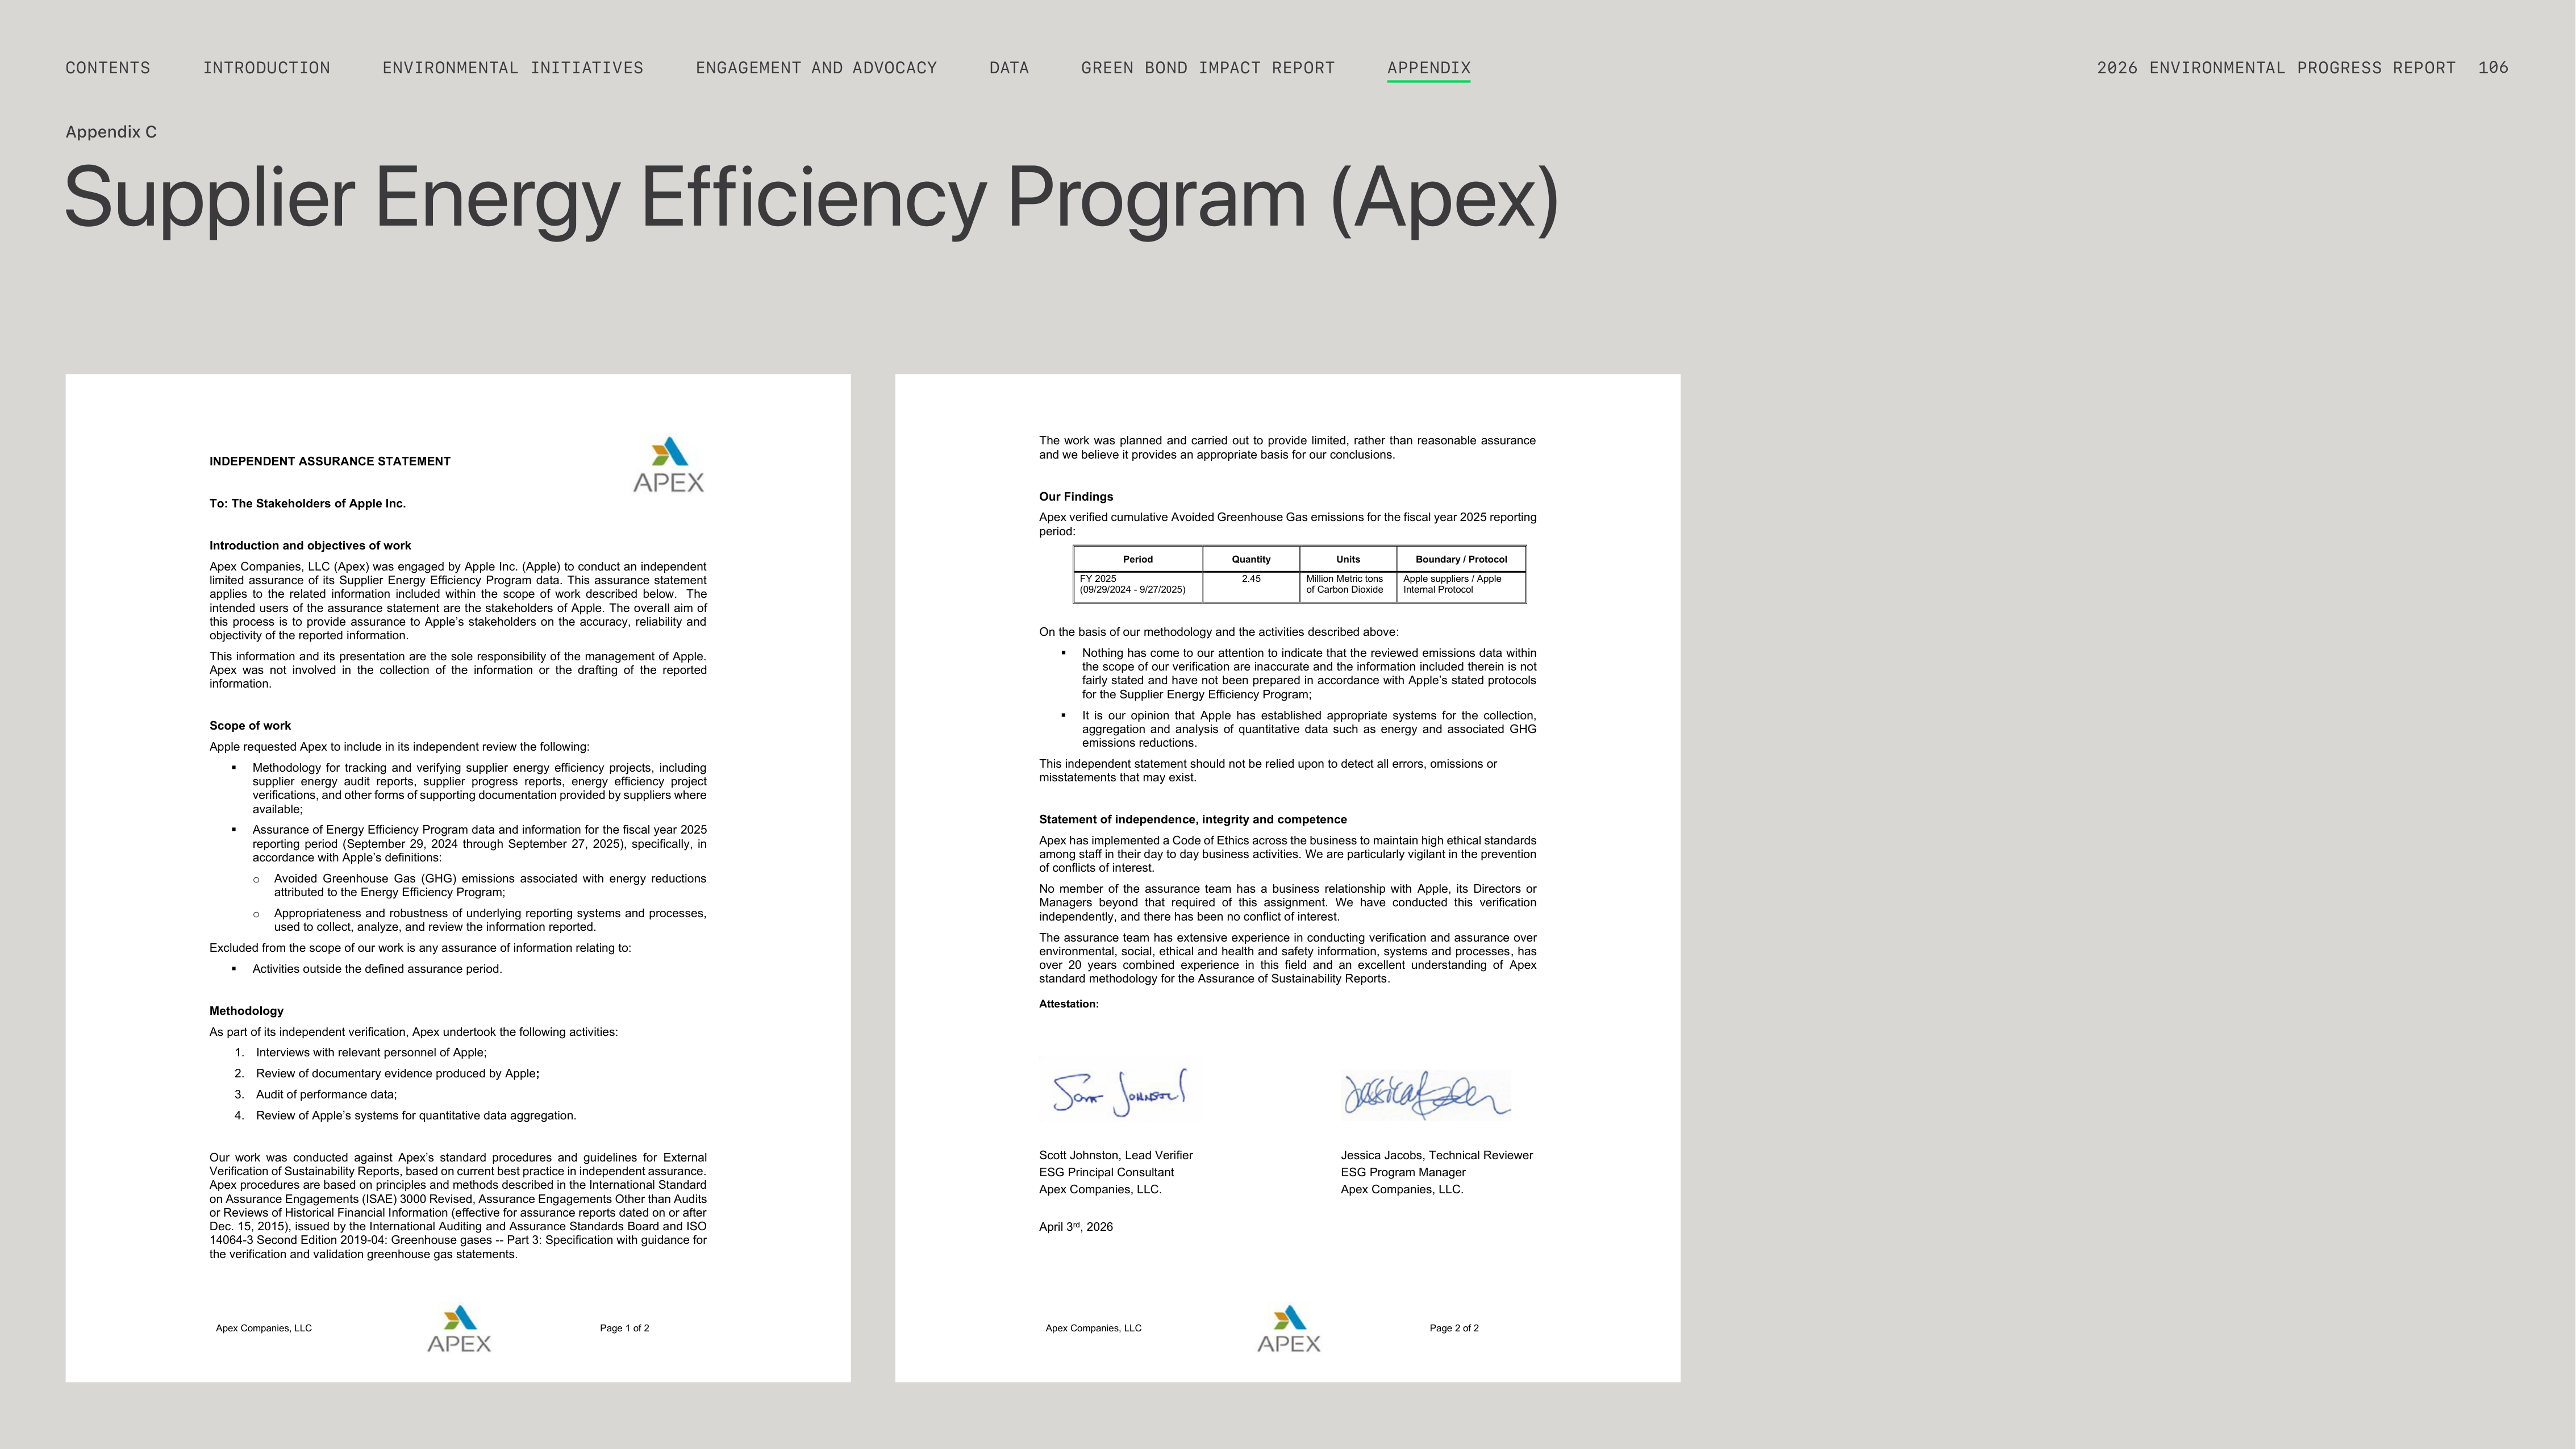




Supplier Energy Efficiency Program (Apex)
Appendix C
Apex Companies, LLC
Page 1 of 2
INDEPENDENT ASSURANCE STATEMENT
To: The Stakeholders of Apple Inc.
Introduction and objectives of work
Apex Companies, LLC (Apex) was engaged by Apple Inc. (Apple) to conduct an independent
limited assurance of its Supplier Energy Efficiency Program data. This assurance statement
applies to the related information included within the scope of work described below. The
intended users of the assurance statement are the stakeholders of Apple. The overall aim of
this process is to provide assurance to Apple’s stakeholders on the accuracy, reliability and
objectivity of the reported information.
This information and its presentation are the sole responsibility of the management of Apple.
Apex was not involved in the collection of the information or the drafting of the reported
information.
Scope of work
Apple requested Apex to include in its independent review the following:
▪
Methodology for tracking and verifying supplier energy efficiency projects, including
supplier energy audit reports, supplier progress reports, energy efficiency project
verifications, and other forms of supporting documentation provided by suppliers where
available;
▪
Assurance of Energy Efficiency Program data and information for the fiscal year 2025
reporting period (September 29, 2024 through September 27, 2025), specifically, in
accordance with Apple’s definitions:
o
Avoided Greenhouse Gas (GHG) emissions associated with energy reductions
attributed to the Energy Efficiency Program;
o
Appropriateness and robustness of underlying reporting systems and processes,
used to collect, analyze, and review the information reported.
Excluded from the scope of our work is any assurance of information relating to:
▪
Activities outside the defined assurance period.
Methodology
As part of its independent verification, Apex undertook the following activities:
1. Interviews with relevant personnel of Apple;
2. Review of documentary evidence produced by Apple
;
3. Audit of performance data;
4. Review of Apple’s
systems for quantitative data aggregation.
Our work was conducted against Apex’s standard procedures and guidelines for External
Verification of Sustainability Reports, based on current best practice in independent assurance.
Apex procedures are based on principles and methods described in the International Standard
on Assurance Engagements (ISAE) 3000 Revised, Assurance Engagements Other than Audits
or Reviews of Historical Financial Information (effective for assurance reports dated on or after
Dec. 15, 2015), issued by the International Auditing and Assurance Standards Board and ISO
14064-3 Second Edition 2019-04: Greenhouse gases -- Part 3: Specification with guidance for
the verification and validation greenhouse gas statements.
Apex Companies, LLC
Page 2 of 2
The work was planned and carried out to provide limited, rather than reasonable assurance
and we believe it provides an appropriate basis for our conclusions.
Our Findings
Apex verified cumulative Avoided Greenhouse Gas emissions for the fiscal year 2025 reporting
period:
Period
Quantity
Units
Boundary / Protocol
FY 2025
(09/29/2024 - 9/27/2025)
2.45
Million Metric tons
of Carbon Dioxide
Apple suppliers / Apple
Internal Protocol
On the basis of our methodology and the activities described above:
▪
Nothing has come to our attention to indicate that the reviewed emissions data within
the scope of our verification
are inaccurate and the information included therein is not
fairly stated and have not been prepared in accordance with Apple’s stated protocols
for the Supplier Energy Efficiency Program;
▪
It is our opinion that Apple
has established appropriate systems for the collection,
aggregation and analysis of quantitative data such as energy and associated GHG
emissions reductions.
This independent statement should not be relied upon to detect all errors, omissions or
misstatements that may exist.
Statement of independence, integrity and competence
Apex has implemented a Code of Ethics across the business to maintain high ethical standards
among staff in their day to day business activities. We are particularly vigilant in the prevention
of conflicts of interest.
No member of the assurance team has a business relationship with Apple, its Directors or
Managers beyond that required of this assignment. We have conducted this verification
independently, and there has been no conflict of interest.
The assurance team has extensive experience in conducting verification and assurance over
environmental, social, ethical and health and safety information, systems and processes, has
over 20 years combined experience in this field and an excellent understanding of Apex
standard methodology for the Assurance of Sustainability Reports.
Attestation:
Scott Johnston, Lead Verifier
Jessica Jacobs, Technical Reviewer
ESG Principal Consultant
ESG Program Manager
Apex Companies, LLC.
Apex Companies, LLC.
April 3
rd
, 2026
ENGAGEMENT AND ADVOCACY
ENVIRONMENTAL INITIATIVES
INTRODUCTION
CONTENTS
GREEN BOND IMPACT REPORT
DATA
2026 ENVIRONMENTAL PROGRESS REPORT
106
APPENDIX
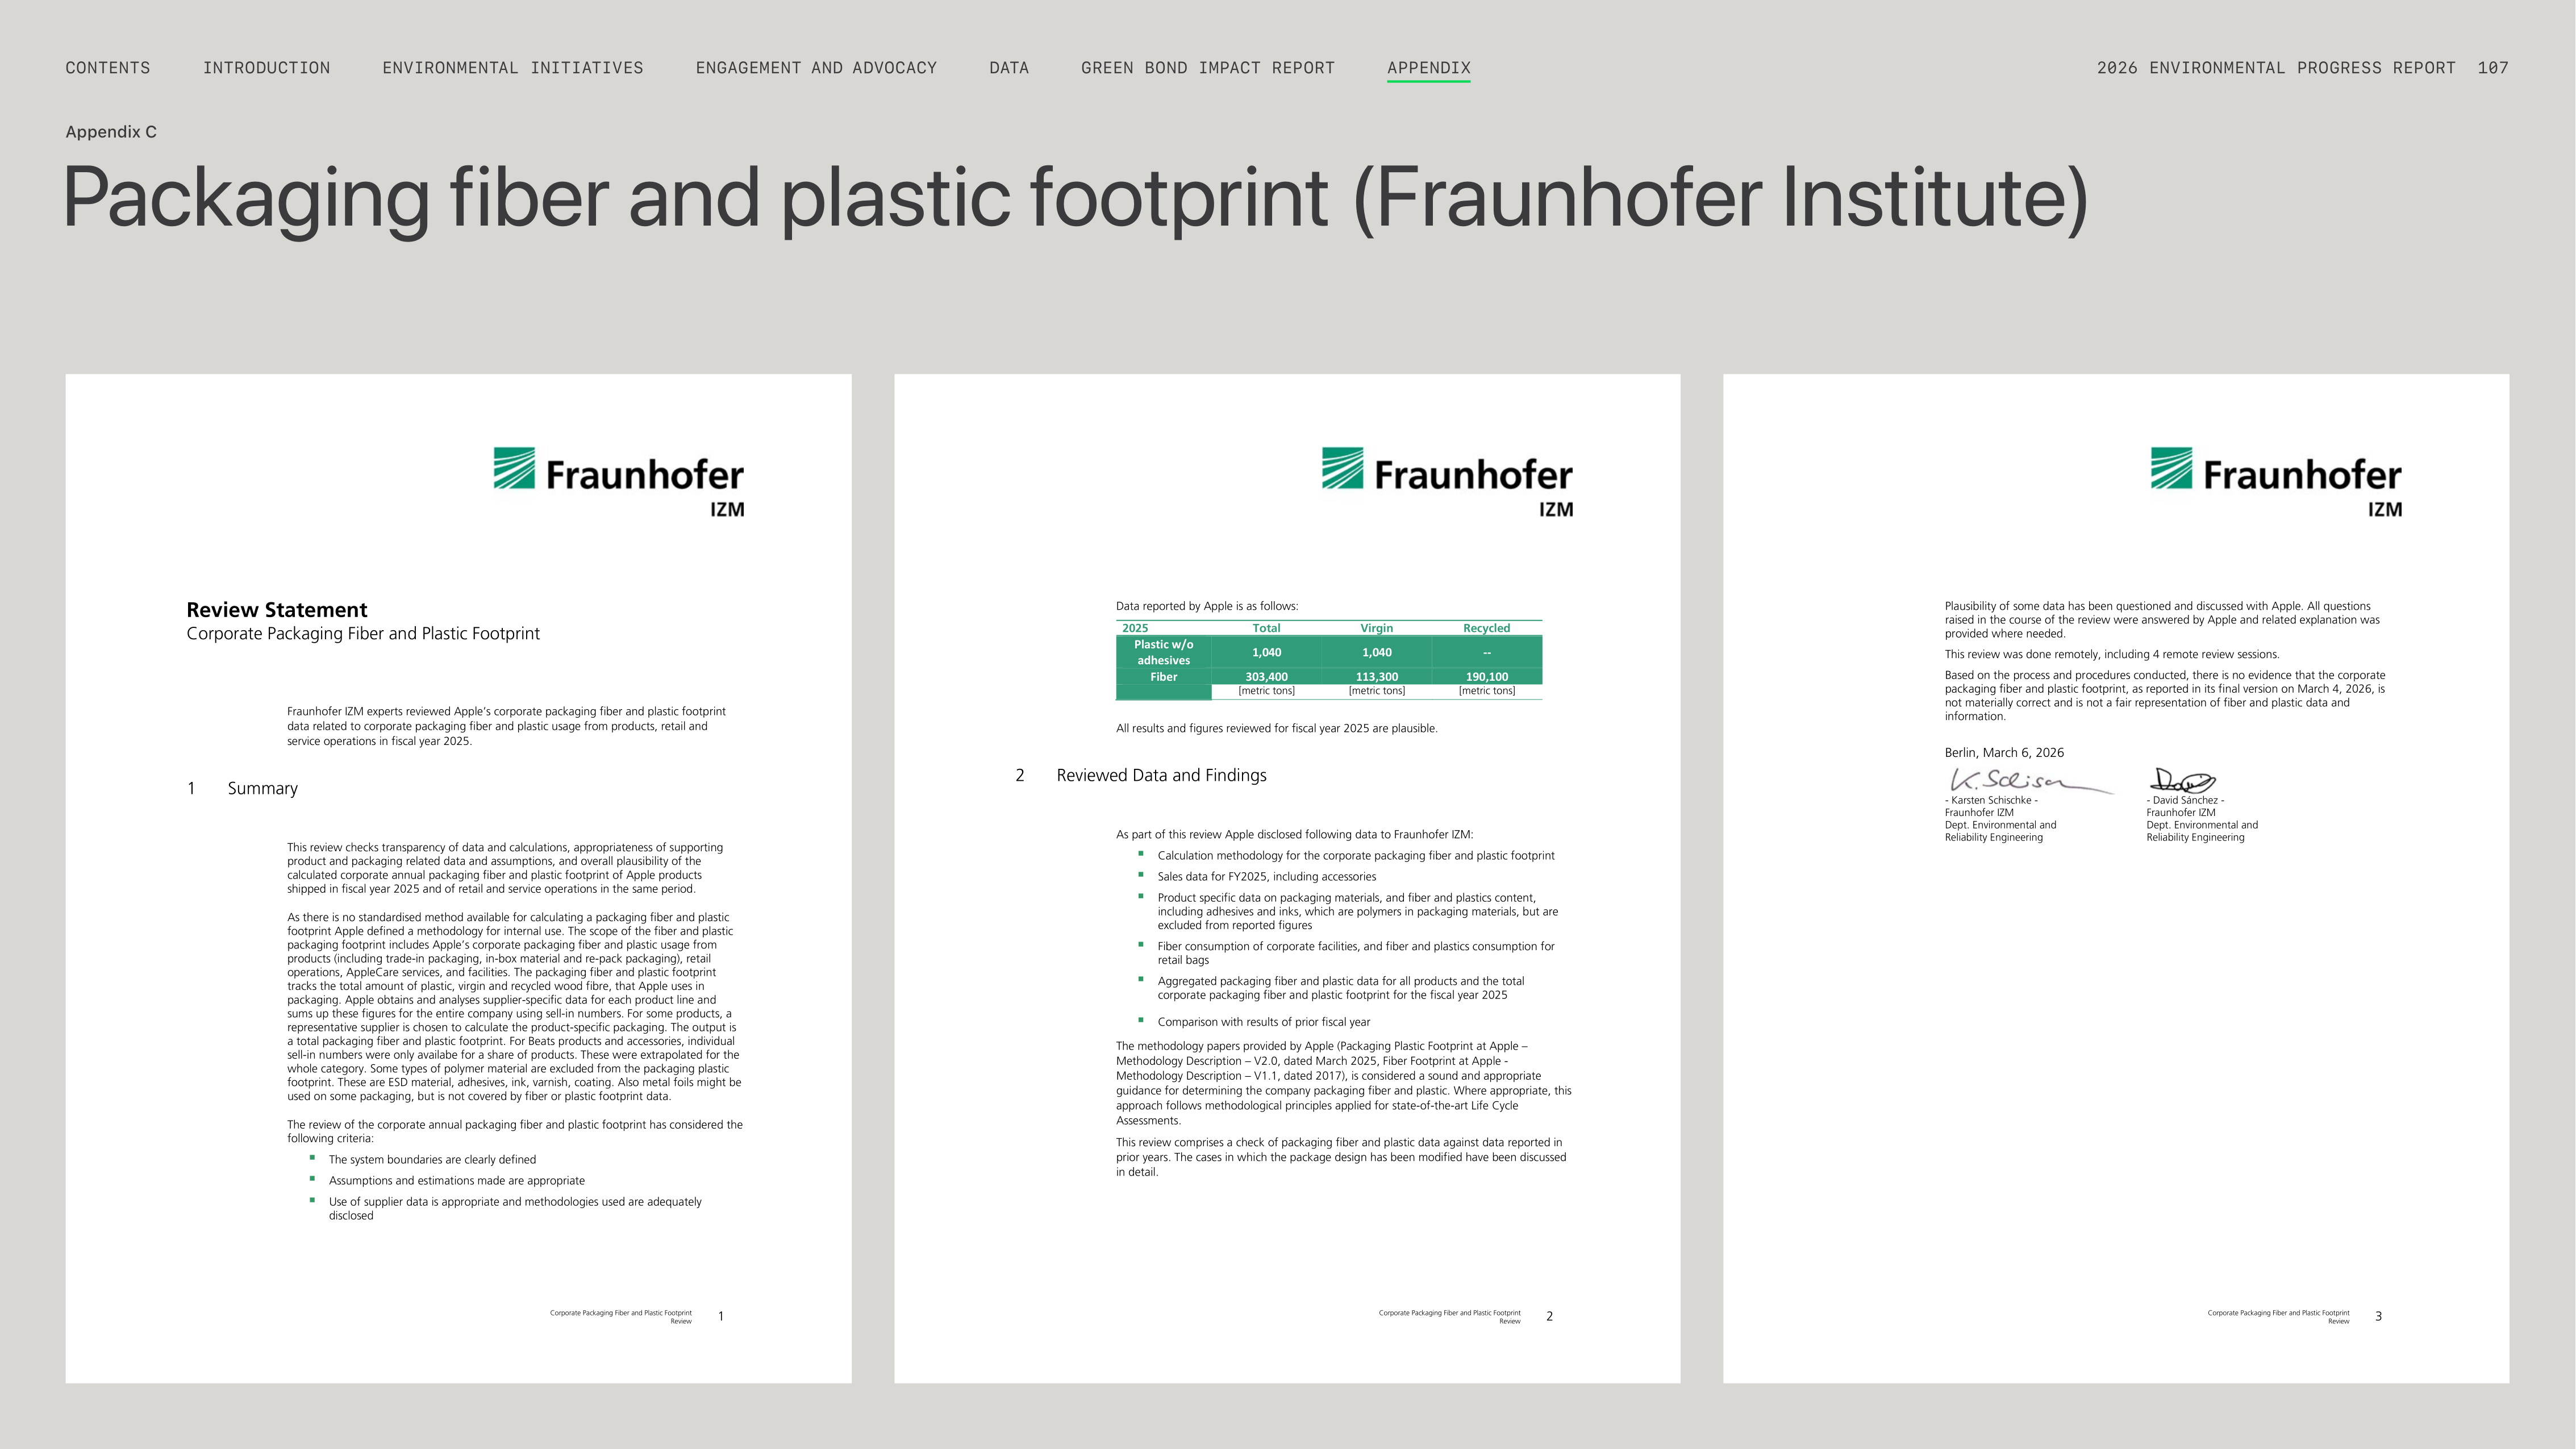



Packaging fiber and plastic footprint (Fraunhofer Institute)
Appendix C
Plastic w/o
adhesives
1,040
1,040
--
Fiber
303,400
113,300
190,100
ENGAGEMENT AND ADVOCACY
ENVIRONMENTAL INITIATIVES
INTRODUCTION
CONTENTS
GREEN BOND IMPACT REPORT
DATA
2026 ENVIRONMENTAL PROGRESS REPORT
107
APPENDIX
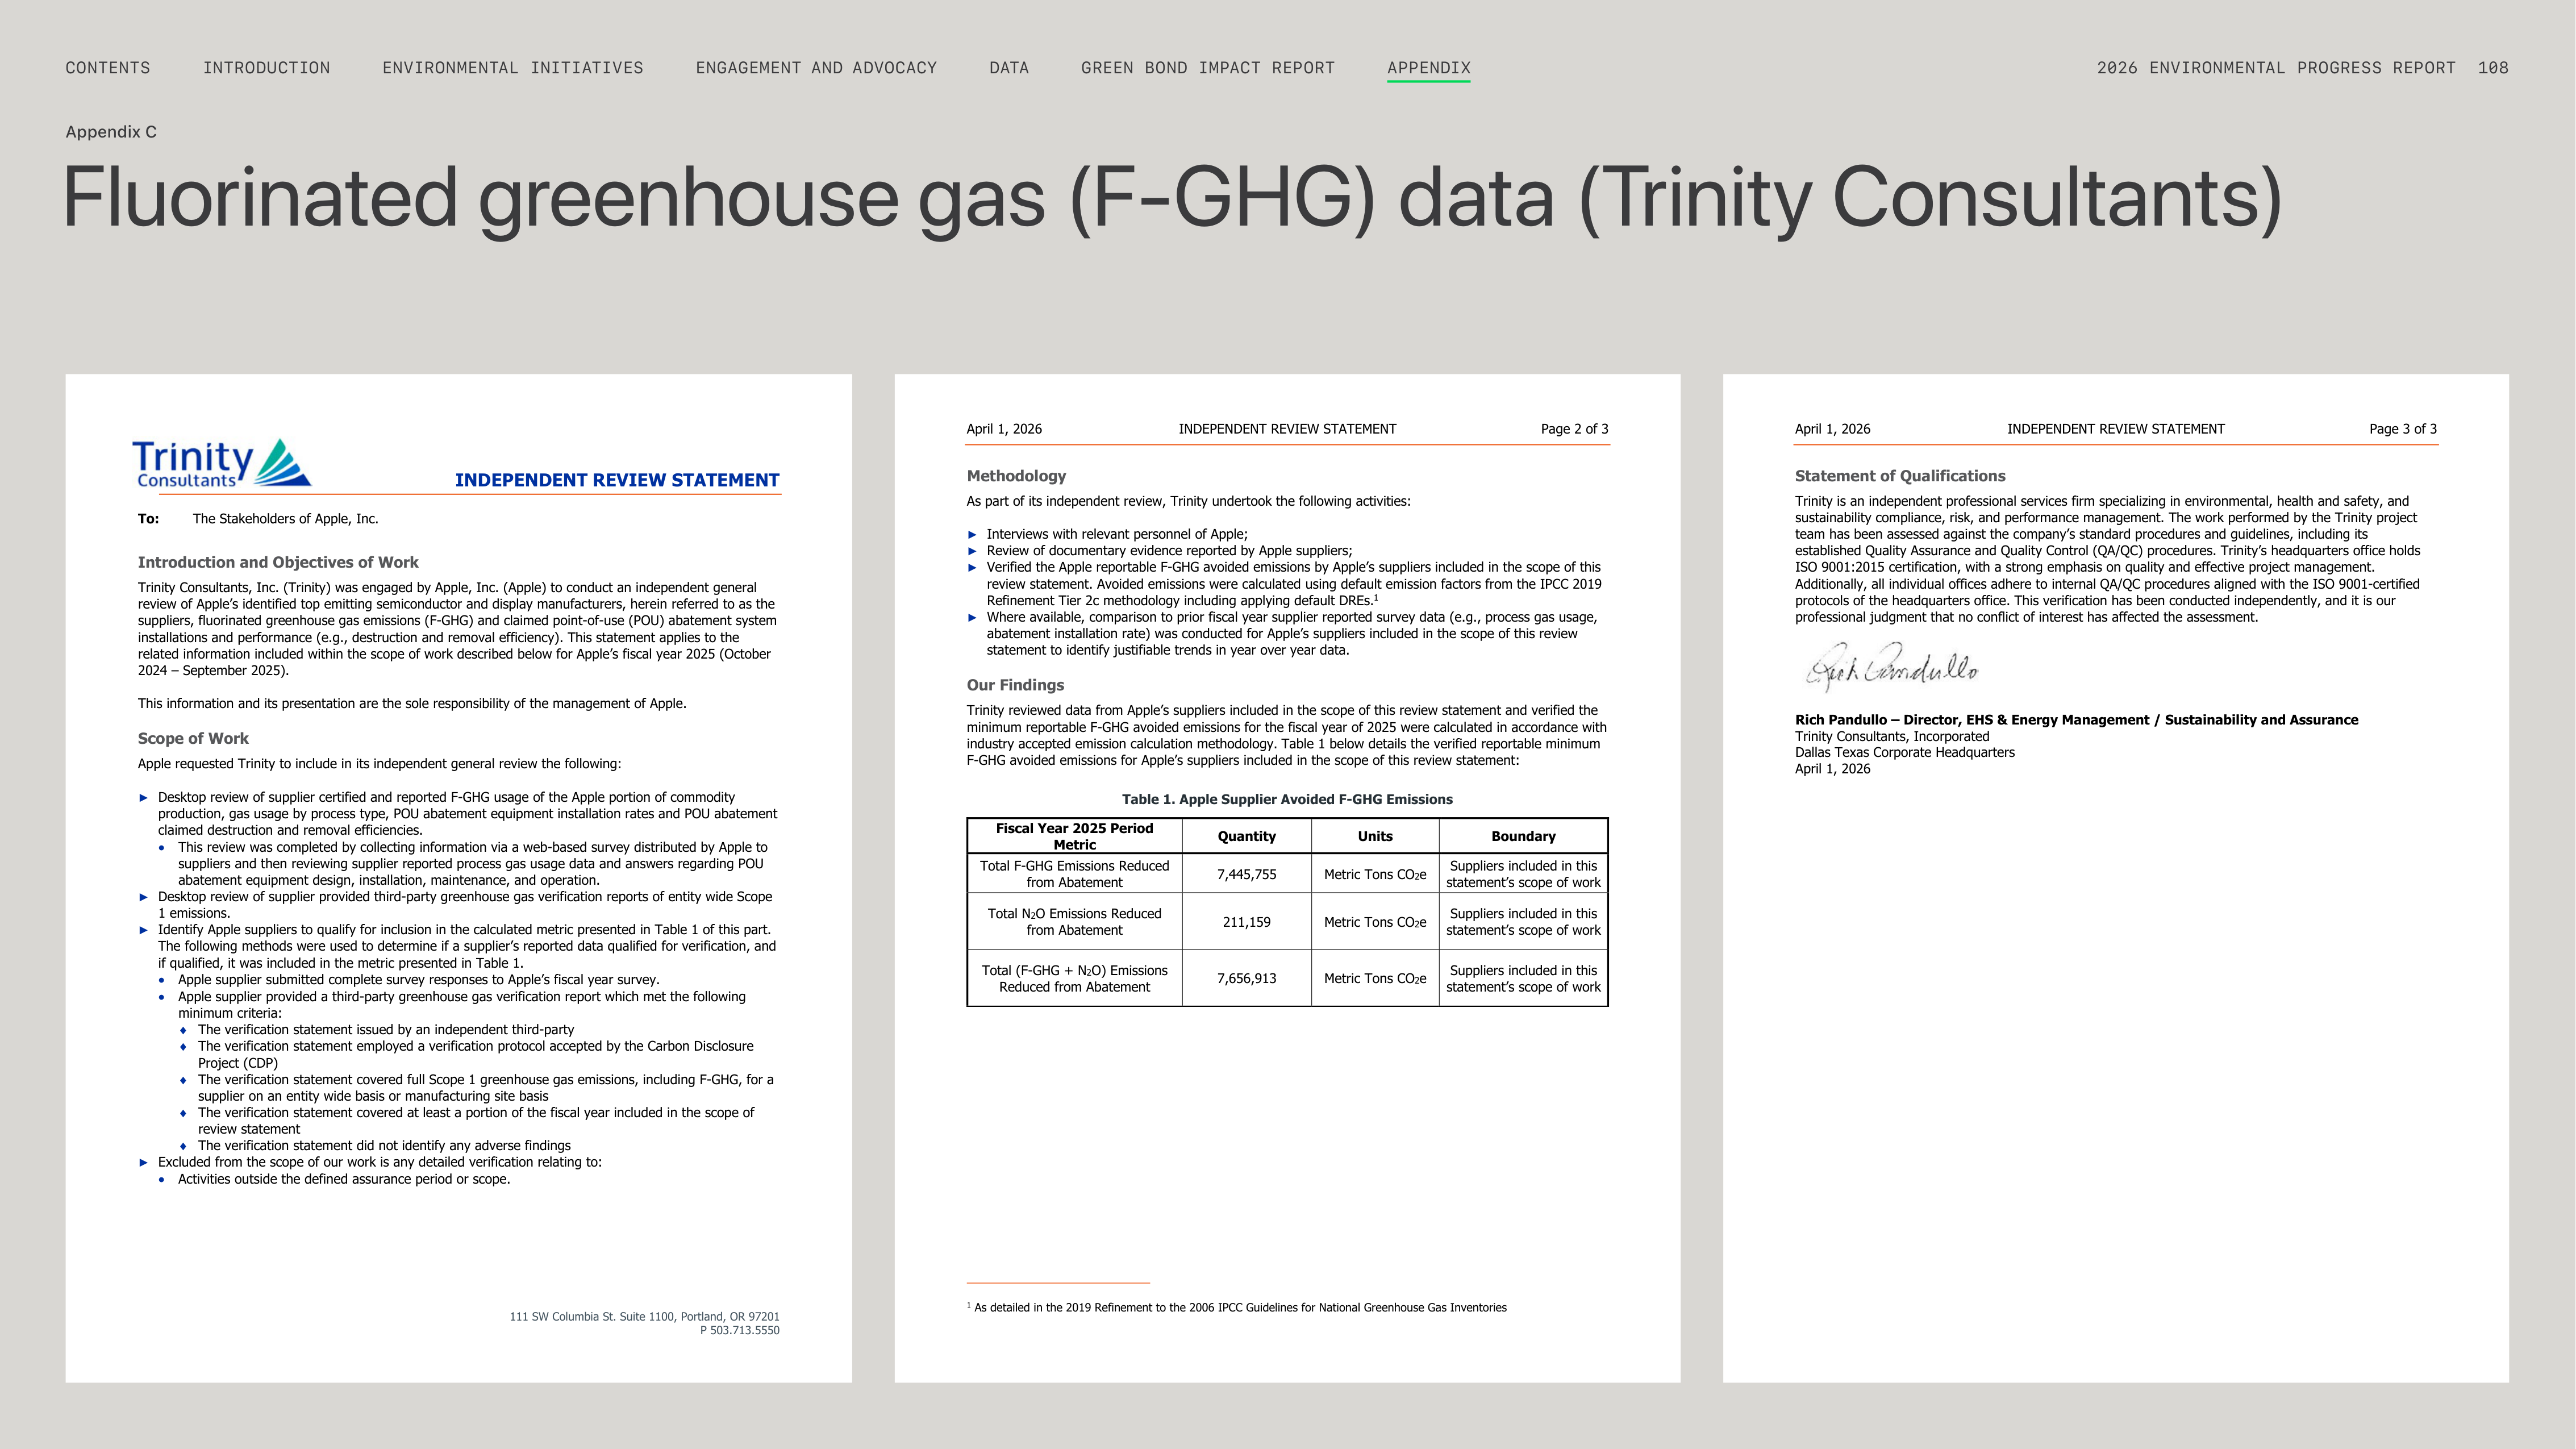


Fluorinated greenhouse gas (F-GHG) data (Trinity Consultants)
Appendix C
INDEPENDENT REVIEW STATEMENT
111 SW Columbia St. Suite 1100, Portland, OR 97201
P 503.713.5550
To:
The Stakeholders of Apple, Inc.
Introduction and Objectives of Work
Trinity Consultants, Inc. (Trinity) was engaged by Apple, Inc. (Apple) to conduct an independent general
review of Apple’s identified top emitting semiconductor and display manufacturers, herein referred to as the
suppliers, fluorinated greenhouse gas emissions (F-GHG) and claimed point-of-use (POU) abatement system
installations and performance (e.g., destruction and removal efficiency). This statement applies to the
related information included within the scope of work described below for Apple’s fiscal year 2025 (October
2024 – September 2025).
This information and its presentation are the sole responsibility of the management of Apple.
Scope of Work
Apple requested Trinity to include in its independent general review the following:
►
Desktop review of supplier certified and reported F-GHG usage of the Apple portion of commodity
production, gas usage by process type, POU abatement equipment installation rates and POU abatement
claimed destruction and removal efficiencies.
This review was completed by collecting information via a web-based survey distributed by Apple to
suppliers and then reviewing supplier reported process gas usage data and answers regarding POU
abatement equipment design, installation, maintenance, and operation.
►
Desktop review of supplier provided third-party greenhouse gas verification reports of entity wide Scope
1 emissions.
►
Identify Apple suppliers to qualify for inclusion in the calculated metric presented in Table 1 of this part.
The following methods were used to determine if a supplier’s reported data qualified for verification, and
if qualified, it was included in the metric presented in Table 1.
Apple supplier submitted complete survey responses to Apple’s fiscal year survey.
Apple supplier provided a third-party greenhouse gas verification report which met the following
minimum criteria:
The verification statement issued by an independent third-party
The verification statement employed a verification protocol accepted by the Carbon Disclosure
Project (CDP)
The verification statement covered full Scope 1 greenhouse gas emissions, including F-GHG, for a
supplier on an entity wide basis or manufacturing site basis
The verification statement covered at least a portion of the fiscal year included in the scope of
review statement
The verification statement did not identify any adverse findings
►
Excluded from the scope of our work is any detailed verification relating to:
Activities outside the defined assurance period or scope.
April 1, 2026
INDEPENDENT REVIEW STATEMENT
Page 2 of 3
Methodology
As part of its independent review, Trinity undertook the following activities:
►
Interviews with relevant personnel of Apple;
►
Review of documentary evidence reported by Apple suppliers;
►
Verified the Apple reportable F-GHG avoided emissions by Apple’s suppliers included in the scope of this
review statement. Avoided emissions were calculated using default emission factors from the IPCC 2019
Refinement Tier 2c methodology including applying default DREs.
1
►
Where available, comparison to prior fiscal year supplier reported survey data (e.g., process gas usage,
abatement installation rate) was conducted for Apple’s suppliers included in the scope of this review
statement to identify justifiable trends in year over year data.
Our Findings
Trinity reviewed data from Apple’s suppliers included in the scope of this review statement and verified the
minimum reportable F-GHG avoided emissions for the fiscal year of 2025 were calculated in accordance with
industry accepted emission calculation methodology. Table 1 below details the verified reportable minimum
F-GHG avoided emissions for Apple’s suppliers included in the scope of this review statement:
Table 1. Apple Supplier Avoided F-GHG Emissions
Fiscal Year 2025 Period
Metric
Quantity
Units
Boundary
Total F-GHG Emissions Reduced
from Abatement
7,445,755
Metric Tons CO
2
e
Suppliers included in this
statement’s scope of work
Total N
2
O Emissions Reduced
from Abatement
211,159
Metric Tons CO
2
e
Suppliers included in this
statement’s scope of work
Total (F-GHG + N
2
O) Emissions
Reduced from Abatement
7,656,913
Metric Tons CO
2
e
Suppliers included in this
statement’s scope of work
1
As detailed in the 2019 Refinement to the 2006 IPCC Guidelines for National Greenhouse Gas Inventories
April 1, 2026
INDEPENDENT REVIEW STATEMENT
Page 3 of 3
Statement of Qualifications
Trinity is an independent professional services firm specializing in environmental, health and safety, and
sustainability compliance, risk, and performance management. The work performed by the Trinity project
team has been assessed against the company’s standard procedures and guidelines, including its
established Quality Assurance and Quality Control (QA/QC) procedures. Trinity’s headquarters office holds
ISO 9001:2015 certification, with a strong emphasis on quality and effective project management.
Additionally, all individual offices adhere to internal QA/QC procedures aligned with the ISO 9001-certified
protocols of the headquarters office. This verification has been conducted independently, and it is our
professional judgment that no conflict of interest has affected the assessment.
Rich Pandullo – Director, EHS & Energy Management / Sustainability and Assurance
Trinity Consultants, Incorporated
Dallas Texas Corporate Headquarters
April 1, 2026
ENGAGEMENT AND ADVOCACY
ENVIRONMENTAL INITIATIVES
INTRODUCTION
CONTENTS
GREEN BOND IMPACT REPORT
DATA
2026 ENVIRONMENTAL PROGRESS REPORT
108
APPENDIX
Environment, Health and Safety Policy
Appendix D
Mission Statement
Apple Inc. is committed to protecting the environment,
health and safety (EHS) of our employees, customers, and
contractors in the design, research, manufacture, distribution,
and use of our products and services in the global
communities where we operate.
We recognize that by integrating best EHS management
practices into all aspects of our business, we can offer
technologically innovative products and services while
conserving and enhancing resources for future generations.
Apple strives for continuous improvement in our EHS
management systems and in the environmental quality of our
products, processes, and services.
Guiding Principles
Meet or exceed all applicable EHS requirements through the
design and safe management of our facilities.
Apply higher standards to protect human health and the
environment, where laws and regulations do not provide
adequate controls.
Promote responsible management and stewardship of clean
energy, water, waste, resources, and biodiversity.
Encourage contractors, vendors, and suppliers to provide safe
working conditions, treat workers with dignity and respect,
and act fairly and ethically.
Support and promote best scientific principles, best practices,
and public policy initiatives that enhance environmental
quality, health and safety performance, and the responsible
sourcing of materials.
Communicate EHS policies and programs to Apple employees
and stakeholders, and hold its suppliers accountable to
Appleʼs Supplier Code of Conduct: apple.com/supplychain.
Strive to create products that are safe in their intended
use and are manufactured in alignment with our strict
environmental standards.
Pursue continual improvement through the evaluation of our
EHS performance by monitoring ongoing performance results
through periodic management reviews, and committing to
correct EHS nonconformities.
Ensure that all employees are aware of their role and
responsibility to fulfill and sustain Appleʼs EHS management
systems and policy by providing training and tools in the
userʼs primary language.
February 2026
ENGAGEMENT AND ADVOCACY
ENVIRONMENTAL INITIATIVES
INTRODUCTION
CONTENTS
GREEN BOND IMPACT REPORT
DATA
2026 ENVIRONMENTAL PROGRESS REPORT
109
APPENDIX
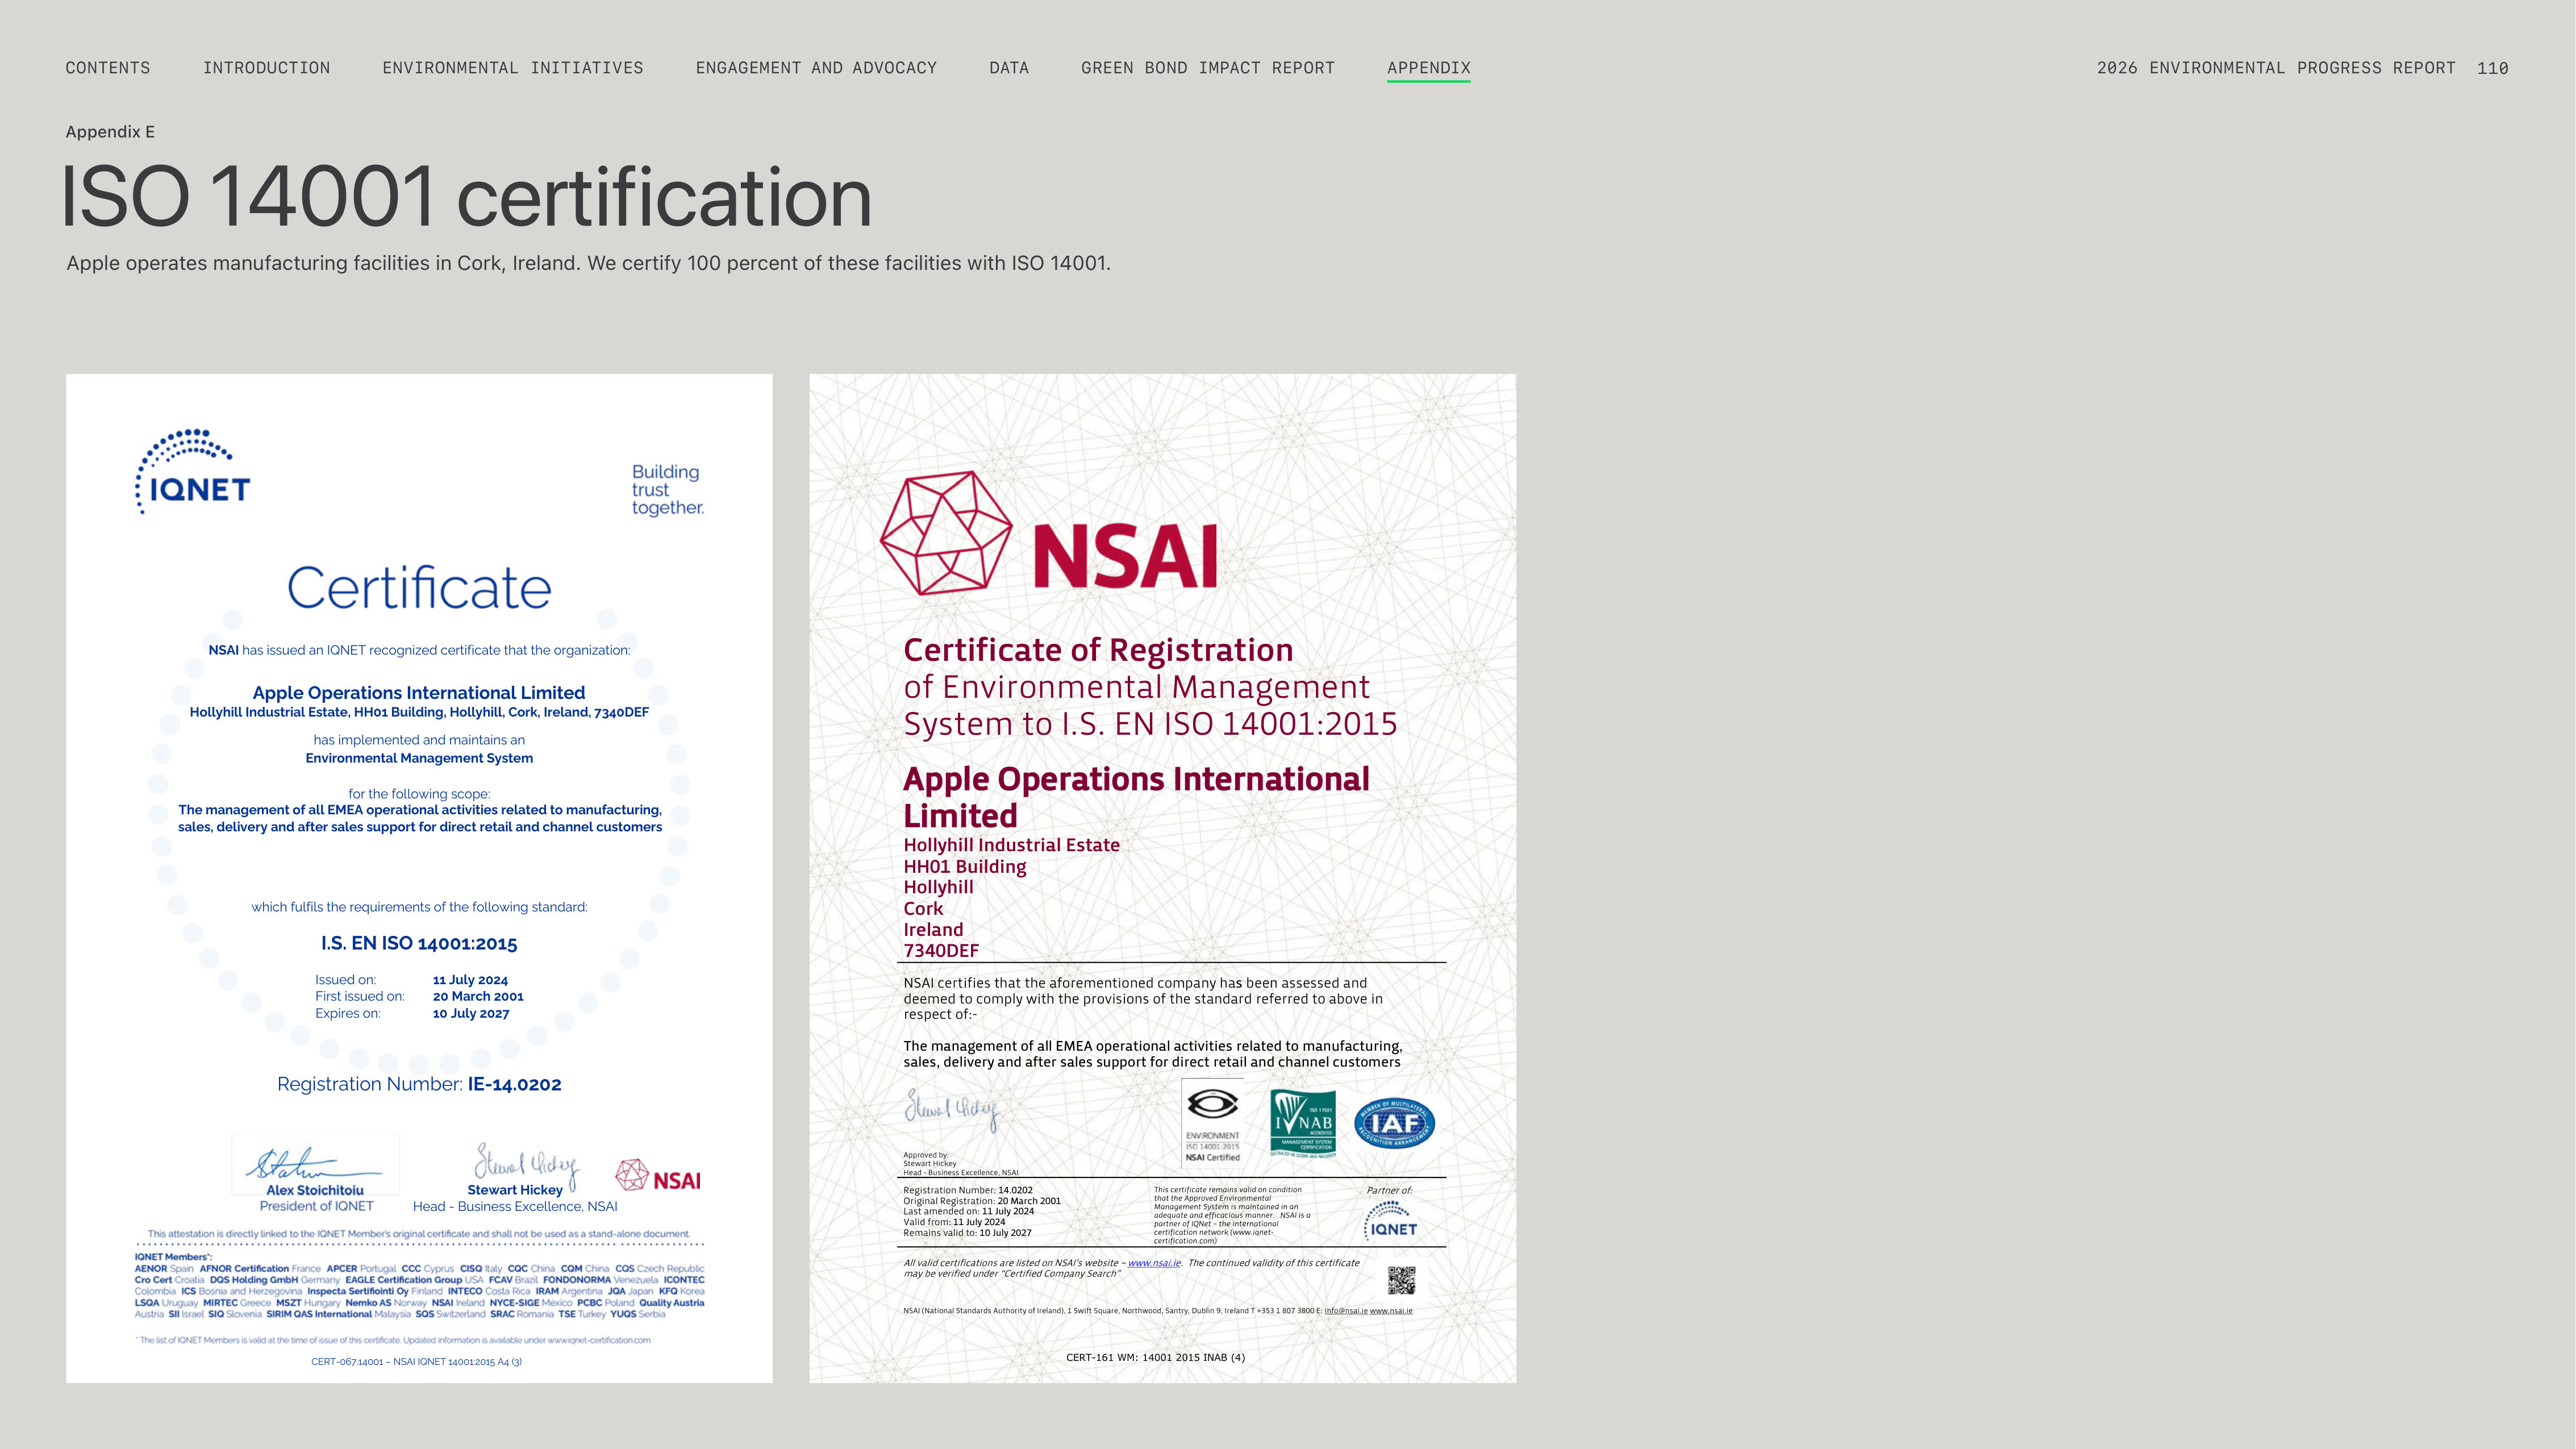









ISO 14001 certification
Appendix E
Apple operates manufacturing facilities in Cork, Ireland. We certify 100 percent of these facilities with ISO 14001.
CERT-067.14001 – NSAI IQNET 14001:2015 A4 (3)
Stewart Hickey
Head - Business Excellence, NSAI
NSAI
has issued an IQNET recognized certificate that the organization:
Apple Operations International Limited
Hollyhill Industrial Estate, HH01 Building, Hollyhill, Cork, Ireland, 7340DEF
has implemented and maintains an
Environmental Management System
for the following scope:
The management of all EMEA operational activities related to manufacturing,
sales, delivery and after sales support for direct retail and channel customers
which fulfils the requirements of the following standard:
I.S. EN ISO 14001:2015
Issued on:
11 July 2024
First issued on:
20 March 2001
Expires on:
10 July 2027
Registration Number:
IE-14.0202
CERT-161 WM: 14001 2015 INAB (4)
Certificate of Registration
of Environmental Management
System to I.S. EN ISO 14001:2015
Apple Operations International
Limited
Hollyhill Industrial Estate
HH01 Building
Hollyhill
Cork
Ireland
7340DEF
NSAI certifies that
the aforementioned company ha
s
been assessed and
deemed to comply with the provisions of the standard referred to above in
respect of:-
The management of all EMEA operational activities related to manufacturing,
sales, delivery and after sales support for direct retail and channel customers
Approved by
:
Stewart Hickey
Head - Business Excellence, NSAI
Registration Number:
14.0202
Original Registration:
20 March 2001
Last amended on:
11 July 2024
Valid from:
11 July 2024
Remains valid to:
10 July 2027
This certificate remains valid on condition
that the Approved Environmental
Management System is maintained in an
adequate and efficacious manner. NSAI is a
partner of IQNet – the international
certification network (www.iqnet-
certification.com)
Partner of:
All valid certifications are listed on NSAI’s website –
www.nsai.ie
. The continued validity of this certificate
may be verified under “Certified Company Search”
NSAI (National Standards Authority of Ireland), 1 Swift Square, Northwood, Santry, Dublin 9, Ireland T +353 1 807 3800 E: info@nsai.ie www.nsai.ie
ENGAGEMENT AND ADVOCACY
ENVIRONMENTAL INITIATIVES
INTRODUCTION
CONTENTS
GREEN BOND IMPACT REPORT
DATA
2026 ENVIRONMENTAL PROGRESS REPORT
110
APPENDIX
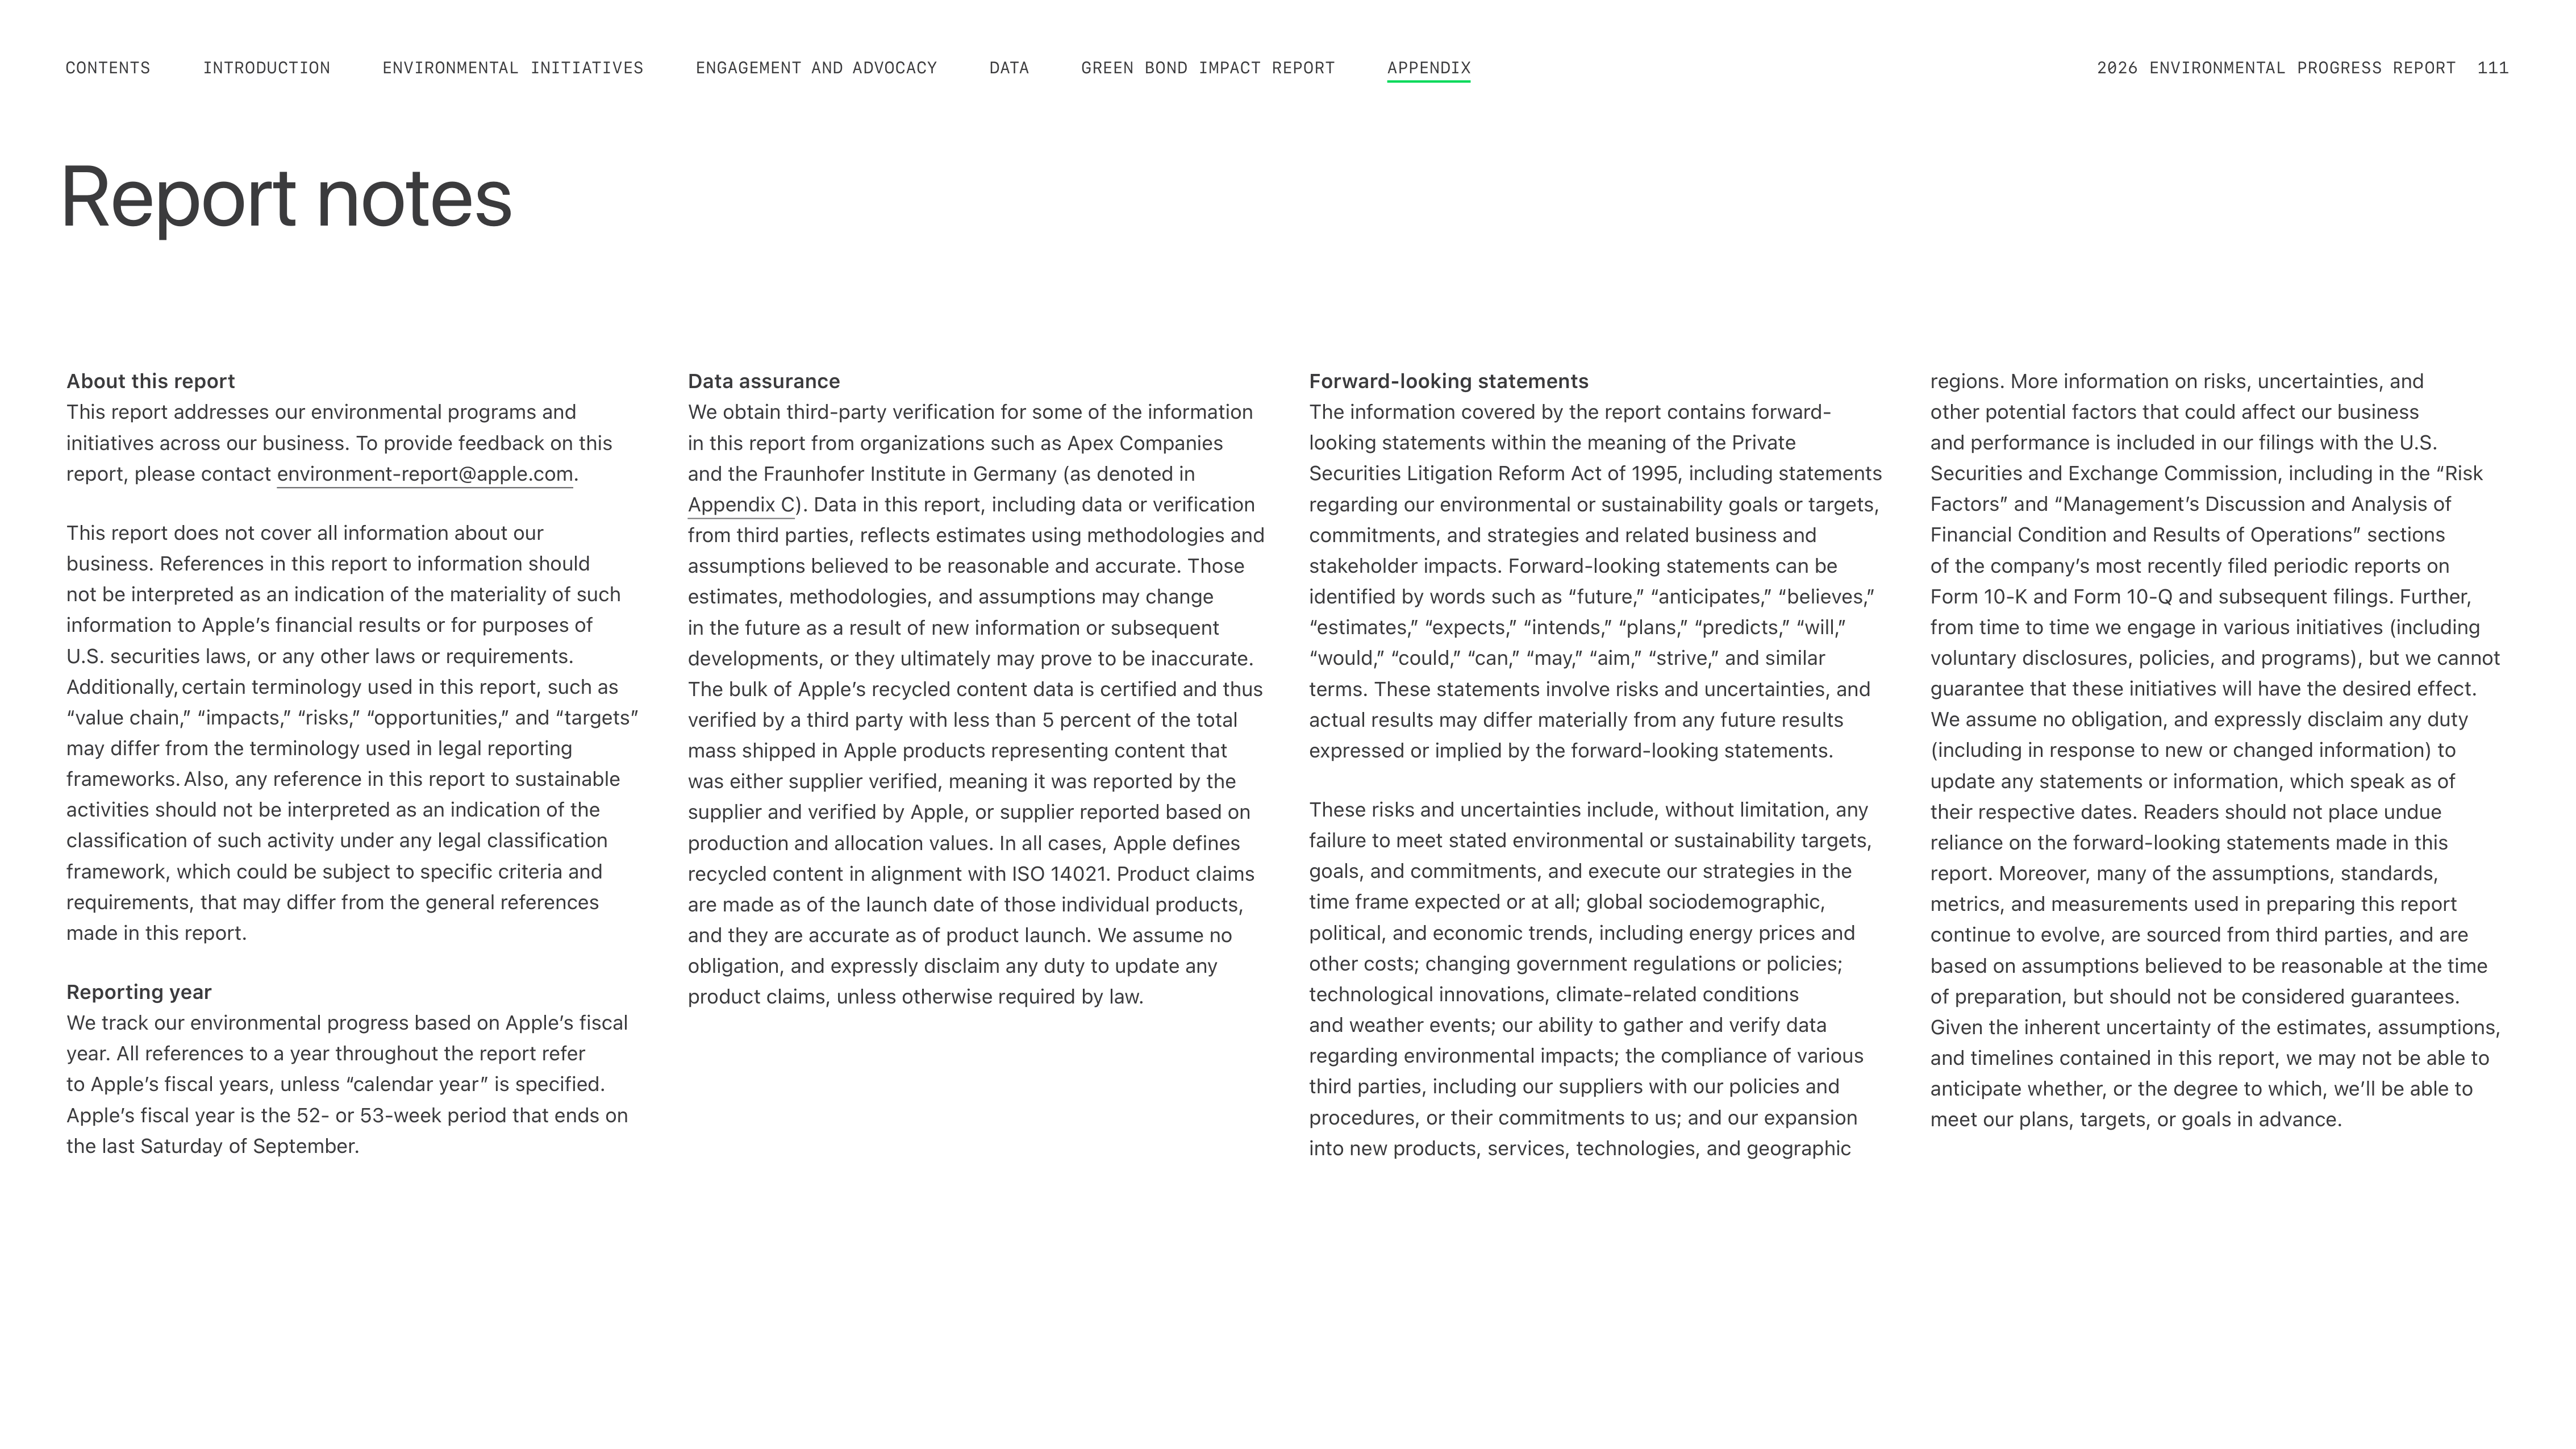
Report notes
About this report
This report addresses our environmental programs and
initiatives across our business. To provide feedback on this
report, please contact environment-report@apple.com.
This report does not cover all information about our
business. References in this report to information should
not be interpreted as an indication of the materiality of such
information to Appleʼs financial results or for purposes of
U.S. securities laws, or any other laws or requirements.
Additionally, certain terminology used in this report, such as
“value chain,” “impacts,” “risks,” “opportunities,” and “targets”
may differ from the terminology used in legal reporting
frameworks. Also, any reference in this report to sustainable
activities should not be interpreted as an indication of the
classification of such activity under any legal classification
framework, which could be subject to specific criteria and
requirements, that may differ from the general references
made in this report.
Reporting year
We track our environmental progress based on Appleʼs fiscal
year. All references to a year throughout the report refer
to Appleʼs fiscal years, unless “calendar year” is specified.
Appleʼs fiscal year is the 52- or 53-week period that ends on
the last Saturday of September.
Data assurance
We obtain third-party verification for some of the information
in this report from organizations such as Apex Companies
and the Fraunhofer Institute in Germany (as denoted in
Appendix C). Data in this report, including data or verification
from third parties, reflects estimates using methodologies and
assumptions believed to be reasonable and accurate. Those
estimates, methodologies, and assumptions may change
in the future as a result of new information or subsequent
developments, or they ultimately may prove to be inaccurate.
The bulk of Appleʼs recycled content data is certified and thus
verified by a third party with less than 5 percent of the total
mass shipped in Apple products representing content that
was either supplier verified, meaning it was reported by the
supplier and verified by Apple, or supplier reported based on
production and allocation values. In all cases, Apple defines
recycled content in alignment with ISO 14021. Product claims
are made as of the launch date of those individual products,
and they are accurate as of product launch. We assume no
obligation, and expressly disclaim any duty to update any
product claims, unless otherwise required by law.
Forward-looking statements
The information covered by the report contains forward-
looking statements within the meaning of the Private
Securities Litigation Reform Act of 1995, including statements
regarding our environmental or sustainability goals or targets,
commitments, and strategies and related business and
stakeholder impacts. Forward-looking statements can be
identified by words such as “future,” “anticipates,” “believes,”
“estimates,” “expects,” “intends,” “plans,” “predicts,” “will,”
“would,” “could,” “can,” “may,” “aim,” “strive,” and similar
terms. These statements involve risks and uncertainties, and
actual results may differ materially from any future results
expressed or implied by the forward-looking statements.
These risks and uncertainties include, without limitation, any
failure to meet stated environmental or sustainability targets,
goals, and commitments, and execute our strategies in the
time frame expected or at all; global sociodemographic,
political, and economic trends, including energy prices and
other costs; changing government regulations or policies;
technological innovations, climate-related conditions
and weather events; our ability to gather and verify data
regarding environmental impacts; the compliance of various
third parties, including our suppliers with our policies and
procedures, or their commitments to us; and our expansion
into new products, services, technologies, and geographic
regions. More information on risks, uncertainties, and
other potential factors that could affect our business
and performance is included in our filings with the U.S.
Securities and Exchange Commission, including in the “Risk
Factors” and “Managementʼs Discussion and Analysis of
Financial Condition and Results of Operations” sections
of the companyʼs most recently filed periodic reports on
Form 10-K and Form 10-Q and subsequent filings. Further,
from time to time we engage in various initiatives (including
voluntary disclosures, policies, and programs), but we cannot
guarantee that these initiatives will have the desired effect.
We assume no obligation, and expressly disclaim any duty
(including in response to new or changed information) to
update any statements or information, which speak as of
their respective dates. Readers should not place undue
reliance on the forward-looking statements made in this
report. Moreover, many of the assumptions, standards,
metrics, and measurements used in preparing this report
continue to evolve, are sourced from third parties, and are
based on assumptions believed to be reasonable at the time
of preparation, but should not be considered guarantees.
Given the inherent uncertainty of the estimates, assumptions,
and timelines contained in this report, we may not be able to
anticipate whether, or the degree to which, weʼll be able to
meet our plans, targets, or goals in advance.
ENGAGEMENT AND ADVOCACY
ENVIRONMENTAL INITIATIVES
INTRODUCTION
CONTENTS
GREEN BOND IMPACT REPORT
DATA
2026 ENVIRONMENTAL PROGRESS REPORT
111
APPENDIX
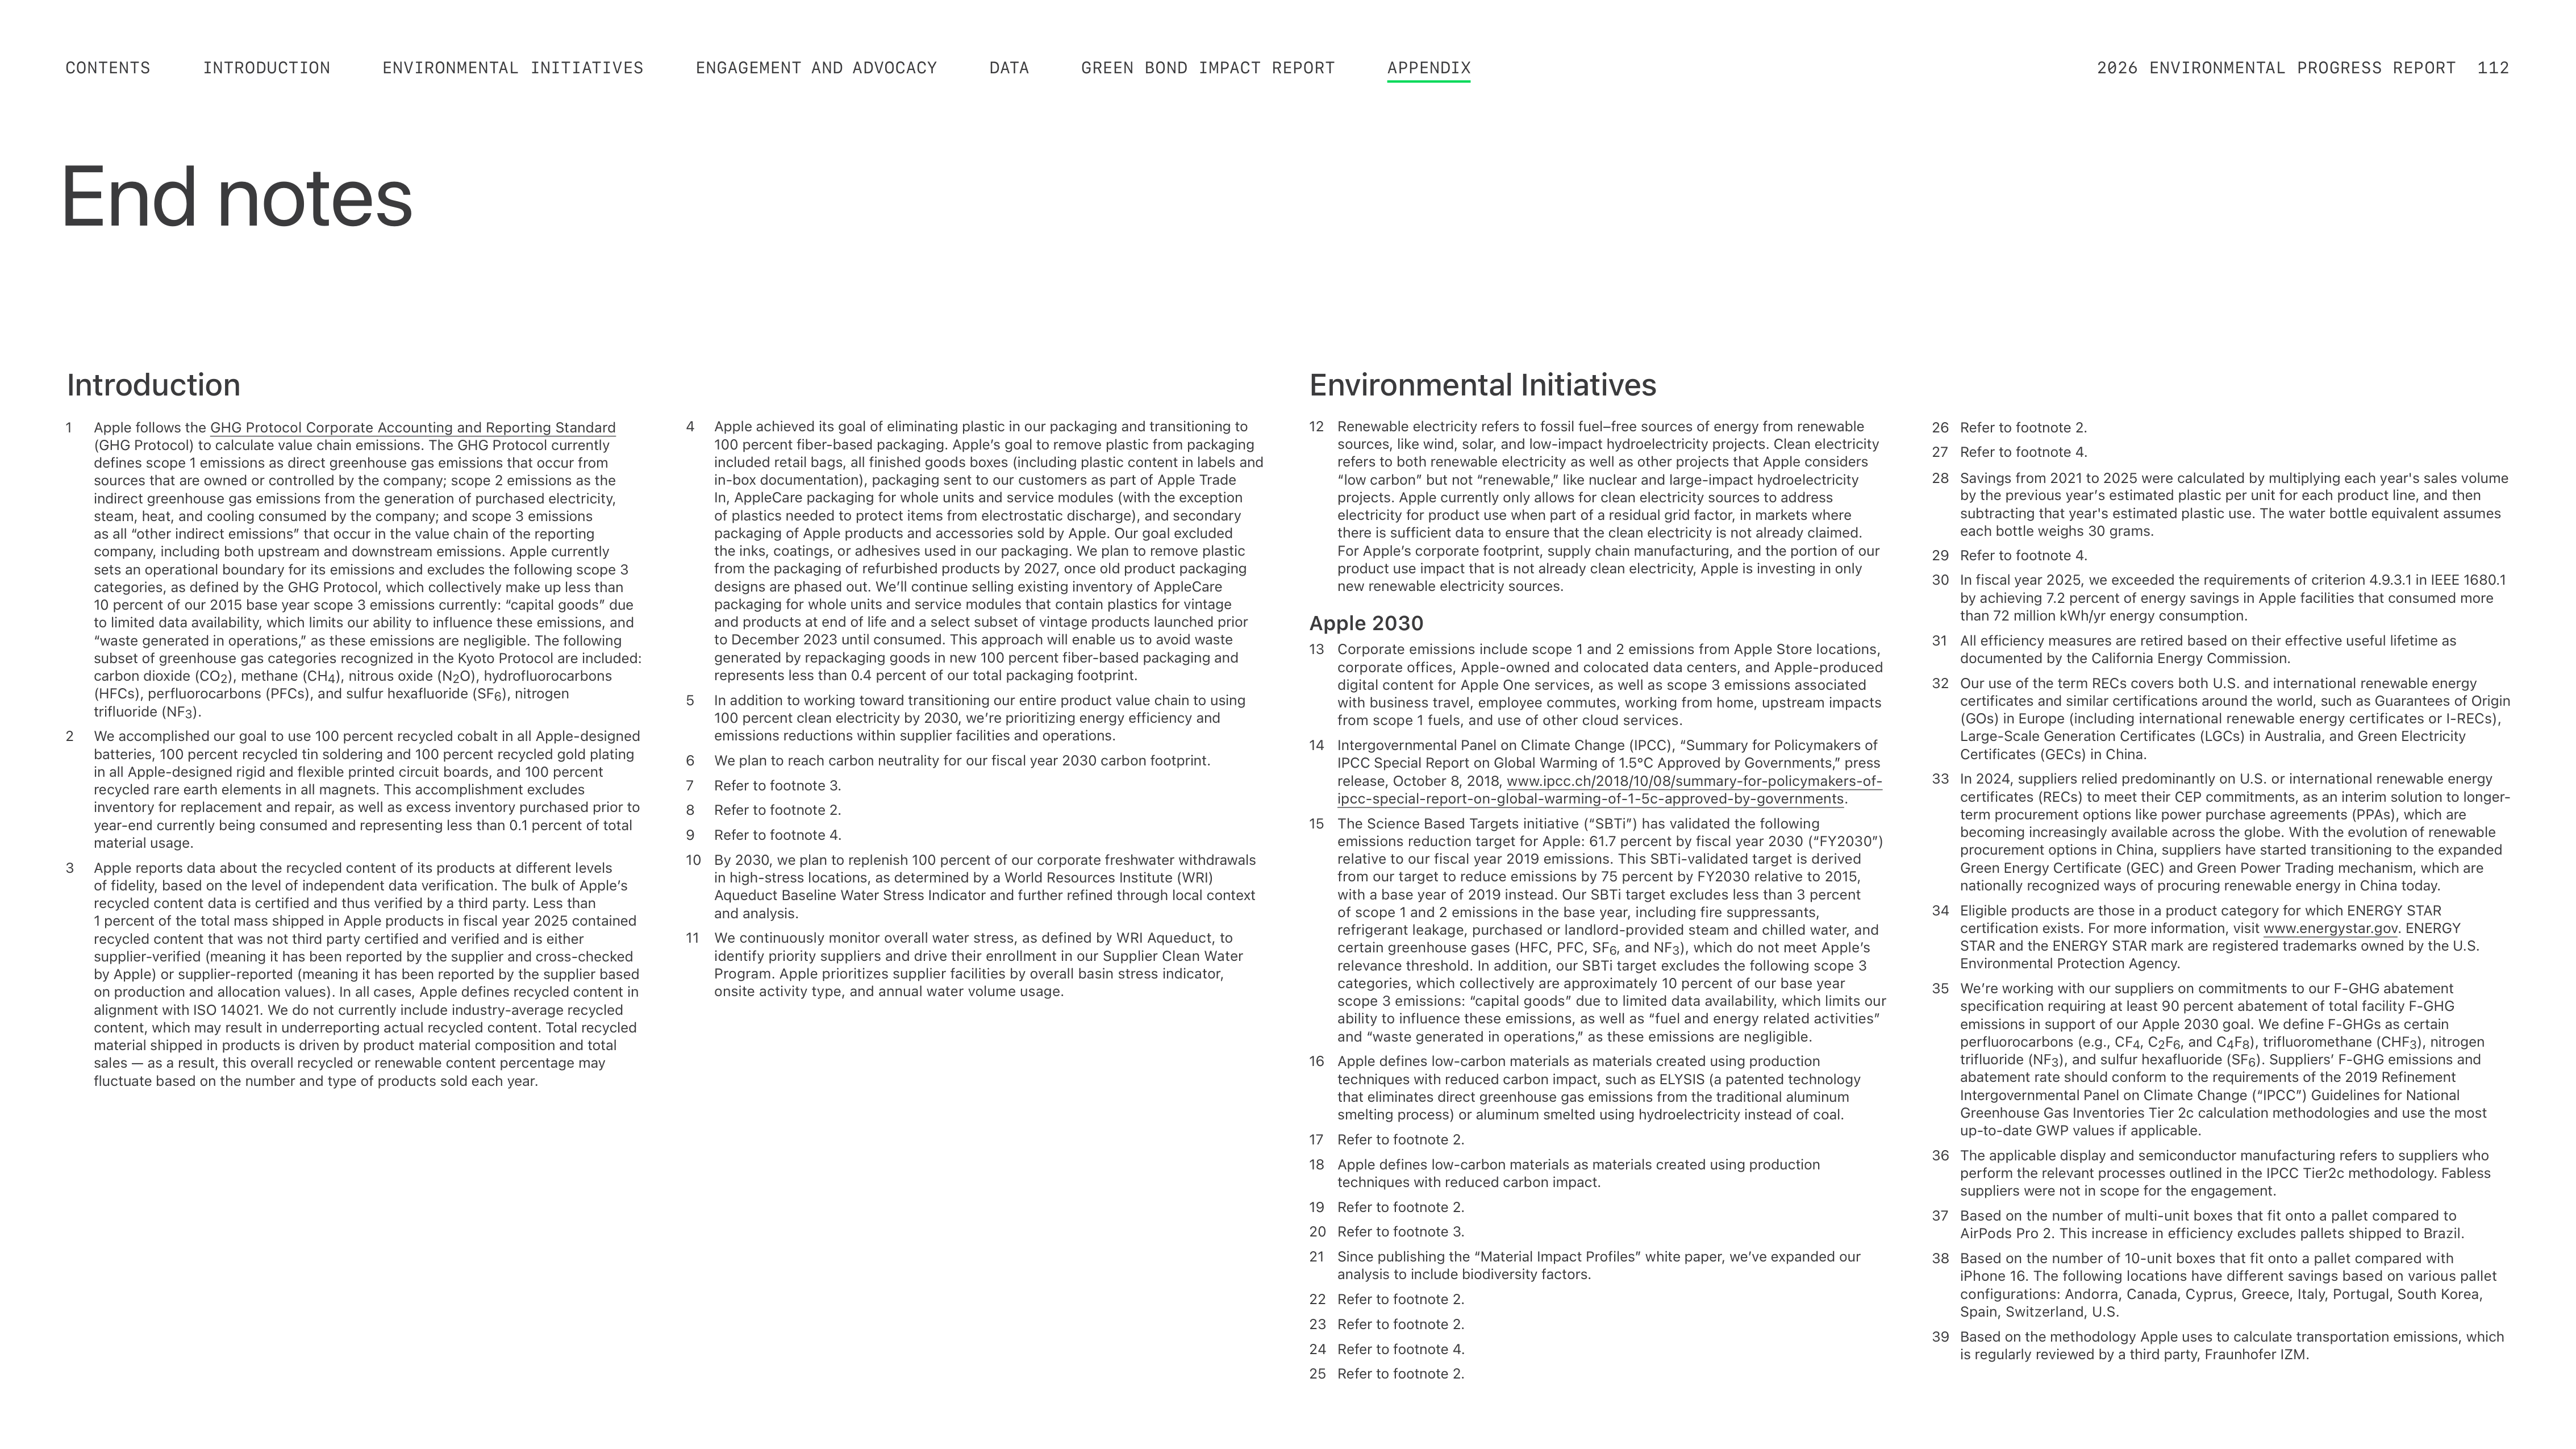
End notes
Introduction
Environmental Initiatives
Apple 2030
13
Corporate emissions include scope 1 and 2 emissions from Apple Store locations,
corporate offices, Apple-owned and colocated data centers, and Apple-produced
digital content for Apple One services, as well as scope 3 emissions associated
with business travel, employee commutes, working from home, upstream impacts
from scope 1 fuels, and use of other cloud services.
14
Intergovernmental Panel on Climate Change (IPCC), “Summary for Policymakers of
IPCC Special Report on Global Warming of 1.5°C Approved by Governments,” press
release, October 8, 2018, www.ipcc.ch/2018/10/08/summary-for-policymakers-of-
ipcc-special-report-on-global-warming-of-1-5c-approved-by-governments.
15
The Science Based Targets initiative (“SBTi”) has validated the following
emissions reduction target for Apple: 61.7 percent by fiscal year 2030 (“FY2030”)
relative to our fiscal year 2019 emissions. This SBTi-validated target is derived
from our target to reduce emissions by 75 percent by FY2030 relative to 2015,
with a base year of 2019 instead. Our SBTi target excludes less than 3 percent
of scope 1 and 2 emissions in the base year, including fire suppressants,
refrigerant leakage, purchased or landlord-provided steam and chilled water, and
certain greenhouse gases (HFC, PFC, SF
6
, and NF
3
), which do not meet Appleʼs
relevance threshold. In addition, our SBTi target excludes the following scope 3
categories, which collectively are approximately 10 percent of our base year
scope 3 emissions: “capital goods” due to limited data availability, which limits our
ability to influence these emissions, as well as “fuel and energy related activities”
and “waste generated in operations,” as these emissions are negligible.
16
Apple defines low-carbon materials as materials created using production
techniques with reduced carbon impact, such as ELYSIS (a patented technology
that eliminates direct greenhouse gas emissions from the traditional aluminum
smelting process) or aluminum smelted using hydroelectricity instead of coal.
17
Refer to footnote 2.
18
Apple defines low-carbon materials as materials created using production
techniques with reduced carbon impact.
19
Refer to footnote 2.
20
Refer to footnote 3.
21
Since publishing the “Material Impact Profiles” white paper, weʼve expanded our
analysis to include biodiversity factors.
22
Refer to footnote 2.
23
Refer to footnote 2.
24
Refer to footnote 4.
25
Refer to footnote 2.
1
Apple follows the GHG Protocol Corporate Accounting and Reporting Standard
(GHG Protocol) to calculate value chain emissions. The GHG Protocol currently
defines scope 1 emissions as direct greenhouse gas emissions that occur from
sources that are owned or controlled by the company; scope 2 emissions as the
indirect greenhouse gas emissions from the generation of purchased electricity,
steam, heat, and cooling consumed by the company; and scope 3 emissions
as all “other indirect emissions” that occur in the value chain of the reporting
company, including both upstream and downstream emissions. Apple currently
sets an operational boundary for its emissions and excludes the following scope 3
categories, as defined by the GHG Protocol, which collectively make up less than
10 percent of our 2015 base year scope 3 emissions currently: “capital goods” due
to limited data availability, which limits our ability to influence these emissions, and
“waste generated in operations,” as these emissions are negligible. The following
subset of greenhouse gas categories recognized in the Kyoto Protocol are included:
carbon dioxide (CO
2
), methane (CH
4
), nitrous oxide (N
2
O), hydrofluorocarbons
(HFCs), perfluorocarbons (PFCs), and sulfur hexafluoride (SF
6
), nitrogen
trifluoride (NF
3
).
2
We accomplished our goal to use 100 percent recycled cobalt in all Apple-designed
batteries, 100 percent recycled tin soldering and 100 percent recycled gold plating
in all Apple-designed rigid and flexible printed circuit boards, and 100 percent
recycled rare earth elements in all magnets. This accomplishment excludes
inventory for replacement and repair, as well as excess inventory purchased prior to
year-end currently being consumed and representing less than 0.1 percent of total
material usage.
3
Apple reports data about the recycled content of its products at different levels
of fidelity, based on the level of independent data verification. The bulk of Appleʼs
recycled content data is certified and thus verified by a third party. Less than
1 percent of the total mass shipped in Apple products in fiscal year 2025 contained
recycled content that was not third party certified and verified and is either
supplier-verified (meaning it has been reported by the supplier and cross-checked
by Apple) or supplier-reported (meaning it has been reported by the supplier based
on production and allocation values). In all cases, Apple defines recycled content in
alignment with ISO 14021. We do not currently include industry-average recycled
content, which may result in underreporting actual recycled content. Total recycled
material shipped in products is driven by product material composition and total
sales — as a result, this overall recycled or renewable content percentage may
fluctuate based on the number and type of products sold each year.
12
Renewable electricity refers to fossil fuel–free sources of energy from renewable
sources, like wind, solar, and low-impact hydroelectricity projects. Clean electricity
refers to both renewable electricity as well as other projects that Apple considers
“low carbon” but not “renewable,” like nuclear and large-impact hydroelectricity
projects. Apple currently only allows for clean electricity sources to address
electricity for product use when part of a residual grid factor, in markets where
there is sufficient data to ensure that the clean electricity is not already claimed.
For Appleʼs corporate footprint, supply chain manufacturing, and the portion of our
product use impact that is not already clean electricity, Apple is investing in only
new renewable electricity sources.
4
Apple achieved its goal of eliminating plastic in our packaging and transitioning to
100 percent fiber-based packaging. Appleʼs goal to remove plastic from packaging
included retail bags, all finished goods boxes (including plastic content in labels and
in-box documentation), packaging sent to our customers as part of Apple Trade
In, AppleCare packaging for whole units and service modules (with the exception
of plastics needed to protect items from electrostatic discharge), and secondary
packaging of Apple products and accessories sold by Apple. Our goal excluded
the inks, coatings, or adhesives used in our packaging. We plan to remove plastic
from the packaging of refurbished products by 2027, once old product packaging
designs are phased out. Weʼll continue selling existing inventory of AppleCare
packaging for whole units and service modules that contain plastics for vintage
and products at end of life and a select subset of vintage products launched prior
to December 2023 until consumed. This approach will enable us to avoid waste
generated by repackaging goods in new 100 percent fiber-based packaging and
represents less than 0.4 percent of our total packaging footprint.
5
In addition to working toward transitioning our entire product value chain to using
100 percent clean electricity by 2030, weʼre prioritizing energy efficiency and
emissions reductions within supplier facilities and operations.
6
We plan to reach carbon neutrality for our fiscal year 2030 carbon footprint.
7
Refer to footnote 3.
8
Refer to footnote 2.
9
Refer to footnote 4.
10
By 2030, we plan to replenish 100 percent of our corporate freshwater withdrawals
in high-stress locations, as determined by a World Resources Institute (WRI)
Aqueduct Baseline Water Stress Indicator and further refined through local context
and analysis.
11
We continuously monitor overall water stress, as defined by WRI Aqueduct, to
identify priority suppliers and drive their enrollment in our Supplier Clean Water
Program. Apple prioritizes supplier facilities by overall basin stress indicator,
onsite activity type, and annual water volume usage.
26
Refer to footnote 2.
27
Refer to footnote 4.
28 Savings from 2021 to 2025 were calculated by multiplying each year's sales volume
by the previous yearʼs estimated plastic per unit for each product line, and then
subtracting that year's estimated plastic use. The water bottle equivalent assumes
each bottle weighs 30 grams.
29 Refer to footnote 4.
30 In fiscal year 2025, we exceeded the requirements of criterion 4.9.3.1 in IEEE 1680.1
by achieving 7.2 percent of energy savings in Apple facilities that consumed more
than 72 million kWh/yr energy consumption.
31
All efficiency measures are retired based on their effective useful lifetime as
documented by the California Energy Commission.
32 Our use of the term RECs covers both U.S. and international renewable energy
certificates and similar certifications around the world, such as Guarantees of Origin
(GOs) in Europe (including international renewable energy certificates or I-RECs),
Large-Scale Generation Certificates (LGCs) in Australia, and Green Electricity
Certificates (GECs) in China.
33 In 2024, suppliers relied predominantly on U.S. or international renewable energy
certificates (RECs) to meet their CEP commitments, as an interim solution to longer-
term procurement options like power purchase agreements (PPAs), which are
becoming increasingly available across the globe. With the evolution of renewable
procurement options in China, suppliers have started transitioning to the expanded
Green Energy Certificate (GEC) and Green Power Trading mechanism, which are
nationally recognized ways of procuring renewable energy in China today.
34
Eligible products are those in a product category for which ENERGY STAR
certification exists. For more information, visit www.energystar.gov. ENERGY
STAR and the ENERGY STAR mark are registered trademarks owned by the U.S.
Environmental Protection Agency.
35 Weʼre working with our suppliers on commitments to our F-GHG abatement
specification requiring at least 90 percent abatement of total facility F-GHG
emissions in support of our Apple 2030 goal. We define F-GHGs as certain
perfluorocarbons (e.g., CF
4
, C
2
F
6
, and C
4
F
8
), trifluoromethane (CHF
3
), nitrogen
trifluoride (NF
3
), and sulfur hexafluoride (SF
6
). Suppliersʼ F-GHG emissions and
abatement rate should conform to the requirements of the 2019 Refinement
Intergovernmental Panel on Climate Change (“IPCC”) Guidelines for National
Greenhouse Gas Inventories Tier 2c calculation methodologies and use the most
up-to-date GWP values if applicable.
36 The applicable display and semiconductor manufacturing refers to suppliers who
perform the relevant processes outlined in the IPCC Tier2c methodology. Fabless
suppliers were not in scope for the engagement.
37
Based on the number of multi-unit boxes that fit onto a pallet compared to
AirPods Pro 2. This increase in efficiency excludes pallets shipped to Brazil.
38
Based on the number of 10-unit boxes that fit onto a pallet compared with
iPhone 16. The following locations have different savings based on various pallet
configurations: Andorra, Canada, Cyprus, Greece, Italy, Portugal, South Korea,
Spain, Switzerland, U.S.
39 Based on the methodology Apple uses to calculate transportation emissions, which
is regularly reviewed by a third party, Fraunhofer IZM.
ENGAGEMENT AND ADVOCACY
ENVIRONMENTAL INITIATIVES
INTRODUCTION
CONTENTS
GREEN BOND IMPACT REPORT
DATA
2026 ENVIRONMENTAL PROGRESS REPORT
112
APPENDIX
Environmental Initiatives
continued
Resources
40 Based on data from FDM | CCS Insight from 2023 to mid-2025, comparing average
trade-in price of working-condition smartphones from major brands in key markets.
41
This applies specifically to our U.S.-based Apple Trade In program.
42 We define facility water use as high stress if the area is located within, or withdraws
water from, a basin that has high or extremely high baseline water stress, based
on the Aqueduct Water Risk Atlas V4.0 tool from the World Resources Institute and
refined by additional local knowledge and third-party research.
43 Based on previous estimated consumption.
44 Refer to footnote 11.
45 We account for savings through this program on a fiscal-year basis rather than a
calendar-year basis, as reported in publications before fiscal year 2021.
46 By the end of fiscal year 2030, we plan to replenish 100 percent of our corporate
freshwater withdrawals, starting in high-stress locations, as determined by a WRI
Aqueduct Baseline Water Stress Indicator and further refined through local context
and analysis.
47
Waste diversion rates do not include construction and demolition waste or
electronic waste for fiscal year 2025. Electronic waste is accounted for in the total
metric tons of electronic waste that we sent to recycling, found on page 81.
48 Taiwan Technology Center has been third-party verified by UL Solutions against the
UL 2799Zero Waste to Landfill Environmental Claim Validation Procedure (ECVP).
UL Solutions requires at least 90 percent diversion through methods other than
waste-to-energy to achieve Zero Waste to Landfill (Silver: 90–94 percent, Gold:
95–99 percent, and Platinum: 100 percent) designations.
49 Our Mesa and Prineville data centers are third-party certified as Zero Waste
by USGBC TRUE, receiving their certifications in 2021. Corporate offices in
Sacramento and Los Angeles, California, and data centers in Reno, Nevada, and
Maiden, North Carolina, received TRUE certification in 2024; Cork, Ireland, and
Capital Ridge in Austin, Texas, received it in 2025. Our retail store, Apple Fifth
Avenue received TRUE certification in 2026. TRUE requires 90 percent diversion or
higher from the landfill without the use of waste-to-energy to achieve the TRUE-
certified project designation.
50 All established final assembly supplier sites — or those that have been Apple
suppliers for more than one year — for iPhone, iPad, Mac, Apple Watch, AirPods,
HomePod, Apple TV, and Beats have been third-party verified by UL Solutions
against the UL 2799 Zero Waste to Landfill Environmental Claim Validation
Procedure (ECVP). UL Solutions requires at least 90 percent diversion through
methods other than waste-to-energy to achieve Zero Waste to Landfill (Silver:
90–94 percent, Gold: 95–99 percent, and Platinum: 100 percent) designations.
51
Refer to footnote 48.
52
Final assembly, test, and packout (FATP) facilities do not include all facilities that
support Accessories and Beats.
Smarter chemistry
© 2026 Apple Inc. All rights reserved. Apple and the Apple logo are trademarks of Apple
Inc. registered in the U.S. and other countries and regions. Beats is a trademark of
Beats Electronics, LLC., registered in the U.S. and other countries and regions. iOS is a
trademark or registered trademark of Cisco in the U.S. and other countries and is used
under license. ENERGY STAR and the ENERGY STAR mark are registered trademarks
owned by the U.S. Environmental Protection Agency. Other product and company
names mentioned herein may be trademarks of their respective companies.
ENGAGEMENT AND ADVOCACY
ENVIRONMENTAL INITIATIVES
INTRODUCTION
CONTENTS
GREEN BOND IMPACT REPORT
DATA
2026 ENVIRONMENTAL PROGRESS REPORT
113
APPENDIX