
B
ERKSHIRE
H
ATHAWAY
INC.
2025
ANNUAL
REPORT

BERKSHIRE HATHAWAY INC.
2025 ANNUAL REPORT
TABLE OF CONTENTS
CEO’s Letter . . . . . . . . . . . . . . . . . . . . . . . . . . . . . . . . . . . . . . . . . . . . . . . . . . . . . . . . . . . . . . . . . . . . . . . . . . . .
1
Berkshire’s Performance vs. the S&P 500 . . . . . . . . . . . . . . . . . . . . . . . . . . . . . . . . . . . . . . . . . . . . . . . . . . . . .
19
Form 10-K –
Business Description . . . . . . . . . . . . . . . . . . . . . . . . . . . . . . . . . . . . . . . . . . . . . . . . . . . . . . . . . . . . . .
K-1
Risk Factors . . . . . . . . . . . . . . . . . . . . . . . . . . . . . . . . . . . . . . . . . . . . . . . . . . . . . . . . . . . . . . . . . . . . .K-24
Cybersecurity . . . . . . . . . . . . . . . . . . . . . . . . . . . . . . . . . . . . . . . . . . . . . . . . . . . . . . . . . . . . . . . . . . .K-28
Description of Properties . . . . . . . . . . . . . . . . . . . . . . . . . . . . . . . . . . . . . . . . . . . . . . . . . . . . . . . . . . .K-29
Legal Proceedings . . . . . . . . . . . . . . . . . . . . . . . . . . . . . . . . . . . . . . . . . . . . . . . . . . . . . . . . . . . . . . . .K-31
Management’s Discussion . . . . . . . . . . . . . . . . . . . . . . . . . . . . . . . . . . . . . . . . . . . . . . . . . . . . . . . . . .K-34
Management’s Report on Internal Control . . . . . . . . . . . . . . . . . . . . . . . . . . . . . . . . . . . . . . . . . . . . .K-63
Independent Auditor’s Report . . . . . . . . . . . . . . . . . . . . . . . . . . . . . . . . . . . . . . . . . . . . . . . . . . . . . . .K-64
Consolidated Financial Statements . . . . . . . . . . . . . . . . . . . . . . . . . . . . . . . . . . . . . . . . . . . . . . . . . . .K-66
Notes to Consolidated Financial Statements . . . . . . . . . . . . . . . . . . . . . . . . . . . . . . . . . . . . . . . . . . . .K-71
Appendices –
Shareholder Event and Meeting Information . . . . . . . . . . . . . . . . . . . . . . . . . . . . . . . . . . . . . . . . . . .
A-1
Operating Companies . . . . . . . . . . . . . . . . . . . . . . . . . . . . . . . . . . . . . . . . . . . . . . . . . . . . . . . . . . . . .
A-2
Stock Transfer Agent . . . . . . . . . . . . . . . . . . . . . . . . . . . . . . . . . . . . . . . . . . . . . . . . . . . . . . . . . . . . .
A-3
Directors and Officers of the Company . . . . . . . . . . . . . . . . . . . . . . . . . . . . . . . . . . . . . . . . . .
Inside Back Cover

Berkshire Hathaway Inc.
To My Fellow Berkshire Shareholders,
Warren Buffett is arguably the greatest investor of all time, with generations benefiting from his
investment acumen. He has also been a remarkable CEO, executing his vision of building a great
insurance business since the acquisition of National Indemnity in 1967, and deploying the float to
make successful investments across major sectors of the economy, concentrating in the U.S. (To
Warren’s great frustration, this letter begins with these observations – yet we all know they are
true.)
In the past, Warren has spoken about how he draws inspiration from Ted Williams – the baseball
Hall of Fame hitter who divided the strike zone into 77 segments and tried to swing only at pitches
in a much smaller “happy zone,” resulting in a .344 career batting average and a historic .406
season in 1941. Similar discipline, patience, and judgment define Warren’s investing: determining
preferred pitches, waiting for them, then swinging decisively. But he is more than an investing
guru. Warren built Berkshire into an enduring enterprise with his business partner Charlie Munger.
They combined world-class capital allocation with the vision and leadership to create a business
fully equipped to transition from founder-led to one well-positioned for the next 60 years and
beyond.
More than these achievements, what endures is how Berkshire treated its shareholders as true
partners for 60 years. Warren has frequently expressed his respect and appreciation for Berkshire’s
long-term shareholders, who represent one of the most remarkable owner bases of any publicly
owned business. He invested alongside us, wrote with candor about both mistakes and successes,
and welcomed us to Omaha each year for open, unfiltered discussion. His annual shareholder
letters and direct interactions at Berkshire’s annual shareholder meetings are the clearest
expression of Warren’s – and Berkshire’s – commitment to partnership with our shareholders.
We are fortunate to have Warren as Berkshire’s Chairman, in the office five days a week, and
available to us as we underwrite insurance, operate our non-insurance businesses, and deploy
capital including equity investments. Warren also continues as an owner of Berkshire (although his
shares will all go to philanthropy over the 10 years or so following his passing).
To invest in Berkshire has long been a vote of trust in our founder – a trust that now rests with
Berkshire. Your capital is commingled with ours, but it does not belong to us. Our role is
stewardship. That stewardship has shaped a culture and reinforced a set of values that are not the
result of our success, but the reason for it.
* * * * * * * * * * * *
I am honored by our Board’s decision to appoint me CEO of Berkshire and humbled to succeed
Warren as I write my first annual letter to you. Warren is obviously a very hard act to follow.
1

Stepping into any leadership role begins with understanding the organization – why it exists, how
its culture shapes its people, and what values guide its decisions. While you will see similarities
and differences between Warren, Charlie, and me, we share the view that Berkshire is shareholder-
oriented to an unusual degree.
My understanding of Berkshire in this way began in 1992, when I moved to Omaha to join
CalEnergy, then unaffiliated with Berkshire. CalEnergy was partly owned by Peter Kiewit Sons’,
and chaired by Walter Scott, Jr., who was also a Berkshire director. Walter had succeeded Peter
Kiewit as the firm’s CEO and set a standard for leadership that mattered greatly to me.
My specific roles at CalEnergy matter little today. What matters is that it was an extraordinary
period of personal development. I felt fortunate to live in Omaha, a city that represented a form of
capitalism grounded in fundamentals and advanced by values, anchored in businesses built to last,
across industries such as insurance, construction, railroads, manufacturing, and – soon – energy.
I met Warren and Charlie after CalEnergy became MidAmerican Energy Holdings and was
acquired by Berkshire. I admired how they worked together to build an enterprise that reflected
their beliefs about business and life. Those beliefs fostered Berkshire’s culture and values that
continue to guide the company today, enabling it to endure through market cycles, disruptions, and
change. Our durability comes from knowing who we are and how we operate.
That deep understanding of the role our culture and values play in our success is shared by our
unique shareholders – our partners in this enterprise. Through my engagement with you at annual
meetings, I recognize how you want us to succeed together, and to do so in the right way.
Berkshire’s culture and values form the basis of our operating framework, which shapes the
strategy we pursue and the choices we make as we build Berkshire. As CEO, the framework
governs how I lead every day.
Our owners’ time horizon extends beyond the tenure of any individual CEO. I will not be your
CEO for the next 60 years as simple arithmetic makes that – shall we say – an ambitious plan.
However, 20 years from now, when I will have just a fraction of the tenure that Warren had, my
intention is that you – or your descendants – will be proud that your company is even stronger.
Culture and Foundational Values
Berkshire’s success depends on our nearly 400,000 employees. Their commitment to applying our
culture and values across Berkshire’s operating businesses – from See’s Candies to GEICO and
everything in between – and in every circumstance is central to our progress. Our success also
benefits from our Board’s leadership and ongoing alignment with our focus.
2
Last month, I sent a letter to our employees to emphasize that Berkshire’s culture and values remain
unchanged and will continue into perpetuity. It is important to share with you the full articulation
of this statement that was provided to them, with additional observations (shown in regular type)
about what they mean to me personally, based on my experience at Berkshire. While these values
are listed individually, they are mutually reinforcing and inseparable.
Berkshire
Berkshire is a unique conglomerate, intentionally designed to allocate capital rationally and
efficiently. Insurance is our core, and we also hold substantial investments in businesses across
many other sectors. Our approach underpins our goal to be exceptional stewards of our
shareholders’ capital, maximizing the growth in Berkshire’s intrinsic value per share over the long
term.
We are committed to strengthening the great legacy built by Warren Buffett and his business
partner Charlie Munger, ensuring it endures through our commitment to excellence.
Our Culture
Our culture begins with a partnership attitude. Our shareholders are our partners whose trust we
have earned and must work to keep. Their interests are at the center of our decision-making.
This attitude goes well beyond Berkshire’s corporate office in Omaha. It extends across our
operating businesses, where employees embrace an ownership mindset, managing our
shareholders’ assets as if they were their own. We think in decades, act with discipline, and uphold
our commitments. Stewardship is embedded in how we operate, reinforcing that our culture is a
system for generating long-term performance, not just a set of beliefs.
Charlie’s comment on May 1, 2021, that “Greg will keep the culture” will forever resonate with
me. It was a reminder that our culture is our most treasured asset, a call to maintain what defines
Berkshire, and a challenge to ensure our culture continues.
When I led Berkshire Hathaway Energy (BHE), Berkshire’s culture influenced how we operated.
When capital was allocated or underlying risks were assessed, Warren’s questions consistently cut
to the heart of the issue. Beyond that, we were entrusted with real autonomy to run the business,
always focusing on our customers, and taking a long-term view. That owner’s mindset is expected
from every Berkshire leader.
Our Foundational Values
The foundational values that follow are statements of principle that we embrace fully and strive
every day to achieve.
3
Decentralized Model
We seek the best managers to run our operating businesses, who in turn lead talented teams. We
operate a decentralized model with autonomy grounded in deserved trust. We minimize
bureaucracy to provide our managers the independence to focus relentlessly on their business. In
return, we expect accountability and integrity in performance. This autonomy attracts exceptional
people to Berkshire.
As I transitioned to Vice Chairman – Non-Insurance Operations in 2018, the leaders of those
operating businesses shared a similar question: will the decentralized model and their
responsibilities change? I assured them I had lived the culture of autonomy paired with
accountability and seen the results. Decisions are made faster, with better knowledge and greater
conviction, when they are made by those who are closest to the business and have accountability
for its outcomes. This will not change. Our CEOs will never have to navigate layers of bureaucracy
or have short-term earnings expectations dictated to them, leading to long-term value destruction.
Our decentralized approach is a competitive advantage, attracting managers who thrive on
autonomy and deliver on accountability. Berkshire must have leaders that reflect its principles, and
not principles that fit individuals.
Integrity
We uphold Berkshire’s reputation for integrity, as demonstrated by alignment between how we
think, what we say, and what we do. We make decisions that uphold our culture, communicate with
candor and transparency, and deliver on our commitments. The result is a reputation that is
earned, not claimed, through cumulative principled conduct. Every action reflects a deliberate
effort to deepen the trust placed in Berkshire.
For over 25 years, at each shareholder meeting we played a clip from Warren’s 1991 Salomon
Brothers Congressional testimony: “Lose money for the firm, and I will be understanding; lose a
shred of reputation for the firm, and I will be ruthless.” Our commitment to integrity has always
been steadfast and uncompromising. We know integrity is not a quality you admire on a shelf; it
is an active quality that must be earned, re-earned, and maintained daily.
We will encounter business successes and setbacks. When we fail, we will say so. Doing the right
thing also means rectifying our errors. A great example of both is BNSF’s resolution in 2025 of a
longstanding dispute with the Swinomish Indian Tribal Community over crude oil shipments
across Tribal lands. The BNSF decisions that sparked the dispute were made long ago, but the
current BNSF leadership built a partnership rooted in communication, understanding, and respect.
BNSF acknowledged its past mistakes and apologized, paving the way for mutually beneficial
agreements that allow it to meet customer needs while operating safely on Tribal lands.
4
Across our operating businesses, we make choices every day about how we conduct ourselves. We
have hundreds of thousands of employees who are good people and act with integrity and do the
right thing. But in any large organization a small minority will fail to meet our standards. We will
not tolerate such behavior. When it occurs, we will act decisively and ruthlessly to address it.
Protecting our integrity and reputation is a never-ending journey. You can rest assured that we will
remain relentless in this effort.
Financial Strength
We maintain a fortress-like balance sheet, ensuring Berkshire’s foundation is never compromised.
We preserve this financial strength by using debt sparingly and prudently. Our substantial liquidity
enables us to meet our obligations even under the most adverse conditions and to respond swiftly
when opportunities arise.
We are committed to maintaining exceptional financial strength. Our balance sheet is a strategic
asset to be deployed at the right time. It allows us to act decisively, invest when others are tentative
or fearful, and stand firm when financial storms roll through.
We uphold Berkshire’s financial resilience and independence by holding limited levels of debt. We
will remain an asset, not a risk, to America and the global financial system. Our cash and U.S.
Treasury holdings now exceed $370 billion. While some of this capital is required to support our
insurance operations and protect Berkshire against extreme scenarios, it also constitutes our dry
powder.
There will undoubtedly be incremental opportunities to deploy our owners’ capital without
compromising Berkshire’s resilience. My role is to ensure our liquidity levels and capital
deployment remain intentional and deliberate. We will always aim for ownership of productive
businesses over U.S. Treasuries.
Capital Discipline
We deploy our shareholders’ capital to opportunities that generate rewards commensurate with
their risk. When we expand existing operations, acquire new operating businesses, invest in equity
securities, and repurchase Berkshire stock, we evaluate each opportunity based on its potential to
grow Berkshire’s intrinsic value per share over a time horizon measured in perpetuity.
Berkshire’s capital allocation principles and strategy guide us in identifying opportunities:
•
Invest in businesses that we thoroughly understand, with durable advantages and long-term
economic prospects;
•
Partner with high integrity leaders who understand their customers and act like owners;
5
•
Avoid businesses that undermine the fabric of society or could jeopardize Berkshire’s
reputation;
•
Act quickly and concentrate our capital in a few high conviction ideas; and
•
Maintain discipline and let compounding unfold.
These criteria enable us to effectively and efficiently evaluate opportunities that come our way.
Despite our substantial size, we take pride in a nimble culture where big investment opportunities
can be confidentially shared with us, with a prompt response assured (and if we like it, no financing
contingency attached). We quickly say “no” to those that do not align with our principles, and
pursue those that do, knowing there will be many more of the former than the latter.
Many times in Berkshire’s history, some observers have suggested that our substantial cash
position signals a retreat from investing. It does not. We continue to evaluate many opportunities
and will remain patient and disciplined in pursuing the right ones for the benefit of our owners.
In 2025, our approach resulted in Berkshire announcing the acquisition of two very different
businesses: OxyChem and Bell Laboratories.
OxyChem is a well-run industrial chemicals business we first encountered through our investment
in Occidental. The chlorine and caustic soda it produces serve essential markets, led by
construction and core industrial uses. Management prioritizes efficient execution over volume,
supported by an integrated asset base and access to low-cost raw materials. For Berkshire, this
translates into cash flows from a compelling addition to our operating businesses.
Last year, Warren received a letter from Steve Levy, Bell Laboratories’ CEO, asking that we look
at the family-owned business he manages for the daughters of founder Malcolm Stack. Steve’s
letter was perfect. Bell Laboratories meets a persistent need: rodent control. In Steve’s words, it
possesses “high operating margins, very good historical growth and future growth potential, easy
to understand and always needed, and a strong management team.” In our words: a business with
durable advantages and long-term economic prospects run by excellent managers. We only wish it
had been ten times bigger.
These investments now join Berkshire’s strong set of operating businesses. Some of them require
little incremental investment and return excess cash to Berkshire; others present compelling
investment opportunities that will compound over time.
Share repurchases are another important capital allocation option. We will buy back Berkshire
shares when they trade below our estimate of intrinsic value, conservatively determined, ensuring
that repurchases enhance per-share value for continuing owners. We may also purchase large
blocks of shares directly from major holders when the opportunity presents itself. These purchases
allow shareholders to own an incrementally larger piece of Berkshire’s businesses, without
deploying any additional capital of their own.
6
Our approach to cash dividends continues to be that Berkshire will not pay dividends so long as
more than one dollar of market value for shareholders is reasonably likely to be created by each
dollar of retained earnings. On an annual basis, the Board reviews our policy.
Our capital discipline guides us, whether we seek to purchase an entire business, a portion of equity
in a publicly traded company, or our own shares. We maintain this approach regardless of the size
of our cash and U.S. Treasury holdings. We will assess value carefully, act patiently, and hold for
the long term – preferably forever.
Risk Management
We identify risks and strive to manage the level of risk across our organization. Our approach is
decentralized, suited to each operating business’s scale and complexity. We focus on risks that
could threaten Berkshire’s reputation, financial strength, or ability to realize opportunities for the
long term.
Risk management is central to Berkshire. The CEO is responsible for serving as Chief Risk Officer
– there is no more important duty.
An important part of fulfilling that responsibility is having the best on our team. When it comes to
risk, Ajit wrote the playbook. His rigor in managing and pricing risk sets the standard in insurance.
Any contract can be subject to legal challenge, and new coverages are particularly dangerous. We
often set a price today for a cost that may not be known for many years. Pricing insurance risk
correctly is essential, and we will walk away when the price is wrong. This approach is core to our
insurance business, and Ajit is simply peerless at doing it.
As a result, our insurance operations are a global powerhouse, able to accept risks others cannot,
and pay claims without hesitation. Our unmatched financial strength allows us to retain
underwriting risk and preserve the full economics for our owners, rather than dilute it through the
purchase of reinsurance.
Of course, understanding and managing risk is also essential for our non-insurance businesses.
Each must thoroughly assess its specific risks and plan for new risks before pursuing new or
incremental opportunities.
Across all our businesses, our responsibility is to understand the risks and actively manage them.
7
Operational Excellence
We pursue operational excellence across our operating businesses. Our employees continuously
strive to exceed customer expectations, improve efficiency to better compete and prepare for
challenges to our operating models, and reinvest prudently in their operations. We recognize that
performance fluctuates year to year, so we assess a business’s success not by short-term results
but by its ability over the long term to maintain and strengthen its competitive position and improve
its economic prospects.
Operational excellence at Berkshire is not a program. It is the result of disciplined decision making
across our businesses. That work starts with safety and carries through to how we serve customers,
make products, and compete – every day.
In February 2025, Precision Castparts’ response to a major fire at its Jenkintown, Pennsylvania
facility showed Berkshire at its best. All employees on site were evacuated safely. The team then
worked closely with first responders, providing site layouts and identifying potential hazards. In the
aftermath, Precision Castparts supported the local volunteer fire department, assisted the city, and
conducted extensive environmental testing that confirmed the area was safe.
At the same time, the fire created a significant operational challenge. The facility produced more
than 700 parts that were sole-sourced and critical to major aerospace customers. Mark Donegan,
Precision Castparts’ CEO, and his team quickly redistributed production across U.S. and
international sites, doing so without compromising safety, quality, or delivery standards. No
customer experienced a production line stoppage. The episode reflected our model at work:
decentralized leadership, clear accountability, and exceptional execution under pressure.
The daily pursuit of excellence must be never-ending. By focusing on customers, efficiency, and
continuous improvement, we create value over the long term.
Taken together, the foundational values listed above built Berkshire, and equip us to succeed in the
decades ahead. While we have set them out explicitly this year, we will publish them as an
attachment to future letters, with each letter discussing how we practiced those values across
Berkshire.
Their impact is also very evident in the operating performance of our businesses today.
* * * * * * * * * * *
Berkshire’s Performance
Berkshire delivered operating earnings of $44.5 billion in 2025, below $47.4 billion in 2024 and
above the $37.5 billion we have averaged over the past five years, a result that underscored the
durability of our operating businesses, while also reflecting the fact that we have opportunities for
further improvement.
8
Before diving into details, it is worth reiterating a Berkshire belief: our GAAP net earnings – with
its sometimes-large annual swings from realized and unrealized investment gains and losses – must
be assessed with caution. These gains and losses matter over the long run, but when evaluating
Berkshire’s annual business performance, we believe operating earnings remains the best measure.
Equally important is the cash our businesses generate. In 2025, Berkshire produced $46 billion of
net cash flows from operating activities, compared to a five-year average of more than $40 billion,
underscoring our ability to invest in opportunities across our businesses.
Insurance Operations
In 2025, Berkshire’s insurance operations accomplished their fundamental goals: grow
underwriting profits and float in a disciplined manner.
We own an extraordinary group of insurance businesses, each managed with a long-term
orientation. Their performance reflected both their inherent strengths and an industry that, after
several years of needed adjustments to pricing and policy terms, in 2025 began to experience a
deceleration or reversal of these trends, particularly in the latter half of the year. This likely means
we will write less property and casualty business for a period of time.
Although the year began with significant wildfire-related losses in Los Angeles, the Atlantic
hurricane season was unusually benign. For the first time in a decade, no hurricane made landfall in
the U.S., our largest region of global exposure for our primary insurance and reinsurance
businesses – a reminder that nature controls the winds, not Warren and certainly not me.
We produced a combined ratio of 87.1% across our property and casualty businesses in 2025,
comparing favorably with our five-year average of 90.7%, ten-year average of 93.0% and twenty-
year average of 92.2%, an exceptional underwriting result for an insurer of our scale. (Our
retroactive reinsurance business, which does not receive regular premiums, is excluded from these
figures.)
No discussion of our insurance businesses would be complete without again acknowledging and
appreciating Ajit. For nearly four decades, his judgment and discipline have shaped our ability to
underwrite large and complex risks with care and precision. The organization and team he built
understand both the limits and the opportunities inherent in very large risks, and his example
continues to guide our teams. Their steadiness benefits us all.
9
GEICO
GEICO has been a significant contributor to the group’s lower combined ratio. Over the past few
years, GEICO has improved its cost structure, strengthened its underwriting discipline, and
enhanced its ability to segment customers and the related pricing of risk. Industrywide rate
increases from the end of 2022 through 2024 continued to positively impact performance in 2025.
While these increases varied by product and jurisdiction, the pricing environment remained firm,
and GEICO benefited accordingly.
GEICO’s broad rate increases in recent years have restored margins but come at the cost of lower
retention. Competitors’ rate reductions may extend that pressure into 2026. The GEICO team
remains focused on pricing risks correctly for both existing and new customers. Restoring retention
while maintaining underwriting discipline will take time.
Alongside retaining its customer base with a more nuanced pricing strategy, GEICO is investing
in technology to improve efficiency and service, while preserving its position as the industry’s
low-cost provider.
Primary Group
Across our other primary property and casualty businesses, demand entering 2025 was solid, and
pricing in most commercial insurance business segments was adequate or improving. As the year
progressed, additional capital entered the market, resulting in lower pricing or decelerating rate
increases in several important lines. We have always prioritized underwriting discipline over
volume, and as pricing became less attractive, our premium growth plateaued. We expect these
primary insurance businesses to face continued headwinds in 2026, and potentially beyond.
Reinsurance Group
Our reinsurance operations face similar dynamics. The reinsurance sector has attracted significant
increases in available capital from both the traditional and alternative markets, which together with
a more benign reinsured catastrophe loss burden in 2025 in most major regions has led to
significant price declines in property reinsurance. In most casualty reinsurance segments, claims
inflation continued to outpace pricing. As long as these phases of the cycle endure, we expect to
write less reinsurance premium.
Our insurance team will remain patient because of Berkshire’s structural strengths:
1.
We have significant capital, enabling us to underwrite large and unusual risks.
2.
We give our insurance managers autonomy to run their businesses, without quarterly
earnings targets or growth mandates that might otherwise distort their underwriting
judgment.
10
3.
We insist on underwriting discipline as the most important ingredient in insurance success.
4.
We focus on the long term, resisting temporary industry enthusiasms and exuberances.
The environment ahead will reward insurers whose focus remains on growing underwriting profit
sustainably, not volume; customer trust and loyalty, not temporary spikes in market share; and
long-term resilience, not short-lived opportunism.
At year-end, our insurance float – the capital we hold to pay future losses and, in the meantime,
invest for Berkshire’s benefit – stood at $176 billion. That amount increased from $171 billion at
the end of 2024 and from $88 billion at the end of 2015.
Our insurance businesses’ ability to declare ordinary dividends to Berkshire is restricted by
insurance statutes and regulations, permitting up to $31 billion during 2025 without prior
regulatory approval. The insurance businesses ultimately returned $29 billion to Berkshire in the
year, underscoring the continued strength of their capital base.
Non-Insurance Operations
Our non-insurance group is composed of strong businesses operating within the railroad, utilities
and energy, manufacturing, service and retailing industries. It also includes Pilot and McLane.
Berkshire’s approach with its 51 non-insurance operating businesses is markedly different from
most conglomerates. There are no layers of management and no allocated goals or targets set by
Berkshire. Each business is accountable to its CEO, who is expected to pursue operational
excellence relentlessly and close performance gaps. Capital allocation decisions for these
businesses ultimately reside with me as Berkshire’s CEO and are based on each business’s
opportunities and related risks. Most operate with no debt, and will remain that way.
Across these businesses, we have made progress in the fundamentals that drive long-term value
but also have a clear understanding of where we need to improve performance. Regardless of
industry, our expectations are the same: managers who think like owners and rigorous execution –
measured by results, not intentions.
We are fortunate to have Adam Johnson now serving as president of our consumer products,
service, and retailing businesses. Adam, who has lived the Berkshire culture for nearly 30 years
(10 as CEO of NetJets), is now responsible for a group consisting of 32 companies. Adam and his
team at NetJets think like owners and earned their reputation for operational excellence over the
past decade. Their work transformed NetJets from a challenged business model into a successful
enterprise that delivers value for Berkshire shareholders. That same approach – accountability and
a focus on avoiding complacency – will guide how he works with the CEOs across his portfolio.
11
BNSF
As one of the six major freight railroads in North America, BNSF is a key part of the transportation
backbone of the U.S. economy. Berkshire acquired this iconic business in 2010 with an equity
value of $34.5 billion. In 2025, BNSF produced $8.1 billion in net operating cash flows and
returned $4.4 billion of that cash to Berkshire through dividends. For context, its average annual
dividend over the past five years was $4.1 billion.
Safe operations, reliable service, and a competitive cost structure ultimately determine a railroad’s
success – and accordingly how we assess management’s performance. BNSF has focused on
improving each of these. Safety remains the top priority, and BNSF has been the industry leader
for the past decade. In 2025, shipments spent less time idling at terminals and moved through the
network faster than in nearly any year in the company’s history.
These gains matter, but they are not enough; more progress is needed to translate operational
improvements into stronger financial results. We view operating margin (the inverse of the
industry’s operating ratio) as the best measure of performance. In 2025, BNSF’s operating margin
improved to 34.5% from 32.0% in 2024. It remained only modestly above its five-year average.
The gap to the industry’s best remains too wide and closing it will require continued improvements
in efficiency and service. Each one-percentage-point improvement in operating margin generates
approximately $230 million of incremental operating cash flow for our owners. The team
recognizes the significance of this opportunity, and we will be disappointed if we do not deliver a
substantial improvement over the next few years.
Alongside BNSF’s own improvements, there is also potential consolidation in the rail industry
with the proposed Union Pacific–Norfolk Southern merger. Berkshire has been clear that it is not
interested in acquiring one of the other Class I railroads, since the current economics would not
work in our shareholders’ favor. BNSF’s focus on the proposed merger has been to ensure BNSF
can continue to offer customers a compelling value proposition, including full and competitive
access to Eastern rail markets.
BHE
BHE’s objective is straightforward: to deliver affordable and reliable energy service for its
customers. That responsibility has grown as the industry enters a significant investment cycle,
driven by rising electricity demand from artificial intelligence computing and by increasing
wildfire risk, particularly in the Western U.S. Growth is welcome, but it will not come at the
expense of affordability or reliability for households, small businesses, and industrial users.
12
BHE is proud that it continues to offer meaningful value to customers in the markets it serves –
averaging 24% below the national retail electric rate level, with all its markets priced at least in
the double-digit range beneath that benchmark. Infrastructure built for hyperscalers and data
centers must be paid for by those customers and reflect the risks tied to step-changes in long-term
demand. BHE will pursue this incremental growth and invest our shareholders’ capital only when
those risks and rewards are appropriately balanced.
On wildfire risk, BHE has taken a leadership role, working with regulators, public officials, and
the communities it serves. Its mitigation programs are among the most comprehensive in the
industry. When a BHE utility is responsible for a wildfire, it has acknowledged that responsibility,
including PacifiCorp’s settlements related primarily to the 2020 Labor Day fires. At the same time,
PacifiCorp is not an insurer of last resort and should not be treated as a deep pocket. Where
responsibility does not exist, it will continue to seek judicial relief. Accountability, paired with
principled opposition to unwarranted liability, is essential to preserving the regulatory compact
that governs utilities.
BHE is rebalancing as the team positions it to move forward. In 2025, BHE produced $8.4 billion
in net cash flows from operating activities, consistent with its five-year average, even as it absorbed
these challenges. Our willingness to invest capital depends on the continued functioning of the
regulatory compact through which utilities earn a reasonable return on invested capital. Near-term
opportunities are significant, and BHE will pursue them selectively.
Manufacturing – Industrial Products
The macro environment in 2025 for our industrial products businesses was challenging, yet the
businesses delivered earnings results that demonstrated underlying resilience. Operational
execution was strong across the group, and specifically at Precision Castparts, Marmon, IMC, and
Lubrizol, which positions all of them well to pursue incremental opportunities.
The Lubrizol team, led by Rebecca Liebert, was integral to the acquisition of OxyChem and its
planned integration as a standalone operating business within Berkshire. Rebecca has assumed
responsibility for OxyChem in addition to her role as CEO of Lubrizol, working in partnership
with OxyChem CEO Wade Alleman and his leadership team.
Our largest industrial manufacturing business, Precision Castparts, spent much of the past decade
navigating a difficult period for the aerospace industry. Aircraft production slowed materially,
volumes declined, and a series of disruptions – most notably the pandemic, when air travel
effectively stopped – put sustained pressure on earnings.
13
The Precision Castparts team has now worked through the most challenging part of that period.
Air travel has recovered, aircraft orders have resumed, and demand for the company’s components
has normalized and is growing. The business has remained disciplined throughout, with
management focused on translating a healthier industry backdrop into margins that better reflect
its long-term potential. In 2025, Precision Castparts generated $2.4 billion of net cash flows from
operating activities, compared to an average of $0.9 billion in 2021 and 2022 and $1.7 billion in
2015, the last full fiscal year before our acquisition.
Manufacturing – Building Products
Our building products businesses span the U.S. housing and commercial building landscape, from
the homes Clayton builds to the materials and finishes our other companies supply. As in any
market, end-consumer preferences can evolve, and our businesses must adapt accordingly to meet
those changing demands.
Shaw has navigated a challenging period as consumers moved away from soft-surface flooring
(carpets), and some of its difficulties were self-inflicted. As it expanded hard-surface production,
execution slipped, affecting quality and service. Shaw is now rebuilding its manufacturing
organization and restoring the operational discipline needed to regain customer confidence.
Clayton leads the group in size. Its business model – centered on efficient manufacturing and
construction of well-built homes, supported by integrated financing – has proven resilient through
short-term shifts in the broader housing market. This approach enables Clayton to meet the
ongoing need for quality, affordable housing nationwide.
While activity in this building-products sector varies from year to year with broader construction
trends, the long-term needs for housing and commercial buildings remain strong, positioning the
group, which also includes Johns Manville and MiTek, well for the future. This durable demand
underpins these operations, which are distinguished by disciplined and knowledgeable
management, a strong focus on customers, and well-established operating models.
Manufacturing – Consumer Products; and Service and Retailing
As highlighted earlier in the letter, Adam is president of Berkshire’s consumer products, service,
and retailing businesses. These businesses performed well overall in 2025, recognizing certain
consumer segments faced a very challenging environment.
NetJets is the largest business in our service group. NetJets maintains a relentless focus on safety
and exceptional service to reinforce its position as a premium offering. That foundation has enabled
NetJets to attract many customers, and today it operates nearly 1,100 aircraft in over 150 countries
around the world. It is a prized asset in a very tough industry.
14
Pilot
Pilot continues to strengthen its operations. As the largest operator of travel centers in North
America, it competes on location, service, and reliability. Management has focused on execution
at the store level – improving customer experience for both professional drivers and everyday
travelers, investing in store upgrades, food offerings, and customer loyalty. Since 2023, Pilot has
increased capital spending to modernize facilities and expand its electric vehicle charging network.
These efforts are reflected in Pilot’s Pro Preference score – a third-party study of how often
professional drivers choose Pilot over travel center competitors – which rose from 27% in 2022 to
35% in 2025, placing the business second in the industry. We should be #1 and we will not be
pleased until that standard is achieved. We first invested in Pilot in 2017; however, our ability to
manage it was contractually delayed until 2023. That mistake will not happen again.
The underlying economics of the business are reflected in its cash generation. In 2025, Pilot
delivered $1.7 billion of net cash flow from operating activities, an improvement from 2024. As
operations continue to strengthen and capital needs normalize, we expect more cash to be returned
to Berkshire.
Equity Investments
We apply the same fundamental value of capital discipline to Berkshire’s portfolio of equity
securities as we do to our operating businesses. A large portion of our portfolio is concentrated in
a small number of American companies such as Apple, American Express, Coca-Cola, and
Moody’s – businesses we understand well, have a high regard for their leaders, and expect will
compound over decades. This concentrated approach will continue, with limited activity in these
holdings, though we may significantly adjust a holding if we see fundamental changes in its long-
term economic prospects.
(Dollars in millions)
December 31, 2025
Company
Percentage of
Company Owned
Cost Basis
Market Value
2025 Dividends
Apple Inc.
1.6%
$
6,255
$
61,962
$
280
American Express Company
22.1%
1,287
56,088
479
The Coca-Cola Company
9.3%
1,299
27,964
816
Moody’s Corporation
13.9%
248
12,603
93
Total
$
9,089
$
158,617
$
1,668
15
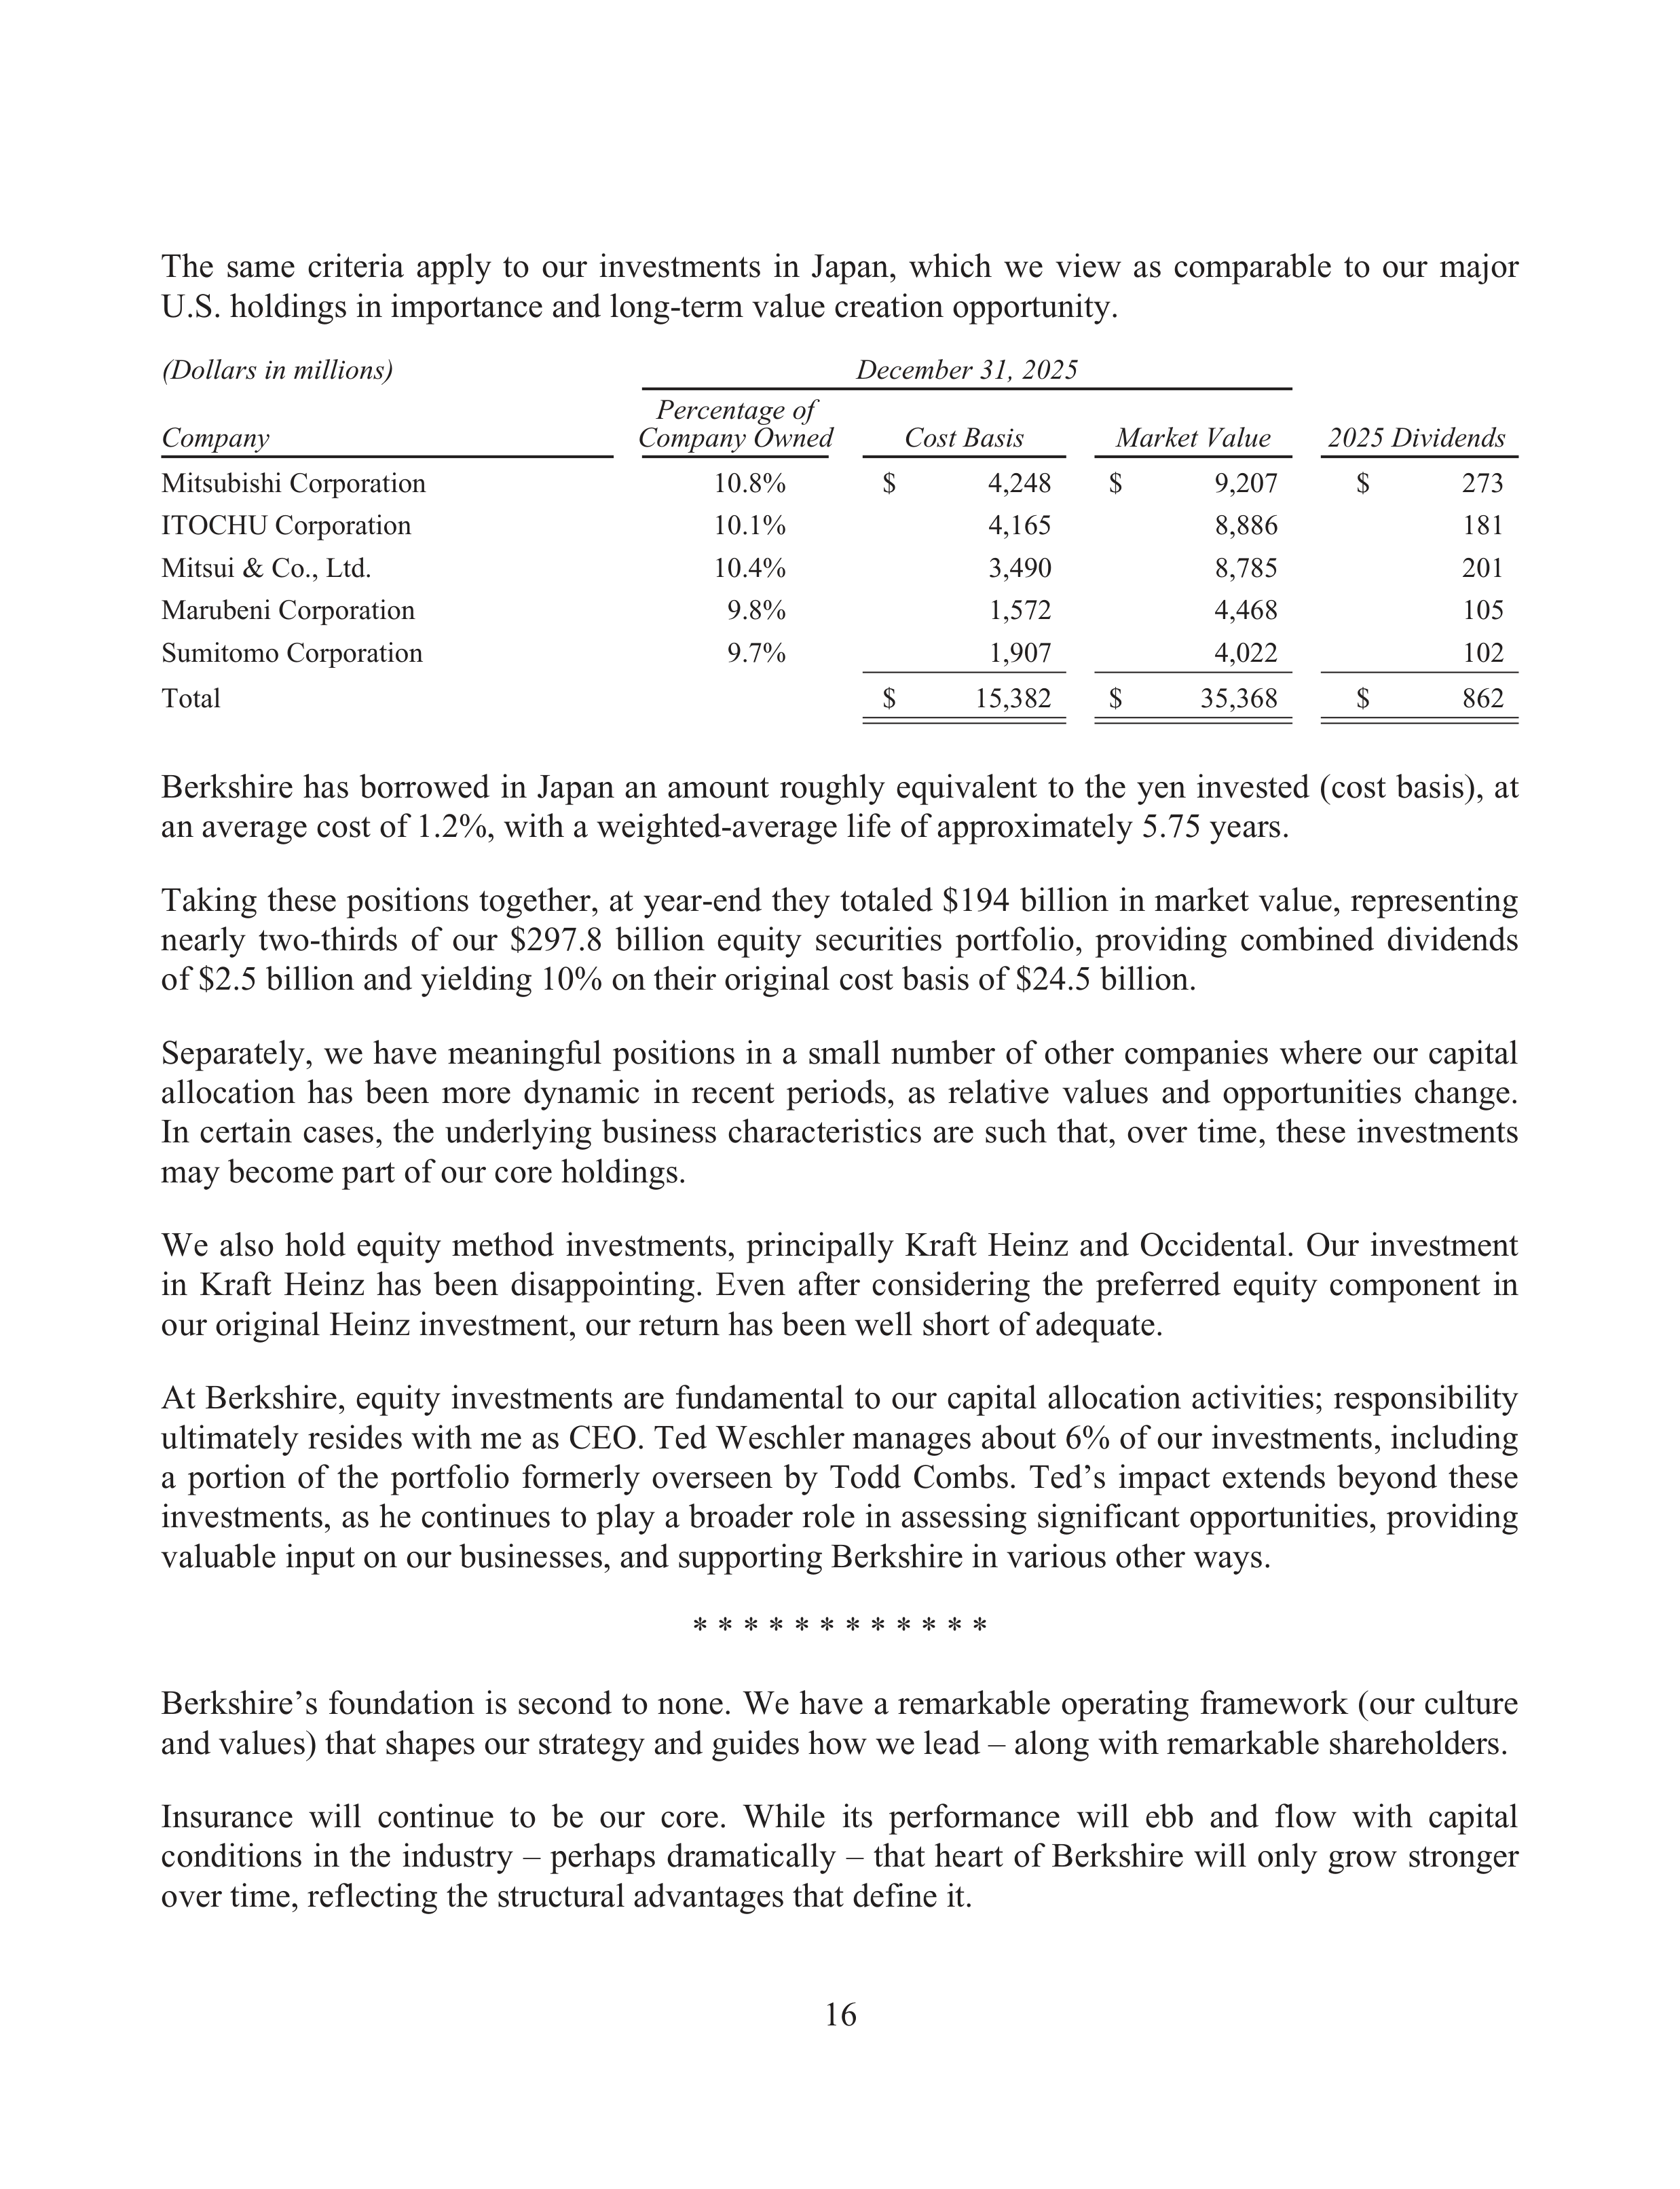
The same criteria apply to our investments in Japan, which we view as comparable to our major
U.S. holdings in importance and long-term value creation opportunity.
(Dollars in millions)
December 31, 2025
Company
Percentage of
Company Owned
Cost Basis
Market Value
2025 Dividends
Mitsubishi Corporation
10.8%
$
4,248
$
9,207
$
273
ITOCHU Corporation
10.1%
4,165
8,886
181
Mitsui & Co., Ltd.
10.4%
3,490
8,785
201
Marubeni Corporation
9.8%
1,572
4,468
105
Sumitomo Corporation
9.7%
1,907
4,022
102
Total
$
15,382
$
35,368
$
862
Berkshire has borrowed in Japan an amount roughly equivalent to the yen invested (cost basis), at
an average cost of 1.2%, with a weighted-average life of approximately 5.75 years.
Taking these positions together, at year-end they totaled $194 billion in market value, representing
nearly two-thirds of our $297.8 billion equity securities portfolio, providing combined dividends
of $2.5 billion and yielding 10% on their original cost basis of $24.5 billion.
Separately, we have meaningful positions in a small number of other companies where our capital
allocation has been more dynamic in recent periods, as relative values and opportunities change.
In certain cases, the underlying business characteristics are such that, over time, these investments
may become part of our core holdings.
We also hold equity method investments, principally Kraft Heinz and Occidental. Our investment
in Kraft Heinz has been disappointing. Even after considering the preferred equity component in
our original Heinz investment, our return has been well short of adequate.
At Berkshire, equity investments are fundamental to our capital allocation activities; responsibility
ultimately resides with me as CEO. Ted Weschler manages about 6% of our investments, including
a portion of the portfolio formerly overseen by Todd Combs. Ted’s impact extends beyond these
investments, as he continues to play a broader role in assessing significant opportunities, providing
valuable input on our businesses, and supporting Berkshire in various other ways.
* * * * * * * * * * * *
Berkshire’s foundation is second to none. We have a remarkable operating framework (our culture
and values) that shapes our strategy and guides how we lead – along with remarkable shareholders.
Insurance will continue to be our core. While its performance will ebb and flow with capital
conditions in the industry – perhaps dramatically – that heart of Berkshire will only grow stronger
over time, reflecting the structural advantages that define it.
16
Our non-insurance operations generate substantial operating earnings and recurring cash flows. A
sustained focus on operational excellence will strengthen this group of businesses, positioning it
to deliver even greater long-term value.
Our investment portfolio – specifically, our equity investments – will evolve and grow as
opportunities arise. This portfolio is an integral extension of our insurance operations and capital
base. We will effectively and efficiently return capital to our owners through share repurchases
when the value proposition is compelling.
At Berkshire’s scale, the math of compounding works against us – a reality long understood and
best acknowledged plainly. Our opportunity is improvement in per-share value over the long term,
even when progress comes in smaller increments, with a constant focus on managing downside risk
for our owners.
* * * * * * * * * * * *
The value we create at Berkshire stems from the judgment and leadership exercised every day
across our operating businesses. We as shareholders are fortunate to have a Board that clearly
understands and supports Berkshire, including our culture and values, and whose diverse skills,
experience, and perspectives strengthen its stewardship of the company. Warren and Charlie built
the framework for that alignment, and we continue to draw on Warren’s exceptional judgment as
Chairman.
In December, we announced that our CFO, Marc Hamburg, will be retiring from Berkshire
effective June 1, 2027, and will transition his Chief Financial Officer responsibilities a year prior
on June 1, 2026. Chuck Chang will have an enormous pair of shoes to fill as his successor. Marc
will help Chuck settle into his new role before fully enjoying his well-deserved retirement. Marc
has been a treasured partner to me, and, as Warren has noted, “Marc has been indispensable to
Berkshire and to me. His integrity and judgment are priceless. He has done more for this company
than many of our shareholders will ever know.” I strongly echo Warren’s comments.
To further strengthen our management capabilities at the corporate office, we recently welcomed
Mike O’Sullivan as Berkshire’s first General Counsel, where he will provide legal support while
maintaining our culture.
A central part of our partnership with our owners is to continue maintaining clear, candid
communication with you. Berkshire will always communicate with all shareholders at the same
time and through the same channels to give each of you the necessary information to assess
Berkshire’s performance.
We concentrate on quality, not frequency. If a significant issue arises, you will hear from me, but
it will not be through quarterly commentary, given our long-term horizon.
17
The next time we gather as owners will be in Omaha on May 2, 2026, for the annual meeting (our
owners’ day, or what other companies might call an “investor day”). The format you know well
will guide the day, centered on open communication and direct engagement, with your questions
answered in the same unscripted manner during sessions moderated by Becky Quick. We also look
forward to owners getting to know, over time, more of the Berkshire team.
This year’s program will include a CEO’s update on Berkshire, and two Q&A sessions – one with
Ajit and me, and a second featuring Katie Farmer (BNSF), Adam Johnson (NetJets and president
of consumer products, service, and retailing), and me, where Katie and Adam will discuss the
challenges and opportunities they see in their respective businesses. In that way, we will be able
to cover Berkshire’s insurance and non-insurance operations. While each session has a natural
focus based on who is on stage with me, shareholders may ask me any question at any time. Further
details are included in this Annual Report.
Our Board, the CEOs and managers at Berkshire, and I look forward to welcoming you to Omaha
and to our continued partnership. Central to Berkshire’s extraordinary success is the relationship
we maintain with you, our owners. I am honored by the responsibility of continuing to build our
company and our partnership in the years ahead. We move forward with great intent and purpose.
Gregory E. Abel
Chief Executive Officer
February 28, 2026
18
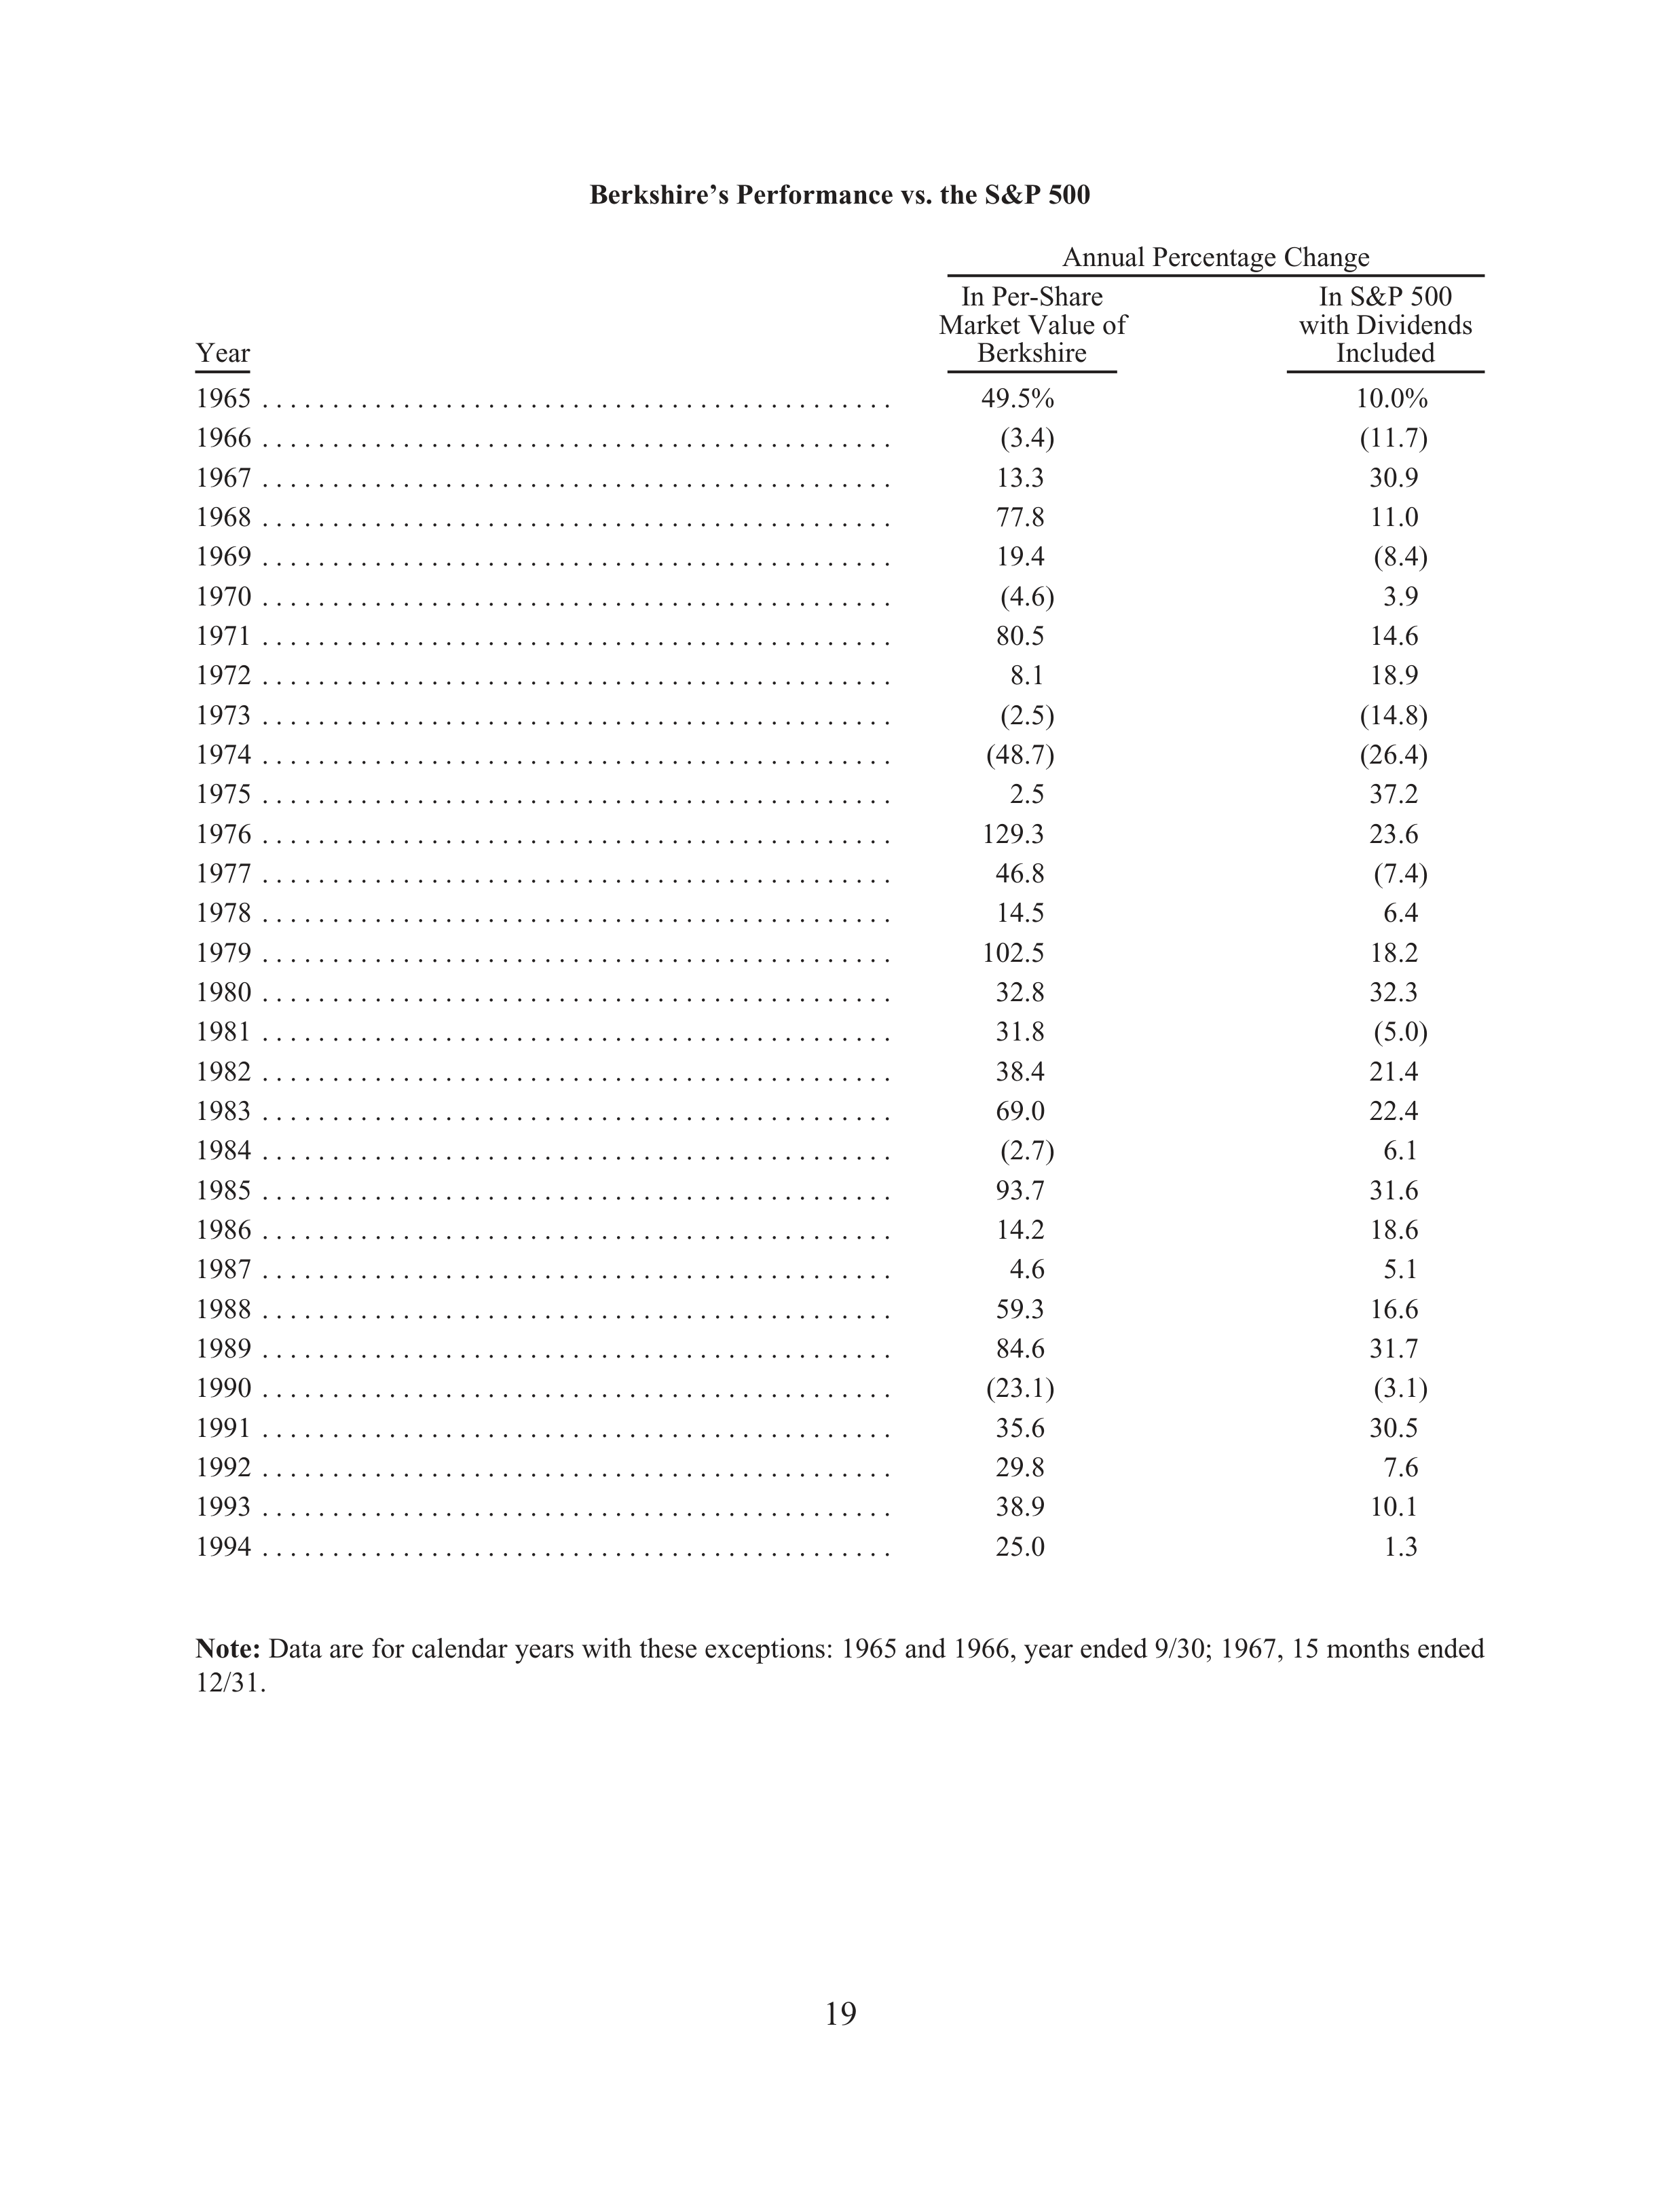
Berkshire’s Performance vs. the S&P 500
Annual Percentage Change
Year
In Per-Share
Market Value of
Berkshire
In S&P 500
with Dividends
Included
1965 . . . . . . . . . . . . . . . . . . . . . . . . . . . . . . . . . . . . . . . . . . . . .
49.5%
10.0%
1966 . . . . . . . . . . . . . . . . . . . . . . . . . . . . . . . . . . . . . . . . . . . . .
(3.4)
(11.7)
1967 . . . . . . . . . . . . . . . . . . . . . . . . . . . . . . . . . . . . . . . . . . . . .
13.3
30.9
1968 . . . . . . . . . . . . . . . . . . . . . . . . . . . . . . . . . . . . . . . . . . . . .
77.8
11.0
1969 . . . . . . . . . . . . . . . . . . . . . . . . . . . . . . . . . . . . . . . . . . . . .
19.4
(8.4)
1970 . . . . . . . . . . . . . . . . . . . . . . . . . . . . . . . . . . . . . . . . . . . . .
(4.6)
3.9
1971 . . . . . . . . . . . . . . . . . . . . . . . . . . . . . . . . . . . . . . . . . . . . .
80.5
14.6
1972 . . . . . . . . . . . . . . . . . . . . . . . . . . . . . . . . . . . . . . . . . . . . .
8.1
18.9
1973 . . . . . . . . . . . . . . . . . . . . . . . . . . . . . . . . . . . . . . . . . . . . .
(2.5)
(14.8)
1974 . . . . . . . . . . . . . . . . . . . . . . . . . . . . . . . . . . . . . . . . . . . . .
(48.7)
(26.4)
1975 . . . . . . . . . . . . . . . . . . . . . . . . . . . . . . . . . . . . . . . . . . . . .
2.5
37.2
1976 . . . . . . . . . . . . . . . . . . . . . . . . . . . . . . . . . . . . . . . . . . . . .
129.3
23.6
1977 . . . . . . . . . . . . . . . . . . . . . . . . . . . . . . . . . . . . . . . . . . . . .
46.8
(7.4)
1978 . . . . . . . . . . . . . . . . . . . . . . . . . . . . . . . . . . . . . . . . . . . . .
14.5
6.4
1979 . . . . . . . . . . . . . . . . . . . . . . . . . . . . . . . . . . . . . . . . . . . . .
102.5
18.2
1980 . . . . . . . . . . . . . . . . . . . . . . . . . . . . . . . . . . . . . . . . . . . . .
32.8
32.3
1981 . . . . . . . . . . . . . . . . . . . . . . . . . . . . . . . . . . . . . . . . . . . . .
31.8
(5.0)
1982 . . . . . . . . . . . . . . . . . . . . . . . . . . . . . . . . . . . . . . . . . . . . .
38.4
21.4
1983 . . . . . . . . . . . . . . . . . . . . . . . . . . . . . . . . . . . . . . . . . . . . .
69.0
22.4
1984 . . . . . . . . . . . . . . . . . . . . . . . . . . . . . . . . . . . . . . . . . . . . .
(2.7)
6.1
1985 . . . . . . . . . . . . . . . . . . . . . . . . . . . . . . . . . . . . . . . . . . . . .
93.7
31.6
1986 . . . . . . . . . . . . . . . . . . . . . . . . . . . . . . . . . . . . . . . . . . . . .
14.2
18.6
1987 . . . . . . . . . . . . . . . . . . . . . . . . . . . . . . . . . . . . . . . . . . . . .
4.6
5.1
1988 . . . . . . . . . . . . . . . . . . . . . . . . . . . . . . . . . . . . . . . . . . . . .
59.3
16.6
1989 . . . . . . . . . . . . . . . . . . . . . . . . . . . . . . . . . . . . . . . . . . . . .
84.6
31.7
1990 . . . . . . . . . . . . . . . . . . . . . . . . . . . . . . . . . . . . . . . . . . . . .
(23.1)
(3.1)
1991 . . . . . . . . . . . . . . . . . . . . . . . . . . . . . . . . . . . . . . . . . . . . .
35.6
30.5
1992 . . . . . . . . . . . . . . . . . . . . . . . . . . . . . . . . . . . . . . . . . . . . .
29.8
7.6
1993 . . . . . . . . . . . . . . . . . . . . . . . . . . . . . . . . . . . . . . . . . . . . .
38.9
10.1
1994 . . . . . . . . . . . . . . . . . . . . . . . . . . . . . . . . . . . . . . . . . . . . .
25.0
1.3
Note:
Data are for calendar years with these exceptions: 1965 and 1966, year ended 9/30; 1967, 15 months ended
12/31.
19
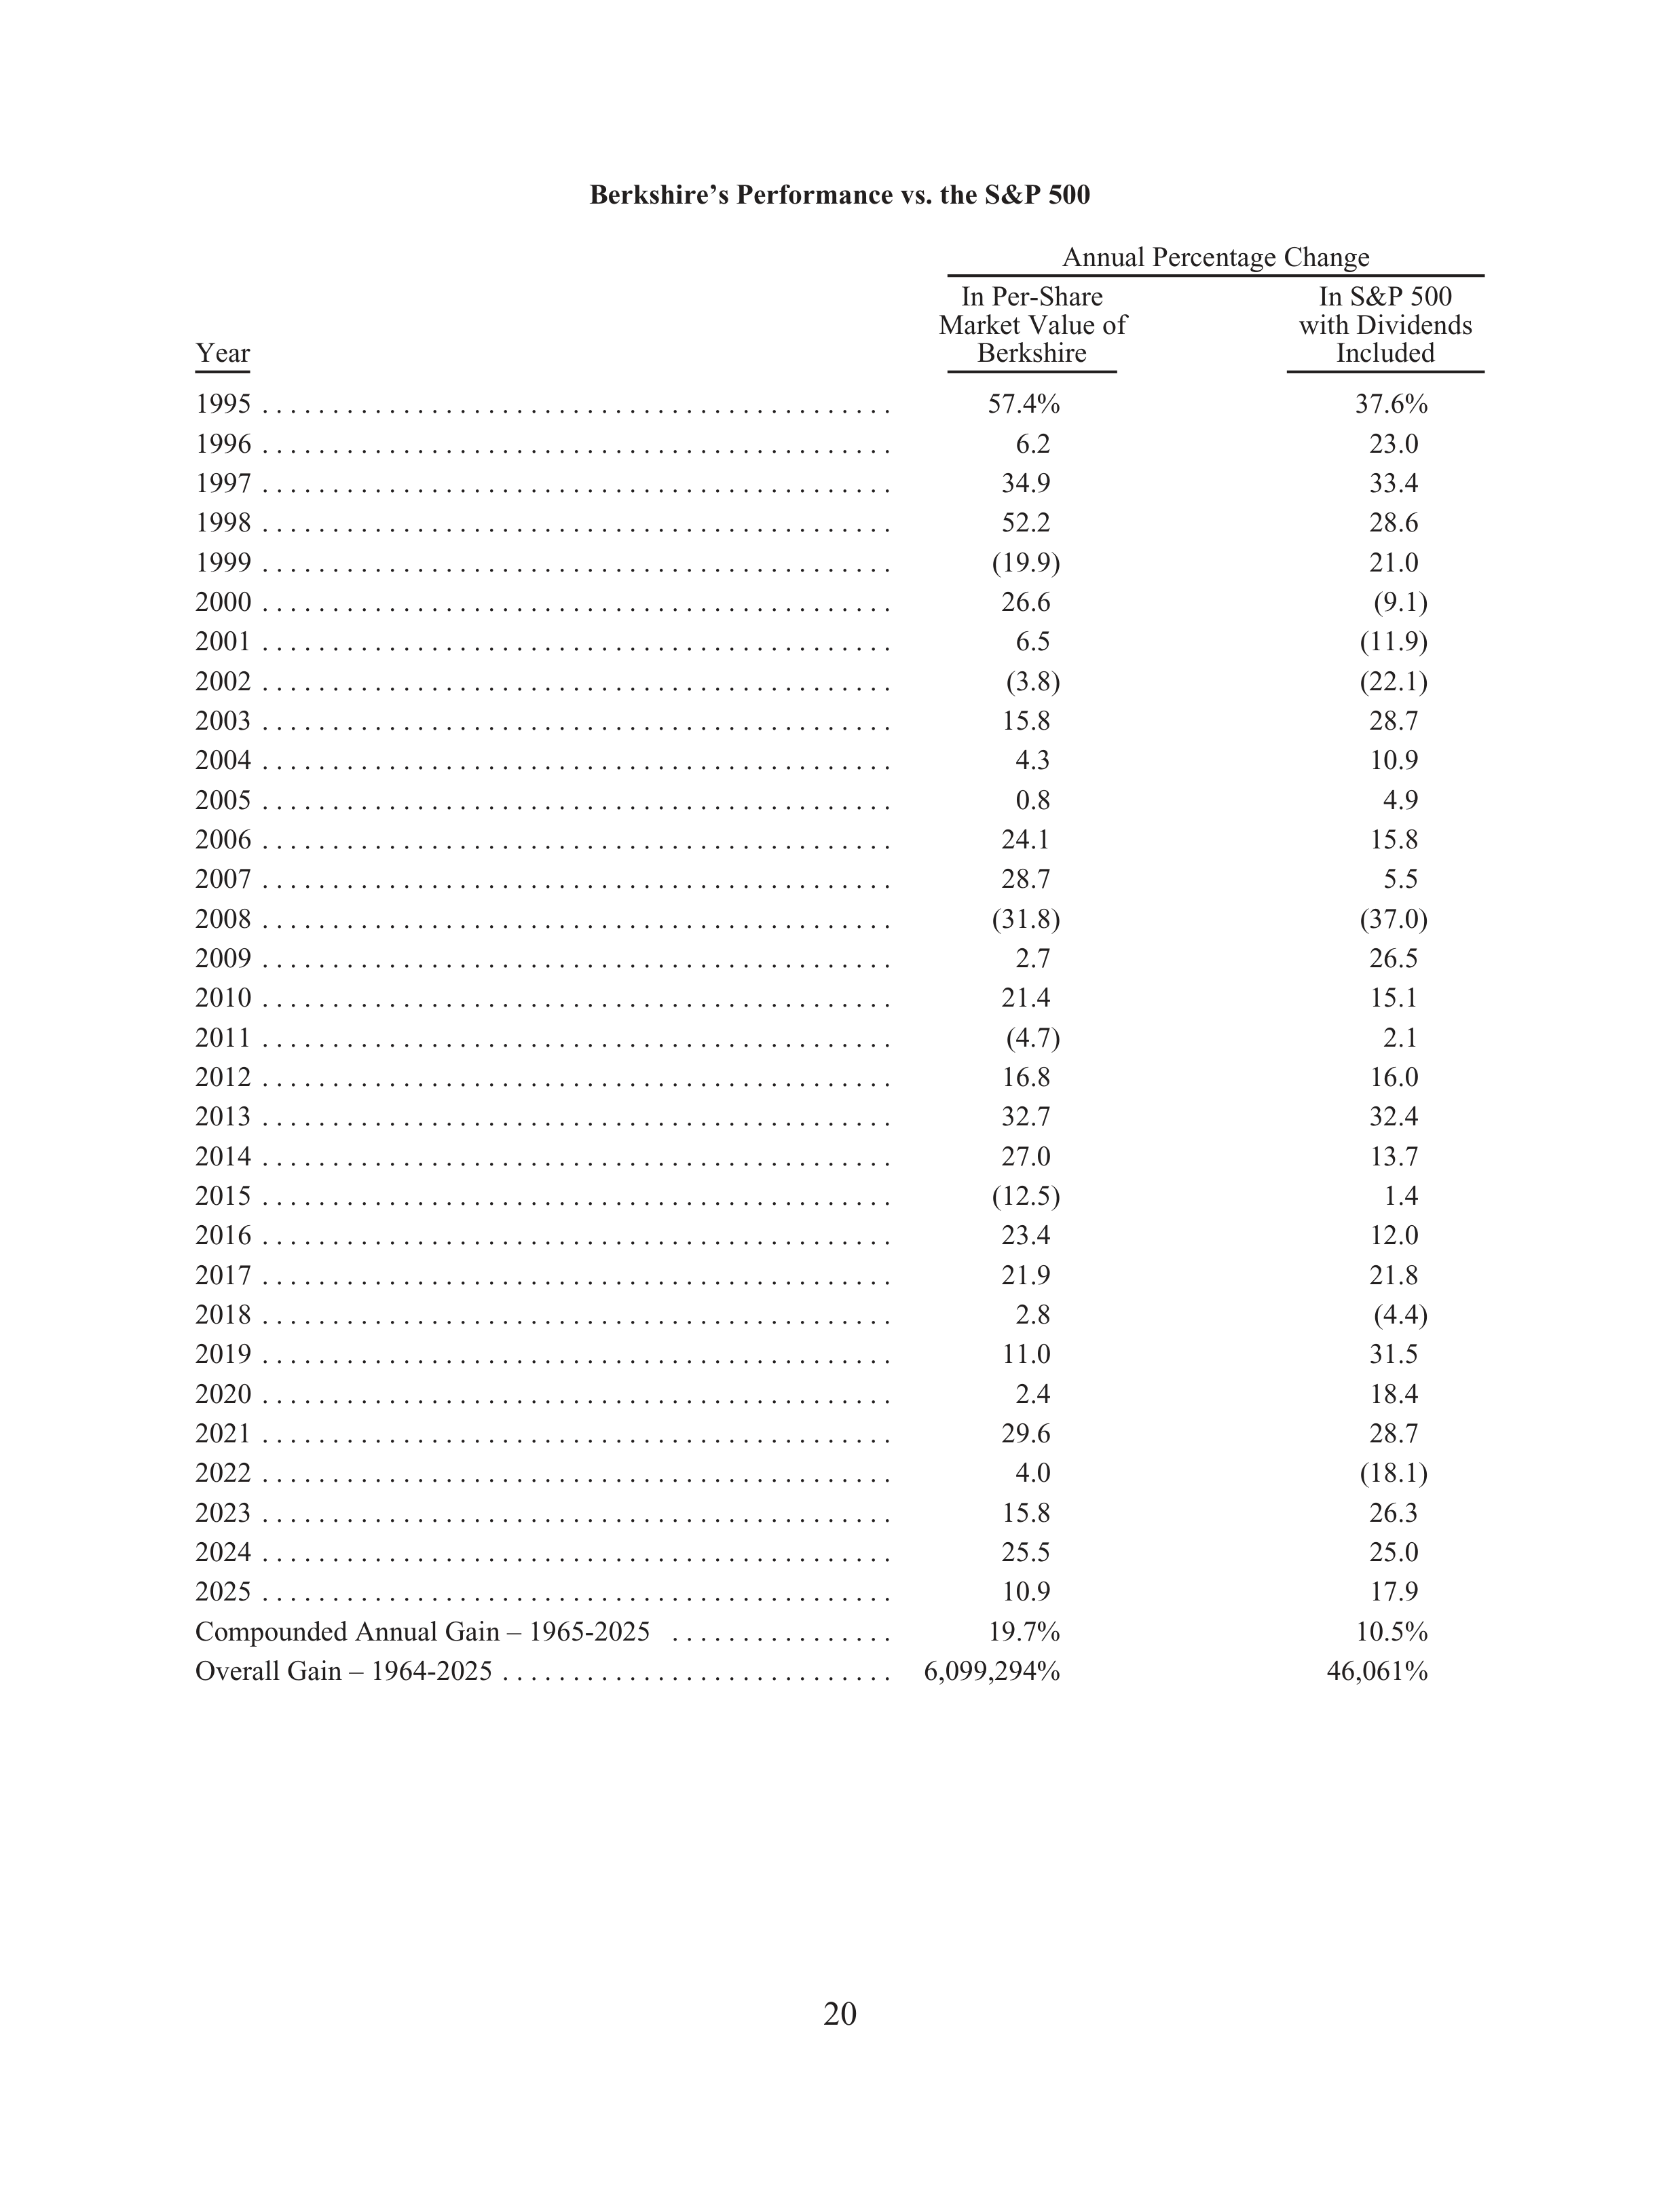
Berkshire’s Performance vs. the S&P 500
Annual Percentage Change
Year
In Per-Share
Market Value of
Berkshire
In S&P 500
with Dividends
Included
1995 . . . . . . . . . . . . . . . . . . . . . . . . . . . . . . . . . . . . . . . . . . . . .
57.4%
37.6%
1996 . . . . . . . . . . . . . . . . . . . . . . . . . . . . . . . . . . . . . . . . . . . . .
6.2
23.0
1997 . . . . . . . . . . . . . . . . . . . . . . . . . . . . . . . . . . . . . . . . . . . . .
34.9
33.4
1998 . . . . . . . . . . . . . . . . . . . . . . . . . . . . . . . . . . . . . . . . . . . . .
52.2
28.6
1999 . . . . . . . . . . . . . . . . . . . . . . . . . . . . . . . . . . . . . . . . . . . . .
(19.9)
21.0
2000 . . . . . . . . . . . . . . . . . . . . . . . . . . . . . . . . . . . . . . . . . . . . .
26.6
(9.1)
2001 . . . . . . . . . . . . . . . . . . . . . . . . . . . . . . . . . . . . . . . . . . . . .
6.5
(11.9)
2002 . . . . . . . . . . . . . . . . . . . . . . . . . . . . . . . . . . . . . . . . . . . . .
(3.8)
(22.1)
2003 . . . . . . . . . . . . . . . . . . . . . . . . . . . . . . . . . . . . . . . . . . . . .
15.8
28.7
2004 . . . . . . . . . . . . . . . . . . . . . . . . . . . . . . . . . . . . . . . . . . . . .
4.3
10.9
2005 . . . . . . . . . . . . . . . . . . . . . . . . . . . . . . . . . . . . . . . . . . . . .
0.8
4.9
2006 . . . . . . . . . . . . . . . . . . . . . . . . . . . . . . . . . . . . . . . . . . . . .
24.1
15.8
2007 . . . . . . . . . . . . . . . . . . . . . . . . . . . . . . . . . . . . . . . . . . . . .
28.7
5.5
2008 . . . . . . . . . . . . . . . . . . . . . . . . . . . . . . . . . . . . . . . . . . . . .
(31.8)
(37.0)
2009 . . . . . . . . . . . . . . . . . . . . . . . . . . . . . . . . . . . . . . . . . . . . .
2.7
26.5
2010 . . . . . . . . . . . . . . . . . . . . . . . . . . . . . . . . . . . . . . . . . . . . .
21.4
15.1
2011 . . . . . . . . . . . . . . . . . . . . . . . . . . . . . . . . . . . . . . . . . . . . .
(4.7)
2.1
2012 . . . . . . . . . . . . . . . . . . . . . . . . . . . . . . . . . . . . . . . . . . . . .
16.8
16.0
2013 . . . . . . . . . . . . . . . . . . . . . . . . . . . . . . . . . . . . . . . . . . . . .
32.7
32.4
2014 . . . . . . . . . . . . . . . . . . . . . . . . . . . . . . . . . . . . . . . . . . . . .
27.0
13.7
2015 . . . . . . . . . . . . . . . . . . . . . . . . . . . . . . . . . . . . . . . . . . . . .
(12.5)
1.4
2016 . . . . . . . . . . . . . . . . . . . . . . . . . . . . . . . . . . . . . . . . . . . . .
23.4
12.0
2017 . . . . . . . . . . . . . . . . . . . . . . . . . . . . . . . . . . . . . . . . . . . . .
21.9
21.8
2018 . . . . . . . . . . . . . . . . . . . . . . . . . . . . . . . . . . . . . . . . . . . . .
2.8
(4.4)
2019 . . . . . . . . . . . . . . . . . . . . . . . . . . . . . . . . . . . . . . . . . . . . .
11.0
31.5
2020 . . . . . . . . . . . . . . . . . . . . . . . . . . . . . . . . . . . . . . . . . . . . .
2.4
18.4
2021 . . . . . . . . . . . . . . . . . . . . . . . . . . . . . . . . . . . . . . . . . . . . .
29.6
28.7
2022 . . . . . . . . . . . . . . . . . . . . . . . . . . . . . . . . . . . . . . . . . . . . .
4.0
(18.1)
2023 . . . . . . . . . . . . . . . . . . . . . . . . . . . . . . . . . . . . . . . . . . . . .
15.8
26.3
2024 . . . . . . . . . . . . . . . . . . . . . . . . . . . . . . . . . . . . . . . . . . . . .
25.5
25.0
2025 . . . . . . . . . . . . . . . . . . . . . . . . . . . . . . . . . . . . . . . . . . . . .
10.9
17.9
Compounded Annual Gain – 1965-2025 . . . . . . . . . . . . . . . .
19.7%
10.5%
Overall Gain – 1964-2025 . . . . . . . . . . . . . . . . . . . . . . . . . . . .
6,099,294%
46,061%
20
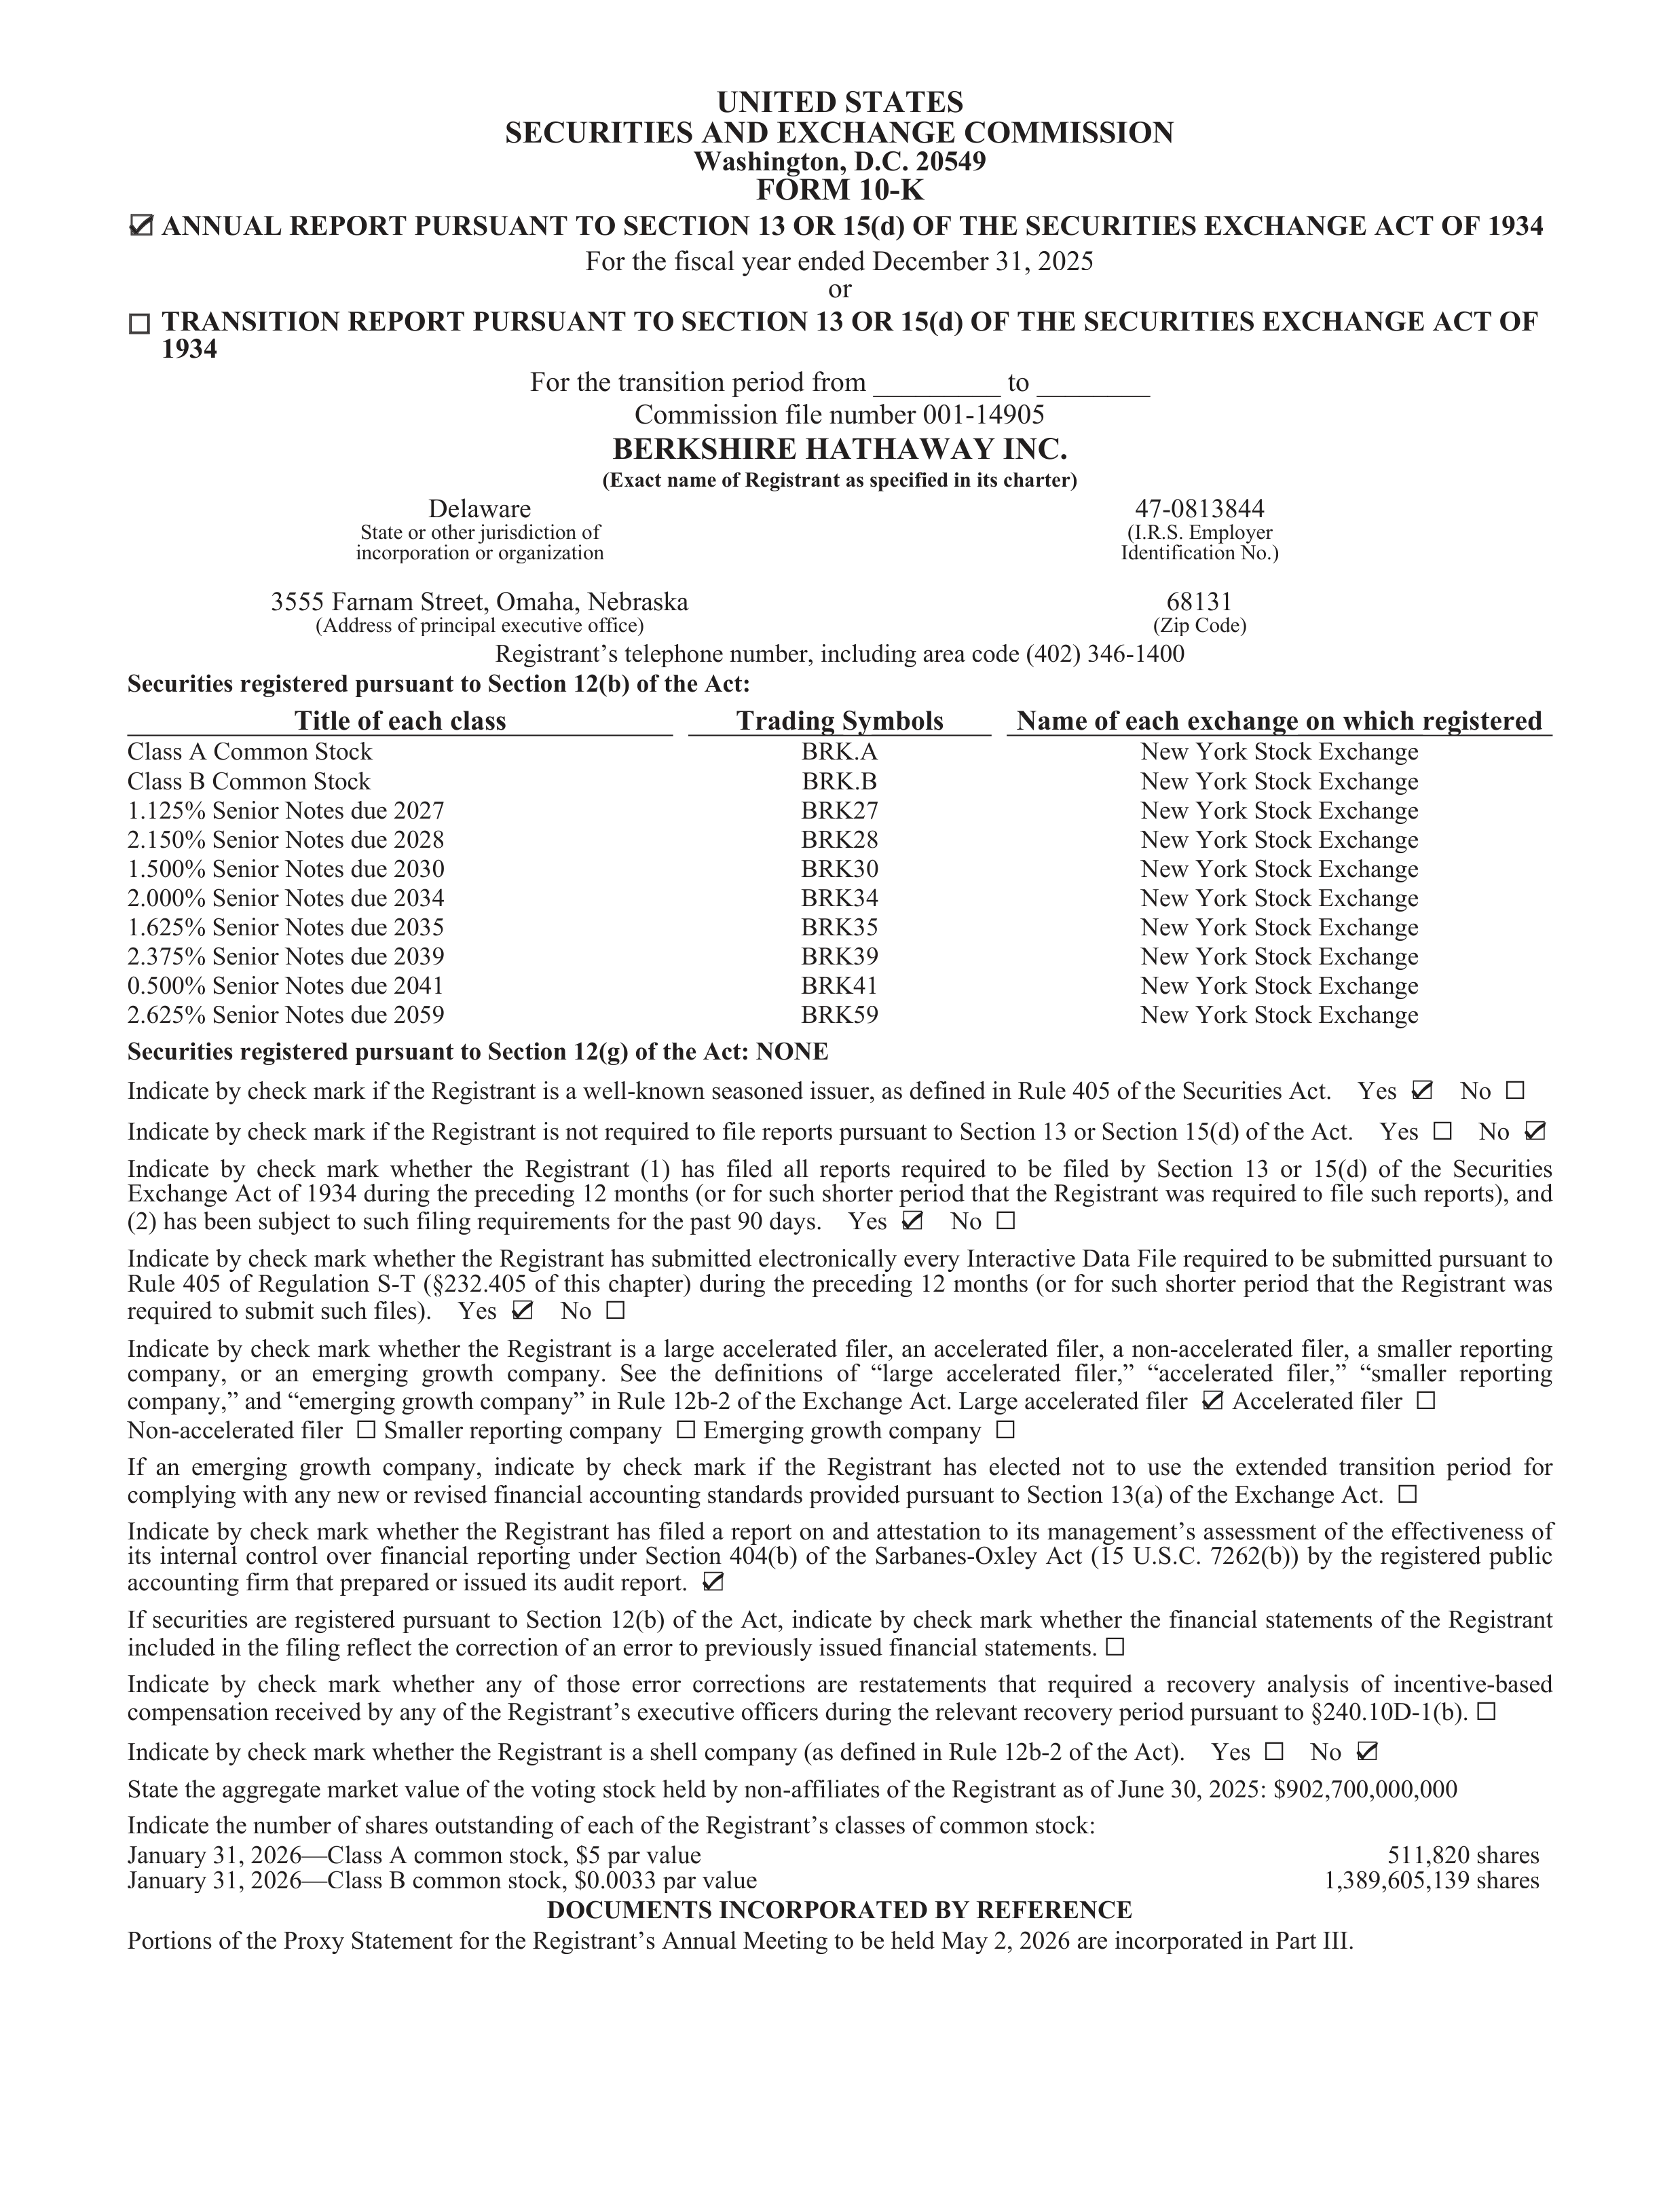
UNITED STATES
SECURITIES AND EXCHANGE COMMISSION
Washington, D.C. 20549
FORM 10-K
☑
ANNUAL REPORT PURSUANT TO SECTION 13 OR 15(d) OF THE SECURITIES EXCHANGE ACT OF 1934
For the fiscal year ended December 31, 2025
or
☐
TRANS
R
ITION REPORT PURSUANT TO SECTION 13 OR 15(d) OF THE SECURITIES EXCHANGE ACT OF
1934
For the transition period from _________ to ________
Commission file number 001-14905
BERKSHIRE HATHAWAY INC.
(Exact name of Registrant as specified in its charter)
Delaware
47-0813844
State or other jurisdiction of
incorporation or organization
(I.R.S. Employer
Identific
f
ation No.)
3555 Farnam Street, Omaha, Nebraska
68131
(Address of principal executive offi
f
ce)
(Zip Code)
Registrant’s telephone number, including area code (402) 346-1400
Securities registered pursuant to Section 12(b) of the Act:
Title of each class
Trading Symbols
Name of each exchange on which registered
Class A Common Stock
Class B Common Stock
1.125% Senior Notes due 2027
2.150% Senior Notes due 2028
1.500% Senior Notes due 2030
2.000% Senior Notes due 2034
1.625% Senior Notes due 2035
2.375% Senior Notes due 2039
0.500% Senior Notes due 2041
2.625% Senior Notes due 2059
BRK.A
BRK.B
BRK27
BRK28
BRK30
BRK34
BRK35
BRK39
BRK41
BRK59
New York Stock Exchange
New York Stock Exchange
New York Stock Exchange
New York Stock Exchange
New York Stock Exchange
New York Stock Exchange
New York Stock Exchange
New York Stock Exchange
New York Stock Exchange
New York Stock Exchange
Securities registered pursuant to Section 12(g) of the Act: NONE
Indicate by check mark if the Registrant is a well-known seasoned issuer, as defined in Rule 405 of the Securities Act.
Yes
☑
No
☐
Indicate by check mark if the Registrant is not required to file reports pursuant to Section 13 or Section 15(d) of the Act.
Yes
☐
No
☑
Indicate
by
check
mark
whether
the
Registrant
(1)
has
filed
all
reports
required
to
be
filed
by
Section
13
or
15(d)
of
the
Securities
Exchange Act of 1934 during the preceding 12 months (or for such shorter period that the Registrant was required to file such reports), and
(2) has been subj
u
ect to such filing requirements for the past 90 days.
Yes
☑
No
☐
Indicate by check mark whether the Registrant has subm
u
itted electronically every
r
Interactive Data File required to be subm
u
itted pursuant to
Rule
405
of
Regulation
S-T
(§232.405
of
this
chapter)
during
the
preceding
12
months
(or
for
such
shorter
period
that
the
Registrant
was
required to subm
u
it such files).
Yes
☑
No
☐
Indicate
by
check
mark
whether
the
Registrant
is
a
large
accelerated
filer,
an
accelerated
filer,
a
non-accelerated
filer,
a
smaller
reporting
company,
or
an
emerging
growth
company.
See
the
definitions
of
“large
accelerated
filer,”
“accelerated
filer,”
“smaller
reporting
company,” and “emerging growth company” in Rule 12b-2 of the Exchange Act. Large accelerated filer
☑
Accelerated filer
☐
Non-accelerated filer
☐
Smaller reporting company
☐
Emerging growth company
☐
If
an
emerging
growth
company,
indicate
by
check
mark
if
the
Registrant
has
elected
not
to
use
the
extended
transition
period
for
complying with any new or revised financial accounting standards provided pursuant to Section 13(a) of the Exchange Act.
☐
Indicate by check mark whether the Registrant has filed a report on and attestation to its management’s assessment of the effe
f
ctiveness of
its
internal
control
over
financial
reporting
under
Section
404(b)
of
the
Sarbanes-Oxley
Act
(15
U.S.C.
7262(b))
by
the
registered
public
accounting firm that prepared or issued its audit report.
☑
If
securities
are
registered
pursuant
to
Section
12(b)
of
the
Act,
indicate
by
check
mark
whether
the
financial
statements
of
the
Registrant
included in the filing reflect the correction of an error to previously issued financial statements.
☐
Indicate
by
check
mark
whether
any
of
those
error
corrections
are
restatements
that
required
a
recovery
analysis
of
incentive-based
compensation received by any of the Registrant’s executive offi
f
cers during the relevant recovery period pursuant to §240.10D-1(b).
☐
Indicate by check mark whether the Registrant is a shell company (as defined in Rule 12b-2 of the Act).
Yes
☐
No
☑
State the aggregate market value of the voting stock held by non-affi
f
liates of the Registrant as of June 30, 2025: $902,700,000,000
Indicate the number of shares outstanding of each of the Registrant’s classes of common stock:
January 31, 2026—Class A common stock, $5 par value
511,820 shares
January 31, 2026—Class B common stock, $0.0033 par value
1,389,605,139 shares
DOCUMENTS INCORPORAT
R
ED BY REFERENCE
Portions of the Proxy Statement for the Registrant’s Annual Meeting to be held May 2, 2026 are incorporated in Part III.
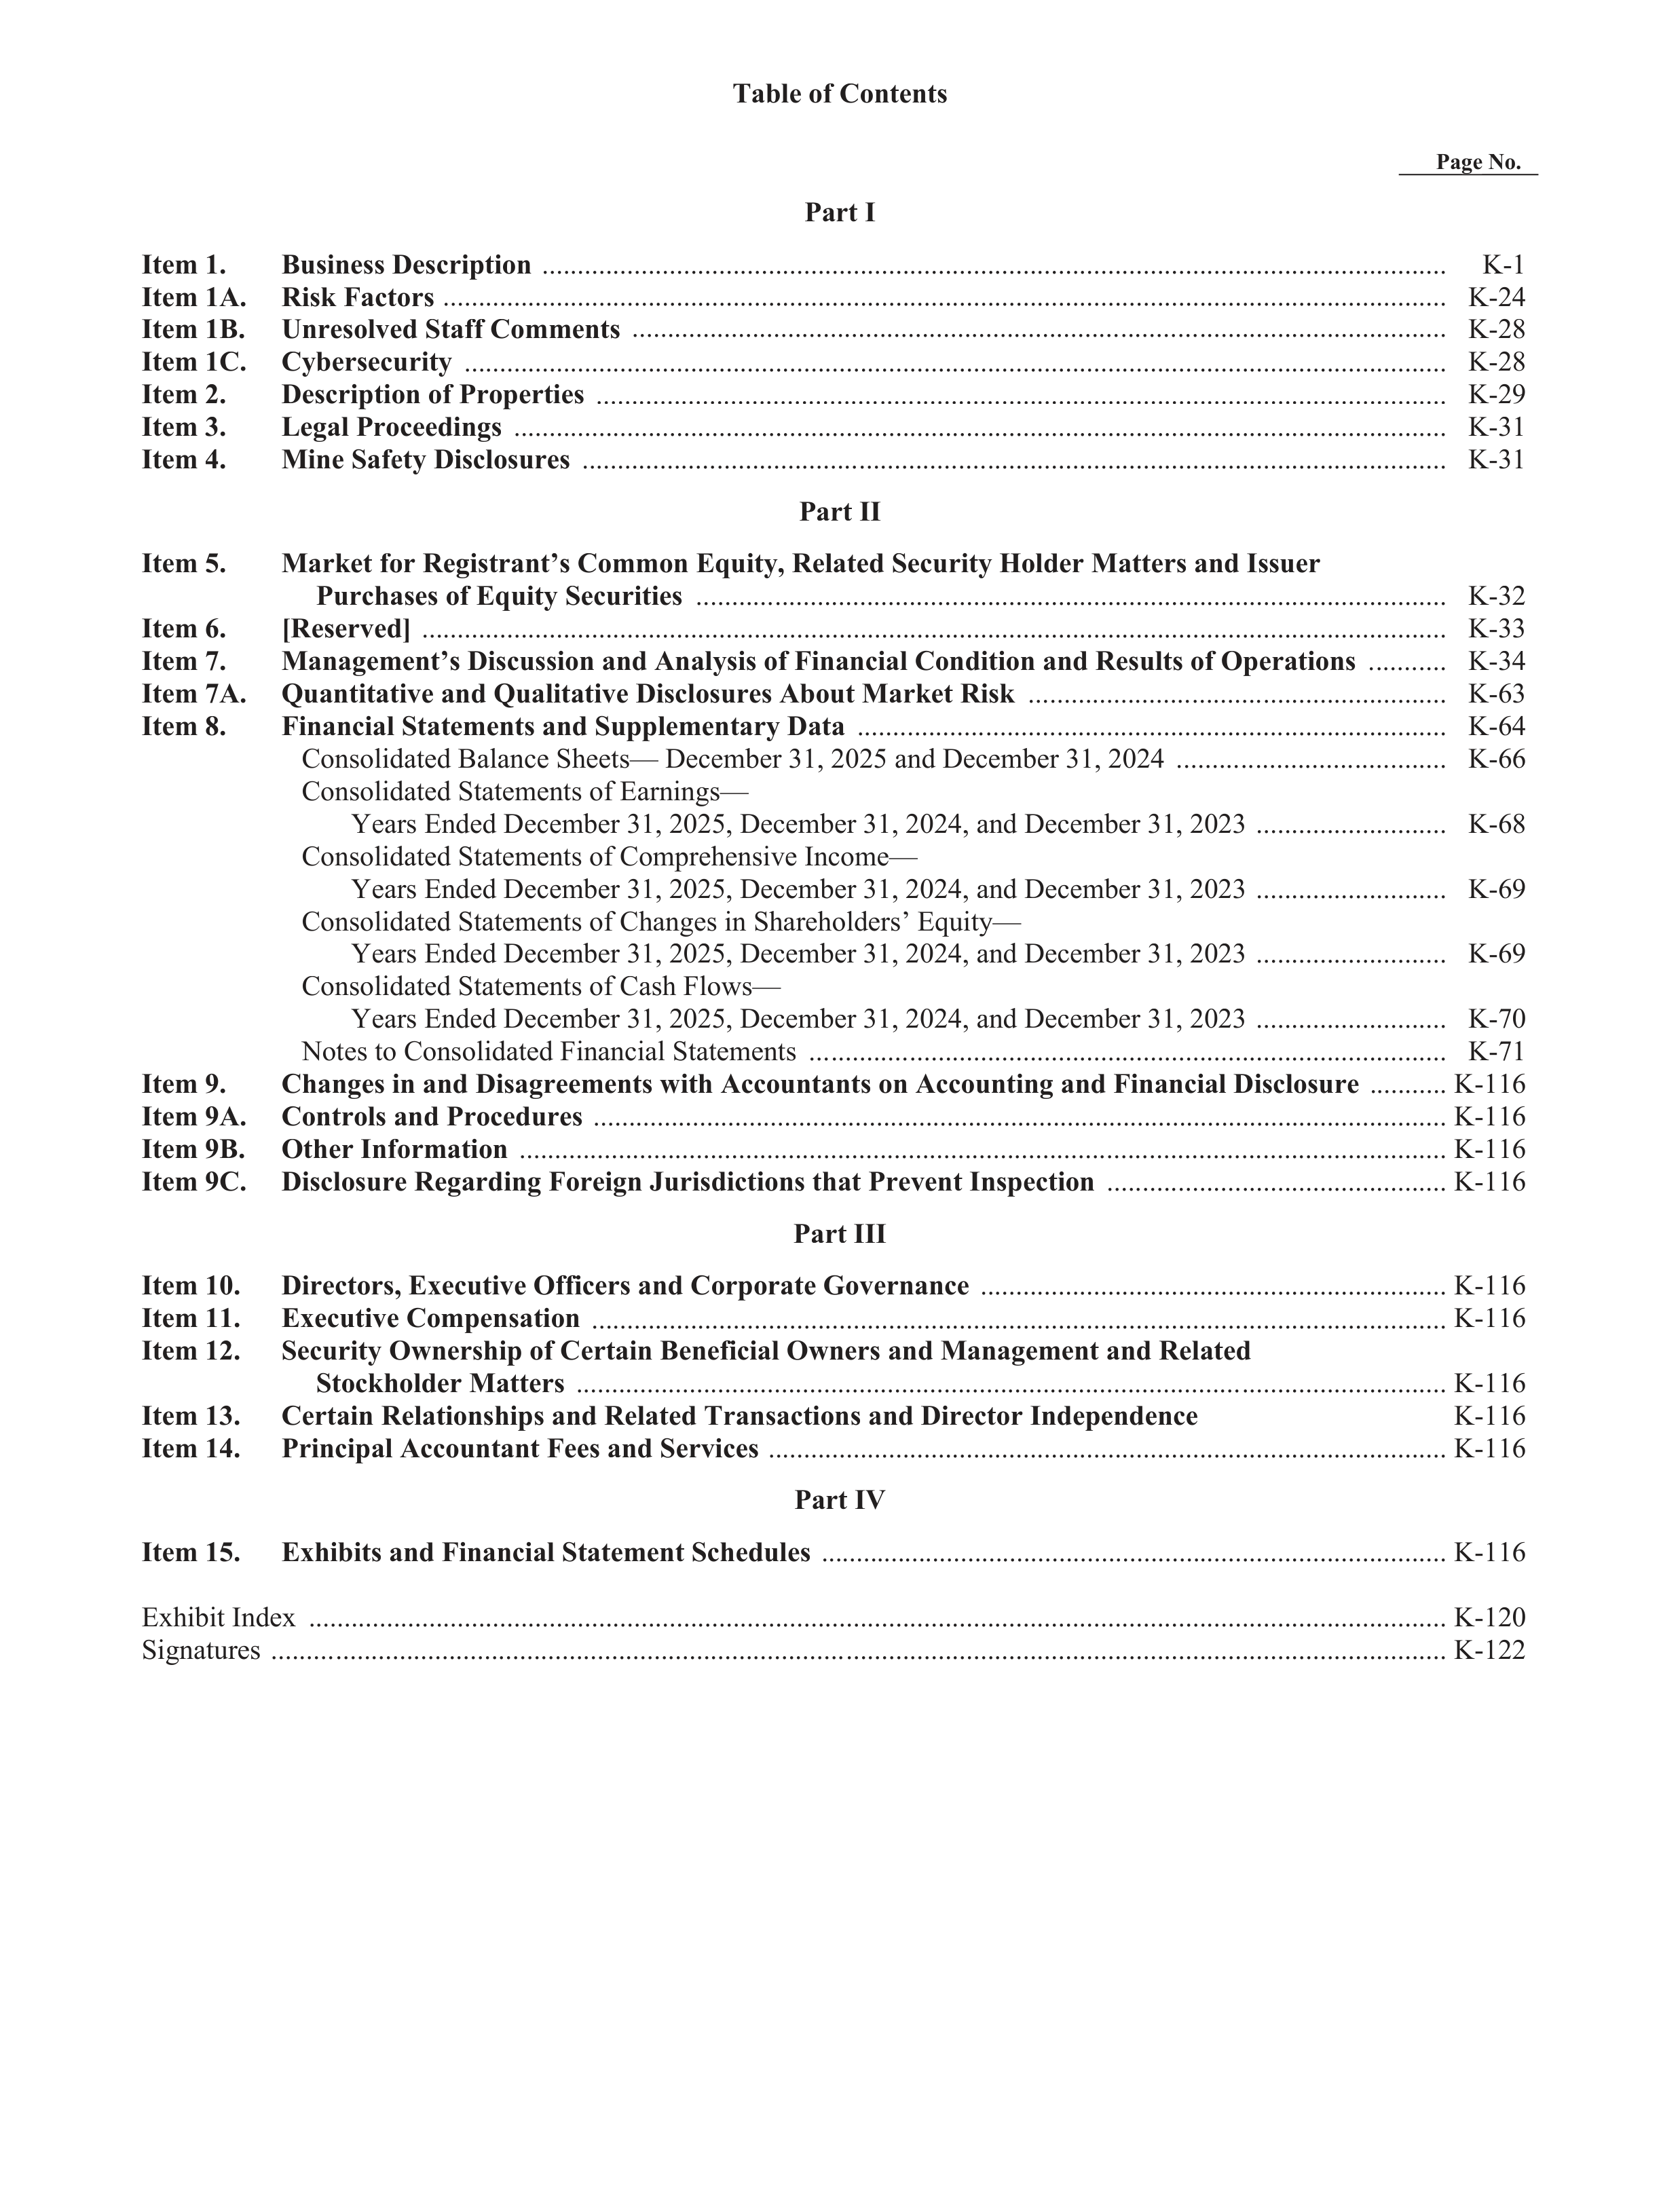
Table of Contents
Page No.
K-1
K-24
K-28
K-28
K-29
K-31
K-31
K-32
K-33
K-34
K-63
K-64
K-66
K-68
K-69
K-69
K-70
K-71
K-116
K-116
K-116
K-116
K-116
K-116
K-116
K-116
K-116
K-116
K-120
K-122
Part I
Item 1.
Business Description
Item 1A.
Risk Factors
Item 1B.
Unresolved Stafff
Comments
Item 1C.
Cybersecurity
Item 2.
Description of Properties
Item 3.
Legal Proceedings
Item 4.
Mine Safef
ty Disclosures
Part II
Item 5.
Market fo
f
r Registrant’s Common Equity, Related Security Holder Matters and Issuer
Purchases of Equity Securities
Item 6.
Item 7.
Management’s Discussion and Analysis of Financial Condition and Results of Operations
Item 7A.
Quantitative and Qualitative Disclosures About Market Risk
Item 8.
Financial Statements and Supplementary Data
Consolidated Balance Sheets— December 31, 2025 and December 31, 2024
Consolidated Statements of Earnings—
Years Ended December 31, 2025, December 31, 2024, and December 31, 2023
Consolidated Statements of Comprehensive Income—
Years Ended December 31, 2025, December 31, 2024, and December 31, 2023
Consolidated Statements of Changes in Shareholders’ Equity—
y
Years Ended December 31, 2025, December 31, 2024, and December 31, 2023
Consolidated Statements of Cash Flows—
Years Ended December 31, 2025, December 31, 2024, and December 31, 2023
Notes to Consolidated Financial Statements
Item 9.
Changes in and Disagreements with Accountants on Accounting and Financial Disclosure
Item 9A.
Controls and Procedures
Item 9B.
Other Info
f
rmation
Item 9C.
Disclosure Regarding Foreign Jurisdictions that Prevent Inspection
Part III
Item 10.
Directors, Executive Offf
if cers and Corporate Governance
Item 11.
Executive Compensation
Item 12.
Security Ownership of Certain Benefif cial Owners and Management and Related
Stockholder Matters
Item 13.
Certain Relationships and Related Transactions and Director Independence
Item 14.
Principal Accountant Fees and Services
Part IV
Item 15.
Exhibits and Financial Statement Schedules
Exhibit Index
.................................................................................................................................................................
Signatut
res
......................................................................................................................................................................
[Reserved]
K-1
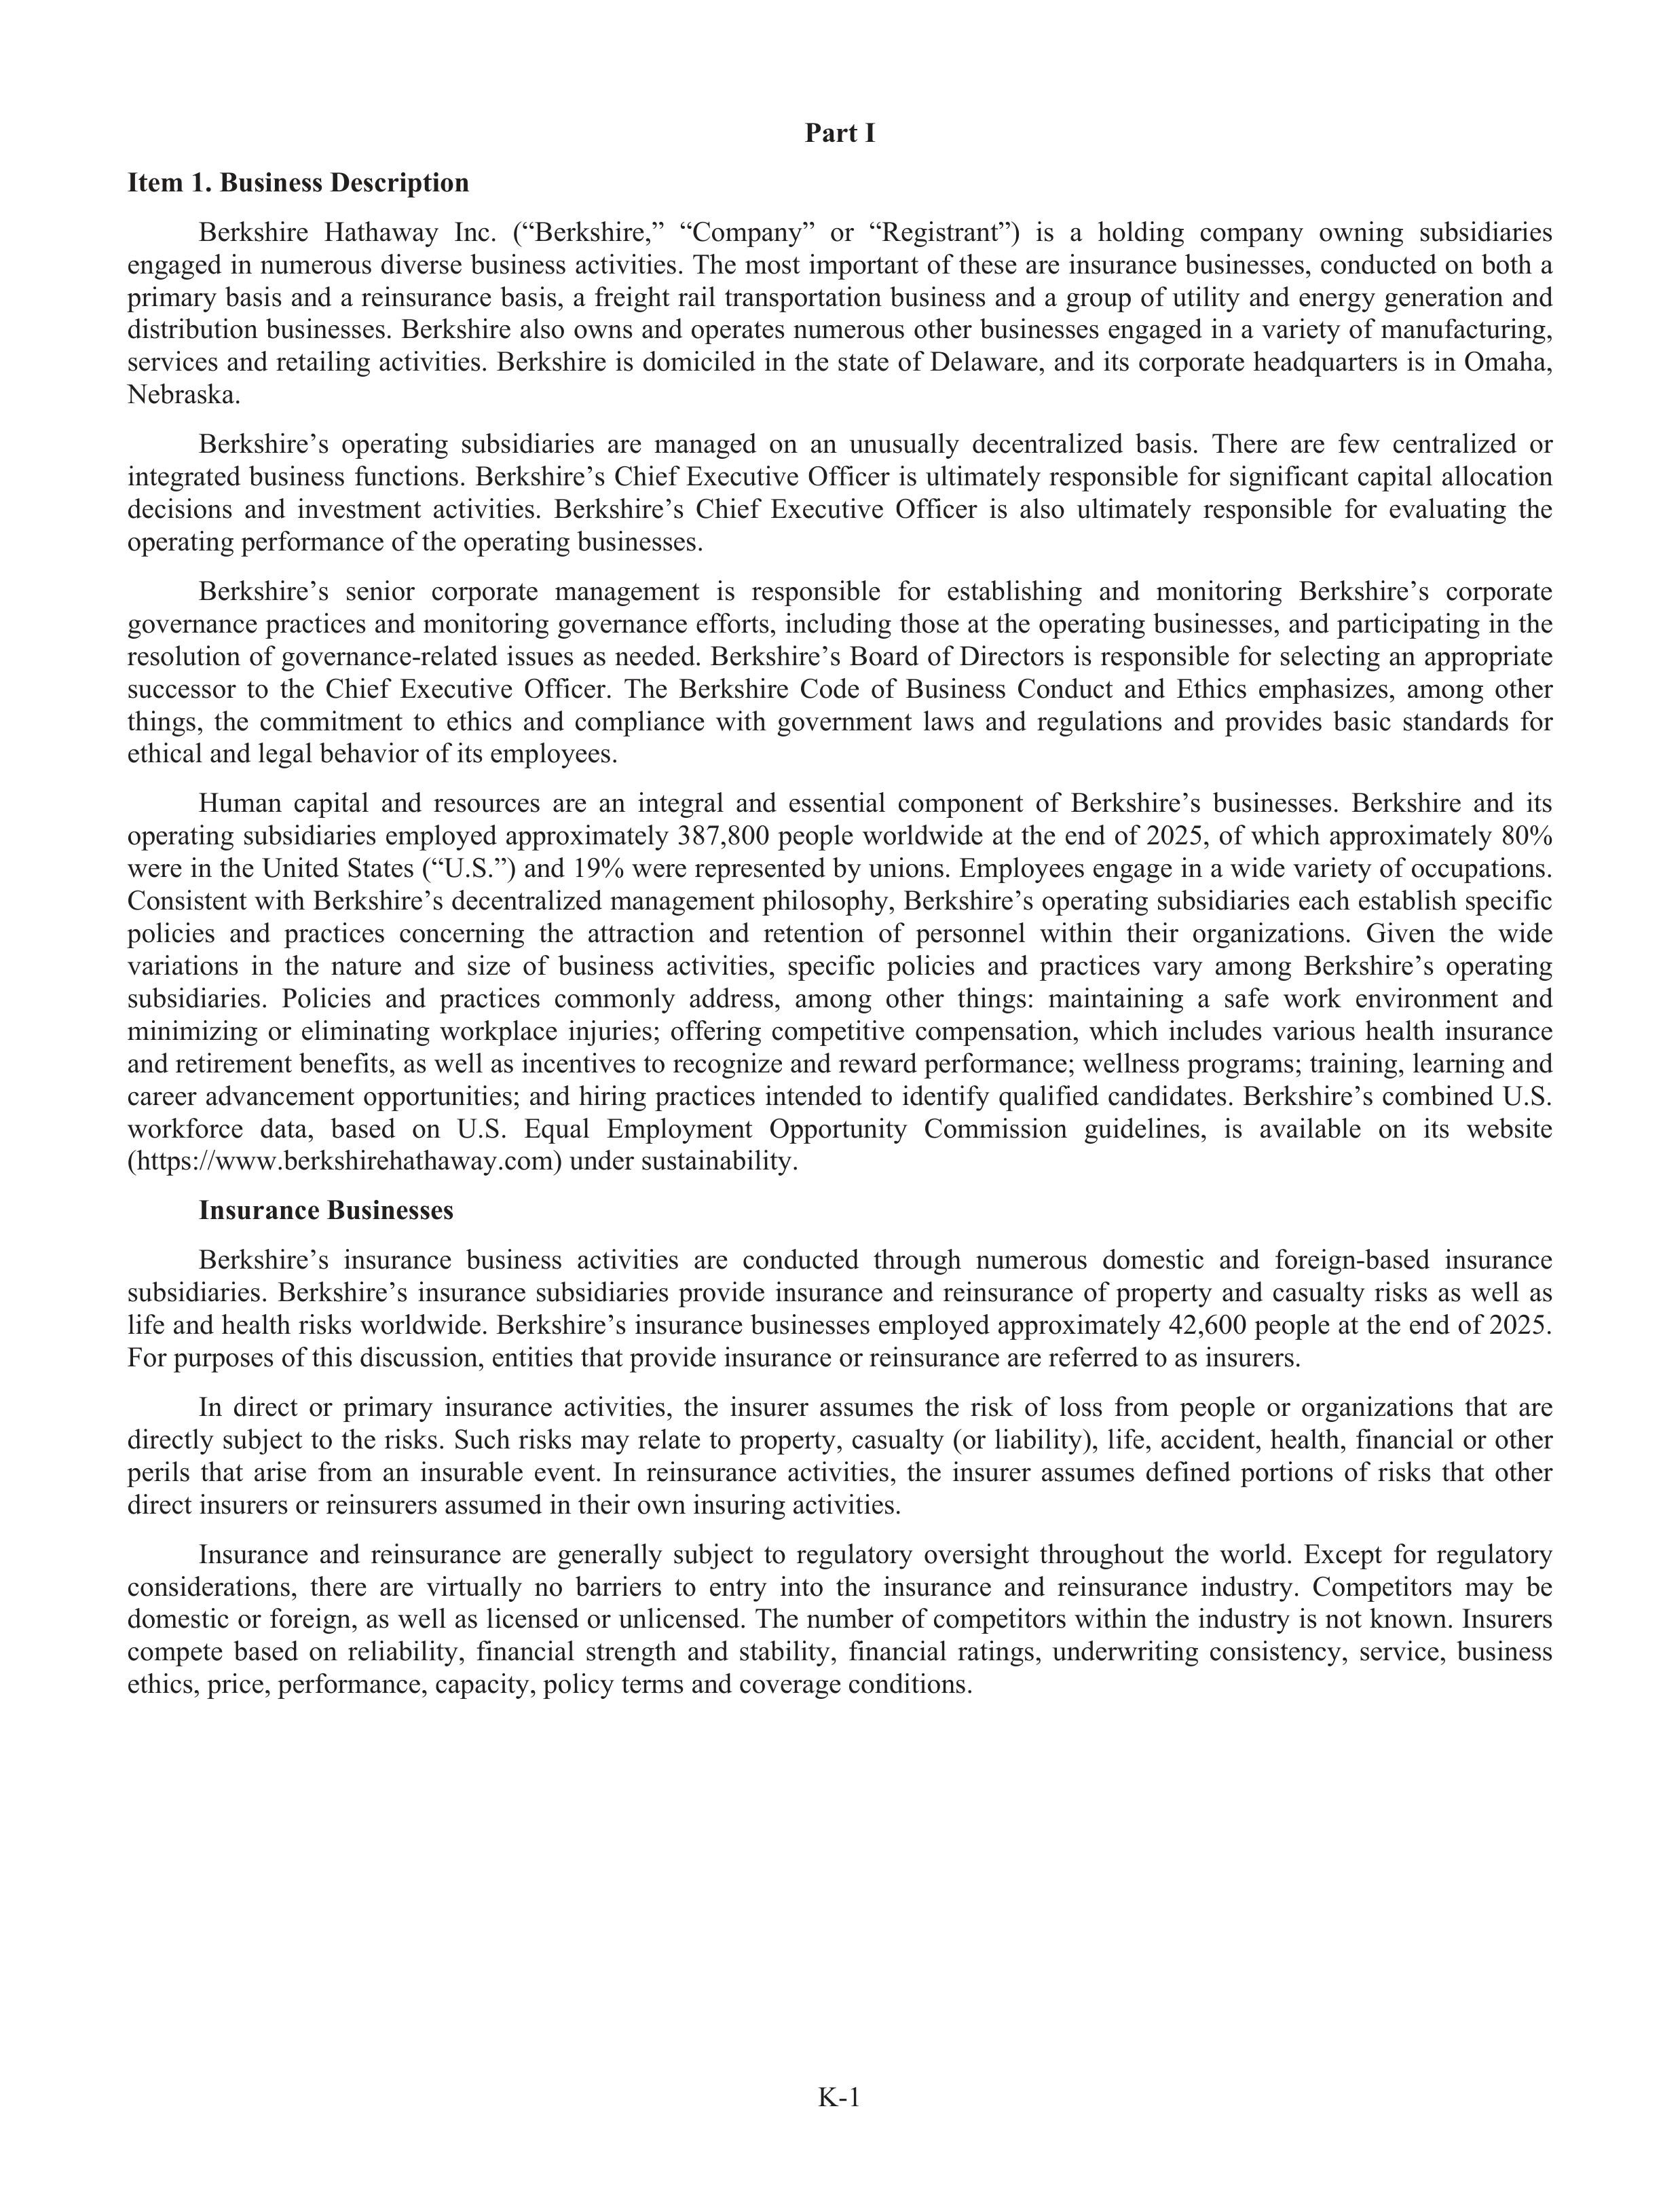
Part I
Item 1. Business Description
Berkshire
Hathaway
Inc.
(“Berkshire,”
“Company”
or
“Registrant”)
is
a
holding
company
owning
subs
u
idiaries
engaged in numerous diverse business activities. The most important of these are insurance businesses, conducted on both a
primary
basis
and
a
reinsurance
basis,
a
freight
rail
transportation
business
and
a
group
of
utility
and
energy
generation
and
distribution businesses. Berkshire also owns and operates numerous other businesses engaged in a variety of manufact
f
ur
t
ing,
services and retailing activities. Berkshire is domiciled in the state of Delaware, and its corporate headquarters is in Omaha,
Nebraska.
Berkshire’s
operating
subs
u
idiaries
are
managed
on
an
unusually
decentralized
basis.
There
are
few
centralized
or
integrated
business
functions.
Berkshire’s
Chief
Executive
Offi
f
cer
is
ultimately
responsible
for
significant
capital
allocation
decisions
and
investment
activities.
Berkshire’s
Chief
Executive
Offi
f
cer
is
also
ultimately
responsible
for
evaluating
the
operating performance of the operating businesses.
Berkshire’s
senior
corporate
management
is
responsible
for
establ
a
ishing
and
monitoring
Berkshire’s
corpor
r
ate
governance practices and monitoring governance effo
f
rts, including those at the operating businesses, and participating in the
resolution
of
governance-related
issues
as
needed.
Berkshire’s
Board
of
Directors
is
responsible
for
selecting
an
appropriate
successor
to
the
Chief
Executive
Offi
f
cer.
The
Berkshire
Code
of
Business
Conduct
and
Ethics
emphasizes,
among
other
things,
the
commitment
to
ethics
and
compliance
with
government
laws
and
regulations
and
provides
basic
standards
for
ethical and legal behavior of its employees.
Human
capital
and
resources
are
an
integral
and
essential
component
of
Berkshire’s
businesses.
Berkshire
and
its
operating
subs
u
idiaries
employed
approximately
387,800
people
worldwide
at
the
end
of
2025,
of
which
approximately
80%
were in the United States (“U.S.”) and 19% were represented by unions. Employees engage in a wide variety of occupa
u
tions.
Consistent with Berkshire’s decentralized management philosophy, Berkshire’s operating subs
u
idiaries each establ
a
ish specific
policies
and
practices
concerning
the
attraction
and
retention
of
personnel
within
their
organizations.
Given
the
wide
variations
in
the
nature
and
size
of
business
activities,
specific
policies
and
practices
vary
among
Berkshire’s
operating
subs
u
idiaries.
Policies
and
practices
commonly
address,
among
other
things:
maintaining
a
safe
work
environment
and
minimizing
or
eliminating
workpl
k
ace
inju
n
ries;
offe
f
ring
competitive
compensation,
which
includes
various
health
insurance
and retirement benefits, as well as incentives to recognize and reward performance; wellness programs; training, learning and
career
advancement
opportunities;
and
hiring
practices
intended
to
identify
f
qualifie
f
d
candidates.
Berkshire’s
combined
U.S.
workforce
data,
based
on
U.S.
Equal
Employment
Opportunity
Commission
guidelines,
is
availabl
a
e
on
its
website
(https://www.berkshirehathaway.com) under sustainabi
a
lity.
Insurance Businesses
Berkshire’s
insurance
business
activities
are
conducted
through
numerous
domestic
and
foreign-based
insurance
subs
u
idiaries.
Berkshire’s
insurance
subs
u
idiaries
provide
insurance
and
reinsurance
of
property
and
casualty
risks
as
well
as
lifef
and health risks worldwide. Berkshire’s insurance businesses employed approximately 42,600 people at the end of 2025.
For purpos
r
es of this discussion, entities that provide insurance or reinsurance are referred to as insurers.
In
direct
or
primary
insurance
activities,
the
insurer
assumes
the
risk
of
loss
from
people
or
organizations
that
are
directly
subj
u
ect
to
the
risks.
Such
risks
may
relate
to
property,
casualty
(or
liabi
a
lity),
life,
f
accident,
health,
financial
or
other
perils
that
arise
from
an
insurabl
a
e
event.
In
reinsurance
activities,
the
insurer
assumes
defined
portions
of
risks
that
other
direct insurers or reinsurers assumed in their own insuring activities.
Insurance
and
reinsurance
are
generally
subj
u
ect
to
regulatory
r
oversight
throughout
the
world.
Except
for
regulatory
r
considerations,
there
are
virtua
t
lly
no
barriers
to
entry
r
into
the
insurance
and
reinsurance
industry.
r
Competitors
may
be
domestic or foreign, as well as licensed or unlicensed. The number of competitors within the industry
r
is not known. Insurers
compete
based
on
reliabi
a
lity,
financial
strength
and
stability,
financial
ratings,
underwriting
consistency,
service,
business
ethics, price, performance, capacity, policy terms and coverage conditions.
K-2
Insurers
based
in
the
U.S.
are
subj
u
ect
to
regulation
by
their
states
of
domicile
and
by
those
states
in
which
they
are
licensed
to
write
policies
on
an
admitted
basis.
The
primary
r
focus
of
state
regulation
is
to
monitor
financial
solvency
of
insurers
and
otherwise
protect
policyholder
interests.
States
establ
a
ish
minimum
capital
levels
for
insurance
companies
and
establ
a
ish
guidelines
for
permissible
business
and
investment
activities
and
have
the
authority
to
suspend
or
revoke
a
company’s authority to do business. States regulate the payment of shareholder dividends by insurance companies and other
transactions with affi
f
liates.
Insurers that market, sell and service insurance policies in the states where they are licensed are referred to as admitted
insurers.
Admitted
insurers
are
generally
required
to
obtain
regulatory
r
approval
of
their
policy
forms
and/or
premium
rates.
Non-admitted
insurance
markets
have
developed
to
provide
insurance
that
is
otherwise
unavailabl
a
e
through
admitted
insurers. Non-admitted insurance, ofte
f
n referred to as “excess and surplus” lines, is procured by either state-licensed surplus
lines
brokers
who
place
risks
with
insurers
not
licensed
in
that
state
or
by
the
insured
party’s
direct
procurement
from
non-
admitted
insurers.
Non-admitted
insurance
is
subj
u
ect
to
considerably
less
regulation
with
respect
to
policy
rates
and
forms.
Reinsurers are normally not required to obtain regulatory approval of premium rates or reinsurance contracts.
The insurance regulators of every
r
state participate in the National Association of Insurance Commissioners (“NAIC”).
The
NAIC
adopts
forms,
instructions
and
accounting
procedur
d
es
for
use
by
U.S.
insurers
in
preparing
and
filing
annual
statut
t
ory
r
financial
statements.
In
addition,
the
NAIC
develops
or
adopts
statut
t
ory
r
accounting
principles,
model
laws,
regulations
and
programs
dealing
with
regulatory
oversight
of
solvency,
risk
management,
compliance
with
financial
regulation
standards
and
risk-based
capital
reporting
requirements.
However,
an
insurer’s
state
of
domicile
has
ultimate
authority
over
these
solvency
and
soundness
related
matters,
and
the
laws
and
regulations
implemented
in
individual
states
may differ from those adopted by the NAIC.
International insurance regulators, through the International Association of Insurance Supe
u
rvisors (“IAIS”), have been
developing
advisory
standards
and
best
practices
focused
on
establ
a
ishing
a
common
set
of
principles
(“Insurance
Core
Principles”)
and
framework
(“ComFrame”)
for
the
regulation
of
large
multi-national
insurance
groups. The
Insurance
Core
Principles
and
ComFrame
cover
a
wide
range
of
topics,
including
group-wide
supe
u
rvision
by
regulators,
corporate
governance, risk management, capital adequacy and other macroprude
r
ntial issues. As part of ComFrame, the IAIS adopted an
international capital standard (“ICS”) for
f
internationally active insurance groups in December 2024.
While
the
IAIS
standards
do
not
have
legal
effe
f
ct,
U.S.
state
insurance
departments
and
the
NAIC
are
implementing
various
group
supe
u
rvision
regulatory
r
tools
and
mandates
that
are
responsive
to
certain
IAIS
standards.
U.S.
state
regulators
have
formed
supe
u
rvisory
r
colleges
intended
to
promote
communication
and
cooperation
amongst
the
various
domestic
and
international
insurance
regulators.
U.S.
state
regulators
require
insurance
groups
to
file
an
annual
report
and
an
Own
Risk
Solvency
Assessment
(“ORSA”),
with
the
group’s
lead
supe
u
rvisor.
The
NAIC
also
adopted
a
group
capital
calculation
(“GCC”)
tool
for
large
insurance
groups.
The
GCC
tool
is
designed
to
help
the
lead
supe
u
rvisor
understand
the
capital
adequacy across an insurance group. The NAIC is also developing further tools, including various liquidity assessments, that
will
likely
be
imposed
on
insurance
groups
in
the
future.
While
the
ICS
is
based
on
a
consolidation
approach,
the
GCC
is
based
on
an
aggregation
approach
called
the
Aggregation
Method. In
December
2024,
the
IAIS
announced
that
the
Aggregation Method has been deemed to be comparable to the ICS.
Insurance
regulators
from
the
U.S.
(Nebraska,
Delaware
and
Connecticut),
Germany,
Ireland
and
the
U.K.
participate
in
a
Berkshire
insurance
group
supe
u
rvisory
r
college.
The
Nebraska
Department
of
Insurance
(“Nebraska
DOI”)
acts
as
the
lead
supe
u
rvisor
for
Berkshire’s
insurance
group
and
chairs
the
Berkshire
supe
u
rvisory
r
college. Nebraska
amended
its
insurance laws in 2022 and adopted the GCC tool. Berkshire’s insurance subs
u
idiaries are required to subm
u
it an annual GCC
to the Nebraska DOI.
Berkshire’s insurance companies maintain capital strength at exceptionally high levels, which differentiates them from
their
competitors.
The
combined
statut
t
ory
r
surplus
of
Berkshire’s
U.S.-based
insurers
was
approximately
$333
billion
at
December
31,
2025.
Berkshire’s
major
insurance
subs
u
idiaries
are
rated
AA+
by
Standard
&
Poor’s
and
A++
(superior)
by
A.M. Best with respect to their financial condition and claims paying ability.
The
Terrorism
Risk
Insurance
Act
of
2002
establ
a
ished
a
Terrorism
Insurance
Program
(“Program”)
within
the
U.S.
Department of the Treasury
r
to provide federal reinsurance of certifie
f
d terrorism losses incurred by U.S. commercial property
and
casualty
insurers.
The
Program
extends
to
December
31,
2027
through
the
Terrorism
Risk
Insurance
Program
Reauthorization Act of 2019. Hereinafte
f
r, these Acts are collectively referred to as TRIA. The Department of the Treasury
r
is
responsible
for
certifyi
f
ng
acts
of
terrorism
under
TRIA.
Federal
reinsurance
under
TRIA
may
apply
if
the
industry
r
insured
loss for certifie
f
d events occurring during the calendar year exceeds $200 million.
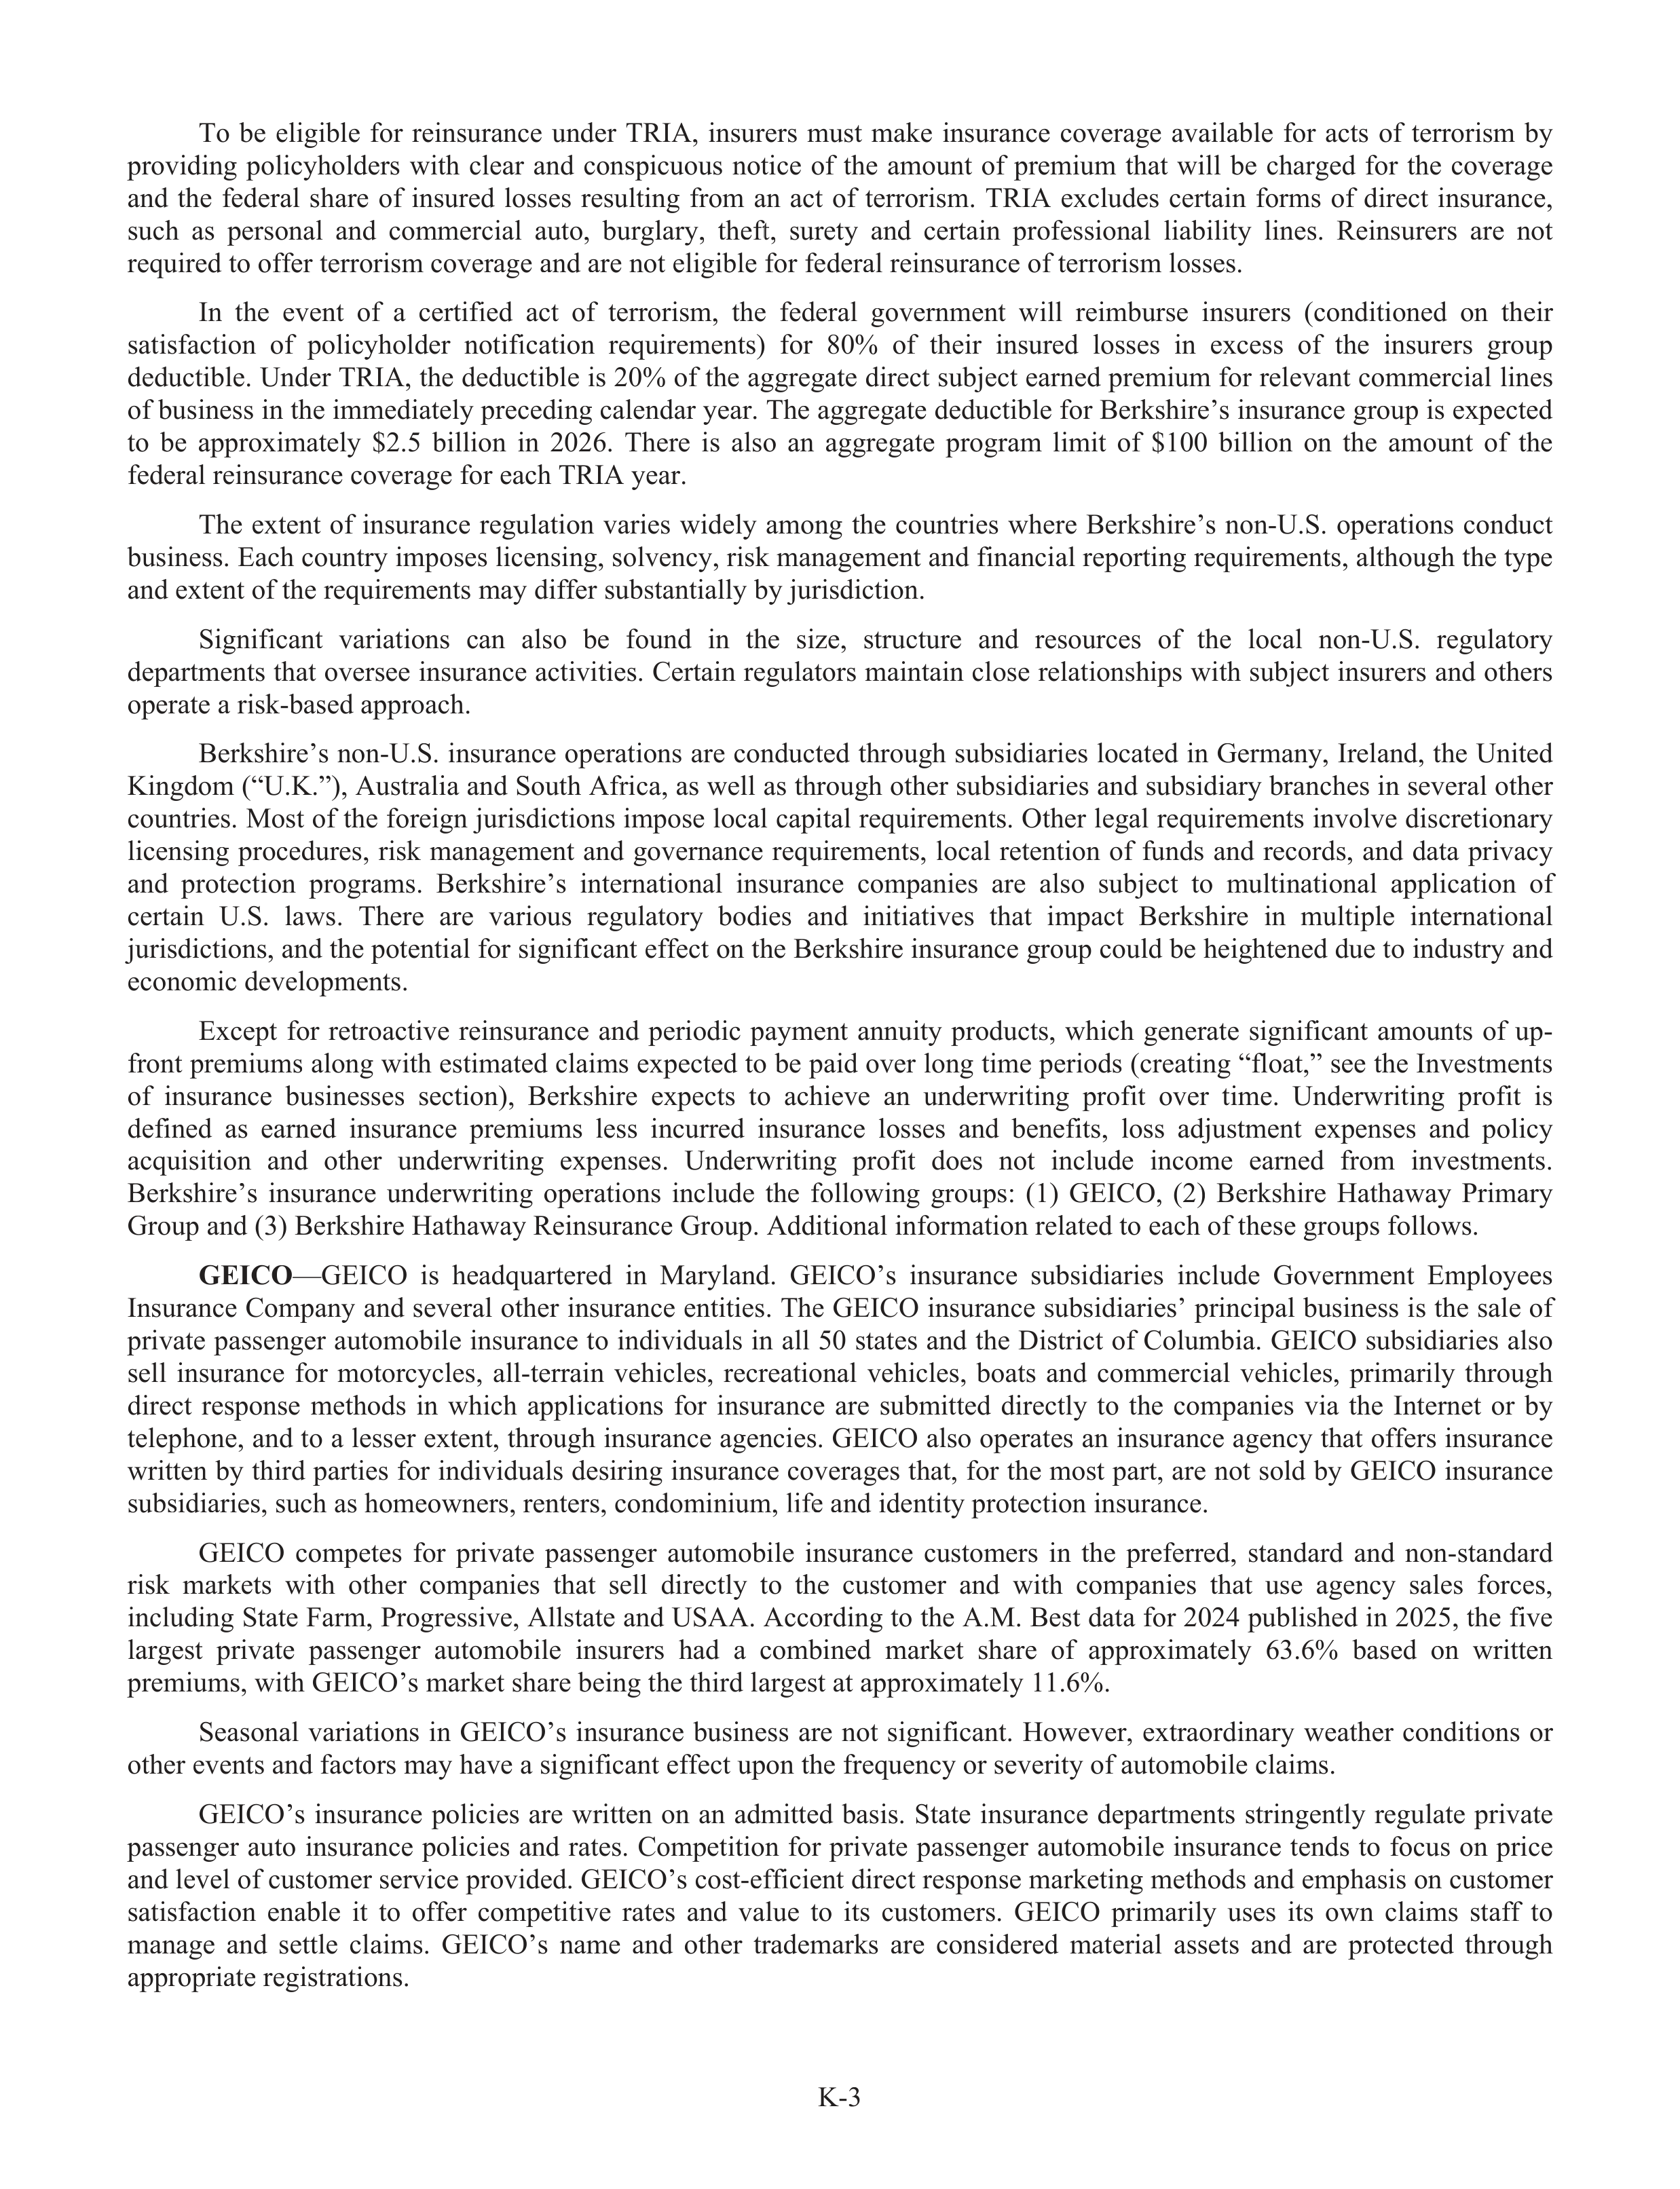
K-3
To
be
eligible
for
reinsurance
under
TRIA,
insurers
must
make
insurance
coverage
availabl
a
e
for
acts
of
terrorism
by
providing
policyholders
with
clear
and
conspicuous
notice
of
the
amount
of
premium
that
will
be
charged
for
the
coverage
and
the
federal
share
of
insured
losses
resulting
from
an
act
of
terrorism.
TRIA
excludes
certain
forms
of
direct
insurance,
such
as
personal
and
commercial
auto,
burglary,
r
theft,
f
surety
and
certain
profes
f
sional
liabi
a
lity
lines.
Reinsurers
are
not
required to offe
f
r terrorism coverage and are not eligible for federal reinsurance of terrorism losses.
In
the
event
of
a
certifie
f
d
act
of
terrorism,
the
federal
government
will
reimburse
insurers
(conditioned
on
their
satisfaction
of
policyholder
notific
f
ation
requirements)
for
80%
of
their
insured
losses
in
excess
of
the
insurers
group
deductible. Under TRIA, the deductible is 20% of the aggregate direct subj
u
ect earned premium for relevant commercial lines
of business in the immediately preceding calendar year. The aggregate deductible for Berkshire’s insurance group is expected
to
be
approximately
$2.5
billion
in
2026.
There
is
also
an
aggregate
program
limit
of
$100
billion
on
the
amount
of
the
federal reinsurance coverage for each TRIA year.
The
extent
of
insurance
regulation
varies
widely
among
the
countries
where
Berkshire’s
non-U.S.
operations
conduct
business. Each country imposes licensing, solvency, risk management and financial reporting requirements, although the type
and extent of the requirements may differ subs
u
tantially by jurisdiction.
Significant
variations
can
also
be
found
in
the
size,
structur
t
e
and
resources
of
the
local
non-U.S.
regulatory
r
departments that oversee insurance activities. Certain regulators maintain close relationships with subj
u
ect insurers and others
operate a risk-based approach.
Berkshire’s non-U.S. insurance operations are conducted through subs
u
idiaries located in Germany, Ireland, the United
Kingdom (“U.K.”), Australia and South Afri
f
ca, as well as through other subs
u
idiaries and subs
u
idiary branches in several other
countries. Most of the foreign jurisdictions impose local capi
a
tal requirements. Other legal requirements involve discretionary
licensing
procedur
d
es,
risk
management
and
governance
requirements,
local
retention
of
funds
and
records,
and
data
privacy
and
protection
programs.
Berkshire’s
international
insurance
companies
are
also
subj
u
ect
to
multinational
application
of
certain
U.S.
laws.
There
are
various
regulatory
r
bodies
and
initiatives
that
impact
Berkshire
in
multiple
international
jurisdictions, and the potential for significant effe
f
ct on the Berkshire insurance group could be heightened due to indus
d
try
r
and
economic developments.
Except
for
retroactive
reinsurance
and
periodic
payment
annuity
products,
which
generate
significant
amounts
of
up-
front premiums along with estimated claims expected to be paid over long time periods (creating “float,” see the Investments
of
insurance
businesses
section),
Berkshire
expects
to
achieve
an
underwriting
profit
f
over
time.
Underwriting
profit
f
is
defined
as
earned
insurance
premiums
less
incurred
insurance
losses
and
benefits,
loss
adju
d
stment
expenses
and
policy
acquisition
and
other
underwriting
expenses.
Underwriting
profit
f
does
not
include
income
earned
from
investments.
Berkshire’s
insurance
underwriting
operations
include
the
following
groups:
(1)
GEICO,
(2)
Berkshire
Hathaway
Primary
Group and (3) Berkshire Hathaway Reinsurance Group. Additional information related to each of these groups follows.
GEICO
—GEICO
is
headquartered
in
Maryland.
GEICO’s
insurance
subs
u
idiaries
include
Government
Employees
Insurance Company and several other insurance entities. The GEICO insurance subsidiaries’ principal business is the sale of
private passenger automobile insurance to individuals in all 50 states and the District of Columbia. GEICO subs
u
idiaries also
sell
insurance
for
motorcycles,
all-terrain
vehicles,
recreational
vehicles,
boats
and
commercial
vehicles,
primarily
through
direct
response
methods
in
which
applications
for
insurance
are
subm
u
itted
directly
to
the
companies
via
the
Internet
or
by
telephone, and to a lesser extent, through insurance agencies. GEICO also operates an insurance agency that offe
f
rs insurance
written by third parties for individuals desiring insurance coverages that, for the most part, are not sold by GEICO insurance
subs
u
idiaries, such as homeowners, renters, condominium, lifef
and identity protection insurance.
GEICO
competes
for
private
passenger
automobile
insurance
customers
in
the
prefer
f
red,
standard
and
non-standard
risk
markets
with
other
companies
that
sell
directly
to
the
customer
and
with
companies
that
use
agency
sales
forces,
including State Farm, Progressive, Allstate and USAA. According to the A.M. Best data for 2024 published in 2025, the five
largest
private
passenger
automobile
insurers
had
a
combined
market
share
of
approximately
63.6%
based
on
written
premiums, with GEICO’s market share being the third largest at approximately 11.6%.
Seasonal
variations
in
GEICO’s
insurance
business
are
not
significant.
However,
extraordinary
r
weather
conditions
or
other events and factors may have a significant effe
f
ct upon the frequency or severity of automobile claims.
GEICO’s
insurance
policies
are
written
on
an
admitted
basis.
State
insurance
departments
stringently
regulate
private
passenger
auto
insurance
policies
and
rates.
Competition
for
private
passenger
automobile
insurance
tends
to
focus
on
price
and level of customer service provided. GEICO’s cost-effi
f
cient direct response marketing methods and emphasis on customer
satisfaction
enable
it
to
offe
f
r
competitive
rates
and
value
to
its
customers.
GEICO
primarily
uses
its
own
claims
stafff
to
manage
and
settle
claims.
GEICO’s
name
and
other
trademarks
are
considered
material
assets
and
are
protected
through
appropriate registrations.
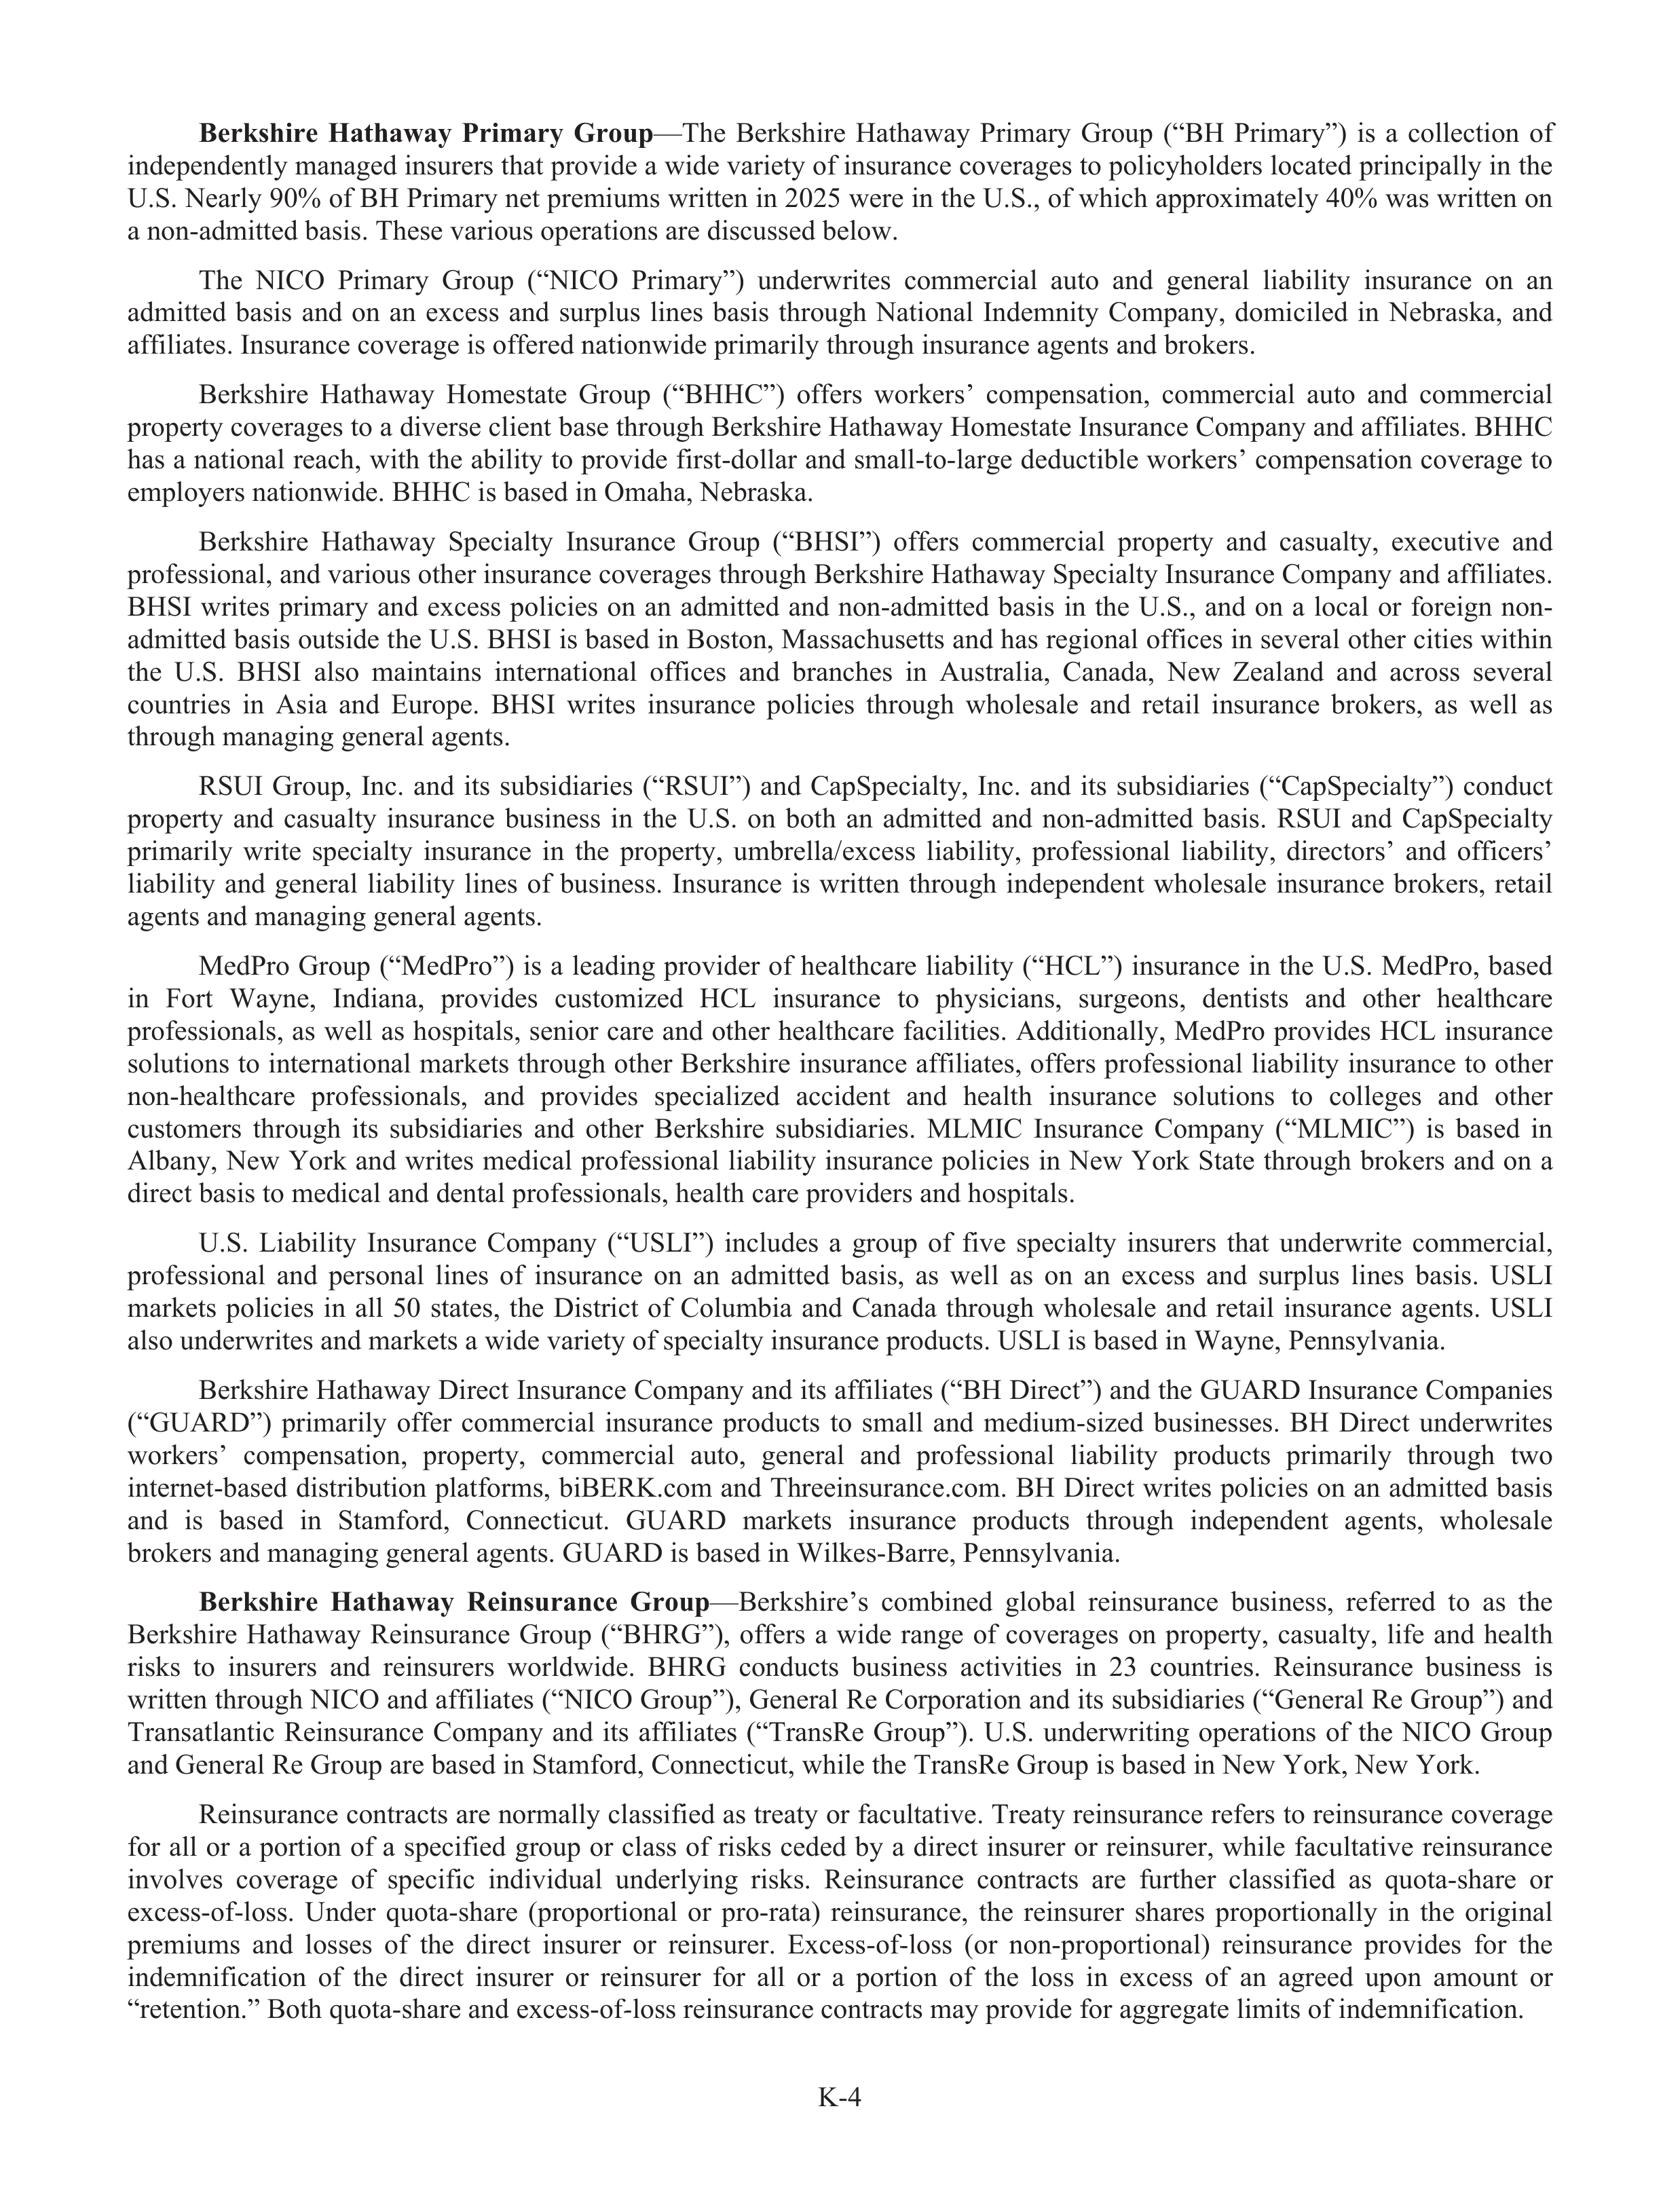
K-4
Berkshire
Hathaway
Primary
Group
—The
Berkshire
Hathaway
Primary
Group
(
u
“BH
Primary”)
is
a
collection
of
independently managed insurers that provide a wide variety of insurance coverages to policyholders located principally in the
U.S. Nearly 90% of BH Primary net premiums written in 2025 were in the U.S., of which approximately 40% was written on
a non-admitted basis. These various operations are discussed below.
The
NICO
Primary
Group
(“NICO
Primary”)
underwrites
commercial
auto
and
general
liabi
a
lity
insurance
on
an
admitted
basis
and
on
an
excess
and
surplus
lines
basis
through
National
Indemnity
Company,
domiciled
in
Nebraska,
and
affi
f
liates. Insurance coverage is offe
f
red nationwide primarily through insurance agents and brokers.
Berkshire
Hathaway
Homestate
Group
(“BHHC”)
offe
f
rs
workers’
compensation,
commercial
auto
and
commercial
property coverages to a diverse client base through Berkshire Hathaway Homestate Insurance Company and affi
f
liates. BHHC
has a national reach, with the ability to provide first-dollar and small-to-large deductible workers’ compensation coverage to
employers nationwide. BHHC is based in Omaha, Nebraska.
Berkshire
Hathaway
Specialty
Insurance
Group
(“BHSI”)
offe
f
rs
commercial
property
and
casualty,
executive
and
profes
f
sional, and various other insurance coverages through Berkshire Hathaway Specialty Insurance Company and affi
f
liates.
BHSI
writes
primary
and
excess
policies
on
an
admitted
and
non-admitted
basis
in
the
U.S.,
and
on
a
local
or
foreign
non-
admitted basis outside the U.S. BHSI is based in Boston, Massachusetts and has regional offi
f
ces in several other cities within
the
U.S.
BHSI
also
maintains
international
offi
f
ces
and
branches
in
Australia,
Canada,
New
Zealand
and
across
several
countries
in
Asia
and
Europe.
BHSI
writes
insurance
policies
through
wholesale
and
retail
insurance
brokers,
as
well
as
through managing general agents.
RSUI
Group,
Inc.
and
its
subs
u
idiaries
(“RSUI”)
and
CapS
a
pecialty,
Inc.
and
its
subs
u
idiaries
(“CapS
a
pecialty”)
conduct
property
and
casualty
insurance
business
in
the
U.S.
on
both
an
admitted
and
non-admitted
basis.
RSUI
and
CapS
a
pecialty
primarily
write
specialty
insurance
in
the
property,
umbrella/excess
liabi
a
lity,
profes
f
sional
liabi
a
lity,
directors’
and
officers’
liabi
a
lity
and
general
liabi
a
lity
lines
of
business.
Insurance
is
written
through
independent
wholesale
insurance
brokers,
retail
agents and managing general agents.
MedPro
Group
(“MedPro”)
is
a
leading
provider
of
healthcare
liabi
a
lity
(“HCL”)
insurance
in
the
U.S.
MedPro,
based
in
Fort
Wayne,
Indiana,
provides
customized
HCL
insurance
to
physicians,
surgeons,
dentists
and
other
healthcare
profes
f
sionals, as well as hospitals, senior care and other healthcare facilities. Additionally, MedPro provides HCL insurance
solutions to international markets through other Berkshire insurance affi
f
liates, offe
f
rs profes
f
sional liabi
a
lity insurance to other
non-healthcare
profes
f
sionals,
and
provides
specialized
accident
and
health
insurance
solutions
to
colleges
and
other
customers
through
its
subs
u
idiaries
and
other
Berkshire
subs
u
idiaries.
MLMIC
Insurance
Company
(“MLMIC”)
is
based
in
Albany,
New
York
and
writes
medical
profes
f
sional
liabi
a
lity
insurance
policies
in
New
York
State
through
brokers
and
on
a
direct basis to medical and dental profes
f
sionals, health care providers and hospitals.
U.S.
Liability
Insurance
Company
(“USLI”)
includes
a
group
of
five
specialty
insurers
that
underwrite
commercial,
profes
f
sional
and
personal
lines
of
insurance
on
an
admitted
basis,
as
well
as
on
an
excess
and
surplus
lines
basis.
USLI
markets
policies
in
all
50
states,
the
District
of
Columbia
and
Canada
through
wholesale
and
retail
insurance
agents.
USLI
also underwrites and markets a wide variety of specialty insurance products. USLI is based in Wayne, Pennsylvania.
Berkshire Hathaway Direct Insurance Company and its affi
f
liates (“BH Direct”) and the GUARD Insurance Companies
(“GUARD”)
primarily
offe
f
r
commercial
insurance
products
to
small
and
medium-sized
businesses.
BH
Direct
underwrites
workers’
compensation,
property,
commercial
auto,
general
and
profes
f
sional
liabi
a
lity
products
primarily
through
two
internet-based
distribution
platforms,
biBERK.com
and
Threeinsurance.com.
BH
Direct
writes
policies
on
an
admitted
basis
and
is
based
in
Stamford,
Connecticut.
GUARD
markets
insurance
products
through
independent
agents,
wholesale
brokers and managing general agents. GUARD is based in Wilkes-Barre, Pennsylvania.
Berkshire
Hathaway
Reinsurance
Group
—Berkshire’s
combined
global
reinsurance
business,
referred
to
as
the
Berkshire
Hathaway
Reinsurance
Group
(“BHRG”),
offers
a
wide
range
of
coverages
on
property,
casualty,
lifef
and
health
risks
to
insurers
and
reinsurers
worldwide.
BHRG
conducts
business
activities
in
23
countries.
Reinsurance
business
is
written through NICO and affi
f
liates (“NICO Group”), General Re Corporation and its subs
u
idiaries (“General Re Group”) and
Transatlantic
Reinsurance
Company
and
its
affi
f
liates
(“TransRe
Group”).
U.S.
underwriting
operations
of
the
NICO
Group
and General Re Group are based in Stamford, Connecticut, while the TransRe Group is based in New York, New York.
Reinsurance contracts are normally classified as treaty or facultative. Treaty reinsurance refers to reinsurance coverage
for
all
or
a
portion
of
a
specifie
f
d
group
or
class
of
risks
ceded
by
a
direct
insurer
or
reinsurer,
while
facultative
reinsurance
involves
coverage
of
specific
individual
underlying
risks.
Reinsurance
contracts
are
further
classified
as
quota-share
or
excess-of-l
f
oss.
Under
quota-share
(proportional
or
pro-rata)
reinsurance,
the
reinsurer
shares
proportionally
in
the
original
premiums
and
losses
of
the
direct
insurer
or
reinsurer.
Excess-of-l
f
oss
(or
non-proportional)
reinsurance
provides
for
the
indemnific
f
ation
of
the
direct
insurer
or
reinsurer
for
all
or
a
portion
of
the
loss
in
excess
of
an
agreed
upon
amount
or
“retention.” Both quota-share and excess-of-l
f
oss reinsurance contracts may provide for aggregate limits of indemnific
f
ation.
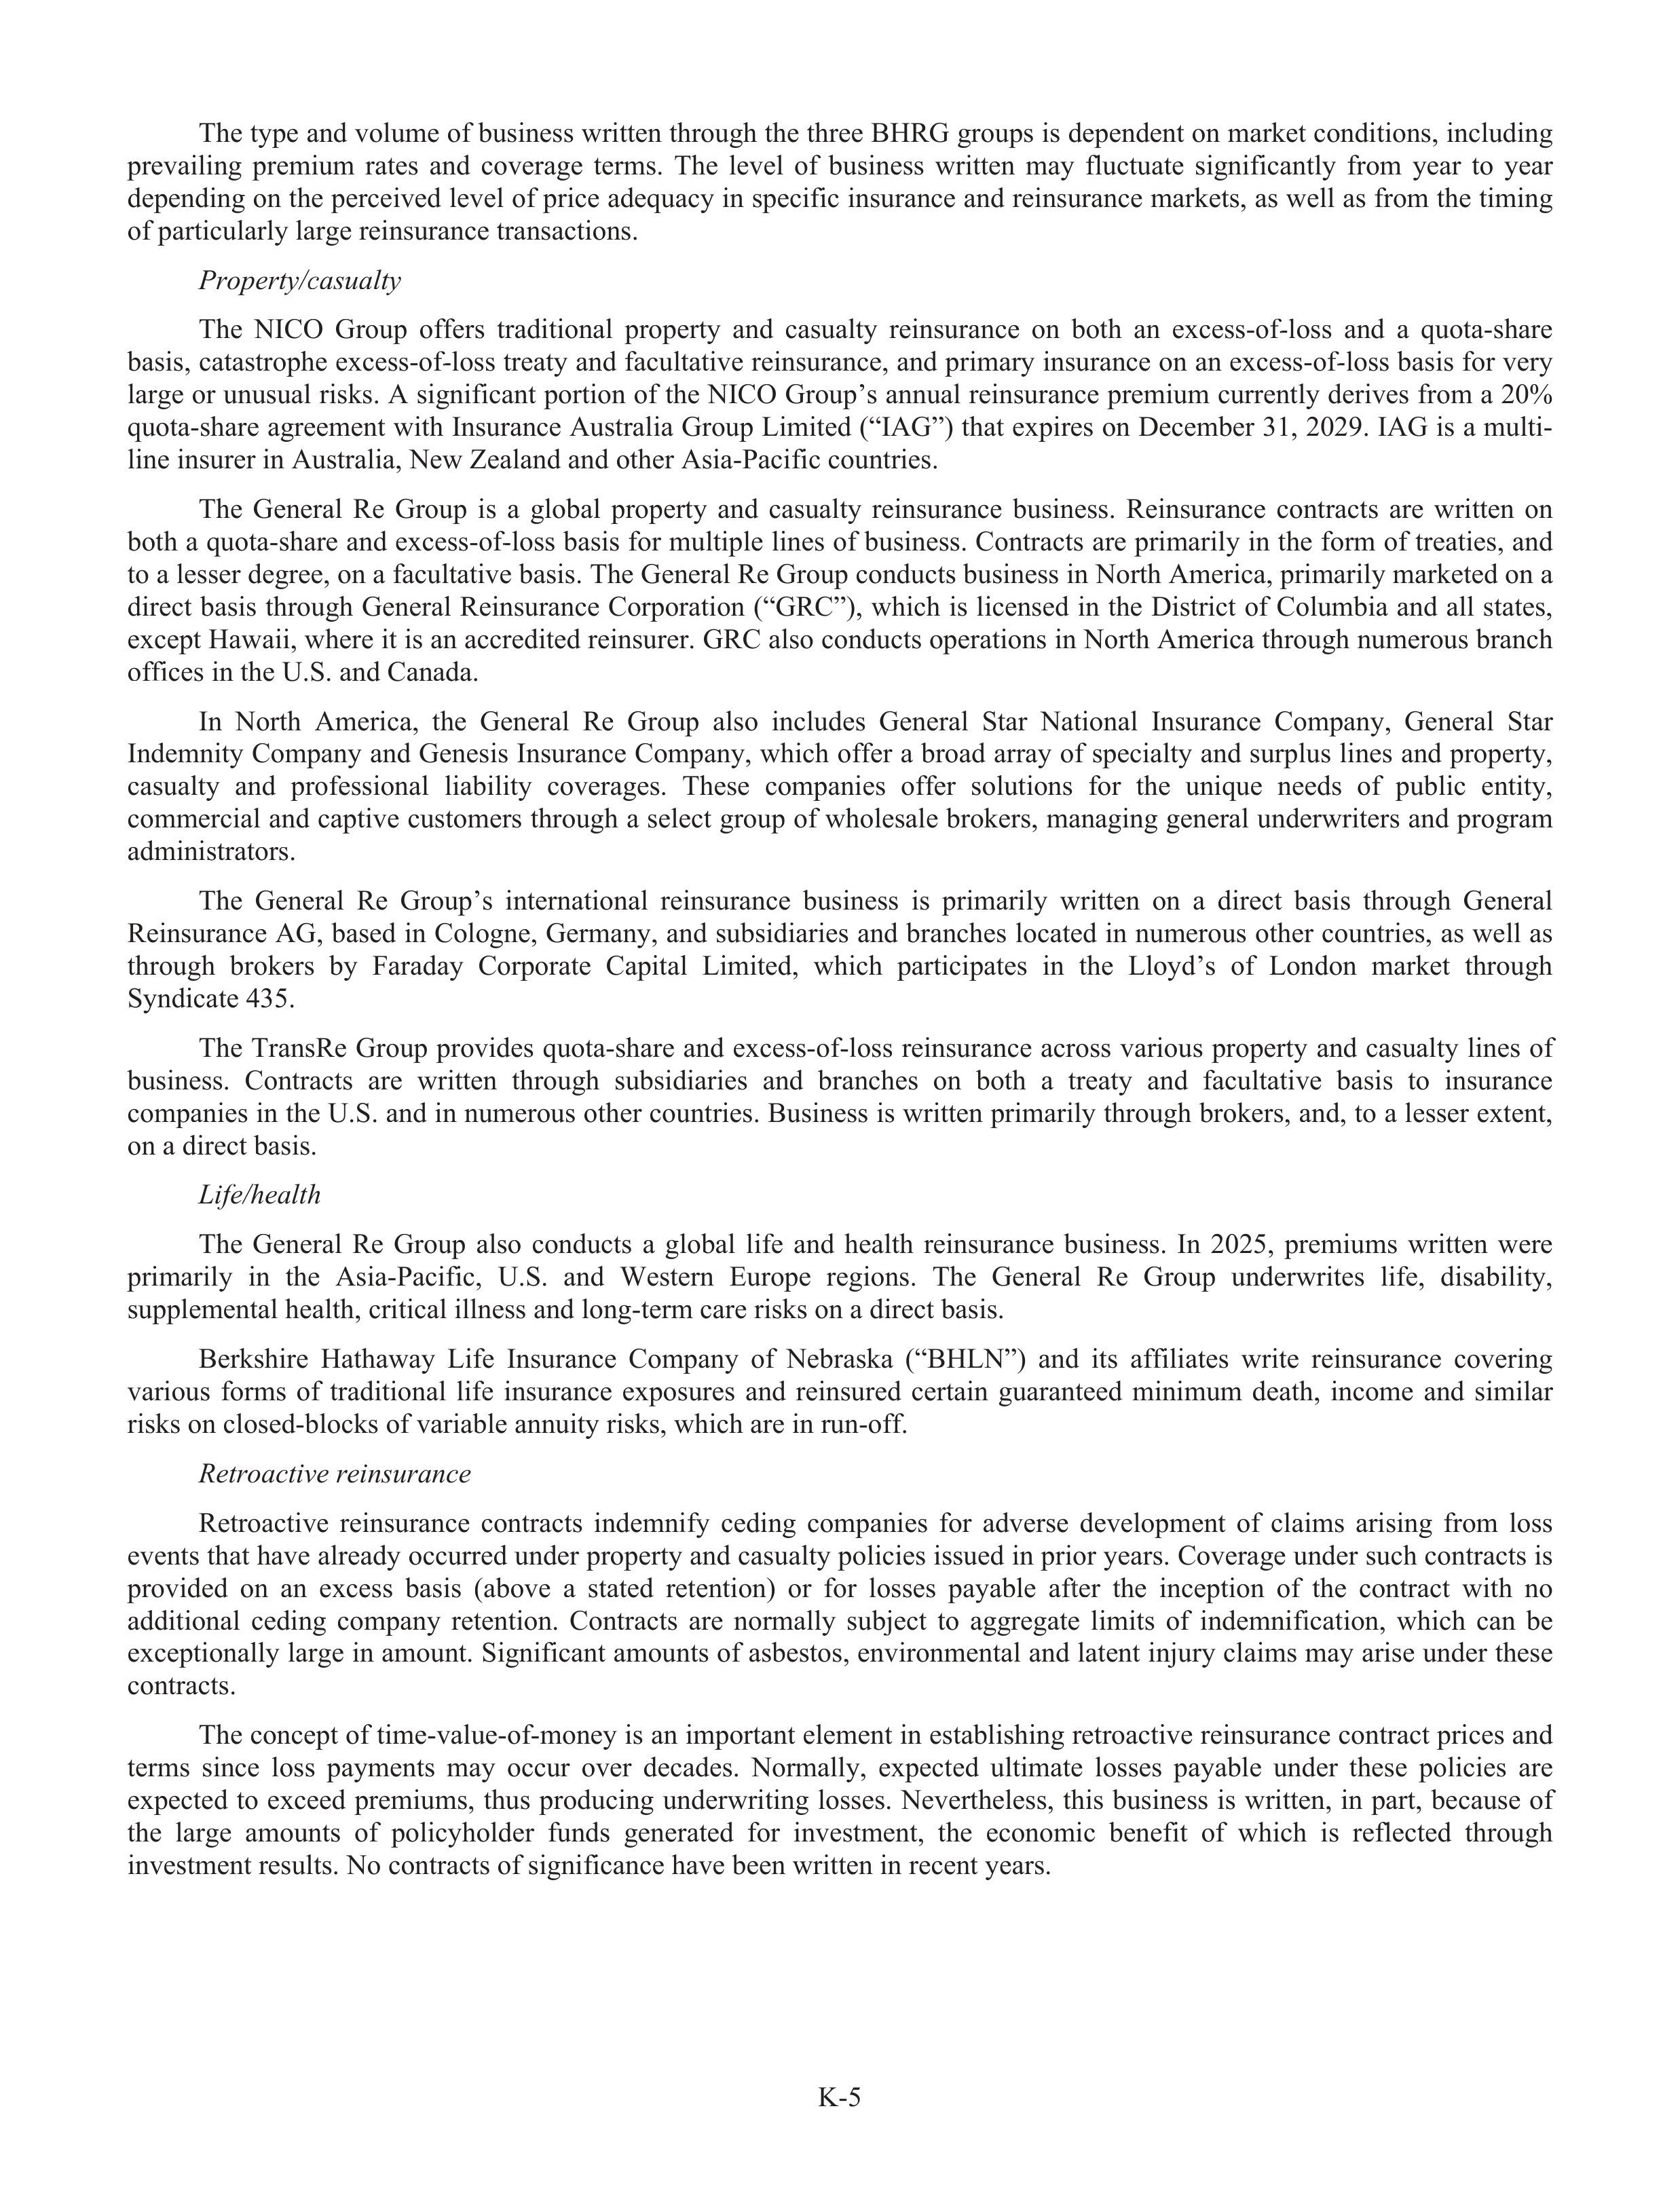
K-5
The type and volume of business written through the three BHRG groups is dependent on market conditions, including
prevailing
premium
rates
and
coverage
terms.
The
level
of
business
written
may
fluctuate
significantly
from
year
to
year
depending on the perceived level of price adequacy in specific insurance and reinsurance markets, as well as from the timing
of particularly large reinsurance transactions.
Property/
t
ca
/
sualty
The
NICO
Group
offe
f
rs
traditional
property
and
casualty
reinsurance
on
both
an
excess-of-l
f
oss
and
a
quota-share
basis, catastrophe excess-of-l
f
oss treaty and facultative reinsurance, and primary insurance on an excess-of-l
f
oss basis for very
large or unusual risks. A significant portion of the NICO Group’s annual reinsurance premium currently derives from a 20%
quota-share agreement with Insurance Australia Group Limited (“IAG”) that expires on December 31, 2029. IAG is a multi-
line insurer in Australia, New Zealand and other Asia-Pacific countries.
The
General
Re
Group
is
a
global
property
and
casualty
reinsurance
business.
Reinsurance
contracts
are
written
on
both a quota-share and excess-of-l
f
oss basis for multiple lines of business. Contracts are primarily in the form of treaties, and
to a lesser degree, on a facultative basis. The General Re Group conducts business in North America, primarily marketed on a
direct
basis
through
General
Reinsurance
Corporation (“GRC”),
which
is
licensed
in
the
District
of
Columbia
and
all
states,
except Hawaii, where it is an accredited reinsurer. GRC also conducts operations in North America through numerous branch
offi
f
ces in the U.S. and Canada.
In
North
America,
the
General
Re
Group
also
includes
General
Star
National
Insurance
Company,
General
Star
Indemnity Company and Genesis Insurance Company, which offe
f
r a broad array of specialty and surplus lines and property,
casualty
and
profes
f
sional
liabi
a
lity
coverages.
These
companies
offe
f
r
solutions
for
the
unique
needs
of
public
entity,
commercial and captive customers through a select group
u
of wholesale brokers, managing general underwriters and program
administrators.
The
General
Re
Group’s
international
reinsurance
business
is
primarily
written
on
a
direct
basis
through
General
Reinsurance AG, based in Cologne, Germany, and subs
u
idiaries and branches located in numerous other countries, as well as
through
brokers
by
Faraday
Corporate
Capi
a
tal
Limited,
which
participates
in
the
Lloyd’s
of
London
market
through
Syndicate 435.
The
TransRe
Group
provides
quota-share
and
excess-of-l
f
oss
reinsurance
across
various
property
and
casualty
lines
of
business.
Contracts
are
written
through
subs
u
idiaries
and
branches
on
both
a
treaty
and
facultative
basis
to
insurance
companies in the U.S. and in numerous other countries. Business is written primarily through brokers, and, to a lesser extent,
on a direct basis.
Life
i
/h
e
ealth
The
General
Re
Group
also
conducts
a
global
lifef
and
health
reinsurance
business.
In
2025,
premiums
written
were
primarily
in
the
Asia-Pacific,
U.S.
and
Western
Europe
regions.
The
General
Re
Group
underwrites
life,
f
disabi
a
lity,
suppl
u
emental health, critical illness and long-term care risks on a direct basis.
Berkshire
Hathaway
Life
Insurance
Company
of
Nebraska
(“BHLN”)
and
its
affi
f
liates
write
reinsurance
covering
various
forms
of
traditional
lifef
insurance
exposures
and
reinsured
certain
guaranteed
minimum
death,
income
and
similar
risks on closed-blocks of variable annuity risks, which are in run-off.
f
Retroactive reinsurance
Retroactive
reinsurance
contracts
indemnify
f
ceding
companies
for
adverse
development
of
claims
arising
from
loss
events that have already occurred under property and casualty policies issued in prior years. Coverage under such contracts is
provided
on
an
excess
basis
(above
a
a
stated
retention)
or
for
losses
payabl
a
e
afte
f
r
the
inception
of
the
contract
with
no
additional
ceding
company
retention.
Contracts
are
normally
subj
u
ect
to
aggregate
limits
of
indemnific
f
ation,
which
can
be
exceptionally large in amount. Significant amounts of asbestos, environmental and latent inju
n
ry claims may arise under these
contracts.
The concept of time-value-of-money is an important element in establ
a
ishing retroactive reinsurance contract prices and
terms
since
loss
payments
may
occur
over
decades.
Normally,
expected
ultimate
losses
payabl
a
e
under
these
policies
are
expected
to
exceed
premiums,
thus
producing
underwriting
losses.
Nevertheless,
this
business
is
written,
in
part,
because
of
the
large
amounts
of
policyholder
funds
generated
for
investment,
the
economic
benefit
of
which
is
reflected
through
investment results. No contracts of significance have been written in recent years.
K-6
Periodic payment annuity
BHLN writes periodic payment annuity insurance policies and reinsures annuity-like obligations. Under these policies,
BHLN
receives
upfro
f
nt
consideration
and
agrees
in
the
future
to
make
periodic
payments
that
ofte
f
n
extend
for
decades.
These
policies
generally
relate
to
the
settlement
of
underlying
personal
inju
n
ry
or
workers’
compensation
claims
of
other
insurers,
known
as
structur
t
ed
settlements.
Consistent
with
retroactive
reinsurance
contracts,
time-value-of-money
is
an
important
factor
in
establ
a
ishing
annuity
premiums
and
ultimate
payments
are
expected
to
exceed
premiums
received,
producing underwriting losses. BHLN has not written any new policies since 2022.
Investments
of
insurance
businesses
—Berkshire’s
insurance
subs
u
idiaries
hold
significant
levels
of
invested
assets.
Investments include a very large portfol
f
io of publicly traded equity securities, which are unusually concentrated in relatively
few
companies,
as
well
as
in
short-term
investments
and
fixed
maturity
securities.
Generally,
there
are
no
target
allocations
by
investment
type
or
attempts
to
match
investment
asset
and
insurance
liabi
a
lity
durations.
However,
investment
portfol
f
ios
have historically included a much greater proportion of equity securities than is customary
r
in the insurance industry.
r
Invested
assets
derive
from
shareholder
capital
as
well
as
funds
provided
from
policyholders
through
insurance
and
reinsurance
businesses
(“flo
f
at”).
Float
represents
the
approximate
net
policyholder
funds
generated
through
underwriting
activities
that
are
held
for
investment.
The
majo
a
r
components
of
float
are
unpaid
losses
and
loss
adju
d
stment
expenses,
life,
f
annuity
and
health
benefit
insurance
liabi
a
lities
(excluding
the
effe
f
cts
of
discount
rate
changes
that
are
recorded
in
accumulated
other
comprehensive
income),
unearned
insurance
premiums
and
other
insurance
policyholder
liabi
a
lities
less
premium
and
reinsurance
receivabl
a
es,
deferred
policy
acquisition
costs
and
deferred
charges
on
assumed
retroactive
reinsurance
contracts.
On
a
consolidated
basis,
float
has
increased
from
approximately
$138
billion
at
the
end
of
2020
to
approximately $176 billion at the end of 2025. The cost of float can be measured as the net pre-tax underwriting earnings (or
loss) as a percentage of the average float balance.
Burlington Northern Santa Fe
Burlington
Northern
Santa
Fe,
LLC
(“BNSF”)
is
based
in
Fort
Worth,
Texas,
and
through
BNSF
Railway
Company
(“BNSF
Railway”)
operates
one
of
the
largest
freight
rail
transportation
systems
in
North
America.
BNSF
Railway
had
approximately 35,000 employees at the end of 2025, of whom approximately 30,000 were members of a labor
a
union.
In
serving
the
Midwest,
Pacific
Northwest,
Western,
Southwestern
and
Southeastern
regions
and
certain
ports
of
the
U.S.,
BNSF
Railway
transports
a
range
of
products
and
commodities
derived
from
manufact
f
ur
t
ing,
agricultural
and
natural
resource
industries.
Freight
revenues
are
covered
by
contractua
t
l
agreements
of
varying
durations
or
common
carrier
published
prices
or
company
quotations.
BNSF’s
fin
f
ancial
performance
is
influenced
by,
among
other
things,
general
and
industry
r
economic conditions at the international, national and regional levels.
BNSF
Railway’s
primary
routes,
including
trackage
rights,
allow
it
to
access
majo
a
r
cities
and
certain
ports
in
the
western
and
southern
U.S.,
as
well
as
parts
of
Canada
and
Mexico.
In
addition
to
majo
a
r
cities
and
ports,
BNSF
Railway
effi
f
ciently
serves
many
smaller
markets
by
working
closely
with
approximately
200
shortline
railroads.
BNSF
Railway
has
also
entered
into
marketing
agreements
with
other
rail
carriers,
expanding
the
marketing
reach
for
each
railroad
and
its
customers.
Freight
revenues
are
classified
into
the
following
categories:
consumer
products,
industrial
products,
agricultural
and energy products and coal. The volumes shipped and rates charged are affe
f
cted by competition from other freight carriers
within the transportation industry,
r
and changes in the underlying suppl
u
y and demand for such products.
Regul
e
atory
r
matters
BNSF
is
subj
u
ect
to
federal,
state
and
local
laws
and
regulations
generally
applicable
to
its
businesses.
Rail
operations
are subj
u
ect to the regulatory
r
jurisdiction of the Surface Transportation Board (“STB”), the Federal Railroad Administration of
the
U.S.
Department
of
Transportation
(“DOT”),
the
Occupa
u
tional
Safety
and
Health
Administration
(“OSHA”),
the
Environmental
Protection
Agency
(“EPA”),
as
well
as
other
federal
and
state
regulatory
r
agencies
and
Canadian
regulatory
r
agencies for operations in Canada. The STB has jurisdiction over disputes and complaints involving certain rates, routes and
services,
the
sale
or
abandonment
of
rail
lines,
applications
for
line
extensions
and
construc
r
tion,
and
the
merger
with
or
acquisition
of
control
of
rail
common
carriers.
The
outcome
of
STB
proceedings
can
affe
f
ct
the
profita
f
bi
a
lity
of
BNSF
Railway’s business.
The
DOT,
OSHA
and
EPA
have
jurisdiction
under
several
federal
statut
t
es
over
a
number
of
safety,
health
and
environmental
aspects
of
rail
operations,
including
the
transportation
of
hazardous
materials.
BNSF
Railway
is
required
to
transport
these
materials
to
the
extent
of
its
common
carrier
obligation.
State
agencies
regulate
some
health,
safety
and
environmental aspects of rail operations in areas not otherwise preempted by federal law.
K-7
Environmental matters
BNSF’s
rail
operations,
as
well
as
those
of
its
competitors,
are
also
subj
u
ect
to
extensive
federal,
state
and
local
environmental
regulations
covering
discharges
to
the
ground
or
waters,
air
emissions,
toxic
subs
u
tances
and
the
generation,
handling,
storage,
transportation
and
disposal
of
waste
and
hazardous
materials.
Such
regulations
effe
f
ctively
increase
the
costs and liabi
a
lities associated with rail operations. Environmental risks are also inherent in rail operations, which frequently
involve transporting chemicals and other hazardous materials.
Many
of
BNSF’s
land
holdings
are
or
have
been
used
for
industrial
or
transportation-related
purpos
r
es
or
leased
to
commercial
or
industrial
companies
whose
activities
may
have
resulted
in
discharges
onto
the
property.
Under
federal
statut
t
es
(in
particular,
the
Comprehensive
Environmental
Response,
Compensation
and
Liability
Act)
and
state
statut
t
es,
BNSF
may
be
held
jointly
and
severally
liabl
a
e
for
cleanup
and
enforcement
costs
associated
with
a
particular
site
without
regard
to
fault
or
the
legality
of
the
original
conduct.
BNSF
may
also
be
subj
u
ect
to
claims
by
third
parties
for
investigation,
cleanup, restoration or other environmental costs under environmental statut
t
es or common law with respect to properties they
own that have been impacted by BNSF operations.
Consumption
of
diesel
fuel
by
locomotives
accounted
for
approximately
80%
of
BNSF
Railway’s
greenhouse
gas
(“GHG”) emissions in its baseline year of 2018. BNSF management has committed to a broad sustainabi
a
lity model, applying
science-based approaches, that is anticipated to result in a 30% reduction in BNSF Railway’s GHG emissions by 2030 from
its
baseline
year
of
2018.
BNSF
Railway
intends
to
continue
improvements
in
fuel
effi
f
ciency
and
increased
utilization
of
renewabl
a
e
diesel
fuel.
Long-term
solutions,
such
as
battery-electric
and
hydrogen
locomotives,
are
also
being
evaluated
and
field-tested.
Competition
The
business
environment
in
which
BNSF
Railway
operates
is
highly
competitive.
Depending
on
the
specific
market,
deregulated
motor
carriers
and
other
railroads,
as
well
as
river
barges,
ships
and
pipelines,
may
exert
pressure
on
price
and
service
levels.
The
presence
of
advanced,
high
service
truc
r
k
lines
with
expedited
delivery,
r
subs
u
idized
infrastructure
and
minimal empty mileage continues to affe
f
ct the market for non-bulk, time-sensitive freight. The potential expansion of longer
combination
vehicles
could
further
encroach
upon
markets
traditionally
served
by
railroads.
To
remain
competitive,
BNSF
Railway and other railroads seek to develop and implement operating effi
f
ciencies to improve productivity.
As railroads streamline, rationalize and otherwise enhance their franchises, competition among rail carriers intensifie
f
s.
BNSF Railway’s primary rail competitor in the Western region of the U.S. is Union Pacific Railroad Company. Other Class I
railroads
and
numerous
regional
railroads
and
motor
carriers
also
operate
in
parts
of
the
same
territories
served
by
BNSF
Railway.
Berkshire Hathaway Energy
Berkshire
Hathaway
Energy
Company
(“BHE”)
is
a
holding
company
headquartered
in
Iowa
with
investments
in
a
diversifie
f
d
portfol
f
io
of
locally
managed
and
operated
businesses,
principally
within
the
energy
industry.
r
BHE’s
domestic
regulated
energy
interests
are
comprised
of
four
regulated
U.S.
utility
companies
(collectively,
“U.S.
utilities”)
serving
approximately 5.4 million retail customers and five U.S. interstate natural gas pipeline companies with approximately 20,900
miles
of
operated
pipeline
having
a
design
capacity
of
approximately
21.6
billion
cubi
u
c
feet
of
natural
gas
per
day.
Other
energy
businesses
include
electric
transmission
and
distribution
operations
in
Great
Britain
and
Canada,
a
diversifie
f
d
portfol
f
io
of
mostly
renewabl
a
e
independent
power
projects
and
investments,
and
a
75%
interest
in
a
liquefied
natural
gas
export, import and storage facility. BHE also has an investment in a residential real estate brokerage firm in the U.S. and is a
franchisor
to
a
large
network
of
residential
real
estate
brokerages
in
the
U.S.
BHE
employs
approximately
24,000
people
in
connection with its various operations.
Energy
r
businesses
BHE’s
U.S.
utilities
include
PacifiCorp,
MidAmerican
Energy
Company
(“MEC”)
and
NV
Energy,
Inc.’s
(“NV
Energy”)
two
regulated
utility
subs
u
idiaries,
Nevada
Power
Company
(“Nevada
Power”)
and
Sierra
Pacific
Power
Company
(“Sierra Pacific”).
K-8
PacifiCorp
is
a
regulated
electric
utility
company
headquartered
in
Oregon,
serving
electric
customers
in
portions
of
Utah,
Oregon,
Wyoming,
Washington,
Idaho
and
Califor
f
nia.
The
combined
service
territory’s
diverse
regional
economy
ranges from rural, agricultural and mining areas to urba
r
n, manufact
f
ur
t
ing and government service centers. No single segment
of
the
economy
dominates
the
combined
service
territory,
which
helps
mitigate
PacifiCorp’s
exposure
to
economic
fluctuations. In addition to retail sales, PacifiCorp buys and sells electricity on a wholesale basis.
MEC
is
a
regulated
electric
and
natural
gas
utility
company
headquartered
in
Iowa,
serving
electric
and
natural
gas
customers primarily in Iowa and also in portions of Illinois, South Dakota and Nebraska. MEC’s diverse retail customer base
operates
in
the
electronic
data
storage,
agricultural,
manufact
f
ur
t
ing
and
government
service
centers
industries.
In
addition
to
retail sales and natural gas transportation, MEC sells electricity and natural gas on a wholesale basis.
Nevada
Power
serves
retail
electric
customers
in
southern
Nevada
and
Sierra
Pacific
serves
retail
electric
and
natural
gas
customers
in
northern
Nevada.
The
combined
Nevada
Power/Sierra
Pacific
service
territory
economy
includes
retail
customers
in
the
gaming,
mining,
recreation,
warehousing,
manufact
f
ur
t
ing
and
governmental
service
centers
sectors.
These
utilities also buy and sell electricity on a wholesale basis.
As
vertically
integrated
utilities,
BHE’s
U.S.
utilities
collectively
own
approximately
32,400
net
megawatts
of
generation
capacity
in
operation
and
under
construc
r
tion.
The
U.S.
utilities’
business
is
subj
u
ect
to
seasonal
variations
principally
related
to
the
use
of
electricity
for
air
conditioning
and
natural
gas
for
heating.
Typically,
regulated
electric
revenues are higher in the summer months, while regulated natural gas revenues are higher in the winter months.
The
natural
gas
pipelines
consist
of
BHE
GT&S,
LLC
(“BHE
GT&S”),
Northern
Natural
Gas
Company
(“Northern
Natural”) and Kern River Gas Transmission Company (“Kern River”).
BHE
GT&S,
based
in
Virginia,
operates
three
interstate
natural
gas
pipeline
systems
that
consist
of
approximately
5,400
miles
of
natural
gas
transmission,
gathering
and
storage
pipelines
and
operates
seventeen
underground
natural
gas
storage
fields
in
the
eastern
region
of
the
U.S.
BHE
GT&S’s
large
underground
natural
gas
storage
assets
and
pipeline
systems are part of an interconnected gas transmission network that provides transportation services to utilities and numerous
other
customers.
BHE
GT&S
is
also
an
industry
r
leader
in
liquefied
natural
gas
solutions
through
its
investments
in
and
ownership of several liquefied natural gas facilities located throughout the eastern region of the U.S.
Northern Natural, based in Nebraska, operates the largest interstate natural gas pipeline system in the U.S., as measured
by
pipeline
miles,
reaching
from
west
Texas
to
Michigan’s
Upper
Peninsula.
Northern
Natural’s
pipeline
system
consists
of
approximately
14,100
miles
of
natural
gas
pipelines.
Northern
Natural’s
extensive
pipeline
system,
which
is
interconnected
with
many
interstate
and
intrastate
pipelines
in
the
national
grid
system,
has
access
to
suppl
u
ies
from
multiple
majo
a
r
suppl
u
y
basins
and
provides
transportation
services
to
utilities
and
numerous
other
customers.
Northern
Natural
also
operates
three
underground
natural
gas
storage
facilities
and
two
liquefied
natural
gas
storage
peaking
units.
Northern
Natural’s
pipeline
system
experiences
significant
seasonal
swings
in
demand
and
revenue,
with
the
highest
demand
typically
occurring
during
the months of November through March.
Kern River, based in Utah, operates an interstate natural gas pipeline system that consists of approximately 1,400 miles
and
extends
from
suppl
u
y
areas
in
the
Rocky
k
Mountains
to
consuming
markets
in
Utah,
Nevada
and
Califor
f
nia.
Kern
River
transports
natural
gas
for
electric
and
natural
gas
distribution
utilities,
majo
a
r
oil
and
natural
gas
companies
or
affi
f
liates
of
such companies, electric generating companies, energy marketing and trading companies, and financial institutions.
Other
energy
businesses
include
Northern
Powergrid
(Northeast)
plc
and
Northern
Powergrid
(Yorkshire)
plc,
which
own
a
subs
u
tantial
electricity
distribution
network
that
delivers
electricity
to
end-users
in
northeast
England
in
an
area
covering
approximately
10,000
square
miles.
These
distribution
companies
primarily
charge
suppl
u
y
companies
regulated
tariffs for the use of their distribution systems and serve about 4.0 million electricity end-users. AltaLink L.P. (“AltaLink”) is
a
regulated
electric
transmission-only
utility
company
headquartered
in
Calgary,
r
Alberta.
AltaLink’s
high
voltage
transmission
lines
and
related
facilities
transmit
electricity
from
generating
facilities
to
majo
a
r
load
centers,
cities
and
large
industrial
plants
throughout
its
87,000
square
mile
service
territory.
AltaLink
serves
approximately
85%
of
Alberta’s
population.
BHE
and
its
subs
u
idiaries,
also
own
interests
in
independent
power
projects
having
approximately
6,400
net
megawatts of generation capacity that are in service and under construc
r
tion in Califor
f
nia, Texas, Illinois, Nebraska, Montana,
New
York,
Arizona,
West
Virginia,
Minnesota,
Kansas,
Iowa,
Hawaii,
Australia
and
Canada.
These
independent
power
projects
sell
power
generated
primarily
from
wind,
solar,
geothermal
and
hydro
sources
under
long-term
contracts.
Additionally,
BHE
subs
u
idiaries
have
invested
approximately
$7.1
billion
in
wind
projects
sponsored
by
third
parties,
commonly referred to as tax equity investments.
K-9
Regul
e
atory
r
matters
The
U.S.
utilities
are
subj
u
ect
to
comprehensive
regulation
by
various
federal,
state
and
local
agencies.
The
Federal
Energy
Regulatory
r
Commission
(“FERC”)
is
an
independent
agency
with
broad
authority
to
implement
provisions
of
the
Federal Power Act, the Energy Policy Act of 2005 and other federal statut
t
es. The FERC regulates rates for wholesale sales of
electricity;
transmission
of
electricity,
including
pricing
and
regional
planning
for
the
expansion
of
transmission
systems;
electric system reliabi
a
lity; utility holding companies; accounting and records retention; securities issuances; construc
r
tion and
operation of hydroelectric facilities; and other matters. The FERC also has the enforcement authority to assess civil penalties
for
violation
of
rules,
regulations
and
orders
issued
under
the
Federal
Power
Act.
MEC
is
also
subj
u
ect
to
regulation
by
the
Nuclear Regulatory
r
Commission pursuant to the Atomic Energy Act of 1954, as amended, with respect to its 25% ownership
of the Quad Cities Nuclear Station.
With certain limited exceptions, the U.S. utilities have an exclusive right to serve retail customers within their service
territories
and,
in
turn,
have
an
obligation
to
provide
service
to
those
customers.
In
some
jurisdictions,
certain
classes
of
customers
may
choose
to
purchase
all
or
a
portion
of
their
energy
from
alternative
energy
suppl
u
iers,
and
in
some
jurisdictions,
retail
customers
can
generate
all
or
a
portion
of
their
own
energy.
Historically,
state
regulatory
r
commissions
have
establ
a
ished
retail
electric
and
natural
gas
rates
on
a
cost-of-service
basis,
which
are
designed
to
allow
a
utility
the
opportunity to recover what each state regulatory commission deems to be the utility’s reasonabl
a
e costs of providing services,
including
the
opportunity
to
earn
a
fair
and
reasonabl
a
e
return
on
its
investments
based
on
its
cost
of
debt
and
equity.
The
retail
electric
rates
of
U.S.
utilities
are
generally
based
on
the
cost
of
providing
traditional
bundled
services,
including
generation,
transmission
and
distribution
services;
however,
rates
are
availabl
a
e
for
transmission-only
and
distribution-only
services.
Northern
Powergrid
(Northeast)
plc
and
Northern
Powergrid
(Yorkshire)
plc
each
charge
fees
for
the
use
of
their
distribution
systems
that
are
controlled
by
a
formula
prescribed
by
the
Gas
and
Electricity
Markets
Authority,
the
British
electricity regulatory
r
body. The current electricity distribution price control runs from April 1, 2023 through March 31, 2028.
AltaLink is regulated by the Alberta Utilities Commission (“AUC”), pursuant to the Electric Utilities Act (Alberta), the
Publ
u
ic
Utilities
Act
(Alberta),
the
Alberta
Utilities
Commission
Act
(Alberta)
and
the
Hydro
and
Electric
Energy
Act
(Alberta). The AUC is an independent quasi-judicial agency, which regulates and oversees Alberta’s electricity transmission
sector with broad authority that may impact many of AltaLink’s activities, including its tariffs, rates, construc
r
tion, operations
and financing. Under the Electric Utilities Act, AltaLink prepares and files applications with the AUC for approval of tariffsf
to
be
paid
by
the
Alberta
Electric
System
Operator
(“AESO”)
for
the
use
of
its
transmission
facilities,
and
the
terms
and
conditions
governing
the
use
of
those
facilities.
The
AESO
is
an
independent
system
operator
in
Alberta,
Canada
that
oversees
Alberta’s
integrated
electrical
system
(“AIES”)
and
wholesale
electricity
market.
The
AESO
is
responsible
for
directing the safe, reliable and economic operation of the AIES, including long-term transmission system planning.
The
natural
gas
pipelines
are
subj
u
ect
to
regulation
by
various
federal
and
state
agencies.
The
natural
gas
pipeline
and
storage operations of BHE GT&S, Northern Natural and Kern River are regulated by the FERC pursuant to the Natural Gas
Act and the Natural Gas Policy Act of 1978. Under this authority, the FERC regulates, among other items, (a) rates, charges,
terms
and
conditions
of
service;
(b)
the
construc
r
tion
and
operation
of
interstate
pipelines,
storage
and
related
facilities,
including
the
extension,
expansion
or
abandonment
of
such
facilities;
and
(c)
the
construc
r
tion
and
operation
of
liquefied
natural
gas
export/import
facilities.
Interstate
natural
gas
pipeline
companies
are
also
subj
u
ect
to
regulations
administered
by
the
Offi
f
ce
of
Pipeline
Safety
within
the
Pipeline
and
Hazardous
Materials
Safety
Administration,
an
agency
of
the
DOT.
Federal
pipeline
safety
regulations
are
issued
pursuant
to
the
Natural
Gas
Pipeline
Safety
Act
of
1968,
as
amended,
which
establ
a
ishes
safety
requirements
in
the
design,
construc
r
tion,
operation
and
maintenance
of
interstate
natural
gas
pipeline
facilities.
Environmental matters
BHE and its energy businesses are subj
u
ect to federal, state, local and foreign laws and regulations regarding air quality,
climate change, emissions performance standards, water quality, coal ash disposal and other environmental matters that have
the
potential
to
impact
current
and
future
operations.
In
addition
to
imposing
continuing
compliance
obligations,
these
laws
and
regulations,
such
as
the
Federal
Clean
Air
Act,
provide
regulators
with
the
authority
to
levy
subs
u
tantial
penalties
for
noncompliance, including fines, inju
n
nctive relief and other sanctions.
The
Federal
Clean
Air
Act,
as
well
as
state
laws
and
regulations
impacting
air
emissions,
provides
a
framework
for
protecting
and
improving
air
quality
and
controlling
sources
of
air
emissions.
The
implementation
of
these
laws
and
regulations
may
impact
the
operation
of
BHE’s
generating
facilities,
including
requiring
reductions
in
emissions
at
those
facilities to comply with the requirements. In addition, the potential adoption of state or federal clean energy standards, which
include
low-carbon,
r
non-carbon
r
and
renewabl
a
e
electricity
generating
resources,
may
also
impact
electricity
generators
and
natural gas providers.
K-10
In
December
2015,
an
international
agreement
was
negotiated
by
195
nations
to
create
a
universal
framework
for
coordinated
action
on
climate
change
in
what
is
referred
to
as
the
Paris
Agreement.
The
Paris
Agreement
reaffi
f
rms
the
goal
of limiting global temperatur
t
e increase well below 2 degrees Celsius, while urging effo
f
rts to limit the increase to 1.5 degrees
Celsius
and
reaching
a
global
peak
of
GHG
emissions
as
soon
as
possible
to
achieve
climate
neutrality
by
mid-century;
establ
a
ishes
commitments
by
all
parties
to
make
nationally
determined
contributions
and
pursue
domestic
measures
aimed
at
achieving
the
commitments;
commits
all
countries
to
subm
u
it
emissions
inventories
and
report
regularly
on
their
emissions
and
progress
made
in
implementing
and
achieving
their
nationally
determined
commitments;
and
commits
all
countries
to
subm
u
it
new
commitments
every
r
five
years,
with
the
expectation
that
the
commitments
will
be
more
aggressive
in
reducing
GHG
emissions.
The
Paris
Agreement
formally
became
effe
f
ctive
on
November
4,
2016;
however,
the
U.S.
completed
its
withdrawal from the Paris Agreement in November 2020. The U.S. accepted the terms of the Paris Agreement following the
inauguration
of
President
Biden
on
January
20,
2021,
and
completed
its
reentry
r
on
Februa
r
ry
19,
2021.
Following
President
Trum
r
p’s
inauguration
on
January
20,
2025,
the
U.S.
announced
its
second
departur
t
e
from
the
Paris
Agreement,
which
was
finalized in January 2026.
In July 2025, the EPA proposed a rule that would repeal the EPA’s 2009 Endangerment Finding, a determination that
greenhouse
gas
emissions
qualify
f
as
air
pollution
that
endangers
human
health
or
the
environment.
The
EPA
finalized
the
Endangerment
Finding
Rescission
on
Februa
r
ry
11,
2026.
The
EPA
said
that
Section
202(a)
of
the
Clean
Air
Act
does
not
allow the agency to enact emissions regulations for vehicles in a way that addresses climate change, so there is no legal basis
to
issue
the
endangerment
finding
and
any
resulting
regulations.
The
EPA
further
argues
that
the
Clean
Air
Act
was
never
intended
to
allow
for
regulation
of
greenhouse
gases
because
climate
change
is
a
global
phenomenon.
The
final
rule
is
expected
to
be
challenged
in
the
U.S.
Court
of
Appeals
for
the
District
of
Columbia
Circuit
and
ultimately
appealed
to
the
U.S.
Supr
u
eme
Court
for
final
adju
d
dication.
The
legal
process
could
take
several
years.
The
EPA
has
indicated
it
intends
to
address greenhouse gas rules for individual industry
r
sectors in separate and subs
u
equent actions.
In
April
2024,
the
EPA
finalized
new
rules
addressing
GHG
emissions
for
the
power
sector.
The
requirements
are
scheduled
to
take
effe
f
ct
January
1,
2030.
New
natural
gas-fueled
combustion
turbines
are
expected
to
utilize
lower-emitting
fuels
and
operate
as
highly
effi
f
cient
generation.
Additionally,
new
baseload
combustion
turbines
exceeding
a
40%
annual
capacity factor must meet an emission limit equivalent to operating with carbon
r
capture and sequestration beginning January
1,
2032.
The
EPA
also
identifie
f
d
carbon
r
capture
and
sequestration
as
the
technology
basis
for
the
emissions
standards
for
coal
units.
Coal-fueled
units
that
will
operate
afte
f
r
December
31,
2038,
must
meet
emission
limits
equivalent
to
operating
with
carbon
r
capture
and
sequestration
beginning
January
1,
2032.
Other
units
are
anticipated
to
co-fire
with
natural
gas
and
retire
prior
to
January
r
1,
2039,
or
convert
to
natural
gas
operations
and
meet
emission
limits
corresponding
to
capacity
factors.
The
EPA
deferred
action
on
standards
for
existing
natural
gas-fueled
combustion
turbines.
In
June
2025,
the
EPA
proposed to rescind the 2024 rules, reflecting a change in federal policy. The proposed rescission is expected to be finalized
in the spring of 2026, at which time BHE and its energy subs
u
idiaries will be able to ascertain remaining requirements.
In November 2021, the EPA proposed rules that would reduce methane emissions from both new and existing sources
in
the
oil
and
natural
gas
industry.
r
The
proposals
would
expand
and
strengthen
emission
reduction
requirements
for
new,
modified
and
reconstruc
r
ted
oil
and
natural
gas
sources
and
would
require
states
to
reduce
methane
emissions
from
existing
sources nationwide. The EPA issued a suppl
u
emental proposal in November 2022 to further strengthen emission requirements.
The
rule
was
finalized
in
December
2023.
Affe
f
cted
sources
may
have
up
to
five
years
from
the
rul
r
e’s
effective
date
to
comply with requirements identifie
f
d in state implementation plans. The rule has been challenged in the D.C. Circuit Court of
Appeals.
In
July
2025,
the
EPA
extended
several
compliance
deadlines
in
the
methane
rule
while
it
reconsiders
the
subs
u
tantive requirements of the rule.
BHE
and
its
energy
subs
u
idiaries
continue
to
focus
on
delivering
reliabl
a
e,
affo
f
rdable,
safe
and
clean
energy
to
its
customers
and
on
actions
to
mitigate
its
GHG
emissions.
BHE’s
primary
source
of
GHG
emissions
is
the
generation
of
electricity
from
its
power
plants
that
are
fueled
by
coal
or
natural
gas.
In
managing
its
electricity
generation,
BHE’s
subs
u
idiaries
work
with
their
regulators
to
protect
the
energy
and
economic
needs
of
customers
by
considering
costs,
reliabi
a
lity
and
sources
of
electric
generation.
Over
the
years,
BHE
has
invested
heavily
in
owned
renewabl
a
e
generation
and
storage,
with
cumulative
investments
of
$38.0
billion
through
December
31,
2025.
Additionally,
BHE
has
ceased
coal
operations at 22 generation units. As a result, as of December 31, 2025, BHE has reduced its annual GHG emissions by 30%
as compared to 2005 levels. To the extent it is beneficial for customers and consistent with regulatory
r
provisions, BHE plans
to continue investing in renewabl
a
e and other low-carbon
r
generation and storage in the future
and to cease coal operations at
additional coal generation units in a reliable and cost-effec
f
tive manner.
K-11
Non-Energy
r
businesses
HomeServices
of
America,
Inc.
(“HomeServices”)
is
a
residential
real
estate
brokerage
firm
in
the
U.S.
In
addition
to
providing
traditional
residential
real
estate
brokerage
services,
HomeServices
offe
f
rs
other
integrated
real
estate
services,
including
mortgage
originations
and
mortgage
banking,
title
and
closing
services,
insurance,
home
warranties,
relocation
services and other home-related services. It operates under 46 brand names with nearly 35,000 real estate agents in over 770
brokerage offi
f
ces in 35 states and the District of Columbia.
HomeServices’
fra
f
nchise
network
includes
over
250
franchisees
and
nearly
1,400
brokerage
offi
f
ces
with
approximately
39,700
third-party
real
estate
agents
under
two
brand
names.
In
exchange
for
franchise
fees,
HomeServices
provides the right to use the Berkshire Hathaway HomeServices or Real Living brand names and other related service marks,
as well as providing orientation programs, training and consultation services, advertising programs and other services.
HomeServices’
principal
sources
of
revenue
are
dependent
on
residential
real
estate
transaction
volumes,
which
are
normally higher in the second and third quarters of each year. This business is highly competitive and subj
u
ect to general real
estate market conditions.
Manufac
f
turing Businesses
Berkshire’s numerous and diverse manufact
f
ur
t
ing subs
u
idiaries are groupe
u
d into three categories: (1) industrial products,
(2)
building
products
and
(3)
consumer
products.
Berkshire’s
industrial
products
businesses
manufact
f
ur
t
e
and
distribute
components
for
aerospace
and
power
generation
applications,
specialty
chemicals,
metal
cutting
tools
and
a
variety
of
other
products
primarily
for
industrial
use.
The
building
products
group
u
produces
prefab
f
ricated
and
site-built
residential
homes,
flooring
products,
insulation,
roofin
f
g
and
engineered
produc
d
ts,
building
and
engineered
components,
paint
and
coatings
and
bricks
and
masonry
r
products.
The
consumer
products
group
u
manufact
f
ur
t
es
and/or
distributes
recreational
vehicles,
batteries,
apparel,
footwear
and
other
products.
Information
concerning
the
majo
a
r
activities
of
these
three
groups
follows.
Berkshire’s
manufact
f
ur
t
ing businesses employed approximately 175,600 people at the end of 2025.
Industrial products
Precision Castpa
t
rts
Precision
Castpa
t
rts
Corp.
(“PCC”),
based
in
Lake
Oswego,
Oregon,
manufact
f
ur
t
es
complex
metal
components
and
products
and
provides
high-quality
investment
castings,
forgings,
fasteners/fastener
systems
and
aerostruc
r
tures
for
critical
aerospace
and
power
and
energy
applications.
PCC
also
manufact
f
ur
t
es
(1)
investment
castings
and
forgings
for
general
industrial,
armament,
medical
and
other
applications;
(2)
nickel,
titanium
and
cobalt
alloys
in
all
standard
mill
forms,
including
specialty
alloys
used
to
produce
investment
castings
and
forgings
for
the
aerospace,
chemical
processing,
oil
and
gas,
pollution
control
and
other
industries;
(3)
fasteners
and
engineered
products
for
automotive
and
general
industrial
markets; and (4) other products and services for various markets and applications.
Investment
casting
technology
involves
a
multi-step
process
that
uses
ceramic
molds
in
the
manufact
f
ur
t
e
of
metal
components
with
more
complex
shapes,
closer
tolerances
and
finer
surface
finishes
than
parts
manufact
f
ur
t
ed
using
other
methods.
PCC
uses
this
process
to
manufact
f
ur
t
e
products
for
aircraft
engines,
industrial
gas
turbine
and
other
aeroderivative
engines,
airframes,
medical
implants,
armament,
unmanned
aerial
vehicles
and
other
industrial
applications.
PCC
also
manufact
f
ur
t
es
high
temperatur
t
e
carbon
r
and
ceramic
composite
components,
including
ceramic
matrix
composites,
for
use
in
next-generation aerospace engines.
PCC
uses
forging
processes
to
manufactur
t
e
components
for
the
aerospace
and
power
generation
markets.
PCC
manufact
f
ur
t
es
high-performance,
nickel-based
alloys,
as
well
as
titanium
alloys
and
products.
PCC’s
nickel-based
alloys
are
used to produce forged components and investment castings for aerospace and non-aerospace applications in such markets as
oil and gas, chemical processing and pollution control. PCC’s titanium produc
d
ts are used to manufact
f
ur
t
e components for the
commercial and military aerospace, power generation, energy, medical and industrial end markets.
PCC is also a leading developer and manufact
f
ur
t
er of highly engineered fasteners, fastener systems, aerostruc
r
tures and
precision components, primarily for critical aerospace applications. These products are produced for the aerospace and power
and
energy
markets,
as
well
as
for
construc
r
tion,
automotive,
heavy
truc
r
k,
farm
machinery,
r
mining
and
construc
r
tion
equipment, shipbuilding, machine tools, appliances and recreation markets.
PCC
has
several
significant
customers,
including
aerospace
original
equipment
manufact
f
ur
t
ers
(“OEMs”)
(Boeing
and
Airbus)
and
aircraft
engine
manufact
f
ur
t
er
suppl
u
iers
(GE
Aerospace,
Rolls
Royce
and
Pratt
&
Whitney).
The
majo
a
rity
of
PCC’s
sales
are
from
customer
orders
or
demand
schedules
pursuant
to
long-term
agreements.
Contractua
t
l
terms
may
provide
for
termination
by
the
customer,
subj
u
ect
to
payment
for
work
performed.
PCC
typically
does
not
experience
significant order cancellations, although periodically it receives requests for delays in delivery
r
schedules.
p
K-12
Long-term
industry
r
forecasts
continue
to
show
growth
and
strong
demand
for
air
travel
and
aerospace
products.
Continued
growth
in
revenues
and
earnings
will
be
predicated
on PCC’s
and
the
aerospace
industry’
r
s
abi
a
lity
to
successful
f
ly
increase production levels to match the demand in aerospace products.
PCC is subj
u
ect to subs
u
tantial competition in each of its markets. Components and similar products may be produced by
competitors, who use either the same types of manufact
f
ur
t
ing processes as PCC or other processes. Although PCC believes its
manufact
f
ur
t
ing processes, technology and experience provide its customers with advantages, such as high quality, competitive
prices
and
physical
properties
that
ofte
f
n
meet
more
stringent
demands,
alternative
forms
of
manufact
f
ur
t
ing
can
be
used
to
produce many of the same components and products. Nevertheless, PCC is a leading suppl
u
ier in most of its principal markets.
Several
factors,
including
long-standing
customer
relationships,
technical
expertise,
state-of-t
f
he-art
facilities
and
dedicated
employees, aid PCC in maintaining competitive advantages.
Several
raw
materials
used
in
PCC
products,
including
certain
metals
such
as
nickel,
titanium,
cobalt,
tantalum,
hafnium, vanadium, rhenium and molybdenum, are found in only a few parts of the world. These metals are required for the
alloys
used
in
manufact
f
ur
t
ed
products.
The
availabi
a
lity
and
costs
of
these
metals
may
be
influenced
by
private
or
governmental
cartels,
changes
in
world
politics,
labor
a
relations
between
the
metal
producers
and
their
workforces
and
inflation. Future shortages or price fluctuations in raw materials could have a material adverse effe
f
ct on results.
PCC
is
subj
u
ect
to
various
federal,
state
and
foreign
environmental
laws
concerning,
among
other
things,
water
discharges,
air
emissions,
waste
management,
toxic
materials
use
reduction
and
environmental
cleanup.
Environmental
laws
and
regulations
continue
to
evolve,
particularly
related
to
air
and
water
quality
and
climate
change,
including
reporting
of
GHG emissions. As a result, it is also reasonabl
a
y likely that PCC will be regularly required to make additional expenditures,
including capital expenditures, which could be significant, relating to environmental matters.
Lubr
u
izol
The
Lubr
u
izol
Corporation
(“Lubrizol”),
headquartered
in
Wickliffe
f
,
Ohio,
is
a
specialty
chemical
and
performance
materials
company
that
manufactur
t
es
products
and
suppl
u
ies
technologies
for
the
global
transportation,
industrial
and
consumer markets. Lubr
u
izol operates two business segments: Lubr
u
izol Additives, which produces engine lubr
u
icant additives,
driveline lubr
u
icant additives and industrial specialties products; and Lubr
u
izol Advanced Materials, which includes engineered
materials
(engineered
polymers
and
performance
coatings)
and
lifef
sciences
(beauty,
personal
care,
health
and
home
care
solutions).
Lubr
u
izol
Additives’
products
are
used
in
a
broad
range
of
applications
including
engine
oils,
transmission
fluids,
gear
oils,
specialty
driveline
lubr
u
icants,
fuels,
metalworking
fluids
and
compressor
lubr
u
icants
for
transportation
and
industrial
applications.
Lubr
u
izol
Advanced
Materials’
products
are
used
in
many
different
types
of
applications
including
beauty,
personal
care,
home
care,
over-the-counter
pharmaceuticals,
medical
devices,
performance
coatings,
sporting
goods,
plumbing
and
fire
sprinkler
systems.
Lubr
u
izol
is
an
industry
r
leader
in
many
of
the
markets
in
which
it
competes.
Lubr
u
izol
Additives’
principal
competitors
are
Infineum
International
Ltd.,
Chevron
Oronite
Company
and
Afto
f
n
Chemical
Corporation.
Lubr
u
izol
Advanced
Materials’
businesses
compete
in
many
markets
with
a
variety
of
competitors
in
each
product line.
Lubr
u
izol
uses
its
technological
leadership
position
and
applies
its
scientific
f
capabilities,
formulation
know-how
and
market expertise in product development to improve the demand, quality and value of its products. Lubr
u
izol also leverages its
scientific
f
and
applications
knowledge
to
meet
and
exceed
customer
performance
and
sustainabi
a
lity
requirements.
While
Lubr
u
izol
typically
has
patents
that
expire
each
year,
it
invests
resources
to
protect
its
intellectua
t
l
property
and
to
develop
or
acquire innovative products for the markets it serves. Lubr
u
izol uses many specialty and commodity chemical raw materials in
its
manufact
f
ur
t
ing
processes.
Raw
materials
are
primarily
feedstocks
derived
from
petroleum
and
petrochemicals
and,
generally, are obtainabl
a
e from several sources. The materials that Lubr
u
izol chooses to purchase from a single source typically
are subj
u
ect to long-term suppl
u
y contracts to ensure reliabi
a
lity.
Lubr
u
izol
operates
its
business
on
a
global
basis
through
more
than
100
offi
f
ces,
labor
a
atories,
production
facilities
and
warehouses
on
six
continents,
the
most
significant
of
which
are
North
America,
Europe,
Asia
and
South
America.
Lubr
u
izol
markets its produ
d
cts worldwide through direct sales, sales agents and distributors. Lubr
u
izol’s customers principally consist of
majo
a
r
global
and
regional
oil
companies
and
industrial
and
consumer
products
companies.
Some
of
Lubr
u
izol’s
largest
customers
also
may
be
suppl
u
iers,
although
no
single
customer
represented
more
than
10%
of
Lubr
u
izol’s
consolidated
revenues
in
2025.
In
recent
years,
suppl
u
y
chain
disrupt
r
ions
arising
from
various
sources
and
severe
weather
affe
f
cted
the
availabi
a
lity of raw materials and fulfillme
f
nt of customer orders and otherwise disrupt
r
ed Lubr
u
izol’s operations.
Lubr
u
izol
expends
significant
capi
a
tal
to
ensure
the
safety
of
its
employees
and
the
communities
where
it
operates,
as
well
as
delivering
on
its
commitments
to
operational
excellence
and
cybersecurity.
Lubr
u
izol
also
makes
significant
capital
investments
to
ensure
reliabl
a
e
suppl
u
y
and
compliance
with
regulations
governing
its
operations,
while
reducing
its
environmental footpr
t
int.
K-13
Lubr
u
izol
is
subj
u
ect
to
foreign,
federal,
state
and
local
laws
to
protect
the
environment,
limit
manufact
f
ur
t
ing
waste
and
emissions,
ensure
product
and
employee
safety
and
regulate
trade.
While
Lubr
u
izol’s
policies,
practices
and
procedur
d
es
are
designed
to
limit
the
associated
risks
and
consequent
financial
liabi
a
lity,
the
operation
of
chemical
manufact
f
ur
t
ing
plants
entails
inherent
environmental,
safety
and
other
risks,
and
significant
capital
expenditures,
costs
or
liabi
a
lities
could
be
incurred in the future.
IMC International Metalworking Companies
IMC
International
Metalworking
Companies
and
its
subs
u
idiaries
(“IMC”)
is
one
of
the
three
largest
multinational
manufact
f
ur
t
ers of consumable precision carbi
r
de metal cutting tools for applications in a broad range of industrial end markets.
IMC’s
primary
brand
names
include
ISCAR®,
TaeguTec®,
Ingersoll®,
Tungaloy®
and
NTK®.
Other
IMC
brand
names
include,
among
others,
Unitac®,
UOP,
It.te.di,
Qutiltec,
Tool—Flo®,
PCT®,
IMCO®,
BSW®,
RKS®,
Supermill®
and
Neoboss.
IMC’s
primary
manufact
f
ur
t
ing
facilities
are
in
Israel,
the
U.S.,
South
Korea,
Japa
a
n,
Germany,
Italy,
Switzerland,
India, China, Mexico and Hungary.
IMC
has
six
primary
product
lines:
milling
tools,
parting
and
grooving
tools,
turning/thread
tools,
hole
making
tools,
round
tools
and
tooling.
These
main
product
lines
are
split
between
consumable
cemented
tungsten
carbi
r
de
inserts
and
steel
tool
holders.
Inserts
comprise
a
majo
a
r
portion
of
IMC’s
sales
and
earnings.
Metal
cutting
inserts
are
used
by
industrial
manufact
f
ur
t
ers to cut metals and are consumed during their use in cutting applications. Steel tool holders are used to hold the
insert
against
the
cutting
piece.
IMC
manufact
f
ur
t
es
hundreds
of
types
of
highly
engineered
inserts
within
each
produc
d
t
line
that
are
tailored
to
maximize
productivity
and
meet
the
technical
requirements
of
customers.
IMC’s
staff
of
scientists
and
engineers continuously develop and innovate products that address end-user needs and requirements.
IMC’s
global
sales
and
marketing
network
operates
in
nearly
every
r
majo
a
r
manufact
f
ur
t
ing
center
around
the
world,
staffe
f
d
with
highly
skilled
engineers
and
technical
personnel.
IMC’s
customer
base
is
very
diverse,
with
its
primary
customers
being
large,
multinational
businesses
in
the
automotive,
aerospace,
engineering
and
machinery
r
industries.
IMC
operates
a
regional
central
warehouse
system
with
locations
in
Israel,
the
U.S.,
Belgium,
South
Korea,
Japa
a
n
and
China.
Additional
small
quantities
of
products
are
maintained
at
local
IMC
sales
offi
f
ces
to
provide
on-time
customer
suppor
u
t
and
inventory
r
management.
IMC
competes
in
the
metal
cutting
tools
segment
of
the
global
metalworking
tools
market.
The
segment
includes
hundreds
of
participants
who
range
from
small,
private
manufact
f
ur
t
ers
of
specialized
products
for
niche
applications
and
markets to larger, global multinational businesses (such as Sandvik and Kennametal, Inc.) with a wide assortment of products
and
extensive
distribution
networks.
Other
manufact
f
ur
t
ing
companies
such
as
Kyocera,
Mitsubishi,
Sumitomo,
Ceratizit,
OSG, Guhring, Mapa
a
l and YG-1 also play a significant role in the cutting tool market.
Cemented tungsten carbi
r
de powder is the main raw material used in manufact
f
ur
t
ing cutting tools. Most of IMC’s insert
products
are
made
from
tungsten.
While
suppl
u
ies,
including
alternative
sources,
are
currently
adequate,
significant
disrupt
r
ions
or
constraints
in
production
processing
facilities,
or
other
global
suppl
u
y
chain
restrictions,
could
cause
reduced
availabi
a
lity and increased prices.
IMC
is
committed
to
following
and
complying
with
all
government
and
environmental
rules,
regulations
and
requirements and applicable laws. IMC considers environmental preservation and pollution prevention as important factors in
all
operations
and
activities.
IMC
production
facilities
are
built
with
the
highest
standards
and
follow
all
applicable
regulations.
Marmon
Marmon Holdings, Inc. (“Marmon”), headquartered in Chicago, Illinois, is a global industrial organization comprising
eleven
diverse
business
groups
and
more
than
120
autonomous
manufact
f
ur
t
ing
and
service
businesses.
Marmon’s
manufact
f
ur
t
ing
and
service
operations
are
conducted
at
approximately
630
manufact
f
ur
t
ing,
distribution
and
service
facilities
located primarily in the U.S., as well as 19 other countries worldwide. Marmon’s business groups are as follows.
The
Foodservice
Technologies
group
manufact
f
ur
t
es
beverage
dispensing
and
cooling
equipment,
hot
and
cold
food
preparation and holding equipment and related products for restaurants, global brand owners and other foodservice providers.
Operations
are
based
in
the
U.S.
with
manufactur
t
ing
facilities
in
the
U.S.,
Mexico,
China,
the
Czech
Republic
and
Italy.
Products are sold primarily throughout the U.S., Europe and Asia.
The
Water
Technologies
group
manufact
f
ur
t
es
water
treatment
equipment
for
residential,
commercial
and
industrial
applications
worldwide.
Operations
are
based
primarily
in
the
U.S.,
Canada,
China,
Singapor
a
e,
India
and
Poland
with
business centers located in Belgium, France, Germany and Italy.
g
p
K-14
The
Transportation
Products
group
serves
the
automotive
and
heavy-duty
highway
transportation
industries
with
precision-molded
plastic
components;
aluminum
tubi
u
ng
and
extrus
r
ions;
replacement
parts
and
solutions
for
the
automotive
afte
f
rmarket;
dry
r
van,
flatbe
t
d,
lowbed
and
specialty
trailers;
and
truc
r
k
and
trailer
components.
Operations
are
conducted
primarily in the U.S., Mexico, Canada, Europe and China.
The
Retail
Solutions
group
provides
retailer
design
services;
in-store
digital
merchandising,
dispensing
and
display
fixtur
t
es;
and
shopping,
material
handling
and
security
carts.
Operations
are
conducted
in
the
U.S.,
the
U.K.
and
the
Czech
Republic.
The Metal Services group provides specialty metal pipe, tubi
u
ng, tooling and related value-added distribution services to
customers across a broad range of industries including aerospace, construc
r
tion and agricultural. Operations are conducted in
the U.S., India, Poland, Singapor
a
e, Spain, the U.K., the Netherlands, Canada and Mexico.
The
Electrical
group
produces
electrical
wire
for
use
in
residential
and
commercial
buildings,
and
specialty
wire
and
cable
for
use
in
energy,
transit,
aerospace,
defense,
communication
and
other
industrial
applications.
Operations
are
conducted in the U.S., Canada, India and England.
The
Plumbing
&
Refrigeration
group
manufact
f
ur
t
es
copper
tubi
u
ng
and
copper,
brass,
aluminum
and
stainless-steel
fittings and components for the plumbing, heating, ventilation, air conditioning and refrigeration (HVAC-R) market; custom
heat
exchange,
ducting,
air
handling
units
and
energy
recovery
solutions
for
the
HVAC-R
market;
HVAC
systems
and
structur
t
es
for
data
centers,
pharmaceutical
and
industrial
sites;
and
aluminum
and
brass
forgings
for
many
commercial
and
industrial
applications.
Key
raw
materials,
including
aluminum,
copper
and
stainless
steel
are
widely
availabl
a
e.
Operations
are conducted primarily in the U.S., Canada and the U.K.
The
Industrial
Products
group
suppl
u
ies
construc
r
tion
fasteners;
masonry
r
and
stone
anchoring
systems
used
in
commercial construc
r
tion; two component polymer produc
d
ts for anchoring, bonding and repair applications, gloves and other
protective wear; gear drives, gearboxe
r
s, fan and pump drives for various markets; wind machines for agricultural use; wheels,
axles
and
gears
for
rail,
mining
and
other
applications;
lighting
products
for
industrial
and
mining;
equipment
for
the
manufact
f
ur
t
e and assembly of lead acid batteries; the manufact
f
ur
t
ing and installation of afte
f
r lifef
service products; assembly of
air
compressor
systems
used
within
the
medical
and
industrial
markets;
manufact
f
ur
t
ing
and
assembly
of
various
awning
solutions
for
use
in
residential
and
motor
homes;
development
and
licensing
of
educ
d
ational
software
and
literature;
and
financial service offe
f
rings across multiple verticals. Operations are primarily based in the U.S., the U.K., Canada and China.
The Rail & Leasing group manufact
f
ur
t
es, leases and maintains railcars; leases intermodal tank containers; manufact
f
ur
t
es
mobile
railcar
movers;
provides
in-plant
rail
switching
and
loading
services;
and
performs
track
construc
r
tion
and
maintenance.
Union Tank Car Company (“UTLX”) is the largest component of the Rail & Leasing group and is a leading designer,
builder and full-service lessor of railroad tank cars and other specialized railcars. Together, with its Canadian affi
f
liate Procor,
UTLX
owns
a
fleet
of
approximately
118,000
railcars
for
lease
to
customers
in
chemical,
petrochemical,
energy
and
agricultural/food
f
industries. UTLX manufact
f
ur
t
es tank cars in the U.S. and performs railcar maintenance services at more than
100 locations across North America.
UTLX
has
a
diversifie
f
d
customer
base,
both
geographically
and
across
industries.
UTLX,
while
subj
u
ect
to
cyclicality
and significant competition in most of its markets, competes by offe
f
ring a broad range of high-quality products and services
targeted
at
its
niche
markets.
Railcars
are
typically
leased
for
multiple-year
terms
and
most
of
the
leases
are
renewed
upon
expiration.
Due
to
selective
ongoing
capital
investment,
utilization
rates
(the
number
of
railcars
on
lease
as
a
percentage
of
the total fleet) are generally high.
Intermodal tank containers are leased through EXSIF Worldwide (“EXSIF”). EXSIF is a leading international lessor of
intermodal
tank
containers
with
a
fleet
of
approximately
76,000
units,
primarily
serving
chemical
producers
and
logistics
operators.
The
Crane
Services
group
is
a
provider
of
mobile
cranes
and
operators
in
North
America
and
Australia
with
a
combined
fleet
of
approximately
1,000
cranes,
primarily
serving
the
energy,
mining,
petrochemical
and
infrastructure
markets.
Cranes
are
leased
on
a
fully
operated
and
maintained
service
basis
or
on
an
equipment-only
basis.
The
Crane
Services group is subj
u
ect to customer seasonality, with concentration of volume typically in the warmer months.
The
Medical
group
develops,
manufact
f
ur
t
es
and
sells
a
wide
range
of
innovative
medical
devices
in
the
extremities
fixation,
craniomaxillofacial
surgery,
r
neurosurgery,
aesthetics
and
cardiac
rehabi
a
litation
markets.
The
group’s
leading-edge
medical
technology
and
products
are
used
globally
to
help
improve
patient
care
and
outcomes.
Operations
are
based
in
the
U.S.,
Europe,
Australia
and
China
and
business
is
conducted
primarily
in
North
and
South
America,
Europe,
Asia
and
Australia.
K-15
Certain
Marmon
businesses,
including
the
Rail
&
Leasing
and
Medical
groups,
are
subj
u
ect
to
government
regulation
and
oversight.
Marmon
has
numerous
known
environmental
matters
which
are
subj
u
ect
to
on-going
monitoring
and/or
remediation effo
f
rts. Marmon follows all federal, state and local environmental regulations.
Other industrial products
CTB
International
Corp.
(“CTB”),
headquartered
in
Milfor
f
d,
Indiana,
is
a
leading
global
designer,
manufactur
t
er
and
marketer of a wide range of agricultural systems and solutions for preserving grain, producing poultry,
r
pigs and eggs, and for
processing
poultry,
r
fish,
vegetabl
a
es
and
other
foods.
CTB
operates
from
facilities
located
around
the
globe
and
suppor
u
ts
customers through a worldwide network of independent distributors and dealers.
CTB
competes
with
a
variety
of
manufact
f
ur
t
ers
and
suppl
u
iers,
including
many
that
offe
f
r
only
a
limited
number
of
the
products offe
f
red by CTB, as well as a few that offe
f
r products across several of CTB’s product lines. Competition is based on
the
price,
value,
reputation,
quality
and
design
of
the
products
offe
f
red
and
the
customer
service
provided
by
distributors,
dealers
and
manufact
f
ur
t
ers
of
the
products.
CTB’s
leading
brand
names,
distribution
network,
diversifie
f
d
product
line,
product
suppor
u
t
and
high-quality
products
enable
it
to
compete
effe
f
ctively.
CTB
manufact
f
ur
t
es
its
products
primarily
from
galvanized steel, steel wire, stainless steel and polymer materials. The availabi
a
lity of these materials in recent years has been
adequate.
LiquidPower
Specialty
Products
Inc.
(“LSPI”),
headquartered
in
Houston,
Texas,
is
a
global
leader
in
the
science
of
drag
reduction
application
(“DRA”)
technology
by
maximizing
the
flow
potential
of
pipelines,
increasing
operational
flexibility
and
throughput
capa
a
city,
and
effi
f
ciencies
for
customers.
LSPI
develops
innovative
flow
improver
solutions
with
customers
in
27
countries
on
five
continents,
treating
over
50
million
barrels
of
hydrocarbon
r
liquids
per
day.
LSPI’s
DRA
R
offe
f
ring
is
part
of
a
comprehensive,
full-service
solution
that
encompasses
industry-
r
leading
technology,
quality
manufact
f
ur
t
ing,
technical
suppor
u
t
and
consulting,
a
reliabl
a
e
suppl
u
y
chain,
inje
n
ction
equipment
and
field
service.
LSPI
is
subj
u
ect to foreign, federal, state and local laws to protect the environment and limit manufact
f
ur
t
ing waste and emissions.
W&W|AFCO
Steel
(“W&W|AFCO”)
is
a
leading
structur
t
al
steel
fabr
a
icator
and
steel
construc
r
tion
business
in
North
America.
W&W|AFCO
operates
19
steel
fabr
a
ication
plants
located
across
the
U.S.
W&W|AFCO’s projects
include
semiconductor plants, stadiums, high-rise buildings, bridges, mining facilities, aircraft hangars, military projects, automotive
assembly
plants,
as
well
as
international
projects.
W&W|AFCO’s
multiyear
backlog
of
projects
at
the
end
of
2025
was
subs
u
tantial.
W&W|AFCO
was
acquired
in
connection
with
the
Alleghany
acquisition
in
October
2022,
and
its
headquarters
are in Oklahoma City, Oklahoma.
Berkshire
acquired
Bell
Labor
a
atories,
LLC
(“Bell
Laboratories”)
on
July
31,
2025.
Bell
Labor
a
atories
produces
high
quality rodenticides and other rodent control products for commercial, agricultural and retail markets and is headquartered in
Windsor, Wisconsin.
OxyChem
Berkshire
completed
the
acquisition
of
Occidental
Petroleum
Corporation’s
chemicals
business
(“OxyChem”)
on
January
2,
2026,
pursuant
to
a
definitive
agreement
as
of
October
1,
2025.
Pursuant
to
the
agreement,
Occidental
retained
OxyChem’s legacy environmental liabi
a
lities. See Note 2 to the accompanying Consolidated Financial Statements. OxyChem
is
a
leading
producer
of
basic
chemicals
that
suppor
u
t
critical
applications
in
water
treatment,
pharmaceuticals,
healthcare,
manufact
f
ur
t
ing,
automotive,
personal
hygiene
and
construc
r
tion
and
other
industries.
OxyChem
is
headquartered
in
Dallas,
Texas
and
operates
21
manufact
f
ur
t
ing
plants
in
the
U.S.
in
ten
states
and
two
international
sites
in
Canada
and
Chile.
OxyChem has approximately 4,000 employees and contractors.
OxyChem
is
a
top
three
North
American
manufact
f
ur
t
er
of
polyvinyl
chloride
(PVC),
chlor-alkali
products
and
chlorinated organic chemicals. OxyChem concentrates on the chlorovinyl chain, beginning with the co-production of caustic
soda
and
chlorine,
which
are
marketed
to
external
customers.
In
addition,
chlorine,
together
with
ethylene,
is
converted
through
a
series
of
intermediate
products
into
PVC.
OxyChem
is
subj
u
ect
to
federal,
state,
local
and
foreign
government
regulations,
including
environmental
and
worker
safety
regulations,
and
invests
significant
resources
to
ensure
the
safety
of
employees
and
the
communities
in
which
it
operates
and
to
maintain
full
compliance
with
environmental
and
governmental
regulations.
OxyChem’s primary feedstocks are ethylene, ethane, natural gas and salt, which are generally obtainabl
a
e from several
sources
and
suppl
u
iers.
Materials
that
OxyChem
chooses
to
purchase
from
a
single
source
are
typically
subj
u
ect
to
long-term
suppl
u
y contracts to ensure reliabi
a
lity.
OxyChem
operates
through
five
international
sales
offi
f
ces
and
markets
its
products
worldwide
through
direct
sales,
sales agents and distributors. OxyChem’s primary customers consist of leading chemical manufact
f
ur
t
ers, several of which are
connected to OxyChem manufact
f
ur
t
ing sites via pipelines.
p
y
K-16
Building products
Clayton
Clayton Homes, Inc. (“Clayton”), headquartered near Knoxville, Tennessee, is a vertically integrated housing company
offe
f
ring off-s
f
ite (factory)
r
and site-built homes, including modular, manufact
f
ur
t
ed, CrossMod™, town homes and tiny homes.
In
2025,
Clayton
shipped
approximately
49,400
off-s
f
ite
built
homes,
over
83%
of
which
were
built
to
the
Department
of
Energy’s
Zero
Energy
Ready
Home
program
requirements,
as
well
as
approximately
10,000
site-built
homes.
Clayton
also
offe
f
rs home financing and other financial services and competes on price, service, location and delivery
r
capabilities.
All
Clayton
Built®
off-s
f
ite
built
homes
are
designed,
engineered
and
assembled
in
the
U.S.
At
the
end
of
December
2025, off-s
f
ite backlog was approximately $285 million. Clayton construc
r
ts its off-s
f
ite homes with components like windows,
interior
doors
and
cabinets
manufact
f
ur
t
ed
by
its
suppl
u
y
division.
Clayton
sells
off-s
f
ite
built
homes
through
independent
and
company-owned
home
centers,
realtors
and
subdi
u
vision
channels.
Clayton
considers
its
ability
to
offe
f
r
financing
to
retail
purchasers
a
factor
affe
f
cting
the
marketpl
t
ace
acceptance
of
its
off-s
f
ite
built
homes.
Clayton’s
fin
f
ancing
programs
utilize
proprietary loan underwriting guidelines to evaluate loan applicants.
Clayton’s
site-built
division,
Clayton
Properties
Group
(“CPG”),
includes
nine
builders
across
17
states
with
approximately
300
subdi
u
visions,
suppl
u
ementing
the
portfol
f
io
of
housing
products
offe
f
red
to
customers.
CPG
owned
and
controlled approximately 67,300 homesites, with a home order backlog of approximately $1.2 billion at the end of December
2025.
Access to key housing inputs, including lumber, oriented strand board, steel and resin products, was adequate in 2025.
Historically,
the
availabi
a
lity
and
pricing
of
these
and
other
inputs
has
been
volatile.
Clayton’s
home
building
business
is
impacted by changes in U.S. home mortgage interest rates and the suppl
u
y of pre-existing homes for sale, which affe
f
ct home
affo
f
rdability.
Clayton’s
home
building
business
regularly
makes
capital
and
non-capital
expenditures
with
respect
to
compliance
with
federal,
state
and
local
environmental
regulations,
primarily
related
to
erosion
control,
permitting
and
stormwater
protection for site-built home subdi
u
visions. The financing business originates and services loans which are federally regulated
by
the
Consumer
Financial
Protection
Bureau,
various
state
regulatory
r
agencies
and
reviewed
by
the
U.S.
Department
of
Housing and Urba
r
n Development, the Government National Mortgage Association and government-sponsored enterprises.
Shaw
Shaw
Industries
Group,
Inc.
(“Shaw”),
headquartered
in
Dalton,
Georgia,
is
a
leading
manufact
f
ur
t
er
and
distributor
of
carpe
r
t, carpe
r
t tile and hard surface flooring products. Shaw designs and manufact
f
ur
t
es over 3,800 styles of tufted carpe
r
t, wood
and
resilient
flooring
for
residential
and
commercial
use
under
numerous
brand
and
trade
names
and
under
certain
private
labe
a
ls.
Soft
and
hard
surface
products
are
availabl
a
e
in
a
broad
range
of
patterns,
colors
and
textur
t
es.
Shaw’s
carpe
r
t
manufact
f
ur
t
ing
operations
are
fully
integrated
from
the
processing
of
raw
materials
used
to
make
fiber
through
the
carpe
r
t
finishing.
Shaw’s
flooring
business
is
primarily
in
the
U.S.
Shaw
also
manufact
f
ur
t
es
carpe
r
t
tile
in
China
and
the
U.K.
and
distributes
carpe
r
t
tile
throughout
Europe
and
Southeast
Asia.
It
manufact
f
ur
t
es
or
distributes
a
variety
of
hardwood,
wood
plastic
composite,
stone
plastic
composite,
vinyl
and
laminate
floor
products
(collectively,
“hard
surfaces”).
Shaw’s
Integrated Solutions business also provides project management and installation services.
Shaw
also
operates
Shaw
Sports
Turf,
Shawgrass
and
Southwest
Greens
International,
LLC,
which
provide
synthetic
sports
turf,
golf
greens
and
landscape
turf
products.
Shaw’s
Watershed
Geosynthetics
subs
u
idiary
sells
innovative
and
patented environmental solutions for utility, waste management, erosion control and mining industries and provides patented
renewabl
a
e energy solutions.
Shaw
products
are
sold
wholesale
to
over
42,000
retailers,
distributors
and
commercial
users
throughout
the
world.
Shaw’s
wholesale
products
are
marketed
domestically
by
over
1,700
salaried
and
commissioned
sales
personnel
directly
to
retailers
and
distributors
and
to
large
national
accounts.
Shaw’s
distribution
facilities,
including
seven
carpe
r
t,
nine
hard
surfaces, one sample full-service and three sample satellite facilities and 29 redistribution centers, enable it to provide prompt
and effi
f
cient delivery
r
of its products to both its retail customers and wholesale distributors.
Subs
u
tantially all carpe
r
t manufact
f
ur
t
ed by Shaw is tufted carpe
r
t made from nylon, polypropylene and polyester, as well
as
recycled
materials.
During
2025,
Shaw
processed
approximately
92%
of
its
requirements
for
carpe
r
t
yarn
in
its
own
yarn
processing
facilities.
The
availabi
a
lity
of
raw
materials
is
adequate,
but
costs
are
impacted
by
petro-chemical
and
natural
gas
price
changes.
A
significant
portion
of
Shaw’s
soft-flooring
raw
materials
derive
from
recycled
sources.
Raw
material
cost
changes are periodically factored into selling prices to customers.
y
K-17
The soft floor covering industry
r
is highly competitive with only a handful
f
of majo
a
r competitors domestically. There are
numerous manufact
f
ur
t
ers, domestically and internationally, that are engaged in the hard surfaces flooring sector. According to
industry
r
estimates published in 2025 for 2024, carpe
r
t and rugs account for approximately 44% of the total U.S. consumption
of
all
flooring
types.
The
principal
competitive
measures
within
the
floor
covering
industry
r
are
quality,
style,
price
and
service.
Johns Manville
Johns
Manville
Corporation
(“JM”),
based
in
Denver,
Colorado,
is
a
leading
manufact
f
ur
t
er
and
marketer
of
premium-
quality products for building insulation, mechanical and industrial insulation, commercial roofin
f
g and roof insulation, as well
as reinforcement fiberglass and technical nonwovens. JM serves markets that include residential and nonresidential buildings,
automotive
and
transportation,
air
handling,
appliance,
HVAC,
pipe
and
equipment,
air
and
liquid
filtration,
waterproofing,
flooring,
interiors,
aerospace
and
wind
energy.
Fiberglass
is
the
basic
material
in
many
of
JM’s
products,
although
JM
also
manufact
f
ur
t
es a significant portion of its products with other materials to satisfy the broader needs of its customers.
JM
regards
its
patents
and
licenses
as
valuable;
however,
it
does
not
consider
any
of
its
businesses
to
be
materially
dependent
on
any
single
patent
or
license.
JM
operates
over
40
manufact
f
ur
t
ing
facilities
in
North
America
and
Europe
and
conducts research and development at its technical center in Littleton, Colorado and at other facilities in the U.S. and Europe.
Fiberglass
is
made
from
earthen
raw
materials
and
recycled
glass.
JM’s
products
also
contain
materials
other
than
fiberglass,
including
chemical
agents
to
bind
many
of
its
glass
fibers
and
various
chemical-based
and
petrochemical-based
materials used in roofin
f
g and other specialized products. JM uses recycled material when availabl
a
e and suitabl
a
e to satisfy
f
the
broader needs of its customers. The raw materials used in these various products are generally readily availabl
a
e in suffic
f
ient
quantities
from
various
sources
to
maintain
and
expand
current
production
levels,
although
the
availabi
a
lity
of
recycled
glass
can fluctuate.
JM’s
operations
are
subj
u
ect
to
a
variety
of
federal,
state
and
local
environmental
laws
and
regulations,
which
regulate
or
impose
liabi
a
lity
for
the
discharge
of
materials
into
the
air,
land
and
water
and
govern
the
use
and
disposal
of
hazardous
subs
u
tances
and
use
of
chemical
subs
u
tances.
The
most
relevant
of
the
federal
laws
are
the
Federal
Clean
Air
Act,
the
Clean
Water
Act,
the
Toxic
Subs
u
tances
Control
Act,
the
Resource
Conservation
and
Recovery
Act
and
the
Comprehensive
Environmental
Response,
Compensation
and
Liability
Act,
which
are
administered
by
the
EPA.
Canadian
and
European
regulatory
r
authorities
have
also
adopted
their
own
environmental
laws
and
regulations.
JM
continually
monitors
new
and
pending regulations and assesses their potential impact on the business. JM’s capital projects regularly address environmental
compliance,
although
capital
expenditures
for
environmental
compliance
are
generally
in
conjunction
with
other
capital
project expenditures.
JM sells its products through a wide variety of channels including contractors, distributors, retailers, manufact
f
ur
t
ers and
fabr
a
icators.
JM
operates
in
highly
competitive
markets.
Competitors
are
primarily
large
U.S.
and
internationally-based
manufact
f
ur
t
ers,
as
well
as
smaller
regional
manufact
f
ur
t
ers.
JM
holds
leadership
positions
in
the
key
markets
that
it
serves.
JM’s
products
compete
primarily
on
value,
differentiation
and
customization,
breadth
of
product
line,
quality
and
service.
Sales of JM’s products are moderately seasonal due to increases in construc
r
tion activity that typically occur in the second and
third quarters of the calendar year.
MiTek
MiTek
Industries,
Inc.
(“MiTek”),
based
in
Chesterfield,
Missouri,
operates
in
two
separate
building
markets:
residential
and
commercial.
MiTek
operates
worldwide
with
sales
in
over
60
countries
and
with
manufact
f
ur
t
ing
facilities
and/or sales/engineering offi
f
ces located in 15 countries.
In
the
residential
building
market,
MiTek
is
a
leading
suppl
u
ier
of
engineered
connector
products,
construc
r
tion
hardware,
engineering
software
and
services,
and
computer-driven
manufact
f
ur
t
ing
machinery
r
to
the
trus
r
s
component
market
of
the
building
components
industry.
r
MiTek’s
primary
customers
are
component
manufact
f
ur
t
ers,
who
manufact
f
ur
t
e
prefab
f
ricated
roof
and
floor
trus
r
ses
and
wall
panels
for
the
residential
building
market.
MiTek
also
sells
construc
r
tion
hardware to commercial distributors and retail stores for do-it-yourself customers.
A significant raw material used by MiTek is hot dipped galvanized sheet steel. While suppl
u
ies are adequate, variations
in suppl
u
y can produce significant variations in cost and availabi
a
lity.
Benjamin Moore
Benjamin
Moore
&
Co.
(“Benja
n
min
Moore”),
headquartered
in
Montvale,
New
Jersey,
is
one
of
North
America’s
leading
manufact
f
ur
t
ers
of
premium
quality
residential,
commercial
and
industrial
maintenance
coatings.
Benjamin
Moore
is
committed
to
innovation
and
sustainabl
a
e
manufact
f
ur
t
ing
practices.
The
Benjamin
Moore
premium
portfol
f
io
includes Aura®,
Regal® Select, Ben®, Advance®, Element Guard®, Woodluxe®, Ultra Spec® and others. The Benjamin Moore diversifie
f
d
brands include specialty and architectur
t
al paints from Coronado® and Insl-x®.
j
K-18
Benjamin
Moore
coatings
are
availabl
a
e
through
more
than
8,000
independently
owned
and
operated
paint,
decorating
and hardware retailers, including approximately 4,000 Ace Hardware (“Ace”) stores, throughout the U.S. and Canada, as well
as 66 other countries. Benjamin Moore is the prefer
f
red paint suppl
u
ier for Ace stores through an agreement which permits Ace
stores
to
carry
specified
Benjamin
Moore
products.
Additionally,
Benjamin
Moore
manufact
f
ur
t
es
Clark+Kensington®
and
Royal® brands, as well as the balance of Ace’s private labe
a
l paint brands.
Benjamin
Moore
also
allows
customers
to
directly
order
coatings
or
color
samples
online
or
via
its
customer
information center for national accounts. Orders may be delivered to the customer or a retailer near the customer.
Benjamin
Moore
competes
with
numerous
manufact
f
ur
t
ers,
distributors
and
paint,
coatings
and
related
products
retailers.
Product
quality,
product
innovation,
breadth
of
product
line,
technical
expertise,
service
and
price
determine
the
competitive
advantage.
Competitors
include
other
premium
paint
and
decorating
stores,
mass
merchandisers,
home
centers,
independent hardware stores, hardware chains and manufact
f
ur
t
er-operated direct outlets, such as Sherwin-Williams Company,
The Pittsburgh Paints Company, The Home Depot, Inc., Lowe’s Companies, Inc and Farrow & Ball.
The most significant raw materials in Benjamin Moore products are titanium dioxide, monomers, polymers, packaging
materials and pigments. Historically, the purchased raw materials have been generally availabl
a
e, with pricing and availabi
a
lity
subj
u
ect to fluctuation.
Benjamin
Moore
complies
with
applicable
regulations
relating
to
protection
of
the
environment
and
workers’
safet
f
y
and
Benjamin
Moore
products
are
compliant
with
environmental
standards.
Benjamin
Moore
has
certain
known
past
environmental matters, which are subj
u
ect to on-going monitoring and/or remediation effo
f
rts.
Acme
Acme Brick Company (“Acme”), headquartered in Fort Worth, Texas, manufact
f
ur
t
es and distributes clay bricks (Acme
Brick®)
and
concrete
block
(Featherlite).
In
addition,
Acme
distributes
numerous
other
building
products
of
other
manufact
f
ur
t
ers, including cladding, floor and wall tile, wood flooring and other masonry
r
products. Products are sold primarily
in
the
South
Central
and
Southeastern
U.S.
through
company-operated
sales
offi
f
ces.
Acme
distributes
products
primarily
to
homebuilders and masonry
r
and general contractors.
Acme operates 12 clay brick manufactur
t
ing sites located in four states and three concrete block facilities in Texas. The
demand
for
Acme’s
products
is
seasonal,
with
higher
sales
in
the
warmer
weather
months,
and
is
subj
u
ect
to
the
level
of
construc
r
tion
activity,
which
is
cyclical.
Acme
also
owns
and
leases
properties
and
mineral
rights
that
suppl
u
y
raw
materials
used in many of its manufactur
t
ed products. Acme’s raw materials suppl
u
y is currently adequate.
The brick industry
r
is subj
u
ect to the EPA Maximum Achievable Control Technology Standards (“MACT”). As required
under
the
1990
Clean
Air
Act,
the
EPA
developed
a
list
of
source
categories
that
require
the
development
of
National
Emission Standards for Hazardous Air Pollutants, which are also referred to as MACT Standards (“Rul
R
e”). Key elements of
the MACT Rule include emission limits establ
a
ished for certain hazardous air pollutants and acidic gases. Acme’s brick plants
comply with the current Rule.
Consumer products
Recreational vehicles
Forest
River,
Inc.
(“Forest
River”),
headquartered
in
Elkhart,
Indiana,
manufact
f
ur
t
es
recreational
vehicles
(“RV”),
utility
cargo
trailers,
commercial
truc
r
ks,
buses
and
pontoon
boats,
which
are
sold
in
the
U.S.
and
Canada
through
an
independent
dealer
network.
Forest
River
has
numerous
manufactur
t
ing
facilities
located
in
seven
states
and
is
a
leading
manufact
f
ur
t
er
of
RVs
with
numerous
brand
names,
including
Forest
River,
Coachmen
RV,
Cherokee,
Rockwood,
Salem,
Wildwood,
Surveyor,
Sunseeker,
Entrada,
Forester
and
Georgetown.
Utility
cargo
trailers
are
sold
under
a
variety
of
brand
names.
Commercial
truc
r
ks
are
sold
under
the
Rockpor
k
t
brand
name.
Buses
are
sold
under
several
brand
names,
including
Starcraftf
Bus. Pontoon boats are sold under the Berkshire, South Bay, Trifect
f
a and Dockside brand names.
The
RV
industry
r
is
highly
competitive.
Competition
is
based
primarily
on
price,
design,
quality
and
service.
The
industry
r
has
consolidated
over
the
past
several
years
and
is
concentrated
in
a
few
companies,
the
largest
of
which
had
a
market
share
of
approximately
39%
based
on
industry
r
data
as
of
December
2025.
Forest
River
held
a
market
share
of
approximately 36% at that time. Forest River is subj
u
ect to regulations of the National Traffi
f
c and Motor Vehicle Safety Act,
the
safety
standards
for
recreational
vehicles
establ
a
ished
by
the
U.S.
Department
of
Transportation
and
similar
laws
and
regulations issued by the Canadian government. Forest River is a member of the Recreational Vehicle Industry
r
Association, a
voluntary
r
association
of
RV
manufact
f
ur
t
ers
which
promotes
safety
standards
for
RVs.
Forest
River
believes
its
products
comply in all material respects with the standards that govern their products.
K-19
Apparel and footwear
Frui
r
t
of
the
Loom,
Inc.
(“FOL”),
headquartered
in
Bowling
Green,
Kentuc
t
ky,
manufact
f
ur
t
es
and
distributes
basic
apparel,
underwear,
outerwear,
athletic
apparel
and
sports
equipment.
Products
under
the
Frui
r
t
of
the
Loom®
and
JERZEES®
labels
are
primarily
sold
in
the
mass
merchandise,
mid-tier
chains
and
wholesale
markets.
In
the
Vanity
Fair
Brands product line, Vassarette®, Curvation® and Radiant by Vanity Fair® are sold in the mass merchandise market, while
other
Vanity
Fair®
products
are
sold
to
mid-tier
chains
and
department
stores.
FOL
also
markets
and
sells
athletic
apparel
and sports equipment to team dealers and to sporting goods retailers under the Russell Athletic® and Spalding® brands.
FOL
generally
perfor
f
ms
its
own
knitting,
cloth
finishing,
cutting,
sewing
and
packaging
for
apparel.
For
the
North
American market, which is FOL’s predominant sales region, cloth manufact
f
ur
t
ing is primarily performed in Honduras. Labor
a
-
intensive
cutting,
sewing
and
packaging
operations
are
in
Central
America
and
Asia.
For
the
European
market,
products
are
either
sourced
from
third-party
contractors
in
Europe
or
Asia
or
sewn
in
Morocco
from
textiles
internally
produced
in
Morocco.
Athletic
equipment,
sporting
goods
and
other
athletic
apparel
lines
are
generally
sourced
from
third-party
contractors located primarily in Asia.
U.S.-grown
cotton
fiber
and
manufact
f
ur
t
ed
polyester
fiber
are
the
main
raw
materials
used
in
manufact
f
ur
t
ing
FOL’s
products.
Currently,
suppl
u
ies
are
adequate.
If
relationships
with
suppl
u
iers
cannot
be
maintained
or
delays
occur
in
obtaining
alternative
sources
of
suppl
u
y,
production
can
be
adversely
affe
f
cted,
which
can
result
in
a
corresponding
adverse
effe
f
ct
on
results
of
operations.
FOL’s
markets
are
highly
competitive,
consisting
of
many
domestic
and
foreign
manufact
f
ur
t
ers
and
distributors. Competition is generally based upon product featur
t
es, quality, customer service and price.
Garan Incorporated (“Garan”), headquartered in New York, New York, designs, manufact
f
ur
t
es, imports and distributes
children’s
apparel,
including
products
for
boys,
girls,
toddlers
and
infants.
Garan
markets
its
products
under
its
own
trademarks,
including
GARANI
R
MALS®,
365
Kids
from
Garanimals®
and
easy-peasy®,
as
well
as
customer
private-labe
a
l
brands and licensed trademarks, and sells to a diversifie
f
d group of retailers as well as through its direct-to-consumer channel.
Garan operates through subs
u
idiaries located in the U.S., Central America and Asia, with subs
u
tantially all products distributed
through
its
U.S.-based
distribution
centers.
Fechheimer
Brothers
Company
(“Fechheimers”)
manufact
f
ur
t
es
and
distributes
uniforms,
principally
for
the
publ
u
ic
service
and
safety
markets,
including
police,
fire,
postal
and
military
markets.
Fechheimers is based in Cincinnati, Ohio.
Through
its
subs
u
idiaries,
BH
Shoe
Holdings,
Inc.
manufact
f
ur
t
es,
imports
and
distributes
work,
rugged
outdoor
and
casual
shoes
and
western-style
footwear
under
several
brand
names,
including
Justin®,
BØRN®,
Carolina®,
Söfft
f
®
and
Double-H
Boots®,
as
well
as
under
several
other
brand
names.
Brooks
Sports,
Inc.,
headquartered
in
Seattle,
Washington,
markets and sells high-performance running footwear and apparel to specialty and national retailers and directly to consumers
under
the
Brooks®
brand.
A
significant
volume
of
the
shoes
sold
by
Berkshire’s
shoe
businesses
are
manufact
f
ur
t
ed
or
purchased
from
sources
located
outside
the
U.S.
Products
are
sold
worldwide
through
a
variety
of
channels
including
department
stores,
footwear
chains,
specialty
stores,
catalogs
and
e-commerce,
as
well
as
through
company-owned
retail
stores.
Other consumer products
The Duracell Company (“Duracell”), headquartered in Chicago, Illinois, is a leading manufact
f
ur
t
er of high-performance
alkaline and lithium coin batteries. Duracell manufact
f
ur
t
es batteries primarily in the U.S., as well as in Europe and China and
provides a network of worldwide sales and distribution centers. Duracell sells its products to a diverse group of retailers and
distributors across the globe. There are several competitors in the battery manufact
f
ur
t
ing market. Duracell estimates that it had
a 32% market share of the global alkaline battery market in 2025. The availabi
a
lity of raw materials, which are primarily steel,
zinc, manganese and nickel-based chemistries, is currently suffic
f
ient.
The consumer products group also includes Jazwares, LLC, (“Jazwares”), acquired in October 2022 in connection with
Alleghany. Jazwares, headquartered in Plantation, Florida, is a leading global toy and consumer products manufact
f
ur
t
er with a
robust portfol
f
io of owned and licensed brands, such as Squishmallows™, BLDR™, Pokémon™, Hello Kitty™, Star Wars™,
Disney™,
BumBumz™Stranger
Things™and
Five
Nights
at
Freddy’s™.
In
addition
to
toys
and
plush,
offe
f
rings
also
include virtua
t
l games, costum
t
es, pet products and housewares. Jazwares sells its products in more than 100 countries.
Richline Group, Inc., headquartered in New York, New York, operates four strategic business units: Richline Jewelry,
r
LeachGarner,
Rio
Grande
and
Inverness.
Each
business
unit
is
a
manufact
f
ur
t
er
and/or
distributor
of
precious
metal,
non-
precious
metal,
diamond
and
gem
products
to
specific
target
markets,
including
large
jewelry
r
chains,
department
stores,
shopping
networks,
mass
merchandisers,
e-commerce
retailers
and
artisans
as
well
as
certain
global
manufact
f
ur
t
ers
and
wholesalers
in
the
medical,
electronics
and
aerospace
industries.
Albecca
Inc.,
headquartered
in
Suwanee,
Georgia,
operates
in the U.S., Canada and several other countries, primarily under the Larson-Juhl® name (“Larson-Juhl”). Larson-Juhl designs
and
distributes
a
complete
line
of
high
quality,
branded
custom
framing
products,
including
wood
and
metal
moulding,
matboard, foamboard, glass and framing suppl
u
ies. Complementary
r
to its framing products, Larson Juhl offe
f
rs art printing and
fulfillme
f
nt services.
pp
p
K-20
Service and Retailing Businesses
Service businesses
Berkshire’s service businesses provide shared aircraft ownership programs and profes
f
sional aviation training programs
(“aviation
services”),
and
distribution
of
electronic
components.
Additionally,
service
businesses
include
franchising
and
servicing of quick service restaurants, media businesses (television and information distribution), as well as logistics services
businesses.
Berkshire’s
service
businesses,
excluding
McLane,
employed
approximately
31,200
people
at
the
end
of
2025.
Information regarding each of these operations follows.
NetJets
NetJets
is
the
leader
in
private
aviation
services
and
operates
a
large,
diverse
private
aircraft
fleet
and
offe
f
rs
a
full
range
of
personalized
private
aviation
solutions
to
meet
and
exceed
the
high
standards
of
its
customers.
NetJets’
global
headquarters
are
in
Columbus,
Ohio
and
its
European
operations
are
based
in
Lisbon,
Portuga
t
l.
The
shared
ownership
concept
is
designed
to
meet
the
travel
needs
of
customers
who
require
the
scale,
flexibility
and
access
of
a
large
fleet
of
aircraft
as
opposed
to
reliance
on
whole
aircraft
ownership.
In
addition,
shared
ownership
programs
are
availabl
a
e
for
corporate flight departments seeking to outsource their general aviation needs or add capacity for peak periods and for others
that previously chartered aircraft.
NetJets’
programs
are
focused
on
safety
and
service
and
are
designed
to
offe
f
r
customers
guaranteed
availabi
a
lity
of
aircraft, predictabl
a
e operating costs and increased liquidity. NetJets’ shared aircraft ownership programs permit customers to
acquire
a
specific
percentage
of
a
certain
aircraft
type
and
allow
customers
to
utilize
the
aircraft
for
a
specified
number
of
flight
hours
annually.
In
addition,
NetJets
offe
f
rs
prepaid
flight
cards
and
other
aviation
solutions
and
services
for
aircraft
management, customized aircraft sales and acquisition, ground suppor
u
t and flight operation services under several programs,
including NetJets Shares™, NetJets Leases™and the NetJets Card Program™.
NetJets
is
subj
u
ect
to
the
rules
and
regulations
of
the
U.S.
Federal
Aviation
Administration
(“FAA”),
the
Portugue
t
se
Civil
Aviation
Authority
and
the
European
Union
Aviation
Safety
Agency.
Regulations
address
aircraft
registration,
maintenance
requirements,
pilot
qualific
f
ations
and
airport
operations,
including
flight
planning
and
scheduling,
as
well
as
security
issues
and
other
matters.
NetJets
maintains
comprehensive
training
and
development
programs
in
compliance
with
regulatory
r
requirements
for
pilots,
flight
attendants,
maintenance
mechanics
and
other
flight
operations
specialists,
many
of
whom are represented by unions.
FlightSafety
FlightSafety
is
an
industry
r
leading
provider
of
profes
f
sional
aviation
training
services
and
flight
simulation
products.
FlightSafety
and
FlightSafety
Textron
Aviation
Training,
a
joint
ventur
t
e
with
Textron,
provide
high
technology
training
to
pilots, aircraft maintenance technicians, flight attendants and dispatchers who operate and suppor
u
t a wide variety of business,
commercial
and
military
aircraft.
The
training
is
provided
using
a
large
fleet
of
advanced
full
flight
simulators
at
learning
centers and training locations in the U.S., Australia, Brazil, Canada, France, Japa
a
n, Norway, Singapor
a
e, South Afri
f
ca and the
U.K.
Compliance
with
applicable
environmental
regulations
is
an
inherent
requirement
to
operate
the
facilities.
The
vast
majo
a
rity
of
the
instructors,
training
programs
and
flight
simulators
are
qualifie
f
d
by
the
FAA
and
other
aviation
regulatory
r
agencies around the world.
FlightSafety, based in Columbus, Ohio, is also a leader in the design and manufact
f
ur
t
ing of full flight simulators, visual
systems,
displays
and
other
advanced
technology
training
devices.
This
equipment
is
used
to
suppor
u
t
FlightSafety
training
programs and is offe
f
red for sale to airlines and governments around the world. Manufact
f
ur
t
ing facilities are in Oklahoma and
Illinois.
FlightSafety
strives
to
maintain
and
manufact
f
ur
t
e
simulators
and
develop
courseware
using
state-of-t
f
he-art
technology, incorporating critical safety standards and procedur
d
es. FlightSafety invests in research and development, further
advancing the delivery
r
of new equipment and training programs.
TTI
TTI,
Inc.
(“TTI”),
headquartered
in
Fort
Worth,
Texas,
is
a
global
specialty
distributor
of
passive,
interconnect,
electromechanical,
discrete
and
semiconductor
components
used
by
customers
in
the
manufact
f
ur
t
ing
and
assembling
of
electronic
products.
TTI’s
customer
base
includes
OEMs,
electronic
manufact
f
ur
t
ing
services,
original
design
manufact
f
ur
t
ers
and
military
and
commercial
customers,
as
well
as
design
and
system
engineers.
TTI’s
distribution
agreements
with
the
industry’
r
s
leading
suppl
u
iers
allow
it
to
uniquely
leverage
its
produc
d
t
cost
and
to
expand
its
business
by
providing
new
lines
and
products
to
its
customers.
TTI
operates
sales
offi
f
ces
and
distribution
centers
from
more
than
180
locations
throughout
North America, South America, Europe and Asia.
g
y
K-21
TTI
services
a
variety
of
industries
including
telecommunications,
medical
devices,
computers
and
offi
f
ce
equipment,
military/aerospace,
automotive
and
industrial
electronics.
TTI’s
core
businesses
serve
customers
in
the
design
through
production
stages
in
the
electronic
component
suppl
u
y
chain,
which
suppor
u
ts
high-volume
customers.
Its
Mouser
subs
u
idiary
suppor
u
ts
a
broader
base
of
customers
with
lower
volume
purchases
through
internet-based
marketing,
and
its
XTG
division
services customers with specialty semiconductors and design services.
McLane
McLane Company, Inc. (“McLane”) provides wholesale distribution services in all 50 states to customers that include
convenience
stores,
discount
retailers,
wholesale
clubs,
drug
r
stores,
military
bases,
quick
service
restaurants
and
casual
dining
restaurants.
McLane’s
majo
a
r
customers
during
2025
included
Walmart
(appr
a
oximately
17.2%
of
revenues);
7-Eleven
(appr
a
oximately
13.3%
of
revenues);
and
Yum!
Brands
(appr
a
oximately
13.3%
of
revenues).
McLane’s
business
model
is
based
on
a
high
volume
of
sales,
rapi
a
d
inventory
r
turnover
and
stringent
expense
controls.
Operations
are
divided
into
three
business units: retail distribution, restaurant distribution and beverage distribution.
McLane’s
retail
distribution
unit,
based
in
Temple,
Texas,
is
a
leader
within
the
convenience
store
market,
serving
many
national
convenience
store
chains
and
majo
a
r
oil
company
retail
outlets.
Retail
operations
provide
products
to
approximately
43,100
retail
locations
nationwide.
McLane’s
retail
distribution
unit
operates
27
distribution
facilities
in
20
states.
McLane’s
restaurant
distribution
unit,
based
in
Carrollton,
Texas,
focuses
on
serving
the
quick
service
and
casual
dining
restaurant
industry
r
with
high
quality,
timely-delivered
products.
Operations
are
conducted
through
46
facilities
in
22
states. The restaurant distribution unit services approximately 35,300 restaurants nationwide.
Through its subs
u
idiaries, McLane also operates wholesale distributors of distilled spirits, wine and beer. The beverage
unit
operates
as
Empire
Distributors,
with
operations
conducted
through
14
distribution
centers
in
Georgia,
North
Carolina,
Tennessee
and
Colorado.
Empire
Distributors
services
approximately
30,800
retail
locations
in
the
Southeastern
U.S.
and
Colorado. McLane had approximately 24,900 employees at the end of 2025.
Other
XTRA
Corporation
(“XTRA”
R
),
headquartered
in
St.
Louis,
Missouri,
is
a
leading
transportation
equipment
lessor
operating under the XTRA Lease® brand name. XTRA manages a diverse fleet of approximately 90,000 units located at 47
facilities
throughout
the
U.S.
The
fleet
includes
over-the-road
and
storage
trailers,
chassis,
temperatur
t
e-controlled
vans
and
flatbe
t
d
trailers.
XTRA
is
one
of
the
largest
lessors
(in
terms
of
units
availabl
a
e)
of
over-the-road
trailers
in
North
America.
Transportation equipment customers lease equipment to cover cyclical, seasonal and geographic needs and as a subs
u
titute for
purchasing
equipment.
By
maintaining
a
large
fleet,
XTRA
provides
customers
with
a
broad
selection
of
equipment
and
quick response times.
IPS-Integrated Project Services, LLC (“IPS”) was acquired in connection with the Alleghany acquisition in 2022. IPS
operates
globally
and
provides
a
range
of
profes
f
sional
design,
qualific
f
ation/validation,
construc
r
tion
and
construc
r
tion/pr
/
oject
management
consulting
services
for
manufact
f
ur
t
ing,
research
labor
a
atory
r
and
suppor
u
t
facilities
within
the
pharmaceutical,
biotech
and
lifef
sciences,
technology,
data
center,
industrial,
commercial
and
retail
industries
sectors.
Most
of
IPS
services
are subj
u
ect to strict regulatory
r
compliance requirements that adds to the complexity of its services.
International
Dairy
r
Queen
Inc.
develops
and
services
a
worldwide
system
of
approximately
7,800
franchised
restaurants
operating
primarily
under
the
names
DQ
Grill
and
Chill®,
Dairy
Queen®,
DQ®
and
Orange
Julius®
that
offe
f
r
various
dairy
r
desserts,
beverages,
prepared
foods
and
blended
fruit
drinks.
Business
Wire
Inc.
(“Business
Wire”)
transmits
full-text
news
releases,
regulatory
r
filings,
photos
and
other
multimedia
content
primarily
to
journalists,
financial
profes
f
sionals, investor services and regulatory
r
authorities. Releases are distributed globally via Business Wire’s patented NX
network.
CORT
Business
Services
Corporation
(“CORT”)
is
a
leading
national
provider
of
rental
furniture
and
related
services
in
the
“rent-to-rent”
segment
of
the
furniture
rental
industry.
r
CORT
primarily
rents
furniture
to
individua
d
ls,
businesses,
government
agencies
and
the
trade
show
and
events
industry.
r
CORT
also
sells
new
and
used
furniture.
WPLG,
Inc.
is
an
independent
television
broadcasting
station
serving
the
Miami/Ft.
Lauderdale
market
and
operates
WPLG-TV,
local10.com,
MeTV
South
Florida
and
Heroes
&
Icons
Network
in
South
Florida.
Charter
Brokerage
Holdings
Corp.
is
a
leading non-asset based third party logistics provider to various industries.
Retailing businesses
Berkshire’s
retailing
businesses
include
automotive,
home
furnishings
and
several
other
operations
that
sell
various
consumer products and services. Berkshire’s retailing businesses, excluding Pilot, employed approximately 25,400 people at
the end of 2025. Information regarding each of these operations follows.
K-22
Berkshire Hathaway Automotive
Berkshire
Hathaway
Automotive,
Inc.
(“BHA”)
is
one
of
the
largest
automotive
retailers
in
the
U.S.,
operating
108
new
vehicle
franchises
through
83
dealerships
located
primarily
in
majo
a
r
metropolitan
markets
in
the
U.S.
The
dealerships
sell
new
and
used
vehicles,
vehicle
maintenance
and
repair
services,
extended
service
contracts,
vehicle
protection
products
and other afte
f
rmarket products. BHA also arranges financing for its customers through third-party lenders. BHA operates 31
collision
centers
directly
connected
to
the
dealerships’
operations
and
owns
and
operates
two
auto
auctions
and
an
automotive fluid maintenance products distributor.
Dealership
operations
are
highly
concentrated
in
the
Arizona
and
Texas
markets,
with
approximately
75%
of
dealership-related
revenues
derived
from
sales
in
these
markets.
BHA
maintains
franchise
agreements
with
26
different
vehicle
manufact
f
ur
t
ers,
although
it
derives
a
significant
portion
of
its
revenue
from
the
Toyota/Lexus,
General
Motors,
Ford/L
d
incoln,
Nissan/Infiniti
and
Honda/Acura
brands.
These
manufact
f
ur
t
ers
normally
represent
approximately
90%
of
the
revenue generated by BHA’s dealerships.
The
retail
automotive
industry
r
is
highly
competitive.
BHA
faces
competition
from
large
public
and
private
dealership
groups
and
from
individual
franchised
dealerships.
Given
the
retail
price
transparency
availabl
a
e
through
online
platforms,
and
the
fact
that
franchised
dealers
acquire
vehicles
from
the
manufact
f
ur
t
ers
on
the
same
terms
irrespective
of
volume,
the
location
and
quality
of
the
dealership
facility,
customer
service
and
transaction
speed
are
key
differentiators
in
attracting
customers.
BHA’s
overall
relationships
with
the
automobile
manufact
f
ur
t
ers
are
governed
by
framework
agreements.
The
framework
agreements
contain
provisions
relating
to
the
management,
operation,
acquisition
and
ownership
structure
of
BHA’s dealerships. Failure to meet the terms of these agreements could adversely impact BHA’s abi
a
lity to acquire additional
dealerships
representing
those
manufact
f
ur
t
ers.
Additionally,
these
agreements
contain
limitations
on
the
number
of
dealerships from a specific manufactur
t
er that may be owned by BHA.
Individual
dealerships
operate
under
franchise
agreements
with
the
manufact
f
ur
t
er,
which
grants
the
dealership
entity
a
non-exclusive right to sell the manufact
f
ur
t
er’s brand of vehicles and offe
f
r related parts and service within a specified market
area, as well as the right to use the manufact
f
ur
t
er’s trademarks. The agreements contain various requirements and restrictions
related
to
the
management
and
operation
of
the
franchised
dealership
and
provide
for
termination
of
the
agreement
by
the
manufact
f
ur
t
er or non-renewal for a variety of causes. States generally have automotive dealership franchise laws that provide
subs
u
tantial protection to the franchisee, and it is difficult for a manufact
f
ur
t
er to terminate or not renew a franchise agreement
outside of bankrupt
r
cy or with “good cause” under the applicable state franchise law.
BHA
also
develops,
underwrites
and
administers
various
vehicle
protection
plans
sold
to
consumers
through
BHA’s
dealerships and third-party dealerships. BHA also develops proprietary training programs and materials and provides ongoing
monitoring and training of the dealership’s finance and insurance personnel.
Home furnishings
The
home
furnishings
retailing
businesses
consist
of
Nebraska
Furniture
Mart
Inc.
(“NFM”),
R.C.
Willey
Home
Furnishings
(“R.C.
Willey”),
Star
Furniture
Company
(“Star”)
and
Jordan’s
Furniture,
Inc.
(“Jordan’s”).
These
businesses
offe
f
r
a
wide
selection
of
furnitur
t
e,
bedding
and
accessories.
In
addition,
NFM
and
R.C.
Willey
sell
a
full
line
of
majo
a
r
household
appliances,
electronics,
floor
coverings
and
other
home
furnishings,
and
offe
f
r
customer
financing
to
complement
their
retail
operations.
An
important
featur
t
e
of
each
of
these
businesses
is
their
ability
to
control
costs
and
to
produc
d
e
high
business volume by offe
f
ring significant value to their customers.
NFM
operates
its
business
from
four
retail
complexes
with
almost
4.5
million
square
feet
of
retail,
warehouse
and
administrative
facilities
located
in
Omaha,
Nebraska,
Clive,
Iowa,
Kansas
City,
Kansas
and
The
Colony,
Texas.
NFM
also
owns
Homemakers
Furniture
located
in
Urba
r
ndale,
Iowa,
which
has
approximately
600,000
square
feet
of
retail,
warehouse
and
administrative
space.
NFM
is
the
largest
home
furnishings
retailer
in
each
of
these
markets.
R.C.
Willey,
based
in
Salt
Lake City, Utah, currently operates ten full-line retail home furnishings stores and three distribution centers. These facilities
include
approximately
1.3
million
square
feet
of
retail
space
with
four
stores
located
in
Utah,
one
store
in
Meridian,
Idaho,
three stores in Nevada (Las Vegas and Reno) and two stores in the Sacramento, Califor
f
nia area.
Jordan’s
operates
a
retail
furniture
business
from
eight
locations
with
approximately
1
million
square
feet
of
retail
space
in
stores
located
in
Massachusetts,
New
Hampshire,
Rhode
Island,
Maine
and
Connecticut.
The
retail
stores
are
suppor
u
ted
by
an
800,000
square
foot
distribution
center
in
Taunton,
Massachusetts.
Jordan’s
is
the
largest
furniture
retailer,
as
measured
by
sales,
in
Massachusetts,
Maine
and
New
Hampshire
and
is
well
known
in
its
markets
for
its
unique
store
arrangements
and
advertising
campaigns.
Star
operates
home
furnishings
retail
stores
in
Texas.
Star’s
retail
facilities
currently include about 700,000 square feet of retail space in 10 locations in Texas, including seven in Houston.
y
g
K-23
Pilot Travel Centers
In
2017,
Berkshire
acquired
a
38.6%
noncontrolling
interest
in
Pilot
Travel
Centers
LLC
(“Pilot”).
On
January
31,
2023, Berkshire acquired an additional 41.4% interest and attained control of Pilot and began consolidating Pilot for financial
reporting purpos
r
es beginning Februa
r
ry 1, 2023. On January 16, 2024, Berkshire acquired the remaining 20% noncontrolling
interest and Pilot became an indirect wholly-owned subs
u
idiary.
Pilot
operates
675
travel
center
and
82
fuel-only
retail
locations
across
the
U.S.
and
in
five
Canadian
provinces,
primarily
under
the
names
Pilot
or
Flying
J,
through
663
company-owned
locations,
as
well
as
through
94
locations
held
in
unconsolidated
joint
ventur
t
es.
Pilot
and
subs
u
idiaries
also
conduct
wholesale
fuel
and
fuel
marketing
businesses
in
the
U.S.
and
sell
diesel
fuel
at
over
150
locations
in
the
U.S.
and
Canada
through
various
third-party
arrangements
in
which
Pilot
procures
and
sells
diesel
fuel
to
consumers
at
locations
owned
by
the
third
parties.
Pilot
also
operates
a
water
disposal
business in the oil fields sector.
Pilot
sold
approximately
10.9
billion
gallons
of
fuel
(primarily
diesel,
gasoline
and
diesel
exhaust
fluid)
in
2025
through
its
various
company-owned
retail
locations,
third-party
arrangements
and
wholesale
businesses.
The
Pilot
operated
joint ventur
t
es also sold approximately 900 million gallons of fuel in 2025. Additionally, Pilot provides charging stations for
electric
vehicles
at
approximately
245
travel
centers
in
connection
with
an
agreement
with
General
Motors
to
develop
a
nationwide
electric
vehicle
fast
charger
network
of
up
to
2,000
charging
stalls
in
up
to
500
U.S.
locations.
Pilot
and
subs
u
idiaries had approximately 29,300 employees at the end of 2025.
Pilot’s
travel
centers
are
generally
located
close
to
an
interstate
highway
and
offe
f
r
petroleum
products,
merchandise,
food
and
other
services
and
amenities
to
consumers,
travelers
and
profes
f
sional
truc
r
k
drivers.
The
travel
center
industry
r
is
concentrated
among
a
few
large
operators,
including
Love’s
Travel
Stops
and
TravelCenters
of
America,
although
there
are
numerous independent operators that operate one to ten travel centers. Pilot’s top 10 customers for diesel sales accounted for
approximately 10% of total diesel gallons sold in 2025, while Pilot’s top 10 fuel suppl
u
iers accounted for approximately 45%
of gallons purchased in 2025.
Pilot
is
subj
u
ect
to
federal,
state
and
local
laws
and
regulations
relating
to
the
environment.
These
laws
generally
provide
for
control
of
pollutants
released
into
the
environment
and
require
responsible
parties
to
undertake
remediation
of
hazardous
waste
disposal
sites.
Penalties
may
be
imposed
for
non-compliance.
The
retirement
of
certain
long-lived
assets
(such as petroleum tanks, dispensers and disposal wells) may result in asset retirement obligations.
Other
Other
retailing
businesses
include
three
jewelry
r
companies.
Borsheim
Jewelry
r
Company,
Inc.
(“Borsheims”)
operates
from
a
single
store
in
Omaha,
Nebraska.
Borsheims
is
a
high-volume
retailer
of
luxury
r
jewelry,
r
engagement
rings,
watches,
home décor and repair services. Helzberg’s Diamond Shops, LLC (“Helzberg”) is based in North Kansas City, Missouri, and
operates
a
chain
of
161
retail
jewelry
r
stores
in
34
states,
which
includes
approximately
350,000
square
feet
of
retail
space.
Helzberg’s
stores
are
in
malls,
outlet
malls
and
other
retail
venues,
and
operate
under
the
name
Helzberg
Diamonds®,
Helzberg Diamonds Outlet® or Helzberg®. Ben Bridge Jeweler (“Ben Bridge”), based in Seattle, Washington, operates retail
jewelry
r
stores
under
the
Ben
Bridge
Jeweler
and
six
other
brand
names
in
nine
western
states.
The
Ben
Bridge
Jeweler
locations offe
f
r loose diamonds, finished jewelry
r
and high-end timepieces. Ben Bridge also operates seven boutiques that sell
timepieces of specific
f
brands, including Rolex, Tudor, Grand Seiko, Omega, IWC and Breitling.
See’s
Candy
Shops,
Incorporated
(“See’s”)
produces
boxed
chocolates
and
other
confect
f
ionery
products
with
an
emphasis
on
quality
and
distinctiveness
in
two
large
kitchens
in
Los
Angeles
and
South
San
Francisco
and
a
facility
in
Burlingame,
Califor
f
nia.
See’s
operates
approximately
250
retail
and
volume
saving
stores
located
mainly
in
Califor
f
nia
and
other Western states, as well as appr
a
oximately 100 seasonal locations. See’s revenues are highly seasonal with approximately
half of its annual revenues earned in the fourth quarter.
The Pampered Chef,f
Ltd. (“Pampered Chef”)
f
is a premier direct seller of distinctive high-quality kitchenware products
with
sales
and
operations
in
the
U.S.,
Canada,
Germany,
Austria
and
France
and
operations
in
China.
Pampered
Chef’s
f
product portfol
f
io consists of over 400 Pampered Chef® b
f
randed kitchenware items in categories ranging from stoneware and
cutlery
to
grilling
and
entertaining.
Pampered
Chef’s
f
products
are
availabl
a
e
through
its
sales
force
of
independent
cooking
consultants and online.
K-24
Oriental Trading Company (“OTC”) is an online retailer for fun value-priced party suppl
u
ies, seasonal products, arts and
crafts
f
,
toys
and
novelties,
school
suppl
u
ies,
educ
d
ational
games
and
patient
giveaways.
OTC,
headquartered
in
Omaha,
Nebraska, serves a broad base of over three million customers annually, including consumers, schools, churches, medical and
dental
offi
f
ces
and
other
businesses.
OTC
offe
f
rs
a
unique
assortment
of
over
70,000
fun
value-priced
products
emphasizing
proprietary
designs.
OTC
operates
both
direct-to-consumer
and
business-to-business
brands
including
Oriental
Trading®,
Fun
Express®,
MindWare®,
SmileMakers®,
Morris
Costumes®
and
HalloweenExpress.com®
and
utilizes
a
multi-channel
marketing approach along with dedicated sales teams to promote online sales.
Detlev
Louis
Motorrad
(“Louis”),
headquartered
in
Hamburg,
Germany,
is
a
leading
retailer
of
motorcycle
clothing
and
equipment
in
Europe.
Louis
carries
over
50,000
different
store
and
private
labe
a
l
products,
mainly
covering
the
areas
of
clothing, technical equipment and leisure. Louis has over 80 stores in Germany, Austria, Switzerland and the Netherlands as
well as an online business with online shops in various languages in Europe.
Additional information with respect to Berkshire’s businesses
Revenue,
earnings
before
taxes
and
identifia
f
bl
a
e
assets
attributable
to
Berkshire’s
reportabl
a
e
business
segments
are
included
in
Note
26
to
Berkshire’s
Consolidated
Financial
Statements
contained
in
Item
8,
Financial
Statements
and
Suppl
u
ementary
Data.
Additional
information
regarding
Berkshire’s
investments
in
fixed
maturity
and
equity
securities
is
included in Notes 3, 4 and 5 to Berkshire’s Consolidated Financial Statements.
Berkshire
maintains
a
website
(http://www.berkshirehathaway.com)
where
its
annual
reports,
certain
corporate
governance
documents,
press
releases,
interim
shareholder
reports
and
links
to
its
subs
u
idiaries’
websites
can
be
found.
Berkshire’s
periodic
reports
filed
with
the
SEC,
which
include
Form
10-K,
Form
10-Q,
Form
8-K
and
amendments
thereto,
may be accessed by the public free of charge from the SEC and through Berkshire. Electronic copies of these reports can be
accessed
at
the
SEC’s
website
(http:
t
//www.sec.gov)
and
indirectly
through
Berkshire’s
website
(http://www.berkshirehathaway.com).
Copies
of
these
reports
may
also
be
obtained,
free
of
charge,
upon
written
request
to:
Berkshire Hathaway Inc., 3555 Farnam Street, Omaha, NE 68131, Attn: Corporate Secretary.
r
Item 1A. Risk Factors
Berkshire and its subs
u
idiaries (referred to herein as “we,” “us,” “our” or similar expressions) are subj
u
ect to certain risks
and
uncertainties
in
its
business
operations
which
are
described
below.
The
risks
and
uncertainties
described
below
are
not
the only risks we face. Additional risks and uncertainties that are presently unknown or are currently deemed immaterial may
also impair our business operations.
General Business Risks
Terrorist acts could hurt our operating businesses.
A
nuclear,
biological
or
chemical
terrorist
attack
or
armed
terrorist
incursions
could
produce
significant
losses
to
our
worldwide
operations.
Our
business
operations
could
be
adversely
affe
f
cted
from
such
acts
through
the
loss
of
human
life,
f
destruction
of
production
facilities
and
information
systems
or
other
property
damage.
We
share
these
risks
with
all
businesses.
Cybersecurity risks could result in economic losses to our businesses and reputational damage.
We
rely
on
technology
in
virtua
t
lly
all
aspects
of
our
business.
Like
those
of
many
large
businesses,
certain
of
our
information
systems
have
been
subj
u
ect
to
cyber
threats,
including
computer
viruses,
malicious
codes,
unauthorized
access,
phishing effo
f
rts, denial-of-service attacks and other cyber-attacks. We expect continued exposure to such attacks in the future
and attacks have become more sophisticated and frequent. A significant disrupt
r
ion or failure of our technology systems could
result
in
service
interrupt
u
ions,
safety
failures,
security
events,
regulatory
r
compliance
failures,
an
inability
to
protect
information
and
assets
against
unauthorized
users
and
other
operational
difficulties.
Cyber-attacks
perpetrated
against
our
systems could result in loss of assets and critical information and expose us to remediation costs and reputation damage.
K-25
Although
we
have
taken
steps
intended
to
mitigate
these
risks,
including
business
continuity
planning,
disaster
recovery
planning
and
business
impact
analysis,
a
significant
disrupt
r
ion
or
cyber
intrus
r
ion
at
one
or
more
of
our
significant
operations could adversely affe
f
ct our results of operations, financial condition and/or liquidity. Additionally, if we are unabl
a
e
to
acquire,
develop,
implement,
adopt
or
protect
rights
around
new
technology,
we
may
suffer
a
competitive
disadvantage,
which could also have an adverse effe
f
ct on our results of operations, financial condition and/or liquidity.
Cyber-attacks
could
further
adversely
affe
f
ct
our
ability
to
operate
our
facilities,
information
technology
and
business
systems
or
could
compromise
confid
f
ential
company,
customer
and
employee
information.
Political,
economic,
social
or
financial market instability or damage to or interfer
f
ence with our operating assets, customers or suppl
u
iers from cyber-attacks
may
result
in
business
interrupt
u
ions,
lost
revenues,
higher
commodity
prices,
disrupt
r
ion
in
fuel
suppl
u
ies,
lower
energy
consumption, unstabl
a
e markets, increased security, repairs and other costs, including penalties and legal proceedings, or may
materially
adversely
affe
f
ct
us
in
ways
that
cannot
be
predicted
at
this
time.
Any
of
these
risks
could
materially
affe
f
ct
our
consolidated
financial
results.
Furthermore,
instability
in
the
financial
markets
resulting
from
terrorism,
sustained
or
significant cyber-attacks or war could also have a material adverse effe
f
ct on our ability to raise capital. We share these risks
with all businesses.
Geopolitical events could cause losses to our business and losses in the values of securities we own.
We
believe
risks
of
adverse
effe
f
cts
from
geopolitical
events
are
rising,
through
armed
and
diplomatic
conflic
f
ts
involving
governments
in
various
parts
of
the
world.
Government
policies
and
actions
taken
in
the
U.S.
and
elsewhere,
including
responses
of
other
governments
to
such
actions
may
adversely
affe
f
ct
our
operating
businesses
through
reduced
sales, increased operating costs or sanctions, restricted suppl
u
y chains, physical damage to our properties and loss of lifef
of our
employees
and
losses
in
the
values
of
the
securities
we
own.
In
addition,
international
trade
policies
in
the
U.S.
and
elsewhere,
including
tariffs
and
other
barriers,
could
negatively
impact
our
operating
results.
We
share
these
risks
with
all
businesses.
We are dependent on a few key people for our majo
a
r investment and capital allocation decisions.
In
May
2025,
Berkshire’s
Board
of
Directors
appointed
Mr.
Gregory
r
E.
Abel
to
succeed
Mr.
Warren
E.
Buffet
f
t
as
Chief Executive Offi
f
cer effe
f
ctive January 1, 2026. Majo
a
r capital allocation and investment decisions are the responsibility of
Mr. Abel. Mr. Ajit Jain is Vice Chairman of Berkshire’s insurance operations. Mr. Adam Johnson is President of Berkshire’s
Consumer Products, Service and Retailing operations. Mr. Jain and Mr. Johnson each report directly to Mr. Abel.
If for any reason the services of our key personnel were to become unavailabl
a
e, there could be a material adverse effe
f
ct
on our operations. The Board continually monitors this risk. We believe that the Board’s succession plans, together with the
outstanding managers running our numerous highly diversifie
f
d operating units, helps to mitigate this risk.
We need qualifie
f
d personnel to manage and operate our various businesses.
In
our
decentralized
business
model,
we
need
qualifie
f
d
and
competent
management
to
direct
day-to-day
business
activities
of
our
operating
subs
u
idiaries
and
to
manage
changes
in
future
business
operations
due
to
changing
business
or
regulatory
r
environments.
Our
operating
subs
u
idiaries
also
need
qualifie
f
d
and
competent
personnel
to
execute
business
plans
and
serve
their
customers,
suppl
u
iers
and
other
stakeholders.
Our
inability
to
recrui
r
t,
train
and
retain
qualifie
f
d
and
competent
managers and personnel could negatively affe
f
ct the operating results, financial condition and liquidity of our subs
u
idiaries and
Berkshire as a whole. Further, labor
a
disrupt
r
ions or strikes at our subs
u
idiaries, our customers or within our suppl
u
y chains could
reduce our sales, increase our costs and negatively impact our periodic operating results.
Investments are unusually concentrated in equity securities and fair values are subject to loss in value.
We
concentrate
a
high
percentage
of
the
equity
security
investments
of
our
insurance
subs
u
idiaries
in
relatively
small
number
of
issuers.
A
significant
decline
in
the
fair
values
of
our
larger
investments
in
equity
securities
may
produce
a
material decline in our consolidated shareholders’ equity and our consolidated earnings.
Since a large percentage of our equity securities are held by our insurance subs
u
idiaries, significant decreases in the fair
values of these investments will produce significant declines in the statut
t
ory
r
surplus of our insurance subs
u
idiaries. Our large
statut
t
ory
r
surplus
is
a
competitive
advantage,
and
a
long-term
material
decline
could
have
an
adverse
effe
f
ct
on
our
claims-
paying
ability
ratings
and
our
ability
to
write
new
insurance
business,
thus
potentially
reducing
our
future
underwriting
profits
f
.
K-26
Competition and technology may erode our business franchises and result in lower earnings.
Each
of
our
operating
businesses
faces
intense
competition
within
markets
in
which
they
operate.
While
we
manage
our
businesses
with
the
objective
of
achieving
long-term
sustainabl
a
e
growth
by
developing
and
strengthening
competitive
advantages,
many
factors,
including
technological
changes,
disrupt
r
ive
innovations
and
difficulties
in
enforcing,
protecting
and
defending
our
intellectual
properties,
may
erode
or
prevent
the
strengthening
of
competitive
advantages.
Accordingly,
our
future
operating
results
will
depend
to
some
degree
on
our
operating
units
successful
f
ly
protecting
and
enhancing
their
competitive
advantages.
If
our
operating
businesses
are
unsuccessful
f
in
these
effo
f
rts,
our
periodic
operating
results
in
the
future may decline.
Unfavorable
general
economic
conditions
may
signific
f
antly
reduce
our
operating
earnings
and
impair
our
ability
to
access capital markets at a reasonable cost.
Our
operating
businesses
are
subj
u
ect
to
normal
economic
cycles
affe
f
cting
the
general
economy
or
the
specific
industries
in
which
they
operate.
Significant
deteriorations
of
economic
conditions,
including
significant
inflation
over
prolonged time periods could produce a material adverse effe
f
ct on one or more of our significant operations. In addition, our
utilities
and
energy
businesses
and
our
railroad
business
regularly
utilize
debt
as
a
component
of
their
capital
structures
and
depend
on
having
access
to
borrowed
funds
through
the
capital
markets
at
reasonabl
a
e
rates.
To
the
extent
that
access
to
the
capital markets is restricted or the cost of funding increases, these operations could be adversely affe
f
cted.
Epidemics, pandemics or other similar outbreaks could hurt our operating businesses.
The
outbr
t
eak
of
epidemics,
pandemics
or
other
similar
outbr
t
eaks
in
the
future
may
adversely
affe
f
ct
our
operations,
including
the
value
of
our
equity
securities
portfol
f
io.
This
may
be
due
to
closures
or
restrictions
requested
or
mandated
by
governmental
authorities,
disrupt
r
ion
to
suppl
u
y
chains
and
workforce,
reduction
of
demand
for
our
products
and
services,
credit
losses
when
customers
and
other
counterpa
r
rties
fail
to
satisfy
their
obligations
to
us,
and
volatility
in
global
equity
securities markets, among other factors. We share most of these risks with all businesses.
Regulatory changes may adversely impact our future operating results.
Over
time,
regulatory
r
initiatives
have
been
adopted
in
the
United
States
and
elsewhere
for
a
variety
of
reasons,
including
as
responses
to
financial
markets
crises,
global
economic
recessions,
and
social
and
environmental
issues.
Such
initiatives address, for example, the regulation of banks and other majo
a
r financial institutions, the regulation of produc
d
ts and
services
and
environmental
and
climate
change
matters
and
income
tax
policy.
These
initiatives
impact
each
of
our
businesses,
albeit
in
varying
ways.
Increased
regulatory
r
compliance
costs
could
have
a
significant
negative
impact
on
our
operating
businesses,
as
well
as
on
the
businesses
in
which
we
have
significant,
but
not
controlling,
economic
interests.
We
cannot
predict
whether
such
initiatives
will
have
a
material
adverse
impact
on
our
consolidated
financial
position,
results
of
operations or cash flows.
Data
privacy
and
artific
f
ial
intelligence
laws
and
regulations
have
been
enacted
or
are
under
development
in
various
jurisdictions
in
the
U.S.
and
throughout
the
world.
These
regulations
address
numerous
aspects
related
to
the
security
of
personal
information
that
is
stored
in
our
information
systems,
networks
and
facilities
and
the
use
of
artific
f
ial
intelligence
tools. Failure to comply with these increased laws and regulations could result in reputation damage and significant economic
penalties.
Climate change and the regulation of greenhouse gas (“GHG”) emissions may impact our businesses.
Climate
and
weather-related
events
and
the
regulation
of
GHG
emissions
could
impact
our
businesses
to
varying
degrees.
Climate-related
events,
including
hurricanes,
floods,
wildfires,
and
other
extreme
weather
events
may
increase
the
physical risks and impacts to our operations. An increase in the frequency or intensity of extreme weather events and storms
could
negatively
impact
the
physical
assets
of
our
non-insurance
operations
and
could
produce
losses
affe
f
cting
our
businesses.
Similarly,
extreme
weather
events
may
produc
d
e
losses
affe
f
cting
our
insurance
operations,
as
their
primary
business is to monitor, assess and price risk, including climate-related risk, at an expected economic profit
f
to address the risk-
transfer
f
needs of their insurance customers.
Additional GHG and climate-related policies, including legislation, may emerge that influence the transition to a lower
GHG-emitting economy and could, in turn, influence costs for our businesses to comply with those policies, including BNSF
and
BHE,
which
combined
represent
the
vast
majo
a
rity
of
Berkshire’s
direct
emissions.
The
failure
to
comply
with
new
or
existing
regulations
or
reinterpretation
of
existing
regulations
relating
to
climate
change
could
have
a
significant
adverse
effe
f
ct on our financial results.
K-27
Risks unique to our regulated businesses
Our
tolerance
for
underwriting
risk
assumed
in
our
various
insurance
businesses
may
result
in
signific
f
ant
underwriting losses.
When
properly
paid
for
the
risk
assumed,
we
have
been
and
will
continue
to
be
willing
to
assume
more
risk
from
a
single
event
than
any
other
insurer
has
knowingly
assumed.
Accordingly,
we
could
incur
a
significant
loss
from
a
single
catastrophe
event
resulting
from
a
natural
disaster
or
man-made
catastrophes
such
as
terrorism
or
cyber-attacks.
We
employ
various
disciplined
underwriting
practices
intended
to
mitigate
potential
losses,
attempt
to
consider
all
possible
correlations
and avoid writing groups of policies from which pre-tax losses from a single catastrophe event might aggregate in excess of
$15
billion.
However,
despite
our
effo
f
rts,
it
is
possible
that
losses
could
manifest
in
ways
that
we
do
not
anticipate
and
that
our risk mitigation strategies are not designed to address. Various provisions of our policies, negotiated to limit our risk, such
as
limitations
or
exclusions
from
coverage,
may
not
be
enforceable
in
the
manner
we
intend,
as
it
is
possible
that
a
court
or
regulatory
r
authority could nullify
f
or void an exclusion or limitation, or legislation could be enacted modifying or barring the
use of these exclusions and limitations. Our tolerance for significant insurance losses may result in lower reported earnings in
a future period.
The
principal
cost
associated
with
the
property
and
casualty
insurance
business
is
claims.
In
writing
property
and
casualty insurance policies, we receive premiums today and promise to pay covered losses in the future. However, it will take
decades
before
all
claims
that
have
occurred
as
of
any
given
balance
sheet
date
will
be
settled.
Although
we
believe
that
recorded liabi
a
lities for unpaid losses are adequate, we will not know whether these liabi
a
lities or the premiums charged for the
coverages
provided
were
sufficient
until
well
afte
f
r
the
balance
sheet
date.
Estimating
insurance
claim
costs
is
inherently
imprecise. It is possible that signific
f
ant claims may emerge or develop in the future from the policies we have written in the
past.
As industry
r
practices and legal, social and environmental conditions evolve, unexpected and unintended issues related
to claims and coverage may emerge, including new or expanded theories of liabi
a
lity, increased frequency of litigation driven,
in
part,
by
the
increasing
trend
of
third-party
litigation
funding,
and
other
social
inflation
trends
such
as
juries
awarding
increasingly
larger
verdicts.
These
or
other
changes
could
impose
new
financial
obligations
on
us
by
extending
coverage
beyond
our
underwriting
intent
and
result
in
increased
litigation
costs
and
adverse
judicial
awards.
In
some
instances,
these
changes may not become apparent until sometime afte
f
r we have issued insurance or reinsurance contracts that are affe
f
cted by
the changes. As a result, the full extent of liabi
a
lity under our insurance or reinsurance contracts may not be known for many
years afte
f
r a contract is issued. Our estimated unpaid losses arising under contracts covering property and casualty insurance
risks
are
large
($151.8
billion
at
December
31,
2025),
and
a
small
percentage
increase
to
those
liabi
a
lities
can
result
in
a
material reduction in reported earnings.
Changes
in
regulations
and
regulatory
actions
can
adversely
affe
f
ct
our
operating
results
and
our
ability
to
allocate
capital.
Our insurance businesses are subj
u
ect to regulation in the jurisdictions in which we operate. Such regulations may relate
to,
among
other
things,
the
types
of
business
that
can
be
written,
the
rates
that
can
be
charged
for
coverage,
the
level
of
capital that must be maintained and restrictions on the types and size of investments that can be made. Regulations may also
restrict
the
timing
and
amount
of
dividend
payments
to
Berkshire
by
these
businesses.
U.S.
state
insurance
regulators
and
international
insurance
regulators
are
also
actively
developing
various
regulatory
r
mechanisms
to
address
the
regulation
of
large
internationally
active
insurance
groups,
including
regulations
concerning
group
capital,
liquidity,
governance
and
risk
management. Accordingly, changes in regulations related to these or other matters or regulatory
r
actions imposing restrictions
on our insurance businesses may adversely impact our results of operations and restrict our ability to allocate capital.
Our
railroad
business
conducted
through
BNSF
is
also
subj
u
ect
to
a
significant
number
of
laws
and
regulations
with
respect
to
rates
and
practices,
taxes,
railroad
operations
and
a
variety
of
health,
safety,
labor
a
,
environmental
and
other
matters.
Failure
to
comply
with
applicable
laws
and
regulations
could
have
a
material
adverse
effe
f
ct
on
BNSF’s
business.
Governments
may
change
the
legislative
and/or
regulatory
r
framework
within
which
BNSF
operates,
without
providing
any
recourse for any adverse effe
f
cts that the change may have on the business. Complying with legislative and regulatory
r
changes
may
pose
significant
operating
and
implementation
risks
and
require
significant
capital
expenditures.
BNSF
can
be
exposed
to significant litigation costs and losses arising from these matters and from ongoing business operations.
q
g
K-28
BNSF
derives
significant
revenues
from
the
transportation
of
energy-related
commodities,
including
coal.
Changes
in
government
policies
that
limit,
restrict
or
displace
coal
as
a
fuel
source
in
generating
electricity,
or
limit
or
restrict
other
commodities
that
BNSF
transports,
could
adversely
affe
f
ct
revenues
and
earnings.
As
a
common
carrier,
BNSF
is
also
required
to
transport
toxic
inhalation
hazard
chemicals
and
other
hazardous
materials.
The
release
of
hazardous
materials
could
expose
BNSF
to
significant
claims,
losses,
penalties
and
environmental
remediation
obligations.
Changes
in
the
regulation of the rail industry
r
could negatively impact BNSF’s abi
a
lity to determine prices for rail services and to make capital
improvements
to
its
rail
network,
resulting
in
an
adverse
effe
f
ct
on
our
results
of
operations,
financial
condition
and/or
liquidity.
The
U.S.
freight
transportation
infrastructur
t
e
is
integrated.
BNSF’s
operations
may
be
negatively
affe
f
cted
by
service
disrupt
r
ions
of
other
entities,
such
as
ports,
passenger
trains,
and
other
railroads,
which
interchange
with
BNSF
Railway.
A
prolonged service disrupt
r
ion at any of these entities could have adverse consequences on BNSF. Significant consolidation or
integration involving participants within the freight transportation industry,
r
including mergers among majo
a
r rail carriers, may
lead
to
operational
disrupt
r
ions
across
the
rail
network
and
broader
suppl
u
y
chain,
which
could
negatively
impact
BNSF’s
operating results, financial condition and liquidity.
Our
utilities
and
energy
businesses
operated
under
BHE
are
highly
regulated
by
numerous
federal,
state,
local
and
foreign governmental authorities in the jurisdictions in which they operate. These laws and regulations are complex, dynamic
and
subj
u
ect
to
new
interpretations
or
change.
Regulations
affe
f
ct
almost
every
r
aspect
of
our
utilities
and
energy
businesses.
Regulations
broadly
apply
and
may
limit
management’s
ability
to
independently
make
and
implement
decisions
regarding
numerous matters including: acquiring businesses; construc
r
ting, acquiring, disposing or retiring of operating assets; operating
and
maintaining
generating
facilities
and
transmission
and
distribution
system
assets;
complying
with
pipeline
safety
and
integrity and environmental requirements; setting rates charged to customers; establ
a
ishing capital structur
t
es and issuing debt;
managing
and
reporting
transactions
between
our
domestic
utilities
and
our
other
subs
u
idiaries
and
affi
f
liates;
and
paying
dividends
or
similar
distributions.
Failure
to
comply
with
or
reinterpretations
of
existing
regulations
and
new
legislation
or
regulations,
such
as
those
relating
to
air
quality,
climate
change,
emissions
performance
standards,
water
quality,
coal
ash
disposal
and
other
environmental
matters,
or
changes
in
the
nature
of
the
regulatory
r
process
may
have
a
significant
adverse
impact
on
our
financial
results.
Furthermore,
our
regulated
energy
subs
u
idiaries
are
exposed
to
losses
arising
from
wildfires
and
related
litigation
and
judicial
outcomes.
The
energy
rates
charged
by
our
regulated
energy
subs
u
idiaries
to
customers
are
based on the costs of the business and require regulatory approval. To the extent costs are not recoverabl
a
e through approved
rates, the operating results and financial condition of these businesses can be negatively impacted, perhaps materially.
BNSF
requires
significant
ongoing
capital
investment
to
improve
and
maintain
its
railroad
network
so
that
transportation
services
can
be
safely
and
reliabl
a
y
provided
to
customers
on
a
timely
basis.
BHE
also
requires
significant
capital
to
construc
r
t,
operate
and
maintain
generation,
transmission
and
distribution
systems
to
meet
their
customers’
needs
and
reliabi
a
lity
criteria.
System
assets
need
to
be
operational
for
long
periods
of
time
to
justify
f
the
financial
investment.
The
operational or financial failure of capital projects may not be recoverabl
a
e through rates that are charged to customers. Further,
a significant portion of costs of capital improvements may be funded through debt. Restricted access to debt capital markets
by BNSF or BHE could adversely affe
f
ct the results of operations, liquidity and/or capital resources of these businesses.
Item 1B. Unresolved Stafff
Comments
None.
Item 1C. Cybersecurity
Berkshire
recognizes
that
maintaining
processes
for
identifyi
f
ng,
assessing,
and
managing
cybersecurity
threats
is
important
in
dealing
with
its
significant
business
risks.
As
such,
Berkshire
has
implemented
a
framework
for
cybersecurity
and
cyber-related
information
management
across
Berkshire’s
diverse
groups
of
businesses.
The
framework
permits
each
Berkshire
Business
Group
(“Business
Group”)
to
tailor
solutions
to
identify,
f
manage,
and
mitigate
risks
based
on
their
own
assessment of their unique cybersecurity risks in conjunction with each Business Group’s overall risk management processes.
At
the
same
time,
the
framework
helps
enable
consistent
and
appropriate
compliance
in
reporting
material
cyber
events
and
risks across Berkshire.
Each
Business
Group’s
Chief
Information
Security
Offi
f
cer
(“CISO”)
on
at
least
an
annual
basis
is
to
provide
a
report
to
the
Business
Group’s
senior
management,
regarding
the
state
of
their
cybersecurity
program
and
its
material
cyber
risks.
These
reports
are
also
shared
with
Berkshire’s
internal
audit
group
to
inform
and
enhance
the
overall
risk
management
processes.
In
addition,
each
Business
Group
is
required
to
maintain
an
incident
reporting
process
to
report
significant
cybersecurity events to Berkshire. Berkshire and its Business Groups engage and partner with a wide range of third parties to
assess, audit, educ
d
ate, implement, operate, protect, and remediate various cybersecurity related elements.
K-29
Berkshire
and
its
Business
Groups
rely
on
third-party
service
providers
for
a
variety
of
products
and
services
to
run
their
information
systems.
This
dependence
exposes
Berkshire
and
the
Business
Groups,
along
with
others
who
use
these
service
providers,
to
the
impact
of
a
cyber-attack
on
their
service
providers.
On
occasion,
a
cyber-attack
on
a
third-party
service provider could have a significant financial, operational or reputational impact to Berkshire. Berkshire and its Business
Groups continuously monitor the risks associated with its service providers.
The
Audit
Committee
of
Berkshire’s
Board
of
Directors
has
responsibility
for
oversight
of
Berkshire’s
cybersecurity
risk
management
program.
The
Audit
Committee
receives
periodic
reports
regarding
the
number
of
and
impact
from
cybersecurity
incidents
reported
through
Berkshire’s
cybersecurity
incident
reporting
process.
Additionally,
the
Audit
Committee
is
updated
on
cybersecurity
trends
and
related
issues.
Furthermore,
the
Audit
Committee
approves
and
receives
updates
on
the
workpl
k
an
performed
by
Berkshire’s
internal
audit
group
that
focuses
on
information
technology
and
cybersecurity
risks.
This
includes
audit
procedur
d
es
related
to
internal
and
external
penetration
testing,
attack
simulations,
vulnerabi
a
lity
assessments,
cybersecurity
program
reviews
and
other
audits
designed
to
investigate
specific
risks.
The
frequency of these updates is determined by the Audit Committee in conjunction with Berkshire’s senior management.
In
addition
to
the
Audit
Committee’s
oversight,
the
senior
management
of
Berkshire’s
Businesses
Groups
are
responsible
for
the
day-to-day
operations
of
protecting
their
businesses’
information
systems.
Each
Business
Group
is
required
to
report
significant
cybersecurity
events
to
Berkshire.
Berkshire’s
senior
management
reviews
incident
reports
to
determine whether a cyber incident report should be filed with the SEC.
Item 2. Description of Properties
The properties used by Berkshire’s business segments are summarized in this section. Berkshire’s railroad and utilities
and energy businesses, in particular, utilize considerable physical assets in their businesses.
Burlington Northern Santa Fe
Through BNSF Railway, BNSF operates over 32,500 route miles of track (excluding multiple main tracks, yard tracks
and
sidings)
in
28
states.
BNSF
also
operates
in
three
Canadian
provinces.
BNSF
owns
over
23,000
route
miles,
including
easements,
and
operates
over
9,000
route
miles
of
trackage
rights
that
permit
BNSF
to
operate
its
trains
with
its
crews
over
other railroads’ tracks. As of December 31, 2025, the total BNSF Railway system, including single and multiple main tracks,
yard tracks and sidings, consisted of over 50,000 operated miles of track.
BNSF
operates
various
facilities
and
equipment
to
suppor
u
t
its
transportation
system,
including
its
infrastruc
r
ture,
locomotives
and
freight
cars.
It
also
owns
or
leases
other
equipment
to
suppor
u
t
rail
operations,
such
as
vehicles.
Suppor
u
t
facilities
for
rail
operations
include
yards
and
terminals
throughout
its
rail
network,
system
locomotive
shops
to
perform
locomotive
servicing
and
maintenance,
a
centralized
network
operations
center
for
train
dispatching
and
network
operations
monitoring and management, computers, telecommunications equipment, signal systems and other suppor
u
t systems. Transfer
f
facilities
are
maintained
for
rail-to-rail
as
well
as
intermodal
transfer
f
of
containers,
trailers
and
other
freight
traffi
f
c
and
include
approximately
27
intermodal
hubs
located
across
the
system.
BNSF
owns
or
holds
under
non-cancelable
leases
exceeding
one
year
approximately
6,700
locomotives
and
70,700
freight
cars,
in
addition
to
maintenance
of
way
and
other
equipment.
In
the
ordinary
r
course
of
business,
BNSF
incurs
significant
costs
in
repairing
and
maintaining
its
properties.
In
2025,
BNSF recorded approximately $2.4 billion in repairs and maintenance expense.
Berkshire Hathaway Energy
BHE’s
energy
properties
consist
of
the
physical
assets
necessary
to
suppor
u
t
its
electricity
and
natural
gas
businesses.
Properties of BHE’s electricity businesses include electric generation, transmission and distribution facilities, as well as coal
mining assets that suppor
u
t certain of BHE’s electric generating facilities. Properties of BHE’s natur
t
al gas businesses include
natural
gas
distribution
facilities,
interstate
pipelines,
storage
facilities,
liquefied
natural
gas
facilities,
compressor
stations
and
meter
stations.
The
transmission
and
distribution
assets
are
primarily
within
each
of
BHE’s
utility
service
territories.
In
addition
to
these
physical
assets,
BHE
has
rights-of-w
f
ay,
mineral
rights
and
water
rights
that
enable
BHE
to
utilize
its
facilities.
Pursuant
to
separate
financing
agreements,
the
majo
a
rity
of BHE’s
energy
properties
are
pledged
or
encumbered
to
suppor
u
t or otherwise provide the security for the related subs
u
idiary debt.
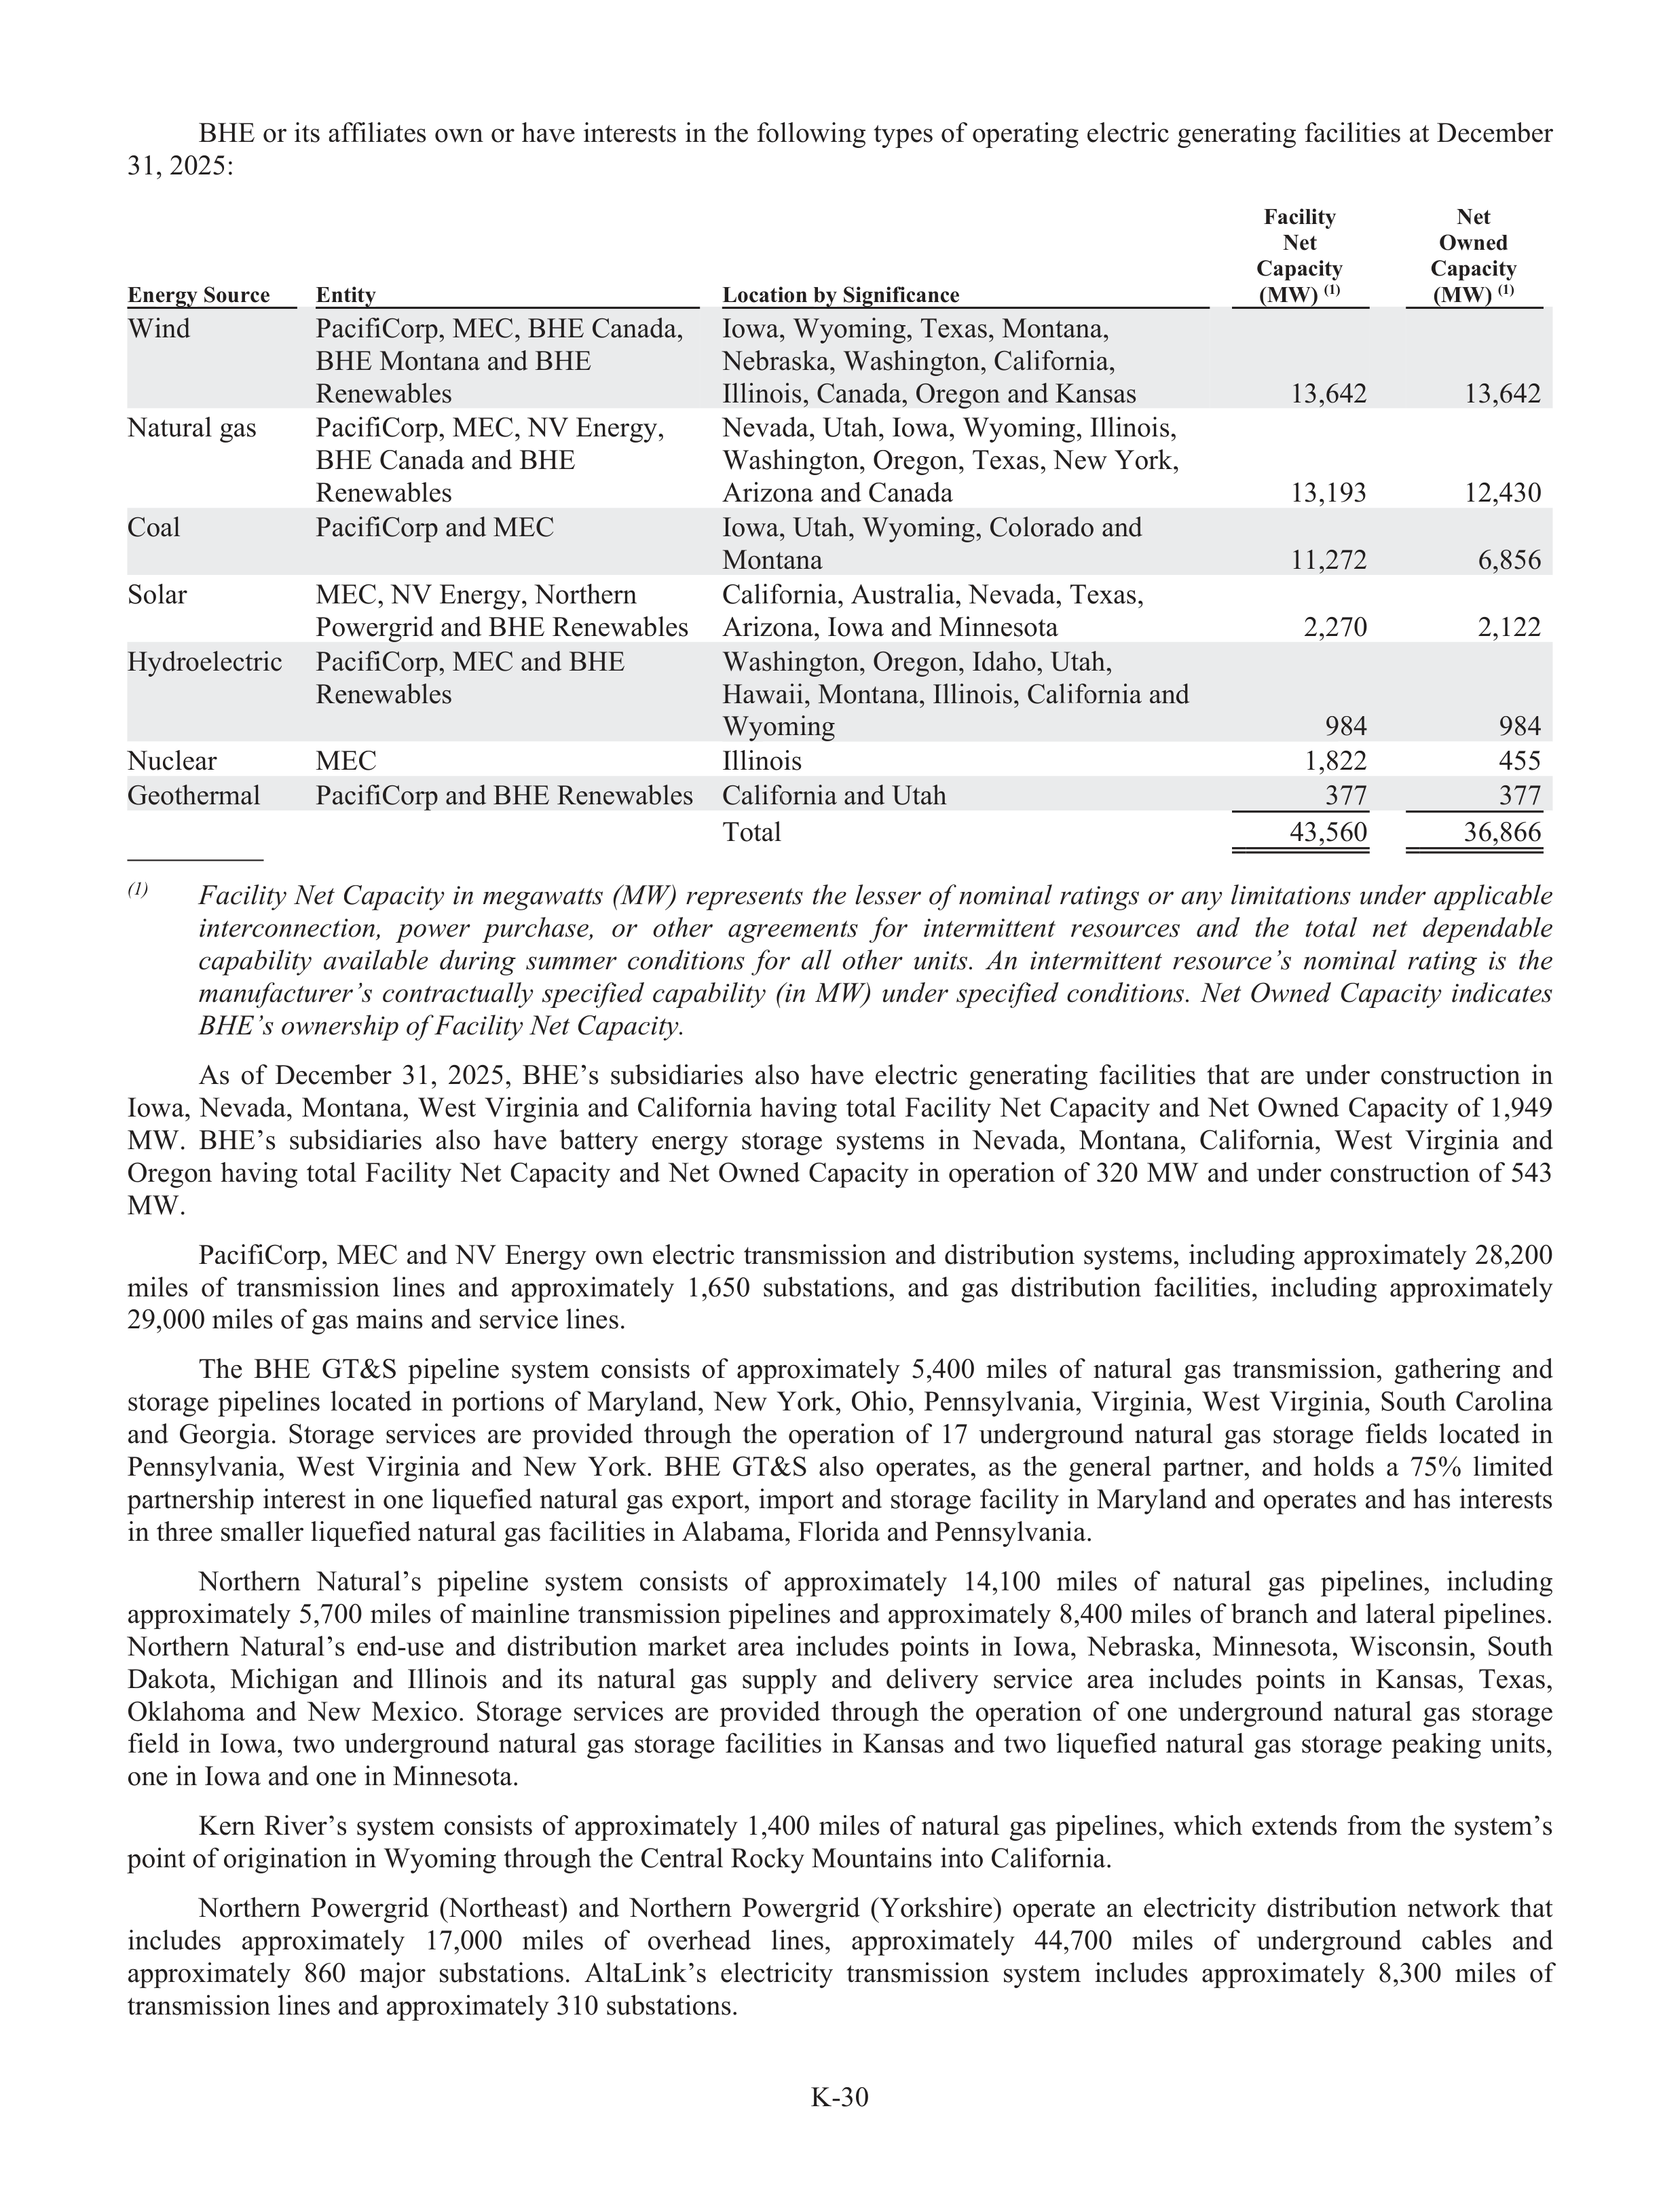
K-30
BHE or its affi
f
liates own or have interests in the following types of operating electric generating facilities at December
31, 2025:
Energy Source
Entity
Location by Signific
f
ance
Facility
Net
Capacity
(MW)
(1)
Net
Owned
Capacity
(MW)
(1)
Wind
PacifiCorp, MEC, BHE Canada,
BHE Montana and BHE
Renewabl
a
es
Iowa, Wyoming, Texas, Montana,
Nebraska, Washington, Califor
f
nia,
Illinois, Canada, Oregon and Kansas
13,642
13,642
Natural gas
PacifiCorp, MEC, NV Energy,
BHE Canada and BHE
Renewabl
a
es
Nevada, Utah, Iowa, Wyoming, Illinois,
Washington, Oregon, Texas, New York,
Arizona and Canada
13,193
12,430
Coal
PacifiCorp and MEC
Iowa, Utah, Wyoming, Colorado and
Montana
11,272
6,856
Solar
MEC, NV Energy, Northern
Powergrid and BHE Renewabl
a
es
Califor
f
nia, Australia, Nevada, Texas,
Arizona, Iowa and Minnesota
2,270
2,122
Hydroelectric
PacifiCorp, MEC and BHE
Renewabl
a
es
Washington, Oregon, Idaho, Utah,
Hawaii, Montana, Illinois, Califor
f
nia and
Wyoming
984
984
Nuclear
MEC
Illinois
1,822
455
Geothermal
PacifiCorp and BHE Renewabl
a
es
Califor
f
nia and Utah
377
377
Total
43,560
36,866
(1)
1
Facility Net Capac
a
ity in megaw
e
atts (MW) repr
e
esents the lesser of nominal ratings or any limitations under applicable
interconnection,
power
purchase,
or
other
agreements
for
intermittent
resources
and
the
total
net
depe
e
ndable
capabi
a
lity
available
during
summer
conditions
for
all
other
units.
An
intermittent
resource’s
nominal
rating
is
the
manufac
f
turer’s
contractually
specifie
i
d
capabi
a
lity
(in
MW)
under
specifie
i
d
conditions.
Net
Owned
Capac
a
ity
indicates
BHE’
H
s ownersh
r
ip of Facility Net Capac
a
ity.
As
of
December
31,
2025,
BHE’s
subsidiaries
also
have
electric
generating
facilities
that
are
under
construc
r
tion
in
Iowa,
Nevada,
Montana,
West
Virginia
and
Califor
f
nia
having
total
Facility
Net
Capa
a
city
and
Net
Owned
Capa
a
city
of
1,949
MW.
BHE’s
subs
u
idiaries
also
have
battery
energy
storage
systems
in
Nevada,
Montana,
Califor
f
nia,
West
Virginia
and
Oregon
having
total
Facility
Net
Capa
a
city
and
Net
Owned
Capa
a
city
in
operation
of
320
MW
and
under
construc
r
tion
of
543
MW.
PacifiCorp, MEC and NV Energy own electric transmission and distribution systems, including approximately 28,200
miles
of
transmission
lines
and
approximately
1,650
subs
u
tations,
and
gas
distribution
facilities,
including
approximately
29,000 miles of gas mains and service lines.
The
BHE
GT&S
pipeline
system
consists
of
approximately
5,400
miles
of
natural
gas
transmission,
gathering
and
storage
pipelines
located
in
portions
of
Maryland,
New
York,
Ohio,
Pennsylvania,
Virginia,
West
Virginia,
South
Carolina
and
Georgia.
Storage
services
are
provided
through
the
operation
of
17
underground
natural
gas
storage
fields
located
in
Pennsylvania,
West
Virginia
and
New
York.
BHE
GT&S
also
operates,
as
the
general
partner,
and
holds
a
75%
limited
partnership interest in one liquefied natural gas export, import and storage facility in Maryland and operates and has interests
in three smaller liquefied natural gas facilities in Alabama, Florida and Pennsylvania.
Northern
Natural’s
pipeline
system
consists
of
approximately
14,100
miles
of
natural
gas
pipelines,
including
approximately 5,700 miles of mainline transmission pipelines and approximately 8,400 miles of branch and lateral pipelines.
Northern
Natural’s
end-use
and
distribution
market
area
includes
points
in
Iowa,
Nebraska,
Minnesota,
Wisconsin,
South
Dakota,
Michigan
and
Illinois
and
its
natural
gas
suppl
u
y
and
delivery
r
service
area
includes
points
in
Kansas,
Texas,
Oklahoma
and
New
Mexico.
Storage
services
are
provided
through
the
operation
of
one
underground
natural
gas
storage
field
in
Iowa,
two
underground
natural
gas
storage
facilities
in
Kansas
and
two
liquefied
natural
gas
storage
peaking
units,
one in Iowa and one in Minnesota.
Kern
River’s
system
consists
of
approximately
1,400
miles
of
natural
gas
pipelines,
which
extends
from
the
system’s
point of origination in Wyoming through the Central Rocky
k
Mountains into Califor
f
nia.
Northern
Powergrid
(Northeast)
and
Northern
Powergrid
(Yorkshire)
operate
an
electricity
distribution
network
that
includes
approximately
17,000
miles
of
overhead
lines,
approximately
44,700
miles
of
underground
cables
and
approximately
860
majo
a
r
subs
u
tations.
AltaLink’s
electricity
transmission
system
includes
approximately
8,300
miles
of
transmission lines and approximately 310 subs
u
tations.
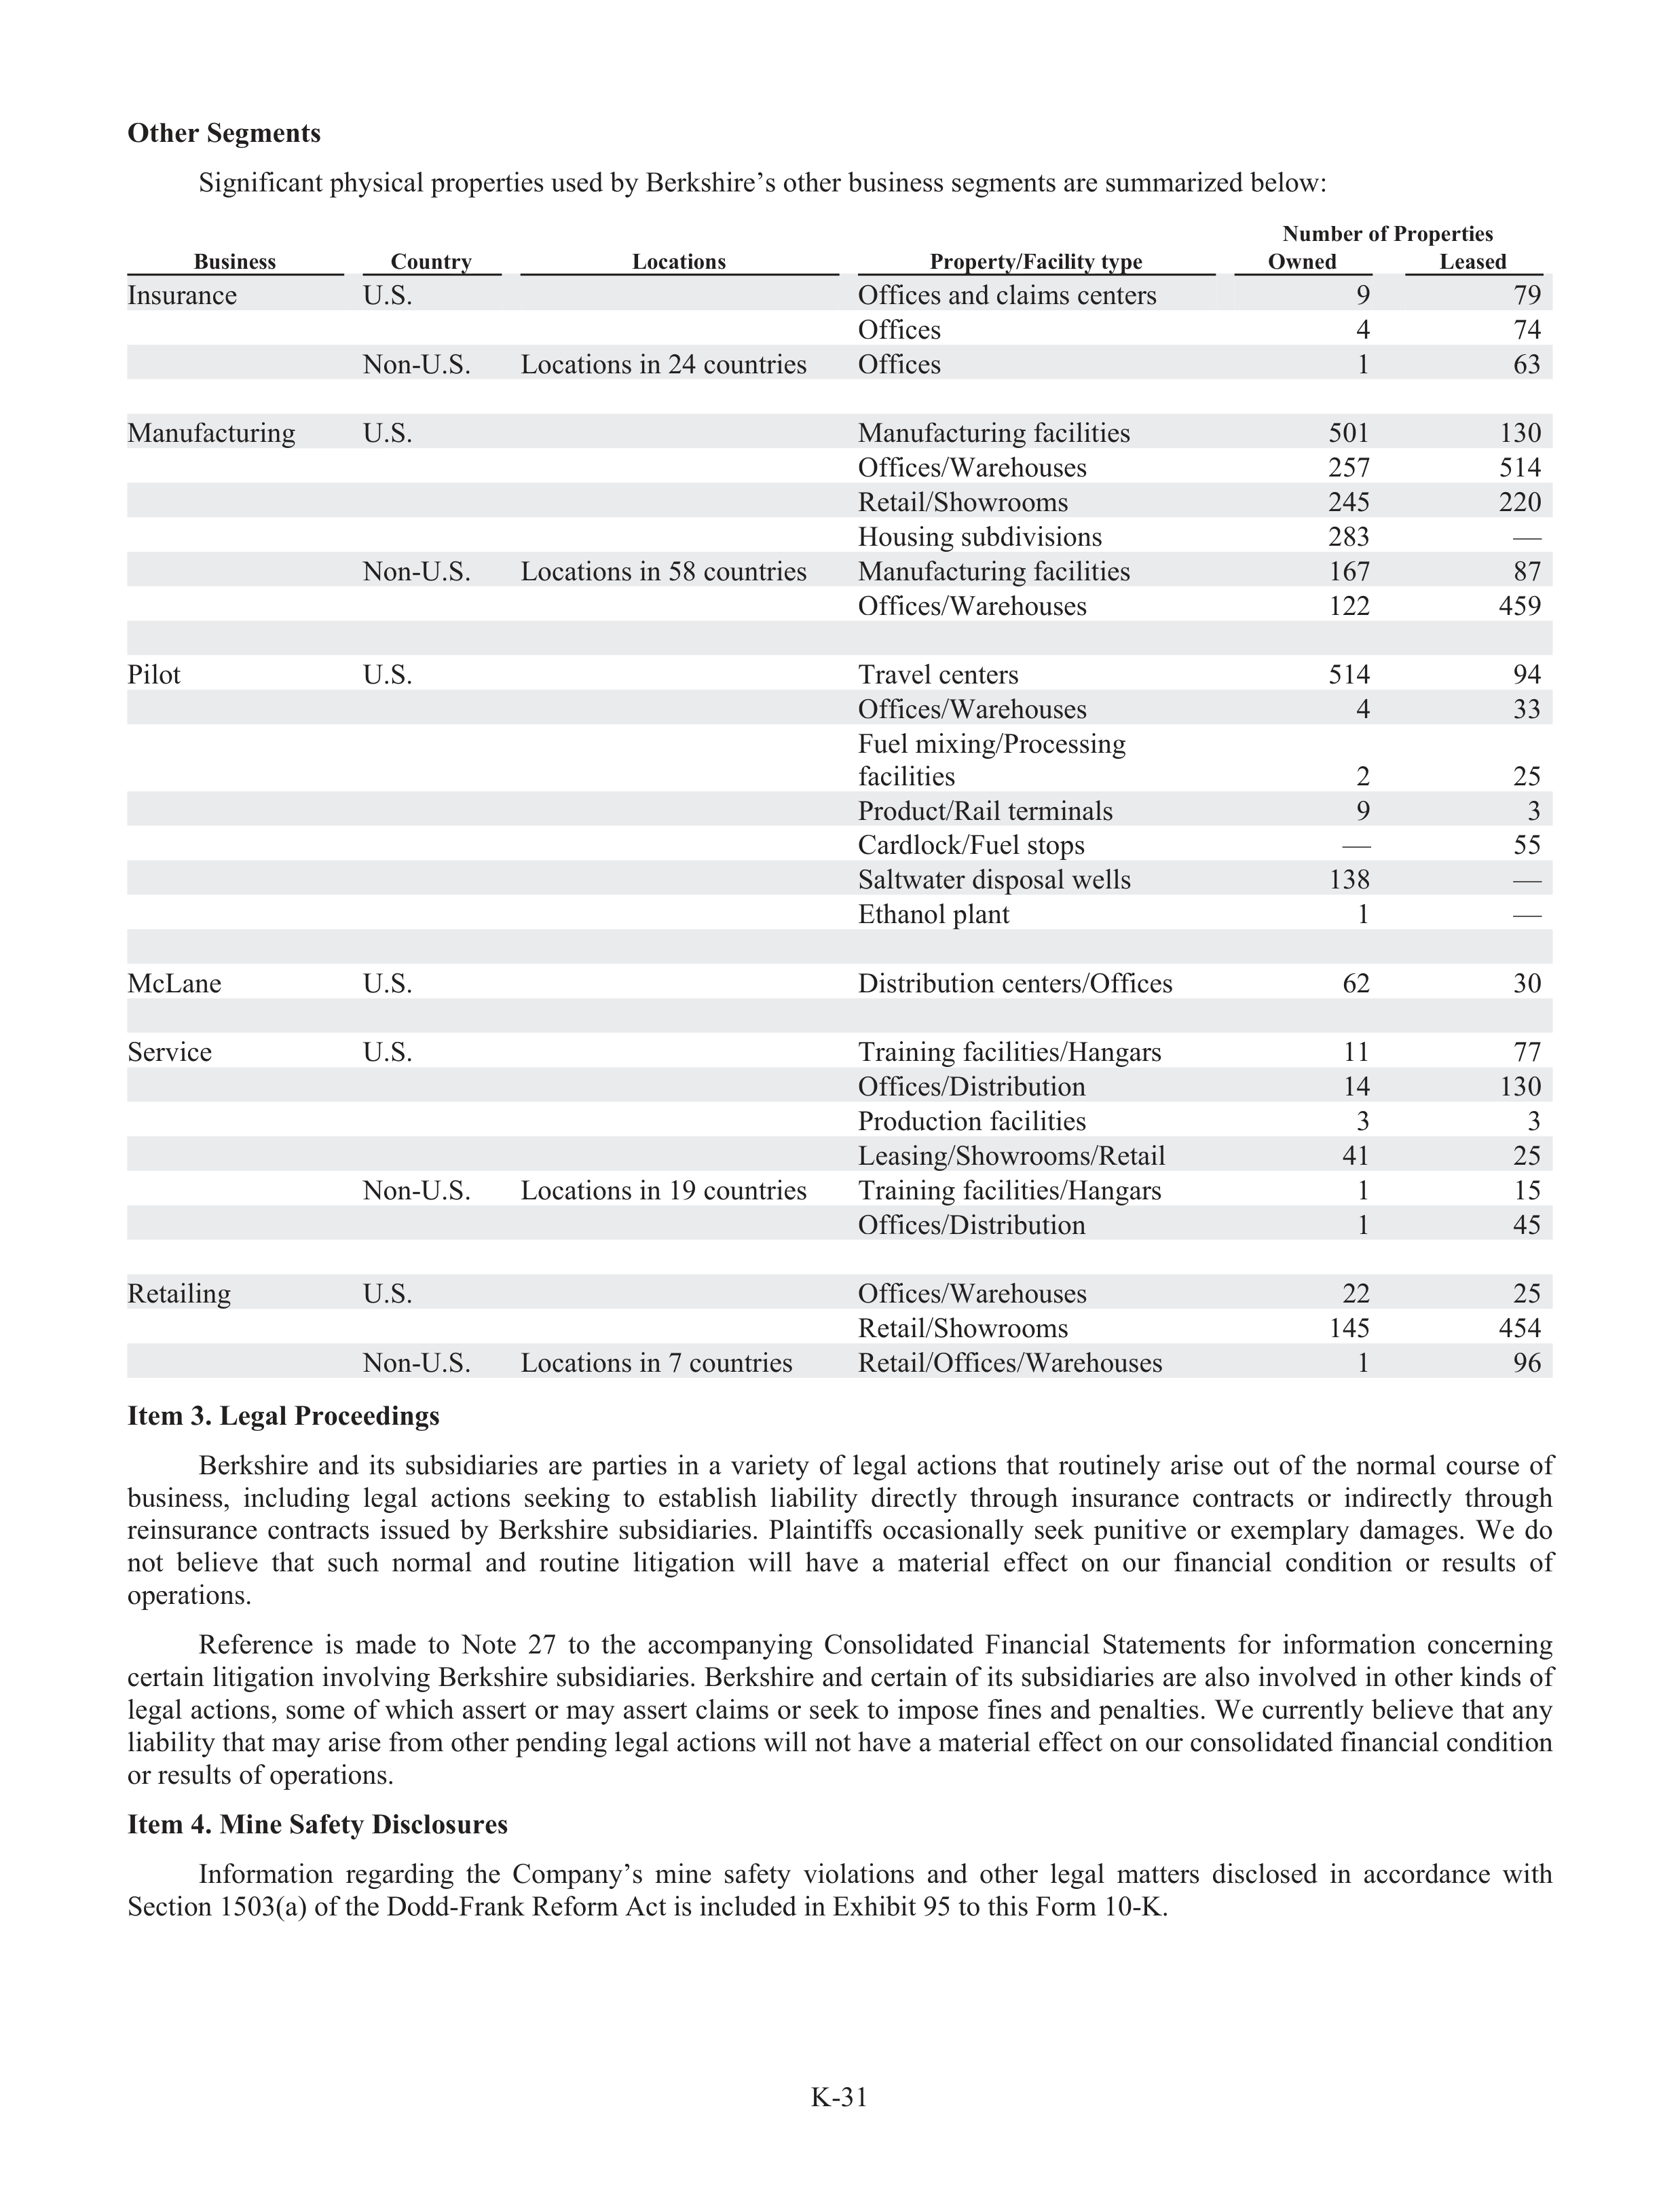
K-31
Other Segments
Significant physical properties used by Berkshire’s other business segments are summarized below:
Number of Properties
Business
Country
Locations
Property/Facility type
Owned
Leased
Insurance
U.S.
Offices and claims centers
9
79
Offi
f
ces
4
74
Non-U.S.
Locations in 24 countries
Offi
f
ces
1
63
Manufact
f
ur
t
ing
U.S.
Manufact
f
ur
t
ing facilities
501
130
Offi
f
ces/Warehouses
257
514
Retail/Showrooms
245
220
Housing subdi
u
visions
283
—
Non-U.S.
Locations in 58 countries
Manufact
f
ur
t
ing facilities
167
87
Offi
f
ces/Warehouses
122
459
Pilot
U.S.
Travel centers
514
94
Offi
f
ces/Warehouses
4
33
Fuel mixing/Processing
facilities
2
25
Product/Rail terminals
9
3
Cardlock/F
k
uel stops
—
55
Saltwater disposal wells
138
—
Ethanol plant
1
—
McLane
U.S.
Distribution centers/Offices
62
30
Service
U.S.
Training facilities/Hangars
11
77
Offi
f
ces/Distribution
14
130
Production facilities
3
3
Leasing/Showrooms/Retail
41
25
Non-U.S.
Locations in 19 countries
Training facilities/Hangars
1
15
Offi
f
ces/Distribution
1
45
Retailing
U.S.
Offices/Warehouses
22
25
Retail/Showrooms
145
454
Non-U.S.
Locations in 7 countries
Retail/Offices/Warehouses
1
96
Item 3. Legal Proceedings
Berkshire
and
its
subs
u
idiaries
are
parties
in
a
variety
of
legal
actions
that
routinely
arise
out
of
the
normal
course
of
business,
including
legal
actions
seeking
to
establ
a
ish
liabi
a
lity
directly
through
insurance
contracts
or
indirectly
through
reinsurance
contracts
issued
by
Berkshire
subs
u
idiaries.
Plaintiffs
f
occasionally
seek
punitive
or
exemplary
r
damages.
We
do
not
believe
that
such
normal
and
routine
litigation
will
have
a
material
effe
f
ct
on
our
financial
condition
or
results
of
operations.
Reference
is
made
to
Note
27
to
the
accompanying
Consolidated
Financial
Statements
for
information
concerning
certain litigation involving Berkshire subs
u
idiaries. Berkshire and certain of its subs
u
idiaries are also involved in other kinds of
legal actions, some of which assert or may assert claims or seek to impose fines and penalties. We currently believe that any
liabi
a
lity that may arise from other pending legal actions will not have a material effe
f
ct on our consolidated financial condition
or results of operations.
Item 4. Mine Safety Disclosures
Information
regarding
the
Company’s
mine
safety
violations
and
other
legal
matters
disclosed
in
accordance
with
Section 1503(a) of the Dodd-Frank Reform Act is included in Exhibit 95 to this Form 10-K.
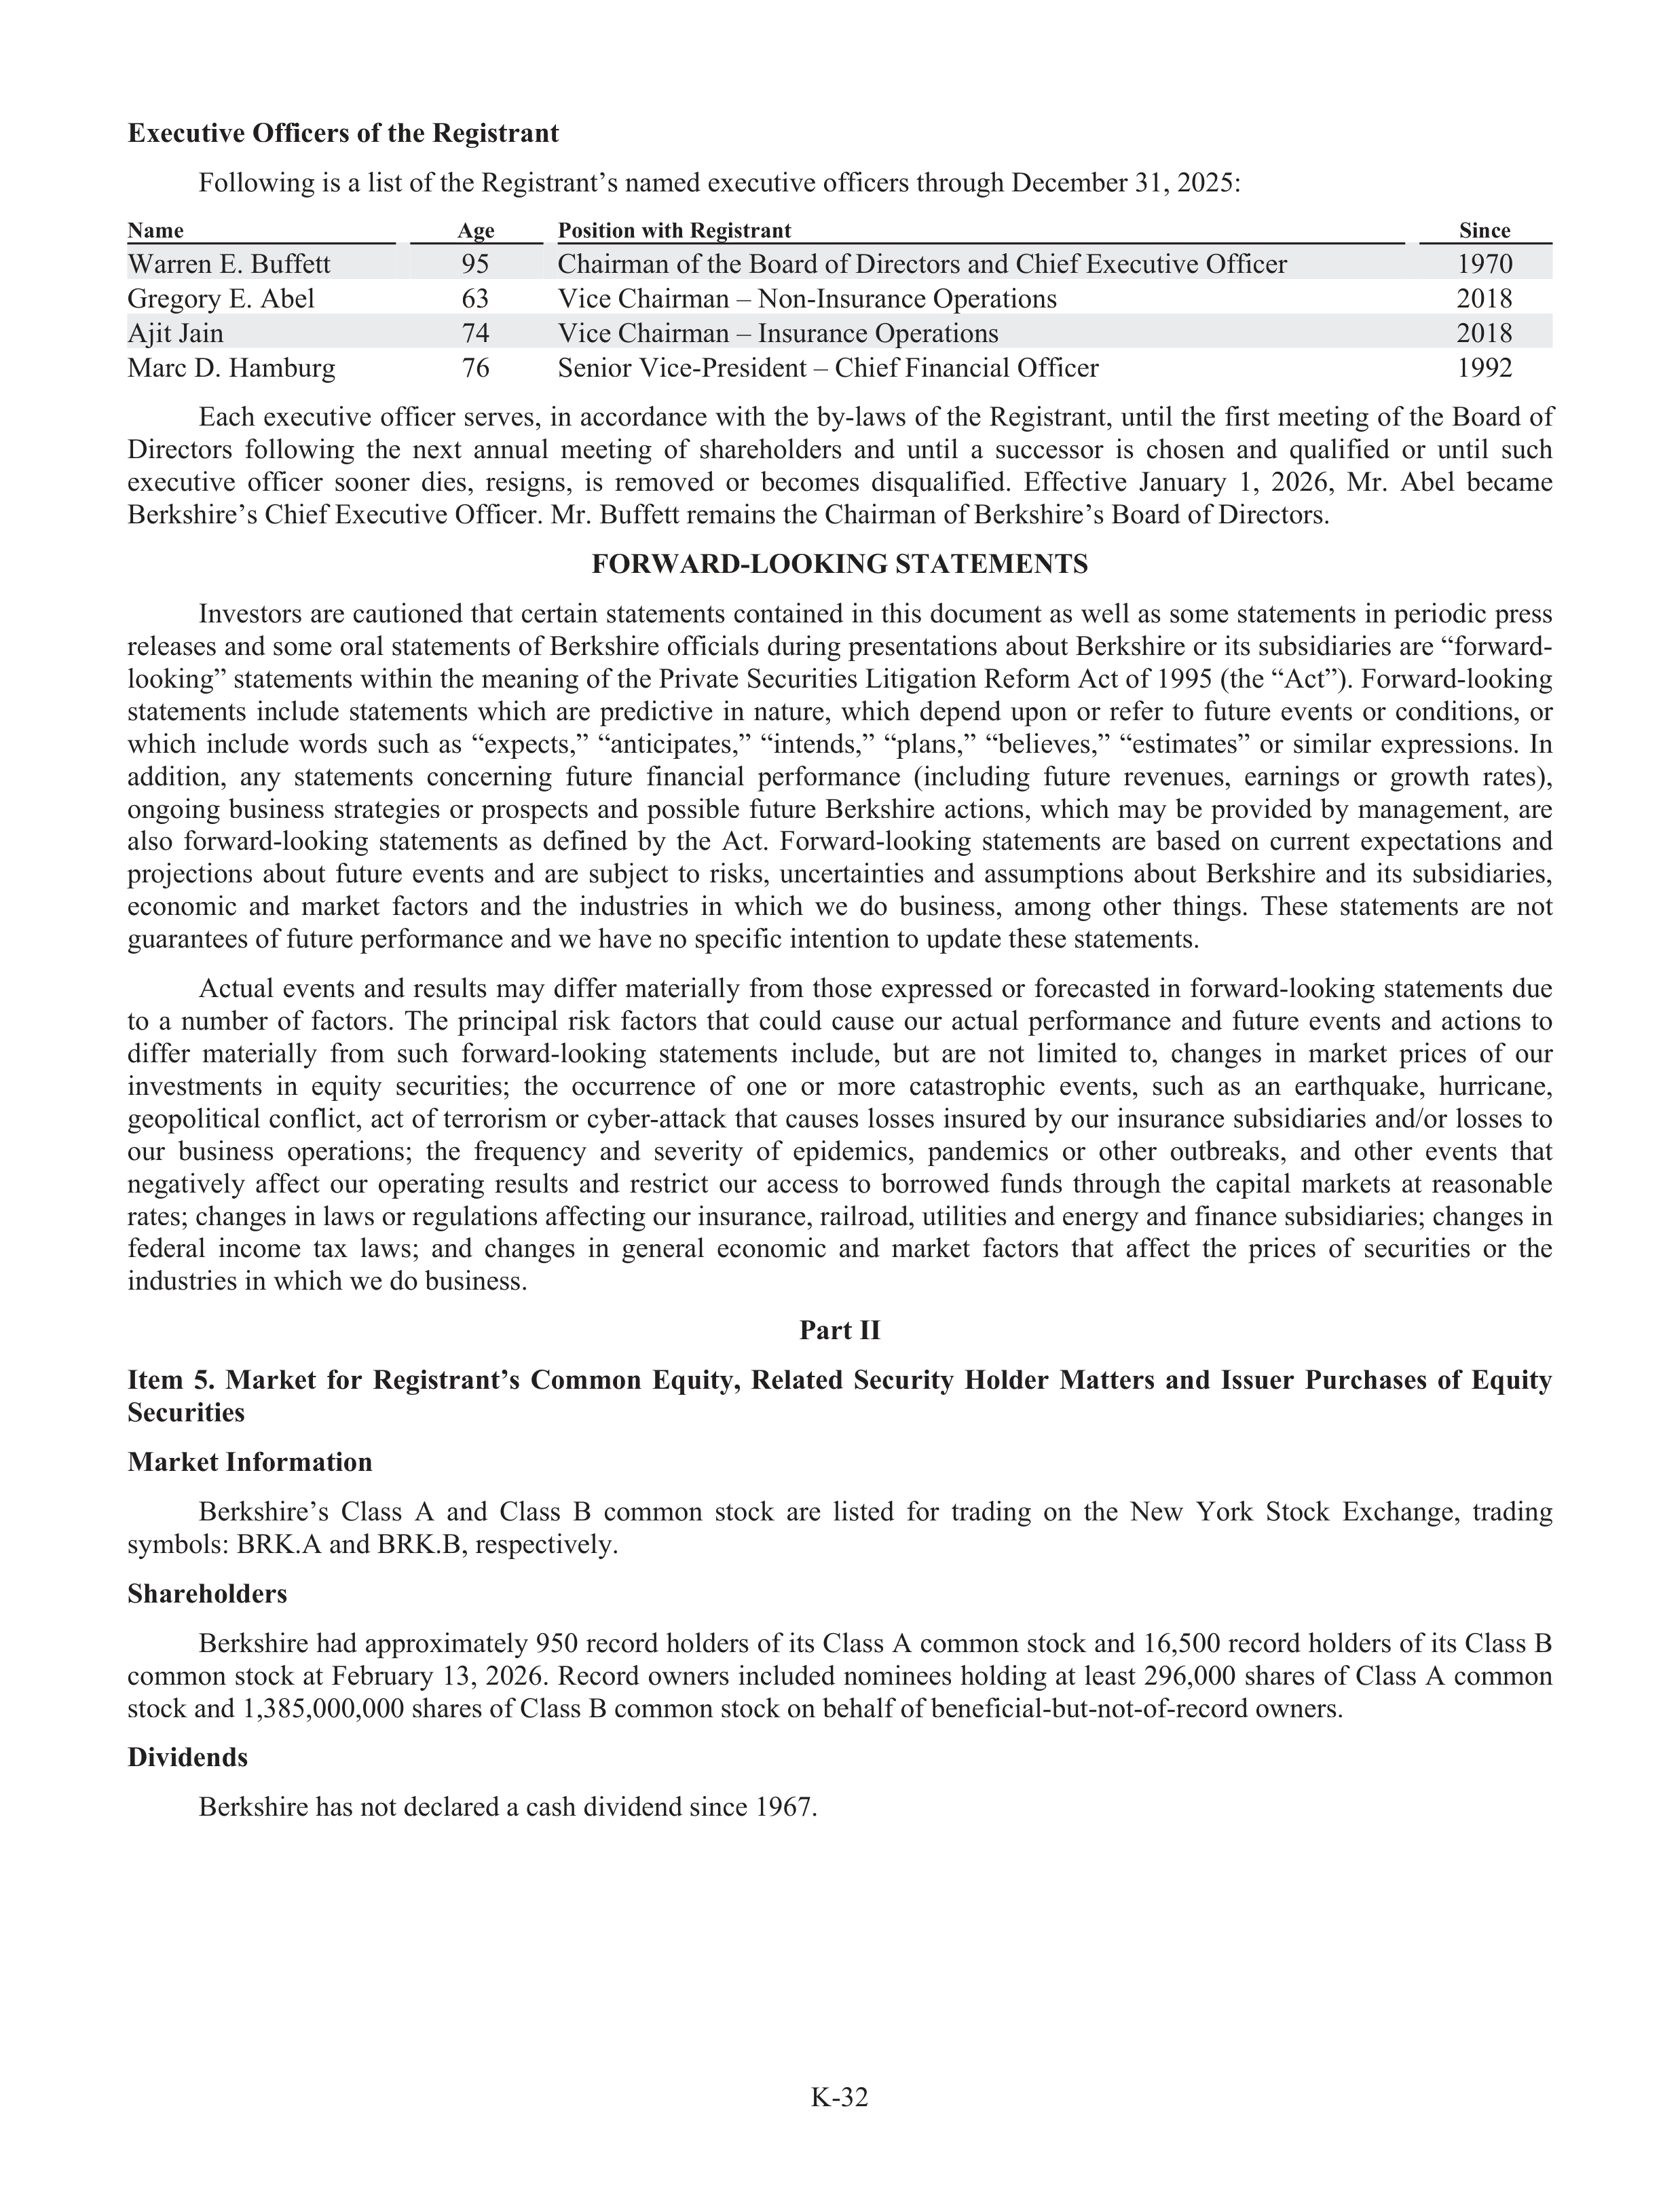
K-32
Executive Offi
f
cers of the Registrant
Following is a list of the Registrant’s named executive offi
f
cers through December 31, 2025:
Name
Age
Position with Registrant
Since
Warren E. Buffett
95
Chairman of the Board of Directors and Chief Executive Offi
f
cer
1970
Gregory
r
E. Abel
63
Vice Chairman – Non-Insurance Operations
2018
Ajit Jain
74
Vice Chairman – Insurance Operations
2018
Marc D. Hamburg
76
Senior Vice-President – Chief Financial Offi
f
cer
1992
Each executive offi
f
cer serves, in accordance with the by-laws of the Registrant, until the first meeting of the Board of
Directors
following
the
next
annual
meeting
of
shareholders
and
until
a
successor
is
chosen
and
qualifie
f
d
or
until
such
executive
offi
f
cer
sooner
dies,
resigns,
is
removed
or
becomes
disqualifie
f
d.
Effe
f
ctive
January
1,
2026,
Mr.
Abel
became
Berkshire’s Chief Executive Offi
f
cer. Mr. Buffett remains the Chairman of Berkshire’s Board of Directors.
FORWARD-LOOKING STATEMENTS
Investors are cautioned that certain statements contained in this document as well as some statements in periodic press
releases and some oral statements of Berkshire offi
f
cials during presentations about Berkshire or its subs
u
idiaries are “forward-
looking” statements within the meaning of the Private Securities Litigation Reform Act of 1995 (the “Act”). Forward-looking
statements
include
statements
which
are
predictive
in
nature,
which
depend
upon
or
refer
to
future
events
or
conditions,
or
which
include
words
such
as
“expects,”
“anticipates,”
“intends,”
“plans,”
“believes,”
“estimates”
or
similar
expressions.
In
addition,
any
statements
concerning
future
financial
perfor
f
mance
(including
future
revenues,
earnings
or
growth
rates),
ongoing
business
strategies
or
prospects
and
possible
future
Berkshire
actions,
which
may
be
provided
by
management,
are
also
forward-looking
statements
as
defined
by
the
Act.
Forward-looking
statements
are
based
on
current
expectations
and
projections
about
future
events
and
are
subj
u
ect
to
risks,
uncertainties
and
assumptions
about
Berkshire
and
its
subs
u
idiaries,
economic
and
market
factors
and
the
industries
in
which
we
do
business,
among
other
things.
These
statements
are
not
guarantees of future performance and we have no specific intention to update these statements.
Actual
events
and
results
may
differ
materially
from
those
expressed
or
forecasted
in
forward-looking
statements
due
to
a
number
of
factors.
The
principal
risk
factors
that
could
cause
our
actua
t
l
performance
and
future
events
and
actions
to
differ
materially
from
such
forward-looking
statements
include,
but
are
not
limited
to,
changes
in
market
prices
of
our
investments
in
equity
securities;
the
occurrence
of
one
or
more
catastrophic
events,
such
as
an
earthquake,
hurricane,
geopolitical conflic
f
t, act of terrorism or cyber-attack that causes losses insured by our insurance subs
u
idiaries and/or losses to
our
business
operations;
the
frequency
and
severity
of
epidemics,
pandemics
or
other
outbr
t
eaks,
and
other
events
that
negatively
affe
f
ct
our
operating
results
and
restrict
our
access
to
borrowed
funds
through
the
capital
markets
at
reasonabl
a
e
rates; changes in laws or regulations affe
f
cting our insurance, railroad, utilities and energy and finance subs
u
idiaries; changes in
federal
income
tax
laws;
and
changes
in
general
economic
and
market
factors
that
affe
f
ct
the
prices
of
securities
or
the
industries in which we do business.
Part II
Item
5.
Market
for
Registrant’s
Common
Equity,
Related
Security
Holder
Matters
and
Issuer
Purchases
of
Equity
Securities
Market Information
Berkshire’s
Class
A
and
Class
B
common
stock
are
listed
for
trading
on
the
New
York
Stock
Exchange,
trading
symbols: BRK.A and BRK.B, respectively.
Shareholders
Berkshire had approximately 950 record holders of its Class A common stock and 16,500 record holders of its Class B
common stock at Februa
r
ry 13, 2026. Record owners included nominees holding at least 296,000 shares of Class A common
stock and 1,385,000,000 shares of Class B common stock on behalf of beneficial-but-not-of-record owners.
Dividends
Berkshire has not declared a cash dividend since 1967.
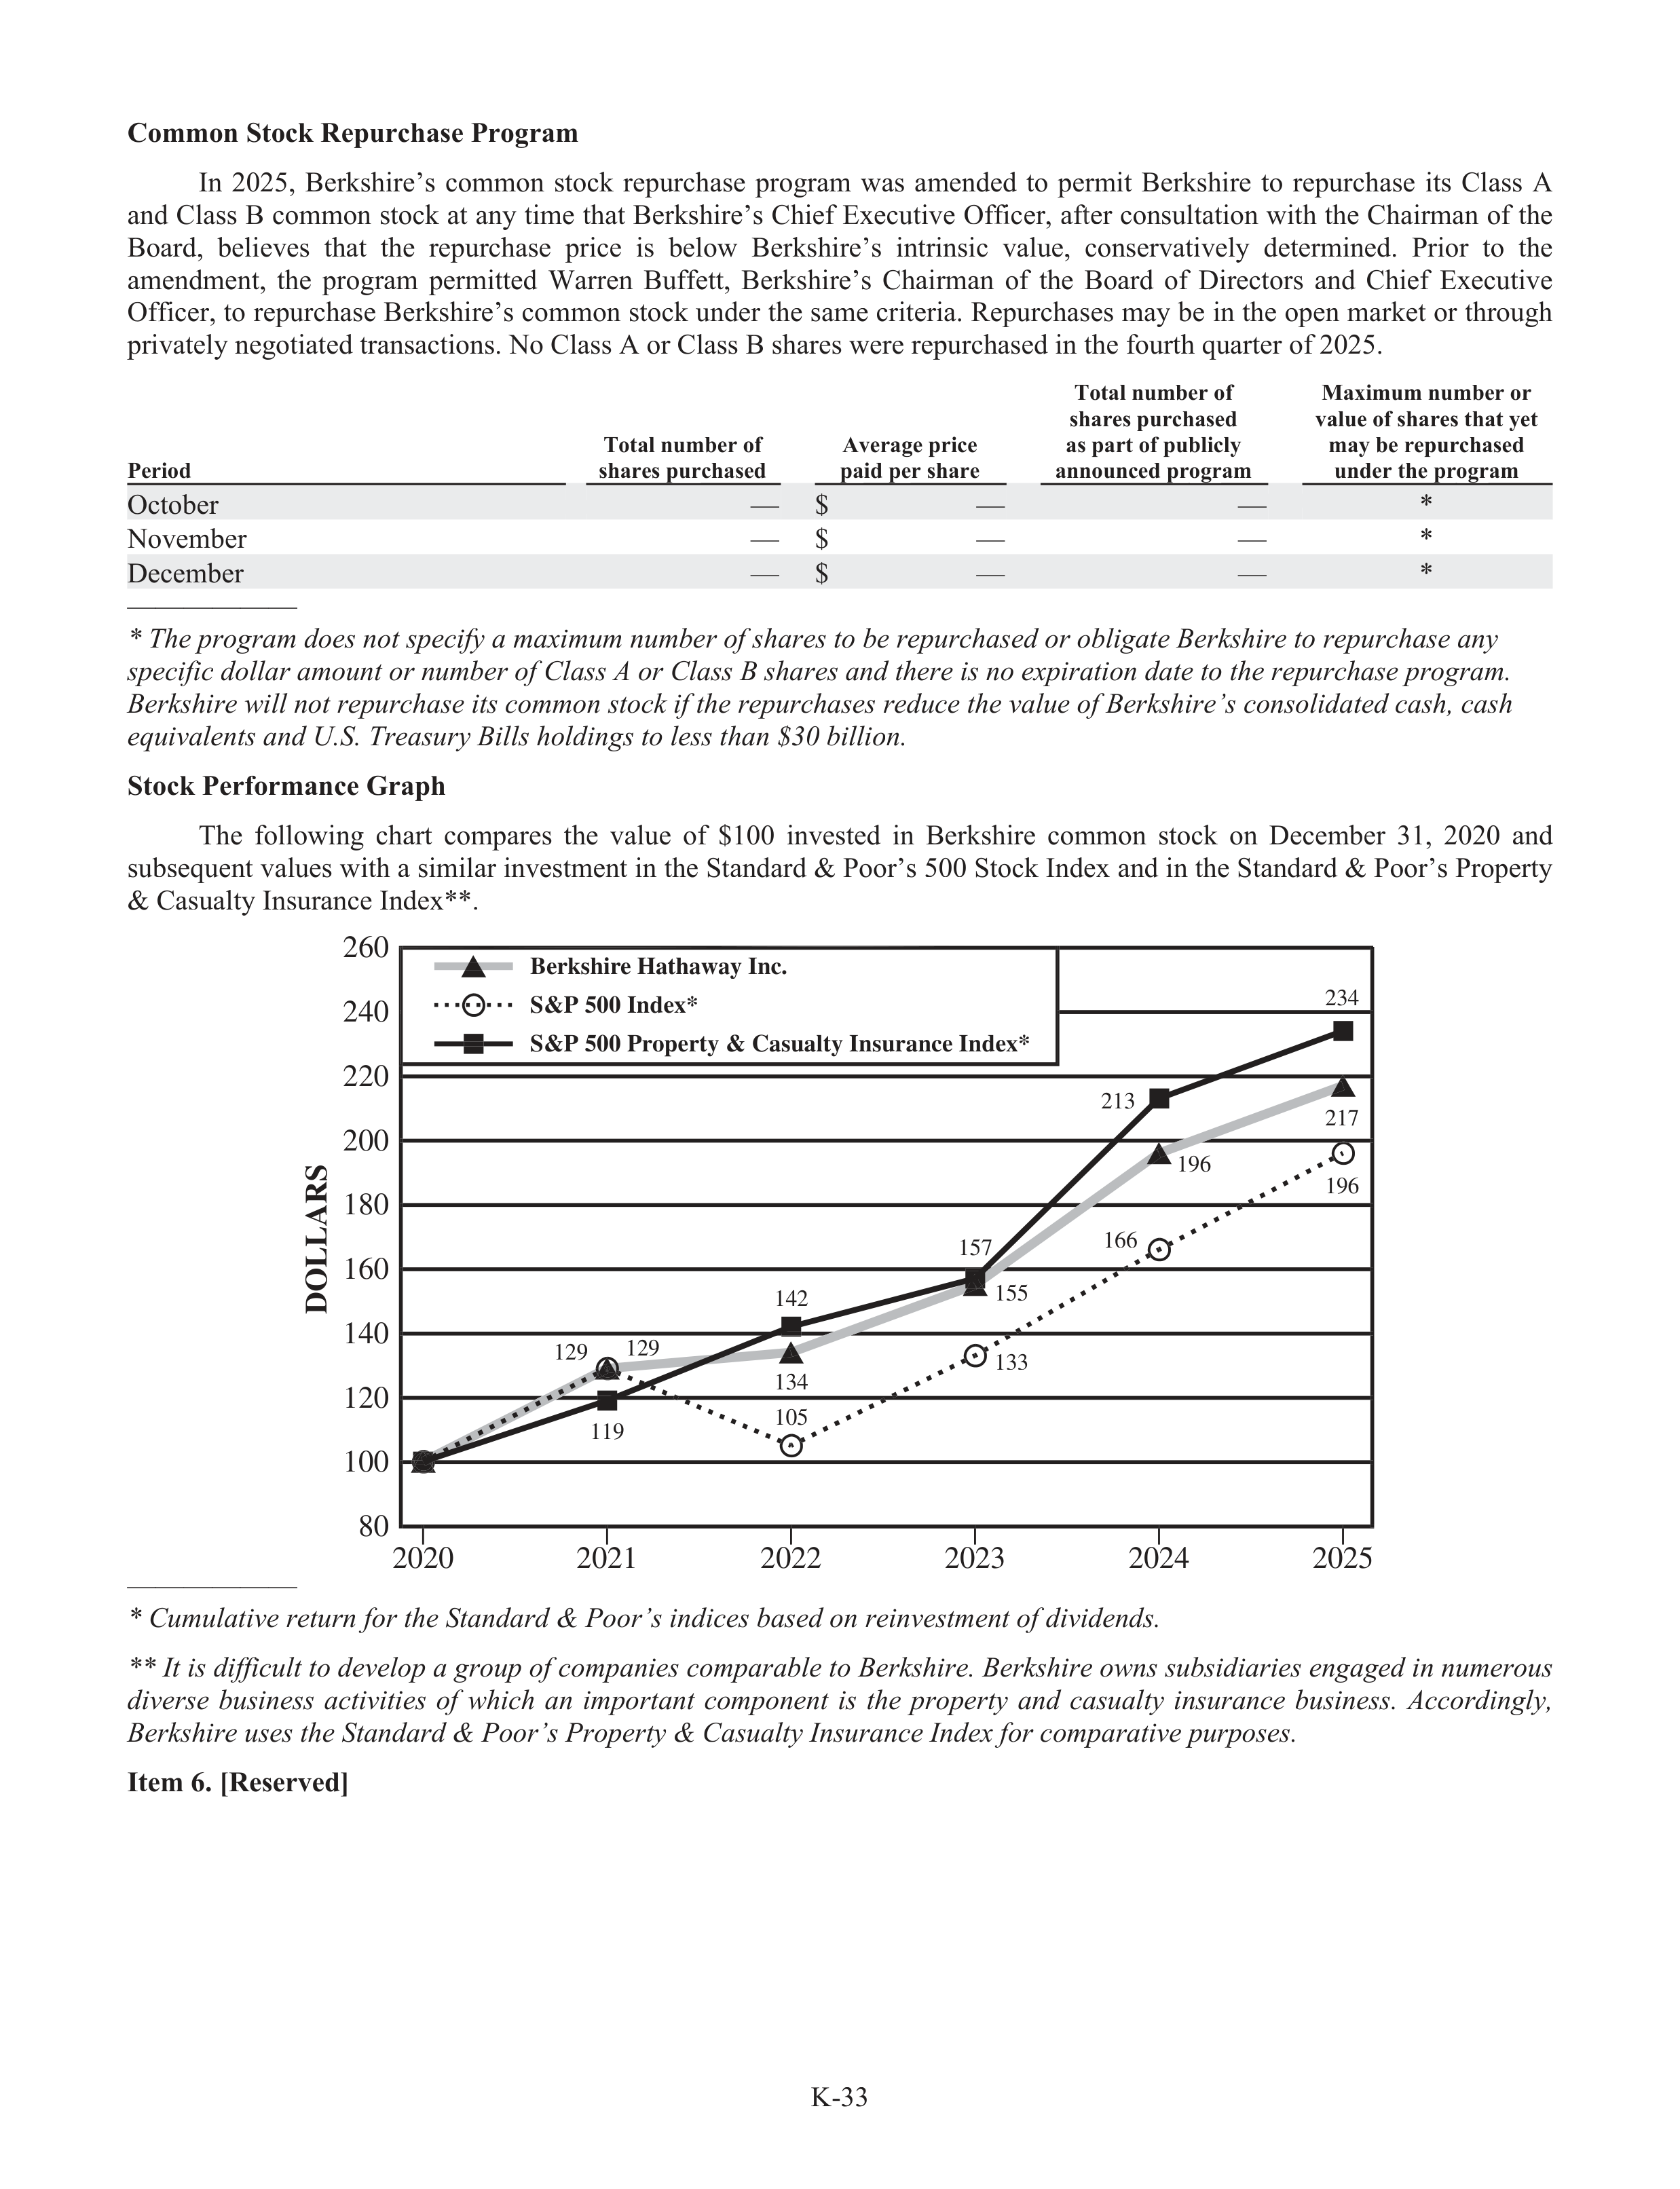
K-33
Common Stock Repurchase Program
In
2025,
Berkshire’s
common
stock
repurchase
program
was
amended
to
permit
Berkshire
to
repurchase
its
Class
A
and Class B common stock at any time that Berkshire’s Chief Executive Offi
f
cer, afte
f
r consultation with the Chairman of the
Board,
believes
that
the
repurchase
price
is
below
Berkshire’s
intrinsic
value,
conservatively
determined.
Prior
to
the
amendment,
the
program
permitted
Warren
Buffett,
Berkshire’s
Chairman
of
the
Board
of
Directors
and
Chief
Executive
Offi
f
cer, to repurchase Berkshire’s common stock under the same criteria. Repurchases may be in the open market or through
privately negotiated transactions. No Class A or Class B shares were repurchased in the fourth quarter of 2025.
Period
Total number of
shares purchased
Average price
paid per share
Total number of
shares purchased
as part of publicly
announced program
Maximum number or
value of shares that yet
may be repurchased
under the program
October
—
$
—
—
*
November
—
$
—
—
*
December
—
$
—
—
*
——————
* The program does not specify
i
a maxi
a
mum number of shares to be repur
e
chased or obligate Berksh
k
ire to repur
e
chase any
specific
i
dollar amount or number of Class A or Class B shares and there is no expiration date to the repur
e
chase program.
Berksh
k
ire will not repur
e
chase its common stock if the repur
e
chases reduce the value of Berksh
k
ire’s consolidat
d
ed cash, cash
equivalentst
and U.S. Treasury Bills holdings to less than $30 billion.
Stock Perfor
f
mance Graph
The
following
chart
compares
the
value
of
$100
invested
in
Berkshire
common
stock
on
December
31,
2020
and
subs
u
equent values with a similar investment in the Standard & Poor’s 500 Stock Index and in the Standard & Poor’s Property
& Casualty Insurance Index**.
——————
* Cumulative return for the Standard & Poor’s indices based on reinvestment of dividends.
** It is diffic
i
ult to develop a group of companies comparable to Berksh
k
ire. Berksh
k
ire owns subsidiaries engaged in numerous
diverse
r
business
activities
of
which
an
impor
m
tant
component
is
the
propertyt
and
casualty
insurance
business.
Accordingly,
l
Berksh
k
ire uses the Standard & Poor’s Propertyt
& Casualty Insurance Index
e
for comparative purpos
r
es.
Item 6. [Reserved]
119
105
133
166
196
129
142
157
196
217
129
134
155
213
234
80
DOLLARS
100
140
120
180
160
220
200
240
2020
2021
2022
2023
2024
S&P 500 Property & Casualty Insurance Index*
S&P 500 Index*
Berkshire Hathaway Inc.
2025
260
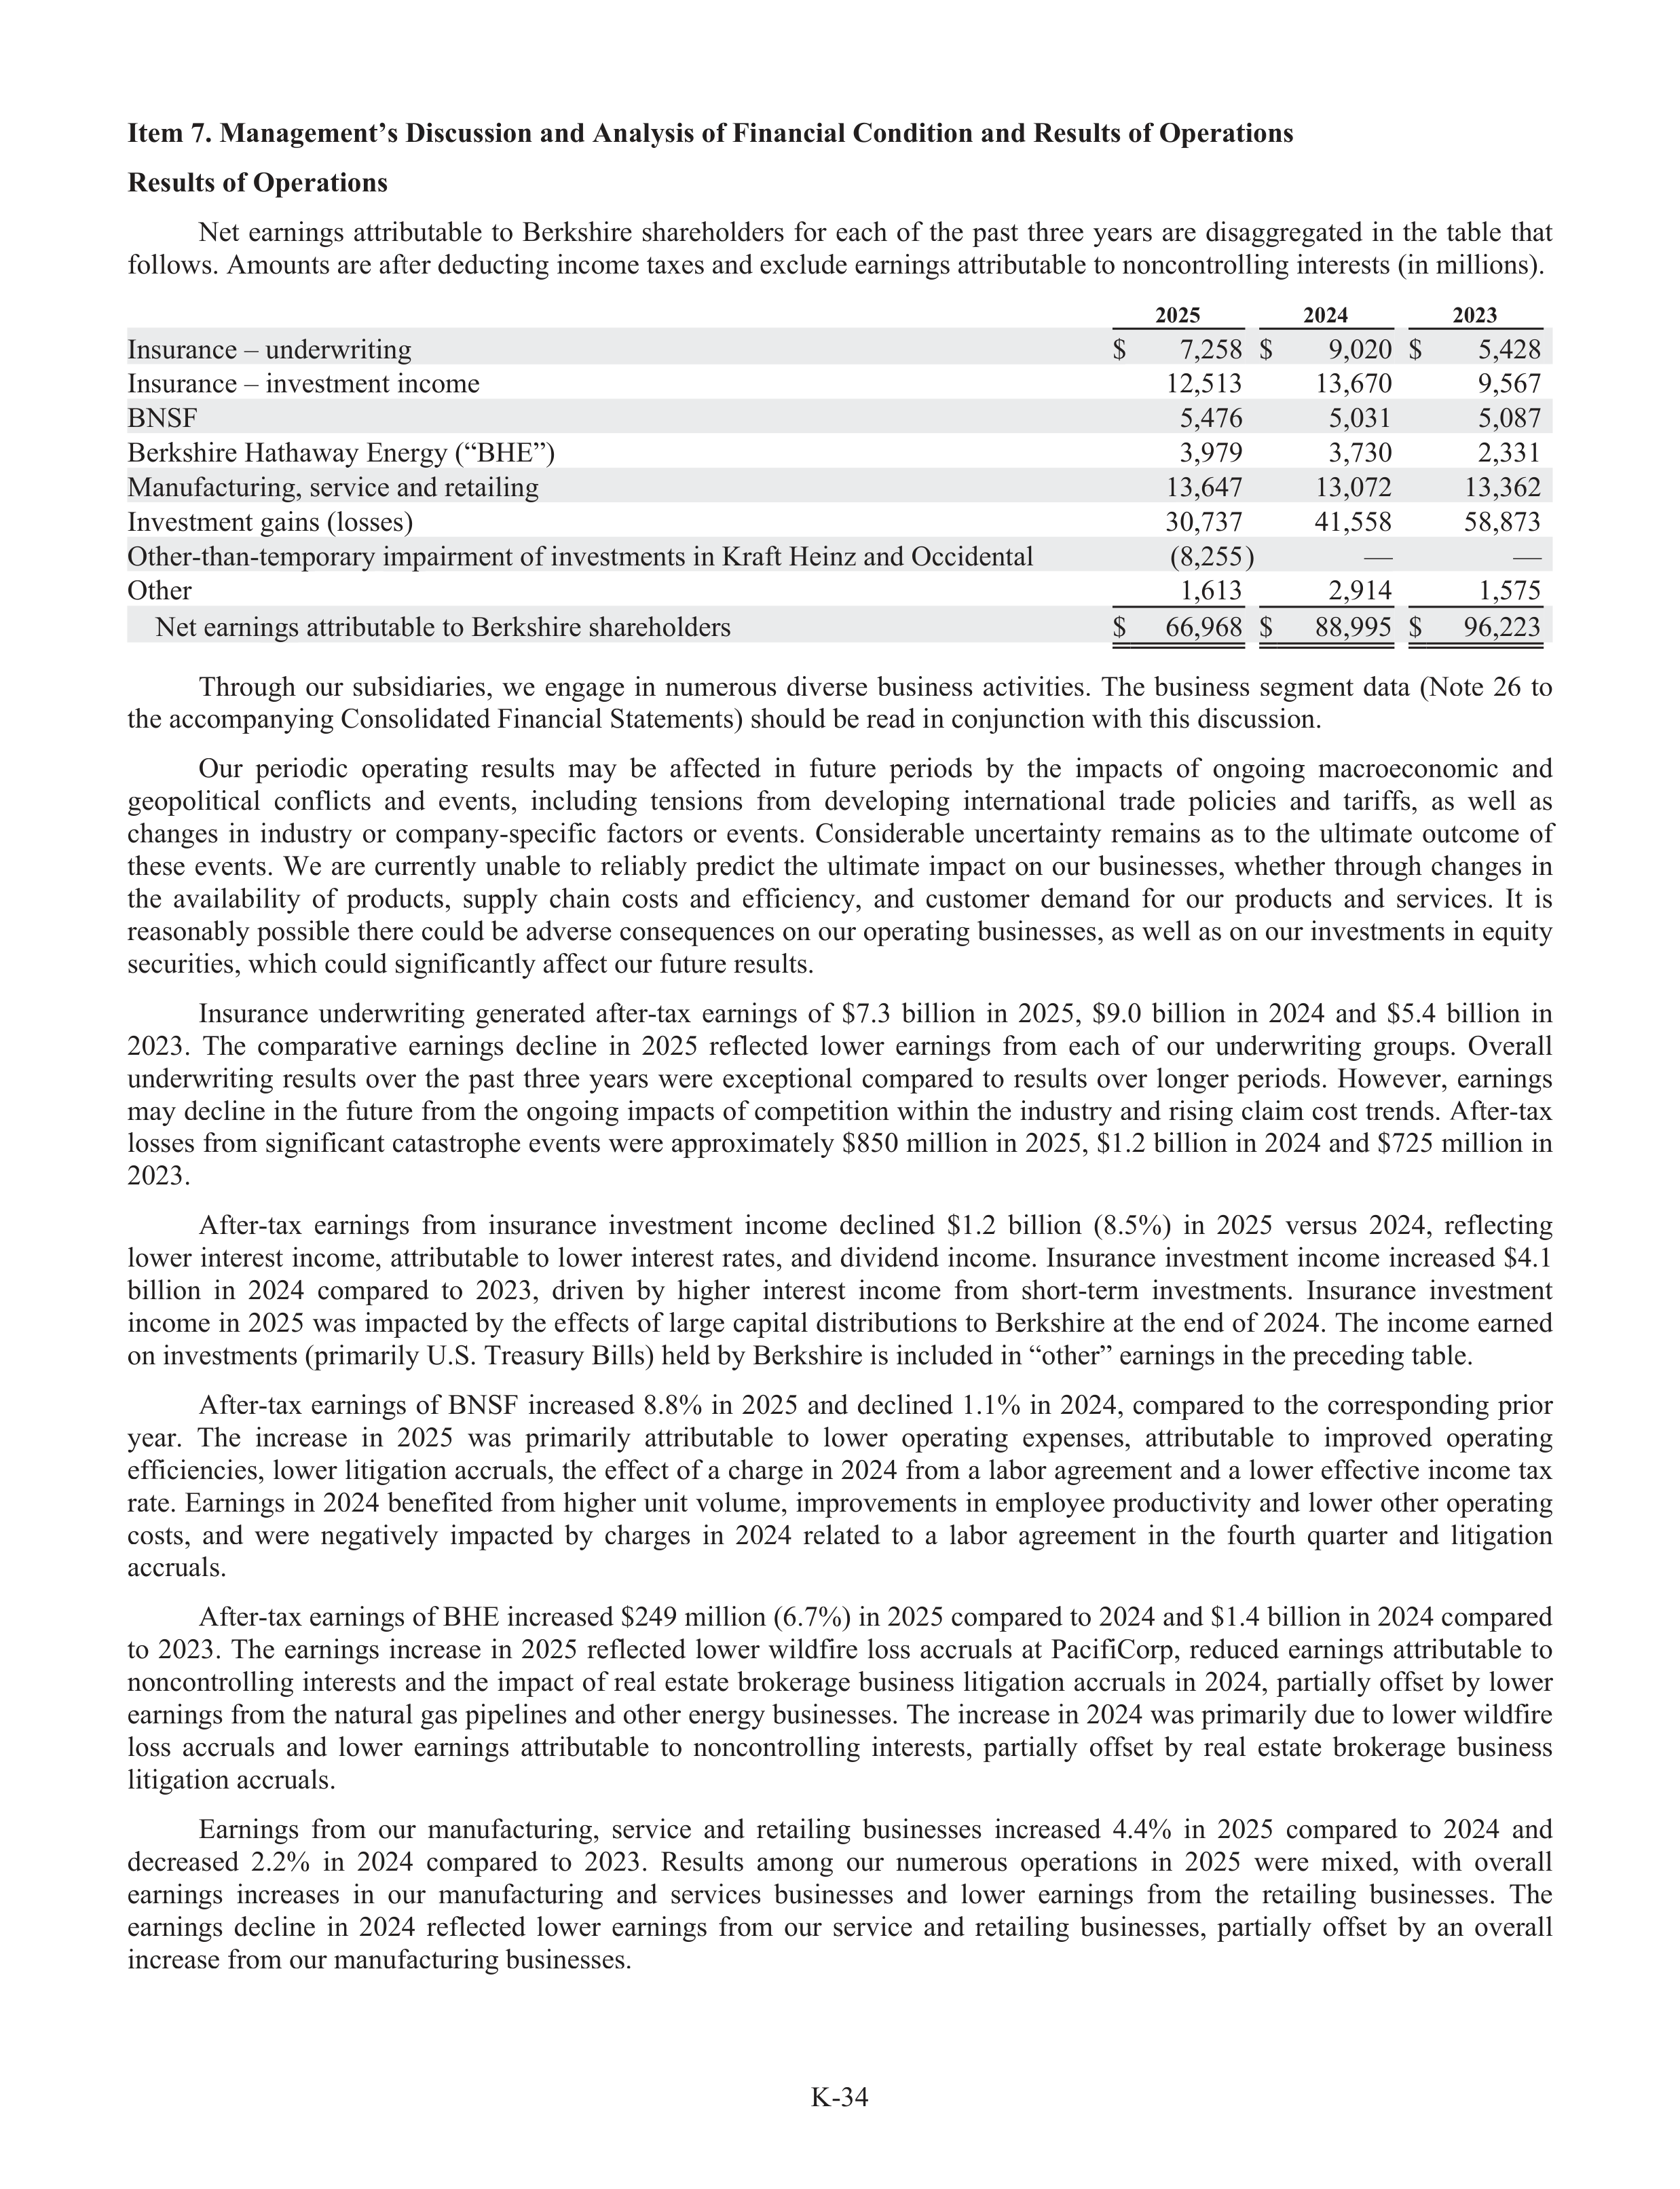
K-34
Item 7. Management’s Discussion and Analysis of Financial Condition and Results of Operations
Results of Operations
Net
earnings
attributable
to
Berkshire
shareholders
for
each
of
the
past
three
years
are
disaggregated
in
the
tabl
a
e
that
follows. Amounts are afte
f
r deducting income taxes and exclude earnings attributable to noncontrolling interests (in millions).
2025
2024
2023
Insurance – underwriting
$
7,258
$
9,020
$
5,428
Insurance – investment income
12,513
13,670
9,567
BNSF
5,476
5,031
5,087
Berkshire Hathaway Energy (“BHE”)
3,979
3,730
2,331
Manufact
f
ur
t
ing, service and retailing
13,647
13,072
13,362
Investment gains (losses)
30,737
41,558
58,873
Other-than-temporary
r
impairment of investments in Kraftf
Heinz and Occidental
(8,255)
—
—
Other
1,613
2,914
1,575
Net earnings attributable to Berkshire shareholders
$
66,968
$
88,995
$
96,223
Through
our
subs
u
idiaries,
we
engage
in
numerous
diverse
business
activities.
The
business
segment
data
(Note
26
to
the accompanying Consolidated Financial Statements) should be read in conjunction with this discussion.
Our
periodic
operating
results
may
be
affe
f
cted
in
future
periods
by
the
impacts
of
ongoing
macroeconomic
and
geopolitical
conflic
f
ts
and
events,
including
tensions
from
developing
international
trade
policies
and
tariffs,
as
well
as
changes
in
industry
r
or
company-specific
factors
or
events.
Considerable
uncertainty
remains
as
to
the
ultimate
outcome
of
these
events.
We
are
currently
unabl
a
e
to
reliabl
a
y
predict
the
ultimate
impact
on
our
businesses,
whether
through
changes
in
the
availabi
a
lity
of
products,
suppl
u
y
chain
costs
and
effi
f
ciency,
and
customer
demand
for
our
products
and
services.
It
is
reasonabl
a
y possible there could be adverse consequences on our operating businesses, as well as on our investments in equity
securities, which could significantly affe
f
ct our future results.
Insurance
underwriting
generated
afte
f
r-tax
earnings
of
$7.3
billion
in
2025,
$9.0
billion
in
2024
and
$5.4
billion
in
2023.
The
comparative
earnings
decline
in
2025
reflected
lower
earnings
from
each
of
our
underwriting
groups.
Overall
underwriting
results
over
the
past
three
years
were
exceptional
compared
to
results
over
longer
periods.
However,
earnings
may decline in the future from the ongoing impacts of competition within the industry
r
and rising claim cost trends. Afte
f
r-tax
losses from significant catastrophe events were approximately $850 million in 2025, $1.2 billion in 2024 and $725 million in
2023.
Afte
f
r-tax
earnings
from
insurance
investment
income
declined
$1.2
billion
(8.5%)
in
2025
versus
2024,
reflecting
lower interest income, attributable to lower interest rates, and dividend income. Insurance investment income increased $4.1
billion
in
2024
compared
to
2023,
driven
by
higher
interest
income
from
short-term
investments.
Insurance
investment
income in 2025 was impacted by the effe
f
cts of large capital distributions to Berkshire at the end of 2024. The income earned
on investments (primarily U.S. Treasury Bills) held by Berkshire is included in “other” earnings in the preceding tabl
a
e.
Afte
f
r-tax
earnings
of
BNSF
increased
8.8%
in
2025
and
declined
1.1%
in
2024,
compared
to
the
corresponding
prior
year.
The
increase
in
2025
was
primarily
attributable
to
lower
operating
expenses,
attributable
to
improved
operating
effi
f
ciencies, lower litigation accrua
r
ls, the effe
f
ct of a charge in 2024 from a labor
a
agreement and a lower effe
f
ctive income tax
rate. Earnings in 2024 benefited from higher unit volume, improvements in employee productivity and lower other operating
costs,
and
were
negatively
impacted
by
charges
in
2024
related
to
a
labor
a
agreement
in
the
fourth
quarter
and
litigation
accrua
r
ls.
Afte
f
r-tax earnings of BHE increased $249 million (6.7%) in 2025 compared to 2024 and $1.4 billion in 2024 compared
to
2023.
The
earnings
increase
in
2025
reflected
lower
wildfire
loss
accrua
r
ls
at
PacifiCorp,
reduced
earnings
attributable
to
noncontrolling interests and the impact of real estate brokerage business litigation accrua
r
ls in 2024, partially offs
f
et by lower
earnings from the natural gas pipelines and other energy businesses. The increase in 2024 was primarily due to lower wildfire
loss
accrua
r
ls
and
lower
earnings
attributable
to
noncontrolling
interests,
partially
offs
f
et
by
real
estate
brokerage
business
litigation accrua
r
ls.
Earnings
from
our
manufact
f
ur
t
ing,
service
and
retailing
businesses
increased
4.4%
in
2025
compared
to
2024
and
decreased
2.2%
in
2024
compared
to
2023.
Results
among
our
numerous
operations
in
2025
were
mixed,
with
overall
earnings
increases
in
our
manufact
f
ur
t
ing
and
services
businesses
and
lower
earnings
from
the
retailing
businesses.
The
earnings
decline
in
2024
reflected
lower
earnings
from
our
service
and
retailing
businesses,
partially
offs
f
et
by
an
overall
increase from our manufact
f
ur
t
ing businesses.
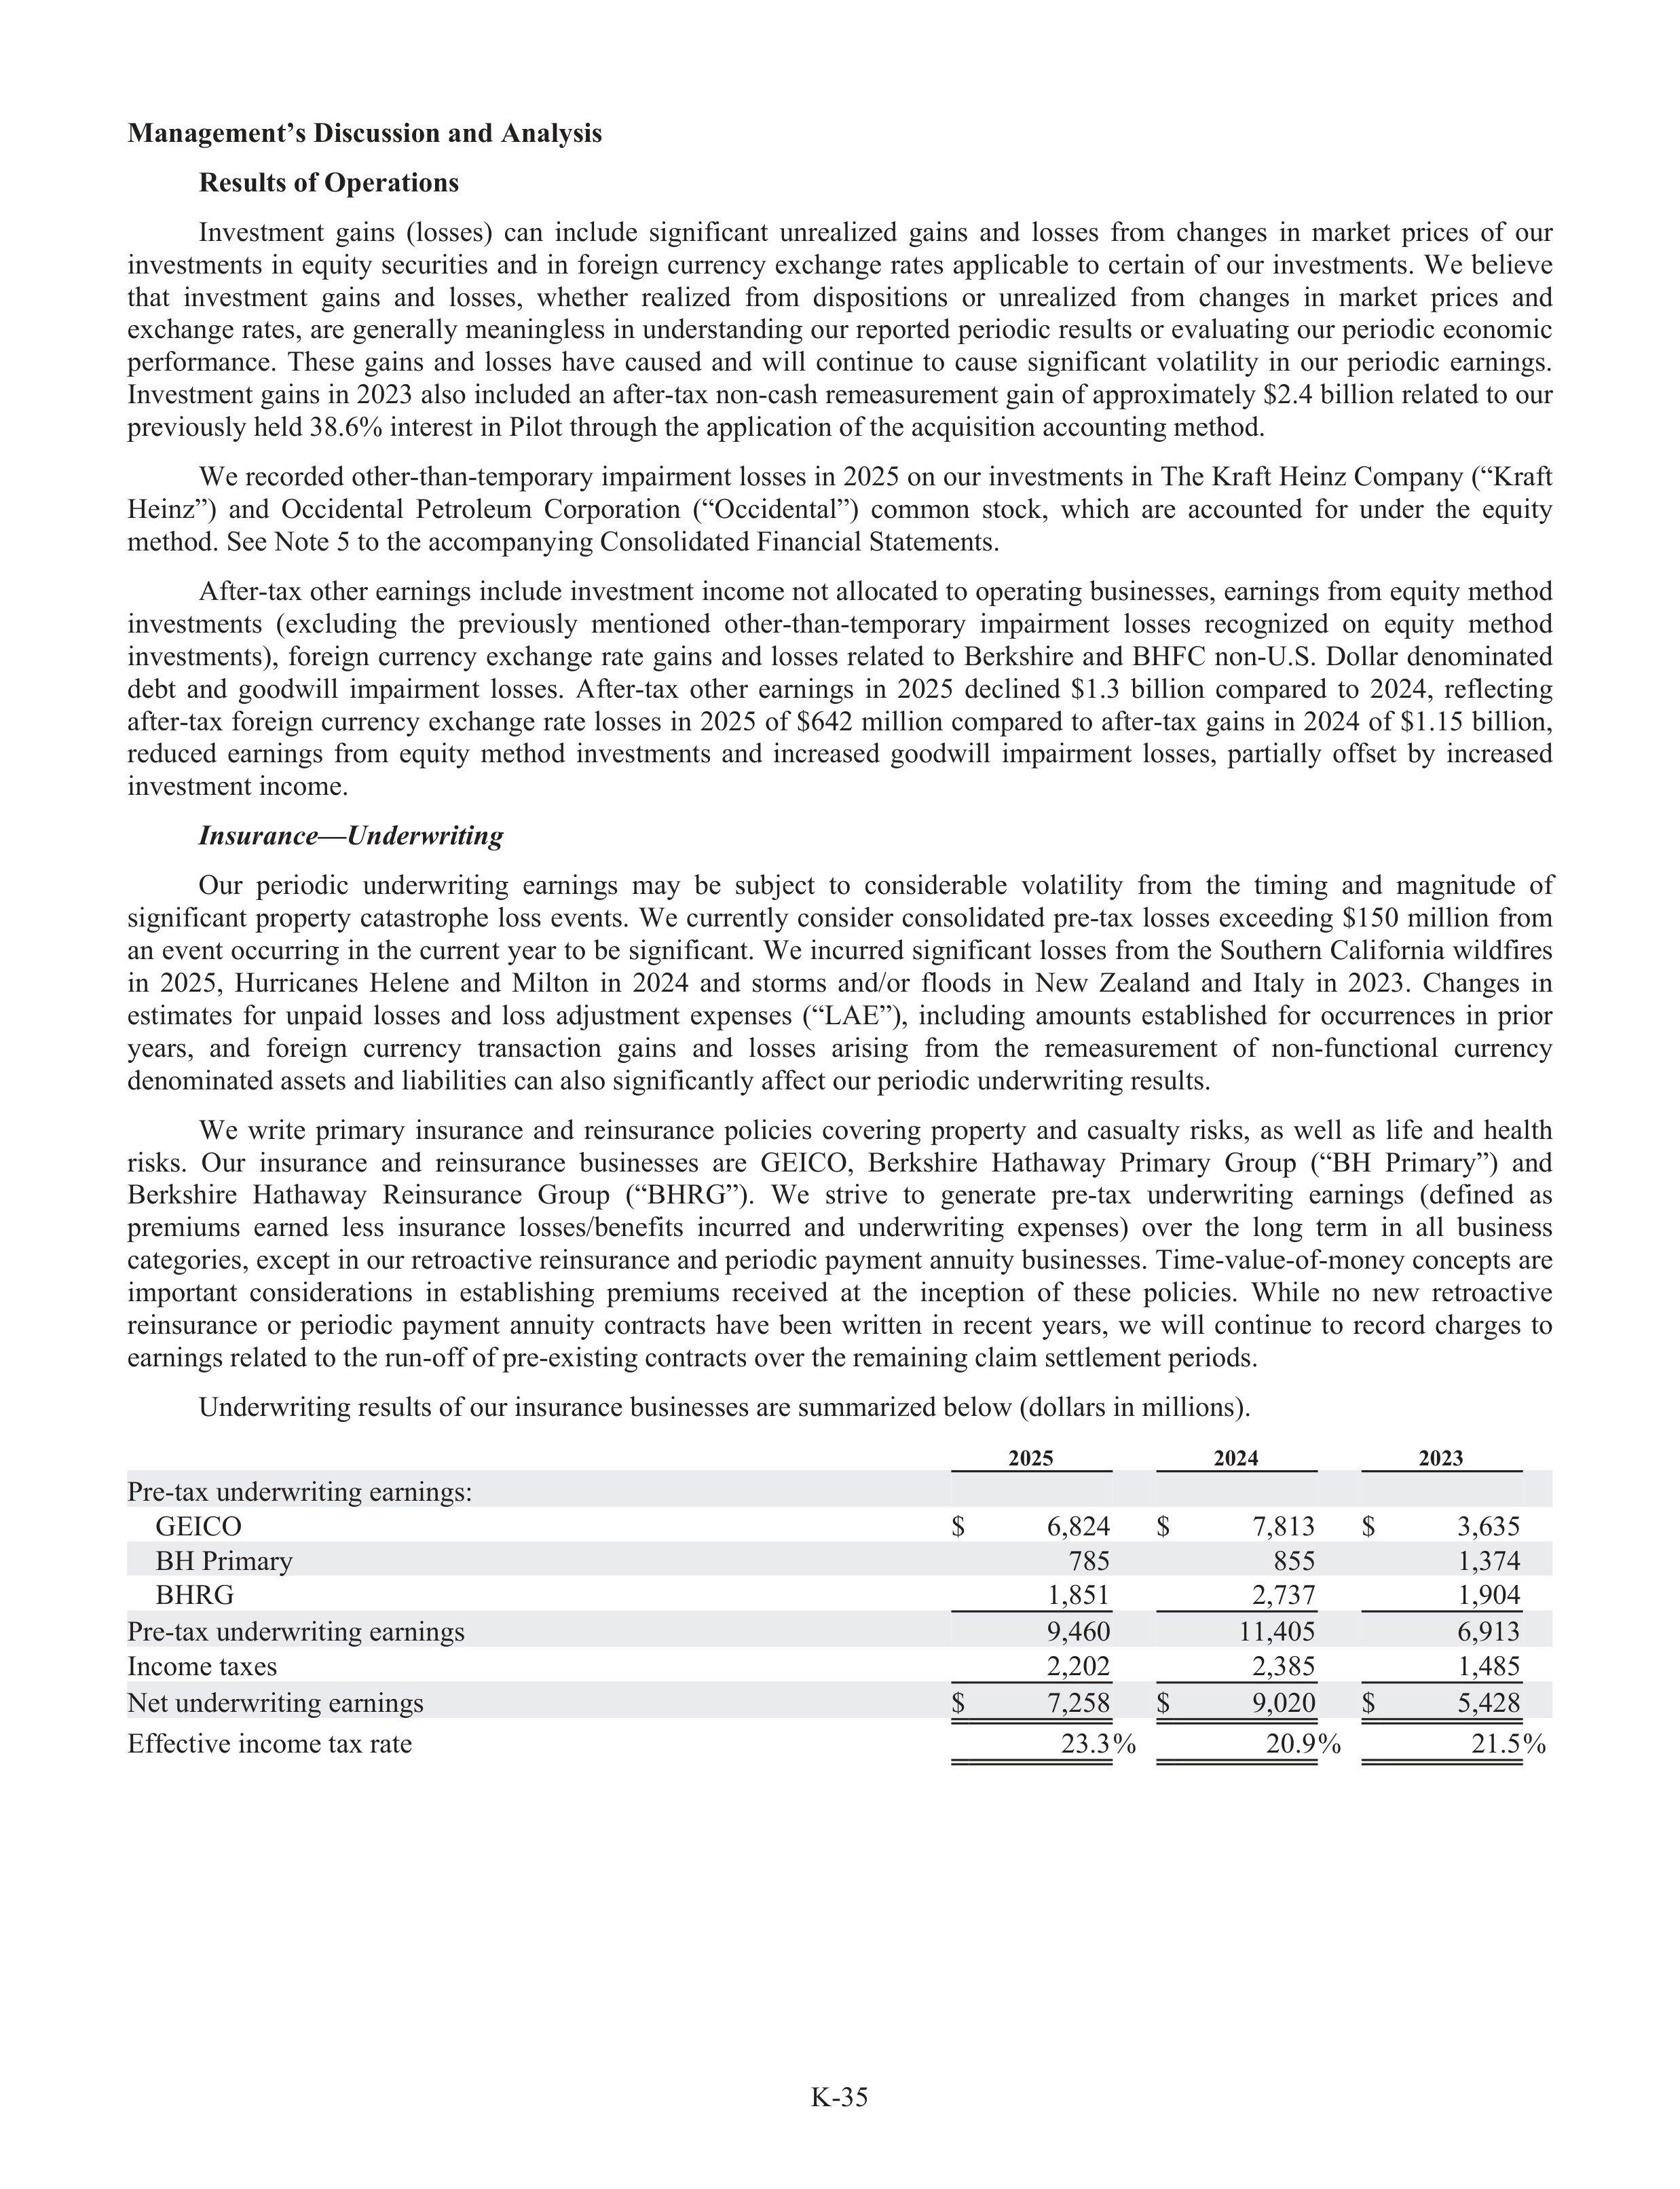
K-35
Management’s Discussion and Analysis
Results of Operations
Investment
gains
(losses)
can
include
significant
unrealized
gains
and
losses
from
changes
in
market
prices
of
our
investments
in
equity
securities
and
in
foreign
currency
exchange
rates
applicable
to
certain
of
our
investments.
We
believe
that
investment
gains
and
losses,
whether
realized
from
dispositions
or
unrealized
from
changes
in
market
prices
and
exchange rates, are generally meaningless in understanding our reported periodic results or evaluating our periodic economic
performance.
These
gains
and
losses
have
caused
and
will
continue
to
cause
significant
volatility
in
our
periodic
earnings.
Investment gains in 2023 also included an after-tax non-cash remeasurement gain of approximately $2.4 billion related to our
previously held 38.6% interest in Pilot through the application of the acquisition accounting method.
We recorded other-than-temporary
r
impairment losses in 2025 on our investments in The Kraftf
Heinz Company (“Kra
K
ft
Heinz”)
and
Occidental
Petroleum
Corporation
(“Occidental”)
common
stock,
which
are
accounted
for
under
the
equity
method. See Note 5 to the accompanying Consolidated Financial Statements.
Afte
f
r-tax other earnings include investment income not allocated to operating businesses, earnings from equity method
investments
(excluding
the
previously
mentioned
other-than-temporary
r
impairment
losses
recognized
on
equity
method
investments),
foreign
currency
exchange
rate
gains
and
losses
related
to
Berkshire
and
BHFC
non-U.S.
Dollar
denominated
debt
and
goodwill
impairment
losses.
Afte
f
r-tax
other
earnings
in
2025
declined
$1.3
billion
compared
to
2024,
reflecting
afte
f
r-tax foreign currency exchange rate losses in 2025 of $642 million compared to afte
f
r-tax gains in 2024 of $1.15 billion,
reduced
earnings
from
equity
method
investments
and
increased
goodwill
impairment
losses,
partially
offs
f
et
by
increased
investment income.
Insurance—Underwritin
i
g
Our
periodic
underwriting
earnings
may
be
subj
u
ect
to
considerable
volatility
from
the
timing
and
magnitude
of
significant
property
catastrophe
loss
events.
We
currently
consider
consolidated
pre-tax
losses
exceeding
$150
million
from
an event occurring in the current year to be significant. We incurred significant losses from the Southern Califor
f
nia wildfires
in
2025,
Hurricanes
Helene
and
Milton
in
2024
and
storms
and/or
floods
in
New
Zealand
and
Italy
in
2023.
Changes
in
estimates
for
unpaid
losses
and
loss
adju
d
stment
expenses
(“LAE”),
including
amounts
establ
a
ished
for
occurrences
in
prior
years,
and
foreign
currency
transaction
gains
and
losses
arising
from
the
remeasurement
of
non-functional
currency
denominated assets and liabi
a
lities can also significantly affe
f
ct our periodic underwriting results.
We
write
primary
insurance
and
reinsurance
policies
covering
property
and
casualty
risks,
as
well
as
life
and
health
risks.
Our
insurance
and
reinsurance
businesses
are
GEICO,
Berkshire
Hathaway
Primary
Group
(“BH
Primary”)
and
Berkshire
Hathaway
Reinsurance
Group
(“BHRG”).
We
strive
to
generate
pre-tax
underwriting
earnings
(defin
f
ed
as
premiums
earned
less
insurance
losses/be
/
nefits
incurred
and
underwriting
expenses)
over
the
long
term
in
all
business
categories, except in our retroactive reinsurance and periodic payment annuity businesses. Time-value-of-money concepts are
important
considerations
in
establ
a
ishing
premiums
received
at
the
inception
of
these
policies.
While
no
new
retroactive
reinsurance
or
periodic
payment
annuity
contracts
have
been
written
in
recent
years,
we
will
continue
to
record
charges
to
earnings related to the run-offf
of pre-existing contracts over the remaining claim settlement periods.
Underwriting results of our insurance businesses are summarized below (dollars in millions).
2025
2024
2023
Pre-tax underwriting earnings:
GEICO
$
6,824
$
7,813
$
3,635
BH Primary
785
855
1,374
BHRG
1,851
2,737
1,904
Pre-tax underwriting earnings
9,460
11,405
6,913
Income taxes
2,202
2,385
1,485
Net underwriting earnings
$
7,258
$
9,020
$
5,428
Effe
f
ctive income tax rate
23.3%
20.9%
21.5%
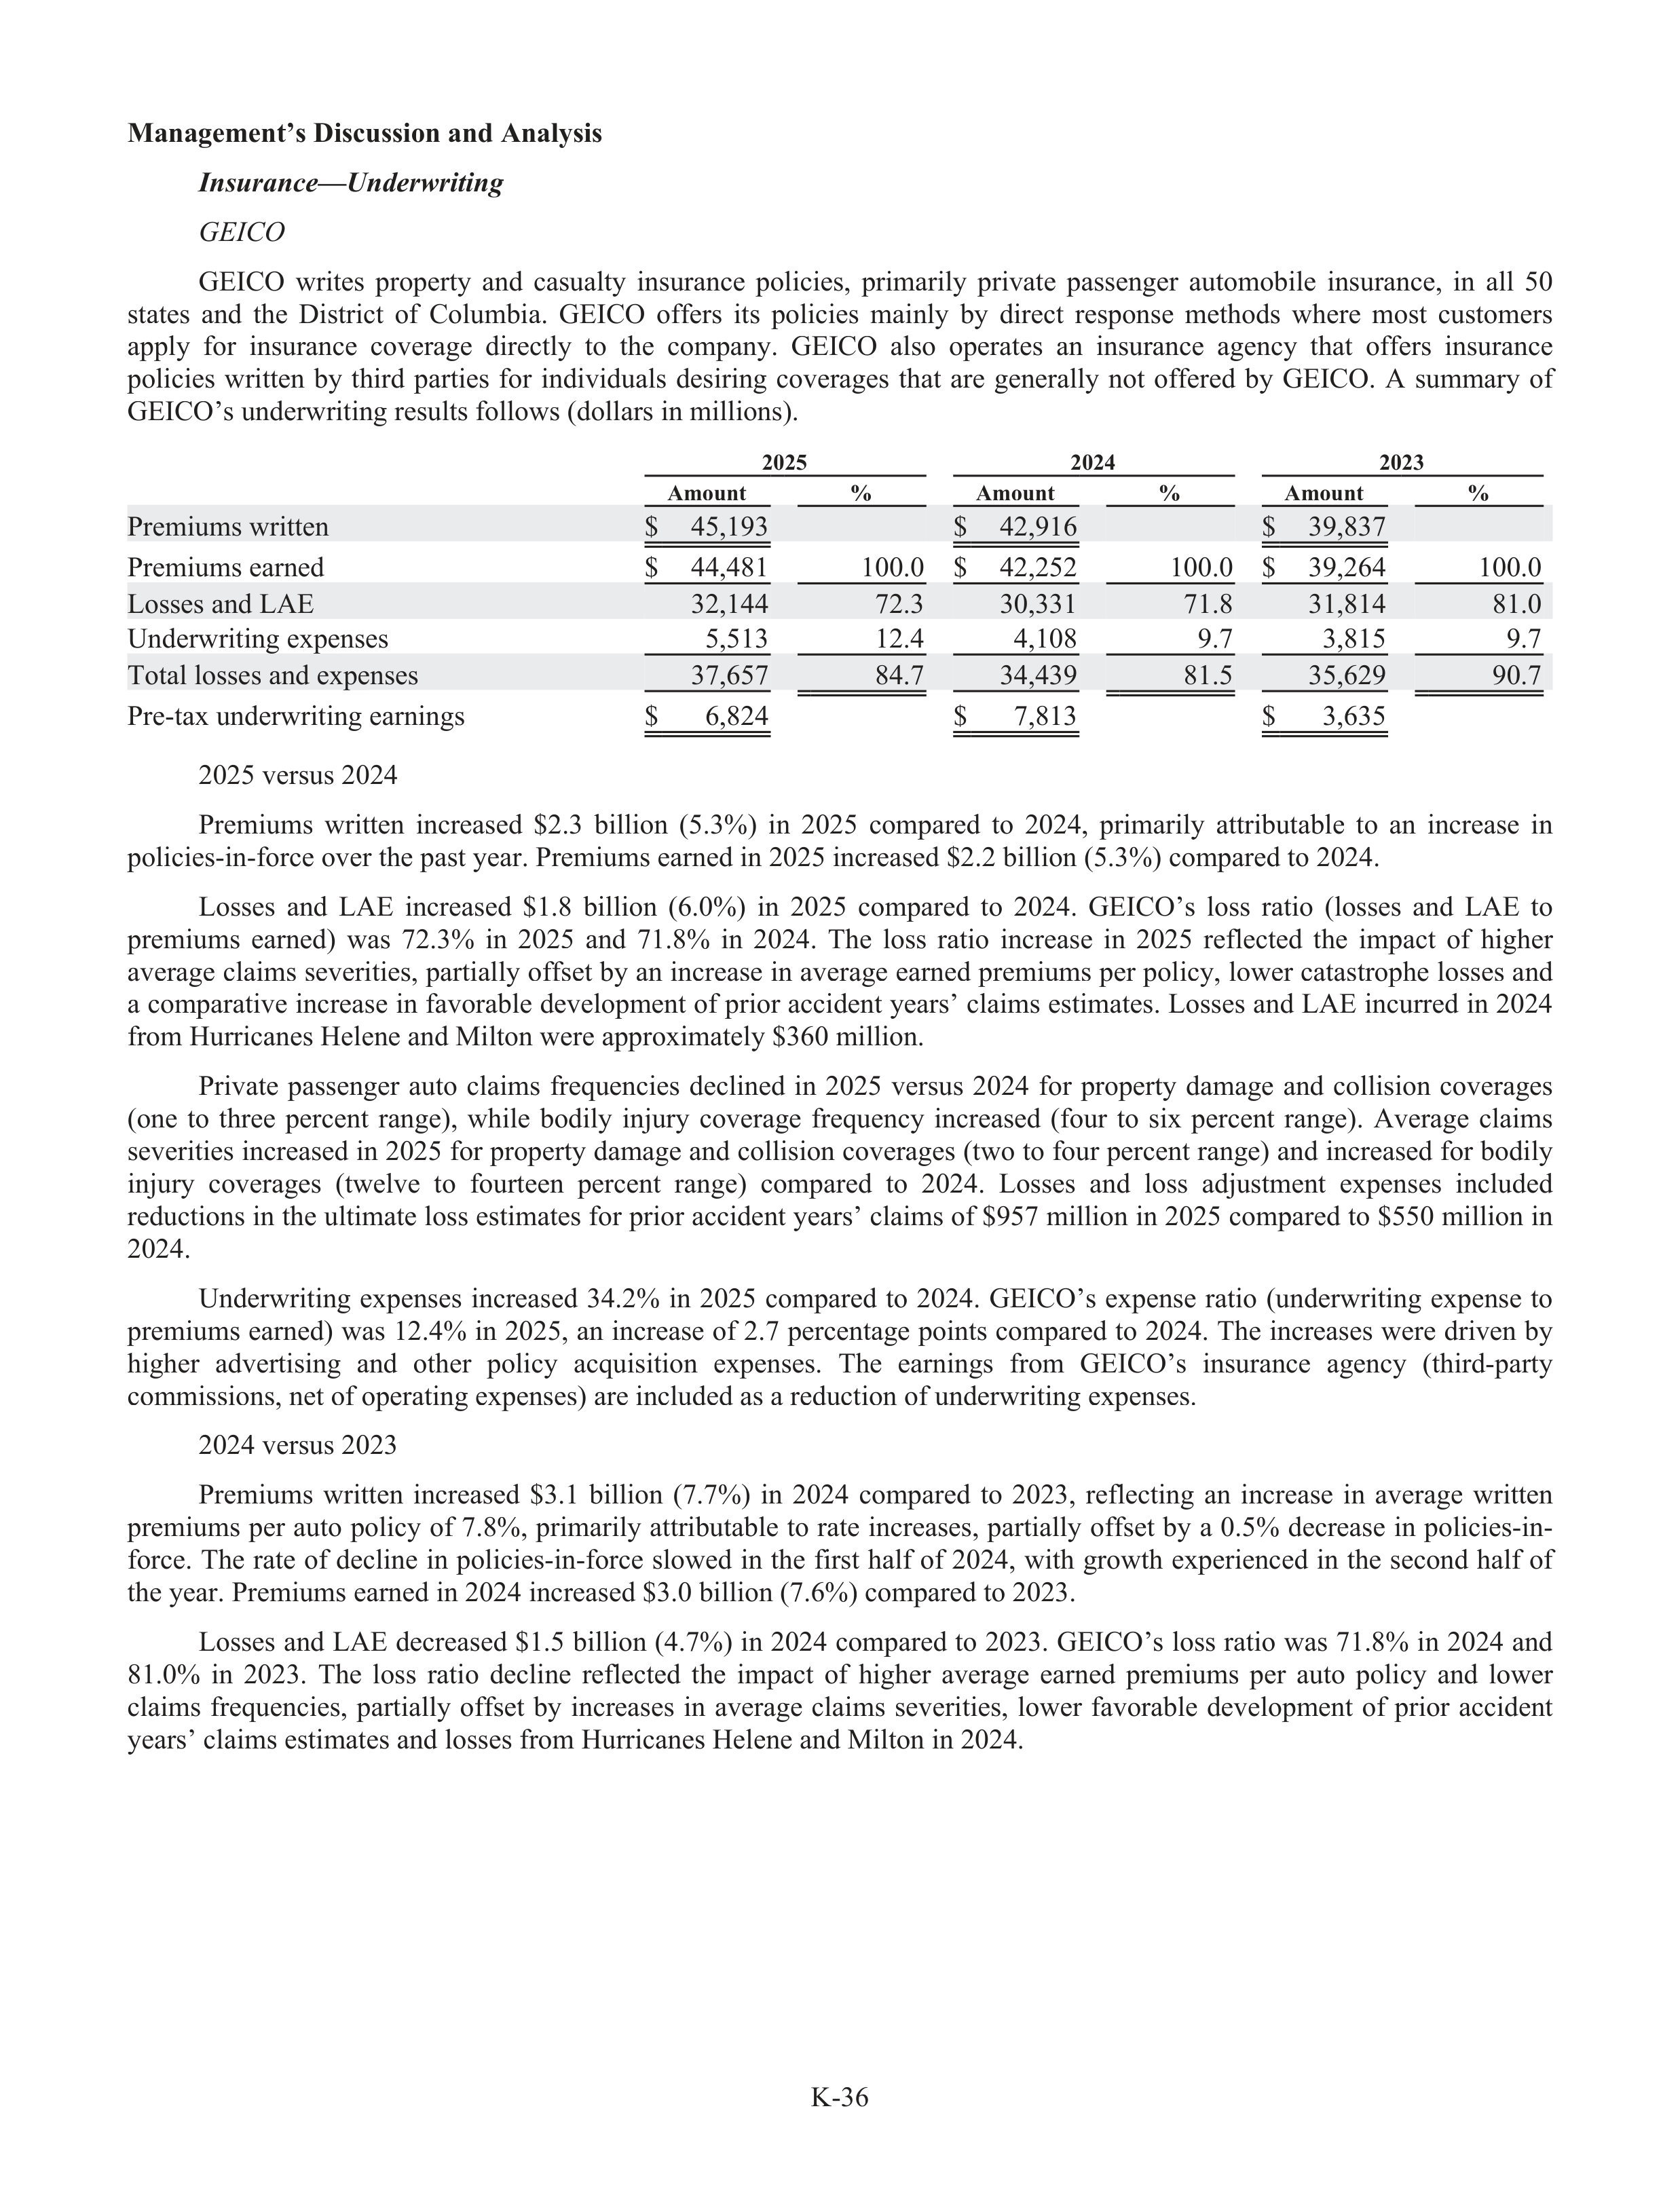
K-36
Management’s Discussion and Analysis
Insurance—Underwritin
i
g
GEIC
E
O
GEICO
writes
property
and
casualty
insurance
policies,
primarily
private
passenger
automobile
insurance,
in
all
50
states
and
the
District
of
Columbia.
GEICO
offe
f
rs
its
policies
mainly
by
direct
response
methods
where
most
customers
apply
for
insurance
coverage
directly
to
the
company.
GEICO
also
operates
an
insurance
agency
that
offe
f
rs
insurance
policies
written
by
third
parties
for
individuals
desiring
coverages
that
are
generally
not
offe
f
red
by
GEICO.
A
summary
of
GEICO’s underwriting results follows (dollars in millions).
2025
2024
2023
Amount
%
Amount
%
Amount
%
Premiums written
$
45,193
$
42,916
$
39,837
Premiums earned
$
44,481
100.0
$
42,252
100.0
$
39,264
100.0
Losses and LAE
32,144
72.3
30,331
71.8
31,814
81.0
Underwriting expenses
5,513
12.4
4,108
9.7
3,815
9.7
Total losses and expenses
37,657
84.7
34,439
81.5
35,629
90.7
Pre-tax underwriting earnings
$
6,824
$
7,813
$
3,635
2025 versus 2024
Premiums
written
increased
$2.3
billion
(5.3%)
in
2025
compared
to
2024,
primarily
attributable
to
an
increase
in
policies-in-force over the past year. Premiums earned in 2025 increased $2.2 billion (5.3%) compared to 2024.
Losses
and
LAE
increased
$1.8
billion
(6.0%)
in
2025
compared
to
2024.
GEICO’s
loss
ratio
(losses
and
LAE
to
premiums
earned)
was
72.3%
in
2025
and
71.8%
in
2024.
The
loss
ratio
increase
in
2025
reflected
the
impact
of
higher
average claims severities, partially offs
f
et by an increase in average earned premiums per policy, lower catastrophe losses and
a comparative increase in favorable development of prior accident years’ claims estimates. Losses and LAE incurred in 2024
from Hurricanes Helene and Milton were approximately $360 million.
Private
passenger
auto
claims
frequencies
declined
in
2025
versus
2024
for
property
damage
and
collision
coverages
(one
to
three
percent
range),
while
bodily
inju
n
ry
coverage
frequency
increased
(four
to
six
percent
range).
Average
claims
severities increased in 2025 for property damage and collision coverages (two to four percent range) and increased for bodily
inju
n
ry
coverages
(twelve
to
fourteen
percent
range)
compared
to
2024.
Losses
and
loss
adju
d
stment
expenses
included
reductions in the ultimate loss estimates for prior accident years’ claims of $957 million in 2025 compared to $550 million in
2024.
Underwriting
expenses
increased
34.2%
in
2025
compared
to
2024.
GEICO’s
expense
ratio
(underwriting
expense
to
premiums earned) was 12.4% in 2025, an increase of 2.7 percentage points compared to 2024. The increases were driven by
higher
advertising
and
other
policy
acquisition
expenses.
The
earnings
from
GEICO’s
insurance
agency
(third-party
commissions, net of operating expenses) are included as a reduction of underwriting expenses.
2024 versus 2023
Premiums
written
increased
$3.1
billion
(7.7%)
in
2024
compared
to
2023,
reflecting
an
increase
in
average
written
premiums per auto policy of 7.8%, primarily attributable to rate increases, partially offs
f
et by a 0.5% decrease in policies-in-
force. The rate of decline in policies-in-force slowed in the first half of 2024, with growth experienced in the second half of
the year. Premiums earned in 2024 increased $3.0 billion (7.6%) compared to 2023.
Losses and LAE decreased $1.5 billion (4.7%) in 2024 compared to 2023. GEICO’s loss ratio was 71.8% in 2024 and
81.0%
in
2023.
The
loss
ratio
decline
reflected
the
impact
of
higher
average
earned
premiums
per
auto
policy
and
lower
claims
frequencies,
partially
offs
f
et
by
increases
in
average
claims
severities,
lower
favorable
development
of
prior
accident
years’ claims estimates and losses from Hurricanes Helene and Milton in 2024.
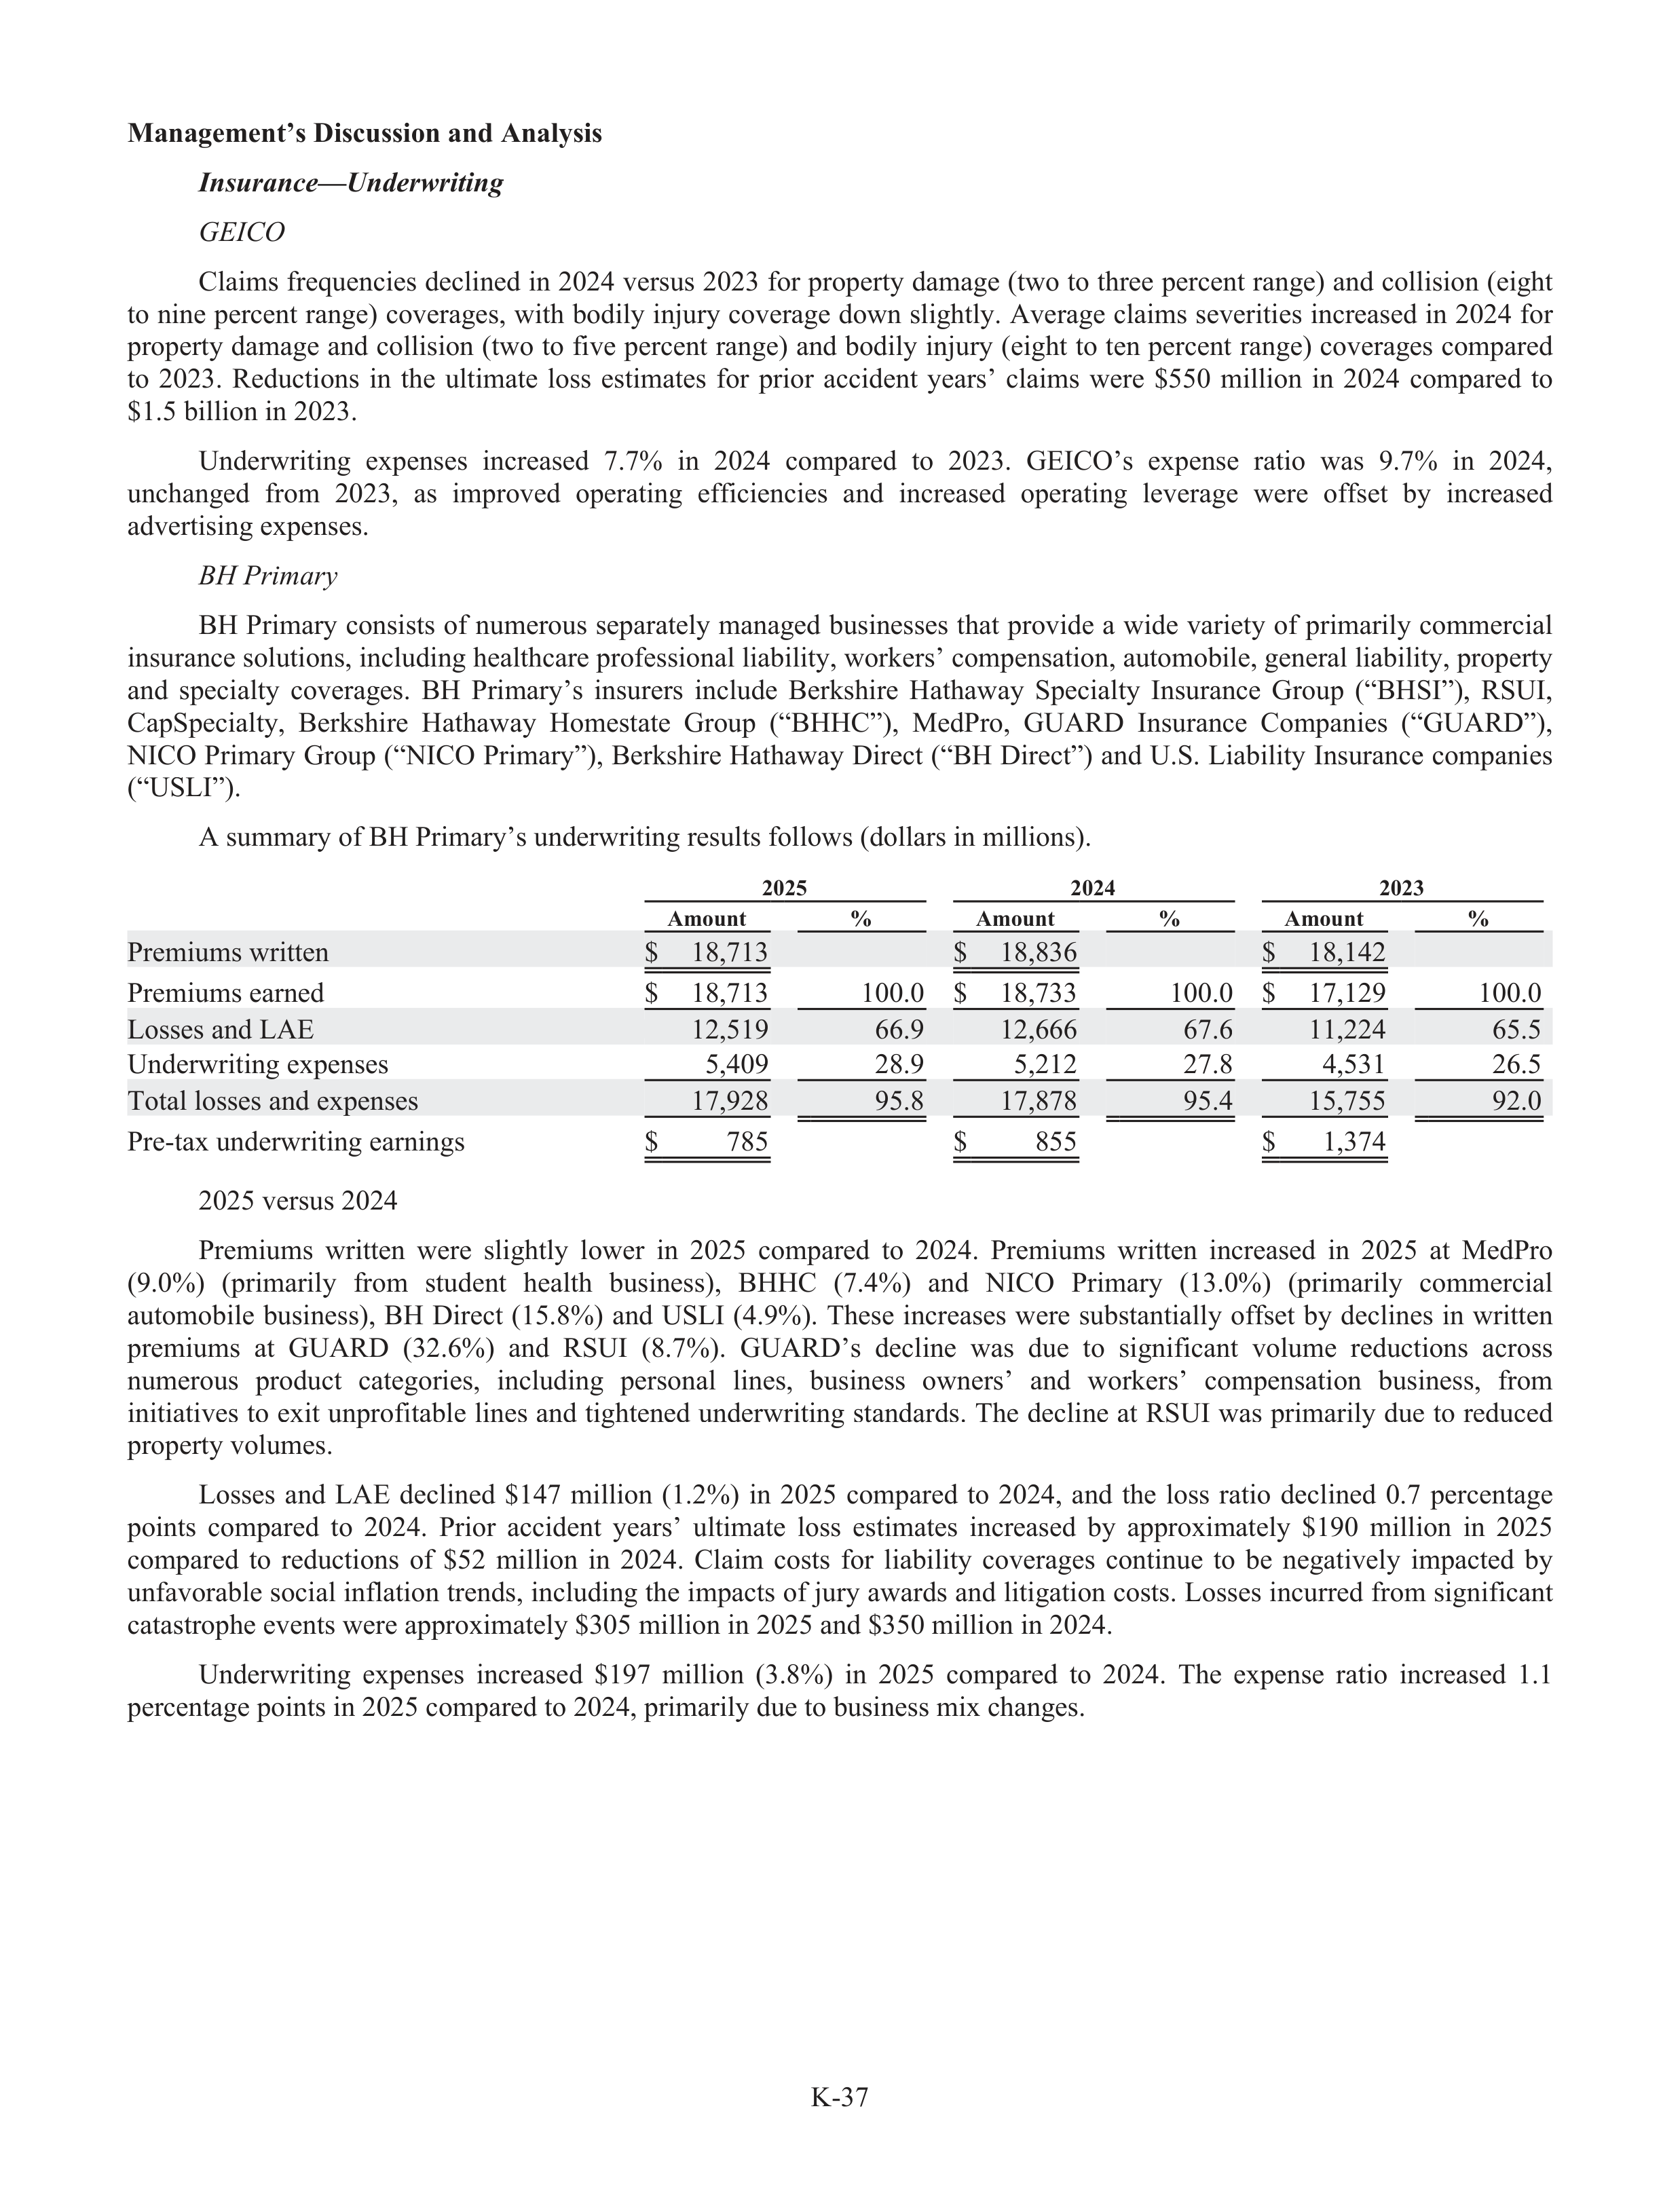
K-37
Management’s Discussion and Analysis
Insurance—Underwritin
i
g
GEIC
E
O
Claims frequencies declined in 2024 versus 2023 for property damage (two to three percent range) and collision (eight
to nine percent range) coverages, with bodily inju
n
ry coverage down slightly. Average claims severities increased in 2024 for
property damage and collision (two to five percent range) and bodily inju
n
ry (eight to ten percent range) coverages compared
to
2023.
Reductions
in
the
ultimate
loss
estimates
for
prior
accident
years’
claims
were
$550
million
in
2024
compared
to
$1.5 billion in 2023.
Underwriting
expenses
increased
7.7%
in
2024
compared
to
2023.
GEICO’s
expense
ratio
was
9.7%
in
2024,
unchanged
from
2023,
as
improved
operating
effi
f
ciencies
and
increased
operating
leverage
were
offs
f
et
by
increased
advertising expenses.
BH Primary
r
BH Primary consists of numerous separately managed businesses that provide a wide variety of primarily commercial
insurance solutions, including healthcare profes
f
sional liabi
a
lity, workers’ compensation, automobile, general liabi
a
lity, property
and
specialty
coverages.
BH
Primary’s
insurers
include
Berkshire
Hathaway
Specialty
Insurance
Group
(“BHSI”),
RSUI,
CapS
a
pecialty,
Berkshire
Hathaway
Homestate
Group
(“BHHC”),
MedPro,
GUARD
Insurance
Companies
(“GUARD”),
NICO Primary Group (“NICO Primary”), Berkshire Hathaway Direct (“BH Direct”) and U.S. Liability Insurance companies
(“USLI”).
A summary of BH Primary’s underwriting results follows (dollars in millions).
2025
2024
2023
Amount
%
Amount
%
Amount
%
Premiums written
$
18,713
$
18,836
$
18,142
Premiums earned
$
18,713
100.0
$
18,733
100.0
$
17,129
100.0
Losses and LAE
12,519
66.9
12,666
67.6
11,224
65.5
Underwriting expenses
5,409
28.9
5,212
27.8
4,531
26.5
Total losses and expenses
17,928
95.8
17,878
95.4
15,755
92.0
Pre-tax underwriting earnings
$
785
$
855
$
1,374
2025 versus 2024
Premiums
written
were
slightly
lower
in
2025
compared
to
2024.
Premiums
written
increased
in
2025
at
MedPro
(9.0%)
(primarily
from
stude
t
nt
health
business),
BHHC
(7.4%)
and
NICO
Primary
(13.0%)
(primarily
commercial
automobile
business),
BH
Direct
(15.8%)
and
USLI
(4.9%).
These
increases
were
subs
u
tantially
offs
f
et
by
declines
in
written
premiums
at
GUARD
(32.6%)
and
RSUI
(8.7%).
GUARD’s
decline
was
due
to
significant
volume
reductions
across
numerous
product
categories,
including
personal
lines,
business
owners’
and
workers’
compensation
business,
from
initiatives to exit unprofita
f
bl
a
e lines and tightened underwriting standards. The decline at RSUI was primarily due to reduced
property volumes.
Losses
and
LAE
declined
$147
million
(1.2%)
in
2025
compared
to
2024,
and
the
loss
ratio
declined
0.7
percentage
points
compared
to
2024.
Prior
accident
years’
ultimate
loss
estimates
increased
by
approximately
$190
million
in
2025
compared
to
reductions
of
$52
million
in
2024.
Claim
costs
for
liabi
a
lity
coverages
continue
to
be
negatively
impacted
by
unfav
f
orable social inflation trends, including the impacts of jury awards and litigation costs. Losses incurred from significant
catastrophe events were approximately $305 million in 2025 and $350 million in 2024.
Underwriting
expenses
increased
$197
million
(3.8%)
in
2025
compared
to
2024.
The
expense
ratio
increased
1.1
percentage points in 2025 compared to 2024, primarily due to business mix changes.
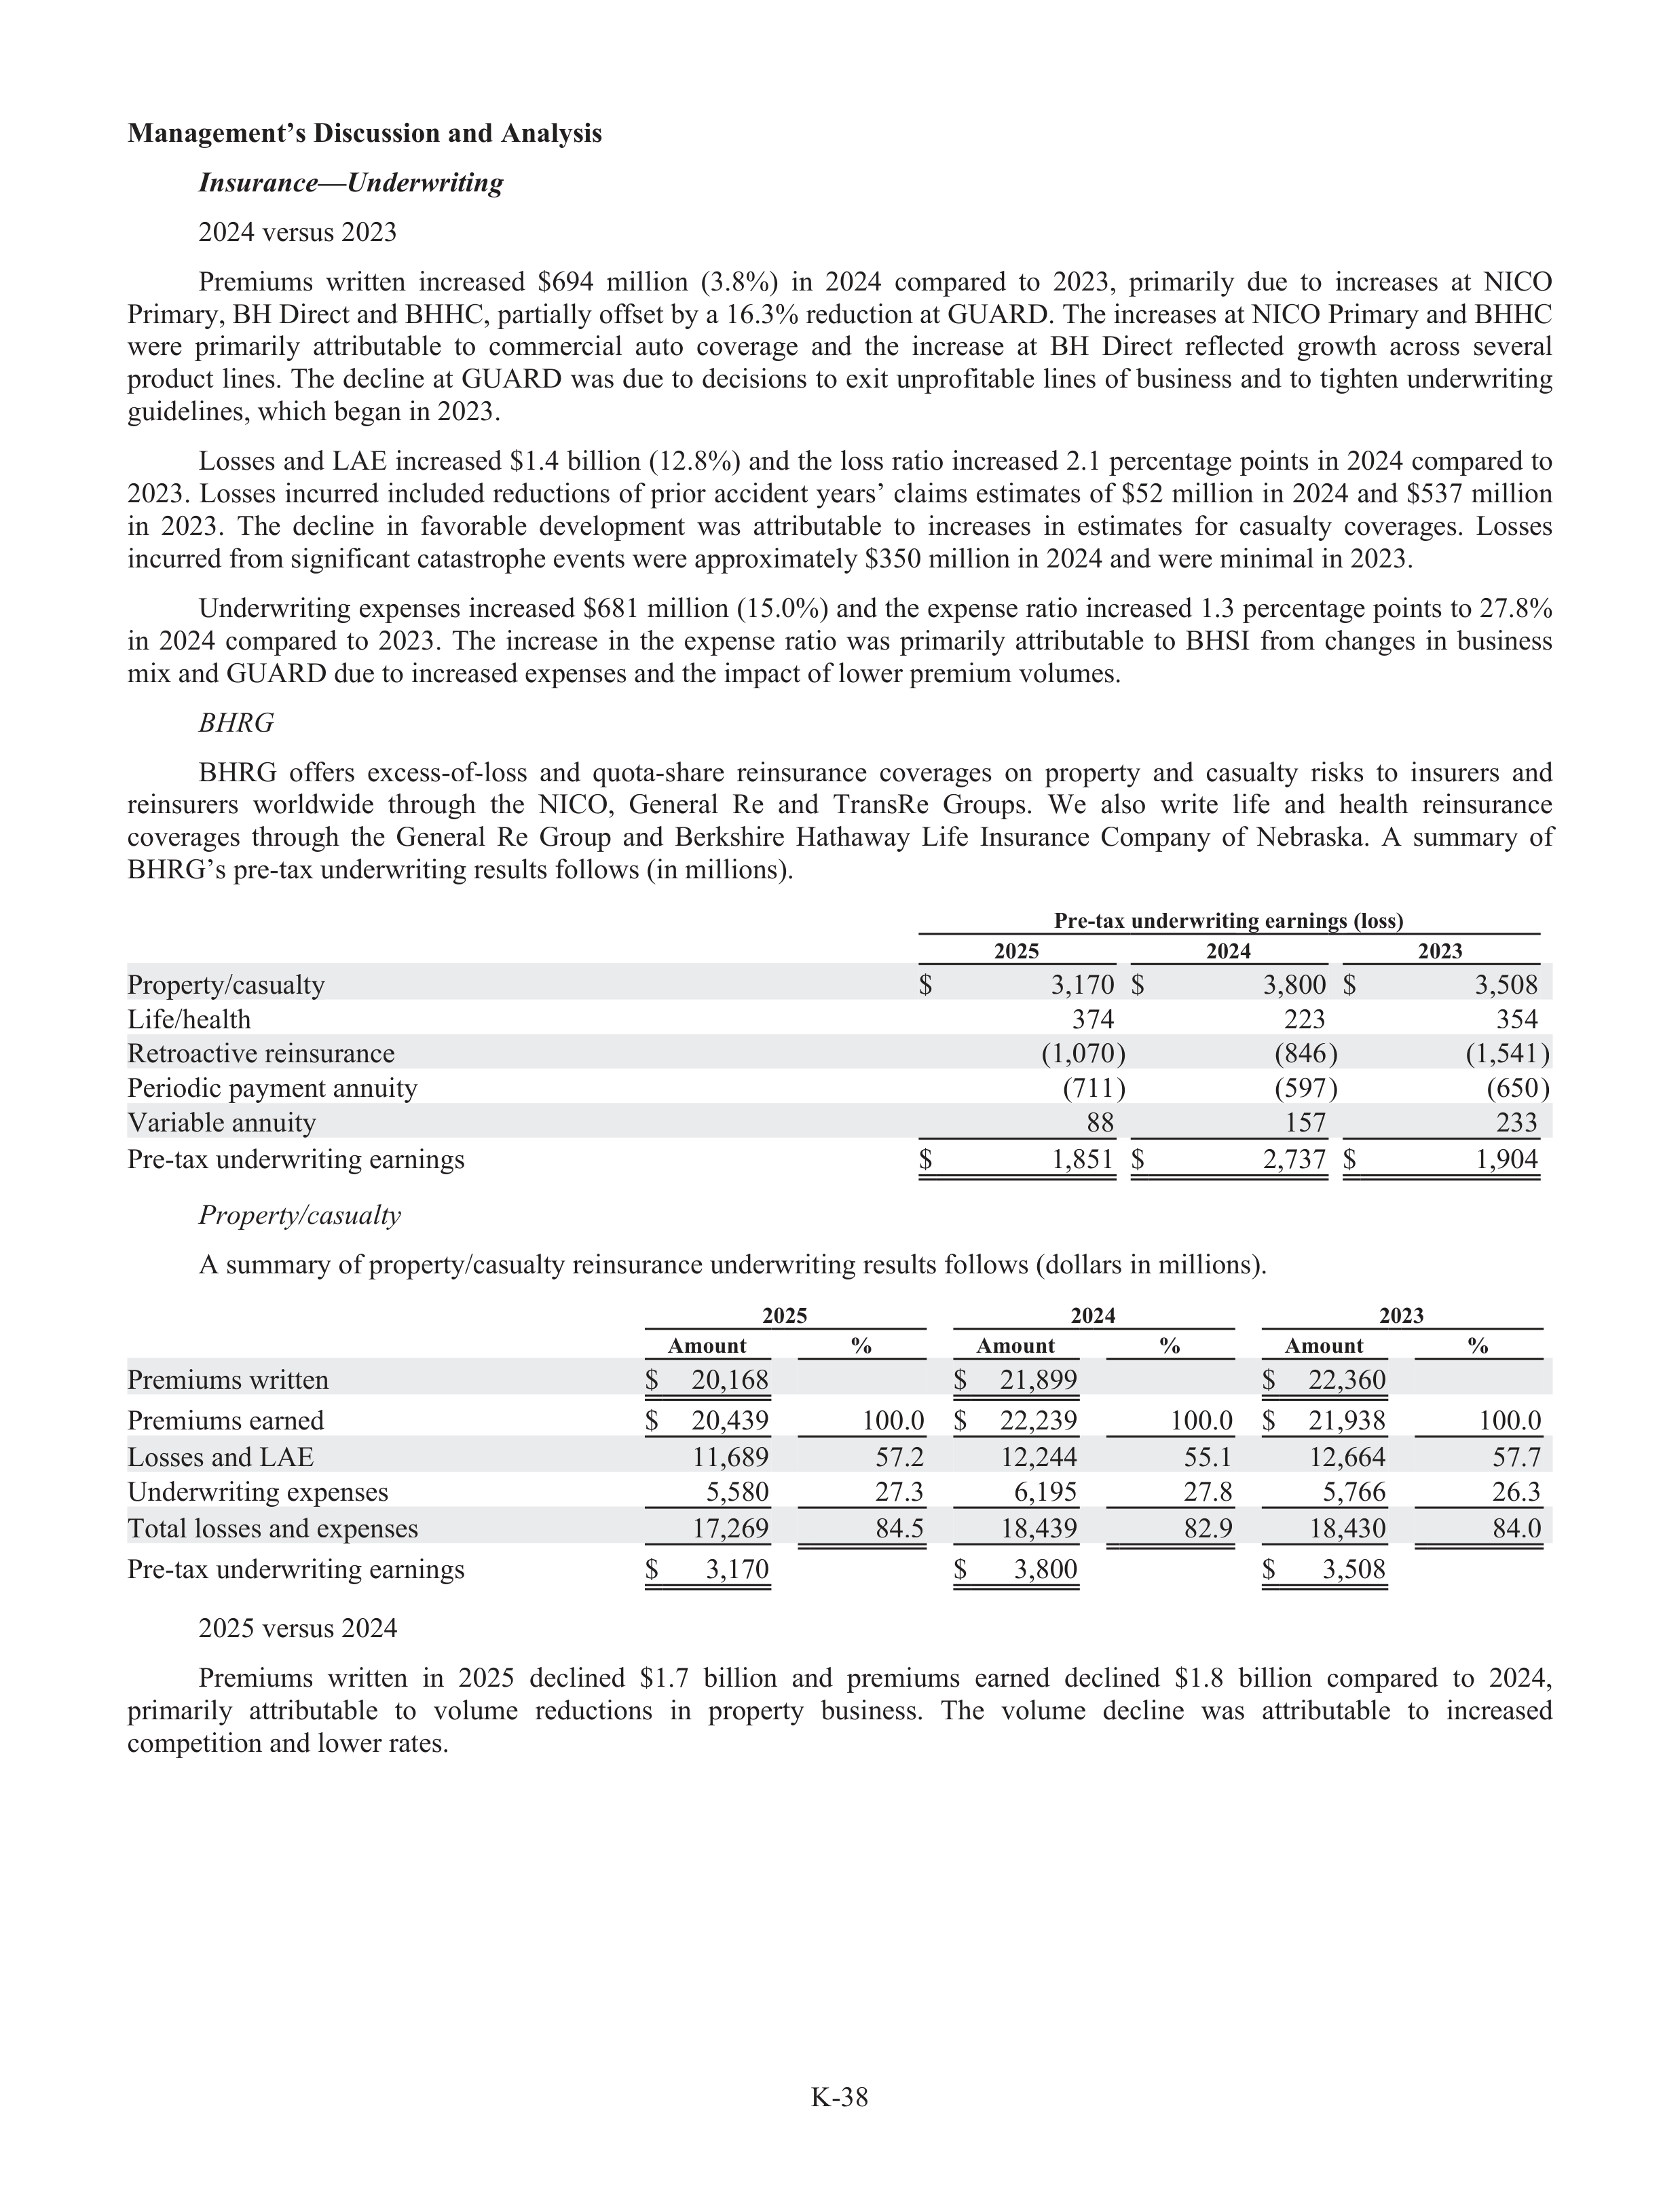
K-38
Management’s Discussion and Analysis
Insurance—Underwritin
i
g
2024 versus 2023
Premiums
written
increased
$694
million
(3.8%)
in
2024
compared
to
2023,
primarily
due
to
increases
at
NICO
Primary, BH Direct and BHHC, partially offs
f
et by a 16.3% reduction at GUARD. The increases at NICO Primary and BHHC
were
primarily
attributable
to
commercial
auto
coverage
and
the
increase
at
BH
Direct
reflected
growth
across
several
product lines. The decline at GUARD was due to decisions to exit unprofita
f
bl
a
e lines of business and to tighten underwriting
guidelines, which began in 2023.
Losses and LAE increased $1.4 billion (12.8%) and the loss ratio increased 2.1 percentage points in 2024 compared to
2023. Losses incurred included reductions of prior accident years’ claims estimates of $52 million in 2024 and $537 million
in
2023.
The
decline
in
favorable
development
was
attributable
to
increases
in
estimates
for
casualty
coverages.
Losses
incurred from significant catastrophe events were approximately $350 million in 2024 and were minimal in 2023.
Underwriting expenses increased $681 million (15.0%) and the expense ratio increased 1.3 percentage points to 27.8%
in
2024
compared
to
2023.
The
increase
in
the
expense
ratio
was
primarily
attributable
to
BHSI
from
changes
in
business
mix and GUARD due to increased expenses and the impact of lower premium volumes.
BHRG
H
BHRG
offe
f
rs
excess-of-l
f
oss
and
quota-share
reinsurance
coverages
on
property
and
casualty
risks
to
insurers
and
reinsurers
worldwide
through
the
NICO,
General
Re
and
TransRe
Groups.
We
also
write
lifef
and
health
reinsurance
coverages
through
the
General
Re
Group
and
Berkshire
Hathaway
Life
Insurance
Company
of
Nebraska.
A
summary
r
of
BHRG’s pre-tax underwriting results follows (in millions).
Pre-tax underwriting earnings (loss)
2025
2024
2023
Property/casualty
$
3,170
$
3,800
$
3,508
Life/health
374
223
354
Retroactive reinsurance
(1,070)
(846)
(1,541)
Periodic payment annuity
(711)
(597)
(650)
Variable annuity
88
157
233
Pre-tax underwriting earnings
$
1,851
$
2,737
$
1,904
Property/
t
ca
/
sualty
A summary of property/casualty reinsurance underwriting results follows (dollars in millions).
2025
2024
2023
Amount
%
Amount
%
Amount
%
Premiums written
$
20,168
$
21,899
$
22,360
Premiums earned
$
20,439
100.0
$
22,239
100.0
$
21,938
100.0
Losses and LAE
11,689
57.2
12,244
55.1
12,664
57.7
Underwriting expenses
5,580
27.3
6,195
27.8
5,766
26.3
Total losses and expenses
17,269
84.5
18,439
82.9
18,430
84.0
Pre-tax underwriting earnings
$
3,170
$
3,800
$
3,508
2025 versus 2024
Premiums
written
in
2025
declined
$1.7
billion
and
premiums
earned
declined
$1.8
billion
compared
to
2024,
primarily
attributable
to
volume
reductions
in
property
business.
The
volume
decline
was
attributable
to
increased
competition and lower rates.
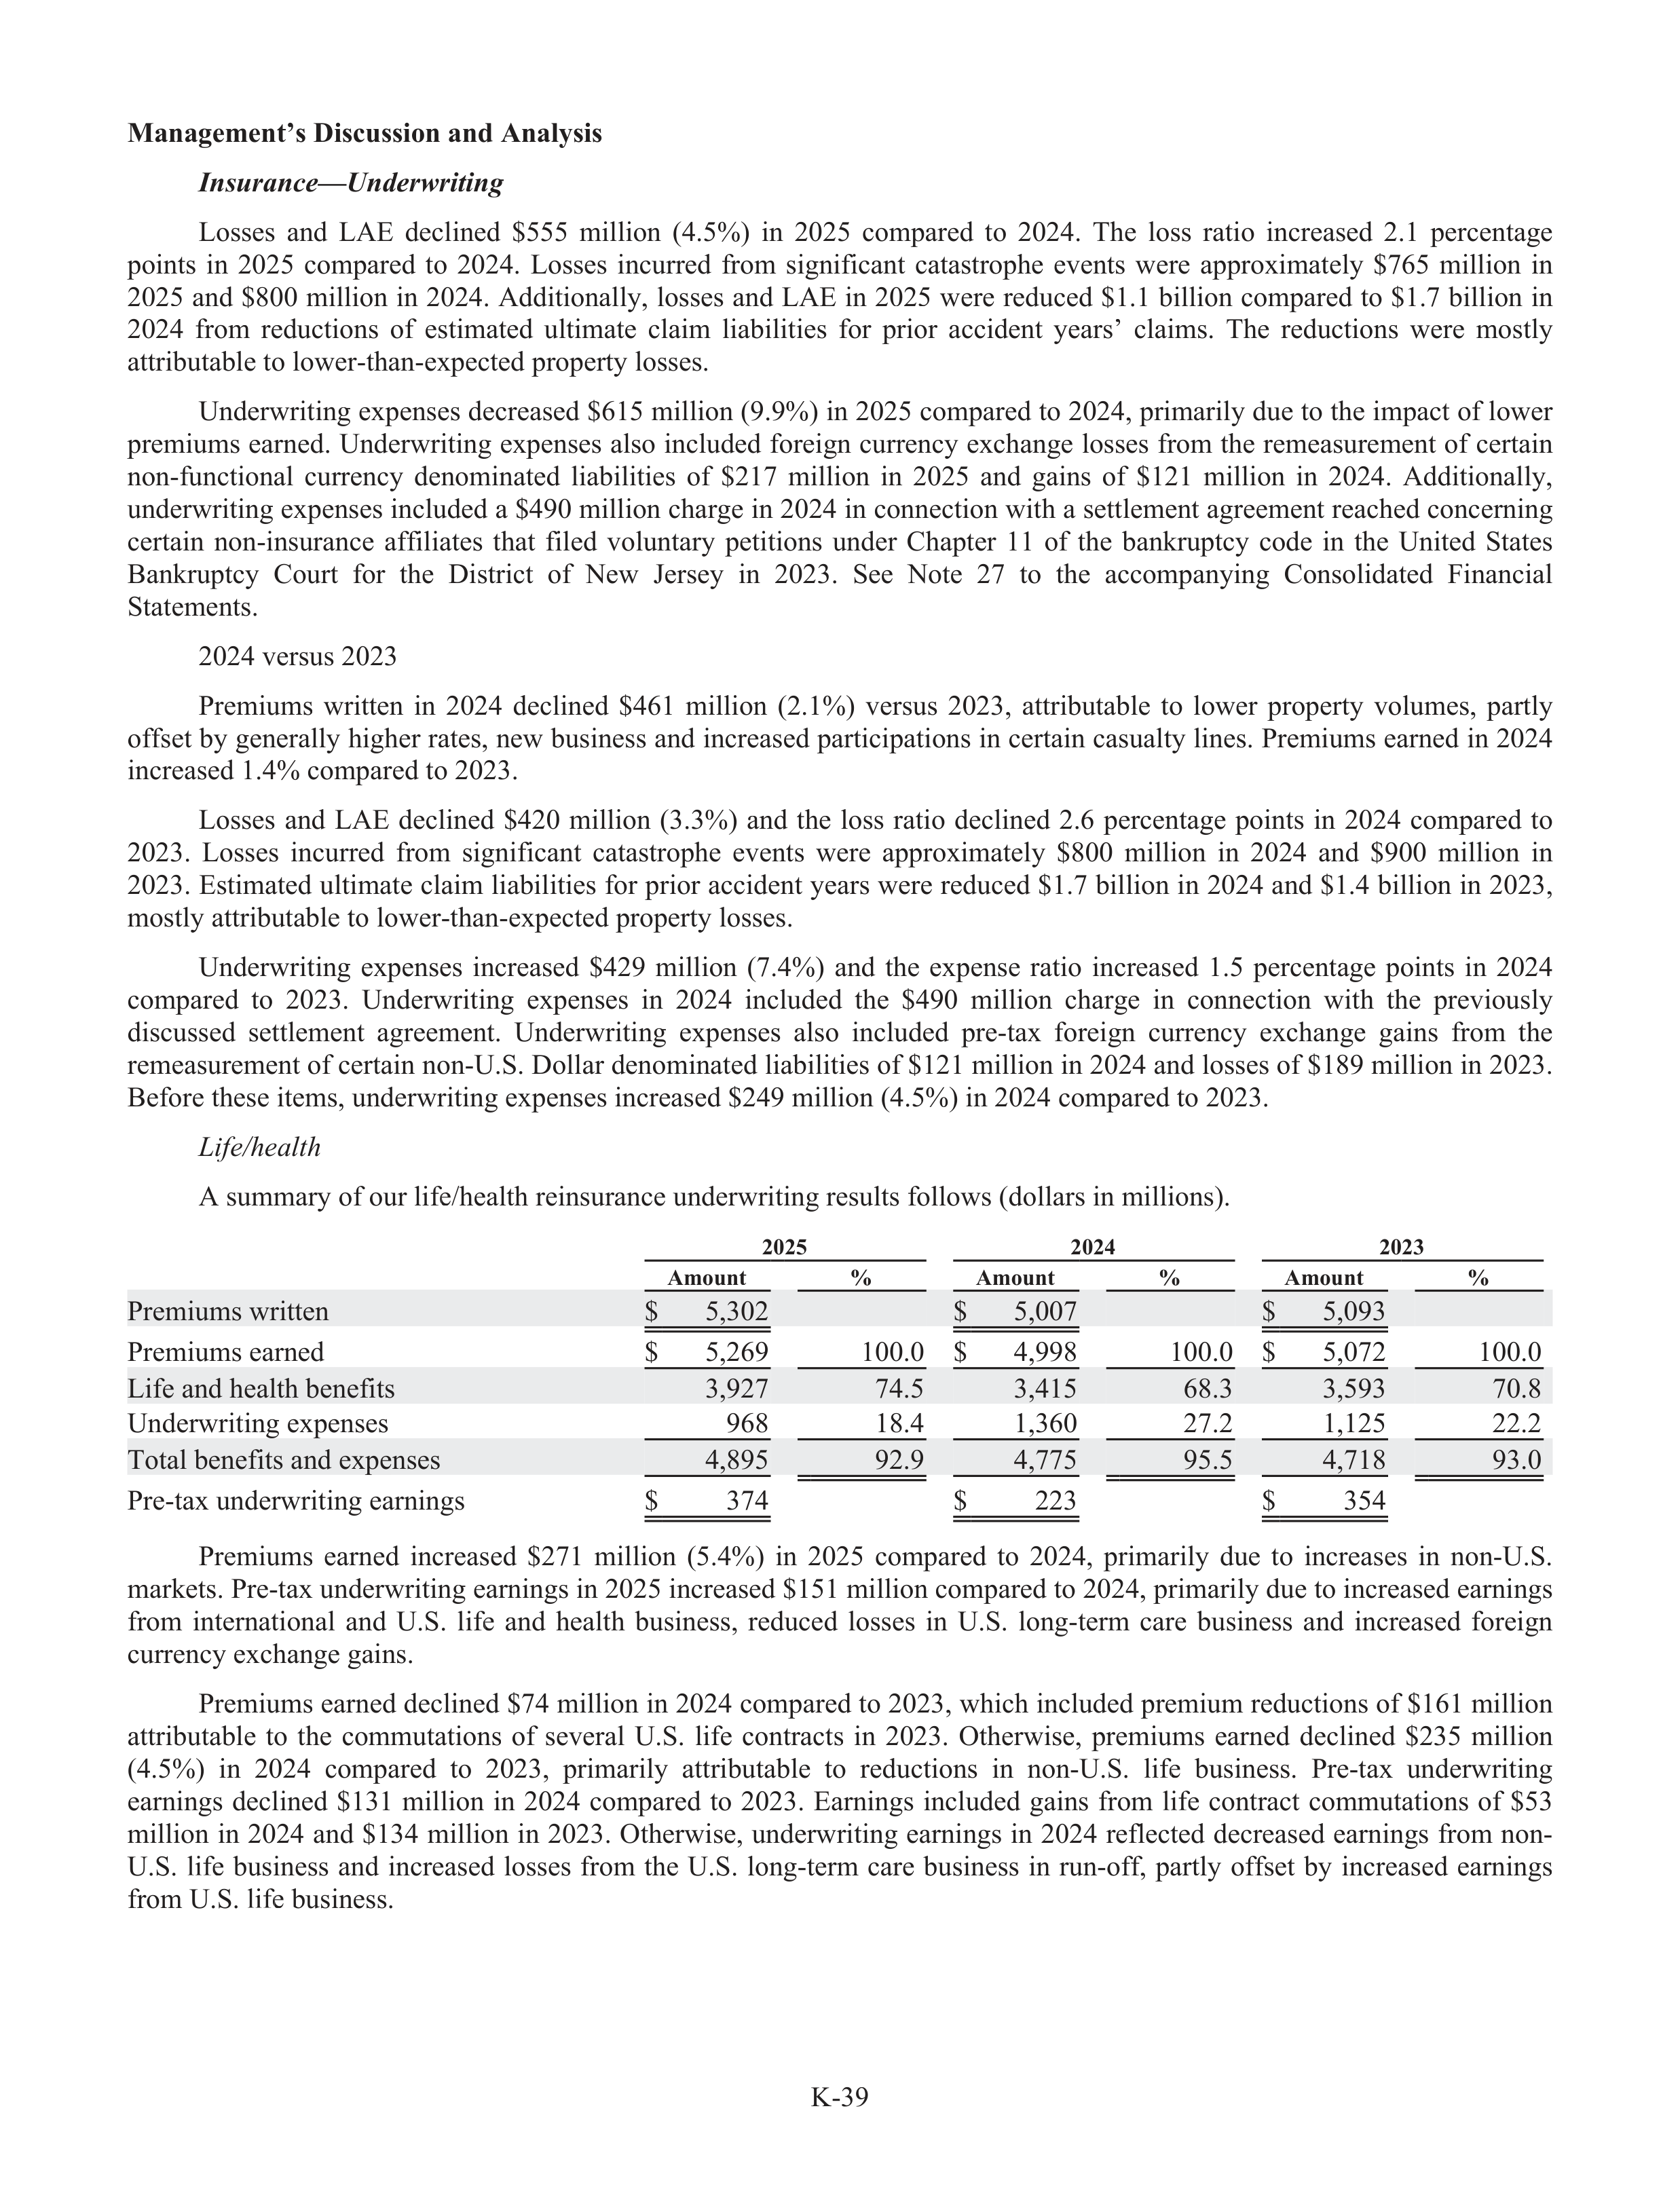
K-39
Management’s Discussion and Analysis
Insurance—Underwritin
i
g
Losses
and
LAE
declined
$555
million
(4.5%)
in
2025
compared
to
2024.
The
loss
ratio
increased
2.1
percentage
points
in
2025
compared
to
2024.
Losses
incurred
from
significant
catastrophe
events
were
approximately
$765
million
in
2025 and $800 million in 2024. Additionally, losses and LAE in 2025 were reduced $1.1 billion compared to $1.7 billion in
2024
from
reductions
of
estimated
ultimate
claim
liabi
a
lities
for
prior
accident
years’
claims.
The
reductions
were
mostly
attributable to lower-than-expected property losses.
Underwriting expenses decreased $615 million (9.9%) in 2025 compared to 2024, primarily due to the impact of lower
premiums earned. Underwriting expenses also included foreign currency exchange losses from the remeasurement of certain
non-functional
currency
denominated
liabi
a
lities
of
$217
million
in
2025
and
gains
of
$121
million
in
2024.
Additionally,
underwriting expenses included a $490 million charge in 2024 in connection with a settlement agreement reached concerning
certain
non-insurance
affi
f
liates
that
filed
voluntary
r
petitions
under
Chapter
11
of
the
bankrupt
r
cy
code
in
the
United
States
Bankrupt
r
cy
Court
for
the
District
of
New
Jersey
in
2023.
See
Note
27
to
the
accompanying
Consolidated
Financial
Statements.
2024 versus 2023
Premiums
written
in
2024
declined
$461
million
(2.1%)
versus
2023,
attributable
to
lower
property
volumes,
partly
offs
f
et by generally higher rates, new business and increased participations in certain casualty lines. Premiums earned in 2024
increased 1.4% compared to 2023.
Losses
and
LAE
declined
$420
million
(3.3%)
and
the
loss
ratio
declined
2.6
percentage
points
in
2024
compared
to
2023.
Losses
incurred
from
significant
catastrophe
events
were
approximately
$800
million
in
2024
and
$900
million
in
2023. Estimated ultimate claim liabi
a
lities for prior accident years were reduced $1.7 billion in 2024 and $1.4 billion in 2023,
mostly attributable to lower-than-expected property losses.
Underwriting
expenses
increased
$429
million
(7.4%)
and
the
expense
ratio
increased
1.5
percentage
points
in
2024
compared
to
2023.
Underwriting
expenses
in
2024
included
the
$490
million
charge
in
connection
with
the
previously
discussed
settlement
agreement.
Underwriting
expenses
also
included
pre-tax
foreign
currency
exchange
gains
from
the
remeasurement of certain non-U.S. Dollar denominated liabi
a
lities of $121 million in 2024 and losses of $189 million in 2023.
Before these items, underwriting expenses increased $249 million (4.5%) in 2024 compared to 2023.
Life
i
/h
e
ealth
A summary of our life/
f
health reinsurance underwriting results follows (dollars in millions).
2025
2024
2023
Amount
%
Amount
%
Amount
%
Premiums written
$
5,302
$
5,007
$
5,093
Premiums earned
$
5,269
100.0
$
4,998
100.0
$
5,072
100.0
Life and health benefits
3,927
74.5
3,415
68.3
3,593
70.8
Underwriting expenses
968
18.4
1,360
27.2
1,125
22.2
Total benefits and expenses
4,895
92.9
4,775
95.5
4,718
93.0
Pre-tax underwriting earnings
$
374
$
223
$
354
Premiums
earned
increased
$271
million
(5.4%)
in
2025
compared
to
2024,
primarily
due
to
increases
in
non-U.S.
markets. Pre-tax underwriting earnings in 2025 increased $151 million compared to 2024, primarily due to increased earnings
from
international
and
U.S.
lifef
and
health
business,
reduced
losses
in
U.S.
long-term
care
business
and
increased
foreign
currency exchange gains.
Premiums earned declined $74 million in 2024 compared to 2023, which included premium reductions of $161 million
attributable
to
the
commutations
of
several
U.S.
life
contracts
in
2023.
Otherwise,
premiums
earned
declined
$235
million
(4.5%)
in
2024
compared
to
2023,
primarily
attributable
to
reductions
in
non-U.S.
lifef
business.
Pre-tax
underwriting
earnings
declined
$131
million
in
2024
compared
to
2023.
Earnings
included
gains
from
lifef
contract
commutations
of
$53
million in 2024 and $134 million in 2023. Otherwise, underwriting earnings in 2024 reflected decreased earnings from non-
U.S.
lifef
business
and
increased
losses
from
the
U.S.
long-term
care
business
in
run-off,
f
partly
offs
f
et
by
increased
earnings
from U.S. lifef
business.
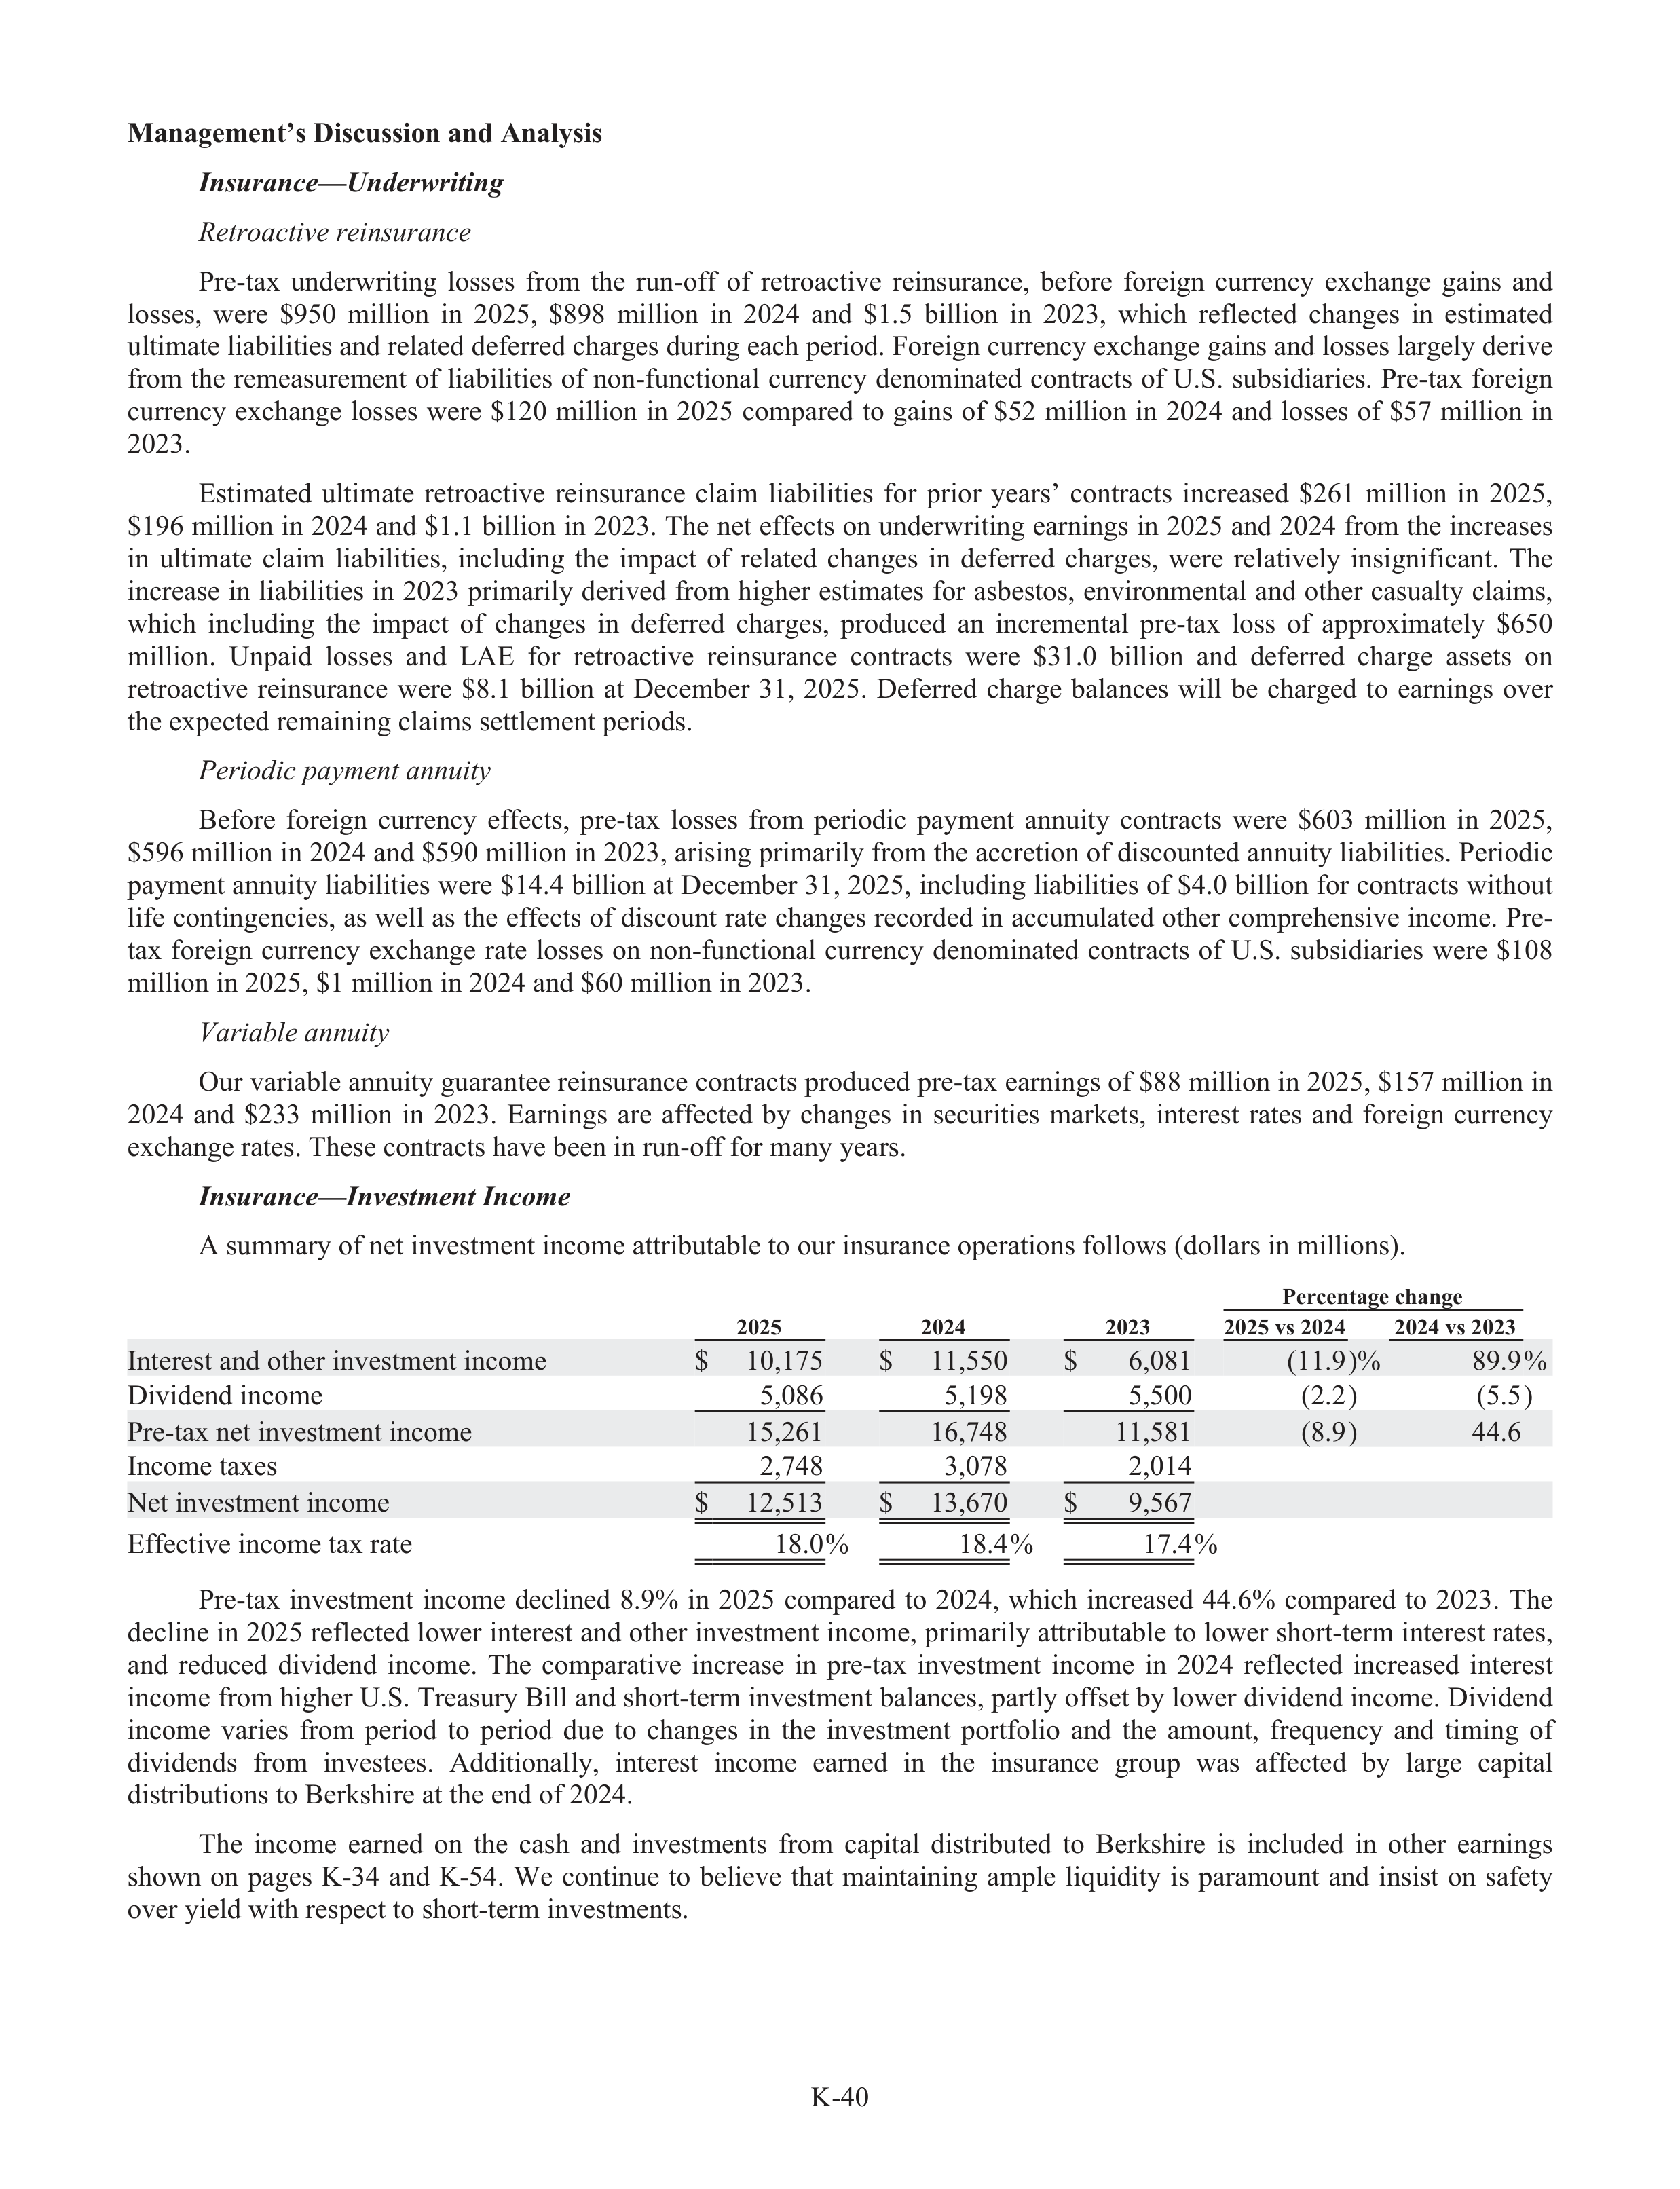
K-40
Management’s Discussion and Analysis
Insurance—Underwritin
i
g
Retroactive reinsurance
Pre-tax
underwriting
losses
from
the
run-offf
of
retroactive
reinsurance,
before
foreign
currency
exchange
gains
and
losses,
were
$950
million
in
2025,
$898
million
in
2024
and
$1.5
billion
in
2023,
which
reflected
changes
in
estimated
ultimate liabi
a
lities and related deferred charges during each period. Foreign currency exchange gains and losses largely derive
from
the
remeasurement
of
liabi
a
lities
of
non-functional
currency
denominated
contracts
of
U.S.
subs
u
idiaries.
Pre-tax
foreign
currency
exchange
losses
were
$120
million
in
2025
compared
to
gains
of
$52
million
in
2024
and
losses
of
$57
million
in
2023.
Estimated
ultimate
retroactive
reinsurance
claim
liabi
a
lities
for
prior
years’
contracts
increased
$261
million
in
2025,
$196 million in 2024 and $1.1 billion in 2023. The net effe
f
cts on underwriting earnings in 2025 and 2024 from the increases
in
ultimate
claim
liabi
a
lities,
including
the
impact
of
related
changes
in
deferred
charges,
were
relatively
insignificant.
The
increase in liabi
a
lities in 2023 primarily derived from higher estimates for asbestos, environmental and other casualty claims,
which
including
the
impact
of
changes
in
deferred
charges,
produced
an
incremental
pre-tax
loss
of
approximately
$650
million.
Unpaid
losses
and
LAE
for
retroactive
reinsurance
contracts
were
$31.0
billion
and
deferred
charge
assets
on
retroactive
reinsurance
were
$8.1
billion
at
December
31,
2025.
Deferred
charge
balances
will
be
charged
to
earnings
over
the expected remaining claims settlement periods.
Periodic payment annuity
Before
foreign
currency
effe
f
cts,
pre-tax
losses
from
periodic
payment
annuity
contracts
were
$603
million
in
2025,
$596 million in 2024 and $590 million in 2023, arising primarily from the accretion of discounted annuity liabi
a
lities. Periodic
payment annuity liabi
a
lities were $14.4 billion at December 31, 2025, including liabi
a
lities of $4.0 billion for contracts without
lifef
contingencies, as well as the effe
f
cts of discount rate changes recorded in accumulated other comprehensive income. Pre-
tax
foreign
currency
exchange
rate
losses
on
non-functional
currency
denominated
contracts
of
U.S.
subs
u
idiaries
were
$108
million in 2025, $1 million in 2024 and $60 million in 2023.
Variable annuity
Our variable annuity guarantee reinsurance contracts produced pre-tax earnings of $88 million in 2025, $157 million in
2024
and
$233
million
in
2023.
Earnings
are
affe
f
cted
by
changes
in
securities
markets,
interest
rates
and
foreign
currency
exchange rates. These contracts have been in run-offf
for many years.
Insurance—In
—
vestment Income
A summary of net investment income attributable to our insurance operations follows (dollars in millions).
Percentage change
2025
2024
2023
2025 vs 2024
2024 vs 2023
Interest and other investment income
$
10,175
$
11,550
$
6,081
(11.9)%
89.9%
Dividend income
5,086
5,198
5,500
(2.2)
(5.5)
Pre-tax net investment income
15,261
16,748
11,581
(8.9)
44.6
Income taxes
2,748
3,078
2,014
Net investment income
$
12,513
$
13,670
$
9,567
Effe
f
ctive income tax rate
18.0%
18.4%
17.4%
Pre-tax
investment
income
declined
8.9%
in
2025
compared
to
2024,
which
increased
44.6%
compared
to
2023.
The
decline in 2025 reflected lower interest and other investment income, primarily attributable to lower short-term interest rates,
and
reduced
dividend
income.
The
comparative
increase
in
pre-tax
investment
income
in
2024
reflected
increased
interest
income from higher U.S. Treasury Bill and short-term investment balances, partly offs
f
et by lower dividend income. Dividend
income
varies
from
period
to
period
due
to
changes
in
the
investment
portfol
f
io
and
the
amount,
frequency
and
timing
of
dividends
from
investees.
Additionally,
interest
income
earned
in
the
insurance
group
was
affe
f
cted
by
large
capital
distributions to Berkshire at the end of 2024.
The
income
earned
on
the
cash
and
investments
from
capital
distributed
to
Berkshire
is
included
in
other
earnings
shown
on
pages
K-34
and
K-54.
We
continue
to
believe
that
maintaining
ample
liquidity
is
paramount
and
insist
on
safety
over yield with respect to short-term investments.
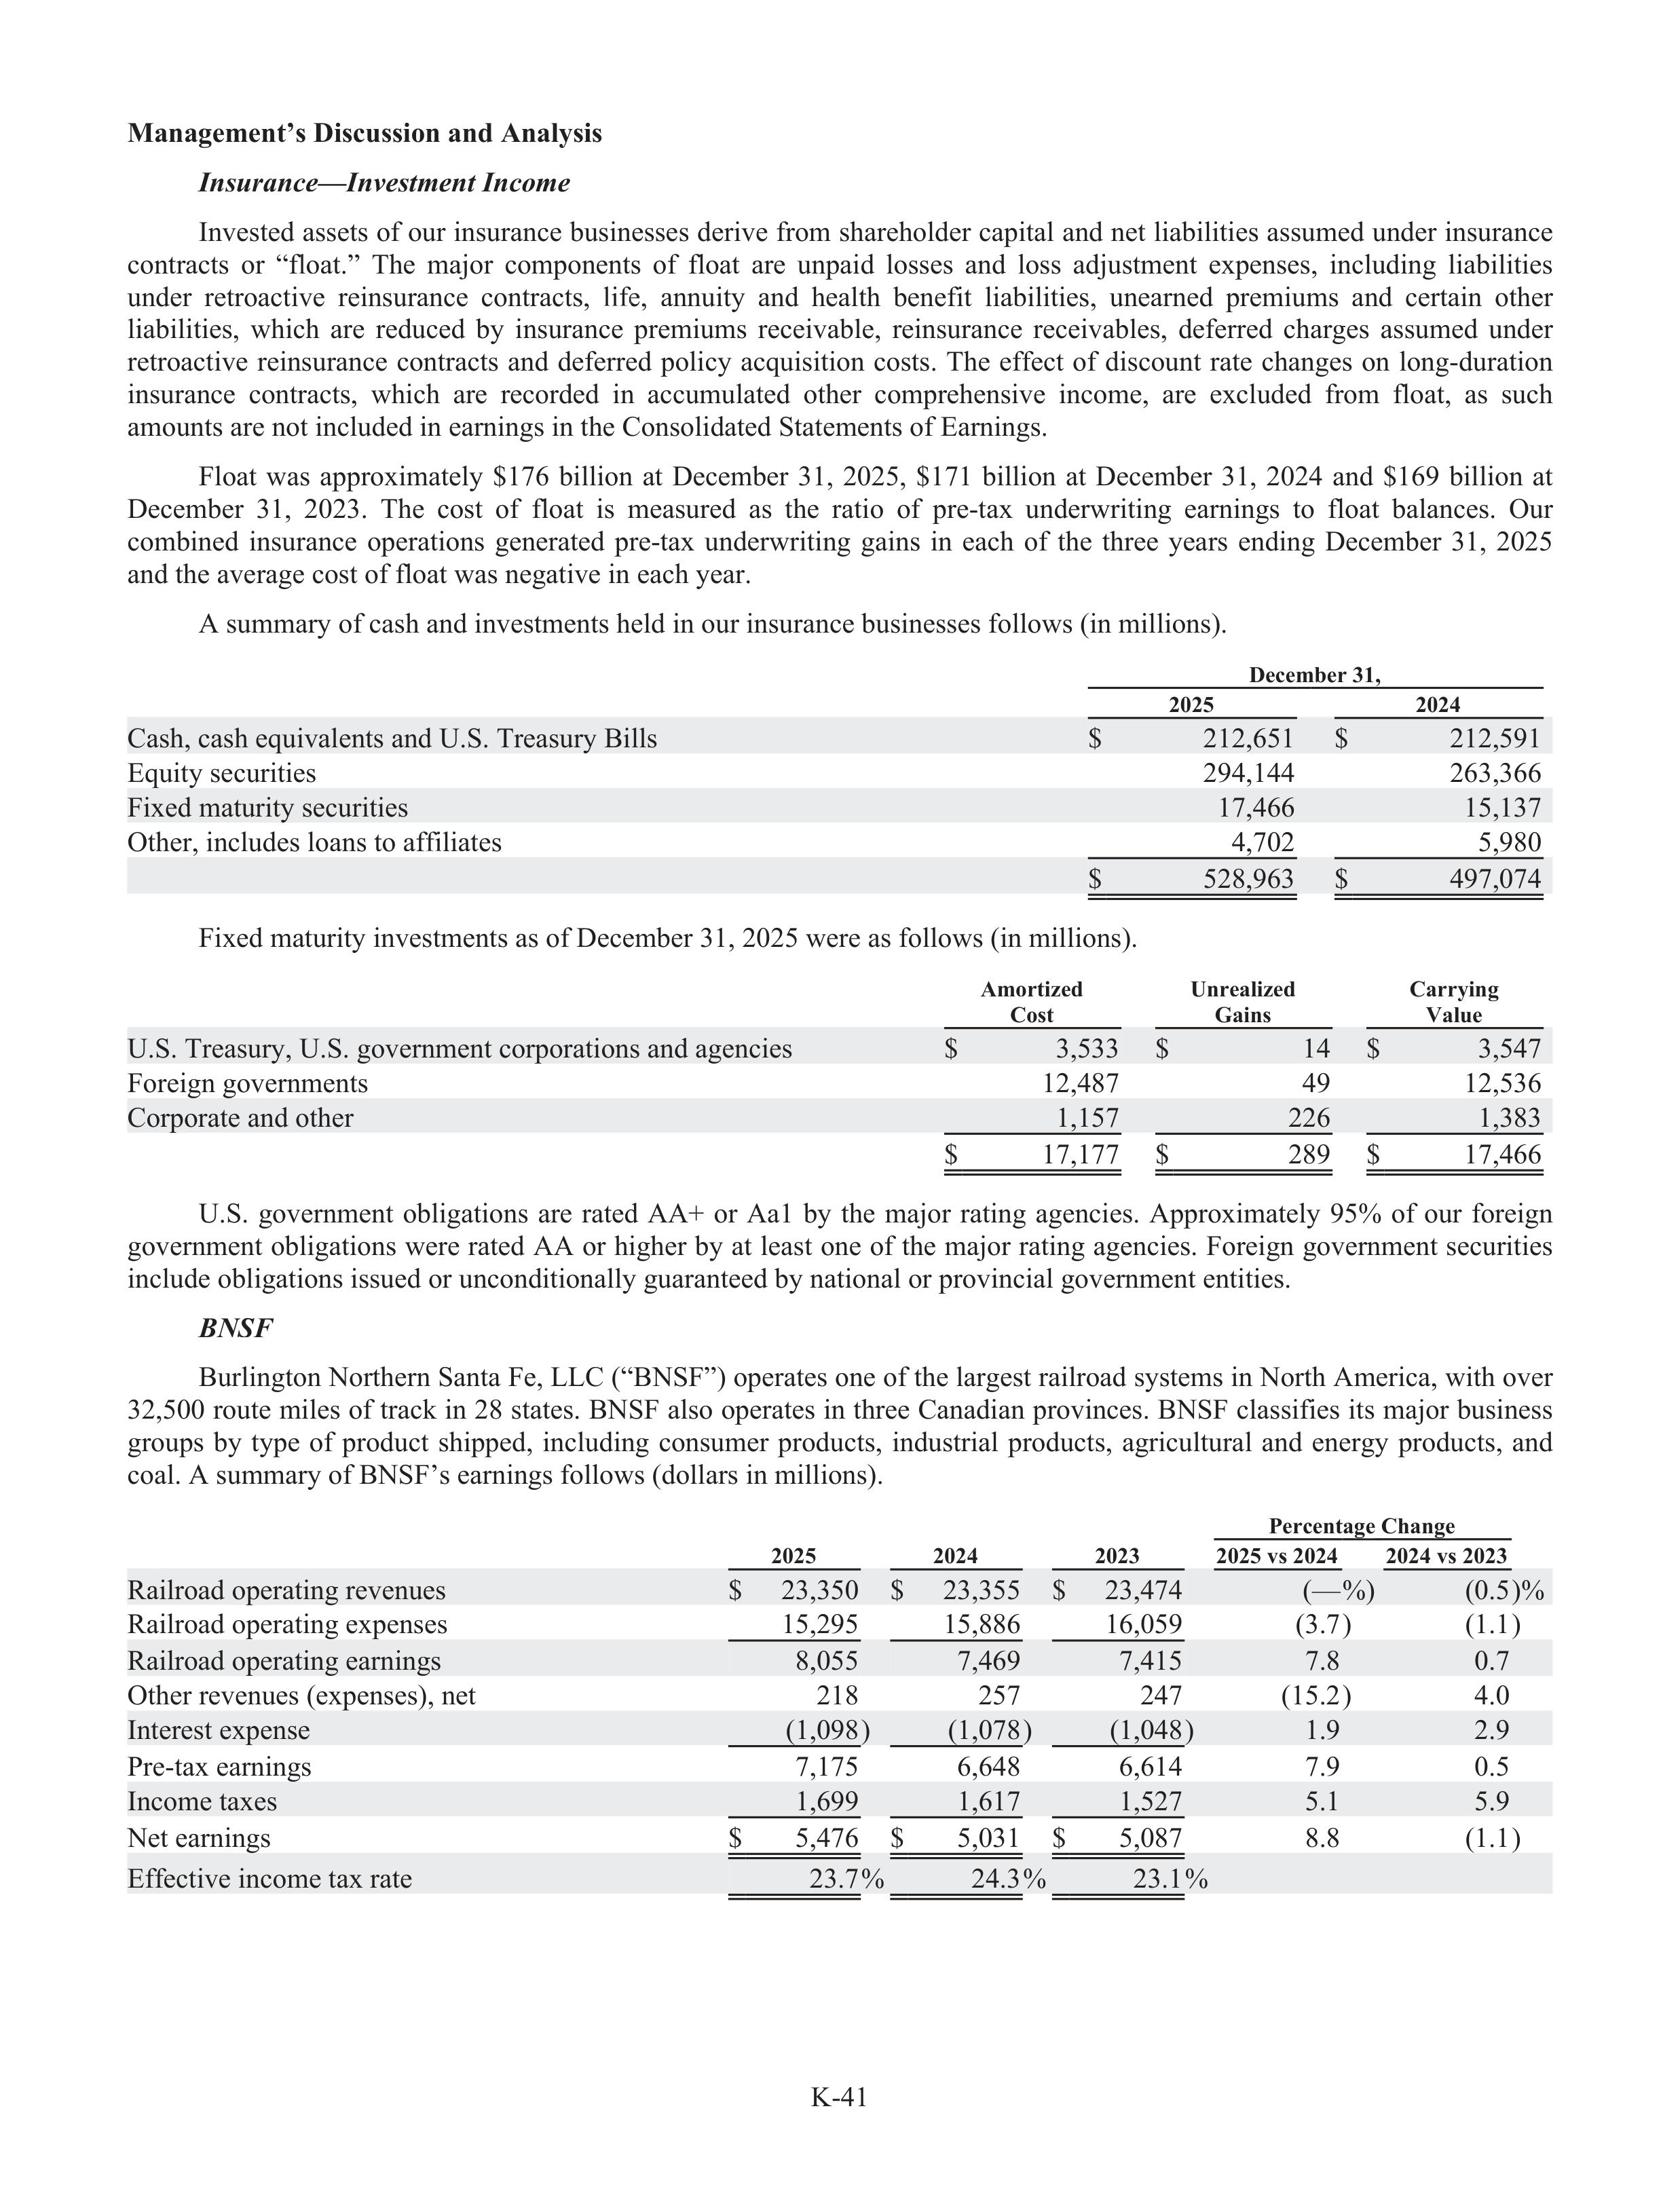
K-41
Management’s Discussion and Analysis
Insurance—In
—
vestment Income
Invested assets of our insurance businesses derive from shareholder capital and net liabi
a
lities assumed under insurance
contracts
or
“flo
f
at.”
The
majo
a
r
components
of
float
are
unpaid
losses
and
loss
adju
d
stment
expenses,
including
liabi
a
lities
under
retroactive
reinsurance
contracts,
life,
f
annuity
and
health
benefit
liabi
a
lities,
unearned
premiums
and
certain
other
liabi
a
lities,
which
are
reduced
by
insurance
premiums
receivabl
a
e,
reinsurance
receivabl
a
es,
deferred
charges
assumed
under
retroactive
reinsurance
contracts
and
deferred
policy
acquisition
costs.
The
effe
f
ct
of
discount
rate
changes
on
long-duration
insurance
contracts,
which
are
recorded
in
accumulated
other
comprehensive
income,
are
excluded
from
float,
as
such
amounts are not included in earnings in the Consolidated Statements of Earnings.
Float
was
approximately
$176
billion
at
December
31,
2025,
$171
billion
at
December
31,
2024
and
$169
billion
at
December
31,
2023.
The
cost
of
float
is
measured
as
the
ratio
of
pre-tax
underwriting
earnings
to
float
balances.
Our
combined
insurance
operations
generated
pre-tax
underwriting
gains
in
each
of
the
three
years
ending
December
31,
2025
and the average cost of float was negative in each year.
A summary of cash and investments held in our insurance businesses follows (in millions).
December 31,
2025
2024
Cash, cash equivalents and U.S. Treasury
r
Bills
$
212,651
$
212,591
Equity securities
294,144
263,366
Fixed maturity securities
17,466
15,137
Other, includes loans to affi
f
liates
4,702
5,980
$
528,963
$
497,074
Fixed maturity investments as of December 31, 2025 were as follows (in millions).
Amortized
Cost
Unrealized
Gains
Carrying
Value
U.S. Treasury,
r
U.S. government corporations and agencies
$
3,533
$
14
$
3,547
Foreign governments
12,487
49
12,536
Corporate and other
1,157
226
1,383
$
17,177
$
289
$
17,466
U.S.
government
obligations
are
rated
AA+
or
Aa1
by
the
majo
a
r
rating
agencies.
Approximately
95%
of
our
foreign
government obligations were rated AA or higher by at least one of the majo
a
r rating agencies. Foreign government securities
include obligations issued or unconditionally guaranteed by national or provincial government entities.
BNSF
N
Burlington Northern Santa Fe, LLC (“BNSF”) operates one of the largest railroad systems in North America, with over
32,500 route miles of track in 28 states. BNSF also operates in three Canadian provinces. BNSF classifies its majo
a
r business
groups
by
type
of
product
shipped,
including
consumer
produc
d
ts,
industrial
products,
agricultural
and
energy
products,
and
coal. A summary of BNSF’s earnings follows (dollars in millions).
Percentage Change
2025
2024
2023
2025 vs 2024
2024 vs 2023
Railroad operating revenues
$
23,350
$
23,355
$
23,474
(—%)
(0.5)%
Railroad operating expenses
15,295
15,886
16,059
(3.7)
(1.1)
Railroad operating earnings
8,055
7,469
7,415
7.8
0.7
Other revenues (expenses), net
218
257
247
(15.2)
4.0
Interest expense
(1,098)
(1,078)
(1,048)
1.9
2.9
Pre-tax earnings
7,175
6,648
6,614
7.9
0.5
Income taxes
1,699
1,617
1,527
5.1
5.9
Net earnings
$
5,476
$
5,031
$
5,087
8.8
(1.1)
Effe
f
ctive income tax rate
23.7%
24.3%
23.1%
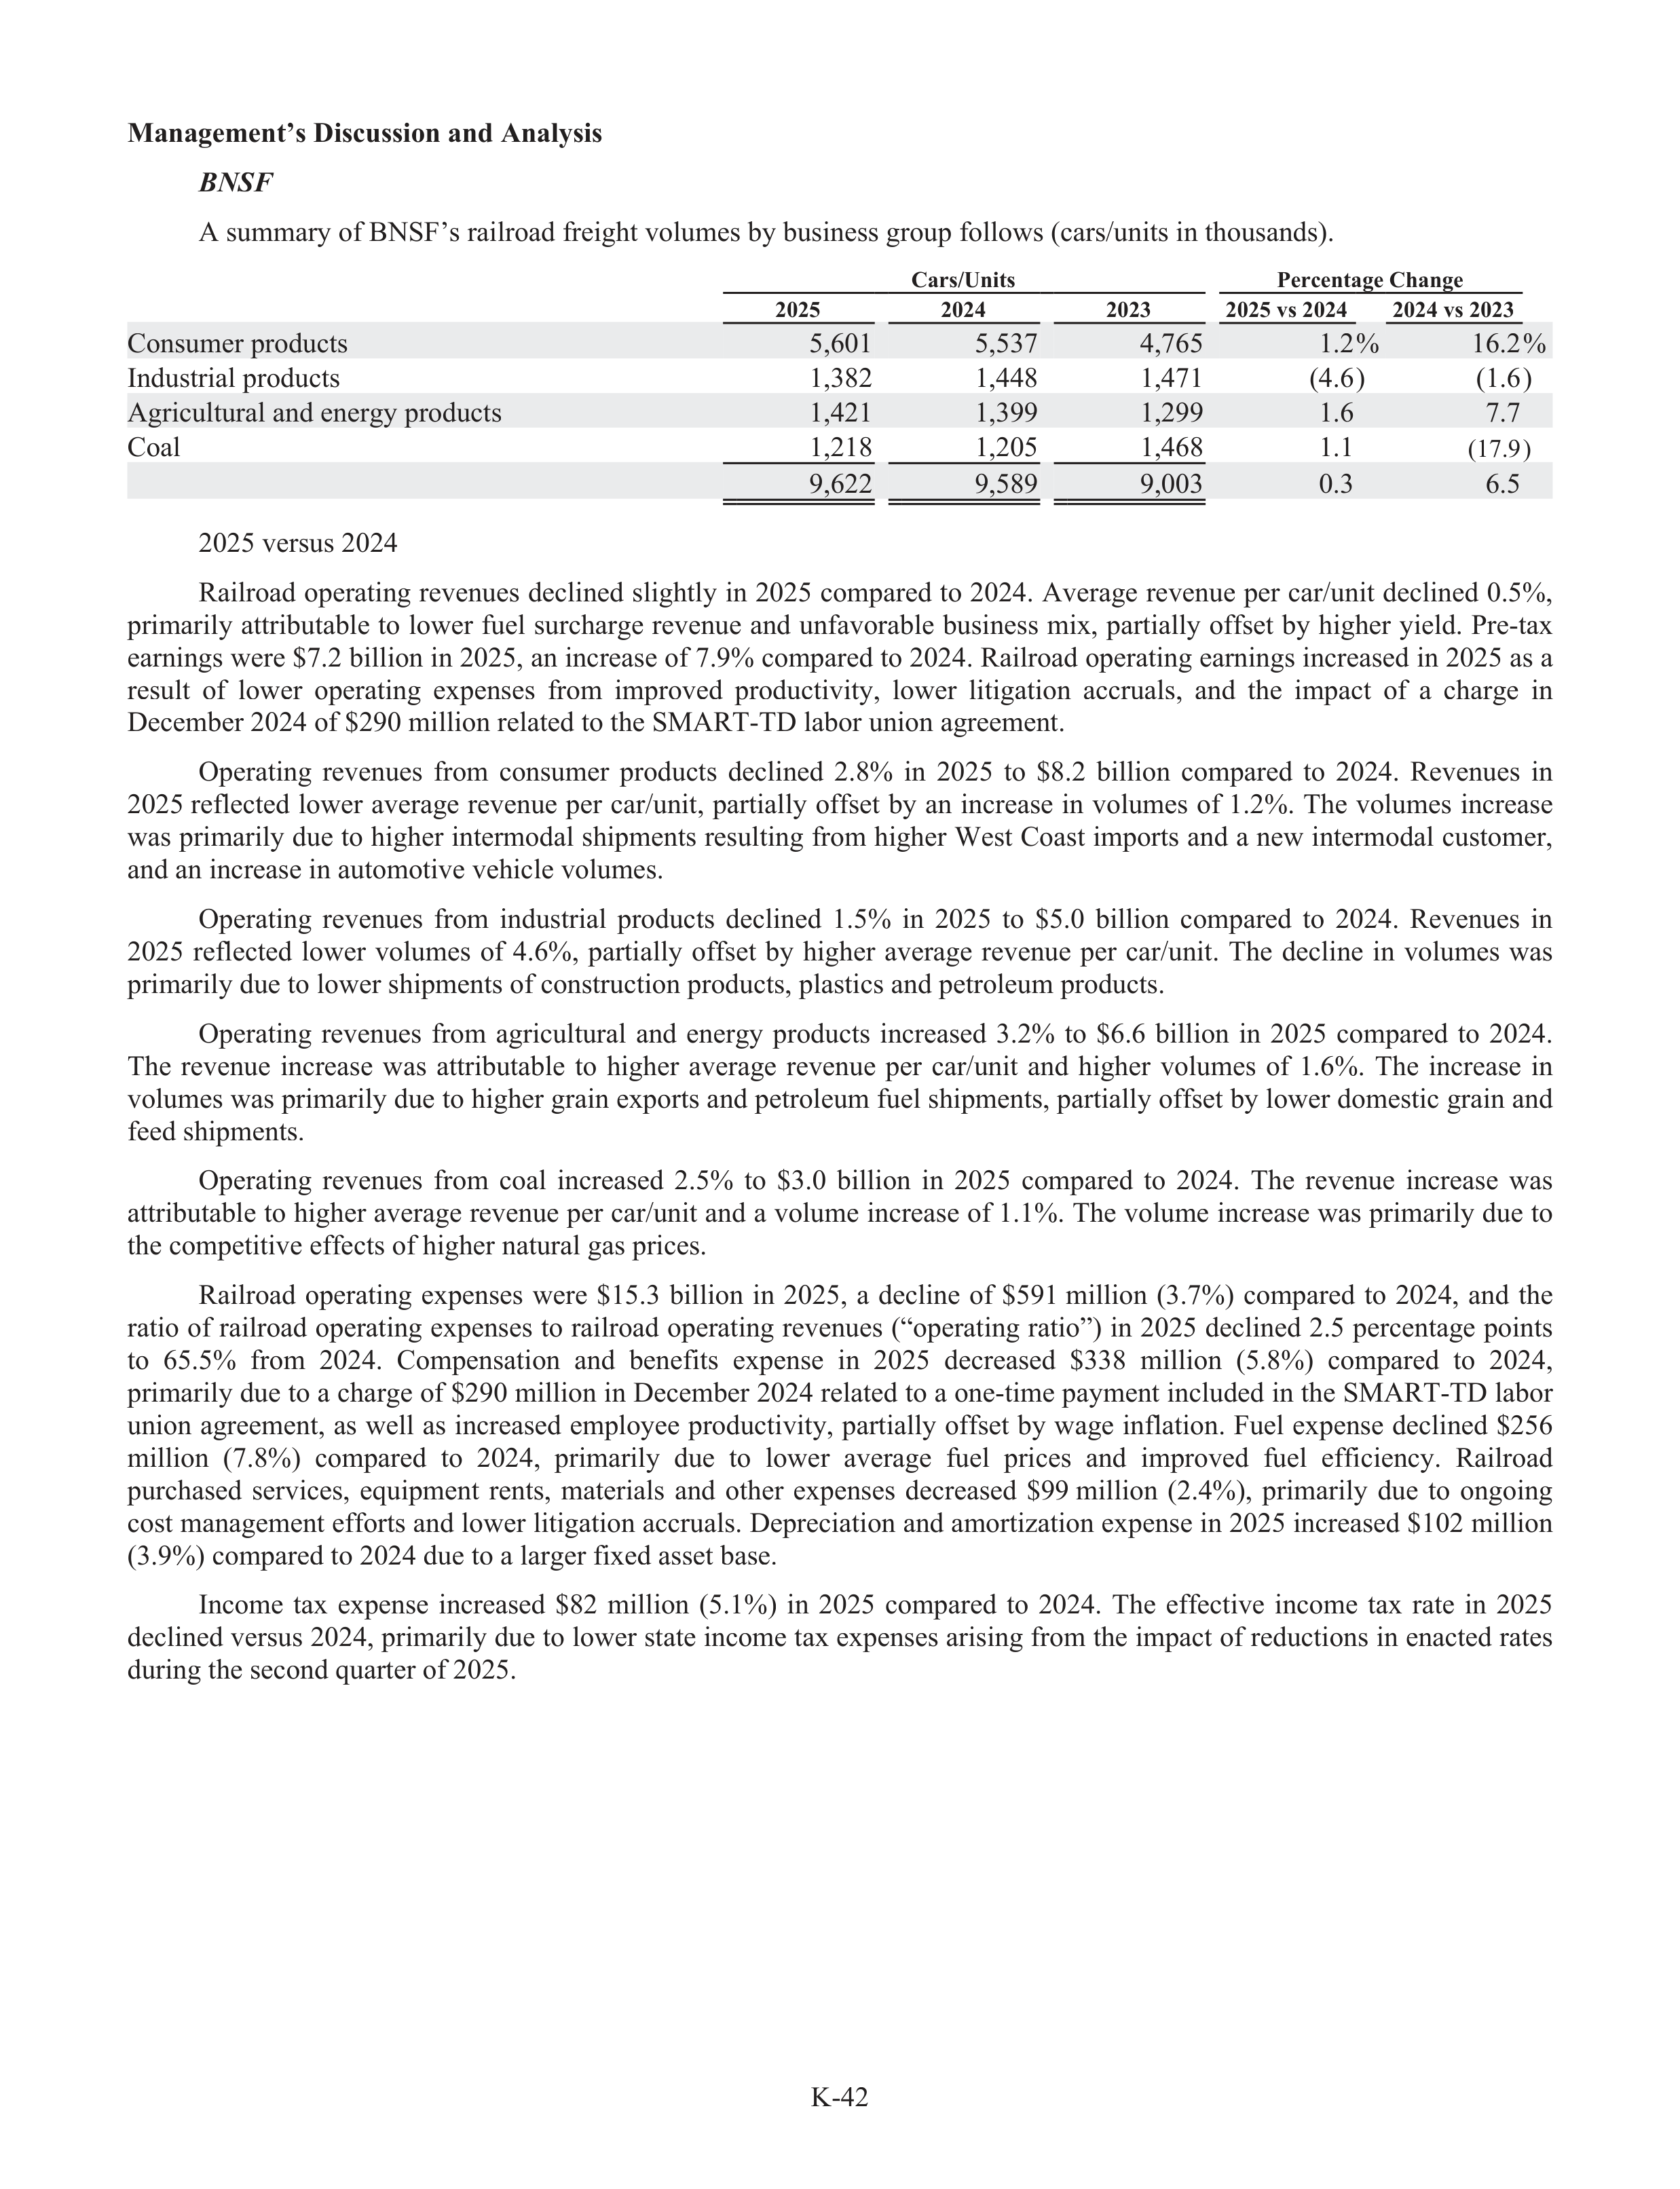
K-42
Management’s Discussion and Analysis
BNSF
N
A summary of BNSF’s railroad freight volumes by business group follows (cars/uni
/
ts in thousands).
Cars/Units
Percentage Change
2025
2024
2023
2025 vs 2024
2024 vs 2023
Consumer products
5,601
5,537
4,765
1.2%
16.2%
Industrial products
1,382
1,448
1,471
(4.6)
(1.6)
Agricultural and energy products
1,421
1,399
1,299
1.6
7.7
Coal
1,218
1,205
1,468
1.1
(17.9)
9,622
9,589
9,003
0.3
6.5
2025 versus 2024
Railroad operating revenues declined slightly in 2025 compared to 2024. Average revenue per car/u
r
nit declined 0.5%,
primarily attributable to lower fuel surcharge revenue and unfav
f
orable business mix, partially offs
f
et by higher yield. Pre-tax
earnings were $7.2 billion in 2025, an increase of 7.9% compared to 2024. Railroad operating earnings increased in 2025 as a
result
of
lower
operating
expenses
from
improved
productivity,
lower
litigation
accrua
r
ls,
and
the
impact
of
a
charge
in
December 2024 of $290 million related to the SMART-TD labor
a
union agreement.
Operating
revenues
from
consumer
products
declined
2.8%
in
2025
to
$8.2
billion
compared
to
2024.
Revenues
in
2025 reflected
lower
average
revenue
per
car/uni
/
t,
partially
offs
f
et
by
an
increase
in
volumes
of
1.2%.
The
volumes
increase
was primarily due to higher intermodal shipments resulting from higher West Coast imports and a new intermodal customer,
and an increase in automotive vehicle volumes.
Operating
revenues
from
industrial
products
declined
1.5%
in
2025
to
$5.0
billion
compared
to
2024.
Revenues
in
2025
reflected
lower
volumes
of
4.6%,
partially
offs
f
et
by
higher
average
revenue
per
car/u
r
nit.
The
decline
in
volumes
was
primarily due to lower shipments of construc
r
tion products, plastics and petroleum products.
Operating
revenues
from
agricultural
and
energy
products
increased
3.2%
to
$6.6
billion
in
2025
compared
to
2024.
The
revenue
increase
was
attributable
to
higher
average
revenue
per
car/u
r
nit
and
higher
volumes
of
1.6%.
The
increase
in
volumes was primarily due to higher grain exports and petroleum fuel shipments, partially offs
f
et by lower domestic grain and
feed shipments.
Operating
revenues
from
coal
increased
2.5%
to
$3.0
billion
in
2025
compared
to
2024.
The
revenue
increase
was
attributable to higher average revenue per car/uni
/
t and a volume increase of 1.1%. The volume increase was primarily due to
the competitive effe
f
cts of higher natural gas prices.
Railroad
operating
expenses
were
$15.3
billion
in
2025,
a
decline
of
$591 million
(3.7%)
compared
to
2024,
and
the
ratio of railroad operating expenses to railroad operating revenues (“operating ratio”) in 2025 declined 2.5 percentage points
to
65.5%
from
2024.
Compensation
and
benefits
expense
in
2025
decreased
$338
million
(5.8%)
compared
to
2024,
primarily due to a charge of $290 million in December 2024 related to a one-time payment included in the SMART-TD labor
a
union agreement, as well as increased employee productivity, partially offs
f
et by wage inflation. Fuel expense declined $256
million
(7.8%)
compared
to
2024,
primarily
due
to
lower
average
fuel
prices
and
improved
fuel
effi
f
ciency.
Railroad
purchased
services,
equipment
rents,
materials
and
other
expenses
decreased
$99 million
(2.4%),
primarily
due
to
ongoing
cost management effo
f
rts and lower litigation accrua
r
ls. Depreciation and amortization expense in 2025 increased $102 million
(3.9%) compared to 2024 due to a larger fixed asset base.
Income
tax
expense
increased
$82
million
(5.1%)
in
2025
compared
to
2024.
The
effe
f
ctive
income
tax
rate
in
2025
declined versus 2024, primarily due to lower state income tax expenses arising from the impact of reductions in enacted rates
during the second quarter of 2025.
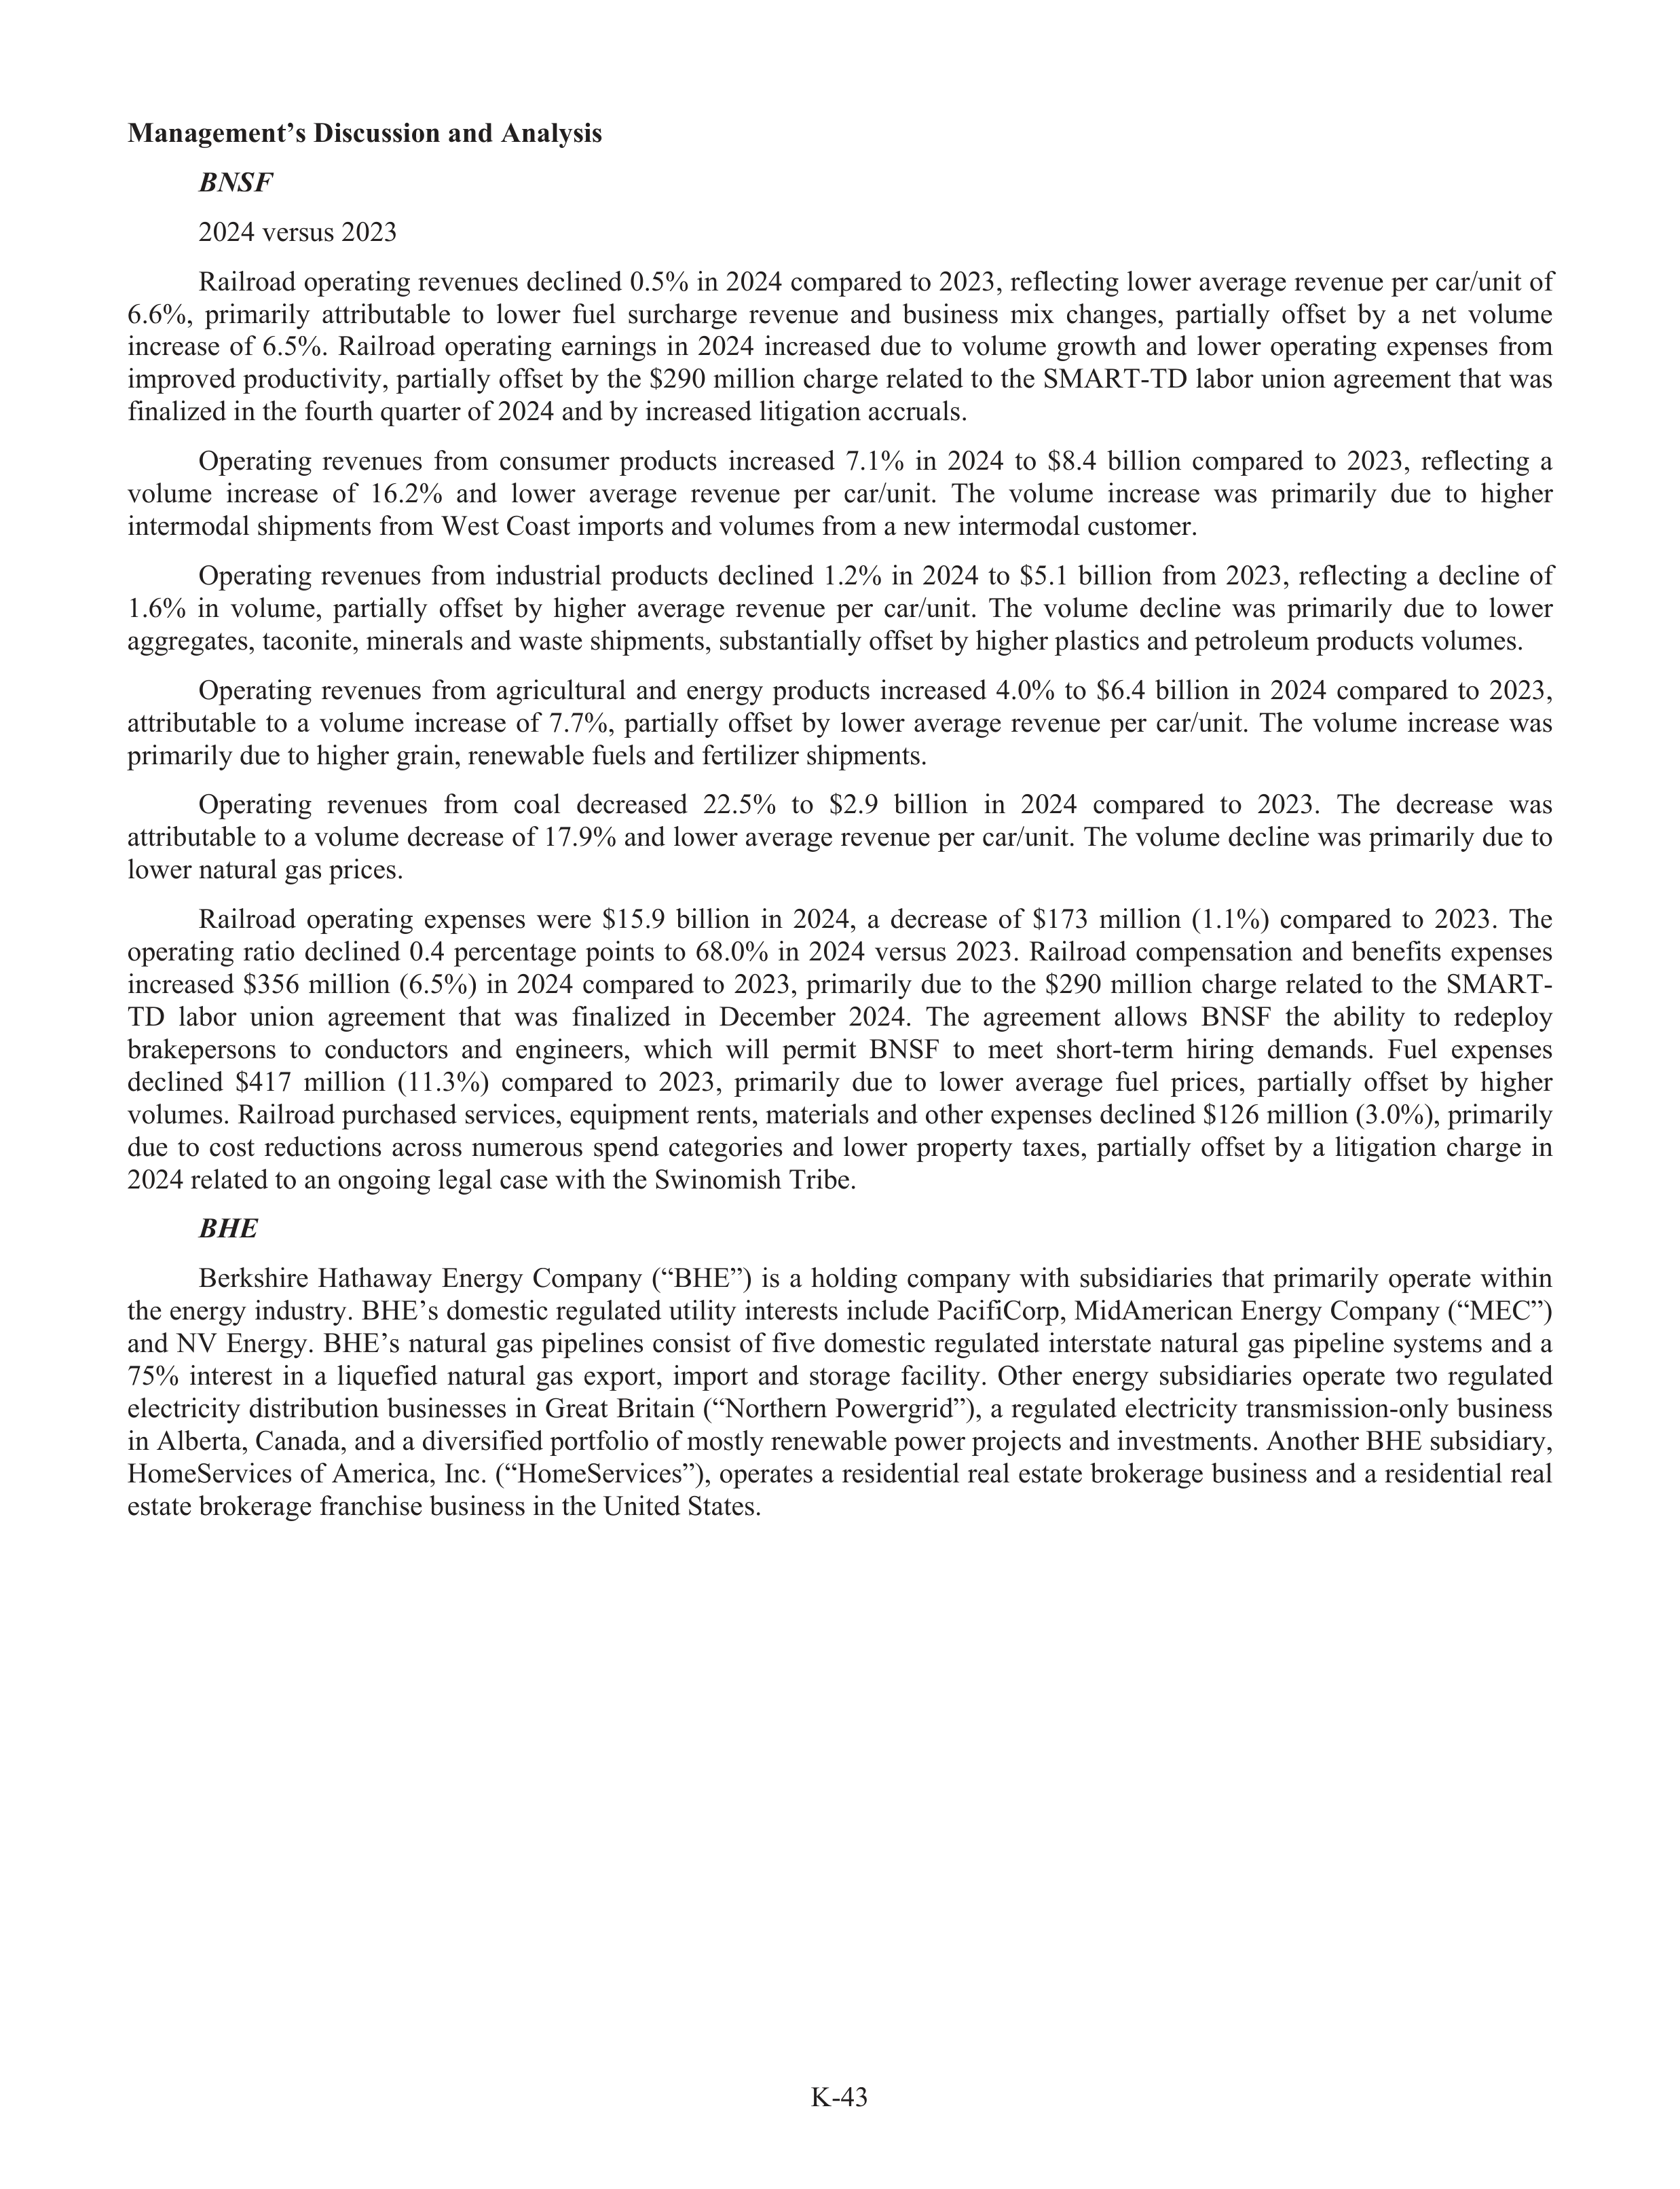
K-43
Management’s Discussion and Analysis
BNSF
N
2024 versus 2023
Railroad operating revenues declined 0.5% in 2024 compared to 2023, reflecting lower average revenue per car/uni
/
t of
6.6%,
primarily
attributable
to
lower
fuel
surcharge
revenue
and
business
mix
changes,
partially
offs
f
et
by
a
net
volume
increase
of
6.5%.
Railroad
operating
earnings
in
2024
increased
due
to
volume
growth
and
lower
operating
expenses
from
improved productivity, partially offs
f
et by the $290 million charge related to the SMART-TD labor
a
union agreement that was
finalized in the fourth quarter of 2024 and by increased litigation accrua
r
ls.
Operating
revenues
from
consumer
products
increased
7.1%
in
2024
to
$8.4
billion
compared
to
2023,
reflecting
a
volume
increase
of
16.2%
and
lower
average
revenue
per
car/uni
/
t.
The
volume
increase
was
primarily
due
to
higher
intermodal shipments from West Coast imports and volumes from a new intermodal customer.
Operating
revenues
from
industrial
products
declined
1.2%
in
2024
to
$5.1
billion
from
2023,
reflecting
a
decline
of
1.6%
in
volume,
partially
offs
f
et
by
higher
average
revenue
per
car/u
r
nit.
The
volume
decline
was
primarily
due
to
lower
aggregates, taconite, minerals and waste shipments, subs
u
tantially offs
f
et by higher plastics and petroleum products volumes.
Operating
revenues
from
agricultural
and
energy
products
increased
4.0%
to
$6.4
billion
in
2024
compared
to
2023,
attributable
to
a
volume
increase
of
7.7%,
partially
offs
f
et
by
lower
average
revenue
per
car/u
r
nit.
The
volume
increase
was
primarily due to higher grain, renewabl
a
e fuels and fertilizer shipments.
Operating
revenues
from
coal
decreased
22.5%
to
$2.9
billion
in
2024
compared
to
2023.
The
decrease
was
attributable to a volume decrease of 17.9% and lower average revenue per car/u
r
nit. The volume decline was primarily due to
lower natural gas prices.
Railroad
operating
expenses
were
$15.9
billion
in
2024,
a
decrease
of
$173
million
(1.1%)
compared
to
2023.
The
operating
ratio
declined
0.4
percentage
points
to
68.0%
in
2024
versus
2023.
Railroad
compensation
and
benefits
expenses
increased
$356
million
(6.5%)
in
2024
compared
to
2023,
primarily
due
to
the
$290
million
charge
related
to
the
SMART-
TD
labor
a
union
agreement
that
was
finalized
in
December
2024.
The
agreement
allows
BNSF
the
ability
to
redeploy
brakepersons
to
conductors
and
engineers,
which
will
permit
BNSF
to
meet
short-term
hiring
demands.
Fuel
expenses
declined
$417
million
(11.3%)
compared
to
2023,
primarily
due
to
lower
average
fuel
prices,
partially
offs
f
et
by
higher
volumes. Railroad purchased services, equipment rents, materials and other expenses declined $126 million (3.0%), primarily
due
to
cost
reductions
across
numerous
spend
categories
and
lower
property
taxes,
partially
offs
f
et
by
a
litigation
charge
in
2024 related to an ongoing legal case with the Swinomish Tribe.
BHE
H
Berkshire
Hathaway
Energy
Company
(“BHE”)
is
a
holding
company
with
subs
u
idiaries
that
primarily
operate
within
the energy industry.
r
BHE’s domestic regulated utility interests include PacifiCorp, MidAmerican Energy Company (“MEC”)
and NV Energy. BHE’s natur
t
al gas pipelines consist of five domestic regulated interstate natural gas pipeline systems and a
75%
interest
in
a
liquefied
natural
gas
export,
import
and
storage
facility.
Other
energy
subs
u
idiaries
operate
two
regulated
electricity distribution businesses in Great Britain (“Northern Powergrid”), a regulated electricity transmission-only business
in Alberta, Canada, and a diversifie
f
d portfol
f
io of mostly renewabl
a
e power projects and investments. Another BHE subs
u
idiary,
HomeServices of America, Inc. (“HomeServices”), operates a residential real estate brokerage business and a residential real
estate brokerage franchise business in the United States.
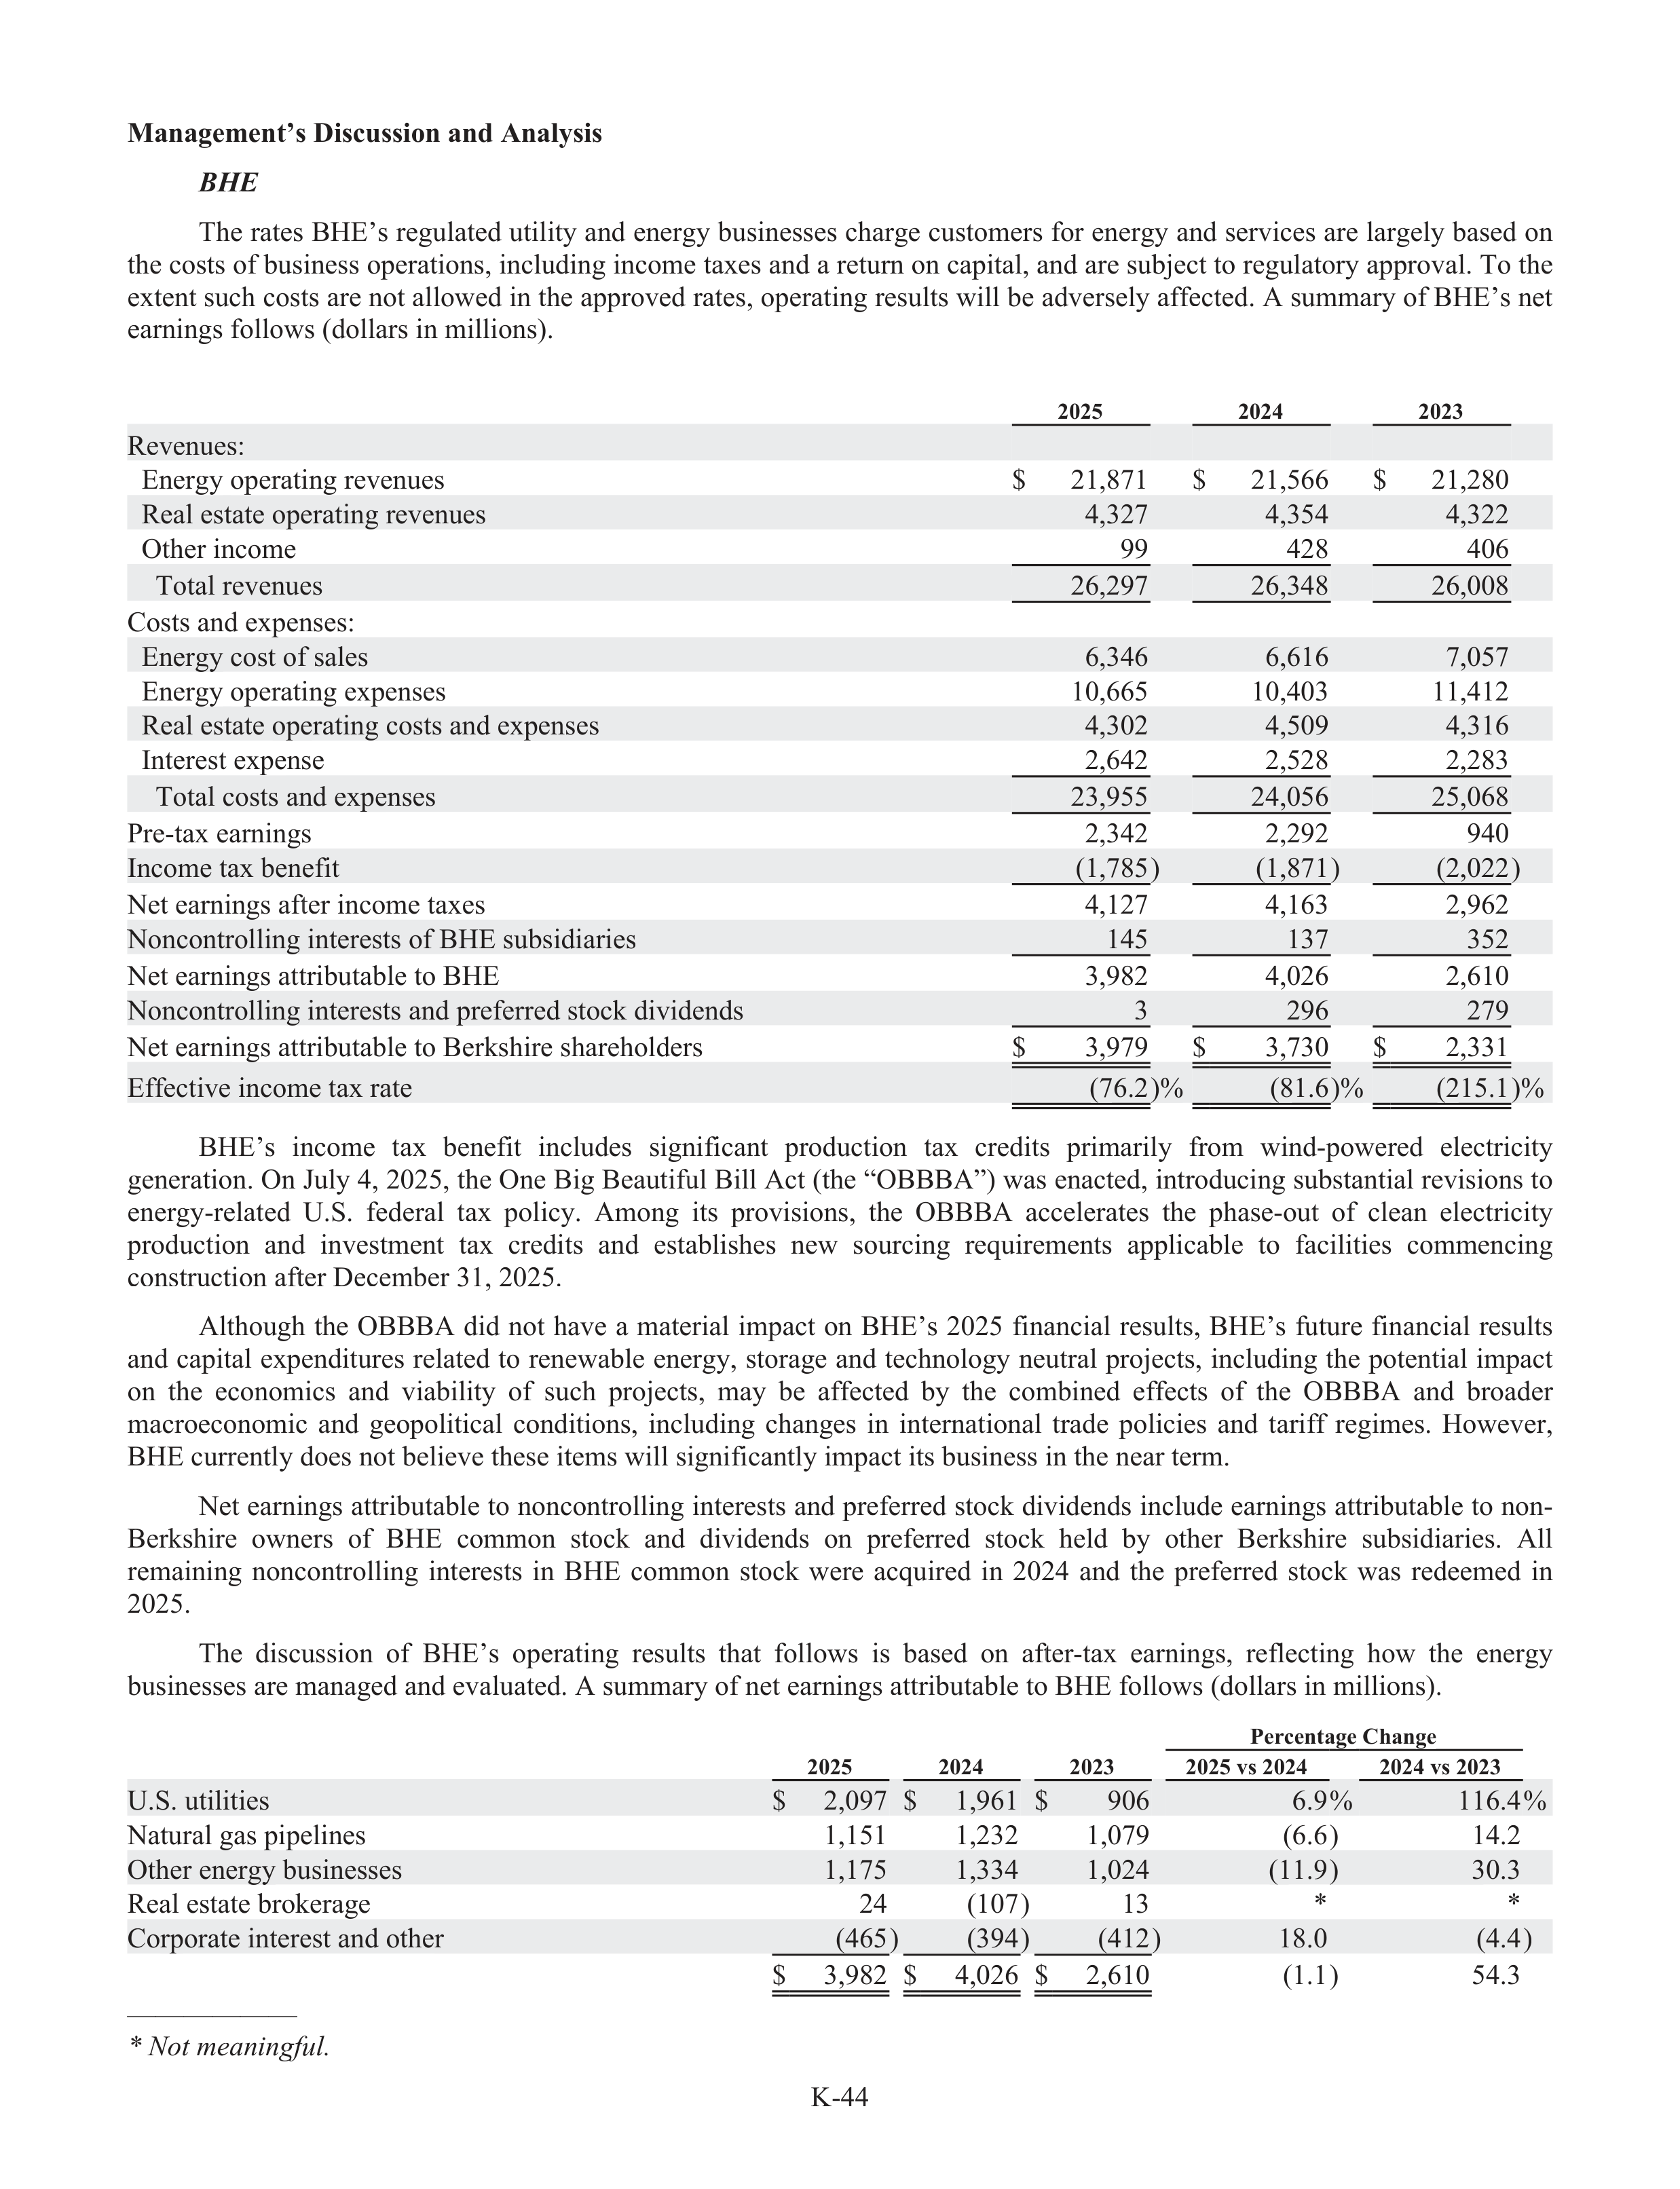
K-44
Management’s Discussion and Analysis
BHE
H
The rates BHE’s regulated utility and energy businesses charge customers for energy and services are largely based on
the costs of business operations, including income taxes and a return on capital, and are subj
u
ect to regulatory
r
approval. To the
extent such costs are not allowed in the approved rates, operating results will be adversely affe
f
cted. A summary of BHE’s net
earnings follows (dollars in millions).
2025
2024
2023
Revenues:
Energy operating revenues
$
21,871
$
21,566
$
21,280
Real estate operating revenues
4,327
4,354
4,322
Other income
99
428
406
Total revenues
26,297
26,348
26,008
Costs and expenses:
Energy cost of sales
6,346
6,616
7,057
Energy operating expenses
10,665
10,403
11,412
Real estate operating costs and expenses
4,302
4,509
4,316
Interest expense
2,642
2,528
2,283
Total costs and expenses
23,955
24,056
25,068
Pre-tax earnings
2,342
2,292
940
Income tax benefit
(1,785)
(1,871)
(2,022)
Net earnings afte
f
r income taxes
4,127
4,163
2,962
Noncontrolling interests of BHE subs
u
idiaries
145
137
352
Net earnings attributable to BHE
3,982
4,026
2,610
Noncontrolling interests and prefer
f
red stock dividends
3
296
279
Net earnings attributable to Berkshire shareholders
$
3,979
$
3,730
$
2,331
Effe
f
ctive income tax rate
(76.2)%
(81.6)%
(215.1)%
BHE’s
income
tax
benefit
includes
significant
production
tax
credits
primarily
from
wind-powered
electricity
generation. On July 4, 2025, the One Big Beautiful
f
Bill Act (the “OBBBA”) was enacted, introducing subs
u
tantial revisions to
energy-related
U.S.
federal
tax
policy.
Among
its
provisions,
the
OBBBA
accelerates
the
phase-out
of
clean
electricity
production
and
investment
tax
credits
and
establ
a
ishes
new
sourcing
requirements
applicable
to
facilities
commencing
construc
r
tion afte
f
r December 31, 2025.
Although
the
OBBBA
did
not
have
a
material
impact
on
BHE’s
2025
financial
results,
BHE’s
future
financial
results
and capital expenditures related to renewabl
a
e energy, storage and technology neutral projects, including the potential impact
on
the
economics
and
viability
of
such
projects,
may
be
affe
f
cted
by
the
combined
effe
f
cts
of
the
OBBBA
and
broader
macroeconomic
and
geopolitical
conditions,
including
changes
in
international
trade
policies
and
tariff
regimes.
However,
BHE currently does not believe these items will significantly impact its business in the near term.
Net earnings attributable to noncontrolling interests and prefer
f
red stock dividends include earnings attributable to non-
Berkshire
owners
of
BHE
common
stock
and
dividends
on
prefer
f
red
stock
held
by
other
Berkshire
subs
u
idiaries.
All
remaining
noncontrolling
interests
in
BHE
common
stock
were
acquired
in
2024
and
the
prefer
f
red
stock
was
redeemed
in
2025.
The
discussion
of
BHE’s
operating
results
that
follows
is
based
on
afte
f
r-tax
earnings,
reflecting
how
the
energy
businesses are managed and evaluated. A summary of net earnings attributable to BHE follows (dollars in millions).
Percentage Change
2025
2024
2023
2025 vs 2024
2024 vs 2023
U.S. utilities
$
2,097
$
1,961
$
906
6.9%
116.4%
Natural gas pipelines
1,151
1,232
1,079
(6.6)
14.2
Other energy businesses
1,175
1,334
1,024
(11.9)
30.3
Real estate brokerage
24
(107)
13
*
*
Corporate interest and other
(465)
(394)
(412)
18.0
(4.4)
$
3,982
$
4,026
$
2,610
(1.1)
54.3
——————
* Not meaningful
f
.
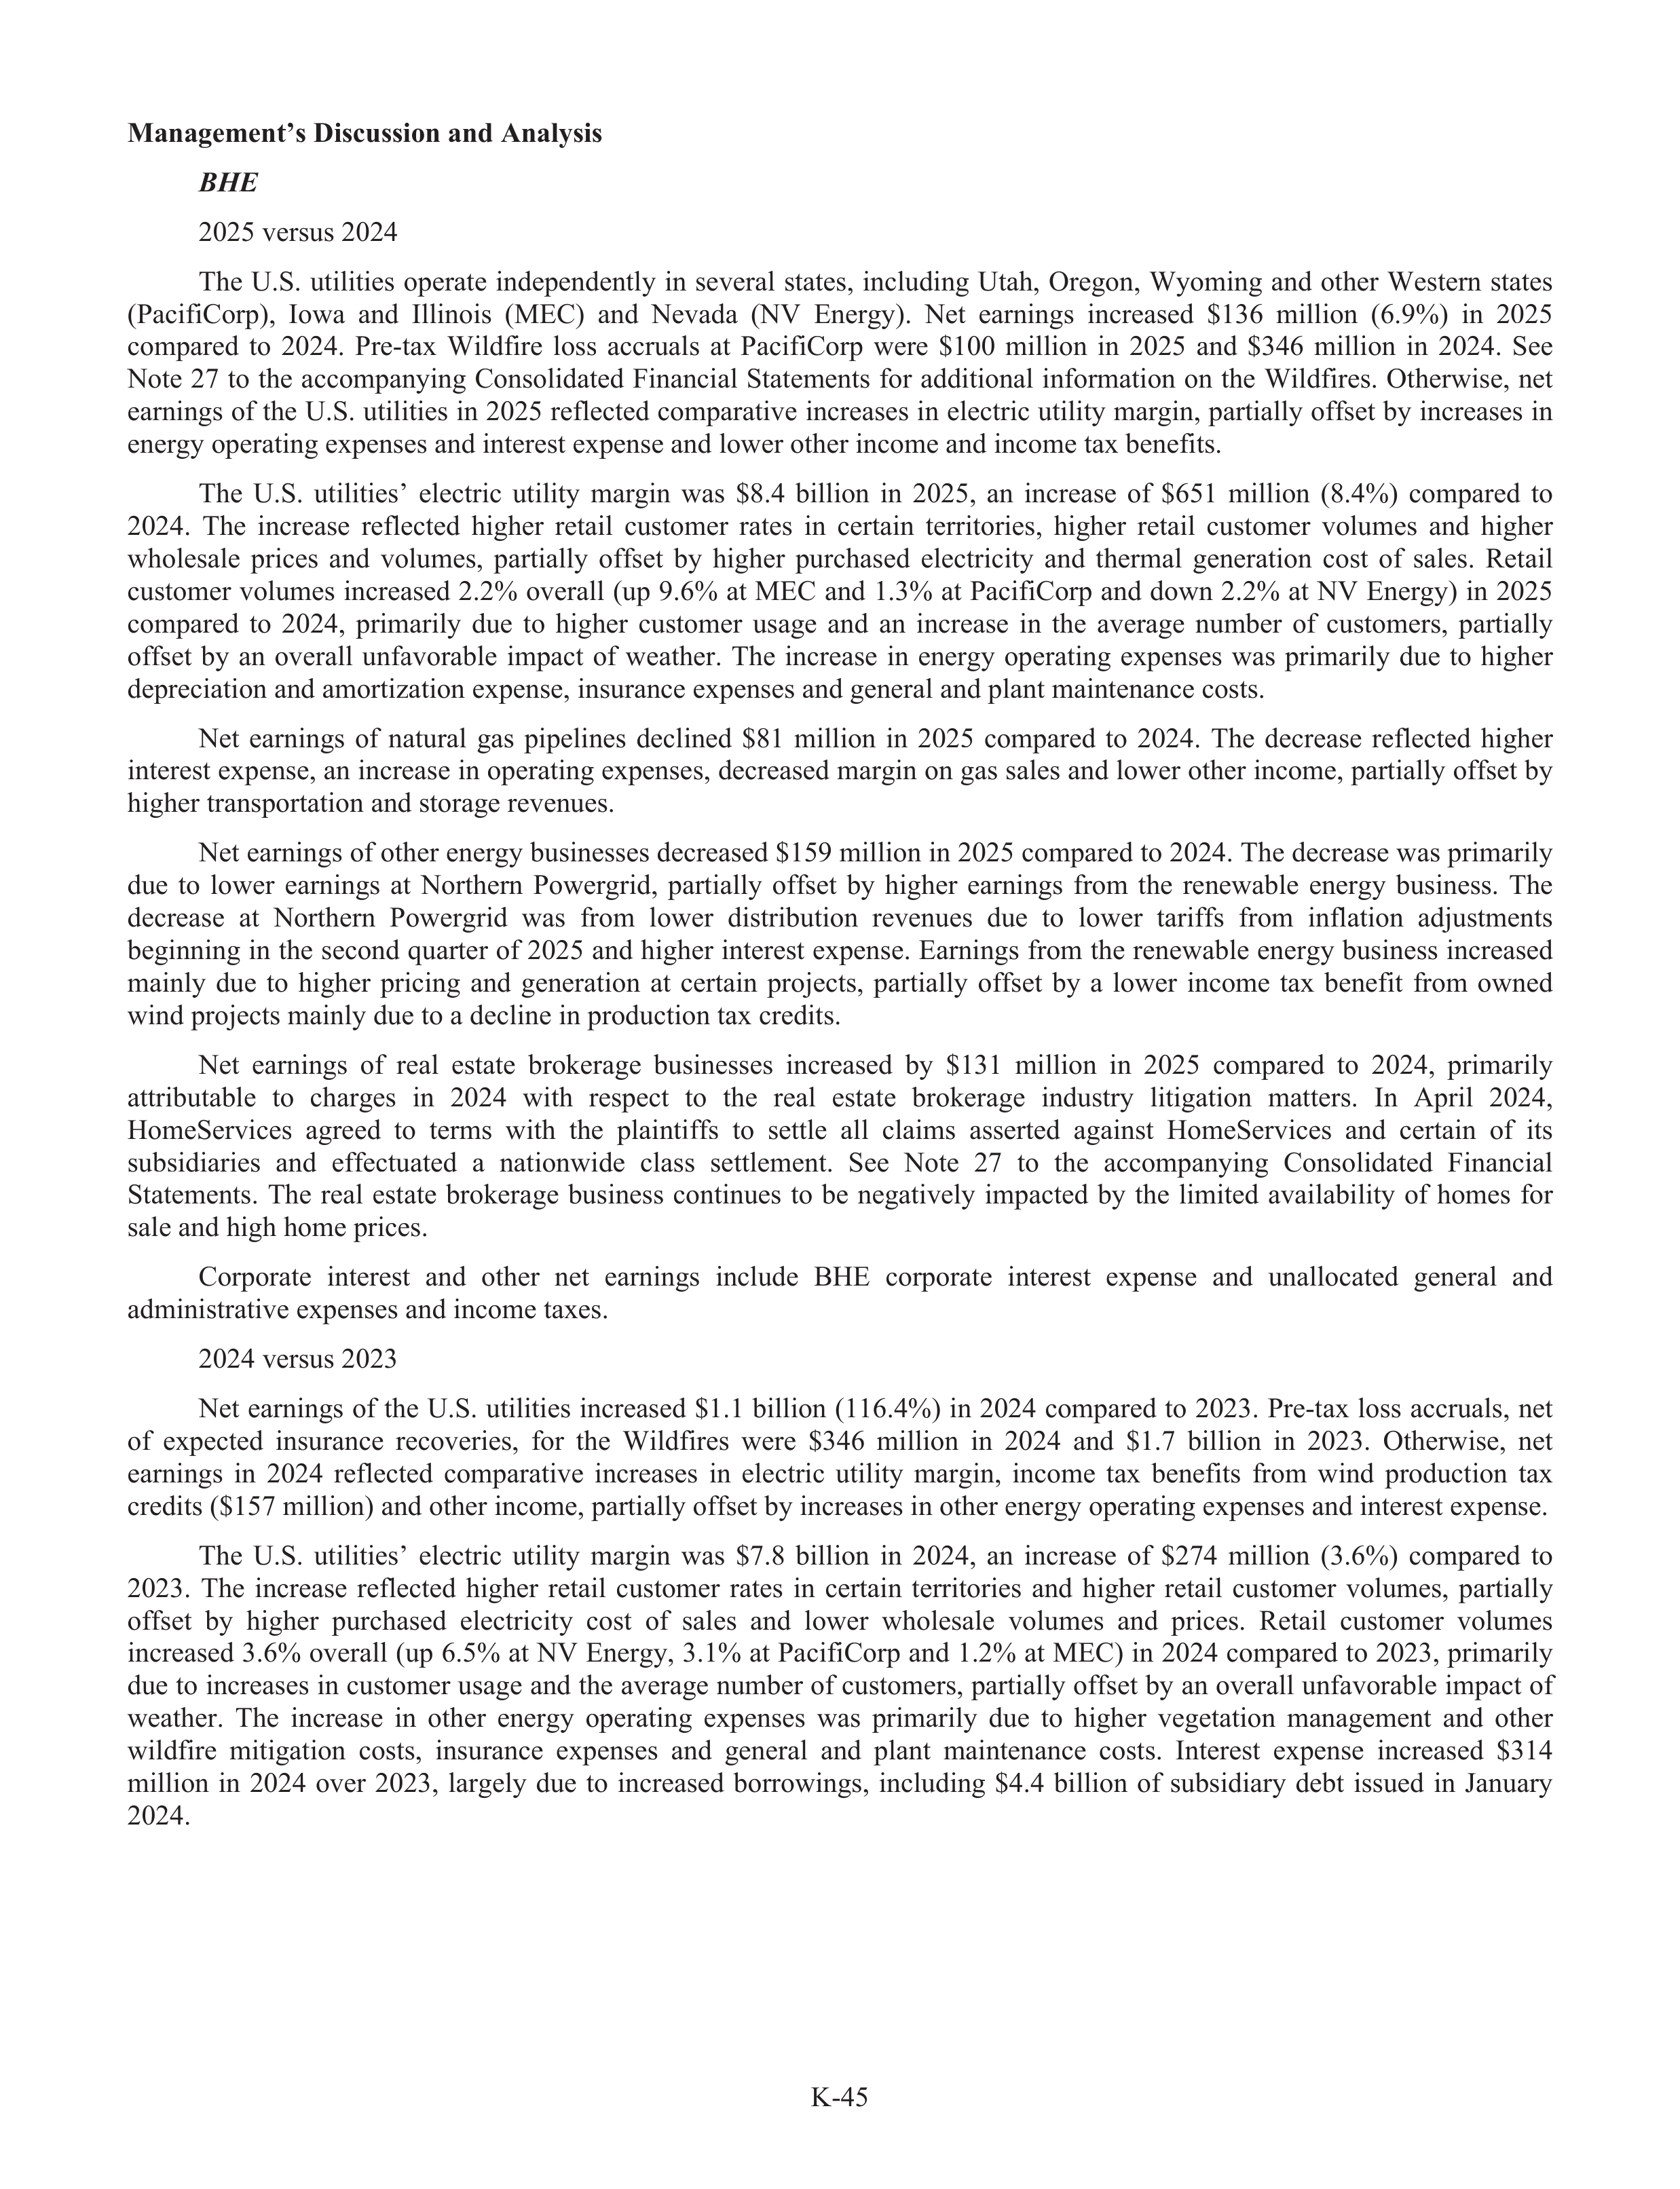
K-45
Management’s Discussion and Analysis
BHE
H
2025 versus 2024
The
U.S.
utilities
operate
independently
in
several
states,
including
Utah,
Oregon,
Wyoming
and
other
Western
states
(PacifiCorp),
Iowa
and
Illinois
(MEC)
and
Nevada
(NV
Energy).
Net
earnings
increased
$136
million
(6.9%)
in
2025
compared
to
2024.
Pre-tax
Wildfire
loss
accrua
r
ls
at
PacifiCorp
were
$100
million
in
2025
and
$346
million
in
2024.
See
Note
27
to
the
accompanying
Consolidated
Financial
Statements
for
additional
information
on
the
Wildfires.
Otherwise,
net
earnings of the U.S. utilities in 2025 reflected comparative increases in electric utility margin, partially offs
f
et by increases in
energy operating expenses and interest expense and lower other income and income tax benefits.
The
U.S.
utilities’
electric
utility
margin
was
$8.4
billion
in
2025,
an
increase
of
$651
million
(8.4%)
compared
to
2024.
The
increase
reflected
higher
retail
customer
rates
in
certain
territories,
higher
retail
customer
volumes
and
higher
wholesale
prices
and
volumes,
partially
offs
f
et
by
higher
purchased
electricity
and
thermal
generation
cost
of
sales.
Retail
customer volumes increased 2.2% overall (up
u
9.6% at MEC and 1.3% at PacifiCorp and down 2.2% at NV Energy) in 2025
compared
to
2024,
primarily
due
to
higher
customer
usage
and
an
increase
in
the
average
number
of
customers,
partially
offs
f
et
by
an
overall
unfav
f
orable
impact
of
weather.
The
increase
in
energy
operating
expenses
was
primarily
due
to
higher
depreciation and amortization expense, insurance expenses and general and plant maintenance costs.
Net
earnings
of
natural
gas
pipelines
declined
$81
million
in
2025
compared
to
2024.
The
decrease
reflected
higher
interest expense, an increase in operating expenses, decreased margin on gas sales and lower other income, partially offs
f
et by
higher transportation and storage revenues.
Net earnings of other energy businesses decreased $159 million in 2025 compared to 2024. The decrease was primarily
due
to
lower
earnings
at
Northern
Powergrid,
partially
offs
f
et
by
higher
earnings
from
the
renewabl
a
e
energy
business.
The
decrease
at
Northern
Powergrid
was
from
lower
distribution
revenues
due
to
lower
tariffs
from
inflation
adju
d
stments
beginning in the second quarter of 2025 and higher interest expense. Earnings from the renewabl
a
e energy business increased
mainly
due
to
higher
pricing
and
generation
at
certain
projects,
partially
offs
f
et
by
a
lower
income
tax
benefit
from
owned
wind projects mainly due to a decline in production tax credits.
Net
earnings
of
real
estate
brokerage
businesses
increased
by
$131
million
in
2025
compared
to
2024,
primarily
attributable
to
charges
in
2024
with
respect
to
the
real
estate
brokerage
industry
r
litigation
matters.
In
April
2024,
HomeServices
agreed
to
terms
with
the
plaintiffs
f
to
settle
all
claims
asserted
against
HomeServices
and
certain
of
its
subs
u
idiaries
and
effe
f
ctua
t
ted
a
nationwide
class
settlement.
See
Note
27
to
the
accompanying
Consolidated
Financial
Statements.
The
real
estate
brokerage
business
continues
to
be
negatively
impacted
by
the
limited
availabi
a
lity
of
homes
for
sale and high home prices.
Corporate
interest
and
other
net
earnings
include
BHE
corporate
interest
expense
and
unallocated
general
and
administrative expenses and income taxes.
2024 versus 2023
Net earnings of the U.S. utilities increased $1.1 billion (116.4%) in 2024 compared to 2023. Pre-tax loss accrua
r
ls, net
of
expected
insurance
recoveries,
for
the
Wildfires
were
$346
million
in
2024
and
$1.7
billion
in
2023.
Otherwise,
net
earnings
in
2024
reflected
comparative
increases
in
electric
utility
margin,
income
tax
benefits
from
wind
production
tax
credits ($157 million) and other income, partially offs
f
et by increases in other energy operating expenses and interest expense.
The
U.S.
utilities’
electric
utility
margin
was
$7.8
billion
in
2024,
an
increase
of
$274
million
(3.6%)
compared
to
2023.
The
increase
reflected
higher
retail
customer
rates
in
certain
territories
and
higher
retail
customer
volumes,
partially
offs
f
et
by
higher
purchased
electricity
cost
of
sales
and
lower
wholesale
volumes
and
prices.
Retail
customer
volumes
increased 3.6% overall (up
u
6.5% at NV Energy, 3.1% at PacifiCorp and 1.2% at MEC) in 2024 compared to 2023, primarily
due to increases in customer usage and the average number of customers, partially offs
f
et by an overall unfav
f
orable impact of
weather.
The
increase
in
other
energy
operating
expenses
was
primarily
due
to
higher
vegetation
management
and
other
wildfire
mitigation
costs,
insurance
expenses
and
general
and
plant
maintenance
costs.
Interest
expense
increased
$314
million
in
2024
over
2023,
largely
due
to
increased
borrowings,
including
$4.4
billion
of
subs
u
idiary
debt
issued
in
January
2024.
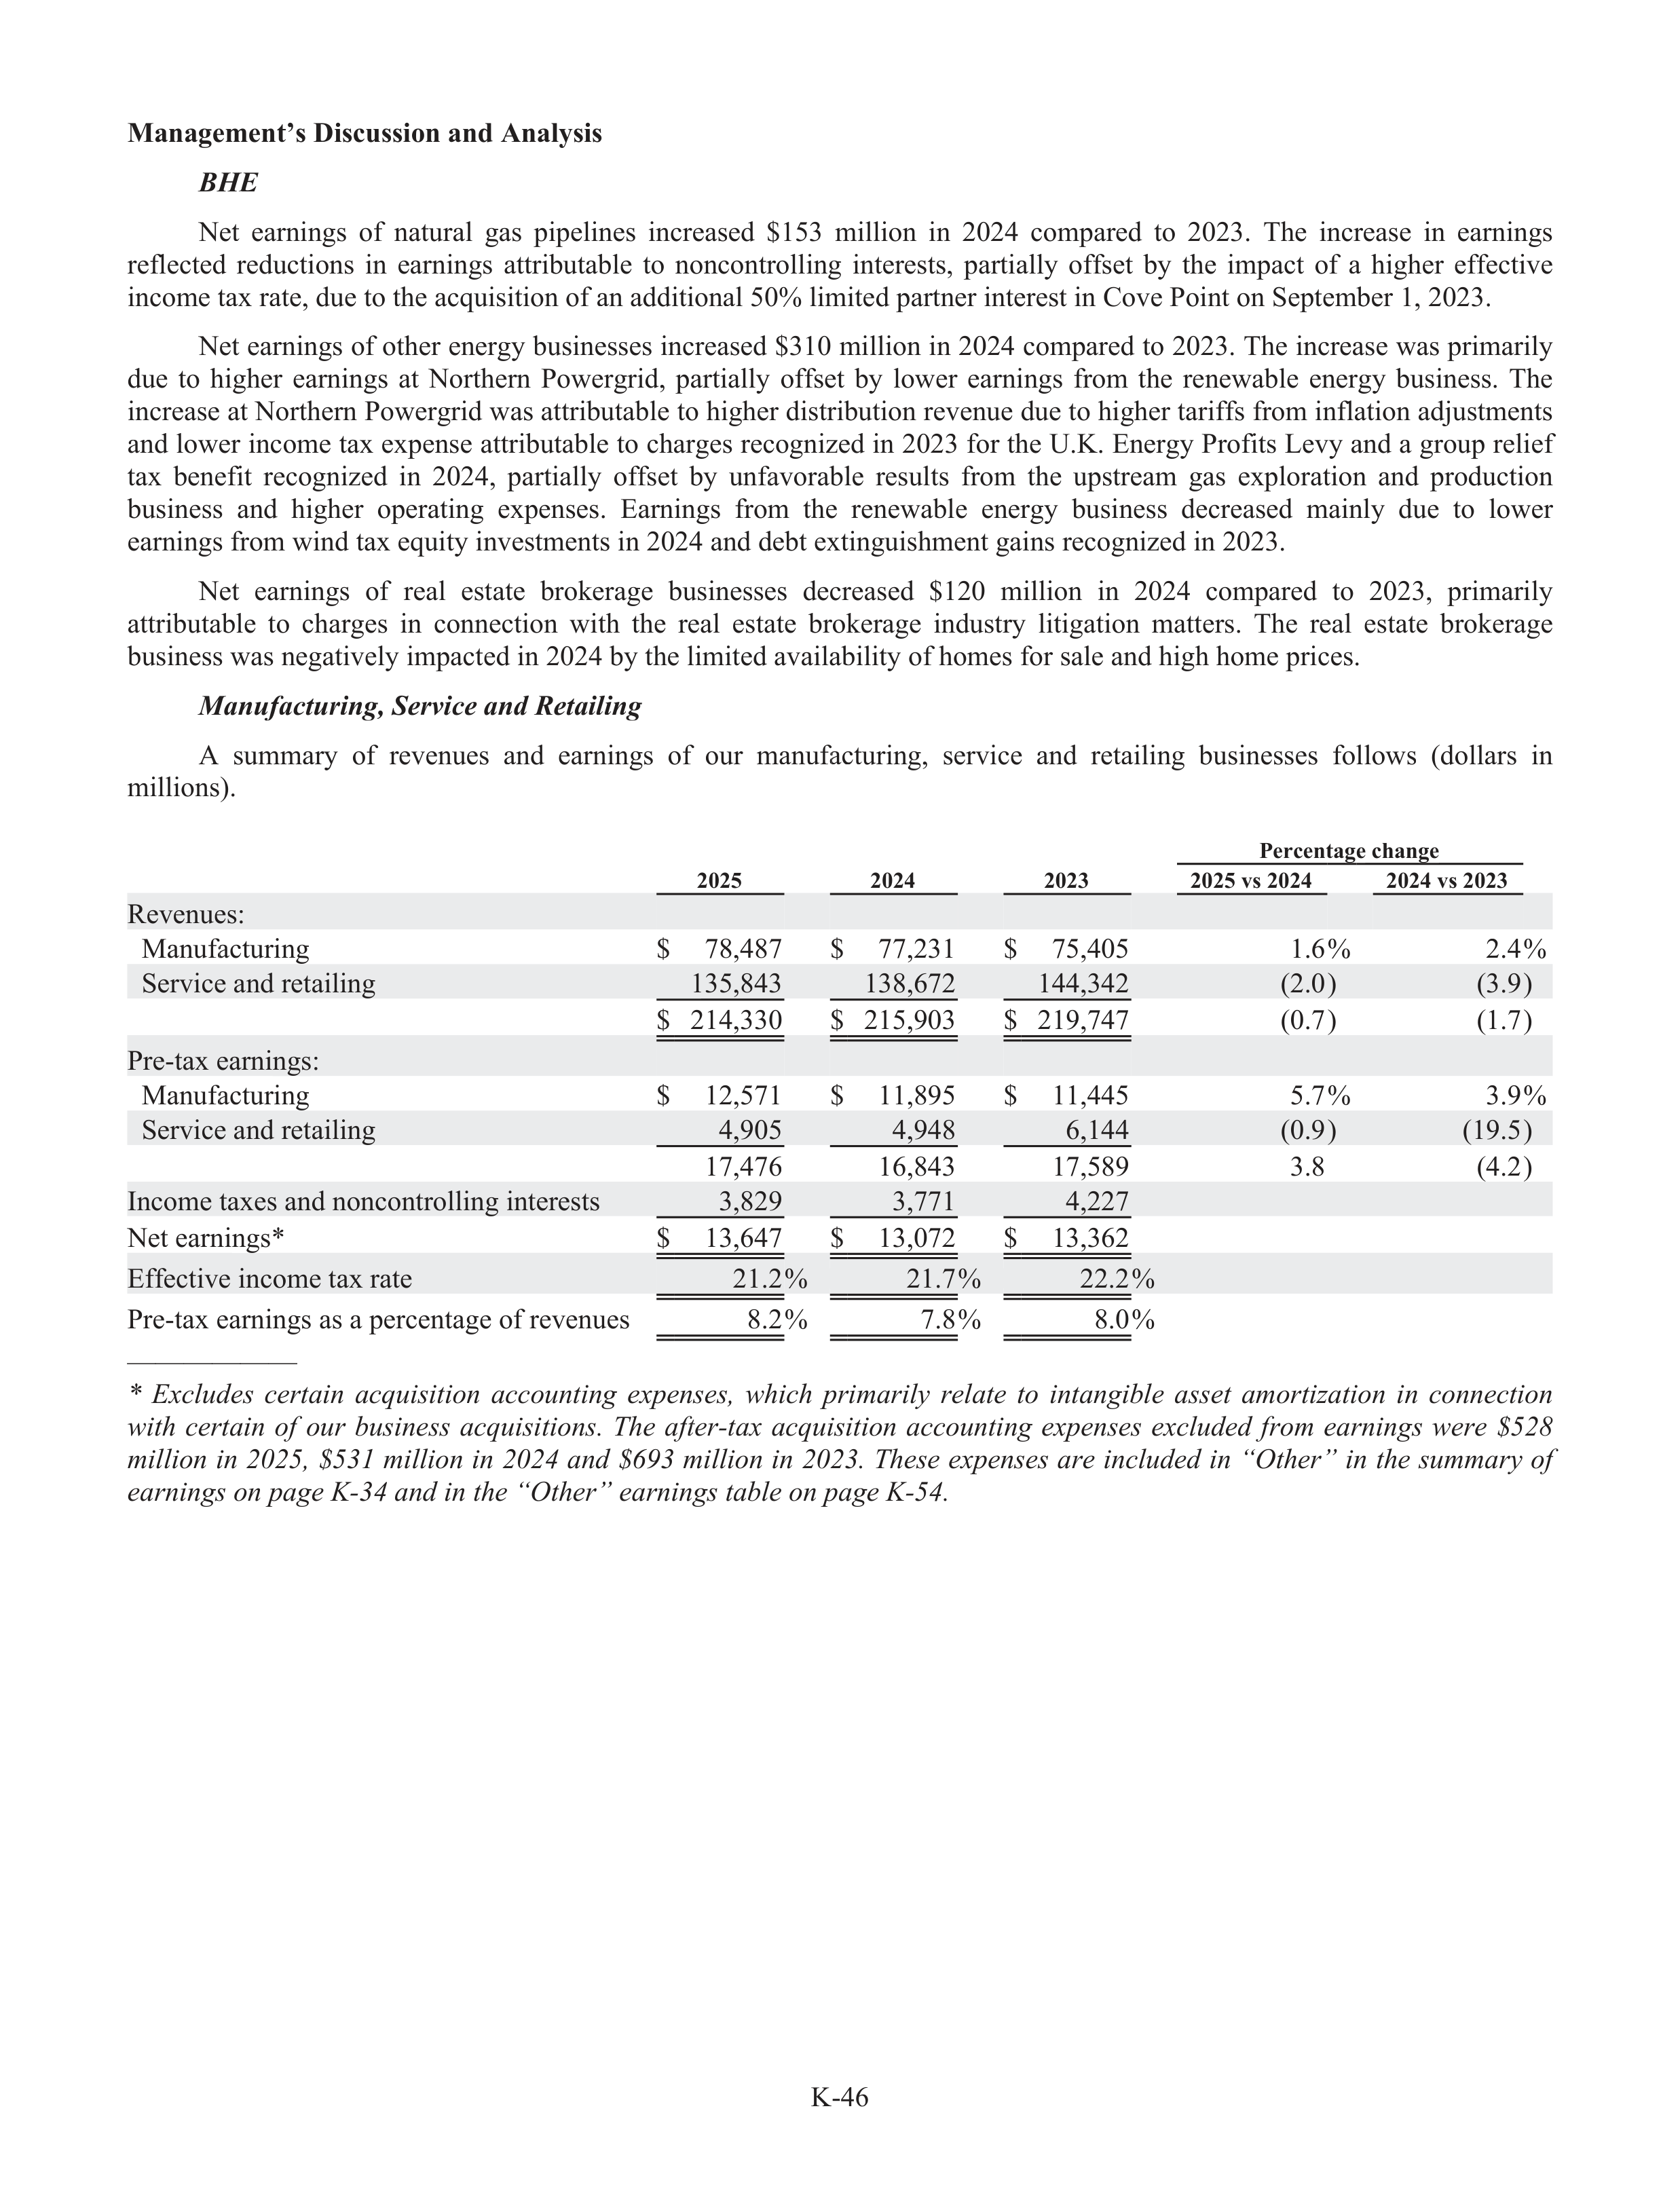
K-46
Management’s Discussion and Analysis
BHE
H
Net
earnings
of
natural
gas
pipelines
increased
$153
million
in
2024
compared
to
2023.
The
increase
in
earnings
reflected
reductions
in
earnings
attributable
to
noncontrolling
interests,
partially
offs
f
et
by
the
impact
of
a
higher
effe
f
ctive
income tax rate, due to the acquisition of an additional 50% limited partner interest in Cove Point on September 1, 2023.
Net earnings of other energy businesses increased $310 million in 2024 compared to 2023. The increase was primarily
due
to
higher
earnings
at
Northern
Powergrid,
partially
offs
f
et
by
lower
earnings
from
the
renewabl
a
e
energy
business.
The
increase at Northern Powergrid was attributable to higher distribution revenue due to higher tariffs from inflation adju
d
stments
and lower income tax expense attributable to charges recognized in 2023 for the U.K. Energy Profits
f
Levy and a group relief
tax
benefit
recognized
in
2024,
partially
offs
f
et
by
unfav
f
orable
results
from
the
upstream
gas
exploration
and
production
business
and
higher
operating
expenses.
Earnings
from
the
renewabl
a
e
energy
business
decreased
mainly
due
to
lower
earnings from wind tax equity investments in 2024 and debt extinguishment gains recognized in 2023.
Net
earnings
of
real
estate
brokerage
businesses
decreased
$120
million
in
2024
compared
to
2023,
primarily
attributable
to
charges
in
connection
with
the
real
estate
brokerage
industry
r
litigation
matters.
The
real
estate
brokerage
business was negatively impacted in 2024 by the limited availabi
a
lity of homes for sale and high home prices.
Manufac
f
turing
i
,g
Service and Retailing
A
summary
of
revenues
and
earnings
of
our
manufact
f
ur
t
ing,
service
and
retailing
businesses
follows
(dollars
in
millions).
Percentage change
2025
2024
2023
2025 vs 2024
2024 vs 2023
Revenues:
Manufact
f
ur
t
ing
$
78,487
$
77,231
$
75,405
1.6%
2.4%
Service and retailing
135,843
138,672
144,342
(2.0)
(3.9)
$
214,330
$
215,903
$
219,747
(0.7)
(1.7)
Pre-tax earnings:
Manufact
f
ur
t
ing
$
12,571
$
11,895
$
11,445
5.7%
3.9%
Service and retailing
4,905
4,948
6,144
(0.9)
(19.5)
17,476
16,843
17,589
3.8
(4.2)
Income taxes and noncontrolling interests
3,829
3,771
4,227
Net earnings*
$
13,647
$
13,072
$
13,362
Effe
f
ctive income tax rate
21.2%
21.7%
22.2%
Pre-tax earnings as a percentage of revenues
8.2%
7.8%
8.0%
——————
*
Excludes
certain
acquisition
accounting
expenses,
which
primarily
relate
to
intangible
asset
amortization
in
connection
with
certain
of
our
business
acquisi
i
tions.
The
afte
f
r-tax
a
acquisi
i
tion
accounting
expenses
excluded
from
earnings
were
$528
million in 2025, $531 million in 2024 and $693 million in 2023. These expenses are included in “Other” in the summary of
earnings on page K-34 and in the “Other” earnings table on page K-54.
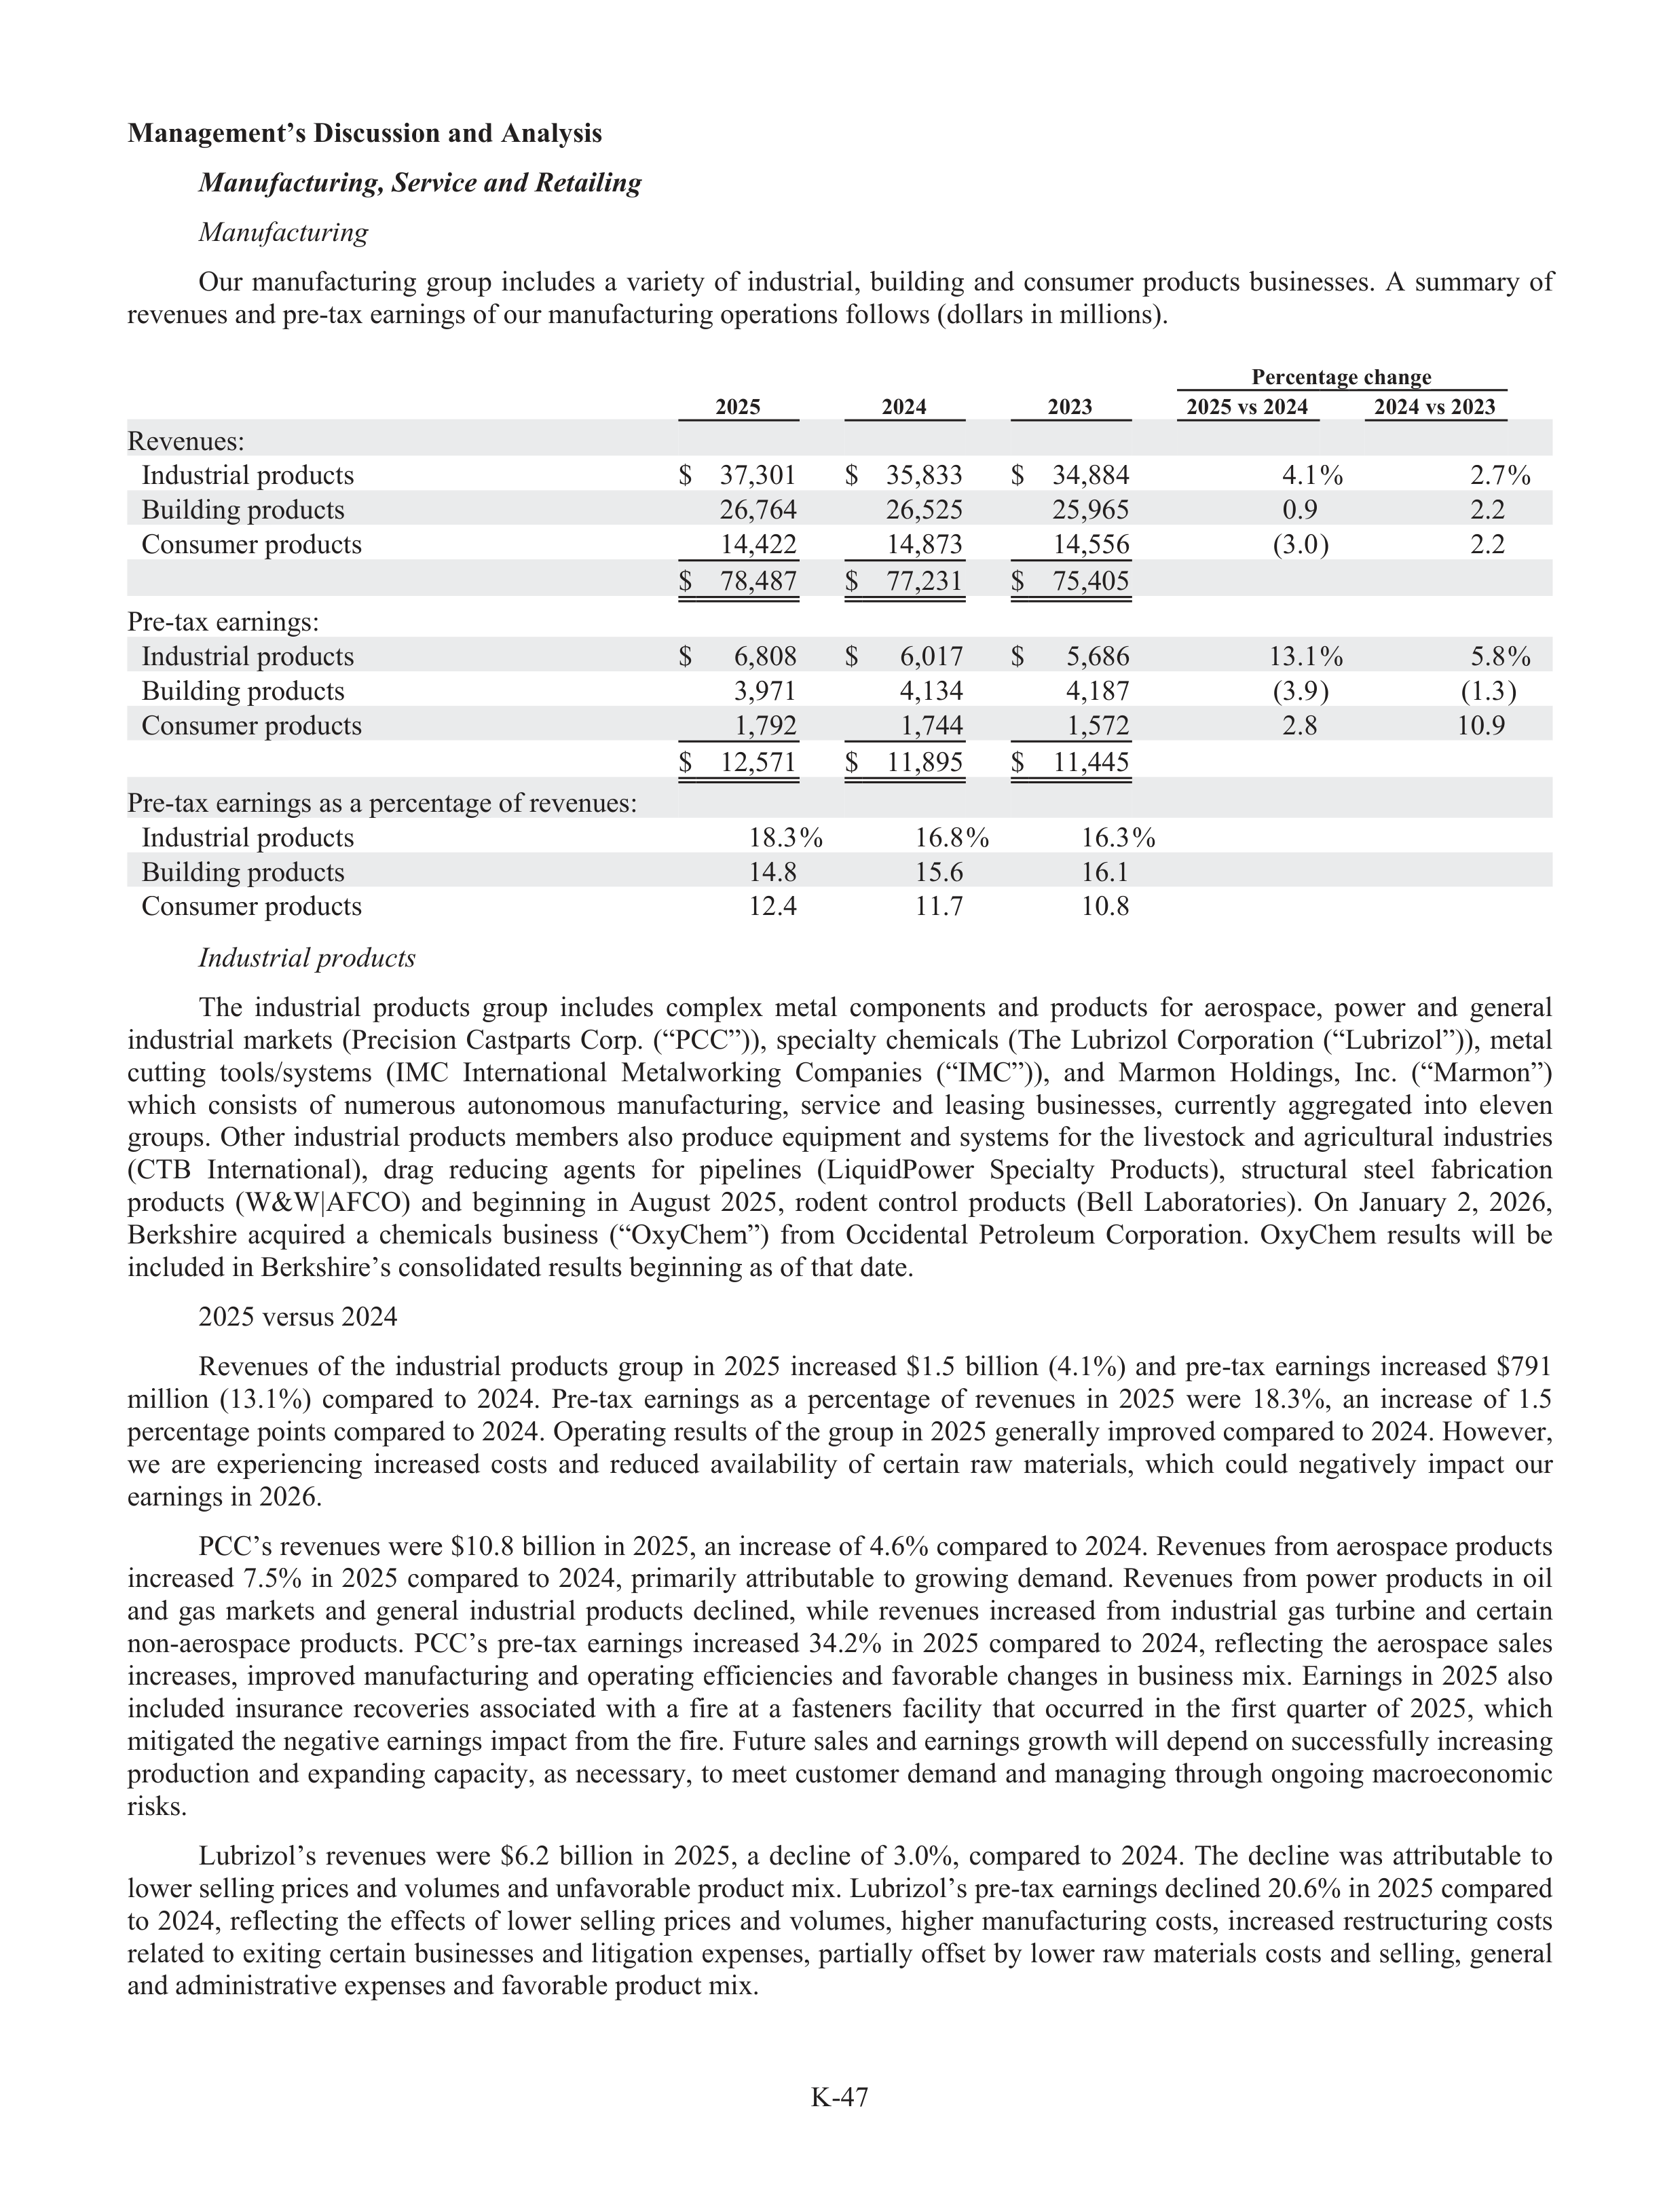
K-47
Management’s Discussion and Analysis
Manufac
f
turing
i
,g
Service and Retailing
Manufac
f
turing
Our
manufact
f
ur
t
ing
group
includes
a
variety
of
industrial,
building
and
consumer
products
businesses.
A
summary
of
revenues and pre-tax earnings of our manufactur
t
ing operations follows (dollars in millions).
Percentage change
2025
2024
2023
2025 vs 2024
2024 vs 2023
Revenues:
Industrial products
$
37,301
$
35,833
$
34,884
4.1%
2.7%
Building products
26,764
26,525
25,965
0.9
2.2
Consumer products
14,422
14,873
14,556
(3.0)
2.2
$
78,487
$
77,231
$
75,405
Pre-tax earnings:
Industrial products
$
6,808
$
6,017
$
5,686
13.1%
5.8%
Building products
3,971
4,134
4,187
(3.9)
(1.3)
Consumer products
1,792
1,744
1,572
2.8
10.9
$
12,571
$
11,895
$
11,445
Pre-tax earnings as a percentage of revenues:
Industrial products
18.3%
16.8%
16.3%
Building products
14.8
15.6
16.1
Consumer products
12.4
11.7
10.8
Industrial products
The
industrial
products
group
includes
complex
metal
components
and
products
for
aerospace,
power
and
general
industrial
markets
(Precision
Castpa
t
rts
Corp.
(“PCC”)),
specialty
chemicals
(The
Lubr
u
izol
Corporation
(“Lubrizol”)),
metal
cutting
tools/systems
(IMC
International
Metalworking
Companies
(“IMC”)),
and
Marmon
Holdings,
Inc.
(“Marmon”)
which
consists
of
numerous
autonomous
manufact
f
ur
t
ing,
service
and
leasing
businesses,
currently
aggregated
into
eleven
groups.
Other
industrial
products
members
also
produce
equipment
and
systems
for
the
livestock
and
agricultural
industries
(CTB
International),
drag
reducing
agents
for
pipelines
(LiquidPower
Specialty
Products),
structur
t
al
steel
fabr
a
ication
products
(W&W|AFCO)
and
beginning
in
August
2025,
rodent
control
products
(Bell
Labor
a
atories).
On
January
2,
2026,
Berkshire
acquired
a
chemicals
business
(“OxyChem”)
fro
f
m
Occidental
Petroleum
Corporation.
OxyChem
results
will
be
included in Berkshire’s consolidated results beginning as of that date.
2025 versus 2024
Revenues
of
the
industrial
products
group
in
2025
increased
$1.5
billion
(4.1%)
and
pre-tax
earnings
increased
$791
million
(13.1%)
compared
to
2024.
Pre-tax
earnings
as
a
percentage
of
revenues
in
2025
were
18.3%,
an
increase
of
1.5
percentage points compared to 2024. Operating results of the group in 2025 generally improved compared to 2024. However,
we
are
experiencing
increased
costs
and
reduced
availabi
a
lity
of
certain
raw
materials,
which
could
negatively
impact
our
earnings in 2026.
PCC’s revenues were $10.8 billion in 2025, an increase of 4.6% compared to 2024. Revenues from aerospace products
increased
7.5%
in
2025
compared
to
2024,
primarily
attributable
to
growing
demand.
Revenues
from
power
produc
d
ts
in
oil
and
gas
markets
and
general
industrial
products
declined,
while
revenues
increased
from
industrial
gas
turbine
and
certain
non-aerospace
products.
PCC’s
pre-tax
earnings
increased
34.2%
in
2025
compared
to
2024,
reflecting
the
aerospace
sales
increases,
improved
manufact
f
ur
t
ing
and
operating
effi
f
ciencies
and
favorable
changes
in
business
mix.
Earnings
in
2025
also
included
insurance
recoveries
associated
with
a
fire
at
a
fasteners
facility
that
occurred
in
the
first
quarter
of
2025,
which
mitigated the negative earnings impact from the fire. Future sales and earnings growth will depend on successful
f
ly increasing
production and expanding capacity, as necessary, to meet customer demand and managing through ongoing macroeconomic
risks.
Lubr
u
izol’s
revenues
were
$6.2
billion
in
2025,
a
decline
of
3.0%,
compared
to
2024.
The
decline
was
attributable
to
lower selling prices and volumes and unfav
f
orable produc
d
t mix. Lubrizol’s pre-tax earnings declined 20.6% in 2025 compared
to
2024,
reflecting
the
effe
f
cts
of
lower
selling
prices
and
volumes,
higher
manufact
f
ur
t
ing
costs,
increased
restructuri
t
ng
costs
related to exiting certain businesses and litigation expenses, partially offs
f
et by lower raw materials costs and selling, general
and administrative expenses and favorabl
a
e product mix.
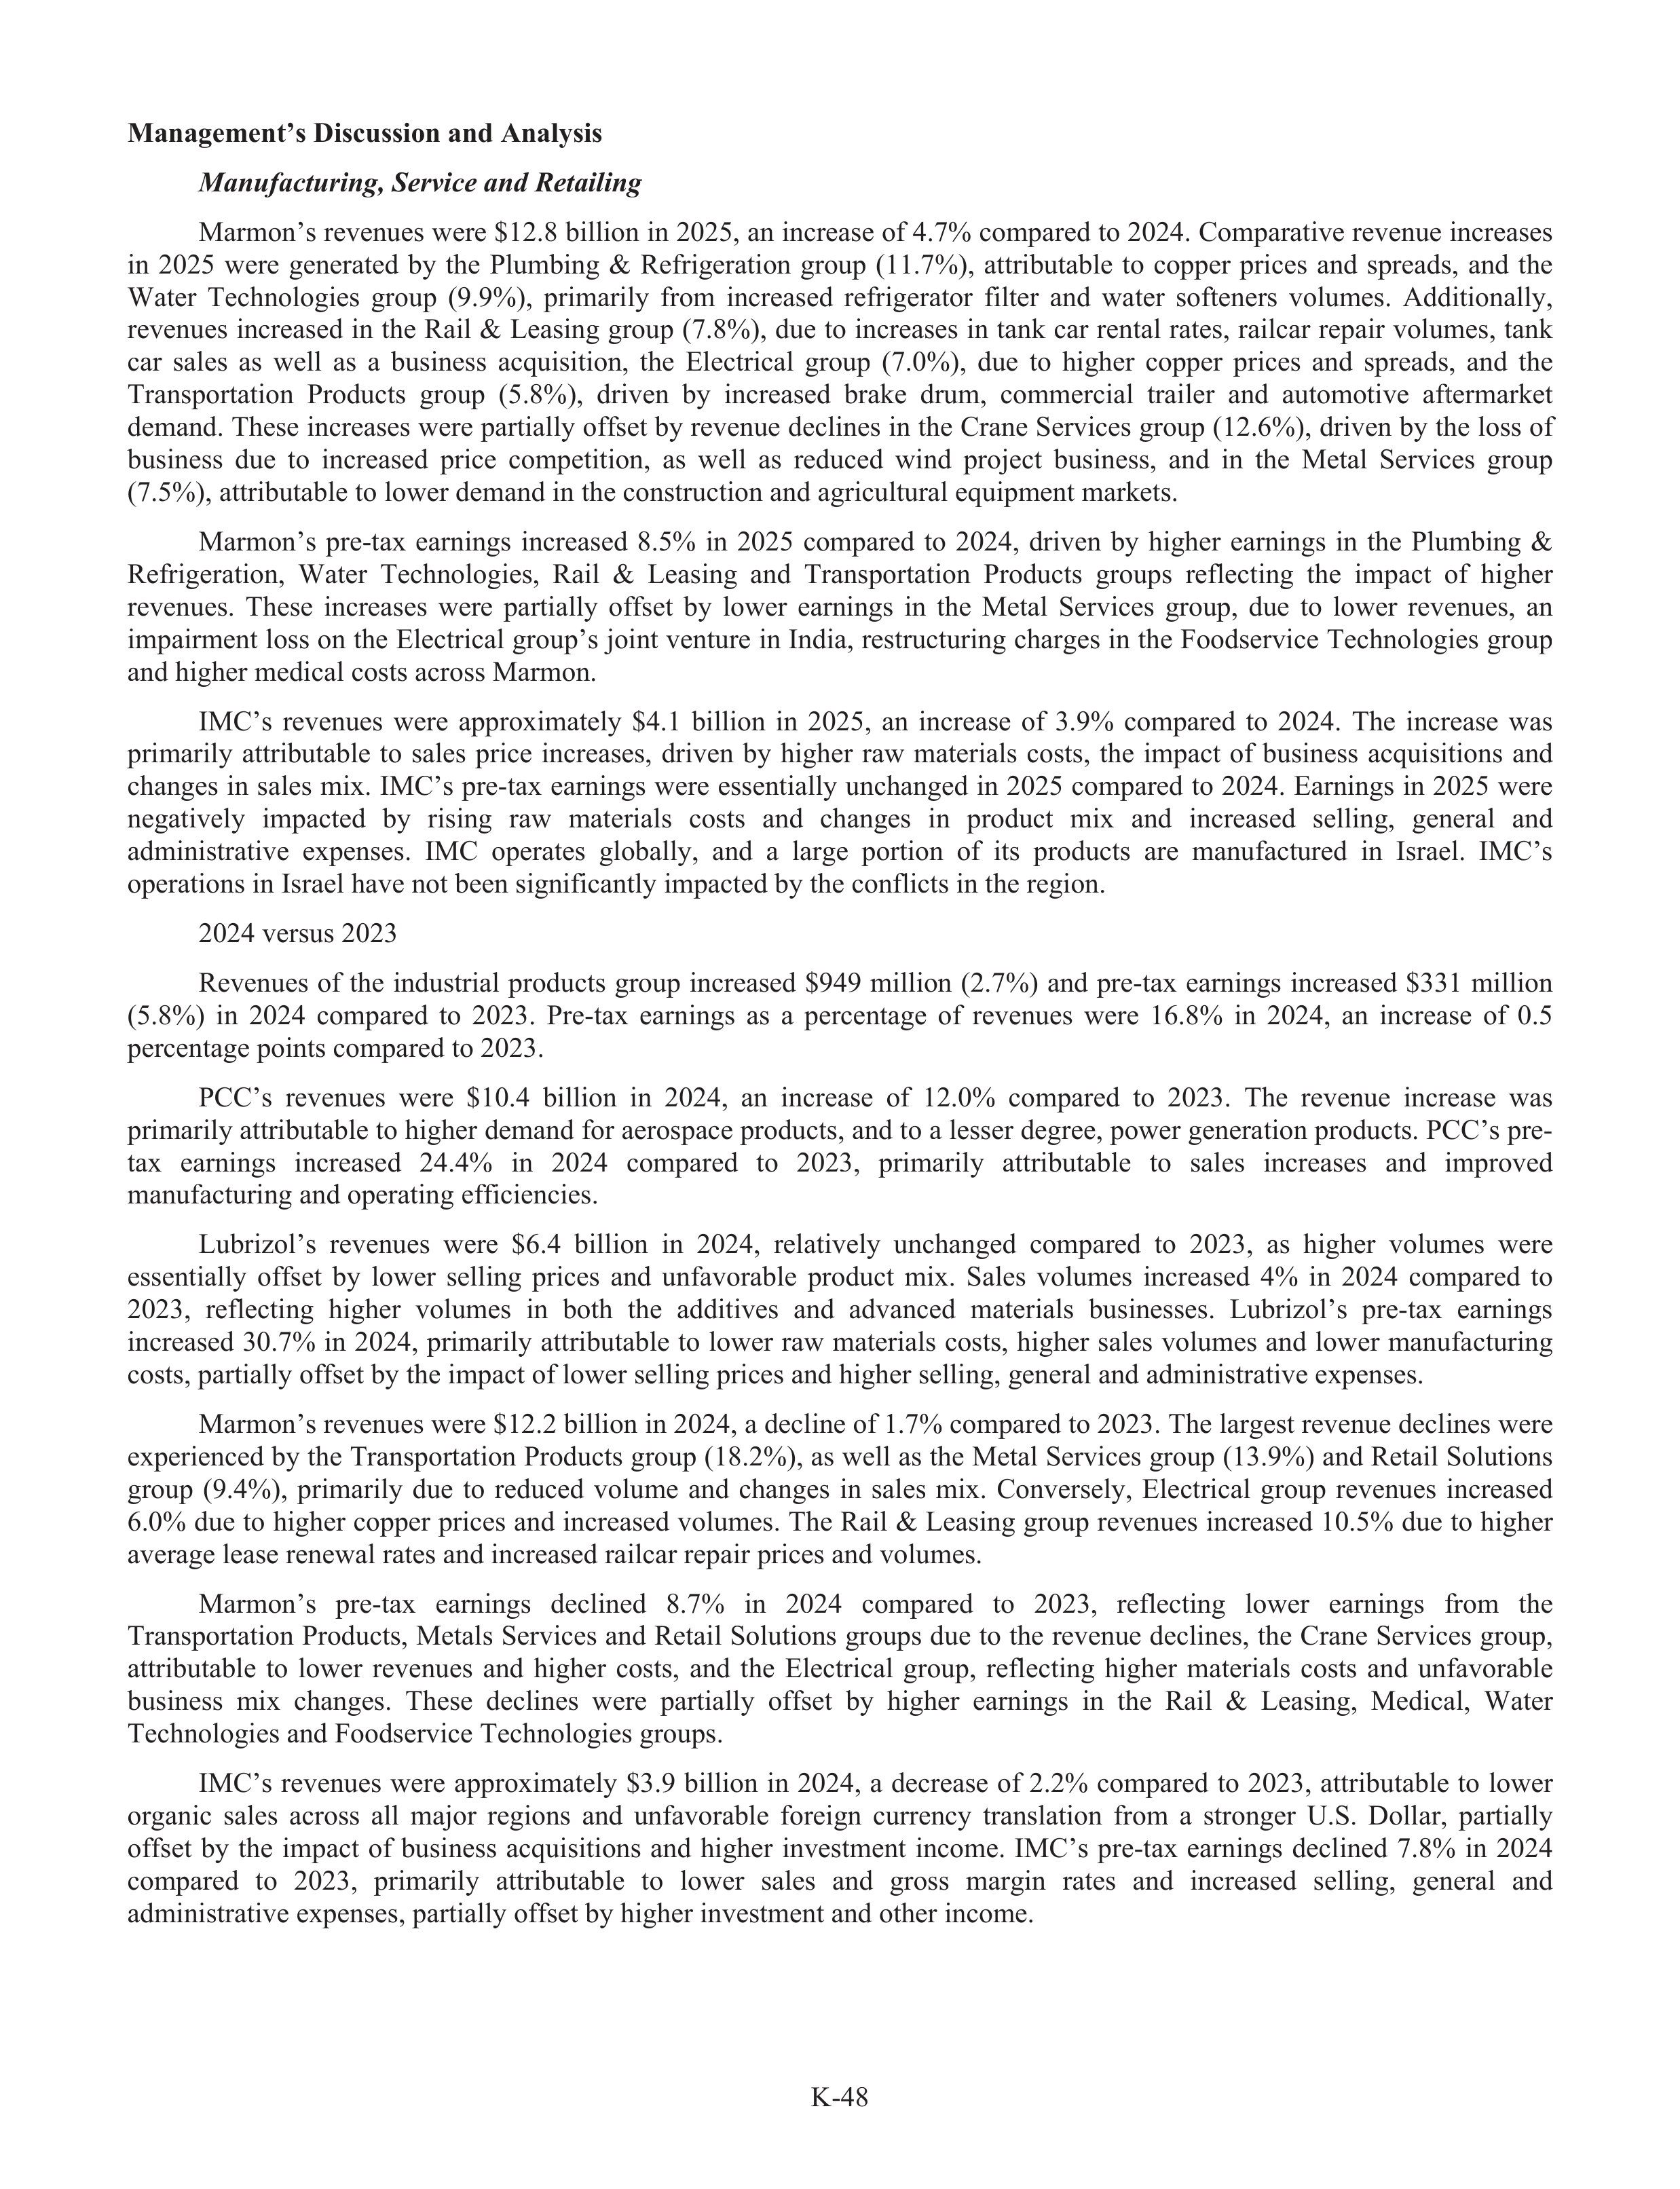
K-48
Management’s Discussion and Analysis
Manufac
f
turing
i
,g
Service and Retailing
Marmon’s revenues were $12.8 billion in 2025, an increase of 4.7% compared to 2024. Comparative revenue increases
in
2025
were
generated
by
the
Plumbing
&
Refrigeration
group
(11.7%),
attributable
to
copper
prices
and
spreads,
and
the
Water
Technologies
group
(9.9%),
primarily
from
increased
refrigerator
filter
and
water
softeners
volumes.
Additionally,
revenues increased in the Rail & Leasing group (7.8%), due to increases in tank car rental rates, railcar repair volumes, tank
car
sales
as
well
as
a
business
acquisition,
the
Electrical
group
u
(7.0%),
due
to
higher
copper
prices
and
spreads,
and
the
Transportation
Products
group
(5.8%),
driven
by
increased
brake
drum
r
,
commercial
trailer
and
automotive
afte
f
rmarket
demand. These increases were partially offs
f
et by revenue declines in the Crane Services group (12.6%), driven by the loss of
business
due
to
increased
price
competition,
as
well
as
reduced
wind
project
business,
and
in
the
Metal
Services
group
(7.5%), attributable to lower demand in the construc
r
tion and agricultural equipment markets.
Marmon’s
pre-tax
earnings
increased
8.5%
in
2025
compared
to
2024,
driven
by
higher
earnings
in
the
Plumbing
&
Refrigeration,
Water
Technologies,
Rail
&
Leasing
and
Transportation
Products
groups
reflecting
the
impact
of
higher
revenues.
These
increases
were
partially
offs
f
et
by
lower
earnings
in
the
Metal
Services
group,
due
to
lower
revenues,
an
impairment loss on the Electrical group’s joint ventur
t
e in India, restructur
t
ing charges in the Foodservice Technologies group
u
and higher medical costs across Marmon.
IMC’s
revenues
were
approximately
$4.1
billion
in
2025,
an
increase
of
3.9%
compared
to
2024.
The
increase
was
primarily
attributable
to
sales
price
increases,
driven
by
higher
raw
materials
costs,
the
impact
of
business
acquisitions
and
changes in sales mix. IMC’s pre-tax earnings were essentially unchanged in 2025 compared to 2024. Earnings in 2025 were
negatively
impacted
by
rising
raw
materials
costs
and
changes
in
product
mix
and
increased
selling,
general
and
administrative
expenses.
IMC
operates
globally,
and
a
large
portion
of
its
products
are
manufact
f
ur
t
ed
in
Israel.
IMC’s
operations in Israel have not been significantly impacted by the conflic
f
ts in the region.
2024 versus 2023
Revenues
of
the
industrial
products
group
increased
$949
million
(2.7%)
and
pre-tax
earnings
increased
$331
million
(5.8%)
in
2024
compared
to
2023.
Pre-tax
earnings
as
a
percentage
of
revenues
were
16.8%
in
2024,
an
increase
of
0.5
percentage points compared to 2023.
PCC’s
revenues
were
$10.4
billion
in
2024,
an
increase
of
12.0%
compared
to
2023.
The
revenue
increase
was
primarily attributable to higher demand for aerospace products, and to a lesser degree, power generation products. PCC’s pre-
tax
earnings
increased
24.4%
in
2024
compared
to
2023,
primarily
attributable
to
sales
increases
and
improved
manufact
f
ur
t
ing and operating effi
f
ciencies.
Lubr
u
izol’s
revenues
were
$6.4
billion
in
2024,
relatively
unchanged
compared
to
2023,
as
higher
volumes
were
essentially
offs
f
et
by
lower
selling
prices
and
unfav
f
orable
product
mix.
Sales
volumes
increased
4%
in
2024
compared
to
2023,
reflecting
higher
volumes
in
both
the
additives
and
advanced
materials
businesses.
Lubr
u
izol’s
pre-tax
earnings
increased
30.7%
in
2024,
primarily
attributable
to
lower
raw
materials
costs,
higher
sales
volumes
and
lower
manufact
f
ur
t
ing
costs, partially offs
f
et by the impact of lower selling prices and higher selling, general and administrative expenses.
Marmon’s revenues were $12.2 billion in 2024, a decline of 1.7% compared to 2023. The largest revenue declines were
experienced by the Transportation Products group (18.2%), as well as the Metal Services group (13.9%) and Retail Solutions
group
(9.4%),
primarily
due
to
reduced
volume
and
changes
in
sales
mix.
Conversely,
Electrical
group
revenues
increased
6.0% due to higher copper prices and increased volumes. The Rail & Leasing group revenues increased 10.5% due to higher
average lease renewal rates and increased railcar repair prices and volumes.
Marmon’s
pre-tax
earnings
declined
8.7%
in
2024
compared
to
2023,
reflecting
lower
earnings
from
the
Transportation Products, Metals Services and Retail Solutions groups due to the revenue declines, the Crane Services group,
u
attributable
to
lower
revenues
and
higher
costs,
and
the
Electrical
group,
reflecting
higher
materials
costs
and
unfav
f
orable
business
mix
changes.
These
declines
were
partially
offs
f
et
by
higher
earnings
in
the
Rail
&
Leasing,
Medical,
Water
Technologies and Foodservice Technologies groups.
IMC’s
revenues
were
approximately
$3.9
billion
in
2024,
a
decrease
of
2.2%
compared
to
2023,
attributable
to
lower
organic
sales
across
all
majo
a
r
regions
and
unfav
f
orable
foreign
currency
translation
from
a
stronger
U.S.
Dollar,
partially
offs
f
et
by
the
impact
of
business
acquisitions
and
higher
investment
income.
IMC’s
pre-tax
earnings
declined
7.8%
in
2024
compared
to
2023,
primarily
attributable
to
lower
sales
and
gross
margin
rates
and
increased
selling,
general
and
administrative expenses, partially offs
f
et by higher investment and other income.
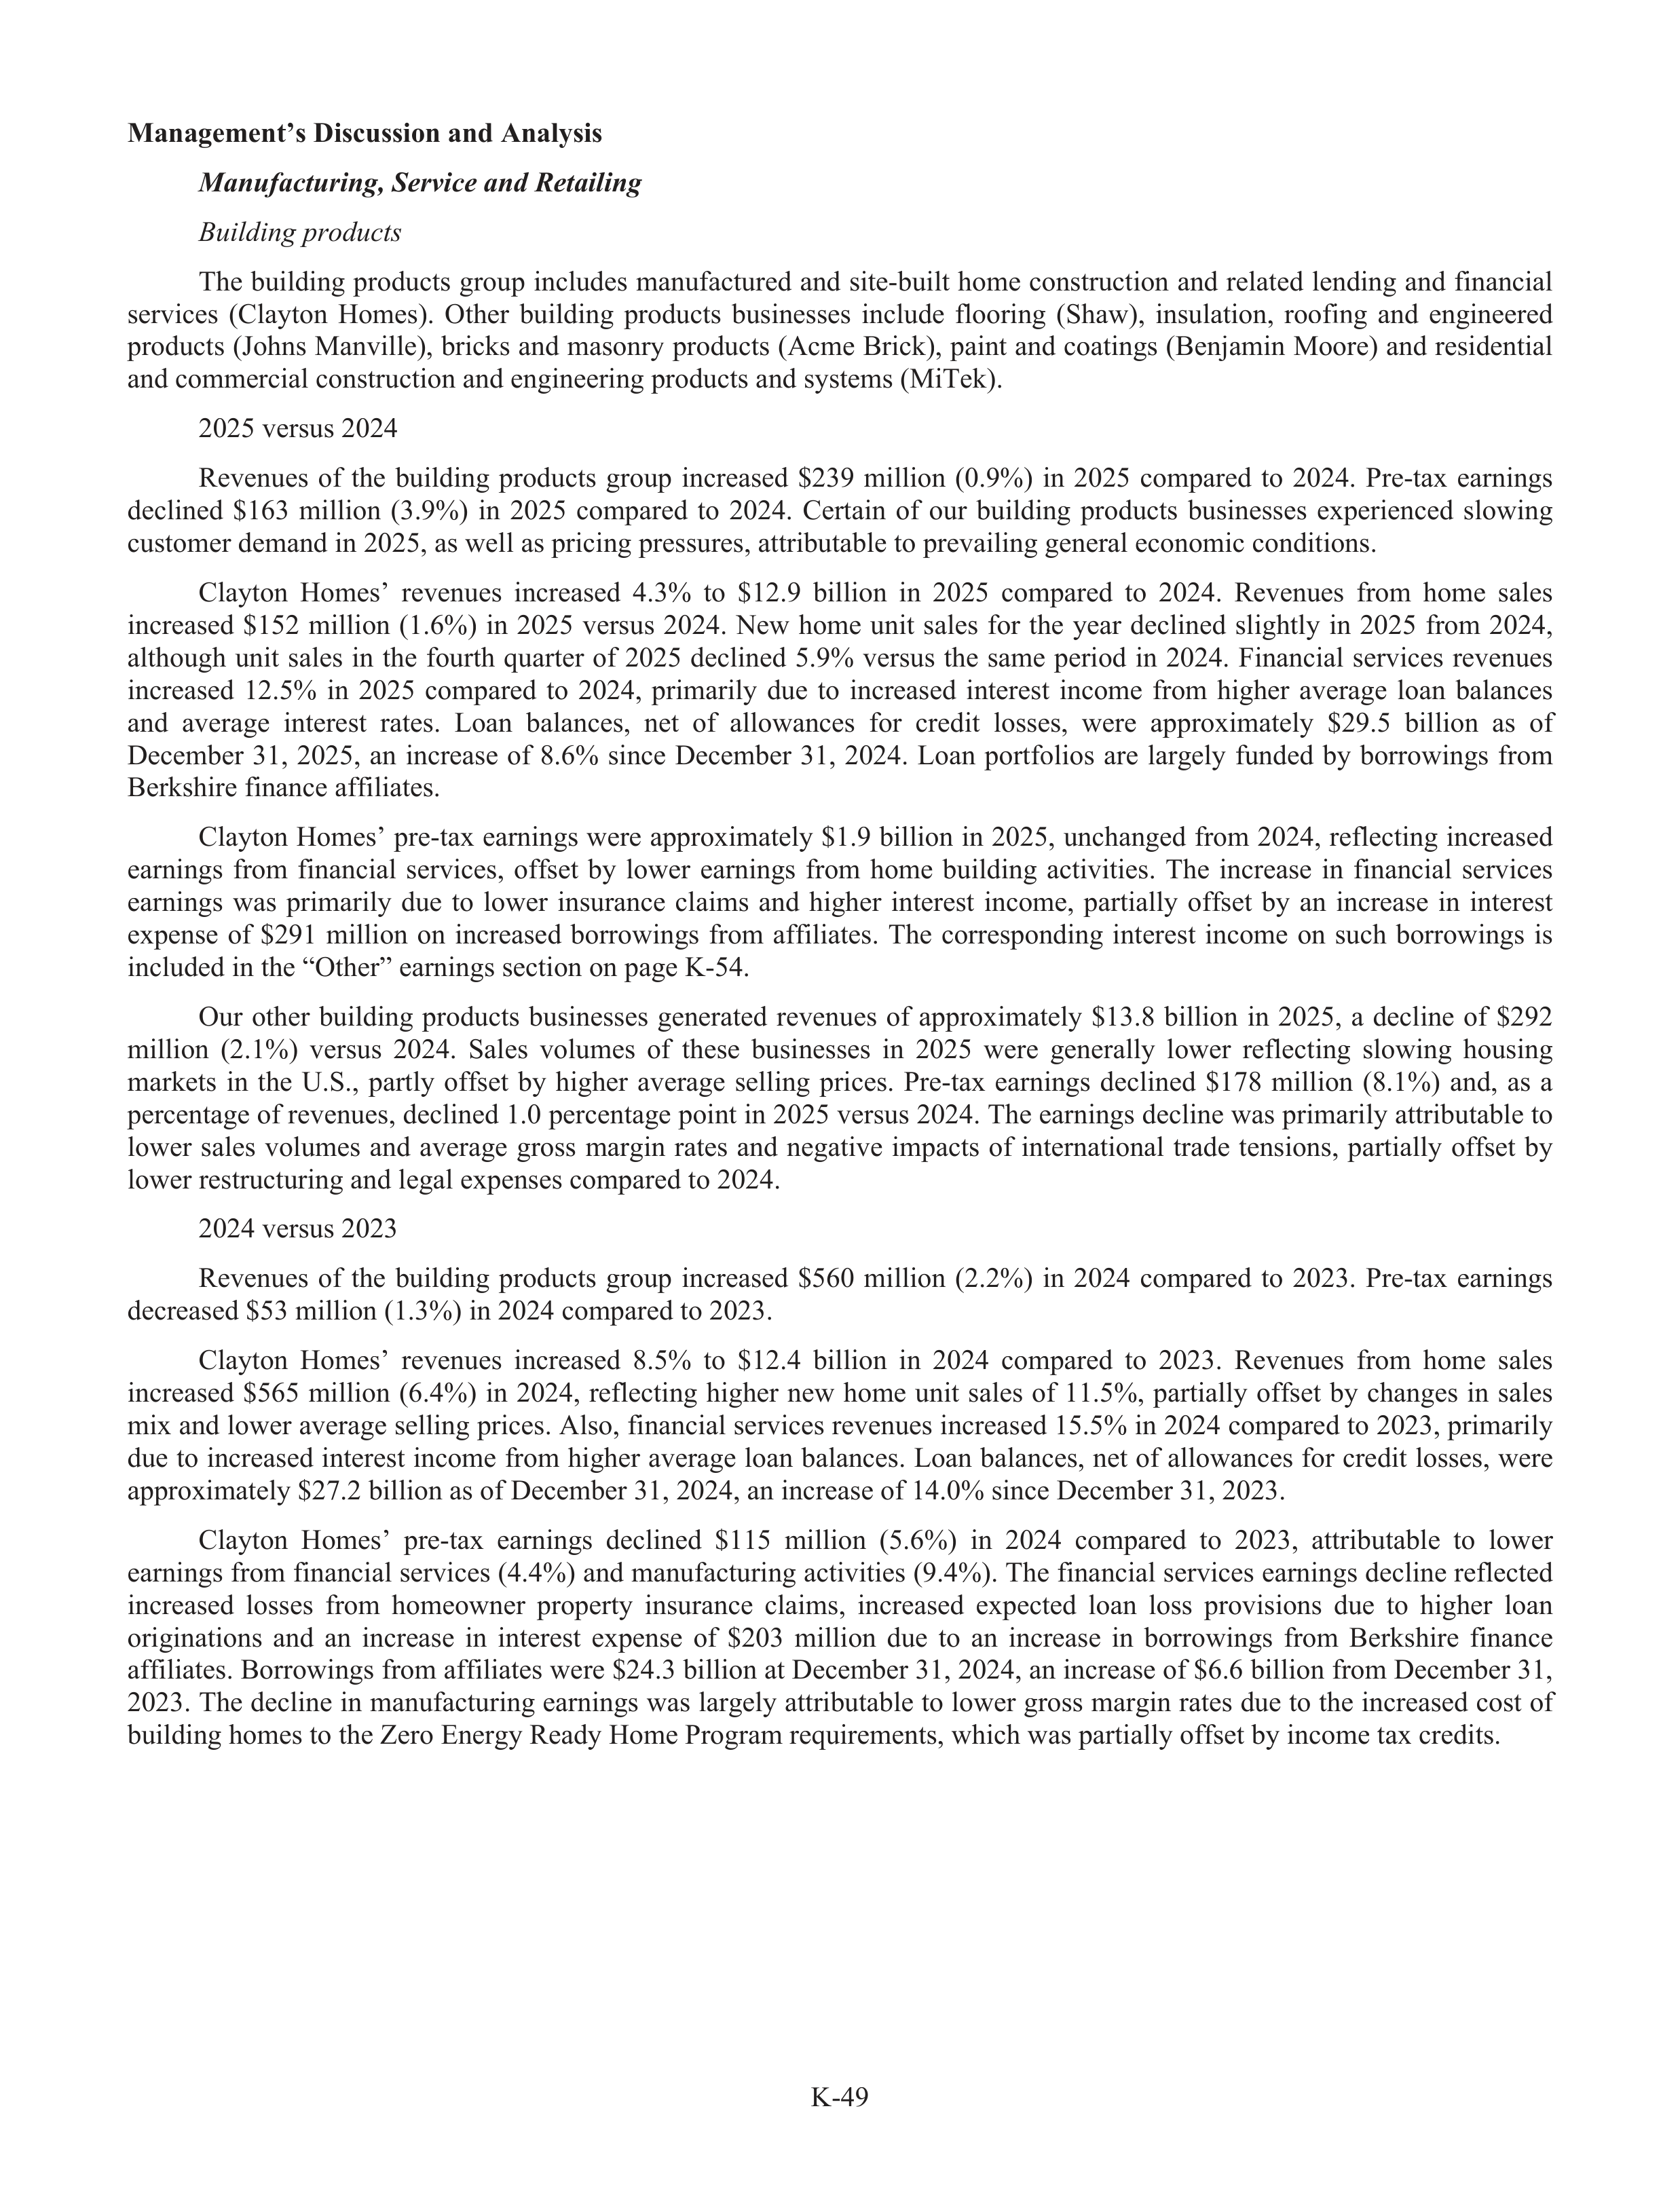
K-49
Management’s Discussion and Analysis
Manufac
f
turing
i
,g
Service and Retailing
Building products
The building products group includes manufact
f
ur
t
ed and site-built home construc
r
tion and related lending and financial
services
(Clayton
Homes).
Other
building
products
businesses
include
flooring
(Shaw),
insulation,
roofin
f
g
and
engineered
products (Johns Manville), bricks and masonry
r
products (Acme Brick), paint and coatings (Benja
n
min Moore) and residential
and commercial construc
r
tion and engineering products and systems (MiTek).
2025 versus 2024
Revenues
of
the
building
products
group
increased
$239
million
(0.9%)
in
2025
compared
to
2024.
Pre-tax
earnings
declined
$163
million
(3.9%)
in
2025
compared
to
2024.
Certain
of
our
building
products
businesses
experienced
slowing
customer demand in 2025, as well as pricing pressures, attributable to prevailing general economic conditions.
Clayton
Homes’
revenues
increased
4.3%
to
$12.9
billion
in
2025
compared
to
2024.
Revenues
from
home
sales
increased
$152
million
(1.6%)
in
2025
versus
2024.
New
home
unit
sales
for
the
year
declined
slightly
in
2025
from
2024,
although
unit
sales
in
the
fourth
quarter
of
2025
declined
5.9%
versus
the
same
period
in
2024.
Financial
services
revenues
increased
12.5%
in
2025
compared
to
2024,
primarily
due
to
increased
interest
income
from
higher
average
loan
balances
and
average
interest
rates.
Loan
balances,
net
of
allowances
for
credit
losses,
were
approximately
$29.5
billion
as
of
December
31,
2025,
an
increase
of
8.6%
since
December
31,
2024.
Loan
portfol
f
ios
are
largely
funded
by
borrowings
from
Berkshire finance affi
f
liates.
Clayton Homes’ pre-tax earnings were approximately $1.9 billion in 2025, unchanged from 2024, reflecting increased
earnings
from
financial
services,
offs
f
et
by
lower
earnings
from
home
building
activities.
The
increase
in
financial
services
earnings
was
primarily
due
to
lower
insurance
claims
and
higher
interest
income,
partially
offs
f
et
by
an
increase
in
interest
expense
of
$291
million
on
increased
borrowings
from
affi
f
liates.
The
corresponding
interest
income
on
such
borrowings
is
included in the “Other” earnings section on page K-54.
Our
other
building
products
businesses
generated
revenues
of
approximately
$13.8
billion
in
2025,
a
decline
of
$292
million
(2.1%)
versus
2024.
Sales
volumes
of
these
businesses
in
2025
were
generally
lower
reflecting
slowing
housing
markets
in
the
U.S.,
partly
offs
f
et
by
higher
average
selling
prices.
Pre-tax
earnings
declined
$178
million
(8.1%)
and,
as
a
percentage of revenues, declined 1.0 percentage point in 2025 versus 2024. The earnings decline was primarily attributable to
lower
sales
volumes
and
average
gross
margin
rates
and
negative
impacts
of
international
trade
tensions,
partially
offs
f
et
by
lower restructur
t
ing and legal expenses compared to 2024.
2024 versus 2023
Revenues
of
the
building
products
group
increased
$560
million
(2.2%)
in
2024
compared
to
2023.
Pre-tax
earnings
decreased $53 million (1.3%) in 2024 compared to 2023.
Clayton
Homes’
revenues
increased
8.5%
to
$12.4
billion
in
2024
compared
to
2023.
Revenues
from
home
sales
increased
$565
million
(6.4%)
in
2024,
reflecting
higher
new
home
unit
sales
of
11.5%,
partially
offs
f
et
by
changes
in
sales
mix and lower average selling prices. Also, financial services revenues increased 15.5% in 2024 compared to 2023, primarily
due to increased interest income from higher average loan balances. Loan balances, net of allowances for credit losses, were
approximately $27.2 billion as of December 31, 2024, an increase of 14.0% since December 31, 2023.
Clayton
Homes’
pre-tax
earnings
declined
$115
million
(5.6%)
in
2024
compared
to
2023,
attributable
to
lower
earnings from financial services (4.4%) and manufact
f
ur
t
ing activities (9.4%). The financial services earnings decline reflected
increased
losses
from
homeowner
property
insurance
claims,
increased
expected
loan
loss
provisions
due
to
higher
loan
originations
and
an
increase
in
interest
expense
of
$203
million
due
to
an
increase
in
borrowings
from
Berkshire
finance
affi
f
liates. Borrowings from affi
f
liates were $24.3 billion at December 31, 2024, an increase of $6.6 billion from December 31,
2023. The decline in manufactur
t
ing earnings was largely attributable to lower gross margin rates due to the increased cost of
building homes to the Zero Energy Ready Home Program requirements, which was partially offs
f
et by income tax credits.
K-50
Management’s Discussion and Analysis
Manufac
f
turing
i
,g
Service and Retailing
Our
other
building
products
businesses
generated
revenues
of
approximately
$14.1
billion
in
2024,
a
decline
of
$413
million
(2.8%)
versus
2023.
Sales
volumes
in
2024
increased
at
Johns
Manville
and
declined
at
the
other
businesses
in
the
group, while average selling prices were lower at Johns Manville and MiTek and slightly higher at the other businesses.
Pre-tax earnings of our other building products businesses increased $61 million (2.9%) in 2024 compared to 2023 and,
as
a
percentage
of
revenues,
increased
0.9
percentage
points
in
2024
to
15.6%.
Earnings
increased
in
2024
from
higher
average
gross
margin
rates
arising
from
lower
raw
materials
costs
and
improved
manufact
f
ur
t
ing
effi
f
ciencies
at
certain
of
the
businesses,
partially
offs
f
et
by
higher
selling,
general
and
administrative
expenses.
Selling,
general
and
administrative
expenses in each year included charges from business restructur
t
ing activities and divestitures, as well as legal settlements and
accrua
r
ls.
Consumer products
The
consumer
products
group
includes
leisure
vehicles
(Forest
River),
several
apparel
and
footwear
operations
(including
Frui
r
t
of
the
Loom,
Garan,
H.H.
Brown
Shoe
Group
and
Brooks
Sports)
and
a
manufact
f
ur
t
er
of
high-performance
alkaline
batteries
(Duracell).
This
group
also
includes
a
global
toy
company
(Jazwares),
jewelry
r
products
(Richline)
and
custom pictur
t
e framing products (Larson-Juhl).
2025 versus 2024
Consumer
products
group
revenues
were
$14.4
billion
in
2025,
a
decrease
of
3.0%
compared
to
2024.
The
revenue
decline
was
primarily
due
to
Frui
r
t
of
the
Loom,
Jazwares
and
Duracell,
largely
attributable
to
lower
sales
volumes.
These
declines were partially offs
f
et by increases at Brooks Sports, Forest River and Richline, attributable to combinations of higher
volumes, changes in sales mix and/or higher prices driven by higher materials and input costs.
Pre-tax
earnings
of
our
consumer
products
group
u
increased
2.8%
in
2025
compared
to
2024.
In
the
third
quarter
of
2025,
Duracell
determined
certain
of
its
U.S.-manufact
f
ur
t
ed
battery
product
components
were
eligible
for
refundabl
a
e
advanced manufact
f
ur
t
ing production income tax credits beginning in the 2023 tax year. Duracell recorded the eligible credits
for the 2023, 2024 and 2025 periods in 2025. Under U.S. GAAP, these credits are reflected in pre-tax earnings, not as income
tax
expense.
Before
the
impact
of
the
production
credits,
pre-tax
earnings
of
the
consumer
products
group
declined
significantly
in
2025
compared
to
2024.
The
decline
reflected
lower
earnings
from
Jazwares,
due
to
a
variety
of
factors,
including
lower
sales
volumes
and
increased
costs
from
suppl
u
y
chain
disrupt
r
ions;
Forest
River,
primarily
attributable
to
lower
gross
margins
from
sales
mix
changes;
and
Duracell
and
Garan,
which
experienced
lower
gross
margins
and
higher
selling,
general
and
administrative
expenses
as
a
percentage
of
revenues.
These
declines
were
partially
offs
f
et
by
higher
earnings from Brooks Sports attributable to increased sales and gross margins, partially offs
f
et by higher selling, general and
administrative expenses.
2024 versus 2023
Consumer
products
group
revenues
were
$14.9
billion
in
2024,
an
increase
of
2.2%
compared
to
2023.
The
increase
was
primarily
attributable
to
higher
revenues
from
Forest
River,
Brooks
Sports
and
Duracell,
partially
offs
f
et
by
lower
revenues
from
Frui
r
t
of
the
Loom,
Garan
and
Richline.
Forest
River
revenues
increased
6.4%
in
2024,
reflecting
increased
unit
sales,
including
the
impact
of
business
acquisitions.
Brooks
Sports
and
Duracell
revenues
increased
9.1%
and
2.5%,
respectively, in 2024 versus 2023. The revenue reductions at Frui
r
t of the Loom and Richline were attributable to lower sales
volumes, whereas the decline at Garan was attributable to lower average selling prices.
Consumer
products
group
pre-tax
earnings
increased
$172
million
(10.9%)
in
2024
versus
2023.
The
increase
was
primarily
attributable
to
higher
earnings
from
our
apparel
and
footwear
businesses
and
Duracell,
partially
offs
f
et
by
lower
earnings
from
Jazwares.
Apparel
and
footwear
earnings
increased
37.0%
in
2024
from
2023,
primarily
due
to
gross
margin
rate
increases
and
increased
gains
on
asset
sales,
as
well
as
from
the
favorable
effe
f
cts
of
past
restructur
t
ing
and
cost
management effo
f
rts. The earnings increase at Duracell was attributable to increased gross margins and lower selling, general
and
administrative
expenses.
The
decline
in
earnings
in
2024
from
Jazwares
was
primarily
due
to
increased
amortization
expense, as well as the impact of reduced sales orders during the fourth quarter.
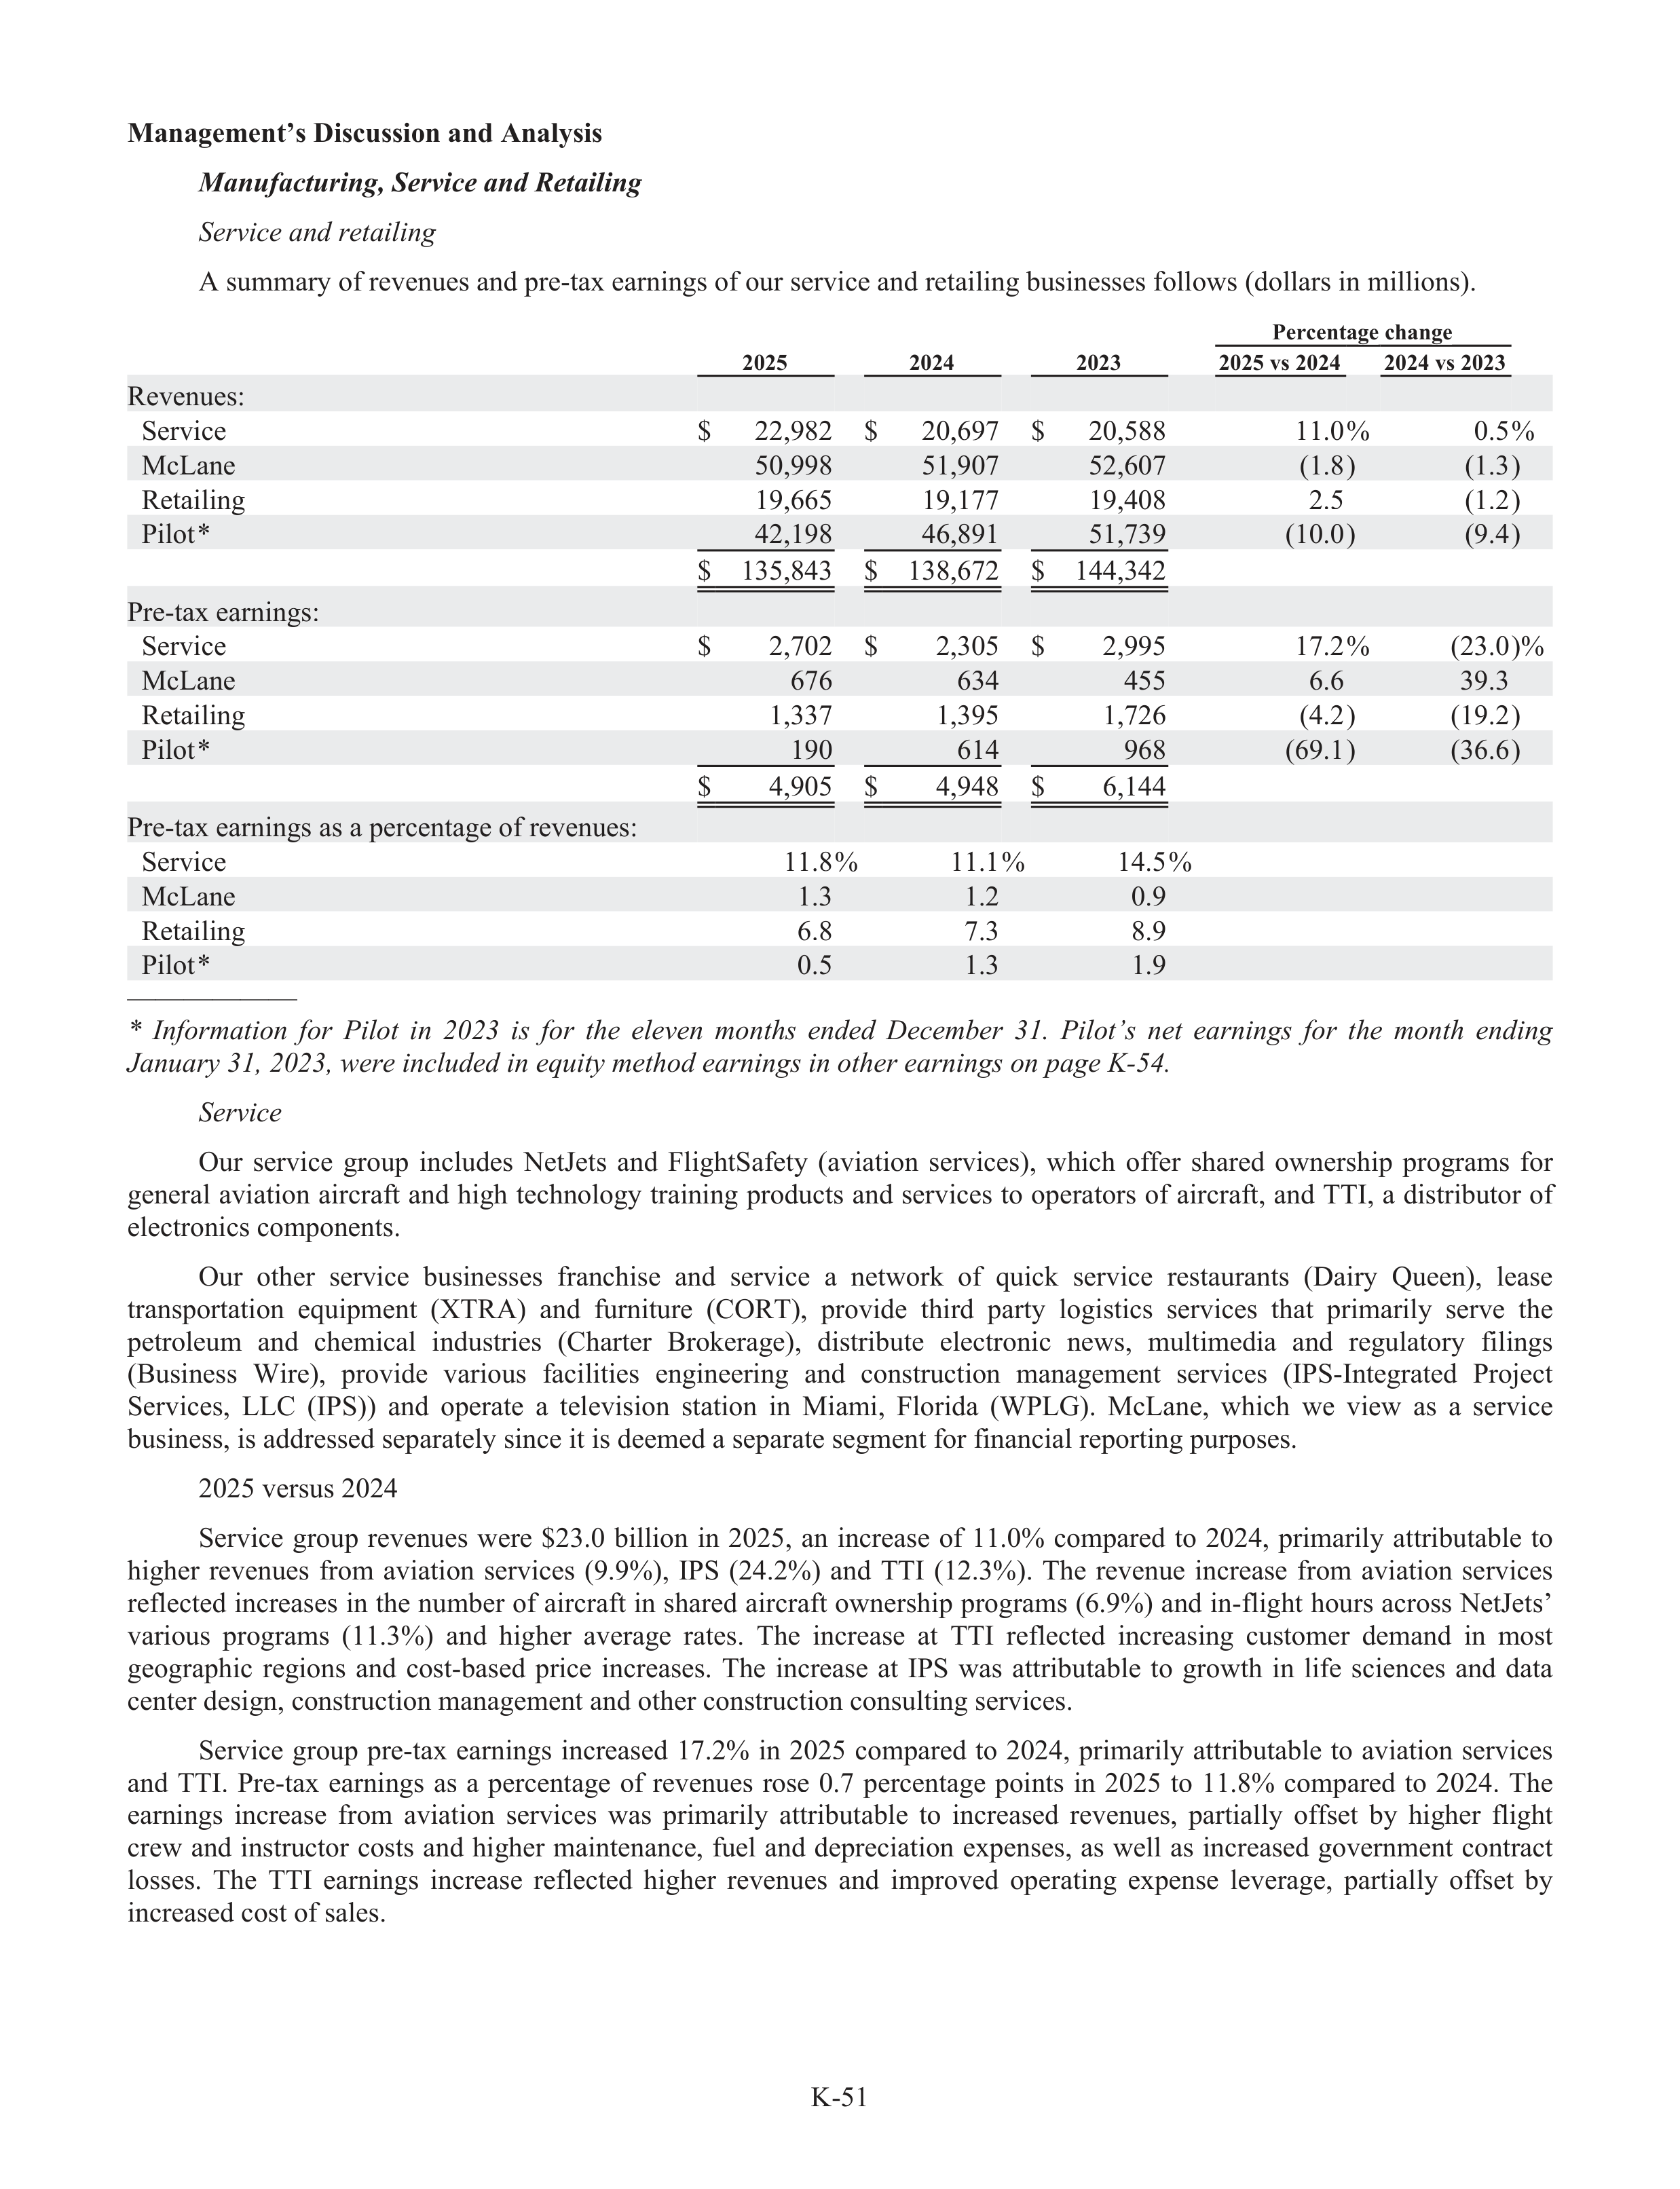
K-51
Management’s Discussion and Analysis
Manufac
f
turing
i
,g
Service and Retailing
Service and retailing
A summary of revenues and pre-tax earnings of our service and retailing businesses follows (dollars in millions).
Percentage change
2025
2024
2023
2025 vs 2024
2024 vs 2023
Revenues:
Service
$
22,982
$
20,697
$
20,588
11.0%
0.5%
McLane
50,998
51,907
52,607
(1.8)
(1.3)
Retailing
19,665
19,177
19,408
2.5
(1.2)
Pilot
*
42,198
46,891
51,739
(10.0)
(9.4)
$
135,843
$
138,672
$
144,342
Pre-tax earnings:
Service
$
2,702
$
2,305
$
2,995
17.2%
(23.0)%
McLane
676
634
455
6.6
39.3
Retailing
1,337
1,395
1,726
(4.2)
(19.2)
Pilot
*
190
614
968
(69.1)
(36.6)
$
4,905
$
4,948
$
6,144
Pre-tax earnings as a percentage of revenues:
Service
11.8%
11.1%
14.5%
McLane
1.3
1.2
0.9
Retailing
6.8
7.3
8.9
Pilot
*
0.5
1.3
1.9
——————
*
Info
n
rmation
for
Pilot
in
2023
is
for
the
eleven
months
ended
December
31.
Pilot’s
net
earnings
for
the
month
ending
January
r
31, 2023, were included in equity method earnings in other earnings on page K-54.
Service
Our
service
group
includes
NetJets
and
FlightSafety
(aviation
services),
which
offe
f
r
shared
ownership
programs
for
general aviation aircraft and high technology training products and services to operators of aircraft, and TTI, a distributor of
electronics components.
Our
other
service
businesses
franchise
and
service
a
network
of
quick
service
restaurants
(Dairy
Queen),
lease
transportation
equipment
(XTRA)
R
and
furniture
(CORT),
provide
third
party
logistics
services
that
primarily
serve
the
petroleum
and
chemical
industries
(Charter
Brokerage),
distribute
electronic
news,
multimedia
and
regulatory
r
filings
(Business
Wire),
provide
various
facilities
engineering
and
construc
r
tion
management
services
(IPS-Integrated
Project
Services,
LLC
(IPS))
and
operate
a
television
station
in
Miami,
Florida
(WPLG).
McLane,
which
we
view
as
a
service
business, is addressed separately since it is deemed a separate segment for financial reporting purpos
r
es.
2025 versus 2024
Service
group
revenues
were
$23.0
billion
in
2025,
an
increase
of
11.0%
compared
to
2024,
primarily
attributable
to
higher
revenues
from
aviation
services
(9.9%),
IPS
(24.2%)
and
TTI
(12.3%).
The
revenue
increase
from
aviation
services
reflected increases in the number of aircraft in shared aircraft ownership programs (6.9%) and in-flight hours across NetJets’
various
programs
(11.3%)
and
higher
average
rates.
The
increase
at
TTI
reflected
increasing
customer
demand
in
most
geographic
regions
and
cost-based
price
increases.
The
increase
at
IPS
was
attributable
to
growth
in
lifef
sciences
and
data
center design, construc
r
tion management and other construc
r
tion consulting services.
Service
group
pre-tax
earnings
increased
17.2%
in
2025
compared
to
2024,
primarily
attributable
to
aviation
services
and
TTI.
Pre-tax
earnings
as
a
percentage
of
revenues
rose
0.7
percentage
points
in
2025
to
11.8%
compared
to
2024.
The
earnings
increase
from
aviation
services
was
primarily
attributable
to
increased
revenues,
partially
offs
f
et
by
higher
flight
crew
and
instructor
costs
and
higher
maintenance,
fuel
and
depreciation
expenses,
as
well
as
increased
government
contract
losses.
The
TTI
earnings
increase
reflected
higher
revenues
and
improved
operating
expense
leverage,
partially
offs
f
et
by
increased cost of sales.
K-52
Management’s Discussion and Analysis
Manufac
f
turing
i
,g
Service and Retailing
2024 versus 2023
Service
group
revenues
were
$20.7
billion
in
2024,
a
slight
increase
compared
to
2023,
reflecting
revenue
increases
from aviation services and IPS, partially offs
f
et by lower revenues from TTI and XTRA. Aviation services revenues increased
9.1%
in
2024,
while
IPS
revenues
increased
14.4%.
The
aviation
services
increase
was
primarily
due
to
an
increase
in
the
number of aircraft in shared aircraft ownership programs and increases in flight hours across NetJets’ various programs. The
increase at IPS was primarily due to increased project volume.
TTI
revenues
declined
10.0%
in
2024
compared
to
2023.
Sales
in
2024
declined
across
most
regions,
markets
and
product
lines,
attributable
to
excess
inventory
r
levels
within
suppl
u
y
chains,
which
contributed
to
lower
sales
volumes
and
pricing pressures. The decline at XTRA was due to fewer units on lease.
Service
group
pre-tax
earnings
declined
23.0%
in
2024
compared
to
2023,
primarily
attributable
to
TTI,
aviation
services
and
XTRA.
Pre-tax
earnings
as
a
percentage
of
revenues
fell
3.4
percentage
points
in
2024
to
11.1%
compared
to
2023.
Earnings
from
TTI
declined
51.0%
in
2024
compared
to
2023,
reflecting
the
impact
of
lower
sales
and
price
competition,
which
contributed
to
reduced
gross
sales
margin
rates,
and
higher
selling,
general
and
administrative
expenses.
Earnings from aviation services declined 10.9% in 2024 versus 2023, primarily attributable to increased cost of services and
leasing,
driven
by
higher
flight
crew,
maintenance,
fuel
and
depreciation
expense,
as
well
as
increased
impairment
charges.
The decline at XTRA was primarily due to lower revenues and increased costs.
McLa
c
ne
McLane
Company,
Inc.
(“McLane”)
operates
a
wholesale
distribution
business
that
provides
grocery
r
and
non-food
consumer
products
to
retailers
and
convenience
stores
(“retail”)
and
to
restaurants
(“restaurant”).
McLane
also
operates
businesses
that
are
wholesale
distributors
of
distilled
spirits,
wine
and
beer
(“beverage”).
McLane’s
retail
and
restaurant
businesses generate very high sales volumes and low profit
f
margins.
2025 versus 2024
McLane’s revenues declined $909 million (1.8%) in 2025 compared to 2024, reflecting one less week in its fiscal year,
lower
volumes
and
higher
prices
attributable
to
inventory
r
cost
inflation.
McLane’s
pre-tax
earnings
increased
$42
million
(6.6%) in 2025 compared to 2024, with earnings increasing in the retail business and declining in the restaurant and beverage
businesses.
2024 versus 2023
McLane’s
revenues
declined
1.3%
in
2024
compared
to
2023,
reflecting
lower
restaurant
business
sales
(5.7%)
and
increased
retail
business
sales
(1.0%).
The
decline
in
restaurant
sales
was
partially
attributable
to
changing
consumer
prefer
f
ences
for
dining
at
restaurants
and
quick-service
restaurants,
partially
offs
f
et
by
impacts
of
price
inflation.
McLane’s
pre-tax
earnings
increased
$179
million
(39.3%)
in
2024
compared
to
2023
reflecting
an
increase
in
gross
margin
rates,
which more than offs
f
et the impacts of lower sales and higher selling, general and administrative expenses.
Retailing
Our
retailing
businesses
include
Berkshire
Hathaway
Automotive,
Inc.
(“BHA”),
which
consists
of
over
80
auto
dealerships
that
sell
new
and
pre-owned
automobiles
and
offe
f
r
repair
services
and
related
products.
BHA
also
offe
f
rs
and
insures vehicle service contracts and related insurance products. Our retailing businesses also
include four
home furnishings
businesses (NFM, R.C. Willey, Star Furniture and Jordan’s), which sell furniture, appliances, flooring and electronics.
Other
retailing
businesses
include
three
jewelry
r
businesses
(Borsheims,
Helzberg
and
Ben
Bridge),
See’s
Candies
(confect
f
ionery
products),
Pampered
Chef
(high
quality
kitchen
tools),
Oriental
Trading
Company
(party
suppl
u
ies,
school
suppl
u
ies
and
toys
and
novelties)
and
Detlev
Louis
Motorrad
(“Louis”),
a
retailer
of
motorcycle
accessories
based
in
Germany.
Pilot,
which
we
view
as
primarily
a
retailing
business,
is
addressed
separately
since
it
is
deemed
a
segment
for
financial reporting purpos
r
es.
2025 versus 2024
Retailing
group
revenues
increased
2.5%
to
$19.7
billion,
while
pre-tax
earnings
declined
$58
million
(4.2%)
in
2025
compared to 2024. With the exception of NFM, our retailing businesses generated flat or lower earnings in 2025 compared to
the prior year.
K-53
Management’s Discussion and Analysis
Manufac
f
turing
i
,g
Service and Retailing
BHA’s revenues increased 4.2% in 2025 compared to 2024, due to a 4.5% increase in new and pre-owned vehicle sales
revenues,
primarily
due
to
increased
new
units
sold,
higher
average
prices
and
changes
in
sales
mix.
BHA’s
fin
f
ance/service
contract
revenues
also
increased
5.8%,
while
parts/service/repair
operations
revenues
increased
2.2%
in
2025
compared
to
2024.
BHA’s
pre-tax
earnings
decreased
0.6%
in
2025
compared
to
2024,
attributable
to
lower
gross
profit
f
margins
and
higher
selling,
general
and
administrative
expenses,
partly
offs
f
et
by
earnings
increases
from
parts/service/repair
and
finance/service contract operations.
Aggregate
revenues
of
our
other
retailing
businesses
declined
1.1%
in
2025
compared
to
2024.
Several
of
these
businesses
experienced
sluggish
customer
demand
in
2025,
attributable
to
a
combination
of
increased
competition
and
the
impacts
of
higher
economic
uncertainty
and
changes
in
consumer
confid
f
ence.
Aggregate
pre-tax
earnings
for
the
remainder
of
our
retailing
group
declined
$53
million
in
2025
compared
to
2024,
generally
reflecting
lower
gross
margins
and
higher
restructur
t
ing costs, partially offs
f
et by lower selling, general and administrative expenses.
2024 versus 2023
Retailing group revenues declined 1.2% to $19.2 billion in 2024 compared to 2023. Except for BHA and Louis, each of
our retailing businesses experienced revenue declines in 2024 compared to 2023. BHA vehicle sales revenues increased 0.5%
in 2024 versus 2023, reflecting an increase in new vehicle unit sales of 7.9% and a decline in pre-owned unit sales of 2.0%.
Further,
average
vehicle
selling
prices
were
lower
in
2024
versus
2023,
attributable
to
increased
inventory
r
availabi
a
lity
and
product mix changes. Revenues of the home furnishings businesses declined 6.4% in 2024 versus 2023, primarily attributable
to
lower
sales
volumes
and
increased
price
competition.
Also,
combined
revenues
of
our
other
retail
businesses
declined
5.8% in 2024 compared to 2023, attributable to increased competition and sluggish consumer demand.
Retailing
group
pre-tax
earnings
declined
$331
million
(19.2%)
in
2024
compared
to
2023.
BHA’s
pre-tax
earnings
declined
7.9%
in
2024
compared
to
2023,
primarily
due
to
lower
vehicle
gross
profit
f
margins,
partially
offs
f
et
by
higher
earnings from finance/service contract and parts/service/repair operations, as well as lower selling, general and administrative
expenses.
Aggregate
pre-tax
earnings
for
the
remainder
of
our
retailing
group
declined
$242
million
(40.2%)
in
2024
compared to 2023. Most of these other retailers generated significantly lower earnings in 2024 compared to 2023, reflecting
lower sales and gross sales margin rates and higher selling, general and administrative expenses as percentages of sales.
Pilot
Pilot
Travel
Centers
(“Pilot”)
operates
travel
centers,
primarily
under
the
names
Pilot
or
Flying
J,
and
fuel-only
retail
locations. Pilot also operates large wholesale fuel and fuel marketing platforms in the U.S.
2025 versus 2024
Pilot’s
revenues
declined
$4.7
billion
(10.0%)
in
2025
from
2024,
primarily
attributable
to
significant
volume
reductions
from
bulk
fuel
sales
and
fuel
trading
activities,
as
well
as
lower
average
fuel
prices
and
wholesale
fuel
volumes.
These declines were partially offs
f
et by increased retail fuel volumes.
Pilot’s
pre-tax
earnings
declined
$424
million
(69.1%)
in
2025
compared
to
2024.
Earnings
in
2025
were
negatively
impacted
by
lower
wholesale
fuel
and
in-store
gross
margins
and
higher
selling,
general
and
administrative
expenses,
primarily
due
to
higher
employee
compensation
and
benefits,
insurance
and
maintenance
costs,
as
well
as
by
charges
from
adju
d
stments
to
certain
fuel-related
balance
sheet
accounts.
These
effe
f
cts
were
partially
offs
f
et
by
lower
interest
expense,
primarily
attributable
to
reduced
borrowing
levels,
and
gains
from
asset
dispositions.
Pilot’s
borrowings,
which
are
from
certain Berkshire insurance subs
u
idiaries, were $3.7 billion at December 31, 2025.
2024 versus 2023
Pilot’s
revenues
declined
$9.9
billion
(17.4%)
in
2024
compared
to
the
full
year
2023.
The
decline
was
primarily
attributable to lower average fuel prices and a decline in volumes from non-core fuel activities.
Pilot’s
pre-tax
earnings
declined
$442
million
(41.9%)
in
2024
compared
to
the
full
year
2023.
Gross
sales
margins
declined
4.3%
in
2024
compared
to
the
full
year
2023,
attributable
to
lower
diesel
margins
from
lower
price
volatility.
Selling,
general
and
administrative
expenses
increased
10.3%
in
2024
compared
to
the
full
year
2023,
reflecting
increased
depreciation and amortization expenses, as well as labor
a
, marketing and maintenance costs. Interest expense declined 30.9%
in
2024
compared
to
the
full
year
2023,
attributable
to
reduced
borrowings
and
lower
rates.
In
March
2024,
Pilot
borrowed
$5.7 billion from certain Berkshire insurance subs
u
idiaries and repaid its then outstanding third-party borrowings.
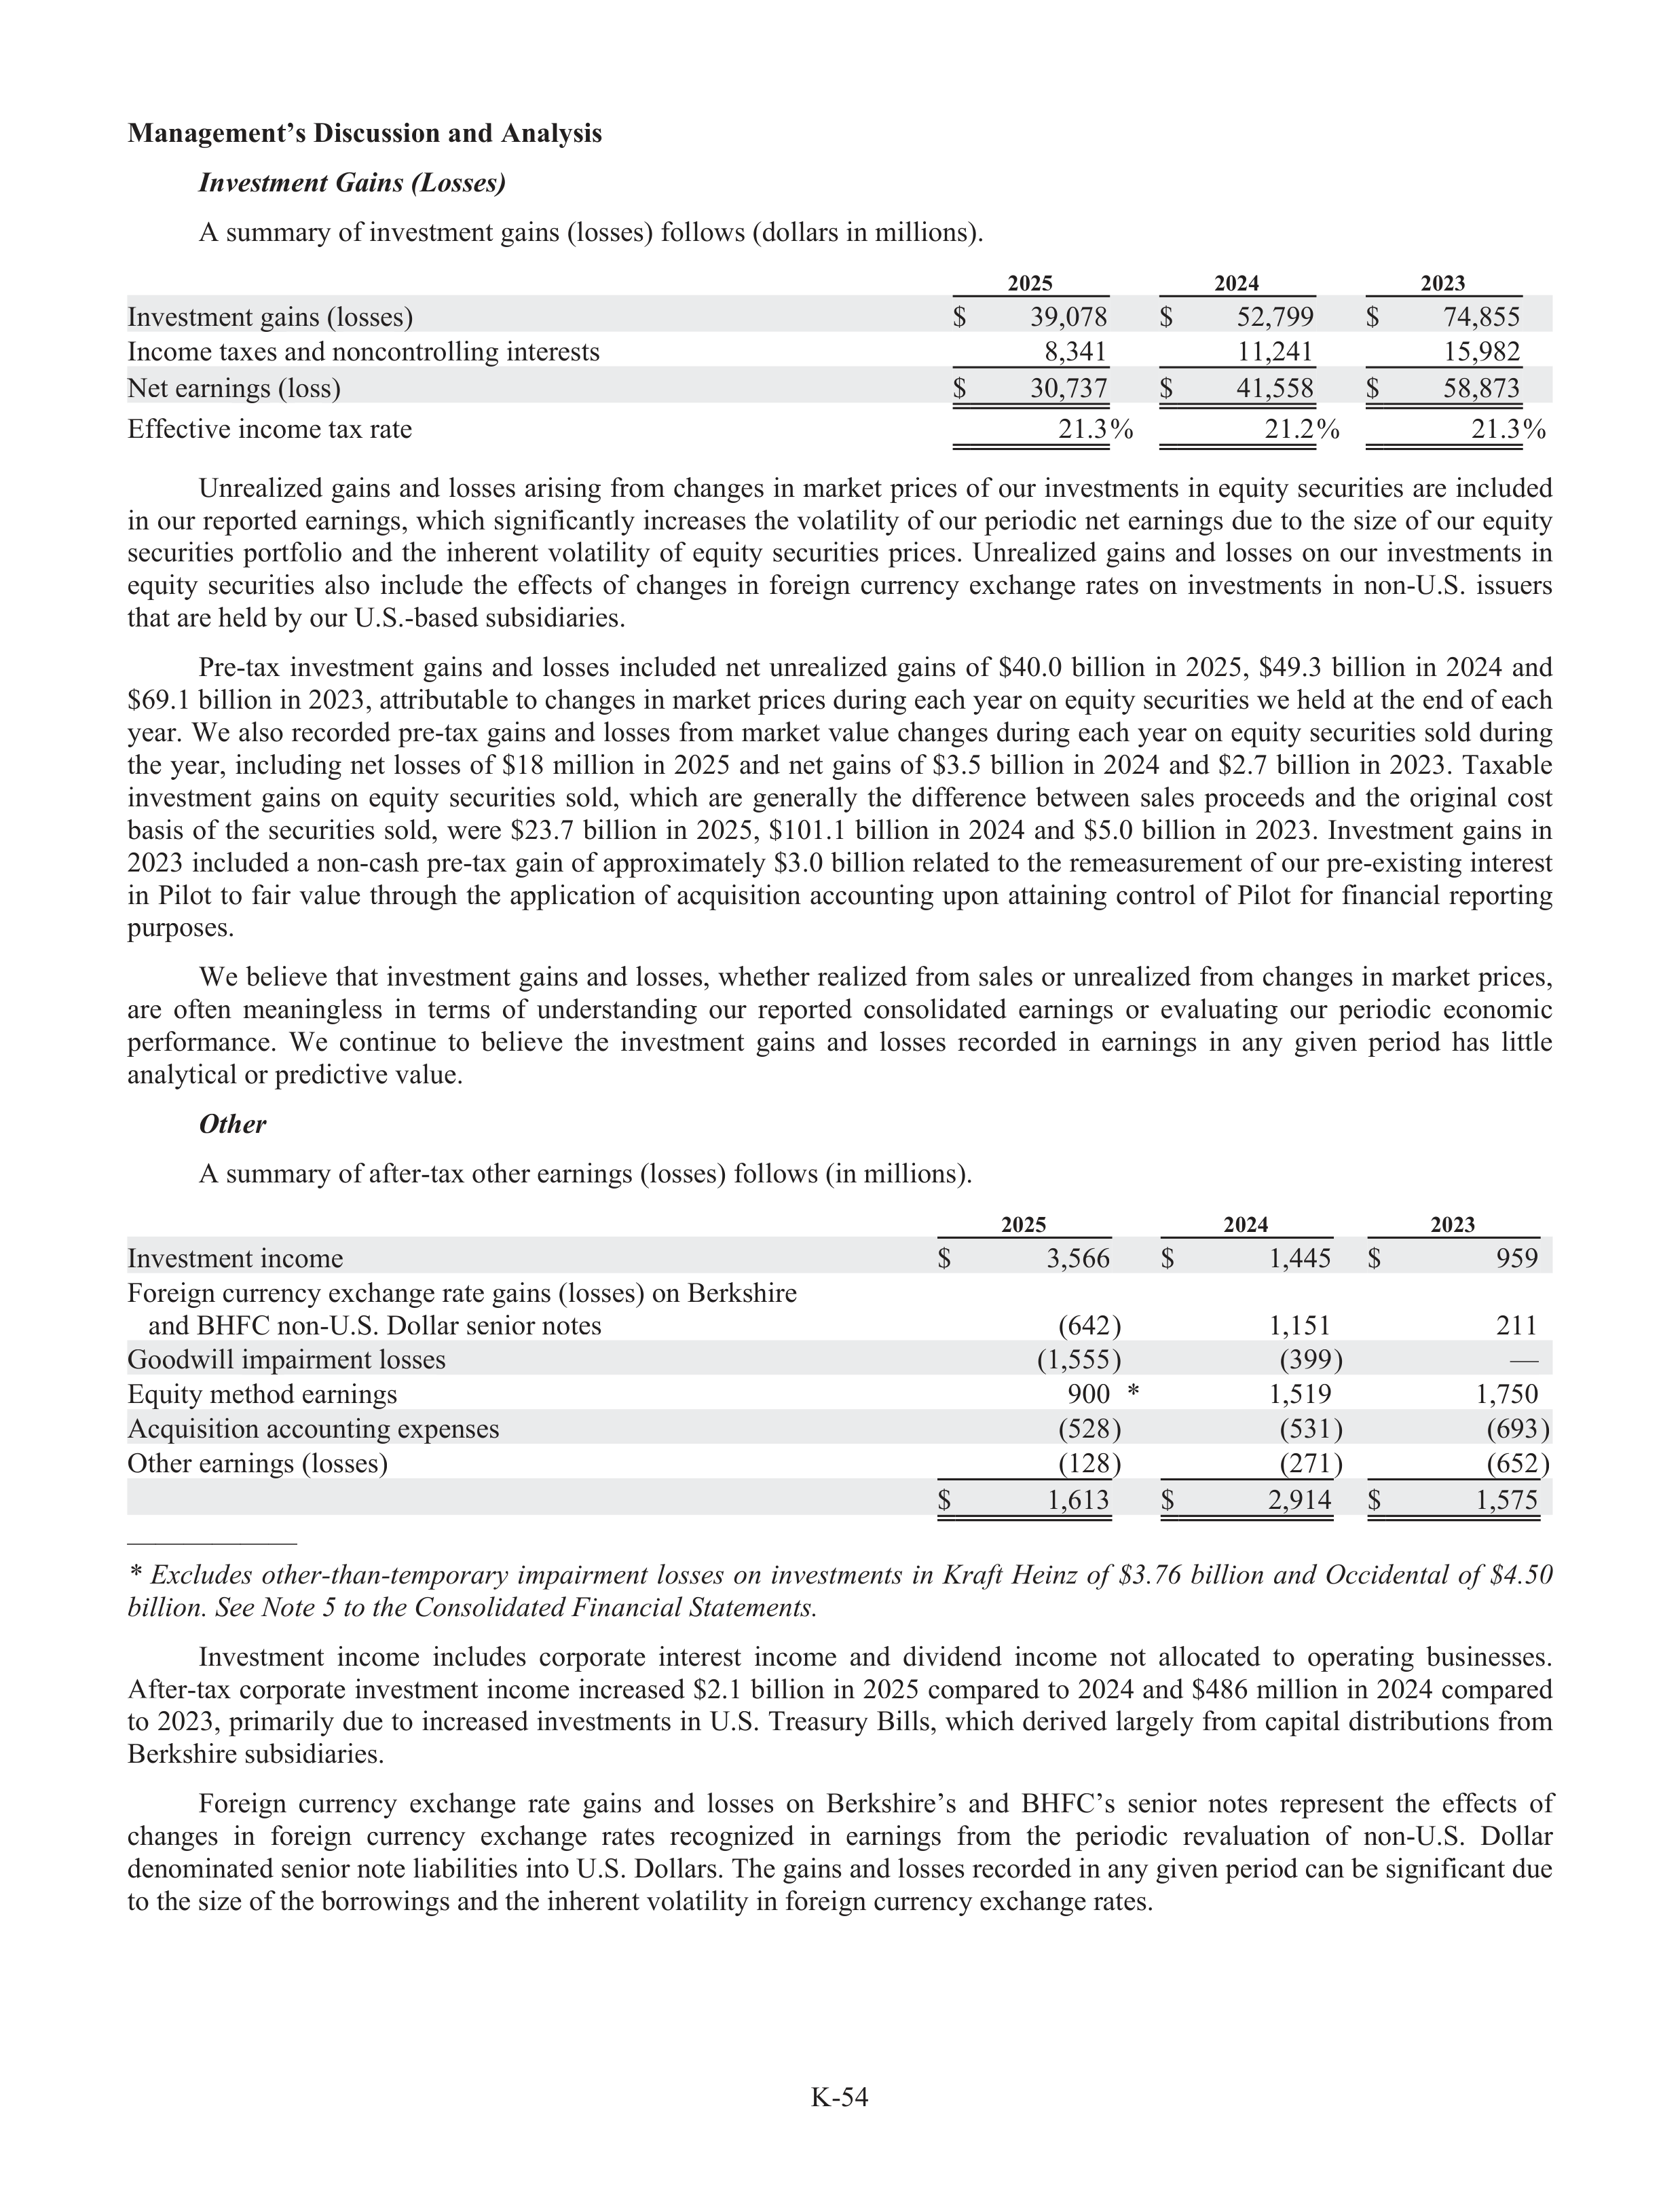
K-54
Management’s Discussion and Analysis
Investment Gains (Losses)
A summary of investment gains (losses) follows (dollars in millions).
2025
2024
2023
Investment gains (losses)
$
39,078
$
52,799
$
74,855
Income taxes and noncontrolling interests
8,341
11,241
15,982
Net earnings (loss)
$
30,737
$
41,558
$
58,873
Effe
f
ctive income tax rate
21.3%
21.2%
21.3%
Unrealized gains and losses arising from changes in market prices of our investments in equity securities are included
in our reported earnings, which significantly increases the volatility of our periodic net earnings due to the size of our equity
securities
portfol
f
io
and
the
inherent
volatility
of
equity
securities
prices.
Unrealized
gains
and
losses
on
our
investments
in
equity
securities
also
include
the
effe
f
cts
of
changes
in
foreign
currency
exchange
rates
on
investments
in
non-U.S.
issuers
that are held by our U.S.-based subs
u
idiaries.
Pre-tax
investment
gains
and
losses
included
net
unrealized
gains
of
$40.0
billion
in
2025,
$49.3
billion
in
2024
and
$69.1 billion in 2023, attributable to changes in market prices during each year on equity securities we held at the end of each
year. We also recorded pre-tax gains and losses from market value changes during each year on equity securities sold during
the
year,
including
net
losses
of
$18
million
in
2025
and
net
gains
of
$3.5
billion
in
2024
and
$2.7
billion
in
2023.
Taxabl
a
e
investment
gains
on
equity
securities
sold,
which
are
generally
the
difference
between
sales
proceeds
and
the
original
cost
basis
of
the
securities
sold,
were
$23.7
billion
in
2025,
$101.1
billion
in
2024
and
$5.0
billion
in
2023.
Investment
gains
in
2023 included a non-cash pre-tax gain of approximately $3.0 billion related to the remeasurement of our pre-existing interest
in
Pilot
to
fair
value
through
the
application
of
acquisition
accounting
upon
attaining
control
of
Pilot
for
financial
reporting
purpos
r
es.
We believe that investment gains and losses, whether realized from sales or unrealized from changes in market prices,
are
ofte
f
n
meaningless
in
terms
of
understanding
our
reported
consolidated
earnings
or
evaluating
our
periodic
economic
performance.
We
continue
to
believe
the
investment
gains
and
losses
recorded
in
earnings
in
any
given
period
has
little
analytical or predictive value.
Othe
t
r
A summary of afte
f
r-tax other earnings (losses) follows (in millions).
2025
2024
2023
Investment income
$
3,566
$
1,445
$
959
Foreign currency exchange rate gains (losses) on Berkshire
and BHFC non-U.S. Dollar senior notes
(642)
1,151
211
Goodwill impairment losses
(1,555)
(399)
—
Equity method earnings
900
*
1,519
1,750
Acquisition accounting expenses
(528)
(531)
(693)
Other earnings (losses)
(128)
(271)
(652)
$
1,613
$
2,914
$
1,575
——————
*
Excludes
other-than-temporary
r
impai
m
rment
losses
on
investments
in
Kraftf
Heinz
of
$3.76
billion
and
Occidental
of
$4.50
billion. See Note 5 to the Consolidat
d
ed Financial Statements.
Investment
income
includes
corporate
interest
income
and
dividend
income
not
allocated
to
operating
businesses.
Afte
f
r-tax corporate investment income increased $2.1 billion in 2025 compared to 2024 and $486 million in 2024 compared
to 2023, primarily due to increased investments in U.S. Treasury
r
Bills, which derived largely from capital distributions from
Berkshire subs
u
idiaries.
Foreign
currency
exchange
rate
gains
and
losses
on
Berkshire’s
and
BHFC’s
senior
notes
represent
the
effe
f
cts
of
changes
in
foreign
currency
exchange
rates
recognized
in
earnings
from
the
periodic
revaluation
of
non-U.S.
Dollar
denominated senior note liabi
a
lities into U.S. Dollars. The gains and losses recorded in any given period can be significant due
to the size of the borrowings and the inherent volatility in foreign currency exchange rates.
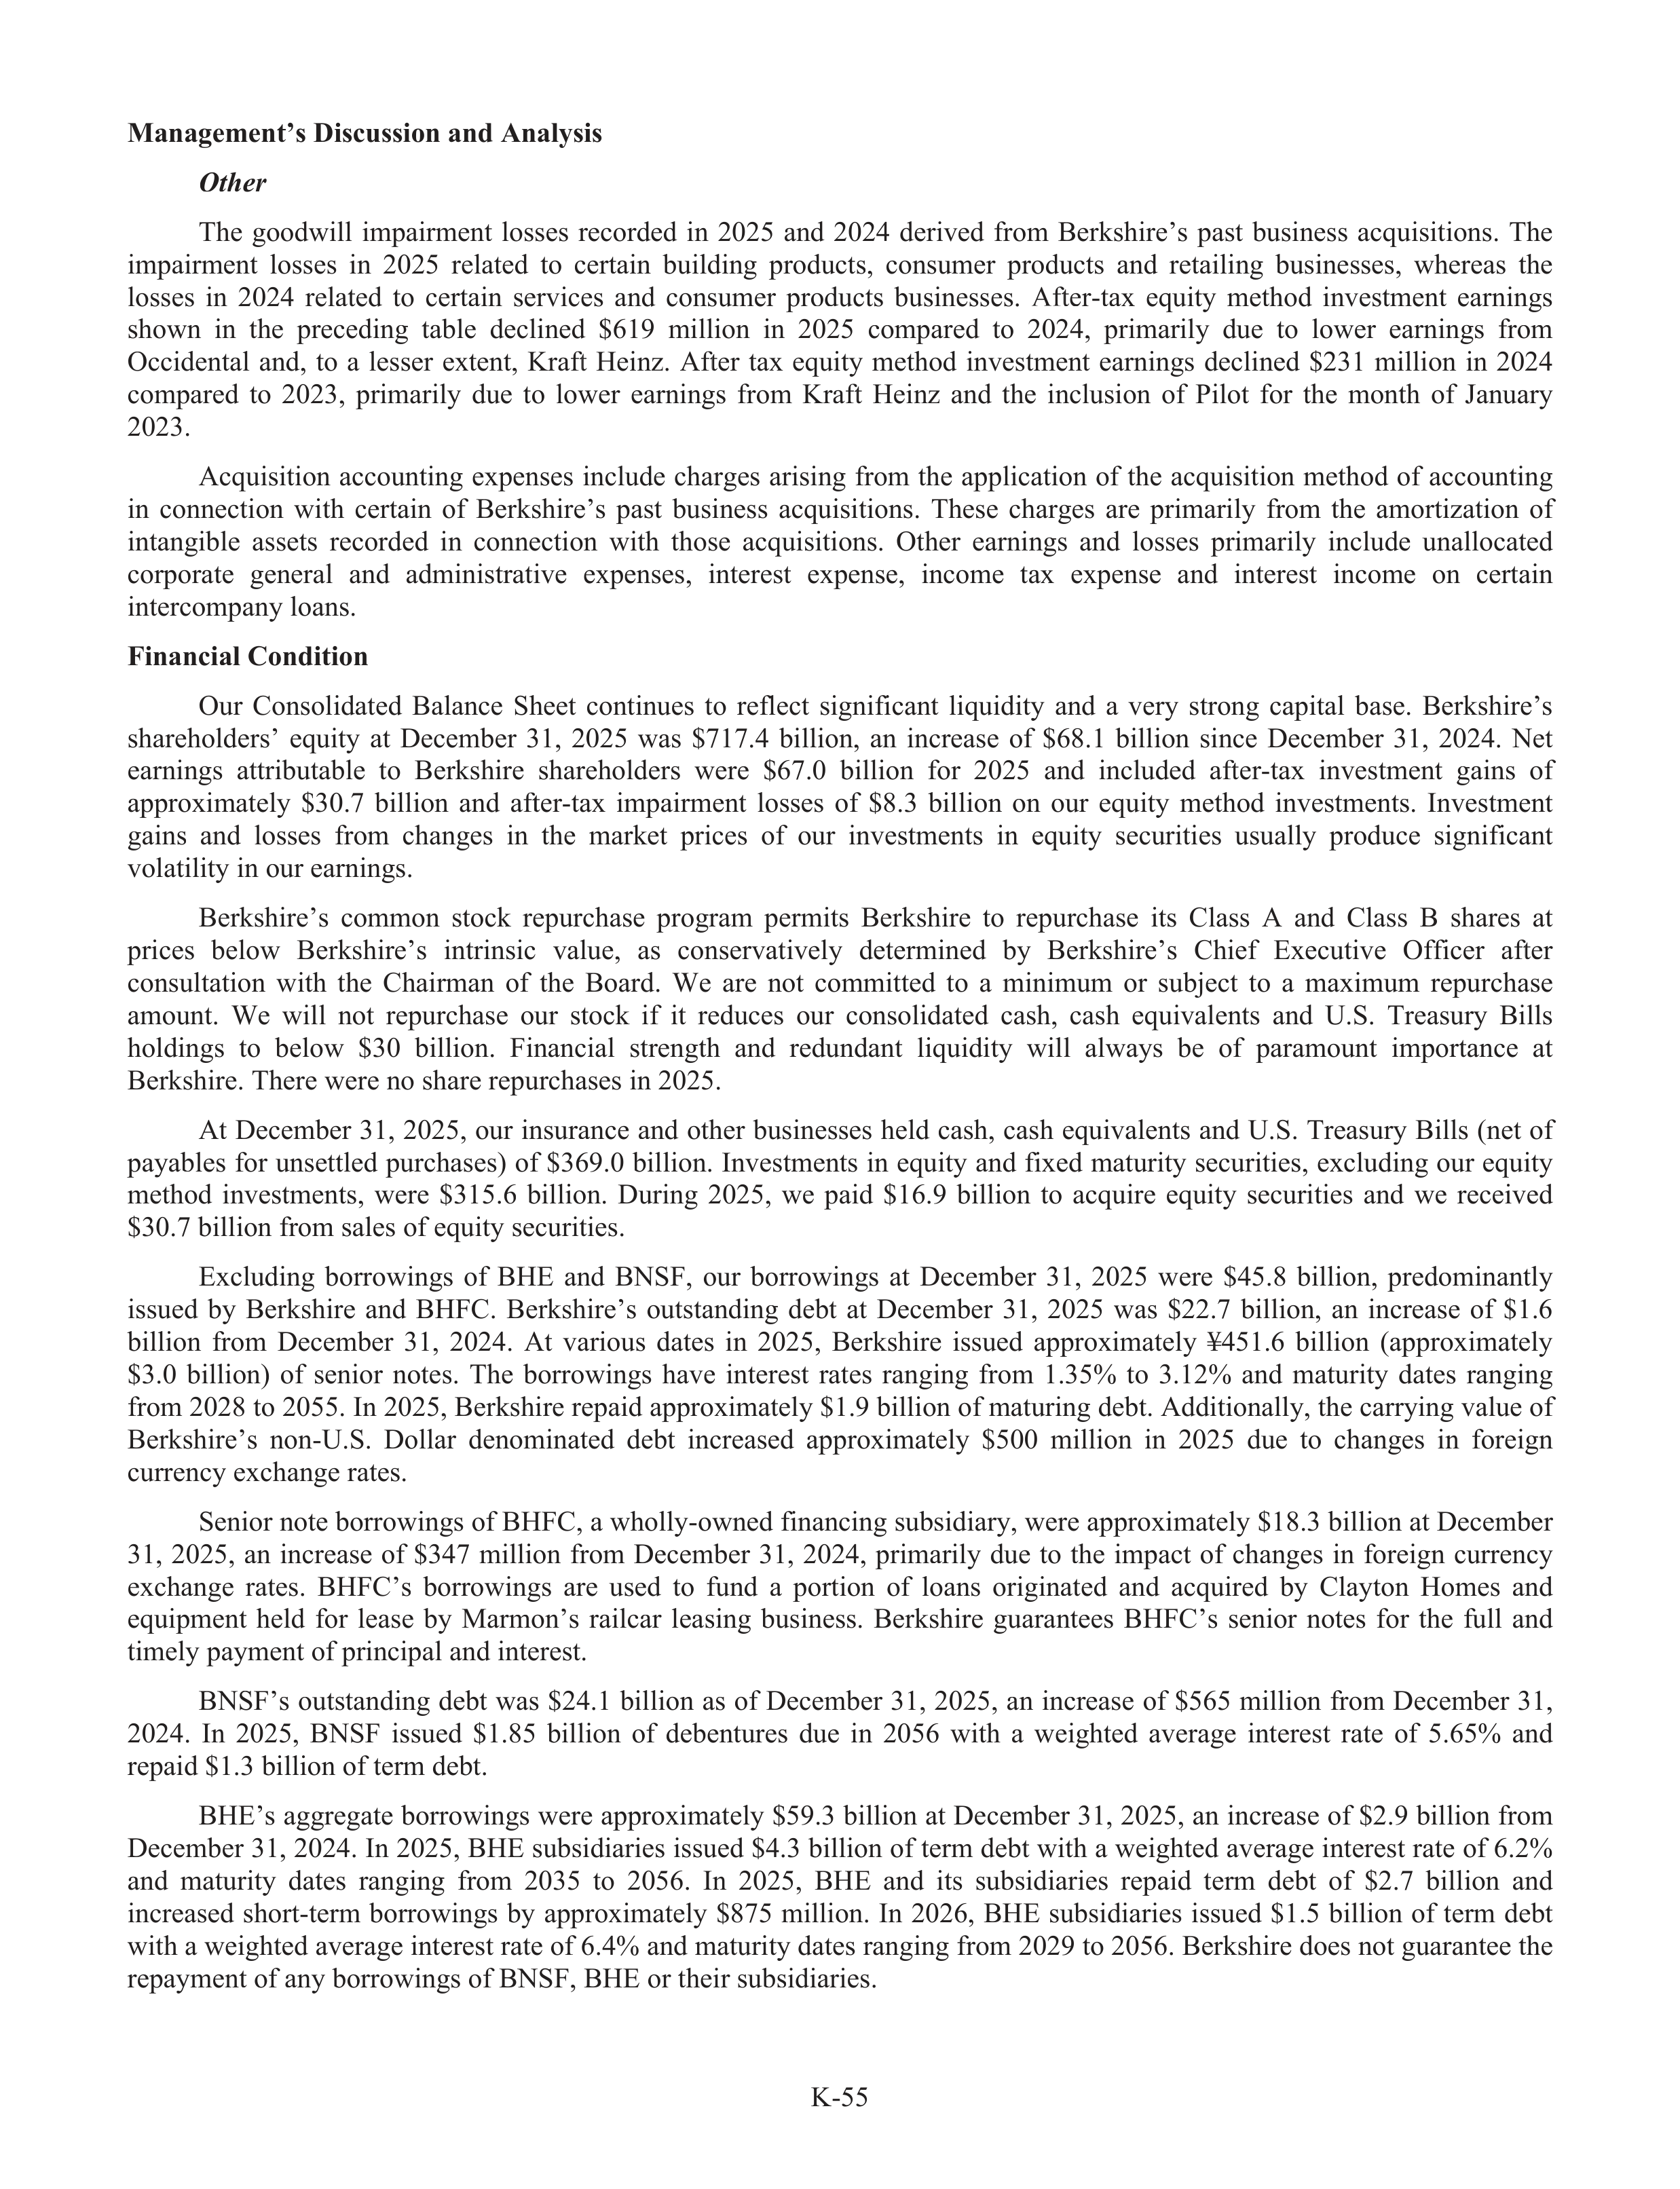
K-55
Management’s Discussion and Analysis
Othe
t
r
The
goodwill
impairment
losses
recorded
in
2025
and
2024
derived
from
Berkshire’s
past
business
acquisitions.
The
impairment
losses
in
2025
related
to
certain
building
products,
consumer
products
and
retailing
businesses,
whereas
the
losses
in
2024
related
to
certain
services
and
consumer
produc
d
ts
businesses.
Afte
f
r-tax
equity
method
investment
earnings
shown
in
the
preceding
tabl
a
e
declined
$619
million
in
2025
compared
to
2024,
primarily
due
to
lower
earnings
from
Occidental
and,
to
a
lesser
extent,
Kraftf
Heinz.
Afte
f
r
tax
equity
method
investment
earnings
declined
$231
million
in
2024
compared
to
2023,
primarily
due
to
lower
earnings
from
Kraftf
Heinz
and
the
inclusion
of
Pilot
for
the
month
of
January
2023.
Acquisition
accounting
expenses
include
charges
arising
from
the
application
of
the
acquisition
method
of
accounting
in
connection
with
certain
of
Berkshire’s
past
business
acquisitions.
These
charges
are
primarily
from
the
amortization
of
intangible
assets
recorded
in
connection
with
those
acquisitions.
Other
earnings
and
losses
primarily
include
unallocated
corporate
general
and
administrative
expenses,
interest
expense,
income
tax
expense
and
interest
income
on
certain
intercompany loans.
Financial Condition
Our
Consolidated
Balance
Sheet
continues
to
reflect
significant
liquidity
and
a
very
strong
capital
base.
Berkshire’s
shareholders’
equity
at
December
31,
2025
was
$717.4
billion,
an
increase
of
$68.1
billion
since
December
31,
2024.
Net
earnings
attributable
to
Berkshire
shareholders
were
$67.0
billion
for
2025
and
included
afte
f
r-tax
investment
gains
of
approximately
$30.7
billion
and
afte
f
r-tax
impairment
losses
of
$8.3
billion
on
our
equity
method
investments.
Investment
gains
and
losses
from
changes
in
the
market
prices
of
our
investments
in
equity
securities
usually
produce
significant
volatility in our earnings.
Berkshire’s
common
stock
repurchase
program
permits
Berkshire
to
repurchase
its
Class
A
and
Class
B
shares
at
prices
below
Berkshire’s
intrinsic
value,
as
conservatively
determined
by
Berkshire’s
Chief
Executive
Offi
f
cer
afte
f
r
consultation
with
the
Chairman
of
the
Board.
We
are
not
committed
to
a
minimum
or
subj
u
ect
to
a
maximum
repurchase
amount.
We
will
not
repurchase
our
stock
if
it
reduces
our
consolidated
cash,
cash
equivalents
and
U.S.
Treasury
Bills
holdings
to
below
$30
billion.
Financial
strength
and
redundant
liquidity
will
always
be
of
paramount
importance
at
Berkshire. There were no share repurchases in 2025.
At December 31, 2025, our insurance and other businesses held cash, cash equivalents and U.S. Treasury
r
Bills (net of
payabl
a
es for unsettled purchases) of $369.0 billion. Investments in equity and fixed maturity securities, excluding our equity
method
investments,
were
$315.6
billion.
During
2025,
we
paid
$16.9
billion
to
acquire
equity
securities
and
we
received
$30.7 billion from sales of equity securities.
Excluding
borrowings
of
BHE
and
BNSF,
our
borrowings
at
December
31,
2025
were
$45.8
billion,
predominantly
issued
by
Berkshire
and
BHFC.
Berkshire’s
outstanding
debt
at
December
31,
2025
was
$22.7
billion,
an
increase
of
$1.6
billion
from
December
31,
2024.
At
various
dates
in
2025,
Berkshire
issued
approximately
¥451.6
billion
(appr
a
oximately
$3.0
billion)
of
senior
notes.
The
borrowings
have
interest
rates
ranging
from
1.35%
to
3.12%
and
maturity
dates
ranging
from 2028 to 2055. In 2025, Berkshire repaid approximately $1.9 billion of maturing debt. Additionally, the carrying value of
Berkshire’s
non-U.S.
Dollar
denominated
debt
increased
approximately
$500
million
in
2025
due
to
changes
in
foreign
currency exchange rates.
Senior note borrowings of BHFC, a wholly-owned financing subs
u
idiary, were approximately $18.3 billion at December
31,
2025,
an
increase
of
$347
million
from
December
31,
2024,
primarily
due
to
the
impact
of
changes
in
foreign
currency
exchange
rates.
BHFC’s
borrowings
are
used
to
fund
a
portion
of
loans
originated
and
acquired
by
Clayton
Homes
and
equipment
held
for
lease
by
Marmon’s
railcar
leasing
business.
Berkshire
guarantees
BHFC’s
senior
notes
for
the
full
and
timely payment of principal and interest.
BNSF’s outstanding debt was $24.1 billion as of December 31, 2025, an increase of $565 million from December 31,
2024.
In
2025,
BNSF
issued
$1.85
billion
of
debentur
t
es
due
in
2056
with
a
weighted
average
interest
rate
of
5.65%
and
repaid $1.3 billion of term debt.
BHE’s aggregate borrowings were approximately $59.3 billion at December 31, 2025, an increase of $2.9 billion from
December 31, 2024. In 2025, BHE subs
u
idiaries issued $4.3 billion of term debt with a weighted average interest rate of 6.2%
and
maturity
dates
ranging
from
2035
to
2056.
In
2025,
BHE
and
its
subs
u
idiaries
repaid
term
debt
of
$2.7
billion
and
increased
short-term
borrowings
by
approximately
$875
million.
In
2026,
BHE
subs
u
idiaries
issued
$1.5
billion
of
term
debt
with a weighted average interest rate of 6.4% and maturity dates ranging from 2029 to 2056. Berkshire does not guarantee the
repayment of any borrowings of BNSF, BHE or their subs
u
idiaries.
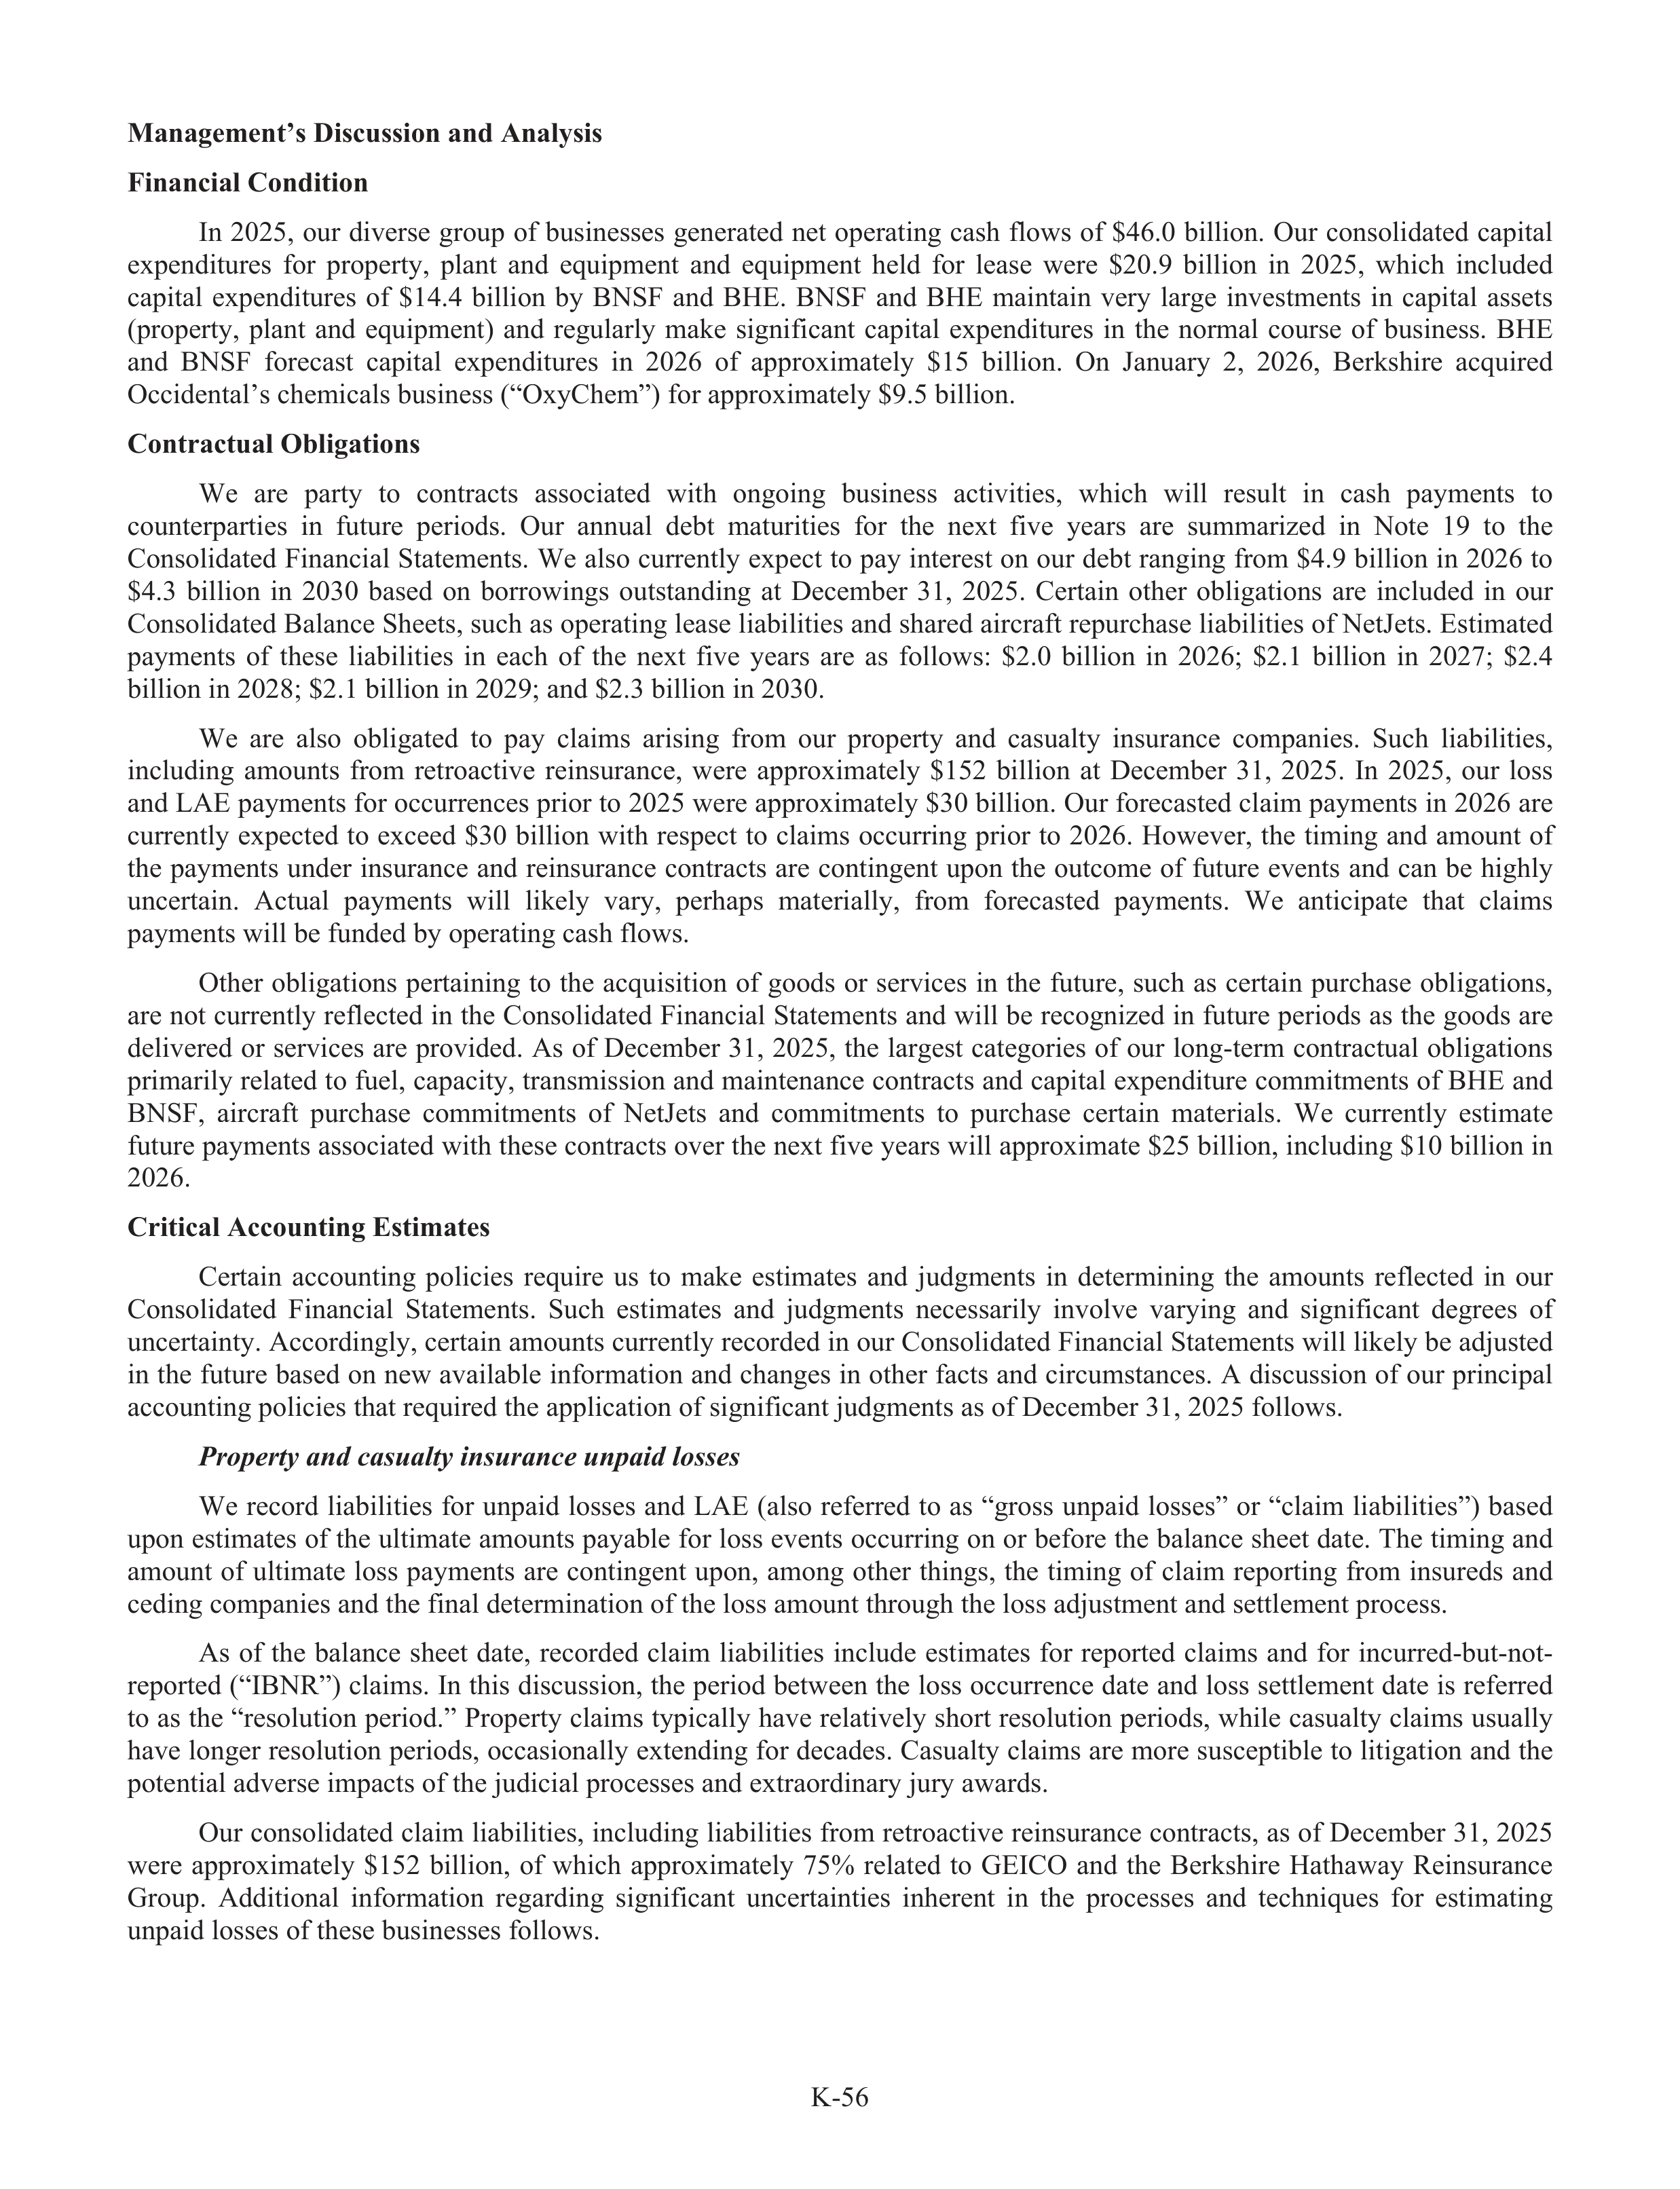
K-56
Management’s Discussion and Analysis
Financial Condition
In 2025, our diverse group of businesses generated net operating cash flows of $46.0 billion. Our consolidated capi
a
tal
expenditures
for
property,
plant
and
equipment
and
equipment
held
for
lease
were
$20.9
billion
in
2025,
which
included
capital
expenditures
of
$14.4
billion
by
BNSF
and
BHE.
BNSF
and
BHE
maintain
very
large
investments
in
capital
assets
(property,
plant
and
equipment)
and
regularly
make
significant
capital
expenditures
in
the
normal
course
of
business.
BHE
and
BNSF
forecast
capital
expenditures
in
2026
of
approximately
$15
billion.
On
January
2,
2026,
Berkshire
acquired
Occidental’s chemicals business (“OxyChem”) for approximately $9.5 billion.
Contractual Obligations
We
are
party
to
contracts
associated
with
ongoing
business
activities,
which
will
result
in
cash
payments
to
counterpa
r
rties
in
future
periods.
Our
annual
debt
maturities
for
the
next
five
years
are
summarized
in
Note
19
to
the
Consolidated Financial Statements. We also currently expect to pay interest on our debt ranging from $4.9 billion in 2026 to
$4.3
billion
in
2030
based
on
borrowings
outstanding
at
December
31,
2025.
Certain
other
obligations
are
included
in
our
Consolidated Balance Sheets, such as operating lease liabi
a
lities and shared aircraft repurchase liabi
a
lities of NetJets. Estimated
payments
of
these
liabi
a
lities
in
each
of
the
next
five
years
are
as
follows:
$2.0
billion
in
2026;
$2.1
billion
in
2027;
$2.4
billion in 2028; $2.1 billion in 2029; and $2.3 billion in 2030.
We
are
also
obligated
to
pay
claims
arising
from
our
property
and
casualty
insurance
companies.
Such
liabi
a
lities,
including
amounts
from
retroactive
reinsurance,
were
approximately
$152
billion
at
December
31,
2025.
In
2025,
our
loss
and LAE payments for occurrences prior to 2025 were approximately $30 billion. Our forecasted claim payments in 2026 are
currently
expected
to
exceed
$30
billion
with
respect
to
claims
occurring
prior
to
2026.
However,
the
timing
and
amount
of
the payments under insurance and reinsurance contracts are contingent upon the outcome of future events and can be highly
uncertain.
Actual
payments
will
likely
vary,
perhaps
materially,
from
forecasted
payments.
We
anticipate
that
claims
payments will be funded by operating cash flows.
Other
obligations
pertaining
to
the
acquisition
of
goods
or
services
in
the
future,
such
as
certain
purchase
obligations,
are not currently reflected in the Consolidated Financial Statements and will be recognized in future periods as the goods are
delivered
or
services
are
provided.
As
of
December
31,
2025,
the
largest
categories
of
our
long-term
contractua
t
l
obligations
primarily related to fuel, capacity, transmission and maintenance contracts and capital expenditure commitments of BHE and
BNSF,
aircraft
purchase
commitments
of
NetJets
and
commitments
to
purchase
certain
materials.
We
currently
estimate
future payments associated with these contracts over the next five years will approximate $25 billion, including $10 billion in
2026.
Critical Accounting Estimates
Certain
accounting
policies
require
us
to
make
estimates
and
judgments
in
determining
the
amounts
reflected
in
our
Consolidated
Financial
Statements.
Such
estimates
and
judgments
necessarily
involve
varying
and
significant
degrees
of
uncertainty. Accordingly, certain amounts currently recorded in our Consolidated Financial Statements will likely be adju
d
sted
in the future based on new availabl
a
e information and changes in other facts and circumstances. A discussion of our principal
accounting policies that required the application of significant judgments as of December 31, 2025 follows.
Propertyt
and casualty
l
insurance unpaid losses
We
record
liabi
a
lities
for
unpaid
losses
and
LAE
(also
referred
to
as “gross
unpaid
losses”
or
“claim
liabi
a
lities”)
based
upon estimates of the ultimate amounts payabl
a
e for loss events occurring on or before the balance sheet date. The timing and
amount
of
ultimate
loss
payments
are
contingent
upon,
among
other
things,
the
timing
of
claim
reporting
from
insureds
and
ceding companies and the final determination of the loss amount through the loss adju
d
stment and settlement process.
As
of
the
balance
sheet
date,
recorded
claim
liabi
a
lities
include
estimates
for
reported
claims
and
for
incurred-but-not-
reported (“IBNR”) claims. In this discussion, the period between the loss occurrence date and loss settlement date is referred
to as the “resolution period.” Property claims typically have relatively short resolution periods, while casualty claims usually
have longer resolution periods, occasionally extending for decades. Casualty claims are more susceptible to litigation and the
potential adverse impacts of the judicial processes and extraordinary
r
jury awards.
Our consolidated claim liabi
a
lities, including liabi
a
lities from retroactive reinsurance contracts, as of December 31, 2025
were
approximately
$152
billion,
of
which
approximately
75%
related
to
GEICO
and
the
Berkshire
Hathaway
Reinsurance
Group.
Additional
information
regarding
significant
uncertainties
inherent
in
the
processes
and
techniques
for
estimating
unpaid losses of these businesses follows.
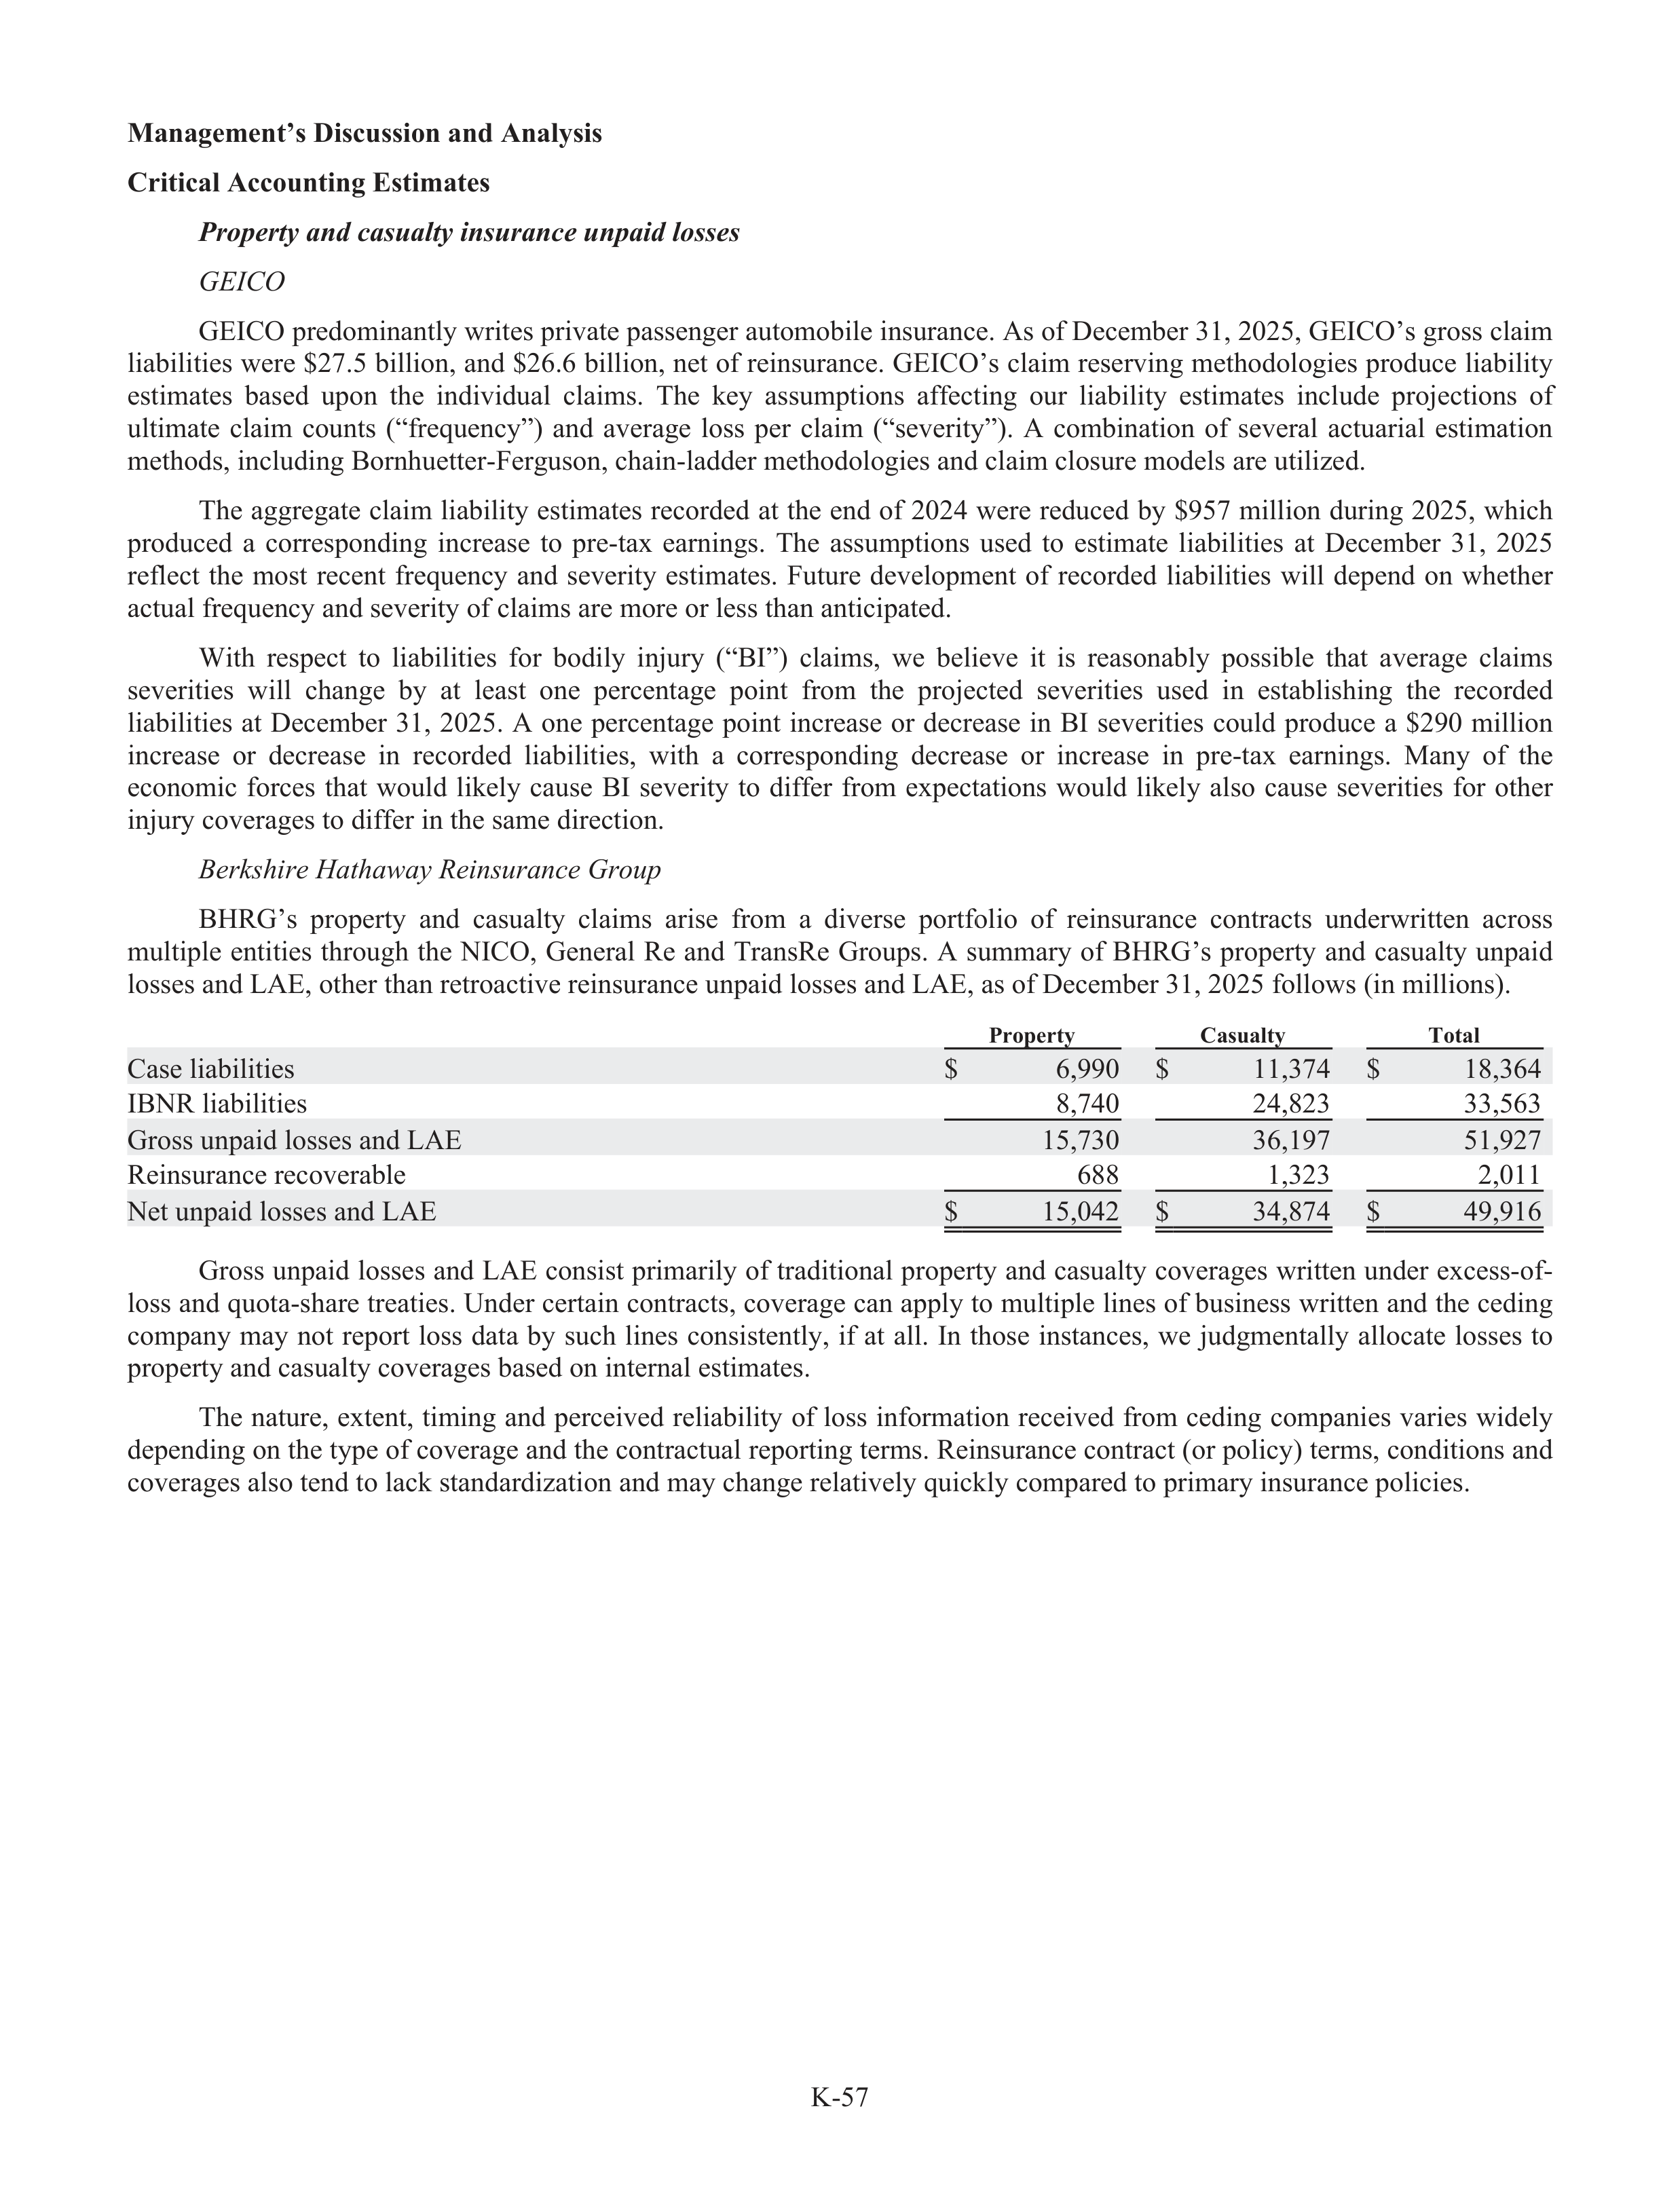
K-57
Management’s Discussion and Analysis
Critical Accounting Estimates
Propertyt
and casualty
l
insurance unpaid losses
GEIC
E
O
GEICO predominantly writes private passenger automobile insurance. As of December 31, 2025, GEICO’s gross claim
liabi
a
lities were $27.5 billion, and $26.6 billion, net of reinsurance. GEICO’s claim reserving methodologies produce liabi
a
lity
estimates
based
upon
the
individual
claims.
The
key
assumptions
affe
f
cting
our
liabi
a
lity
estimates
include
projections
of
ultimate
claim
counts
(“fre
f
quency”)
and
average
loss
per
claim
(“severity”).
A
combination
of
several
actua
t
rial
estimation
methods, including Bornhuetter-Ferguson, chain-ladder methodologies and claim closure models are utilized.
The aggregate claim liabi
a
lity estimates recorded at the end of 2024 were reduced by $957 million during 2025, which
produced
a
corresponding
increase
to
pre-tax
earnings.
The
assumptions
used
to
estimate
liabi
a
lities
at
December
31,
2025
reflect
the
most
recent
frequency
and
severity
estimates.
Future
development
of
recorded
liabi
a
lities
will
depend
on
whether
actua
t
l frequency and severity of claims are more or less than anticipated.
With
respect
to
liabi
a
lities
for
bodily
inju
n
ry
(“BI”)
claims,
we
believe
it
is
reasonabl
a
y
possible
that
average
claims
severities
will
change
by
at
least
one
percentage
point
from
the
projected
severities
used
in
establ
a
ishing
the
recorded
liabi
a
lities
at
December
31,
2025.
A
one
percentage
point
increase
or
decrease
in
BI
severities
could
produce
a
$290
million
increase
or
decrease
in
recorded
liabi
a
lities,
with
a
corresponding
decrease
or
increase
in
pre-tax
earnings.
Many
of
the
economic
forces
that
would
likely
cause
BI
severity
to
differ
from
expectations
would
likely
also
cause
severities
for
other
inju
n
ry coverages to differ in the same direction.
Berksh
k
ire Hathaway Reinsurance Group
BHRG’s
property
and
casualty
claims
arise
from
a
diverse
portfol
f
io
of
reinsurance
contracts
underwritten
across
multiple
entities
through
the
NICO,
General
Re
and
TransRe
Groups.
A
summary
of
BHRG’s
property
and
casualty
unpaid
losses and LAE, other than retroactive reinsurance unpaid losses and LAE, as of December 31, 2025 follows (in millions).
Property
Casualty
Total
Case liabi
a
lities
$
6,990
$
11,374
$
18,364
IBNR liabi
a
lities
8,740
24,823
33,563
Gross unpaid losses and LAE
15,730
36,197
51,927
Reinsurance recoverabl
a
e
688
1,323
2,011
Net unpaid losses and LAE
$
15,042
$
34,874
$
49,916
Gross unpaid losses and LAE consist primarily of traditional property and casualty coverages written under excess-of-f
loss and quota-share treaties. Under certain contracts, coverage can apply to multiple lines of business written and the ceding
company
may
not
report
loss
data
by
such
lines
consistently,
if
at
all.
In
those
instances,
we
judgmentally
allocate
losses
to
property and casualty coverages based on internal estimates.
The
nature,
extent,
timing
and
perceived
reliabi
a
lity
of
loss
information
received
from
ceding
companies
varies
widely
depending on the type of coverage and the contractua
t
l reporting terms. Reinsurance contract (or policy) terms, conditions and
coverages also tend to lack standardization and may change relatively quickly compared to primary insurance policies.
K-58
Management’s Discussion and Analysis
Critical Accounting Estimates
Propertyt
and casualty
l
insurance unpaid losses
The loss information provided under many facultative (individual risk) or per occurrence excess-of-l
f
oss contracts may
be
comparable
to
the
information
received
under
a
primary
insurance
contract.
However,
loss
information
with
respect
to
aggregate excess-of-l
f
oss and quota-share contracts is ofte
f
n in a summary form rather than on an individual claim basis. Loss
data includes currently recoverabl
a
e paid losses, as well as case loss estimates. Ceding companies infrequently provide reliable
IBNR loss estimates.
Loss reporting to reinsurers is typically slower than primary insurers. Client reporting of claims information is required
based
on
the
terms
of
the
contract
at
intervals
ranging
from
30
to
180
days
afte
f
r
the
end
of
the
quarterly
or
annual
period,
reporting
practices
can
vary
by
jurisdiction.
To
the
extent
that
reinsurers
assume
and
cede
underlying
risks
from
other
reinsurers,
further
delays
in
claims
reporting
may
occur.
The
relative
impact
of
reporting
delays
depends
on
the
type
of
coverage,
contractua
t
l
reporting
terms,
or
the
magnitude
of
the
claim
relative
to
the
attachment
point
of
the
reinsurance
coverage.
The
premium
and
loss
data
BHRG
receives
is
at
least
one
level
removed
from
the
underlying
claimant,
so
there
is
a
risk
that
the
loss
data
reported
is
incomplete,
inaccurate
or
the
claim
is
outside
the
coverage
terms.
We
maintain
internal
procedur
d
es
to
determine
that
the
information
is
complete
and
in
compliance
with
the
contract
terms.
Generally,
our
reinsurance
contracts
permit
us
to
audit
the
ceding
company’s
records
with
respect
to
the
subj
u
ect
business
for
compliance
with the terms of the policy. Disputes occasionally arise concerning whether claims are covered by our reinsurance policies,
which
are
normally
resolved
through
negotiation.
If
disputes
cannot
be
resolved,
our
contracts
generally
provide
arbi
r
tration
or
alternative
dispute
resolution
processes.
We
believe
there
are
no
coverage
disputes
at
this
time
for
which
an
adverse
resolution would likely have a material impact on our consolidated results of operations or financial condition.
Establ
a
ishing claim liabi
a
lity estimates for reinsurance requires evaluation of loss information received from our clients.
While
we
generally
rely
on
the
ceding
companies’
reported
case
loss
estimates,
we
sometimes
use
our
own
case
liabi
a
lity
estimate,
if
deemed
appropriate.
As
of
December
31,
2025,
our
case
loss
estimates
exceeded
ceding
company
estimates
by
approximately $1.1 billion. We also periodically conduct detailed reviews of individual client claims, which may cause us to
adju
d
st our case estimates.
Although
liabi
a
lities
for
losses
are
initially
determined
based
on
pricing
and
underwriting
analysis,
we
use
a
variety
of
actua
t
rial
methodologies
that
place
reliance
on
the
extrapolation
of
historical
data,
loss
development
patterns,
industry
r
data
and other benchmarks. The estimate of the IBNR liabi
a
lities also requires judgment by actua
t
ries and management to reflect the
impact of additional factors like change in business mix, volume, claim reporting and handling practices, inflation, social and
legal environment and the terms and conditions of the contracts. The methodologies generally fall into or are hybrids of one
or more of the following categories:
Paid
and
incurred
loss
development
methods
consider
the
expected
case
loss
emergence
and
development
patterns,
together with expected loss ratios by year. Factors affe
f
cting loss development analysis include, but are not limited to, changes
in
the
following:
client
claims
reporting
and
settlement
practices,
the
frequency
of
client
company
claim
reviews,
policy
terms and coverage (such as loss retention levels and occurrence and aggregate policy limits), loss trends and legal trends that
result in unanticipated losses. Collectively, these factors influence our selections of expected case loss emergence patterns.
Incurred and paid loss Bornhuetter-Ferguson methods
consider actua
t
l paid and incurred losses and expected reporting
patterns
of
paid
and
incurred
losses,
taking
the
initial
expected
ultimate
losses
into
account
to
determine
an
estimate
of
the
expected unpaid or unreported losses.
K-59
Management’s Discussion and Analysis
Critical Accounting Estimates
Propertyt
and casualty
l
insurance unpaid losses
Frequency
c
and severity methods
commonly focus on a review of the number of anticipated claims and the anticipated
claims severity and may also rely on development patterns to derive such estimates. However, our processes and techniques
for estimating liabi
a
lities in such analyses generally rely more on a per-policy assessment of the ultimate cost associated with
the individual loss rather than with an analysis of historical development patterns of past losses.
Addi
d
tional
analys
l
is
–
In
some
cases
we
have
establ
a
ished
reinsurance
claim
liabi
a
lities
on
a
contract-by-contract
basis,
determined from case loss estimates reported by the ceding company and IBNR liabi
a
lities that are primarily a function of an
anticipated
loss
ratio
for
the
contract
and
the
reported
case
loss
estimate.
Liabilities
are
adju
d
sted
upward
or
downward
over
time
to
reflect
case
losses
reported
versus
expected
case
losses,
which
we
use
to
form
revised
judgment
on
the
adequacy
of
the expected loss ratio and the level of IBNR liabi
a
lities required for unreported claims. Anticipated loss ratios are also revised
to include estimates of known majo
a
r catastrophe events.
Our claim liabi
a
lity estimation process for lines with shorter resolution periods, primarily property exposures, utilizes a
combination
of
the
paid
and
incurred
loss
development
methods
and
the
incurred
and
paid
loss
Bornhuetter-Ferguson
methods. Certain property, individual risk and aviation excess-of-l
f
oss contracts tend to generate low frequency/high severity
losses.
Our
processes
and
techniques
for
estimating
liabi
a
lities
under
such
contracts
generally
rely
more
on
a
per
contract
assessment
of
the
ultimate
cost
associated
with
the
individual
loss
event
rather
than
with
an
analysis
of
the
historical
development patterns of past losses.
For
claims
with
longer
resolution
periods,
primarily
casualty
exposures,
we
may
rely
on
different
methods
depending
on
the
maturity
of
the
business,
with
estimates
for
the
most
recent
years
being
based
on
pricing
loss
expectations
and
more
mature years reflecting the paid or incurred development pattern indications.
In
2025,
we
reduced
estimated
ultimate
pre-2025
accident
years’
claim
liabi
a
lities
by
$1.1
billion.
This
net
reduction
includes
$1.5
billion
attributable
to
lower-than-expected
reported
property
losses,
partially
offs
f
et
by
increased
estimates
for
casualty claim liabi
a
lities. The net reduction produced a corresponding increase in pre-tax earnings.
The
portfol
f
ios
of
contracts
within
the
three
BHRG
Groups
vary
considerably,
covering
multiple
lines
of
business
within
diverse
geographi
a
c
areas
and
legal
environments,
which
requires
us
to
vary
the
application
of
actua
t
rial
methods
and
weighting
of
assumptions
to
determine
the
appropriate
ultimate
claims
estimates.
Given
the
heterogeneity
of
the
groups
of
contracts
and
actua
t
rial
methods
and
assumptions
applied,
we
believe
it
is
not
possible
to
reasonabl
a
y
quantify
f
the
impact
of
changes in any single or limited group of assumptions to the entire portfol
f
io. Moreover, changes in certain assumptions ofte
f
n
create
iterative
impacts
on
other
actua
t
rial
assumptions.
Accordingly,
we
believe
it
is
impracticable
to
provide
meaningful
f
quantific
f
ation of the impact of changes to any limited number of chosen assumptions.
BHRG’s
property
and
casualty
unpaid
loss
and
loss
adju
d
stment
expenses
could
be
materially
higher
or
lower
than
the
liabi
a
lities
as
of
December
31,
2025
due
to
the
inherent
uncertainty
of
determining
ultimate
claims
costs
for
claims
that
have
occurred
or
will
be
deemed
to
have
occurred
as
of
the
balance
sheet
date.
We
currently
believe,
however,
that
significant
upward
revisions
of
claim
estimates
are
more
likely
for
casualty
claims,
given
longer
resolution
periods
and
evolving
inflation,
legal,
judicial
and
mass
tort
risks,
including
the
manifestation
of
new
forms
of
claims
that
were
not
contemplated
when
the
policies
were
written.
We
believe
a
five
percent
increase
in
BHRG’s
casualty
claim
liabi
a
lities
over
time
is
reasonabl
a
y
possible,
although
this
should
not
be
viewed
as
a
worst-case
scenario
given
the
risks
identifie
f
d.
An
increase
of
this
magnitude
to
our
gross
liabi
a
lities
for
casualty
claims
at
December
31,
2025
could
produce
an
increase
in
casualty
liabi
a
lities of about $1.8 billion, with a corresponding decrease to pre-tax earnings.
Retroactive reinsurance
Our
retroactive
reinsurance
contracts
indemnify
f
insurance
losses
from
events
occurring
before
the
contract
inception
dates. Claim liabi
a
lities associated with these contracts predominately pertain to casualty or liabi
a
lity exposures and we expect
the resolution periods will be very long. At December 31, 2025, gross unpaid losses were $31.0 billion.
Our
contracts
are
generally
subj
u
ect
to
maximum
limits
of
indemnific
f
ation
and,
as
such,
we
currently
expect
that
the
aggregate remaining losses payabl
a
e under our policies will not exceed $46 billion. While ultimate claims will be affe
f
cted by
judicial and legislative changes affe
f
cting asbestos, environmental or mass tort exposures, we currently believe it unlikely that
losses will increase to the maximum or decline by more than 15% of our estimated gross claims liabi
a
lity as of December 31,
2025.
K-60
Management’s Discussion and Analysis
Critical Accounting Estimates
Propertyt
and casualty
l
insurance unpaid losses
We
establ
a
ish
liabi
a
lity
estimates
by
individual
contract,
considering
exposure
and
development
trends,
historical
aggregate
loss
payment
patterns
and
project
expected
ultimate
losses
under
various
scenarios.
We
apply
judgmental
probabi
a
lity
factors
to
these
scenarios
to
determine
an
expected
outcome.
We
also
monitor
subs
u
equent
loss
payment
activity
and
ceding
company
reports
and
other
availabl
a
e
information.
We
re-estimate
ultimate
losses
when
significant
events
or
significant deviations from expectations are revealed.
Certain
of
our
contracts
include
asbestos
and
environmental,
as
well
as
other
mass
tort
exposures.
Our
estimated
liabi
a
lities
for
asbestos
and
environmental
exposures
were
approximately
$11.1
billion
at
December
31,
2025.
Ceding
companies do not consistently provide reliabl
a
e and detailed underlying claims data, particularly with respect to multi-line or
aggregate
excess-of-l
f
oss
policies.
When
possible,
we
conduct
detailed
analyses
of
the
underlying
loss
data
in
making
an
estimate of ultimate remaining claims liabi
a
lities. When detailed loss information is unavailabl
a
e, we may apply recent industry
r
trends
and
projections
to
aggregate
client
data.
Judgments
in
these
areas
necessarily
consider
the
stability
of
the
legal
and
regulatory
r
environment
under
which
we
expect
claims
will
be
adju
d
dicated.
Legal
reform
and
legislation
and
judicial
rulings
could also have a significant impact on our ultimate liabi
a
lities.
Overall,
we
increased
estimated
ultimate
liabi
a
lities
for
prior
year
retroactive
reinsurance
contracts
by
$261
million
in
2025,
primarily
for
asbestos,
environmental
and
other
casualty
exposures.
This
increase,
including
the
changes
in
deferred
charge assets, had an insignificant impact on underwriting earnings.
Deferred
charges
for
retroactive
reinsurance
contracts,
which
at
the
inception
dates
of
the
contracts,
represent
the
excess
of
the
estimated
ultimate
liabi
a
lity
for
unpaid
losses
over
premiums
received.
Deferred
charges
are
subs
u
equently
adju
d
sted
based
on
the
changes
to
expected
ultimate
liabi
a
lities
and
the
timing
of
actua
t
l
and
expected
future
loss
payments.
Deferred
charge
assets
were
$8.1
billion
at
December
31,
2025.
We
estimate
that
deferred
charge
assets
will
decline
approximately $800 million in 2026, producing a corresponding charge to pre-tax earnings.
Othe
t
r Critical Accountin
t
g Estimates
Our
Consolidated
Balance
Sheet
at
December
31,
2025
includes
goodwill
of
acquired
businesses
of
$83.1
billion
and
indefinite-lived other intangible assets of $18.9 billion. We evaluate these assets for impairment annually in the fourth quarter
and
on
an
interim
basis
if
the
facts
and
circumstances
lead
us
to
believe
that
more
likely
than
not
there
has
been
an
impairment.
Goodwill
and
indefinite-lived
intangible
asset
impairment
reviews
include
estimating
the
fair
values
of
our
reporting
units
and
of
indefinite-lived
intangible
assets.
Several
methods
may
be
used
to
estimate
fair
values,
including
market
quotations,
multiples
of
earnings
and
other
valuation
techniques,
such
as
discounted
projected
future
earnings
or
cash
flow
methods.
The
key
assumptions
and
inputs
used
in
fair
value
determinations
may
include
forecasting
revenues
and
expenses,
cash flows and capi
a
tal expenditures, as well as an appropriate discount rate and other inputs.
Significant
judgment
by
management
is
required
in
estimating
the
fair
value
of
a
reporting
unit
and
in
performing
impairment reviews. Due to the inherent subj
u
ectivity and uncertainty in forecasting future cash flows and earnings over long
periods
of
time,
actua
t
l
results
may
differ
materially
from
the
forecasts.
Reasonabl
a
e
estimates
of
the
fair
value
of
a
business
enterprise may range widely.
If the carrying value of a reporting unit exceeds the estimated fair value of the reporting unit, then the excess, limited to
the
carrying
amount
of
goodwill,
is
charged
to
earnings
as
an
impairment
loss.
If
the
carrying
value
of
the
indefinite-lived
intangible asset exceeds fair value, the excess is charged to earnings as an impairment loss.
As of December 31, 2025, we concluded that more-likely-than not, the goodwill recorded in our Consolidated Balance
Sheet
was
not
impaired.
However,
the
fair
value
estimates
of
the
reporting
units
and
assets
are
subj
u
ect
to
change
based
on
market and economic conditions, as well as events affe
f
cting our businesses or the industries in which they operate, which we
cannot
reliabl
a
y
predict.
It
is
reasonabl
a
y
possible
that
adverse
changes
in
such
conditions
or
events
could
result
in
the
recognition of impairment losses in our Consolidated Financial Statements.
K-61
Management’s Discussion and Analysis
Critical Accounting Estimates
Othe
t
r Critical Accountin
t
g Estimates
In connection with the annual goodwill impairment review conducted in the fourth quarter of 2025, our estimated fair
values
of
four
reporting
units
did
not
exceed
our
carryi
r
ng
values
by
at
least
20%.
The
largest
unit
was
Pilot,
which
had
an
estimated
fair
value
of
approximately
$20.2
billion
and
a
carrying
value
of
$18.7
billion,
including
goodwill
of
$6.5
billion.
The
remaining
three
other
reporting
units
had
an
aggregate
estimated
fair
value
of
approximately
$7.5
billion,
which
approximated our carrying values, including goodwill of $2.7 billion at December 31, 2025.
Market Risk Disclosures
Our
Consolidated
Balance
Sheets
include
subs
u
tantial
amounts
of
assets
and
liabi
a
lities
whose
fair
values
are
subj
u
ect
to
market
risks.
Our
significant
market
risks
are
primarily
associated
with
equity
prices,
interest
rates,
foreign
currency
exchange
rates
and
commodity
prices.
The
fair
values
of
our
investment
portfol
f
ios
remain
subj
u
ect
to
considerable
volatility.
The following sections address the significant market risks associated with our business activities.
Equity
i
Price Risk
i
Investments
in
equity
securities
represent
the
most
significant
portion
of
our
consolidated
investment
portfolio.
Strategically,
we
strive
to
invest
in
businesses
that
possess
excellent
economics
and
management,
and
we
prefer
f
to
invest
a
meaningful
f
amount
in
each
company.
Historically,
our
investments
have
been
concentrated
in
relatively
few
issuers.
At
December 31, 2025, approximately 65% of the aggregate fair value of our investments in equity securities was concentrated
in five companies.
We ofte
f
n hold our investments for long periods and short-term price volatility has occurred in the past and will occur in
the future. We also maintain significant levels of shareholder capital and ample liquidity to provide a margin of safety against
short-term price volatility.
The
following
tabl
a
e
summarizes
our
investments
in
equity
securities,
excluding
our
investments
in
Kraftf
Heinz
and
Occidental
common
stocks
that
are
accounted
for
under
the
equity
method,
and
the
estimated
effe
f
cts
of
a
hypothetical
30%
increase and a 30% decrease in market prices as of December 31, 2025 and 2024. The selected 30% hypothetical increase and
decrease does not represent the best- or worst-case scenario. Indeed, results from declines could be far worse due both to the
nature of equity markets and the concentrations existing in our investment portfol
f
io. Dollar amounts are in millions.
Fair Value
Hypothetical
Price Change
Estimated
Fair Value Afte
f
r
Hypothetical
Change in Prices
Estimated
Increase
(Decrease)
in Net Earnings
(1)
1
December 31, 2025
Investments in equity securities
$
297,778
30% increase
$
384,849
$
68,687
30% decrease
210,866
(68,562)
December 31, 2024
Investments in equity securities
$
271,588
30% increase
$
351,020
$
62,615
30% decrease
192,323
(62,483)
——————
(1)
1
The estimated increase (decr
d
ease)e
is afte
f
r income taxes
a
.
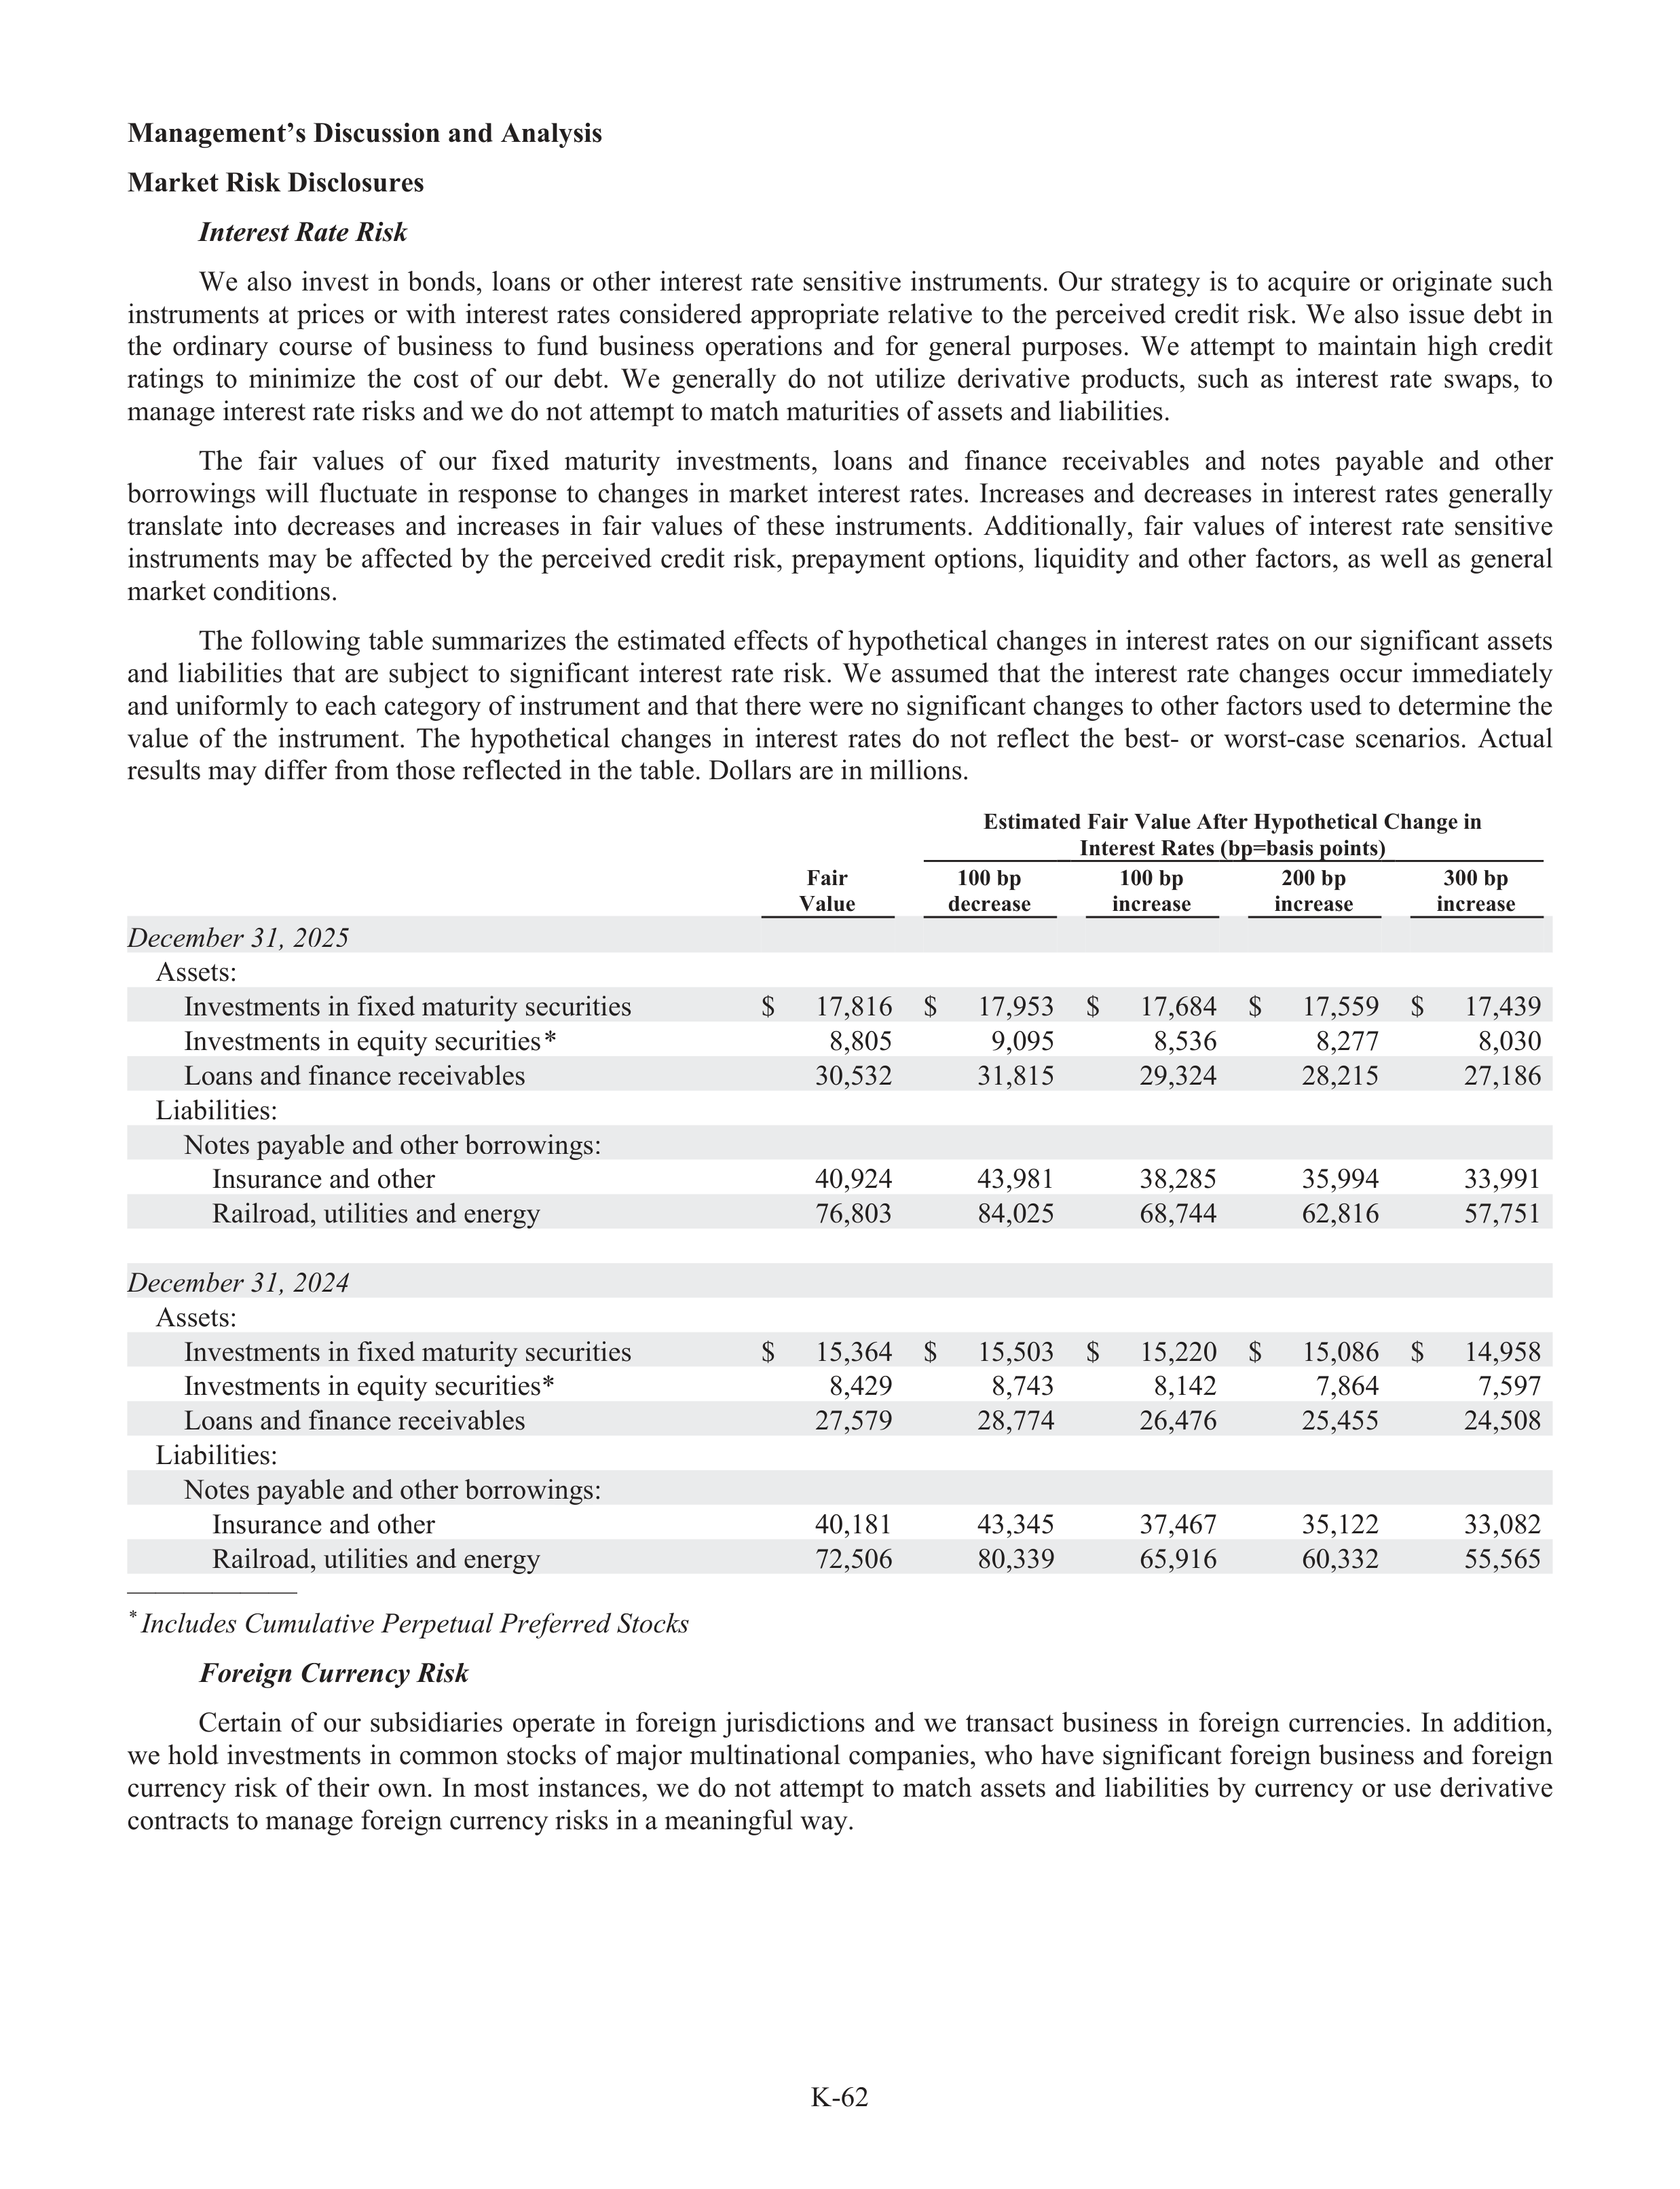
K-62
Management’s Discussion and Analysis
Market Risk Disclosures
Interest Rate Risk
i
We
also
invest
in
bonds,
loans
or
other
interest
rate
sensitive
instruments.
Our
strategy
is
to
acquire
or
originate
such
instruments
at
prices
or
with
interest
rates
considered
appropriate
relative
to
the
perceived
credit
risk.
We
also
issue
debt
in
the
ordinary
course
of
business
to
fund
business
operations
and
for
general
purpos
r
es.
We
attempt
to
maintain
high
credit
ratings
to
minimize
the
cost
of
our
debt.
We
generally
do
not
utilize
derivative
products,
such
as
interest
rate
swaps,
to
manage interest rate risks and we do not attempt to match maturities of assets and liabi
a
lities.
The
fair
values
of
our
fixed
maturity
investments,
loans
and
finance
receivabl
a
es
and
notes
payabl
a
e
and
other
borrowings
will
fluctuate
in
response
to
changes
in
market
interest
rates.
Increases
and
decreases
in
interest
rates
generally
translate
into
decreases
and
increases
in
fair
values
of
these
instruments.
Additionally,
fair
values
of
interest
rate
sensitive
instruments
may
be
affe
f
cted
by
the
perceived
credit
risk,
prepayment
options,
liquidity
and
other
factors,
as
well
as
general
market conditions.
The following tabl
a
e summarizes the estimated effe
f
cts of hypothetical changes in interest rates on our significant assets
and
liabi
a
lities
that
are
subj
u
ect
to
significant
interest
rate
risk.
We
assumed
that
the
interest
rate
changes
occur
immediately
and uniformly to each category
r
of instrument and that there were no significant changes to other factors used to determine the
value
of
the
instrument.
The
hypothetical
changes
in
interest
rates
do
not
reflect
the
best-
or
worst-case
scenarios.
Actual
results may differ from those reflected in the tabl
a
e. Dollars are in millions.
Estimated Fair Value Afte
f
r Hypothetical Change in
Interest Rates (bp=basis points)
Fair
Value
100 bp
decrease
100 bp
increase
200 bp
increase
300 bp
increase
December 31, 2025
Assets:
Investments in fixed maturity securities
$
17,816
$
17,953
$
17,684
$
17,559
$
17,439
Investments in equity securities
*
8,805
9,095
8,536
8,277
8,030
Loans and finance receivabl
a
es
30,532
31,815
29,324
28,215
27,186
Liabilities:
Notes payabl
a
e and other borrowings:
Insurance and other
40,924
43,981
38,285
35,994
33,991
Railroad, utilities and energy
76,803
84,025
68,744
62,816
57,751
December 31, 2024
Assets:
Investments in fixed maturity securities
$
15,364
$
15,503
$
15,220
$
15,086
$
14,958
Investments in equity securities*
8,429
8,743
8,142
7,864
7,597
Loans and finance receivabl
a
es
27,579
28,774
26,476
25,455
24,508
Liabilities:
Notes payabl
a
e and other borrowings:
Insurance and other
40,181
43,345
37,467
35,122
33,082
Railroad, utilities and energy
72,506
80,339
65,916
60,332
55,565
——————
*
Includes Cumulative Perpetual Prefer
f
red Stocks
Foreign
g
Currency
c
Risk
i
Certain
of
our
subs
u
idiaries
operate
in
foreign
jurisdictions
and
we
transact
business
in
foreign
currencies.
In
addition,
we hold investments in common stocks of majo
a
r multinational companies, who have significant foreign business and foreign
currency risk of their own. In most instances, we do not attempt to match assets and liabi
a
lities by currency or use derivative
contracts to manage foreign currency risks in a meaningful
f
way.
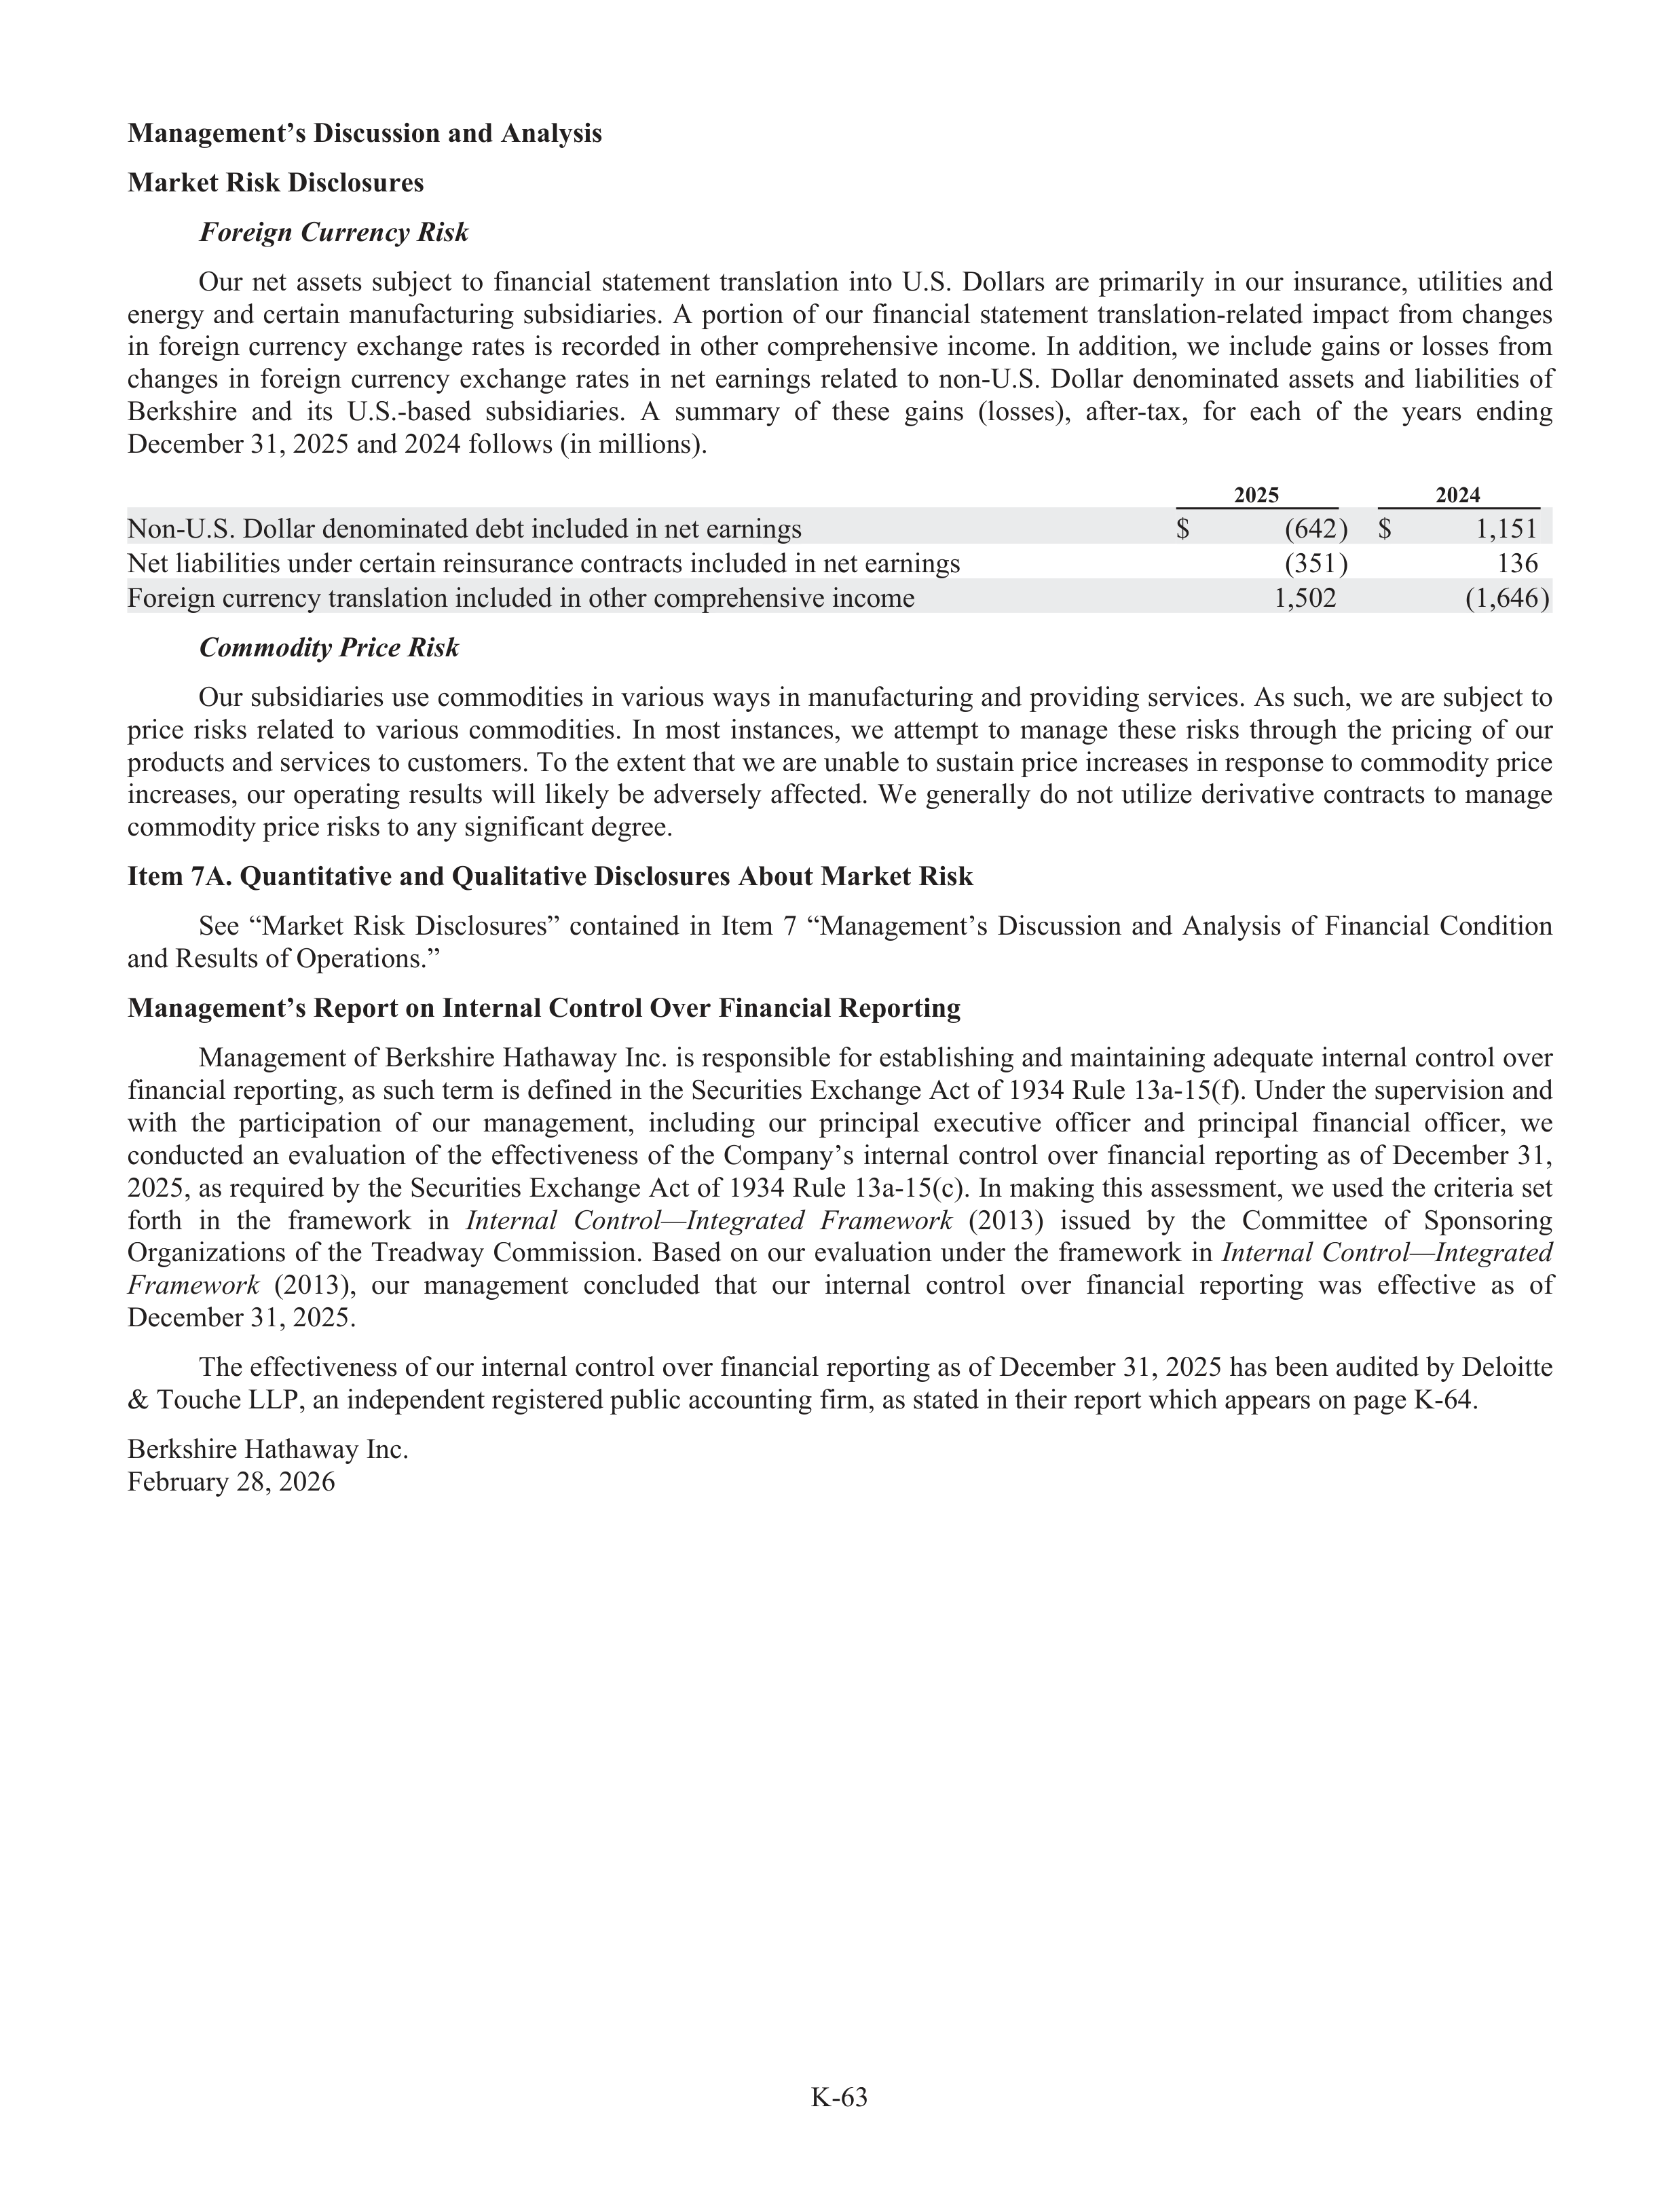
K-63
Management’s Discussion and Analysis
Market Risk Disclosures
Foreign
g
Currency
c
Risk
i
Our
net
assets
subj
u
ect
to
financial
statement
translation
into
U.S.
Dollars
are
primarily
in
our
insurance,
utilities
and
energy
and
certain
manufact
f
ur
t
ing
subs
u
idiaries.
A
portion
of
our
financial
statement
translation-related
impact
from
changes
in
foreign
currency
exchange
rates
is
recorded
in
other
comprehensive
income.
In
addition,
we
include
gains
or
losses
from
changes
in
foreign
currency
exchange
rates
in
net
earnings
related
to
non-U.S.
Dollar
denominated
assets
and
liabi
a
lities
of
Berkshire
and
its
U.S.-based
subs
u
idiaries.
A
summary
of
these
gains
(losses),
afte
f
r-tax,
for
each
of
the
years
ending
December 31, 2025 and 2024 follows (in millions).
2025
2024
Non-U.S. Dollar denominated debt included in net earnings
$
(642)
$
1,151
Net liabi
a
lities under certain reinsurance contracts included in net earnings
(351)
136
Foreign currency translation included in other comprehensive income
1,502
(1,646)
Commodity
i
Price Risk
i
Our subs
u
idiaries use commodities in various ways in manufact
f
ur
t
ing and providing services. As such, we are subj
u
ect to
price
risks
related
to
various
commodities.
In
most
instances,
we
attempt
to
manage
these
risks
through
the
pricing
of
our
products and services to customers. To the extent that we are unabl
a
e to sustain price increases in response to commodity price
increases,
our
operating
results
will
likely
be
adversely
affe
f
cted.
We
generally
do
not
utilize
derivative
contracts
to
manage
commodity price risks to any signific
f
ant degree.
Item 7A. Quantitative and Qualitative Disclosures About Market Risk
See
“Market
Risk
Disclosures”
contained
in
Item
7
“Management’s
Discussion
and
Analysis
of
Financial
Condition
and Results of Operations.”
Management’s Report on Internal Control Over Financial Reporting
Management of Berkshire Hathaway Inc. is responsible for establ
a
ishing and maintaining adequate internal control over
financial reporting, as such term is defined in the Securities Exchange Act of 1934 Rule 13a-15(f). Under the supe
u
rvision and
with
the
participation
of
our
management,
including
our
principal
executive
offi
f
cer
and
principal
financial
offi
f
cer,
we
conducted
an
evaluation
of
the
effe
f
ctiveness
of
the
Company’s
internal
control
over
financial
reporting
as
of
December
31,
2025, as required by the Securities Exchange Act of 1934 Rule 13a-15(c). In making this assessment, we used the criteria set
forth
in
the
framework
in
Internal
Control—In
—
tegr
e
ated
Framework
r
(2013)
issued
by
the
Committee
of
Sponsoring
Organizations
of
the
Treadway
Commission.
Based
on
our
evaluation
under
the
framework
in
Internal
Control—In
—
tegr
e
ated
Framework
r
(2013),
our
management
concluded
that
our
internal
control
over
financial
reporting
was
effe
f
ctive
as
of
December 31, 2025.
The effe
f
ctiveness of our internal control over financial reporting as of December 31, 2025 has been audited by Deloitte
& Touche LLP, an independent registered public accounting firm, as stated in their report which appears on page K-64.
Berkshire Hathaway Inc.
Februa
r
ry 28, 2026
K-64
Item 8. Financial Statements and Supplementary Data
REPORT OF INDEPENDENT REGISTERED PUBLIC ACCOUNTING FIRM
To the Shareholders and the Board of Directors of
Berkshire Hathaway Inc.
Opinions on the Financial Statements and Internal Control over Financial Reporting
We
have
audited
the
accompanying
consolidated
balance
sheets
of
Berkshire
Hathaway
Inc.
and
subs
u
idiaries
(the
“Company”)
as
of
December
31,
2025
and
2024,
the
related
consolidated
statements
of
earnings,
comprehensive
income,
changes in shareholders’ equity, and cash flows, for each of the three years in the period ended December 31, 2025, and the
related
notes
(collectively
referred
to
as
the
“financial
statements”).
We
also
have
audited
the
Company’s
internal
control
over financial reporting as of December 31, 2025, based on criteria establ
a
ished in
Internal Control — Integr
e
ated Framework
r
(2013)
issued by the Committee of Sponsoring Organizations of the Treadway Commission (COSO).
In
our
opinion,
the
financial
statements
referred
to
above
present
fairly,
in
all
material
respects,
the
financial
position
of
the
Company as of December 31, 2025 and 2024, and the results of its operations and its cash flows for each of the three years in
the
period
ended
December
31,
2025,
in
confor
f
mity
with
accounting
principles
generally
accepted
in
the
United
States
of
America.
Also,
in
our
opinion,
the
Company
maintained,
in
all
material
respects,
effe
f
ctive
internal
control
over
financial
reporting as of December 31, 2025, based on criteria establ
a
ished in
Internal Control — Integr
e
ated Framework
r
(2013)
issued
by COSO.
Basis for Opinions
The
Company’s
management
is
responsible
for
these
financial
statements,
for
maintaining
effe
f
ctive
internal
control
over
financial
reporting,
and
for
its
assessment
of
the
effe
f
ctiveness
of
internal
control
over
financial
reporting,
included
in
the
accompanying
Management’s
Report
on
Internal
Control
Over
Financial
Reporting.
Our
responsibility
is
to
express
an
opinion on these financial statements and an opinion on the Company’s internal control over financial reporting based on our
audits.
We
are
a
public
accounting
firm
registered
with
the
Publ
u
ic
Company
Accounting
Oversight
Board
(United
States)
(PCAOB) and are required to be independent with respect to the Company in accordance with the U.S. federal securities laws
and the applicable rules and regulations of the Securities and Exchange Commission and the PCAOB.
We conducted our audits in accordance with the standards of the PCAOB. Those standards require that we plan and perform
the
audits
to
obtain
reasonabl
a
e
assurance
about
whether
the
financial
statements
are
free
of
material
misstatement,
whether
due to error or fraud, and whether effe
f
ctive internal control over financial reporting was maintained in all material respects.
Our
audits
of
the
financial
statements
included
performing
procedur
d
es
to
assess
the
risks
of
material
misstatement
of
the
financial
statements,
whether
due
to
error
or
fraud,
and
performing
procedur
d
es
to
respond
to
those
risks.
Such
procedur
d
es
included
examining,
on
a
test
basis,
evidence
regarding
the
amounts
and
disclosures
in
the
financial
statements.
Our
audits
also included evaluating the accounting principles used and signific
f
ant estimates made by management, as well as evaluating
the
overall
presentation
of
the
financial
statements.
Our
audit
of
internal
control
over
financial
reporting
included
obtaining
an
understanding
of
internal
control
over
financial
reporting,
assessing
the
risk
that
a
material
weakness
exists,
and
testing
and evaluating the design and operating effe
f
ctiveness of internal control based on the assessed risk. Our audits also included
performing
such
other
procedur
d
es
as
we
considered
necessary
in
the
circumstances.
We
believe
that
our
audits
provide
a
reasonabl
a
e basis for our opinions.
Definition and Limitations of Internal Control over Financial Reporting
A
company’s
internal
control
over
financial
reporting
is
a
process
designed
to
provide
reasonabl
a
e
assurance
regarding
the
reliabi
a
lity of financial reporting and the preparation of financial statements for external purpos
r
es in accordance with generally
accepted accounting principles. A company’s internal control over financial reporting includes those policies and procedur
d
es
that
(1)
pertain
to
the
maintenance
of
records
that,
in
reasonabl
a
e
detail,
accurately
and
fairly
reflect
the
transactions
and
dispositions
of
the
assets
of
the
company;
(2)
provide
reasonabl
a
e
assurance
that
transactions
are
recorded
as
necessary
to
permit preparation of financial statements in accordance with generally accepted accounting principles, and that receipts and
expenditures
of
the
company
are
being
made
only
in
accordance
with
authorizations
of
management
and
directors
of
the
company; and (3) provide reasonabl
a
e assurance regarding prevention or timely detection of unauthorized acquisition, use, or
disposition of the company’s assets that could have a material effe
f
ct on the financial statements.
Because
of
its
inherent
limitations,
internal
control
over
financial
reporting
may
not
prevent
or
detect
misstatements.
Also,
projections
of
any
evaluation
of
effe
f
ctiveness
to
future
periods
are
subj
u
ect
to
the
risk
that
controls
may
become
inadequate
because of changes in conditions, or that the degree of compliance with the policies or procedur
d
es may deteriorate.
K-65
REPORT OF INDEPENDENT REGISTERED PUBLIC ACCOUNTING FIRM (Continued)
Critical Audit Matters
The
critical
audit
matters
communicated
below
are
matters
arising
from
the
current-period
audit
of
the
financial
statements
that were communicated or required to be communicated to the audit committee and that (1) relate to accounts or disclosures
that
are
material
to
the
financial
statements
and
(2)
involved
our
especially
challenging,
subj
u
ective,
or
complex
judgments.
The
communication
of
critical
audit
matters
does
not
alter
in
any
way
our
opinion
on
the
financial
statements,
taken
as
a
whole,
and
we
are
not,
by
communicating
the
critical
audit
matters
below,
providing
separate
opinions
on
the
critical
audit
matters or on the accounts or disclosures to which they relate.
Unpai
n
d Losses and Loss Adju
d
stme
t
nt Expe
x
nses — Refer
f
to Notes 1 and 16 to the fina
i
ncial stat
t
em
t
ents
Critical Audit Matter Descript
i
ion
The Company’s unpaid losses and loss adju
d
stment expenses (“claim liabi
a
lities”) include short duration property and casualty
insurance
and
reinsurance
contracts.
Key
assumptions
affe
f
cting
certain
of
these
claim
liabi
a
lities
include
anticipated
claims
and their severity, expected loss ratios, and expected patterns of paid and incurred losses.
Given the subj
u
ectivity of estimating these key assumptions, performing audit procedur
d
es to evaluate whether certain of these
claim
liabi
a
lities
were
appropriately
recorded
as
of
December
31,
2025
required
a
high
degree
of
auditor
judgment
and
an
increased extent of effo
f
rt, including the need to involve our actua
t
rial specialists.
How the Critical Audit Matter Was Addr
d
essed in the Audit
Our audit procedur
d
es related to the key assumptions affe
f
cting certain of these claim liabi
a
lities included the following, among
others:
•
We tested the operating effe
f
ctiveness of controls over claim liabi
a
lities, including those over the key assumptions.
•
We tested the underlying data that served as the basis for the actua
t
rial analysis to evaluate that the inputs to the actuarial
estimate were accurate and complete.
•
With the assistance of our actuarial specialists:
•
We
developed
independent
estimates
of
the
claim
liabi
a
lities,
including
loss
data
and
industry
r
claim
development
factors as needed, and compared our estimates to management’s estimates.
•
We
compared
prior
year
estimates
of
expected
incurred
losses
to
actua
t
l
experience
during
the
most
recent
year
to
identify
f
potential bias in management’s determination of the claim liabi
a
lities.
Unpai
n
d
Losses
and
Loss
Adju
d
stme
t
nt
Expe
x
nses
—
Retro
t
active
Reinsurance
Contra
t
cts
—
t
Refe
e
r
to
Notes
1
and
17
to
the
fina
i
ncial stat
t
em
t
ents
Critical Audit Matter Descript
i
ion
The
Company’s
unpaid
losses
and
loss
adju
d
stment
expenses
under
retroactive
reinsurance
contracts
(“retroactive
claim
liabi
a
lities”)
include
property
and
casualty
retroactive
reinsurance
contracts.
Key
assumptions
affe
f
cting
certain
of
these
retroactive
claim
liabi
a
lities
include
anticipated
claims
and
their
severity,
expected
loss
ratios,
and
expected
patterns
of
paid
and incurred losses.
Given the subj
u
ectivity of estimating these key assumptions, performing audit procedur
d
es to evaluate whether certain of these
claim
liabi
a
lities
were
appropriately
recorded
as
of
December
31,
2025,
required
a
high
degree
of
auditor
judgment
and
an
increased extent of effo
f
rt, including the need to involve our actua
t
rial specialists.
How the Critical Audit Matter Was Addr
d
essed in the Audit
Our audit procedur
d
es related to the key assumptions affe
f
cting claim liabi
a
lities included the following, among others:
•
We tested the operating effe
f
ctiveness of controls over claim liabi
a
lities, including those over the key assumptions.
•
We
tested
the
underlying
data
that
served
as
the
basis
for
the
actua
t
rial
analysis,
including
historical
claims,
to
test
that
the inputs to the actuarial estimate were accurate and complete.
•
With the assistance of our actuarial specialists:
•
We
developed
independent
claim
liabi
a
lity
estimates
for
certain
retroactive
reinsurance
contracts
and
compared
our
estimates
to
management’s
estimates.
For
other
retroactive
reinsurance
contracts,
we
evaluated
the
process
used
by
management to develop the estimated claim liabi
a
lities.
•
We
compared
prior
year
estimates
of
expected
incurred
losses
to
actua
t
l
experience
during
the
most
recent
year
to
identify
f
potential bias in management’s determination of the claim liabi
a
lities.
/s/ Deloitte & Touche LLP
Omaha, Nebraska
Februa
r
ry 28, 2026
We have served as the Company’s auditor since 1985.
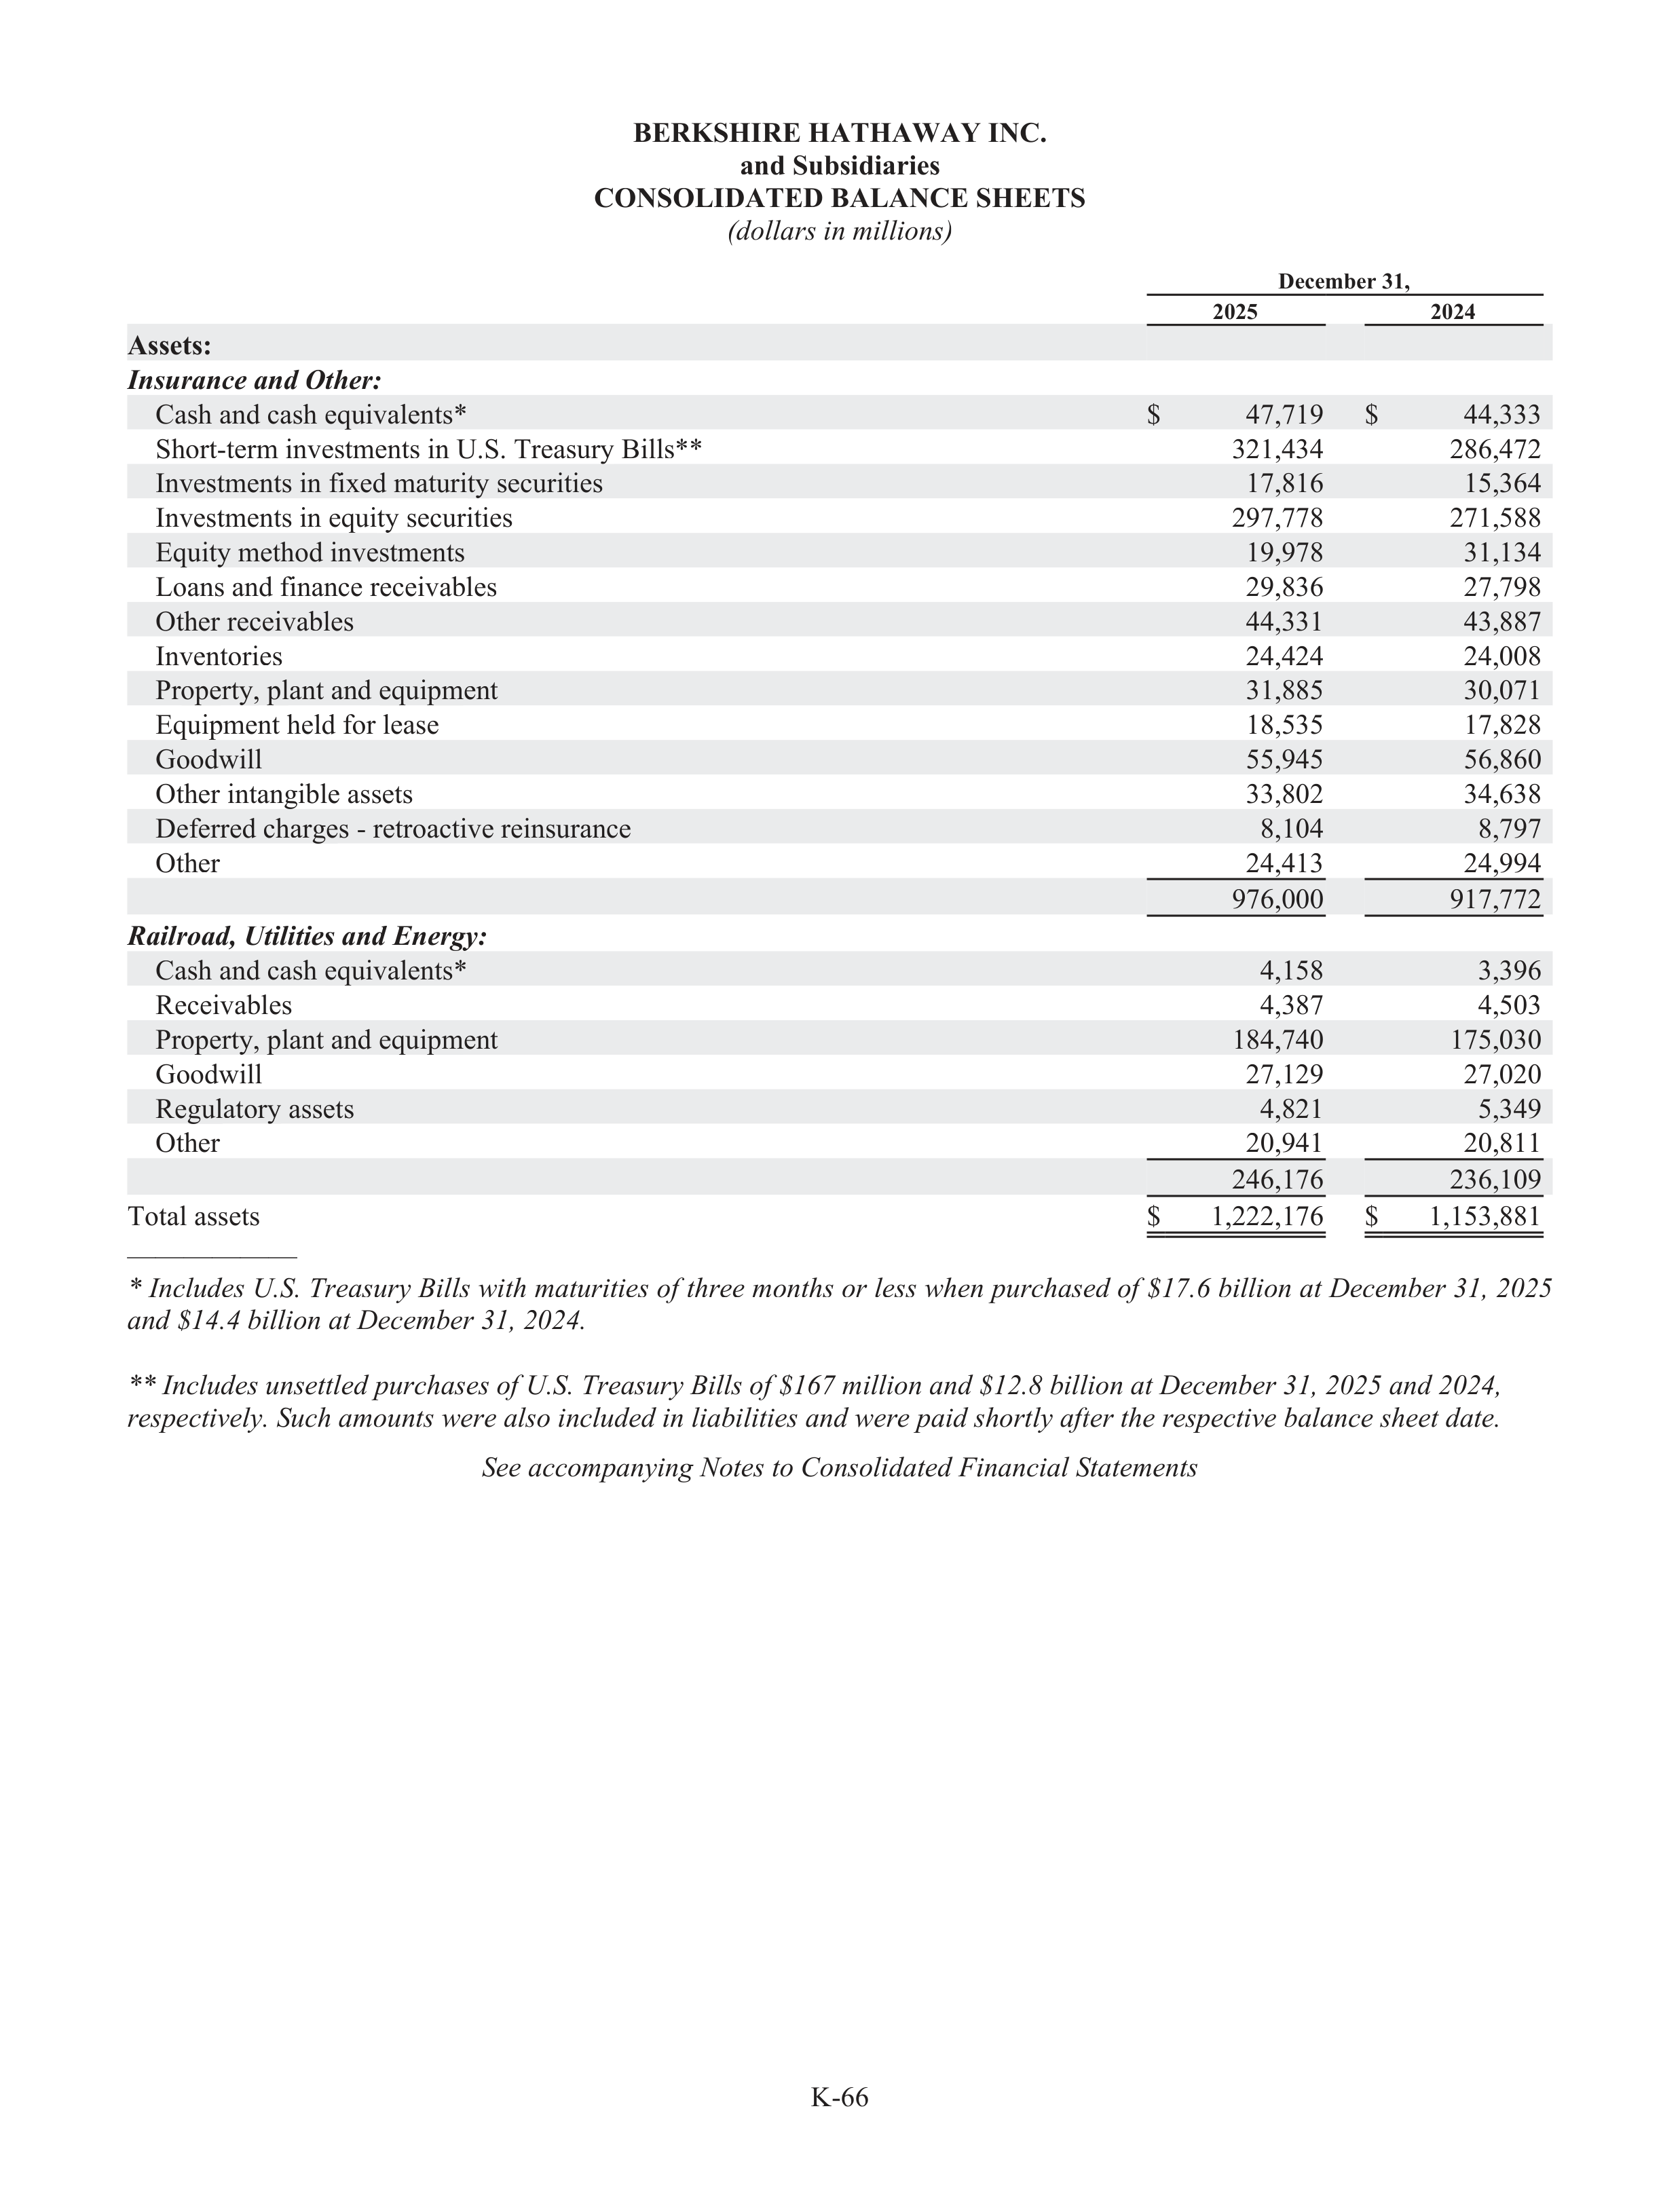
K-66
BERKSHIRE HATHAWAY INC.
and Subsidiaries
CONSOLIDATED BALANCE SHEETS
(dol
d
lars in millions)s
December 31,
2025
2024
Assets:
Insurance and Othe
t
r:
Cash and cash equivalents*
$
47,719
$
44,333
Short-term investments in U.S. Treasury
r
Bills**
321,434
286,472
Investments in fixed maturity securities
17,816
15,364
Investments in equity securities
297,778
271,588
Equity method investments
19,978
31,134
Loans and finance receivabl
a
es
29,836
27,798
Other receivabl
a
es
44,331
43,887
Inventories
24,424
24,008
Property, plant and equipment
31,885
30,071
Equipment held for lease
18,535
17,828
Goodwill
55,945
56,860
Other intangible assets
33,802
34,638
Deferred charges - retroactive reinsurance
8,104
8,797
Other
24,413
24,994
976,000
917,772
Railroad, Utilitie
t
s and Energy
r
:
Cash and cash equivalents*
4,158
3,396
Receivabl
a
es
4,387
4,503
Property, plant and equipment
184,740
175,030
Goodwill
27,129
27,020
Regulatory
r
assets
4,821
5,349
Other
20,941
20,811
246,176
236,109
Total assets
$
1,222,176
$
1,153,881
——————
* Includes U.S. Treasury Bills with maturities of three months or less when purchased of $17.6 billion at December 31, 2025
and $14.4 billion at December 31, 2024.
** Includes unsettled purchases of U.S. Treasury Bills of $167 million and $12.8 billion at December 31, 2025 and 2024,
respectively.
l
Such amountst
were also
l
included in liabilities and were paid shortly afte
f
r the respective balance sheet date.
See accompanying Notes to Consolidat
d
ed Financial Statements
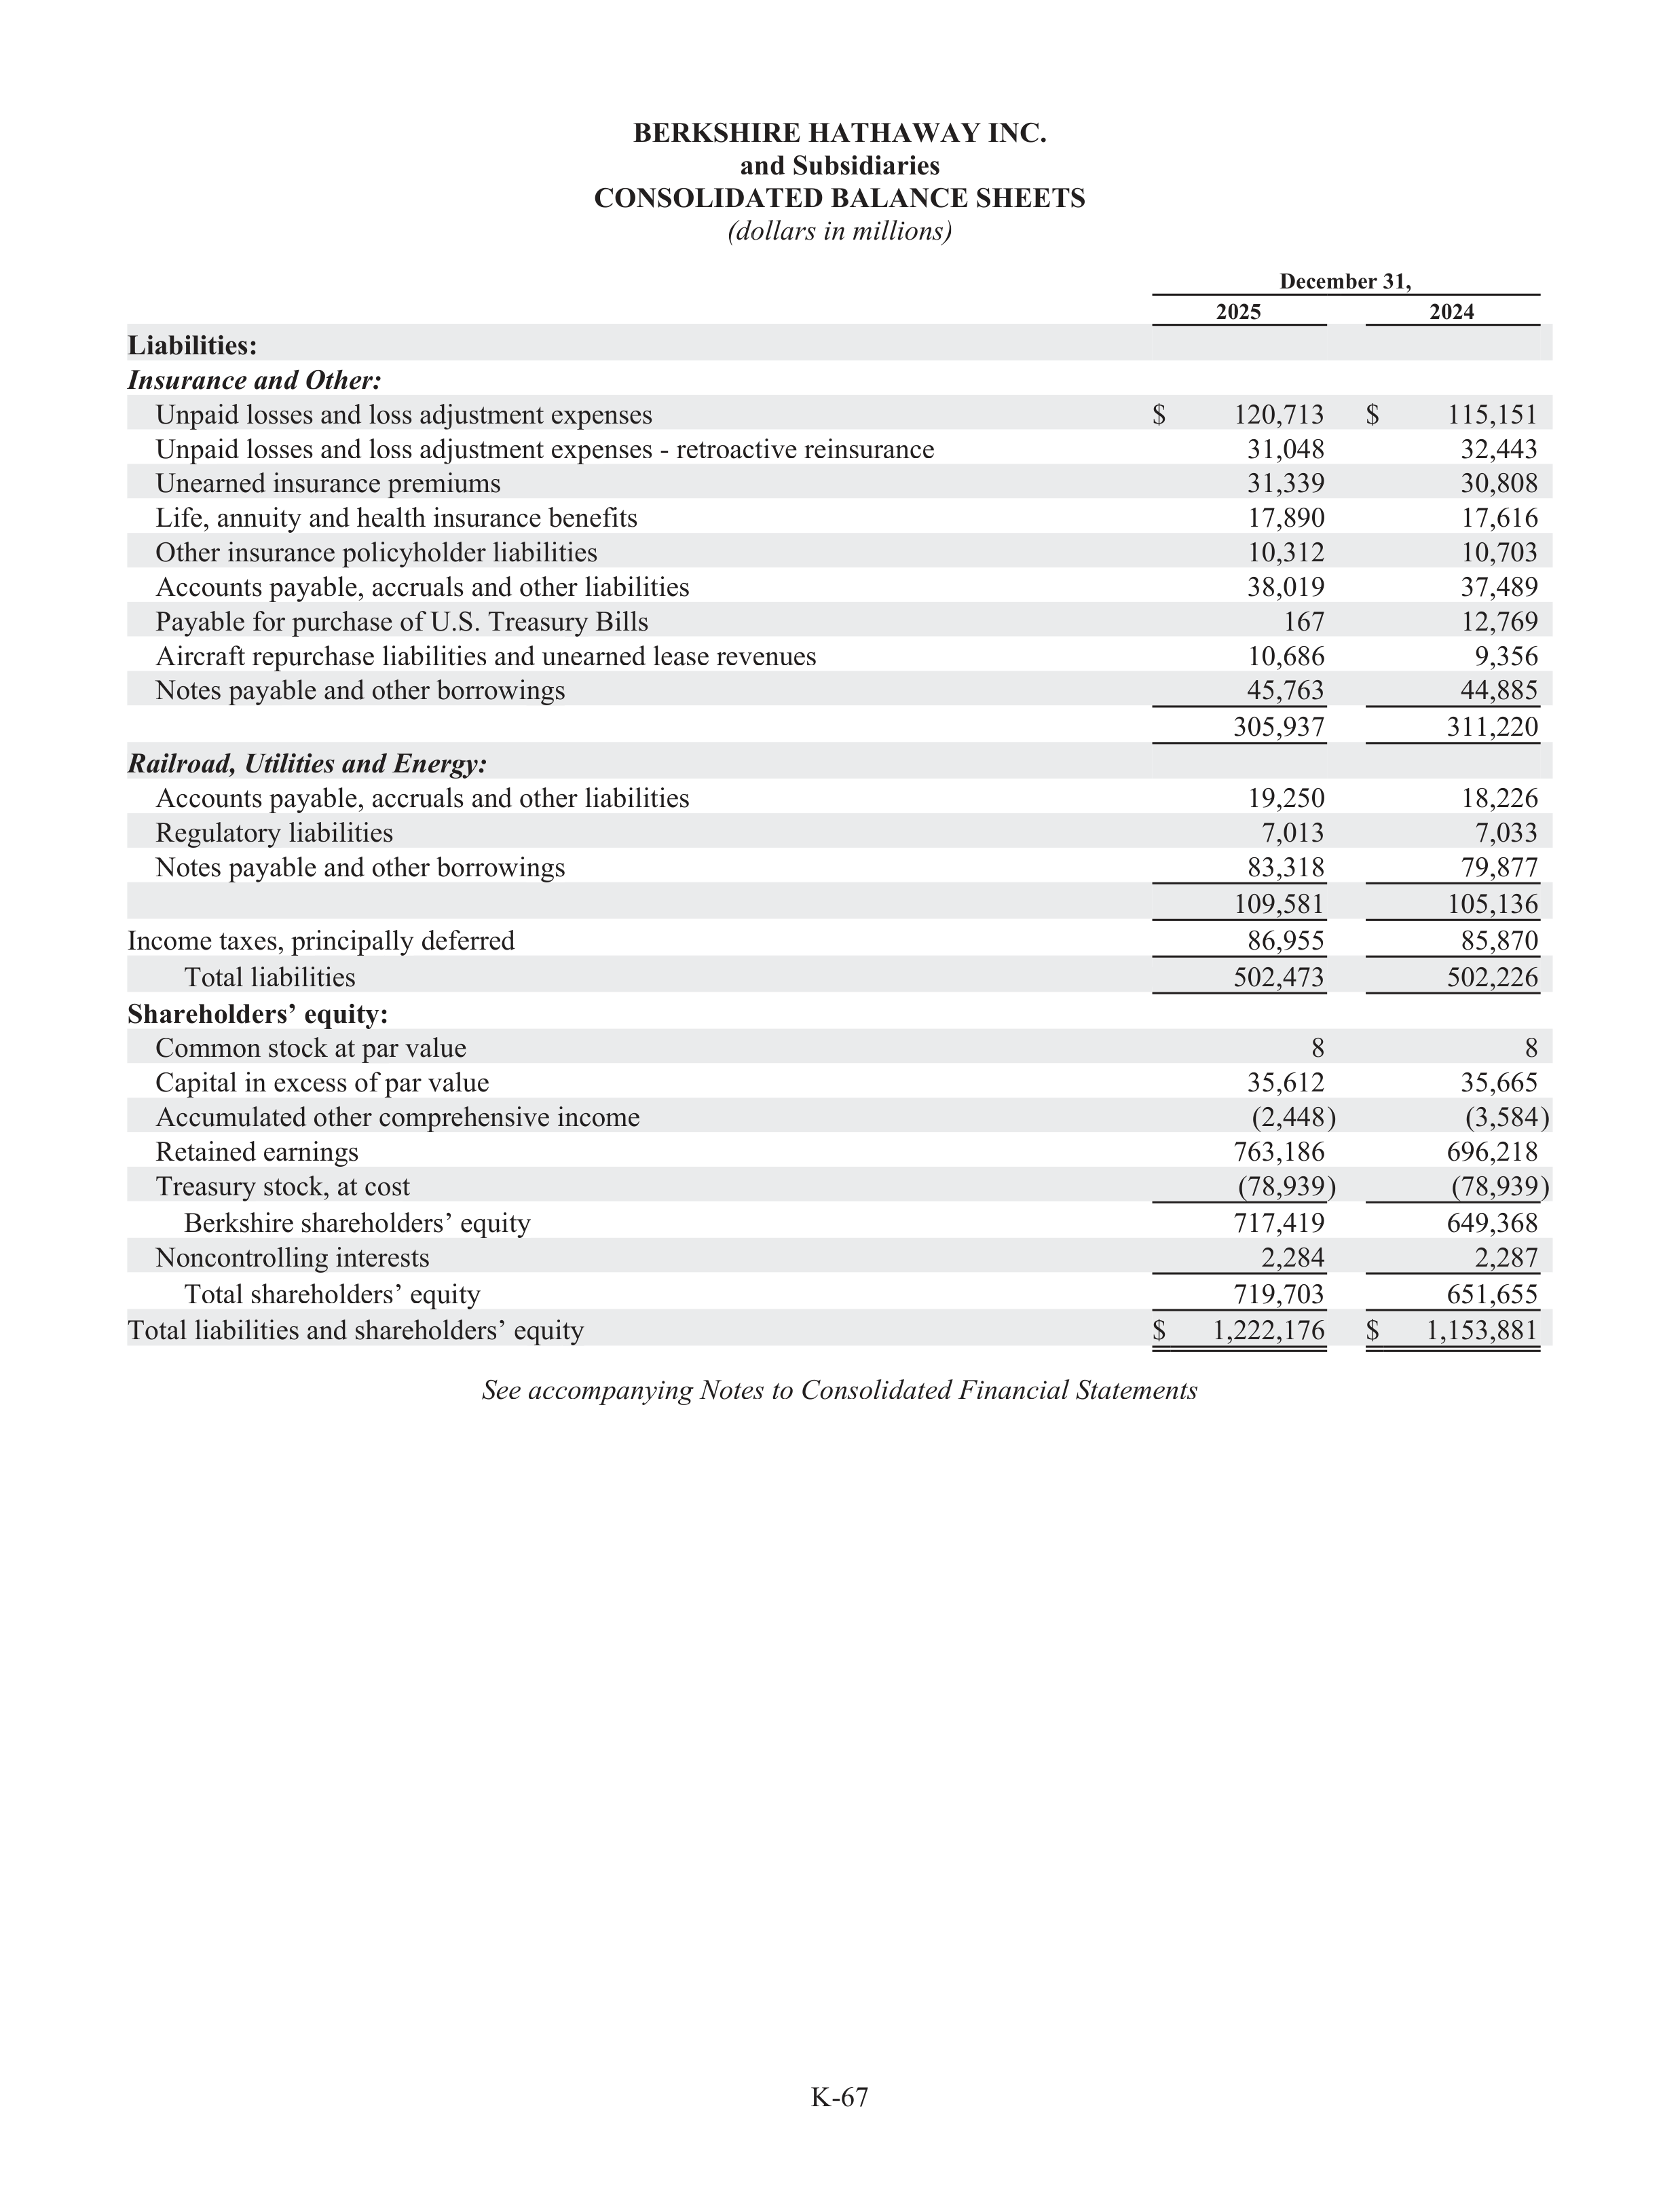
K-67
BERKSHIRE HATHAWAY INC.
and Subsidiaries
CONSOLIDATED BALANCE SHEETS
(dol
d
lars in millions)s
December 31,
2025
2024
Liabilities:
Insurance and Othe
t
r:
Unpaid losses and loss adju
d
stment expenses
$
120,713
$
115,151
Unpaid losses and loss adju
d
stment expenses - retroactive reinsurance
31,048
32,443
Unearned insurance premiums
31,339
30,808
Life, annuity and health insurance benefits
17,890
17,616
Other insurance policyholder liabi
a
lities
10,312
10,703
Accounts payabl
a
e, accrua
r
ls and other liabi
a
lities
38,019
37,489
Payabl
a
e for purchase of U.S. Treasury Bills
167
12,769
Aircraft repurchase liabi
a
lities and unearned lease revenues
10,686
9,356
Notes payabl
a
e and other borrowings
45,763
44,885
305,937
311,220
Railroad, Utilitie
t
s and Energy
r
:
Accounts payabl
a
e, accrua
r
ls and other liabi
a
lities
19,250
18,226
Regulatory
r
liabi
a
lities
7,013
7,033
Notes payabl
a
e and other borrowings
83,318
79,877
109,581
105,136
Income taxes, principally deferred
86,955
85,870
Total liabi
a
lities
502,473
502,226
Shareholders’ equity:
Common stock at par value
8
8
Capi
a
tal in excess of par value
35,612
35,665
Accumulated other comprehensive income
(2,448)
(3,584)
Retained earnings
763,186
696,218
Treasury
r
stock, at cost
(78,939)
(78,939)
Berkshire shareholders’ equity
717,419
649,368
Noncontrolling interests
2,284
2,287
Total shareholders’ equity
719,703
651,655
Total liabi
a
lities and shareholders’ equity
$
1,222,176
$
1,153,881
See accompanying Notes to Consolidat
d
ed Financial Statements
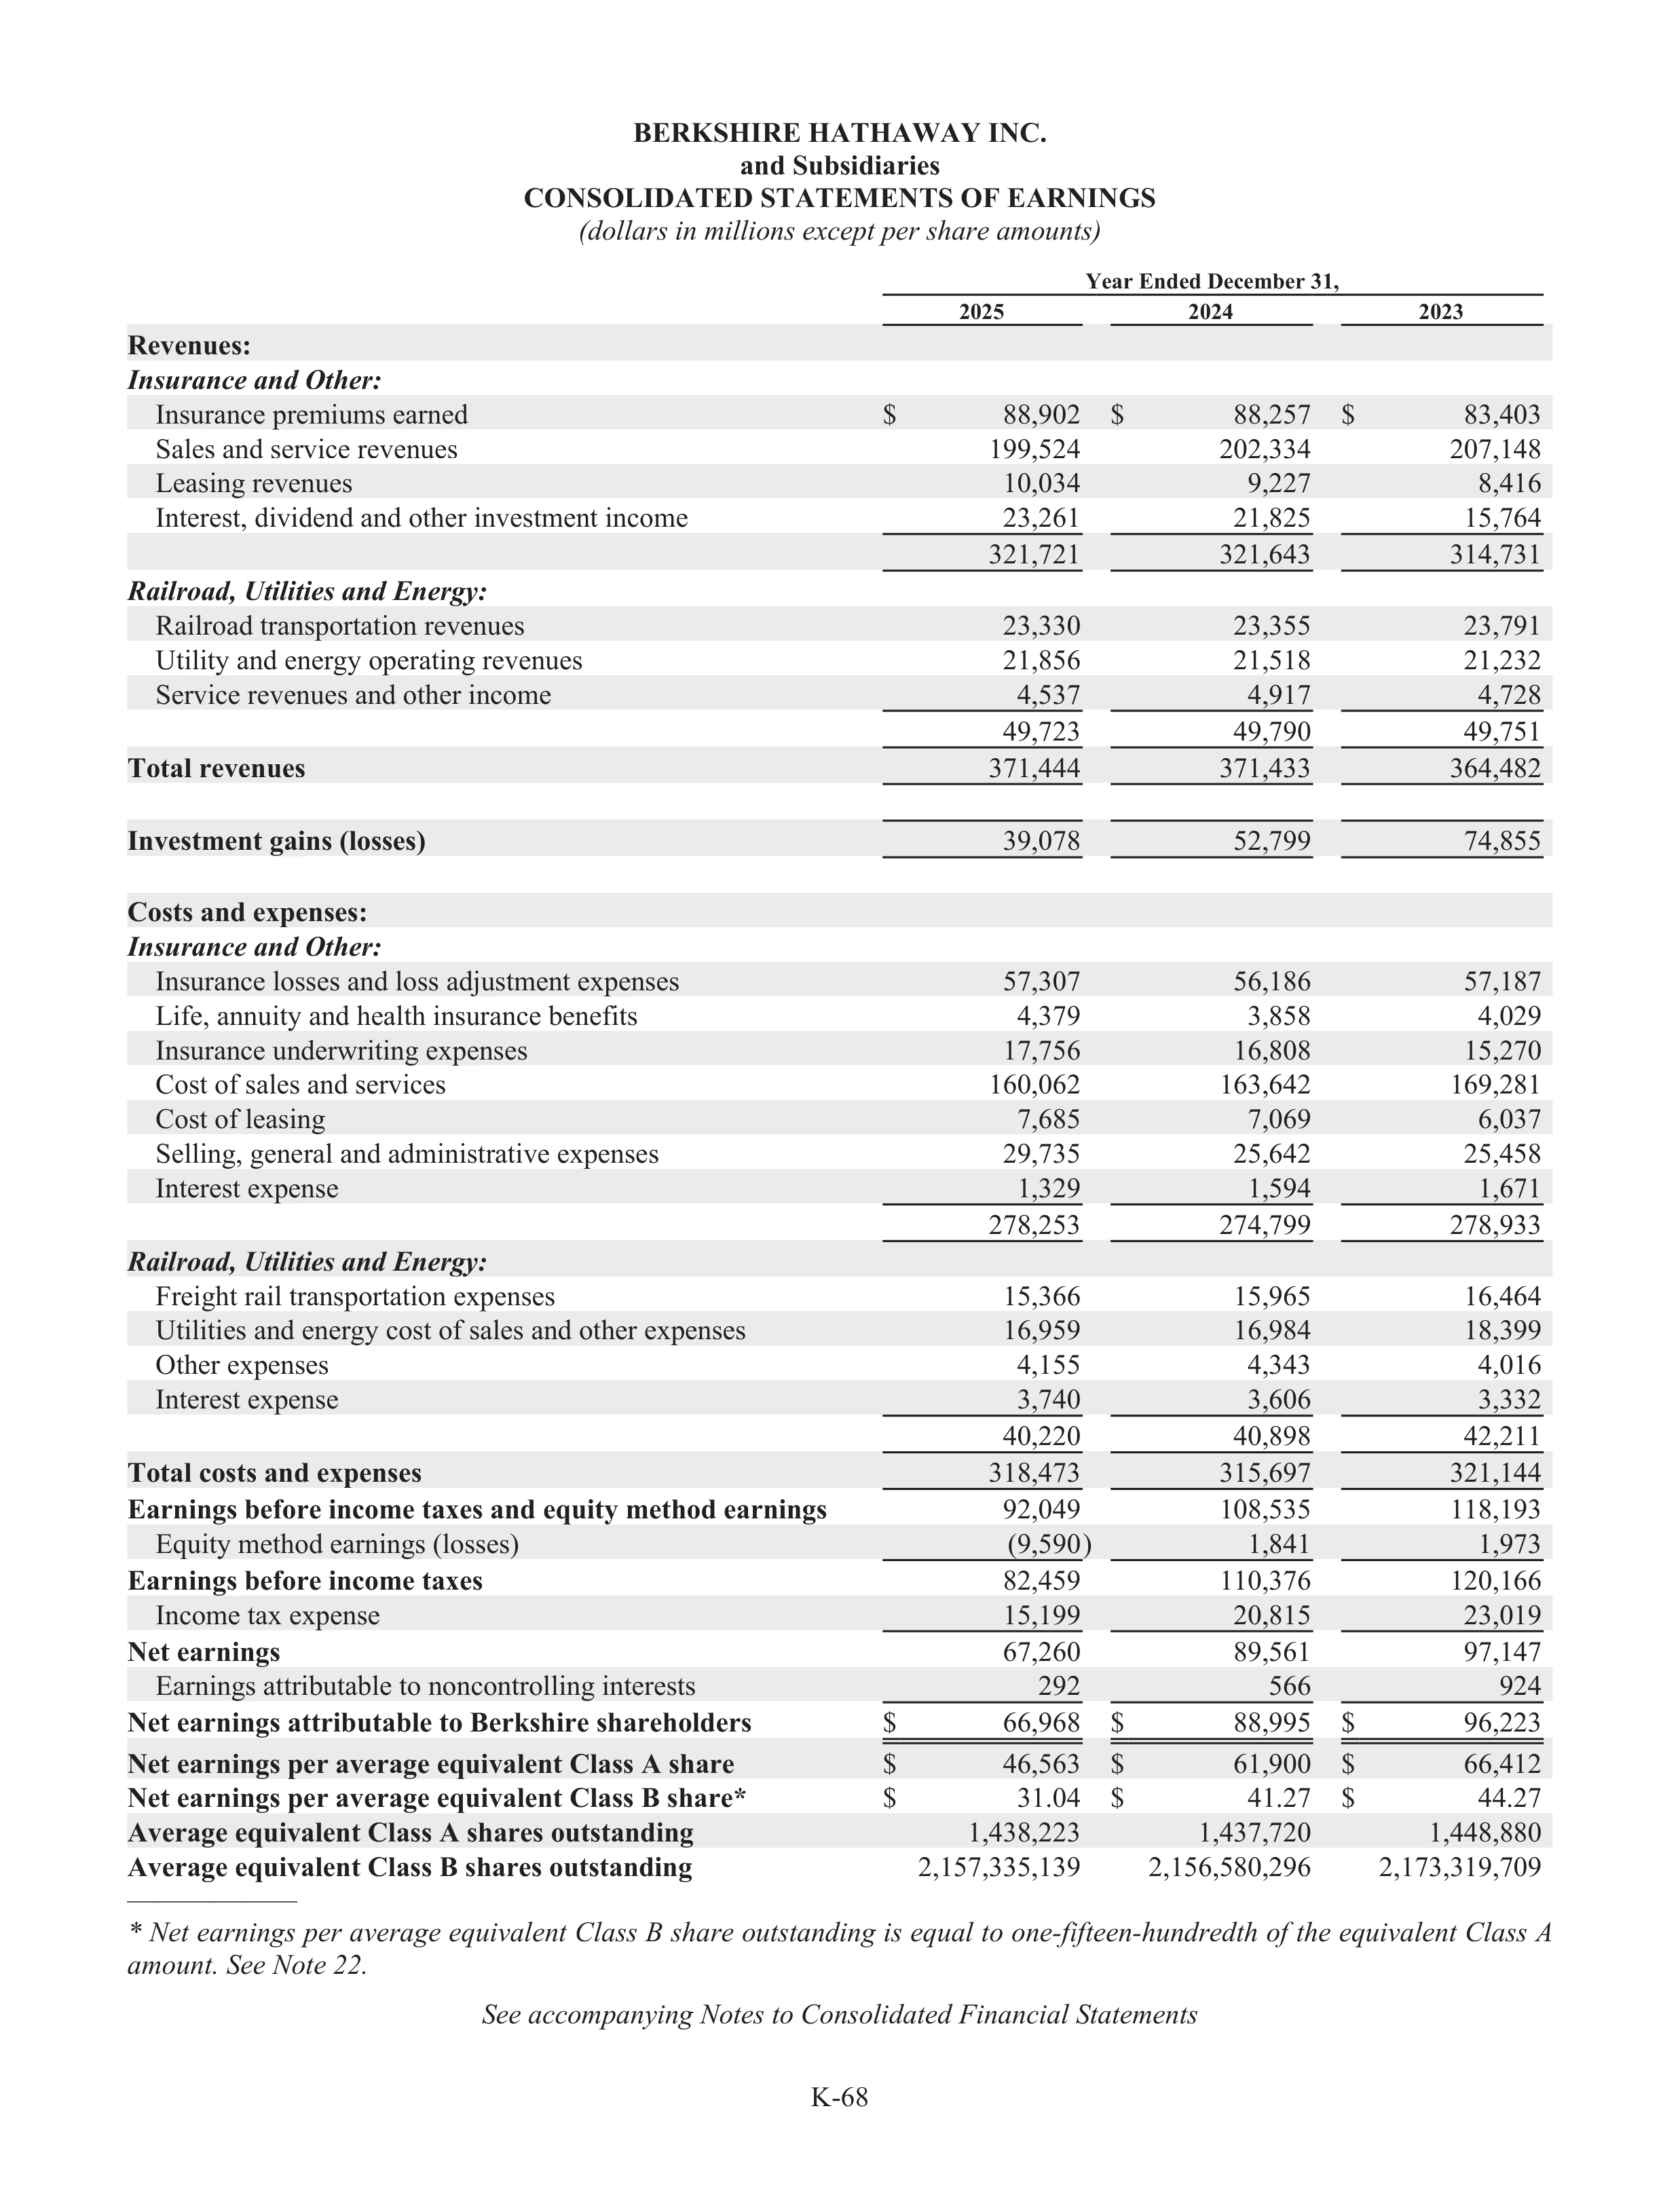
K-68
BERKSHIRE HATHAWAY INC.
and Subsidiaries
CONSOLIDATED STATEMENTS OF EARNINGS
(dol
d
lars in millions except per share amounts)
t
Year Ended December 31,
2025
2024
2023
Revenues:
Insurance and Othe
t
r:
Insurance premiums earned
$
88,902
$
88,257
$
83,403
Sales and service revenues
199,524
202,334
207,148
Leasing revenues
10,034
9,227
8,416
Interest, dividend and other investment income
23,261
21,825
15,764
321,721
321,643
314,731
Railroad, Utilitie
t
s and Energy
r
:
Railroad transportation revenues
23,330
23,355
23,791
Utility and energy operating revenues
21,856
21,518
21,232
Service revenues and other income
4,537
4,917
4,728
49,723
49,790
49,751
Total revenues
371,444
371,433
364,482
Investment gains (losses)
39,078
52,799
74,855
Costs and expenses:
Insurance and Othe
t
r:
Insurance losses and loss adju
d
stment expenses
57,307
56,186
57,187
Life, annuity and health insurance benefits
4,379
3,858
4,029
Insurance underwriting expenses
17,756
16,808
15,270
Cost of sales and services
160,062
163,642
169,281
Cost of leasing
7,685
7,069
6,037
Selling, general and administrative expenses
29,735
25,642
25,458
Interest expense
1,329
1,594
1,671
278,253
274,799
278,933
Railroad, Utilitie
t
s and Energy
r
:
Freight rail transportation expenses
15,366
15,965
16,464
Utilities and energy cost of sales and other expenses
16,959
16,984
18,399
Other expenses
4,155
4,343
4,016
Interest expense
3,740
3,606
3,332
40,220
40,898
42,211
Total costs and expenses
318,473
315,697
321,144
Earnings before income taxes and equity method earnings
92,049
108,535
118,193
Equity method earnings (losses)
(9,590)
1,841
1,973
Earnings before income taxes
82,459
110,376
120,166
Income tax expense
15,199
20,815
23,019
Net earnings
67,260
89,561
97,147
Earnings attributable to noncontrolling interests
292
566
924
Net earnings attributable to Berkshire shareholders
$
66,968
$
88,995
$
96,223
Net earnings per average equivalent Class A share
$
46,563
$
61,900
$
66,412
Net earnings per average equivalent Class B share*
$
31.04
$
41.27
$
44.27
Average equivalent Class A shares outstanding
1,438,223
1,437,720
1,448,880
Average equivalent Class B shares outstanding
2,157,335,139
2,156,580,296
2,173,319,709
——————
* Net earnings per average equivalent Class B share outst
t
anding is equal to one-fifte
f
en-hundredth
d
of the equivalent Class A
amount. See Note 22.
See accompanying Notes to Consolidat
d
ed Financial Statements
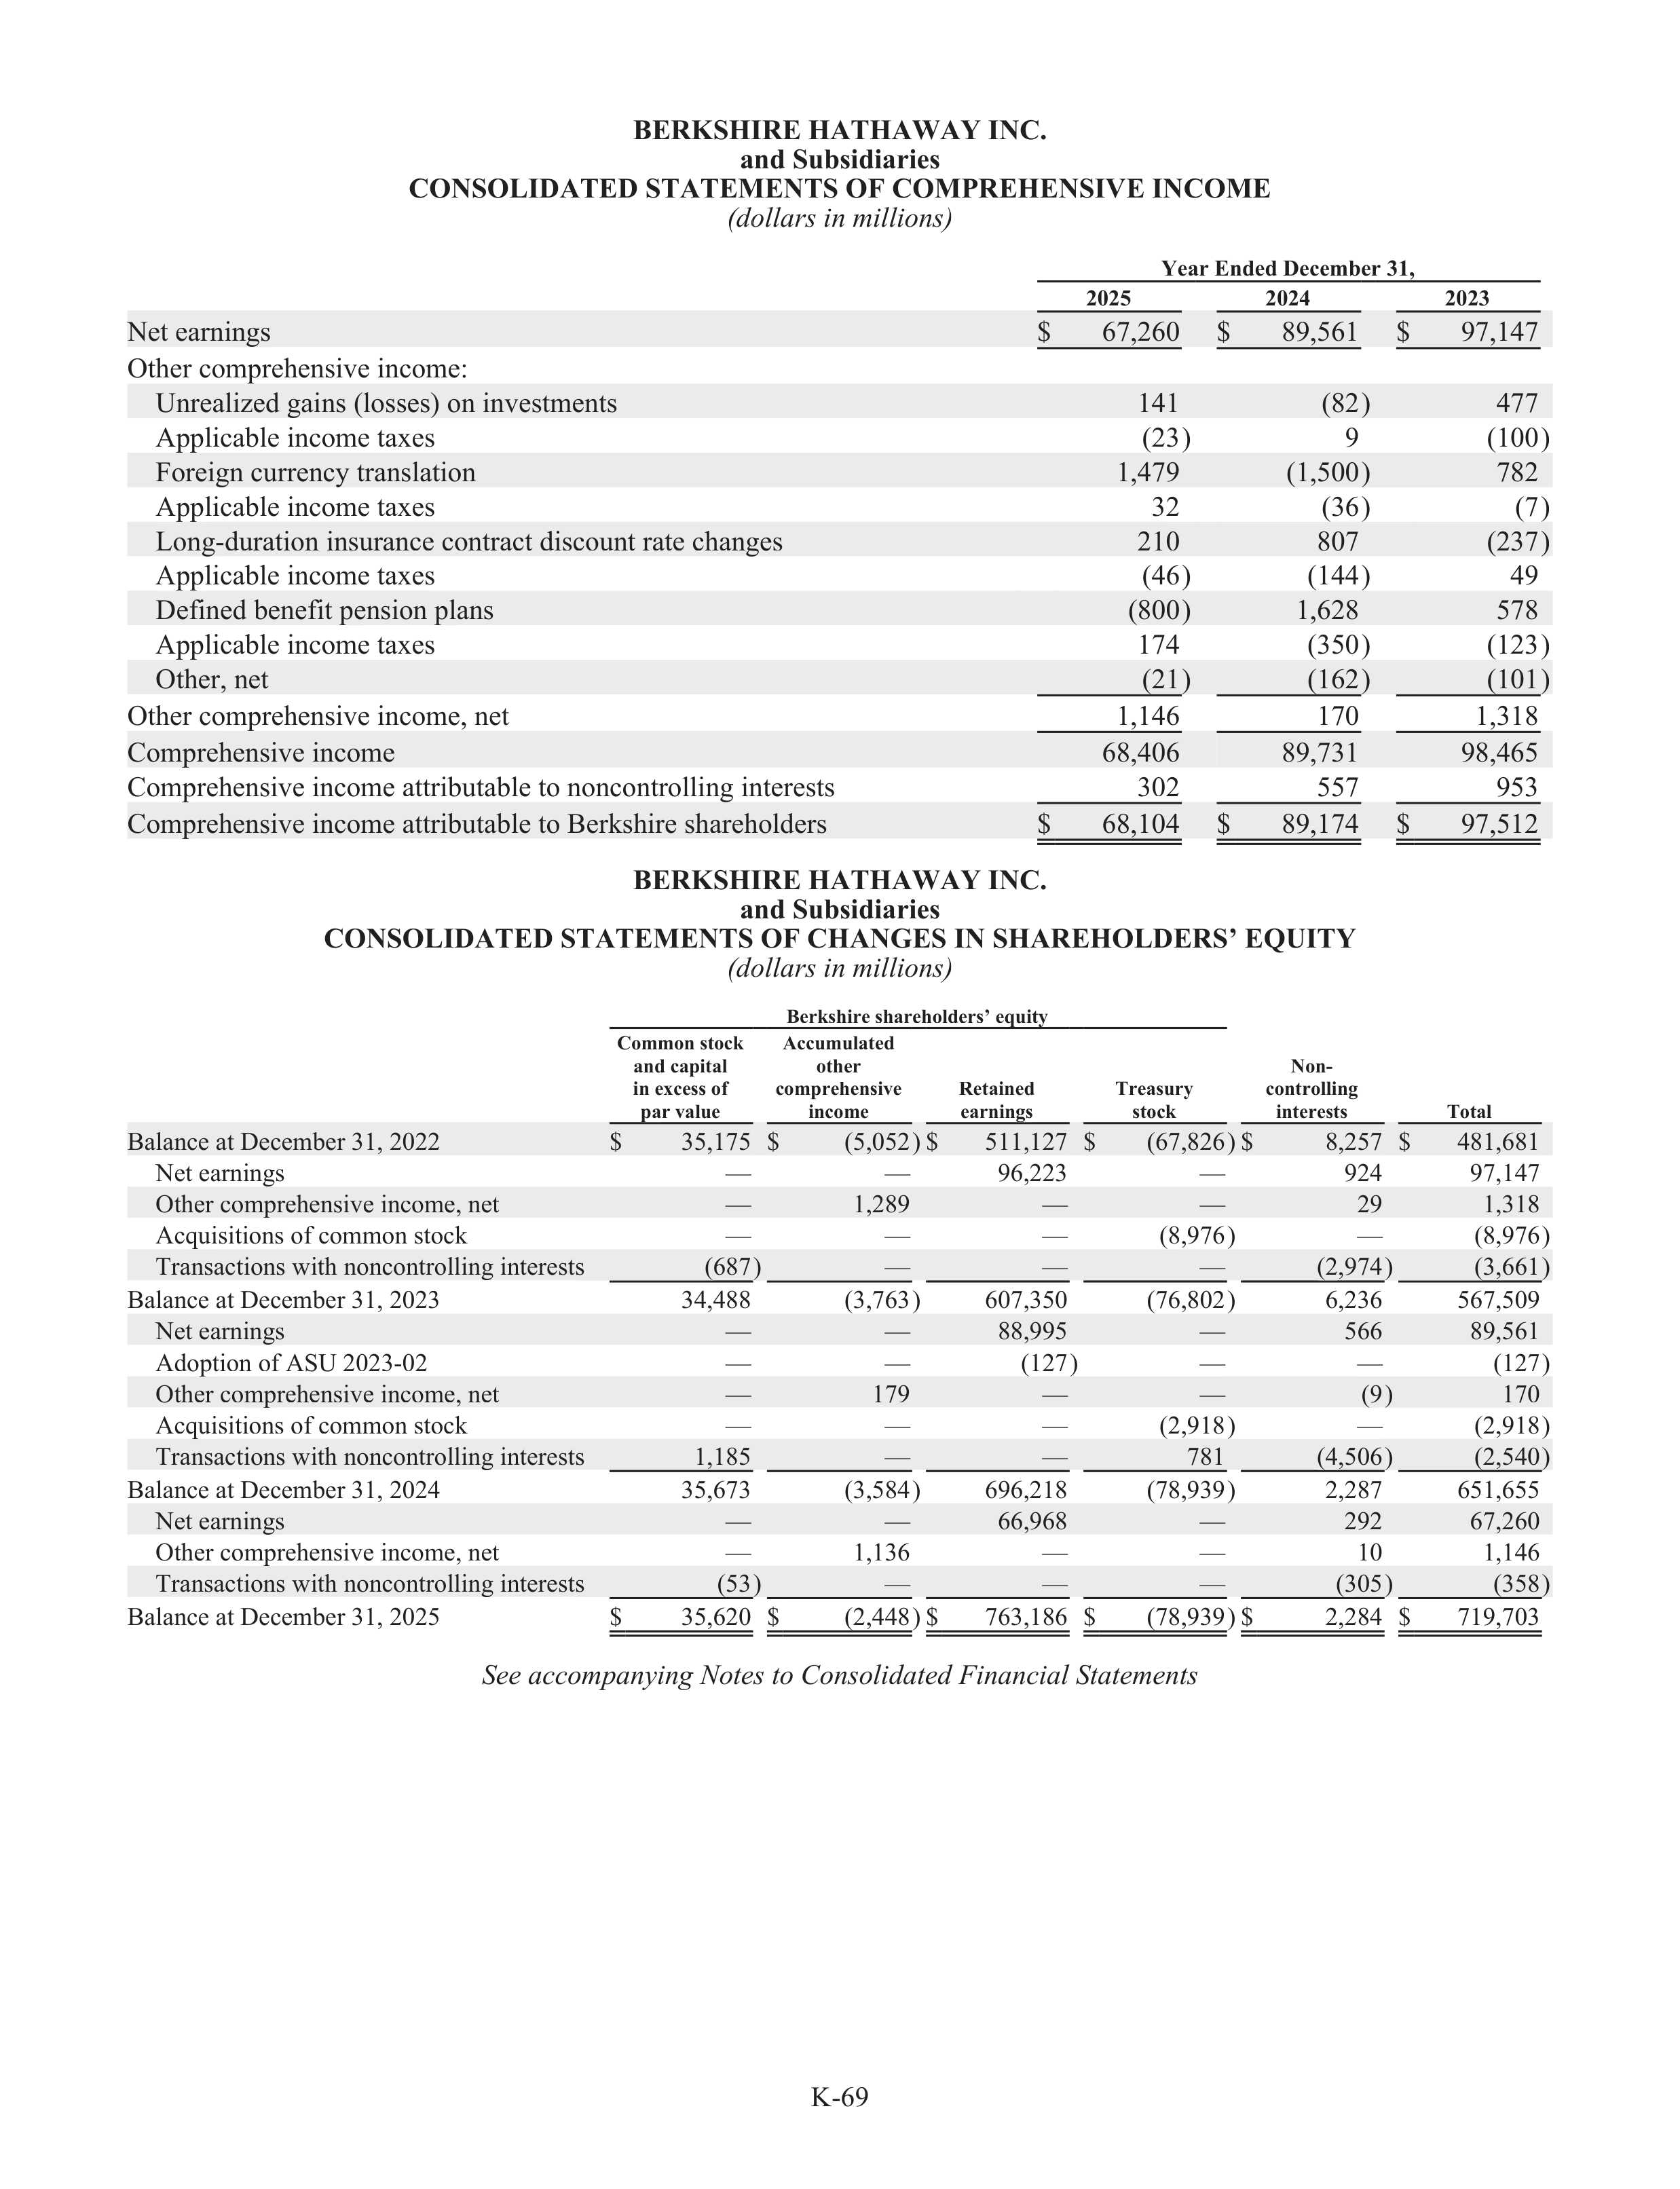
K-69
BERKSHIRE HATHAWAY INC.
and Subsidiaries
CONSOLIDATED STATEMENTS OF COMPREHENSIVE INCOME
(dol
d
lars in millions)s
Year Ended December 31,
2025
2024
2023
Net earnings
$
67,260
$
89,561
$
97,147
Other comprehensive income:
Unrealized gains (losses) on investments
141
(82)
477
Applicable income taxes
(23)
9
(100)
Foreign currency translation
1,479
(1,500)
782
Applicable income taxes
32
(36)
(7)
Long-duration insurance contract discount rate changes
210
807
(237)
Applicable income taxes
(46)
(144)
49
Defined benefit pension plans
(800)
1,628
578
Applicable income taxes
174
(350)
(123)
Other, net
(21)
(162)
(101)
Other comprehensive income, net
1,146
170
1,318
Comprehensive income
68,406
89,731
98,465
Comprehensive income attributable to noncontrolling interests
302
557
953
Comprehensive income attributable to Berkshire shareholders
$
68,104
$
89,174
$
97,512
BERKSHIRE HATHAWAY INC.
and Subsidiaries
CONSOLIDATED STATEMENTS OF CHANGES IN SHAREHOLDERS’ EQUITY
(dol
d
lars in millions)s
Berkshire shareholders’ equity
Common stock
and capital
in excess of
par value
Accumulated
other
comprehensive
income
Retained
earnings
Treasury
stock
Non-
controlling
interests
Total
Balance at December 31, 2022
$
35,175
$
(5,052) $
511,127
$
(67,826) $
8,257
$
481,681
Net earnings
—
—
96,223
—
924
97,147
Other comprehensive income, net
—
1,289
—
—
29
1,318
Acquisitions of common stock
—
—
—
(8,976)
—
(8,976)
Transactions with noncontrolling interests
(687)
—
—
—
(2,974)
(3,661)
Balance at December 31, 2023
34,488
(3,763)
607,350
(76,802)
6,236
567,509
Net earnings
—
—
88,995
—
566
89,561
Adoption of ASU 2023-02
—
—
(127)
—
—
(127)
Other comprehensive income, net
—
179
—
—
(9)
170
Acquisitions of common stock
—
—
—
(2,918)
—
(2,918)
Transactions with noncontrolling interests
1,185
—
—
781
(4,506)
(2,540)
Balance at December 31, 2024
35,673
(3,584)
696,218
(78,939)
2,287
651,655
Net earnings
—
—
66,968
—
292
67,260
Other comprehensive income, net
—
1,136
—
—
10
1,146
Transactions with noncontrolling interests
(53)
—
—
—
(305)
(358)
Balance at December 31, 2025
$
35,620
$
(2,448) $
763,186
$
(78,939) $
2,284
$
719,703
See accompanying Notes to Consolidat
d
ed Financial Statements
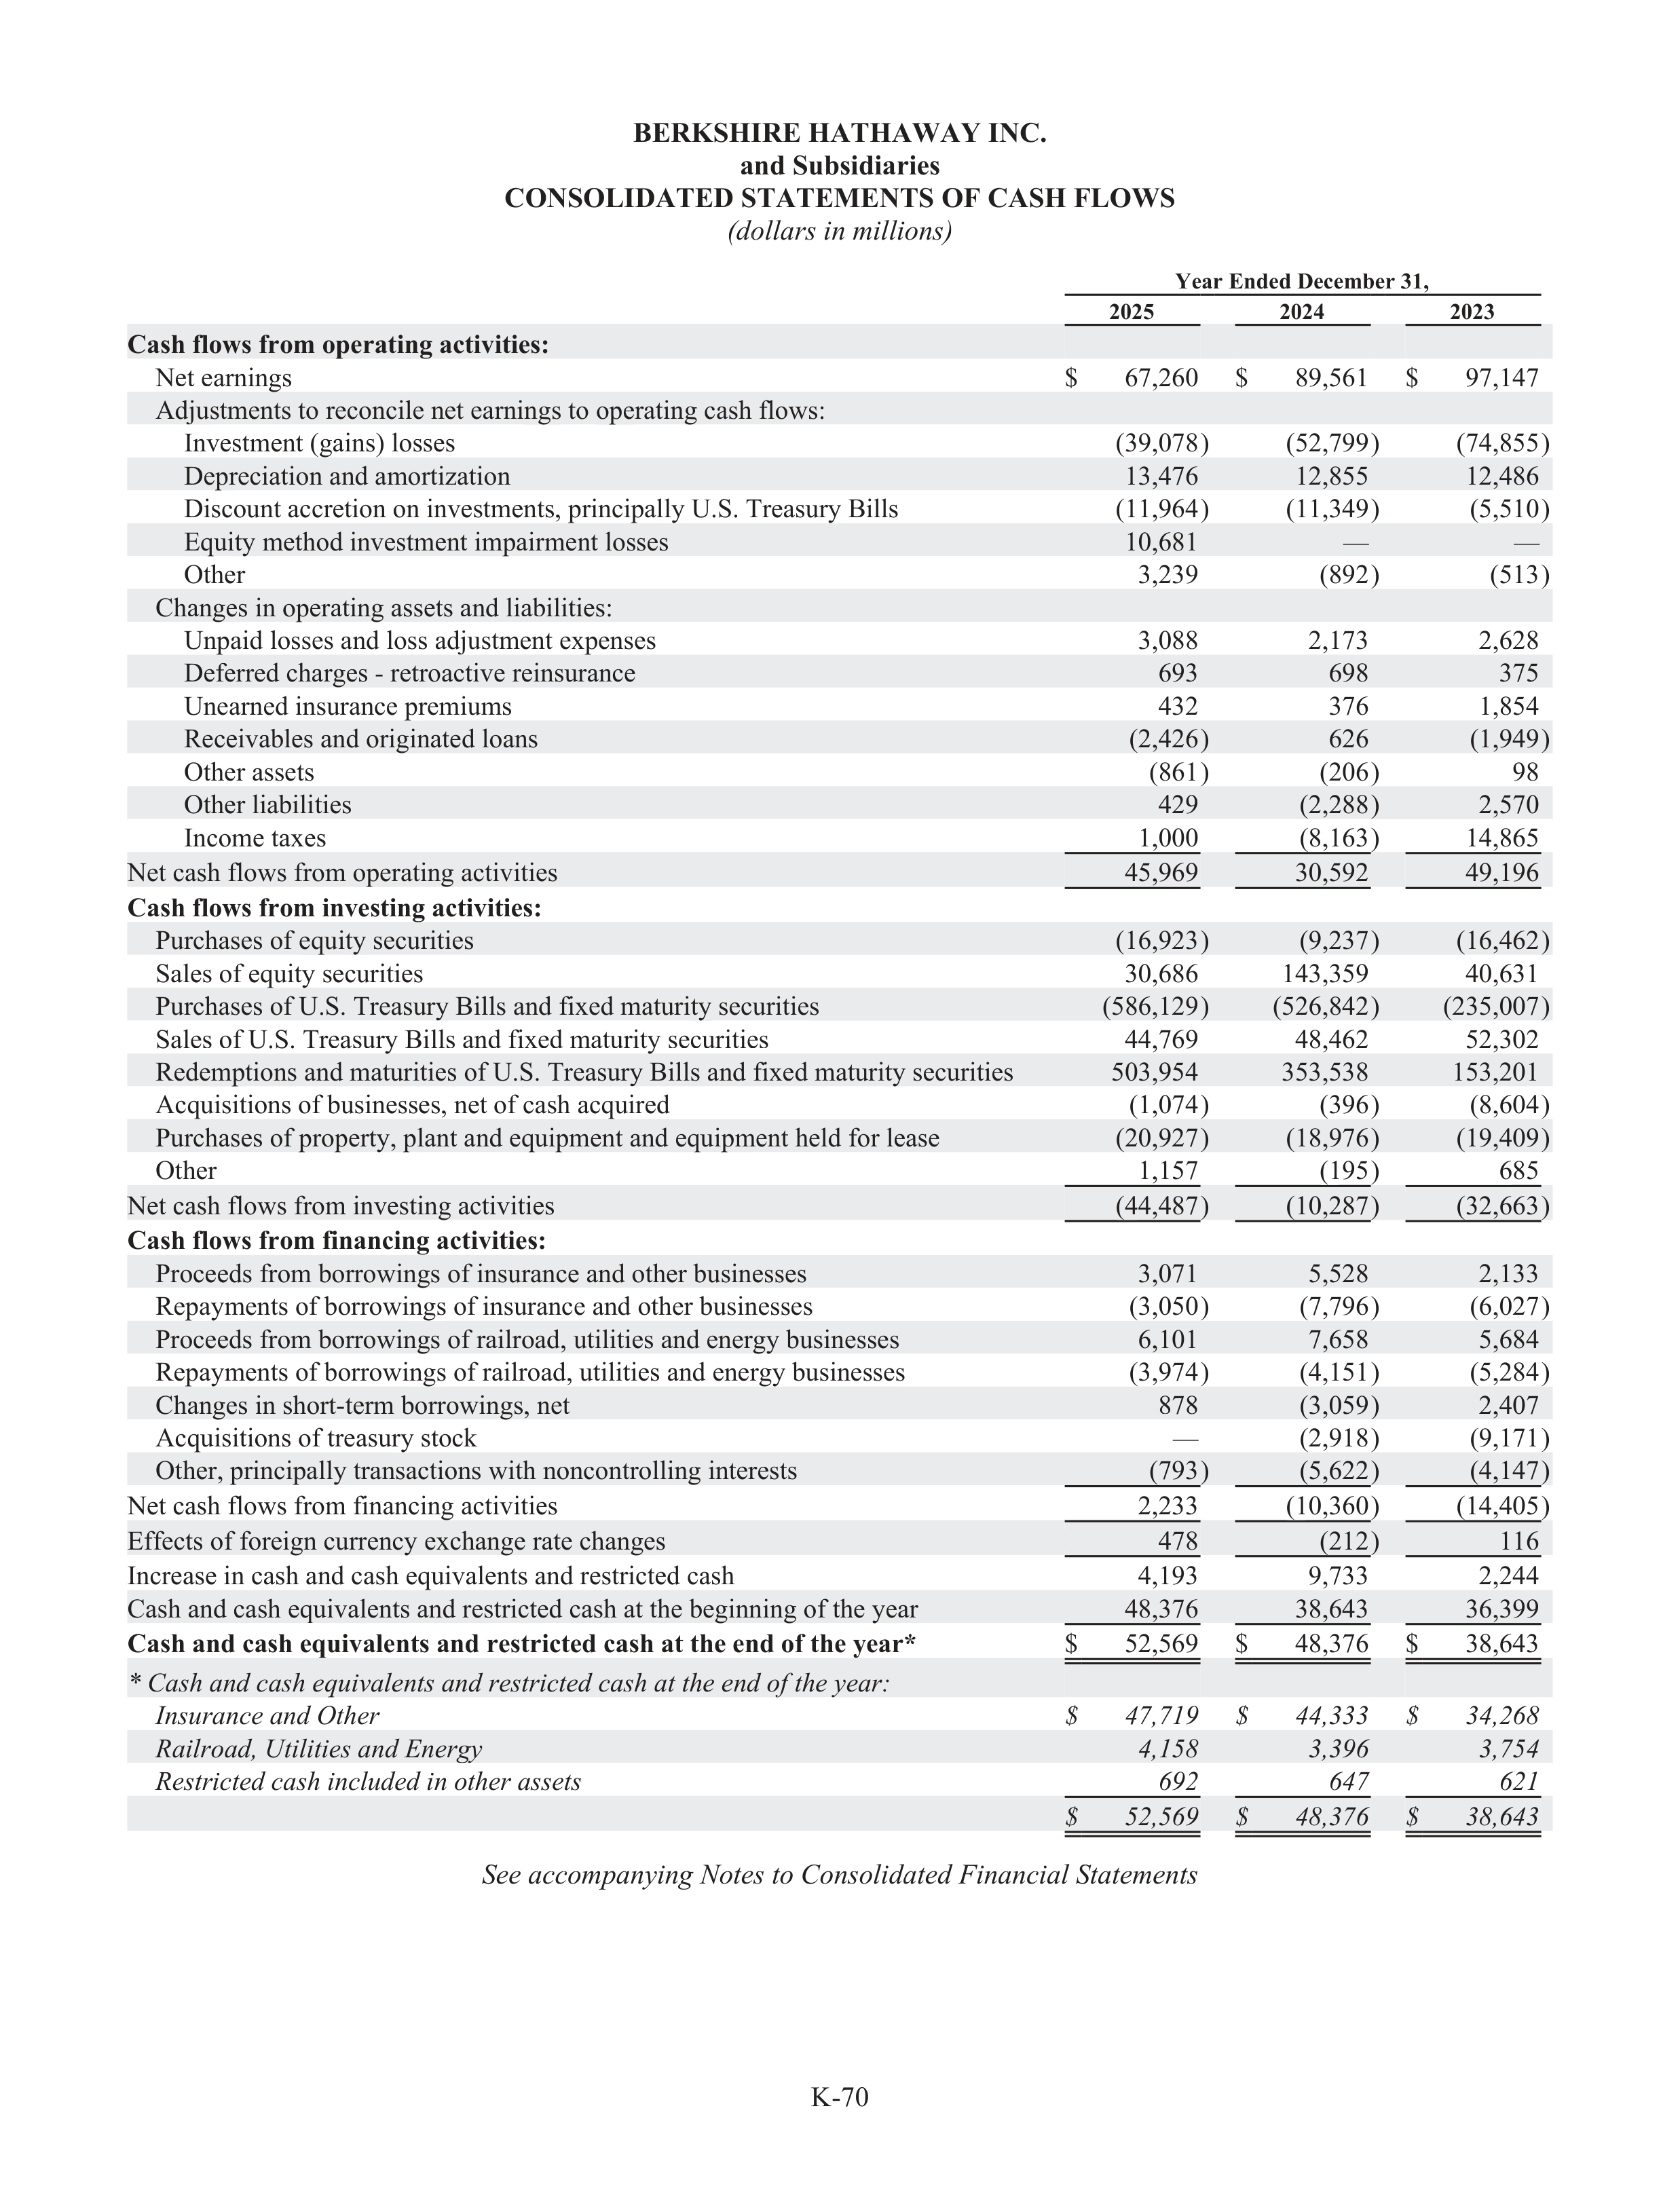
K-70
BERKSHIRE HATHAWAY INC.
and Subsidiaries
CONSOLIDATED STATEMENTS OF CASH FLOWS
(dol
d
lars in millions)s
Year Ended December 31,
2025
2024
2023
Cash flows from operating activities:
Net earnings
$
67,260
$
89,561
$
97,147
Adju
d
stments to reconcile net earnings to operating cash flows:
Investment (gains) losses
(39,078)
(52,799)
(74,855)
Depreciation and amortization
13,476
12,855
12,486
Discount accretion on investments, principally U.S. Treasury Bills
(11,964)
(11,349)
(5,510)
Equity method investment impairment losses
10,681
—
—
Other
3,239
(892)
(513)
Changes in operating assets and liabi
a
lities:
Unpaid losses and loss adju
d
stment expenses
3,088
2,173
2,628
Deferred charges - retroactive reinsurance
693
698
375
Unearned insurance premiums
432
376
1,854
Receivabl
a
es and originated loans
(2,426)
626
(1,949)
Other assets
(861)
(206)
98
Other liabi
a
lities
429
(2,288)
2,570
Income taxes
1,000
(8,163)
14,865
Net cash flows from operating activities
45,969
30,592
49,196
Cash flows from investing activities:
Purchases of equity securities
(16,923)
(9,237)
(16,462)
Sales of equity securities
30,686
143,359
40,631
Purchases of U.S. Treasury
r
Bills and fixed maturity securities
(586,129)
(526,842)
(235,007)
Sales of U.S. Treasury Bills and fixed maturity securities
44,769
48,462
52,302
Redemptions and maturities of U.S. Treasury
r
Bills and fixed maturity securities
503,954
353,538
153,201
Acquisitions of businesses, net of cash acquired
(1,074)
(396)
(8,604)
Purchases of property, plant and equipment and equipment held for lease
(20,927)
(18,976)
(19,409)
Other
1,157
(195)
685
Net cash flows from investing activities
(44,487)
(10,287)
(32,663)
Cash flows from financing activities:
Proceeds from borrowings of insurance and other businesses
3,071
5,528
2,133
Repayments of borrowings of insurance and other businesses
(3,050)
(7,796)
(6,027)
Proceeds from borrowings of railroad, utilities and energy businesses
6,101
7,658
5,684
Repayments of borrowings of railroad, utilities and energy businesses
(3,974)
(4,151)
(5,284)
Changes in short-term borrowings, net
878
(3,059)
2,407
Acquisitions of treasury stock
—
(2,918)
(9,171)
Other, principally transactions with noncontrolling interests
(793)
(5,622)
(4,147)
Net cash flows from financing activities
2,233
(10,360)
(14,405)
Effe
f
cts of foreign currency exchange rate changes
478
(212)
116
Increase in cash and cash equivalents and restricted cash
4,193
9,733
2,244
Cash and cash equivalents and restricted cash at the beginning of the year
48,376
38,643
36,399
Cash and cash equivalents and restricted cash at the end of the year*
$
52,569
$
48,376
$
38,643
* Cash and cash equivalentst
and restricted cash at the end of the year:
Insurance and Other
$
47,719
$
44,333
$
34,268
Railroad, Utilities and Energy
r
4,158
3,396
3,754
Restricted cash included
d
in other assets
692
647
621
$
52,569
$
48,376
$
38,643
See accompanying Notes to Consolidat
d
ed Financial Statements
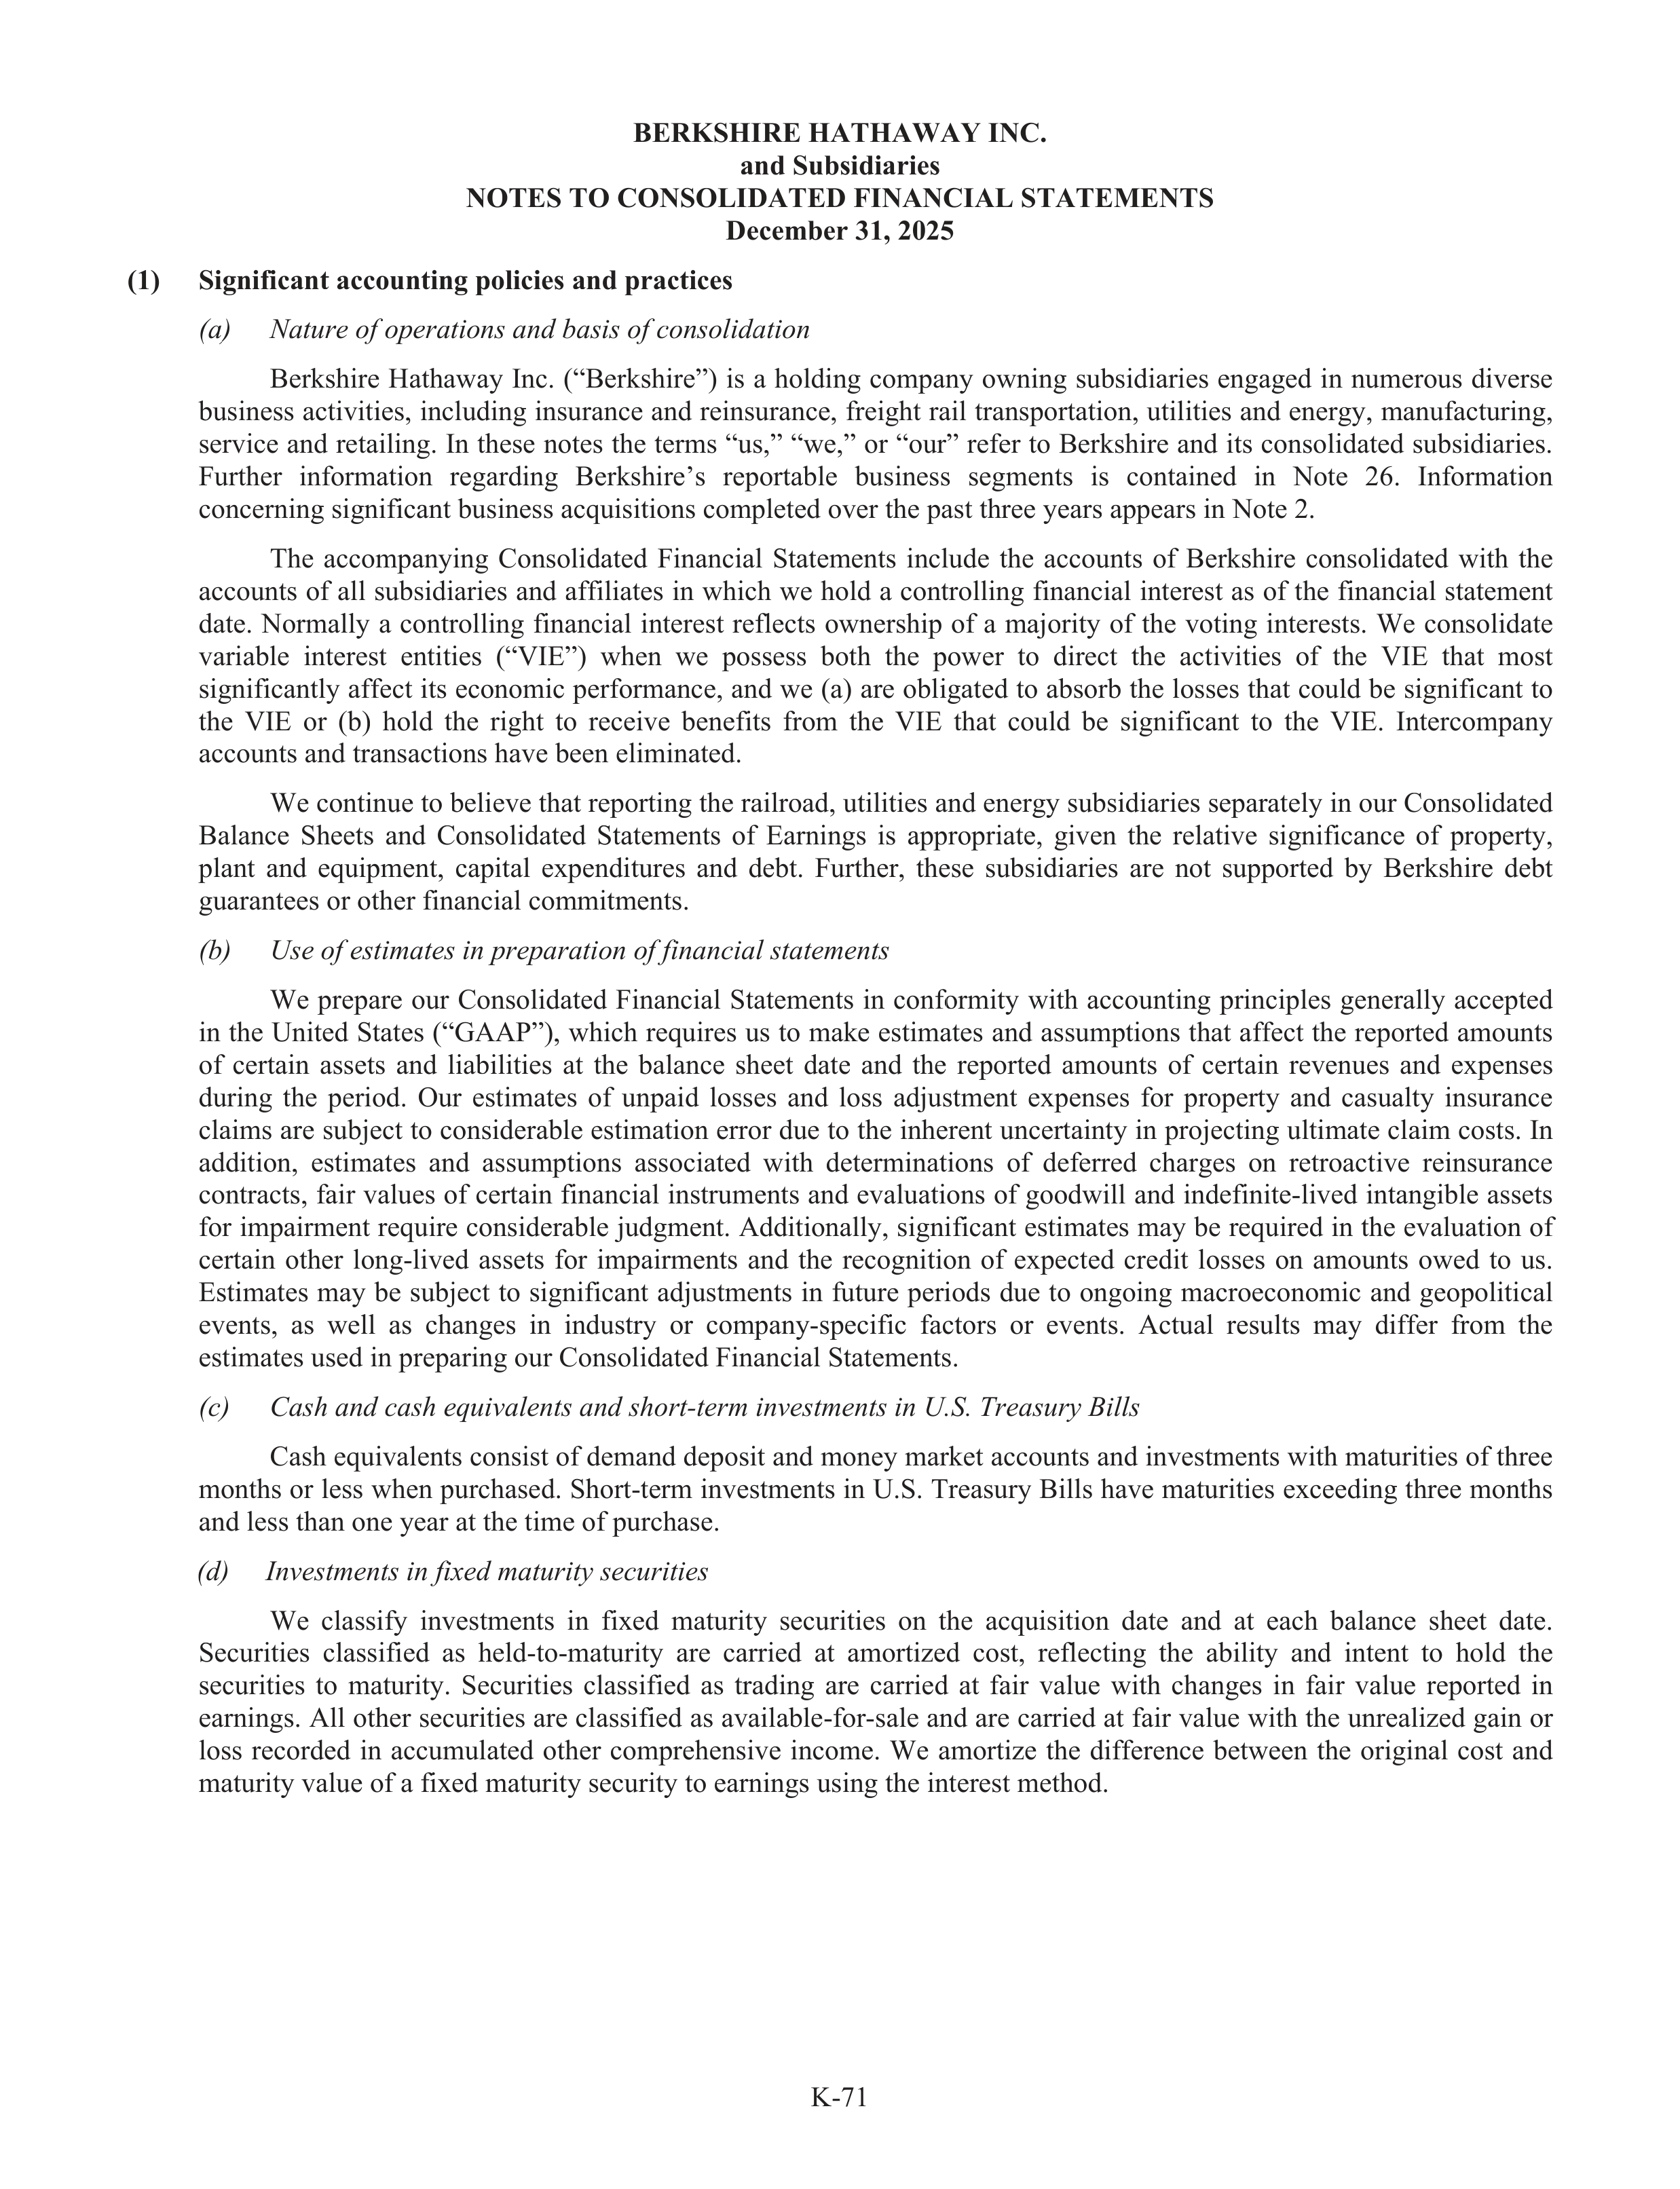
K-71
BERKSHIRE HATHAWAY INC.
and Subsidiaries
NOTES TO CONSOLIDATED FINANCIAL STATEMENTS
December 31, 2025
(1)
Significant accounting policies and practices
(a)
N
a
at
N
ure of operations and basis of consolidat
d
ion
Berkshire
Hathaway
Inc.
(“Berkshire”)
is
a
holding
company
owning
subs
u
idiaries
engaged
in
numerous
diverse
business activities, including insurance and reinsurance, freight rail transportation, utilities and energy, manufact
f
ur
t
ing,
service and retailing. In these notes the terms “us,” “we,” or “our” refer
f
to Berkshire and its consolidated subs
u
idiaries.
Further
information
regarding
Berkshire’s
reportabl
a
e
business
segments
is
contained
in
Note
26.
Information
concerning significant business acquisitions completed over the past three years appears in Note 2.
The
accompanying
Consolidated
Financial
Statements
include
the
accounts
of
Berkshire
consolidated
with
the
accounts of all subs
u
idiaries and affi
f
liates in which we hold a controlling financial interest as of the financial statement
date.
Normally
a
controlling
financial
interest
reflects
ownership
of
a
majo
a
rity
of
the
voting
interests.
We
consolidate
variable
interest
entities
(“VIE”)
when
we
possess
both
the
power
to
direct
the
activities
of
the
VIE
that
most
significantly affe
f
ct its economic performance, and we (a) are obligated to absorb the losses that could be signific
f
ant to
the
VIE
or
(b)
hold
the
right
to
receive
benefits
from
the
VIE
that
could
be
significant
to
the
VIE.
Intercompany
accounts and transactions have been eliminated.
We continue to believe that reporting the railroad, utilities and energy subs
u
idiaries separately in our Consolidated
Balance
Sheets
and
Consolidated
Statements
of
Earnings
is
appropriate,
given
the
relative
significance
of
property,
plant
and
equipment,
capital
expenditures
and
debt.
Further,
these
subs
u
idiaries
are
not
suppor
u
ted
by
Berkshire
debt
guarantees or other financial commitments.
(b)
U
b
se
U
of estimates in preparation of fin
f
ancial statements
We
prepare
our
Consolidated
Financial
Statements
in
confor
f
mity
with
accounting
principles
generally
accepted
in the United States (“GAAP”), which requires us to make estimates and assumptions that affe
f
ct the reported amounts
of
certain
assets
and
liabi
a
lities
at
the
balance
sheet
date
and
the
reported
amounts
of
certain
revenues
and
expenses
during
the
period.
Our
estimates
of
unpaid
losses
and
loss
adju
d
stment
expenses
for
property
and
casualty
insurance
claims are subj
u
ect to considerable estimation error due to the inherent uncertainty in projecting ultimate claim costs. In
addition,
estimates
and
assumptions
associated
with
determinations
of
deferred
charges
on
retroactive
reinsurance
contracts, fair values of certain financial instruments and evaluations of goodwill and indefinite-lived intangible assets
for impairment require considerable judgment. Additionally, significant estimates may be required in the evaluation of
certain
other
long-lived
assets
for
impairments
and
the
recognition
of
expected
credit
losses
on
amounts
owed
to
us.
Estimates
may
be
subj
u
ect
to
significant
adju
d
stments
in
future
periods
due
to
ongoing
macroeconomic
and
geopolitical
events,
as
well
as
changes
in
industry
r
or
company-specific
factors
or
events.
Actual
results
may
differ
f
from
the
estimates used in preparing our Consolidated Financial Statements.
(c)
C
c
as
C
h and cash equivalentst
and short-term investments in U.S. Treasury Bills
Cash equivalents consist of demand deposit and money market accounts and investments with maturities of three
months or less when purchased. Short-term investments in U.S. Treasury
r
Bills have maturities exceeding three months
and less than one year at the time of purchase.
(d)
I
d
nv
I
estments in fixed maturity securities
We
classify
investments
in
fixed
maturity
securities
on
the
acquisition
date
and
at
each
balance
sheet
date.
Securities
classified
as
held-to-maturity
are
carried
at
amortized
cost,
reflecting
the
ability
and
intent
to
hold
the
securities
to
maturity.
Securities
classified
as
trading
are
carried
at
fair
value
with
changes
in
fair
value
reported
in
earnings. All other securities are classified as availabl
a
e-for-sale and are carried at fair value with the unrealized gain or
loss
recorded
in
accumulated
other
comprehensive
income.
We
amortize
the
difference
between
the
original
cost
and
maturity value of a fixed maturity security to earnings using the interest method.
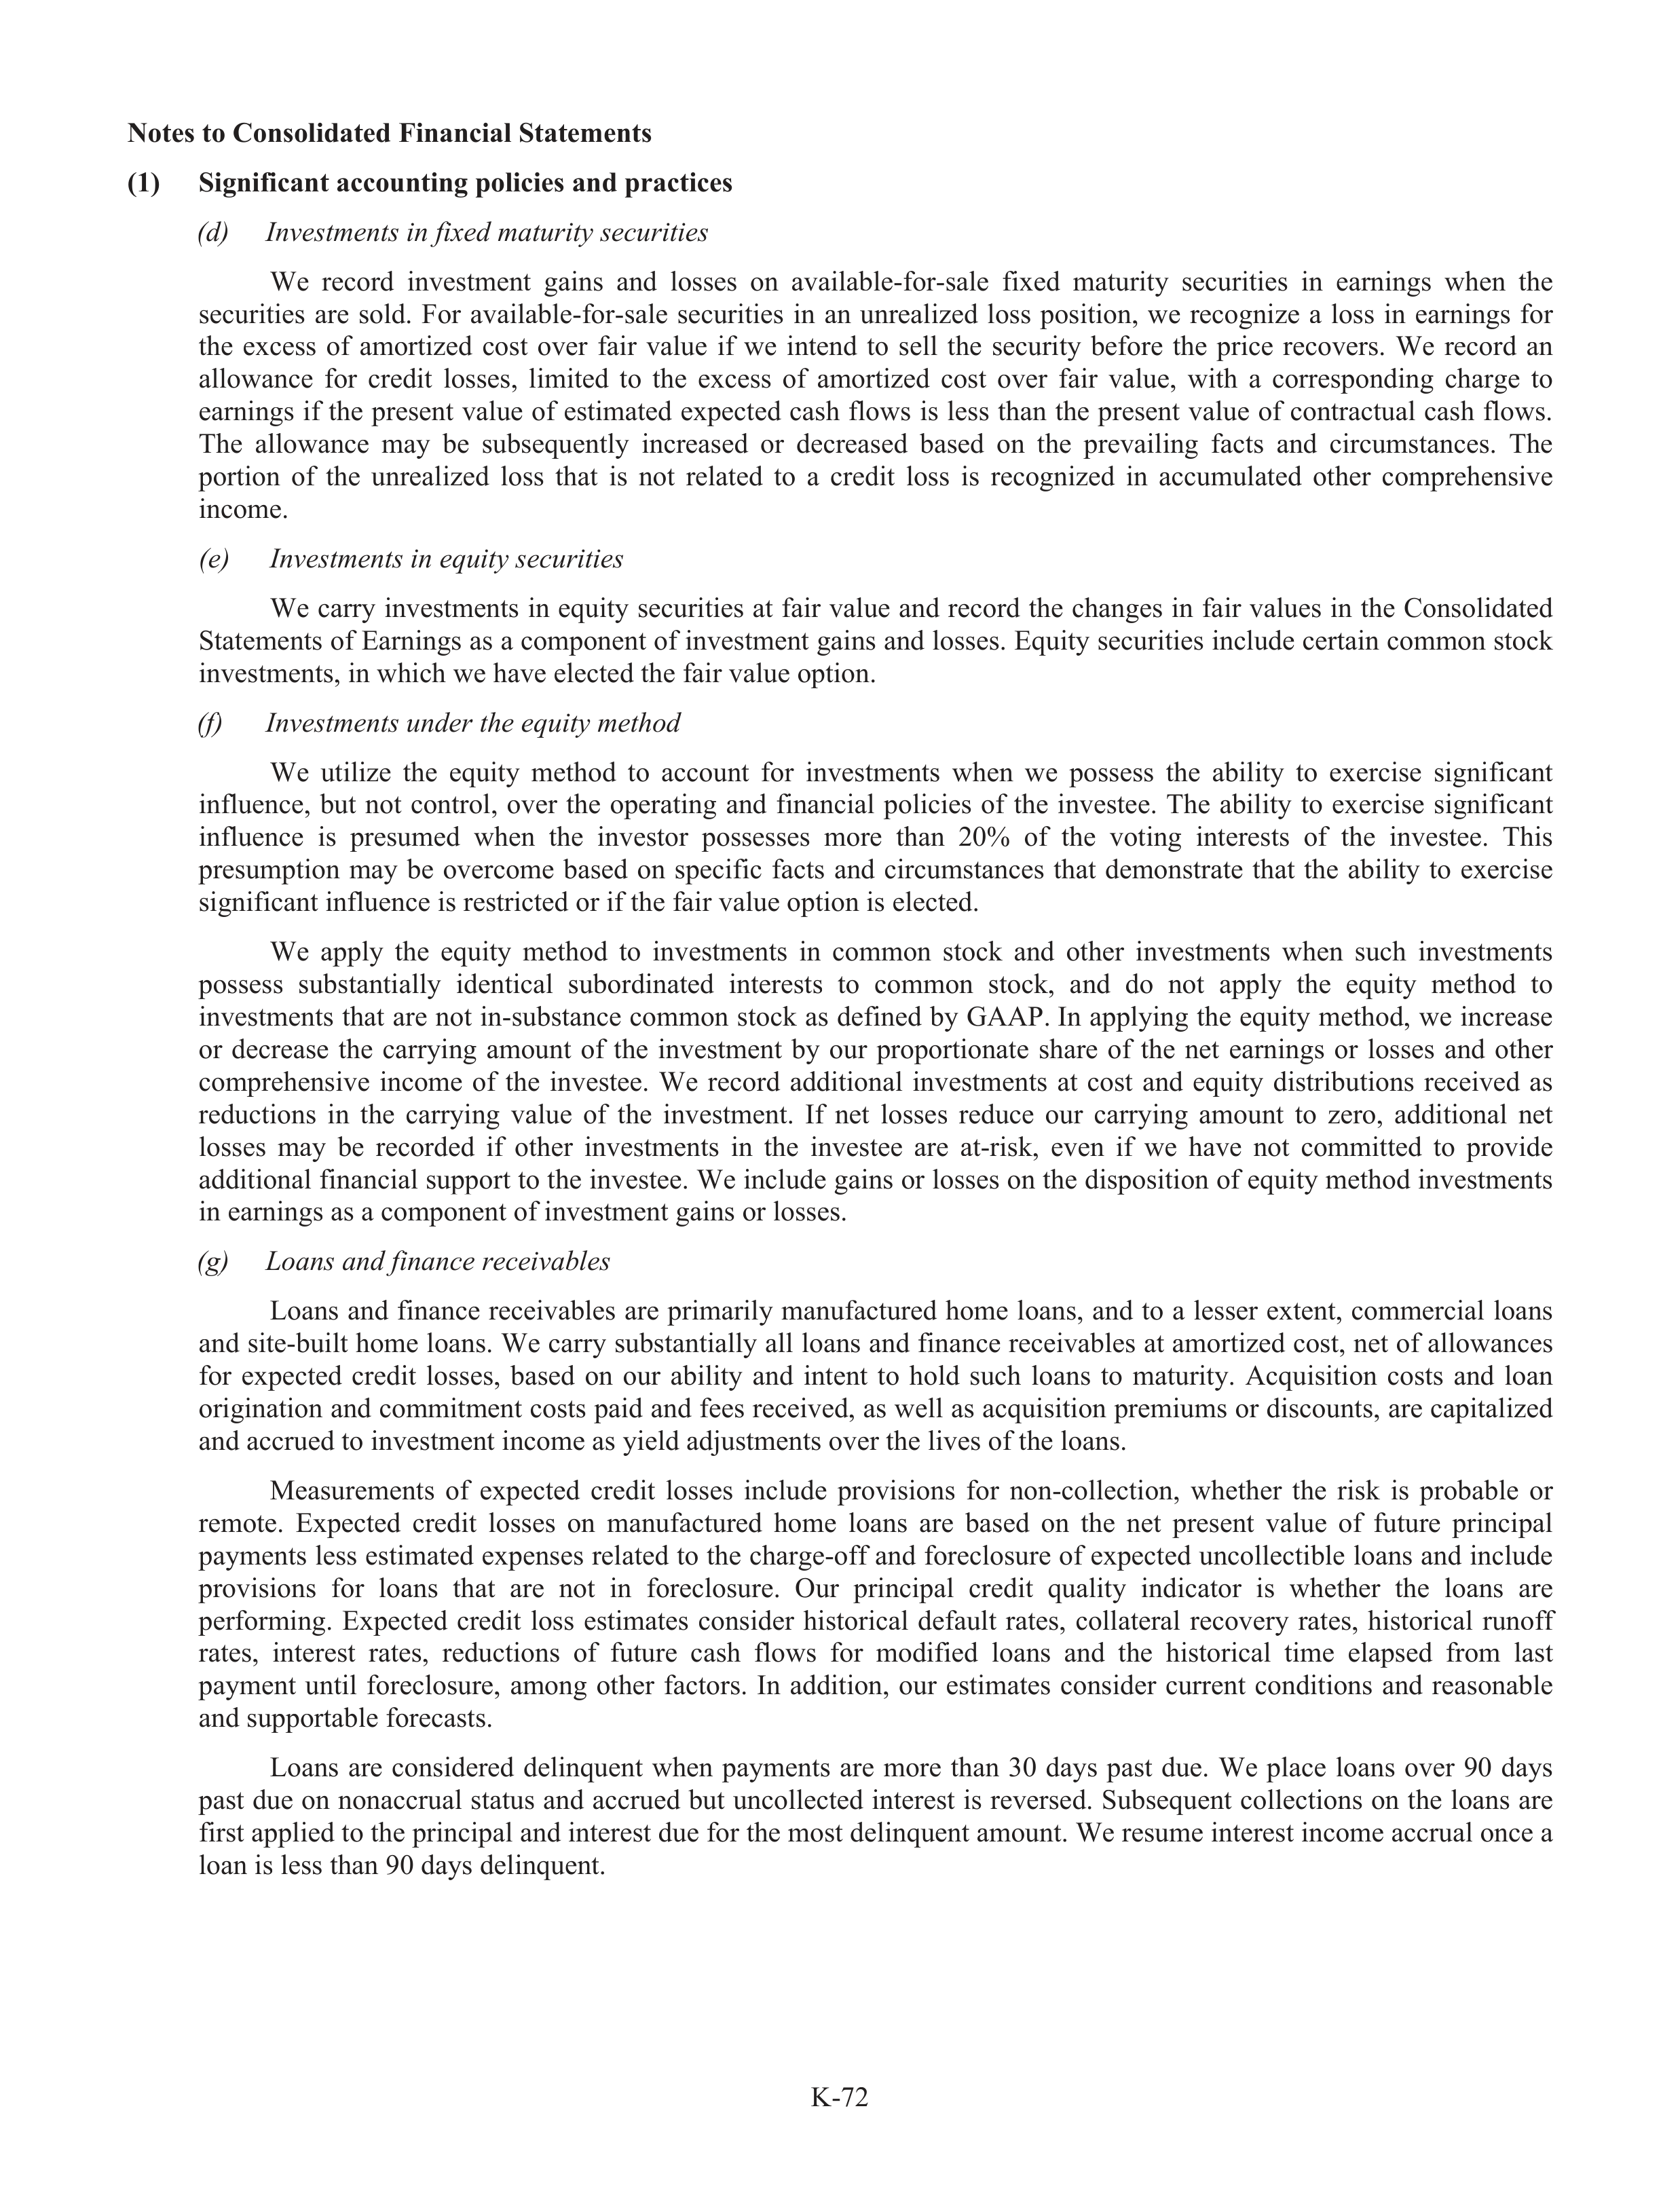
K-72
Notes to Consolidated Financial Statements
(1)
Significant accounting policies and practices
(d)
I
d
nv
I
estments in fixed maturity securities
We
record
investment
gains
and
losses
on
availabl
a
e-for-sale
fixed
maturity
securities
in
earnings
when
the
securities
are
sold.
For
availabl
a
e-for-sale
securities
in
an
unrealized
loss
position,
we
recognize
a
loss
in
earnings
for
the
excess
of
amortized
cost
over
fair
value
if
we
intend
to
sell
the
security
before
the
price
recovers.
We
record
an
allowance
for
credit
losses,
limited
to
the
excess
of
amortized
cost
over
fair
value,
with
a
corresponding
charge
to
earnings if the present value of estimated expected cash flows is less
than the present value of contractua
t
l cash flows.
The
allowance
may
be
subs
u
equently
increased
or
decreased
based
on
the
prevailing
facts
and
circumstances.
The
portion
of
the
unrealized
loss
that
is
not
related
to
a
credit
loss
is
recognized
in
accumulated
other
comprehensive
income.
(e)
I
e
nv
I
estments in equity securities
We carry investments in equity securities at fair value and record the changes in fair values in the Consolidated
Statements of Earnings as a component of investment gains and losses. Equity securities include certain common stock
investments, in which we have elected the fair value option.
(f)
I
f
nv
I
estments under the equity method
We
utilize
the
equity
method
to
account
for
investments
when
we
possess
the
ability
to
exercise
significant
influence,
but
not
control,
over
the
operating
and
financial
policies
of
the
investee.
The
ability
to
exercise
significant
influence
is
presumed
when
the
investor
possesses
more
than
20%
of
the
voting
interests
of
the
investee.
This
presumption
may
be
overcome
based
on
specific
facts
and
circumstances
that
demonstrate
that
the
ability
to
exercise
significant influence is restricted or if the fair value option is elected.
We
apply
the
equity
method
to
investments
in
common
stock
and
other
investments
when
such
investments
possess
subs
u
tantially
identical
subor
u
dinated
interests
to
common
stock,
and
do
not
apply
the
equity
method
to
investments that are not in-substance common stock as defined by GAAP. In applying the equity method, we increase
or
decrease
the
carrying
amount
of
the
investment
by
our
proportionate
share
of
the
net
earnings
or
losses
and
other
comprehensive
income
of
the
investee.
We
record
additional
investments
at
cost
and
equity
distributions
received
as
reductions
in
the
carrying
value
of
the
investment.
If
net
losses
reduce
our
carrying
amount
to
zero,
additional
net
losses
may
be
recorded
if
other
investments
in
the
investee
are
at-risk,
even
if
we
have
not
committed
to
provide
additional financial suppor
u
t to the investee. We include gains or losses on the disposition of equity method investments
in earnings as a component of investment gains or losses.
(g)
L
g
oans and finance receivables
Loans
and
finance
receivabl
a
es
are
primarily
manufact
f
ur
t
ed
home
loans,
and
to
a
lesser
extent,
commercial
loans
and site-built home loans. We carry subs
u
tantially all loans and finance receivabl
a
es at amortized cost, net of allowances
for
expected
credit
losses,
based
on
our
ability
and
intent
to
hold
such
loans
to
maturity.
Acquisition
costs
and
loan
origination and commitment costs paid and fees received, as well as acquisition premiums or discounts, are capitalized
and accrue
r
d to investment income as yield adju
d
stments over the lives of the loans.
Measurements
of
expected
credit
losses
include
provisions
for
non-collection,
whether
the
risk
is
probabl
a
e
or
remote.
Expected
credit
losses
on
manufact
f
ur
t
ed
home
loans
are
based
on
the
net
present
value
of
future
principal
payments less estimated expenses related to the charge-off and foreclosure of expected uncollectible loans and include
provisions
for
loans
that
are
not
in
foreclosure.
Our
principal
credit
quality
indicator
is
whether
the
loans
are
performing.
Expected
credit
loss
estimates
consider
historical
default
rates,
collateral
recovery
rates,
historical
runofff
rates,
interest
rates,
reductions
of
future
cash
flows
for
modified
loans
and
the
historical
time
elapsed
from
last
payment
until
foreclosure,
among
other
factors.
In
addition,
our
estimates
consider
current
conditions
and
reasonabl
a
e
and suppor
u
tabl
a
e forecasts.
Loans
are
considered
delinquent
when
payments
are
more
than
30
days
past
due.
We
place
loans
over
90
days
past due on nonaccrua
r
l status
t
and accrue
r
d but uncollected interest is reversed. Subs
u
equent collections on the loans are
first applied to the principal and interest due for the most delinquent amount. We resume interest income accrua
r
l once a
loan is less than 90 days delinquent.
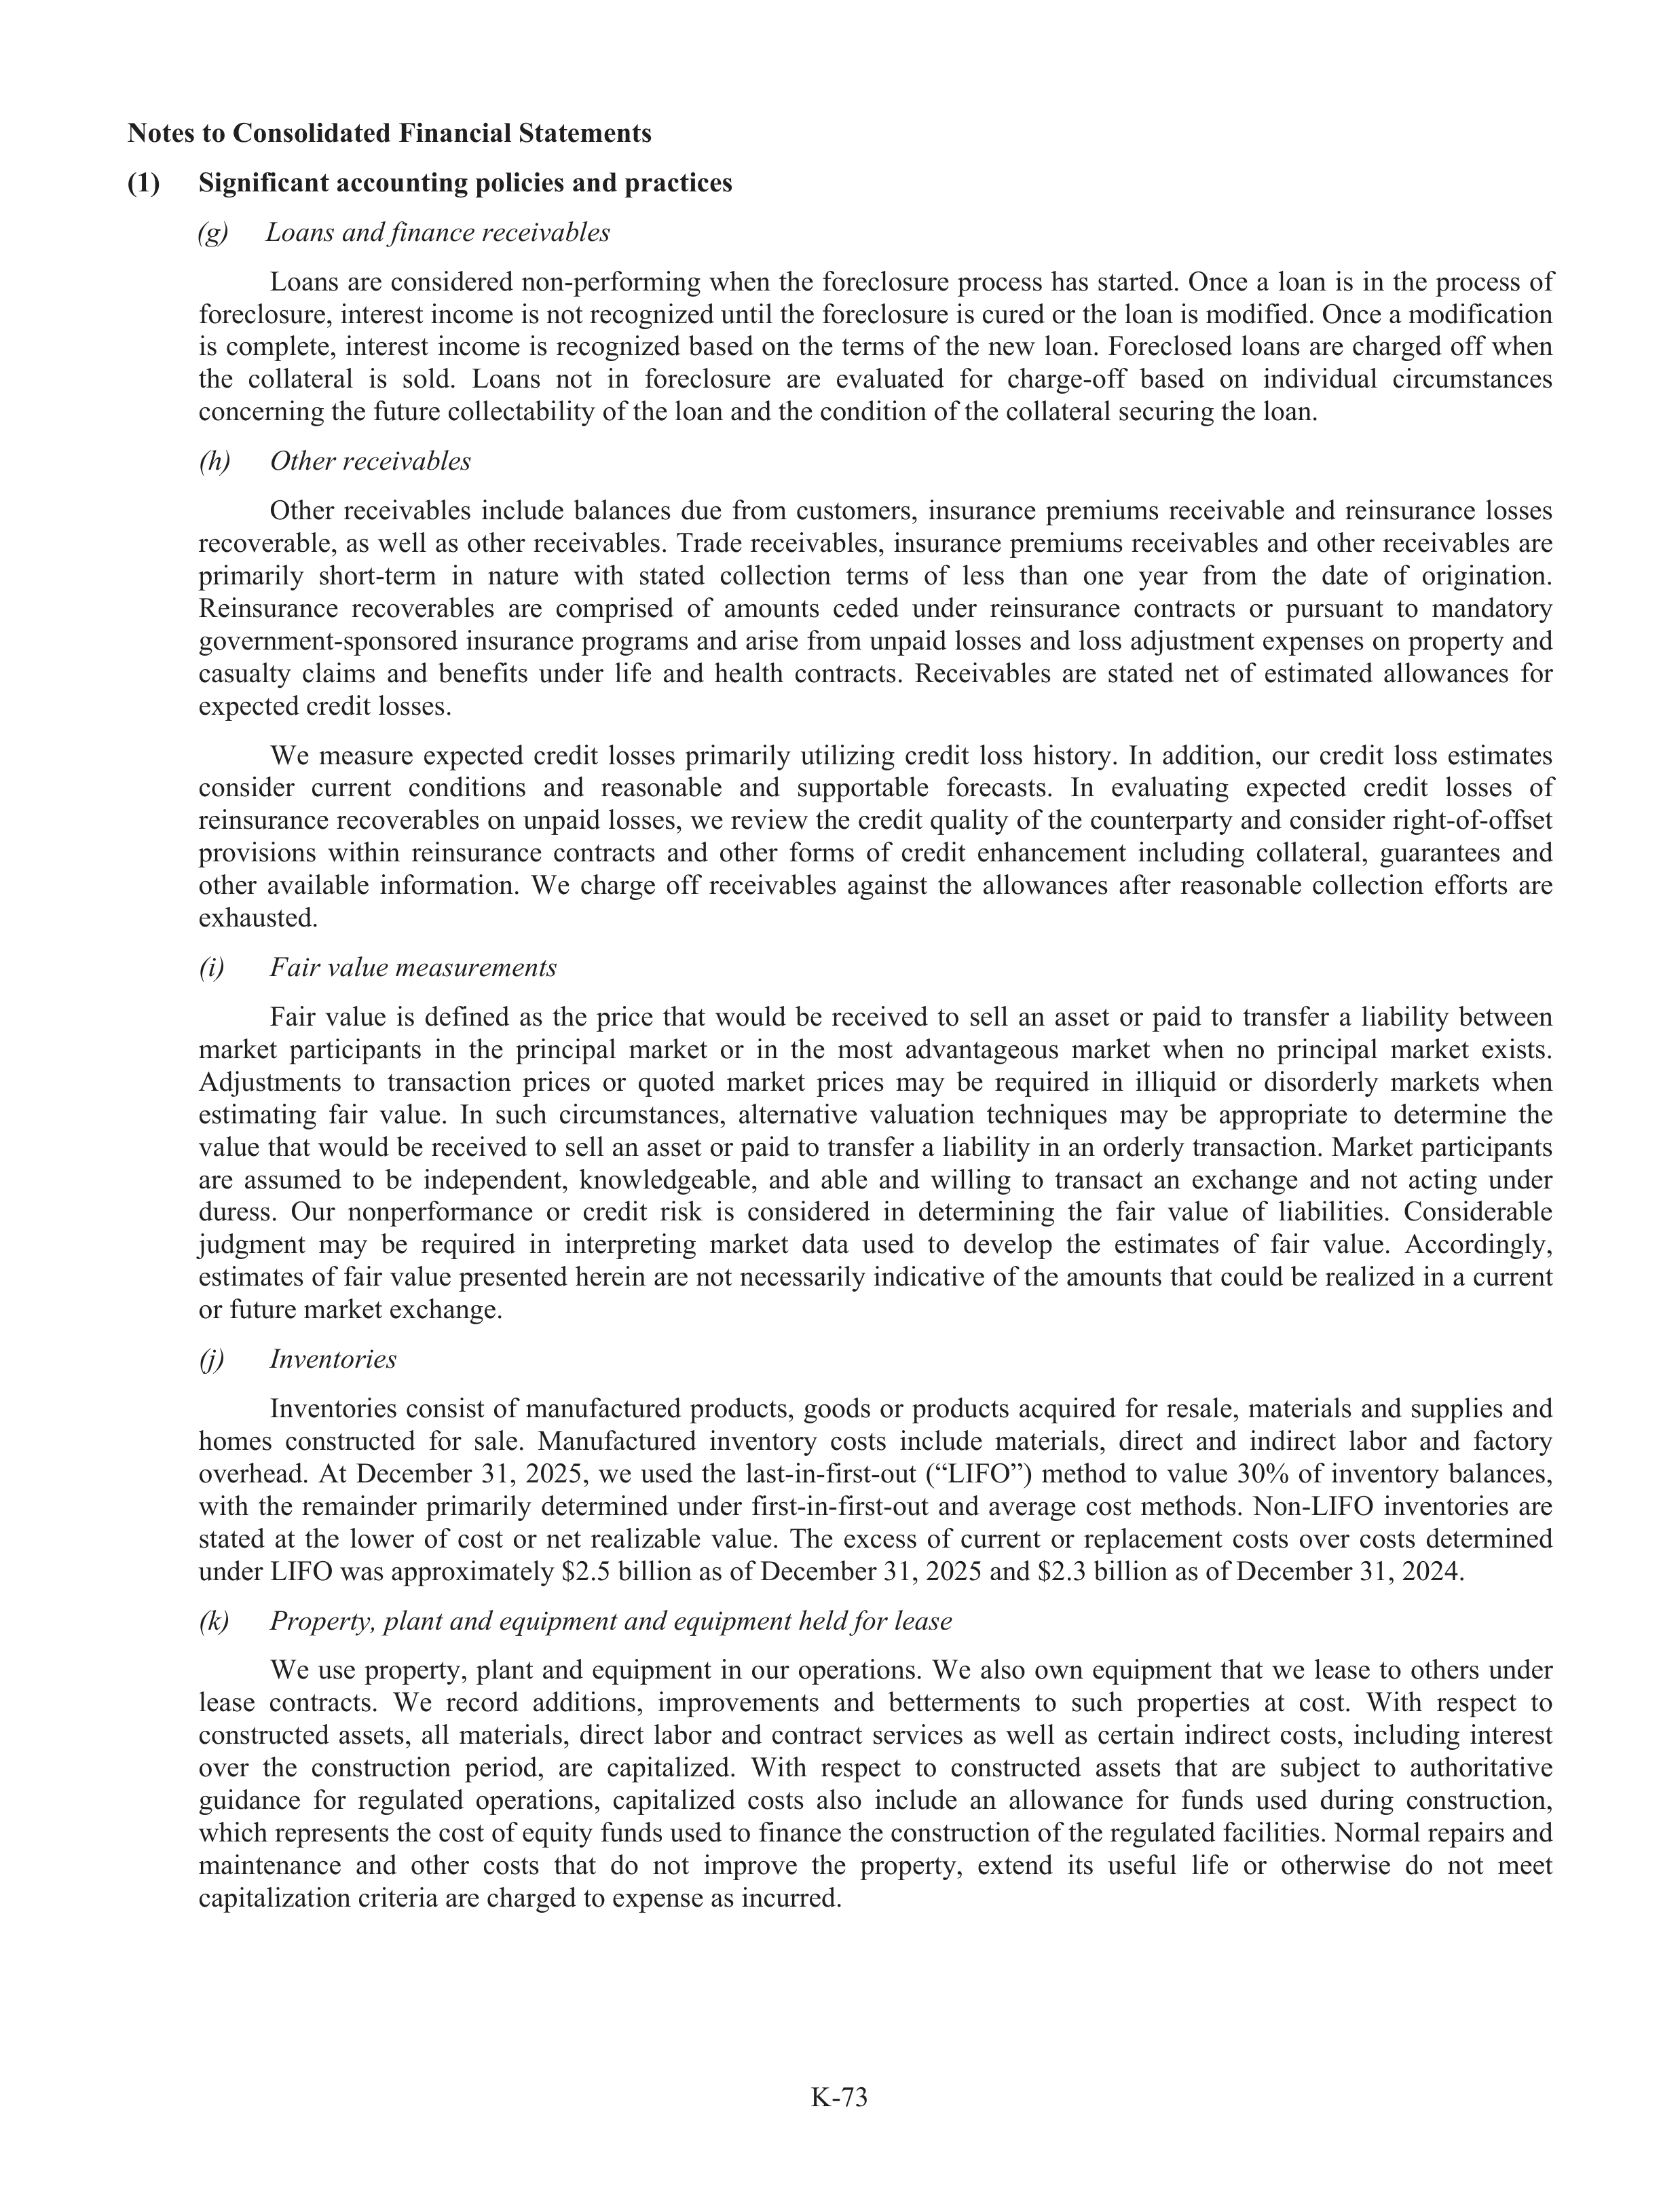
K-73
Notes to Consolidated Financial Statements
(1)
Significant accounting policies and practices
(g)
L
g
oans and finance receivables
Loans
are
considered
non-performing
when
the
foreclosure
process
has
started.
Once
a
loan
is
in
the
process
of
foreclosure, interest income is not recognized until the foreclosure is cured or the loan is modified. Once a modification
is
complete,
interest
income
is
recognized
based
on
the
terms
of
the
new
loan.
Foreclosed
loans
are
charged
offf
when
the
collateral
is
sold.
Loans
not
in
foreclosure
are
evaluated
for
charge-off
based
on
individual
circumstances
concerning the future collectability of the loan and the condition of the collateral securing the loan.
(h)
O
h
ther receivables
Other
receivabl
a
es
include
balances
due
from
customers,
insurance
premiums
receivabl
a
e
and
reinsurance
losses
recoverabl
a
e, as well as other receivables. Trade receivabl
a
es, insurance premiums receivabl
a
es and other receivabl
a
es are
primarily
short-term
in
nature
with
stated
collection
terms
of
less
than
one
year
from
the
date
of
origination.
Reinsurance
recoverabl
a
es
are
comprised
of
amounts
ceded
under
reinsurance
contracts
or
pursuant
to
mandatory
government-sponsored insurance programs and arise from unpaid losses and loss adju
d
stment expenses on property and
casualty
claims
and
benefits
under
lifef
and
health
contracts.
Receivabl
a
es
are
stated
net
of
estimated
allowances
for
expected credit losses.
We
measure
expected
credit
losses
primarily
utilizing
credit
loss
history.
r
In
addition,
our
credit
loss
estimates
consider
current
conditions
and
reasonabl
a
e
and
suppor
u
tabl
a
e
forecasts.
In
evaluating
expected
credit
losses
of
reinsurance recoverabl
a
es on unpaid losses, we review the credit quality of the counterpa
r
rty and consider right-of-offset
provisions
within
reinsurance
contracts
and
other
forms
of
credit
enhancement
including
collateral,
guarantees
and
other
availabl
a
e
information.
We
charge
offf
receivabl
a
es
against
the
allowances
afte
f
r
reasonabl
a
e
collection
effort
f
s
are
exhausted.
(i)
F
i
ai
F
r value measurements
Fair
value
is
defined
as
the
price
that
would
be
received
to
sell
an
asset
or
paid
to
transfer
f
a
liabi
a
lity
between
market
participants
in
the
principal
market
or
in
the
most
advantageous
market
when
no
principal
market
exists.
Adju
d
stments
to
transaction
prices
or
quoted
market
prices
may
be
required
in
illiquid
or
disorderly
markets
when
estimating
fair
value.
In
such
circumstances,
alternative
valuation
techniques
may
be
appropriate
to
determine
the
value that would be received to sell an asset or paid to transfer
f
a liabi
a
lity in an orderly transaction. Market participants
are
assumed
to
be
independent,
knowledgeable,
and
able
and
willing
to
transact
an
exchange
and
not
acting
under
duress.
Our
nonperformance
or
credit
risk
is
considered
in
determining
the
fair
value
of
liabi
a
lities.
Considerable
judgment
may
be
required
in
interpreting
market
data
used
to
develop
the
estimates
of
fair
value.
Accordingly,
estimates of fair value presented herein are not necessarily indicative of the amounts that could be realized in a current
or future market exchange.
(j)
I
j
nv
I
entories
Inventories
consist
of
manufact
f
ur
t
ed
produc
d
ts,
goods
or
products
acquired
for
resale,
materials
and
suppl
u
ies
and
homes
construc
r
ted
for
sale.
Manufact
f
ur
t
ed
inventory
r
costs
include
materials,
direct
and
indirect
labor
a
and
factory
r
overhead.
At
December
31,
2025,
we
used
the
last-in-first-out
(“LIFO”)
method
to
value
30%
of
inventory
r
balances,
with
the
remainder
primarily
determined
under
first-in-first-out
and
average
cost
methods.
Non-LIFO
inventories
are
stated
at
the
lower
of
cost
or
net
realizable
value.
The
excess
of
current
or
replacement
costs
over
costs
determined
under LIFO was approximately $2.5 billion as of December 31, 2025 and $2.3 billion as of December 31, 2024.
(k)
P
k
rope
o
rty,
t
plant and equipm
i
ent and equipm
i
ent held for lease
We
use
property,
plant
and
equipment
in
our
operations.
We
also
own
equipment
that
we
lease
to
others
under
lease
contracts.
We
record
additions,
improvements
and
betterments
to
such
properties
at
cost.
With
respect
to
construc
r
ted
assets,
all
materials,
direct
labor
a
and
contract
services
as
well
as
certain
indirect
costs,
including
interest
over
the
construc
r
tion
period,
are
capitalized.
With
respect
to
construc
r
ted
assets
that
are
subj
u
ect
to
authoritative
guidance
for
regulated
operations,
capitalized
costs
also
include
an
allowance
for
funds
used
during
construc
r
tion,
which represents the cost of equity funds used to finance the construc
r
tion of the regulated facilities. Normal repairs and
maintenance
and
other
costs
that
do
not
improve
the
property,
extend
its
useful
f
lifef
or
otherwise
do
not
meet
capi
a
talization criteria are charged to expense as incurred.
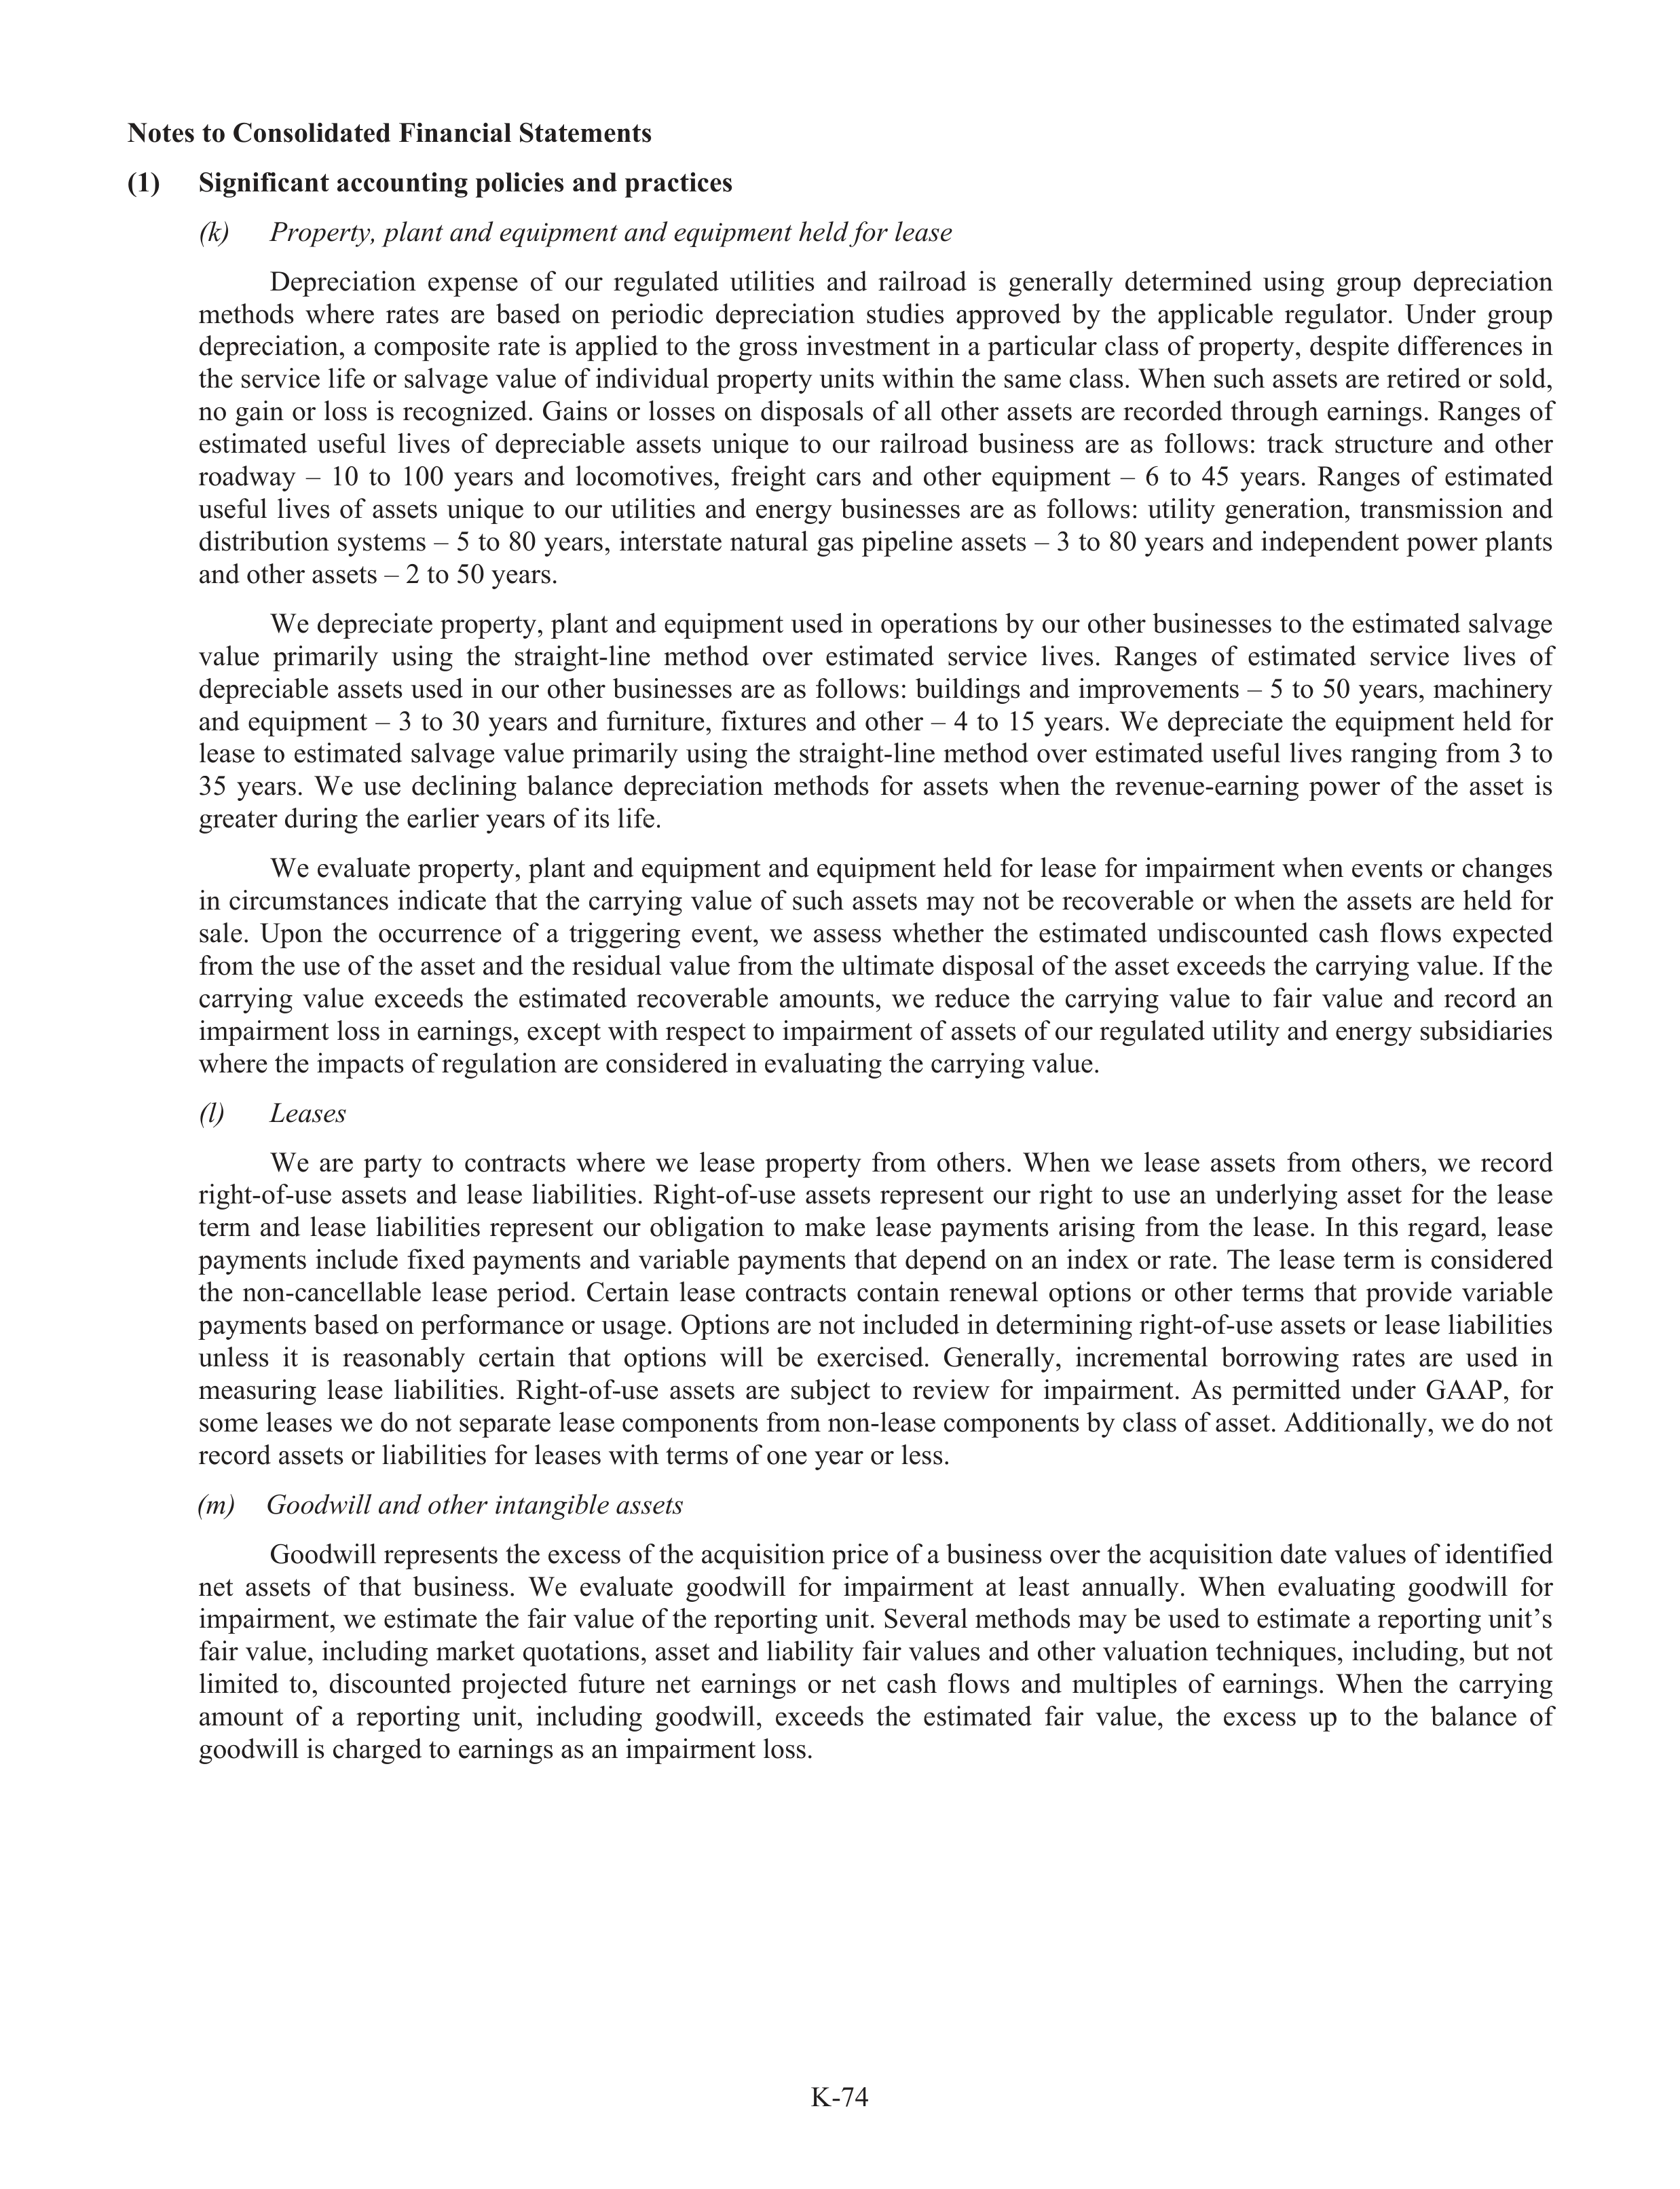
K-74
Notes to Consolidated Financial Statements
(1)
Significant accounting policies and practices
(k)
P
k
rope
o
rty,
t
plant and equipm
i
ent and equipm
i
ent held for lease
Depreciation
expense
of
our
regulated
utilities
and
railroad
is
generally
determined
using
group
depreciation
methods
where
rates
are
based
on
periodic
depreciation
studi
t
es
approved
by
the
applicable
regulator.
Under
group
depreciation, a composite rate is applied to the gross investment in a particular class of property, despite differ
f
ences in
the service lifef
or salvage value of individual property units within the same class. When such assets are retired or sold,
no gain or loss is recognized. Gains or losses on disposals of all other assets are recorded through earnings. Ranges of
estimated
useful
f
lives
of
depreciabl
a
e
assets
unique
to
our
railroad
business
are
as
follows:
track
structure
t
and
other
roadway
–
10
to
100
years
and
locomotives,
freight
cars
and
other
equipment
–
6
to
45
years.
Ranges
of
estimated
useful
f
lives
of
assets
unique
to
our
utilities
and
energy
businesses
are
as
follows:
utility
generation,
transmission
and
distribution systems – 5 to 80 years, interstate natural gas pipeline assets – 3 to 80 years and independent power plants
and other assets – 2 to 50 years.
We depreciate property, plant and equipment used in operations by our other businesses to the estimated salvage
value
primarily
using
the
straight-line
method
over
estimated
service
lives.
Ranges
of
estimated
service
lives
of
depreciable assets used in our other businesses are as follows: buildings and improvements – 5 to 50 years, machinery
r
and
equipment
–
3
to
30
years
and
furniture,
fixtur
t
es
and
other –
4
to
15
years.
We
depreciate
the
equipment
held
for
lease to estimated salvage value primarily using the straight-line method over estimated useful
f
lives ranging from 3 to
35
years.
We
use
declining
balance
depreciation
methods
for
assets
when
the
revenue-earning
power
of
the
asset
is
greater during the earlier years of its life.
f
We evaluate property, plant and equipment and equipment held for lease for impairment when events or changes
in circumstances indicate that the carryi
r
ng value of such assets may not be recoverabl
a
e or when the assets are held for
sale.
Upon
the
occurrence
of
a
triggering
event,
we
assess
whether
the
estimated
undiscounted
cash
flows
expected
from the use of the asset and the residual value from the ultimate disposal of the asset exceeds the carrying value. If the
carrying
value
exceeds
the
estimated
recoverabl
a
e
amounts,
we
reduce
the
carrying
value
to
fair
value
and
record
an
impairment loss in earnings, except with respect to impairment of assets of our regulated utility and energy subs
u
idiaries
where the impacts of regulation are considered in evaluating the carrying value.
(l)
L
l
eases
We
are
party
to
contracts
where
we
lease
property
from
others.
When
we
lease
assets
from
others,
we
record
right-of-use
assets
and
lease
liabi
a
lities.
Right-of-use
assets
represent
our
right
to
use
an
underlying
asset
for
the
lease
term
and
lease
liabi
a
lities
represent
our
obligation
to
make
lease
payments
arising
from
the
lease.
In
this
regard,
lease
payments include fixed payments and variable payments that depend on an index or rate. The lease term is considered
the
non-cancellabl
a
e
lease
period.
Certain
lease
contracts
contain
renewal
options
or
other
terms
that
provide
variable
payments based on performance or usage. Options are not included in determining right-of-use assets or lease liabi
a
lities
unless
it
is
reasonabl
a
y
certain
that
options
will
be
exercised.
Generally,
incremental
borrowing
rates
are
used
in
measuring
lease
liabi
a
lities.
Right-of-u
f
se
assets
are
subj
u
ect
to
review
for
impairment.
As
permitted
under
GAAP,
for
some leases we do not separate lease components from non-lease components by class of asset. Additionally, we do not
record assets or liabi
a
lities for leases with terms of one year or less.
(m)
G
m
oodwill and other intangible assets
Goodwill represents the excess of the acquisition price of a business over the acquisition date values of identified
net
assets
of
that
business.
We
evaluate
goodwill
for
impairment
at
least
annually.
When
evaluating
goodwill
for
impairment, we estimate the fair value of the reporting unit. Several methods may be used to estimate a reporting unit’s
fair value, including market quotations, asset and liabi
a
lity fair values and other valuation techniques, including, but not
limited
to,
discounted
projected
future
net
earnings
or
net
cash
flows
and
multiples
of
earnings.
When
the
carryi
r
ng
amount
of
a
reporting
unit,
including
goodwill,
exceeds
the
estimated
fair
value,
the
excess
up
to
the
balance
of
goodwill is charged to earnings as an impairment loss.
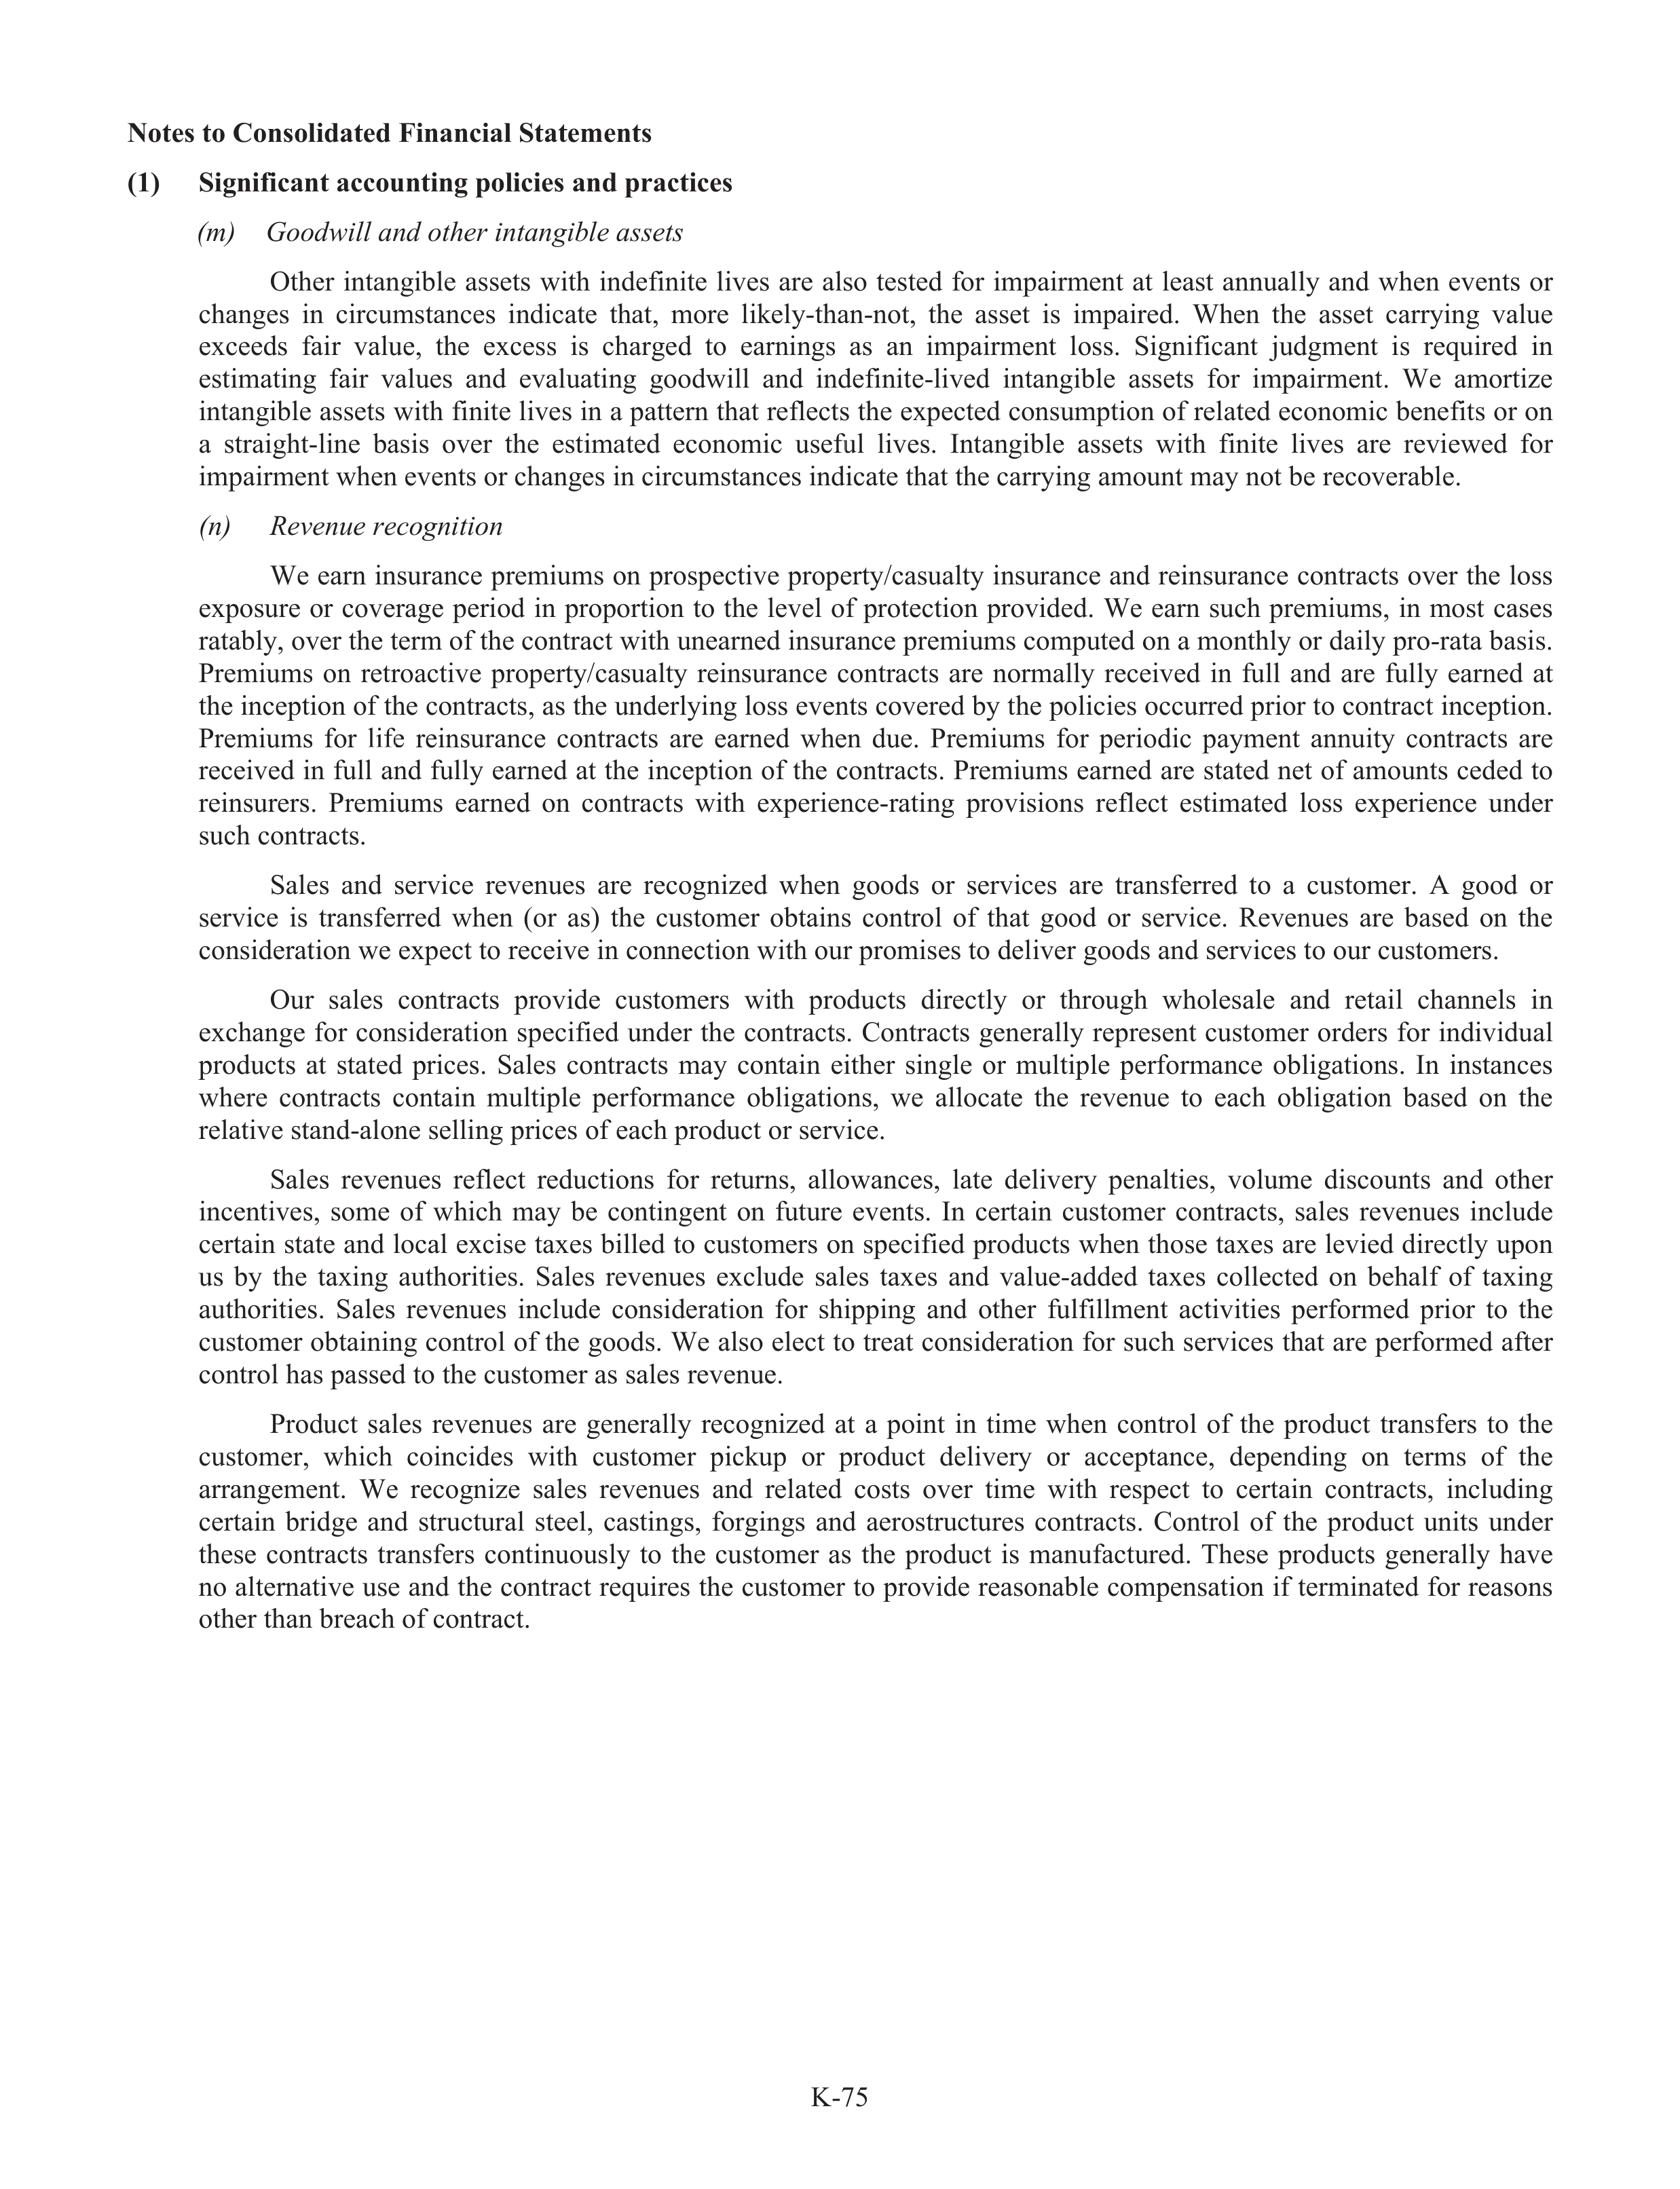
K-75
Notes to Consolidated Financial Statements
(1)
Significant accounting policies and practices
(m)
G
m
oodwill and other intangible assets
Other
intangible
assets
with
indefinite
lives
are
also
tested
for
impairment
at
least
annually
and
when
events
or
changes
in
circumstances
indicate
that,
more
likely-than-not,
the
asset
is
impaired.
When
the
asset
carrying
value
exceeds
fair
value,
the
excess
is
charged
to
earnings
as
an
impairment
loss.
Significant
judgment
is
required
in
estimating
fair
values
and
evaluating
goodwill
and
indefinite-lived
intangible
assets
for
impairment.
We
amortize
intangible assets with finite lives in a pattern that reflects the expected consumption of related economic benefits or on
a
straight-line
basis
over
the
estimated
economic
useful
f
lives.
Intangible
assets
with
finite
lives
are
reviewed
for
impairment when events or changes in circumstances indicate that the carrying amount may not be recoverabl
a
e.
(n)
R
n
evenue recognition
We earn insurance premiums on prospective property/casualty insurance and reinsurance contracts over the loss
exposure
or
coverage
period
in
proportion
to
the
level
of
protection
provided.
We
earn
such
premiums,
in
most
cases
ratabl
a
y, over the term of the contract with unearned insurance premiums computed on a monthly or daily pro-rata basis.
Premiums
on
retroactive
property/casualty
reinsurance
contracts
are
normally
received
in
full
and
are
fully
earned
at
the inception of the contracts, as the underlying loss events covered by the policies occurred prior to contract inception.
Premiums
for
lifef
reinsurance
contracts
are
earned
when
due.
Premiums
for
periodic
payment
annuity
contracts
are
received in full and fully earned at the inception of the contracts. Premiums earned are stated net of amounts ceded to
reinsurers.
Premiums
earned
on
contracts
with
experience-rating
provisions
reflect
estimated
loss
experience
under
such contracts.
Sales
and
service
revenues
are
recognized
when
goods
or
services
are
transfer
f
red
to
a
customer.
A
good
or
service
is
transfer
f
red
when
(or
as)
the
customer
obtains
control
of
that
good
or
service.
Revenues
are
based
on
the
consideration we expect to receive in connection with our promises to deliver goods and services to our customers.
Our
sales
contracts
provide
customers
with
produc
d
ts
directly
or
through
wholesale
and
retail
channels
in
exchange
for
consideration
specified
under
the
contracts.
Contracts
generally
represent
customer
orders
for
individual
products
at
stated
prices.
Sales
contracts
may
contain
either
single
or
multiple
performance
obligations.
In
instances
where
contracts
contain
multiple
perfor
f
mance
obligations,
we
allocate
the
revenue
to
each
obligation
based
on
the
relative stand-alone selling prices of each product or service.
Sales
revenues
reflect
reductions
for
returns,
allowances,
late
delivery
r
penalties,
volume
discounts
and
other
incentives,
some
of
which
may
be
contingent
on
future
events.
In
certain
customer
contracts,
sales
revenues
include
certain state and local excise taxes billed to customers on specified products when those taxes are levied directly upon
us
by
the
taxing
authorities.
Sales
revenues
exclude
sales
taxes
and
value-added
taxes
collected
on
behalf
of
taxing
authorities.
Sales
revenues
include
consideration
for
shipping
and
other
fulfillme
f
nt
activities
performed
prior
to
the
customer obtaining control of the goods. We also elect to treat consideration for such services that are performed afte
f
r
control has passed to the customer as sales revenue.
Product
sales
revenues
are
generally
recognized
at
a
point
in
time
when
control
of
the
product
transfer
f
s
to
the
customer,
which
coincides
with
customer
pickup
k
or
produc
d
t
delivery
r
or
acceptance,
depending
on
terms
of
the
arrangement.
We
recognize
sales
revenues
and
related
costs
over
time
with
respect
to
certain
contracts,
including
certain
bridge
and
structur
t
al
steel,
castings,
forgings
and
aerostruc
r
tures
contracts.
Control
of
the
product
units
under
these
contracts
transfer
f
s
continuously
to
the
customer
as
the
product
is
manufact
f
ur
t
ed.
These
products
generally
have
no alternative use and the contract requires the customer to provide reasonabl
a
e compensation if terminated for reasons
other than breach of contract.
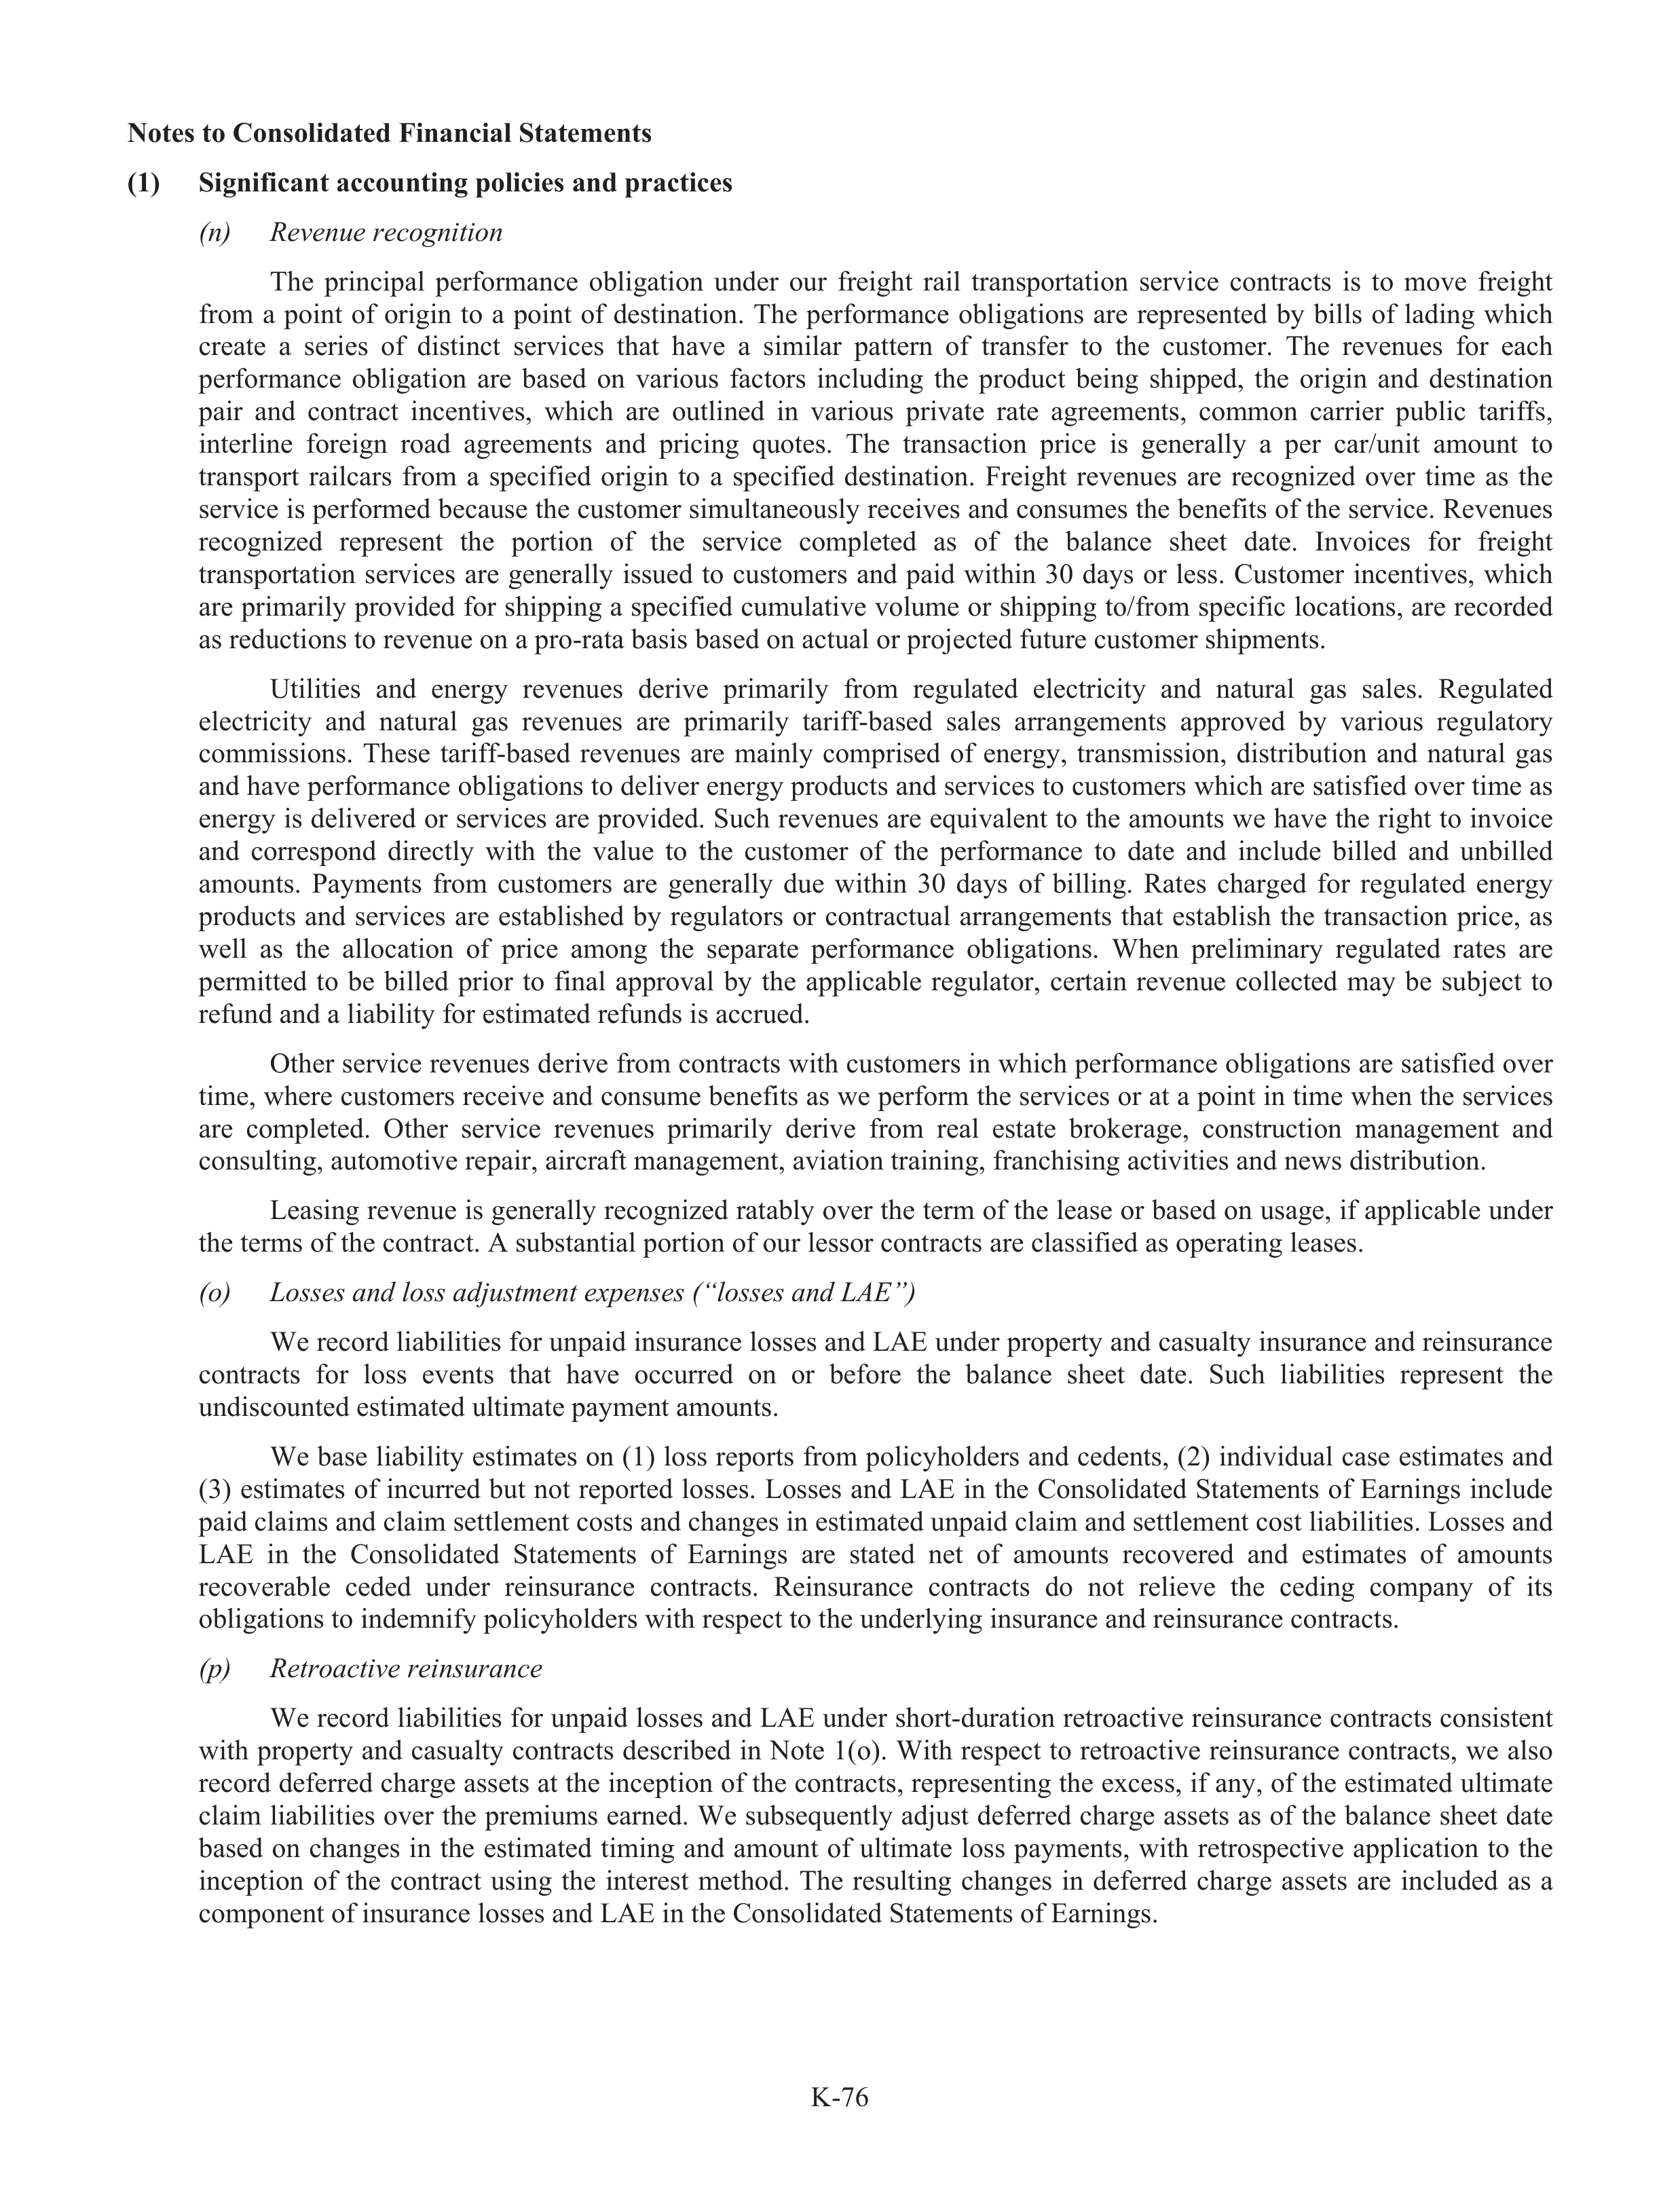
K-76
Notes to Consolidated Financial Statements
(1)
Significant accounting policies and practices
(n)
R
n
evenue recognition
The
principal
performance
obligation
under
our
freight
rail
transportation
service
contracts
is
to
move
freight
from
a
point
of
origin
to
a
point
of
destination.
The
performance
obligations
are
represented
by
bills
of
lading
which
create
a
series
of
distinct
services
that
have
a
similar
pattern
of
transfer
f
to
the
customer.
The
revenues
for
each
performance
obligation
are
based
on
various
factors
including
the
product
being
shipped,
the
origin
and
destination
pair
and
contract
incentives,
which
are
outlined
in
various
private
rate
agreements,
common
carrier
publ
u
ic
tariffs,
f
interline
foreign
road
agreements
and
pricing
quotes.
The
transaction
price
is
generally
a
per
car/u
r
nit
amount
to
transport
railcars
from
a
specified
origin
to
a
specified
destination.
Freight
revenues
are
recognized
over
time
as
the
service is performed because the customer simultaneously receives and consumes the benefits of the service. Revenues
recognized
represent
the
portion
of
the
service
completed
as
of
the
balance
sheet
date.
Invoices
for
freight
transportation
services
are
generally
issued
to
customers
and
paid
within
30
days
or
less.
Customer
incentives,
which
are primarily provided for shipping a specified cumulative volume or shipping to/fro
f
m specific locations, are recorded
as reductions to revenue on a pro-rata basis based on actua
t
l or projected future customer shipments.
Utilities
and
energy
revenues
derive
primarily
from
regulated
electricity
and
natural
gas
sales.
Regulated
electricity
and
natural
gas
revenues
are
primarily
tariff-based
sales
arrangements
approved
by
various
regulatory
r
commissions.
These
tariff-based
revenues
are
mainly
comprised
of
energy,
transmission,
distribution
and
natural
gas
and have performance obligations to deliver energy products and services to customers which are satisfied over time as
energy is delivered or services are provided. Such revenues are equivalent to the amounts we have the right to invoice
and
correspond
directly
with
the
value
to
the
customer
of
the
performance
to
date
and
include
billed
and
unbilled
amounts.
Payments
from
customers
are
generally
due
within
30
days
of
billing.
Rates
charged
for
regulated
energy
products
and
services
are
establ
a
ished
by
regulators
or
contractua
t
l
arrangements
that
establ
a
ish
the
transaction
price,
as
well
as
the
allocation
of
price
among
the
separate
perfor
f
mance
obligations.
When
preliminary
r
regulated
rates
are
permitted
to
be
billed
prior
to
final
approval
by
the
applicable
regulator,
certain
revenue
collected
may
be
subj
u
ect
to
refund and a liabi
a
lity for estimated refunds is accrue
r
d.
Other service revenues derive from contracts with customers in which performance obligations are satisfie
f
d over
time, where customers receive and consume benefits as we perform the services or at a point in time when the services
are
completed.
Other
service
revenues
primarily
derive
from
real
estate
brokerage,
construc
r
tion
management
and
consulting, automotive repair, aircraft management, aviation training, franchising activities and news distribution.
Leasing revenue is generally recognized ratabl
a
y over the term of the lease or based on usage, if applicable under
the terms of the contract. A subs
u
tantial portion of our lessor contracts are classified as operating leases.
(o)
L
o
osses and loss adjustment expenses (“losses and LAE”)
”
We record liabi
a
lities for unpaid insurance losses and LAE under property and casualty insurance and reinsurance
contracts
for
loss
events
that
have
occurred
on
or
before
the
balance
sheet
date.
Such
liabi
a
lities
represent
the
undiscounted estimated ultimate payment amounts.
We base liabi
a
lity estimates on (1) loss reports from policyholders and cedents, (2) individual case estimates and
(3)
estimates
of
incurred
but
not
reported
losses.
Losses
and
LAE
in
the
Consolidated
Statements
of
Earnings
include
paid claims and claim settlement costs and changes in estimated unpaid claim and settlement cost liabi
a
lities. Losses and
LAE
in
the
Consolidated
Statements
of
Earnings
are
stated
net
of
amounts
recovered
and
estimates
of
amounts
recoverabl
a
e
ceded
under
reinsurance
contracts.
Reinsurance
contracts
do
not
relieve
the
ceding
company
of
its
obligations to indemnify
f
policyholders with respect to the underlying insurance and reinsurance contracts.
(p)
R
p
etroactive reinsurance
We record liabi
a
lities for unpaid losses and LAE under short-duration retroactive reinsurance contracts consistent
with property and casualty contracts described in Note 1(o). With respect to retroactive reinsurance contracts, we also
record deferred charge assets at the inception of the contracts, representing the excess, if any, of the estimated ultimate
claim liabi
a
lities over the premiums earned. We subs
u
equently adju
d
st deferred charge assets as of the balance sheet date
based
on
changes
in
the
estimated
timing
and
amount
of
ultimate
loss
payments,
with
retrospective
application
to
the
inception
of
the
contract
using
the
interest
method.
The
resulting
changes
in
deferred
charge
assets
are
included
as
a
component of insurance losses and LAE in the Consolidated Statements of Earnings.
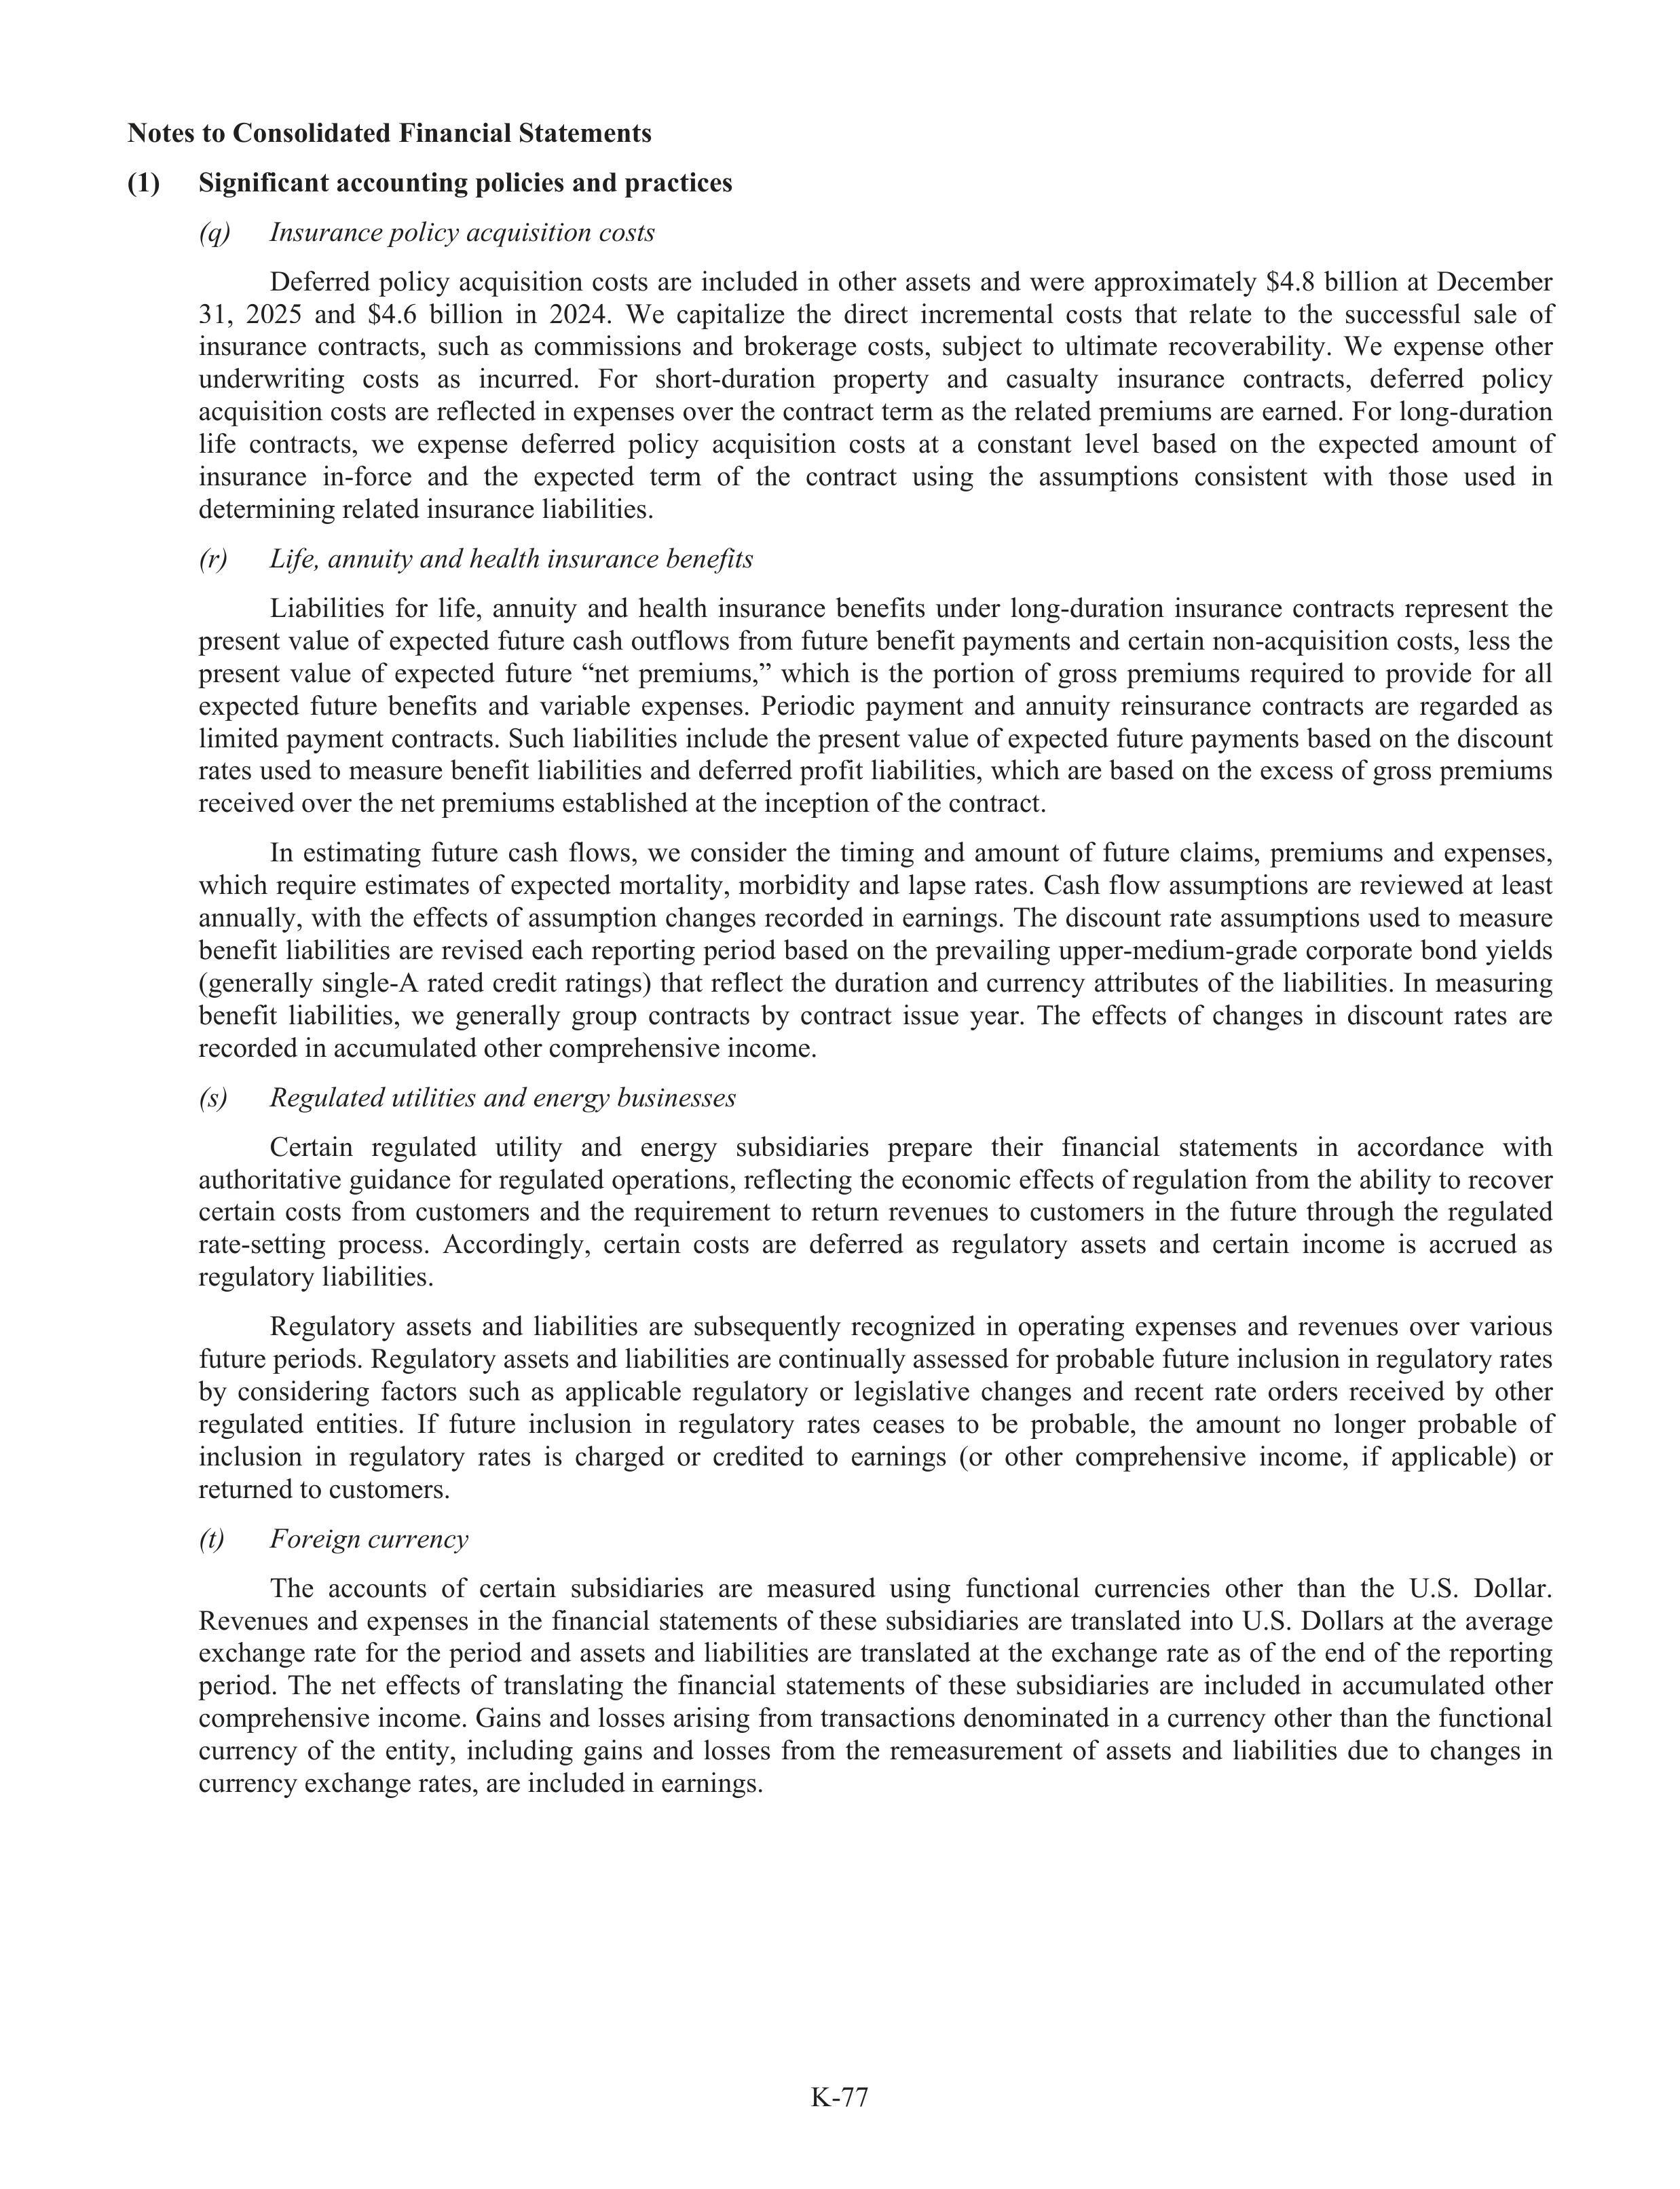
K-77
Notes to Consolidated Financial Statements
(1)
Significant accounting policies and practices
(q)
I
q
ns
I
urance policy
c
acquisi
i
tion costst
Deferred
policy
acquisition
costs
are
included
in
other
assets
and
were
approximately
$4.8
billion
at
December
31,
2025
and
$4.6
billion
in
2024.
We
capitalize
the
direct
incremental
costs
that
relate
to
the
successful
f
sale
of
insurance
contracts,
such
as
commissions
and
brokerage
costs,
subj
u
ect
to
ultimate
recoverabi
a
lity.
We
expense
other
underwriting
costs
as
incurred.
For
short-duration
property
and
casualty
insurance
contracts,
deferred
policy
acquisition costs are reflected in expenses over the contract term as the related premiums are earned. For long-duration
life
contracts,
we
expense
deferred
policy
acquisition
costs
at
a
constant
level
based
on
the
expected
amount
of
insurance
in-force
and
the
expected
term
of
the
contract
using
the
assumptions
consistent
with
those
used
in
determining related insurance liabi
a
lities.
(r)
L
r
ife, annuity and health insurance benefits
e
Liabilities
for
life,
f
annuity
and
health
insurance
benefits
under
long-duration
insurance
contracts
represent
the
present value of expected future cash outflows from future benefit payments and certain non-acquisition costs, less the
present
value
of
expected
future
“net
premiums,”
which
is
the
portion
of
gross
premiums
required
to
provide
for
all
expected
future
benefits
and
variable
expenses.
Periodic
payment
and
annuity
reinsurance
contracts
are
regarded
as
limited payment contracts. Such liabi
a
lities include the present value of expected future payments based on the discount
rates used to measure benefit liabi
a
lities and deferred profit
f
liabi
a
lities, which are based on the excess of gross premiums
received over the net premiums establ
a
ished at the inception of the contract.
In
estimating
future
cash
flows,
we
consider
the
timing
and
amount
of
future
claims,
premiums
and
expenses,
which require estimates of expected mortality, morbidity and laps
a
e rates. Cash flow assumptions are reviewed at least
annually, with the effe
f
cts of assumption changes recorded in earnings. The discount rate assumptions used to measure
benefit liabi
a
lities are revised each reporting period based on the prevailing upper-medium-grade corporate bond yields
(generally single-A rated credit ratings) that reflect the duration and currency attributes of the liabi
a
lities. In measuring
benefit
liabi
a
lities,
we
generally
group
contracts
by
contract
issue
year.
The
effe
f
cts
of
changes
in
discount
rates
are
recorded in accumulated other comprehensive income.
(s)
R
s
egulated utilities and energy
r
businesses
Certain
regulated
utility
and
energy
subs
u
idiaries
prepare
their
financial
statements
in
accordance
with
authoritative guidance for regulated operations, reflecting the economic effe
f
cts of regulation from the ability to recover
certain
costs
from
customers
and
the
requirement
to
return
revenues
to
customers
in
the
future
through
the
regulated
rate-setting
process.
Accordingly,
certain
costs
are
deferred
as
regulatory
r
assets
and
certain
income
is
accrue
r
d
as
regulatory
r
liabi
a
lities.
Regulatory
r
assets
and
liabi
a
lities
are
subs
u
equently
recognized
in
operating
expenses
and
revenues
over
various
future periods. Regulatory
r
assets and liabi
a
lities are continually assessed for probabl
a
e future inclusion in regulatory
r
rates
by
considering
factors
such
as
applicable
regulatory
r
or
legislative
changes
and
recent
rate
orders
received
by
other
regulated
entities.
If
future
inclusion
in
regulatory
r
rates
ceases
to
be
probabl
a
e,
the
amount
no
longer
probabl
a
e
of
inclusion
in
regulatory
r
rates
is
charged
or
credited
to
earnings
(or
other
comprehensive
income,
if
applicable)
or
returned to customers.
(t)
F
t
or
F
eign
i
currency
c
The
accounts
of
certain
subs
u
idiaries
are
measured
using
functional
currencies
other
than
the
U.S.
Dollar.
Revenues
and
expenses
in
the
financial
statements
of
these
subs
u
idiaries
are
translated
into
U.S.
Dollars
at
the
average
exchange
rate
for
the
period
and
assets
and
liabi
a
lities
are
translated
at
the
exchange
rate
as
of
the
end
of
the
reporting
period.
The
net
effe
f
cts
of
translating
the
financial
statements
of
these
subs
u
idiaries
are
included
in
accumulated
other
comprehensive income. Gains and losses arising from transactions denominated in a currency other than the functional
currency
of
the
entity,
including
gains
and
losses
from
the
remeasurement
of
assets
and
liabi
a
lities
due
to
changes
in
currency exchange rates, are included in earnings.
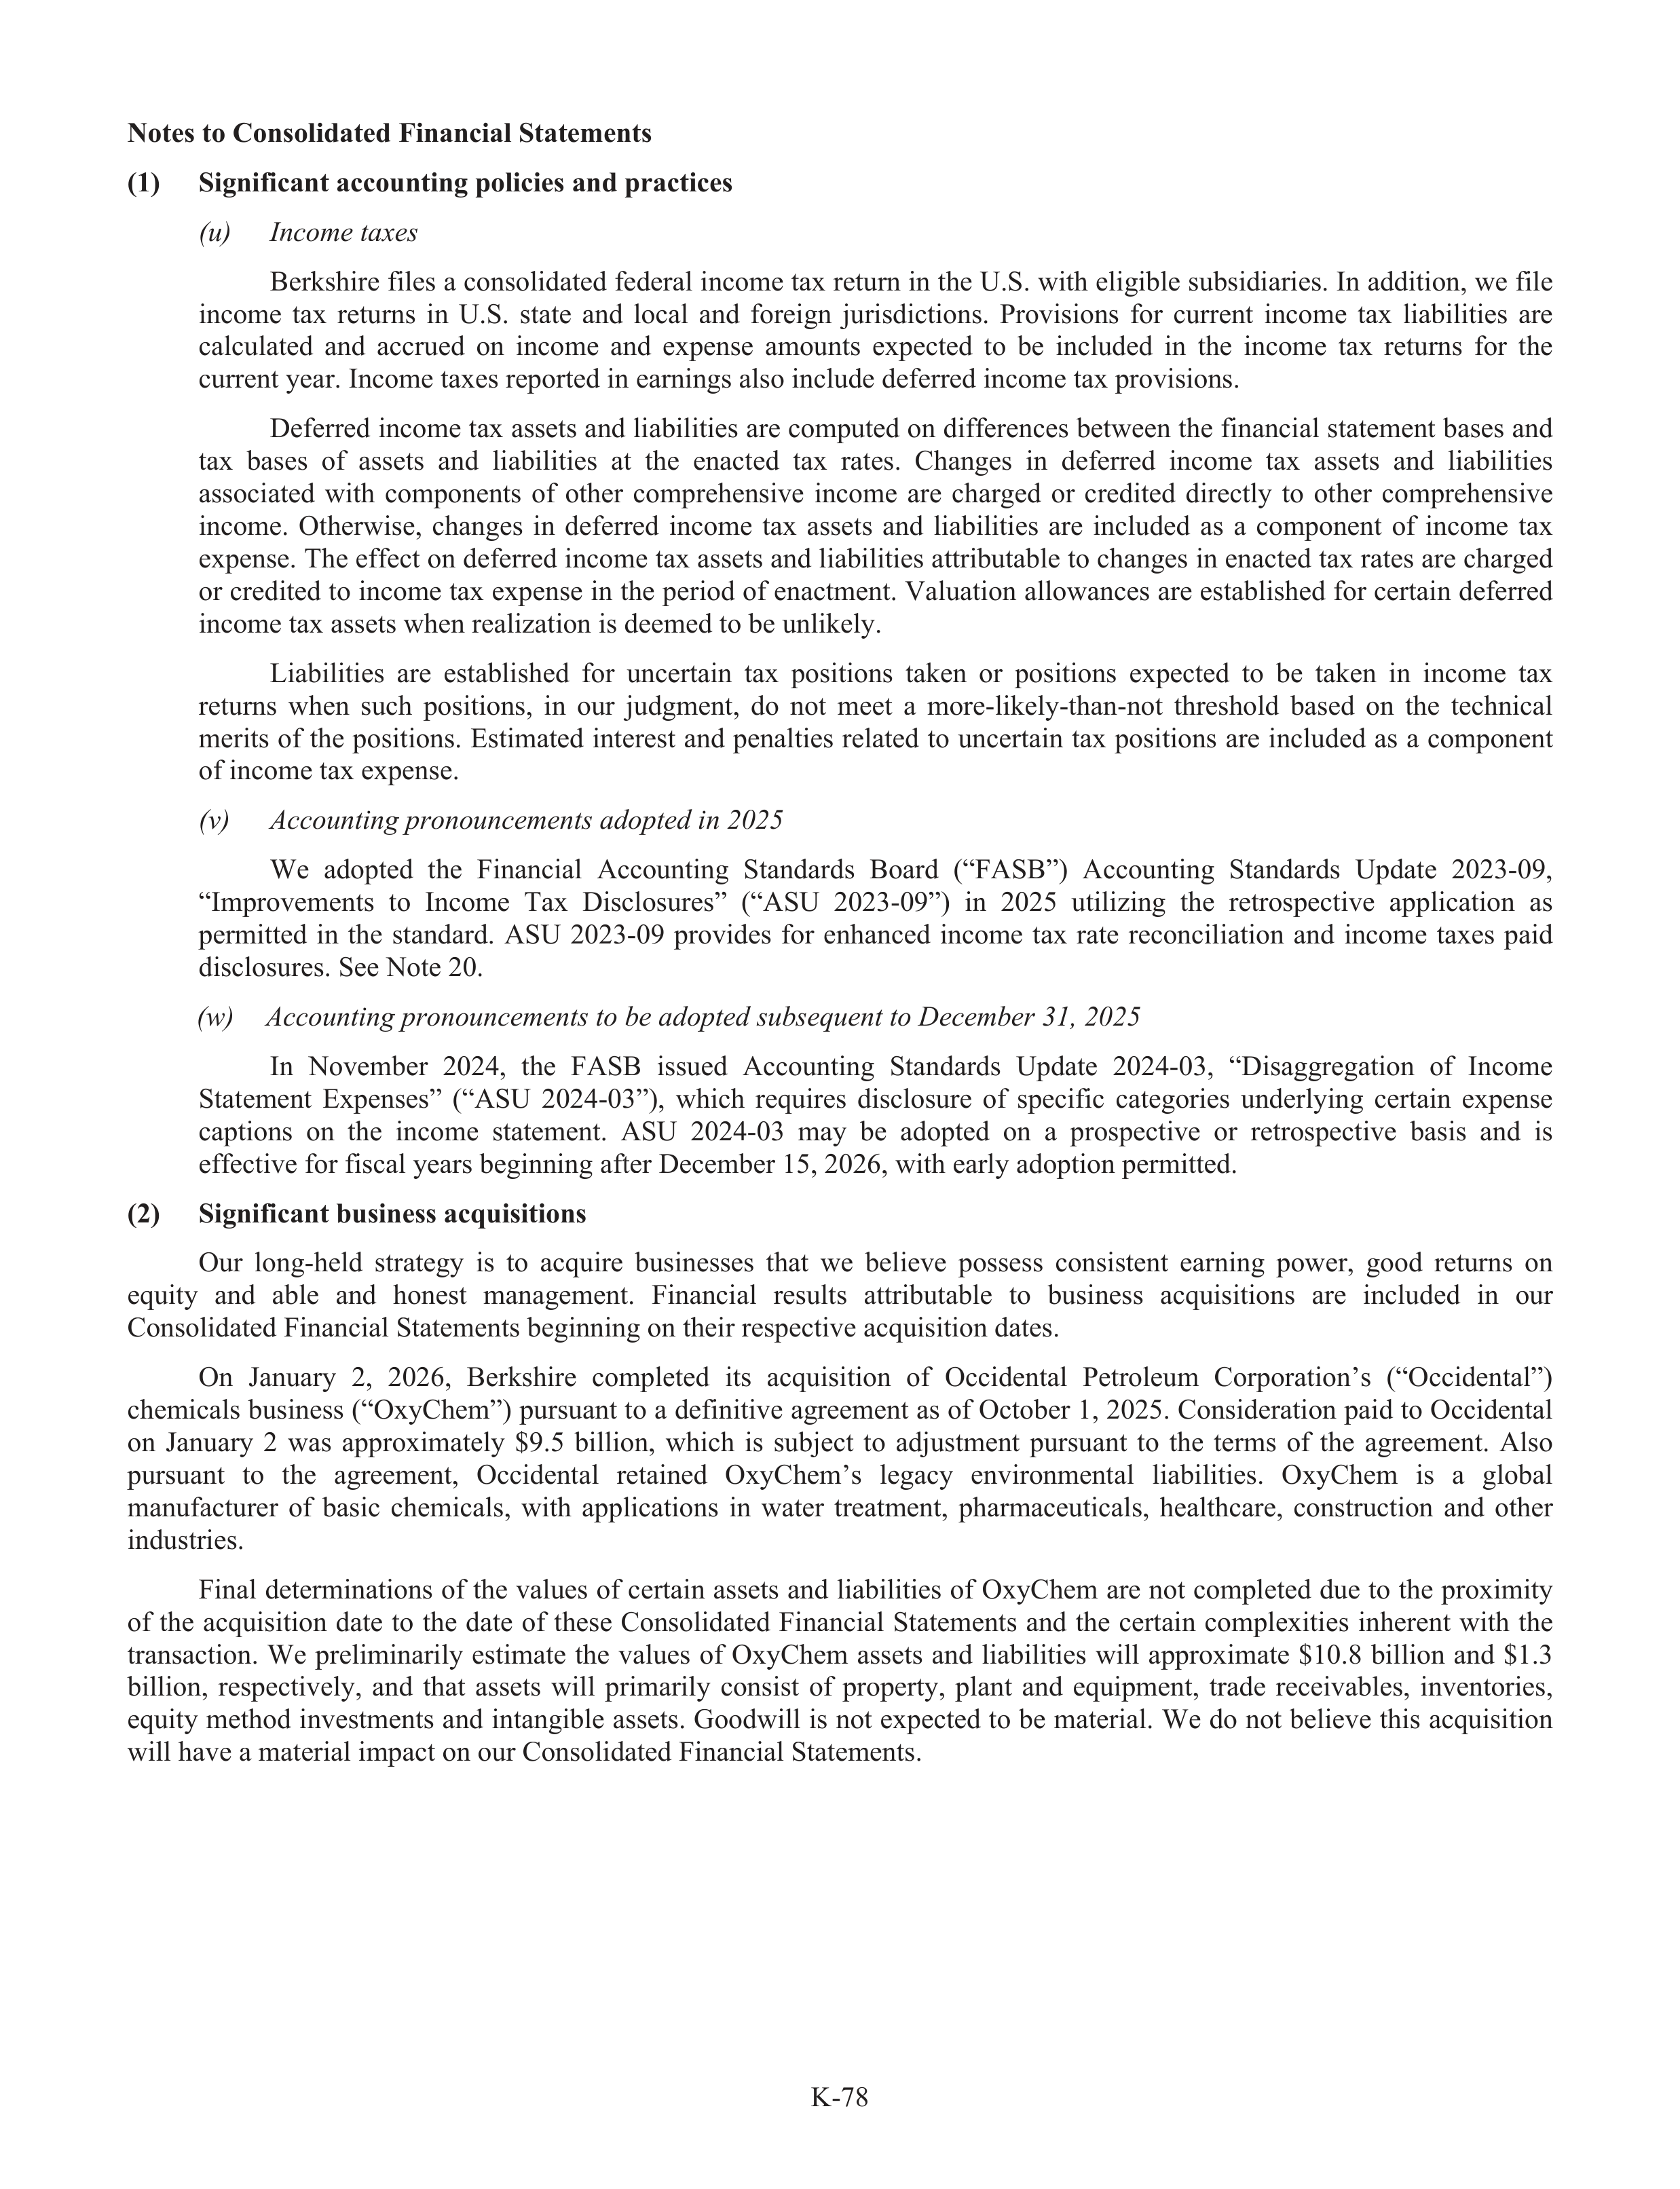
K-78
Notes to Consolidated Financial Statements
(1)
Significant accounting policies and practices
(u)
I
u
nc
I
ome taxes
a
Berkshire files a consolidated federal income tax return in the U.S. with eligible subs
u
idiaries. In addition, we file
income
tax
returns
in
U.S.
state
and
local
and
foreign
jurisdictions.
Provisions
for
current
income
tax
liabi
a
lities
are
calculated
and
accrue
r
d
on
income
and
expense
amounts
expected
to
be
included
in
the
income
tax
returns
for
the
current year. Income taxes reported in earnings also include deferred income tax provisions.
Deferred income tax assets and liabi
a
lities are computed on differences between the financial statement bases and
tax
bases
of
assets
and
liabi
a
lities
at
the
enacted
tax
rates.
Changes
in
deferred
income
tax
assets
and
liabi
a
lities
associated
with
components
of
other
comprehensive
income
are
charged
or
credited
directly
to
other
comprehensive
income.
Otherwise,
changes
in
deferred
income
tax
assets
and
liabi
a
lities
are
included
as
a
component
of
income
tax
expense. The effe
f
ct on deferred income tax assets and liabi
a
lities attributable to changes in enacted tax rates are charged
or credited to income tax expense in the period of enactment. Valuation allowances are establ
a
ished for certain deferred
income tax assets when realization is deemed to be unlikely.
Liabilities
are
establ
a
ished
for
uncertain
tax
positions
taken
or
positions
expected
to
be
taken
in
income
tax
returns
when
such
positions,
in
our
judgment,
do
not
meet
a
more-likely-than-not
threshold
based
on
the
technical
merits of the positions. Estimated interest and penalties related to uncertain tax positions are included as a component
of income tax expense.
(v)
A
v
ccounting pronouncements adopted in 2025
We
adopted
the
Financial
Accounting
Standards
Board
(“FASB”)
Accounting
Standards
Update
2023-09,
“Improvements
to
Income
Tax
Disclosures”
(“ASU
2023-09”)
in
2025
utilizing
the
retrospective
application
as
permitted
in
the
standard.
ASU
2023-09
provides
for
enhanced
income
tax
rate
reconciliation
and
income
taxes
paid
disclosures. See Note 20.
(w)
A
w
ccounting pronouncements to be adopted subsequent to December 31, 2025
In
November
2024,
the
FASB
issued
Accounting
Standards
Update
2024-03,
“Disaggregation
of
Income
Statement
Expenses”
(“ASU
2024-03”),
which
requires
disclosure
of
specific
categories
underlying
certain
expense
capt
a
ions
on
the
income
statement.
ASU
2024-03
may
be
adopted
on
a
prospective
or
retrospective
basis
and
is
effe
f
ctive for fiscal years beginning afte
f
r December 15, 2026, with early adoption permitted.
(2)
Significant business acquisitions
Our
long-held
strategy
is
to
acquire
businesses
that
we
believe
possess
consistent
earning
power,
good
returns
on
equity
and
able
and
honest
management.
Financial
results
attributable
to
business
acquisitions
are
included
in
our
Consolidated Financial Statements beginning on their respective acquisition dates.
On
January
2,
2026,
Berkshire
completed
its
acquisition
of
Occidental
Petroleum
Corpor
r
ation’s
(“Occidental”)
chemicals business (“OxyChem”) pursuant to a definitive agreement as of October 1, 2025. Consideration paid to Occidental
on
January
2
was
approximately
$9.5
billion,
which
is
subj
u
ect
to
adju
d
stment
pursuant
to
the
terms
of
the
agreement.
Also
pursuant
to
the
agreement,
Occidental
retained
OxyChem’s
legacy
environmental
liabi
a
lities.
OxyChem
is
a
global
manufact
f
ur
t
er
of
basic
chemicals,
with
applications
in
water
treatment,
pharmaceuticals,
healthcare,
construc
r
tion
and
other
industries.
Final determinations of the values of certain assets and liabi
a
lities of OxyChem are not completed due to the proximity
of
the
acquisition
date
to
the
date
of
these
Consolidated
Financial
Statements
and
the
certain
complexities
inherent
with
the
transaction.
We
preliminarily
estimate
the
values
of
OxyChem
assets
and
liabi
a
lities
will
approximate
$10.8
billion
and
$1.3
billion,
respectively,
and
that
assets
will
primarily
consist
of
property,
plant
and
equipment,
trade
receivabl
a
es,
inventories,
equity method investments and intangible assets. Goodwill is not expected to be material. We do not believe this acquisition
will have a material impact on our Consolidated Financial Statements.
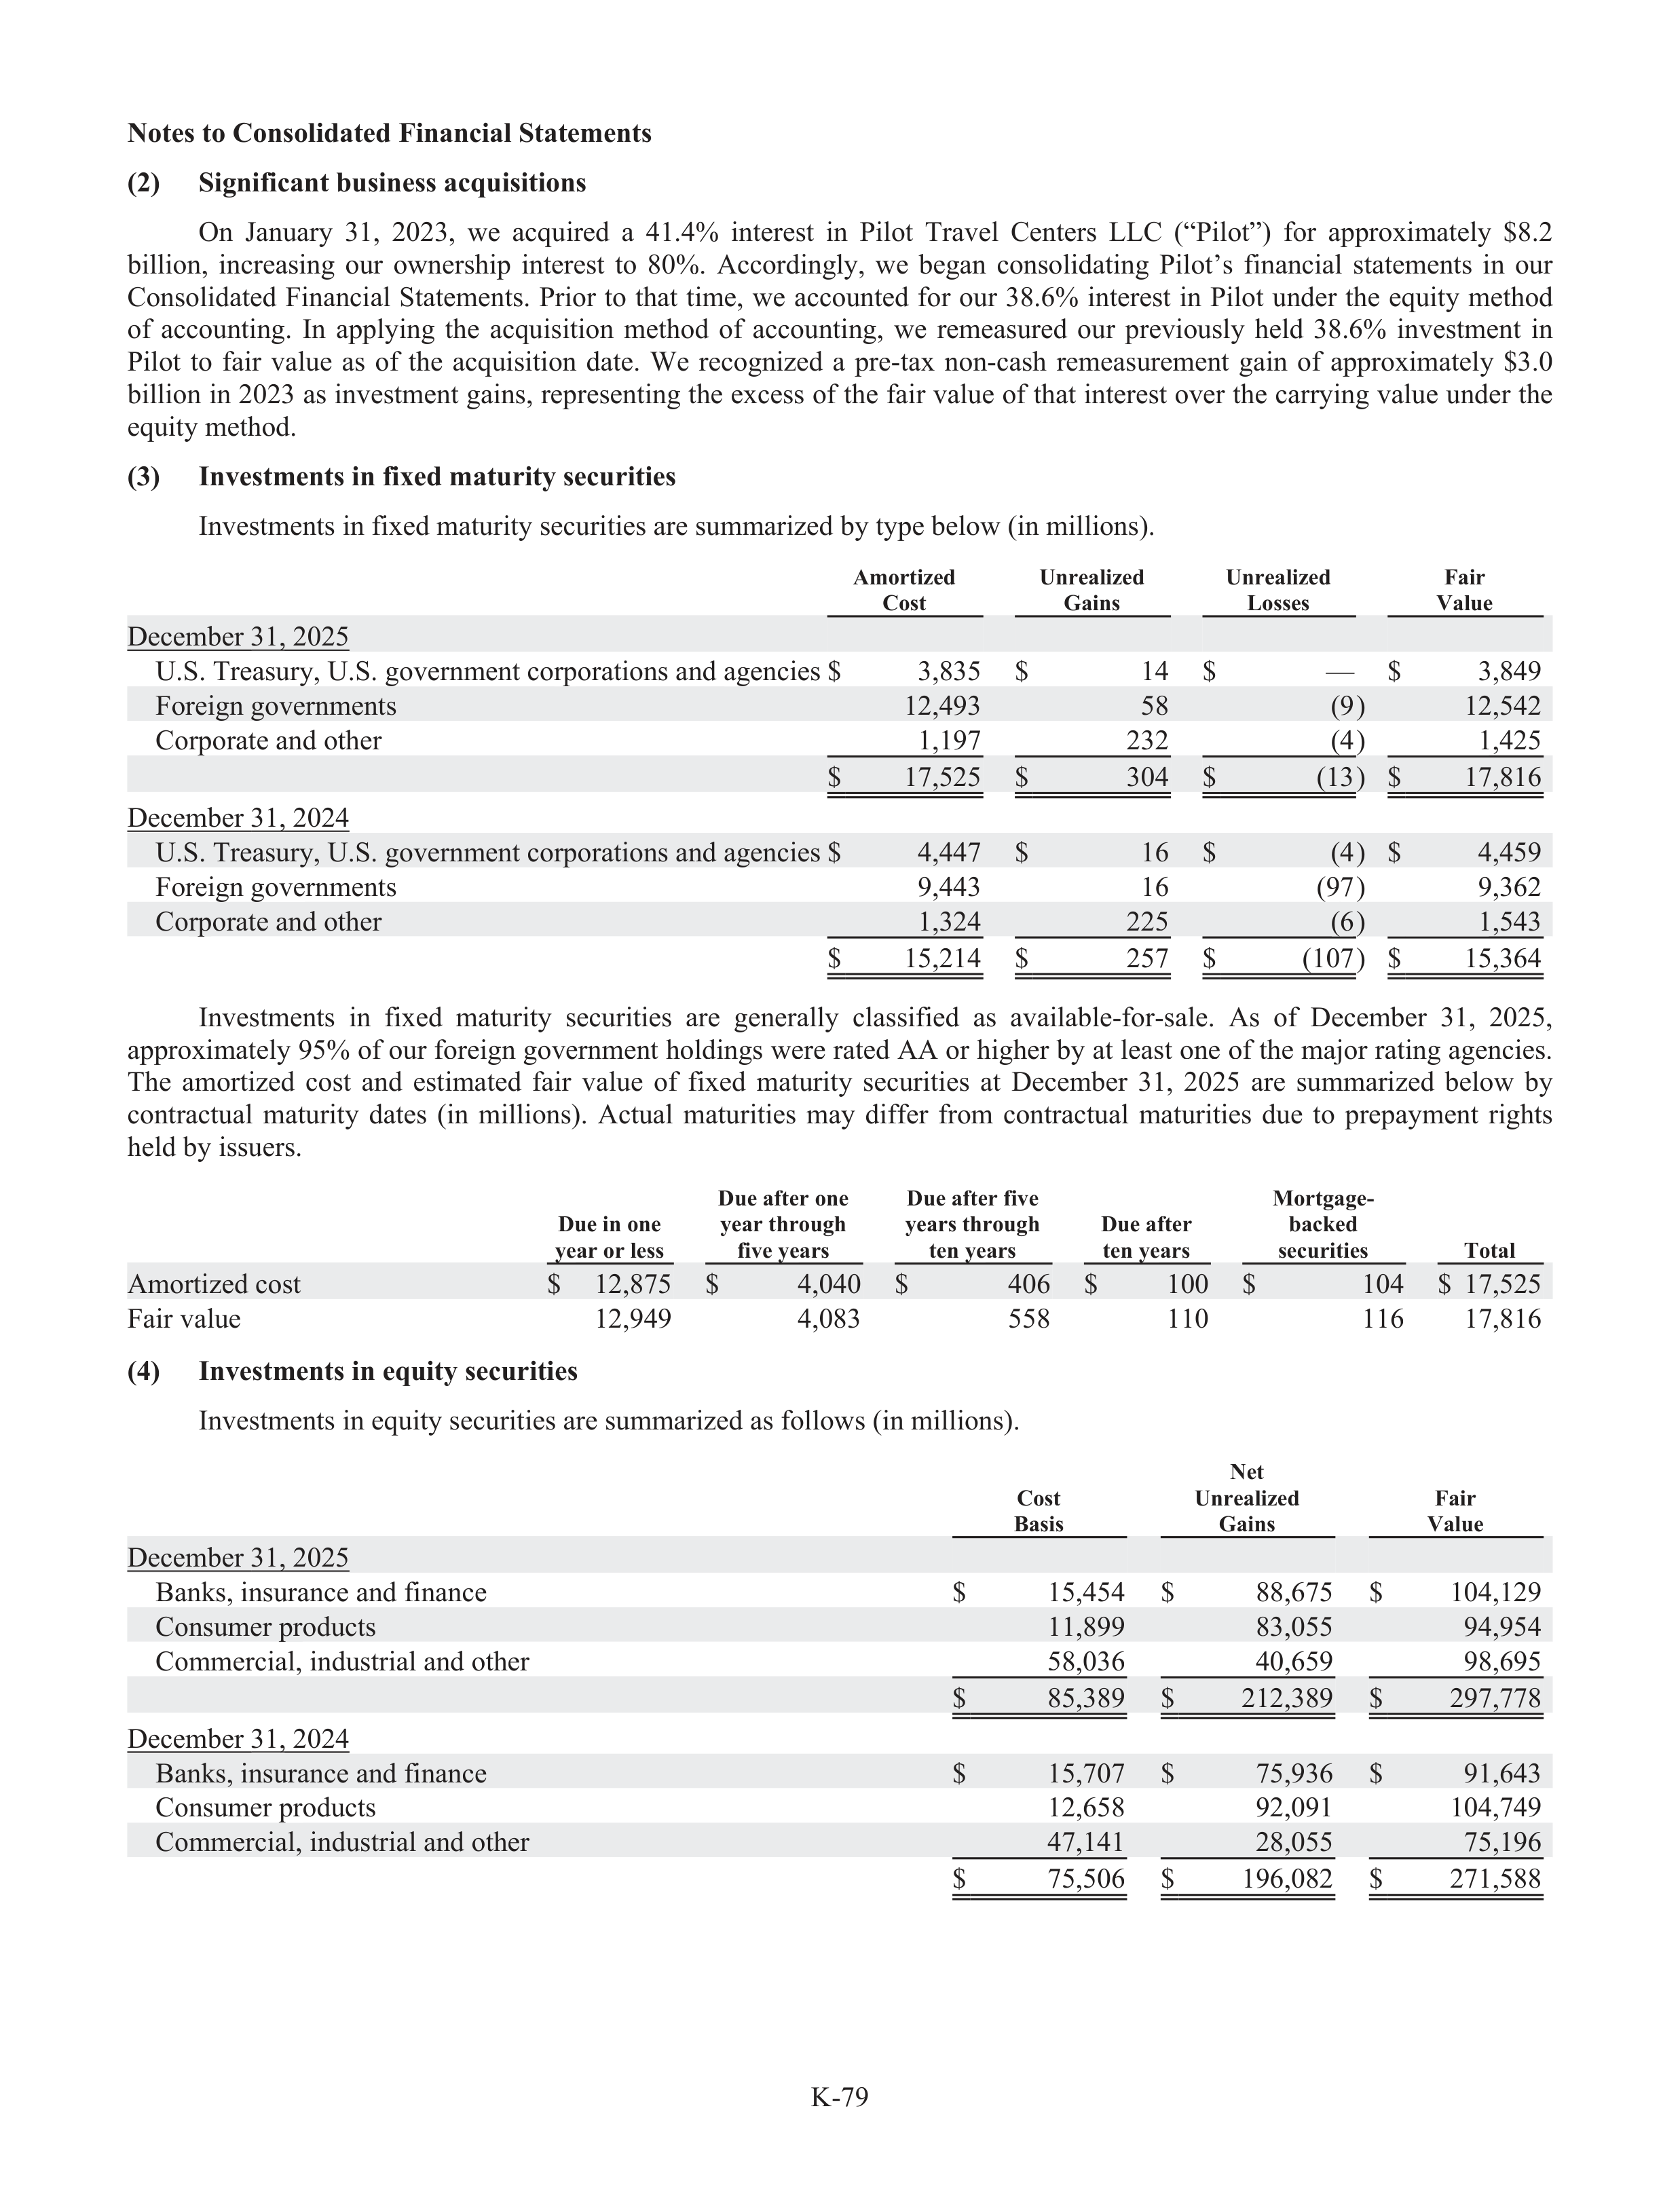
K-79
Notes to Consolidated Financial Statements
(2)
Significant business acquisitions
On
January
31,
2023,
we
acquired
a
41.4%
interest
in
Pilot
Travel
Centers
LLC
(“Pilot”)
for
f
approximately
$8.2
billion,
increasing
our
ownership
interest
to
80%.
Accordingly,
we
began
consolidating
Pilot’s
fin
f
ancial
statements
in
our
Consolidated
Financial
Statements.
Prior
to
that
time,
we
accounted
for
our
38.6%
interest
in
Pilot
under
the
equity
method
of
accounting.
In
applying
the
acquisition
method
of
accounting,
we
remeasured
our
previously
held
38.6%
investment
in
Pilot
to
fair
value
as
of
the
acquisition
date.
We
recognized
a
pre-tax
non-cash
remeasurement
gain
of
approximately
$3.0
billion in 2023 as investment gains, representing the excess of the fair value of that interest over the carrying value under the
equity method.
(3)
Investments in fixed maturity securities
Investments in fixed maturity securities are summarized by type below (in millions).
Amortized
Cost
Unrealized
Gains
Unrealized
Losses
Fair
Value
December 31, 2025
U.S. Treasury,
r
U.S. government corporations and agencies $
3,835
$
14
$
—
$
3,849
Foreign governments
12,493
58
(9)
12,542
Corporate and other
1,197
232
(4)
1,425
$
17,525
$
304
$
(13)
$
17,816
December 31, 2024
U.S. Treasury,
r
U.S. government corporations and agencies $
4,447
$
16
$
(4)
$
4,459
Foreign governments
9,443
16
(97)
9,362
Corporate and other
1,324
225
(6)
1,543
$
15,214
$
257
$
(107)
$
15,364
Investments
in
fixed
maturity
securities
are
generally
classified
as
availabl
a
e-for-sale.
As
of
December
31,
2025,
approximately 95% of our foreign government holdings were rated AA or higher by at least one of the majo
a
r rating agencies.
The
amortized
cost
and
estimated
fair
value
of
fixed
maturity
securities
at
December
31,
2025
are
summarized
below
by
contractua
t
l
maturity
dates
(in
millions).
Actual
maturities
may
differ
from
contractua
t
l
maturities
due
to
prepayment
rights
held by issuers.
Due in one
year or less
Due afte
f
r one
year through
five years
Due afte
f
r five
years through
ten years
Due afte
f
r
ten years
Mortgage-
backed
securities
Total
Amortized cost
$
12,875
$
4,040
$
406
$
100
$
104
$
17,525
Fair value
12,949
4,083
558
110
116
17,816
(4)
Investments in equity securities
Investments in equity securities are summarized as follows (in millions).
Cost
Basis
Net
Unrealized
Gains
Fair
Value
December 31, 2025
Banks, insurance and finance
$
15,454
$
88,675
$
104,129
Consumer products
11,899
83,055
94,954
Commercial, industrial and other
58,036
40,659
98,695
$
85,389
$
212,389
$
297,778
December 31, 2024
Banks, insurance and finance
$
15,707
$
75,936
$
91,643
Consumer products
12,658
92,091
104,749
Commercial, industrial and other
47,141
28,055
75,196
$
75,506
$
196,082
$
271,588
,
,
,
,
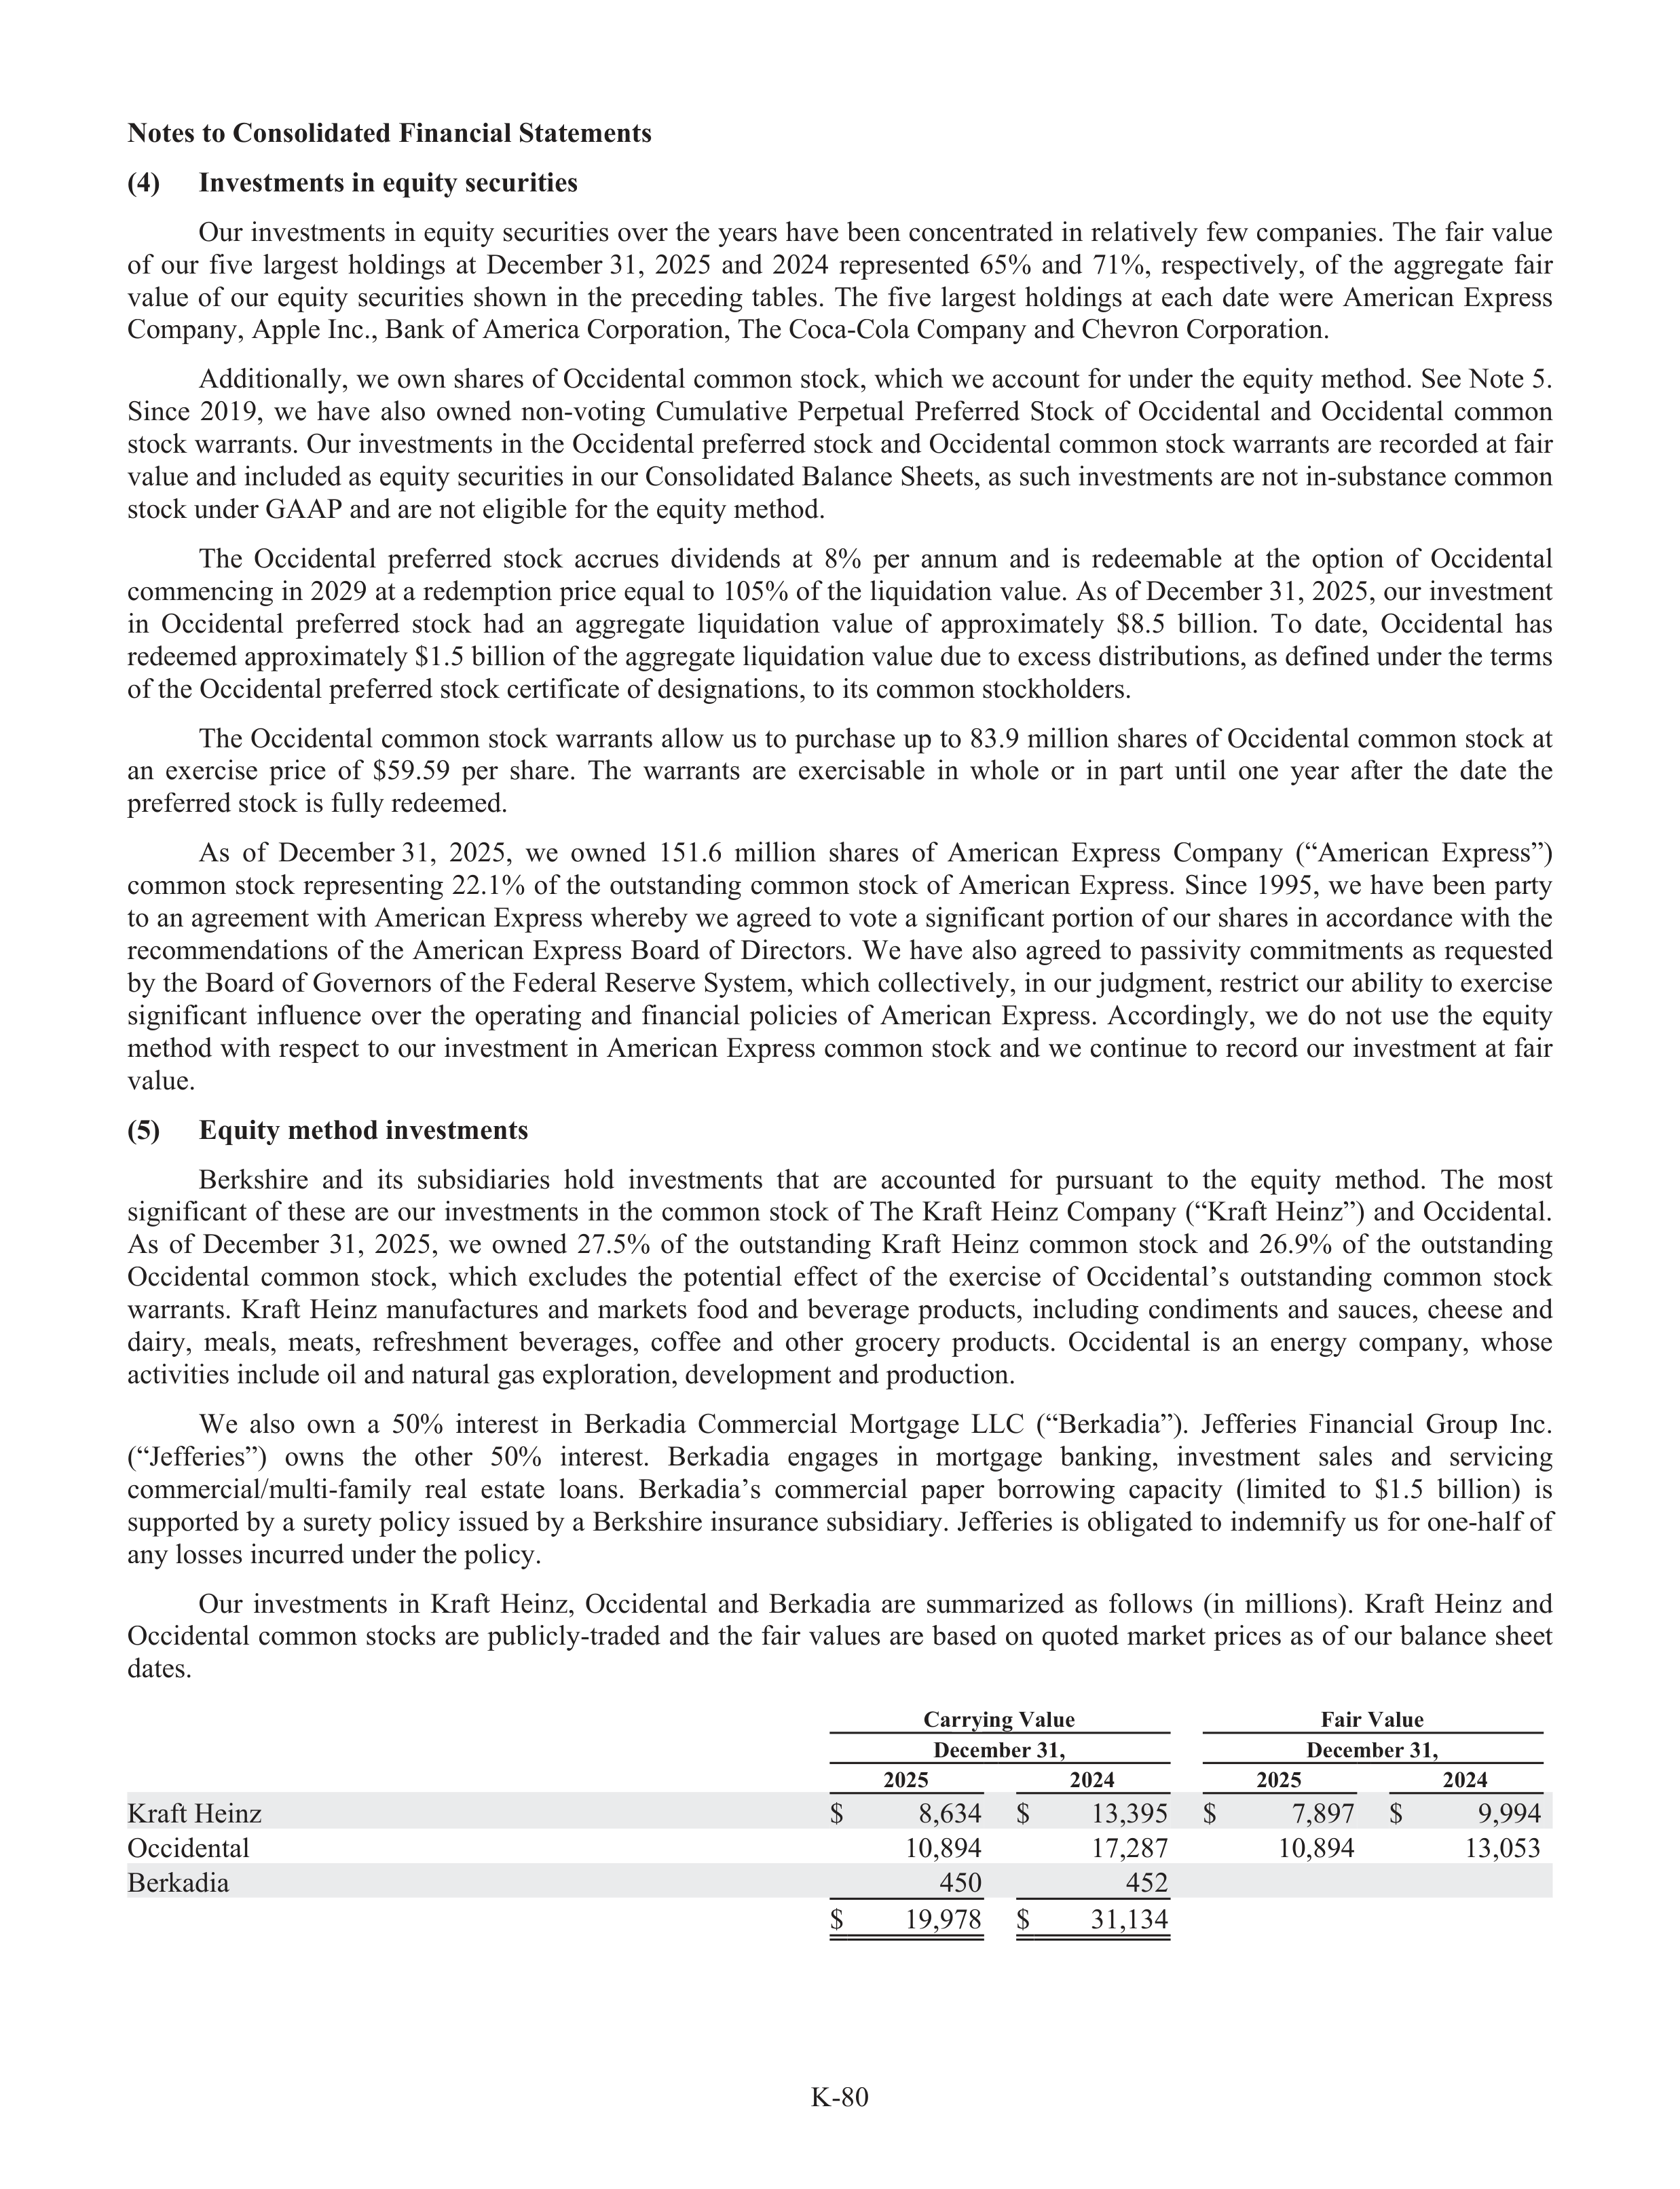
K-80
Notes to Consolidated Financial Statements
(4)
Investments in equity securities
Our investments in equity securities over the years have been concentrated in relatively few companies. The fair value
of
our
five
largest
holdings
at
December 31,
2025
and
2024
represented
65%
and
71%,
respectively,
of
the
aggregate
fair
value
of
our
equity
securities
shown
in
the
preceding
tabl
a
es.
The
five
largest
holdings
at
each
date
were
American
Express
Company, Apple Inc., Bank of America Corporation, The Coca-Cola Company and Chevron Corporation.
Additionally, we own shares of Occidental common stock, which we account for under the equity method. See Note 5.
Since
2019,
we
have
also
owned
non-voting
Cumulative
Perpetua
t
l
Prefer
f
red
Stock
of
Occidental
and
Occidental
common
stock warrants. Our investments in the Occidental prefer
f
red stock and Occidental common stock warrants are recorded at fair
value and included as equity securities in our Consolidated Balance Sheets, as such investments are not in-substance common
stock under GAAP and are not eligible for the equity method.
The
Occidental
prefer
f
red
stock
accrue
r
s
dividends
at
8%
per
annum
and
is
redeemable
at
the
option
of
Occidental
commencing in 2029 at a redemption price equal to 105% of the liquidation value. As of December 31, 2025, our investment
in
Occidental
prefer
f
red
stock
had
an
aggregate
liquidation
value
of
approximately
$8.5
billion.
To
date,
Occidental
has
redeemed approximately $1.5 billion of the aggregate liquidation value due to excess distributions, as defined under the terms
of the Occidental prefer
f
red stock certific
f
ate of designations, to its common stockholders.
The Occidental common stock warrants allow us to purchase up to 83.9 million shares of Occidental common stock at
an
exercise
price
of
$59.59
per
share.
The
warrants
are
exercisabl
a
e
in
whole
or
in
part
until
one
year
afte
f
r
the
date
the
prefer
f
red stock is fully redeemed.
As
of
December 31,
2025,
we
owned
151.6
million
shares
of
American
Express
Company
(“American
Express”)
common
stock
representing
22.1%
of
the
outstanding
common
stock
of
American
Express.
Since
1995,
we
have
been
party
to an agreement with American Express whereby we agreed to vote a significant portion of our shares in accordance with the
recommendations
of
the
American
Express
Board
of
Directors.
We
have
also
agreed
to
passivity
commitments
as
requested
by the Board of Governors of the Federal Reserve System, which collectively, in our judgment, restrict our ability to exercise
significant
influence
over
the
operating
and
financial
policies
of
American
Express.
Accordingly,
we
do
not
use
the
equity
method with respect to our investment in American Express common stock and we continue to record our investment at fair
value.
(5)
Equity method investments
Berkshire
and
its
subs
u
idiaries
hold
investments
that
are
accounted
for
pursuant
to
the
equity
method.
The
most
significant
of
these
are
our
investments
in
the
common
stock
of
The
Kraftf
Heinz
Company
(“Kra
K
ft
Heinz”)
and
Occidental.
As
of
December
31,
2025,
we
owned
27.5%
of
the
outstanding
Kraftf
Heinz
common
stock
and
26.9%
of
the
outstanding
Occidental
common
stock,
which
excludes
the
potential
effe
f
ct
of
the
exercise
of
Occidental’s
outstanding
common
stock
warrants.
Kraftf
Heinz
manufactur
t
es
and
markets
food
and
beverage
products,
including
condiments
and
sauces,
cheese
and
dairy,
r
meals,
meats,
refreshment
beverages,
coffee
and
other
grocery
r
products.
Occidental
is
an
energy
company,
whose
activities include oil and natural gas exploration, development and production.
We
also
own
a
50%
interest
in
Berkadia
Commercial
Mortgage
LLC
(“Berkadia”).
Jeffe
f
ries
Financial
Group
Inc.
(“Jefferies”)
owns
the
other
50%
interest.
Berkadia
engages
in
mortgage
banking,
investment
sales
and
servicing
commercial/multi-family
real
estate
loans.
Berkadia’s
commercial
pape
a
r
borrowing
capacity
(limited
to
$1.5
billion)
is
suppor
u
ted by a surety policy issued by a Berkshire insurance subs
u
idiary. Jefferies is obligated to indemnify
f
us for one-half of
any losses incurred under the policy.
Our
investments
in
Kraftf
Heinz,
Occidental
and
Berkadia
are
summarized
as
follows
(in
millions).
Kraftf
Heinz
and
Occidental common stocks are publicly-traded and the fair values are based on quoted market prices as of our balance sheet
dates.
Carrying Value
Fair Value
December 31,
December 31,
2025
2024
2025
2024
Kraftf
Heinz
$
8,634
$
13,395
$
7,897
$
9,994
Occidental
10,894
17,287
10,894
13,053
Berkadia
450
452
$
19,978
$
31,134
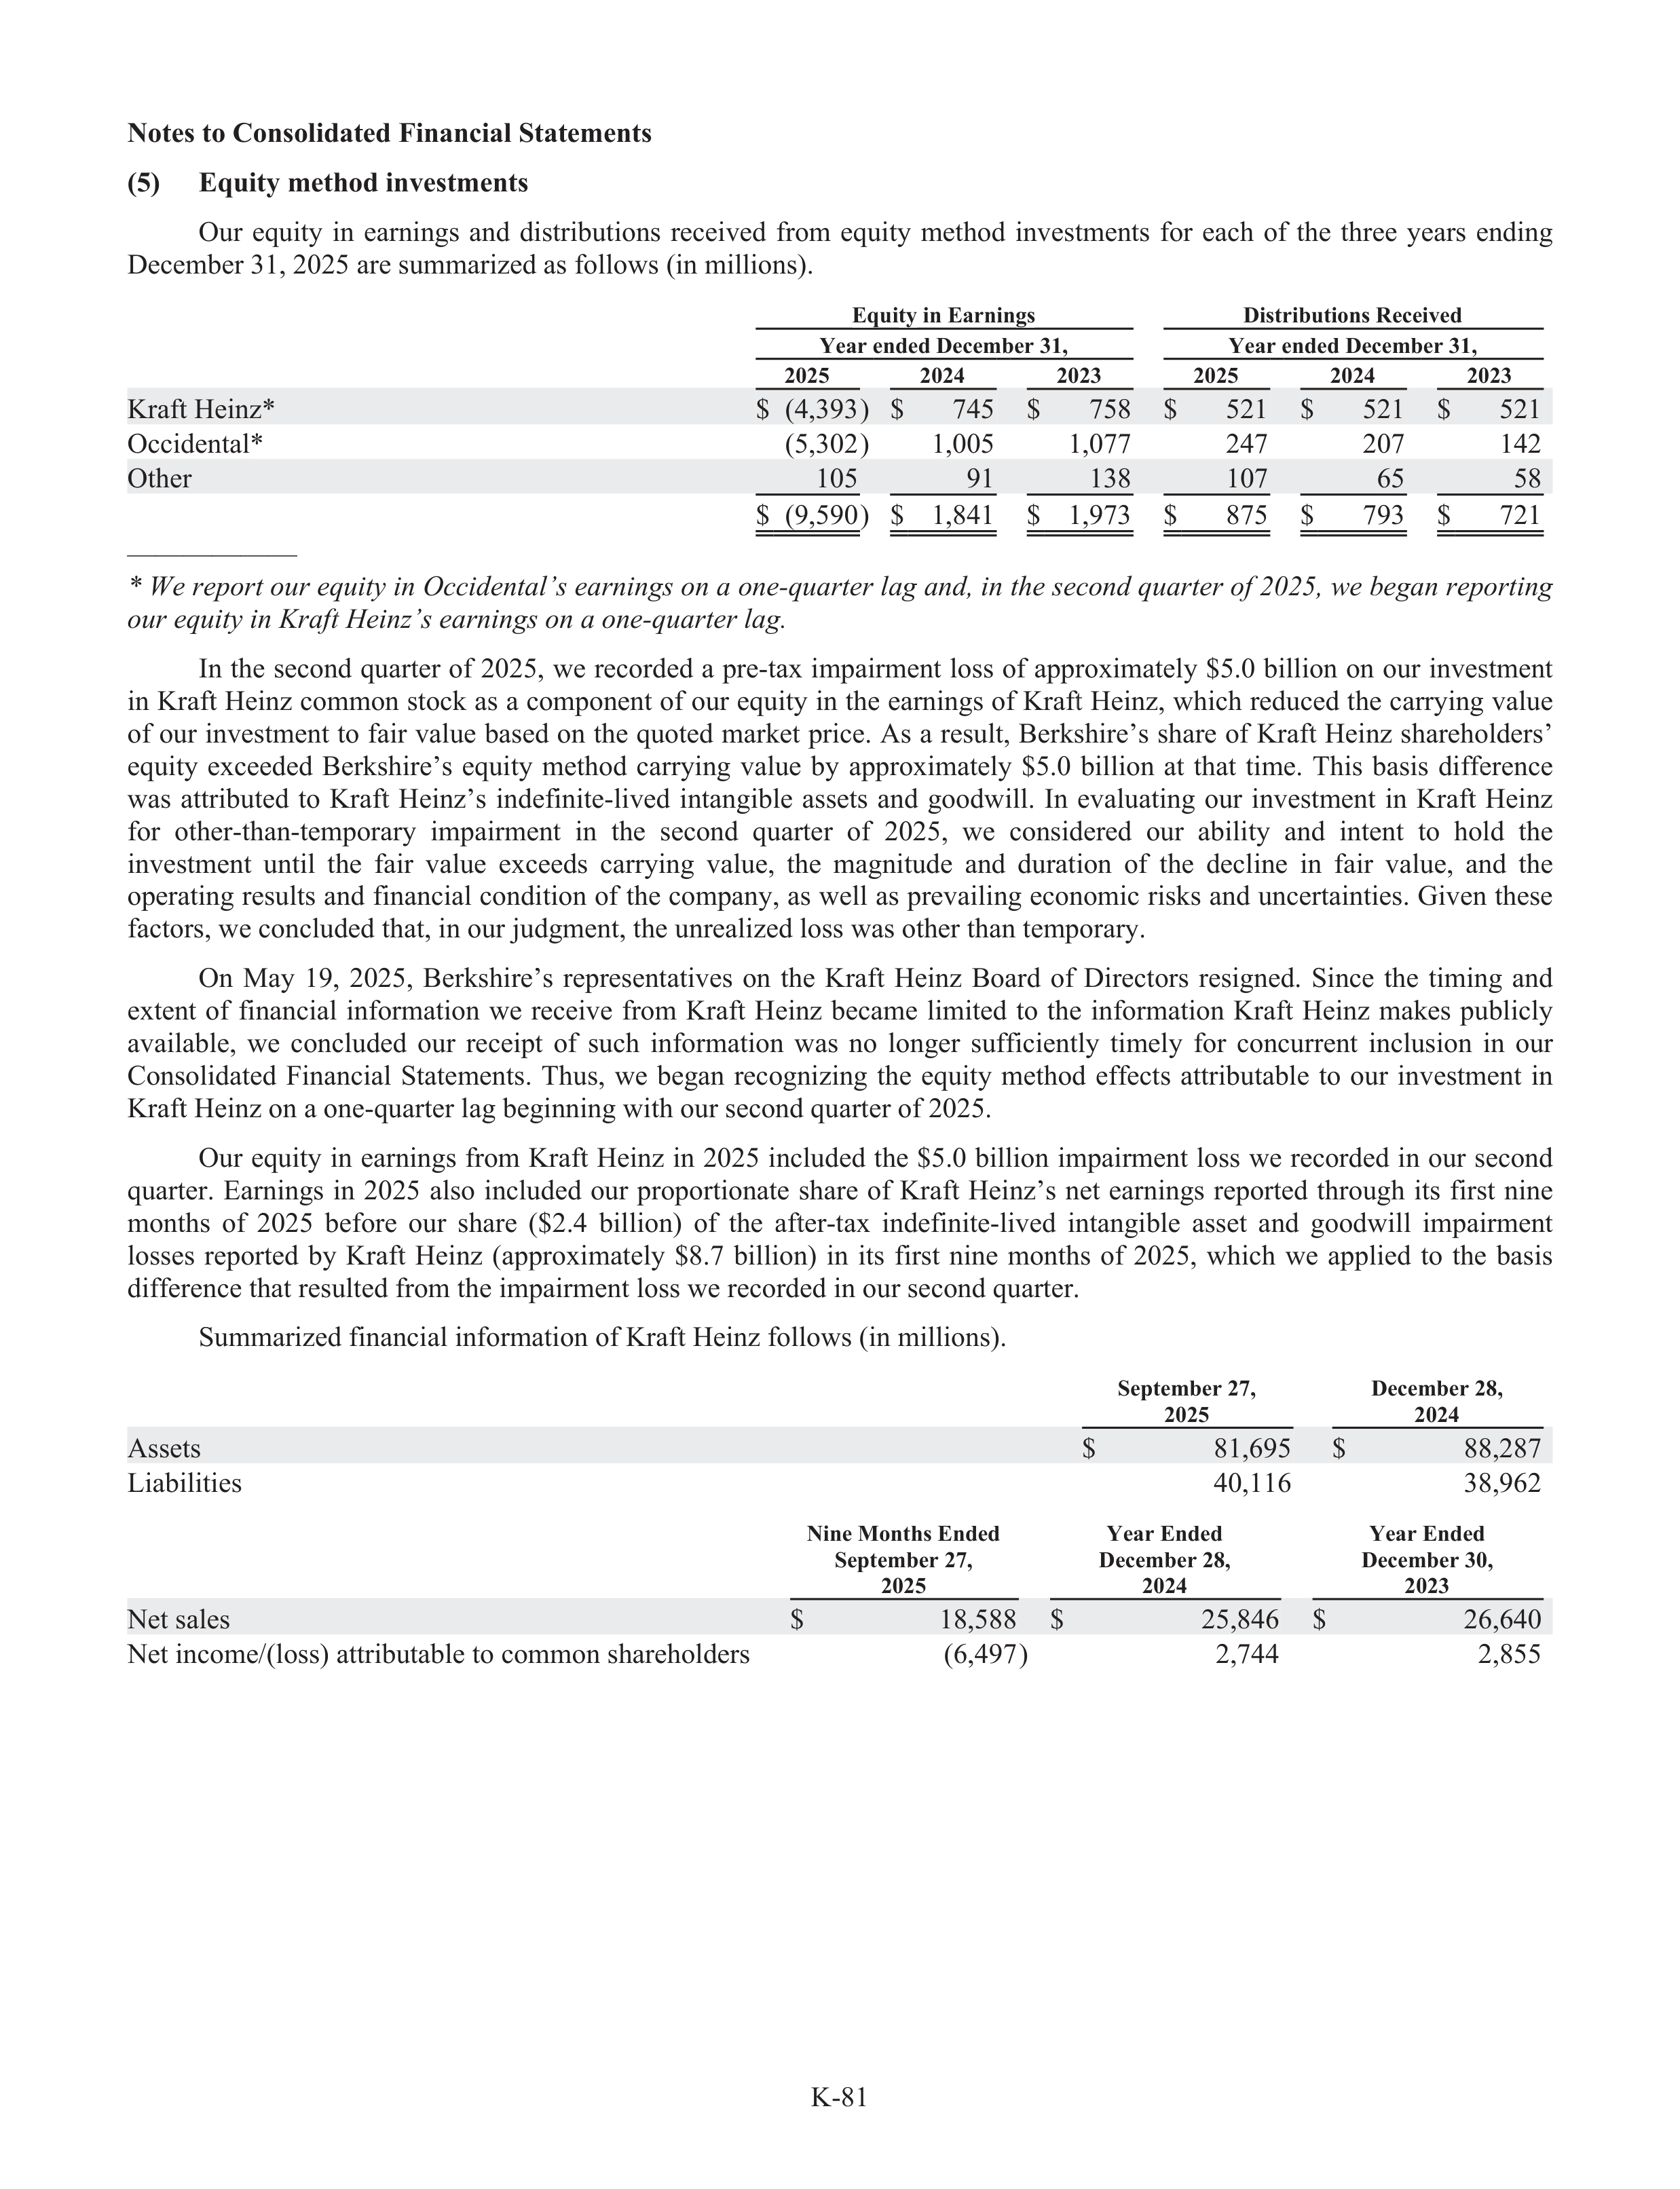
K-81
Notes to Consolidated Financial Statements
(5)
Equity method investments
Our
equity
in
earnings
and
distributions
received
from
equity
method
investments
for
each
of
the
three
years
ending
December 31, 2025 are summarized as follows (in millions).
Equity in Earnings
Distributions Received
Year ended December 31,
Year ended December 31,
2025
2024
2023
2025
2024
2023
Kraftf
Heinz*
$
(4,393)
$
745
$
758
$
521
$
521
$
521
Occidental*
(5,302)
1,005
1,077
247
207
142
Other
105
91
138
107
65
58
$
(9,590)
$
1,841
$
1,973
$
875
$
793
$
721
——————
* We repor
e
t our equity in Occidental’s earnings on a one-quarter lag and, in the second quarter of 2025, we began
e
repor
e
ting
our equity in Kraft H
f
ei
H
nz’s earnings on a one-quarter lag.
In the second quarter of 2025, we recorded a pre-tax impairment loss of approximately $5.0 billion on our investment
in Kraftf
Heinz common stock as a component of our equity in the earnings of Kraftf
Heinz, which reduced the carrying value
of our investment to fair value based on the quoted market price. As a result, Berkshire’s share of Kraftf
Heinz shareholders’
equity
exceeded
Berkshire’s
equity
method
carrying
value
by
approximately
$5.0
billion
at
that
time.
This
basis
differ
f
ence
was
attributed
to
Kraft
H
f
einz’s
indefinite-lived
intangible
assets
and
goodwill.
In
evaluating
our
investment
in
Kraftf
Heinz
for
other-than-temporary
r
impairment
in
the
second
quarter
of
2025,
we
considered
our
ability
and
intent
to
hold
the
investment
until
the
fair
value
exceeds
carrying
value,
the
magnitude
and
duration
of
the
decline
in
fair
value,
and
the
operating results and financial condition of the company, as well as prevailing economic risks and uncertainties. Given these
factors, we concluded that, in our judgment, the unrealized loss was other than temporary.
r
On
May
19,
2025,
Berkshire’s
representatives
on
the
Kraftf
Heinz
Board
of
Directors
resigned.
Since
the
timing
and
extent
of
financial
information
we
receive
from
Kraftf
Heinz
became
limited
to
the
information
Kraftf
Heinz
makes
publicly
availabl
a
e,
we
concluded
our
receipt
of
such
information
was
no
longer
sufficiently
timely
for
concurrent
inclusion
in
our
Consolidated
Financial
Statements.
Thus,
we
began
recognizing
the
equity
method
effe
f
cts
attributable
to
our
investment
in
Kraftf
Heinz on a one-quarter lag beginning with our second quarter of 2025.
Our equity in earnings from Kraftf
Heinz in 2025 included the $5.0 billion impairment loss
we
recorded in our second
quarter.
Earnings
in
2025
also
included
our
proportionate
share
of
Kraft
H
f
einz’s
net
earnings
reported
through
its
first
nine
months
of
2025
before
our
share
($2.4
billion)
of
the
afte
f
r-tax
indefinite-lived
intangible
asset
and
goodwill
impairment
losses
reported
by
Kraftf
Heinz
(appr
a
oximately
$8.7
billion)
in
its
first
nine
months
of
2025,
which
we
applied
to
the
basis
difference that resulted from the impairment loss we recorded in our second quarter.
Summarized financial information of Kraftf
Heinz follows (in millions).
September 27,
2025
December 28,
2024
Assets
$
81,695
$
88,287
Liabilities
40,116
38,962
Nine Months Ended
September 27,
2025
Year Ended
December 28,
2024
Year Ended
December 30,
2023
Net sales
$
18,588
$
25,846
$
26,640
Net income/(loss) attributable to common shareholders
(6,497)
2,744
2,855
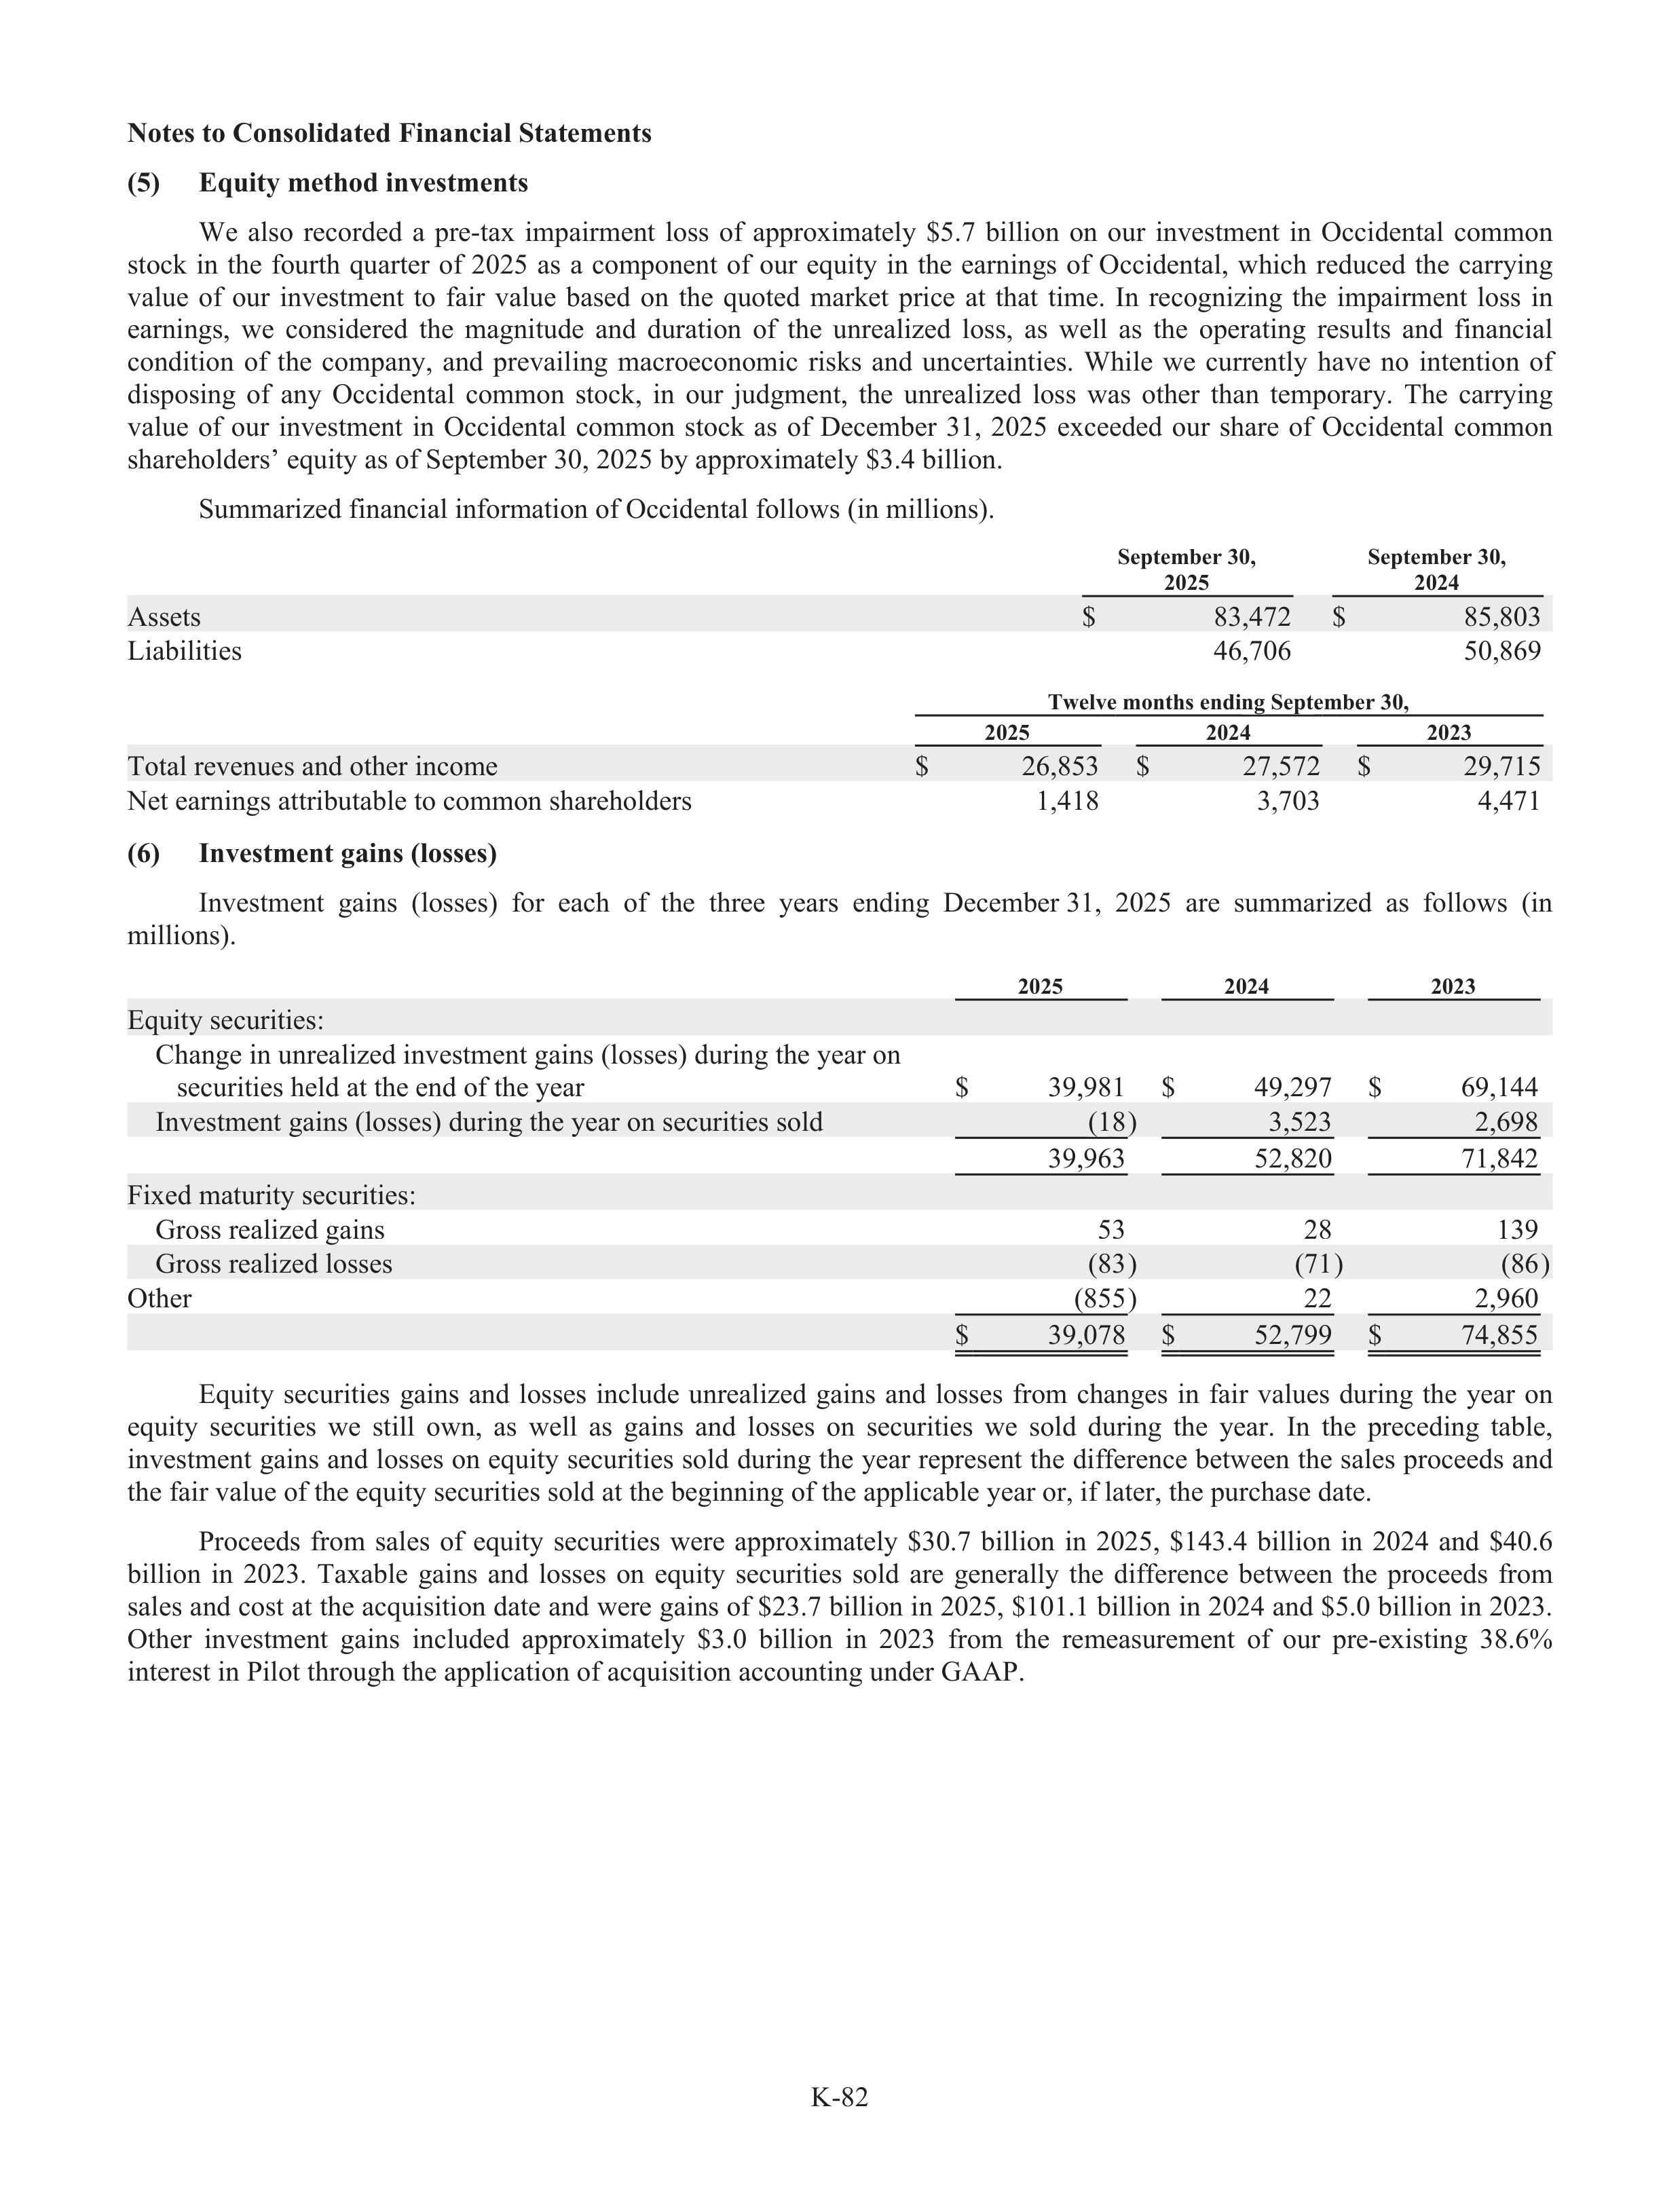
K-82
Notes to Consolidated Financial Statements
(5)
Equity method investments
We
also
recorded
a
pre-tax
impairment
loss
of
approximately
$5.7
billion
on
our
investment
in
Occidental
common
stock
in
the
fourth
quarter
of
2025
as
a
component
of
our
equity
in
the
earnings
of
Occidental,
which
reduced
the
carrying
value
of
our
investment
to
fair
value
based
on
the
quoted
market
price
at
that
time.
In
recognizing
the
impairment
loss
in
earnings,
we
considered
the
magnitude
and
duration
of
the
unrealized
loss,
as
well
as
the
operating
results
and
financial
condition
of
the
company,
and
prevailing
macroeconomic
risks
and
uncertainties.
While
we
currently
have
no
intention
of
disposing
of
any
Occidental
common
stock,
in
our
judgment,
the
unrealized
loss
was
other
than
temporary.
r
The
carrying
value
of
our
investment
in
Occidental
common
stock
as
of
December
31,
2025
exceeded
our
share
of
Occidental
common
shareholders’ equity as of September 30, 2025 by approximately $3.4 billion.
Summarized financial information of Occidental follows (in millions).
September 30,
2025
September 30,
2024
Assets
$
83,472
$
85,803
Liabilities
46,706
50,869
Twelve months ending September 30,
2025
2024
2023
Total revenues and other income
$
26,853
$
27,572
$
29,715
Net earnings attributable to common shareholders
1,418
3,703
4,471
(6)
Investment gains (losses)
Investment
gains
(losses)
for
each
of
the
three
years
ending
December 31,
2025
are
summarized
as
follows
(in
millions).
2025
2024
2023
Equity securities:
Change in unrealized investment gains (losses) during the year on
securities held at the end of the year
$
39,981
$
49,297
$
69,144
Investment gains (losses) during the year on securities sold
(18)
3,523
2,698
39,963
52,820
71,842
Fixed maturity securities:
Gross realized gains
53
28
139
Gross realized losses
(83)
(71)
(86)
Other
(855)
22
2,960
$
39,078
$
52,799
$
74,855
Equity
securities
gains
and
losses
include
unrealized
gains
and
losses
from
changes
in
fair
values
during
the
year
on
equity
securities
we
still
own,
as
well
as
gains
and
losses
on
securities
we
sold
during
the
year.
In
the
preceding
tabl
a
e,
investment gains and losses on equity securities sold during the year represent the difference between the sales proceeds and
the fair value of the equity securities sold at the beginning of the applicable year or, if later, the purchase date.
Proceeds
from
sales
of
equity
securities
were
approximately
$30.7
billion
in
2025,
$143.4
billion
in
2024
and
$40.6
billion
in
2023.
Taxabl
a
e
gains
and
losses
on
equity
securities
sold
are
generally
the
difference
between
the
proceeds
from
sales and cost at the acquisition date and were gains of $23.7 billion in 2025, $101.1 billion in 2024 and $5.0 billion in 2023.
Other
investment
gains
included
approximately
$3.0
billion
in
2023
from
the
remeasurement
of
our
pre-existing
38.6%
interest in Pilot through the application of acquisition accounting under GAAP.
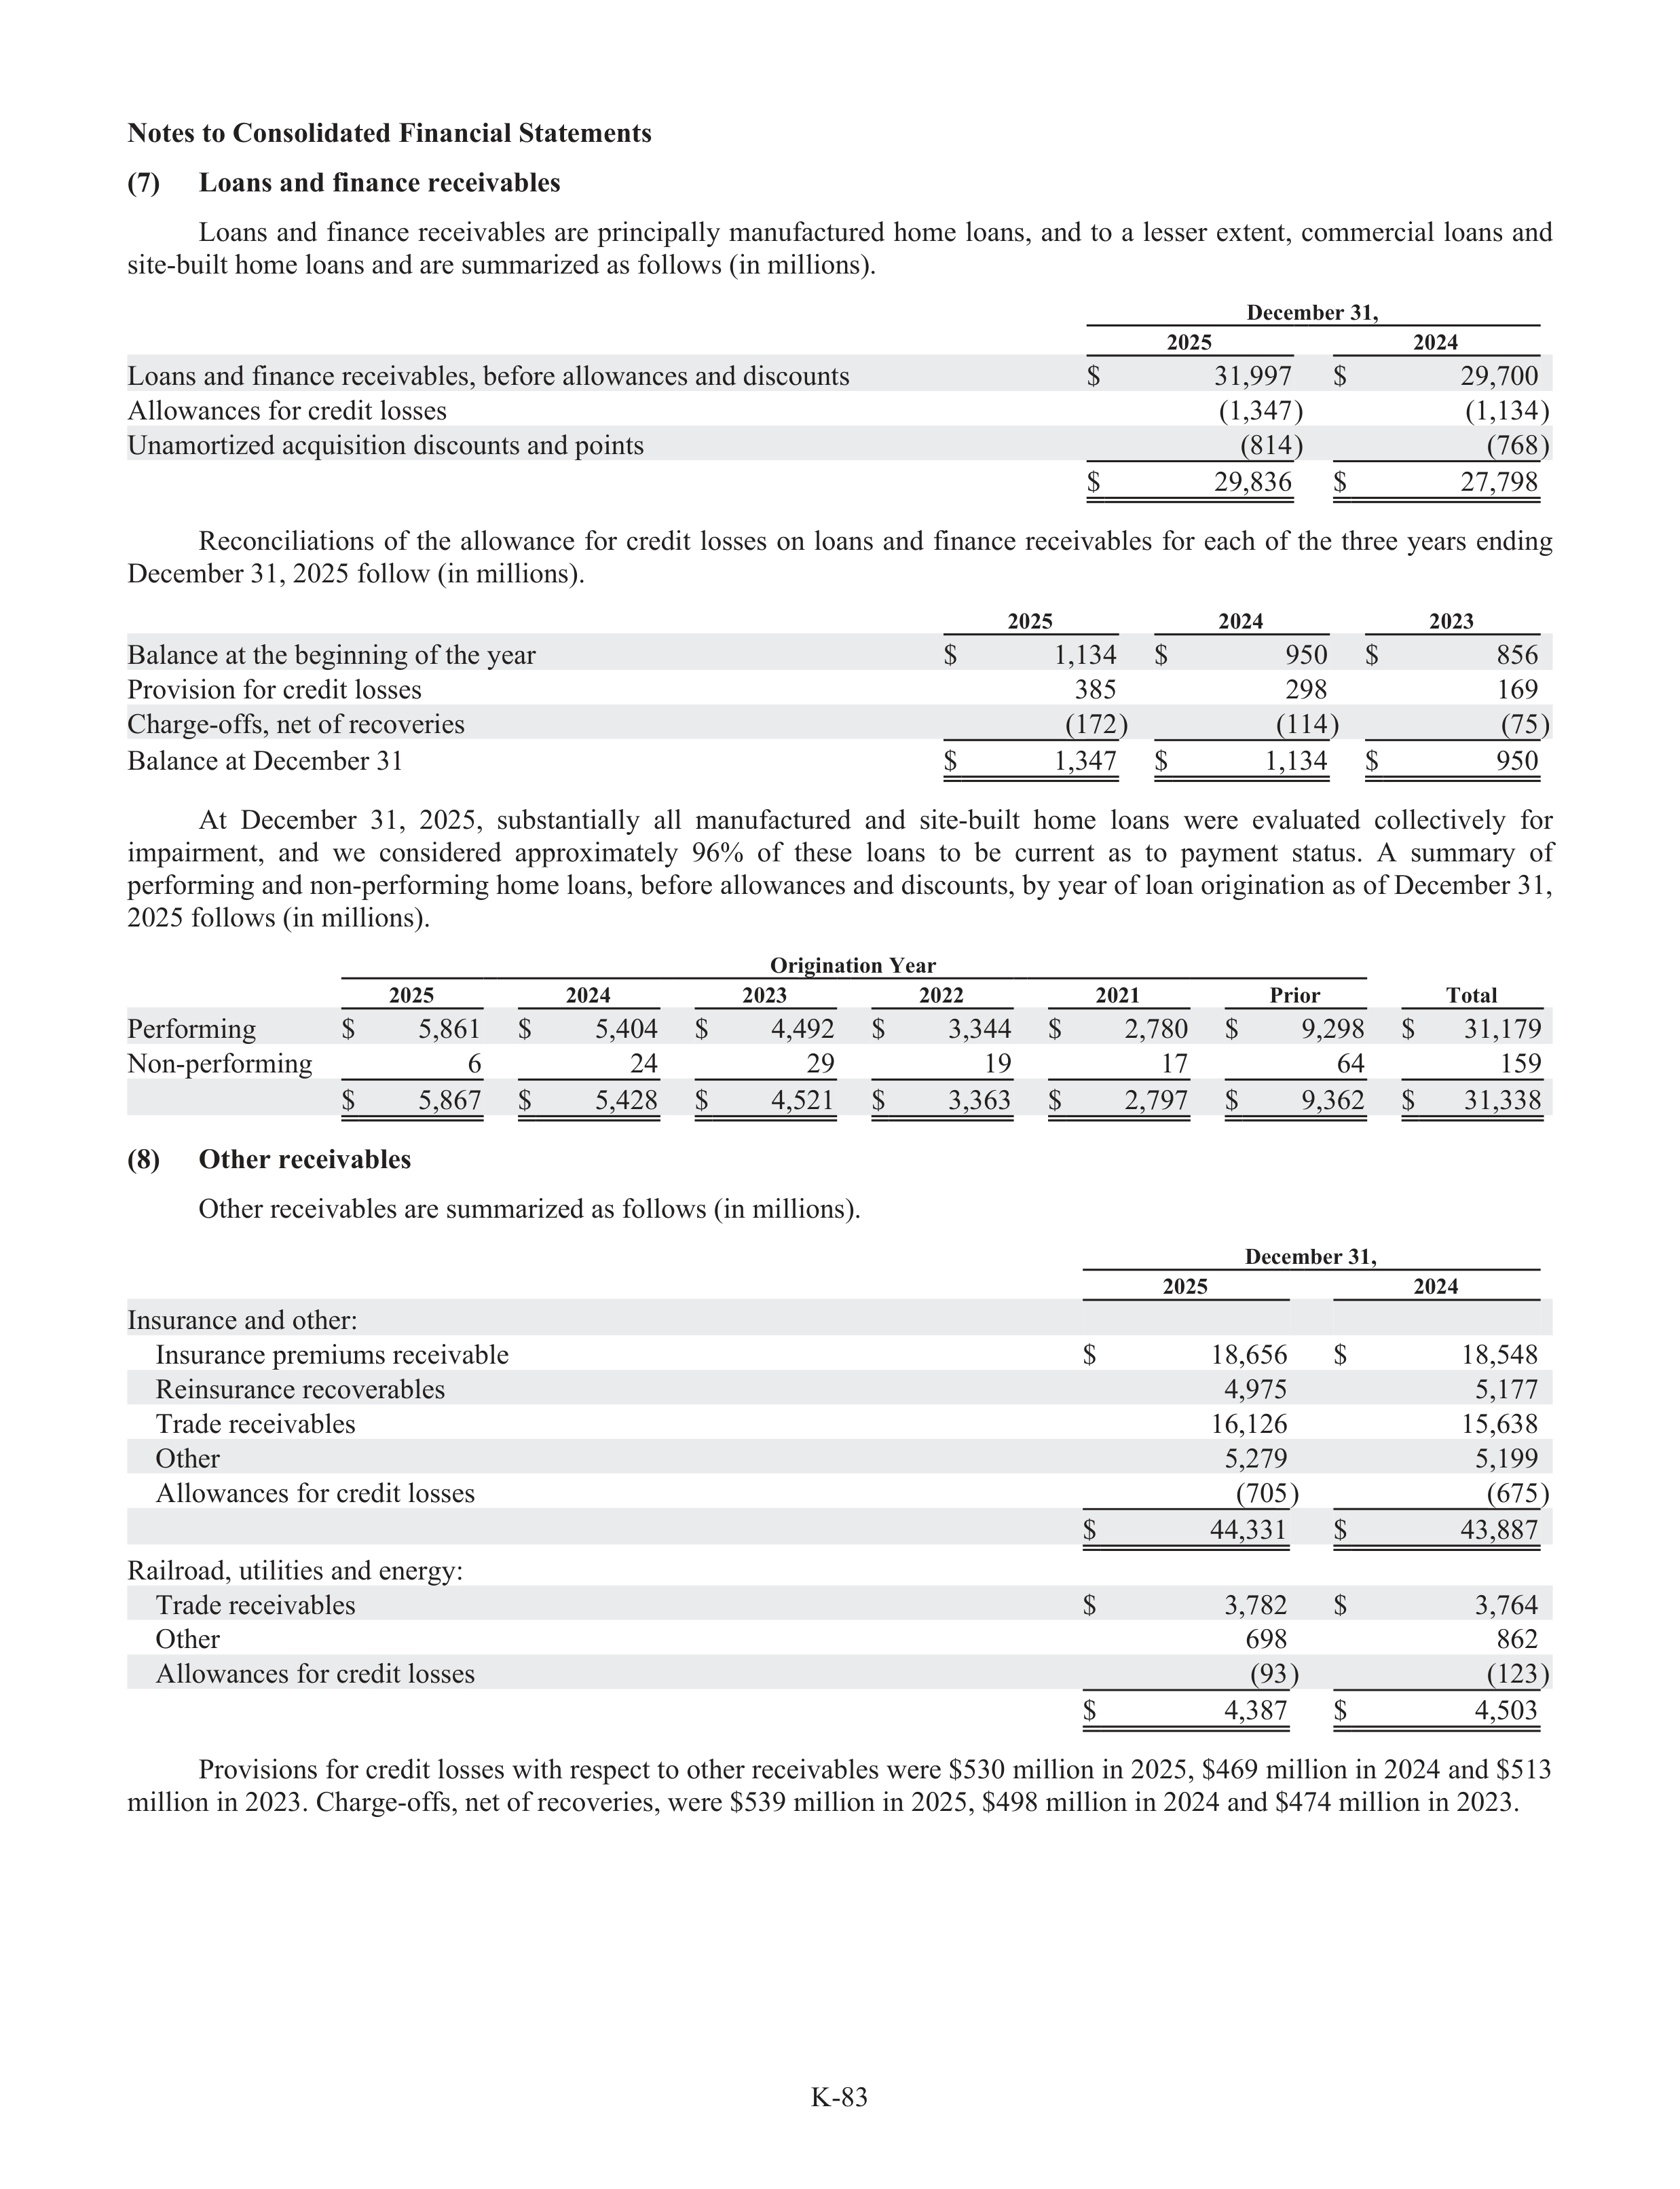
K-83
Notes to Consolidated Financial Statements
(7)
Loans and finance receivables
Loans
and
finance
receivabl
a
es
are
principally
manufact
f
ur
t
ed
home
loans,
and
to
a
lesser
extent,
commercial
loans
and
site-built home loans and are summarized as follows (in millions).
December 31,
2025
2024
Loans and finance receivabl
a
es, before allowances and discounts
$
31,997
$
29,700
Allowances for credit losses
(1,347)
(1,134)
Unamortized acquisition discounts and points
(814)
(768)
$
29,836
$
27,798
Reconciliations
of
the
allowance
for
credit
losses
on
loans
and
finance
receivabl
a
es
for
each
of
the
three
years
ending
December 31, 2025 follow (in millions).
2025
2024
2023
Balance at the beginning of the year
$
1,134
$
950
$
856
Provision for credit losses
385
298
169
Charge-offs, net of recoveries
(172)
(114)
(75)
Balance at December 31
$
1,347
$
1,134
$
950
At
December
31,
2025,
subs
u
tantially
all
manufact
f
ur
t
ed
and
site-built
home
loans
were
evaluated
collectively
for
impairment,
and
we
considered
appr
a
oximately
96%
of
these
loans
to
be
current
as
to
payment
status
t
.
A
summary
of
performing and non-performing home loans, before allowances and discounts, by year of loan origination as of December 31,
2025 follows (in millions).
Origination Year
2025
2024
2023
2022
2021
Prior
Total
Performing
$
5,861
$
5,404
$
4,492
$
3,344
$
2,780
$
9,298
$
31,179
Non-performing
6
24
29
19
17
64
159
$
5,867
$
5,428
$
4,521
$
3,363
$
2,797
$
9,362
$
31,338
(8)
Other receivables
Other receivabl
a
es are summarized as follows (in millions).
December 31,
2025
2024
Insurance and other:
Insurance premiums receivabl
a
e
$
18,656
$
18,548
Reinsurance recoverabl
a
es
4,975
5,177
Trade receivabl
a
es
16,126
15,638
Other
5,279
5,199
Allowances for credit losses
(705)
(675)
$
44,331
$
43,887
Railroad, utilities and energy:
Trade receivabl
a
es
$
3,782
$
3,764
Other
698
862
Allowances for credit losses
(93)
(123)
$
4,387
$
4,503
Provisions for credit losses with respect to other receivabl
a
es were $530 million in 2025, $469 million in 2024 and $513
million in 2023. Charge-offs, net of recoveries, were $539 million in 2025, $498 million in 2024 and $474 million in 2023.
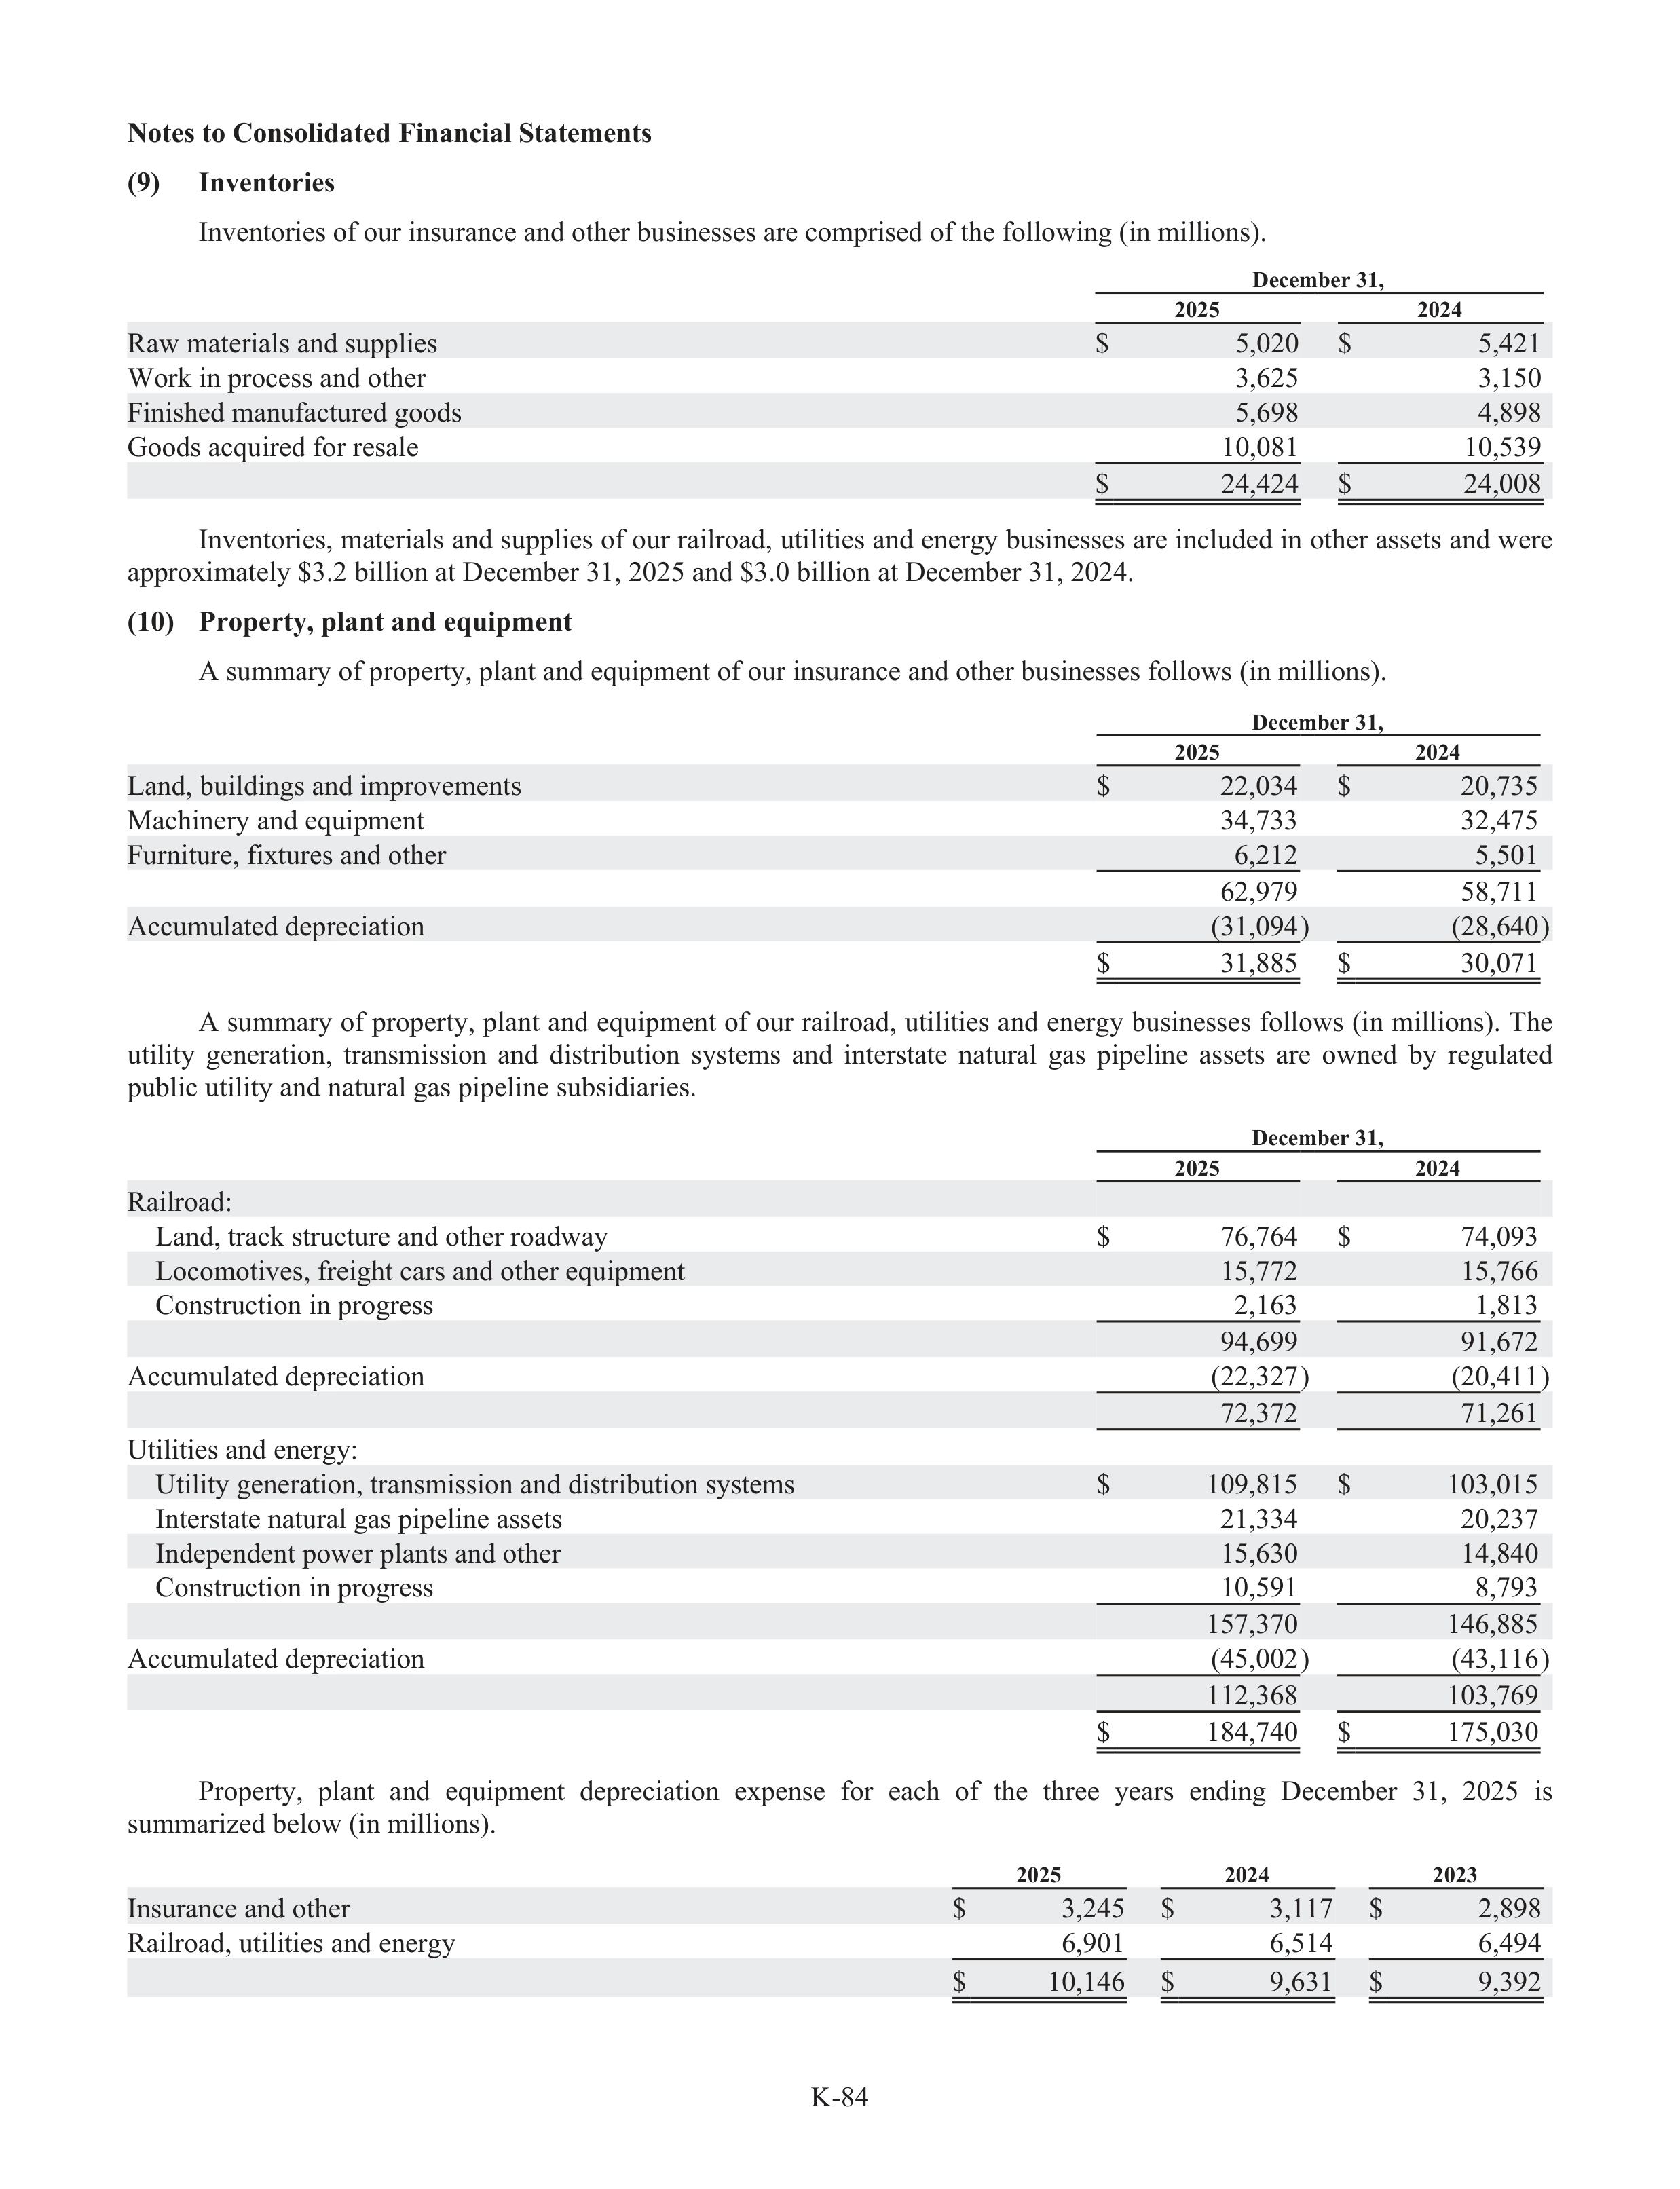
K-84
Notes to Consolidated Financial Statements
(9)
Inventories
Inventories of our insurance and other businesses are comprised of the following (in millions).
December 31,
2025
2024
Raw materials and suppl
u
ies
$
5,020
$
5,421
Work in process and other
3,625
3,150
Finished manufact
f
ur
t
ed goods
5,698
4,898
Goods acquired for resale
10,081
10,539
$
24,424
$
24,008
Inventories, materials and suppl
u
ies of our railroad, utilities and energy businesses are included in other assets and were
approximately $3.2 billion at December 31, 2025 and $3.0 billion at December 31, 2024.
(10)
Property, plant and equipment
A summary of property, plant and equipment of our insurance and other businesses follows (in millions).
December 31,
2025
2024
Land, buildings and improvements
$
22,034
$
20,735
Machinery
r
and equipment
34,733
32,475
Furniture, fixtur
t
es and other
6,212
5,501
62,979
58,711
Accumulated depreciation
(31,094)
(28,640)
$
31,885
$
30,071
A summary of property, plant and equipment of our railroad, utilities and energy businesses follows (in millions). The
utility
generation,
transmission
and
distribution
systems
and
interstate
natural
gas
pipeline
assets
are
owned
by
regulated
public utility and natural gas pipeline subs
u
idiaries.
December 31,
2025
2024
Railroad:
Land, track structur
t
e and other roadway
$
76,764
$
74,093
Locomotives, freight cars and other equipment
15,772
15,766
Construc
r
tion in progress
2,163
1,813
94,699
91,672
Accumulated depreciation
(22,327)
(20,411)
72,372
71,261
Utilities and energy:
Utility generation, transmission and distribution systems
$
109,815
$
103,015
Interstate natural gas pipeline assets
21,334
20,237
Independent power plants and other
15,630
14,840
Construc
r
tion in progress
10,591
8,793
157,370
146,885
Accumulated depreciation
(45,002)
(43,116)
112,368
103,769
$
184,740
$
175,030
Property,
plant
and
equipment
depreciation
expense
for
each
of
the
three
years
ending
December
31,
2025
is
summarized below (in millions).
2025
2024
2023
Insurance and other
$
3,245
$
3,117
$
2,898
Railroad, utilities and energy
6,901
6,514
6,494
$
10,146
$
9,631
$
9,392
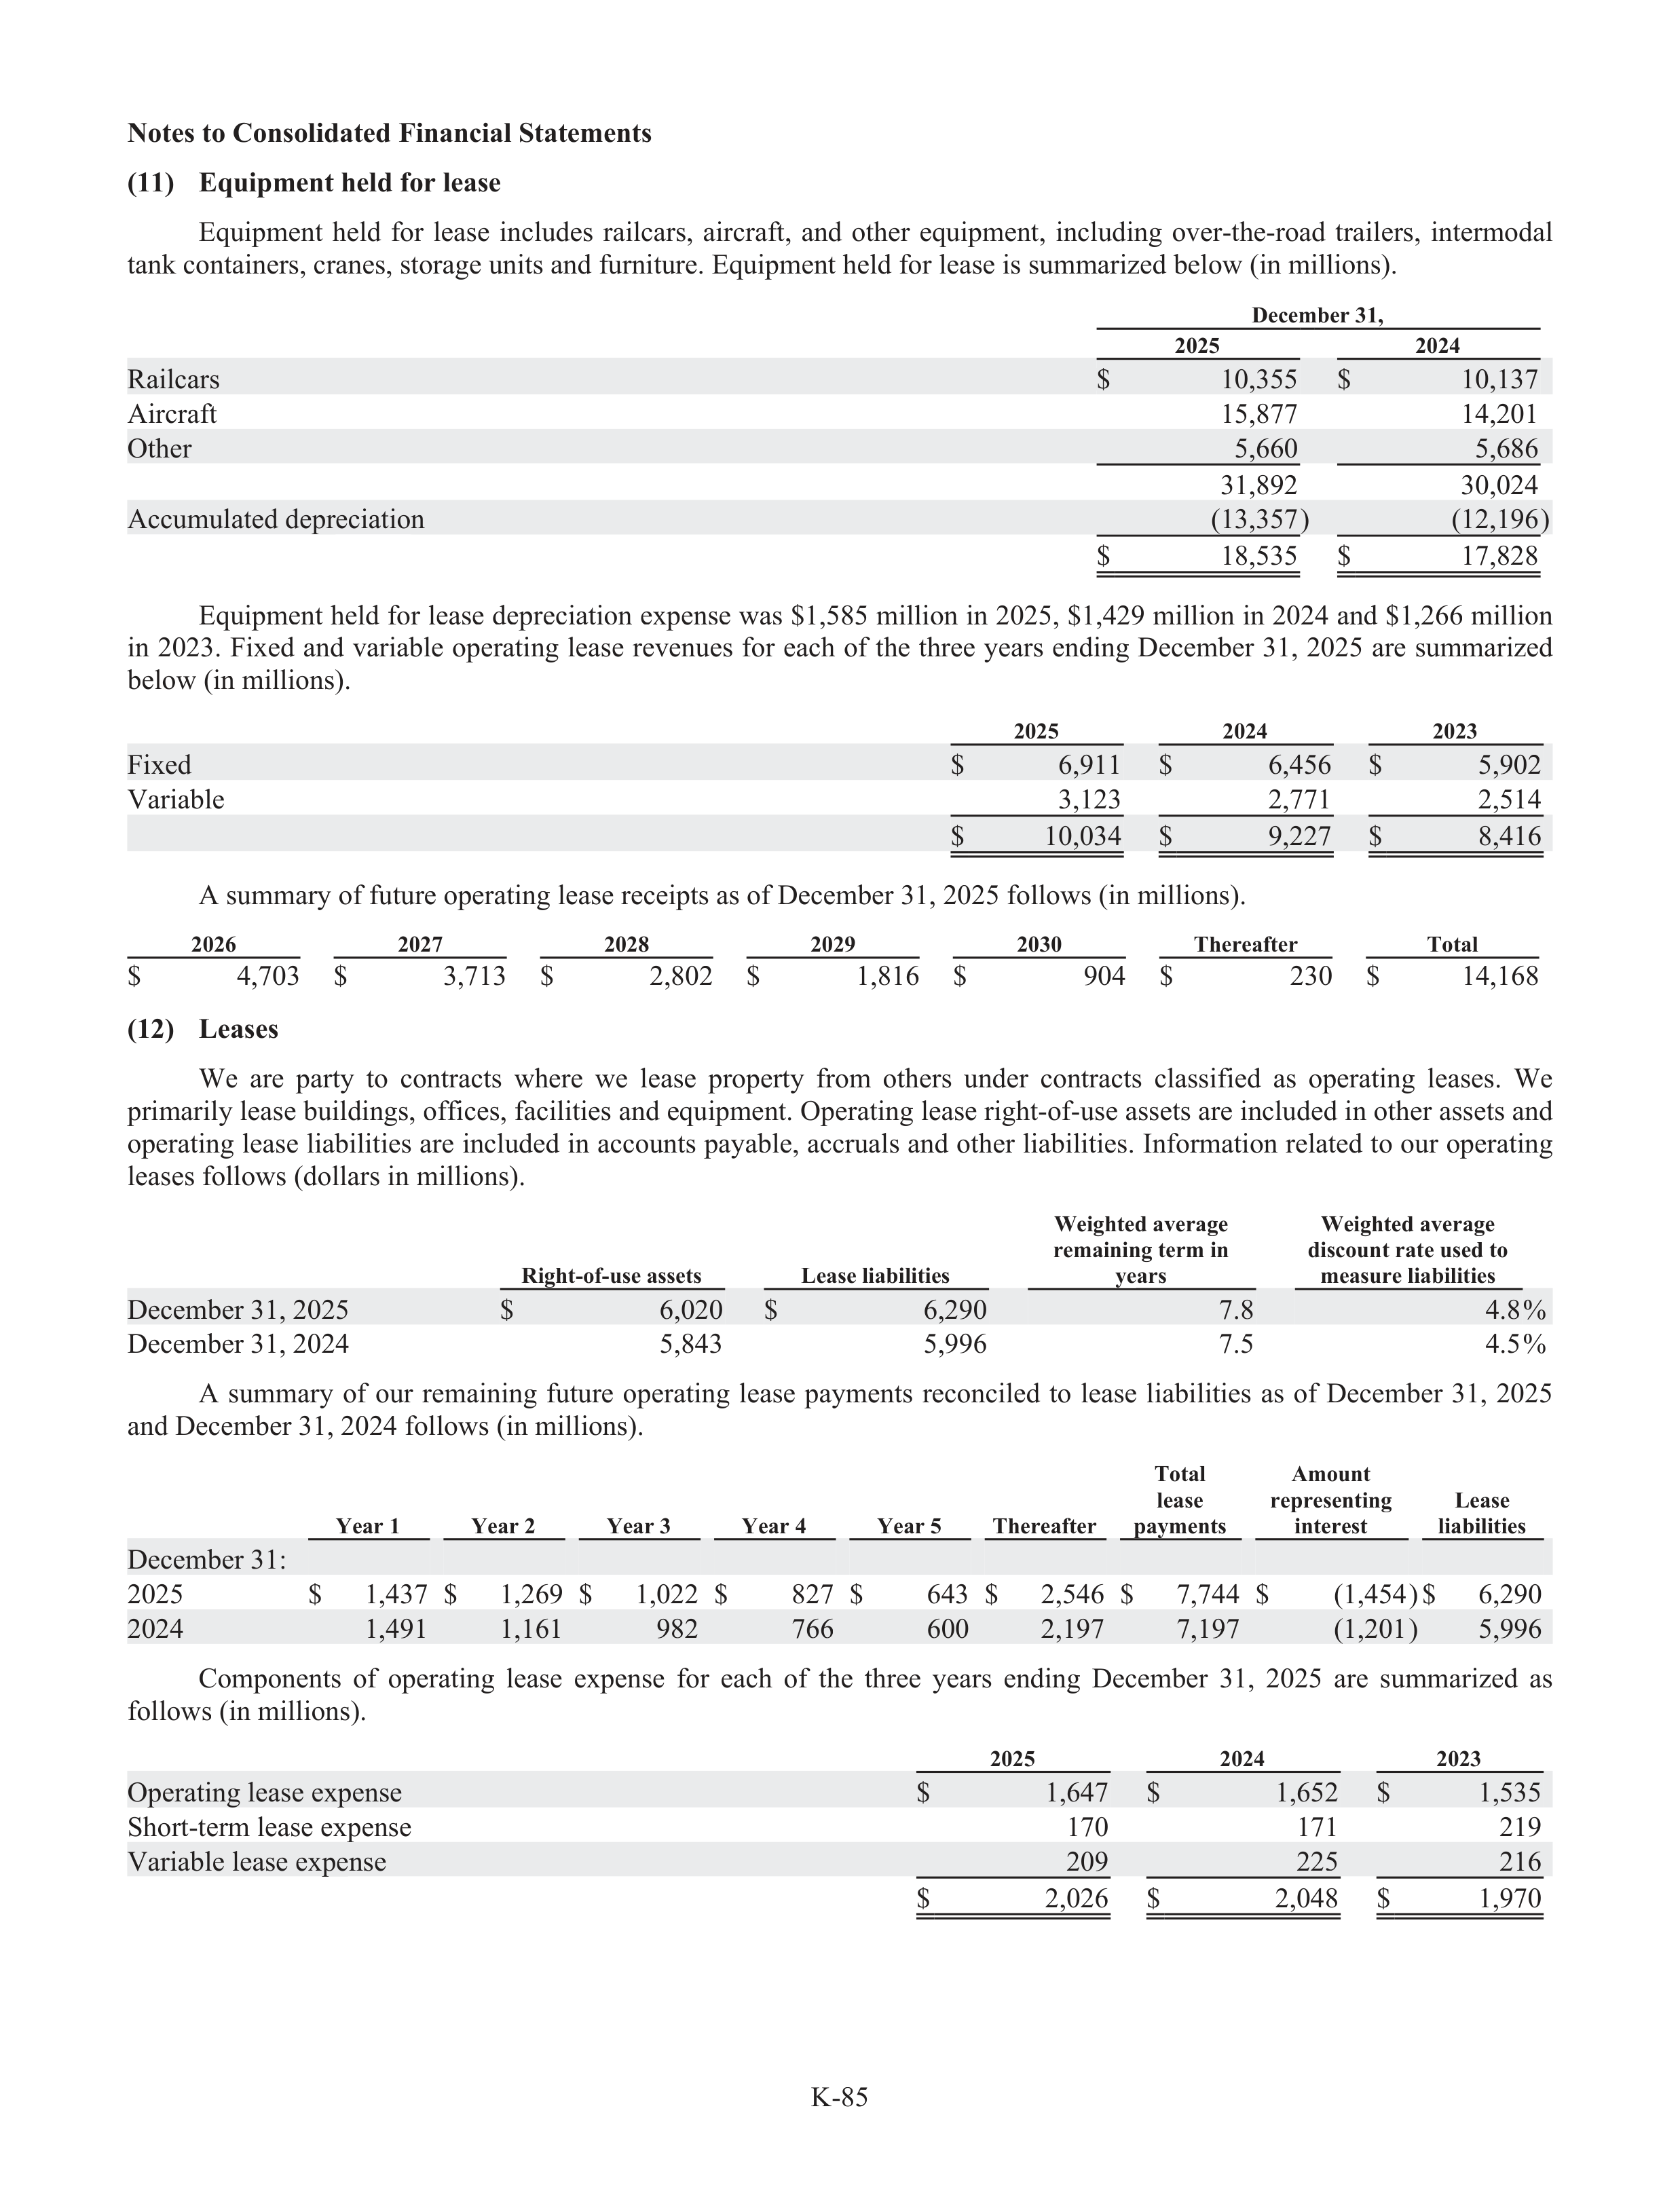
K-85
Notes to Consolidated Financial Statements
(11)
Equipment held for lease
Equipment
held
for
lease
includes
railcars,
aircraft,
and
other
equipment,
including
over-the-road
trailers,
intermodal
tank containers, cranes, storage units and furniture. Equipment held for lease is summarized below (in millions).
December 31,
2025
2024
Railcars
$
10,355
$
10,137
Aircraft
15,877
14,201
Other
5,660
5,686
31,892
30,024
Accumulated depreciation
(13,357)
(12,196)
$
18,535
$
17,828
Equipment held for lease depreciation expense was $1,585 million in 2025, $1,429 million in 2024 and $1,266 million
in
2023.
Fixed
and
variable
operating
lease
revenues
for
each
of
the
three
years
ending
December
31,
2025
are
summarized
below (in millions).
2025
2024
2023
Fixed
$
6,911
$
6,456
$
5,902
Variable
3,123
2,771
2,514
$
10,034
$
9,227
$
8,416
A summary of future operating lease receipts as of December 31, 2025 follows (in millions).
2026
2027
2028
2029
2030
Thereafter
Total
$
4,703
$
3,713
$
2,802
$
1,816
$
904
$
230
$
14,168
(12)
Leases
We
are
party
to
contracts
where
we
lease
property
from
others
under
contracts
classified
as
operating
leases.
We
primarily lease buildings, offi
f
ces, facilities and equipment. Operating lease right-of-use assets are included in other assets and
operating lease liabi
a
lities are included in accounts payabl
a
e, accrua
r
ls and other liabi
a
lities. Information related to our operating
leases follows (dollars in millions).
Right-of-use assets
Lease liabilities
Weighted average
remaining term in
years
Weighted average
discount rate used to
measure liabilities
December 31, 2025
$
6,020
$
6,290
7.8
4.8%
December 31, 2024
5,843
5,996
7.5
4.5%
A
summary
of
our
remaining
future
operating
lease
payments
reconciled
to
lease
liabi
a
lities
as
of
December
31,
2025
and December 31, 2024 follows (in millions).
Year 1
Year 2
Year 3
Year 4
Year 5
Thereafter
Total
lease
payments
Amount
representing
interest
Lease
liabilities
December 31:
2025
$
1,437
$
1,269
$
1,022
$
827
$
643
$
2,546
$
7,744
$
(1,454)$
6,290
2024
1,491
1,161
982
766
600
2,197
7,197
(1,201)
5,996
Components
of
operating
lease
expense
for
each
of
the
three
years
ending
December
31,
2025
are
summarized
as
follows (in millions).
2025
2024
2023
Operating lease expense
$
1,647
$
1,652
$
1,535
Short-term lease expense
170
171
219
Variable lease expense
209
225
216
$
2,026
$
2,048
$
1,970
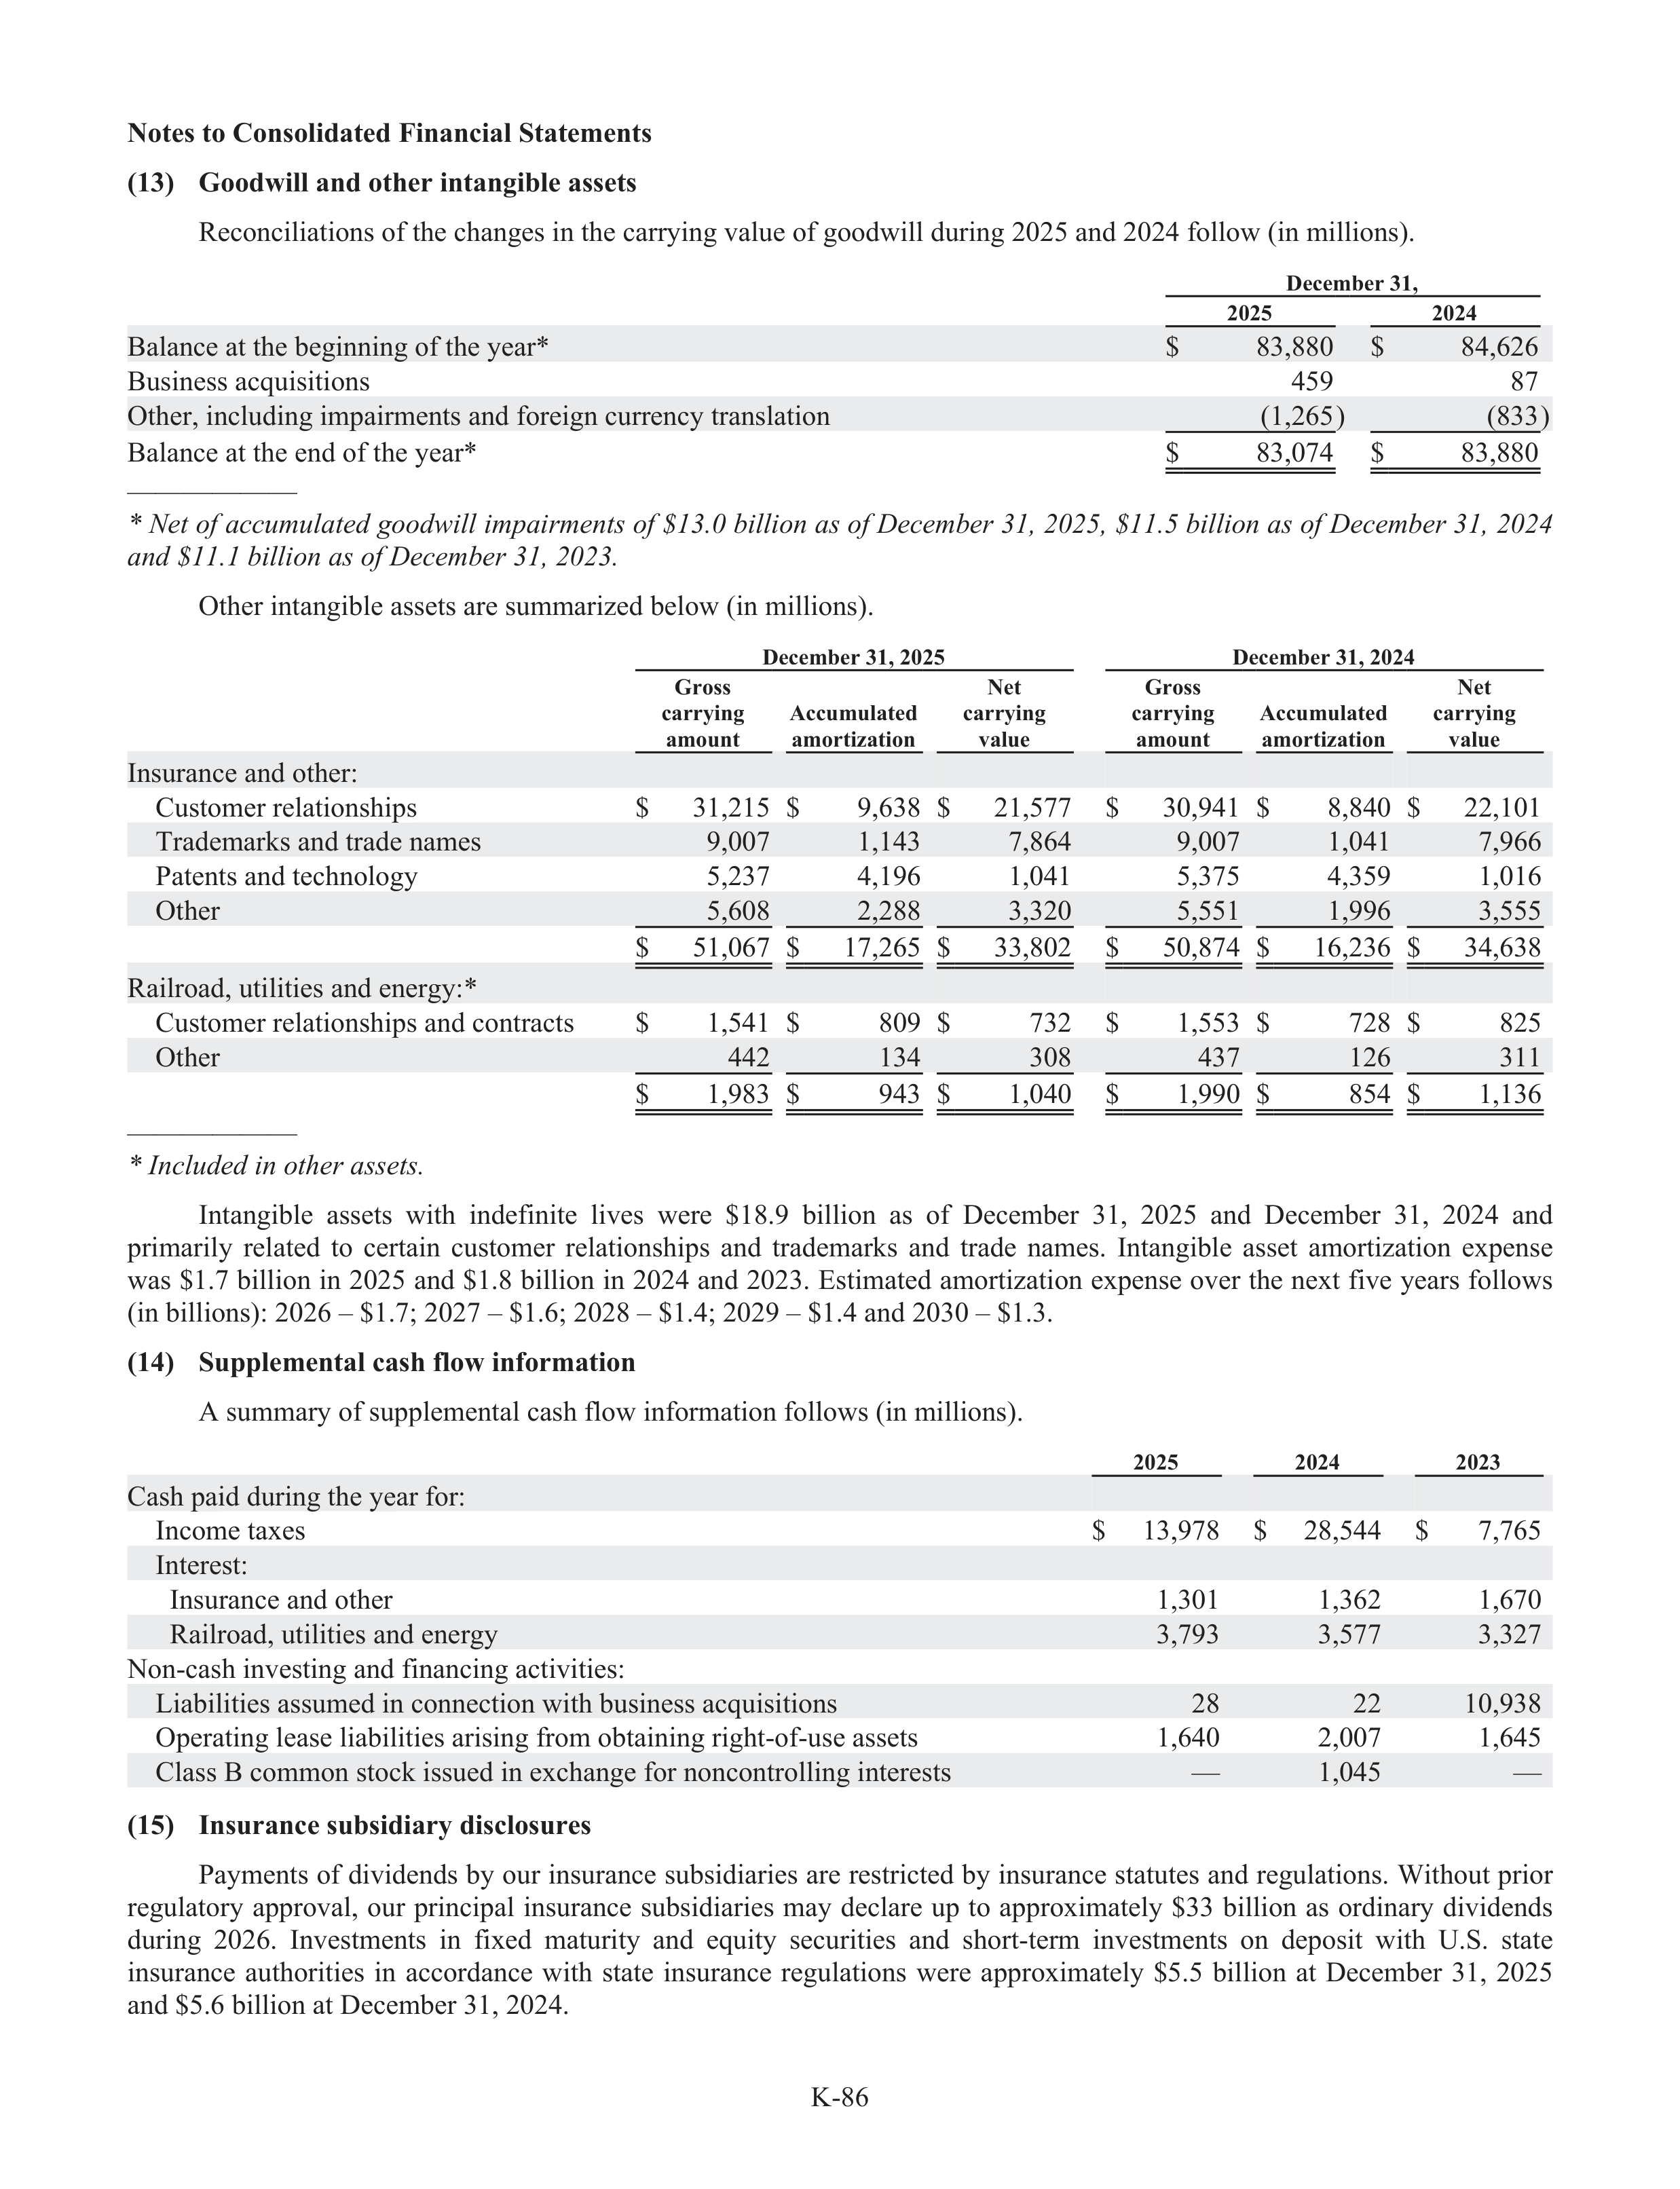
K-86
Notes to Consolidated Financial Statements
(13)
Goodwill and other intangible assets
Reconciliations of the changes in the carryi
r
ng value of goodwill during 2025 and 2024 follow (in millions).
December 31,
2025
2024
Balance at the beginning of the year*
$
83,880
$
84,626
Business acquisitions
459
87
Other, including impairments and foreign currency translation
(1,265)
(833)
Balance at the end of the year*
$
83,074
$
83,880
——————
* Net of accumulated goodwill impai
m
rments of $13.0 billion as of December 31, 2025, $11.5 billion as of December 31, 2024
and $11.1 billion as of December 31, 2023.
Other intangible assets are summarized below (in millions).
December 31, 2025
December 31, 2024
Gross
carrying
amount
Accumulated
amortization
Net
carrying
value
Gross
carrying
amount
Accumulated
amortization
Net
carrying
value
Insurance and other:
Customer relationships
$
31,215
$
9,638
$
21,577
$
30,941
$
8,840
$
22,101
Trademarks and trade names
9,007
1,143
7,864
9,007
1,041
7,966
Patents and technology
5,237
4,196
1,041
5,375
4,359
1,016
Other
5,608
2,288
3,320
5,551
1,996
3,555
$
51,067
$
17,265
$
33,802
$
50,874
$
16,236
$
34,638
Railroad, utilities and energy:*
Customer relationships and contracts
$
1,541
$
809
$
732
$
1,553
$
728
$
825
Other
442
134
308
437
126
311
$
1,983
$
943
$
1,040
$
1,990
$
854
$
1,136
——————
* Included in other assets.
Intangible
assets
with
indefinite
lives
were
$18.9
billion
as
of
December
31,
2025
and
December
31,
2024
and
primarily
related
to
certain
customer
relationships
and
trademarks
and
trade
names.
Intangible
asset
amortization
expense
was $1.7 billion in 2025 and $1.8 billion in 2024 and 2023. Estimated amortization expense over the next five years follows
(in billions): 2026 – $1.7; 2027 – $1.6; 2028 – $1.4; 2029 – $1.4 and 2030 – $1.3.
(14)
Supplemental cash flow information
A summary of suppl
u
emental cash flow information follows (in millions).
2025
2024
2023
Cash paid during the year for:
Income taxes
$
13,978
$
28,544
$
7,765
Interest:
Insurance and other
1,301
1,362
1,670
Railroad, utilities and energy
3,793
3,577
3,327
Non-cash investing and financing activities:
Liabilities assumed in connection with business acquisitions
28
22
10,938
Operating lease liabi
a
lities arising from obtaining right-of-use assets
1,640
2,007
1,645
Class B common stock issued in exchange for noncontrolling interests
—
1,045
—
(15)
Insurance subsidiary disclosures
Payments of dividends by our insurance subs
u
idiaries are restricted by insurance statut
t
es and regulations. Without prior
regulatory
r
approval,
our
principal
insurance
subs
u
idiaries
may
declare
up
to
approximately
$33
billion
as
ordinary
dividends
during
2026.
Investments
in
fixed
maturity
and
equity
securities
and
short-term
investments
on
deposit
with
U.S.
state
insurance
authorities
in
accordance
with
state
insurance
regulations
were
approximately
$5.5
billion
at
December
31,
2025
and $5.6 billion at December 31, 2024.
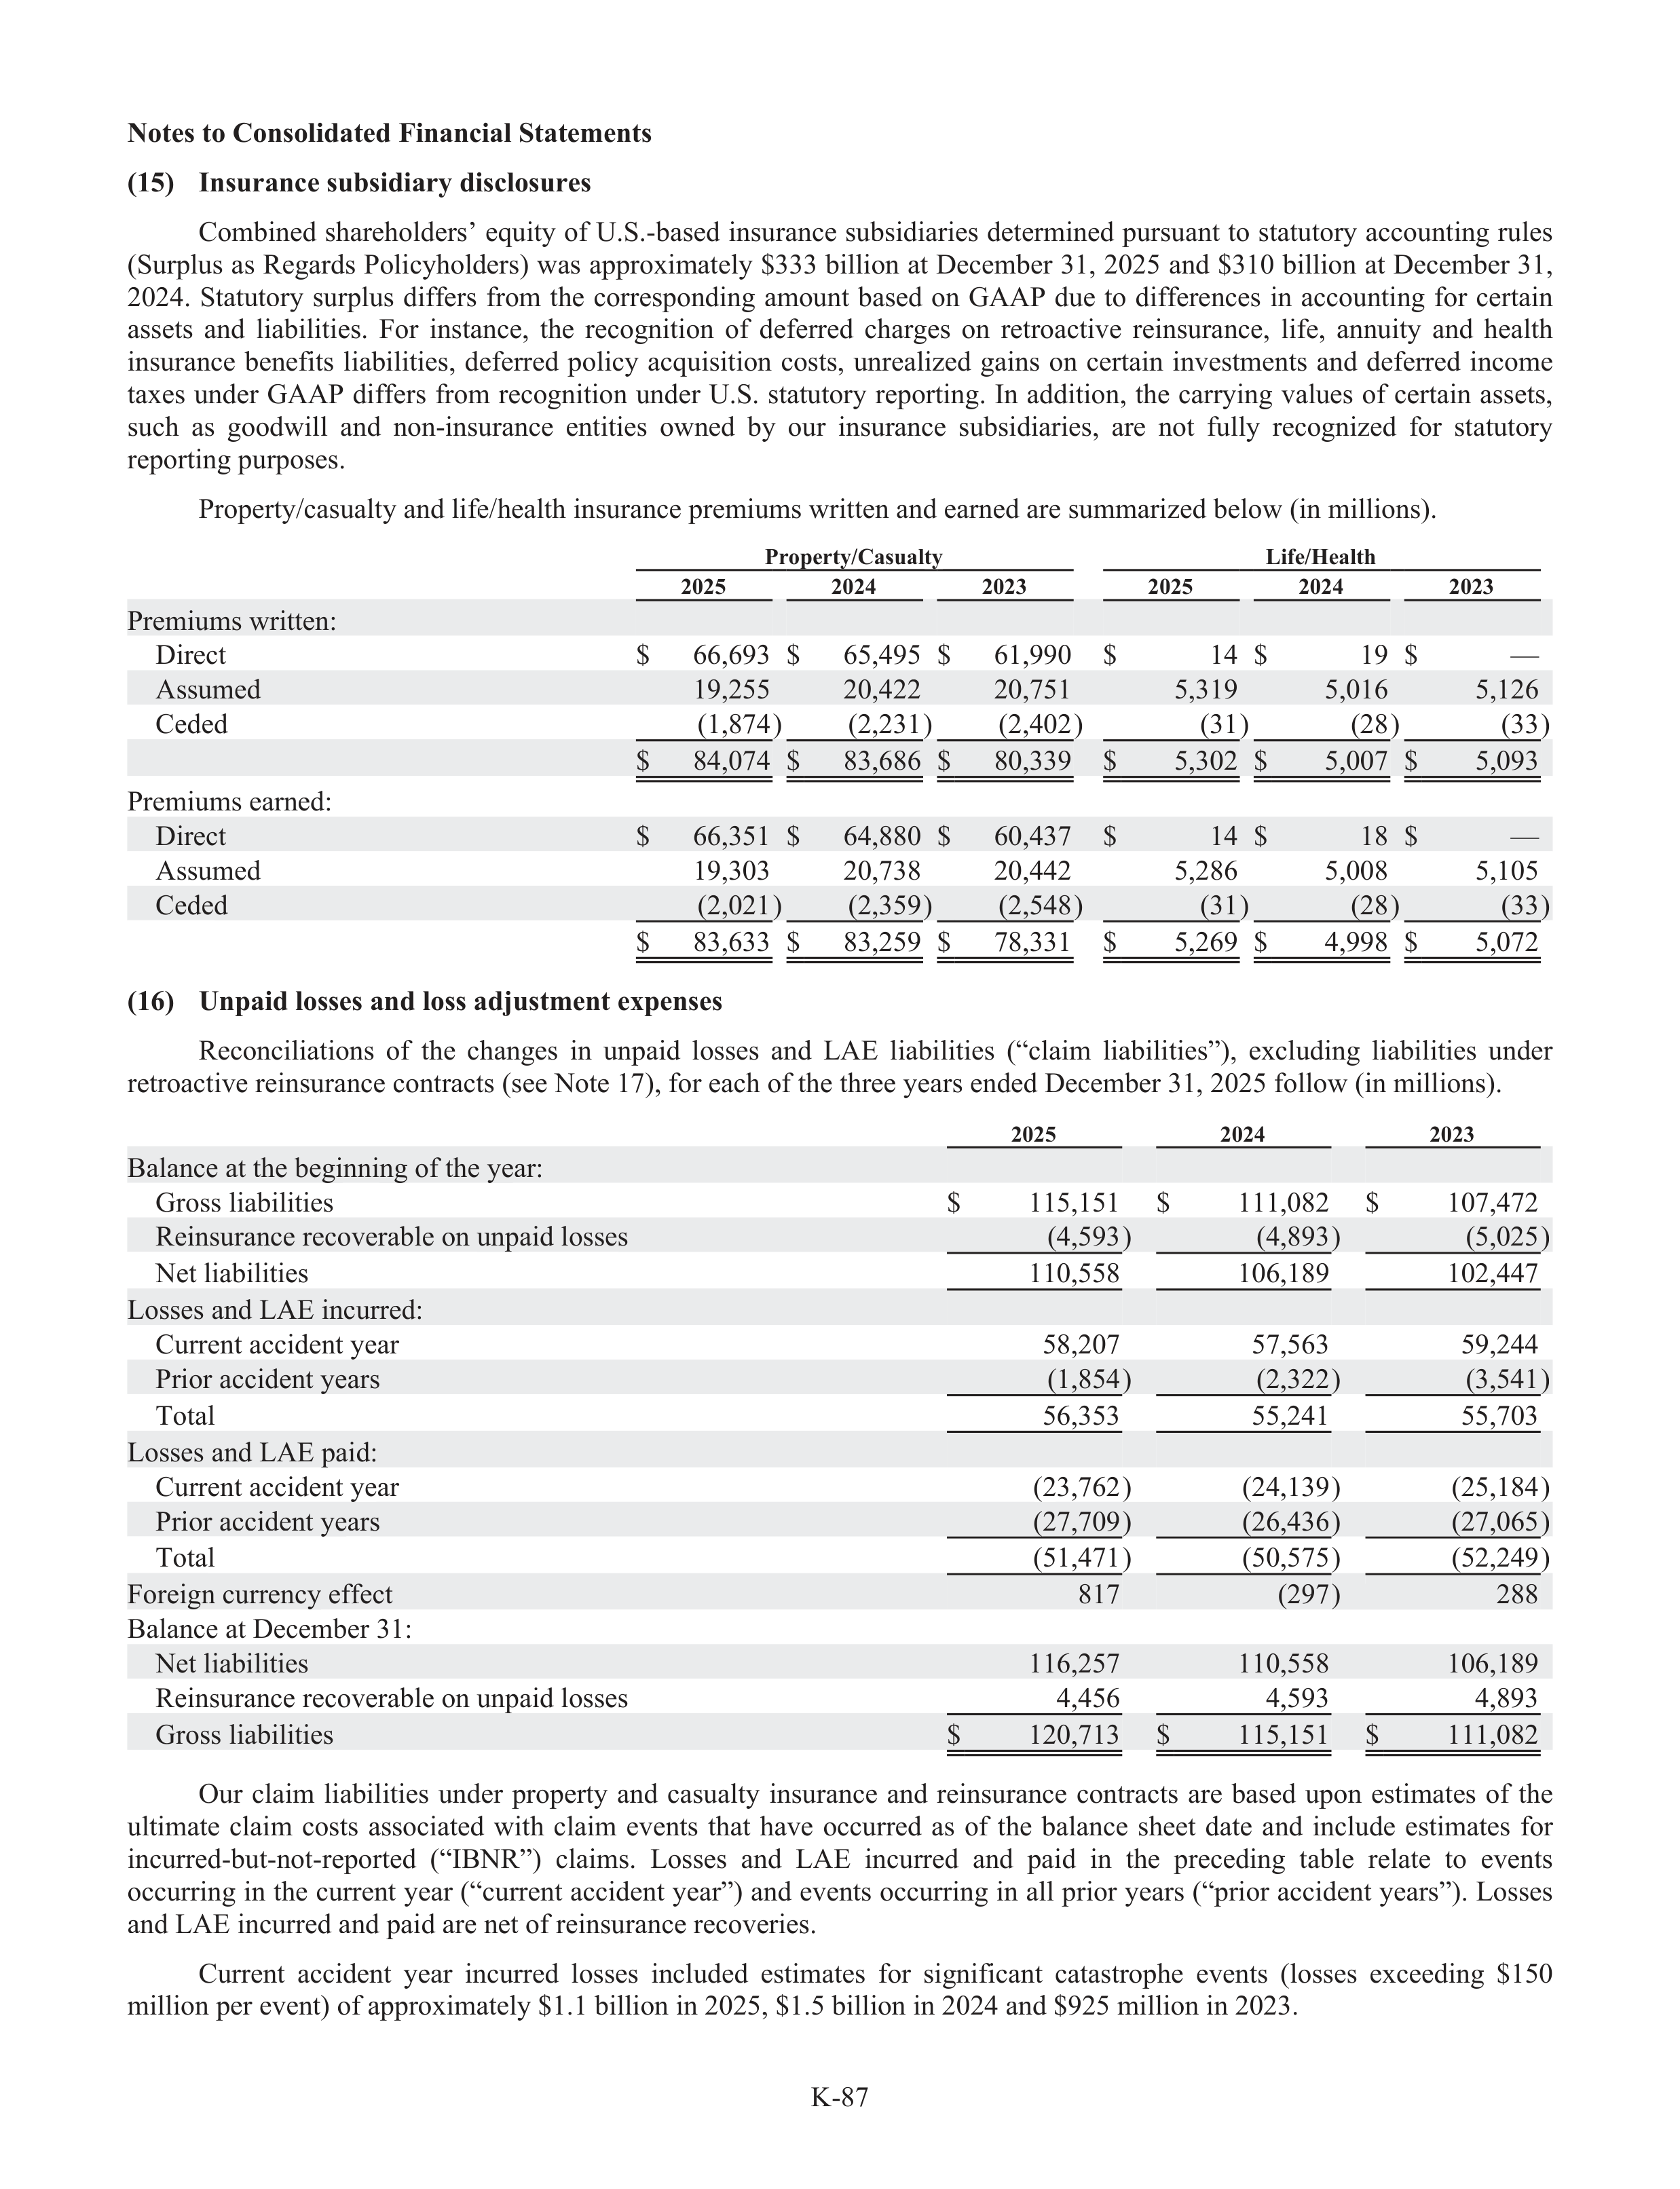
K-87
Notes to Consolidated Financial Statements
(15)
Insurance subsidiary disclosures
Combined shareholders’ equity of U.S.-based insurance subs
u
idiaries determined pursuant to statut
t
ory
r
accounting rules
(Surpl
r
us as Regards Policyholders) was approximately $333 billion at December 31, 2025 and $310 billion at December 31,
2024.
Statut
t
ory
r
surplus
differs
from
the
corresponding
amount
based
on
GAAP
due
to
differences
in
accounting
for
certain
assets
and
liabi
a
lities.
For
instance,
the
recognition
of
deferred
charges
on
retroactive
reinsurance,
life,
f
annuity
and
health
insurance
benefits
liabi
a
lities,
deferred
policy
acquisition
costs,
unrealized
gains
on
certain
investments
and
deferred
income
taxes
under
GAAP
differs
from
recognition
under
U.S.
statut
t
ory
r
reporting.
In
addition,
the
carrying
values
of
certain
assets,
such
as
goodwill
and
non-insurance
entities
owned
by
our
insurance
subs
u
idiaries,
are
not
fully
recognized
for
statut
t
ory
r
reporting purpos
r
es.
Property/casualty and life/
f
health insurance premiums written and earned are summarized below (in millions).
Property/Casualty
Life/Health
2025
2024
2023
2025
2024
2023
Premiums written:
Direct
$
66,693
$
65,495
$
61,990
$
14
$
19
$
—
Assumed
19,255
20,422
20,751
5,319
5,016
5,126
Ceded
(1,874)
(2,231)
(2,402)
(31)
(28)
(33)
$
84,074
$
83,686
$
80,339
$
5,302
$
5,007
$
5,093
Premiums earned:
Direct
$
66,351
$
64,880
$
60,437
$
14
$
18
$
—
Assumed
19,303
20,738
20,442
5,286
5,008
5,105
Ceded
(2,021)
(2,359)
(2,548)
(31)
(28)
(33)
$
83,633
$
83,259
$
78,331
$
5,269
$
4,998
$
5,072
(16)
Unpaid losses and loss adju
d
stment expenses
Reconciliations
of
the
changes
in
unpaid
losses
and
LAE
liabi
a
lities
(“claim
liabi
a
lities”),
excluding
liabi
a
lities
under
retroactive reinsurance contracts (see Note 17), for each of the three years ended December 31, 2025 follow (in millions).
2025
2024
2023
Balance at the beginning of the year:
Gross liabi
a
lities
$
115,151
$
111,082
$
107,472
Reinsurance recoverabl
a
e on unpaid losses
(4,593)
(4,893)
(5,025)
Net liabi
a
lities
110,558
106,189
102,447
Losses and LAE incurred:
Current accident year
58,207
57,563
59,244
Prior accident years
(1,854)
(2,322)
(3,541)
Total
56,353
55,241
55,703
Losses and LAE paid:
Current accident year
(23,762)
(24,139)
(25,184)
Prior accident years
(27,709)
(26,436)
(27,065)
Total
(51,471)
(50,575)
(52,249)
Foreign currency effe
f
ct
817
(297)
288
Balance at December 31:
Net liabi
a
lities
116,257
110,558
106,189
Reinsurance recoverabl
a
e on unpaid losses
4,456
4,593
4,893
Gross liabi
a
lities
$
120,713
$
115,151
$
111,082
Our
claim
liabilities
under
property
and
casualty
insurance
and
reinsurance
contracts
are
based
upon
estimates
of
the
ultimate
claim
costs
associated
with
claim
events
that
have
occurred
as
of
the
balance
sheet
date
and
include
estimates
for
incurred-but-not-reported
(“IBNR”)
claims.
Losses
and
LAE
incurred
and
paid
in
the
preceding
tabl
a
e
relate
to
events
occurring in the current year (“current accident year”) and events occurring in all prior years (“prior accident years”). Losses
and LAE incurred and paid are net of reinsurance recoveries.
Current
accident
year
incurred
losses
included
estimates
for
significant
catastrophe
events
(losses
exceeding
$150
million per event) of approximately $1.1 billion in 2025, $1.5 billion in 2024 and $925 million in 2023.
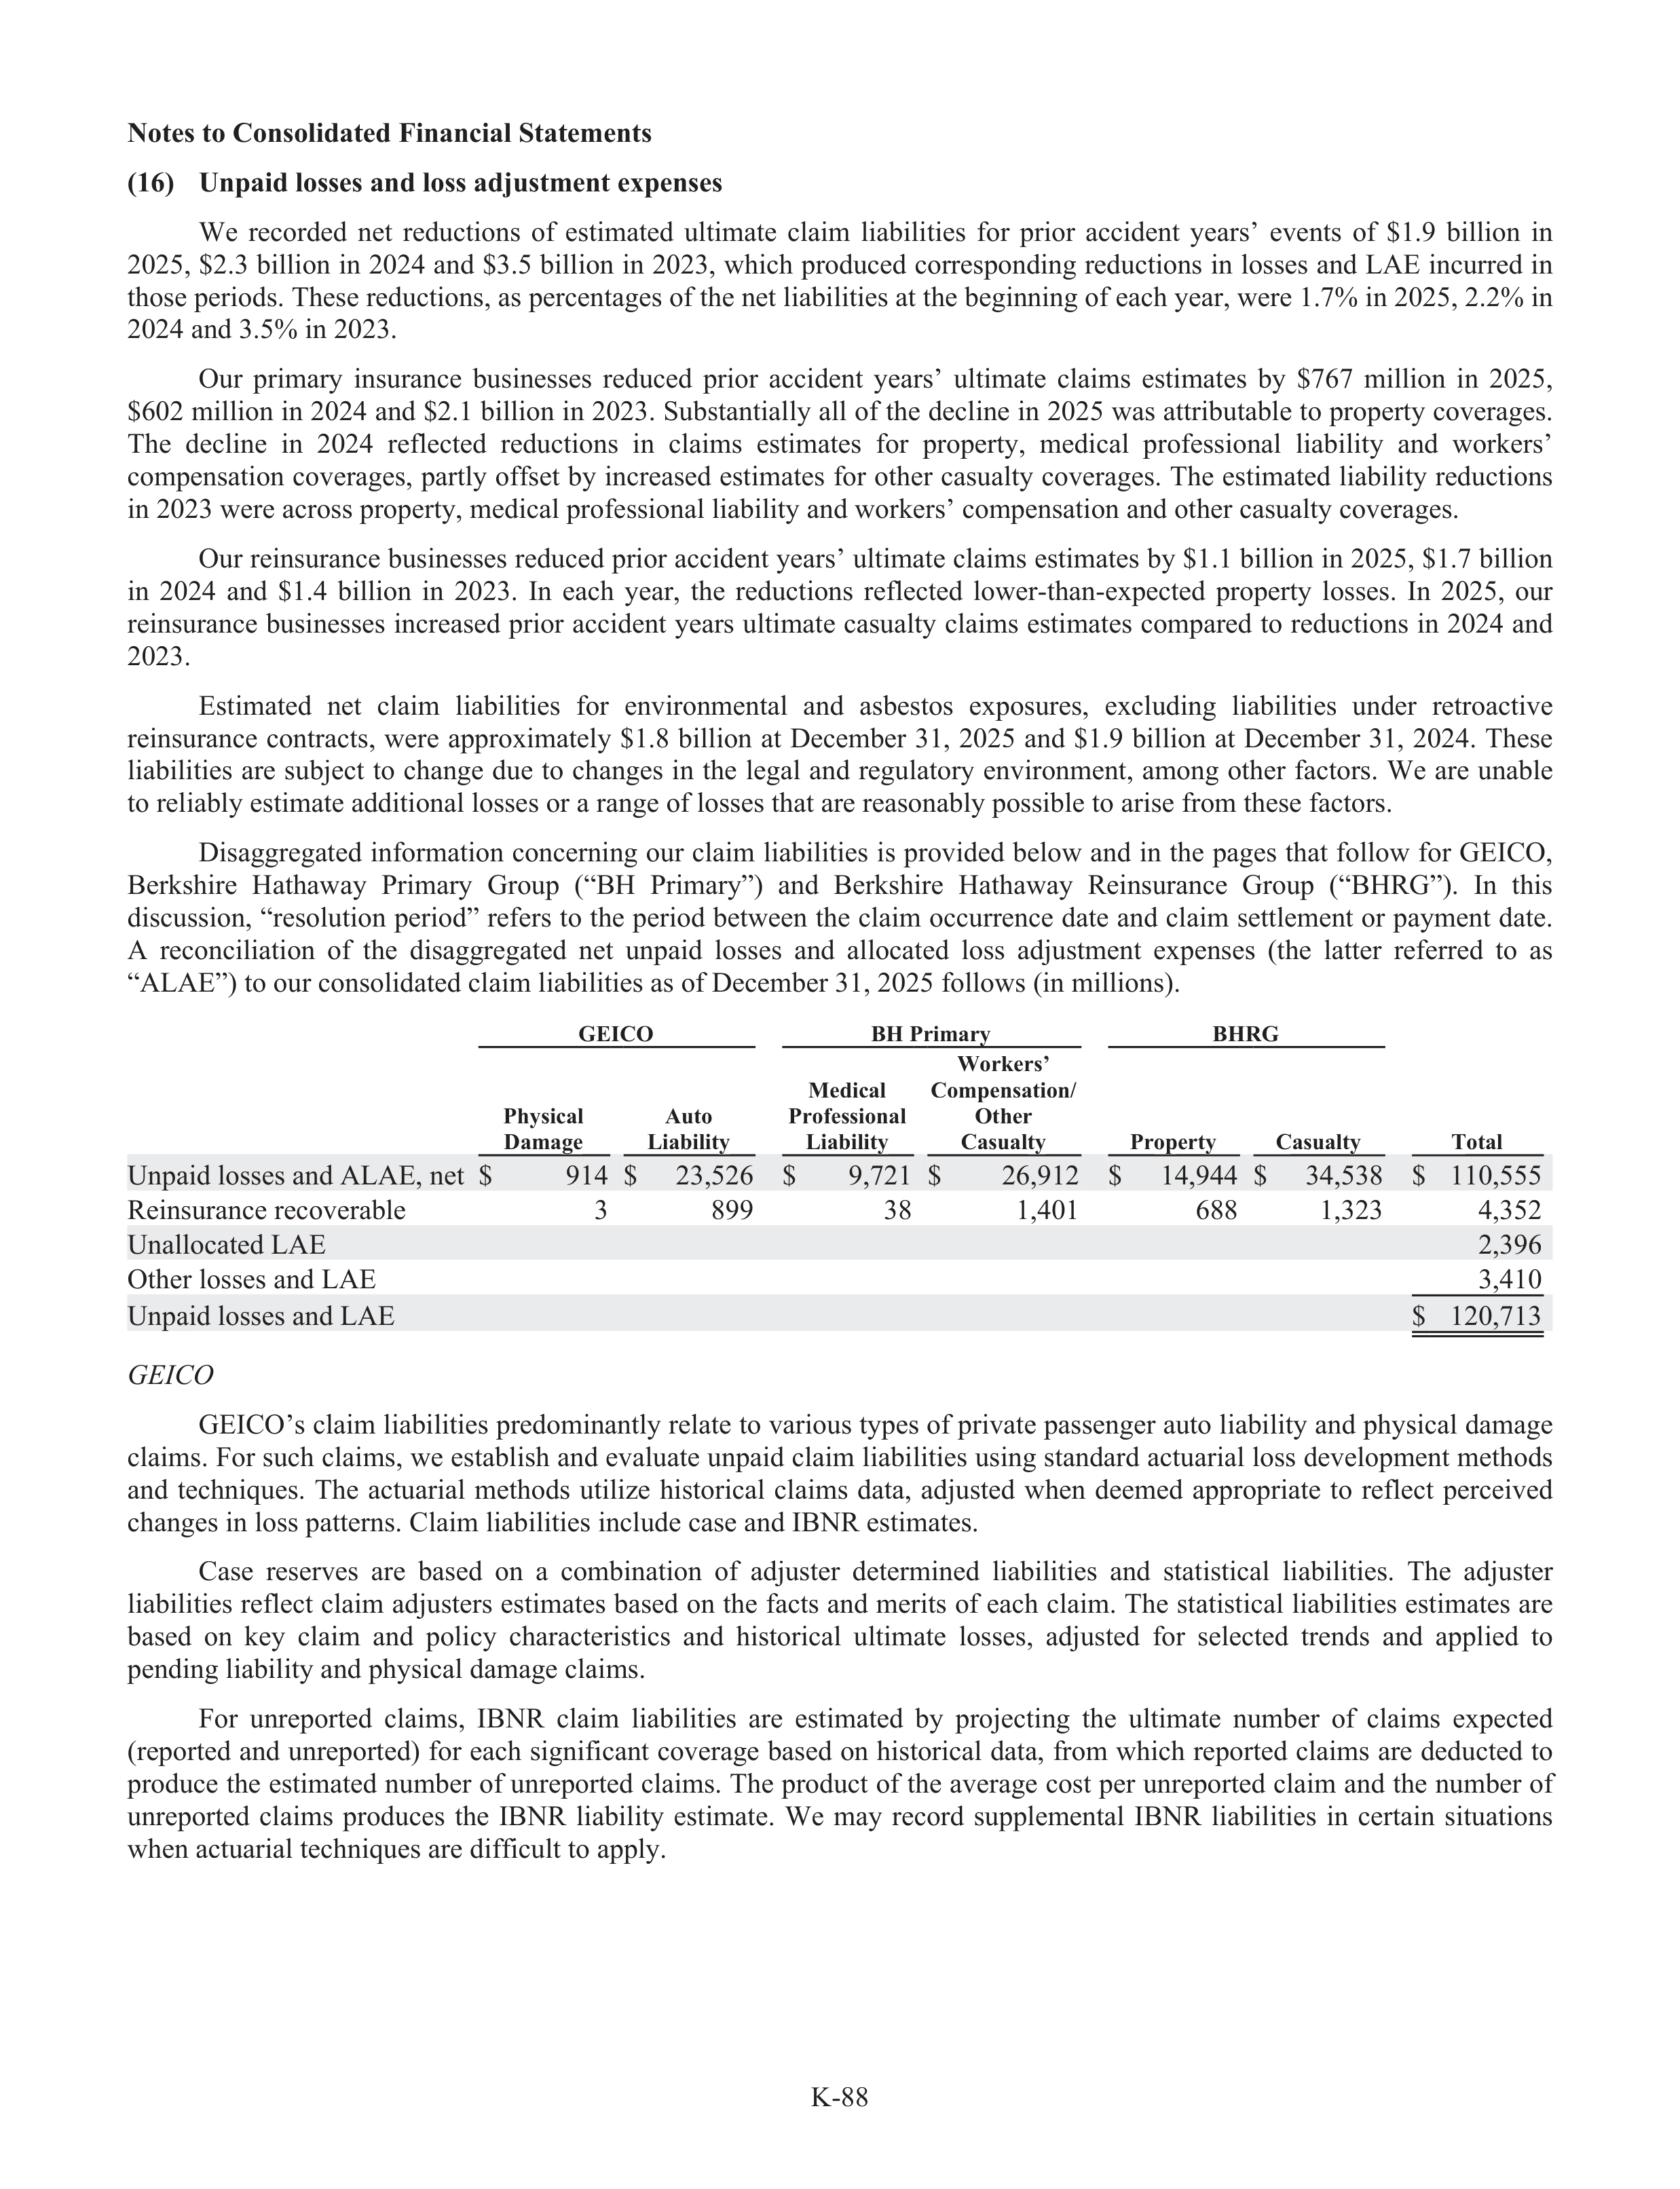
K-88
Notes to Consolidated Financial Statements
(16)
Unpaid losses and loss adju
d
stment expenses
We
recorded
net
reductions
of
estimated
ultimate
claim
liabi
a
lities
for
prior
accident
years’
events
of
$1.9
billion
in
2025, $2.3 billion in 2024 and $3.5 billion in 2023, which produced corresponding reductions in losses and LAE incurred in
those periods. These reductions, as percentages of the net liabi
a
lities at the beginning of each year, were 1.7% in 2025, 2.2% in
2024 and 3.5% in 2023.
Our
primary
insurance
businesses
reduced
prior
accident
years’
ultimate
claims
estimates
by
$767
million
in
2025,
$602 million in 2024 and $2.1 billion in 2023. Subs
u
tantially all of the decline in 2025 was attributable to property coverages.
The
decline
in
2024
reflected
reductions
in
claims
estimates
for
property,
medical
profes
f
sional
liabi
a
lity
and
workers’
compensation coverages, partly offs
f
et by increased estimates for other casualty coverages. The estimated liabi
a
lity reductions
in 2023 were across property, medical profes
f
sional liabi
a
lity and workers’ compensation and other casualty coverages.
Our reinsurance businesses reduced prior accident years’ ultimate claims estimates by $1.1 billion in 2025, $1.7 billion
in
2024
and
$1.4
billion
in
2023.
In
each
year,
the
reductions
reflected
lower-than-expected
property
losses.
In
2025,
our
reinsurance businesses increased prior accident years ultimate casualty claims estimates compared to reductions in 2024 and
2023.
Estimated
net
claim
liabi
a
lities
for
environmental
and
asbestos
exposures,
excluding
liabi
a
lities
under
retroactive
reinsurance
contracts,
were
approximately
$1.8
billion
at
December
31,
2025
and
$1.9
billion
at
December
31,
2024.
These
liabi
a
lities
are
subj
u
ect
to
change
due
to
changes
in
the
legal
and
regulatory
r
environment,
among
other
factors.
We
are
unabl
a
e
to reliabl
a
y estimate additional losses or a range of losses that are reasonabl
a
y possible to arise from these factors.
Disaggregated information concerning our claim liabi
a
lities is provided below and in the pages that follow for GEICO,
Berkshire
Hathaway
Primary
Group
(“BH
Primary”)
and
Berkshire
Hathaway
Reinsurance
Group
(“BHRG”).
In
this
discussion, “resolution period” refers to the period between the claim occurrence date and claim settlement or payment date.
A
reconciliation
of
the
disaggregated
net
unpaid
losses
and
allocated
loss
adju
d
stment
expenses
(the
latter
referred
to
as
“ALAE”) to our consolidated claim liabi
a
lities as of December 31, 2025 follows (in millions).
GEICO
BH Primary
BHRG
Physical
Damage
Auto
Liability
Medical
Profes
f
sional
Liability
Workers’
Compensation/
Other
Casualty
Property
Casualty
Total
Unpaid losses and ALAE, net
$
914
$
23,526
$
9,721
$
26,912
$
14,944
$
34,538
$
110,555
Reinsurance recoverabl
a
e
3
899
38
1,401
688
1,323
4,352
Unallocated LAE
2,396
Other losses and LAE
3,410
Unpaid losses and LAE
$
120,713
GEIC
E
O
GEICO’s claim liabi
a
lities predominantly relate to various types of private passenger auto liabi
a
lity and physical damage
claims. For such claims, we establ
a
ish and evaluate unpaid claim liabi
a
lities using standard actua
t
rial loss development methods
and
techniques.
The
actua
t
rial
methods
utilize
historical
claims
data,
adju
d
sted
when
deemed
appropriate
to
reflect
perceived
changes in loss patterns. Claim liabi
a
lities include case and IBNR estimates.
Case
reserves
are
based
on
a
combination
of
adju
d
ster
determined
liabi
a
lities
and
statistical
liabi
a
lities.
The
adju
d
ster
liabi
a
lities reflect claim adju
d
sters estimates based on the facts and merits of each claim. The statistical liabi
a
lities estimates are
based
on
key
claim
and
policy
characteristics
and
historical
ultimate
losses,
adju
d
sted
for
selected
trends
and
applied
to
pending liabi
a
lity and physical damage claims.
For
unreported
claims,
IBNR
claim
liabi
a
lities
are
estimated
by
projecting
the
ultimate
number
of
claims
expected
(reported and unreported) for each significant coverage based on historical data, from which reported claims are deducted to
produce the estimated number of unreported claims. The product of the average cost per unreported claim and the number of
unreported
claims
produces
the
IBNR
liabi
a
lity
estimate.
We
may
record
suppl
u
emental
IBNR
liabi
a
lities
in
certain
situations
when actua
t
rial techniques are difficult to apply.
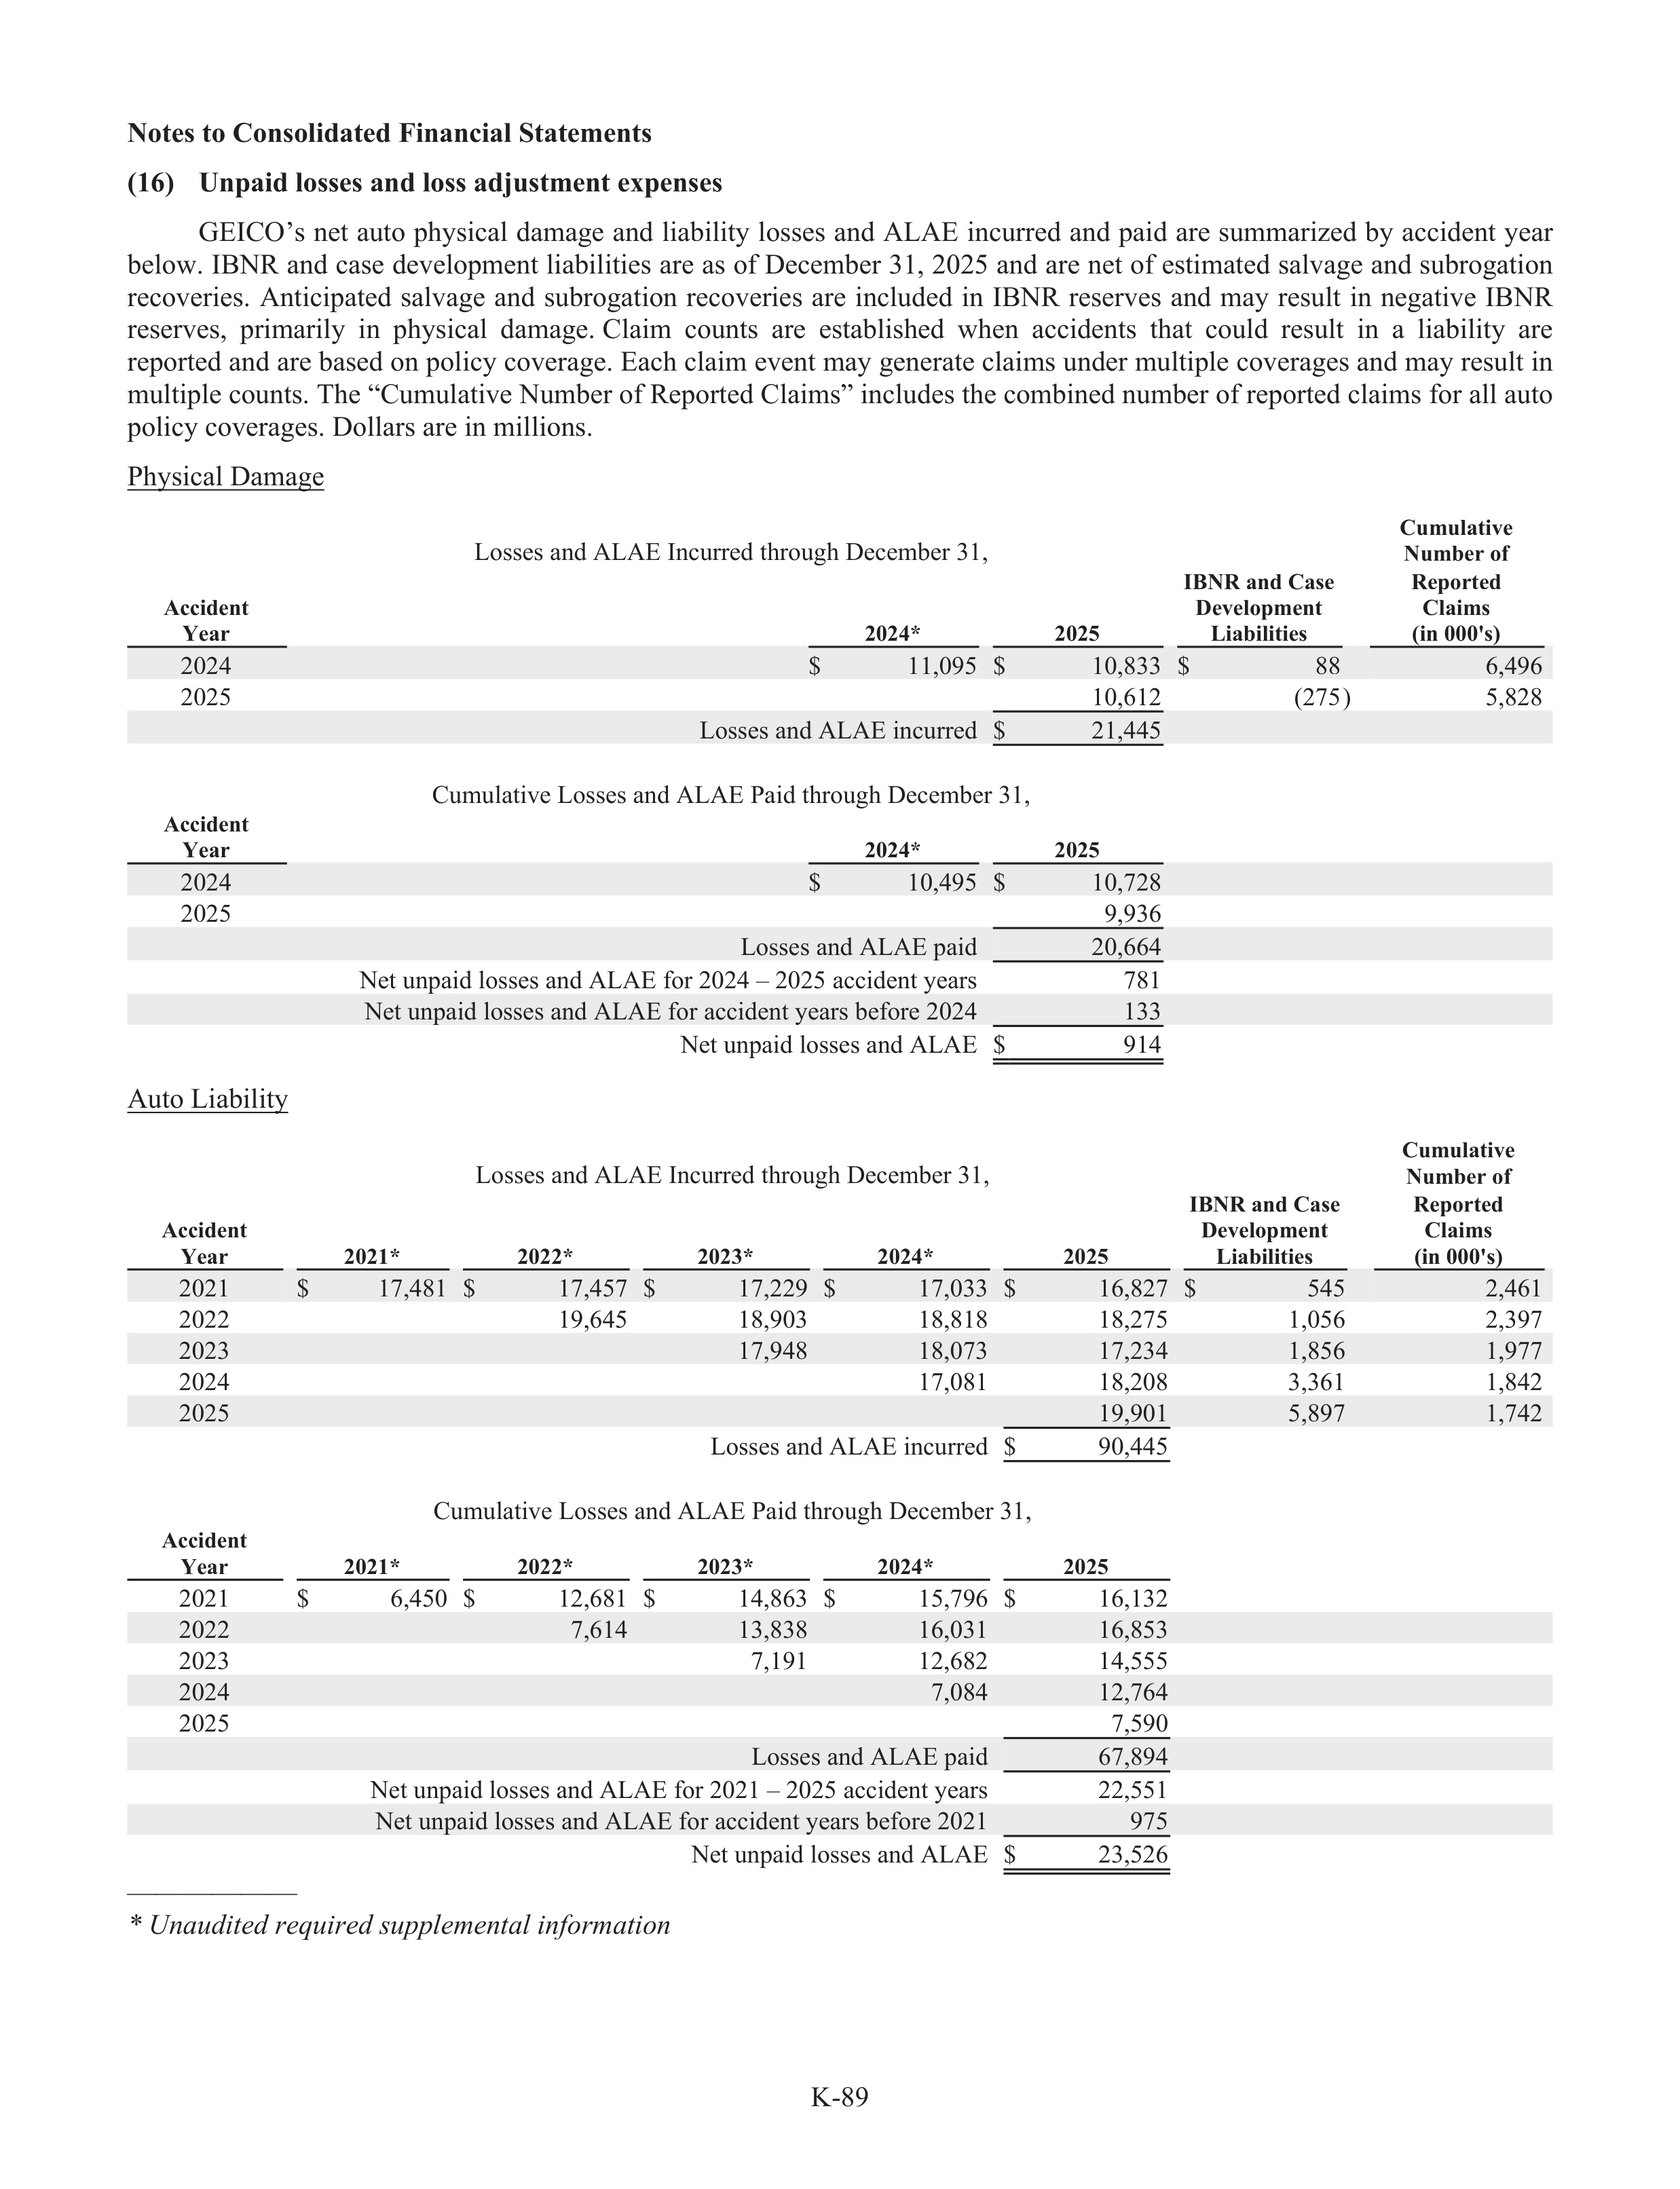
K-89
Notes to Consolidated Financial Statements
(16)
Unpaid losses and loss adju
d
stment expenses
GEICO’s net auto physical damage and liabi
a
lity losses and ALAE incurred and paid are summarized by accident year
below. IBNR and case development liabi
a
lities are as of December 31, 2025 and are net of estimated salvage and subr
u
ogation
recoveries.
Anticipated
salvage
and
subr
u
ogation
recoveries
are
included
in
IBNR
reserves
and
may
result
in
negative
IBNR
reserves,
primarily
in
physical
damage. Claim
counts
are
establ
a
ished
when
accidents
that
could
result
in
a
liability
are
reported and are based on policy coverage. Each claim event may generate claims under multiple coverages and may result in
multiple counts. The “Cumulative Number of Reported Claims” includes the combined number of reported claims for all auto
policy coverages. Dollars are in millions.
Physical Damage
Losses and ALAE Incurred through December 31,
Cumulative
Number of
Accident
Year
2024*
2025
IBNR and Case
Development
Liabilities
Reported
Claims
(in 000's)
2024
$
11,095
$
10,833
$
88
6,496
2025
10,612
(275)
5,828
Losses and ALAE incurred
$
21,445
Cumulative Losses and ALAE Paid through December 31,
Accident
Year
2024*
2025
2024
$
10,495
$
10,728
2025
9,936
Losses and ALAE paid
20,664
Net unpaid losses and ALAE for 2024 – 2025 accident years
781
Net unpaid losses and ALAE for accident years before 2024
133
Net unpaid losses and ALAE
$
914
Auto Liability
Losses and ALAE Incurred through December 31,
Cumulative
Number of
Accident
Year
2021*
2022*
2023*
2024*
2025
IBNR and Case
Development
Liabilities
Reported
Claims
(in 000's)
2021
$
17,481
$
17,457
$
17,229
$
17,033
$
16,827
$
545
2,461
2022
19,645
18,903
18,818
18,275
1,056
2,397
2023
17,948
18,073
17,234
1,856
1,977
2024
17,081
18,208
3,361
1,842
2025
19,901
5,897
1,742
Losses and ALAE incurred
$
90,445
Cumulative Losses and ALAE Paid through December 31,
Accident
Year
2021*
2022*
2023*
2024*
2025
2021
$
6,450
$
12,681
$
14,863
$
15,796
$
16,132
2022
7,614
13,838
16,031
16,853
2023
7,191
12,682
14,555
2024
7,084
12,764
2025
7,590
Losses and ALAE paid
67,894
Net unpaid losses and ALAE for 2021 – 2025 accident years
22,551
Net unpaid losses and ALAE for accident years before 2021
975
Net unpaid losses and ALAE
$
23,526
——————
* Unaudited required suppl
u
emental info
n
rmation
y
g
y
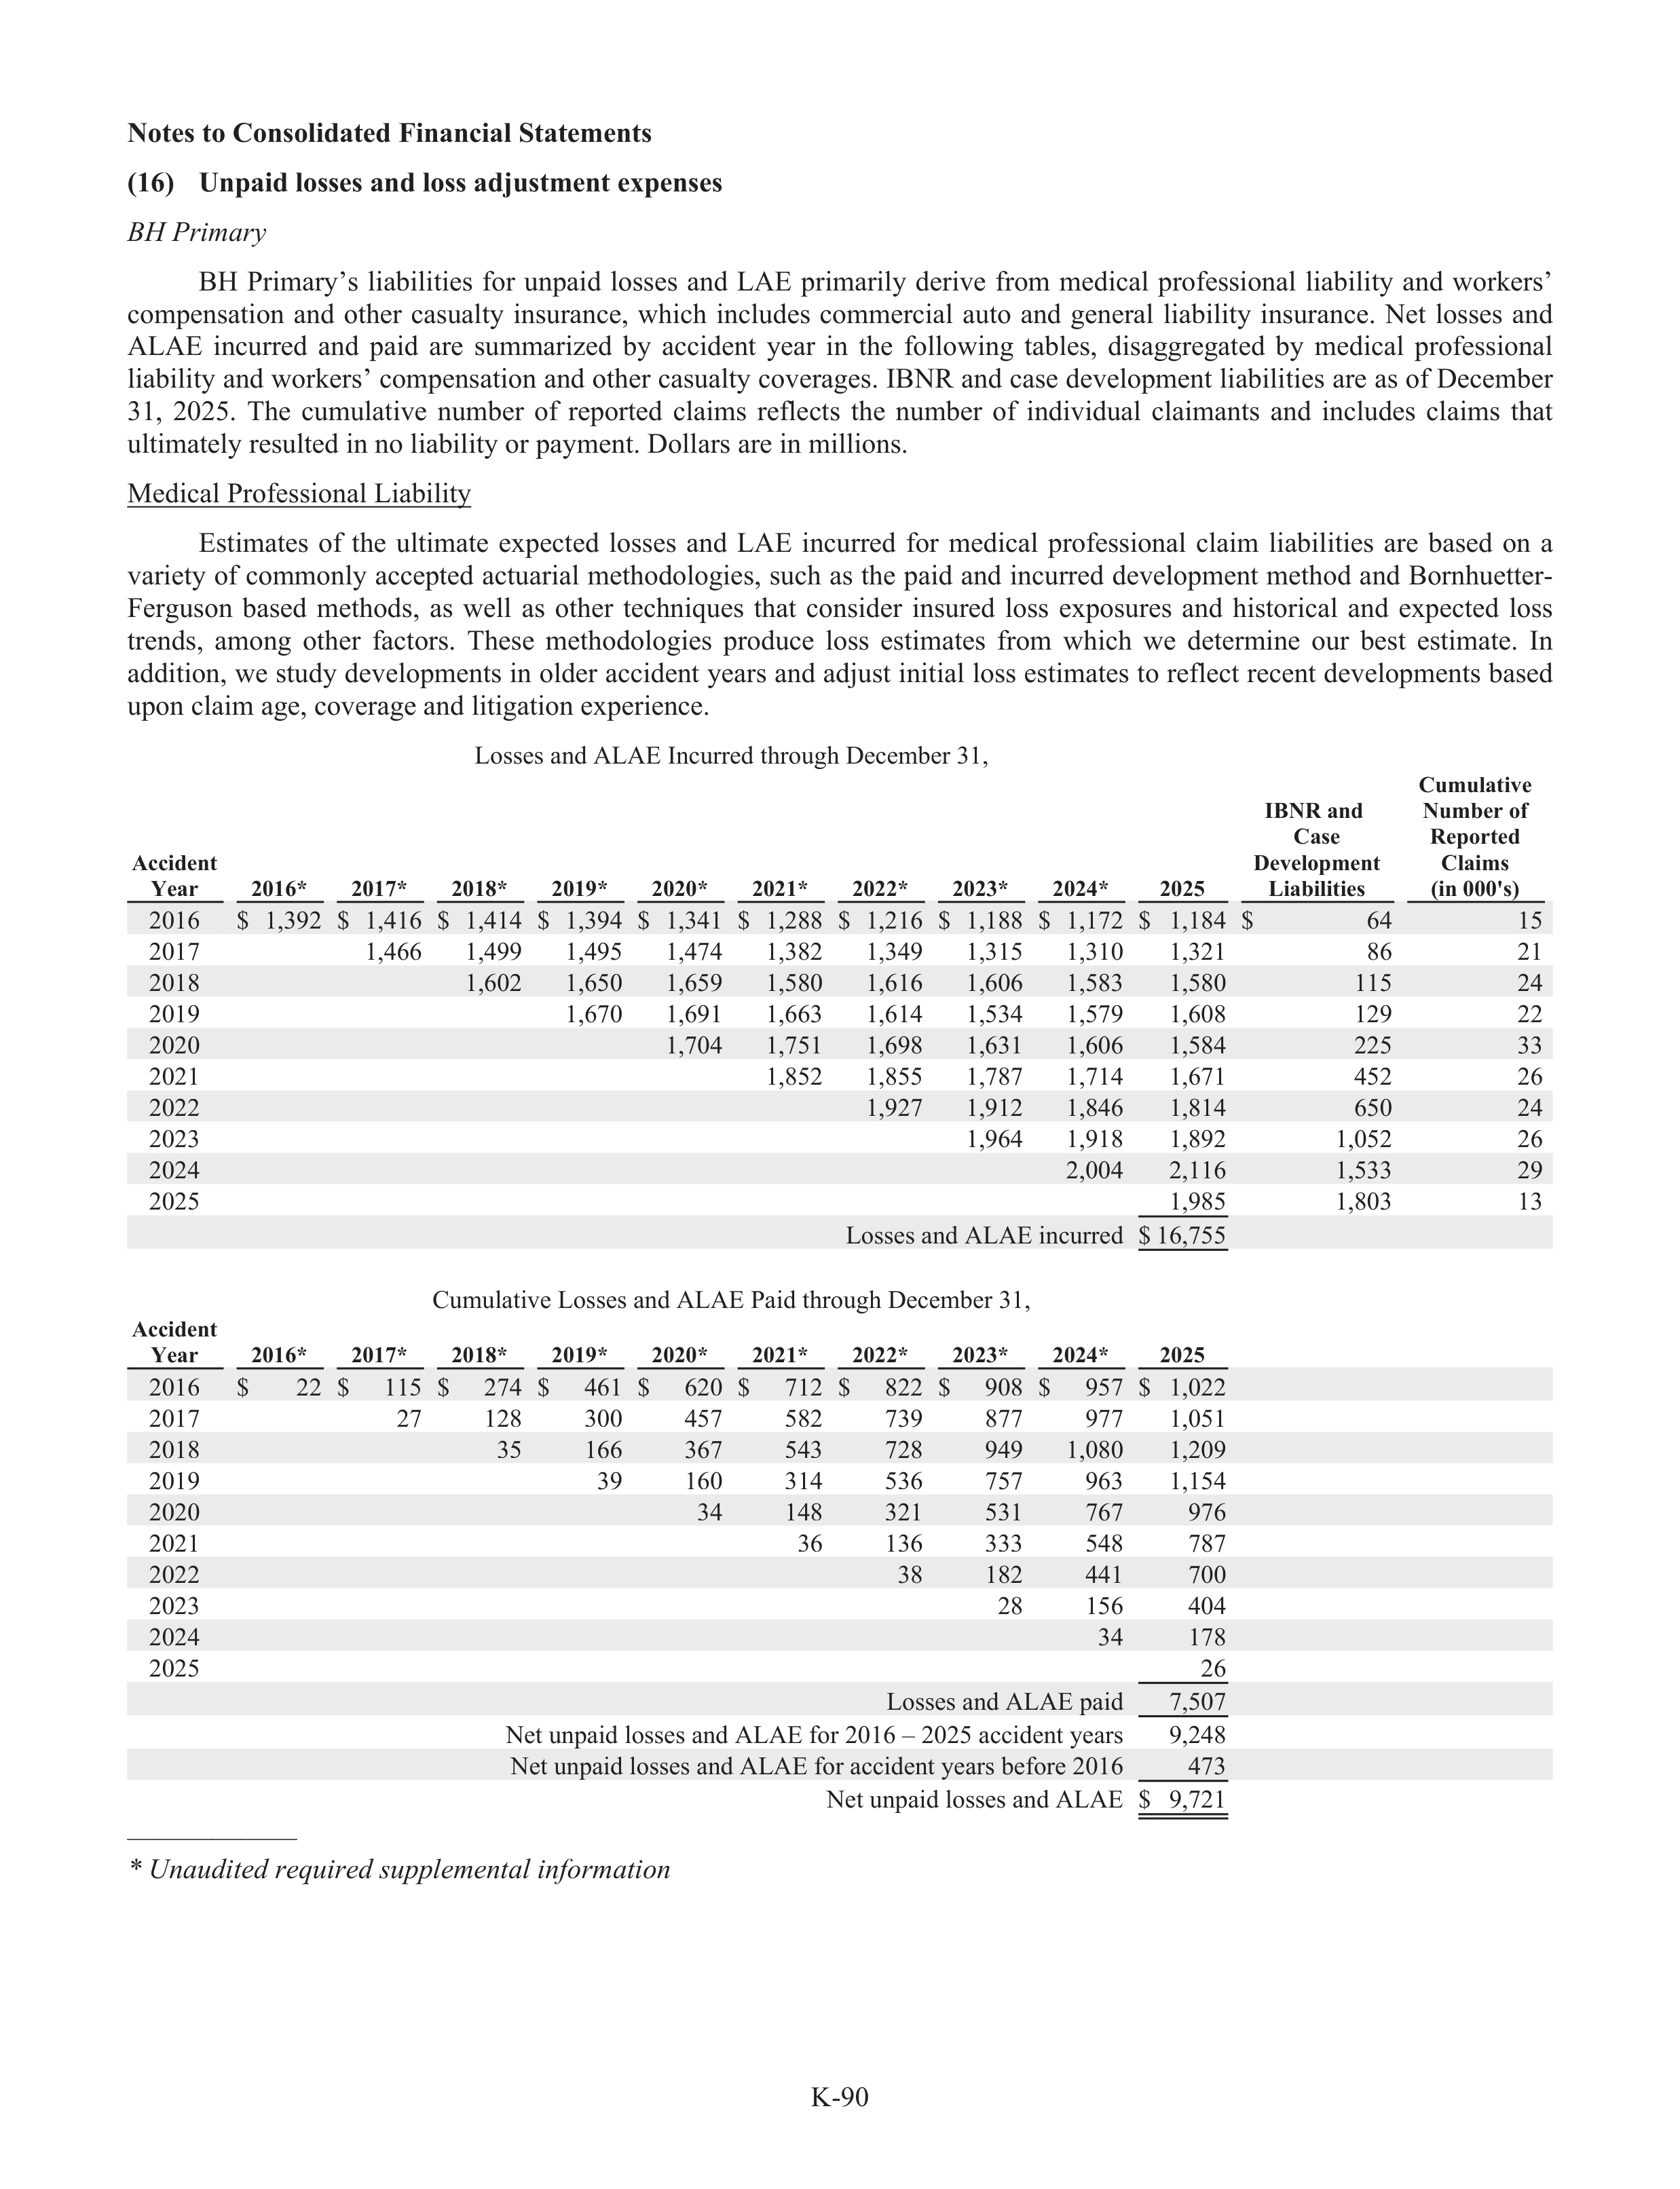
K-90
Notes to Consolidated Financial Statements
(16)
Unpaid losses and loss adju
d
stment expenses
BH Primary
r
BH
Primary’s
liabi
a
lities
for
unpaid
losses
and
LAE
primarily
derive
from
medical
profes
f
sional
liabi
a
lity
and
workers’
compensation
and
other
casualty
insurance,
which
includes
commercial
auto
and
general
liabi
a
lity
insurance.
Net
losses
and
ALAE
incurred
and
paid
are
summarized
by
accident
year
in
the
following
tabl
a
es,
disaggregated
by
medical
profes
f
sional
liabi
a
lity and workers’ compensation and other casualty coverages. IBNR and case development liabi
a
lities are as of December
31,
2025.
The
cumulative
number
of
reported
claims
reflects
the
number
of
individual
claimants
and
includes
claims
that
ultimately resulted in no liabi
a
lity or payment. Dollars are in millions.
Medical Profes
f
sional Liability
Estimates
of
the
ultimate
expected
losses
and
LAE
incurred
for
medical
profes
f
sional
claim
liabi
a
lities
are
based
on
a
variety of commonly accepted actua
t
rial methodologies, such as the paid and incurred development method and Bornhuetter-
Ferguson
based
methods,
as
well
as
other
techniques
that
consider
insured
loss
exposures
and
historical
and
expected
loss
trends,
among
other
factors.
These
methodologies
produc
d
e
loss
estimates
from
which
we
determine
our
best
estimate.
In
addition, we study
t
developments in older accident years and adju
d
st initial loss estimates to reflect recent developments based
upon claim age, coverage and litigation experience.
Losses and ALAE Incurred through December 31,
Accident
Year
2016*
2017*
2018*
2019*
2020*
2021*
2022*
2023*
2024*
2025
IBNR and
Case
Development
Liabilities
Cumulative
Number of
Reported
Claims
(in 000's)
2016
$
1,392
$
1,416
$
1,414
$
1,394
$
1,341
$
1,288
$
1,216
$
1,188
$
1,172
$
1,184
$
64
15
2017
1,466
1,499
1,495
1,474
1,382
1,349
1,315
1,310
1,321
86
21
2018
1,602
1,650
1,659
1,580
1,616
1,606
1,583
1,580
115
24
2019
1,670
1,691
1,663
1,614
1,534
1,579
1,608
129
22
2020
1,704
1,751
1,698
1,631
1,606
1,584
225
33
2021
1,852
1,855
1,787
1,714
1,671
452
26
2022
1,927
1,912
1,846
1,814
650
24
2023
1,964
1,918
1,892
1,052
26
2024
2,004
2,116
1,533
29
2025
1,985
1,803
13
Losses and ALAE incurred
$ 16,755
Cumulative Losses and ALAE Paid through December 31,
Accident
Year
2016*
2017*
2018*
2019*
2020*
2021*
2022*
2023*
2024*
2025
2016
$
22
$
115
$
274
$
461
$
620
$
712
$
822
$
908
$
957
$
1,022
2017
27
128
300
457
582
739
877
977
1,051
2018
35
166
367
543
728
949
1,080
1,209
2019
39
160
314
536
757
963
1,154
2020
34
148
321
531
767
976
2021
36
136
333
548
787
2022
38
182
441
700
2023
28
156
404
2024
34
178
2025
26
Losses and ALAE paid
7,507
Net unpaid losses and ALAE for 2016 – 2025 accident years
9,248
Net unpaid losses and ALAE for accident years before 2016
473
Net unpaid losses and ALAE
$
9,721
——————
* Unaudited required suppl
u
emental info
n
rmation
y
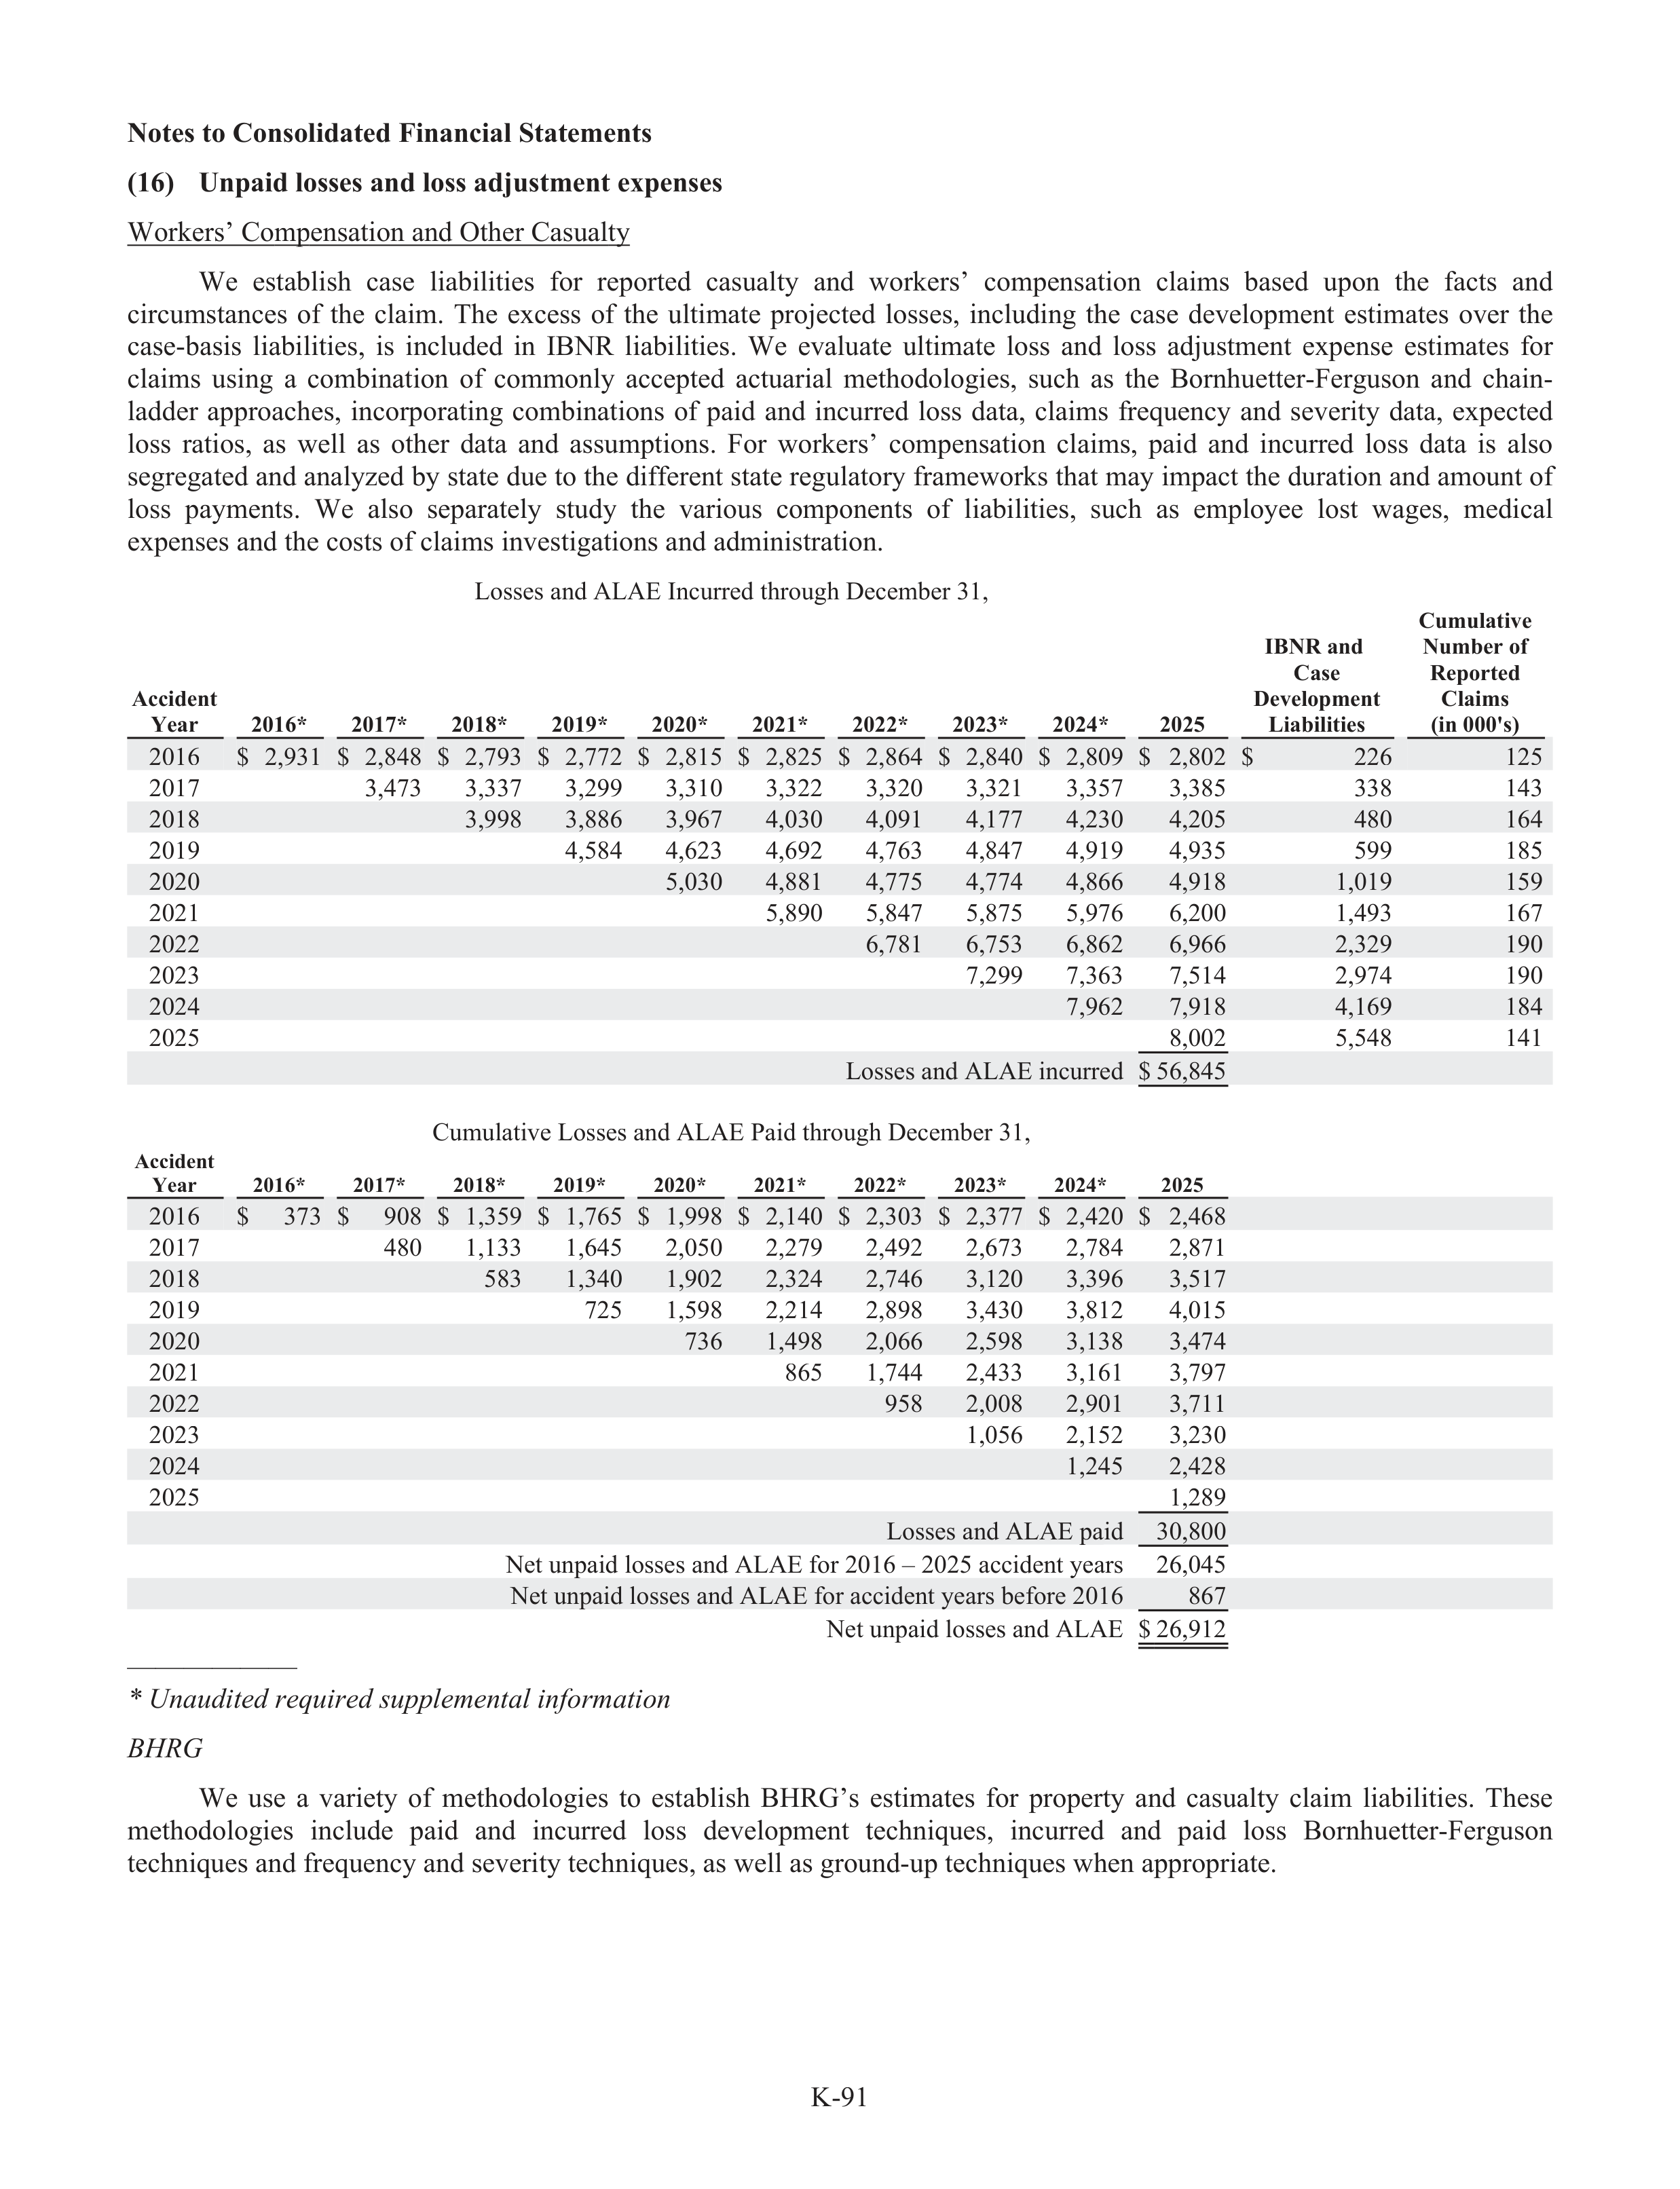
K-91
Notes to Consolidated Financial Statements
(16)
Unpaid losses and loss adju
d
stment expenses
Workers’ Compensation and Other Casualty
We
establ
a
ish
case
liabi
a
lities
for
reported
casualty
and
workers’
compensation
claims
based
upon
the
facts
and
circumstances
of
the
claim.
The
excess
of
the
ultimate
projected
losses,
including
the
case
development
estimates
over
the
case-basis
liabi
a
lities,
is
included
in
IBNR
liabi
a
lities.
We
evaluate
ultimate
loss
and
loss
adju
d
stment
expense
estimates
for
claims
using
a
combination
of
commonly
accepted
actua
t
rial
methodologies,
such
as
the
Bornhuetter-Ferguson
and
chain-
ladder
approaches,
incorporating
combinations
of
paid
and
incurred
loss
data,
claims
frequency
and
severity
data,
expected
loss
ratios,
as
well
as
other
data
and
assumptions.
For
workers’
compensation
claims,
paid
and
incurred
loss
data
is
also
segregated and analyzed by state due to the different state regulatory
r
frameworks that may impact the duration and amount of
loss
payments.
We
also
separately
study
t
the
various
components
of
liabi
a
lities,
such
as
employee
lost
wages,
medical
expenses and the costs of claims investigations and administration.
Losses and ALAE Incurred through December 31,
Accident
Year
2016*
2017*
2018*
2019*
2020*
2021*
2022*
2023*
2024*
2025
IBNR and
Case
Development
Liabilities
Cumulative
Number of
Reported
Claims
(in 000's)
2016
$
2,931
$
2,848
$
2,793
$
2,772
$
2,815
$
2,825
$
2,864
$
2,840
$
2,809
$
2,802
$
226
125
2017
3,473
3,337
3,299
3,310
3,322
3,320
3,321
3,357
3,385
338
143
2018
3,998
3,886
3,967
4,030
4,091
4,177
4,230
4,205
480
164
2019
4,584
4,623
4,692
4,763
4,847
4,919
4,935
599
185
2020
5,030
4,881
4,775
4,774
4,866
4,918
1,019
159
2021
5,890
5,847
5,875
5,976
6,200
1,493
167
2022
6,781
6,753
6,862
6,966
2,329
190
2023
7,299
7,363
7,514
2,974
190
2024
7,962
7,918
4,169
184
2025
8,002
5,548
141
Losses and ALAE incurred
$ 56,845
Cumulative Losses and ALAE Paid through December 31,
Accident
Year
2016*
2017*
2018*
2019*
2020*
2021*
2022*
2023*
2024*
2025
2016
$
373
$
908
$
1,359
$
1,765
$
1,998
$
2,140
$
2,303
$
2,377
$
2,420
$
2,468
2017
480
1,133
1,645
2,050
2,279
2,492
2,673
2,784
2,871
2018
583
1,340
1,902
2,324
2,746
3,120
3,396
3,517
2019
725
1,598
2,214
2,898
3,430
3,812
4,015
2020
736
1,498
2,066
2,598
3,138
3,474
2021
865
1,744
2,433
3,161
3,797
2022
958
2,008
2,901
3,711
2023
1,056
2,152
3,230
2024
1,245
2,428
2025
1,289
Losses and ALAE paid
30,800
Net unpaid losses and ALAE for 2016 – 2025 accident years
26,045
Net unpaid losses and ALAE for accident years before 2016
867
Net unpaid losses and ALAE
$ 26,912
——————
* Unaudited required suppl
u
emental info
n
rmation
BHRG
H
We
use
a
variety
of
methodologies
to
establ
a
ish
BHRG’s
estimates
for
property
and
casualty
claim
liabi
a
lities.
These
methodologies
include
paid
and
incurred
loss
development
techniques,
incurred
and
paid
loss
Bornhuetter-Ferguson
techniques and frequency and severity techniques, as well as ground-up techniques when appropriate.
p
y
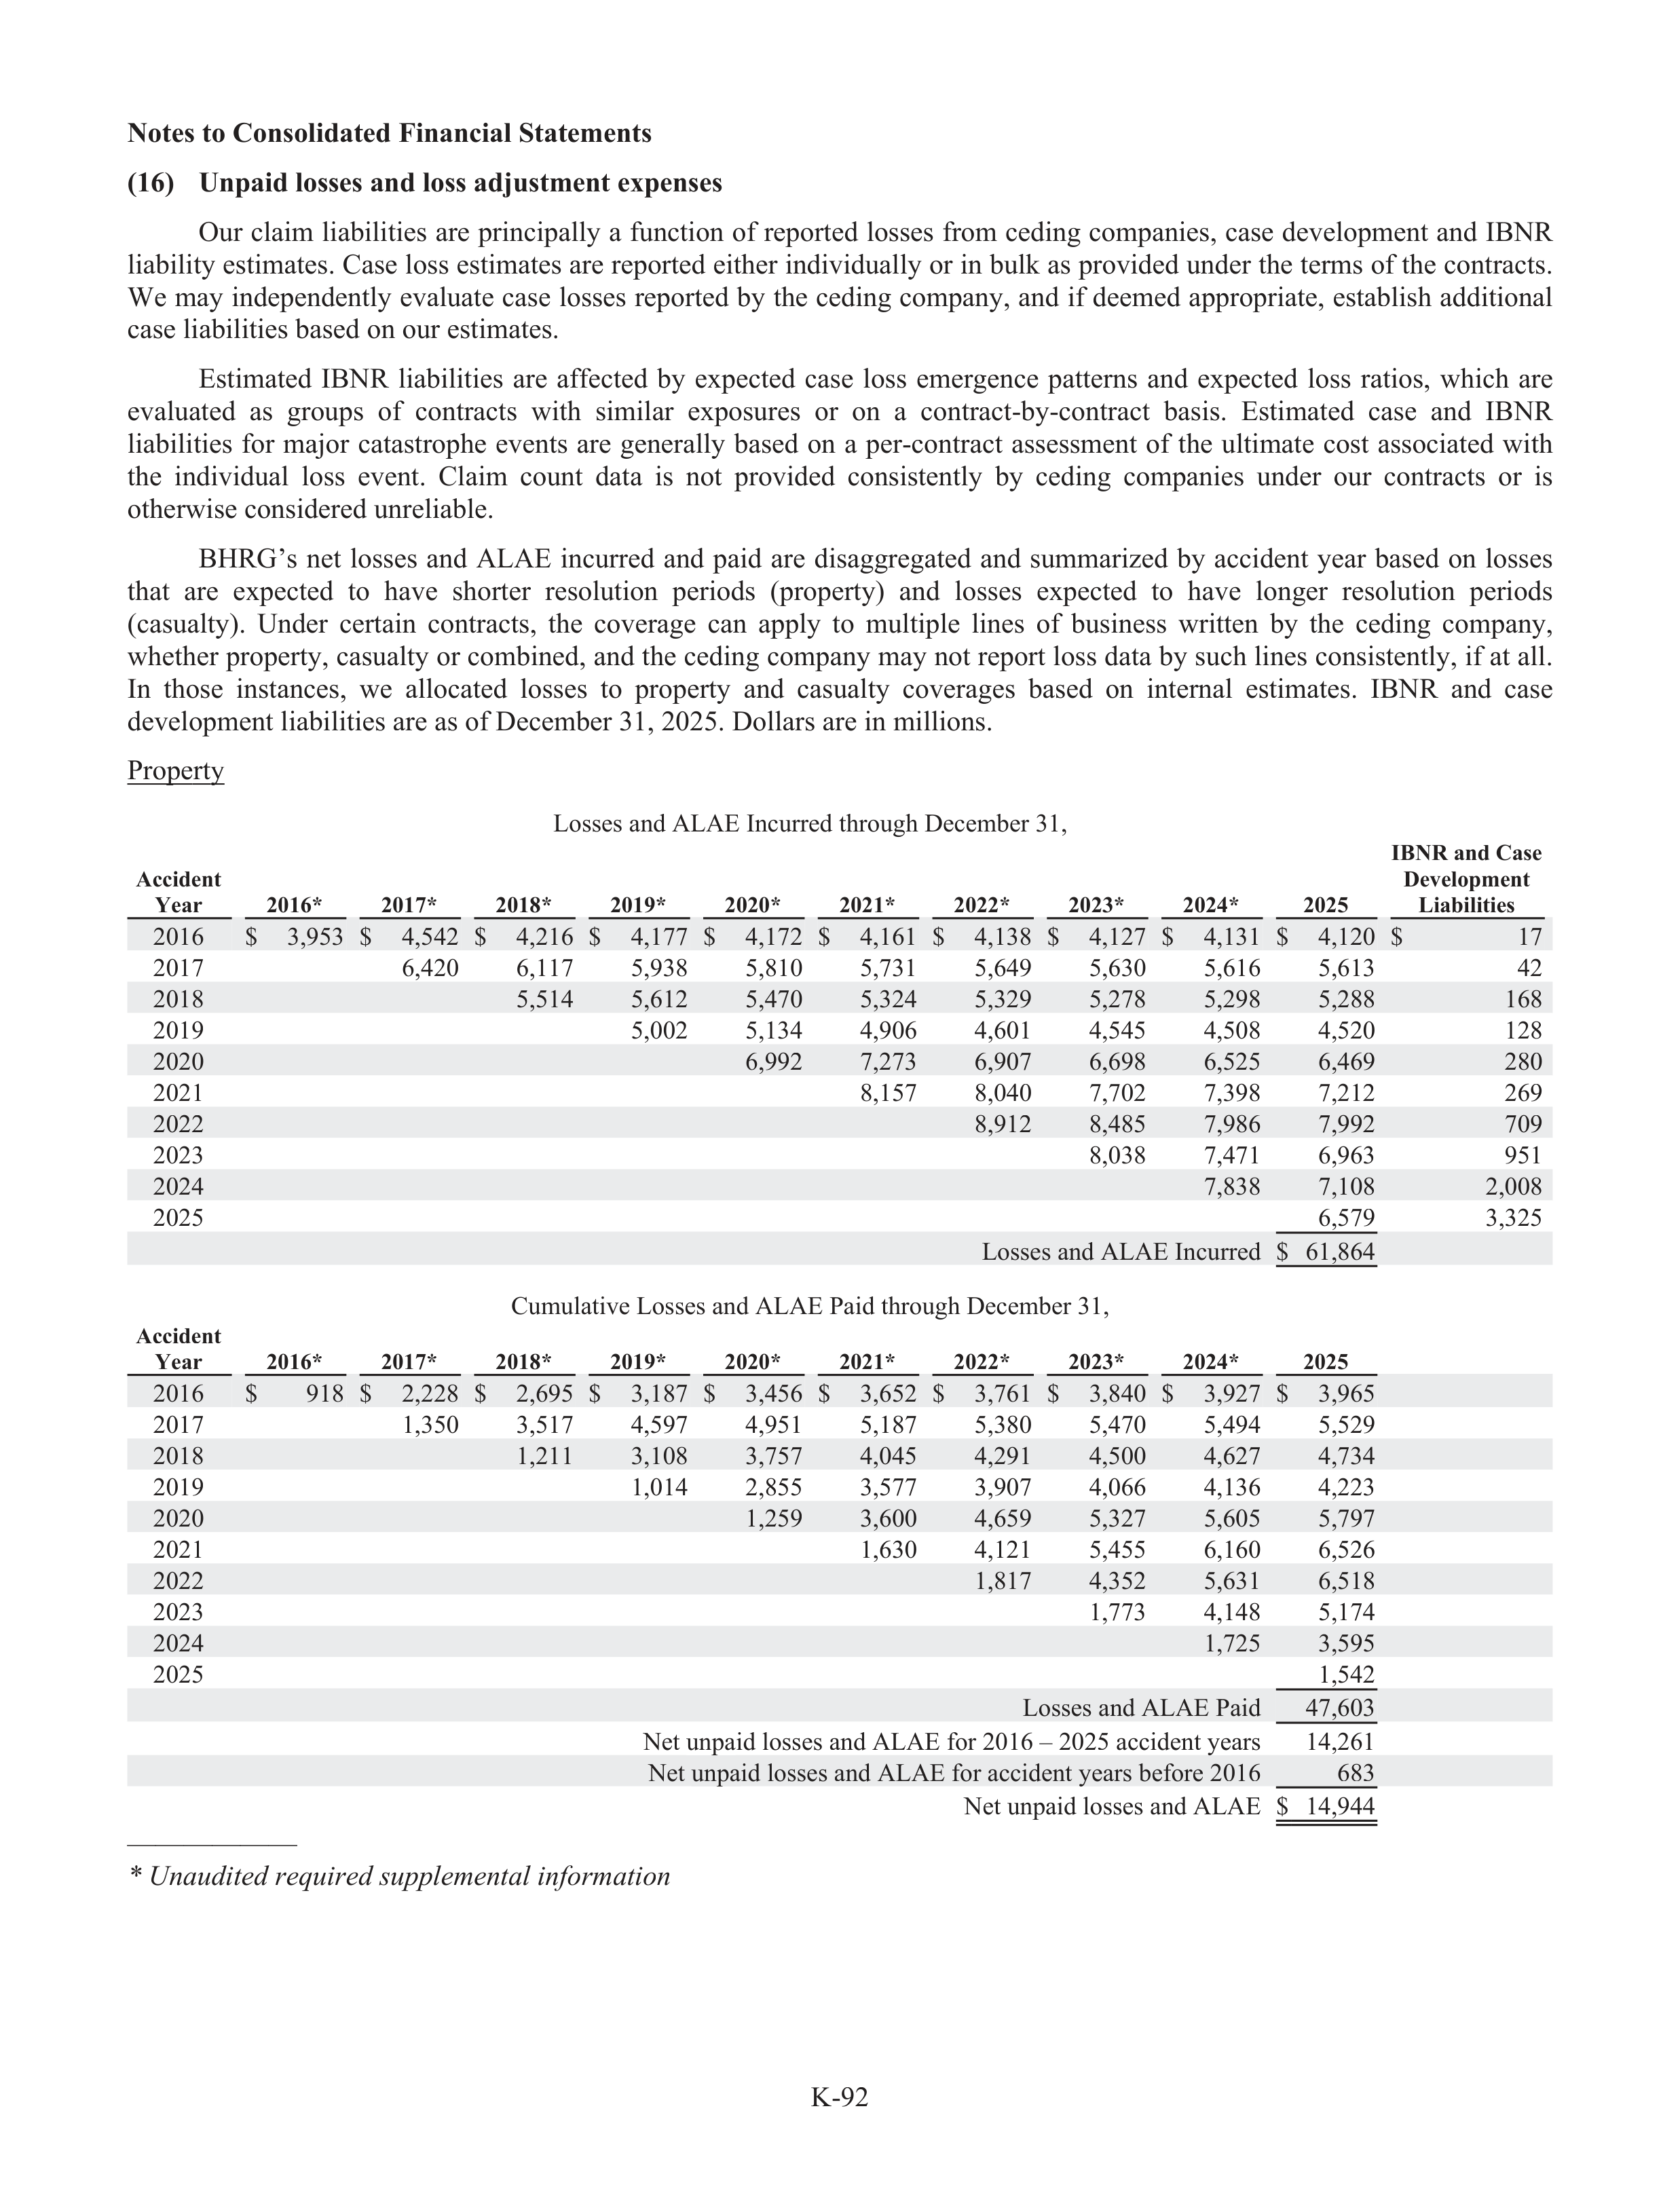
K-92
Notes to Consolidated Financial Statements
(16)
Unpaid losses and loss adju
d
stment expenses
Our claim liabi
a
lities are principally a function of reported losses from ceding companies, case development and IBNR
liabi
a
lity estimates. Case loss estimates are reported either individually or in bulk as provided under the terms of the contracts.
We may independently evaluate case losses reported by the ceding company, and if deemed appropriate, establ
a
ish additional
case liabi
a
lities based on our estimates.
Estimated
IBNR
liabi
a
lities
are
affe
f
cted
by
expected
case
loss
emergence
patterns
and
expected
loss
ratios,
which
are
evaluated
as
groups
of
contracts
with
similar
exposures
or
on
a
contract-by-contract
basis.
Estimated
case
and
IBNR
liabi
a
lities
for
majo
a
r
catastrophe
events
are
generally
based
on
a
per-contract
assessment
of
the
ultimate
cost
associated
with
the
individual
loss
event.
Claim
count
data
is
not
provided
consistently
by
ceding
companies
under
our
contracts
or
is
otherwise considered unreliabl
a
e.
BHRG’s
net
losses
and
ALAE
incurred
and
paid
are
disaggregated
and
summarized
by
accident
year
based
on
losses
that
are
expected
to
have
shorter
resolution
periods
(property)
and
losses
expected
to
have
longer
resolution
periods
(casualty).
Under
certain
contracts,
the
coverage
can
apply
to
multiple
lines
of
business
written
by
the
ceding
company,
whether property, casualty or combined, and the ceding company may not report loss data by such lines consistently, if at all.
In
those
instances,
we
allocated
losses
to
property
and
casualty
coverages
based
on
internal
estimates.
IBNR
and
case
development liabi
a
lities are as of December 31, 2025. Dollars are in millions.
Property
Losses and ALAE Incurred through December 31,
Accident
Year
2016*
2017*
2018*
2019*
2020*
2021*
2022*
2023*
2024*
2025
IBNR and Case
Development
Liabilities
2016
$
3,953
$
4,542
$
4,216
$
4,177
$
4,172
$
4,161
$
4,138
$
4,127
$
4,131
$
4,120
$
17
2017
6,420
6,117
5,938
5,810
5,731
5,649
5,630
5,616
5,613
42
2018
5,514
5,612
5,470
5,324
5,329
5,278
5,298
5,288
168
2019
5,002
5,134
4,906
4,601
4,545
4,508
4,520
128
2020
6,992
7,273
6,907
6,698
6,525
6,469
280
2021
8,157
8,040
7,702
7,398
7,212
269
2022
8,912
8,485
7,986
7,992
709
2023
8,038
7,471
6,963
951
2024
7,838
7,108
2,008
2025
6,579
3,325
Losses and ALAE Incurred
$
61,864
Cumulative Losses and ALAE Paid through December 31,
Accident
Year
2016*
2017*
2018*
2019*
2020*
2021*
2022*
2023*
2024*
2025
2016
$
918
$
2,228
$
2,695
$
3,187
$
3,456
$
3,652
$
3,761
$
3,840
$
3,927
$
3,965
2017
1,350
3,517
4,597
4,951
5,187
5,380
5,470
5,494
5,529
2018
1,211
3,108
3,757
4,045
4,291
4,500
4,627
4,734
2019
1,014
2,855
3,577
3,907
4,066
4,136
4,223
2020
1,259
3,600
4,659
5,327
5,605
5,797
2021
1,630
4,121
5,455
6,160
6,526
2022
1,817
4,352
5,631
6,518
2023
1,773
4,148
5,174
2024
1,725
3,595
2025
1,542
Losses and ALAE Paid
47,603
Net unpaid losses and ALAE for 2016 – 2025 accident years
14,261
Net unpaid losses and ALAE for accident years before 2016
683
Net unpaid losses and ALAE
$
14,944
——————
* Unaudited required suppl
u
emental info
n
rmation
p
y
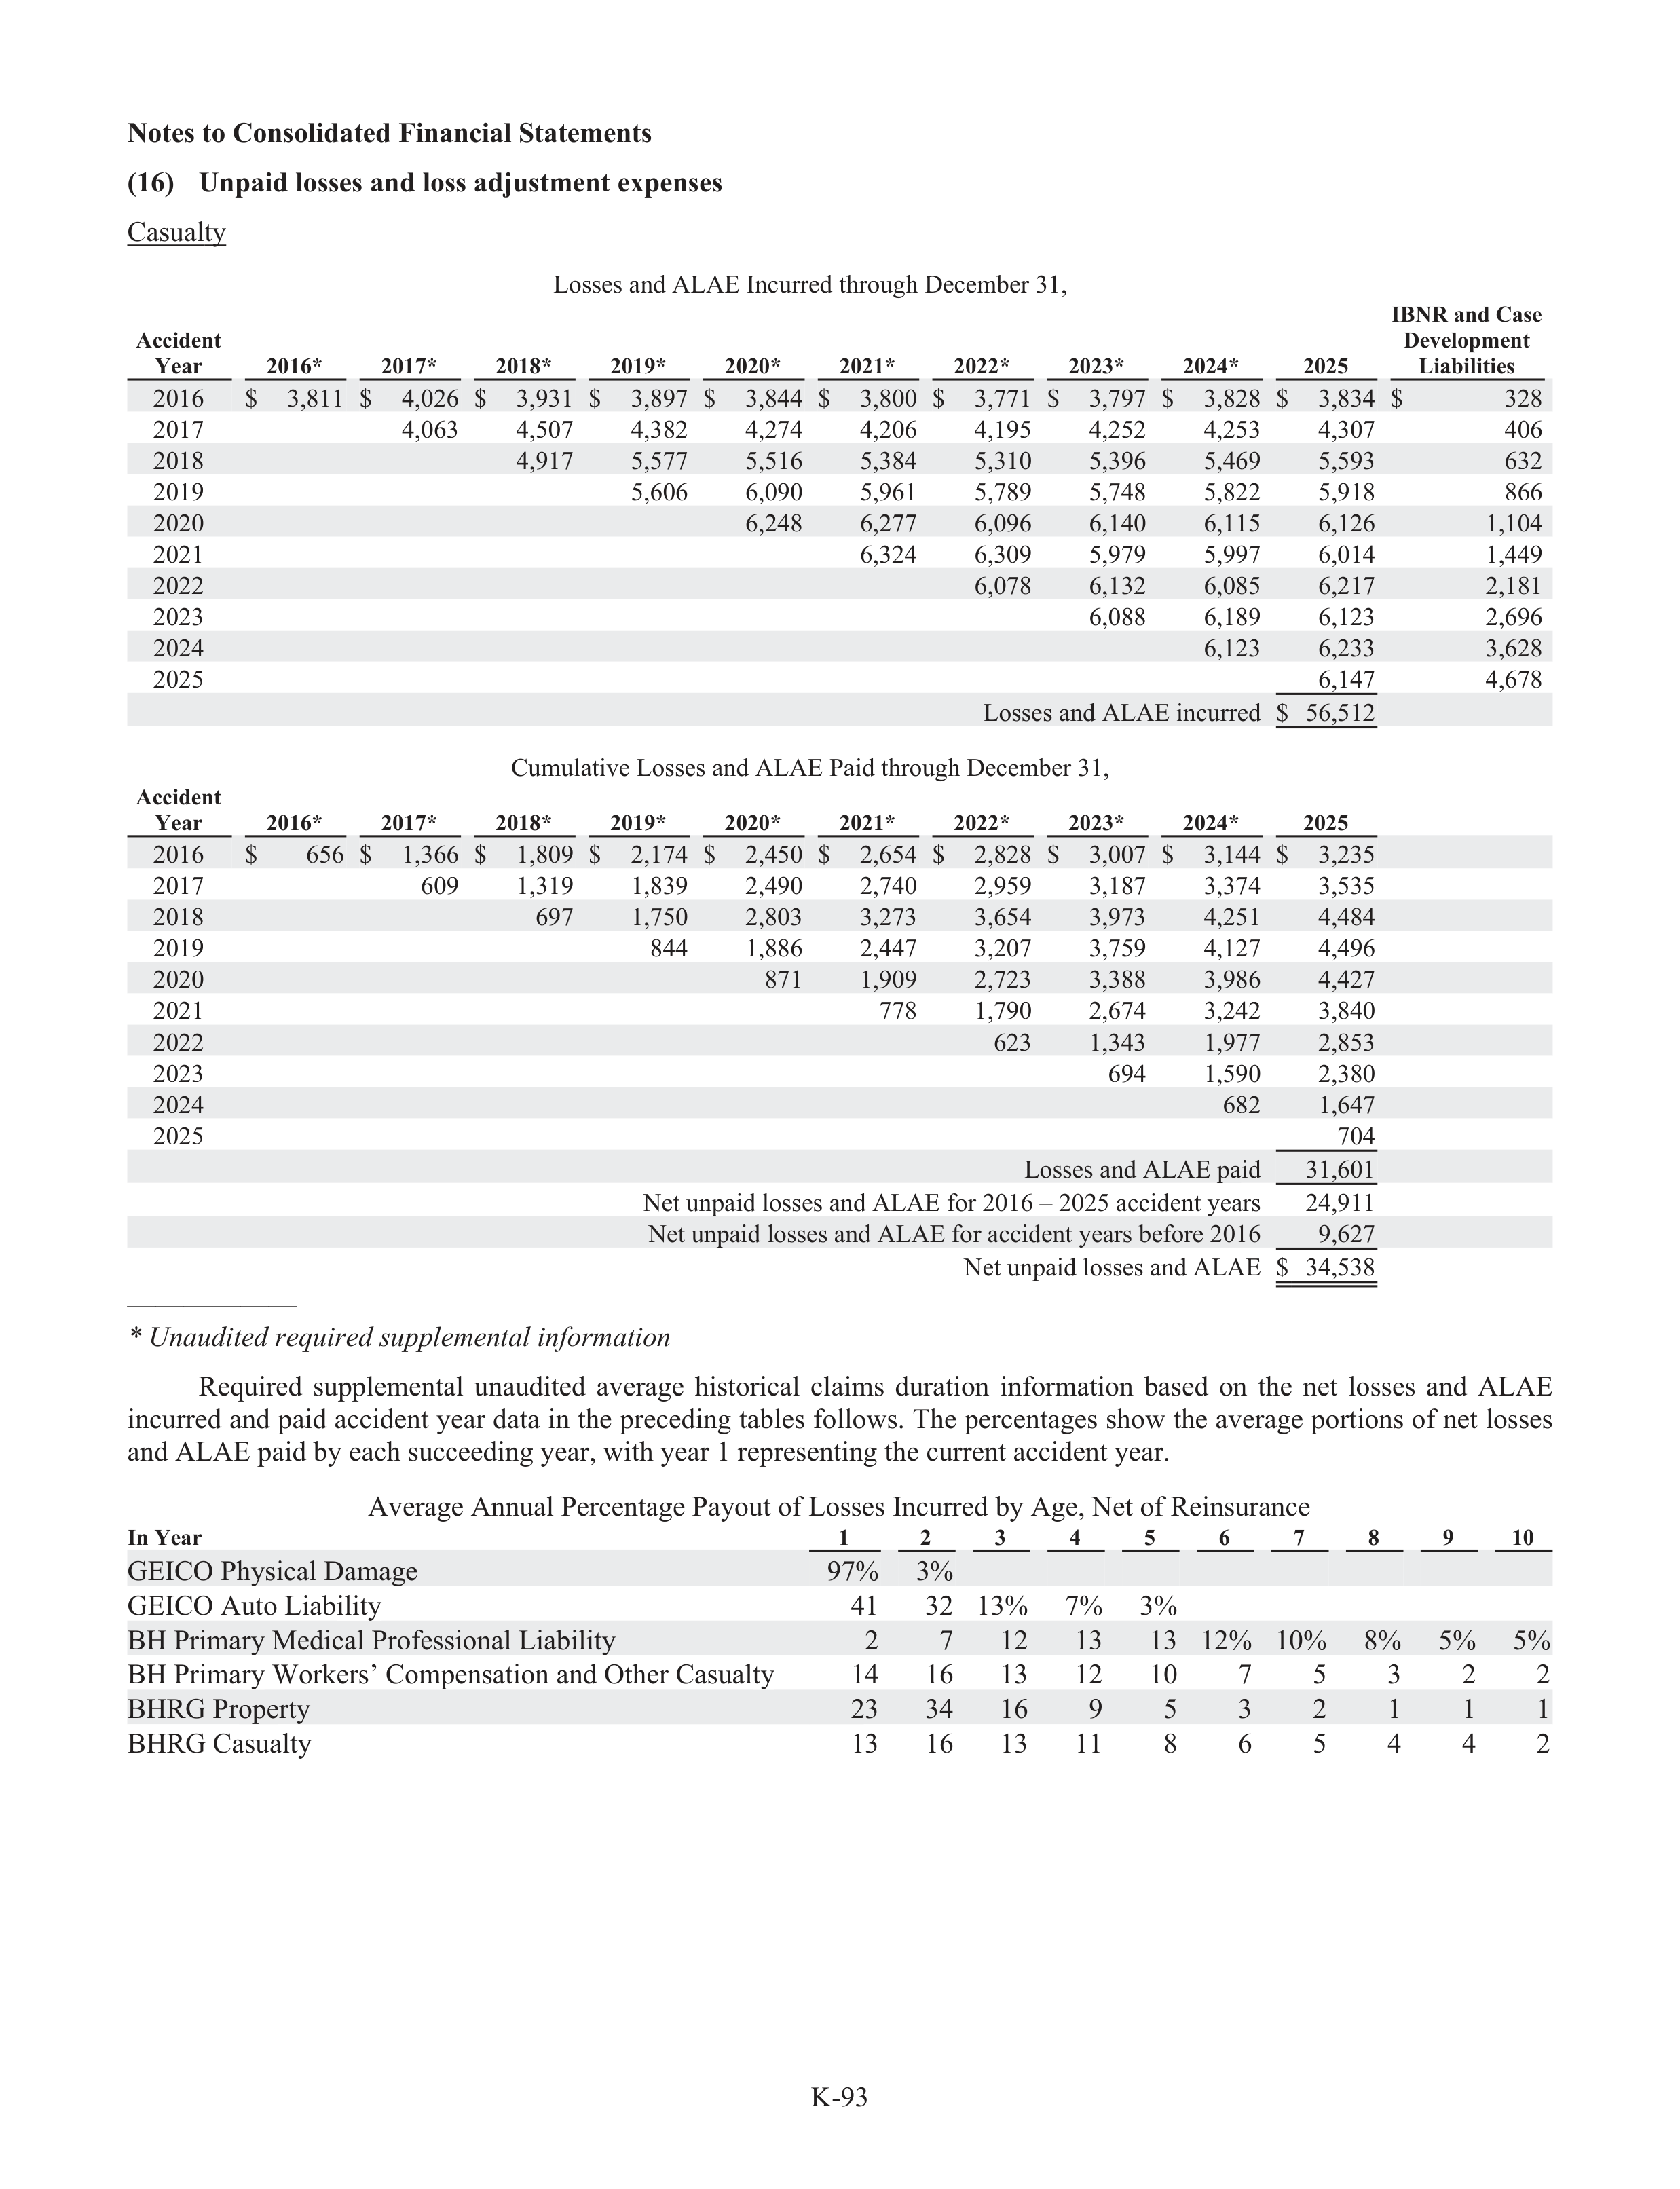
K-93
Notes to Consolidated Financial Statements
(16)
Unpaid losses and loss adju
d
stment expenses
Casualty
Losses and ALAE Incurred through December 31,
Accident
Year
2016*
2017*
2018*
2019*
2020*
2021*
2022*
2023*
2024*
2025
IBNR and Case
Development
Liabilities
2016
$
3,811
$
4,026
$
3,931
$
3,897
$
3,844
$
3,800
$
3,771
$
3,797
$
3,828
$
3,834
$
328
2017
4,063
4,507
4,382
4,274
4,206
4,195
4,252
4,253
4,307
406
2018
4,917
5,577
5,516
5,384
5,310
5,396
5,469
5,593
632
2019
5,606
6,090
5,961
5,789
5,748
5,822
5,918
866
2020
6,248
6,277
6,096
6,140
6,115
6,126
1,104
2021
6,324
6,309
5,979
5,997
6,014
1,449
2022
6,078
6,132
6,085
6,217
2,181
2023
6,088
6,189
6,123
2,696
2024
6,123
6,233
3,628
2025
6,147
4,678
Losses and ALAE incurred
$
56,512
Cumulative Losses and ALAE Paid through December 31,
Accident
Year
2016*
2017*
2018*
2019*
2020*
2021*
2022*
2023*
2024*
2025
2016
$
656
$
1,366
$
1,809
$
2,174
$
2,450
$
2,654
$
2,828
$
3,007
$
3,144
$
3,235
2017
609
1,319
1,839
2,490
2,740
2,959
3,187
3,374
3,535
2018
697
1,750
2,803
3,273
3,654
3,973
4,251
4,484
2019
844
1,886
2,447
3,207
3,759
4,127
4,496
2020
871
1,909
2,723
3,388
3,986
4,427
2021
778
1,790
2,674
3,242
3,840
2022
623
1,343
1,977
2,853
2023
694
1,590
2,380
2024
682
1,647
2025
704
Losses and ALAE paid
31,601
Net unpaid losses and ALAE for 2016 – 2025 accident years
24,911
Net unpaid losses and ALAE for accident years before 2016
9,627
Net unpaid losses and ALAE
$
34,538
——————
* Unaudited required suppl
u
emental info
n
rmation
Required
suppl
u
emental
unaudited
average
historical
claims
duration
information
based
on
the
net
losses
and
ALAE
incurred and paid accident year data in the preceding tabl
a
es follows. The percentages show the average portions of net losses
and ALAE paid by each succeeding year, with year 1 representing the current accident year.
Average Annual Percentage Payout of Losses Incurred by Age, Net of Reinsurance
In Year
1
2
3
4
5
6
7
8
9
10
GEICO Physical Damage
97%
3%
GEICO Auto Liability
41
32
13%
7%
3%
BH Primary Medical Profes
f
sional Liability
2
7
12
13
13
12%
10%
8%
5%
5%
BH Primary Workers’ Compensation and Other Casualty
14
16
13
12
10
7
5
3
2
2
BHRG Property
23
34
16
9
5
3
2
1
1
1
BHRG Casualty
13
16
13
11
8
6
5
4
4
2
y
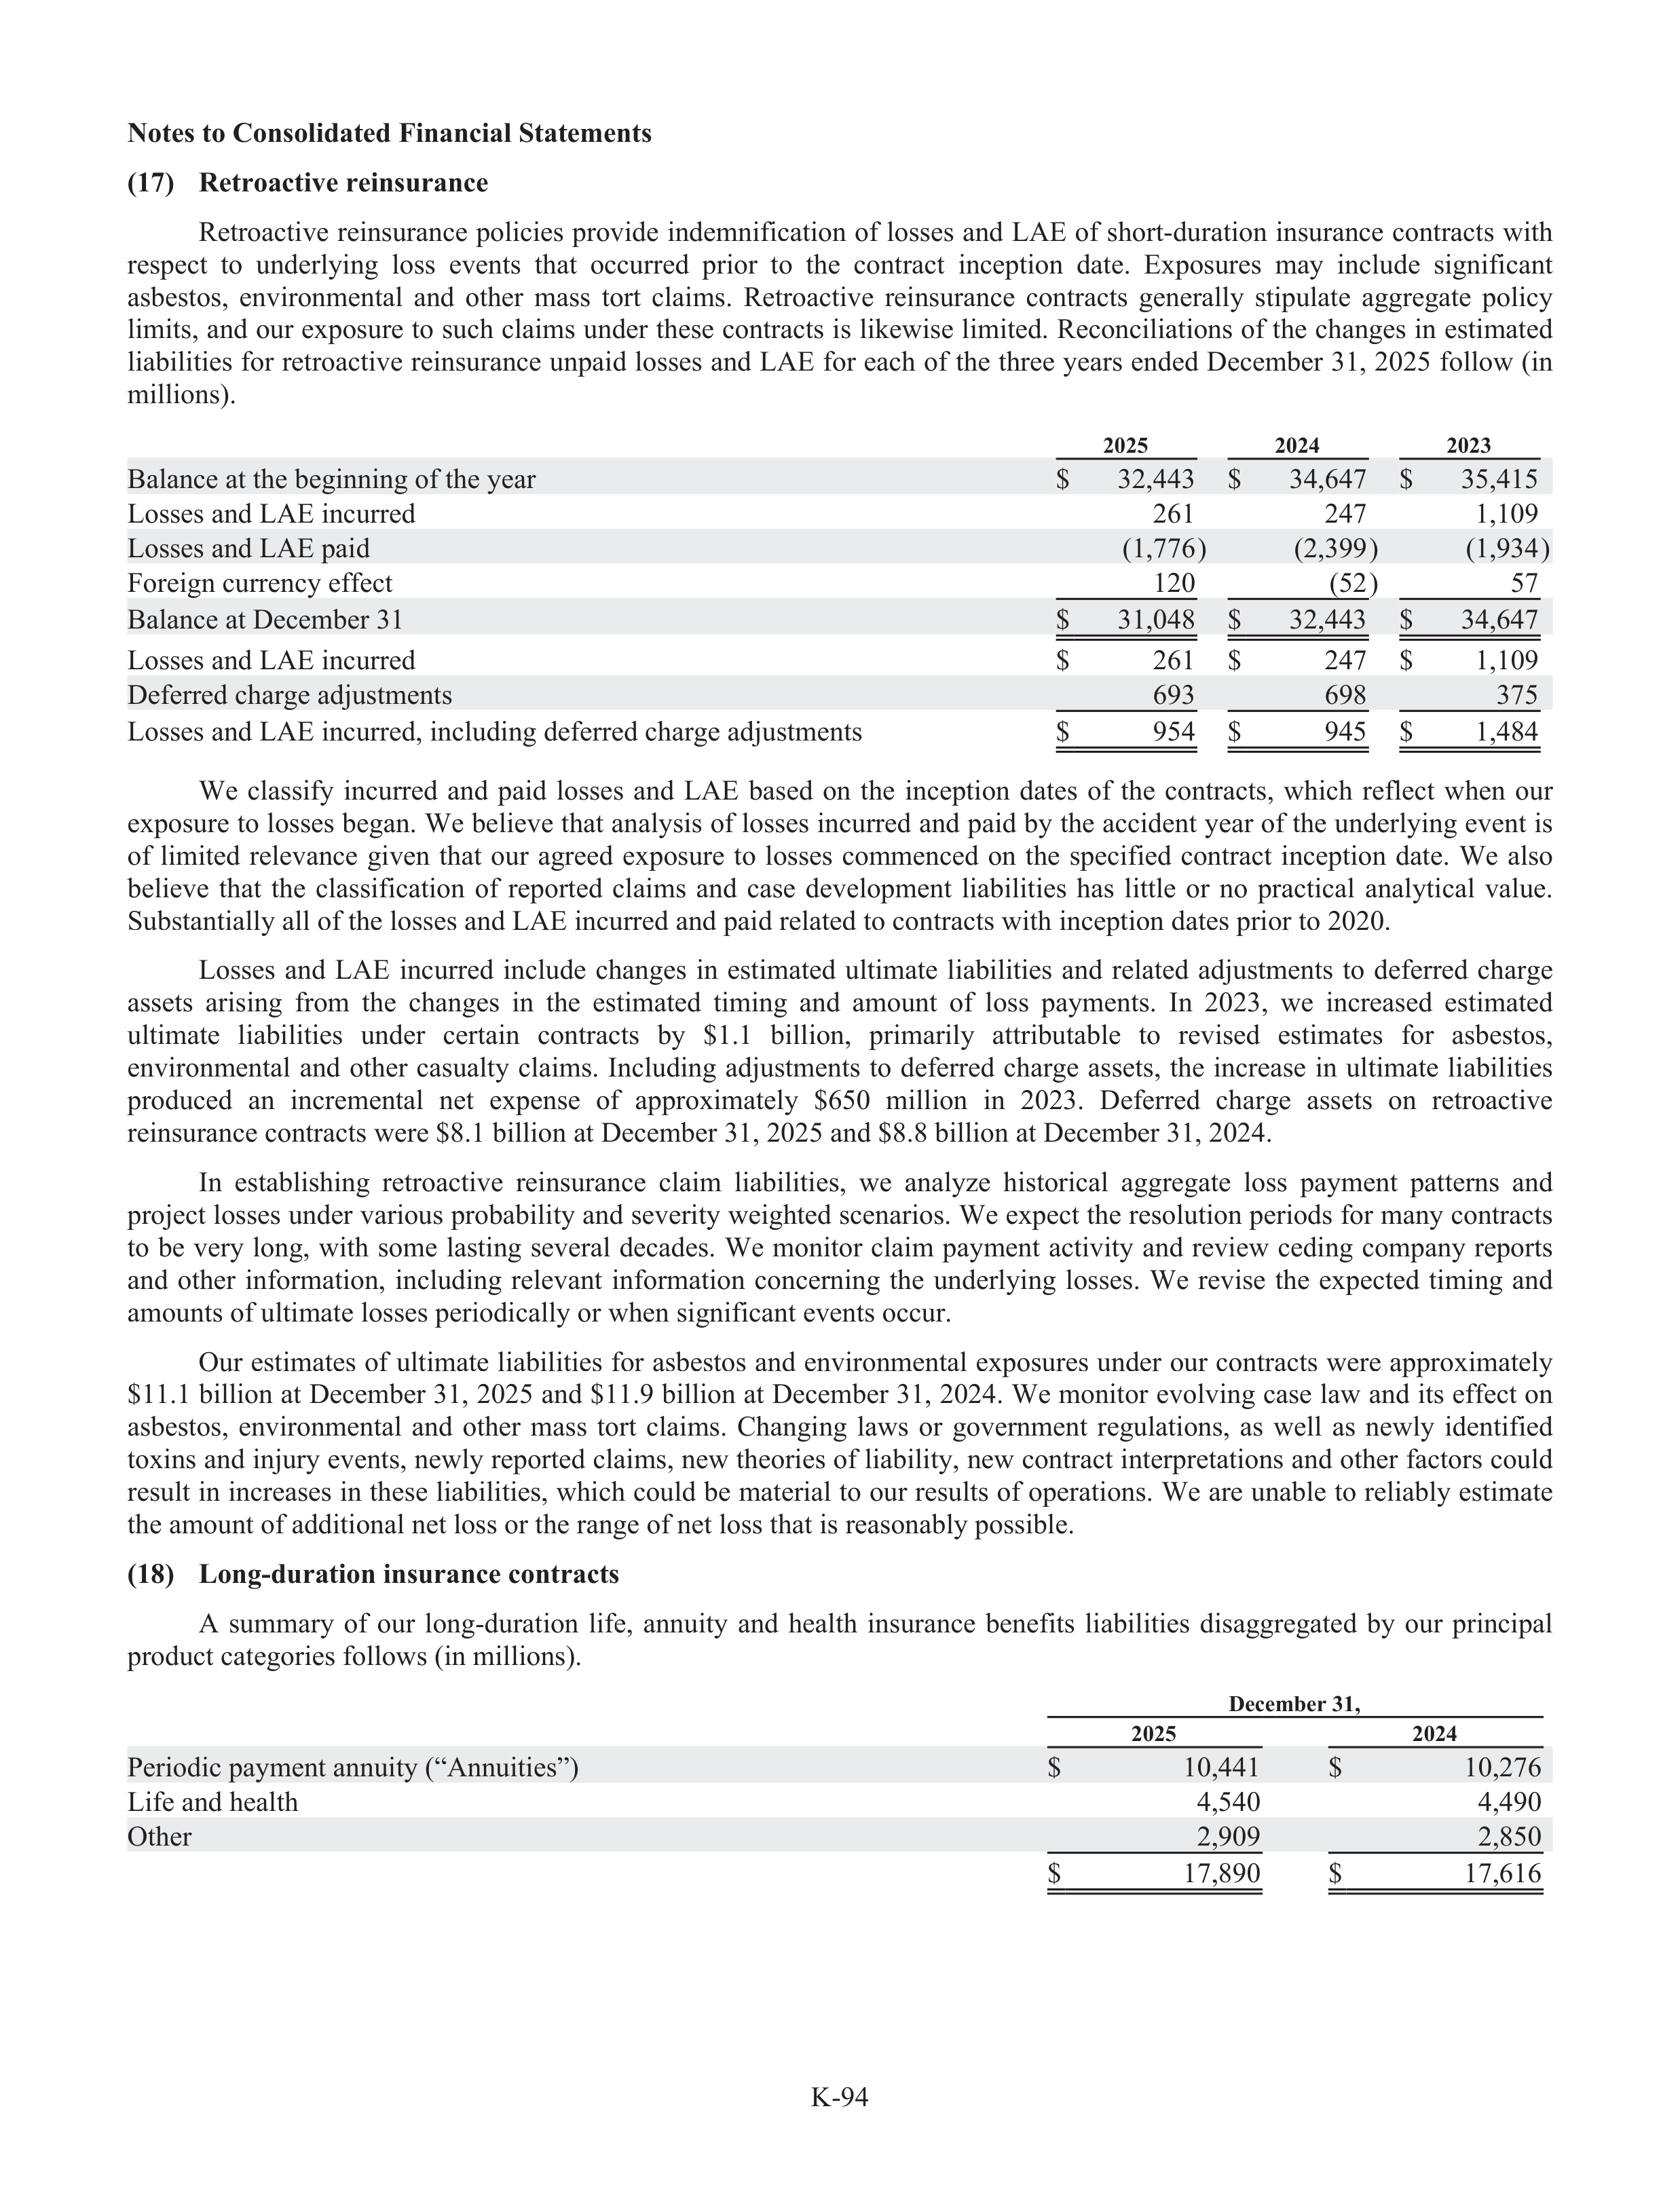
K-94
Notes to Consolidated Financial Statements
(17)
Retroactive reinsurance
Retroactive reinsurance policies provide indemnific
f
ation of losses and LAE of short-duration insurance contracts with
respect
to
underlying
loss
events
that
occurred
prior
to
the
contract
inception
date.
Exposures
may
include
significant
asbestos,
environmental
and
other
mass
tort
claims.
Retroactive
reinsurance
contracts
generally
stipulate
aggregate
policy
limits, and our exposure to such claims under these contracts is likewise limited. Reconciliations of the changes in estimated
liabi
a
lities for retroactive reinsurance unpaid losses and LAE for each of the three years ended December 31, 2025 follow (in
millions).
2025
2024
2023
Balance at the beginning of the year
$
32,443
$
34,647
$
35,415
Losses and LAE incurred
261
247
1,109
Losses and LAE paid
(1,776)
(2,399)
(1,934)
Foreign currency effe
f
ct
120
(52)
57
Balance at December 31
$
31,048
$
32,443
$
34,647
Losses and LAE incurred
$
261
$
247
$
1,109
Deferred charge adju
d
stments
693
698
375
Losses and LAE incurred, including deferred charge adju
d
stments
$
954
$
945
$
1,484
We
classify
incurred
and
paid
losses
and
LAE
based
on
the
inception
dates
of
the
contracts,
which
reflect
when
our
exposure to losses began. We believe that analysis of losses incurred and paid by the accident year of the underlying event is
of
limited
relevance
given
that
our
agreed
exposure
to
losses
commenced
on
the
specified
contract
inception
date.
We
also
believe
that
the
classification
of
reported
claims
and
case
development
liabi
a
lities
has
little
or
no
practical
analytical
value.
Subs
u
tantially all of the losses and LAE incurred and paid related to contracts with inception dates prior to 2020.
Losses
and
LAE
incurred
include
changes
in
estimated
ultimate
liabi
a
lities
and
related
adju
d
stments
to
deferred
charge
assets
arising
from
the
changes
in
the
estimated
timing
and
amount
of
loss
payments.
In
2023,
we
increased
estimated
ultimate
liabi
a
lities
under
certain
contracts
by
$1.1
billion,
primarily
attributable
to
revised
estimates
for
asbestos,
environmental
and
other
casualty
claims.
Including
adju
d
stments
to
deferred
charge
assets,
the
increase
in
ultimate
liabi
a
lities
produced
an
incremental
net
expense
of
approximately
$650
million
in
2023.
Deferred
charge
assets
on
retroactive
reinsurance contracts were $8.1 billion at December 31, 2025 and $8.8 billion at December 31, 2024.
In
establ
a
ishing
retroactive
reinsurance
claim
liabi
a
lities,
we
analyze
historical
aggregate
loss
payment
patterns
and
project losses under various probabi
a
lity and severity weighted scenarios. We expect the resolution periods for many contracts
to
be
very
long,
with
some
lasting
several
decades.
We
monitor
claim
payment
activity
and
review
ceding
company
reports
and
other
information,
including
relevant
information
concerning
the
underlying
losses.
We
revise
the
expected
timing
and
amounts of ultimate losses periodically or when significant events occur.
Our estimates of ultimate liabi
a
lities for asbestos and environmental exposures under our contracts were approximately
$11.1 billion at December 31, 2025 and $11.9 billion at December 31, 2024. We monitor evolving case law and its effe
f
ct on
asbestos,
environmental
and
other
mass
tort
claims.
Changing
laws
or
government
regulations,
as
well
as
newly
identified
toxins and inju
n
ry events, newly reported claims, new theories of liabi
a
lity, new contract interpretations and other factors could
result in increases in these liabi
a
lities, which could be material to our results of operations. We are unabl
a
e to reliabl
a
y estimate
the amount of additional net loss or the range of net loss that is reasonabl
a
y possible.
(18)
Long-duration insurance contracts
A
summary
of
our
long-duration
life,
f
annuity
and
health
insurance
benefits
liabi
a
lities
disaggregated
by
our
principal
product categories follows (in millions).
December 31,
2025
2024
Periodic payment annuity (“Annuities”)
$
10,441
$
10,276
Life and health
4,540
4,490
Other
2,909
2,850
$
17,890
$
17,616
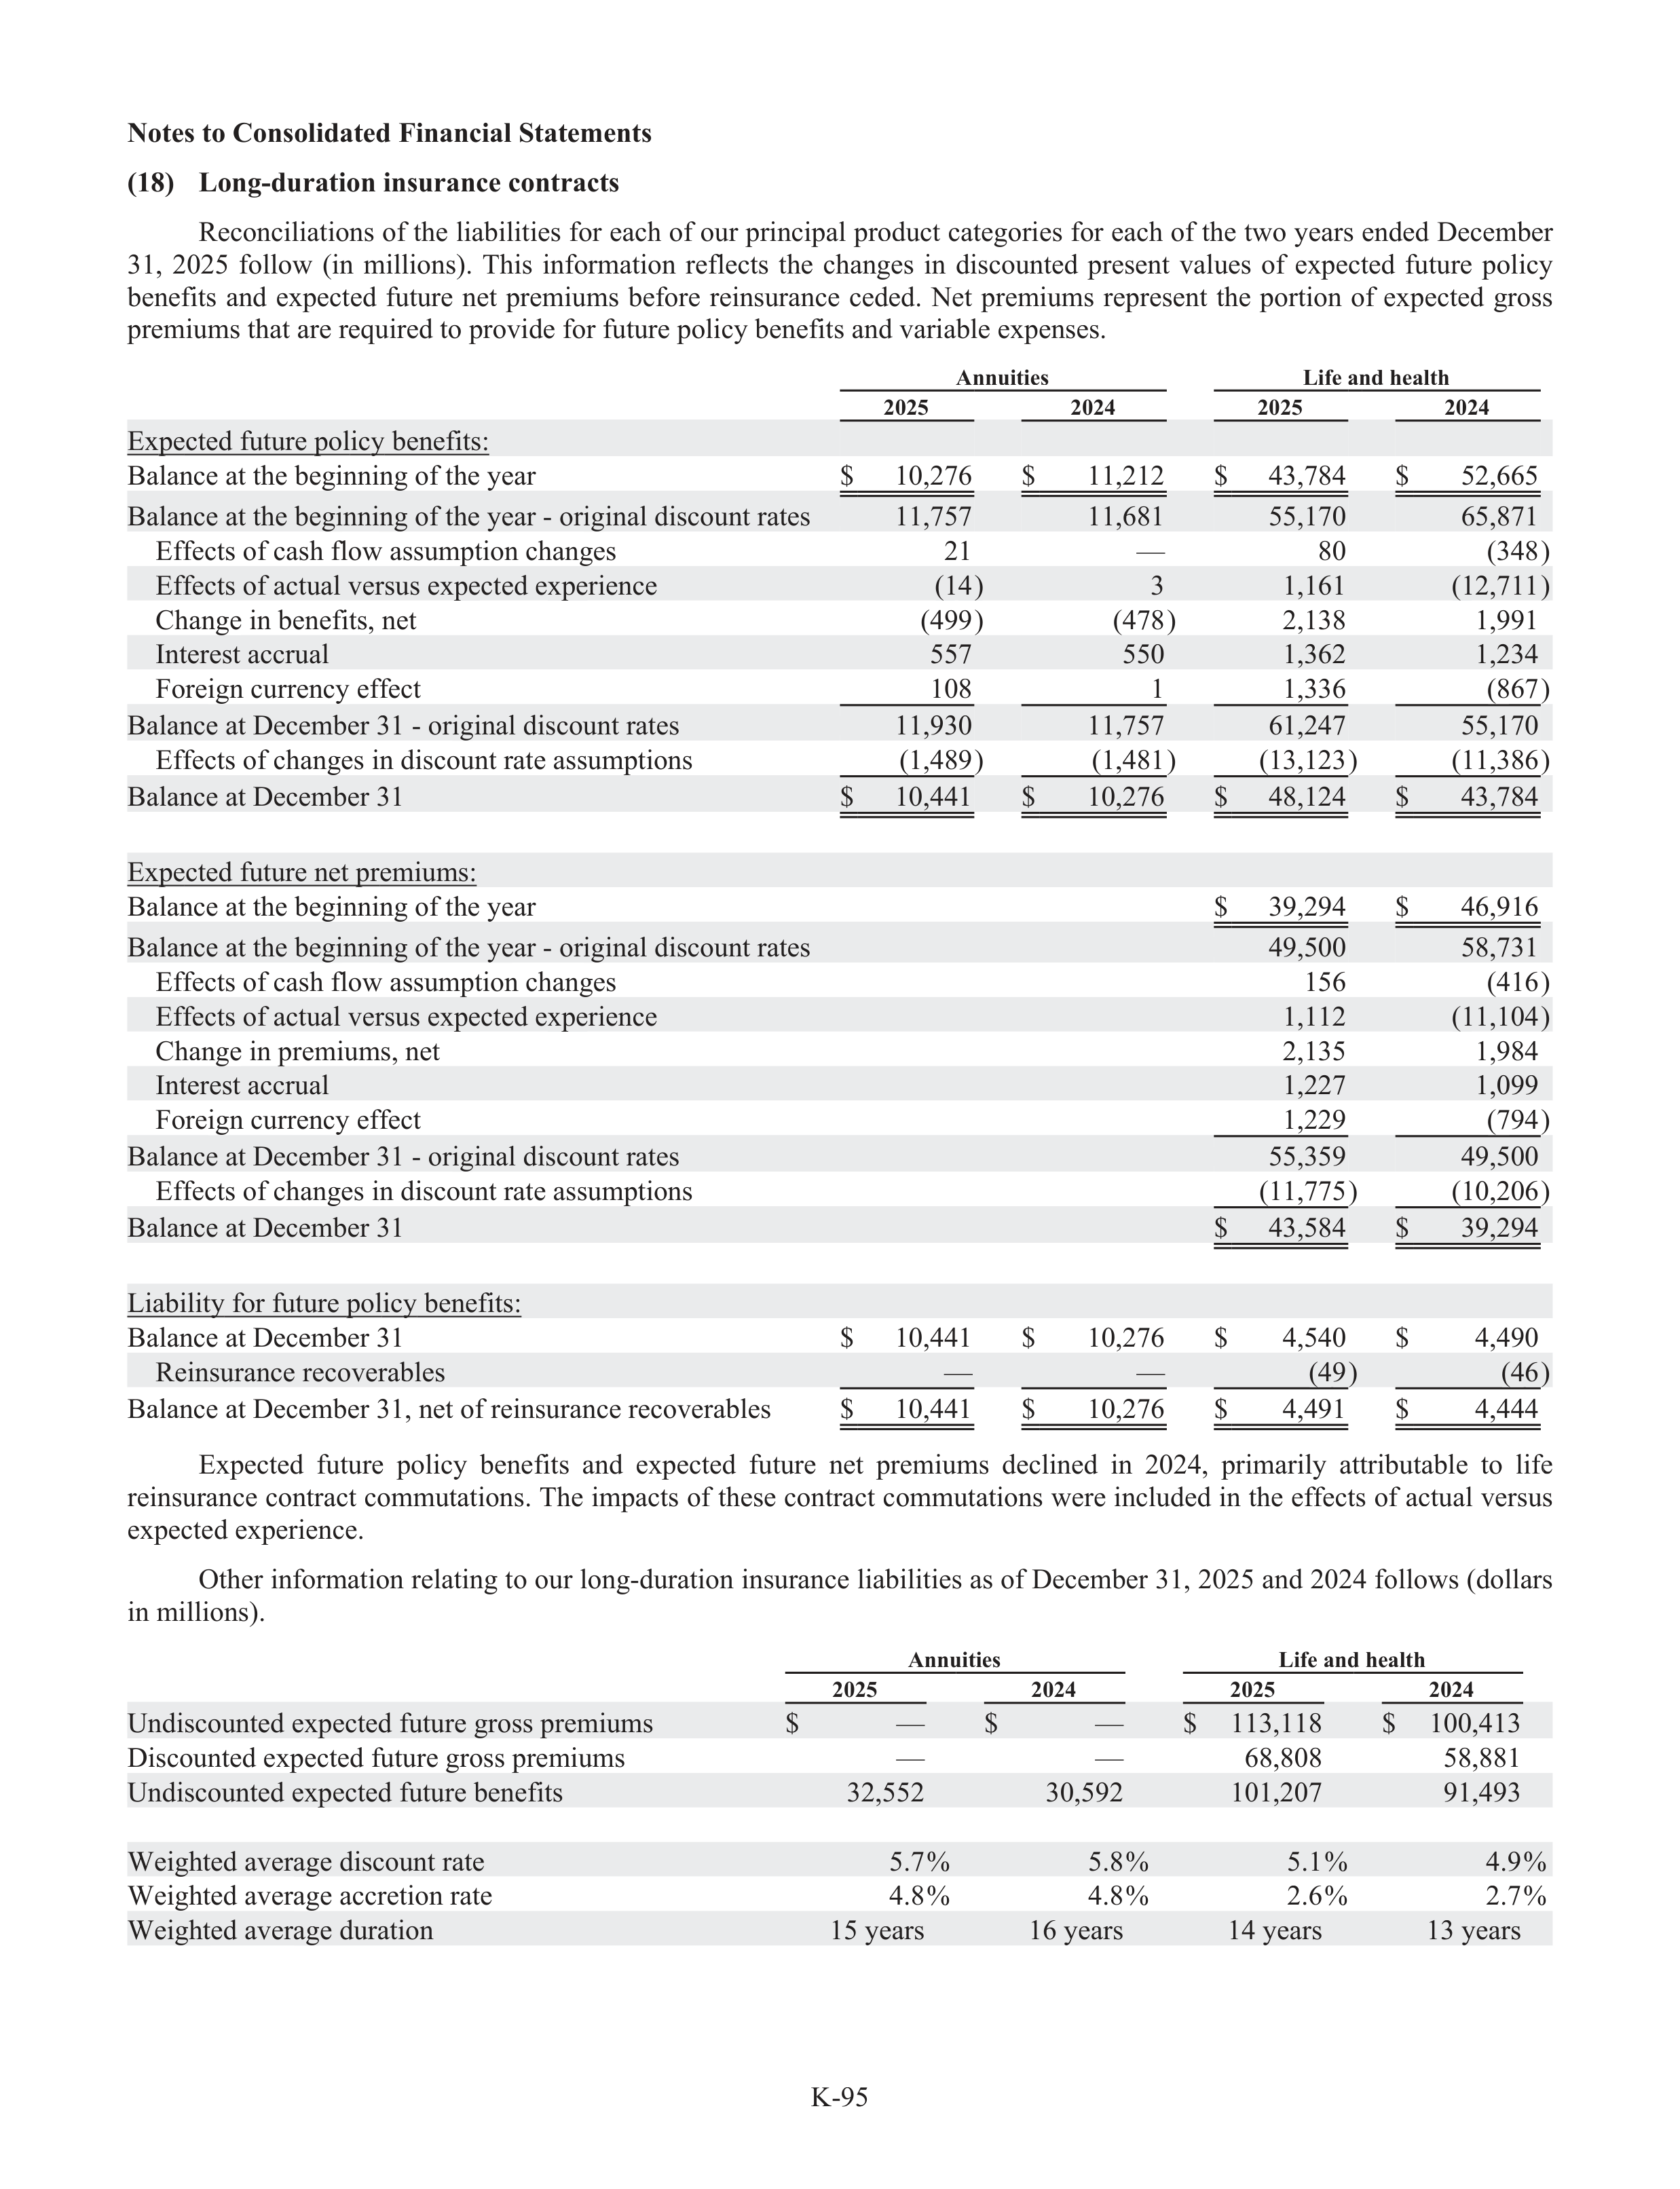
K-95
Notes to Consolidated Financial Statements
(18)
Long-duration insurance contracts
Reconciliations of the liabi
a
lities for each of our principal produc
d
t categories for each of the two years ended December
31,
2025
follow
(in
millions).
This
information
reflects
the
changes
in
discounted
present
values
of
expected
future
policy
benefits
and
expected
future
net
premiums
before
reinsurance
ceded.
Net
premiums
represent
the
portion
of
expected
gross
premiums that are required to provide for future policy benefits and variable expenses.
Annuities
Life and health
2025
2024
2025
2024
Expected future policy benefits:
Balance at the beginning of the year
$
10,276
$
11,212
$
43,784
$
52,665
Balance at the beginning of the year - original discount rates
11,757
11,681
55,170
65,871
Effe
f
cts of cash flow assumption changes
21
—
80
(348)
Effe
f
cts of actual versus expected experience
(14)
3
1,161
(12,711)
Change in benefits, net
(499)
(478)
2,138
1,991
Interest accrua
r
l
557
550
1,362
1,234
Foreign currency effe
f
ct
108
1
1,336
(867)
Balance at December 31 - original discount rates
11,930
11,757
61,247
55,170
Effe
f
cts of changes in discount rate assumptions
(1,489)
(1,481)
(13,123)
(11,386)
Balance at December 31
$
10,441
$
10,276
$
48,124
$
43,784
Expected future net premiums:
Balance at the beginning of the year
$
39,294
$
46,916
Balance at the beginning of the year - original discount rates
49,500
58,731
Effe
f
cts of cash flow assumption changes
156
(416)
Effe
f
cts of actual versus expected experience
1,112
(11,104)
Change in premiums, net
2,135
1,984
Interest accrua
r
l
1,227
1,099
Foreign currency effe
f
ct
1,229
(794)
Balance at December 31 - original discount rates
55,359
49,500
Effe
f
cts of changes in discount rate assumptions
(11,775)
(10,206)
Balance at December 31
$
43,584
$
39,294
Liability for future policy benefits:
Balance at December 31
$
10,441
$
10,276
$
4,540
$
4,490
Reinsurance recoverabl
a
es
—
—
(49)
(46)
Balance at December 31, net of reinsurance recoverabl
a
es
$
10,441
$
10,276
$
4,491
$
4,444
Expected
future
policy
benefits
and
expected
future
net
premiums
declined
in
2024,
primarily
attributable
to
lifef
reinsurance contract commutations. The impacts of these contract commutations were included in the effe
f
cts of actua
t
l versus
expected experience.
Other information relating to our long-duration insurance liabi
a
lities as of December 31, 2025 and 2024 follows (dollars
in millions).
Annuities
Life and health
2025
2024
2025
2024
Undiscounted expected future gross premiums
$
—
$
—
$
113,118
$
100,413
Discounted expected future gross premiums
—
—
68,808
58,881
Undiscounted expected future benefits
32,552
30,592
101,207
91,493
Weighted average discount rate
5.7%
5.8%
5.1%
4.9%
Weighted average accretion rate
4.8%
4.8%
2.6%
2.7%
Weighted average duration
15 years
16 years
14 years
13 years
p
p
y
p
p
y
p
y
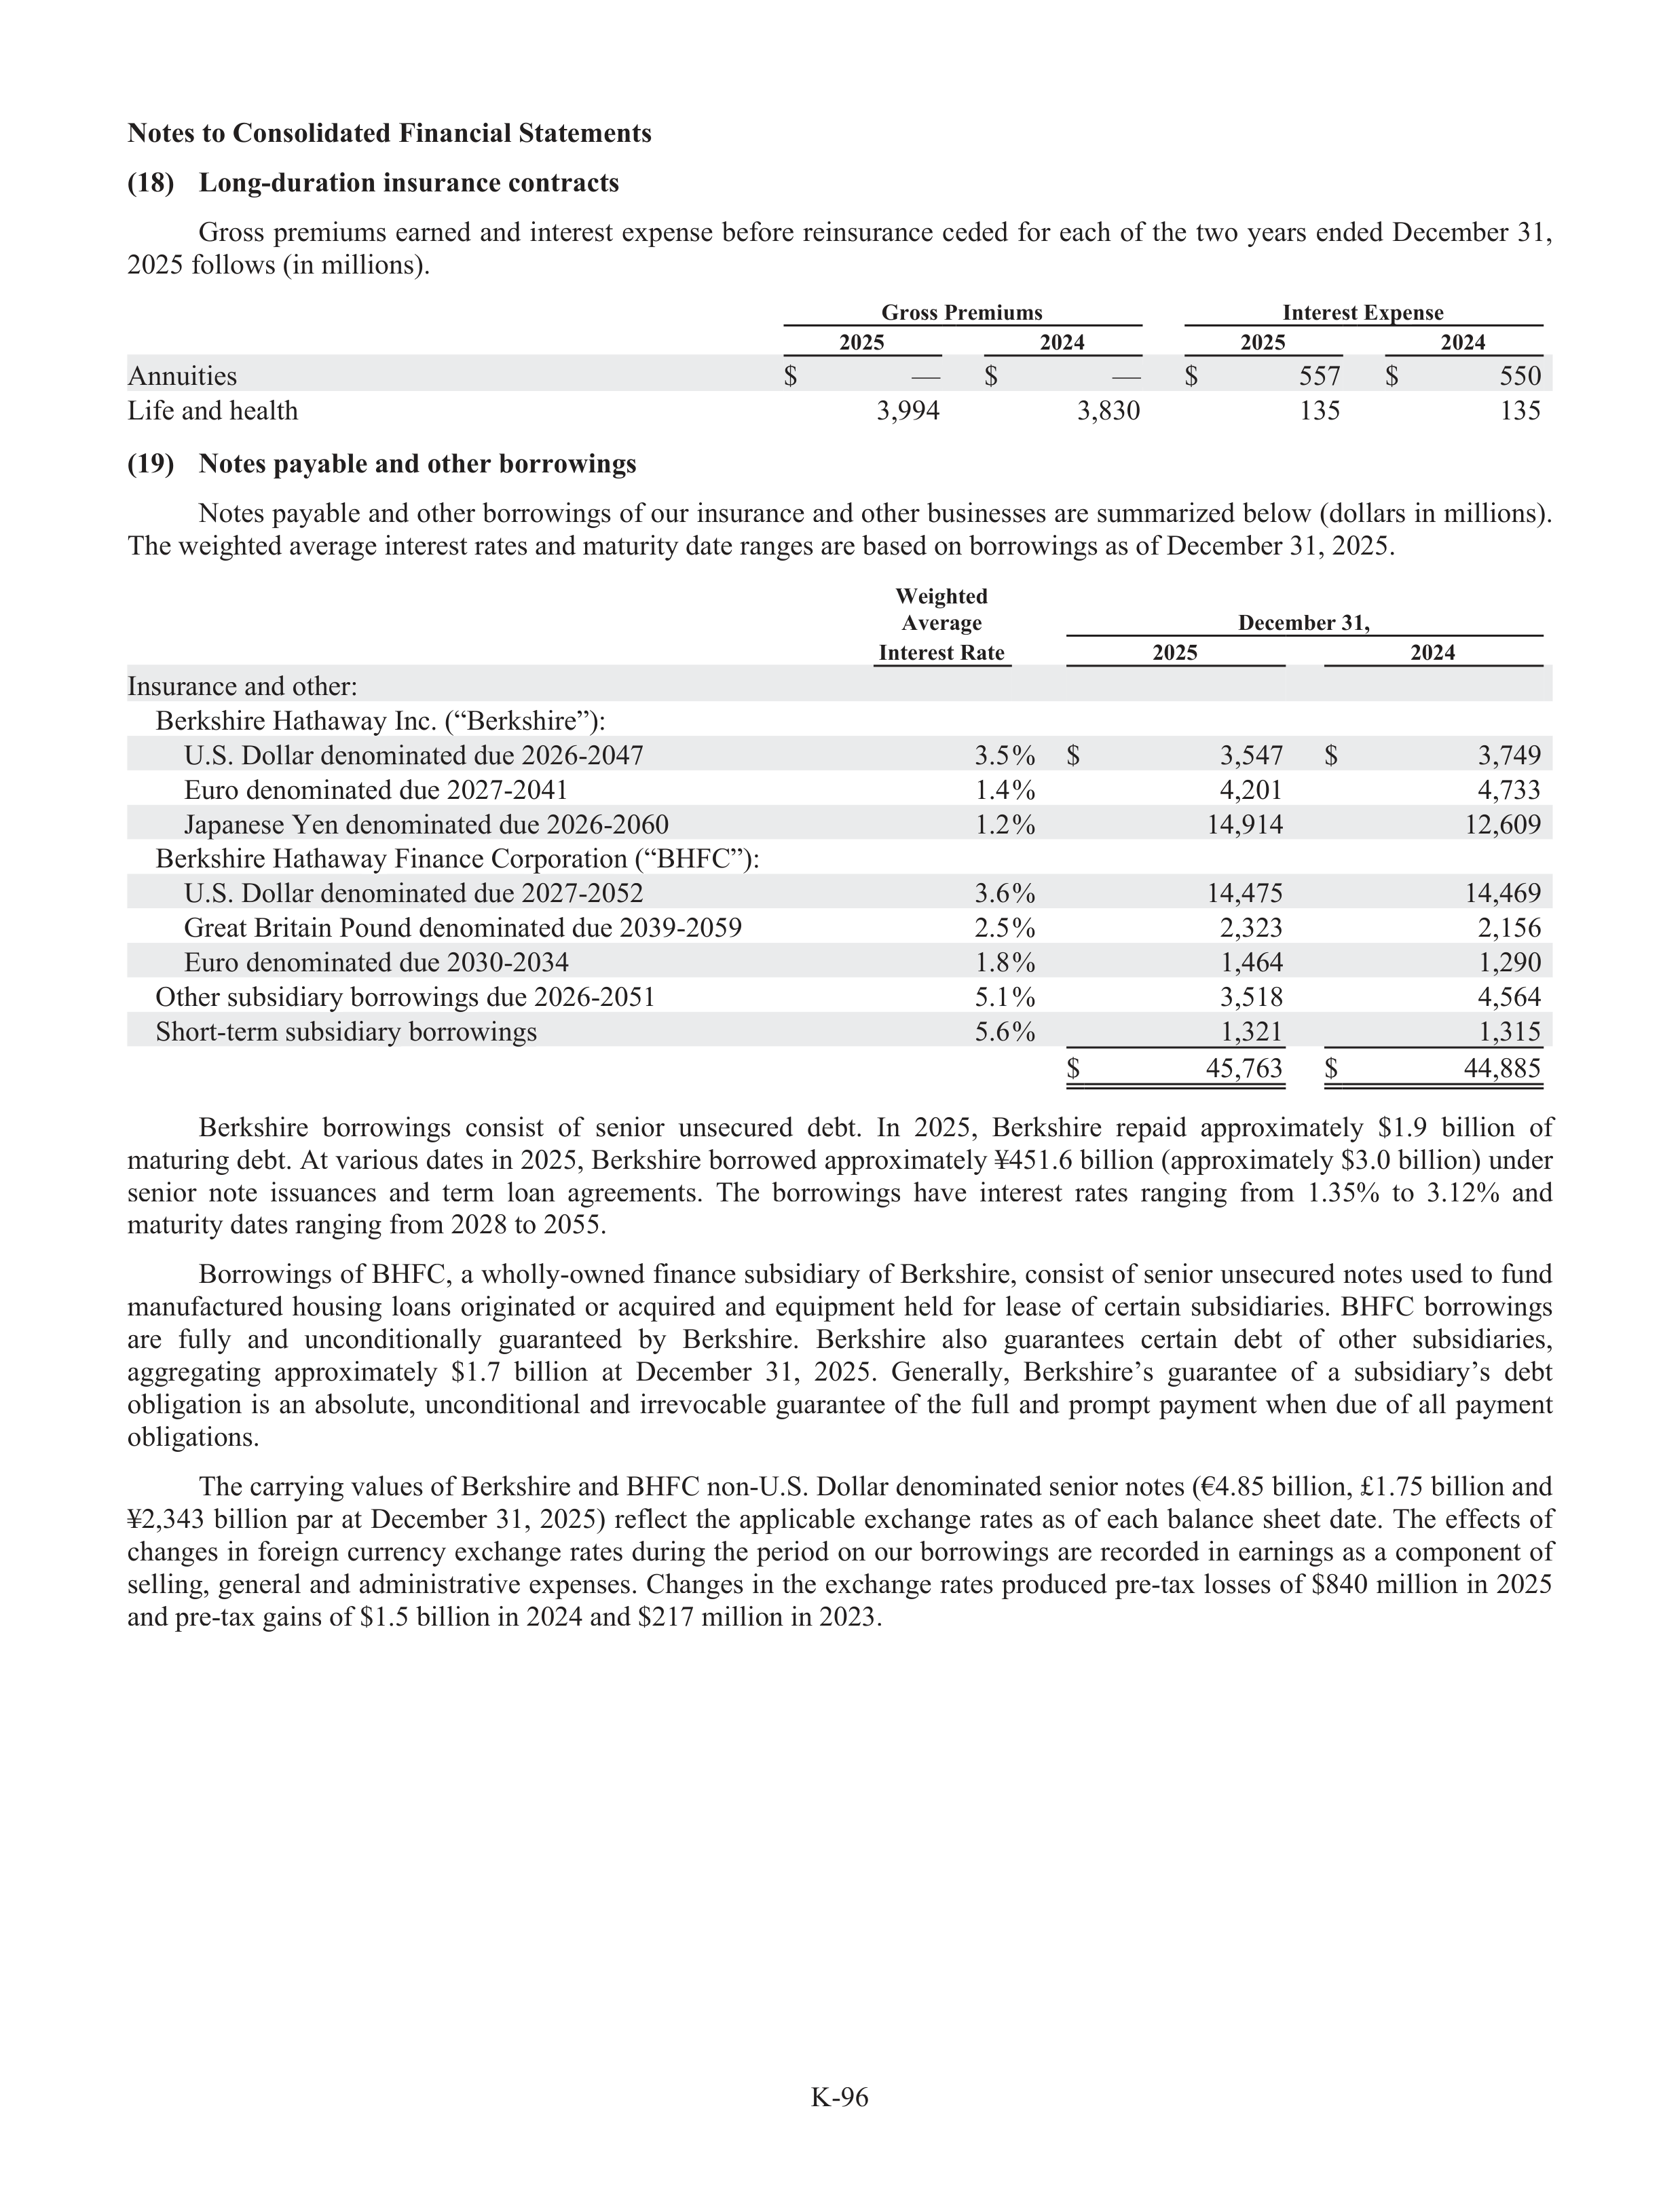
K-96
Notes to Consolidated Financial Statements
(18)
Long-duration insurance contracts
Gross
premiums
earned
and
interest
expense
before
reinsurance
ceded
for
each
of
the
two
years
ended
December
31,
2025 follows (in millions).
Gross Premiums
Interest Expense
2025
2024
2025
2024
Annuities
$
—
$
—
$
557
$
550
Life and health
3,994
3,830
135
135
(19)
Notes payable and other borrowings
Notes payabl
a
e and other borrowings of our insurance and other businesses are summarized below (dollars in millions).
The weighted average interest rates and maturity date ranges are based on borrowings as of December 31, 2025.
Weighted
Average
December 31,
Interest Rate
2025
2024
Insurance and other:
Berkshire Hathaway Inc. (“Berkshire”):
U.S. Dollar denominated due 2026-2047
3.5%
$
3,547
$
3,749
Euro denominated due 2027-2041
1.4%
4,201
4,733
Japa
a
nese Yen denominated due 2026-2060
1.2%
14,914
12,609
Berkshire Hathaway Finance Corporation (“BHFC”):
U.S. Dollar denominated due 2027-2052
3.6%
14,475
14,469
Great Britain Pound denominated due 2039-2059
2.5%
2,323
2,156
Euro denominated due 2030-2034
1.8%
1,464
1,290
Other subs
u
idiary borrowings due 2026-2051
5.1%
3,518
4,564
Short-term subs
u
idiary borrowings
5.6%
1,321
1,315
$
45,763
$
44,885
Berkshire
borrowings
consist
of
senior
unsecured
debt.
In
2025,
Berkshire
repaid
approximately
$1.9
billion
of
maturing debt. At various dates in 2025, Berkshire borrowed approximately ¥451.6 billion (appr
a
oximately $3.0 billion) under
senior
note
issuances
and
term
loan
agreements.
The
borrowings
have
interest
rates
ranging
from
1.35%
to
3.12%
and
maturity dates ranging from 2028 to 2055.
Borrowings of BHFC, a wholly-owned finance subs
u
idiary of Berkshire, consist of senior unsecured notes used to fund
manufact
f
ur
t
ed
housing
loans
originated
or
acquired
and
equipment
held
for
lease
of
certain
subs
u
idiaries.
BHFC
borrowings
are
fully
and
unconditionally
guaranteed
by
Berkshire.
Berkshire
also
guarantees
certain
debt
of
other
subs
u
idiaries,
aggregating
approximately
$1.7
billion
at
December
31,
2025.
Generally,
Berkshire’s
guarantee
of
a
subsidiary’s
debt
obligation
is
an
absolute,
unconditional
and
irrevocable
guarantee
of
the
full
and
prompt
payment
when
due
of
all
payment
obligations.
The carrying values of Berkshire and BHFC non-U.S. Dollar denominated senior notes (€4.85 billion, £1.75 billion and
¥2,343
billion
par
at
December
31,
2025)
reflect
the
applicable
exchange
rates
as
of
each
balance
sheet
date.
The
effe
f
cts
of
changes in foreign currency exchange rates during the period on our borrowings are recorded in earnings as a component of
selling, general and administrative expenses. Changes in the exchange rates produced pre-tax losses of $840 million in 2025
and pre-tax gains of $1.5 billion in 2024 and $217 million in 2023.
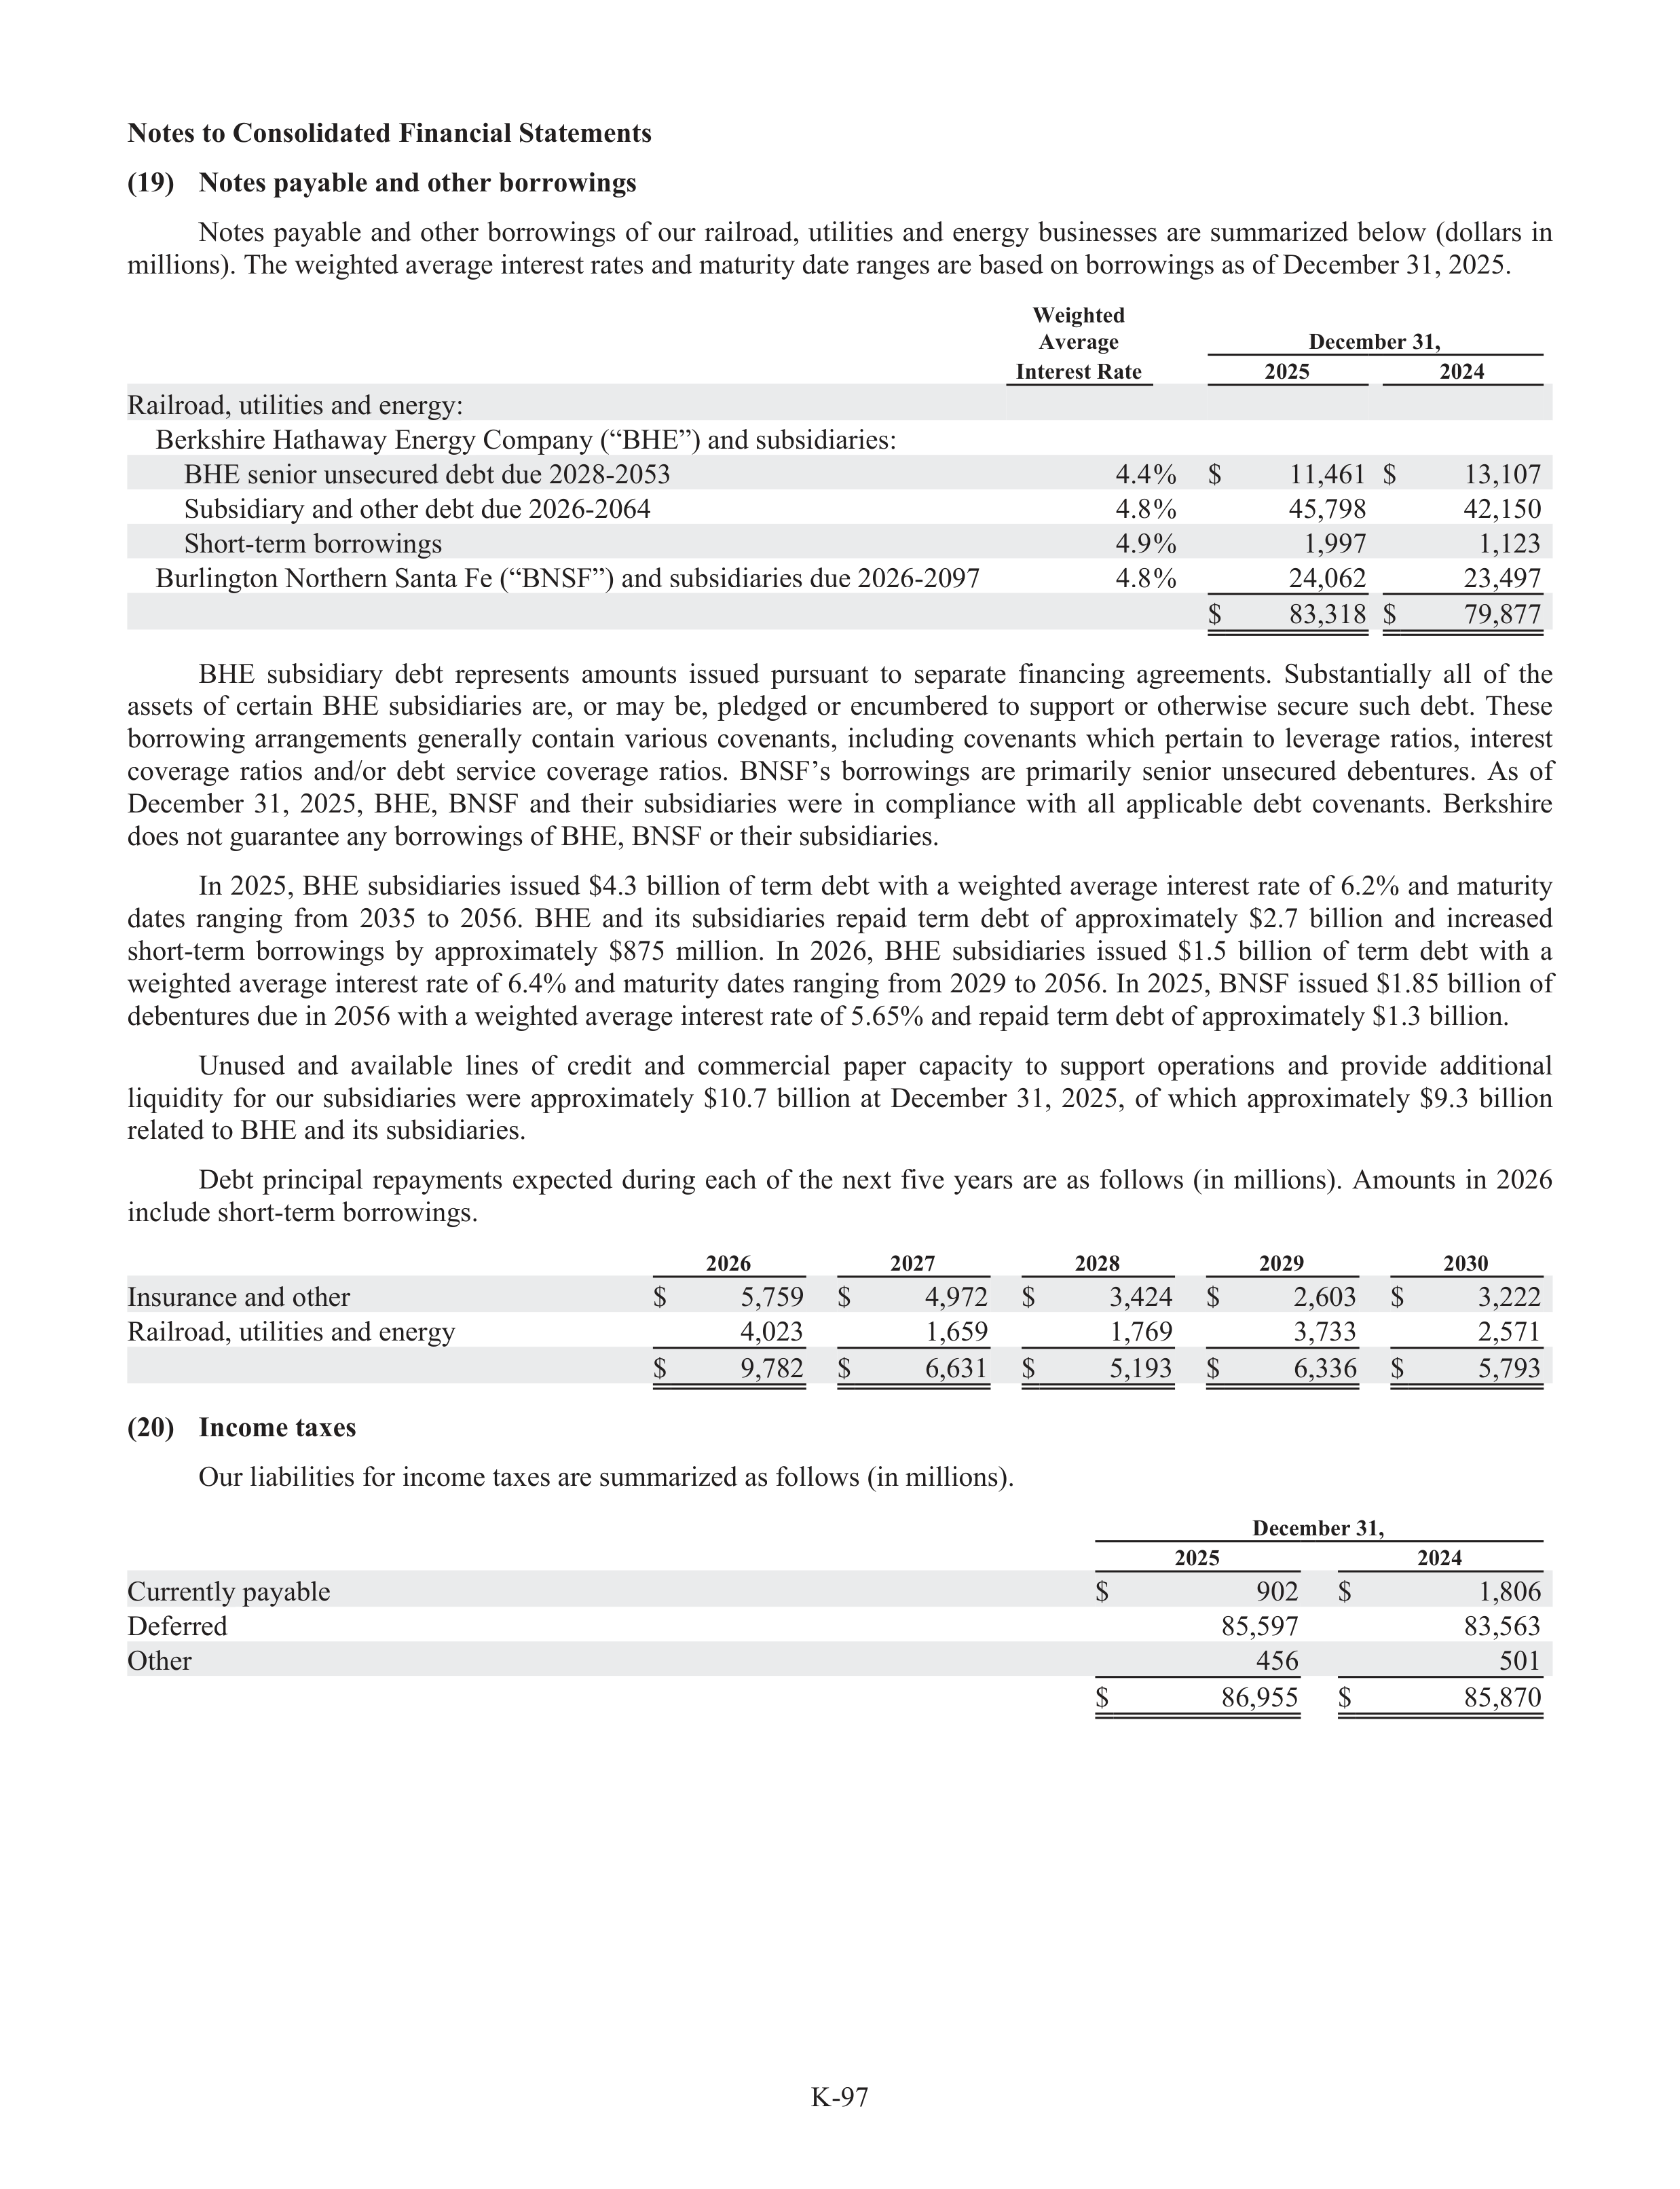
K-97
Notes to Consolidated Financial Statements
(19)
Notes payable and other borrowings
Notes
payabl
a
e
and
other
borrowings
of
our
railroad,
utilities
and
energy
businesses
are
summarized
below
(dollars
in
millions). The weighted average interest rates and maturity date ranges are based on borrowings as of December 31, 2025.
Weighted
Average
December 31,
Interest Rate
2025
2024
Railroad, utilities and energy:
Berkshire Hathaway Energy Company (“BHE”) and subs
u
idiaries:
BHE senior unsecured debt due 2028-2053
4.4%
$
11,461
$
13,107
Subs
u
idiary and other debt due 2026-2064
4.8%
45,798
42,150
Short-term borrowings
4.9%
1,997
1,123
Burlington Northern Santa Fe (“BNSF”) and subs
u
idiaries due 2026-2097
4.8%
24,062
23,497
$
83,318
$
79,877
BHE
subs
u
idiary
debt
represents
amounts
issued
pursuant
to
separate
financing
agreements.
Subs
u
tantially
all
of
the
assets
of
certain
BHE
subs
u
idiaries
are,
or
may
be,
pledged
or
encumbered
to
suppor
u
t
or
otherwise
secure
such
debt.
These
borrowing
arrangements
generally
contain
various
covenants,
including
covenants
which
pertain
to
leverage
ratios,
interest
coverage
ratios
and/or
debt
service
coverage
ratios.
BNSF’s
borrowings
are
primarily
senior
unsecured
debentur
t
es.
As
of
December
31,
2025,
BHE,
BNSF
and
their
subs
u
idiaries
were
in
compliance
with
all
applicable
debt
covenants.
Berkshire
does not guarantee any borrowings of BHE, BNSF or their subs
u
idiaries.
In 2025, BHE subs
u
idiaries issued $4.3 billion of term debt with a weighted average interest rate of 6.2% and maturity
dates
ranging
from
2035
to
2056.
BHE
and
its
subs
u
idiaries
repaid
term
debt
of
approximately
$2.7
billion
and
increased
short-term
borrowings
by
approximately
$875
million.
In
2026,
BHE
subs
u
idiaries
issued
$1.5
billion
of
term
debt
with
a
weighted average interest rate of 6.4% and maturity dates ranging from 2029 to 2056. In 2025, BNSF issued $1.85 billion of
debentur
t
es due in 2056 with a weighted average interest rate of 5.65% and repaid term debt of approximately $1.3 billion.
Unused
and
availabl
a
e
lines
of
credit
and
commercial
pape
a
r
capacity
to
suppor
u
t
operations
and
provide
additional
liquidity
for
our
subs
u
idiaries
were
approximately
$10.7
billion
at
December
31,
2025,
of
which
approximately
$9.3
billion
related to BHE and its subs
u
idiaries.
Debt
principal
repayments
expected
during
each
of
the
next
five
years
are
as
follows
(in
millions).
Amounts
in
2026
include short-term borrowings.
2026
2027
2028
2029
2030
Insurance and other
$
5,759
$
4,972
$
3,424
$
2,603
$
3,222
Railroad, utilities and energy
4,023
1,659
1,769
3,733
2,571
$
9,782
$
6,631
$
5,193
$
6,336
$
5,793
(20)
Income taxes
Our liabi
a
lities for income taxes are summarized as follows (in millions).
December 31,
2025
2024
Currently payabl
a
e
$
902
$
1,806
Deferred
85,597
83,563
Other
456
501
$
86,955
$
85,870
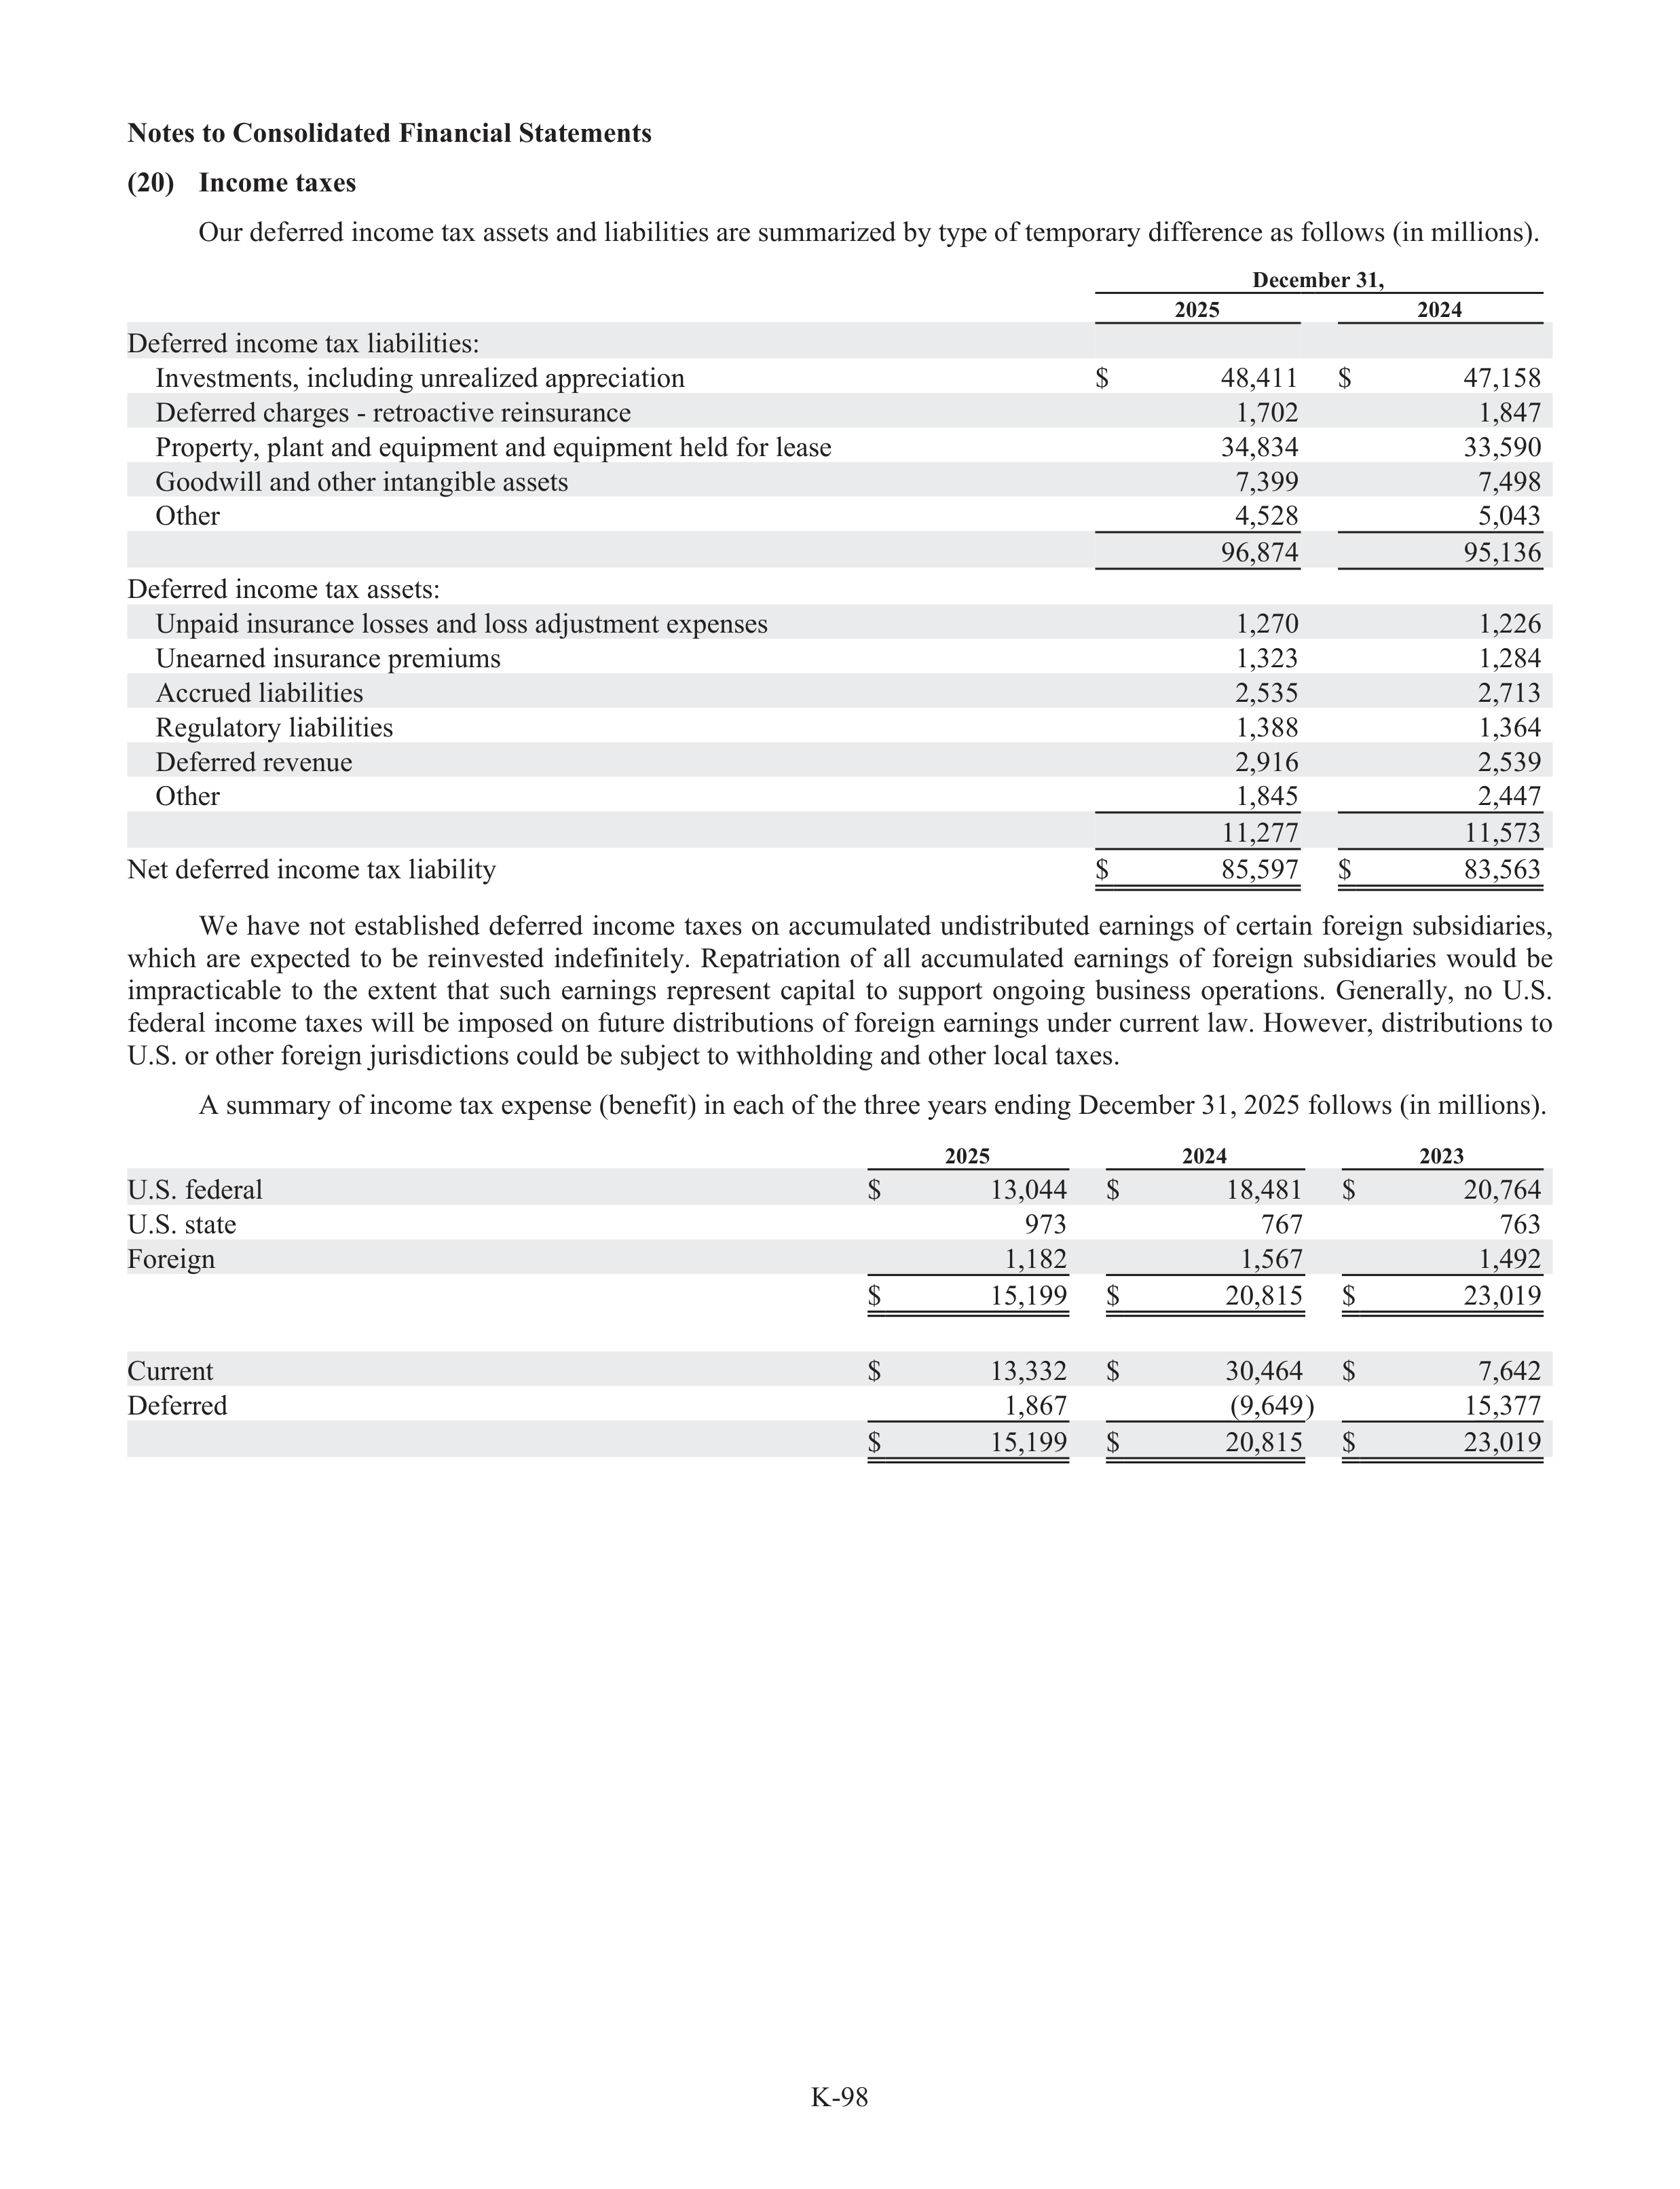
K-98
Notes to Consolidated Financial Statements
(20)
Income taxes
Our deferred income tax assets and liabi
a
lities are summarized by type of temporary
r
difference as follows (in millions).
December 31,
2025
2024
Deferred income tax liabi
a
lities:
Investments, including unrealized appreciation
$
48,411
$
47,158
Deferred charges - retroactive reinsurance
1,702
1,847
Property, plant and equipment and equipment held for lease
34,834
33,590
Goodwill and other intangible assets
7,399
7,498
Other
4,528
5,043
96,874
95,136
Deferred income tax assets:
Unpaid insurance losses and loss adju
d
stment expenses
1,270
1,226
Unearned insurance premiums
1,323
1,284
Accrue
r
d liabi
a
lities
2,535
2,713
Regulatory
r
liabi
a
lities
1,388
1,364
Deferred revenue
2,916
2,539
Other
1,845
2,447
11,277
11,573
Net deferred income tax liabi
a
lity
$
85,597
$
83,563
We
have
not
establ
a
ished
deferred
income
taxes
on
accumulated
undistributed
earnings
of
certain
foreign
subs
u
idiaries,
which
are
expected
to
be
reinvested
indefinitely.
Repatriation
of
all
accumulated
earnings
of
foreign
subs
u
idiaries
would
be
impracticable
to
the
extent
that
such
earnings
represent
capital
to
suppor
u
t
ongoing
business
operations.
Generally,
no
U.S.
federal income taxes will be imposed on future distributions of foreign earnings under current law. However, distributions to
U.S. or other foreign jurisdictions could be subj
u
ect to withholding and other local taxes.
A summary of income tax expense (benefit)
f
in each of the three years ending December 31, 2025 follows (in millions).
2025
2024
2023
U.S. federal
$
13,044
$
18,481
$
20,764
U.S. state
973
767
763
Foreign
1,182
1,567
1,492
$
15,199
$
20,815
$
23,019
Current
$
13,332
$
30,464
$
7,642
Deferred
1,867
(9,649)
15,377
$
15,199
$
20,815
$
23,019
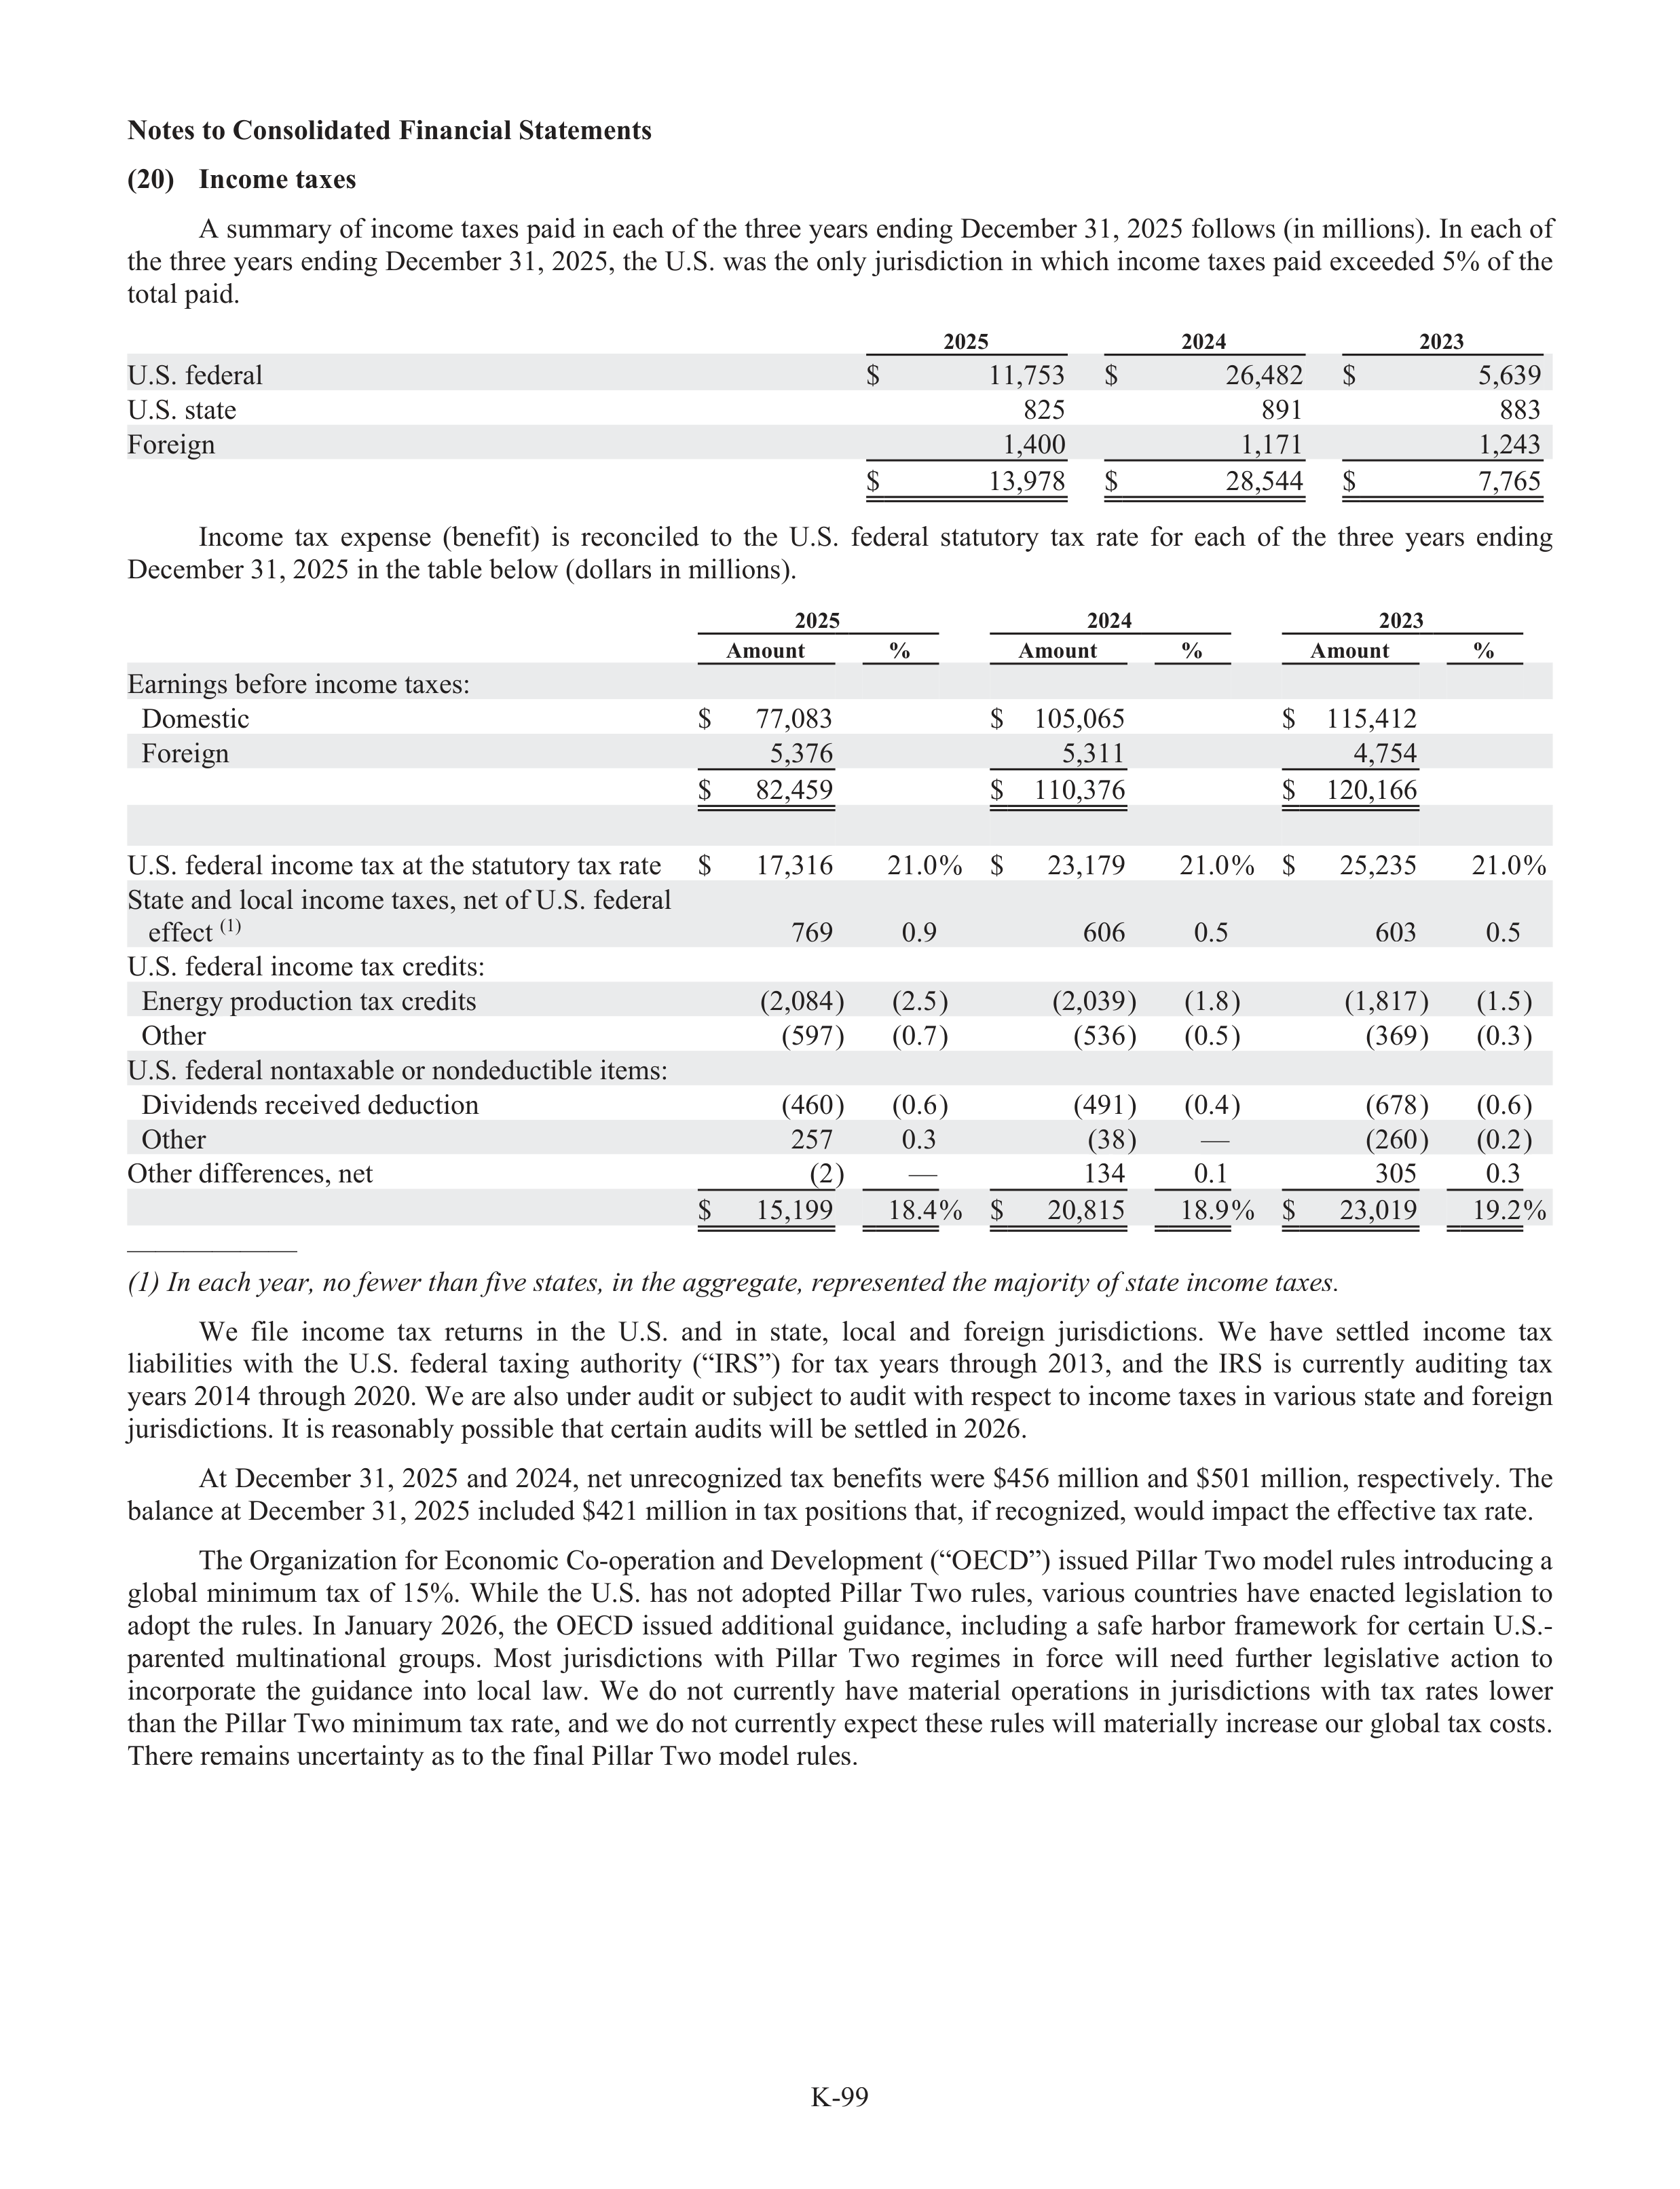
K-99
Notes to Consolidated Financial Statements
(20)
Income taxes
A summary of income taxes paid in each of the three years ending December 31, 2025 follows (in millions). In each of
the three years ending December 31, 2025, the U.S. was the only jurisdiction in which income taxes paid exceeded 5% of the
total paid.
2025
2024
2023
U.S. federal
$
11,753
$
26,482
$
5,639
U.S. state
825
891
883
Foreign
1,400
1,171
1,243
$
13,978
$
28,544
$
7,765
Income
tax
expense
(benefit)
f
is
reconciled
to
the
U.S.
federal
statut
t
ory
r
tax
rate
for
each
of
the
three
years
ending
December 31, 2025 in the tabl
a
e below (dollars in millions).
2025
2024
2023
Amount
%
Amount
%
Amount
%
Earnings before income taxes:
Domestic
$
77,083
$
105,065
$
115,412
Foreign
5,376
5,311
4,754
$
82,459
$
110,376
$
120,166
U.S. federal income tax at the statut
t
ory
r
tax rate
$
17,316
21.0%
$
23,179
21.0%
$
25,235
21.0%
State and local income taxes, net of U.S. federal
effe
f
ct
(1)
769
0.9
606
0.5
603
0.5
U.S. federal income tax credits:
Energy production tax credits
(2,084)
(2.5)
(2,039)
(1.8)
(1,817)
(1.5)
Other
(597)
(0.7)
(536)
(0.5)
(369)
(0.3)
U.S. federal nontaxable or nondeductible items:
Dividends received deduction
(460)
(0.6)
(491)
(0.4)
(678)
(0.6)
Other
257
0.3
(38)
—
(260)
(0.2)
Other differences, net
(2)
—
134
0.1
305
0.3
$
15,199
18.4%
$
20,815
18.9%
$
23,019
19.2%
——————
(1)
1
In each year, no fewer than five states, in the aggregate, repr
e
esented the majo
a
rity of state income taxes
a
.
We
file
income
tax
returns
in
the
U.S.
and
in
state,
local
and
foreign
jurisdictions.
We
have
settled
income
tax
liabi
a
lities
with
the
U.S.
federal
taxing
authority
(“IRS”)
for
f
tax
years
through
2013,
and
the
IRS
is
currently
auditing
tax
years 2014 through 2020. We are also under audit or subj
u
ect to audit with respect to income taxes in various state and foreign
jurisdictions. It is reasonabl
a
y possible that certain audits will be settled in 2026.
At December 31, 2025 and 2024, net unrecognized tax benefits were $456 million and $501 million, respectively. The
balance at December 31, 2025 included $421 million in tax positions that, if recognized, would impact the effe
f
ctive tax rate.
The Organization for Economic Co-operation and Development (“OECD”) issued Pillar Two model rules introducing a
global
minimum
tax
of
15%.
While
the
U.S.
has
not
adopted
Pillar
Two
rules,
various
countries
have
enacted
legislation
to
adopt
the
rules.
In
January
2026,
the
OECD
issued
additional
guidance,
including
a
safe
harbor
framework
for
certain
U.S.-
parented
multinational
groups.
Most
jurisdictions
with
Pillar
Two
regimes
in
force
will
need
further
legislative
action
to
incorporate
the
guidance
into
local
law.
We
do
not
currently
have
material
operations
in
jurisdictions
with
tax
rates
lower
than the Pillar Two minimum tax rate, and we do not currently expect these rules will materially increase our global tax costs.
There remains uncertainty as to the final Pillar Two model rules.
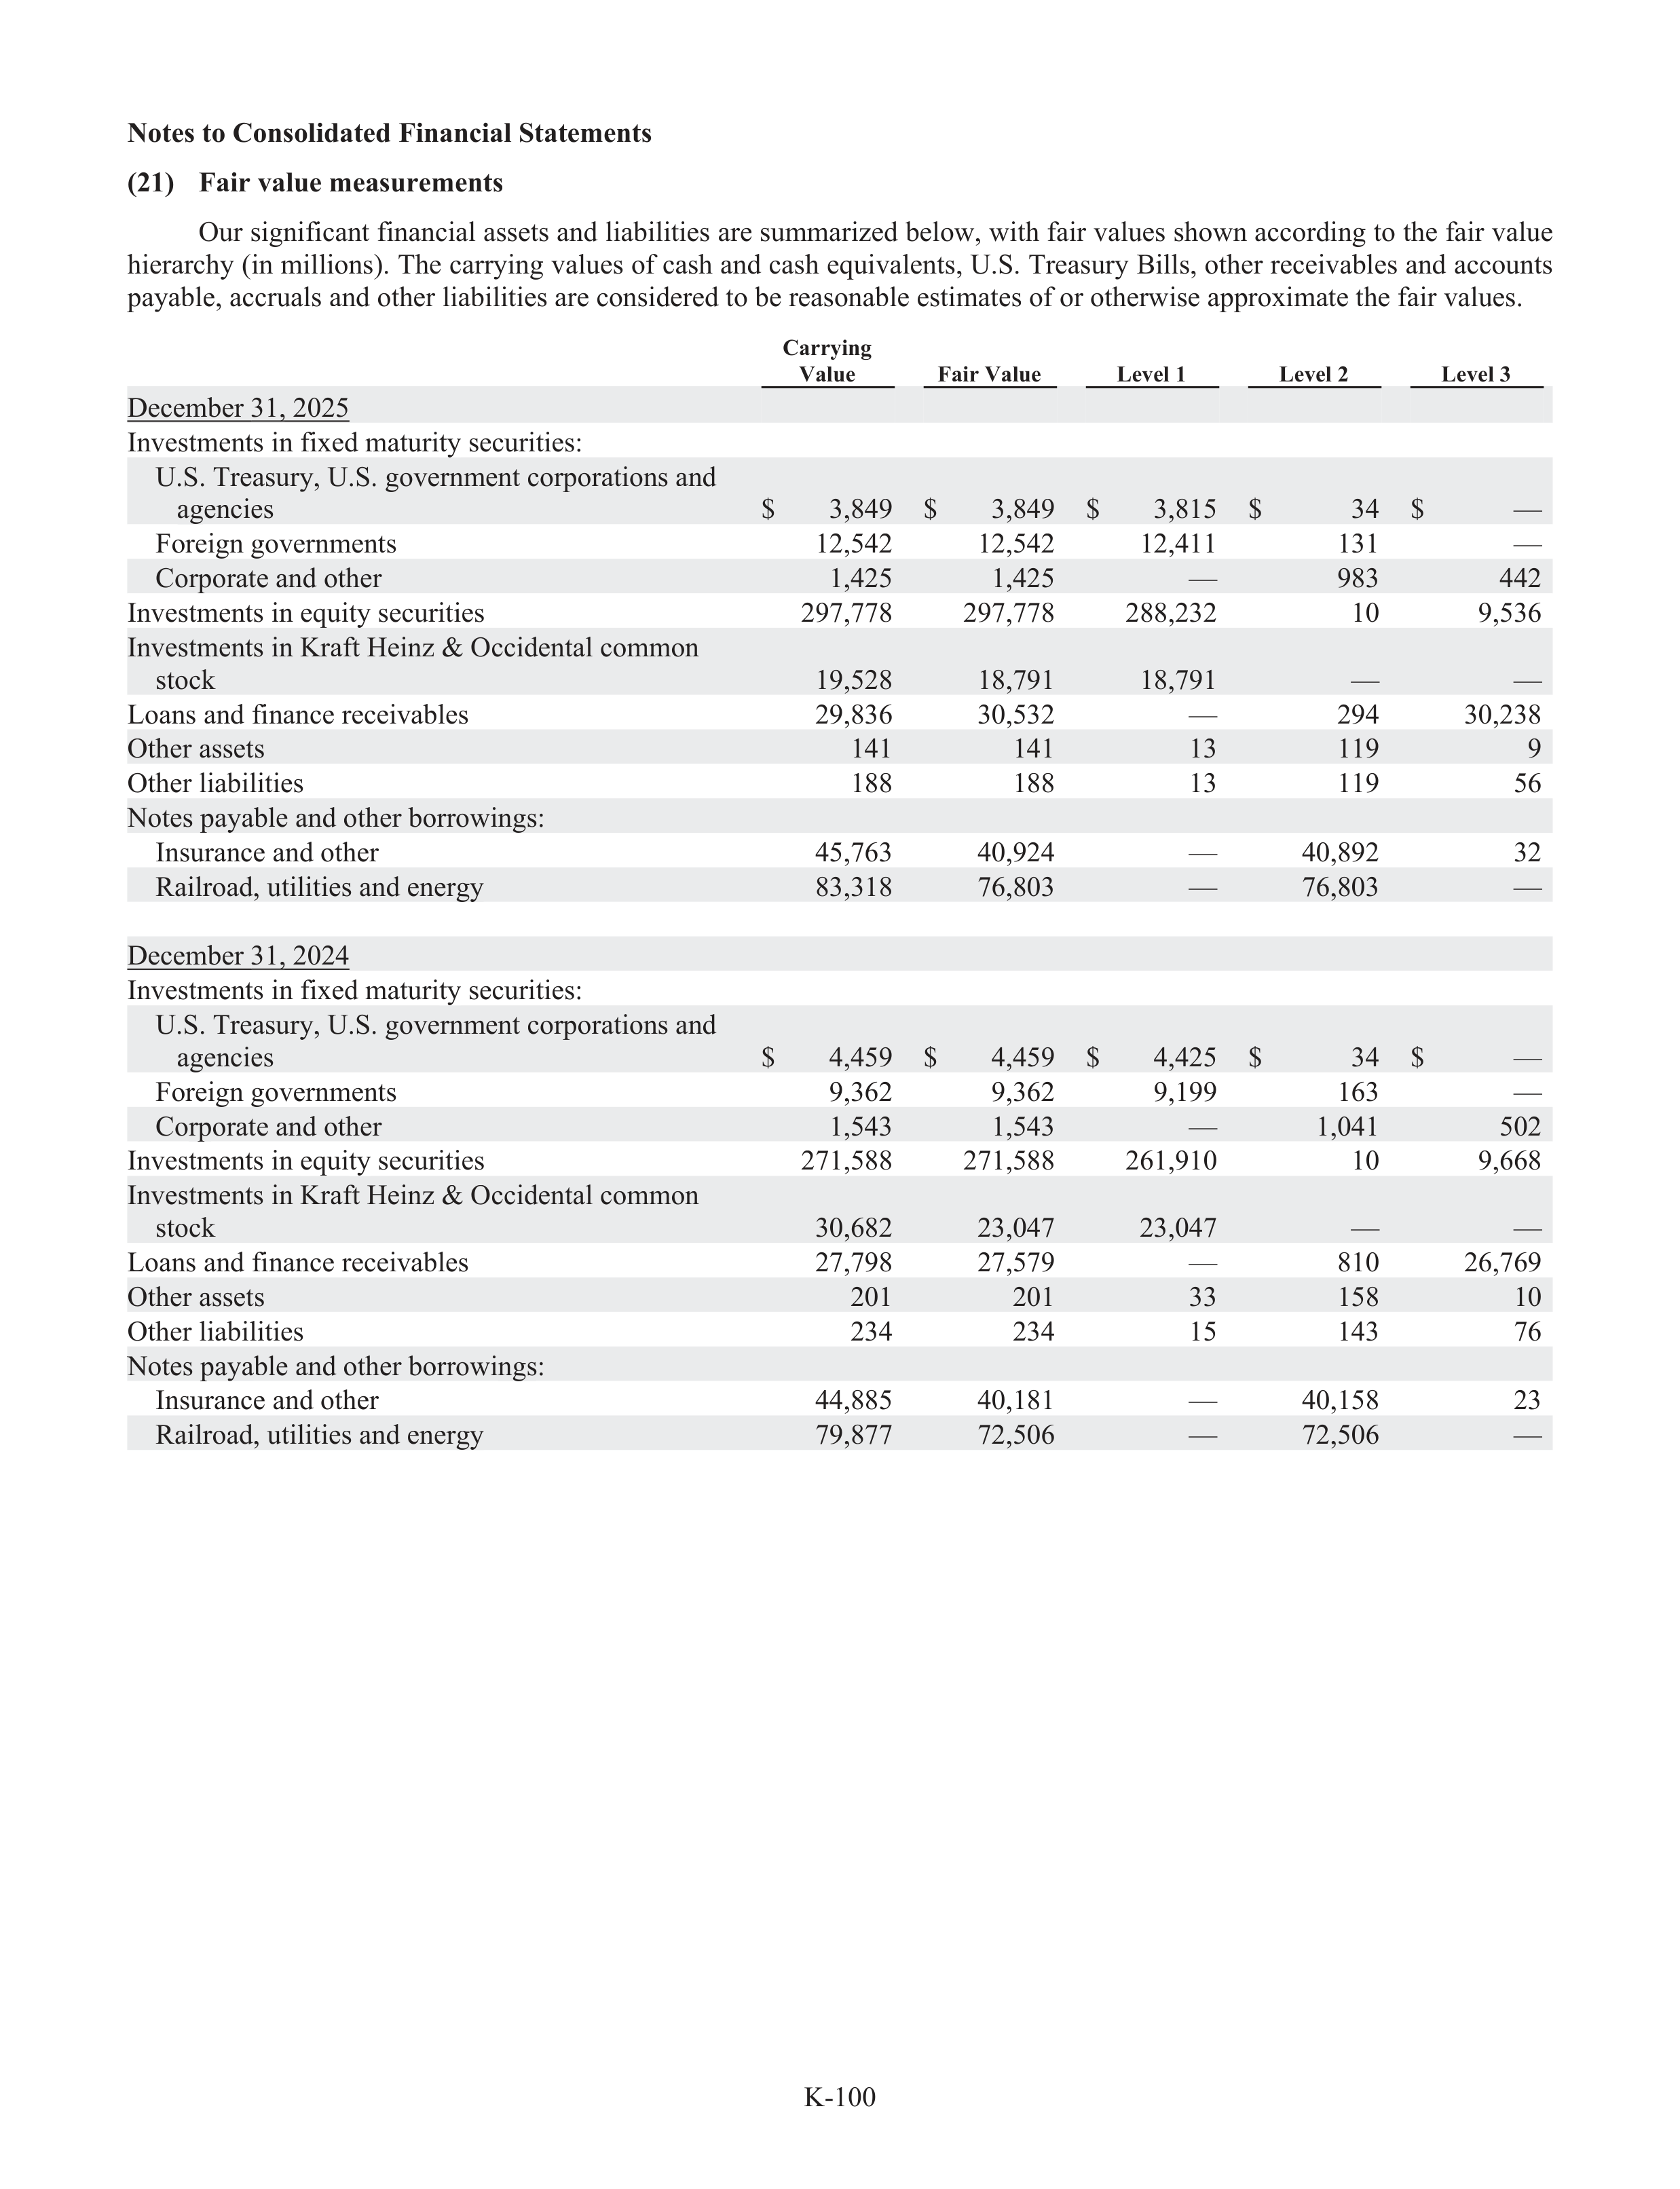
K-100
Notes to Consolidated Financial Statements
(21)
Fair value measurements
Our significant financial assets and liabi
a
lities are summarized below, with fair values shown according to the fair value
hierarchy (in millions). The carryi
r
ng values of cash and cash equivalents, U.S. Treasury
r
Bills, other receivabl
a
es and accounts
payabl
a
e, accrua
r
ls and other liabi
a
lities are considered to be reasonabl
a
e estimates of or otherwise approximate the fair values.
Carrying
Value
Fair Value
Level 1
Level 2
Level 3
December 31, 2025
Investments in fixed maturity securities:
U.S. Treasury,
r
U.S. government corporations and
agencies
$
3,849
$
3,849
$
3,815
$
34
$
—
Foreign governments
12,542
12,542
12,411
131
—
Corporate and other
1,425
1,425
—
983
442
Investments in equity securities
297,778
297,778
288,232
10
9,536
Investments in Kraftf
Heinz & Occidental common
stock
19,528
18,791
18,791
—
—
Loans and finance receivabl
a
es
29,836
30,532
—
294
30,238
Other assets
141
141
13
119
9
Other liabi
a
lities
188
188
13
119
56
Notes payabl
a
e and other borrowings:
Insurance and other
45,763
40,924
—
40,892
32
Railroad, utilities and energy
83,318
76,803
—
76,803
—
December 31, 2024
Investments in fixed maturity securities:
U.S. Treasury,
r
U.S. government corporations and
agencies
$
4,459
$
4,459
$
4,425
$
34
$
—
Foreign governments
9,362
9,362
9,199
163
—
Corporate and other
1,543
1,543
—
1,041
502
Investments in equity securities
271,588
271,588
261,910
10
9,668
Investments in Kraftf
Heinz & Occidental common
stock
30,682
23,047
23,047
—
—
Loans and finance receivabl
a
es
27,798
27,579
—
810
26,769
Other assets
201
201
33
158
10
Other liabi
a
lities
234
234
15
143
76
Notes payabl
a
e and other borrowings:
Insurance and other
44,885
40,181
—
40,158
23
Railroad, utilities and energy
79,877
72,506
—
72,506
—
,
,
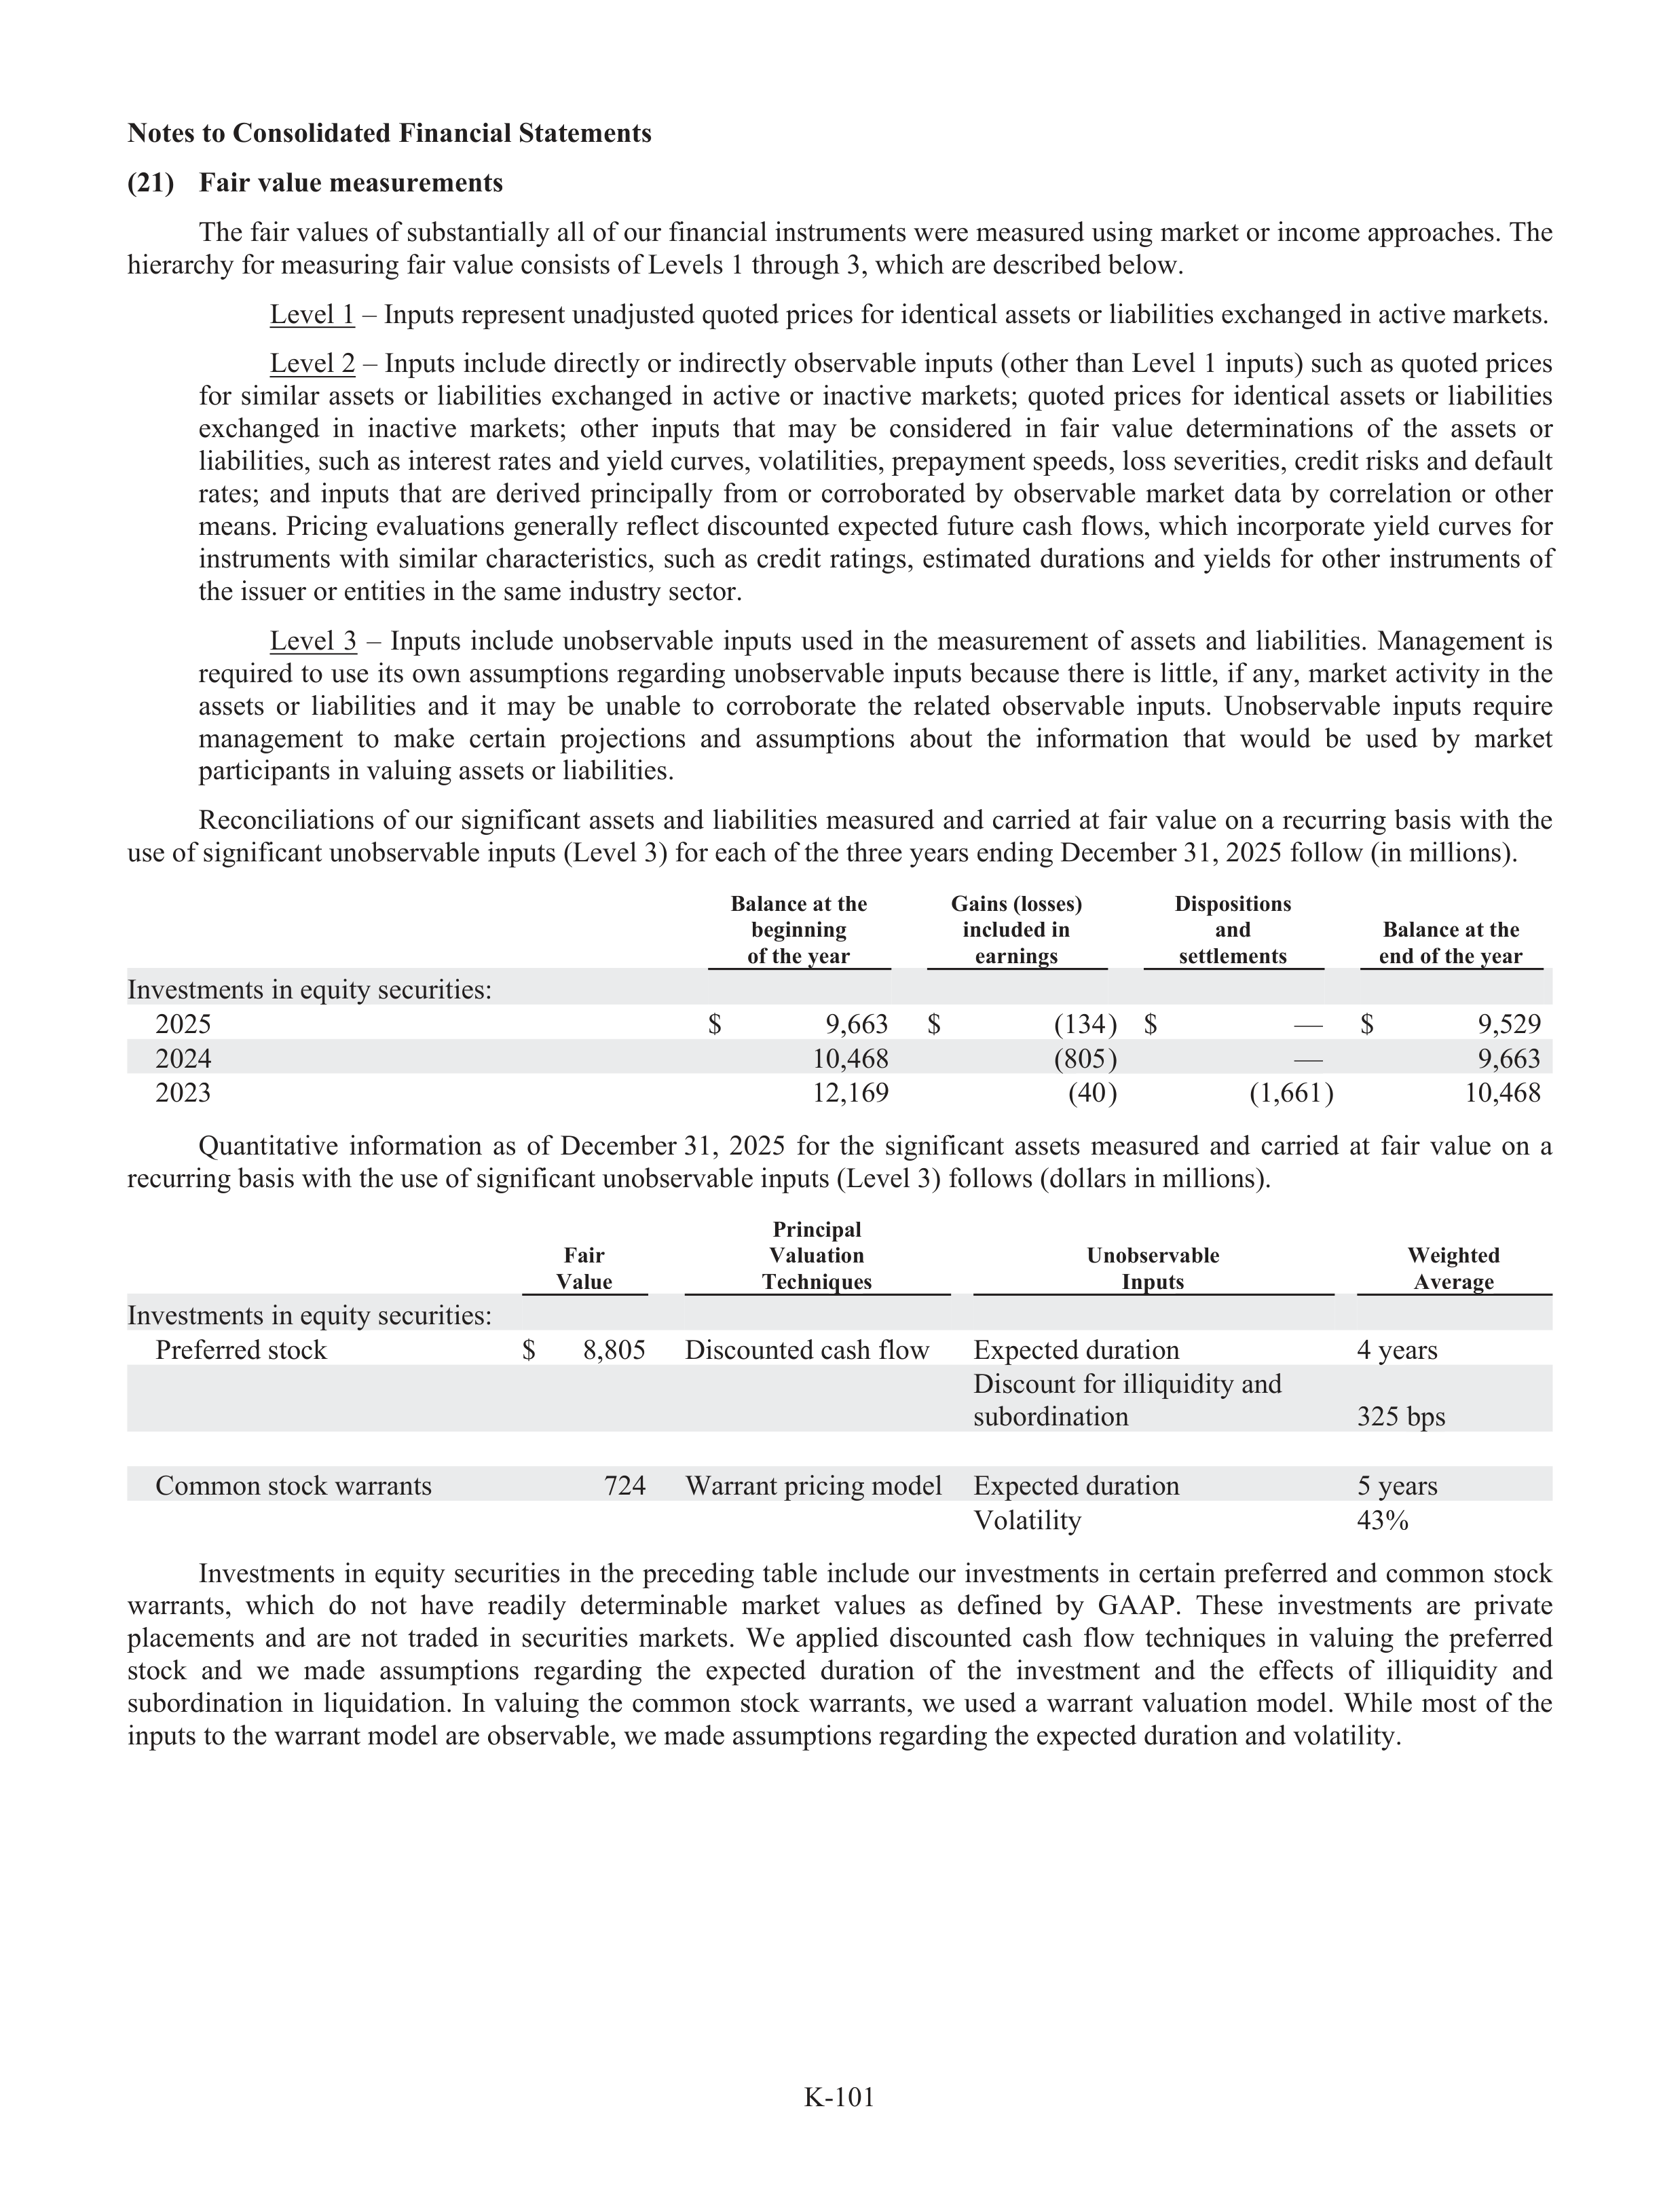
K-101
Notes to Consolidated Financial Statements
(21)
Fair value measurements
The fair values of subs
u
tantially all of our financial instruments were measured using market or income approaches. The
hierarchy for measuring fair value consists of Levels 1 through 3, which are described below.
Level 1 – Inputs represent unadjusted quoted prices for identical assets or liabi
a
lities exchanged in active markets.
Level 2 – Inputs include directly or indirectly observable inputs (other than Level 1 inputs) such as quoted prices
for
similar
assets
or
liabi
a
lities
exchanged
in
active
or
inactive
markets;
quoted
prices
for
identical
assets
or
liabi
a
lities
exchanged
in
inactive
markets;
other
inputs
that
may
be
considered
in
fair
value
determinations
of
the
assets
or
liabilities, such as interest rates and yield curves, volatilities, prepayment speeds, loss severities, credit risks and default
rates;
and
inputs
that
are
derived
principally
from
or
corroborated
by
observabl
a
e
market
data
by
correlation
or
other
means. Pricing evaluations generally reflect discounted expected future cash flows, which incorporate yield curves for
instruments
with
similar
characteristics,
such
as
credit
ratings,
estimated
durations
and
yields
for
other
instruments
of
the issuer or entities in the same industry
r
sector.
Level
3
–
Inputs
include
unobservabl
a
e
inputs
used
in
the
measurement
of
assets
and
liabi
a
lities.
Management
is
required to use its own assumptions regarding unobservabl
a
e inputs because there is little, if any, market activity in the
assets
or
liabi
a
lities
and
it
may
be
unabl
a
e
to
corroborate
the
related
observabl
a
e
inputs.
Unobservabl
a
e
inputs
require
management
to
make
certain
projections
and
assumptions
about
the
information
that
would
be
used
by
market
participants in valuing assets or liabi
a
lities.
Reconciliations of our significant assets and liabi
a
lities measured and carried at fair value on a recurring basis with the
use of significant unobservabl
a
e inputs (Level 3) for each of the three years ending December 31, 2025 follow (in millions).
Balance at the
beginning
of the year
Gains (losses)
included in
earnings
Dispositions
and
settlements
Balance at the
end of the year
Investments in equity securities:
2025
$
9,663
$
(134)
$
—
$
9,529
2024
10,468
(805)
—
9,663
2023
12,169
(40)
(1,661)
10,468
Quantitative
information
as
of
December 31,
2025
for
the
significant
assets
measured
and
carried
at
fair
value
on
a
recurring basis with the use of significant unobservabl
a
e inputs (Level 3) follows (dollars in millions).
Fair
Value
Principal
Valuation
Techniques
Unobservable
Inputs
Weighted
Average
Investments in equity securities:
Prefer
f
red stock
$
8,805
Discounted cash flow
Expected duration
4 years
Discount for illiquidity and
subor
u
dination
325 bps
Common stock warrants
724
Warrant pricing model
Expected duration
5 years
Volatility
43%
Investments
in
equity
securities
in
the
preceding
tabl
a
e
include
our
investments
in
certain
prefer
f
red
and
common
stock
warrants,
which
do
not
have
readily
determinable
market
values
as
defined
by
GAAP.
These
investments
are
private
placements
and
are
not
traded
in
securities
markets.
We
applied
discounted
cash
flow
techniques
in
valuing
the
prefer
f
red
stock
and
we
made
assumptions
regarding
the
expected
duration
of
the
investment
and
the
effe
f
cts
of
illiquidity
and
subor
u
dination
in
liquidation.
In
valuing
the
common
stock
warrants,
we
used
a
warrant
valuation
model.
While
most
of
the
inputs to the warrant model are observabl
a
e, we made assumptions regarding the expected duration and volatility.
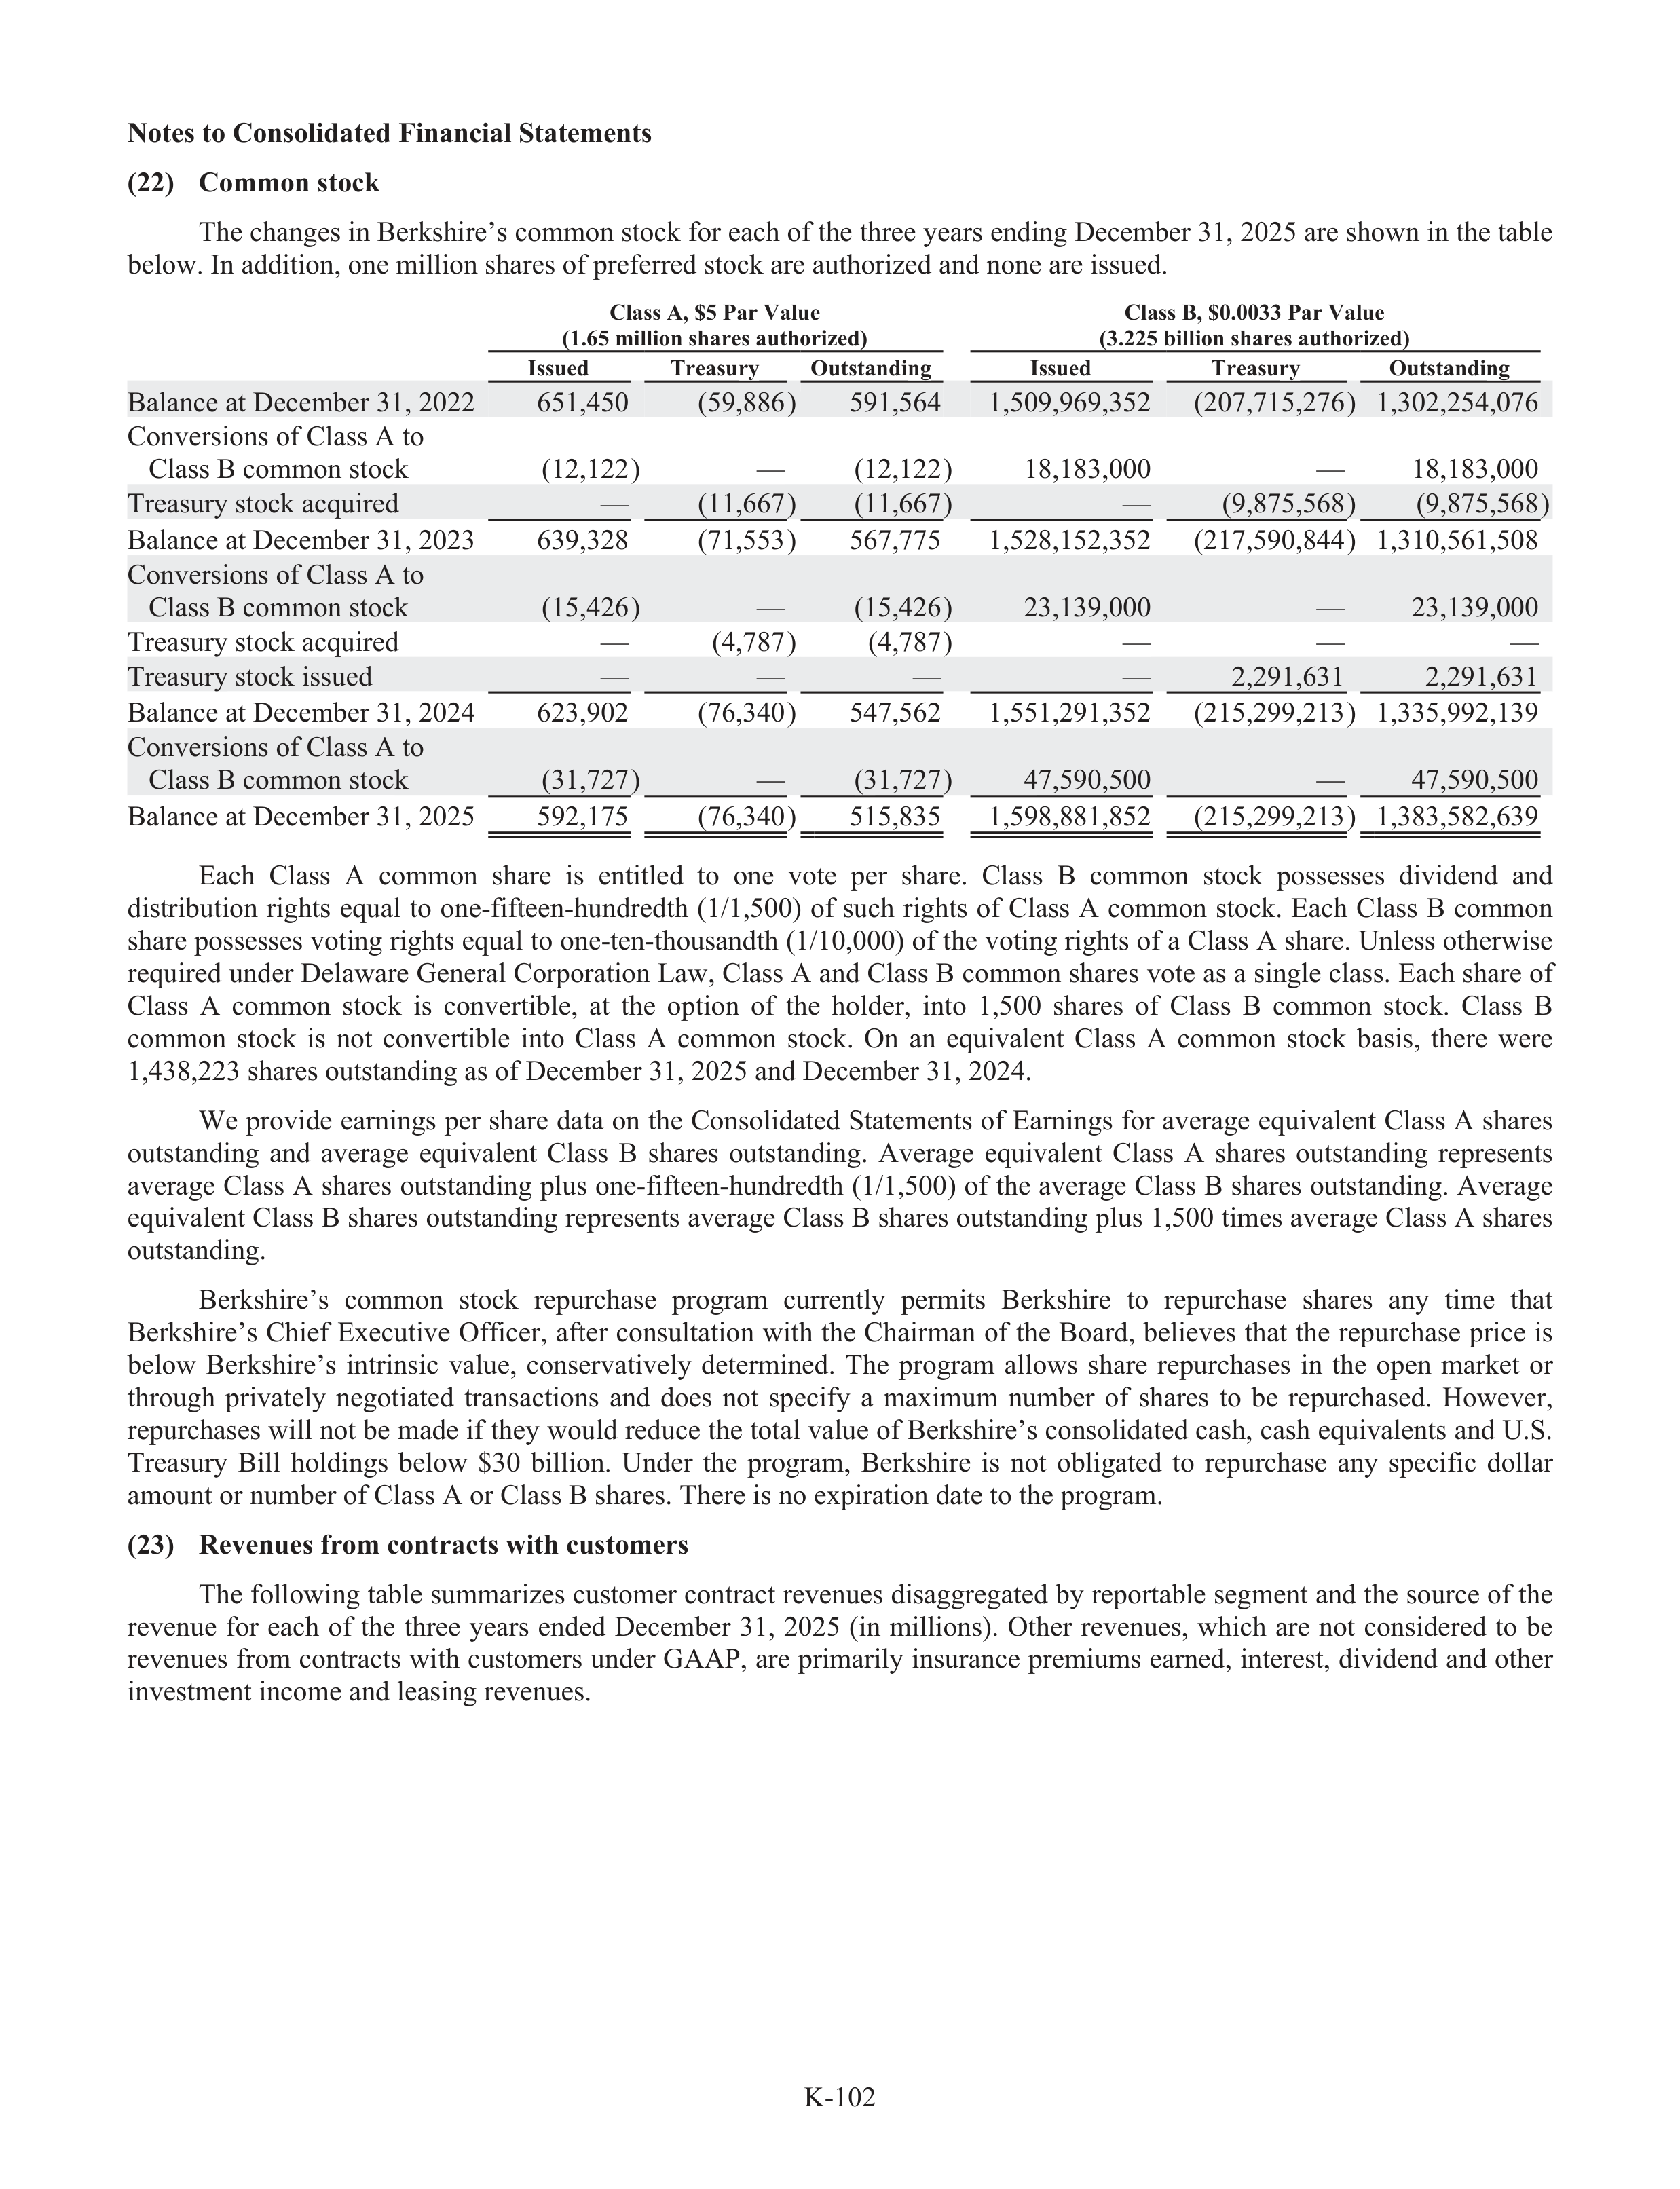
K-102
Notes to Consolidated Financial Statements
(22)
Common stock
The changes in Berkshire’s common stock for each of the three years ending December 31, 2025 are shown in the tabl
a
e
below. In addition, one million shares of prefer
f
red stock are authorized and none are issued.
Class A, $5 Par Value
(1.65 million shares authorized)
Class B, $0.0033 Par Value
(3.225 billion shares authorized)
Issued
Treasury
Outstanding
Issued
Treasury
Outstanding
Balance at December 31, 2022
651,450
(59,886)
591,564
1,509,969,352
(207,715,276)
1,302,254,076
Conversions of Class A to
Class B common stock
(12,122)
—
(12,122)
18,183,000
—
18,183,000
Treasury
r
stock acquired
—
(11,667)
(11,667)
—
(9,875,568)
(9,875,568)
Balance at December 31, 2023
639,328
(71,553)
567,775
1,528,152,352
(217,590,844)
1,310,561,508
Conversions of Class A to
Class B common stock
(15,426)
—
(15,426)
23,139,000
—
23,139,000
Treasury
r
stock acquired
—
(4,787)
(4,787)
—
—
—
Treasury
r
stock issued
—
—
—
—
2,291,631
2,291,631
Balance at December 31, 2024
623,902
(76,340)
547,562
1,551,291,352
(215,299,213)
1,335,992,139
Conversions of Class A to
Class B common stock
(31,727)
—
(31,727)
47,590,500
—
47,590,500
Balance at December 31, 2025
592,175
(76,340)
515,835
1,598,881,852
(215,299,213)
1,383,582,639
Each
Class
A
common
share
is
entitled
to
one
vote
per
share.
Class
B
common
stock
possesses
dividend
and
distribution
rights
equal
to
one-fif
f
te
f
en-hundredth
(1/1,500)
of
such
rights
of
Class
A
common
stock.
Each
Class
B
common
share possesses voting rights equal to one-ten-thousandth (1/10,000) of the voting rights of a Class A share. Unless otherwise
required under Delaware General Corporation Law, Class A and Class B common shares vote as a single class. Each share of
Class
A
common
stock
is
convertible,
at
the
option
of
the
holder,
into
1,500
shares
of
Class
B
common
stock.
Class
B
common
stock
is
not
convertible
into
Class
A
common
stock.
On
an
equivalent
Class
A
common
stock
basis,
there
were
1,438,223 shares outstanding as of December 31, 2025 and December 31, 2024.
We provide earnings per share data on the Consolidated Statements of Earnings for average equivalent Class A shares
outstanding
and
average
equivalent
Class
B
shares
outstanding.
Average
equivalent
Class
A
shares
outstanding
represents
average Class A shares outstanding plus one-fifteen-hundredth (1/1,500) of the average Class B shares outstanding. Average
equivalent Class B shares outstanding represents average Class B shares outstanding plus 1,500 times average Class A shares
outstanding.
Berkshire’s
common
stock
repurchase
program
currently
permits
Berkshire
to
repurchase
shares
any
time
that
Berkshire’s Chief Executive Offi
f
cer, afte
f
r consultation with the Chairman of the Board, believes that the repurchase price is
below
Berkshire’s
intrinsic
value,
conservatively
determined.
The
program
allows
share
repurchases
in
the
open
market
or
through
privately
negotiated
transactions
and
does
not
specify
a
maximum
number
of
shares
to
be
repurchased.
However,
repurchases will not be made if they would reduce the total value of Berkshire’s consolidated cash, cash equivalents and U.S.
Treasury
r
Bill
holdings
below
$30
billion.
Under
the
program,
Berkshire
is
not
obligated
to
repurchase
any
specific
dollar
amount or number of Class A or Class B shares. There is no expiration date to the program.
(23)
Revenues from contracts with customers
The following tabl
a
e summarizes customer contract revenues disaggregated by reportabl
a
e segment and the source of the
revenue
for
each
of
the
three
years
ended
December
31,
2025
(in
millions).
Other
revenues,
which
are
not
considered
to
be
revenues from contracts with customers under GAAP, are primarily insurance premiums earned, interest, dividend and other
investment income and leasing revenues.
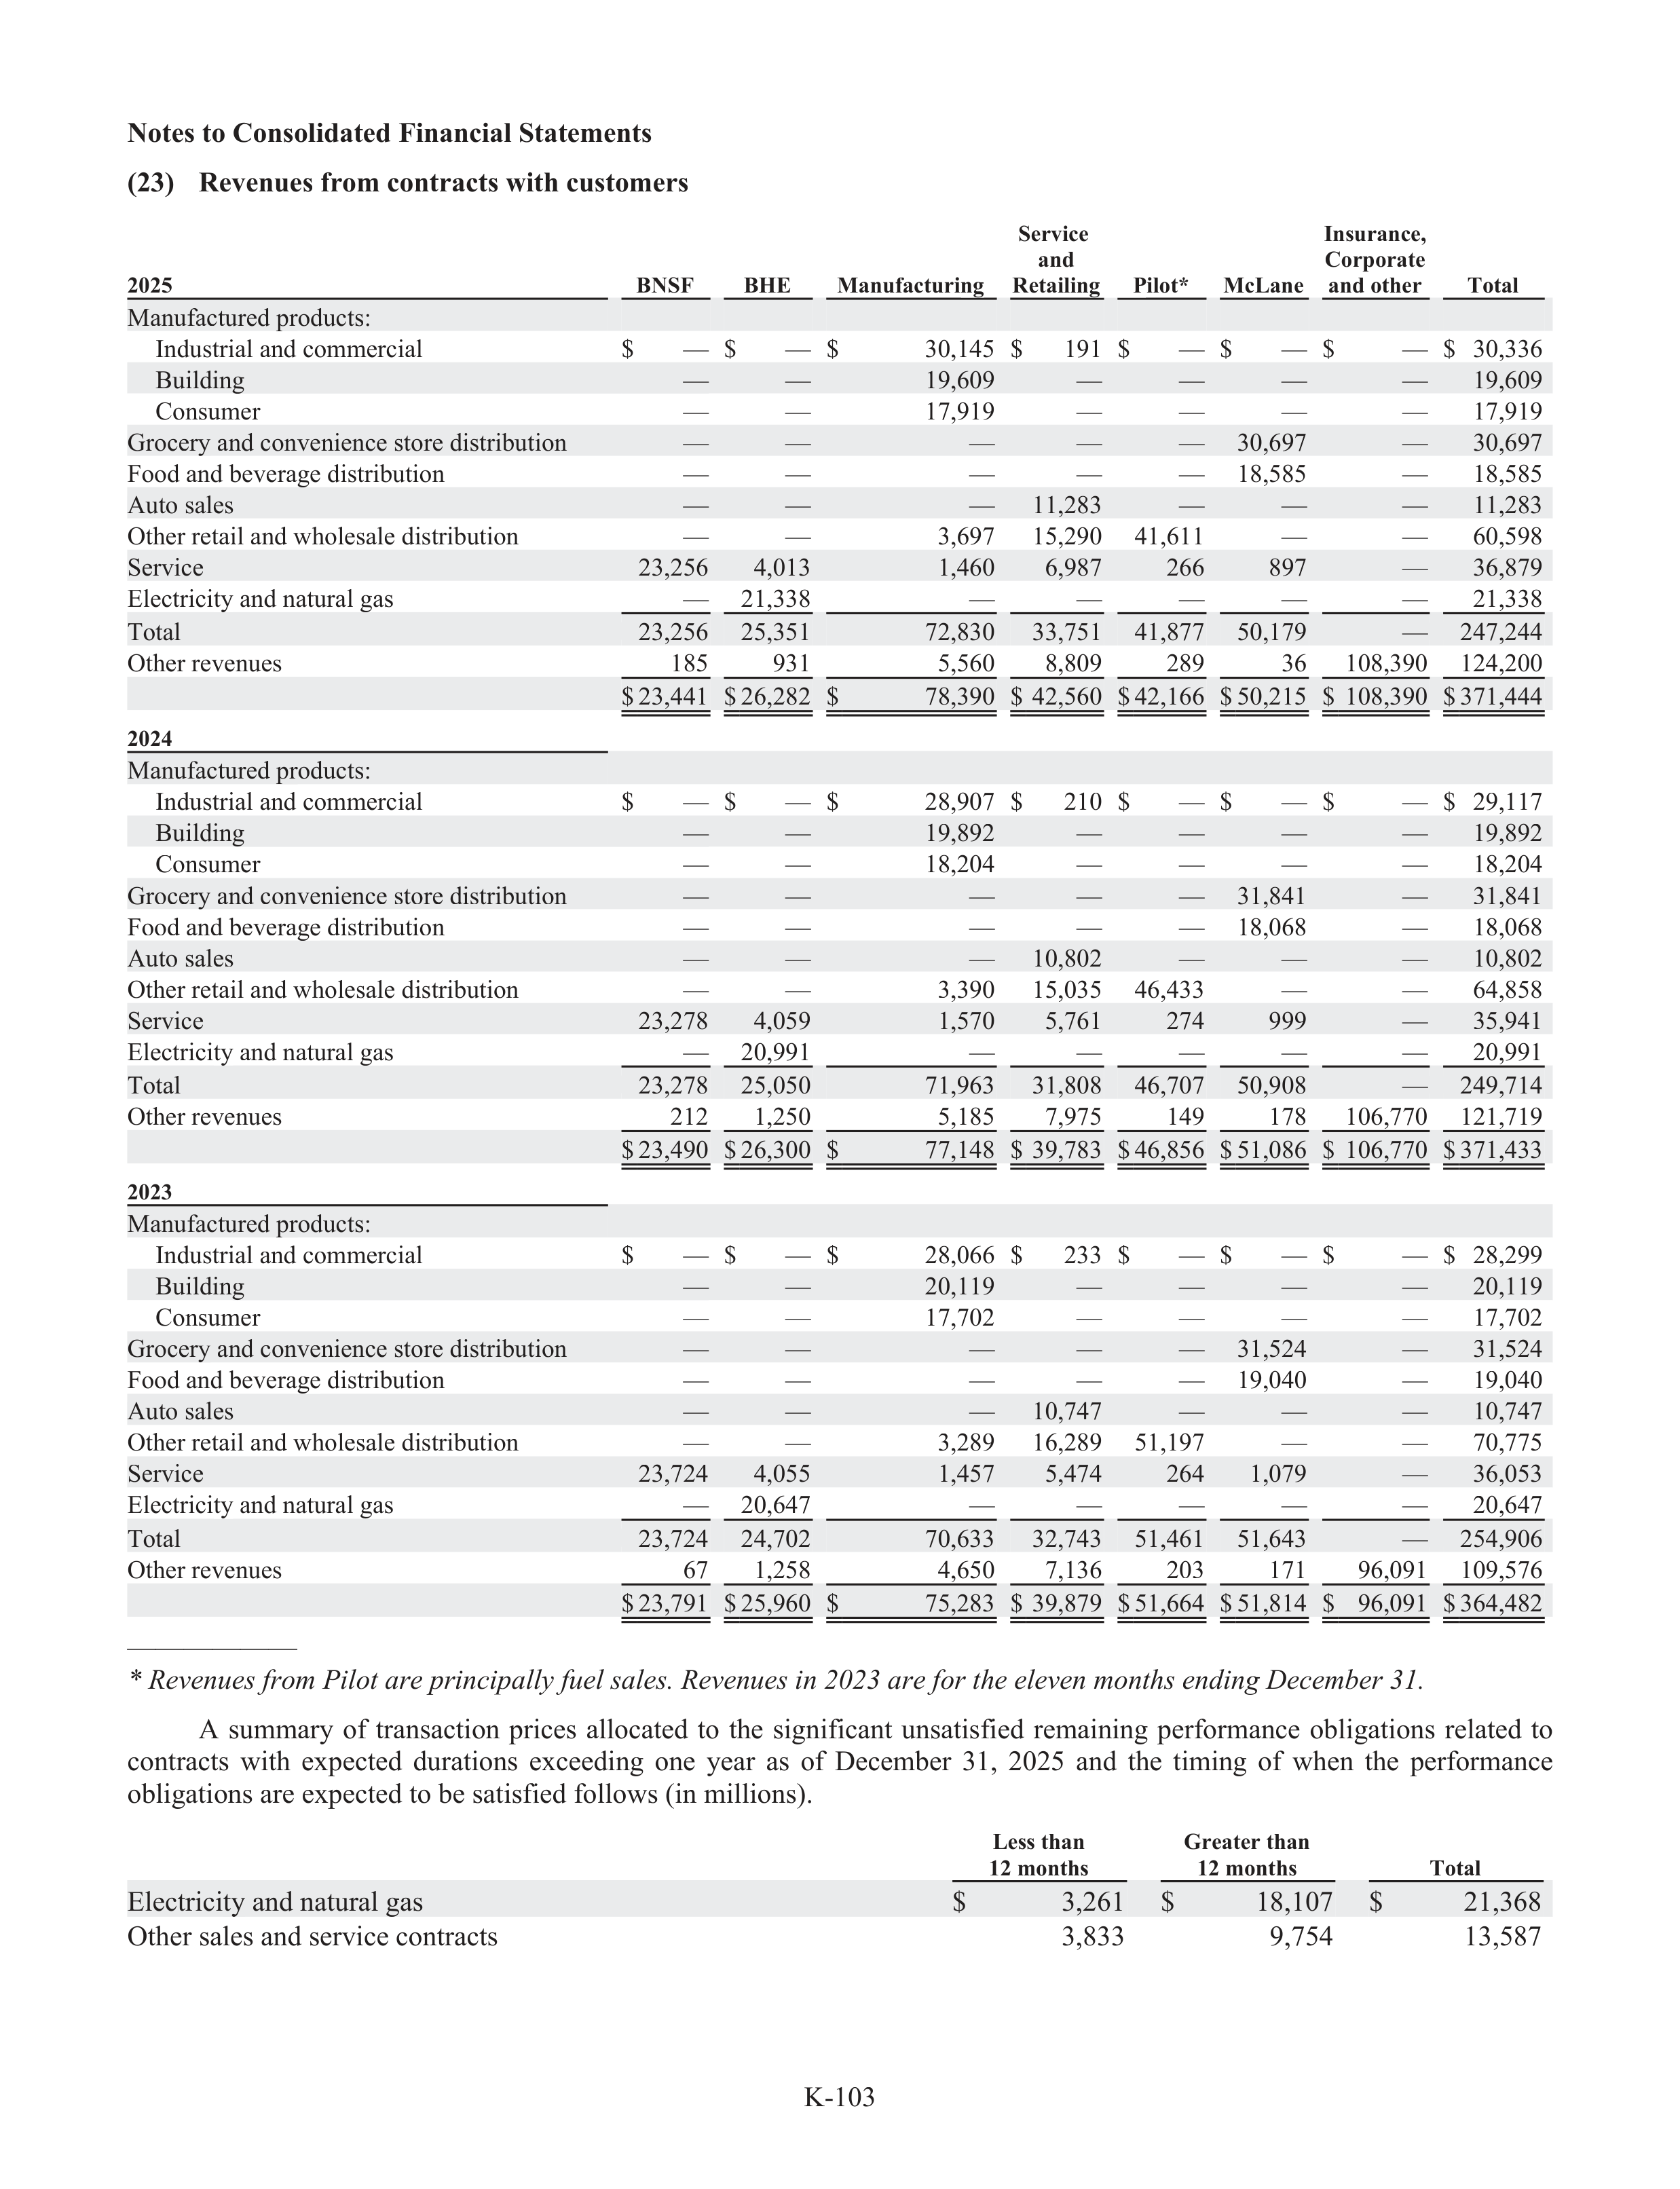
K-103
Notes to Consolidated Financial Statements
(23)
Revenues from contracts with customers
2025
BNSF
BHE
Manufac
f
turing
Service
and
Retailing
Pilot*
McLane
Insurance,
Corporate
and other
Total
Manufact
f
ur
t
ed products:
Industrial and commercial
$
—
$
—
$
30,145
$
191
$
—
$
—
$
—
$
30,336
Building
—
—
19,609
—
—
—
—
19,609
Consumer
—
—
17,919
—
—
—
—
17,919
Grocery
r
and convenience store distribution
—
—
—
—
—
30,697
—
30,697
Food and beverage distribution
—
—
—
—
—
18,585
—
18,585
Auto sales
—
—
—
11,283
—
—
—
11,283
Other retail and wholesale distribution
—
—
3,697
15,290
41,611
—
—
60,598
Service
23,256
4,013
1,460
6,987
266
897
—
36,879
Electricity and natural gas
—
21,338
—
—
—
—
—
21,338
Total
23,256
25,351
72,830
33,751
41,877
50,179
—
247,244
Other revenues
185
931
5,560
8,809
289
36
108,390
124,200
$ 23,441
$ 26,282
$
78,390
$
42,560
$ 42,166
$ 50,215
$
108,390
$ 371,444
2024
Manufact
f
ur
t
ed products:
Industrial and commercial
$
—
$
—
$
28,907
$
210
$
—
$
—
$
—
$
29,117
Building
—
—
19,892
—
—
—
—
19,892
Consumer
—
—
18,204
—
—
—
—
18,204
Grocery
r
and convenience store distribution
—
—
—
—
—
31,841
—
31,841
Food and beverage distribution
—
—
—
—
—
18,068
—
18,068
Auto sales
—
—
—
10,802
—
—
—
10,802
Other retail and wholesale distribution
—
—
3,390
15,035
46,433
—
—
64,858
Service
23,278
4,059
1,570
5,761
274
999
—
35,941
Electricity and natural gas
—
20,991
—
—
—
—
—
20,991
Total
23,278
25,050
71,963
31,808
46,707
50,908
—
249,714
Other revenues
212
1,250
5,185
7,975
149
178
106,770
121,719
$ 23,490
$ 26,300
$
77,148
$
39,783
$ 46,856
$ 51,086
$
106,770
$ 371,433
2023
Manufact
f
ur
t
ed products:
Industrial and commercial
$
—
$
—
$
28,066
$
233
$
—
$
—
$
—
$
28,299
Building
—
—
20,119
—
—
—
—
20,119
Consumer
—
—
17,702
—
—
—
—
17,702
Grocery
r
and convenience store distribution
—
—
—
—
—
31,524
—
31,524
Food and beverage distribution
—
—
—
—
—
19,040
—
19,040
Auto sales
—
—
—
10,747
—
—
—
10,747
Other retail and wholesale distribution
—
—
3,289
16,289
51,197
—
—
70,775
Service
23,724
4,055
1,457
5,474
264
1,079
—
36,053
Electricity and natural gas
—
20,647
—
—
—
—
—
20,647
Total
23,724
24,702
70,633
32,743
51,461
51,643
—
254,906
Other revenues
67
1,258
4,650
7,136
203
171
96,091
109,576
$ 23,791
$ 25,960
$
75,283
$
39,879
$ 51,664
$ 51,814
$
96,091
$ 364,482
——————
* Revenues from Pilot are principal
i
ly fuel sales. Revenues in 2023 are for the eleven months ending December 31.
A
summary
of
transaction
prices
allocated
to
the
significant
unsatisfied
remaining
performance
obligations
related
to
contracts
with
expected
durations
exceeding
one
year
as
of
December
31,
2025
and
the
timing
of
when
the
performance
obligations are expected to be satisfie
f
d follows (in millions).
Less than
12 months
Greater than
12 months
Total
Electricity and natural gas
$
3,261
$
18,107
$
21,368
Other sales and service contracts
3,833
9,754
13,587
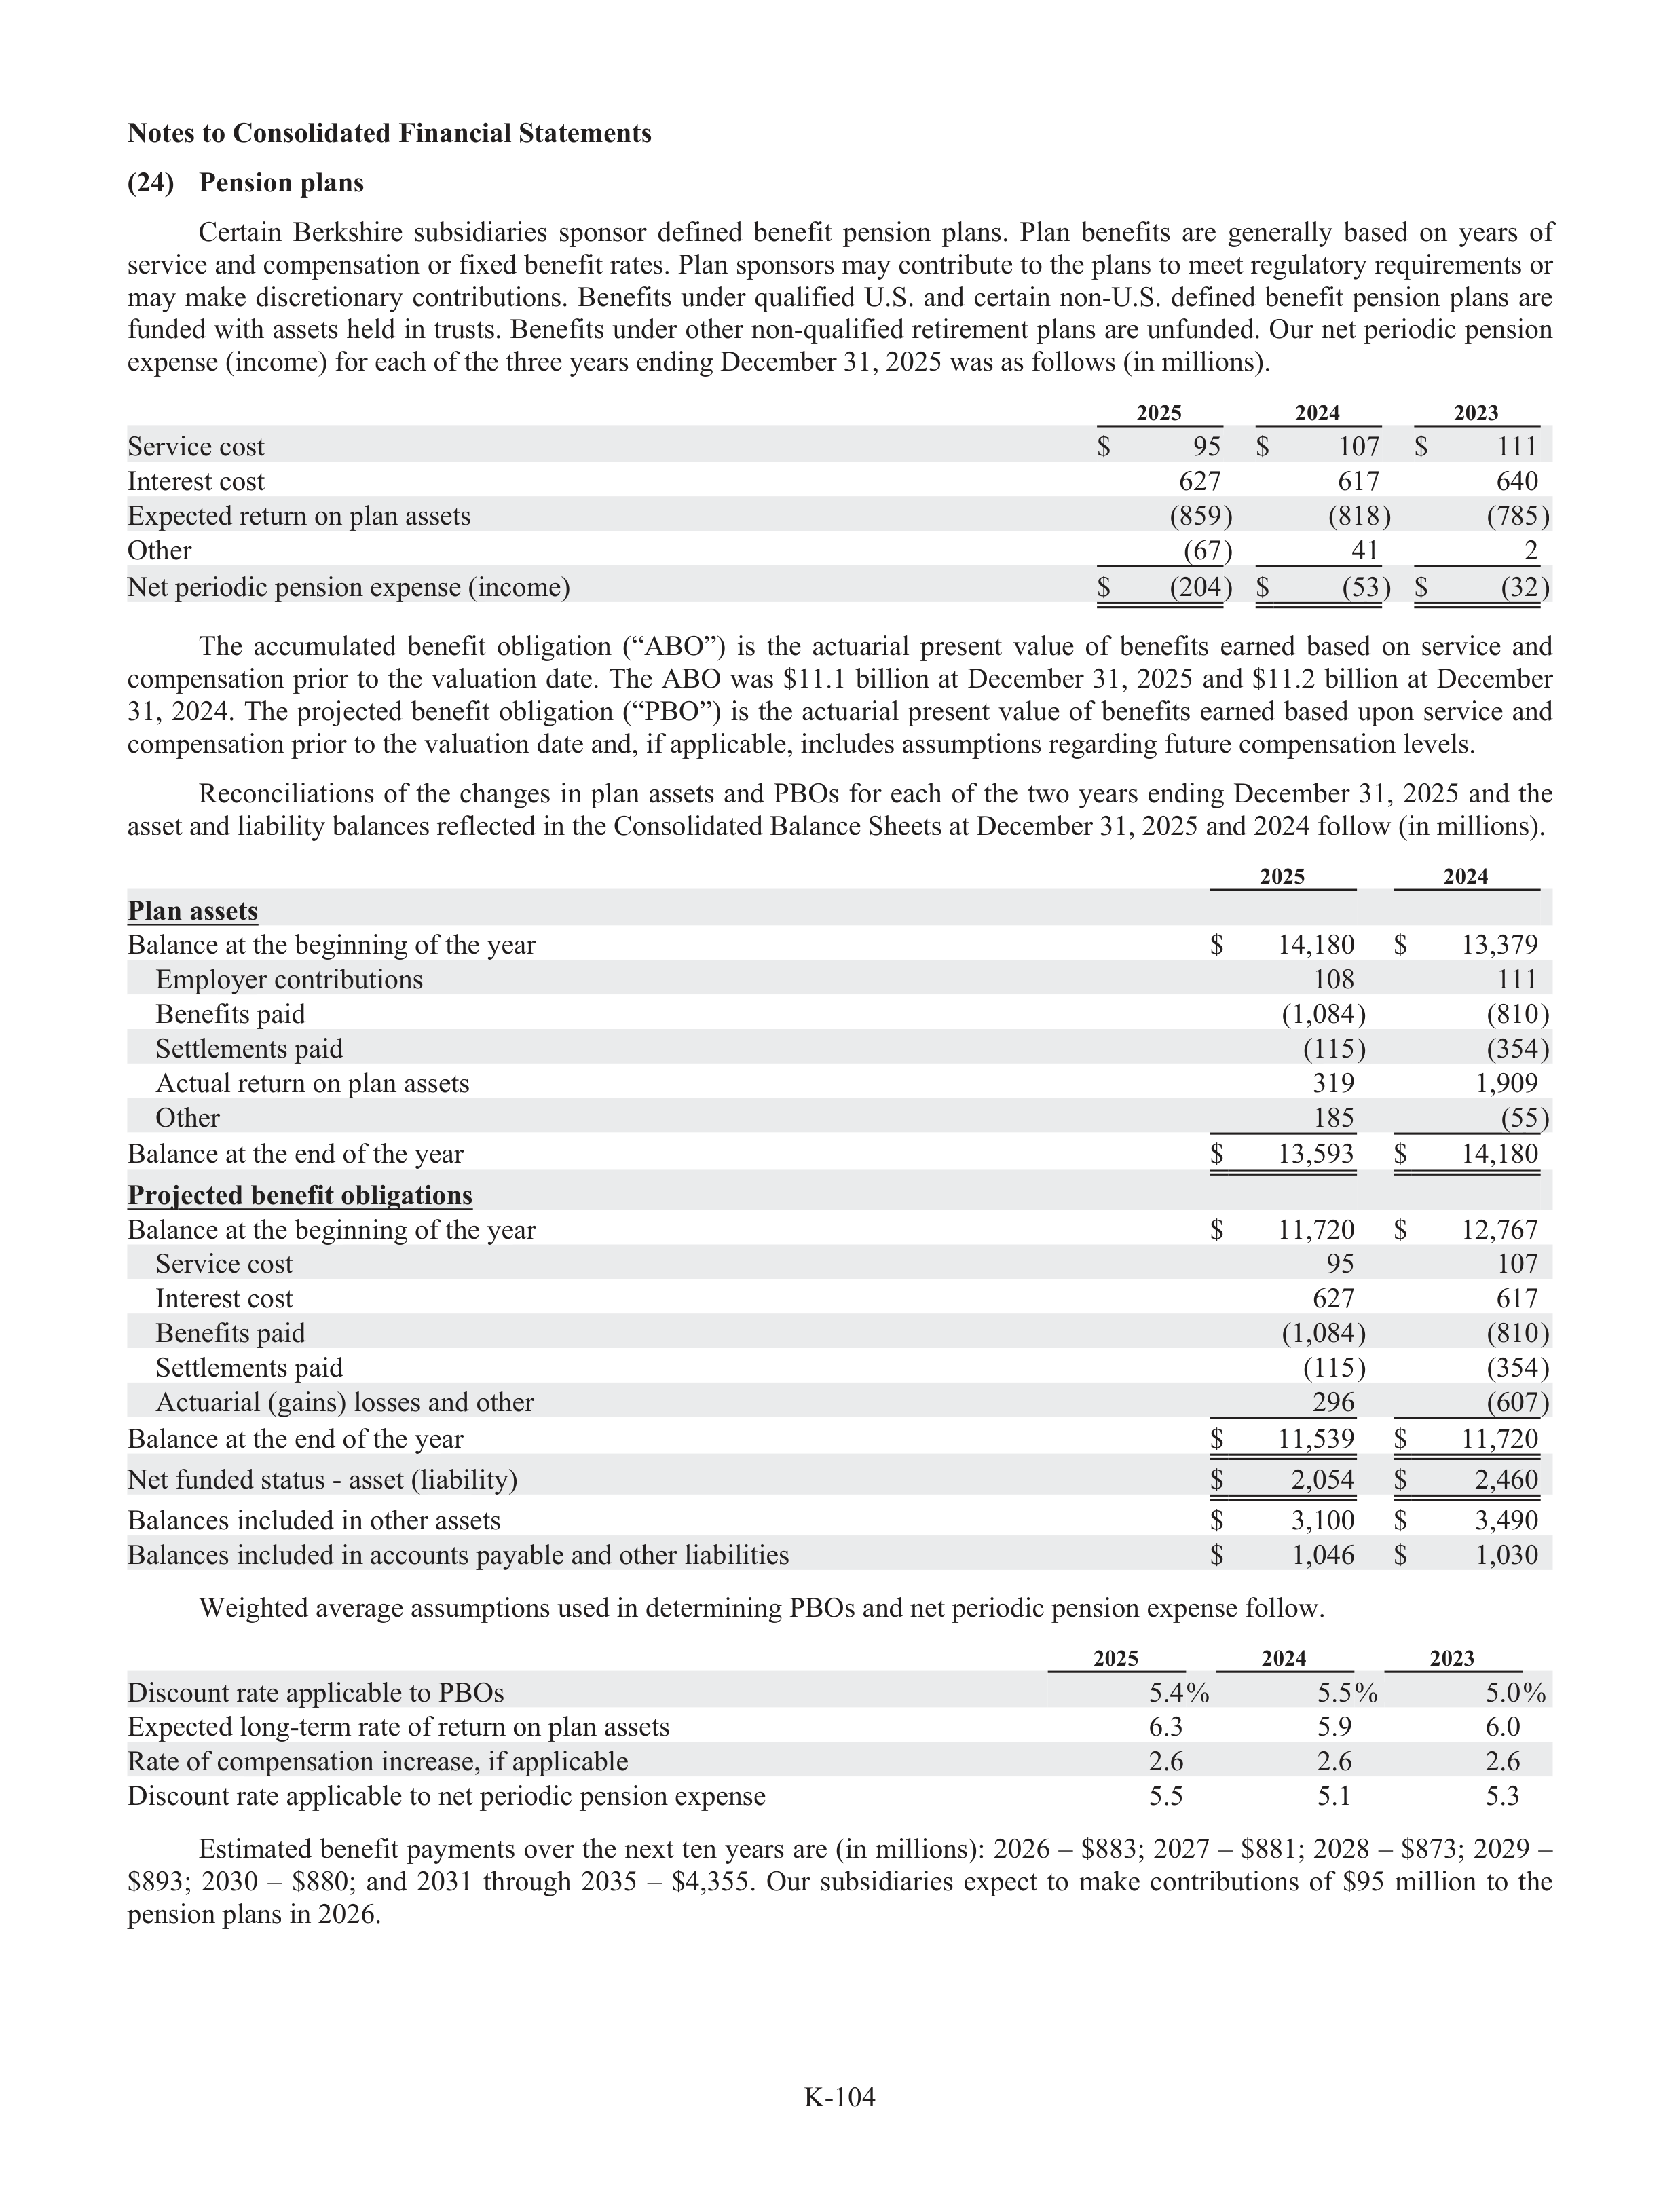
K-104
Notes to Consolidated Financial Statements
(24)
Pension plans
Certain
Berkshire
subs
u
idiaries
sponsor
defined
benefit
pension
plans.
Plan
benefits
are
generally
based
on
years
of
service and compensation or fixed benefit rates. Plan sponsors may contribute to the plans to meet regulatory
r
requirements or
may
make
discretionary
contributions.
Benefits
under
qualifie
f
d
U.S.
and
certain
non-U.S.
defined
benefit
pension
plans
are
funded with assets held in trus
r
ts. Benefits under other non-qualifie
f
d retirement plans are unfunde
f
d. Our net periodic pension
expense (income) for each of the three years ending December 31, 2025 was as follows (in millions).
2025
2024
2023
Service cost
$
95
$
107
$
111
Interest cost
627
617
640
Expected return on plan assets
(859)
(818)
(785)
Other
(67)
41
2
Net periodic pension expense (income)
$
(204)
$
(53)
$
(32)
The
accumulated
benefit
obligation
(“ABO”)
is
the
actuarial
present
value
of
benefits
earned
based
on
service
and
compensation
prior
to
the
valuation
date.
The
ABO
was
$11.1
billion
at
December
31,
2025
and
$11.2
billion
at
December
31,
2024.
The
projected
benefit
obligation
(“PBO”)
is
the
actua
t
rial
present
value
of
benefits
earned
based
upon
service
and
compensation prior to the valuation date and, if applicable, includes assumptions regarding future compensation levels.
Reconciliations
of
the
changes
in
plan
assets
and
PBOs
for
each
of
the
two
years
ending
December
31,
2025
and
the
asset and liabi
a
lity balances reflected in the Consolidated Balance Sheets at December 31, 2025 and 2024 follow (in millions).
2025
2024
Plan assets
Balance at the beginning of the year
$
14,180
$
13,379
Employer contributions
108
111
Benefits paid
(1,084)
(810)
Settlements paid
(115)
(354)
Actual return on plan assets
319
1,909
Other
185
(55)
Balance at the end of the year
$
13,593
$
14,180
Projected benefit obligations
Balance at the beginning of the year
$
11,720
$
12,767
Service cost
95
107
Interest cost
627
617
Benefits paid
(1,084)
(810)
Settlements paid
(115)
(354)
Actuarial (gains) losses and other
296
(607)
Balance at the end of the year
$
11,539
$
11,720
Net funded status
t
- asset (liabi
a
lity)
$
2,054
$
2,460
Balances included in other assets
$
3,100
$
3,490
Balances included in accounts payabl
a
e and other liabi
a
lities
$
1,046
$
1,030
Weighted average assumptions used in determining PBOs and net periodic pension expense follow.
2025
2024
2023
Discount rate applicable to PBOs
5.4%
5.5%
5.0%
Expected long-term rate of return on plan assets
6.3
5.9
6.0
Rate of compensation increase, if applicable
2.6
2.6
2.6
Discount rate applicable to net periodic pension expense
5.5
5.1
5.3
Estimated benefit payments over the next ten years are (in millions): 2026 – $883; 2027 – $881; 2028 – $873; 2029 –
$893;
2030
–
$880;
and
2031
through
2035
–
$4,355.
Our
subs
u
idiaries
expect
to
make
contributions
of
$95
million
to
the
pension plans in 2026.
j
g
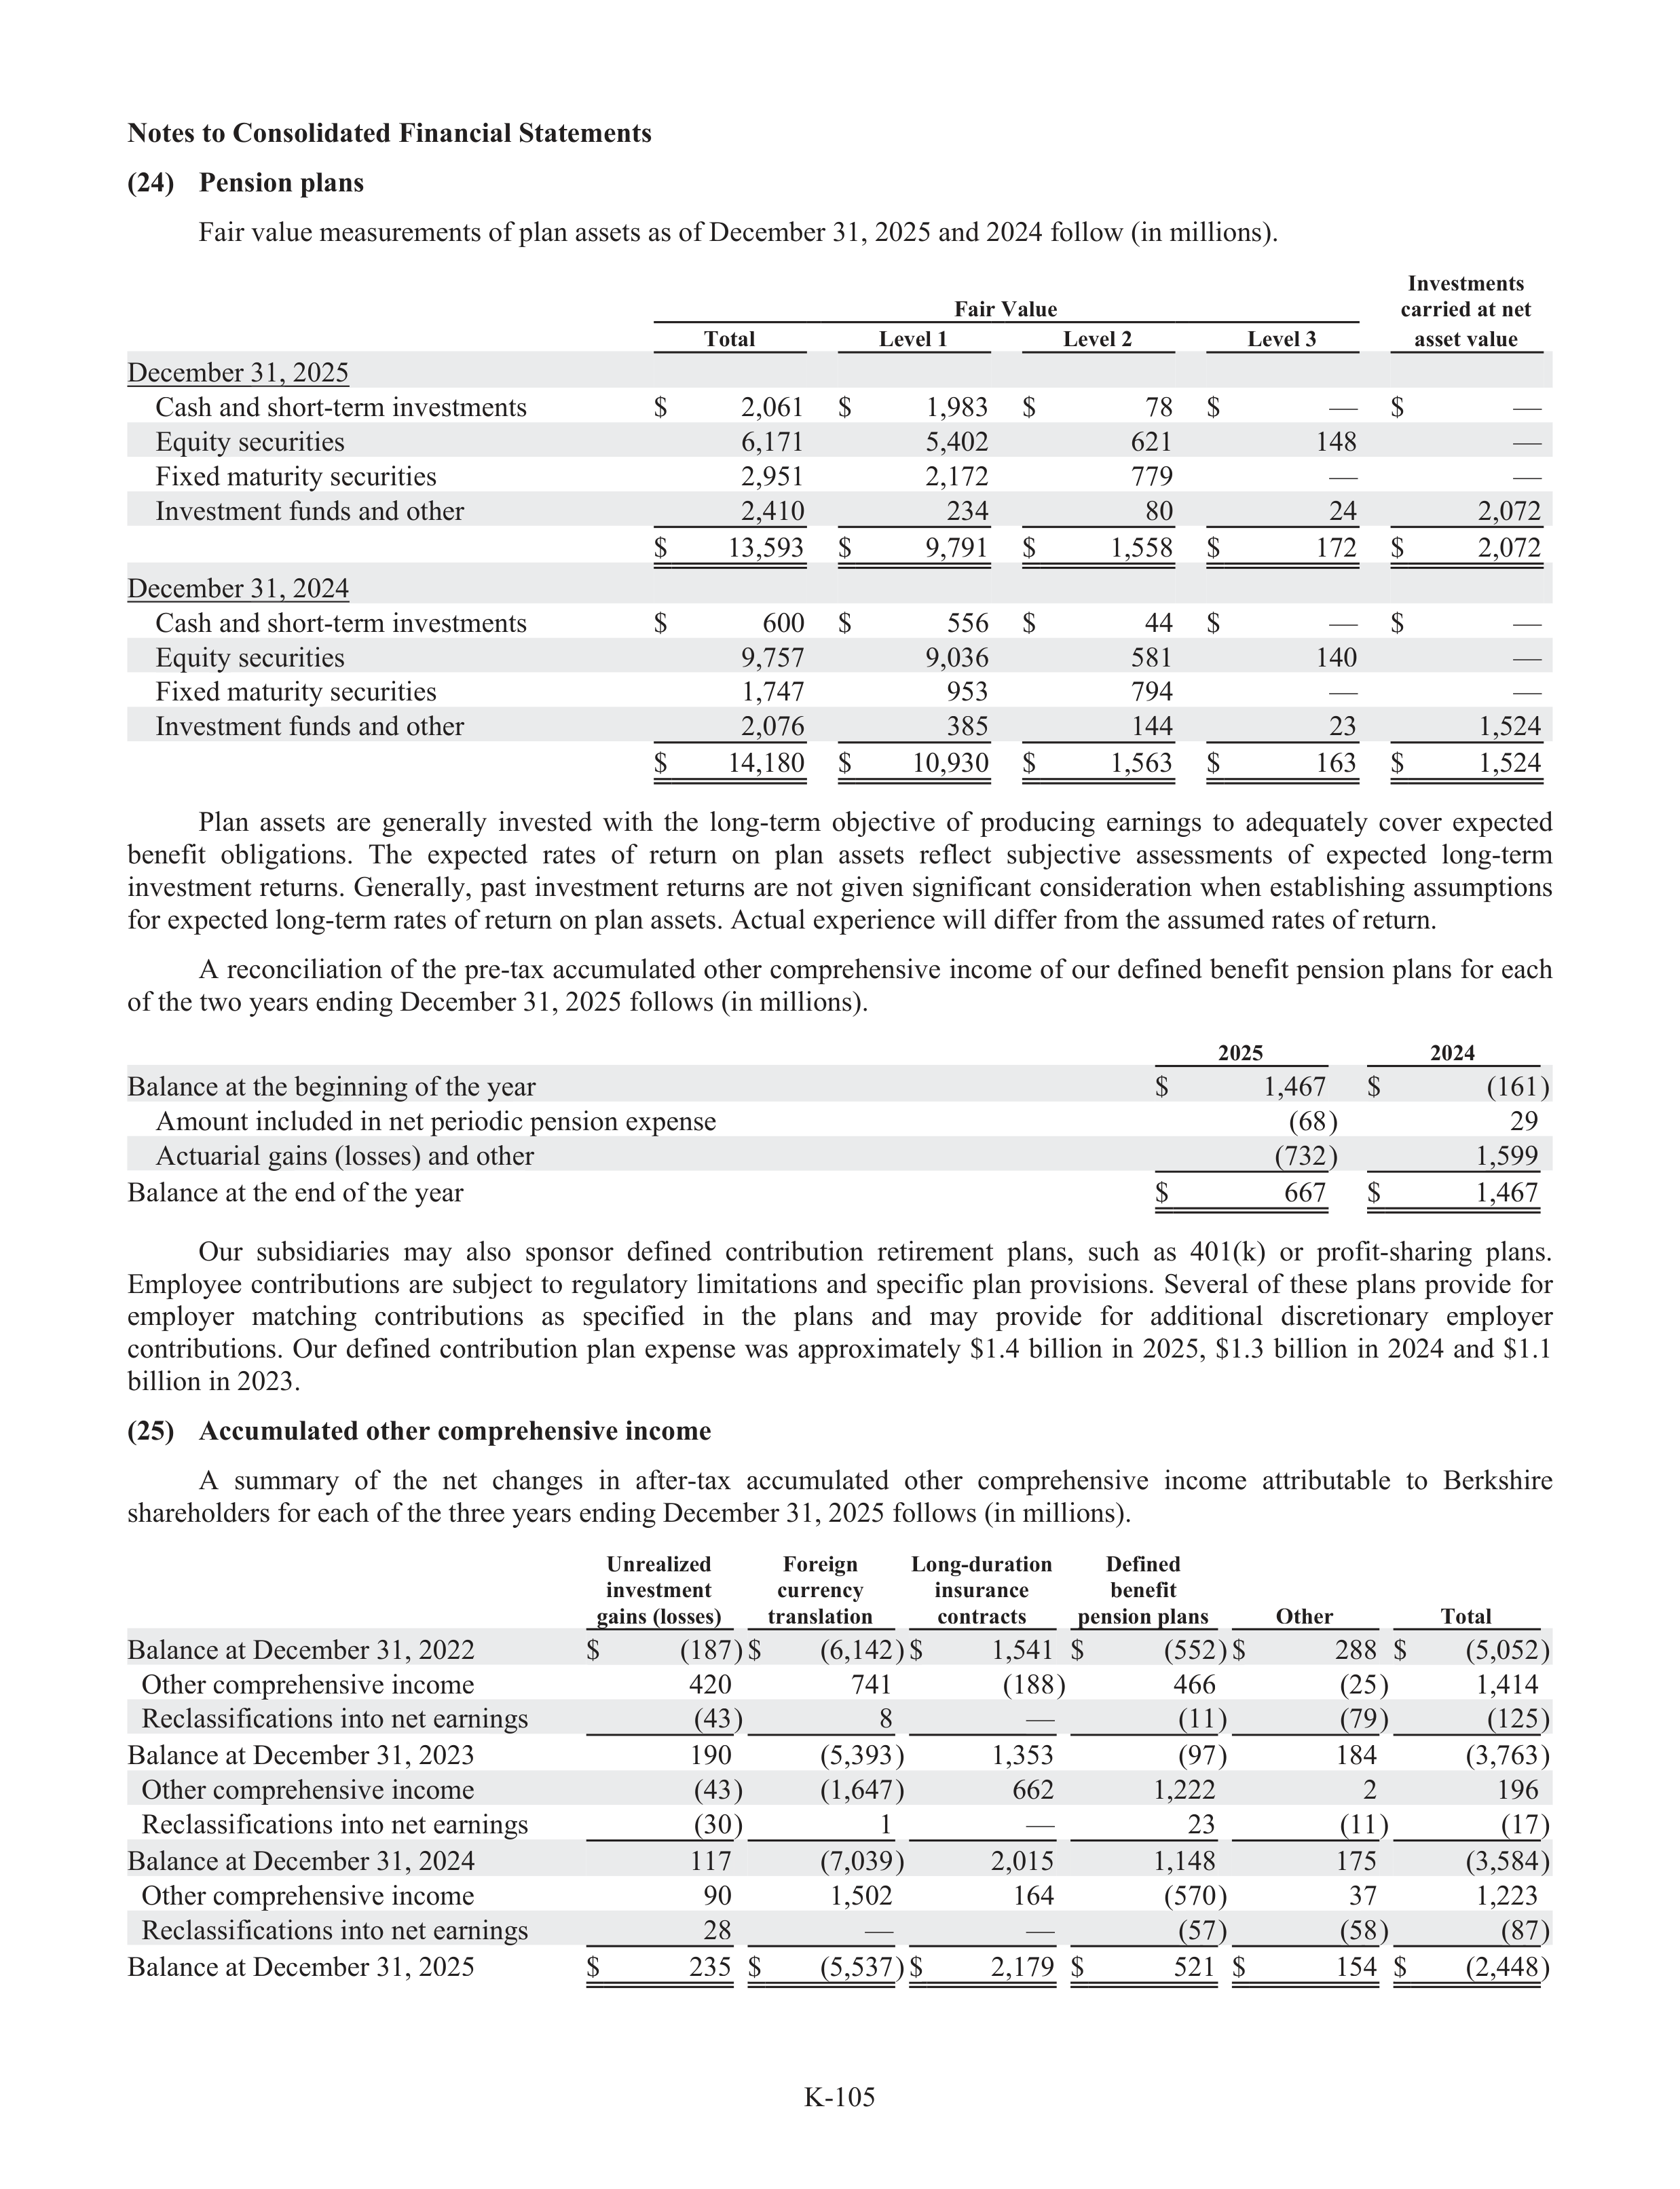
K-105
Notes to Consolidated Financial Statements
(24)
Pension plans
Fair value measurements of plan assets as of December 31, 2025 and 2024 follow (in millions).
Fair Value
Investments
carried at net
Total
Level 1
Level 2
Level 3
asset value
December 31, 2025
Cash and short-term investments
$
2,061
$
1,983
$
78
$
—
$
—
Equity securities
6,171
5,402
621
148
—
Fixed maturity securities
2,951
2,172
779
—
—
Investment funds and other
2,410
234
80
24
2,072
$
13,593
$
9,791
$
1,558
$
172
$
2,072
December 31, 2024
Cash and short-term investments
$
600
$
556
$
44
$
—
$
—
Equity securities
9,757
9,036
581
140
—
Fixed maturity securities
1,747
953
794
—
—
Investment funds and other
2,076
385
144
23
1,524
$
14,180
$
10,930
$
1,563
$
163
$
1,524
Plan
assets
are
generally
invested
with
the
long-term
objective
of
producing
earnings
to
adequately
cover
expected
benefit
obligations.
The
expected
rates
of
return
on
plan
assets
reflect
subj
u
ective
assessments
of
expected
long-term
investment returns. Generally, past investment returns are not given significant consideration when establ
a
ishing assumptions
for expected long-term rates of return on plan assets. Actual experience will differ from the assumed rates of return.
A reconciliation of the pre-tax accumulated other comprehensive income of our defined benefit pension plans for each
of the two years ending December 31, 2025 follows (in millions).
2025
2024
Balance at the beginning of the year
$
1,467
$
(161)
Amount included in net periodic pension expense
(68)
29
Actuarial gains (losses) and other
(732)
1,599
Balance at the end of the year
$
667
$
1,467
Our
subs
u
idiaries
may
also
sponsor
defined
contribution
retirement
plans,
such
as
401(k)
or
profit-
f
sharing
plans.
Employee
contributions
are
subj
u
ect
to
regulatory
r
limitations
and
specific
plan
provisions.
Several
of
these
plans
provide
for
employer
matching
contributions
as
specified
in
the
plans
and
may
provide
for
additional
discretionary
employer
contributions.
Our
defined
contribution
plan
expense
was
approximately
$1.4
billion
in
2025,
$1.3
billion
in
2024
and
$1.1
billion in 2023.
(25)
Accumulated other comprehensive income
A
summary
of
the
net
changes
in
afte
f
r-tax
accumulated
other
comprehensive
income
attributable
to
Berkshire
shareholders for each of the three years ending December 31, 2025 follows (in millions).
Unrealized
investment
gains (losses)
Foreign
currency
translation
Long-duration
insurance
contracts
Defined
benefit
pension plans
Other
Total
Balance at December 31, 2022
$
(187) $
(6,142) $
1,541
$
(552) $
288
$
(5,052)
Other comprehensive income
420
741
(188)
466
(25)
1,414
Reclassifications into net earnings
(43)
8
—
(11)
(79)
(125)
Balance at December 31, 2023
190
(5,393)
1,353
(97)
184
(3,763)
Other comprehensive income
(43)
(1,647)
662
1,222
2
196
Reclassifications into net earnings
(30)
1
—
23
(11)
(17)
Balance at December 31, 2024
117
(7,039)
2,015
1,148
175
(3,584)
Other comprehensive income
90
1,502
164
(570)
37
1,223
Reclassifications into net earnings
28
—
—
(57)
(58)
(87)
Balance at December 31, 2025
$
235
$
(5,537) $
2,179
$
521
$
154
$
(2,448)
,
,
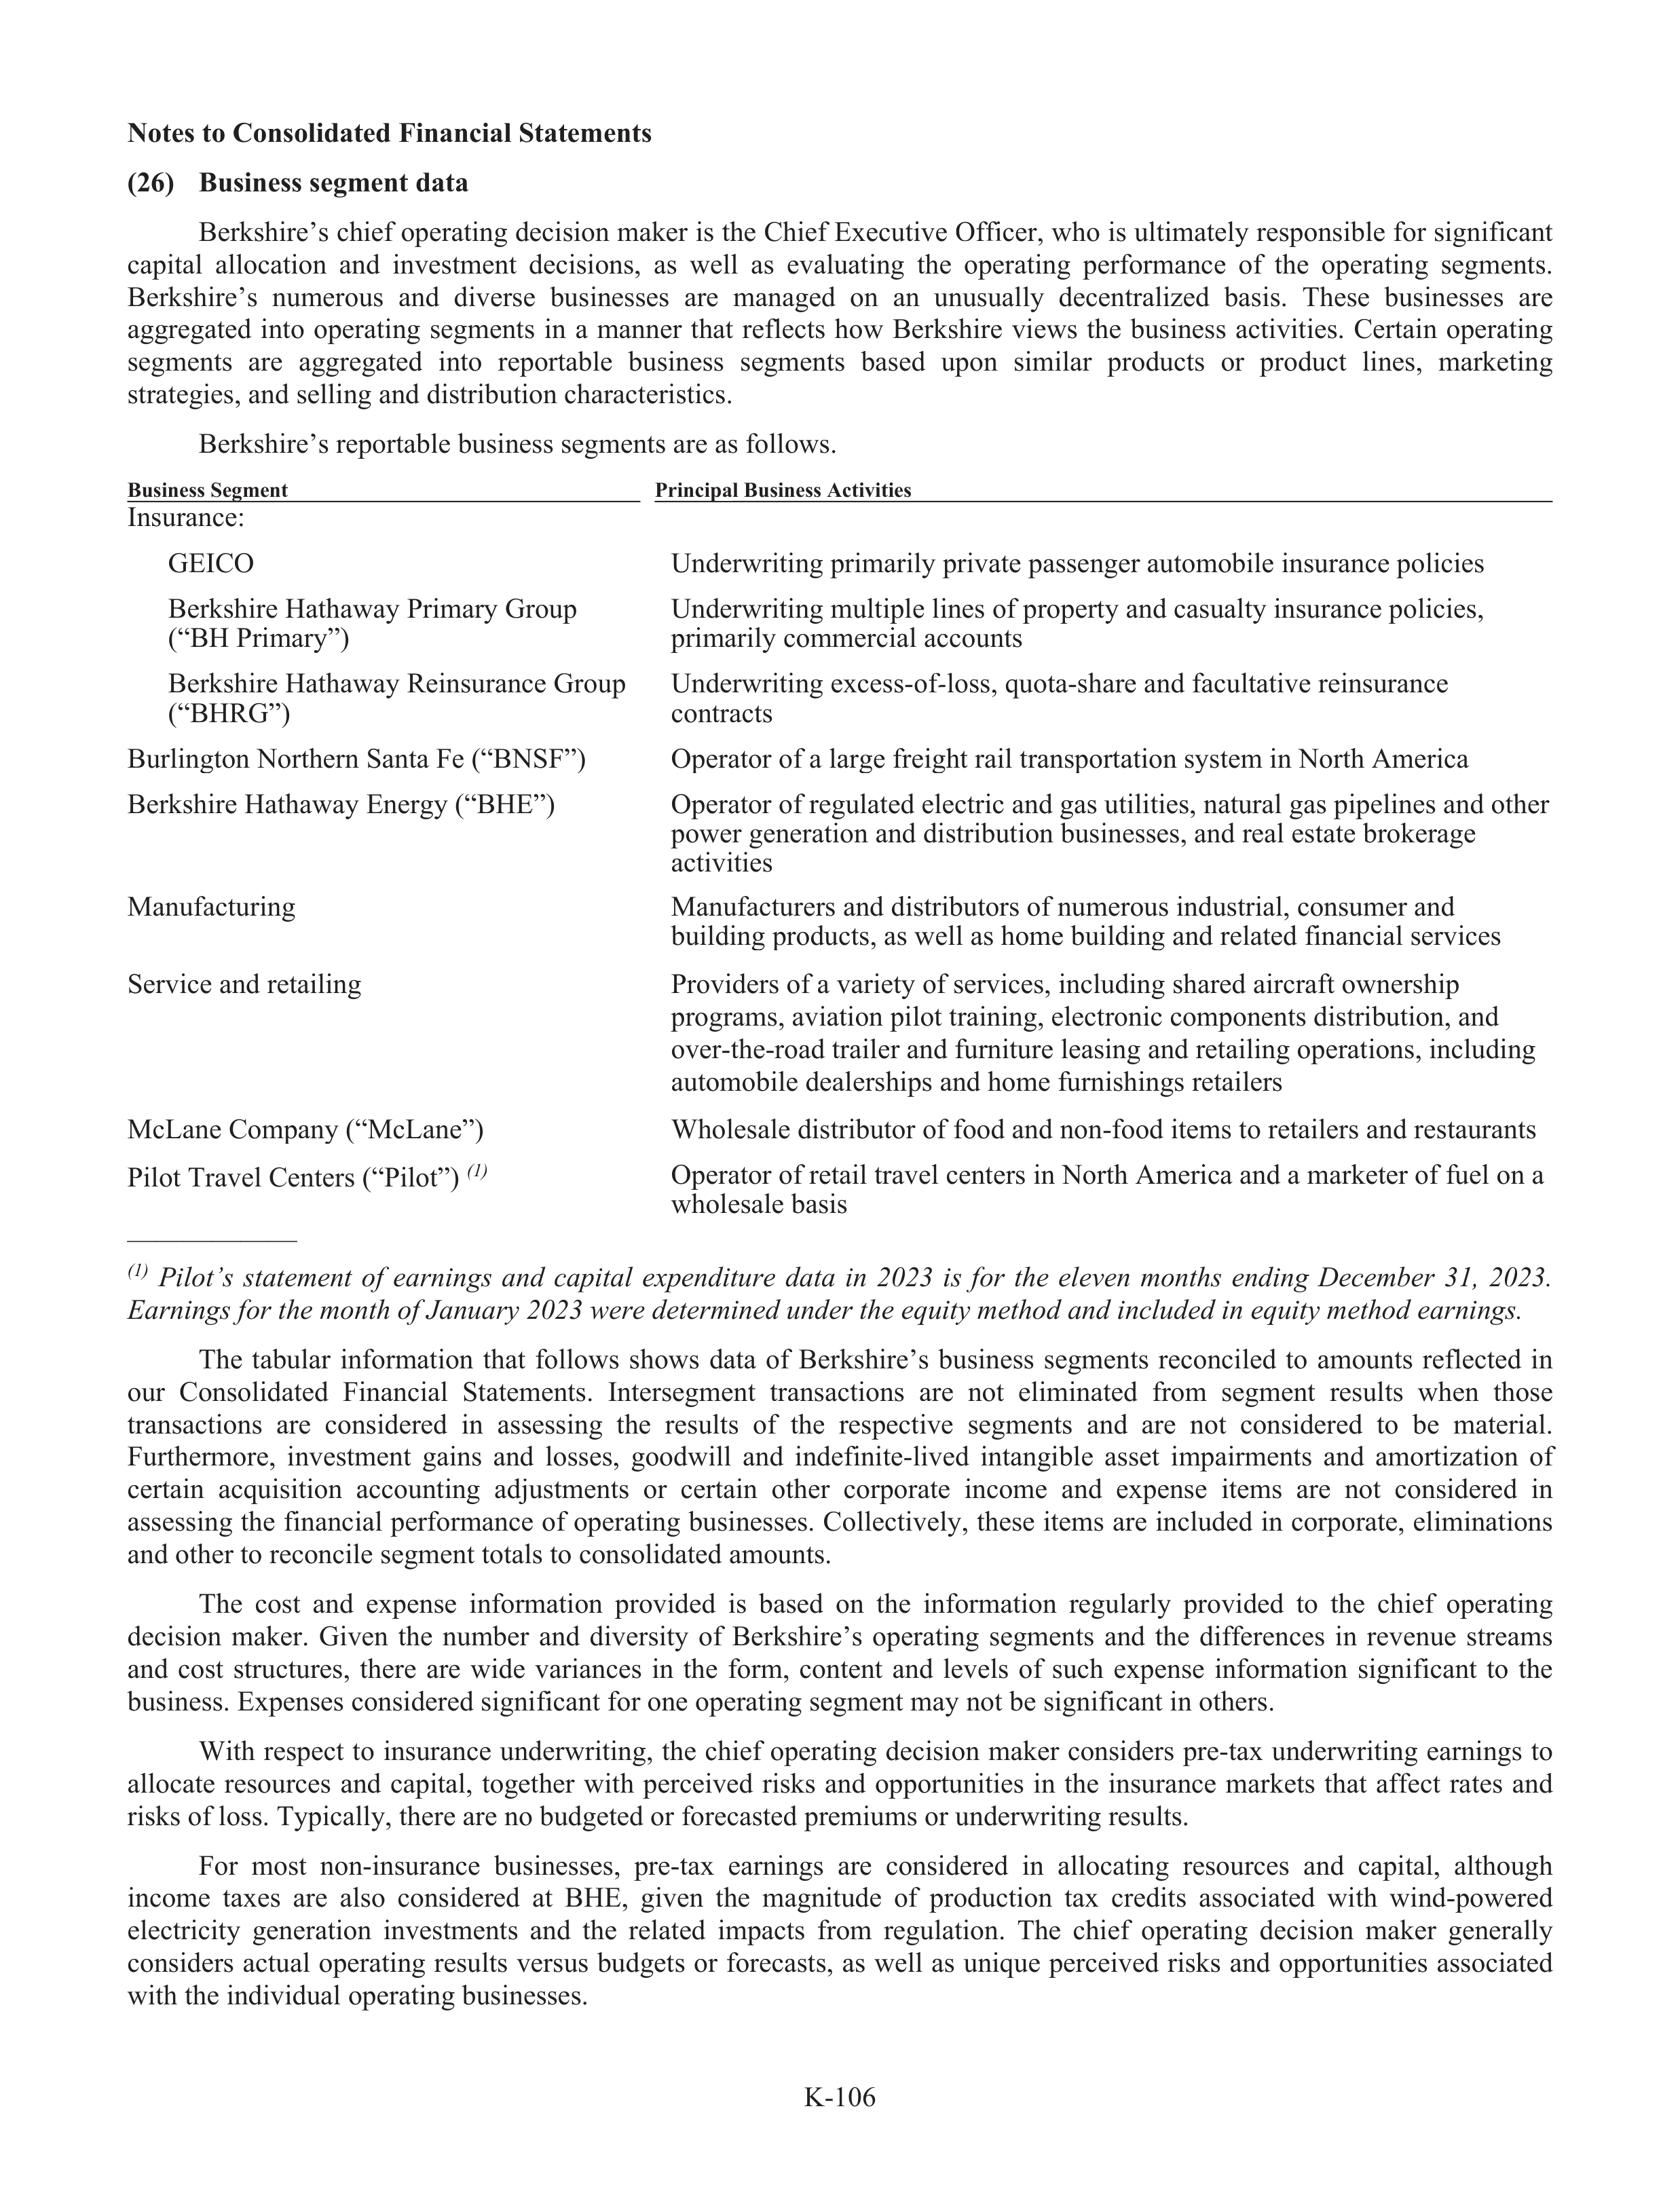
K-106
Notes to Consolidated Financial Statements
(26)
Business segment data
Berkshire’s chief operating decision maker is the Chief Executive Offi
f
cer, who is ultimately responsible for signific
f
ant
capital
allocation
and
investment
decisions,
as
well
as
evaluating
the
operating
performance
of
the
operating
segments.
Berkshire’s
numerous
and
diverse
businesses
are
managed
on
an
unusually
decentralized
basis.
These
businesses
are
aggregated
into
operating
segments
in
a
manner
that
reflects
how
Berkshire
views
the
business
activities.
Certain
operating
segments
are
aggregated
into
reportabl
a
e
business
segments
based
upon
similar
products
or
product
lines,
marketing
strategies, and selling and distribution characteristics.
Berkshire’s reportabl
a
e business segments are as follows.
Business Segment
Principal Business Activities
Insurance:
GEICO
Underwriting primarily private passenger automobile insurance policies
Berkshire Hathaway Primary Group
(“BH Primary”)
Underwriting multiple lines of property and casualty insurance policies,
primarily commercial accounts
Berkshire Hathaway Reinsurance Group
(“BHRG”)
Underwriting excess-of-l
f
oss, quota-share and facultative reinsurance
contracts
Burlington Northern Santa Fe (“BNSF”)
Operator of a large freight rail transportation system in North America
Berkshire Hathaway Energy (“BHE”)
Operator of regulated electric and gas utilities, natural gas pipelines and other
power generation and distribution businesses, and real estate brokerage
activities
Manufact
f
ur
t
ing
Manufact
f
ur
t
ers and distributors of numerous industrial, consumer and
building products, as well as home building and related financial services
Service and retailing
Providers of a variety of services, including shared aircraft ownership
programs, aviation pilot training, electronic components distribution, and
over-the-road trailer and furniture leasing and retailing operations, including
automobile dealerships and home furnishings retailers
McLane Company (“McLane”)
Wholesale distributor of food and non-food items to retailers and restaurants
Pilot Travel Centers (“Pilot”)
(1)
1
Operator of retail travel centers in North America and a marketer of fuel on a
wholesale basis
——————
(1)
1
Pilot’s
statement
of
earnings
and
capi
a
tal
expenditure
data
in
2023
is
for
the
eleven
months
ending
December
31,
2023.
Earnings for the month of January
r
2023 were determined under the equity method and included in equity method earnings.
The
tabul
a
ar
information
that
follows
shows
data
of
Berkshire’s
business
segments
reconciled
to
amounts
reflected
in
our
Consolidated
Financial
Statements.
Intersegment
transactions
are
not
eliminated
from
segment
results
when
those
transactions
are
considered
in
assessing
the
results
of
the
respective
segments
and
are
not
considered
to
be
material.
Furthermore,
investment
gains
and
losses,
goodwill
and
indefinite-lived
intangible
asset
impairments
and
amortization
of
certain
acquisition
accounting
adju
d
stments
or
certain
other
corporate
income
and
expense
items
are
not
considered
in
assessing the financial performance of operating businesses. Collectively, these items are included in corporate, eliminations
and other to reconcile segment totals to consolidated amounts.
The
cost
and
expense
information
provided
is
based
on
the
information
regularly
provided
to
the
chief
operating
decision
maker.
Given
the
number
and
diversity
of
Berkshire’s
operating
segments
and
the
differences
in
revenue
streams
and
cost
structur
t
es,
there
are
wide
variances
in
the
form,
content
and
levels
of
such
expense
information
significant
to
the
business. Expenses considered significant for one operating segment may not be significant in others.
With
respect
to
insurance
underwriting,
the
chief
operating
decision
maker
considers
pre-tax
underwriting
earnings
to
allocate
resources
and
capital,
together
with
perceived
risks
and
opportunities
in
the
insurance
markets
that
affe
f
ct
rates
and
risks of loss. Typically, there are no budgeted or forecasted premiums or underwriting results.
For
most
non-insurance
businesses,
pre-tax
earnings
are
considered
in
allocating
resources
and
capital,
although
income
taxes
are
also
considered
at
BHE,
given
the
magnitude
of
production
tax
credits
associated
with
wind-powered
electricity
generation
investments
and
the
related
impacts
from
regulation.
The
chief
operating
decision
maker
generally
considers
actua
t
l
operating
results
versus
budgets
or
forecasts,
as
well
as
unique
perceived
risks
and
opportunities
associated
with the individual operating businesses.
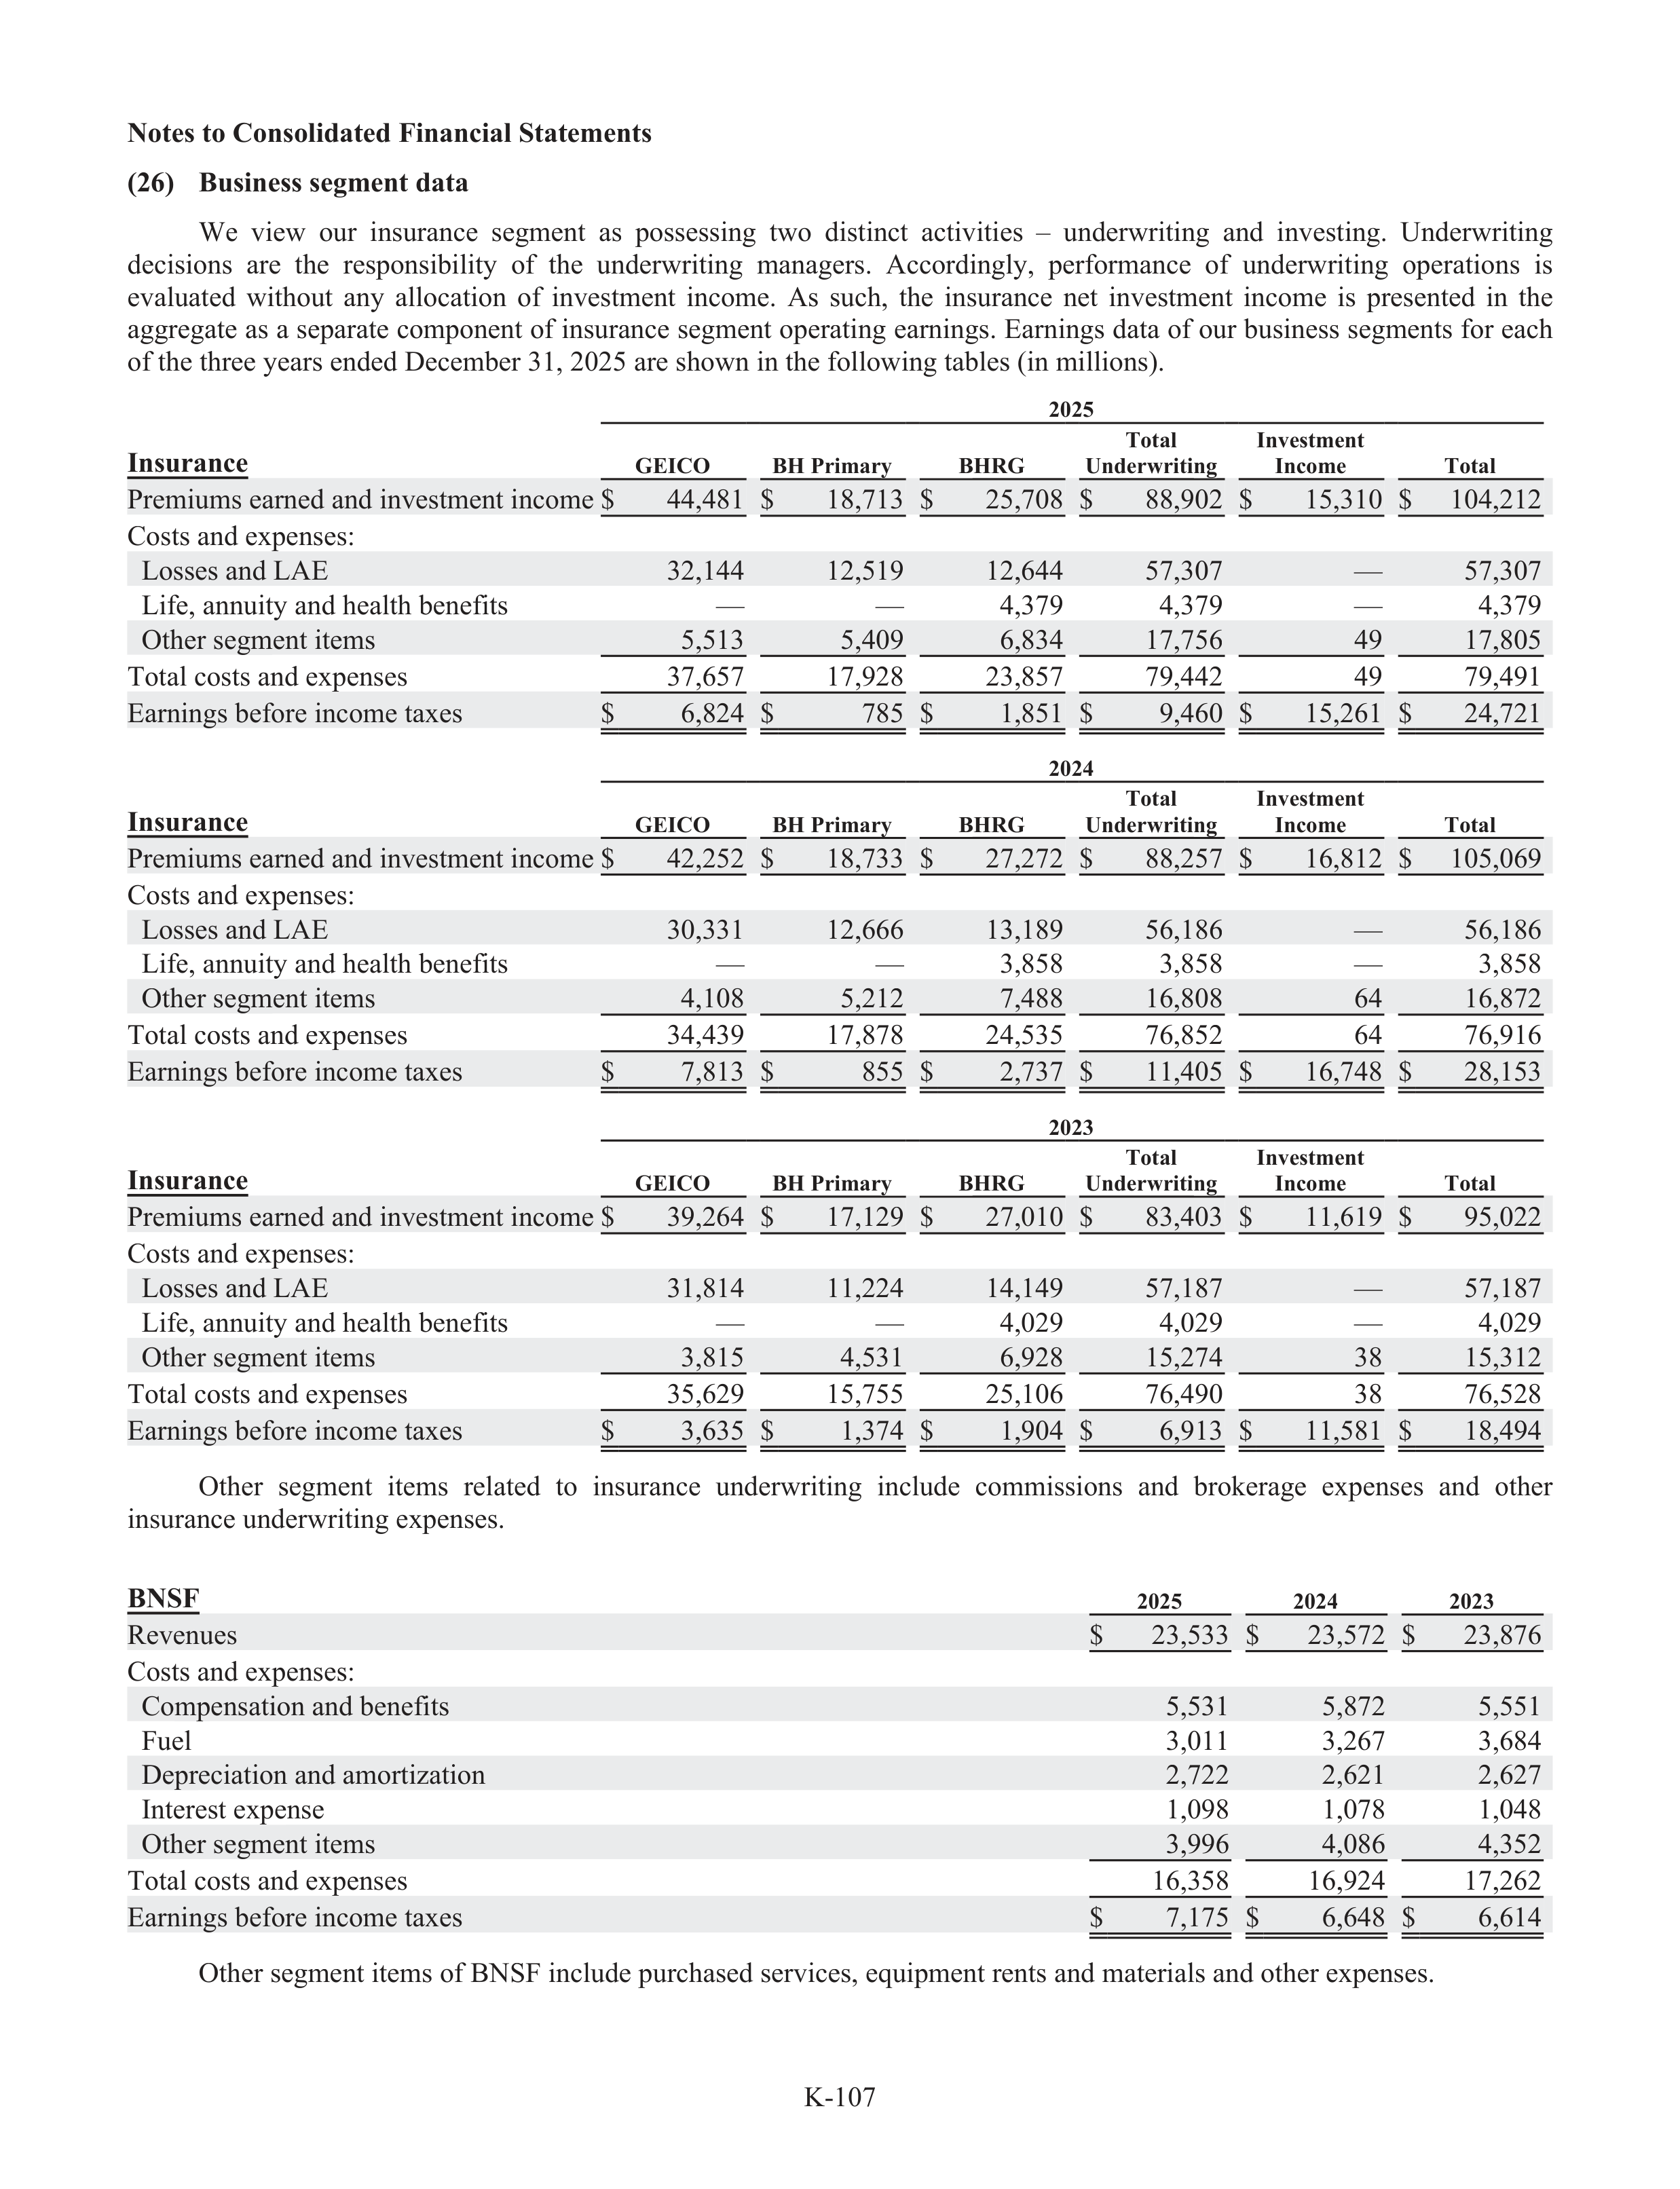
K-107
Notes to Consolidated Financial Statements
(26)
Business segment data
We
view
our
insurance
segment
as
possessing
two
distinct
activities
–
underwriting
and
investing.
Underwriting
decisions
are
the
responsibility
of
the
underwriting
managers.
Accordingly,
performance
of
underwriting
operations
is
evaluated
without
any
allocation
of
investment
income.
As
such,
the
insurance
net
investment
income
is
presented
in
the
aggregate as a separate component of insurance segment operating earnings. Earnings data of our business segments for each
of the three years ended December 31, 2025 are shown in the following tabl
a
es (in millions).
2025
Insurance
GEICO
BH Primary
BHRG
Total
Underwriting
Investment
Income
Total
Premiums earned and investment income $
44,481
$
18,713
$
25,708
$
88,902
$
15,310
$
104,212
Costs and expenses:
Losses and LAE
32,144
12,519
12,644
57,307
—
57,307
Life, annuity and health benefits
—
—
4,379
4,379
—
4,379
Other segment items
5,513
5,409
6,834
17,756
49
17,805
Total costs and expenses
37,657
17,928
23,857
79,442
49
79,491
Earnings before income taxes
$
6,824
$
785
$
1,851
$
9,460
$
15,261
$
24,721
2024
Insurance
GEICO
BH Primary
BHRG
Total
Underwriting
Investment
Income
Total
Premiums earned and investment income $
42,252
$
18,733
$
27,272
$
88,257
$
16,812
$
105,069
Costs and expenses:
Losses and LAE
30,331
12,666
13,189
56,186
—
56,186
Life, annuity and health benefits
—
—
3,858
3,858
—
3,858
Other segment items
4,108
5,212
7,488
16,808
64
16,872
Total costs and expenses
34,439
17,878
24,535
76,852
64
76,916
Earnings before income taxes
$
7,813
$
855
$
2,737
$
11,405
$
16,748
$
28,153
2023
Insurance
GEICO
BH Primary
BHRG
Total
Underwriting
Investment
Income
Total
Premiums earned and investment income $
39,264
$
17,129
$
27,010
$
83,403
$
11,619
$
95,022
Costs and expenses:
Losses and LAE
31,814
11,224
14,149
57,187
—
57,187
Life, annuity and health benefits
—
—
4,029
4,029
—
4,029
Other segment items
3,815
4,531
6,928
15,274
38
15,312
Total costs and expenses
35,629
15,755
25,106
76,490
38
76,528
Earnings before income taxes
$
3,635
$
1,374
$
1,904
$
6,913
$
11,581
$
18,494
Other
segment
items
related
to
insurance
underwriting
include
commissions
and
brokerage
expenses
and
other
insurance underwriting expenses.
BNSF
2025
2024
2023
Revenues
$
23,533
$
23,572
$
23,876
Costs and expenses:
Compensation and benefits
5,531
5,872
5,551
Fuel
3,011
3,267
3,684
Depreciation and amortization
2,722
2,621
2,627
Interest expense
1,098
1,078
1,048
Other segment items
3,996
4,086
4,352
Total costs and expenses
16,358
16,924
17,262
Earnings before income taxes
$
7,175
$
6,648
$
6,614
Other segment items of BNSF include purchased services, equipment rents and materials and other expenses.
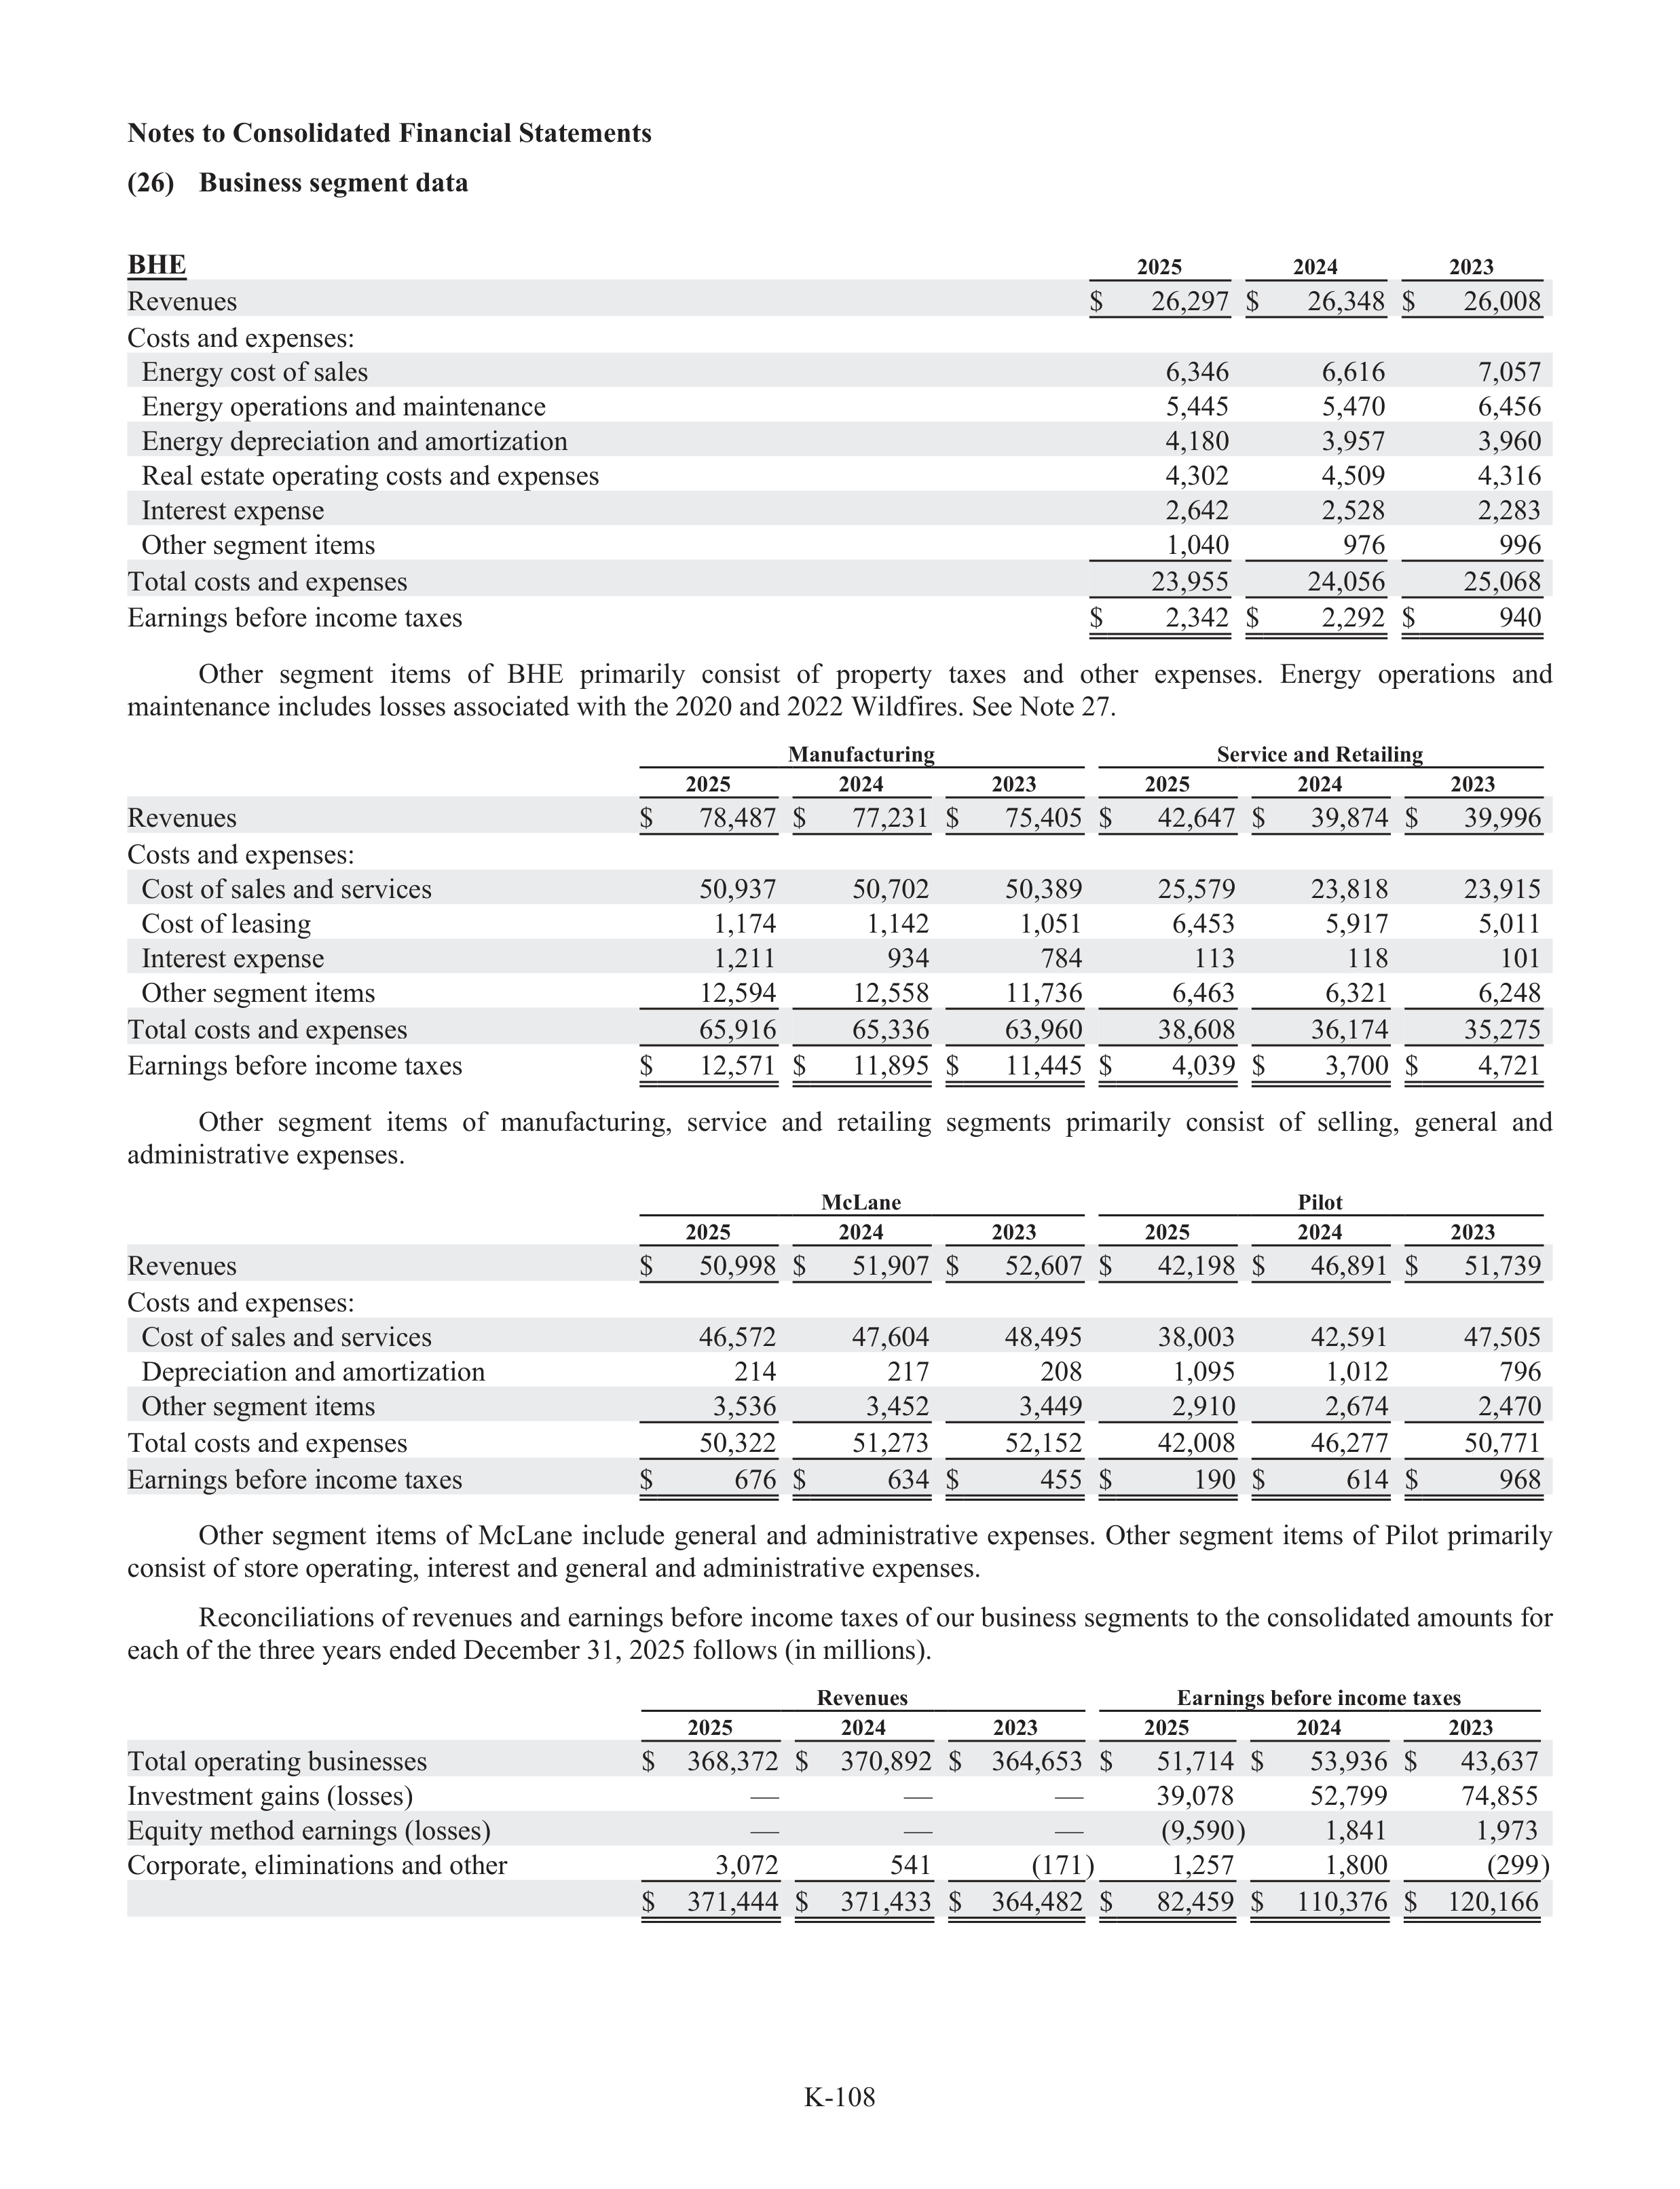
K-108
Notes to Consolidated Financial Statements
(26)
Business segment data
BHE
2025
2024
2023
Revenues
$
26,297
$
26,348
$
26,008
Costs and expenses:
Energy cost of sales
6,346
6,616
7,057
Energy operations and maintenance
5,445
5,470
6,456
Energy depreciation and amortization
4,180
3,957
3,960
Real estate operating costs and expenses
4,302
4,509
4,316
Interest expense
2,642
2,528
2,283
Other segment items
1,040
976
996
Total costs and expenses
23,955
24,056
25,068
Earnings before income taxes
$
2,342
$
2,292
$
940
Other
segment
items
of
BHE
primarily
consist
of
property
taxes
and
other
expenses.
Energy
operations
and
maintenance includes losses associated with the 2020 and 2022 Wildfires. See Note 27.
Manufac
f
turing
Service and Retailing
2025
2024
2023
2025
2024
2023
Revenues
$
78,487
$
77,231
$
75,405
$
42,647
$
39,874
$
39,996
Costs and expenses:
Cost of sales and services
50,937
50,702
50,389
25,579
23,818
23,915
Cost of leasing
1,174
1,142
1,051
6,453
5,917
5,011
Interest expense
1,211
934
784
113
118
101
Other segment items
12,594
12,558
11,736
6,463
6,321
6,248
Total costs and expenses
65,916
65,336
63,960
38,608
36,174
35,275
Earnings before income taxes
$
12,571
$
11,895
$
11,445
$
4,039
$
3,700
$
4,721
Other
segment
items
of
manufact
f
ur
t
ing,
service
and
retailing
segments
primarily
consist
of
selling,
general
and
administrative expenses.
McLane
Pilot
2025
2024
2023
2025
2024
2023
Revenues
$
50,998
$
51,907
$
52,607
$
42,198
$
46,891
$
51,739
Costs and expenses:
Cost of sales and services
46,572
47,604
48,495
38,003
42,591
47,505
Depreciation and amortization
214
217
208
1,095
1,012
796
Other segment items
3,536
3,452
3,449
2,910
2,674
2,470
Total costs and expenses
50,322
51,273
52,152
42,008
46,277
50,771
Earnings before income taxes
$
676
$
634
$
455
$
190
$
614
$
968
Other
segment
items
of
McLane
include
general
and
administrative
expenses.
Other
segment
items
of
Pilot
primarily
consist of store operating, interest and general and administrative expenses.
Reconciliations of revenues and earnings before income taxes of our business segments to the consolidated amounts for
each of the three years ended December 31, 2025 follows (in millions).
Revenues
Earnings before income taxes
2025
2024
2023
2025
2024
2023
Total operating businesses
$
368,372
$
370,892
$
364,653
$
51,714
$
53,936
$
43,637
Investment gains (losses)
—
—
—
39,078
52,799
74,855
Equity method earnings (losses)
—
—
—
(9,590)
1,841
1,973
Corporate, eliminations and other
3,072
541
(171)
1,257
1,800
(299)
$
371,444
$
371,433
$
364,482
$
82,459
$
110,376
$
120,166
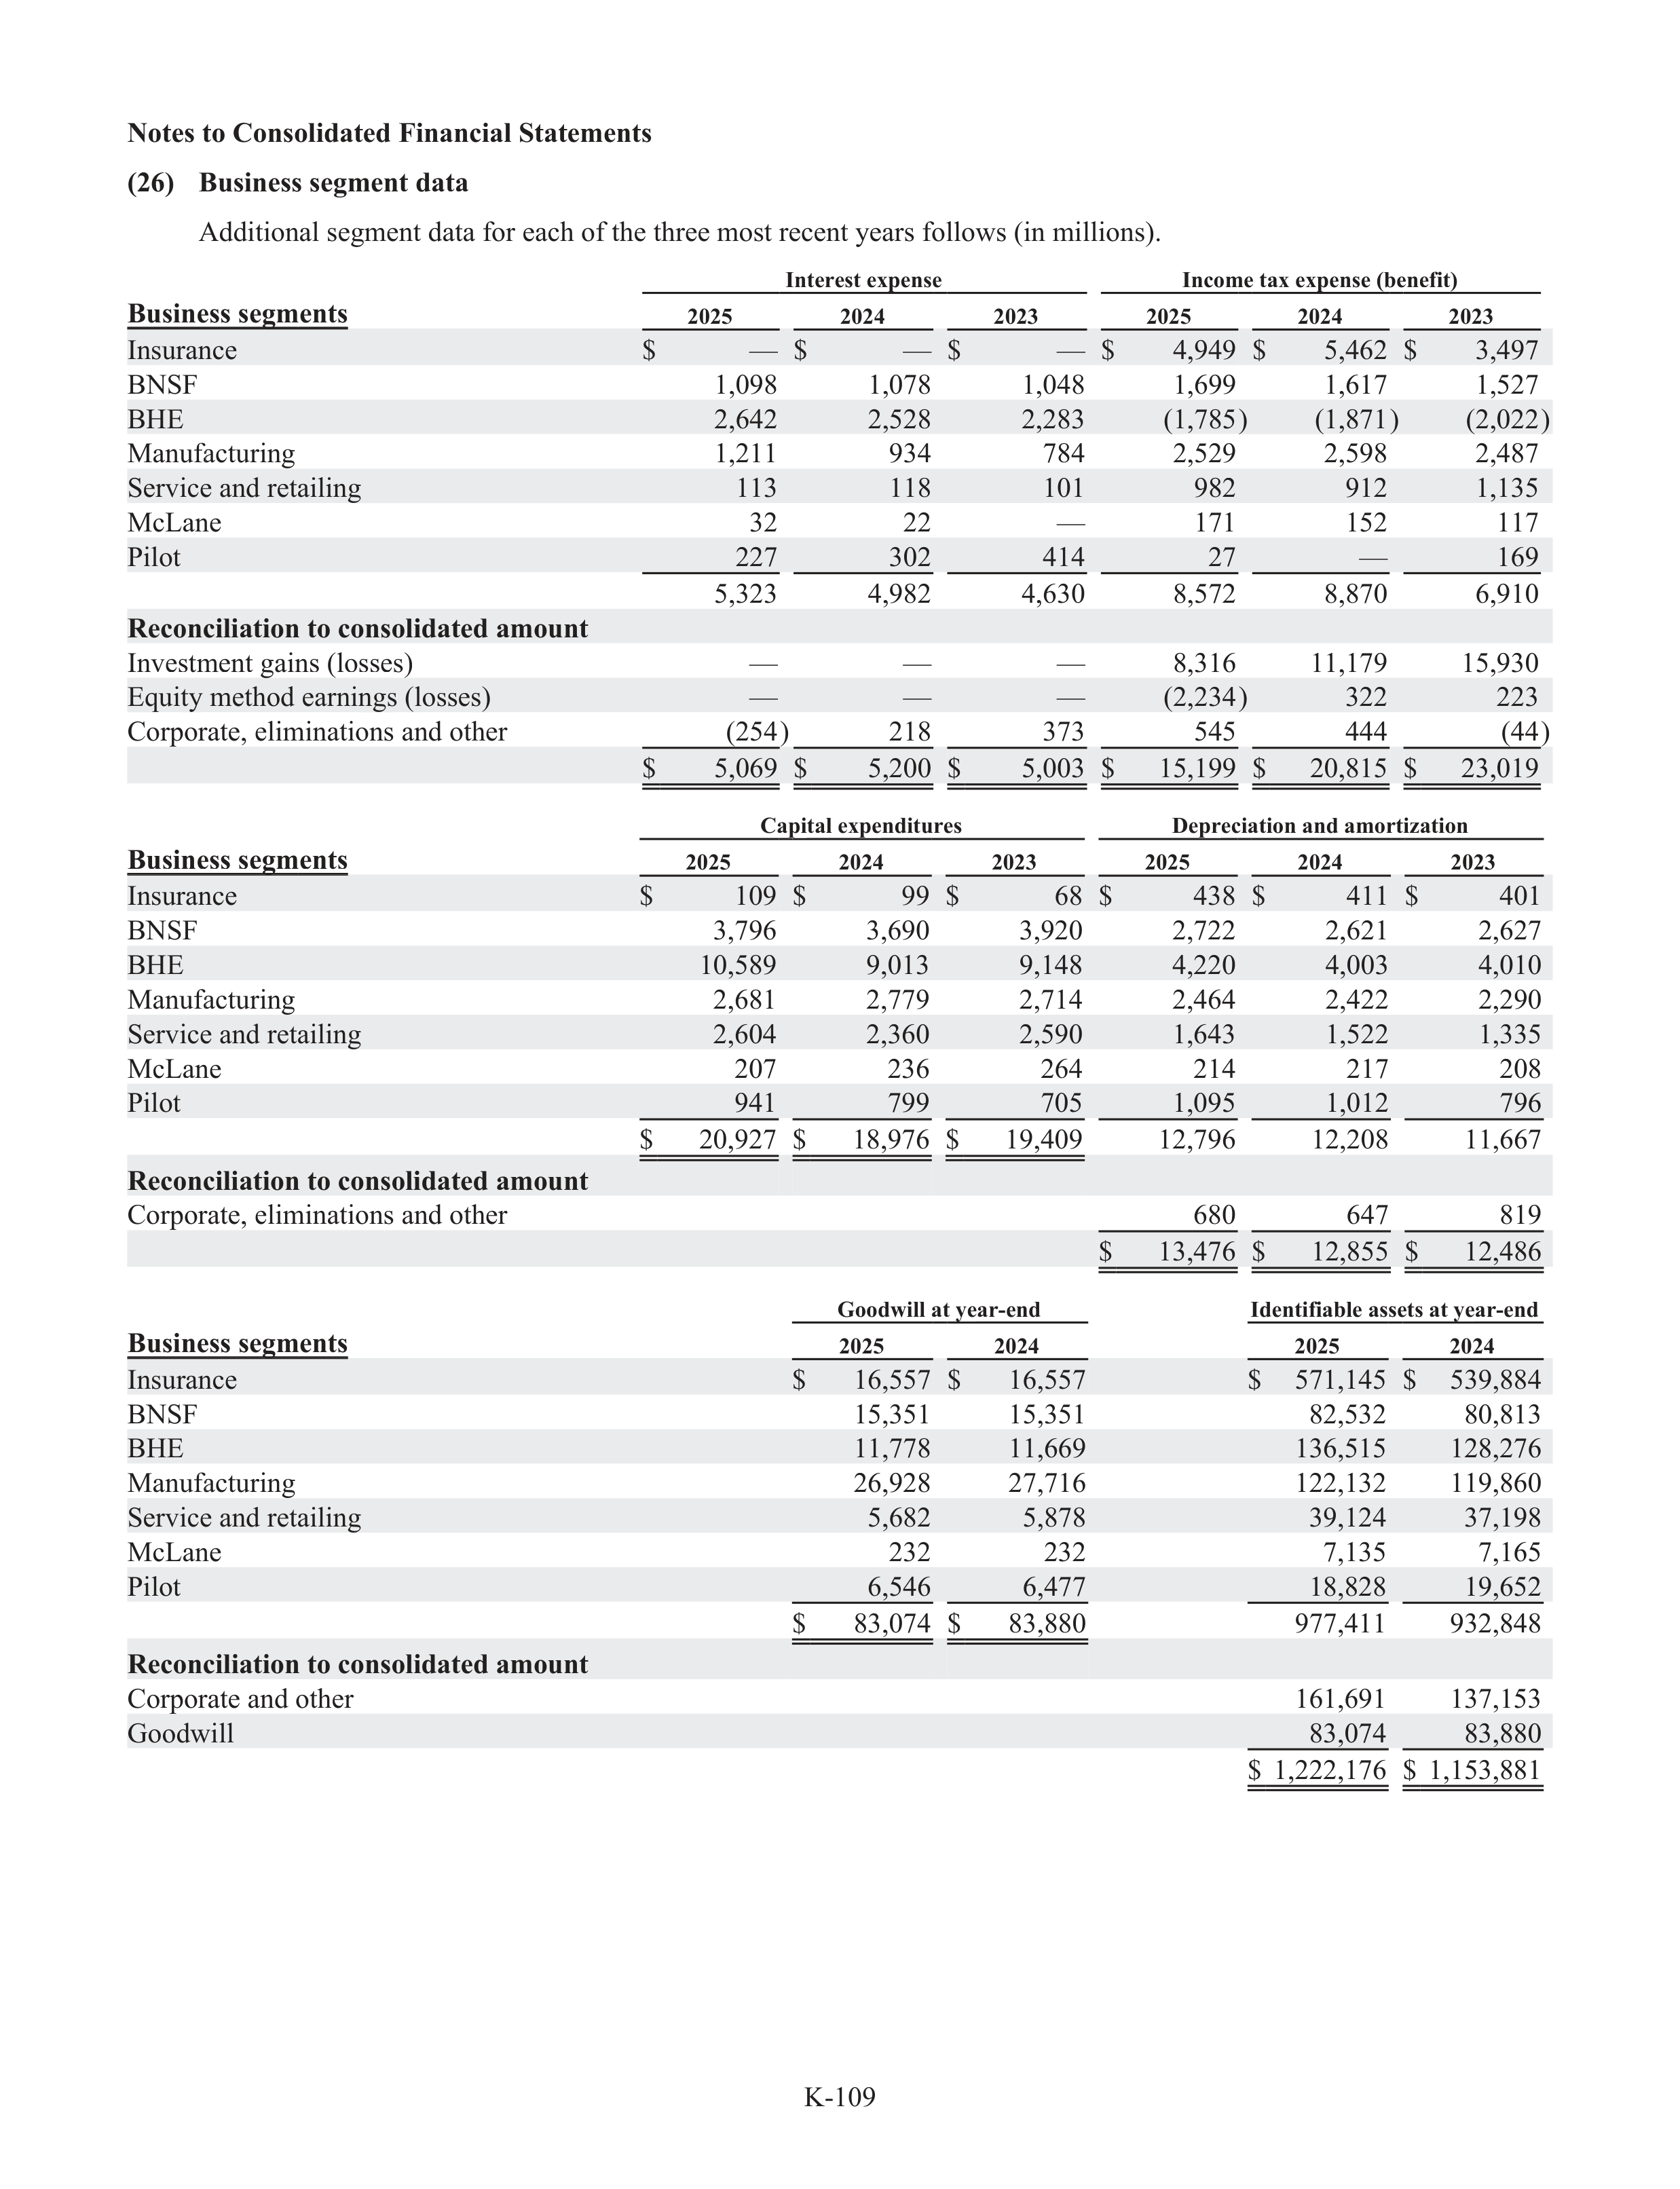
K-109
Notes to Consolidated Financial Statements
(26)
Business segment data
Additional segment data for each of the three most recent years follows (in millions).
Interest expense
Income tax expense (benefit
f
)
Business segments
2025
2024
2023
2025
2024
2023
Insurance
$
—
$
—
$
—
$
4,949
$
5,462
$
3,497
BNSF
1,098
1,078
1,048
1,699
1,617
1,527
BHE
2,642
2,528
2,283
(1,785)
(1,871)
(2,022)
Manufact
f
ur
t
ing
1,211
934
784
2,529
2,598
2,487
Service and retailing
113
118
101
982
912
1,135
McLane
32
22
—
171
152
117
Pilot
227
302
414
27
—
169
5,323
4,982
4,630
8,572
8,870
6,910
Reconciliation to consolidated amount
Investment gains (losses)
—
—
—
8,316
11,179
15,930
Equity method earnings (losses)
—
—
—
(2,234)
322
223
Corporate, eliminations and other
(254)
218
373
545
444
(44)
$
5,069
$
5,200
$
5,003
$
15,199
$
20,815
$
23,019
Capital expenditures
Depreciation and amortization
Business segments
2025
2024
2023
2025
2024
2023
Insurance
$
109
$
99
$
68
$
438
$
411
$
401
BNSF
3,796
3,690
3,920
2,722
2,621
2,627
BHE
10,589
9,013
9,148
4,220
4,003
4,010
Manufact
f
ur
t
ing
2,681
2,779
2,714
2,464
2,422
2,290
Service and retailing
2,604
2,360
2,590
1,643
1,522
1,335
McLane
207
236
264
214
217
208
Pilot
941
799
705
1,095
1,012
796
$
20,927
$
18,976
$
19,409
12,796
12,208
11,667
Reconciliation to consolidated amount
Corporate, eliminations and other
680
647
819
$
13,476
$
12,855
$
12,486
Goodwill at year-end
Identifiable assets at year-end
Business segments
2025
2024
2025
2024
Insurance
$
16,557
$
16,557
$
571,145
$
539,884
BNSF
15,351
15,351
82,532
80,813
BHE
11,778
11,669
136,515
128,276
Manufact
f
ur
t
ing
26,928
27,716
122,132
119,860
Service and retailing
5,682
5,878
39,124
37,198
McLane
232
232
7,135
7,165
Pilot
6,546
6,477
18,828
19,652
$
83,074
$
83,880
977,411
932,848
Reconciliation to consolidated amount
Corporate and other
161,691
137,153
Goodwill
83,074
83,880
$
1,222,176
$
1,153,881
g
g
g
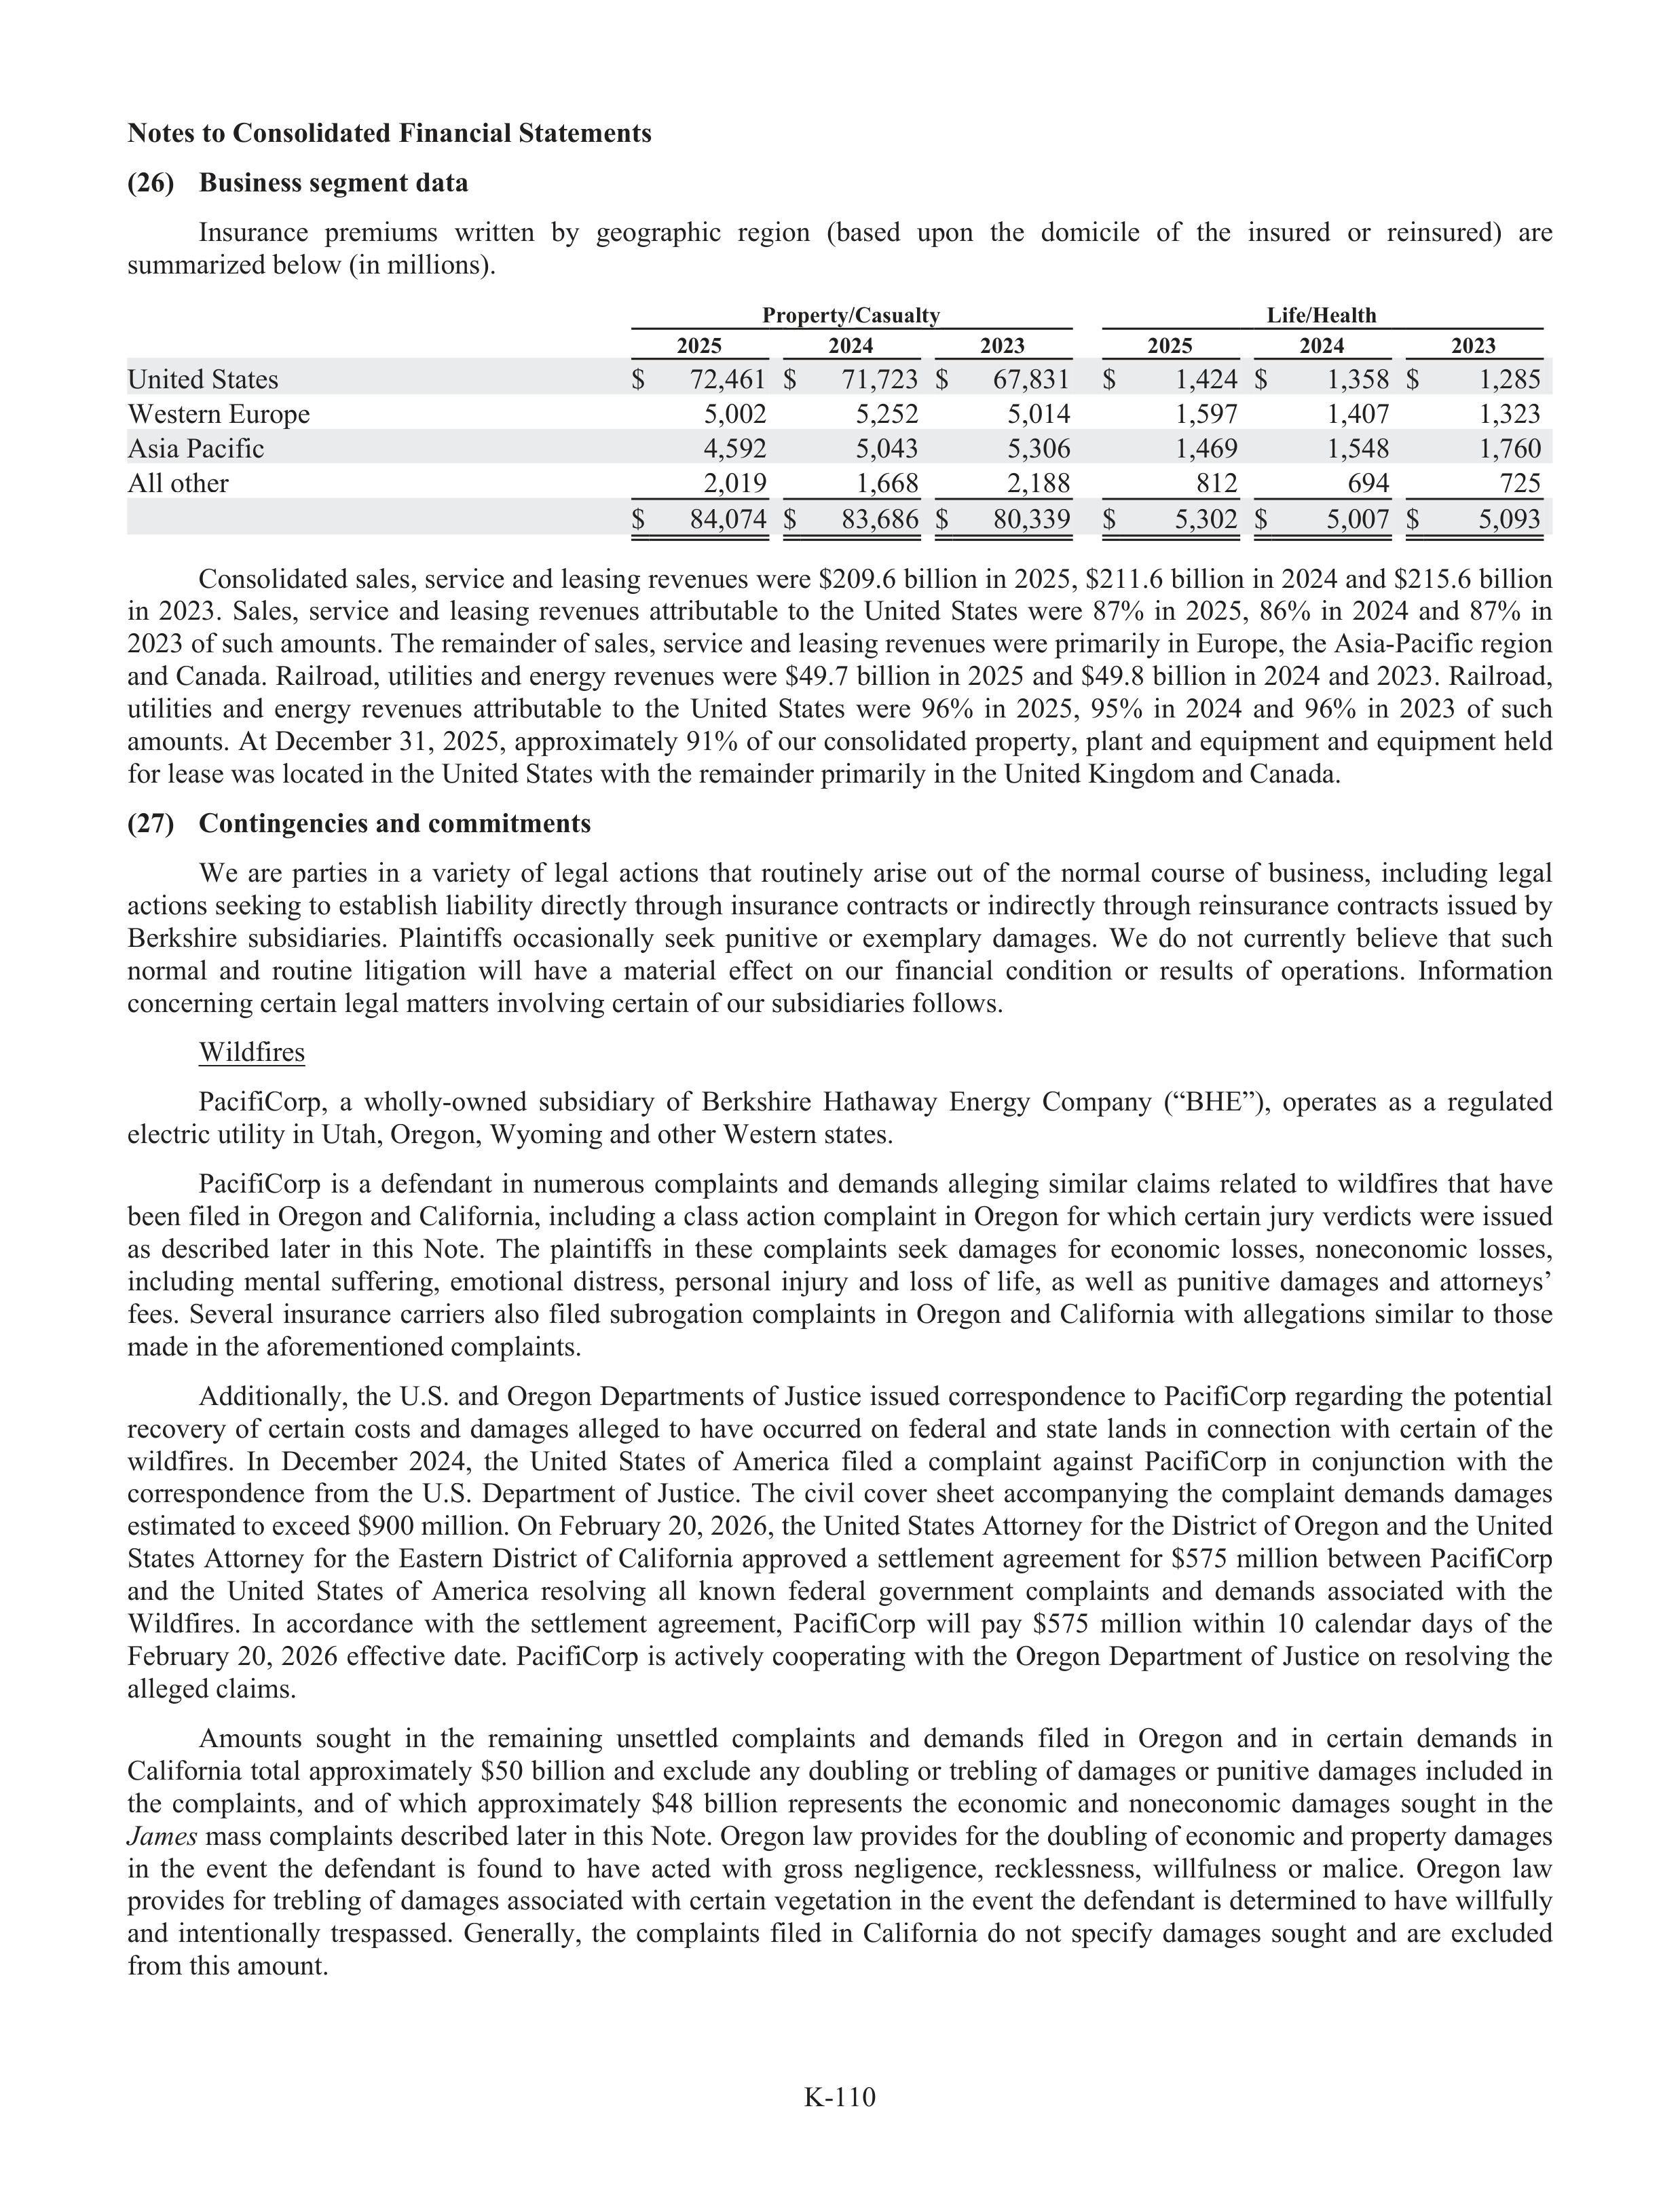
K-110
Notes to Consolidated Financial Statements
(26)
Business segment data
Insurance
premiums
written
by
geographic
region
(based
upon
the
domicile
of
the
insured
or
reinsured)
are
summarized below (in millions).
Property/Casualty
Life/Health
2025
2024
2023
2025
2024
2023
United States
$
72,461
$
71,723
$
67,831
$
1,424
$
1,358
$
1,285
Western Europe
5,002
5,252
5,014
1,597
1,407
1,323
Asia Pacific
4,592
5,043
5,306
1,469
1,548
1,760
All other
2,019
1,668
2,188
812
694
725
$
84,074
$
83,686
$
80,339
$
5,302
$
5,007
$
5,093
Consolidated sales, service and leasing revenues were $209.6 billion in 2025, $211.6 billion in 2024 and $215.6 billion
in
2023.
Sales,
service
and
leasing
revenues
attributable
to
the
United
States
were
87%
in
2025,
86%
in
2024
and
87%
in
2023 of such amounts. The remainder of sales, service and leasing revenues were primarily in Europe, the Asia-Pacific region
and Canada. Railroad, utilities and energy revenues were $49.7 billion in 2025 and $49.8 billion in 2024 and 2023. Railroad,
utilities
and
energy
revenues
attributable
to
the
United
States
were
96%
in
2025,
95%
in
2024
and
96%
in
2023
of
such
amounts. At December 31, 2025, approximately 91% of our consolidated property, plant and equipment and equipment held
for lease was located in the United States with the remainder primarily in the United Kingdom and Canada.
(27)
Contingencies and commitments
We
are
parties
in
a
variety
of
legal
actions
that
routinely
arise
out
of
the
normal
course
of
business,
including
legal
actions seeking to establ
a
ish liabi
a
lity directly through insurance contracts or indirectly through reinsurance contracts issued by
Berkshire
subs
u
idiaries.
Plaintiffs
f
occasionally
seek
punitive
or
exemplary
r
damages.
We
do
not
currently
believe
that
such
normal
and
routine
litigation
will
have
a
material
effe
f
ct
on
our
financial
condition
or
results
of
operations.
Information
concerning certain legal matters involving certain of our subs
u
idiaries follows.
Wildfires
PacifiCorp,
a
wholly-owned
subs
u
idiary
of
Berkshire
Hathaway
Energy
Company
(“BHE”),
operates
as
a
regulated
electric utility in Utah, Oregon, Wyoming and other Western states.
PacifiCorp
is
a
defendant
in
numerous
complaints
and
demands
alleging
similar
claims
related
to
wildfires
that
have
been filed in Oregon and Califor
f
nia, including a class action complaint in Oregon for which certain jury verdicts were issued
as
described
later
in
this
Note.
The
plaintiffs
f
in
these
complaints
seek
damages
for
economic
losses,
noneconomic
losses,
including
mental
suffering,
emotional
distress,
personal
inju
n
ry
and
loss
of
life,
f
as
well
as
punitive
damages
and
attorneys’
fees.
Several
insurance
carriers
also
filed
subr
u
ogation
complaints
in
Oregon
and
Califor
f
nia
with
allegations
similar
to
those
made in the afor
f
ementioned complaints.
Additionally, the U.S. and Oregon Departments of Justice issued correspondence to PacifiCorp regarding the potential
recovery
of
certain
costs
and
damages
alleged
to
have
occurred
on
federal
and
state
lands
in
connection
with
certain
of
the
wildfires.
In
December
2024,
the
United
States
of
America
filed
a
complaint
against
PacifiCorp
in
conjunction
with
the
correspondence
from
the
U.S.
Department
of
Justice.
The
civil
cover
sheet
accompanying
the
complaint
demands
damages
estimated to exceed $900 million. On Februa
r
ry 20, 2026, the United States Attorney for the District of Oregon and the United
States
Attorney
for
the
Eastern
District
of
Califor
f
nia
approved
a
settlement
agreement
for
$575
million
between
PacifiCorp
r
and
the
United
States
of
America
resolving
all
known
federal
government
complaints
and
demands
associated
with
the
Wildfires.
In
accordance
with
the
settlement
agreement,
PacifiCorp
will
pay
$575
million
within
10
calendar
days
of
the
Februa
r
ry 20, 2026 effe
f
ctive date. PacifiCorp is actively cooperating with the Oregon Department of Justice on resolving the
alleged claims.
Amounts
sought
in
the
remaining
unsettled
complaints
and
demands
filed
in
Oregon
and
in
certain
demands
in
Califor
f
nia total approximately $50 billion and exclude any doubling or trebling of damages or punitive damages included in
the
complaints,
and
of
which
approximately
$48
billion
represents
the
economic
and
noneconomic
damages
sought
in
the
James
mass complaints described later in this Note. Oregon law provides for the doubling of economic and property damages
in
the
event
the
defendant
is
found
to
have
acted
with
gross
negligence,
recklessness,
willful
f
ness
or
malice.
Oregon
law
provides for trebling of damages associated with certain vegetation in the event the defendant is determined to have willful
f
ly
and
intentionally
trespassed.
Generally,
the
complaints
filed
in
Califor
f
nia
do
not
specify
damages
sought
and
are
excluded
from this amount.
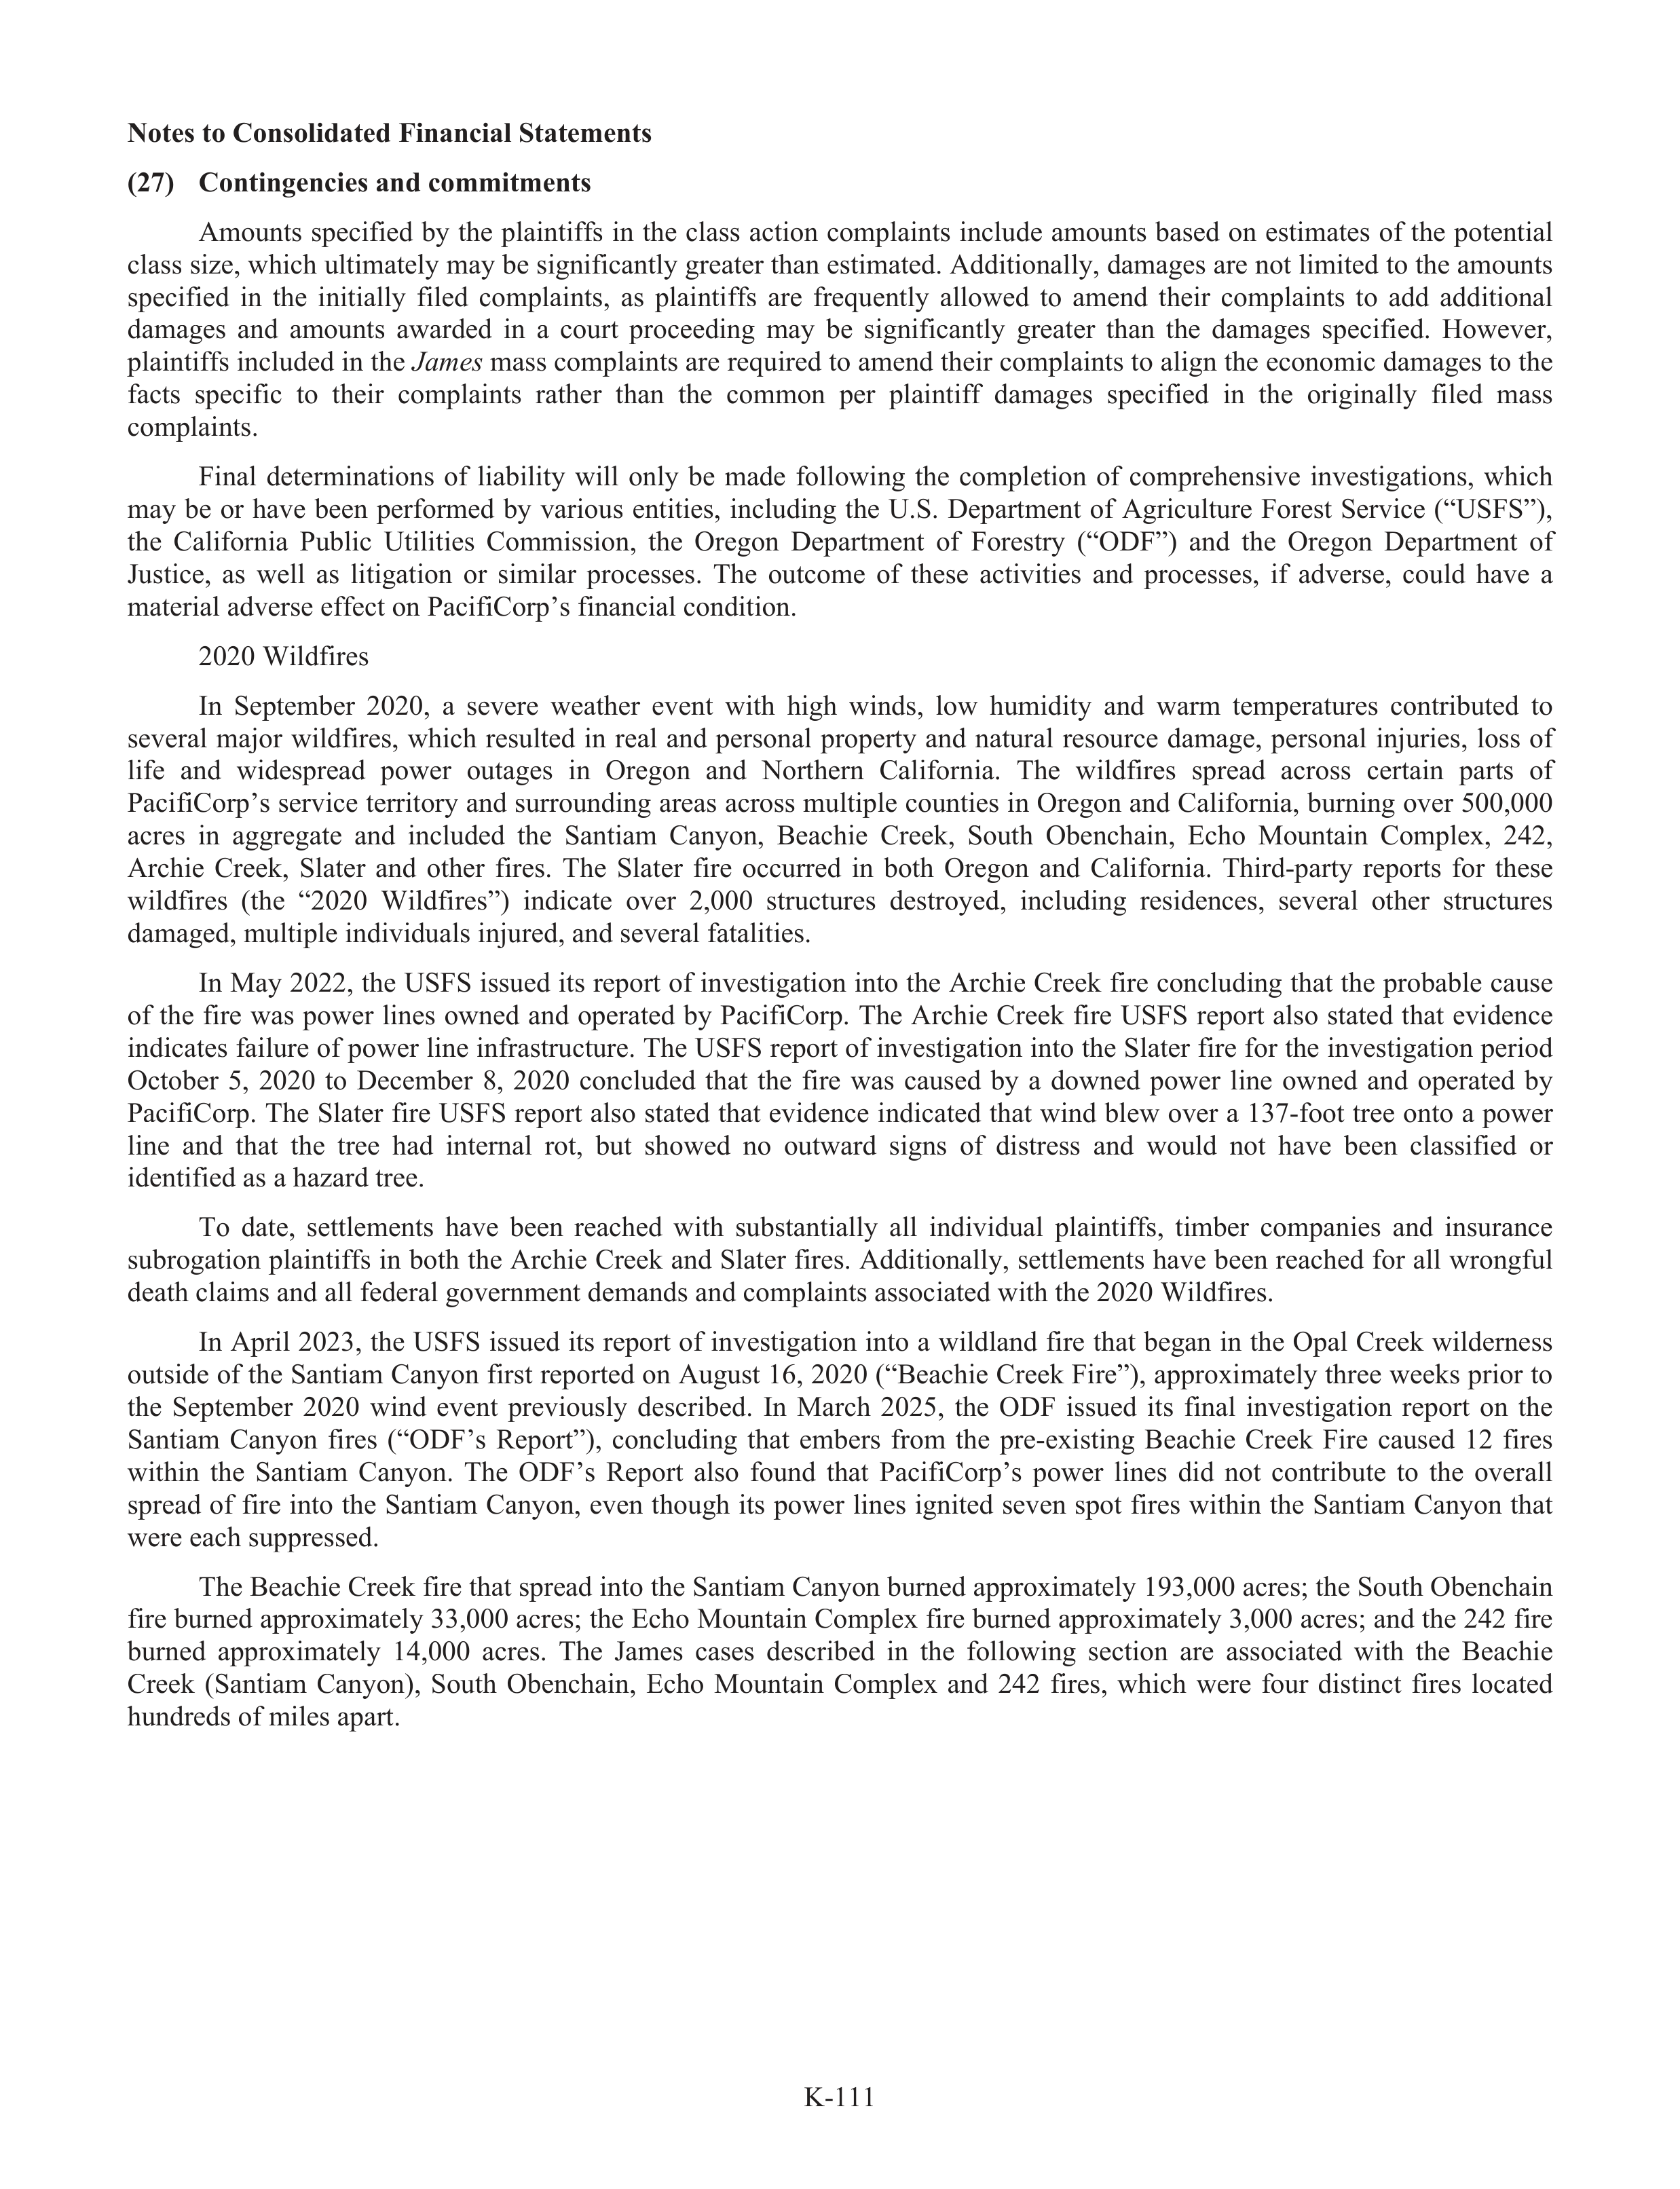
K-111
Notes to Consolidated Financial Statements
(27)
Contingencies and commitments
Amounts
specified
by
the
plaintiffs
f
in
the
class
action
complaints
include
amounts
based
on
estimates
of
the
potential
class size, which ultimately may be significantly greater than estimated. Additionally, damages are not limited to the amounts
specified
in
the
initially
filed
complaints,
as
plaintiffs
f
are
frequently
allowed
to
amend
their
complaints
to
add
additional
damages
and
amounts
awarded
in
a
court
proceeding
may
be
significantly
greater
than
the
damages
specified.
However,
plaintiffs
f
included in the
James
mass complaints are required to amend their complaints to align the economic damages to the
facts
specific
to
their
complaints
rather
than
the
common
per
plaintifff
damages
specified
in
the
originally
filed
mass
complaints.
Final
determinations
of
liabi
a
lity
will
only
be
made
following
the
completion
of
comprehensive
investigations,
which
may
be
or
have
been
performed
by
various
entities,
including
the
U.S.
Department
of
Agriculture
Forest
Service
(“USFS”),
the
Califor
f
nia
Publ
u
ic
Utilities
Commission,
the
Oregon
Department
of
Forestry
(“ODF”)
and
the
Oregon
Department
of
Justice,
as
well
as
litigation
or
similar
processes.
The
outcome
of
these
activities
and
processes,
if
adverse,
could
have
a
material adverse effe
f
ct on PacifiCorp’s financial condition.
2020 Wildfires
In
September
2020,
a
severe
weather
event
with
high
winds,
low
humidity
and
warm
temperatur
t
es
contributed
to
several
majo
a
r
wildfires,
which
resulted
in
real
and
personal
property
and
natural
resource
damage,
personal
inju
n
ries,
loss
of
lifef
and
widespread
power
outages
in
Oregon
and
Northern
Califor
f
nia.
The
wildfires
spread
across
certain
parts
of
PacifiCorp’s service territory and surrounding areas across multiple counties in Oregon and Califor
f
nia, burning over 500,000
acres
in
aggregate
and
included
the
Santiam
Canyon,
Beachie
Creek,
South
Obenchain,
Echo
Mountain
Complex,
242,
Archie
Creek,
Slater
and
other
fires.
The
Slater
fire
occurred
in
both
Oregon
and
Califor
f
nia.
Third-party
reports
for
these
wildfires
(the
“2020
Wildfires”)
indicate
over
2,000
structur
t
es
destroyed,
including
residences,
several
other
structures
damaged, multiple individuals inju
n
red, and several fatalities.
In May 2022, the USFS issued its report of investigation into the Archie Creek fire concluding that the probable cause
of
the
fire
was
power
lines
owned
and
operated
by
PacifiCorp.
The
Archie
Creek
fire
USFS
report
also
stated
that
evidence
indicates failure of power line infrastructur
t
e. The USFS report of investigation into the Slater fire for the investigation period
October
5,
2020
to
December
8,
2020
concluded
that
the
fire
was
caused
by
a
downed
power
line
owned
and
operated
by
PacifiCorp. The Slater fire USFS report also stated that evidence indicated that wind blew over a 137-foot tree onto a power
line
and
that
the
tree
had
internal
rot,
but
showed
no
outward
signs
of
distress
and
would
not
have
been
classified
or
identifie
f
d as a hazard tree.
To
date,
settlements
have
been
reached
with
subs
u
tantially
all
individual
plaintiffs
f
,
timber
companies
and
insurance
subr
u
ogation plaintiffs
f
in both the Archie Creek and Slater fires. Additionally, settlements have been reached for all wrongful
f
death claims and all federal government demands and complaints associated with the 2020 Wildfires.
In April 2023, the USFS issued its report of investigation into a wildland fire that began in the Opal Creek wilderness
outside of the Santiam Canyon first reported on August 16, 2020 (“Beachie Creek Fire”), appr
a
oximately three weeks prior to
the
September
2020
wind
event
previously
described.
In
March
2025,
the
ODF
issued
its
final
investigation
report
on
the
Santiam
Canyon
fires
(“ODF’s
Report”),
concluding
that
embers
from
the
pre-existing
Beachie
Creek
Fire
caused
12
fires
within
the
Santiam
Canyon.
The
ODF’s
Report
also
found
that
PacifiCorp’s
power
lines
did
not
contribute
to
the
overall
spread of fire into the Santiam Canyon, even though its power lines ignited seven spot fires within the Santiam Canyon that
were each suppr
u
essed.
The Beachie Creek fire that spread into the Santiam Canyon burned approximately 193,000 acres; the South Obenchain
fire burned approximately 33,000 acres; the Echo Mountain Complex fire burned approximately 3,000 acres; and the 242 fire
burned
approximately
14,000
acres.
The
James
cases
described
in
the
following
section
are
associated
with
the
Beachie
Creek
(Santiam
Canyon),
South
Obenchain,
Echo
Mountain
Complex
and
242
fires,
which
were
four
distinct
fires
located
hundreds of miles apart.
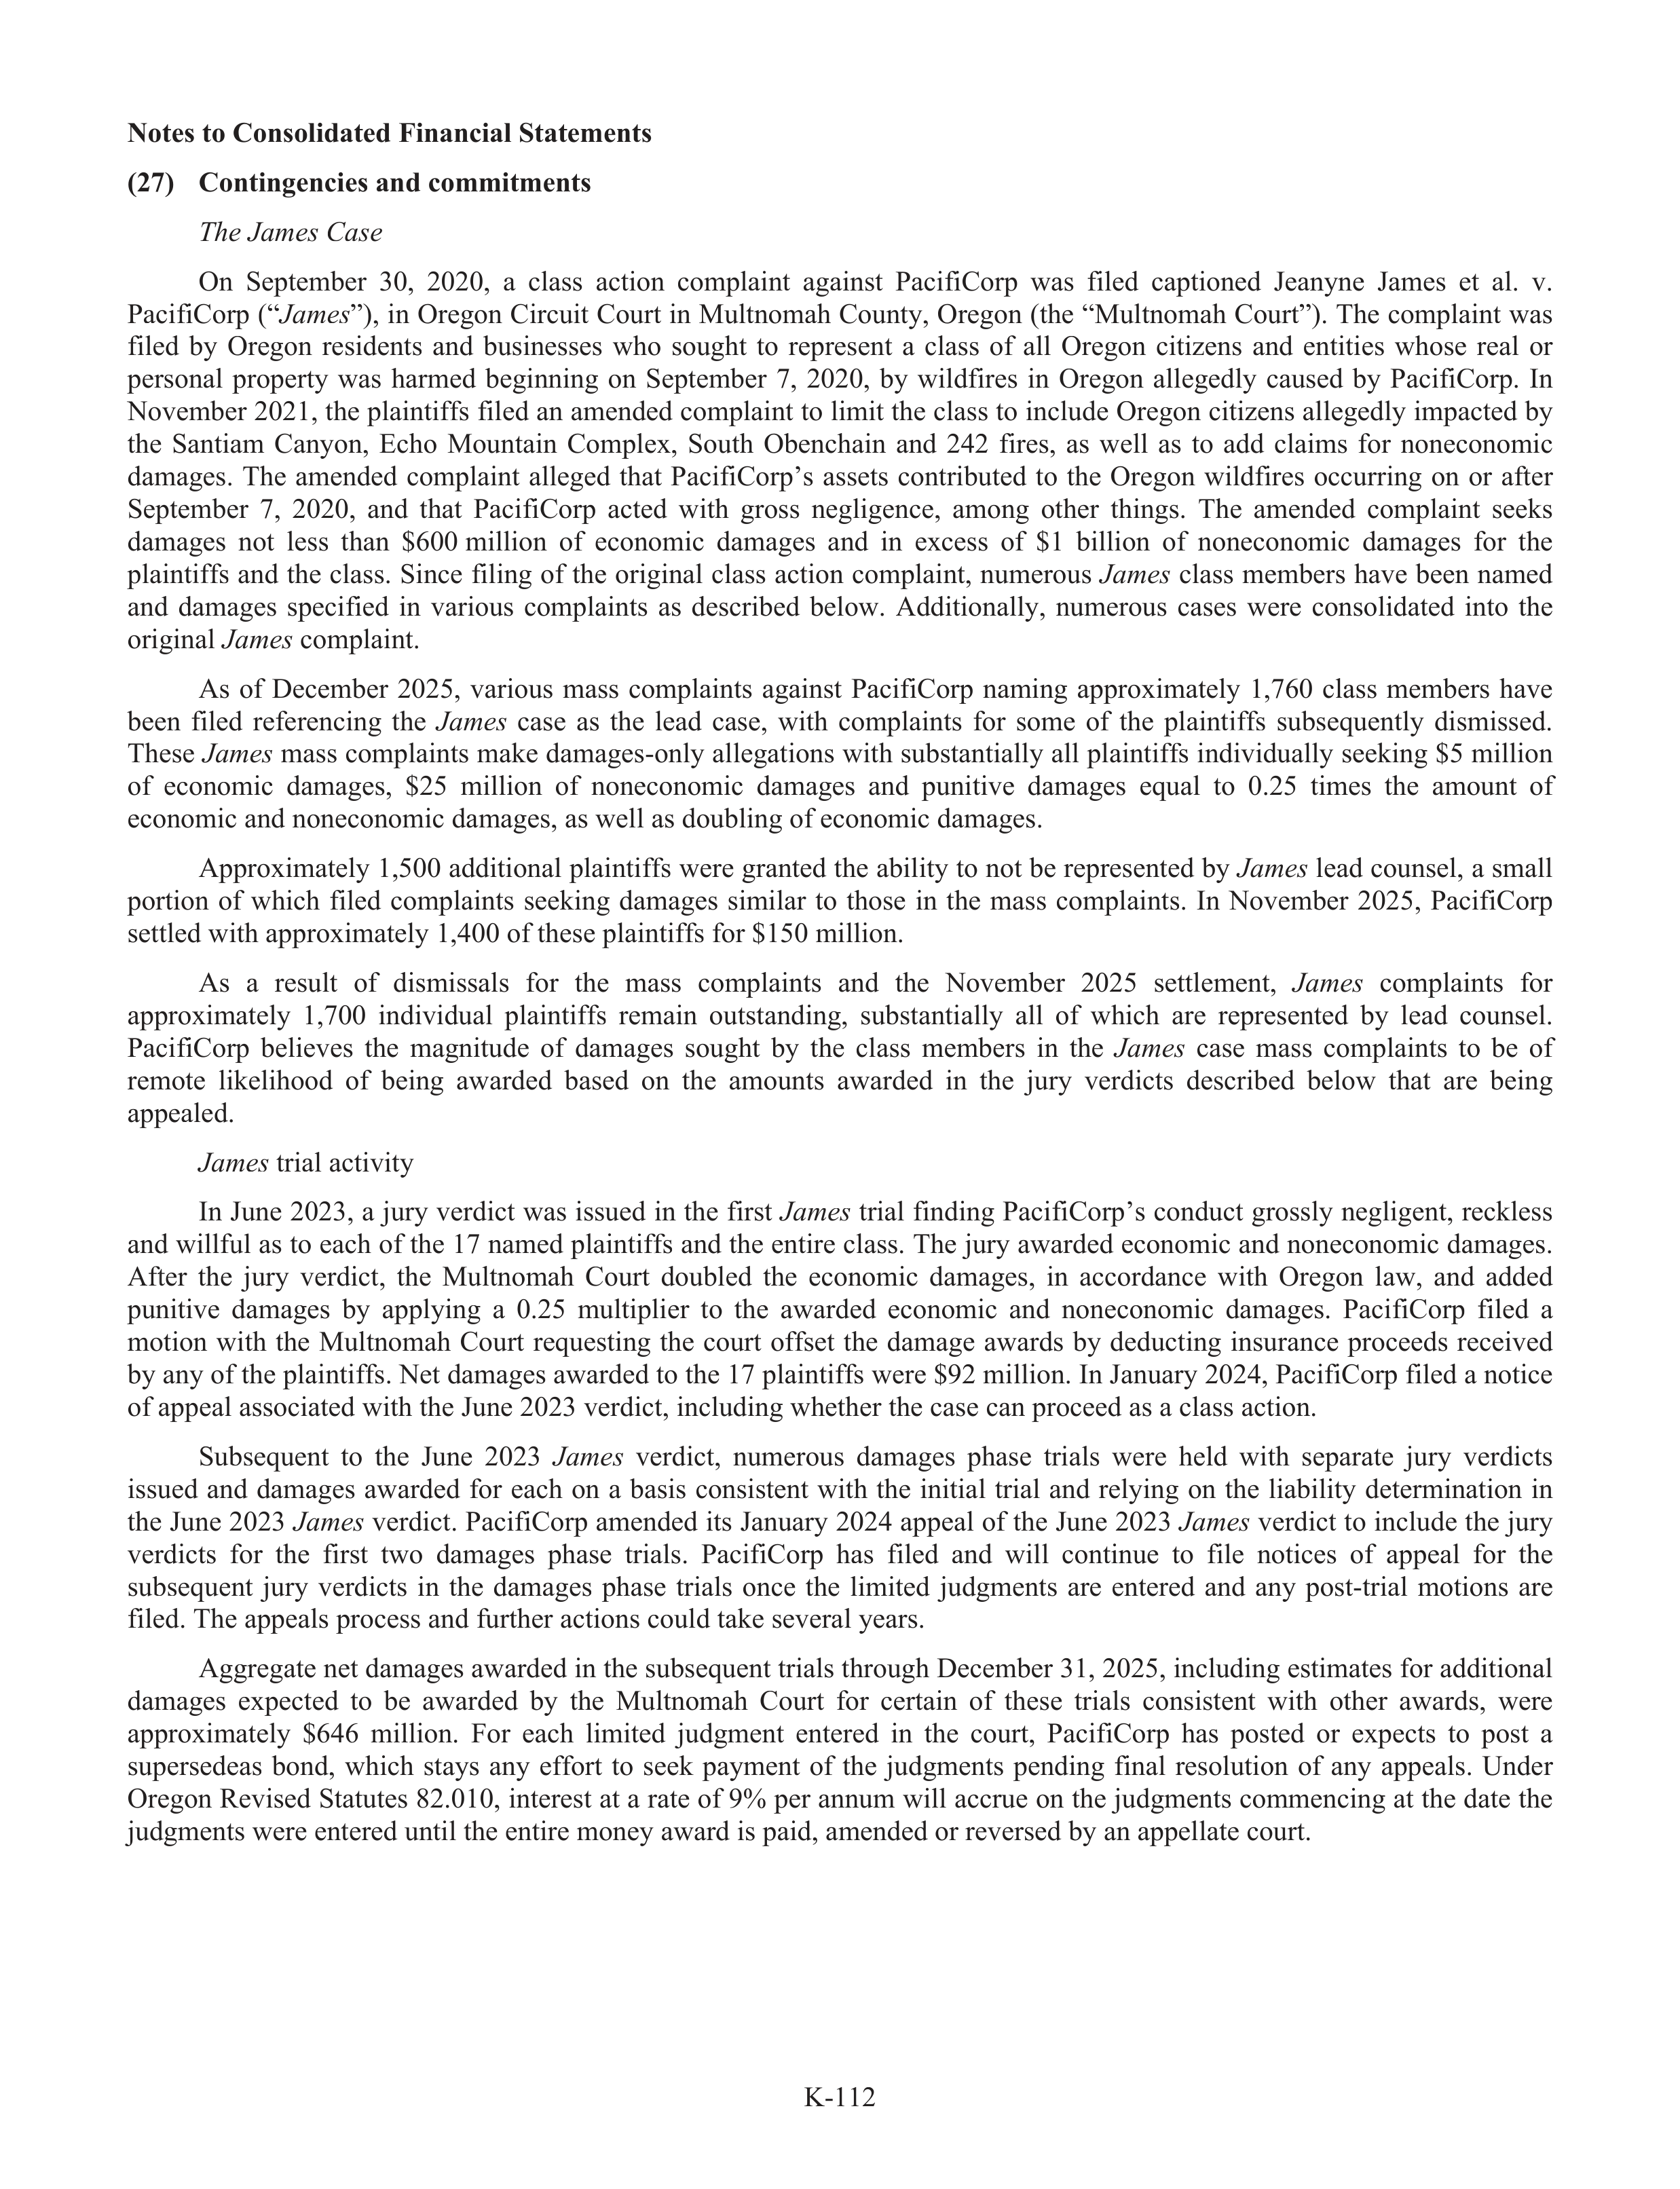
K-112
Notes to Consolidated Financial Statements
(27)
Contingencies and commitments
The James Case
On
September
30,
2020,
a
class
action
complaint
against
PacifiCorp
was
filed
captioned
Jeanyne
James
et
al.
v.
PacifiCorp (“
Ja
“
mes
”), in Oregon Circuit Court in Multnomah County, Oregon (the “Multnomah Court”). The complaint was
filed
by
Oregon
residents
and
businesses
who
sought
to
represent
a
class
of
all
Oregon
citizens
and
entities
whose
real
or
personal
property
was
harmed
beginning
on
September
7,
2020,
by
wildfires
in
Oregon
allegedly
caused
by
PacifiCorp.
r
In
November 2021, the plaintiffs
f
filed an amended complaint to limit the class to include Oregon citizens allegedly impacted by
the
Santiam
Canyon,
Echo
Mountain
Complex,
South
Obenchain
and
242
fires,
as
well
as
to
add
claims
for
noneconomic
damages.
The
amended
complaint
alleged
that
PacifiCorp’s
assets
contributed
to
the
Oregon
wildfires
occurring
on
or
afte
f
r
September
7,
2020,
and
that
PacifiCorp
acted
with
gross
negligence,
among
other
things.
The
amended
complaint
seeks
damages
not
less
than
$600 million
of
economic
damages
and
in
excess
of
$1
billion
of
noneconomic
damages
for
the
plaintiffs
f
and the class. Since filing of the original class action complaint, numerous
James
class members have been named
and
damages
specified
in
various
complaints
as
described
below.
Additionally,
numerous
cases
were
consolidated
into
the
original
James
complaint.
As
of
December
2025,
various
mass
complaints
against
PacifiCorp
naming
approximately
1,760
class
members
have
been
filed
referencing
the
James
case
as
the
lead
case,
with
complaints
for
some
of
the
plaintiffs
f
subs
u
equently
dismissed.
These
James
mass complaints make damages-only allegations with subs
u
tantially all plaintiffs
f
individually seeking $5 million
of
economic
damages,
$25
million
of
noneconomic
damages
and
punitive
damages
equal
to
0.25
times
the
amount
of
economic and noneconomic damages, as well as doubling of economic damages.
Approximately 1,500 additional plaintiffs
f
were granted the ability to not be represented by
James
lead counsel, a small
portion
of
which
filed
complaints
seeking
damages
similar
to
those
in
the
mass
complaints.
In
November
2025,
PacifiCorp
r
settled with approximately 1,400 of these plaintiffs
f
for $150 million.
As
a
result
of
dismissals
for
the
mass
complaints
and
the
November
2025
settlement,
James
complaints
for
approximately
1,700
individual
plaintiffs
f
remain
outstanding,
subs
u
tantially
all
of
which
are
represented
by
lead
counsel.
PacifiCorp
believes
the
magnitude
of
damages
sought
by
the
class
members
in
the
James
case
mass
complaints
to
be
of
remote
likelihood
of
being
awarded
based
on
the
amounts
awarded
in
the
jury
verdicts
described
below
that
are
being
appealed.
James
trial activity
In June 2023, a jury verdict was issued in the first
James
trial finding PacifiCorp’s conduct grossly negligent, reckless
and willful
f
as to each of the 17 named plaintiffs
f
and the entire class. The jury awarded economic and noneconomic damages.
Afte
f
r
the
jury
verdict,
the
Multnomah
Court
doubled
the
economic
damages,
in
accordance
with
Oregon
law,
and
added
punitive
damages
by
applying
a
0.25
multiplier
to
the
awarded
economic
and
noneconomic
damages.
PacifiCorp
r
filed
a
motion
with
the
Multnomah
Court
requesting
the
court
offs
f
et
the
damage
awards
by
deducting
insurance
proceeds
received
by any of the plaintiffs
f
. Net damages awarded to the 17 plaintiffs
f
were $92 million. In January 2024, PacifiCorp filed a notice
of appeal associated with the June 2023 verdict, including whether the case can proceed as a class action.
Subs
u
equent
to
the
June
2023
James
verdict,
numerous
damages
phase
trials
were
held
with
separate
jury
verdicts
issued
and
damages
awarded
for
each
on
a
basis
consistent
with
the
initial
trial
and
relying
on
the
liabi
a
lity
determination
in
the June 2023
James
verdict. PacifiCorp amended its January 2024 appeal of the June 2023
James
verdict to include the jury
verdicts
for
the
first
two
damages
phase
trials.
PacifiCorp
has
filed
and
will
continue
to
file
notices
of
appeal
for
the
subs
u
equent
jury
verdicts
in
the
damages
phase
trials
once
the
limited
judgments
are
entered
and
any
post-trial
motions
are
filed. The appeals process and further actions could take several years.
Aggregate net damages awarded in the subs
u
equent trials through December 31, 2025, including estimates for additional
damages
expected
to
be
awarded
by
the
Multnomah
Court
for
certain
of
these
trials
consistent
with
other
awards,
were
approximately
$646
million.
For
each
limited
judgment
entered
in
the
court,
PacifiCorp
has
posted
or
expects
to
post
a
supe
u
rsedeas
bond,
which
stays
any
effo
f
rt
to
seek
payment
of
the
judgments
pending
final
resolution
of
any
appeals.
Under
Oregon Revised Statut
t
es 82.010, interest at a rate of 9% per annum will accrue
r
on the judgments commencing at the date the
judgments were entered until the entire money award is paid, amended or reversed by an appellate court.
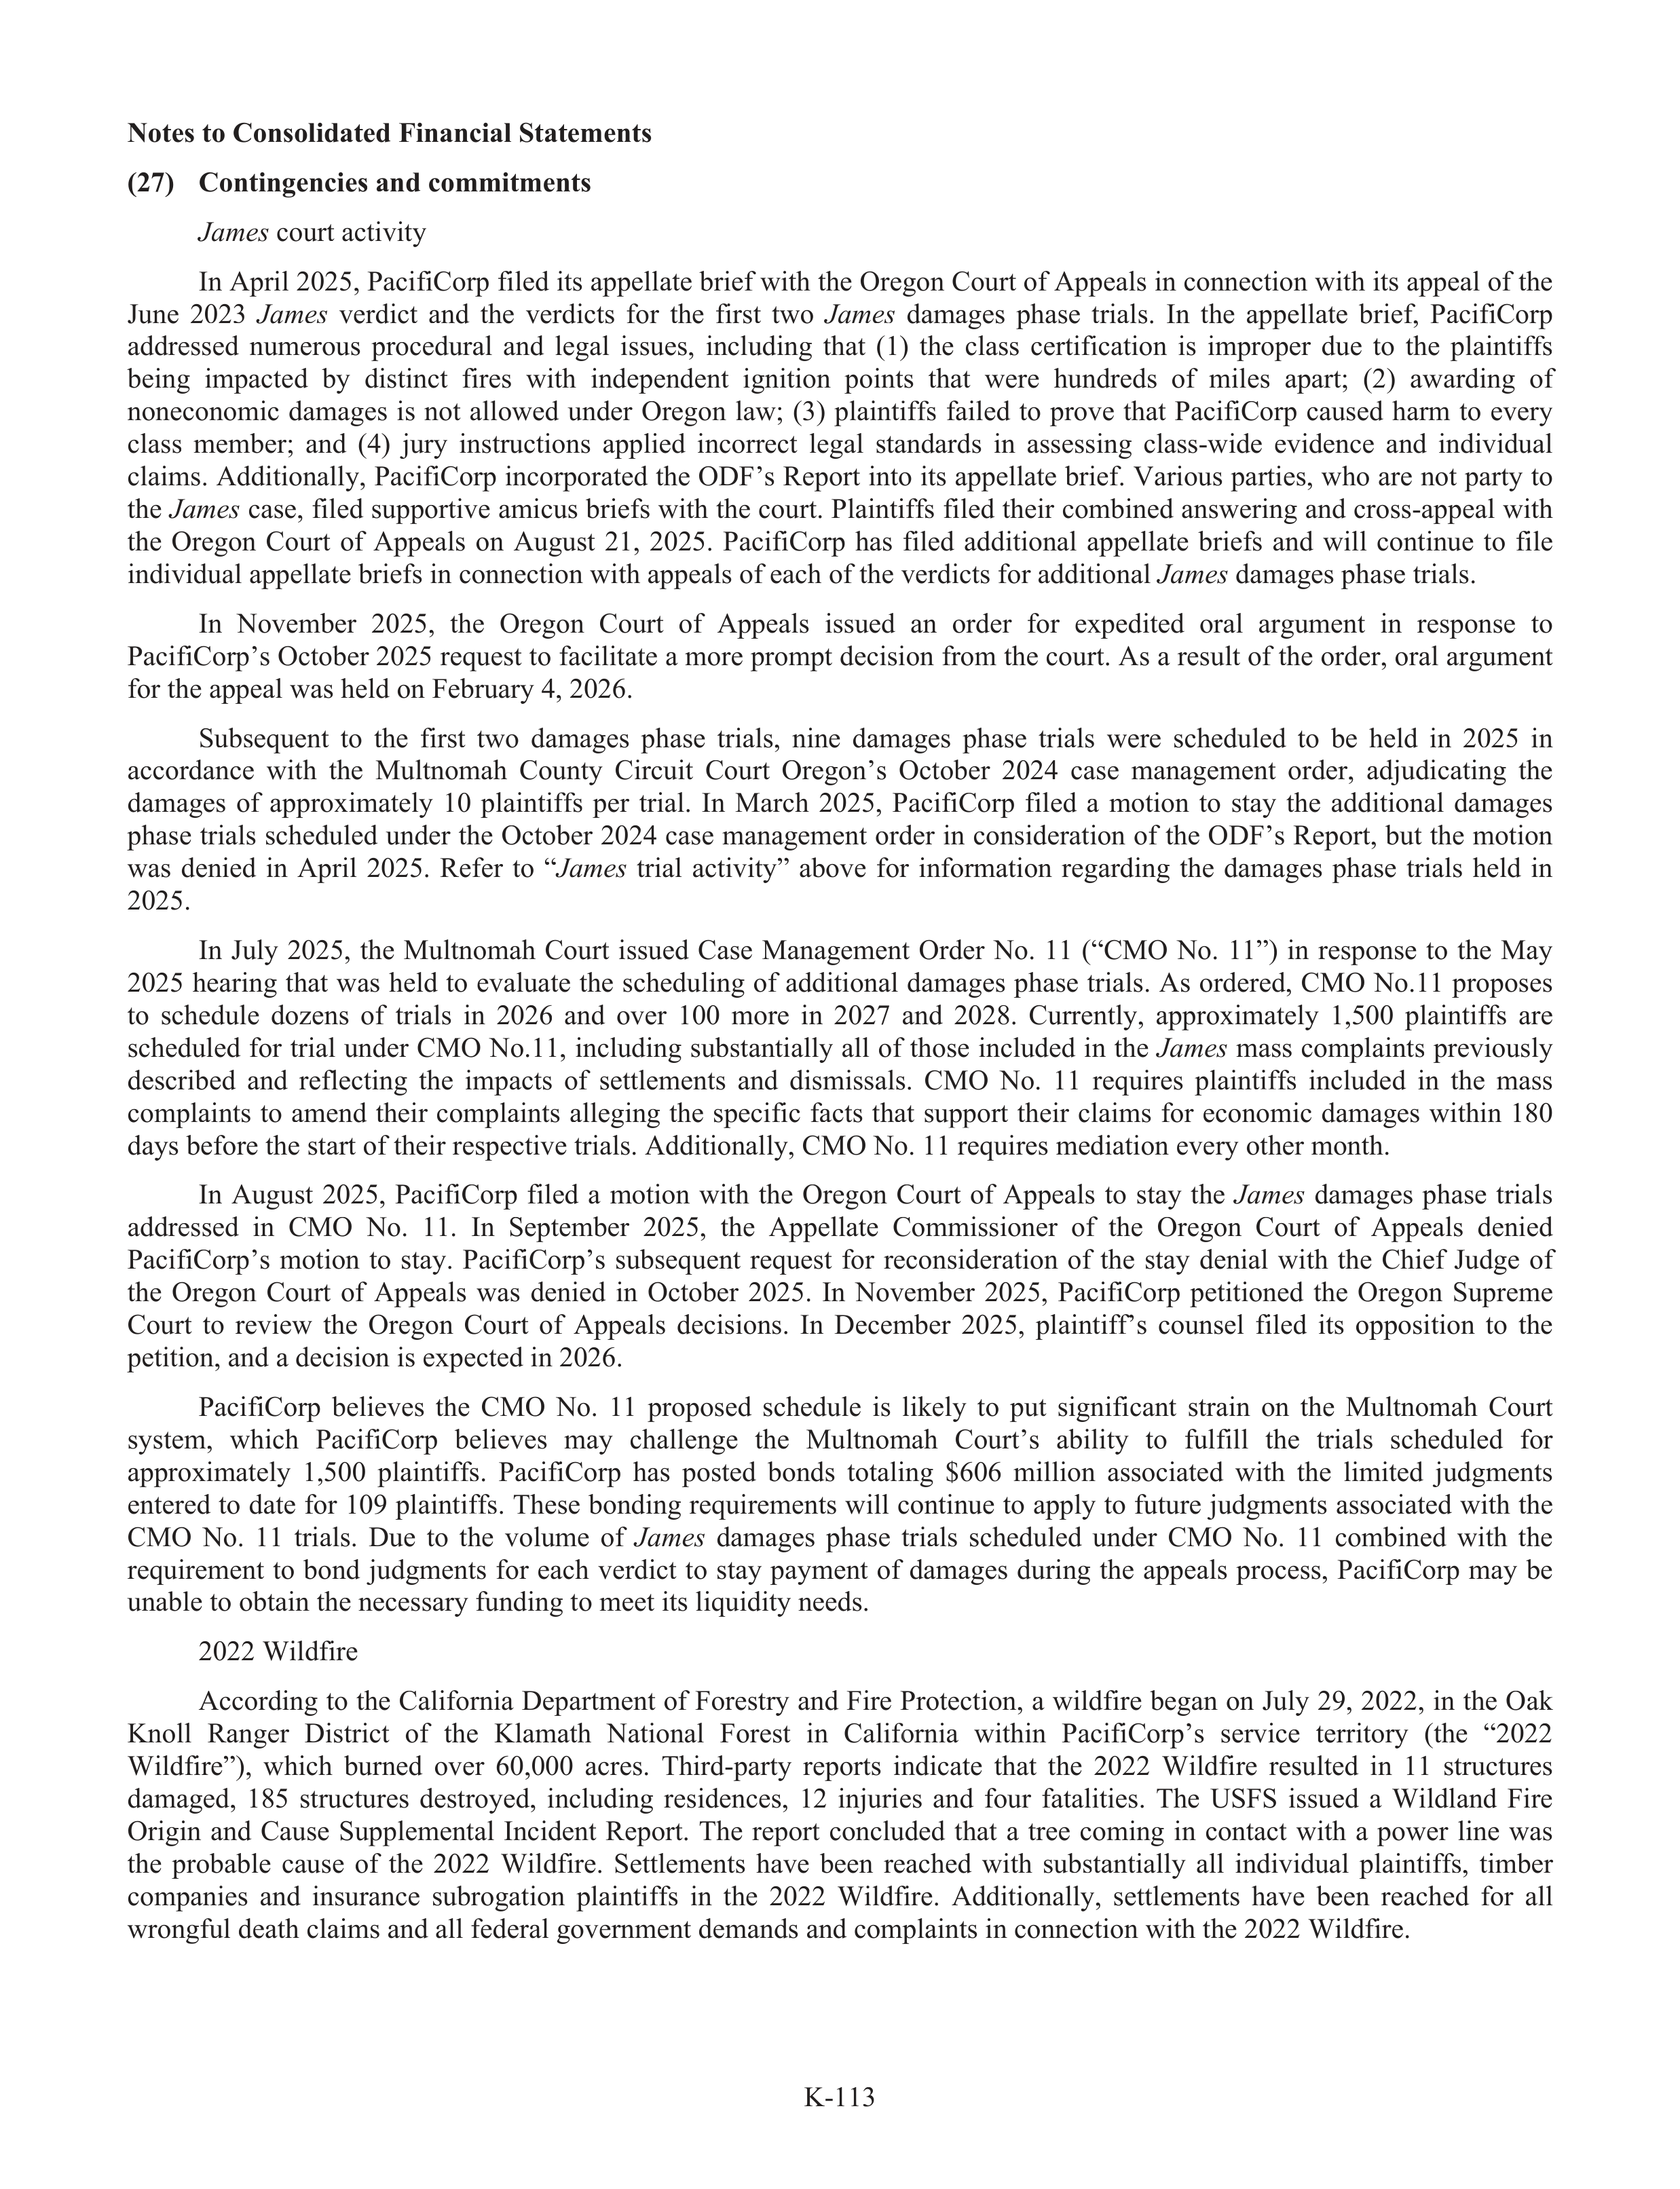
K-113
Notes to Consolidated Financial Statements
(27)
Contingencies and commitments
James
court activity
In April 2025, PacifiCorp filed its appellate brief with the Oregon Court of Appeals in connection with its appeal of the
June
2023
James
verdict
and
the
verdicts
for
the
first
two
James
damages
phase
trials.
In
the
appellate
brief,
PacifiCorp
addressed
numerous
procedur
d
al
and
legal
issues,
including
that
(1)
the
class
certific
f
ation
is
improper
due
to
the
plaintiffs
f
being
impacted
by
distinct
fires
with
independent
ignition
points
that
were
hundreds
of
miles
apart;
(2)
awarding
of
noneconomic
damages
is
not
allowed
under
Oregon
law;
(3)
plaintiffs
f
failed
to
prove
that
PacifiCorp
caused
harm
to
every
r
class
member;
and
(4)
jury
instructions
applied
incorrect
legal
standards
in
assessing
class-wide
evidence
and
individual
claims. Additionally, PacifiCorp incorporated the ODF’s Report into its appellate brief. Various parties, who are not party to
the
James
case, filed suppor
u
tive amicus briefs with the court. Plaintiffs
f
filed their combined answering and cross-appeal with
the
Oregon
Court
of
Appeals
on
August
21,
2025.
PacifiCorp
has
filed
additional
appellate
briefs
and
will
continue
to
file
individual appellate briefs in connection with appeals of each of the verdicts for additional
James
damages phase trials.
In
November
2025,
the
Oregon
Court
of
Appeals
issued
an
order
for
expedited
oral
argument
in
response
to
PacifiCorp’s October 2025 request to facilitate a more prompt decision from the court. As a result of the order, oral argument
for the appeal was held on Februa
r
ry 4, 2026.
Subs
u
equent
to
the
first
two
damages
phase
trials,
nine
damages
phase
trials
were
scheduled
to
be
held
in
2025
in
accordance
with
the
Multnomah
County
Circuit
Court
Oregon’s
October
2024
case
management
order,
adju
d
dicating
the
damages
of
approximately
10
plaintiffs
f
per
trial.
In
March
2025,
PacifiCorp
filed
a
motion
to
stay
the
additional
damages
phase trials scheduled under the October 2024 case management order in consideration of the ODF’s Report, but the motion
was
denied
in
April
2025.
Refer
to
“
Ja
“
mes
trial
activity”
above
a
for
information
regarding
the
damages
phase
trials
held
in
2025.
In
July
2025,
the
Multnomah
Court
issued
Case
Management
Order
No.
11
(“CMO
No.
11”)
in
response
to
the
May
2025 hearing that was held to evaluate the scheduling of additional damages phase trials. As ordered, CMO No.11 proposes
to
schedule
dozens
of
trials
in
2026
and
over
100
more
in
2027
and
2028.
Currently,
approximately
1,500
plaintiffs
f
are
scheduled for trial under CMO No.11, including subs
u
tantially all of those included in the
James
mass complaints previously
described
and
reflecting
the
impacts
of
settlements
and
dismissals.
CMO
No.
11
requires
plaintiffs
f
included
in
the
mass
complaints
to
amend
their
complaints
alleging
the
specific
facts
that
suppor
u
t
their
claims
for
economic
damages
within
180
days before the start of their respective trials. Additionally, CMO No. 11 requires mediation every
r
other month.
In
August
2025,
PacifiCorp
filed
a
motion
with
the
Oregon
Court
of
Appeals
to
stay
the
James
damages
phase
trials
addressed
in
CMO
No.
11.
In
September
2025,
the
Appellate
Commissioner
of
the
Oregon
Court
of
Appeals
denied
PacifiCorp’s
motion
to
stay.
PacifiCorp’s
subs
u
equent
request
for
reconsideration
of
the
stay
denial
with
the
Chief
Judge
of
the
Oregon
Court
of
Appeals
was
denied
in
October
2025.
In
November
2025,
PacifiCorp
petitioned
the
Oregon
Supr
u
eme
Court
to
review
the
Oregon
Court
of
Appeals
decisions.
In
December
2025,
plaintiff’
f
s
counsel
filed
its
opposition
to
the
petition, and a decision is expected in 2026.
PacifiCorp
believes
the
CMO
No.
11
proposed
schedule
is
likely
to
put
significant
strain
on
the
Multnomah
Court
system,
which
PacifiCorp
believes
may
challenge
the
Multnomah
Court’s
abi
a
lity
to
fulfill
f
the
trials
scheduled
for
approximately
1,500
plaintiffs
f
.
PacifiCorp
has
posted
bonds
totaling
$606
million
associated
with
the
limited
judgments
entered to date for 109 plaintiffs
f
. These bonding requirements will continue to apply to future judgments associated with the
CMO
No.
11
trials.
Due
to
the
volume
of
James
damages
phase
trials
scheduled
under
CMO
No.
11
combined
with
the
requirement
to
bond
judgments
for
each
verdict
to
stay
payment
of
damages
during
the
appeals
process,
PacifiCorp
may
be
unabl
a
e to obtain the necessary funding to meet its liquidity needs.
2022 Wildfire
According to the California Department of Forestry and Fire Protection, a wildfire began on July 29, 2022, in the Oak
Knoll
Ranger
District
of
the
Klamath
National
Forest
in
Califor
f
nia
within
PacifiCorp’s
service
territory
(the
“2022
Wildfire”),
which
burned
over
60,000
acres.
Third-party
reports
indicate
that
the
2022
Wildfire
resulted
in
11
structures
damaged,
185
structur
t
es
destroyed,
including
residences,
12
inju
n
ries
and
four
fatalities.
The
USFS
issued
a
Wildland
Fire
Origin
and
Cause
Suppl
u
emental
Incident
Report.
The
report
concluded
that
a
tree
coming
in
contact
with
a
power
line
was
the
probabl
a
e
cause
of
the
2022
Wildfire.
Settlements
have
been
reached
with
subs
u
tantially
all
individual
plaintiffs
f
,
timber
companies
and
insurance
subr
u
ogation
plaintiffs
f
in
the
2022
Wildfire.
Additionally,
settlements
have
been
reached
for
all
wrongful
f
death claims and all federal government demands and complaints in connection with the 2022 Wildfire.
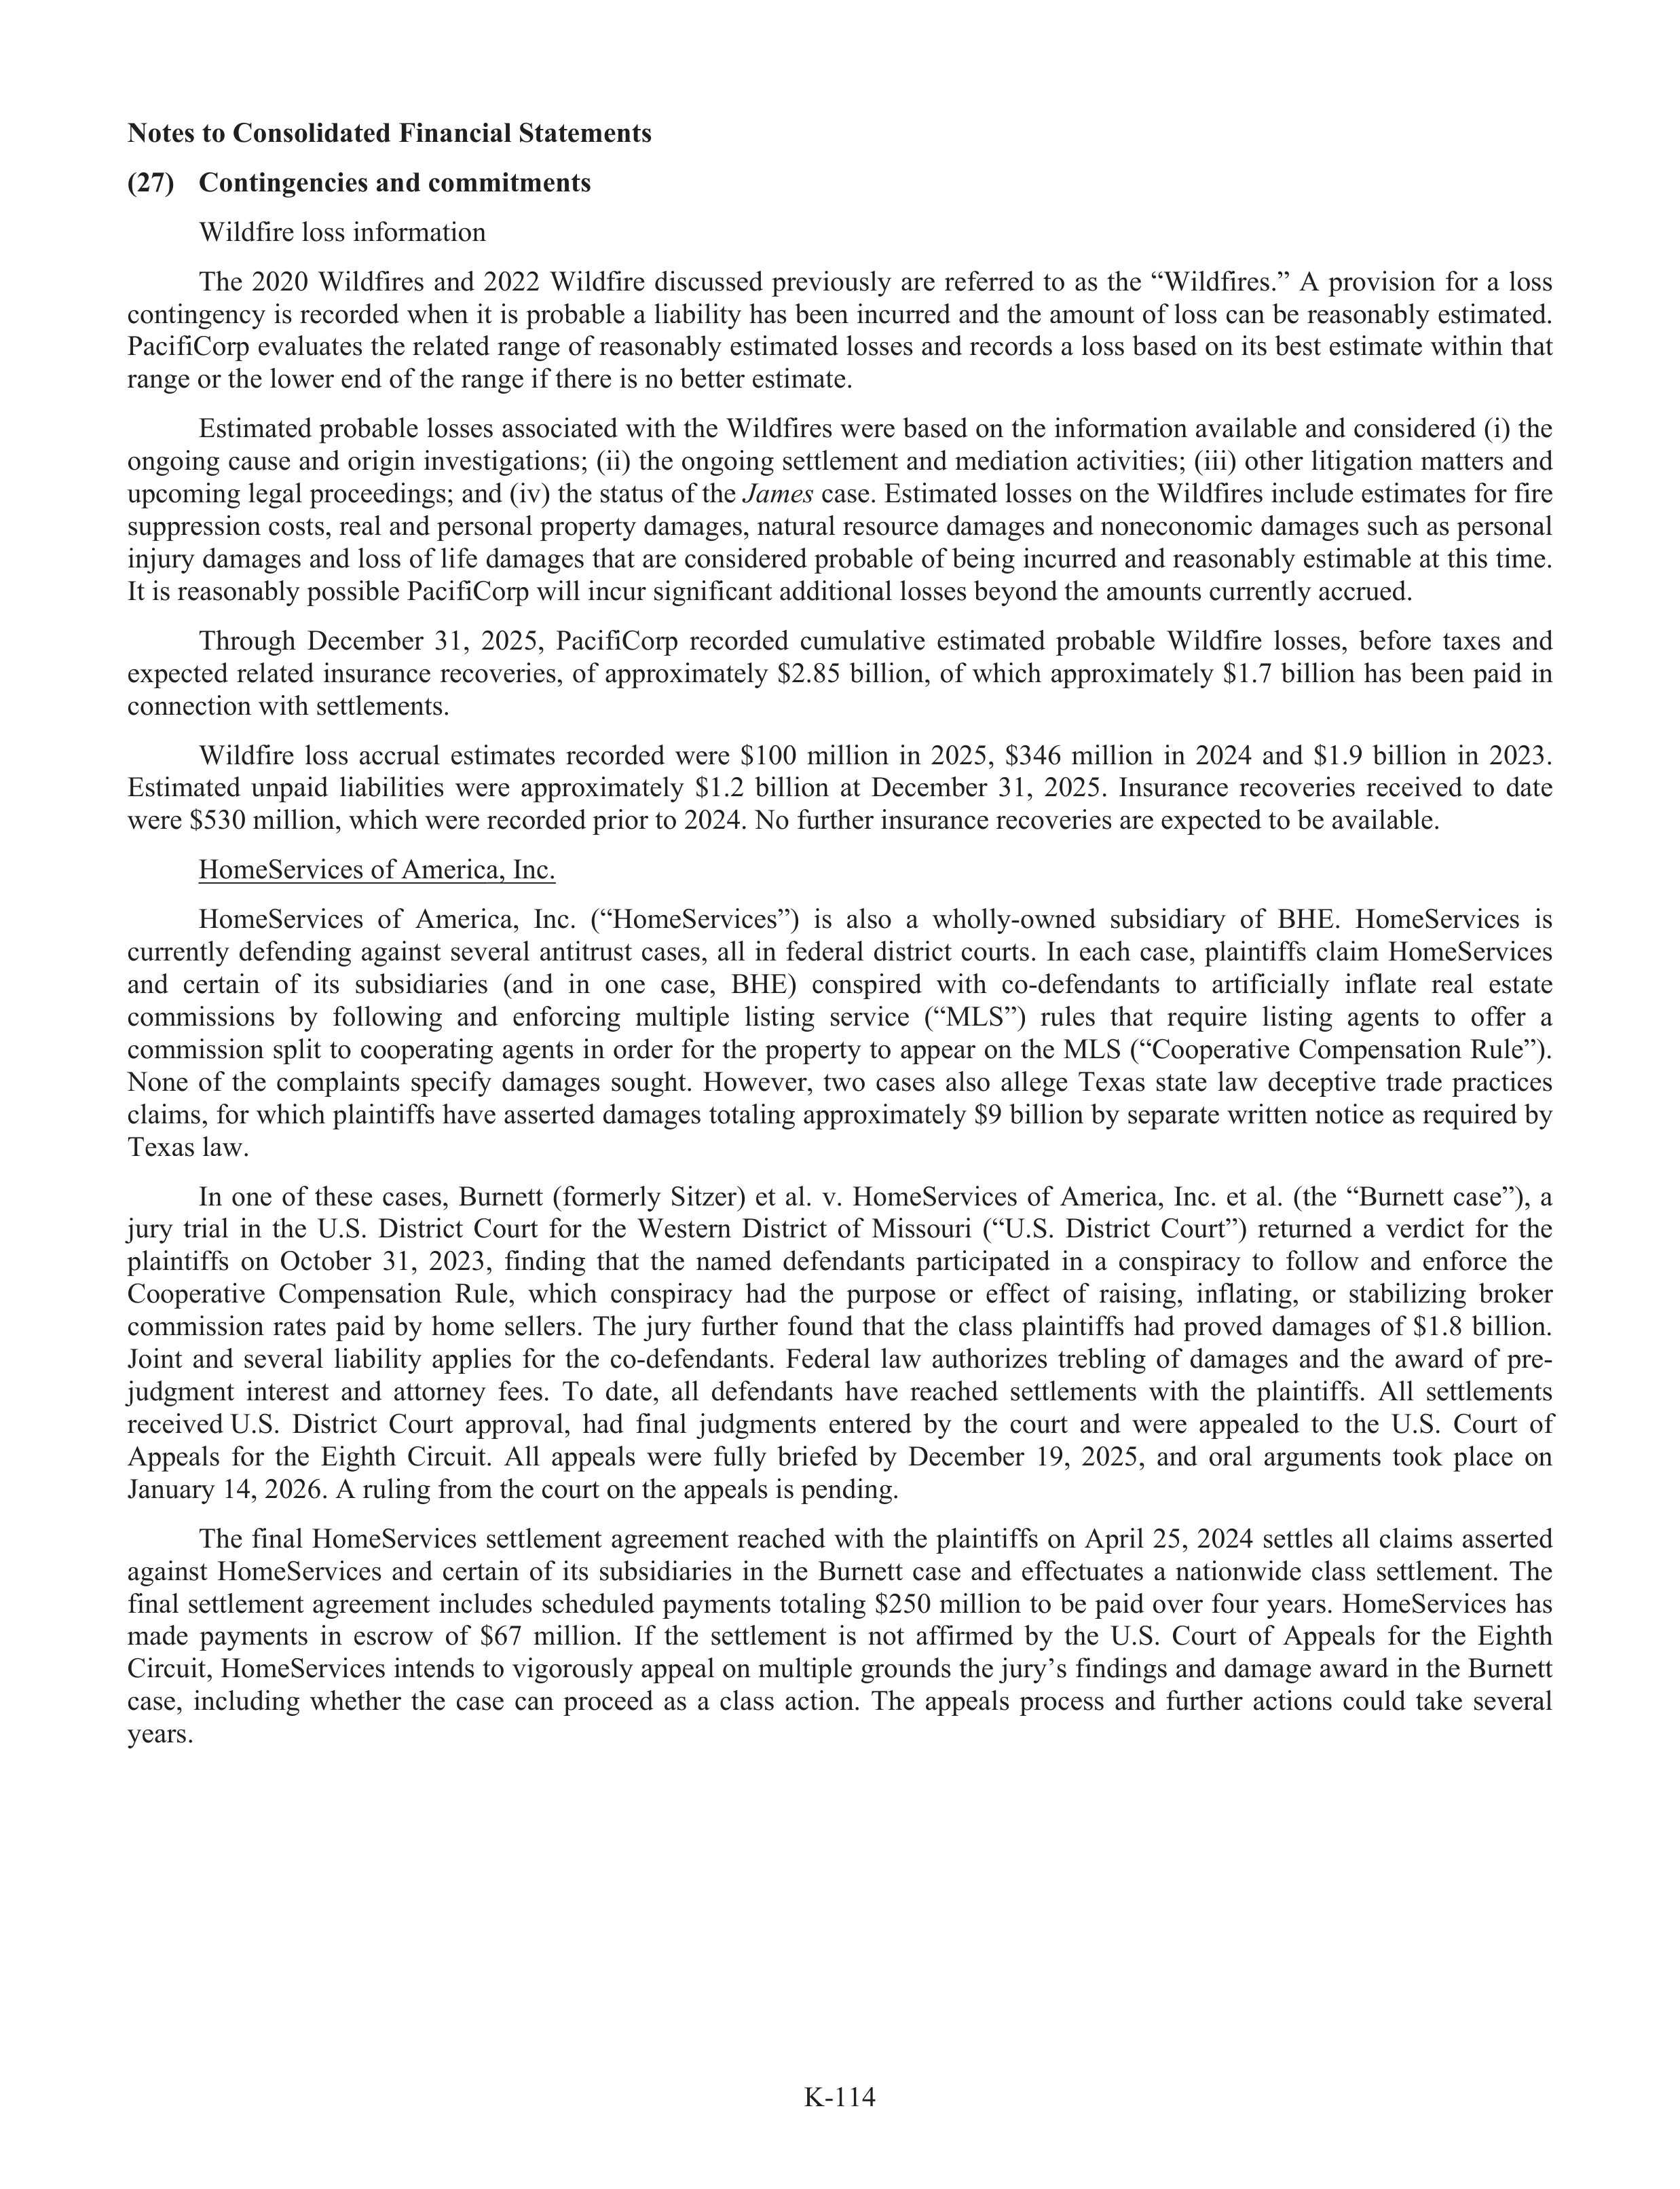
K-114
Notes to Consolidated Financial Statements
(27)
Contingencies and commitments
Wildfire loss information
The
2020
Wildfires
and
2022
Wildfire
discussed
previously
are
referred
to
as
the
“Wildfires.”
A
provision
for
a
loss
contingency is recorded when it is probabl
a
e a liabi
a
lity has been incurred and the amount of loss can be reasonabl
a
y estimated.
PacifiCorp evaluates the related range of reasonabl
a
y estimated losses and records a loss based on its best estimate within that
range or the lower end of the range if there is no better estimate.
Estimated probabl
a
e losses associated with the Wildfires were based on the information availabl
a
e and considered (i) the
ongoing cause and origin investigations; (ii) the ongoing settlement and mediation activities; (iii) other litigation matters and
upcoming legal proceedings; and (iv) the status
t
of the
James
case. Estimated losses on the Wildfires include estimates for fire
suppr
u
ession costs, real and personal property damages, natural resource damages and noneconomic damages such as personal
inju
n
ry damages and loss of lifef
damages that are considered probable of being incurred and reasonabl
a
y estimabl
a
e at this time.
It is reasonabl
a
y possible PacifiCorp will incur significant additional losses beyond the amounts currently accrue
r
d.
Through
December
31,
2025,
PacifiCorp
recorded
cumulative
estimated
probabl
a
e
Wildfire
losses,
before
taxes
and
expected
related
insurance
recoveries,
of
approximately
$2.85
billion,
of
which
approximately
$1.7
billion
has
been
paid
in
connection with settlements.
Wildfire
loss
accrua
r
l
estimates
recorded
were
$100
million
in
2025,
$346
million
in
2024
and
$1.9
billion
in
2023.
Estimated
unpaid
liabi
a
lities
were
approximately
$1.2
billion
at
December
31,
2025.
Insurance
recoveries
received
to
date
were $530 million, which were recorded prior to 2024. No further insurance recoveries are expected to be availabl
a
e.
HomeServices of America, Inc.
HomeServices
of
America,
Inc.
(“HomeServices”)
is
also
a
wholly-owned
subs
u
idiary
of
BHE.
HomeServices
is
currently
defending
against
several
antitrus
r
t
cases,
all
in
federal
district
courts.
In
each
case,
plaintiffs
f
claim
HomeServices
and
certain
of
its
subs
u
idiaries
(and
in
one
case,
BHE)
conspired
with
co-defen
f
dants
to
artific
f
ially
inflate
real
estate
commissions
by
following
and
enforcing
multiple
listing
service
(“MLS”)
rules
that
require
listing
agents
to
offe
f
r
a
commission split to cooperating agents in order for the property to appear on the MLS (“Cooperative Compensation Rul
R
e”).
None
of
the
complaints
specify
f
damages
sought.
However,
two
cases
also
allege
Texas
state
law
deceptive
trade
practices
claims, for which plaintiffs
f
have asserted damages totaling approximately $9 billion by separate written notice as required by
Texas law.
In
one
of
these
cases,
Burnett
(formerly
Sitzer)
et
al.
v.
HomeServices
of
America,
Inc.
et
al.
(the
“Burnett
case”),
a
jury
trial
in
the
U.S.
District
Court
for
the
Western
District
of
Missouri
(“U.S.
District
Court”)
retur
t
ned
a
verdict
for
the
plaintiffs
f
on
October
31,
2023,
finding
that
the
named
defendants
participated
in
a
conspiracy
to
follow
and
enforce
the
Cooperative
Compensation
Rule,
which
conspiracy
had
the
purpose
or
effe
f
ct
of
raising,
inflating,
or
stabilizing
broker
commission
rates
paid
by
home
sellers.
The
jury
further
found
that
the
class
plaintiffs
f
had
proved
damages
of
$1.8
billion.
Joint
and
several
liabi
a
lity
applies
for
the
co-defen
f
dants.
Federal
law
authorizes
trebling
of
damages
and
the
award
of
pre-
judgment
interest
and
attorney
fees.
To
date,
all
defendants
have
reached
settlements
with
the
plaintiffs
f
.
All
settlements
received U.S.
District
Court
approval,
had
final
judgments
entered
by
the
court
and
were
appealed
to
the
U.S.
Court
of
Appeals
for
the
Eighth
Circuit.
All
appeals
were
fully
briefed
by
December
19,
2025,
and
oral
arguments
took
place
on
January 14, 2026. A ruling from the court on the appeals is pending.
The
final
HomeServices
settlement
agreement
reached
with
the
plaintiffs
f
on
April
25,
2024
settles
all
claims
asserted
against
HomeServices
and
certain
of
its
subs
u
idiaries
in
the
Burnett
case
and
effe
f
ctua
t
tes
a
nationwide
class
settlement.
The
final settlement agreement includes scheduled payments totaling $250 million to be paid over four years. HomeServices has
made
payments
in
escrow
of
$67
million.
If
the
settlement
is
not
affi
f
rmed
by
the
U.S.
Court
of
Appeals
for
the
Eighth
Circuit, HomeServices intends to vigorously appeal on multiple grounds the jury’
r
s fin
f
dings and damage award in the Burnett
case,
including
whether
the
case
can
proceed
as
a
class
action.
The
appeals
process
and
further
actions
could
take
several
years.
,
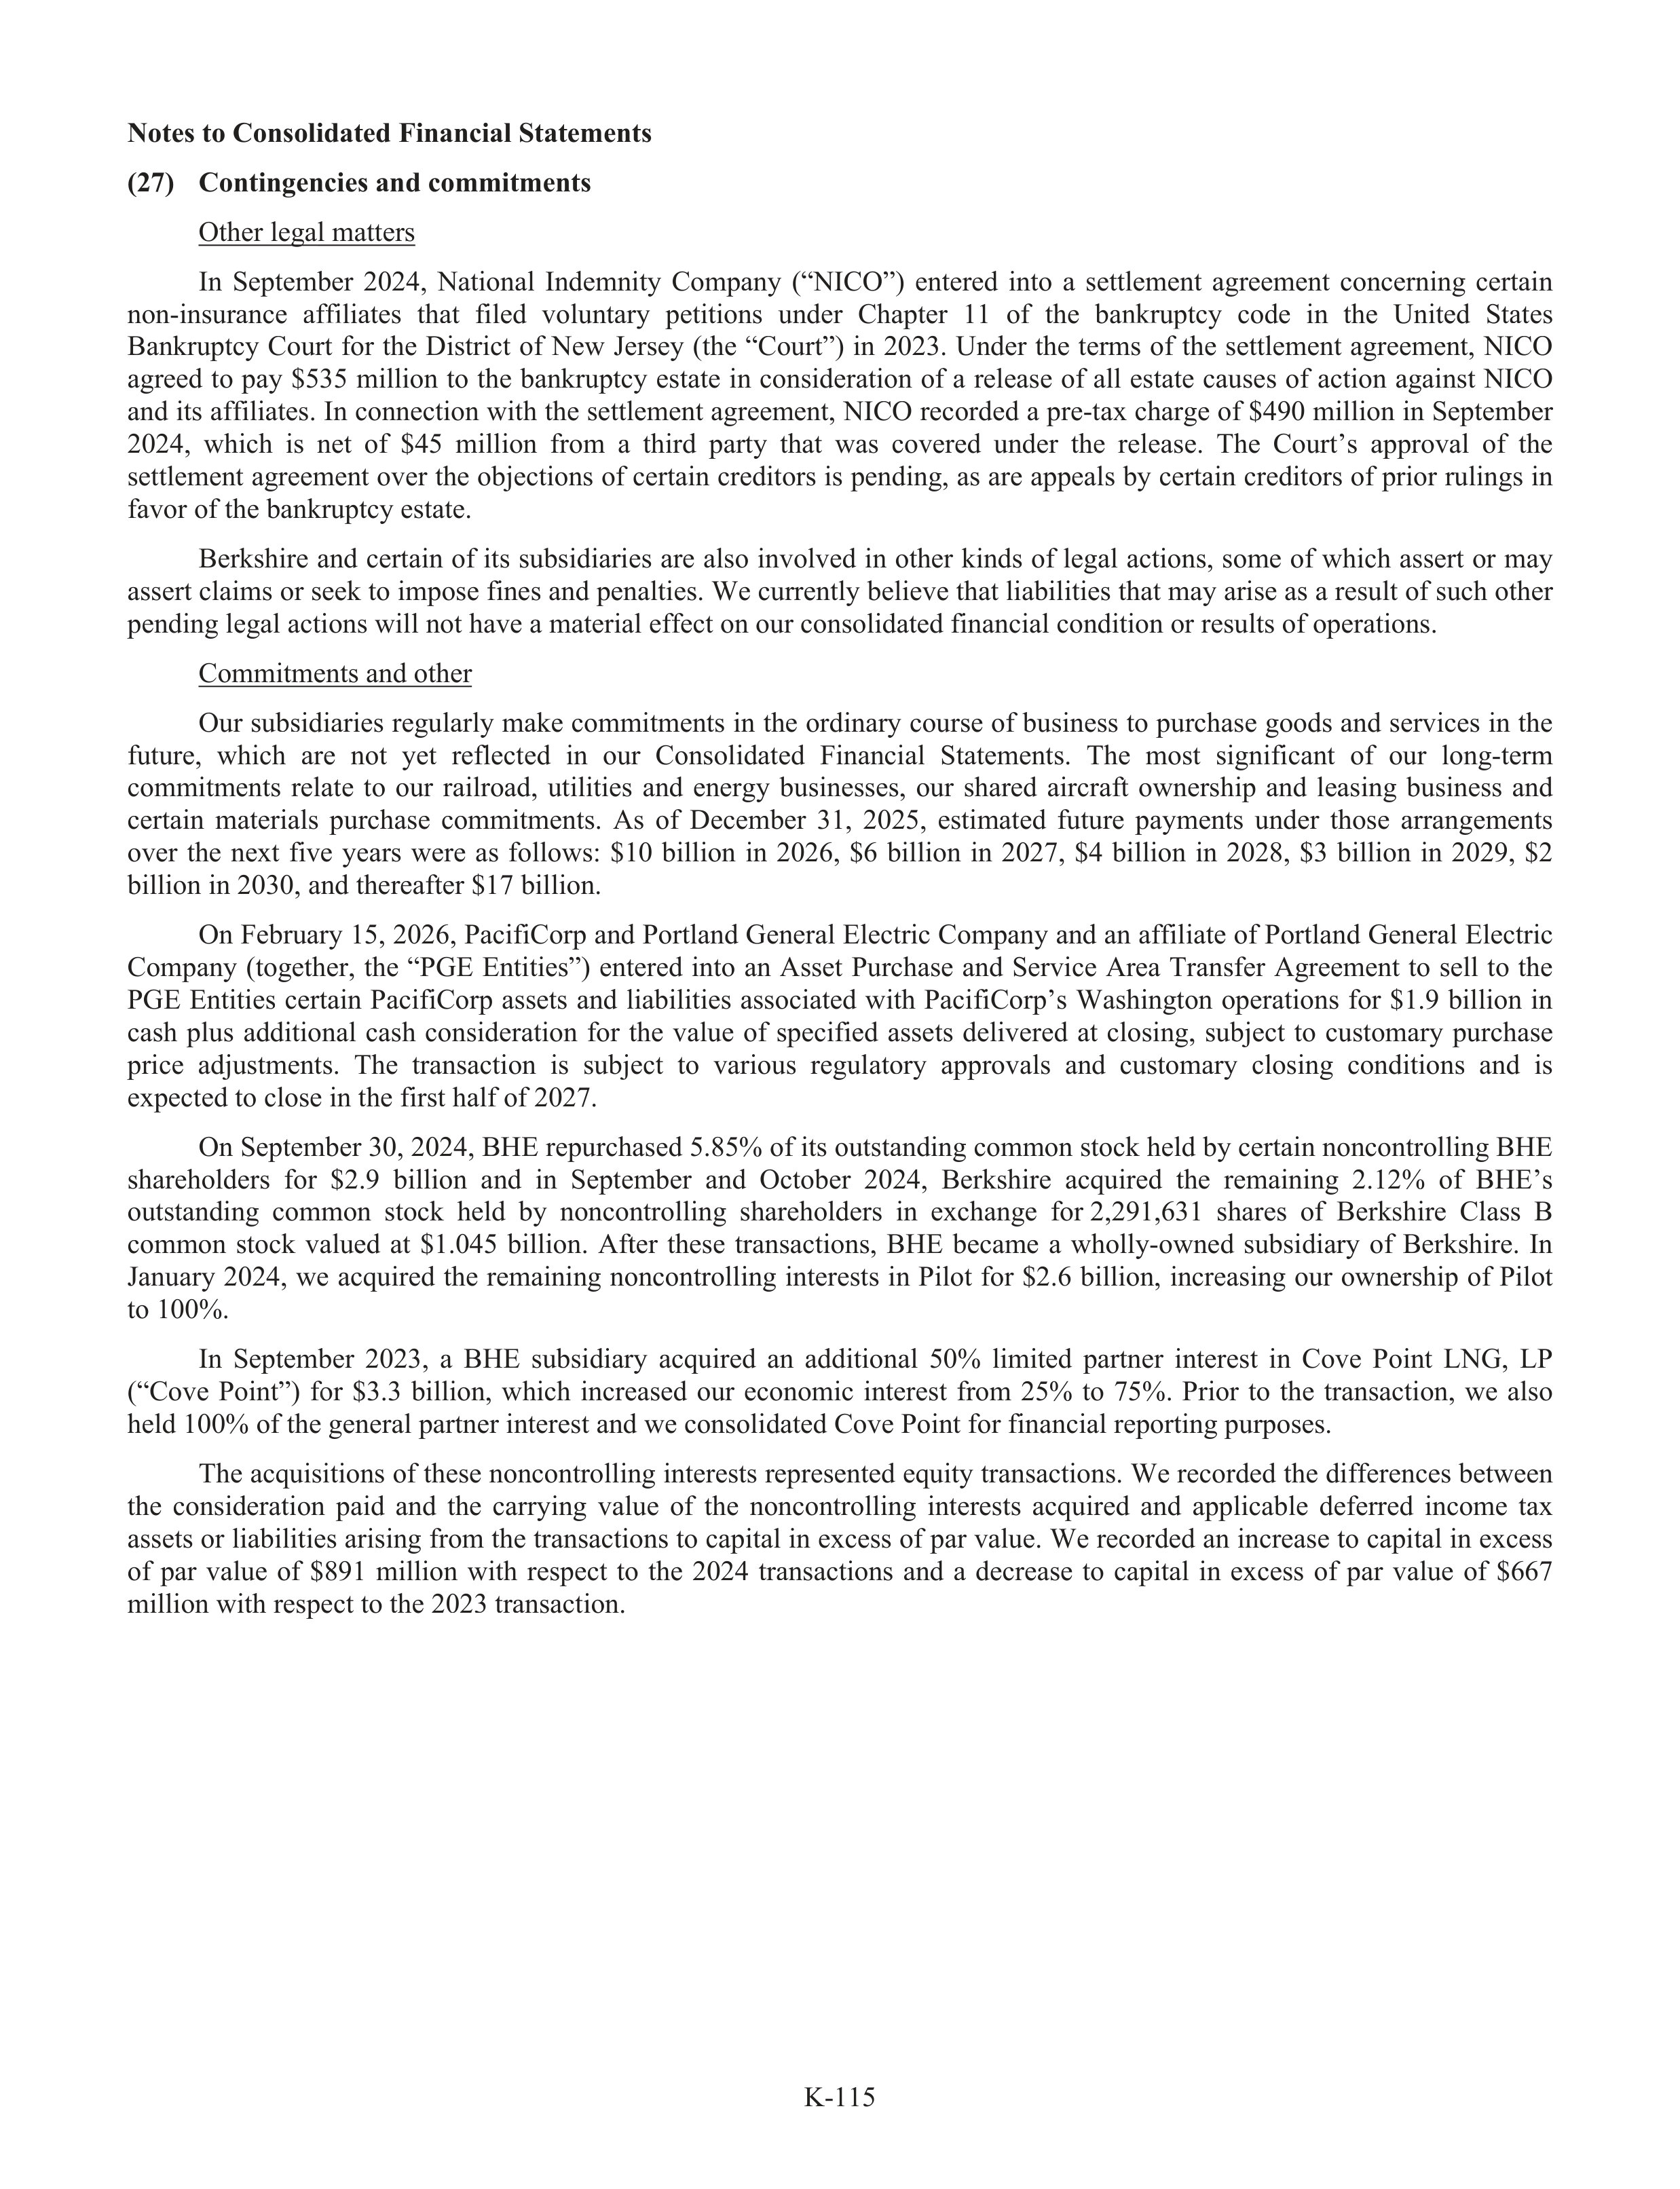
K-115
Notes to Consolidated Financial Statements
(27)
Contingencies and commitments
Other legal matters
In
September
2024,
National
Indemnity
Company
(“NICO”)
entered
into
a
settlement
agreement
concerning
certain
non-insurance
affi
f
liates
that
filed
voluntary
r
petitions
under
Chapter
11
of
the
bankrupt
r
cy
code
in
the
United
States
Bankrupt
r
cy
Court
for
the
District
of
New
Jersey
(the
“Court”)
in
2023.
Under
the
terms
of
the
settlement
agreement,
NICO
agreed
to
pay
$535
million
to
the
bankrupt
r
cy
estate
in
consideration
of
a
release
of
all
estate
causes
of
action
against
NICO
and its affi
f
liates. In connection with the settlement agreement, NICO recorded a pre-tax charge of $490 million in September
2024,
which
is
net
of
$45
million
from
a
third
party
that
was
covered
under
the
release.
The
Court’s
appr
a
oval
of
the
settlement agreement over the objections of certain creditors is pending, as are appeals by certain creditors of prior rulings in
favor of the bankrupt
r
cy estate.
Berkshire and certain of its subs
u
idiaries are also involved in other kinds of legal actions, some of which assert or may
assert claims or seek to impose fines and penalties. We currently believe that liabi
a
lities that may arise as a result of such other
pending legal actions will not have a material effe
f
ct on our consolidated financial condition or results of operations.
Commitments and other
Our subs
u
idiaries regularly make commitments in the ordinary course of business to purchase goods and services in the
future,
which
are
not
yet
reflected
in
our
Consolidated
Financial
Statements.
The
most
significant
of
our
long-term
commitments
relate
to
our
railroad,
utilities
and
energy
businesses,
our
shared
aircraft
ownership
and
leasing
business
and
certain
materials
purchase
commitments.
As
of
December
31,
2025,
estimated
future
payments
under
those
arrangements
over
the
next
five
years
were
as
follows:
$10
billion
in
2026,
$6
billion
in
2027,
$4
billion
in
2028,
$3
billion
in
2029,
$2
billion in 2030, and thereafter $17 billion.
On Februa
r
ry 15, 2026, PacifiCorp and Portland General Electric Company and an affi
f
liate of Portland General Electric
Company
(together,
the
“PGE
Entities”)
entered
into
an
Asset
Purchase
and
Service
Area
Transfer
f
Agreement
to
sell
to
the
PGE
Entities
certain
PacifiCorp
assets
and
liabi
a
lities
associated
with
PacifiCorp’s
Washington
operations
for
$1.9
billion
in
cash
plus
additional
cash
consideration
for
the
value
of
specified
assets
delivered
at
closing,
subj
u
ect
to
customary
r
purchase
price
adju
d
stments.
The
transaction
is
subj
u
ect
to
various
regulatory
r
approvals
and
customary
r
closing
conditions
and
is
expected to close in the first half of 2027.
On September 30, 2024, BHE repurchased 5.85% of its outstanding common stock held by certain noncontrolling BHE
shareholders
for
$2.9
billion
and
in
September
and
October
2024,
Berkshire
acquired
the
remaining
2.12%
of
BHE’s
outstanding
common
stock
held
by
noncontrolling
shareholders
in
exchange
for 2,291,631
shares
of
Berkshire
Class
B
common
stock
valued
at
$1.045
billion.
Afte
f
r
these
transactions,
BHE
became
a
wholly-owned
subs
u
idiary
of
Berkshire.
In
January
2024,
we
acquired
the
remaining
noncontrolling
interests
in
Pilot
for
$2.6
billion,
increasing
our
ownership
of
Pilot
to 100%.
In
September
2023,
a
BHE
subs
u
idiary
acquired
an
additional
50%
limited
partner
interest
in
Cove
Point
LNG,
LP
(“Cove
Point”)
for
f
$3.3
billion,
which
increased
our
economic
interest
from
25%
to
75%.
Prior
to
the
transaction,
we
also
held 100% of the general partner interest and we consolidated Cove Point for financial reporting purpos
r
es.
The acquisitions of these noncontrolling interests represented equity transactions. We recorded the differences between
the
consideration
paid
and
the
carrying
value
of
the
noncontrolling
interests
acquired
and
applicable
deferred
income
tax
assets or liabi
a
lities arising from the transactions to capital in excess of par value. We recorded an increase to capital in excess
of
par
value
of
$891
million
with
respect
to
the
2024
transactions
and
a
decrease
to
capital
in
excess
of
par
value
of
$667
million with respect to the 2023 transaction.
g
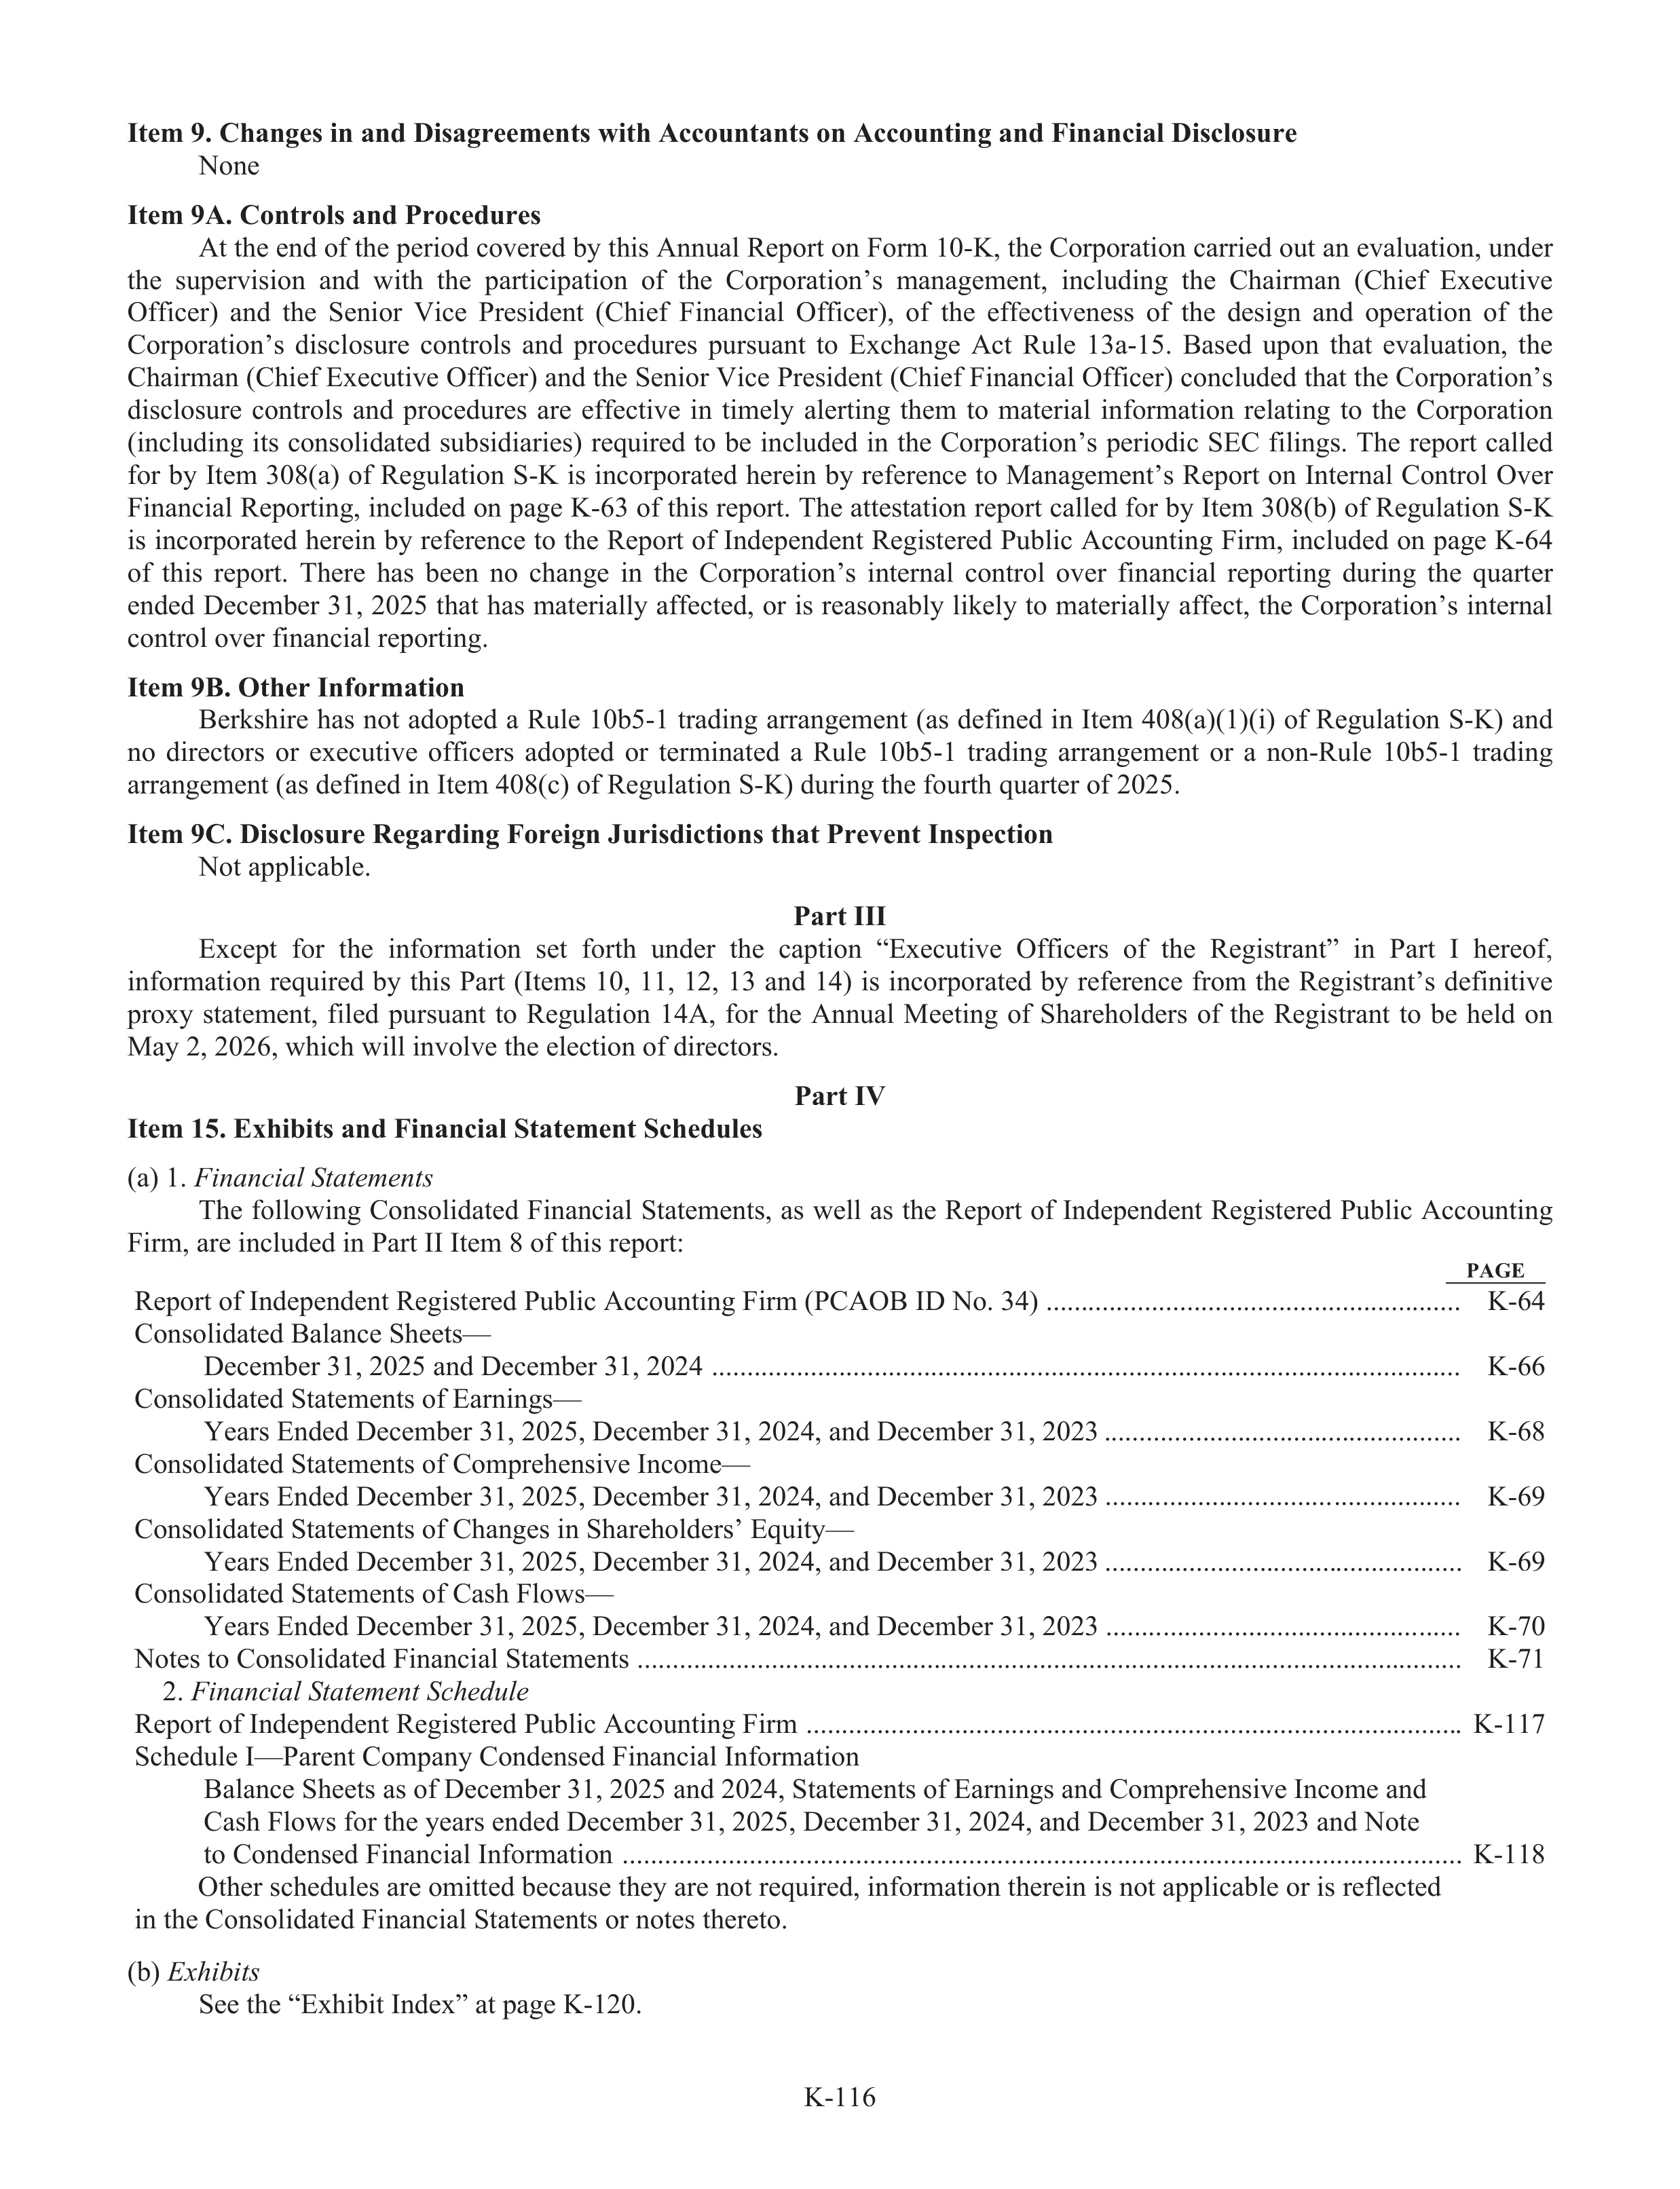
K-116
Item 9. Changes in and Disagreements with Accountants on Accounting and Financial Disclosure
None
Item 9A. Controls and Procedures
At the end of the period covered by this Annual Report on Form 10-K, the Corp
r
oration carried out an evaluation, under
the
sup
u
ervision
and
with
the
participation
of
the
Corp
r
oration’s
management,
including
the
Chairman
(Chief
Executive
Offf
if cer)
and
the
Senior
Vice
President
(Chief
Financial
Offf
if cer),
of
the
efff
ef
ctiveness
of
the
design
and
operation
of
the
Corp
r
oration’s
disclosure
controls
and
procedu
d
res
pursuant
to
Exchange
Act
Ru
R
le
13a-15.
Based
up
u
on
that
evaluation,
the
Chairman (Chief Executive Offf
if cer) and the Senior Vice President (Chief Financial Offf
if cer) concluded that the Corp
r
oration’s
disclosure
controls
and
procedu
d
res
are
efff
ef
ctive
in
timely
alerting
them
to
material
info
f
rmation
relating
to
the
Corp
r
oration
(including
its
consolidated
sub
u
sidiaries)
required
to
be
included
in
the
Corp
r
oration’s
periodic
SEC
fif lings.
The
report
called
fo
f
r
by
Item
308(a)
of
Regulation
S-K
is
incorp
r
orated
herein
by
refef
rence
to Management’s
Report
on
Internal
Control
Over
Financial Reporting, included on page K-63 of this report. The attestation report called fo
f
r by Item 308(b) of Regulation S-K
is incorp
r
orated herein by refef
rence to the Report of Independent Registered Pub
u
lic Accounting Firm, included on page K-64
of
this
report.
There
has
been
no
change
in
the
Corp
r
oration’s
internal
control
over
fif nancial
reporting
du
d
ring
the
quarter
ended December 31, 2025 that has materially afff
ef
cted, or is reasonab
a
ly likely to materially afff
ef
ct, the Corp
r
oration’s internal
control over fif nancial reporting.
Item 9B. Other Info
f
rmation
Berkshire
has
not
adopted
a
Ru
R
le
10b5-1
trading
arrangement
(as
defif ned
in
Item
408(a)(1)(i)
of
Regulation
S-K)
and
no
directors
or
executive
offf
if cers
adopted
or
terminated
a
Ru
R
le
10b5-1
trading
arrangement
or
a
non-Ru
R
le
10b5-1
trading
arrangement (as defif ned in Item 408(c) of Regulation S-K) du
d
ring the fo
f
urth quarter of 2025.
Item 9C. Disclosure Regarding Foreign Jurisdictions that Prevent Inspection
Not ap
a
plicab
a
le.
Part III
Except
fo
f
r
the
info
f
rmation
set
fo
f
rth
under
the
cap
a
tion
“Executive
Offf
if cers
of
the
Registrant”
in
Part
I
hereof,f
info
f
rmation
required
by
this
Part
(Items
10,
11,
12,
13
and
14)
is
incorp
r
orated
by
refef
rence
frf
om
the
Registrant’s
defif nitive
proxy
statement,
fif led
pursuant
to
Regulation
14A,
fo
f
r
the
Annual
Meeting
of
Shareholders
of
the
Registrant
to
be
held
on
May 2, 2026, which will involve the election of directors.
Part IV
Item 15. Exhibits and Financial Statement Schedules
(a) 1.
Fi
F nancial StS atementst
The fo
f
llowing Consolidated Financial Statements, as well as the Report of Independent Registered Pub
u
lic Accounting
Firm, are included in Part II Item 8 of this report:
PAGE
K-64
K-66
K-68
K-69
K-69
K-70
K-71
K-117
K-118
(b)
Ex
E
hibitst
See the “Exhibit Index” at page K-120.
Report of Independent Registered Pub
u
lic Accounting Firm (PCAOB ID No. 34) ...........................................................
Consolidated Balance Sheets—
December 31, 2025 and December 31, 2024 ..........................................................................................................
Consolidated Statements of Earnings—
Years Ended December 31, 2025, December 31, 2024, and December 31, 2023
Consolidated Statements of Comprehensive Income—
Years Ended December 31, 2025, December 31, 2024, and December 31, 2023
Consolidated Statements of Changes in Shareholders’ Equity—
y
Years Ended December 31, 2025, December 31, 2024, and December 31, 2023
Consolidated Statements of Cash Flows—
Years Ended December 31, 2025, December 31, 2024, and December 31, 2023
Notes to Consolidated Financial Statements .....................................................................................................................
2.
Fi
F nancial StS atement Sc
S
hedu
d
le
Report of Independent Registered Pub
u
lic Accounting Firm .............................................................................................
Schedu
d
le I—Parent Company Condensed Financial Info
f
rmation
Balance Sheets as of December 31, 2025 and 2024, Statements of Earnings and Comprehensive Income and
Cash Flows fo
f
r the years ended December 31, 2025, December 31, 2024, and December 31, 2023 and Note
to Condensed Financial Info
f
rmation
Other schedu
d
les are omitted because they are not required, info
f
rmation therein is not ap
a
plicab
a
le or is reflf ected
in the Consolidated Financial Statements or notes thereto.
...................................................
..................................................
...................................................
..................................................
.......................................................................................................................
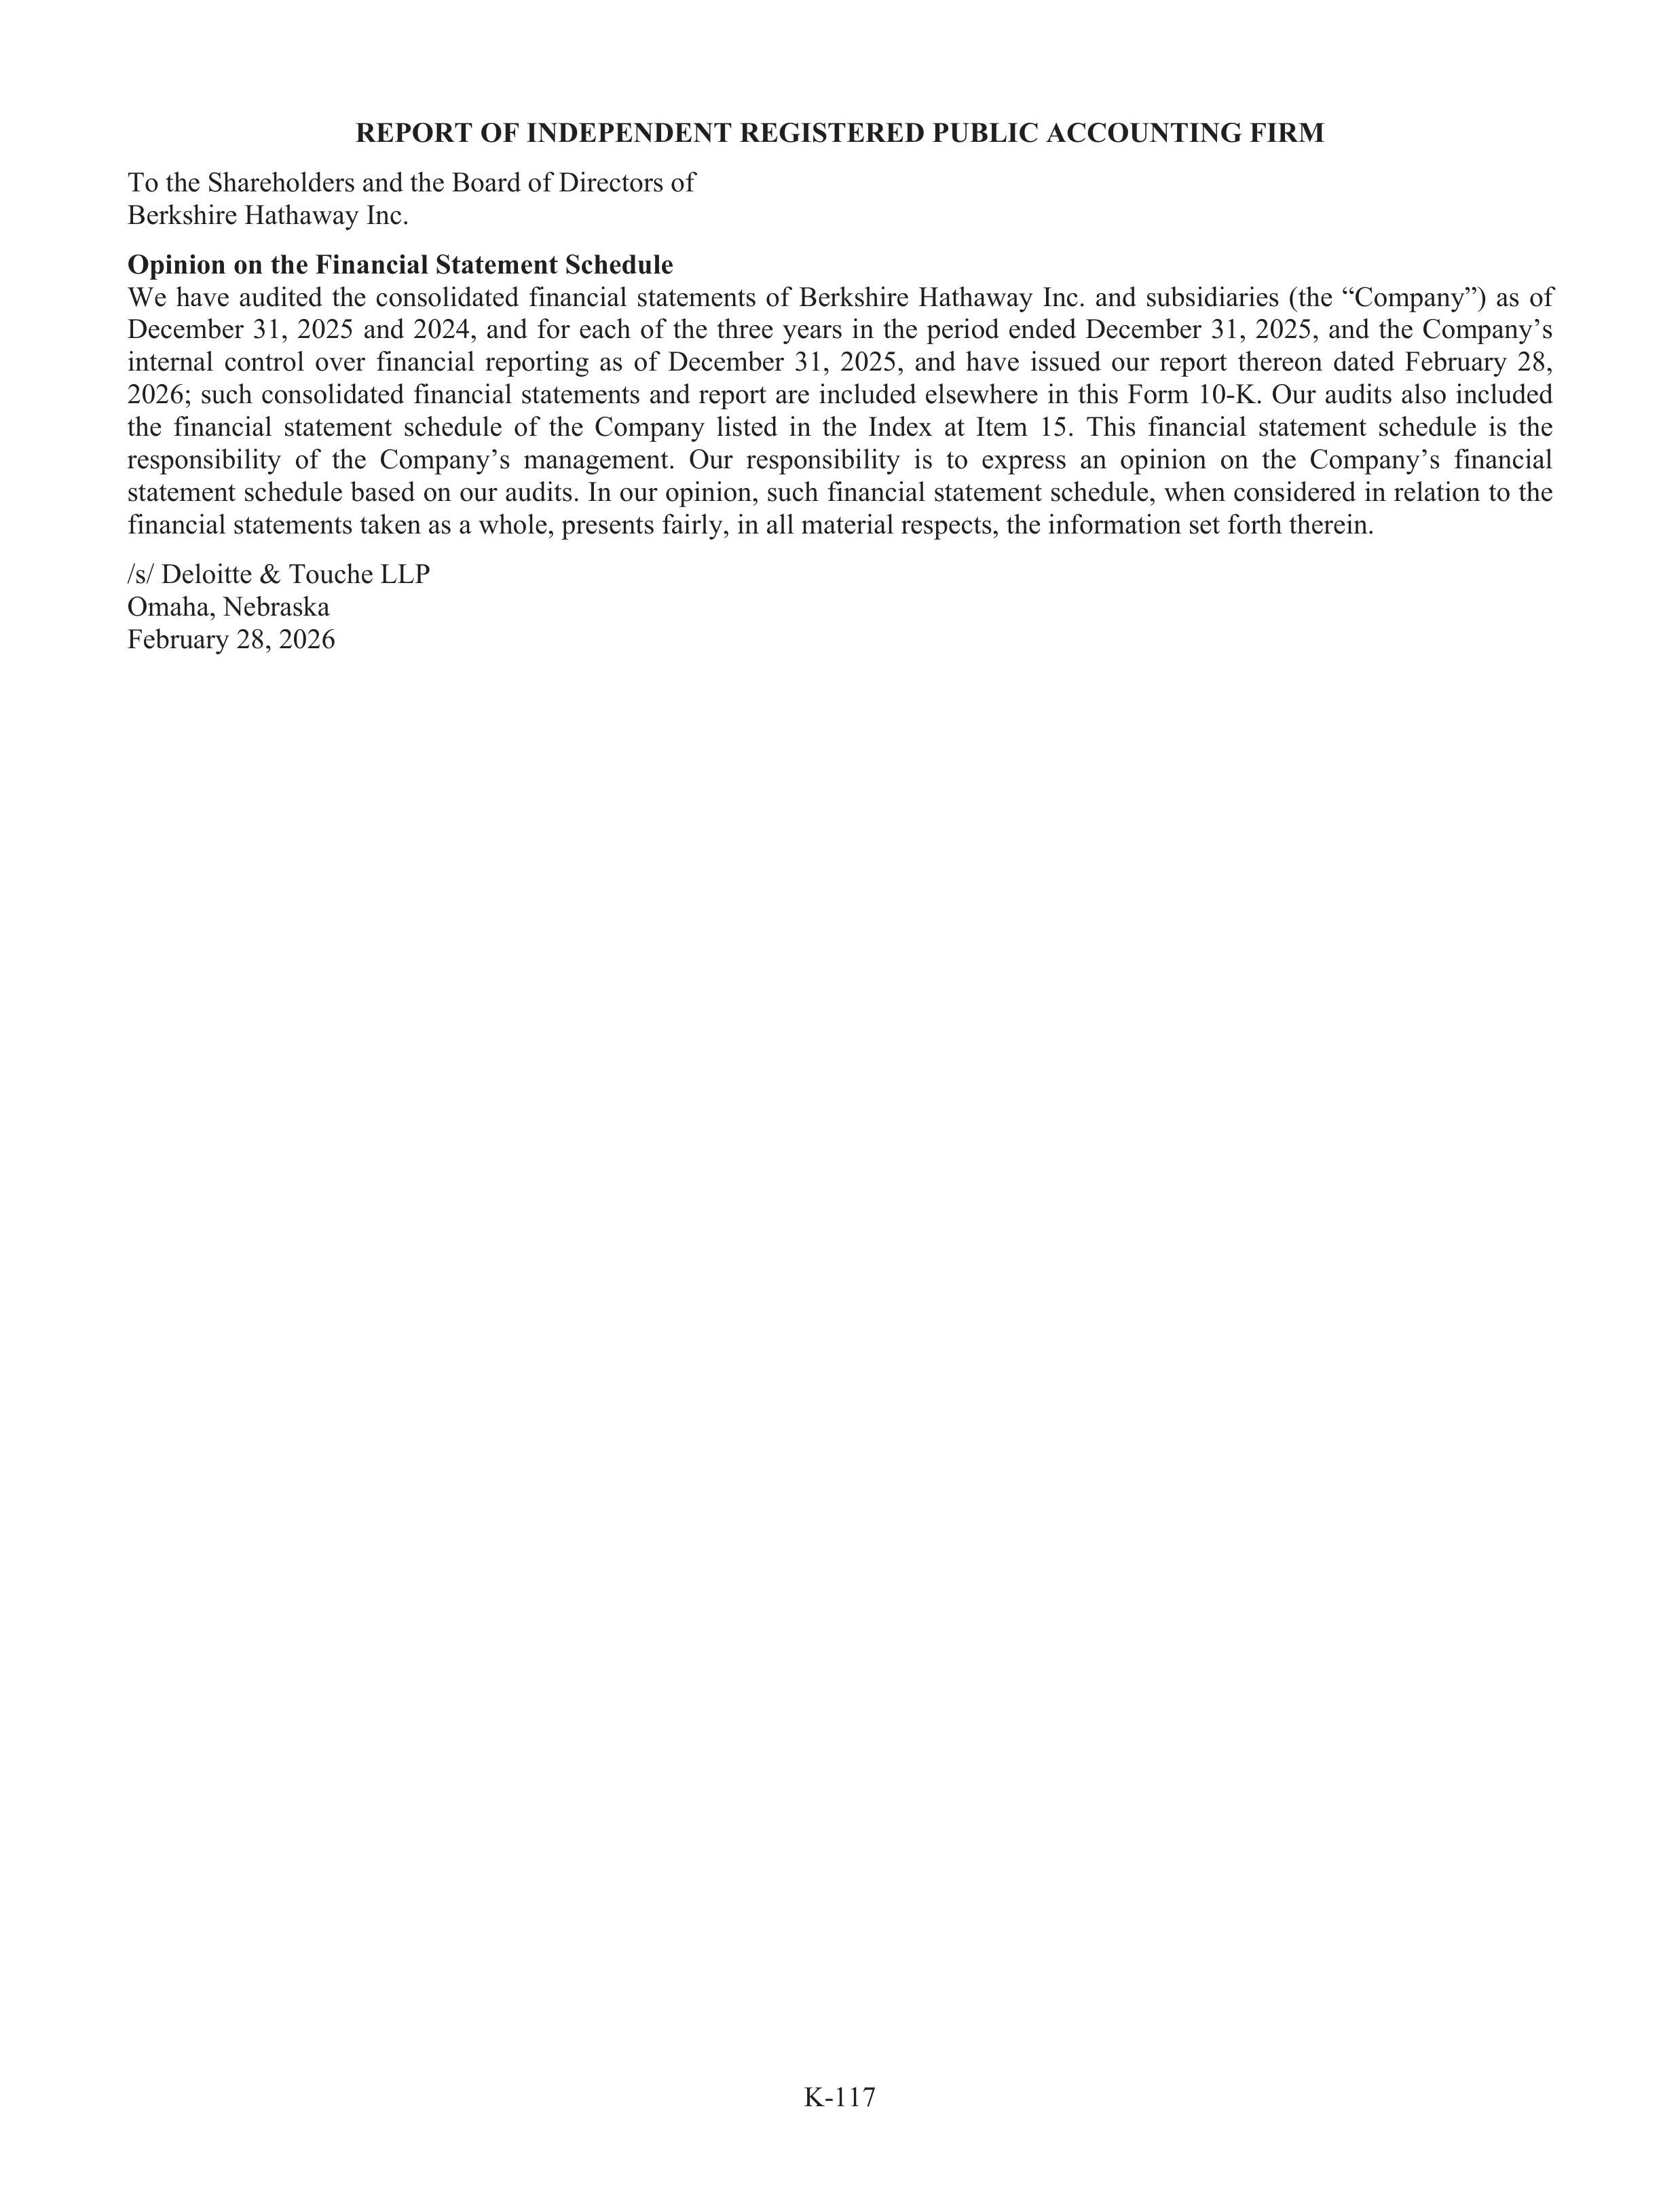
K-117
REPORT OF INDEPENDENT REGISTERED PUBLIC ACCOUNTING FIRM
To the Shareholders and the Board of Directors of
Berkshire Hathaway Inc.
Opinion on the Financial Statement Schedule
We
have
audited
the
consolidated
financial
statements
of
Berkshire
Hathaway
Inc.
and
subs
u
idiaries
(the
“Company”)
as
of
December
31,
2025
and
2024,
and
for
each
of
the
three
years
in
the
period
ended
December
31,
2025,
and
the
Company’s
internal
control
over
financial
reporting
as
of
December
31,
2025,
and
have
issued
our
report
thereon
dated
Februa
r
ry
28,
2026;
such
consolidated
financial
statements
and
report
are
included
elsewhere
in
this
Form
10-K.
Our
audits
also
included
the
financial
statement
schedule
of
the
Company
listed
in
the
Index
at
Item
15.
This
financial
statement
schedule
is
the
responsibility
of
the
Company’s
management.
Our
responsibility
is
to
express
an
opinion
on
the
Company’s
fin
f
ancial
statement schedule based on our audits. In our opinion, such financial statement schedule, when considered in relation to the
financial statements taken as a whole, presents fairly, in all material respects, the information set forth therein.
/s/ Deloitte & Touche LLP
Omaha, Nebraska
Februa
r
ry 28, 2026
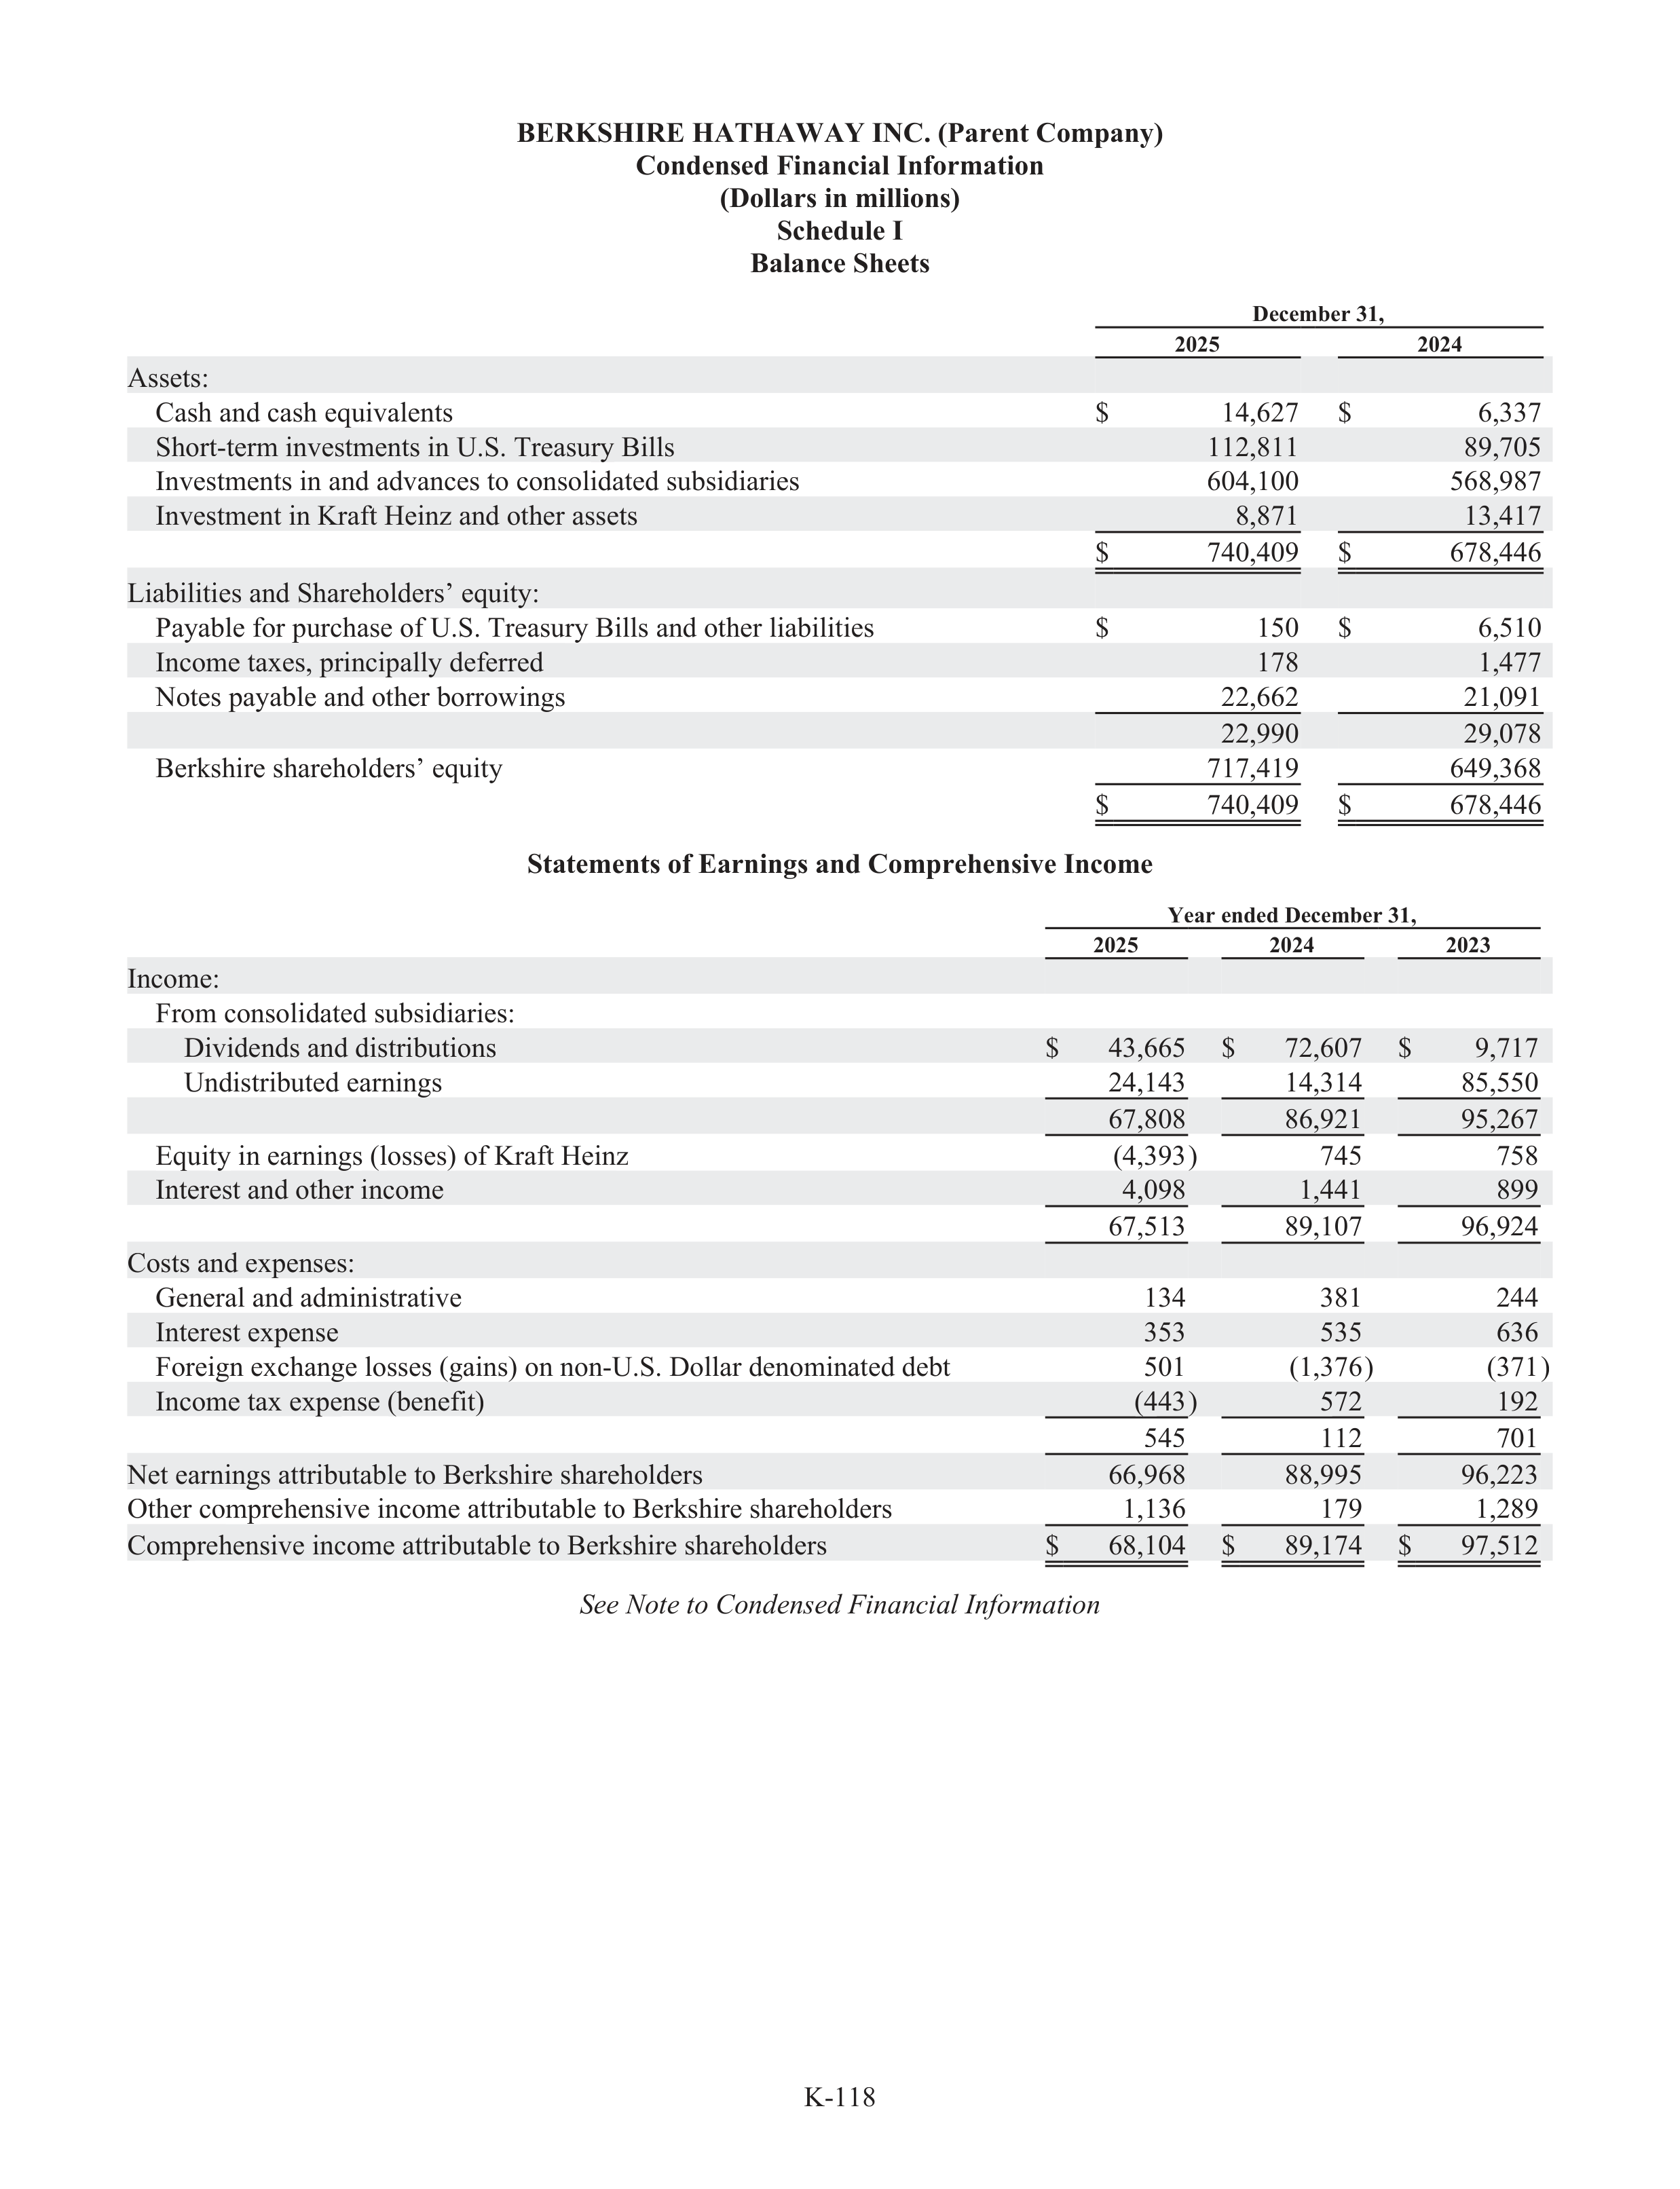
K-118
BERKSHIRE HATHAWAY INC. (Parent Company)
Condensed Financial Information
(Dollars in millions)
Schedule I
Balance Sheets
December 31,
2025
2024
Assets:
Cash and cash equivalents
$
14,627
$
6,337
Short-term investments in U.S. Treasury Bills
112,811
89,705
Investments in and advances to consolidated subs
u
idiaries
604,100
568,987
Investment in Kraftf
Heinz and other assets
8,871
13,417
$
740,409
$
678,446
Liabilities and Shareholders’ equity:
Payabl
a
e for purchase of U.S. Treasury Bills and other liabi
a
lities
$
150
$
6,510
Income taxes, principally deferred
178
1,477
Notes payabl
a
e and other borrowings
22,662
21,091
22,990
29,078
Berkshire shareholders’ equity
717,419
649,368
$
740,409
$
678,446
Statements of Earnings and Comprehensive Income
Year ended December 31,
2025
2024
2023
Income:
From consolidated subs
u
idiaries:
Dividends and distributions
$
43,665
$
72,607
$
9,717
Undistributed earnings
24,143
14,314
85,550
67,808
86,921
95,267
Equity in earnings (losses) of Kraftf
Heinz
(4,393)
745
758
Interest and other income
4,098
1,441
899
67,513
89,107
96,924
Costs and expenses:
General and administrative
134
381
244
Interest expense
353
535
636
Foreign exchange losses (gains) on non-U.S. Dollar denominated debt
501
(1,376)
(371)
Income tax expense (benefit)
f
(443)
572
192
545
112
701
Net earnings attributable to Berkshire shareholders
66,968
88,995
96,223
Other comprehensive income attributable to Berkshire shareholders
1,136
179
1,289
Comprehensive income attributable to Berkshire shareholders
$
68,104
$
89,174
$
97,512
See Note to Condensed Financial Info
n
rmation
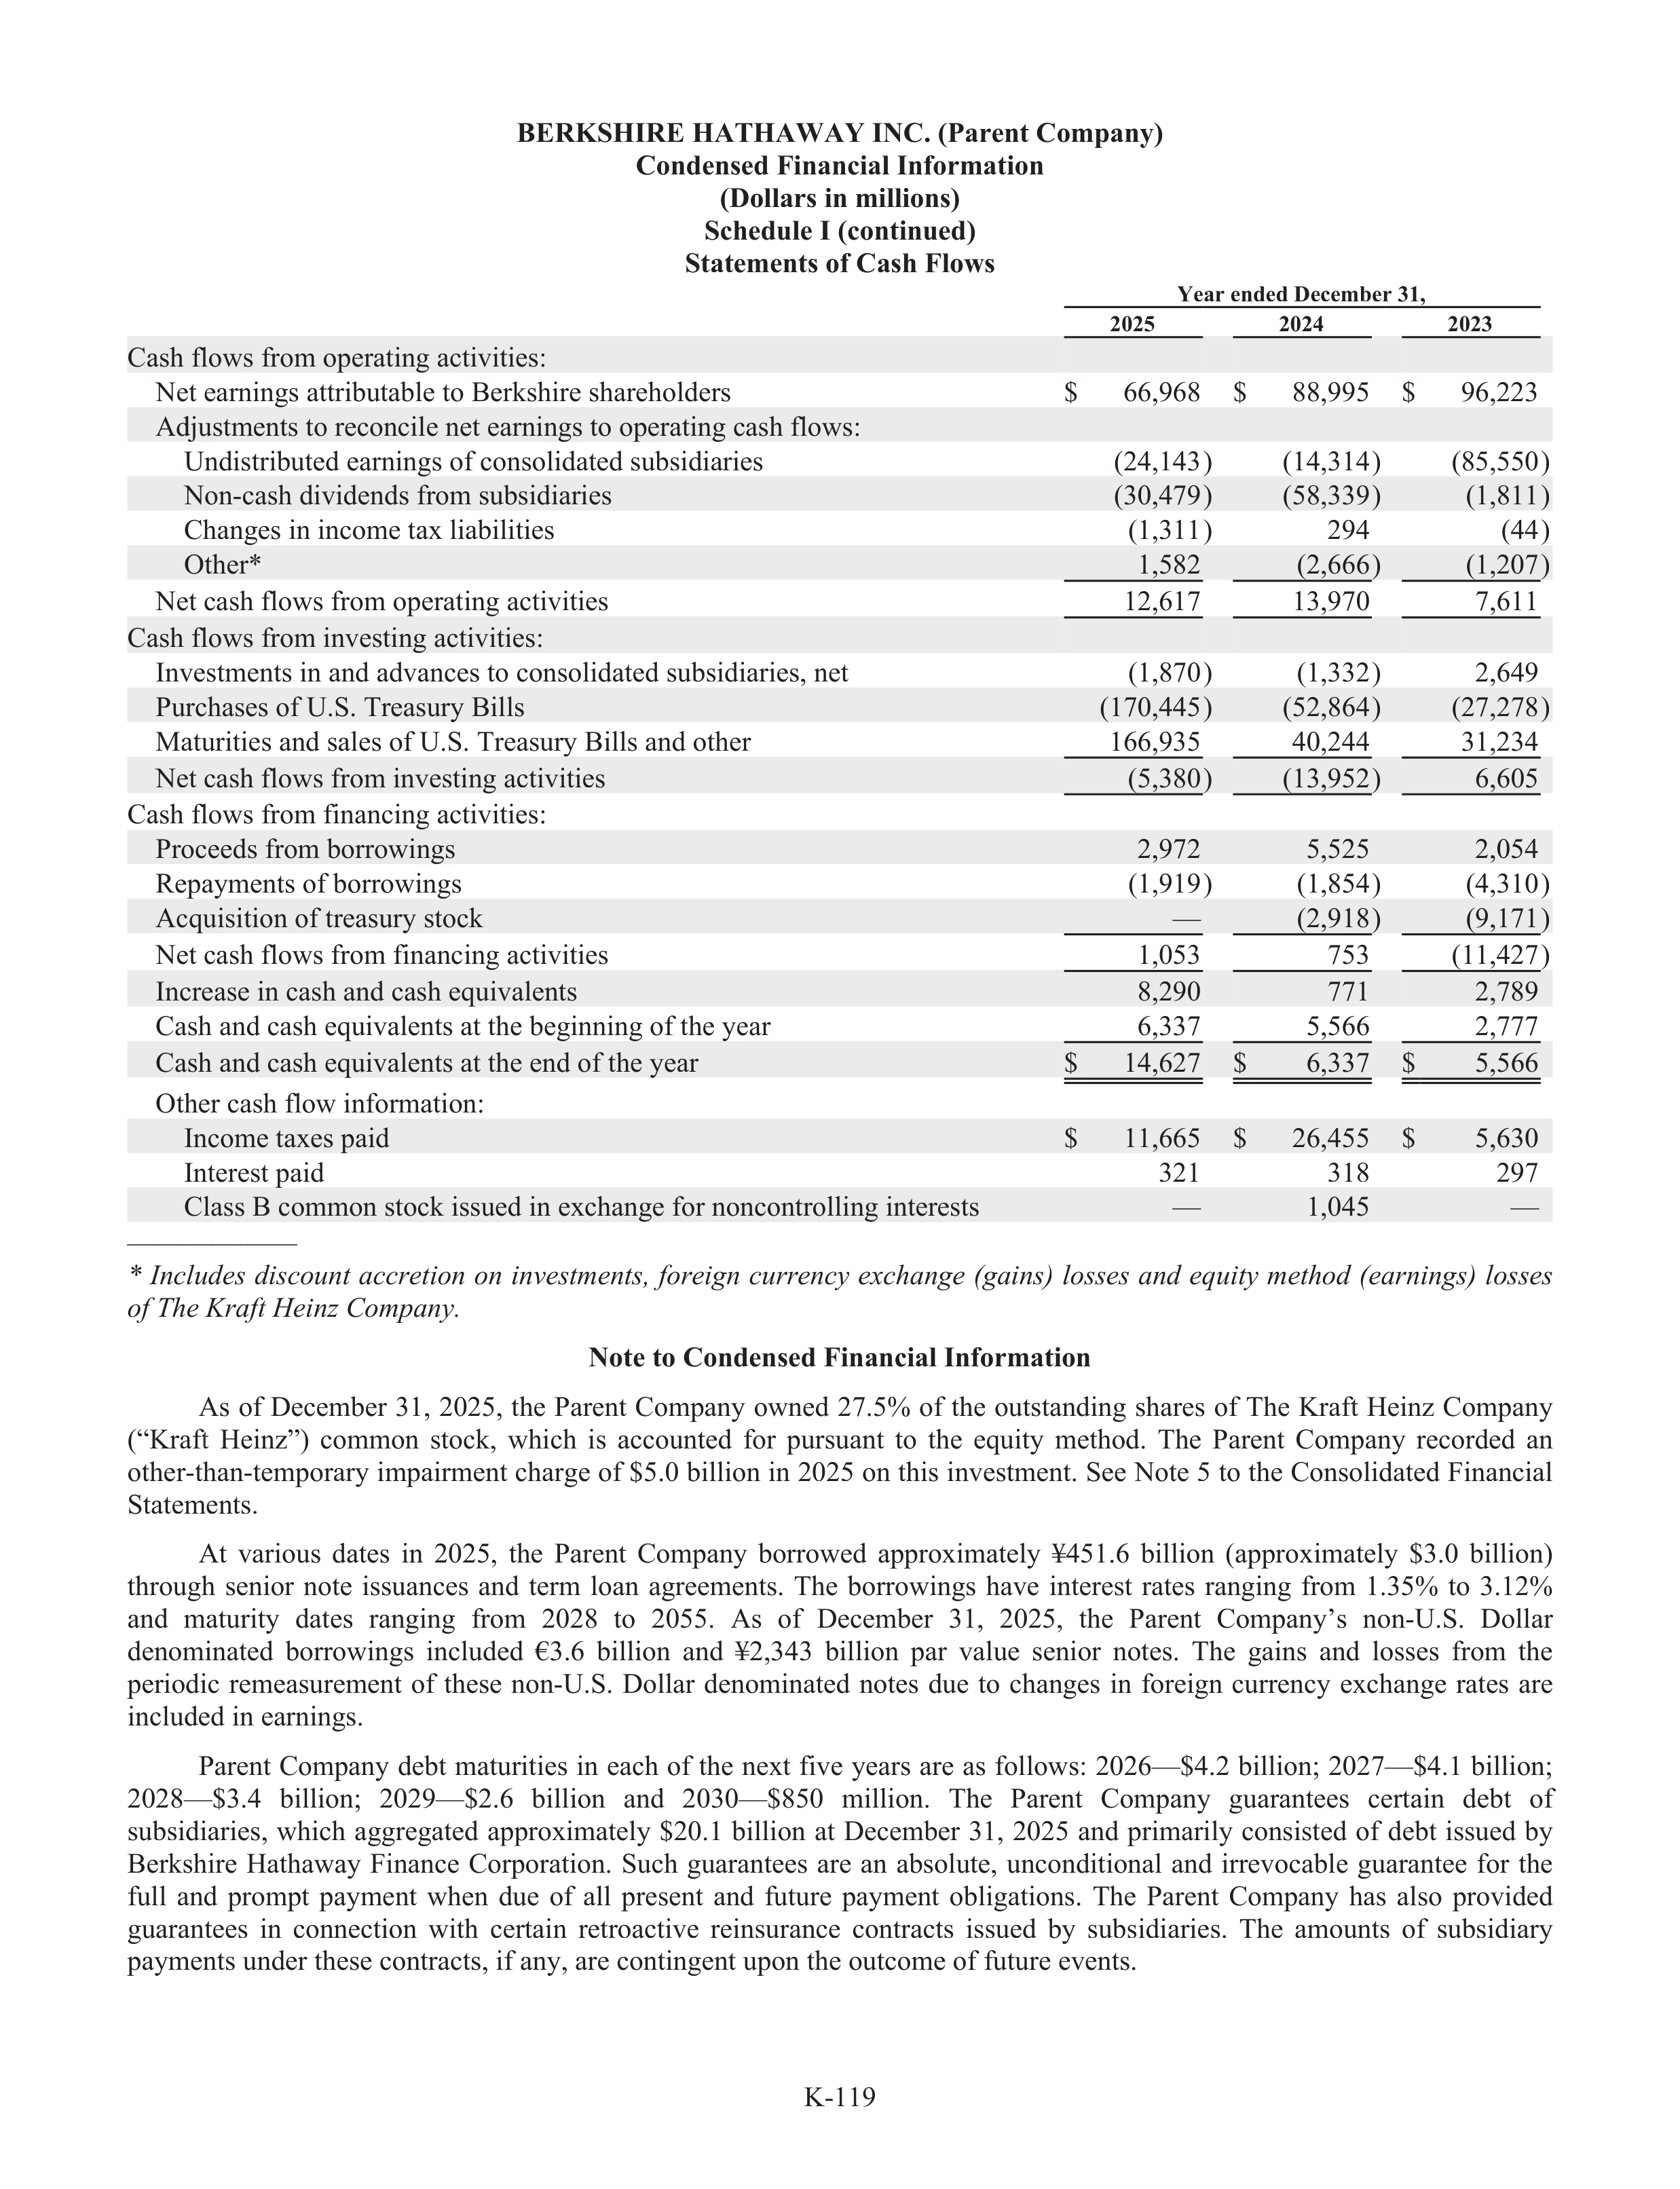
K-119
BERKSHIRE HATHAWAY INC. (Parent Company)
Condensed Financial Information
(Dollars in millions)
Schedule I (continued)
Statements of Cash Flows
Year ended December 31,
2025
2024
2023
Cash flows from operating activities:
Net earnings attributable to Berkshire shareholders
$
66,968
$
88,995
$
96,223
Adju
d
stments to reconcile net earnings to operating cash flows:
Undistributed earnings of consolidated subs
u
idiaries
(24,143)
(14,314)
(85,550)
Non-cash dividends from subs
u
idiaries
(30,479)
(58,339)
(1,811)
Changes in income tax liabi
a
lities
(1,311)
294
(44)
Other*
1,582
(2,666)
(1,207)
Net cash flows from operating activities
12,617
13,970
7,611
Cash flows from investing activities:
Investments in and advances to consolidated subs
u
idiaries, net
(1,870)
(1,332)
2,649
Purchases of U.S. Treasury Bills
(170,445)
(52,864)
(27,278)
Maturities and sales of U.S. Treasury
r
Bills and other
166,935
40,244
31,234
Net cash flows from investing activities
(5,380)
(13,952)
6,605
Cash flows from financing activities:
Proceeds from borrowings
2,972
5,525
2,054
Repayments of borrowings
(1,919)
(1,854)
(4,310)
Acquisition of treasury stock
—
(2,918)
(9,171)
Net cash flows from financing activities
1,053
753
(11,427)
Increase in cash and cash equivalents
8,290
771
2,789
Cash and cash equivalents at the beginning of the year
6,337
5,566
2,777
Cash and cash equivalents at the end of the year
$
14,627
$
6,337
$
5,566
Other cash flow information:
Income taxes paid
$
11,665
$
26,455
$
5,630
Interest paid
321
318
297
Class B common stock issued in exchange for noncontrolling interests
—
1,045
—
——————
*
Includes
disc
i
ount
accretion
on
investments,
foreign
g
currency
c
exchange
(gains)s
losses
and
equity
method
(earnings)s
losses
of The Kraftf
Heinz Company.
Note to Condensed Financial Information
As
of
December
31,
2025,
the
Parent
Company
owned
27.5%
of
the
outstanding
shares
of
The
Kraftf
Heinz
Company
(“Kraft
H
f
einz”)
common
stock,
which
is
accounted
for
pursuant
to
the
equity
method.
The
Parent
Company
recorded
an
other-than-temporary
r
impairment charge of $5.0 billion in 2025 on this investment. See Note 5 to the Consolidated Financial
Statements.
At
various
dates
in
2025,
the
Parent
Company
borrowed
approximately
¥451.6
billion
(appr
a
oximately
$3.0
billion)
through
senior
note
issuances
and
term
loan
agreements.
The
borrowings
have
interest
rates
ranging
from
1.35%
to
3.12%
and
maturity
dates
ranging
from
2028
to
2055.
As
of
December
31,
2025,
the
Parent
Company’s
non-U.S.
Dollar
denominated
borrowings
included
€3.6
billion
and
¥2,343
billion
par
value
senior
notes.
The
gains
and
losses
from
the
periodic
remeasurement
of
these
non-U.S.
Dollar
denominated
notes
due
to
changes
in
foreign
currency
exchange
rates
are
included in earnings.
Parent Company debt maturities in each of the next five years are as follows: 2026—$4.2 billion; 2027—$4.1 billion;
2028—$3.4
billion;
2029—$2.6
billion
and
2030—$850
million.
The
Parent
Company
guarantees
certain
debt
of
subs
u
idiaries,
which
aggregated
appr
a
oximately
$20.1
billion
at
December
31,
2025
and
primarily
consisted
of
debt
issued
by
Berkshire
Hathaway
Finance
Corporation.
Such
guarantees
are
an
absolute,
unconditional
and
irrevocable
guarantee
for
the
full
and
prompt
payment
when
due
of
all
present
and
future
payment
obligations.
The
Parent
Company
has
also
provided
guarantees
in
connection
with
certain
retroactive
reinsurance
contracts
issued
by
subs
u
idiaries.
The
amounts
of
subs
u
idiary
payments under these contracts, if any, are contingent upon the outcome of future events.
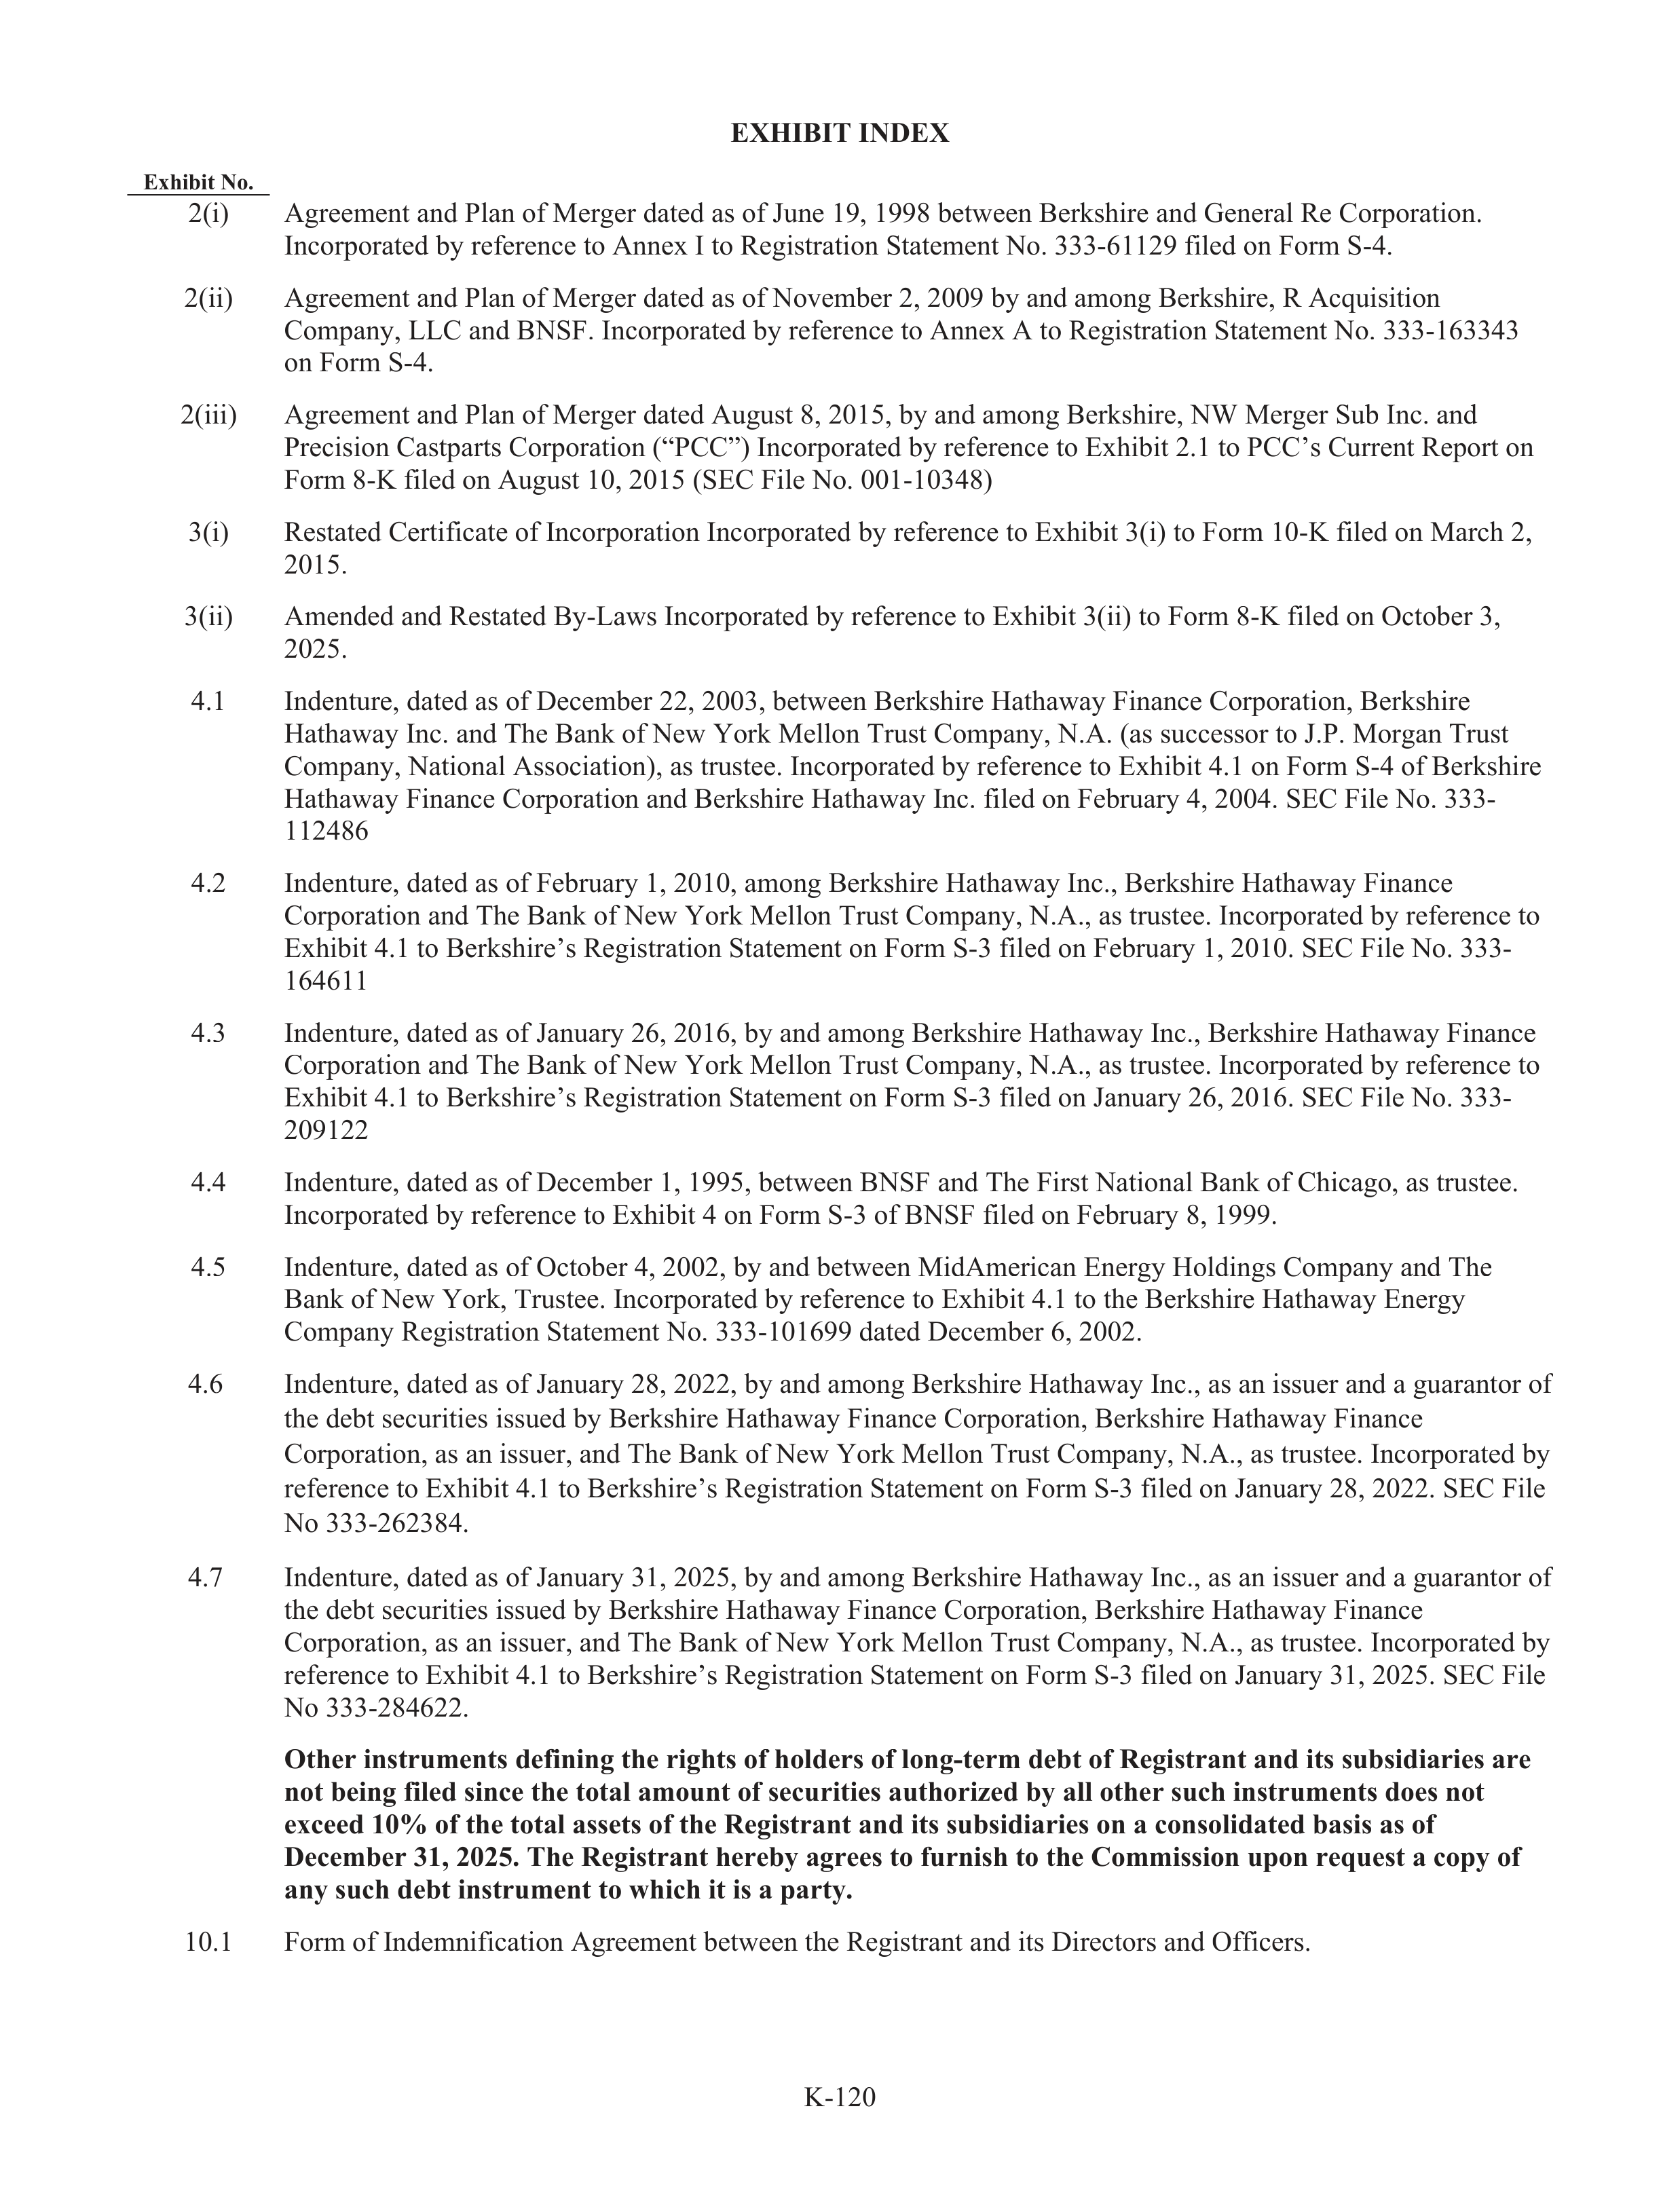
K-120
EXHIBIT INDEX
Exhibit No.
2(i)
Agreement and Plan of Merger dated as of June 19, 1998 between Berkshire and General Re Corporation.
Incorporated by reference to Annex I to Registration Statement No. 333-61129 filed on Form S-4.
2(ii)
Agreement and Plan of Merger dated as of November 2, 2009 by and among Berkshire, R Acquisition
Company, LLC and BNSF. Incorporated by reference to Annex A to Registration Statement No. 333-163343
on Form S-4.
2(iii)
Agreement and Plan of Merger dated August 8, 2015, by and among Berkshire, NW Merger Sub
u
Inc. and
Precision Castpa
t
rts Corporation (“PCC”) Incorpor
r
ated by reference to Exhibit 2.1 to PCC’s Current Report on
Form 8-K filed on August 10, 2015 (SEC File No. 001-10348)
3(i)
Restated Certific
f
ate of Incorporation Incorporated by reference to Exhibit 3(i) to Form 10-K filed on March 2,
2015.
3(ii)
Amended and Restated By-Laws Incorporated by reference to Exhibit 3(ii) to Form 8-K filed on October 3,
2025.
4.1
Indentur
t
e, dated as of December 22, 2003, between Berkshire Hathaway Finance Corporation, Berkshire
Hathaway Inc. and The Bank of New York Mellon Trus
r
t Company, N.A. (as successor to J.P. Morgan Trus
r
t
Company, National Association), as trus
r
tee. Incorporated by reference to Exhibit 4.1 on Form S-4 of Berkshire
Hathaway Finance Corporation and Berkshire Hathaway Inc. filed on Februa
r
ry 4, 2004. SEC File No. 333-
112486
4.2
Indentur
t
e, dated as of Februa
r
ry 1, 2010, among Berkshire Hathaway Inc., Berkshire Hathaway Finance
Corporation and The Bank of New York Mellon Trus
r
t Company, N.A., as trus
r
tee. Incorporated by reference to
Exhibit 4.1 to Berkshire’s Registration Statement on Form S-3 filed on Februa
r
ry 1, 2010. SEC File No. 333-
164611
4.3
Indentur
t
e, dated as of January
r
26, 2016, by and among Berkshire Hathaway Inc., Berkshire Hathaway Finance
Corporation and The Bank of New York Mellon Trus
r
t Company, N.A., as trus
r
tee. Incorporated by reference to
Exhibit 4.1 to Berkshire’s Registration Statement on Form S-3 filed on January 26, 2016. SEC File No. 333-
209122
4.4
Indentur
t
e, dated as of December 1, 1995, between BNSF and The First National Bank of Chicago, as trus
r
tee.
Incorporated by reference to Exhibit 4 on Form S-3 of BNSF filed on Februa
r
ry 8, 1999.
4.5
Indentur
t
e, dated as of October 4, 2002, by and between MidAmerican Energy Holdings Company and The
Bank of New York, Trus
r
tee. Incorporated by reference to Exhibit 4.1 to the Berkshire Hathaway Energy
Company Registration Statement No. 333-101699 dated December 6, 2002.
4.6
Indentur
t
e, dated as of January
r
28, 2022, by and among Berkshire Hathaway Inc., as an issuer and a guarantor of
the debt securities issued by Berkshire Hathaway Finance Corporation, Berkshire Hathaway Finance
Corporation, as an issuer, and The Bank of New York Mellon Trus
r
t Company, N.A., as trus
r
tee. Incorporated by
reference to Exhibit 4.1 to Berkshire’s Registration Statement on Form S-3 filed on January 28, 2022. SEC File
No 333-262384.
4.7
Indentur
t
e, dated as of January
r
31, 2025, by and among Berkshire Hathaway Inc., as an issuer and a guarantor of
the debt securities issued by Berkshire Hathaway Finance Corporation, Berkshire Hathaway Finance
Corporation, as an issuer, and The Bank of New York Mellon Trus
r
t Company, N.A., as trus
r
tee. Incorporated by
reference to Exhibit 4.1 to Berkshire’s Registration Statement on Form S-3 filed on January 31, 2025. SEC File
No 333-284622.
Other instruments defining the rights of holders of long-term debt of Registrant and its subsidiaries are
not being filed since the total amount of securities authorized by all other such instruments does not
exceed 10% of the total assets of the Registrant and its subsidiaries on a consolidated basis as of
December 31, 2025. The Registrant hereby agrees to furnish to the Commission upon request a copy of
any such debt instrument to which it is a party.
10.1
Form of Indemnific
f
ation Agreement between the Registrant and its Directors and Offi
f
cers.
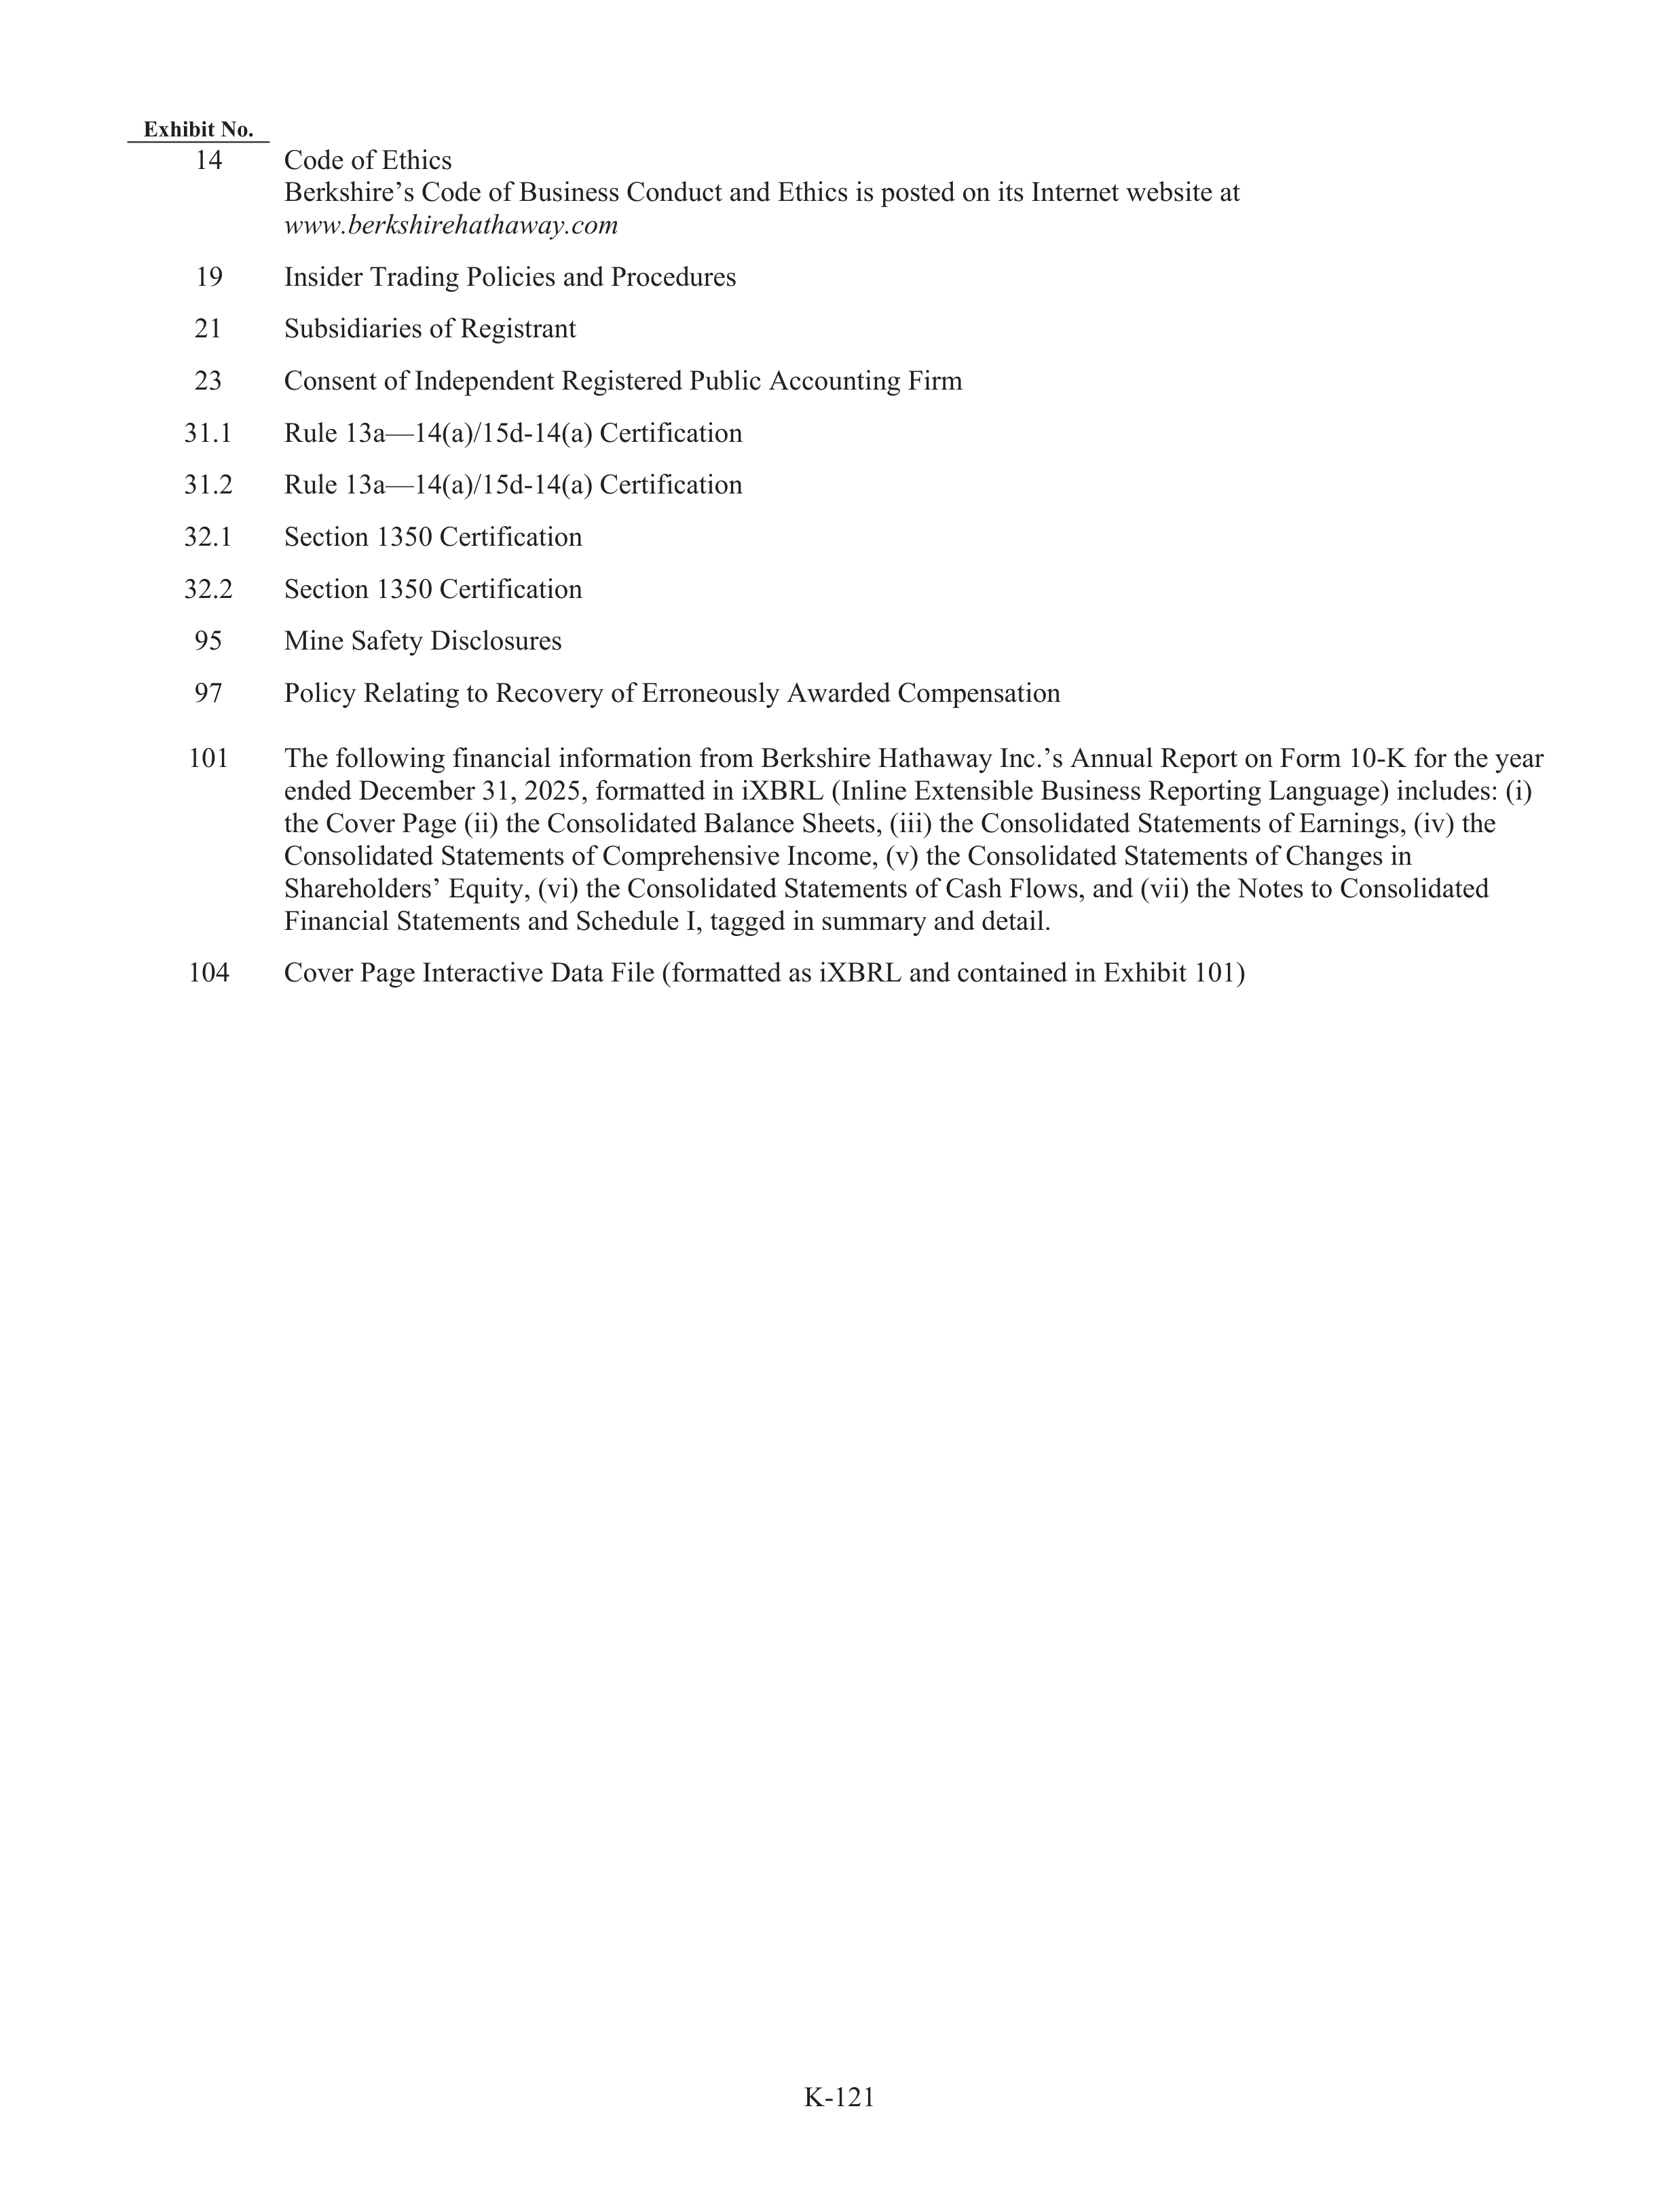
K-121
Exhibit No.
14
Code of Ethics
Berkshire’s Code of Business Conduct and Ethics is posted on its Internet website at
www.berksh
k
irehathaway.com
19
Insider Trading Policies and Procedur
d
es
21
Subs
u
idiaries of Registrant
23
Consent of Independent Registered Publ
u
ic Accounting Firm
31.1
Rule 13a—14(
a
a)/15d-14(a) Certific
f
ation
31.2
Rule 13a—14(
a
a)/15d-14(a) Certific
f
ation
32.1
Section 1350 Certific
f
ation
32.2
Section 1350 Certific
f
ation
95
Mine Safety Disclosures
97
Policy Relating to Recovery of Erroneously Awarded Compensation
101
The following financial information from Berkshire Hathaway Inc.’s Annual Report on Form 10-K for the year
ended December 31, 2025, formatted in iXBRL (Inline Extensible Business Reporting Language) includes: (i)
the Cover Page (ii) the Consolidated Balance Sheets, (iii) the Consolidated Statements of Earnings, (iv) the
Consolidated Statements of Comprehensive Income, (v) the Consolidated Statements of Changes in
Shareholders’ Equity, (vi) the Consolidated Statements of Cash Flows, and (vii) the Notes to Consolidated
Financial Statements and Schedule I, tagged in summary and detail.
104
Cover Page Interactive Data File (formatted as iXBRL and contained in Exhibit 101)
K-122
SIGNATURES
Pursuant
to
the
requirements
of
Section
13
or
15(d)
of
the
Securities
Exchange
Act
of
1934,
the
Registrant
has
duly
caused this report to be signed on its behalf by the undersigned thereunto duly authorized.
BERKSHIRE HATHAWAY INC.
Date: Februa
r
ry 28, 2026
/S/
MARC D. HAMBURG
Marc D. Hamburg
Senior Vice President and
Principal Financial Offi
f
cer
Pursuant
to
the
requirements
of
the
Securities
Exchange
Act
of
1934,
this
report
has
been
signed
below
by
the
following persons on behalf of the Registrant and in the capacities and on the dates indicated.
/
S
/
G
REGORY
E. A
BEL
Gregory E. Abel
Director—P
r
resident and Chief Executive Offi
f
cer
Februa
r
ry 28, 2026
Date
/
S
/
H
OWARD
G. B
UFFETT
Howard G. Buffett
Director
Februa
r
ry 28, 2026
Date
/
S
/
S
USAN
A
.
B
UFFETT
Susan A. Buffett
Director
Februa
r
ry 28, 2026
Date
/
S
/
W
ARREN
E. B
UFFETT
Warren E. Buffett
Chairman of the Board of Directors
Februa
r
ry 28, 2026
Date
/
S
/
S
TEPHEN
B. B
URKE
Stephen B. Burke
Director
Februa
r
ry 28, 2026
Date
/
S
/
K
ENNETH
I
.
C
HENAULT
Kenneth I. Chenault
Director
Februa
r
ry 28, 2026
Date
/
S
/
C
HRISTOPHER
C. D
AVIS
Christopher C. Davis
Director
Februa
r
ry 28, 2026
Date
/
S
/
S
USAN
L. D
ECKER
Susan L. Decker
Director
Februa
r
ry 28, 2026
Date
/
S
/
C
HARLOTTE
G
UYMAN
Charlotte Guyman
Director
Februa
r
ry 28, 2026
Date
/
S
/
A
JIT
J
AIN
Ajit Jain
Director—V
r
ice Chairman—Insurance Operations
Februa
r
ry 28, 2026
Date
/
S
/
T
HOMAS
S. M
URPHY
, J
R
.
Thomas S. Murphy, Jr.
Director
Februa
r
ry 28, 2026
Date
/
S
/
W
ALLACE
R. W
EITZ
Wallace R. Weitz
Director
Februa
r
ry 28, 2026
Date
/
S
/
M
ERYL
B. W
ITMER
Meryl B. Witmer
Director
Februa
r
ry 28, 2026
Date
/
S
/
M
ARC
D. H
AMBURG
Marc D. Hamburg
Senior Vice President—Principal Financial Offi
f
cer
Februa
r
ry 28, 2026
Date
/
S
/
D
ANIEL
J. J
AKSICH
Daniel J. Jaksich
Vice President—Principal Accounting Offi
f
cer
Februa
r
ry 28, 2026
Date


BERKSHIRE HATHAWAY INC.
SHAREHOLDER EVENT INFORMATION
SHAREHOLDER MEETING SCHEDULE – SATURDAY, MAY 2
CHI Health Center
7:00am
Doors Open
8:30am
Welcome & Business Update
9:30am
Q & A Session
10:45am
Break
11:45am
Q & A Session
1:00pm
Recess
2:00pm
Annual Shareholders Meeting
4:00pm
Exhibit Hall Closes
Details: Becky Quick, of CNBC will review questions that shareholders have submitted by e-mail and select
those she believes will have the widest interest. Questions can be submitted to Becky at
berkshirequestions@cnbc.com. We will have a drawing at 8:15am at each of the 10 microphone locations for
those shareholders wishing to ask questions themselves. At the meeting, Greg will alternate the questions asked
by Becky and the shareholders in attendance.
At the 9:30am Q & A Session, Greg and Ajit will be available to answer questions. At the 11:45am Q & A
Session, Greg will be joined by Katie Farmer (CEO of BNSF) and Adam Johnson (CEO of NetJets and President
of Consumer Products, Service and Retailing).
The Berkshire Q & A Sessions will be webcast in English and Mandarin beginning at 8:15am central time. Visit
www.cnbc.com/brklive.
OTHER SHAREHOLDER EVENTS INFORMATION
Friday, May 1
Shareholder Shopping Day-CHI Health Center
Noon – 5pm
Details: An extended afternoon of shopping for our shareholders.
Borsheims Shareholder-Only Shopping Night
6pm – 8pm
Saturday, May 2
NFM’s Berkshire Picnic
4pm – 8pm
Details: NFM will be hosting a Berkshire Picnic at the Omaha store with food and live entertainment.
NFM Omaha will be open late until 10pm on May 2
nd
.
Sunday, May 3
Berkshire Hathaway “Invest in Yourself” 5K presented by Brooks
8am – 11am
Details: Run, Jog, or Walk towards the best version of yourself at the Invest in Yourself 5K presented by Brooks
Running. Brooks and Berkshire Hathaway encourage you to join us for the annual 5K through the streets of
Downtown Omaha. Location: Lewis & Clark Landing at The Riverfront. Registration opens on March 1, 2026.
Register by visiting www.investinyourself5k.com.
Borsheims Shareholder-Only Shopping Day
11am – 4pm
NFM Shareholder Discount Period
Wednesday, April 22 through Tuesday, May 5
(Discounts also available in Dallas/Fort Worth, Kansas City and Des Moines Stores.)
Omaha Store Hours:
Sunday – Friday: 11am – 8pm
| Saturday: 10am – 8pm
Borsheims Shareholder Discount Period
Saturday, April 25 through Sunday, May 10
Standard Store Hours:
Monday – Friday*: 10am – 6pm
Saturday**: 10am – 5pm
| Sunday***Closed
Shareholder Weekend Store Hours:
* Shareholder-Only Shopping Night, Friday, May 1 / 6 – 8pm
** Shareholder Shopping Day, Saturday, May 2 / 10am – 5pm
*** Shareholder-Only Shopping Day Sunday, May 3 / 11am – 4pm
A-1
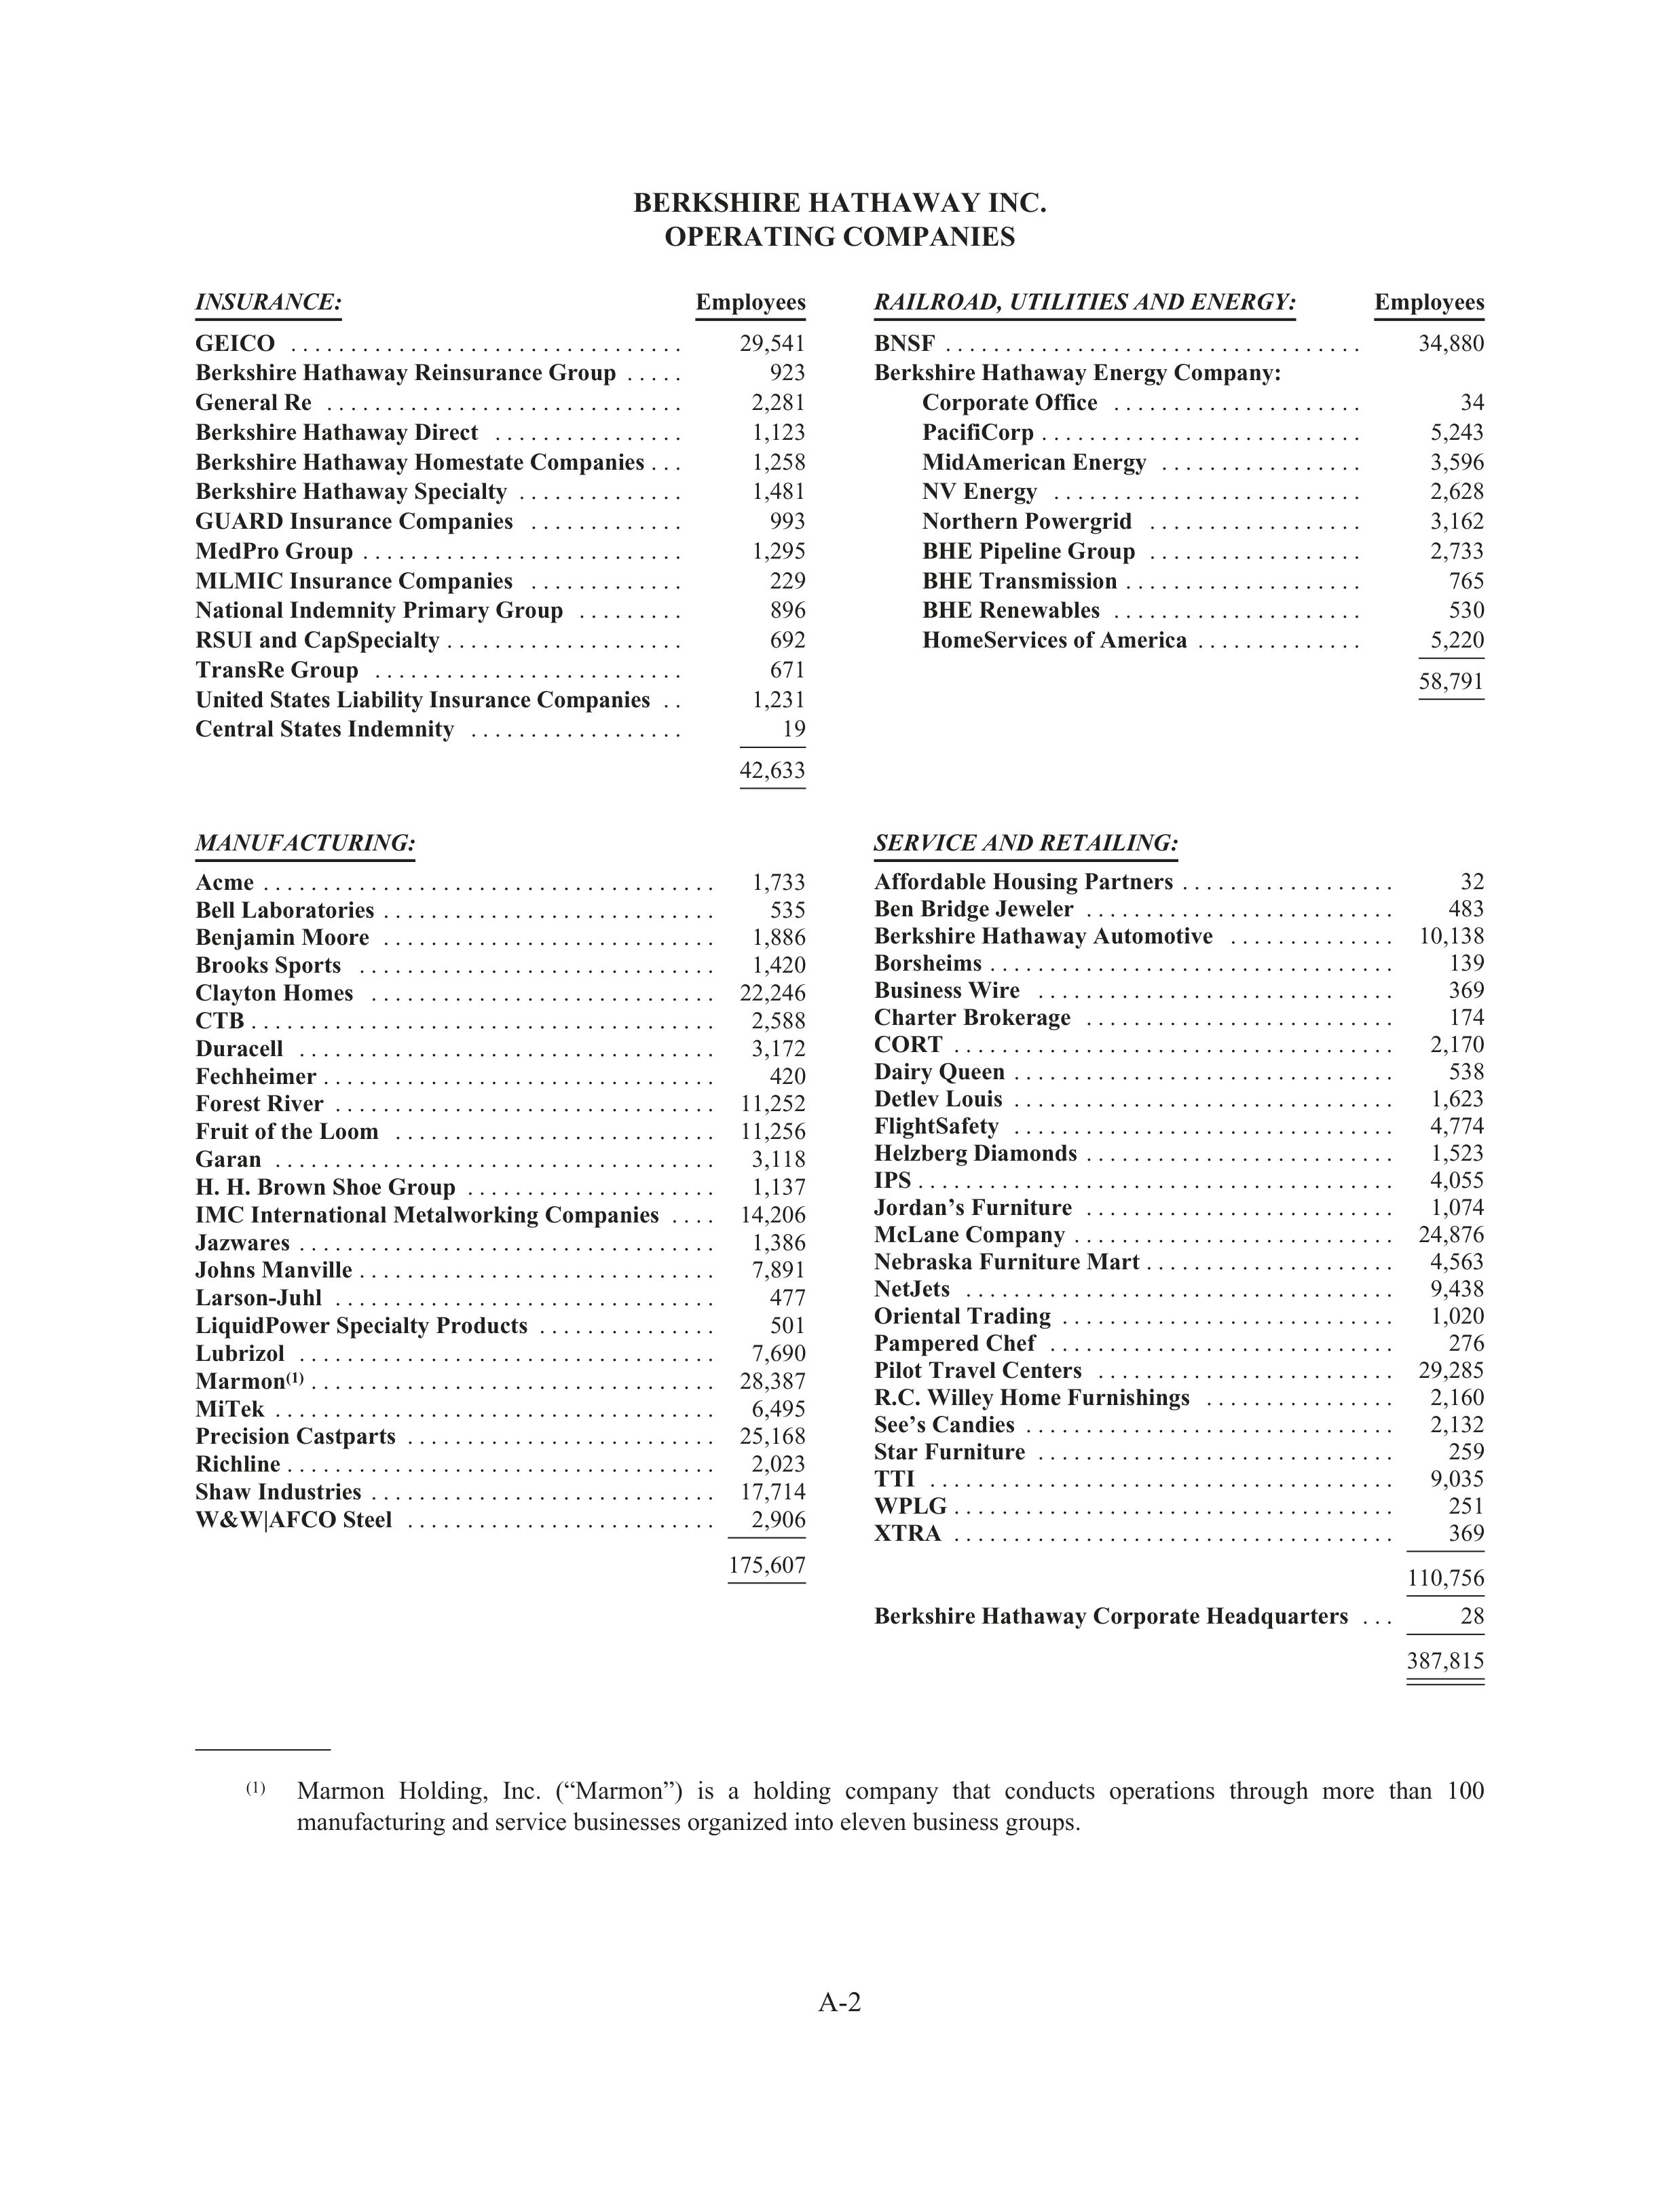
BERKSHIRE HATHAWAY INC.
OPERATING COMPANIES
INSURANCE:
Employees
GEICO
. . . . . . . . . . . . . . . . . . . . . . . . . . . . . . . . .
29,541
Berkshire Hathaway Reinsurance Group
. . . . .
923
General Re
. . . . . . . . . . . . . . . . . . . . . . . . . . . . . .
2,281
Berkshire Hathaway Direct
. . . . . . . . . . . . . . . .
1,123
Berkshire Hathaway Homestate Companies
. . .
1,258
Berkshire Hathaway Specialty
. . . . . . . . . . . . . .
1,481
GUARD Insurance Companies
. . . . . . . . . . . . .
993
MedPro Group
. . . . . . . . . . . . . . . . . . . . . . . . . . .
1,295
MLMIC Insurance Companies
. . . . . . . . . . . . .
229
National Indemnity Primary Group
. . . . . . . . .
896
RSUI and CapSpecialty
. . . . . . . . . . . . . . . . . . . .
692
TransRe Group
. . . . . . . . . . . . . . . . . . . . . . . . . .
671
United States Liability Insurance Companies
. .
1,231
Central States Indemnity
. . . . . . . . . . . . . . . . . .
19
42,633
RAILROAD, UTILITIES AND ENERGY:
Employees
BNSF
. . . . . . . . . . . . . . . . . . . . . . . . . . . . . . . . . . .
34,880
Berkshire Hathaway Energy Company:
Corporate Office
. . . . . . . . . . . . . . . . . . . . .
34
PacifiCorp
. . . . . . . . . . . . . . . . . . . . . . . . . . .
5,243
MidAmerican Energy
. . . . . . . . . . . . . . . . .
3,596
NV Energy
. . . . . . . . . . . . . . . . . . . . . . . . . .
2,628
Northern Powergrid
. . . . . . . . . . . . . . . . . .
3,162
BHE Pipeline Group
. . . . . . . . . . . . . . . . . .
2,733
BHE Transmission
. . . . . . . . . . . . . . . . . . . .
765
BHE Renewables
. . . . . . . . . . . . . . . . . . . . .
530
HomeServices of America
. . . . . . . . . . . . . .
5,220
58,791
MANUFACTURING:
Acme
. . . . . . . . . . . . . . . . . . . . . . . . . . . . . . . . . . . . . .
1,733
Bell Laboratories
. . . . . . . . . . . . . . . . . . . . . . . . . . . .
535
Benjamin Moore
. . . . . . . . . . . . . . . . . . . . . . . . . . . .
1,886
Brooks Sports
. . . . . . . . . . . . . . . . . . . . . . . . . . . . . .
1,420
Clayton Homes
. . . . . . . . . . . . . . . . . . . . . . . . . . . . .
22,246
CTB
. . . . . . . . . . . . . . . . . . . . . . . . . . . . . . . . . . . . . . .
2,588
Duracell
. . . . . . . . . . . . . . . . . . . . . . . . . . . . . . . . . . .
3,172
Fechheimer
. . . . . . . . . . . . . . . . . . . . . . . . . . . . . . . . .
420
Forest River
. . . . . . . . . . . . . . . . . . . . . . . . . . . . . . . .
11,252
Fruit of the Loom
. . . . . . . . . . . . . . . . . . . . . . . . . . .
11,256
Garan
. . . . . . . . . . . . . . . . . . . . . . . . . . . . . . . . . . . . .
3,118
H. H. Brown Shoe Group
. . . . . . . . . . . . . . . . . . . . .
1,137
IMC International Metalworking Companies
. . . .
14,206
Jazwares
. . . . . . . . . . . . . . . . . . . . . . . . . . . . . . . . . . .
1,386
Johns Manville
. . . . . . . . . . . . . . . . . . . . . . . . . . . . . .
7,891
Larson-Juhl
. . . . . . . . . . . . . . . . . . . . . . . . . . . . . . . .
477
LiquidPower Specialty Products
. . . . . . . . . . . . . . .
501
Lubrizol
. . . . . . . . . . . . . . . . . . . . . . . . . . . . . . . . . . .
7,690
Marmon
(1)
. . . . . . . . . . . . . . . . . . . . . . . . . . . . . . . . . .
28,387
MiTek
. . . . . . . . . . . . . . . . . . . . . . . . . . . . . . . . . . . . .
6,495
Precision Castparts
. . . . . . . . . . . . . . . . . . . . . . . . . .
25,168
Richline
. . . . . . . . . . . . . . . . . . . . . . . . . . . . . . . . . . . .
2,023
Shaw Industries
. . . . . . . . . . . . . . . . . . . . . . . . . . . . .
17,714
W&W|AFCO Steel
. . . . . . . . . . . . . . . . . . . . . . . . . .
2,906
175,607
SERVICE AND RETAILING:
Affordable Housing Partners
. . . . . . . . . . . . . . . . . .
32
Ben Bridge Jeweler
. . . . . . . . . . . . . . . . . . . . . . . . . .
483
Berkshire Hathaway Automotive
. . . . . . . . . . . . . .
10,138
Borsheims
. . . . . . . . . . . . . . . . . . . . . . . . . . . . . . . . . .
139
Business Wire
. . . . . . . . . . . . . . . . . . . . . . . . . . . . . .
369
Charter Brokerage
. . . . . . . . . . . . . . . . . . . . . . . . . .
174
CORT
. . . . . . . . . . . . . . . . . . . . . . . . . . . . . . . . . . . . .
2,170
Dairy Queen
. . . . . . . . . . . . . . . . . . . . . . . . . . . . . . . .
538
Detlev Louis
. . . . . . . . . . . . . . . . . . . . . . . . . . . . . . . .
1,623
FlightSafety
. . . . . . . . . . . . . . . . . . . . . . . . . . . . . . . .
4,774
Helzberg Diamonds
. . . . . . . . . . . . . . . . . . . . . . . . . .
1,523
IPS
. . . . . . . . . . . . . . . . . . . . . . . . . . . . . . . . . . . . . . . .
4,055
Jordan’s Furniture
. . . . . . . . . . . . . . . . . . . . . . . . . .
1,074
McLane Company
. . . . . . . . . . . . . . . . . . . . . . . . . . .
24,876
Nebraska Furniture Mart
. . . . . . . . . . . . . . . . . . . . .
4,563
NetJets
. . . . . . . . . . . . . . . . . . . . . . . . . . . . . . . . . . . .
9,438
Oriental Trading
. . . . . . . . . . . . . . . . . . . . . . . . . . . .
1,020
Pampered Chef
. . . . . . . . . . . . . . . . . . . . . . . . . . . . .
276
Pilot Travel Centers
. . . . . . . . . . . . . . . . . . . . . . . . .
29,285
R.C. Willey Home Furnishings
. . . . . . . . . . . . . . . .
2,160
See’s Candies
. . . . . . . . . . . . . . . . . . . . . . . . . . . . . . .
2,132
Star Furniture
. . . . . . . . . . . . . . . . . . . . . . . . . . . . . .
259
TTI
. . . . . . . . . . . . . . . . . . . . . . . . . . . . . . . . . . . . . . .
9,035
WPLG
. . . . . . . . . . . . . . . . . . . . . . . . . . . . . . . . . . . . .
251
XTRA
. . . . . . . . . . . . . . . . . . . . . . . . . . . . . . . . . . . . .
369
110,756
Berkshire Hathaway Corporate Headquarters
. . .
28
387,815
(1)
Marmon Holding, Inc. (“Marmon”) is a holding company that conducts operations through more than 100
manufacturing and service businesses organized into eleven business groups.
A-2
BERKSHIRE HATHAWAY INC.
STOCK TRANSFER AGENT
EQ Shareowner Services (“EQ”), a division of Equiniti Trust Company., P. O. Box 64854, St. Paul, MN
55164-0854 serves as Transfer Agent and Registrar for the Company’s common stock. Correspondence may be
directed to EQ at the address indicated or at
www.shareowneronline.com.
Telephone inquiries should be directed
to the Shareowner Relations Department at 1-877-602-7411 between 7:00 A.M. and 7:00 P.M. Central Time.
Certificates for re-issue or transfer should be directed to the Transfer Department at the address indicated.
Berkshire has two classes of common stock designated Class A common stock and Class B common stock.
Each share of Class A common stock is convertible, at the option of the holder, into 1,500 shares of Class B
common stock. Shares of Class B common stock are not convertible into shares of Class A common stock.
Registered owner’s holding Berkshire stock in certificate form or through EQ’s direct registration system,
may contact EQ directly for instructions regarding changes in registration, including shareowner’s mailing
address or conversion of Class A shares to Class B shares. Correspondence may be directed to EQ at the address
indicated above or at
www.shareowneronline.com
. Telephone inquiries should be directed to the Shareowner
Relations Department at 1-877-602-7411 between 7:00 A.M. and 7:00 P.M. Central Time. Certificates for
re-issue or transfer should be directed to the Transfer Department at the address indicated above. Shareowners
can also view account information at the EQ website
www.shareowneronline.com
.
If a shareowner has lost or misplaced stock certificates, he or she should contact EQ to arrange for
replacements. Transfer agent’s, including EQ, will require the shareowner to provide an indemnification bond
based on the value of the share certificate being replaced. Shareholders are encouraged to contact EQ periodically
to verify the mailing address of record to assure that Company communications are delivered. We encourage you
to vote on shareholder proposals contained in our annual proxy solicitation. Contact with EQ is established
automatically through the voting process.
Shareholders of record wishing to convert Class A common stock into Class B common stock may contact
EQ in writing. Along with the underlying stock certificate, shareholders should provide EQ with specific written
instructions regarding the number of shares to be converted and the manner in which the Class B shares are to be
registered. We recommend that you use certified or registered mail addressed to EQ Shareowner Services, 1110
Centre Pointe Curve, Suite 101, Mendota Heights, MN 55120 when delivering the stock certificates and written
instructions.
Owners holding Berkshire common stock in street name (in a bank, broker or other nominee account)
should contact the bank, broker or nominee for changes in registration. If Class A shares are held in “street
name,” shareholders wishing to convert all or a portion of their holding to Class B should contact their broker or
bank nominee. It will be necessary for the nominee to make the request for conversion.
A-3
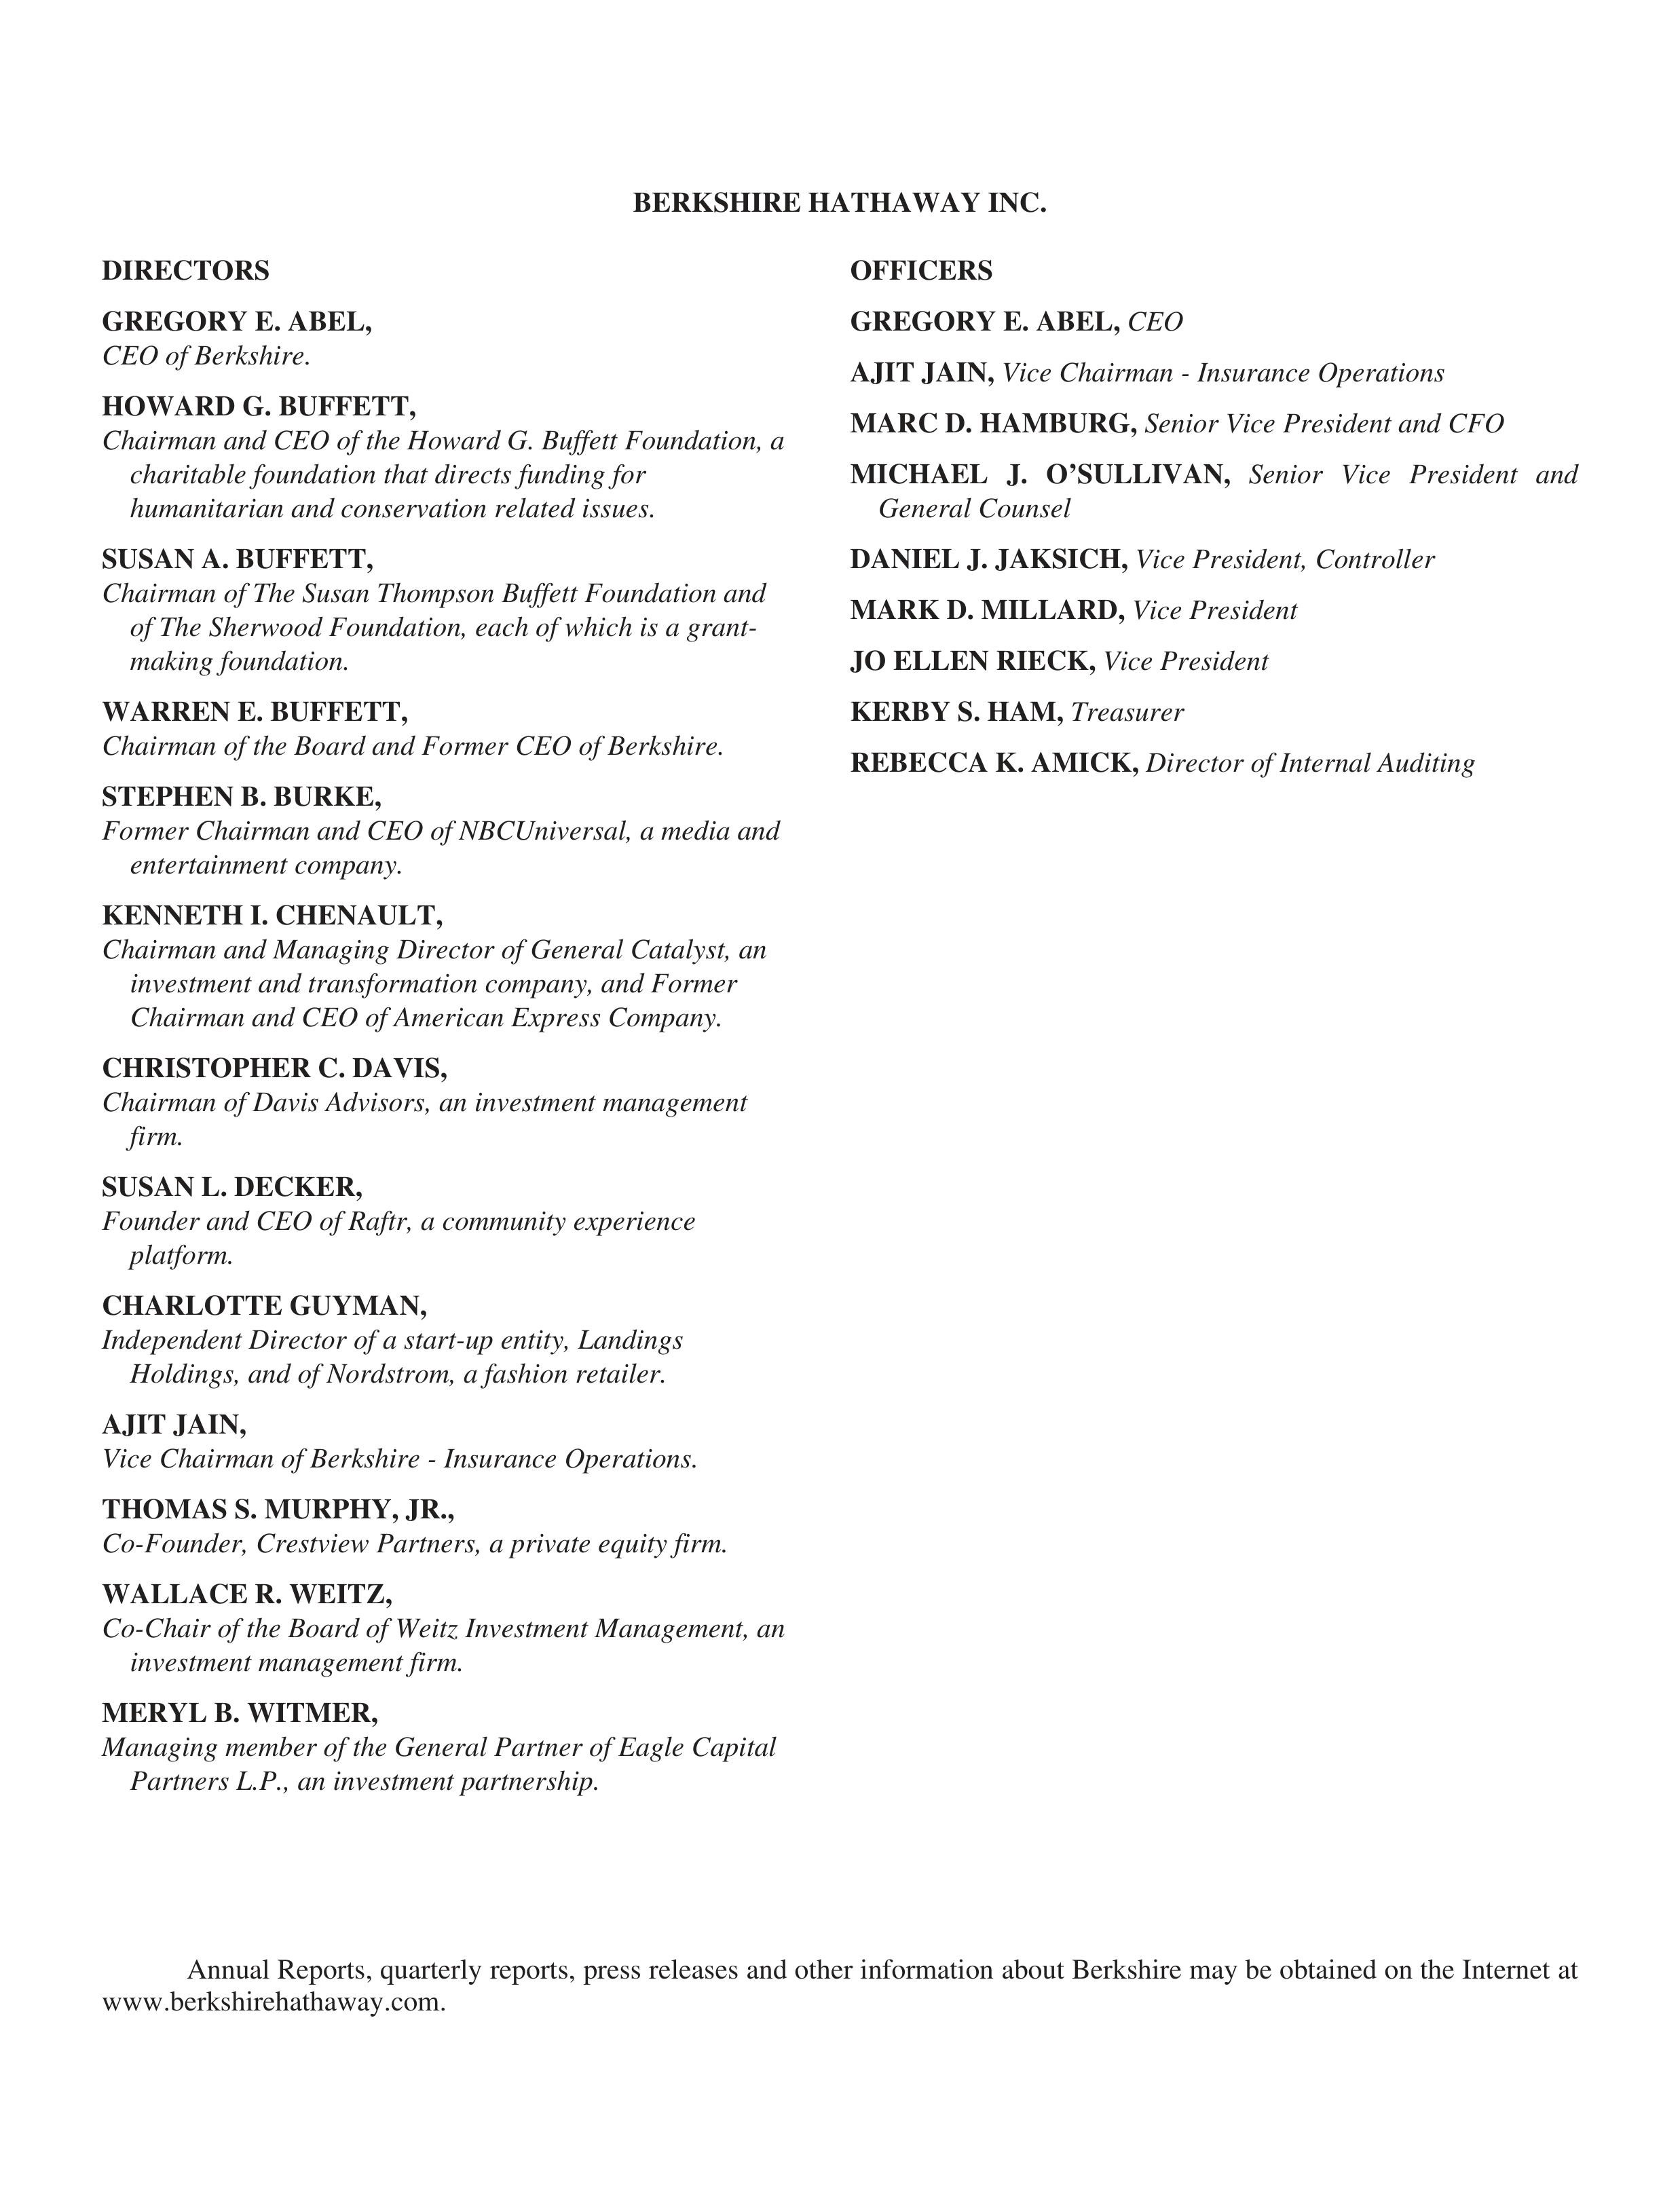
BERKSHIRE HATHAWAY INC.
DIRECTORS
OFFICERS
GREGORY E. ABEL,
CEO of Berkshire.
HOWARD G. BUFFETT,
Chairman and CEO of the Howard G. Buffett Foundation, a
charitable foundation that directs funding for
humanitarian and conservation related issues.
SUSAN A. BUFFETT,
Chairman of The Susan Thompson Buffett Foundation and
of The Sherwood Foundation, each of which is a grant-
making foundation.
WARREN E. BUFFETT,
Chairman of the Board and Former CEO of Berkshire.
STEPHEN B. BURKE,
Former Chairman and CEO of NBCUniversal, a media and
entertainment company.
KENNETH I. CHENAULT,
Chairman and Managing Director of General Catalyst, an
investment and transformation company, and Former
Chairman and CEO of American Express Company.
CHRISTOPHER C. DAVIS,
Chairman of Davis Advisors, an investment management
firm.
SUSAN L. DECKER,
Founder and CEO of Raftr, a community experience
platform.
CHARLOTTE GUYMAN,
Independent Director of a start-up entity, Landings
Holdings, and of Nordstrom, a fashion retailer.
AJIT JAIN,
Vice Chairman of Berkshire - Insurance Operations.
THOMAS S. MURPHY, JR.,
Co-Founder, Crestview Partners, a private equity firm.
WALLACE R. WEITZ,
Co-Chair of the Board of Weitz Investment Management, an
investment management firm.
MERYL B. WITMER,
Managing member of the General Partner of Eagle Capital
Partners L.P., an investment partnership.
GREGORY E. ABEL,
CEO
AJIT JAIN,
Vice Chairman - Insurance Operations
MARC D. HAMBURG,
Senior Vice President and CFO
MICHAEL J. O’SULLIVAN,
Senior Vice President and
General Counsel
DANIEL J. JAKSICH,
Vice President, Controller
MARK D. MILLARD,
Vice President
JO ELLEN RIECK,
Vice President
KERBY S. HAM,
Treasurer
REBECCA K. AMICK,
Director of Internal Auditing
Annual Reports, quarterly reports, press releases and other information about Berkshire may be obtained on the Internet at
www.berkshirehathaway.com.

B
ERKSHIRE
H
ATHAWAY INC.
Executive Offices
—
3555
Farnam
Street,
Omaha,
Nebraska
68131