















































Starbucks
Fiscal 2025
Annual Report
© 2026
STARBUCKS CORPORATION
UNITED STATES
SECURITIES AND EXCHANGE COMMISSION
Washington, DC 20549
______________
Form 10-K
______________
ANNUAL REPORT PURSUANT TO SECTION 13 OR 15(d) OF THE SECURITIES EXCHANGE ACT OF 1934
For the Fiscal Year Ended September 28, 2025
or
TRANSITION REPORT PURSUANT TO SECTION 13 OR 15(d) OF THE SECURITIES EXCHANGE ACT OF 1934
For the transition period from to .
Commission File Number: 000-20322
______________
Starbucks Corporation
(Exact Name of Registrant as Specified in its Charter)
______________
Washington
91-1325671
(State of Incorporation)
(IRS Employer ID)
______________
2401 Utah Avenue South, Seattle, Washington 98134
(206) 447-1575
(Address of principal executive office, zip code, telephone number)
Securities Registered Pursuant to Section 12(b) of the Act:
Title of Each Class
Trading Symbol
Name of Each Exchange on Which Registered
Common Stock, $0.001 par value per share
SBUX
Nasdaq Global Select Market
Securities Registered Pursuant to Section 12(g) of the Act: None
______________
Indicate by check mark if the registrant is a well-known seasoned issuer, as defined in Rule 405 of the Securities Act. Yes
No
Indicate by check mark if the registrant is not required to file reports pursuant to Section 13 or Section 15(d) of the Act. Yes
No
Indicate by check mark whether the registrant: (1) has filed all reports required to be filed by Section 13 or 15(d) of the Securities Exchange Act of 1934 during
the preceding 12 months (or for such shorter period that the registrant was required to file such reports), and (2) has been subject to such filing requirements for
the past 90 days. Yes
No
Indicate by check mark whether the registrant has submitted electronically every Interactive Data File required to be submitted pursuant to Rule 405 of Regulation S-T
(§ 232.405 of this chapter) during the preceding 12 months (or for such shorter period that the registrant was required to submit such files). Yes
No
Indicate by check mark whether the registrant is a large accelerated filer, an accelerated filer, a non-accelerated filer, a smaller reporting company, or an emerging
growth company. See the definitions of “large accelerated filer,” “accelerated filer,” “smaller reporting company” and “emerging growth company” in Rule 12b-2 of
the Exchange Act.
Large accelerated filer
Accelerated filer
Non-accelerated filer
Smaller reporting company
Emerging growth company
If an emerging growth company, indicate by check mark if the registrant has elected not to use the extended transition period for complying with any new or
revised financial accounting standards provided pursuant to Section 13(a) of the Exchange Act.
Indicate by check mark whether the registrant has filed a report on and attestation to its management’s assessment of the effectiveness of its internal control over financial
reporting under Section 404(b) of the Sarbanes-Oxley Act (15 U.S.C. 7262(b)) by the registered public accounting firm that prepared or issued its audit report.
If securities are registered pursuant to Section 12(b) of the Act, indicate by check mark whether the financial statements of the registrant included in the filing
reflect the correction of an error to previously issued financial statements.
Indicate by check mark whether any of those error corrections are restatements that required a recovery analysis of incentive-based compensation received by any
of the registrant’s executive officers during the relevant recovery period pursuant to §240.10D-1(b).
Indicate by check mark whether the registrant is a shell company (as defined in Rule 12b-2 of the Act). Yes
No
The aggregate market value of common stock held by non-affiliates of the registrant as of the last business day of the registrant’s most recently completed
second fiscal quarter, based upon the closing sale price of the registrant’s common stock on March 30, 2025 as reported on the Nasdaq Global Select Market was
$111.0 billion. As of November 7, 2025, there were 1,137.1 million shares of the registrant’s Common Stock outstanding.
DOCUMENTS INCORPORATED BY REFERENCE
Portions of the registrant’s definitive Proxy Statement for the registrant’s Annual Meeting of Shareholders to be held on March 25, 2026, have been incorporated
by reference into Part III of this Annual Report on Form 10-K where indicated. Except as expressly incorporated by reference, the registrant’s Proxy Statement
shall not be deemed to be part of this report.
STARBUCKS CORPORATION
Form 10-K
For the Fiscal Year Ended September 28, 2025
TABLE OF CONTENTS
PART I
Item 1
Business
3
Item 1A
Risk Factors
11
Item 1B
Unresolved Staff Comments
23
Item 1C
Cybersecurity
23
Item 2
Properties
25
Item 3
Legal Proceedings
25
Item 4
Mine Safety Disclosures
25
PART II
Item 5
Market for the Registrant’s Common Equity, Related Shareholder Matters, and Issuer Purchases of
Equity Securities
26
Item 6
Reserved
28
Item 7
Management’s Discussion and Analysis of Financial Condition and Results of Operations
28
Item 7A
Quantitative and Qualitative Disclosures About Market Risk
42
Item 8
Financial Statements and Supplementary Data
43
Index for Notes to Consolidated Financial Statements
48
Report of Independent Registered Public Accounting Firm
86
Item 9
Changes in and Disagreements with Accountants on Accounting and Financial Disclosure
88
Item 9A
Controls and Procedures
88
Item 9B
Other Information
90
Item 9C
Disclosure Regarding Foreign Jurisdictions that Prevent Inspections
90
PART III
Item 10
Directors, Executive Officers, and Corporate Governance
91
Item 11
Executive Compensation
91
Item 12
Security Ownership of Certain Beneficial Owners and Management and Related Shareholder
Matters
91
Item 13
Certain Relationships and Related Transactions and Director Independence
91
Item 14
Principal Accountant Fees and Services
91
PART IV
Item 15
Exhibits and Financial Statement Schedules
92
Item 16
Form 10-K Summary
98
SIGNATURES
99
1
CAUTIONARY NOTE REGARDING FORWARD-LOOKING STATEMENTS
This Annual Report on Form 10-K includes “forward-looking” statements within the meaning of the Private Securities
Litigation Reform Act of 1995 regarding future events and the future results of Starbucks Corporation (together with its
subsidiaries) that are based on our current expectations, estimates, forecasts, and projections about our business, our results
of operations, the industry in which we operate, our economic and market outlook, and the beliefs and assumptions of our
management. Forward-looking statements can be identified by the fact that they do not relate strictly to historical or current
facts. They often include words such as “believes,” “expects,” “anticipates,” “estimates,” “intends,” “plans,” “seeks,” or words of
similar meaning, or future or conditional verbs, such as “will,” “should,” “could,” “may,” “aims,” “intends,” or “projects,” and
similar expressions intended to identify forward-looking statements, although not all forward-looking statements contain these
identifying words. By their nature, forward-looking statements involve risks, uncertainties, and other factors (many beyond our
control) that could cause our actual results to differ materially from our historical experience or from our current expectations
or projections. Our forward-looking statements, and the risks and uncertainties related thereto, include, but are not limited to,
those described under the “Risk Factors” and “Management
’
s Discussion and Analysis of Financial Condition and Results
of Operations” sections and in other reports we file with the U.S. Securities and Exchange Commission (“SEC”), as well as,
among others:
•
our ability to preserve, grow, and leverage our brands;
•
the impact of our brand, marketing, promotional, advertising and pricing strategies, platforms, reformulations,
innovations, or customer experience initiatives or investments;
•
the costs and risks associated with, and the successful and timely execution and effects of, our existing and any
future business opportunities, expansions, initiatives, strategies, investments, and plans, including our “Back to
Starbucks”(and restructuring) plan;
•
the costs and risks associated with, and the successful execution and effects of, strategic changes to our ownership
and operating structure, including as a result of acquisitions, divestitures, other strategic transactions or entry into
joint ventures;
•
our ability to align our investment efforts with our strategic goals;
•
evolving consumer preferences, demand, consumption, or spending behavior, reduction in discretionary spending
and price increases, and our ability to anticipate or react to these changes;
•
the ability of our business partners, suppliers, and third-party providers to fulfill their responsibilities and
commitments and our reliance on certain key business partners and suppliers;
•
the potential negative effects of food or beverage-safety incidents or product recalls, and any perceived association
with such incidents;
•
our ability to open new stores and efficiently maintain the attractiveness of our existing stores and manage related
costs;
•
our heavy reliance on the financial performance of our North America operating segment and our dependence on
the performance and growth of certain international markets;
•
our ability to operate and successfully expand our footprint in international markets, which is influenced by factors
distinct from our North America operating segment;
•
inherent risks of operating a global business, including changing conditions in our markets, local factors affecting
store openings, protectionist trade or foreign investment policies, such as tariffs and import/export regulations,
economic or trade sanctions, compliance with local laws and other regulations, and local labor policies and
conditions, including labor strikes and work stoppages;
•
higher costs, lower quality, or unavailability of coffee, dairy, cocoa, energy, water, raw materials, or product
ingredients and related volatility;
•
the ability of our supply chain to meet current or future business needs and our ability to scale and improve our
forecasting, planning, production, and logistics management;
2
•
the potential impact on our supply chain and operations of adverse weather conditions, natural disasters, or
significant increases in logistics costs;
•
a worsening in the terms and conditions upon which we engage with our manufacturers and source suppliers;
•
the impact of unfavorable macro-economic conditions and other factors, including economic slowdowns or
recessions, rising real estate costs, supply chain disruptions, climate change and extreme weather events,
inflection and interest rate fluctuations, government shutdowns, labor unrest, geopolitical instability, disruptions in
credit markets and foreign current exchange rate volatility;
•
failure to meet market expectations for our financial performance or any announced guidance and the impact
thereof;
•
failure to attract or retain key executive or partner talent;
•
changes in the availability and cost of labor, including any union organizing efforts and our responses to such
efforts;
•
the impact of, and our ability to respond to, substantial competition from new entrants, consolidations by
competitors, and other competitive activities, such as pricing actions (including price reductions, promotions,
discounting, couponing, or free goods), marketing, category expansion, product introductions, or entry or
expansion in our geographic markets;
•
potential impacts of climate change;
•
evolving corporate governance and public disclosure regulations and expectations;
•
the potential impact of activist shareholder actions or tactics;
•
failure to comply with applicable laws and complex and changing legal and regulatory requirements, including in
privacy and data protection;
•
the impact or likelihood of significant legal disputes and proceedings or government investigations;
•
the unauthorized access, use, theft, or destruction of our data, or of our proprietary or confidential information
and the impact thereof;
•
potential negative effects of, and our ability to respond to, a material failure, inadequacy, or interruption of our
information technology systems or those of our third-party business partners or service providers, or failure to
comply with data protection laws; and
•
our ability to adequately protect our intellectual property or adequately ensure that we are not infringing the
intellectual property of others.
In addition, many of the foregoing risks and uncertainties are, or could be, exacerbated by any worsening of the global
business and economic environment. A forward-looking statement is neither a prediction nor a guarantee of future events
or circumstances, and those future events or circumstances may not occur. You should not place undue reliance on the
forward-looking statements, which speak only as of the date of this report. We are under no obligation to update or alter any
forward-looking statements, whether as a result of new information, future events, or otherwise.
3
PART I
Item 1.
Business
General
In this Annual Report on Form 10-K (“10-K” or “Report”) for the fiscal year ended September 28, 2025 (“fiscal 2025”),
Starbucks Corporation (together with its subsidiaries) is referred to as “Starbucks,” the “Company,” “we,” “us,” or “our.”
Starbucks is the premier roaster, marketer, and retailer of specialty coffee in the world, operating in 89 markets. Formed
in 1985, Starbucks Corporation’s common stock trades on the Nasdaq Global Select Market (“Nasdaq”) under the symbol
“SBUX.” We purchase and roast high-quality coffees that we sell, along with handcrafted coffee, tea, and other beverages
and a variety of high-quality food items through company-operated stores (“stores” or “coffeehouses”). We also sell a variety
of coffee and tea products and license our trademarks through other channels, such as licensed stores as well as grocery and
foodservice through our Global Coffee Alliance with Nestlé S.A. (“Nestlé”). In addition to our flagship Starbucks Coffee
®
brand, we sell goods and services under the following brands: Teavana
®
, Ethos
®
, and Starbucks Reserve
®
.
Our primary objective is to maintain Starbucks standing as one of the most recognized and respected brands in the world. We
believe the continuous investments in our brand and operations will deliver long-term targeted revenue and income growth.
This includes expansion of our global store base, adding stores in both existing, developed markets such as the U.S. and in
higher growth markets, as well as optimizing the mix of company-operated and licensed stores around the world. In addition,
by leveraging experiences gained through our stores and elsewhere, we continue to drive beverage, equipment, process,
and technology innovation, including in our industry-leading digital platform. We strive to regularly offer consumers new,
innovative coffee and other products in a variety of forms, across new categories and diverse channels.
In the fourth quarter of fiscal 2024, we announced our “Back to Starbucks” strategy, which was implemented with the goal to
bring new and existing customers to our stores and business, and return to growth. The strategy includes supporting our green
apron partners, enhancing the customer experience, reestablishing ourselves as the community coffeehouse, and strengthening
the brand through product development, marketing, in-store and digital experience. This strategic reset provides us with the
opportunity to assess the business and refocus our efforts, including capital allocation priorities, efficiency efforts, and store
growth initiatives.
In the fourth quarter of fiscal 2025, we announced a restructuring plan involving the closure of coffeehouses, and the further
transformation of our support organization, as part of the Company’s “Back to Starbucks” strategy. We assessed our existing
store portfolio with respect to both whether coffeehouses had a viable path to offering the physical environment consistent
with the brand and a clear path to financial performance and we closed, or plan to close, the coffeehouses that did not meet
these criteria. Refer to Note 18, Restructuring, included in Item 8 of Part II of this 10-K, for further discussion.
Human Capital Management
We invest in the well-being — the mental, physical, and financial health — of every partner through our practices, policies,
and benefits. This work is grounded in the belief that we are at our best when we create inclusive, supportive, and welcoming
environments, where we uplift one another with dignity, respect, and kindness. We believe the strength of our workforce is one
of the significant contributors to our success as a global brand that leads with purpose. Therefore, one of our core strategies
is to invest in, and support, our partners to differentiate our brand, products, and services in the competitive specialty coffee
market, including the following areas of focus:
Oversight and Management
We believe in creating an inclusive and equitable environment that represents a broad spectrum of backgrounds and cultures
that is reflective of our customers, partners, and communities. Working under these principles, our Partner Resources
Organization is tasked with managing employment-related matters, including recruiting and hiring, onboarding and training,
compensation planning, performance management, and professional development. Our Board of Directors (the “Board”)
and Board committees provide oversight on certain human capital matters. As noted in its charter, our Compensation and
Management Development Committee is responsible for periodically reviewing Starbucks partner resource programs and
initiatives, including healthcare and other benefits, as well as our management development and succession planning practices
and strategies. Our Audit and Compliance Committee works closely with the Risk Steering Committee, led by Starbucks
4
chief financial officer (“cfo”) and chief legal officer, to monitor and mitigate current and emerging labor and human capital
management risks. The Board, through its committees, annually reviews and assesses the effectiveness of the Company’s
environmental and social strategies, policies, practices, goals, programs, disclosure, and risks, including review of the
Company’s annual global impact report.
These reports and recommendations to the Board and its committees are part of the broader framework that guides how
Starbucks should attract, retain, and develop a skilled workforce that aligns with our values and strategies.
We regularly conduct anonymous surveys to seek feedback from our partners on a variety of topics, including confidence
in company leadership, competitiveness of our compensation and benefits package, career growth opportunities, and
recommendations on how we can remain an employer of choice. The results are shared with our partners and reviewed by
senior leadership, who analyze areas of progress or deterioration and prioritize actions and activities in response to this
feedback to drive meaningful improvements in partner engagement. Our management and cross-functional teams also work
closely to evaluate human capital management issues such as partner retention, workplace safety, harassment, and bullying, as
well as to implement measures to mitigate these issues.
Belonging at Starbucks
At Starbucks, we are committed to creating environments where everyone is welcome and belongs. In 2023, led by Starbucks
partners, we reaffirmed this commitment by cementing “Belonging” as one of our company values.
We are dedicated to being an inclusive, accessible and diverse company, with a deep commitment to opportunity for every one
of our partners by making Starbucks the best job in retail and a great place to build a career.
Starbucks programs and benefits are open to every partner and designed to strengthen a culture of inclusion that values diverse
perspectives and experiences — from strong partner networks to a focus on hiring internally for 90% of retail leadership roles.
Our hiring and recruiting practices are competitive, fair and inclusive. They help us hire the strongest candidate for every
job, every time. We offer industry-leading benefits, competitive pay, and opportunities for learning and development. When
our partners feel good about their future — at Starbucks or beyond — they take care of our customers. Investing in them and
prioritizing their experience creates value for everyone.
Total Rewards
We have demonstrated a history of investing in our workforce by offering competitive salaries and wages by continuously
assessing the current business environment and labor market. We have consistently made enhancements in wages in order to
attract talent to support our growth strategy and to elevate the customer experience. To foster a stronger sense of ownership
and align the interests of partners with shareholders, restricted stock units are provided to eligible non-executive partners under
our broad-based stock incentive programs. Furthermore, we offer competitive pay and a collection of benefits that are best in
class. Partners in the U.S., which is our largest and most mature market, can:
•
Grow their careers with us. We established a goal to fill 90% of retail leadership roles internally, creating a way for
our hourly partners to build a career at Starbucks.
•
Get a college degree, on us. Through the Starbucks College Achievement Plan (SCAP), Starbucks covers 100% of
tuition for a first-time online bachelor’s degree from Arizona State University for partners working an average of
20 hours or more each week.
•
Grow their savings. In fiscal 2025, more than 230,000 partners received a Bean Stock grant giving them an
ownership stake in Starbucks.
•
Obtain comprehensive healthcare coverage. We offer industry-leading health and wellbeing benefits for partners
working an average of 20 hours or more each week.
•
Extend parental leave. Starbucks covers up to 18 weeks of fully paid leave for birth parents, and up to 12 weeks of
fully paid leave for non-birth parents for partners working an average of 20 hours or more each week.
5
Outside of the U.S., we have provided other innovative benefits to help address market-specific needs, such as providing
interest-free loans to our U.K. partners to help cover rental deposits, mental health services in Canada, and, in China, an
extra 14
th
Month Pay initiative, giving retail partners an additional month’s salary as a bonus on top of the 13
th
month pay
that is customary in China, as well as a monthly housing subsidy for full-time Starbucks baristas and shift supervisors, and
comprehensive health insurance coverage for parents of partners.
Role-based Support
To help our partners succeed in their roles, we emphasize ongoing training and development opportunities. These include, but
are not limited to, role-based training for our retail hourly partners, safety and security protocols, updates on new products
and service offerings, and deployment of technologies. We periodically address a wide variety of topics such as achievable
goal setting, giving and receiving constructive feedback, and effective engagement with communities and customers through
the rollout of the Green Apron Service Model, a new foundational operating model that establishes repeatable, consistent, and
scalable standards, across U.S company-operated coffeehouses. It is designed to create deeper connections between partners
and customers by enabling partners to deliver consistent, high-quality experiences with warmth and care. The model includes
new routines and tools that give partners more time to focus on craft and connection, supported by technology that improves
order flow and speed of service.
Pay Equity
To be an employer of choice and maintain the strength of our workforce, we consistently assess the current business
environment and labor market to refine our compensation and benefits programs and other resources available to our partners.
Starbucks is committed to fair pay principles to ensure partners are paid appropriately and equitably for their roles and the
work they do, regardless of race, gender, or other protected categories. Further, we have formulated pay-equity principles,
which provide equal footing, transparency, and accountability as best practices that help address known, systemic barriers to
global pay equity.
As of September 28, 2025, Starbucks employed approximately 381,000 people worldwide. In the U.S., Starbucks
employed approximately 223,000 people, with approximately 214,000 in company-operated stores and the remainder in
corporate support, store development, roasting, manufacturing, warehousing, and distribution operations. Approximately
158,000 employees were employed outside of the U.S., with approximately 153,000 in company-operated stores and the
remainder in regional support operations. Partners in approximately 6% of Starbucks U.S. company-operated stores are
represented by unions. We believe our efforts in managing our workforce have been effective, evidenced by low turnover, a
strong culture, and active employee participation.
Information about our Executive Officers
Name
Age
Position
Brian Niccol
51
chairman and chief executive officer
Cathy R. Smith
62
executive vice president, chief financial officer
Mike Grams
55
executive vice president, chief operating officer
Brady Brewer
52
chief executive officer, Starbucks International
Sara Kelly
46
executive vice president, chief partner officer
Pilar Ramos
53
executive vice president, chief legal officer
Brian Niccol
joined Starbucks as chairman and chief executive officer in September 2024. Mr. Niccol spent more than
25 years in leadership, marketing, and operations roles for some of the world’s most respected restaurant brands. Mr. Niccol
joined Starbucks after leading Chipotle Mexican Grill, Inc. through a period of growth and transformation, having served
as a director and as its Chief Executive Officer from 2018 to 2024 and as its Chairman, from 2020 to 2024. Before joining
Chipotle, he served as Chief Executive Officer of Taco Bell, a division of Yum! Brands, Inc., from 2015 to 2018, after having
served as its President (2013 to 2014) and Chief Marketing and Innovation Officer (2011 to 2012). Mr. Niccol also served in
leadership roles at Pizza Hut, another division of Yum! Brands from 2005 to 2011. Mr. Niccol currently serves on the Board of
Directors of Walmart Inc., a NYSE-listed omni-channel retailer.
6
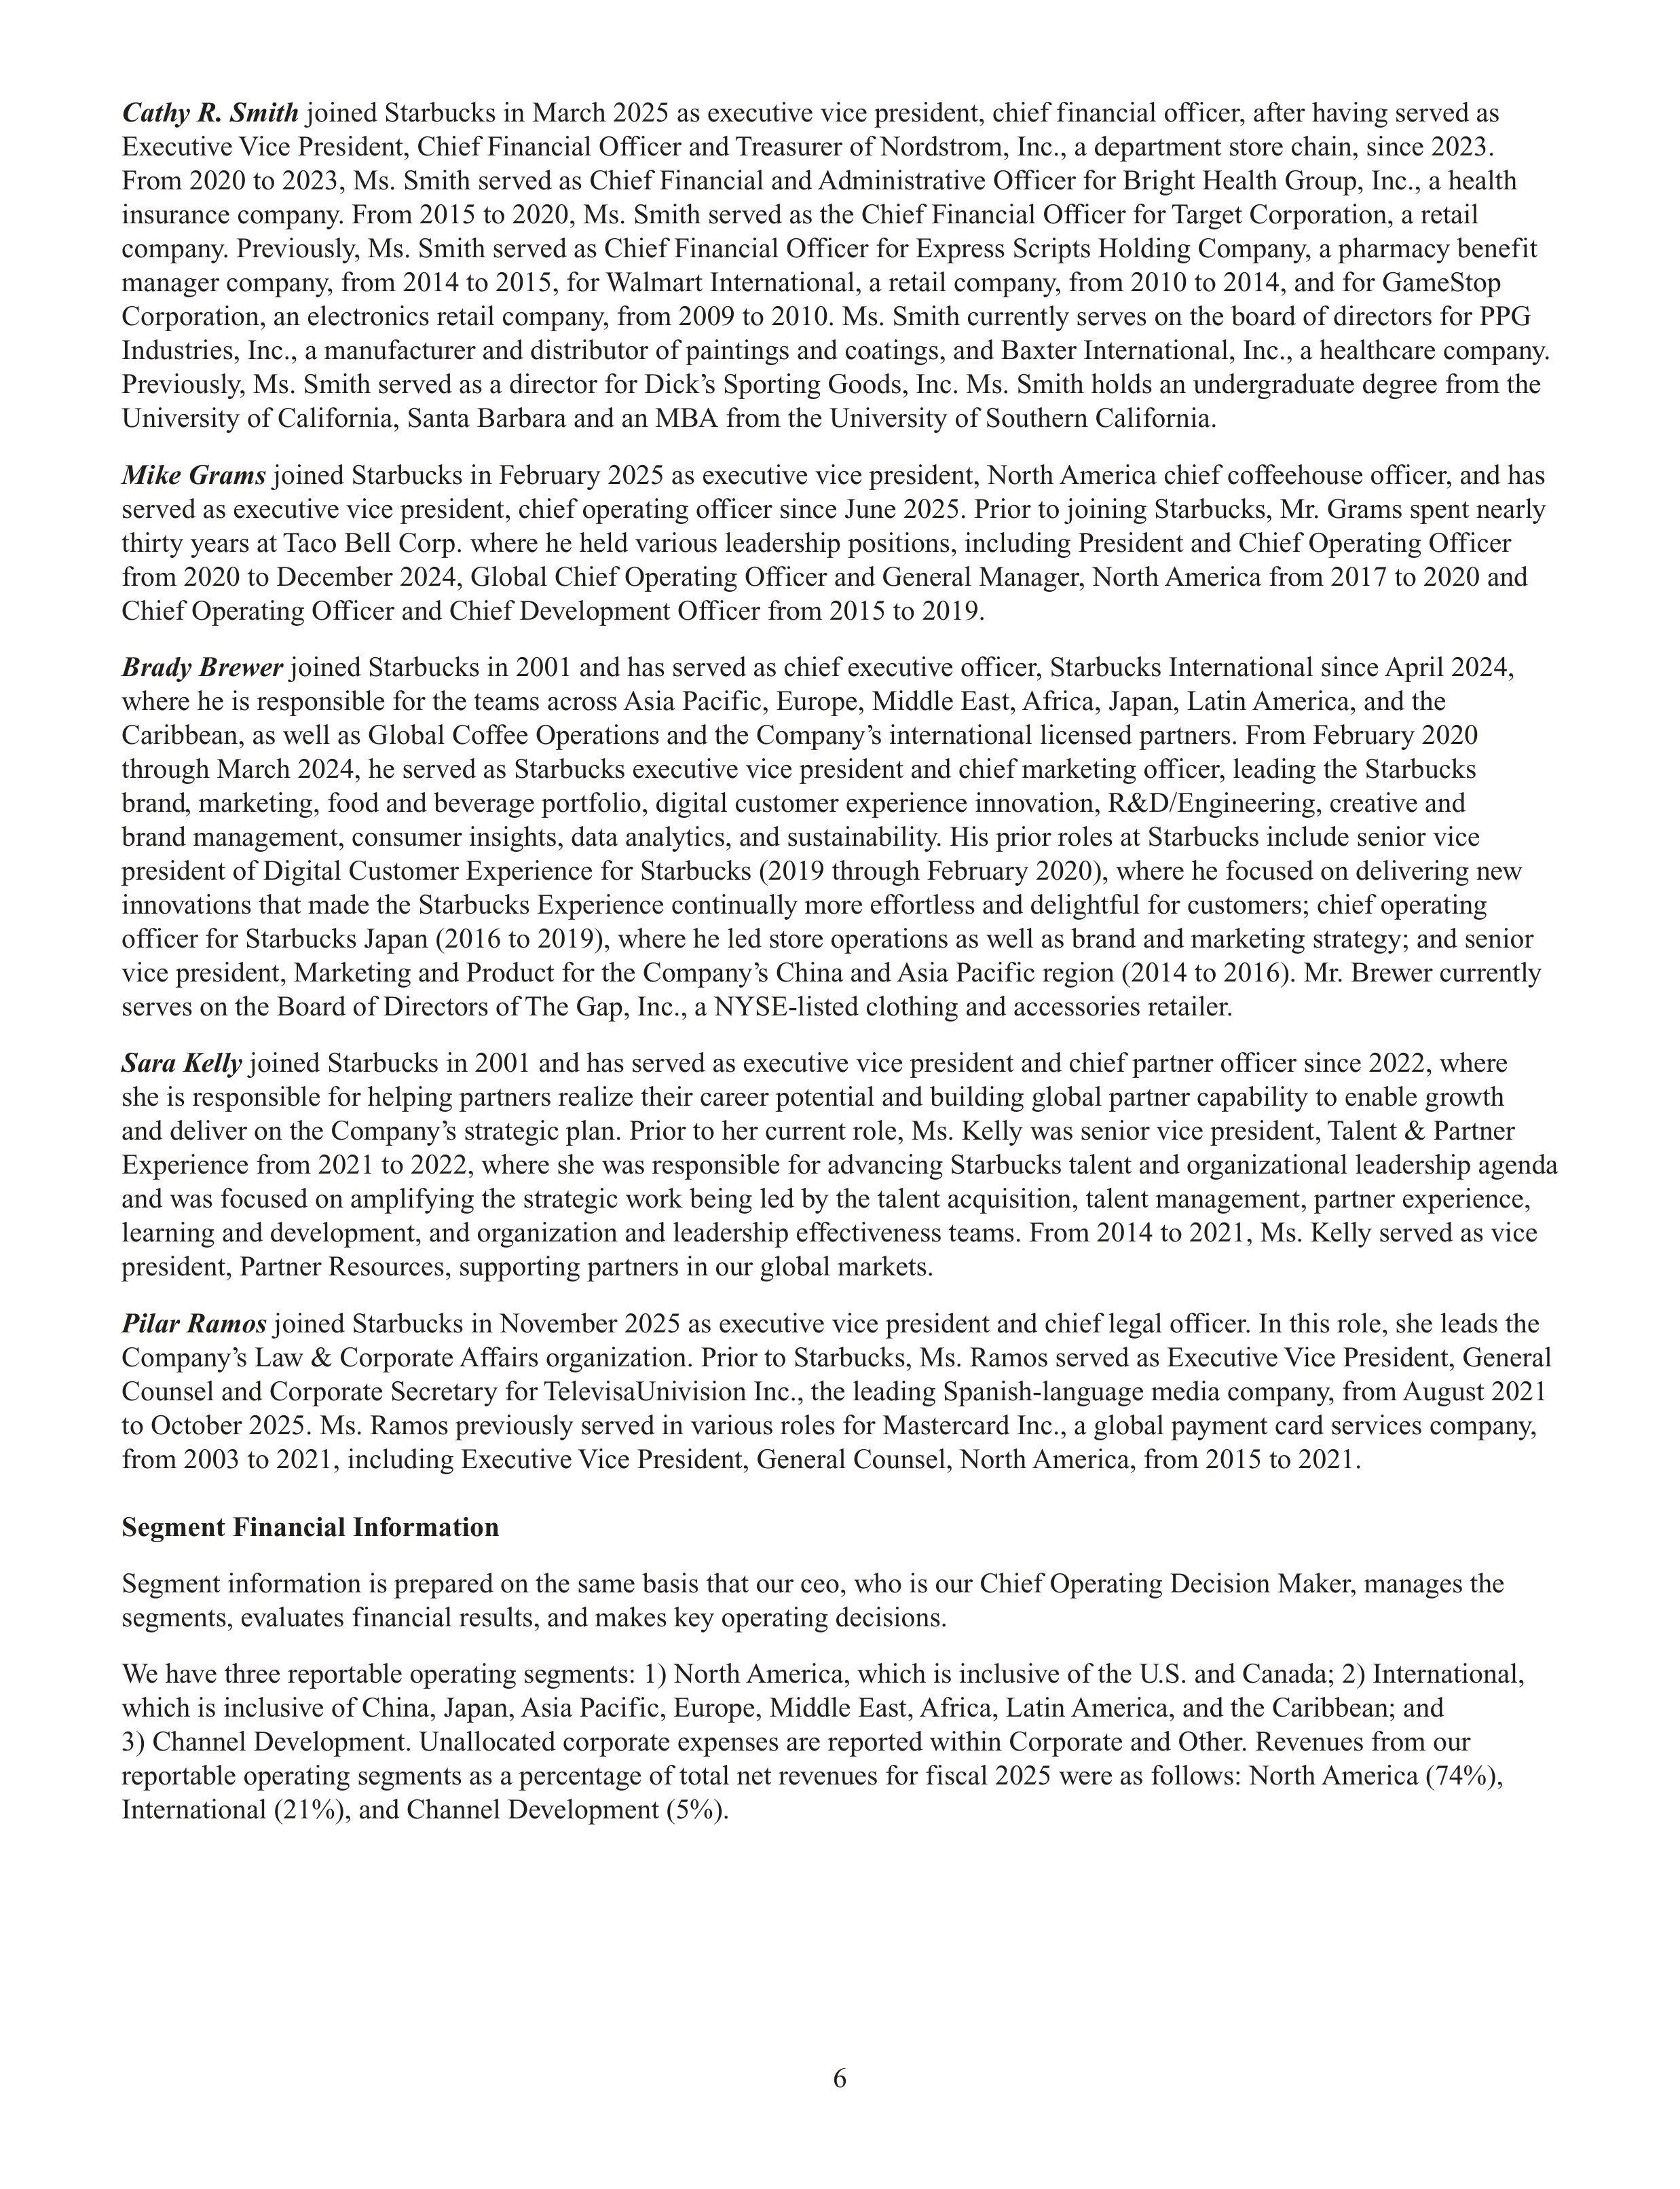
Cathy R. Smith
joined Starbucks in March 2025 as executive vice president, chief financial officer, after having served as
Executive Vice President, Chief Financial Officer and Treasurer of Nordstrom, Inc., a department store chain, since 2023.
From 2020 to 2023, Ms. Smith served as Chief Financial and Administrative Officer for Bright Health Group, Inc., a health
insurance company. From 2015 to 2020, Ms. Smith served as the Chief Financial Officer for Target Corporation, a retail
company. Previously, Ms. Smith served as Chief Financial Officer for Express Scripts Holding Company, a pharmacy benefit
manager company, from 2014 to 2015, for Walmart International, a retail company, from 2010 to 2014, and for GameStop
Corporation, an electronics retail company, from 2009 to 2010. Ms. Smith currently serves on the board of directors for PPG
Industries, Inc., a manufacturer and distributor of paintings and coatings, and Baxter International, Inc., a healthcare company.
Previously, Ms. Smith served as a director for Dick’s Sporting Goods, Inc. Ms. Smith holds an undergraduate degree from the
University of California, Santa Barbara and an MBA from the University of Southern California.
Mike Grams
joined Starbucks in February 2025 as executive vice president, North America chief coffeehouse officer, and has
served as executive vice president, chief operating officer since June 2025. Prior to joining Starbucks, Mr. Grams spent nearly
thirty years at Taco Bell Corp. where he held various leadership positions, including President and Chief Operating Officer
from 2020 to December 2024, Global Chief Operating Officer and General Manager, North America from 2017 to 2020 and
Chief Operating Officer and Chief Development Officer from 2015 to 2019.
Brady Brewer
joined Starbucks in 2001 and has served as chief executive officer, Starbucks International since April 2024,
where he is responsible for the teams across Asia Pacific, Europe, Middle East, Africa, Japan, Latin America, and the
Caribbean, as well as Global Coffee Operations and the Company’s international licensed partners. From February 2020
through March 2024, he served as Starbucks executive vice president and chief marketing officer, leading the Starbucks
brand, marketing, food and beverage portfolio, digital customer experience innovation, R&D/Engineering, creative and
brand management, consumer insights, data analytics, and sustainability. His prior roles at Starbucks include senior vice
president of Digital Customer Experience for Starbucks (2019 through February 2020), where he focused on delivering new
innovations that made the Starbucks Experience continually more effortless and delightful for customers; chief operating
officer for Starbucks Japan (2016 to 2019), where he led store operations as well as brand and marketing strategy; and senior
vice president, Marketing and Product for the Company’s China and Asia Pacific region (2014 to 2016). Mr. Brewer currently
serves on the Board of Directors of The Gap, Inc., a NYSE-listed clothing and accessories retailer.
Sara Kelly
joined Starbucks in 2001 and has served as executive vice president and chief partner officer since 2022, where
she is responsible for helping partners realize their career potential and building global partner capability to enable growth
and deliver on the Company’s strategic plan. Prior to her current role, Ms. Kelly was senior vice president, Talent & Partner
Experience from 2021 to 2022, where she was responsible for advancing Starbucks talent and organizational leadership agenda
and was focused on amplifying the strategic work being led by the talent acquisition, talent management, partner experience,
learning and development, and organization and leadership effectiveness teams. From 2014 to 2021, Ms. Kelly served as vice
president, Partner Resources, supporting partners in our global markets.
Pilar Ramos
joined Starbucks in November 2025 as executive vice president and chief legal officer. In this role, she leads the
Company’s Law & Corporate Affairs organization. Prior to Starbucks, Ms. Ramos served as Executive Vice President, General
Counsel and Corporate Secretary for TelevisaUnivision Inc., the leading Spanish-language media company, from August 2021
to October 2025. Ms. Ramos previously served in various roles for Mastercard Inc., a global payment card services company,
from 2003 to 2021, including Executive Vice President, General Counsel, North America, from 2015 to 2021.
Segment Financial Information
Segment information is prepared on the same basis that our ceo, who is our Chief Operating Decision Maker, manages the
segments, evaluates financial results, and makes key operating decisions.
We have three reportable operating segments: 1) North America, which is inclusive of the U.S. and Canada; 2) International,
which is inclusive of China, Japan, Asia Pacific, Europe, Middle East, Africa, Latin America, and the Caribbean; and
3) Channel Development. Unallocated corporate expenses are reported within Corporate and Other. Revenues from our
reportable operating segments as a percentage of total net revenues for fiscal 2025 were as follows: North America (74%),
International (21%), and Channel Development (5%).
7
Our North America and International segments include both company-operated and licensed stores. Our North America
segment is our most mature business and has achieved significant scale. Certain markets within our International operations
are in various stages of development and may require more extensive support, relative to their current levels of revenue and
operating income, than our North America operations.
Our Channel Development segment includes roasted whole bean and ground coffees, Starbucks-branded single-serve
products, a variety of ready-to-drink beverages, such as Frappuccino
®
and Starbucks Doubleshot
®
, foodservice products,
and other branded products sold worldwide outside of our company-operated and licensed stores. A large portion of our
Channel Development business operates under a licensed model of the Global Coffee Alliance with Nestlé, while our global
ready-to-drink businesses operate under collaborative relationships with PepsiCo, Inc., Nestlé, and others.
Revenue Components
We generate the majority of our revenues through company-operated stores and licensed stores.
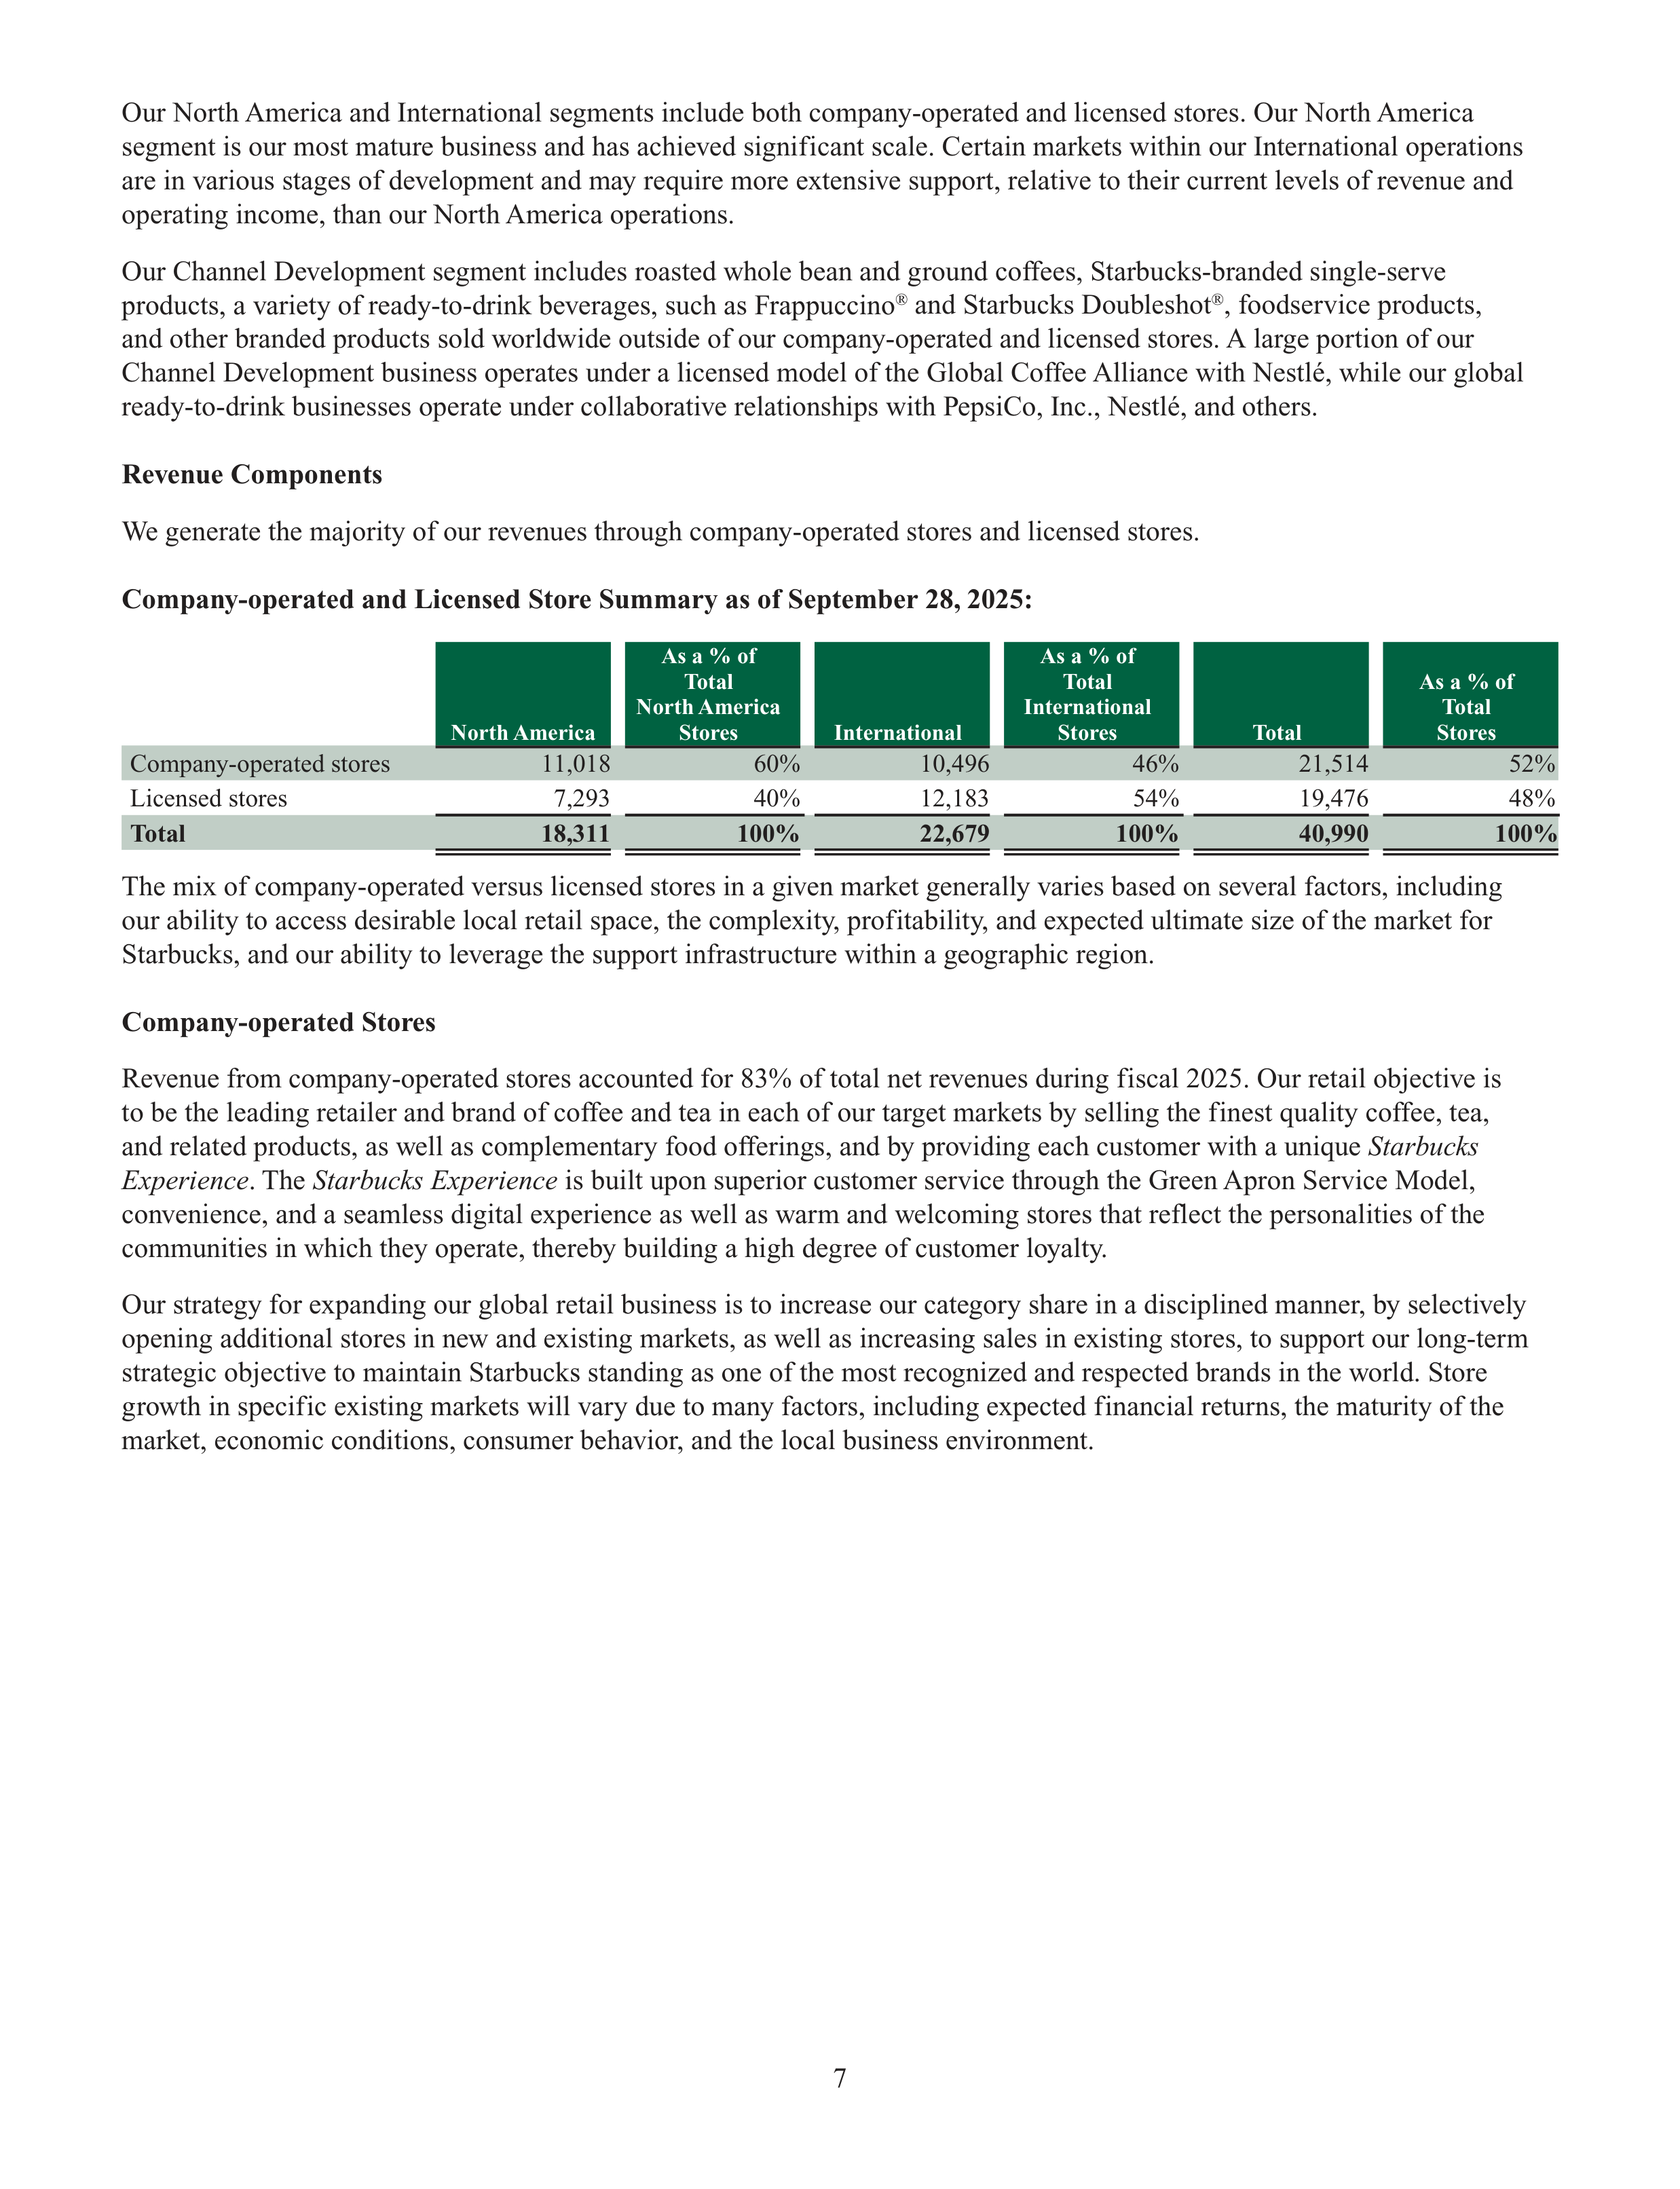
Company-operated and Licensed Store Summary as of September 28, 2025:
North America
As a % of
Total
North America
Stores
International
As a % of
Total
International
Stores
Total
As a % of
Total
Stores
Company-operated stores
11,018
60%
10,496
46%
21,514
52%
Licensed stores
7,293
40%
12,183
54%
19,476
48%
Total
18,311
100%
22,679
100%
40,990
100%
The mix of company-operated versus licensed stores in a given market generally varies based on several factors, including
our ability to access desirable local retail space, the complexity, profitability, and expected ultimate size of the market for
Starbucks, and our ability to leverage the support infrastructure within a geographic region.
Company-operated Stores
Revenue from company-operated stores accounted for 83% of total net revenues during fiscal 2025. Our retail objective is
to be the leading retailer and brand of coffee and tea in each of our target markets by selling the finest quality coffee, tea,
and related products, as well as complementary food offerings, and by providing each customer with a unique
Starbucks
Experience
. The
Starbucks Experience
is built upon superior customer service through the Green Apron Service Model,
convenience, and a seamless digital experience as well as warm and welcoming stores that reflect the personalities of the
communities in which they operate, thereby building a high degree of customer loyalty.
Our strategy for expanding our global retail business is to increase our category share in a disciplined manner, by selectively
opening additional stores in new and existing markets, as well as increasing sales in existing stores, to support our long-term
strategic objective to maintain Starbucks standing as one of the most recognized and respected brands in the world. Store
growth in specific existing markets will vary due to many factors, including expected financial returns, the maturity of the
market, economic conditions, consumer behavior, and the local business environment.
8
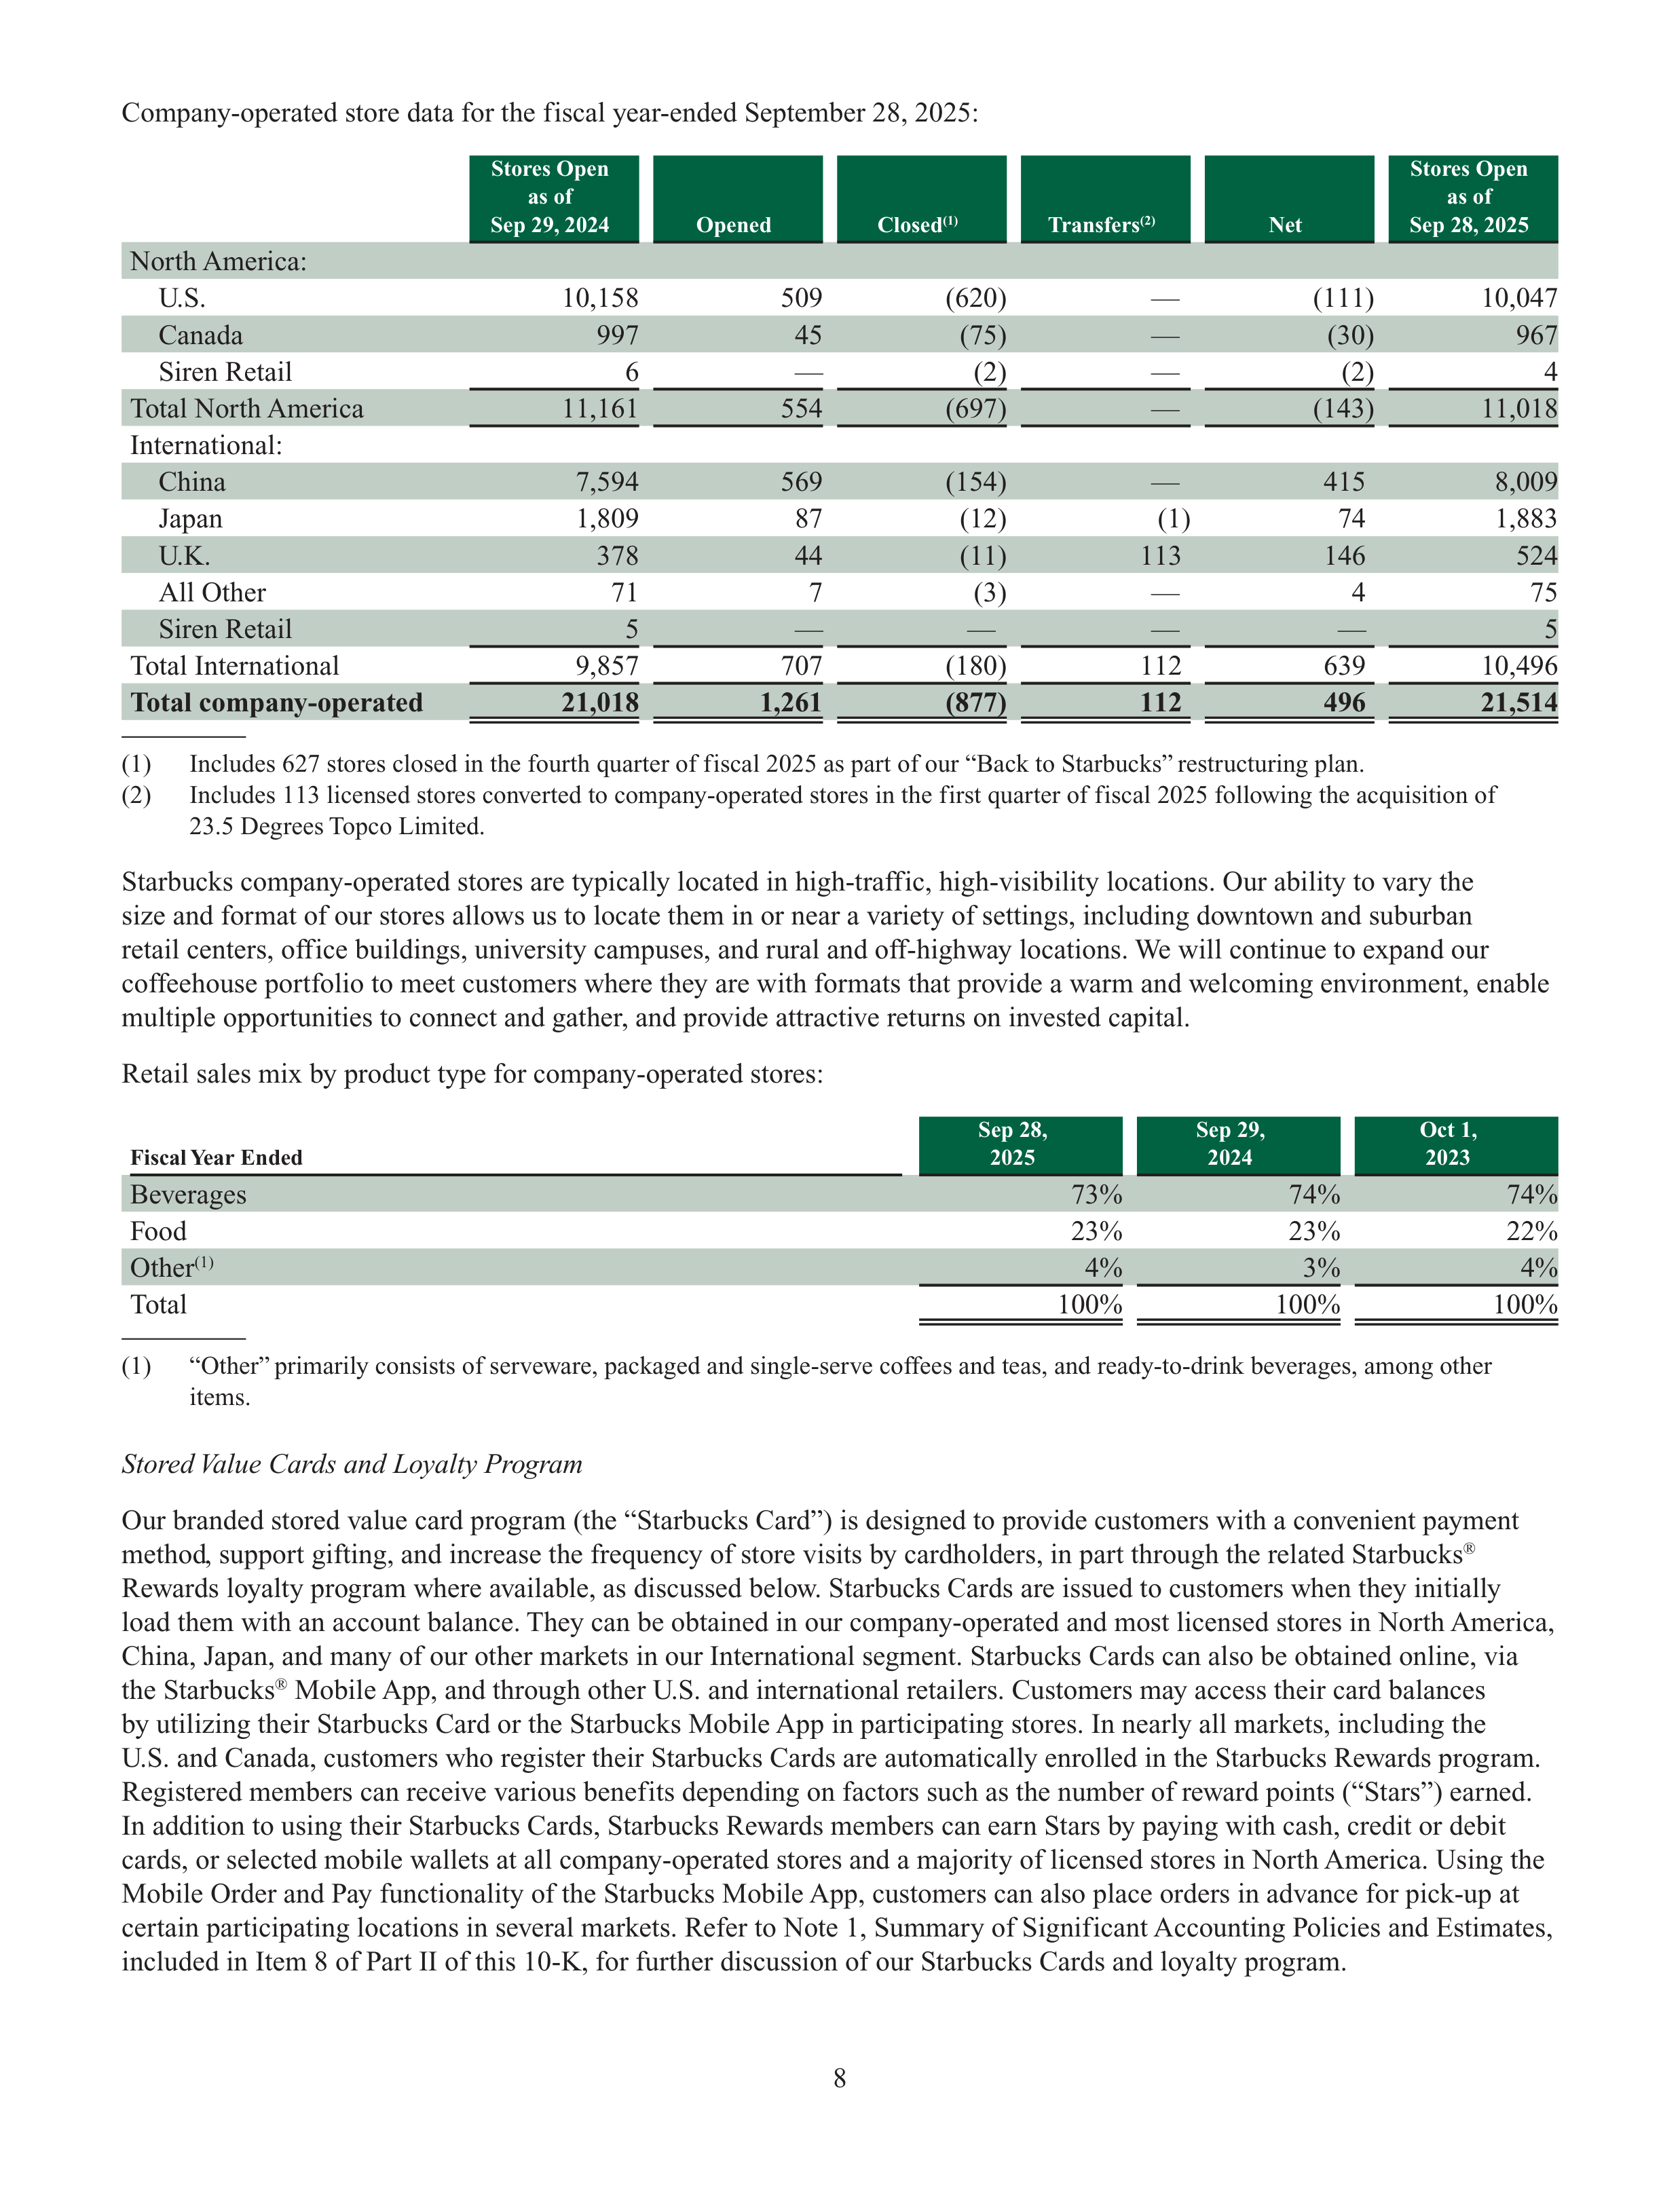
Company-operated store data for the fiscal year-ended September 28, 2025:
Stores Open
as of
Sep 29, 2024
Opened
Closed
(1)
Transfers
(2)
Net
Stores Open
as of
Sep 28, 2025
North America:
U.S.
10,158
509
(620)
—
(111)
10,047
Canada
997
45
(75)
—
(30)
967
Siren Retail
6
—
(2)
—
(2)
4
Total North America
11,161
554
(697)
—
(143)
11,018
International:
China
7,594
569
(154)
—
415
8,009
Japan
1,809
87
(12)
(1)
74
1,883
U.K.
378
44
(11)
113
146
524
All Other
71
7
(3)
—
4
75
Siren Retail
5
—
—
—
—
5
Total International
9,857
707
(180)
112
639
10,496
Total company-operated
21,018
1,261
(877)
112
496
21,514
(1)
Includes 627 stores closed in the fourth quarter of fiscal 2025 as part of our “Back to Starbucks” restructuring plan.
(2)
Includes 113 licensed stores converted to company-operated stores in the first quarter of fiscal 2025 following the acquisition of
23.5 Degrees Topco Limited.
Starbucks company-operated stores are typically located in high-traffic, high-visibility locations. Our ability to vary the
size and format of our stores allows us to locate them in or near a variety of settings, including downtown and suburban
retail centers, office buildings, university campuses, and rural and off-highway locations. We will continue to expand our
coffeehouse portfolio to meet customers where they are with formats that provide a warm and welcoming environment, enable
multiple opportunities to connect and gather, and provide attractive returns on invested capital.
Retail sales mix by product type for company-operated stores:
Fiscal Year Ended
Sep 28,
2025
Sep 29,
2024
Oct 1,
2023
Beverages
73%
74%
74%
Food
23%
23%
22%
Other
(1)
4%
3%
4%
Total
100%
100%
100%
(1)
“Other” primarily consists of serveware, packaged and single-serve coffees and teas, and ready-to-drink beverages, among other
items.
Stored Value Cards and Loyalty Program
Our branded stored value card program (the “Starbucks Card”) is designed to provide customers with a convenient payment
method, support gifting, and increase the frequency of store visits by cardholders, in part through the related Starbucks
®
Rewards loyalty program where available, as discussed below. Starbucks Cards are issued to customers when they initially
load them with an account balance. They can be obtained in our company-operated and most licensed stores in North America,
China, Japan, and many of our other markets in our International segment. Starbucks Cards can also be obtained online, via
the Starbucks
®
Mobile App, and through other U.S. and international retailers. Customers may access their card balances
by utilizing their Starbucks Card or the Starbucks Mobile App in participating stores. In nearly all markets, including the
U.S. and Canada, customers who register their Starbucks Cards are automatically enrolled in the Starbucks Rewards program.
Registered members can receive various benefits depending on factors such as the number of reward points (“Stars”) earned.
In addition to using their Starbucks Cards, Starbucks Rewards members can earn Stars by paying with cash, credit or debit
cards, or selected mobile wallets at all company-operated stores and a majority of licensed stores in North America. Using the
Mobile Order and Pay functionality of the Starbucks Mobile App, customers can also place orders in advance for pick-up at
certain participating locations in several markets. Refer to Note 1, Summary of Significant Accounting Policies and Estimates,
included in Item 8 of Part II of this 10-K, for further discussion of our Starbucks Cards and loyalty program.
9
Licensed Stores
Revenues from our licensed stores accounted for 12% of total net revenues in fiscal 2025. Licensed stores generally have
a lower gross margin and a higher operating margin than company-operated stores. Under the licensed model, Starbucks
receives a margin on branded products and supplies sold to the licensed store operator along with a royalty on retail sales.
Licensees are responsible for operating costs and capital investments, which more than offset the lower revenues we receive
under the licensed store model.
In our licensed store operations, we seek to leverage the expertise of our local partners and share our operating and store
development experience. Licensees provide improved, and at times the only, access to desirable retail space. Most licensees
are prominent retailers with in-depth market knowledge and access. As part of these arrangements, we sell coffee, tea, food,
and related products to licensees for resale to customers and receive royalties and license fees from the licensees. We also
sell certain equipment, such as coffee brewers and espresso machines, to our licensees for use in their operations. Licensee
employees working in licensed retail locations are required to follow our detailed store operating procedures and attend
training classes similar to those given to employees in company-operated stores. In a limited number of international markets,
we also use traditional franchising and include these stores in the results of operations from our other licensed stores.
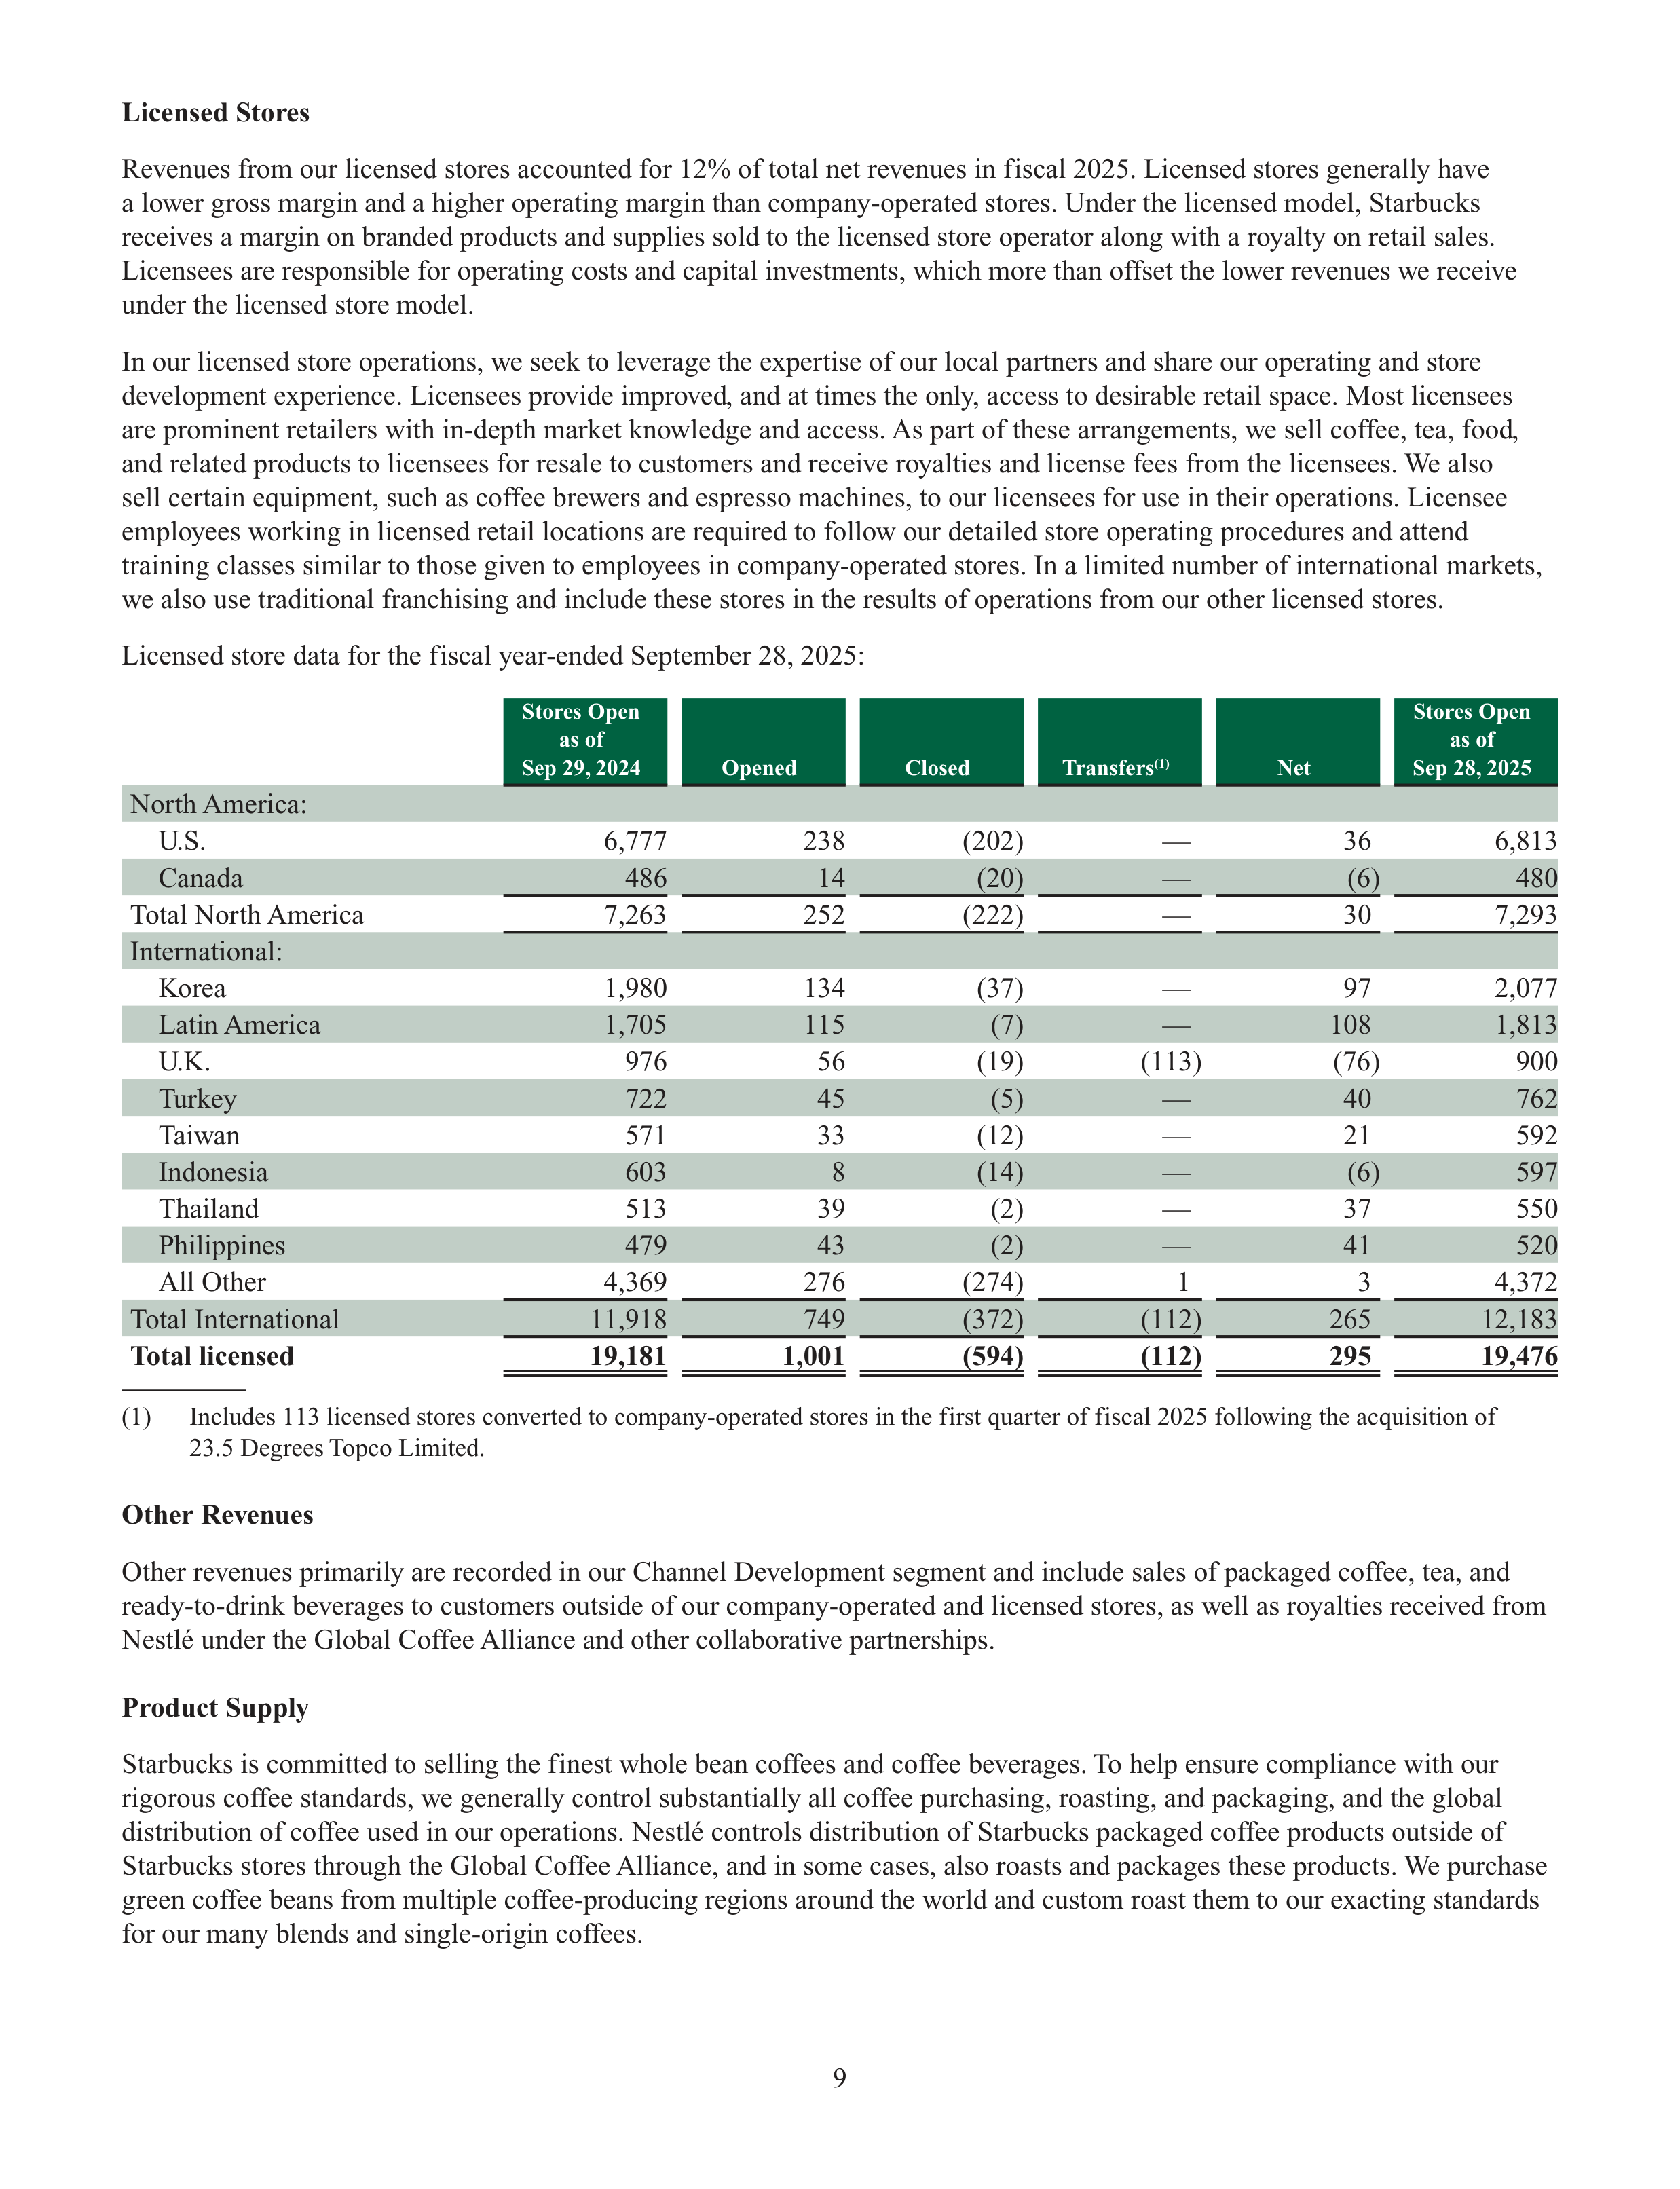
Licensed store data for the fiscal year-ended September 28, 2025:
Stores Open
as of
Sep 29, 2024
Opened
Closed
Transfers
(1)
Net
Stores Open
as of
Sep 28, 2025
North America:
U.S.
6,777
238
(202)
—
36
6,813
Canada
486
14
(20)
—
(6)
480
Total North America
7,263
252
(222)
—
30
7,293
International:
Korea
1,980
134
(37)
—
97
2,077
Latin America
1,705
115
(7)
—
108
1,813
U.K.
976
56
(19)
(113)
(76)
900
Turkey
722
45
(5)
—
40
762
Taiwan
571
33
(12)
—
21
592
Indonesia
603
8
(14)
—
(6)
597
Thailand
513
39
(2)
—
37
550
Philippines
479
43
(2)
—
41
520
All Other
4,369
276
(274)
1
3
4,372
Total International
11,918
749
(372)
(112)
265
12,183
Total licensed
19,181
1,001
(594)
(112)
295
19,476
(1)
Includes 113 licensed stores converted to company-operated stores in the first quarter of fiscal 2025 following the acquisition of
23.5 Degrees Topco Limited.
Other Revenues
Other revenues primarily are recorded in our Channel Development segment and include sales of packaged coffee, tea, and
ready-to-drink beverages to customers outside of our company-operated and licensed stores, as well as royalties received from
Nestlé under the Global Coffee Alliance and other collaborative partnerships.
Product Supply
Starbucks is committed to selling the finest whole bean coffees and coffee beverages. To help ensure compliance with our
rigorous coffee standards, we generally control substantially all coffee purchasing, roasting, and packaging, and the global
distribution of coffee used in our operations. Nestlé controls distribution of Starbucks packaged coffee products outside of
Starbucks stores through the Global Coffee Alliance, and in some cases, also roasts and packages these products. We purchase
green coffee beans from multiple coffee-producing regions around the world and custom roast them to our exacting standards
for our many blends and single-origin coffees.
10
The price of coffee is subject to volatility and has steadily increased over the past five years with significant increases over
the last two years. Although most coffee trades in the commodity market, high-altitude
arabica
coffee of the quality sought
by Starbucks tends to trade on a negotiated basis at a premium above the “C” coffee commodity price. Both the premium
and the commodity price depend upon the supply and demand at the time of purchase. Supply and price can be affected
by multiple factors in the producing countries, including weather and extreme weather events, water supply quality and
availability throughout the coffee production chain, natural disasters, crop disease and pests, general increases in farm inputs
and costs of production, inventory levels, and political and economic conditions. Climate change may further exacerbate
many of these factors. Price is also impacted by geopolitical conditions, including new and existing tariffs on coffee imports
and other trade controls, and by trading activities in the
arabica
coffee futures market, including hedge funds and commodity
index funds. In addition, green coffee prices have been affected in the past, and may be affected in the future, by the actions of
certain organizations and associations that have historically attempted to influence prices of green coffee through agreements
establishing export quotas or by restricting coffee supplies.
We buy coffee using fixed-price and price-to-be-fixed purchase commitments, depending on market conditions, to secure an
adequate supply of quality green coffee. We also utilize forward contracts, futures contracts, and collars to hedge “C” price
exposure under our price-to-be-fixed green coffee contracts and our long-term forecasted coffee demand where underlying
fixed-price and price-to-be-fixed contracts are not yet available. Total purchase commitments, together with existing inventory,
are expected to provide an adequate supply of green coffee through fiscal 2026.
We depend upon our relationships with coffee producers, outside trading companies, and exporters for our supply of
green coffee. We believe, based on the established relationship and historical performance of our suppliers, that the risk of
non-delivery on such purchase commitments is remote.
To help ensure the future supply of high-quality green coffee and to reinforce our leadership role in the coffee industry,
Starbucks operates ten farmer support centers, including our China Farmer Support Center located in the Yunnan Province of
this high-growth market. Farmer support centers are staffed with agronomists and sustainability experts who work with coffee
farming communities to promote best practices in coffee production designed to improve both coffee quality and yields as well
as agronomy support to address climate change and other impacts.
In addition to coffee, we also purchase significant amounts of dairy, particularly fluid milk, and to a lesser degree, plant-based
dairy-free alternative products, such as oat milk and almond milk, to support the needs of our company-operated stores. We
believe, based on the established relationship and historical performance of our dairy and plant-based dairy-free suppliers,
that the risk of non-delivery of sufficient fluid milk and plant-based dairy-free alternatives to support our stores generally is
remote.
Products other than whole bean coffees and coffee beverages sold in Starbucks stores include tea and a number of
ready-to-drink beverages that are purchased from several specialty suppliers, usually under long-term supply contracts. Food
products, such as pastries, breakfast sandwiches, and lunch items, are purchased from national, regional, and local sources.
We also purchase a broad range of paper and plastic products, such as cups and cutlery, from several companies to support
the needs of our retail stores as well as our manufacturing and distribution operations. We believe, based on the established
relationship and historical performance of our suppliers and manufacturers, that the risk of non-delivery of sufficient amounts
of these items generally is remote.
Competition
Our primary competitors for coffee beverage sales are specialty coffee retailers and shops. We believe that our customers
choose among specialty coffee retailers and shops primarily on the basis of product quality, brand reputation, service, and
convenience, as well as price. We continue to experience direct competition from large competitors in the quick-service
restaurant sector and the ready-to-drink coffee beverage market, in addition to both well-established and start-up companies
in many international markets. We also compete with restaurants and other specialty retailers for prime retail locations and
qualified personnel to operate both new and existing stores.
Our coffee and tea products sold through our Channel Development segment compete directly against specialty coffees and
teas sold through grocery stores, warehouse clubs, specialty retailers, convenience stores, and foodservice accounts and also
compete indirectly against all other coffees and teas on the market.
11
Trademarks, Copyrights, Patents, and Domain Names
Starbucks owns and has applied to register numerous trademarks and service marks in the U.S. and in other countries
throughout the world. Some of our trademarks, including Starbucks, the Starbucks logo, Starbucks Reserve, and Frappuccino,
are of material importance. The duration of trademark registrations varies from country to country. However, trademarks are
generally valid and may be renewed indefinitely as long as they are in use and/or their registrations are properly maintained.
We own numerous copyrights for items such as product packaging, promotional materials, in-store graphics, and training
materials. We also hold patents on certain products, systems, and designs, which have an average remaining duration of
approximately fifteen years. In addition, Starbucks has registered and maintains numerous Internet domain names, including
“Starbucks.com,” “Starbucks.net,” and “Starbucksreserve.com.”
Seasonality and Quarterly Results
Our business is subject to moderate seasonal fluctuations, of which our second fiscal quarter typically experiences lower
revenues and operating income. Additionally, as Starbucks Cards are issued to, and loaded by, customers during the holiday
season, we tend to have higher cash flows from operations during the first quarter of the fiscal year. However, since revenues
from Starbucks Cards are recognized upon redemption and not when cash is loaded onto the Starbucks Cards, the impact of
seasonal fluctuations on the consolidated statements of earnings is much less pronounced. As a result of moderate seasonal
fluctuations, results for any quarter are not necessarily indicative of the results that may be achieved for the full fiscal year.
Government Regulation
As a company with global operations, we are subject to the laws and regulations of the United States and the multiple foreign
jurisdictions in which we operate as well as the rules, reporting obligations, and interpretations of all such requirements and
obligations by various governing bodies, which may differ among jurisdictions. In addition, changes to such laws, regulations,
rules, reporting obligations, and related compliance obligations could result in significant costs but are not expected to have a
material effect on our capital expenditures, results of operations, and competitive position as compared to prior periods.
Available Information
Starbucks Annual Report on Form 10-K reports, along with all other reports and amendments filed with or furnished to the
SEC, are publicly available free of charge on the Investor Relations section of our website at
investor.starbucks.com
as soon as
reasonably practicable after these materials are filed with or furnished to the SEC. In addition, the SEC maintains an internet
site that contains reports, proxy and information statements, and other information regarding issuers that file electronically
with the SEC at
www.sec.gov
. Our corporate governance policies, code of ethics, and Board committee charters and policies
are also posted on the Investor Relations section of our website. We also use the Investor Relations section of our website
and our social media channels as tools to disclose important information about the Company and comply with our disclosure
obligations under Regulation Fair Disclosure. We encourage investors and others to review the information we make public
on the Investor Relations section of our website and our social media channels, as such information could be deemed material
information. The information on our website (or any webpages referenced in this Report) or our social media channels is
not part of this or any other report Starbucks files with, or furnishes to, the SEC, and all website addresses in this report are
intended to be inactive textual references only.
Item 1A.
Risk Factors
You should carefully consider the risks described below in addition to the other information set forth in this Annual Report
on Form 10-K, including the Management’s Discussion and Analysis of Financial Conditions and Results of Operations
section, the Quantitative and Qualitative Disclosures About Market Risk section, the Controls and Procedures section, and
the consolidated financial statements and related notes. The risks described below are not the only risks facing the Company.
The following risks, some of which have occurred and any of which may occur in the future, could materially and adversely
affect our current and future business and financial performance. Risks and uncertainties not currently known to us or that we
currently deem to be immaterial also may materially adversely affect our business, financial condition, and operating results.
12
Risks Related to Brand Relevance and Brand Execution
Our success depends substantially on the value of our brand, and failure to preserve its value could have a negative impact
on our financial results.
The Starbucks brand is recognized throughout most of the world, and we have received high ratings in global brand value
studies. To be successful in the future, we believe we must preserve, grow, and leverage the value of our brands across all sales
channels.
Various factors, events, or conditions may result in a diminution or erosion of trust in our brand value. Adverse developments
pertaining to the matters discussed elsewhere in this risk factors section may negatively impact the value of our brands. Such
developments may include difficulties executing strategic initiatives, adapting to shifting consumer preferences, or managing
global operations, and challenges stemming from macroeconomic volatility, supply chain pressures and disruptions, or an
evolving competitive, regulatory, social, and geopolitical landscape. The impact of such developments on the value of our
brands may be exacerbated if they receive considerable publicity or if they result in litigation. The value of our brands may be
affected by actual or perceived developments, whether isolated or recurring, whether the result of actions by us or our business
partners or the result of external developments, and whether such developments are in our control. Negative commentary about
Starbucks, even if inaccurate or malicious, has in the past, and could in the future, damage the value of our brand, and adverse
impacts may be compounded by social media, video-sharing, and messaging platforms that could dramatically increase the
speed with which negative publicity may be disseminated, often before we have a meaningful opportunity to investigate,
respond to, and address an issue. In addition, we cannot ensure that our store partners, licensees, or other business partners
will not act or refrain from acting in a manner that adversely affects the value and relevance of our brand. Because brand
value is based in part on consumer perceptions on a variety of subjective qualities, it may be difficult to address developments
negatively impacting the value of our brands in a timely and effective manner to mitigate harm.
The diminution of, or erosion of trust in, our brand value may have negative consequences for the Company. Consumer
demand for our products and our brand value could diminish significantly if we or our employees, licensees, or other business
partners fail to preserve the quality of our products, or act, or are perceived to act, in an unethical, illegal, or otherwise
inappropriate manner. To the extent third parties object to actions or positions taken or perceived to have been taken by us,
it may generate negative sentiment around our business. Developments affecting the value of our brands have in the past,
and may in the future, trigger boycotts of our stores, products, and brand. Each of these consequences, individually and
collectively, could have potentially material impacts on our brand value, business performance, and financial results.
We may not be successful in our brand, marketing, promotional, advertising, and pricing strategies.
Our continued success depends on our ability to adapt brand, marketing, promotional, advertising, and pricing strategies
to shifting economic conditions, competitive pressures, and evolving customer preferences. We operate in a complex and
costly marketing environment. Decisions to collaborate or refrain from collaborating with certain parties may impact our
brand image and, consequently, our financial performance. Our programs may not always reach consumers as intended,
particularly given the wide range of generational, geographical, cultural, and socioeconomic characteristics and channels
of communication used by our customers, and effective resource allocation across channels, including digital, is critical.
Additionally, factors such as operating costs, competitor strategies, and inflation may affect our pricing decisions, which could
impact demand. For example, there is no guarantee future cost increases will be absorbed by customers. If our marketing
or pricing strategies underperform relative to competitors, our sales and market share could decline. Likewise, if we do not
continuously strengthen our capabilities in marketing, data analytics (including artificial intelligence and machine learning)
and innovation to understand and maintain or grow consumer interest, brand loyalty, and market share while strategically
expanding into other profitable categories of the commercial beverage industry, our business could be negatively affected.
Risks Related to Our Business
We may not be successful in implementing important strategic initiatives (including our restructuring plan), effectively
managing growth, or executing strategic transactions, any of which may have an adverse impact on our business and
financial results.
We may not be able to implement important strategic initiatives in accordance with our expectations or that generate expected
returns, which may result in an adverse impact on our business and financial results. In conjunction with our broader Back
to Starbucks plan, these strategic initiatives are designed to create growth, improve our results of operations, and drive
13
long-term shareholder value. Such initiatives include improving our service model, and further transforming our non-retail
support organization; enhancing partner investment to improve customer experience; closing, renovating, and redesigning
coffeehouses; strengthening our leadership in coffee; expanding digital engagement through mobile, loyalty, delivery, and
international platforms; simplifying store operations; and responsibly growing our global footprint. We have in the past
and may in the future undertake restructuring initiatives, which have resulted, and may continue to result, in the incurrence
of significant additional costs, and our ability to achieve the anticipated cost savings and other benefits from these actions
is subject to many estimates and assumptions, which are subject to uncertainties. Such initiatives may be disruptive both
internally and to our customers and may be viewed negatively by our stakeholders.
We undertake these initiatives in the context of ongoing efforts to adapt to shifting consumer behaviors amid economic
volatility, optimize our mix of licensed and company-operated stores, expand relevant product offerings across dayparts,
and drive growth in cold beverages and Channel Development partnerships, while also advancing appropriate sustainability
efforts, managing climate-related risks, and reducing operating costs. Risks to successful and timely implementation of these
initiatives include delays or cancellations of store openings due to labor or material shortages, permit procurement issues,
or lack of suitable real estate; supply chain scalability and sustainability challenges; underperformance or delays in product
innovation; remodel disruptions or cost overruns; coordination and execution challenges; failure to realize cost savings;
increased taxation; regulatory constraints, including public health mandates; credit rating deterioration; and geopolitical
instability. If these initiatives fail to deliver expected results or we do not fully realize their intended benefits, our financial
performance may suffer. Additionally, prioritizing these efforts over other organizational needs or misallocating resources
could materially impact our business and operating results.
Managing growth — particularly in international markets — requires balancing local autonomy with consistency in our goals,
policies, and standards. Ineffectively balancing these imperatives could materially harm our business results and financial
performance.
Furthermore, we may be unsuccessful in implementing strategic initiatives through large acquisitions, integrations,
divestitures, partnerships, joint ventures, or other strategic transactions. If we are unable to complete such transactions or
successfully integrate and develop acquired businesses, including the effective management of integration activities, we could
fail to achieve the expected increases in revenues and operating results or the anticipated synergies and cost savings. In the
past we have been, and in the future we may be, unable to realize the expected benefits of strategic transactions, or it may also
take longer than expected to realize the expected benefits. This has in the past required, and may in the future require, us to
assess potential impairment of assets, including goodwill and intangibles. Any resulting impairment charges could materially
affect our financial results.
Evolving consumer preferences and tastes, as well as adverse public or medical opinions about the health effects of
consuming our products, may adversely affect our business.
Our success depends on attracting and retaining customers. Financial performance may be adversely affected by reduced
discretionary spending, lack of acceptance of new products, brands, or platforms, or declining demand for existing offerings.
We have previously been, and may in the future be, unable to accurately predict consumer demand for our products. This has
resulted, and may in the future result, in insufficient or excess inventory, increased inventory markdowns, and higher costs.
Any of these outcomes could adversely affect our results of operations and financial condition.
Additionally, health concerns related to ingredients such as caffeine, dairy, sugar, or allergens — whether accurate or
not — along with increased litigation, regulation and regulatory scrutiny, or taxes on certain food components, ingredients,
or additives, could reduce demand and harm our results. Shifts in consumer behavior, including dietary changes or use of
weight-loss drugs, may also impact sales.
If our business partners and third-party providers do not satisfactorily fulfill their responsibilities and commitments, it
could damage our brand, and our financial results could suffer.
Our global business strategy, including our plans for new stores, branded products, and other initiatives, relies significantly on
a variety of business partners, including licensees, joint venture partners, third-party manufacturers, distributors, and retailers,
particularly for our entire global Channel Development business. These partners are often authorized to use our logos and
deliver branded products directly to customers. To maintain consistent customer experience, we provide training and oversight
to certain partners; however, factors beyond our control — such as financial instability, labor shortages, or noncompliance
with sanitation protocols — may affect the quality of their service and products. We do not have direct control over these
partners and may lack visibility into their operations.
14
We source products from a broad network of domestic and international business partners, and in some cases, licensees source
products independently. We do not monitor the quality of non-Starbucks products served by authorized foodservice operators.
Failures by business partners to comply with applicable laws or meet brand standards may negatively impact our business.
Additionally, inconsistent use or inadequate protection of our brand and intellectual property could erode consumer trust and
materially affect our financial results.
Reported incidents involving food- or beverage-borne illnesses, tampering, adulteration, contamination, or mislabeling,
whether or not accurate, could harm our business.
We may experience food or beverage-safety incidents such as contamination, mislabeling, or adulteration during any stage
of production or preparation. We rely on third-party suppliers for many of our ingredients and finished products. A failure to
meet quality standards — even if due to factors beyond our control — could result in public exposure, regulatory scrutiny or
action, litigation (including product liability claims and class actions), or temporary store closures, which could materially
harm our business. Additionally, clean water is essential for beverage preparation, and access may be limited in certain
international markets. As we expand our offerings requiring temperature control, the risk of food-safety incidents increases
if proper conditions are not maintained due to mechanical failure or human error. Such incidents may harm our brand and
reputation and could negatively impact our business and financial performance.
Reports — whether accurate or not — of food- or beverage-safety issues such as contamination, mislabeling, or adulteration
during any stage of production or preparation have historically harmed the reputations of companies in our industry. Any
perceived association with such incidents, even if unfounded, could harm our reputation and materially impact our business
and financial performance. Food-safety incidents involving competitors or shared suppliers, even if unrelated to Starbucks,
could generate negative publicity and impact our sales regionally or globally. In addition, real or perceived concerns about
food safety issues, such as phthalates, per- and polyfluoroalkyl substances (PFAS), microplastics or heavy metals in the
U.S. food supply chain, could impact consumers’ confidence in our offerings. Confirmed food-safety issues may also result in
product recalls. A widespread product recall could lead to significant financial losses from recall costs, inventory destruction,
lost sales, and reputational damage. Declines in customer traffic due to safety concerns, negative publicity, or store closures
could adversely affect our operations.
If we are unable to meet our projections for new store openings or efficiently maintain the attractiveness of our existing
stores, our operating results could suffer.
Our growth depends in part on our ability to open new stores and operate them profitably within projected timelines. Store
development costs have risen due to construction labor inflation and increased material and equipment expenses. Each new
store involves substantial startup costs and a ramp-up period during which profitability may be delayed as we train partners
and build a customer base. If we fail to attract sufficient customers or offset higher startup costs, new stores may underperform
relative to existing ones.
Store development is subject to risks including site selection, lease negotiations, permitting and regulatory compliance,
contractor availability, labor and material costs, and external disruptions such as weather events, natural disasters, or
pandemics. We also face competition for prime locations, contractors, and qualified personnel. Additionally, new stores
may cannibalize sales from nearby existing locations. Failure to manage these risks could result in increased costs and
lower-than-expected sales and earnings, materially affecting our operating results.
We also invest in remodeling and maintaining existing stores. If costs exceed projections, closures last longer than planned, or
remodeled stores underperform, we may not achieve expected returns, which could negatively impact our financial results.
Risks Related to Operating a Global Business
We are highly dependent on the financial performance of our North America operating segment.
Our financial performance is heavily reliant on our North America operating segment, which accounted for approximately
74% of total net revenues in fiscal year 2025. A slowdown or decline in this segment — particularly in the U.S. — has in the
past, and could in the future, materially impact our overall business, as other segments may not offset the shortfall. Given its
maturity and role as the primary source of operating cash flow, reduced performance in North America could limit our ability
to fund international expansion, strategic initiatives, and shareholder returns.
15
We are dependent on the performance of licensed and company-owned international markets to achieve our growth targets.
The International segment is a critical profit center. Achievement of our growth targets is partially dependent on sustained
performance and growth internationally, particularly in the markets operated by our larger regional licensees and in key
company-owned markets outside North America. If one or more of these international markets fail to achieve stable revenues
and earnings — due to economic downturns or other factors — our consolidated results could be materially impacted.
In addition to the risks that apply to our business generally, wherever conducted, our International business may also be subject
to certain additional risks and risks that take on a different magnitude or character in the context of our international business.
Success in international markets can depend on factors distinct from those in the U.S., including regional taste preferences,
varying consumer acceptance of our products, and differing regulatory regimes across markets. International operations
may also face higher occupancy and operating costs due to elevated rents and regulatory compliance. Finally, because many
markets are in earlier development stages, operating expenses as a percentage of revenue tend to be higher than in more
established markets. Each of these factors present risks to our business performance and financial results.
We face risks as a global business that could adversely affect our financial performance.
Operating in 89 global markets, we face diverse cultural, regulatory, geopolitical, and economic environments. Our success
depends on navigating these differences effectively and leveraging operational strengths across markets. However, planned
initiatives may not resonate uniformly with customers and could lead to unexpected shifts in perception or market share. Our
international operations are also subject to additional inherent risks of conducting business abroad, such as:
•
Uncertainty in economic, legal, regulatory, social, and political conditions, including rising anti-American
sentiment in certain markets;
•
Governmental trade and investment restrictions, such as tariffs, export duties, ownership limits, and favoritism
toward local competitors;
•
Economic or trade sanctions limiting product sourcing or business operations;
•
Delays in store openings due to external factors, competition, or limited access to affordable real estate, potentially
impacting financial performance;
•
Operational and supply chain challenges abroad, including staffing, logistics, product consistency, and cultural or
language barriers;
•
Slower-than-expected growth in disposable income in developing economies;
•
Complex and varying interpretations of laws and regulations, including those related to taxes, labor, privacy, and
responsible business matters;
•
Local employment laws increasing the cost and complexity of hiring and termination;
•
Labor disruptions due to geopolitical instability or social unrest;
•
Health and safety regulations affecting store operations;
•
Challenges in enforcing intellectual property and contract rights;
•
Foreign currency fluctuations and restrictions on currency use or fund repatriation; and
•
Licensing and import requirements that may hinder business operations.
Moreover, many of the foregoing risks are particularly acute in developing markets, which are important to our long-term
growth prospects. An inability to effectively manage the risks associated with our international operations could adversely
affect our business performance and financial results.
16
Our reliance on key business partners may adversely affect our business and operations.
Our growth depends on the ability of licensee partners to execute our strategies and implement our growth platforms and
product innovations. Success also relies on negotiating, maintaining, and enforcing commercial agreements, and on partner
performance under those agreements. International licensees may face legal or financial constraints that limit expansion. Our
Channel Development business is heavily reliant on Nestlé, which holds global rights to distribute certain Starbucks branded
packaged goods. If Nestlé fails to meet its obligations or support our brand, it could materially impact Channel Development
and our overall financial results. Additionally, our retail licensed operations are concentrated among a few large licensees, and
their inability to access capital or grow effectively, including their inability to meet store development and renovation targets,
could adversely affect performance in key markets. A failure by any of our large regional licensees or Channel Development
business partners to grow the relevant Starbucks business, or otherwise perform its obligations under agreements with us,
could adversely affect our performance. We may not have the ability to offset such poor performance or non-performance in
the markets or verticals into which these parties extend Starbucks brand. Likewise, if we are unable to maintain and grow our
relationships with these licensees and business partners, it could adversely affect our business performance and financial results.
Risks Related to Supply Chain
Increases in the cost of high-quality arabica coffee beans or other commodities or decreases in the availability of
high-quality arabica coffee beans or other commodities could have an adverse impact on our business operations and
financial results.
The availability and price of coffee beans and other commodities are highly volatile. We purchase, roast, and sell high-quality
arabica coffee, which typically trades at a premium above the “C” commodity price. This premium varies based on supply
and demand and can significantly impact our ability to secure fixed-price contracts. We often enter supply agreements with
defined quality, quantity, and delivery terms, but with pricing tied to future “C” market rates.
Coffee supply and pricing are influenced by factors in producing countries, including weather and extreme weather events,
water availability, natural disasters, crop disease, input costs, inventory levels, political and economic conditions, and
actions by organizations seeking to influence global prices. Climate change may intensify these risks — for example,
droughts or frosts in Brazil have in the past driven price increases. Speculative trading also contributes to volatility. Tariffs
have also affected, and in the future may affect, our costs to procure coffee. Given coffee’s central role in our operations
and our limited ability to fully hedge against price increases, rising costs or supply shortages could materially impact our
profitability and ability to meet customer demand. We supply strategic products, including coffee, to our licensees, and we
may have limited ability to pass along increased costs.
We also rely on significant quantities of dairy products and plant-based alternatives, such as oat and almond milk, as well
as other commodities including tea, cocoa, produce, meats, eggs, energy, and packaging materials. Price increases or supply
disruptions — whether due to shortages, processing delays, tariffs, or other factors — could materially affect our profitability,
particularly in international markets.
Our supply chain may be unable to fully support current and future business needs.
Even without acute disruptions, our supply chain may not fully meet current or future business needs. We cannot guarantee
that suppliers will support our growth or continue providing products at current volumes or favorable prices and other terms.
Delays or cost inefficiencies in supply could impair growth and adversely affect our business, financial condition, and results.
Inaccurate sales forecasting or insufficient inventory may lead to expedited shipping costs, stockouts, and diminished customer
and partner satisfaction. Conversely, overestimating demand — especially for new products — can result in inventory
write-offs. Failure to scale and improve forecasting, planning, production, and logistics could frustrate customers, reduce sales,
and harm our brand reputation.
We are subject to risks from changes to the trade policies and tariff and import/export regulations by the U.S. and other
foreign governments.
Changes in the import and export policies, including trade restrictions such as new, increased, threatened, or retaliatory tariffs
or quotas, embargoes, sanctions and countersanctions, safeguards, or customs restrictions by the U.S. and foreign governments,
have in the past required, and could in the future require, us to change the way we conduct business and such changes have in
the past adversely affected, and could in the future adversely affect, our financial condition, results of operations, reputation,
17
and our relationships with customers, suppliers, and employees in the short- or long-term. It may be time-consuming and
expensive for us to alter our business operations to adapt to or comply with any such changes. Likewise, changes in laws
and policies governing foreign trade, manufacturing, development, and investment in the territories or countries where we
currently sell our products or conduct our business could adversely affect our business.
Interruption of our supply chain and our reliance on suppliers could affect our ability to produce or deliver our products
and could negatively impact our business and profitability.
Any material disruption to our supply chain — such as the loss of a roasting plant, logistics interruptions, trade restrictions,
pandemics, labor shortages, natural disasters, or geopolitical conflicts — could materially impact our business and profitability.
We rely on a broad network of domestic and international suppliers to provide high-quality products in compliance with
applicable laws, and in certain cases, products are sourced by our licensees directly. As we update our fresh and prepared food
offerings, sourcing from regions with limited infrastructure or political instability may present additional challenges. For certain
products, we depend on a limited number of suppliers, and their failure to meet our standards, deliver on time, or comply with
regulations — factors often beyond our control — could materially harm our operations and financial results.
Risks Related to Macroeconomic Conditions
Our financial condition and results of operations have been, and may continue to be, adversely affected by a number of
macroeconomic and other factors, many of which are largely outside our control.
As a retailer reliant on discretionary spending, our financial results are sensitive to macroeconomic conditions. A prolonged
downturn or slow recovery may reduce consumer spending, leading to lower demand or shifts to lower-priced products. Factors
such as job loss, inflation, interest rate changes, taxation, credit access, public health crises, trade disputes, and geopolitical
instability can all impact consumer behavior, including spending and routines, potentially affecting demand for our products.
Reduced customer traffic or transaction value without corresponding cost reductions could pressure margins. If economic
uncertainty persists, consumers may adopt lasting changes in spending habits, potentially affecting our sales, profitability, and
growth plans.
Our operating results have been, and will continue to be, subject to a number of other macroeconomic and other factors, many
of which are largely outside our control. Any one or more of the factors listed below could have a material adverse impact on
our business, financial condition, or results of operations:
•
Rising real estate costs in certain domestic and international markets;
•
Supply chain disruptions;
•
Climate change and extreme weather affecting input costs and availability;
•
Changes in tax laws and government regulations, such as the One Big Beautiful Bill Act, enacted in the U.S. in
July 2025;
•
Adverse litigation outcomes;
•
Inflation and interest rate fluctuations;
•
Natural or man-made disasters disrupting major markets;
•
Government shutdowns and election-related impacts globally, including regime change and political and civil
unrest;
•
Terminations of, or changes in, existing trade agreements among the countries in which we operate;
•
Tariffs imposed on commodities or goods, including recent tariffs imposed or threatened to be imposed by the
U.S. on other countries, and any retaliation measures taken by such countries;
•
Labor unrest, geopolitical instability, terrorism, anti-American sentiment, or public health crises — especially in
key markets; and
•
Foreign currency exchange rate volatility.
18
A disruption in the credit markets or a downgrade of our current credit rating could increase our future borrowing costs and
impair our ability to access capital and credit markets on terms commercially acceptable to us, which could adversely affect
our liquidity and capital resources or significantly increase our cost of capital. Furthermore, unfavorable economic conditions
could also adversely affect our suppliers and licensees, who in turn could experience cash flow problems, more costly or
unavailable financing, credit defaults, and other financial hardships. This could lead to supplier or licensee insolvency,
increase our bad debt expense, or cause us to increase the levels of unsecured credit that we provide to suppliers and licensees.
Additionally, the insolvency of any of our licensees could result in disrupted operations or our exit from a particular market
and negatively impact our reputation.
Failure to meet market expectations for our financial performance or any announced guidance will likely adversely affect
the market price and increase the volatility of our stock, and fluctuations in the stock market as a whole may also impact
the market price and volatility of our stock.
We have in the past failed, and may in the future fail, to meet announced guidance or market expectations, which has adversely
affected, and could in the future adversely affect, the market price of our stock. Any guidance we provide is based on certain
assumptions, which may or may not prove to be correct. Failure to meet announced guidance or market expectations going
forward, particularly with respect to our operational and financial results, shareholder returns, and expectations regarding the
success of our Back to Starbucks plan and related guidance, whether due to our assumptions not being met or the impact of
various risks and uncertainties, will likely result in either or both a decline in or increased volatility in the market price of our
stock. In addition, price and volume fluctuations in the stock market as a whole may affect the market price of our stock in
ways that may be unrelated to our financial performance.
Risks Related to Human Capital
The loss of key personnel, difficulties with recruiting and retaining qualified personnel, or ineffectively managing changes
in our workforce could adversely impact our business and financial results.
Much of our future success depends on the continued availability and service of key personnel and employees. The loss of
any of our executive officers, including our chief executive officer or other key senior management personnel, could harm
our business. Our success also depends substantially on the contributions and abilities of our retail store employees we rely
on to give customers a superior in-store experience and elevate our brand. Accordingly, our performance depends on our
ability to recruit and retain high-quality management personnel and other employees to work in and manage our stores, both
domestically and internationally. Our ability to do so has been and may continue to be impacted by challenges in the labor
market (which has experienced, and may continue to experience, wage inflation and labor shortages), our position with respect
to unions and the unionization of partners, increased employee turnover, changes in availability of our workforce, and shifts
in remote or hybrid work arrangements. Our ability to attract and retain corporate, retail, and other personnel is also acutely
impacted in certain international and domestic markets where the competition for a relatively small number of qualified
employees is intense or in markets where large high-tech companies are able to offer more competitive salaries and benefits.
These factors and others have also made, and may continue to make, it more difficult to maintain an effective system of
operational internal controls for a dispersed workforce, and to train partners to deliver a consistently high-quality product and
customer experience.
Additionally, there is intense competition for qualified technology systems developers, who are necessary to develop and
implement new technologies for our growth initiatives, including increasing our digital relationships with customers. If we
are unable to recruit, retain, and motivate employees sufficiently to maintain our current business and support our projected
growth, our business and financial performance may be adversely affected.
Changes in the availability and cost of labor could adversely affect our business.
Our business could be adversely impacted by increases in labor costs, including wages and benefits, which, in a retail business
such as ours, are two of our most significant costs, both domestically and internationally. Such increases could be triggered
by state and federal legislation and regulatory actions regarding wages, scheduling, and benefits; increases in healthcare and
workers’ compensation insurance costs; and increases in wages and costs of other benefits necessary to attract and retain
high-quality employees with the right skill sets. For example, at the federal level, effective July 1, 2024, the United States
Department of Labor increased the minimum salary threshold requirements for employees who are exempt from the Fair Labor
Standards Act overtime requirements, and at the state level, Assembly Bill 1228 increased minimum wage and established
working hour and working condition standards for certain partners in California. These changes, along with others that may
19
occur in the future, could have a significant impact on the classification of employees as being exempt from overtime and
add to our labor costs. The growth of our business can make it increasingly difficult to locate and hire sufficient numbers of
employees, to maintain an effective system of operational internal controls for a globally dispersed enterprise, and to train
employees worldwide to deliver a consistently high-quality product and customer experience; the failure to do so could
materially harm our business and results of operations. Furthermore, we have experienced, and could continue to experience, a
shortage of labor for store positions, and the increased availability of alternative telecommuting employment options by other
employers could decrease the pool of available qualified talent for other key functions. In addition, our wages and benefits
programs may be insufficient to attract and retain the best talent.
Starting in September 2021, Starbucks partners at a number of company-operated stores sought union representation through
elections conducted by the National Labor Relations Board. Unions have secured representation rights at around 6% of our
more than 10,000 U.S. company-operated stores, with potentially more to follow, and Starbucks has been engaged in collective
bargaining for initial collective bargaining agreements for these stores. If we encounter difficulties negotiating collective
bargaining agreements, are unsuccessful in those efforts, or obtain contracts with unfavorable terms, then we could incur
additional costs, change our employee culture, decrease our flexibility, and increase our operational complexity. These risks
could also present the potential to disrupt our current operational model by affecting our ability to fully implement operational
changes to enhance our efficiency and adapt to changing business needs.
The law places limitations on unilateral actions taken with respect to employees who are represented by unions because, in
certain circumstances, the law requires the employer to notify and to bargain with the union prior to making certain operational
or other changes that may affect employee wages, hours, or other terms and conditions of employment. Moreover, where a
petition for representation has been filed by a union, the employer is also constrained from making changes in wages, hours,
and working conditions. These limitations could also negatively affect our costs, change our employee culture, decrease our
flexibility, and increase our operational complexity. They also present the potential to disrupt our current operational model by
affecting our ability to fully implement operational changes to enhance our efficiency and adapt to changing business needs.
Moreover, we have experienced work stoppages and other disruptions caused by union activities or organizing efforts in some
company-operated stores. Such work stoppages and other disruptions have the potential to negatively impact our operations,
third-party providers upon whom we rely to deliver product, our sales and customer flow in impacted locations, our costs, and
can also have a negative impact on our reputation and brand.
Additionally, while we respect the rights of partners to organize, our position with respect to unions and the unionization of
partners could negatively impact how our brand is perceived and could have material adverse effects on our business, including
on our financial results. These positions could also expose us to legal risk, causing us to incur costs to defend legal and
regulatory actions, potential penalties and restrictions, and reputational harm.
Risks Related to Competition
We face intense competition in each of our channels and markets, which could lead to reduced profitability.
The specialty coffee market is highly competitive across product quality, innovation, service, convenience (e.g., delivery
and mobile ordering), and price. We face increasing competition in all channels and markets and do not hold leadership
positions in every segment. In the U.S., large quick-service competitors offering coffee, tea, and other competitive products
may reduce customer traffic and transaction value. Globally, competition from established brands, new entrants, and smaller
specialty operators may hinder growth and impact sales. Furthermore, our competitors may attempt to gain market share by
offering products at prices at or below those typically offered by our company, which may require us to increase spending on
advertising and promotions and/or reduce prices.
In packaged coffee, tea, and ready-to-drink segments, competition from well-funded players may affect Channel Development
profitability.
Our ability to compete depends on product improvement and innovation, pricing, customer experience, and strategic
investments in store development, technology, and digital engagement. If we are unable to respond to consumer demand for
healthy beverages and foods, or our competitors respond more effectively, this could have a negative effect on our business.
However, our competitive strategies may not always succeed and could have unintended consequences. Declines in consumer
demand — due to shifting preferences, economic pressures, or changes in routines — could also negatively affect our
business.
20
Risks Related to Responsible Business Matters
Climate change may have an adverse impact on our business.
We recognize that climate-related risks are inherent to global business operations. Climate change can affect the supply
and pricing of coffee and other non-coffee inputs due to weather volatility, water scarcity, and other environmental factors
in producing regions. It may also impact water availability across our supply chain and markets. Operating in 89 global
markets, our properties and operations are increasingly vulnerable to extreme weather events — such as wildfires and
droughts — which may disrupt operations, close stores, affect customers and suppliers, and increase costs, potentially resulting
in financial losses.
Our business is subject to evolving corporate governance and public disclosure regulations and expectations, including
with respect to responsible business matters, that could expose us to numerous risks.
We are subject to evolving and increasingly complex laws and regulations from various authorities and regulatory bodies.
These rules — often inconsistent across jurisdictions — can increase compliance uncertainty and administrative costs.
Additionally, growing stakeholder focus on responsible business matters has led to heightened expectations and regulatory
requirements, such as extended producer responsibility obligations that relate to our product packaging, the EU’s Corporate
Sustainability Reporting Directive, or the state of California’s new climate change disclosure requirements. The evolving
obligations may increase compliance costs and the risk of noncompliance.
Implementing responsible business initiatives and reporting progress can be costly, complex, and subject to evolving standards,
assumptions, and internal controls. Public disclosures may be criticized for accuracy or completeness, and previously reported
data may require future adjustments. Failure to meet targets or goals adopted in connection with our responsible business
initiatives or otherwise respond to stakeholder expectations on these topics could harm our reputation, reduce customer loyalty,
and adversely affect our financial performance. Inadequate progress on responsible business initiatives may also erode trust,
trigger negative publicity, litigation, or boycotts, and expose us to civil or criminal liability. Objections from third parties
or governments to these initiatives may result in reputational harm, administrative, legislative, or public backlash, or other
adverse action, and could negatively impact our financial results or business performance. Such consequences could also result
from actual or perceived changes to the scope or extent of our responsible business initiatives, or any discontinuation thereof.
Objections may come both from those who believe these initiatives are overly ambitious or inappropriate, and from those who
believe they are not ambitious enough. As focus on these issues from consumers, government actors, and other stakeholders
intensifies, the risks described in this section may increase.
Certain activist shareholder actions have caused, and could continue to cause, us to incur expense, hinder execution of our
business strategy, and adversely impact our stock price.
We regularly engage with shareholders to strengthen the Company and enhance long-term value. However, activist campaigns
can result in significant costs, including legal expenses and diversion of management and Board attention. Public activism
may also create uncertainty about our strategic direction, strain relationships with stakeholders, hinder talent recruitment, and
cause stock price volatility unrelated to business fundamentals. Shareholders with substantial holdings may influence key
decisions, including director elections, mergers, and amendments to governing documents. These risks could materially affect
our business and operating results.
Risks Related to Regulation and Litigation
Failure to comply with applicable laws and changing legal and regulatory requirements could harm our business and
financial results.
Our policies and procedures are designed to ensure compliance with all applicable laws, regulations, and reporting
requirements, including those imposed by the SEC, Nasdaq, and foreign jurisdictions. This includes trade, labor, healthcare,
food and beverage, sanitation, safety, environmental, labeling, anti-bribery and corruption, and merchandise laws. These
legal frameworks are complex and often subject to varying interpretations, which may result in inadvertent non-compliance.
Regulatory shifts — such as changes in enforcement priorities — can increase compliance costs and expand reporting
obligations. Failure to comply with such laws and regulations could result in the imposition of civil or criminal liability.
21
Environmental regulations are evolving, with new or expanded rules targeting carbon emissions, plastic use, and commercial
water consumption. These changes may lead to higher compliance costs, capital expenditures, and other financial obligations
for us and our partners, potentially affecting profitability. Additional emerging regulations, such as import tariffs tied
to alleged human rights violations, may also impact operations. Certain jurisdictions have enacted or proposed taxes or
other restrictions on the manufacture, distribution, or sale of certain of our products, particularly beverages containing
caloric sweeteners. These taxes and other measures vary in structure and may apply broadly or selectively. Additionally,
environmentally focused taxes or other measures, such as plastic packaging levies or extended producer responsibility laws,
are gaining traction. These measures can adversely affect our financial performance by raising product costs, reducing
consumption, or generating negative publicity.
Separately, the OECD’s Pillar Two initiative establishes a 15% global minimum tax for multinational entities. As of
September 28, 2025, several countries where we operate have enacted legislation implementing the OECD’s Pillar Two
initiative. While not expected to materially impact our consolidated financial results, we continue to monitor developments.
Overall, the regulatory environment is growing more complex due to evolving laws, market expansion, and jurisdictional
conflicts. Due to evolving technologies, such as artificial intelligence technologies, the legal and regulatory landscape is
uncertain and evolving, and may impose compliance obligations that could increase our costs or limit how we may use these
technologies. Moreover, the costs of monitoring and responding to such regulations could have an adverse effect on our
operations or financial condition. Non-compliance — whether by us or our partners — can result in litigation, liability, fines,
reputational harm, and financial restatements, all of which may adversely affect our business and results of operations.
We have been, and could continue to be, party to litigation or other legal proceedings that could adversely affect our
business, results, operations, and reputation.
We are, and may continue to be, subject to litigation and legal proceedings that could adversely affect our business. These
may involve claims from employees, customers, regulators, suppliers, shareholders, or others, including class or collective
actions. Allegations have included claims related to employment practices, food safety and product defects, data privacy,
discrimination, personal injury, advertising, intellectual property disputes, securities violations, and other matters. A judgment
significantly in excess of any applicable insurance coverage or third-party indemnity could materially adversely affect
our financial condition or results of operations. Even unfounded claims can result in substantial legal costs, management
distraction, and potential settlements or penalties. Litigation may also generate negative publicity, harming our reputation,
customer relationships, and financial performance. See Note 16, Commitments and Contingencies, to the consolidated
financial statements included in Item 8 of Part II of this 10-K for information regarding certain legal proceedings in which we
are involved.
Risks Related to Cybersecurity, Data Privacy, and Information Technology
The unauthorized access, use, theft, or destruction of customer or employee data (personal, financial, or other), or of
Starbucks proprietary or confidential information, that is stored in our information systems or by third parties could impact
our reputation and brand and expose us to potential liability and loss of revenues.
Our information technology systems and those of our third-party service providers, business partners, and licensees —
including those supporting point-of-sale, mobile platforms, payment systems, delivery, rewards, and administrative
functions — store personal, financial, and confidential data from customers, employees, business partners, and licensees, as
well as proprietary business information. Although we have put in place policies, procedures, and technological safeguards
designed to protect the security of this information, we cannot guarantee that this information will not be improperly disclosed
or accessed. Like other prominent retail companies, we have experienced cyber-attacks (e.g., phishing) and other attempts to
breach or gain unauthorized access to our systems, as have our third-party service providers, business partners, and licensees.
We expect such threats to continue and evolve, especially with the rapid evolution and increased adoption of artificial
intelligence.
Unauthorized access, theft, or destruction of data or any breach, ransomware attack or other incident affecting our
systems — whether through external attacks or internal methods — could result in reputational harm, loss of customers,
business disruption, regulatory investigations, litigation (including class actions), and significant financial costs. It may
take considerable time for us to investigate and evaluate the full impact of incidents, particularly for sophisticated attacks.
Responding to cybersecurity incidents may require substantial investments in technology, personnel, legal compliance, and
22
customer support, including notification and credit monitoring. These costs could materially impact our financial results and
divert resources from strategic initiatives. Media reports of actual or perceived vulnerabilities — whether involving us or our
third-party service providers, business partners, or licensees — can damage our brand and business, regardless of an incident’s
scope or validity.
Failure to maintain satisfactory compliance with certain privacy and data protection laws and regulations may result in
substantial negative financial consequences, reputational harm, and civil or criminal penalties.
We are subject to a complex and rapidly evolving landscape of local, national, and international laws and regulations governing
the collection, use, retention, protection, disclosure, transfer, and other processing of personal data. These laws and regulations
are frequently amended, reinterpreted, and increasingly enforced, often resulting in heightened compliance obligations,
litigation risk, and operational costs. Regulatory scrutiny is intensifying, with agencies such as the Federal Trade Commission
and state attorneys general applying consumer protection laws to online data practices. The legal landscape remains fluid,
with privacy and data protection laws potentially limiting data use, requiring changes to processing practices, exposing us to
fines, litigation, or other penalties, or impacting our ability to develop new services. Regulatory changes may include new
legislation, invalidation of existing rules, or increased penalties, all of which can impact our ability to develop and offer new
products and services. For example, the EU’s GDPR and the U.K. equivalent impose strict data protection requirements and
significant penalties for noncompliance. China’s Personal Information Protection Law (PIPL) and Data Security Law similarly
regulate personal and non-personal data processing activities and establish data subject rights and obligations for personal
information processors, with civil and criminal liabilities for violations. Other jurisdictions served by Starbucks and its
licensees are enacting or proposing comparable laws, including restrictions on cross-border data transfers and enhanced data
safeguards, which may increase compliance costs and affect business operations.
In the U.S., the California Consumer Privacy Act (CCPA) and numerous other state privacy laws impose disclosure obligations
and grant consumers rights over their personal data. Some such laws include private rights of action. These state laws require
ongoing investment in compliance infrastructure. Privacy and data protection laws, such as those referenced above, may also
affect emerging business models, such as Starbucks Digital Solutions, which rely on Starbucks acting as a data controller in
licensed markets. In such cases, Starbucks may bear primary responsibility for compliance with applicable privacy regulations.
The increasing adoption of artificial intelligence technologies has led data protection authorities around the world to consider
and adopt new and evolving interpretations of privacy and data protection laws, with specific obligations regarding processing
of personal data, including required notices, consents, and opt-outs.
Claims we have failed to comply with applicable privacy and data protection laws or to adequately safeguard personal
data, even if unfounded, may result in regulatory investigations, enforcement actions, litigation (including class actions),
reputational harm, and financial penalties, any of which could materially affect our operations and financial performance.
We rely heavily on information technology in our operations and growth initiatives, and any material failure, inadequacy,
interruption, or security failure of that technology could harm our ability to effectively operate and grow our business and
could adversely affect our financial results.
We rely extensively on interconnected information technology systems to support our operations, including point-of-sale,
mobile ordering, payments, supply chain management, loyalty programs, and administrative functions. We also depend on
third-party providers for key systems and services, which may lack full redundancy within or across markets. Our growth
initiatives — particularly those involving digital engagement and convenience-led formats — depend heavily on the reliability
and performance of these systems. Any failure, inadequacy, inefficiency, or interruption could disrupt operations and adversely
affect financial results. Our contractual and operational safeguards may not be effective in preventing the failure of these
systems or services to operate effectively and be available. Failures — whether due to outages, cyber-attacks, software flaws,
misconfigurations, or other disruptions — could materially impact product availability, operational efficiency, and financial
performance. If our incident response and recovery plans are ineffective or delayed, remediation efforts may incur significant,
unplanned costs.
Emerging technologies, including artificial intelligence and machine learning, may not deliver expected efficiencies and could
introduce new risks, such as those related to cybersecurity, data privacy, inaccuracies, hallucinations, bias or discrimination
and intellectual property infringement, which may become more pronounced as the Company’s reliance on such technologies
increases.
23
Risks Related to Intellectual Property
Failure to adequately protect our intellectual property or ensure that we are not infringing on the intellectual property of
others could harm the value of our brand and our business.
Our brand names, trademarks, and other intellectual property are critical assets that support brand awareness and product
development across domestic and international markets. We protect these assets through a combination of trademarks,
copyrights, service marks, trade secrets, patents, and other intellectual property rights. While we have registered certain
trademarks in the U.S. and abroad, not all of our trademarks are registered in every market where we operate or may operate in
the future, and some may never be registered.
Securing and enforcing intellectual property rights — especially in rapidly evolving areas — can be costly and
time-consuming. Additionally, the laws and enforcement mechanisms we rely on to protect our intellectual property from
unauthorized use may be inadequate. Our competitive position may be adversely affected by our possible inability to
effectively protect our intellectual property.
We also seek to maintain certain intellectual property as trade secrets. The secrecy of such trade secrets and other sensitive
information could be compromised, which could cause us to lose the competitive advantage resulting from these trade secrets.
Additionally, we also face the risk of infringing third-party intellectual property rights. Any infringement claims, even
unmerited claims, can be time consuming and disruptive to our ability to generate revenues or enter into new market
opportunities. Further, such claims may lead to expensive and disruptive litigation or significantly increased costs as a result
of our attempt to license the intellectual property rights to avoid infringement of third-party rights. Additionally, licensees and
other third parties who hold licenses to our intellectual property may take actions that diminish the value of our intellectual
property, further exposing us to reputational and financial risk.
Item 1B.
Unresolved Staff Comments
None.
Item 1C.
Cybersecurity
Risk Management and Strategy
Starbucks has implemented a cybersecurity program that leverages industry-standard cybersecurity frameworks, such as the
National Institute of Standards and Technology Cybersecurity Framework, to assess, identify, and manage cybersecurity risk.
Our cybersecurity program is integrated with the Enterprise Risk Management (“ERM”) framework and governance processes
utilized by management and our Board to oversee our various top enterprise risks. Our internal audit function periodically
evaluates our cybersecurity program and selected aspects of it.
We have implemented various processes and tools to identify cybersecurity threats, detect potential attacks, and protect our
data and information technology. We periodically evaluate evolving cybersecurity risks and legal and compliance requirements,
and we make ongoing strategic investments to address those evolving risks and requirements. We also participate in multiple
cybersecurity forums that share threat intelligence and best practices.
Starbucks assesses, measures, and reports on cybersecurity risk at operational, program or management, and strategic or
executive oversight levels. We maintain and periodically update written cybersecurity policies, standards, and controls, which
are reviewed by a cross-functional management-level committee and designed to align with business objectives, regulatory
requirements, and industry best practices. We train our employees through annual cybersecurity awareness training, which
includes information about how to report cybersecurity concerns and incidents, as well as phishing simulations and periodic
communications about timely cybersecurity topics and threats. We also implement a variety of tools to monitor our systems
and network activity, and we conduct various simulated attacks and penetration tests to assess the effectiveness of these tools.
We maintain an incident response plan that guides us in identifying, evaluating, responding to, and recovering from
cybersecurity incidents. The plan provides for the creation of a cross-functional, tailored incident response team, led by
dedicated incident responders, that may include both Company personnel and third-party service providers, as appropriate.
The incident response plan includes incident classification and escalation protocols, including a process for informing senior
management and the Board, as appropriate, as well as processes to assess and comply with applicable legal obligations. We
periodically test the effectiveness of the plan, and review and update it, as appropriate.
24
We also maintain insurance coverage that, subject to its terms and conditions, is intended to help us mitigate certain costs
associated with cybersecurity incidents.
We engage third-party security experts, as appropriate, to support our processes for assessing, identifying, and managing
cybersecurity risks, including, for example, periodic evaluations of our cybersecurity program from a design and effectiveness
perspective, penetration testing, vulnerability scanning, employee awareness training, phishing simulations, and incident
monitoring and response.
To address cybersecurity risk arising from our relationships with our third-party business partners and service providers, we
maintain a third-party risk management program, which takes a risk-based approach and includes elements such as conducting
cybersecurity assessments, including cybersecurity-related obligations in agreements, and utilizing external monitoring
sources.
In addition, we maintain a global privacy program to identify, assess, and manage privacy risks related to how we are
collecting, using, sharing, storing, and otherwise processing personal data.
As of the date of this filing, we have not identified any cybersecurity threats or incidents that have materially affected or are
reasonably likely to materially affect our business strategy, results of operations, or financial condition. However, there can be
no assurance that we, or our third-party business partners or service providers, will not experience a cybersecurity threat or
incident in the future that could materially adversely affect our business strategy, results of operations, or financial condition.
For further discussion of the risks related to cybersecurity, see the risk factors discussed under “Risks Related to Cybersecurity,
Data Privacy, and Information Technology” in our Risk Factors in Item 1A of this Form 10-K.
Governance
Our cybersecurity program is led by our senior vice president, chief information security officer (“ciso”), who is responsible
for identifying, assessing, and managing our collective information security and technology risks. Our ciso has more than
20 years of experience in the information security and technology fields, including various leadership roles in several large
companies across multiple industries. Those roles have included leading various cybersecurity capabilities and managing
information security, business intelligence, and data analytics teams.
The ciso is informed about the prevention, detection, mitigation, and remediation of cybersecurity incidents through
management of, and participation in, the cybersecurity program described above, including through reports prepared by
our internal cybersecurity team and the operation of our incident response plan. The ciso meets regularly with leaders of
our various information technology management teams and with the Risk Management Committee (a cross-functional
management-level committee, which is co-managed by our cfo and chief legal officer and meets at least quarterly), to review
and discuss our cybersecurity and other information technology risks and opportunities.
Our Board has ultimate cybersecurity and data privacy risk oversight responsibility for the Company and administers this
responsibility both directly and with assistance from the Audit and Compliance Committee (“Audit Committee”). The Audit
Committee oversees our cybersecurity and technology risks, along with our data privacy risks, all of which are integrated
into our overall ERM program. The Audit Committee actively reviews and discusses our cybersecurity and technology risk
management programs and regularly reports out to the full Board on our relevant strengths and opportunities. The Audit
Committee also reviews our data privacy risk management programs and reports out to the full Board on our relevant strengths
and opportunities.
The Audit Committee receives quarterly updates from the ciso or other members of the ciso’s team with responsibility for
oversight of our key cybersecurity program components. These updates include, as appropriate, ongoing changes in our
external and internal cybersecurity threat landscape, new technology trends and regulatory developments, evolving internal
policies and practices used to manage and mitigate cybersecurity and technology-related risks, cybersecurity incidents and our
response to them, and trends in various metrics that are used to help assess our overall cybersecurity program effectiveness.
25
Item 2.
Properties
The material properties used by Starbucks in connection with its roasting, manufacturing, warehousing, distribution, and
corporate administrative operations, serving all segments, are as follows:
Location
Approximate Size in
Square Feet
Purpose
York, PA
1,957,000
Roasting, warehousing and distribution
Seattle, WA
1,294,000
Corporate administrative
Minden, NV (Carson Valley)
1,080,000
Roasting, warehousing and distribution
Auburn, WA
750,000
Warehousing and distribution
Lebanon, TN
680,000
Warehousing and distribution
Kunshan, China
630,000
Roasting, warehousing and distribution
Kent, WA
510,000
Roasting and distribution
Shanghai, China
221,000
Corporate administrative
We own most of our roasting facilities and lease the majority of our warehousing and distribution locations. As of
September 28, 2025, Starbucks had 21,514 company-operated stores, almost all of which are leased. We also lease space in
various locations worldwide for regional, district, and other administrative offices, training facilities, and storage. In addition
to the locations listed above, we hold inventory at various locations managed by third-party warehouses. We believe our
existing facilities, both owned and leased, are in good condition and suitable for the conduct of our business.
Item 3.
Legal Proceedings
See Note 16, Commitments and Contingencies, to the consolidated financial statements included in Item 8 of Part II of this
10-K for information regarding certain legal proceedings in which we are involved.
Item 4.
Mine Safety Disclosures
Not applicable.
26
PART II
Item 5.
Market for the Registrant’s Common Equity, Related Shareholder Matters, and Issuer Purchases of Equity
Securities
SHAREHOLDER INFORMATION
As of November 7, 2025, we had approximately 16,000 shareholders of record. This does not include persons whose stock is in
nominee or “street name” accounts through brokers.
MARKET INFORMATION AND DIVIDEND POLICY
Starbucks common stock is traded on Nasdaq, under the symbol “SBUX.”
Future decisions to pay comparable cash dividends to those paid in the past continue to be at the discretion of the Board and
will be dependent on our operating performance, financial condition, capital expenditure requirements and other factors that
the Board considers relevant.
ISSUER PURCHASES OF EQUITY SECURITIES
Shares under our ongoing share repurchase program may be repurchased in open market transactions, including pursuant
to a trading plan adopted in accordance with Rule 10b5-1 of the Securities Exchange Act of 1934, as amended (the
“Exchange Act”), or through privately negotiated transactions. The timing, manner, price, and amount of repurchases will be
determined at our discretion and the share repurchase program may be suspended, terminated, or modified at any time for any
reason. During the fiscal fourth quarter ended September 28, 2025, there was no share repurchase activity.
Performance Comparison Graph
The following graph shall not be deemed “filed” for purposes of section 18 of the Exchange Act, or otherwise subject to the
liabilities under that section and shall not be deemed to be incorporated by reference into any filing of Starbucks Corporation
under the Securities Act of 1933, as amended, or the Exchange Act, whether made before or after the date hereof and
irrespective of any general incorporation language in any such filing.
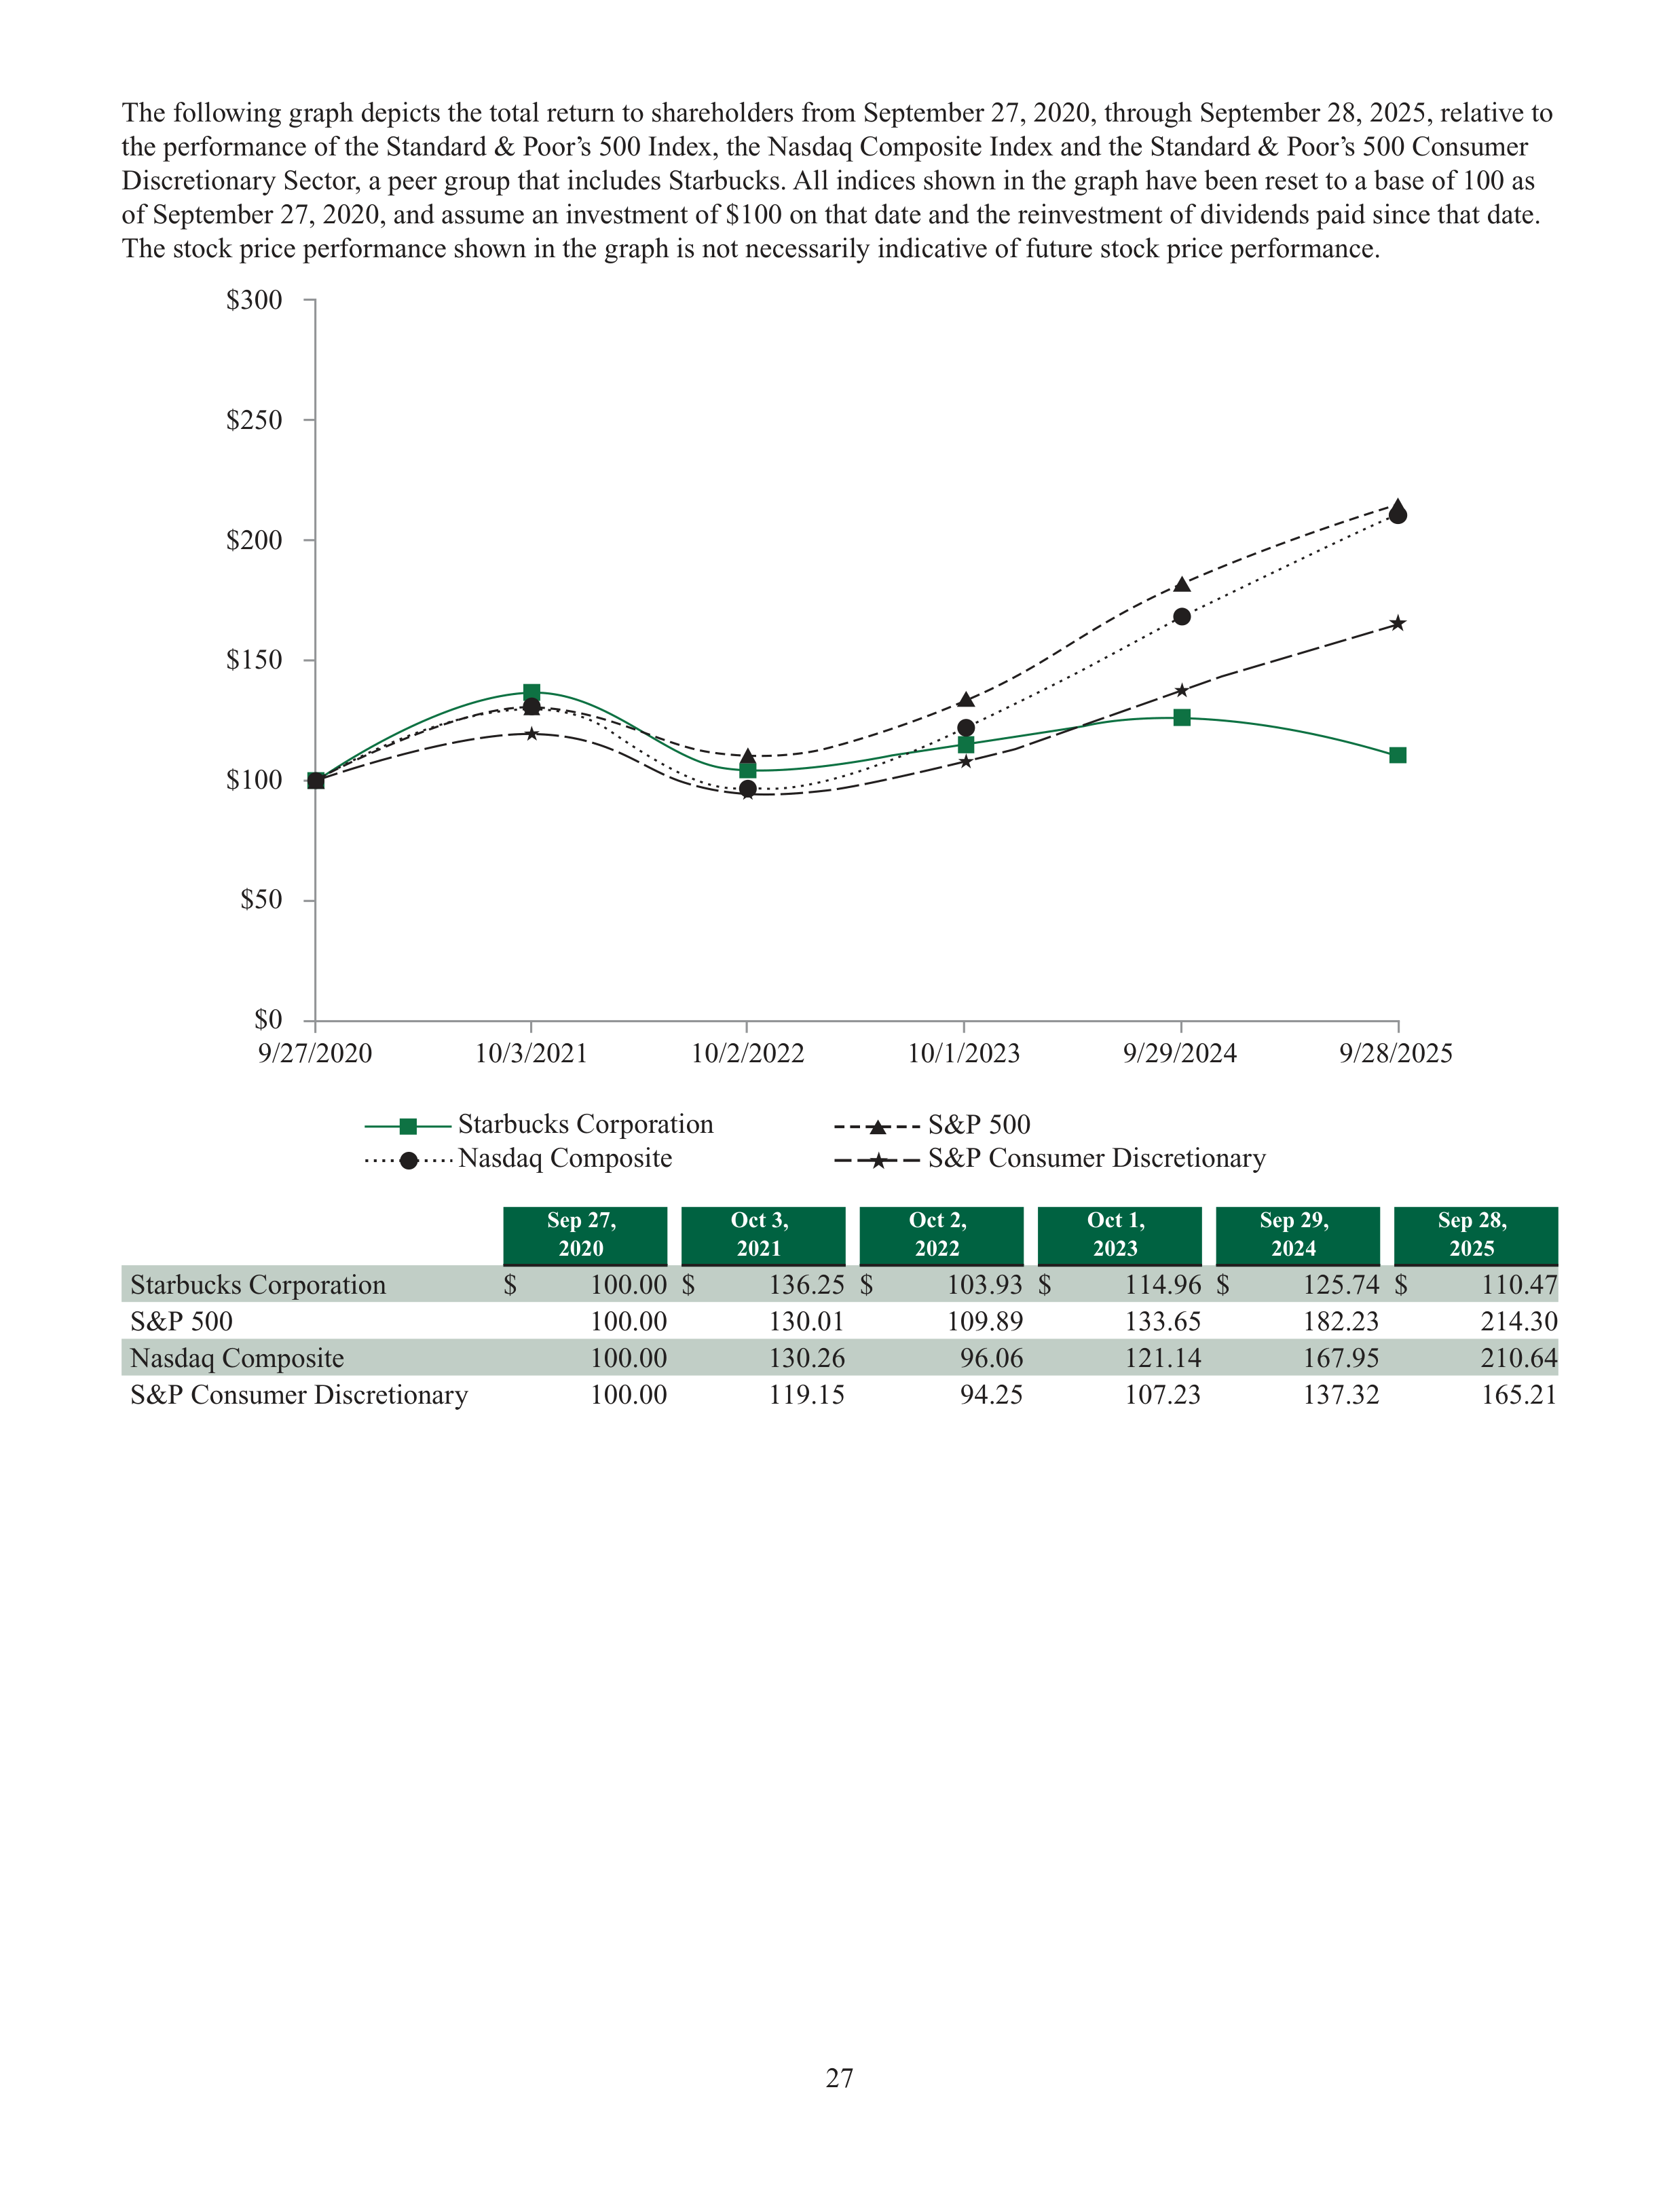
27
The following graph depicts the total return to shareholders from September 27, 2020, through September 28, 2025, relative to
the performance of the Standard & Poor’s 500 Index, the Nasdaq Composite Index and the Standard & Poor’s 500 Consumer
Discretionary Sector, a peer group that includes Starbucks. All indices shown in the graph have been reset to a base of 100 as
of September 27, 2020, and assume an investment of $100 on that date and the reinvestment of dividends paid since that date.
The stock price performance shown in the graph is not necessarily indicative of future stock price performance.
$300
$250
$200
$150
$100
$50
$0
9/27/2020
10/3/2021
10/2/2022
10/1/2023
9/29/2024
9/28/2025
Starbucks Corporation
S&P 500
S&P Consumer Discretionary
Nasdaq Composite
Sep 27,
2020
Oct 3,
2021
Oct 2,
2022
Oct 1,
2023
Sep 29,
2024
Sep 28,
2025
Starbucks Corporation
$
100.00
$
136.25
$
103.93
$
114.96
$
125.74
$
110.47
S&P 500
100.00
130.01
109.89
133.65
182.23
214.30
Nasdaq Composite
100.00
130.26
96.06
121.14
167.95
210.64
S&P Consumer Discretionary
100.00
119.15
94.25
107.23
137.32
165.21
28
Item 6.
[Reserved]
Item 7.
Management’s Discussion and Analysis of Financial Condition and Results of Operations
You should read the following discussion of our financial condition and results of operations in conjunction with the financial
statements and the notes thereto included elsewhere in this 10-K. The following discussion contains forward-looking
statements that reflect our plans, estimates, and beliefs. Readers are cautioned that these forward-looking statements are
subject to risks, uncertainties, and assumptions that are difficult to predict, including those identified above, under Risk
Factors in Part I, Item 1A of this 10-K, and elsewhere herein. Therefore, our actual results could differ materially from those
discussed in the forward-looking statements. We undertake no obligation to revise or update any forward-looking statements
for any reason. Please also see the cautionary language at the beginning of Part I of this 10-K regarding forward-looking
statements.
General
Our fiscal year ends on the Sunday closest to September 30. All references to store counts, including data for new store
openings, are reported net of related store closures, unless otherwise noted. Fiscal years 2025, 2024, and 2023 included
52 weeks.
The discussion of our financial condition and results of operations for the fiscal year ended October 1, 2023, included in
Item 7. Management’s Discussion and Analysis of Financial Condition and Results of Operations (“MD&A”) can be found in
the Annual Report on Form 10-K for the fiscal year ended September 29, 2024.
Overview
We have three reportable operating segments: 1) North America, which is inclusive of the U.S. and Canada; 2) International,
which is inclusive of China, Japan, Asia Pacific, Europe, Middle East, Africa, Latin America, and the Caribbean; and
3) Channel Development. Unallocated corporate expenses are reported within Corporate and Other.
We believe our financial results and long-term growth model will continue to be driven by new store openings, comparable
store sales, and operating margin management, underpinned by disciplined capital allocation. Comparable store sales includes
company-operated stores open 13 months or longer, and exclude the effects of foreign currency exchange rates. Stores that
are temporarily closed remain in comparable store sales while permanent store closures are removed in the month following
closure. We believe these key operating metrics are useful to investors because management uses these metrics to assess
the growth of our business and the effectiveness of our marketing and operational strategies. Throughout this MD&A, we
commonly discuss the following key operating metrics:
•
New store openings and store count
•
Comparable store sales
•
Operating margin
Starbucks results for fiscal 2025 showed continued progress on key “Back to Starbucks” initiatives, specifically investments
in coffeehouse partners, as we work to rebuild a stronger Starbucks. These investments include the Green Apron Service
model, additional investments in staffing and hours at the right times to deliver enhanced customer service, and the Leadership
Experience 2025, a conference designed to empower and motivate our retail leaders to accelerate our “Back to Starbucks”
strategy. Consolidated net revenues increased 3% to $37.2 billion in fiscal 2025 compared to $36.2 billion in fiscal 2024,
primarily driven by incremental revenues from net new company-operated stores over the past 12 months, an increase in
revenue in the Global Coffee Alliance, and incremental revenue from the acquisition of 23.5 Degrees Topco Limited, a U.K.
licensed business partner, partially offset by a decrease in comparable store sales and a decline in our licensed store business.
For both the North America segment and U.S. market, revenue increased 1% in fiscal 2025 compared to fiscal 2024, primarily
driven by net new company-operated store growth of 4%, or 441 stores, over the past 12 months, prior to the 584 North
America restructuring closures late in the fourth quarter of fiscal 2025. This growth was partially offset by a 2% decline in
comparable store sales. Comparable transactions declined 4%, partially offset by average ticket growth of 2%, primarily driven
by annualization of pricing in the current year. Also contributing were lower product and equipment sales to, and royalty
revenues from, our licensees.
29
For the International segment, revenue increased 7% in fiscal 2025 compared to fiscal 2024, primarily driven by net new
company-operated and licensed store openings over the past 12 months, incremental net revenue from the conversion of
113 licensed stores to company-operated stores following the acquisition of 23.5 Degrees Topco Limited during the first
quarter of fiscal 2025, and higher product and equipment sales to, and royalty revenues from, our licensees.
Revenue for our Channel Development segment increased 6% in fiscal 2025 compared with fiscal 2024, primarily driven by
an increase in revenue in the Global Coffee Alliance.
In support of our “Back to Starbucks” strategy, we completed our assessment of our coffeehouse portfolio late in the fourth
quarter and made decisions to close stores that did not demonstrate a viable path to profitability, or meet our standards of
delivering a warm, welcoming space for our customers and partners. Our store closures in North America were substantially
completed in fiscal 2025 and the International store closures are expected to be completed in the first half of fiscal 2026. As a
result of these closures, we expect a fiscal 2026 reduction in our baseline North America company-operated revenues, partially
offset by sales transfer to nearby coffeehouses that remain open. We also expect the future impact to operating margins to be
slightly accretive. With a healthier base of coffeehouses, we see meaningful opportunity for disciplined growth. We anticipate
that these actions, along with simplifying our broader support organization, will allow us to restructure, redeploy, and refocus
our resources on priorities that we believe will deliver long-term sustainable business growth.
We expect that the macroeconomic challenges we have been experiencing, including impacts from new tariffs and dynamic
coffee prices, will continue; however, we are encouraged by the results we have seen from our “Back to Starbucks” initiatives.
Following our Green Apron Service model going live across our full U.S company-operated store portfolio in the fourth
quarter of fiscal 2025, we are focused on empowering coffeehouse leaders to take ownership of sustaining the model as our
permanent way of working, which we expect to enhance the customer experience and drive future transaction growth. Further,
as announced in early November 2025, we look forward to working with our new strategic joint venture partner, Boyu Capital,
to accelerate long-term growth in China. We believe, through strategic prioritization, that we are taking the right actions
now and in the future, specifically through our investments in store partners, uplifting the coffeehouse experience through
disciplined capital deployment, introducing new food and beverage platforms, reimagining the Starbucks rewards program,
and enhancing support for our licensee partners. These actions, while driving more efficiency, accountability, and agility as a
company, will lay the foundation for the future of Starbucks.
Financial Highlights
•
Total net revenues increased 3% to $37.2 billion in fiscal 2025 compared to $36.2 billion in fiscal 2024.
•
Consolidated operating income decreased to $2.9 billion in fiscal 2025 compared to $5.4 billion in fiscal
2024. Fiscal 2025 operating margin was 7.9% compared to 15.0% in fiscal 2024. Operating margin contraction
of 710 basis points was primarily due to restructuring costs associated with the closure of coffeehouses and
simplification of our support organization (approximately 240 basis points), deleverage (approximately
210 basis points), investments in support of “Back to Starbucks,” which were largely in labor hours
(approximately 130 basis points), and inflation (approximately 80 basis points).
•
Diluted earnings per share (“EPS”) for fiscal 2025 declined to $1.63, compared to EPS of $3.31 in fiscal 2024.
The decrease was primarily driven by contraction in operating margin, including restructuring and impairment
costs in support of our “Back to Starbucks” strategy, as compared to the prior year.
•
Capital expenditures were $2.3 billion in fiscal 2025 and $2.8 billion in fiscal 2024.
•
We returned $2.8 billion and $3.8 billion to our shareholders in fiscal 2025 and fiscal 2024, respectively, through
dividends and share repurchases.
Acquisitions and Divestitures
See Note 2, Acquisitions and Divestitures, to the consolidated financial statements included in Item 8 of Part II of this 10-K
for information regarding acquisitions and divestitures.
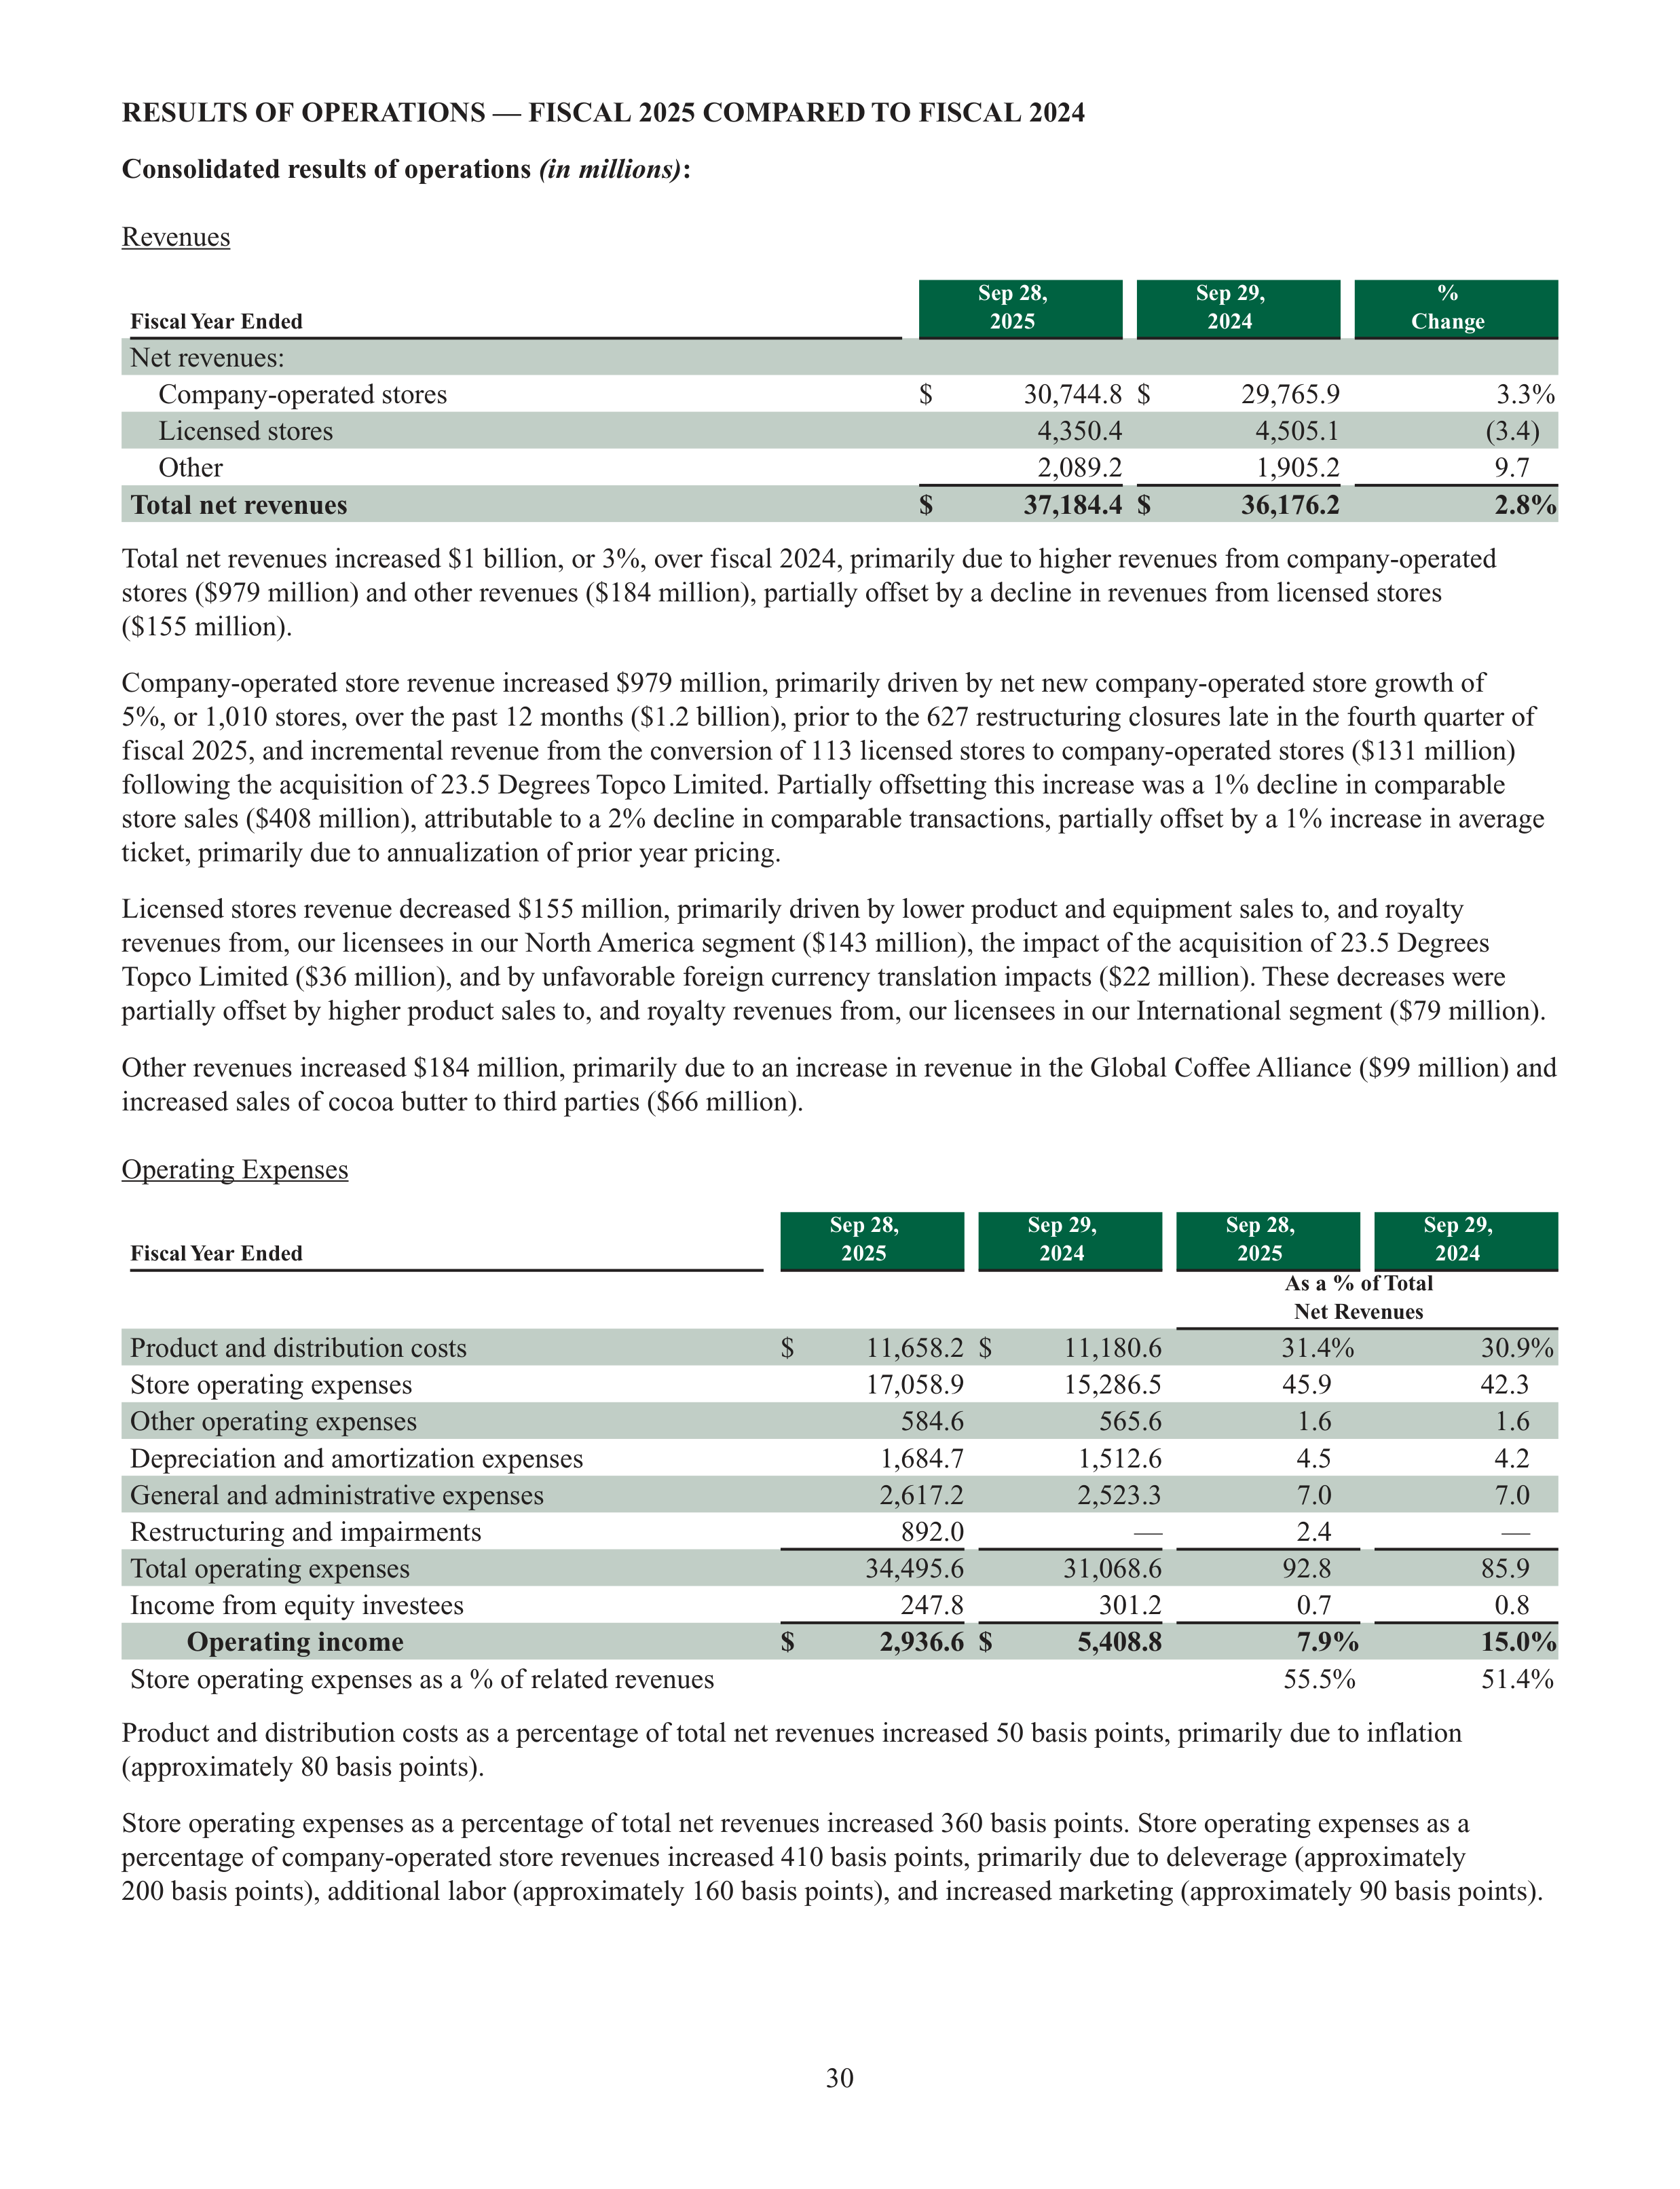
30
RESULTS OF OPERATIONS — FISCAL 2025 COMPARED TO FISCAL 2024
Consolidated results of operations
(in millions)
:
Revenues
Fiscal Year Ended
Sep 28,
2025
Sep 29,
2024
%
Change
Net revenues:
Company-operated stores
$
30,744.8
$
29,765.9
3.3%
Licensed stores
4,350.4
4,505.1
(3.4)
Other
2,089.2
1,905.2
9.7
Total net revenues
$
37,184.4
$
36,176.2
2.8%
Total net revenues increased $1 billion, or 3%, over fiscal 2024, primarily due to higher revenues from company-operated
stores ($979 million) and other revenues ($184 million), partially offset by a decline in revenues from licensed stores
($155 million).
Company-operated store revenue increased $979 million, primarily driven by net new company-operated store growth of
5%, or 1,010 stores, over the past 12 months ($1.2 billion), prior to the 627 restructuring closures late in the fourth quarter of
fiscal 2025, and incremental revenue from the conversion of 113 licensed stores to company-operated stores ($131 million)
following the acquisition of 23.5 Degrees Topco Limited. Partially offsetting this increase was a 1% decline in comparable
store sales ($408 million), attributable to a 2% decline in comparable transactions, partially offset by a 1% increase in average
ticket, primarily due to annualization of prior year pricing.
Licensed stores revenue decreased $155 million, primarily driven by lower product and equipment sales to, and royalty
revenues from, our licensees in our North America segment ($143 million), the impact of the acquisition of 23.5 Degrees
Topco Limited ($36 million), and by unfavorable foreign currency translation impacts ($22 million). These decreases were
partially offset by higher product sales to, and royalty revenues from, our licensees in our International segment ($79 million).
Other revenues increased $184 million, primarily due to an increase in revenue in the Global Coffee Alliance ($99 million) and
increased sales of cocoa butter to third parties ($66 million).
Operating Expenses
Fiscal Year Ended
Sep 28,
2025
Sep 29,
2024
Sep 28,
2025
Sep 29,
2024
As a % of Total
Net Revenues
Product and distribution costs
$
11,658.2
$
11,180.6
31.4%
30.9%
Store operating expenses
17,058.9
15,286.5
45.9
42.3
Other operating expenses
584.6
565.6
1.6
1.6
Depreciation and amortization expenses
1,684.7
1,512.6
4.5
4.2
General and administrative expenses
2,617.2
2,523.3
7.0
7.0
Restructuring and impairments
892.0
—
2.4
—
Total operating expenses
34,495.6
31,068.6
92.8
85.9
Income from equity investees
247.8
301.2
0.7
0.8
Operating income
$
2,936.6
$
5,408.8
7.9%
15.0%
Store operating expenses as a % of related revenues
55.5%
51.4%
Product and distribution costs as a percentage of total net revenues increased 50 basis points, primarily due to inflation
(approximately 80 basis points).
Store operating expenses as a percentage of total net revenues increased 360 basis points. Store operating expenses as a
percentage of company-operated store revenues increased 410 basis points, primarily due to deleverage (approximately
200 basis points), additional labor (approximately 160 basis points), and increased marketing (approximately 90 basis points).
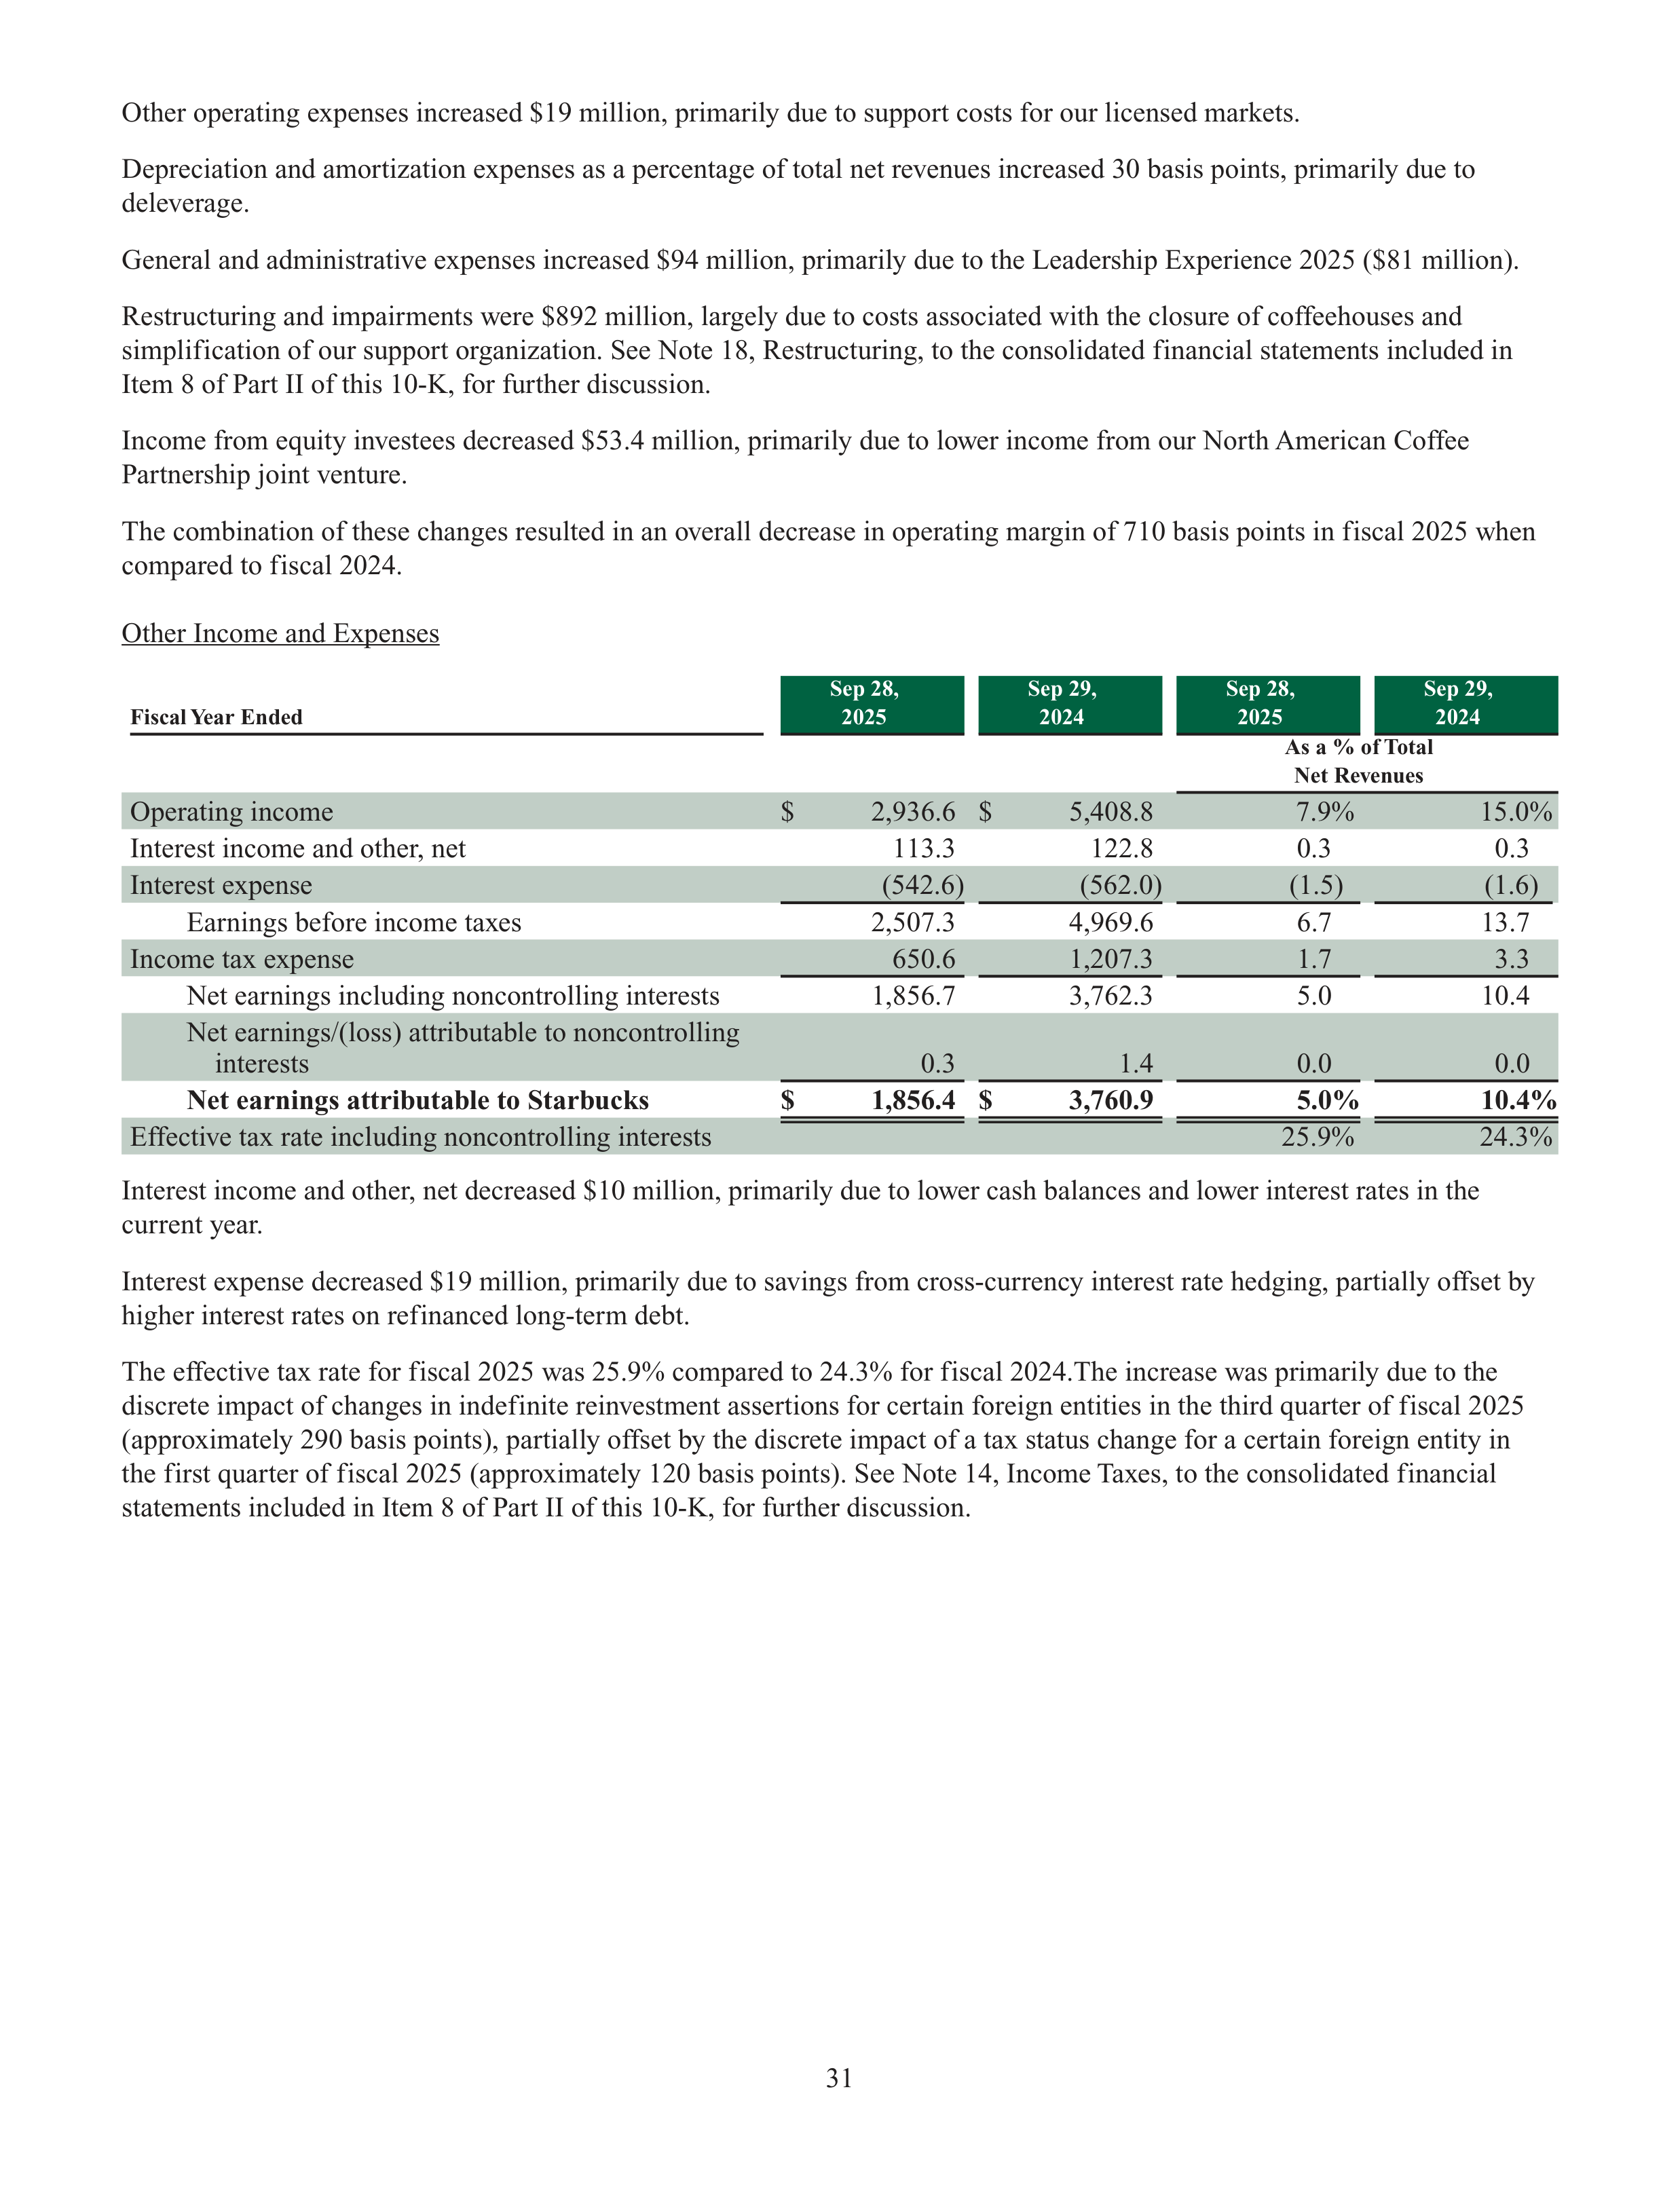
31
Other operating expenses increased $19 million, primarily due to support costs for our licensed markets.
Depreciation and amortization expenses as a percentage of total net revenues increased 30 basis points, primarily due to
deleverage.
General and administrative expenses increased $94 million, primarily due to the Leadership Experience 2025 ($81 million).
Restructuring and impairments were $892 million, largely due to costs associated with the closure of coffeehouses and
simplification of our support organization. See Note 18, Restructuring, to the consolidated financial statements included in
Item 8 of Part II of this 10-K, for further discussion.
Income from equity investees decreased $53.4 million, primarily due to lower income from our North American Coffee
Partnership joint venture.
The combination of these changes resulted in an overall decrease in operating margin of 710 basis points in fiscal 2025 when
compared to fiscal 2024.
Other Income and Expenses
Fiscal Year Ended
Sep 28,
2025
Sep 29,
2024
Sep 28,
2025
Sep 29,
2024
As a % of Total
Net Revenues
Operating income
$
2,936.6
$
5,408.8
7.9%
15.0%
Interest income and other, net
113.3
122.8
0.3
0.3
Interest expense
(542.6)
(562.0)
(1.5)
(1.6)
Earnings before income taxes
2,507.3
4,969.6
6.7
13.7
Income tax expense
650.6
1,207.3
1.7
3.3
Net earnings including noncontrolling interests
1,856.7
3,762.3
5.0
10.4
Net earnings/(loss) attributable to noncontrolling
interests
0.3
1.4
0.0
0.0
Net earnings attributable to Starbucks
$
1,856.4
$
3,760.9
5.0%
10.4%
Effective tax rate including noncontrolling interests
25.9%
24.3%
Interest income and other, net decreased $10 million, primarily due to lower cash balances and lower interest rates in the
current year.
Interest expense decreased $19 million, primarily due to savings from cross-currency interest rate hedging, partially offset by
higher interest rates on refinanced long-term debt.
The effective tax rate for fiscal 2025 was 25.9% compared to 24.3% for fiscal 2024.The increase was primarily due to the
discrete impact of changes in indefinite reinvestment assertions for certain foreign entities in the third quarter of fiscal 2025
(approximately 290 basis points), partially offset by the discrete impact of a tax status change for a certain foreign entity in
the first quarter of fiscal 2025 (approximately 120 basis points). See Note 14, Income Taxes, to the consolidated financial
statements included in Item 8 of Part II of this 10-K, for further discussion.
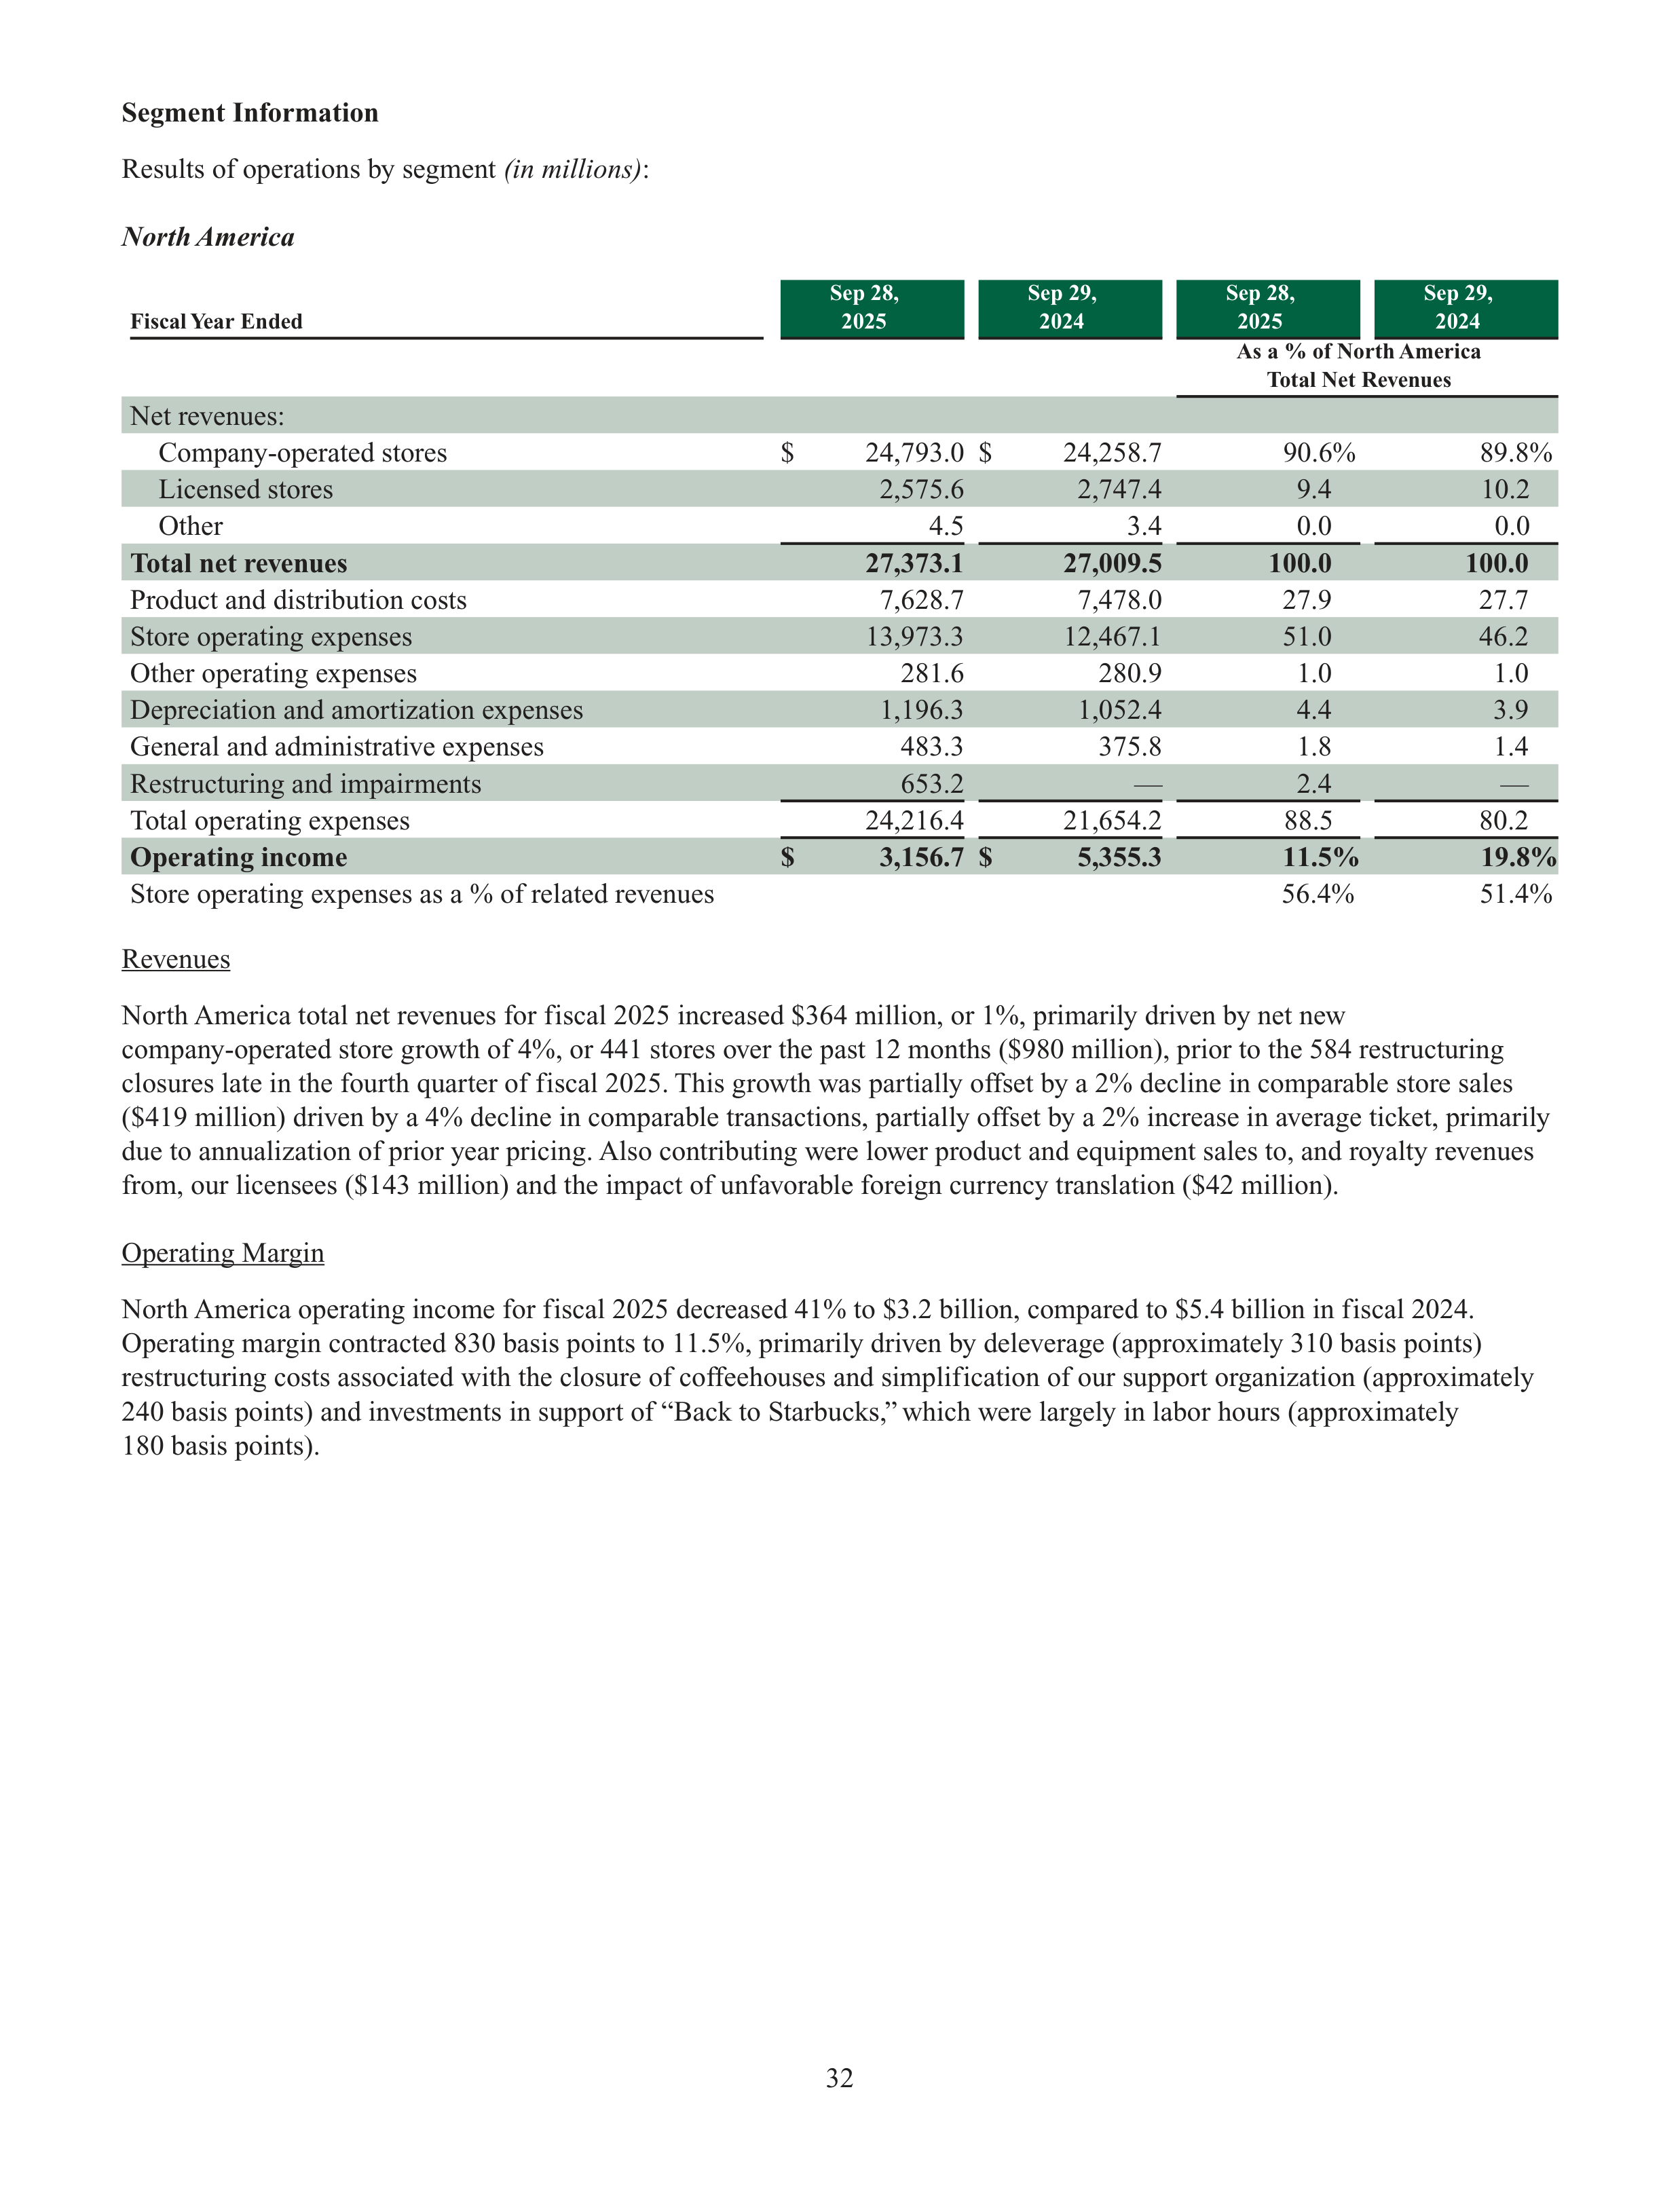
32
Segment Information
Results of operations by segment
(in millions)
:
North America
Fiscal Year Ended
Sep 28,
2025
Sep 29,
2024
Sep 28,
2025
Sep 29,
2024
As a % of North America
Total Net Revenues
Net revenues:
Company-operated stores
$
24,793.0
$
24,258.7
90.6%
89.8%
Licensed stores
2,575.6
2,747.4
9.4
10.2
Other
4.5
3.4
0.0
0.0
Total net revenues
27,373.1
27,009.5
100.0
100.0
Product and distribution costs
7,628.7
7,478.0
27.9
27.7
Store operating expenses
13,973.3
12,467.1
51.0
46.2
Other operating expenses
281.6
280.9
1.0
1.0
Depreciation and amortization expenses
1,196.3
1,052.4
4.4
3.9
General and administrative expenses
483.3
375.8
1.8
1.4
Restructuring and impairments
653.2
—
2.4
—
Total operating expenses
24,216.4
21,654.2
88.5
80.2
Operating income
$
3,156.7
$
5,355.3
11.5%
19.8%
Store operating expenses as a % of related revenues
56.4%
51.4%
Revenues
North America total net revenues for fiscal 2025 increased $364 million, or 1%, primarily driven by net new
company-operated store growth of 4%, or 441 stores over the past 12 months ($980 million), prior to the 584 restructuring
closures late in the fourth quarter of fiscal 2025. This growth was partially offset by a 2% decline in comparable store sales
($419 million) driven by a 4% decline in comparable transactions, partially offset by a 2% increase in average ticket, primarily
due to annualization of prior year pricing. Also contributing were lower product and equipment sales to, and royalty revenues
from, our licensees ($143 million) and the impact of unfavorable foreign currency translation ($42 million).
Operating Margin
North America operating income for fiscal 2025 decreased 41% to $3.2 billion, compared to $5.4 billion in fiscal 2024.
Operating margin contracted 830 basis points to 11.5%, primarily driven by deleverage (approximately 310 basis points)
restructuring costs associated with the closure of coffeehouses and simplification of our support organization (approximately
240 basis points) and investments in support of “Back to Starbucks,” which were largely in labor hours (approximately
180 basis points).
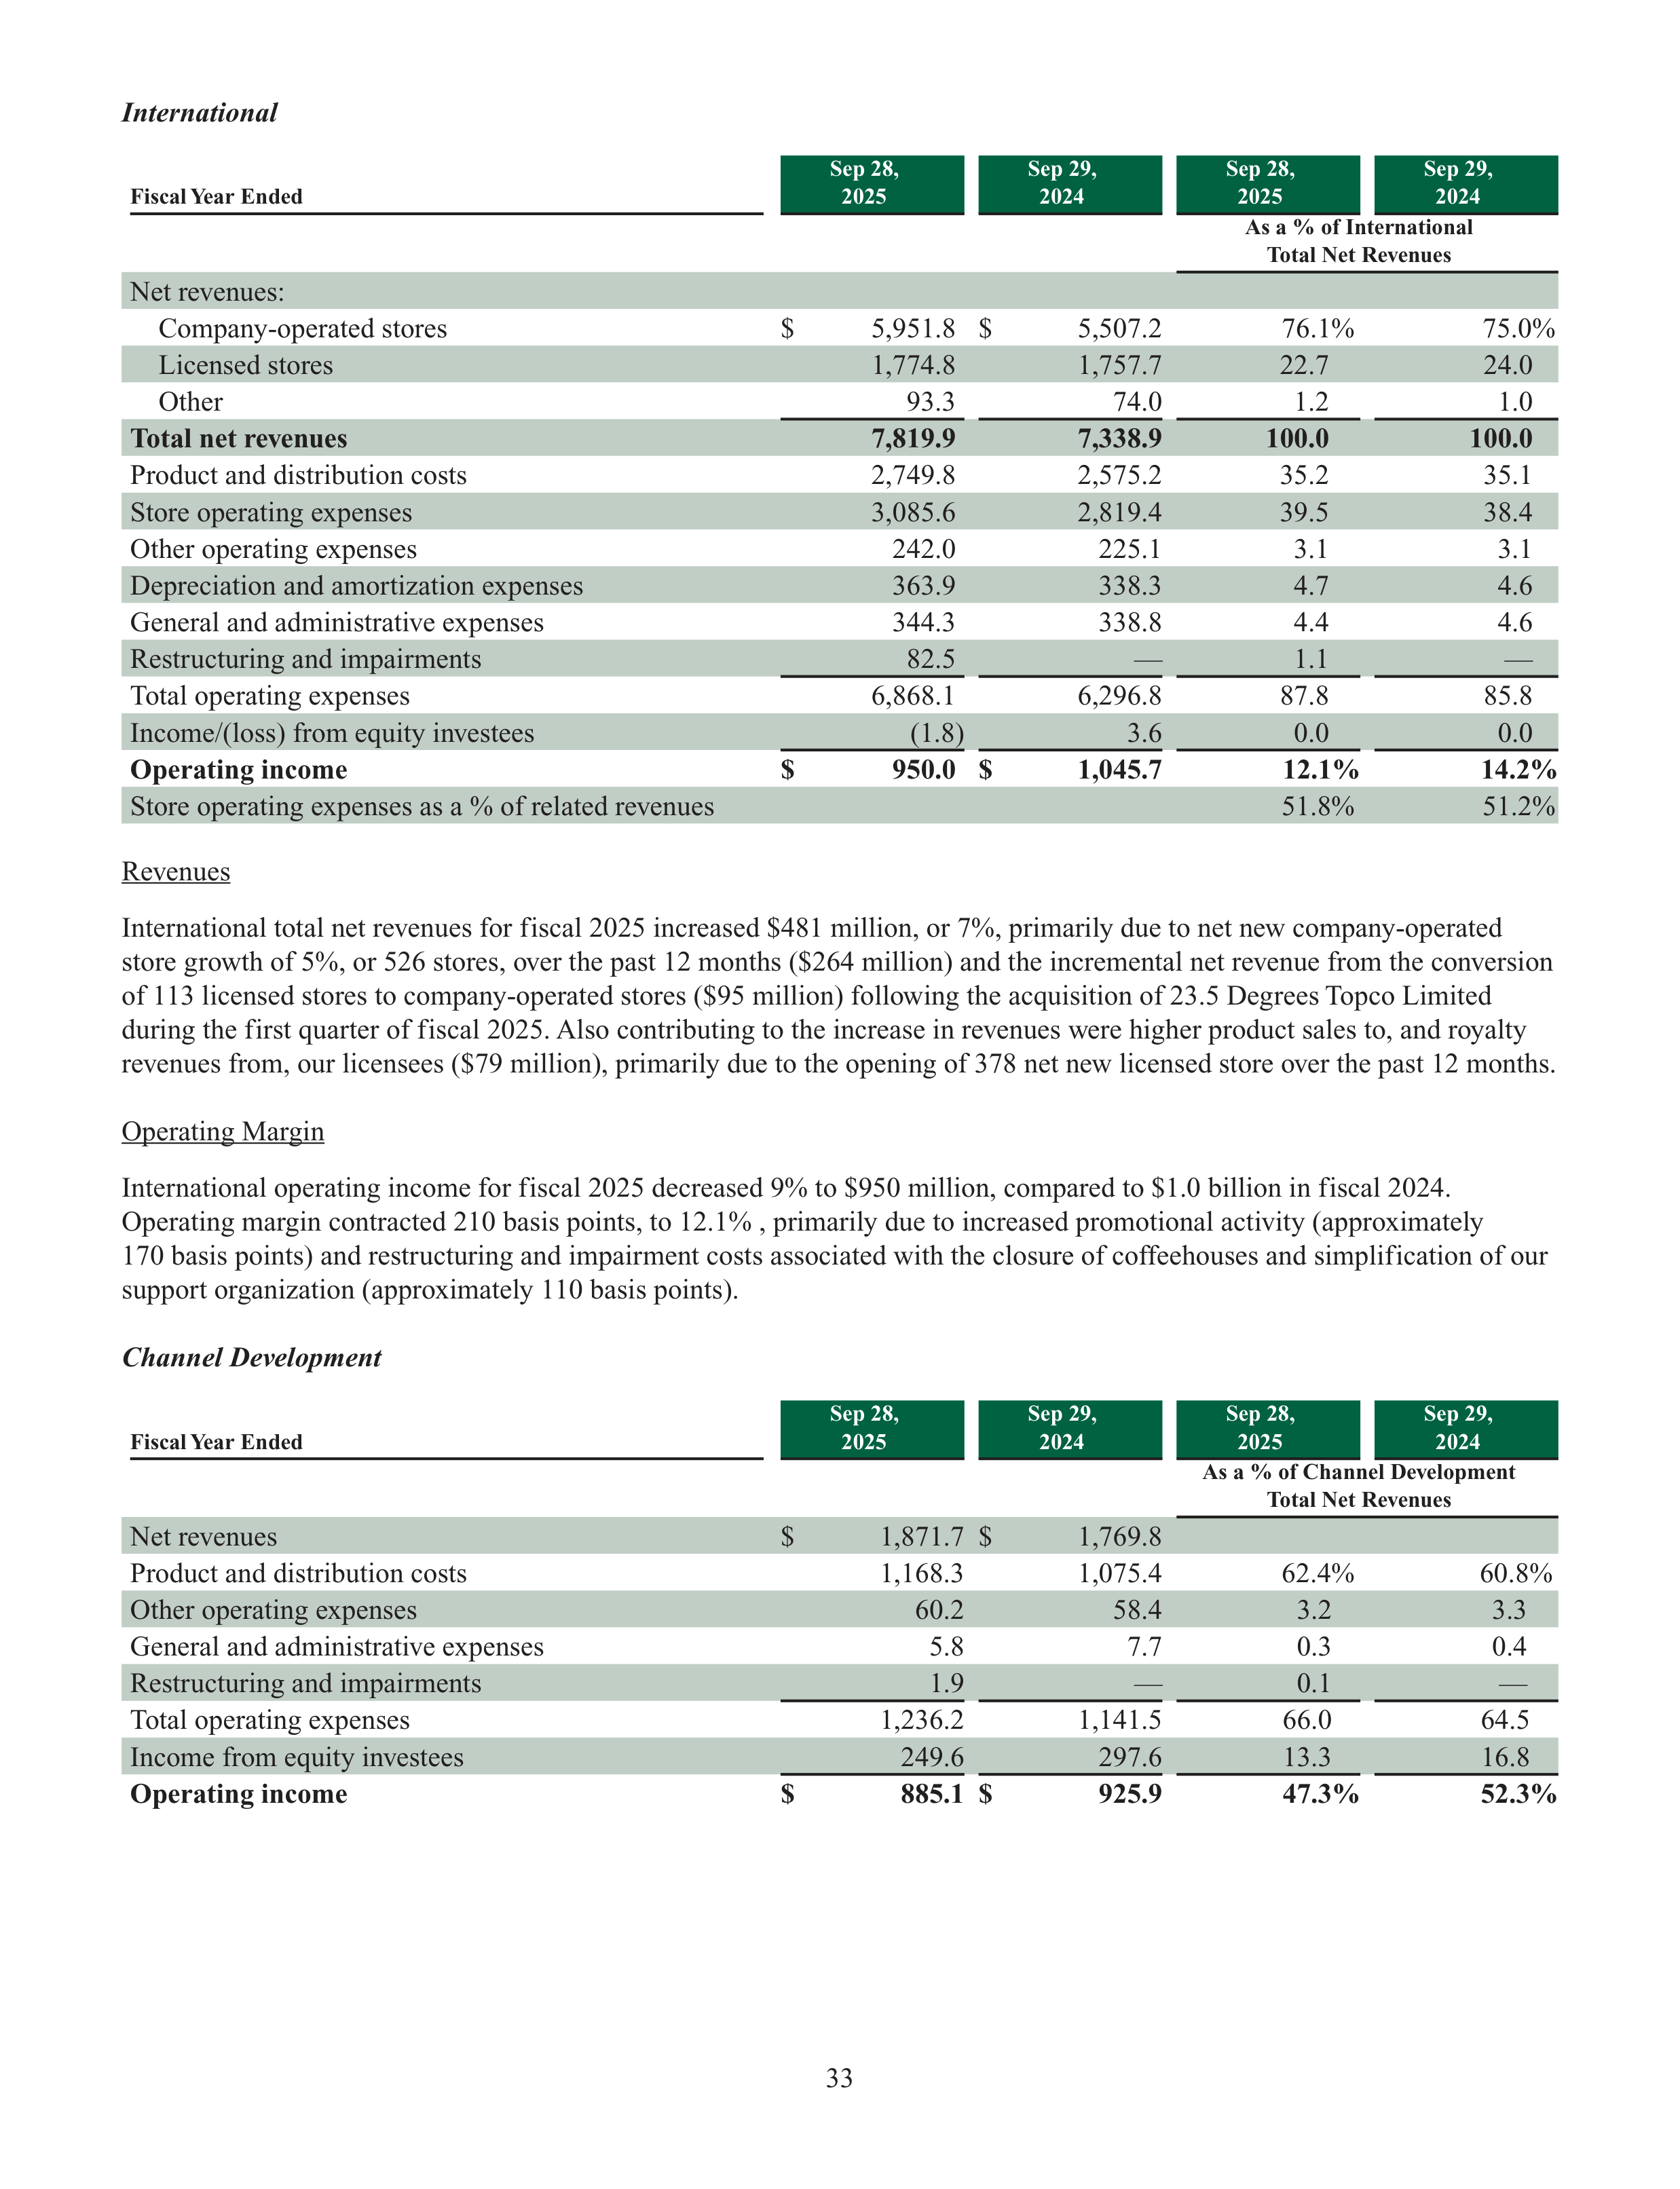
33
International
Fiscal Year Ended
Sep 28,
2025
Sep 29,
2024
Sep 28,
2025
Sep 29,
2024
As a % of International
Total Net Revenues
Net revenues:
Company-operated stores
$
5,951.8
$
5,507.2
76.1%
75.0%
Licensed stores
1,774.8
1,757.7
22.7
24.0
Other
93.3
74.0
1.2
1.0
Total net revenues
7,819.9
7,338.9
100.0
100.0
Product and distribution costs
2,749.8
2,575.2
35.2
35.1
Store operating expenses
3,085.6
2,819.4
39.5
38.4
Other operating expenses
242.0
225.1
3.1
3.1
Depreciation and amortization expenses
363.9
338.3
4.7
4.6
General and administrative expenses
344.3
338.8
4.4
4.6
Restructuring and impairments
82.5
—
1.1
—
Total operating expenses
6,868.1
6,296.8
87.8
85.8
Income/(loss) from equity investees
(1.8)
3.6
0.0
0.0
Operating income
$
950.0
$
1,045.7
12.1%
14.2%
Store operating expenses as a % of related revenues
51.8%
51.2%
Revenues
International total net revenues for fiscal 2025 increased $481 million, or 7%, primarily due to net new company-operated
store growth of 5%, or 526 stores, over the past 12 months ($264 million) and the incremental net revenue from the conversion
of 113 licensed stores to company-operated stores ($95 million) following the acquisition of 23.5 Degrees Topco Limited
during the first quarter of fiscal 2025. Also contributing to the increase in revenues were higher product sales to, and royalty
revenues from, our licensees ($79 million), primarily due to the opening of 378 net new licensed store over the past 12 months.
Operating Margin
International operating income for fiscal 2025 decreased 9% to $950 million, compared to $1.0 billion in fiscal 2024.
Operating margin contracted 210 basis points, to 12.1% , primarily due to increased promotional activity (approximately
170 basis points) and restructuring and impairment costs associated with the closure of coffeehouses and simplification of our
support organization (approximately 110 basis points).
Channel Development
Fiscal Year Ended
Sep 28,
2025
Sep 29,
2024
Sep 28,
2025
Sep 29,
2024
As a % of Channel Development
Total Net Revenues
Net revenues
$
1,871.7
$
1,769.8
Product and distribution costs
1,168.3
1,075.4
62.4%
60.8%
Other operating expenses
60.2
58.4
3.2
3.3
General and administrative expenses
5.8
7.7
0.3
0.4
Restructuring and impairments
1.9
—
0.1
—
Total operating expenses
1,236.2
1,141.5
66.0
64.5
Income from equity investees
249.6
297.6
13.3
16.8
Operating income
$
885.1
$
925.9
47.3%
52.3%
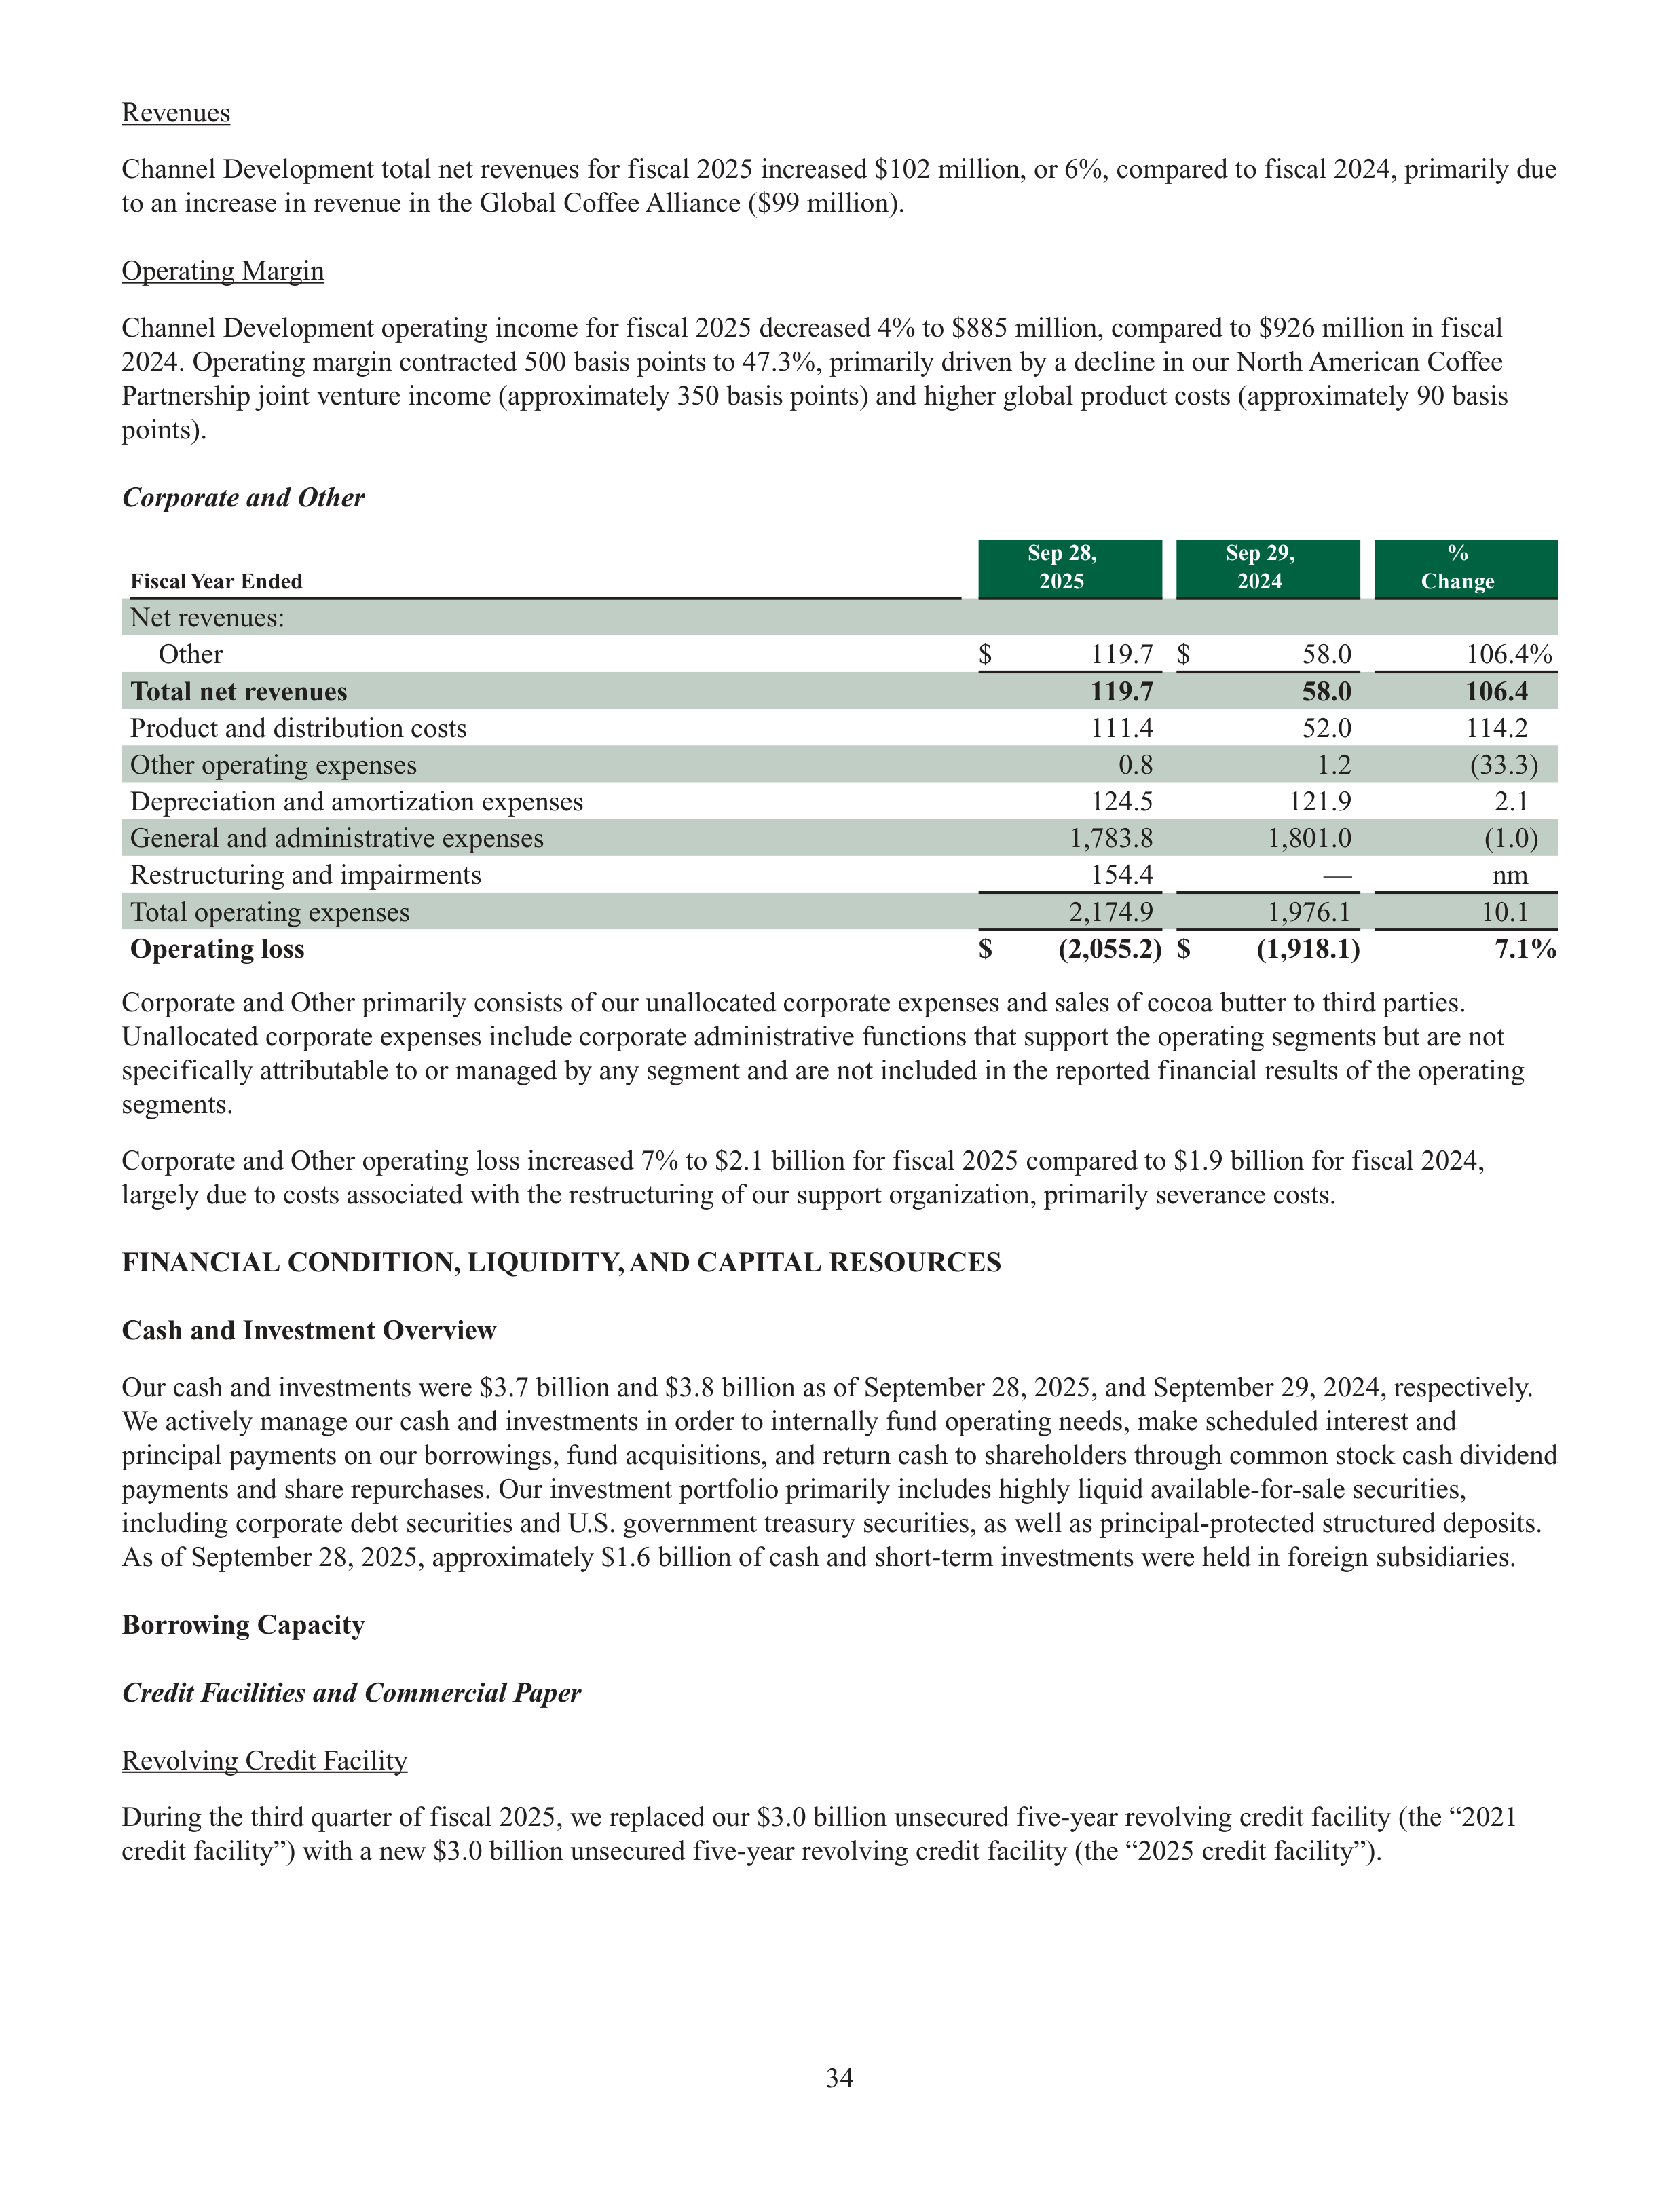
34
Revenues
Channel Development total net revenues for fiscal 2025 increased $102 million, or 6%, compared to fiscal 2024, primarily due
to an increase in revenue in the Global Coffee Alliance ($99 million).
Operating Margin
Channel Development operating income for fiscal 2025 decreased 4% to $885 million, compared to $926 million in fiscal
2024. Operating margin contracted 500 basis points to 47.3%, primarily driven by a decline in our North American Coffee
Partnership joint venture income (approximately 350 basis points) and higher global product costs (approximately 90 basis
points).
Corporate and Other
Fiscal Year Ended
Sep 28,
2025
Sep 29,
2024
%
Change
Net revenues:
Other
$
119.7
$
58.0
106.4%
Total net revenues
119.7
58.0
106.4
Product and distribution costs
111.4
52.0
114.2
Other operating expenses
0.8
1.2
(33.3)
Depreciation and amortization expenses
124.5
121.9
2.1
General and administrative expenses
1,783.8
1,801.0
(1.0)
Restructuring and impairments
154.4
—
nm
Total operating expenses
2,174.9
1,976.1
10.1
Operating loss
$
(2,055.2)
$
(1,918.1)
7.1%
Corporate and Other primarily consists of our unallocated corporate expenses and sales of cocoa butter to third parties.
Unallocated corporate expenses include corporate administrative functions that support the operating segments but are not
specifically attributable to or managed by any segment and are not included in the reported financial results of the operating
segments.
Corporate and Other operating loss increased 7% to $2.1 billion for fiscal 2025 compared to $1.9 billion for fiscal 2024,
largely due to costs associated with the restructuring of our support organization, primarily severance costs.
FINANCIAL CONDITION, LIQUIDITY, AND CAPITAL RESOURCES
Cash and Investment Overview
Our cash and investments were $3.7 billion and $3.8 billion as of September 28, 2025, and September 29, 2024, respectively.
We actively manage our cash and investments in order to internally fund operating needs, make scheduled interest and
principal payments on our borrowings, fund acquisitions, and return cash to shareholders through common stock cash dividend
payments and share repurchases. Our investment portfolio primarily includes highly liquid available-for-sale securities,
including corporate debt securities and U.S. government treasury securities, as well as principal-protected structured deposits.
As of September 28, 2025, approximately $1.6 billion of cash and short-term investments were held in foreign subsidiaries.
Borrowing Capacity
Credit Facilities and Commercial Paper
Revolving Credit Facility
During the third quarter of fiscal 2025, we replaced our $3.0 billion unsecured five-year revolving credit facility (the “2021
credit facility”) with a new $3.0 billion unsecured five-year revolving credit facility (the “2025 credit facility”).
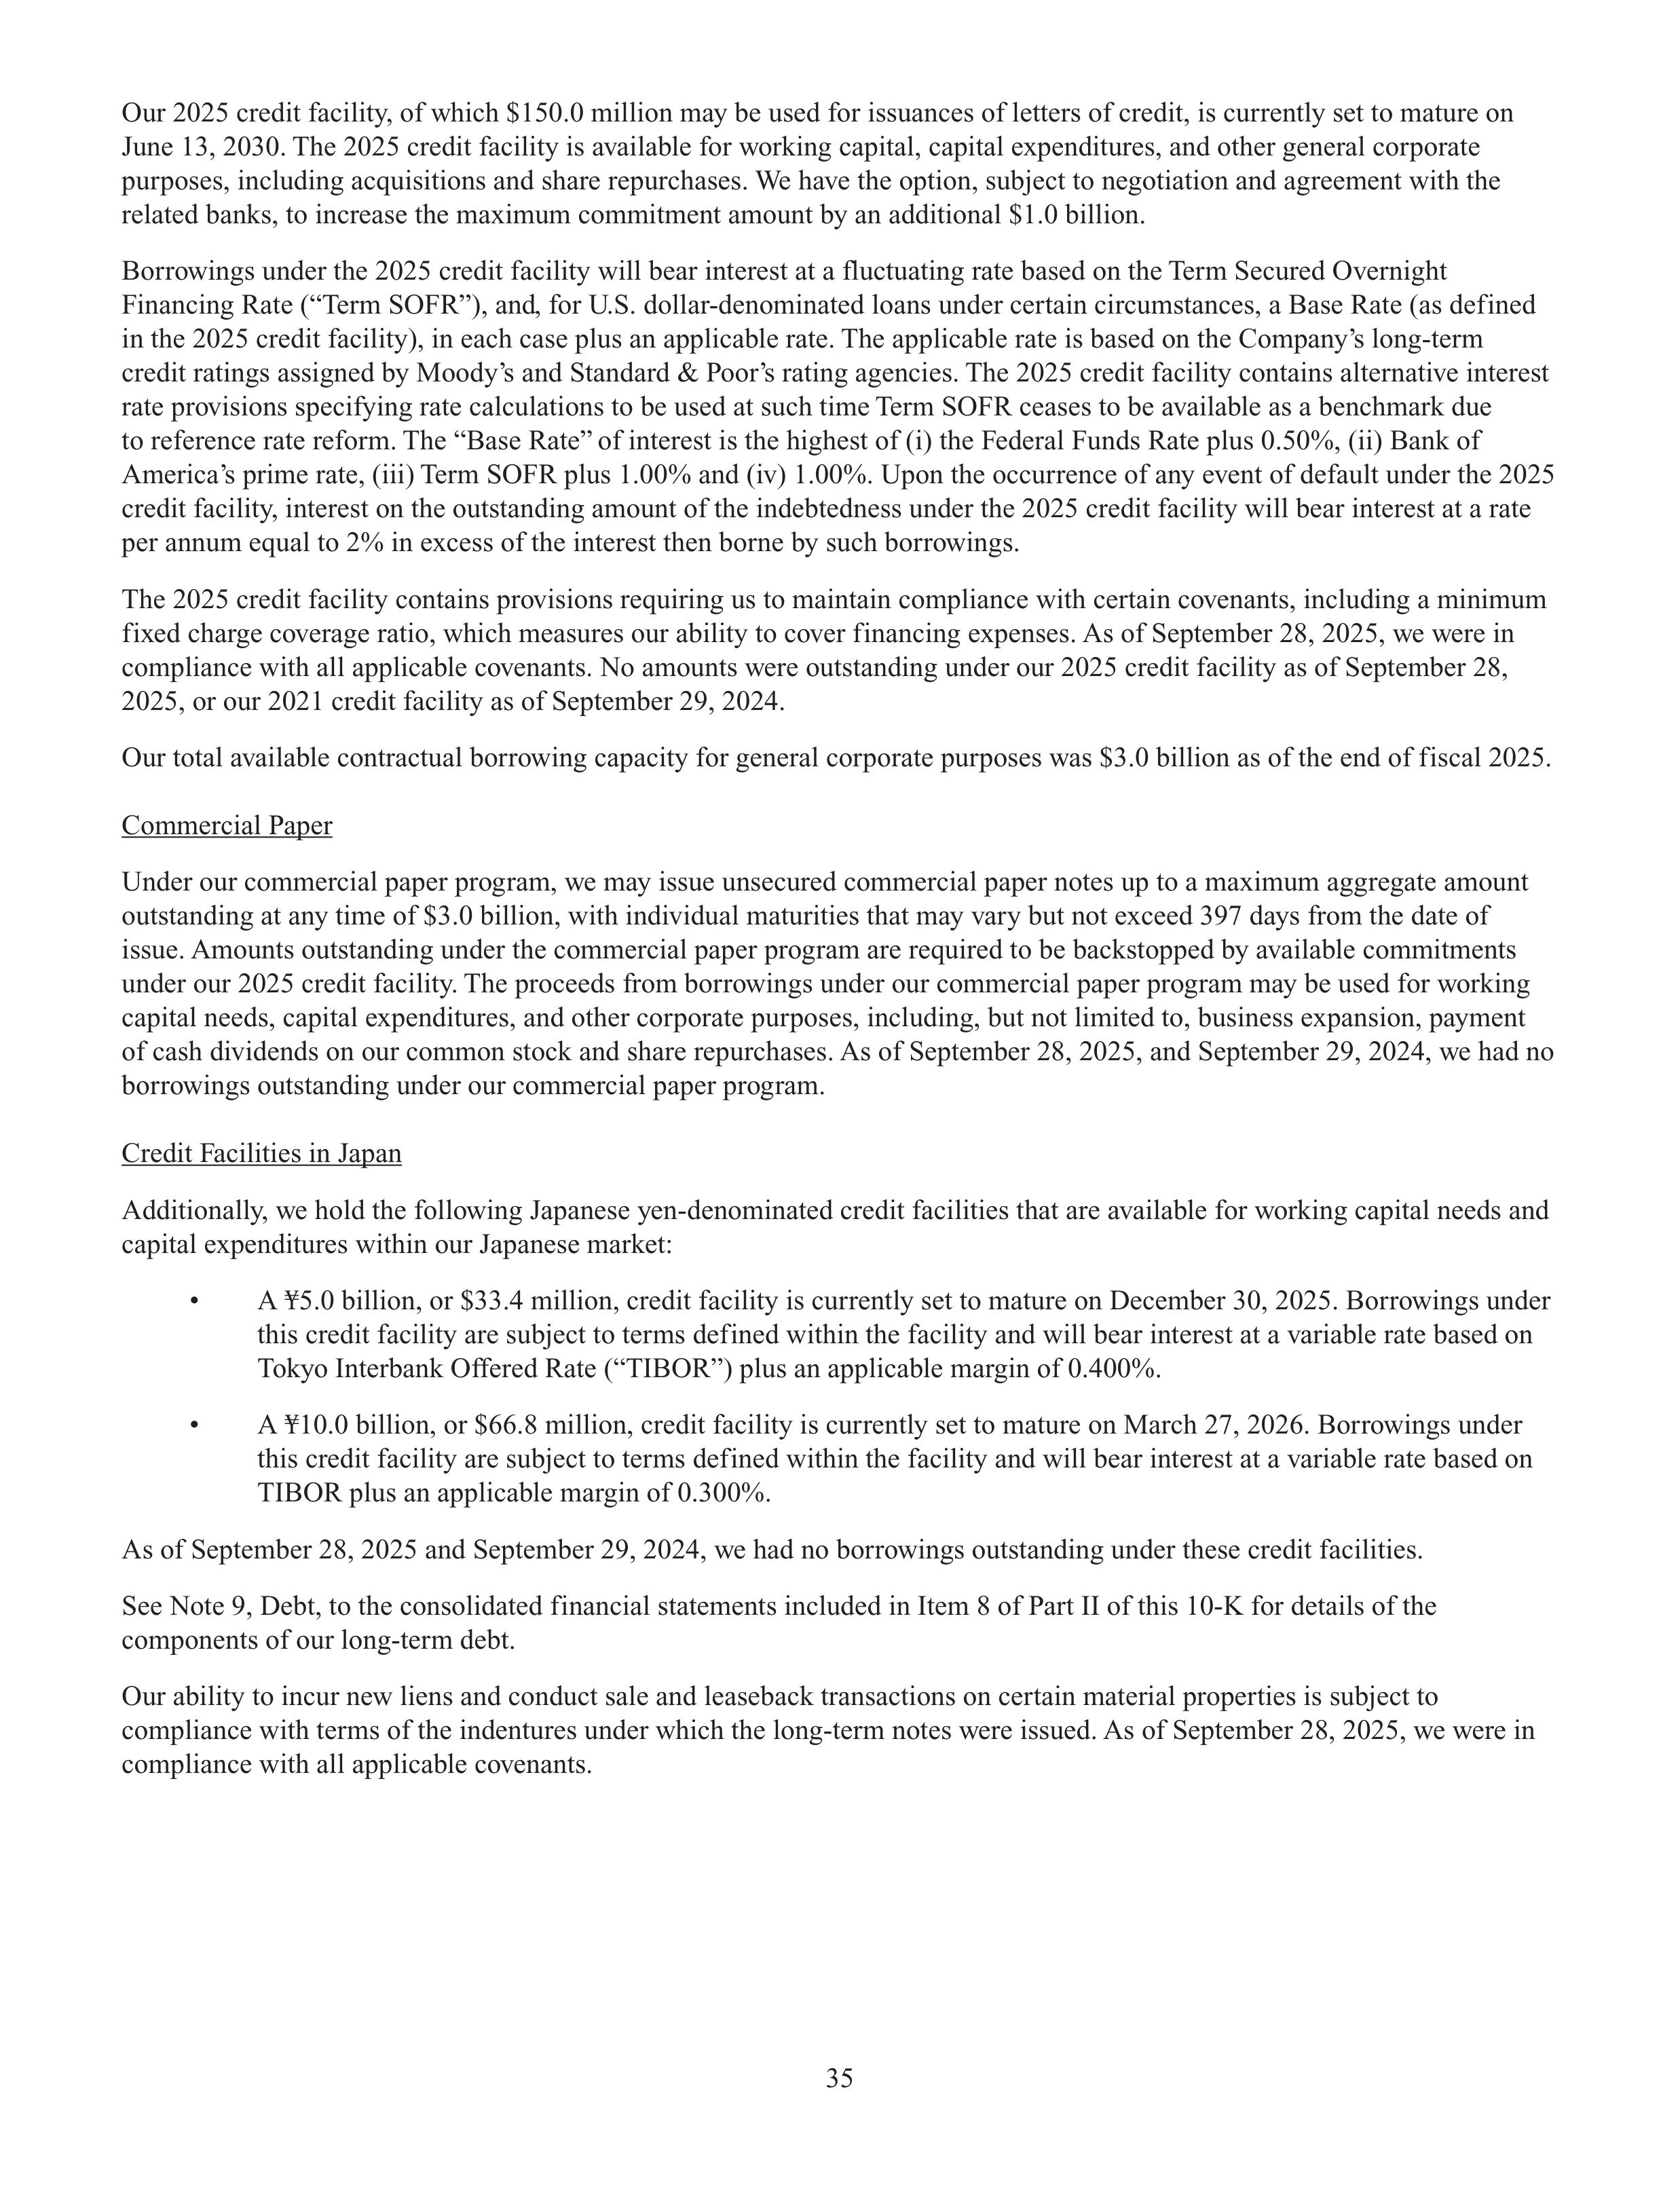
35
Our 2025 credit facility, of which $150.0 million may be used for issuances of letters of credit, is currently set to mature on
June 13, 2030. The 2025 credit facility is available for working capital, capital expenditures, and other general corporate
purposes, including acquisitions and share repurchases. We have the option, subject to negotiation and agreement with the
related banks, to increase the maximum commitment amount by an additional $1.0 billion.
Borrowings under the 2025 credit facility will bear interest at a fluctuating rate based on the Term Secured Overnight
Financing Rate (“Term SOFR”), and, for U.S. dollar-denominated loans under certain circumstances, a Base Rate (as defined
in the 2025 credit facility), in each case plus an applicable rate. The applicable rate is based on the Company’s long-term
credit ratings assigned by Moody’s and Standard & Poor’s rating agencies. The 2025 credit facility contains alternative interest
rate provisions specifying rate calculations to be used at such time Term SOFR ceases to be available as a benchmark due
to reference rate reform. The “Base Rate” of interest is the highest of (i) the Federal Funds Rate plus 0.50%, (ii) Bank of
America’s prime rate, (iii) Term SOFR plus 1.00% and (iv) 1.00%. Upon the occurrence of any event of default under the 2025
credit facility, interest on the outstanding amount of the indebtedness under the 2025 credit facility will bear interest at a rate
per annum equal to 2% in excess of the interest then borne by such borrowings.
The 2025 credit facility contains provisions requiring us to maintain compliance with certain covenants, including a minimum
fixed charge coverage ratio, which measures our ability to cover financing expenses. As of September 28, 2025, we were in
compliance with all applicable covenants. No amounts were outstanding under our 2025 credit facility as of September 28,
2025, or our 2021 credit facility as of September 29, 2024.
Our total available contractual borrowing capacity for general corporate purposes was $3.0 billion as of the end of fiscal 2025.
Commercial Paper
Under our commercial paper program, we may issue unsecured commercial paper notes up to a maximum aggregate amount
outstanding at any time of $3.0 billion, with individual maturities that may vary but not exceed 397 days from the date of
issue. Amounts outstanding under the commercial paper program are required to be backstopped by available commitments
under our 2025 credit facility. The proceeds from borrowings under our commercial paper program may be used for working
capital needs, capital expenditures, and other corporate purposes, including, but not limited to, business expansion, payment
of cash dividends on our common stock and share repurchases. As of September 28, 2025, and September 29, 2024, we had no
borrowings outstanding under our commercial paper program.
Credit Facilities in Japan
Additionally, we hold the following Japanese yen-denominated credit facilities that are available for working capital needs and
capital expenditures within our Japanese market:
•
A ¥5.0 billion, or $33.4 million, credit facility is currently set to mature on December 30, 2025. Borrowings under
this credit facility are subject to terms defined within the facility and will bear interest at a variable rate based on
Tokyo Interbank Offered Rate (“TIBOR”) plus an applicable margin of 0.400%.
•
A ¥10.0 billion, or $66.8 million, credit facility is currently set to mature on March 27, 2026. Borrowings under
this credit facility are subject to terms defined within the facility and will bear interest at a variable rate based on
TIBOR plus an applicable margin of 0.300%.
As of September 28, 2025 and September 29, 2024, we had no borrowings outstanding under these credit facilities.
See Note 9, Debt, to the consolidated financial statements included in Item 8 of Part II of this 10-K for details of the
components of our long-term debt.
Our ability to incur new liens and conduct sale and leaseback transactions on certain material properties is subject to
compliance with terms of the indentures under which the long-term notes were issued. As of September 28, 2025, we were in
compliance with all applicable covenants.
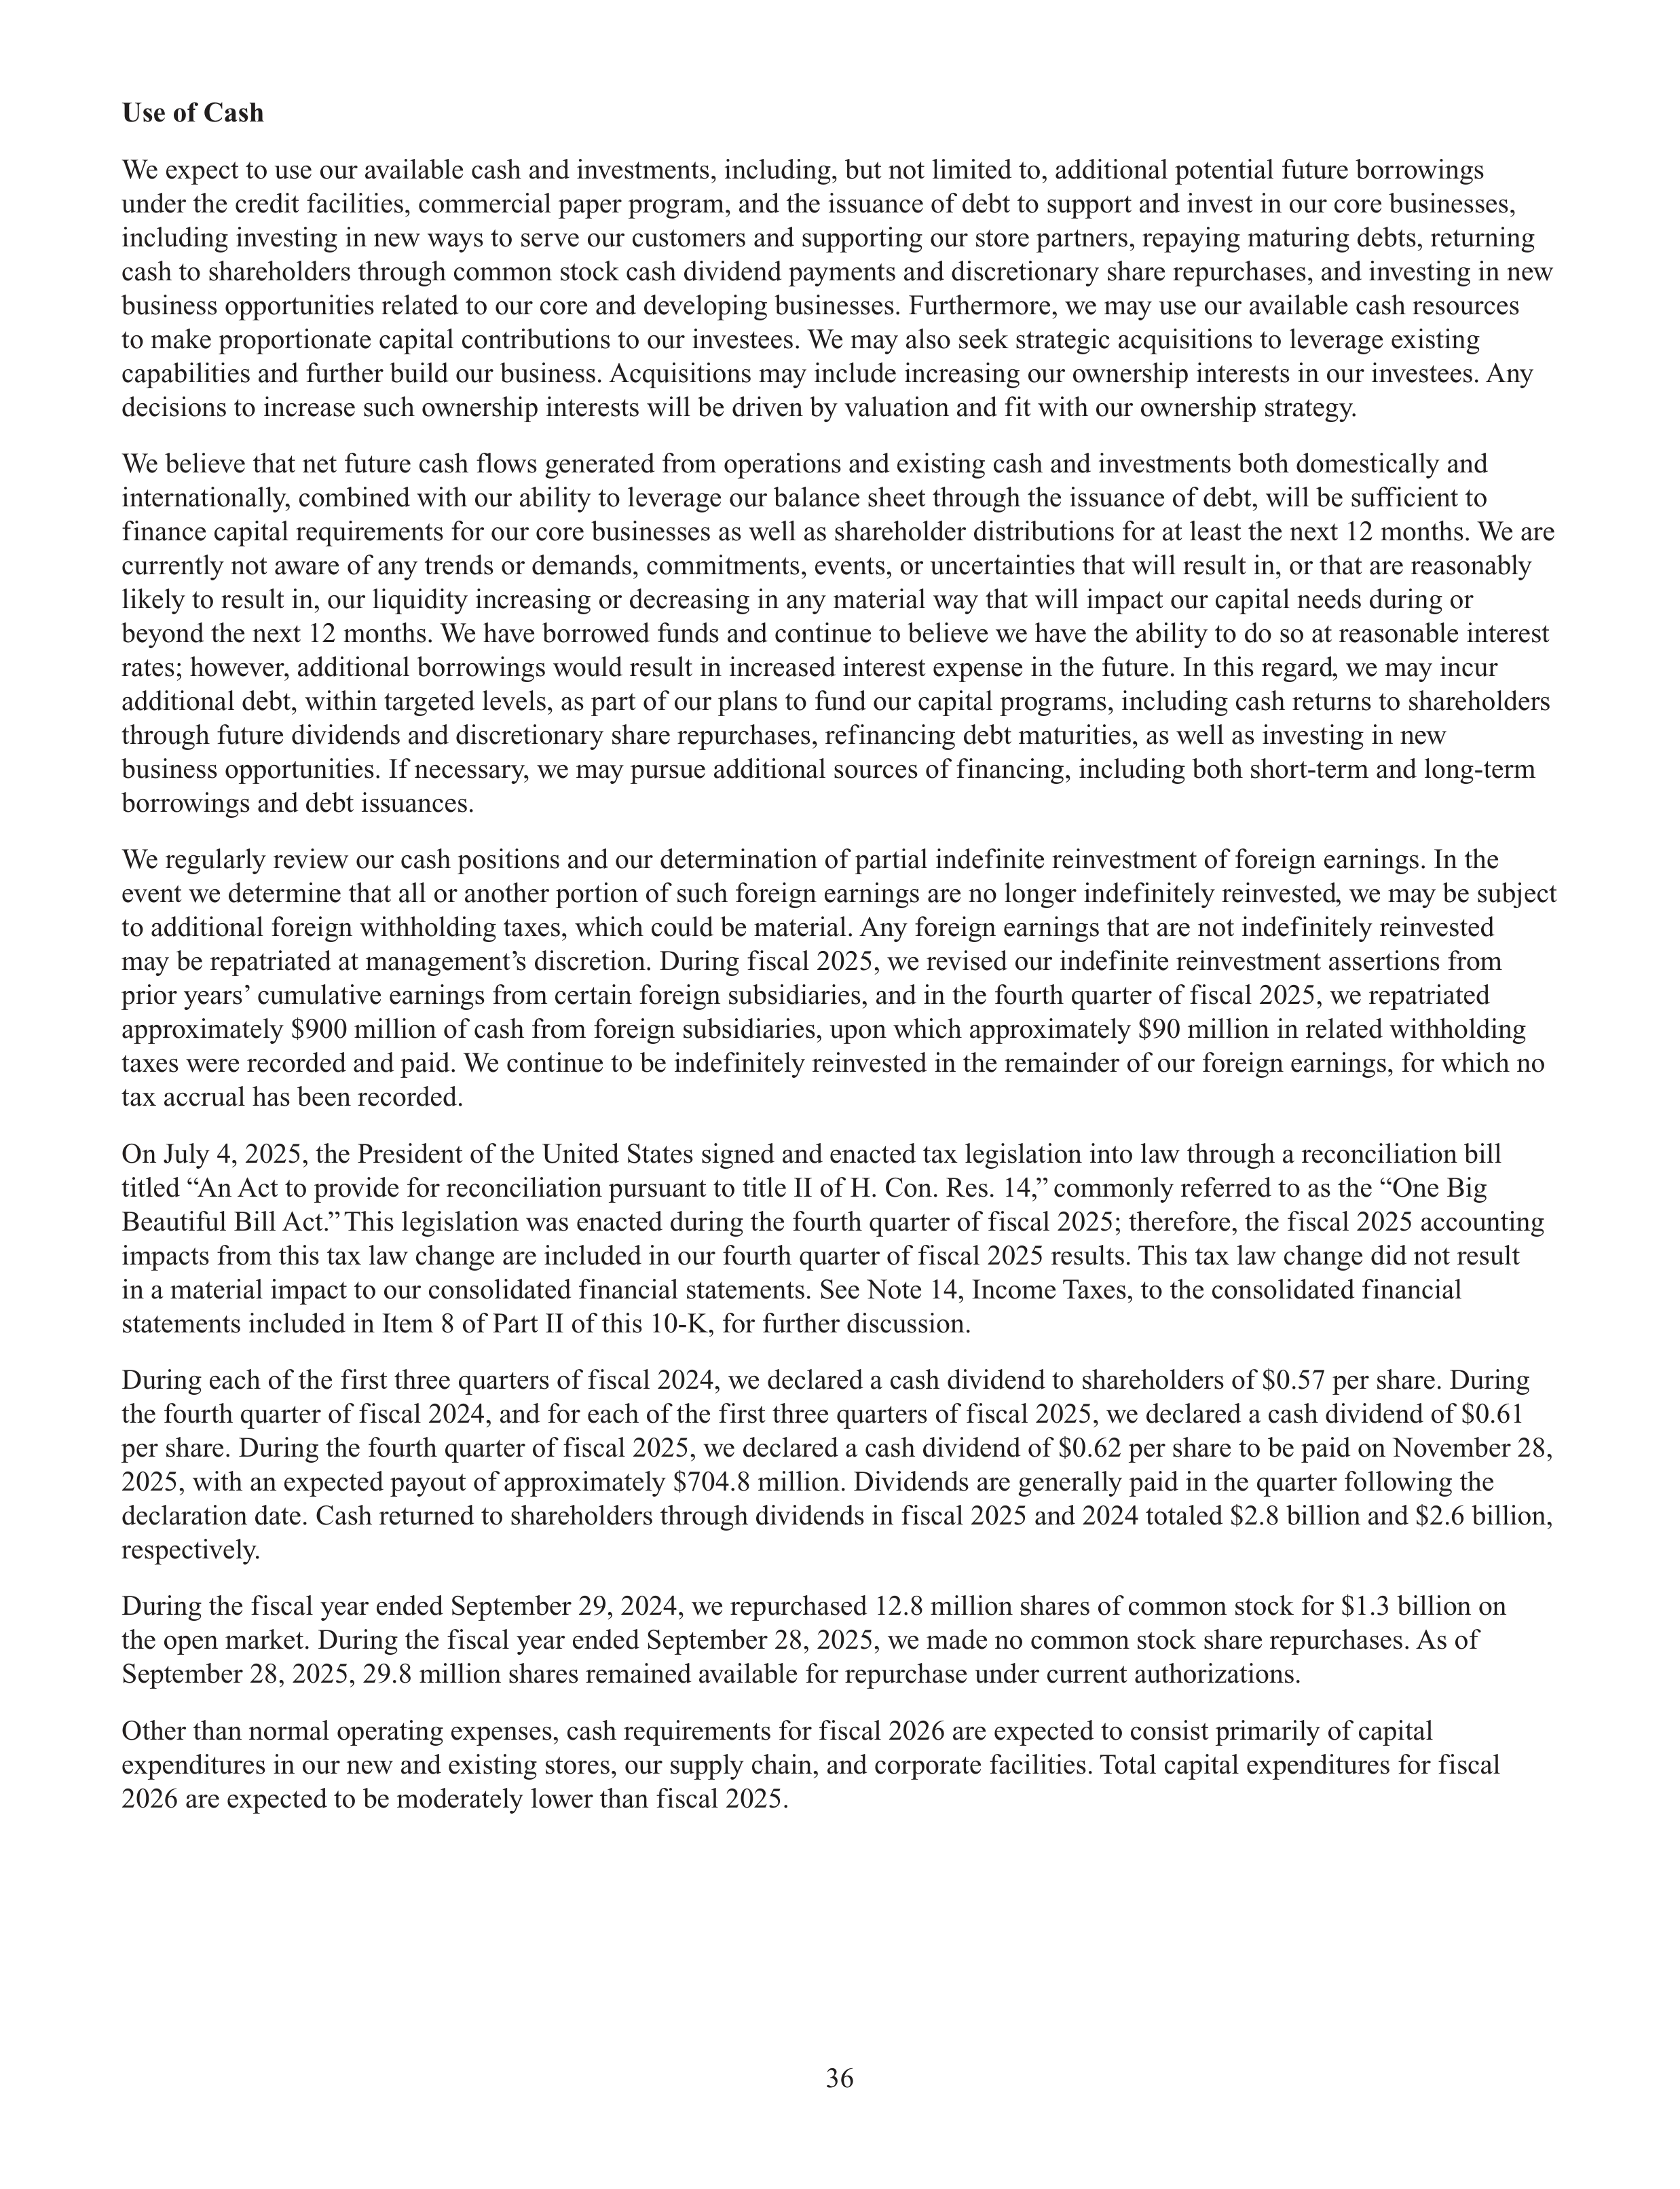
36
Use of Cash
We expect to use our available cash and investments, including, but not limited to, additional potential future borrowings
under the credit facilities, commercial paper program, and the issuance of debt to support and invest in our core businesses,
including investing in new ways to serve our customers and supporting our store partners, repaying maturing debts, returning
cash to shareholders through common stock cash dividend payments and discretionary share repurchases, and investing in new
business opportunities related to our core and developing businesses. Furthermore, we may use our available cash resources
to make proportionate capital contributions to our investees. We may also seek strategic acquisitions to leverage existing
capabilities and further build our business. Acquisitions may include increasing our ownership interests in our investees. Any
decisions to increase such ownership interests will be driven by valuation and fit with our ownership strategy.
We believe that net future cash flows generated from operations and existing cash and investments both domestically and
internationally, combined with our ability to leverage our balance sheet through the issuance of debt, will be sufficient to
finance capital requirements for our core businesses as well as shareholder distributions for at least the next 12 months. We are
currently not aware of any trends or demands, commitments, events, or uncertainties that will result in, or that are reasonably
likely to result in, our liquidity increasing or decreasing in any material way that will impact our capital needs during or
beyond the next 12 months. We have borrowed funds and continue to believe we have the ability to do so at reasonable interest
rates; however, additional borrowings would result in increased interest expense in the future. In this regard, we may incur
additional debt, within targeted levels, as part of our plans to fund our capital programs, including cash returns to shareholders
through future dividends and discretionary share repurchases, refinancing debt maturities, as well as investing in new
business opportunities. If necessary, we may pursue additional sources of financing, including both short-term and long-term
borrowings and debt issuances.
We regularly review our cash positions and our determination of partial indefinite reinvestment of foreign earnings. In the
event we determine that all or another portion of such foreign earnings are no longer indefinitely reinvested, we may be subject
to additional foreign withholding taxes, which could be material. Any foreign earnings that are not indefinitely reinvested
may be repatriated at management’s discretion. During fiscal 2025, we revised our indefinite reinvestment assertions from
prior years’ cumulative earnings from certain foreign subsidiaries, and in the fourth quarter of fiscal 2025, we repatriated
approximately $900 million of cash from foreign subsidiaries, upon which approximately $90 million in related withholding
taxes were recorded and paid. We continue to be indefinitely reinvested in the remainder of our foreign earnings, for which no
tax accrual has been recorded.
On July 4, 2025, the President of the United States signed and enacted tax legislation into law through a reconciliation bill
titled “An Act to provide for reconciliation pursuant to title II of H. Con. Res. 14,” commonly referred to as the “One Big
Beautiful Bill Act.” This legislation was enacted during the fourth quarter of fiscal 2025; therefore, the fiscal 2025 accounting
impacts from this tax law change are included in our fourth quarter of fiscal 2025 results. This tax law change did not result
in a material impact to our consolidated financial statements. See Note 14, Income Taxes, to the consolidated financial
statements included in Item 8 of Part II of this 10-K, for further discussion.
During each of the first three quarters of fiscal 2024, we declared a cash dividend to shareholders of $0.57 per share. During
the fourth quarter of fiscal 2024, and for each of the first three quarters of fiscal 2025, we declared a cash dividend of $0.61
per share. During the fourth quarter of fiscal 2025, we declared a cash dividend of $0.62 per share to be paid on November 28,
2025, with an expected payout of approximately $704.8 million. Dividends are generally paid in the quarter following the
declaration date. Cash returned to shareholders through dividends in fiscal 2025 and 2024 totaled $2.8 billion and $2.6 billion,
respectively.
During the fiscal year ended September 29, 2024, we repurchased 12.8 million shares of common stock for $1.3 billion on
the open market. During the fiscal year ended September 28, 2025, we made no common stock share repurchases. As of
September 28, 2025, 29.8 million shares remained available for repurchase under current authorizations.
Other than normal operating expenses, cash requirements for fiscal 2026 are expected to consist primarily of capital
expenditures in our new and existing stores, our supply chain, and corporate facilities. Total capital expenditures for fiscal
2026 are expected to be moderately lower than fiscal 2025.
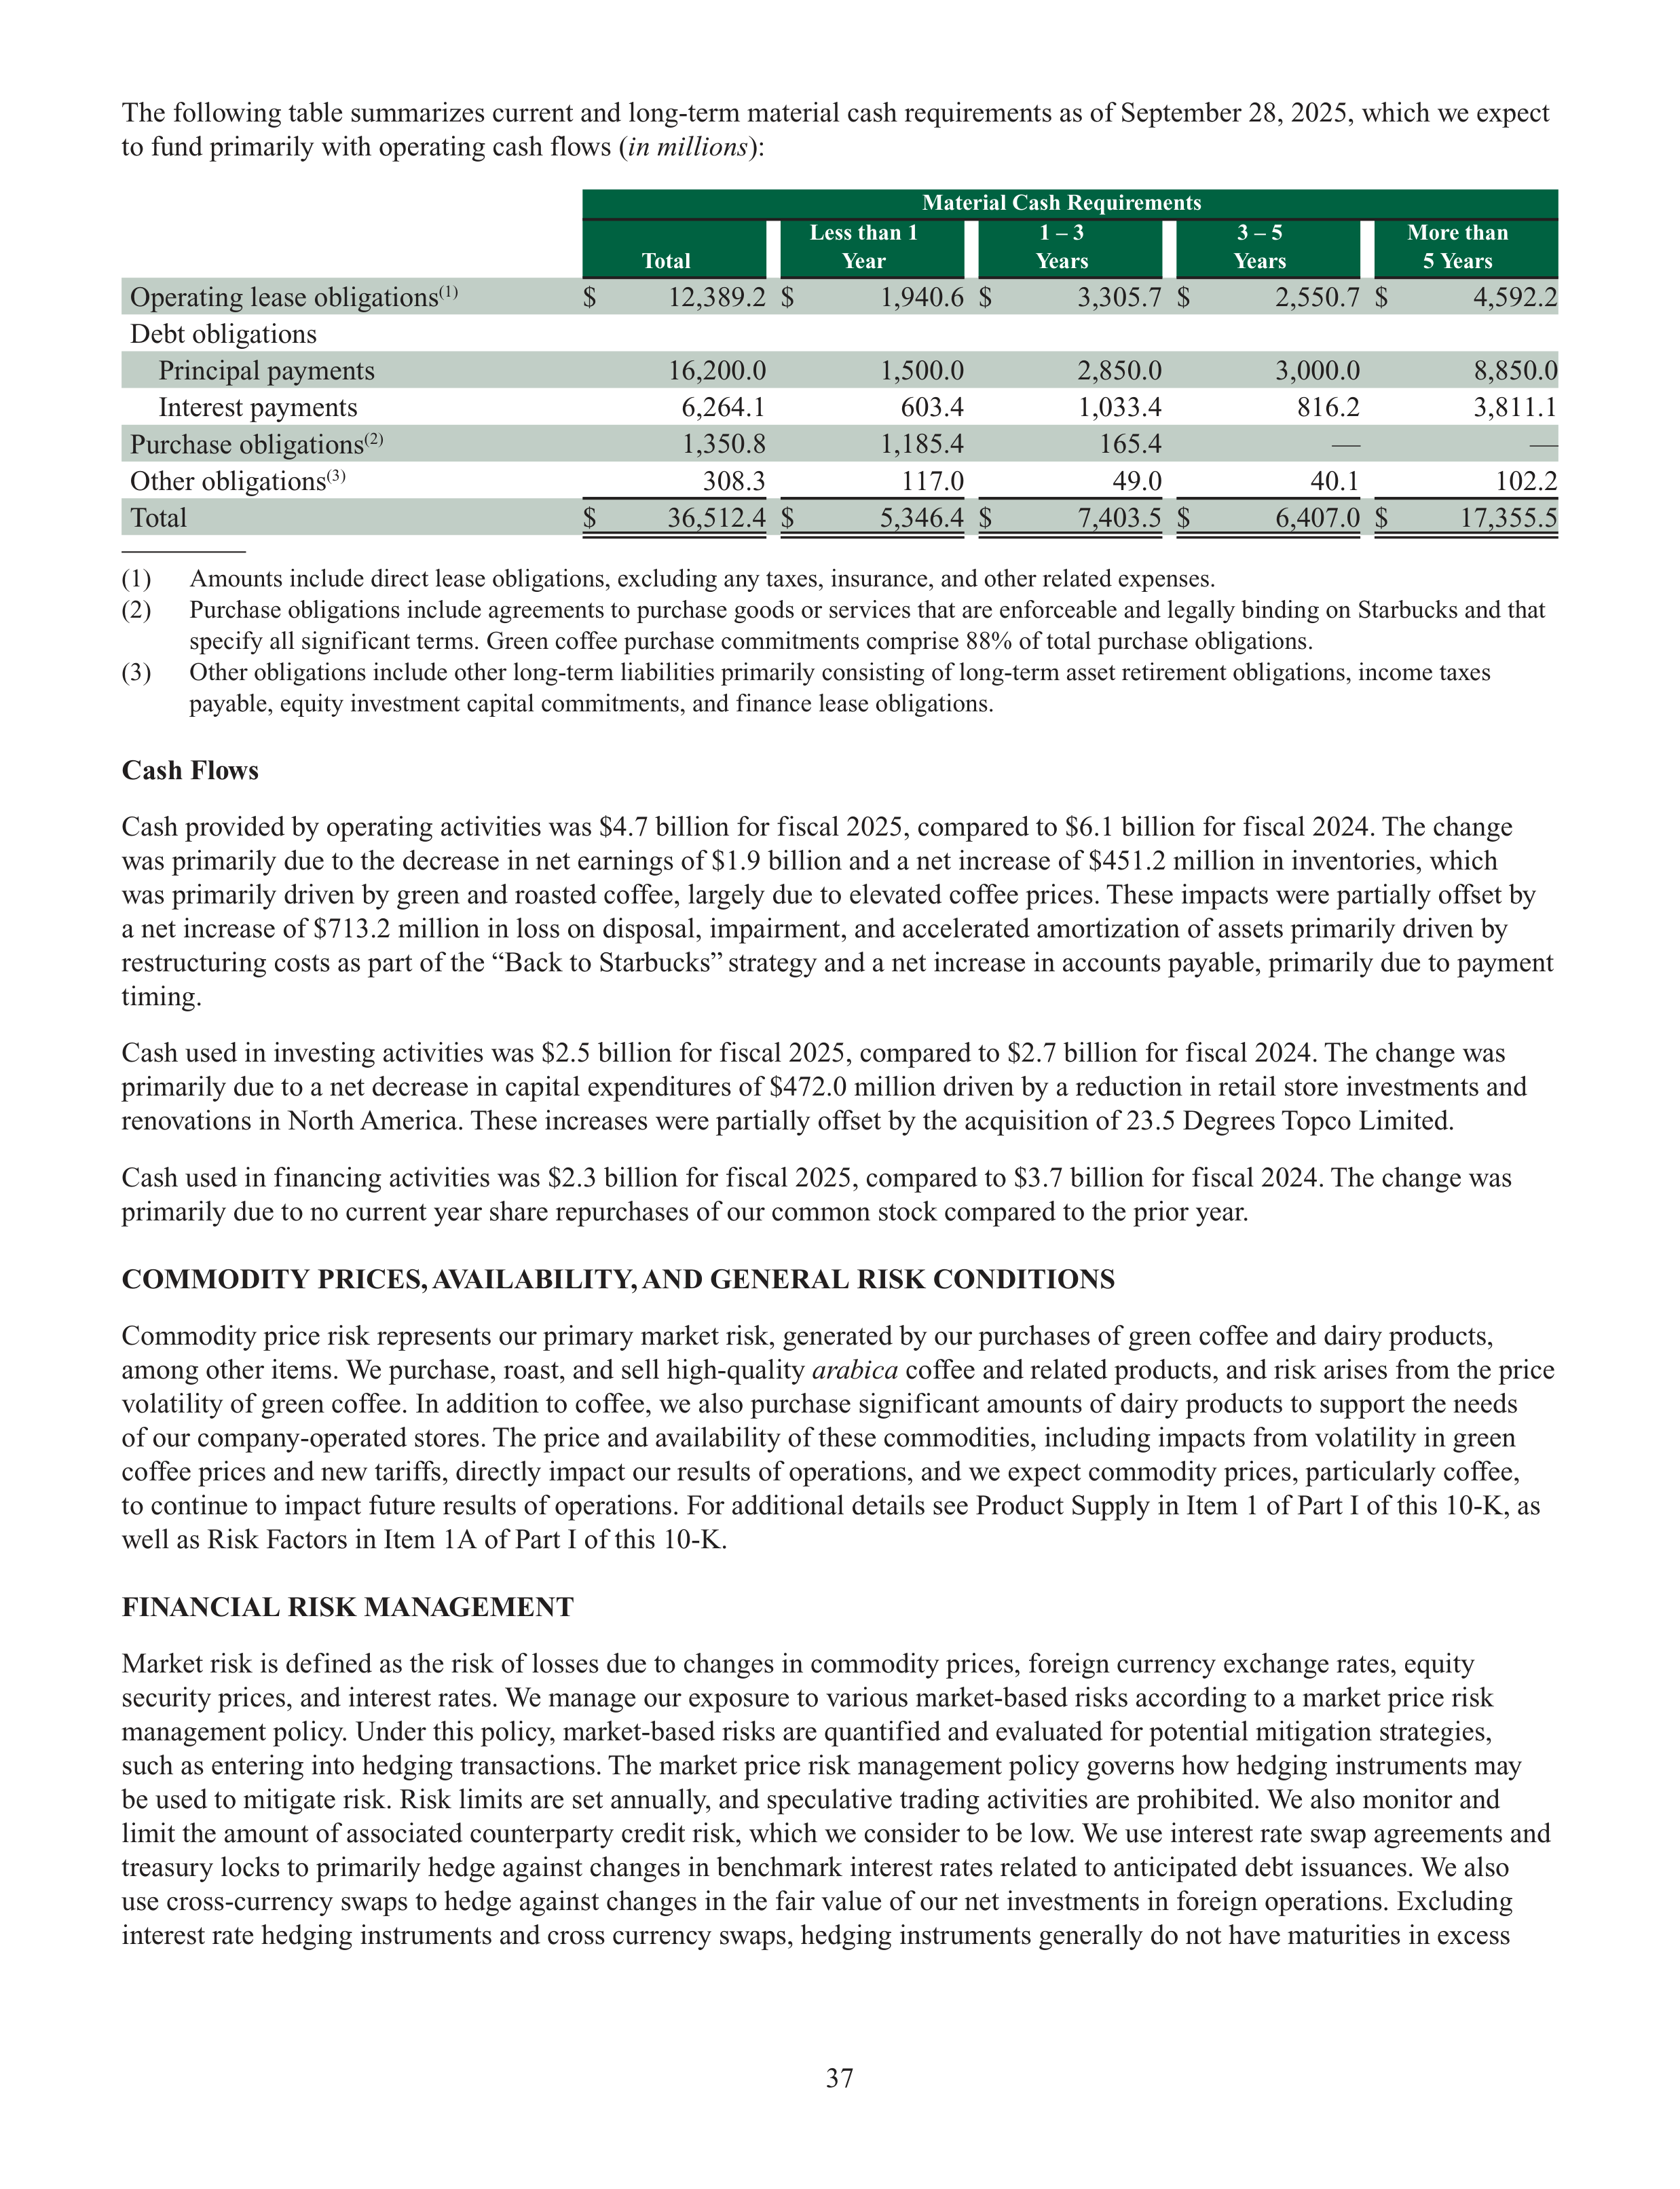
37
The following table summarizes current and long-term material cash requirements as of September 28, 2025, which we expect
to fund primarily with operating cash flows (
in millions
):
Material Cash Requirements
Total
Less than 1
Year
1 – 3
Years
3 – 5
Years
More than
5 Years
Operating lease obligations
(1)
$
12,389.2
$
1,940.6
$
3,305.7
$
2,550.7
$
4,592.2
Debt obligations
Principal payments
16,200.0
1,500.0
2,850.0
3,000.0
8,850.0
Interest payments
6,264.1
603.4
1,033.4
816.2
3,811.1
Purchase obligations
(2)
1,350.8
1,185.4
165.4
—
—
Other obligations
(3)
308.3
117.0
49.0
40.1
102.2
Total
$
36,512.4
$
5,346.4
$
7,403.5
$
6,407.0
$
17,355.5
(1)
Amounts include direct lease obligations, excluding any taxes, insurance, and other related expenses.
(2)
Purchase obligations include agreements to purchase goods or services that are enforceable and legally binding on Starbucks and that
specify all significant terms. Green coffee purchase commitments comprise 88% of total purchase obligations.
(3)
Other obligations include other long-term liabilities primarily consisting of long-term asset retirement obligations, income taxes
payable, equity investment capital commitments, and finance lease obligations.
Cash Flows
Cash provided by operating activities was $4.7 billion for fiscal 2025, compared to $6.1 billion for fiscal 2024. The change
was primarily due to the decrease in net earnings of $1.9 billion and a net increase of $451.2 million in inventories, which
was primarily driven by green and roasted coffee, largely due to elevated coffee prices. These impacts were partially offset by
a net increase of $713.2 million in loss on disposal, impairment, and accelerated amortization of assets primarily driven by
restructuring costs as part of the “Back to Starbucks” strategy and a net increase in accounts payable, primarily due to payment
timing.
Cash used in investing activities was $2.5 billion for fiscal 2025, compared to $2.7 billion for fiscal 2024. The change was
primarily due to a net decrease in capital expenditures of $472.0 million driven by a reduction in retail store investments and
renovations in North America. These increases were partially offset by the acquisition of 23.5 Degrees Topco Limited.
Cash used in financing activities was $2.3 billion for fiscal 2025, compared to $3.7 billion for fiscal 2024. The change was
primarily due to no current year share repurchases of our common stock compared to the prior year.
COMMODITY PRICES, AVAILABILITY, AND GENERAL RISK CONDITIONS
Commodity price risk represents our primary market risk, generated by our purchases of green coffee and dairy products,
among other items. We purchase, roast, and sell high-quality
arabica
coffee and related products, and risk arises from the price
volatility of green coffee. In addition to coffee, we also purchase significant amounts of dairy products to support the needs
of our company-operated stores. The price and availability of these commodities, including impacts from volatility in green
coffee prices and new tariffs, directly impact our results of operations, and we expect commodity prices, particularly coffee,
to continue to impact future results of operations. For additional details see Product Supply in Item 1 of Part I of this 10-K, as
well as Risk Factors in Item 1A of Part I of this 10-K.
FINANCIAL RISK MANAGEMENT
Market risk is defined as the risk of losses due to changes in commodity prices, foreign currency exchange rates, equity
security prices, and interest rates. We manage our exposure to various market-based risks according to a market price risk
management policy. Under this policy, market-based risks are quantified and evaluated for potential mitigation strategies,
such as entering into hedging transactions. The market price risk management policy governs how hedging instruments may
be used to mitigate risk. Risk limits are set annually, and speculative trading activities are prohibited. We also monitor and
limit the amount of associated counterparty credit risk, which we consider to be low. We use interest rate swap agreements and
treasury locks to primarily hedge against changes in benchmark interest rates related to anticipated debt issuances. We also
use cross-currency swaps to hedge against changes in the fair value of our net investments in foreign operations. Excluding
interest rate hedging instruments and cross currency swaps, hedging instruments generally do not have maturities in excess
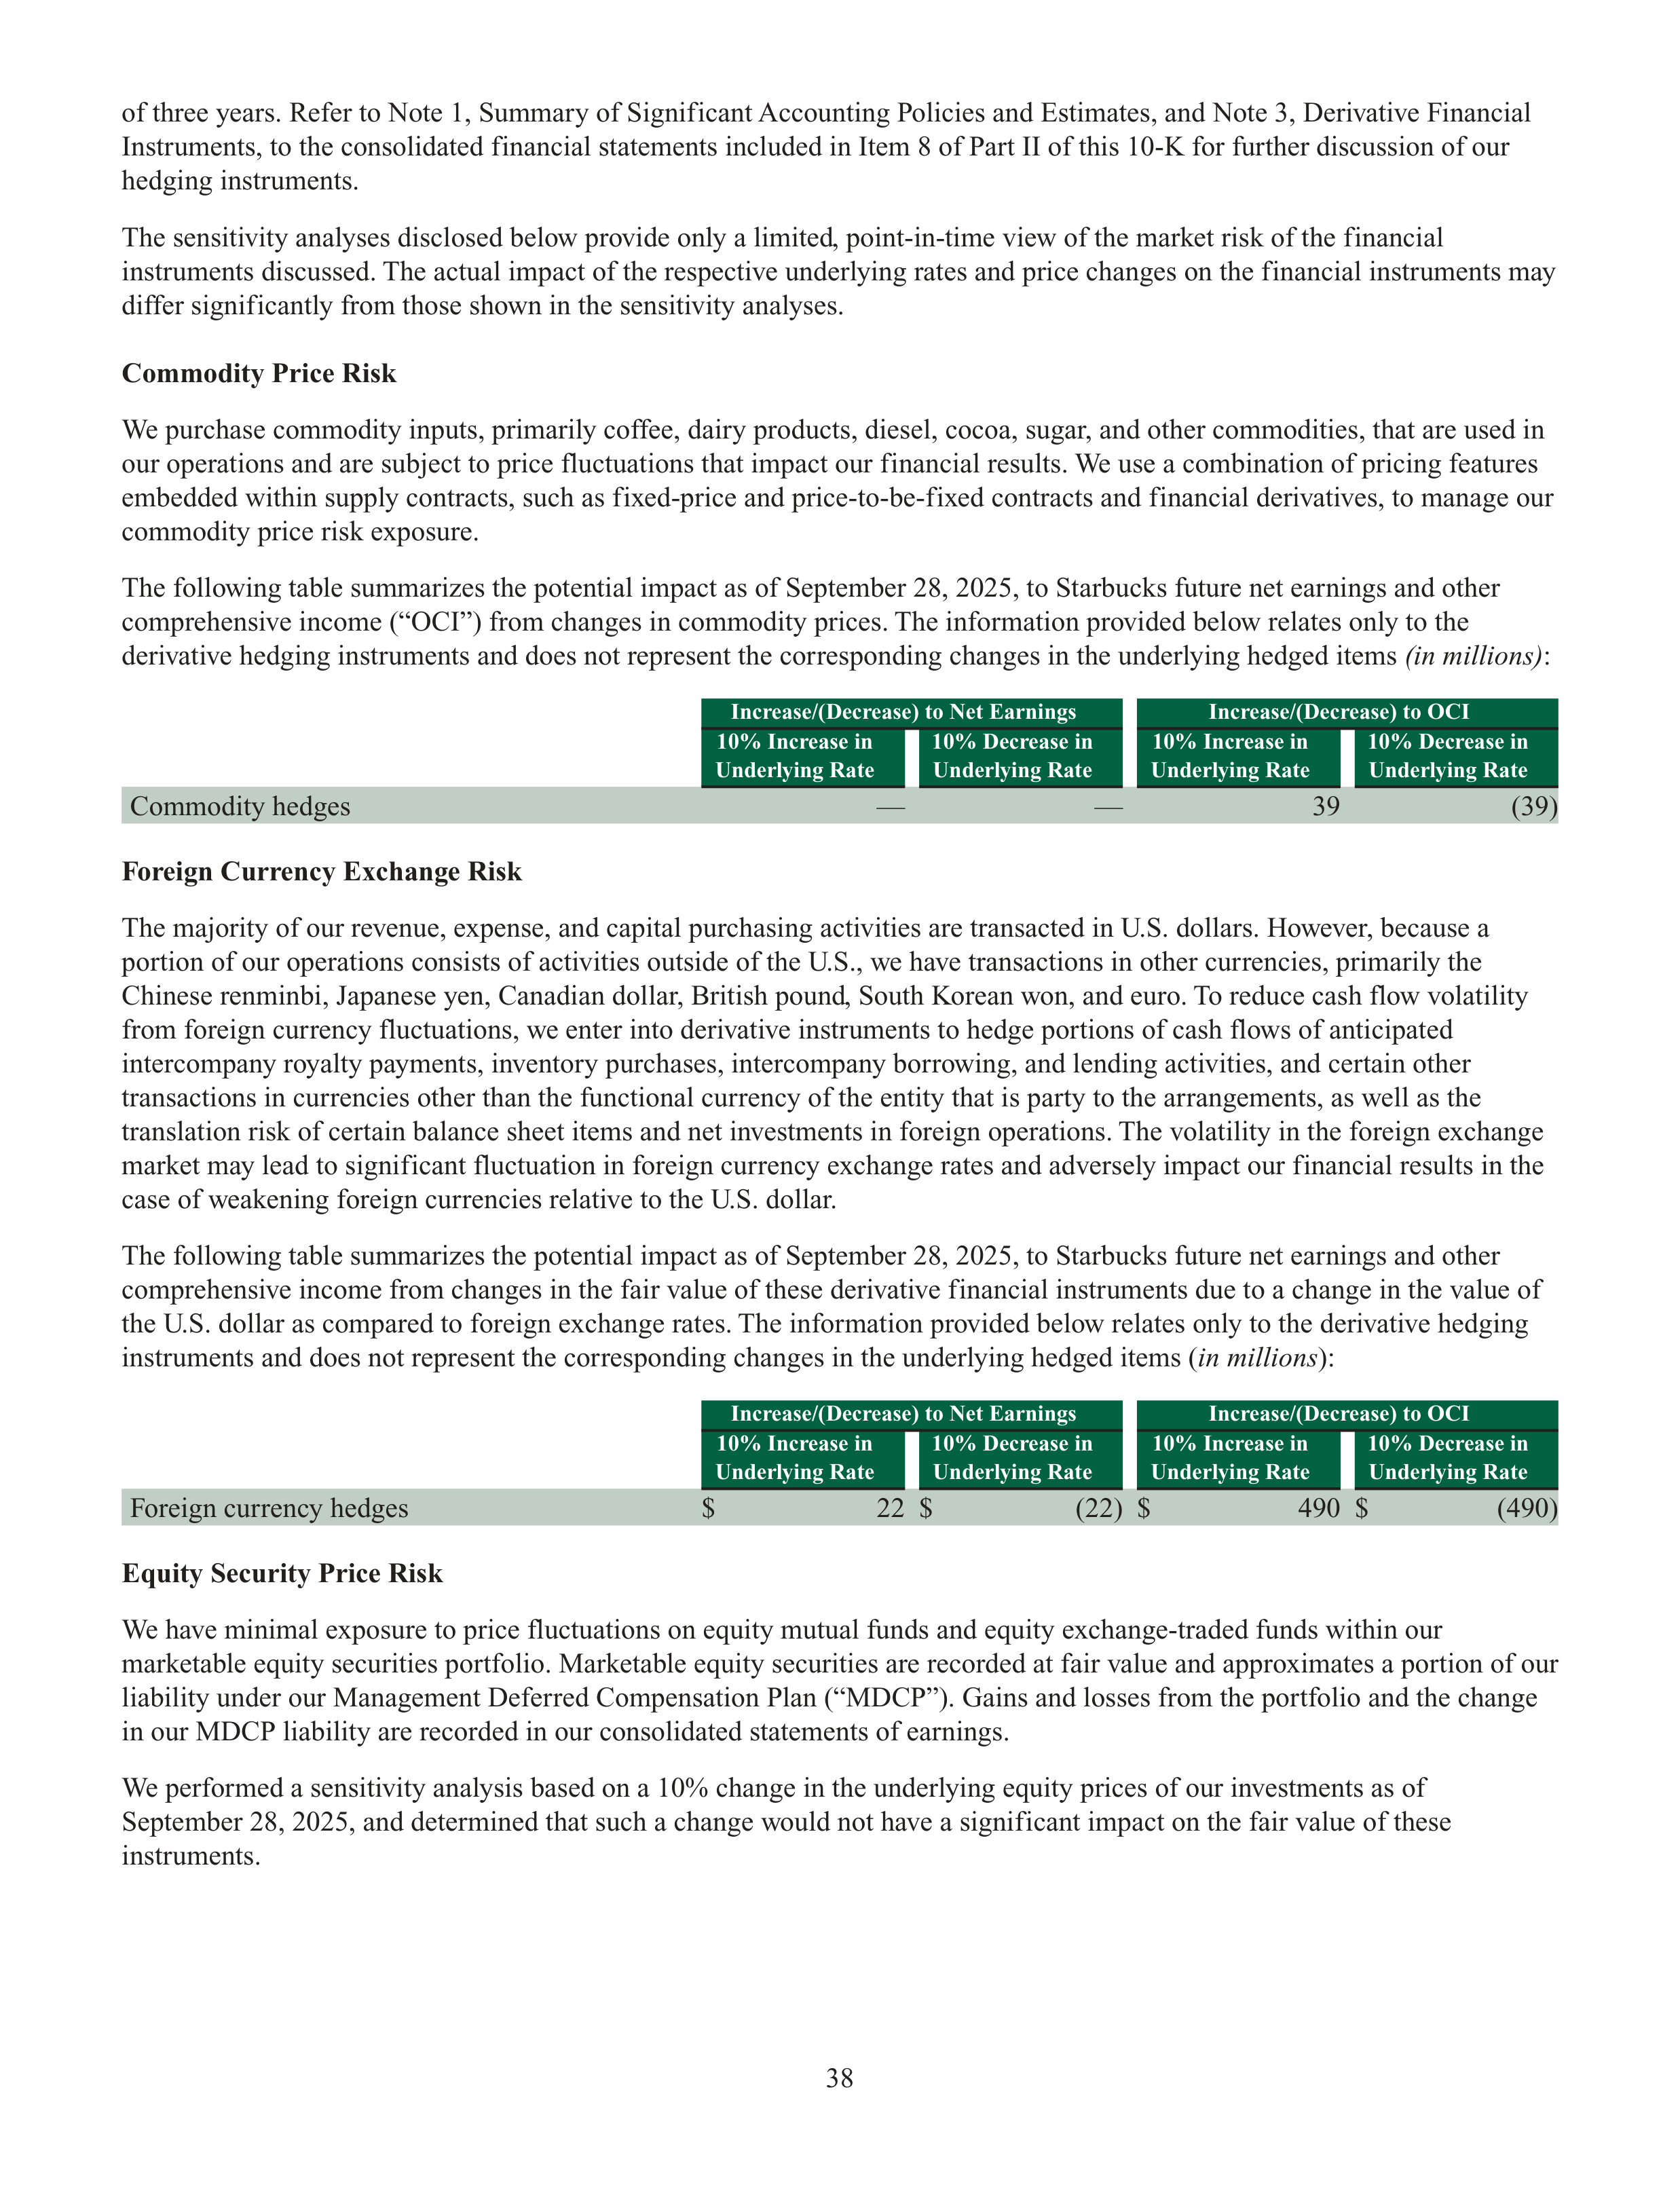
38
of three years. Refer to Note 1, Summary of Significant Accounting Policies and Estimates, and Note 3, Derivative Financial
Instruments, to the consolidated financial statements included in Item 8 of Part II of this 10-K for further discussion of our
hedging instruments.
The sensitivity analyses disclosed below provide only a limited, point-in-time view of the market risk of the financial
instruments discussed. The actual impact of the respective underlying rates and price changes on the financial instruments may
differ significantly from those shown in the sensitivity analyses.
Commodity Price Risk
We purchase commodity inputs, primarily coffee, dairy products, diesel, cocoa, sugar, and other commodities, that are used in
our operations and are subject to price fluctuations that impact our financial results. We use a combination of pricing features
embedded within supply contracts, such as fixed-price and price-to-be-fixed contracts and financial derivatives, to manage our
commodity price risk exposure.
The following table summarizes the potential impact as of September 28, 2025, to Starbucks future net earnings and other
comprehensive income (“OCI”) from changes in commodity prices. The information provided below relates only to the
derivative hedging instruments and does not represent the corresponding changes in the underlying hedged items
(in millions)
:
Increase/(Decrease) to Net Earnings
Increase/(Decrease) to OCI
10% Increase in
Underlying Rate
10% Decrease in
Underlying Rate
10% Increase in
Underlying Rate
10% Decrease in
Underlying Rate
Commodity hedges
—
—
39
(39)
Foreign Currency Exchange Risk
The majority of our revenue, expense, and capital purchasing activities are transacted in U.S. dollars. However, because a
portion of our operations consists of activities outside of the U.S., we have transactions in other currencies, primarily the
Chinese renminbi, Japanese yen, Canadian dollar, British pound, South Korean won, and euro. To reduce cash flow volatility
from foreign currency fluctuations, we enter into derivative instruments to hedge portions of cash flows of anticipated
intercompany royalty payments, inventory purchases, intercompany borrowing, and lending activities, and certain other
transactions in currencies other than the functional currency of the entity that is party to the arrangements, as well as the
translation risk of certain balance sheet items and net investments in foreign operations. The volatility in the foreign exchange
market may lead to significant fluctuation in foreign currency exchange rates and adversely impact our financial results in the
case of weakening foreign currencies relative to the U.S. dollar.
The following table summarizes the potential impact as of September 28, 2025, to Starbucks future net earnings and other
comprehensive income from changes in the fair value of these derivative financial instruments due to a change in the value of
the U.S. dollar as compared to foreign exchange rates. The information provided below relates only to the derivative hedging
instruments and does not represent the corresponding changes in the underlying hedged items (
in millions
):
Increase/(Decrease) to Net Earnings
Increase/(Decrease) to OCI
10% Increase in
Underlying Rate
10% Decrease in
Underlying Rate
10% Increase in
Underlying Rate
10% Decrease in
Underlying Rate
Foreign currency hedges
$
22 $
(22)
$
490
$
(490)
Equity Security Price Risk
We have minimal exposure to price fluctuations on equity mutual funds and equity exchange-traded funds within our
marketable equity securities portfolio. Marketable equity securities are recorded at fair value and approximates a portion of our
liability under our Management Deferred Compensation Plan (“MDCP”). Gains and losses from the portfolio and the change
in our MDCP liability are recorded in our consolidated statements of earnings.
We performed a sensitivity analysis based on a 10% change in the underlying equity prices of our investments as of
September 28, 2025, and determined that such a change would not have a significant impact on the fair value of these
instruments.
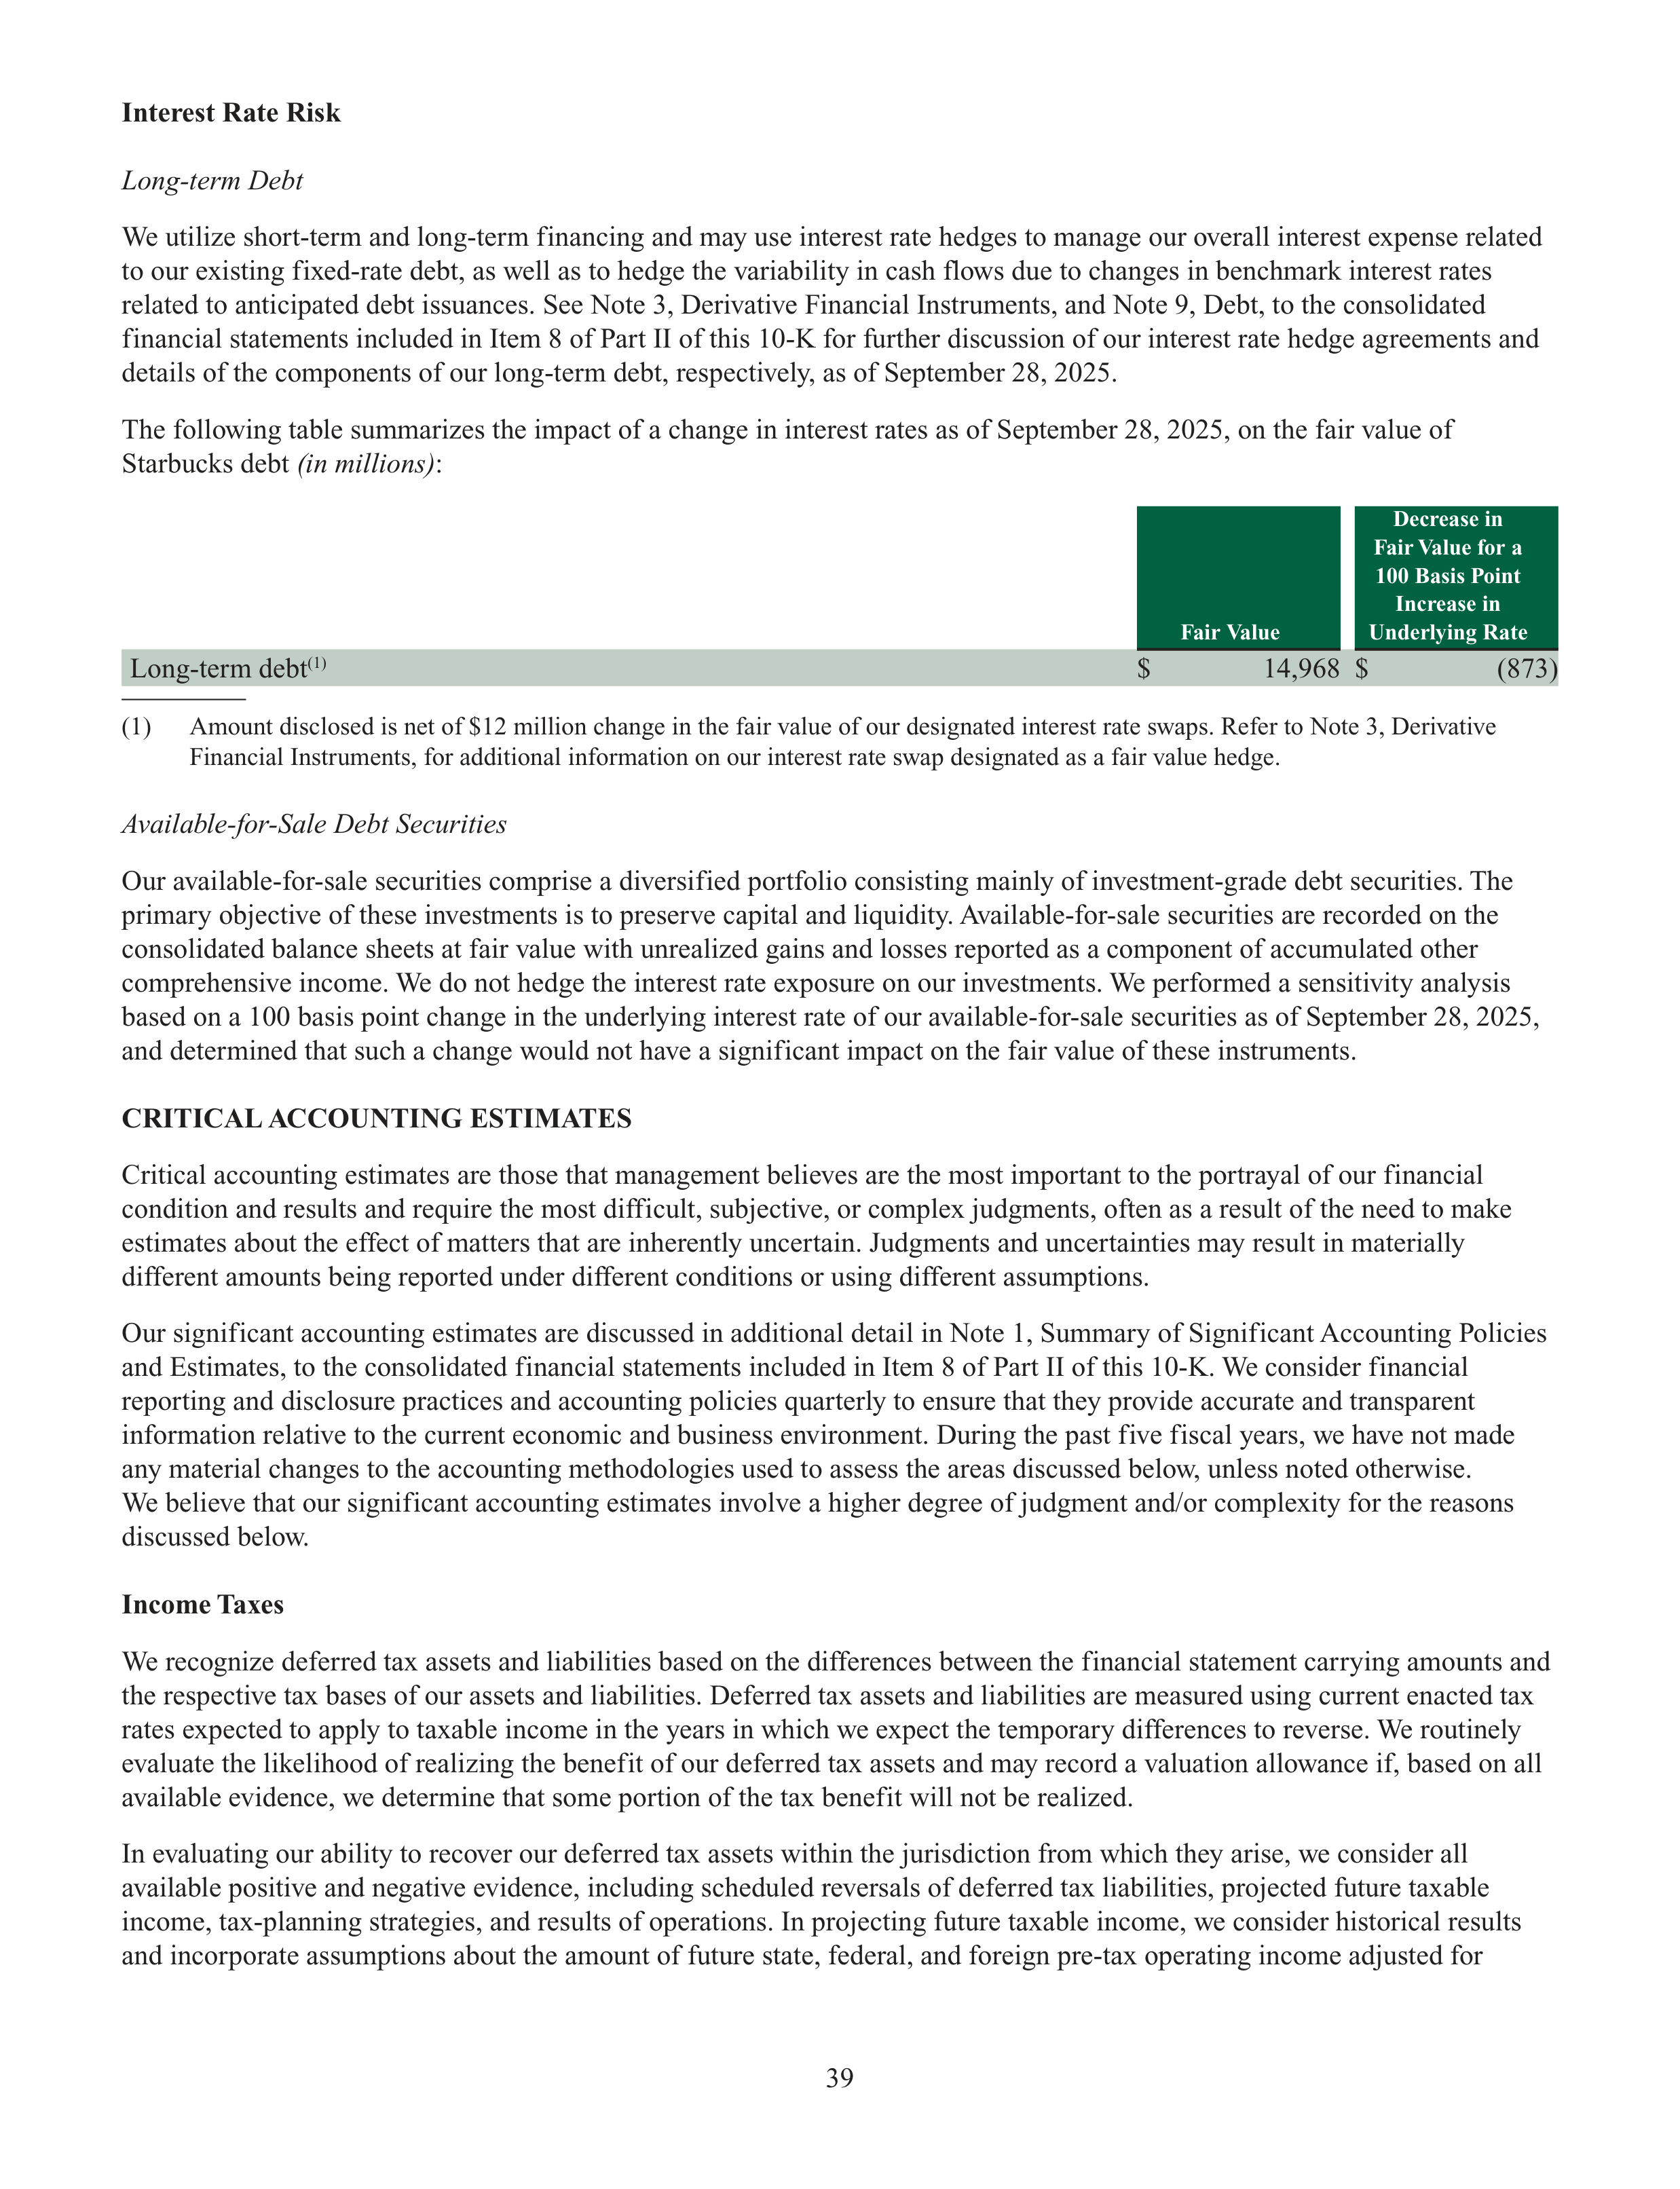
39
Interest Rate Risk
Long-term Debt
We utilize short-term and long-term financing and may use interest rate hedges to manage our overall interest expense related
to our existing fixed-rate debt, as well as to hedge the variability in cash flows due to changes in benchmark interest rates
related to anticipated debt issuances. See Note 3, Derivative Financial Instruments, and Note 9, Debt, to the consolidated
financial statements included in Item 8 of Part II of this 10-K for further discussion of our interest rate hedge agreements and
details of the components of our long-term debt, respectively, as of September 28, 2025.
The following table summarizes the impact of a change in interest rates as of September 28, 2025, on the fair value of
Starbucks debt
(in millions)
:
Fair Value
Decrease in
Fair Value for a
100 Basis Point
Increase in
Underlying Rate
Long-term debt
(1)
$
14,968
$
(873)
(1)
Amount disclosed is net of $12 million change in the fair value of our designated interest rate swaps. Refer to Note 3, Derivative
Financial Instruments, for additional information on our interest rate swap designated as a fair value hedge.
Available-for-Sale Debt Securities
Our available-for-sale securities comprise a diversified portfolio consisting mainly of investment-grade debt securities. The
primary objective of these investments is to preserve capital and liquidity. Available-for-sale securities are recorded on the
consolidated balance sheets at fair value with unrealized gains and losses reported as a component of accumulated other
comprehensive income. We do not hedge the interest rate exposure on our investments. We performed a sensitivity analysis
based on a 100 basis point change in the underlying interest rate of our available-for-sale securities as of September 28, 2025,
and determined that such a change would not have a significant impact on the fair value of these instruments.
CRITICAL ACCOUNTING ESTIMATES
Critical accounting estimates are those that management believes are the most important to the portrayal of our financial
condition and results and require the most difficult, subjective, or complex judgments, often as a result of the need to make
estimates about the effect of matters that are inherently uncertain. Judgments and uncertainties may result in materially
different amounts being reported under different conditions or using different assumptions.
Our significant accounting estimates are discussed in additional detail in Note 1, Summary of Significant Accounting Policies
and Estimates, to the consolidated financial statements included in Item 8 of Part II of this 10-K. We consider financial
reporting and disclosure practices and accounting policies quarterly to ensure that they provide accurate and transparent
information relative to the current economic and business environment. During the past five fiscal years, we have not made
any material changes to the accounting methodologies used to assess the areas discussed below, unless noted otherwise.
We believe that our significant accounting estimates involve a higher degree of judgment and/or complexity for the reasons
discussed below.
Income Taxes
We recognize deferred tax assets and liabilities based on the differences between the financial statement carrying amounts and
the respective tax bases of our assets and liabilities. Deferred tax assets and liabilities are measured using current enacted tax
rates expected to apply to taxable income in the years in which we expect the temporary differences to reverse. We routinely
evaluate the likelihood of realizing the benefit of our deferred tax assets and may record a valuation allowance if, based on all
available evidence, we determine that some portion of the tax benefit will not be realized.
In evaluating our ability to recover our deferred tax assets within the jurisdiction from which they arise, we consider all
available positive and negative evidence, including scheduled reversals of deferred tax liabilities, projected future taxable
income, tax-planning strategies, and results of operations. In projecting future taxable income, we consider historical results
and incorporate assumptions about the amount of future state, federal, and foreign pre-tax operating income adjusted for
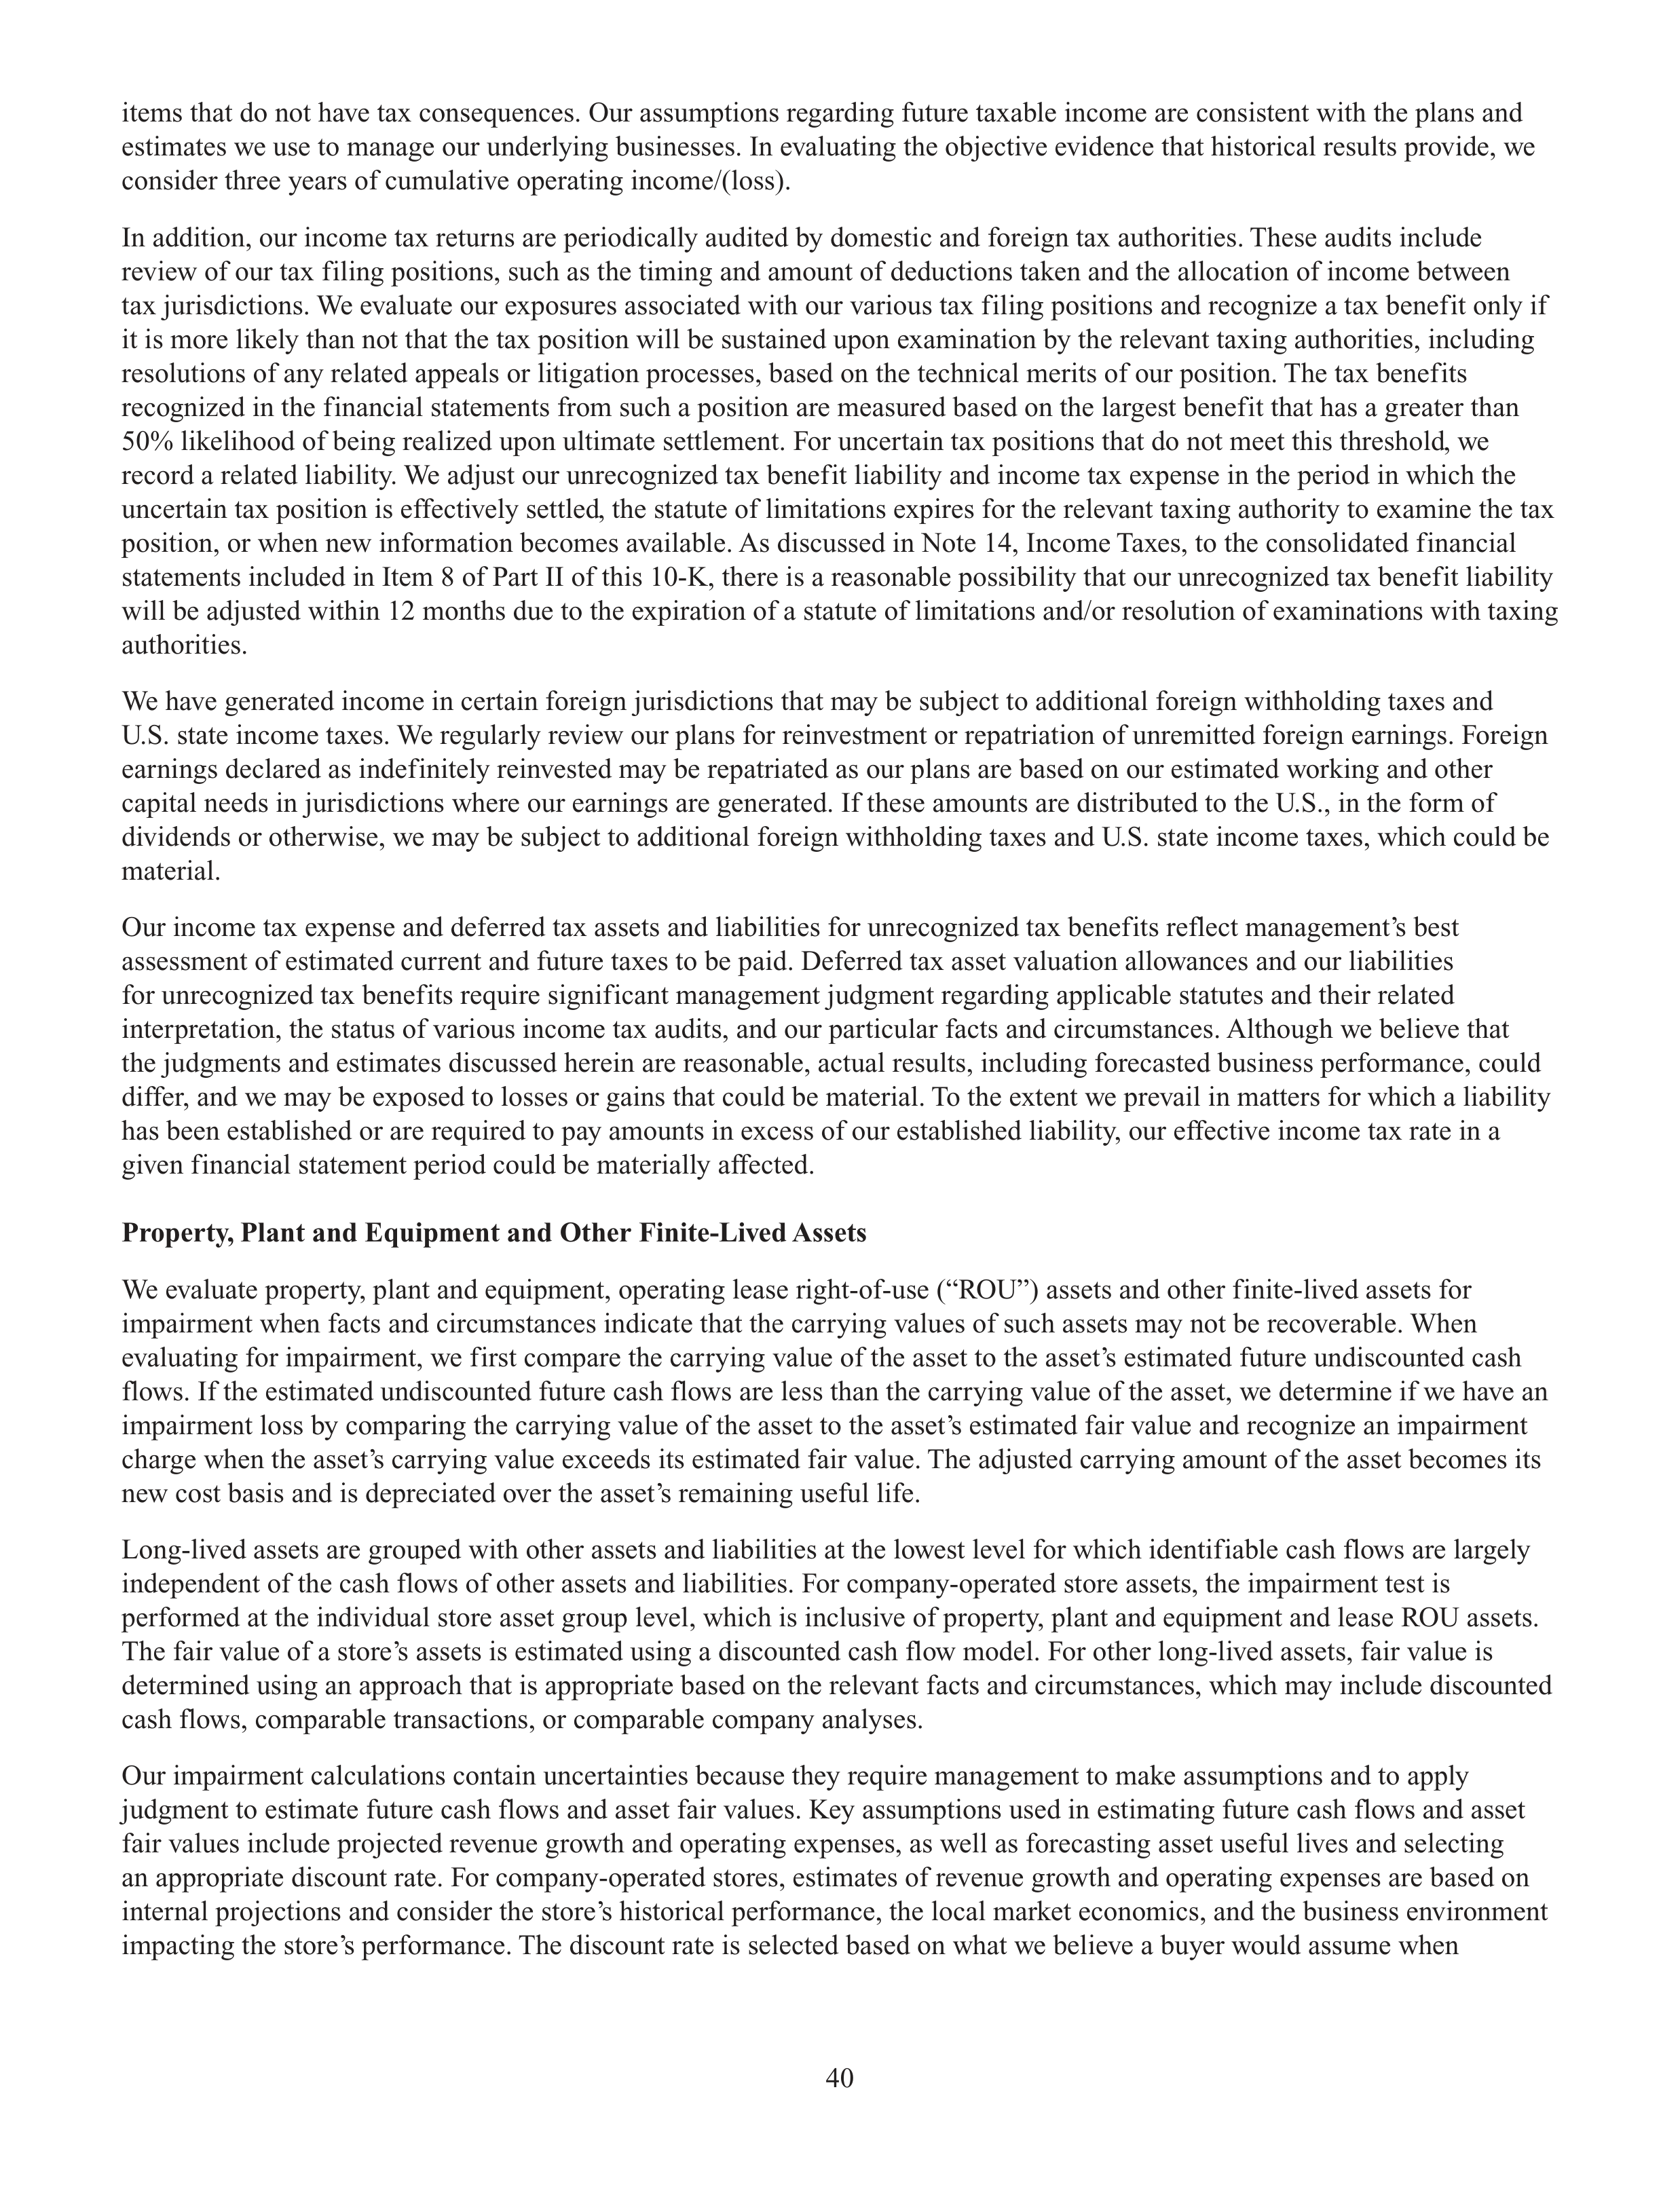
40
items that do not have tax consequences. Our assumptions regarding future taxable income are consistent with the plans and
estimates we use to manage our underlying businesses. In evaluating the objective evidence that historical results provide, we
consider three years of cumulative operating income/(loss).
In addition, our income tax returns are periodically audited by domestic and foreign tax authorities. These audits include
review of our tax filing positions, such as the timing and amount of deductions taken and the allocation of income between
tax jurisdictions. We evaluate our exposures associated with our various tax filing positions and recognize a tax benefit only if
it is more likely than not that the tax position will be sustained upon examination by the relevant taxing authorities, including
resolutions of any related appeals or litigation processes, based on the technical merits of our position. The tax benefits
recognized in the financial statements from such a position are measured based on the largest benefit that has a greater than
50% likelihood of being realized upon ultimate settlement. For uncertain tax positions that do not meet this threshold, we
record a related liability. We adjust our unrecognized tax benefit liability and income tax expense in the period in which the
uncertain tax position is effectively settled, the statute of limitations expires for the relevant taxing authority to examine the tax
position, or when new information becomes available. As discussed in Note 14, Income Taxes, to the consolidated financial
statements included in Item 8 of Part II of this 10-K, there is a reasonable possibility that our unrecognized tax benefit liability
will be adjusted within 12 months due to the expiration of a statute of limitations and/or resolution of examinations with taxing
authorities.
We have generated income in certain foreign jurisdictions that may be subject to additional foreign withholding taxes and
U.S. state income taxes. We regularly review our plans for reinvestment or repatriation of unremitted foreign earnings. Foreign
earnings declared as indefinitely reinvested may be repatriated as our plans are based on our estimated working and other
capital needs in jurisdictions where our earnings are generated. If these amounts are distributed to the U.S., in the form of
dividends or otherwise, we may be subject to additional foreign withholding taxes and U.S. state income taxes, which could be
material.
Our income tax expense and deferred tax assets and liabilities for unrecognized tax benefits reflect management’s best
assessment of estimated current and future taxes to be paid. Deferred tax asset valuation allowances and our liabilities
for unrecognized tax benefits require significant management judgment regarding applicable statutes and their related
interpretation, the status of various income tax audits, and our particular facts and circumstances. Although we believe that
the judgments and estimates discussed herein are reasonable, actual results, including forecasted business performance, could
differ, and we may be exposed to losses or gains that could be material. To the extent we prevail in matters for which a liability
has been established or are required to pay amounts in excess of our established liability, our effective income tax rate in a
given financial statement period could be materially affected.
Property, Plant and Equipment and Other Finite-Lived Assets
We evaluate property, plant and equipment, operating lease right-of-use (“ROU”) assets and other finite-lived assets for
impairment when facts and circumstances indicate that the carrying values of such assets may not be recoverable. When
evaluating for impairment, we first compare the carrying value of the asset to the asset’s estimated future undiscounted cash
flows. If the estimated undiscounted future cash flows are less than the carrying value of the asset, we determine if we have an
impairment loss by comparing the carrying value of the asset to the asset’s estimated fair value and recognize an impairment
charge when the asset’s carrying value exceeds its estimated fair value. The adjusted carrying amount of the asset becomes its
new cost basis and is depreciated over the asset’s remaining useful life.
Long-lived assets are grouped with other assets and liabilities at the lowest level for which identifiable cash flows are largely
independent of the cash flows of other assets and liabilities. For company-operated store assets, the impairment test is
performed at the individual store asset group level, which is inclusive of property, plant and equipment and lease ROU assets.
The fair value of a store’s assets is estimated using a discounted cash flow model. For other long-lived assets, fair value is
determined using an approach that is appropriate based on the relevant facts and circumstances, which may include discounted
cash flows, comparable transactions, or comparable company analyses.
Our impairment calculations contain uncertainties because they require management to make assumptions and to apply
judgment to estimate future cash flows and asset fair values. Key assumptions used in estimating future cash flows and asset
fair values include projected revenue growth and operating expenses, as well as forecasting asset useful lives and selecting
an appropriate discount rate. For company-operated stores, estimates of revenue growth and operating expenses are based on
internal projections and consider the store’s historical performance, the local market economics, and the business environment
impacting the store’s performance. The discount rate is selected based on what we believe a buyer would assume when
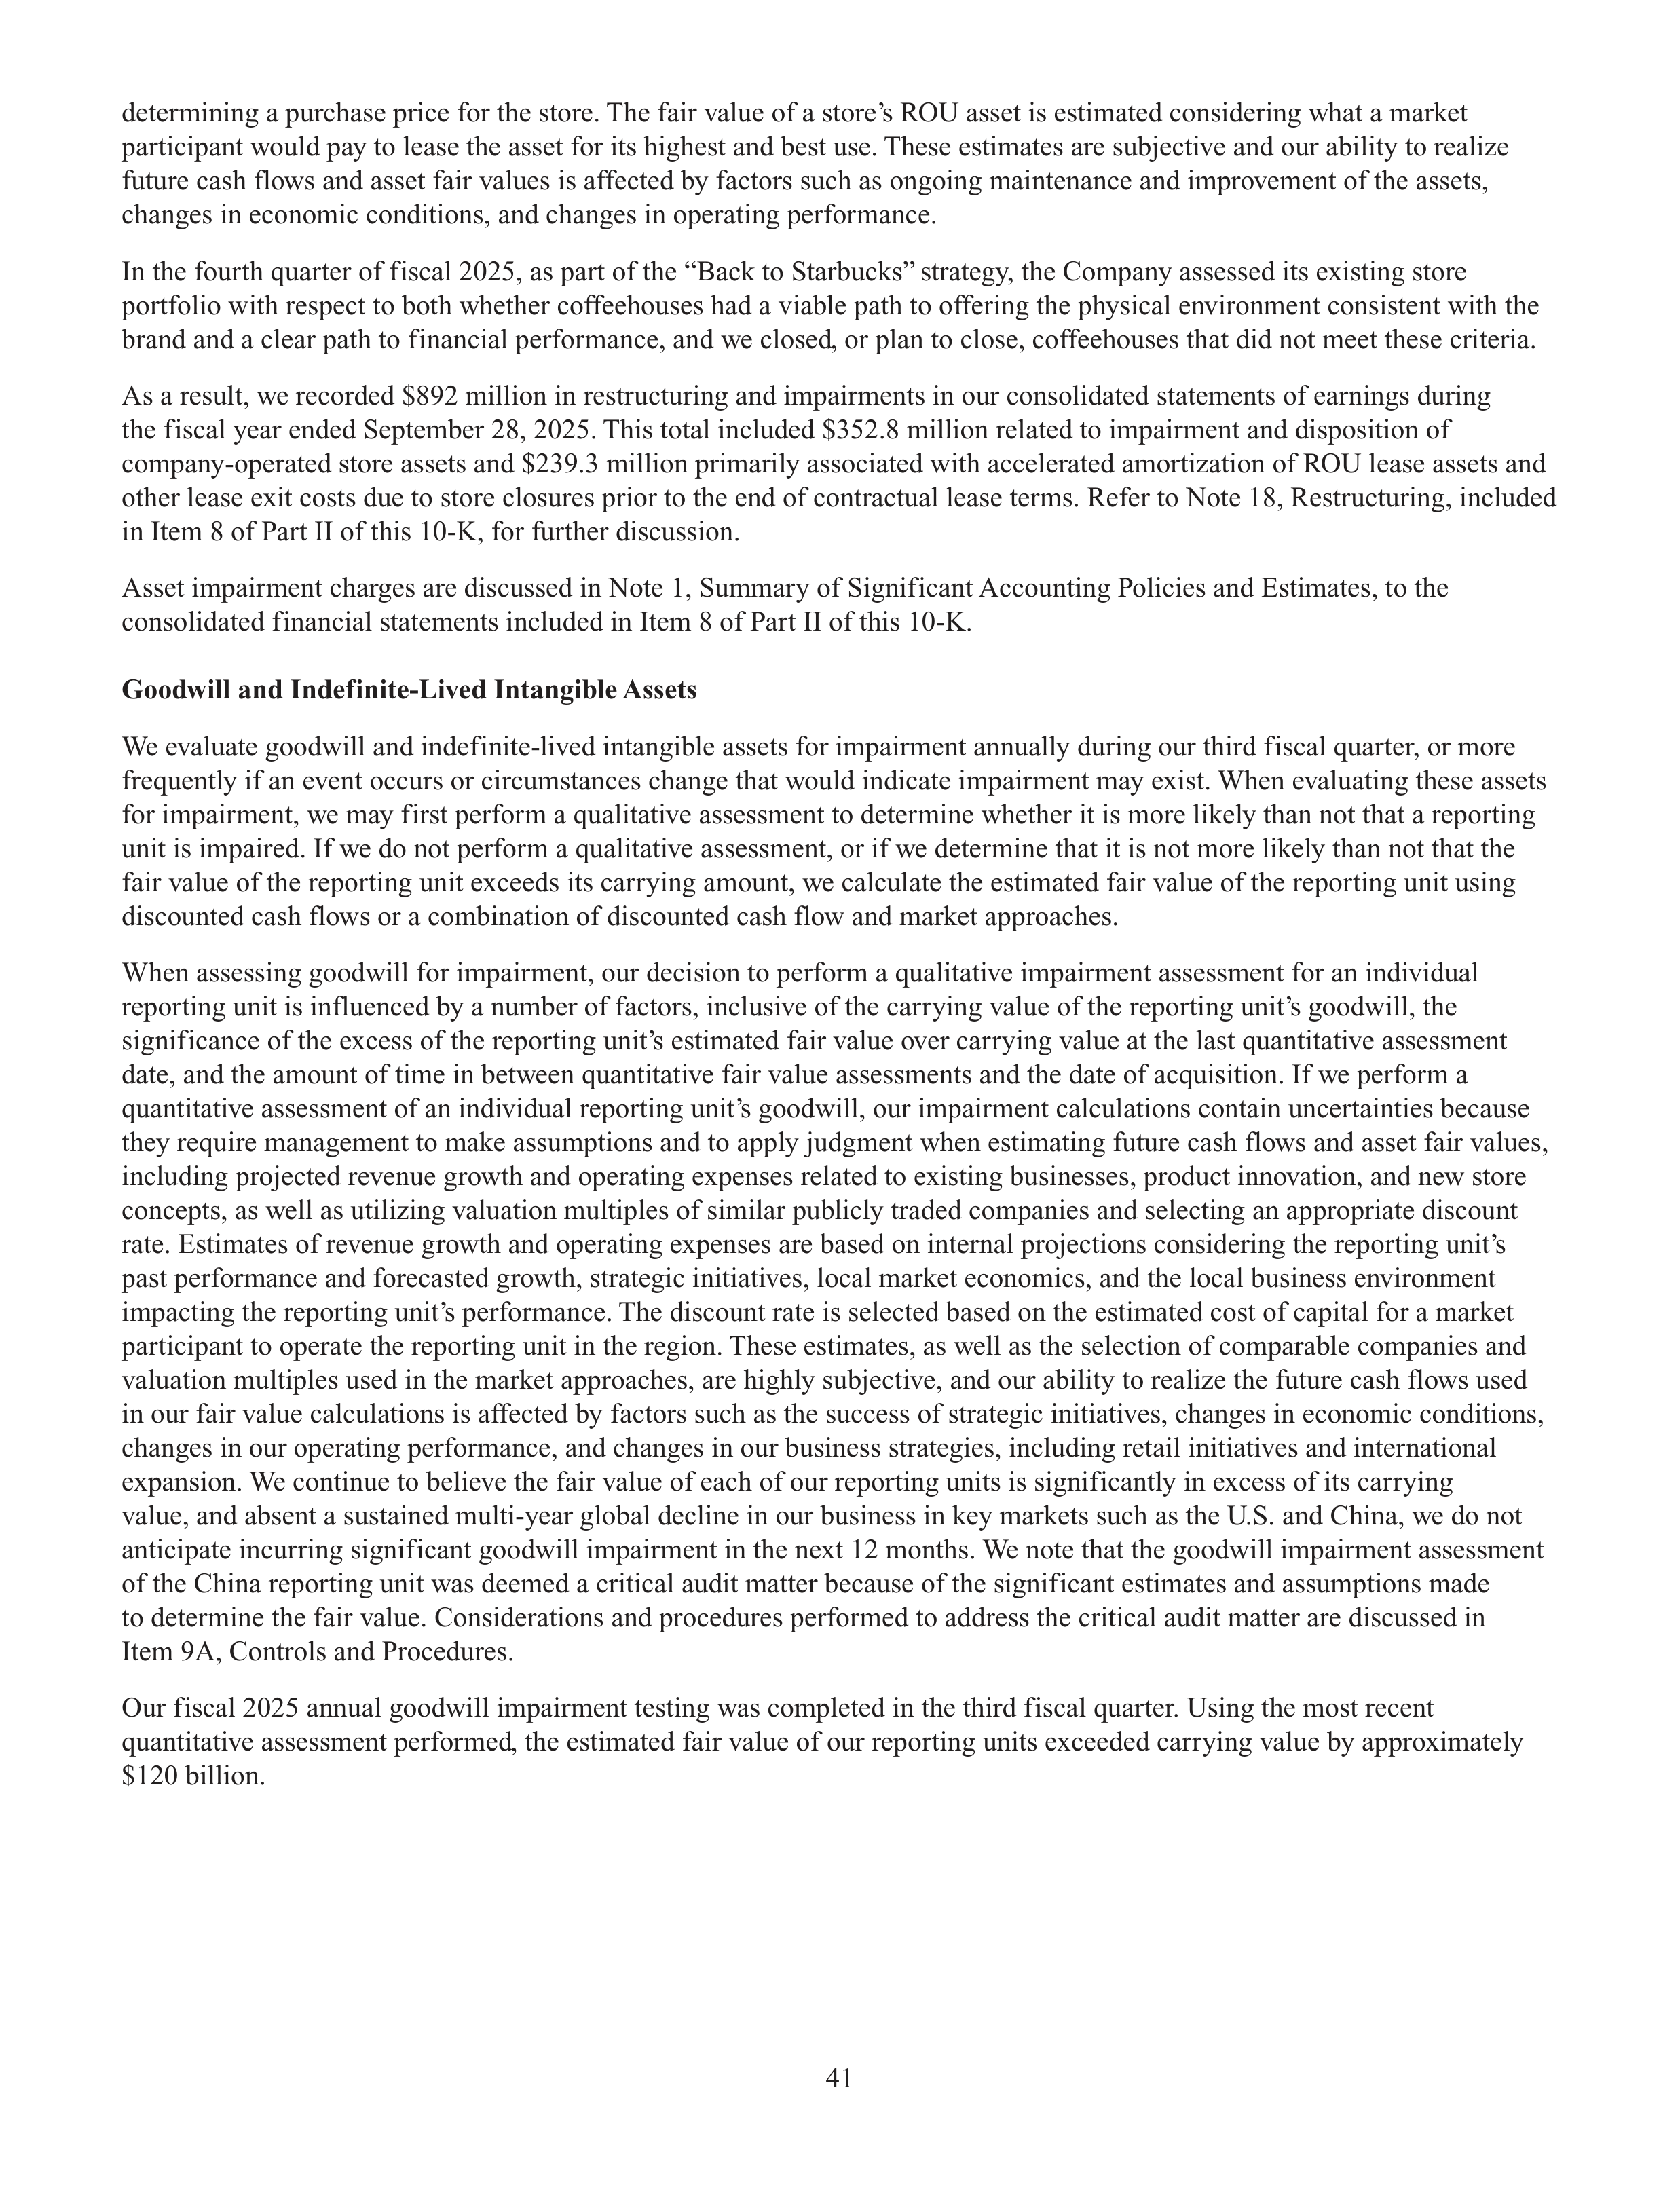
41
determining a purchase price for the store. The fair value of a store’s ROU asset is estimated considering what a market
participant would pay to lease the asset for its highest and best use. These estimates are subjective and our ability to realize
future cash flows and asset fair values is affected by factors such as ongoing maintenance and improvement of the assets,
changes in economic conditions, and changes in operating performance.
In the fourth quarter of fiscal 2025, as part of the “Back to Starbucks” strategy, the Company assessed its existing store
portfolio with respect to both whether coffeehouses had a viable path to offering the physical environment consistent with the
brand and a clear path to financial performance, and we closed, or plan to close, coffeehouses that did not meet these criteria.
As a result, we recorded $892 million in restructuring and impairments in our consolidated statements of earnings during
the fiscal year ended September 28, 2025. This total included $352.8 million related to impairment and disposition of
company-operated store assets and $239.3 million primarily associated with accelerated amortization of ROU lease assets and
other lease exit costs due to store closures prior to the end of contractual lease terms. Refer to Note 18, Restructuring, included
in Item 8 of Part II of this 10-K, for further discussion.
Asset impairment charges are discussed in Note 1, Summary of Significant Accounting Policies and Estimates, to the
consolidated financial statements included in Item 8 of Part II of this 10-K.
Goodwill and Indefinite-Lived Intangible Assets
We evaluate goodwill and indefinite-lived intangible assets for impairment annually during our third fiscal quarter, or more
frequently if an event occurs or circumstances change that would indicate impairment may exist. When evaluating these assets
for impairment, we may first perform a qualitative assessment to determine whether it is more likely than not that a reporting
unit is impaired. If we do not perform a qualitative assessment, or if we determine that it is not more likely than not that the
fair value of the reporting unit exceeds its carrying amount, we calculate the estimated fair value of the reporting unit using
discounted cash flows or a combination of discounted cash flow and market approaches.
When assessing goodwill for impairment, our decision to perform a qualitative impairment assessment for an individual
reporting unit is influenced by a number of factors, inclusive of the carrying value of the reporting unit’s goodwill, the
significance of the excess of the reporting unit’s estimated fair value over carrying value at the last quantitative assessment
date, and the amount of time in between quantitative fair value assessments and the date of acquisition. If we perform a
quantitative assessment of an individual reporting unit’s goodwill, our impairment calculations contain uncertainties because
they require management to make assumptions and to apply judgment when estimating future cash flows and asset fair values,
including projected revenue growth and operating expenses related to existing businesses, product innovation, and new store
concepts, as well as utilizing valuation multiples of similar publicly traded companies and selecting an appropriate discount
rate. Estimates of revenue growth and operating expenses are based on internal projections considering the reporting unit’s
past performance and forecasted growth, strategic initiatives, local market economics, and the local business environment
impacting the reporting unit’s performance. The discount rate is selected based on the estimated cost of capital for a market
participant to operate the reporting unit in the region. These estimates, as well as the selection of comparable companies and
valuation multiples used in the market approaches, are highly subjective, and our ability to realize the future cash flows used
in our fair value calculations is affected by factors such as the success of strategic initiatives, changes in economic conditions,
changes in our operating performance, and changes in our business strategies, including retail initiatives and international
expansion. We continue to believe the fair value of each of our reporting units is significantly in excess of its carrying
value, and absent a sustained multi-year global decline in our business in key markets such as the U.S. and China, we do not
anticipate incurring significant goodwill impairment in the next 12 months. We note that the goodwill impairment assessment
of the China reporting unit was deemed a critical audit matter because of the significant estimates and assumptions made
to determine the fair value. Considerations and procedures performed to address the critical audit matter are discussed in
Item 9A, Controls and Procedures.
Our fiscal 2025 annual goodwill impairment testing was completed in the third fiscal quarter. Using the most recent
quantitative assessment performed, the estimated fair value of our reporting units exceeded carrying value by approximately
$120 billion.
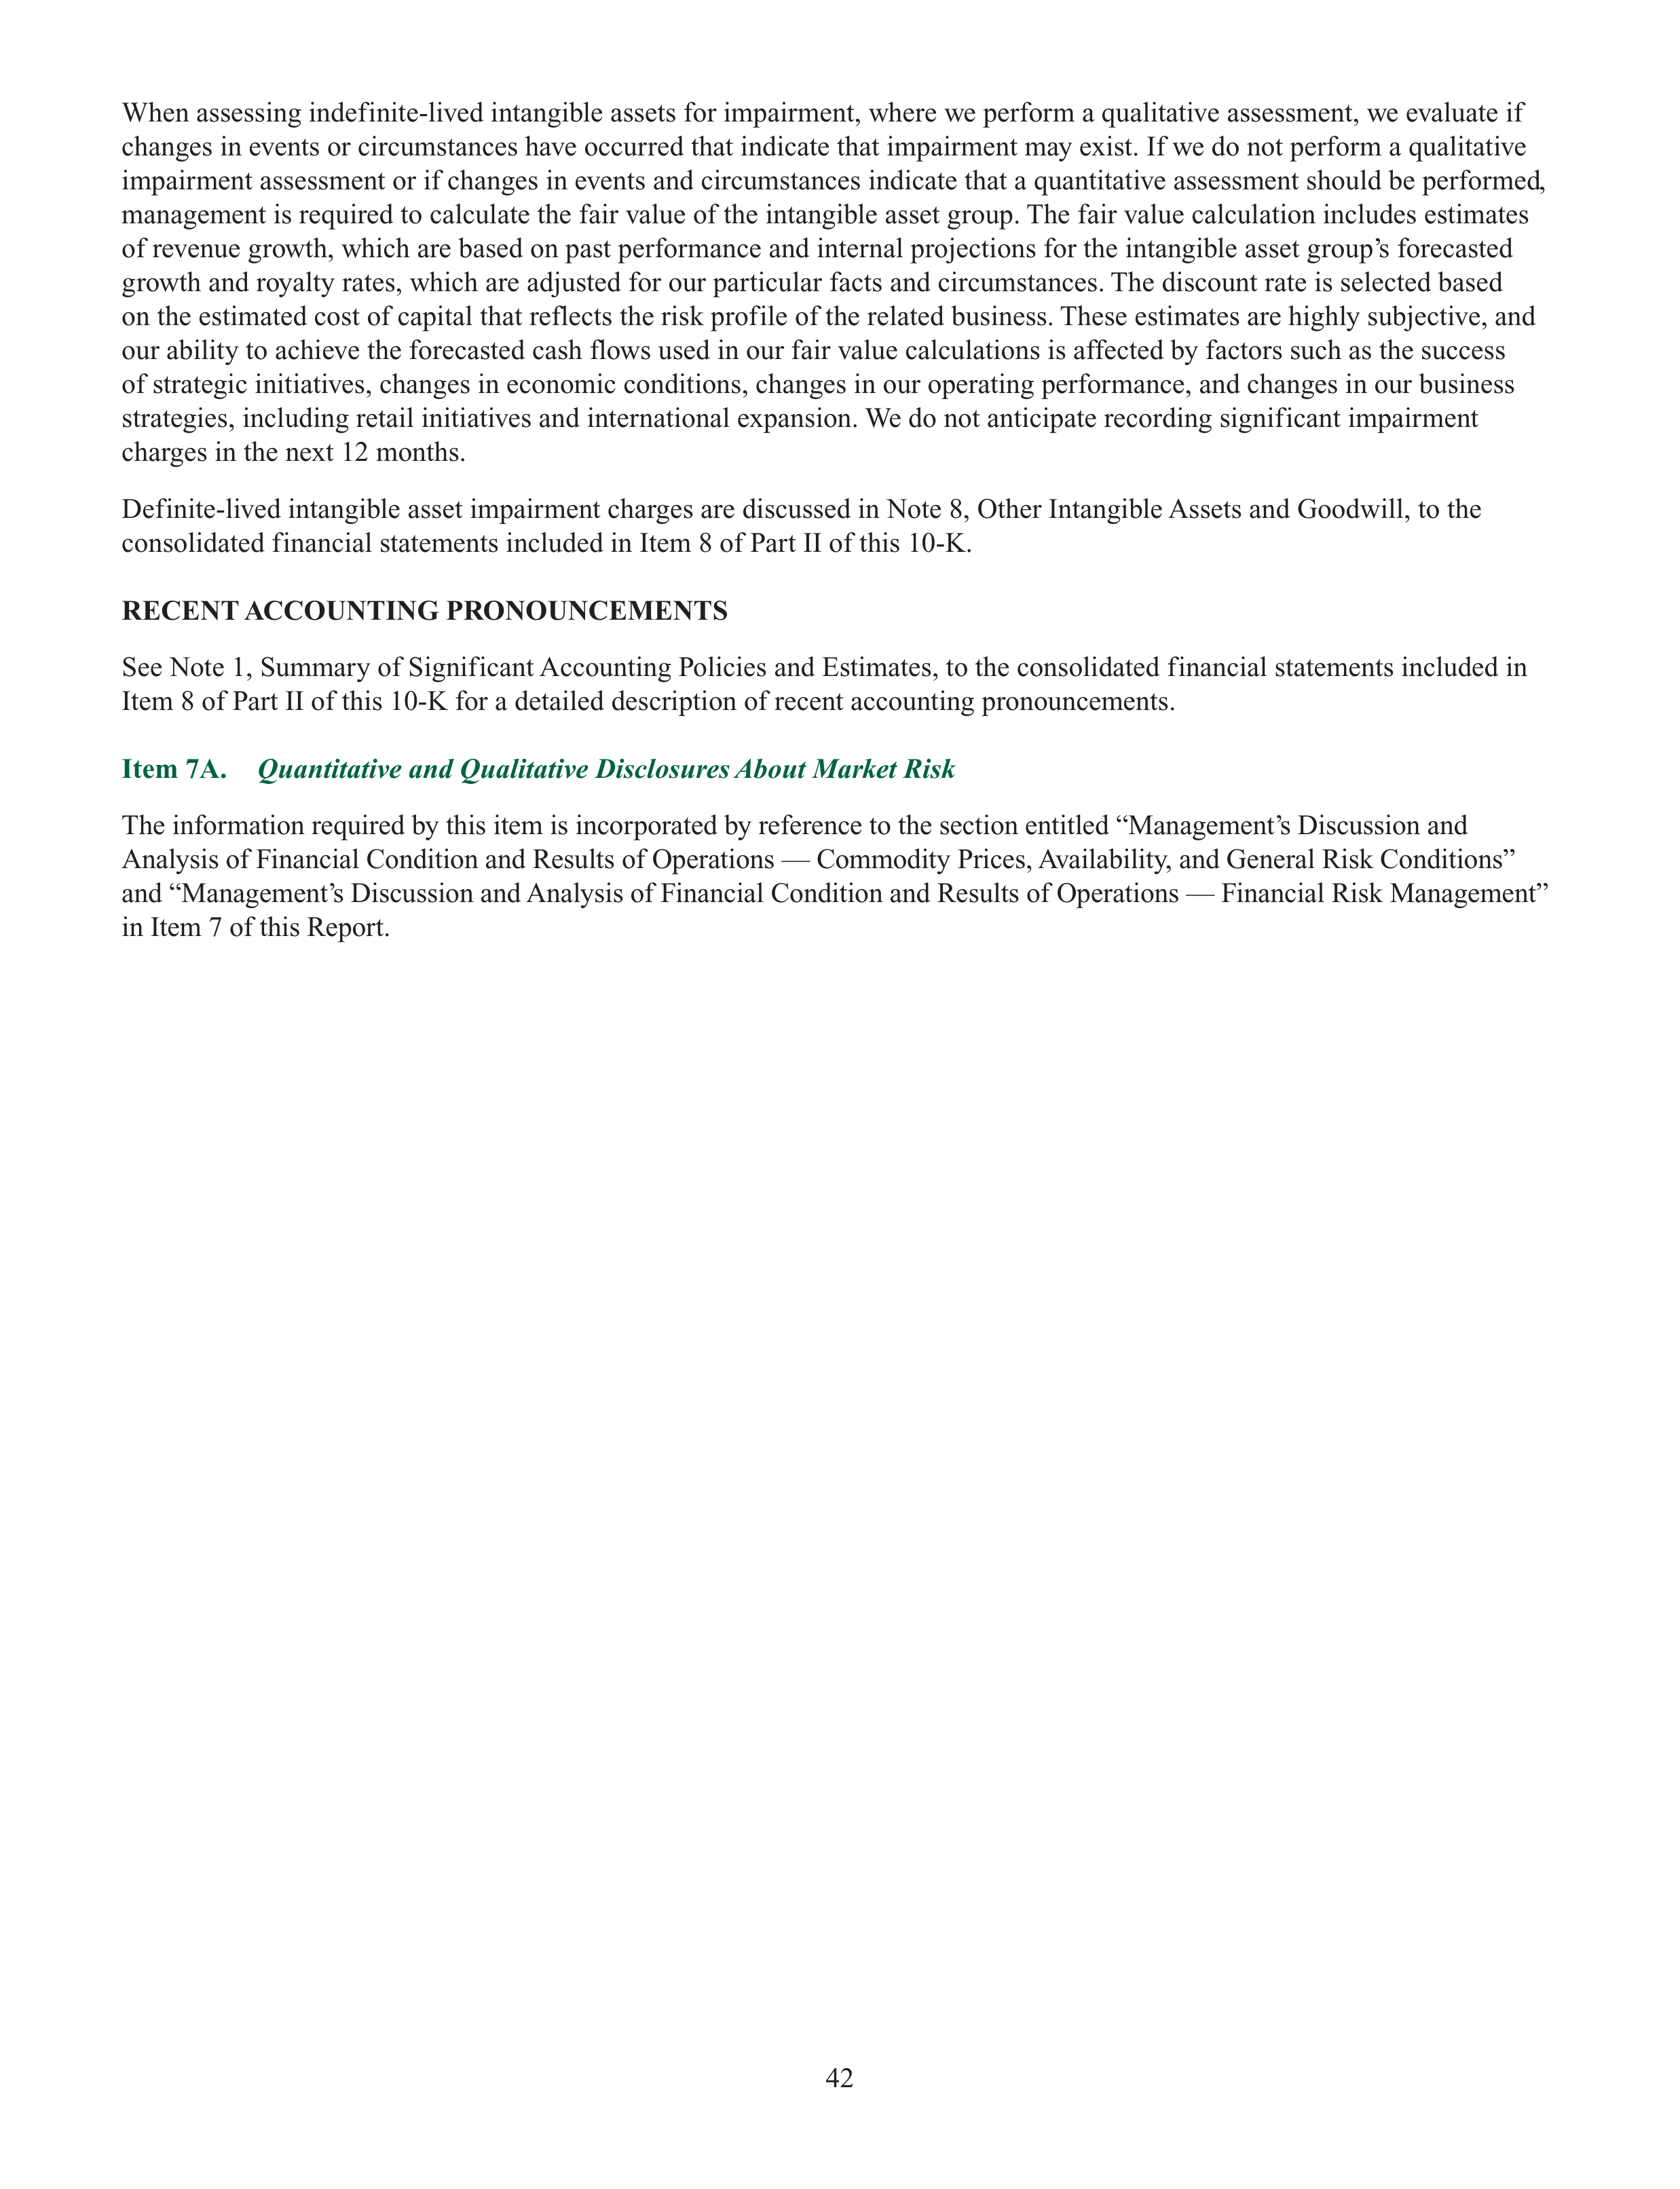
42
When assessing indefinite-lived intangible assets for impairment, where we perform a qualitative assessment, we evaluate if
changes in events or circumstances have occurred that indicate that impairment may exist. If we do not perform a qualitative
impairment assessment or if changes in events and circumstances indicate that a quantitative assessment should be performed,
management is required to calculate the fair value of the intangible asset group. The fair value calculation includes estimates
of revenue growth, which are based on past performance and internal projections for the intangible asset group’s forecasted
growth and royalty rates, which are adjusted for our particular facts and circumstances. The discount rate is selected based
on the estimated cost of capital that reflects the risk profile of the related business. These estimates are highly subjective, and
our ability to achieve the forecasted cash flows used in our fair value calculations is affected by factors such as the success
of strategic initiatives, changes in economic conditions, changes in our operating performance, and changes in our business
strategies, including retail initiatives and international expansion. We do not anticipate recording significant impairment
charges in the next 12 months.
Definite-lived intangible asset impairment charges are discussed in Note 8, Other Intangible Assets and Goodwill, to the
consolidated financial statements included in Item 8 of Part II of this 10-K.
RECENT ACCOUNTING PRONOUNCEMENTS
See Note 1, Summary of Significant Accounting Policies and Estimates, to the consolidated financial statements included in
Item 8 of Part II of this 10-K for a detailed description of recent accounting pronouncements.
Item 7A.
Quantitative and Qualitative Disclosures About Market Risk
The information required by this item is incorporated by reference to the section entitled “Management’s Discussion and
Analysis of Financial Condition and Results of Operations — Commodity Prices, Availability, and General Risk Conditions”
and “Management’s Discussion and Analysis of Financial Condition and Results of Operations — Financial Risk Management”
in Item 7 of this Report.
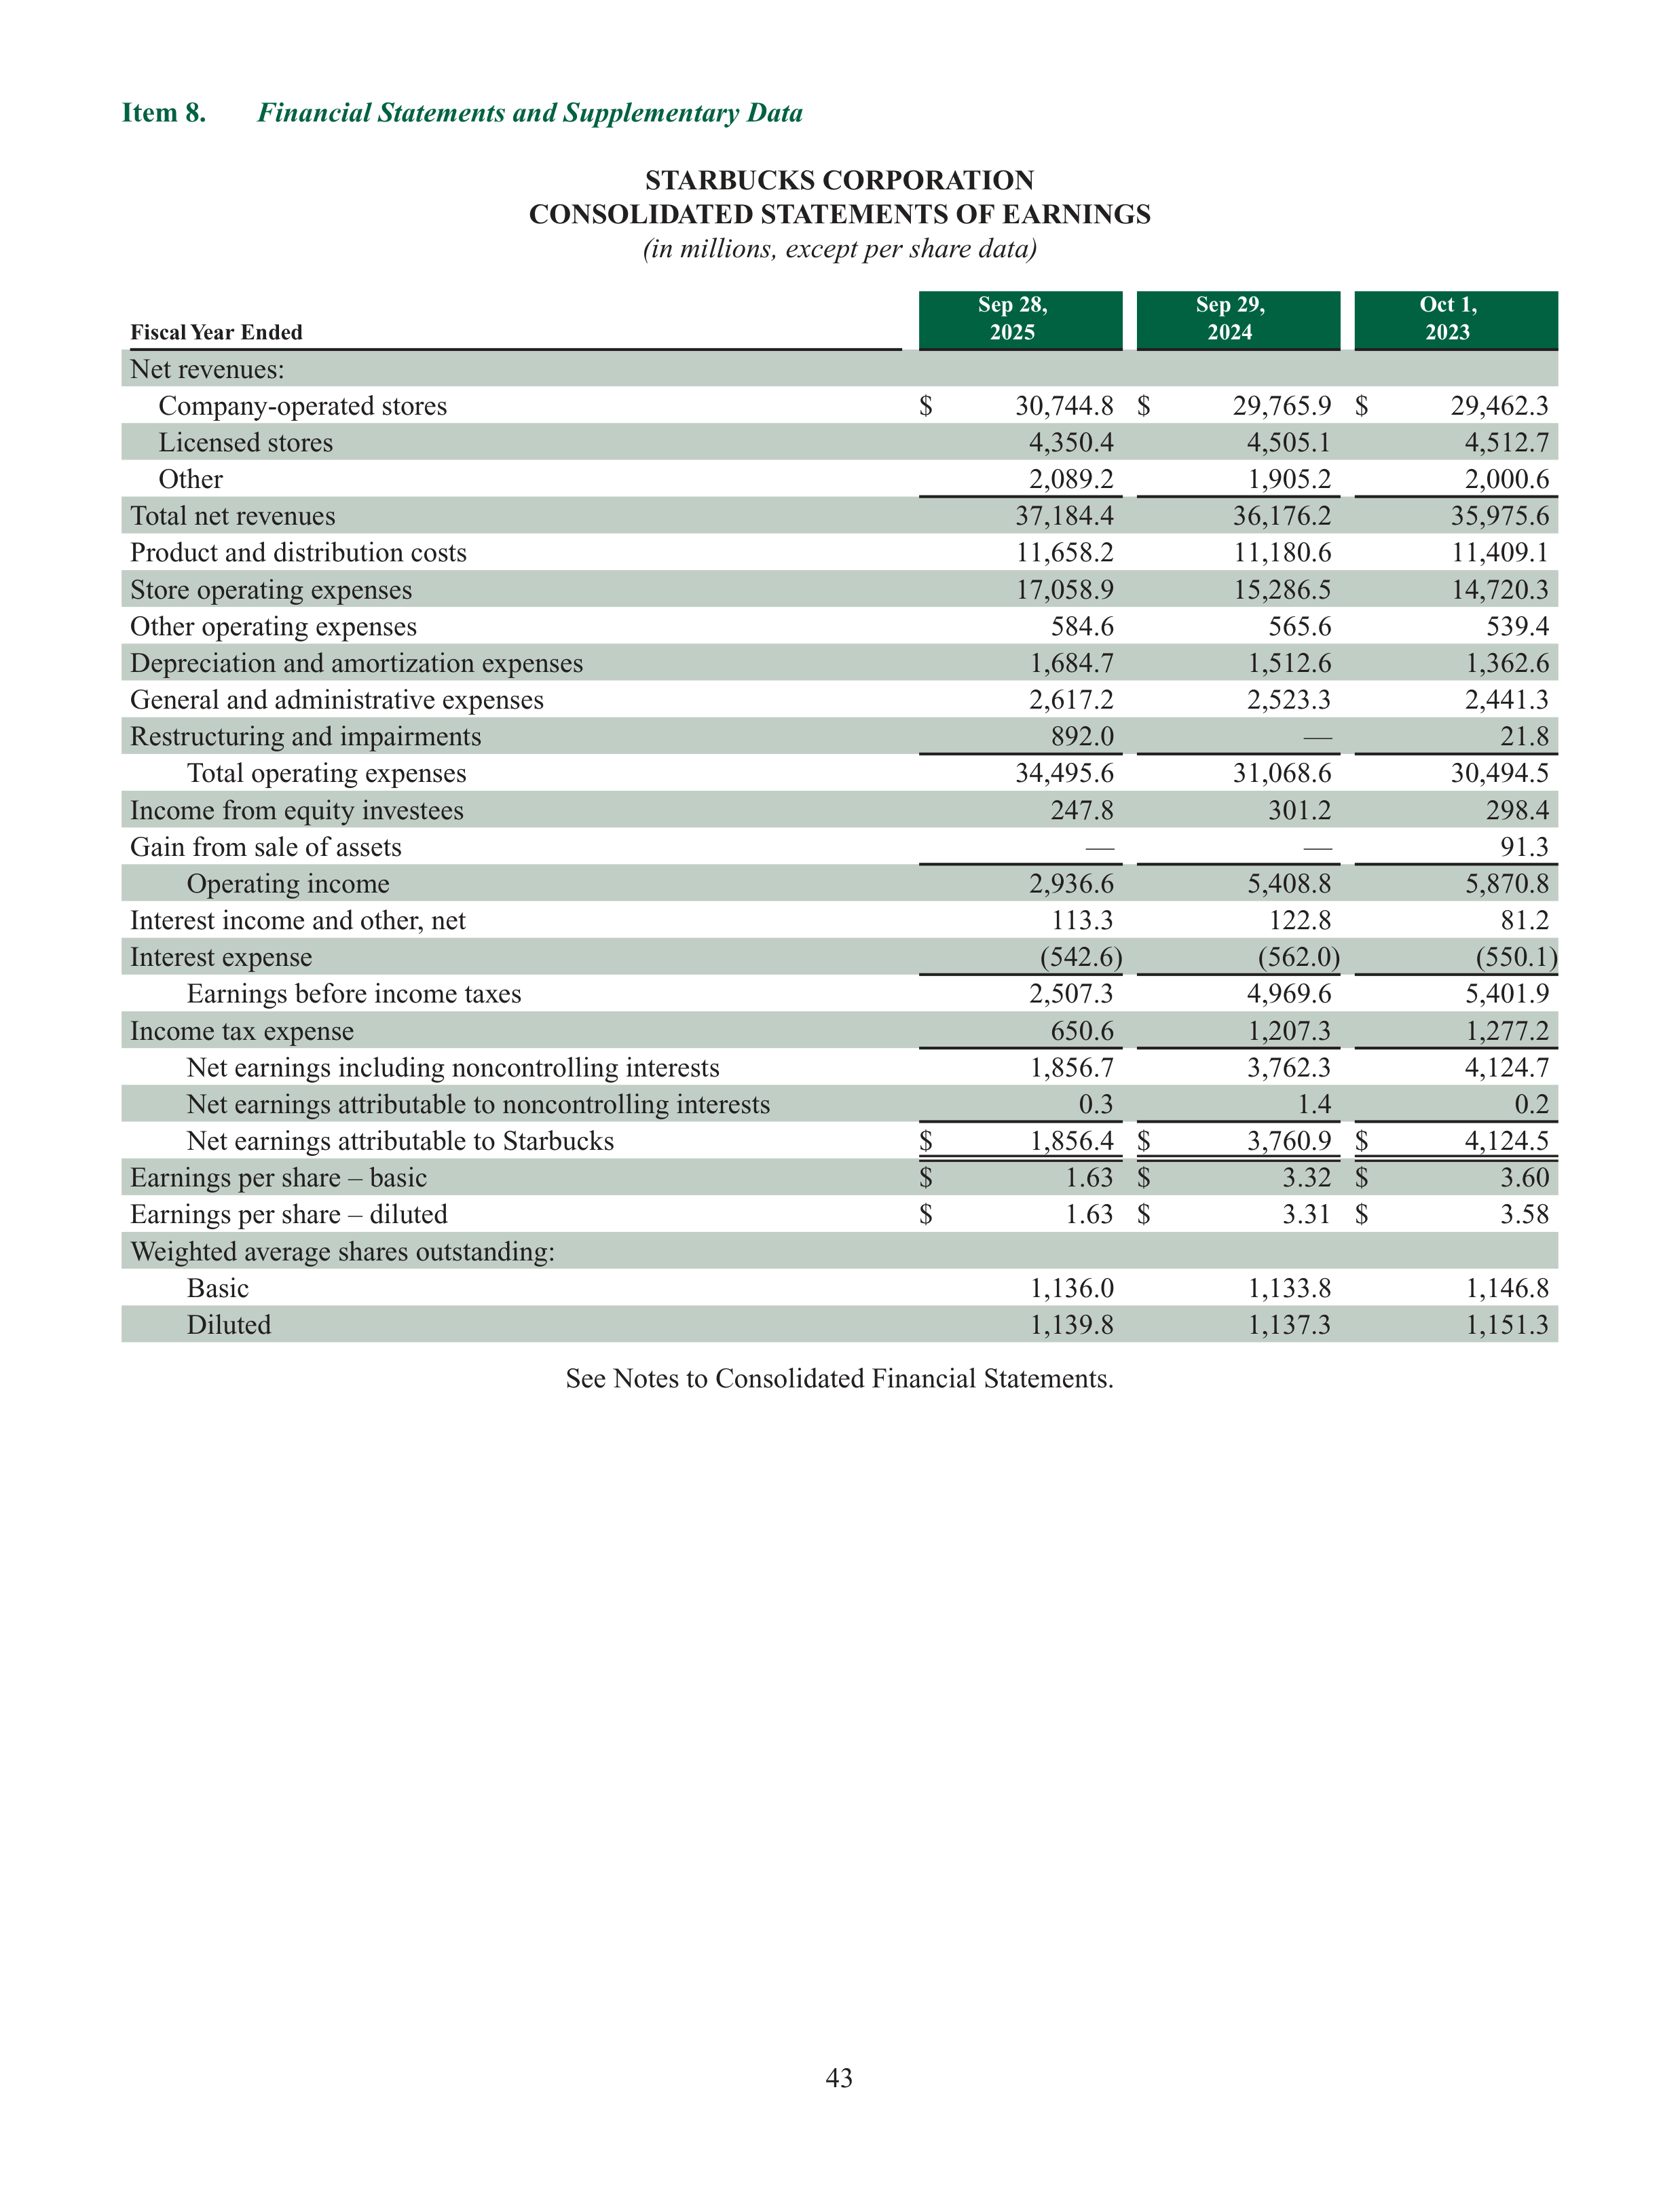
43
Item 8.
Financial Statements and Supplementary Data
STARBUCKS CORPORATION
CONSOLIDATED STATEMENTS OF EARNINGS
(in millions, except per share data)
Fiscal Year Ended
Sep 28,
2025
Sep 29,
2024
Oct 1,
2023
Net revenues:
Company-operated stores
$
30,744.8
$
29,765.9
$
29,462.3
Licensed stores
4,350.4
4,505.1
4,512.7
Other
2,089.2
1,905.2
2,000.6
Total net revenues
37,184.4
36,176.2
35,975.6
Product and distribution costs
11,658.2
11,180.6
11,409.1
Store operating expenses
17,058.9
15,286.5
14,720.3
Other operating expenses
584.6
565.6
539.4
Depreciation and amortization expenses
1,684.7
1,512.6
1,362.6
General and administrative expenses
2,617.2
2,523.3
2,441.3
Restructuring and impairments
892.0
—
21.8
Total operating expenses
34,495.6
31,068.6
30,494.5
Income from equity investees
247.8
301.2
298.4
Gain from sale of assets
—
—
91.3
Operating income
2,936.6
5,408.8
5,870.8
Interest income and other, net
113.3
122.8
81.2
Interest expense
(542.6)
(562.0)
(550.1)
Earnings before income taxes
2,507.3
4,969.6
5,401.9
Income tax expense
650.6
1,207.3
1,277.2
Net earnings including noncontrolling interests
1,856.7
3,762.3
4,124.7
Net earnings attributable to noncontrolling interests
0.3
1.4
0.2
Net earnings attributable to Starbucks
$
1,856.4
$
3,760.9
$
4,124.5
Earnings per share – basic
$
1.63
$
3.32
$
3.60
Earnings per share – diluted
$
1.63
$
3.31
$
3.58
Weighted average shares outstanding:
Basic
1,136.0
1,133.8
1,146.8
Diluted
1,139.8
1,137.3
1,151.3
See Notes to Consolidated Financial Statements.
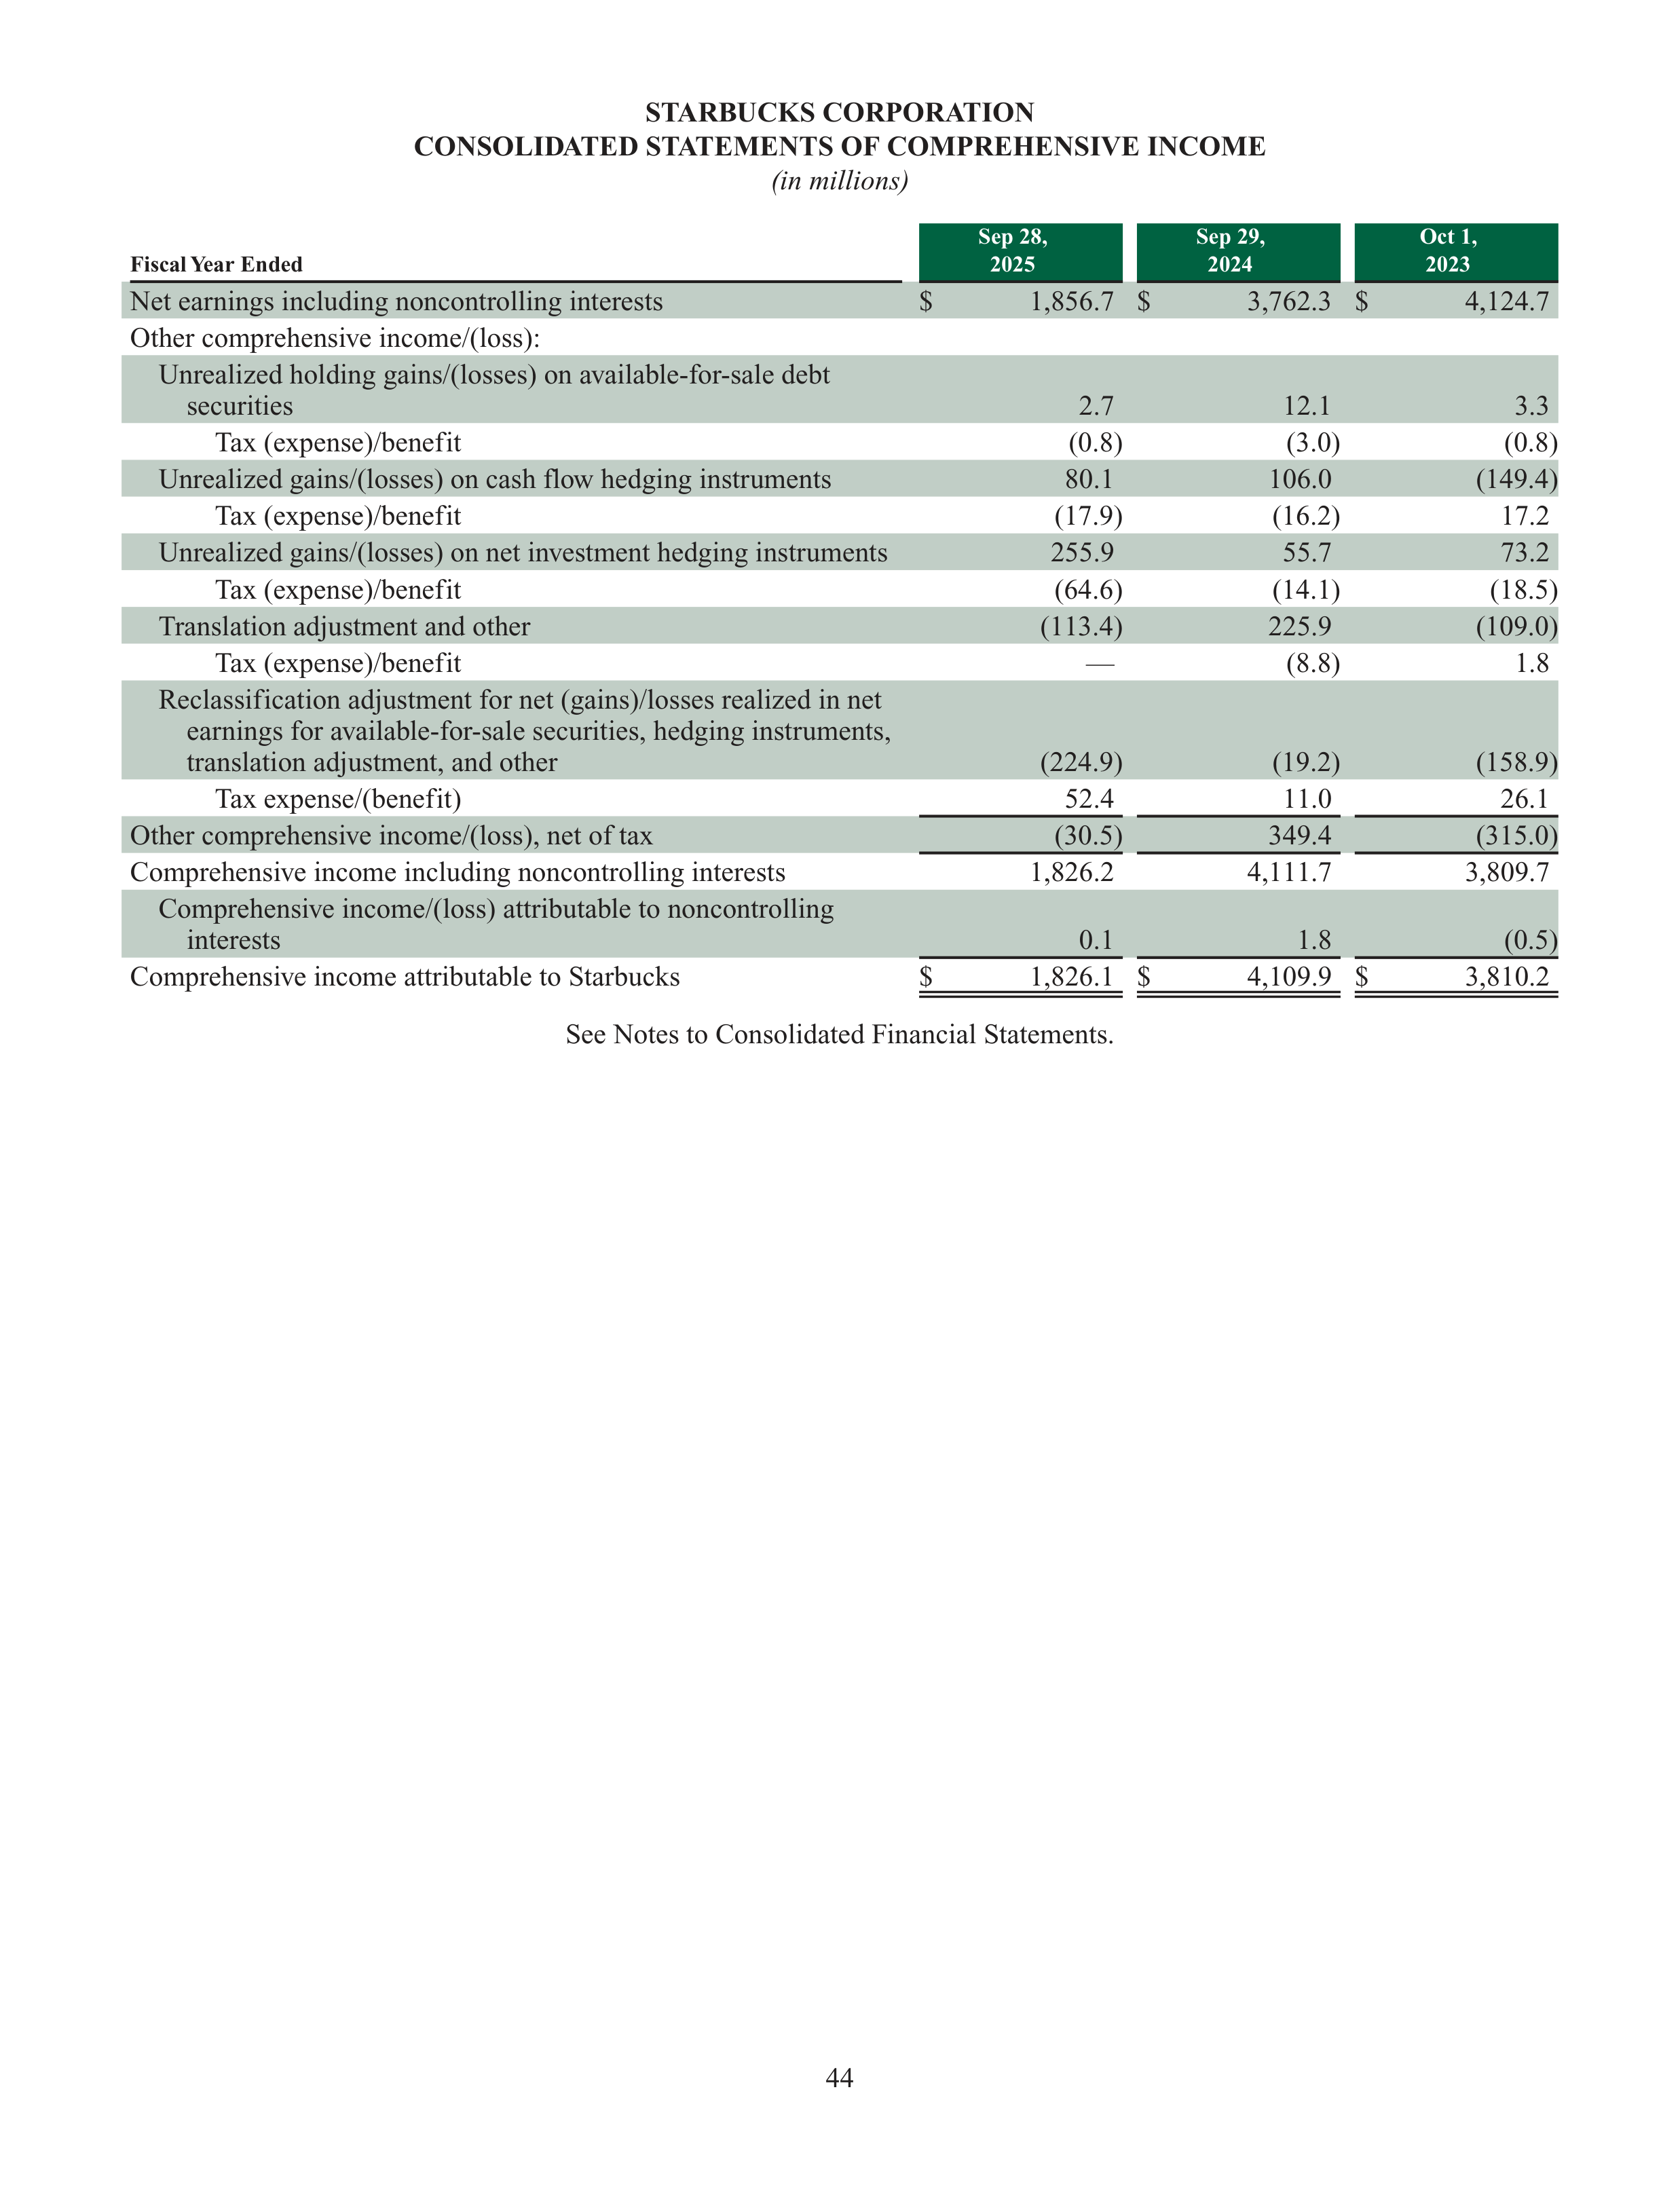
44
STARBUCKS CORPORATION
CONSOLIDATED STATEMENTS OF COMPREHENSIVE INCOME
(in millions)
Fiscal Year Ended
Sep 28,
2025
Sep 29,
2024
Oct 1,
2023
Net earnings including noncontrolling interests
$
1,856.7
$
3,762.3
$
4,124.7
Other comprehensive income/(loss):
Unrealized holding gains/(losses) on available-for-sale debt
securities
2.7
12.1
3.3
Tax (expense)/benefit
(0.8)
(3.0)
(0.8)
Unrealized gains/(losses) on cash flow hedging instruments
80.1
106.0
(149.4)
Tax (expense)/benefit
(17.9)
(16.2)
17.2
Unrealized gains/(losses) on net investment hedging instruments
255.9
55.7
73.2
Tax (expense)/benefit
(64.6)
(14.1)
(18.5)
Translation adjustment and other
(113.4)
225.9
(109.0)
Tax (expense)/benefit
—
(8.8)
1.8
Reclassification adjustment for net (gains)/losses realized in net
earnings for available-for-sale securities, hedging instruments,
translation adjustment, and other
(224.9)
(19.2)
(158.9)
Tax expense/(benefit)
52.4
11.0
26.1
Other comprehensive income/(loss), net of tax
(30.5)
349.4
(315.0)
Comprehensive income including noncontrolling interests
1,826.2
4,111.7
3,809.7
Comprehensive income/(loss) attributable to noncontrolling
interests
0.1
1.8
(0.5)
Comprehensive income attributable to Starbucks
$
1,826.1
$
4,109.9
$
3,810.2
See Notes to Consolidated Financial Statements.
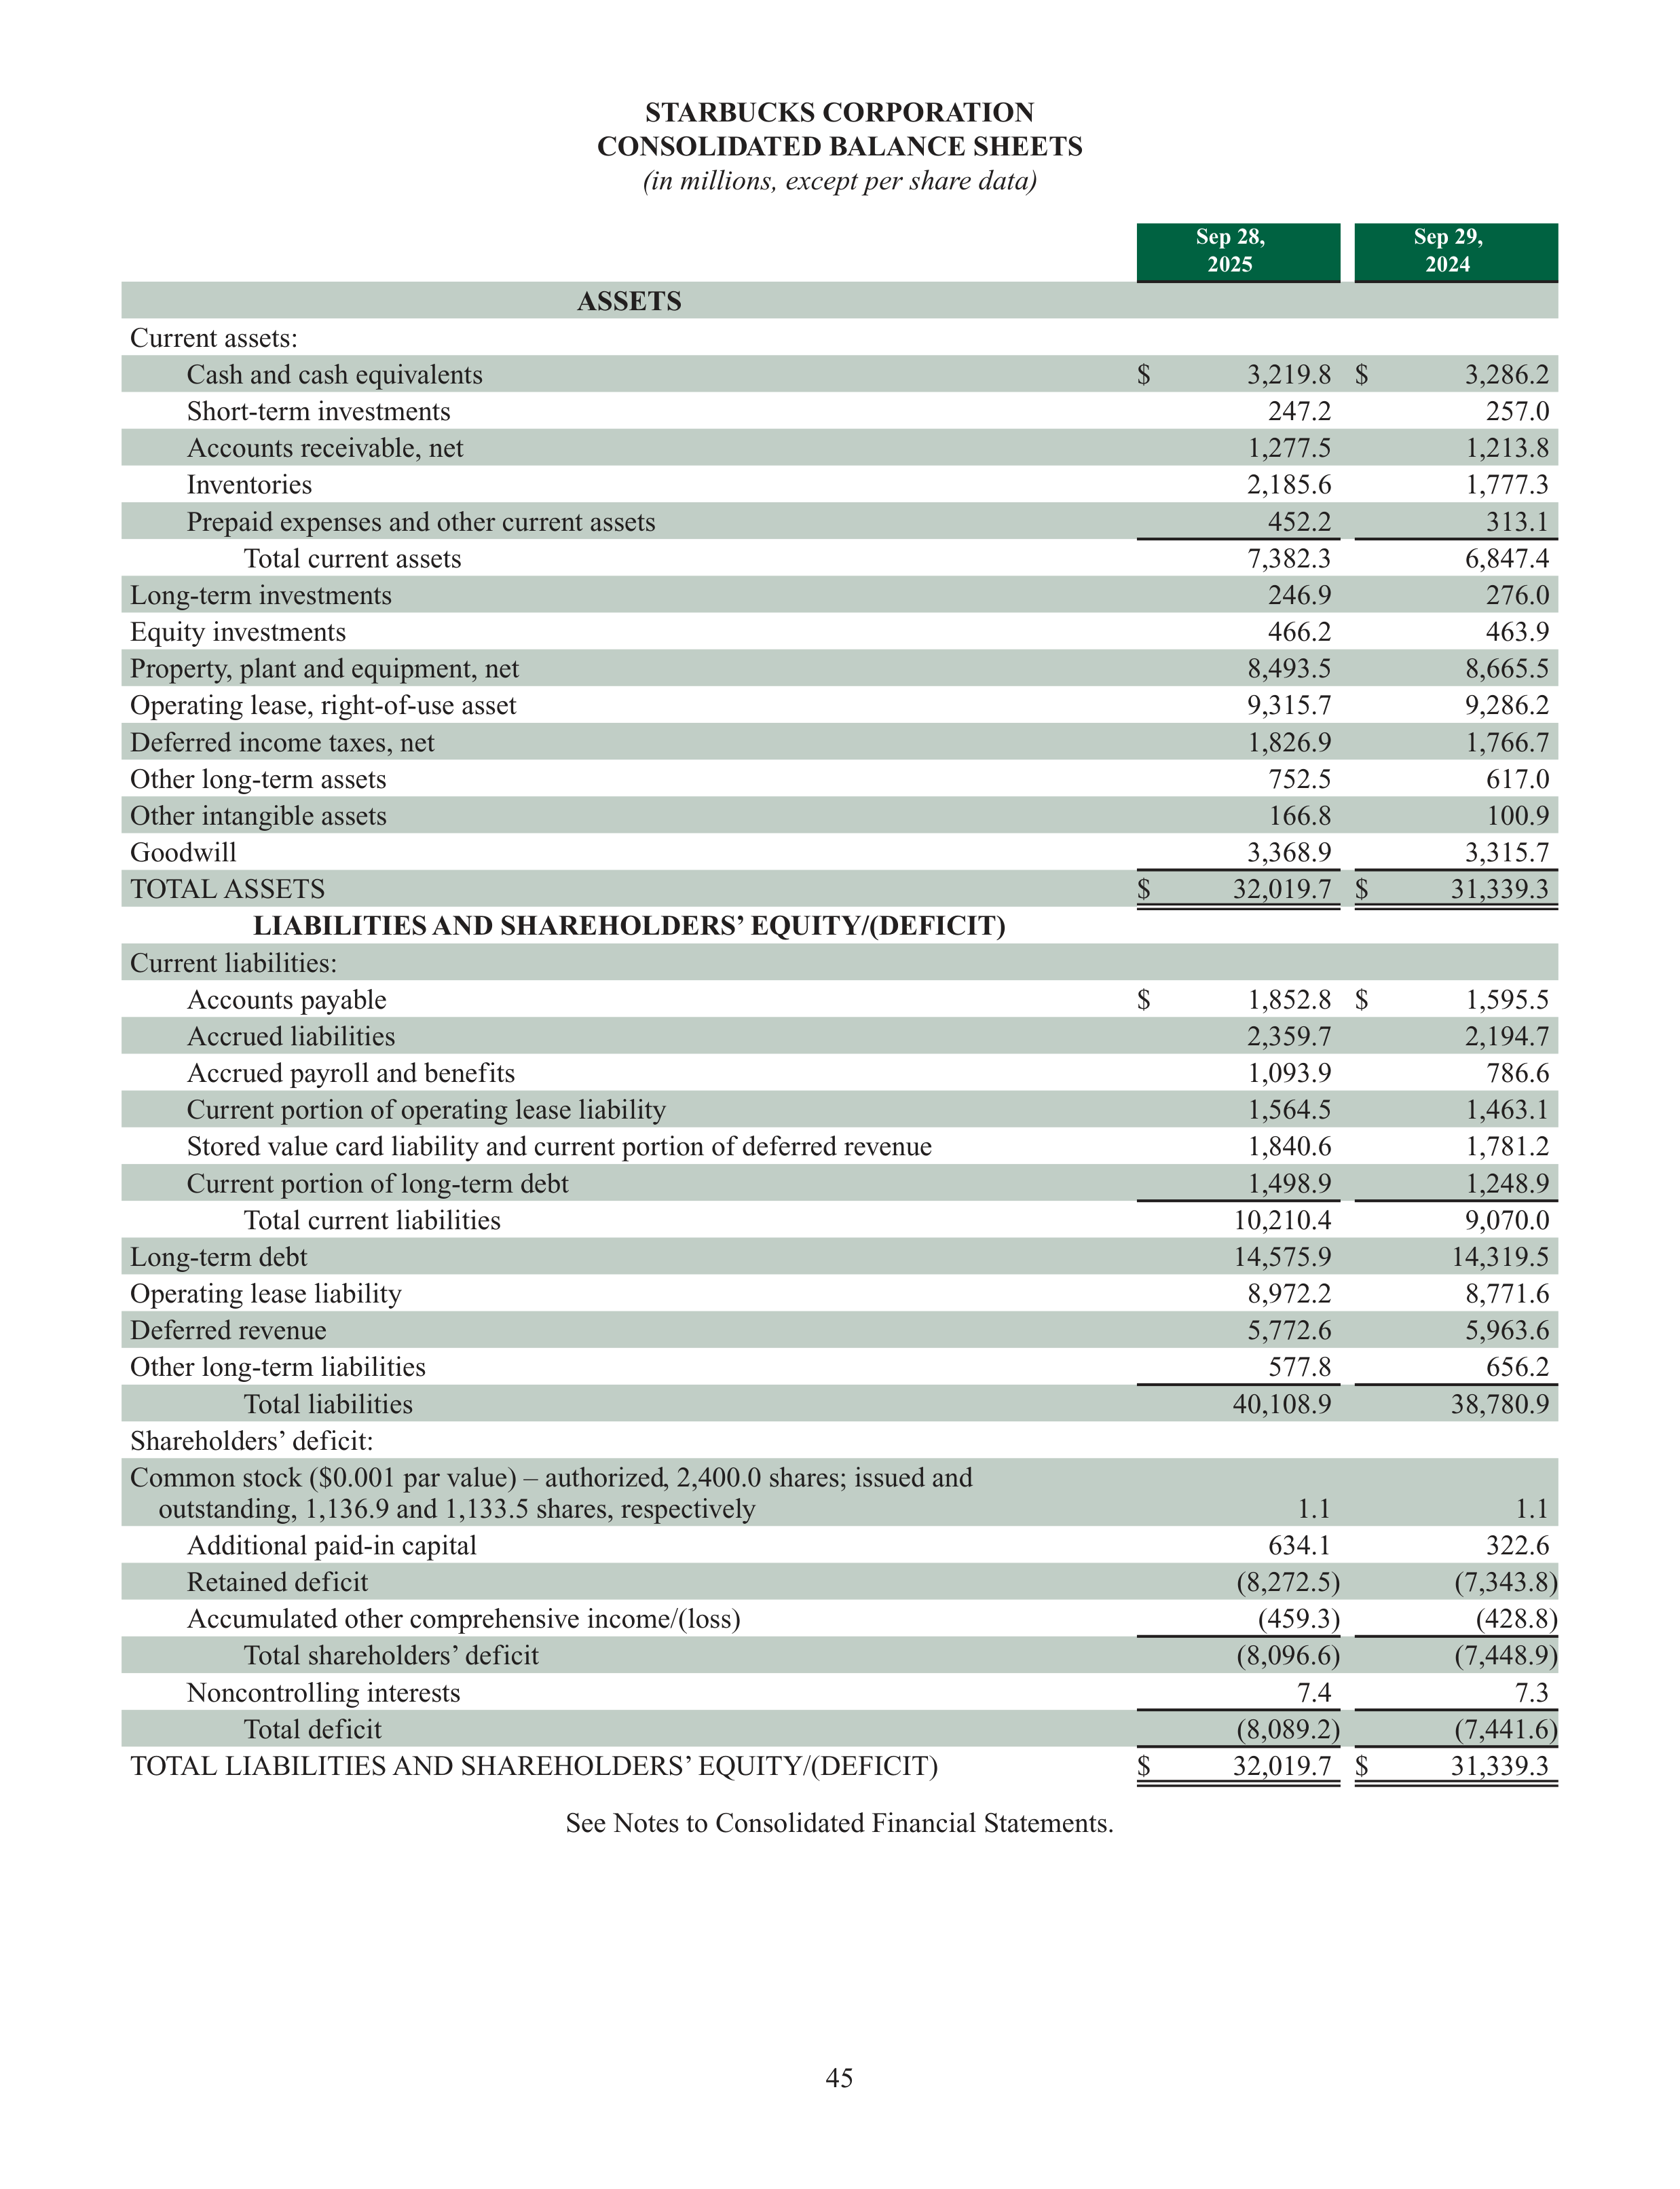
45
STARBUCKS CORPORATION
CONSOLIDATED BALANCE SHEETS
(in millions, except per share data)
Sep 28,
2025
Sep 29,
2024
ASSETS
Current assets:
Cash and cash equivalents
$
3,219.8
$
3,286.2
Short-term investments
247.2
257.0
Accounts receivable, net
1,277.5
1,213.8
Inventories
2,185.6
1,777.3
Prepaid expenses and other current assets
452.2
313.1
Total current assets
7,382.3
6,847.4
Long-term investments
246.9
276.0
Equity investments
466.2
463.9
Property, plant and equipment, net
8,493.5
8,665.5
Operating lease, right-of-use asset
9,315.7
9,286.2
Deferred income taxes, net
1,826.9
1,766.7
Other long-term assets
752.5
617.0
Other intangible assets
166.8
100.9
Goodwill
3,368.9
3,315.7
TOTAL ASSETS
$
32,019.7
$
31,339.3
LIABILITIES AND SHAREHOLDERS’ EQUITY/(DEFICIT)
Current liabilities:
Accounts payable
$
1,852.8
$
1,595.5
Accrued liabilities
2,359.7
2,194.7
Accrued payroll and benefits
1,093.9
786.6
Current portion of operating lease liability
1,564.5
1,463.1
Stored value card liability and current portion of deferred revenue
1,840.6
1,781.2
Current portion of long-term debt
1,498.9
1,248.9
Total current liabilities
10,210.4
9,070.0
Long-term debt
14,575.9
14,319.5
Operating lease liability
8,972.2
8,771.6
Deferred revenue
5,772.6
5,963.6
Other long-term liabilities
577.8
656.2
Total liabilities
40,108.9
38,780.9
Shareholders’ deficit:
Common stock ($0.001 par value) – authorized, 2,400.0 shares; issued and
outstanding, 1,136.9 and 1,133.5 shares, respectively
1.1
1.1
Additional paid-in capital
634.1
322.6
Retained deficit
(8,272.5)
(7,343.8)
Accumulated other comprehensive income/(loss)
(459.3)
(428.8)
Total shareholders’ deficit
(8,096.6)
(7,448.9)
Noncontrolling interests
7.4
7.3
Total deficit
(8,089.2)
(7,441.6)
TOTAL LIABILITIES AND SHAREHOLDERS’ EQUITY/(DEFICIT)
$
32,019.7
$
31,339.3
See Notes to Consolidated Financial Statements.
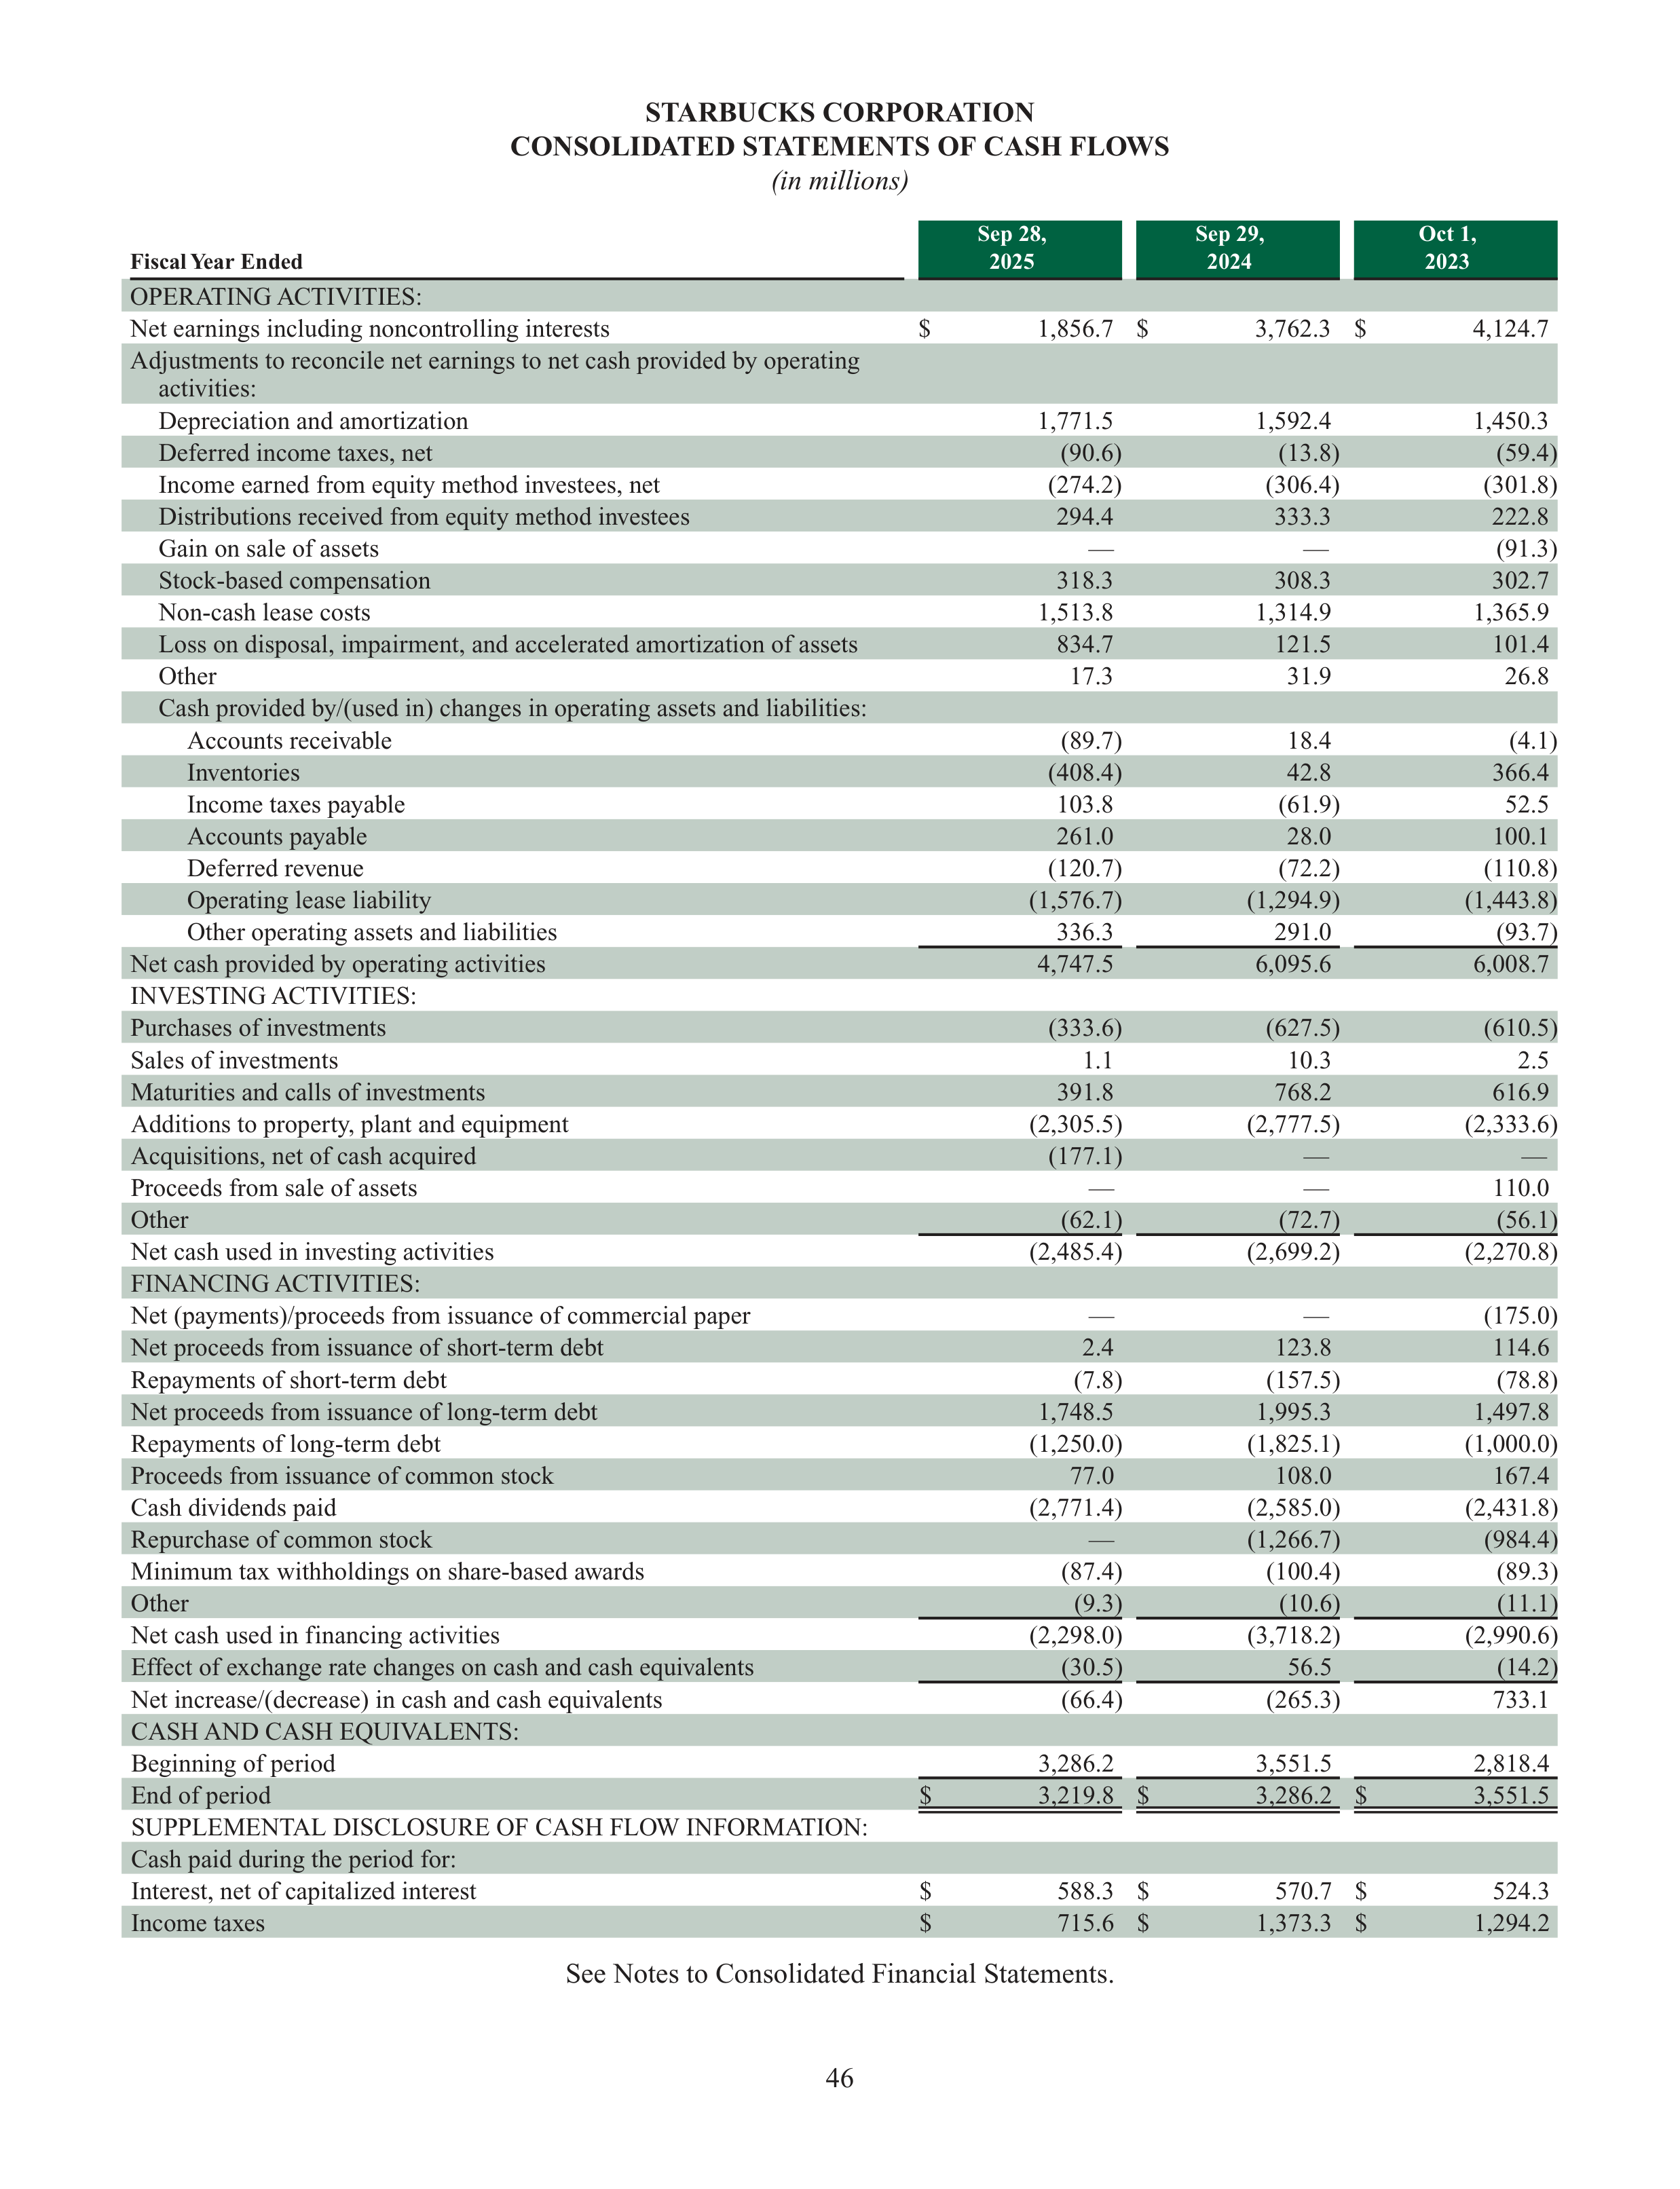
46
STARBUCKS CORPORATION
CONSOLIDATED STATEMENTS OF CASH FLOWS
(in millions)
Fiscal Year Ended
Sep 28,
2025
Sep 29,
2024
Oct 1,
2023
OPERATING ACTIVITIES:
Net earnings including noncontrolling interests
$
1,856.7
$
3,762.3
$
4,124.7
Adjustments to reconcile net earnings to net cash provided by operating
activities:
Depreciation and amortization
1,771.5
1,592.4
1,450.3
Deferred income taxes, net
(90.6)
(13.8)
(59.4)
Income earned from equity method investees, net
(274.2)
(306.4)
(301.8)
Distributions received from equity method investees
294.4
333.3
222.8
Gain on sale of assets
—
—
(91.3)
Stock-based compensation
318.3
308.3
302.7
Non-cash lease costs
1,513.8
1,314.9
1,365.9
Loss on disposal, impairment, and accelerated amortization of assets
834.7
121.5
101.4
Other
17.3
31.9
26.8
Cash provided by/(used in) changes in operating assets and liabilities:
Accounts receivable
(89.7)
18.4
(4.1)
Inventories
(408.4)
42.8
366.4
Income taxes payable
103.8
(61.9)
52.5
Accounts payable
261.0
28.0
100.1
Deferred revenue
(120.7)
(72.2)
(110.8)
Operating lease liability
(1,576.7)
(1,294.9)
(1,443.8)
Other operating assets and liabilities
336.3
291.0
(93.7)
Net cash provided by operating activities
4,747.5
6,095.6
6,008.7
INVESTING ACTIVITIES:
Purchases of investments
(333.6)
(627.5)
(610.5)
Sales of investments
1.1
10.3
2.5
Maturities and calls of investments
391.8
768.2
616.9
Additions to property, plant and equipment
(2,305.5)
(2,777.5)
(2,333.6)
Acquisitions, net of cash acquired
(177.1)
—
—
Proceeds from sale of assets
—
—
110.0
Other
(62.1)
(72.7)
(56.1)
Net cash used in investing activities
(2,485.4)
(2,699.2)
(2,270.8)
FINANCING ACTIVITIES:
Net (payments)/proceeds from issuance of commercial paper
—
—
(175.0)
Net proceeds from issuance of short-term debt
2.4
123.8
114.6
Repayments of short-term debt
(7.8)
(157.5)
(78.8)
Net proceeds from issuance of long-term debt
1,748.5
1,995.3
1,497.8
Repayments of long-term debt
(1,250.0)
(1,825.1)
(1,000.0)
Proceeds from issuance of common stock
77.0
108.0
167.4
Cash dividends paid
(2,771.4)
(2,585.0)
(2,431.8)
Repurchase of common stock
—
(1,266.7)
(984.4)
Minimum tax withholdings on share-based awards
(87.4)
(100.4)
(89.3)
Other
(9.3)
(10.6)
(11.1)
Net cash used in financing activities
(2,298.0)
(3,718.2)
(2,990.6)
Effect of exchange rate changes on cash and cash equivalents
(30.5)
56.5
(14.2)
Net increase/(decrease) in cash and cash equivalents
(66.4)
(265.3)
733.1
CASH AND CASH EQUIVALENTS:
Beginning of period
3,286.2
3,551.5
2,818.4
End of period
$
3,219.8
$
3,286.2
$
3,551.5
SUPPLEMENTAL DISCLOSURE OF CASH FLOW INFORMATION:
Cash paid during the period for:
Interest, net of capitalized interest
$
588.3
$
570.7
$
524.3
Income taxes
$
715.6
$
1,373.3
$
1,294.2
See Notes to Consolidated Financial Statements.
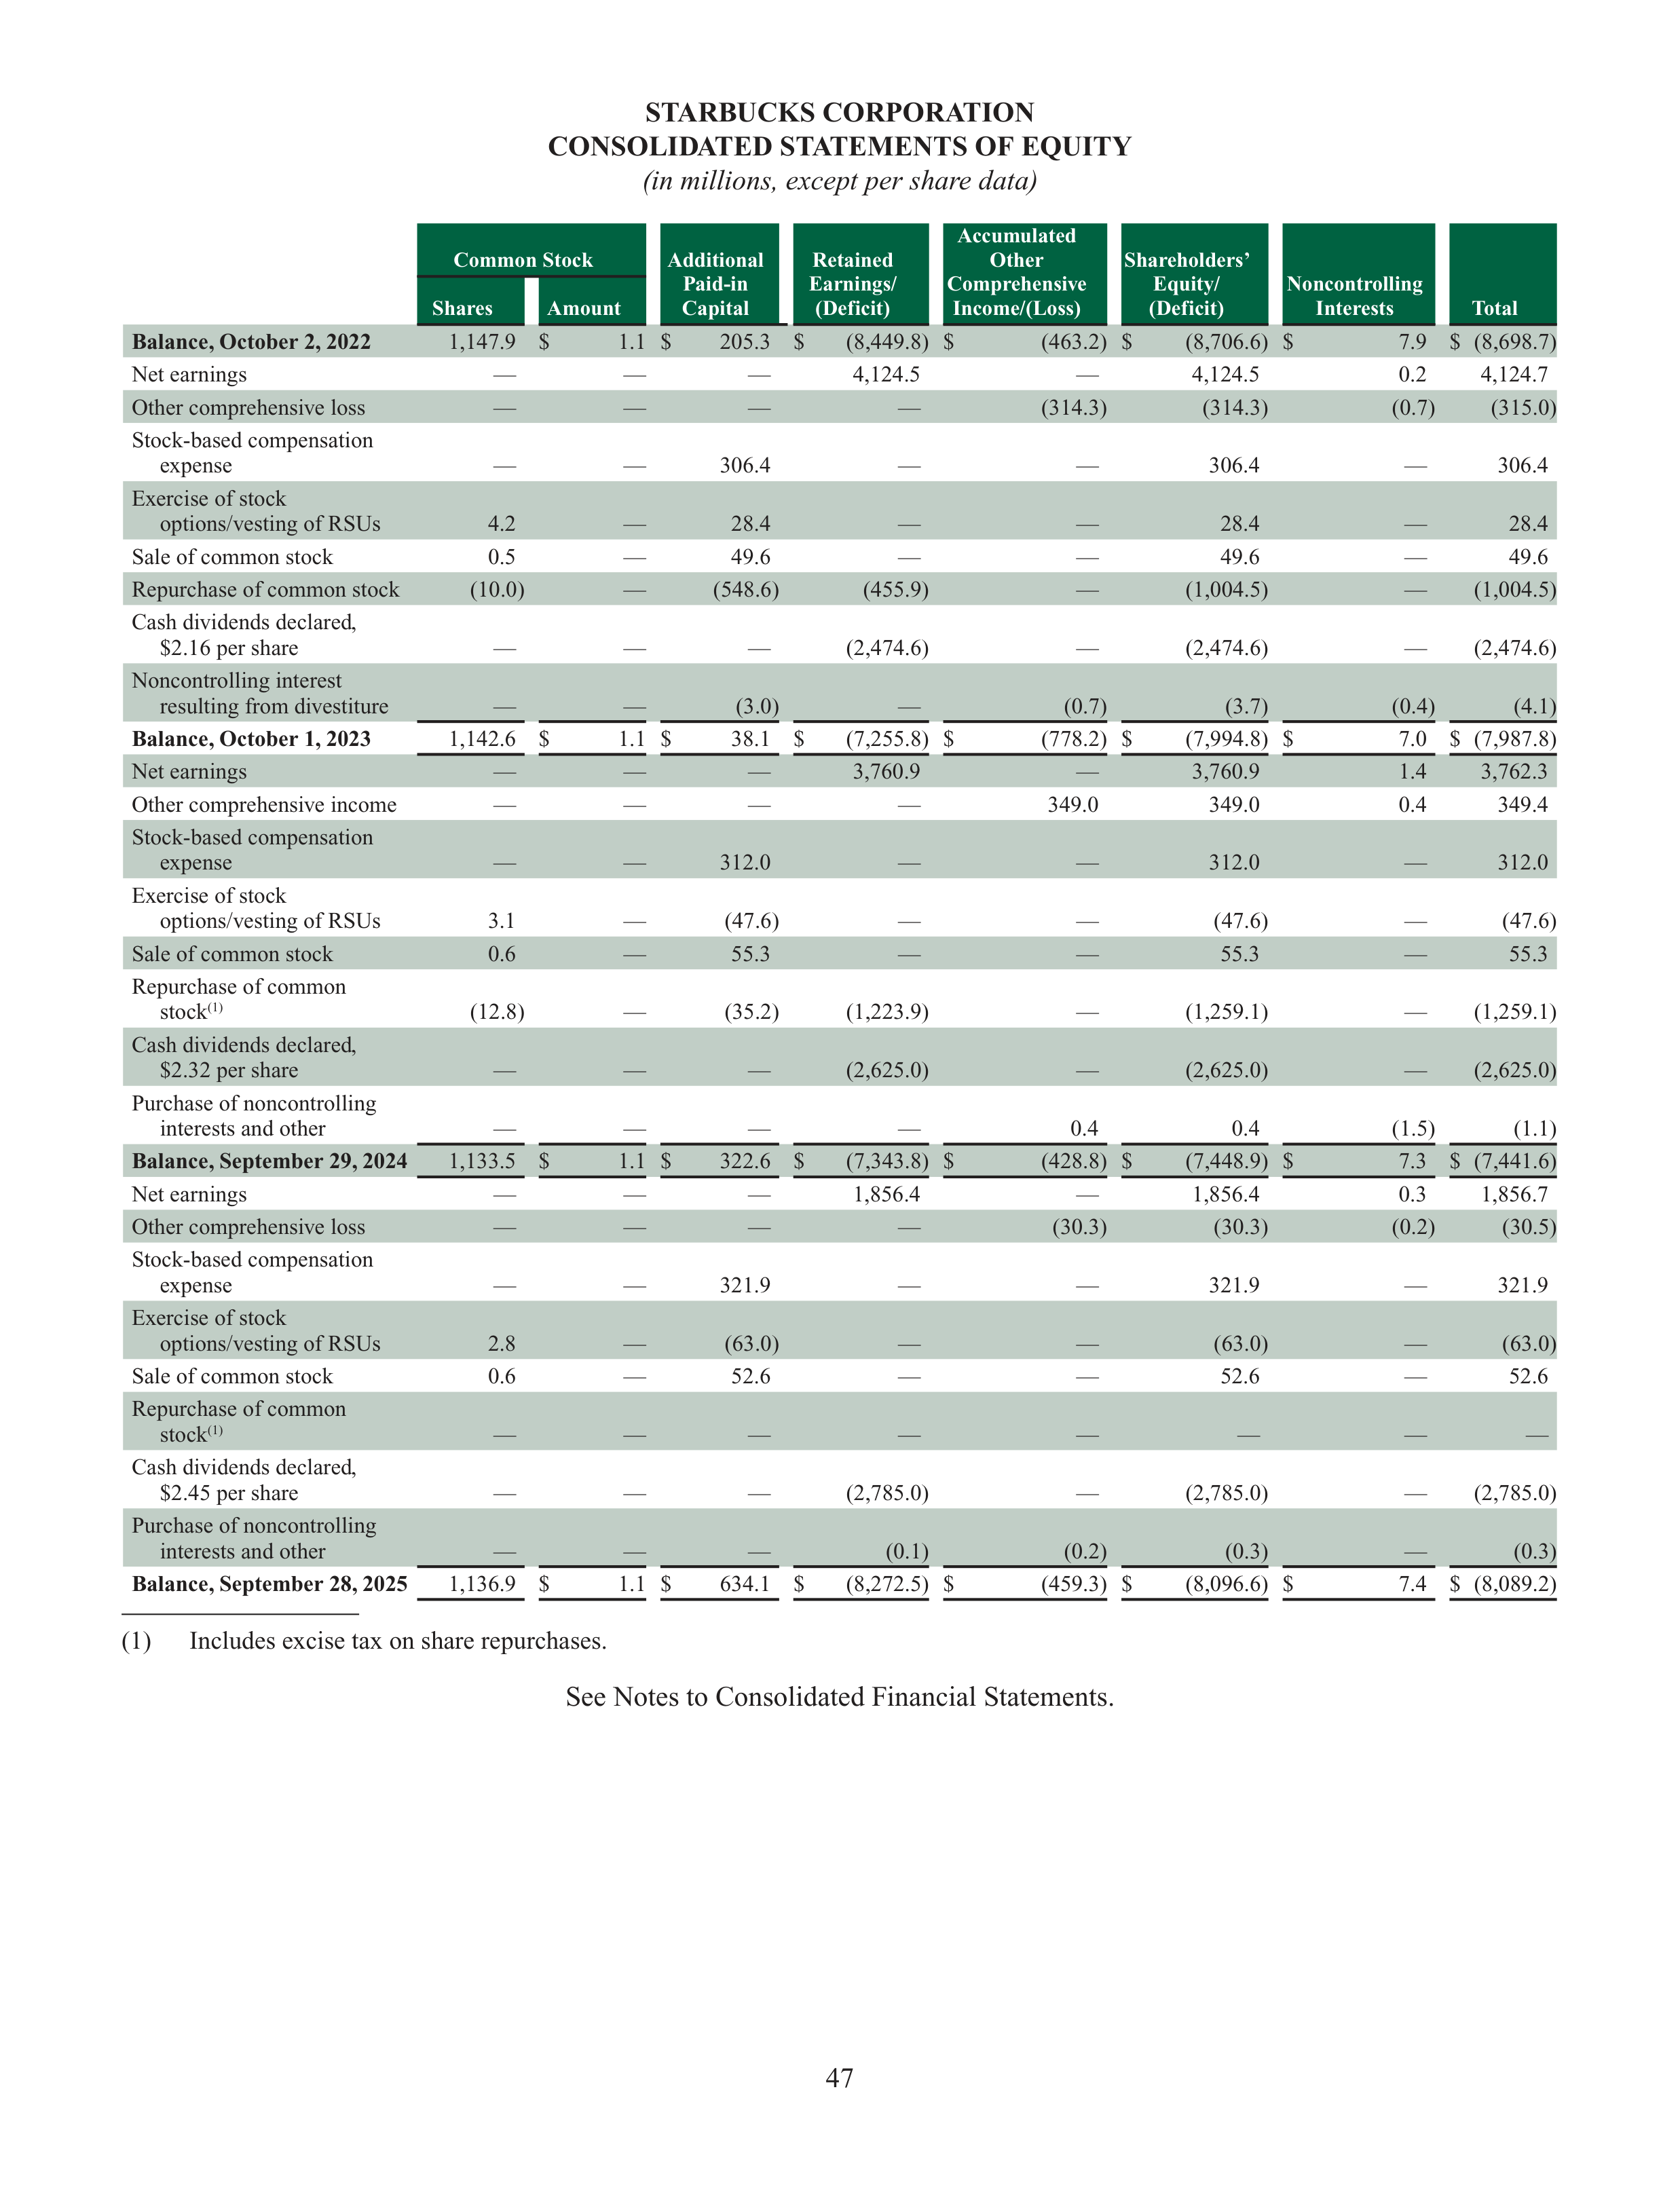
47
STARBUCKS CORPORATION
CONSOLIDATED STATEMENTS OF EQUITY
(in millions, except per share data)
Common Stock
Additional
Paid-in
Capital
Retained
Earnings/
(Deficit)
Accumulated
Other
Comprehensive
Income/(Loss)
Shareholders’
Equity/
(Deficit)
Noncontrolling
Interests
Total
Shares
Amount
Balance, October 2, 2022
1,147.9 $
1.1
$
205.3
$
(8,449.8)
$
(463.2)
$
(8,706.6)
$
7.9 $
(8,698.7)
Net earnings
—
—
—
4,124.5
—
4,124.5
0.2
4,124.7
Other comprehensive loss
—
—
—
—
(314.3)
(314.3)
(0.7)
(315.0)
Stock-based compensation
expense
—
—
306.4
—
—
306.4
—
306.4
Exercise of stock
options/vesting of RSUs
4.2
—
28.4
—
—
28.4
—
28.4
Sale of common stock
0.5
—
49.6
—
—
49.6
—
49.6
Repurchase of common stock
(10.0)
—
(548.6)
(455.9)
—
(1,004.5)
—
(1,004.5)
Cash dividends declared,
$2.16 per share
—
—
—
(2,474.6)
—
(2,474.6)
—
(2,474.6)
Noncontrolling interest
resulting from divestiture
—
—
(3.0)
—
(0.7)
(3.7)
(0.4)
(4.1)
Balance, October 1, 2023
1,142.6
$
1.1
$
38.1
$
(7,255.8)
$
(778.2)
$
(7,994.8)
$
7.0
$
(7,987.8)
Net earnings
—
—
—
3,760.9
—
3,760.9
1.4
3,762.3
Other comprehensive income
—
—
—
—
349.0
349.0
0.4
349.4
Stock-based compensation
expense
—
—
312.0
—
—
312.0
—
312.0
Exercise of stock
options/vesting of RSUs
3.1
—
(47.6)
—
—
(47.6)
—
(47.6)
Sale of common stock
0.6
—
55.3
—
—
55.3
—
55.3
Repurchase of common
stock
(1)
(12.8)
—
(35.2)
(1,223.9)
—
(1,259.1)
—
(1,259.1)
Cash dividends declared,
$2.32 per share
—
—
—
(2,625.0)
—
(2,625.0)
—
(2,625.0)
Purchase of noncontrolling
interests and other
—
—
—
—
0.4
0.4
(1.5)
(1.1)
Balance, September 29, 2024
1,133.5
$
1.1
$
322.6 $
(7,343.8)
$
(428.8)
$
(7,448.9)
$
7.3
$
(7,441.6)
Net earnings
—
—
—
1,856.4
—
1,856.4
0.3
1,856.7
Other comprehensive loss
—
—
—
—
(30.3)
(30.3)
(0.2)
(30.5)
Stock-based compensation
expense
—
—
321.9
—
—
321.9
—
321.9
Exercise of stock
options/vesting of RSUs
2.8
—
(63.0)
—
—
(63.0)
—
(63.0)
Sale of common stock
0.6
—
52.6
—
—
52.6
—
52.6
Repurchase of common
stock
(1)
—
—
—
—
—
—
—
—
Cash dividends declared,
$2.45 per share
—
—
—
(2,785.0)
—
(2,785.0)
—
(2,785.0)
Purchase of noncontrolling
interests and other
—
—
—
(0.1)
(0.2)
(0.3)
—
(0.3)
Balance, September 28, 2025
1,136.9
$
1.1
$
634.1 $
(8,272.5)
$
(459.3)
$
(8,096.6)
$
7.4
$
(8,089.2)
(1)
Includes excise tax on share repurchases.
See Notes to Consolidated Financial Statements.
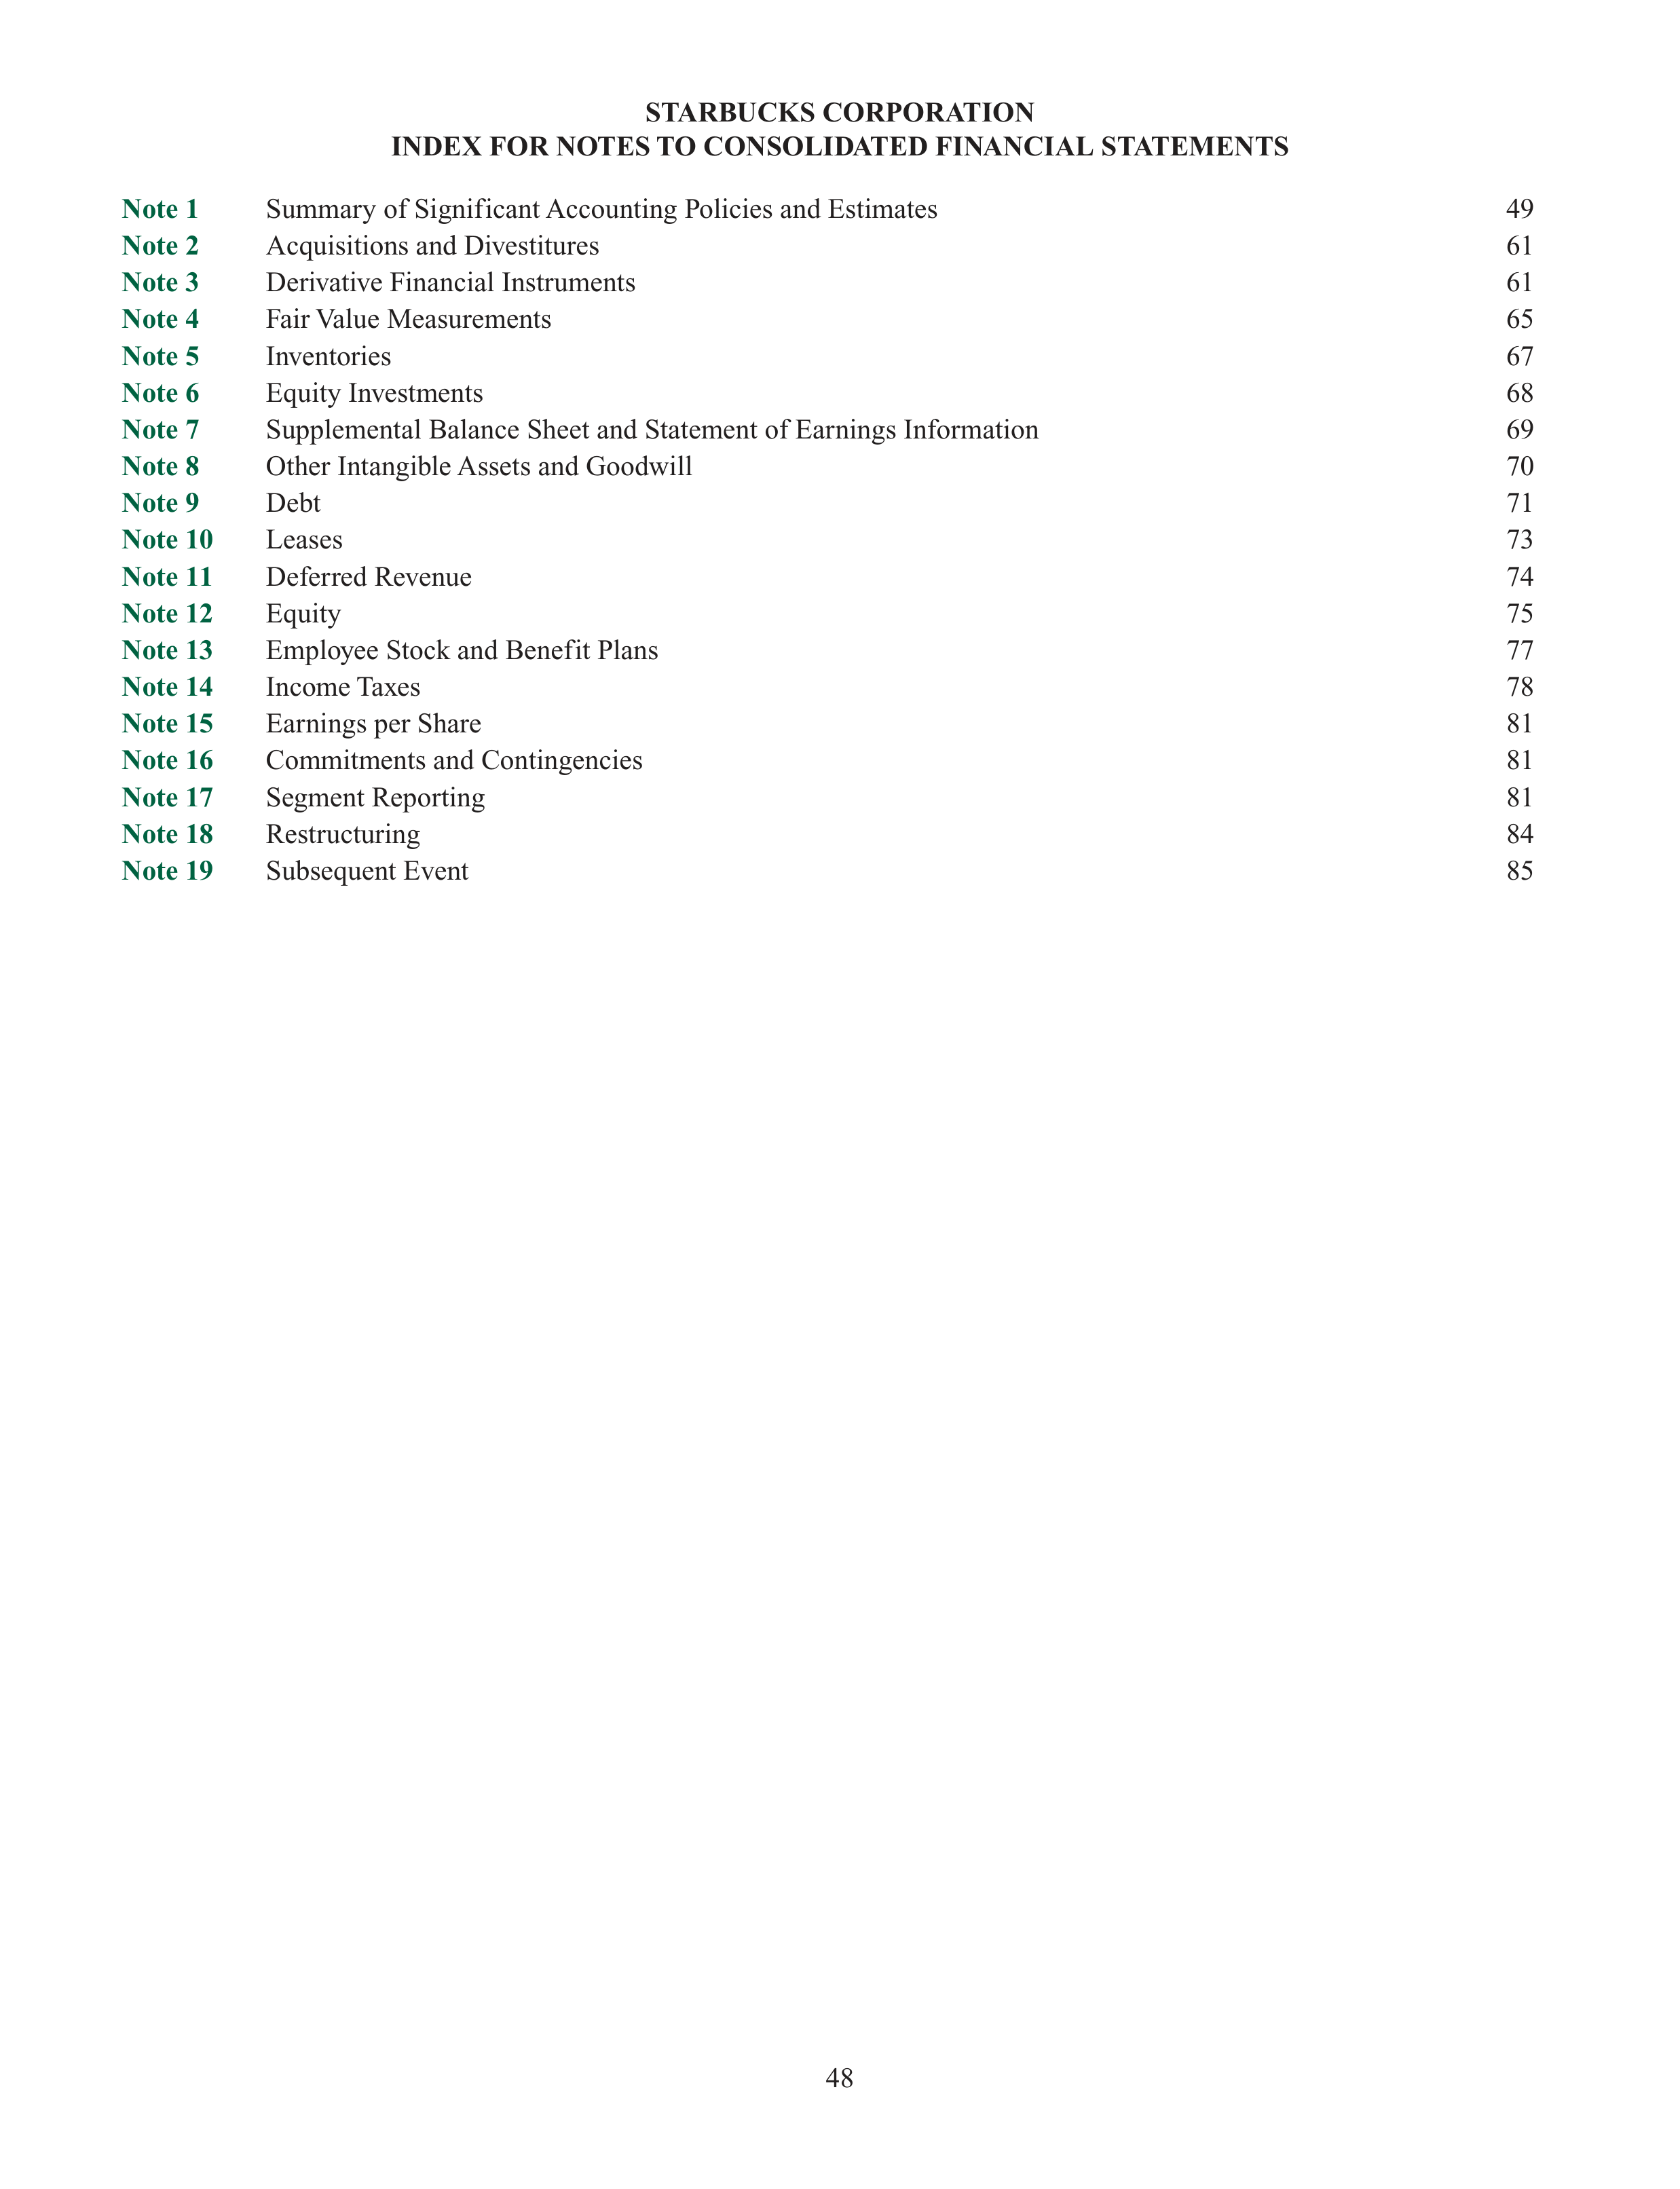
48
STARBUCKS CORPORATION
INDEX FOR NOTES TO CONSOLIDATED FINANCIAL STATEMENTS
Note 1
Summary of Significant Accounting Policies and Estimates
49
Note 2
Acquisitions and Divestitures
61
Note 3
Derivative Financial Instruments
61
Note 4
Fair Value Measurements
65
Note 5
Inventories
67
Note 6
Equity Investments
68
Note 7
Supplemental Balance Sheet and Statement of Earnings Information
69
Note 8
Other Intangible Assets and Goodwill
70
Note 9
Debt
71
Note 10
Leases
73
Note 11
Deferred Revenue
74
Note 12
Equity
75
Note 13
Employee Stock and Benefit Plans
77
Note 14
Income Taxes
78
Note 15
Earnings per Share
81
Note 16
Commitments and Contingencies
81
Note 17
Segment Reporting
81
Note 18
Restructuring
84
Note 19
Subsequent Event
85
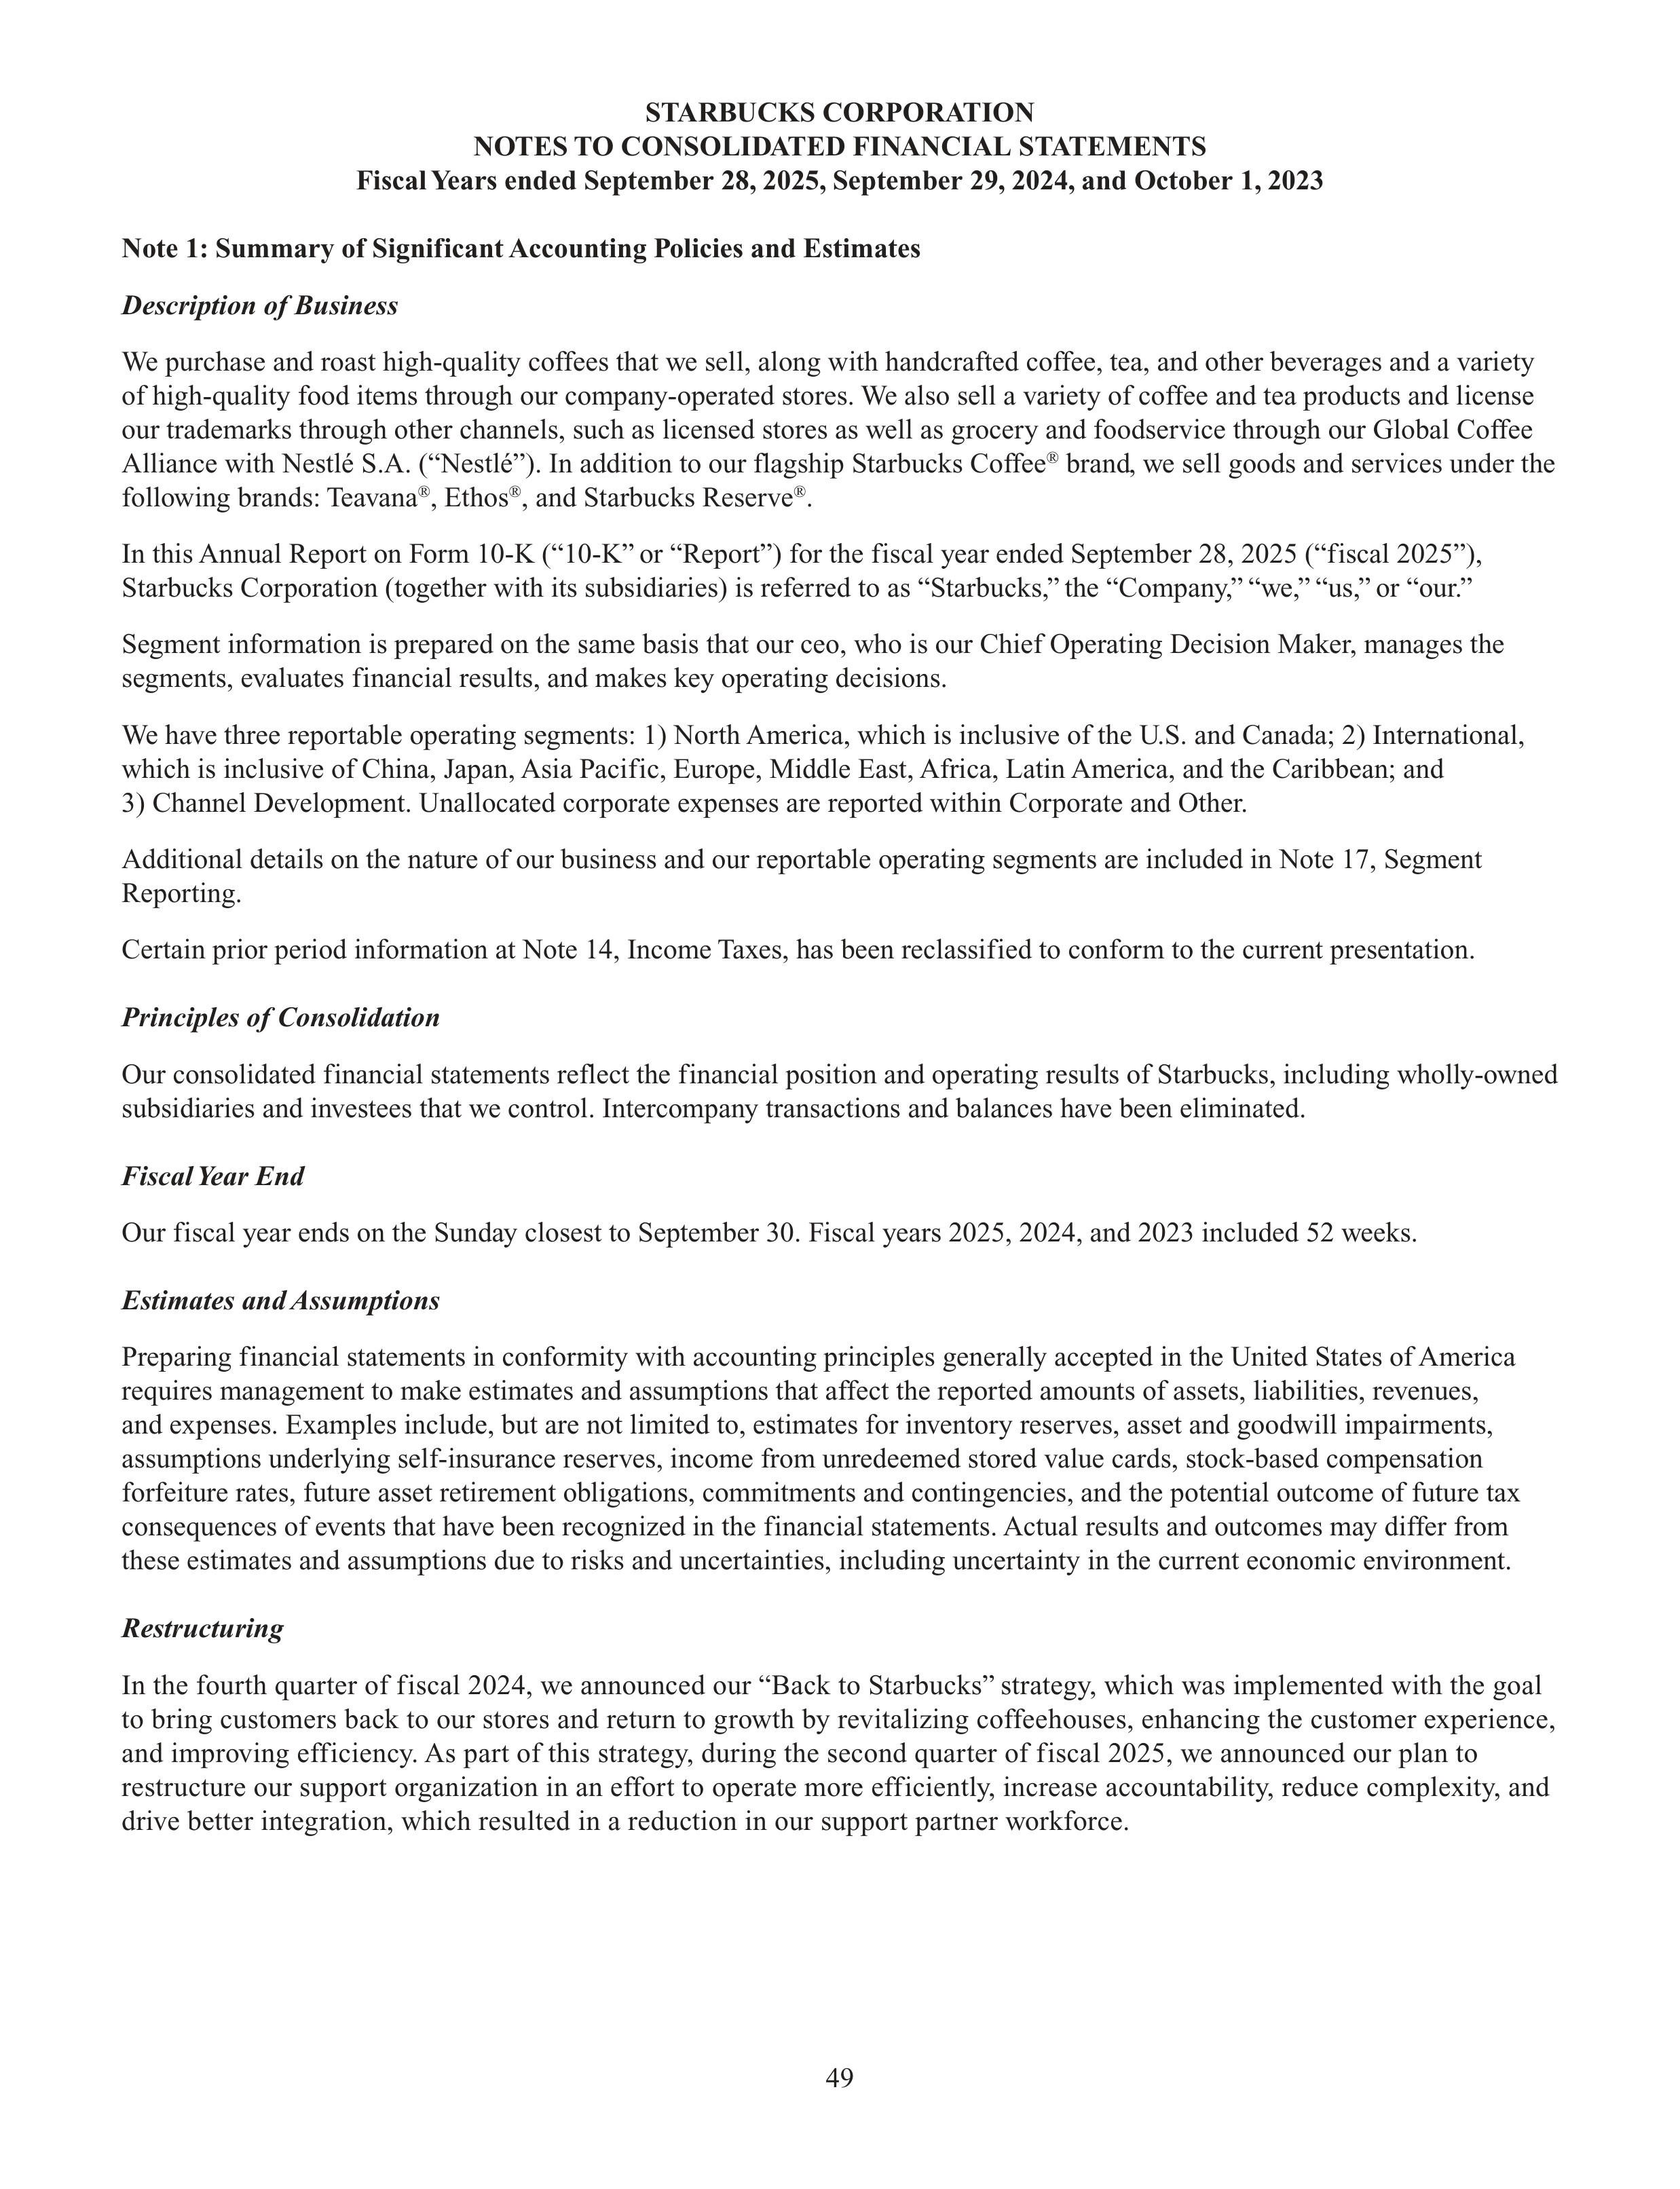
49
STARBUCKS CORPORATION
NOTES TO CONSOLIDATED FINANCIAL STATEMENTS
Fiscal Years ended September 28, 2025, September 29, 2024, and October 1, 2023
Note 1: Summary of Significant Accounting Policies and Estimates
Description of Business
We purchase and roast high-quality coffees that we sell, along with handcrafted coffee, tea, and other beverages and a variety
of high-quality food items through our company-operated stores. We also sell a variety of coffee and tea products and license
our trademarks through other channels, such as licensed stores as well as grocery and foodservice through our Global Coffee
Alliance with Nestlé S.A. (“Nestlé”). In addition to our flagship Starbucks Coffee
®
brand, we sell goods and services under the
following brands: Teavana
®
, Ethos
®
, and Starbucks Reserve
®
.
In this Annual Report on Form 10-K (“10-K” or “Report”) for the fiscal year ended September 28, 2025 (“fiscal 2025”),
Starbucks Corporation (together with its subsidiaries) is referred to as “Starbucks,” the “Company,” “we,” “us,” or “our.”
Segment information is prepared on the same basis that our ceo, who is our Chief Operating Decision Maker, manages the
segments, evaluates financial results, and makes key operating decisions.
We have three reportable operating segments: 1) North America, which is inclusive of the U.S. and Canada; 2) International,
which is inclusive of China, Japan, Asia Pacific, Europe, Middle East, Africa, Latin America, and the Caribbean; and
3) Channel Development. Unallocated corporate expenses are reported within Corporate and Other.
Additional details on the nature of our business and our reportable operating segments are included in Note 17, Segment
Reporting.
Certain prior period information at Note 14, Income Taxes, has been reclassified to conform to the current presentation.
Principles of Consolidation
Our consolidated financial statements reflect the financial position and operating results of Starbucks, including wholly-owned
subsidiaries and investees that we control. Intercompany transactions and balances have been eliminated.
Fiscal Year End
Our fiscal year ends on the Sunday closest to September 30. Fiscal years 2025, 2024, and 2023 included 52 weeks.
Estimates and Assumptions
Preparing financial statements in conformity with accounting principles generally accepted in the United States of America
requires management to make estimates and assumptions that affect the reported amounts of assets, liabilities, revenues,
and expenses. Examples include, but are not limited to, estimates for inventory reserves, asset and goodwill impairments,
assumptions underlying self-insurance reserves, income from unredeemed stored value cards, stock-based compensation
forfeiture rates, future asset retirement obligations, commitments and contingencies, and the potential outcome of future tax
consequences of events that have been recognized in the financial statements. Actual results and outcomes may differ from
these estimates and assumptions due to risks and uncertainties, including uncertainty in the current economic environment.
Restructuring
In the fourth quarter of fiscal 2024, we announced our “Back to Starbucks” strategy, which was implemented with the goal
to bring customers back to our stores and return to growth by revitalizing coffeehouses, enhancing the customer experience,
and improving efficiency. As part of this strategy, during the second quarter of fiscal 2025, we announced our plan to
restructure our support organization in an effort to operate more efficiently, increase accountability, reduce complexity, and
drive better integration, which resulted in a reduction in our support partner workforce.
STARBUCKS CORPORATION
NOTES TO CONSOLIDATED FINANCIAL STATEMENTS
Fiscal Years ended September 28, 2025, September 29, 2024, and October 1, 2023
Note 1: Summary of Significant Accounting Policies and Estimates
(cont.)
50
In the fourth quarter of fiscal 2025, we announced a restructuring plan involving the closure of coffeehouses, and the
further transformation of our support organization, as part of the Company’s “Back to Starbucks” strategy. We assessed our
existing store portfolio with respect to both whether coffeehouses had a viable path to offering the physical environment
consistent with the brand and a clear path to financial performance, and we closed, or plan to close, coffeehouses that did
not meet these criteria.
Refer to Note 18, Restructuring, included in Item 8 of Part II of this 10-K, for further discussion.
Cash and Cash Equivalents
We consider all highly liquid instruments with maturities of three months or less at the time of purchase, as well as credit
card receivables and third-party payment processing receivables for sales to customers in our company-operated stores that
generally settle within two to five business days, to be cash equivalents. We maintain cash and cash equivalent balances with
financial institutions that exceed federally-insured limits. We have not experienced any losses related to these balances, and we
believe credit risk to be minimal.
Our cash management system provides for the funding of all major bank disbursement accounts on a daily basis as checks
are presented for payment. Under this system, outstanding checks are in excess of the cash balances at certain banks, which
creates book overdrafts. Book overdrafts are presented as a current liability in accrued liabilities on our consolidated balance
sheets.
Investments
Available-for-sale Debt Securities
Our short-term and long-term investments include investment-grade debt securities, all of which are classified as
available-for-sale. Available-for-sale debt securities are recorded at fair value, and unrealized holding gains and losses are
recorded, net of tax, as a component of accumulated other comprehensive income. Available-for-sale securities with remaining
maturities of less than one year and those identified by management at the time of purchase to be used to fund operations
within one year are classified as short-term. All other available-for-sale securities are classified as long-term. We evaluate our
available-for-sale securities for other-than-temporary impairment on a quarterly basis. Unrealized losses are charged against
net earnings when a decline in fair value is determined to be other than temporary. We review several factors to determine
whether a loss is other than temporary, such as the length and extent of the fair value decline, the financial condition and
near-term prospects of the issuer, and whether we have the intent to sell, or will more likely than not be required to sell, before
the securities’ anticipated recovery, which may be at maturity. Realized gains and losses are accounted for using the specific
identification method. Purchases and sales are recorded on a trade date basis.
Structured Deposits
We hold short-term, principal-protected structured deposits that provide returns in the form of both fixed and variable yields;
such variable yields are indexed to foreign exchange rates, equity-linked instruments, or interest rate indices. The Company
has elected to account for these using the fair value option with gains and losses recorded in our consolidated statements
of earnings. For fiscal 2025, 2024, and 2023, resulting gains and losses were immaterial to our consolidated statements of
earnings.
Marketable Equity Securities
We also have a marketable equity securities portfolio, which is comprised of marketable equity mutual funds and equity
exchange-traded funds. Marketable equity securities are recorded at fair value and approximate a portion of our liability under
our Management Deferred Compensation Plan (“MDCP”). Gains or losses from the portfolio and the change in our MDCP
liability are recorded in general and administrative expenses in our consolidated statements of earnings. Refer to Note 4, Fair
Value Measurements, for further discussion of our MDCP liability.
STARBUCKS CORPORATION
NOTES TO CONSOLIDATED FINANCIAL STATEMENTS
Fiscal Years ended September 28, 2025, September 29, 2024, and October 1, 2023
Note 1: Summary of Significant Accounting Policies and Estimates
(cont.)
51
Equity Investments
Equity investments are accounted for under the equity method if we are able to exercise significant influence, but not control,
over an investee. Our share of the earnings or losses as reported by the investees is classified as income from equity investees
on our consolidated statements of earnings. The investments are evaluated for impairment annually and when facts and
circumstances indicate that the carrying value may not be recoverable. If a decline in fair value is determined to be other than
temporary, an impairment charge is recorded in interest income and other, net on our consolidated statements of earnings.
We account for equity investments for which we do not have significant influence and without readily determinable fair
values at cost with adjustments for observable changes in price or impairments as permitted by the measurement alternative.
Investments for which the measurement alternative has been elected are assessed for impairment quarterly, or if a triggering
event indicates impairment may be present. Any adjustments as a result of price changes or impairments are recorded in
interest income and other, net on our consolidated statements of earnings.
Fair Value
Fair value is the price we would receive to sell an asset or pay to transfer a liability (exit price) in an orderly transaction
between market participants. For assets and liabilities recorded or disclosed at fair value on a recurring basis, we determine
fair value based on the following:
Level 1:
The carrying value of cash and cash equivalents approximates fair value because of the short-term nature of
these instruments. For equity and U.S. government treasury securities and commodity futures contracts, we
use quoted prices in active markets for identical assets to determine fair value.
Level 2:
When quoted prices in active markets for identical assets are not available, we determine the fair value of
certain assets based upon factors such as the quoted market price of similar assets or a discounted cash flow
model using readily observable market data, which may include interest rate curves and forward and spot
prices for currencies and commodities, depending on the nature of the investment. The fair value of our
long-term debt is estimated based on the quoted market prices for the same or similar issues or on the current
rates offered to us for debt of the same remaining maturities.
Level 3:
We determine the fair value of private equity instruments using valuation models, including Black Scholes’
option pricing model and discounted cash flow models. Inputs are generally unobservable and typically reflect
management’s estimates of assumptions that market participants would use in pricing the asset or liability.
Assets and liabilities recognized or disclosed at fair value on a nonrecurring basis may include items such as property, plant
and equipment, ROU assets, goodwill and other intangible assets, equity and other investments, and other assets. We determine
the fair value of these items using Level 3 inputs, as described in the related sections below.
Derivative Instruments
We manage our exposure to various risks within our consolidated financial statements according to a market price risk
management policy. Under this policy, we may engage in transactions involving various derivative instruments to hedge
interest rates, commodity prices, foreign currency-denominated revenue streams, inventory purchases, and assets, liabilities,
and investments in certain foreign operations. In order to manage our exposure to these risks, we use various types of
derivative instruments including forward contracts, commodity futures contracts, collars, and swaps. Forward contracts
and commodity futures contracts are agreements to buy or sell a quantity of a currency or commodity at a predetermined
future date and at a predetermined rate or price. A collar is a strategy that uses a combination of a purchased call option and
a sold put option with equal premiums to hedge a portion of anticipated cash flows, or to limit possible gains or losses on
an underlying asset or liability to a specific range. A swap agreement is a contract between two parties to exchange cash
flows based on specified underlying notional amounts, assets, and/or indices. We do not enter into derivative instruments for
speculative purposes.
STARBUCKS CORPORATION
NOTES TO CONSOLIDATED FINANCIAL STATEMENTS
Fiscal Years ended September 28, 2025, September 29, 2024, and October 1, 2023
Note 1: Summary of Significant Accounting Policies and Estimates
(cont.)
52
We record all derivatives on our consolidated balance sheets at fair value and typically do not offset derivative assets and
liabilities. Cash flows from derivative financial instruments and the related gains and losses are classified as cash flows
from operating activities on the consolidated statements of cash flows. Excluding interest rate hedging instruments and
cross-currency swaps, we generally do not enter into derivative instruments with maturities longer than three years. We are
allowed to net settle transactions with respective counterparties for certain derivative contracts, inclusive of interest rate swaps
and foreign currency forwards, with a single, net amount payable by one party to the other. As of September 28, 2025, and
September 29, 2024, cash collateral pledged as part of our commodity derivative margin requirements was $37.9 million
and $12.4 million, respectively, and is included in prepaid expenses and other current assets on our consolidated balance
sheets. The potential effects of netting arrangements with our derivative contracts, excluding the effects of collateral, would
not have had a material impact on our consolidated balance sheets. We also hold cash and cash equivalents from various
settled-to-market exchange traded futures related to coffee and dairy hedging.
By using these derivative instruments, we expose ourselves to potential credit risk. Credit risk is the failure of the counterparty
to perform under the terms of the derivative contract. We minimize this credit risk by entering into transactions with carefully
selected, credit-worthy counterparties and distribute contracts among several financial institutions to reduce the concentration
of credit risk. We also enter into collateral security arrangements that provide for collateral to be received or posted when
the net fair value of certain financial instruments fluctuates from contractually established thresholds. As of September 28,
2025, and September 29, 2024, cash collateral received under collateral security arrangements was $187.0 million and
$230.9 million, respectively, and is included in other long-term liabilities on our consolidated balance sheets.
Cash Flow Hedges
For derivative instruments that are designated and qualify as a cash flow hedge, the derivative’s gain or loss is reported as a
component of other comprehensive income (“OCI”) and recorded in accumulated other comprehensive income (“AOCI”) on
our consolidated balance sheets. The gain or loss is subsequently reclassified into net earnings when the hedged exposure
affects net earnings, in the same line item as the underlying hedged item on our consolidated statements of earnings.
Cash flow hedges related to anticipated transactions are designated and documented at the inception of each hedge. Cash
flows from hedging transactions are classified in the same categories as the cash flows from the respective hedged items. For
de-designated cash flow hedges where it is probable that the hedged transaction will not occur during the originally specified
time period or within an additional two-month period thereafter, the related accumulated derivative gains or losses are
recognized in interest income and other, net on our consolidated statements of earnings.
Net Investment Hedges
For derivative instruments that are designated and qualify as a net investment hedge, the derivative’s, or qualifying
non-derivative instrument’s, gain or loss is reported as a component of OCI and recorded in AOCI. The gain or loss will be
subsequently reclassified into net earnings when the hedged net investment is either sold or substantially liquidated.
Fair Value Hedges
For derivative instruments that are designated and qualify as a fair value hedge, the changes in fair value of the derivative
instrument and the offsetting changes in fair value of the underlying hedged item due to changes in the hedged risk are
recorded in interest income and other, net or interest expense on our consolidated statements of earnings.
Derivatives Not Designated As Hedging Instruments
We also enter into certain foreign currency forward contracts, commodity futures contracts, collars, and swaps that are not
designated as hedging instruments for accounting purposes. The changes in the fair values of these contracts are immediately
recognized in interest income and other, net on our consolidated statements of earnings.
STARBUCKS CORPORATION
NOTES TO CONSOLIDATED FINANCIAL STATEMENTS
Fiscal Years ended September 28, 2025, September 29, 2024, and October 1, 2023
Note 1: Summary of Significant Accounting Policies and Estimates
(cont.)
53
Normal Purchase Normal Sale
We enter into fixed-price and price-to-be-fixed green coffee purchase commitments, which we expect will result in physical
delivery and utilization in the ordinary course of business in a reasonable period of time. Since these types of purchase
commitments qualify for the normal purchase normal sale exemption, they are not recorded as derivative instruments on our
consolidated balance sheets.
Refer to Note 3, Derivative Financial Instruments, and Note 5, Inventories, for further discussion of our derivative instruments
and green coffee purchase commitments.
Receivables, net of Allowance for Credit Losses
Our receivables are mainly generated from product and equipment sales to, and royalties from, our licensees, as well as
from our Global Coffee Alliance and other Channel Development customers. The primary indicators of the credit quality
of our receivables are aging, payment history, economic sector information, and outside credit monitoring. These indicators
are assessed on a quarterly basis. Our credit loss exposure is mainly concentrated in our accounts receivable portfolio. Our
allowance for credit losses is calculated using a loss-rate method based on historical experience, current market conditions,
and reasonable forecasts. For the fiscal year ended September 28, 2025, we did not observe a significant deterioration of our
receivable portfolio that required a significant increase in our allowance for credit losses. As of September 28, 2025, and
September 29, 2024, our allowance for credit losses was $24.0 million and $21.2 million, respectively.
Inventories
Inventories are stated at the lower of cost (primarily moving average cost) or net realizable value. We record inventory reserves
for obsolete and slow-moving inventory and for estimated shrinkage between physical inventory counts. Inventory reserves
are based on inventory obsolescence trends, historical experience, and application of the specific identification method. As of
September 28, 2025, and September 29, 2024, inventory reserves were $56.6 million and $58.0 million, respectively.
Property, Plant and Equipment
Property, plant and equipment is carried at cost less accumulated depreciation. Cost includes all direct costs necessary to
acquire and prepare assets for use or to develop or obtain internal-use software, including internal labor and overhead in
some cases. Depreciation is computed using the straight-line method over estimated useful lives of the assets, generally
ranging from 2 to 15 years for equipment, 30 to 40 years for buildings, and 2 to 8 years for capitalized software. Leasehold
improvements are amortized over the shorter of their estimated useful lives or the related lease life, generally 10 years. For
leases with renewal periods at our option, we generally use the original lease term, excluding renewal option periods, to
determine estimated useful lives. If failure to exercise a renewal option imposes a significant economic penalty to us, we
may determine at the inception of the lease that renewal is reasonably assured and include the renewal option period in the
determination of the appropriate estimated useful lives. Capitalized software includes the costs of developing or obtaining
internal-use software, such as external direct costs of materials and services, payroll and benefits costs, interest costs, and
costs to develop or obtain software that allows for access or conversion of historical data by new systems. We capitalize costs
when the preliminary project stage is complete, management has authorized and committed to funding the software project, it
is probable that the software project will be completed, and it is probable that the software will be used to perform the intended
function.
The portion of depreciation expense related to production and distribution facilities is included in product and distribution
costs on our consolidated statements of earnings. The costs of repairs and maintenance are expensed when incurred, while
expenditures for refurbishments and improvements that significantly add to the productive capacity or extend the useful life of
an asset are capitalized. When assets are disposed of, whether through retirement or sale, the net gain or loss is recognized in
net earnings. Long-lived assets to be disposed of are reported at the lower of their carrying amount or fair value less estimated
costs to sell.
STARBUCKS CORPORATION
NOTES TO CONSOLIDATED FINANCIAL STATEMENTS
Fiscal Years ended September 28, 2025, September 29, 2024, and October 1, 2023
Note 1: Summary of Significant Accounting Policies and Estimates
(cont.)
54
We evaluate property, plant and equipment for impairment when facts and circumstances indicate that the carrying values of
such assets may not be recoverable. When evaluating for impairment, we first compare the carrying value of the asset to the
asset’s estimated future undiscounted cash flows. If the estimated undiscounted future cash flows are less than the carrying
value of the asset, we determine if we have an impairment loss by comparing the carrying value of the asset to the asset’s
estimated fair value and recognize an impairment charge when the asset’s carrying value exceeds its estimated fair value. The
fair value of the asset is estimated using a discounted cash flow model based on forecasted future revenues and operating
costs, using internal projections. Property, plant and equipment assets and ROU assets related to the store lease are grouped at
the lowest level for which identifiable cash flows are largely independent of the cash flows of other assets and liabilities. For
company-operated store assets, the impairment test is performed at the individual store asset group level.
We recognized net disposition and impairment charges of $595.3 million, $94.0 million, and $91.1 million in fiscal 2025,
2024, and 2023, respectively. Included in these amounts, we recorded $102.2 million, $23.3 million, and $23.2 million
of impairment losses within store operating expenses on our consolidated statements of earnings during the fiscal years
ended September 28, 2025, September 29, 2024, and October 1, 2023, respectively. Further, of the total net impairment
and disposition charges recorded in fiscal 2025, $352.8 million was restructuring related and recorded in restructuring and
impairment expenses. See Note 18, Restructuring, to the consolidated financial statements included in Item 8 of Part II of this
10-K, for further discussion. Unless it is restructuring related, the nature of the underlying asset that is impaired or disposed of
will determine the operating expense line on which the related impact is recorded on our consolidated statements of earnings.
Leases
The majority of our leases are operating leases for our company-operated retail store locations. We also lease, among other
things, roasting, distribution and warehouse facilities, and office space for corporate administrative purposes.
We categorize leases as either operating or finance leases at the commencement date of the lease. Operating lease agreements
may contain tenant improvement allowances, rent holidays, rent escalation clauses, and/or contingent rent provisions. We have
lease agreements with lease and non-lease components, which are accounted for together as a single lease component for all
underlying classes of assets.
We recognize a ROU asset and lease liability for each operating and finance lease with a contractual term greater than
12 months at the time of lease inception. We do not record leases with an initial term of 12 months or less on our consolidated
balance sheet but continue to record rent expense on a straight-line basis over the lease term. We review contracts for
identified assets where we have the right to direct the use of the asset and record those agreements as embedded leases on our
consolidated balance sheet. Our leases often include options to extend or terminate at our sole discretion, which are included
in the determination of lease term when they are reasonably certain to be exercised.
Our lease liability represents the present value of future lease payments over the lease term. Given our policy election to
combine lease and non-lease components, we also consider fixed common area maintenance (“CAM”) part of our fixed future
lease payments; therefore, fixed CAM is also included in our lease liability.
We generally cannot determine the interest rate implicit in each of our leases. Therefore, we typically use market and
term-specific incremental borrowing rates. Our incremental borrowing rate for a lease is the rate of interest we expect to pay
on a collateralized basis to borrow an amount under similar terms. Because we do not borrow on a collateralized basis, we
consider a combination of factors, including our credit-adjusted risk-free interest rate, the risk profile and funding cost of the
specific geographic market of the lease, the lease term, and the effect of adjusting the rate to reflect consideration of collateral.
Our credit-adjusted risk-free rate takes into consideration interest rates we pay on our unsecured long-term bonds as well as
quoted interest rates obtained from financial institutions.
Total lease costs recorded as rent and other occupancy costs include fixed operating lease costs, variable lease costs, and
short-term lease costs. Most of our real estate leases require we pay certain expenses, such as CAM costs, real estate taxes,
and other executory costs, of which the fixed portion is included in operating lease costs. We recognize operating lease costs
on a straight-line basis over the lease term. In addition to the above costs, variable lease costs also include amounts based on a
STARBUCKS CORPORATION
NOTES TO CONSOLIDATED FINANCIAL STATEMENTS
Fiscal Years ended September 28, 2025, September 29, 2024, and October 1, 2023
Note 1: Summary of Significant Accounting Policies and Estimates
(cont.)
55
percentage of gross sales in excess of specified levels, the costs of which are recognized when probable and are not included in
determining the present value of our lease liability. Our lease agreements do not contain any material residual value guarantees
or material restrictive covenants. A significant majority of our leases are related to our company-operated stores, and the
related costs are recorded within store operating expenses.
The ROU asset is measured at the initial amount of the lease liability adjusted for lease payments made at or before the lease
commencement date, initial direct costs, and any tenant improvement allowances received. For operating leases, ROU assets
are reduced over the lease term by the recognized straight-line lease expense less the amount of accretion of the lease liability
determined using the effective interest method. For finance leases, ROU assets are amortized on a straight-line basis over the
shorter of the useful life of the leased asset or the lease term. Interest expense on each finance lease liability is recognized
utilizing the effective interest method. ROU assets are tested for impairment in the same manner as long-lived assets.
Additionally, we monitor for events or changes in circumstances that may require a reassessment of one of our leases and
determine if a remeasurement is required. See Note 10, Leases, for additional details. For the year ended September 28, 2025,
we recognized accelerated amortization of ROU lease assets and other lease exit costs of $239.3 million, due to store closures
prior to the end of contractual lease terms, which was recorded in restructuring and impairments on the consolidated statement
of earnings. See Note 18, Restructuring, to the consolidated financial statements included in Item 8 of Part II of this 10-K, for
further discussion.
Goodwill
We evaluate goodwill for impairment annually during our third fiscal quarter, or more frequently if an event occurs or
circumstances change, such as material deterioration in performance or a significant number of store closures, indicating that
the carrying value of our goodwill may not be recoverable. When evaluating goodwill for impairment, we may first perform
a qualitative assessment to determine whether it is more likely than not that a reporting unit is impaired. If we do not perform
a qualitative assessment, or if we determine that it is not more likely than not that the fair value of the reporting unit exceeds
its carrying amount, we calculate the estimated fair value of the reporting unit. Fair value is typically calculated using a
discounted cash flow model. For certain reporting units, where deemed appropriate, we may also utilize a market approach for
estimating fair value. If the carrying amount of the reporting unit exceeds the estimated fair value, an impairment charge is
recorded to reduce the carrying value to the estimated fair value.
As part of our ongoing operations, we may close certain stores within a reporting unit containing goodwill due to
underperformance of the store or inability to renew our lease, among other reasons. We may abandon certain assets associated
with a closed store, including leasehold improvements and other non-transferable assets. When a portion of a reporting unit
that constitutes a business is to be disposed of, goodwill associated with the business is included in the carrying amount of
the business in determining any loss on disposal. Our evaluation of whether the portion of a reporting unit being disposed
of constitutes a business occurs on the date of abandonment. Although an operating store meets the accounting definition of
a business prior to abandonment, it does not constitute a business on the closure date because the remaining assets on that
date do not constitute an integrated set of activities (substantive processes) and assets that are capable of being managed for
the purpose of providing a return to investors. As a result, when closing individual stores, we do not include goodwill in the
calculation of any loss on disposal of the related assets.
We recorded no goodwill impairment during fiscal 2025, fiscal 2024, and fiscal 2023. See Note 8, Other Intangible Assets and
Goodwill, for further information.
Other Intangible Assets
Other intangible assets include finite-lived intangible assets, which mainly consist of acquired and reacquired rights, trade
names, trade secrets, licensing agreements, contract-based patents, and copyrights. These assets are amortized over their
estimated useful lives and are tested for impairment using a similar methodology to our property, plant and equipment, as
described above.
STARBUCKS CORPORATION
NOTES TO CONSOLIDATED FINANCIAL STATEMENTS
Fiscal Years ended September 28, 2025, September 29, 2024, and October 1, 2023
Note 1: Summary of Significant Accounting Policies and Estimates
(cont.)
56
Indefinite-lived intangibles, which consist primarily of trade names and trademarks, are tested for impairment annually during
the third fiscal quarter, or more frequently if an event occurs or circumstances change, indicating that the carrying value
of the intangibles may not be recoverable. When evaluating other intangible assets for impairment, we may first perform a
qualitative assessment to determine whether it is more likely than not that an intangible asset group is impaired. If we do not
perform the qualitative assessment, or if we determine that it is not more likely than not that the fair value of the intangible
asset group exceeds its carrying amount, we calculate the estimated fair value of the intangible asset group. Fair value is the
price a willing buyer would pay for the intangible asset group and is typically calculated using an income approach, such as a
relief-from-royalty model. If the carrying amount of the intangible asset group exceeds the estimated fair value, an impairment
charge is recorded to reduce the carrying value to the estimated fair value. In addition, we continuously monitor and may
revise our intangible asset useful lives if and when facts and circumstances change.
There were no significant other intangible asset impairment charges recorded during fiscal years 2025, 2024, and 2023. See
Note 8, Other Intangible Assets and Goodwill, for further information.
Insurance Reserves
We use a combination of insurance and self-insurance mechanisms, including a wholly-owned captive insurance entity and
participation in a reinsurance treaty, to provide for the potential liabilities for certain risks, including workers’ compensation,
healthcare benefits, general liability, and property insurance. Liabilities associated with the risks that are retained by us are
not discounted and are estimated, in part, by considering historical claims experience, demographics, exposure and severity
factors, and other actuarial assumptions.
Revenue Recognition
Consolidated revenues are presented net of intercompany eliminations for wholly-owned subsidiaries and investees controlled
by us and for product sales to, and royalty and other fees from, licensees accounted for under the equity method. Additionally,
consolidated revenues are recognized net of any discounts, returns, allowances, and sales incentives, including coupon
redemptions and rebates.
Company-operated Store Revenues
Company-operated store revenues are recognized when payment is tendered at the point-of-sale as the performance obligation
has been satisfied. For products sold via delivery platforms, contractual terms are evaluated for each service provider to
determine gross versus net presentation, and revenues are also recognized when control of products are transferred to the
customers. Delivery service fees were immaterial in the periods presented. Company-operated store revenues are reported
excluding sales, use, or other transaction taxes that are collected from customers and remitted to taxing authorities.
Licensed Store Revenues
Licensed store revenues consist of product and equipment sales, royalties, and other fees paid by licensees using the Starbucks
brand. Sales of coffee, tea, food, and related products are generally recognized upon shipment to licensees, depending on
contract terms. Shipping charges billed to licensees are also recognized as revenue, and the related shipping costs are included
in product and distribution costs on our consolidated statements of earnings.
We consider pre-opening services, including site evaluation and selection, store architectural/design and development, and
operational training, to be performance obligations that are separate from the license to operate under the Starbucks brand.
These services provide distinct value to our licensees, including business and industry insight and knowledge that transfers
value apart from the license. Revenues associated with pre-opening services are recognized upon completion of the related
performance obligations, generally when a store is opened. Royalty revenues are recognized based upon a percentage of
reported sales, and other continuing fees, such as marketing and service fees, are recognized as the performance obligations
are met.
STARBUCKS CORPORATION
NOTES TO CONSOLIDATED FINANCIAL STATEMENTS
Fiscal Years ended September 28, 2025, September 29, 2024, and October 1, 2023
Note 1: Summary of Significant Accounting Policies and Estimates
(cont.)
57
Stored Value Cards
Stored value cards can be activated through various channels, including at our company-operated and most licensed store
locations, online at Starbucks.com, or via mobile devices held by our customers and at certain other third-party websites and
locations, such as grocery stores, although they cannot be reloaded at these third-party websites or locations. Amounts loaded
onto stored value cards are initially recorded as deferred revenue and recognized as revenue upon redemption. Historically, the
majority of stored value cards are redeemed within one year.
In many of our company-operated markets, including the U.S., our stored value cards do not have an expiration date, nor
do we charge service fees that cause a decrement to customer balances. Based on historical redemption rates, a portion of
stored value cards is not expected to be redeemed and will be recognized as breakage over time in proportion to stored value
card redemptions. The redemption rates are based on historical redemption patterns for each market, including the timing
and business channel in which the card was activated or reloaded, and remittance to government agencies under unclaimed
property laws, if applicable.
Breakage is recognized as company-operated stores and licensed stores revenue within the consolidated statement of earnings.
For the fiscal years ended September 28, 2025, September 29, 2024, and October 1, 2023, we recognized breakage revenue
of $200.4 million, $187.6 million, and $196.1 million in company-operated store revenues, respectively, and $22.0 million,
$20.0 million, and $18.9 million in licensed store revenues, respectively.
Loyalty Program
Customers in the U.S., Canada, and certain other countries who register their stored value card are automatically enrolled
in the Starbucks Rewards program, which is primarily a spend-based loyalty program. They earn loyalty points (“Stars”)
in a variety of ways, including with each purchase at participating Starbucks stores. Starbucks Rewards members can earn
Stars by paying with cash, credit or debit cards, or selected mobile wallets at company-operated and certain participating
licensed stores in the U.S. and Canada. After accumulating a certain number of Stars, the customer earns a reward that can
be redeemed for free product that, regardless of where the related Stars were earned within that country, will be honored at
company-operated stores and certain participating licensed store locations in that same country.
We defer revenue associated with the estimated selling price of Stars earned by Starbucks Rewards members towards free
products as each Star is earned and a corresponding liability is established in deferred revenue. This deferral is based on the
estimated value of the product for which the reward is expected to be redeemed, net of estimated unredeemed Stars. Stars
generally expire after six to twelve months, depending on the market.
When a customer redeems an earned reward, we recognize revenue for the redeemed product and reduce the related deferred
revenue.
Other Revenues
Other revenues primarily include royalty revenues, sales of packaged coffee, tea, and a variety of ready-to-drink beverages and
single-serve coffee and tea products to customers outside of our company-operated and licensed stores. Sales of these products
are generally recognized upon shipment to customers, depending on contract terms.
Other revenues also include product sales to, and licensing revenue from, Nestlé related to our Global Coffee Alliance. Product
sales to Nestlé are generally recognized when the product is shipped, whereas royalty revenues are recognized based on a
percentage of reported sales.
Deferred Revenues
Our deferred revenue primarily consists of the up-front prepaid royalty from Nestlé, for which we have continuing performance
obligations to support the Global Coffee Alliance, and our unredeemed stored value card liability and unredeemed Stars
associated with our loyalty program. See Note 11, Deferred Revenue, for further information.
STARBUCKS CORPORATION
NOTES TO CONSOLIDATED FINANCIAL STATEMENTS
Fiscal Years ended September 28, 2025, September 29, 2024, and October 1, 2023
Note 1: Summary of Significant Accounting Policies and Estimates
(cont.)
58
Disaggregation of Revenues
Revenues disaggregated by segment, product type, and geographic area are disclosed in Note 17, Segment Reporting.
Product and Distribution Costs
Product and distribution costs primarily include expenses related to raw materials, purchased goods, packaging, delivery, and
tariff impacts, along with operational costs of our supply chain organization. This encompasses wages, benefits, occupancy
costs, and depreciation associated with sourcing, procuring, manufacturing, warehousing, and transportation of products sold
at our company-operated and licensed stores, as well as through Channel Development and our other businesses. Additionally,
it includes costs related to inventory and supply chain asset impairments.
Store Operating Expenses
Store operating expenses consist of costs incurred in our company-operated stores, primarily wages and benefits related
to store partners (employees), occupancy costs, marketing, delivery commissions, and other costs that directly support the
operation and sales-related activities of those stores.
General and Administrative Expenses
General and administrative expenses primarily consist of wages and benefits, professional service fees, and occupancy costs
for corporate headquarters and regional offices that support our corporate functions.
Advertising
We expense most advertising costs as they are incurred, except for certain production costs that are expensed the first time the
advertising takes place. Advertising expenses totaled $869.5 million, $597.3 million, and $507.8 million in fiscal 2025, 2024,
and 2023, respectively.
Store Preopening Expenses
Costs incurred in connection with the start-up and promotion of new company-operated store openings are expensed as
incurred.
Asset Retirement Obligations
We recognize a liability for the fair value of required asset retirement obligations (“ARO”) when such obligations are incurred.
Our AROs are primarily associated with leasehold improvements, which, at the end of a lease, we are contractually obligated
to remove to comply with the lease agreement. At the inception of a lease with such conditions, we record an ARO liability and
a corresponding capital asset in an amount equal to the estimated fair value of the obligation. We estimate the liability using
a number of assumptions, including store closing costs, cost inflation rates, and discount rates, and accrete the liability to its
projected future value over time. The capitalized asset is depreciated using the same depreciation convention as leasehold
improvement assets. Upon satisfaction of the ARO conditions, any difference between the recorded ARO liability and the
actual retirement costs incurred is recognized as a gain or loss in store operating expenses on our consolidated statements of
earnings. As of September 28, 2025, and September 29, 2024, our net ARO assets included in property, plant and equipment
were $25.5 million and $25.1 million, respectively, and our net ARO liabilities included in other long-term liabilities were
$126.3 million and $119.2 million, respectively.
Stock-based Compensation
We maintain several equity incentive plans under which we may grant non-qualified stock options, incentive stock options,
restricted stock, restricted stock units (“RSUs”), or stock appreciation rights to employees, non-employee directors, and
consultants; stock options have not been broadly used as part of our compensation strategy in recent years. We also have an
STARBUCKS CORPORATION
NOTES TO CONSOLIDATED FINANCIAL STATEMENTS
Fiscal Years ended September 28, 2025, September 29, 2024, and October 1, 2023
Note 1: Summary of Significant Accounting Policies and Estimates
(cont.)
59
employee stock purchase plan (“ESPP”). RSUs issued by us are equivalent to nonvested shares under the applicable accounting
guidance. We record stock-based compensation expense based on the fair value of stock awards at the grant date and recognize
the expense over the related service period following a graded vesting expense schedule. Expense for performance-based
RSUs is recognized when it is probable the performance goal will be achieved. Performance goals are determined by the
Board and may include measures such as earnings per share, comparable store sales, operating income, return on invested
capital, total shareholder return, and metrics focused on achievement of key components of the “Back to Starbucks” plan. The
fair value of RSUs is based on the closing price of Starbucks common stock on the award date, less the present value of the
dividends expected to be paid on the underlying shares during the vesting period. The fair value of each stock option granted
is estimated on the grant date using the Black-Scholes-Merton option valuation model. The assumptions used to calculate the
fair value of options granted are evaluated and revised, as necessary, to reflect market conditions and our historical experience.
If applicable, our total shareholder return relative to our peer group is incorporated into the underlying assumptions using a
Monte Carlo simulation valuation model to calculate grant date fair value. The related assumptions used in the Monte Carlo
simulation valuation model include expected term, volatility, dividend yield, and risk-free interest rate. Compensation expense
is recognized over the requisite service period for each separately vesting portion of the award, and only for those awards
expected to vest, with forfeitures estimated at the date of grant based on our historical experience and future expectations.
Foreign Currency Translation
Our international operations generally use their local currency as their functional currency. Assets and liabilities are translated
at exchange rates in effect at the balance sheet date. Income and expense accounts are translated at the average monthly
exchange rates during the year. Resulting translation adjustments are reported as a component of OCI and recorded in AOCI
on our consolidated balance sheets.
Income Taxes
We compute income taxes using the asset and liability method, under which deferred income taxes are recognized based on
the differences between the financial statement carrying amounts and the respective tax bases of our assets and liabilities.
Deferred tax assets and liabilities are measured using current enacted tax rates expected to apply to taxable income in the years
in which we expect the temporary differences to reverse. The effect of a change in tax rates on deferred taxes is recognized in
income in the period that includes the enactment date.
We routinely evaluate the likelihood of realizing the benefit of our deferred tax assets and may record a valuation allowance if,
based on all available evidence, we determine that some portion of the tax benefit will not be realized. In evaluating our ability
to recover our deferred tax assets within the jurisdictions from which they arise, we consider all available positive and negative
evidence, including scheduled reversals of deferred tax liabilities, projected future taxable income, tax-planning strategies, and
results of recent operations. If we determine that we would be able to realize our deferred tax assets in the future in excess of
their net recorded amount, we would make an adjustment to the deferred tax asset valuation allowance, which would reduce
the provision for income taxes.
In addition, our income tax returns are periodically audited by domestic and foreign tax authorities. These audits include
review of our tax filing positions, including the timing and amount of deductions taken and the allocation of income between
tax jurisdictions. We evaluate our exposures associated with our various tax filing positions and recognize a tax benefit from
an uncertain tax position only if it is more likely than not that the tax position will be sustained upon examination by the
relevant taxing authorities, including resolutions of any related appeals or litigation processes, based on the technical merits
of our position. The tax benefits recognized in the financial statements from such a position are measured based on the largest
benefit that has a greater than 50% likelihood of being realized upon ultimate settlement. For uncertain tax positions that do
not meet this threshold, we record a related liability. We adjust our unrecognized tax benefit liability and income tax expense
in the period in which the uncertain tax position is effectively settled, the statute of limitations expires for the relevant taxing
authority to examine the tax position, or when new information becomes available.
STARBUCKS CORPORATION
NOTES TO CONSOLIDATED FINANCIAL STATEMENTS
Fiscal Years ended September 28, 2025, September 29, 2024, and October 1, 2023
Note 1: Summary of Significant Accounting Policies and Estimates
(cont.)
60
Starbucks recognizes interest and penalties related to income tax matters in income tax expense on our consolidated statements
of earnings. Accrued interest and penalties are included within the related tax balances on our consolidated balance sheets.
Global intangible low-taxed income (“GILTI”) provisions are applied, providing an incremental tax on foreign income. We
have made a policy election to classify taxes due under the GILTI provision as a current period expense.
Earnings per Share
Basic earnings per share is computed based on the weighted average number of shares of common stock outstanding during
the period. Diluted earnings per share is computed based on the weighted average number of shares of common stock and the
effect of dilutive potential common shares outstanding during the period, calculated using the treasury stock method. Dilutive
potential common shares include outstanding stock options and RSUs. Performance-based RSUs are considered dilutive when
the related performance criterion has been met.
Common Stock Share Repurchases
We may repurchase shares of Starbucks common stock under a program authorized by our Board, including pursuant to a
contract, instruction, or written plan meeting the requirements of Rule 10b5-1(c)(1) of the Exchange Act. Under applicable
Washington State law, shares repurchased are retired and not displayed separately as treasury stock on the financial statements.
Instead, the par value of repurchased shares is deducted from common stock, and the excess repurchase price over par value is
deducted from additional paid-in capital and from retained earnings (deficit).
Recent Accounting Pronouncements
Recently Adopted Accounting Pronouncements
In the fourth quarter of fiscal 2025, we adopted the Financial Accounting Standards Board (“FASB”) issued guidance expanding
segment disclosure requirements. The amendments require enhanced disclosure for certain segment items and disclosure on
how our Chief Operating Decision Maker (“CODM”) uses reported measures to assess segment performance. The amendments
do not change how segments are determined, aggregated, or how thresholds are applied to determine reportable segments.
The adoption of this guidance did not have a significant impact on our consolidated financial statement disclosures. Refer to
Note 17, Segment Reporting, for our segment disclosures including enhancements as a result of the amendments.
Recent Accounting Pronouncements Not Yet Adopted
In December 2023, the FASB issued guidance expanding disclosure requirements related to income taxes. The amendments
require enhanced jurisdictional disclosures for the income tax rate reconciliation and related to cash income taxes paid.
Additionally, certain disclosures related to unrecognized tax benefits and indefinite reinvestment assertions were removed. The
amendments are effective for our fiscal year ending September 27, 2026. While we are still evaluating the specific impacts, we
anticipate this guidance will have a significant impact on our annual income tax disclosures.
In November 2024, the FASB issued guidance expanding disclosure requirements related to certain income statement
expenses. The amendments require tabular disclosure of certain operating expenses disaggregated into categories, such
as purchases of inventory, employee compensation, depreciation, and intangible asset amortization. The amendments are
effective for our fiscal year ending October 1, 2028, and may be applied retrospectively. While we are still evaluating the
specific impacts and adoption method, we anticipate this guidance will have a significant impact on our consolidated financial
statement disclosures.
In July 2025, the FASB issued guidance providing a practical expedient for measuring expected credit losses on current
accounts receivable and current contract assets arising from revenue transactions. The amendment is effective for our fiscal
year ended October 3, 2027. While we are still evaluating the specific impacts, we anticipate the impact to be limited to the
simplification of the estimation process, with no material impact on the allowance for credit losses.
61
STARBUCKS CORPORATION
NOTES TO CONSOLIDATED FINANCIAL STATEMENTS
Fiscal Years ended September 28, 2025, September 29, 2024, and October 1, 2023
Note 2: Acquisitions and Divestitures
Fiscal 2025
On October 14, 2024, we acquired a 100% ownership interest in 23.5 Degrees Topco Limited, a U.K. licensed business partner,
to expand our portfolio of company-operated stores and enhance the coffeehouse experience for customers. The acquisition
converted 113 licensed stores to company-operated stores within our International operating segment.
The assets acquired and liabilities assumed are included in our International operating segment. Assets acquired primarily
include operating lease right-of-use assets, intangible assets, goodwill, and property, plant and equipment. The intangible
assets acquired as part of this transaction include reacquired licensee agreement rights, which will be amortized over the
estimated useful life. In addition, we assumed various liabilities, primarily consisting of operating lease liabilities. The
transaction is not material to our consolidated financial statements.
Fiscal 2023
On January 13, 2023, we sold the assets, primarily consisting of intellectual properties associated with the Seattle’s Best
Coffee brand, to Nestlé for $110.0 million. The transaction resulted in a pre-tax gain of $91.3 million, which was included
in gain from sale of assets on our consolidated statement of earnings for the fiscal year ended October 1, 2023. Results from
Seattle’s Best Coffee operations prior to the sale are reported in our Channel Development operating segment.
Note 3: Derivative Financial Instruments
Interest Rates
From time to time, we enter into designated cash flow hedges to manage the variability in cash flows due to changes in
benchmark interest rates. We enter into interest rate swap agreements, including forward-starting interest rate swaps and treasury
locks, settled in cash based upon the difference between an agreed-upon benchmark rate and the prevailing benchmark rate at
settlement. These agreements are generally settled around the time of the pricing of the related debt. Each derivative agreement’s
gain or loss is recorded in AOCI and is subsequently reclassified to interest expense over the life of the related debt.
To hedge the exposure to changes in the fair value of our fixed-rate debt, we enter into interest rate swap agreements, which
are designated as fair value hedges. The changes in fair values of these derivative instruments and the offsetting changes in fair
values of the underlying hedged debt due to changes in the relevant benchmark interest rates are recorded in interest expense.
Refer to Note 9, Debt, for additional information on our long-term debt.
Foreign Currency
To reduce cash flow volatility from foreign currency fluctuations, we enter into forward and swap contracts to hedge portions
of cash flows of anticipated royalty revenue, inventory purchases, and intercompany borrowing and lending activities. The
resulting gains and losses from these derivatives are recorded in AOCI and subsequently reclassified to revenue, product and
distribution costs, or interest income and other, net, respectively, when the hedged exposures affect net earnings.
From time to time, we may enter into financial instruments, including, but not limited to, forward and swap contracts or
foreign currency-denominated debt, to hedge the currency exposure of our net investments in certain international operations.
The resulting gains and losses from these derivatives are recorded in AOCI and are subsequently reclassified to net earnings
when the hedged net investment is either sold or substantially liquidated. Gains and losses from these derivatives, representing
hedged components excluded from the assessment of effectiveness, are amortized over the life of the hedging instrument using
a systematic and rational method and recognized in interest expense.
Foreign currency forward and swap contracts not designated as hedging instruments are used to mitigate the foreign exchange
risk of certain other balance sheet items. Gains and losses from these derivatives are largely offset by the financial impact of
translating foreign currency-denominated payables and receivables, and these gains and losses are recorded in interest income
and other, net.
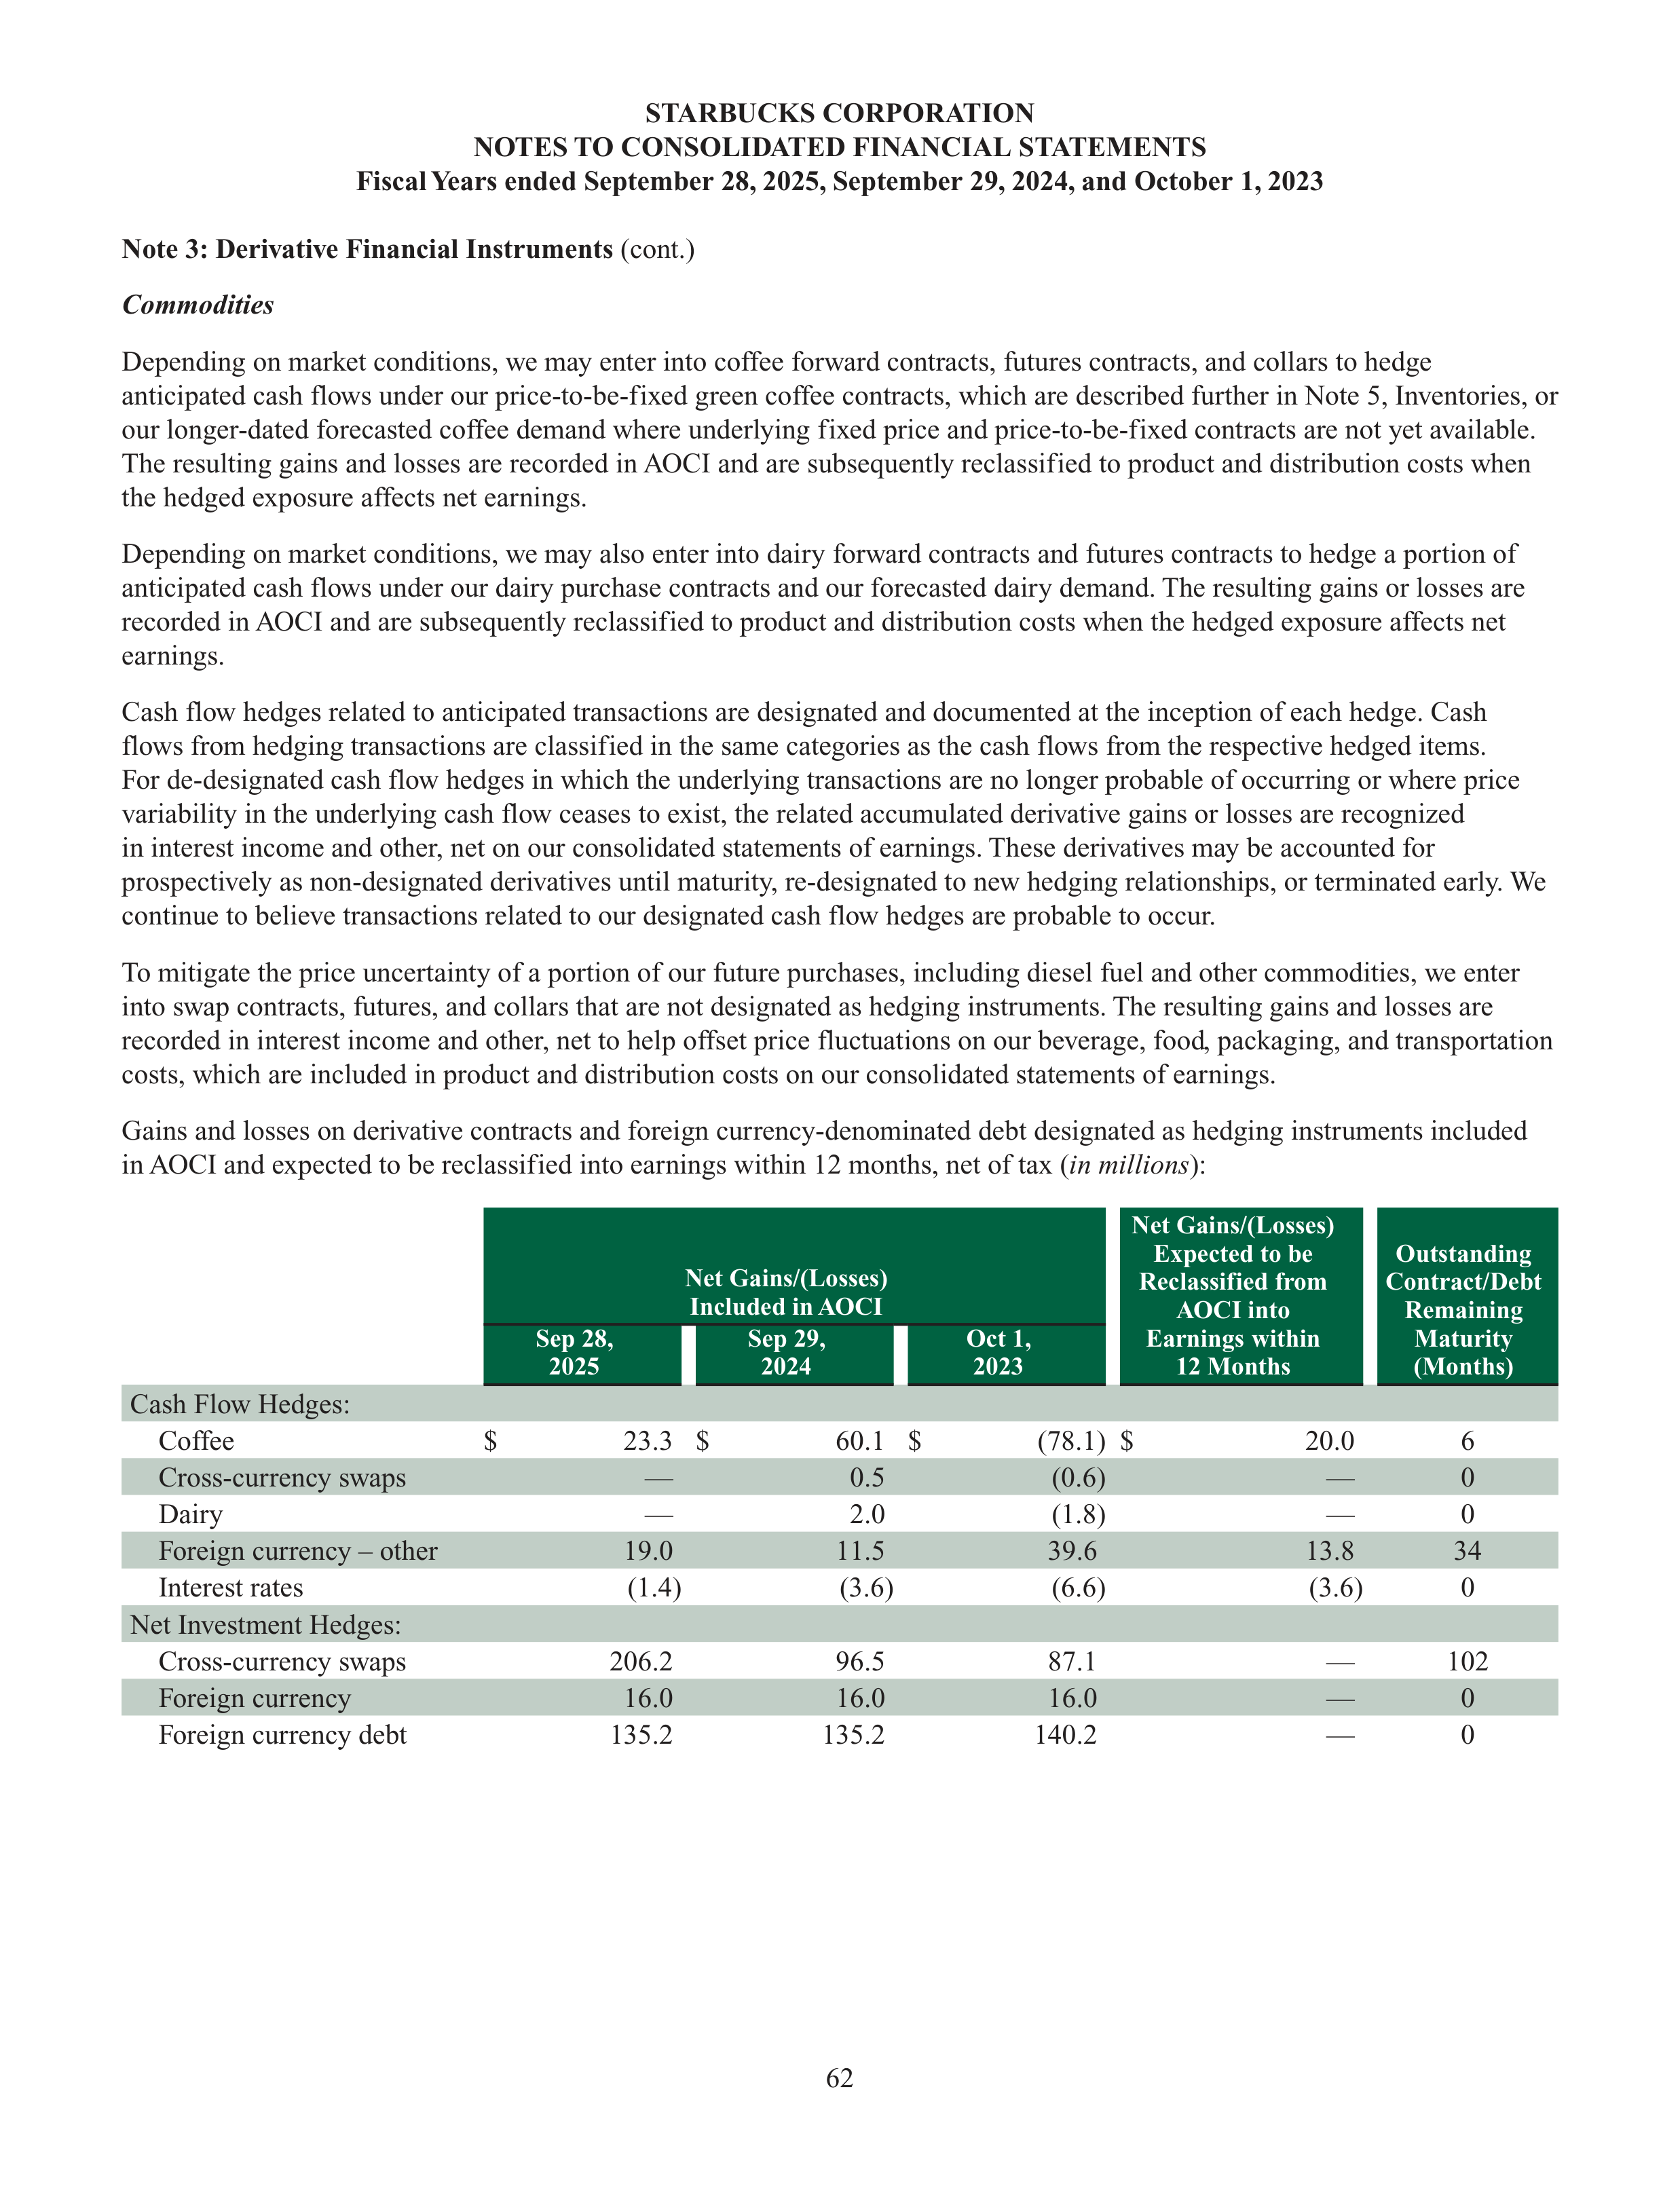
62
STARBUCKS CORPORATION
NOTES TO CONSOLIDATED FINANCIAL STATEMENTS
Fiscal Years ended September 28, 2025, September 29, 2024, and October 1, 2023
Note 3: Derivative Financial Instruments
(cont.)
Commodities
Depending on market conditions, we may enter into coffee forward contracts, futures contracts, and collars to hedge
anticipated cash flows
under our price-to-be-fixed green coffee contracts, which are described further in Note 5, Inventories, or
our longer-dated forecasted coffee demand where underlying fixed price and price-to-be-fixed contracts are not yet available.
The resulting gains and losses are recorded in AOCI and are subsequently reclassified to product and distribution costs when
the hedged exposure affects net earnings.
Depending on market conditions, we may also enter into dairy forward contracts and futures contracts to hedge a portion of
anticipated cash flows under our dairy purchase contracts and our forecasted dairy demand. The resulting gains or losses are
recorded in AOCI and are subsequently reclassified to product and distribution costs when the hedged exposure affects net
earnings.
Cash flow hedges related to anticipated transactions are designated and documented at the inception of each hedge. Cash
flows from hedging transactions are classified in the same categories as the cash flows from the respective hedged items.
For de-designated cash flow hedges in which the underlying transactions are no longer probable of occurring or where price
variability in the underlying cash flow ceases to exist, the related accumulated derivative gains or losses are recognized
in interest income and other, net on our consolidated statements of earnings. These derivatives may be accounted for
prospectively as non-designated derivatives until maturity, re-designated to new hedging relationships, or terminated early. We
continue to believe transactions related to our designated cash flow hedges are probable to occur.
To mitigate the price uncertainty of a portion of our future purchases, including diesel fuel and other commodities, we enter
into swap contracts, futures, and collars that are not designated as hedging instruments. The resulting gains and losses are
recorded in interest income and other, net to help offset price fluctuations on our beverage, food, packaging, and transportation
costs, which are included in product and distribution costs on our consolidated statements of earnings.
Gains and losses on derivative contracts and foreign currency-denominated debt designated as hedging instruments included
in AOCI and expected to be reclassified into earnings within 12 months, net of tax (
in millions
):
Net Gains/(Losses)
Included in AOCI
Net Gains/(Losses)
Expected to be
Reclassified from
AOCI into
Earnings within
12 Months
Outstanding
Contract/Debt
Remaining
Maturity
(Months)
Sep 28,
2025
Sep 29,
2024
Oct 1,
2023
Cash Flow Hedges:
Coffee
$
23.3 $
60.1 $
(78.1)
$
20.0
6
Cross-currency swaps
—
0.5
(0.6)
—
0
Dairy
—
2.0
(1.8)
—
0
Foreign currency – other
19.0
11.5
39.6
13.8
34
Interest rates
(1.4)
(3.6)
(6.6)
(3.6)
0
Net Investment Hedges:
Cross-currency swaps
206.2
96.5
87.1
—
102
Foreign currency
16.0
16.0
16.0
—
0
Foreign currency debt
135.2
135.2
140.2
—
0
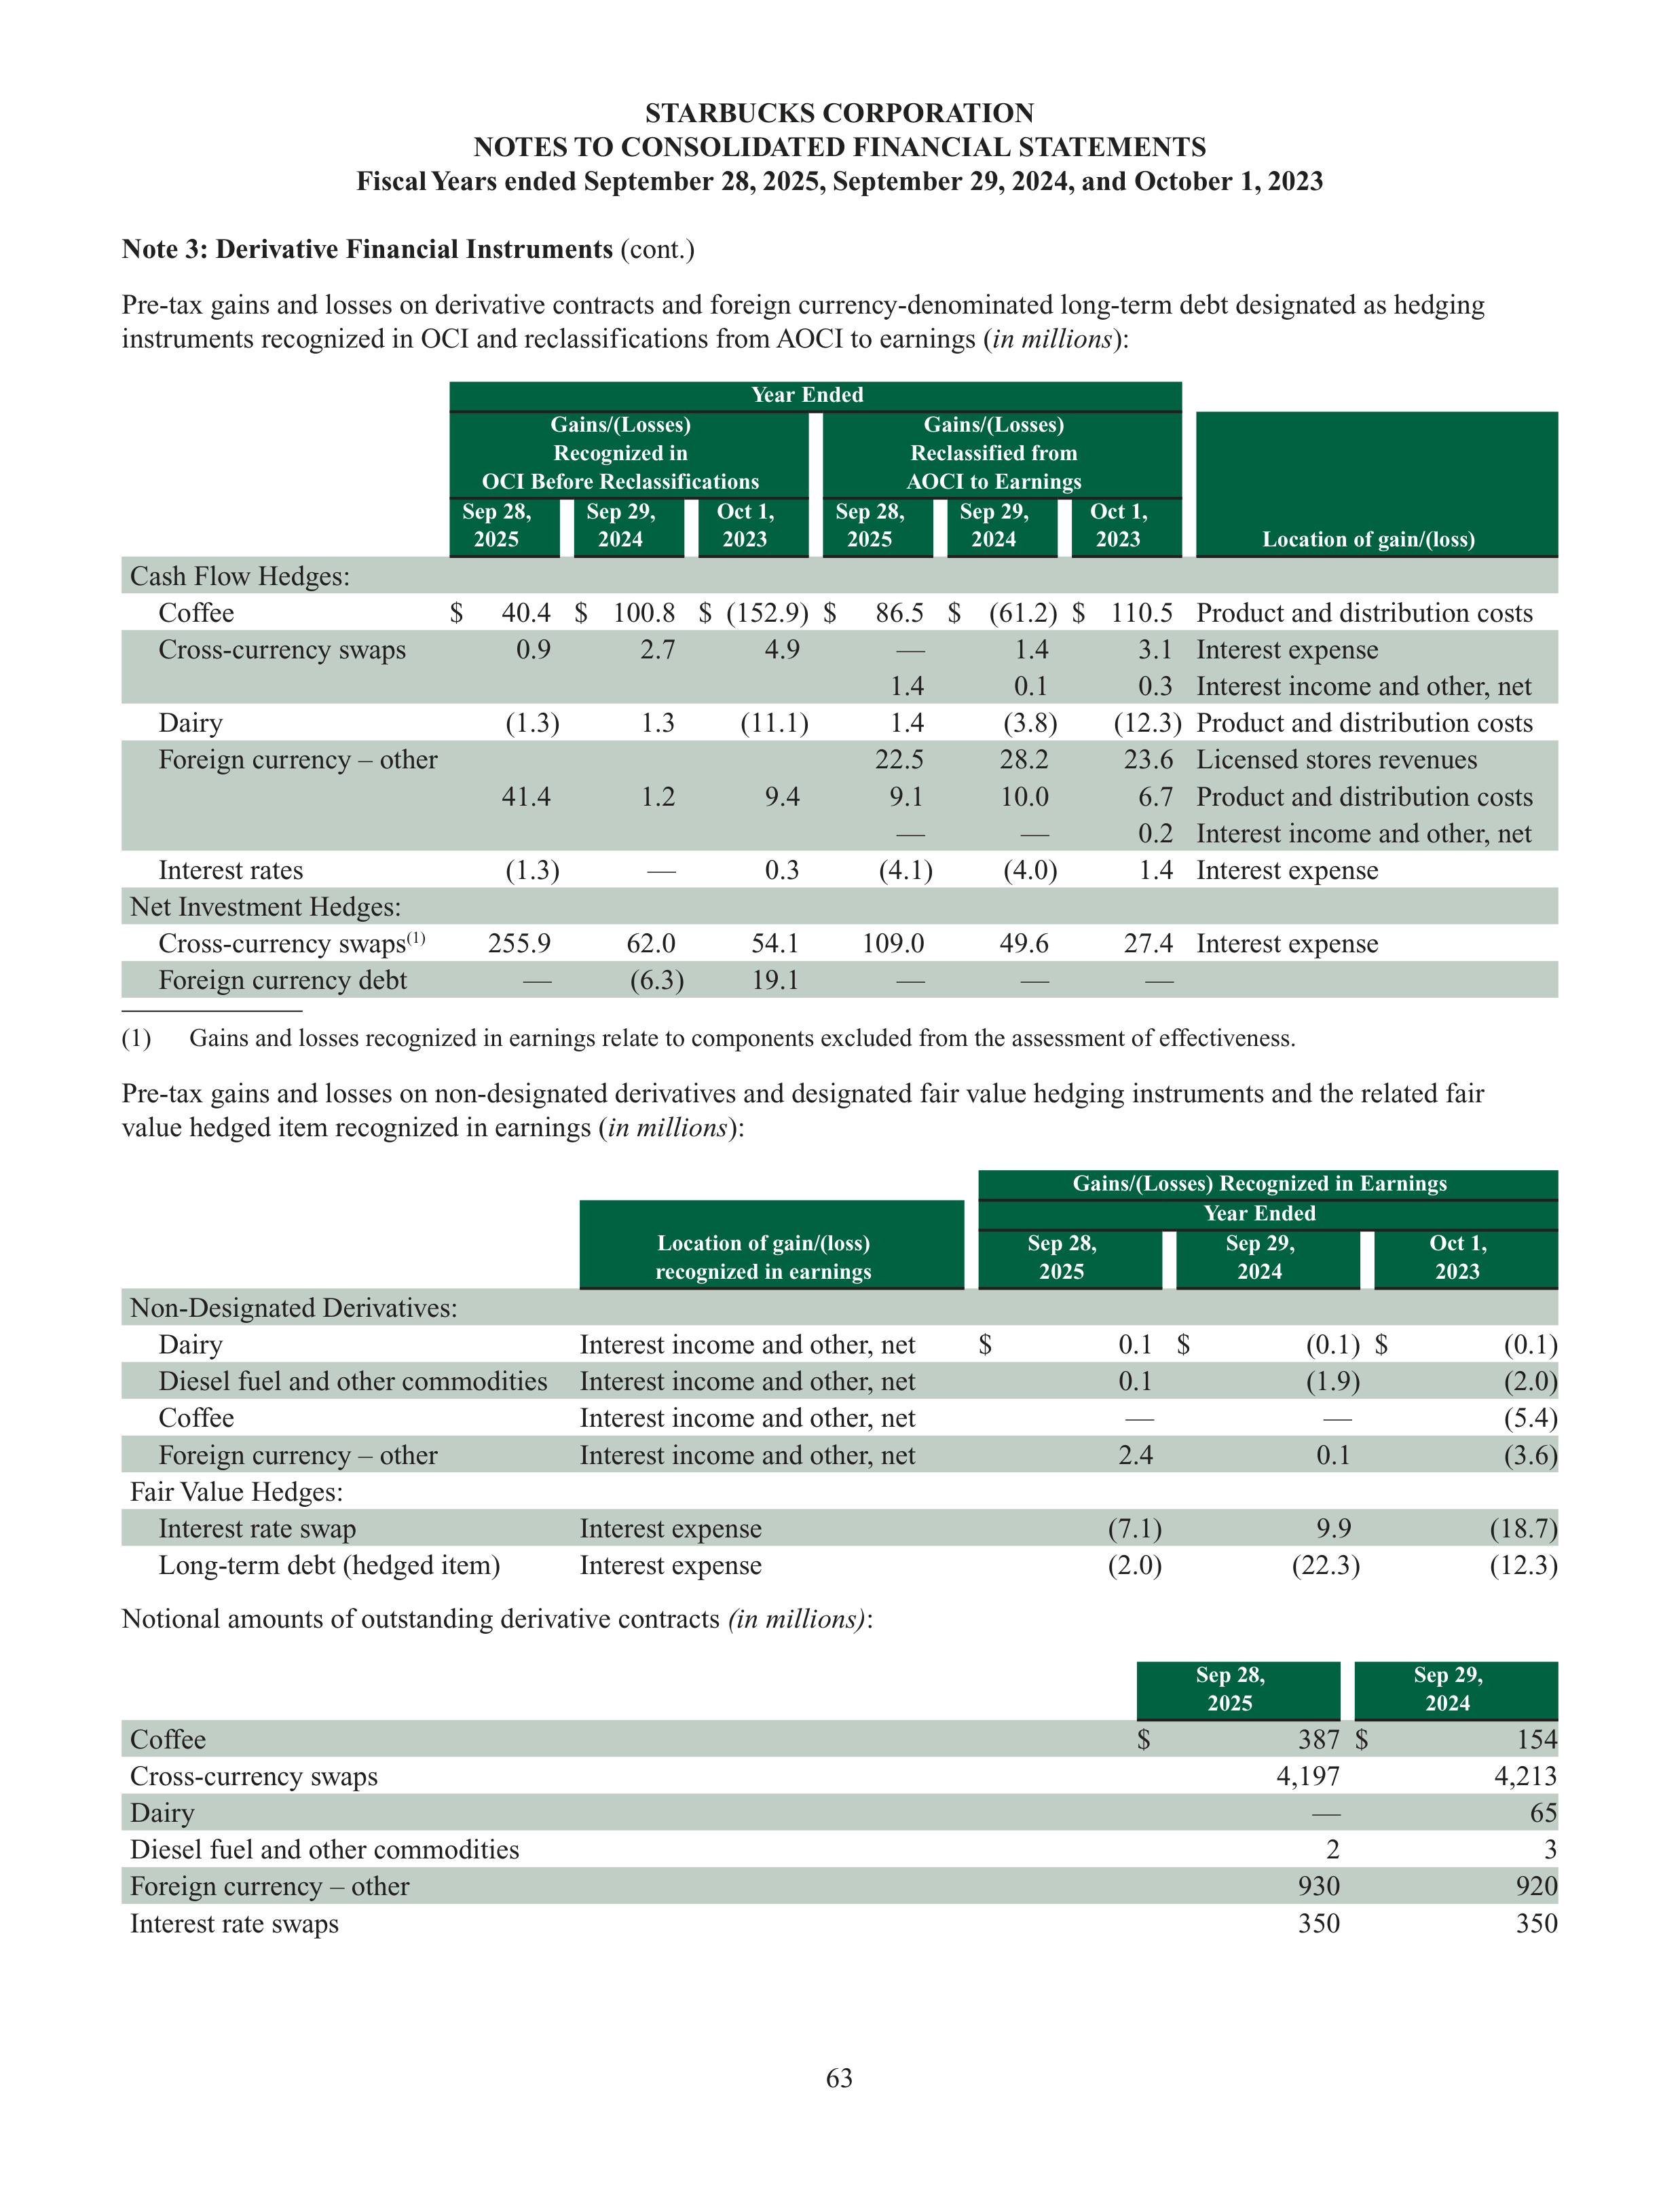
63
STARBUCKS CORPORATION
NOTES TO CONSOLIDATED FINANCIAL STATEMENTS
Fiscal Years ended September 28, 2025, September 29, 2024, and October 1, 2023
Note 3: Derivative Financial Instruments
(cont.)
Pre-tax gains and losses on derivative contracts and foreign currency-denominated long-term debt designated as hedging
instruments recognized in OCI and reclassifications from AOCI to earnings (
in millions
):
Year Ended
Gains/(Losses)
Recognized in
OCI Before Reclassifications
Gains/(Losses)
Reclassified from
AOCI to Earnings
Location of gain/(loss)
Sep 28,
2025
Sep 29,
2024
Oct 1,
2023
Sep 28,
2025
Sep 29,
2024
Oct 1,
2023
Cash Flow Hedges:
Coffee
$
40.4
$
100.8
$ (152.9)
$
86.5 $
(61.2)
$
110.5 Product and distribution costs
Cross-currency swaps
0.9
2.7
4.9
—
1.4
3.1
Interest expense
1.4
0.1
0.3
Interest income and other, net
Dairy
(1.3)
1.3
(11.1)
1.4
(3.8)
(12.3) Product and distribution costs
Foreign currency – other
22.5
28.2
23.6
Licensed stores revenues
41.4
1.2
9.4
9.1
10.0
6.7
Product and distribution costs
—
—
0.2
Interest income and other, net
Interest rates
(1.3)
—
0.3
(4.1)
(4.0)
1.4
Interest expense
Net Investment Hedges:
Cross-currency swaps
(1)
255.9
62.0
54.1
109.0
49.6
27.4
Interest expense
Foreign currency debt
—
(6.3)
19.1
—
—
—
(1)
Gains and losses recognized in earnings relate to components excluded from the assessment of effectiveness.
Pre-tax gains and losses on non-designated derivatives and designated fair value hedging instruments and the related fair
value hedged item recognized in earnings (
in millions
):
Gains/(Losses) Recognized in Earnings
Year Ended
Location of gain/(loss)
recognized in earnings
Sep 28,
2025
Sep 29,
2024
Oct 1,
2023
Non-Designated Derivatives:
Dairy
Interest income and other, net
$
0.1
$
(0.1)
$
(0.1)
Diesel fuel and other commodities
Interest income and other, net
0.1
(1.9)
(2.0)
Coffee
Interest income and other, net
—
—
(5.4)
Foreign currency – other
Interest income and other, net
2.4
0.1
(3.6)
Fair Value Hedges:
Interest rate swap
Interest expense
(7.1)
9.9
(18.7)
Long-term debt (hedged item)
Interest expense
(2.0)
(22.3)
(12.3)
Notional amounts of outstanding derivative contracts
(in millions)
:
Sep 28,
2025
Sep 29,
2024
Coffee
$
387
$
154
Cross-currency swaps
4,197
4,213
Dairy
—
65
Diesel fuel and other commodities
2
3
Foreign currency – other
930
920
Interest rate swaps
350
350
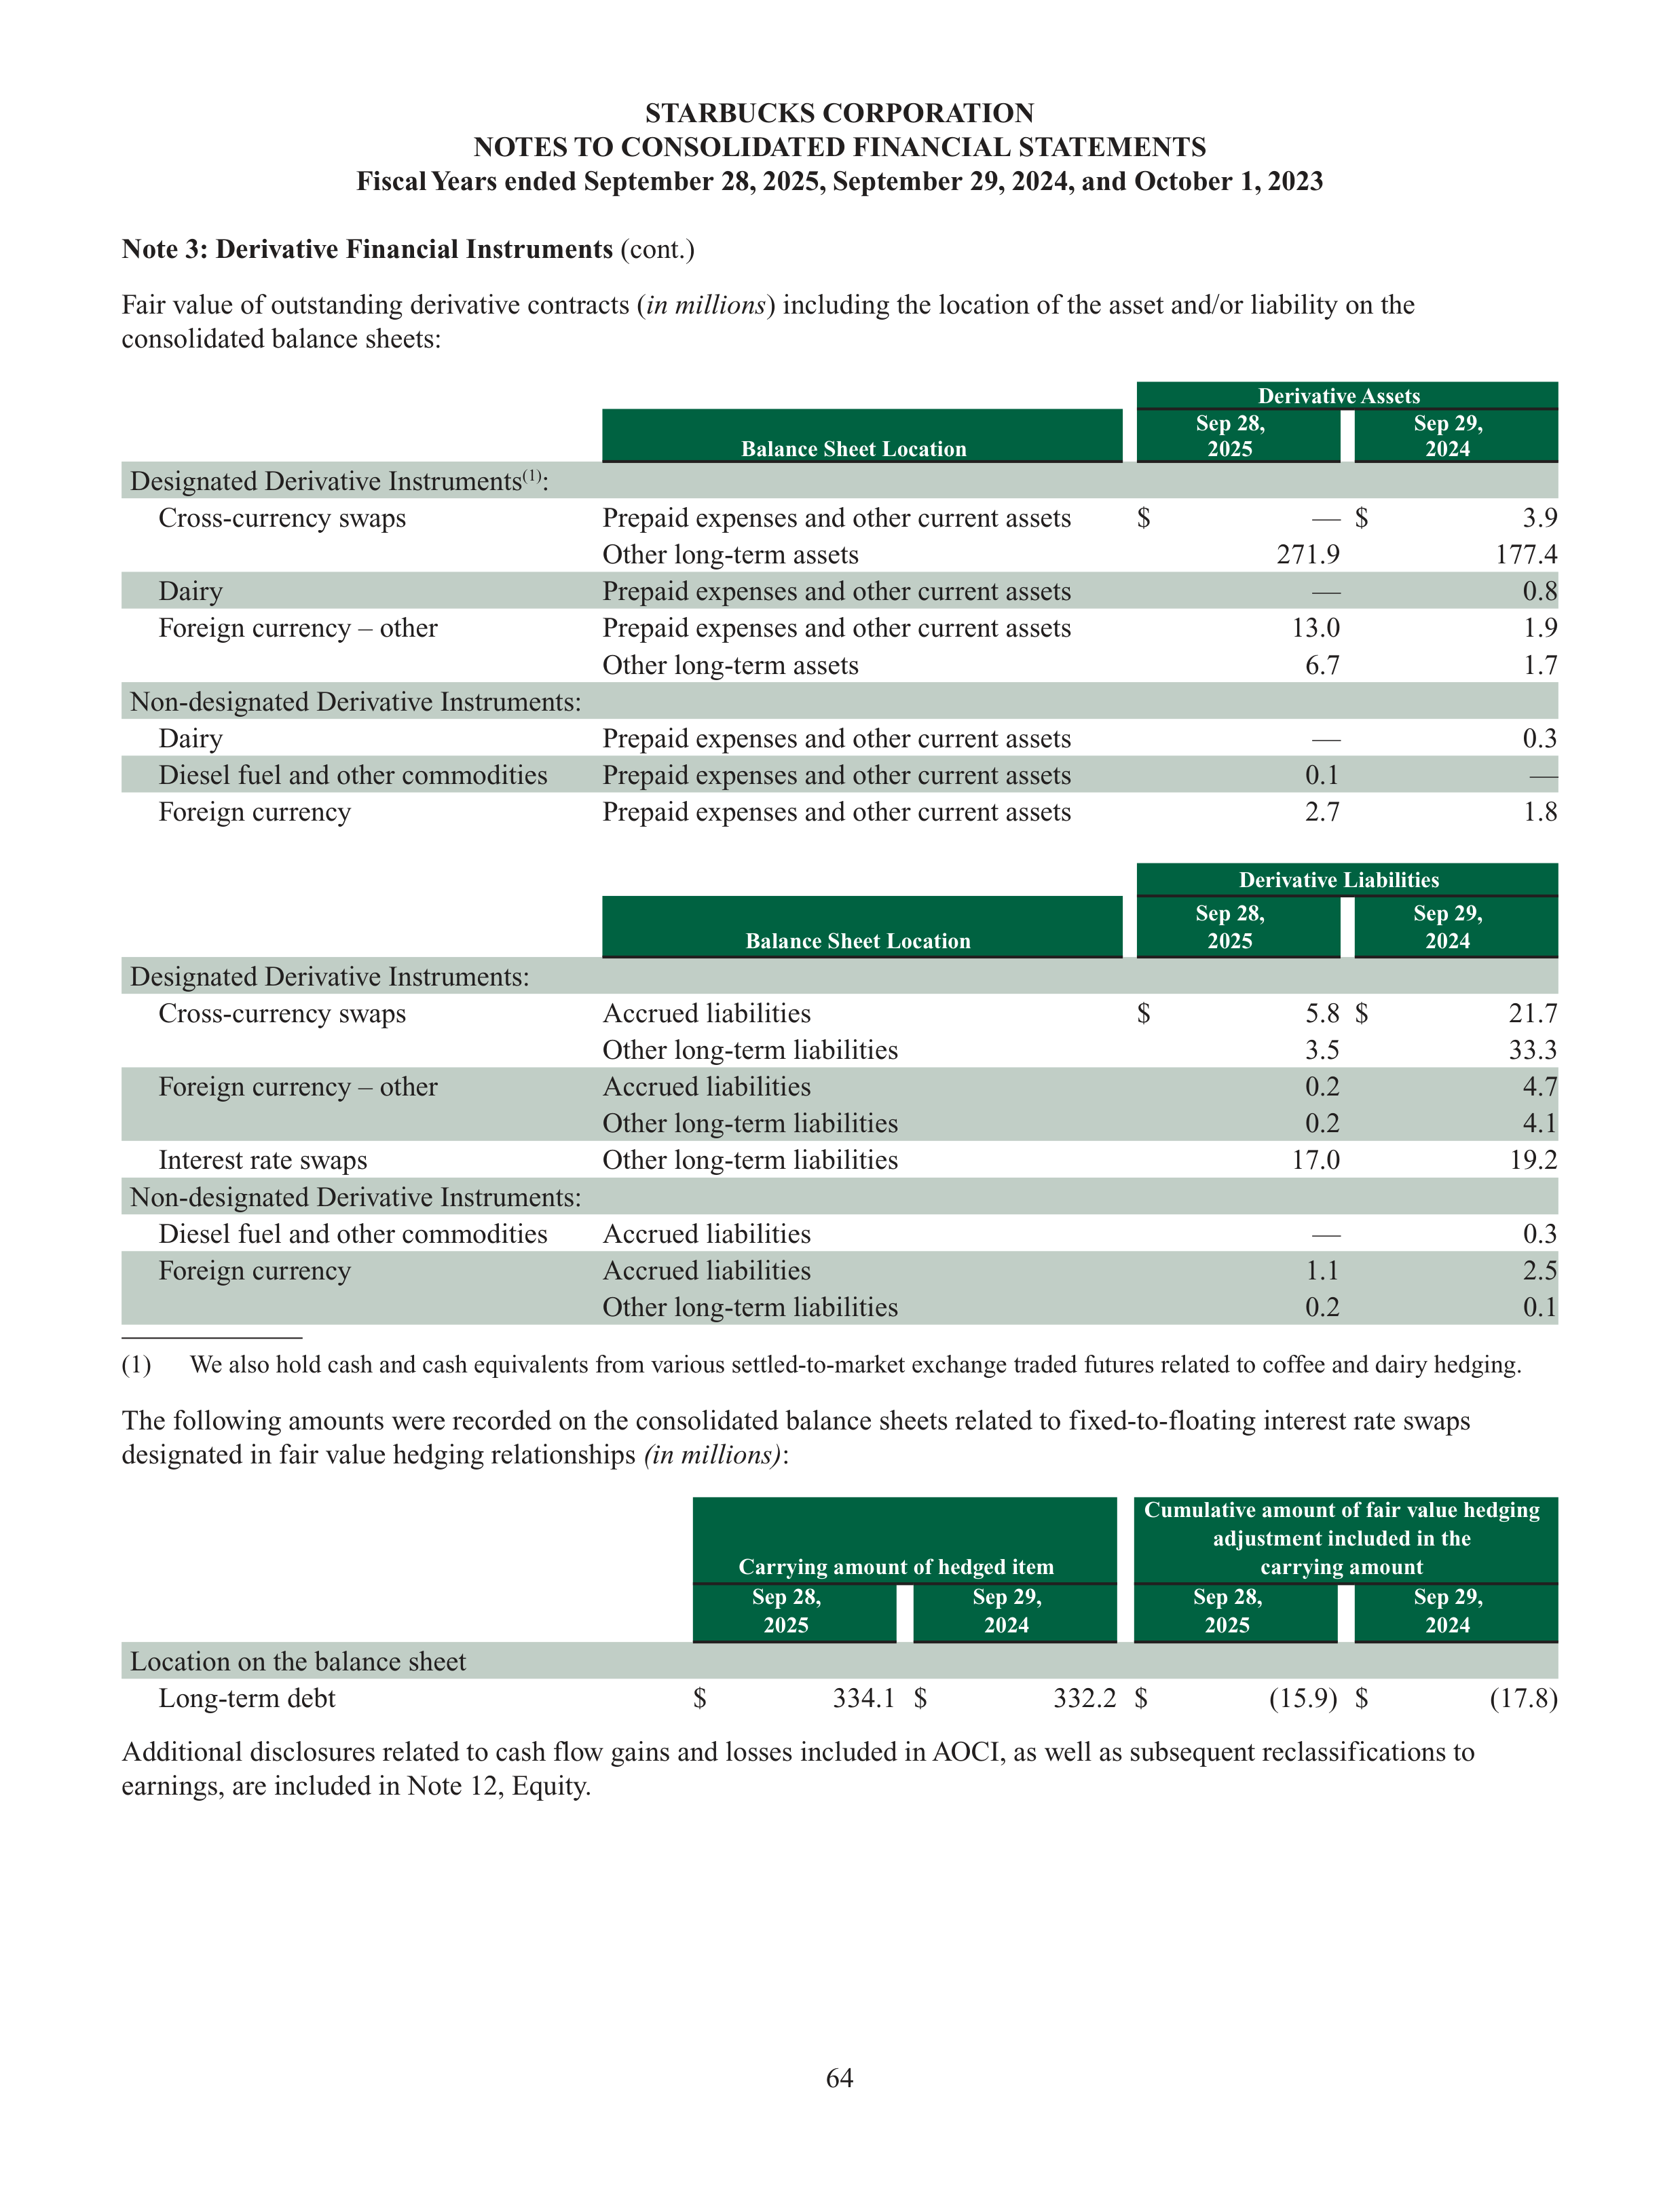
64
STARBUCKS CORPORATION
NOTES TO CONSOLIDATED FINANCIAL STATEMENTS
Fiscal Years ended September 28, 2025, September 29, 2024, and October 1, 2023
Note 3: Derivative Financial Instruments
(cont.)
Fair value of outstanding derivative contracts (
in millions
) including the location of the asset and/or liability on the
consolidated balance sheets:
Derivative Assets
Balance Sheet Location
Sep 28,
2025
Sep 29,
2024
Designated Derivative Instruments
(1)
:
Cross-currency swaps
Prepaid expenses and other current assets
$
—
$
3.9
Other long-term assets
271.9
177.4
Dairy
Prepaid expenses and other current assets
—
0.8
Foreign currency – other
Prepaid expenses and other current assets
13.0
1.9
Other long-term assets
6.7
1.7
Non-designated Derivative Instruments:
Dairy
Prepaid expenses and other current assets
—
0.3
Diesel fuel and other commodities
Prepaid expenses and other current assets
0.1
—
Foreign currency
Prepaid expenses and other current assets
2.7
1.8
Derivative Liabilities
Balance Sheet Location
Sep 28,
2025
Sep 29,
2024
Designated Derivative Instruments:
Cross-currency swaps
Accrued liabilities
$
5.8
$
21.7
Other long-term liabilities
3.5
33.3
Foreign currency – other
Accrued liabilities
0.2
4.7
Other long-term liabilities
0.2
4.1
Interest rate swaps
Other long-term liabilities
17.0
19.2
Non-designated Derivative Instruments:
Diesel fuel and other commodities
Accrued liabilities
—
0.3
Foreign currency
Accrued liabilities
1.1
2.5
Other long-term liabilities
0.2
0.1
(1)
We also hold cash and cash equivalents from various settled-to-market exchange traded futures related to coffee and dairy hedging.
The following amounts were recorded on the consolidated balance sheets related to fixed-to-floating interest rate swaps
designated in fair value hedging relationships
(in millions)
:
Carrying amount of hedged item
Cumulative amount of fair value hedging
adjustment included in the
carrying amount
Sep 28,
2025
Sep 29,
2024
Sep 28,
2025
Sep 29,
2024
Location on the balance sheet
Long-term debt
$
334.1
$
332.2
$
(15.9)
$
(17.8)
Additional disclosures related to cash flow gains and losses included in AOCI, as well as subsequent reclassifications to
earnings, are included in Note 12, Equity.
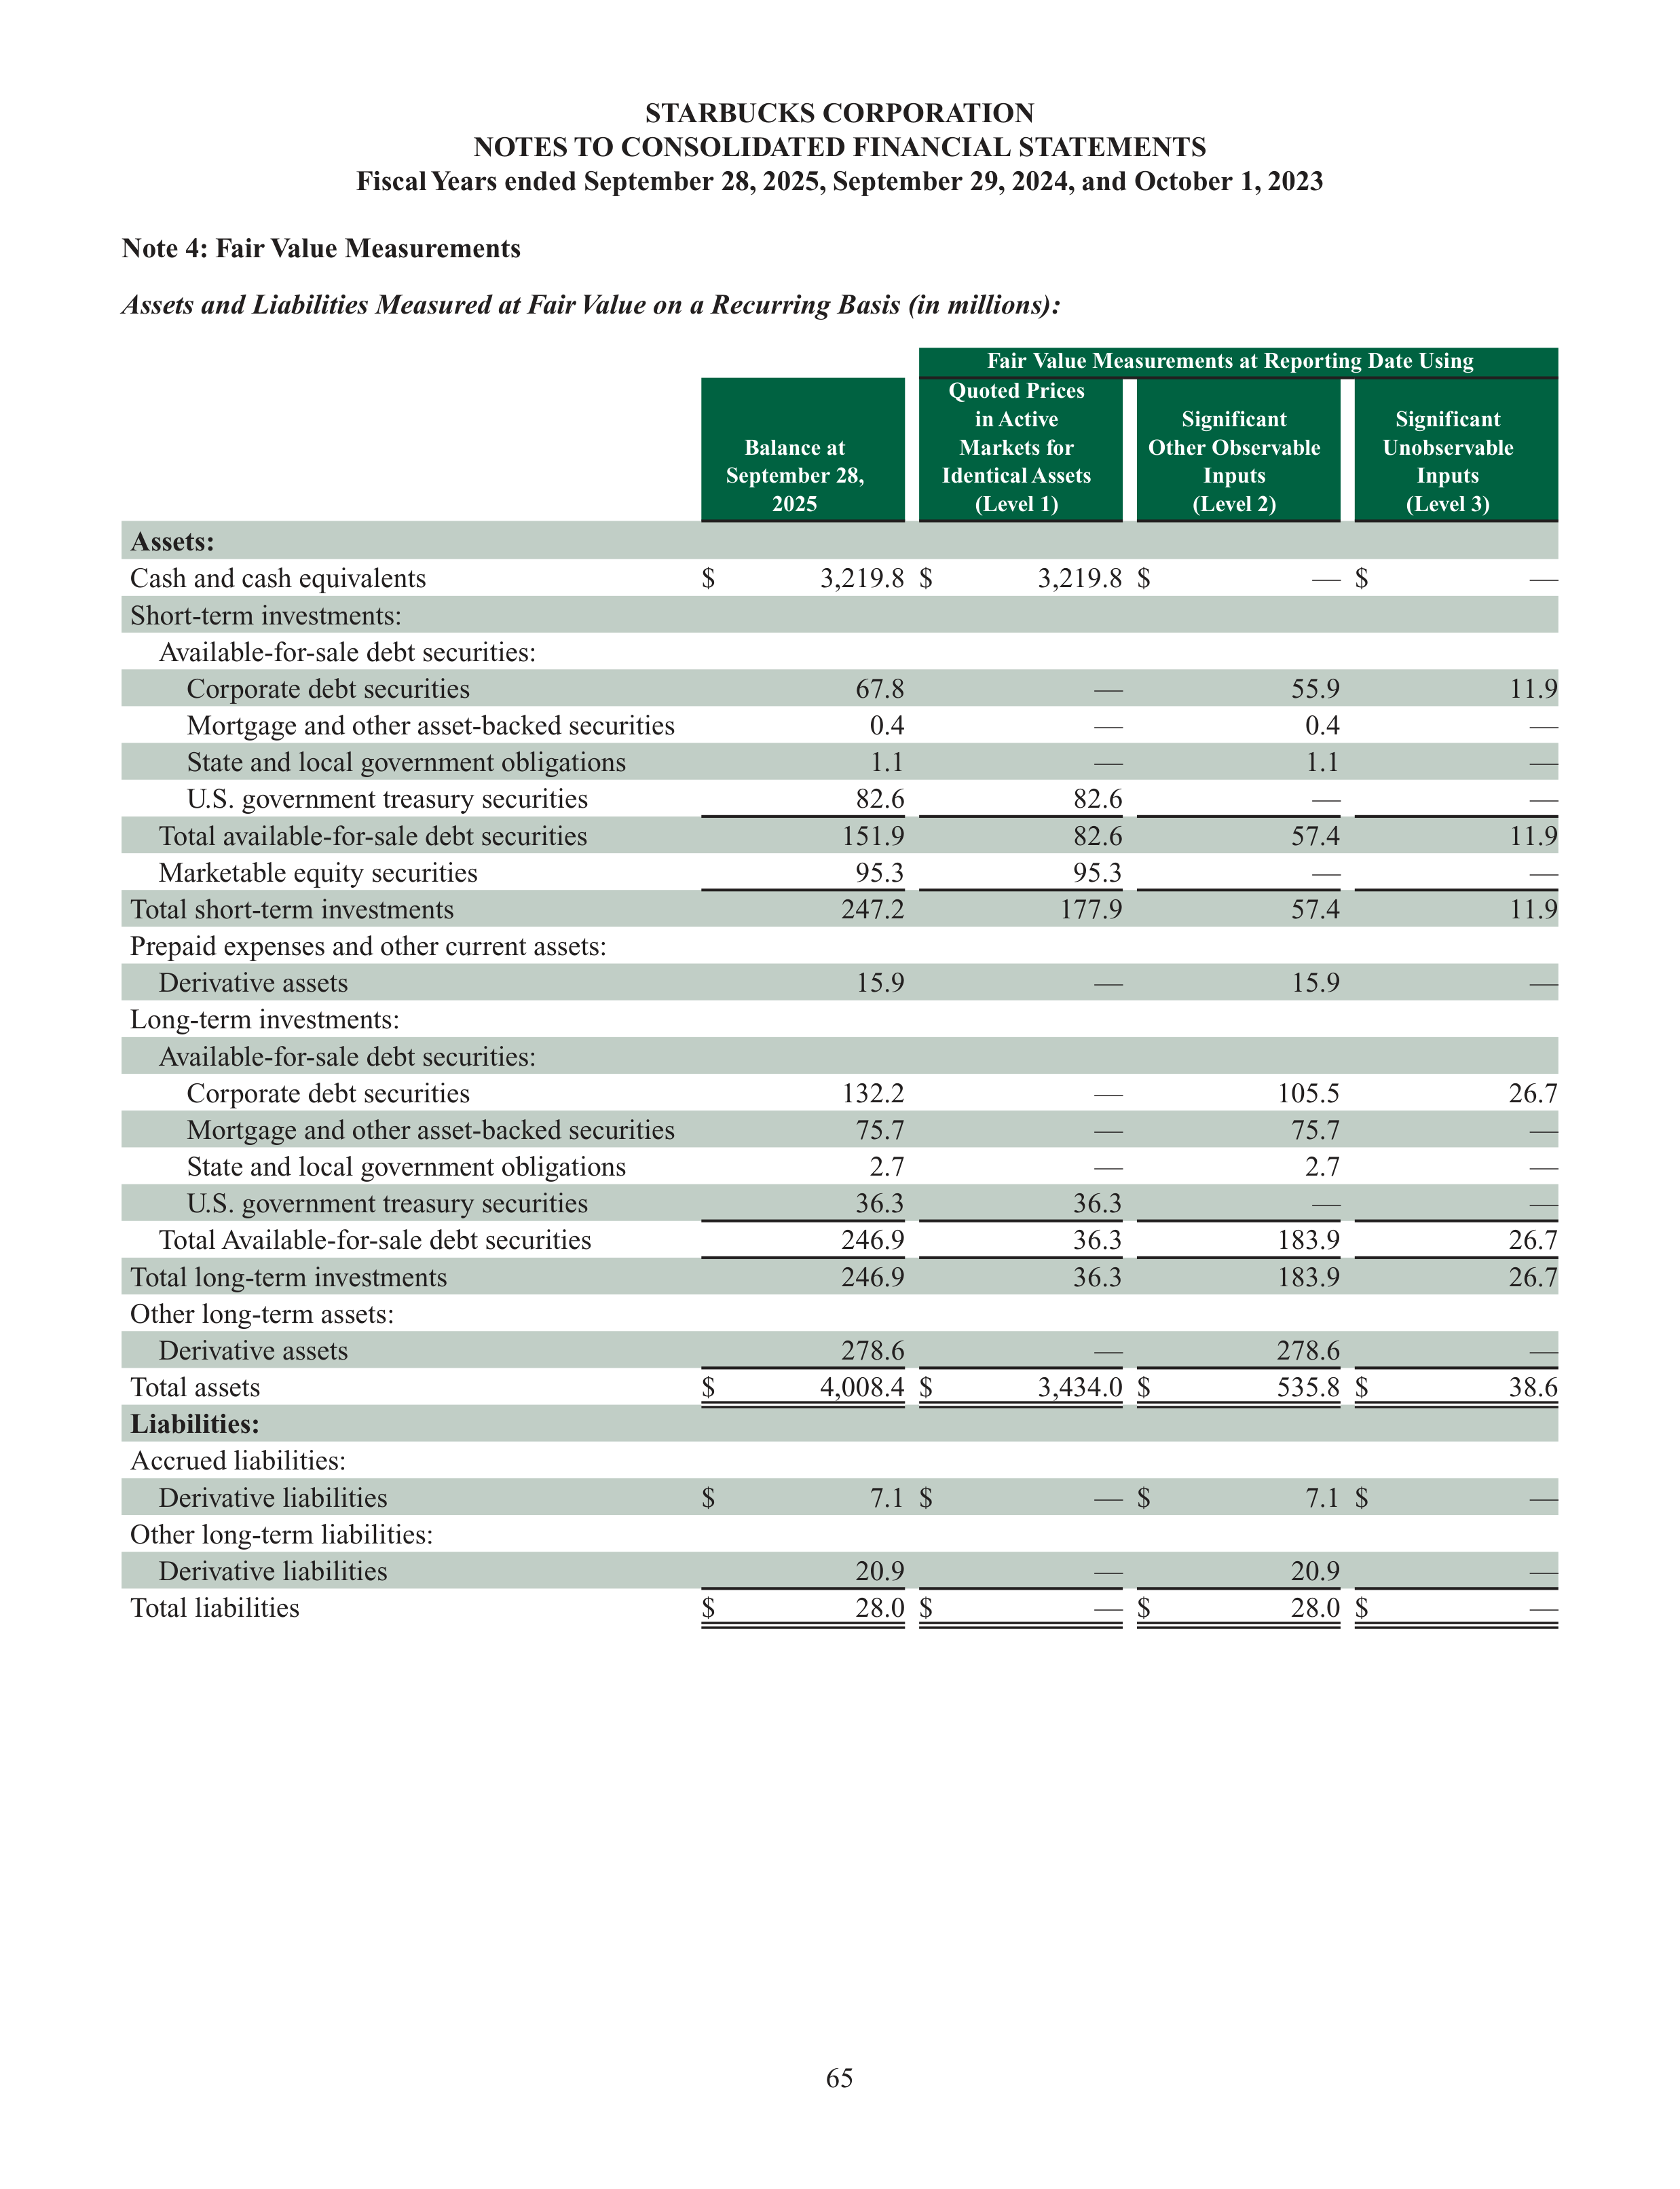
65
STARBUCKS CORPORATION
NOTES TO CONSOLIDATED FINANCIAL STATEMENTS
Fiscal Years ended September 28, 2025, September 29, 2024, and October 1, 2023
Note 4: Fair Value Measurements
Assets and Liabilities Measured at Fair Value on a Recurring Basis (in millions):
Fair Value Measurements at Reporting Date Using
Balance at
September 28,
2025
Quoted Prices
in Active
Markets for
Identical Assets
(Level 1)
Significant
Other Observable
Inputs
(Level 2)
Significant
Unobservable
Inputs
(Level 3)
Assets:
Cash and cash equivalents
$
3,219.8
$
3,219.8
$
—
$
—
Short-term investments:
Available-for-sale debt securities:
Corporate debt securities
67.8
—
55.9
11.9
Mortgage and other asset-backed securities
0.4
—
0.4
—
State and local government obligations
1.1
—
1.1
—
U.S. government treasury securities
82.6
82.6
—
—
Total available-for-sale debt securities
151.9
82.6
57.4
11.9
Marketable equity securities
95.3
95.3
—
—
Total short-term investments
247.2
177.9
57.4
11.9
Prepaid expenses and other current assets:
Derivative assets
15.9
—
15.9
—
Long-term investments:
Available-for-sale debt securities:
Corporate debt securities
132.2
—
105.5
26.7
Mortgage and other asset-backed securities
75.7
—
75.7
—
State and local government obligations
2.7
—
2.7
—
U.S. government treasury securities
36.3
36.3
—
—
Total Available-for-sale debt securities
246.9
36.3
183.9
26.7
Total long-term investments
246.9
36.3
183.9
26.7
Other long-term assets:
Derivative assets
278.6
—
278.6
—
Total assets
$
4,008.4
$
3,434.0
$
535.8
$
38.6
Liabilities:
Accrued liabilities:
Derivative liabilities
$
7.1
$
—
$
7.1
$
—
Other long-term liabilities:
Derivative liabilities
20.9
—
20.9
—
Total liabilities
$
28.0
$
—
$
28.0
$
—
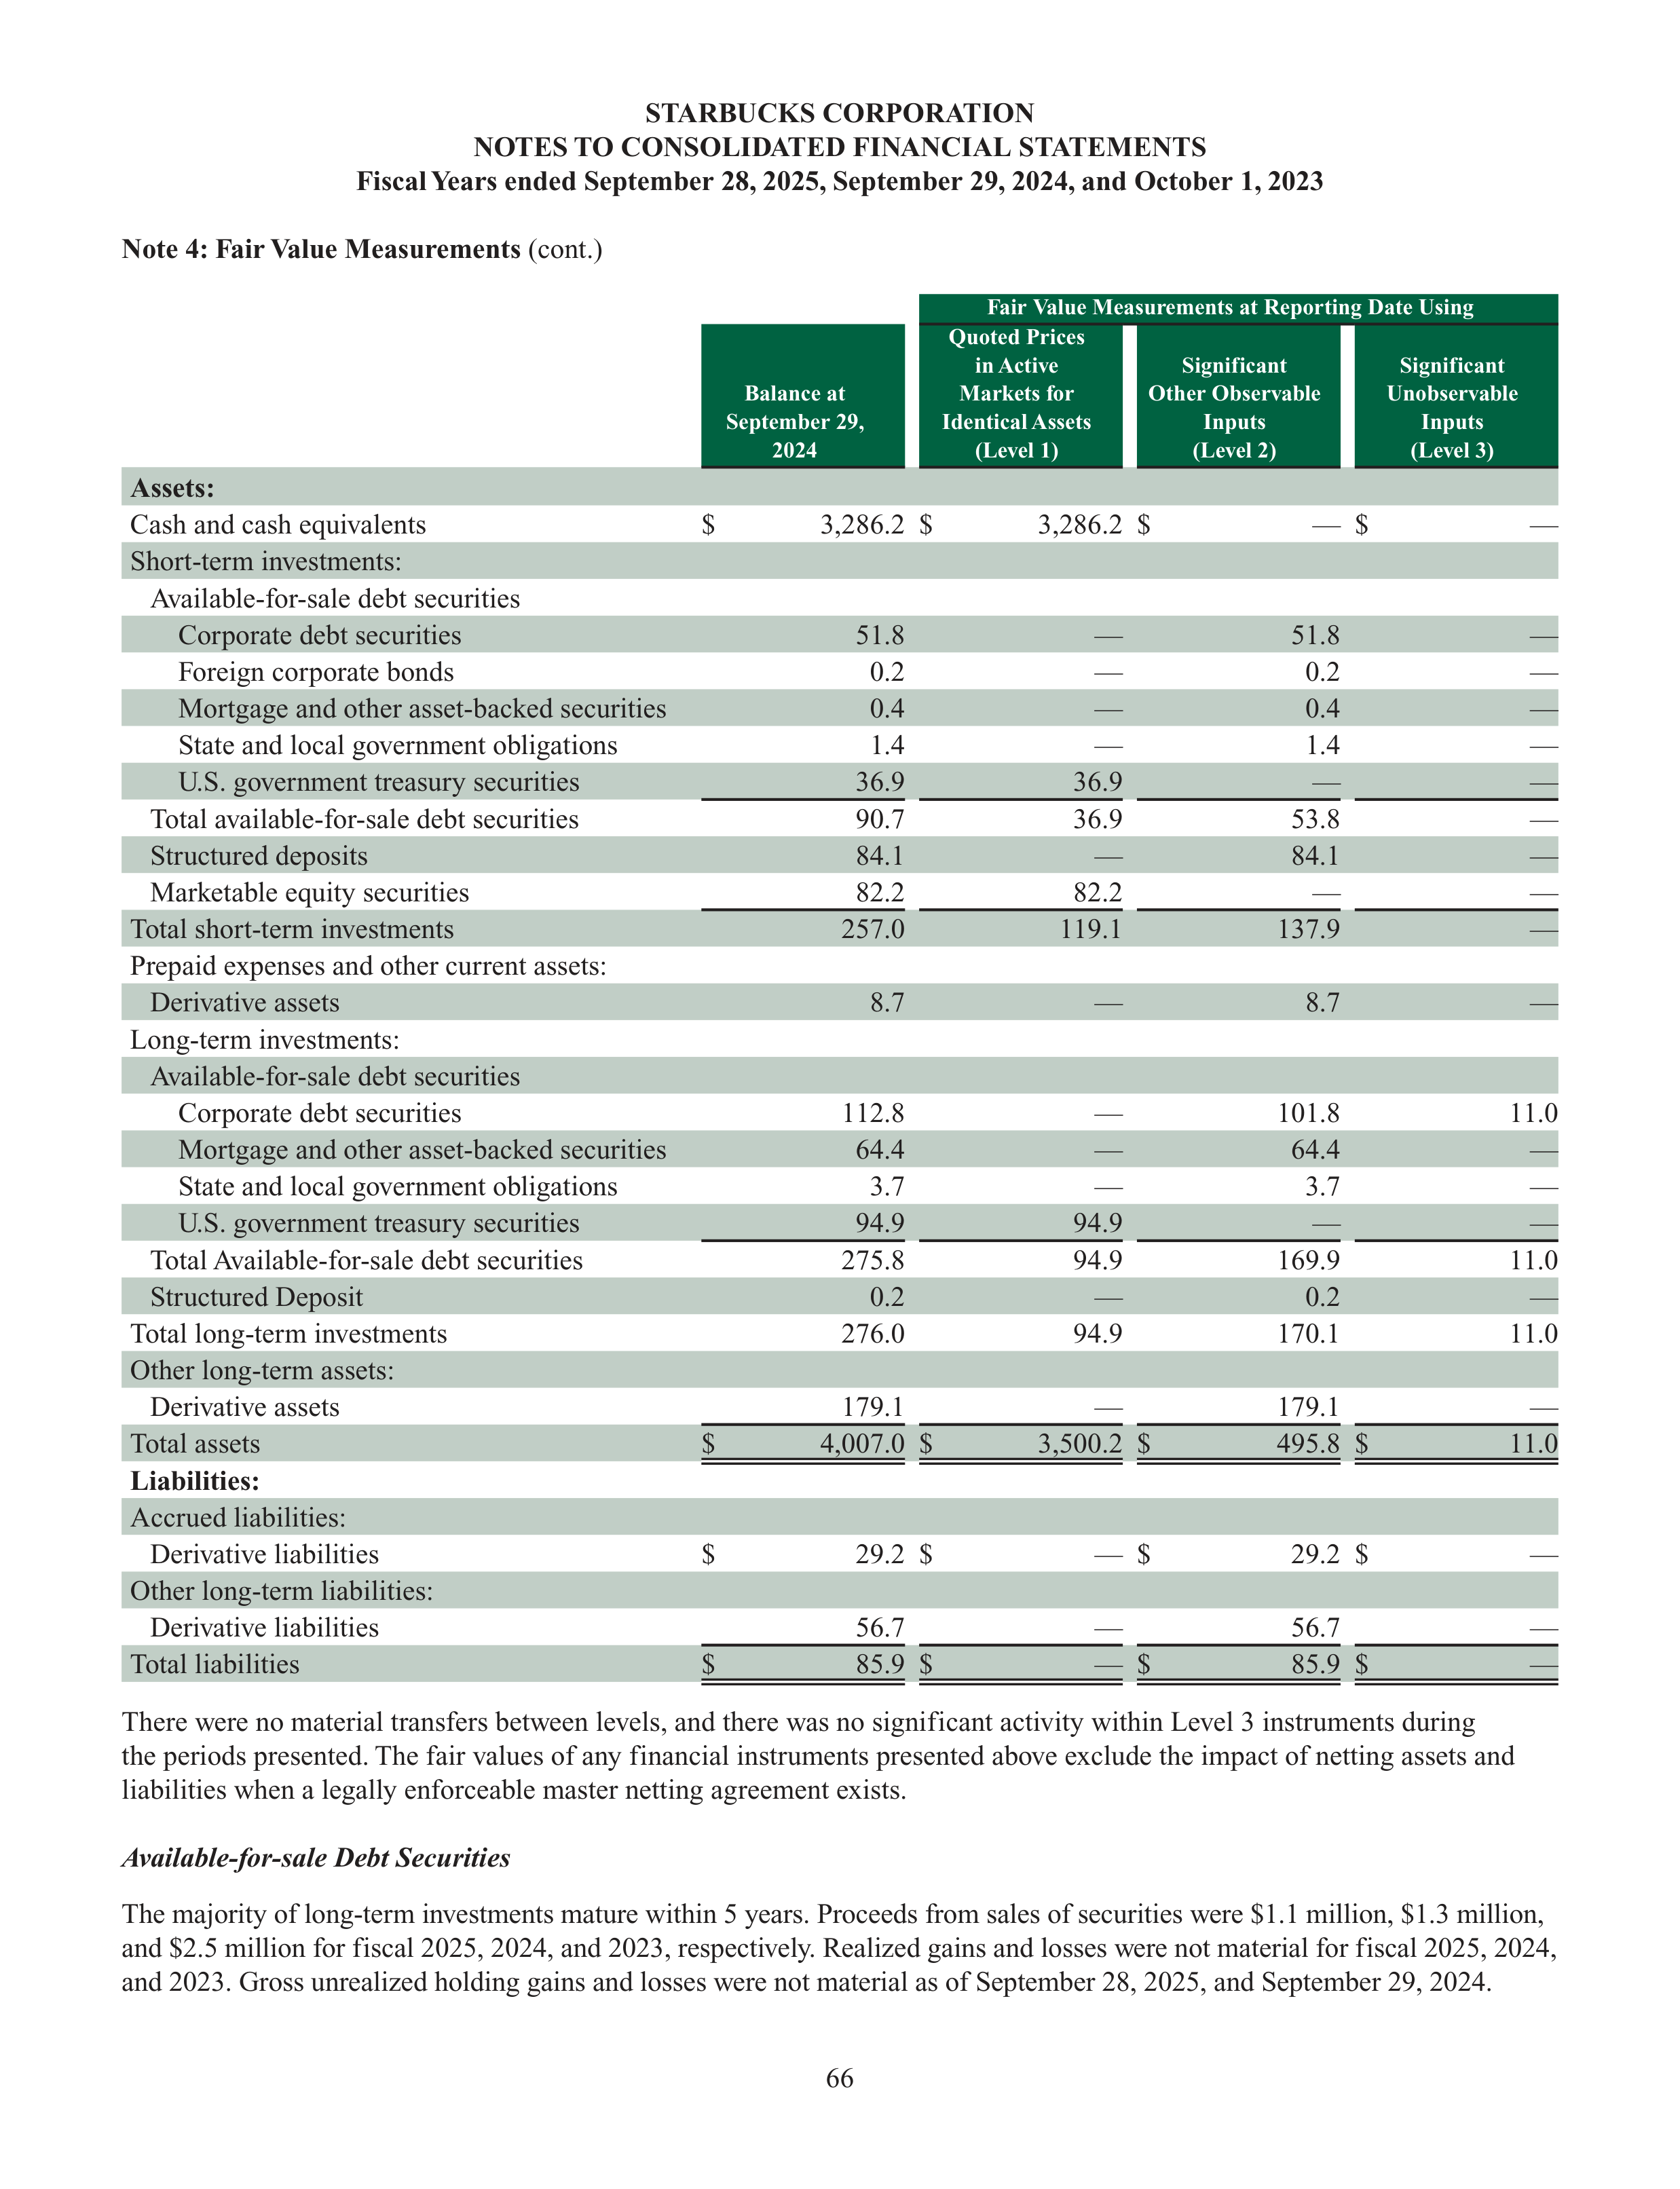
66
STARBUCKS CORPORATION
NOTES TO CONSOLIDATED FINANCIAL STATEMENTS
Fiscal Years ended September 28, 2025, September 29, 2024, and October 1, 2023
Note 4: Fair Value Measurements
(cont.)
Fair Value Measurements at Reporting Date Using
Balance at
September 29,
2024
Quoted Prices
in Active
Markets for
Identical Assets
(Level 1)
Significant
Other Observable
Inputs
(Level 2)
Significant
Unobservable
Inputs
(Level 3)
Assets:
Cash and cash equivalents
$
3,286.2
$
3,286.2
$
—
$
—
Short-term investments:
Available-for-sale debt securities
Corporate debt securities
51.8
—
51.8
—
Foreign corporate bonds
0.2
—
0.2
—
Mortgage and other asset-backed securities
0.4
—
0.4
—
State and local government obligations
1.4
—
1.4
—
U.S. government treasury securities
36.9
36.9
—
—
Total available-for-sale debt securities
90.7
36.9
53.8
—
Structured deposits
84.1
—
84.1
—
Marketable equity securities
82.2
82.2
—
—
Total short-term investments
257.0
119.1
137.9
—
Prepaid expenses and other current assets:
Derivative assets
8.7
—
8.7
—
Long-term investments:
Available-for-sale debt securities
Corporate debt securities
112.8
—
101.8
11.0
Mortgage and other asset-backed securities
64.4
—
64.4
—
State and local government obligations
3.7
—
3.7
—
U.S. government treasury securities
94.9
94.9
—
—
Total Available-for-sale debt securities
275.8
94.9
169.9
11.0
Structured Deposit
0.2
—
0.2
—
Total long-term investments
276.0
94.9
170.1
11.0
Other long-term assets:
Derivative assets
179.1
—
179.1
—
Total assets
$
4,007.0
$
3,500.2
$
495.8
$
11.0
Liabilities:
Accrued liabilities:
Derivative liabilities
$
29.2
$
—
$
29.2
$
—
Other long-term liabilities:
Derivative liabilities
56.7
—
56.7
—
Total liabilities
$
85.9
$
—
$
85.9
$
—
There were no material transfers between levels, and there was no significant activity within Level 3 instruments during
the periods presented. The fair values of any financial instruments presented above exclude the impact of netting assets and
liabilities when a legally enforceable master netting agreement exists.
Available-for-sale Debt Securities
The majority of long-term investments mature within 5 years. Proceeds from sales of securities were $1.1 million, $1.3 million,
and $2.5 million for fiscal 2025, 2024, and 2023, respectively. Realized gains and losses were not material for fiscal 2025, 2024,
and 2023. Gross unrealized holding gains and losses were not material as of September 28, 2025, and September 29, 2024.
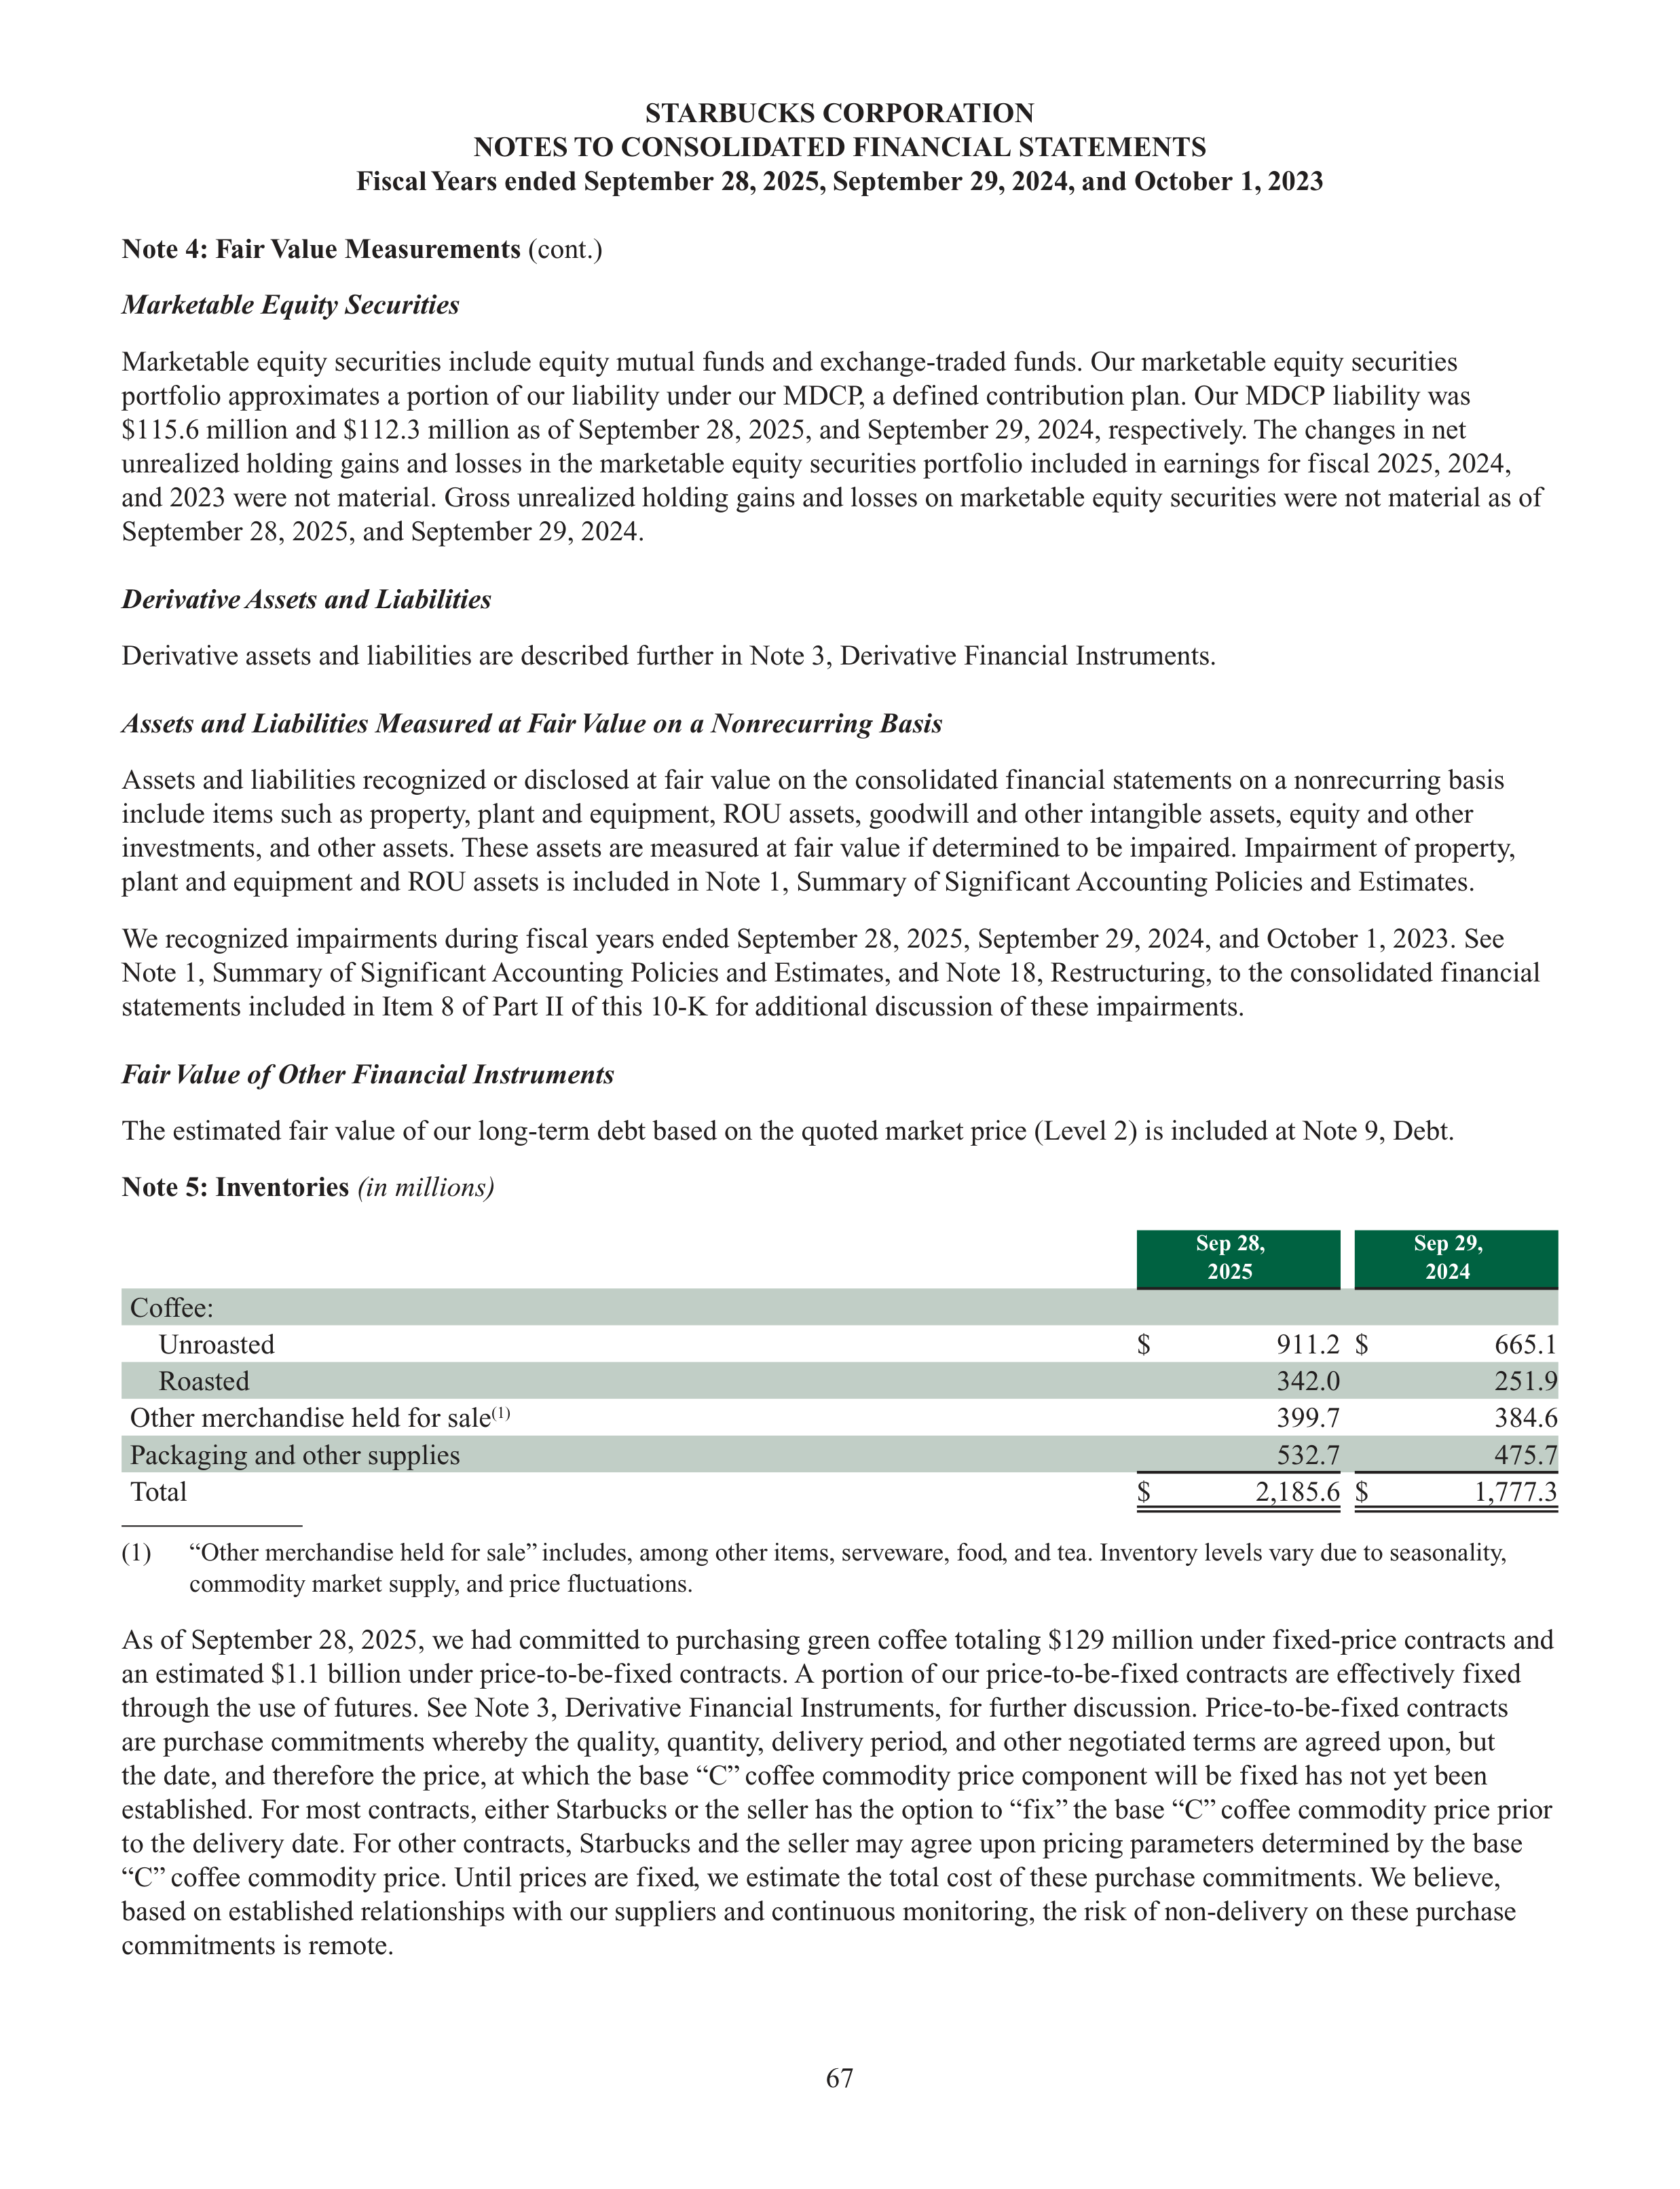
67
STARBUCKS CORPORATION
NOTES TO CONSOLIDATED FINANCIAL STATEMENTS
Fiscal Years ended September 28, 2025, September 29, 2024, and October 1, 2023
Note 4: Fair Value Measurements
(cont.)
Marketable Equity Securities
Marketable equity securities include equity mutual funds and exchange-traded funds. Our marketable equity securities
portfolio approximates a portion of our liability under our MDCP, a defined contribution plan. Our MDCP liability was
$115.6 million and $112.3 million as of September 28, 2025, and September 29, 2024, respectively. The changes in net
unrealized holding gains and losses in the marketable equity securities portfolio included in earnings for fiscal 2025, 2024,
and 2023 were not material. Gross unrealized holding gains and losses on marketable equity securities were not material as of
September 28, 2025, and September 29, 2024.
Derivative Assets and Liabilities
Derivative assets and liabilities are described further in Note 3, Derivative Financial Instruments.
Assets and Liabilities Measured at Fair Value on a Nonrecurring Basis
Assets and liabilities recognized or disclosed at fair value on the consolidated financial statements on a nonrecurring basis
include items such as property, plant and equipment, ROU assets, goodwill and other intangible assets, equity and other
investments, and other assets. These assets are measured at fair value if determined to be impaired. Impairment of property,
plant and equipment and ROU assets is included in Note 1, Summary of Significant Accounting Policies and Estimates.
We recognized impairments during fiscal years ended September 28, 2025, September 29, 2024, and October 1, 2023. See
Note 1, Summary of Significant Accounting Policies and Estimates, and Note 18, Restructuring, to the consolidated financial
statements included in Item 8 of Part II of this 10-K for additional discussion of these impairments.
Fair Value of Other Financial Instruments
The estimated fair value of our long-term debt based on the quoted market price (Level 2) is included at Note 9, Debt.
Note 5: Inventories
(in millions)
Sep 28,
2025
Sep 29,
2024
Coffee:
Unroasted
$
911.2
$
665.1
Roasted
342.0
251.9
Other merchandise held for sale
(1)
399.7
384.6
Packaging and other supplies
532.7
475.7
Total
$
2,185.6
$
1,777.3
(1)
“Other merchandise held for sale” includes, among other items, serveware, food, and tea. Inventory levels vary due to seasonality,
commodity market supply, and price fluctuations.
As of September 28, 2025, we had committed to purchasing green coffee totaling $129 million under fixed-price contracts and
an estimated $1.1 billion under price-to-be-fixed contracts. A portion of our price-to-be-fixed contracts are effectively fixed
through the use of futures. See Note 3, Derivative Financial Instruments, for further discussion. Price-to-be-fixed contracts
are purchase commitments whereby the quality, quantity, delivery period, and other negotiated terms are agreed upon, but
the date, and therefore the price, at which the base “C” coffee commodity price component will be fixed has not yet been
established. For most contracts, either Starbucks or the seller has the option to “fix” the base “C” coffee commodity price prior
to the delivery date. For other contracts, Starbucks and the seller may agree upon pricing parameters determined by the base
“C” coffee commodity price. Until prices are fixed, we estimate the total cost of these purchase commitments. We believe,
based on established relationships with our suppliers and continuous monitoring, the risk of non-delivery on these purchase
commitments is remote.
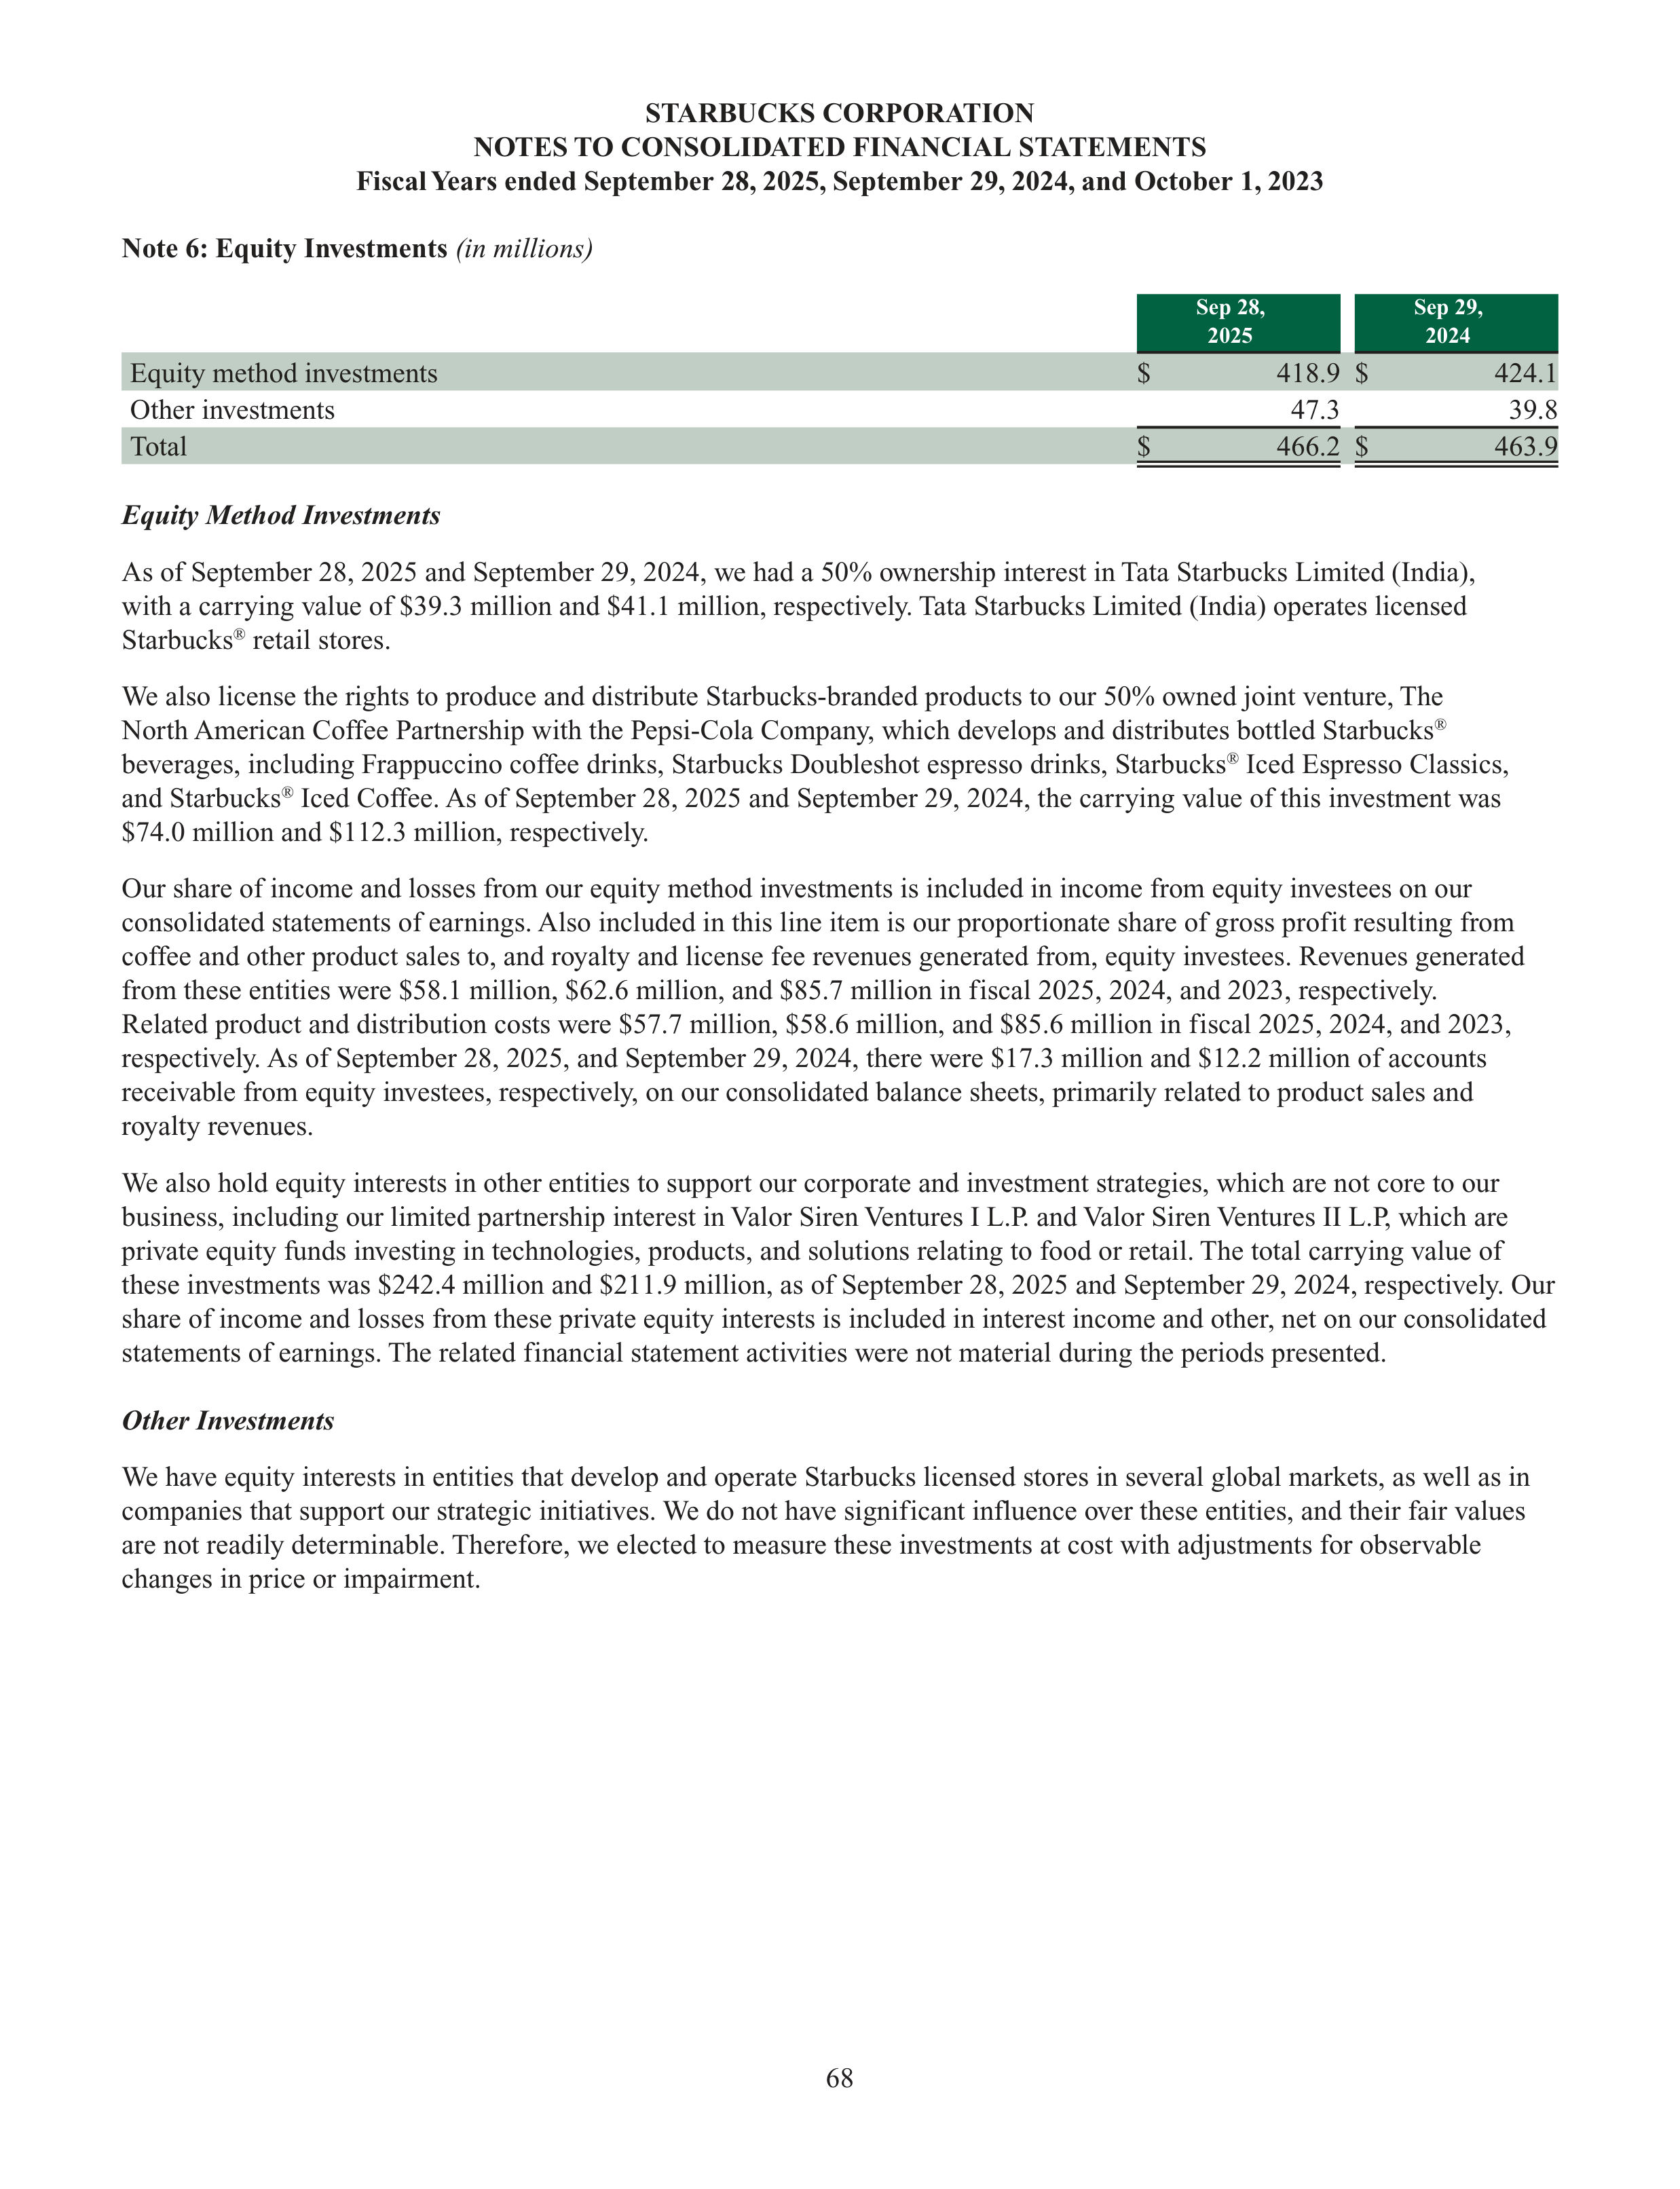
68
STARBUCKS CORPORATION
NOTES TO CONSOLIDATED FINANCIAL STATEMENTS
Fiscal Years ended September 28, 2025, September 29, 2024, and October 1, 2023
Note 6: Equity Investments
(in millions)
Sep 28,
2025
Sep 29,
2024
Equity method investments
$
418.9
$
424.1
Other investments
47.3
39.8
Total
$
466.2
$
463.9
Equity Method Investments
As of September 28, 2025 and September 29, 2024, we had a 50% ownership interest in Tata Starbucks Limited (India),
with a carrying value of $39.3 million and $41.1 million, respectively. Tata Starbucks Limited (India) operates licensed
Starbucks
®
retail stores.
We also license the rights to produce and distribute Starbucks-branded products to our 50% owned joint venture, The
North American Coffee Partnership with the Pepsi-Cola Company, which develops and distributes bottled Starbucks
®
beverages, including Frappuccino coffee drinks, Starbucks Doubleshot espresso drinks, Starbucks
®
Iced Espresso Classics,
and Starbucks
®
Iced Coffee. As of September 28, 2025 and September 29, 2024, the carrying value of this investment was
$74.0 million and $112.3 million, respectively.
Our share of income and losses from our equity method investments is included in income from equity investees on our
consolidated statements of earnings. Also included in this line item is our proportionate share of gross profit resulting from
coffee and other product sales to, and royalty and license fee revenues generated from, equity investees. Revenues generated
from these entities were $58.1 million, $62.6 million, and $85.7 million in fiscal 2025, 2024, and 2023, respectively.
Related product and distribution costs were $57.7 million, $58.6 million, and $85.6 million in fiscal 2025, 2024, and 2023,
respectively. As of September 28, 2025, and September 29, 2024, there were $17.3 million and $12.2 million of accounts
receivable from equity investees, respectively, on our consolidated balance sheets, primarily related to product sales and
royalty revenues.
We also hold equity interests in other entities to support our corporate and investment strategies, which are not core to our
business, including our limited partnership interest in Valor Siren Ventures I L.P. and Valor Siren Ventures II L.P, which are
private equity funds investing in technologies, products, and solutions relating to food or retail. The total carrying value of
these investments was $242.4 million and $211.9 million, as of September 28, 2025 and September 29, 2024, respectively. Our
share of income and losses from these private equity interests is included in interest income and other, net on our consolidated
statements of earnings. The related financial statement activities were not material during the periods presented.
Other Investments
We have equity interests in entities that develop and operate Starbucks licensed stores in several global markets, as well as in
companies that support our strategic initiatives. We do not have significant influence over these entities, and their fair values
are not readily determinable. Therefore, we elected to measure these investments at cost with adjustments for observable
changes in price or impairment.
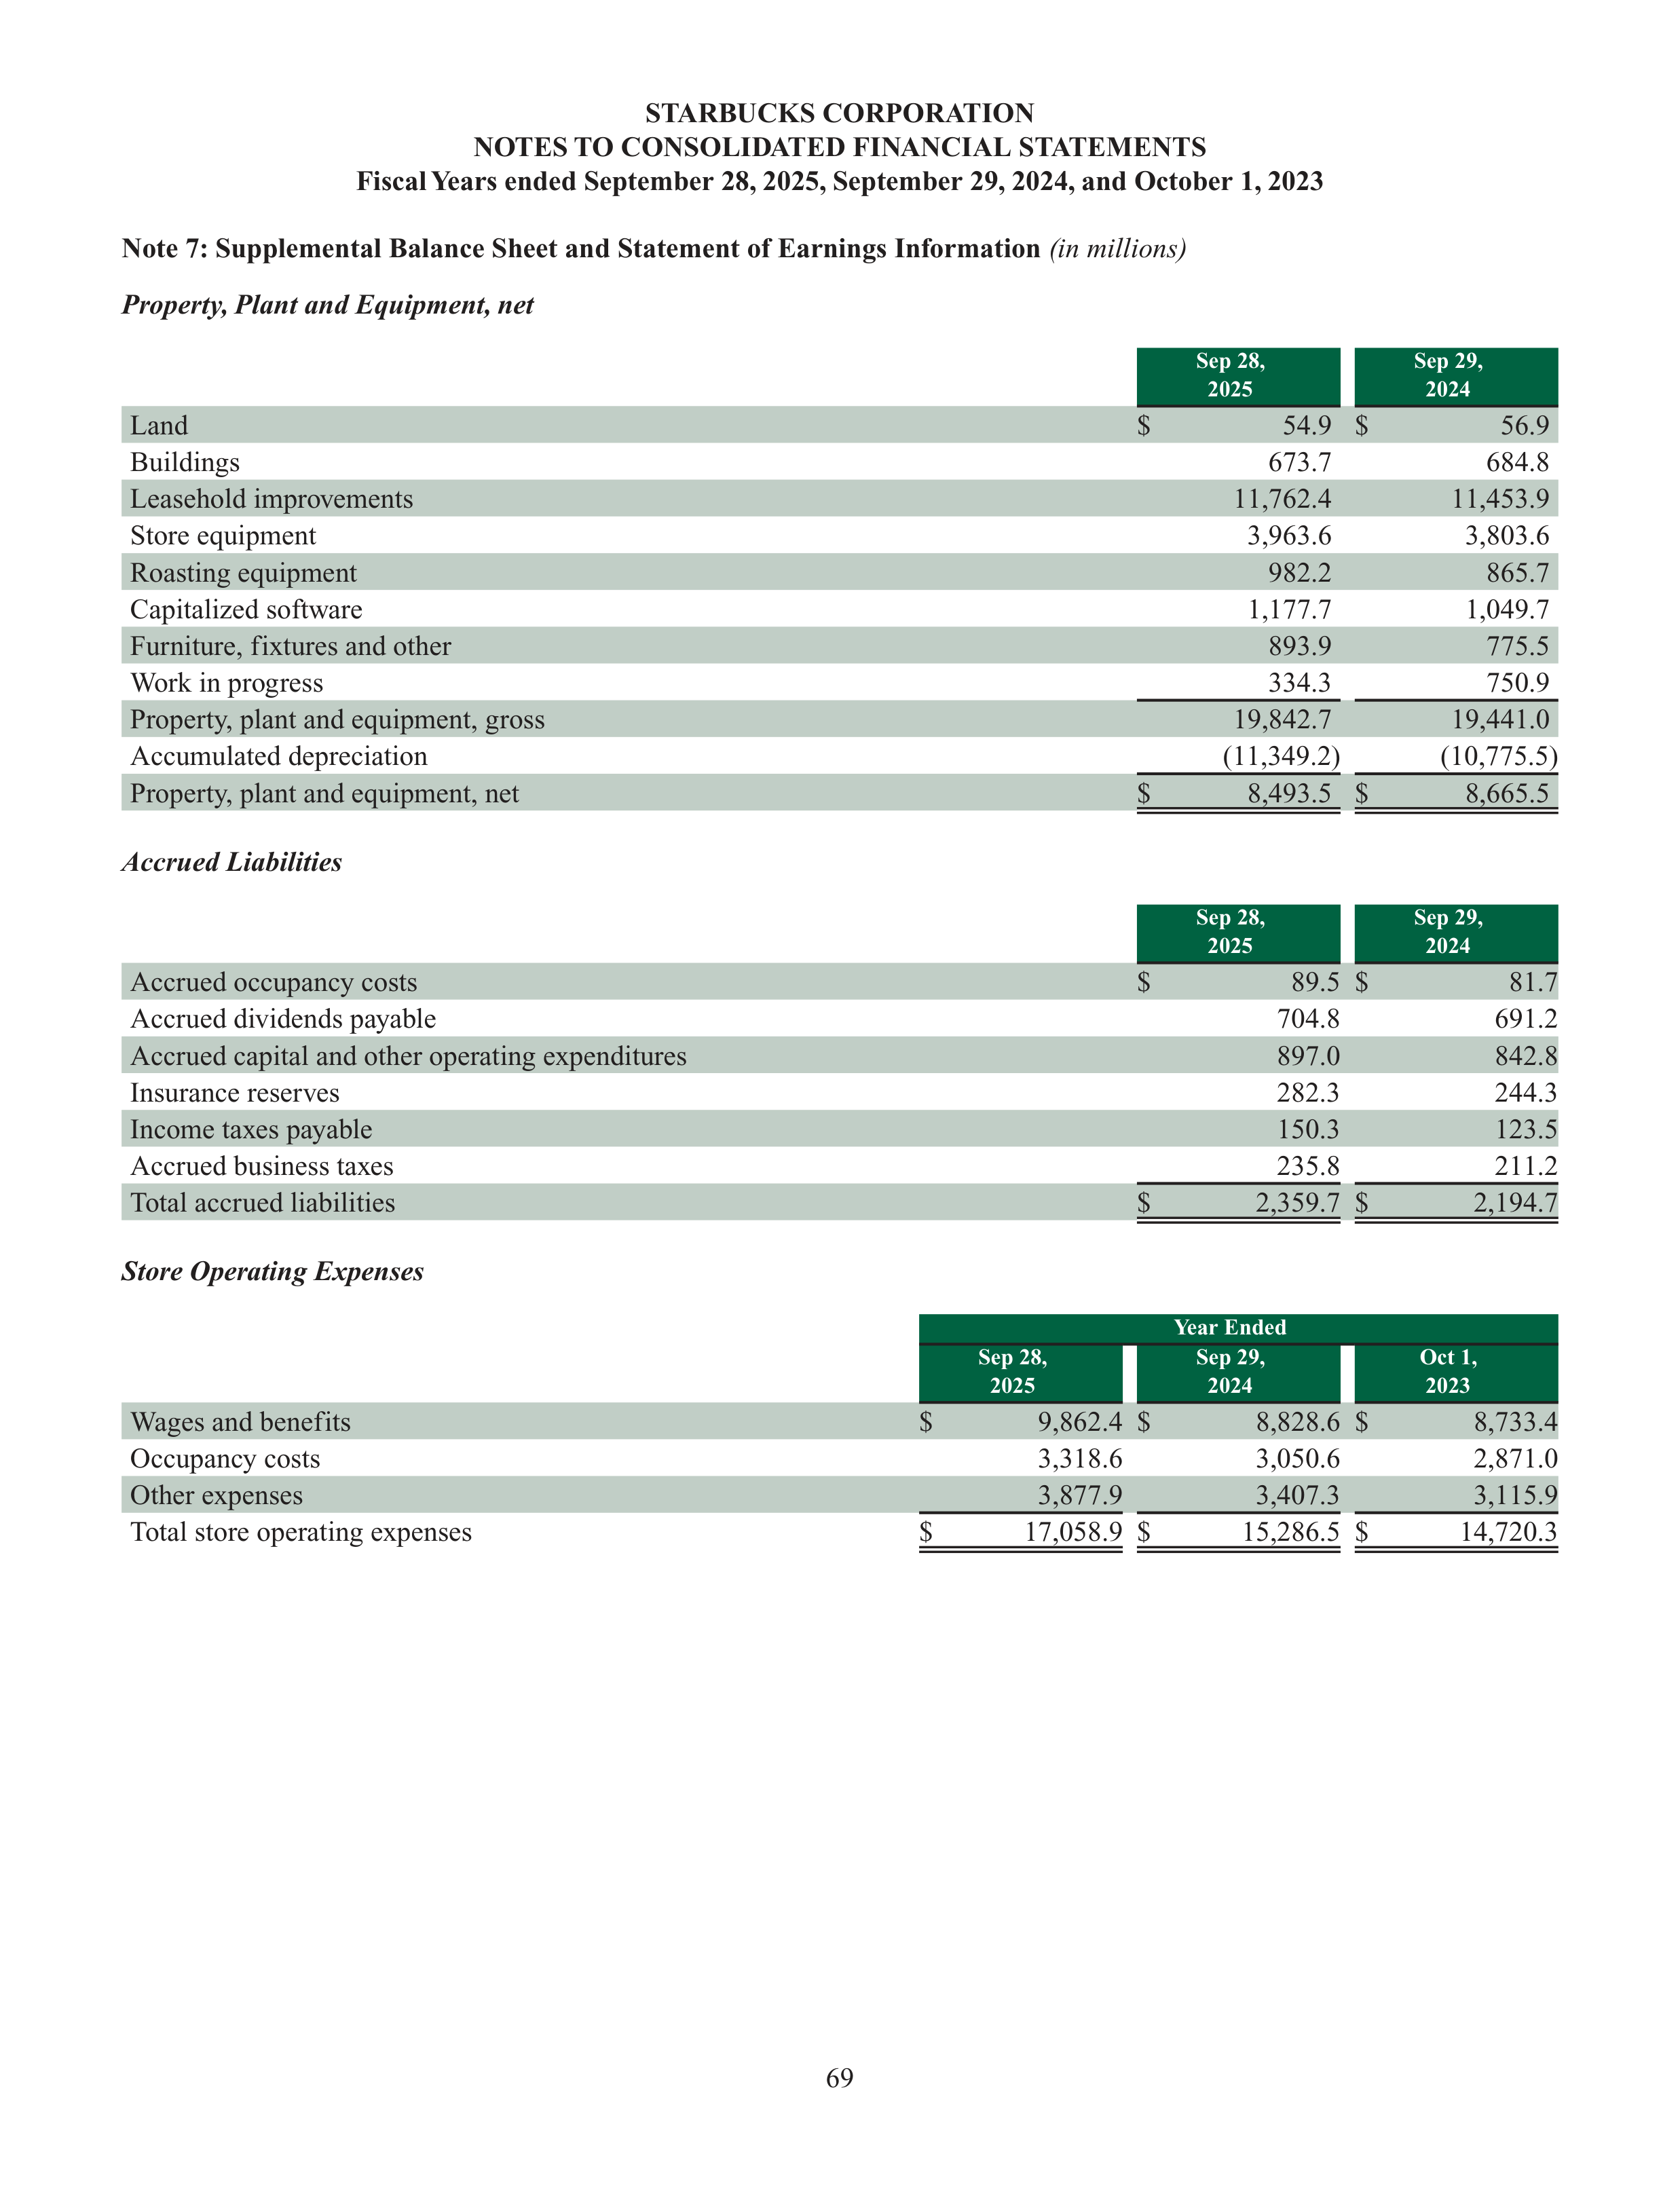
69
STARBUCKS CORPORATION
NOTES TO CONSOLIDATED FINANCIAL STATEMENTS
Fiscal Years ended September 28, 2025, September 29, 2024, and October 1, 2023
Note 7: Supplemental Balance Sheet and Statement of Earnings Information
(in millions)
Property, Plant and Equipment, net
Sep 28,
2025
Sep 29,
2024
Land
$
54.9
$
56.9
Buildings
673.7
684.8
Leasehold improvements
11,762.4
11,453.9
Store equipment
3,963.6
3,803.6
Roasting equipment
982.2
865.7
Capitalized software
1,177.7
1,049.7
Furniture, fixtures and other
893.9
775.5
Work in progress
334.3
750.9
Property, plant and equipment, gross
19,842.7
19,441.0
Accumulated depreciation
(11,349.2)
(10,775.5)
Property, plant and equipment, net
$
8,493.5
$
8,665.5
Accrued Liabilities
Sep 28,
2025
Sep 29,
2024
Accrued occupancy costs
$
89.5
$
81.7
Accrued dividends payable
704.8
691.2
Accrued capital and other operating expenditures
897.0
842.8
Insurance reserves
282.3
244.3
Income taxes payable
150.3
123.5
Accrued business taxes
235.8
211.2
Total accrued liabilities
$
2,359.7
$
2,194.7
Store Operating Expenses
Year Ended
Sep 28,
2025
Sep 29,
2024
Oct 1,
2023
Wages and benefits
$
9,862.4
$
8,828.6
$
8,733.4
Occupancy costs
3,318.6
3,050.6
2,871.0
Other expenses
3,877.9
3,407.3
3,115.9
Total store operating expenses
$
17,058.9
$
15,286.5
$
14,720.3
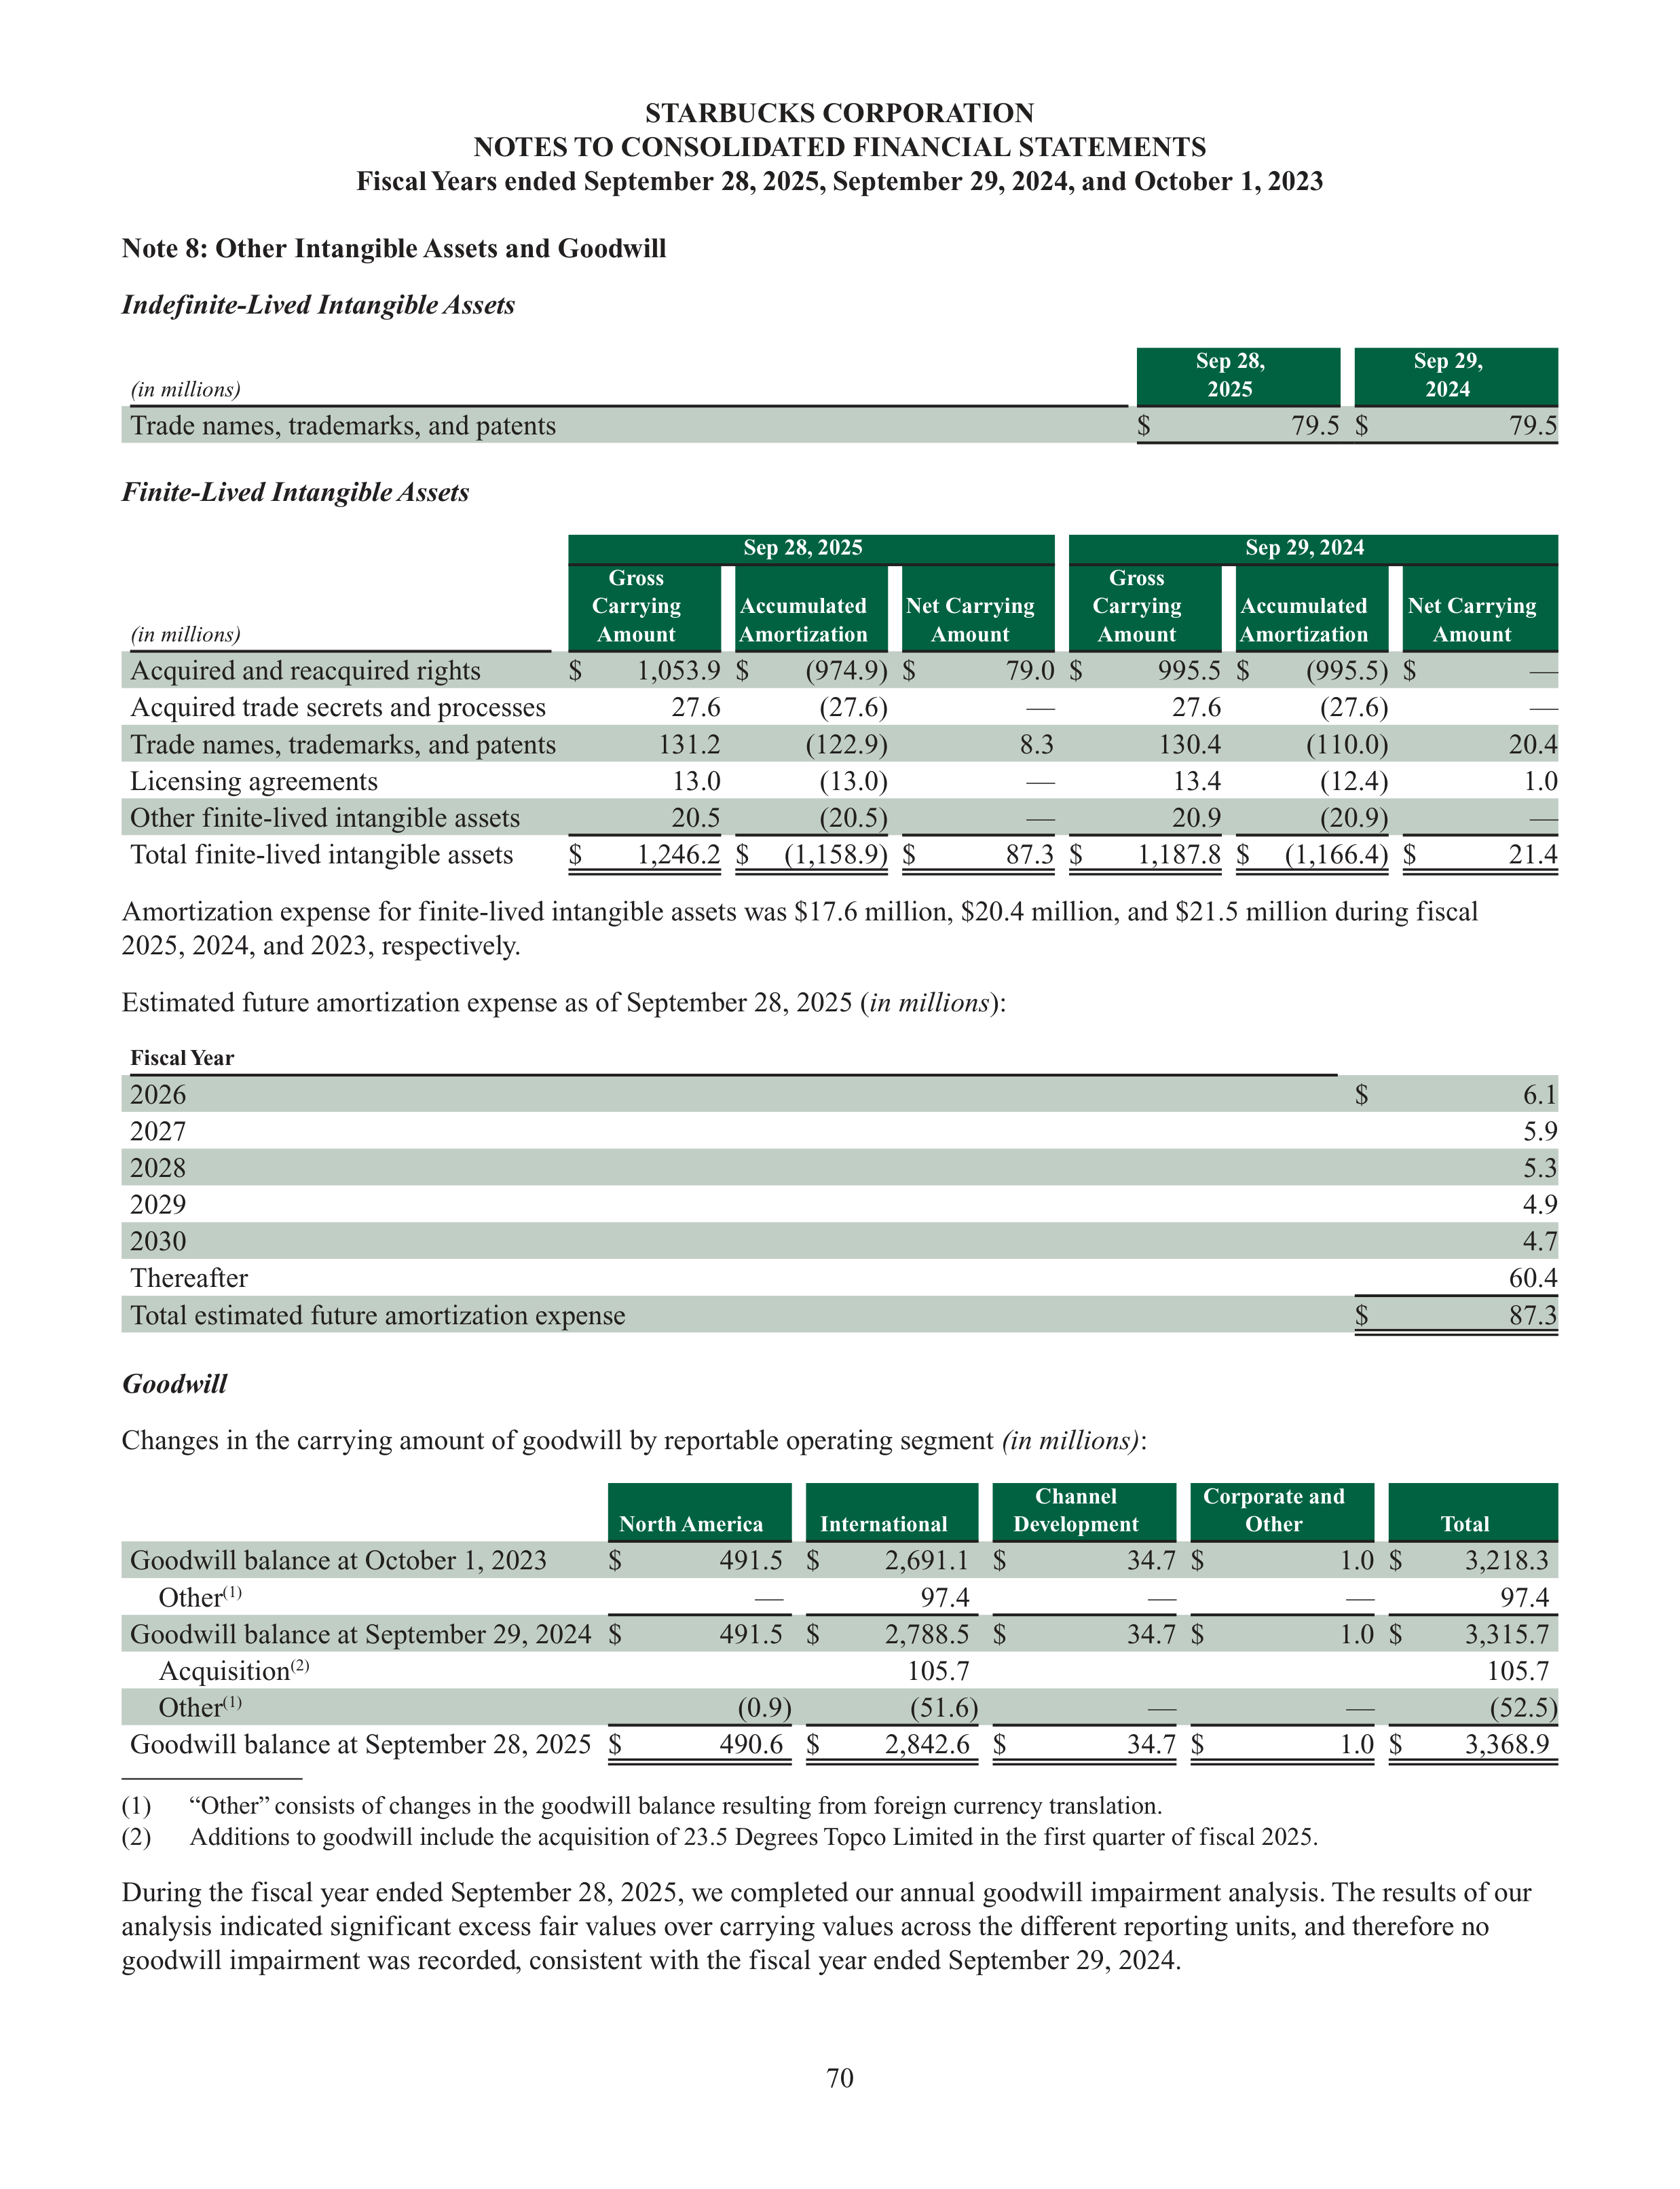
70
STARBUCKS CORPORATION
NOTES TO CONSOLIDATED FINANCIAL STATEMENTS
Fiscal Years ended September 28, 2025, September 29, 2024, and October 1, 2023
Note 8: Other Intangible Assets and Goodwill
Indefinite-Lived Intangible Assets
(in millions)
Sep 28,
2025
Sep 29,
2024
Trade names, trademarks, and patents
$
79.5
$
79.5
Finite-Lived Intangible Assets
Sep 28, 2025
Sep 29, 2024
(in millions)
Gross
Carrying
Amount
Accumulated
Amortization
Net Carrying
Amount
Gross
Carrying
Amount
Accumulated
Amortization
Net Carrying
Amount
Acquired and reacquired rights
$
1,053.9
$
(974.9)
$
79.0
$
995.5
$
(995.5)
$
—
Acquired trade secrets and processes
27.6
(27.6)
—
27.6
(27.6)
—
Trade names, trademarks, and patents
131.2
(122.9)
8.3
130.4
(110.0)
20.4
Licensing agreements
13.0
(13.0)
—
13.4
(12.4)
1.0
Other finite-lived intangible assets
20.5
(20.5)
—
20.9
(20.9)
—
Total finite-lived intangible assets
$
1,246.2
$
(1,158.9)
$
87.3
$
1,187.8
$
(1,166.4)
$
21.4
Amortization expense for finite-lived intangible assets was $17.6 million, $20.4 million, and $21.5 million during fiscal
2025, 2024, and 2023, respectively.
Estimated future amortization expense as of September 28, 2025 (
in millions
):
Fiscal Year
2026
$
6.1
2027
5.9
2028
5.3
2029
4.9
2030
4.7
Thereafter
60.4
Total estimated future amortization expense
$
87.3
Goodwill
Changes in the carrying amount of goodwill by reportable operating segment
(in millions)
:
North America
International
Channel
Development
Corporate and
Other
Total
Goodwill balance at October 1, 2023
$
491.5
$
2,691.1
$
34.7
$
1.0
$
3,218.3
Other
(1)
—
97.4
—
—
97.4
Goodwill balance at September 29, 2024
$
491.5
$
2,788.5
$
34.7
$
1.0
$
3,315.7
Acquisition
(2)
105.7
105.7
Other
(1)
(0.9)
(51.6)
—
—
(52.5)
Goodwill balance at September 28, 2025
$
490.6
$
2,842.6
$
34.7
$
1.0
$
3,368.9
(1)
“Other” consists of changes in the goodwill balance resulting from foreign currency translation.
(2)
Additions to goodwill include the acquisition of 23.5 Degrees Topco Limited in the first quarter of fiscal 2025.
During the fiscal year ended September 28, 2025, we completed our annual goodwill impairment analysis. The results of our
analysis indicated significant excess fair values over carrying values across the different reporting units, and therefore no
goodwill impairment was recorded, consistent with the fiscal year ended September 29, 2024.
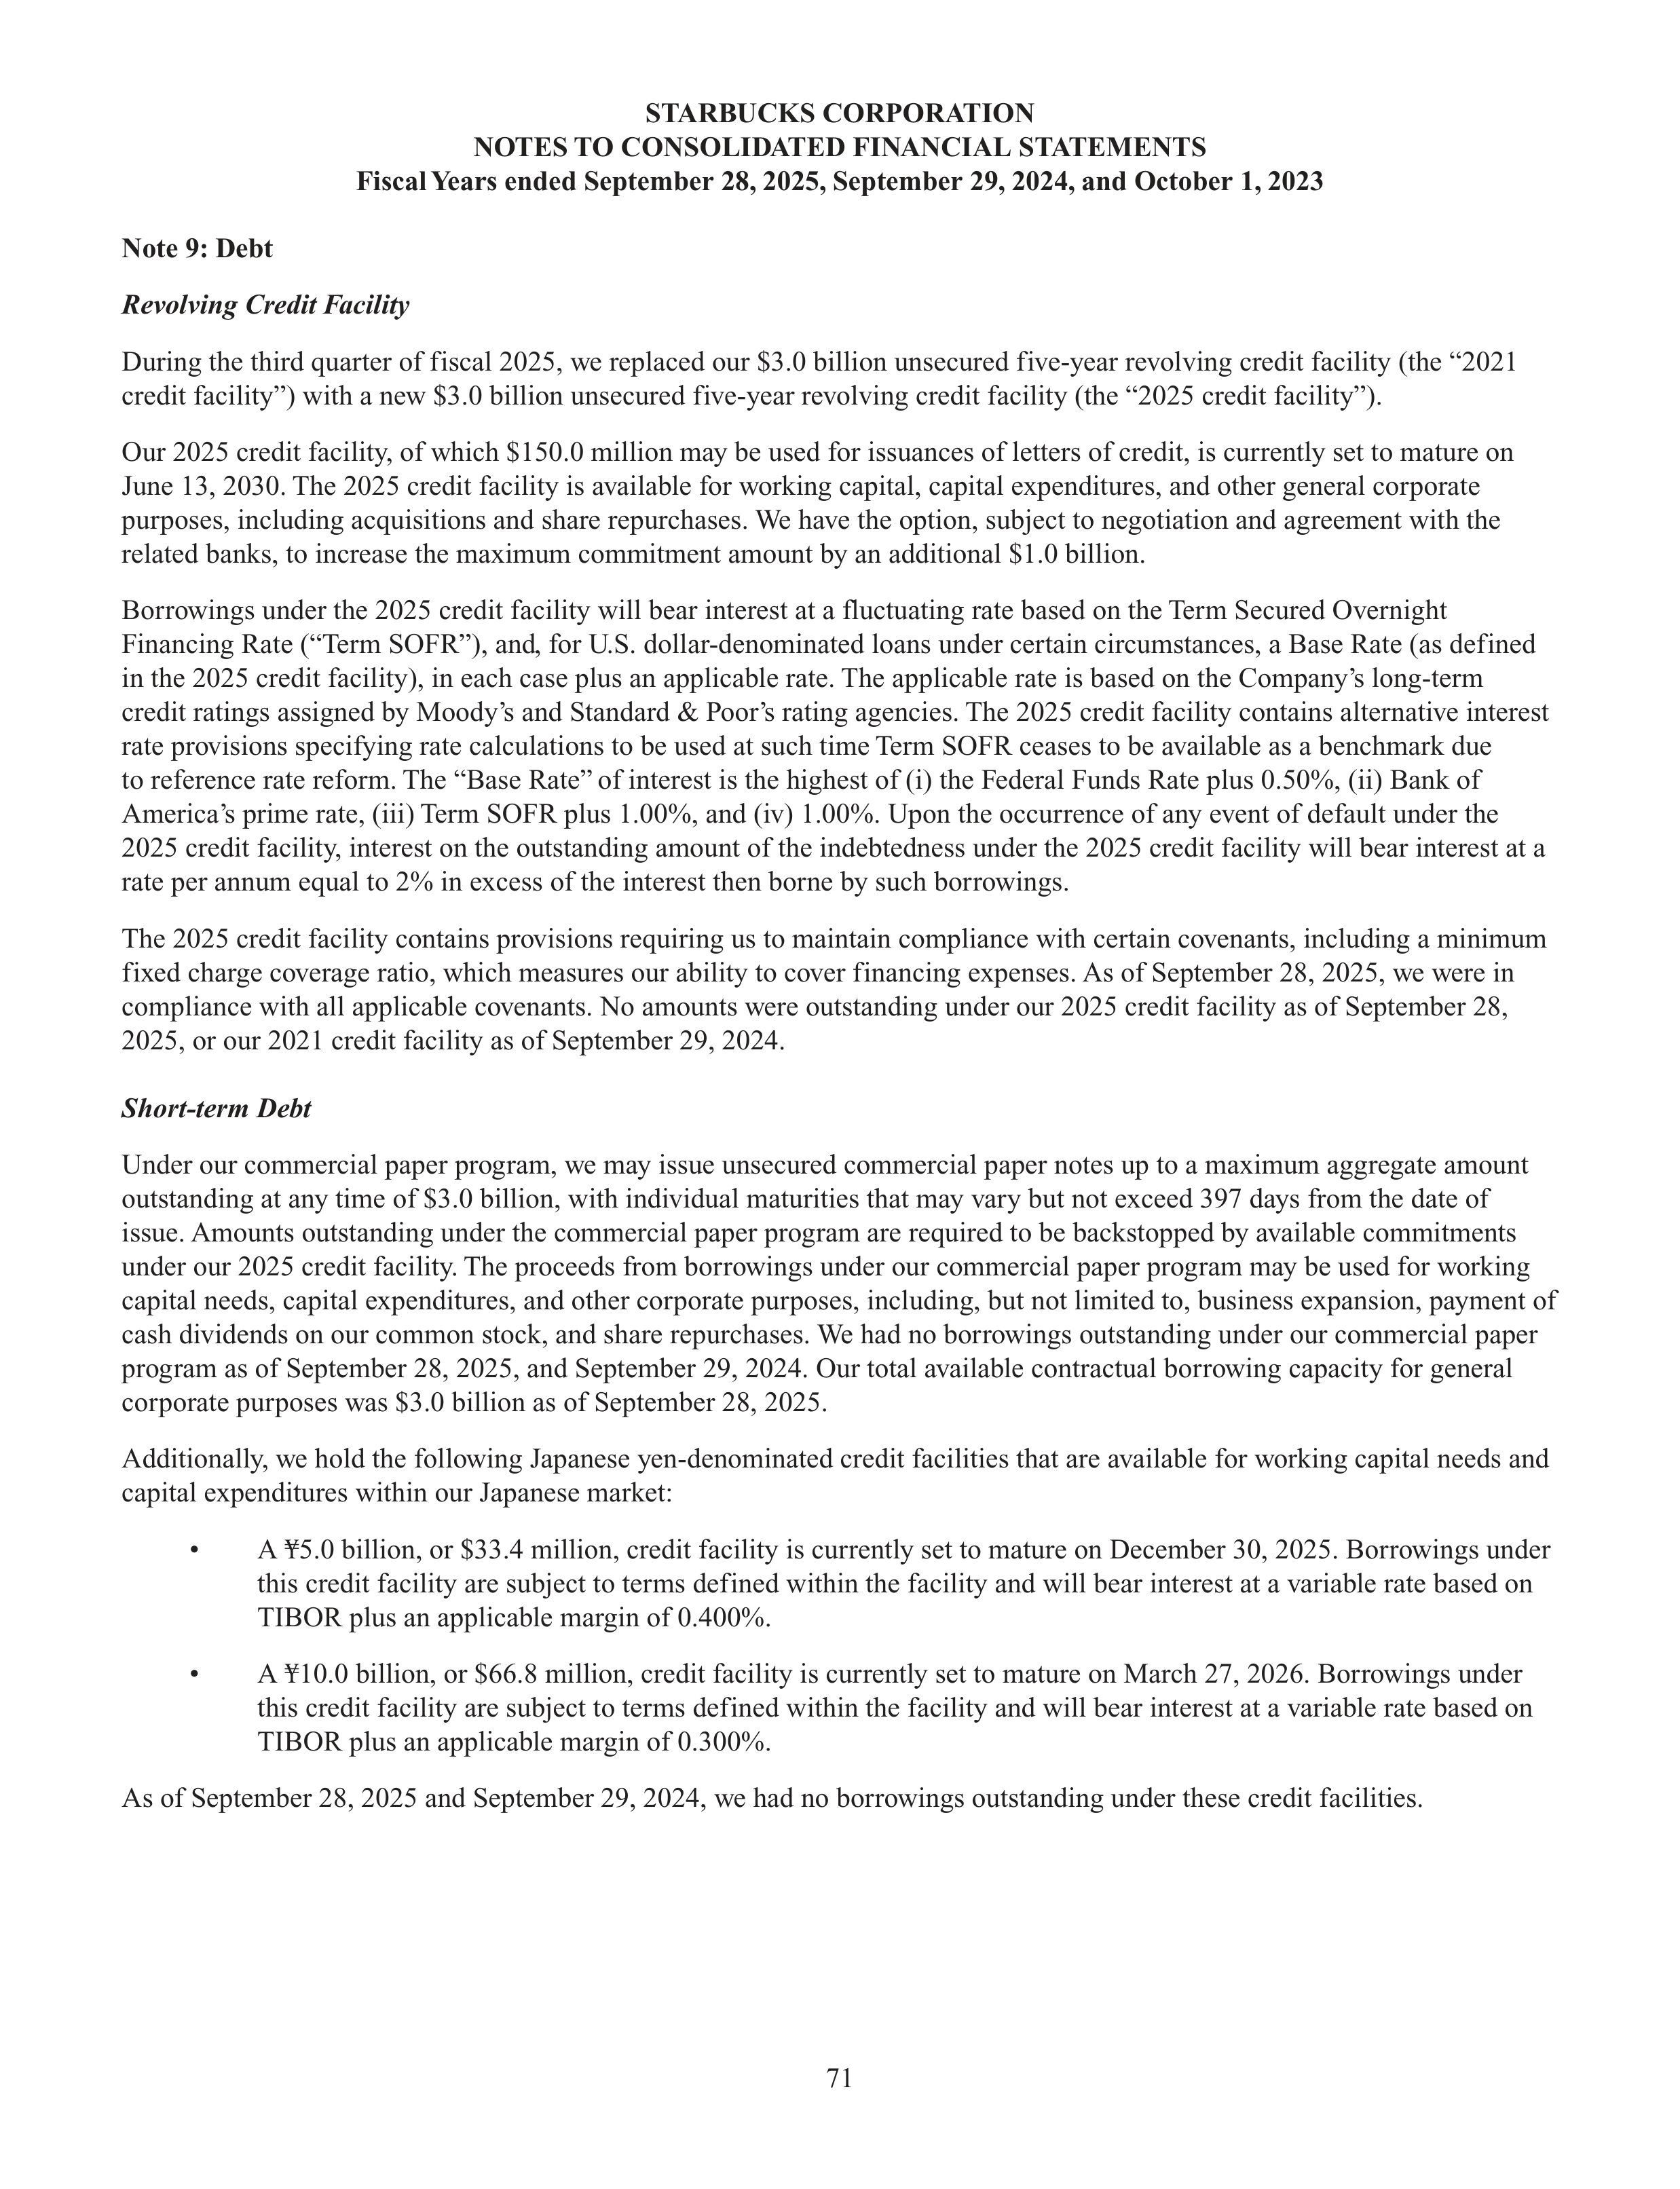
71
STARBUCKS CORPORATION
NOTES TO CONSOLIDATED FINANCIAL STATEMENTS
Fiscal Years ended September 28, 2025, September 29, 2024, and October 1, 2023
Note 9: Debt
Revolving Credit Facility
During the third quarter of fiscal 2025, we replaced our $3.0 billion unsecured five-year revolving credit facility (the “2021
credit facility”) with a new $3.0 billion unsecured five-year revolving credit facility (the “2025 credit facility”).
Our 2025 credit facility, of which $150.0 million may be used for issuances of letters of credit, is currently set to mature on
June 13, 2030. The 2025 credit facility is available for working capital, capital expenditures, and other general corporate
purposes, including acquisitions and share repurchases. We have the option, subject to negotiation and agreement with the
related banks, to increase the maximum commitment amount by an additional $1.0 billion.
Borrowings under the 2025 credit facility will bear interest at a fluctuating rate based on the Term Secured Overnight
Financing Rate (“Term SOFR”), and, for U.S. dollar-denominated loans under certain circumstances, a Base Rate (as defined
in the 2025 credit facility), in each case plus an applicable rate. The applicable rate is based on the Company’s long-term
credit ratings assigned by Moody’s and Standard & Poor’s rating agencies. The 2025 credit facility contains alternative interest
rate provisions specifying rate calculations to be used at such time Term SOFR ceases to be available as a benchmark due
to reference rate reform. The “Base Rate” of interest is the highest of (i) the Federal Funds Rate plus 0.50%, (ii) Bank of
America’s prime rate, (iii) Term SOFR plus 1.00%, and (iv) 1.00%. Upon the occurrence of any event of default under the
2025 credit facility, interest on the outstanding amount of the indebtedness under the 2025 credit facility will bear interest at a
rate per annum equal to 2% in excess of the interest then borne by such borrowings.
The 2025 credit facility contains provisions requiring us to maintain compliance with certain covenants, including a minimum
fixed charge coverage ratio, which measures our ability to cover financing expenses. As of September 28, 2025, we were in
compliance with all applicable covenants. No amounts were outstanding under our 2025 credit facility as of September 28,
2025, or our 2021 credit facility as of September 29, 2024.
Short-term Debt
Under our commercial paper program, we may issue unsecured commercial paper notes up to a maximum aggregate amount
outstanding at any time of $3.0 billion, with individual maturities that may vary but not exceed 397 days from the date of
issue. Amounts outstanding under the commercial paper program are required to be backstopped by available commitments
under our 2025 credit facility. The proceeds from borrowings under our commercial paper program may be used for working
capital needs, capital expenditures, and other corporate purposes, including, but not limited to, business expansion, payment of
cash dividends on our common stock, and share repurchases. We had no borrowings outstanding under our commercial paper
program as of September 28, 2025, and September 29, 2024. Our total available contractual borrowing capacity for general
corporate purposes was $3.0 billion as of September 28, 2025.
Additionally, we hold the following Japanese yen-denominated credit facilities that are available for working capital needs and
capital expenditures within our Japanese market:
•
A ¥5.0 billion, or $33.4 million, credit facility is currently set to mature on December 30, 2025. Borrowings under
this credit facility are subject to terms defined within the facility and will bear interest at a variable rate based on
TIBOR plus an applicable margin of 0.400%.
•
A ¥10.0 billion, or $66.8 million, credit facility is currently set to mature on March 27, 2026. Borrowings under
this credit facility are subject to terms defined within the facility and will bear interest at a variable rate based on
TIBOR plus an applicable margin of 0.300%.
As of September 28, 2025 and September 29, 2024, we had no borrowings outstanding under these credit facilities.
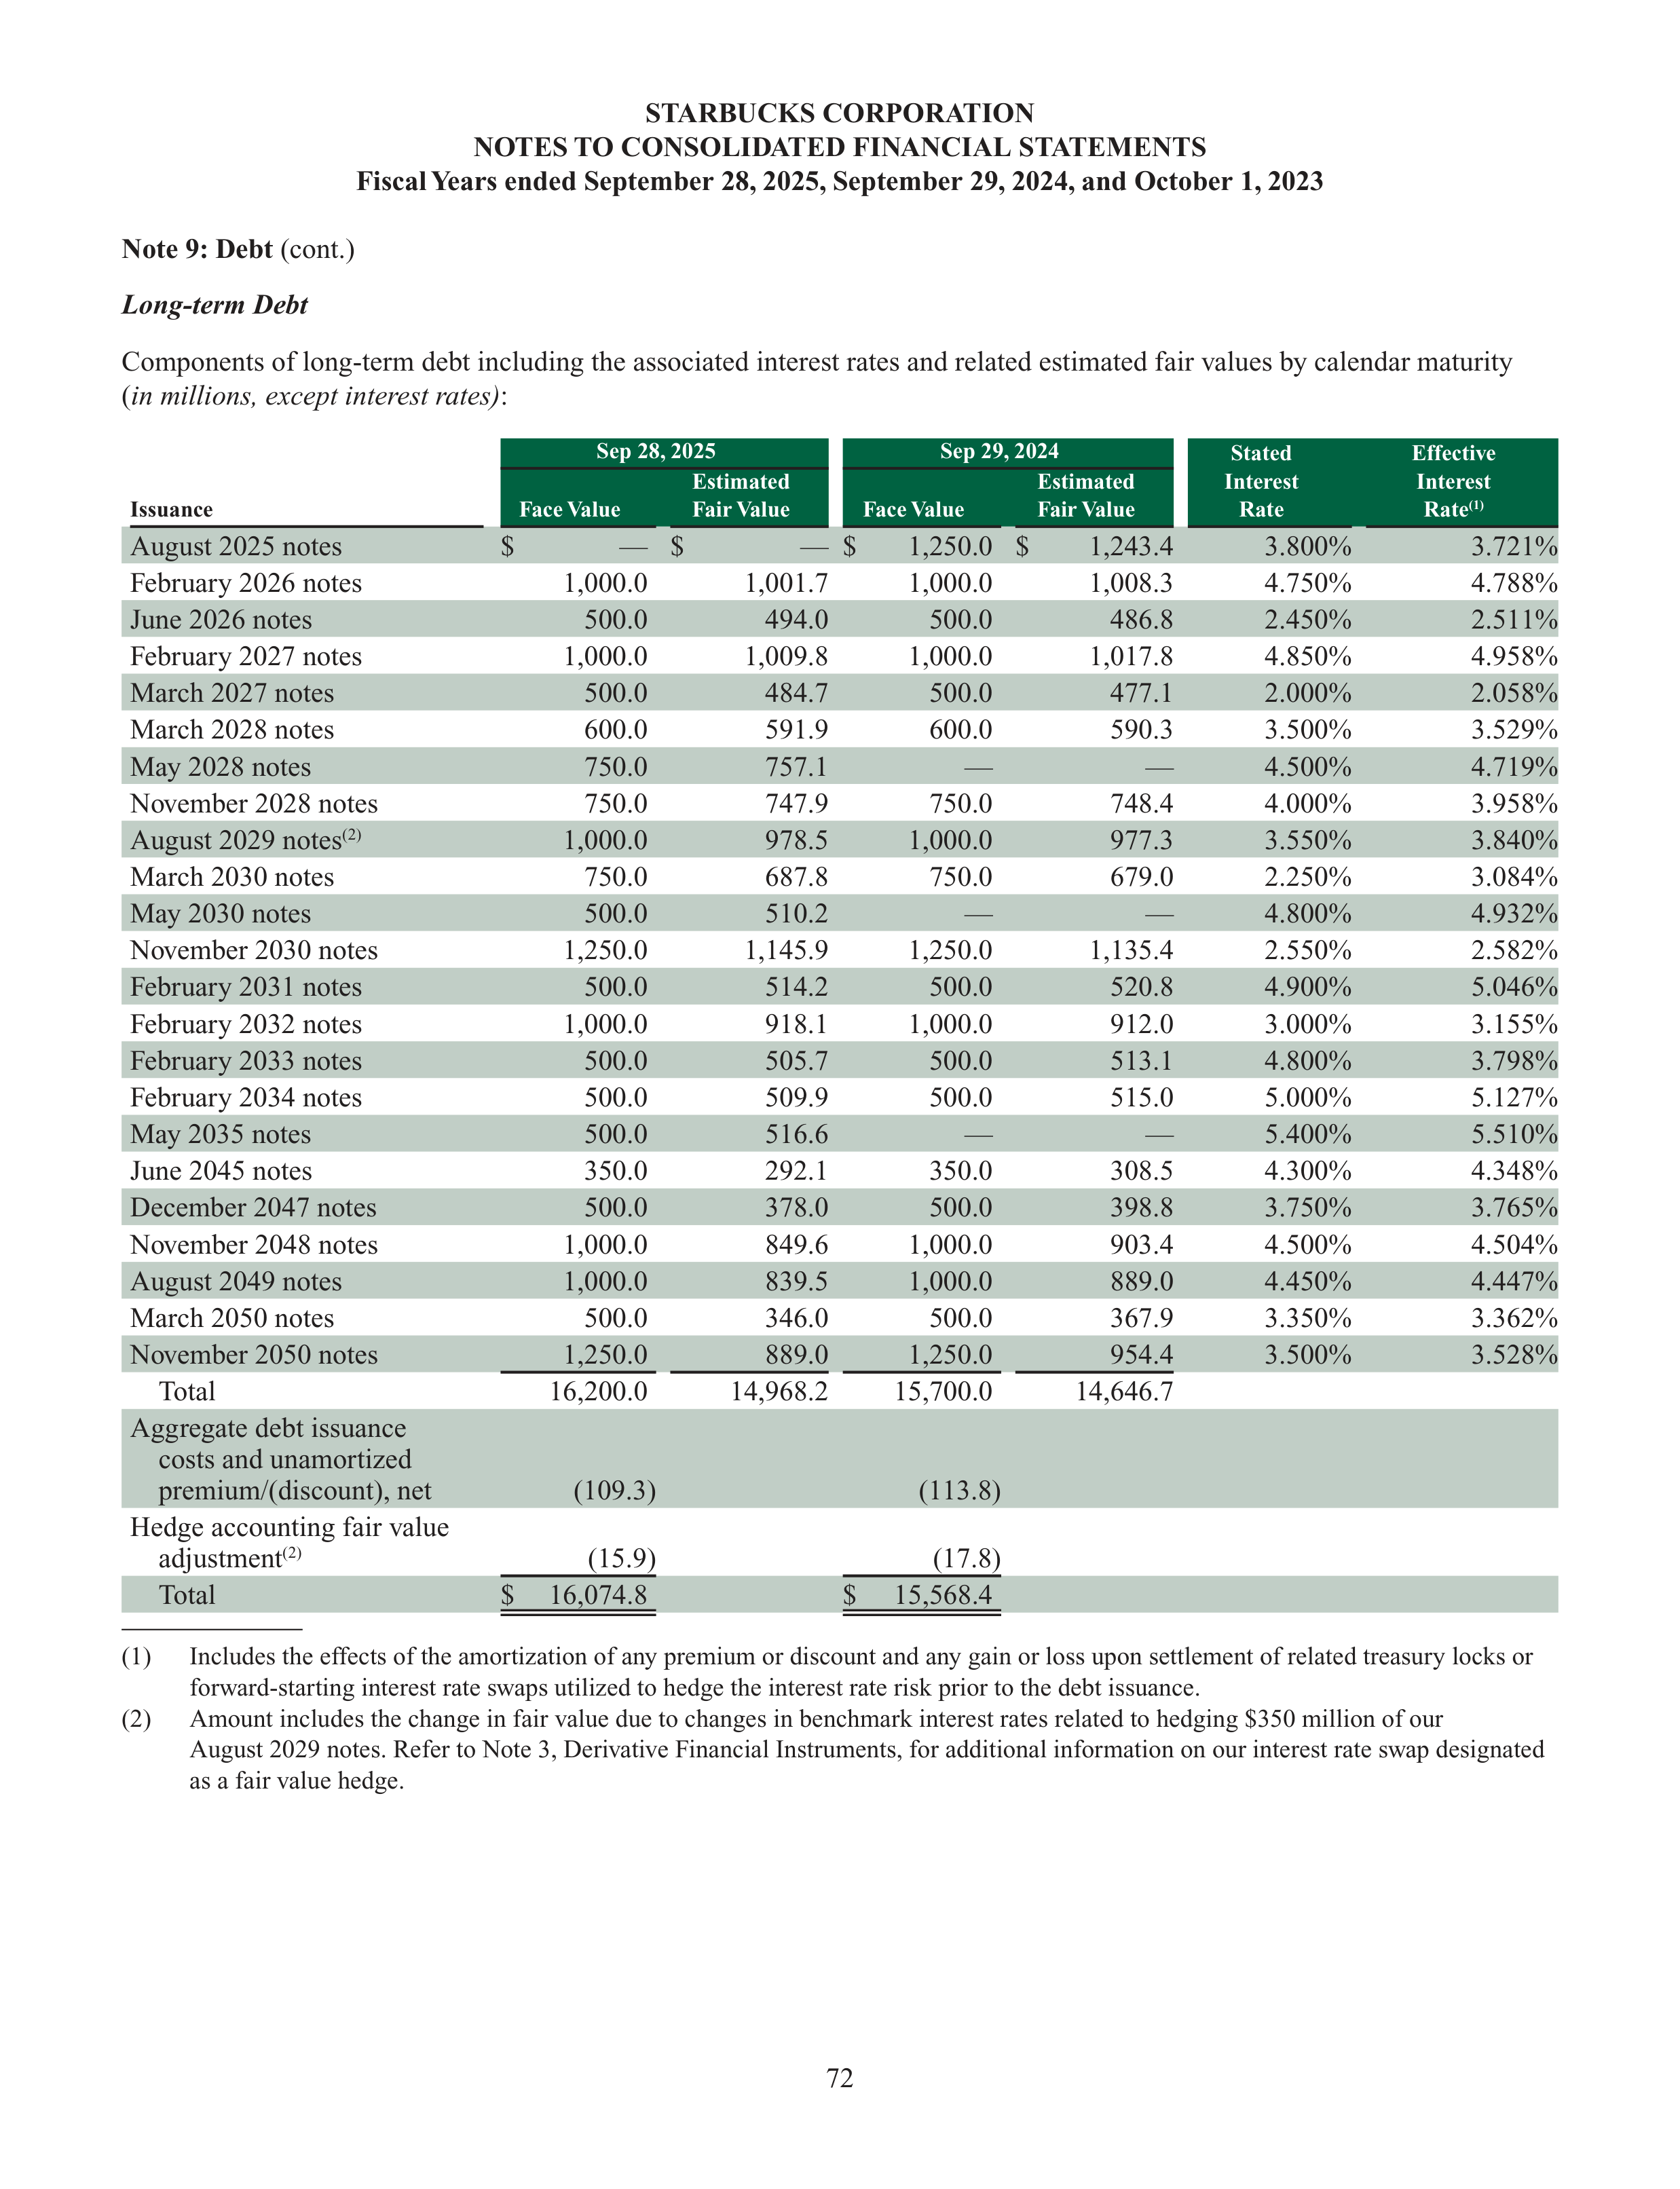
72
STARBUCKS CORPORATION
NOTES TO CONSOLIDATED FINANCIAL STATEMENTS
Fiscal Years ended September 28, 2025, September 29, 2024, and October 1, 2023
Note 9: Debt
(cont.)
Long-term Debt
Components of long-term debt including the associated interest rates and related estimated fair values by calendar maturity
(
in millions, except interest rates)
:
Sep 28, 2025
Sep 29, 2024
Stated
Interest
Rate
Effective
Interest
Rate
(1)
Issuance
Face Value
Estimated
Fair Value
Face Value
Estimated
Fair Value
August 2025 notes
$
—
$
—
$
1,250.0
$
1,243.4
3.800%
3.721%
February 2026 notes
1,000.0
1,001.7
1,000.0
1,008.3
4.750%
4.788%
June 2026 notes
500.0
494.0
500.0
486.8
2.450%
2.511%
February 2027 notes
1,000.0
1,009.8
1,000.0
1,017.8
4.850%
4.958%
March 2027 notes
500.0
484.7
500.0
477.1
2.000%
2.058%
March 2028 notes
600.0
591.9
600.0
590.3
3.500%
3.529%
May 2028 notes
750.0
757.1
—
—
4.500%
4.719%
November 2028 notes
750.0
747.9
750.0
748.4
4.000%
3.958%
August 2029 notes
(2)
1,000.0
978.5
1,000.0
977.3
3.550%
3.840%
March 2030 notes
750.0
687.8
750.0
679.0
2.250%
3.084%
May 2030 notes
500.0
510.2
—
—
4.800%
4.932%
November 2030 notes
1,250.0
1,145.9
1,250.0
1,135.4
2.550%
2.582%
February 2031 notes
500.0
514.2
500.0
520.8
4.900%
5.046%
February 2032 notes
1,000.0
918.1
1,000.0
912.0
3.000%
3.155%
February 2033 notes
500.0
505.7
500.0
513.1
4.800%
3.798%
February 2034 notes
500.0
509.9
500.0
515.0
5.000%
5.127%
May 2035 notes
500.0
516.6
—
—
5.400%
5.510%
June 2045 notes
350.0
292.1
350.0
308.5
4.300%
4.348%
December 2047 notes
500.0
378.0
500.0
398.8
3.750%
3.765%
November 2048 notes
1,000.0
849.6
1,000.0
903.4
4.500%
4.504%
August 2049 notes
1,000.0
839.5
1,000.0
889.0
4.450%
4.447%
March 2050 notes
500.0
346.0
500.0
367.9
3.350%
3.362%
November 2050 notes
1,250.0
889.0
1,250.0
954.4
3.500%
3.528%
Total
16,200.0
14,968.2
15,700.0
14,646.7
Aggregate debt issuance
costs and unamortized
premium/(discount), net
(109.3)
(113.8)
Hedge accounting fair value
adjustment
(2)
(15.9)
(17.8)
Total
$
16,074.8
$
15,568.4
(1)
Includes the effects of the amortization of any premium or discount and any gain or loss upon settlement of related treasury locks or
forward-starting interest rate swaps utilized to hedge the interest rate risk prior to the debt issuance.
(2)
Amount includes the change in fair value due to changes in benchmark interest rates related to hedging $350 million of our
August 2029 notes. Refer to Note 3, Derivative Financial Instruments, for additional information on our interest rate swap designated
as a fair value hedge.
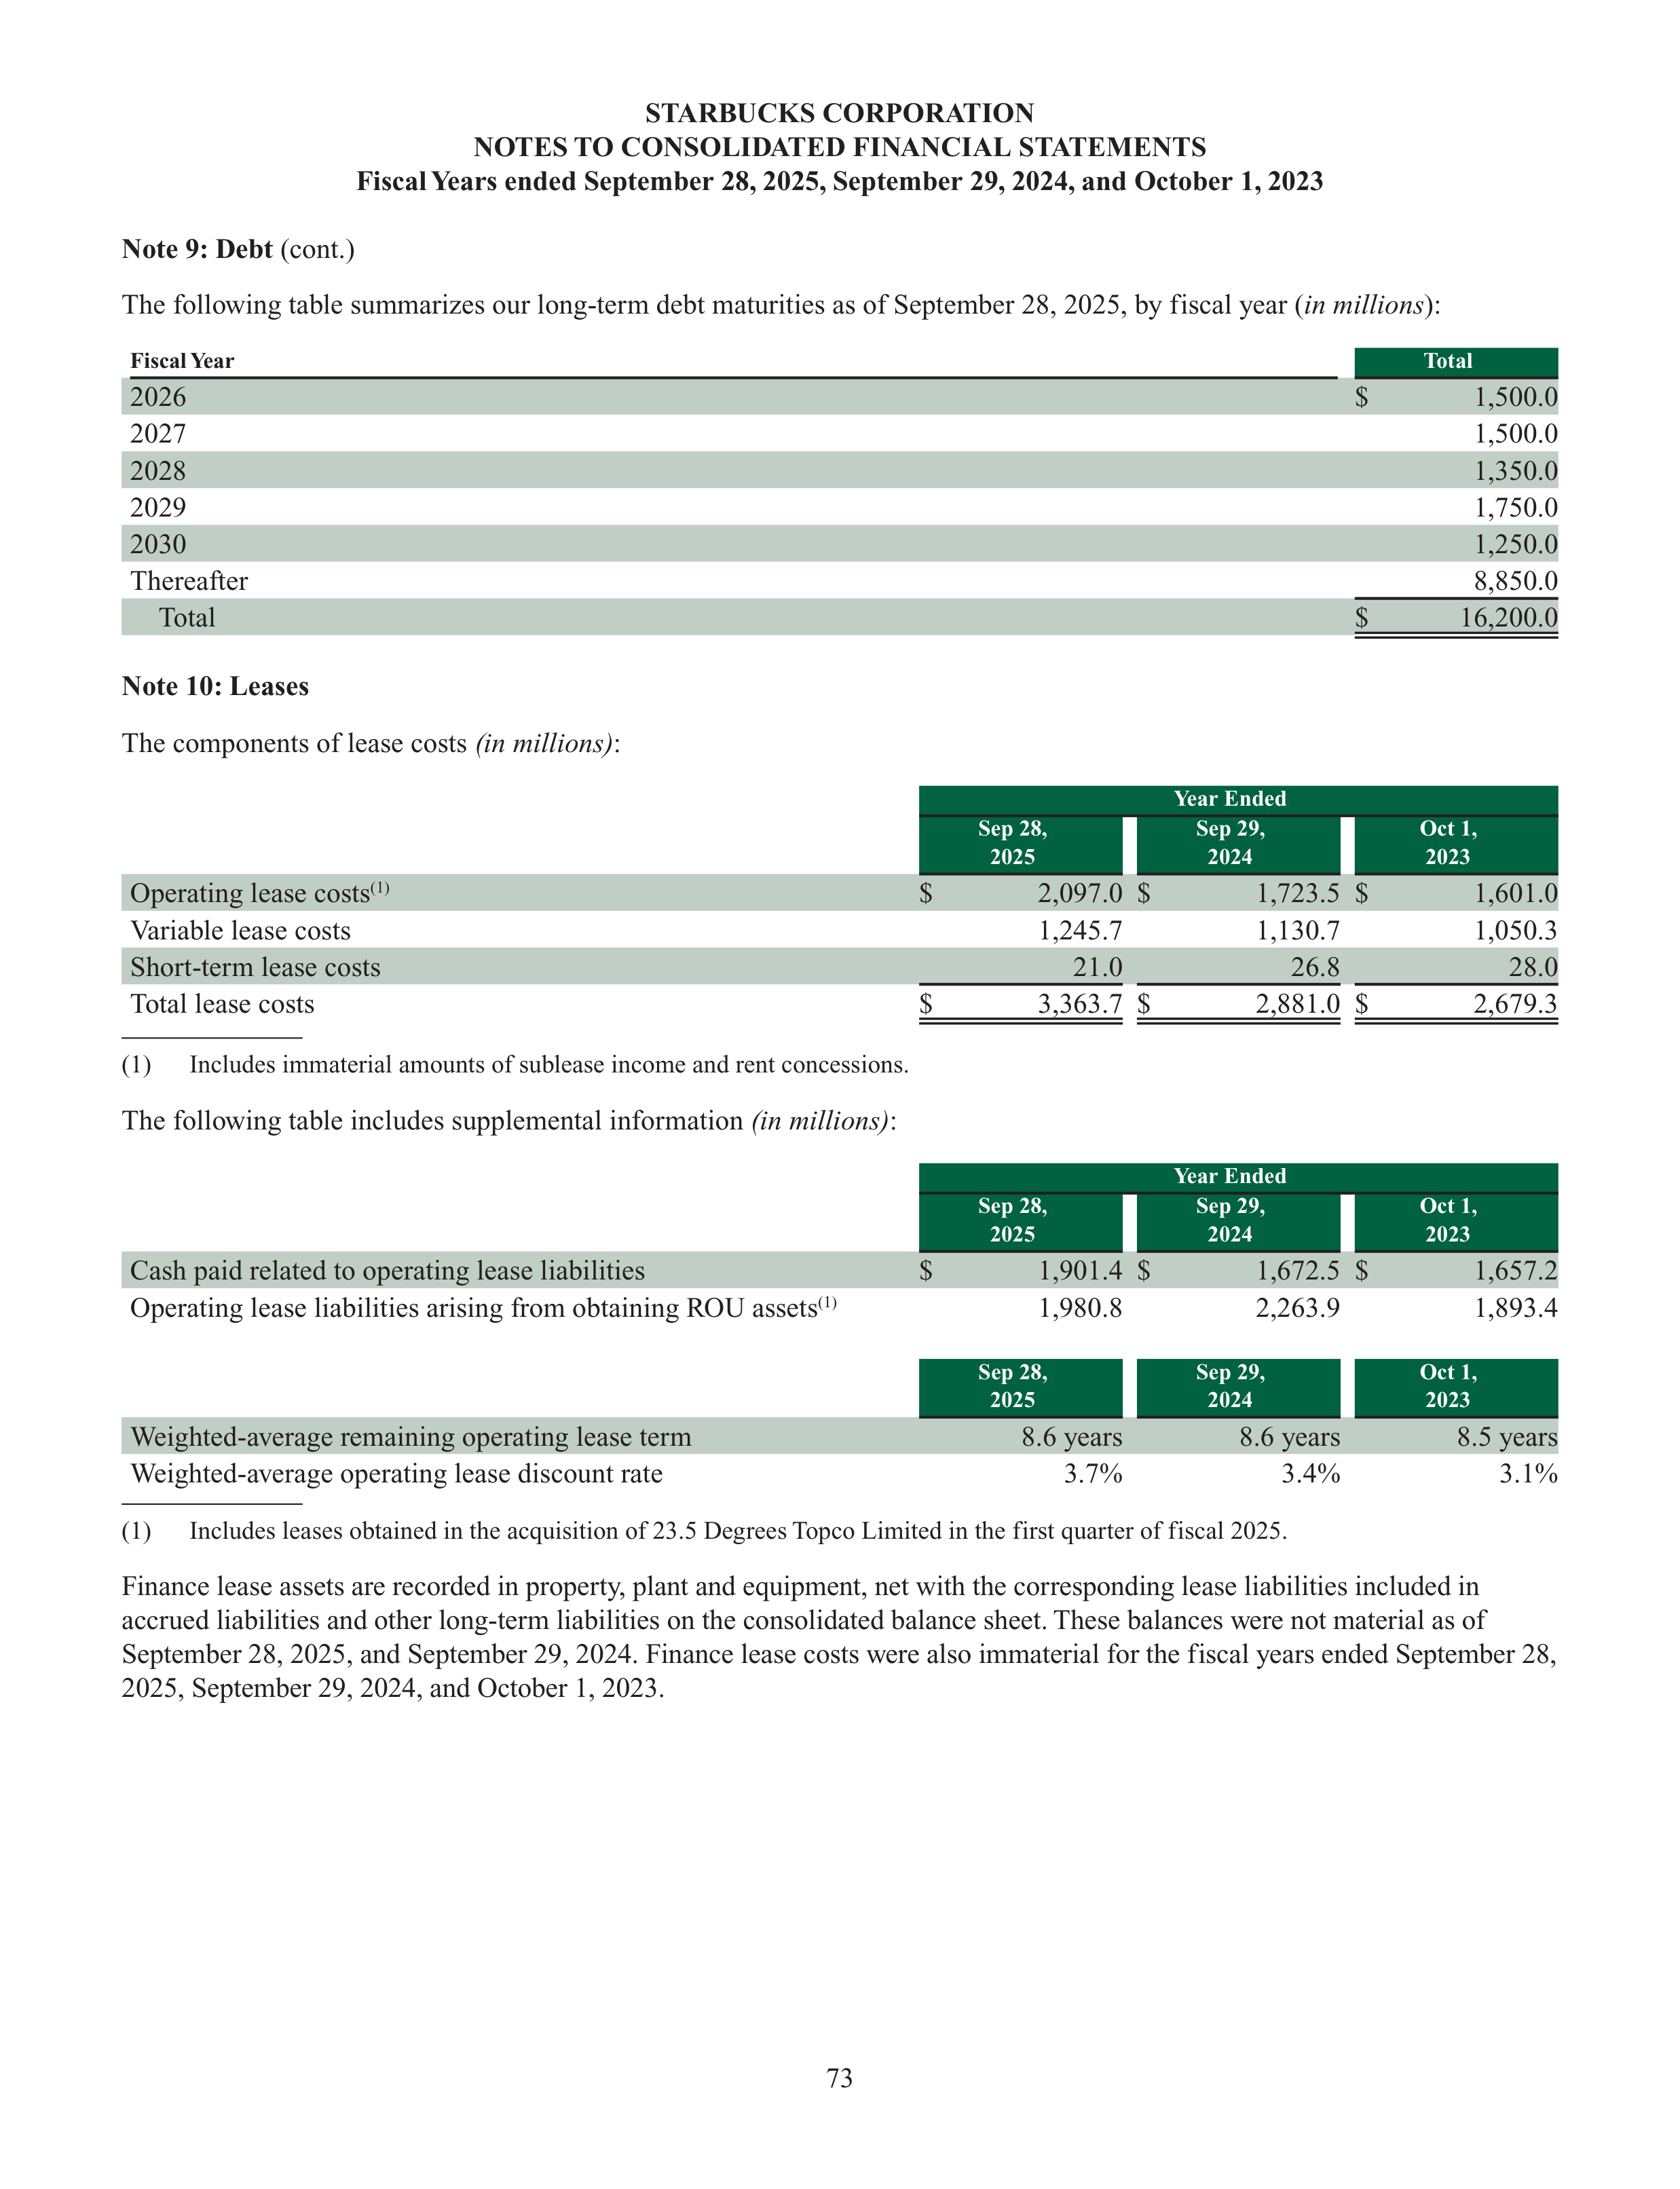
73
STARBUCKS CORPORATION
NOTES TO CONSOLIDATED FINANCIAL STATEMENTS
Fiscal Years ended September 28, 2025, September 29, 2024, and October 1, 2023
Note 9: Debt
(cont.)
The following table summarizes our long-term debt maturities as of September 28, 2025, by fiscal year (
in millions
):
Fiscal Year
Total
2026
$
1,500.0
2027
1,500.0
2028
1,350.0
2029
1,750.0
2030
1,250.0
Thereafter
8,850.0
Total
$
16,200.0
Note 10: Leases
The components of lease costs
(in millions)
:
Year Ended
Sep 28,
2025
Sep 29,
2024
Oct 1,
2023
Operating lease costs
(1)
$
2,097.0
$
1,723.5
$
1,601.0
Variable lease costs
1,245.7
1,130.7
1,050.3
Short-term lease costs
21.0
26.8
28.0
Total lease costs
$
3,363.7
$
2,881.0
$
2,679.3
(1)
Includes immaterial amounts of sublease income and rent concessions.
The following table includes supplemental information
(in millions)
:
Year Ended
Sep 28,
2025
Sep 29,
2024
Oct 1,
2023
Cash paid related to operating lease liabilities
$
1,901.4
$
1,672.5 $
1,657.2
Operating lease liabilities arising from obtaining ROU assets
(1)
1,980.8
2,263.9
1,893.4
Sep 28,
2025
Sep 29,
2024
Oct 1,
2023
Weighted-average remaining operating lease term
8.6 years
8.6 years
8.5 years
Weighted-average operating lease discount rate
3.7%
3.4%
3.1%
(1)
Includes leases obtained in the acquisition of 23.5 Degrees Topco Limited in the first quarter of fiscal 2025.
Finance lease assets are recorded in property, plant and equipment, net with the corresponding lease liabilities included in
accrued liabilities and other long-term liabilities on the consolidated balance sheet. These balances were not material as of
September 28, 2025, and September 29, 2024. Finance lease costs were also immaterial for the fiscal years ended September 28,
2025, September 29, 2024, and October 1, 2023.
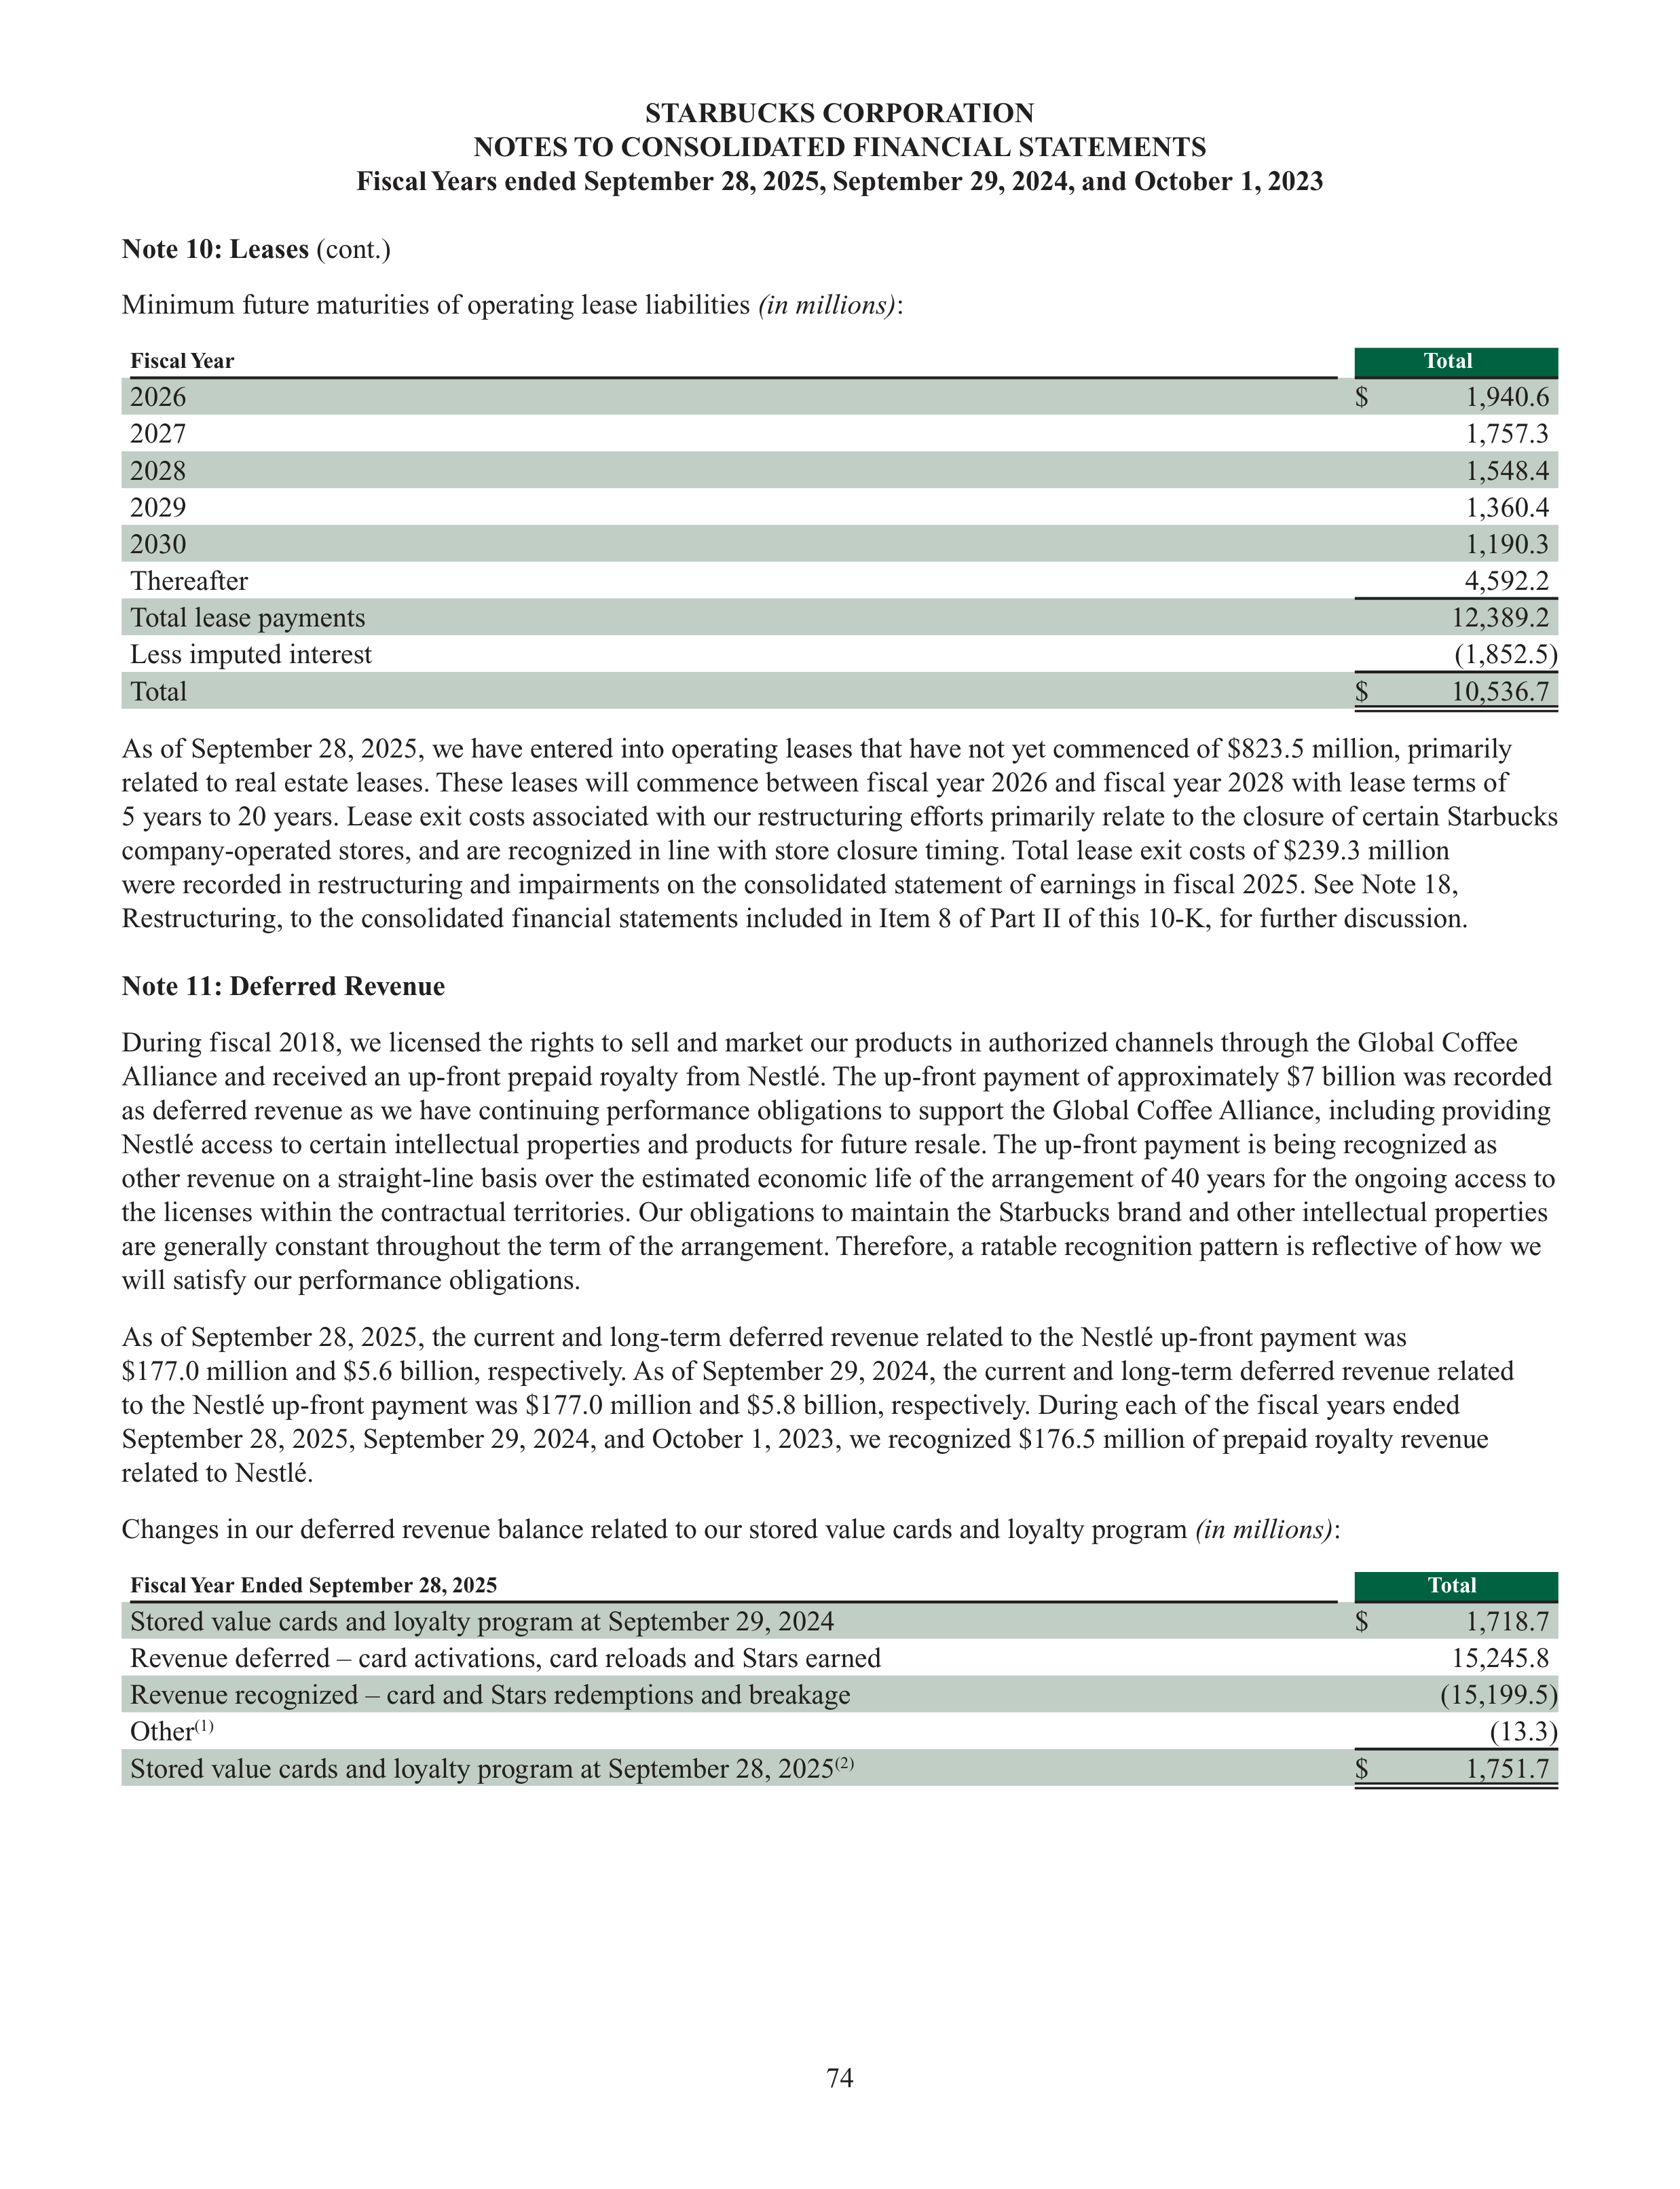
74
STARBUCKS CORPORATION
NOTES TO CONSOLIDATED FINANCIAL STATEMENTS
Fiscal Years ended September 28, 2025, September 29, 2024, and October 1, 2023
Note 10: Leases
(cont.)
Minimum future maturities of operating lease liabilities
(in millions)
:
Fiscal Year
Total
2026
$
1,940.6
2027
1,757.3
2028
1,548.4
2029
1,360.4
2030
1,190.3
Thereafter
4,592.2
Total lease payments
12,389.2
Less imputed interest
(1,852.5)
Total
$
10,536.7
As of September 28, 2025, we have entered into operating leases that have not yet commenced of $823.5 million, primarily
related to real estate leases. These leases will commence between fiscal year 2026 and fiscal year 2028 with lease terms of
5 years to 20 years. Lease exit costs associated with our restructuring efforts primarily relate to the closure of certain Starbucks
company-operated stores, and are recognized in line with store closure timing. Total lease exit costs of $239.3 million
were recorded in restructuring and impairments on the consolidated statement of earnings in fiscal 2025. See Note 18,
Restructuring, to the consolidated financial statements included in Item 8 of Part II of this 10-K, for further discussion.
Note 11: Deferred Revenue
During fiscal 2018, we licensed the rights to sell and market our products in authorized channels through the Global Coffee
Alliance and received an up-front prepaid royalty from Nestlé. The up-front payment of approximately $7 billion was recorded
as deferred revenue as we have continuing performance obligations to support the Global Coffee Alliance, including providing
Nestlé access to certain intellectual properties and products for future resale. The up-front payment is being recognized as
other revenue on a straight-line basis over the estimated economic life of the arrangement of 40 years for the ongoing access to
the licenses within the contractual territories. Our obligations to maintain the Starbucks brand and other intellectual properties
are generally constant throughout the term of the arrangement. Therefore, a ratable recognition pattern is reflective of how we
will satisfy our performance obligations.
As of September 28, 2025, the current and long-term deferred revenue related to the Nestlé up-front payment was
$177.0 million and $5.6 billion, respectively. As of September 29, 2024, the current and long-term deferred revenue related
to the Nestlé up-front payment was $177.0 million and $5.8 billion, respectively. During each of the fiscal years ended
September 28, 2025, September 29, 2024, and October 1, 2023, we recognized $176.5 million of prepaid royalty revenue
related to Nestlé.
Changes in our deferred revenue balance related to our stored value cards and loyalty program
(in millions)
:
Fiscal Year Ended September 28, 2025
Total
Stored value cards and loyalty program at September 29, 2024
$
1,718.7
Revenue deferred – card activations, card reloads and Stars earned
15,245.8
Revenue recognized – card and Stars redemptions and breakage
(15,199.5)
Other
(1)
(13.3)
Stored value cards and loyalty program at September 28, 2025
(2)
$
1,751.7
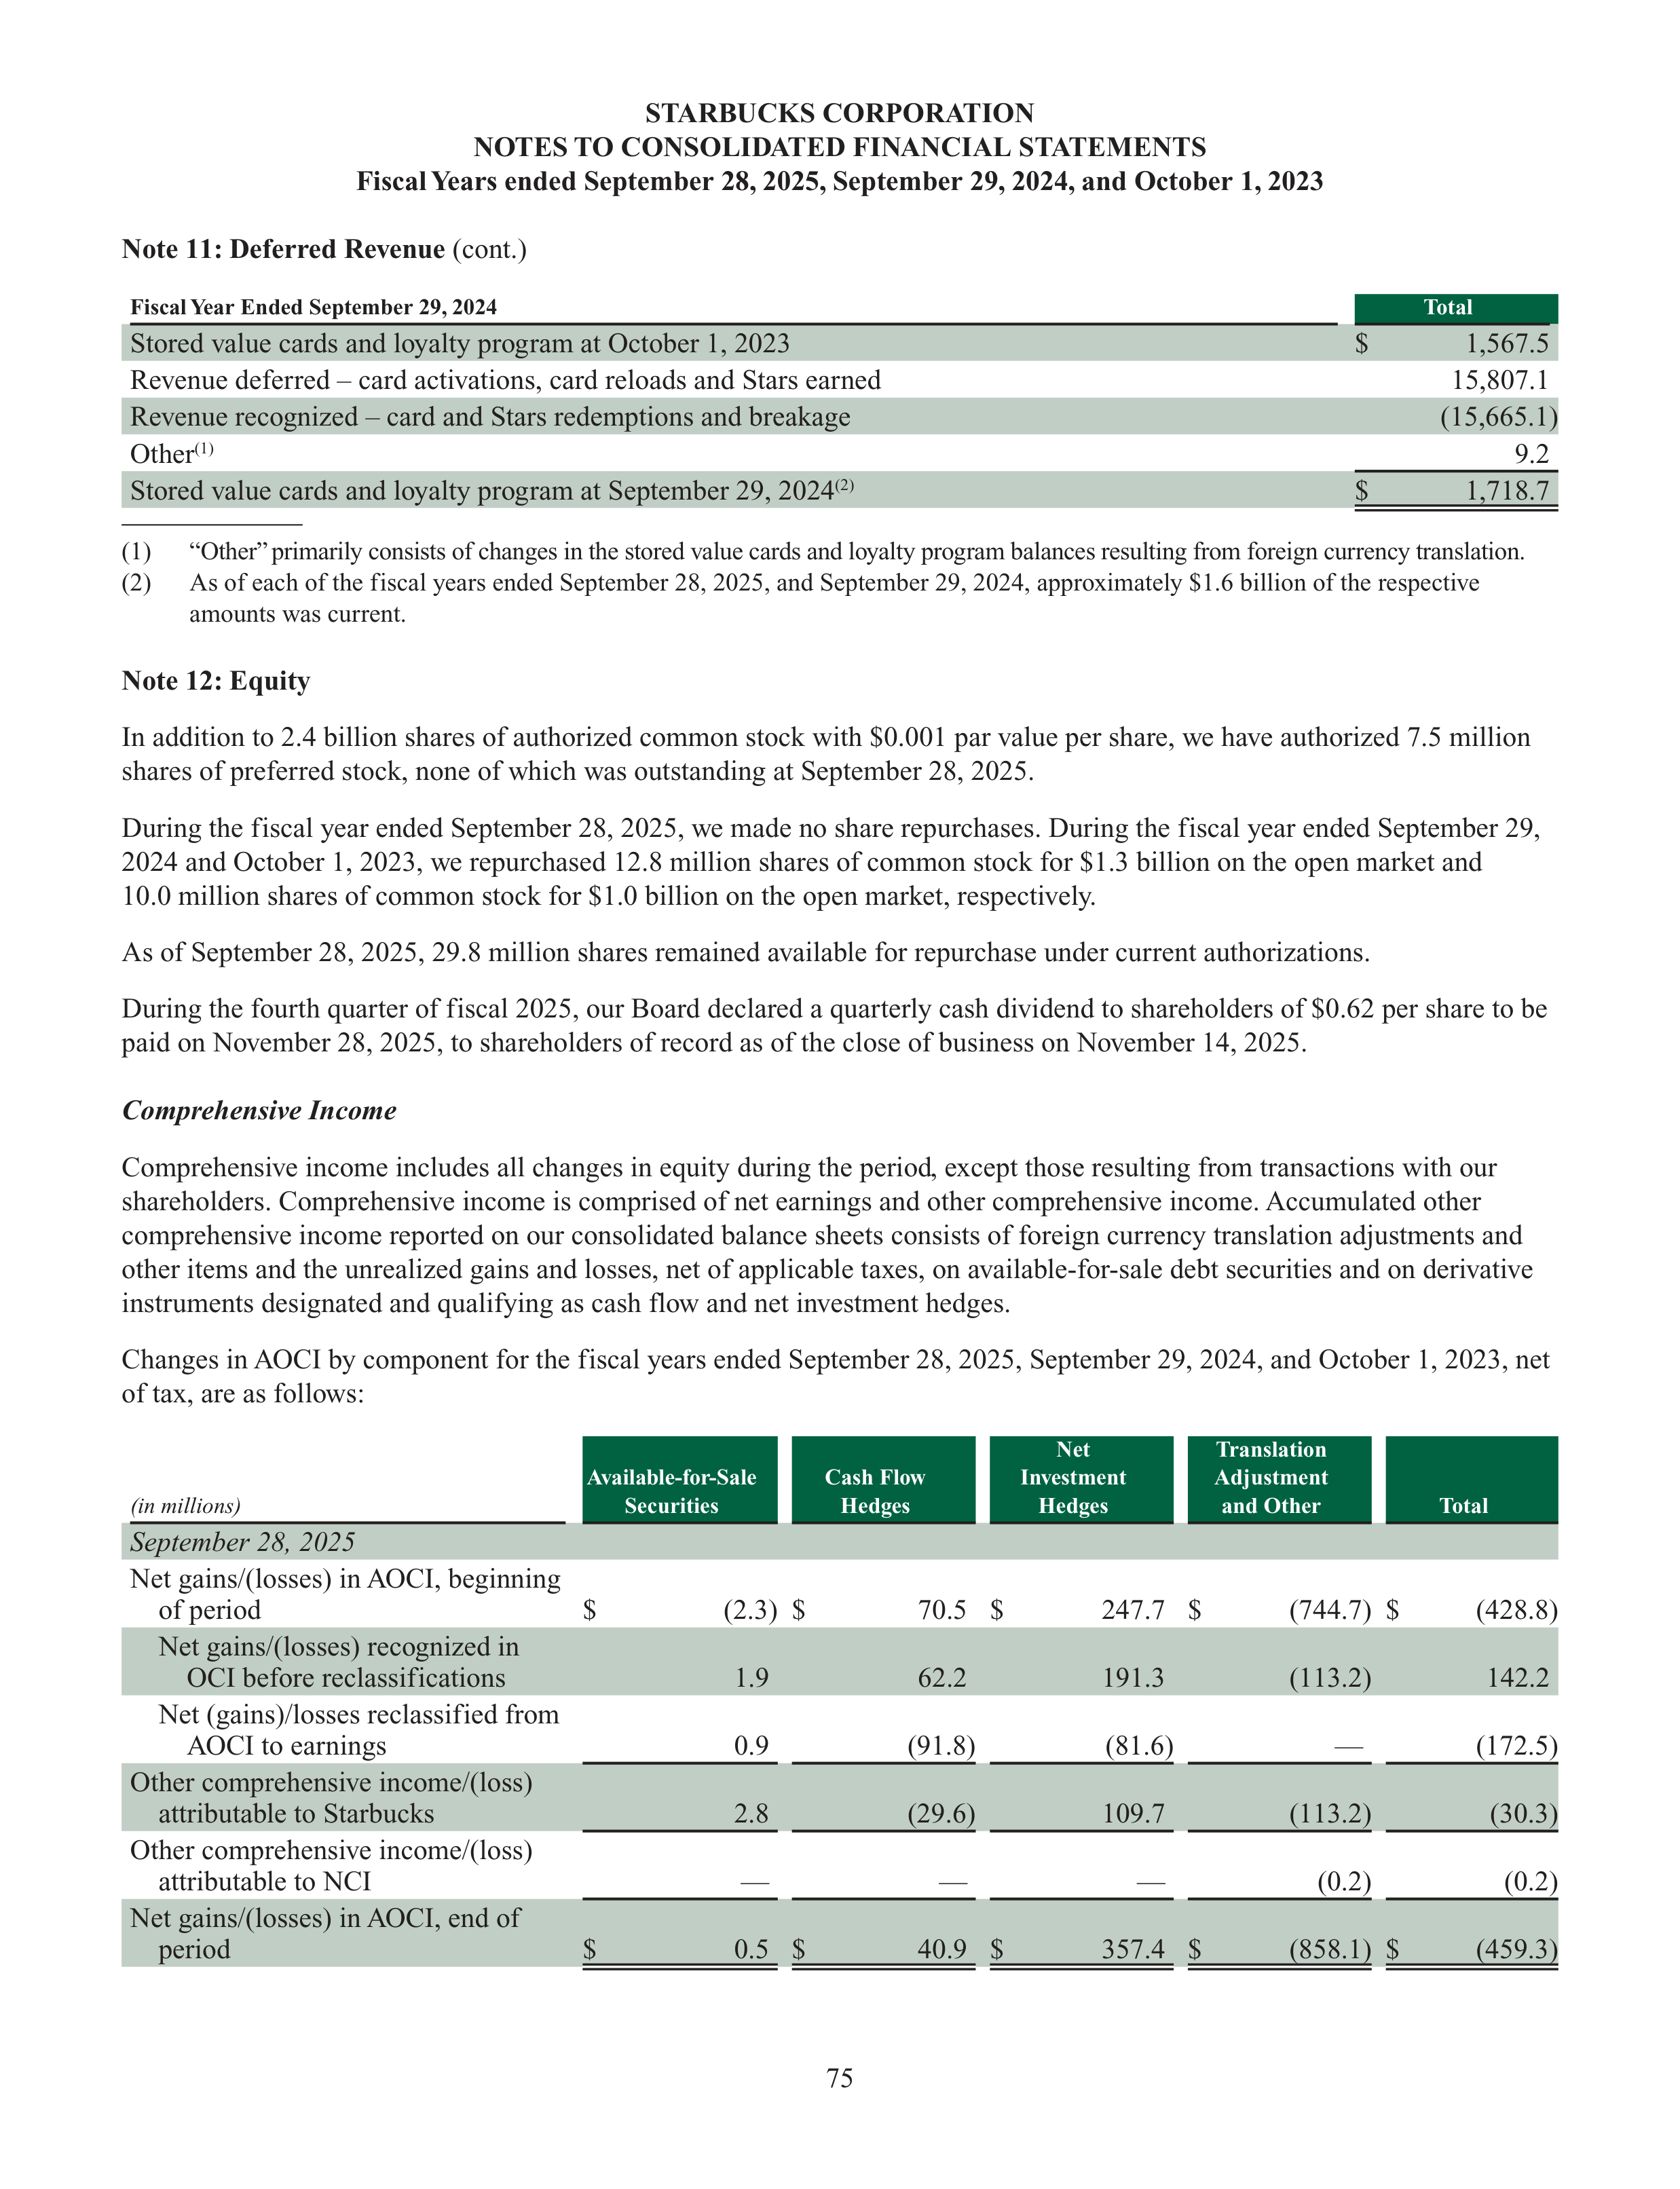
75
STARBUCKS CORPORATION
NOTES TO CONSOLIDATED FINANCIAL STATEMENTS
Fiscal Years ended September 28, 2025, September 29, 2024, and October 1, 2023
Note 11: Deferred Revenue
(cont.)
Fiscal Year Ended September 29, 2024
Total
Stored value cards and loyalty program at October 1, 2023
$
1,567.5
Revenue deferred – card activations, card reloads and Stars earned
15,807.1
Revenue recognized – card and Stars redemptions and breakage
(15,665.1)
Other
(1)
9.2
Stored value cards and loyalty program at September 29, 2024
(2)
$
1,718.7
(1)
“Other” primarily consists of changes in the stored value cards and loyalty program balances resulting from foreign currency translation.
(2)
As of each of the fiscal years ended September 28, 2025, and September 29, 2024, approximately $1.6 billion of the respective
amounts was current.
Note 12: Equity
In addition to 2.4 billion shares of authorized common stock with $0.001 par value per share, we have authorized 7.5 million
shares of preferred stock, none of which was outstanding at September 28, 2025.
During the fiscal year ended September 28, 2025, we made no share repurchases. During the fiscal year ended September 29,
2024 and October 1, 2023, we repurchased 12.8 million shares of common stock for $1.3 billion on the open market and
10.0 million shares of common stock for $1.0 billion on the open market, respectively.
As of September 28, 2025, 29.8 million shares remained available for repurchase under current authorizations.
During the fourth quarter of fiscal 2025, our Board declared a quarterly cash dividend to shareholders of $0.62 per share to be
paid on November 28, 2025, to shareholders of record as of the close of business on November 14, 2025.
Comprehensive Income
Comprehensive income includes all changes in equity during the period, except those resulting from transactions with our
shareholders. Comprehensive income is comprised of net earnings and other comprehensive income. Accumulated other
comprehensive income reported on our consolidated balance sheets consists of foreign currency translation adjustments and
other items and the unrealized gains and losses, net of applicable taxes, on available-for-sale debt securities and on derivative
instruments designated and qualifying as cash flow and net investment hedges.
Changes in AOCI by component for the fiscal years ended September 28, 2025, September 29, 2024, and October 1, 2023, net
of tax, are as follows:
(in millions)
Available-for-Sale
Securities
Cash Flow
Hedges
Net
Investment
Hedges
Translation
Adjustment
and Other
Total
September 28, 2025
Net gains/(losses) in AOCI, beginning
of period
$
(2.3)
$
70.5
$
247.7
$
(744.7)
$
(428.8)
Net gains/(losses) recognized in
OCI before reclassifications
1.9
62.2
191.3
(113.2)
142.2
Net (gains)/losses reclassified from
AOCI to earnings
0.9
(91.8)
(81.6)
—
(172.5)
Other comprehensive income/(loss)
attributable to Starbucks
2.8
(29.6)
109.7
(113.2)
(30.3)
Other comprehensive income/(loss)
attributable to NCI
—
—
—
(0.2)
(0.2)
Net gains/(losses) in AOCI, end of
period
$
0.5
$
40.9
$
357.4
$
(858.1)
$
(459.3)
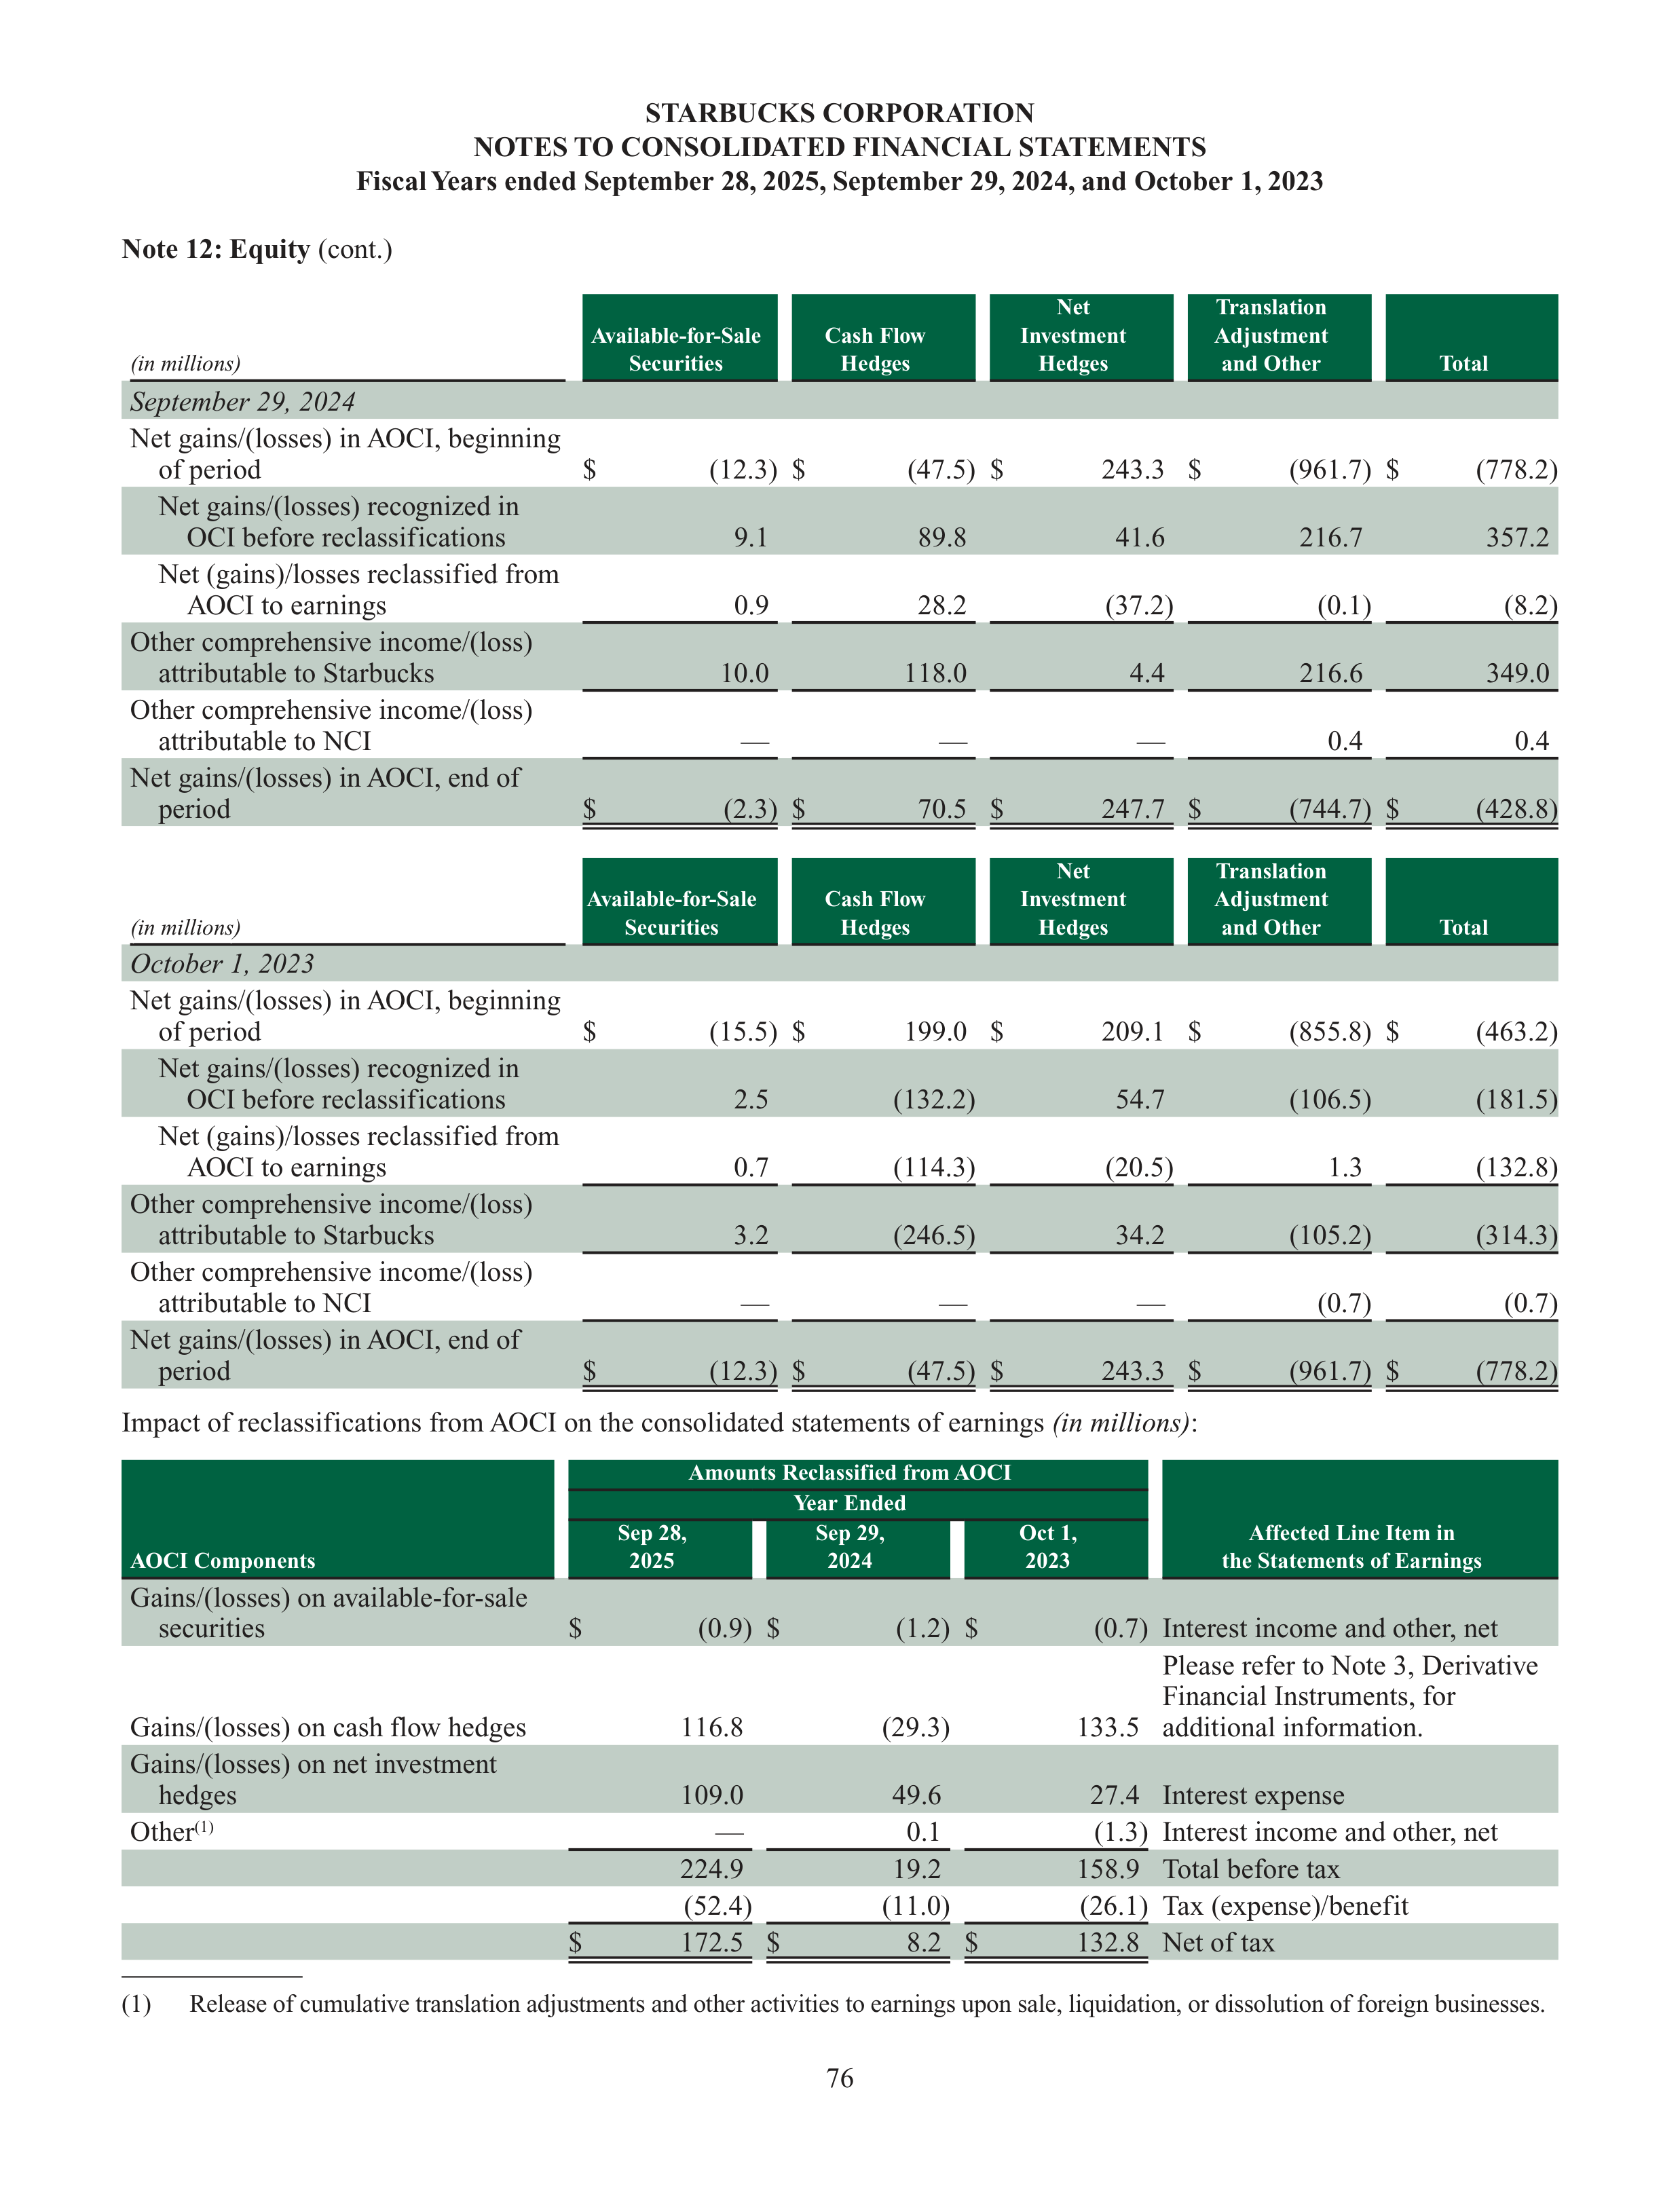
76
STARBUCKS CORPORATION
NOTES TO CONSOLIDATED FINANCIAL STATEMENTS
Fiscal Years ended September 28, 2025, September 29, 2024, and October 1, 2023
Note 12: Equity
(cont.)
(in millions)
Available-for-Sale
Securities
Cash Flow
Hedges
Net
Investment
Hedges
Translation
Adjustment
and Other
Total
September 29, 2024
Net gains/(losses) in AOCI, beginning
of period
$
(12.3)
$
(47.5)
$
243.3
$
(961.7)
$
(778.2)
Net gains/(losses) recognized in
OCI before reclassifications
9.1
89.8
41.6
216.7
357.2
Net (gains)/losses reclassified from
AOCI to earnings
0.9
28.2
(37.2)
(0.1)
(8.2)
Other comprehensive income/(loss)
attributable to Starbucks
10.0
118.0
4.4
216.6
349.0
Other comprehensive income/(loss)
attributable to NCI
—
—
—
0.4
0.4
Net gains/(losses) in AOCI, end of
period
$
(2.3)
$
70.5
$
247.7
$
(744.7)
$
(428.8)
(in millions)
(in millions)
Available-for-Sale
Securities
Cash Flow
Hedges
Net
Investment
Hedges
Translation
Adjustment
and Other
Total
October 1, 2023
Net gains/(losses) in AOCI, beginning
of period
$
(15.5)
$
199.0
$
209.1
$
(855.8)
$
(463.2)
Net gains/(losses) recognized in
OCI before reclassifications
2.5
(132.2)
54.7
(106.5)
(181.5)
Net (gains)/losses reclassified from
AOCI to earnings
0.7
(114.3)
(20.5)
1.3
(132.8)
Other comprehensive income/(loss)
attributable to Starbucks
3.2
(246.5)
34.2
(105.2)
(314.3)
Other comprehensive income/(loss)
attributable to NCI
—
—
—
(0.7)
(0.7)
Net gains/(losses) in AOCI, end of
period
$
(12.3)
$
(47.5)
$
243.3
$
(961.7)
$
(778.2)
Impact of reclassifications from AOCI on the consolidated statements of earnings
(in millions)
:
AOCI Components
Amounts Reclassified from AOCI
Affected Line Item in
the Statements of Earnings
Year Ended
Sep 28,
2025
Sep 29,
2024
Oct 1,
2023
Gains/(losses) on available-for-sale
securities
$
(0.9)
$
(1.2)
$
(0.7)
Interest income and other, net
Gains/(losses) on cash flow hedges
116.8
(29.3)
133.5
Please refer to Note 3, Derivative
Financial Instruments, for
additional information.
Gains/(losses) on net investment
hedges
109.0
49.6
27.4
Interest expense
Other
(1)
—
0.1
(1.3)
Interest income and other, net
224.9
19.2
158.9
Total before tax
(52.4)
(11.0)
(26.1)
Tax (expense)/benefit
$
172.5
$
8.2
$
132.8
Net of tax
(1)
Release of cumulative translation adjustments and other activities to earnings upon sale, liquidation, or dissolution of foreign businesses.
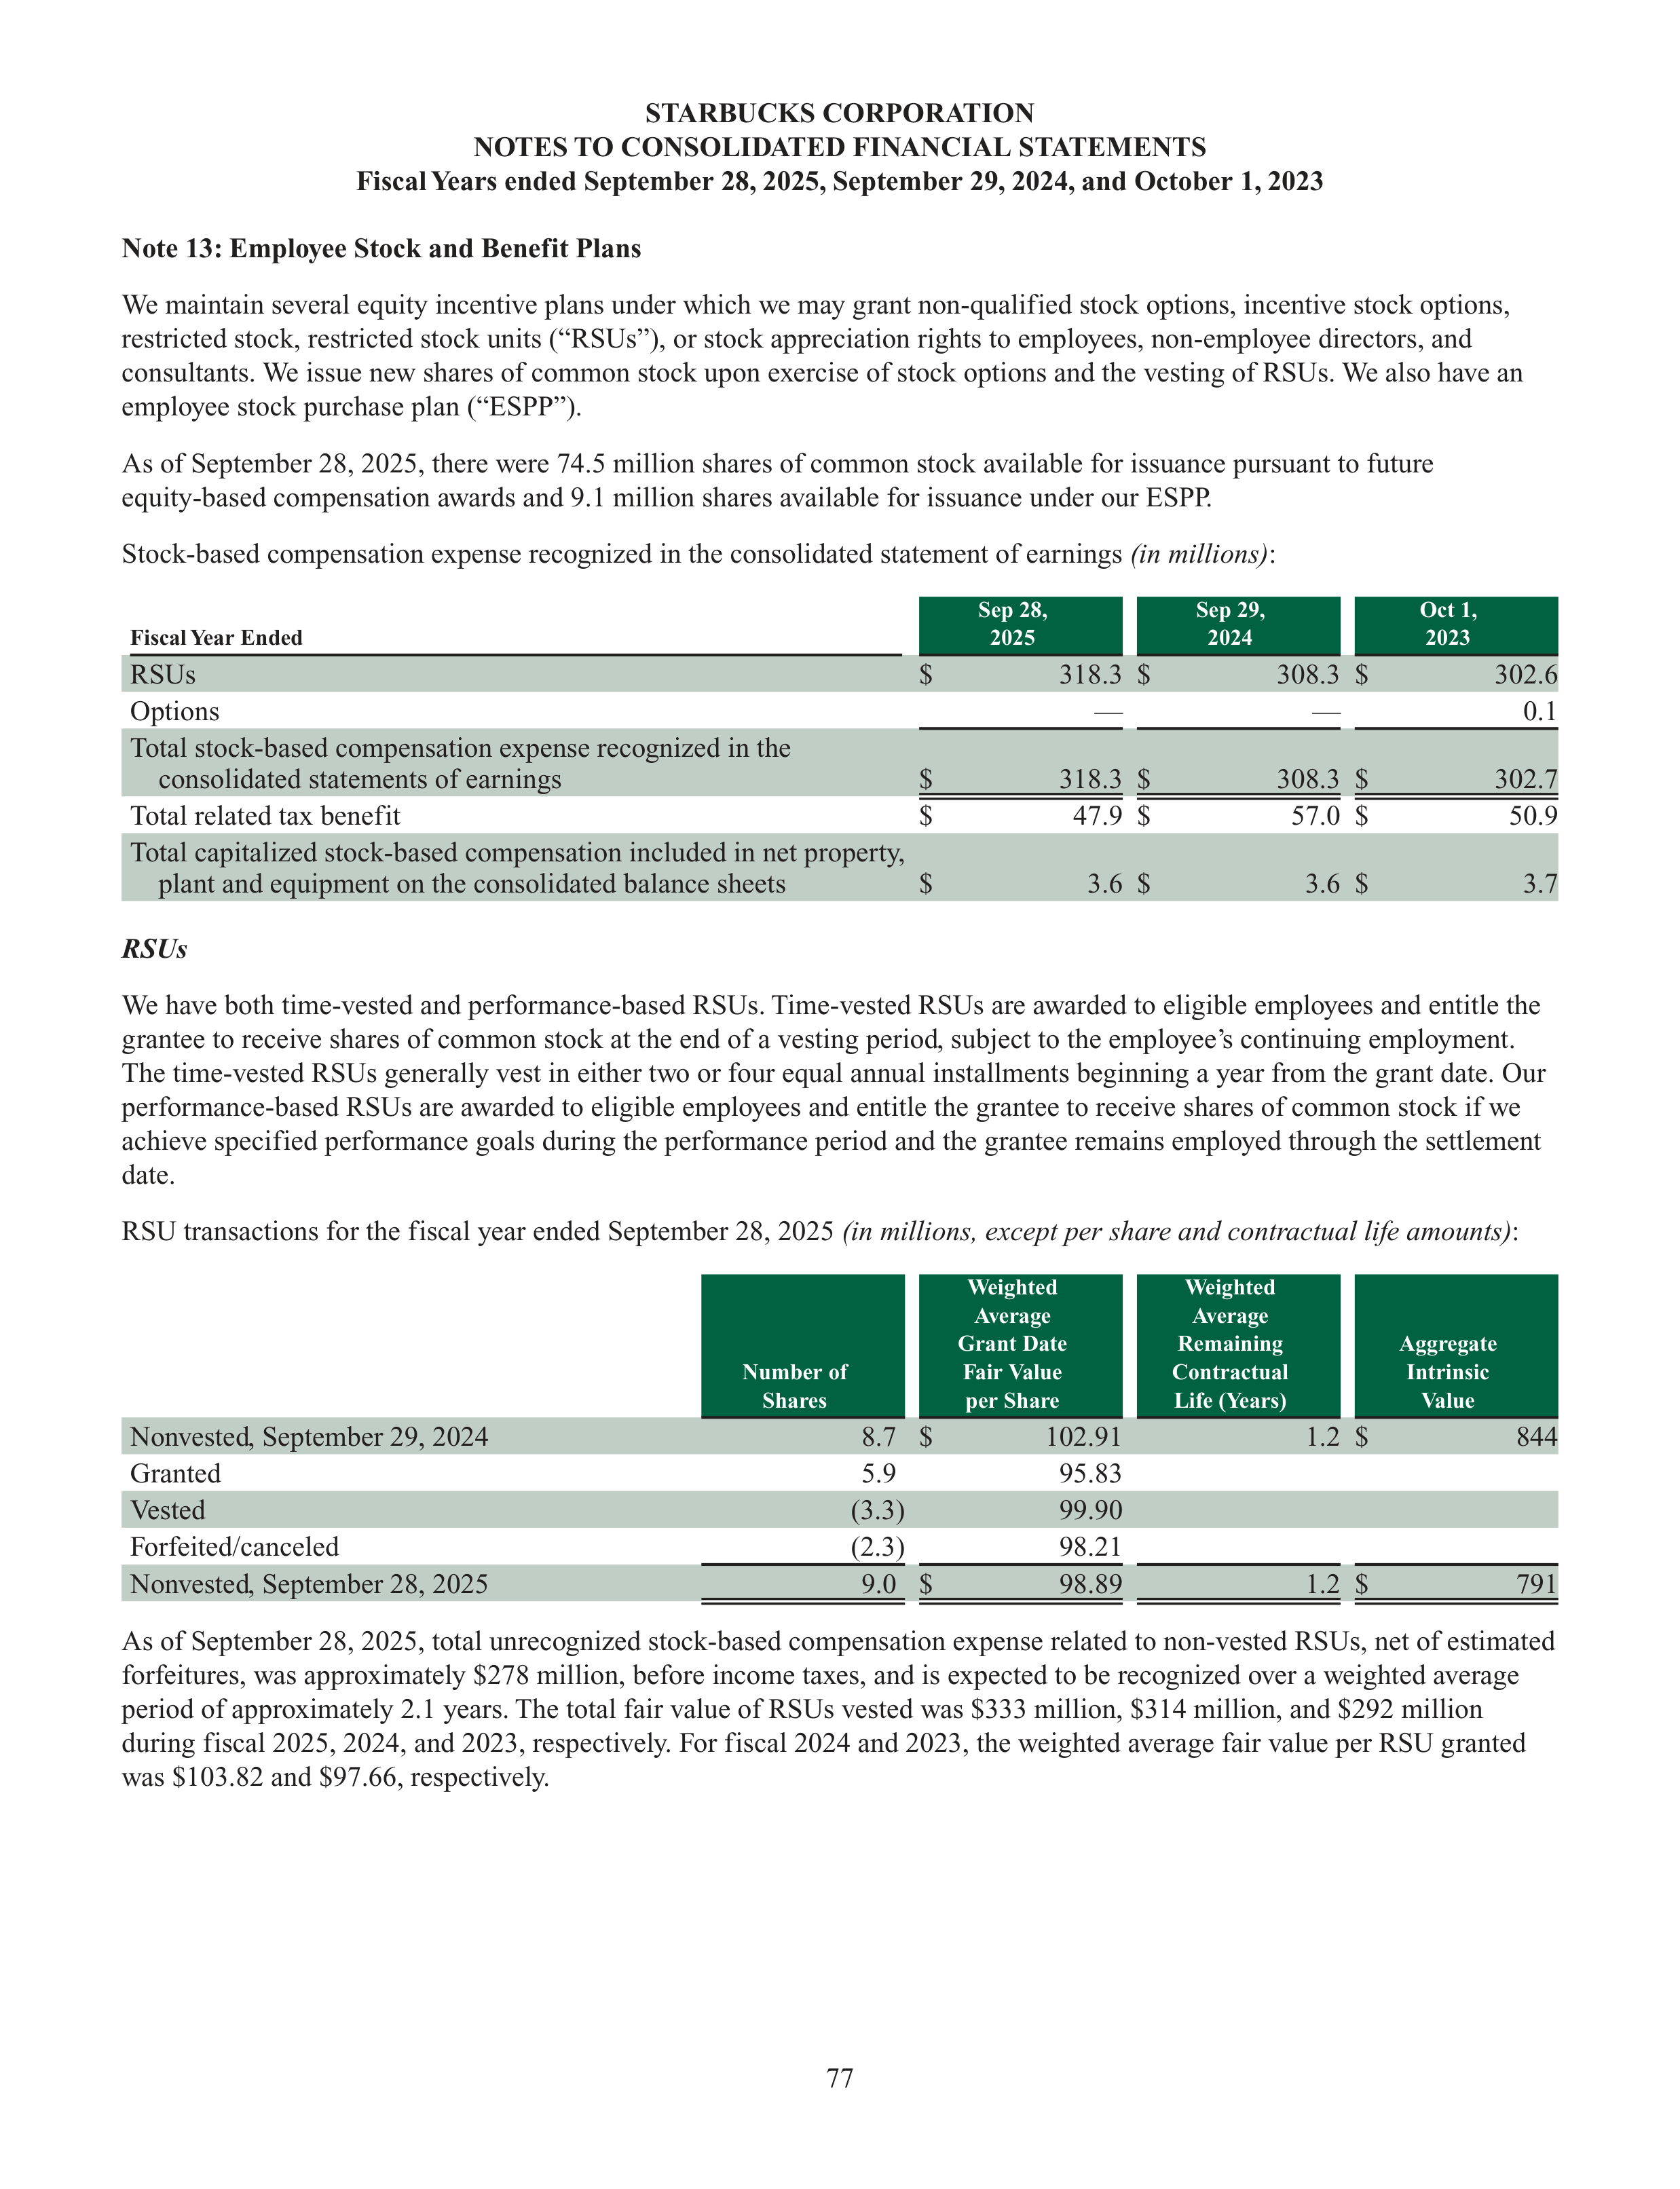
77
STARBUCKS CORPORATION
NOTES TO CONSOLIDATED FINANCIAL STATEMENTS
Fiscal Years ended September 28, 2025, September 29, 2024, and October 1, 2023
Note 13: Employee Stock and Benefit Plans
We maintain several equity incentive plans under which we may grant non-qualified stock options, incentive stock options,
restricted stock, restricted stock units (“RSUs”), or stock appreciation rights to employees, non-employee directors, and
consultants. We issue new shares of common stock upon exercise of stock options and the vesting of RSUs. We also have an
employee stock purchase plan (“ESPP”).
As of September 28, 2025, there were 74.5 million shares of common stock available for issuance pursuant to future
equity-based compensation awards and 9.1 million shares available for issuance under our ESPP.
Stock-based compensation expense recognized in the consolidated statement of earnings
(in millions)
:
Fiscal Year Ended
Fiscal Year Ended
Sep 28,
2025
Sep 29,
2024
Oct 1,
2023
RSUs
$
318.3
$
308.3
$
302.6
Options
—
—
0.1
Total stock-based compensation expense recognized in the
consolidated statements of earnings
$
318.3
$
308.3
$
302.7
Total related tax benefit
$
47.9
$
57.0
$
50.9
Total capitalized stock-based compensation included in net property,
plant and equipment on the consolidated balance sheets
$
3.6
$
3.6
$
3.7
RSUs
We have both time-vested and performance-based RSUs. Time-vested RSUs are awarded to eligible employees and entitle the
grantee to receive shares of common stock at the end of a vesting period, subject to the employee’s continuing employment.
The time-vested RSUs generally vest in either two or four equal annual installments beginning a year from the grant date. Our
performance-based RSUs are awarded to eligible employees and entitle the grantee to receive shares of common stock if we
achieve specified performance goals during the performance period and the grantee remains employed through the settlement
date.
RSU transactions for the fiscal year ended September 28, 2025
(in millions, except per share and contractual life amounts)
:
Number of
Shares
Weighted
Average
Grant Date
Fair Value
per Share
Weighted
Average
Remaining
Contractual
Life (Years)
Aggregate
Intrinsic
Value
Nonvested, September 29, 2024
8.7
$
102.91
1.2
$
844
Granted
5.9
95.83
Vested
(3.3)
99.90
Forfeited/canceled
(2.3)
98.21
Nonvested, September 28, 2025
9.0
$
98.89
1.2
$
791
As of September 28, 2025, total unrecognized stock-based compensation expense related to non-vested RSUs, net of estimated
forfeitures, was approximately $278 million, before income taxes, and is expected to be recognized over a weighted average
period of approximately 2.1 years. The total fair value of RSUs vested was $333 million, $314 million, and $292 million
during fiscal 2025, 2024, and 2023, respectively. For fiscal 2024 and 2023, the weighted average fair value per RSU granted
was $103.82 and $97.66, respectively.
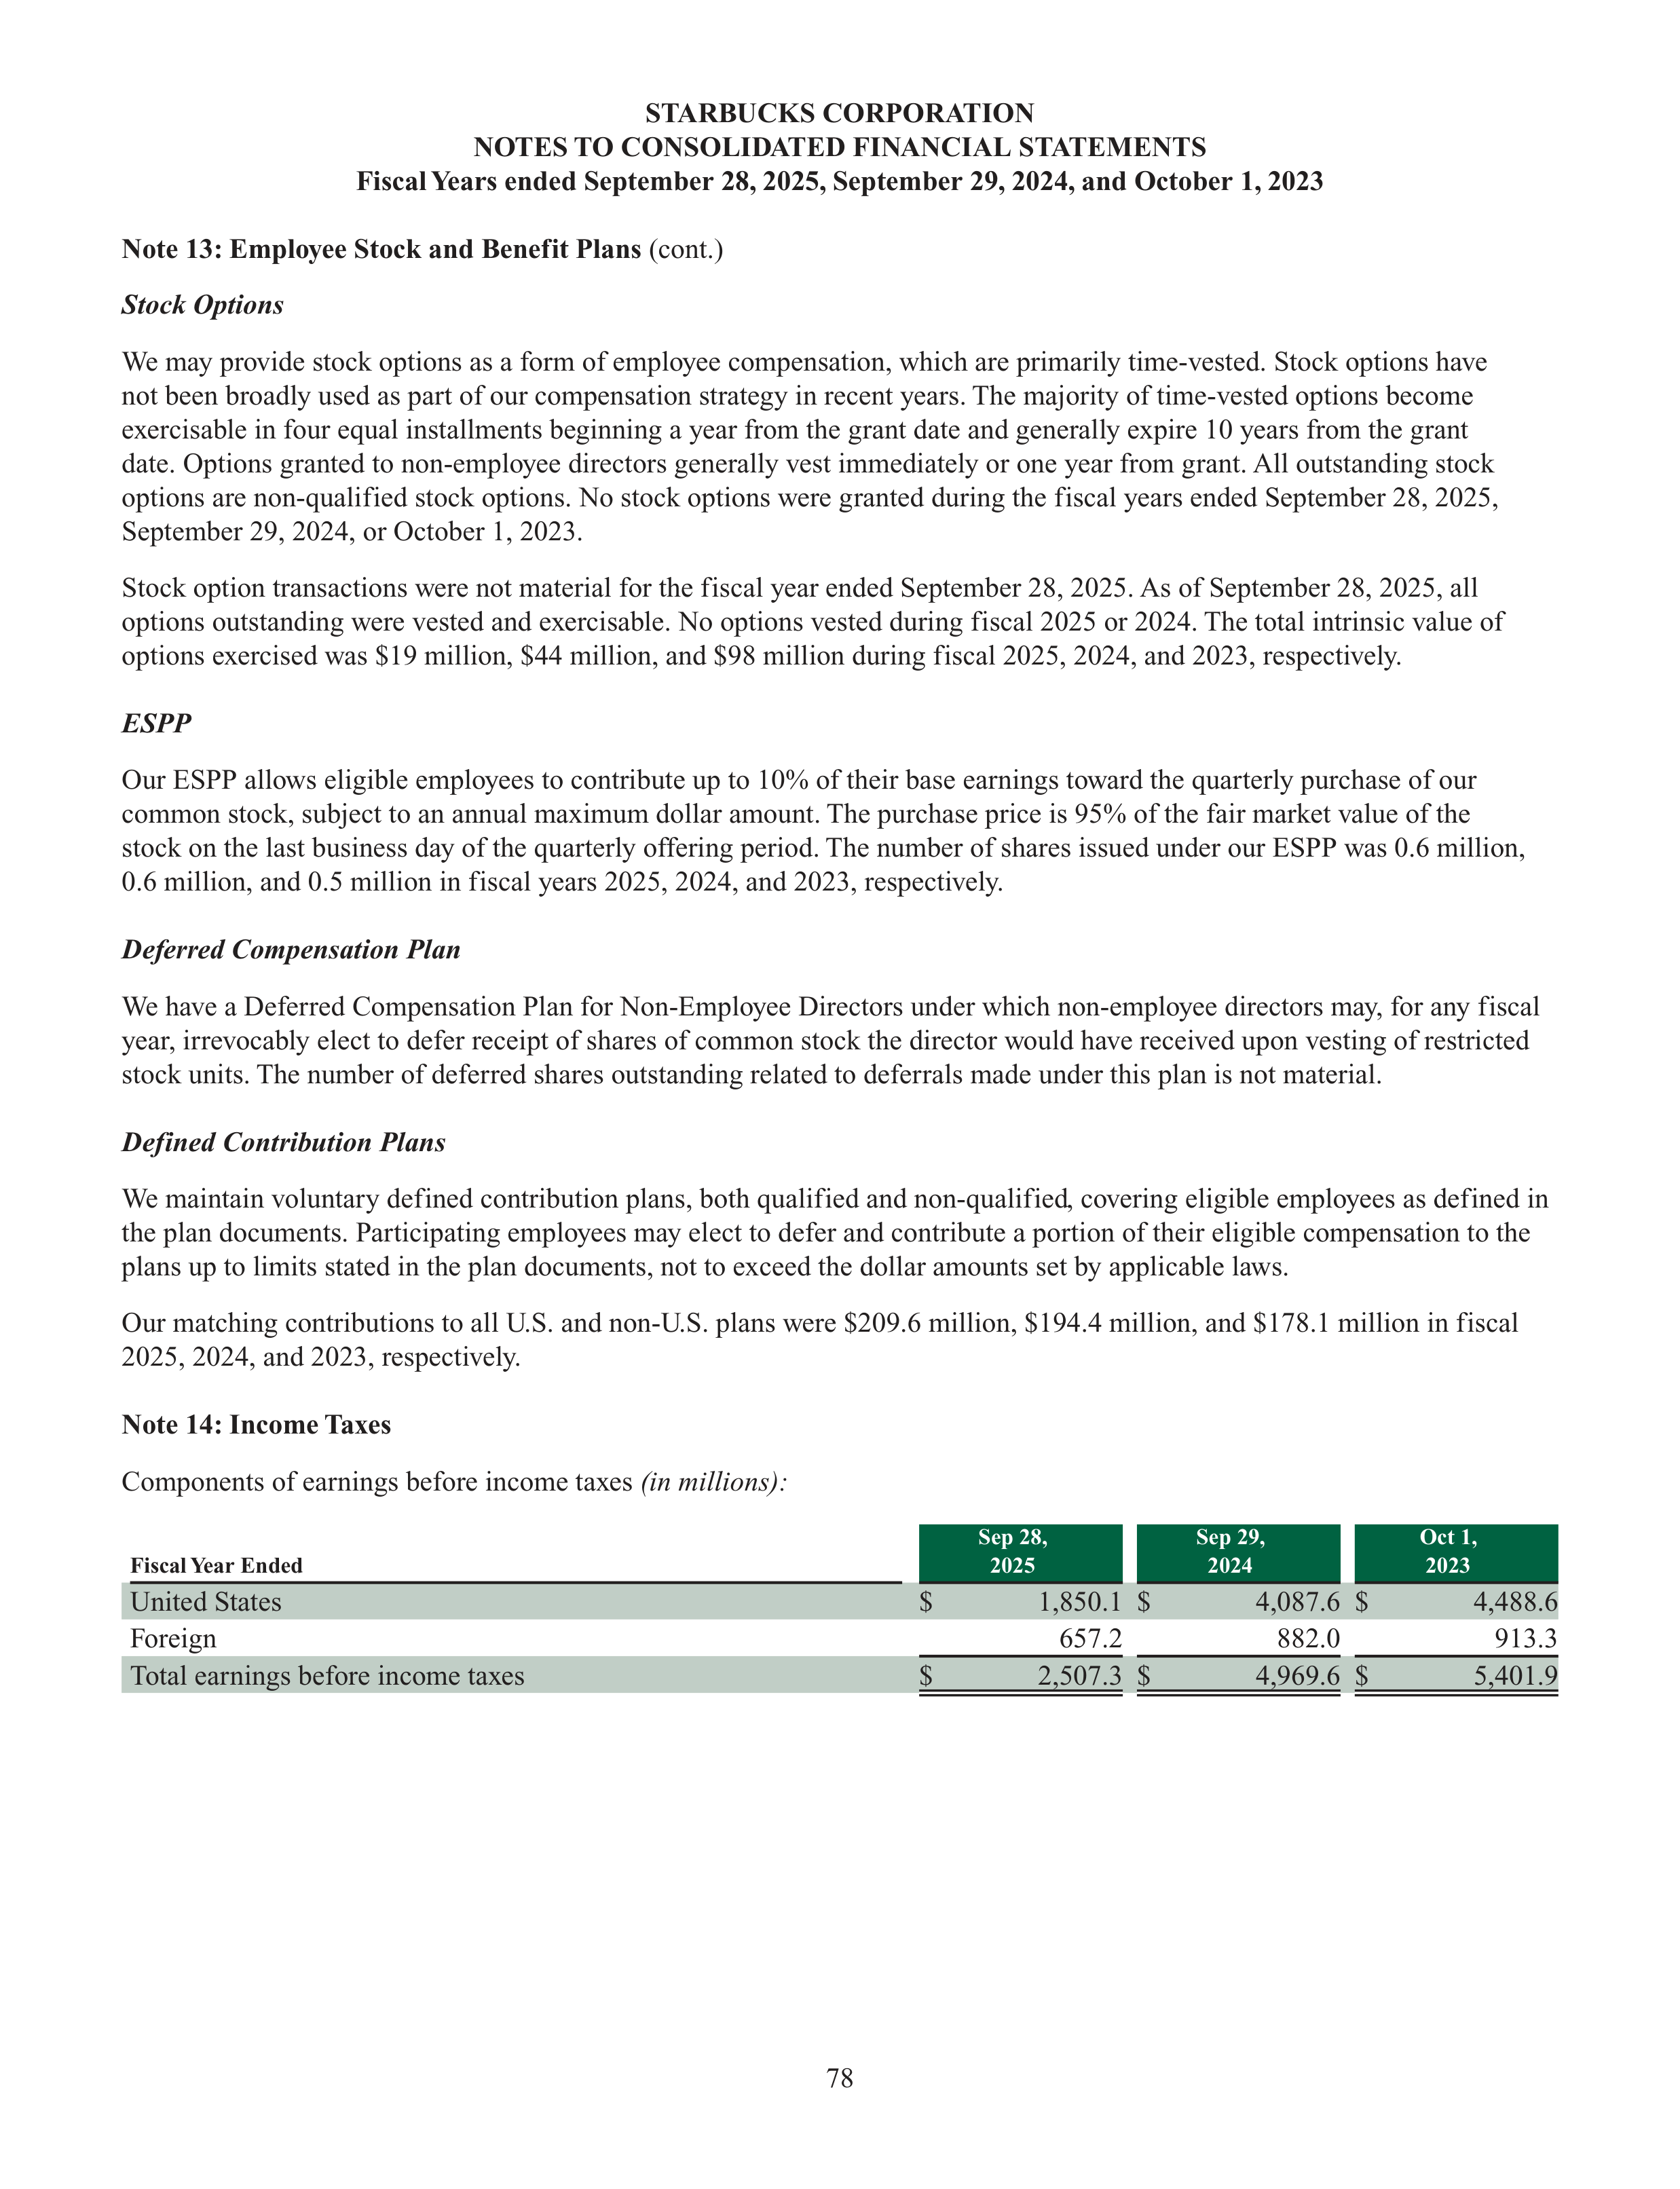
78
STARBUCKS CORPORATION
NOTES TO CONSOLIDATED FINANCIAL STATEMENTS
Fiscal Years ended September 28, 2025, September 29, 2024, and October 1, 2023
Note 13: Employee Stock and Benefit Plans
(cont.)
Stock Options
We may provide stock options as a form of employee compensation, which are primarily time-vested. Stock options have
not been broadly used as part of our compensation strategy in recent years. The majority of time-vested options become
exercisable in four equal installments beginning a year from the grant date and generally expire 10 years from the grant
date. Options granted to non-employee directors generally vest immediately or one year from grant. All outstanding stock
options are non-qualified stock options. No stock options were granted during the fiscal years ended September 28, 2025,
September 29, 2024, or October 1, 2023.
Stock option transactions were not material for the fiscal year ended September 28, 2025. As of September 28, 2025, all
options outstanding were vested and exercisable. No options vested during fiscal 2025 or 2024. The total intrinsic value of
options exercised was $19 million, $44 million, and $98 million during fiscal 2025, 2024, and 2023, respectively.
ESPP
Our ESPP allows eligible employees to contribute up to 10% of their base earnings toward the quarterly purchase of our
common stock, subject to an annual maximum dollar amount. The purchase price is 95% of the fair market value of the
stock on the last business day of the quarterly offering period. The number of shares issued under our ESPP was 0.6 million,
0.6 million, and 0.5 million in fiscal years 2025, 2024, and 2023, respectively.
Deferred Compensation Plan
We have a Deferred Compensation Plan for Non-Employee Directors under which non-employee directors may, for any fiscal
year, irrevocably elect to defer receipt of shares of common stock the director would have received upon vesting of restricted
stock units. The number of deferred shares outstanding related to deferrals made under this plan is not material.
Defined Contribution Plans
We maintain voluntary defined contribution plans, both qualified and non-qualified, covering eligible employees as defined in
the plan documents. Participating employees may elect to defer and contribute a portion of their eligible compensation to the
plans up to limits stated in the plan documents, not to exceed the dollar amounts set by applicable laws.
Our matching contributions to all U.S. and non-U.S. plans were $209.6 million, $194.4 million, and $178.1 million in fiscal
2025, 2024, and 2023, respectively.
Note 14: Income Taxes
Components of earnings before income taxes
(in millions):
Fiscal Year Ended
Sep 28,
2025
Sep 29,
2024
Oct 1,
2023
United States
$
1,850.1
$
4,087.6
$
4,488.6
Foreign
657.2
882.0
913.3
Total earnings before income taxes
$
2,507.3
$
4,969.6
$
5,401.9
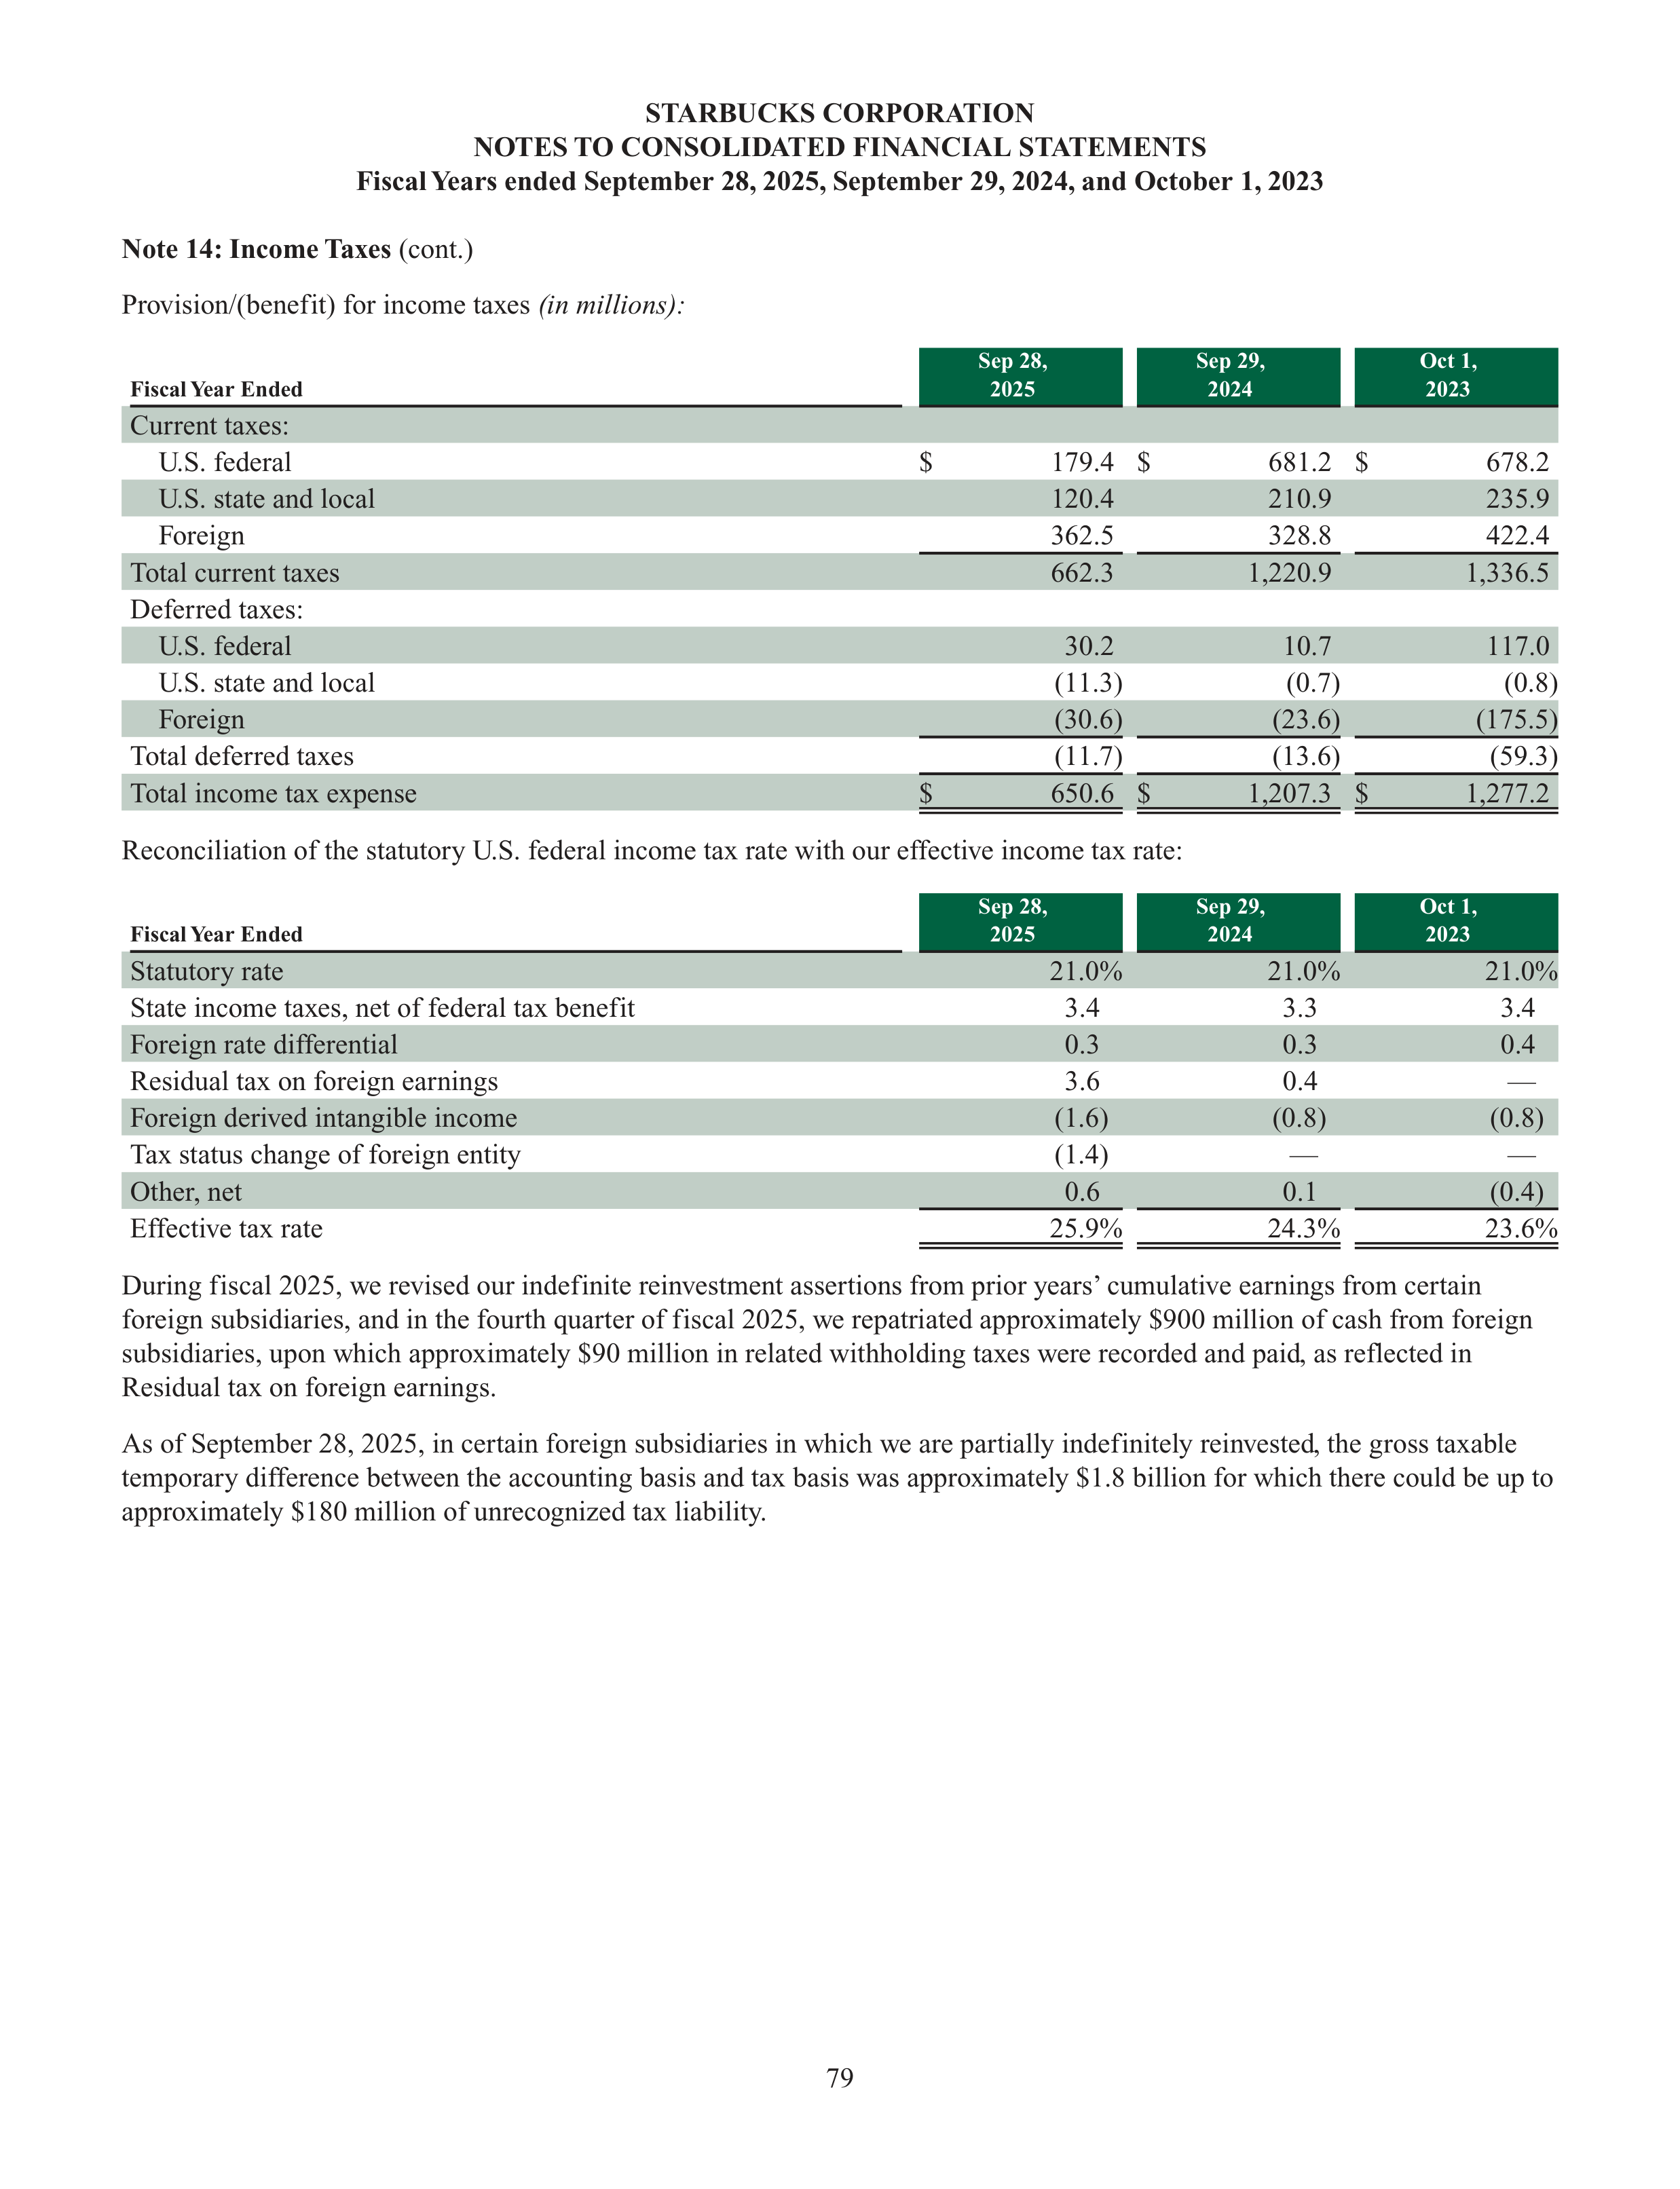
79
STARBUCKS CORPORATION
NOTES TO CONSOLIDATED FINANCIAL STATEMENTS
Fiscal Years ended September 28, 2025, September 29, 2024, and October 1, 2023
Note 14: Income Taxes
(cont.)
Provision/(benefit) for income taxes
(in millions):
Fiscal Year Ended
Fiscal Year Ended
Sep 28,
2025
Sep 29,
2024
Oct 1,
2023
Current taxes:
U.S. federal
$
179.4
$
681.2
$
678.2
U.S. state and local
120.4
210.9
235.9
Foreign
362.5
328.8
422.4
Total current taxes
662.3
1,220.9
1,336.5
Deferred taxes:
U.S. federal
30.2
10.7
117.0
U.S. state and local
(11.3)
(0.7)
(0.8)
Foreign
(30.6)
(23.6)
(175.5)
Total deferred taxes
(11.7)
(13.6)
(59.3)
Total income tax expense
$
650.6
$
1,207.3
$
1,277.2
Reconciliation of the statutory U.S. federal income tax rate with our effective income tax rate:
Fiscal Year Ended
Fiscal Year Ended
Sep 28,
2025
Sep 29,
2024
Oct 1,
2023
Statutory rate
21.0%
21.0%
21.0%
State income taxes, net of federal tax benefit
3.4
3.3
3.4
Foreign rate differential
0.3
0.3
0.4
Residual tax on foreign earnings
3.6
0.4
—
Foreign derived intangible income
(1.6)
(0.8)
(0.8)
Tax status change of foreign entity
(1.4)
—
—
Other, net
0.6
0.1
(0.4)
Effective tax rate
25.9%
24.3%
23.6%
During fiscal 2025, we revised our indefinite reinvestment assertions from prior years’ cumulative earnings from certain
foreign subsidiaries, and in the fourth quarter of fiscal 2025, we repatriated approximately $900 million of cash from foreign
subsidiaries, upon which approximately $90 million in related withholding taxes were recorded and paid, as reflected in
Residual tax on foreign earnings.
As of September 28, 2025, in certain foreign subsidiaries in which we are partially indefinitely reinvested, the gross taxable
temporary difference between the accounting basis and tax basis was approximately $1.8 billion for which there could be up to
approximately $180 million of unrecognized tax liability.
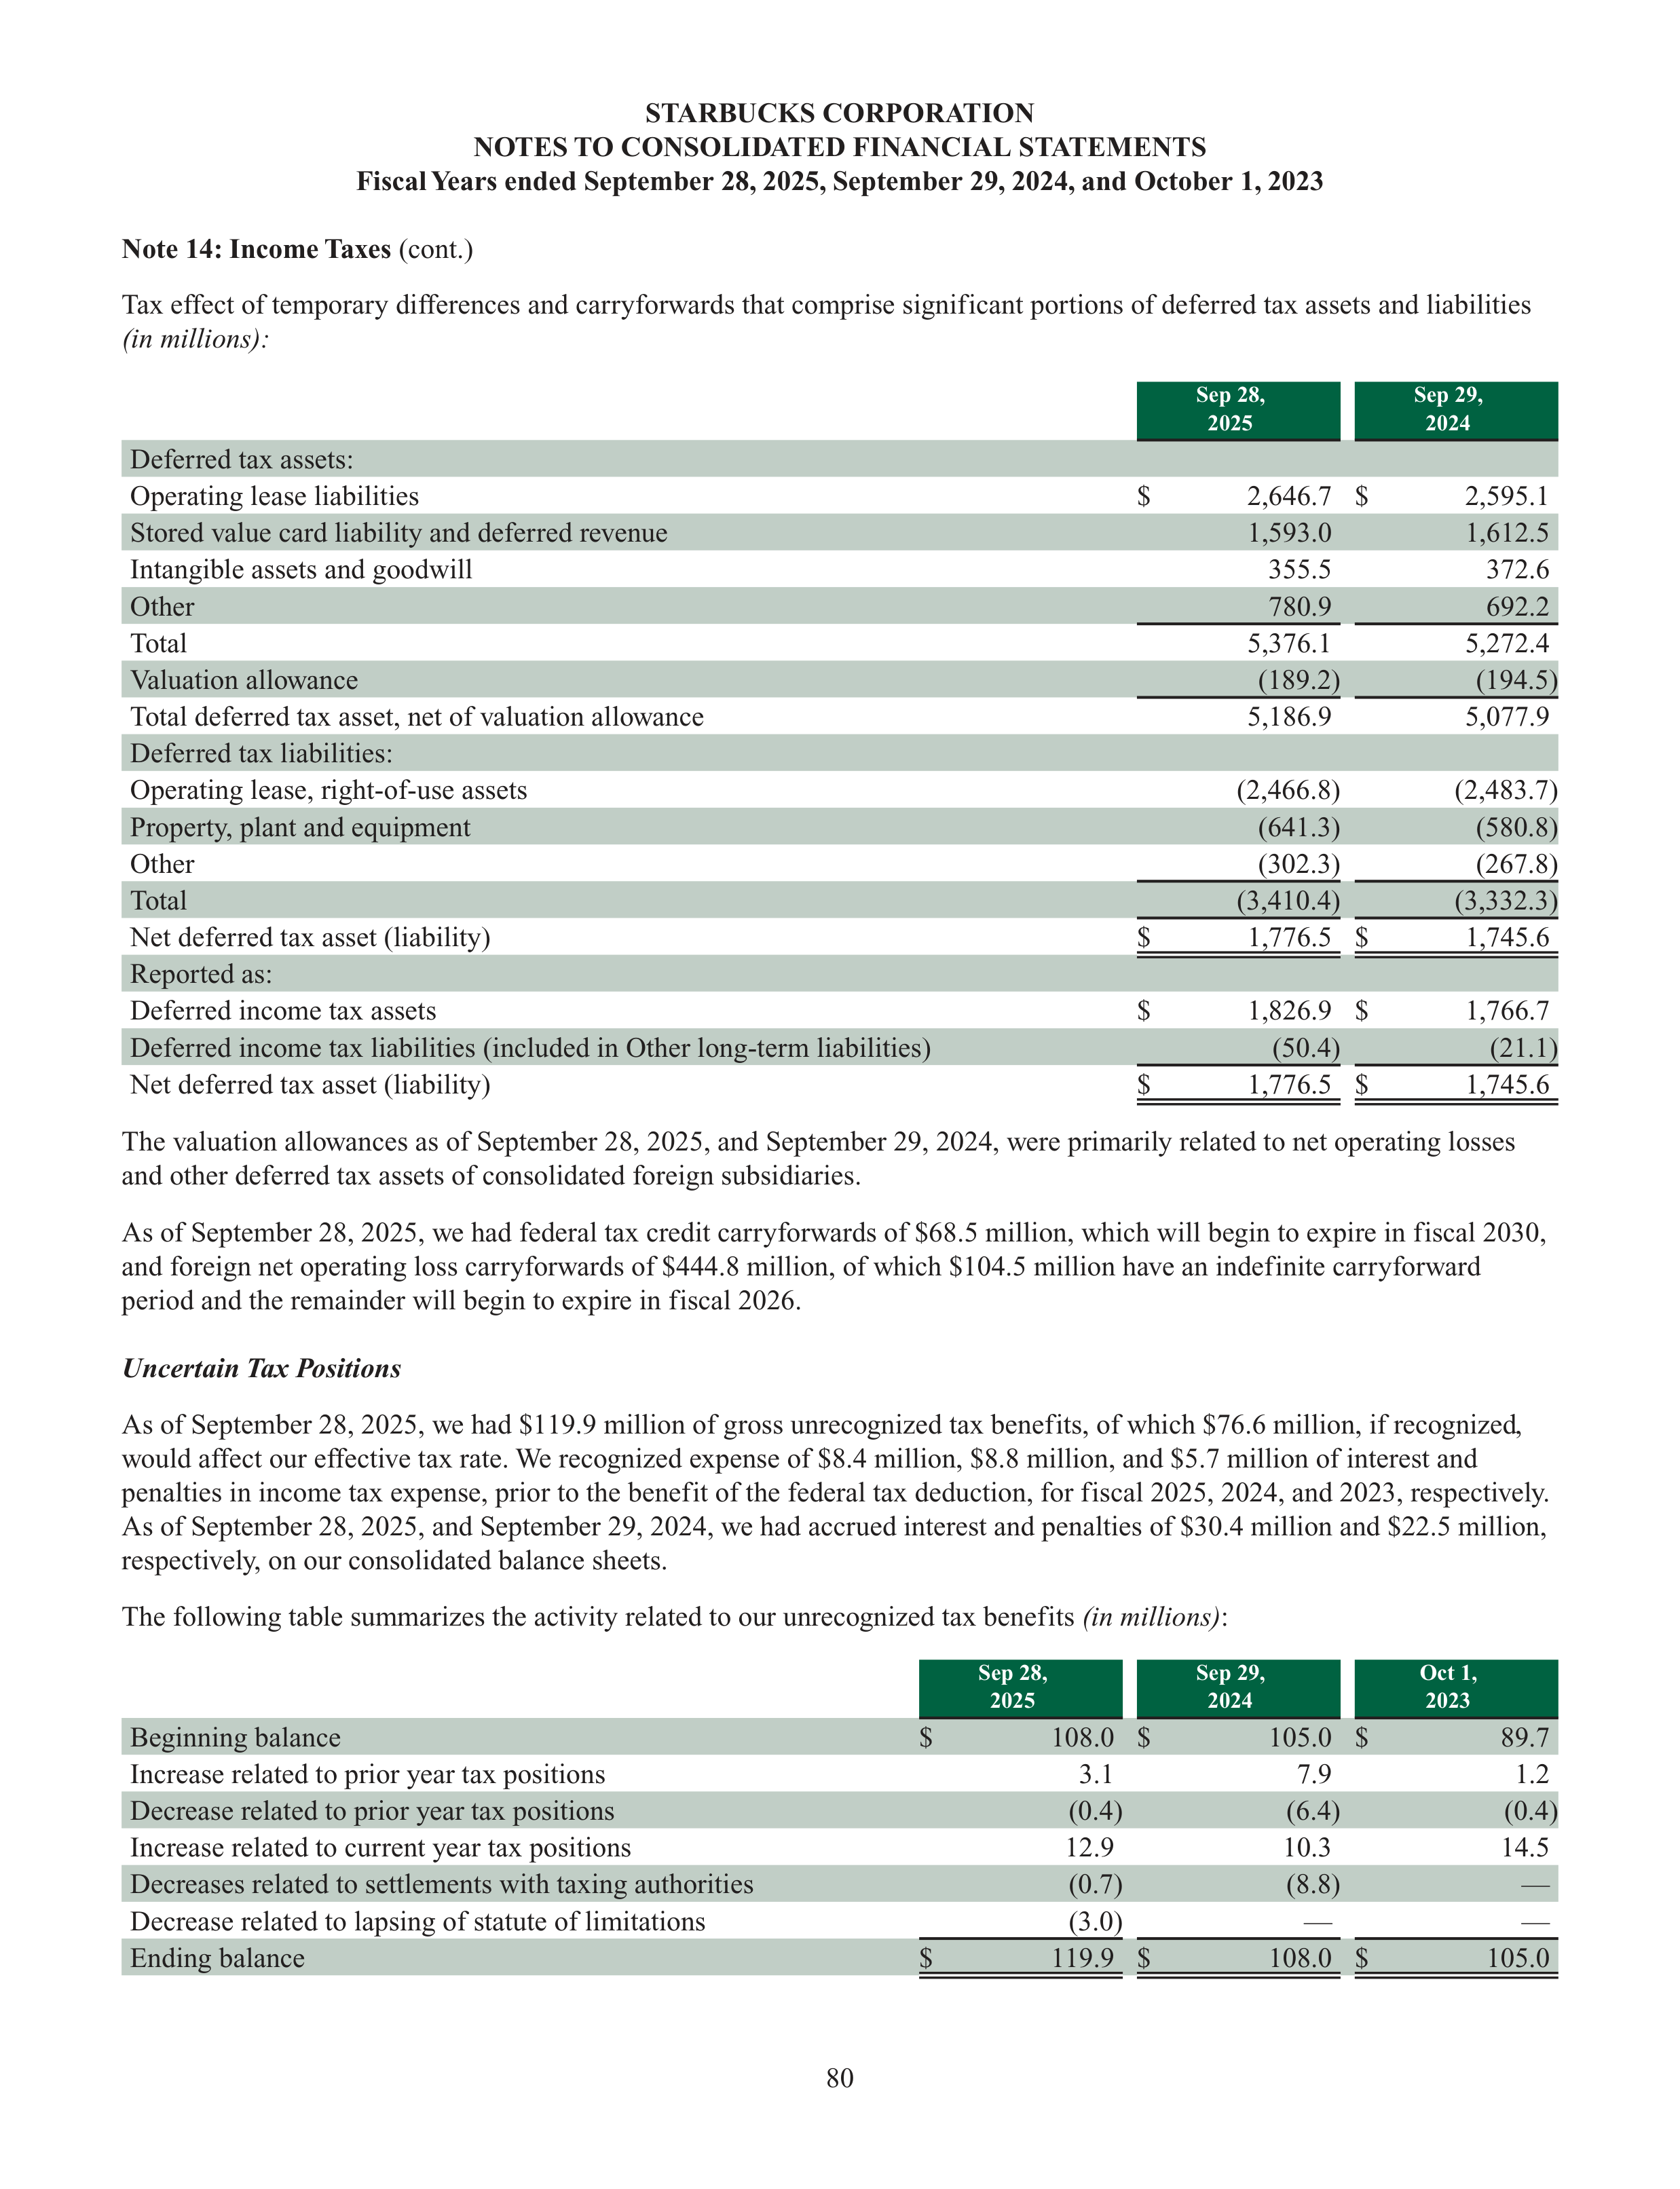
80
STARBUCKS CORPORATION
NOTES TO CONSOLIDATED FINANCIAL STATEMENTS
Fiscal Years ended September 28, 2025, September 29, 2024, and October 1, 2023
Note 14: Income Taxes
(cont.)
Tax effect of temporary differences and carryforwards that comprise significant portions of deferred tax assets and liabilities
(in millions):
Sep 28,
2025
Sep 29,
2024
Deferred tax assets:
Operating lease liabilities
$
2,646.7
$
2,595.1
Stored value card liability and deferred revenue
1,593.0
1,612.5
Intangible assets and goodwill
355.5
372.6
Other
780.9
692.2
Total
5,376.1
5,272.4
Valuation allowance
(189.2)
(194.5)
Total deferred tax asset, net of valuation allowance
5,186.9
5,077.9
Deferred tax liabilities:
Operating lease, right-of-use assets
(2,466.8)
(2,483.7)
Property, plant and equipment
(641.3)
(580.8)
Other
(302.3)
(267.8)
Total
(3,410.4)
(3,332.3)
Net deferred tax asset (liability)
$
1,776.5
$
1,745.6
Reported as:
Deferred income tax assets
$
1,826.9
$
1,766.7
Deferred income tax liabilities (included in Other long-term liabilities)
(50.4)
(21.1)
Net deferred tax asset (liability)
$
1,776.5
$
1,745.6
The valuation allowances as of September 28, 2025, and September 29, 2024, were primarily related to net operating losses
and other deferred tax assets of consolidated foreign subsidiaries.
As of September 28, 2025, we had federal tax credit carryforwards of $68.5 million, which will begin to expire in fiscal 2030,
and foreign net operating loss carryforwards of $444.8 million, of which $104.5 million have an indefinite carryforward
period and the remainder will begin to expire in fiscal 2026.
Uncertain Tax Positions
As of September 28, 2025, we had $119.9 million of gross unrecognized tax benefits, of which $76.6 million, if recognized,
would affect our effective tax rate. We recognized expense of $8.4 million, $8.8 million, and $5.7 million of interest and
penalties in income tax expense, prior to the benefit of the federal tax deduction, for fiscal 2025, 2024, and 2023, respectively.
As of September 28, 2025, and September 29, 2024, we had accrued interest and penalties of $30.4 million and $22.5 million,
respectively, on our consolidated balance sheets.
The following table summarizes the activity related to our unrecognized tax benefits
(in millions)
:
Sep 28,
2025
Sep 29,
2024
Oct 1,
2023
Beginning balance
$
108.0
$
105.0
$
89.7
Increase related to prior year tax positions
3.1
7.9
1.2
Decrease related to prior year tax positions
(0.4)
(6.4)
(0.4)
Increase related to current year tax positions
12.9
10.3
14.5
Decreases related to settlements with taxing authorities
(0.7)
(8.8)
—
Decrease related to lapsing of statute of limitations
(3.0)
—
—
Ending balance
$
119.9
$
108.0
$
105.0
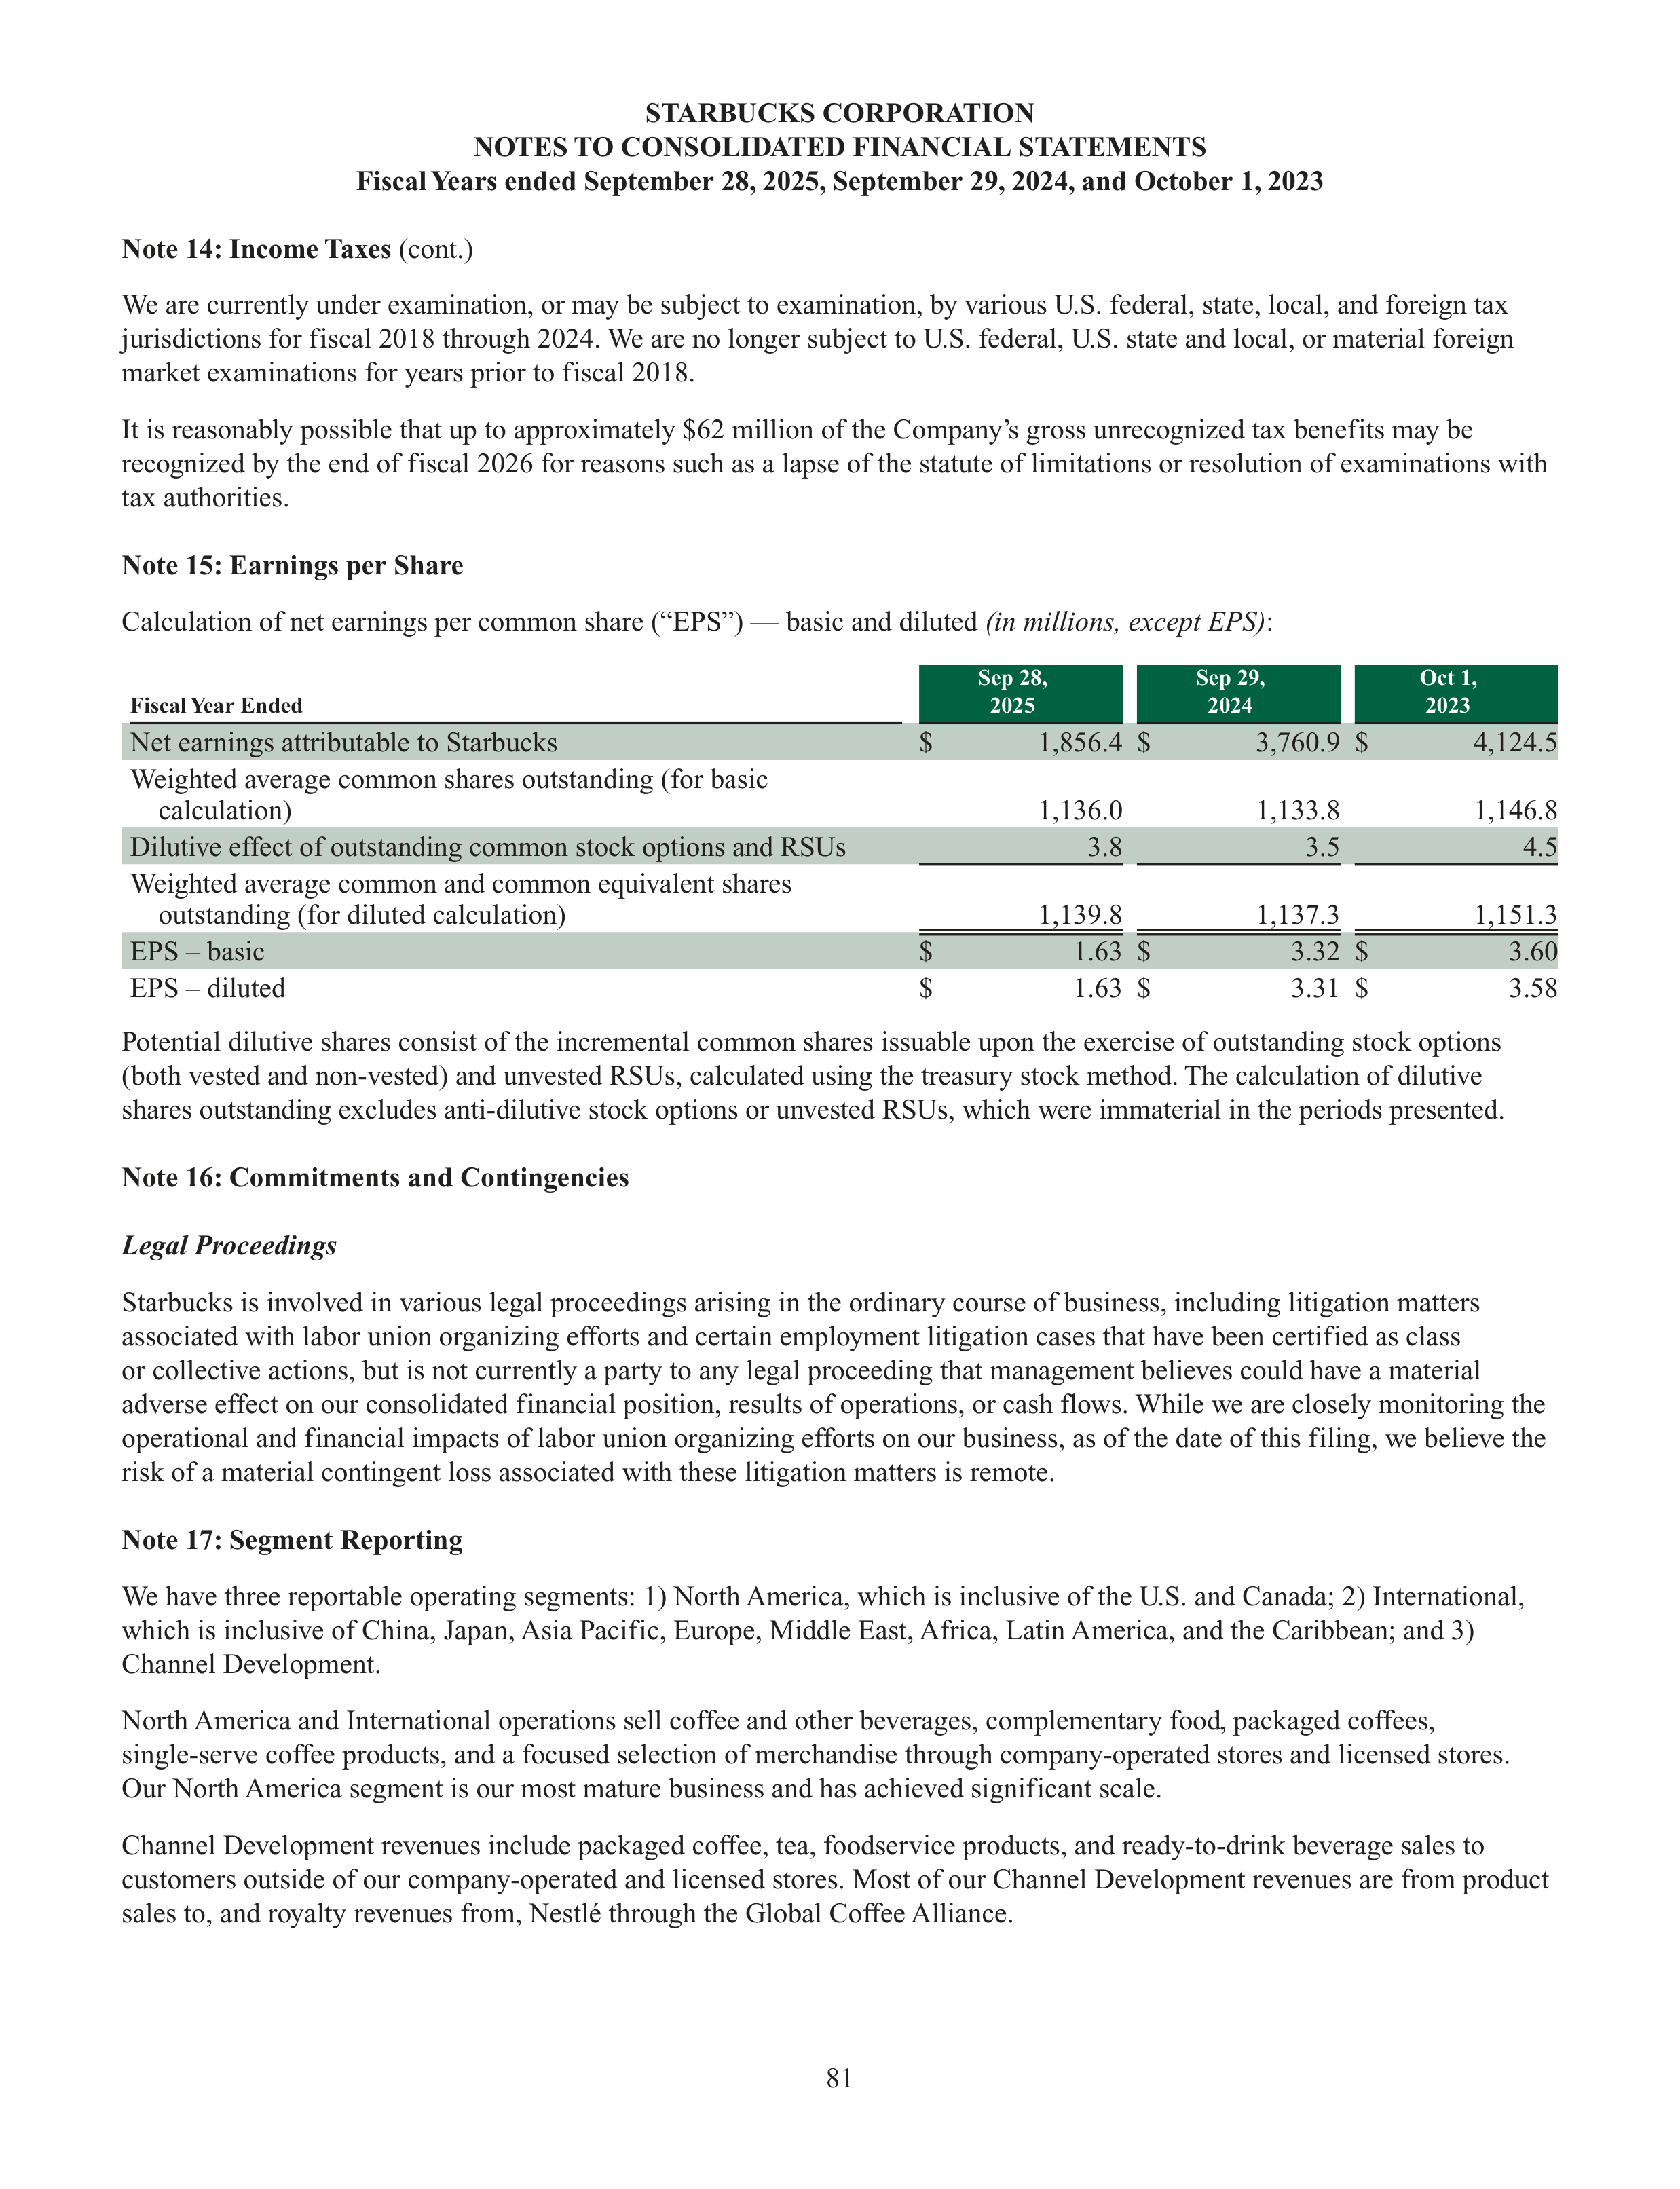
81
STARBUCKS CORPORATION
NOTES TO CONSOLIDATED FINANCIAL STATEMENTS
Fiscal Years ended September 28, 2025, September 29, 2024, and October 1, 2023
Note 14: Income Taxes
(cont.)
We are currently under examination, or may be subject to examination, by various U.S. federal, state, local, and foreign tax
jurisdictions for fiscal 2018 through 2024. We are no longer subject to U.S. federal, U.S. state and local, or material foreign
market examinations for years prior to fiscal 2018.
It is reasonably possible that up to approximately $62 million of the Company’s gross unrecognized tax benefits may be
recognized by the end of fiscal 2026 for reasons such as a lapse of the statute of limitations or resolution of examinations with
tax authorities.
Note 15: Earnings per Share
Calculation of net earnings per common share (“EPS”) — basic and diluted
(in millions, except EPS)
:
Fiscal Year Ended
Sep 28,
2025
Sep 29,
2024
Oct 1,
2023
Net earnings attributable to Starbucks
$
1,856.4
$
3,760.9
$
4,124.5
Weighted average common shares outstanding (for basic
calculation)
1,136.0
1,133.8
1,146.8
Dilutive effect of outstanding common stock options and RSUs
3.8
3.5
4.5
Weighted average common and common equivalent shares
outstanding (for diluted calculation)
1,139.8
1,137.3
1,151.3
EPS – basic
$
1.63
$
3.32
$
3.60
EPS – diluted
$
1.63
$
3.31
$
3.58
Potential dilutive shares consist of the incremental common shares issuable upon the exercise of outstanding stock options
(both vested and non-vested) and unvested RSUs, calculated using the treasury stock method. The calculation of dilutive
shares outstanding excludes anti-dilutive stock options or unvested RSUs, which were immaterial in the periods presented.
Note 16: Commitments and Contingencies
Legal Proceedings
Starbucks is involved in various legal proceedings arising in the ordinary course of business, including litigation matters
associated with labor union organizing efforts and certain employment litigation cases that have been certified as class
or collective actions, but is not currently a party to any legal proceeding that management believes could have a material
adverse effect on our consolidated financial position, results of operations, or cash flows. While we are closely monitoring the
operational and financial impacts of labor union organizing efforts on our business, as of the date of this filing, we believe the
risk of a material contingent loss associated with these litigation matters is remote.
Note 17: Segment Reporting
We have three reportable operating segments: 1) North America, which is inclusive of the U.S. and Canada; 2) International,
which is inclusive of China, Japan, Asia Pacific, Europe, Middle East, Africa, Latin America, and the Caribbean; and 3)
Channel Development.
North America and International operations sell coffee and other beverages, complementary food, packaged coffees,
single-serve coffee products, and a focused selection of merchandise through company-operated stores and licensed stores.
Our North America segment is our most mature business and has achieved significant scale.
Channel Development revenues include packaged coffee, tea, foodservice products, and ready-to-drink beverage sales to
customers outside of our company-operated and licensed stores. Most of our Channel Development revenues are from product
sales to, and royalty revenues from, Nestlé through the Global Coffee Alliance.
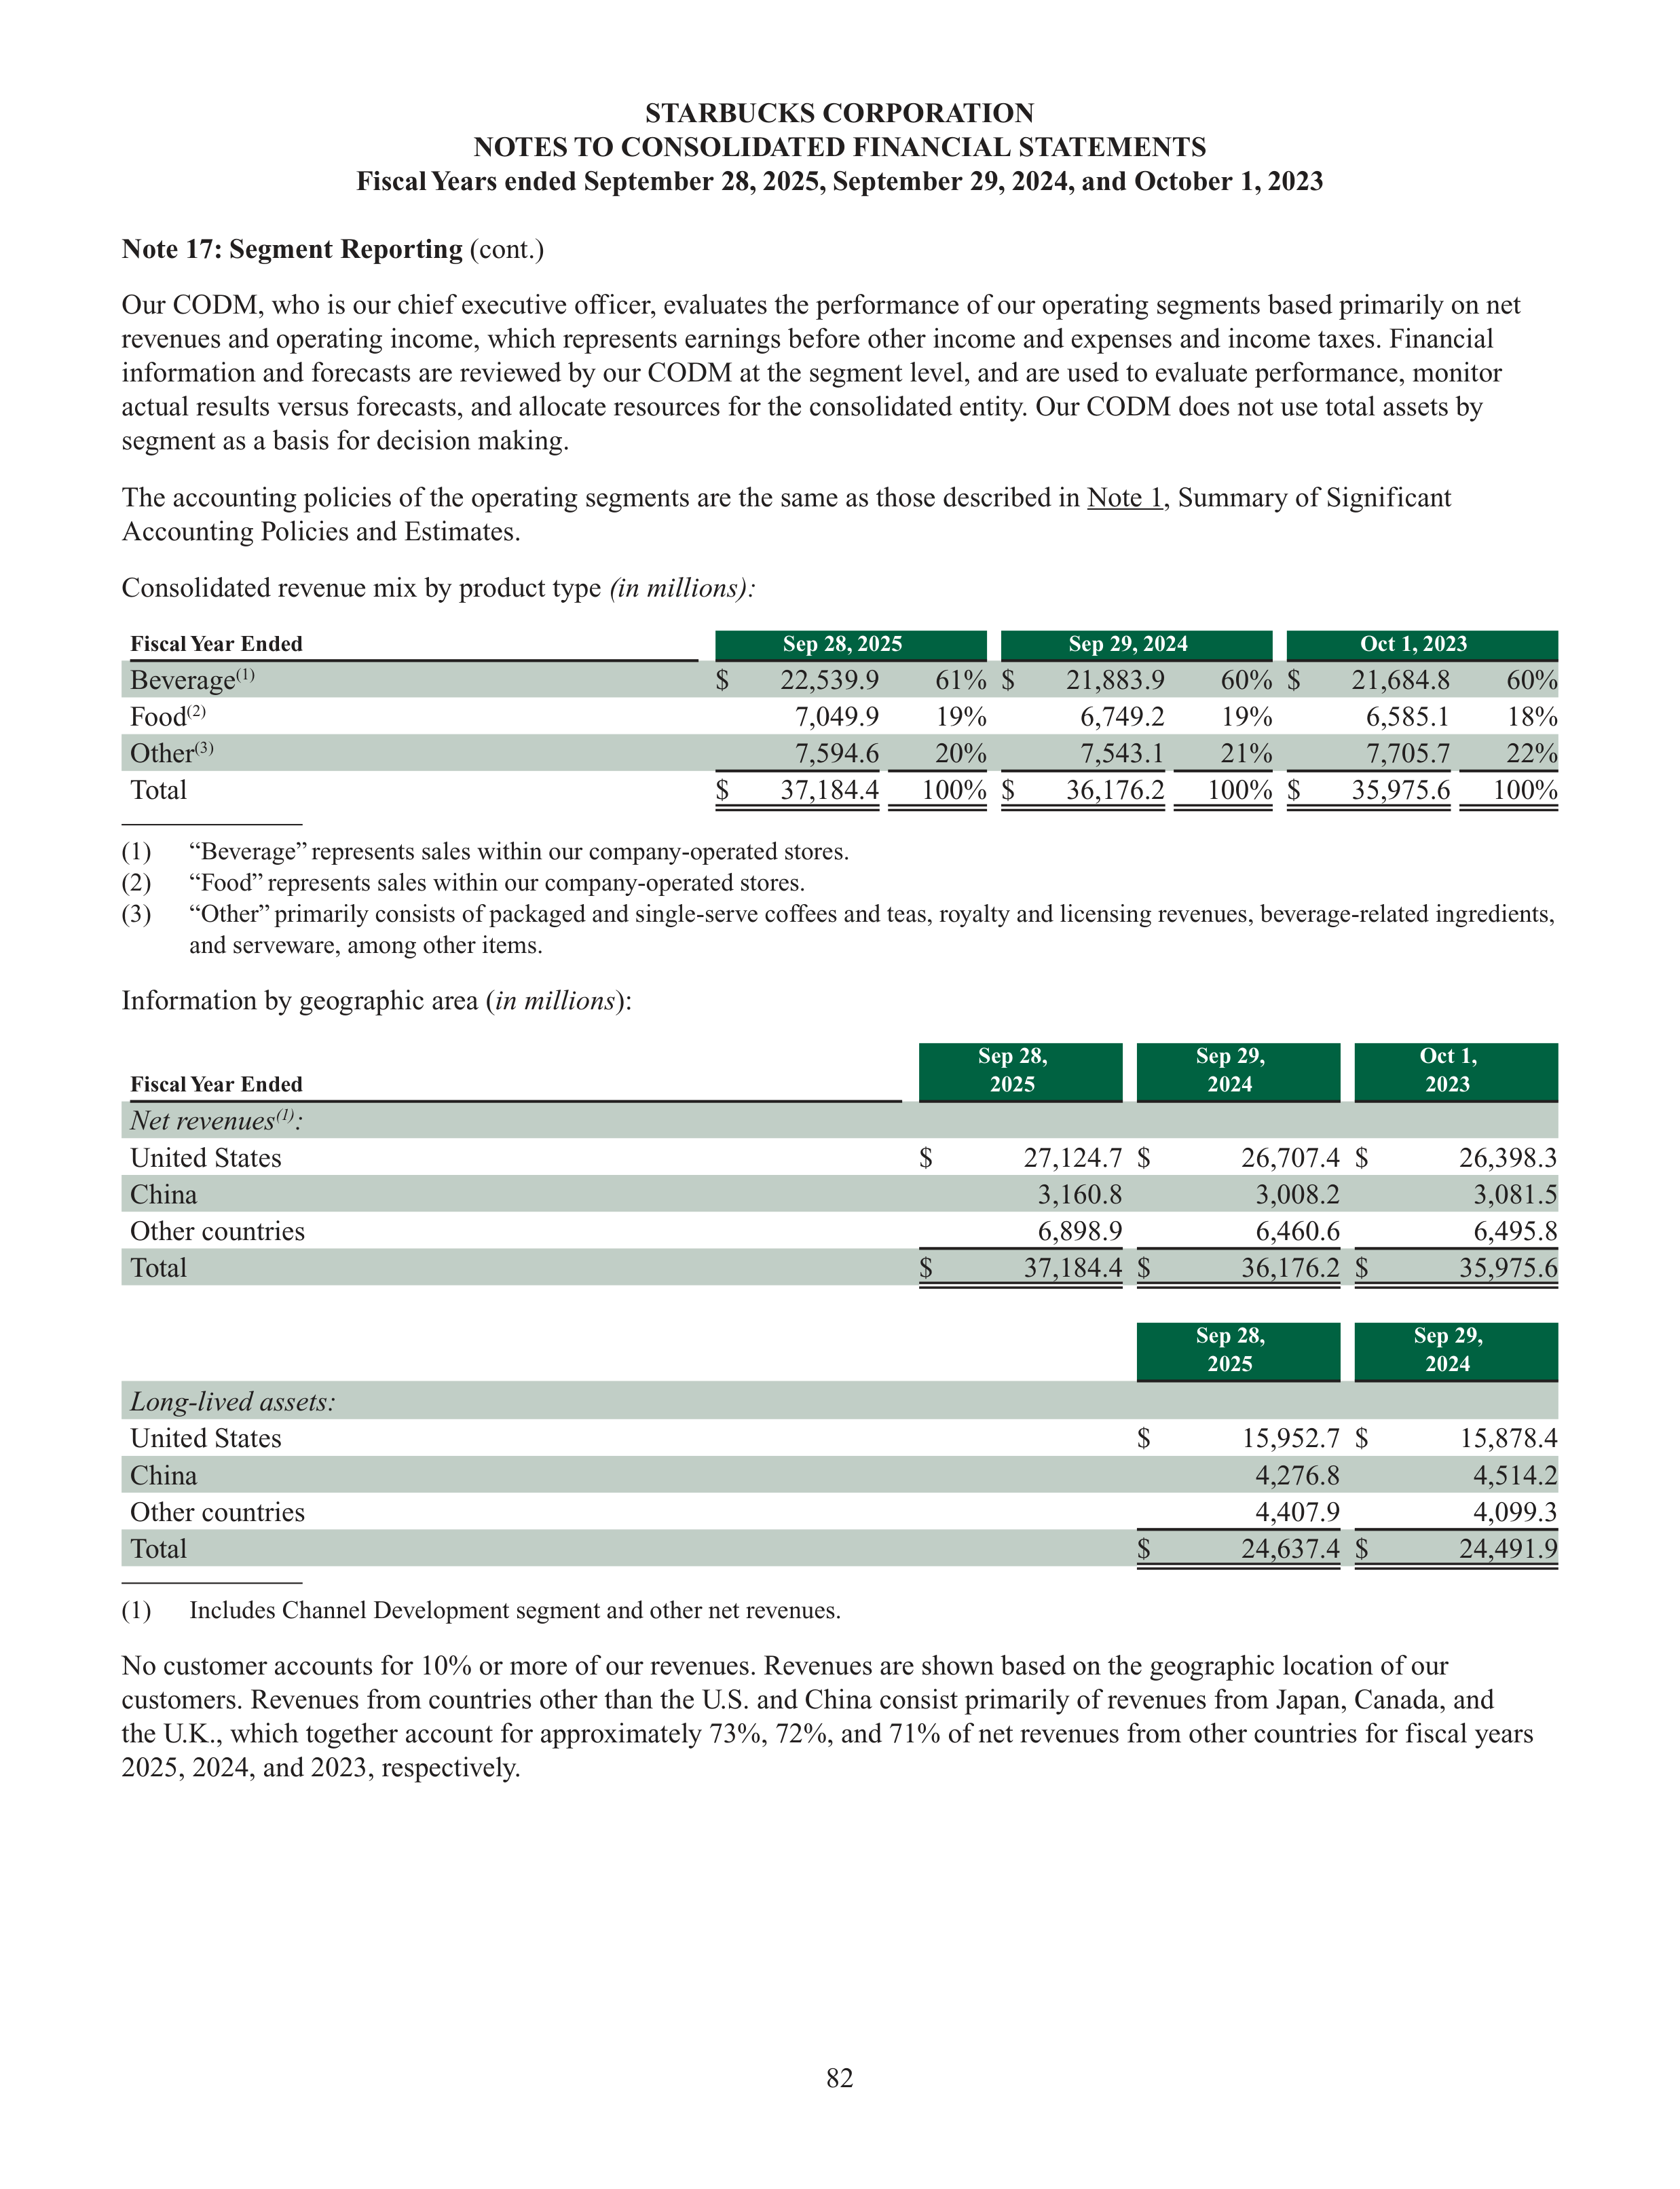
82
STARBUCKS CORPORATION
NOTES TO CONSOLIDATED FINANCIAL STATEMENTS
Fiscal Years ended September 28, 2025, September 29, 2024, and October 1, 2023
Note 17: Segment Reporting
(cont.)
Our CODM, who is our chief executive officer, evaluates the performance of our operating segments based primarily on net
revenues and operating income, which represents earnings before other income and expenses and income taxes. Financial
information and forecasts are reviewed by our CODM at the segment level, and are used to evaluate performance, monitor
actual results versus forecasts, and allocate resources for the consolidated entity. Our CODM does not use total assets by
segment as a basis for decision making.
The accounting policies of the operating segments are the same as those described in Note 1, Summary of Significant
Accounting Policies and Estimates.
Consolidated revenue mix by product type
(in millions):
Fiscal Year Ended
Sep 28, 2025
Sep 29, 2024
Oct 1, 2023
Beverage
(1)
$
22,539.9
61%
$
21,883.9
60%
$
21,684.8
60%
Food
(2)
7,049.9
19%
6,749.2
19%
6,585.1
18%
Other
(3)
7,594.6
20%
7,543.1
21%
7,705.7
22%
Total
$
37,184.4
100%
$
36,176.2
100%
$
35,975.6
100%
(1)
“Beverage” represents sales within our company-operated stores.
(2)
“Food” represents sales within our company-operated stores.
(3)
“Other” primarily consists of packaged and single-serve coffees and teas, royalty and licensing revenues, beverage-related ingredients,
and serveware, among other items.
Information by geographic area (
in millions
):
Fiscal Year Ended
Sep 28,
2025
Sep 29,
2024
Oct 1,
2023
Net revenues
(1)
:
United States
$
27,124.7
$
26,707.4
$
26,398.3
China
3,160.8
3,008.2
3,081.5
Other countries
6,898.9
6,460.6
6,495.8
Total
$
37,184.4
$
36,176.2
$
35,975.6
Sep 28,
2025
Sep 29,
2024
Long-lived assets:
United States
$
15,952.7
$
15,878.4
China
4,276.8
4,514.2
Other countries
4,407.9
4,099.3
Total
$
24,637.4
$
24,491.9
(1)
Includes Channel Development segment and other net revenues.
No customer accounts for 10% or more of our revenues. Revenues are shown based on the geographic location of our
customers. Revenues from countries other than the U.S. and China consist primarily of revenues from Japan, Canada, and
the U.K., which together account for approximately 73%, 72%, and 71% of net revenues from other countries for fiscal years
2025, 2024, and 2023, respectively.
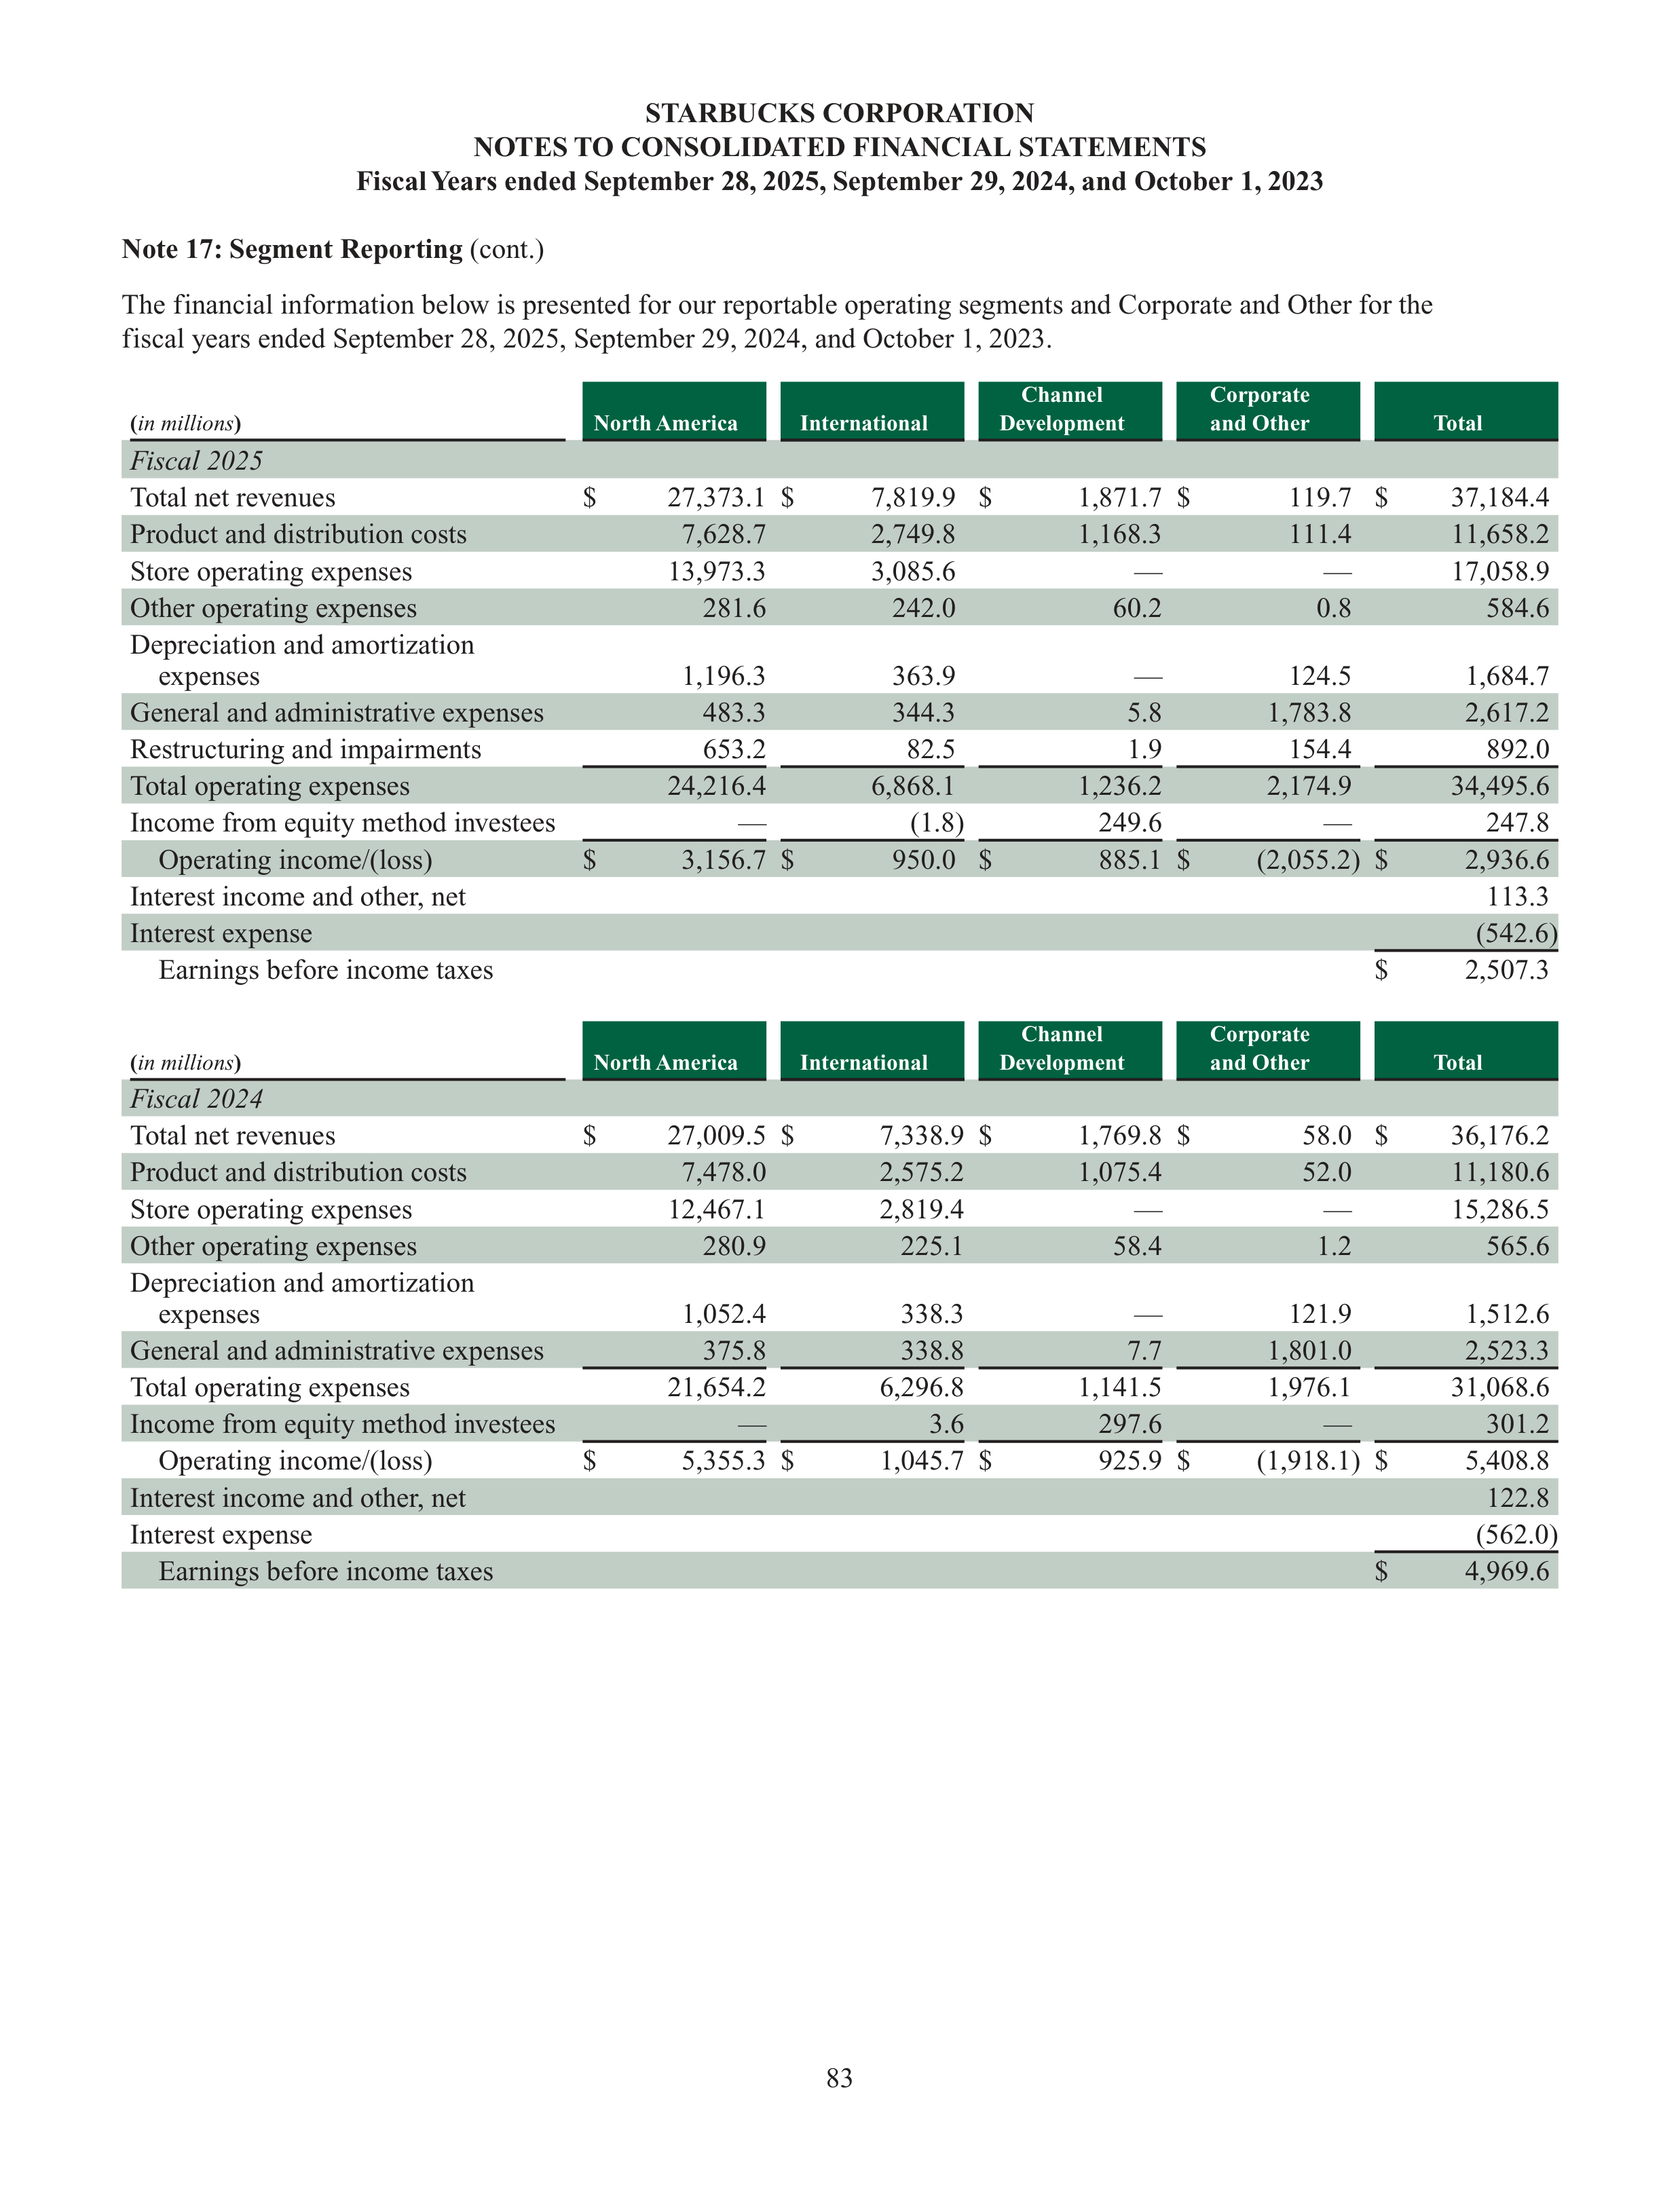
83
STARBUCKS CORPORATION
NOTES TO CONSOLIDATED FINANCIAL STATEMENTS
Fiscal Years ended September 28, 2025, September 29, 2024, and October 1, 2023
Note 17: Segment Reporting
(cont.)
The financial information below is presented for our reportable operating segments and Corporate and Other for the
fiscal years ended September 28, 2025, September 29, 2024, and October 1, 2023.
(
in millions
)
North America
International
Channel
Development
Corporate
and Other
Total
Fiscal 2025
Total net revenues
$
27,373.1
$
7,819.9
$
1,871.7
$
119.7
$
37,184.4
Product and distribution costs
7,628.7
2,749.8
1,168.3
111.4
11,658.2
Store operating expenses
13,973.3
3,085.6
—
—
17,058.9
Other operating expenses
281.6
242.0
60.2
0.8
584.6
Depreciation and amortization
expenses
1,196.3
363.9
—
124.5
1,684.7
General and administrative expenses
483.3
344.3
5.8
1,783.8
2,617.2
Restructuring and impairments
653.2
82.5
1.9
154.4
892.0
Total operating expenses
24,216.4
6,868.1
1,236.2
2,174.9
34,495.6
Income from equity method investees
—
(1.8)
249.6
—
247.8
Operating income/(loss)
$
3,156.7
$
950.0
$
885.1
$
(2,055.2)
$
2,936.6
Interest income and other, net
113.3
Interest expense
(542.6)
Earnings before income taxes
$
2,507.3
(
in millions
)
North America
International
Channel
Development
Corporate
and Other
Total
Fiscal 2024
Total net revenues
$
27,009.5
$
7,338.9
$
1,769.8
$
58.0
$
36,176.2
Product and distribution costs
7,478.0
2,575.2
1,075.4
52.0
11,180.6
Store operating expenses
12,467.1
2,819.4
—
—
15,286.5
Other operating expenses
280.9
225.1
58.4
1.2
565.6
Depreciation and amortization
expenses
1,052.4
338.3
—
121.9
1,512.6
General and administrative expenses
375.8
338.8
7.7
1,801.0
2,523.3
Total operating expenses
21,654.2
6,296.8
1,141.5
1,976.1
31,068.6
Income from equity method investees
—
3.6
297.6
—
301.2
Operating income/(loss)
$
5,355.3
$
1,045.7
$
925.9
$
(1,918.1)
$
5,408.8
Interest income and other, net
122.8
Interest expense
(562.0)
Earnings before income taxes
$
4,969.6
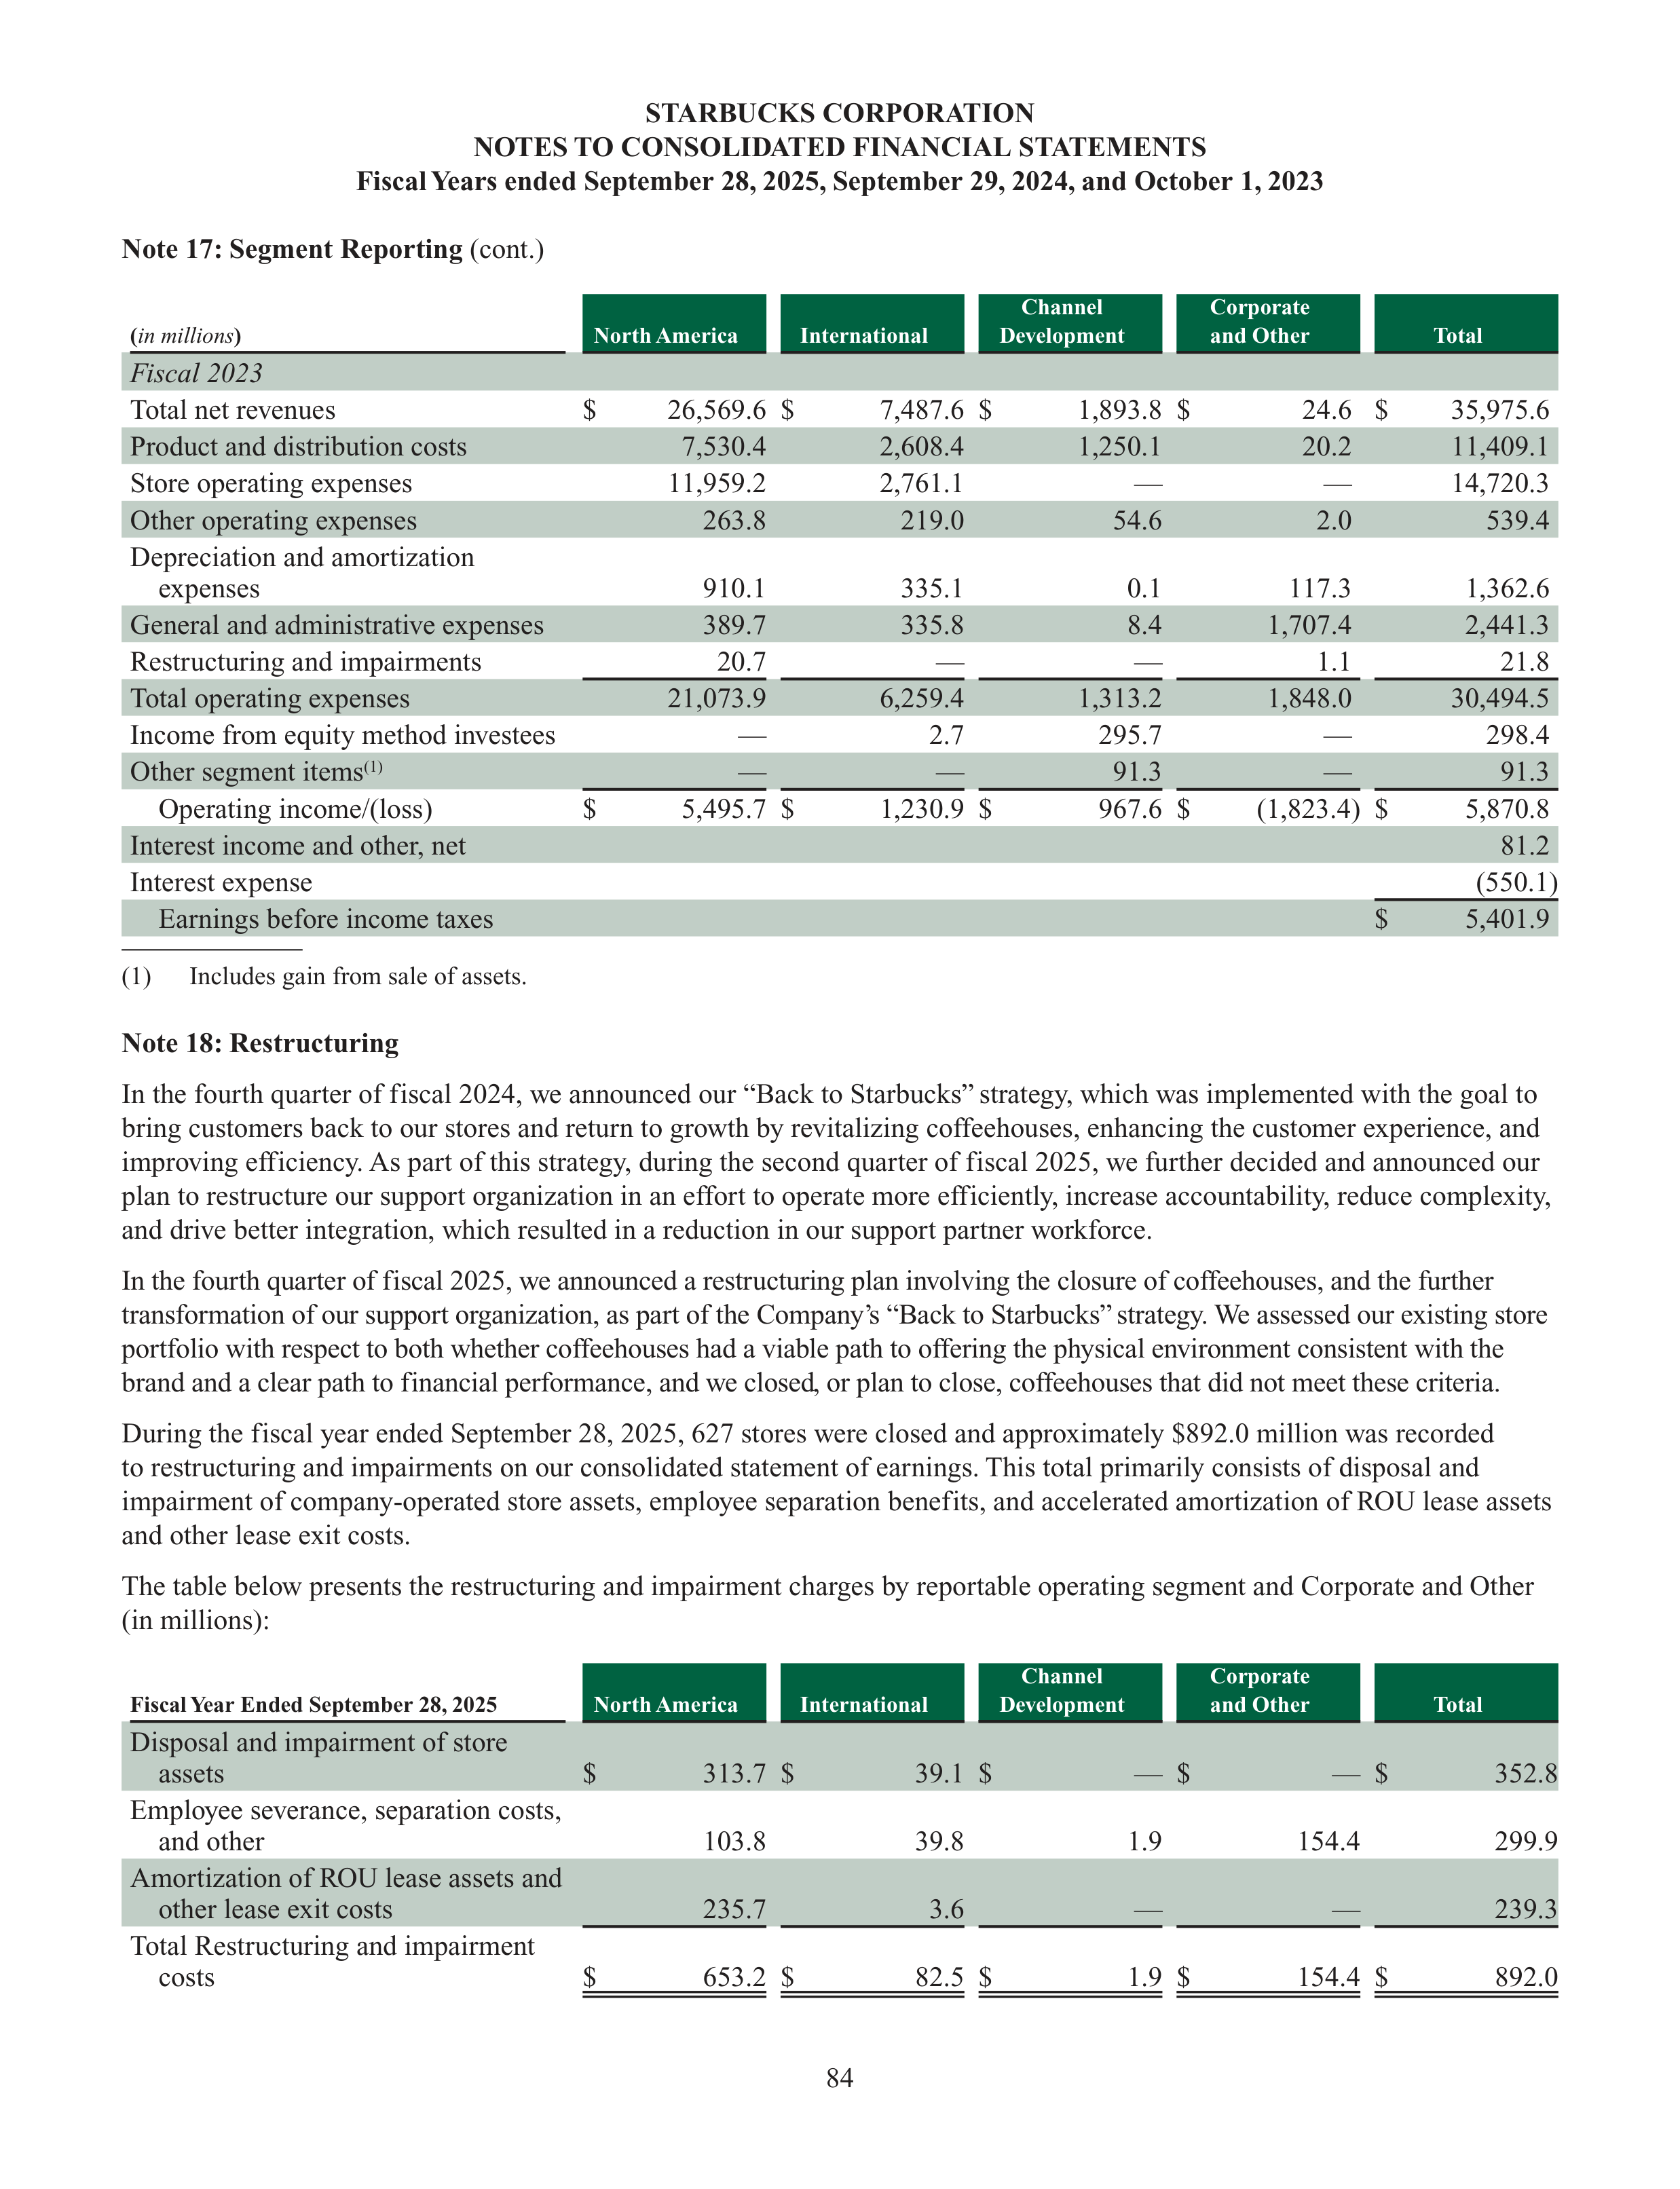
84
STARBUCKS CORPORATION
NOTES TO CONSOLIDATED FINANCIAL STATEMENTS
Fiscal Years ended September 28, 2025, September 29, 2024, and October 1, 2023
Note 17: Segment Reporting
(cont.)
(
in millions
)
North America
International
Channel
Development
Corporate
and Other
Total
Fiscal 2023
Total net revenues
$
26,569.6
$
7,487.6
$
1,893.8
$
24.6
$
35,975.6
Product and distribution costs
7,530.4
2,608.4
1,250.1
20.2
11,409.1
Store operating expenses
11,959.2
2,761.1
—
—
14,720.3
Other operating expenses
263.8
219.0
54.6
2.0
539.4
Depreciation and amortization
expenses
910.1
335.1
0.1
117.3
1,362.6
General and administrative expenses
389.7
335.8
8.4
1,707.4
2,441.3
Restructuring and impairments
20.7
—
—
1.1
21.8
Total operating expenses
21,073.9
6,259.4
1,313.2
1,848.0
30,494.5
Income from equity method investees
—
2.7
295.7
—
298.4
Other segment items
(1)
—
—
91.3
—
91.3
Operating income/(loss)
$
5,495.7
$
1,230.9
$
967.6
$
(1,823.4)
$
5,870.8
Interest income and other, net
81.2
Interest expense
(550.1)
Earnings before income taxes
$
5,401.9
(1)
Includes gain from sale of assets.
Note 18: Restructuring
In the fourth quarter of fiscal 2024, we announced our “Back to Starbucks” strategy, which was implemented with the goal to
bring customers back to our stores and return to growth by revitalizing coffeehouses, enhancing the customer experience, and
improving efficiency. As part of this strategy, during the second quarter of fiscal 2025, we further decided and announced our
plan to restructure our support organization in an effort to operate more efficiently, increase accountability, reduce complexity,
and drive better integration, which resulted in a reduction in our support partner workforce.
In the fourth quarter of fiscal 2025, we announced a restructuring plan involving the closure of coffeehouses, and the further
transformation of our support organization, as part of the Company’s “Back to Starbucks” strategy. We assessed our existing store
portfolio with respect to both whether coffeehouses had a viable path to offering the physical environment consistent with the
brand and a clear path to financial performance, and we closed, or plan to close, coffeehouses that did not meet these criteria.
During the fiscal year ended September 28, 2025, 627 stores were closed and approximately $892.0 million was recorded
to restructuring and impairments on our consolidated statement of earnings. This total primarily consists of disposal and
impairment of company-operated store assets, employee separation benefits, and accelerated amortization of ROU lease assets
and other lease exit costs.
The table below presents the restructuring and impairment charges by reportable operating segment and Corporate and Other
(in millions):
Fiscal Year Ended September 28, 2025
Fiscal Year Ended September 28, 2025
North America
International
Channel
Development
Corporate
and Other
Total
Disposal and impairment of store
assets
$
313.7
$
39.1
$
—
$
—
$
352.8
Employee severance, separation costs,
and other
103.8
39.8
1.9
154.4
299.9
Amortization of ROU lease assets and
other lease exit costs
235.7
3.6
—
—
239.3
Total Restructuring and impairment
costs
$
653.2
$
82.5
$
1.9
$
154.4
$
892.0
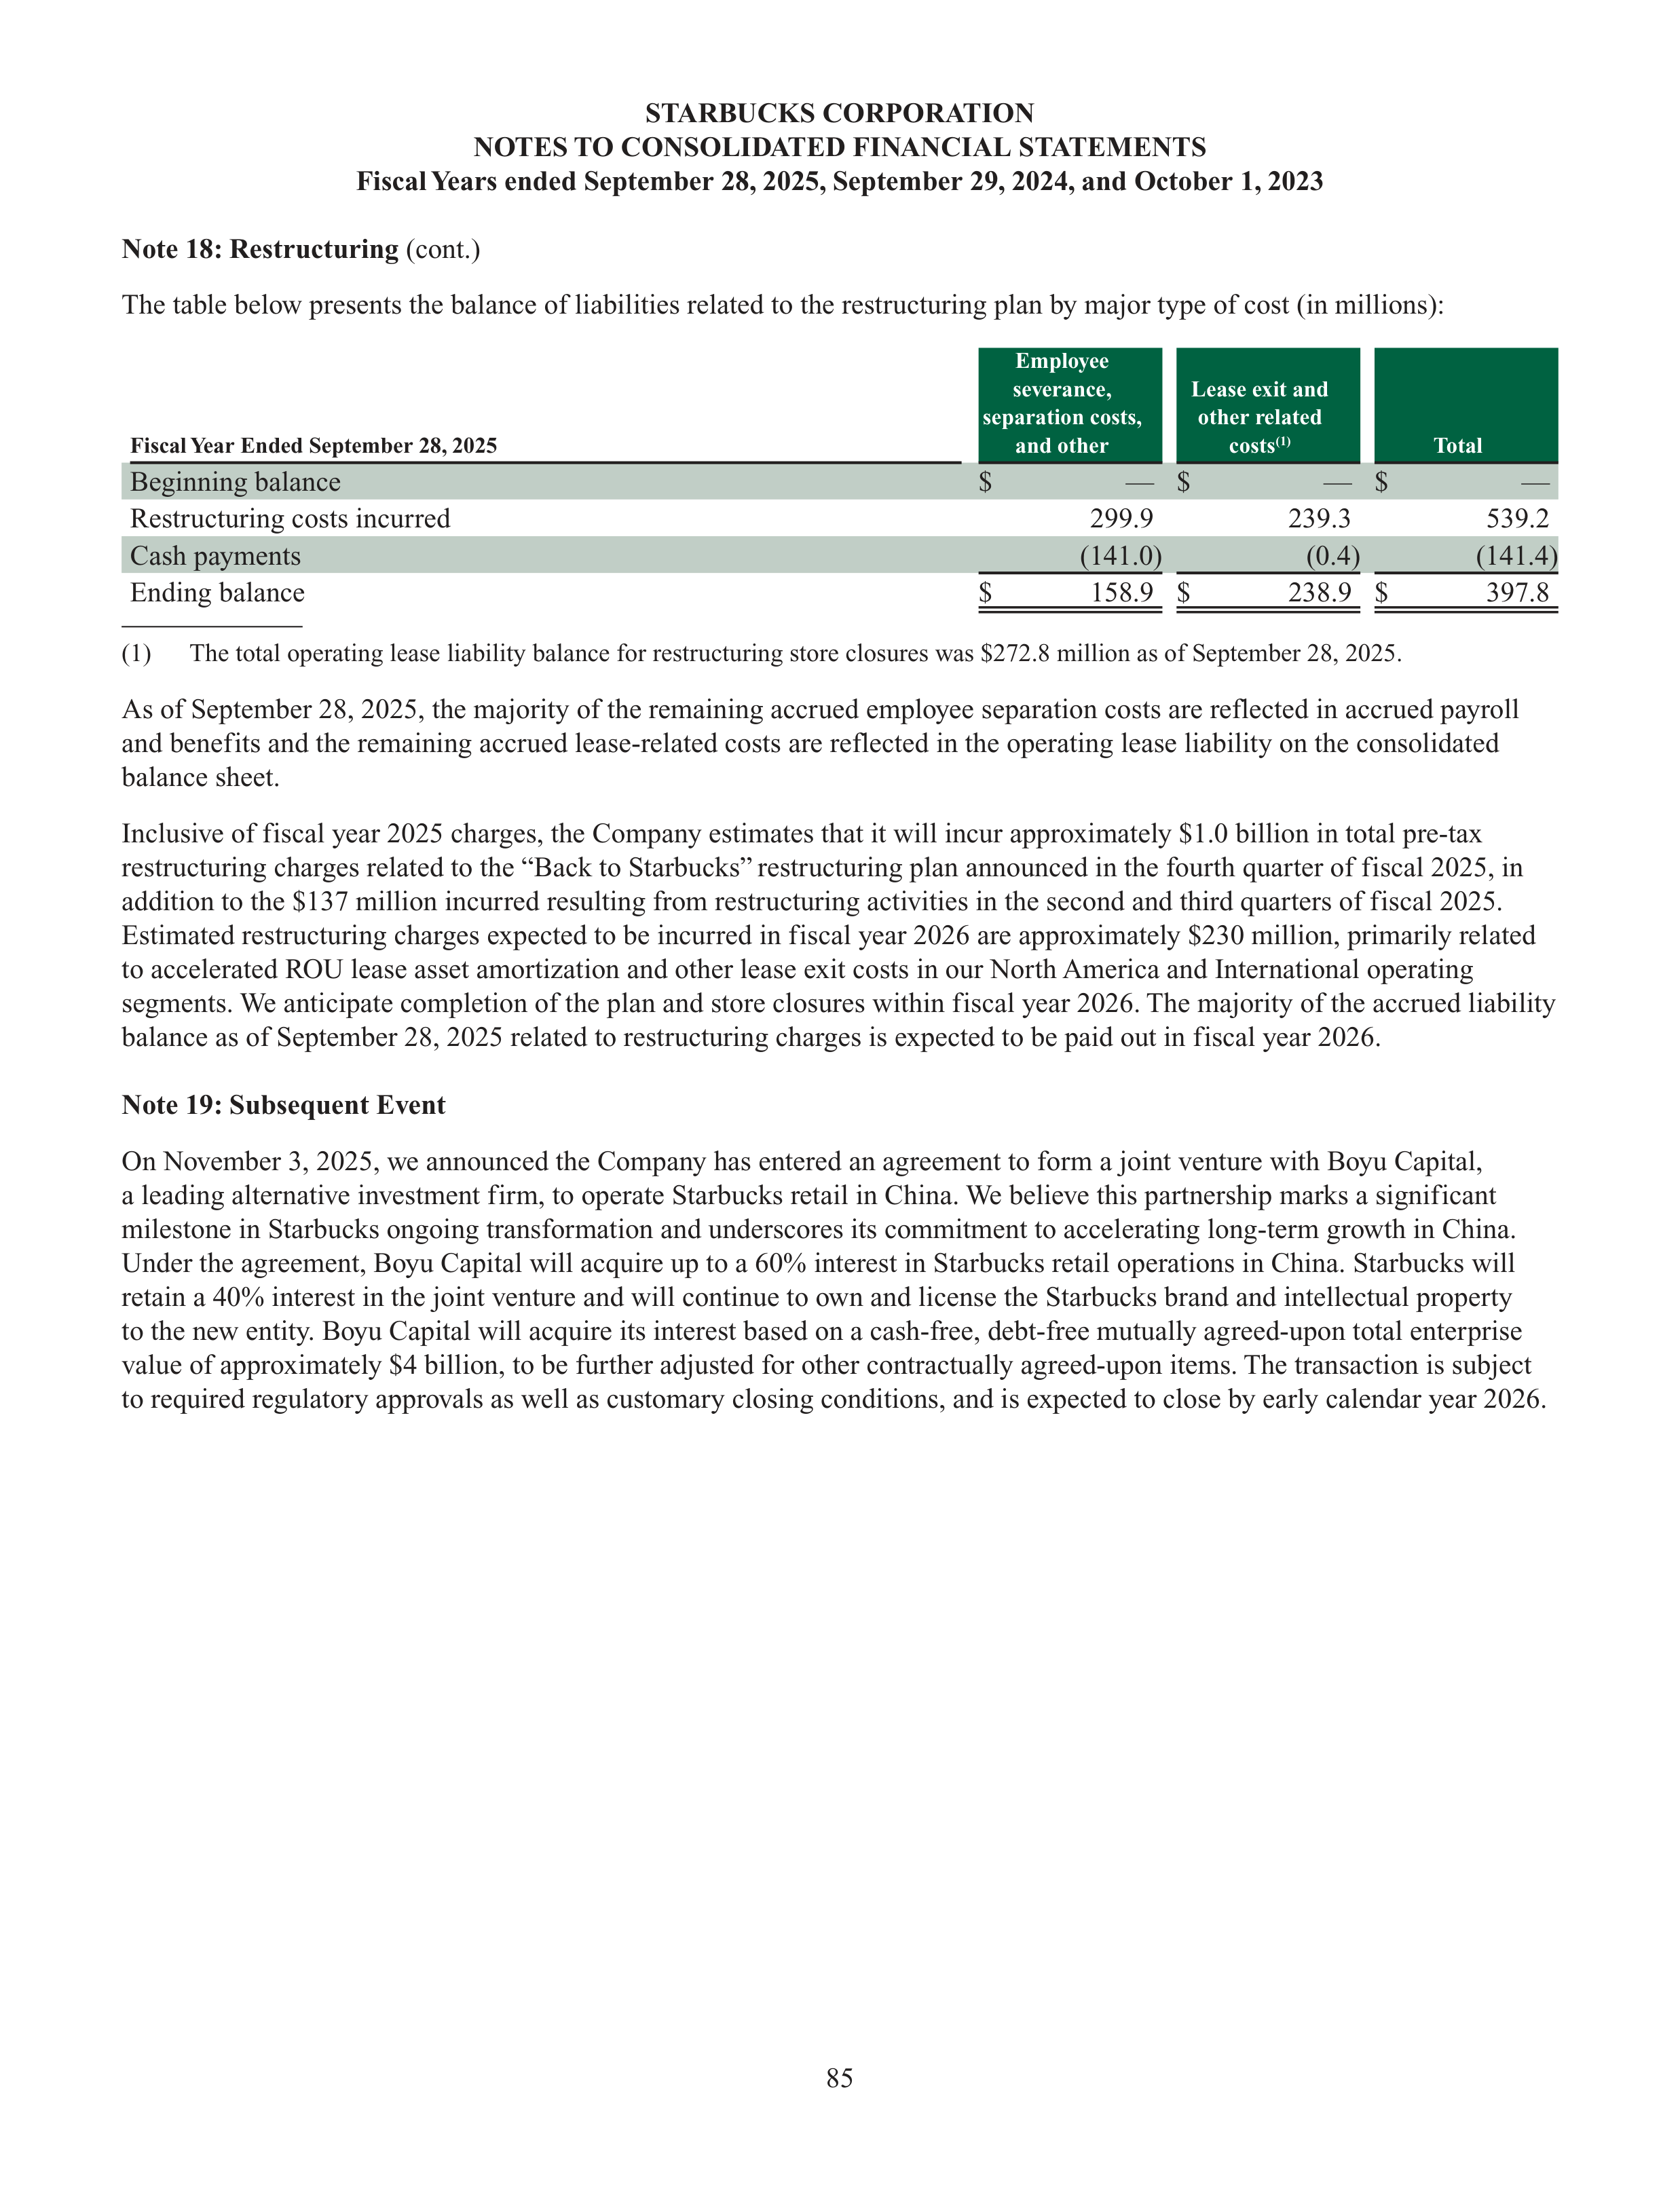
85
STARBUCKS CORPORATION
NOTES TO CONSOLIDATED FINANCIAL STATEMENTS
Fiscal Years ended September 28, 2025, September 29, 2024, and October 1, 2023
Note 18: Restructuring
(cont.)
The table below presents the balance of liabilities related to the restructuring plan by major type of cost (in millions):
Fiscal Year Ended September 28, 2025
Fiscal Year Ended September 28, 2025
Employee
severance,
separation costs,
and other
Lease exit and
other related
costs
(1)
Total
Beginning balance
$
—
$
—
$
—
Restructuring costs incurred
299.9
239.3
539.2
Cash payments
(141.0)
(0.4)
(141.4)
Ending balance
$
158.9
$
238.9
$
397.8
(1)
The total operating lease liability balance for restructuring store closures was $272.8 million as of September 28, 2025.
As of September 28, 2025, the majority of the remaining accrued employee separation costs are reflected in accrued payroll
and benefits and the remaining accrued lease-related costs are reflected in the operating lease liability on the consolidated
balance sheet.
Inclusive of fiscal year 2025 charges, the Company estimates that it will incur approximately $1.0 billion in total pre-tax
restructuring charges related to the “Back to Starbucks” restructuring plan announced in the fourth quarter of fiscal 2025, in
addition to the $137 million incurred resulting from restructuring activities in the second and third quarters of fiscal 2025.
Estimated restructuring charges expected to be incurred in fiscal year 2026 are approximately $230 million, primarily related
to accelerated ROU lease asset amortization and other lease exit costs in our North America and International operating
segments. We anticipate completion of the plan and store closures within fiscal year 2026. The majority of the accrued liability
balance as of September 28, 2025 related to restructuring charges is expected to be paid out in fiscal year 2026.
Note 19: Subsequent Event
On November 3, 2025, we announced the Company has entered an agreement to form a joint venture with Boyu Capital,
a leading alternative investment firm, to operate Starbucks retail in China. We believe this partnership marks a significant
milestone in Starbucks ongoing transformation and underscores its commitment to accelerating long-term growth in China.
Under the agreement, Boyu Capital will acquire up to a 60% interest in Starbucks retail operations in China. Starbucks will
retain a 40% interest in the joint venture and will continue to own and license the Starbucks brand and intellectual property
to the new entity. Boyu Capital will acquire its interest based on a cash-free, debt-free mutually agreed-upon total enterprise
value of approximately $4 billion, to be further adjusted for other contractually agreed-upon items. The transaction is subject
to required regulatory approvals as well as customary closing conditions, and is expected to close by early calendar year 2026.
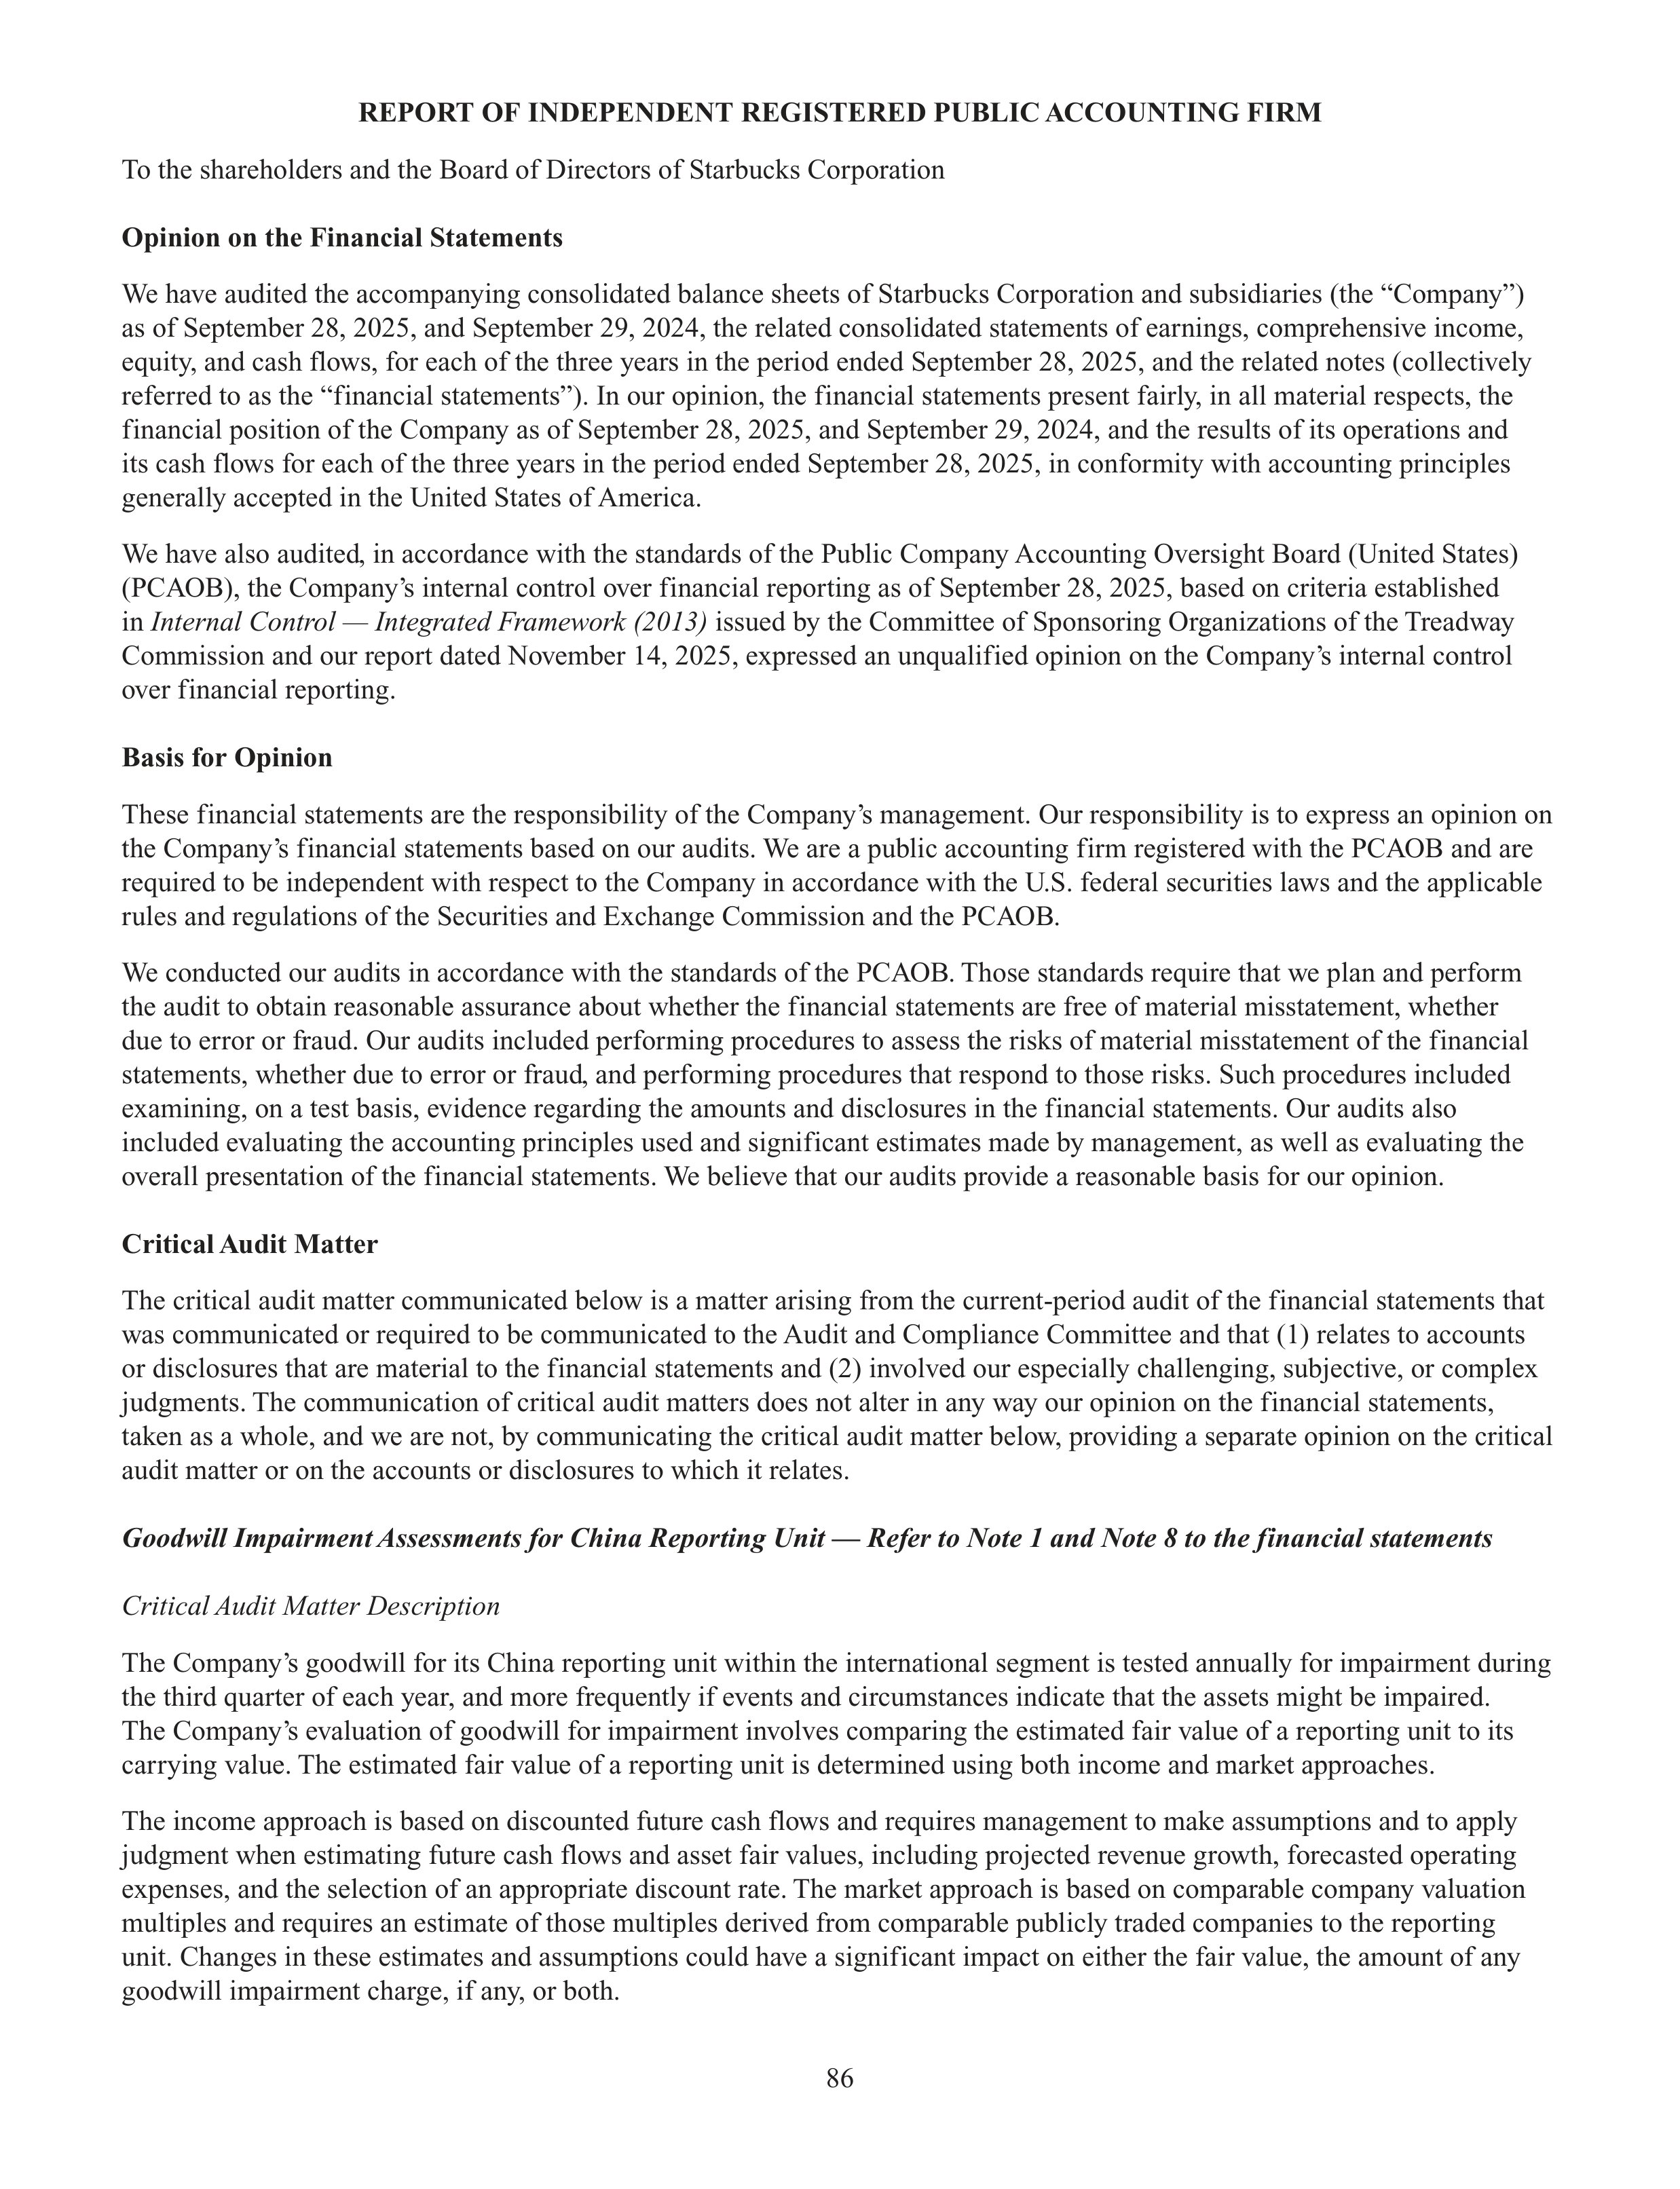
86
REPORT OF INDEPENDENT REGISTERED PUBLIC ACCOUNTING FIRM
To the shareholders and the Board of Directors of Starbucks Corporation
Opinion on the Financial Statements
We have audited the accompanying consolidated balance sheets of Starbucks Corporation and subsidiaries (the “Company”)
as of September 28, 2025, and September 29, 2024, the related consolidated statements of earnings, comprehensive income,
equity, and cash flows, for each of the three years in the period ended September 28, 2025, and the related notes (collectively
referred to as the “financial statements”). In our opinion, the financial statements present fairly, in all material respects, the
financial position of the Company as of September 28, 2025, and September 29, 2024, and the results of its operations and
its cash flows for each of the three years in the period ended September 28, 2025, in conformity with accounting principles
generally accepted in the United States of America.
We have also audited, in accordance with the standards of the Public Company Accounting Oversight Board (United States)
(PCAOB), the Company’s internal control over financial reporting as of September 28, 2025, based on criteria established
in
Internal Control — Integrated Framework (2013)
issued by the Committee of Sponsoring Organizations of the Treadway
Commission and our report dated November 14, 2025, expressed an unqualified opinion on the Company’s internal control
over financial reporting.
Basis for Opinion
These financial statements are the responsibility of the Company’s management. Our responsibility is to express an opinion on
the Company’s financial statements based on our audits. We are a public accounting firm registered with the PCAOB and are
required to be independent with respect to the Company in accordance with the U.S. federal securities laws and the applicable
rules and regulations of the Securities and Exchange Commission and the PCAOB.
We conducted our audits in accordance with the standards of the PCAOB. Those standards require that we plan and perform
the audit to obtain reasonable assurance about whether the financial statements are free of material misstatement, whether
due to error or fraud. Our audits included performing procedures to assess the risks of material misstatement of the financial
statements, whether due to error or fraud, and performing procedures that respond to those risks. Such procedures included
examining, on a test basis, evidence regarding the amounts and disclosures in the financial statements. Our audits also
included evaluating the accounting principles used and significant estimates made by management, as well as evaluating the
overall presentation of the financial statements. We believe that our audits provide a reasonable basis for our opinion.
Critical Audit Matter
The critical audit matter communicated below is a matter arising from the current-period audit of the financial statements that
was communicated or required to be communicated to the Audit and Compliance Committee and that (1) relates to accounts
or disclosures that are material to the financial statements and (2) involved our especially challenging, subjective, or complex
judgments. The communication of critical audit matters does not alter in any way our opinion on the financial statements,
taken as a whole, and we are not, by communicating the critical audit matter below, providing a separate opinion on the critical
audit matter or on the accounts or disclosures to which it relates.
Goodwill Impairment Assessments for China Reporting Unit — Refer to Note 1 and Note 8 to the financial statements
Critical Audit Matter Description
The Company’s goodwill for its China reporting unit within the international segment is tested annually for impairment during
the third quarter of each year, and more frequently if events and circumstances indicate that the assets might be impaired.
The Company’s evaluation of goodwill for impairment involves comparing the estimated fair value of a reporting unit to its
carrying value. The estimated fair value of a reporting unit is determined using both income and market approaches.
The income approach is based on discounted future cash flows and requires management to make assumptions and to apply
judgment when estimating future cash flows and asset fair values, including projected revenue growth, forecasted operating
expenses, and the selection of an appropriate discount rate. The market approach is based on comparable company valuation
multiples and requires an estimate of those multiples derived from comparable publicly traded companies to the reporting
unit. Changes in these estimates and assumptions could have a significant impact on either the fair value, the amount of any
goodwill impairment charge, if any, or both.
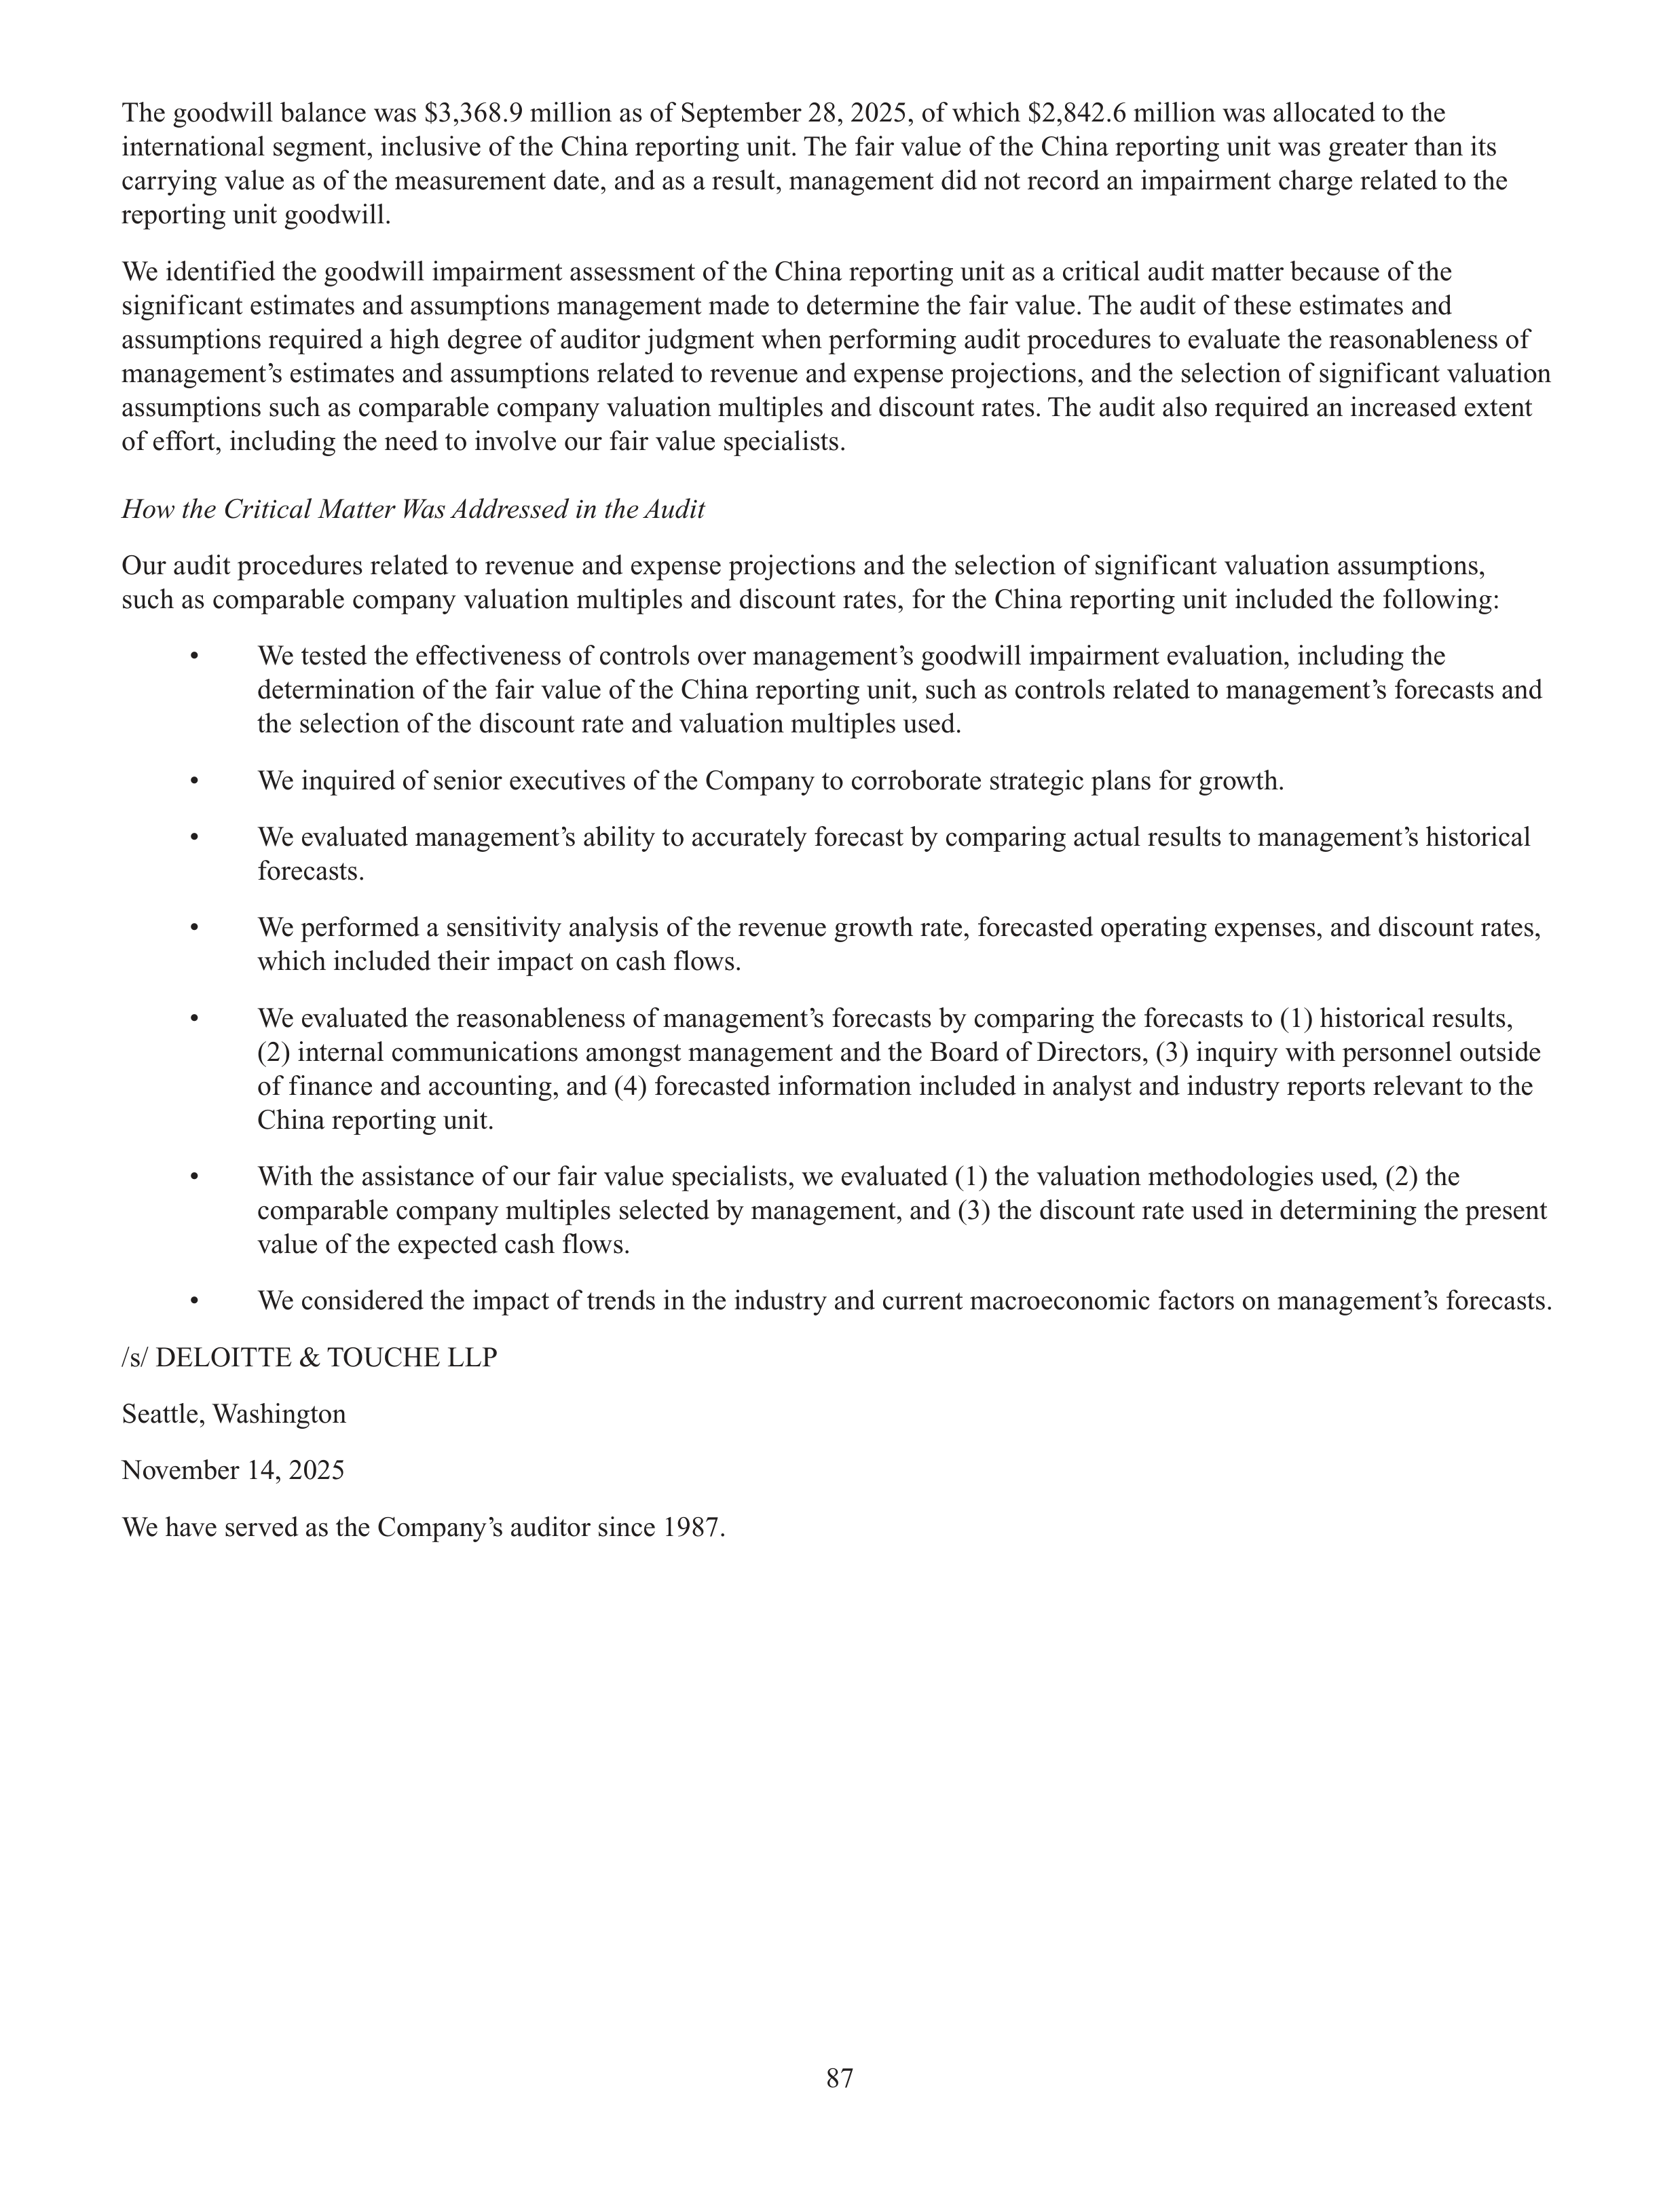
87
The goodwill balance was $3,368.9 million as of September 28, 2025, of which $2,842.6 million was allocated to the
international segment, inclusive of the China reporting unit. The fair value of the China reporting unit was greater than its
carrying value as of the measurement date, and as a result, management did not record an impairment charge related to the
reporting unit goodwill.
We identified the goodwill impairment assessment of the China reporting unit as a critical audit matter because of the
significant estimates and assumptions management made to determine the fair value. The audit of these estimates and
assumptions required a high degree of auditor judgment when performing audit procedures to evaluate the reasonableness of
management’s estimates and assumptions related to revenue and expense projections, and the selection of significant valuation
assumptions such as comparable company valuation multiples and discount rates. The audit also required an increased extent
of effort, including the need to involve our fair value specialists.
How the Critical Matter Was Addressed in the Audit
Our audit procedures related to revenue and expense projections and the selection of significant valuation assumptions,
such as comparable company valuation multiples and discount rates, for the China reporting unit included the following:
•
We tested the effectiveness of controls over management’s goodwill impairment evaluation, including the
determination of the fair value of the China reporting unit, such as controls related to management’s forecasts and
the selection of the discount rate and valuation multiples used.
•
We inquired of senior executives of the Company to corroborate strategic plans for growth.
•
We evaluated management’s ability to accurately forecast by comparing actual results to management’s historical
forecasts.
•
We performed a sensitivity analysis of the revenue growth rate, forecasted operating expenses, and discount rates,
which included their impact on cash flows.
•
We evaluated the reasonableness of management’s forecasts by comparing the forecasts to (1) historical results,
(2) internal communications amongst management and the Board of Directors, (3) inquiry with personnel outside
of finance and accounting, and (4) forecasted information included in analyst and industry reports relevant to the
China reporting unit.
•
With the assistance of our fair value specialists, we evaluated (1) the valuation methodologies used, (2) the
comparable company multiples selected by management, and (3) the discount rate used in determining the present
value of the expected cash flows.
•
We considered the impact of trends in the industry and current macroeconomic factors on management’s forecasts.
/s/ DELOITTE & TOUCHE LLP
Seattle, Washington
November 14, 2025
We have served as the Company’s auditor since 1987.
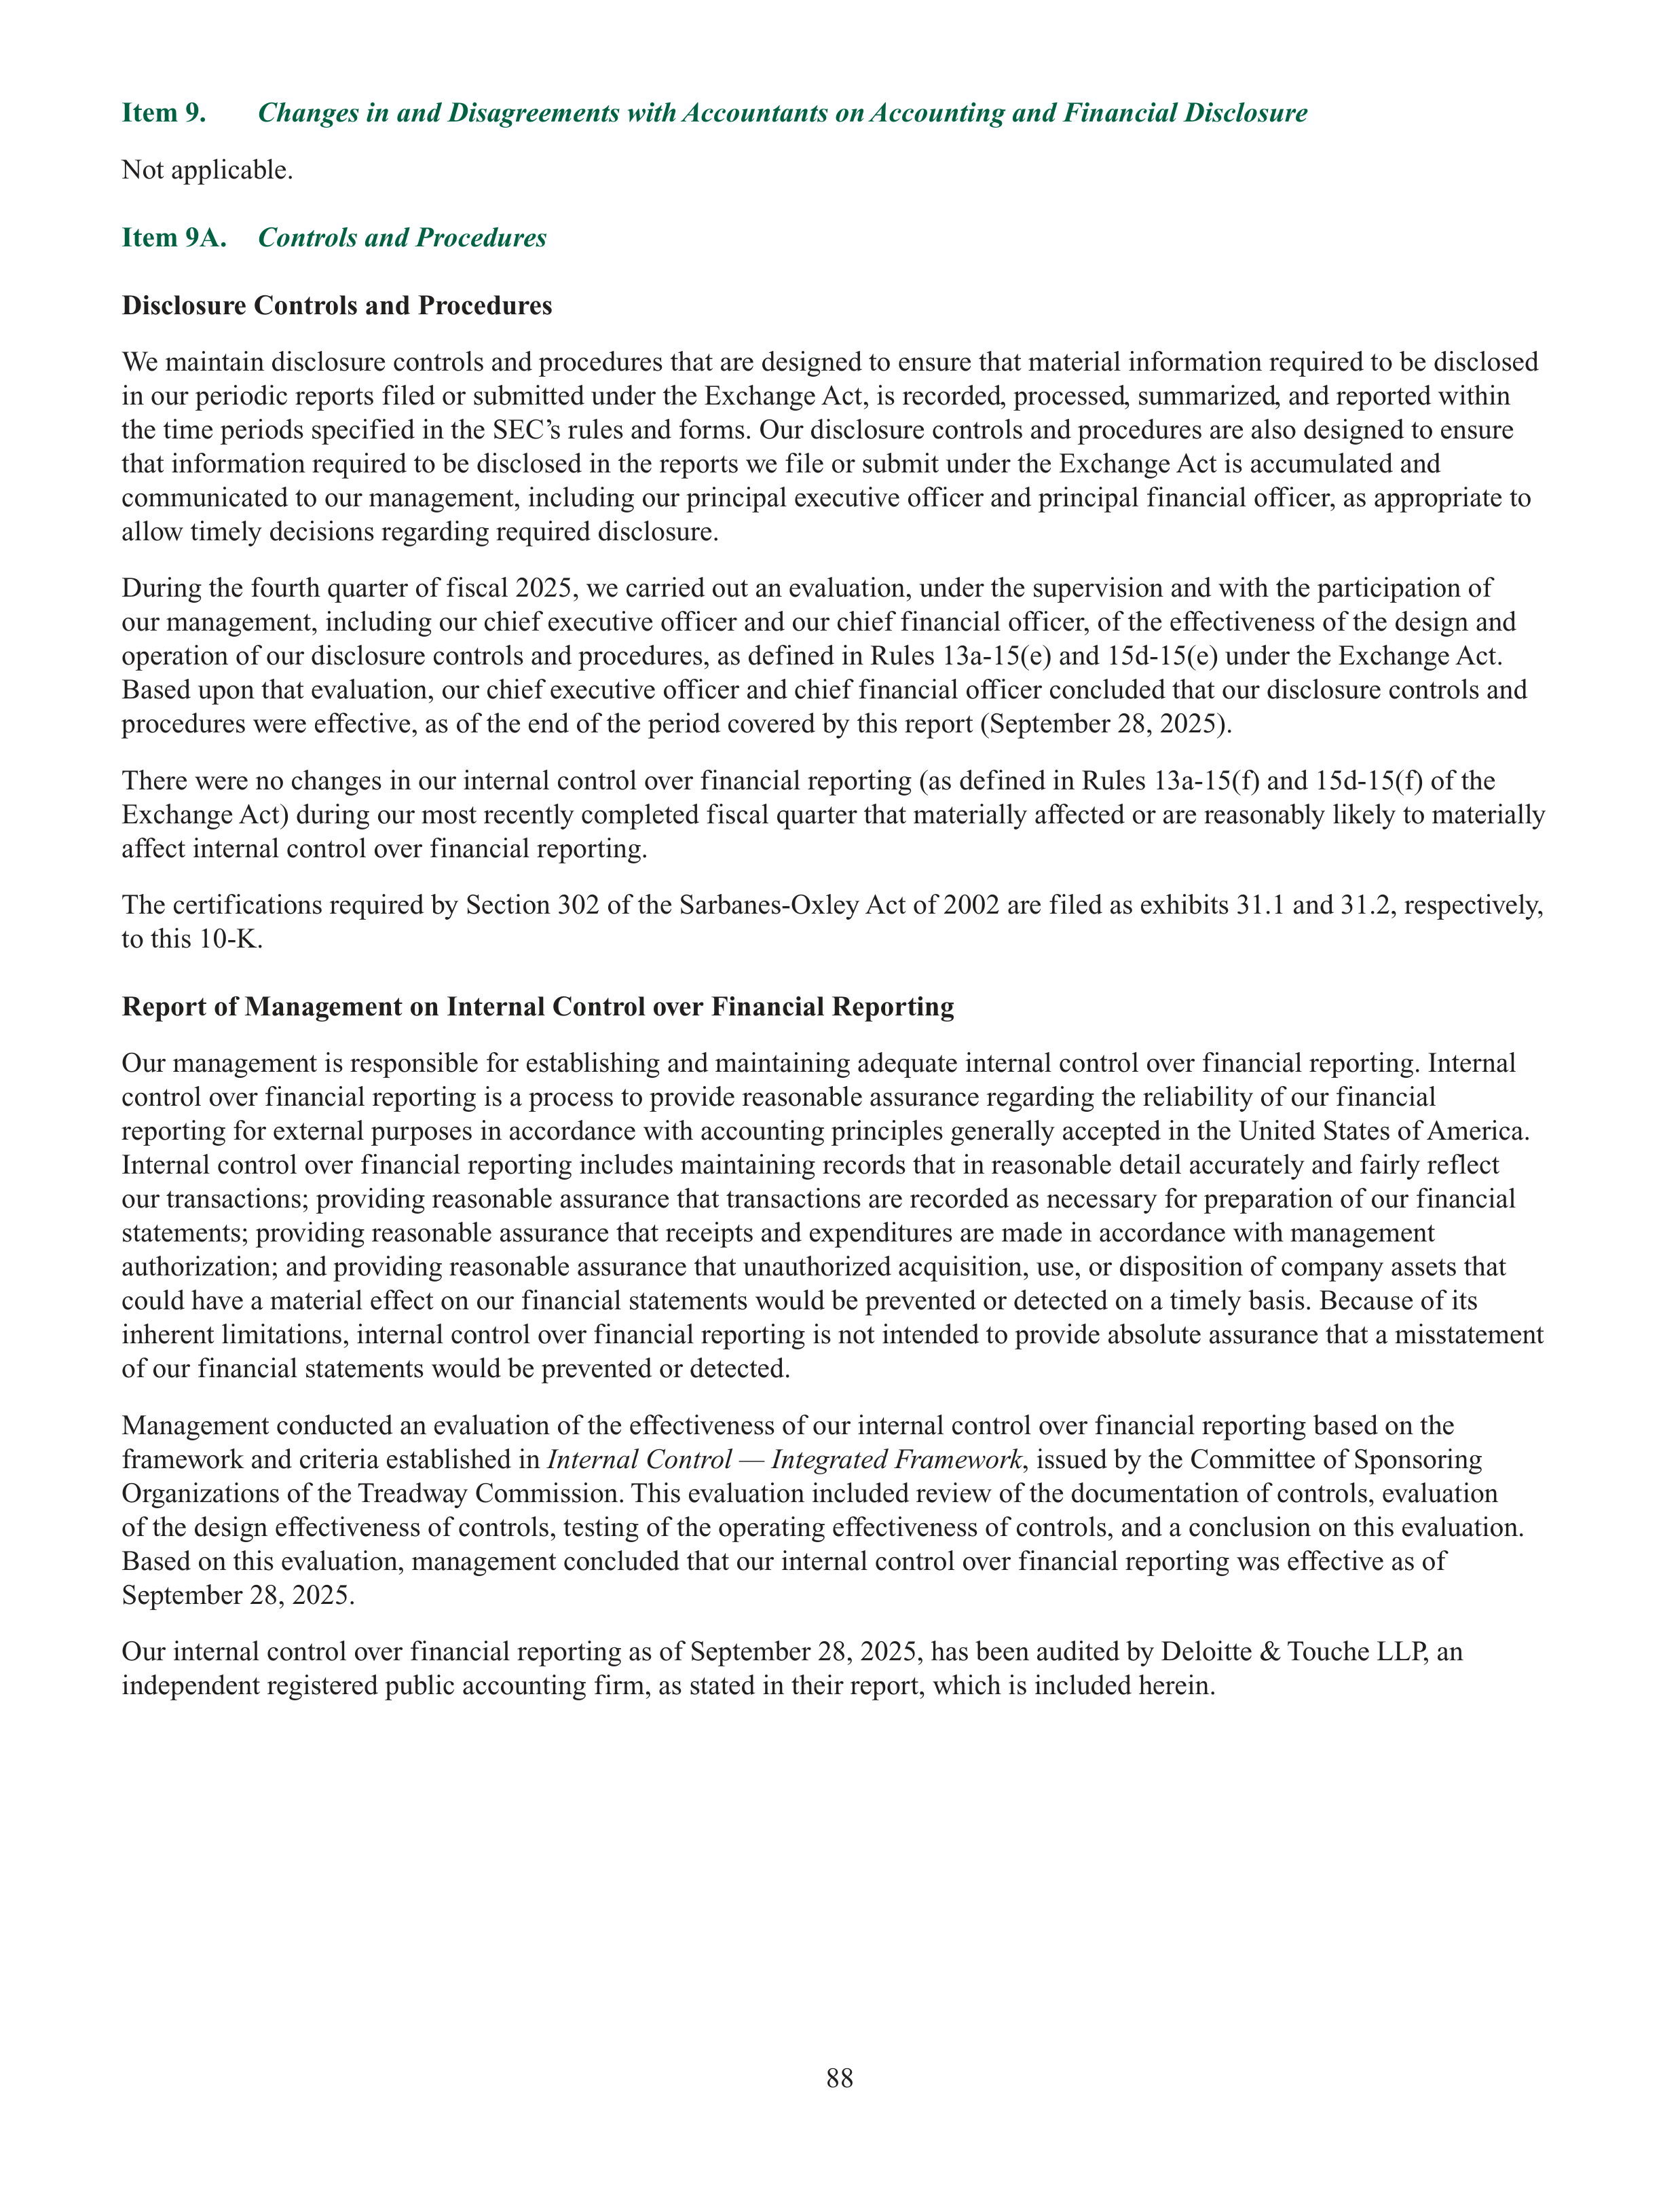
88
Item 9.
Changes in and Disagreements with Accountants on Accounting and Financial Disclosure
Not applicable.
Item 9A.
Controls and Procedures
Disclosure Controls and Procedures
We maintain disclosure controls and procedures that are designed to ensure that material information required to be disclosed
in our periodic reports filed or submitted under the Exchange Act, is recorded, processed, summarized, and reported within
the time periods specified in the SEC’s rules and forms. Our disclosure controls and procedures are also designed to ensure
that information required to be disclosed in the reports we file or submit under the Exchange Act is accumulated and
communicated to our management, including our principal executive officer and principal financial officer, as appropriate to
allow timely decisions regarding required disclosure.
During the fourth quarter of fiscal 2025, we carried out an evaluation, under the supervision and with the participation of
our management, including our chief executive officer and our chief financial officer, of the effectiveness of the design and
operation of our disclosure controls and procedures, as defined in Rules 13a-15(e) and 15d-15(e) under the Exchange Act.
Based upon that evaluation, our chief executive officer and chief financial officer concluded that our disclosure controls and
procedures were effective, as of the end of the period covered by this report (September 28, 2025).
There were no changes in our internal control over financial reporting (as defined in Rules 13a-15(f) and 15d-15(f) of the
Exchange Act) during our most recently completed fiscal quarter that materially affected or are reasonably likely to materially
affect internal control over financial reporting.
The certifications required by Section 302 of the Sarbanes-Oxley Act of 2002 are filed as exhibits 31.1 and 31.2, respectively,
to this 10-K.
Report of Management on Internal Control over Financial Reporting
Our management is responsible for establishing and maintaining adequate internal control over financial reporting. Internal
control over financial reporting is a process to provide reasonable assurance regarding the reliability of our financial
reporting for external purposes in accordance with accounting principles generally accepted in the United States of America.
Internal control over financial reporting includes maintaining records that in reasonable detail accurately and fairly reflect
our transactions; providing reasonable assurance that transactions are recorded as necessary for preparation of our financial
statements; providing reasonable assurance that receipts and expenditures are made in accordance with management
authorization; and providing reasonable assurance that unauthorized acquisition, use, or disposition of company assets that
could have a material effect on our financial statements would be prevented or detected on a timely basis. Because of its
inherent limitations, internal control over financial reporting is not intended to provide absolute assurance that a misstatement
of our financial statements would be prevented or detected.
Management conducted an evaluation of the effectiveness of our internal control over financial reporting based on the
framework and criteria established in
Internal Control — Integrated Framework
, issued by the Committee of Sponsoring
Organizations of the Treadway Commission. This evaluation included review of the documentation of controls, evaluation
of the design effectiveness of controls, testing of the operating effectiveness of controls, and a conclusion on this evaluation.
Based on this evaluation, management concluded that our internal control over financial reporting was effective as of
September 28, 2025.
Our internal control over financial reporting as of September 28, 2025, has been audited by Deloitte & Touche LLP, an
independent registered public accounting firm, as stated in their report, which is included herein.
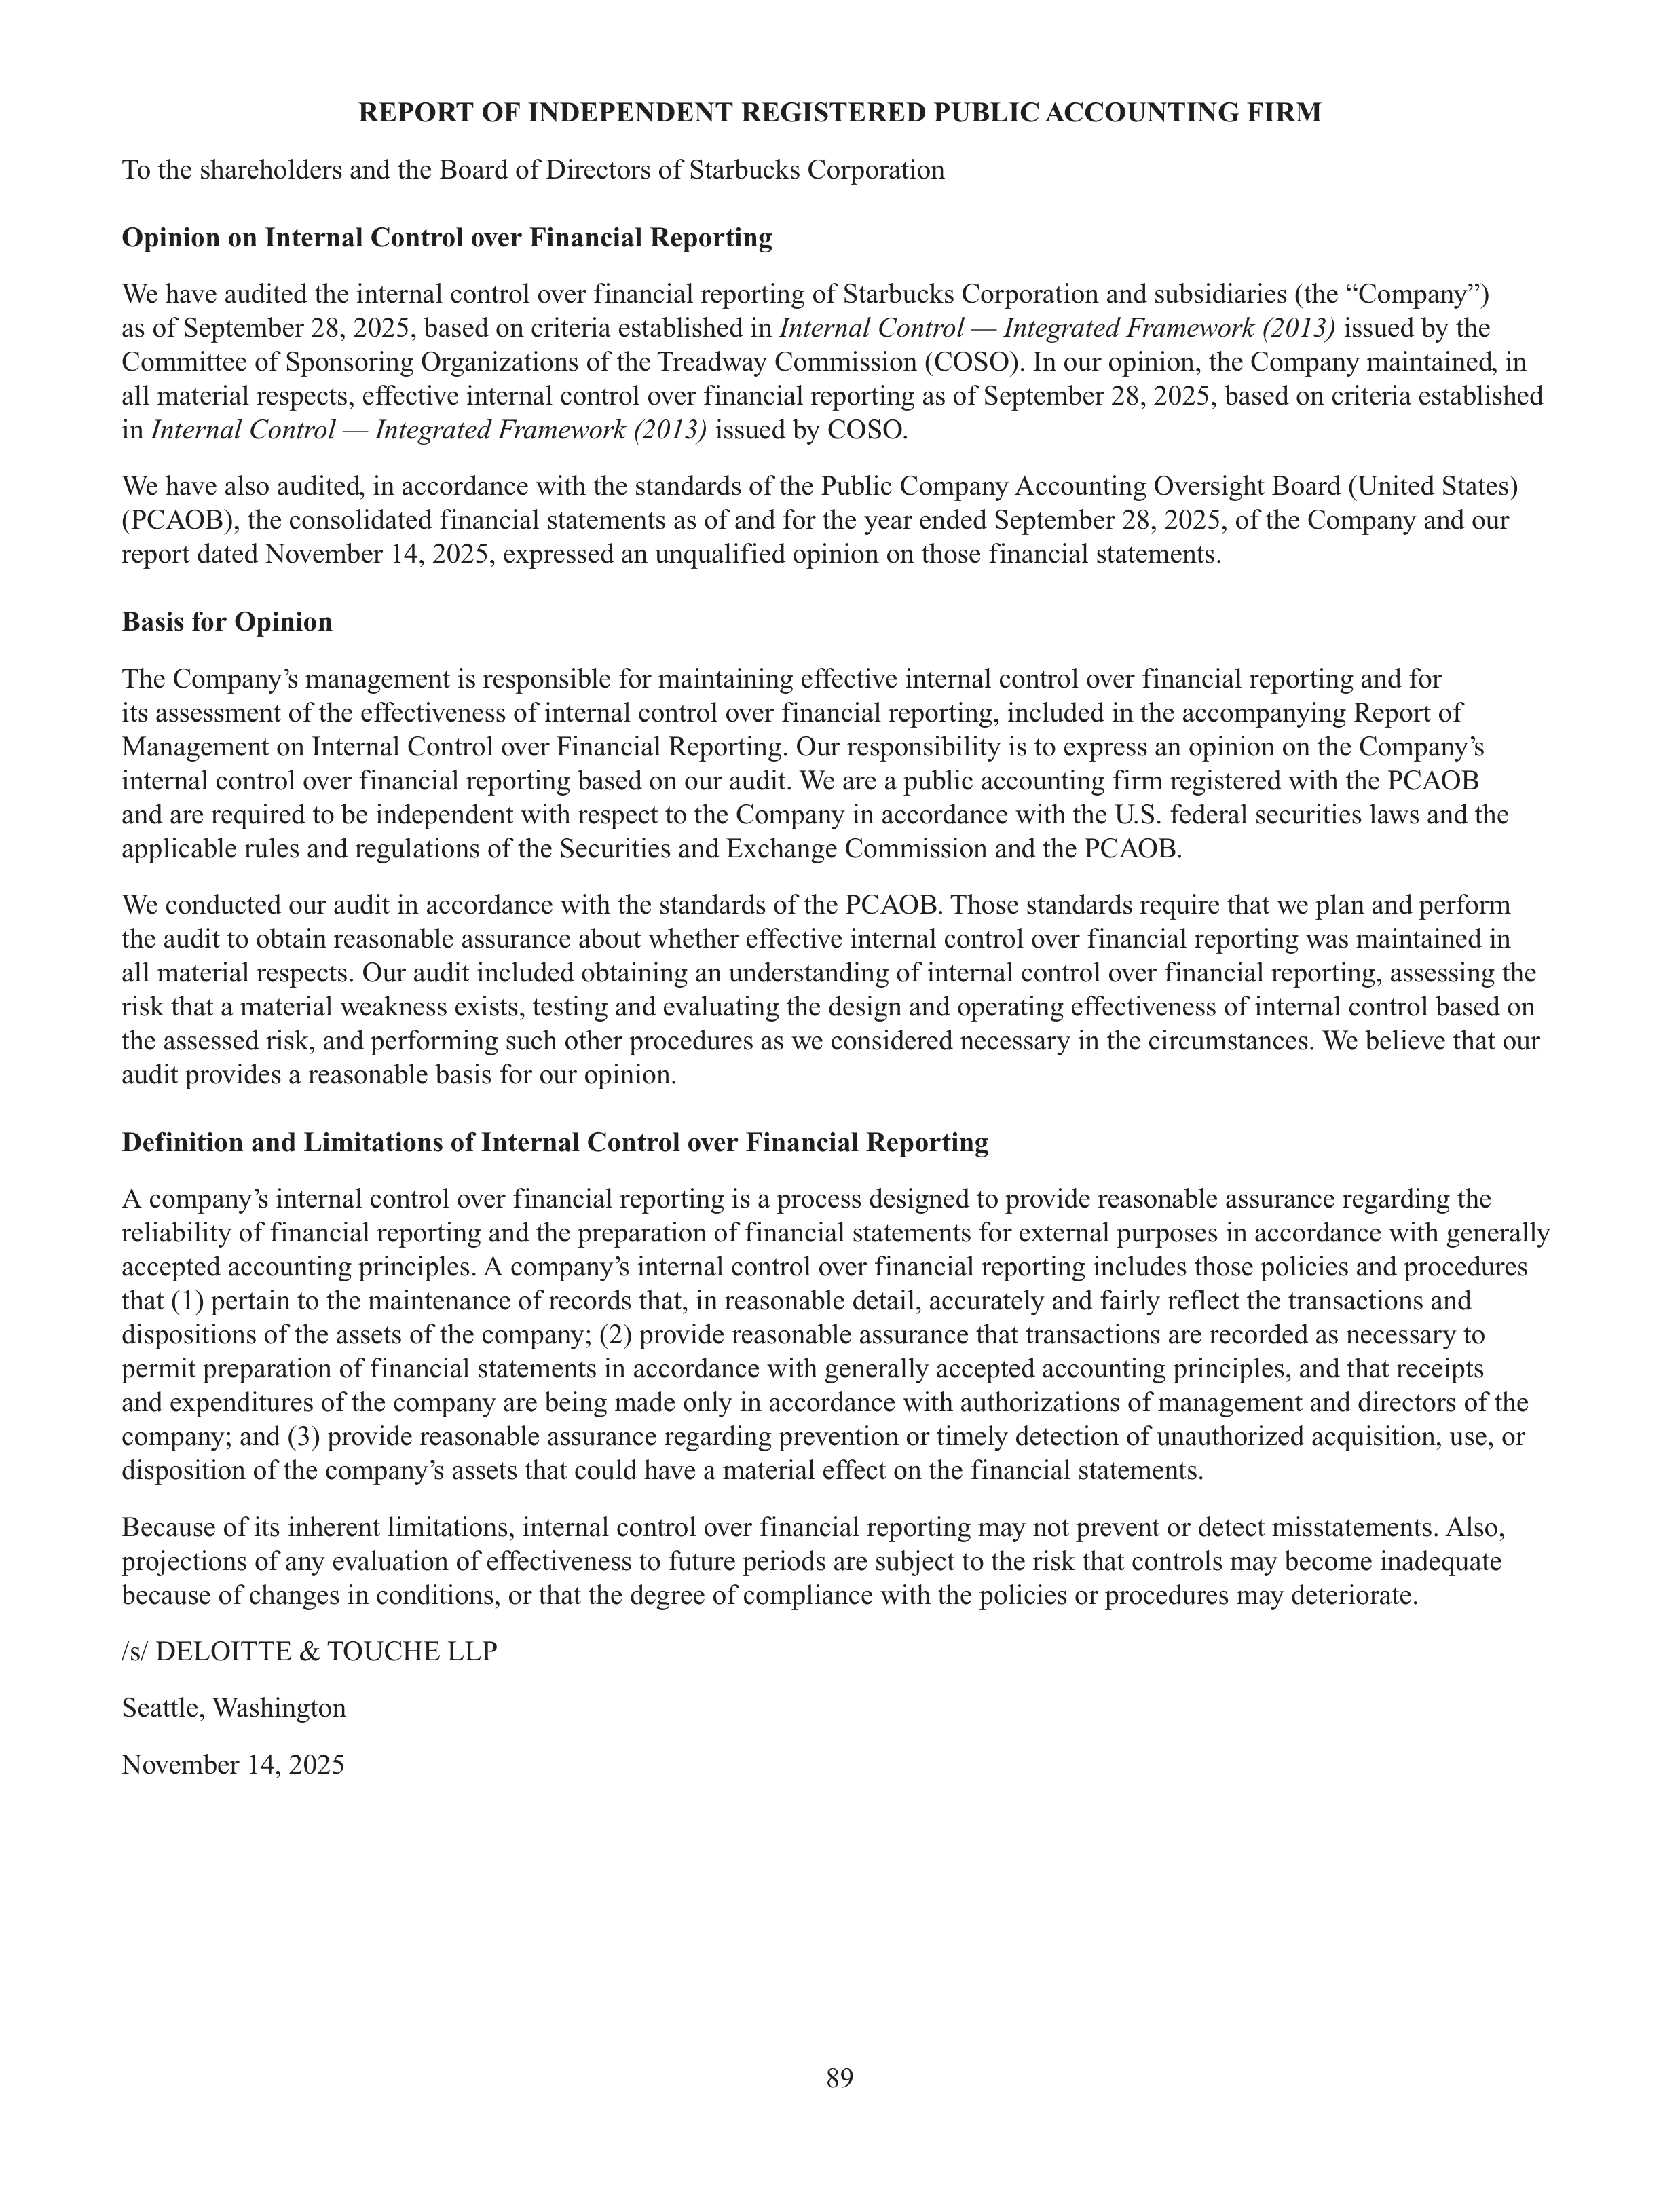
89
REPORT OF INDEPENDENT REGISTERED PUBLIC ACCOUNTING FIRM
To the shareholders and the Board of Directors of Starbucks Corporation
Opinion on Internal Control over Financial Reporting
We have audited the internal control over financial reporting of Starbucks Corporation and subsidiaries (the “Company”)
as of September 28, 2025, based on criteria established in
Internal Control — Integrated Framework (2013)
issued by the
Committee of Sponsoring Organizations of the Treadway Commission (COSO). In our opinion, the Company maintained, in
all material respects, effective internal control over financial reporting as of September 28, 2025, based on criteria established
in
Internal Control — Integrated Framework (2013)
issued by COSO.
We have also audited, in accordance with the standards of the Public Company Accounting Oversight Board (United States)
(PCAOB), the consolidated financial statements as of and for the year ended September 28, 2025, of the Company and our
report dated November 14, 2025, expressed an unqualified opinion on those financial statements.
Basis for Opinion
The Company’s management is responsible for maintaining effective internal control over financial reporting and for
its assessment of the effectiveness of internal control over financial reporting, included in the accompanying Report of
Management on Internal Control over Financial Reporting. Our responsibility is to express an opinion on the Company’s
internal control over financial reporting based on our audit. We are a public accounting firm registered with the PCAOB
and are required to be independent with respect to the Company in accordance with the U.S. federal securities laws and the
applicable rules and regulations of the Securities and Exchange Commission and the PCAOB.
We conducted our audit in accordance with the standards of the PCAOB. Those standards require that we plan and perform
the audit to obtain reasonable assurance about whether effective internal control over financial reporting was maintained in
all material respects. Our audit included obtaining an understanding of internal control over financial reporting, assessing the
risk that a material weakness exists, testing and evaluating the design and operating effectiveness of internal control based on
the assessed risk, and performing such other procedures as we considered necessary in the circumstances. We believe that our
audit provides a reasonable basis for our opinion.
Definition and Limitations of Internal Control over Financial Reporting
A company’s internal control over financial reporting is a process designed to provide reasonable assurance regarding the
reliability of financial reporting and the preparation of financial statements for external purposes in accordance with generally
accepted accounting principles. A company’s internal control over financial reporting includes those policies and procedures
that (1) pertain to the maintenance of records that, in reasonable detail, accurately and fairly reflect the transactions and
dispositions of the assets of the company; (2) provide reasonable assurance that transactions are recorded as necessary to
permit preparation of financial statements in accordance with generally accepted accounting principles, and that receipts
and expenditures of the company are being made only in accordance with authorizations of management and directors of the
company; and (3) provide reasonable assurance regarding prevention or timely detection of unauthorized acquisition, use, or
disposition of the company’s assets that could have a material effect on the financial statements.
Because of its inherent limitations, internal control over financial reporting may not prevent or detect misstatements. Also,
projections of any evaluation of effectiveness to future periods are subject to the risk that controls may become inadequate
because of changes in conditions, or that the degree of compliance with the policies or procedures may deteriorate.
/s/ DELOITTE & TOUCHE LLP
Seattle, Washington
November 14, 2025
90
Item 9B.
Other Information
Insider Adoption or Termination of Trading Arrangements:
During the fiscal quarter ended September 28, 2025, none of our directors or officers informed us of the adoption or
termination of a “Rule 10b5-1 trading arrangement” or “non-Rule 10b5-1 trading arrangement,” as those terms are defined in
Regulation S-K, Item 408.
Item 9C.
Disclosure Regarding Foreign Jurisdictions that Prevent Inspections
Not applicable.
91
PART III
Item 10.
Directors, Executive Officers, and Corporate Governance
Information regarding our executive officers is set forth in Item 1 of Part I of this Report under the caption “Information about
our Executive Officers.”
We adopted a code of ethics that applies to our chief executive officer, chief financial officer, chief accounting officer,
controller, and other finance leaders, which is a “code of ethics” as defined by applicable rules of the SEC. This code is
publicly available on our website at
www.starbucks.com/about-us/corporate-governance
. If we make any amendments to
this code other than technical, administrative or other non-substantive amendments, or grant any waivers, including implicit
waivers, from a provision of this code to our chief executive officer, chief financial officer, chief accounting officer, or
controller, we will disclose the nature of the amendment or waiver, its effective date, and to whom it applies on our website
at
www.starbucks.com/about-us/corporate-governance
or in a report on Form 8-K filed electronically with the SEC
at
www.sec.gov
.
The remaining information required by this item is incorporated herein by reference to the sections entitled “Proposal 1 —
Election of Directors,” “Stock Ownership — Beneficial Ownership of Common Stock,” “Corporate Governance,” “Corporate
Governance — Audit and Compliance Committee” and “Executive Compensation Governance Policies and Practices — Insider
trading policy” in our definitive Proxy Statement for the Annual Meeting of Shareholders to be held on March 25, 2026
(the “Proxy Statement”).
We will provide disclosure of delinquent Section 16(a) reports, if any, in our Proxy Statement in a section entitled “Stock
Ownership — Delinquent Section 16(a) Reports,” and such disclosure, if any, is incorporated herein by reference.
Item 11.
Executive Compensation
The information required by this item is incorporated by reference to the sections entitled “Executive Compensation,”
“Executive Compensation — Executive Compensation Tables,” “Corporate Governance — Compensation of Directors,” and
“Corporate Governance — Role of Our Board Committees — Compensation Committee Interlocks and Insider Participation”
in the Proxy Statement.
Item 12.
Security Ownership of Certain Beneficial Owners and Management and Related Shareholder Matters
The information required by this item is incorporated by reference to the sections entitled “Stock Ownership — Equity
Compensation Plan Information” and “Stock Ownership — Beneficial Ownership of Common Stock” in the Proxy Statement.
Item 13.
Certain Relationships and Related Transactions and Director Independence
The information required by this item is incorporated by reference to the section entitled “Corporate Governance — Certain
Relationships and Related Person Transactions” and “Corporate Governance — Director Independence” in the Proxy
Statement.
Item 14.
Principal Accountant Fees and Services
The information required by this item is incorporated by reference to the sections entitled “Proposal 3 — Ratification of
Selection of Deloitte & Touche LLP as our Independent Registered Public Accounting Firm — Independent Registered Public
Accounting Firm Fees” and “Proposal 3 — Ratification of Selection of Deloitte & Touche LLP as our Independent Registered
Public Accounting Firm — Policy on Audit Committee Pre-Approval of Audit and Permissible Non-Audit Services of the
Independent Registered Public Accounting Firm” in the Proxy Statement.
92
PART IV
Item 15.
Exhibits and Financial Statement Schedules
(a)
The following documents are filed as a part of this 10-K:
1.
Financial Statements
The following financial statements are included in Part II, Item 8 of this 10-K:
•
Consolidated Statements of Earnings for the fiscal years ended September 28, 2025, September 29, 2024, and
October 1, 2023;
•
Consolidated Statements of Comprehensive Income for the fiscal years ended September 28, 2025, September 29,
2024, and October 1, 2023;
•
Consolidated Balance Sheets as of September 28, 2025, and September 29, 2024;
•
Consolidated Statements of Cash Flows for the fiscal years ended September 28, 2025, September 29, 2024, and
October 1, 2023;
•
Consolidated Statements of Equity for the fiscal years ended September 28, 2025, September 29, 2024, and
October 1, 2023;
•
Notes to Consolidated Financial Statements; and
•
Reports of Independent Registered Public Accounting Firm (PCAOB ID No. 34)
2.
Financial Statement Schedules
Financial statement schedules are omitted because they are not required or are not applicable, or the required information is
provided in the consolidated financial statements or notes described in Item 15(a)(1) above.
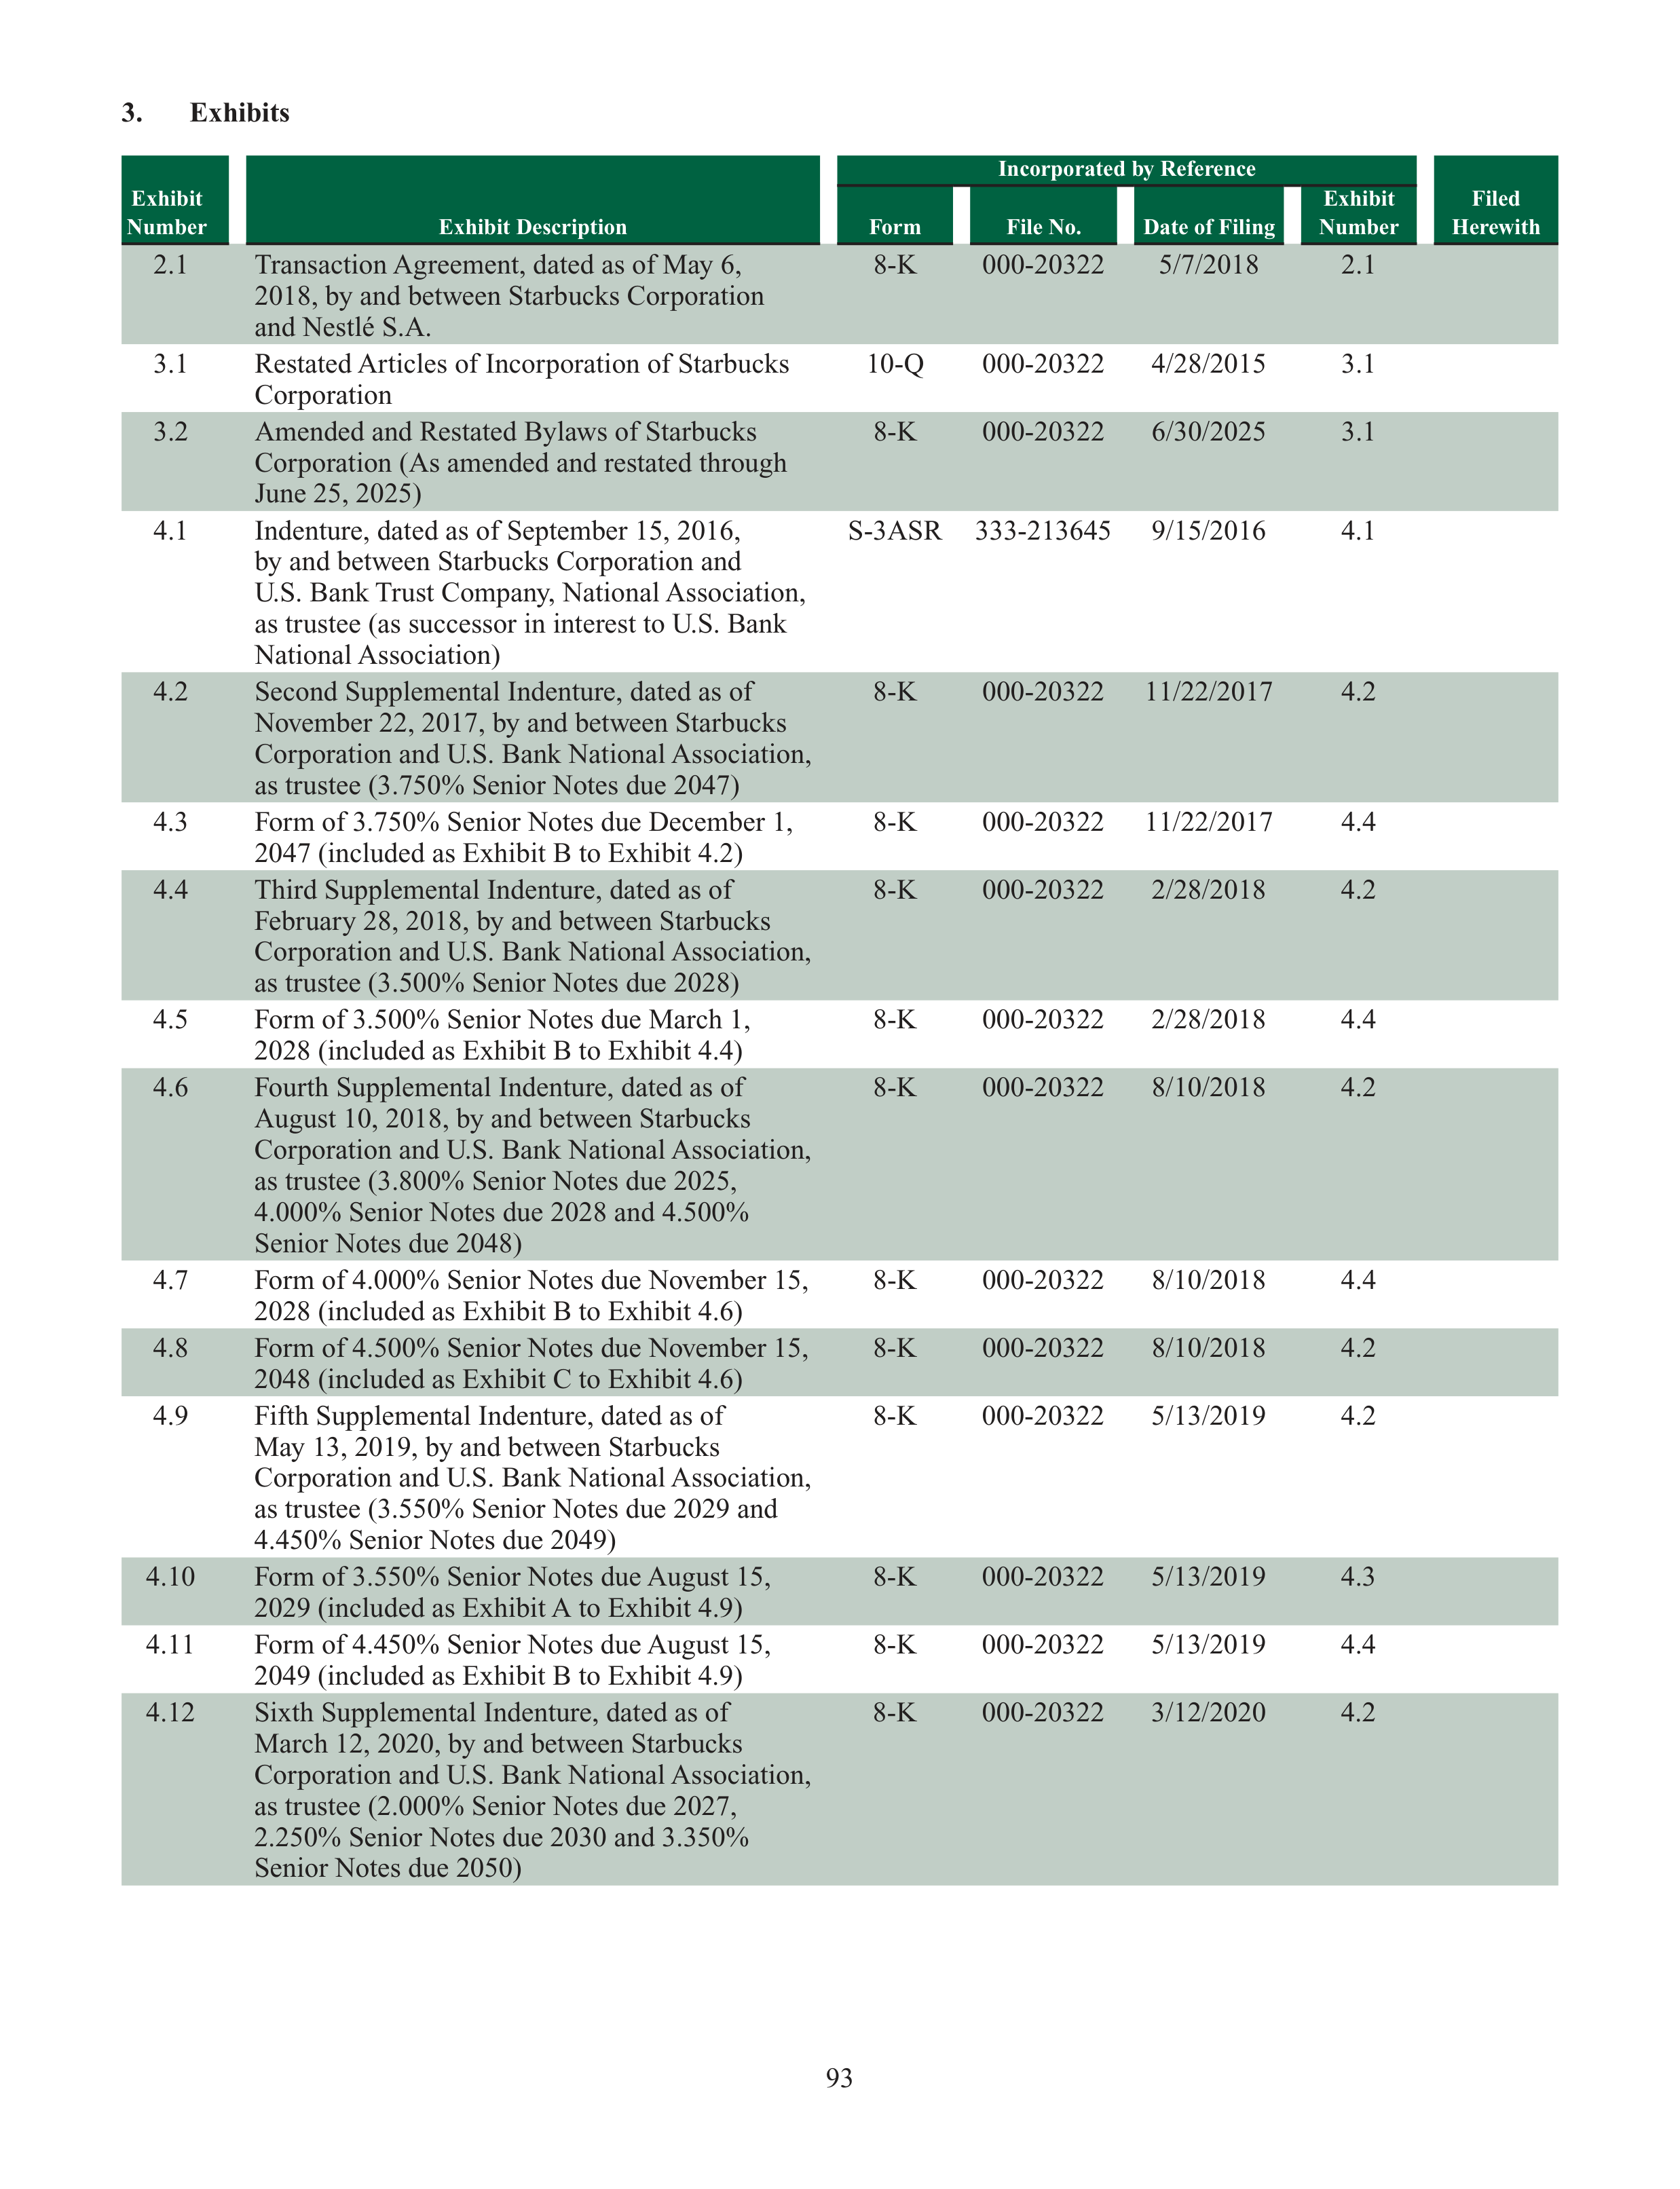
93
3.
Exhibits
Exhibit
Number
Exhibit Description
Incorporated by Reference
Form
File No.
Date of Filing
Exhibit
Number
Filed
Herewith
2.1
Transaction Agreement, dated as of May 6,
2018, by and between Starbucks Corporation
and Nestlé S.A.
8-K
000-20322
5/7/2018
2.1
3.1
Restated Articles of Incorporation of Starbucks
Corporation
10-Q
000-20322
4/28/2015
3.1
3.2
Amended and Restated Bylaws of Starbucks
Corporation (As amended and restated through
June 25, 2025)
8-K
000-20322
6/30/2025
3.1
4.1
Indenture, dated as of September 15, 2016,
by and between Starbucks Corporation and
U.S. Bank Trust Company, National Association,
as trustee (as successor in interest to U.S. Bank
National Association)
S-3ASR
333-213645
9/15/2016
4.1
4.2
Second Supplemental Indenture, dated as of
November 22, 2017, by and between Starbucks
Corporation and U.S. Bank National Association,
as trustee (3.750% Senior Notes due 2047)
8-K
000-20322
11/22/2017
4.2
4.3
Form of 3.750% Senior Notes due December 1,
2047 (included as Exhibit B to Exhibit 4.2)
8-K
000-20322
11/22/2017
4.4
4.4
Third Supplemental Indenture, dated as of
February 28, 2018, by and between Starbucks
Corporation and U.S. Bank National Association,
as trustee (3.500% Senior Notes due 2028)
8-K
000-20322
2/28/2018
4.2
4.5
Form of 3.500% Senior Notes due March 1,
2028 (included as Exhibit B to Exhibit 4.4)
8-K
000-20322
2/28/2018
4.4
4.6
Fourth Supplemental Indenture, dated as of
August 10, 2018, by and between Starbucks
Corporation and U.S. Bank National Association,
as trustee (3.800% Senior Notes due 2025,
4.000% Senior Notes due 2028 and 4.500%
Senior Notes due 2048)
8-K
000-20322
8/10/2018
4.2
4.7
Form of 4.000% Senior Notes due November 15,
2028 (included as Exhibit B to Exhibit 4.6)
8-K
000-20322
8/10/2018
4.4
4.8
Form of 4.500% Senior Notes due November 15,
2048 (included as Exhibit C to Exhibit 4.6)
8-K
000-20322
8/10/2018
4.2
4.9
Fifth Supplemental Indenture, dated as of
May 13, 2019, by and between Starbucks
Corporation and U.S. Bank National Association,
as trustee (3.550% Senior Notes due 2029 and
4.450% Senior Notes due 2049)
8-K
000-20322
5/13/2019
4.2
4.10
Form of 3.550% Senior Notes due August 15,
2029 (included as Exhibit A to Exhibit 4.9)
8-K
000-20322
5/13/2019
4.3
4.11
Form of 4.450% Senior Notes due August 15,
2049 (included as Exhibit B to Exhibit 4.9)
8-K
000-20322
5/13/2019
4.4
4.12
Sixth Supplemental Indenture, dated as of
March 12, 2020, by and between Starbucks
Corporation and U.S. Bank National Association,
as trustee (2.000% Senior Notes due 2027,
2.250% Senior Notes due 2030 and 3.350%
Senior Notes due 2050)
8-K
000-20322
3/12/2020
4.2
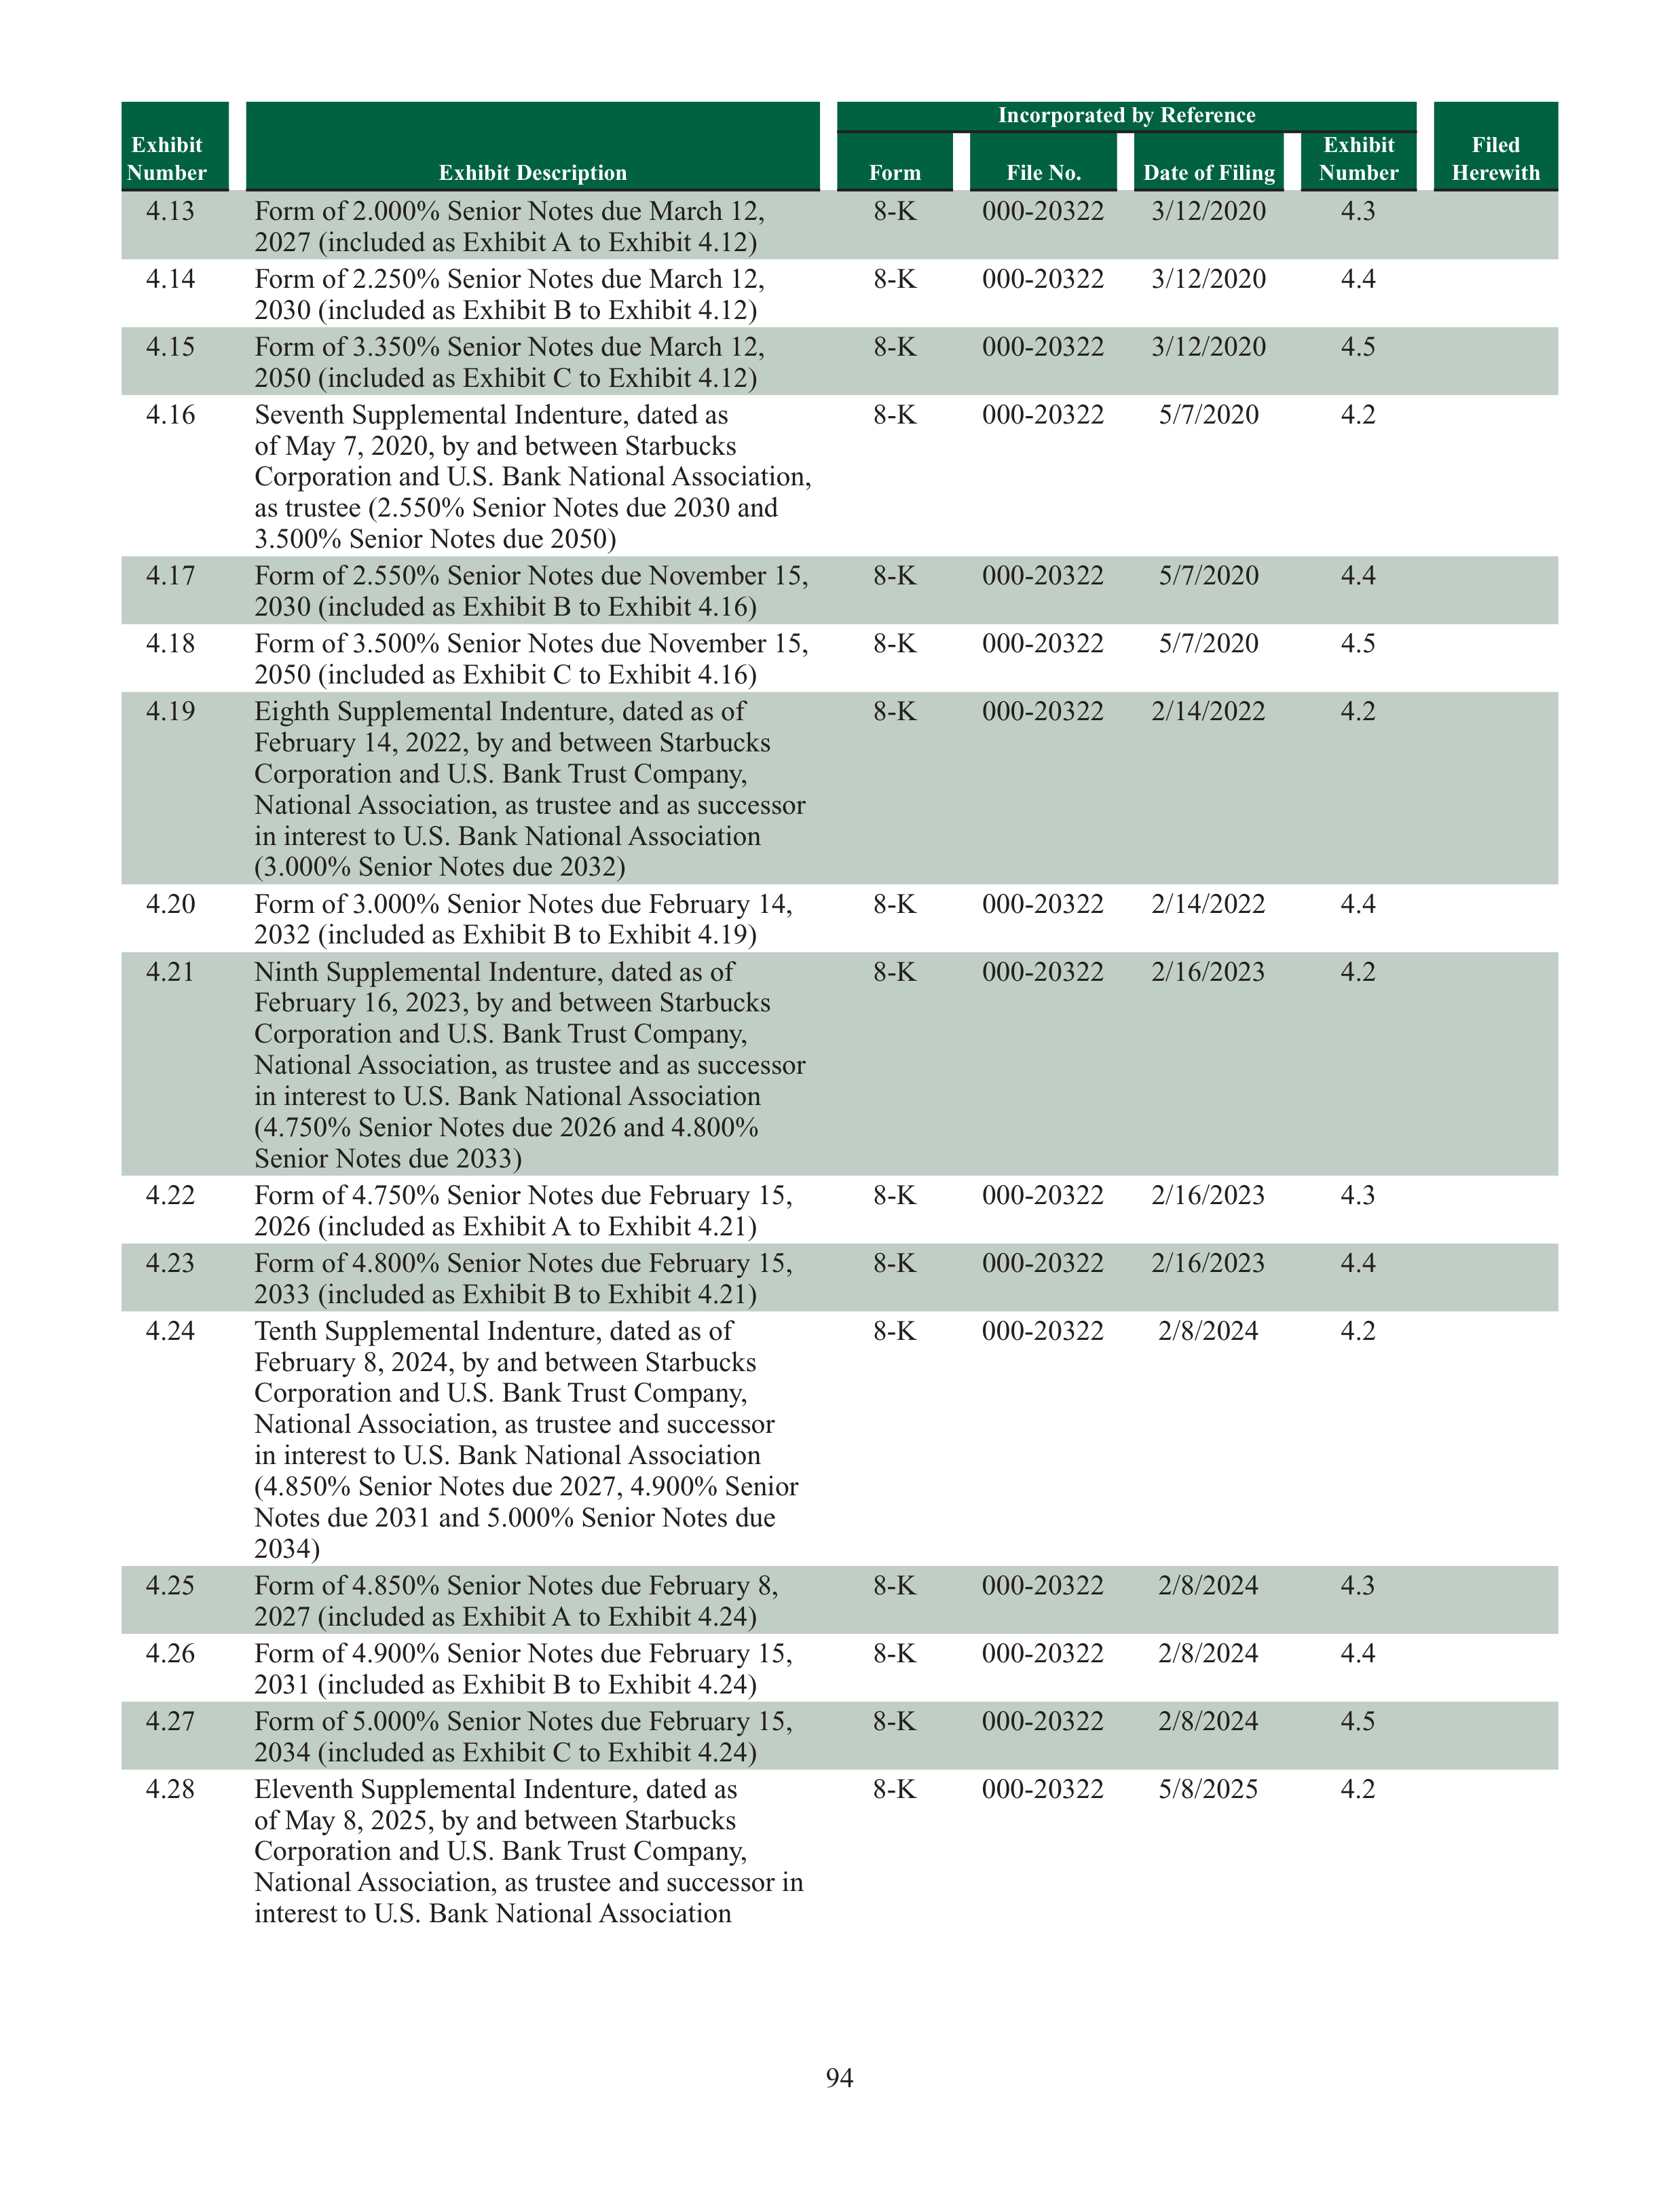
94
Exhibit
Number
Exhibit Description
Incorporated by Reference
Form
File No.
Date of Filing
Exhibit
Number
Filed
Herewith
4.13
Form of 2.000% Senior Notes due March 12,
2027 (included as Exhibit A to Exhibit 4.12)
8-K
000-20322
3/12/2020
4.3
4.14
Form of 2.250% Senior Notes due March 12,
2030 (included as Exhibit B to Exhibit 4.12)
8-K
000-20322
3/12/2020
4.4
4.15
Form of 3.350% Senior Notes due March 12,
2050 (included as Exhibit C to Exhibit 4.12)
8-K
000-20322
3/12/2020
4.5
4.16
Seventh Supplemental Indenture, dated as
of May 7, 2020, by and between Starbucks
Corporation and U.S. Bank National Association,
as trustee (2.550% Senior Notes due 2030 and
3.500% Senior Notes due 2050)
8-K
000-20322
5/7/2020
4.2
4.17
Form of 2.550% Senior Notes due November 15,
2030 (included as Exhibit B to Exhibit 4.16)
8-K
000-20322
5/7/2020
4.4
4.18
Form of 3.500% Senior Notes due November 15,
2050 (included as Exhibit C to Exhibit 4.16)
8-K
000-20322
5/7/2020
4.5
4.19
Eighth Supplemental Indenture, dated as of
February 14, 2022, by and between Starbucks
Corporation and U.S. Bank Trust Company,
National Association, as trustee and as successor
in interest to U.S. Bank National Association
(3.000% Senior Notes due 2032)
8-K
000-20322
2/14/2022
4.2
4.20
Form of 3.000% Senior Notes due February 14,
2032 (included as Exhibit B to Exhibit 4.19)
8-K
000-20322
2/14/2022
4.4
4.21
Ninth Supplemental Indenture, dated as of
February 16, 2023, by and between Starbucks
Corporation and U.S. Bank Trust Company,
National Association, as trustee and as successor
in interest to U.S. Bank National Association
(4.750% Senior Notes due 2026 and 4.800%
Senior Notes due 2033)
8-K
000-20322
2/16/2023
4.2
4.22
Form of 4.750% Senior Notes due February 15,
2026 (included as Exhibit A to Exhibit 4.21)
8-K
000-20322
2/16/2023
4.3
4.23
Form of 4.800% Senior Notes due February 15,
2033 (included as Exhibit B to Exhibit 4.21)
8-K
000-20322
2/16/2023
4.4
4.24
Tenth Supplemental Indenture, dated as of
February 8, 2024, by and between Starbucks
Corporation and U.S. Bank Trust Company,
National Association, as trustee and successor
in interest to U.S. Bank National Association
(4.850% Senior Notes due 2027, 4.900% Senior
Notes due 2031 and 5.000% Senior Notes due
2034)
8-K
000-20322
2/8/2024
4.2
4.25
Form of 4.850% Senior Notes due February 8,
2027 (included as Exhibit A to Exhibit 4.24)
8-K
000-20322
2/8/2024
4.3
4.26
Form of 4.900% Senior Notes due February 15,
2031 (included as Exhibit B to Exhibit 4.24)
8-K
000-20322
2/8/2024
4.4
4.27
Form of 5.000% Senior Notes due February 15,
2034 (included as Exhibit C to Exhibit 4.24)
8-K
000-20322
2/8/2024
4.5
4.28
Eleventh Supplemental Indenture, dated as
of May 8, 2025, by and between Starbucks
Corporation and U.S. Bank Trust Company,
National Association, as trustee and successor in
interest to U.S. Bank National Association
8-K
000-20322
5/8/2025
4.2
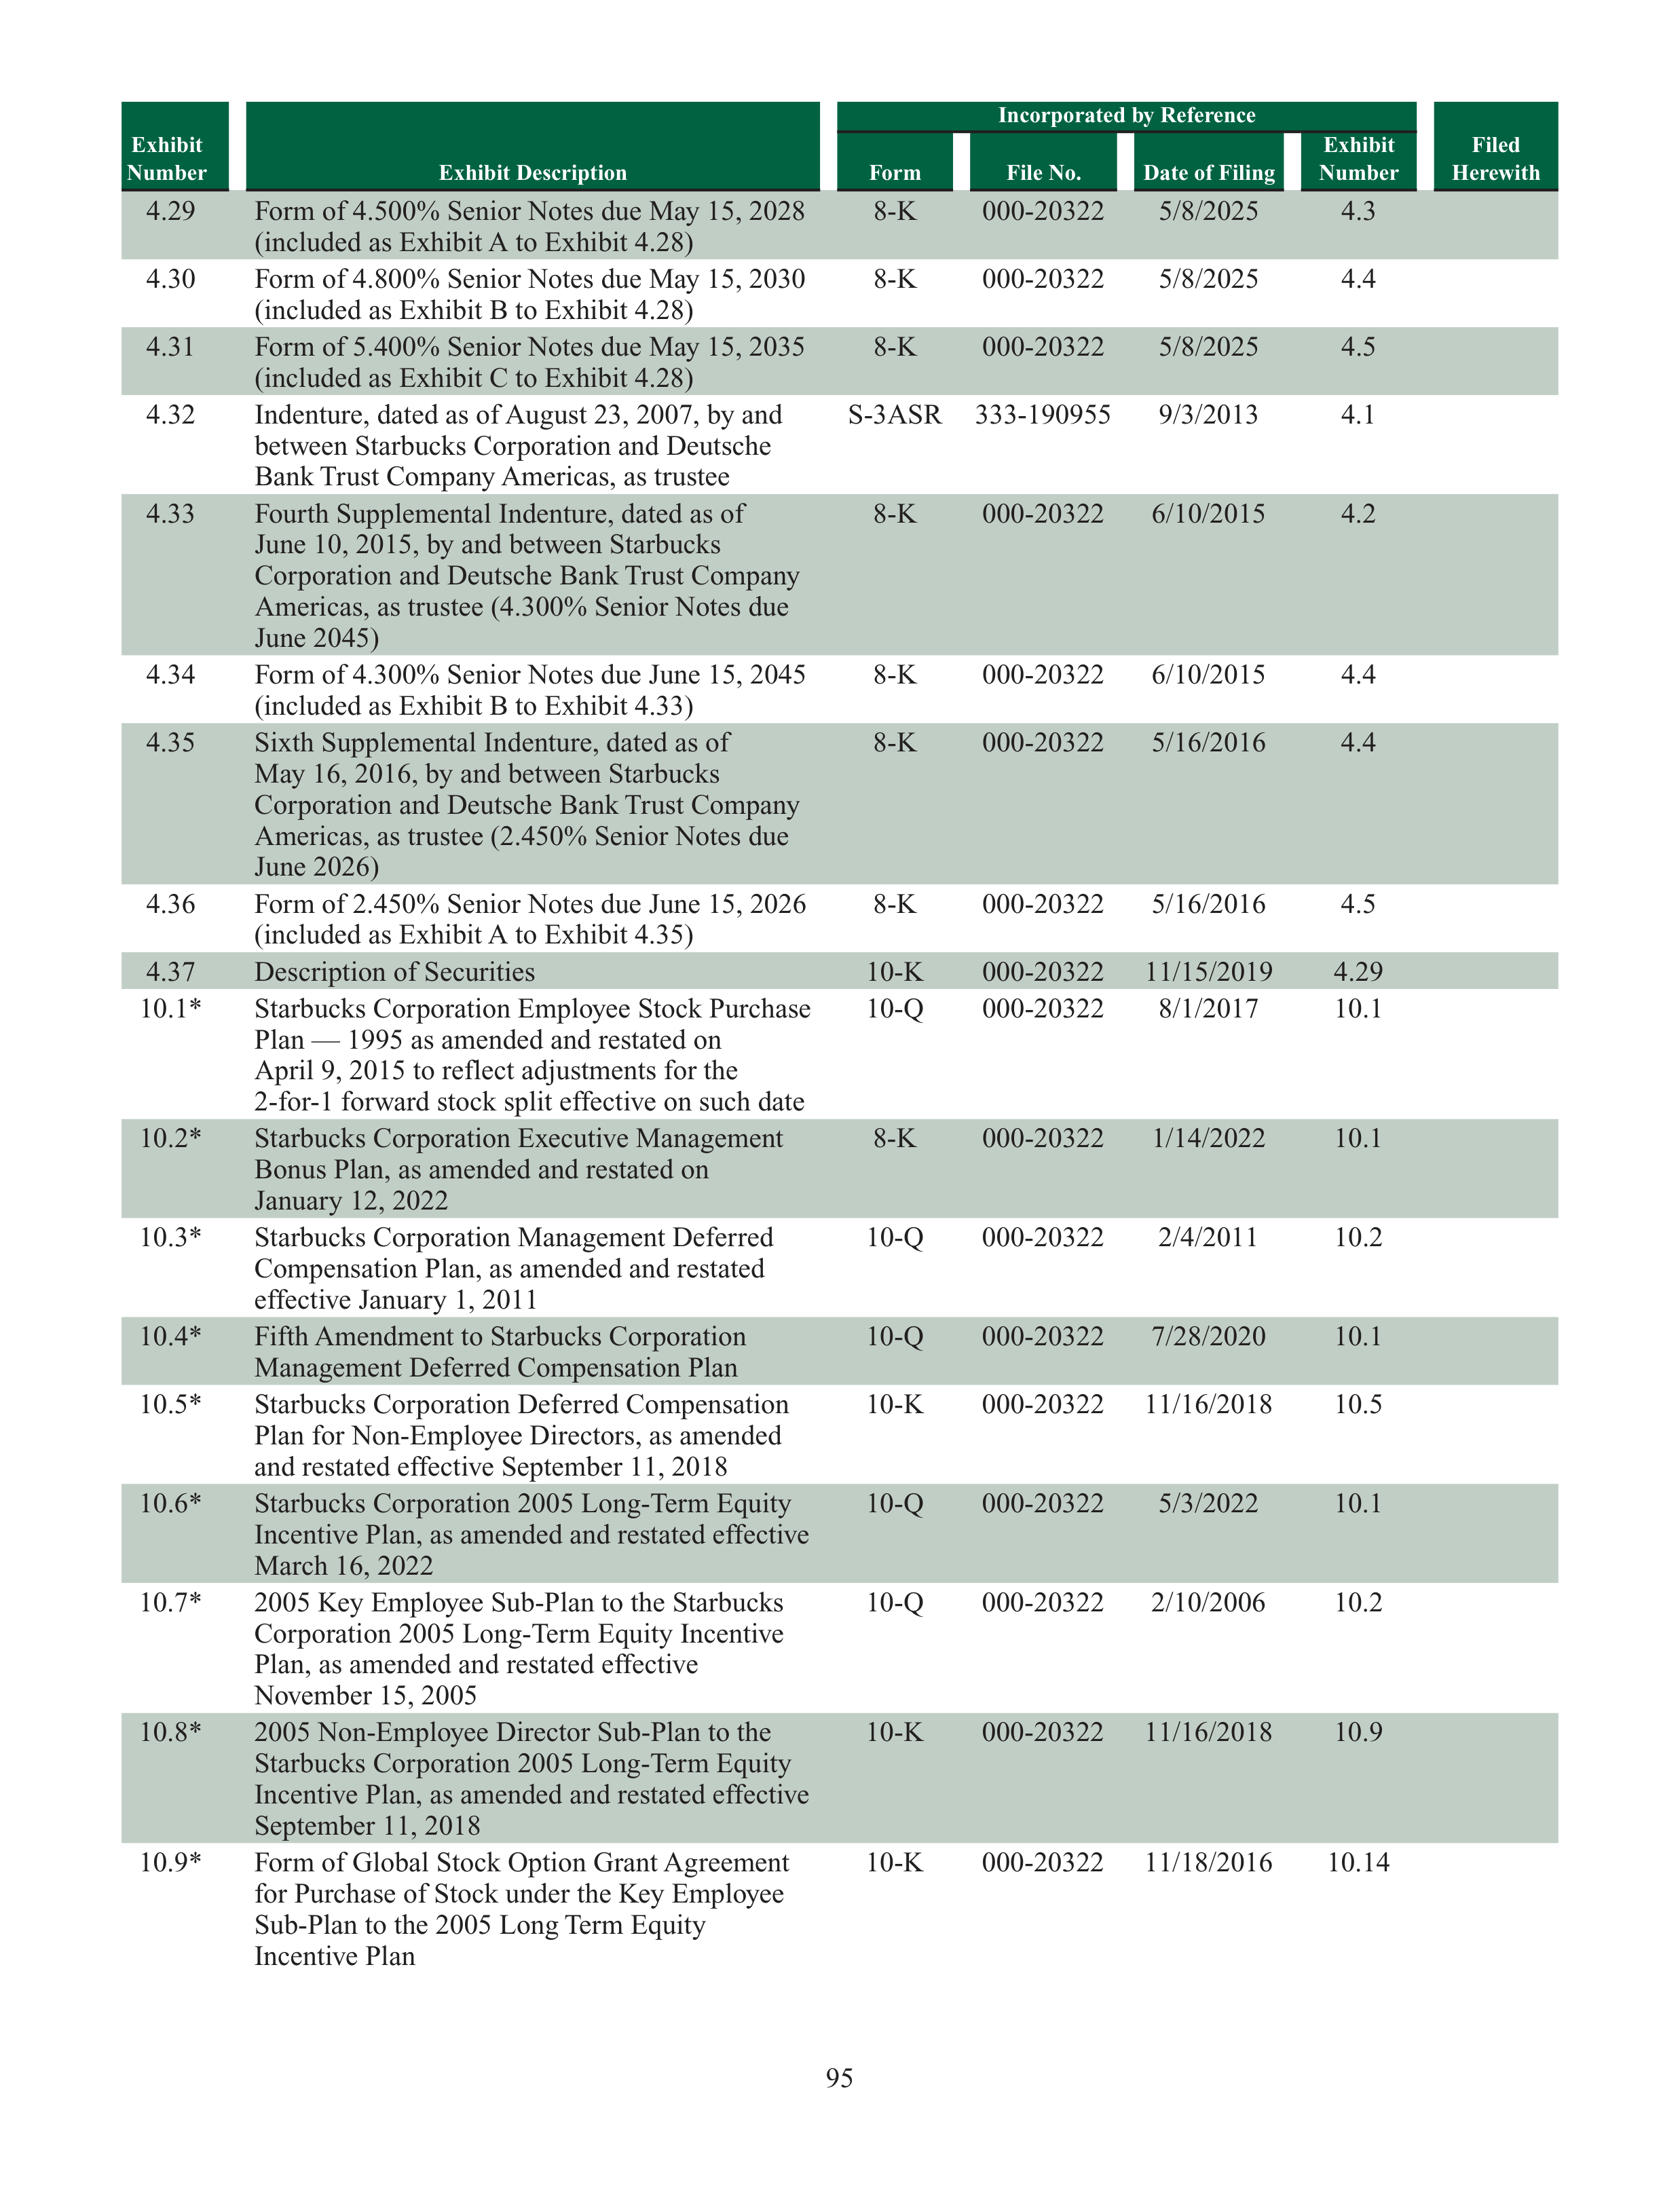
95
Exhibit
Number
Exhibit Description
Incorporated by Reference
Form
File No.
Date of Filing
Exhibit
Number
Filed
Herewith
4.29
Form of 4.500% Senior Notes due May 15, 2028
(included as Exhibit A to Exhibit 4.28)
8-K
000-20322
5/8/2025
4.3
4.30
Form of 4.800% Senior Notes due May 15, 2030
(included as Exhibit B to Exhibit 4.28)
8-K
000-20322
5/8/2025
4.4
4.31
Form of 5.400% Senior Notes due May 15, 2035
(included as Exhibit C to Exhibit 4.28)
8-K
000-20322
5/8/2025
4.5
4.32
Indenture, dated as of August 23, 2007, by and
between Starbucks Corporation and Deutsche
Bank Trust Company Americas, as trustee
S-3ASR
333-190955
9/3/2013
4.1
4.33
Fourth Supplemental Indenture, dated as of
June 10, 2015, by and between Starbucks
Corporation and Deutsche Bank Trust Company
Americas, as trustee (4.300% Senior Notes due
June 2045)
8-K
000-20322
6/10/2015
4.2
4.34
Form of 4.300% Senior Notes due June 15, 2045
(included as Exhibit B to Exhibit 4.33)
8-K
000-20322
6/10/2015
4.4
4.35
Sixth Supplemental Indenture, dated as of
May 16, 2016, by and between Starbucks
Corporation and Deutsche Bank Trust Company
Americas, as trustee (2.450% Senior Notes due
June 2026)
8-K
000-20322
5/16/2016
4.4
4.36
Form of 2.450% Senior Notes due June 15, 2026
(included as Exhibit A to Exhibit 4.35)
8-K
000-20322
5/16/2016
4.5
4.37
Description of Securities
10-K
000-20322
11/15/2019
4.29
10.1*
Starbucks Corporation Employee Stock Purchase
Plan — 1995 as amended and restated on
April 9, 2015 to reflect adjustments for the
2-for-1 forward stock split effective on such date
10-Q
000-20322
8/1/2017
10.1
10.2*
Starbucks Corporation Executive Management
Bonus Plan, as amended and restated on
January 12, 2022
8-K
000-20322
1/14/2022
10.1
10.3*
Starbucks Corporation Management Deferred
Compensation Plan, as amended and restated
effective January 1, 2011
10-Q
000-20322
2/4/2011
10.2
10.4*
Fifth Amendment to Starbucks Corporation
Management Deferred Compensation Plan
10-Q
000-20322
7/28/2020
10.1
10.5*
Starbucks Corporation Deferred Compensation
Plan for Non-Employee Directors, as amended
and restated effective September 11, 2018
10-K
000-20322
11/16/2018
10.5
10.6*
Starbucks Corporation 2005 Long-Term Equity
Incentive Plan, as amended and restated effective
March 16, 2022
10-Q
000-20322
5/3/2022
10.1
10.7*
2005 Key Employee Sub-Plan to the Starbucks
Corporation 2005 Long-Term Equity Incentive
Plan, as amended and restated effective
November 15, 2005
10-Q
000-20322
2/10/2006
10.2
10.8*
2005 Non-Employee Director Sub-Plan to the
Starbucks Corporation 2005 Long-Term Equity
Incentive Plan, as amended and restated effective
September 11, 2018
10-K
000-20322
11/16/2018
10.9
10.9*
Form of Global Stock Option Grant Agreement
for Purchase of Stock under the Key Employee
Sub-Plan to the 2005 Long Term Equity
Incentive Plan
10-K
000-20322
11/18/2016
10.14
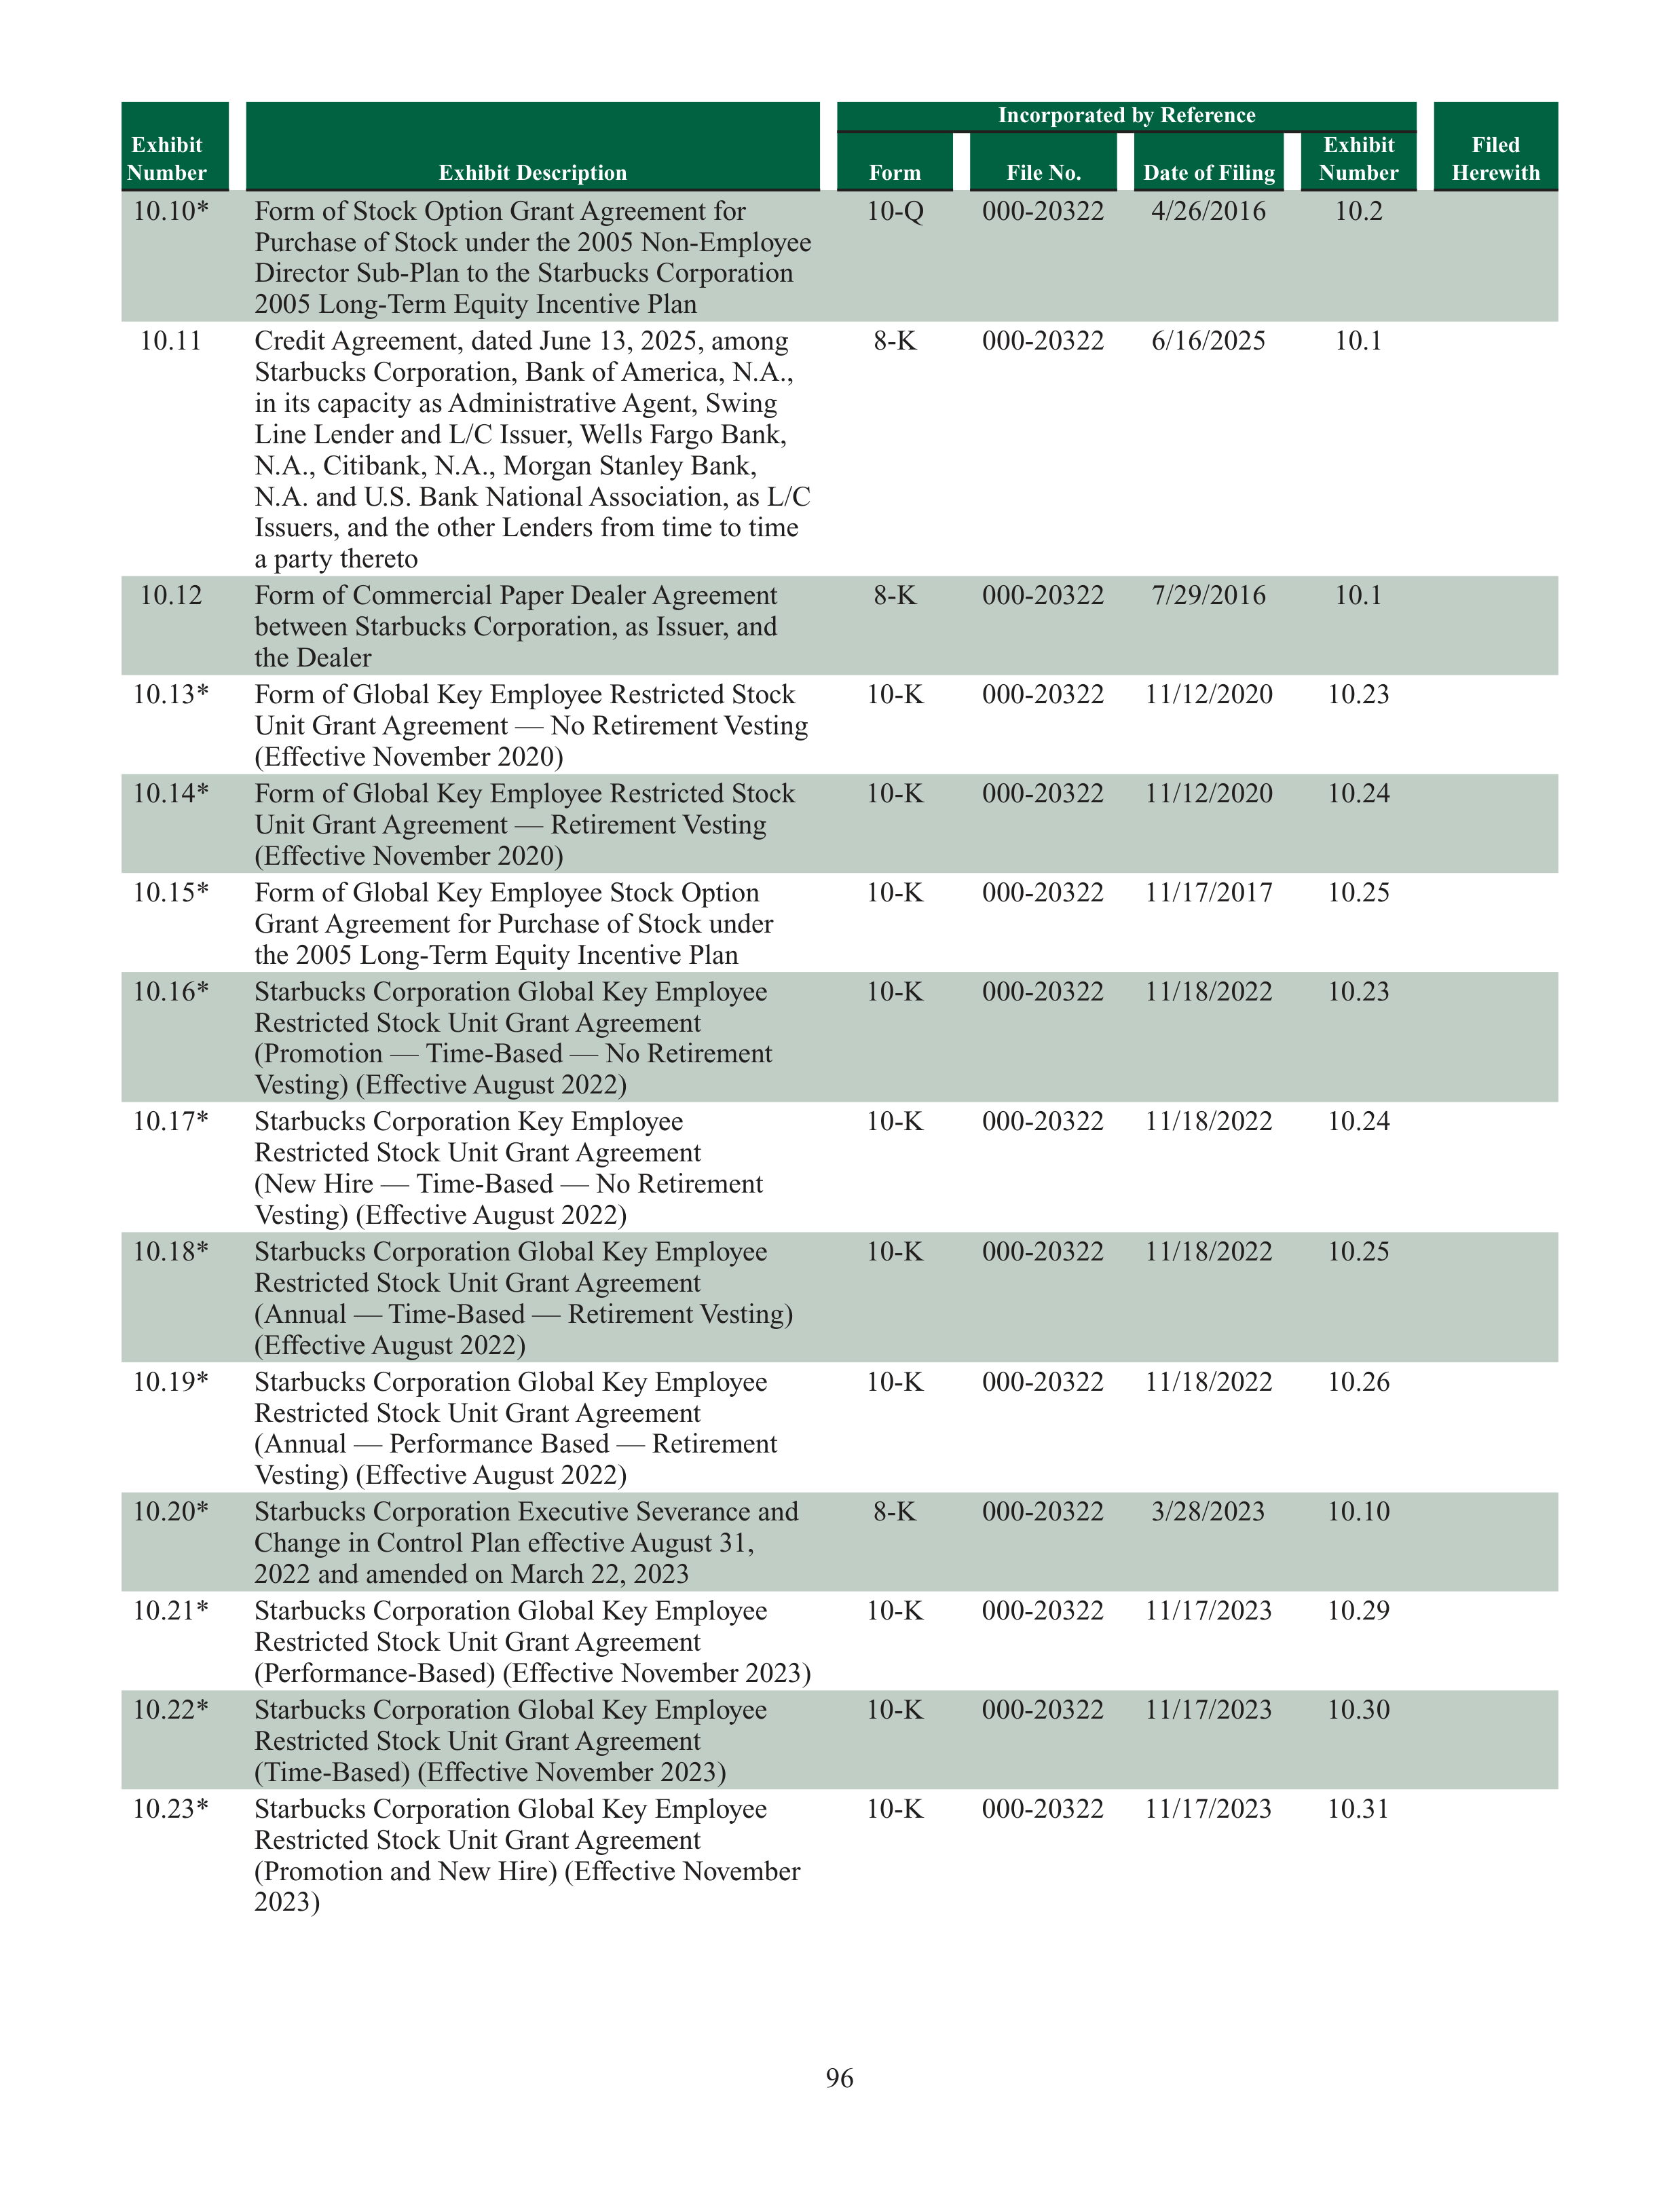
96
Exhibit
Number
Exhibit Description
Incorporated by Reference
Form
File No.
Date of Filing
Exhibit
Number
Filed
Herewith
10.10*
Form of Stock Option Grant Agreement for
Purchase of Stock under the 2005 Non-Employee
Director Sub-Plan to the Starbucks Corporation
2005 Long-Term Equity Incentive Plan
10-Q
000-20322
4/26/2016
10.2
10.11
Credit Agreement, dated June 13, 2025, among
Starbucks Corporation, Bank of America, N.A.,
in its capacity as Administrative Agent, Swing
Line Lender and L/C Issuer, Wells Fargo Bank,
N.A., Citibank, N.A., Morgan Stanley Bank,
N.A. and U.S. Bank National Association, as L/C
Issuers, and the other Lenders from time to time
a party thereto
8-K
000-20322
6/16/2025
10.1
10.12
Form of Commercial Paper Dealer Agreement
between Starbucks Corporation, as Issuer, and
the Dealer
8-K
000-20322
7/29/2016
10.1
10.13*
Form of Global Key Employee Restricted Stock
Unit Grant Agreement — No Retirement Vesting
(Effective November 2020)
10-K
000-20322
11/12/2020
10.23
10.14*
Form of Global Key Employee Restricted Stock
Unit Grant Agreement — Retirement Vesting
(Effective November 2020)
10-K
000-20322
11/12/2020
10.24
10.15*
Form of Global Key Employee Stock Option
Grant Agreement for Purchase of Stock under
the 2005 Long-Term Equity Incentive Plan
10-K
000-20322
11/17/2017
10.25
10.16*
Starbucks Corporation Global Key Employee
Restricted Stock Unit Grant Agreement
(Promotion — Time-Based — No Retirement
Vesting) (Effective August 2022)
10-K
000-20322
11/18/2022
10.23
10.17*
Starbucks Corporation Key Employee
Restricted Stock Unit Grant Agreement
(New Hire — Time-Based — No Retirement
Vesting) (Effective August 2022)
10-K
000-20322
11/18/2022
10.24
10.18*
Starbucks Corporation Global Key Employee
Restricted Stock Unit Grant Agreement
(Annual — Time-Based — Retirement Vesting)
(Effective August 2022)
10-K
000-20322
11/18/2022
10.25
10.19*
Starbucks Corporation Global Key Employee
Restricted Stock Unit Grant Agreement
(Annual — Performance Based — Retirement
Vesting) (Effective August 2022)
10-K
000-20322
11/18/2022
10.26
10.20*
Starbucks Corporation Executive Severance and
Change in Control Plan effective August 31,
2022 and amended on March 22, 2023
8-K
000-20322
3/28/2023
10.10
10.21*
Starbucks Corporation Global Key Employee
Restricted Stock Unit Grant Agreement
(Performance-Based) (Effective November 2023)
10-K
000-20322
11/17/2023
10.29
10.22*
Starbucks Corporation Global Key Employee
Restricted Stock Unit Grant Agreement
(Time-Based) (Effective November 2023)
10-K
000-20322
11/17/2023
10.30
10.23*
Starbucks Corporation Global Key Employee
Restricted Stock Unit Grant Agreement
(Promotion and New Hire) (Effective November
2023)
10-K
000-20322
11/17/2023
10.31
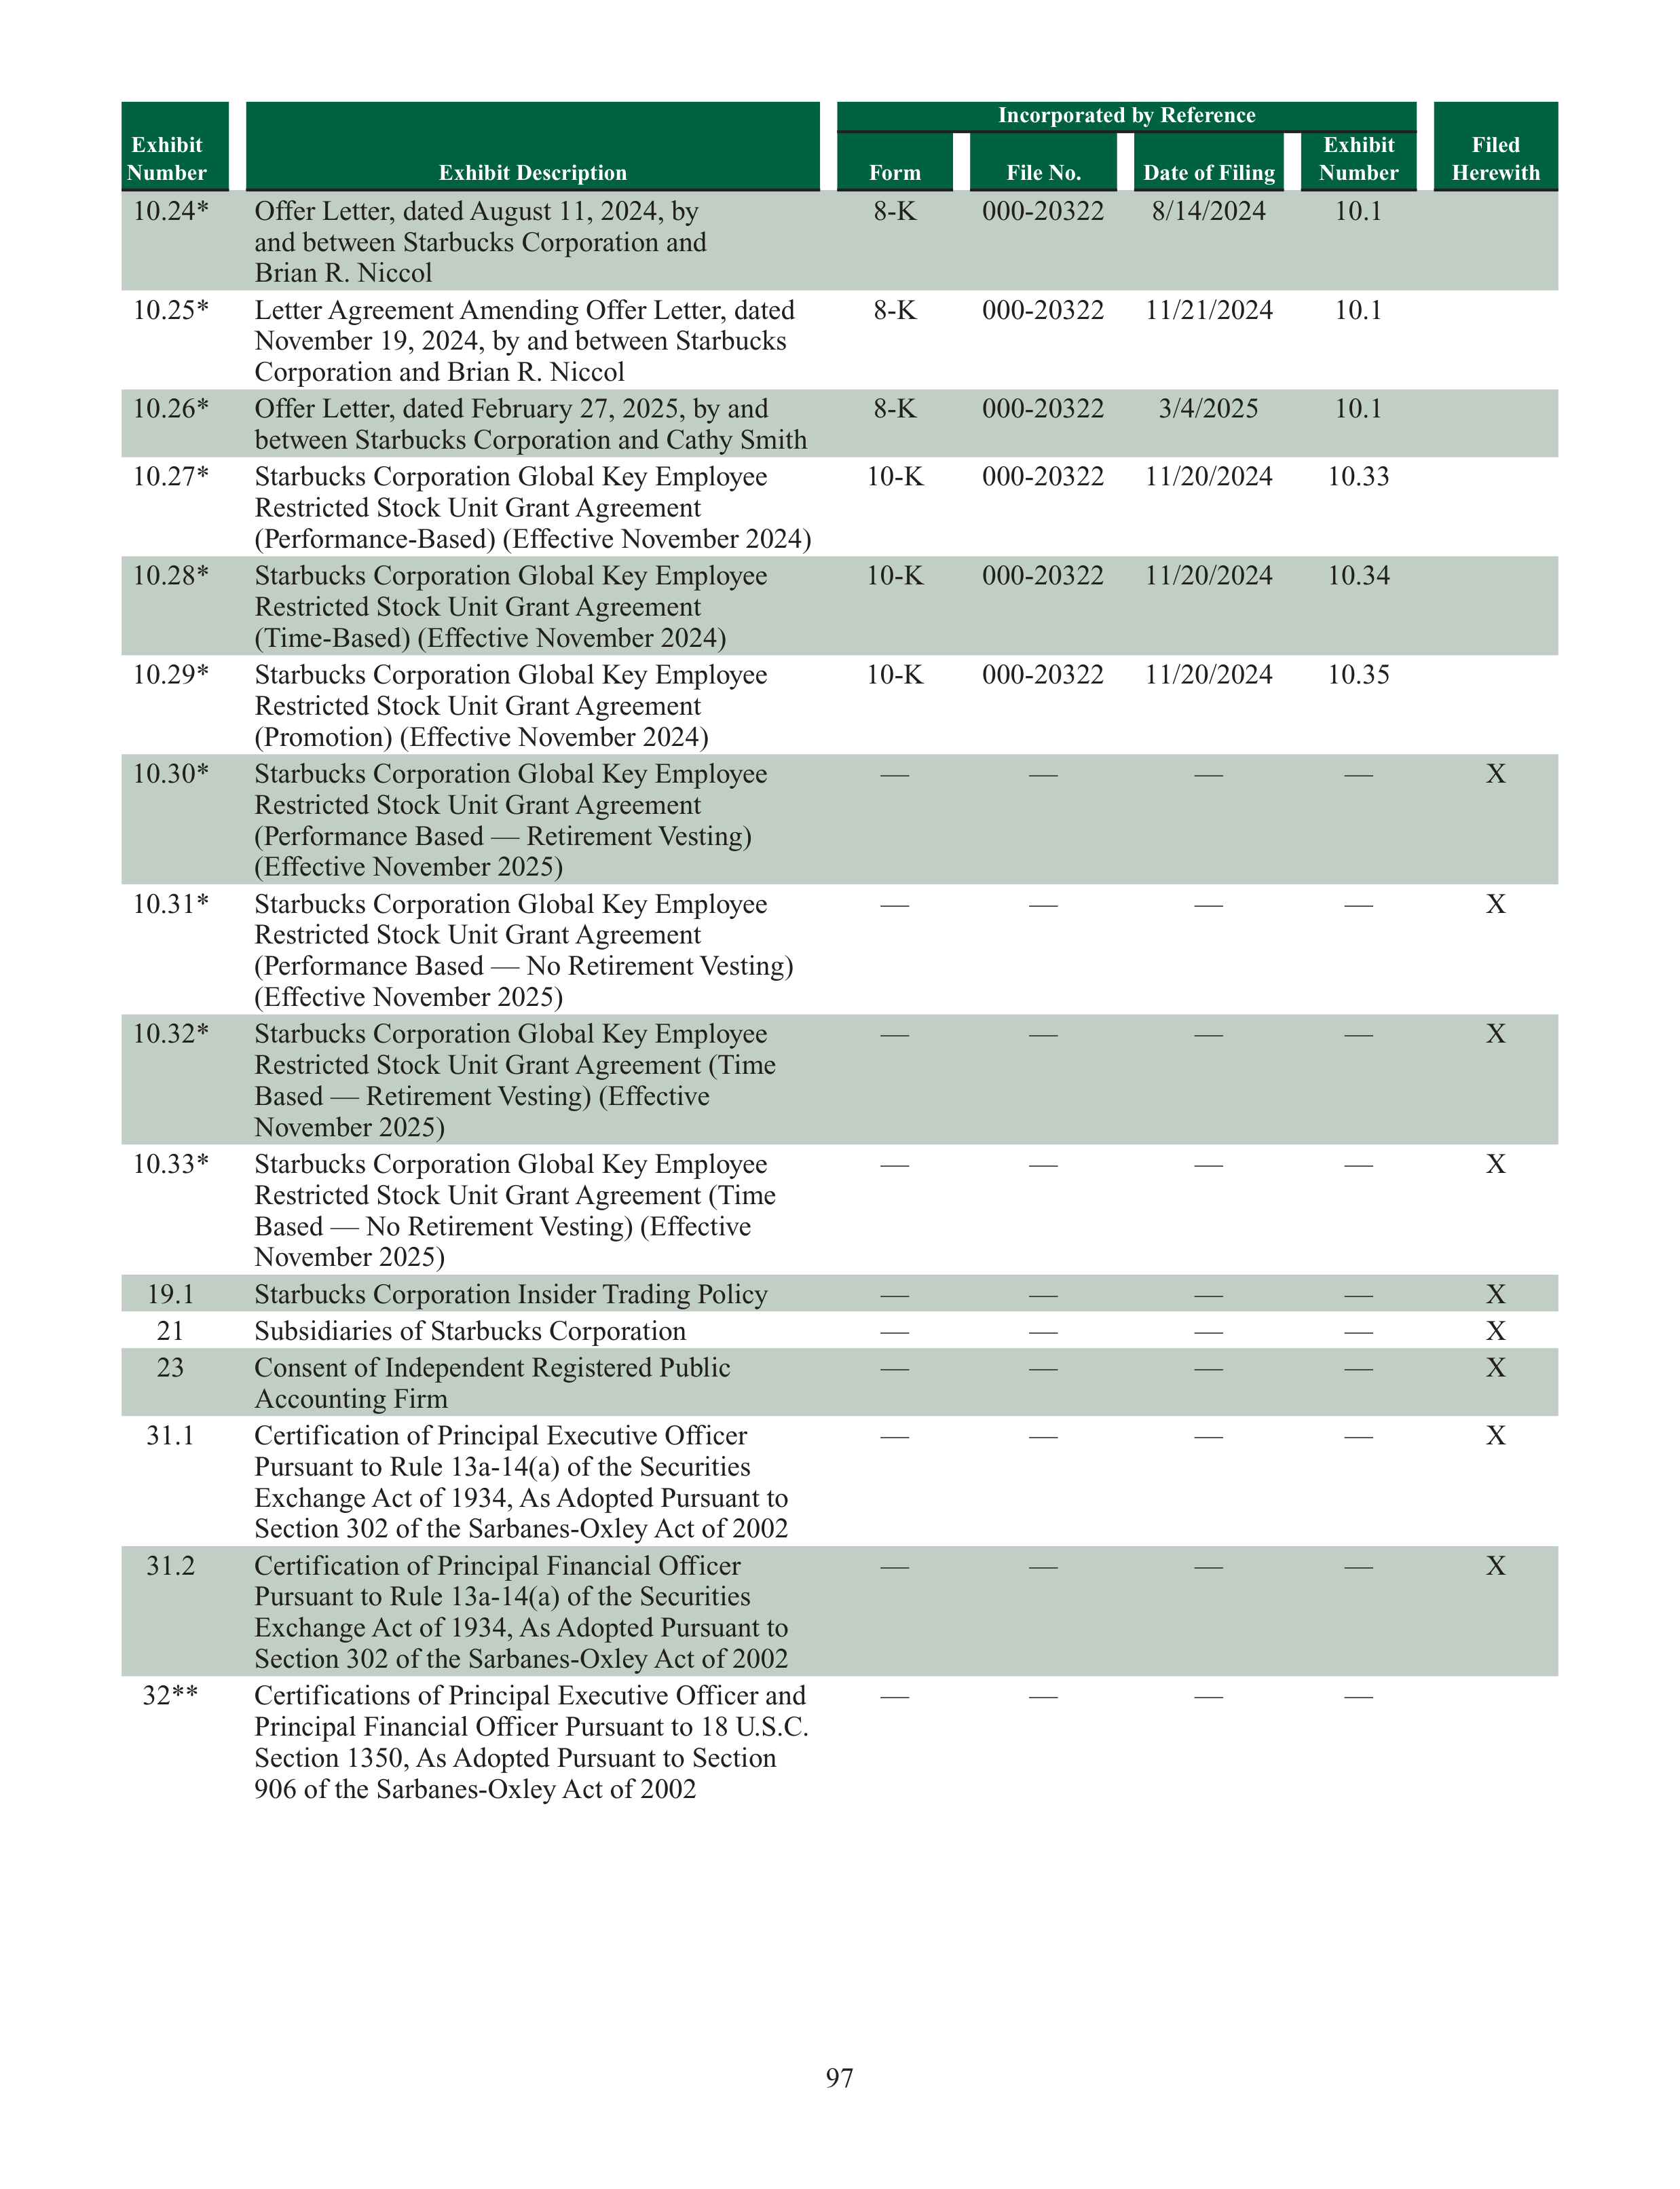
97
Exhibit
Number
Exhibit Description
Incorporated by Reference
Form
File No.
Date of Filing
Exhibit
Number
Filed
Herewith
10.24*
Offer Letter, dated August 11, 2024, by
and between Starbucks Corporation and
Brian R. Niccol
8-K
000-20322
8/14/2024
10.1
10.25*
Letter Agreement Amending Offer Letter, dated
November 19, 2024, by and between Starbucks
Corporation and Brian R. Niccol
8-K
000-20322
11/21/2024
10.1
10.26*
Offer Letter, dated February 27, 2025, by and
between Starbucks Corporation and Cathy Smith
8-K
000-20322
3/4/2025
10.1
10.27*
Starbucks Corporation Global Key Employee
Restricted Stock Unit Grant Agreement
(Performance-Based) (Effective November 2024)
10-K
000-20322
11/20/2024
10.33
10.28*
Starbucks Corporation Global Key Employee
Restricted Stock Unit Grant Agreement
(Time-Based) (Effective November 2024)
10-K
000-20322
11/20/2024
10.34
10.29*
Starbucks Corporation Global Key Employee
Restricted Stock Unit Grant Agreement
(Promotion) (Effective November 2024)
10-K
000-20322
11/20/2024
10.35
10.30*
Starbucks Corporation Global Key Employee
Restricted Stock Unit Grant Agreement
(Performance Based — Retirement Vesting)
(Effective November 2025)
—
—
—
—
X
10.31*
Starbucks Corporation Global Key Employee
Restricted Stock Unit Grant Agreement
(Performance Based — No Retirement Vesting)
(Effective November 2025)
—
—
—
—
X
10.32*
Starbucks Corporation Global Key Employee
Restricted Stock Unit Grant Agreement (Time
Based — Retirement Vesting) (Effective
November 2025)
—
—
—
—
X
10.33*
Starbucks Corporation Global Key Employee
Restricted Stock Unit Grant Agreement (Time
Based — No Retirement Vesting) (Effective
November 2025)
—
—
—
—
X
19.1
Starbucks Corporation Insider Trading Policy
—
—
—
—
X
21
Subsidiaries of Starbucks Corporation
—
—
—
—
X
23
Consent of Independent Registered Public
Accounting Firm
—
—
—
—
X
31.1
Certification of Principal Executive Officer
Pursuant to Rule 13a-14(a) of the Securities
Exchange Act of 1934, As Adopted Pursuant to
Section 302 of the Sarbanes-Oxley Act of 2002
—
—
—
—
X
31.2
Certification of Principal Financial Officer
Pursuant to Rule 13a-14(a) of the Securities
Exchange Act of 1934, As Adopted Pursuant to
Section 302 of the Sarbanes-Oxley Act of 2002
—
—
—
—
X
32**
Certifications of Principal Executive Officer and
Principal Financial Officer Pursuant to 18 U.S.C.
Section 1350, As Adopted Pursuant to Section
906 of the Sarbanes-Oxley Act of 2002
—
—
—
—
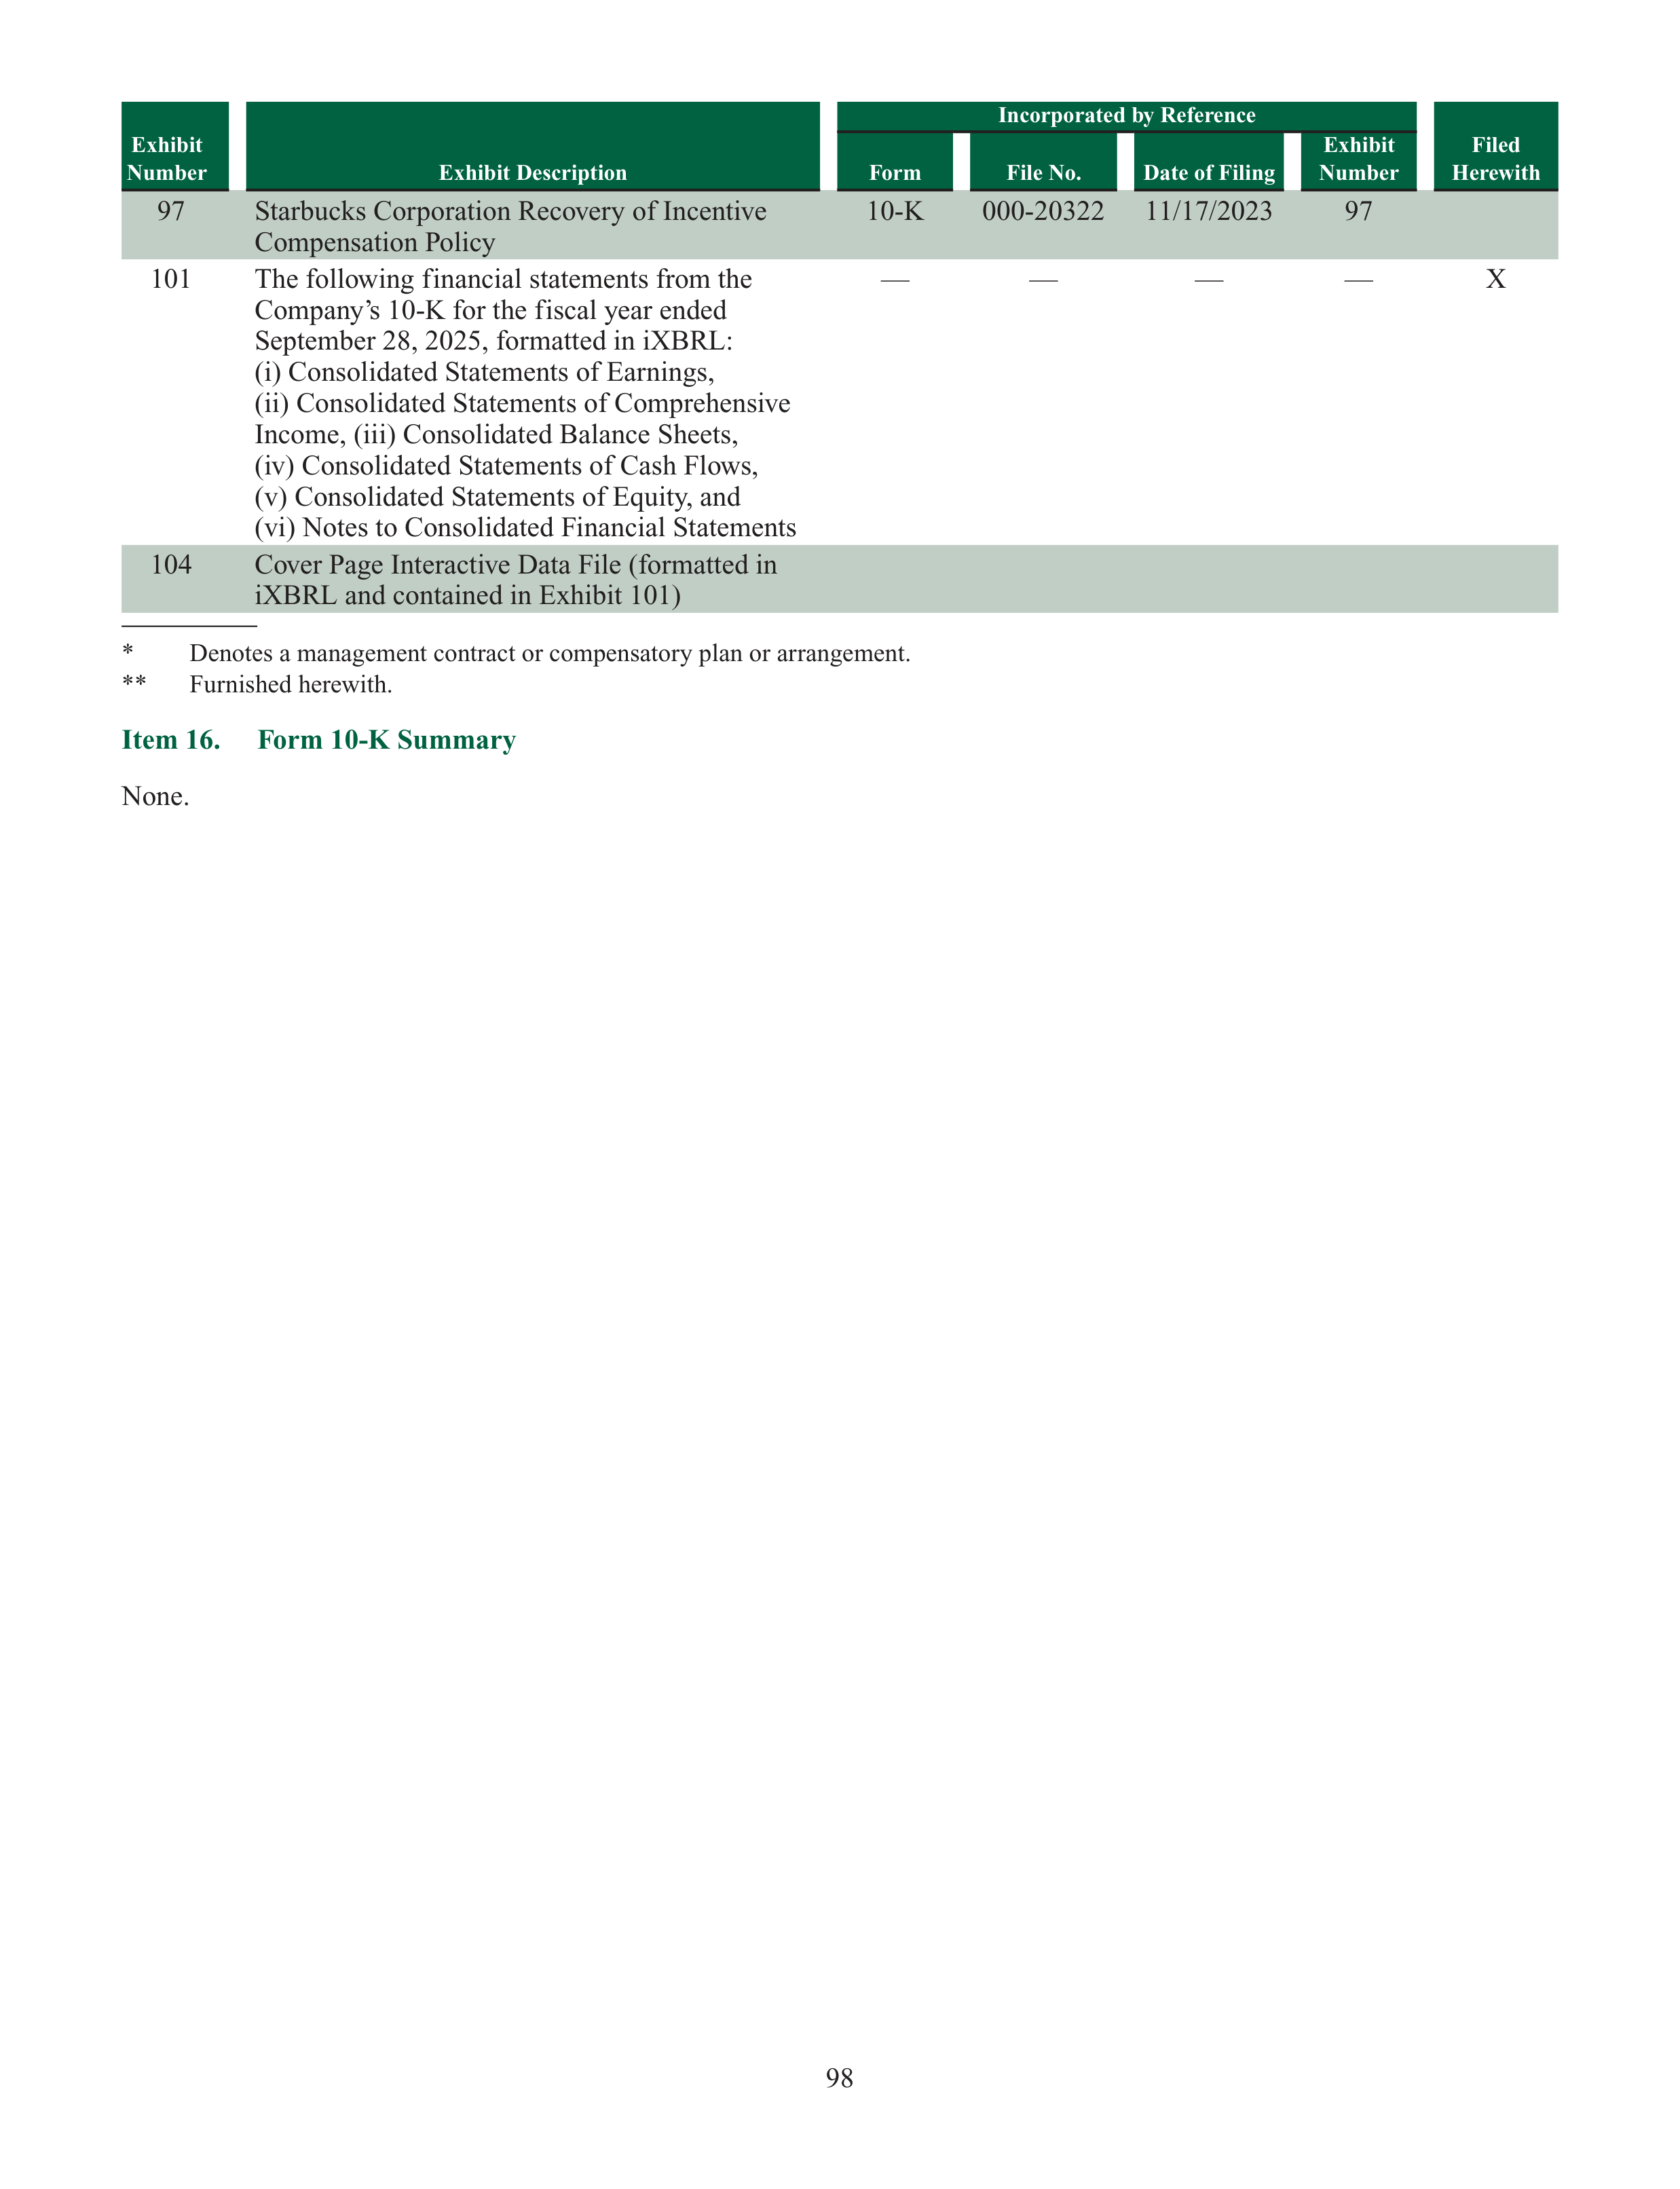
98
Exhibit
Number
Exhibit Description
Incorporated by Reference
Form
File No.
Date of Filing
Exhibit
Number
Filed
Herewith
97
Starbucks Corporation Recovery of Incentive
Compensation Policy
10-K
000-20322
11/17/2023
97
101
The following financial statements from the
Company’s 10-K for the fiscal year ended
September 28, 2025, formatted in iXBRL:
(i) Consolidated Statements of Earnings,
(ii) Consolidated Statements of Comprehensive
Income, (iii) Consolidated Balance Sheets,
(iv) Consolidated Statements of Cash Flows,
(v) Consolidated Statements of Equity, and
(vi) Notes to Consolidated Financial Statements
—
—
—
—
X
104
Cover Page Interactive Data File (formatted in
iXBRL and contained in Exhibit 101)
*
Denotes a management contract or compensatory plan or arrangement.
**
Furnished herewith.
Item 16.
Form 10-K Summary
None.
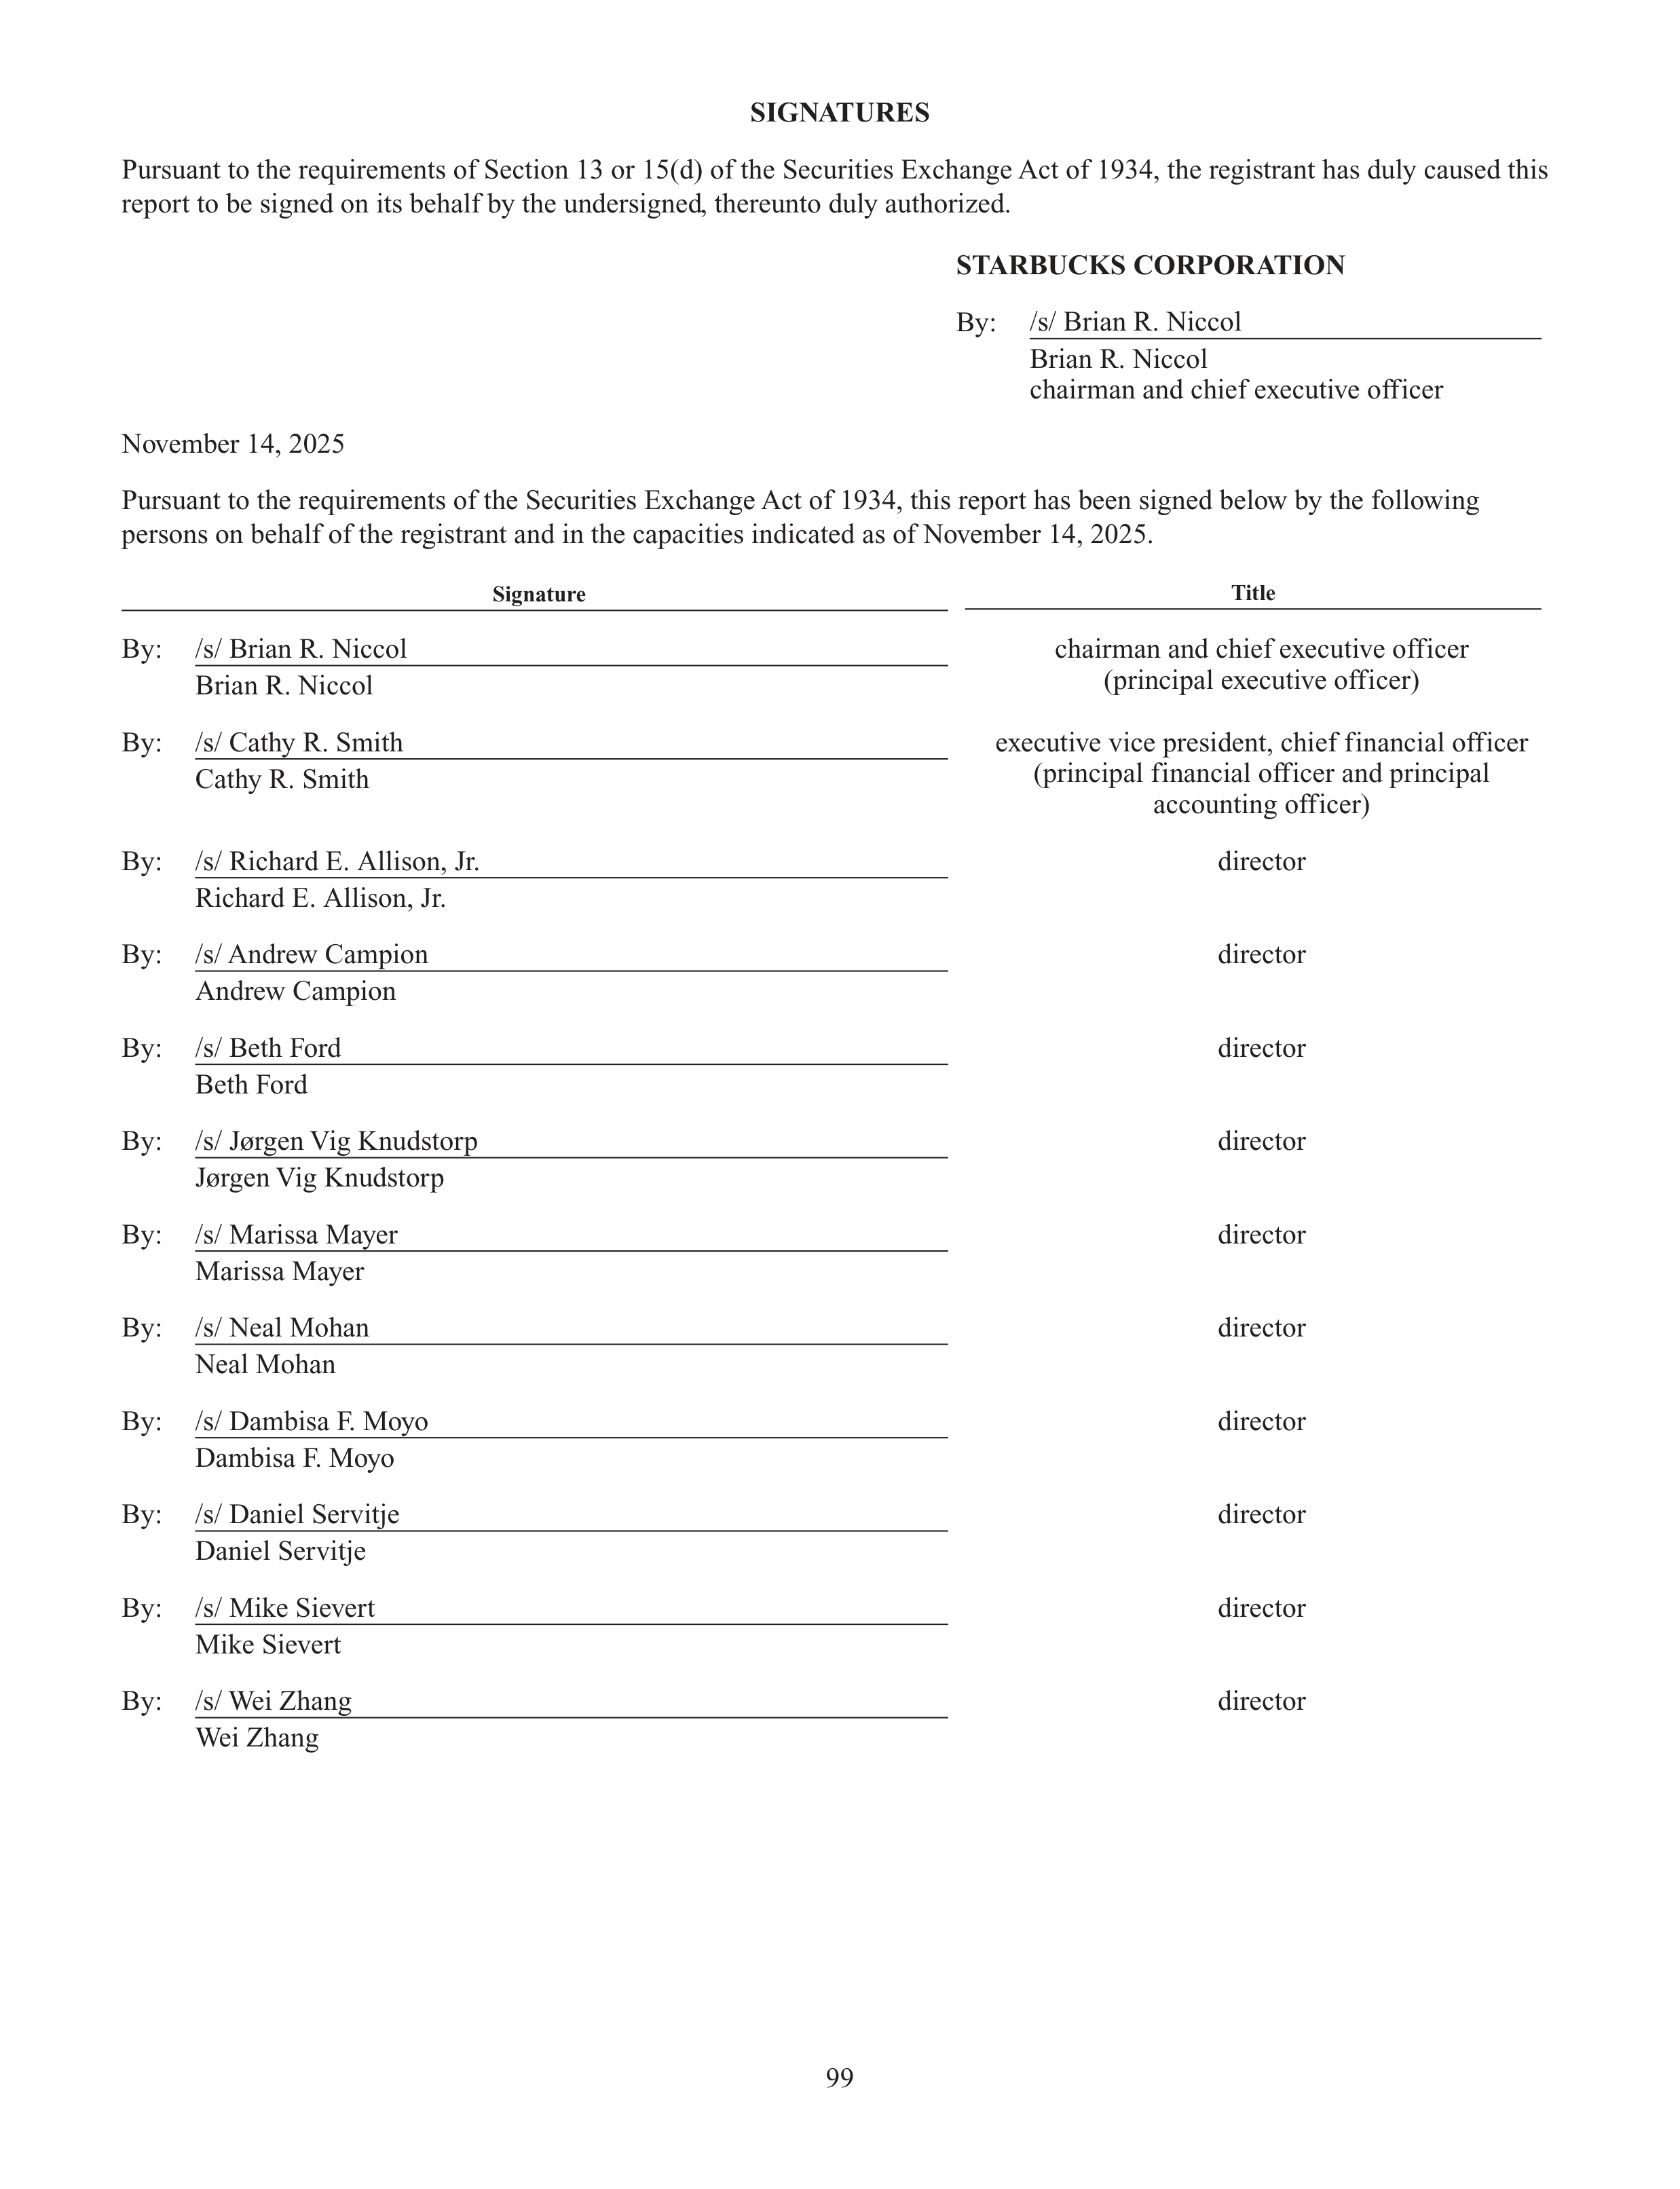
99
SIGNATURES
Pursuant to the requirements of Section 13 or 15(d) of the Securities Exchange Act of 1934, the registrant has duly caused this
report to be signed on its behalf by the undersigned, thereunto duly authorized.
STARBUCKS CORPORATION
By:
/s/ Brian R. Niccol
Brian R. Niccol
chairman and chief executive officer
November 14, 2025
Pursuant to the requirements of the Securities Exchange Act of 1934, this report has been signed below by the following
persons on behalf of the registrant and in the capacities indicated as of November 14, 2025.
Signature
Title
By:
/s/ Brian R. Niccol
chairman and chief executive officer
(principal executive officer)
Brian R. Niccol
By:
/s/ Cathy R. Smith
executive vice president, chief financial officer
(principal financial officer and principal
accounting officer)
Cathy R. Smith
By:
/s/ Richard E. Allison, Jr.
director
Richard E. Allison, Jr.
By:
/s/ Andrew Campion
director
Andrew Campion
By:
/s/ Beth Ford
director
Beth Ford
By:
/s/ Jørgen Vig Knudstorp
director
Jørgen Vig Knudstorp
By:
/s/ Marissa Mayer
director
Marissa Mayer
By:
/s/ Neal Mohan
director
Neal Mohan
By:
/s/ Dambisa F. Moyo
director
Dambisa F. Moyo
By:
/s/ Daniel Servitje
director
Daniel Servitje
By:
/s/ Mike Sievert
director
Mike Sievert
By:
/s/ Wei Zhang
director
Wei Zhang

Starbucks Corporation
2401 Utah Avenue South
Seattle, Washington 98134
starbucks.com
© 2026 STARBUCKS CORPORATION