




‘25
Annual
Report


Dear Shareholders:
Fiscal 2025: A Year of Continued Focus on our Growth
Strategy
During fiscal 2025 our teams executed well despite
several dynamics pressuring housing and home
improvement demand. Fiscal 2025 was also a year
of progress on our growth strategy, as we invested
in a number of areas across the business to position
ourselves for continued success.
During fiscal 2025, total sales grew by $5.2 billion or 3.2
percent to $164.7 billion, compared to fiscal 2024. Fiscal
2025 comparable sales growth was 0.3 percent for the
total Company and 0.5 percent in the U.S. Our fiscal 2025
net earnings were $14.2 billion, and adjusted
(1)
earnings
per diluted share decreased 3.6 percent to $14.69.
Focused on our Growth Strategy
Over the last few years, we have successfully managed
through a dynamic environment, including elevated
interest rates, pressured housing affordability, and general
economic uncertainty. Throughout this period our growth
strategy has remained unchanged: drive our core and
culture, deliver a frictionless interconnected experience,
and win with the Pro. And everything we do is rooted in
our enduring set of values and empowering culture. Our
objectives to grow market share and deliver shareholder
value also remain unchanged.
Drive our Core and Culture
Our stores remain the core of our business, and we will
continue to invest in our associates and store experience
to deliver the best customer experience in home
improvement. Knowledgeable associates and on shelf
availability are critical to the store experience, and we are
empowering our associates to drive sales by enhancing
training and product knowledge, optimizing processes,
simplifying tasks, and leveraging technology to drive a
better customer experience. Customers expect us to
have a broad assortment of quality products and our
LETTER TO
SHAREHOLDERS
best-in-class merchandising team partners with leading
suppliers to deliver innovation, exclusivity, and everyday
value.
Nothing speaks to the vitality of our business more than our
commitment to open new stores. During our Investor and
Analyst Conference in 2023, we announced plans to build
80 new stores over a five-year period. We are building these
stores in geographic areas that have experienced significant
population growth, or where we need to relieve pressure on
existing high-volume stores. The performance in the 37 new
stores we have built over the past three years is exceeding
our expectations, which is why at our 2025 Investor and
Analyst Conference we announced that following the
completion of our approximately 80 new stores plan in
2027, we anticipate that we will continue to build 15 to 20
stores per year for the foreseeable future.
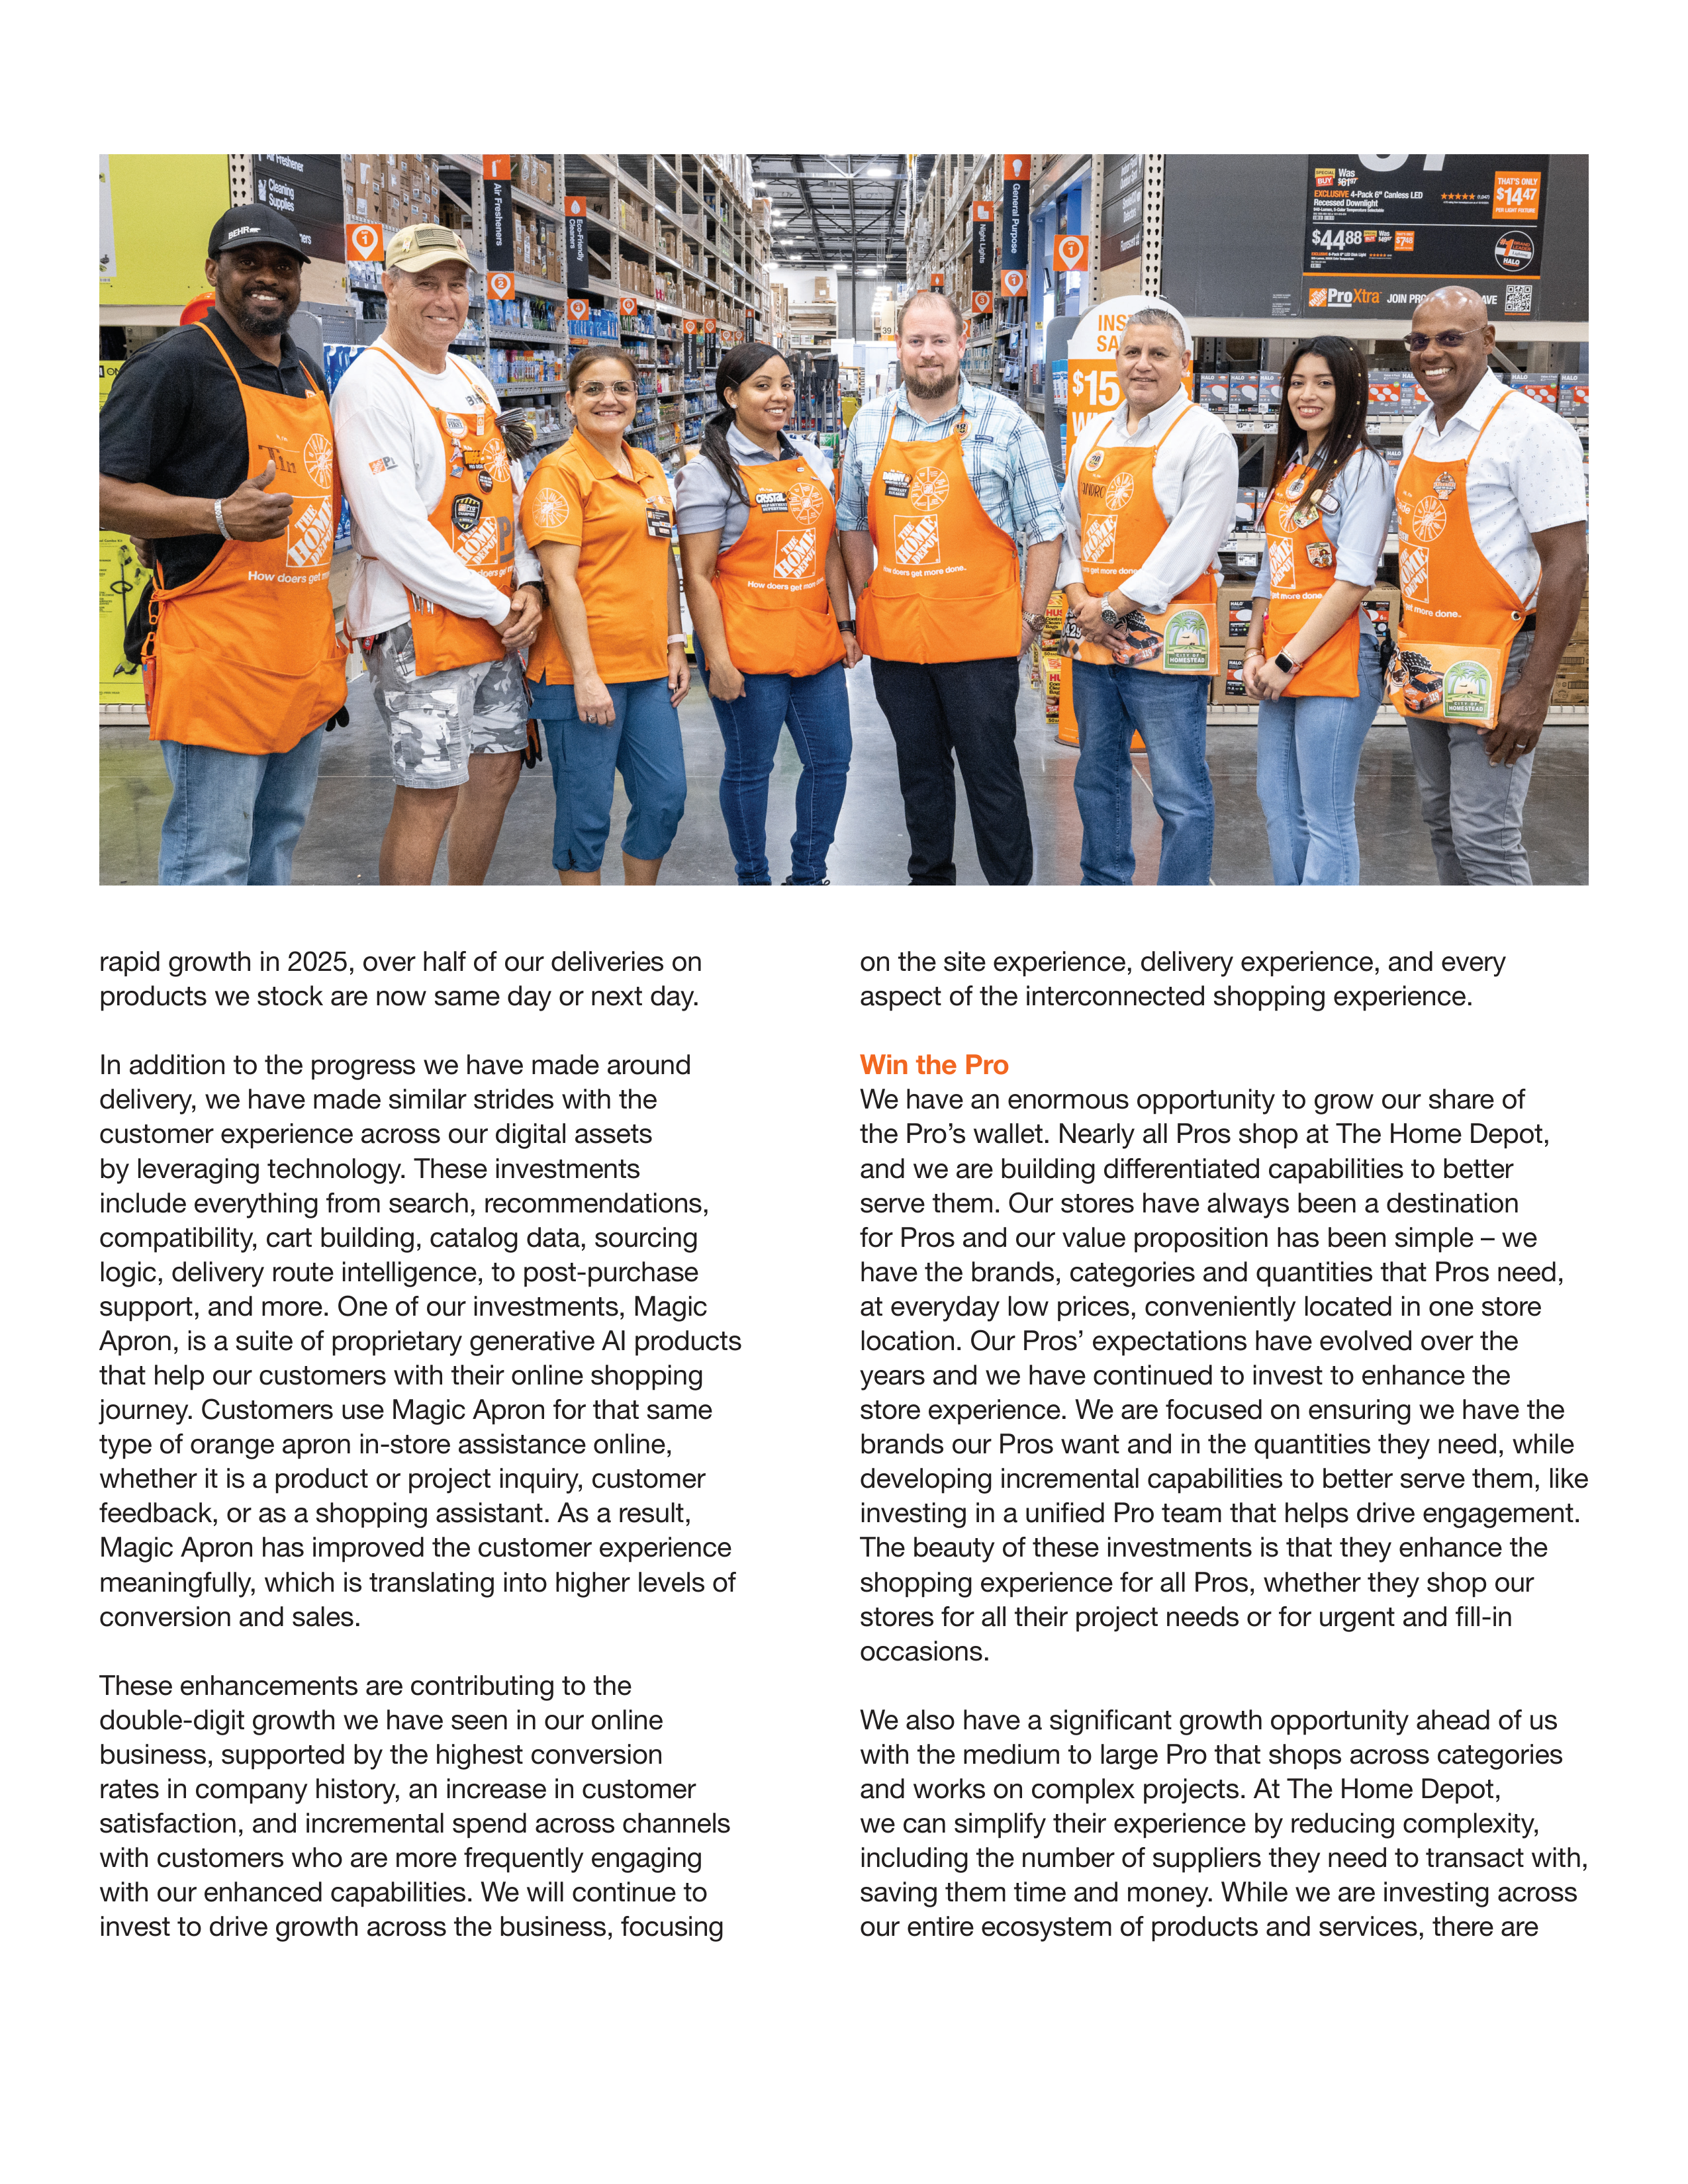
While our stores are the center of our ecosystem, it’s
our orange-blooded associates and culture that bring
them to life every day. Our Culture has guided us as we
revolutionized home improvement, and it will continue to
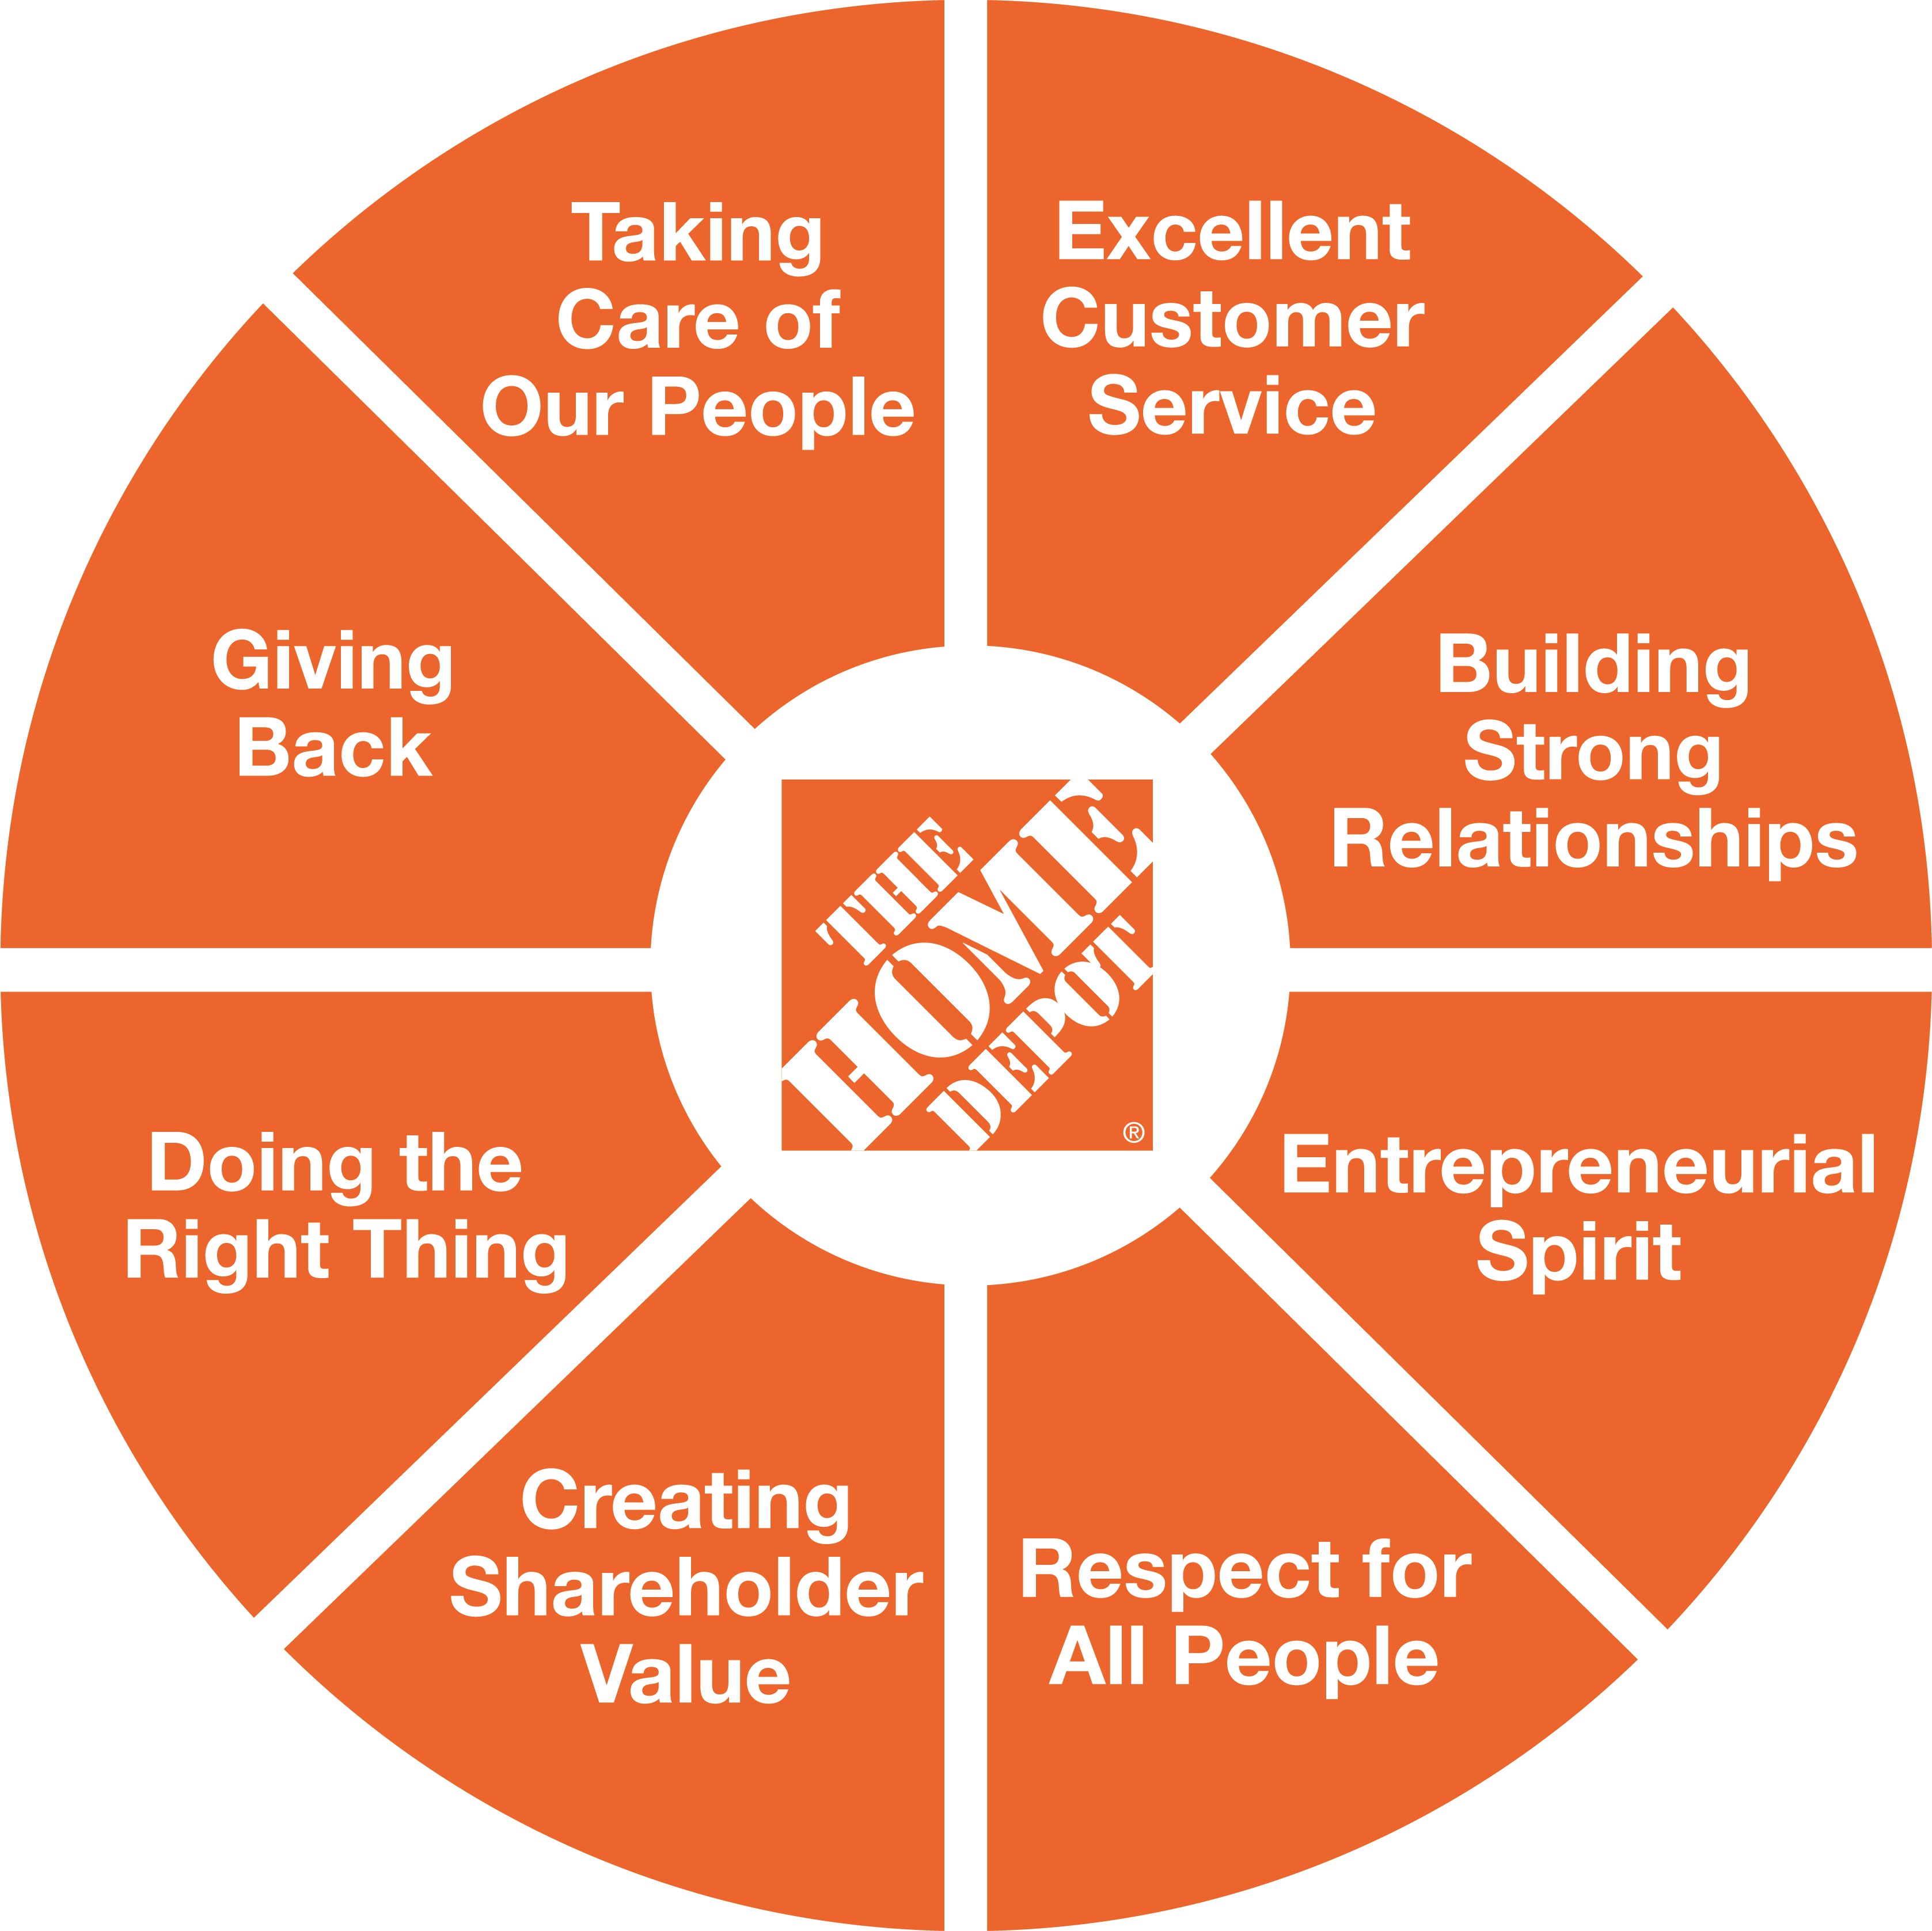
guide us as our business evolves. Our Values Wheel is
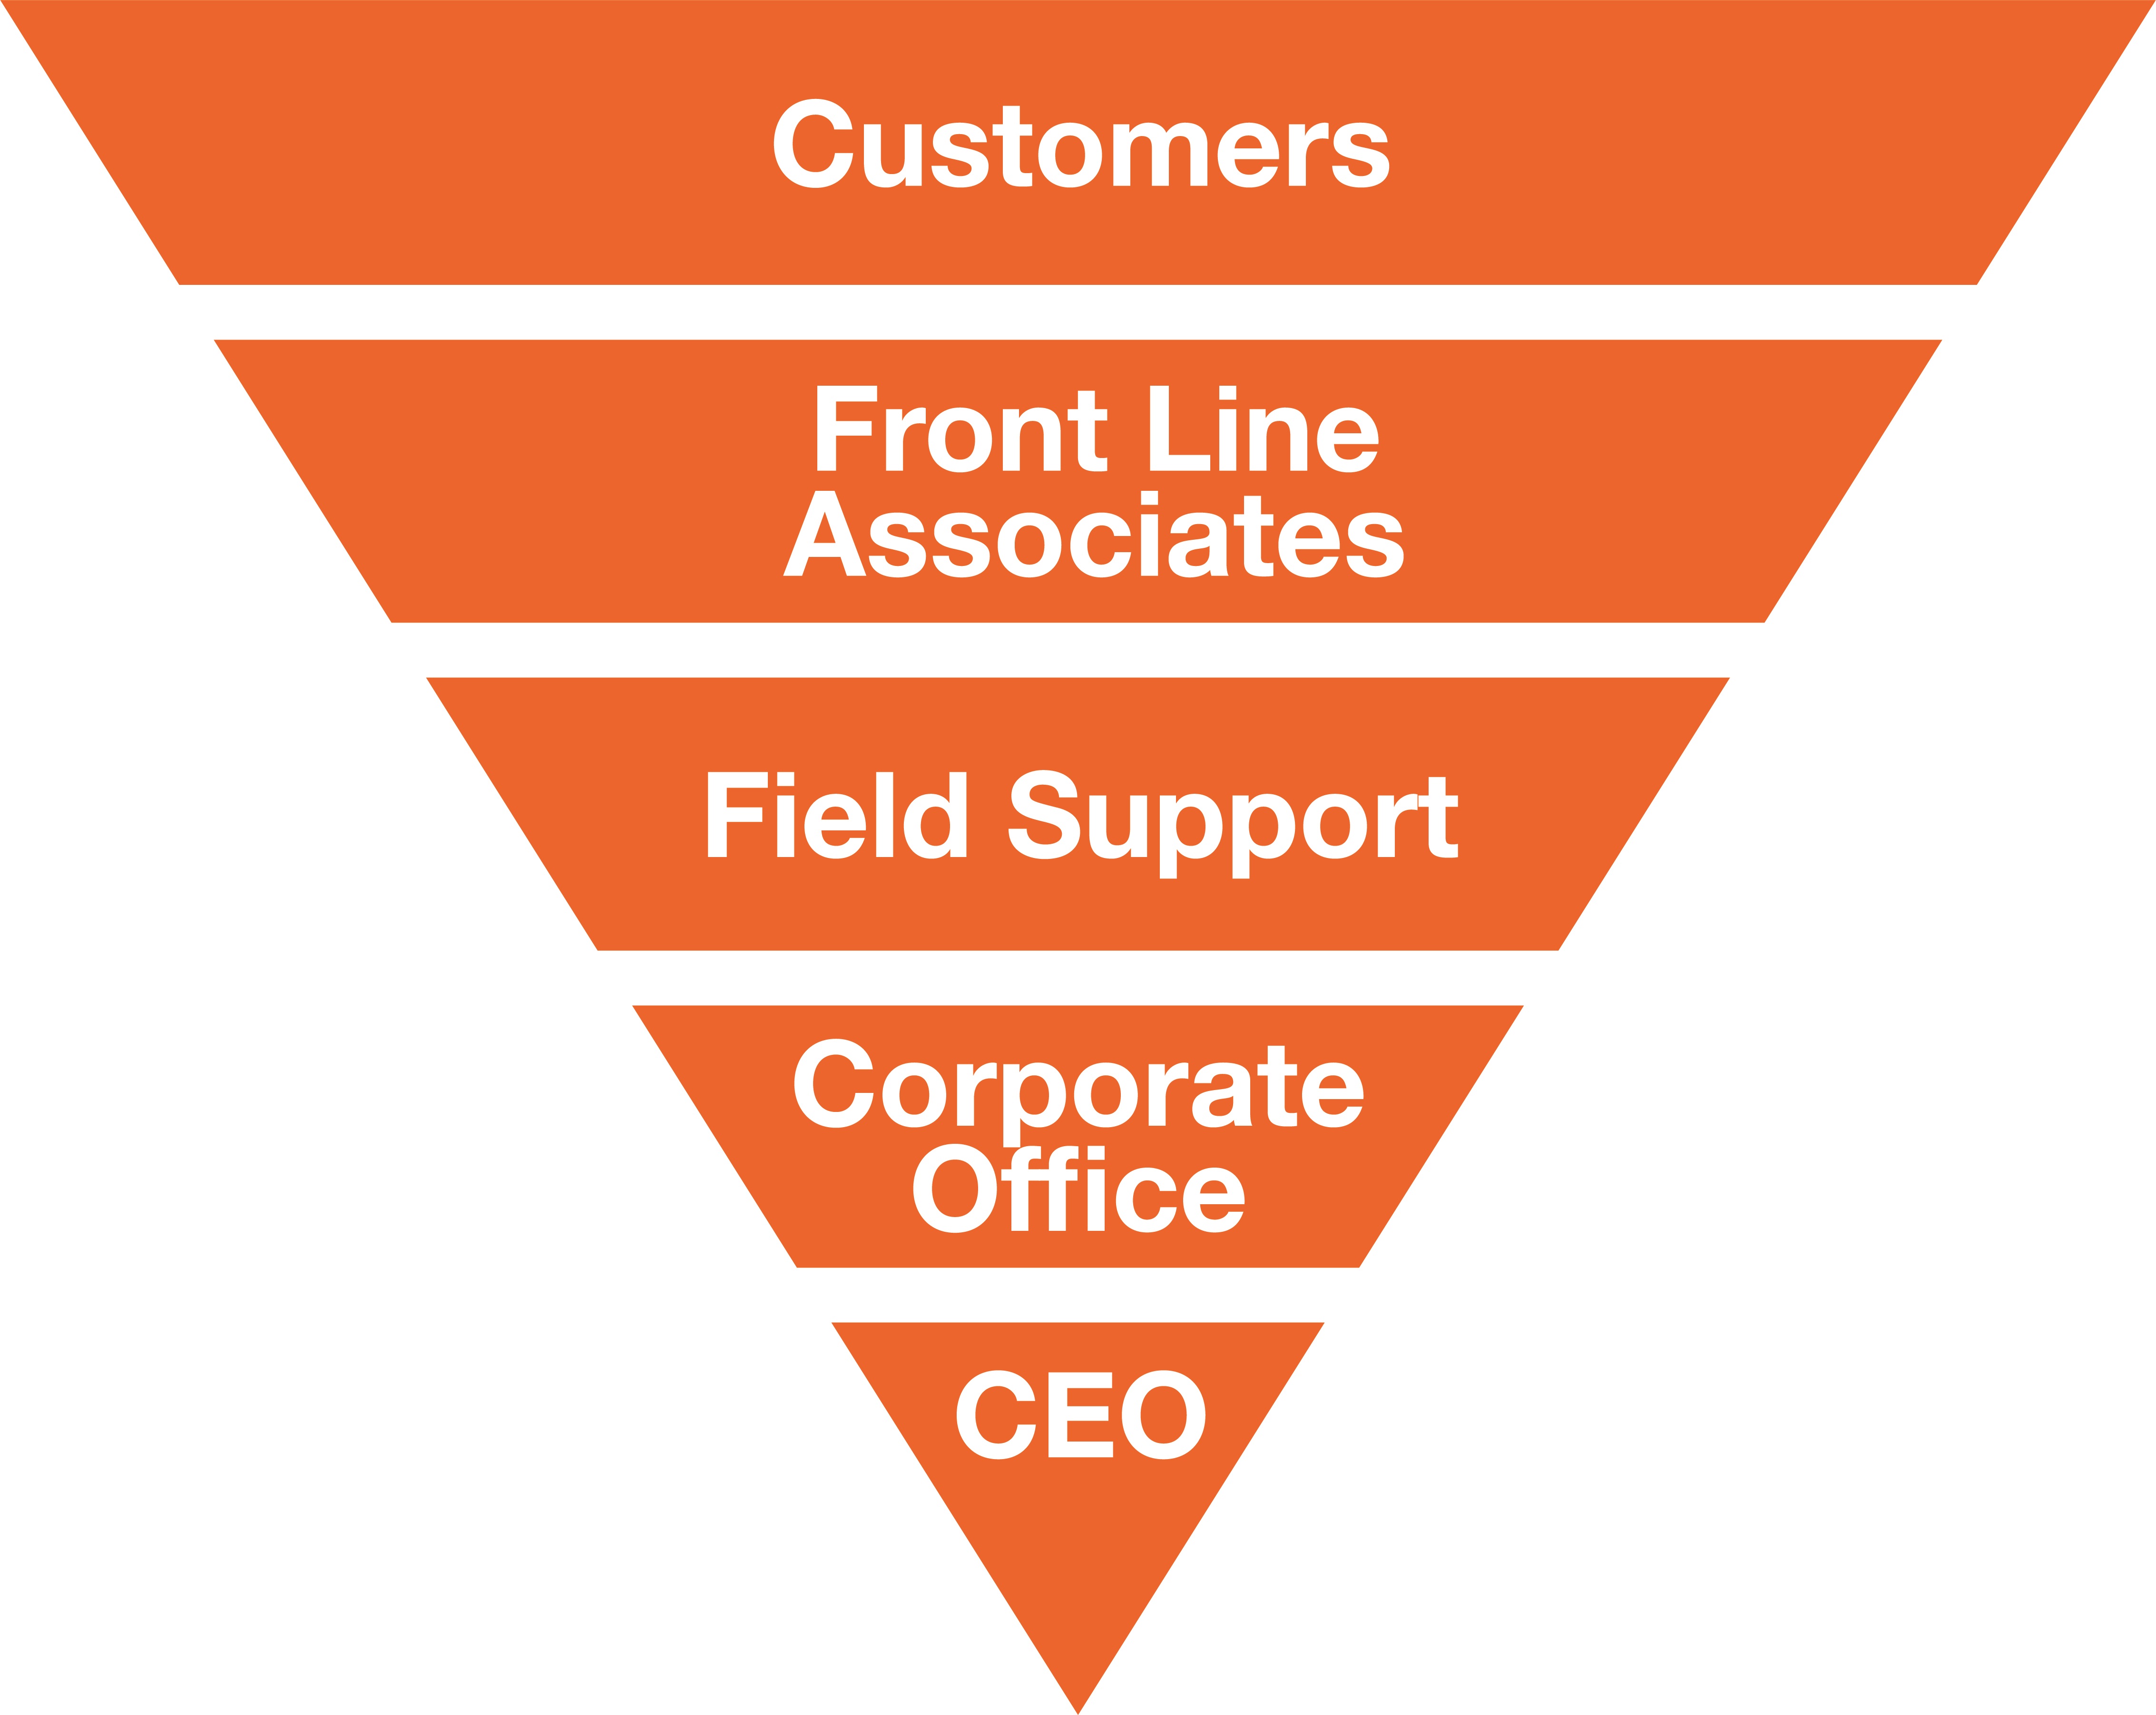
our North Star, and our Inverted Pyramid reminds us who
matters most – our customers and our associates.
Deliver a Frictionless Interconnected Experience
We know our customers navigate between our physical
and digital assets and it is our intent to deliver a frictionless
interconnected customer experience regardless of how our
customers choose to engage and shop with us. This year, a
key focus area was speed of delivery. Through investments
in inventory, technology, and our nearly 200 last-mile
distribution assets, we achieved the fastest delivery speeds
in our history. We accomplished this by using ship from best
location, a proprietary algorithm that looks across all of our
distribution assets, including our stores, to optimize speed,
determining when, where and how to most effectively ship
products to our customers. Despite our delivery volumes’
(1)
The Company reports its financial results in accordance with U.S. generally accepted accounting principles (GAAP). As used above, adjusted diluted earnings per share is a non-GAAP
financial measure. Refer to the end of this annual report for an explanation of this non-GAAP financial measure and a reconciliation to the most directly comparable GAAP measure.
rapid growth in 2025, over half of our deliveries on
products we stock are now same day or next day.
In addition to the progress we have made around
delivery, we have made similar strides with the
customer experience across our digital assets
by leveraging technology. These investments
include everything from search, recommendations,
compatibility, cart building, catalog data, sourcing
logic, delivery route intelligence, to post-purchase
support, and more. One of our investments, Magic
Apron, is a suite of proprietary generative AI products
that help our customers with their online shopping
journey. Customers use Magic Apron for that same
type of orange apron in-store assistance online,
whether it is a product or project inquiry, customer
feedback, or as a shopping assistant. As a result,
Magic Apron has improved the customer experience
meaningfully, which is translating into higher levels of
conversion and sales.
These enhancements are contributing to the
double-digit growth we have seen in our online
business, supported by the highest conversion
rates in company history, an increase in customer
satisfaction, and incremental spend across channels
with customers who are more frequently engaging
with our enhanced capabilities. We will continue to
invest to drive growth across the business, focusing
on the site experience, delivery experience, and every
aspect of the interconnected shopping experience.
Win the Pro
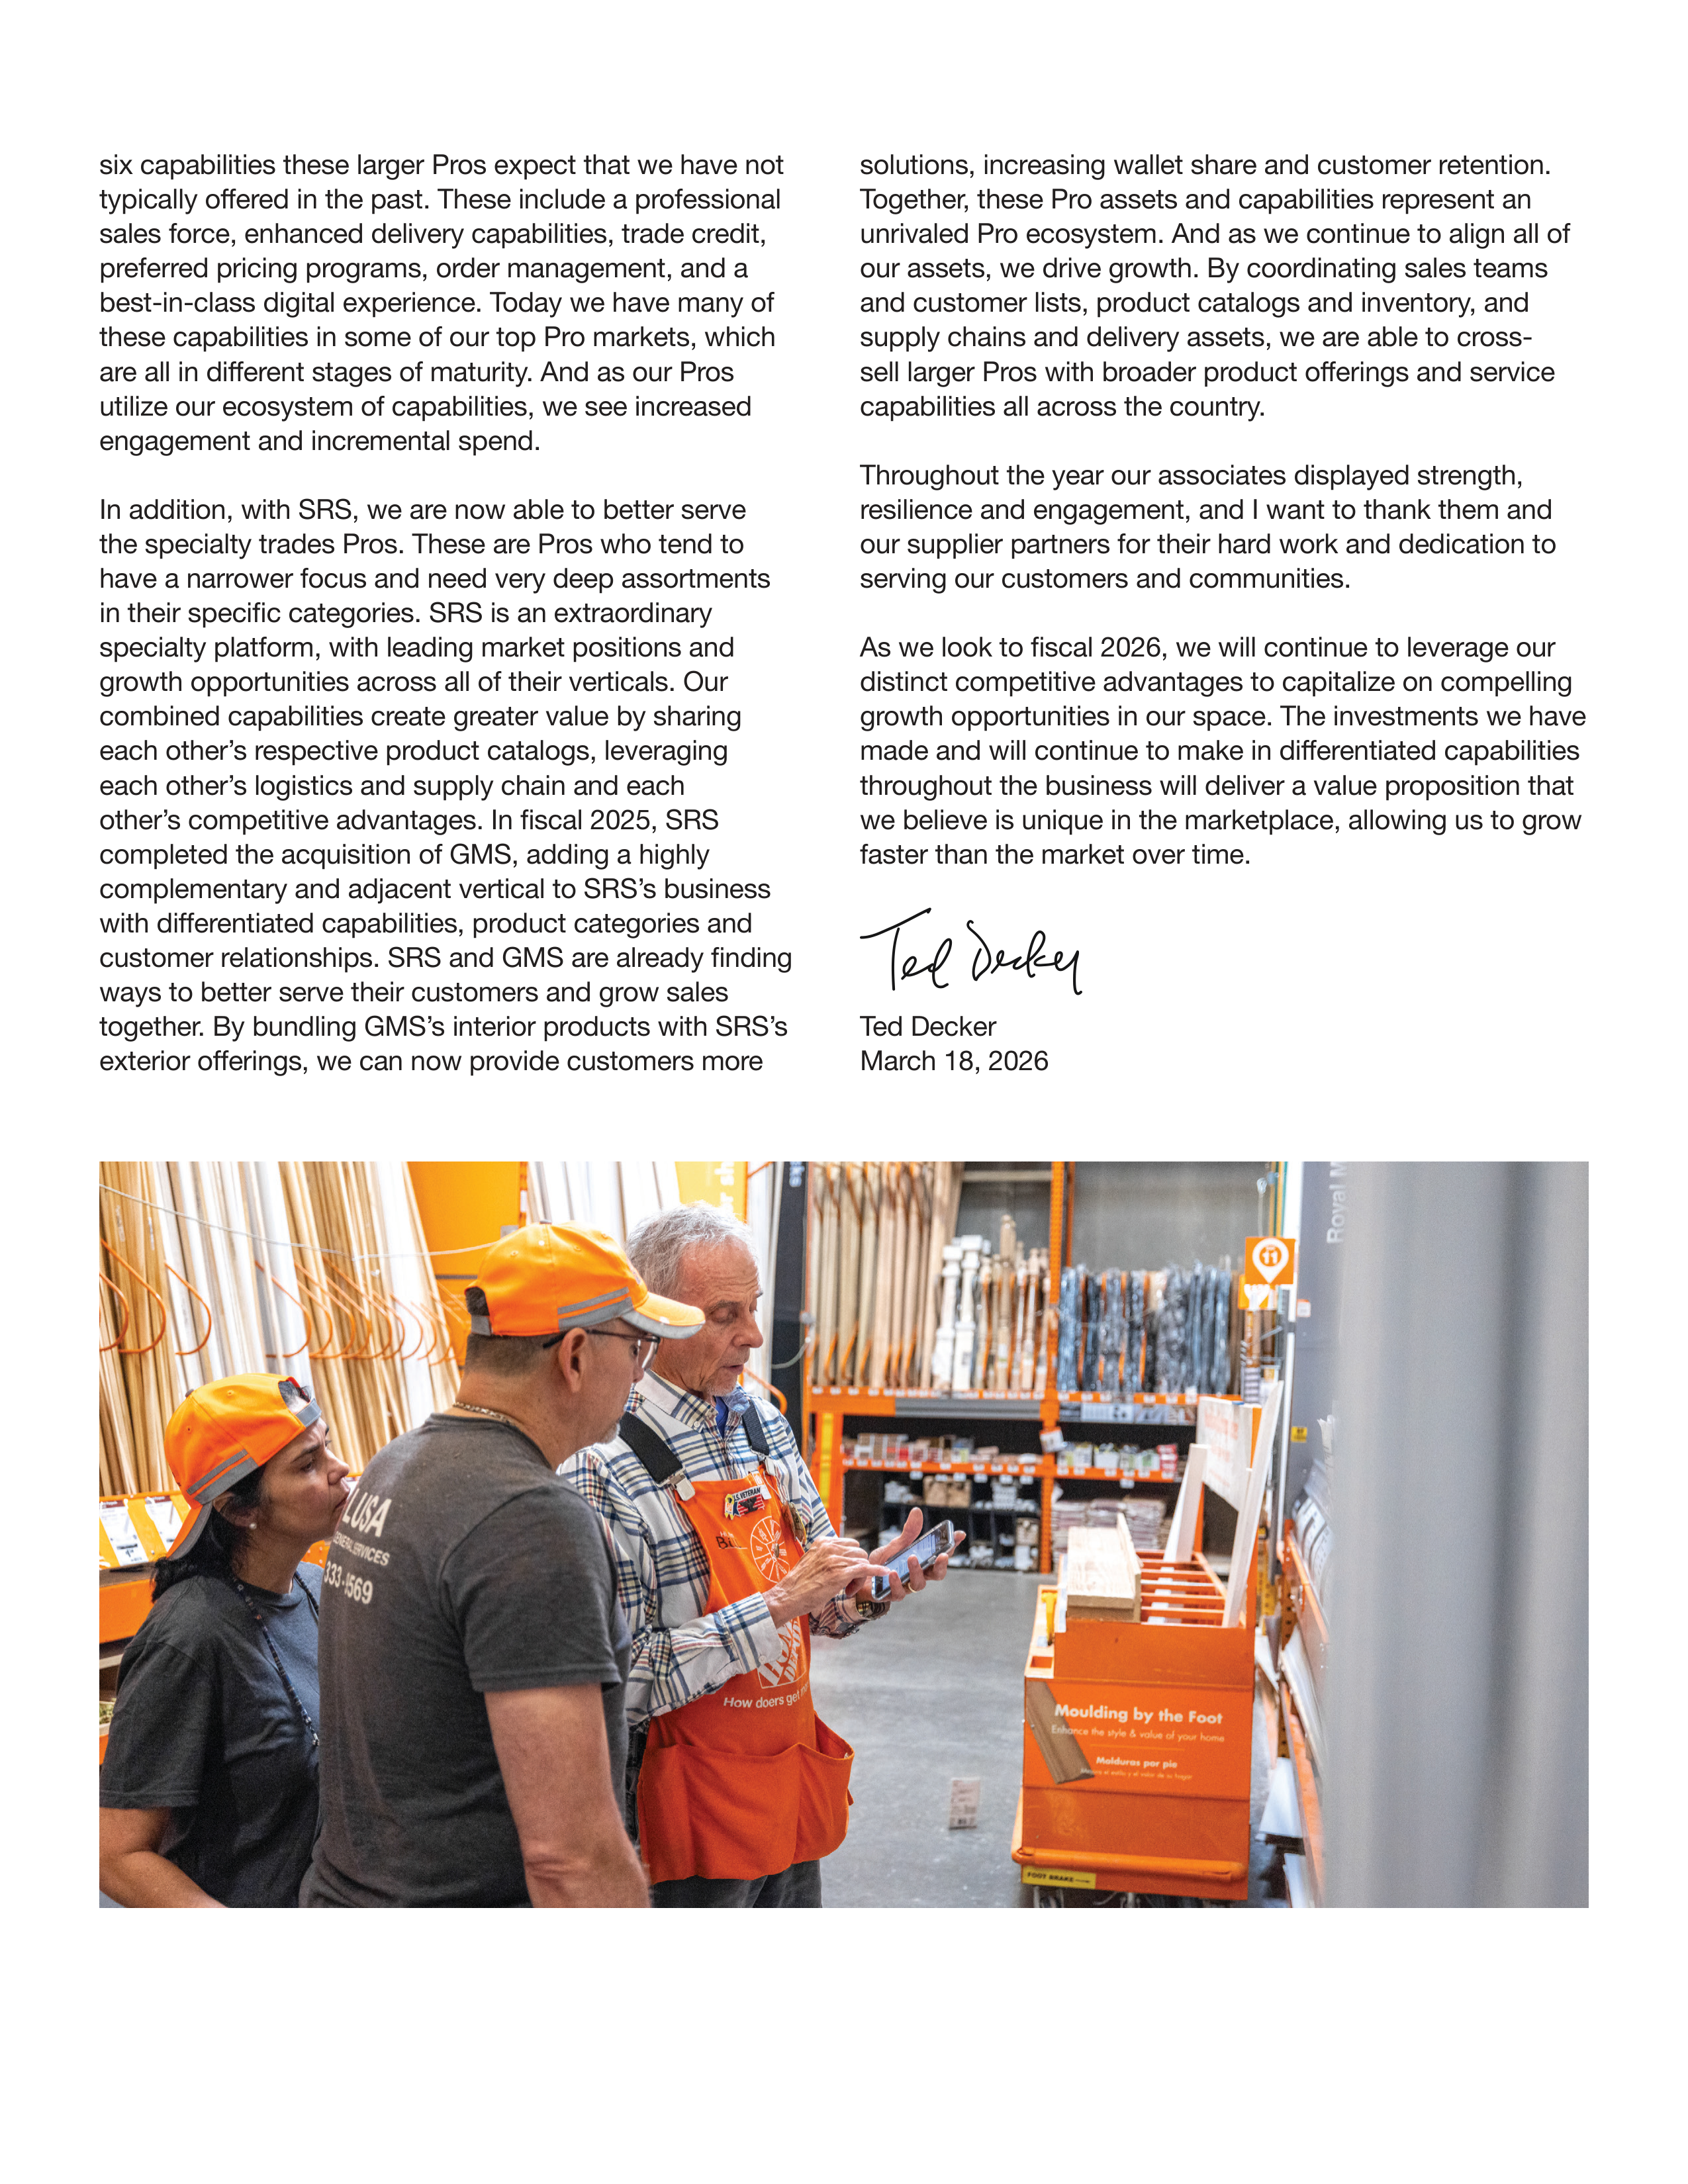
We have an enormous opportunity to grow our share of
the Pro’s wallet. Nearly all Pros shop at The Home Depot,
and we are building differentiated capabilities to better
serve them. Our stores have always been a destination
for Pros and our value proposition has been simple – we
have the brands, categories and quantities that Pros need,
at everyday low prices, conveniently located in one store
location. Our Pros’ expectations have evolved over the
years and we have continued to invest to enhance the
store experience. We are focused on ensuring we have the
brands our Pros want and in the quantities they need, while
developing incremental capabilities to better serve them, like
investing in a unified Pro team that helps drive engagement.
The beauty of these investments is that they enhance the
shopping experience for all Pros, whether they shop our
stores for all their project needs or for urgent and fill-in
occasions.
We also have a significant growth opportunity ahead of us
with the medium to large Pro that shops across categories
and works on complex projects. At The Home Depot,
we can simplify their experience by reducing complexity,
including the number of suppliers they need to transact with,
saving them time and money. While we are investing across
our entire ecosystem of products and services, there are
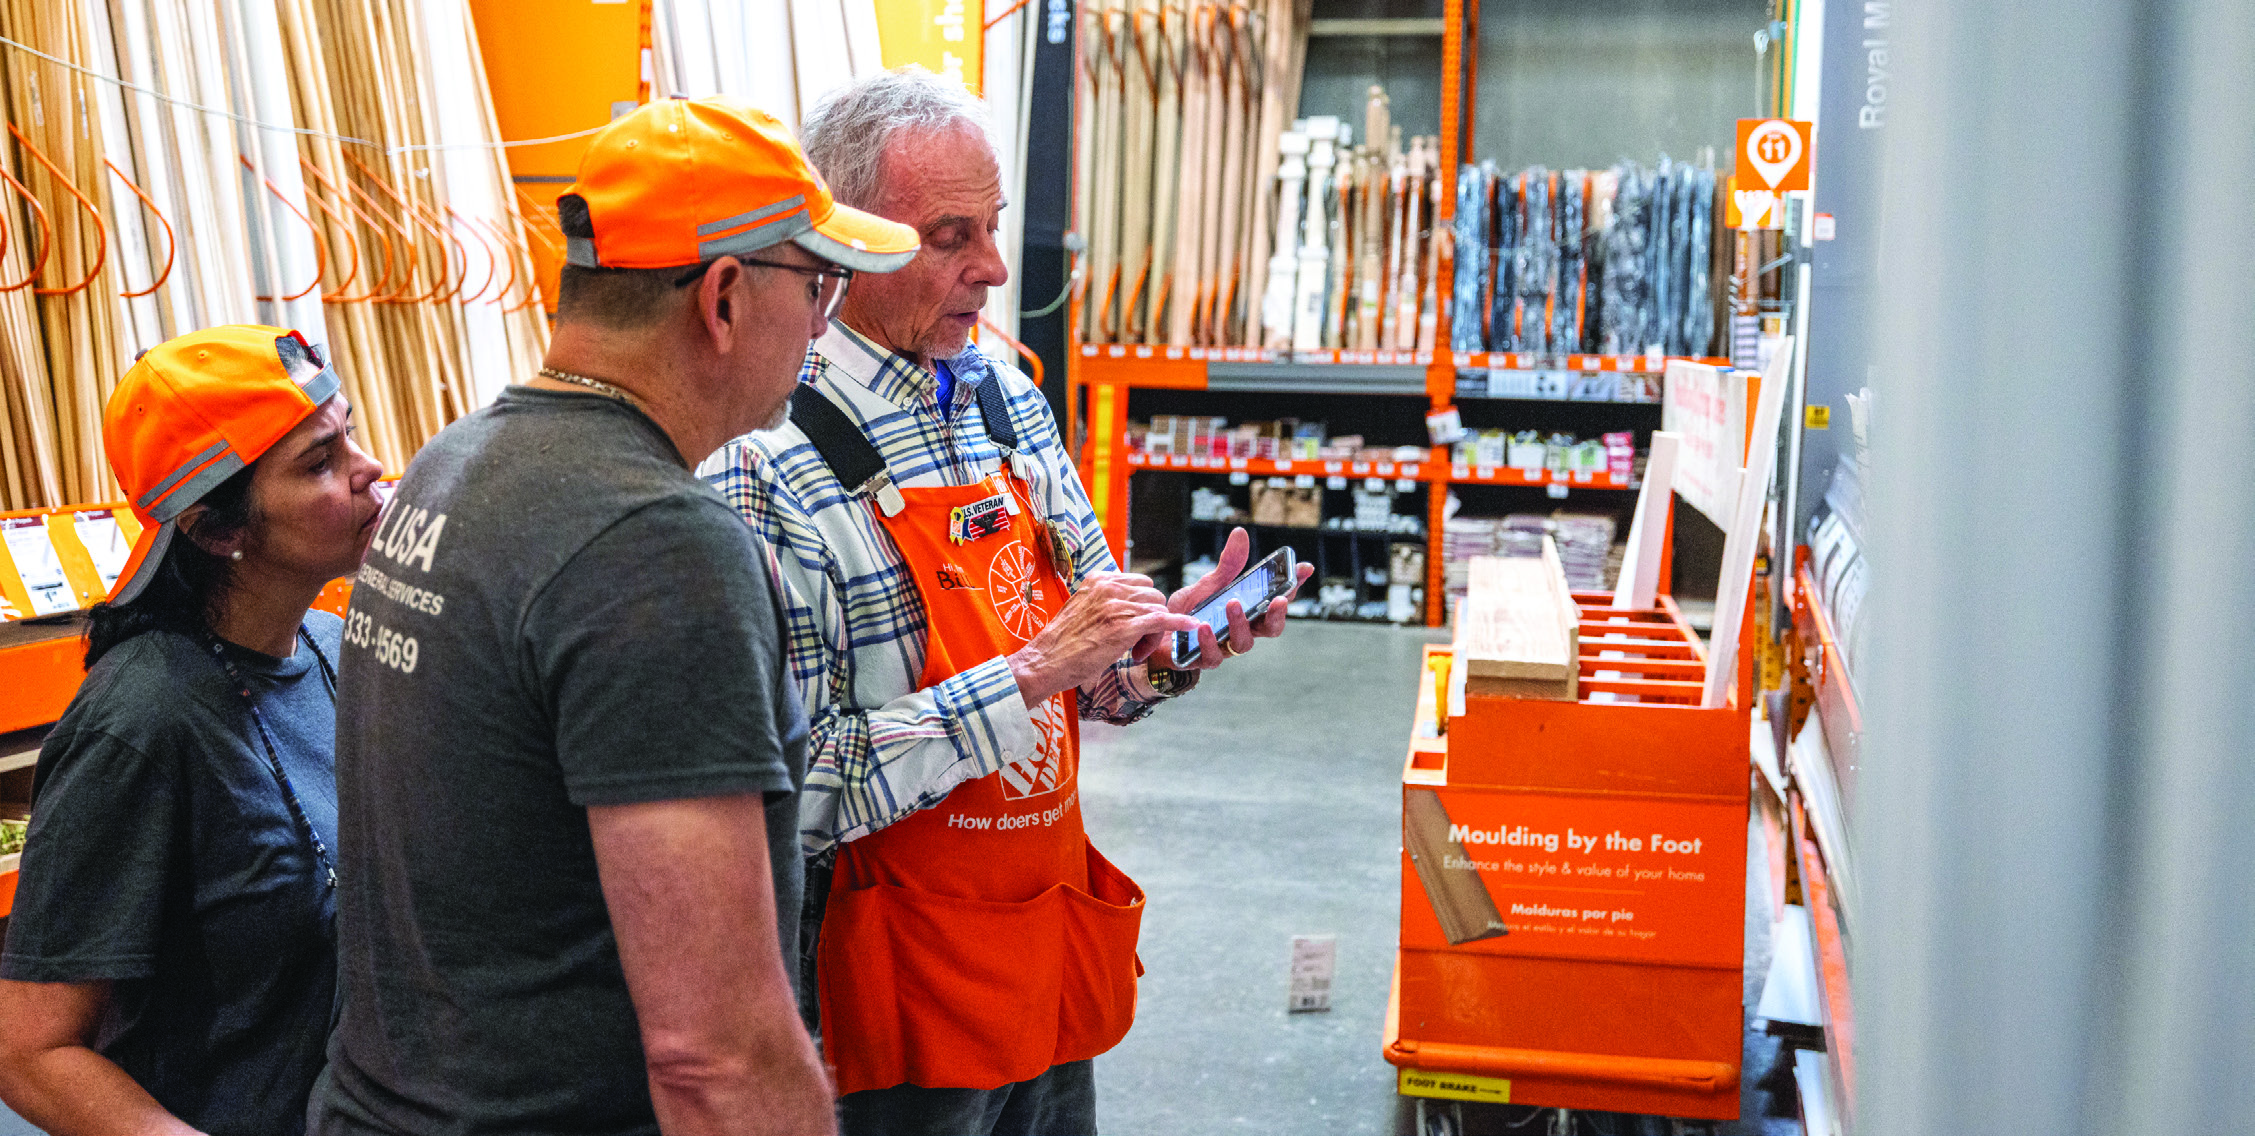
six capabilities these larger Pros expect that we have not
typically offered in the past. These include a professional
sales force, enhanced delivery capabilities, trade credit,
preferred pricing programs, order management, and a
best-in-class digital experience. Today we have many of
these capabilities in some of our top Pro markets, which
are all in different stages of maturity. And as our Pros
utilize our ecosystem of capabilities, we see increased
engagement and incremental spend.
In addition, with SRS, we are now able to better serve
the specialty trades Pros. These are Pros who tend to
have a narrower focus and need very deep assortments
in their specific categories. SRS is an extraordinary
specialty platform, with leading market positions and
growth opportunities across all of their verticals. Our
combined capabilities create greater value by sharing
each other’s respective product catalogs, leveraging
each other’s logistics and supply chain and each
other’s competitive advantages. In fiscal 2025, SRS
completed the acquisition of GMS, adding a highly
complementary and adjacent vertical to SRS’s business
with differentiated capabilities, product categories and
customer relationships. SRS and GMS are already finding
ways to better serve their customers and grow sales
together. By bundling GMS’s interior products with SRS’s
exterior offerings, we can now provide customers more
solutions, increasing wallet share and customer retention.
Together, these Pro assets and capabilities represent an
unrivaled Pro ecosystem. And as we continue to align all of
our assets, we drive growth. By coordinating sales teams
and customer lists, product catalogs and inventory, and
supply chains and delivery assets, we are able to cross-
sell larger Pros with broader product offerings and service
capabilities all across the country.
Throughout the year our associates displayed strength,
resilience and engagement, and I want to thank them and
our supplier partners for their hard work and dedication to
serving our customers and communities.
As we look to fiscal 2026, we will continue to leverage our
distinct competitive advantages to capitalize on compelling
growth opportunities in our space. The investments we have
made and will continue to make in differentiated capabilities
throughout the business will deliver a value proposition that
we believe is unique in the marketplace, allowing us to grow
faster than the market over time.
Ted Decker
March 18, 2026
UNITED STATES
SECURITIES AND EXCHANGE COMMISSION
Washington, D.C. 20549
FORM 10-K
(Mark One)
☒
ANNUAL REPORT PURSUANT TO SECTION 13 OR 15(d) OF THE SECURITIES EXCHANGE ACT OF 1934
For the fiscal year ended February 1, 2026
or
☐
TRANSITION REPORT PURSUANT TO SECTION 13 OR 15(d) OF THE SECURITIES EXCHANGE ACT OF 1934
For the transition period from to
Commission file number 1-8207
THE HOME DEPOT, INC.
(Exact name of registrant as specified in its charter)
Delaware
95-3261426
(State or other jurisdiction of incorporation or organization)
(I.R.S. Employer Identification No.)
2455 Paces Ferry Road
Atlanta,
Georgia
30339
(Address of principal executive offices)
(Zip Code)
Registrant’s telephone number, including area code:
(770) 433-8211
Securities registered pursuant to Section 12(b) of the Act:
Title of each class
Trading Symbol
Name of each exchange on which registered
Common Stock, $0.05 Par Value Per Share
HD
New York Stock Exchange
Securities registered pursuant to section 12(g) of the Act:
None
Indicate by check mark if the registrant is a well-known seasoned issuer, as defined in Rule 405 of the Securities Act. Yes
☒
No
☐
Indicate by check mark if the registrant is not required to file reports pursuant to Section 13 or Section 15(d) of the Act. Yes
☐
No
☒
Indicate by check mark whether the registrant (1) has filed all reports required to be filed by Section 13 or 15(d) of the Securities
Exchange Act of 1934 during the preceding 12 months (or for such shorter period that the registrant was required to file such reports),
and (2) has been subject to such filing requirements for the past 90 days. Yes
☒
No
☐
Indicate by check mark whether the registrant has submitted electronically every Interactive Data File required to be submitted
pursuant to Rule 405 of Regulation S-T (§ 232.405 of this chapter) during the preceding 12 months (or for such shorter period that the
registrant was required to submit such files). Yes
☒
No
☐
Indicate by check mark whether the registrant is a large accelerated filer, an accelerated filer, a non-accelerated filer, a smaller
reporting company, or an emerging growth company. See the definitions of “large accelerated filer,” “accelerated filer,” “smaller
reporting company,” and “emerging growth company” in Rule 12b-2 of the Exchange Act.
Large accelerated filer
☒
Accelerated filer
☐
Non-accelerated filer
☐
Smaller reporting company
☐
Emerging growth company
☐
If an emerging growth company, indicate by check mark if the registrant has elected not to use the extended transition period for
complying with any new or revised financial accounting standards provided pursuant to Section 13(a) of the Exchange Act.
¨
Indicate by check mark whether the registrant has filed a report on and attestation to its management’s assessment of the
effectiveness of its internal control over financial reporting under Section 404(b) of the Sarbanes-Oxley Act (15 U.S.C. 7262(b)) by the
registered public accounting firm that prepared or issued its audit report.
☒
If securities are registered pursuant to Section 12(b) of the Act, indicate by check mark whether the financial statements of the
registrant included in the filing reflect the correction of an error to previously issued financial statements.
☐
Indicate by check mark whether any of those error corrections are restatements that required a recovery analysis of incentive-based
compensation received by any of the registrant’s executive officers during the relevant recovery period pursuant to § 240.10D-1(b).
☐
Indicate by check mark whether the registrant is a shell company (as defined in Rule 12b-2 of the Act). Yes
☐
No
☒
The aggregate market value of voting common stock held by non-affiliates of the registrant on August 1, 2025 was $371.8 billion.
The number of shares outstanding of the registrant’s common stock as of March 4, 2026 was 996,011,466 shares.
DOCUMENTS INCORPORATED BY REFERENCE
Portions of the registrant’s proxy statement for the 2026 Annual Meeting of Shareholders are incorporated by reference in Part III of
this Form 10-K to the extent described herein.
Table of Contents
TABLE OF CONTENTS
Commonly Used or Defined Terms
ii
Forward-Looking Statements
iii
PART I
Item 1.
Business
.
1
Item 1A.
Risk Factors
.
9
Item 1B.
Unresolved Staff Comments
.
22
Item 1C.
Cybersecurity
.
22
Item 2.
Properties
.
24
Item 3.
Legal Proceedings
.
25
Item 4.
Mine Safety Disclosures
.
25
PART II
Item 5.
Market for Registrant’s Common Equity, Related Stockholder Matters and Issuer Purchases of
Equity Securities
.
26
Item 6.
Reserved
.
27
Item 7.
Management’s Discussion and Analysis of Financial Condition and Results of Operations
.
27
Item 7A.
Quantitative and Qualitative Disclosures About Market Risk
.
35
Item 8.
Financial Statements and Supplementary Data
.
36
Item 9.
Changes in and Disagreements With Accountants on Accounting and Financial Disclosure
.
73
Item 9A.
Controls and Procedures
.
73
Item 9B.
Other Information
.
75
Item 9C.
Disclosure Regarding Foreign Jurisdictions that Prevent Inspections
.
75
PART III
Item 10.
Directors, Executive Officers and Corporate Governance
.
75
Item 11.
Executive Compensation
.
76
Item 12.
Security Ownership of Certain Beneficial Owners and Management and Related Stockholder
Matters
.
76
Item 13.
Certain Relationships and Related Transactions, and Director Independence
.
77
Item 14.
Principal Accountant Fees and Services
.
77
PART IV
Item 15.
Exhibits and Financial Statement Schedules
.
77
Item 16.
Form 10-K Summary
.
80
SIGNATURES
81
Fiscal 2025 Form 10-K
i
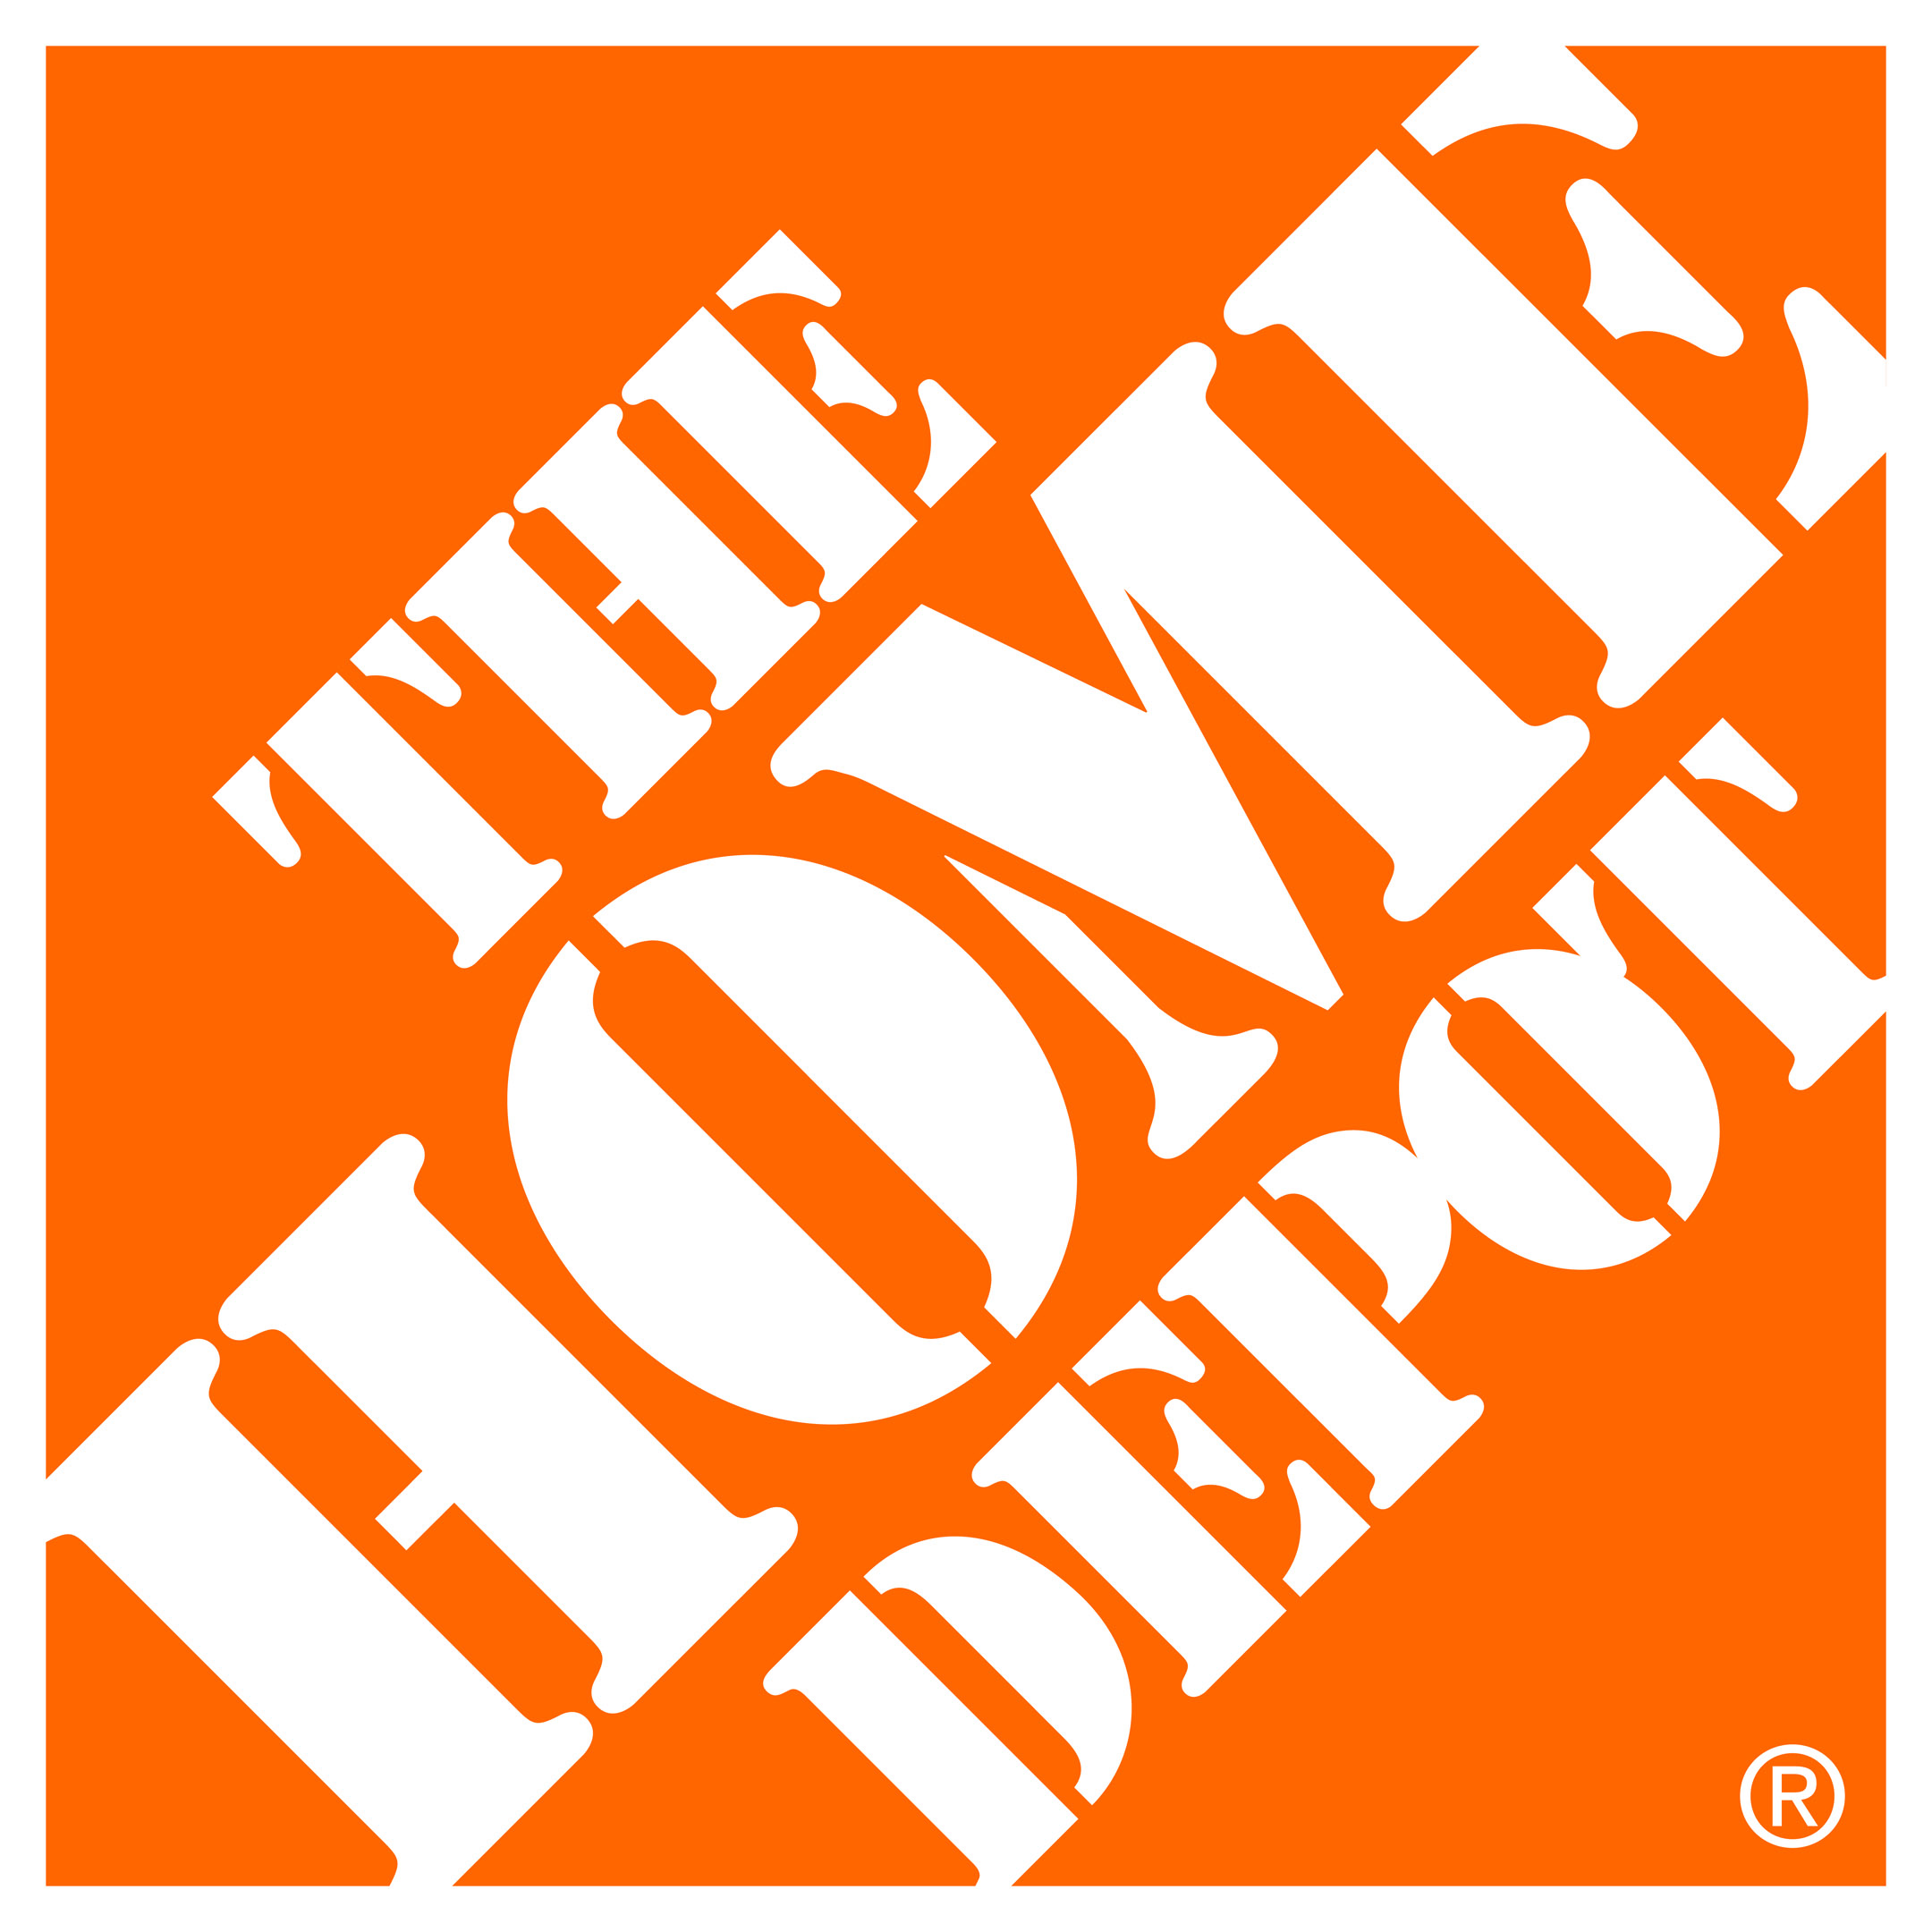
COMMONLY USED OR DEFINED TERMS
AI
Artificial intelligence
ASU
Accounting Standards Update
BODFS
Buy Online, Deliver From Store
BOPIS
Buy Online, Pickup In Store
BORIS
Buy Online, Return In Store
BOSS
Buy Online, Ship to Store
Comparable sales
As defined in the
Results of Operations
section of MD&A
DIFM
Do-It-For-Me
DIY
Do-It-Yourself
EH&S
Environmental, Health, and Safety
EPA
U.S. Environmental Protection Agency
ESPP
Employee Stock Purchase Plan
Exchange Act
Securities Exchange Act of 1934, as amended
FASB
Financial Accounting Standards Board
FDC
Flatbed distribution centers
fiscal 2023
Fiscal year ended January 28, 2024 (includes 52 weeks)
fiscal 2024
Fiscal year ended February 2, 2025 (includes 53 weeks)
fiscal 2025
Fiscal year ended February 1, 2026 (includes 52 weeks)
fiscal 2026
Fiscal year ending January 31, 2027 (includes 52 weeks)
GAAP
U.S. generally accepted accounting principles
GMS
GMS Inc.
IRS
Internal Revenue Service
MD&A
Management’s Discussion and Analysis of Financial Condition and Results of Operations
MRO
Maintenance, repair, and operations
NOPAT
Net operating profit after tax
NYSE
New York Stock Exchange
PLCC
Private label credit card
Pro
Professional customer
Restoration Plans
Home Depot FutureBuilder Restoration Plan and HD Supply Restoration Plan
ROIC
Return on invested capital
SEC
Securities and Exchange Commission
Securities Act
Securities Act of 1933, as amended
SG&A
Selling, general, and administrative expenses
SRS
SRS Distribution Inc.
Term
Definition
Table of Contents
Fiscal 2025 Form 10-K
ii
FORWARD-LOOKING STATEMENTS
Certain statements contained herein, as well as in other filings we make with the SEC and other written and oral
information we release, including statements regarding our performance, estimates, expectations, beliefs,
intentions, projections, strategies for the future, or other events or developments in the future may constitute
“forward-looking statements” under the federal securities laws, including as defined in the Private Securities
Litigation Reform Act of 1995. Forward-looking statements are based on currently available information and our
current assumptions, expectations and projections about future events, and use words such as “may,” “will,” “could,”
“should,” “would,” “anticipate,” “intend,” “estimate,” “project,” “plan,” “believe,” “expect,” “target,” “prospects,”
“potential,” “commit” and “forecast,” or words of similar import or meaning or refer to future time periods.
Forward-looking statements may relate to, among other things, our brand and reputation; the demand for our
products and services, including as a result of macroeconomic conditions and changing customer preferences and
expectations; net sales growth; comparable sales; the effects of competition; implementation of interconnected,
store, supply chain, technology, innovation and other strategic initiatives, including with respect to real estate;
inventory, on-shelf availability, and in-stock positions; the state of the economy; the state of the housing and home
improvement markets; the state of the credit markets, including mortgages, home equity loans, and consumer and
trade credit; the impact of tariffs; trade policy changes or restrictions, or international trade disputes and efforts and
ability to continue to diversify our supply chain; issues related to the payment methods we accept; demand for credit
offerings, including trade credit; management of relationships with our associates, jobseekers, suppliers and service
providers; cost and availability of labor; costs of fuel and other energy sources; events that could disrupt our
business, supply chain, technology infrastructure, or demand for our products and services, such as tariffs, trade
policy changes or restrictions or international trade disputes, natural disasters, climate change, public health issues,
cybersecurity events, and labor disputes; geopolitical tensions or conflicts, military conflicts, or acts of war; our
ability to maintain a safe and secure store environment; our ability to address expectations regarding sustainability
and human capital management matters and meet related goals; continuation or suspension of share repurchases;
net earnings and margin performance; earnings per share; future dividends; capital allocation and expenditures;
productivity; liquidity; ROIC; expense and debt leverage; changes in interest rates; changes in foreign currency
exchange rates; commodity or other price inflation and deflation; our ability to issue debt on terms and at rates
acceptable to us; the impact and expected outcome of investigations, inquiries, claims, and litigation, including
compliance with related settlements; the challenges of operating in international markets; the adequacy of insurance
coverage; the effect of accounting charges; the effect of adopting certain accounting standards; the impact of legal
and regulatory changes, including executive orders and other administrative or legislative actions, such as changes
to tax laws and regulations; store openings and closures; financial outlook; and the impact of acquired companies,
including SRS and GMS, on our organization and the ability to recognize the anticipated benefits of completed or
pending acquisitions.
These statements are not guarantees of future performance and are subject to future events, risks and uncertainties
— many of which are beyond our control, dependent on the actions of third parties, or currently unknown to us — as
well as potentially inaccurate assumptions that could cause actual results to differ materially from our historical
experience and our expectations and projections. These risks and uncertainties include, but are not limited to, those
described in
Part I, Item 1A. Risk Factors
, and elsewhere in this report and also as described from time to time in
reports subsequently filed with the SEC. You should read such information in conjunction with our consolidated
financial statements and related notes and
Part II, Item 7. Management’s Discussion and Analysis of Financial
Condition and Results of Operations
in this report. There also may be other factors that we cannot anticipate or that
are not described herein, generally because we do not currently perceive them to be material. Such factors could
cause results to differ materially from our expectations. Forward-looking statements speak only as of the date they
are made, and we do not undertake to update these statements other than as required by law. You are advised,
however, to review any further disclosures we make on related subjects in our filings with the SEC and in our other
public statements.
Table of Contents
Fiscal 2025 Form 10-K
iii
PART I
Item 1. Business.
INTRODUCTION
The Home Depot, Inc. is the world’s largest home improvement retailer based on net sales for fiscal 2025. We offer
our customers a wide assortment of home improvement products, building materials, lawn and garden products,
décor products, and facilities MRO products, in stores and online. We also provide a number of services, including
home improvement installation services, and tool and equipment rental. As of the end of fiscal 2025, we operated
2,359 stores located throughout the U.S. (including the Commonwealth of Puerto Rico and the territories of the
U.S. Virgin Islands and Guam), Canada, and Mexico. The Home Depot stores average approximately
104,000 square feet of enclosed space, with approximately 24,000 additional square feet of outside garden area.
We also maintain a network of distribution and fulfillment centers, as well as mobile applications and e-commerce
websites in the U.S., Canada, and Mexico. For disclosure purposes, the geographic operating segments of the U.S.,
Canada and Mexico are aggregated into one reportable segment (the “Primary segment”).
In fiscal 2024, we acquired SRS, a leading residential specialty trade distribution company across several verticals
engaged in the distribution of residential and commercial roofing products and complementary building products,
landscape supplies, and swimming pool supplies serving the professional roofer, landscaper, and pool contractor. In
fiscal 2025, SRS completed the acquisition of GMS, a leading distributor of specialty building products, including
drywall, ceilings, steel framing and other complementary construction products. At the end of fiscal 2025, SRS,
which includes GMS, operated over 1,250 locations throughout the U.S. and Canada, most of which have a
distribution center, material handling and delivery equipment, and inventory. Following the GMS acquisition, SRS is
organized as four different lines of business: roofing and building products, interior and construction products,
landscape, and pool. Each line of business was determined to represent an operating segment, none of which are
deemed reportable segments.
Unless otherwise indicated or the context otherwise requires, when we refer to “The Home Depot,” “Home Depot,”
the “Company,” “we,” “us” or “our” in this report, we are referring to The Home Depot, Inc. and its consolidated
subsidiaries.
The Home Depot, Inc. is a Delaware corporation that was incorporated in 1978. Our Store Support Center
(corporate headquarters) is located at 2455 Paces Ferry Road, Atlanta, Georgia 30339. Our telephone number at
that address is (770) 433-8211.
OUR BUSINESS
OUR STRATEGY
The Home Depot is focused on leveraging its distinct competitive advantages – our brand, excellent customer
service, product authority in home improvement, knowledgeable associates and culture, scale, premier real estate
portfolio, digital and interconnected experience, supply chain network, and our deep relationships with Pros – to
take advantage of the significant growth opportunities in the highly fragmented markets in which we operate. In
fiscal 2025, we strategically invested across our business to advance our growth strategy:
•
Drive our core and culture by supporting our associates so that they can deliver the best customer
experience in home improvement;
•
Deliver a frictionless interconnected customer experience, regardless of whether our customers choose to
engage and shop with us in-store or through our digital properties; and
•
Win with Pros through our differentiated value proposition and ecosystem of capabilities.
We believe that this strategy will help us grow faster than the market and deliver value to our shareholders. Driven
by our core values, our Inverted Pyramid model reminds us who matters most – our customers and our associates.
These values, embedded in our culture since the Company’s founding, continue to guide us as our business
evolves.
Table of Contents
Fiscal 2025 Form 10-K
1
DELIVER SHAREHOLDER VALUE
We seek to deliver on our objective to create shareholder value through our disciplined approach to capital
allocation. Our capital allocation principles are as follows:
•
First, we intend to reinvest in our business to drive growth faster than the market.
•
Second, after reinvesting in the business, we look to pay a quarterly dividend.
•
Third, after reinvesting in our business and paying our dividend, we intend to return excess cash to our
shareholders through share repurchases.
In fiscal 2025, we invested $3.7 billion in capital expenditures across initiatives supporting our strategy of driving our
core and culture, including building new stores and maintaining existing stores, delivering a frictionless,
interconnected experience, and winning with Pros. SRS also acquired GMS to accelerate the vision of becoming a
leading, multi-category building materials distributor. We continue to focus on driving productivity throughout the
business, including by leveraging technology to drive efficiency in freight flow management, supply chain
optimization, and streamlining central processes. By reinvesting in our business to drive growth and productivity, we
are able to improve the customer experience, increase our competitiveness in the market, and deliver shareholder
value.
In fiscal 2025, we returned $9.2 billion to shareholders in the form of cash dividends, following a 2.2% increase in
our quarterly cash dividend from $2.25 per share to $2.30 per share announced in February 2025. Our capital
allocation is discussed further in
Part II, Item 7. Management’s Discussion and Analysis of Financial Condition and
Results of Operations.
OUR CUSTOMERS
We serve two primary customer groups — consumers (including both DIY and DIFM customers) and Pros — and
have developed varying approaches to meet their diverse needs:
DIY Customers
These customers are typically homeowners who purchase products and complete their own projects and
installations. Our associates assist these customers both in our stores and through digital resources designed to
provide product and project knowledge. We also offer a variety of clinics and workshops to share this knowledge
and to build an emotional connection with our DIY customers. As the preferences and behaviors of our DIY
customers change, we are continuing to invest in capabilities to better meet their evolving expectations.
Pros
These customers are primarily professional renovators/remodelers, general contractors, homebuilders,
maintenance professionals, handymen, property managers, building service contractors and specialty tradespeople,
such as electricians, landscapers, insulation installers, plumbers, painters, pool contractors, roofers, and wallboard
and ceiling installers. These customers build, renovate, remodel, repair, and maintain residential properties,
multifamily properties, hospitality properties, and commercial facilities, including educational, healthcare,
governmental, institutional, and office buildings, as well as data centers.
We have a number of initiatives designed to drive growth with Pros, including those working on both simple and
complex projects. We remain focused on providing a customized digital experience tailored to Pros’ needs, a
dedicated sales force, a broad and deep assortment of Pro-focused products and brands, an extensive delivery
network, our Pro Xtra loyalty program, and enhanced credit offerings. Building on our historical strength as a
destination for all Pros, we are continuing to invest in differentiated capabilities that will help us better serve our
Pros’ needs, including differentiated fulfillment options, preferred pricing, additional trade credit offerings including
our Pro Trade Credit program, more convenient locations and showroom space, and technology tools designed to
streamline order management and project planning and management. In fiscal 2024, we acquired SRS, which sells
products to specialty trade roofers, landscapers, and pool contractors. The acquisition of GMS by SRS in fiscal
2025 further expanded our ability to serve Pros by adding specialty interior building products such as wallboard,
ceilings, steel framing and complementary products for residential and commercial projects. We also provide MRO
products and related value-added services to multifamily, hospitality, healthcare, and government housing facilities,
among others, primarily through our subsidiary HD Supply.
We believe these investments in differentiated capabilities support our goal to serve as the preferred partner for our
Pros across their entire project, giving them the choice to streamline their purchasing to optimize efficiency and
complete their jobs on time and on budget.
Table of Contents
Fiscal 2025 Form 10-K
2
DIFM Customers
Intersecting our DIY customers and our Pros are our DIFM customers. These customers are typically homeowners
who use Pros to complete their projects or installations. Currently, we offer installation services in a variety of
categories, such as flooring, water heaters, bath, garage doors, cabinets, cabinet makeovers, countertops, sheds,
furnaces and central air systems, windows, and window coverings. DIFM customers can purchase these services in
our stores, online, or in their homes through in-home consultations. In addition to serving our DIFM customer needs,
we believe our focus on Pros who perform services for these customers helps us drive higher product sales.
OUR PRODUCTS AND SERVICES
A typical Home Depot store stocks approximately 30,000 to 40,000 items during the year, including both national
brand name and proprietary products, across the following merchandising departments: Appliances, Bath, Building
Materials, Electrical, Flooring, Hardware, Indoor Garden, Kitchen & Blinds, Lighting, Lumber, Millwork, Outdoor
Garden, Paint, Plumbing, Power, and Storage & Organization. Our online product offerings complement our stores
by serving as an extended aisle, and we offer a significantly broader product assortment through our mobile
applications and websites, including homedepot.com, our primary website; homedepot.ca and homedepot.com.mx,
our websites in Canada and Mexico, respectively; hdsupply.com, our website for our MRO products and related
services; our websites for custom window coverings, including blinds.com, justblinds.com and americanblinds.com;
constructionresourcesusa.com, our website for design-oriented surfaces, appliances and architectural specialty
products for Pros; thecompanystore.com, our website featuring textiles and décor products; and srsdistribution.com,
heritagelandscapesupplygroup.com, heritagepoolsupplygroup.com, and gms.com, our websites serving the roofing
and exterior building materials, landscape, pool product, and interior building product needs of specialty trade Pros,
respectively.
Our merchandising organization delivers product innovation, assortment and value, which reinforces our position as
the product authority in home improvement and is one of our distinctive competitive advantages. At the same time,
we remain focused on offering the right products at everyday value in our stores and online. The strong strategic
relationships that our merchandising organization builds with our vendors position us to deliver on our goals for our
customers and offer a compelling business proposition for these market-leading suppliers. As part of our focus on
product differentiation, we have formed strategic alliances and exclusive relationships with certain suppliers to
market products under a variety of well-recognized brand names. We have also developed relationships with certain
suppliers to allow us to offer proprietary products that are comparable to national brands. These proprietary
products help differentiate us from other retailers and generally carry higher margins than national brand products.
To keep pace with changing customer expectations and increasing desire for innovation, localization, and
personalization, we continue to invest in tools to better leverage our data and drive a deeper level of collaboration
with our suppliers. As a result, we continue to focus on enhanced merchandising information technology tools to
help us: (1) enhance an interconnected shopping experience tailored to our customers’ shopping intent and location;
(2) provide the best value in the market; and (3) optimize our product assortments. Our merchandising team
leverages technology and works closely with our inventory and supply chain teams, as well as our suppliers, to
manage our assortments, drive innovation, manage the cost environment, and adjust inventory levels to respond to
shifts in demand.
To complement our merchandising efforts, we offer a number of services for our customers, including installation
services for our DIY and DIFM customers, as noted above. We also provide tool and equipment rentals at many
locations, providing value and convenience for both Pros and consumers. To improve the customer experience and
continue to grow this differentiated service offering, we continue to invest in more tool rental locations, more tools,
and better technology.
Sourcing and Quality Assurance
We maintain a global sourcing program to obtain high-quality and innovative products directly from manufacturers in
the U.S. and around the world. For many years, we have worked to diversify our global supply chain. During fiscal
2025, in addition to our U.S. sourcing operations, we maintained sourcing offices in Mexico, Canada, India,
Vietnam, Taiwan and China, as well as certain locations in Europe. Under our standard supplier buying agreement,
our suppliers are obligated to ensure that their products comply with applicable international, federal, state and local
laws. This standard agreement also requires compliance with our responsible sourcing standards, which cover a
variety of expectations, including supply chain transparency, compliance with applicable laws and regulations
addressing prohibitions on child and forced labor, health and safety, environmental matters, compensation, and
hours of work. To drive accountability with our suppliers, our standard supplier buying agreement also includes a
factory audit right related to these standards, and we conduct risk-based factory audits and compliance visits with
Table of Contents
Fiscal 2025 Form 10-K
3
non-Canada and non-U.S. suppliers of private branded and direct import products. Our 2025 Responsible Sourcing
Report, available on our Investor Relations website at https://ir.homedepot.com under “Sustainability,” provides
more information about this program. In addition, we have both quality assurance and engineering resources
dedicated to establishing criteria and overseeing compliance with safety, quality, and performance standards for our
private branded products.
Intellectual Property
Our business has one of the most recognized brands in North America. As a result, we believe that The Home
Depot
®
trademark has significant value and is an important factor in the marketing of our products, e-commerce,
stores and business. We have registered or applied for registration of trademarks, service marks, copyrights and
internet domain names, both domestically and internationally, for use in our business, including our proprietary
brands such as HDX
®
, Husky
®
, Hampton Bay
®
, Home Decorators Collection
®
, Glacier Bay
®
, Vigoro
®
, Everbilt
®
and
Lifeproof
®
. The duration of trademark registrations varies from country to country. However, trademarks are
generally valid and may be renewed indefinitely as long as they are in use and/or their registrations are properly
maintained.
We also maintain patent portfolios relating to our business operations, retail services, and products, and we seek to
patent or otherwise protect innovations we incorporate into our business. Patents generally have a term of twenty
years from the date they are filed. As our patent portfolio has been built over time, the remaining terms of individual
patents across our patent portfolio vary. Although our patents have value, no single patent is essential to our
business. We regularly assess our merchandising departments and product lines for opportunities to expand the
assortment of products offered within The Home Depot’s portfolio of proprietary and exclusive brands.
COMPETITION AND SEASONALITY
Our industry is highly competitive, highly fragmented, and evolving. As a result, we face competition for customers
for our products and services from a variety of retailers (including those operating reseller marketplaces), suppliers,
service providers, distributors and manufacturers that sell products directly to their respective customer bases.
These competitors range from traditional brick-and-mortar, to multichannel, to exclusively online, and they include a
number of other home improvement retailers; local, regional and national hardware stores; electrical, plumbing and
building materials supply houses; and lumber yards. With respect to some products and services, we also compete
with specialty design stores, showrooms, discount stores, paint stores, specialty and mass digital retailers,
warehouse clubs, MRO distributors, national and local wholesale supply distributors, home décor retailers, and
other retailers, as well as with providers of home improvement services and tool and equipment rental. Online and
other digital capabilities, as well as AI tools, facilitate competitive entry, price transparency, and comparison
shopping, increasing the level of competition we face.
Both in-store and online, we compete primarily based on customer experience; price; quality; product availability,
assortment, and innovation; and delivery options and capabilities. We also compete based on store and branch
location and appearance, presentation of merchandise, and ease of shopping experience throughout every step of
the project, from inspiration and research to any post-purchase support. Our Pros also look for dedicated sales
support, competitive credit and pricing options, project planning tools, professional and reliable deliveries, and
product depth and job-lot quantities, particularly for their complex project needs. Furthermore, with respect to
delivery options, customers are seeking faster and/or guaranteed delivery times, real-time updates on delivery
status, low-price or free shipping, and/or convenient pickup options. Our ability to be competitive on delivery and
pickup times, options and costs depends on many factors, as described more fully under “Our Supply Chain” below,
and our interconnected strategy.
Our business is subject to seasonal influences. Generally, our highest volume of sales occurs in our second fiscal
quarter, as we move into the spring season in the regions in which we operate.
INTERCONNECTED SHOPPING EXPERIENCE
We continue to enhance our capabilities to provide our customers with a frictionless interconnected shopping
experience across our stores, branches, online, on the job site, and in their homes, focusing on continued
investments in our mobile applications and websites to enhance the customer experience. When we discuss the
“interconnected experience,” we are referring to our customers’ many touchpoints across our physical and digital
assets throughout their entire shopping journey. Home Depot is primarily a project retailer, and it is our goal to help
customers solve problems across their entire project. We aim to provide the best experience across our physical
and digital assets, throughout the entire shopping journey from inspiration to post-purchase support, and we believe
that engagement with customers across different touchpoints has driven increases in sales.
Table of Contents
Fiscal 2025 Form 10-K
4
Digital Experience
Enhancements to our digital platforms are critical for our increasingly interconnected customers, who often research
products and check available inventory online before visiting one of our stores to view products in person or talk to
an associate and then making their purchase either in store or online. While in the store, or following a visit to one of
our stores, customers may also go online to access ratings and reviews, compare prices, view our extended
assortment, and purchase additional products. Our investments in a truly interconnected experience are focused on
bringing together the power of our physical presence and the frictionless interaction of our digital capabilities.
A significant majority of the traffic in Home Depot’s digital channels is on mobile devices. Mobile users expect more
simplicity and relevancy in their digital interactions. In addition to supporting our DIY and DIFM customers
throughout their shopping journeys, our mobile applications and other digital tools can also help serve the needs of
Pros, including those working on complex projects. As a result, we have invested in our digital platforms to improve
the overall presentation and ease of navigation for our customers. We have also enhanced the “shopability” of an
online product by including more information on the product’s landing page, including related products and/or parts
of a collection, as well as various fulfillment options. In addition, we are leveraging AI tools to improve our search,
recommendations, and chat features, and offering new AI-powered customer-facing tools such as Magic Apron
TM
,
which supports customers and associates with online product and project inquiries, and our AI-powered Blueprint
Takeoffs Tool and Material List Builder, which generate project-specific materials lists and quotes. We believe our
focus on improving search capabilities, digital functionality, category presentation, product content such as customer
product review summaries, project inspiration and support, speed to checkout, and fulfillment options has yielded
higher traffic, better conversion and continued sales growth. As our customers expect a more personalized
experience, our ability to collect, use, retain, and protect relevant customer data is important to effectively meet their
expectations.
Further, we do not view the interconnected experience as a specific transaction; rather, we believe it encompasses
an entire journey from inspiration and know-how, to purchase and fulfillment, to post-purchase support. Customers
continue to expect more personalized messaging, and we remain focused on connecting marketing activities with
the online and in-store experiences to create seamless engagement across channels. From the inspirational point of
the purchase journey to providing product know-how, we continue to invest in the infrastructure and capabilities
needed to deliver the most relevant marketing messages to our customers based on what is important to them
today.
Store Experience
Our stores remain the hub of our business, and we continue to invest to improve the customer shopping experience
through easier navigation and increased convenience and speed of checkout. In fiscal 2025, we continued to
leverage the investments made in our store experience over the past several years to operate effectively and meet
customer expectations, as well as investing in dedicated teams to better meet the needs of our Pros in-store. We
have also empowered our customers with additional self-help tools, including mobile application-enabled store
navigation and Magic Apron. Our Home Depot mobile application provides store-specific maps that allow customers
to pinpoint the exact location of an item on their mobile devices. We also recognize that another critical part of
delivering an excellent customer experience in the store is having products on our shelves, and we have enhanced
our use of technology such as Computer Vision, which provides greater visibility into where product is located,
including both on shelves and in the overhead space, enabling us to drive higher on-shelf availability. We believe
these investments are driving higher customer satisfaction scores, and we will continue to invest to improve the
customer experience. In addition, we have identified areas that have experienced significant population growth or
where market voids exist. In fiscal 2023, we initiated a plan to open approximately 80 new stores over a five-year
period to address those opportunities, and in fiscal 2025, we opened 12 new stores. We expect to complete this
goal of approximately 80 new stores in fiscal 2027, after which point we plan to open approximately 15 to 20 new
stores per year. These new stores will continue to help relieve pressure at existing high-volume stores and add
capacity in areas with less store coverage, helping us to improve the customer experience and drive sales growth.
Investing in the Associate Experience.
We continually strive to improve our store operations by removing
complexity and inefficient processes, allowing our associates to spend more of their time serving our customers. To
this end, we have continued to focus on process improvements like optimizing product flow to improve on-shelf
availability and reduce the amount of time store associates spend locating products, as well as expanding in-aisle,
real-time mobile learning tools for our associates’ development and assistance with customer questions. Our
associates are also using web-enabled handheld devices to help them more efficiently meet the needs of the
business and serve customers. These digital “hdPhone” devices offer enhanced functionality that allows associates
to readily query inventory, access applications that support customer service, and assist with locating products. Our
Table of Contents
Fiscal 2025 Form 10-K
5
hdPhones also give our U.S. Home Depot store associates access to Sidekick, an application that directs
associates to bays where product is low or out of stock and helps our associates prioritize the highest value tasks
more effectively. In addition, we are using labor model tools to better align associate activity with customer needs.
This includes transitioning more of our store tasking to our merchandising execution team (MET), leveraging MET
associates’ expertise to reinforce in-aisle associates’ focus on excellent customer service.
Investing in Safety.
We remain committed to maintaining a safe shopping and working environment for our
customers and associates. We accomplish this by creating a strong culture of safety, building on our core value of
Taking Care of Our People, that starts from the top with engaged leaders who empower associates to make
decisions that prioritize the safety of everyone. We use data to identify areas of greatest risk, including emerging
risks, and invest in tools, equipment and technology to reduce those risks in our packaging, processes, and
behaviors. Our associate training and awareness initiatives target individual roles and responsibilities, integrating
with overall strategies that promote physical and psychological safety and emotional wellness.
We empower trained EH&S associates to continuously evaluate, develop, implement and enforce policies,
processes and programs in our stores, facilities and offices across the Company. Our EH&S policies are woven into
our everyday operations for site, district and regional teams, and integrate with operating platforms to provide safety
line-of-sight to associates and their leaders. Common program elements include daily store inspection checklists;
routine follow-up audits from our store-based safety team members; preventative maintenance programs to promote
equipment and physical space safety; and departmental merchandising safety standards.
OUR SUPPLY CHAIN
We continue to focus on building best-in-class competitive advantages in our supply chain to be responsive to our
customers’ expectations for how, when and where they choose to receive our products and services. As part of
enhancing the interconnected experience, over the past several years, we have invested in our supply chain
network with the goal of achieving the fastest, most efficient and most reliable delivery capabilities in home
improvement. With that investment now largely complete, our supply chain initiatives have positioned us to operate
effectively and meet our customers’ needs for product availability and fast, reliable delivery.
We centrally forecast and replenish the vast majority of our Home Depot store products through sophisticated
inventory management systems and utilize our network of distribution centers to serve both our stores’ and
customers’ needs. Our supply chain includes multiple distribution center platforms in the U.S., Canada, and Mexico
that are tailored to meet the needs of our stores and customers based on types of products, location, transportation,
and delivery requirements. These include rapid deployment centers, stocking distribution centers, bulk distribution
centers, FDCs, and direct fulfillment centers, among others. Over the past several years, we have invested to
further automate and mechanize our rapid deployment center network to drive greater efficiency and faster
movement of product.
We have also enhanced our supply chain network with our expanded fulfillment facilities designed to drive speed
and reliability of delivery for our customers. Our 'ship from best location' initiative seeks to optimize delivery speed,
reliability, cost, and capacity by leveraging machine learning algorithms to route orders to the optimal fulfillment
node. In many markets, we offer same day or next day delivery of a multitude of products through our stores and
fulfillment centers. We have market delivery operations that function as local hubs to consolidate freight for dispatch
to customers for the final mile of delivery, with a focus on appliances. Because we typically do not stock appliances
in our facilities, we have invested in our capabilities to control more of our appliance delivery end-to-end, manage
our appliance delivery volume through our market delivery operations, and expand our last mile delivery capacity.
We have also opened FDCs that handle large items like lumber and building materials transported on flatbed trucks.
We are deploying a new delivery method called FDC Relay, which leverages our existing FDCs to enhance our
performance in our current FDC markets and broadens our reach across a greater number of markets. Our network
is designed to create a competitive advantage with unique, industry-leading capabilities for home improvement
needs for both our Pros and consumers. We will continue to invest in our supply chain network as needed to
support our business.
In addition to our distribution and fulfillment centers, we leverage our stores as a network of convenient customer
pickup, return, and delivery fulfillment locations. We believe our premium real estate footprint provides a distinct
competitive advantage. For customers who shop online and want to pick up or return merchandise at a store, or
have product delivered from a store, we offer a variety of options: BOSS, BOPIS, BODFS, and BORIS. We also
provide curbside pickup to complement our BOPIS offerings, in addition to the self-service lockers at the front
entrance of many of our stores. We also offer car and van delivery service from the majority of our U.S. stores. For
fiscal 2025, approximately 50% of our U.S. online orders were fulfilled through a store. SRS branch locations
throughout the U.S. and Canada also enable deliveries direct to customer job sites on their preferred timelines. We
Table of Contents
Fiscal 2025 Form 10-K
6
continue to focus on developing new capabilities to improve both efficiency and customer experience for delivery
from our stores and branches. Our strategic intent is to have a portfolio of efficient, timely and reliable sources and
methods of delivery to choose from, optimizing order fulfillment and delivery based on customer needs, inventory
locations, and available transportation options.
SUSTAINABILITY AND HUMAN CAPITAL MANAGEMENT
We view sustainability and human capital management matters through the lens of our business, with an
understanding that if we support our associates, our customers, our suppliers, and the communities we serve, we
also support our business and create value for our shareholders. Our sustainability and human capital management
priorities build on the culture and values on which Home Depot was founded, and our initiatives are embedded in
our business strategy and activities. We organize our efforts around three pillars: (1) Focus on Our People, (2)
Operate Sustainably, and (3) Strengthen Our Communities. Highlights of each of these pillars are set forth below.
For further information on our three pillars, including related goals, see our Fiscal 2024 Living Our Values Report,
available on our investor relations website at https://ir.homedepot.com/sustainability.
Focus on Our People
Our culture and our associates provide intangible and hard-to-replicate competitive advantages, which have been
key to helping us navigate challenging market conditions. Our associates are essential to providing the experience
and service that our customers expect. To preserve and protect that customer experience, we focus on cultivating a
compelling associate experience, which we believe supports our ability to attract and retain our associates. This
includes investing in competitive wages and benefits while also providing the culture, tools, training, and
development opportunities that make working at The Home Depot an enjoyable and rewarding experience. These
actions are the foundation of our core values of Taking Care of our People, Entrepreneurial Spirit, Building Strong
Relationships, and Respect for all People.
Culture and Values.
The Home Depot has a strong commitment to ethics and integrity, and we are a values- and
culture-centric business. Our commitment to our core values drives our approach to human capital management.
Our culture is based on our servant leadership philosophy represented by the inverted pyramid, which puts primary
importance on our customers and our associates by positioning them at the top, with senior management at the
base in a support role. We bring our culture to life through our core values, which serve as the foundation of our
business and as the guiding principles behind the decisions we make every day.
Our values also guide our efforts to create an environment that will help us attract and retain skilled associates in
the competitive marketplace for talent. We empower our associates to deliver a superior customer experience by
living our values, and we position our associates to embody our core values by integrating the importance of our
culture into ongoing development programs and rewards programs. Leaders participate in programs designed to
build and strengthen our culture, such as training on leadership skills, cross-functional collaboration, leading with
our values, and associate engagement. Our core values are at the root of our human capital management
programs.
Table of Contents
Fiscal 2025 Form 10-K
7
Our Workforce.
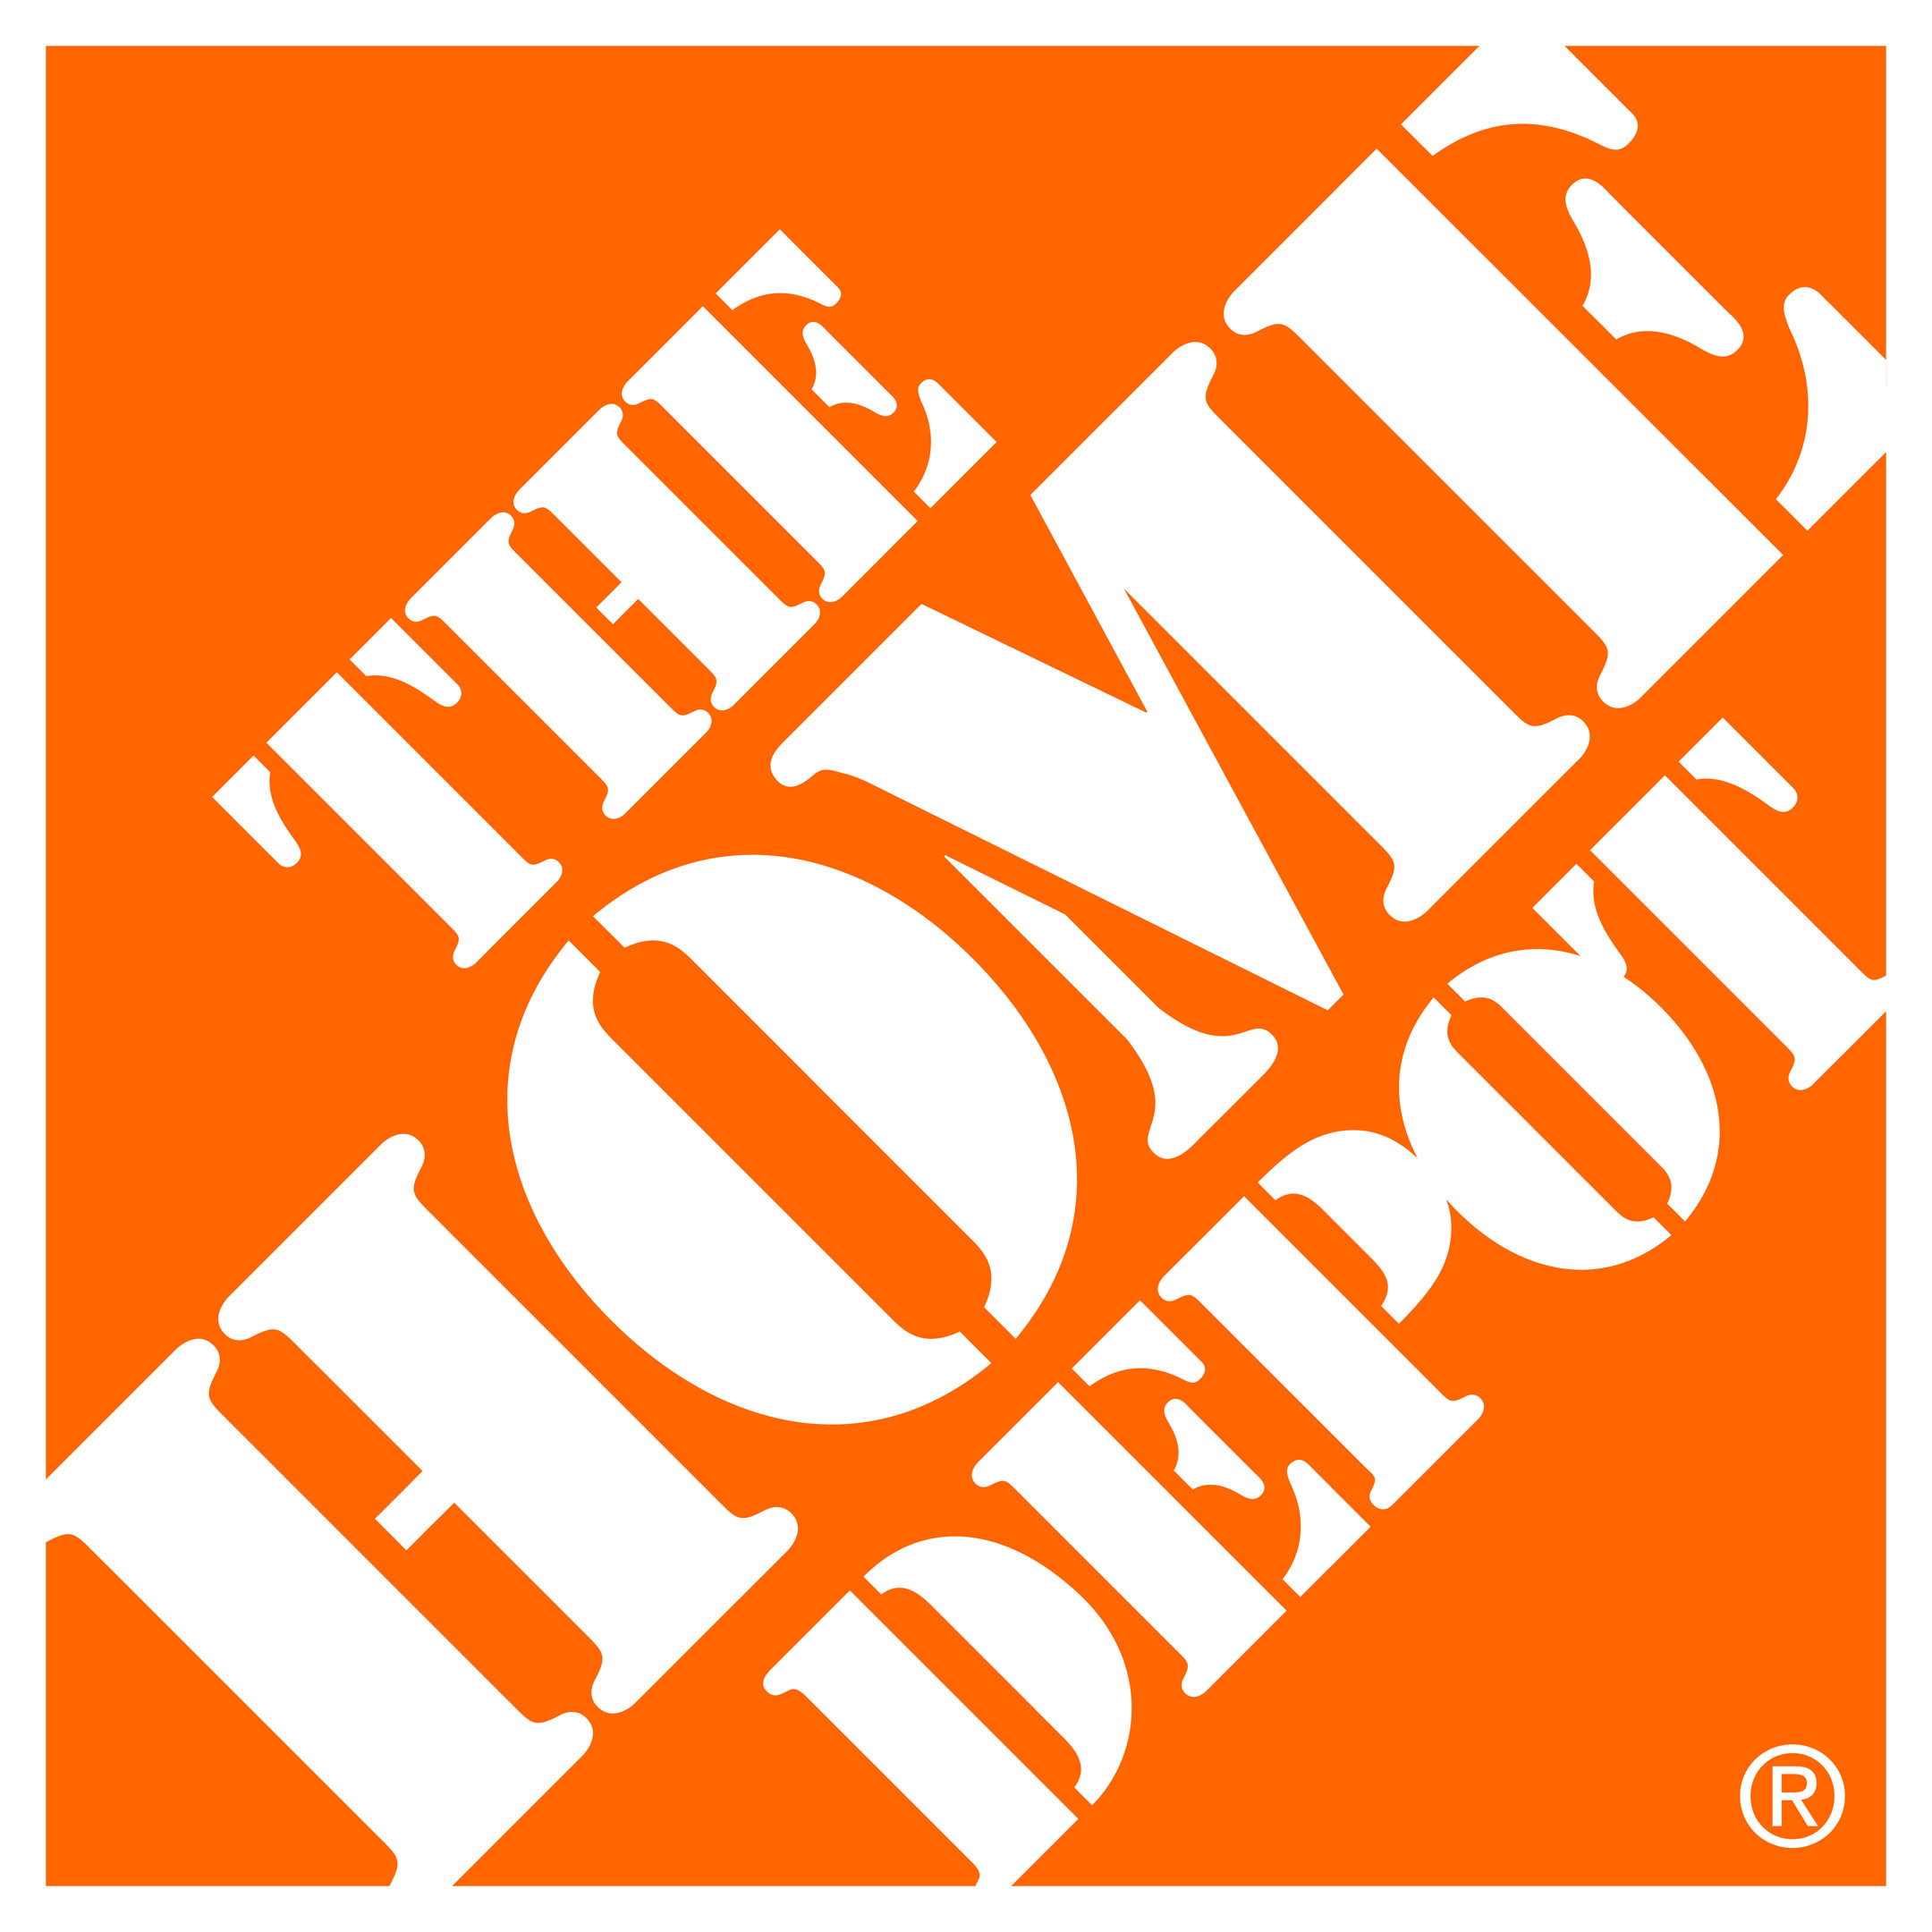
At the end of fiscal 2025, we employed approximately 472,400 associates, of whom approximately
53,400 were salaried, with the remainder compensated on an hourly basis. Set forth below is the geographic
makeup of our workforce:
Geographic Location
Number of Associates
% of Total Workforce
United States
422,500
89.4 %
Canada
31,700
6.7 %
Mexico
17,800
3.8 %
Other
(1)
400
0.1 %
Total
472,400
100%
————
Note: Certain percentages may not sum to totals due to rounding.
(1) Includes associates in our sourcing organization located in India, Italy, Poland, Türkiye, Taiwan, Vietnam and China.
Additional information regarding our workforce, including the demographic data for our U.S. associates, can be
found in our Fiscal 2024 Living Our Values Report, available on our investor relations website at https://
ir.homedepot.com/sustainability.
Talent Attraction and Development.
As we attract and hire new associates, we strive to create a customer-like
experience for jobseekers as they move through the steps of our recruiting process. Jobseekers can apply for roles
from anywhere using desktop or mobile devices. Once a jobseeker has applied for a role and has been selected to
move forward in the recruiting process, we provide self-service for many of our positions by allowing jobseekers to
schedule or reschedule pre-hire activities directly from their mobile device.
We offer our associates the opportunity to benefit from robust development opportunities. Our Home Depot
University, or “HDU,” program, is a key part of this development, offering relevant content through multiple
platforms, including instructor-led classes, e-learning, mobile learning, and additional online resources. We also
invest in ongoing growth and development by providing coaching through continuous leader support and
empowering our associates to learn new skills at their own pace through mobile applications that they can access at
any time. We equip our leaders with the tools they need to develop themselves and their teams through several
programs designed to help them lead effectively, empower their teams, and serve as mentors for our associates.
We continually assess and refine our leadership structure throughout the organization to allow our associates to
focus on training and development and to better serve our customers.
Associate Engagement.
Associate engagement is the emotional commitment associates have to The Home
Depot. It is vital to our culture and to our success. We foster an engaging workplace by continuously listening to and
acting on associate feedback. Throughout the year, we provide several pulse check surveys to our associates that
help us understand how emotionally connected those associates feel to our customers, the Company, their jobs,
fellow associates, and leaders. In addition, our annual Voice of the Associate survey serves as our primary tool for
gauging associates’ level of engagement within their roles. We use the insights from these surveys to help improve
the overall associate experience. We also maintain digital associate engagement platforms that can connect
associates with common interests and fuel connections to co-workers and Company leaders. Additionally, we have
a number of programs to recognize stores and individual associates for exceptional customer service and
demonstrating our core values.
Respect For All People.
We strive to maintain a culture that welcomes everyone, and we believe it helps us
achieve our business goals by driving excellent customer service and innovation, empowering our associates to
thrive and excel, and enriching the communities in which we operate. This includes creating an environment where
our associates feel valued and respected and providing equal opportunity for all of our associates.
Compensation and Benefits.
Consistent with our core values, we take care of our people by offering competitive
compensation and comprehensive benefits programs. We continue to make wage investments to ensure our
compensation packages reflect the evolving circumstances across our markets. For instance, in Fiscal 2025, we
made a significant investment in our people by increasing equity awards to our field leadership, including store
managers and assistant store managers. Our profit-sharing programs for hourly associates also provide awards for
performance against our business plan. Our associates can take advantage of a range of benefits, including
healthcare and wellness programs, vacation and leave of absence benefits, including parental leave and paid sick/
personal time off, a 401(k) match, our ESPPs, personal finance education and advisory services, assistance
programs to help with managing personal and work-life challenges, family support programs, and educational
assistance.
Table of Contents
Fiscal 2025 Form 10-K
8
Operate Sustainably
We have a long-standing commitment to
reduce the impact that our operations and products have on the
environment, which we believe helps make our business stronger, more agile, and more resilient. This approach
extends from the products and services we offer to our customers; to our store construction, maintenance and
operations; to our supply chain and packaging initiatives; and to our responsible sourcing program. As we strive to
operate sustainably, we focus on sourcing products responsibly, driving innovation, and reducing our environmental
impact.
Strengthen Our Communities
One of our core values is “Giving Back,” and we support our communities in a number of ways. The Home Depot
Foundation, a nonprofit organization supported by Home Depot and our suppliers, focuses on improving the homes
and lives of U.S. veterans, assisting communities affected by natural disasters, and helping prepare more people for
careers in the skilled trades. The Company and The Home Depot Foundation partner with industry leaders through
our Path to Pro programs on training programs to develop the next generation of skilled tradespeople and help them
find careers in the home improvement industry, which includes a Home Depot-powered career networking site to
connect jobseekers with Pros looking to hire skilled tradespeople. Our Team Depot associate volunteers also extend
the mission of The Home Depot Foundation in communities across the country, donating thousands of volunteer
hours each year to serve the needs of our communities. We also partner with a variety of suppliers and
organizations to further support our efforts to strengthen the communities where our customers and associates live.
GOVERNMENT REGULATION
As a company with both U.S. and international operations, we are subject to the laws of the U.S. and foreign
jurisdictions in which we operate and the rules and regulations of various governing bodies, which may differ among
jurisdictions. Compliance with these laws, rules and regulations has not had, and is not expected to have, a material
effect on our capital expenditures, results of operations, or competitive position as compared to prior periods.
AVAILABLE INFORMATION
Our primary internet website is www.homedepot.com. We make available on the Investor Relations section of our
website, free of charge, our filings with the SEC. These filings include our annual reports to shareholders, Annual
Reports on Form 10-K, Quarterly Reports on Form 10-Q, Current Reports on Form 8-K, proxy statements, and
Forms 3, 4 and 5 for our directors and certain of our officers, and amendments to those reports, as soon as
reasonably practicable after filing such documents with, or furnishing such documents to, the SEC.
We include website addresses throughout this report for reference only. The information contained on our websites,
including any document posted on or accessible through them, is not incorporated by reference into this report.
Item 1A. Risk Factors.
Our business, results of operations, cash flows, financial condition and prospects are subject to numerous risks and
uncertainties. In connection with any investment decision with respect to our securities, you should carefully
consider the following risk factors, as well as the other information contained in this report and our other filings with
the SEC. These disclosures reflect the Company’s beliefs and opinions as to factors that could materially and
adversely affect the Company and its securities in the future. References to past events are provided by way of
example only and are not intended to be a complete listing or a representation as to whether or not such factors
have occurred in the past or their likelihood of occurring in the future. Additional risks and uncertainties not presently
known to us or that we currently deem immaterial may also impact our business operations. Should any of these
risks materialize, our business, results of operations, cash flows, financial condition and prospects could be
negatively impacted, which in turn could affect the trading value of our securities. You should read these Risk
Factors in conjunction with
Part II, Item 7. Management’s Discussion and Analysis of Financial Condition and
Results of Operations
and our consolidated financial statements and related notes in Item 8.
STRATEGIC RISKS
A positive brand and reputation are critical to our business success, and, if our brand and reputation are
damaged, it could negatively impact our relationships with our customers, associates and jobseekers,
suppliers, service providers, vendors, shareholders, regulators, and the communities we serve, and,
consequently, our business, results of operations and the price of our stock.
Our brand and reputation are critical to attracting customers, associates and jobseekers, suppliers, service
providers, and vendors to do business with us. We must continue to manage and protect our brand and reputation.
Table of Contents
Fiscal 2025 Form 10-K
9
Negative incidents can erode trust and confidence quickly, and adverse publicity about us, regardless of its
accuracy, the reputability of its source and whether we are involved in the incident, could damage our brand and
reputation; undermine our customers’ confidence in us; reduce demand for our products and services, including as
a result of boycotts; affect our ability to recruit, engage, motivate and retain associates; attract regulatory scrutiny or
investigations; lead to litigation; and impact our relationships with current and potential suppliers and vendors. Third
party actions, including our suppliers’, service providers’, and vendors’ business practices and positions, may also
be attributed to us, regardless of the Company’s actions, meaning the actions of third parties pose similar risks to
our brand and reputation. Partnerships with celebrities and social media content creators may also expose us to
brand and reputational risks. Further, our actual or perceived position or lack of position on social, environmental,
governance, political, public policy, regulatory, economic, geopolitical, or other sensitive issues, and any perceived
lack of transparency about those matters, could harm our reputation with certain groups and attract regulatory
scrutiny, investigations, litigation, or boycotts. In addition, we could be criticized for the scope or nature of initiatives
or goals related to these matters, or for any revisions to or failure to achieve these goals on a timely basis or at all. If
data, processes, and reporting related to these matters are incomplete or inaccurate, we could face regulatory
scrutiny or investigations, litigation and/or adverse reputational impacts. Customers are also increasingly using
social media to provide feedback and information about the Company, including our products and services, in a
manner that can be quickly and broadly disseminated. Negative sentiment about the Company shared over social
media, or misinformation from fraudulent accounts impersonating the Company, could impact our brand and
reputation, whether or not it is based in fact.
Strong competition could adversely affect prices and demand for our products and services and could
decrease our market share.
Our industry is highly competitive, highly fragmented, and evolving. As a result, we face competition for customers
for our products and services from a variety of retailers (including those operating reseller marketplaces), suppliers,
service providers, distributors and manufacturers that sell products directly to their respective customer bases.
These competitors range from traditional brick-and-mortar, to multichannel, to exclusively online, and they include a
number of other home improvement retailers; local, regional and national hardware stores; electrical, plumbing and
building materials supply houses; and lumber yards. With respect to some products and services, we also compete
with specialty design stores, showrooms, discount stores, paint stores, specialty and mass digital retailers,
warehouse clubs, MRO distributors, national and local wholesale supply distributors, home décor retailers, and
other retailers, as well as with providers of home improvement services and tool and equipment rental. Online and
other digital capabilities, as well as AI tools, facilitate competitive entry, price transparency, and comparison
shopping, increasing the level of competition we face.
We compete primarily based on customer experience; price; quality; product availability, assortment, and innovation;
and delivery options and capabilities, both in-store and online. We also compete based on store and branch location
and appearance, presentation of merchandise, and ease of shopping experience throughout every step of the
customer’s project, from inspiration and research to any post-purchase support. Our Pros also look for dedicated
sales support, competitive credit and pricing options, project planning tools, professional and reliable deliveries, and
product depth and job lot quantities, particularly for their complex project needs. Furthermore, with respect to
delivery options, customers are seeking faster and/or guaranteed delivery times, real-time updates on delivery
status, low-price or free shipping, and/or convenient pickup options. Our ability to be competitive on delivery and
pickup times, options and costs depends on many factors, including leveraging the momentum of our investments in
our supply chain and our interconnected capabilities to further enhance the customer shopping experience. Failure
to successfully manage these factors and offer competitive delivery and pickup options could negatively impact the
demand for our products and services and our profit margins.
We use our marketing, advertising and promotional programs to drive customer traffic and compete more effectively,
and we must regularly assess and adjust our efforts to address changes in the competitive landscape. Intense
competitive pressures from one or more of our competitors, such as through aggressive promotional pricing or
liquidation events, or our inability to adapt effectively and quickly to a changing competitive landscape, could
adversely affect our prices, our margins, or demand for our products and services. If we are unable to timely and
appropriately respond to these competitive pressures, including through the delivery of a superior interconnected
experience leveraging both our digital and physical platforms, our market share and our financial performance could
be adversely affected.
Table of Contents
Fiscal 2025 Form 10-K
10
We may not timely identify or effectively respond to customer needs, expectations or trends, which could
adversely affect our relationship with our customers, the demand for our products and services, and our
market share.
The success of our business depends on our ability to identify and respond promptly to evolving trends in
demographics and shifts in customer preferences, expectations and needs, while also managing appropriate
inventory levels in our stores, branches and distribution or fulfillment centers and maintaining an excellent customer
experience. These trends include those driven by changes in the macroeconomic or political environment,
geopolitical tensions or conflicts, military conflicts, or civil unrest, as well as unexpected weather conditions, natural
disasters, or public health issues (including pandemics or quarantines and related impacts) that impact our
customers. It is difficult to successfully predict the products and services our customers will demand. As our
customers expect a more personalized experience, our ability to collect, use, retain, and protect relevant customer
data is important for effectively meeting their expectations. Our ability to collect and use that data, however, is
subject to a number of external factors, including the impact of legislation or regulations governing data privacy,
data-driven technologies such as AI, and data security, as well as customer expectations around data collection,
retention, and use. In addition, each of our primary customer groups has different needs and expectations, many of
which evolve as the demographics in a particular customer group change. Customer preferences and expectations
related to sustainability of products and operations are also changing. If we do not successfully differentiate the
shopping experience to attract our customers and meet their individual needs and expectations, it may adversely
impact our sales or our market share.
Customer expectations about the methods by which they find, evaluate, purchase and receive products or services
are also evolving. Customers routinely and increasingly use technology and a variety of electronic devices and
digital platforms to rapidly gather inspiration, compare products and prices, read product reviews, determine real-
time product availability, and purchase products. New channels and tools to enhance the customer experience
appear and change rapidly, and some of those technologies, such as generative and agentic AI tools, may
dramatically change customer shopping and buying habits. Our Pros also look for additional capabilities, including
dedicated sales support, competitive credit and pricing options, project planning tools, professional and reliable
deliveries, and product depth and job lot quantities, particularly for their complex project needs. Once products are
purchased, customers seek alternate options for delivery of those products, including advance ordering through
digital platforms for Pros, and they often expect quick, timely, and low-price or free delivery, real-time updates on
delivery status, and/or convenient pickup or delivery options. We must continually anticipate and adapt to these
changes in the planning, shopping and purchasing process by continuing to adjust and enhance the online and in-
store customer experience as well as our delivery options. The coordinated operation of our network of physical
stores, branches, distribution facilities, and online platforms is fundamental to the success of our interconnected
strategy. We cannot guarantee that our current or future fulfillment options will be maintained and implemented
successfully or that we will be able to meet customer expectations on delivery or pickup times, options and costs. In
addition, as our customers continue to leverage our enhanced interconnected and fulfillment options, a greater
concentration of online sales with direct fulfillment could result in a reduction in the amount of traffic in our stores,
which would, in turn, reduce the opportunities for cross-selling of merchandise that such traffic creates and could
reduce our overall sales and adversely affect our financial performance. A greater concentration of online sales with
direct fulfillment could also impact our profit margins.
Failure to provide a relevant and effective customer experience in a timely manner that keeps pace with
technological developments and dynamic customer expectations; to maintain appropriate inventory; to provide quick
and cost-effective or free delivery alternatives, real-time updates on delivery status, and convenient pickup options;
to differentiate the customer experience for our primary customer groups; to effectively implement an appropriately
localized merchandising assortment; or to otherwise timely identify or respond to changing customer preferences,
expectations and home improvement needs could adversely affect our relationship with our customers, the demand
for our products and services, and our market share.
The execution of initiatives to deliver our interconnected experience could adversely impact our business
operations or financial results, and these initiatives might not provide the anticipated benefits.
Over the past several years, we have made significant investments to deliver a frictionless interconnected
experience, including enhancing and expanding our supply chain, developing differentiated capabilities for our
customers, including enhancements and improvements to our digital capabilities, expanding our store base, and
making strategic acquisitions. These investments are designed to streamline our operations to allow our associates
to continue to provide high-quality service to our customers; simplify customer interactions; provide our customers
with a more interconnected experience; expand our sales to Pros and better address their needs for complex
projects; and create the fastest, most efficient, and most reliable delivery network for home improvement products.
Table of Contents
Fiscal 2025 Form 10-K
11
Executing our interconnected experience requires continual investment in our operations and information
technology systems, as well as the development and execution of new processes, systems and support. In addition,
our stores are a critical component of our interconnected experience, serving as the hub of our customers’
interconnected shopping journey. We have an aging store base that requires maintenance, investment, and space
reallocation initiatives to deliver the shopping experience that our customers desire. We also need to identify and
secure available locations with appropriate characteristics for new stores, branches, and supply chain facilities to
ensure we can continue to serve our customers effectively.
We must effectively manage the volume, timing, nature, location, and cost of our investments, projects and
changes. Failure to continue to make investments to effectively support our strategy and to implement or integrate
those investments in the right manner and at the right pace could adversely impact our business operations or
financial results. The cost and potential problems, defects of design, and interruptions associated with the
implementation of these initiatives, including those associated with managing third-party service providers,
employing new online tools and services, implementing new technologies using AI, implementing and restructuring
support systems and processes, securing appropriate store and other facility locations, and addressing impacts on
inventory levels, could disrupt or reduce the efficiency of our operations in the near term, lead to product availability
issues, create complexity in our systems and operations and impact our profitability. Our investments to enhance
our interconnected experience, including investments in our store base, supply chain, and differentiated capabilities,
including our digital assets, might not provide the anticipated benefits, or might take longer than expected to
complete, integrate or realize anticipated benefits, any of which could adversely impact our competitive position and
our financial condition, results of operations, or cash flows.
If we are unable to effectively manage and expand our strategic alliances and relationships with certain
suppliers of both brand name and proprietary products, we may be unable to effectively execute our
strategy to differentiate ourselves from our competitors.
As part of our focus on product differentiation, we have formed strategic alliances and exclusive relationships with
certain suppliers to market products under a variety of well-recognized brand names. We have also developed
relationships with certain suppliers to allow us to offer proprietary products that are comparable to national brands.
These proprietary products help differentiate us from other retailers and generally carry higher margins than national
brand products. If we are unable to effectively manage and expand these strategic alliances and relationships,
maintain favorable terms with current suppliers, or identify alternative sources for comparable brand name and
proprietary products, we may not be able to effectively execute product differentiation, which may impact our sales
and gross margin. Additionally, our suppliers’ business practices and positions may also be attributed to us,
regardless of the Company’s actions, meaning that controversies regarding our suppliers of brand name or
proprietary products could pose risks to our reputation and brand, and may require us to quickly identify alternative
sources for comparable products.
Our strategic transactions involve risks, which could have an adverse impact on our business, financial
condition and results of operations, and we may not realize the anticipated benefits of these transactions.
We regularly consider and enter into strategic transactions, including mergers, acquisitions, investments, alliances,
and other growth and market expansion strategies. We generally expect that these transactions will result in sales
increases, cost savings, synergies, enhanced capabilities, and/or various other benefits. Assessing the viability and
realizing the benefits of these transactions is subject to significant uncertainty. For each of our acquisitions, we need
to determine the appropriate level of integration of the target company’s products, services, associates, and
information technology, financial, human resources, compliance, and other systems and processes, and then
successfully manage that integration into our corporate structure. Integration is a complex and time-consuming
process, and if the integration is not fully successful or is delayed for a material period of time, we may not achieve
the anticipated synergies, cost savings, enhanced capabilities, or other benefits of the acquisition. In addition, the
integration of businesses may create increased complexity in our financial systems, internal controls, technology
and cybersecurity systems, and operations and may make them more difficult to manage. Even if the target
companies are successfully integrated, the acquisitions may fail to further our business strategy as anticipated,
expose us to increased competition or challenges with respect to our products or services, and expose us to
additional or unanticipated risks and liabilities. Strategic transactions may also be subject to significant regulatory
uncertainty, and changes in the regulatory landscape may result in additional costs or delays that affect the
anticipated outcome of a transaction. Any failure in the execution of a strategic transaction or investment, our
approach to the integration of an acquired asset or business, our ability to integrate new associates, or achievement
of anticipated synergies or other benefits could result in slower growth, higher than expected costs, the recording of
an impairment of goodwill or other intangible assets or restructuring costs, and other actions which could adversely
affect our business, financial condition and results of operations.
Table of Contents
Fiscal 2025 Form 10-K
12
OPERATIONAL RISKS
A failure of one or more key elements of our technology infrastructure, including associated systems or
processes, could adversely affect our business, financial results, and reputation.
We rely extensively on our technology infrastructure, including associated information technology systems,
applications, processes, and related personnel to operate our day-to-day business and to collect, use, retain,
manage, transmit, and protect transactions and data. Some of these systems are managed or provided by third-
party service providers, including certain cloud platform providers. In managing our business, we also rely heavily
on the integrity of, security of, and consistent access to, systems that provide operational and financial data and
capabilities related to sales (both in store and online), customer data, supplier data, associate data, jobseeker data,
partner data, demand forecasting, merchandise ordering, inventory replenishment, supply chain management,
payment processing, order fulfillment, customer service, and post-purchase support. For these information
technology systems, applications, and processes to operate effectively, we or our service providers must maintain
and update them. Delays in the maintenance, updates, upgrading, or patching of these systems, applications or
processes, as well as the actions taken to maintain, update, upgrade and patch, could, and on occasion have,
impaired their operation and effectiveness or exposed us to security risks. Our technology infrastructure and the
third-party systems with which we interact, as well as any systems those third parties utilize, are subject to, and on
occasion have experienced, damage, interruption, or malicious activity from a number of causes, including power
and other critical infrastructure outages; computer and telecommunications failures; computer viruses; data or
security breaches; internal or external data theft or misuse; cyber-attacks, including the use of malicious codes,
worms, phishing, smishing, vishing, spyware, denial of service attacks, and ransomware; responsive containment
measures by us that may involve voluntarily taking systems offline; natural disasters and catastrophic events such
as fires, floods, earthquakes, tornadoes, hurricanes, or other extreme weather events; public health concerns, such
as pandemics and quarantines; geopolitical tensions or conflicts, military conflicts, acts of war, terrorism or civil
unrest; other systems outages; inadequate or ineffective redundancy; and design or usage errors or malfeasance by
our associates, contractors or third-party service providers. In addition, as more business activities have shifted
online, and as certain of our support center associates work in a remote or hybrid environment, we continue to face
an increased risk due to the potential failure of internal or external technology infrastructure as well as increased
cybersecurity threats and attempts to breach our security networks.
Although we and our third-party service providers seek to maintain our respective technology infrastructure and
related systems and processes effectively and to successfully address the risk of compromise of their integrity,
security and consistent operations of these systems, such efforts are not always successful. As a result, we or our
service providers could experience, and on occasion have experienced, errors, interruptions, delays or cessations
of service in key portions of our technology infrastructure, which could significantly disrupt our operations or impair
data security; prevent us from efficiently accepting or fulfilling orders or providing services to customers; impact our
ability to operate or access communications, financial or banking systems; be costly, time-consuming and resource-
intensive to remedy; and adversely impact our reputation and relationship with our customers, associates, suppliers,
shareholders or regulators. We may have to expend significant resources to mitigate the impact of any errors,
interruptions, delays or cessations of service and may have insufficient recourse against service providers who
experience such events.
In addition, we are currently making, and expect to continue to make, substantial investments in our technology
infrastructure, systems, processes, and personnel, in certain cases with the assistance of strategic partners and
other third-party service providers. These investments involve replacing existing systems, some of which are older,
legacy systems that are less flexible and efficient, with successor systems, and updating applications and websites;
outsourcing certain technology and business processes to third-party service providers; making changes to existing
systems, including the migration of applications to the cloud; maintaining or enhancing legacy systems that are not
currently being replaced; designing or cost-effectively acquiring new systems with new functionality; or testing,
developing and deploying AI tools, including generative AI. These efforts could result, and on occasion have
resulted, in significant potential risks, including failure of the technology infrastructure to operate as designed,
unexpected impacts on related systems or processes, potential loss or corruption of data, failures in security
processes and internal controls, cost overruns, implementation delays or errors, disruption of operations, and the
potential inability to meet business and reporting requirements. Any technology infrastructure implementation and
transition difficulty may result in operational challenges, security or internal control failures, reputational harm, lost
sales, increased costs, or other financial losses that could adversely affect our business, our relationships with our
customers, and results of operations.
Table of Contents
Fiscal 2025 Form 10-K
13
Disruptions in our customer-facing technology infrastructure could impair our interconnected experience
strategy and give rise to negative customer experiences, damage our brand and reputation and adversely
impact our sales.
Through our technology infrastructure, we are able to provide an improved overall shopping and interconnected
experience that empowers our customers to shop and interact with us from a variety of electronic devices and digital
platforms at each stage of their shopping journey. We use our digital platforms as sales channels for our products
and services, as methods of providing inspiration, and as sources of product, project, and other relevant information
to our customers to help drive sales. In addition to supporting our DIY and DIFM customers, we make other
resources available that are designed to serve the needs of Pros, including those working on complex projects. We
also have multiple online communities, digital platforms, and knowledge centers that allow us to inform, assist and
interact with our customers. The retail industry is continually evolving and expanding, with a significant increase in
sales initiated online and via mobile applications in recent years. We may not be successful at managing this
increased volume and related delivery options without interruption in the future. Additionally, we must effectively
respond to new developments and changing customer preferences with respect to a complex, evolving digital and
interconnected experience, including adopting AI tools and other technology innovations to better serve our
customers. We continually seek to enhance all of our online and digital platforms to provide a personalized, user-
friendly interface for our customers. Disruptions, delays, failures, inaccuracies, or other performance issues in or
with our customer-facing technology systems, either due to increased volumes, system or other technology
modifications, cybersecurity incidents or attacks, information technology outages or other interruptions, launches of
new or emerging technologies; or other factors, or a failure of these systems to meet our or our customers’
expectations, could impair the value they provide, damage our brand and reputation, and adversely impact our
sales.
Disruptions in our supply chain and other factors affecting the availability and distribution of our
merchandise could adversely impact our business, financial results, and reputation.
Disruptions within our logistics or supply chain network, such as the industry-wide supply chain challenges that
resulted from the COVID-19 pandemic, have adversely affected and may in the future adversely affect, our ability to
receive and deliver inventory in a timely manner, impair our ability to meet customer demand for products, and
result in lost sales, increased costs, and/or damage to our reputation. Such disruptions may result, and on occasion
have resulted, from damage or destruction to our distribution or fulfillment centers or those of our supply chain
service providers; weather-related events; cybersecurity incidents or attacks; information technology outages or
other interruptions; natural disasters; international trade disputes, trade policy changes or restrictions, or import- or
export-related governmental sanctions or restrictions; customs actions, including regulatory enforcement inquiries,
holds, detentions, and exclusions; quotas, tariffs or other import-related taxes; strikes, lock-outs, work stoppages or
slowdowns; shortages of supply chain labor, including truck drivers; shipping capacity constraints, including
shortages of related equipment; raw material or other shortages; third-party contract disputes or inability to maintain
favorable contract terms; supply or shipping interruptions or costs; increased costs or unavailability of fuel; political
instability; geopolitical tensions or conflicts, or military conflicts or acts of war, as well as any related sanctions or
other government or private responses; acts of terrorism; civil unrest; public health issues, including pandemics or
quarantines and other related impacts; or other factors beyond our control. In recent years, ports in the U.S. and
elsewhere have been impacted by capacity constraints, port congestion and delays, periodic labor disputes, strikes,
security issues, weather-related events, and natural or man-made disasters.
These types of disruptions place strain on the domestic and international supply chain, which has affected in some
circumstances, and may in the future negatively affect, the flow or availability of certain products. Even when we are
able to find alternate sources for certain products, they may cost more or require us to incur higher transportation
costs, which could adversely impact our profitability and financial condition. Increased demand for online purchases
of products can impact, and in the past has impacted, our fulfillment operations, as well as those of our third-party
carriers, resulting in delays in delivering products to customers and increases in our out-of-stock levels.
We and our suppliers have experienced, and may experience in the future, labor shortages at some of our
distribution and fulfillment centers both due to the competitive labor market and unexpected events such as
pandemics and quarantines. Such labor shortages, whether temporary or sustained, may adversely impact the flow
or availability of products to our stores and customers.
Any of these circumstances could impair our ability to meet customer demand for products and result in lost sales,
increased costs, or damage to our reputation, any of which could negatively impact our business performance or
financial condition.
Table of Contents
Fiscal 2025 Form 10-K
14
Failure to maintain a safe and secure shopping and working environment may adversely impact sales,
costs, the customer and associate experience, and our brand and reputation.
Our customers and associates expect a safe and secure environment in which to shop and work, and maintaining
that environment helps protect against inventory losses (also called “shrink”), including due to theft. Like other
retailers, we saw heightened shrink in recent years, particularly as a result of organized retail crime. While we have
a number of initiatives in place to address shrink, minimize theft, and maintain safety in and around our stores and
other facilities, these efforts require operational changes that may increase costs and reduce margins, and they can
negatively impact the customer or associate experience. Furthermore, an unsafe environment or negative publicity
regarding the Company or regarding incidents in or around our stores and/or other facilities, such as civil unrest,
raids, protests, or similar activities, may diminish trust and confidence with customers, associates, and jobseekers,
which can adversely impact traffic in our stores, sales, associate recruiting, morale, and retention, and our brand
and reputation.
If our efforts to maintain the privacy and security of customer, associate, jobseeker, business partner, and
Company information are not successful, we could incur substantial costs and reputational damage and
could become subject to litigation and enforcement actions.
Our business, like that of most retailers, involves the collection, use, retention, management, transmission, and
deletion of personal information (including identifiers, localization, internet activity, preferences, and payment
information) from our customers, associates, jobseekers, and business partners, as well as confidential Company
information. We also work with third-party service providers that provide technology, systems and services that we
use in connection with the handling of information. Our information systems, and those of our third-party service
providers, are vulnerable to continually evolving data protection and cybersecurity risks. Despite our efforts, our
cybersecurity risk management processes may not be fully implemented, complied with or effective in preventing or
mitigating future cybersecurity risks. Unauthorized parties, including criminal threat actors, nation-states, or insiders
(including associates or contractors engaged in fraudulent or malicious activities), have in the past gained access,
and will continue to attempt to gain access, to these systems and data through technical vulnerabilities, breach of
security policies, fraud or other means of deceiving or coercing our associates, contractors or third-party service
providers, which could jeopardize the confidentiality, integrity, or availability of such information systems or data that
we may handle. Hardware, software or applications we develop or obtain from third parties may contain, and on
occasion have contained, exploitable vulnerabilities, bugs, or defects in design, maintenance or manufacture or
other problems that could unexpectedly compromise information security. We have experienced and continue to
face the ongoing risk of exploitation of our software providers and our software development and implementation
process, including from coding and process vulnerabilities and the installation of so-called back doors that provide
unauthorized access to systems and data, and through unauthorized access to or theft of our intellectual property.
The continued availability of remote or hybrid working arrangements has also expanded the possible attack surface
areas and increased risks posed by insider threats, as our interactions with associates, contractors and third-party
service providers increasingly occur on information systems, networks and environments over which we have less
control and which may be more difficult to monitor. In addition, the risk of cyber-attacks has increased in connection
with geopolitical tensions or conflicts and ongoing trade and diplomatic tensions. In light of the conflicts in Europe,
the Middle East and South America and other geopolitical events, nation-state actors or their supporters and other
politically-motivated actors may launch retaliatory cyber-attacks, and may attempt to cause supply chain and other
third-party service provider disruptions, or take other geopolitically-motivated retaliatory actions that may disrupt our
business operations, result in data compromise, or both. Nation-state actors have in the past carried out, and may in
the future carry out, cyber-attacks to achieve their aims and goals, which may include espionage, monetary gain,
disruption, and destruction. Similarly, there may be increased activities by organized or coordinating groups of cyber
criminals who seek to attack larger organizations’ data or systems for their own aims and goals, which can include
financial gain. The availability of AI may enable new types of threat actors who may not otherwise have had the
capabilities to engage in malicious activity to do so, or may enhance the capabilities of nation-state actors or
organizing or coordinating groups to carry out attacks, or may generally enable novel types of attacks to be
developed and deployed. Because the techniques that threat actors use to obtain unauthorized access, disable or
degrade service, or sabotage systems, including use of stolen passwords, social engineering, phishing, smishing,
vishing, identity spoofing (including through the use of emerging technologies such as deep fakes), ransomware or
other disruptive and destructive malware, supply chain compromises, insider threats, and man-in-the-middle and
denial of service attacks, change frequently and may not immediately produce signs of anomalous activity or
compromise, we may be unable to anticipate or detect these techniques or implement adequate preventative
measures.
Table of Contents
Fiscal 2025 Form 10-K
15
The ever-evolving cybersecurity threat landscape means that we and our third-party service providers and business
partners must continually evaluate and adapt our respective systems and processes and overall security
environment, as well as those of companies we or they acquire. There is no guarantee that the measures we take
will be adequate to safeguard against all threats, including vulnerabilities, data security breaches, system
compromises or misuses or loss of data. As we have experienced in the past, any significant compromise or breach
of our data security, whether external or internal, or misuse of customer, associate, jobseeker, business partner, or
Company data, could result in significant costs, including costs to investigate, mitigate, and remediate, as well as
lost sales, fines, lawsuits, regulatory investigations, and damage to our reputation. Additionally, as we have
experienced in the past, we or our third-party service providers may not discover any vulnerability, data security
breach, system compromise, or data misuse or loss for a significant period of time after the occurrence of a security
incident. When our systems or those of our third-party service providers on which we rely are breached or attacked,
we may also suffer, and on some occasions have suffered, an outage, failure, or unavailability of data or information
technology systems, cessations of service, and interruptions to our business operations while such breach or attack
is being remedied; this may impact data or systems operated by us or by third-party service providers. Furthermore,
our cyber insurance coverage may not be adequate for liabilities or costs actually incurred, and we cannot be
certain that insurance will continue to be available to us on economically reasonable terms, or at all, or that any
insurer will not deny coverage of a future claim.
Data governance failures can also adversely affect our reputation and business. Our business depends on our
customers’, associates’, jobseekers’, contractors’, and business partners’ willingness to entrust us with their
personal information. Events that adversely affect that trust, including inadequate disclosure to our customers,
associates, jobseekers, contractors, or business partners of our uses of their information or failing to keep our
information technology systems and our customers’, associates’, jobseekers’, contractors’, and business partners’
personal information secure from significant attack, theft, damage, loss or unauthorized or unintended disclosure or
access, whether as a result of our action or inaction (including human error or malfeasance) or that of our service
providers or other third parties, could adversely affect our brand and harm our reputation.
The regulatory environment related to data privacy, cybersecurity, and AI and other emerging technologies is
constantly changing, with new and increasingly rigorous requirements applicable to our business. The
implementation of these requirements has also become more complex. Maintaining our adherence to evolving data
privacy and cybersecurity regulatory requirements, including state and international privacy laws, requires
significant effort and cost, requires changes to our business practices, and may limit our ability to collect and use
certain data for our business operations, including to support the customer experience. In addition, many regulators
have indicated an intention to take more aggressive enforcement actions regarding data privacy and cybersecurity
matters, and private litigation resulting from such matters is increasing and resulting in progressively larger
judgments and settlements. Complying with current or contemplated information security, cybersecurity, data
privacy, data protection, and data processing laws and regulations (including reporting and disclosure regimes), or
any failure to comply, could cause us to incur substantial costs. As we have experienced in the past, failure to
comply with applicable requirements could subject us to fines, sanctions, governmental investigations, or lawsuits,
which could lead to negative publicity and reputational harm, and may cause customers to lose confidence in the
effectiveness of our cybersecurity measures, data privacy practices, or our business more generally.
Our success depends upon our ability to attract, develop and retain highly qualified associates to provide
excellent customer service and to support our strategic initiatives while also controlling our labor costs.
Our customers expect a high level of customer service and product knowledge from our associates. To meet the
needs and expectations of our customers, we must attract, develop and retain a large number of highly qualified
associates, including those with specialized product and project knowledge who can help serve our Pros, and
maintain a productive relationship with those associates. Our ability to meet our labor needs while controlling labor
costs is subject to numerous factors, including increased market pressures with respect to prevailing wage rates,
unemployment levels, and health and other insurance costs; the impact of legislation or regulations governing labor
relations, employment, immigration, minimum wage, and healthcare benefits; changing demographics and
expectations among the workforce; safety and security in our stores and other facilities; and our brand and
reputation within the labor market. We compete with other retail businesses for many of our associates in hourly
positions, and we invest significant resources in training and motivating them to maintain a high level of job
satisfaction. These positions often have high turnover rates, which can lead to increased training and retention
costs, particularly in a competitive labor market. We have faced and may continue to face additional challenges in
recruiting and retaining associates due to wage pressure; flexible scheduling needs; health and safety concerns;
and challenges related to a remote or hybrid working environment for associates who work in our support centers.
These factors, together with competition among potential employers, have resulted in and may continue to result in
Table of Contents
Fiscal 2025 Form 10-K
16
increased compensation costs, and/or may impair our ability to recruit and retain associates, which could have an
adverse impact on our business operations, financial condition and results of operations. A limited number of our
associates are represented by labor unions, and we may be subject to future labor union efforts to organize groups
of our associates from time to time. If successful, those organizational efforts may decrease our operational
flexibility and efficiency, and/or otherwise negatively impact our operations or reputation.
In addition, to deliver our interconnected customer experience, we must attract and retain a large number of skilled
professionals, including technology professionals, to implement our ongoing technology and other investments. The
market for these professionals is very competitive. Not providing competitive wages and/or benefits, including
remote or hybrid work flexibility, within the markets in which we operate could adversely affect our ability to retain
and attract associates.
Additionally, our ability to successfully execute organizational changes, including management transitions within the
Company’s senior leadership, and to effectively motivate, integrate, and retain associates is critical to our business
success. If we are unable to attract, develop or retain qualified associates, or manage leadership transitions
successfully, our ability to effectively implement our strategy may be negatively impacted, the quality of service we
provide to our customers may decrease, and our financial performance may be adversely affected.
We are subject to payment-related risks that could increase our operating costs, expose us to fraud or theft,
subject us to potential liability, and potentially disrupt our business.
We accept payments using a variety of methods, including credit and debit cards, our PLCCs, cash, electronic
payments, checks, digital wallets, loan programs including installment loans, trade credit, and gift cards, and we
may offer new payment options over time. As we offer new payment options to our customers, we may be subject to
additional rules, regulations, and compliance requirements, and higher fraud losses. Acceptance of these payment
options subjects us to rules, regulations, contractual obligations and compliance requirements, including payment
network rules and operating guidelines, data security standards and certification requirements, and rules governing
electronic funds transfers. These rules and requirements may change over time or be reinterpreted, making
compliance more difficult, costly, or uncertain. For certain payment methods, including credit and debit cards, we
pay interchange fees and other costs to accept these payments, and we may also incur losses, all of which may
increase over time and raise our operating costs. We rely on third parties to provide payment processing services,
including the processing of credit cards, debit cards, and other forms of electronic payment. If these companies
become unable to provide these services to us, or if their systems are compromised or do not operate as intended,
it could disrupt our business. The payment methods that we offer, and the selling channels in which we operate,
also subject us to fraud and theft by threat actors, who are becoming increasingly more sophisticated, including by
using means such as AI, seeking to obtain unauthorized access to or exploit weaknesses that may exist in our
sales, payments, and payment processing systems. If we fail to comply with applicable rules or requirements for the
payment methods we accept, or if payment-related data is compromised due to a breach or misuse of data, we may
be liable for costs incurred by payment card issuing banks and other third parties or we may be subject to fines and
higher transaction fees, or our ability to accept or facilitate certain types of payments may be impaired.
Trade credit offerings are an important part of serving Pros, including SRS customers, and we anticipate expanding
our Pro Trade Credit program as we further develop our capabilities. If we fail to offer attractive terms or services, or
employ underwriting criteria that are not competitive, our ability to grow our sales to these Pros may be adversely
impacted. If our Pros are unable to make their payments, we may experience losses. In addition, our customers
could lose confidence in certain payment types, or may expect or demand payment methods that we do not
currently offer, which could result in competitive disadvantages or require a shift to other payment types or potential
changes to our payment systems that may result in higher costs or present other risks. As a result, our business and
operating results could be adversely affected.
Natural disasters, unseasonable, unexpected or extreme weather conditions, as well as other catastrophic
or uncharacteristic events, could impact our operations and financial results, seasonal events such as
storms may impact sales compared to prior periods, and the potential impacts of catastrophic or
uncharacteristic events may lead to changes in demand or availability of products or cause business
interruptions.
Natural disasters, such as hurricanes, tropical storms, fires, floods, droughts or water scarcity, tornadoes, and
earthquakes; unseasonable, unexpected or extreme weather conditions; acts of terrorism or violence, including
active shooter situations; public health concerns, such as pandemics and quarantines and related impacts; civil
unrest; geopolitical tensions or conflicts, or military conflicts or acts of war, as well as any related sanctions or other
government or private responses; or similar disruptions and catastrophic events could have and on occasion have
had an adverse effect on our operations and financial performance in a number of ways. These types of events can
Table of Contents
Fiscal 2025 Form 10-K
17
affect consumer spending and confidence and consumers’ disposable income, particularly with respect to home
improvement or construction projects. They can also adversely affect our work force and prevent associates and
customers from reaching our stores, branches and other facilities. They can, temporarily or on a long-term basis,
disrupt or disable the operations of stores, branches, other facilities and support centers, and portions of our supply
chain and distribution network, including causing reductions in the availability of inventory and disruptions of utility
services. In addition, these events may affect our information systems and digital platforms, resulting in disruptions
to various aspects of our operations, including our ability to transact with customers and fulfill orders; to
communicate with our stores, branches, other facilities or support centers or senior management; or to access
financial or banking systems. Unseasonable, unexpected or extreme weather conditions such as excessive
precipitation, warm temperatures during the winter season, or prolonged or extreme periods of warm or cold
temperatures could render a portion of our inventory incompatible with customer needs and adversely impact our
financial results.
Demand for certain of our products has historically been influenced by the occurrence of seasonal events, such as
storms. The impact of these events on our sales varies depending on their location, frequency and magnitude.
Sustained periods without such events can lead, and in the past have led, to lower sales compared to prior periods.
Furthermore, the potential long-term impacts of climate change, whether involving physical risks (such as extreme
weather conditions) or transition risks (such as regulatory or technology changes), could be widespread and
unpredictable. Over time, these changes could affect, for example, the availability and cost of or demand for certain
products, commodities, and energy (including utilities), which in turn may impact our ability to procure certain goods
or services for the operation of our business at the quantities and levels we consider optimal.
As a consequence of these or other catastrophic or uncharacteristic events, we may experience interruption to our
operations, increased costs, changes in customer behavior or demand, or losses of property, equipment or
inventory, any of which could adversely affect our sales and profitability.
If we fail to identify and develop relationships with a sufficient number of qualified suppliers, or if our
suppliers experience financial difficulties or other challenges, our ability to timely and efficiently access
products that meet our high standards for quality could be adversely affected.
We buy our products from suppliers located around the world, who in turn procure materials from across the globe.
Our ability to continue to identify and develop relationships with qualified suppliers who can meet our standards for
quality and responsible sourcing, as well as our need to access products in a timely and efficient manner, is a
significant challenge. Our ability to access products from our suppliers can be, and on occasion has been, adversely
affected by economic or political instability; civil unrest; geopolitical tensions or conflicts, or military conflicts or acts
of war, as well as any related sanctions or other government or private responses; acts of terrorism or violence;
public health issues (including pandemics and related impacts); the financial instability of suppliers; suppliers’
noncompliance with applicable laws; contract disputes or inability to maintain favorable contract terms; trade
restrictions; tariffs; currency exchange rates; disruptions in our suppliers’ logistics or supply chain networks or
information technology systems; inability to sell certain products due to customs actions, including regulatory
enforcement inquiries, holds, detentions, and exclusions; raw material or other shortages; actual, potential or
perceived noncompliance with our standards for suppliers or other controversies regarding suppliers’ business
practices or operations; and other factors beyond our or our suppliers’ control. If we are unable to access products
to meet our customers’ demands and expectations in a timely and efficient manner, our sales and gross margin may
be adversely impacted.
Failure to achieve and maintain a high level of product and service quality and safety and ensure
compliance with responsible sourcing laws and standards could damage our reputation with customers,
expose us to litigation or enforcement actions, and negatively impact our sales and results of operations.
Product and service quality issues could negatively impact customer confidence in our brands and the Company. If
our product and service offerings, including those of our suppliers, do not meet applicable product standards or our
customers’ expectations regarding safety, quality, security, or responsible business practices, we could experience
lost sales and increased costs and be exposed to legal, financial and reputational risks, as well as governmental
enforcement actions. Actual, potential or perceived product safety or security concerns, including health- or privacy-
related concerns, could expose, and in some cases have exposed, us to litigation or governmental enforcement
actions, and could result in costly product recalls and other liabilities. For any actions related to actual, potential, or
perceived product-safety concerns, we may not be successful in obtaining adequate contractual indemnification and
insurance coverage from our suppliers and service providers, which may result in claims having an adverse effect
on our business, financial condition and results of operations. Furthermore, our delivery operations and reliance on
third-party carriers expose us to potential liability for property damage, personal injury, or vehicular accidents, which
Table of Contents
Fiscal 2025 Form 10-K
18
could result in financial losses and reputational harm. Even with adequate insurance and indemnification, our
reputation as a provider of high-quality products, including both national brand names and our proprietary products,
and services could suffer, damaging our reputation and impacting customer loyalty.
In addition, we and our customers have expectations around responsible sourcing. Under our standard supplier
buying agreements, our suppliers must comply with our responsible sourcing standards, which cover a variety of
expectations across multiple areas, including supply chain transparency, health and safety, environmental laws and
regulations, compensation, hours of work, and prohibitions on child and forced labor. Further, suppliers must comply
with Company policies and applicable law, including applicable laws governing the sourcing of raw materials, such
as timber and minerals, used in our products. However, we are also dependent on our suppliers to ensure that the
products and services we provide to our customers comply with our standards and applicable law, including with
respect to information provided by suppliers to government agencies about the source of the products or the
constituent elements of those products. Further, the supply chain for some of the products we sell may be too
attenuated for us to know with certainty the source of their components, such as timber, minerals, or other raw
materials. Actual, potential, or perceived supplier non-compliance with our standards or applicable law — including
allegations of non-compliance raised by non-governmental organizations or in third-party reports — could, and in
certain instances in the past has, exposed us to litigation or governmental enforcement actions and resulted in
costly product recalls; resulted in inability to sell certain products due to failure to meet our standards or due to
customs actions, including regulatory enforcement inquiries, holds, detentions, and exclusions; impacted our
reputation; and resulted in termination of supplier relationships and/or other liabilities.
Our proprietary products subject us to certain increased risks, including regulatory, product liability,
intellectual property, supplier relations, and reputational risks.
In addition to other product-related risks discussed in this section, as we expand our proprietary product offerings,
we may become subject to increased risks due to our greater role in the design, manufacture, marketing and sale of
those products. The risks include greater responsibility to administer and comply with applicable regulatory
requirements, increased potential product liability and product recall exposure, and increased potential reputational
risks related to the responsible sourcing of those products. To effectively execute on our product differentiation
strategy, we must also be able to successfully protect our proprietary rights and successfully navigate and avoid
claims related to the proprietary rights of third parties. In addition, an increase in sales of our proprietary products
may adversely affect sales of our suppliers’ products, which in turn could adversely affect our relationships with
certain of our suppliers. Any failure to appropriately address some or all of these risks could damage our reputation
and have an adverse effect on our business, results of operations, and financial condition.
If we are unable to effectively manage our installation services business, we could lose sales and be
subject to fines, lawsuits, reputational damage or the loss of our general contractor licenses.
We act as a general contractor to provide installation services to our DIFM customers through professional third-
party licensed and insured installers. As such, we are subject to regulatory requirements and risks applicable to
general contractors, which include management of background checks, licensing, permitting, and handling of
environmental risks, as well as quality of work performed by our third-party installers. We have established
processes and procedures to manage these requirements and manage customer satisfaction with the services
provided by our third-party installers. However, as we experienced in part with the EPA investigation and the
resulting consent decree in April 2021, and the subsequent discussions with the EPA regarding compliance with the
consent decree, if we fail to manage these processes effectively, collect the appropriate documentation, perform
regular job site inspections, or provide proper oversight of these services, we could lose sales or face fines or
lawsuits, including governmental enforcement actions for violations of regulatory requirements, as well as claims for
property damage or personal injury. In addition, we may suffer damage to our reputation or the loss of our general
contractor licenses, which could adversely affect our business.
MARKET, LEGAL, FINANCIAL, REGULATORY, AND OTHER EXTERNAL RISKS
Adverse conditions in or uncertainty regarding the housing and home improvement markets, economic
conditions, political and social climate, public health issues, and other factors beyond our control could
adversely affect demand for our products and services, our costs of doing business, and our financial
performance.
Our financial performance depends significantly on the stability of the housing and home improvement markets, as
well as general economic conditions, including changes in gross domestic product. Adverse conditions in or
uncertainty about these markets, the economy, or the political or social climate could adversely impact, and we
believe in some cases has adversely impacted, our customers’ confidence or financial condition, causing them to
Table of Contents
Fiscal 2025 Form 10-K
19
decide against purchasing home improvement products and services, causing them to delay purchasing decisions,
or impacting their ability to pay for products and services. Other factors beyond our control – including
unemployment and foreclosure rates; inventory loss due to theft (including as a result of organized retail crime);
inflation or deflation; interest rate fluctuations, including central banks’ actions to control inflation; tariff and trade
policy; fuel and other energy costs; raw material or other shortages; labor and healthcare costs; the availability of
financing; the state of the credit markets, including mortgages, home equity loans and consumer credit; changes in
policy and regulations, including with respect to tax rates; prolonged government shutdowns; weather and natural
disasters (including the potential impacts of climate change); acts of terrorism or violence, including active shooter
situations; public health issues, including pandemics or quarantines and related impacts; geopolitical tensions or
conflicts, or military conflicts or acts of war, as well as any related sanctions or other government or private
responses; civil unrest, and potential societal shifts in investment in large home improvement projects could further
adversely affect, and in certain cases has adversely affected, demand for our products and services, our costs of
doing business, and our financial performance. For instance, the high interest rate environment that persisted
throughout fiscal 2025 and the significant increase in home prices in recent years have impacted housing
affordability. Together, these factors have contributed to historically low levels of housing turnover, which has
reduced demand for projects and other purchases associated with buying and selling a home.
Further, our specialty trade and MRO customers, who have higher spend and longer-term relationships than a
typical retail customer, increasingly use trade credit to finance their purchases, as do some of our other Pros in
order to purchase our products. Their ability to pay is highly dependent on the economic strength of the industry in
which they operate. If these customers are unable to repay the trade credit invoice, we may face greater default
risk, which could reduce our cash flow and adversely affect our results of operations.
Our costs of doing business could increase as a result of changes in, expanded enforcement of, or
adoption of new federal, state, local or international laws, regulations and executive orders.
We are subject to various U.S. federal, state and local laws and regulations, as well as international laws and
regulations, that govern numerous aspects of our business. In recent years, a number of new laws and regulations
have been adopted, new executive orders have been announced, there has been expanded enforcement and
differing interpretations of certain existing laws and regulations by federal, state, local and international agencies,
and the interpretation of certain laws and regulations has become increasingly complex. These laws and
regulations, and related executive orders, interpretations and enforcement activity, may change as a result of a
variety of factors, including political, economic or social events. Changes in, expanded regulatory investigations or
enforcement of, litigation regarding, or adoption of new federal, state, local or international laws, regulations and/or
executive orders governing minimum wage or living wage requirements; the classification of exempt and non-
exempt employees; the distinction between employees and contractors; diversity, equity, and inclusion programs;
immigration; and other human capital management matters; healthcare; data privacy, governance, and
cybersecurity; the sale, marketing, sourcing, and pricing of our products; transportation, logistics and interstate
delivery operations, including Department of Transportation regulations on vehicles and drivers; international trade
and tariffs; supply chain transparency; the sourcing of raw materials, including timber and minerals, used in our
products; taxes, including changes to corporate tax rates; restrictions on carbon dioxide and other greenhouse gas
emissions; competition and antitrust requirements and enforcement; sustainability programs, transparency and
reporting; unclaimed property; energy costs and consumption; or hazardous waste disposal and other
environmental matters, including with respect to our installation services business, could increase our costs of doing
business or impact our sales, operations or profitability.
In addition, regulators, customers, shareholders, associates, and other stakeholders remain focused on
cybersecurity, data privacy, human capital management and sustainability matters and related disclosures. These
changing rules, regulations and stakeholder expectations have resulted in, and may continue to result in, increased
general and administrative expenses, heightened risks of litigation and enforcement actions, and increased
management time and attention spent complying with or meeting such regulations and expectations. Initiatives and
goals related to these matters could be difficult and expensive to implement, the technologies needed to implement
them may not be cost effective and may not advance at a sufficient pace or scale, and we could be criticized or face
reputational or regulatory risks regarding the accuracy, adequacy or completeness of the disclosures.
Regulators, customers, and other stakeholders are also increasingly focusing on federal, state, and local consumer-
protection laws and regulations, including those that could relate to how Home Depot prices, discounts, or
advertises the products that it sells. This increased attention has resulted in and may continue to result in increased
general and administrative expenses, heightened risks of litigation and enforcement actions, and increased
management time and attention spent on managing the Company’s response to those matters and its compliance
with consumer-protection laws and regulations.
Table of Contents
Fiscal 2025 Form 10-K
20
If we cannot successfully manage the challenges presented by operating in international markets, we may
not be successful in our international operations and our sales and profitability may be negatively
impacted.
Our ability to successfully operate in, and source products and materials from, international markets is affected by
many of the same risks we face in our U.S. operations, as well as other costs and difficulties specific to managing
international operations. Our international operations, including any expansion in international markets, may be, and
on occasion have been, adversely affected by local laws and customs, U.S. laws or administrative actions
applicable to foreign operations and other foreign legal and regulatory constraints, as well as political, social and
economic conditions. Risks inherent in international operations also include, among others, potential adverse tax
consequences; international trade disputes, trade policy changes or tariffs and other import-related taxes, fees and
controls; inability to sell certain products due to customs actions, including regulatory enforcement inquiries, holds,
detentions, and exclusions; greater difficulty in enforcing intellectual property rights; limitations on access to ports;
risks associated with the Foreign Corrupt Practices Act and local anti-bribery law compliance; geopolitical tensions
or conflicts, military conflicts or acts of war, as well as any related sanctions or other government or private
responses; compliance with forced labor laws; compliance with environmental and responsible sourcing laws and
regulations; and challenges in identifying and gaining access to local suppliers. For example, trade tensions
between the U.S. and numerous other countries have led to a series of tariffs on the importation of certain product
categories since the beginning of fiscal 2025. Following the recent U.S. Supreme Court decision that struck down
tariffs previously imposed under the International Emergency Economic Powers Act, there is additional uncertainty
regarding the U.S. tariff regime, and the imposition by the U.S. government of new or different tariffs under different
authority. For the retail products we source, directly or indirectly, outside of the U.S., including Mexico, Canada and
China, major changes in tax or trade policies, tariffs or trade relations could significantly adversely impact the cost
of, demand for, and profitability of retail product sales in our U.S. or other locations. Countries outside the U.S. may
also change, and on occasion have changed, their business and trade policies in anticipation of or in response to
increased import tariffs and other changes in U.S. trade policy and regulations, and consumers may seek to avoid
goods not sourced domestically, all of which could significantly adversely impact the cost of, demand for, and
profitability of retail products in our U.S., Mexico and Canada locations. In addition, our operations in international
markets create risk due to foreign currency exchange rates and fluctuations in those rates, which may adversely
impact our sales and profitability.
The inflation or deflation of commodity and other prices could affect our prices, demand for our products,
our sales and our profit margins.
Prices of certain commodity products, including lumber and other raw materials, are historically volatile and are
subject to fluctuations arising from changes in domestic and international supply and demand, inflationary or
deflationary pressures, labor costs, competition, market speculation, government regulations, tariffs and trade
restrictions (including retaliatory tariffs), changes in trade and other policies of the U.S. and other countries, natural
disasters, geopolitical tensions or conflicts, military conflicts or acts of war, and periodic delays in delivery. For
example, in recent years, conflicts in Europe and the Middle East and the related international responses
exacerbated inflationary pressures, including causing increases in commodity prices, fuel and other energy costs,
and shipping costs. Rapid and significant changes in commodity and other prices, such as changes in lumber
prices, and our ability to pass them on to our customers or manage them through our portfolio strategy, may be
limited by the competitive environment in which we operate, and may affect the demand for our products, our sales
and our profit margins. If we are unable to mitigate the impact of product cost inflation through vendor negotiations
and other strategic initiatives, we may need to increase prices to a point which could negatively impact consumer
demand for our products.
We may incur property, casualty or other losses not covered by our insurance.
We are predominantly self-insured for a number of different risk categories, such as general liability (including
product liability), property loss, workers’ compensation, employee group medical, employment practices liability and
wage and hour claims, automobile claims, and cybersecurity and privacy liability, with third-party insurance
coverage for certain catastrophic risks above the self-insurance levels. The types and amounts of insurance may
vary from time to time based on our decisions with respect to risk retention and regulatory requirements. The
incurrence of losses from significant claims, a substantial rise in costs to maintain our insurance, the failure to
maintain adequate insurance coverage, or disputes with insurers regarding coverage could have an adverse impact
on our financial condition and results of operations.
Table of Contents
Fiscal 2025 Form 10-K
21
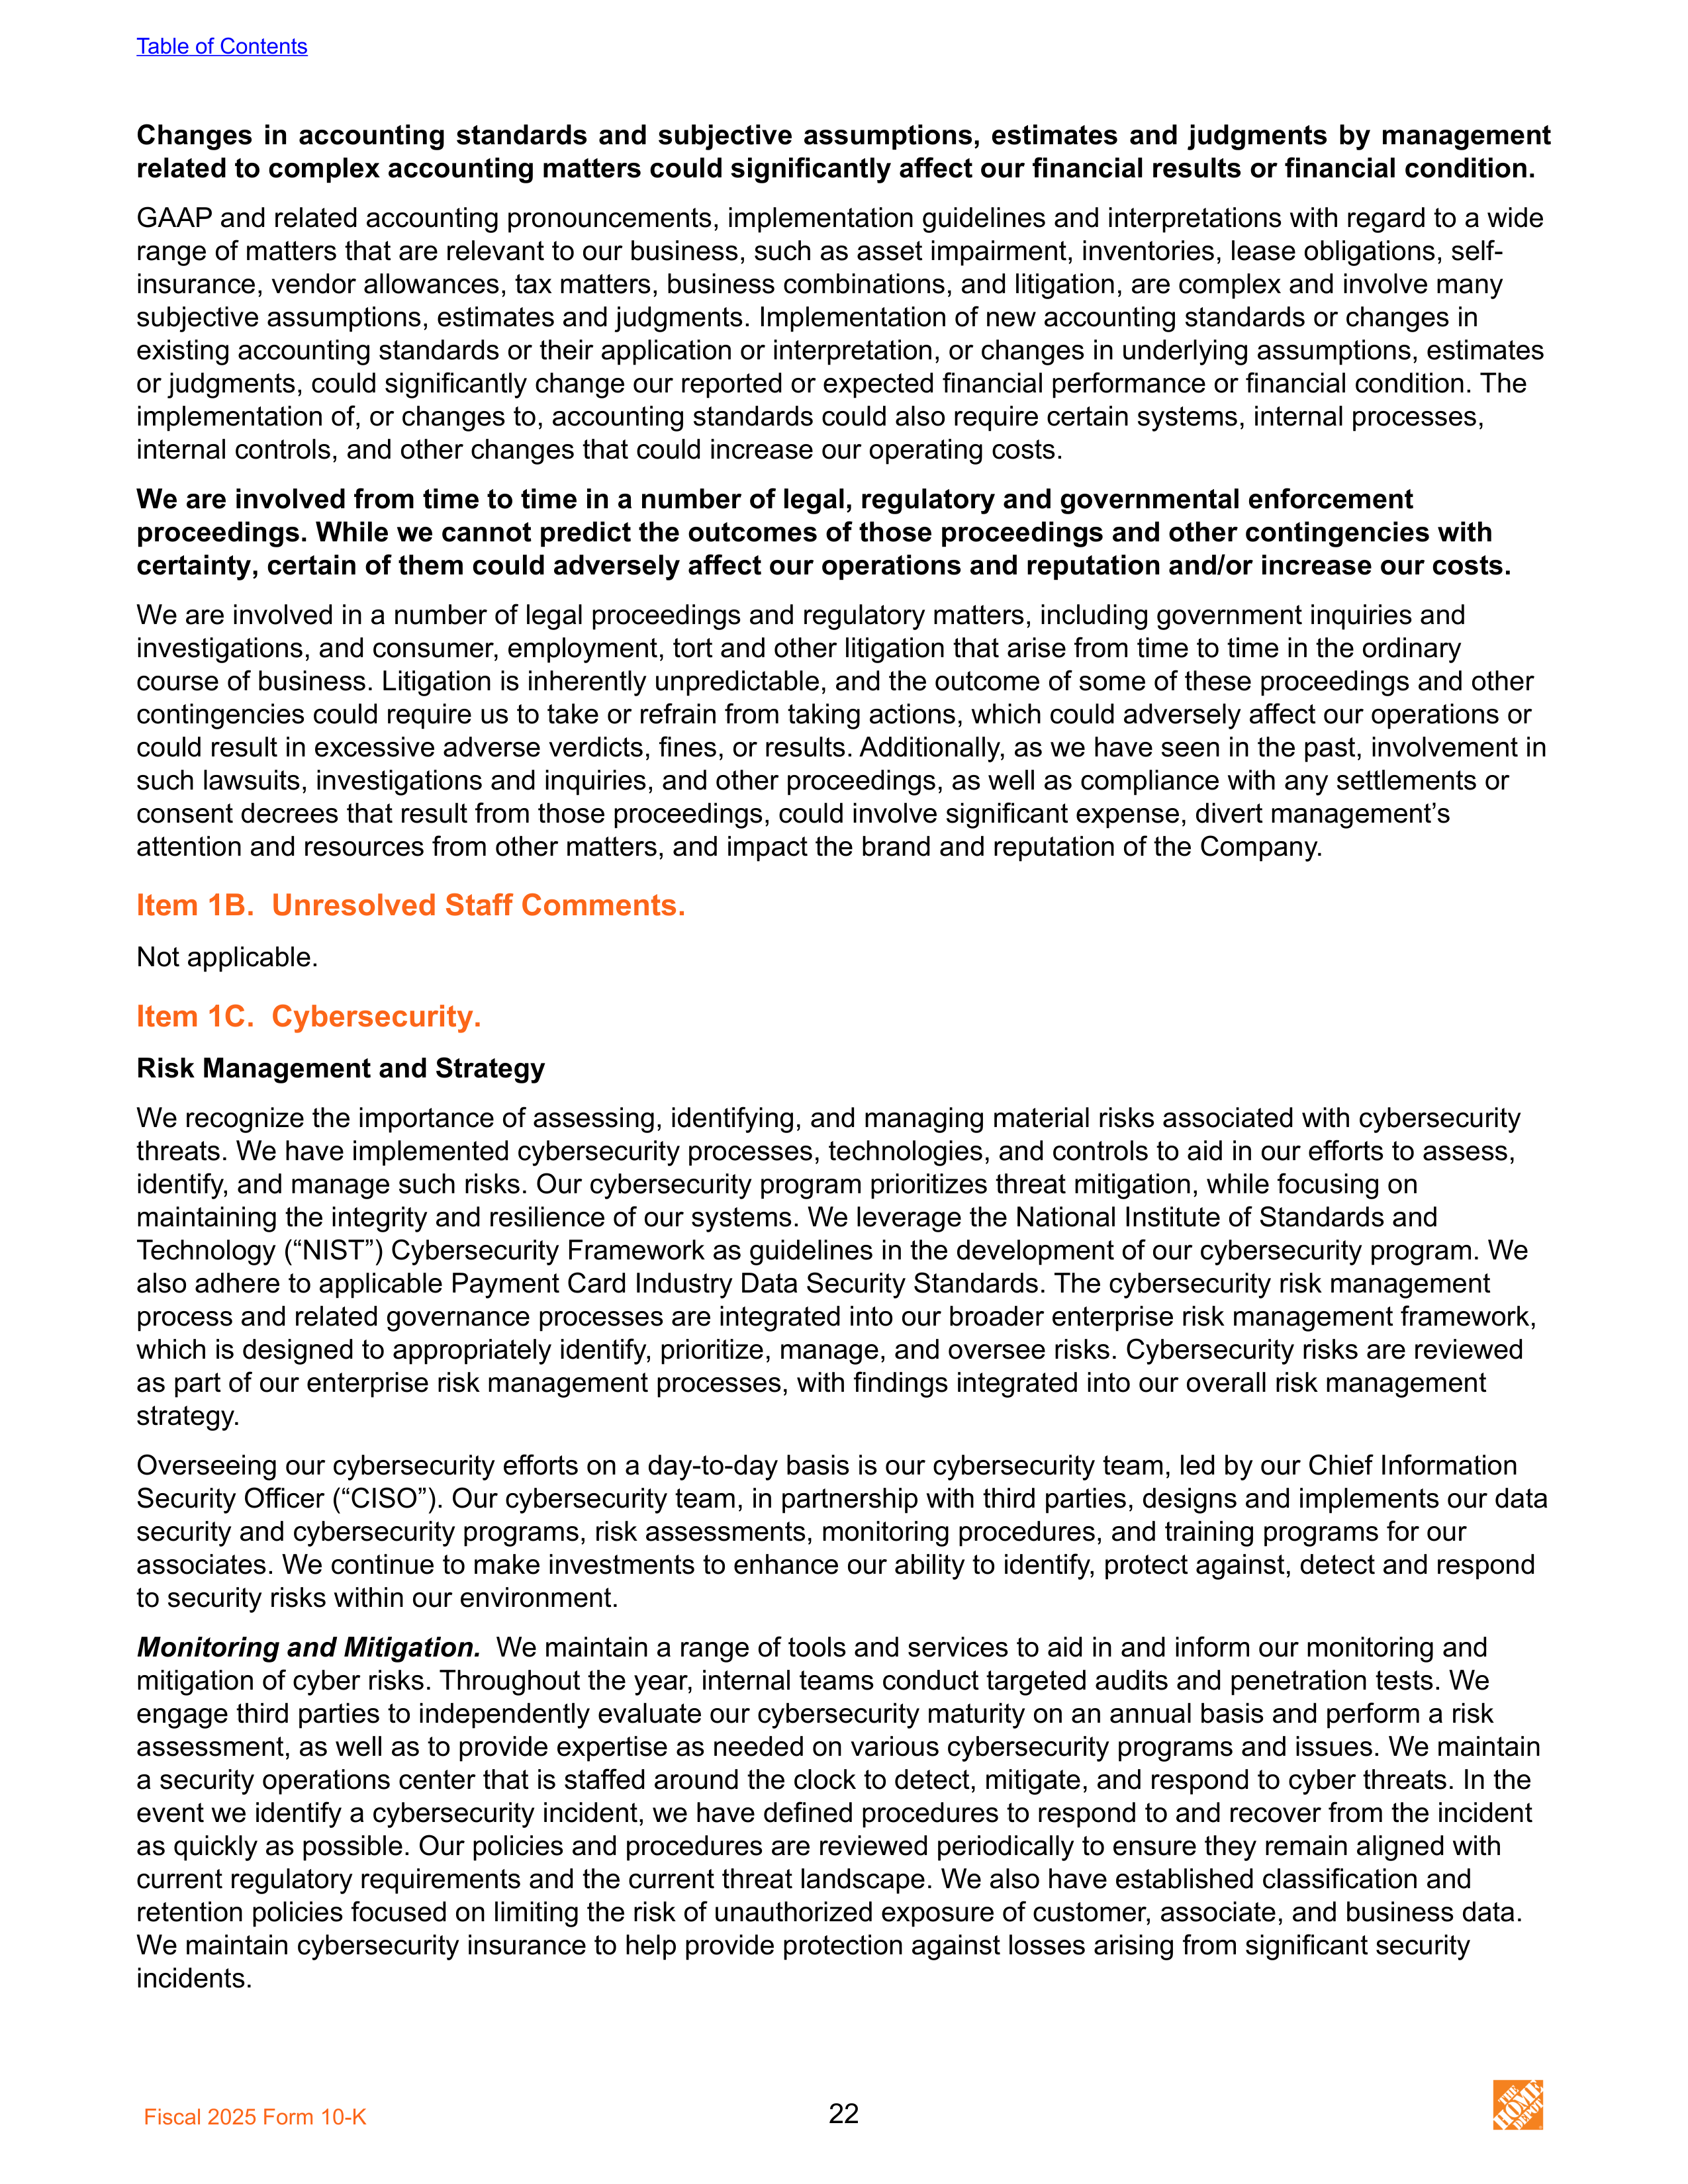
Changes in accounting standards and subjective assumptions, estimates and judgments by management
related to complex accounting matters could significantly affect our financial results or financial condition.
GAAP and related accounting pronouncements, implementation guidelines and interpretations with regard to a wide
range of matters that are relevant to our business, such as asset impairment, inventories, lease obligations, self-
insurance, vendor allowances, tax matters, business combinations, and litigation, are complex and involve many
subjective assumptions, estimates and judgments. Implementation of new accounting standards or changes in
existing accounting standards or their application or interpretation, or changes in underlying assumptions, estimates
or judgments, could significantly change our reported or expected financial performance or financial condition. The
implementation of, or changes to, accounting standards could also require certain systems, internal processes,
internal controls, and other changes that could increase our operating costs.
We are involved from time to time in a number of legal, regulatory and governmental enforcement
proceedings. While we cannot predict the outcomes of those proceedings and other contingencies with
certainty, certain of them could adversely affect our operations and reputation and/or increase our costs.
We are involved in a number of legal proceedings and regulatory matters, including government inquiries and
investigations, and consumer, employment, tort and other litigation that arise from time to time in the ordinary
course of business. Litigation is inherently unpredictable, and the outcome of some of these proceedings and other
contingencies could require us to take or refrain from taking actions, which could adversely affect our operations or
could result in excessive adverse verdicts, fines, or results. Additionally, as we have seen in the past, involvement in
such lawsuits, investigations and inquiries, and other proceedings, as well as compliance with any settlements or
consent decrees that result from those proceedings, could involve significant expense, divert management’s
attention and resources from other matters, and impact the brand and reputation of the Company.
Item 1B. Unresolved Staff Comments.
Not applicable.
Item 1C. Cybersecurity.
Risk Management and Strategy
We recognize the importance of assessing, identifying, and managing material risks associated with cybersecurity
threats. We have implemented cybersecurity processes, technologies, and controls to aid in our efforts to assess,
identify, and manage such risks. Our cybersecurity program prioritizes threat mitigation, while focusing on
maintaining the integrity and resilience of our systems. We leverage the National Institute of Standards and
Technology (“NIST”) Cybersecurity Framework as guidelines in the development of our cybersecurity program. We
also adhere to applicable Payment Card Industry Data Security Standards. The cybersecurity risk management
process and related governance processes are integrated into our broader enterprise risk management framework,
which is designed to appropriately identify, prioritize, manage, and oversee risks. Cybersecurity risks are reviewed
as part of our enterprise risk management processes, with findings integrated into our overall risk management
strategy.
Overseeing our cybersecurity efforts on a day-to-day basis is our cybersecurity team, led by our Chief Information
Security Officer (“CISO”). Our cybersecurity team, in partnership with third parties, designs and implements our data
security and cybersecurity programs, risk assessments, monitoring procedures, and training programs for our
associates. We continue to make investments to enhance our ability to identify, protect against, detect and respond
to security risks within our environment.
Monitoring and Mitigation.
We maintain a range of tools and services to aid in and inform our monitoring and
mitigation of cyber risks. Throughout the year, internal teams conduct targeted audits and penetration tests. We
engage third parties to independently evaluate our cybersecurity maturity on an annual basis and perform a risk
assessment, as well as to provide expertise as needed on various cybersecurity programs and issues. We maintain
a security operations center that is staffed around the clock to detect, mitigate, and respond to cyber threats. In the
event we identify a cybersecurity incident, we have defined procedures to respond to and recover from the incident
as quickly as possible. Our policies and procedures are reviewed periodically to ensure they remain aligned with
current regulatory requirements and the current threat landscape. We also have established classification and
retention policies focused on limiting the risk of unauthorized exposure of customer, associate, and business data.
We maintain cybersecurity insurance to help provide protection against losses arising from significant security
incidents.
Table of Contents
Fiscal 2025 Form 10-K
22
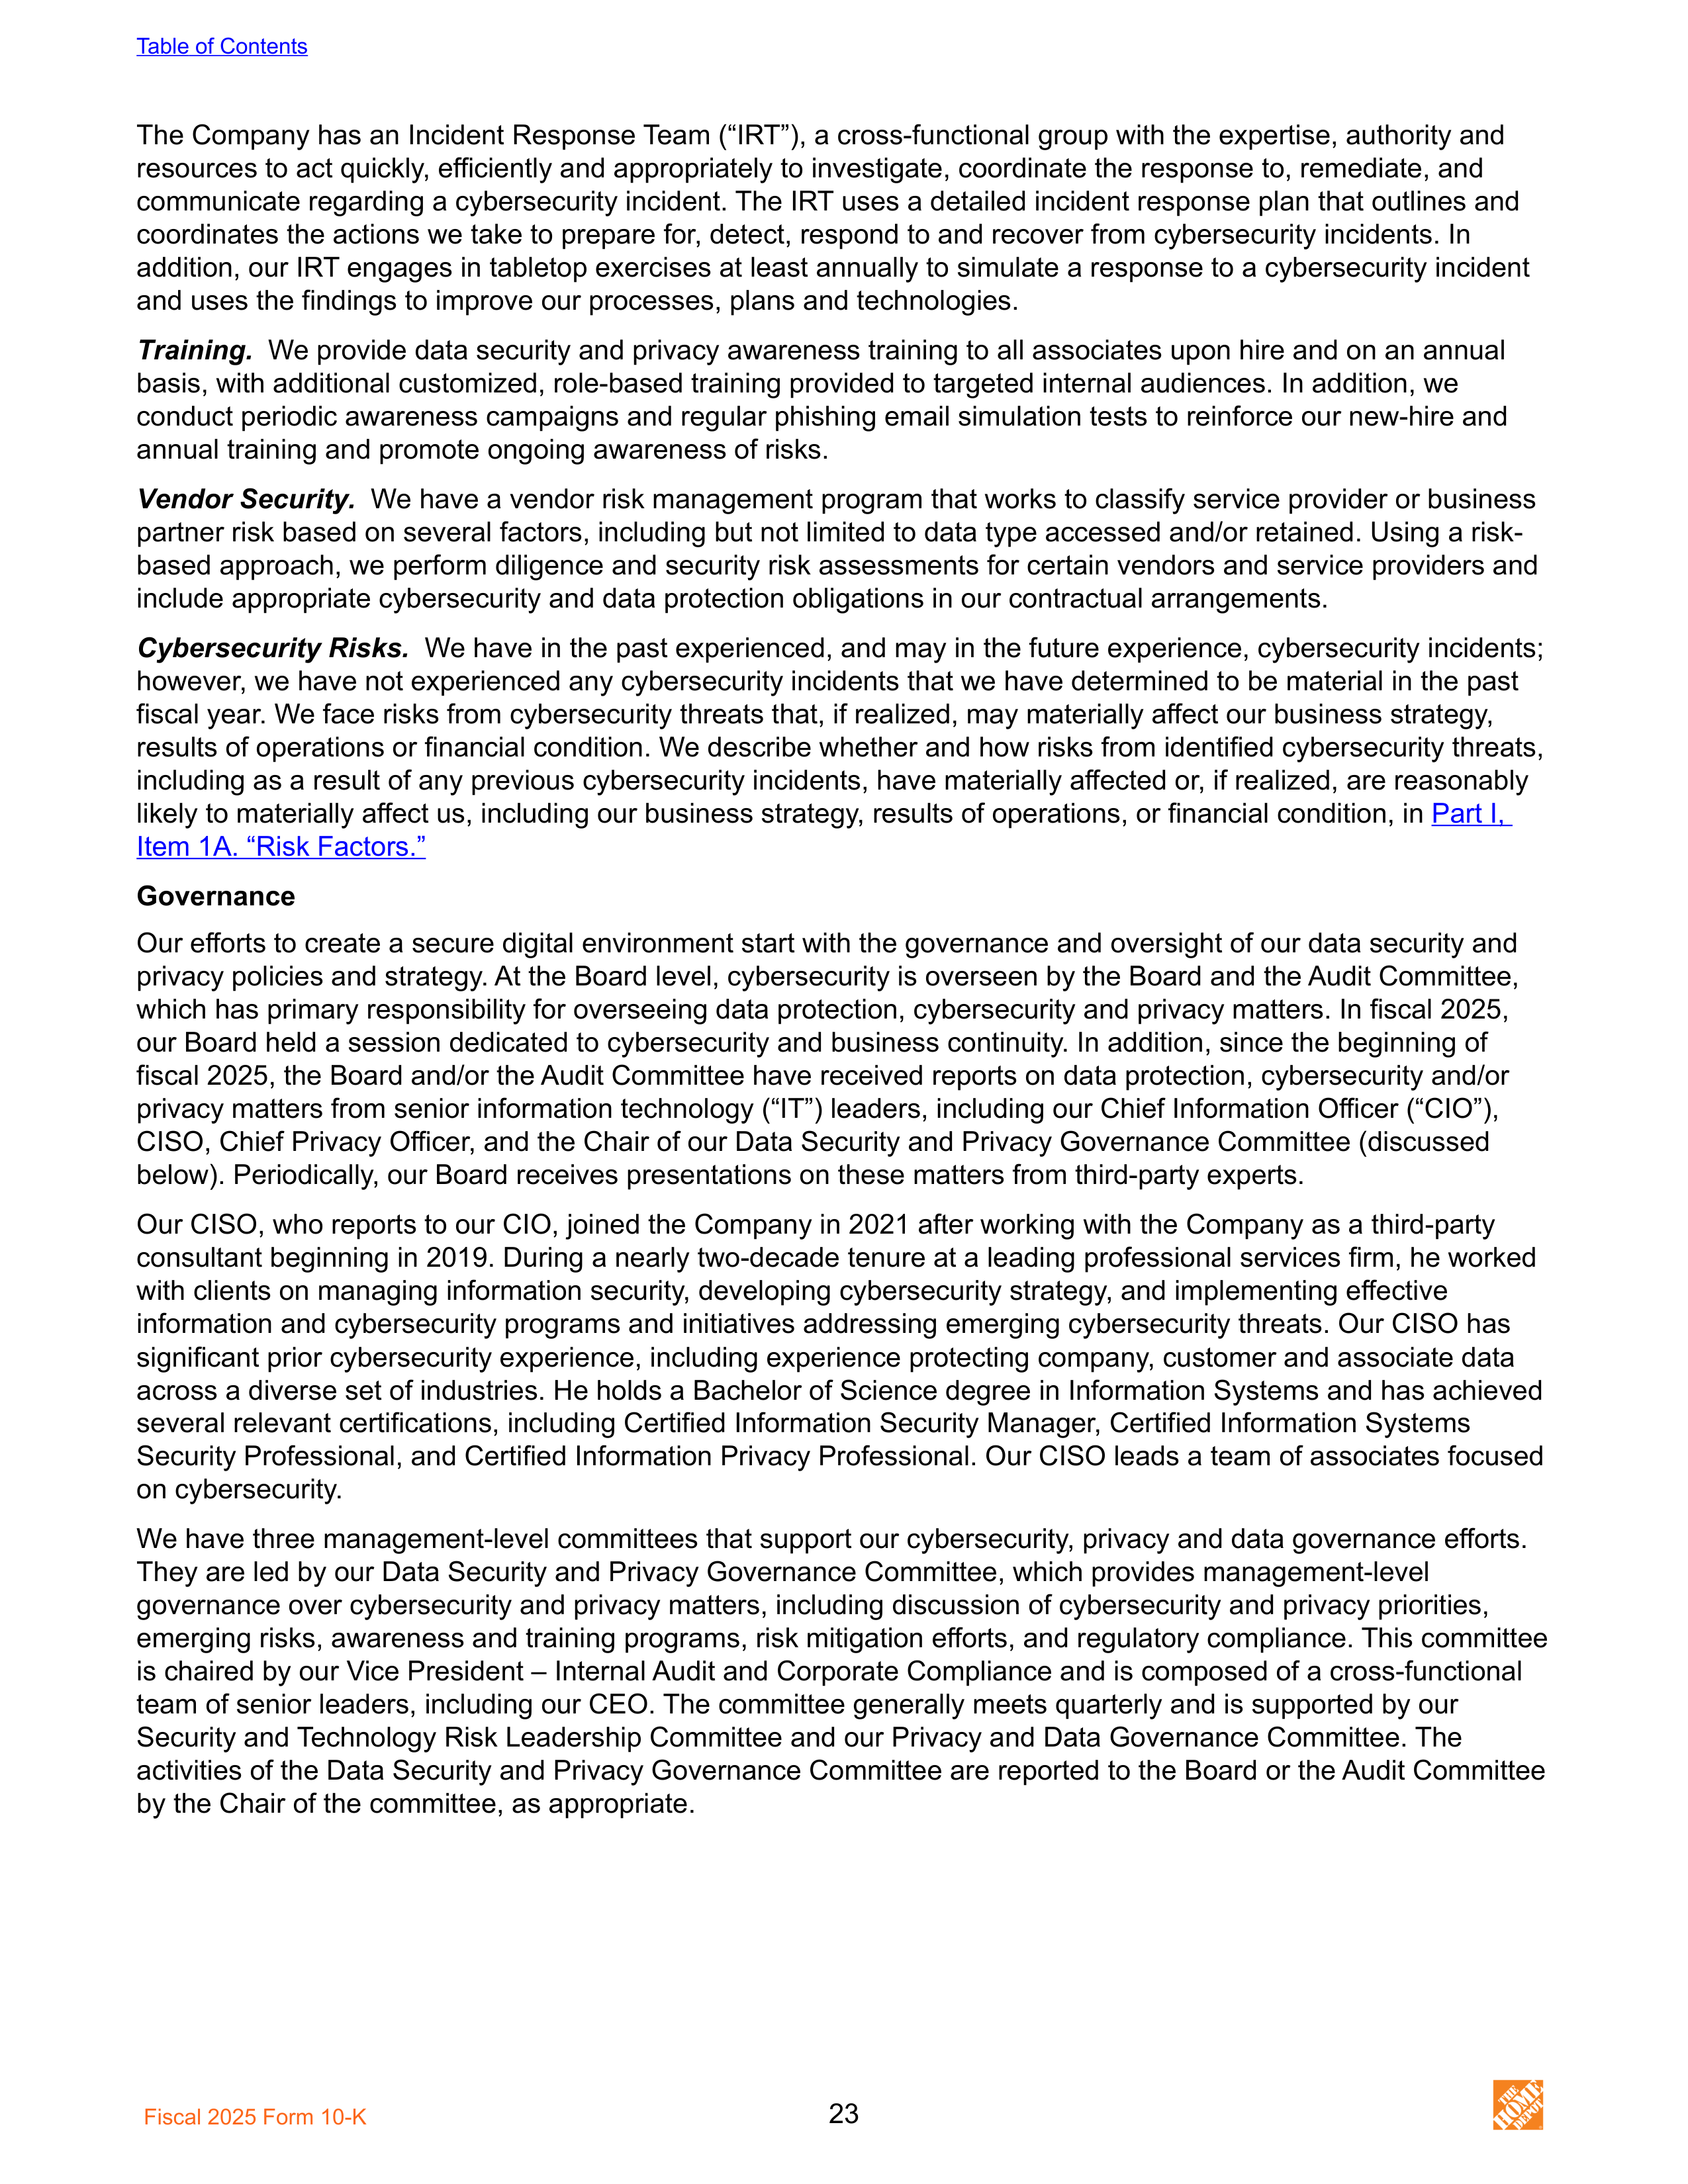
The Company has an Incident Response Team (“IRT”), a cross-functional group with the expertise, authority and
resources to act quickly, efficiently and appropriately to investigate, coordinate the response to, remediate, and
communicate regarding a cybersecurity incident. The IRT uses a detailed incident response plan that outlines and
coordinates the actions we take to prepare for, detect, respond to and recover from cybersecurity incidents. In
addition, our IRT engages in tabletop exercises at least annually to simulate a response to a cybersecurity incident
and uses the findings to improve our processes, plans and technologies.
Training.
We provide data security and privacy awareness training to all associates upon hire and on an annual
basis, with additional customized, role-based training provided to targeted internal audiences. In addition, we
conduct periodic awareness campaigns and regular phishing email simulation tests to reinforce our new-hire and
annual training and promote ongoing awareness of risks.
Vendor Security.
We have a vendor risk management program that works to classify service provider or business
partner risk based on several factors, including but not limited to data type accessed and/or retained. Using a risk-
based approach, we perform diligence and security risk assessments for certain vendors and service providers and
include appropriate cybersecurity and data protection obligations in our contractual arrangements.
Cybersecurity Risks.
We have in the past experienced, and may in the future experience, cybersecurity incidents;
however, we have not experienced any cybersecurity incidents that we have determined to be material in the past
fiscal year. We face risks from cybersecurity threats that, if realized, may materially affect our business strategy,
results of operations or financial condition. We describe whether and how risks from identified cybersecurity threats,
including as a result of any previous cybersecurity incidents, have materially affected or, if realized, are reasonably
likely to materially affect us, including our business strategy, results of operations, or financial condition, in
Part I,
Item 1A. “Risk Factors.”
Governance
Our efforts to create a secure digital environment start with the governance and oversight of our data security and
privacy policies and strategy. At the Board level, cybersecurity is overseen by the Board and the Audit Committee,
which has primary responsibility for overseeing data protection, cybersecurity and privacy matters. In fiscal 2025,
our Board held a session dedicated to cybersecurity and business continuity. In addition, since the beginning of
fiscal 2025, the Board and/or the Audit Committee have received reports on data protection, cybersecurity and/or
privacy matters from senior information technology (“IT”) leaders, including our Chief Information Officer (“CIO”),
CISO, Chief Privacy Officer, and the Chair of our Data Security and Privacy Governance Committee (discussed
below). Periodically, our Board receives presentations on these matters from third-party experts.
Our CISO, who reports to our CIO, joined the Company in 2021 after working with the Company as a third-party
consultant beginning in 2019. During a nearly two-decade tenure at a leading professional services firm, he worked
with clients on managing information security, developing cybersecurity strategy, and implementing effective
information and cybersecurity programs and initiatives addressing emerging cybersecurity threats. Our CISO has
significant prior cybersecurity experience, including experience protecting company, customer and associate data
across a diverse set of industries. He holds a Bachelor of Science degree in Information Systems and has achieved
several relevant certifications, including Certified Information Security Manager, Certified Information Systems
Security Professional, and Certified Information Privacy Professional. Our CISO leads a team of associates focused
on cybersecurity.
We have three management-level committees that support our cybersecurity, privacy and data governance efforts.
They are led by our Data Security and Privacy Governance Committee, which provides management-level
governance over cybersecurity and privacy matters, including discussion of cybersecurity and privacy priorities,
emerging risks, awareness and training programs, risk mitigation efforts, and regulatory compliance. This committee
is chaired by our Vice President – Internal Audit and Corporate Compliance and is composed of a cross-functional
team of senior leaders, including our CEO. The committee generally meets quarterly and is supported by our
Security and Technology Risk Leadership Committee and our Privacy and Data Governance Committee. The
activities of the Data Security and Privacy Governance Committee are reported to the Board or the Audit Committee
by the Chair of the committee, as appropriate.
Table of Contents
Fiscal 2025 Form 10-K
23
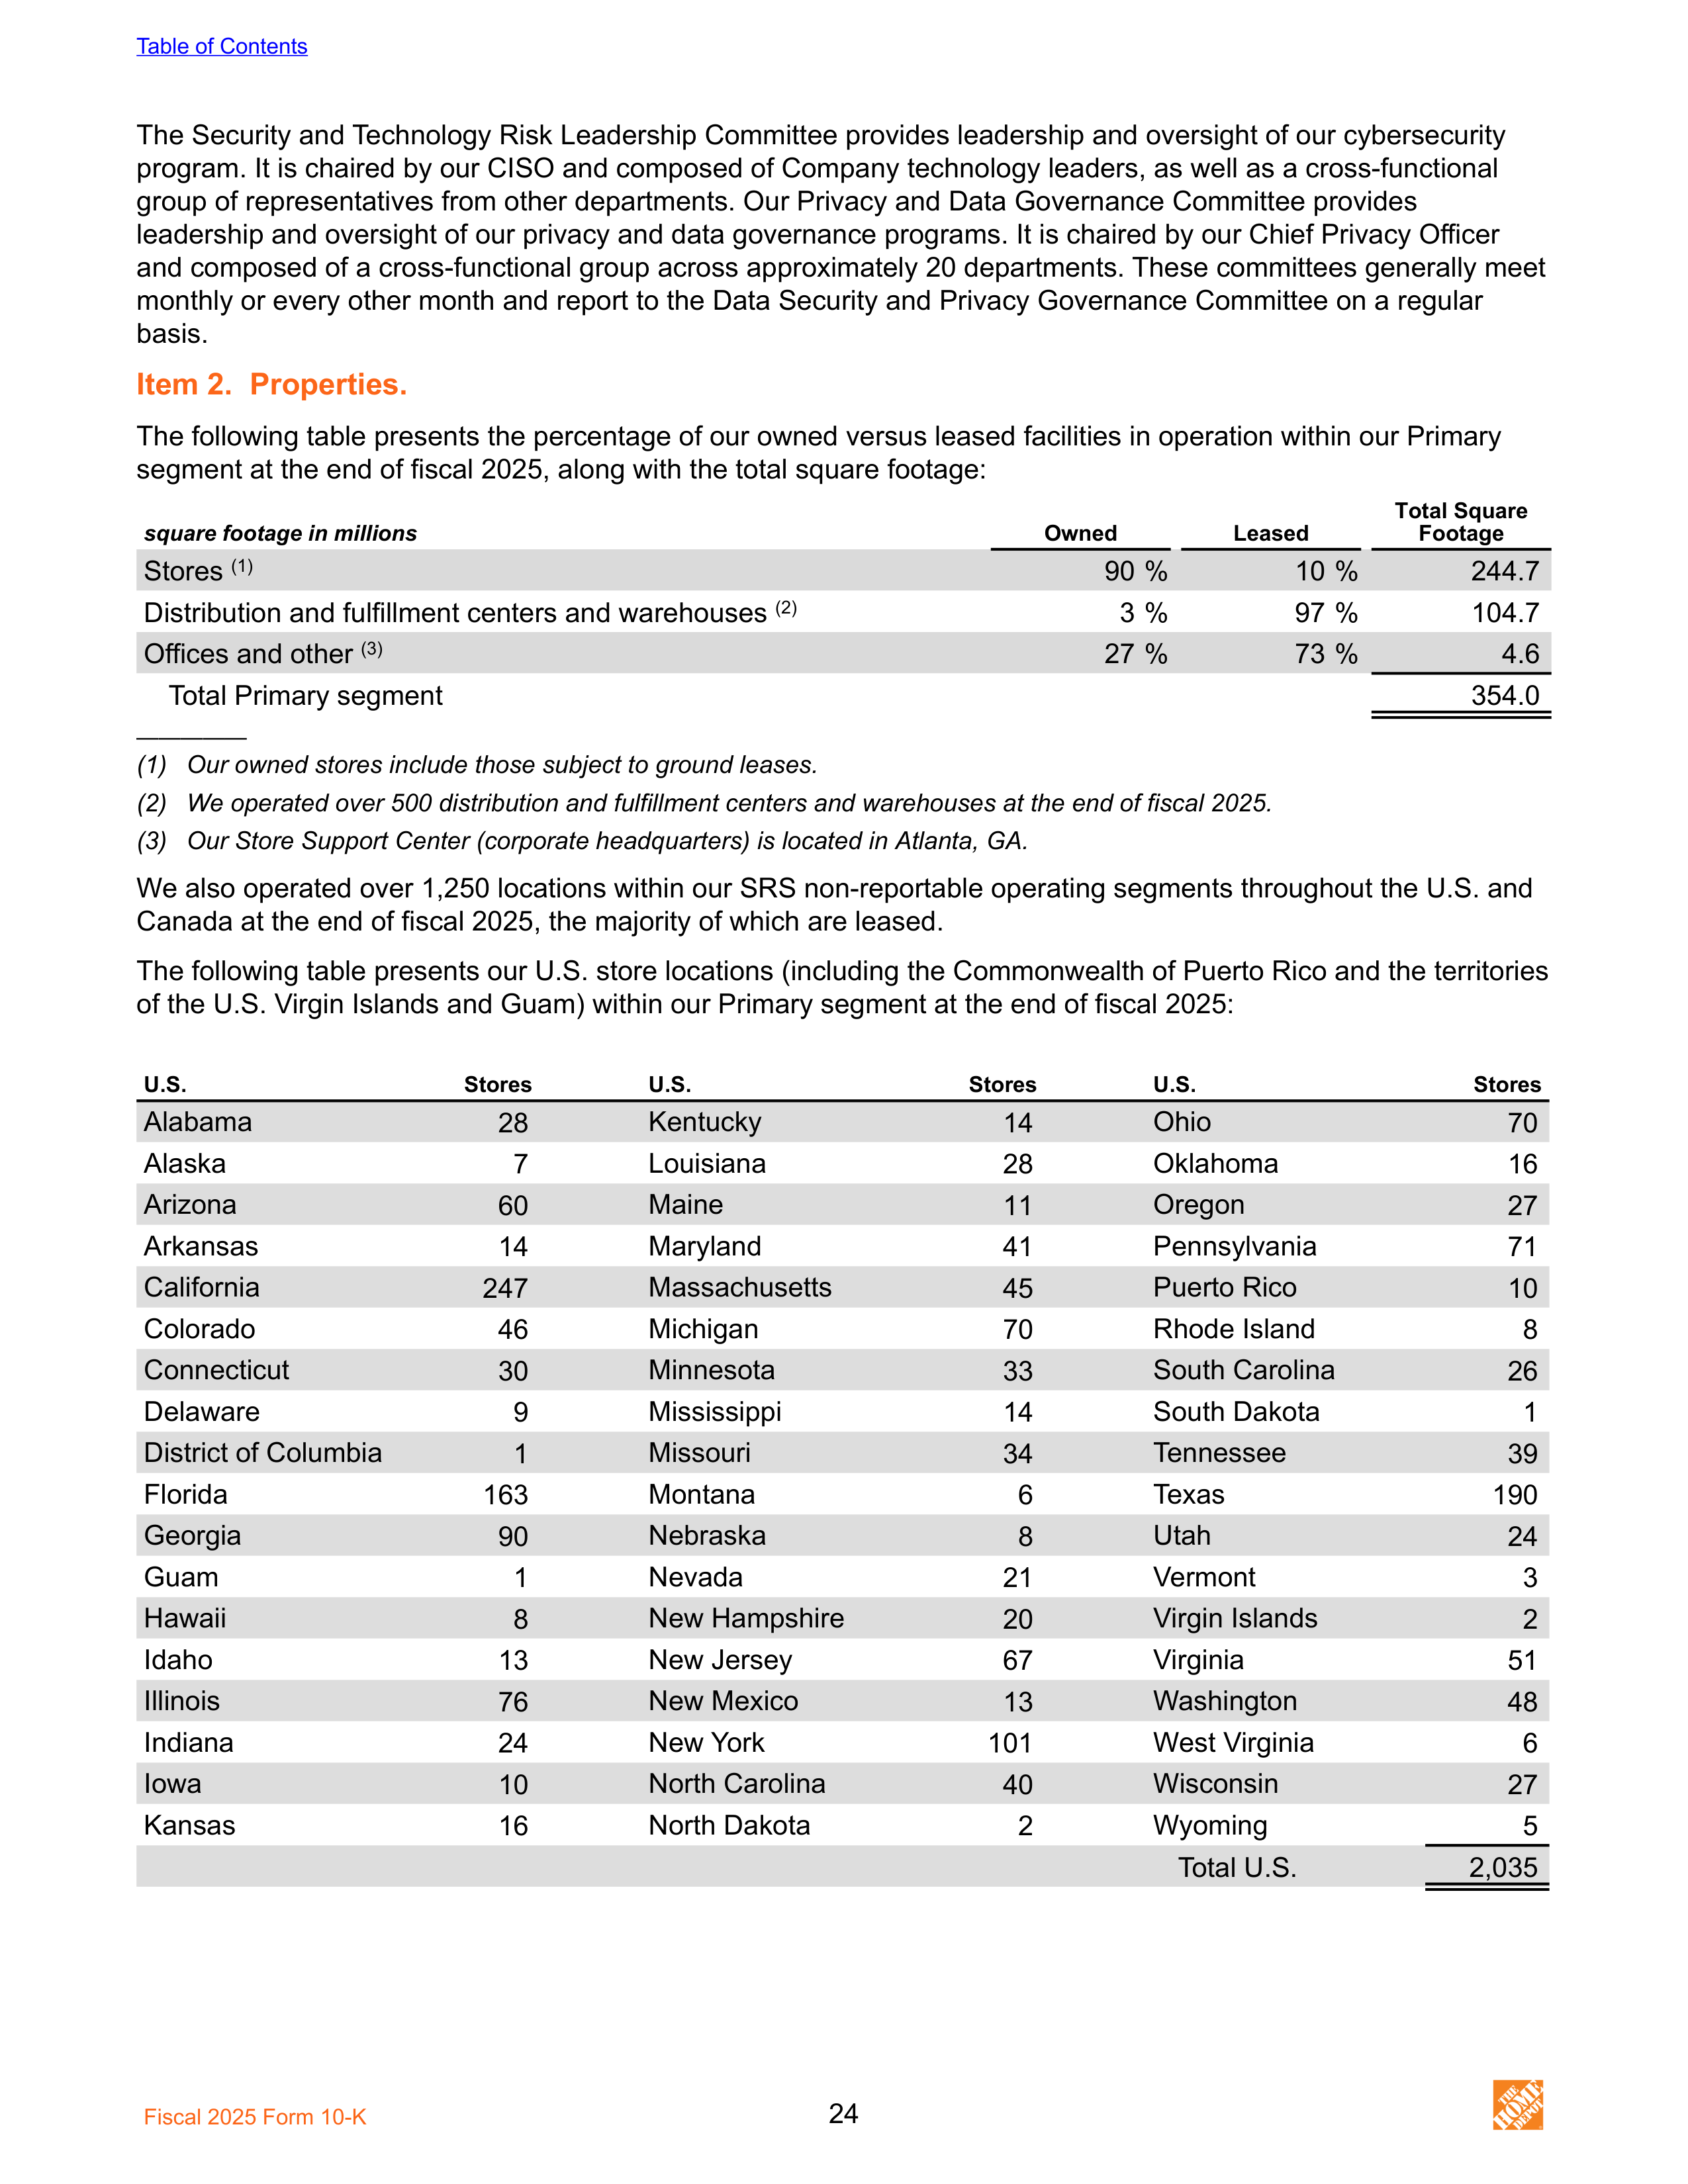
The Security and Technology Risk Leadership Committee provides leadership and oversight of our cybersecurity
program. It is chaired by our CISO and composed of Company technology leaders, as well as a cross-functional
group of representatives from other departments. Our Privacy and Data Governance Committee provides
leadership and oversight of our privacy and data governance programs. It is chaired by our Chief Privacy Officer
and composed of a cross-functional group across approximately 20 departments. These committees generally meet
monthly or every other month and report to the Data Security and Privacy Governance Committee on a regular
basis.
Item 2. Properties.
The following table presents the percentage of our owned versus leased facilities in operation within our Primary
segment at the end of fiscal 2025, along with the total square footage:
square footage in millions
Owned
Leased
Total Square
Footage
Stores
(1)
90 %
10 %
244.7
Distribution and fulfillment centers and warehouses
(2)
3 %
97 %
104.7
Offices and other
(3)
27 %
73 %
4.6
Total Primary segment
354.0
—————
(1)
Our owned stores include those subject to ground leases.
(2)
We operated over 500 distribution and fulfillment centers and warehouses at the end of fiscal 2025.
(3)
Our Store Support Center (corporate headquarters) is located in Atlanta, GA.
We also operated over 1,250 locations within our SRS non-reportable operating segments throughout the U.S. and
Canada at the end of fiscal 2025, the majority of which are leased.
The following table presents our U.S. store locations (including the Commonwealth of Puerto Rico and the territories
of the U.S. Virgin Islands and Guam) within our Primary segment at the end of fiscal 2025:
U.S.
Stores
U.S.
Stores
U.S.
Stores
Alabama
28
Kentucky
14
Ohio
70
Alaska
7
Louisiana
28
Oklahoma
16
Arizona
60
Maine
11
Oregon
27
Arkansas
14
Maryland
41
Pennsylvania
71
California
247
Massachusetts
45
Puerto Rico
10
Colorado
46
Michigan
70
Rhode Island
8
Connecticut
30
Minnesota
33
South Carolina
26
Delaware
9
Mississippi
14
South Dakota
1
District of Columbia
1
Missouri
34
Tennessee
39
Florida
163
Montana
6
Texas
190
Georgia
90
Nebraska
8
Utah
24
Guam
1
Nevada
21
Vermont
3
Hawaii
8
New Hampshire
20
Virgin Islands
2
Idaho
13
New Jersey
67
Virginia
51
Illinois
76
New Mexico
13
Washington
48
Indiana
24
New York
101
West Virginia
6
Iowa
10
North Carolina
40
Wisconsin
27
Kansas
16
North Dakota
2
Wyoming
5
Total U.S.
2,035
Table of Contents
Fiscal 2025 Form 10-K
24
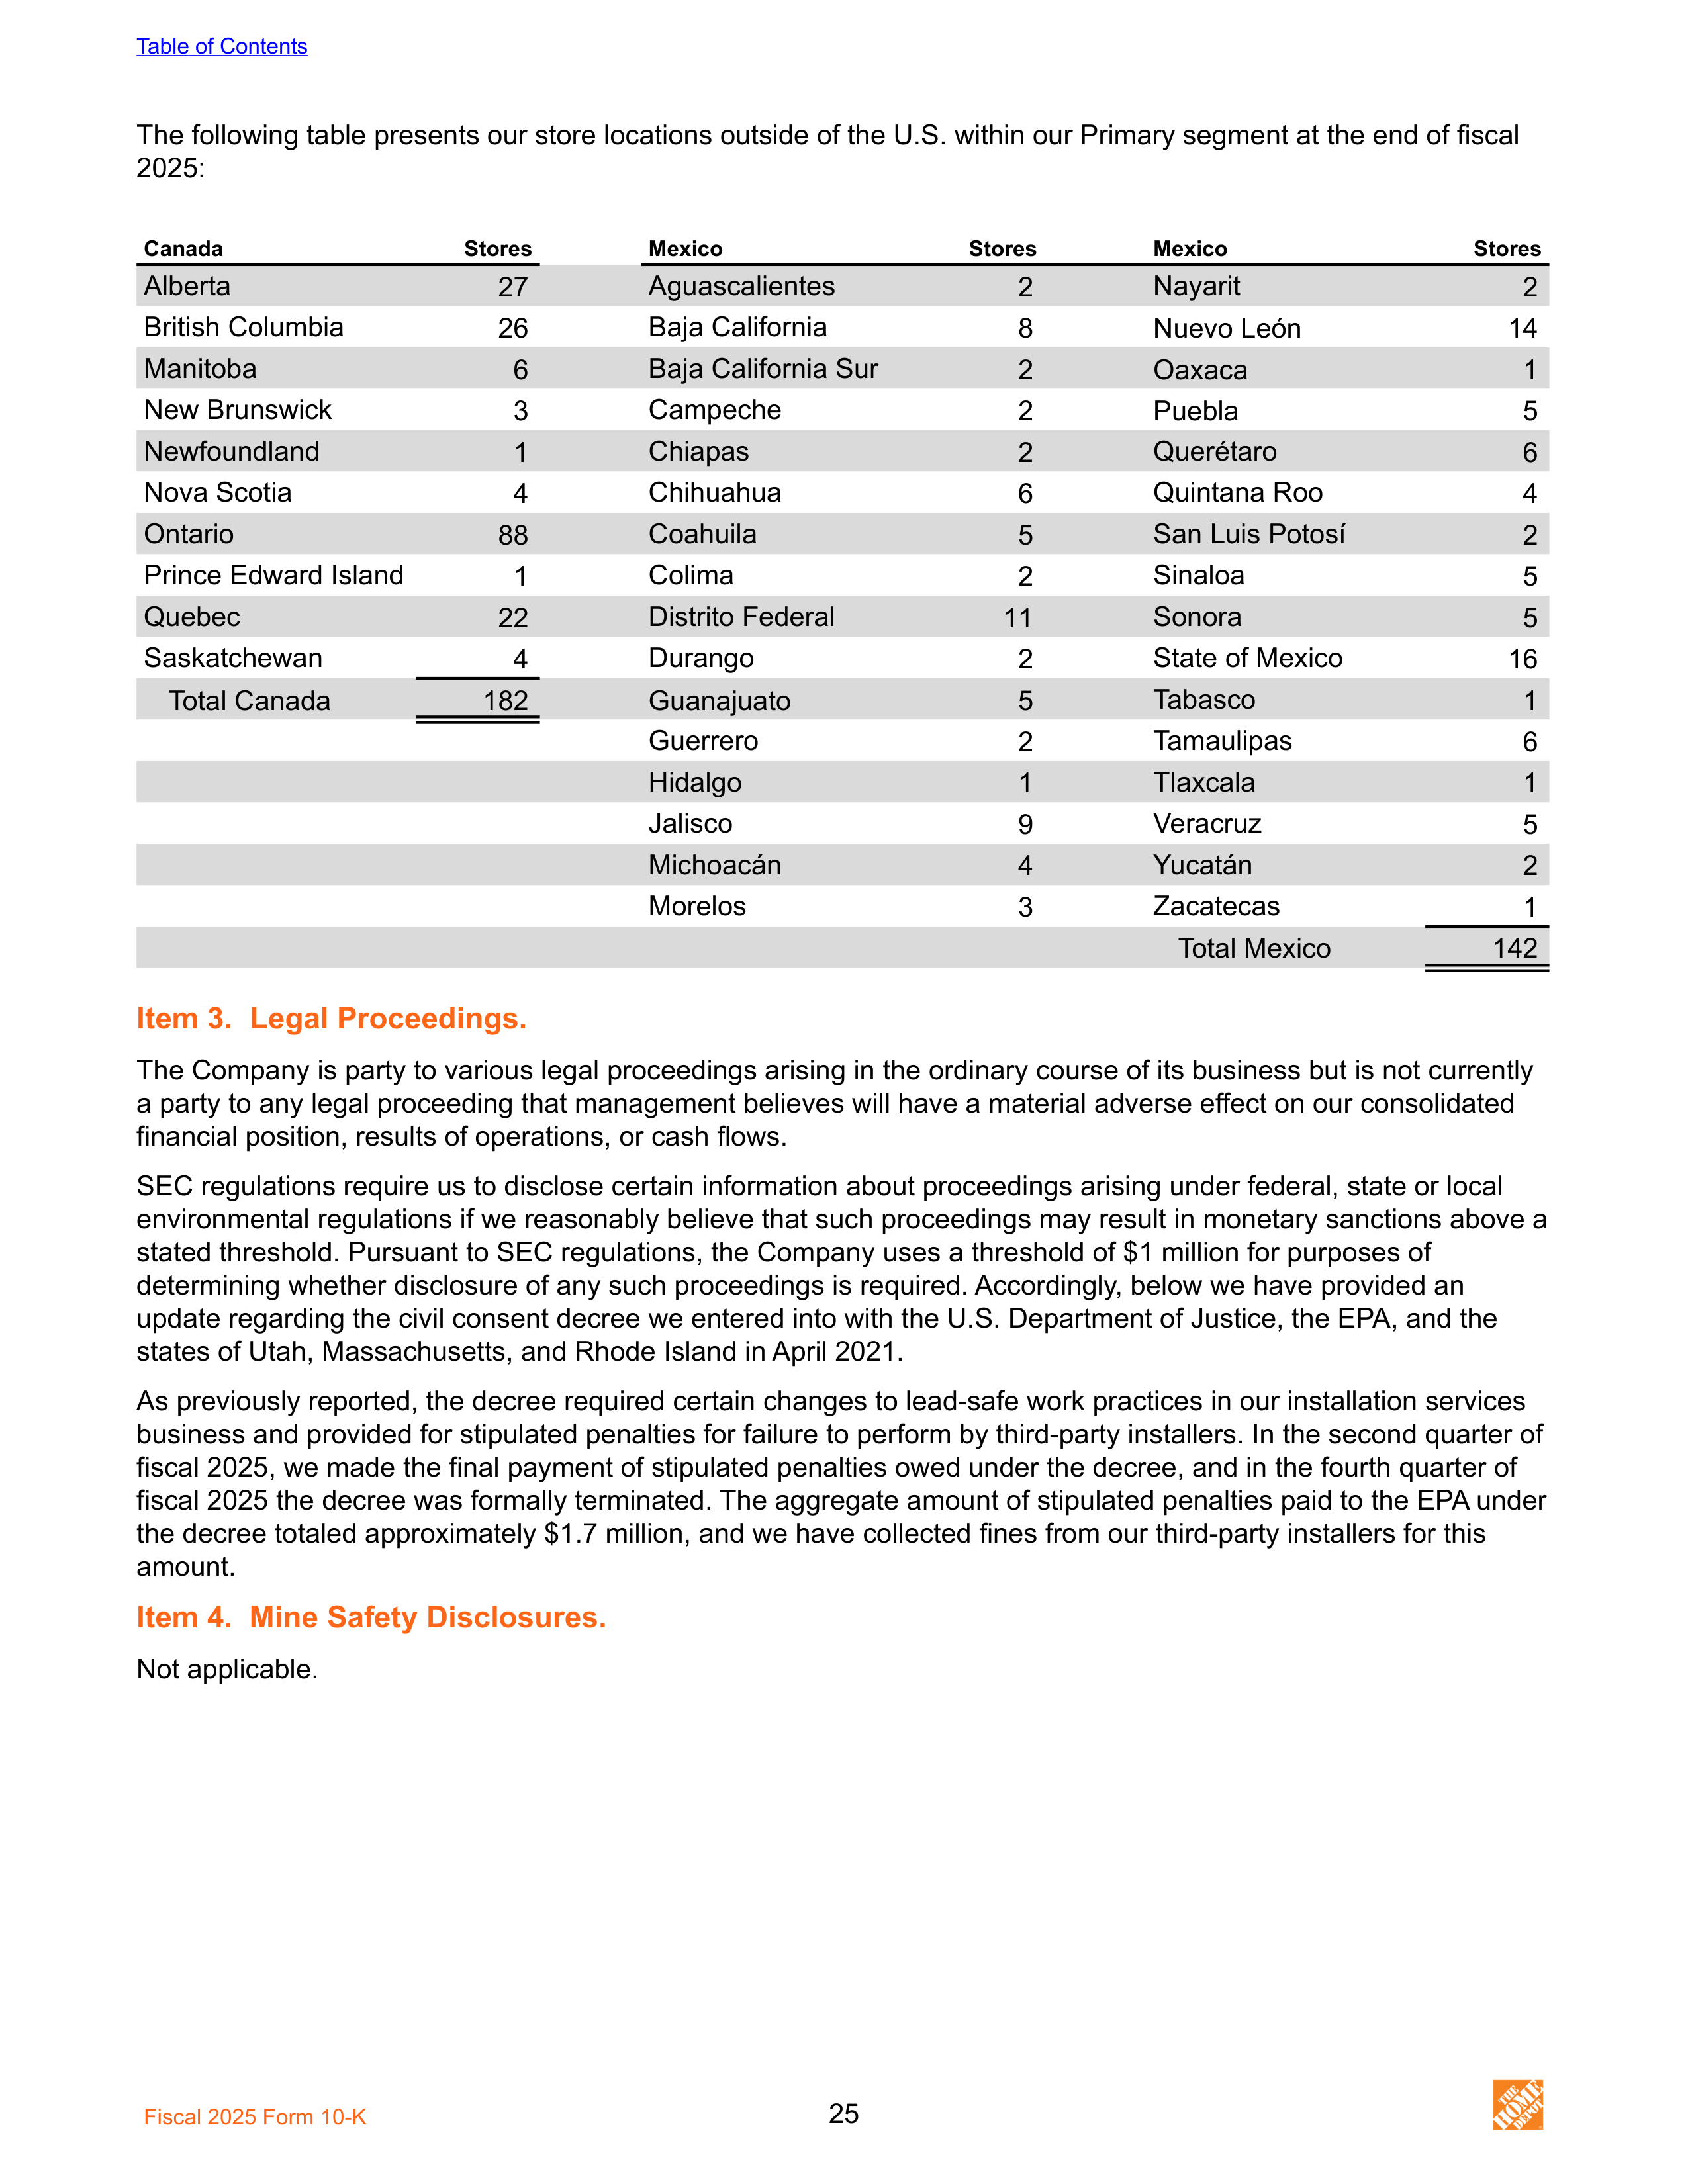
The following table presents our store locations outside of the U.S. within our Primary segment at the end of fiscal
2025:
Canada
Stores
Mexico
Stores
Mexico
Stores
Alberta
27
Aguascalientes
2
Nayarit
2
British Columbia
26
Baja California
8
Nuevo León
14
Manitoba
6
Baja California Sur
2
Oaxaca
1
New Brunswick
3
Campeche
2
Puebla
5
Newfoundland
1
Chiapas
2
Querétaro
6
Nova Scotia
4
Chihuahua
6
Quintana Roo
4
Ontario
88
Coahuila
5
San Luis Potosí
2
Prince Edward Island
1
Colima
2
Sinaloa
5
Quebec
22
Distrito Federal
11
Sonora
5
Saskatchewan
4
Durango
2
State of Mexico
16
Total Canada
182
Guanajuato
5
Tabasco
1
Guerrero
2
Tamaulipas
6
Hidalgo
1
Tlaxcala
1
Jalisco
9
Veracruz
5
Michoacán
4
Yucatán
2
Morelos
3
Zacatecas
1
Total Mexico
142
Item 3. Legal Proceedings.
The Company is party to various legal proceedings arising in the ordinary course of its business but is not currently
a party to any legal proceeding that management believes will have a material adverse effect on our consolidated
financial position, results of operations, or cash flows.
SEC regulations require us to disclose certain information about proceedings arising under federal, state or local
environmental regulations if we reasonably believe that such proceedings may result in monetary sanctions above a
stated threshold. Pursuant to SEC regulations, the Company uses a threshold of $1 million for purposes of
determining whether disclosure of any such proceedings is required. Accordingly, below we have provided an
update regarding the civil consent decree we entered into with the U.S. Department of Justice, the EPA, and the
states of Utah, Massachusetts, and Rhode Island in April 2021.
As previously reported, the decree required certain changes to lead-safe work practices in our installation services
business and provided for stipulated penalties for failure to perform by third-party installers. In the second quarter of
fiscal 2025, we made the final payment of stipulated penalties owed under the decree, and in the fourth quarter of
fiscal 2025 the decree was formally terminated. The aggregate amount of stipulated penalties paid to the EPA under
the decree totaled approximately $1.7 million, and we have collected fines from our third-party installers for this
amount.
Item 4. Mine Safety Disclosures.
Not applicable.
Table of Contents
Fiscal 2025 Form 10-K
25
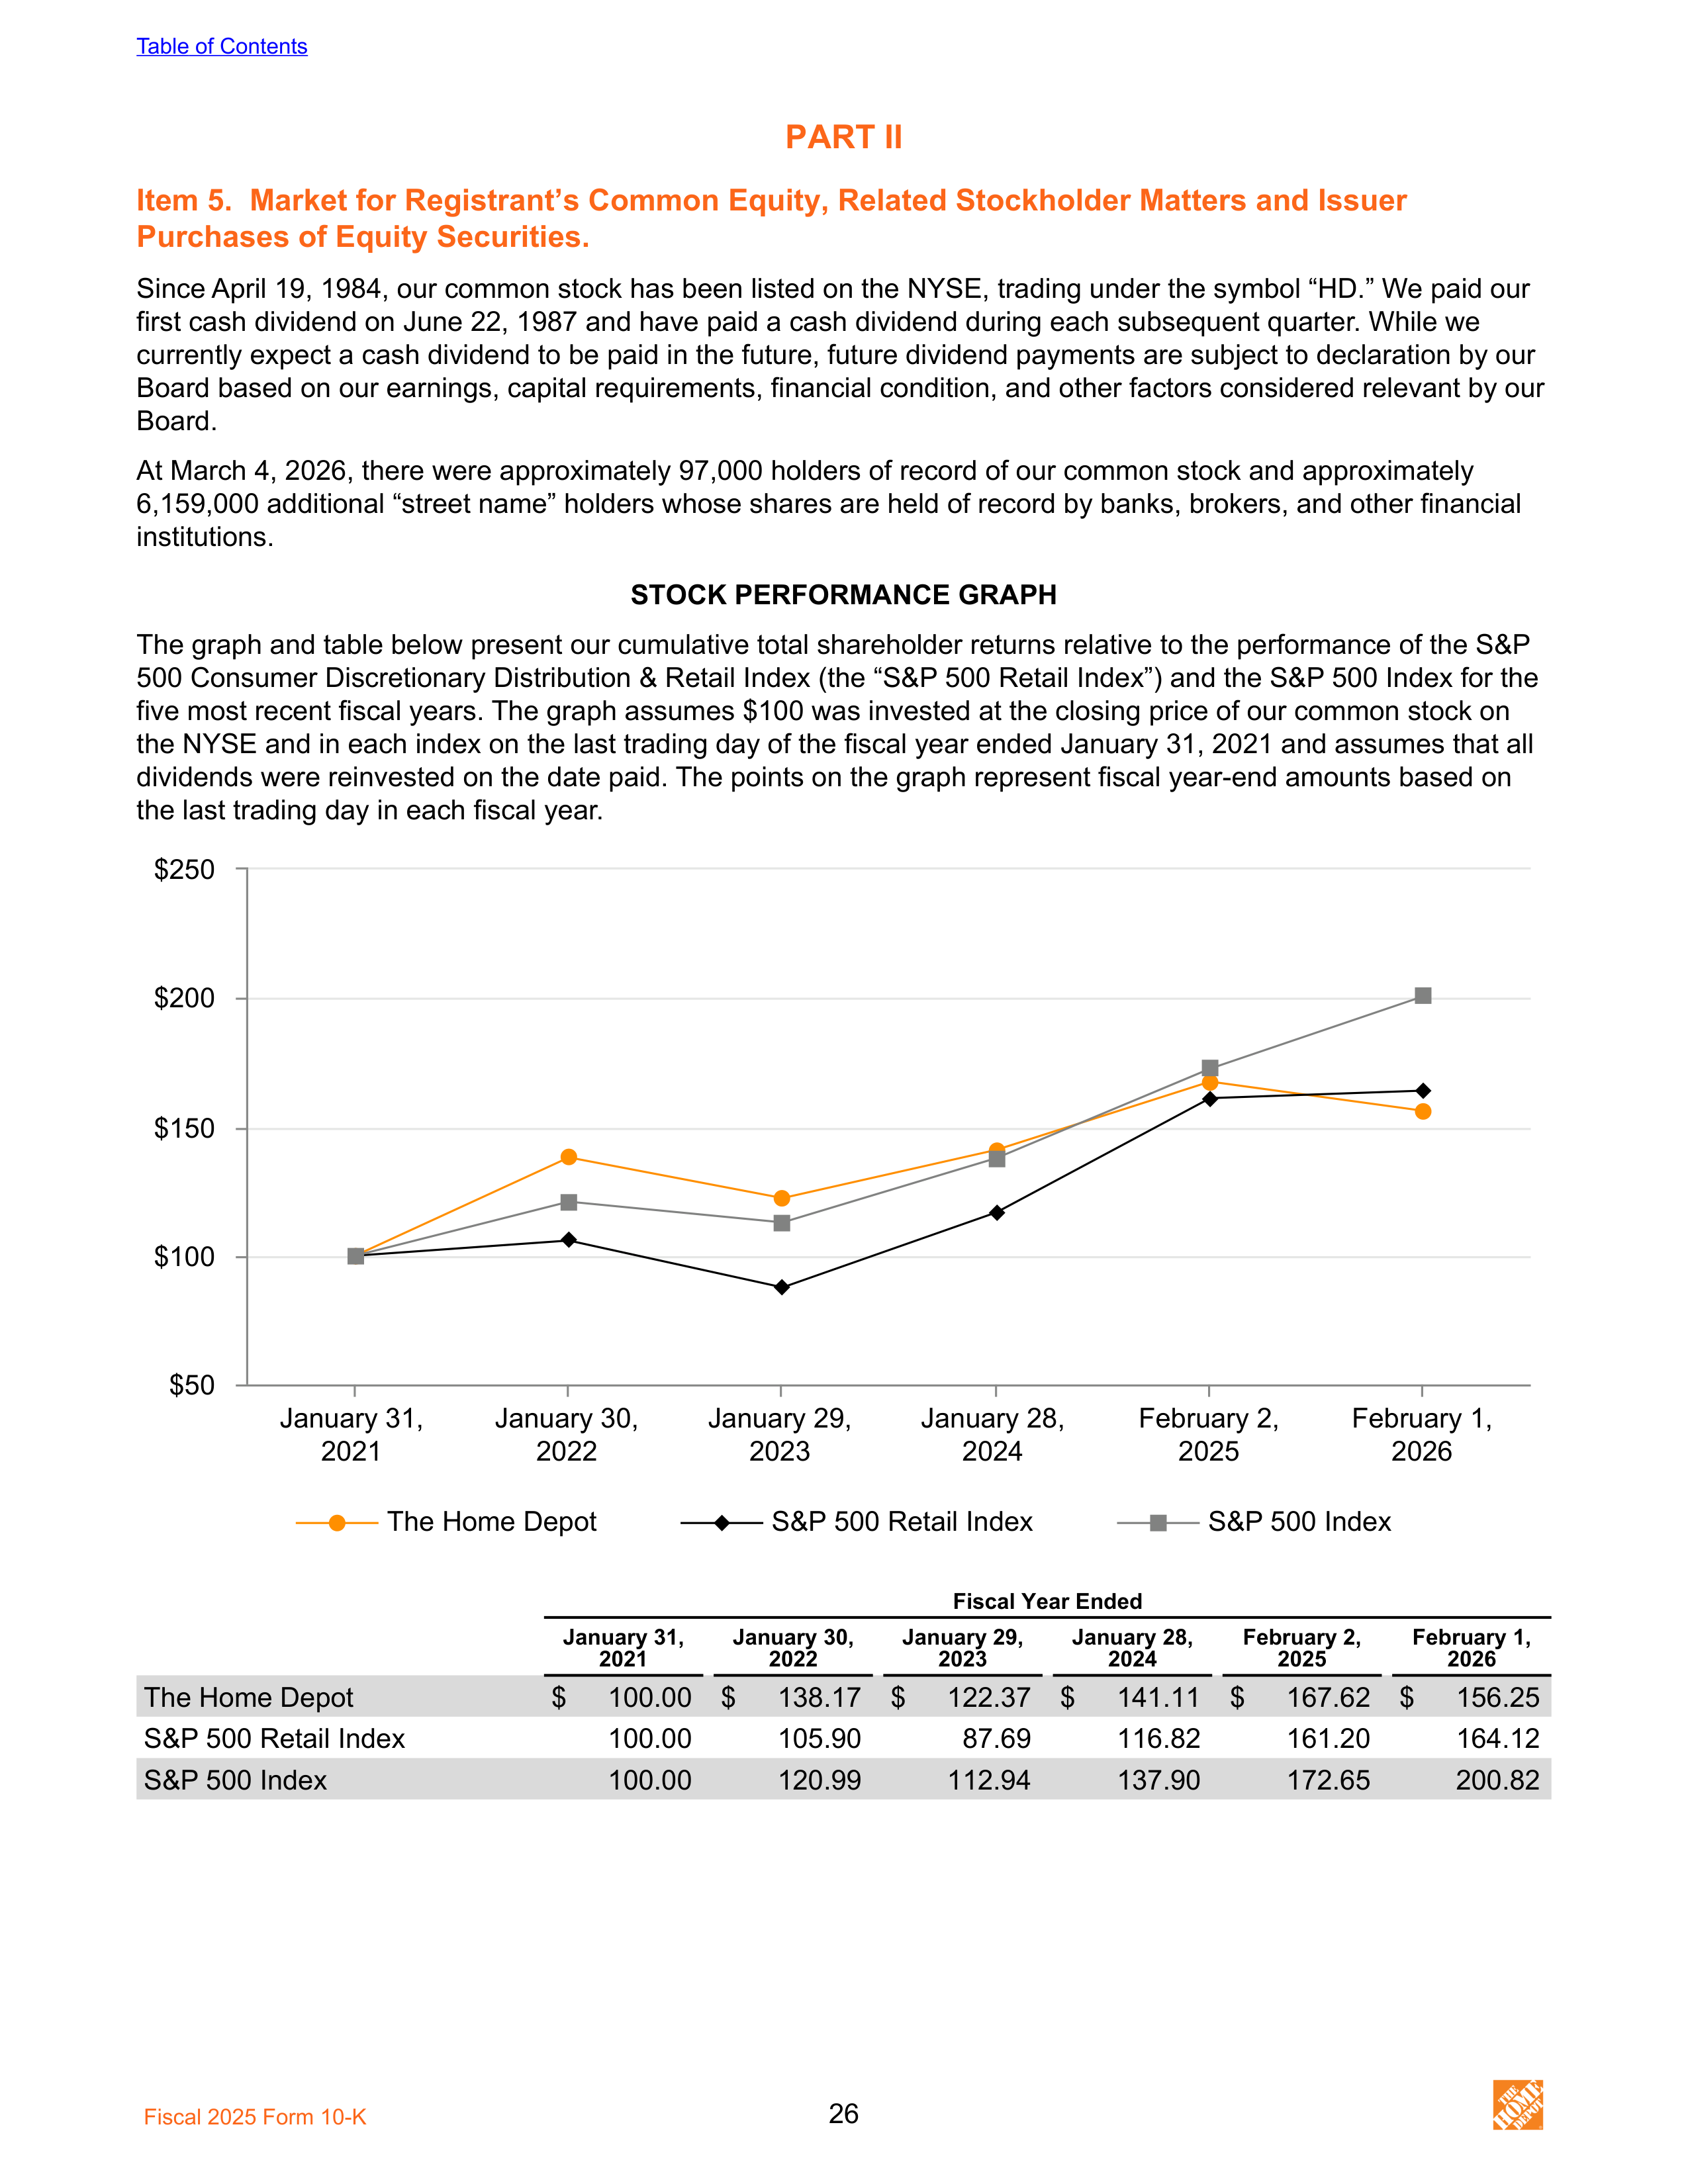
PART II
Item 5. Market for Registrant’s Common Equity, Related Stockholder Matters and Issuer
Purchases of Equity Securities.
Since April 19, 1984, our common stock has been listed on the NYSE, trading under the symbol “HD.” We paid our
first cash dividend on June 22, 1987 and have paid a cash dividend during each subsequent quarter. While we
currently expect a cash dividend to be paid in the future, future dividend payments are subject to declaration by our
Board based on our earnings, capital requirements, financial condition, and other factors considered relevant by our
Board.
At March 4, 2026, there were approximately 97,000 holders of record of our common stock and approximately
6,159,000 additional “street name” holders whose shares are held of record by banks, brokers, and other financial
institutions.
STOCK PERFORMANCE GRAPH
The graph and table below present our cumulative total shareholder returns relative to the performance of the S&P
500 Consumer Discretionary Distribution & Retail Index (the “S&P 500 Retail Index”) and the S&P 500 Index for the
five most recent fiscal years. The graph assumes $100 was invested at the closing price of our common stock on
the NYSE and in each index on the last trading day of the fiscal year ended January 31, 2021 and assumes that all
dividends were reinvested on the date paid. The points on the graph represent fiscal year-end amounts based on
the last trading day in each fiscal year.
The Home Depot
S&P 500 Retail Index
S&P 500 Index
January 31,
2021
January 30,
2022
January 29,
2023
January 28,
2024
February 2,
2025
February 1,
2026
$50
$100
$150
$200
$250
Fiscal Year Ended
January 31,
2021
January 30,
2022
January 29,
2023
January 28,
2024
February 2,
2025
February 1,
2026
The Home Depot
$
100.00 $
138.17 $
122.37 $
141.11 $
167.62 $
156.25
S&P 500 Retail Index
100.00
105.90
87.69
116.82
161.20
164.12
S&P 500 Index
100.00
120.99
112.94
137.90
172.65
200.82
Table of Contents
Fiscal 2025 Form 10-K
26
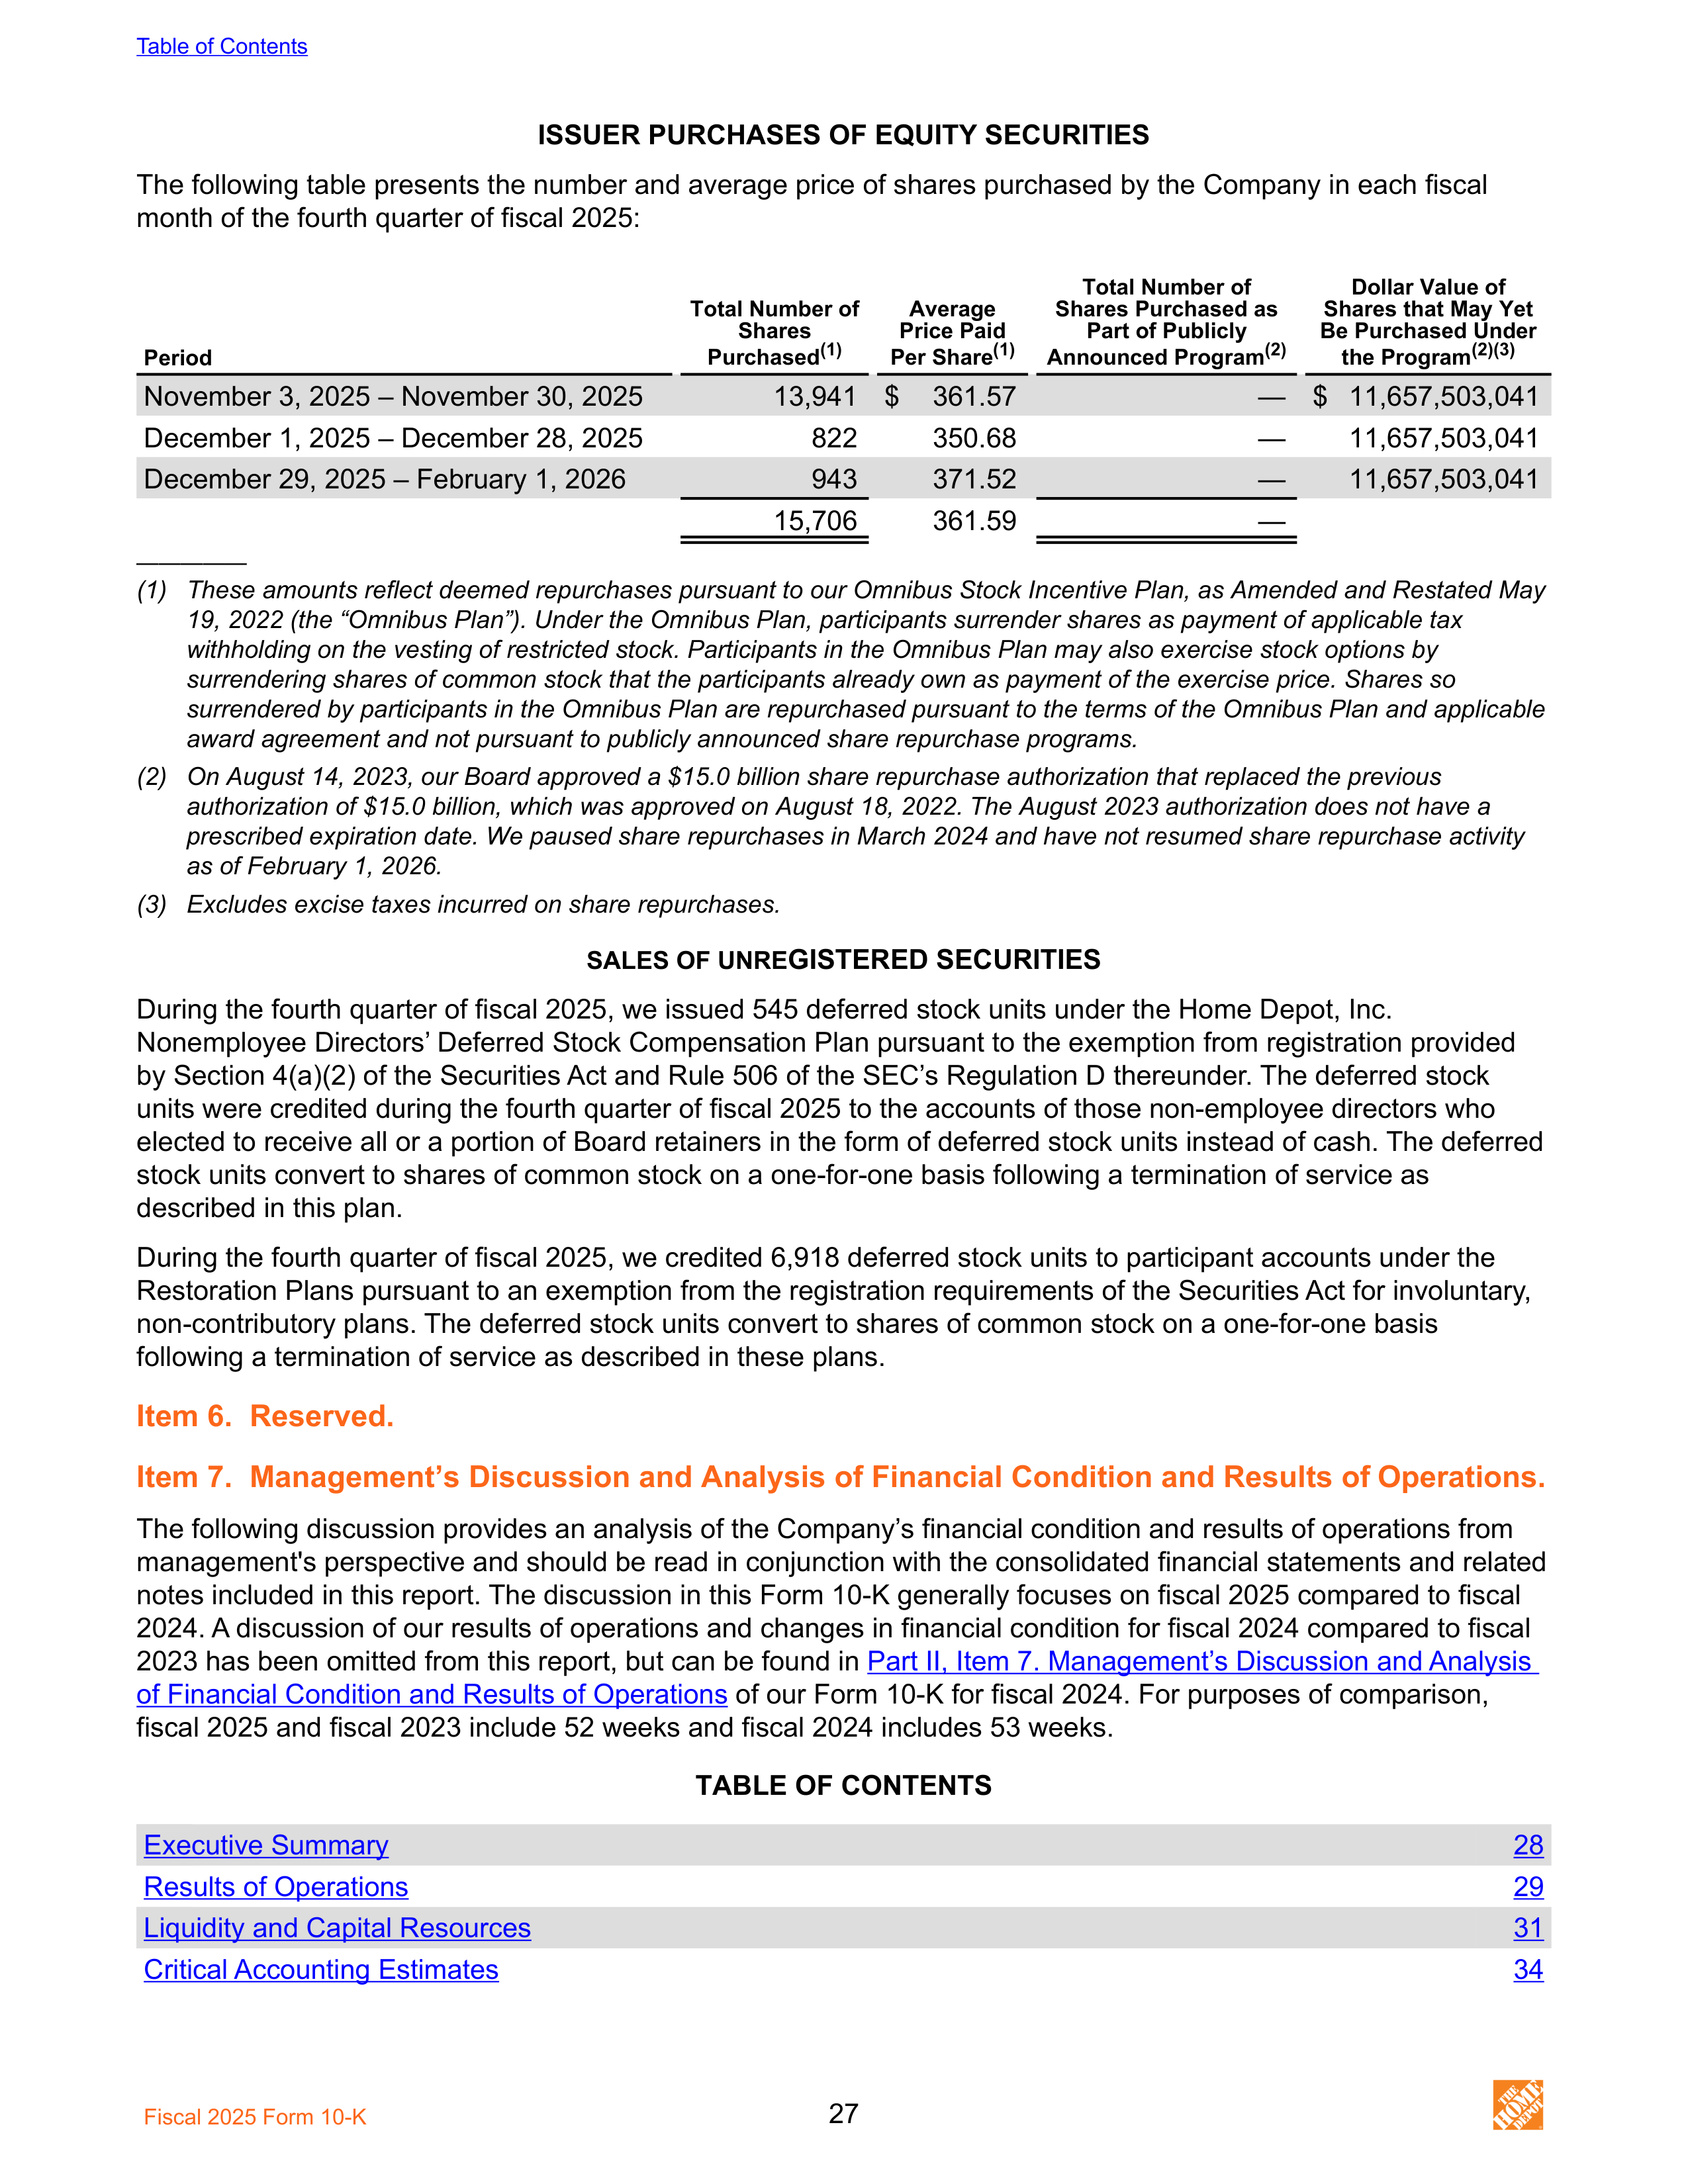
ISSUER PURCHASES OF EQUITY SECURITIES
The following table presents the number and average price of shares purchased by the Company in each fiscal
month of the fourth quarter of fiscal 2025:
Period
Total Number of
Shares
Purchased
(1)
Average
Price Paid
Per Share
(1)
Total Number of
Shares Purchased as
Part of Publicly
Announced Program
(2)
Dollar Value of
Shares that May Yet
Be Purchased Under
the Program
(2)(3)
November 3, 2025 – November 30, 2025
13,941 $
361.57
— $ 11,657,503,041
December 1, 2025 – December 28, 2025
822
350.68
—
11,657,503,041
December 29, 2025 – February 1, 2026
943
371.52
—
11,657,503,041
15,706
361.59
—
—————
(1)
These amounts reflect deemed repurchases pursuant to our Omnibus Stock Incentive Plan, as Amended and Restated May
19, 2022 (the “Omnibus Plan”). Under the Omnibus Plan, participants surrender shares as payment of applicable tax
withholding on the vesting of restricted stock. Participants in the Omnibus Plan may also exercise stock options by
surrendering shares of common stock that the participants already own as payment of the exercise price. Shares so
surrendered by participants in the Omnibus Plan are repurchased pursuant to the terms of the Omnibus Plan and applicable
award agreement and not pursuant to publicly announced share repurchase programs.
(2)
On August 14, 2023, our Board approved a $15.0 billion share repurchase authorization that replaced the previous
authorization of $15.0 billion, which was approved on August 18, 2022. The August 2023 authorization does not have a
prescribed expiration date. We paused share repurchases in March 2024 and have not resumed share repurchase activity
as of February 1, 2026.
(3)
Excludes excise taxes incurred on share repurchases.
SALES OF UNRE
GISTERED SECURITIES
During the fourth quarter of fiscal 2025, we issued 545 deferred stock units under the Home Depot, Inc.
Nonemployee Directors’ Deferred Stock Compensation Plan pursuant to the exemption from registration provided
by Section 4(a)(2) of the Securities Act and Rule 506 of the SEC’s Regulation D thereunder. The deferred stock
units were credited during the fourth quarter of fiscal 2025 to the accounts of those non-employee directors who
elected to receive all or a portion of Board retainers in the form of deferred stock units instead of cash. The deferred
stock units convert to shares of common stock on a one-for-one basis following a termination of service as
described in this plan.
During the fourth quarter of fiscal 2025, we credited 6,918 deferred stock units to participant accounts under the
Restoration Plans pursuant to an exemption from the registration requirements of the Securities Act for involuntary,
non-contributory plans. The deferred stock units convert to shares of common stock on a one-for-one basis
following a termination of service as described in these plans.
Item 6. Reserved.
Item 7. Management’s Discussion and Analysis of Financial Condition and Results of Operations.
The following discussion provides an analysis of the Company’s financial condition and results of operations from
management's perspective and should be read in conjunction with the consolidated financial statements and related
notes included in this report. The discussion in this Form 10-K generally focuses on fiscal 2025 compared to fiscal
2024. A discussion of our results of operations and changes in financial condition for fiscal 2024 compared to fiscal
2023 has been omitted from this report, but can be found in
Part II, Item 7. Management’s Discussion and Analysis
of Financial Condition and Results of Operations
of our Form 10-K for fiscal 2024. For purposes of comparison,
fiscal 2025 and fiscal 2023 include 52 weeks and fiscal 2024 includes 53 weeks.
TABLE OF CONTENTS
Executive Summary
28
Results of Operations
29
Liquidity and Capital Resources
31
Critical Accounting Estimates
34
Table of Contents
Fiscal 2025 Form 10-K
27
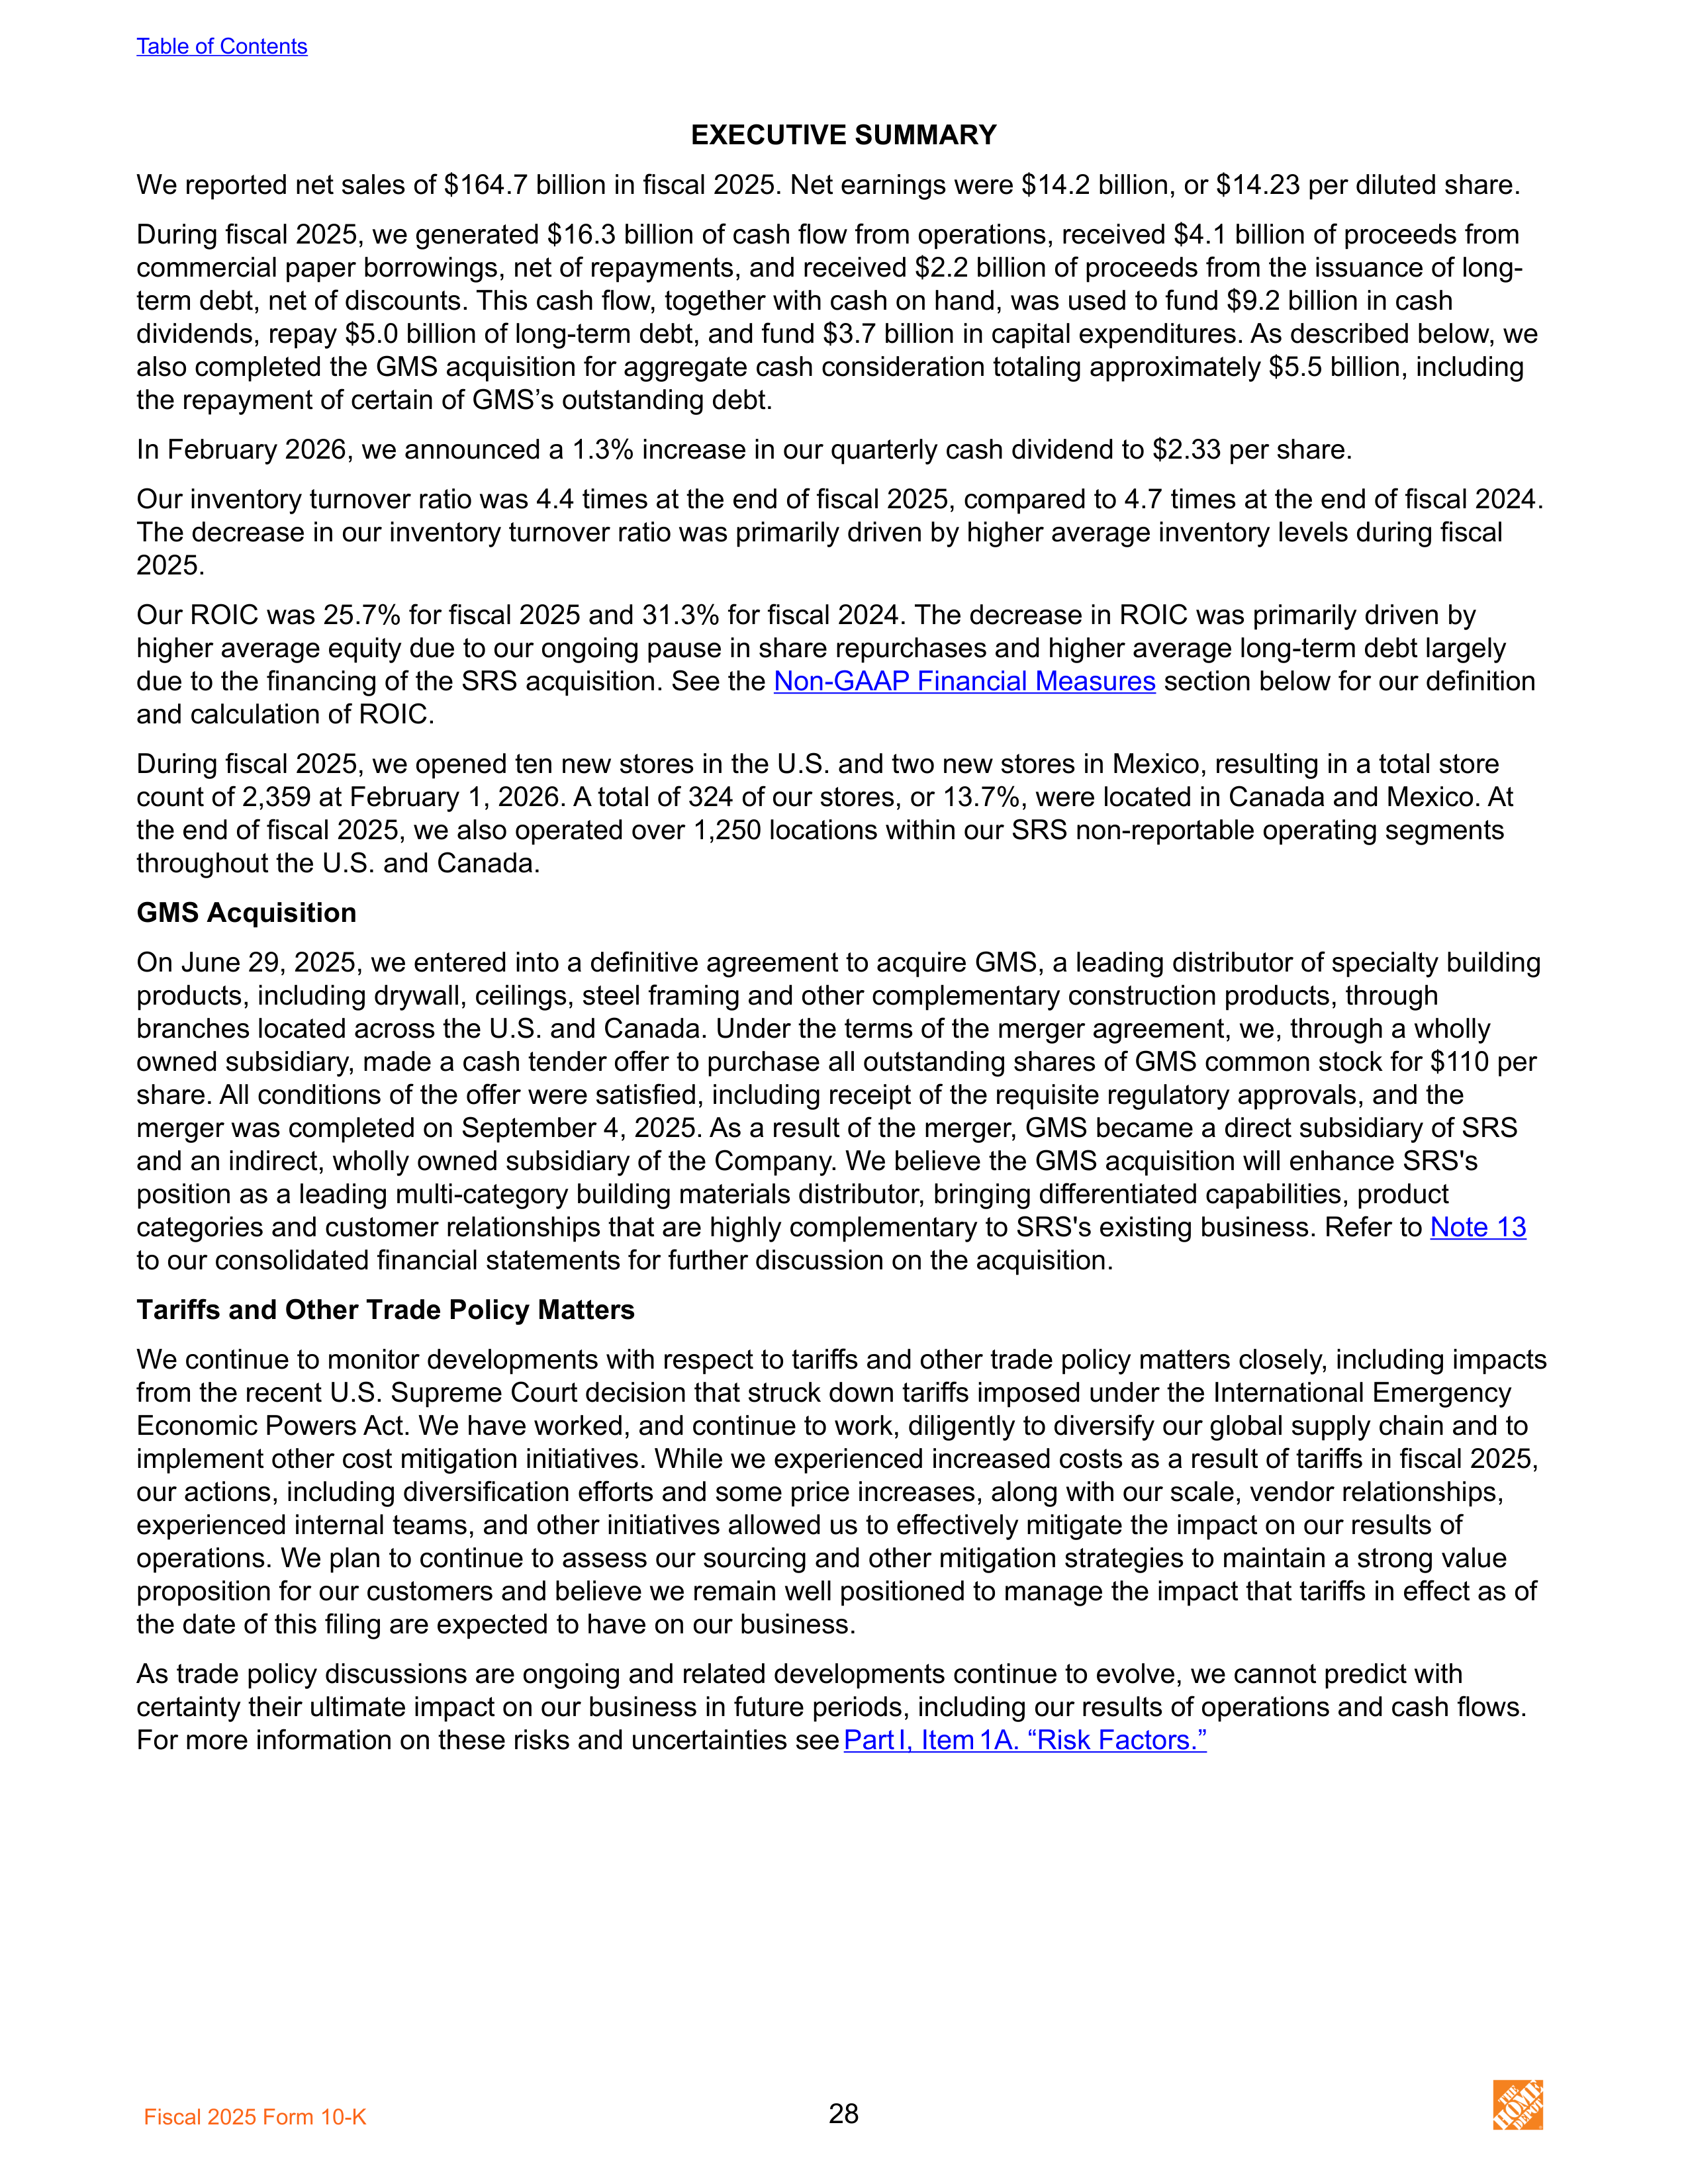
EXECUTIVE SUMMARY
We reported net sales of $164.7 billion in fiscal 2025. Net earnings were $14.2 billion, or $14.23 per diluted share.
During fiscal 2025, we generated $16.3 billion of cash flow from operations, received $4.1 billion of proceeds from
commercial paper borrowings, net of repayments, and received $2.2 billion of proceeds from the issuance of long-
term debt, net of discounts. This cash flow, together with cash on hand, was used to fund $9.2 billion in cash
dividends, repay $5.0 billion of long-term debt, and fund $3.7 billion in capital expenditures. As described below, we
also completed the GMS acquisition for aggregate cash consideration totaling approximately $5.5 billion, including
the repayment of certain of GMS’s outstanding debt.
In February 2026, we announced a 1.3% increase in our quarterly cash dividend to $2.33 per share.
Our inventory turnover ratio was 4.4 times at the end of fiscal 2025, compared to 4.7 times at the end of fiscal 2024.
The decrease in our inventory turnover ratio was primarily driven by higher average inventory levels during fiscal
2025.
Our ROIC was 25.7% for fiscal 2025 and 31.3% for fiscal 2024. The decrease in ROIC was primarily driven by
higher average equity due to our ongoing pause in share repurchases and higher average long-term debt largely
due to the financing of the SRS acquisition. See the
Non-GAAP Financial Measures
section below for our definition
and calculation of ROIC.
During fiscal 2025, we opened ten new stores in the U.S. and two new stores in Mexico, resulting in a total store
count of 2,359 at February 1, 2026. A total of 324 of our stores, or 13.7%, were located in Canada and Mexico. At
the end of fiscal 2025, we also operated over 1,250 locations within our SRS non-reportable operating segments
throughout the U.S. and Canada.
GMS Acquisition
On June 29, 2025, we entered into a definitive agreement to acquire GMS, a leading distributor of specialty building
products, including drywall, ceilings, steel framing and other complementary construction products, through
branches located across the U.S. and Canada. Under the terms of the merger agreement, we, through a wholly
owned subsidiary, made a cash tender offer to purchase all outstanding shares of GMS common stock for $110 per
share. All conditions of the offer were satisfied, including receipt of the requisite regulatory approvals, and the
merger was completed on September 4, 2025. As a result of the merger, GMS became a direct subsidiary of SRS
and an indirect, wholly owned subsidiary of the Company. We believe the GMS acquisition will enhance SRS's
position as a leading multi-category building materials distributor, bringing differentiated capabilities, product
categories and customer relationships that are highly complementary to SRS's existing business. Refer to
Note 13
to our consolidated financial statements for further discussion on the acquisition.
Tariffs and Other Trade Policy Matters
We continue to monitor developments with respect to tariffs and other trade policy matters closely, including impacts
from the recent U.S. Supreme Court decision that struck down tariffs imposed under the International Emergency
Economic Powers Act. We have worked, and continue to work, diligently to diversify our global supply chain and to
implement other cost mitigation initiatives. While we experienced increased costs as a result of tariffs in fiscal 2025,
our actions, including diversification efforts and some price increases, along with our scale, vendor relationships,
experienced internal teams, and other initiatives allowed us to effectively mitigate the impact on our results of
operations. We plan to continue to assess our sourcing and other mitigation strategies to maintain a strong value
proposition for our customers and believe we remain well positioned to manage the impact that tariffs in effect as of
the date of this filing are expected to have on our business.
As trade policy discussions are ongoing and related developments continue to evolve, we cannot predict with
certainty their ultimate impact on our business in future periods, including our results of operations and cash flows.
For more information on these risks and uncertainties see
Part
I, Item
1A. “Risk Factors.”
Table of Contents
Fiscal 2025 Form 10-K
28
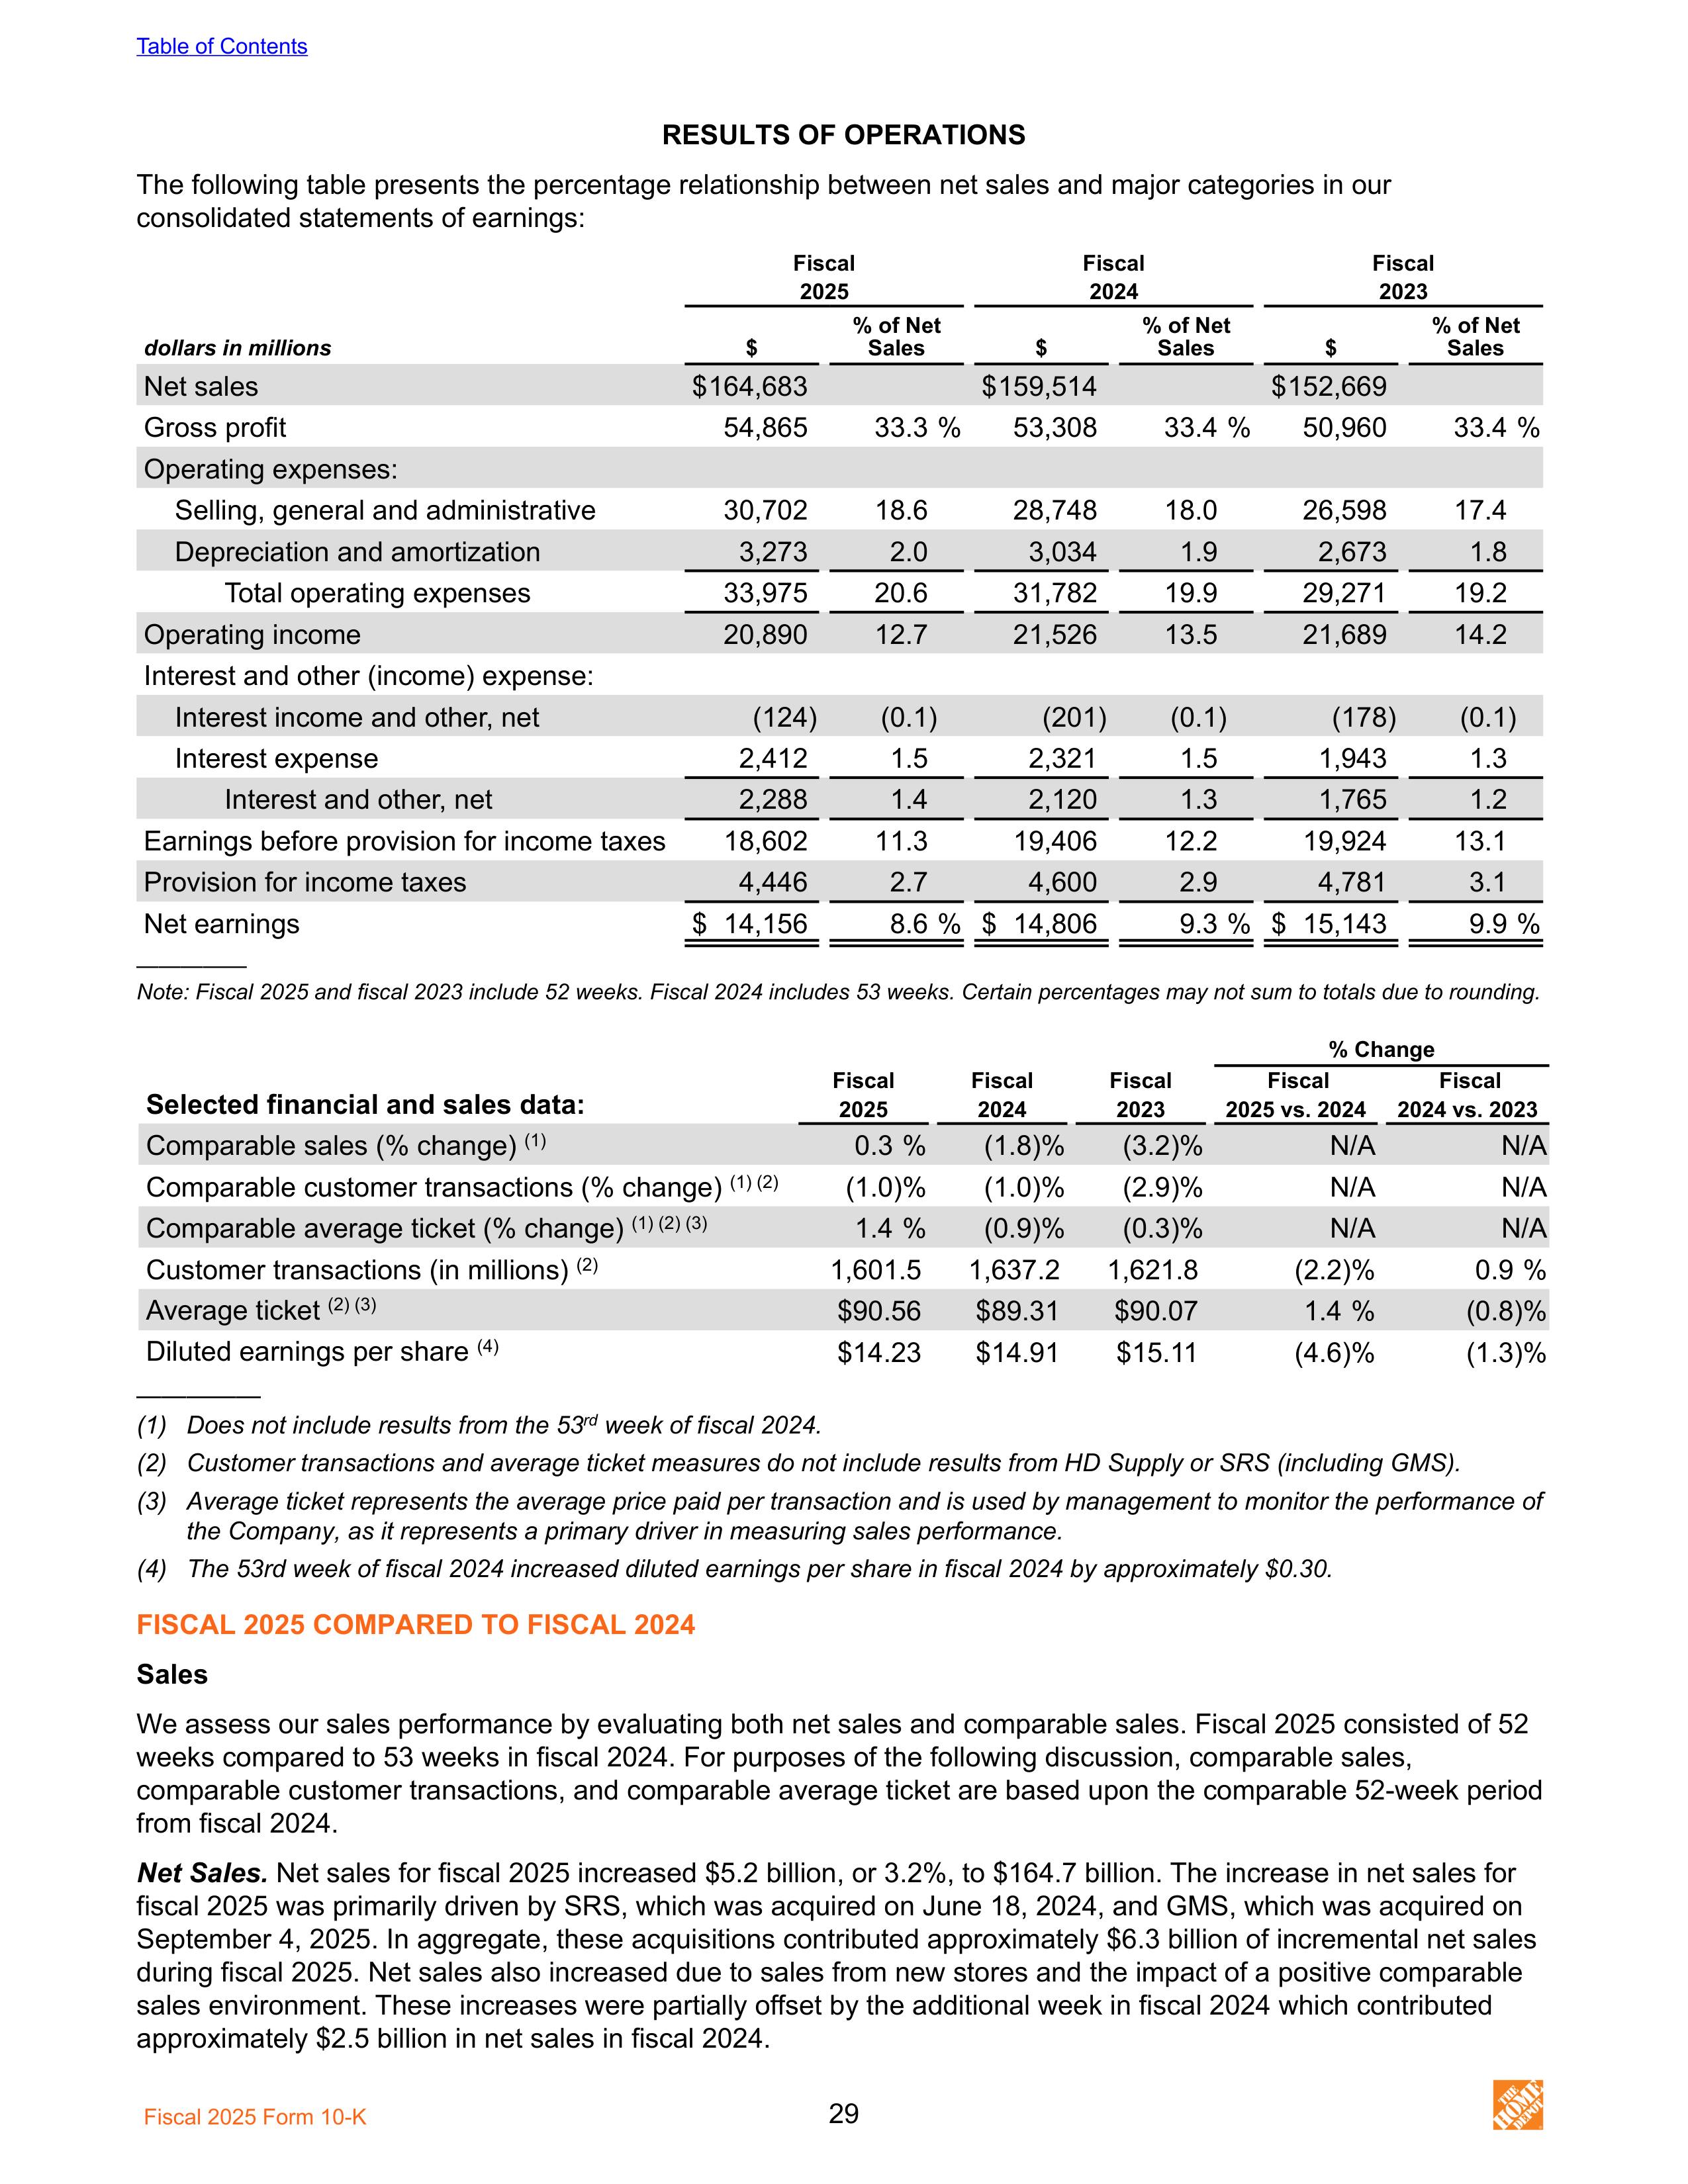
RESULTS OF OPERATIONS
The following table presents the percentage relationship between net sales and major categories in our
consolidated statements of earnings:
Fiscal
Fiscal
Fiscal
2025
2024
2023
dollars in millions
$
% of Net
Sales
$
% of Net
Sales
$
% of Net
Sales
Net sales
$ 164,683
$ 159,514
$ 152,669
Gross profit
54,865
33.3 %
53,308
33.4 %
50,960
33.4 %
Operating expenses:
Selling, general and administrative
30,702
18.6
28,748
18.0
26,598
17.4
Depreciation and amortization
3,273
2.0
3,034
1.9
2,673
1.8
Total operating expenses
33,975
20.6
31,782
19.9
29,271
19.2
Operating income
20,890
12.7
21,526
13.5
21,689
14.2
Interest and other (income) expense:
Interest income and other, net
(124)
(0.1)
(201)
(0.1)
(178)
(0.1)
Interest expense
2,412
1.5
2,321
1.5
1,943
1.3
Interest and other, net
2,288
1.4
2,120
1.3
1,765
1.2
Earnings before provision for income taxes
18,602
11.3
19,406
12.2
19,924
13.1
Provision for income taxes
4,446
2.7
4,600
2.9
4,781
3.1
Net earnings
$ 14,156
8.6 %
$ 14,806
9.3 %
$ 15,143
9.9 %
—————
Note: Fiscal 2025 and fiscal 2023 include 52 weeks. Fiscal 2024 includes 53 weeks. Certain percentages may not sum to totals due to rounding.
% Change
Selected financial and sales data:
Fiscal
Fiscal
Fiscal
Fiscal
Fiscal
2025
2024
2023
2025 vs. 2024
2024 vs. 2023
Comparable sales (% change)
(1)
0.3 %
(1.8) %
(3.2) %
N/A
N/A
Comparable customer transactions (% change)
(1) (2)
(1.0) %
(1.0) %
(2.9) %
N/A
N/A
Comparable average ticket (% change)
(1) (2) (3)
1.4 %
(0.9) %
(0.3) %
N/A
N/A
Customer transactions (in millions)
(2)
1,601.5
1,637.2
1,621.8
(2.2) %
0.9 %
Average ticket
(2) (3)
$90.56
$89.31
$90.07
1.4 %
(0.8) %
Diluted earnings per share
(4)
$14.23
$14.91
$15.11
(4.6) %
(1.3) %
—————
(1)
Does not include results from the 53
rd
week of fiscal 2024.
(2)
Customer transactions and average ticket measures do not include results from HD Supply or SRS (including GMS).
(3)
Average ticket represents the average price paid per transaction and is used by management to monitor the performance of
the Company, as it represents a primary driver in measuring sales performance.
(4)
The 53rd week of fiscal 2024 increased diluted earnings per share in fiscal 2024 by approximately $0.30.
FISCAL 2025 COMPARED TO FISCAL 2024
Sales
We assess our sales performance by evaluating both net sales and comparable sales. Fiscal 2025 consisted of 52
weeks compared to 53 weeks in fiscal 2024. For purposes of the following discussion, comparable sales,
comparable customer transactions, and comparable average ticket are based upon the comparable 52-week period
from fiscal 2024.
Net Sales.
Net sales for fiscal 2025 increased $5.2 billion, or 3.2%, to $164.7 billion. The increase in net sales for
fiscal 2025 was primarily driven by SRS, which was acquired on June 18, 2024, and GMS, which was acquired on
September 4, 2025. In aggregate, these acquisitions contributed approximately $6.3 billion of incremental net sales
during fiscal 2025. Net sales also increased due to sales from new stores and the impact of a positive comparable
sales environment. These increases were partially offset by the additional week in fiscal 2024 which contributed
approximately $2.5 billion in net sales in fiscal 2024.
Table of Contents
Fiscal 2025 Form 10-K
29
Online sales represented 15.9% of net sales during fiscal 2025 and increased by 8.7% compared to fiscal 2024.
Calculated on a comparable week basis relative to fiscal 2024, online sales increased by 10.4%. Online sales
consist of sales of products generated through websites and mobile applications and does not include results from
HD Supply or SRS (including GMS).
A stronger U.S. dollar compared to fiscal 2024 negatively impacted net sales by $307 million in fiscal 2025.
Comparable Sales.
Comparable sales is a measure that highlights the performance of our existing locations and
websites by measuring the change in net sales for a period over the comparable prior period of equivalent length.
Comparable sales includes sales at locations, physical and online, open greater than 52 weeks (including remodels
and relocations) and excludes closed stores. Acquisitions are typically included in comparable sales after they have
been owned for more than 52 weeks. For our calculation of comparable sales in fiscal 2025, we compare weeks 1
through 52 in fiscal 2025 against weeks 2 through 53 in fiscal 2024. Comparable sales is intended only as
supplemental information and is not a substitute for net sales presented in accordance with GAAP. The method of
calculating comparable sales varies across the retail industry. As a result, our method of calculating comparable
sales may not be the same as similarly titled measures reported by other companies.
Total comparable sales increased 0.3% in fiscal 2025, primarily reflecting a 1.4% increase in comparable average
ticket, partially offset by a 1.0% decrease in comparable customer transactions compared to fiscal 2024. Our
comparable sales results reflect customer engagement with smaller home improvement projects, which was offset
by the impact of continued macroeconomic uncertainties and other macroeconomic factors, including a persisting
high interest rate environment, that continue to pressure broader home improvement demand.
For fiscal 2025, our Storage & Organization, Electrical, Bath, Plumbing, Indoor Garden, Outdoor Garden, Kitchen &
Blinds, Hardware, Power, Building Materials, and Appliances merchandising departments within our Primary
segment posted positive comparable sales compared to fiscal 2024. Our other merchandising departments within
our Primary segment posted negative comparable sales during fiscal 2025 compared to fiscal 2024.
Gross Profit
Gross profit increased $1.6 billion, or 2.9%, to $54.9 billion in fiscal 2025. Gross profit as a percent of net sales, or
gross profit margin, was 33.3% in fiscal 2025 compared to 33.4% in fiscal 2024. The decrease in gross profit margin
reflects the inclusion of SRS and GMS in our consolidated results, partially offset by lower shrink and certain supply
chain benefits within our Primary segment.
Operating Expenses
Our operating expenses are composed of SG&A and depreciation and amortization.
Selling, General & Administrative.
SG&A increased $2.0 billion, or 6.8%, to $30.7 billion in fiscal 2025. As a
percent of net sales, SG&A was 18.6% in fiscal 2025 compared to 18.0% in fiscal 2024, which primarily reflects
higher payroll and related costs in fiscal 2025 along with the impact of a non-recurring legal-related benefit
recognized during fiscal 2024 within our Primary segment.
Depreciation and Amortization.
Depreciation and amortization increased $239 million, or 7.9%, to $3.3 billion in
fiscal 2025. As a percent of net sales, depreciation and amortization was 2.0% in fiscal 2025 compared to 1.9% in
fiscal 2024, which primarily reflects increased intangible asset amortization expense resulting from our acquisitions
of SRS and GMS.
Interest and Other, net
Interest and other, net increased $168 million, or 7.9%, to $2.3 billion in fiscal 2025. As a percentage of net sales,
interest and other, net, was 1.4% in fiscal 2025 compared to 1.3% in fiscal 2024, primarily due to higher average
long-term debt balances and lower interest income in fiscal 2025.
Provision for Income Taxes
Our combined effective income tax rate was 23.9% in fiscal 2025 compared to 23.7% in fiscal 2024.
Diluted Earnings per Share
Diluted earnings per share were $14.23 in fiscal 2025 compared to $14.91 in fiscal 2024. The decrease in diluted
earnings per share for fiscal 2025 was primarily driven by lower net earnings during fiscal 2025. The 53rd week of
fiscal 2024 increased diluted earnings per share in fiscal 2024 by approximately $0.30.
Table of Contents
Fiscal 2025 Form 10-K
30
NON-GAAP FINANCIAL MEASURES
To provide clarity on our operating performance, we supplement our reporting with certain non-GAAP financial
measures. However, this supplemental information should not be considered in isolation or as a substitute for the
related GAAP measures. Non-GAAP financial measures presented herein may differ from similar measures used by
other companies.
Return on Invested Capital
We believe ROIC is meaningful for management, investors and ratings agencies because it measures how
effectively we deploy our capital base. ROIC is a non-GAAP profitability measure, not a measure of financial
performance under GAAP. We define ROIC as NOPAT, a non-GAAP financial measure, for the most recent twelve-
month period, divided by average debt and equity. We define average debt and equity as the average of beginning
and ending long-term debt (including current installments) and equity for the most recent twelve-month period.
The following table presents the calculation of ROIC, together with a reconciliation of NOPAT to net earnings (the
most comparable GAAP financial measure):
Fiscal
Fiscal
Fiscal
dollars in millions
2025
2024
2023
Net earnings
$
14,156
$
14,806
$
15,143
Interest and other, net
2,288
2,120
1,765
Provision for income taxes
4,446
4,600
4,781
Operating income
20,890
21,526
21,689
Income tax adjustment
(1)
(4,993)
(5,102)
(5,205)
NOPAT
$
15,897
$
16,424
$
16,484
Average debt and equity
$
61,914
$
52,431
$
44,955
ROIC
25.7 %
31.3 %
36.7 %
—————
Note: Fiscal 2025 and fiscal 2023 include 52 weeks. Fiscal 2024 includes 53 weeks. Consistent with our consolidated financial
statements, periods presented only include operating results for acquisitions since their respective acquisition dates.
(1)
Income tax adjustment is defined as operating income multiplied by our effective tax rate for the trailing twelve months.
LIQUIDITY AND CAPITAL RESOURCES
At February 1, 2026, we had $1.4 billion in cash and cash equivalents, of which $1.0 billion was held by our foreign
subsidiaries. We believe that our current cash position, cash flow generated from operations, funds available from
our commercial paper program, and access to the long-term debt capital markets should be sufficient not only for
our operating requirements, any required debt payments, and satisfaction of other contractual obligations, but also
to enable us to invest in the business, fund dividend payments, and fund any share repurchases through the next
several fiscal years. In addition, we believe we have the ability to obtain alternative sources of financing, if
necessary or appropriate.
Our material cash requirements include contractual and other obligations arising in the normal course of business.
Our contractual obligations include long-term debt and related interest payments, operating and finance lease
obligations, and purchase obligations. In addition to our cash requirements, we follow a disciplined approach to
capital allocation. This approach first prioritizes investing in the business, followed by paying dividends, with the
intent of then returning excess cash to shareholders in the form of share repurchases. In March 2024, we paused
share repurchases in connection with the SRS acquisition and do not have plans to resume share repurchases in
fiscal 2026 as we seek to reduce our outstanding debt.
On July 4, 2025, the legislation commonly referred to as the One Big Beautiful Bill Act (the “OBBBA”) was signed
into law in the U.S., which contains a broad range of tax provisions, including the allowance to expense 100% of the
cost of qualified property and immediate expensing of domestic research and experimental expenditures. The
above mentioned provisions resulted in a reduction in our fiscal 2025 cash tax payments.
Table of Contents
Fiscal 2025 Form 10-K
31
During fiscal 2025, we invested approximately $3.7 billion back into our business in the form of capital expenditures.
We plan to invest approximately $4 billion back into our business in the form of capital expenditures in fiscal 2026,
in line with our expectation of approximately 2.5% of projected fiscal 2026 net sales. We expect to make these
investments across initiatives supporting our strategy of driving our core and culture, including building new stores
and maintaining existing stores, delivering a frictionless, interconnected experience, and winning with Pros.
However, as in the past, we may adjust our capital expenditures to support the operations of the business, to
enhance long-term strategic positioning, or in response to the economic environment, as necessary or appropriate.
We may also utilize strategic acquisitions to help accelerate our strategic initiatives.
During fiscal 2025, we paid cash dividends of $9.2 billion to shareholders. In February 2026, we announced a 1.3%
increase in our quarterly cash dividend from $2.30 to $2.33 per share. We intend to pay a dividend in the future;
however, any future dividend is subject to declaration by our Board based on our earnings, capital requirements,
financial condition, and other factors considered relevant by our Board.
In August 2023, our Board approved a $15.0 billion share repurchase authorization that replaced the previous
authorization of $15.0 billion, which was approved in August 2022. The August 2023 authorization does not have a
prescribed expiration date. As of February 1, 2026, approximately $11.7 billion of the $15.0 billion share repurchase
authorization remained available.
DEBT
At the beginning of fiscal 2025, we had a commercial paper program that allowed for an aggregate of $7.0 billion in
borrowings, and was supported by $7.0 billion of back-up credit facilities. These back-up credit facilities consisted of
a five-year $3.5 billion credit facility scheduled to expire in July 2027, a 364-day $2.0 billion credit facility scheduled
to expire in May 2025, and a 364-day $1.5 billion credit facility scheduled to expire in July 2025.
In May 2025, we terminated all three back-up credit facility agreements and simultaneously entered into a new five-
year $3.5 billion credit facility scheduled to expire in May 2030 and a new 364-day $3.5 billion credit facility
scheduled to expire in May 2026.
In July 2025, we increased our commercial paper program by $4.0 billion in connection with the anticipated
financing of the GMS acquisition (see
Note 13
to our consolidated financial statements). In July 2025, in connection
with the increase in the commercial paper program, we also entered into a new three-year $3.0 billion back-up
credit facility scheduled to expire in July 2028, and a new 364-day $1.0 billion back-up credit facility scheduled to
expire in July 2026, as well as amended and restated our existing 364-day $3.5 billion credit facility to extend the
maturity from May 2026 to July 2026. In the aggregate, as of February 1, 2026, our commercial paper program
allows for borrowings up to $11.0 billion and is supported by $11.0 billion of back-up credit facilities.
On September 4, 2025, we utilized approximately $2.0 billion of commercial paper borrowings, together with cash
on hand, to fund the GMS acquisition. These borrowings were subsequently repaid with the $2.0 billion of proceeds
from our September 2025 senior notes issuance. We also utilized commercial paper borrowings in fiscal 2025 to
support general liquidity, including the repayment of senior note maturities.
During fiscal 2025, all of our short-term borrowings were under our commercial paper program, and the maximum
amount outstanding during that period was $5.8 billion. At February 1, 2026, we had outstanding borrowings under
our commercial paper program of $4.5 billion with a weighted average interest rate of 3.7%. At February 1, 2026, we
had no outstanding borrowings under our back-up credit facilities, and we were in compliance with all of the
covenants contained in our back-up credit facilities, none of which are expected to impact our liquidity or capital
resources.
We also issue senior notes from time to time. As discussed above, in September 2025, we issued $2.0 billion of
senior notes, which were used to repay commercial paper borrowings used to fund the GMS acquisition. Separately,
during fiscal 2025, we repaid an aggregate of $4.25 billion of senior notes at maturity.
At February 1, 2026, we had an aggregate principal amount of senior notes outstanding of $48.8 billion, with $4.6
billion payable within 12 months. Future interest payments associated with these senior notes total $25.4 billion,
with $2.0 billion payable within 12 months, based on current interest rates, which include the impact of our active
interest rate swap agreements.
The indentures governing our senior notes do not generally limit our ability to incur additional indebtedness or
require us to maintain financial ratios or specified levels of net worth or liquidity. The indentures governing our notes
contain various covenants, none of which are expected to impact our liquidity or capital resources. We were in
compliance with all such covenants at February 1, 2026. See
Note 5
to our consolidated financial statements for
further discussion of our debt arrangements.
Table of Contents
Fiscal 2025 Form 10-K
32
LEASES
We use operating and finance leases largely to obtain a portion of our real estate, including our stores, distribution
centers, branches, and support centers. At February 1, 2026, we had aggregate remaining lease payment
obligations of $15.9 billion, with $2.2 billion payable within 12 months. Aggregate lease obligations include
approximately $675 million of obligations related to leases not yet commenced. See
Note 3
to our consolidated
financial statements for further discussion of our operating and finance leases.
PURCHASE OBLIGATIONS AND OTHER
Purchase obligations include all legally binding contracts such as firm commitments for inventory purchases, media
and sponsorship spend, software and license commitments, and legally binding service contracts. We issue
inventory purchase orders in the ordinary course of business, which are typically cancellable by their terms,
therefore we do not consider purchase orders that are cancellable to be firm inventory commitments. At February 1,
2026, we had aggregate purchase obligations of $1.9 billion, with $1.2 billion payable within 12 months.
At February 1, 2026, we had aggregate liabilities for unrecognized tax benefits totaling $559 million, nearly all of
which are recorded as non-current liabilities. The timing of payment, if any, associated with our long-term
unrecognized tax benefit liabilities is unknown. See
Note 6
to our consolidated financial statements for further
discussion of our unrecognized tax benefits.
We have no material off-balance sheet arrangements.
CASH FLOWS SUMMARY
(in billions)
$16.3
$9.0
$7.7
$19.8
$21.0
$0.7
$21.2
$4.7
$15.4
Fiscal 2025
Fiscal 2024
Fiscal 2023
Net cash provided by
operating activities
Net cash used in
investing activities
Net cash used in
financing activities
Operating Activities
Cash flow generated from operations provides us with a significant source of liquidity. Our operating cash flows
result primarily from cash received from our customers, offset by cash payments we make for products and
services, associate compensation, operations, occupancy costs, and income taxes. Cash provided by or used in
operating activities is also subject to changes in working capital. Working capital at any point in time is subject to
many variables, including seasonality, inventory management and category expansion, the timing of cash receipts
and payments, vendor payment terms, and fluctuations in foreign exchange rates.
Net cash provided by operating activities decreased by $3.5 billion in fiscal 2025 compared to fiscal 2024, primarily
due to changes in working capital. Changes in working capital were primarily driven by the timing of vendor
payments and increased inventories during fiscal 2025, along with the deferral of our fourth quarter fiscal 2024
estimated federal tax payment to the first quarter of fiscal 2025, resulting in fewer estimated tax payments in fiscal
2024 compared to fiscal 2025. This was partially offset by a reduction to our fiscal 2025 cash tax payments resulting
from the OBBBA.
Table of Contents
Fiscal 2025 Form 10-K
33
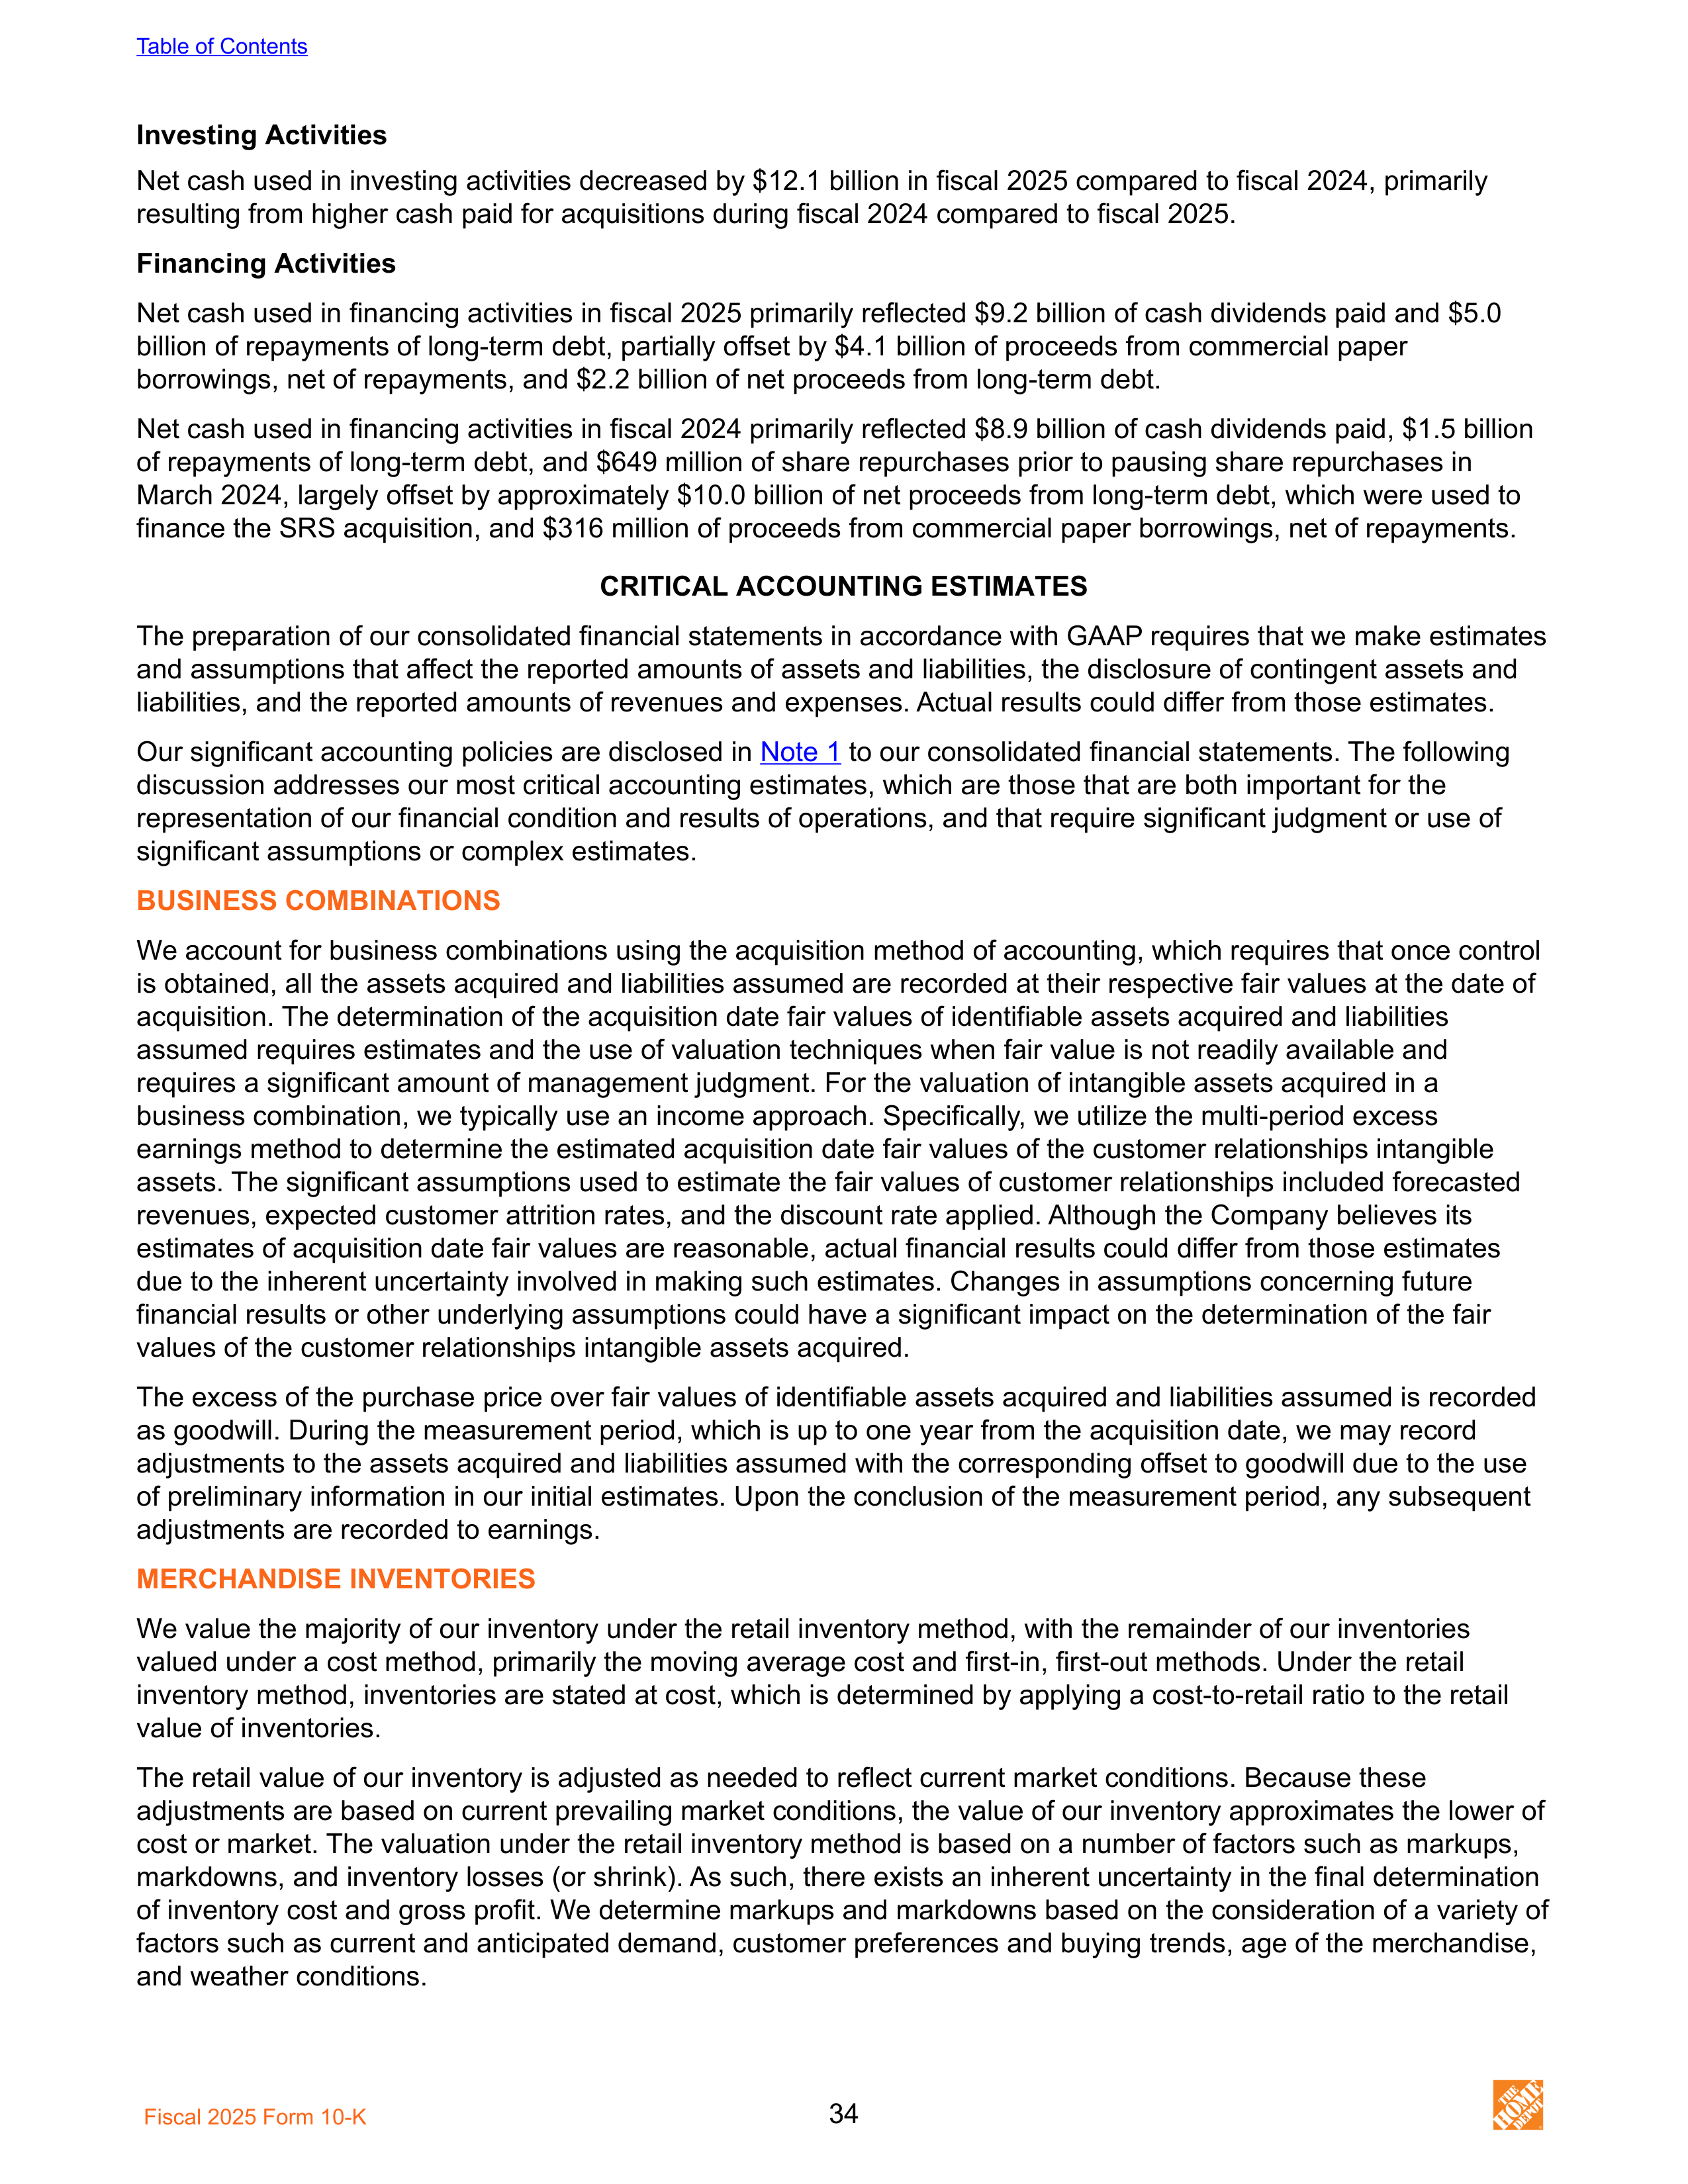
Investing Activities
Net cash used in investing activities decreased by $12.1 billion in fiscal 2025 compared to fiscal 2024, primarily
resulting from higher cash paid for acquisitions during fiscal 2024 compared to fiscal 2025.
Financing Activities
Net cash used in financing activities in fiscal 2025 primarily reflected $9.2 billion of cash dividends paid and $5.0
billion of repayments of long-term debt, partially offset by $4.1 billion of proceeds from commercial paper
borrowings, net of repayments, and $2.2 billion of net proceeds from long-term debt.
Net cash used in financing activities in fiscal 2024 primarily reflected $8.9 billion of cash dividends paid, $1.5 billion
of repayments of long-term debt, and $649 million of share repurchases prior to pausing share repurchases in
March 2024, largely offset by approximately $10.0 billion of net proceeds from long-term debt, which were used to
finance the SRS acquisition, and $316 million of proceeds from commercial paper borrowings, net of repayments.
CRITICAL ACCOUNTING ESTIMATES
The preparation of our consolidated financial statements in accordance with GAAP requires that we make estimates
and assumptions that affect the reported amounts of assets and liabilities, the disclosure of contingent assets and
liabilities, and the reported amounts of revenues and expenses. Actual results could differ from those estimates.
Our significant accounting policies are disclosed in
Note 1
to our consolidated financial statements. The following
discussion addresses our most critical accounting estimates, which are those that are both important for the
representation of our financial condition and results of operations, and that require significant judgment or use of
significant assumptions or complex estimates.
BUSINESS COMBINATIONS
We account for business combinations using the acquisition method of accounting, which requires that once control
is obtained, all the assets acquired and liabilities assumed are recorded at their respective fair values at the date of
acquisition. The determination of the acquisition date fair values of identifiable assets acquired and liabilities
assumed requires estimates and the use of valuation techniques when fair value is not readily available and
requires a significant amount of management judgment. For the valuation of intangible assets acquired in a
business combination, we typically use an income approach. Specifically, we utilize the multi-period excess
earnings method to determine the estimated acquisition date fair values of the customer relationships intangible
assets. The significant assumptions used to estimate the fair values of customer relationships included forecasted
revenues, expected customer attrition rates, and the discount rate applied. Although the Company believes its
estimates of acquisition date fair values are reasonable, actual financial results could differ from those estimates
due to the inherent uncertainty involved in making such estimates. Changes in assumptions concerning future
financial results or other underlying assumptions could have a significant impact on the determination of the fair
values of the customer relationships intangible assets acquired.
The excess of the purchase price over fair values of identifiable assets acquired and liabilities assumed is recorded
as goodwill. During the measurement period, which is up to one year from the acquisition date, we may record
adjustments to the assets acquired and liabilities assumed with the corresponding offset to goodwill due to the use
of preliminary information in our initial estimates. Upon the conclusion of the measurement period, any subsequent
adjustments are recorded to earnings.
MERCHANDISE INVENTORIES
We value the majority of our inventory under the retail inventory method, with the remainder of our inventories
valued under a cost method, primarily the moving average cost and first-in, first-out methods. Under the retail
inventory method, inventories are stated at cost, which is determined by applying a cost-to-retail ratio to the retail
value of inventories.
The retail value of our inventory is adjusted as needed to reflect current market conditions. Because these
adjustments are based on current prevailing market conditions, the value of our inventory approximates the lower of
cost or market. The valuation under the retail inventory method is based on a number of factors such as markups,
markdowns, and inventory losses (or shrink). As such, there exists an inherent uncertainty in the final determination
of inventory cost and gross profit. We determine markups and markdowns based on the consideration of a variety of
factors such as current and anticipated demand, customer preferences and buying trends, age of the merchandise,
and weather conditions.
Table of Contents
Fiscal 2025 Form 10-K
34
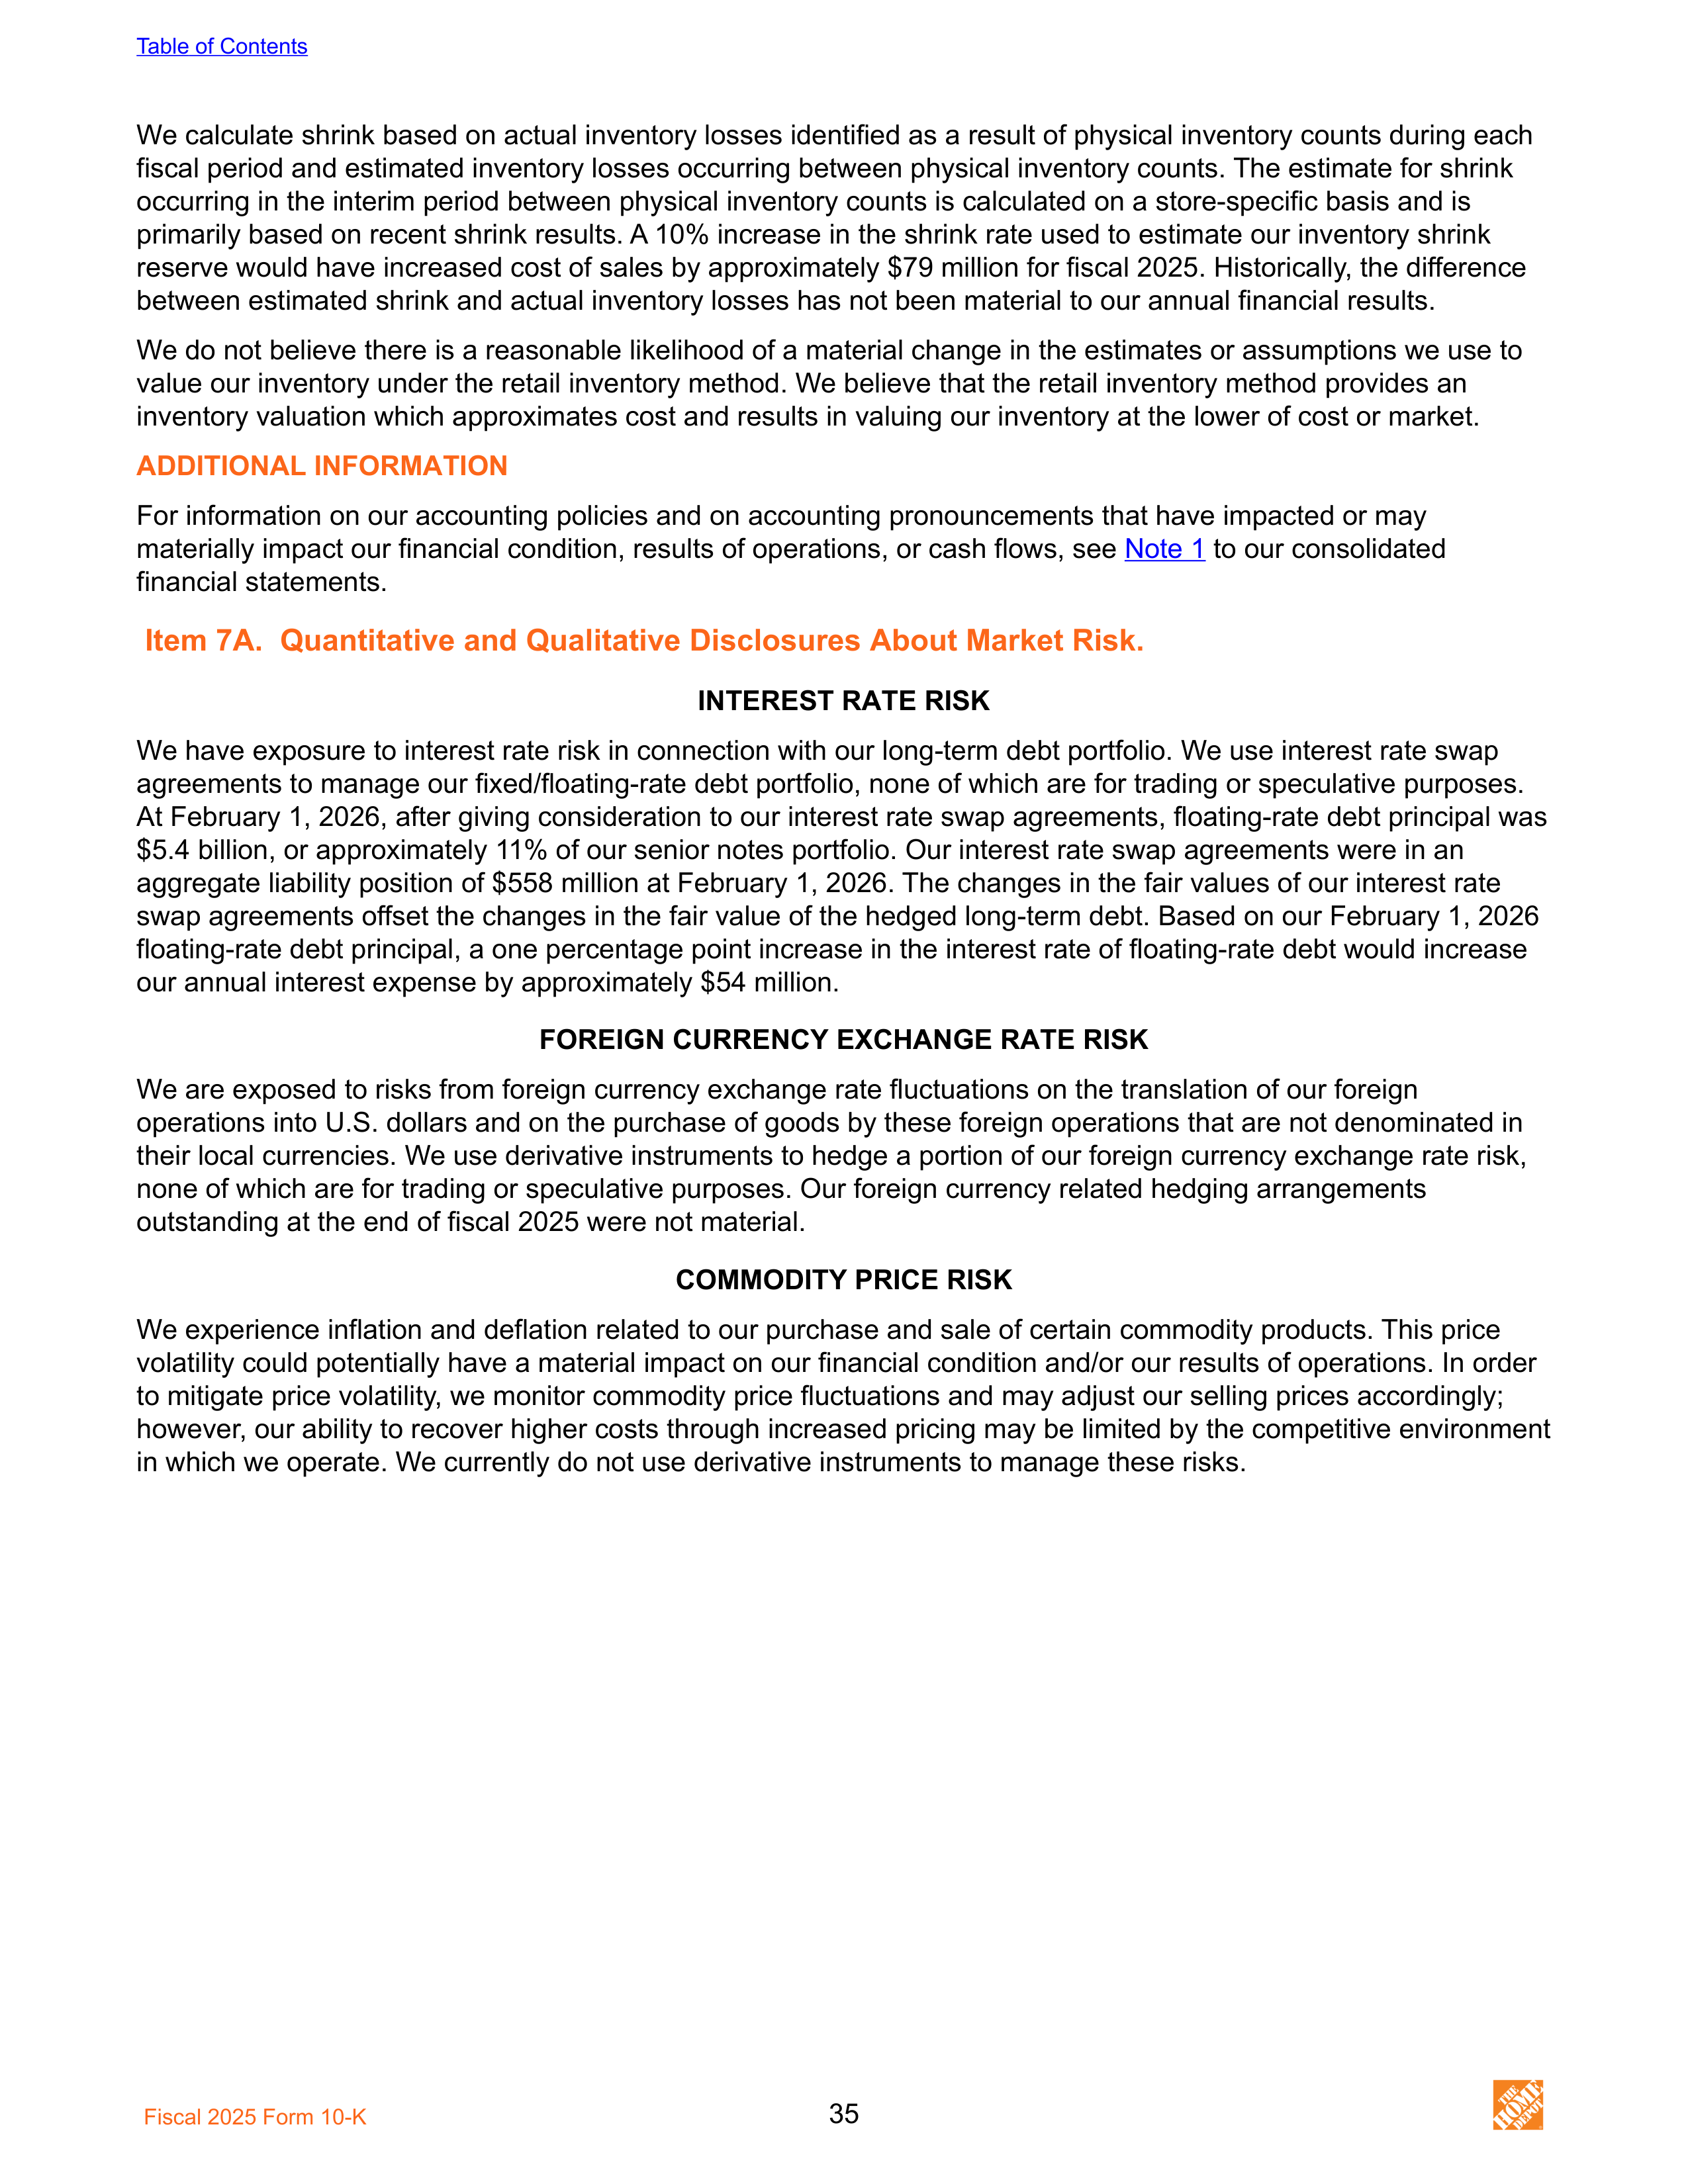
We calculate shrink based on actual inventory losses identified as a result of physical inventory counts during each
fiscal period and estimated inventory losses occurring between physical inventory counts. The estimate for shrink
occurring in the interim period between physical inventory counts is calculated on a store-specific basis and is
primarily based on recent shrink results. A 10% increase in the shrink rate used to estimate our inventory shrink
reserve would have increased cost of sales by approximately $79 million for fiscal 2025. Historically, the difference
between estimated shrink and actual inventory losses has not been material to our annual financial results.
We do not believe there is a reasonable likelihood of a material change in the estimates or assumptions we use to
value our inventory under the retail inventory method. We believe that the retail inventory method provides an
inventory valuation which approximates cost and results in valuing our inventory at the lower of cost or market.
ADDITIONAL INFORMATION
For information on our accounting policies and on accounting pronouncements that have impacted or may
materially impact our financial condition, results of operations, or cash flows, see
Note 1
to our consolidated
financial statements.
Item 7A. Quantitative and Qualitative Disclosures About Market Risk.
INTEREST RATE RISK
We have exposure to interest rate risk in connection with our long-term debt portfolio. We use interest rate swap
agreements to manage our fixed/floating-rate debt portfolio, none of which are for trading or speculative purposes.
At February 1, 2026, after giving consideration to our interest rate swap agreements, floating-rate debt principal was
$5.4 billion, or approximately 11% of our senior notes portfolio. Our interest rate swap agreements were in an
aggregate liability position of $558 million at February 1, 2026. The changes in the fair values of our interest rate
swap agreements offset the changes in the fair value of the hedged long-term debt. Based on our February 1, 2026
floating-rate debt principal, a one percentage point increase in the interest rate of floating-rate debt would increase
our annual interest expense by approximately $54 million.
FOREIGN CURRENCY EXCHANGE RATE RISK
We are exposed to risks from foreign currency exchange rate fluctuations on the translation of our foreign
operations into U.S. dollars and on the purchase of goods by these foreign operations that are not denominated in
their local currencies. We use derivative instruments to hedge a portion of our foreign currency exchange rate risk,
none of which are for trading or speculative purposes. Our foreign currency related hedging arrangements
outstanding at the end of fiscal 2025 were not material.
COMMODITY PRICE RISK
We experience inflation and deflation related to our purchase and sale of certain commodity products. This price
volatility could potentially have a material impact on our financial condition and/or our results of operations. In order
to mitigate price volatility, we monitor commodity price fluctuations and may adjust our selling prices accordingly;
however, our ability to recover higher costs through increased pricing may be limited by the competitive environment
in which we operate. We currently do not use derivative instruments to manage these risks.
Table of Contents
Fiscal 2025 Form 10-K
35
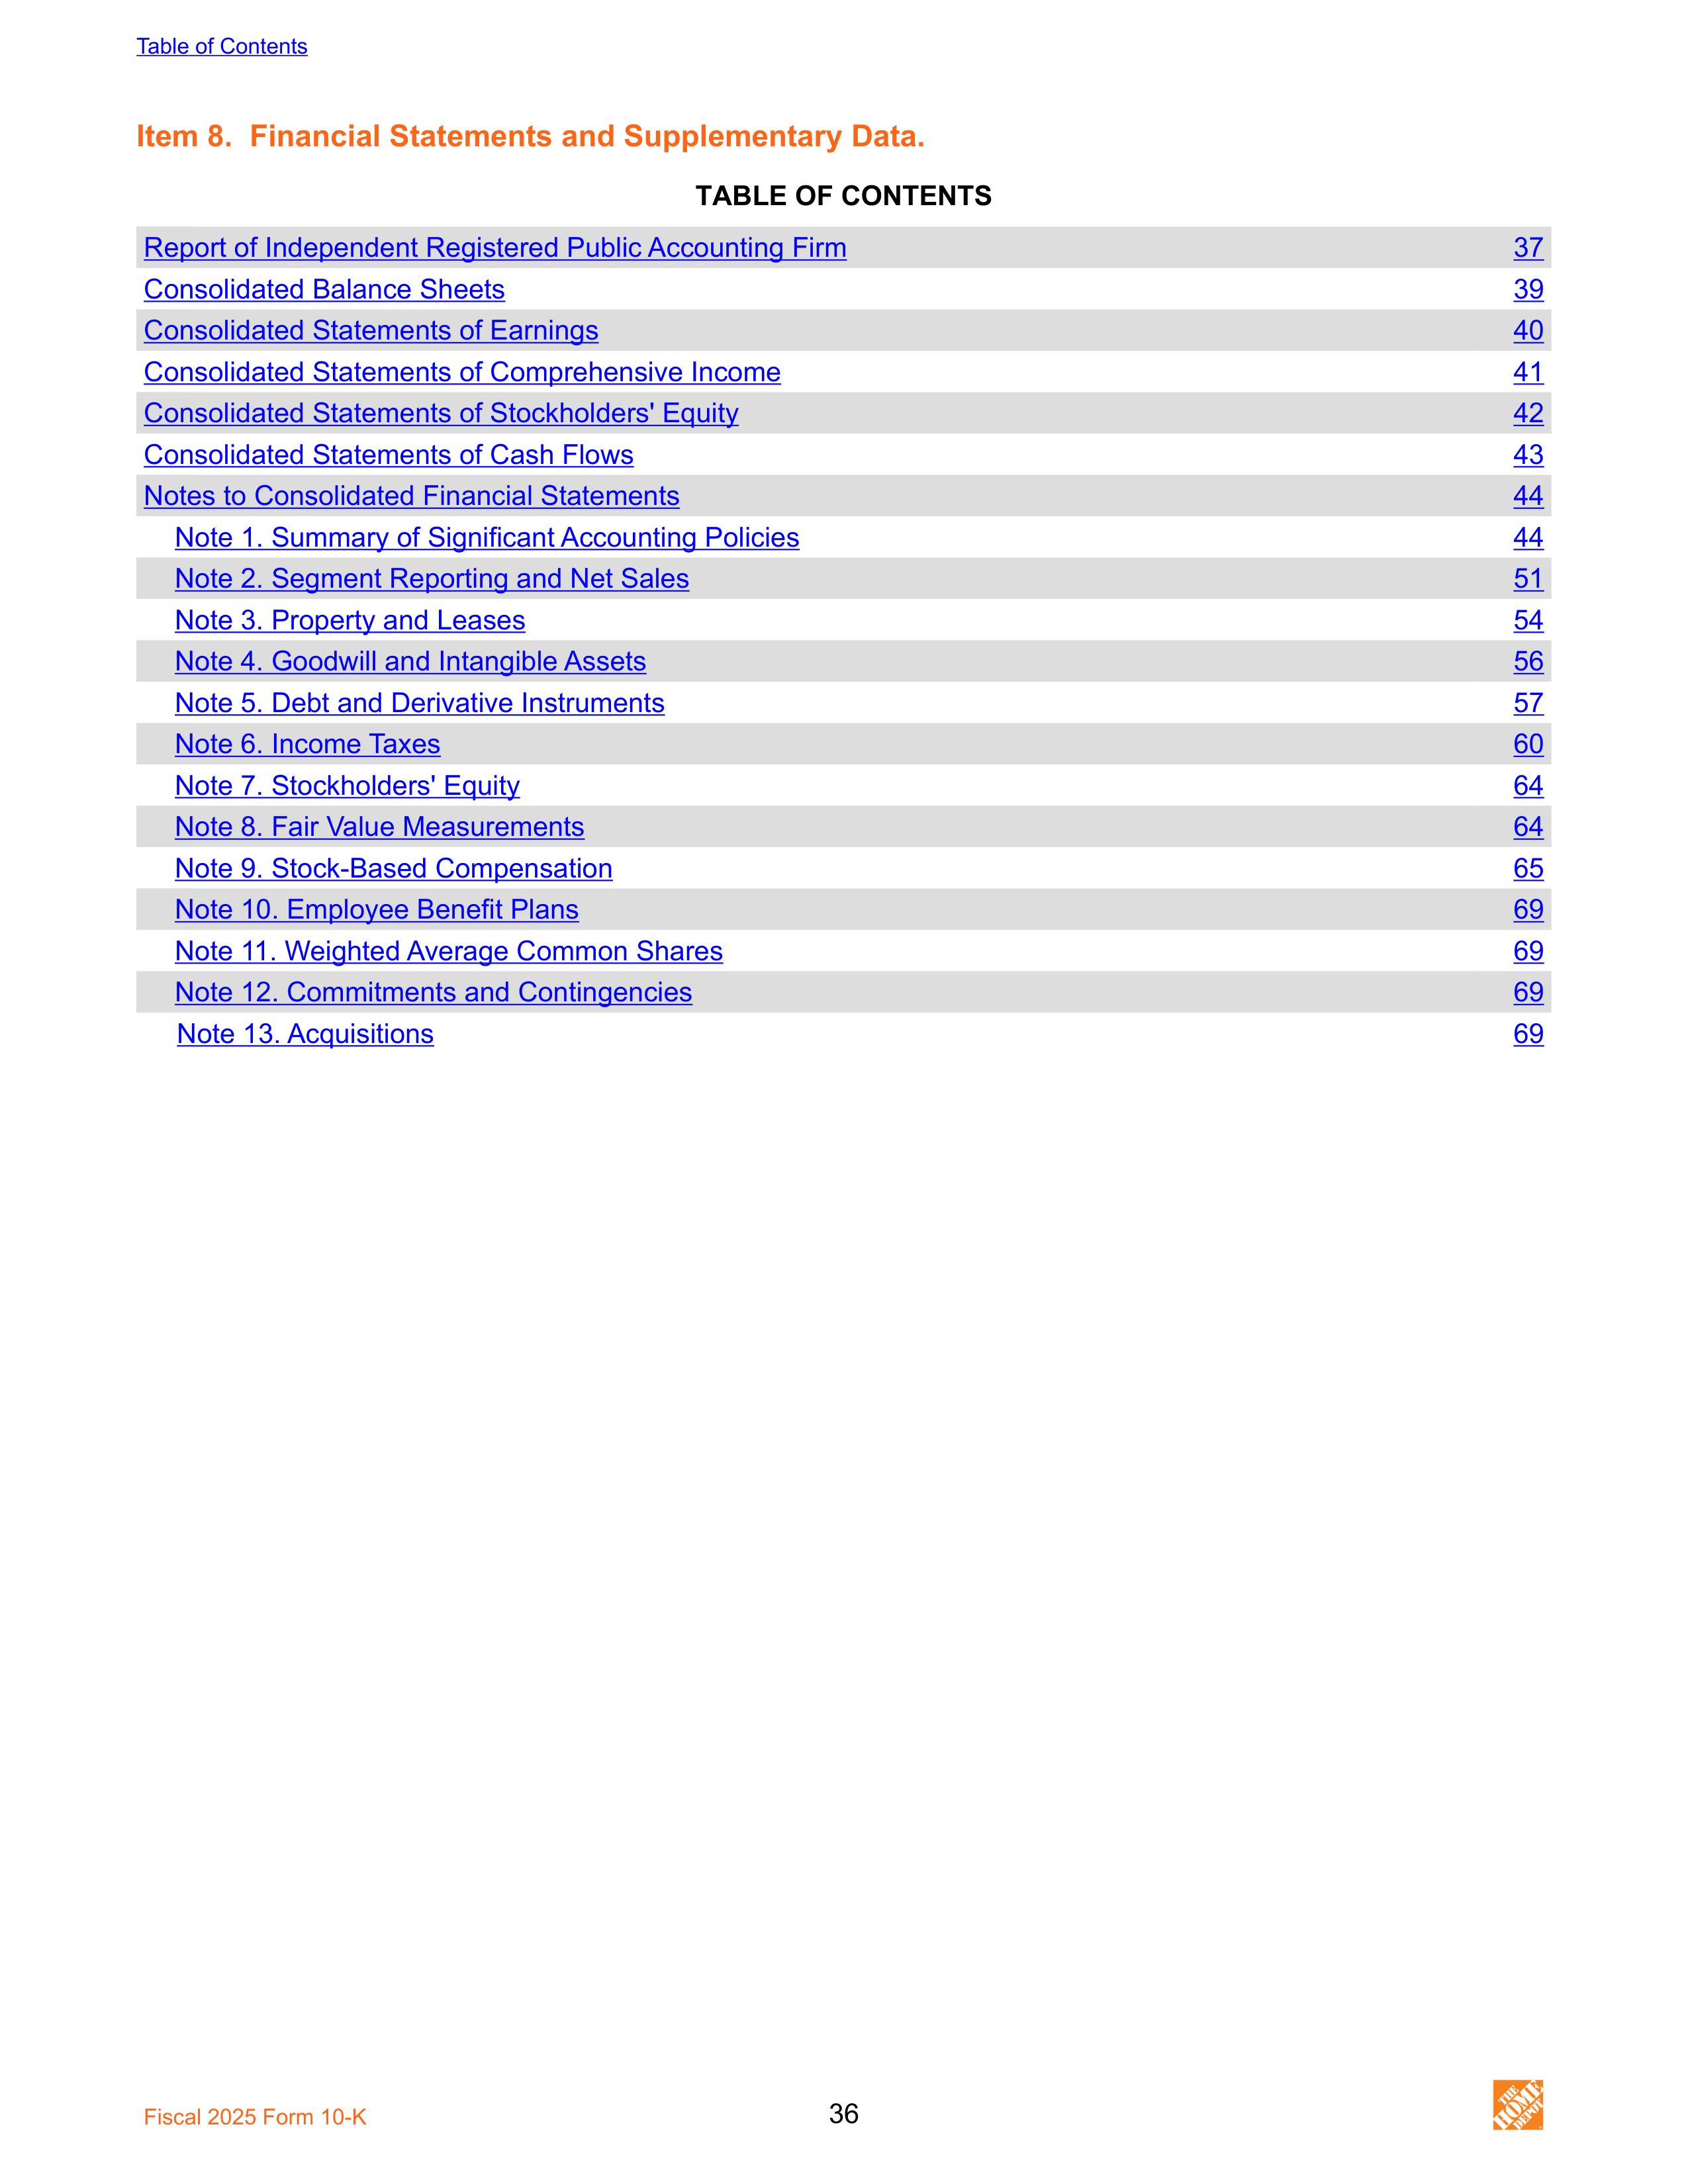
Item 8. Financial Statements and Supplementary Data.
TABLE OF CONTENTS
Report of Independent Registered Public Accounting Firm
37
Consolidated Balance Sheets
39
Consolidated Statements of Earnings
40
Consolidated Statements of Comprehensive Income
41
Consolidated Statements of Stockholders' Equity
42
Consolidated Statements of Cash Flows
43
Notes to Consolidated Financial Statements
44
Note 1. Summary of Significant Accounting Policies
44
Note 2. Segment Reporting and Net Sales
51
Note 3. Property and Leases
54
Note 4. Goodwill and Intangible Assets
56
Note 5. Debt and Derivative Instruments
57
Note 6. Income Taxes
60
Note 7. Stockholders' Equity
64
Note 8. Fair Value Measurements
64
Note 9. Stock-Based Compensation
65
Note 10. Employee Benefit Plans
69
Note 11. Weighted Average Common Shares
69
Note 12. Commitments and Contingencies
69
Note 13. Acquisitions
69
Table of Contents
Fiscal 2025 Form 10-K
36
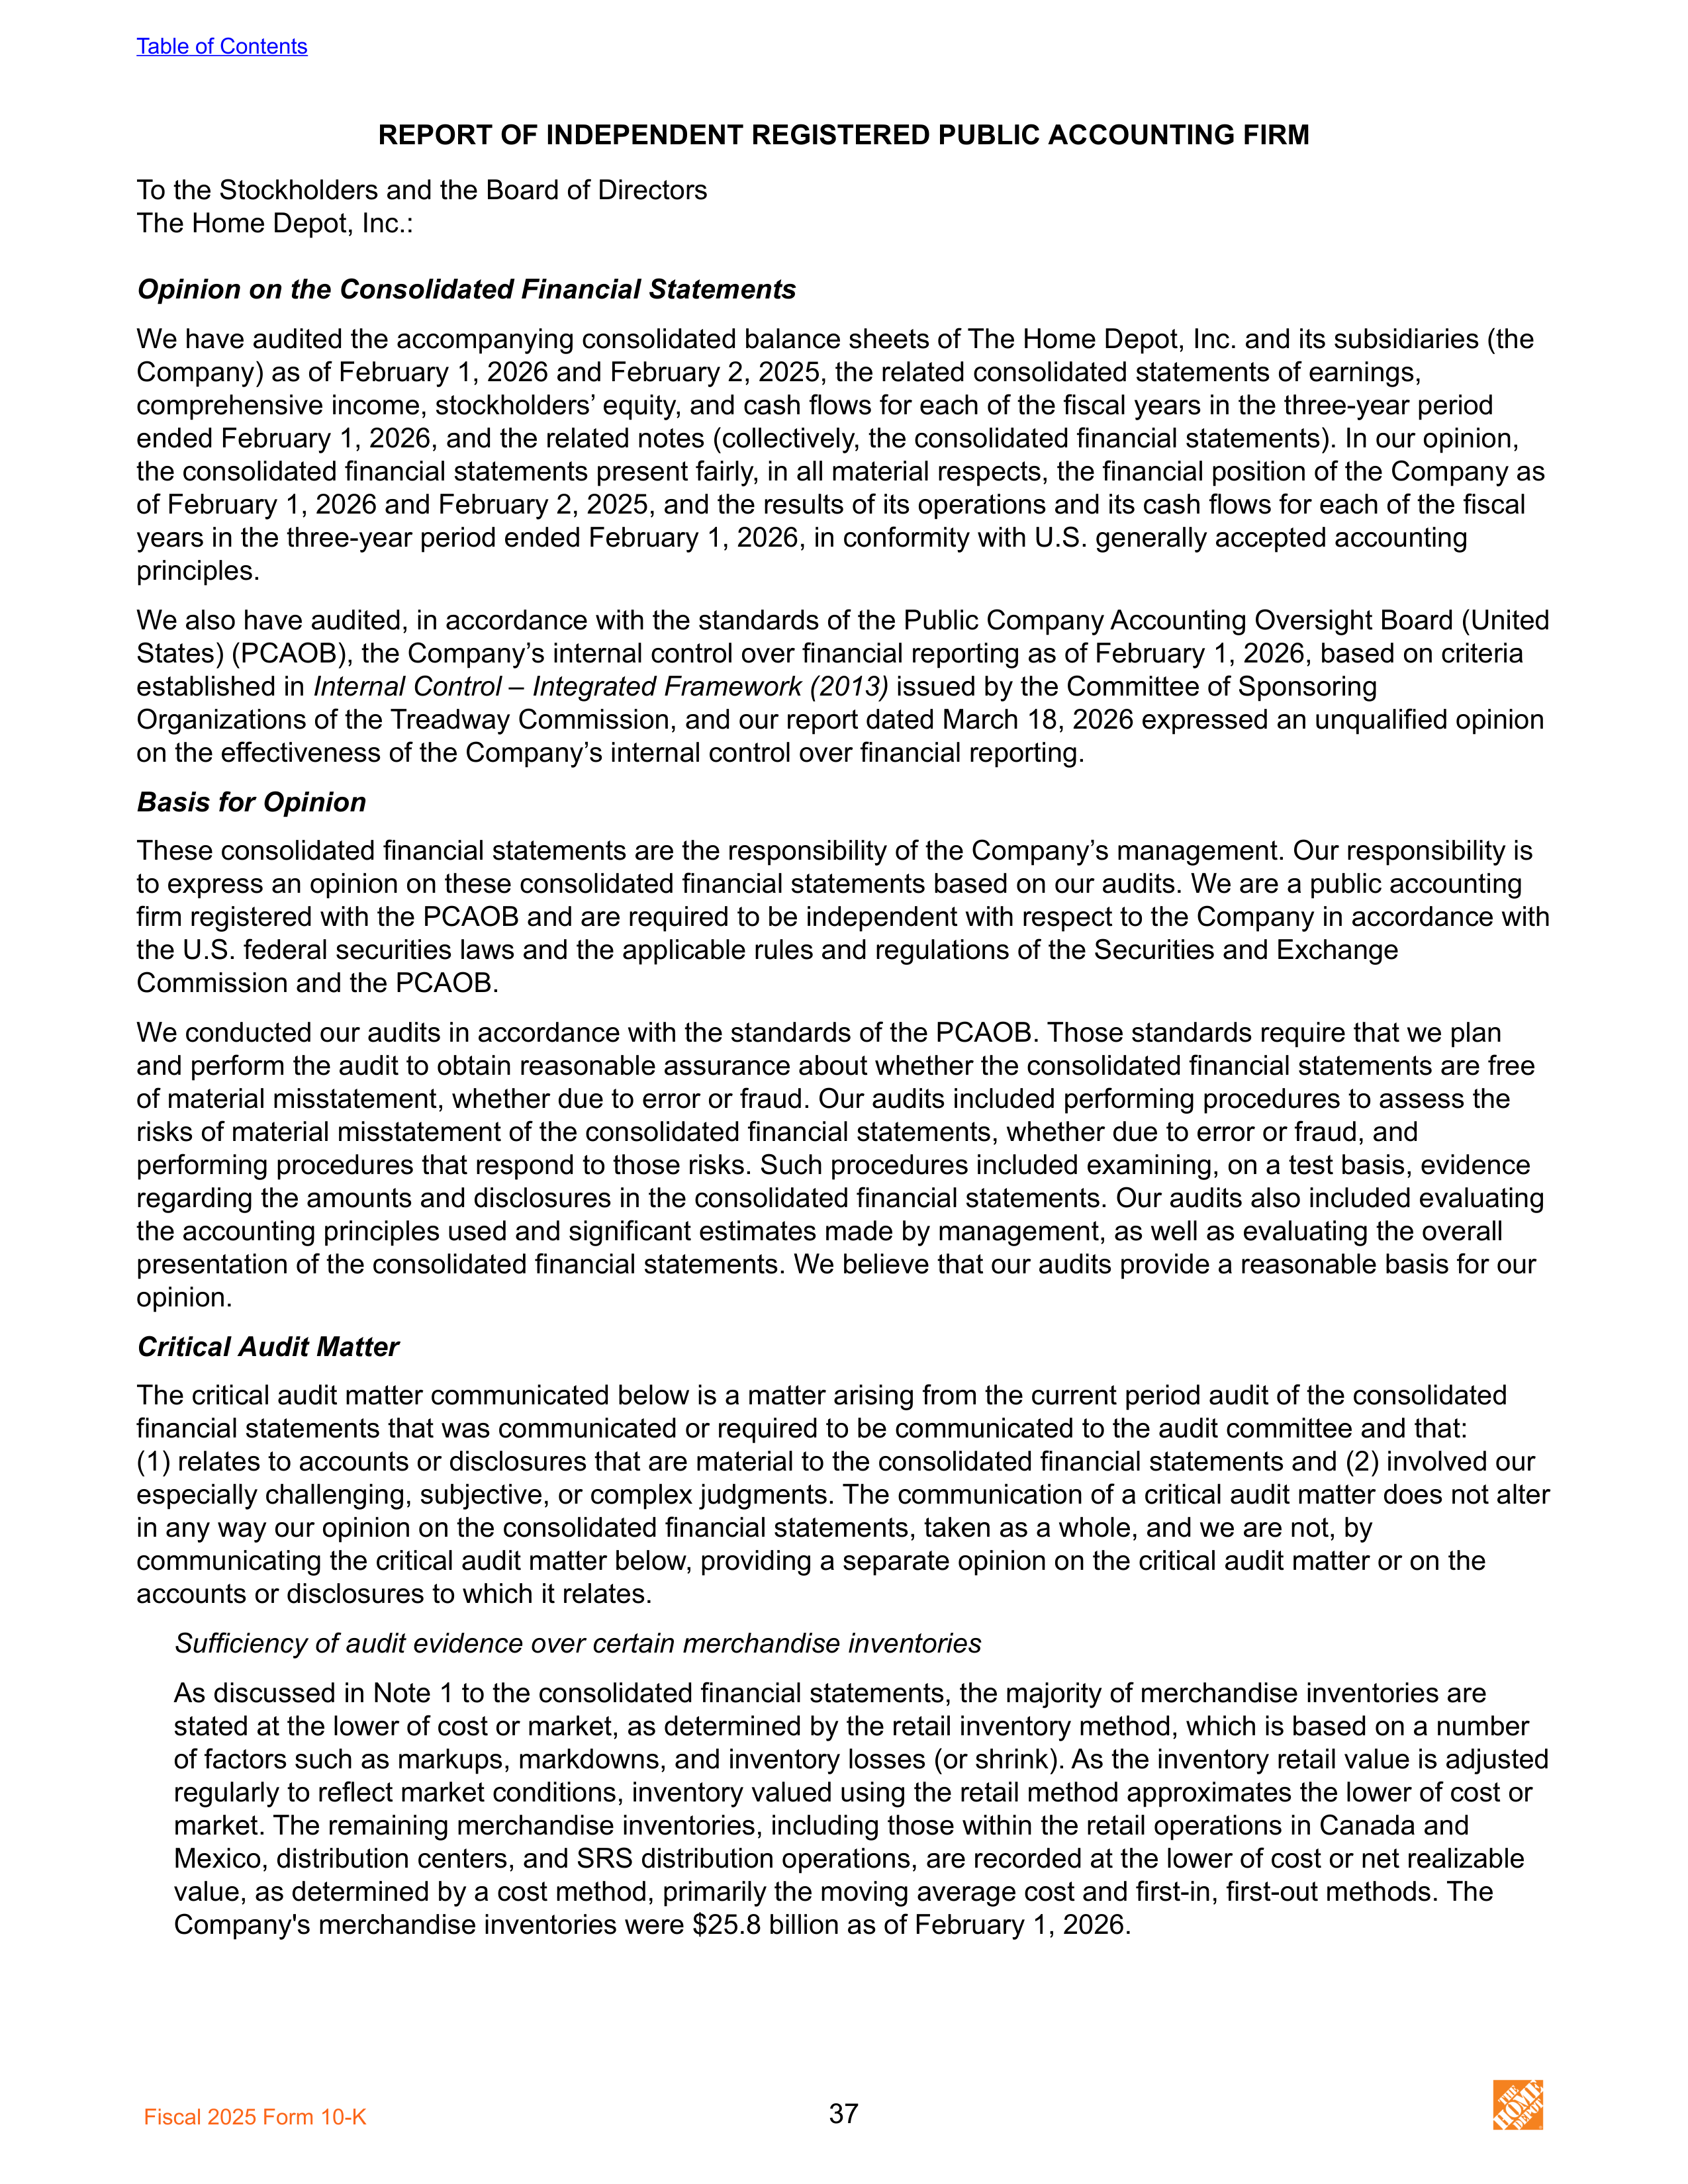
REPORT OF INDEPENDENT REGISTERED PUBLIC ACCOUNTING FIRM
To the Stockholders and the Board of Directors
The Home Depot, Inc.:
Opinion on the Consolidated Financial Statements
We have audited the accompanying consolidated balance sheets of The Home Depot, Inc. and its subsidiaries (the
Company) as of February 1, 2026 and February 2, 2025, the related consolidated statements of earnings,
comprehensive income, stockholders’ equity, and cash flows for each of the fiscal years in the three-year period
ended February 1, 2026, and the related notes (collectively, the consolidated financial statements). In our opinion,
the consolidated financial statements present fairly, in all material respects, the financial position of the Company as
of February 1, 2026 and February 2, 2025, and the results of its operations and its cash flows for each of the fiscal
years in the three-year period ended February 1, 2026, in conformity with U.S. generally accepted accounting
principles.
We also have audited, in accordance with the standards of the Public Company Accounting Oversight Board (United
States) (PCAOB), the Company’s internal control over financial reporting as of February 1, 2026, based on criteria
established in
Internal Control – Integrated Framework (2013)
issued by the Committee of Sponsoring
Organizations of the Treadway Commission, and our report dated March 18, 2026 expressed an unqualified opinion
on the effectiveness of the Company’s internal control over financial reporting.
Basis for Opinion
These consolidated financial statements are the responsibility of the Company’s management. Our responsibility is
to express an opinion on these consolidated financial statements based on our audits. We are a public accounting
firm registered with the PCAOB and are required to be independent with respect to the Company in accordance with
the U.S. federal securities laws and the applicable rules and regulations of the Securities and Exchange
Commission and the PCAOB.
We conducted our audits in accordance with the standards of the PCAOB. Those standards require that we plan
and perform the audit to obtain reasonable assurance about whether the consolidated financial statements are free
of material misstatement, whether due to error or fraud. Our audits included performing procedures to assess the
risks of material misstatement of the consolidated financial statements, whether due to error or fraud, and
performing procedures that respond to those risks. Such procedures included examining, on a test basis, evidence
regarding the amounts and disclosures in the consolidated financial statements. Our audits also included evaluating
the accounting principles used and significant estimates made by management, as well as evaluating the overall
presentation of the consolidated financial statements. We believe that our audits provide a reasonable basis for our
opinion.
Critical Audit Matter
The critical audit matter communicated below is a matter arising from the current period audit of the consolidated
financial statements that was communicated or required to be communicated to the audit committee and that:
(1) relates to accounts or disclosures that are material to the consolidated financial statements and (2) involved our
especially challenging, subjective, or complex judgments. The communication of a critical audit matter does not alter
in any way our opinion on the consolidated financial statements, taken as a whole, and we are not, by
communicating the critical audit matter below, providing a separate opinion on the critical audit matter or on the
accounts or disclosures to which it relates.
Sufficiency of audit evidence over certain merchandise inventories
As discussed in Note 1 to the consolidated financial statements, the majority of merchandise inventories are
stated at the lower of cost or market, as determined by the retail inventory method, which is based on a number
of factors such as markups, markdowns, and inventory losses (or shrink). As the inventory retail value is adjusted
regularly to reflect market conditions, inventory valued using the retail method approximates the lower of cost or
market. The remaining merchandise inventories, including those within the retail operations in Canada and
Mexico, distribution centers, and SRS distribution operations, are recorded at the lower of cost or net realizable
value, as determined by a cost method, primarily the moving average cost and first-in, first-out methods. The
Company's merchandise inventories were $25.8 billion as of February 1, 2026.
Table of Contents
Fiscal 2025 Form 10-K
37
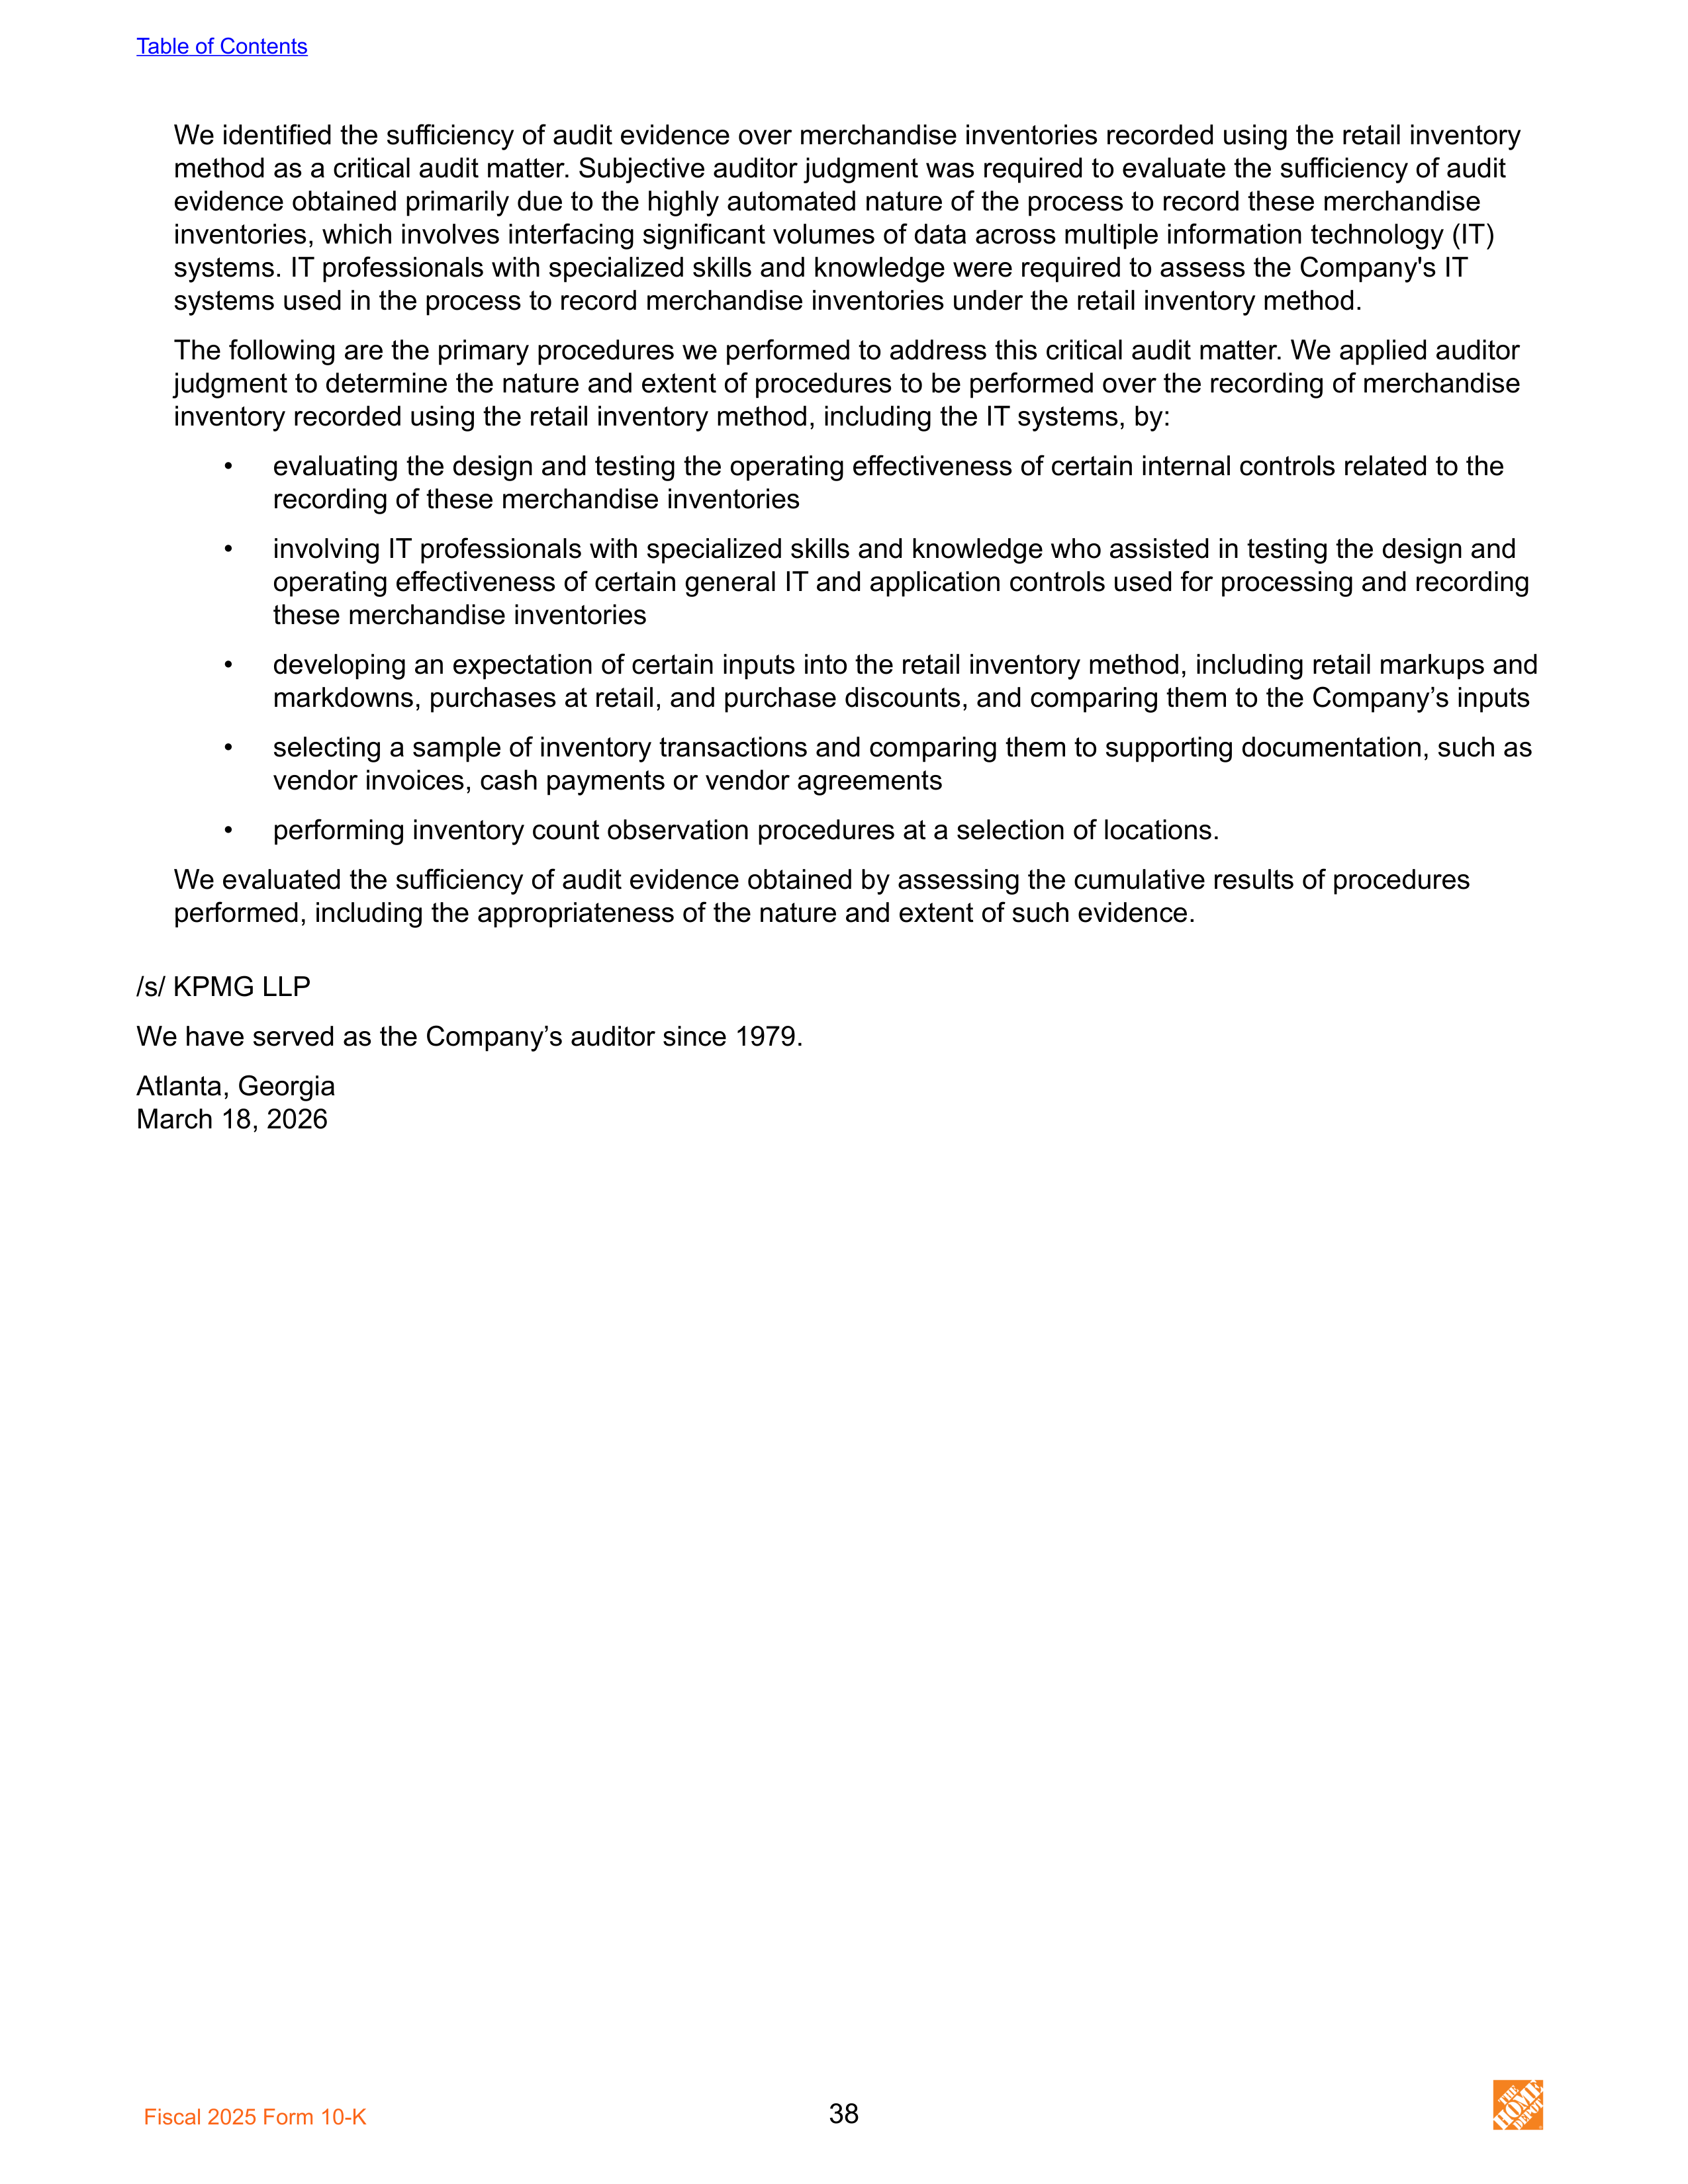
We identified the sufficiency of audit evidence over merchandise inventories recorded using the retail inventory
method as a critical audit matter. Subjective auditor judgment was required to evaluate the sufficiency of audit
evidence obtained primarily due to the highly automated nature of the process to record these merchandise
inventories, which involves interfacing significant volumes of data across multiple information technology (IT)
systems. IT professionals with specialized skills and knowledge were required to assess the Company's IT
systems used in the process to record merchandise inventories under the retail inventory method.
The following are the primary procedures we performed to address this critical audit matter. We applied auditor
judgment to determine the nature and extent of procedures to be performed over the recording of merchandise
inventory recorded using the retail inventory method, including the IT systems, by:
•
evaluating the design and testing the operating effectiveness of certain internal controls related to the
recording of these merchandise inventories
•
involving IT professionals with specialized skills and knowledge who assisted in testing the design and
operating effectiveness of certain general IT and application controls used for processing and recording
these merchandise inventories
•
developing an expectation of certain inputs into the retail inventory method, including retail markups and
markdowns, purchases at retail, and purchase discounts, and comparing them to the Company’s inputs
•
selecting a sample of inventory transactions and comparing them to supporting documentation, such as
vendor invoices, cash payments or vendor agreements
•
performing inventory count observation procedures at a selection of locations.
We evaluated the sufficiency of audit evidence obtained by assessing the cumulative results of procedures
performed, including the appropriateness of the nature and extent of such evidence.
/s/ KPMG LLP
We have served as the Company’s auditor since 1979.
Atlanta, Georgia
March 18, 2026
Table of Contents
Fiscal 2025 Form 10-K
38
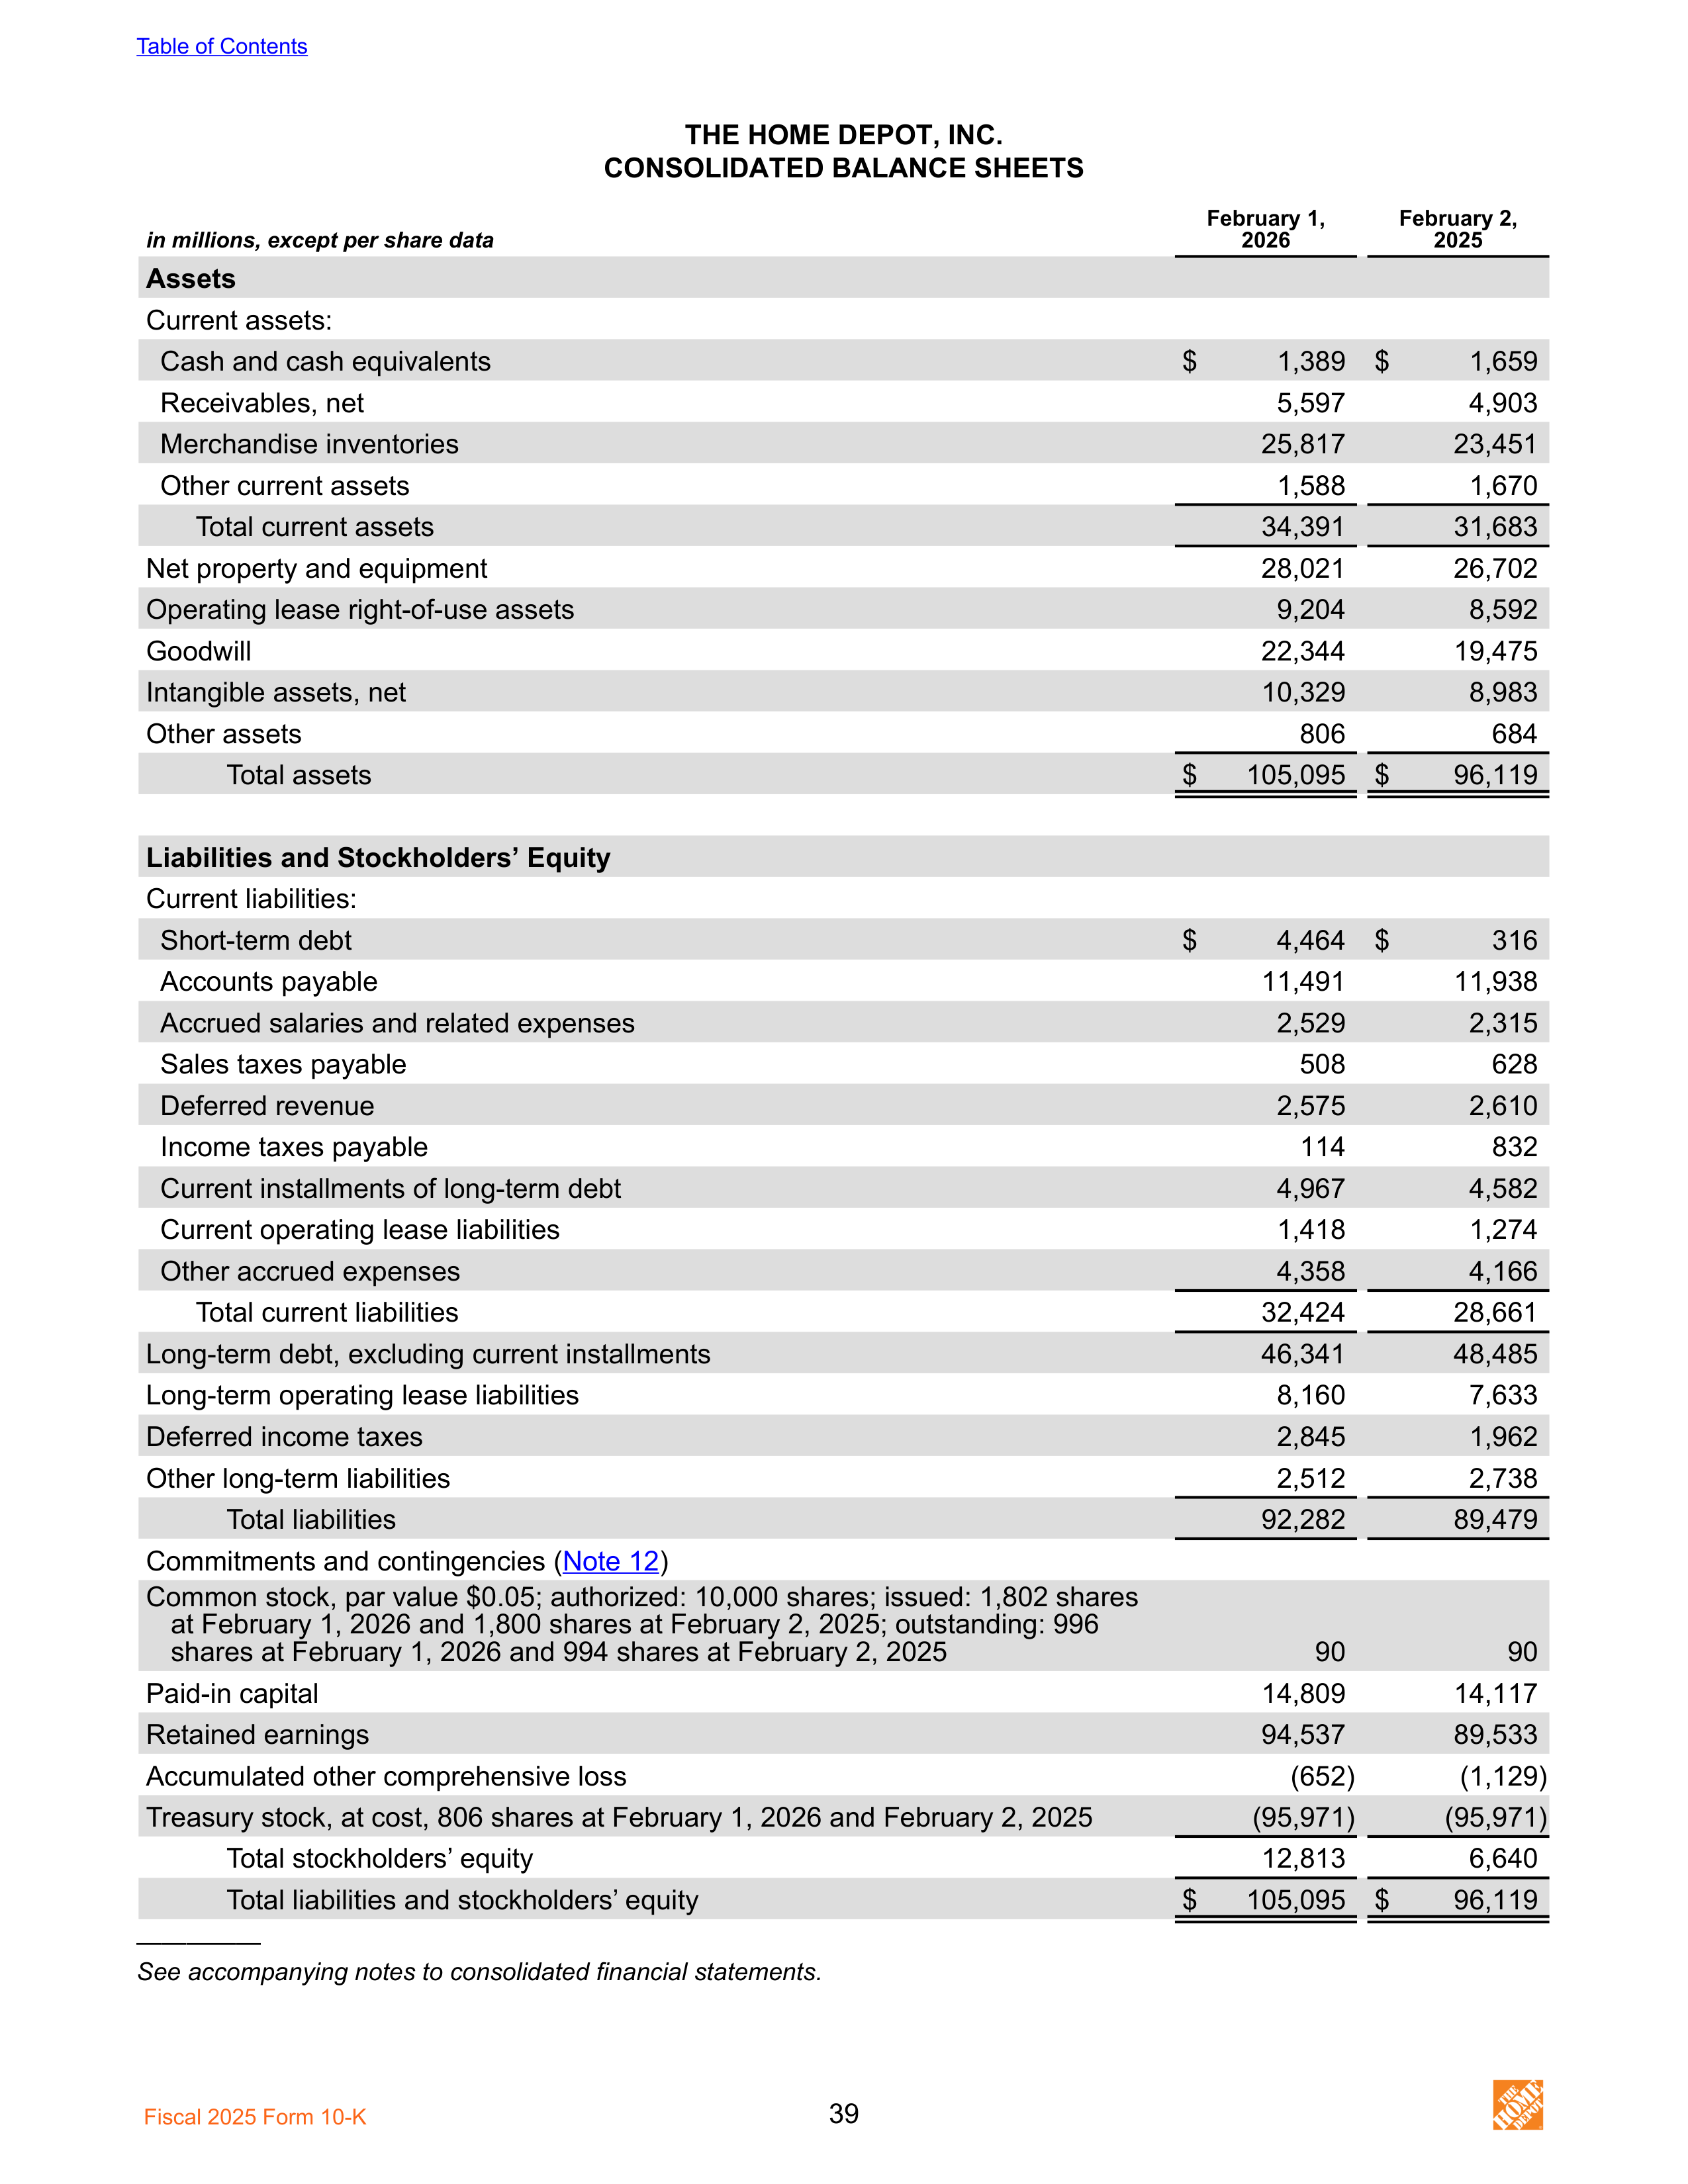
THE HOME DEPOT, INC.
CONSOLIDATED BALANCE SHEETS
in millions, except per share data
February 1,
2026
February 2,
2025
Assets
Current assets:
Cash and cash equivalents
$
1,389 $
1,659
Receivables, net
5,597
4,903
Merchandise inventories
25,817
23,451
Other current assets
1,588
1,670
Total current assets
34,391
31,683
Net property and equipment
28,021
26,702
Operating lease right-of-use assets
9,204
8,592
Goodwill
22,344
19,475
Intangible assets, net
10,329
8,983
Other assets
806
684
Total assets
$
105,095 $
96,119
Liabilities and Stockholders’ Equity
Current liabilities:
Short-term debt
$
4,464 $
316
Accounts payable
11,491
11,938
Accrued salaries and related expenses
2,529
2,315
Sales taxes payable
508
628
Deferred revenue
2,575
2,610
Income taxes payable
114
832
Current installments of long-term debt
4,967
4,582
Current operating lease liabilities
1,418
1,274
Other accrued expenses
4,358
4,166
Total current liabilities
32,424
28,661
Long-term debt, excluding current installments
46,341
48,485
Long-term operating lease liabilities
8,160
7,633
Deferred income taxes
2,845
1,962
Other long-term liabilities
2,512
2,738
Total liabilities
92,282
89,479
Commitments and contingencies (
Note 12
)
Common stock, par value $0.05; authorized: 10,000 shares; issued: 1,802 shares
at February 1, 2026 and 1,800 shares at February 2, 2025; outstanding: 996
shares at February 1, 2026 and 994 shares at February 2, 2025
90
90
Paid-in capital
14,809
14,117
Retained earnings
94,537
89,533
Accumulated other comprehensive loss
(652)
(1,129)
Treasury stock, at cost, 806 shares at February 1, 2026 and February 2, 2025
(95,971)
(95,971)
Total stockholders’ equity
12,813
6,640
Total liabilities and stockholders’ equity
$
105,095 $
96,119
—————
See accompanying notes to consolidated financial statements.
Table of Contents
Fiscal 2025 Form 10-K
39
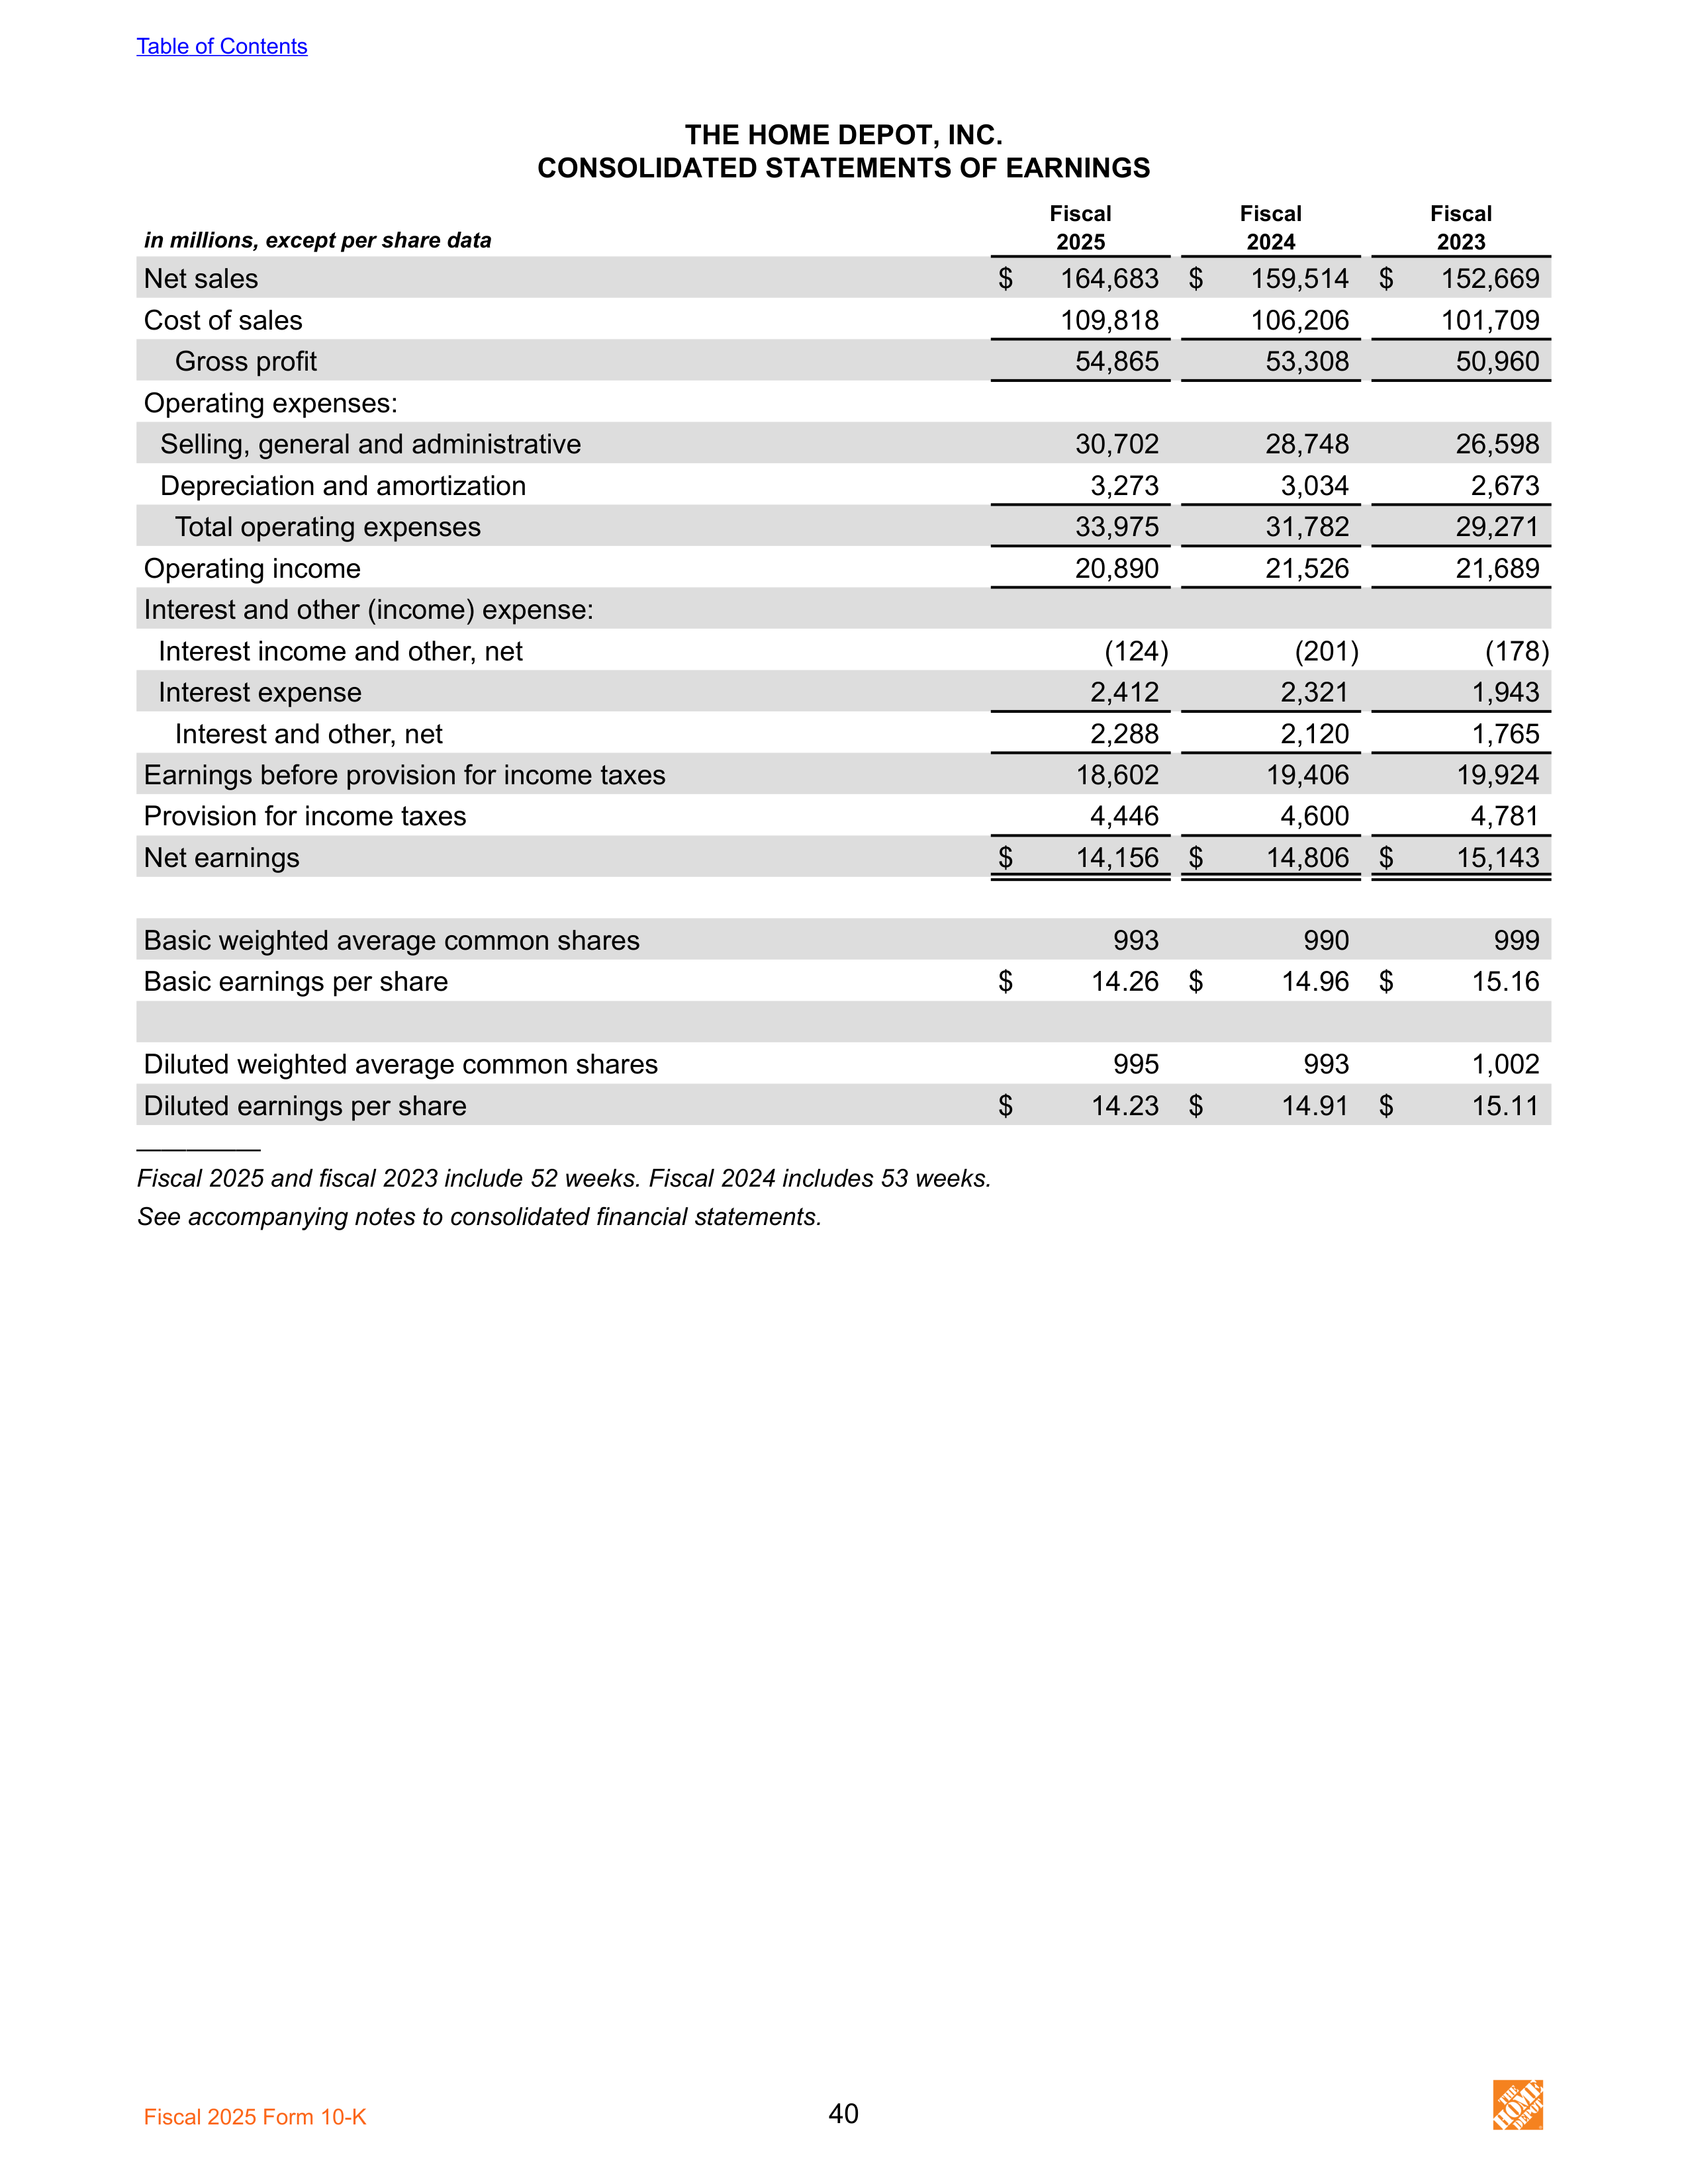
THE HOME DEPOT, INC.
CONSOLIDATED STATEMENTS OF EARNINGS
in millions, except per share data
Fiscal
Fiscal
Fiscal
2025
2024
2023
Net sales
$
164,683 $
159,514 $
152,669
Cost of sales
109,818
106,206
101,709
Gross profit
54,865
53,308
50,960
Operating expenses:
Selling, general and administrative
30,702
28,748
26,598
Depreciation and amortization
3,273
3,034
2,673
Total operating expenses
33,975
31,782
29,271
Operating income
20,890
21,526
21,689
Interest and other (income) expense:
Interest income and other, net
(124)
(201)
(178)
Interest expense
2,412
2,321
1,943
Interest and other, net
2,288
2,120
1,765
Earnings before provision for income taxes
18,602
19,406
19,924
Provision for income taxes
4,446
4,600
4,781
Net earnings
$
14,156 $
14,806 $
15,143
Basic weighted average common shares
993
990
999
Basic earnings per share
$
14.26 $
14.96 $
15.16
Diluted weighted average common shares
995
993
1,002
Diluted earnings per share
$
14.23 $
14.91 $
15.11
—————
Fiscal 2025 and fiscal 2023 include 52 weeks. Fiscal 2024 includes 53 weeks.
See accompanying notes to consolidated financial statements.
Table of Contents
Fiscal 2025 Form 10-K
40
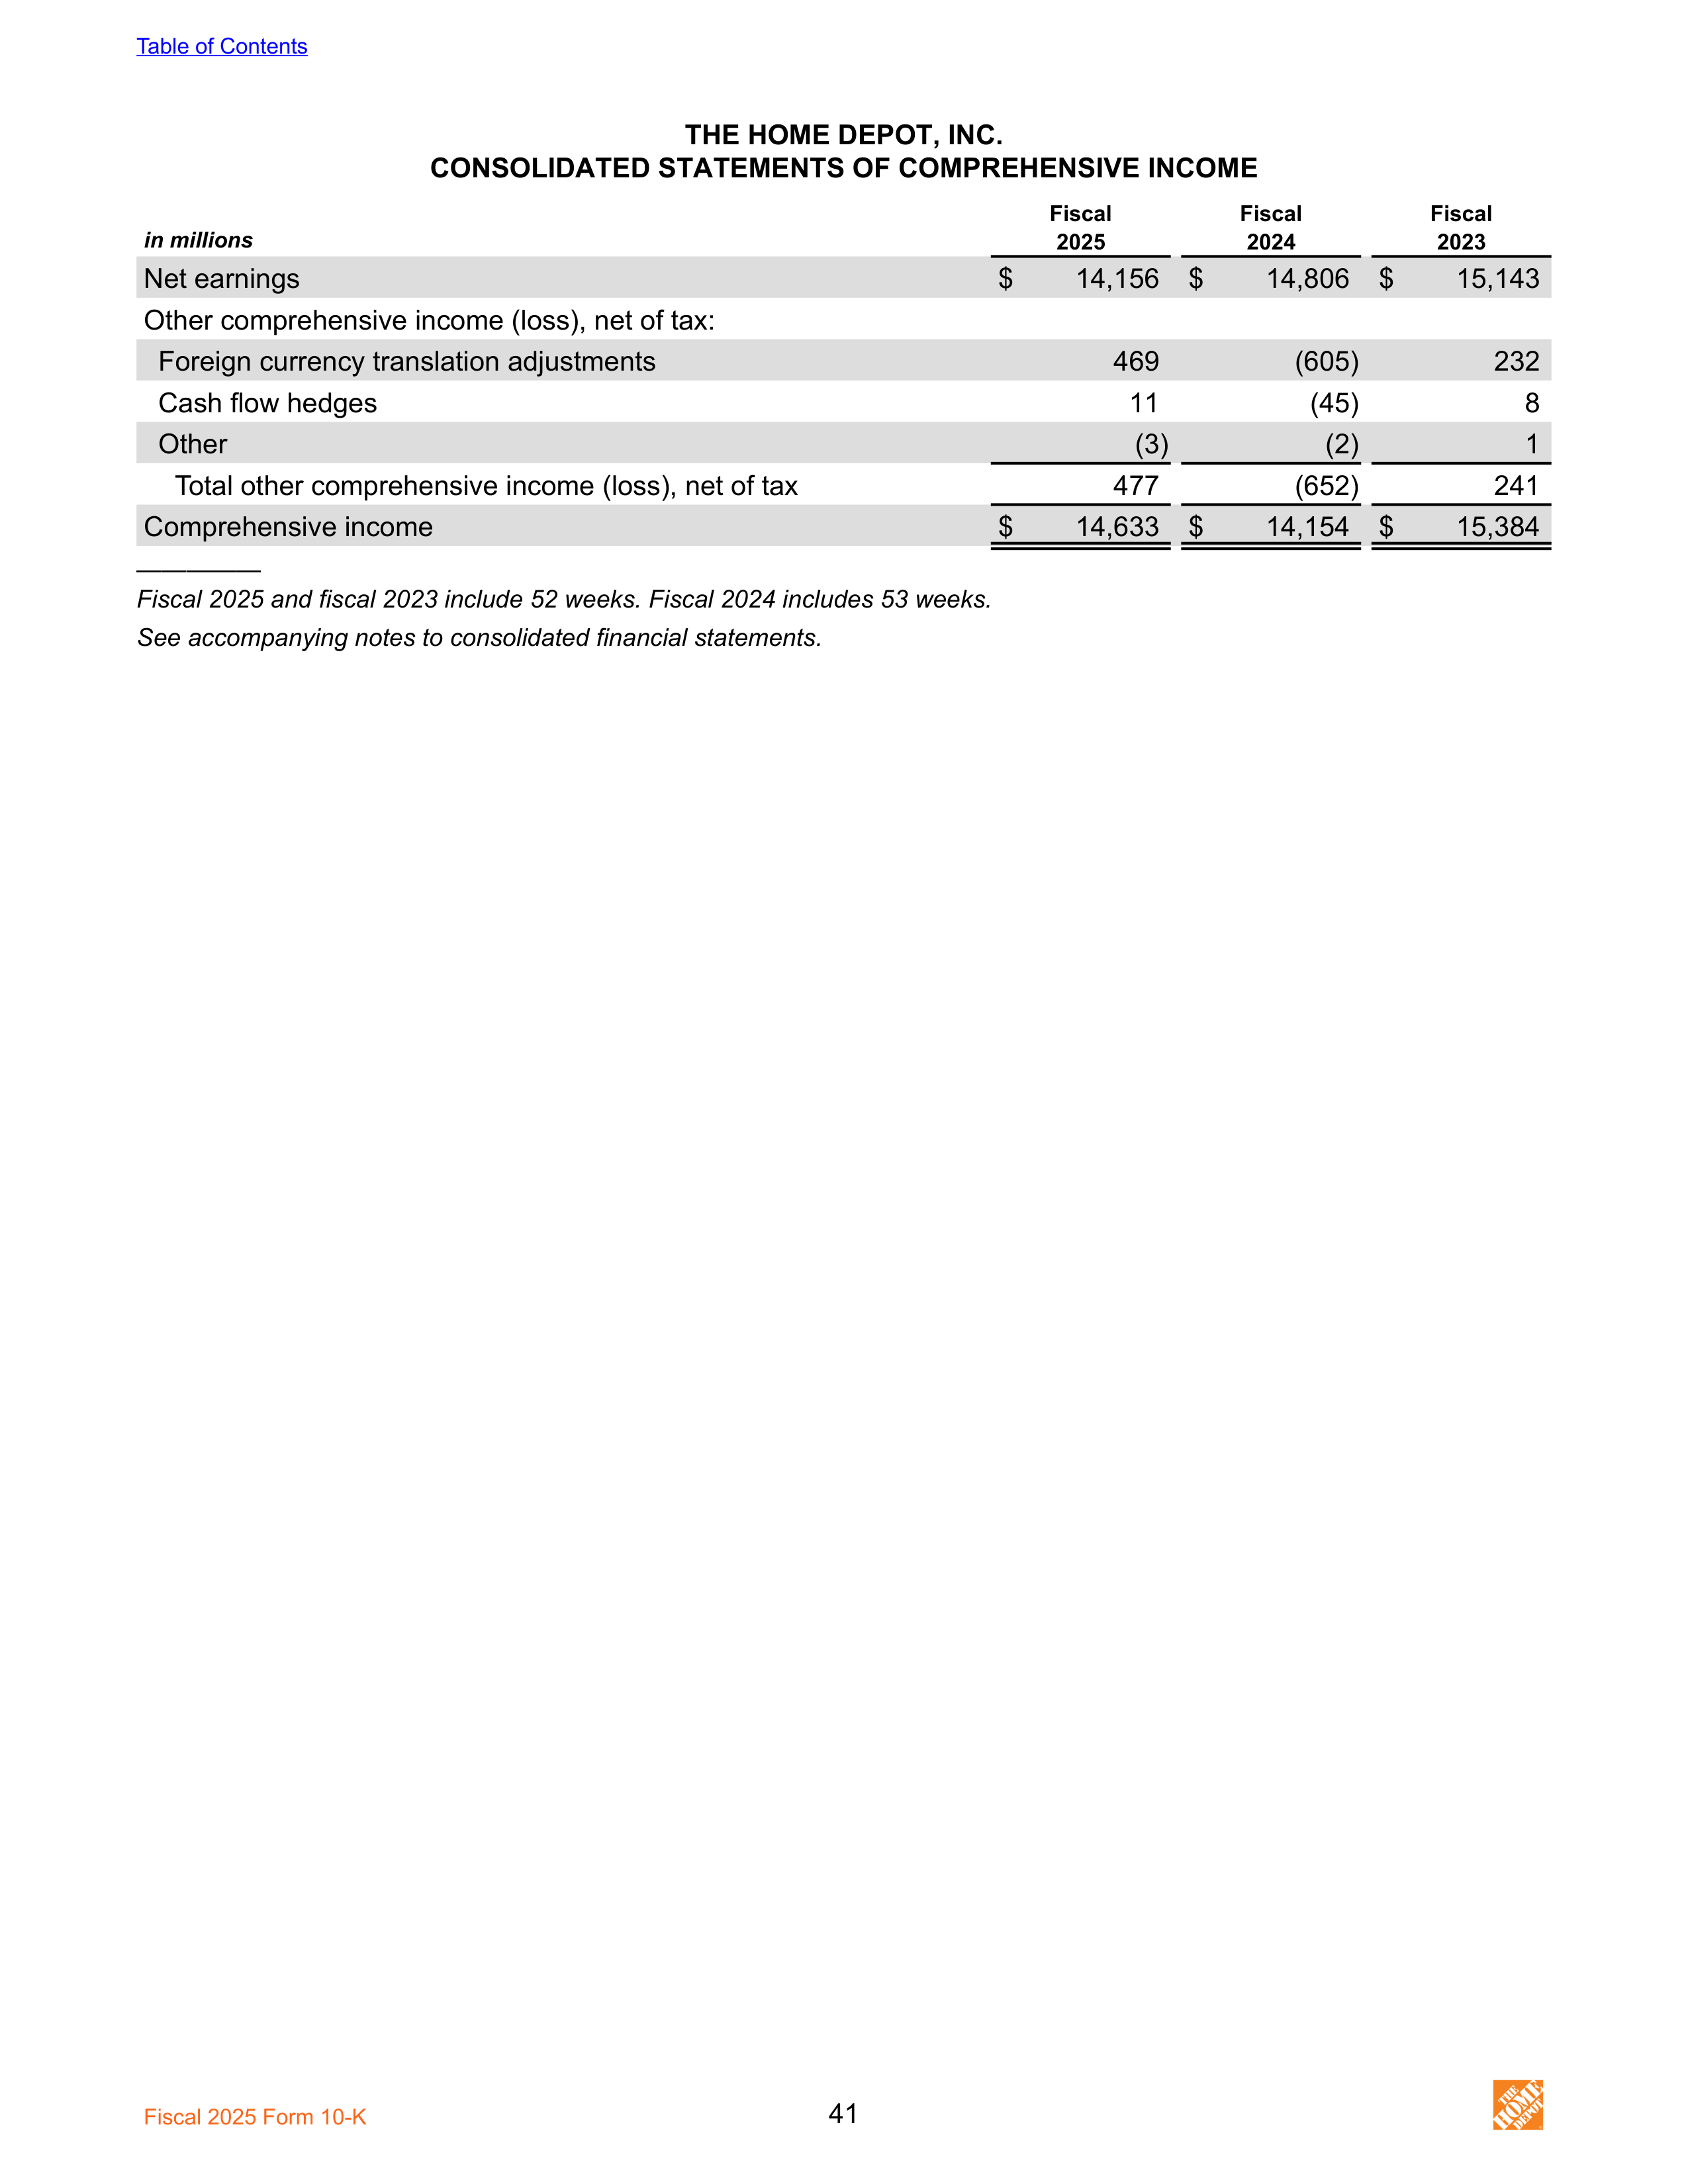
THE HOME DEPOT, INC.
CONSOLIDATED STATEMENTS OF COMPREHENSIVE INCOME
Fiscal
Fiscal
Fiscal
in millions
2025
2024
2023
Net earnings
$
14,156 $
14,806 $
15,143
Other comprehensive income (loss), net of tax:
Foreign currency translation adjustments
469
(605)
232
Cash flow hedges
11
(45)
8
Other
(3)
(2)
1
Total other comprehensive income (loss), net of tax
477
(652)
241
Comprehensive income
$
14,633 $
14,154 $
15,384
—————
Fiscal 2025 and fiscal 2023 include 52 weeks. Fiscal 2024 includes 53 weeks.
See accompanying notes to consolidated financial statements.
Table of Contents
Fiscal 2025 Form 10-K
41
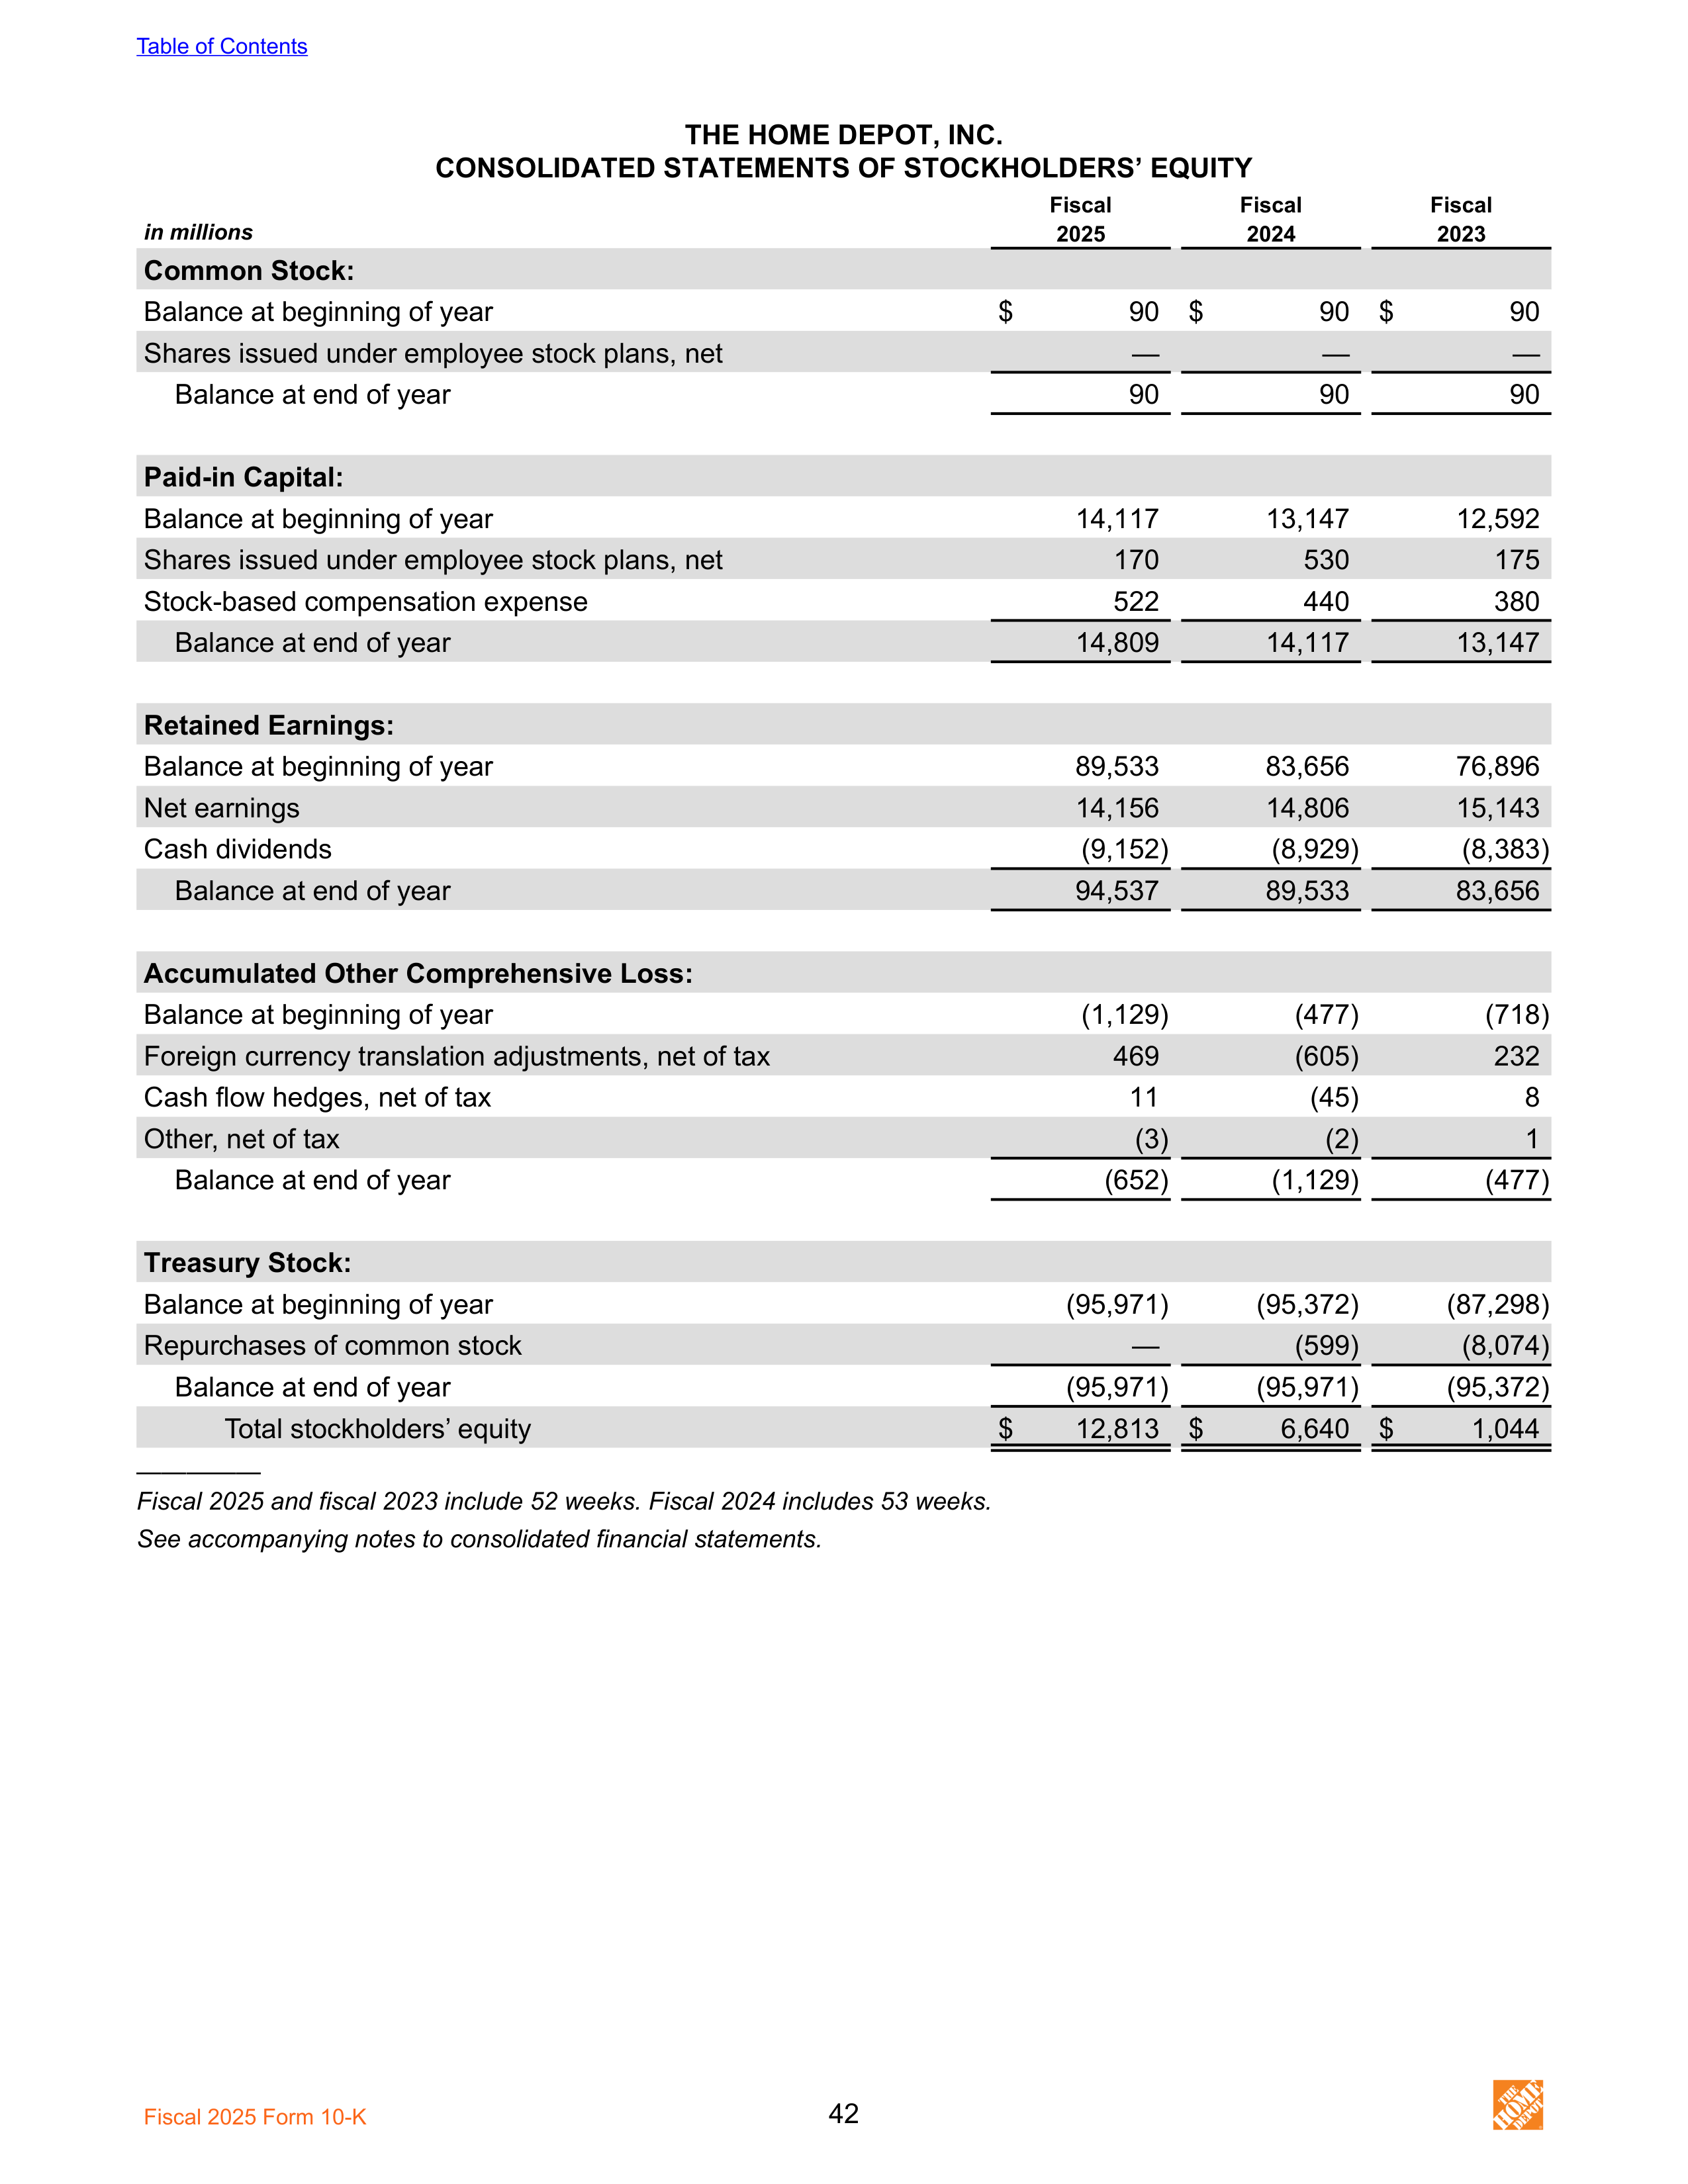
THE HOME DEPOT, INC.
CONSOLIDATED STATEMENTS OF STOCKHOLDERS’ EQUITY
in millions
Fiscal
Fiscal
Fiscal
2025
2024
2023
Common Stock:
Balance at beginning of year
$
90 $
90 $
90
Shares issued under employee stock plans, net
—
—
—
Balance at end of year
90
90
90
Paid-in Capital:
Balance at beginning of year
14,117
13,147
12,592
Shares issued under employee stock plans, net
170
530
175
Stock-based compensation expense
522
440
380
Balance at end of year
14,809
14,117
13,147
Retained Earnings:
Balance at beginning of year
89,533
83,656
76,896
Net earnings
14,156
14,806
15,143
Cash dividends
(9,152)
(8,929)
(8,383)
Balance at end of year
94,537
89,533
83,656
Accumulated Other Comprehensive Loss:
Balance at beginning of year
(1,129)
(477)
(718)
Foreign currency translation adjustments, net of tax
469
(605)
232
Cash flow hedges, net of tax
11
(45)
8
Other, net of tax
(3)
(2)
1
Balance at end of year
(652)
(1,129)
(477)
Treasury Stock:
Balance at beginning of year
(95,971)
(95,372)
(87,298)
Repurchases of common stock
—
(599)
(8,074)
Balance at end of year
(95,971)
(95,971)
(95,372)
Total stockholders’ equity
$
12,813 $
6,640 $
1,044
—————
Fiscal 2025 and fiscal 2023 include 52 weeks. Fiscal 2024 includes 53 weeks.
See accompanying notes to consolidated financial statements.
Table of Contents
Fiscal 2025 Form 10-K
42
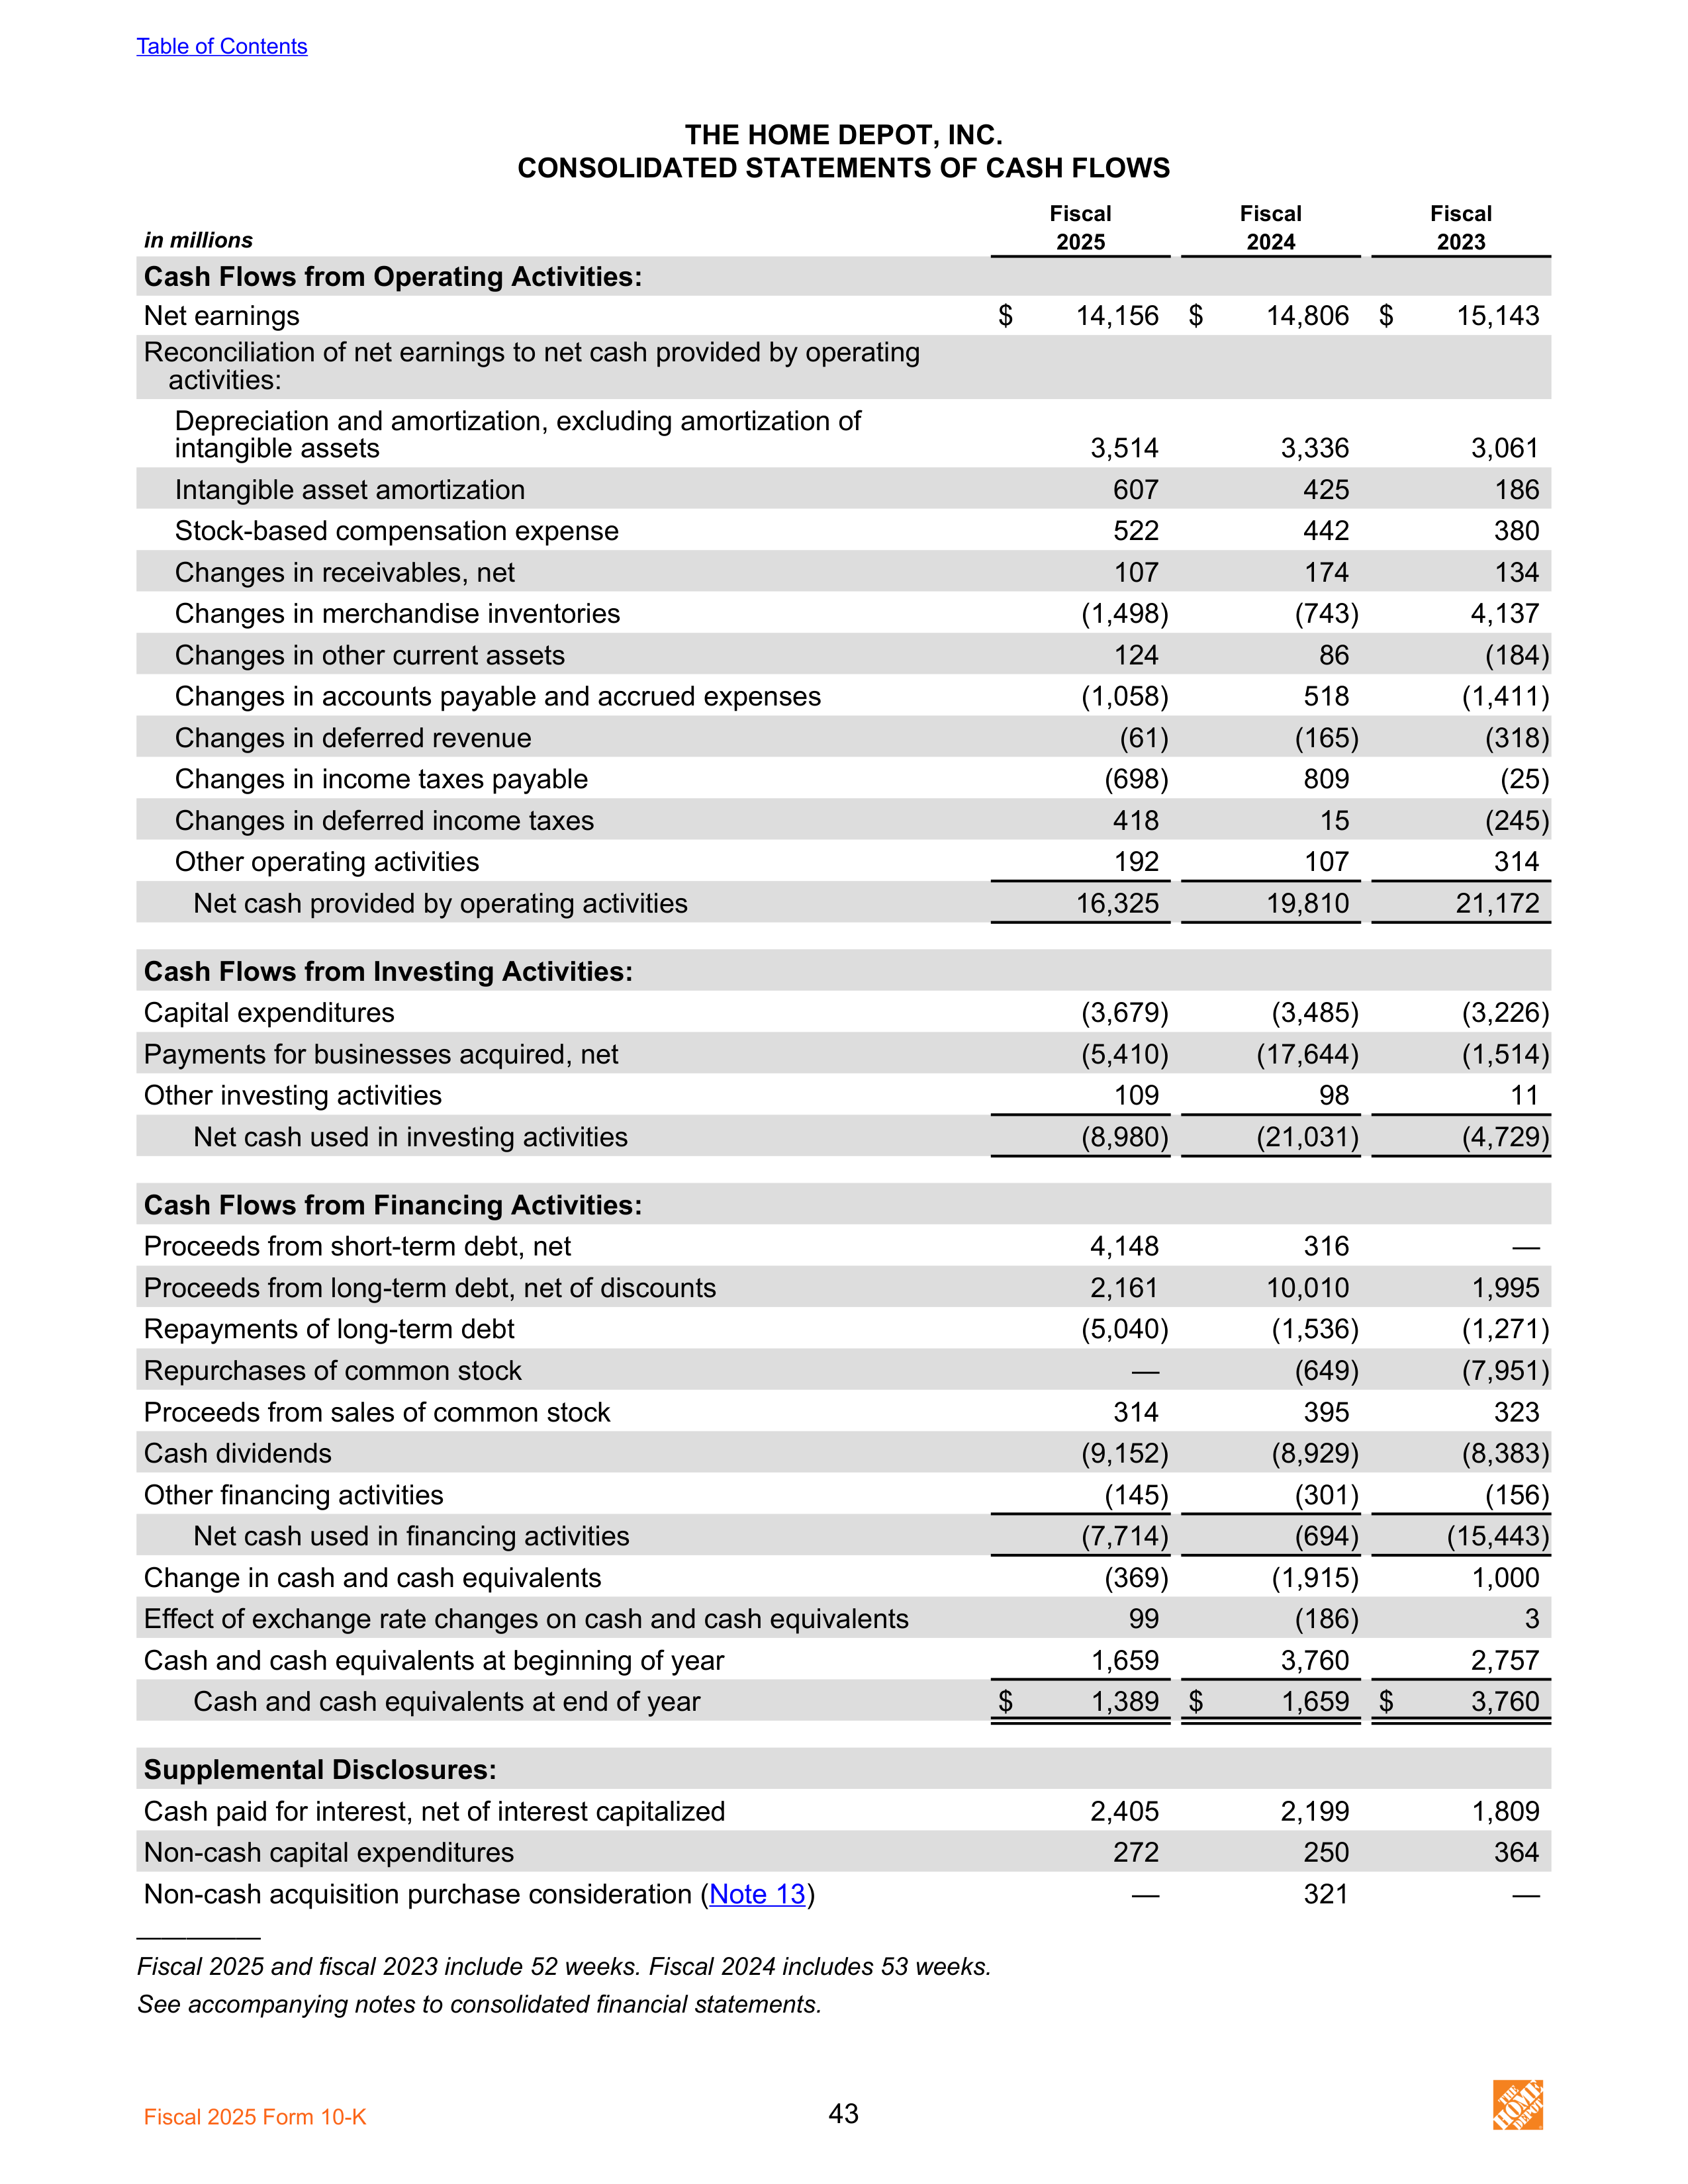
THE HOME DEPOT, INC.
CONSOLIDATED STATEMENTS OF CASH FLOWS
Fiscal
Fiscal
Fiscal
in millions
2025
2024
2023
Cash Flows from Operating Activities:
Net earnings
$
14,156 $
14,806 $
15,143
Reconciliation of net earnings to net cash provided by operating
activities:
Depreciation and amortization, excluding amortization of
intangible assets
3,514
3,336
3,061
Intangible asset amortization
607
425
186
Stock-based compensation expense
522
442
380
Changes in receivables, net
107
174
134
Changes in merchandise inventories
(1,498)
(743)
4,137
Changes in other current assets
124
86
(184)
Changes in accounts payable and accrued expenses
(1,058)
518
(1,411)
Changes in deferred revenue
(61)
(165)
(318)
Changes in income taxes payable
(698)
809
(25)
Changes in deferred income taxes
418
15
(245)
Other operating activities
192
107
314
Net cash provided by operating activities
16,325
19,810
21,172
Cash Flows from Investing Activities:
Capital expenditures
(3,679)
(3,485)
(3,226)
Payments for businesses acquired, net
(5,410)
(17,644)
(1,514)
Other investing activities
109
98
11
Net cash used in investing activities
(8,980)
(21,031)
(4,729)
Cash Flows from Financing Activities:
Proceeds from short-term debt, net
4,148
316
—
Proceeds from long-term debt, net of discounts
2,161
10,010
1,995
Repayments of long-term debt
(5,040)
(1,536)
(1,271)
Repurchases of common stock
—
(649)
(7,951)
Proceeds from sales of common stock
314
395
323
Cash dividends
(9,152)
(8,929)
(8,383)
Other financing activities
(145)
(301)
(156)
Net cash used in financing activities
(7,714)
(694)
(15,443)
Change in cash and cash equivalents
(369)
(1,915)
1,000
Effect of exchange rate changes on cash and cash equivalents
99
(186)
3
Cash and cash equivalents at beginning of year
1,659
3,760
2,757
Cash and cash equivalents at end of year
$
1,389 $
1,659 $
3,760
Supplemental Disclosures:
Cash paid for interest, net of interest capitalized
2,405
2,199
1,809
Non-cash capital expenditures
272
250
364
Non-cash acquisition purchase consideration (
Note 13
)
—
321
—
—————
Fiscal 2025 and fiscal 2023 include 52 weeks. Fiscal 2024 includes 53 weeks.
See accompanying notes to consolidated financial statements.
Table of Contents
Fiscal 2025 Form 10-K
43
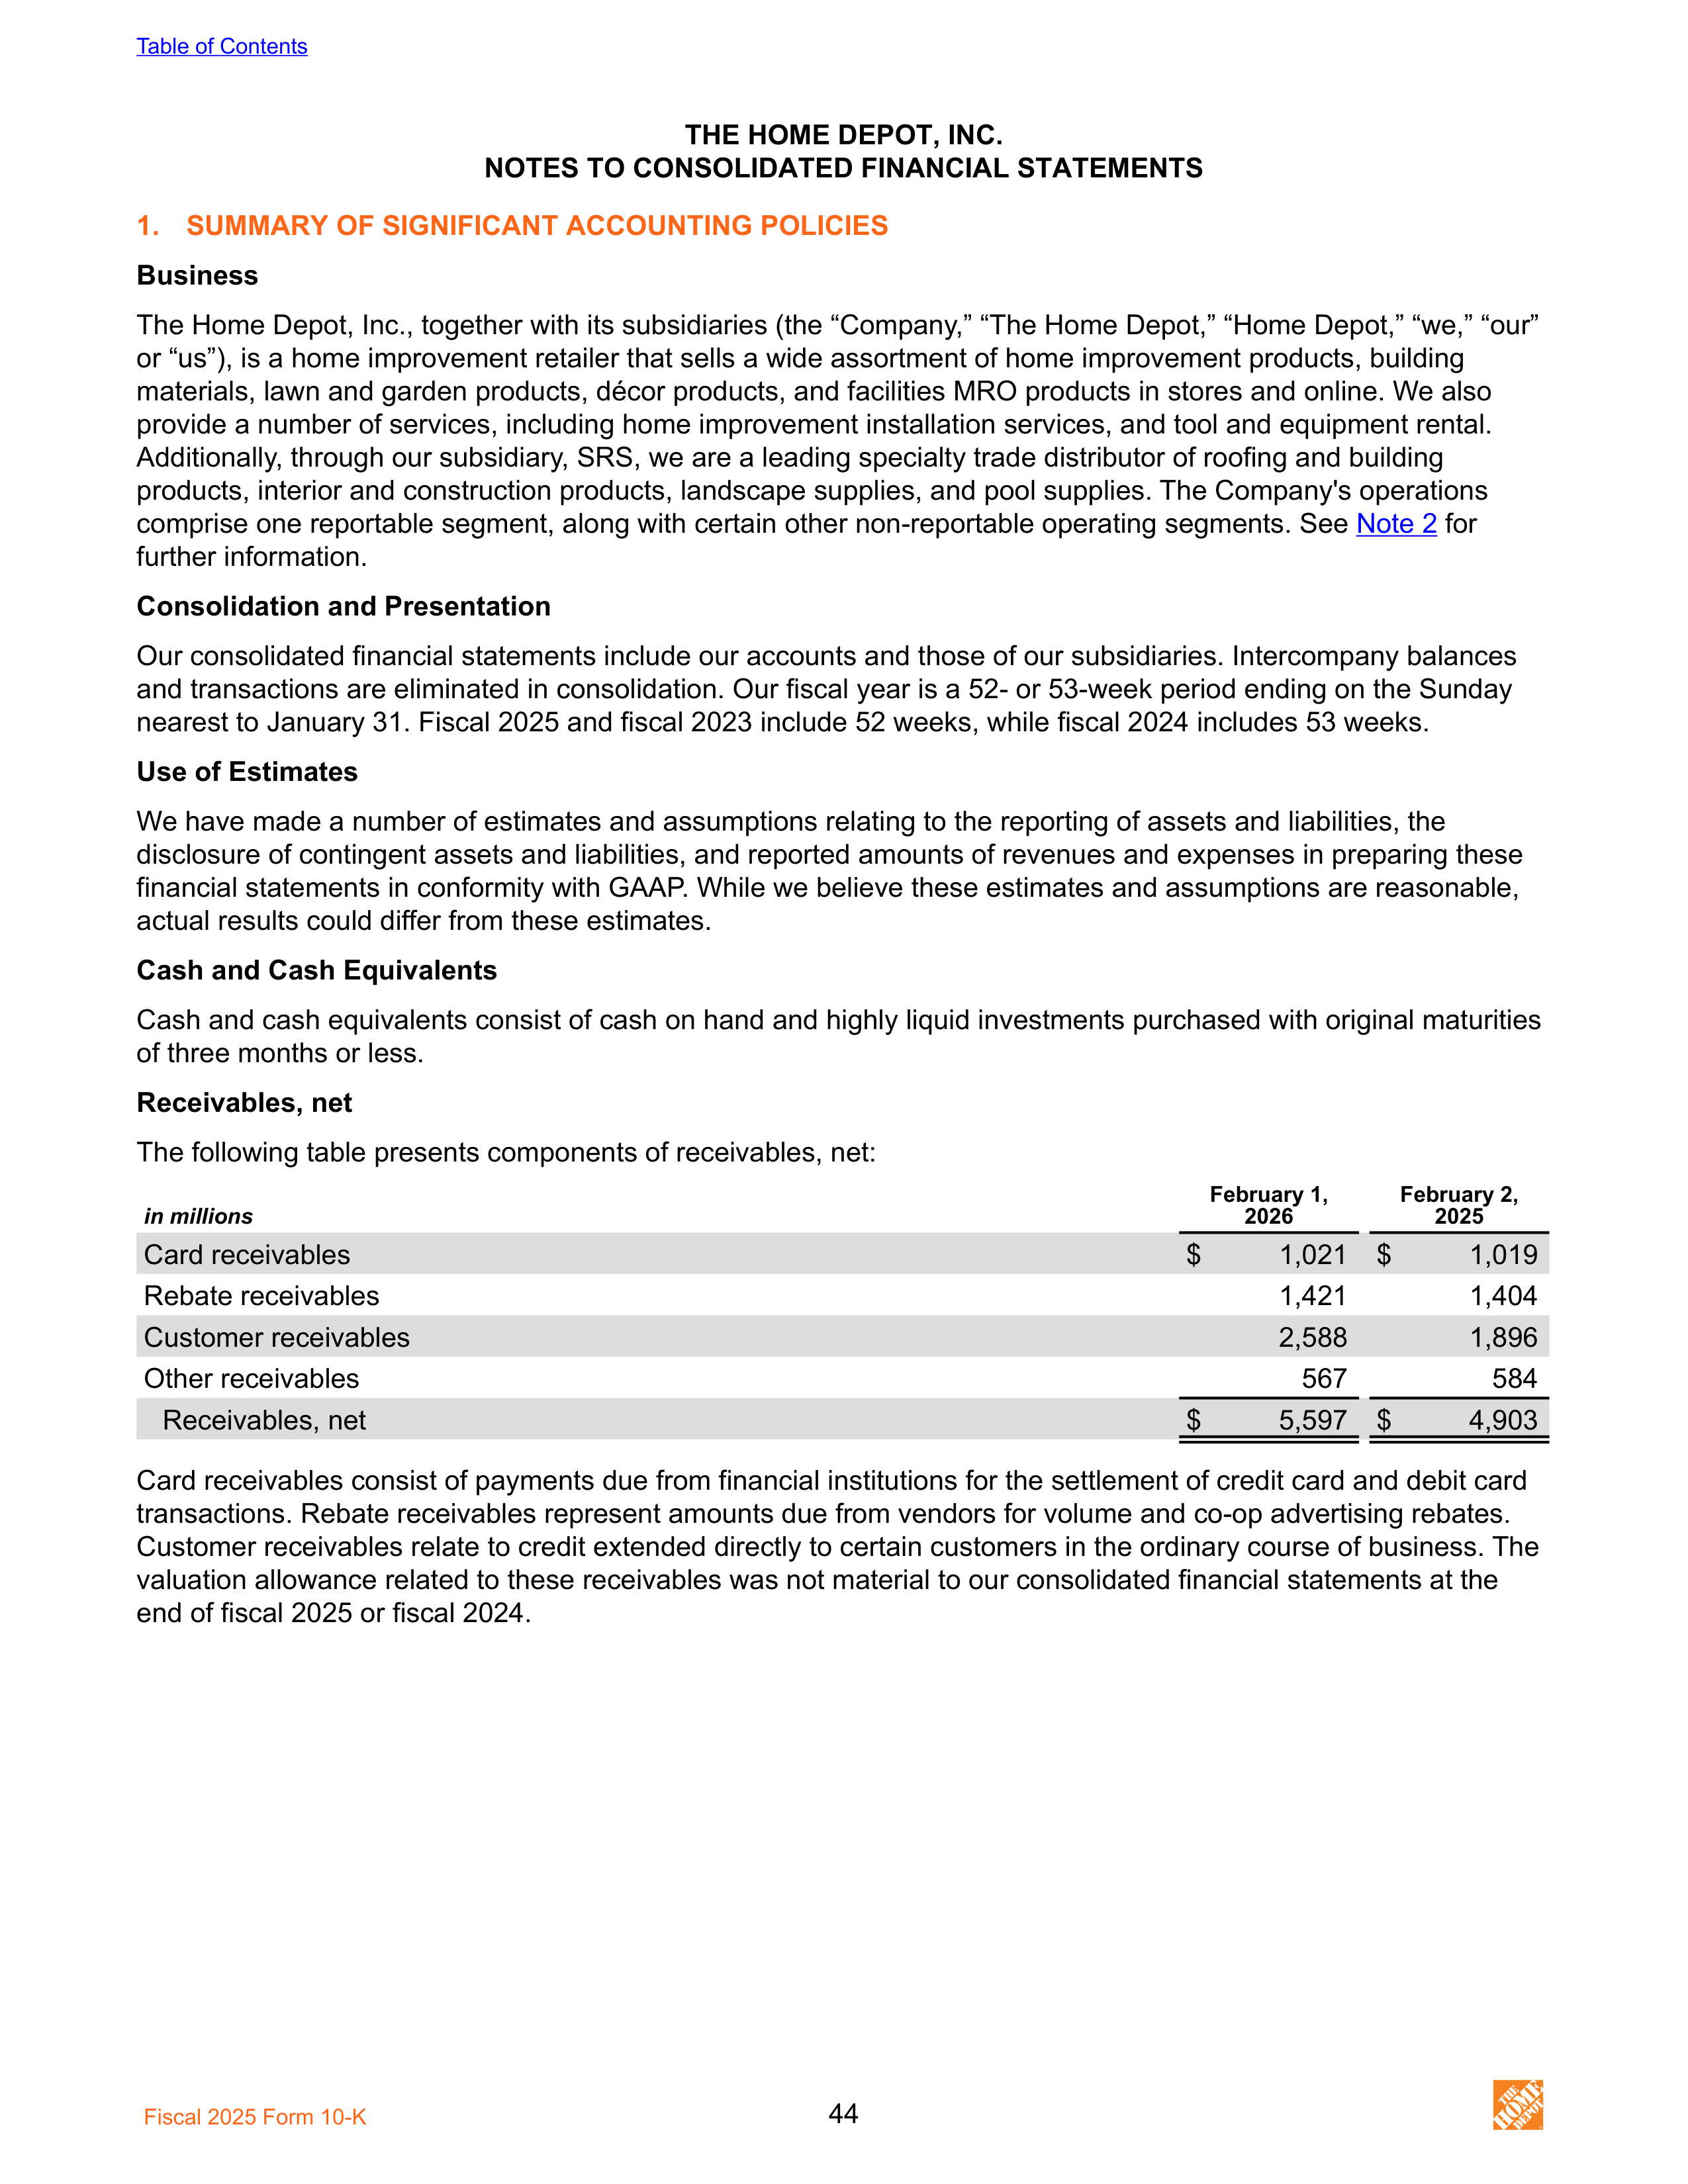
THE HOME DEPOT, INC.
NOTES TO CONSOLIDATED FINANCIAL STATEMENTS
1.
SUMMARY OF SIGNIFICANT ACCOUNTING POLICIES
Business
The Home Depot, Inc., together with its subsidiaries (the “Company,” “The Home Depot,” “Home Depot,” “we,” “our”
or “us”), is a home improvement retailer that sells a wide assortment of home improvement products, building
materials, lawn and garden products, décor products, and facilities MRO products in stores and online. We also
provide a number of services, including home improvement installation services, and tool and equipment rental.
Additionally, through our subsidiary, SRS, we are a leading specialty trade distributor of roofing and building
products, interior and construction products, landscape supplies, and pool supplies. The Company's operations
comprise one reportable segment, along with certain other non-reportable operating segments. See
Note 2
for
further information.
Consolidation and Presentation
Our consolidated financial statements include our accounts and those of our subsidiaries. Intercompany balances
and transactions are eliminated in consolidation. Our fiscal year is a 52- or 53-week period ending on the Sunday
nearest to January 31. Fiscal 2025 and fiscal 2023 include 52 weeks, while fiscal 2024 includes 53 weeks.
Use of Estimates
We have made a number of estimates and assumptions relating to the reporting of assets and liabilities, the
disclosure of contingent assets and liabilities, and reported amounts of revenues and expenses in preparing these
financial statements in conformity with GAAP. While we believe these estimates and assumptions are reasonable,
actual results could differ from these estimates.
Cash and Cash Equivalents
Cash and cash equivalents consist of cash on hand and highly liquid investments purchased with original maturities
of three months or less.
Receivables, net
The following table presents components of receivables, net:
in millions
February 1,
2026
February 2,
2025
Card receivables
$
1,021 $
1,019
Rebate receivables
1,421
1,404
Customer receivables
2,588
1,896
Other receivables
567
584
Receivables, net
$
5,597 $
4,903
Card receivables consist of payments due from financial institutions for the settlement of credit card and debit card
transactions. Rebate receivables represent amounts due from vendors for volume and co-op advertising rebates.
Customer receivables relate to credit extended directly to certain customers in the ordinary course of business. The
valuation allowance related to these receivables was not material to our consolidated financial statements at the
end of fiscal 2025 or fiscal 2024.
Table of Contents
Fiscal 2025 Form 10-K
44
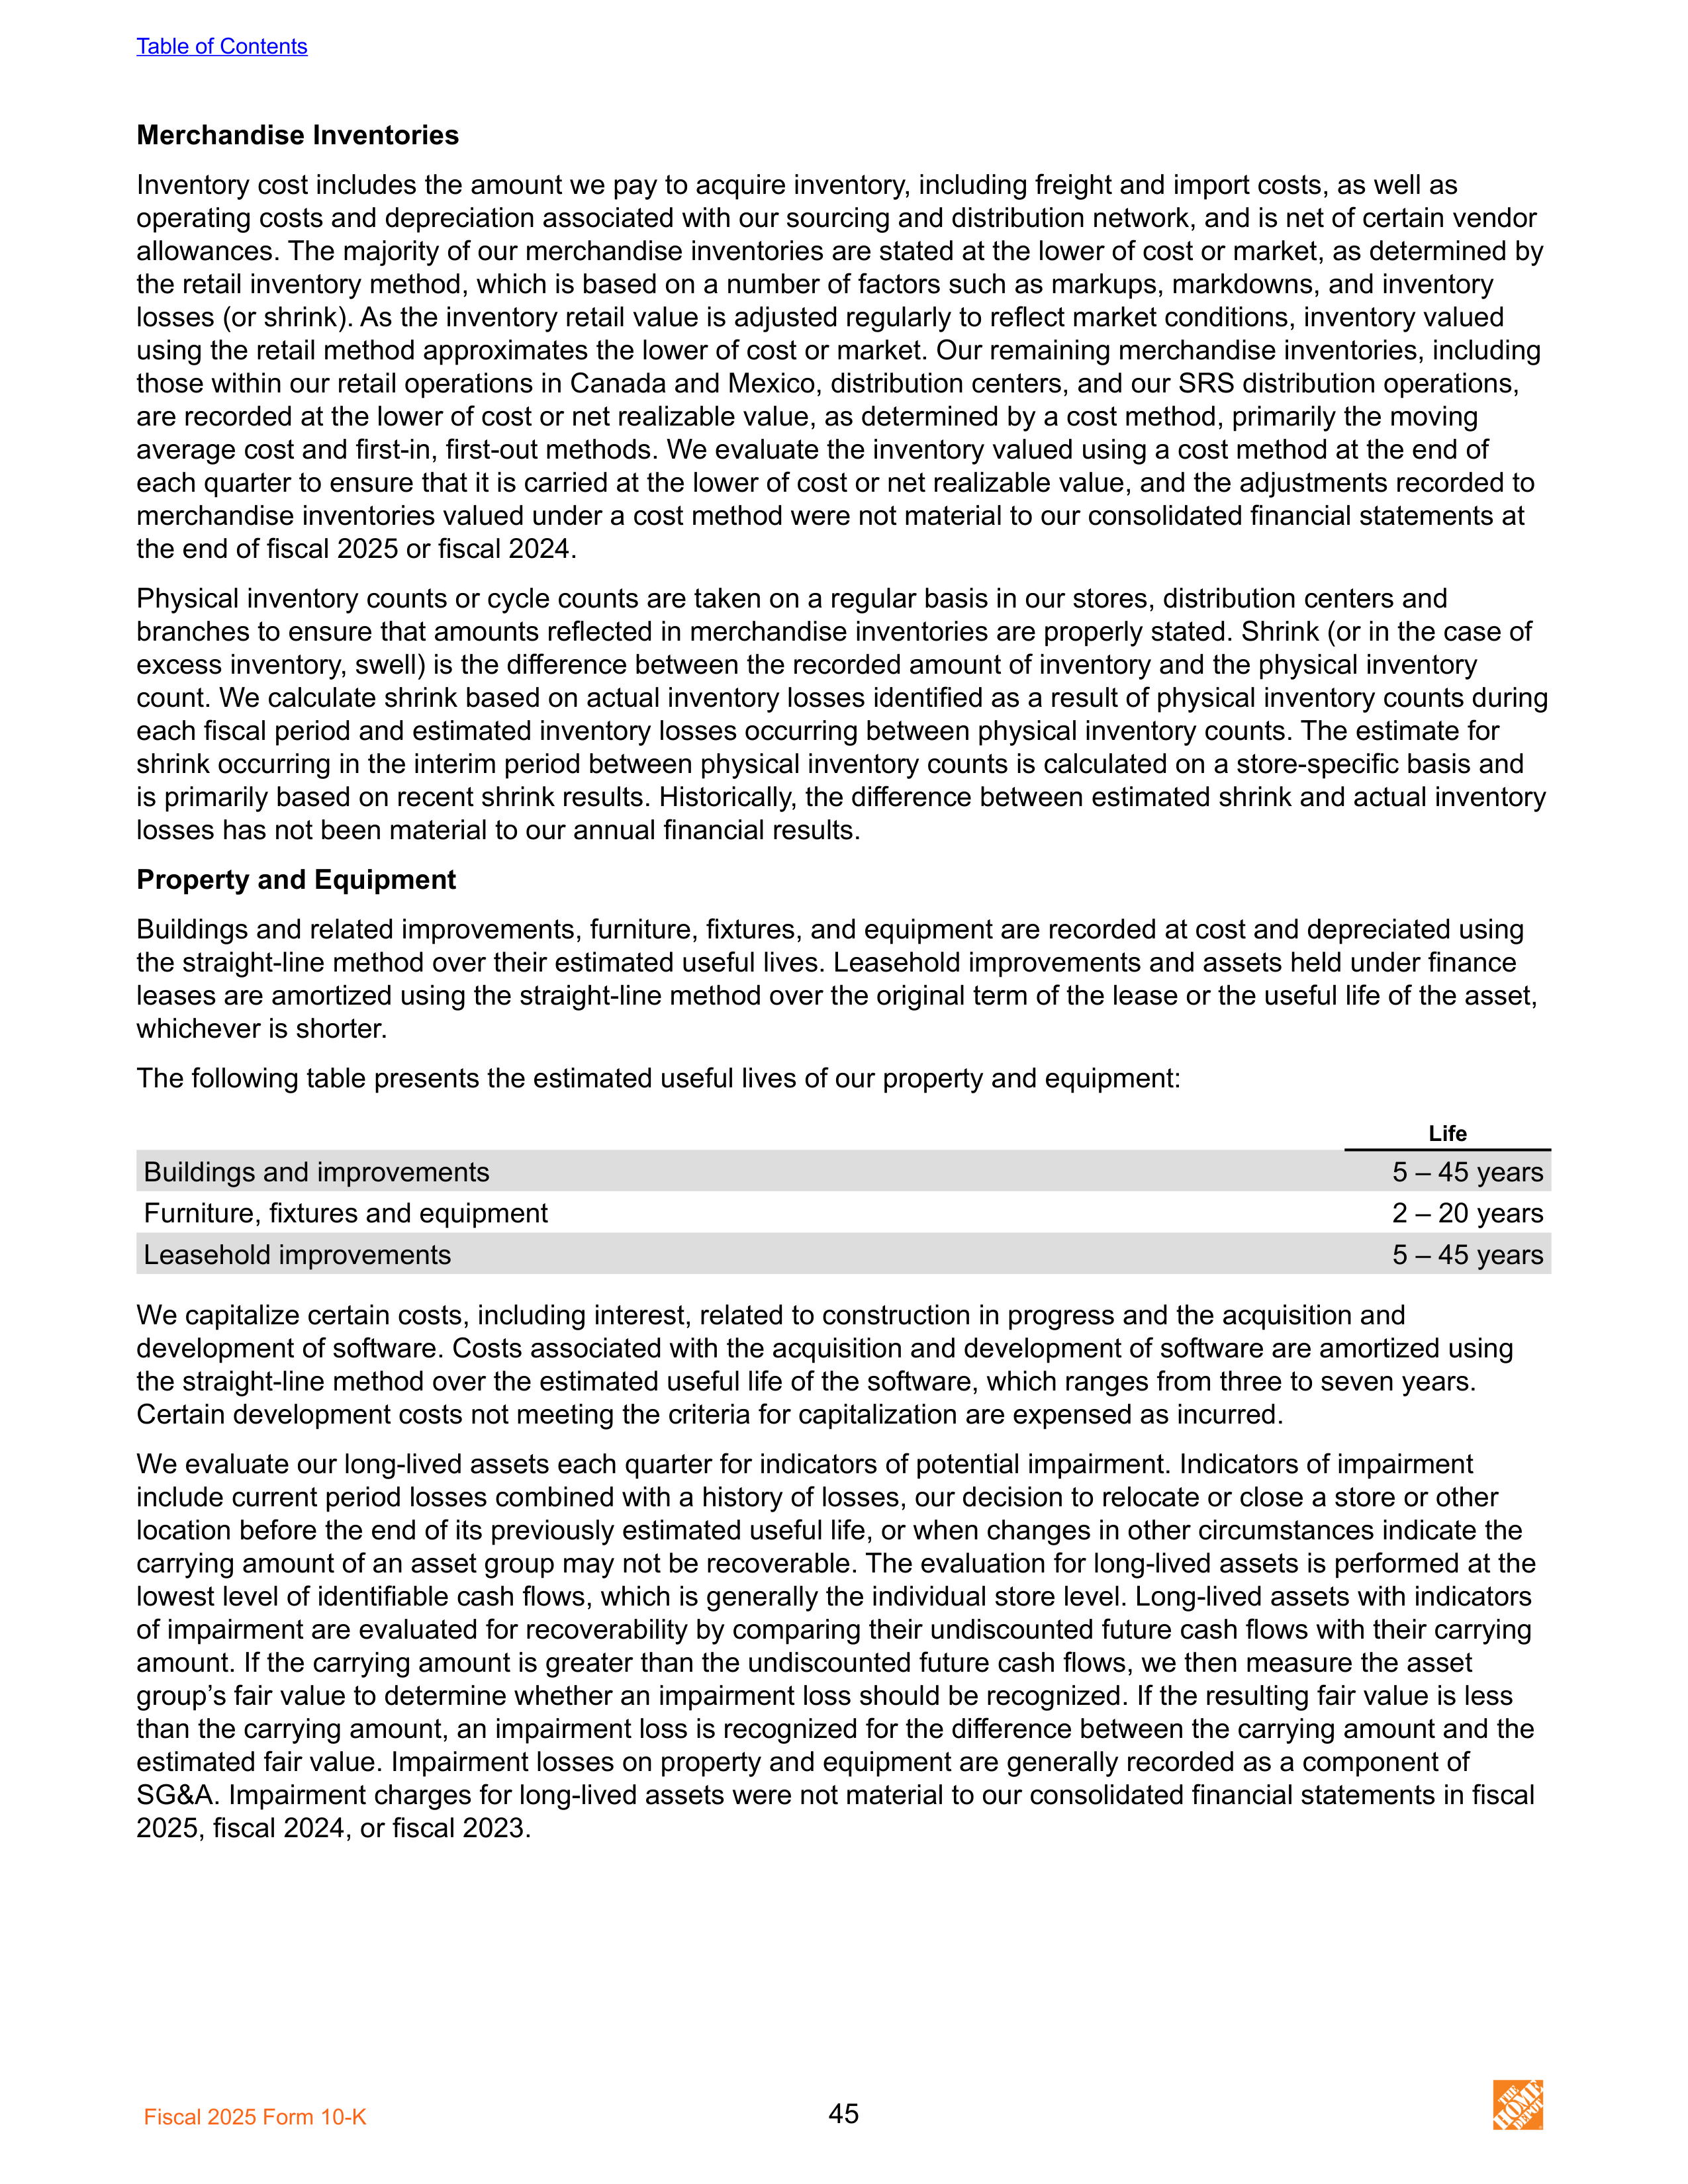
Merchandise Inventories
Inventory cost includes the amount we pay to acquire inventory, including freight and import costs, as well as
operating costs and depreciation associated with our sourcing and distribution network, and is net of certain vendor
allowances. The majority of our merchandise inventories are stated at the lower of cost or market, as determined by
the retail inventory method, which is based on a number of factors such as markups, markdowns, and inventory
losses (or shrink). As the inventory retail value is adjusted regularly to reflect market conditions, inventory valued
using the retail method approximates the lower of cost or market. Our remaining merchandise inventories, including
those within our retail operations in Canada and Mexico, distribution centers, and our SRS distribution operations,
are recorded at the lower of cost or net realizable value, as determined by a cost method, primarily the moving
average cost and first-in, first-out methods. We evaluate the inventory valued using a cost method at the end of
each quarter to ensure that it is carried at the lower of cost or net realizable value, and the adjustments recorded to
merchandise inventories valued under a cost method were not material to our consolidated financial statements at
the end of fiscal 2025 or fiscal 2024.
Physical inventory counts or cycle counts are taken on a regular basis in our stores, distribution centers and
branches to ensure that amounts reflected in merchandise inventories are properly stated. Shrink (or in the case of
excess inventory, swell) is the difference between the recorded amount of inventory and the physical inventory
count. We calculate shrink based on actual inventory losses identified as a result of physical inventory counts during
each fiscal period and estimated inventory losses occurring between physical inventory counts. The estimate for
shrink occurring in the interim period between physical inventory counts is calculated on a store-specific basis and
is primarily based on recent shrink results. Historically, the difference between estimated shrink and actual inventory
losses has not been material to our annual financial results.
Property and Equipment
Buildings and related improvements, furniture, fixtures, and equipment are recorded at cost and depreciated using
the straight-line method over their estimated useful lives. Leasehold improvements and assets held under finance
leases are amortized using the straight-line method over the original term of the lease or the useful life of the asset,
whichever is shorter.
The following table presents the estimated useful lives of our property and equipment:
Life
Buildings and improvements
5 – 45 years
Furniture, fixtures and equipment
2 – 20 years
Leasehold improvements
5 – 45 years
We capitalize certain costs, including interest, related to construction in progress and the acquisition and
development of software. Costs associated with the acquisition and development of software are amortized using
the straight-line method over the estimated useful life of the software, which ranges from three to seven years.
Certain development costs not meeting the criteria for capitalization are expensed as incurred.
We evaluate our long-lived assets each quarter for indicators of potential impairment. Indicators of impairment
include current period losses combined with a history of losses, our decision to relocate or close a store or other
location before the end of its previously estimated useful life, or when changes in other circumstances indicate the
carrying amount of an asset group may not be recoverable. The evaluation for long-lived assets is performed at the
lowest level of identifiable cash flows, which is generally the individual store level. Long-lived assets with indicators
of impairment are evaluated for recoverability by comparing their undiscounted future cash flows with their carrying
amount. If the carrying amount is greater than the undiscounted future cash flows, we then measure the asset
group’s fair value to determine whether an impairment loss should be recognized. If the resulting fair value is less
than the carrying amount, an impairment loss is recognized for the difference between the carrying amount and the
estimated fair value. Impairment losses on property and equipment are generally recorded as a component of
SG&A. Impairment charges for long-lived assets were not material to our consolidated financial statements in fiscal
2025, fiscal 2024, or fiscal 2023.
Table of Contents
Fiscal 2025 Form 10-K
45
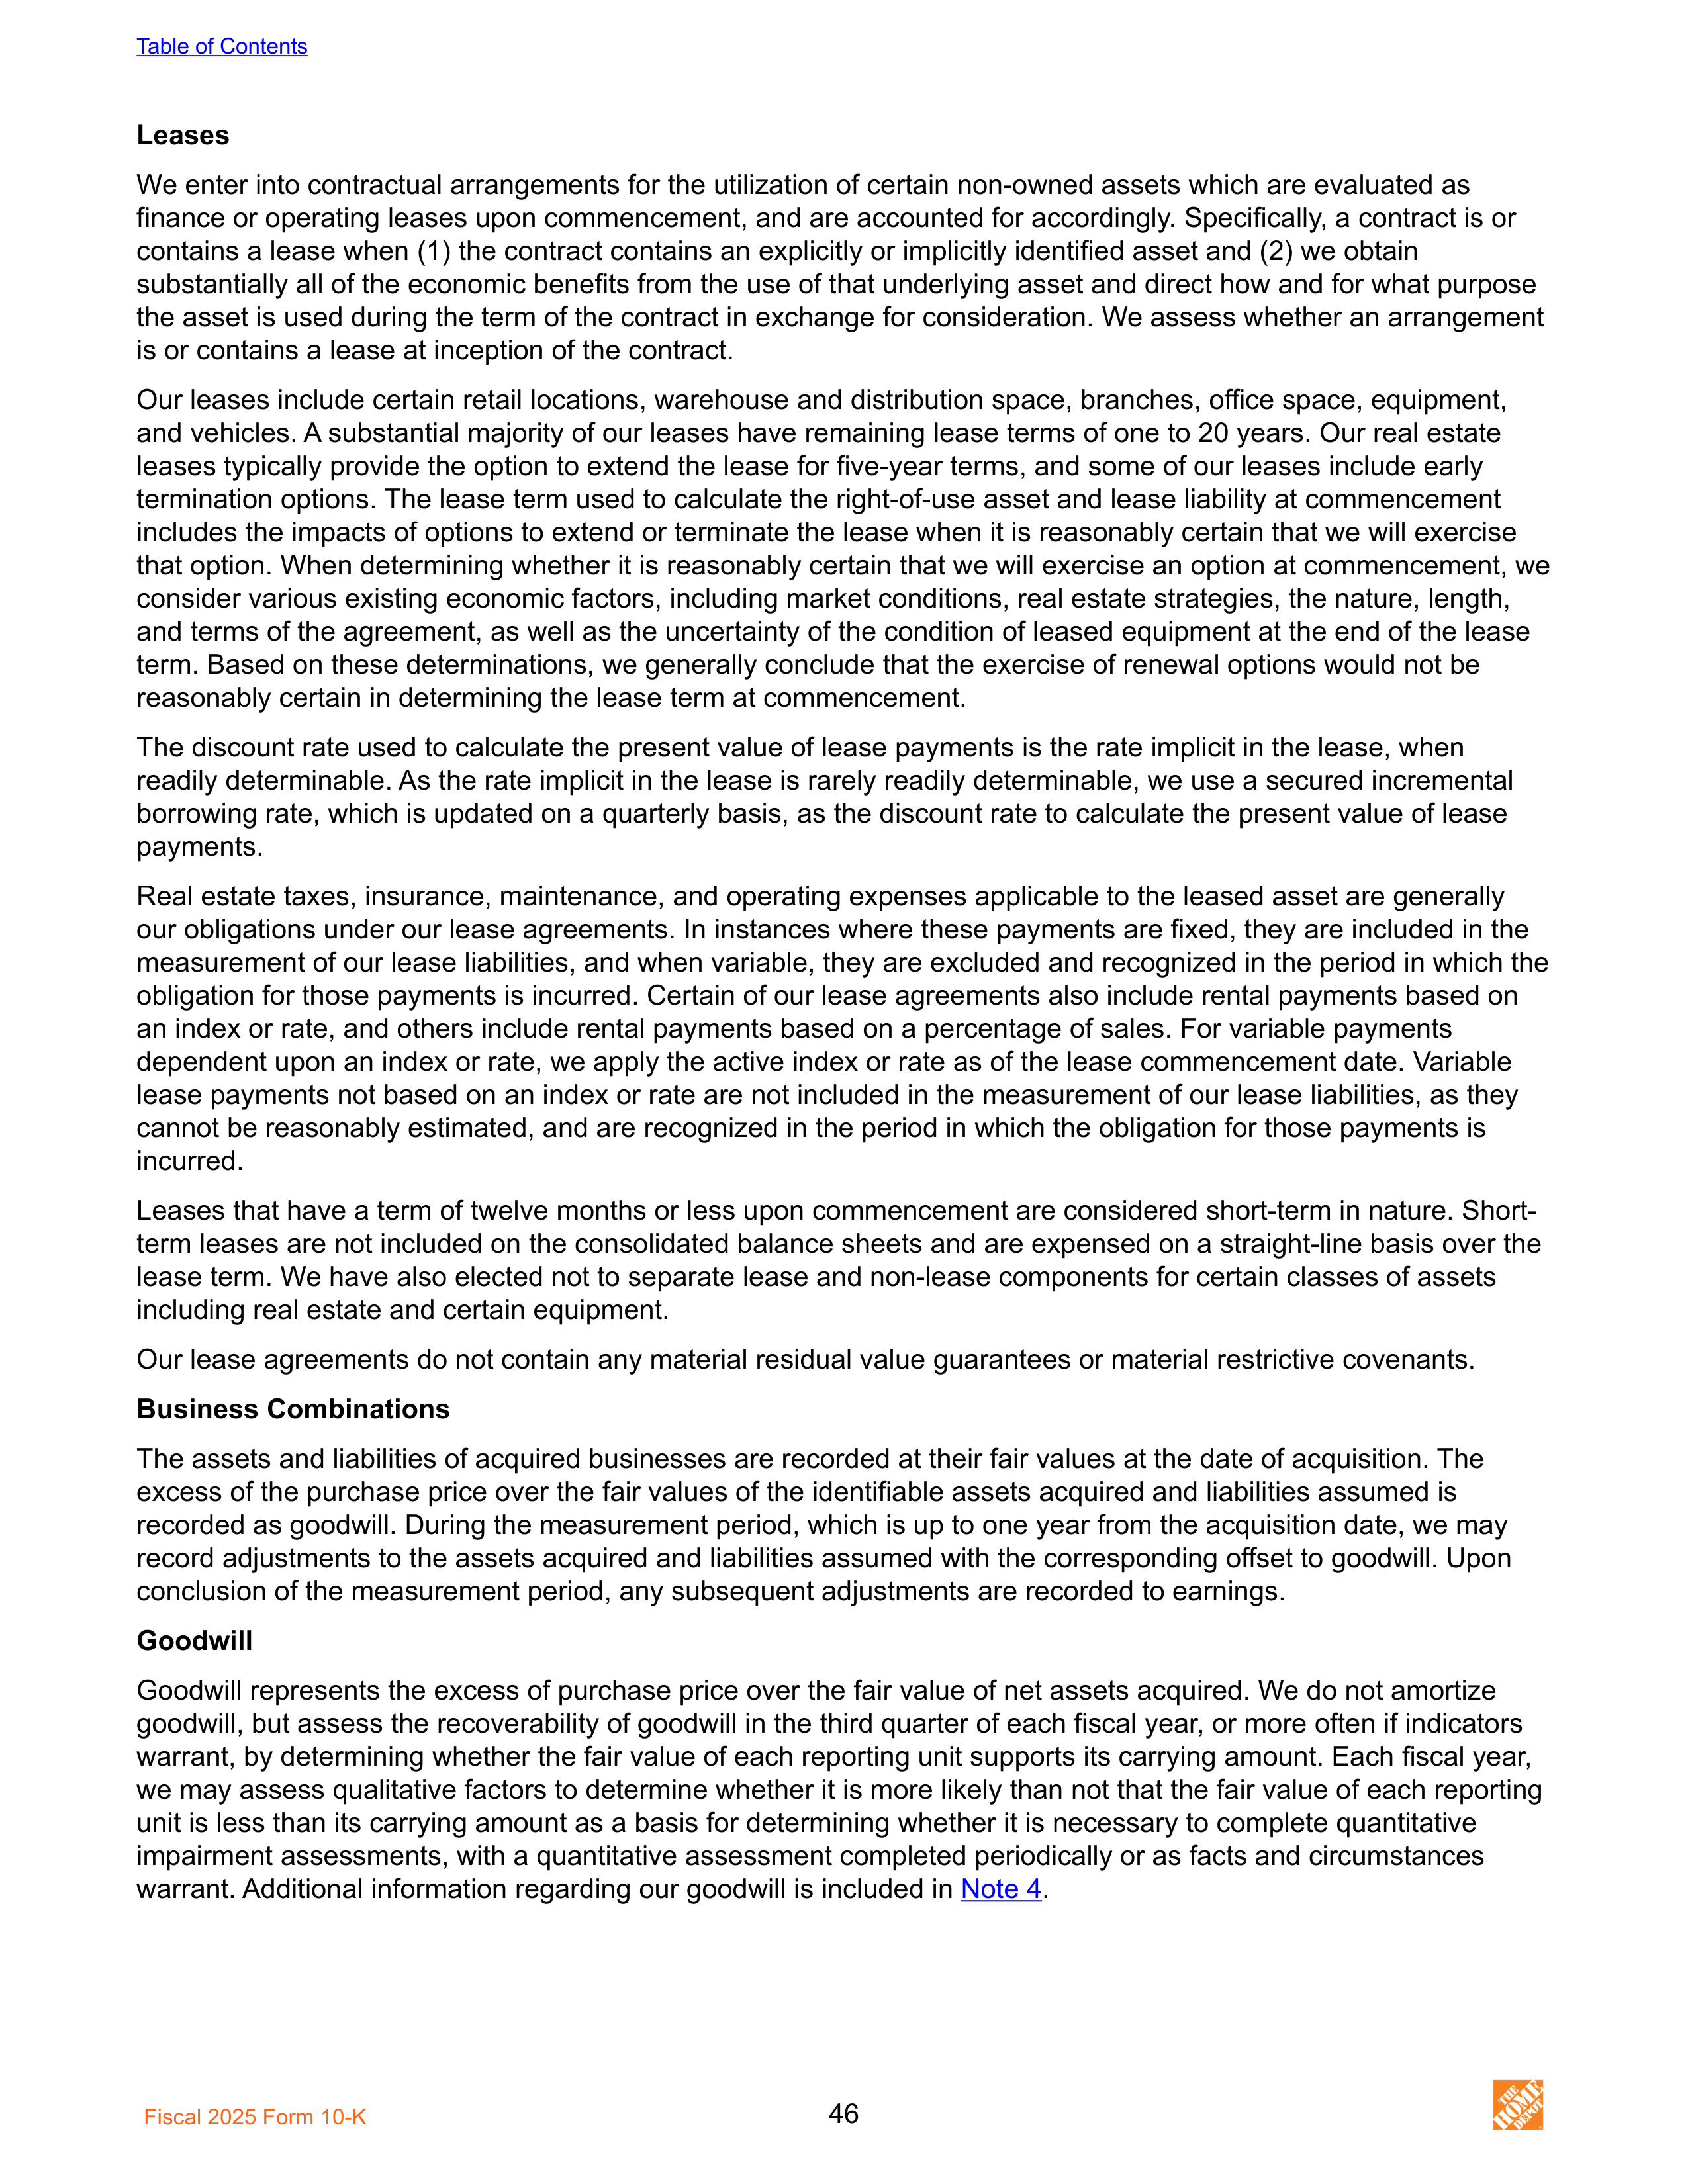
Leases
We enter into contractual arrangements for the utilization of certain non-owned assets which are evaluated as
finance or operating leases upon commencement, and are accounted for accordingly. Specifically, a contract is or
contains a lease when (1) the contract contains an explicitly or implicitly identified asset and (2) we obtain
substantially all of the economic benefits from the use of that underlying asset and direct how and for what purpose
the asset is used during the term of the contract in exchange for consideration. We assess whether an arrangement
is or contains a lease at inception of the contract.
Our leases include certain retail locations, warehouse and distribution space, branches, office space, equipment,
and vehicles. A substantial majority of our leases have remaining lease terms of one to 20 years. Our real estate
leases typically provide the option to extend the lease for five-year terms, and some of our leases include early
termination options. The lease term used to calculate the right-of-use asset and lease liability at commencement
includes the impacts of options to extend or terminate the lease when it is reasonably certain that we will exercise
that option. When determining whether it is reasonably certain that we will exercise an option at commencement, we
consider various existing economic factors, including market conditions, real estate strategies, the nature, length,
and terms of the agreement, as well as the uncertainty of the condition of leased equipment at the end of the lease
term. Based on these determinations, we generally conclude that the exercise of renewal options would not be
reasonably certain in determining the lease term at commencement.
The discount rate used to calculate the present value of lease payments is the rate implicit in the lease, when
readily determinable. As the rate implicit in the lease is rarely readily determinable, we use a secured incremental
borrowing rate, which is updated on a quarterly basis, as the discount rate to calculate the present value of lease
payments.
Real estate taxes, insurance, maintenance, and operating expenses applicable to the leased asset are generally
our obligations under our lease agreements. In instances where these payments are fixed, they are included in the
measurement of our lease liabilities, and when variable, they are excluded and recognized in the period in which the
obligation for those payments is incurred. Certain of our lease agreements also include rental payments based on
an index or rate, and others include rental payments based on a percentage of sales. For variable payments
dependent upon an index or rate, we apply the active index or rate as of the lease commencement date. Variable
lease payments not based on an index or rate are not included in the measurement of our lease liabilities, as they
cannot be reasonably estimated, and are recognized in the period in which the obligation for those payments is
incurred.
Leases that have a term of twelve months or less upon commencement are considered short-term in nature. Short-
term leases are not included on the consolidated balance sheets and are expensed on a straight-line basis over the
lease term. We have also elected not to separate lease and non-lease components for certain classes of assets
including real estate and certain equipment.
Our lease agreements do not contain any material residual value guarantees or material restrictive covenants.
Business Combinations
The assets and liabilities of acquired businesses are recorded at their fair values at the date of acquisition. The
excess of the purchase price over the fair values of the identifiable assets acquired and liabilities assumed is
recorded as goodwill. During the measurement period, which is up to one year from the acquisition date, we may
record adjustments to the assets acquired and liabilities assumed with the corresponding offset to goodwill. Upon
conclusion of the measurement period, any subsequent adjustments are recorded to earnings.
Goodwill
Goodwill represents the excess of purchase price over the fair value of net assets acquired. We do not amortize
goodwill, but assess the recoverability of goodwill in the third quarter of each fiscal year, or more often if indicators
warrant, by determining whether the fair value of each reporting unit supports its carrying amount. Each fiscal year,
we may assess qualitative factors to determine whether it is more likely than not that the fair value of each reporting
unit is less than its carrying amount as a basis for determining whether it is necessary to complete quantitative
impairment assessments, with a quantitative assessment completed periodically or as facts and circumstances
warrant. Additional information regarding our goodwill is included in
Note 4
.
Table of Contents
Fiscal 2025 Form 10-K
46
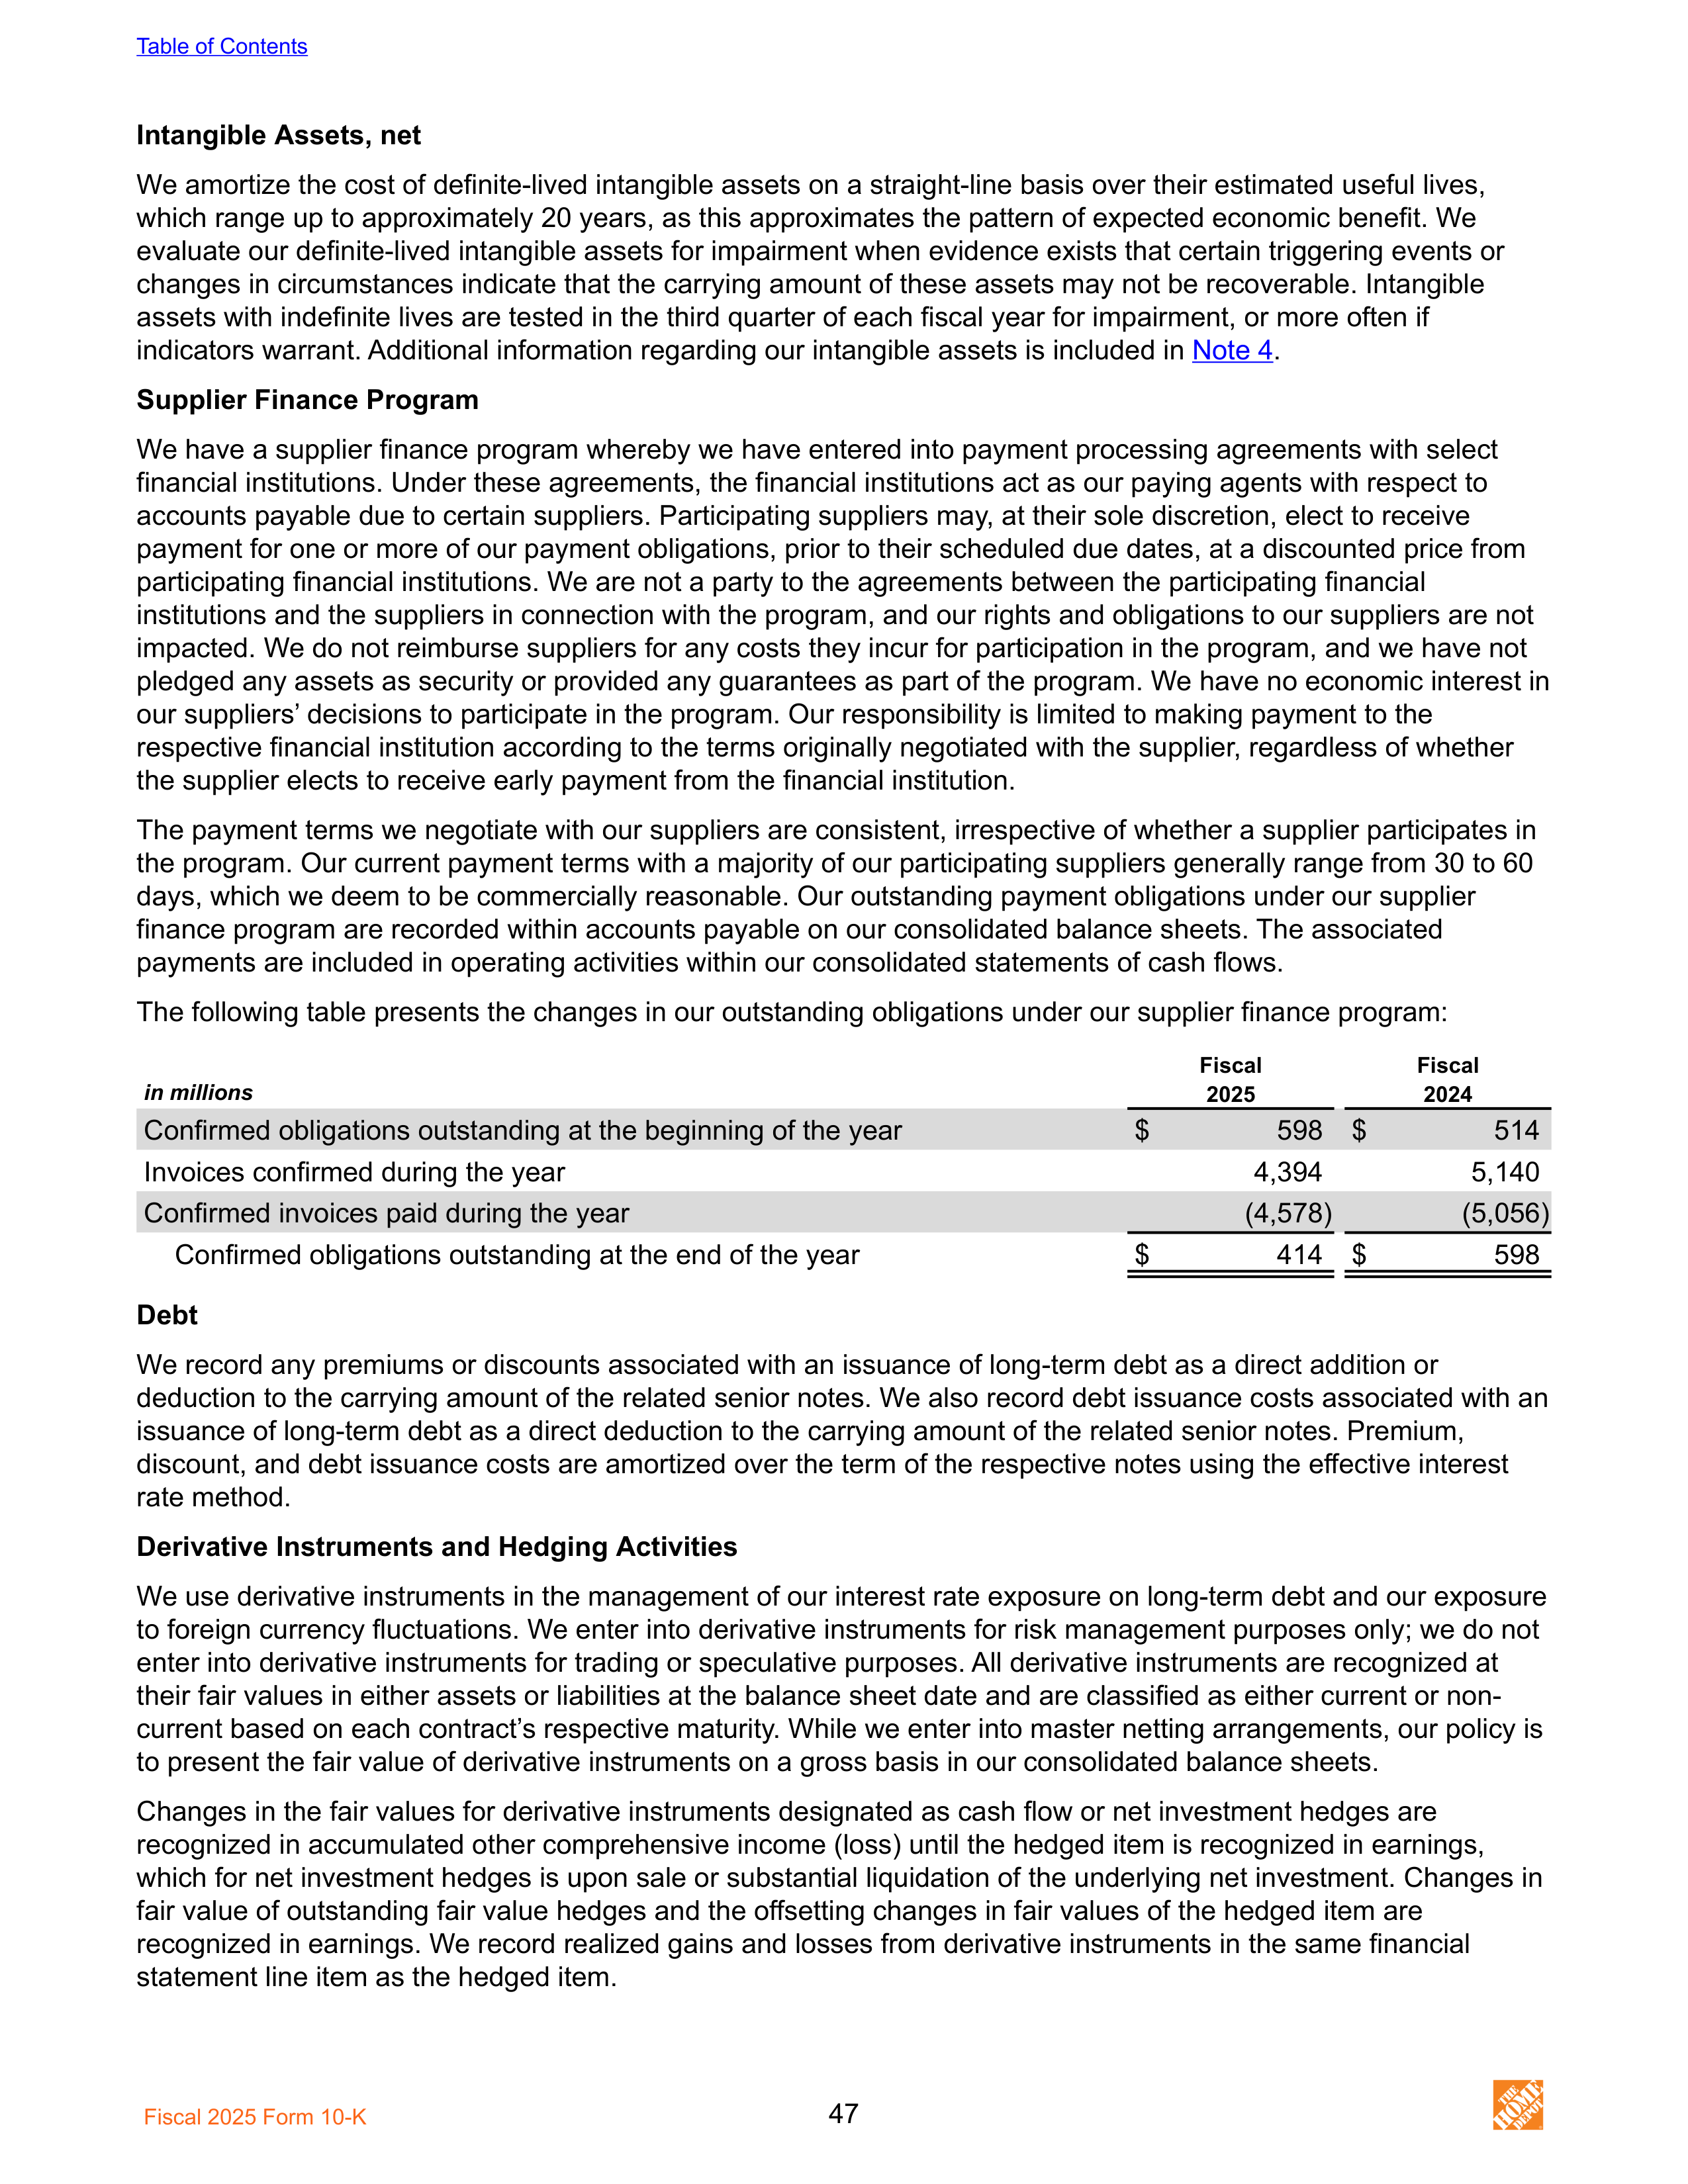
Intangible Assets, net
We amortize the cost of definite-lived intangible assets on a straight-line basis over their estimated useful lives,
which range up to approximately 20 years, as this approximates the pattern of expected economic benefit. We
evaluate our definite-lived intangible assets for impairment when evidence exists that certain triggering events or
changes in circumstances indicate that the carrying amount of these assets may not be recoverable. Intangible
assets with indefinite lives are tested in the third quarter of each fiscal year for impairment, or more often if
indicators warrant. Additional information regarding our intangible assets is included in
Note 4
.
Supplier Finance Program
We have a supplier finance program whereby we have entered into payment processing agreements with select
financial institutions. Under these agreements, the financial institutions act as our paying agents with respect to
accounts payable due to certain suppliers. Participating suppliers may, at their sole discretion, elect to receive
payment for one or more of our payment obligations, prior to their scheduled due dates, at a discounted price from
participating financial institutions. We are not a party to the agreements between the participating financial
institutions and the suppliers in connection with the program, and our rights and obligations to our suppliers are not
impacted. We do not reimburse suppliers for any costs they incur for participation in the program, and we have not
pledged any assets as security or provided any guarantees as part of the program. We have no economic interest in
our suppliers’ decisions to participate in the program. Our responsibility is limited to making payment to the
respective financial institution according to the terms originally negotiated with the supplier, regardless of whether
the supplier elects to receive early payment from the financial institution.
The payment terms we negotiate with our suppliers are consistent, irrespective of whether a supplier participates in
the program. Our current payment terms with a majority of our participating suppliers generally range from 30 to 60
days, which we deem to be commercially reasonable. Our outstanding payment obligations under our supplier
finance program are recorded within accounts payable on our consolidated balance sheets. The associated
payments are included in operating activities within our consolidated statements of cash flows.
The following table presents the changes in our outstanding obligations under our supplier finance program:
Fiscal
Fiscal
in millions
2025
2024
Confirmed obligations outstanding at the beginning of the year
$
598 $
514
Invoices confirmed during the year
4,394
5,140
Confirmed invoices paid during the year
(4,578)
(5,056)
Confirmed obligations outstanding at the end of the year
$
414 $
598
Debt
We record any premiums or discounts associated with an issuance of long-term debt as a direct addition or
deduction to the carrying amount of the related senior notes. We also record debt issuance costs associated with an
issuance of long-term debt as a direct deduction to the carrying amount of the related senior notes. Premium,
discount, and debt issuance costs are amortized over the term of the respective notes using the effective interest
rate method.
Derivative Instruments and Hedging Activities
We use derivative instruments in the management of our interest rate exposure on long-term debt and our exposure
to foreign currency fluctuations. We enter into derivative instruments for risk management purposes only; we do not
enter into derivative instruments for trading or speculative purposes. All derivative instruments are recognized at
their fair values in either assets or liabilities at the balance sheet date and are classified as either current or non-
current based on each contract’s respective maturity. While we enter into master netting arrangements, our policy is
to present the fair value of derivative instruments on a gross basis in our consolidated balance sheets.
Changes in the fair values for derivative instruments designated as cash flow or net investment hedges are
recognized in accumulated other comprehensive income (loss) until the hedged item is recognized in earnings,
which for net investment hedges is upon sale or substantial liquidation of the underlying net investment. Changes in
fair value of outstanding fair value hedges and the offsetting changes in fair values of the hedged item are
recognized in earnings. We record realized gains and losses from derivative instruments in the same financial
statement line item as the hedged item.
Table of Contents
Fiscal 2025 Form 10-K
47
Cash flows from the settlement of derivative instruments appear in our consolidated statements of cash flows in the
same categories as the cash flows of the hedged item.
Self-Insurance Reserves
We are self-insured for certain losses related to general liability (including product liability), workers’ compensation,
employee group medical, and automobile claims. We recognize the expected ultimate cost for claims incurred
(undiscounted) at the balance sheet date as a liability. The expected ultimate cost for claims incurred is estimated
based upon analysis of historical data and actuarial estimates. We also maintain cybersecurity and privacy liability
insurance coverage to help limit our exposure to losses such as those that may be caused by a significant
compromise or breach of our data security, as well as property loss coverage. Our self-insurance liabilities, which
are included in accrued salaries and related expenses, other accrued expenses, and other long-term liabilities in the
consolidated balance sheets, were $1.6 billion at February 1, 2026, and $1.5 billion at February 2, 2025.
Treasury Stock
Treasury stock is reflected as a reduction of stockholders’ equity at cost. We use the weighted average purchase
cost to determine the cost of treasury stock that is reissued, if any. Excise taxes incurred on share repurchases
represent direct costs of the repurchase and are recorded as a part of the cost basis of the shares within treasury
stock.
Revenue Recognition
We recognize revenue, net of expected returns and sales tax, at the time the customer takes possession of
merchandise or when a service is performed. We recognize a liability for sales returns, which is estimated based on
historical return levels and our expectation of future returns. We also recognize a return asset, and corresponding
adjustment to cost of sales, for our right to recover the goods returned by the customer, measured at the former
carrying amount of the goods, less any expected recovery cost. At each financial reporting date, we assess our
estimates of expected returns, refund liabilities, and return assets.
Services revenue is generated through a variety of installation, home maintenance, and professional service
programs. In these programs, the customer selects and purchases material for a project, and we provide or arrange
for professional installation. These programs are offered through our stores, online, and in-home sales programs.
Under certain programs, when we provide or arrange for the installation of a project and the subcontractor provides
material as part of the installation, both the material and labor are included in services revenue. We recognize
services revenue when the service for the customer is complete, which is not materially different from recognizing
the revenue over the service period as the substantial majority of our services are completed within one week.
For products and services sold in stores or online, payment is typically due at the point of sale. When we receive
payment before the customer has taken possession of the merchandise or the service has been performed, the
amount received is recorded as deferred revenue until the sale or service is complete. Such performance
obligations are part of contracts with expected original durations of typically three months or less. As of both
February 1, 2026 and February 2, 2025, deferred revenue for products and services was $1.5 billion.
We further record deferred revenue for the sale of gift cards and recognize the associated revenue upon the
redemption of those gift cards, which generally occurs within six months of gift card issuance. As of both February 1,
2026 and February 2, 2025, our performance obligations for unredeemed gift cards were $1.1 billion. Gift card
breakage income, which is our estimate of the portion of our outstanding gift card balance not expected to be
redeemed, is recognized in net sales and was immaterial in fiscal 2025, fiscal 2024, and fiscal 2023.
Certain customers are provided with the ability to purchase products on credit with pre-approved limits where
payment is due after delivery to the customer. We also have agreements with third-party service providers who
directly extend credit to customers, manage our PLCC program, and own the related receivables. We have
evaluated the third-party entities holding the receivables under the program and concluded that they should not be
consolidated. The agreement with the primary third-party service provider for our PLCC program expires in 2028,
with us having the option, but no obligation, to purchase the existing receivables at the end of the agreement.
Deferred interest charges incurred for our deferred financing programs offered to these customers, interchange fees
charged to us for their use of the cards, and any profit sharing with the third-party service providers are included in
net sales.
Table of Contents
Fiscal 2025 Form 10-K
48
Cost of Sales
Cost of sales includes the actual cost of merchandise sold and services performed; the cost of transportation of
merchandise from vendors to our distribution network, stores, or customers; shipping and handling costs from our
stores or distribution network to customers; and the operating cost and depreciation of our sourcing and distribution
network. Vendor allowances that are not reimbursements of specific, incremental, and identifiable costs are also
included within cost of sales.
Vendor Allowances
Vendor allowances primarily consist of volume rebates that are earned as a result of attaining certain purchase
levels and co-op advertising allowances for the promotion of vendors’ products that are typically based on
guaranteed minimum amounts with additional amounts being earned for attaining certain purchase levels. These
vendor allowances are accrued as earned, with those allowances received as a result of attaining certain purchase
levels accrued over the incentive period, which generally concludes at the end of the calendar year, based on
estimates of purchases. Volume rebates and certain co-op advertising allowances reduce the carrying cost of
inventory and are recognized in cost of sales when the related inventory is sold.
Selling, General and Administrative
Selling, general and administrative expenses generally include compensation and benefits for retail and support
center associates, occupancy and operating costs of retail locations and support centers, insurance-related
expenses, advertising costs, credit and debit card processing fees, and other administrative costs.
Advertising Expense
Advertising costs, including digital, television, radio and print, are expensed when the advertisement first appears.
Certain co-op advertising allowances that are reimbursements of specific, incremental, and identifiable costs
incurred to promote vendors’ products are recorded as an offset against advertising expense. Net advertising
expense included in SG&A was $1.3 billion, $1.2 billion, and $1.1 billion for fiscal 2025, 2024, and 2023,
respectively.
Stock-Based Compensation
We are currently authorized to issue equity awards including incentive and nonqualified stock options, restricted
stock, restricted stock units, performance shares, performance units, stock appreciation rights, and deferred shares
to certain of our associates and non-employee directors under certain stock incentive plans. We measure and
recognize compensation expense for all stock-based payment awards granted to associates and non-employee
directors based on estimated fair values. The value of the portion of the award that is ultimately expected to vest is
recognized as stock-based compensation expense, on a straight-line basis, over the requisite service period or as
restrictions lapse. We include estimated forfeitures expected to occur when calculating stock-based compensation
expense. Additional information on our stock-based payment awards is included in
Note 9
.
Income Taxes
Income taxes are accounted for under the asset and liability method. We provide for federal, state, and foreign
income taxes currently payable, as well as for those deferred due to timing differences between reporting income
and expenses for financial statement purposes versus tax purposes. Deferred tax assets and liabilities are
recognized for the future tax consequences attributable to temporary differences between the financial statement
carrying amounts of existing assets and liabilities and their respective tax bases. Deferred tax assets and liabilities
are measured using enacted income tax rates expected to apply to taxable income in the years in which those
temporary differences are expected to be recovered or settled. The effect of a change in income tax rates is
recognized as income or expense in the period that includes the enactment date. We routinely evaluate the
likelihood of realizing the benefit of our deferred tax assets and may record a valuation allowance if, based on all
available evidence, we determine that it is more likely than not that some portion of the tax benefit will not be
realized.
We recognize the effect of income tax positions only if those positions are more likely than not of being sustained.
Recognized income tax positions are measured at the largest amount that is greater than 50% likely of being
realized. Changes in recognition or measurement are reflected in the period in which the change in judgment
occurs.
We recognize interest and penalties related to income tax matters in interest expense and SG&A, respectively, on
our consolidated statements of earnings. Accrued interest and penalties related to income tax matters are
recognized in other accrued expenses and other long-term liabilities on our consolidated balance sheets.
Table of Contents
Fiscal 2025 Form 10-K
49
We file a consolidated U.S. federal income tax return which includes certain eligible subsidiaries. Non-U.S.
subsidiaries and certain U.S. subsidiaries, which are consolidated for financial reporting purposes, are not eligible to
be included in our consolidated U.S. federal income tax return. Separate provisions for income taxes have been
determined for these entities. For unremitted earnings of our non-U.S. subsidiaries, we are required to make an
assertion regarding reinvestment or repatriation for tax purposes. For any earnings that we do not make a
permanent reinvestment assertion, we recognize a provision for deferred income taxes. For earnings where we
have made a permanent reinvestment assertion, no provision is recognized. See
Note 6
for further discussion.
We are subject to global intangible low-taxed income tax, an incremental tax on foreign income. We have made an
accounting election to record this tax in the period the tax arises.
Comprehensive Income
Comprehensive income includes net earnings adjusted for certain gains and losses that are excluded from net
earnings and recognized within accumulated other comprehensive loss as a component of equity, which consists
primarily of foreign currency translation adjustments. Accumulated other comprehensive loss also includes net
losses on cash flow hedges that were immaterial as of February 1, 2026 and February 2, 2025. Reclassifications
from accumulated other comprehensive loss into earnings were immaterial in fiscal 2025, fiscal 2024, and fiscal
2023.
Foreign Currency Translation
Assets and liabilities denominated in a foreign currency are translated into U.S. dollars at the current rate of
exchange on the last day of the reporting period. Revenues and expenses are translated using average exchange
rates for the period, and equity transactions are translated using the actual rate on the day of the transaction.
Cumulative foreign currency translation adjustments recorded in accumulated other comprehensive loss as of
February 1, 2026 and February 2, 2025 were losses of $501 million and $970 million, respectively.
Recently Adopted Accounting Pronouncements
ASU No. 2023-09.
In December 2023, the FASB issued ASU No. 2023-09, “Income Taxes (Topic 740):
Improvements to Income Tax Disclosures,” which requires disclosure of disaggregated information about a reporting
entity’s effective tax rate reconciliation as well as disclosures on income taxes paid by jurisdiction. ASU No. 2023-09
is effective for annual periods beginning after December 15, 2024. The guidance is required to be applied on a
prospective basis, with the option to apply the standard retrospectively. We adopted ASU No. 2023-09 on a
retrospective basis in the fourth quarter of fiscal 2025. The adoption of this guidance resulted in additional financial
statement disclosures and had no impact to our consolidated financial condition, results of operations, or cash
flows. See
Note 6
, which includes the disclosures resulting from our adoption of this guidance.
Accounting Pronouncements Not Yet Adopted
ASU No. 2025-06.
In September 2025, the FASB issued ASU No. 2025-06, “Intangibles—Goodwill and Other—
Internal-Use Software (Subtopic 350-40): Targeted Improvements to the Accounting for Internal-Use Software,”
which is intended to modernize internal-use software guidance by removing all references to project stages and by
clarifying the thresholds entities apply to begin capitalizing costs. ASU No. 2025-06 is effective for fiscal years
beginning after December 15, 2027, and interim periods within those annual reporting periods. Early adoption is
permitted. The guidance can be applied on a prospective basis, a modified basis for in-process projects, or a
retrospective basis. We are currently evaluating the impact of the standard on our consolidated financial statements.
ASU No. 2024-03.
In November 2024, the FASB issued ASU No. 2024-03, “Income Statement—Reporting
Comprehensive Income—Expense Disaggregation Disclosures (Subtopic 220-40): Disaggregation of Income
Statement Expenses,” which is intended to improve disclosures about a public business entity’s expenses by
requiring disaggregated disclosure, in the notes to the financial statements, of prescribed categories of expenses
within relevant income statement captions. ASU No. 2024-03 is effective for fiscal years beginning after December
15, 2026 and interim periods within fiscal years beginning after December 15, 2027. Early adoption is permitted.
The new standard may be applied either on a prospective or retrospective basis. We are currently evaluating the
impact of the standard on our consolidated financial statement disclosures.
Recent accounting pronouncements adopted or pending adoption not discussed above are either not applicable or
are not expected to have a material impact on our consolidated financial condition, results of operations, or cash
flows.
Table of Contents
Fiscal 2025 Form 10-K
50
2.
SEGMENT REPORTING AND NET SALES
Segment Reporting
The Company defines its segments based on how internally reported financial information is regularly reviewed by
the chief operating decision maker (“CODM”), our President and Chief Executive Officer, to analyze financial
performance, make decisions, and allocate resources.
Primary Segment.
We are engaged in retail operations and sell a wide assortment of home improvement products,
building materials, lawn and garden products, décor products, and facilities MRO products both in stores and online.
We also provide a number of services, including home improvement installation services, and tool and equipment
rental. We currently conduct these operations in the U.S. (including the Commonwealth of Puerto Rico and the
territories of the U.S. Virgin Islands and Guam), Canada, and Mexico, each of which represents an operating
segment. For disclosure purposes, we aggregate these three geographic operating segments into one reportable
segment (the “Primary segment”) due to the similar nature of their operations and economic characteristics.
Other.
As discussed in
Note 13
, in June 2024, we acquired SRS, a leading residential specialty trade distribution
company across several verticals serving the professional roofer, landscaper and pool contractor through branches
located throughout the U.S. On September 4, 2025, SRS completed the acquisition of GMS, a leading distributor of
specialty building products, including drywall, ceilings, steel framing and other complementary construction
products, through branches located across the U.S. and Canada. GMS became an additional vertical within SRS
referred to as interior and construction products, and SRS is now organized as four different lines of business:
roofing and building products, interior and construction products, landscape, and pool. We have determined that
each of these four lines of business represents an operating segment, none of which meets the thresholds
prescribed under Accounting Standards Codification Topic 280: “Segment Reporting” to be deemed a reportable
segment. Therefore, results from these operating segments are presented in “Other.”
Segment Information.
For our Primary segment, our CODM uses operating income to allocate resources in the
planning and forecasting process and to assess segment performance by monitoring actual results versus prior-
period, forecasted results, and the annual plan. Assets are reviewed by our CODM on a total company consolidated
basis and not by segment. The accounting policies of our Primary segment are the same as those described in our
summary of significant accounting policies.
The following table presents net sales, significant expenses, and operating income for our Primary segment:
in millions
Fiscal
2025
Fiscal
2024
Fiscal
2023
Net sales
$
151,966 $
153,108 $
152,669
Cost of sales
99,717
101,194
101,709
Selling, general and administrative
28,885
27,822
26,598
Depreciation and amortization
2,790
2,779
2,673
Operating income
$
20,574 $
21,313 $
21,689
The following table presents a reconciliation of certain segment information to our consolidated totals:
Fiscal 2025
Fiscal 2024
in millions
Primary
Other
(1)
Consolidated
Primary
Other
(1)
Consolidated
Net sales
$ 151,966 $ 12,717 $ 164,683 $ 153,108 $
6,406 $ 159,514
Operating income
20,574
316
20,890
21,313
213
21,526
Interest income and other, net
(124)
(201)
Interest expense
2,412
2,321
Earnings before provision for income taxes
$
18,602
$
19,406
Depreciation and amortization
(2)
$
3,344 $
715 $
4,059 $
3,350 $
358 $
3,708
—————
(1)
Net sales presented in Other relate to the sale of products within our SRS non-reportable operating segments, following our
acquisition of SRS in the second quarter of fiscal 2024 and the subsequent acquisition of GMS in the third quarter of fiscal
2025. Operating income presented in Other includes cost of sales and operating expenses totaling $12.4 billion and $6.2
billion for fiscal 2025 and fiscal 2024, respectively, within these SRS non-reportable operating segments.
Table of Contents
Fiscal 2025 Form 10-K
51
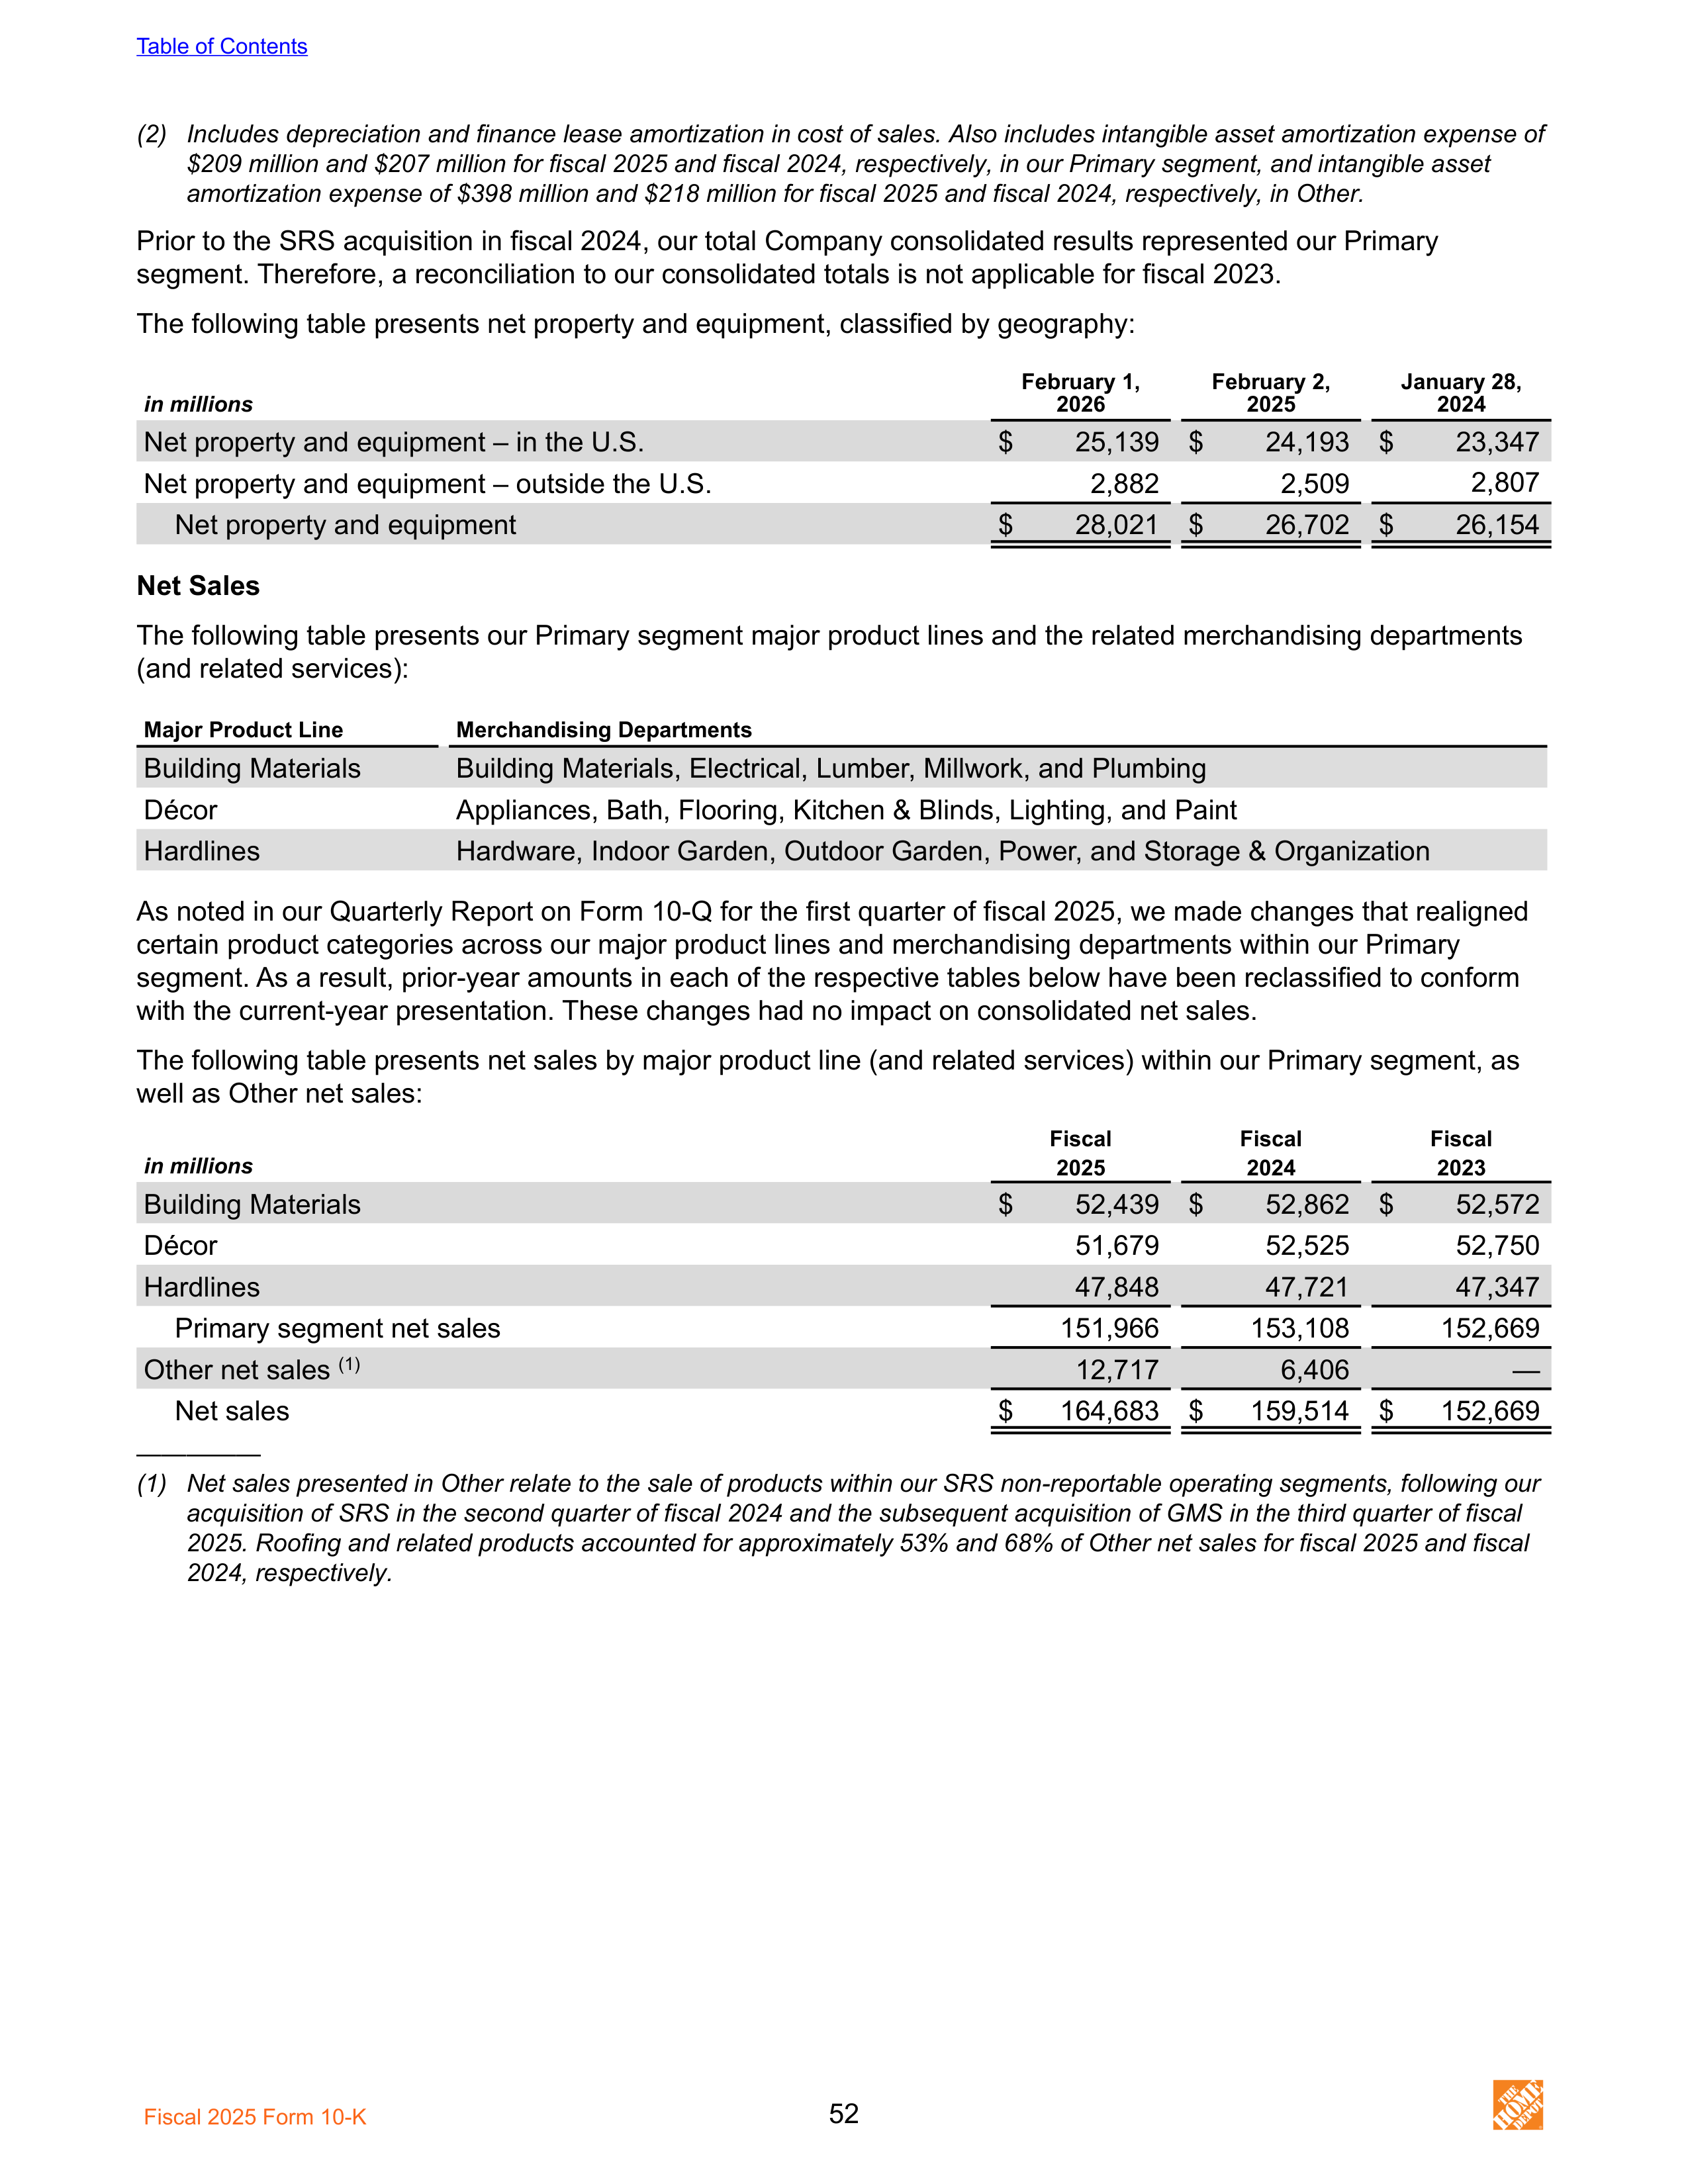
(2)
Includes depreciation and finance lease amortization in cost of sales. Also includes intangible asset amortization expense of
$209 million and $207 million for fiscal 2025 and fiscal 2024, respectively, in our Primary segment, and intangible asset
amortization expense of $398 million and $218 million for fiscal 2025 and fiscal 2024, respectively, in Other.
Prior to the SRS acquisition in fiscal 2024, our total Company consolidated results represented our Primary
segment. Therefore, a reconciliation to our consolidated totals is not applicable for fiscal 2023.
The following table presents net property and equipment, classified by geography:
in millions
February 1,
2026
February 2,
2025
January 28,
2024
Net property and equipment – in the U.S.
$
25,139 $
24,193 $
23,347
Net property and equipment – outside the U.S.
2,882
2,509
2,807
Net property and equipment
$
28,021 $
26,702 $
26,154
Net Sales
The following table presents our Primary segment major product lines and the related merchandising departments
(and related services):
Major Product Line
Merchandising Departments
Building Materials
Building Materials, Electrical, Lumber, Millwork, and Plumbing
Décor
Appliances, Bath, Flooring, Kitchen & Blinds, Lighting, and Paint
Hardlines
Hardware, Indoor Garden, Outdoor Garden, Power, and Storage & Organization
As noted in our Quarterly Report on Form 10-Q for the first quarter of fiscal 2025, we made changes that realigned
certain product categories across our major product lines and merchandising departments within our Primary
segment. As a result, prior-year amounts in each of the respective tables below have been reclassified to conform
with the current-year presentation. These changes had no impact on consolidated net sales.
The following table presents net sales by major product line (and related services) within our Primary segment, as
well as Other net sales:
Fiscal
Fiscal
Fiscal
in millions
2025
2024
2023
Building Materials
$
52,439 $
52,862 $
52,572
Décor
51,679
52,525
52,750
Hardlines
47,848
47,721
47,347
Primary segment net sales
151,966
153,108
152,669
Other net sales
(1)
12,717
6,406
—
Net sales
$
164,683 $
159,514 $
152,669
—————
(1)
Net sales presented in Other relate to the sale of products within our SRS non-reportable operating segments, following our
acquisition of SRS in the second quarter of fiscal 2024 and the subsequent acquisition of GMS in the third quarter of fiscal
2025. Roofing and related products accounted for approximately 53% and 68% of Other net sales for fiscal 2025 and fiscal
2024, respectively.
Table of Contents
Fiscal 2025 Form 10-K
52
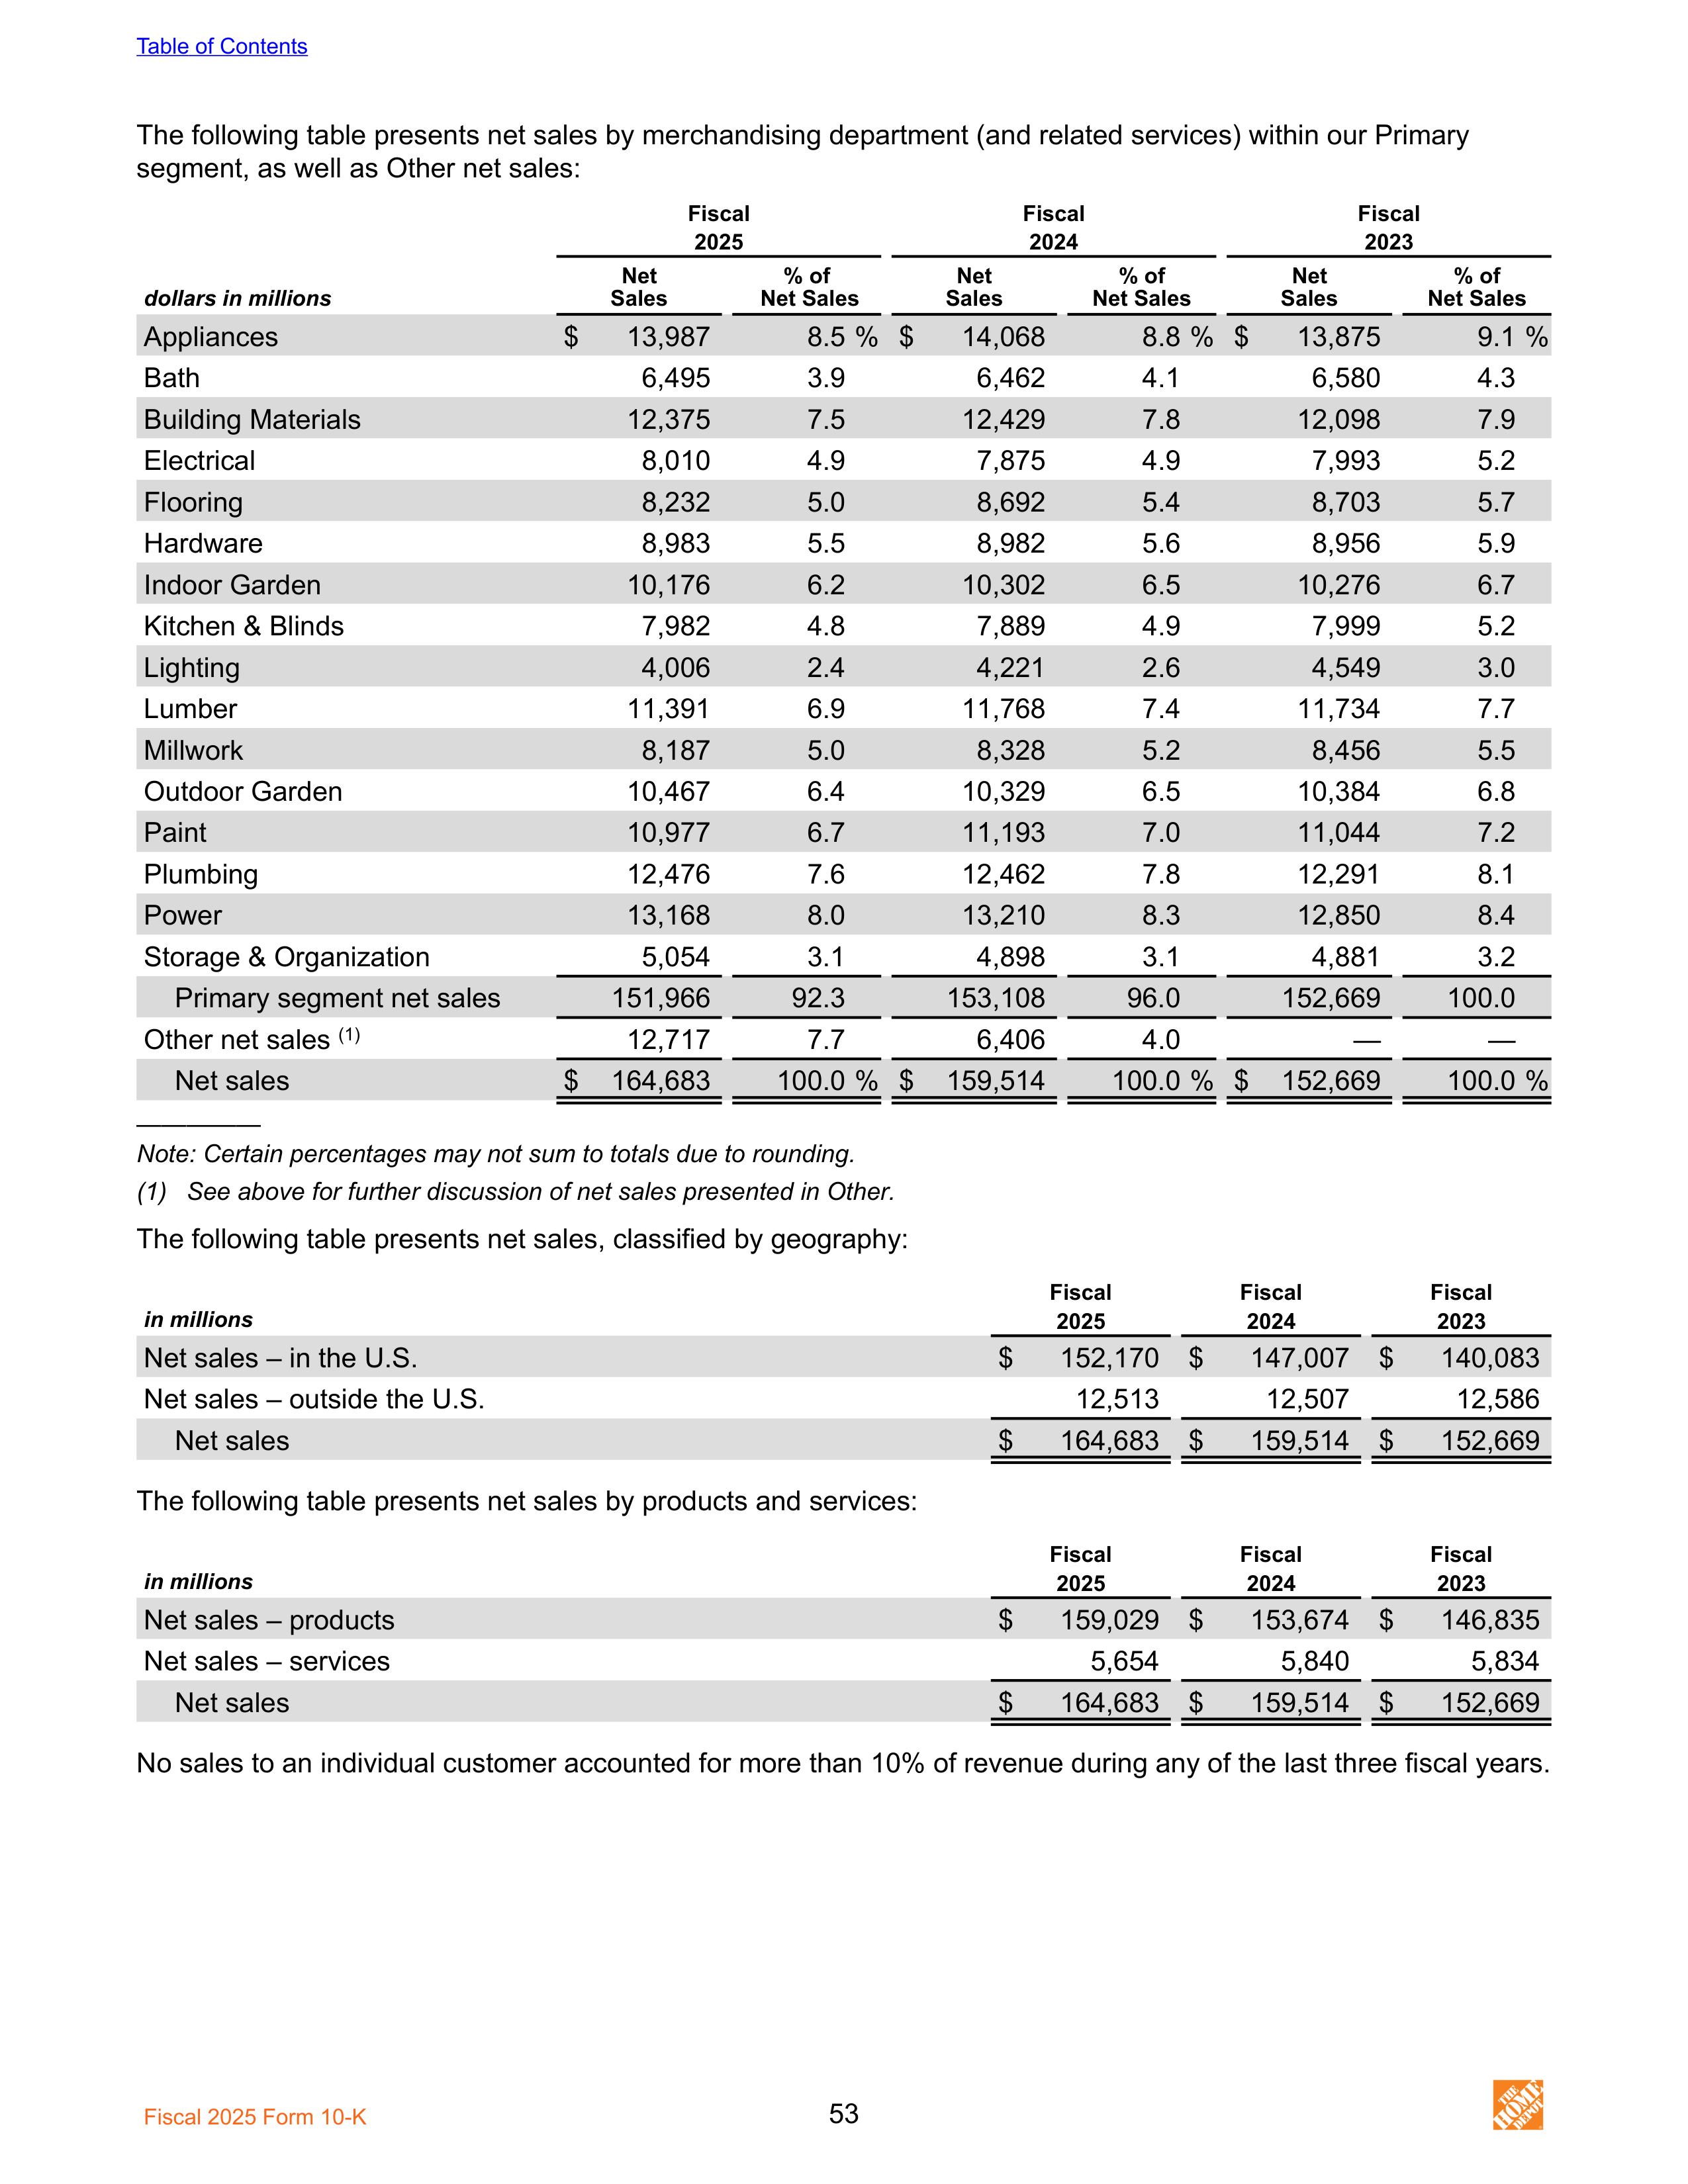
The following table presents net sales by merchandising department (and related services) within our Primary
segment, as well as Other net sales:
Fiscal
Fiscal
Fiscal
2025
2024
2023
dollars in millions
Net
Sales
% of
Net Sales
Net
Sales
% of
Net Sales
Net
Sales
% of
Net Sales
Appliances
$
13,987
8.5 %
$
14,068
8.8 %
$
13,875
9.1 %
Bath
6,495
3.9
6,462
4.1
6,580
4.3
Building Materials
12,375
7.5
12,429
7.8
12,098
7.9
Electrical
8,010
4.9
7,875
4.9
7,993
5.2
Flooring
8,232
5.0
8,692
5.4
8,703
5.7
Hardware
8,983
5.5
8,982
5.6
8,956
5.9
Indoor Garden
10,176
6.2
10,302
6.5
10,276
6.7
Kitchen & Blinds
7,982
4.8
7,889
4.9
7,999
5.2
Lighting
4,006
2.4
4,221
2.6
4,549
3.0
Lumber
11,391
6.9
11,768
7.4
11,734
7.7
Millwork
8,187
5.0
8,328
5.2
8,456
5.5
Outdoor Garden
10,467
6.4
10,329
6.5
10,384
6.8
Paint
10,977
6.7
11,193
7.0
11,044
7.2
Plumbing
12,476
7.6
12,462
7.8
12,291
8.1
Power
13,168
8.0
13,210
8.3
12,850
8.4
Storage & Organization
5,054
3.1
4,898
3.1
4,881
3.2
Primary segment net sales
151,966
92.3
153,108
96.0
152,669
100.0
Other net sales
(1)
12,717
7.7
6,406
4.0
—
—
Net sales
$
164,683
100.0 %
$
159,514
100.0 %
$
152,669
100.0 %
—————
Note: Certain percentages may not sum to totals due to rounding.
(1)
See above for further discussion of net sales presented in Other.
The following table presents net sales, classified by geography:
Fiscal
Fiscal
Fiscal
in millions
2025
2024
2023
Net sales – in the U.S.
$
152,170 $
147,007 $
140,083
Net sales – outside the U.S.
12,513
12,507
12,586
Net sales
$
164,683 $
159,514 $
152,669
The following table presents net sales by products and services:
Fiscal
Fiscal
Fiscal
in millions
2025
2024
2023
Net sales – products
$
159,029 $
153,674 $
146,835
Net sales – services
5,654
5,840
5,834
Net sales
$
164,683 $
159,514 $
152,669
No sales to an individual customer accounted for more than 10% of revenue during any of the last three fiscal years.
Table of Contents
Fiscal 2025 Form 10-K
53
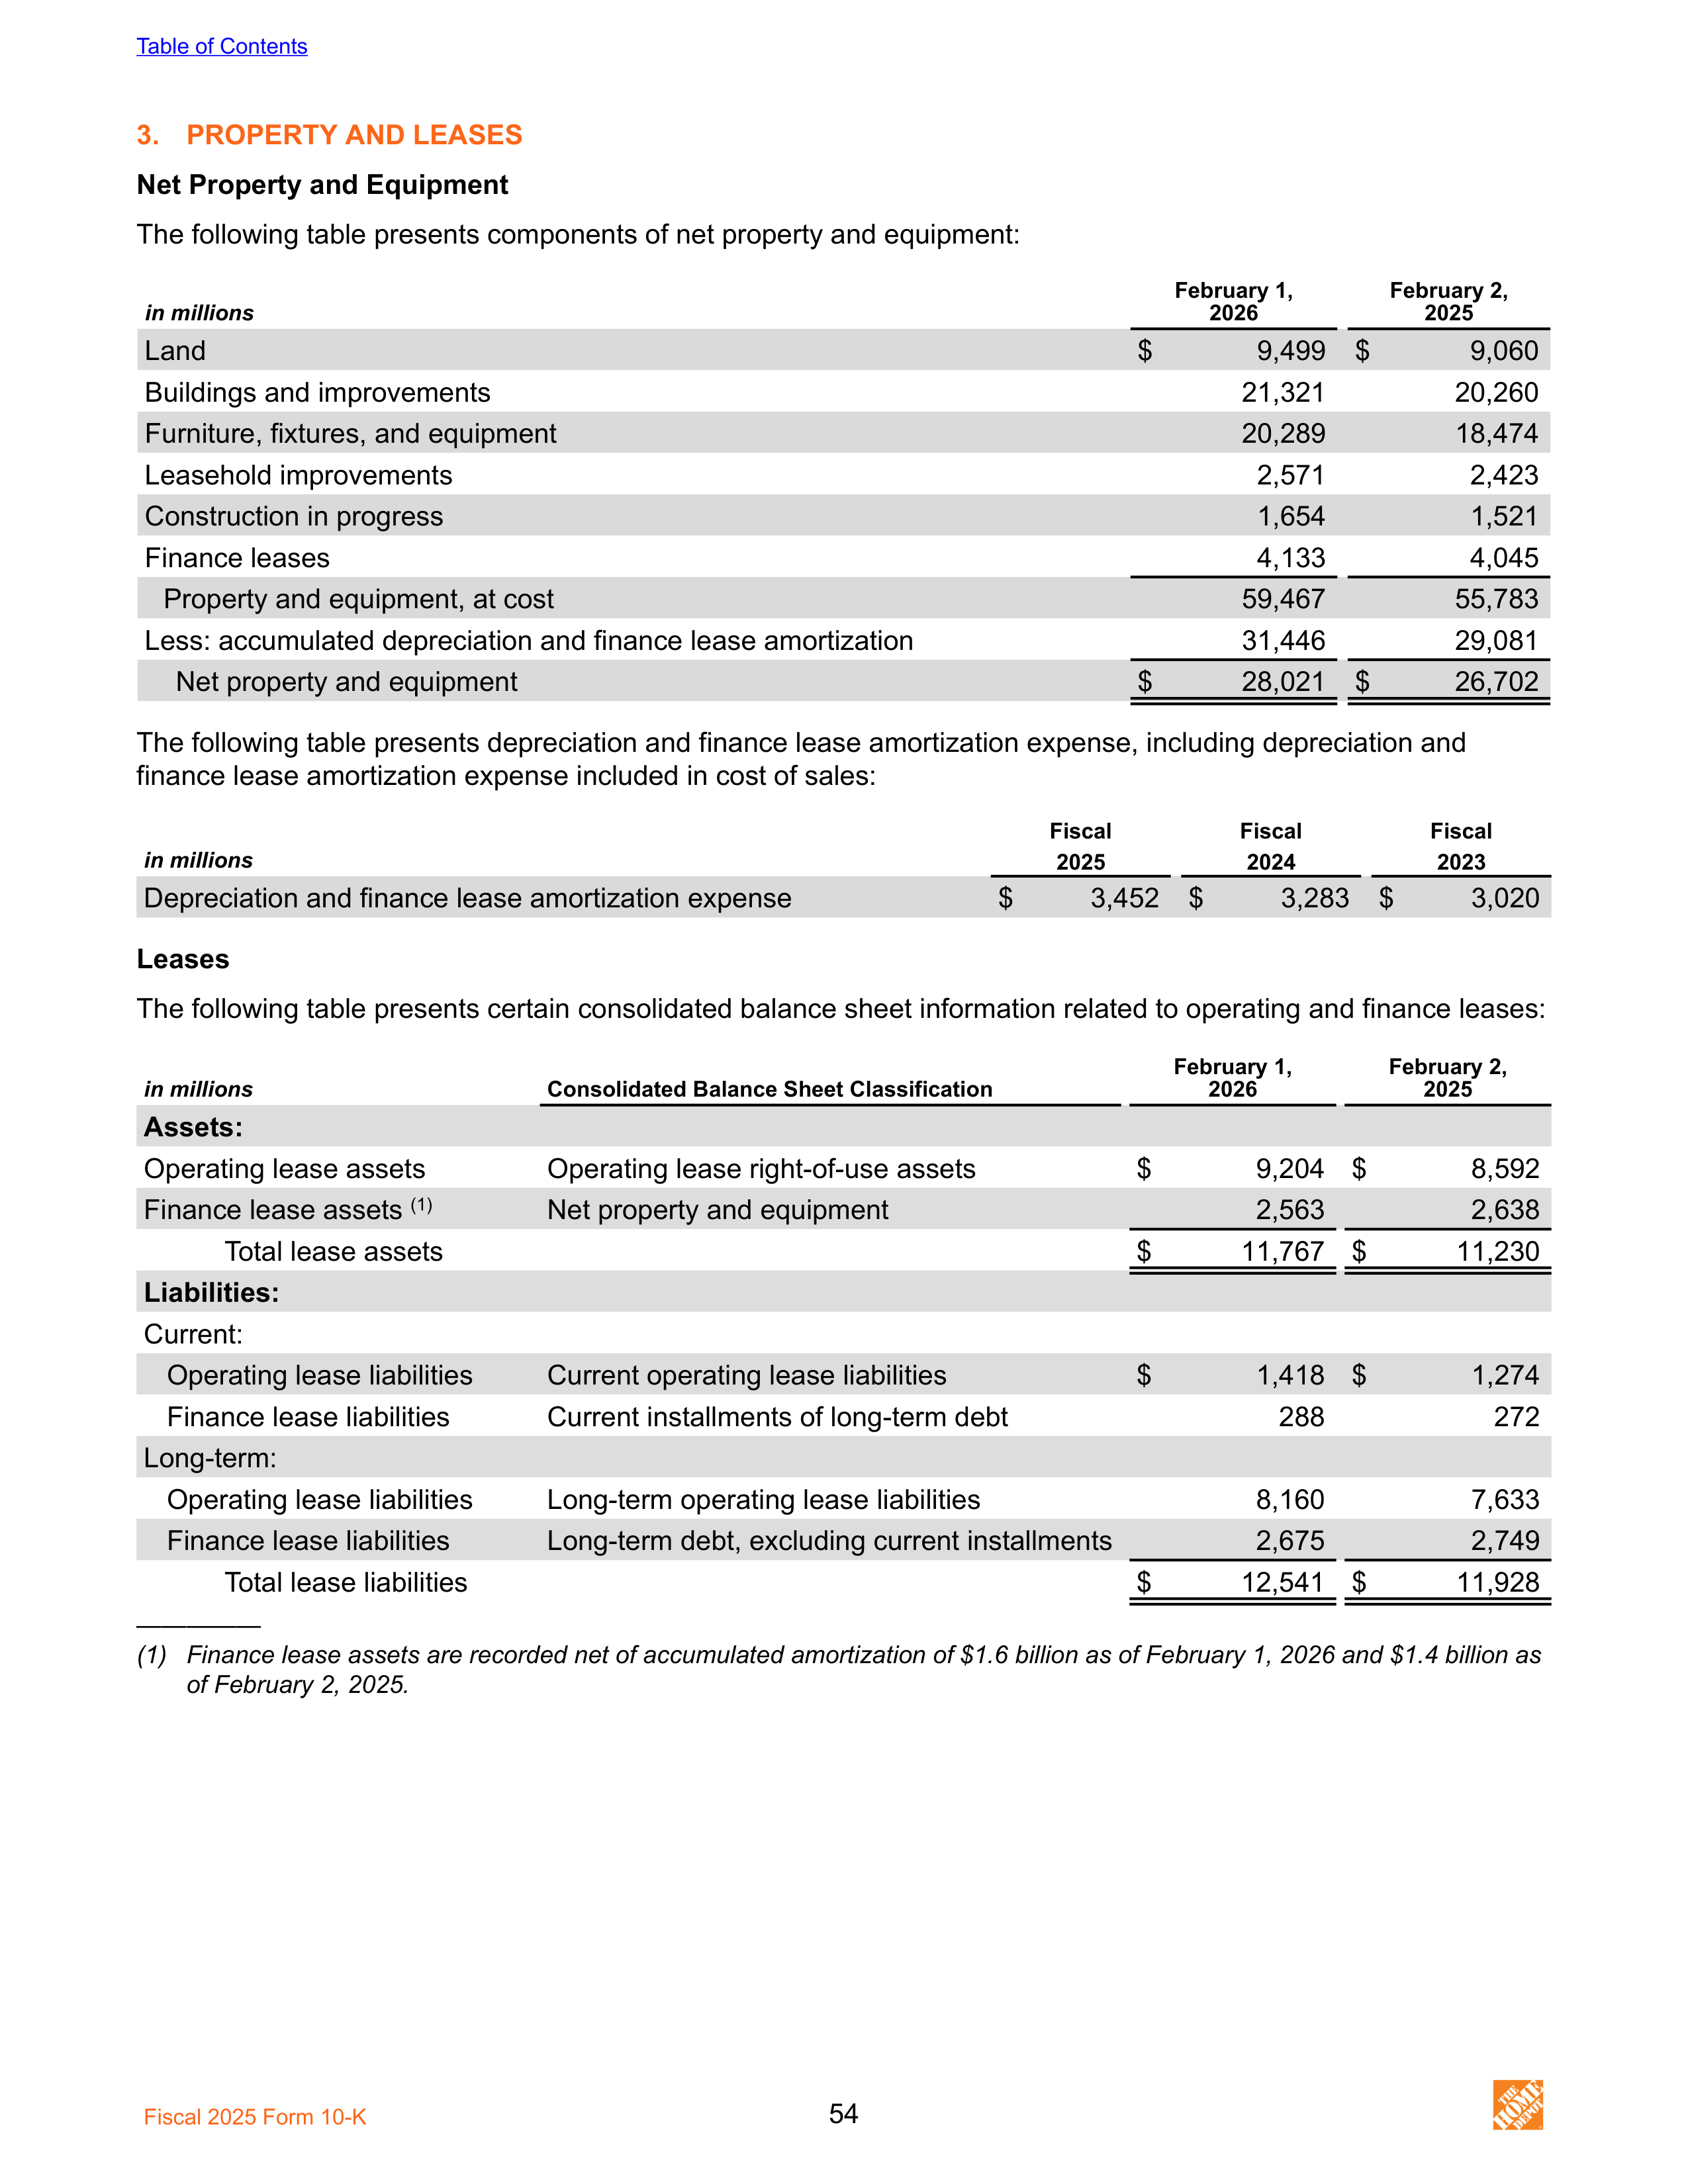
3.
PROPERTY AND LEASES
Net Property and Equipment
The following table presents components of net property and equipment:
in millions
February 1,
2026
February 2,
2025
Land
$
9,499 $
9,060
Buildings and improvements
21,321
20,260
Furniture, fixtures, and equipment
20,289
18,474
Leasehold improvements
2,571
2,423
Construction in progress
1,654
1,521
Finance leases
4,133
4,045
Property and equipment, at cost
59,467
55,783
Less: accumulated depreciation and finance lease amortization
31,446
29,081
Net property and equipment
$
28,021 $
26,702
The following table presents depreciation and finance lease amortization expense, including depreciation and
finance lease amortization expense included in cost of sales:
in millions
Fiscal
Fiscal
Fiscal
2025
2024
2023
Depreciation and finance lease amortization expense
$
3,452 $
3,283 $
3,020
Leases
The following table presents certain consolidated balance sheet information related to operating and finance leases:
in millions
Consolidated Balance Sheet Classification
February 1,
2026
February 2,
2025
Assets:
Operating lease assets
Operating lease right-of-use assets
$
9,204 $
8,592
Finance lease assets
(1)
Net property and equipment
2,563
2,638
Total lease assets
$
11,767 $
11,230
Liabilities:
Current:
Operating lease liabilities
Current operating lease liabilities
$
1,418 $
1,274
Finance lease liabilities
Current installments of long-term debt
288
272
Long-term:
Operating lease liabilities
Long-term operating lease liabilities
8,160
7,633
Finance lease liabilities
Long-term debt, excluding current installments
2,675
2,749
Total lease liabilities
$
12,541 $
11,928
—————
(1) Finance lease assets are recorded net of accumulated amortization of $1.6 billion as of February 1, 2026 and $1.4 billion as
of February 2, 2025.
Table of Contents
Fiscal 2025 Form 10-K
54
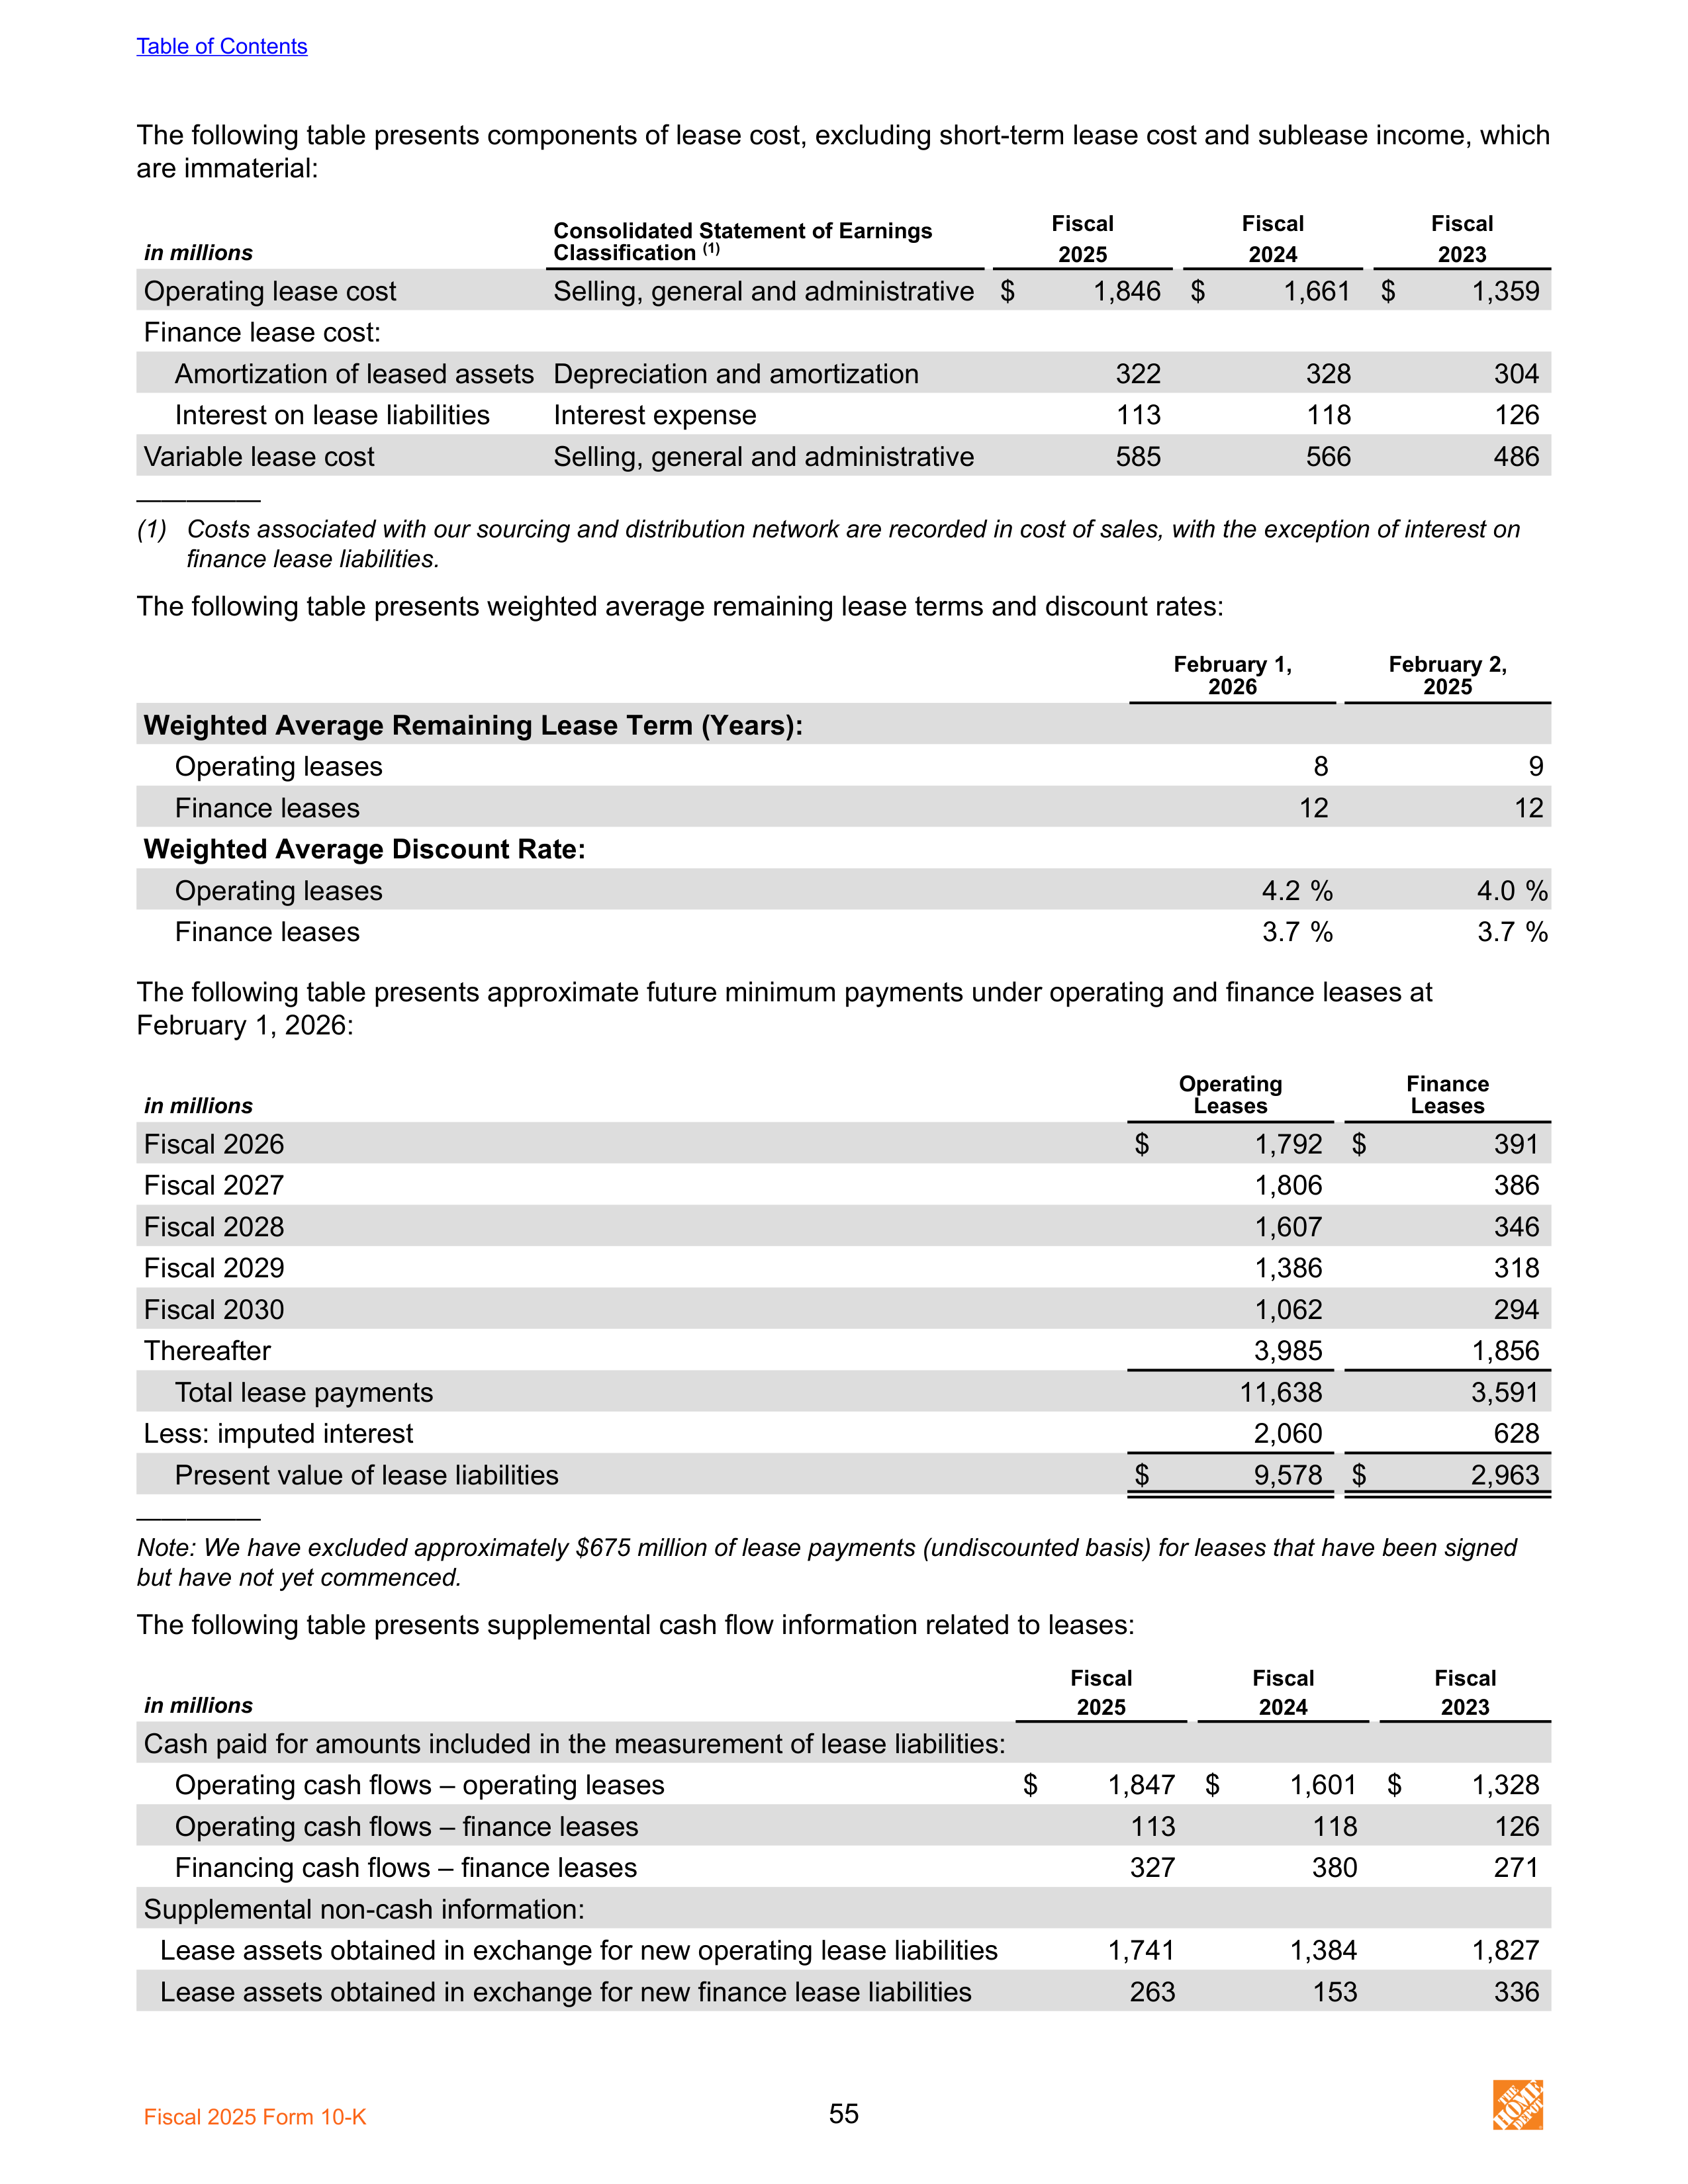
The following table presents components of lease cost, excluding short-term lease cost and sublease income, which
are immaterial:
Consolidated Statement of Earnings
Classification
(1)
Fiscal
Fiscal
Fiscal
in millions
2025
2024
2023
Operating lease cost
Selling, general and administrative
$
1,846 $
1,661 $
1,359
Finance lease cost:
Amortization of leased assets
Depreciation and amortization
322
328
304
Interest on lease liabilities
Interest expense
113
118
126
Variable lease cost
Selling, general and administrative
585
566
486
—————
(1)
Costs associated with our sourcing and distribution network are recorded in cost of sales, with the exception of interest on
finance lease liabilities.
The following table presents weighted average remaining lease terms and discount rates:
February 1,
2026
February 2,
2025
Weighted Average Remaining Lease Term (Years):
Operating leases
8
9
Finance leases
12
12
Weighted Average Discount Rate:
Operating leases
4.2 %
4.0 %
Finance leases
3.7 %
3.7 %
The following table presents approximate future minimum payments under operating and finance leases at
February 1, 2026:
in millions
Operating
Leases
Finance
Leases
Fiscal 2026
$
1,792 $
391
Fiscal 2027
1,806
386
Fiscal 2028
1,607
346
Fiscal 2029
1,386
318
Fiscal 2030
1,062
294
Thereafter
3,985
1,856
Total lease payments
11,638
3,591
Less: imputed interest
2,060
628
Present value of lease liabilities
$
9,578 $
2,963
—————
Note: We have excluded approximately $675 million of lease payments (undiscounted basis) for leases that have been signed
but have not yet commenced.
The following table presents supplemental cash flow information related to leases:
Fiscal
Fiscal
Fiscal
in millions
2025
2024
2023
Cash paid for amounts included in the measurement of lease liabilities:
Operating cash flows – operating leases
$
1,847 $
1,601 $
1,328
Operating cash flows – finance leases
113
118
126
Financing cash flows – finance leases
327
380
271
Supplemental non-cash information:
Lease assets obtained in exchange for new operating lease liabilities
1,741
1,384
1,827
Lease assets obtained in exchange for new finance lease liabilities
263
153
336
Table of Contents
Fiscal 2025 Form 10-K
55
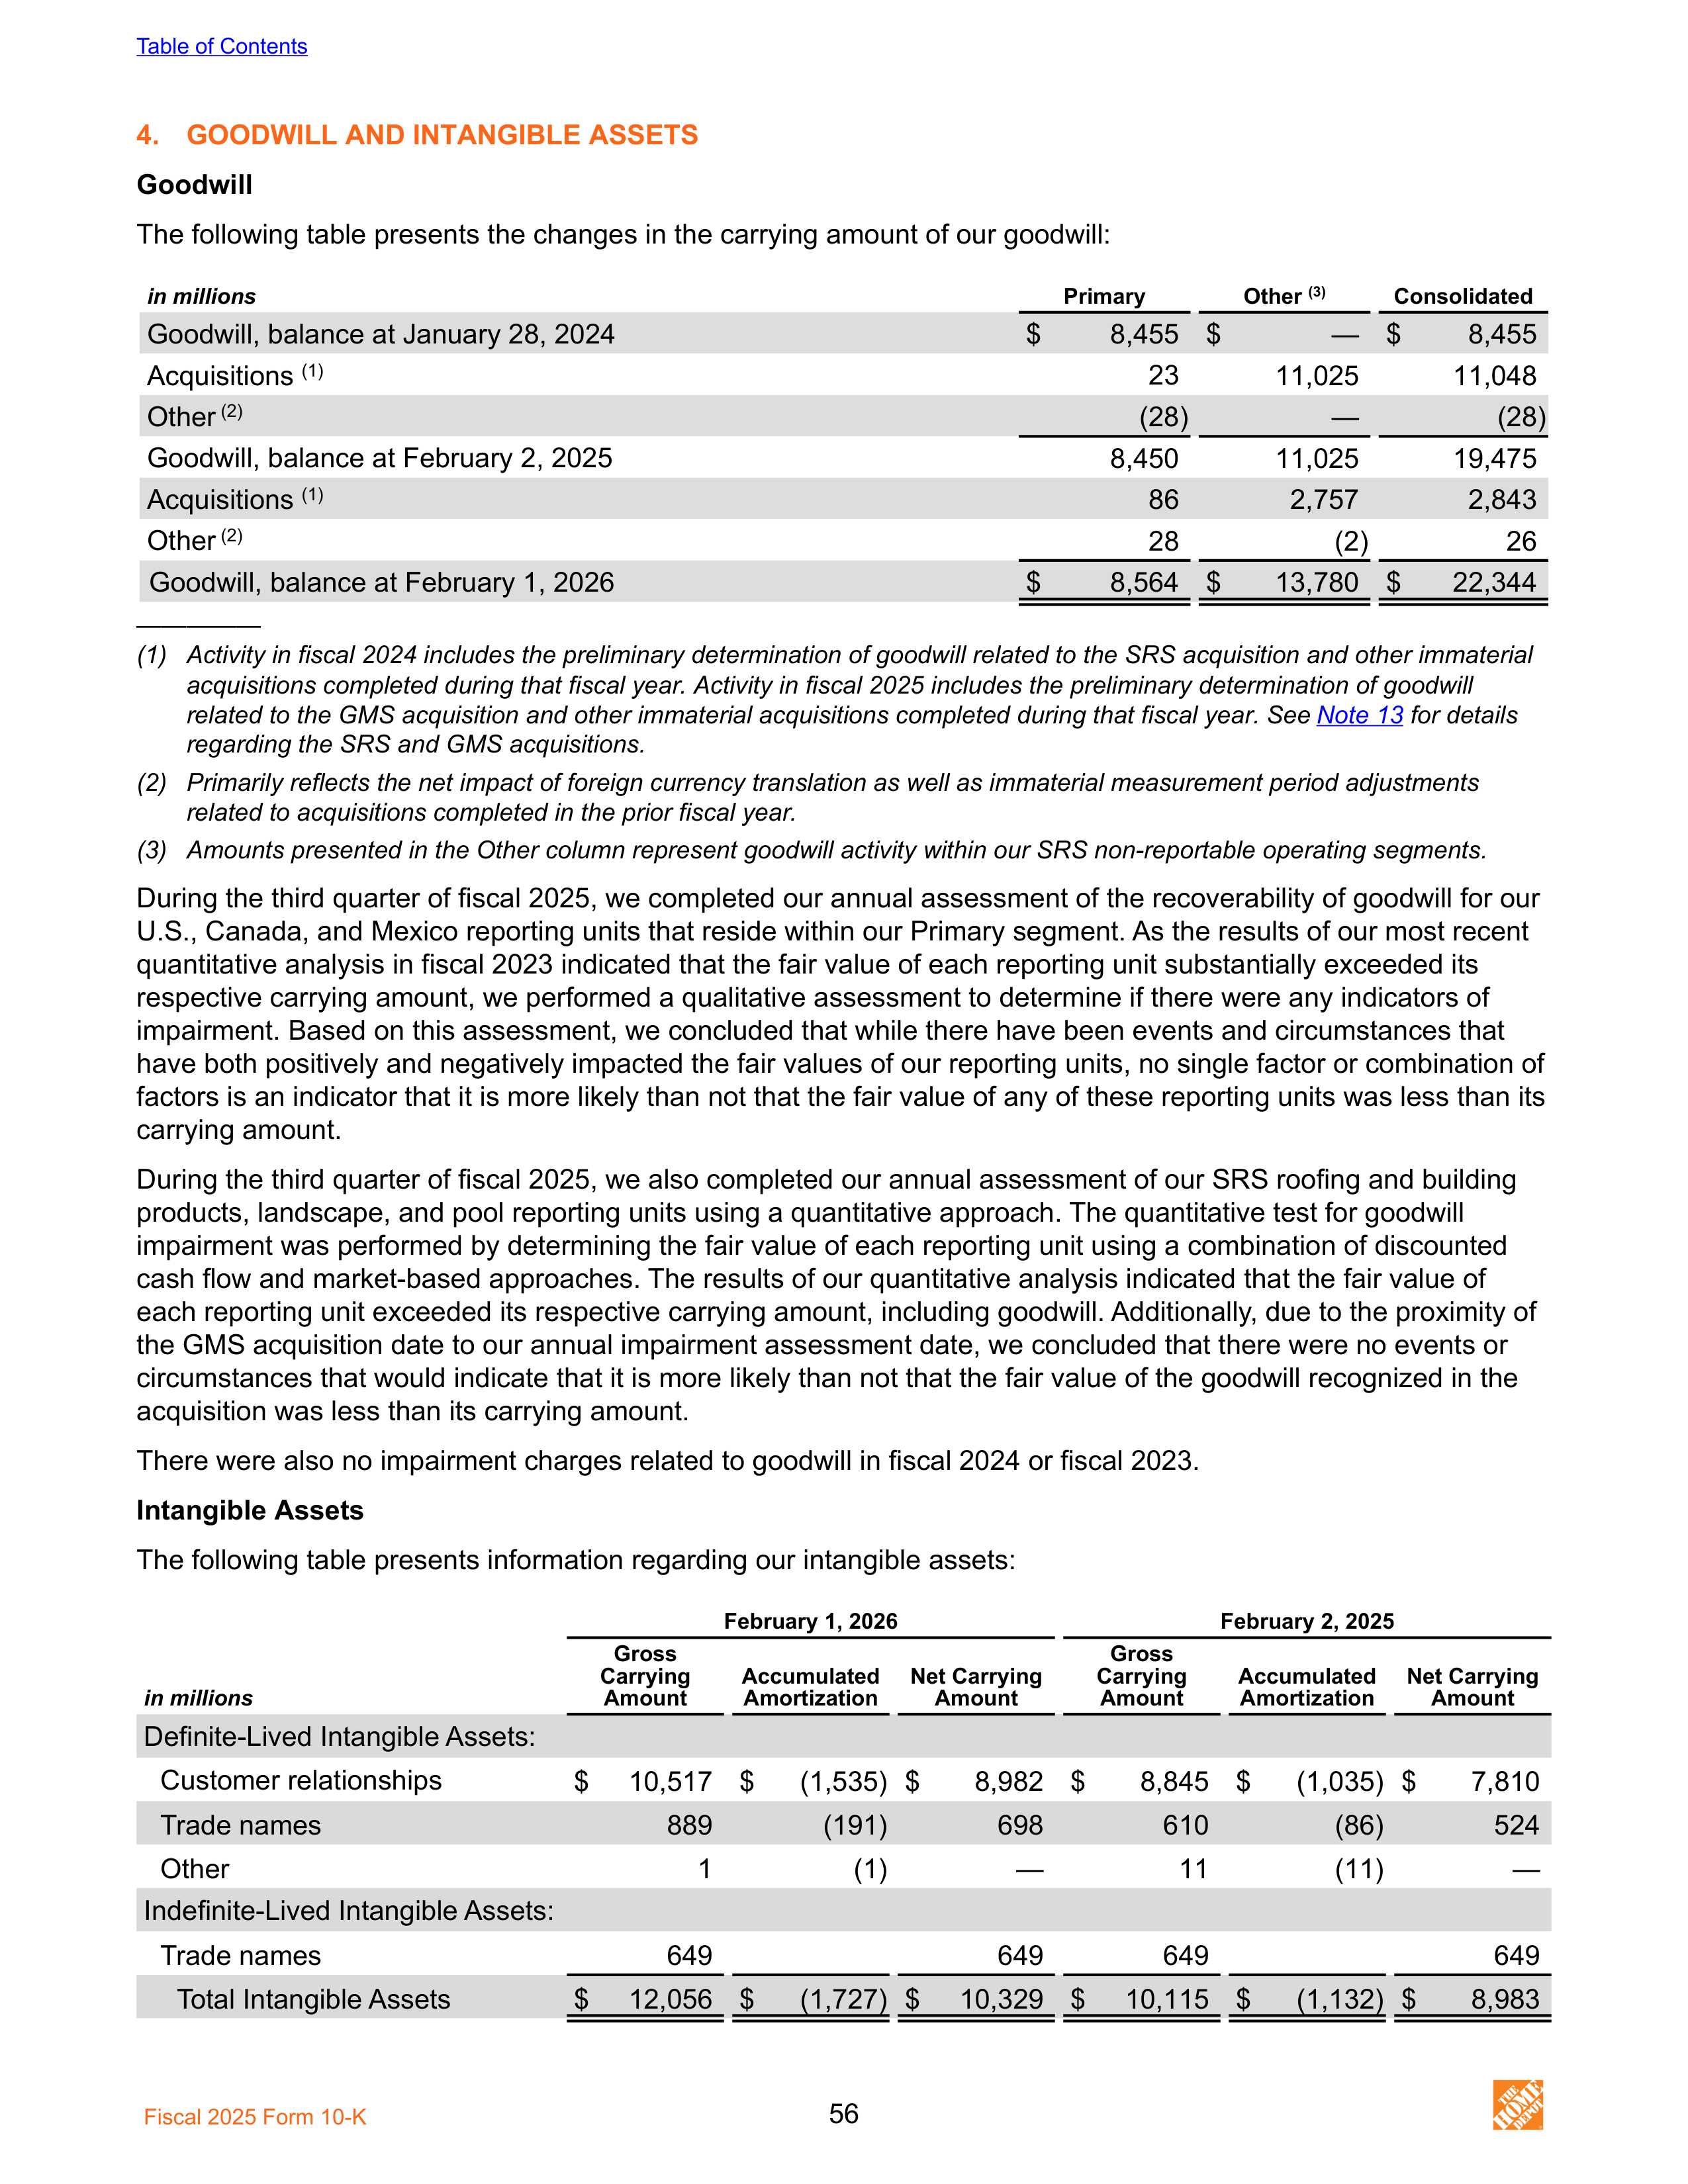
4.
GOODWILL AND INTANGIBLE ASSETS
Goodwill
The following table presents the changes in the carrying amount of our goodwill:
in millions
Primary
Other
(3)
Consolidated
Goodwill, balance at January 28, 2024
$
8,455 $
— $
8,455
Acquisitions
(1)
23
11,025
11,048
Other
(2)
(28)
—
(28)
Goodwill, balance at February 2, 2025
8,450
11,025
19,475
Acquisitions
(1)
86
2,757
2,843
Other
(2)
28
(2)
26
Goodwill, balance at February 1, 2026
$
8,564 $
13,780 $
22,344
—————
(1) Activity in fiscal 2024 includes the preliminary determination of goodwill related to the SRS acquisition and other immaterial
acquisitions completed during that fiscal year. Activity in fiscal 2025 includes the preliminary determination of goodwill
related to the GMS acquisition and other immaterial acquisitions completed during that fiscal year. See
Note 13
for details
regarding the SRS and GMS acquisitions.
(2) Primarily reflects the net impact of foreign currency translation as well as immaterial measurement period adjustments
related to acquisitions completed in the prior fiscal year.
(3) Amounts presented in the Other column represent goodwill activity within our SRS non-reportable operating segments.
During the third quarter of fiscal 2025, we completed our annual assessment of the recoverability of goodwill for our
U.S., Canada, and Mexico reporting units that reside within our Primary segment. As the results of our most recent
quantitative analysis in fiscal 2023 indicated that the fair value of each reporting unit substantially exceeded its
respective carrying amount, we performed a qualitative assessment to determine if there were any indicators of
impairment. Based on this assessment, we concluded that while there have been events and circumstances that
have both positively and negatively impacted the fair values of our reporting units, no single factor or combination of
factors is an indicator that it is more likely than not that the fair value of any of these reporting units was less than its
carrying amount.
During the third quarter of fiscal 2025, we also completed our annual assessment of our SRS roofing and building
products, landscape, and pool reporting units using a quantitative approach. The quantitative test for goodwill
impairment was performed by determining the fair value of each reporting unit using a combination of discounted
cash flow and market-based approaches. The results of our quantitative analysis indicated that the fair value of
each reporting unit exceeded its respective carrying amount, including goodwill. Additionally, due to the proximity of
the GMS acquisition date to our annual impairment assessment date, we concluded that there were no events or
circumstances that would indicate that it is more likely than not that the fair value of the goodwill recognized in the
acquisition was less than its carrying amount.
There were also no impairment charges related to goodwill in fiscal 2024 or fiscal 2023.
Intangible Assets
The following table presents information regarding our intangible assets:
February 1, 2026
February 2, 2025
in millions
Gross
Carrying
Amount
Accumulated
Amortization
Net Carrying
Amount
Gross
Carrying
Amount
Accumulated
Amortization
Net Carrying
Amount
Definite-Lived Intangible Assets:
Customer relationships
$
10,517 $
(1,535) $
8,982 $
8,845 $
(1,035) $
7,810
Trade names
889
(191)
698
610
(86)
524
Other
1
(1)
—
11
(11)
—
Indefinite-Lived Intangible Assets:
Trade names
649
649
649
649
Total Intangible Assets
$
12,056 $
(1,727) $
10,329 $
10,115 $
(1,132) $
8,983
Table of Contents
Fiscal 2025 Form 10-K
56
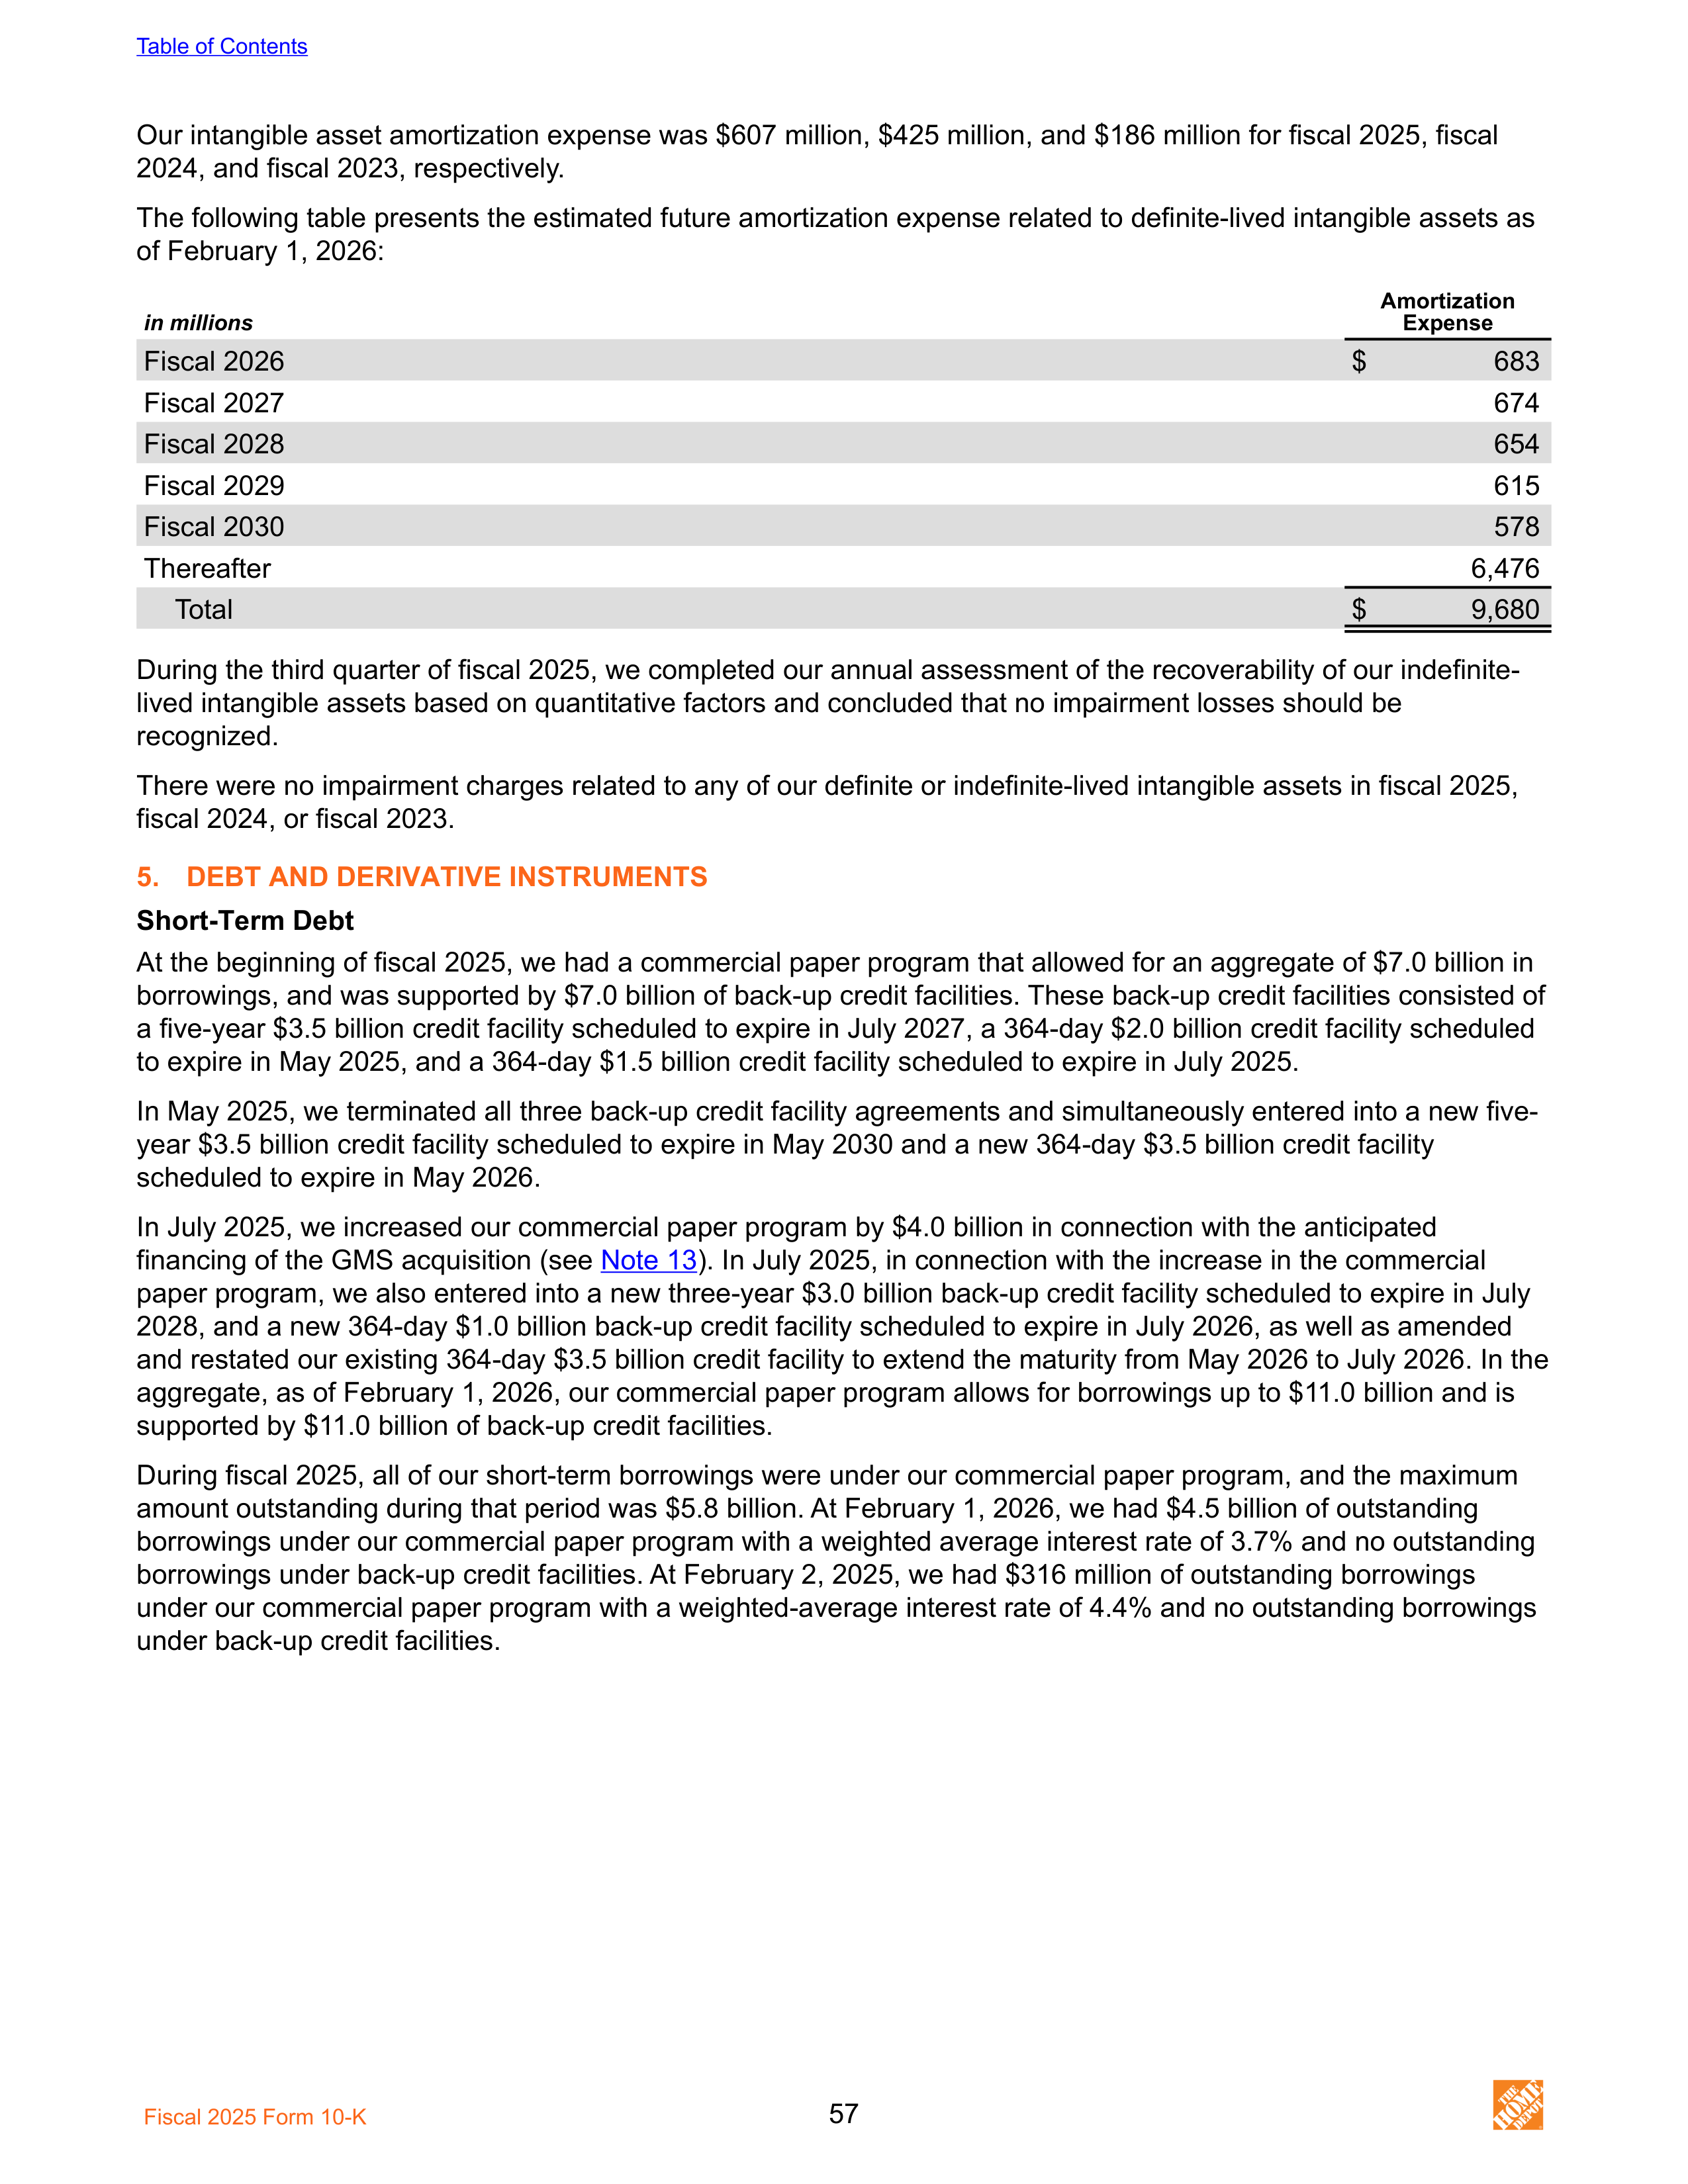
Our intangible asset amortization expense was $607 million, $425 million, and $186 million for fiscal 2025, fiscal
2024, and fiscal 2023, respectively.
The following table presents the estimated future amortization expense related to definite-lived intangible assets as
of February 1, 2026:
in millions
Amortization
Expense
Fiscal 2026
$
683
Fiscal 2027
674
Fiscal 2028
654
Fiscal 2029
615
Fiscal 2030
578
Thereafter
6,476
Total
$
9,680
During the third quarter of fiscal 2025, we completed our annual assessment of the recoverability of our indefinite-
lived intangible assets based on quantitative factors and concluded that no impairment losses should be
recognized.
There were no impairment charges related to any of our definite or indefinite-lived intangible assets in fiscal 2025,
fiscal 2024, or fiscal 2023.
5.
DEBT AND DERIVATIVE INSTRUMENTS
Short-Term Debt
At the beginning of fiscal 2025, we had a commercial paper program that allowed for an aggregate of $7.0 billion in
borrowings, and was supported by $7.0 billion of back-up credit facilities. These back-up credit facilities consisted of
a five-year $3.5 billion credit facility scheduled to expire in July 2027, a 364-day $2.0 billion credit facility scheduled
to expire in May 2025, and a 364-day $1.5 billion credit facility scheduled to expire in July 2025.
In May 2025, we terminated all three back-up credit facility agreements and simultaneously entered into a new five-
year $3.5 billion credit facility scheduled to expire in May 2030 and a new 364-day $3.5 billion credit facility
scheduled to expire in May 2026.
In July 2025, we increased our commercial paper program by $4.0 billion in connection with the anticipated
financing of the GMS acquisition (see
Note 13
). In July 2025, in connection with the increase in the commercial
paper program, we also entered into a new three-year $3.0 billion back-up credit facility scheduled to expire in July
2028, and a new 364-day $1.0 billion back-up credit facility scheduled to expire in July 2026, as well as amended
and restated our existing 364-day $3.5 billion credit facility to extend the maturity from May 2026 to July 2026. In the
aggregate, as of February 1, 2026, our commercial paper program allows for borrowings up to $11.0 billion and is
supported by $11.0 billion of back-up credit facilities.
During fiscal 2025, all of our short-term borrowings were under our commercial paper program, and the maximum
amount outstanding during that period was $5.8 billion. At February 1, 2026, we had $4.5 billion of outstanding
borrowings under our commercial paper program with a weighted average interest rate of 3.7% and no outstanding
borrowings under back-up credit facilities. At February 2, 2025, we had $316 million of outstanding borrowings
under our commercial paper program with a weighted-average interest rate of 4.4% and no outstanding borrowings
under back-up credit facilities.
Table of Contents
Fiscal 2025 Form 10-K
57
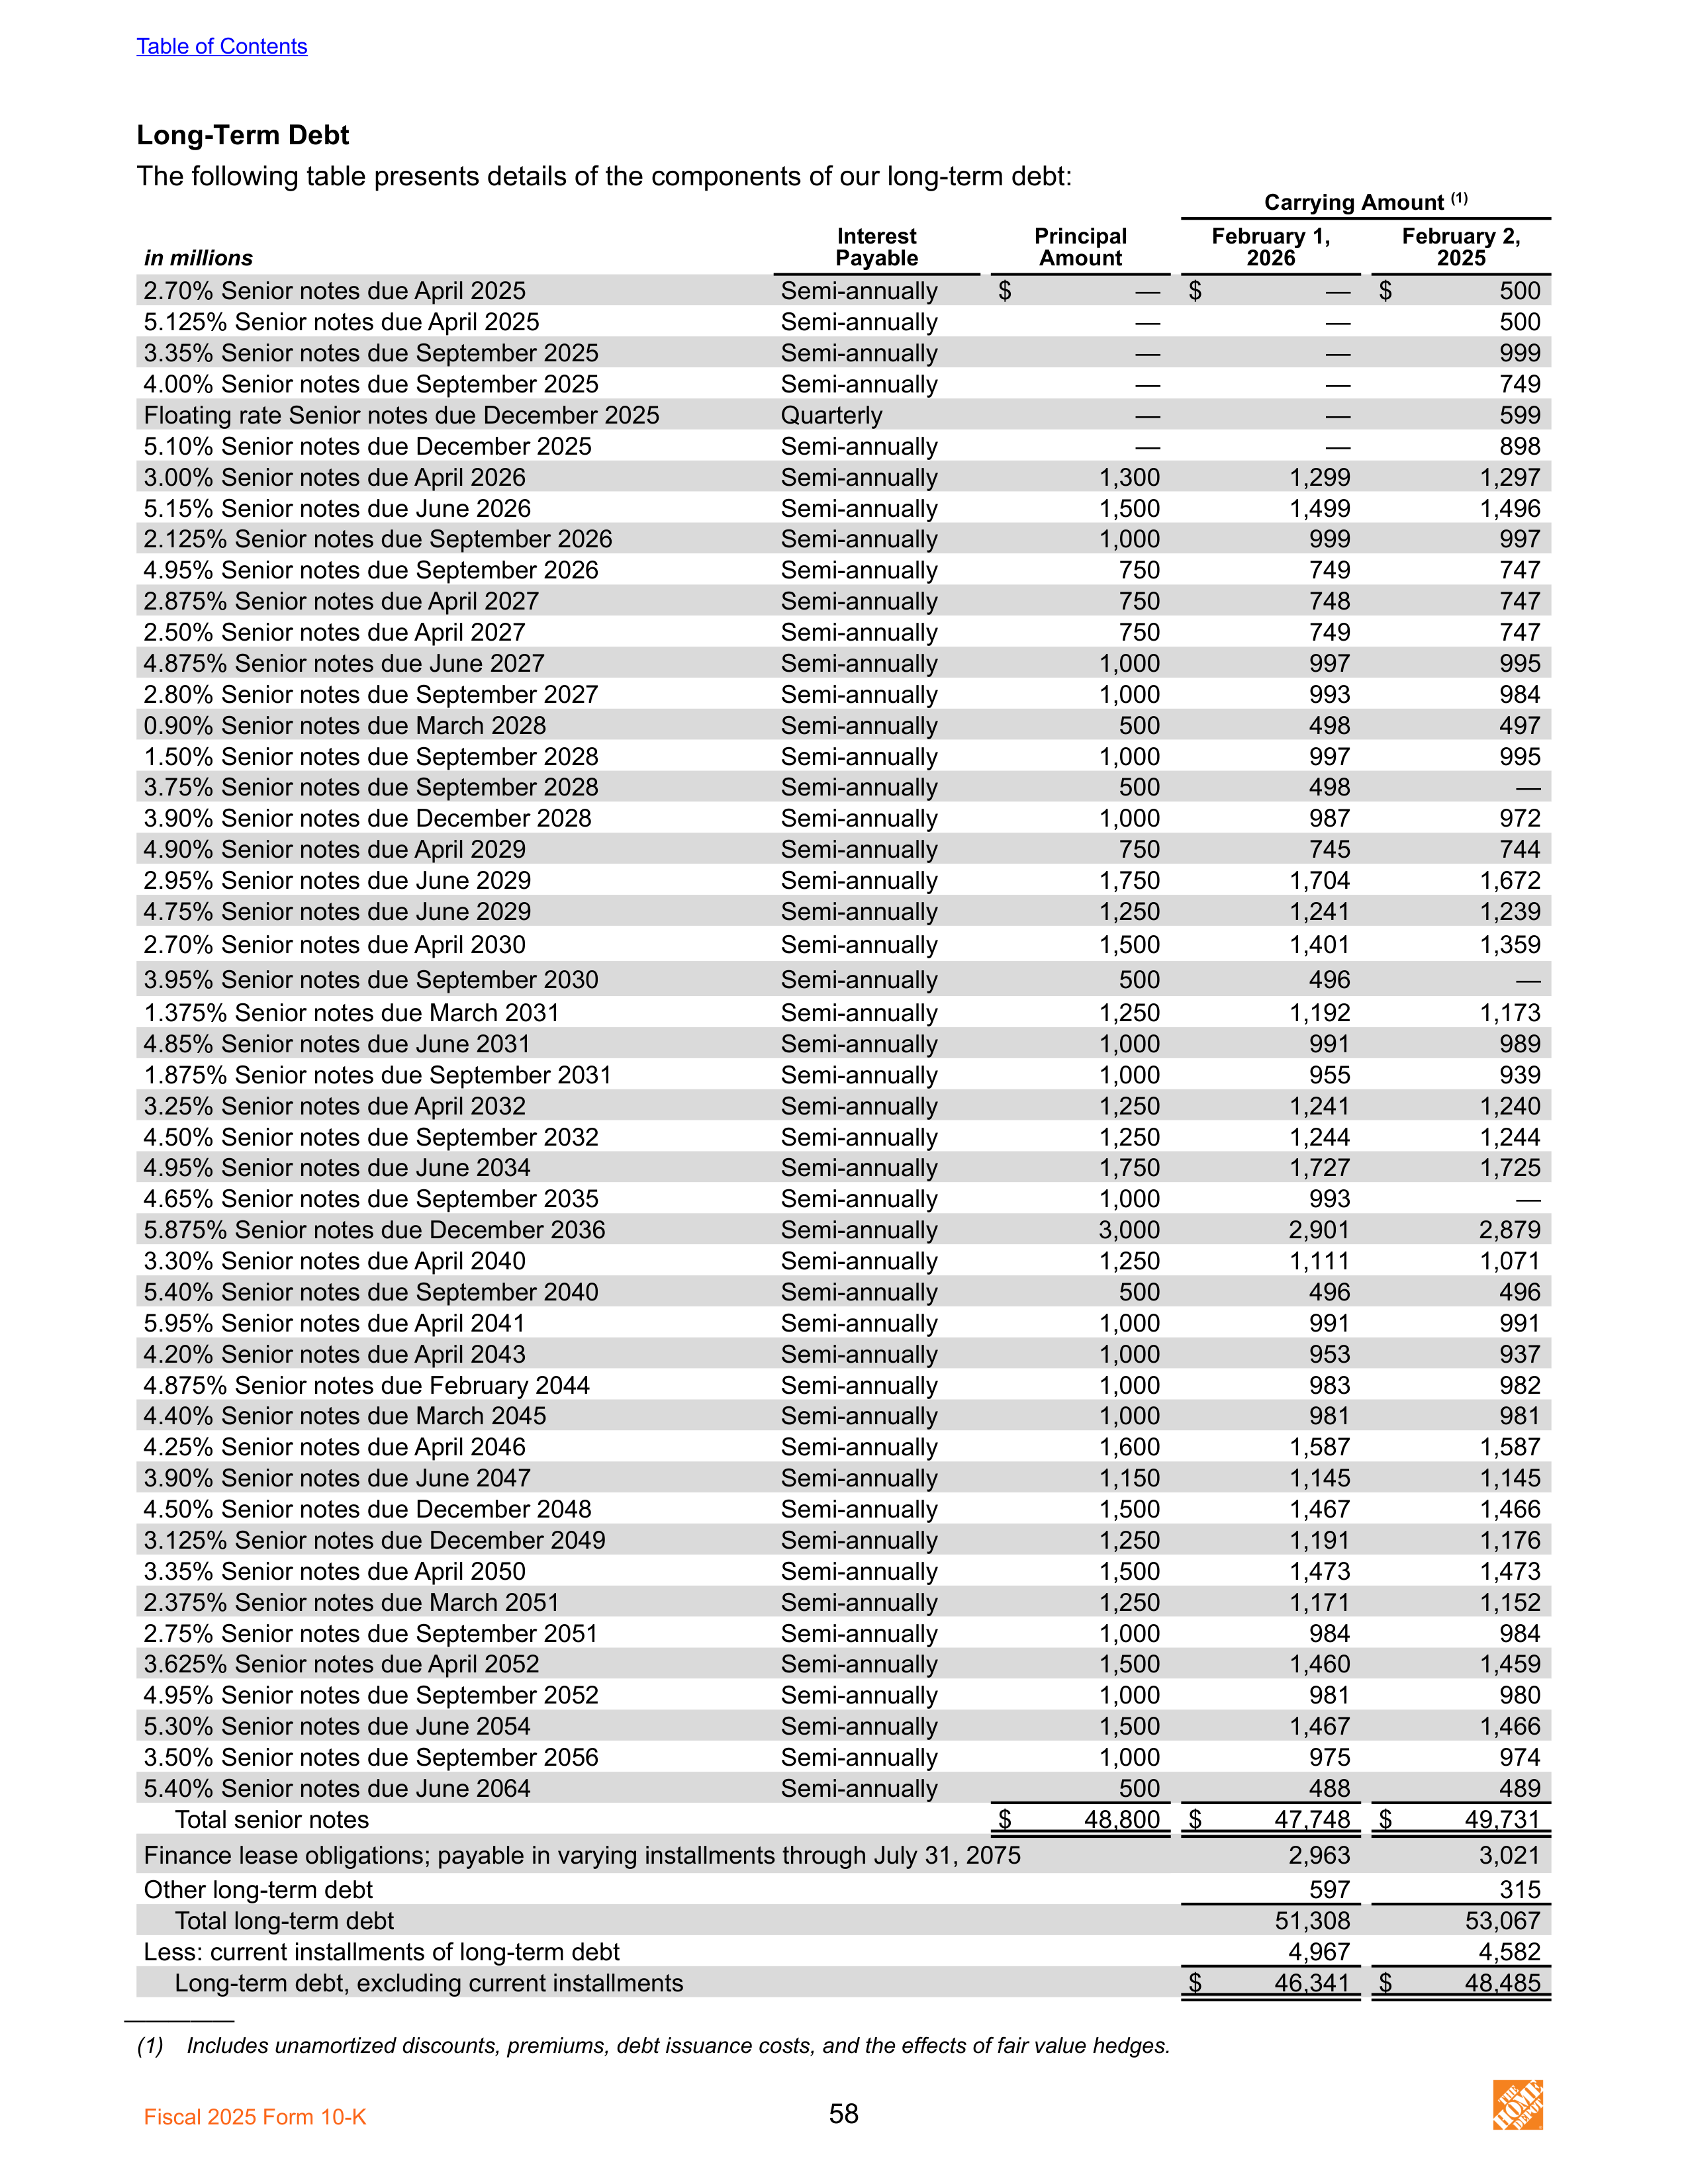
Long-Term Debt
The following table presents details of the components of our long-term debt:
2.70% Senior notes due April 2025
Semi-annually
$
—
$
—
$
500
5.125% Senior notes due April 2025
Semi-annually
—
—
500
3.35% Senior notes due September 2025
Semi-annually
—
—
999
4.00% Senior notes due September 2025
Semi-annually
—
—
749
Floating rate Senior notes due December 2025
Quarterly
—
—
599
5.10% Senior notes due December 2025
Semi-annually
—
—
898
3.00% Senior notes due April 2026
Semi-annually
1,300
1,299
1,297
5.15% Senior notes due June 2026
Semi-annually
1,500
1,499
1,496
2.125% Senior notes due September 2026
Semi-annually
1,000
999
997
4.95% Senior notes due September 2026
Semi-annually
750
749
747
2.875% Senior notes due April 2027
Semi-annually
750
748
747
2.50% Senior notes due April 2027
Semi-annually
750
749
747
4.875% Senior notes due June 2027
Semi-annually
1,000
997
995
2.80% Senior notes due September 2027
Semi-annually
1,000
993
984
0.90% Senior notes due March 2028
Semi-annually
500
498
497
1.50% Senior notes due September 2028
Semi-annually
1,000
997
995
3.75% Senior notes due September 2028
Semi-annually
500
498
—
3.90% Senior notes due December 2028
Semi-annually
1,000
987
972
4.90% Senior notes due April 2029
Semi-annually
750
745
744
2.95% Senior notes due June 2029
Semi-annually
1,750
1,704
1,672
4.75% Senior notes due June 2029
Semi-annually
1,250
1,241
1,239
2.70% Senior notes due April 2030
Semi-annually
1,500
1,401
1,359
3.95% Senior notes due September 2030
Semi-annually
500
496
—
1.375% Senior notes due March 2031
Semi-annually
1,250
1,192
1,173
4.85% Senior notes due June 2031
Semi-annually
1,000
991
989
1.875% Senior notes due September 2031
Semi-annually
1,000
955
939
3.25% Senior notes due April 2032
Semi-annually
1,250
1,241
1,240
4.50% Senior notes due September 2032
Semi-annually
1,250
1,244
1,244
4.95% Senior notes due June 2034
Semi-annually
1,750
1,727
1,725
4.65% Senior notes due September 2035
Semi-annually
1,000
993
—
5.875% Senior notes due December 2036
Semi-annually
3,000
2,901
2,879
3.30% Senior notes due April 2040
Semi-annually
1,250
1,111
1,071
5.40% Senior notes due September 2040
Semi-annually
500
496
496
5.95% Senior notes due April 2041
Semi-annually
1,000
991
991
4.20% Senior notes due April 2043
Semi-annually
1,000
953
937
4.875% Senior notes due February 2044
Semi-annually
1,000
983
982
4.40% Senior notes due March 2045
Semi-annually
1,000
981
981
4.25% Senior notes due April 2046
Semi-annually
1,600
1,587
1,587
3.90% Senior notes due June 2047
Semi-annually
1,150
1,145
1,145
4.50% Senior notes due December 2048
Semi-annually
1,500
1,467
1,466
3.125% Senior notes due December 2049
Semi-annually
1,250
1,191
1,176
3.35% Senior notes due April 2050
Semi-annually
1,500
1,473
1,473
2.375% Senior notes due March 2051
Semi-annually
1,250
1,171
1,152
2.75% Senior notes due September 2051
Semi-annually
1,000
984
984
3.625% Senior notes due April 2052
Semi-annually
1,500
1,460
1,459
4.95% Senior notes due September 2052
Semi-annually
1,000
981
980
5.30% Senior notes due June 2054
Semi-annually
1,500
1,467
1,466
3.50% Senior notes due September 2056
Semi-annually
1,000
975
974
5.40% Senior notes due June 2064
Semi-annually
500
488
489
Total senior notes
$
48,800
$
47,748
$
49,731
Finance lease obligations; payable in varying installments through July 31, 2075
2,963
3,021
Other long-term debt
597
315
Total long-term debt
51,308
53,067
Less: current installments of long-term debt
4,967
4,582
Long-term debt, excluding current installments
$
46,341
$
48,485
Carrying Amount
(1)
in millions
Interest
Payable
Principal
Amount
February 1,
2026
February 2,
2025
—————
(1) Includes unamortized discounts, premiums, debt issuance costs, and the effects of fair value hedges.
Table of Contents
Fiscal 2025 Form 10-K
58
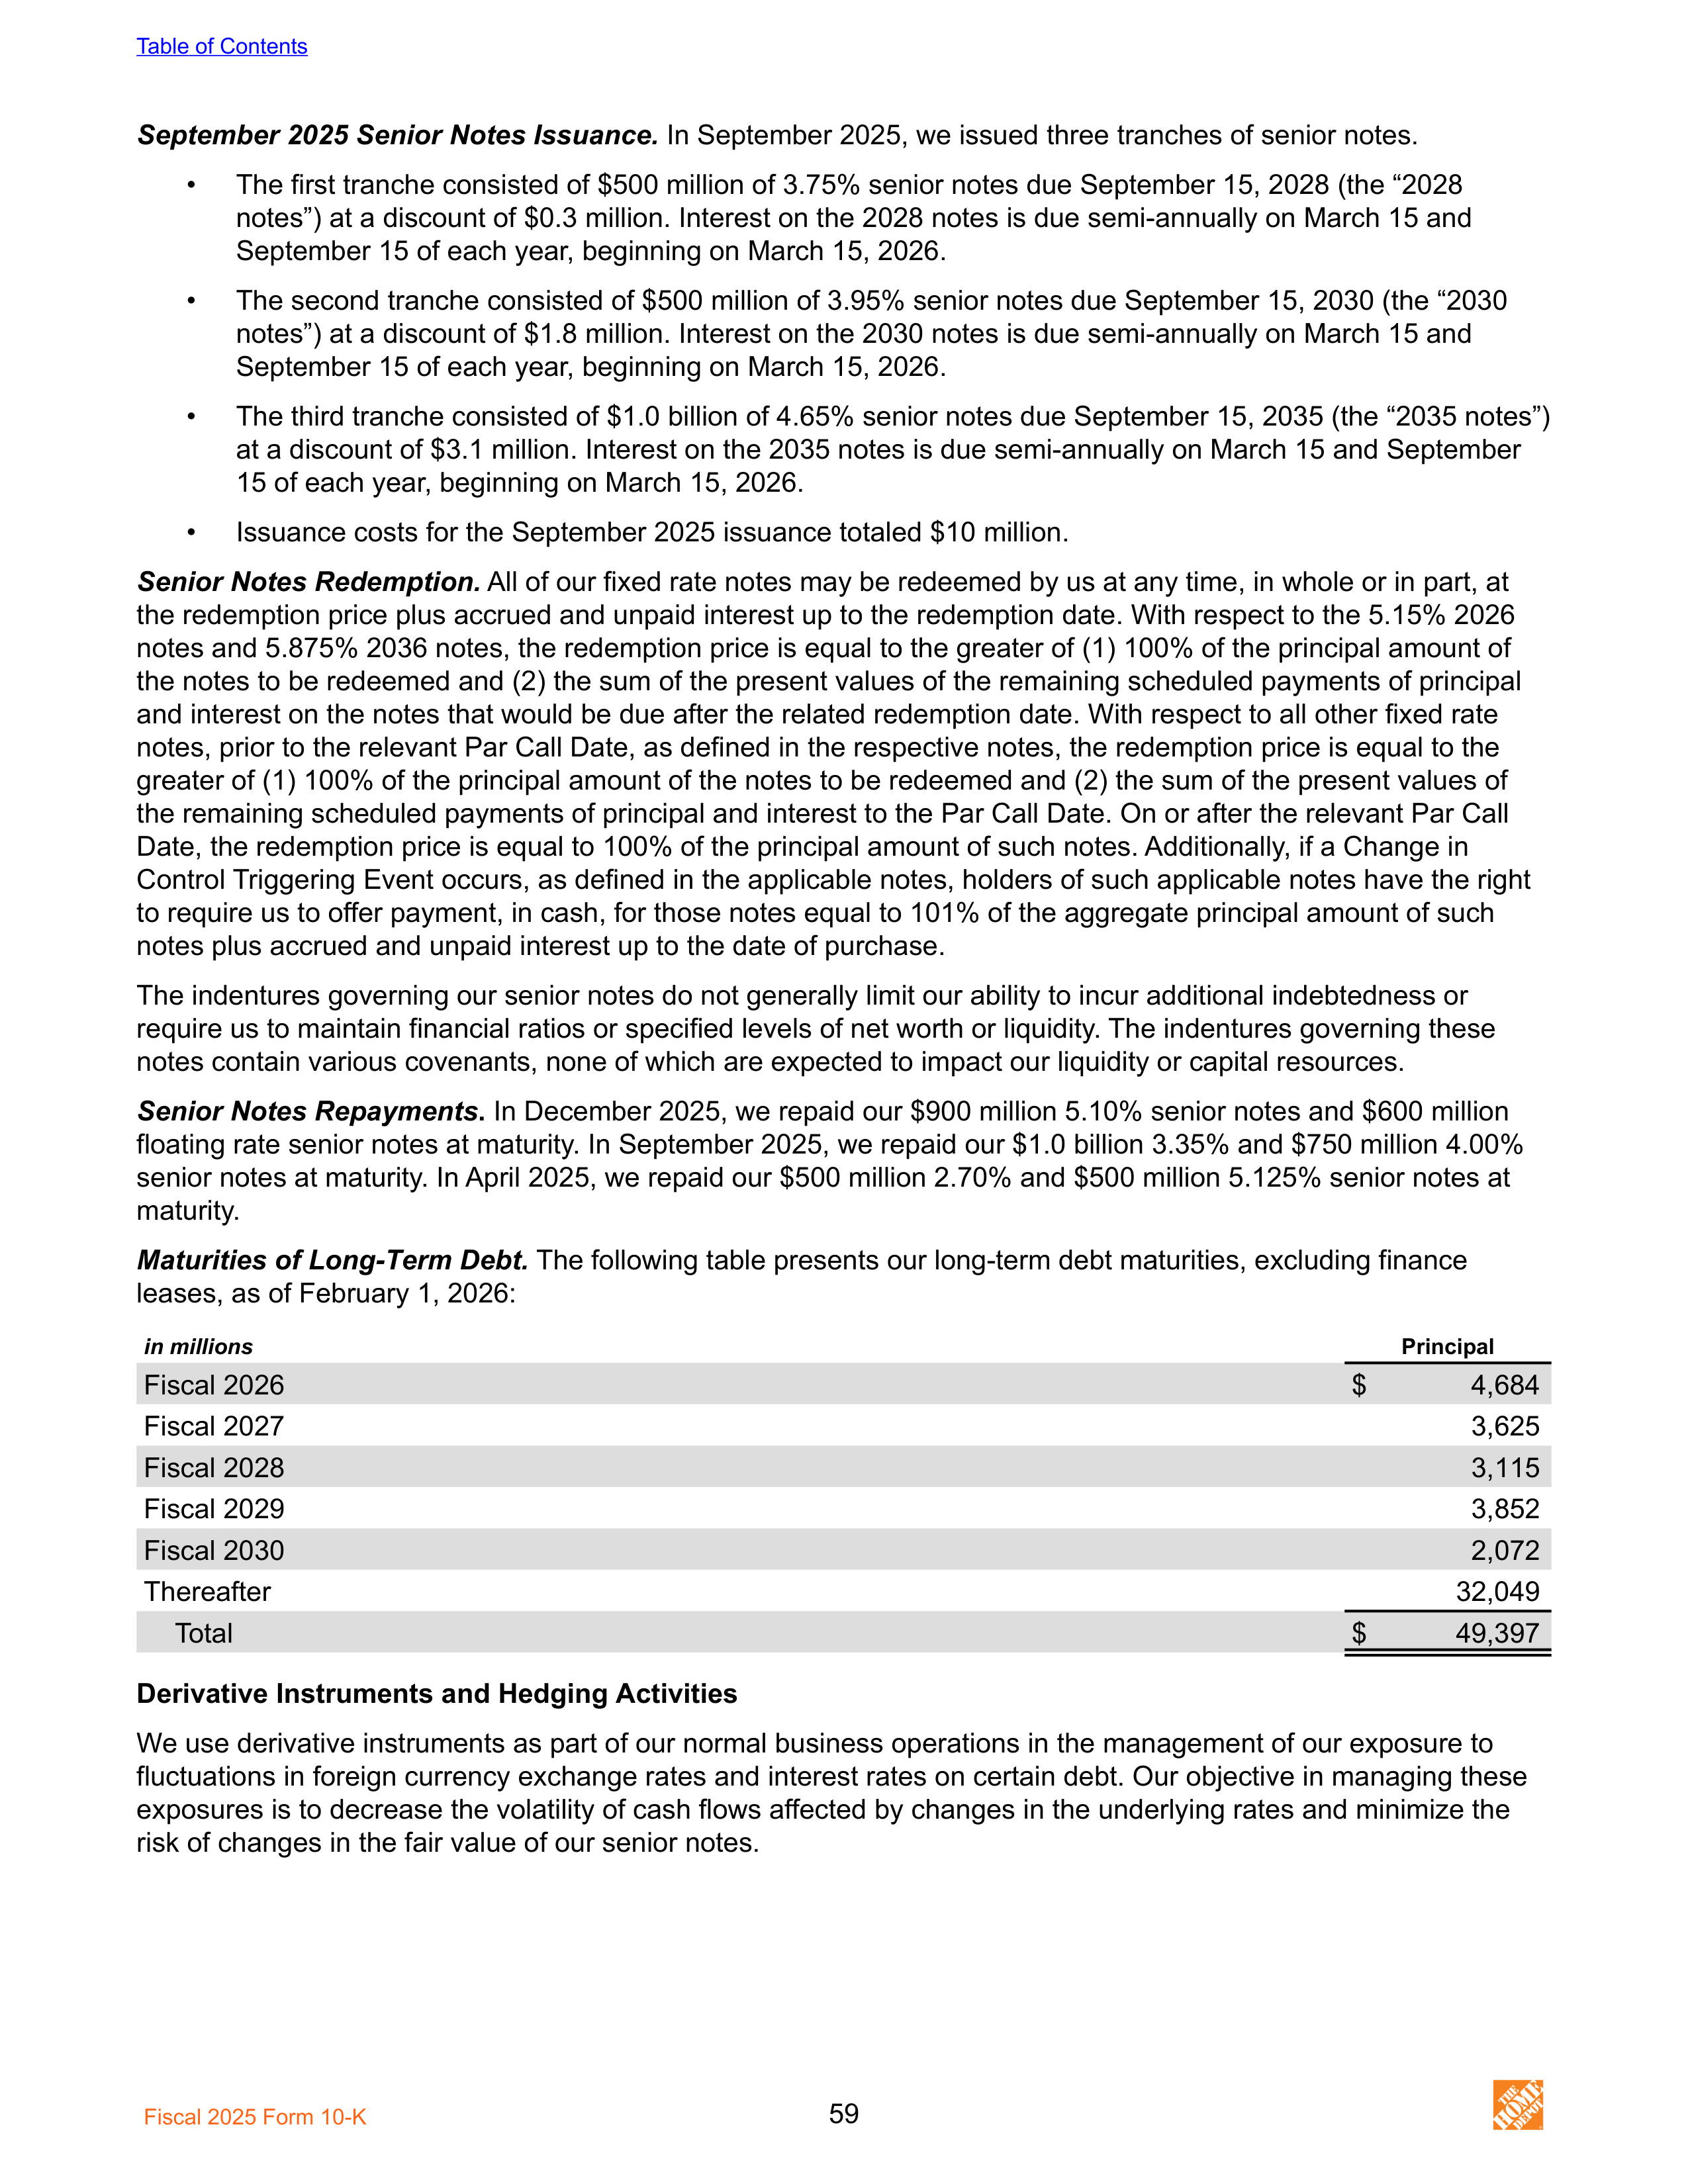
September 2025 Senior Notes Issuance.
In September 2025, we issued three tranches of senior notes.
•
The first tranche consisted of $500 million of 3.75% senior notes due September 15, 2028 (the “2028
notes”) at a discount of $0.3 million. Interest on the 2028 notes is due semi-annually on March 15 and
September 15 of each year, beginning on March 15, 2026.
•
The second tranche consisted of $500 million of 3.95% senior notes due September 15, 2030 (the “2030
notes”) at a discount of $1.8 million. Interest on the 2030 notes is due semi-annually on March 15 and
September 15 of each year, beginning on March 15, 2026.
•
The third tranche consisted of $1.0 billion of 4.65% senior notes due September 15, 2035 (the “2035 notes”)
at a discount of $3.1 million. Interest on the 2035 notes is due semi-annually on March 15 and September
15 of each year, beginning on March 15, 2026.
•
Issuance costs for the September 2025 issuance totaled $10 million.
Senior Notes Redemption.
All of our fixed rate notes may be redeemed by us at any time, in whole or in part, at
the redemption price plus accrued and unpaid interest up to the redemption date. With respect to the 5.15% 2026
notes and 5.875% 2036 notes, the redemption price is equal to the greater of (1) 100% of the principal amount of
the notes to be redeemed and (2) the sum of the present values of the remaining scheduled payments of principal
and interest on the notes that would be due after the related redemption date. With respect to all other fixed rate
notes, prior to the relevant Par Call Date, as defined in the respective notes, the redemption price is equal to the
greater of (1) 100% of the principal amount of the notes to be redeemed and (2) the sum of the present values of
the remaining scheduled payments of principal and interest to the Par Call Date. On or after the relevant Par Call
Date, the redemption price is equal to 100% of the principal amount of such notes. Additionally, if a Change in
Control Triggering Event occurs, as defined in the applicable notes, holders of such applicable notes have the right
to require us to offer payment, in cash, for those notes equal to 101% of the aggregate principal amount of such
notes plus accrued and unpaid interest up to the date of purchase.
The indentures governing our senior notes do not generally limit our ability to incur additional indebtedness or
require us to maintain financial ratios or specified levels of net worth or liquidity. The indentures governing these
notes contain various covenants, none of which are expected to impact our liquidity or capital resources.
Senior Notes Repayments
.
In December 2025, we repaid our $900 million 5.10% senior notes and $600 million
floating rate senior notes at maturity. In September 2025, we repaid our $1.0 billion 3.35% and $750 million 4.00%
senior notes at maturity. In April 2025, we repaid our $500 million 2.70% and $500 million 5.125% senior notes at
maturity.
Maturities of Long-Term Debt.
The following table presents our long-term debt maturities, excluding finance
leases, as of February 1, 2026:
in millions
Principal
Fiscal 2026
$
4,684
Fiscal 2027
3,625
Fiscal 2028
3,115
Fiscal 2029
3,852
Fiscal 2030
2,072
Thereafter
32,049
Total
$
49,397
Derivative Instruments and Hedging Activities
We use derivative instruments as part of our normal business operations in the management of our exposure to
fluctuations in foreign currency exchange rates and interest rates on certain debt. Our objective in managing these
exposures is to decrease the volatility of cash flows affected by changes in the underlying rates and minimize the
risk of changes in the fair value of our senior notes.
Table of Contents
Fiscal 2025 Form 10-K
59
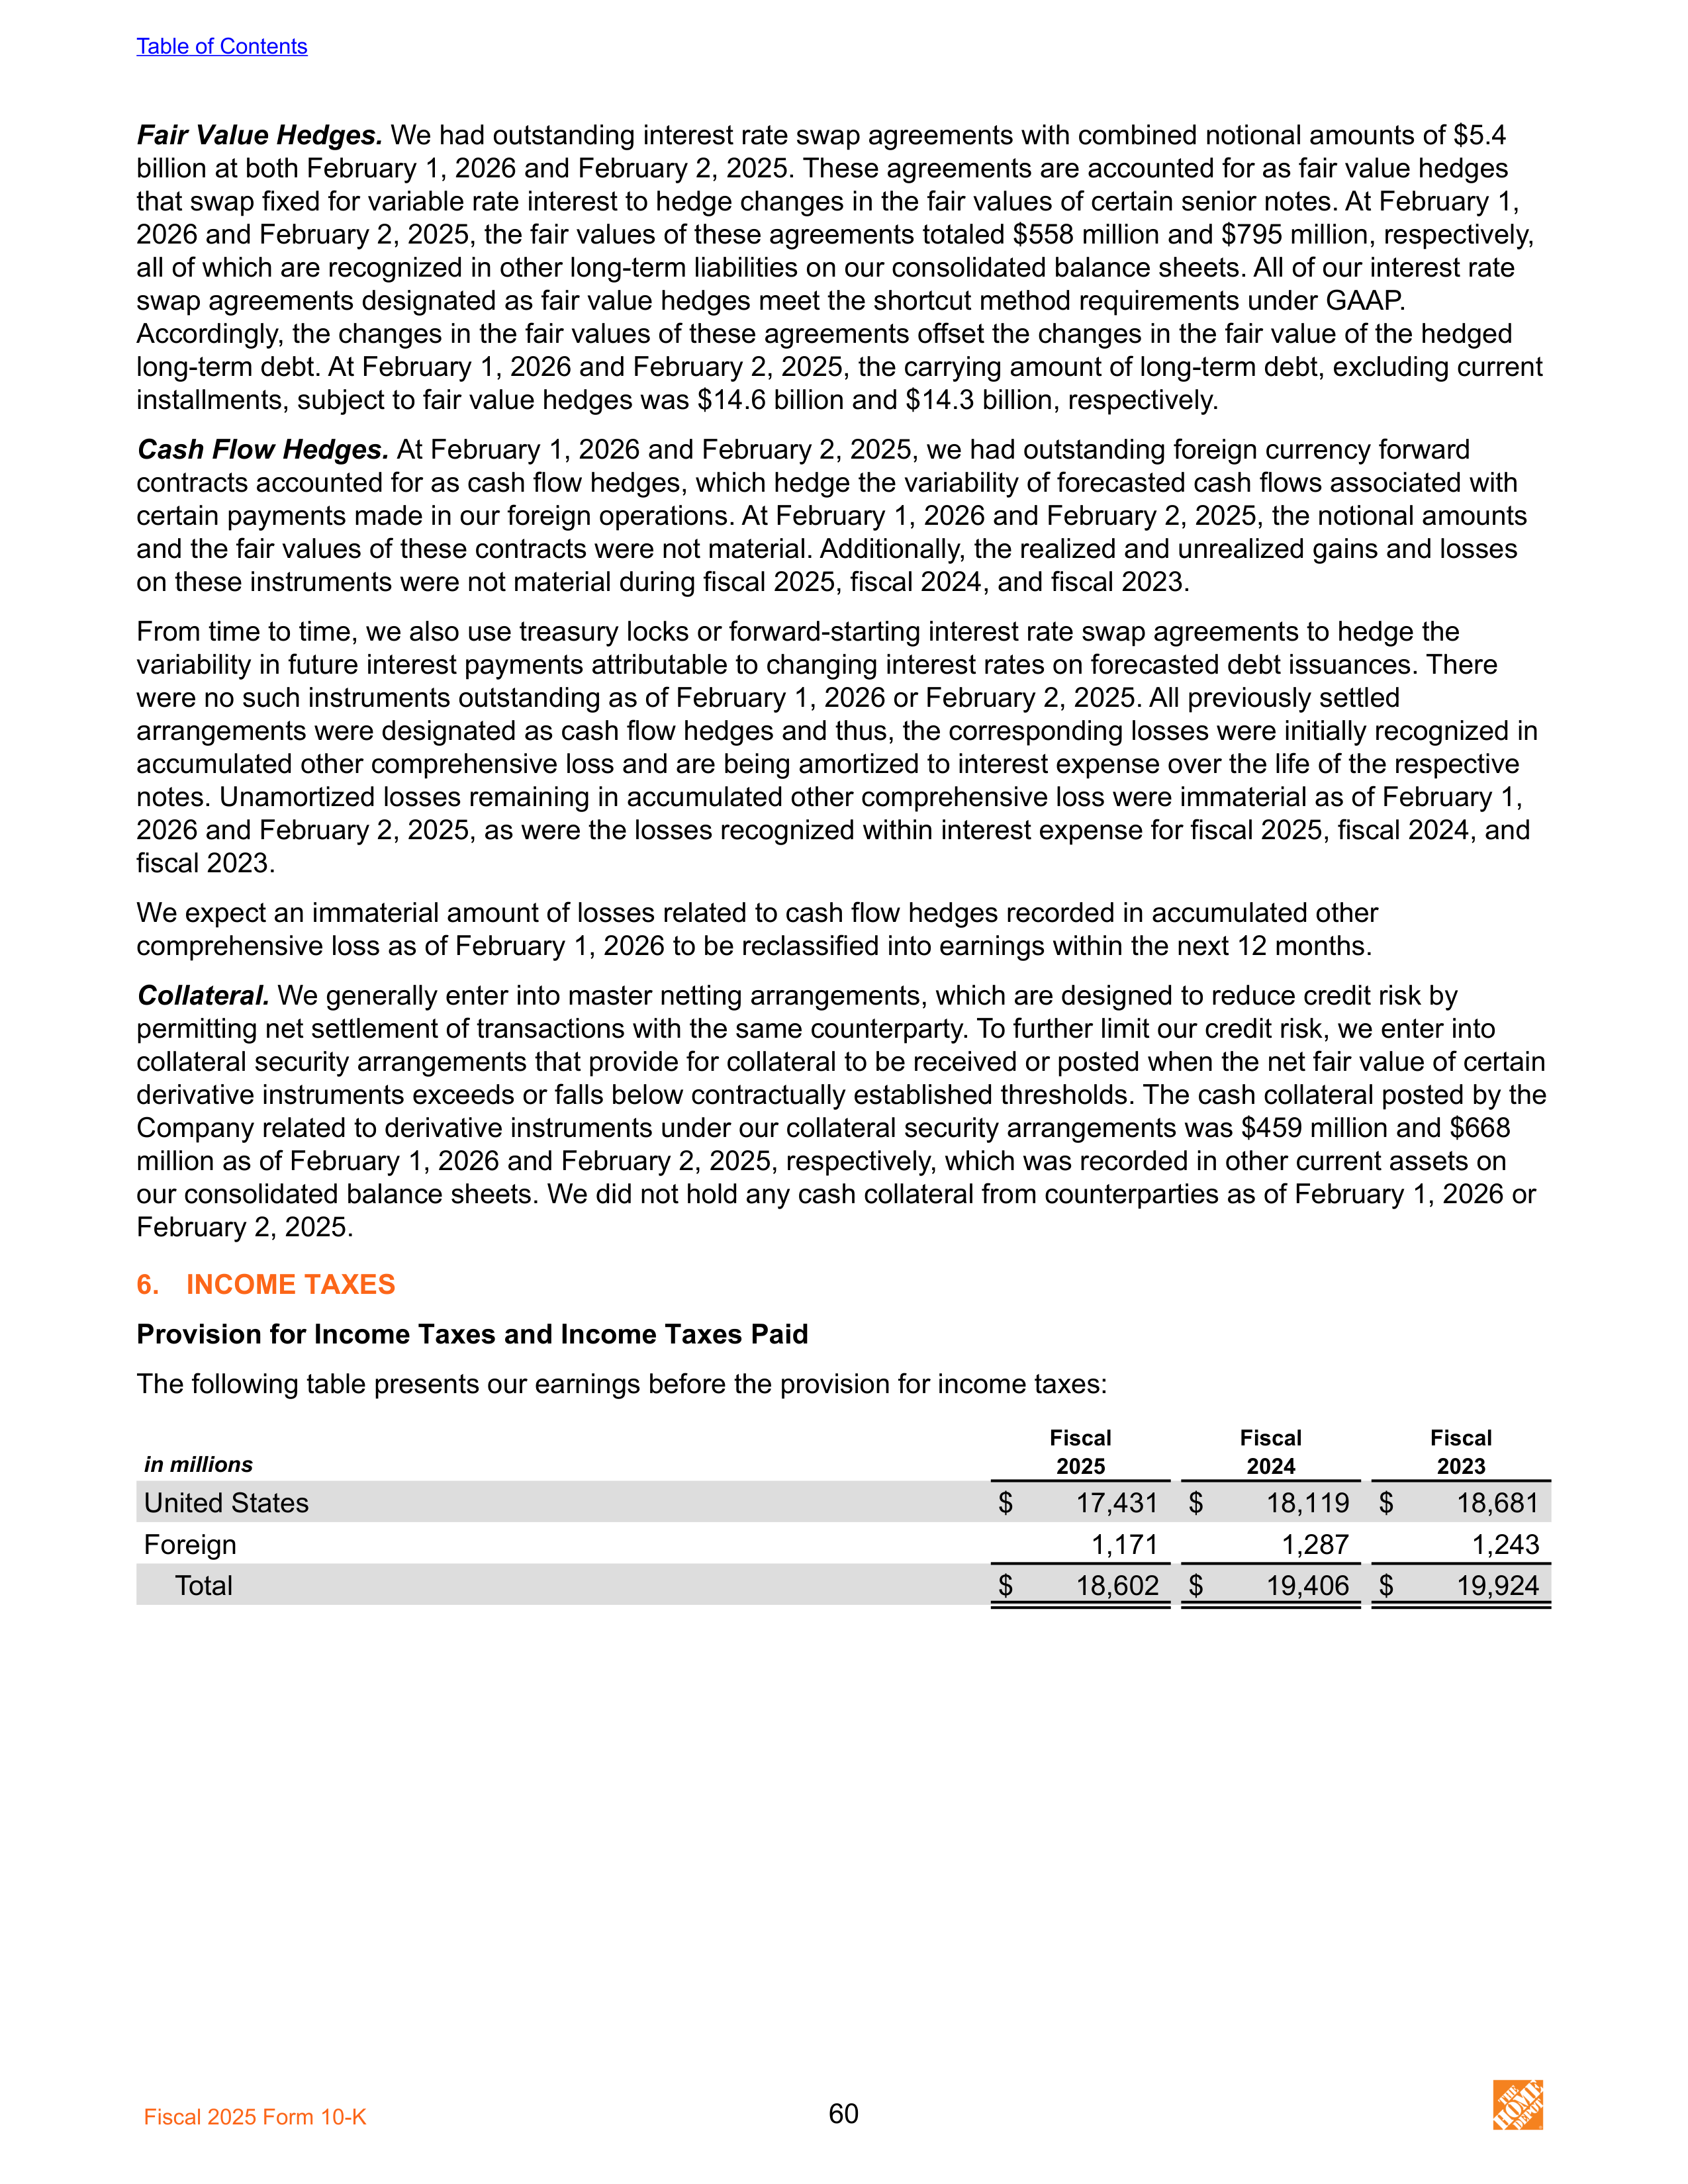
Fair Value Hedges.
We had outstanding interest rate swap agreements with combined notional amounts of $5.4
billion at both February 1, 2026 and February 2, 2025. These agreements are accounted for as fair value hedges
that swap fixed for variable rate interest to hedge changes in the fair values of certain senior notes. At February 1,
2026 and February 2, 2025, the fair values of these agreements totaled $558 million and $795 million, respectively,
all of which are recognized in other long-term liabilities on our consolidated balance sheets. All of our interest rate
swap agreements designated as fair value hedges meet the shortcut method requirements under GAAP.
Accordingly, the changes in the fair values of these agreements offset the changes in the fair value of the hedged
long-term debt. At February 1, 2026 and February 2, 2025, the carrying amount of long-term debt, excluding current
installments, subject to fair value hedges was $14.6 billion and $14.3 billion, respectively.
Cash Flow Hedges.
At February 1, 2026 and February 2, 2025, we had outstanding foreign currency forward
contracts accounted for as cash flow hedges, which hedge the variability of forecasted cash flows associated with
certain payments made in our foreign operations. At February 1, 2026 and February 2, 2025, the notional amounts
and the fair values of these contracts were not material. Additionally, the realized and unrealized gains and losses
on these instruments were not material during fiscal 2025, fiscal 2024, and fiscal 2023.
From time to time, we also use treasury locks or forward-starting interest rate swap agreements to hedge the
variability in future interest payments attributable to changing interest rates on forecasted debt issuances. There
were no such instruments outstanding as of February 1, 2026 or February 2, 2025. All previously settled
arrangements were designated as cash flow hedges and thus, the corresponding losses were initially recognized in
accumulated other comprehensive loss and are being amortized to interest expense over the life of the respective
notes. Unamortized losses remaining in accumulated other comprehensive loss were immaterial as of February 1,
2026 and February 2, 2025, as were the losses recognized within interest expense for fiscal 2025, fiscal 2024, and
fiscal 2023.
We expect an immaterial amount of losses related to cash flow hedges recorded in accumulated other
comprehensive loss as of February 1, 2026 to be reclassified into earnings within the next 12 months.
Collateral.
We generally enter into master netting arrangements, which are designed to reduce credit risk by
permitting net settlement of transactions with the same counterparty. To further limit our credit risk, we enter into
collateral security arrangements that provide for collateral to be received or posted when the net fair value of certain
derivative instruments exceeds or falls below contractually established thresholds. The cash collateral posted by the
Company related to derivative instruments under our collateral security arrangements was $459 million and $668
million as of February 1, 2026 and February 2, 2025, respectively, which was recorded in other current assets on
our consolidated balance sheets. We did not hold any cash collateral from counterparties as of February 1, 2026 or
February 2, 2025.
6.
INCOME TAXES
Provision for Income Taxes and Income Taxes Paid
The following table presents our earnings before the provision for income taxes:
in millions
Fiscal
Fiscal
Fiscal
2025
2024
2023
United States
$
17,431 $
18,119 $
18,681
Foreign
1,171
1,287
1,243
Total
$
18,602 $
19,406 $
19,924
Table of Contents
Fiscal 2025 Form 10-K
60
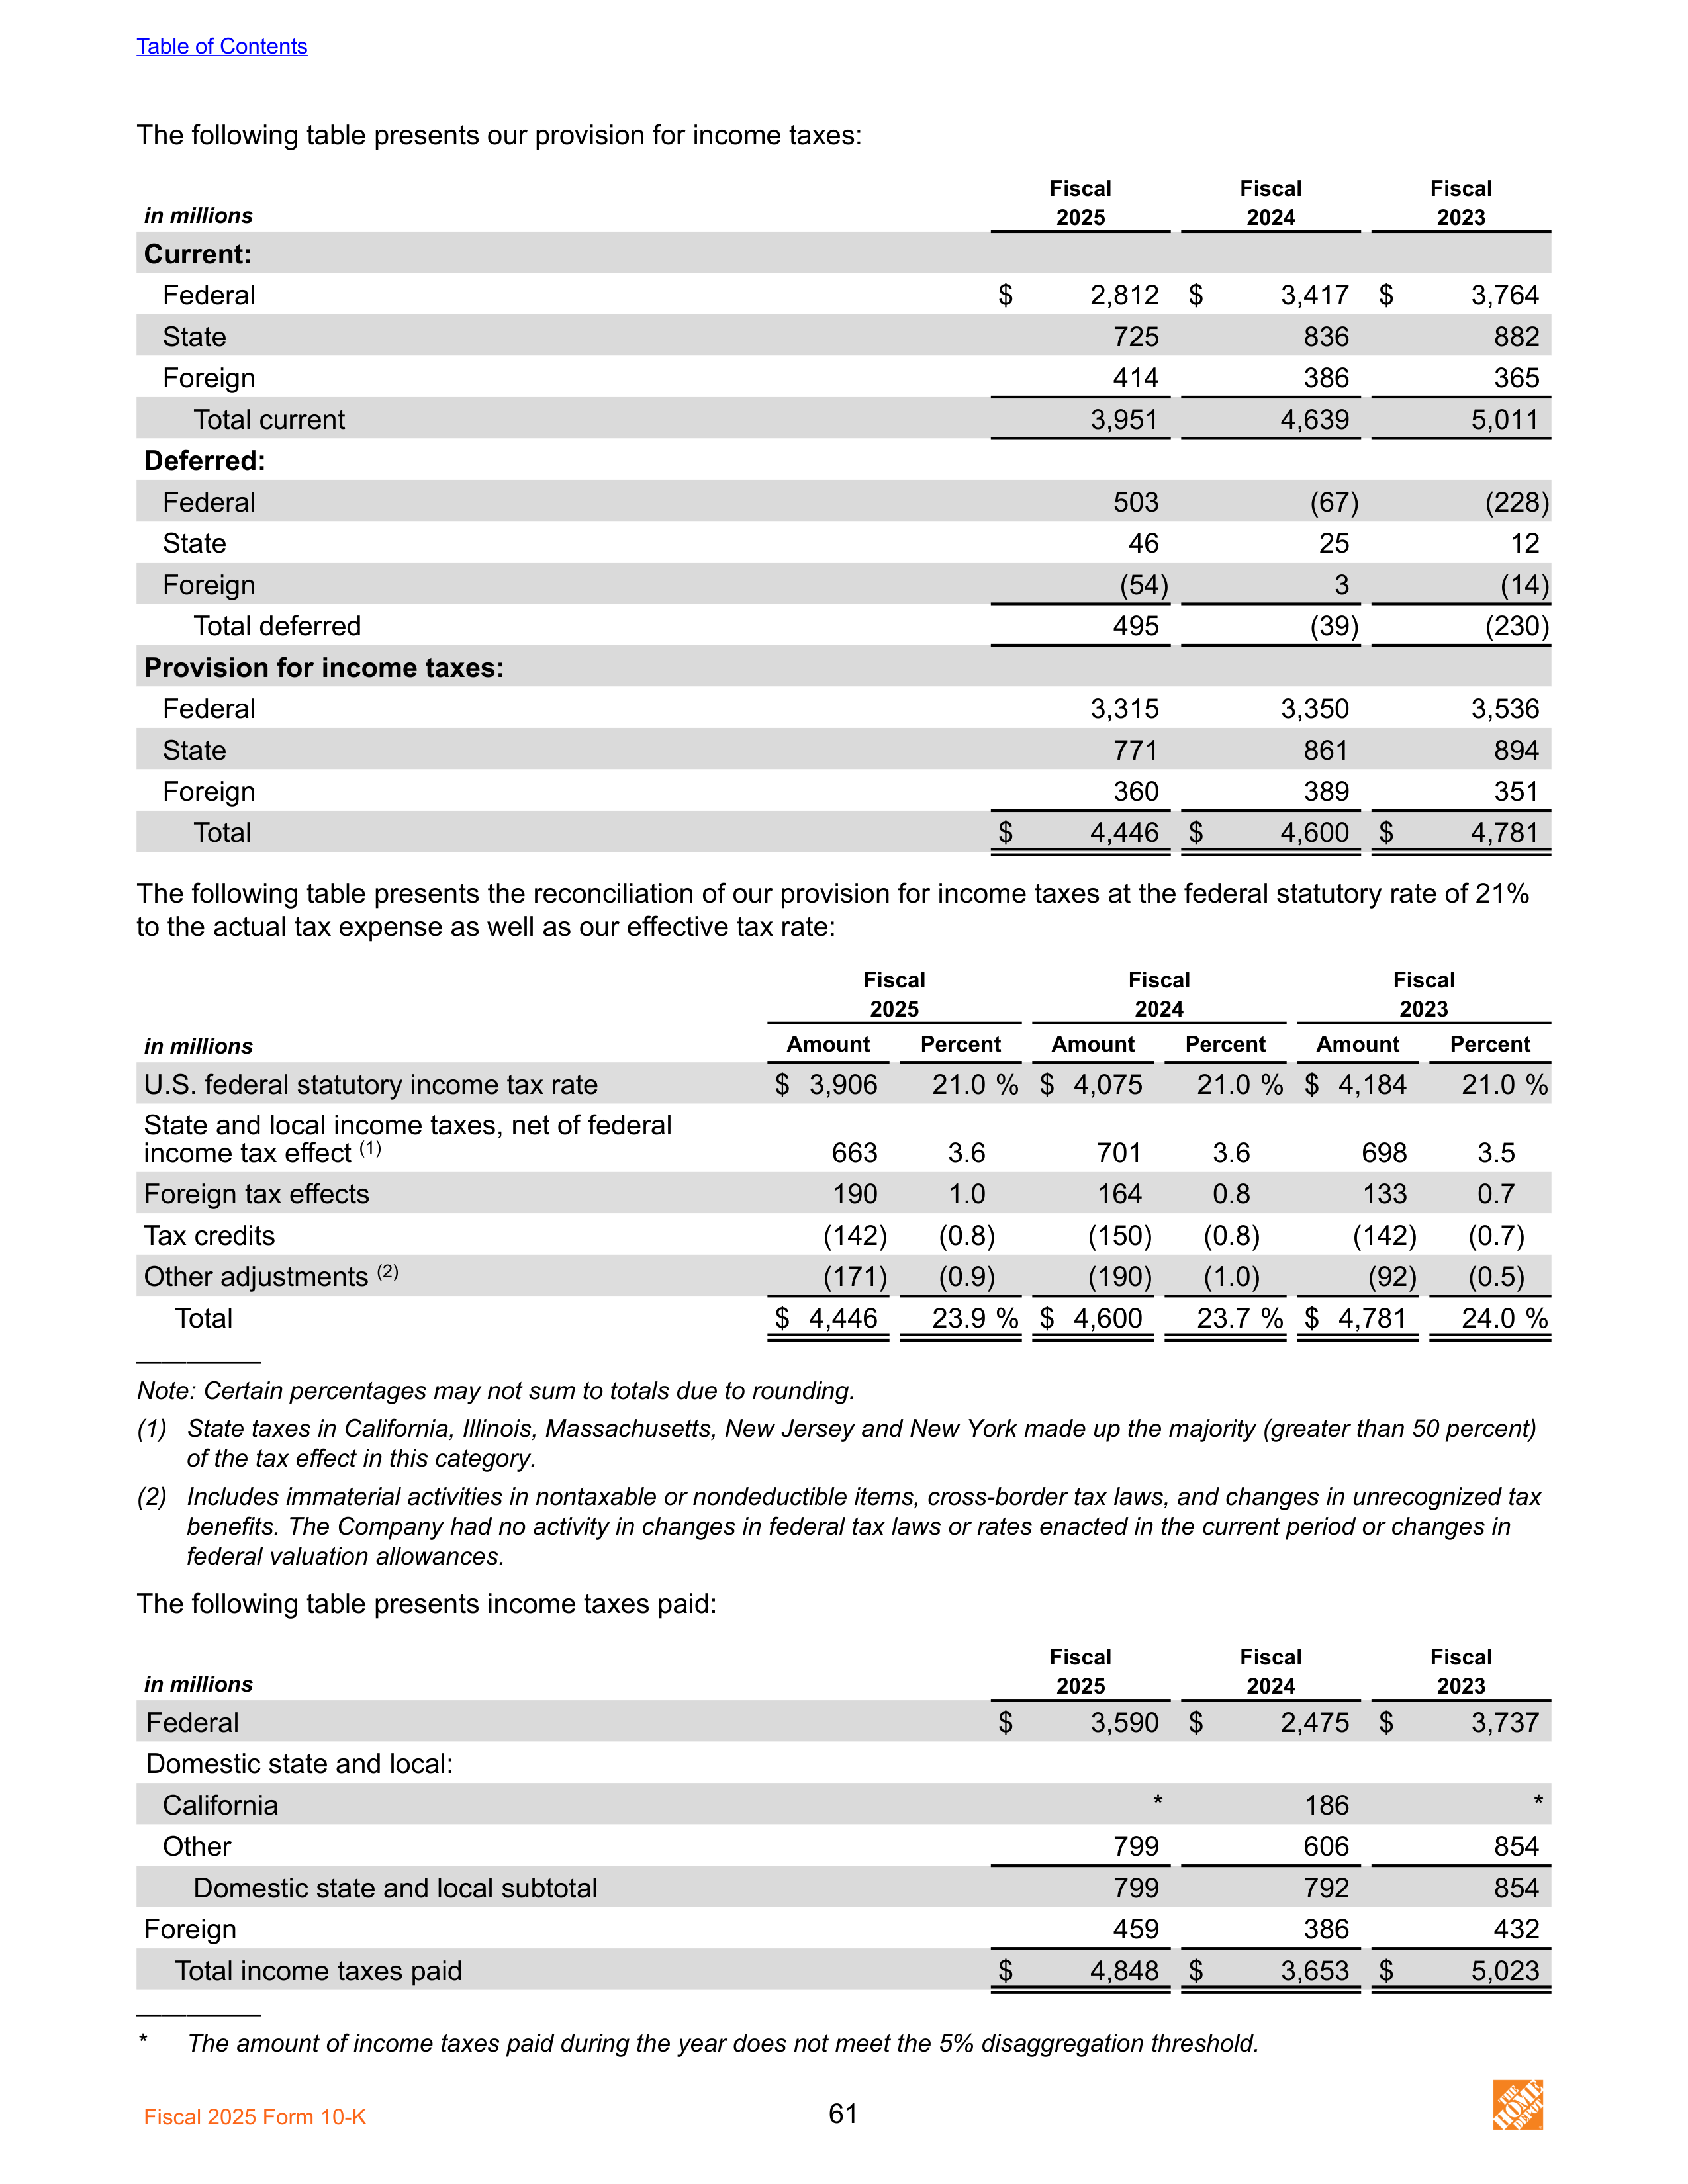
The following table presents our provision for income taxes:
in millions
Fiscal
Fiscal
Fiscal
2025
2024
2023
Current:
Federal
$
2,812 $
3,417 $
3,764
State
725
836
882
Foreign
414
386
365
Total current
3,951
4,639
5,011
Deferred:
Federal
503
(67)
(228)
State
46
25
12
Foreign
(54)
3
(14)
Total deferred
495
(39)
(230)
Provision for income taxes:
Federal
3,315
3,350
3,536
State
771
861
894
Foreign
360
389
351
Total
$
4,446 $
4,600 $
4,781
The following table presents the reconciliation of our provision for income taxes at the federal statutory rate of 21%
to the actual tax expense as well as our effective tax rate:
Fiscal
Fiscal
Fiscal
in millions
2025
2024
2023
Amount
Percent
Amount
Percent
Amount
Percent
U.S. federal statutory income tax rate
$ 3,906
21.0 %
$ 4,075
21.0 %
$ 4,184
21.0 %
State and local income taxes, net of federal
income tax effect
(1)
663
3.6
701
3.6
698
3.5
Foreign tax effects
190
1.0
164
0.8
133
0.7
Tax credits
(142)
(0.8)
(150)
(0.8)
(142)
(0.7)
Other adjustments
(2)
(171)
(0.9)
(190)
(1.0)
(92)
(0.5)
Total
$ 4,446
23.9 %
$ 4,600
23.7 %
$ 4,781
24.0 %
—————
Note: Certain percentages may not sum to totals due to rounding.
(1) State taxes in California, Illinois, Massachusetts, New Jersey and New York made up the majority (greater than 50 percent)
of the tax effect in this category.
(2) Includes immaterial activities in nontaxable or nondeductible items, cross-border tax laws, and changes in unrecognized tax
benefits. The Company had no activity in changes in federal tax laws or rates enacted in the current period or changes in
federal valuation allowances.
The following table presents income taxes paid:
in millions
Fiscal
Fiscal
Fiscal
2025
2024
2023
Federal
$
3,590 $
2,475 $
3,737
Domestic state and local:
California
*
186
*
Other
799
606
854
Domestic state and local subtotal
799
792
854
Foreign
459
386
432
Total income taxes paid
$
4,848 $
3,653 $
5,023
—————
*
The amount of income taxes paid during the year does not meet the 5% disaggregation threshold.
Table of Contents
Fiscal 2025 Form 10-K
61
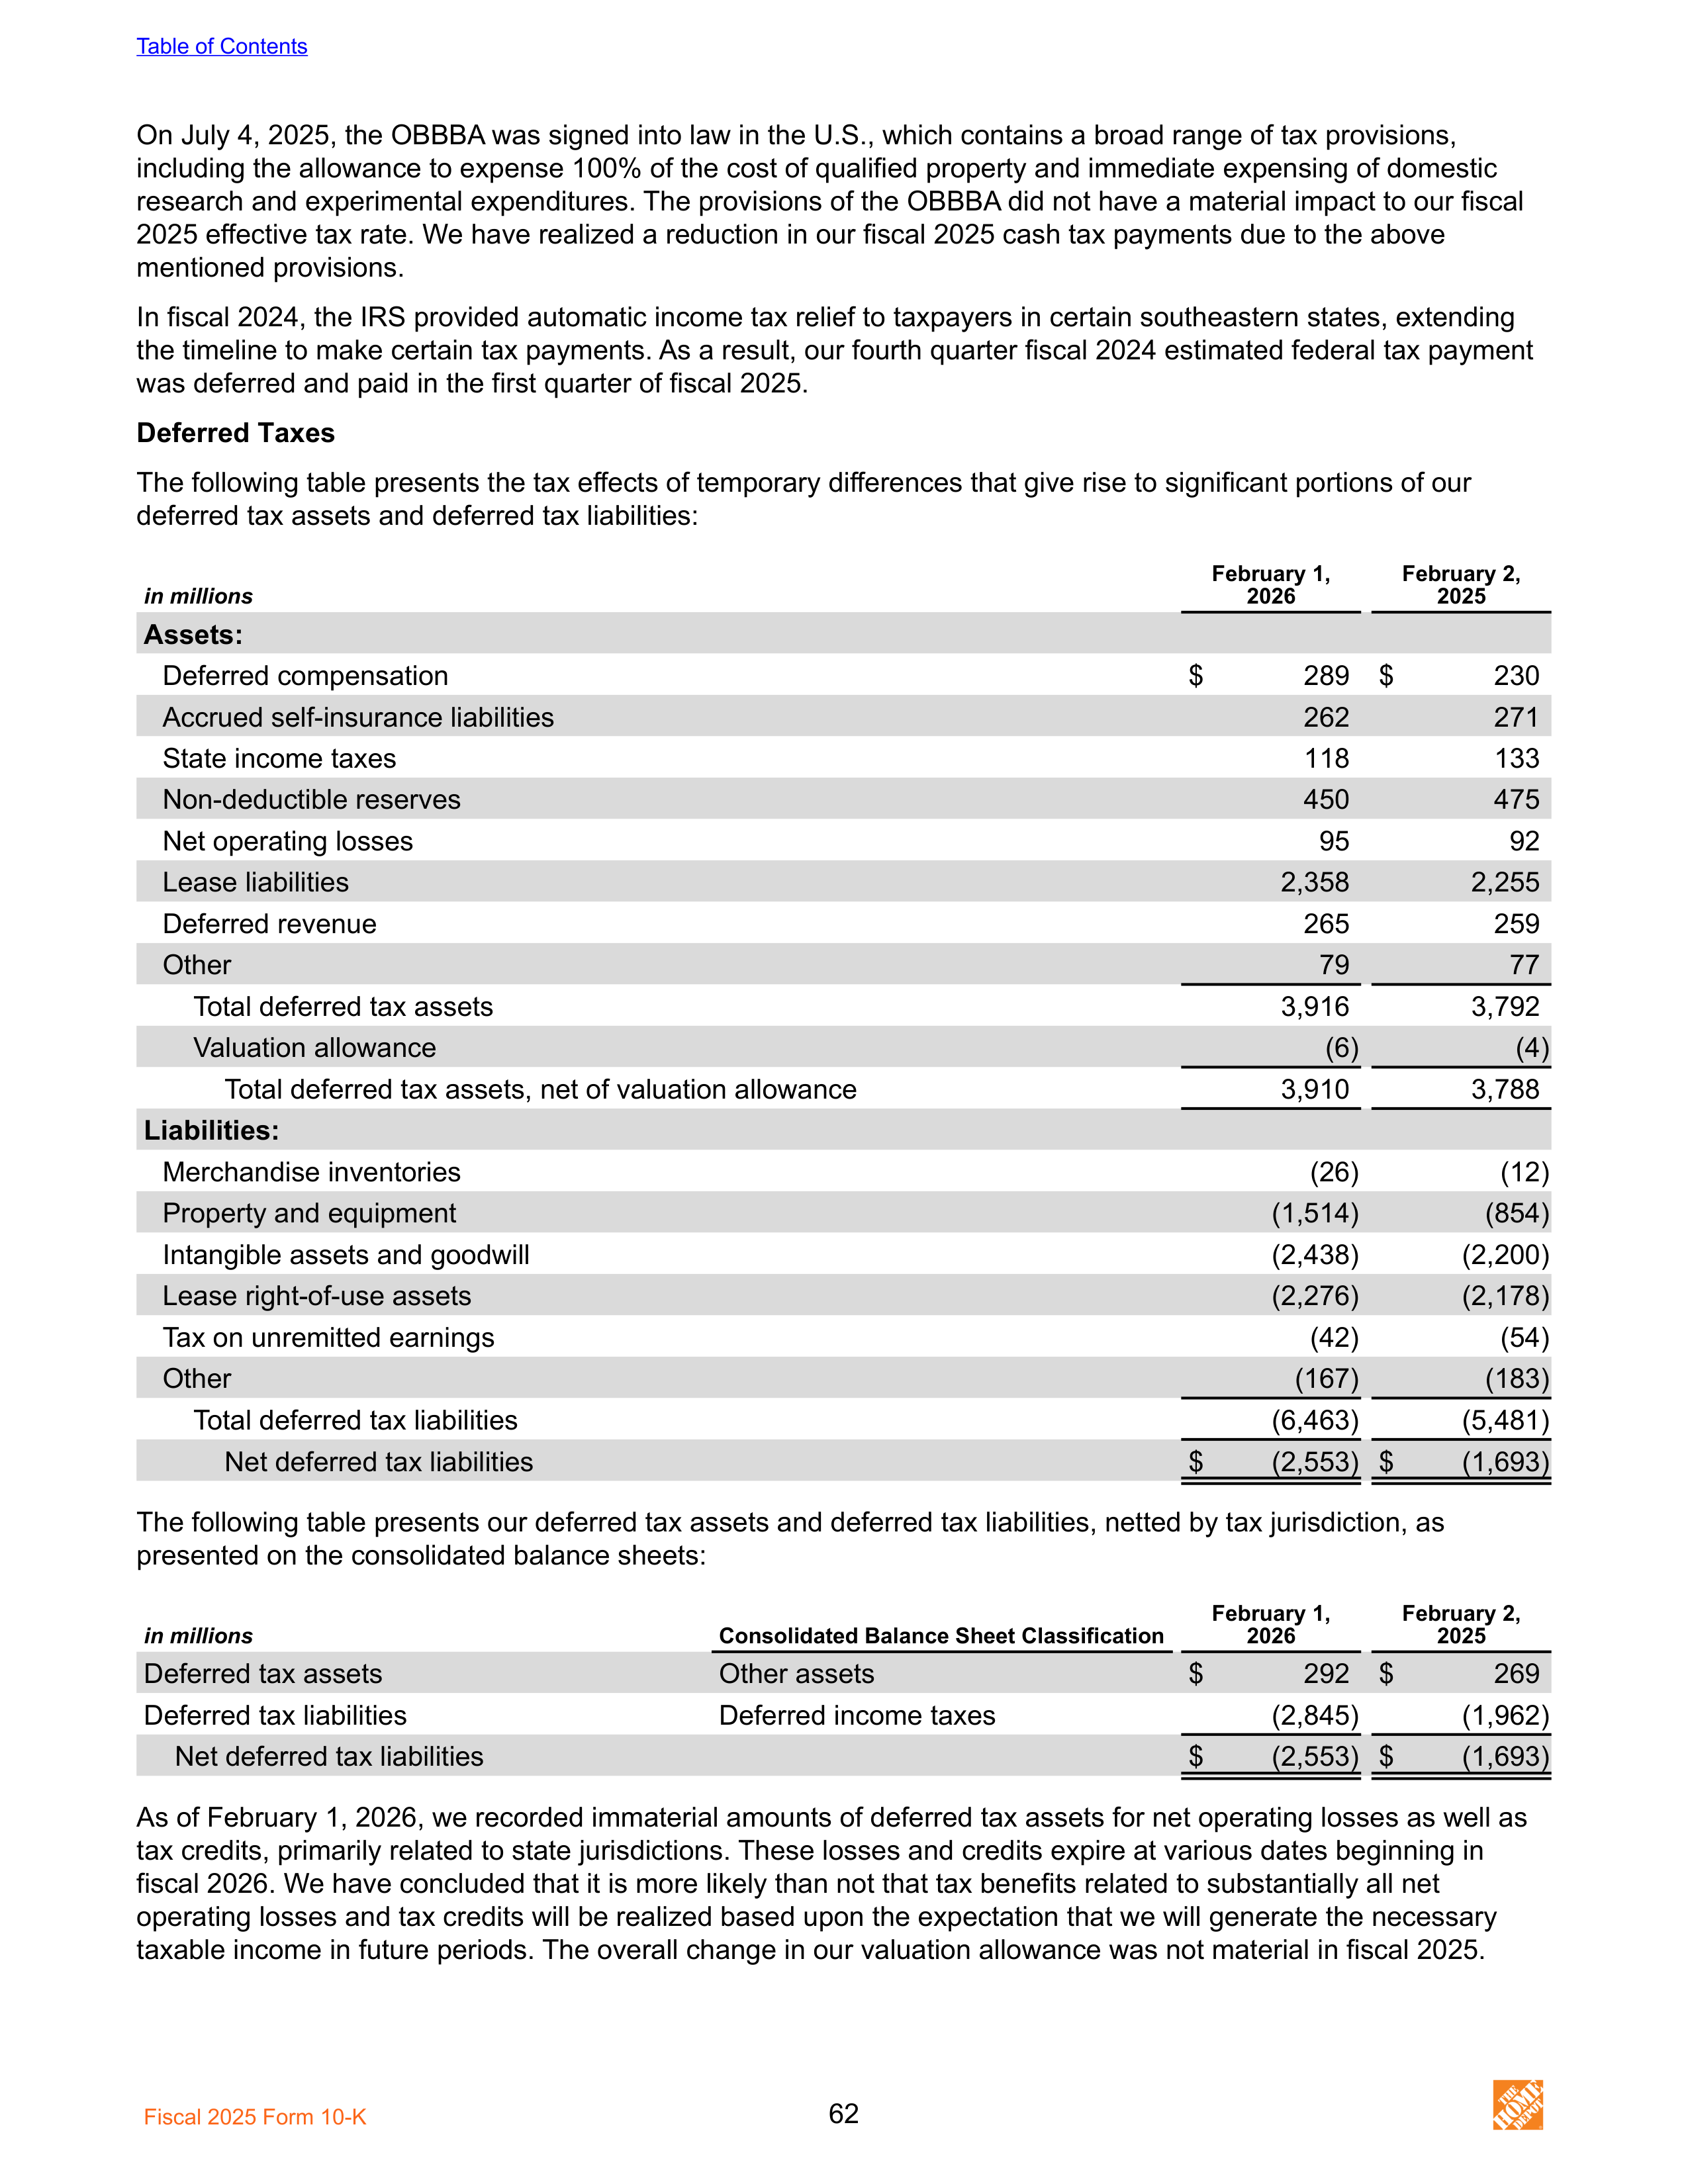
On July 4, 2025, the OBBBA was signed into law in the U.S., which contains a broad range of tax provisions,
including the allowance to expense 100% of the cost of qualified property and immediate expensing of domestic
research and experimental expenditures. The provisions of the OBBBA did not have a material impact to our fiscal
2025 effective tax rate. We have realized a reduction in our fiscal 2025 cash tax payments due to the above
mentioned provisions.
In fiscal 2024, the IRS provided automatic income tax relief to taxpayers in certain southeastern states, extending
the timeline to make certain tax payments. As a result, our fourth quarter fiscal 2024 estimated federal tax payment
was deferred and paid in the first quarter of fiscal 2025.
Deferred Taxes
The following table presents the tax effects of temporary differences that give rise to significant portions of our
deferred tax assets and deferred tax liabilities:
in millions
February 1,
2026
February 2,
2025
Assets:
Deferred compensation
$
289 $
230
Accrued self-insurance liabilities
262
271
State income taxes
118
133
Non-deductible reserves
450
475
Net operating losses
95
92
Lease liabilities
2,358
2,255
Deferred revenue
265
259
Other
79
77
Total deferred tax assets
3,916
3,792
Valuation allowance
(6)
(4)
Total deferred tax assets, net of valuation allowance
3,910
3,788
Liabilities:
Merchandise inventories
(26)
(12)
Property and equipment
(1,514)
(854)
Intangible assets and goodwill
(2,438)
(2,200)
Lease right-of-use assets
(2,276)
(2,178)
Tax on unremitted earnings
(42)
(54)
Other
(167)
(183)
Total deferred tax liabilities
(6,463)
(5,481)
Net deferred tax liabilities
$
(2,553) $
(1,693)
The following table presents our deferred tax assets and deferred tax liabilities, netted by tax jurisdiction, as
presented on the consolidated balance sheets:
in millions
Consolidated Balance Sheet Classification
February 1,
2026
February 2,
2025
Deferred tax assets
Other assets
$
292 $
269
Deferred tax liabilities
Deferred income taxes
(2,845)
(1,962)
Net deferred tax liabilities
$
(2,553) $
(1,693)
As of February 1, 2026, we recorded immaterial amounts of deferred tax assets for net operating losses as well as
tax credits, primarily related to state jurisdictions. These losses and credits expire at various dates beginning in
fiscal 2026. We have concluded that it is more likely than not that tax benefits related to substantially all net
operating losses and tax credits will be realized based upon the expectation that we will generate the necessary
taxable income in future periods. The overall change in our valuation allowance was not material in fiscal 2025.
Table of Contents
Fiscal 2025 Form 10-K
62
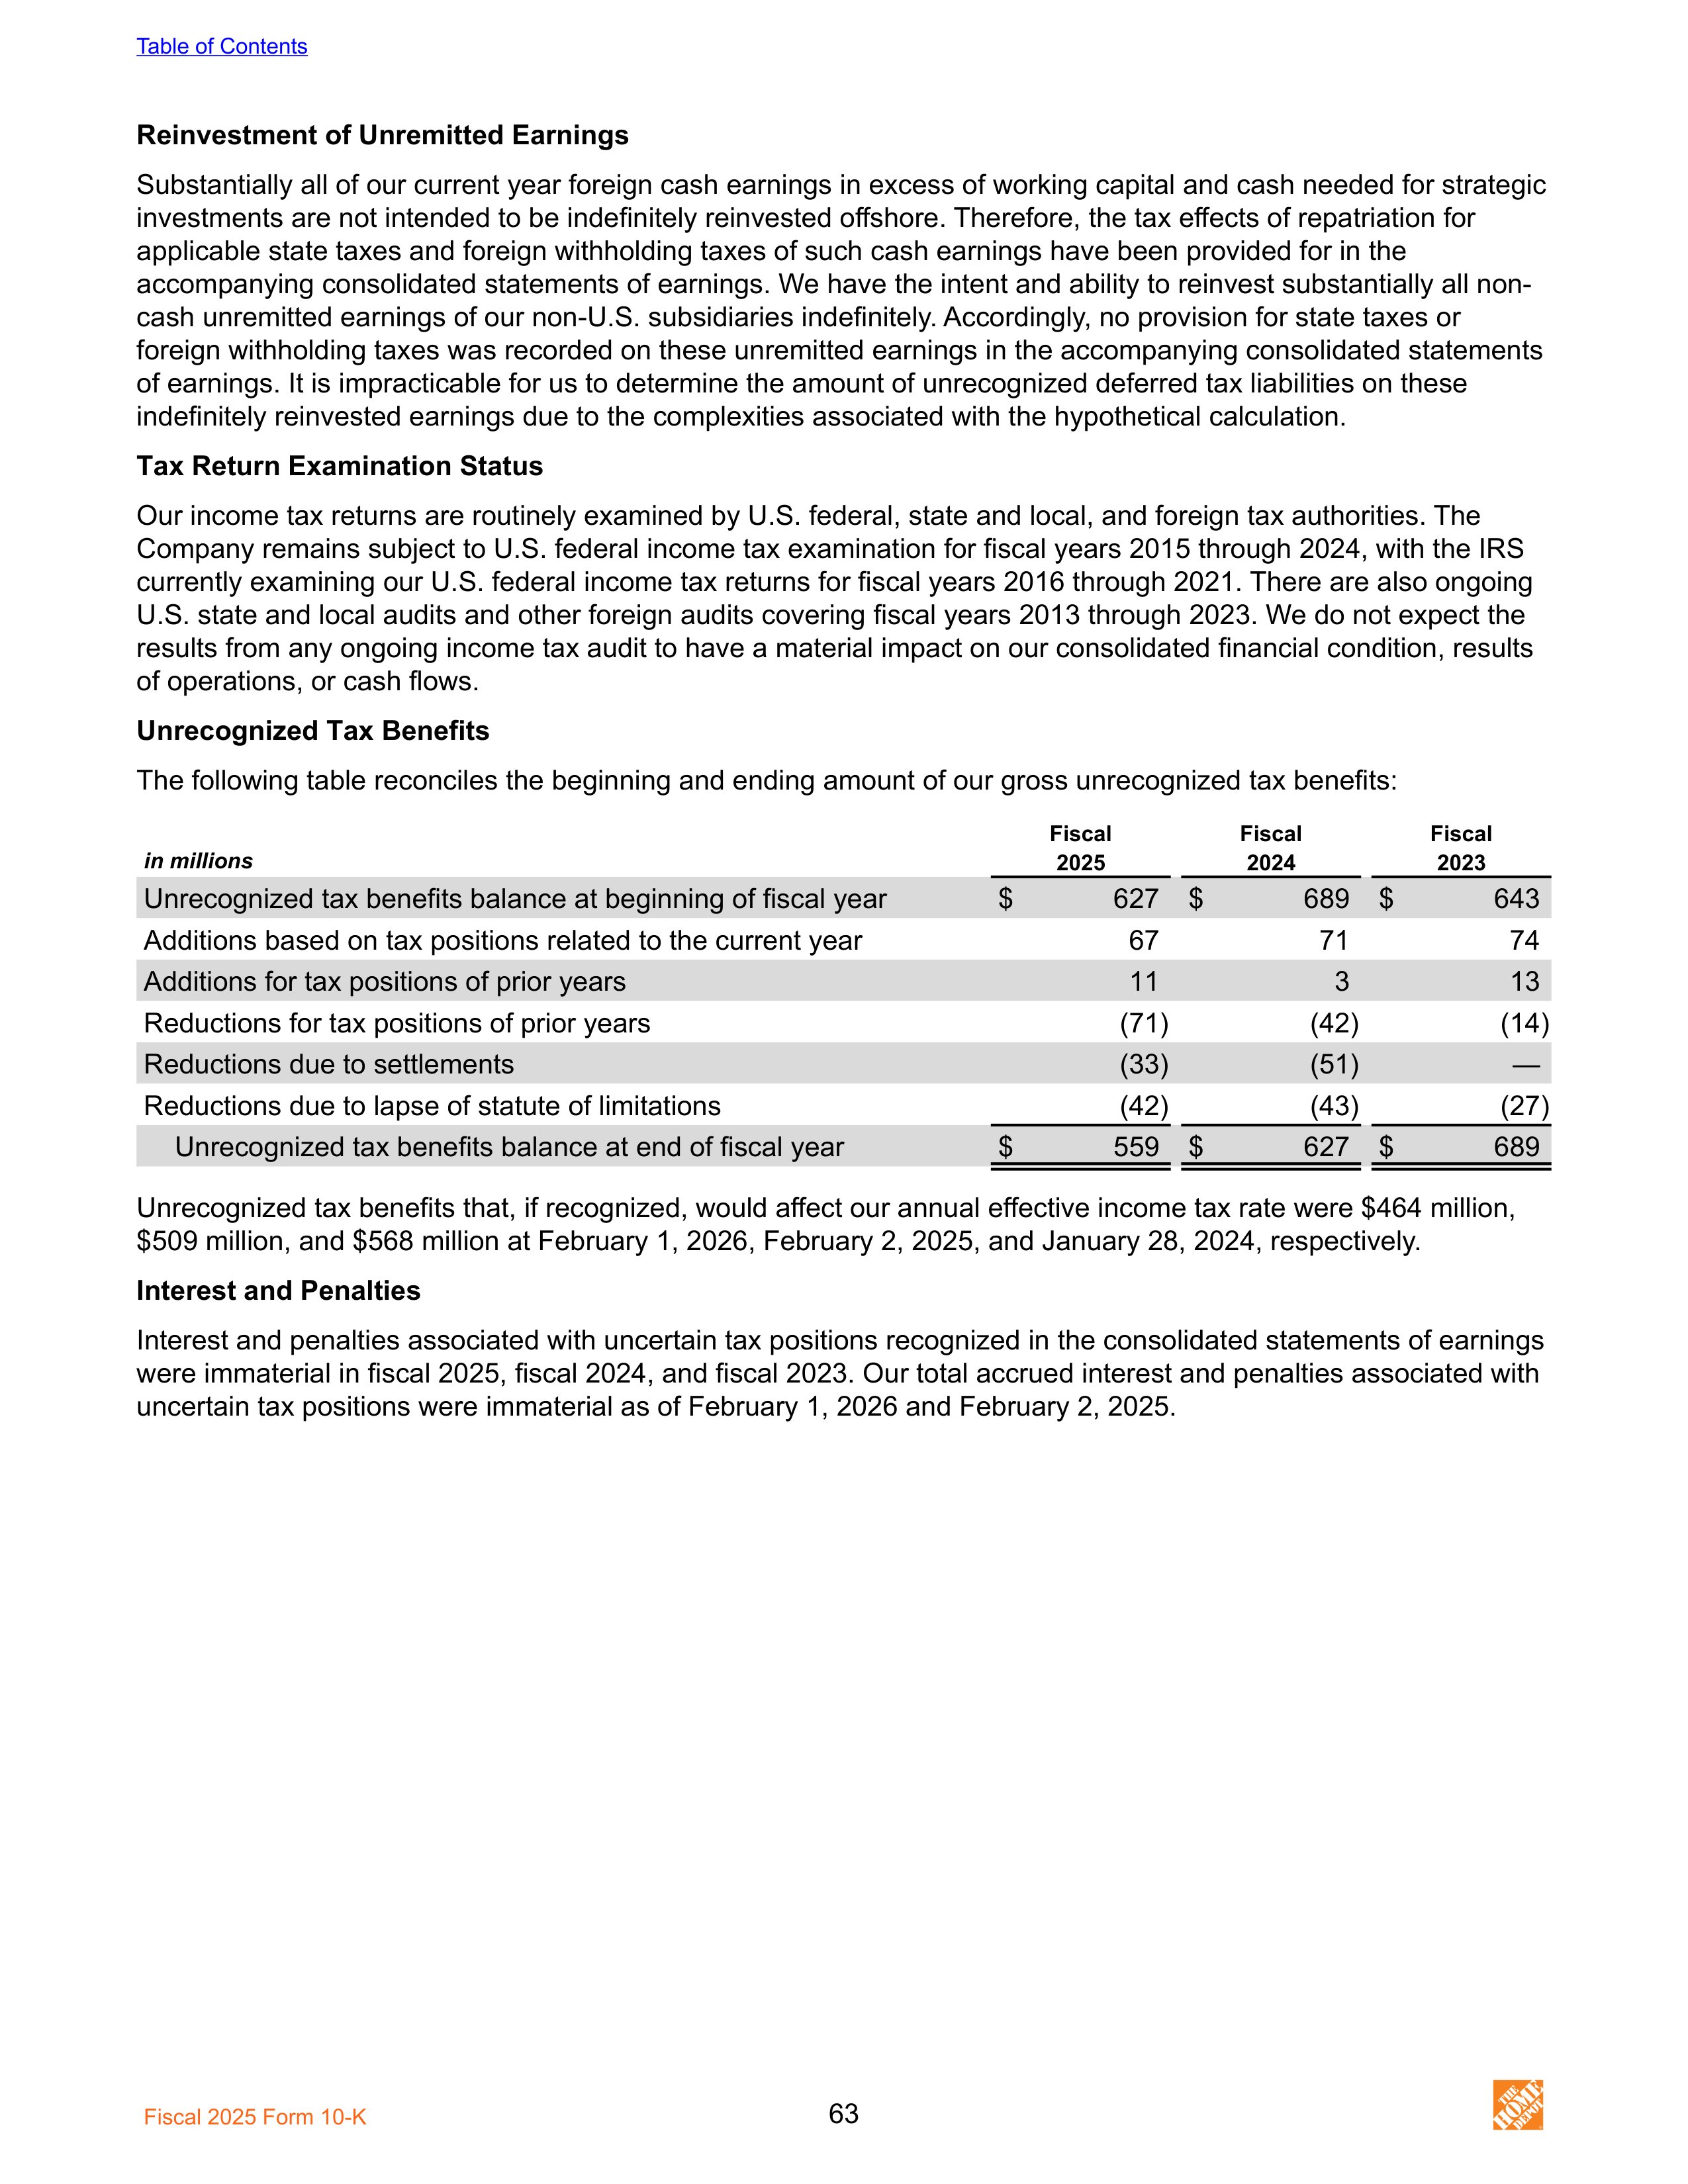
Reinvestment of Unremitted Earnings
Substantially all of our current year foreign cash earnings in excess of working capital and cash needed for strategic
investments are not intended to be indefinitely reinvested offshore. Therefore, the tax effects of repatriation for
applicable state taxes and foreign withholding taxes of such cash earnings have been provided for in the
accompanying consolidated statements of earnings. We have the intent and ability to reinvest substantially all non-
cash unremitted earnings of our non-U.S. subsidiaries indefinitely. Accordingly, no provision for state taxes or
foreign withholding taxes was recorded on these unremitted earnings in the accompanying consolidated statements
of earnings. It is impracticable for us to determine the amount of unrecognized deferred tax liabilities on these
indefinitely reinvested earnings due to the complexities associated with the hypothetical calculation.
Tax Return Examination Status
Our income tax returns are routinely examined by U.S. federal, state and local, and foreign tax authorities. The
Company remains subject to U.S. federal income tax examination for fiscal years 2015 through 2024, with the IRS
currently examining our U.S. federal income tax returns for fiscal years 2016 through 2021. There are also ongoing
U.S. state and local audits and other foreign audits covering fiscal years 2013 through 2023. We do not expect the
results from any ongoing income tax audit to have a material impact on our consolidated financial condition, results
of operations, or cash flows.
Unrecognized Tax Benefits
The following table reconciles the beginning and ending amount of our gross unrecognized tax benefits:
in millions
Fiscal
Fiscal
Fiscal
2025
2024
2023
Unrecognized tax benefits balance at beginning of fiscal year
$
627 $
689 $
643
Additions based on tax positions related to the current year
67
71
74
Additions for tax positions of prior years
11
3
13
Reductions for tax positions of prior years
(71)
(42)
(14)
Reductions due to settlements
(33)
(51)
—
Reductions due to lapse of statute of limitations
(42)
(43)
(27)
Unrecognized tax benefits balance at end of fiscal year
$
559 $
627 $
689
Unrecognized tax benefits that, if recognized, would affect our annual effective income tax rate were $464 million,
$509 million, and $568 million at February 1, 2026, February 2, 2025, and January 28, 2024, respectively.
Interest and Penalties
Interest and penalties associated with uncertain tax positions recognized in the consolidated statements of earnings
were immaterial in fiscal 2025, fiscal 2024, and fiscal 2023. Our total accrued interest and penalties associated with
uncertain tax positions were immaterial as of February 1, 2026 and February 2, 2025.
Table of Contents
Fiscal 2025 Form 10-K
63
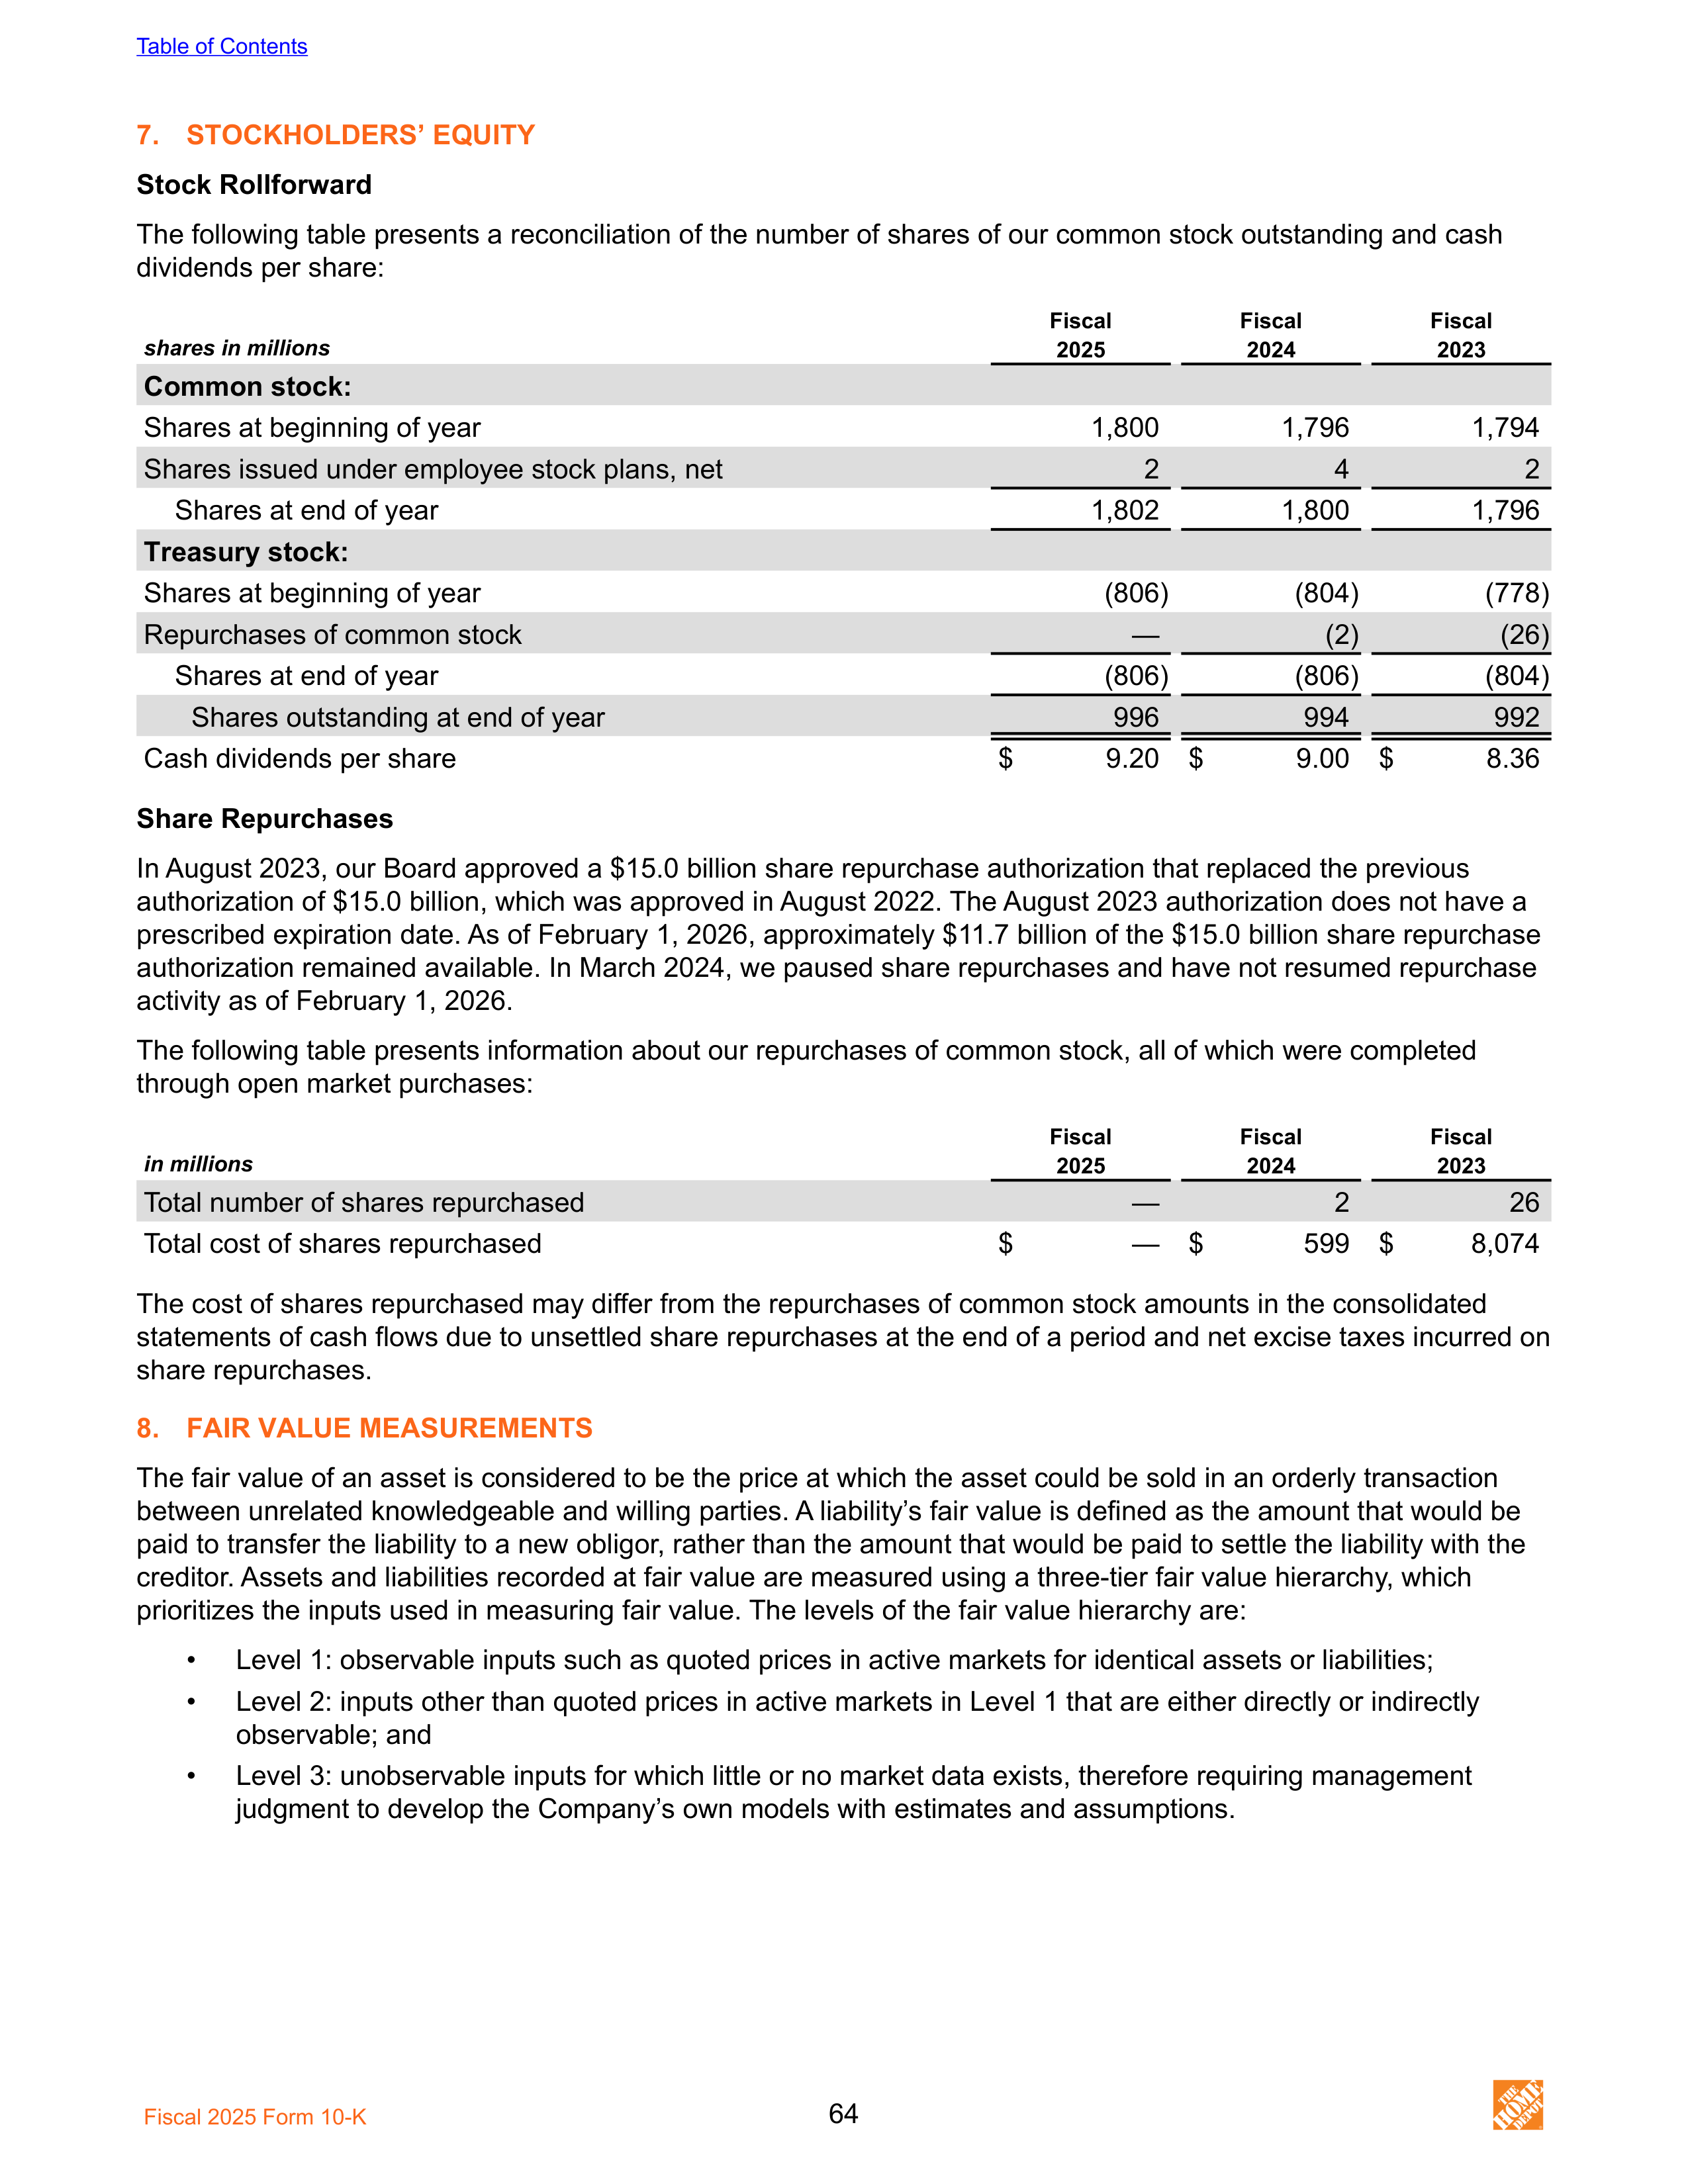
7.
STOCKHOLDERS’ EQUITY
Stock Rollforward
The following table presents a reconciliation of the number of shares of our common stock outstanding and cash
dividends per share:
shares in millions
Fiscal
Fiscal
Fiscal
2025
2024
2023
Common stock:
Shares at beginning of year
1,800
1,796
1,794
Shares issued under employee stock plans, net
2
4
2
Shares at end of year
1,802
1,800
1,796
Treasury stock:
Shares at beginning of year
(806)
(804)
(778)
Repurchases of common stock
—
(2)
(26)
Shares at end of year
(806)
(806)
(804)
Shares outstanding at end of year
996
994
992
Cash dividends per share
$
9.20 $
9.00 $
8.36
Share Repurchases
In August 2023, our Board approved a $15.0 billion share repurchase authorization that replaced the previous
authorization of $15.0 billion, which was approved in August 2022. The August 2023 authorization does not have a
prescribed expiration date. As of February 1, 2026, approximately $11.7 billion of the $15.0 billion share repurchase
authorization remained available. In March 2024, we paused share repurchases and have not resumed repurchase
activity as of February 1, 2026.
The following table presents information about our repurchases of common stock, all of which were completed
through open market purchases:
Fiscal
Fiscal
Fiscal
in millions
2025
2024
2023
Total number of shares repurchased
—
2
26
Total cost of shares repurchased
$
— $
599 $
8,074
The cost of shares repurchased may differ from the repurchases of common stock amounts in the consolidated
statements of cash flows due to unsettled share repurchases at the end of a period and net excise taxes incurred on
share repurchases.
8.
FAIR VALUE MEASUREMENTS
The fair value of an asset is considered to be the price at which the asset could be sold in an orderly transaction
between unrelated knowledgeable and willing parties. A liability’s fair value is defined as the amount that would be
paid to transfer the liability to a new obligor, rather than the amount that would be paid to settle the liability with the
creditor. Assets and liabilities recorded at fair value are measured using a three-tier fair value hierarchy, which
prioritizes the inputs used in measuring fair value. The levels of the fair value hierarchy are:
•
Level 1: observable inputs such as quoted prices in active markets for identical assets or liabilities;
•
Level 2: inputs other than quoted prices in active markets in Level 1 that are either directly or indirectly
observable; and
•
Level 3: unobservable inputs for which little or no market data exists, therefore requiring management
judgment to develop the Company’s own models with estimates and assumptions.
Table of Contents
Fiscal 2025 Form 10-K
64
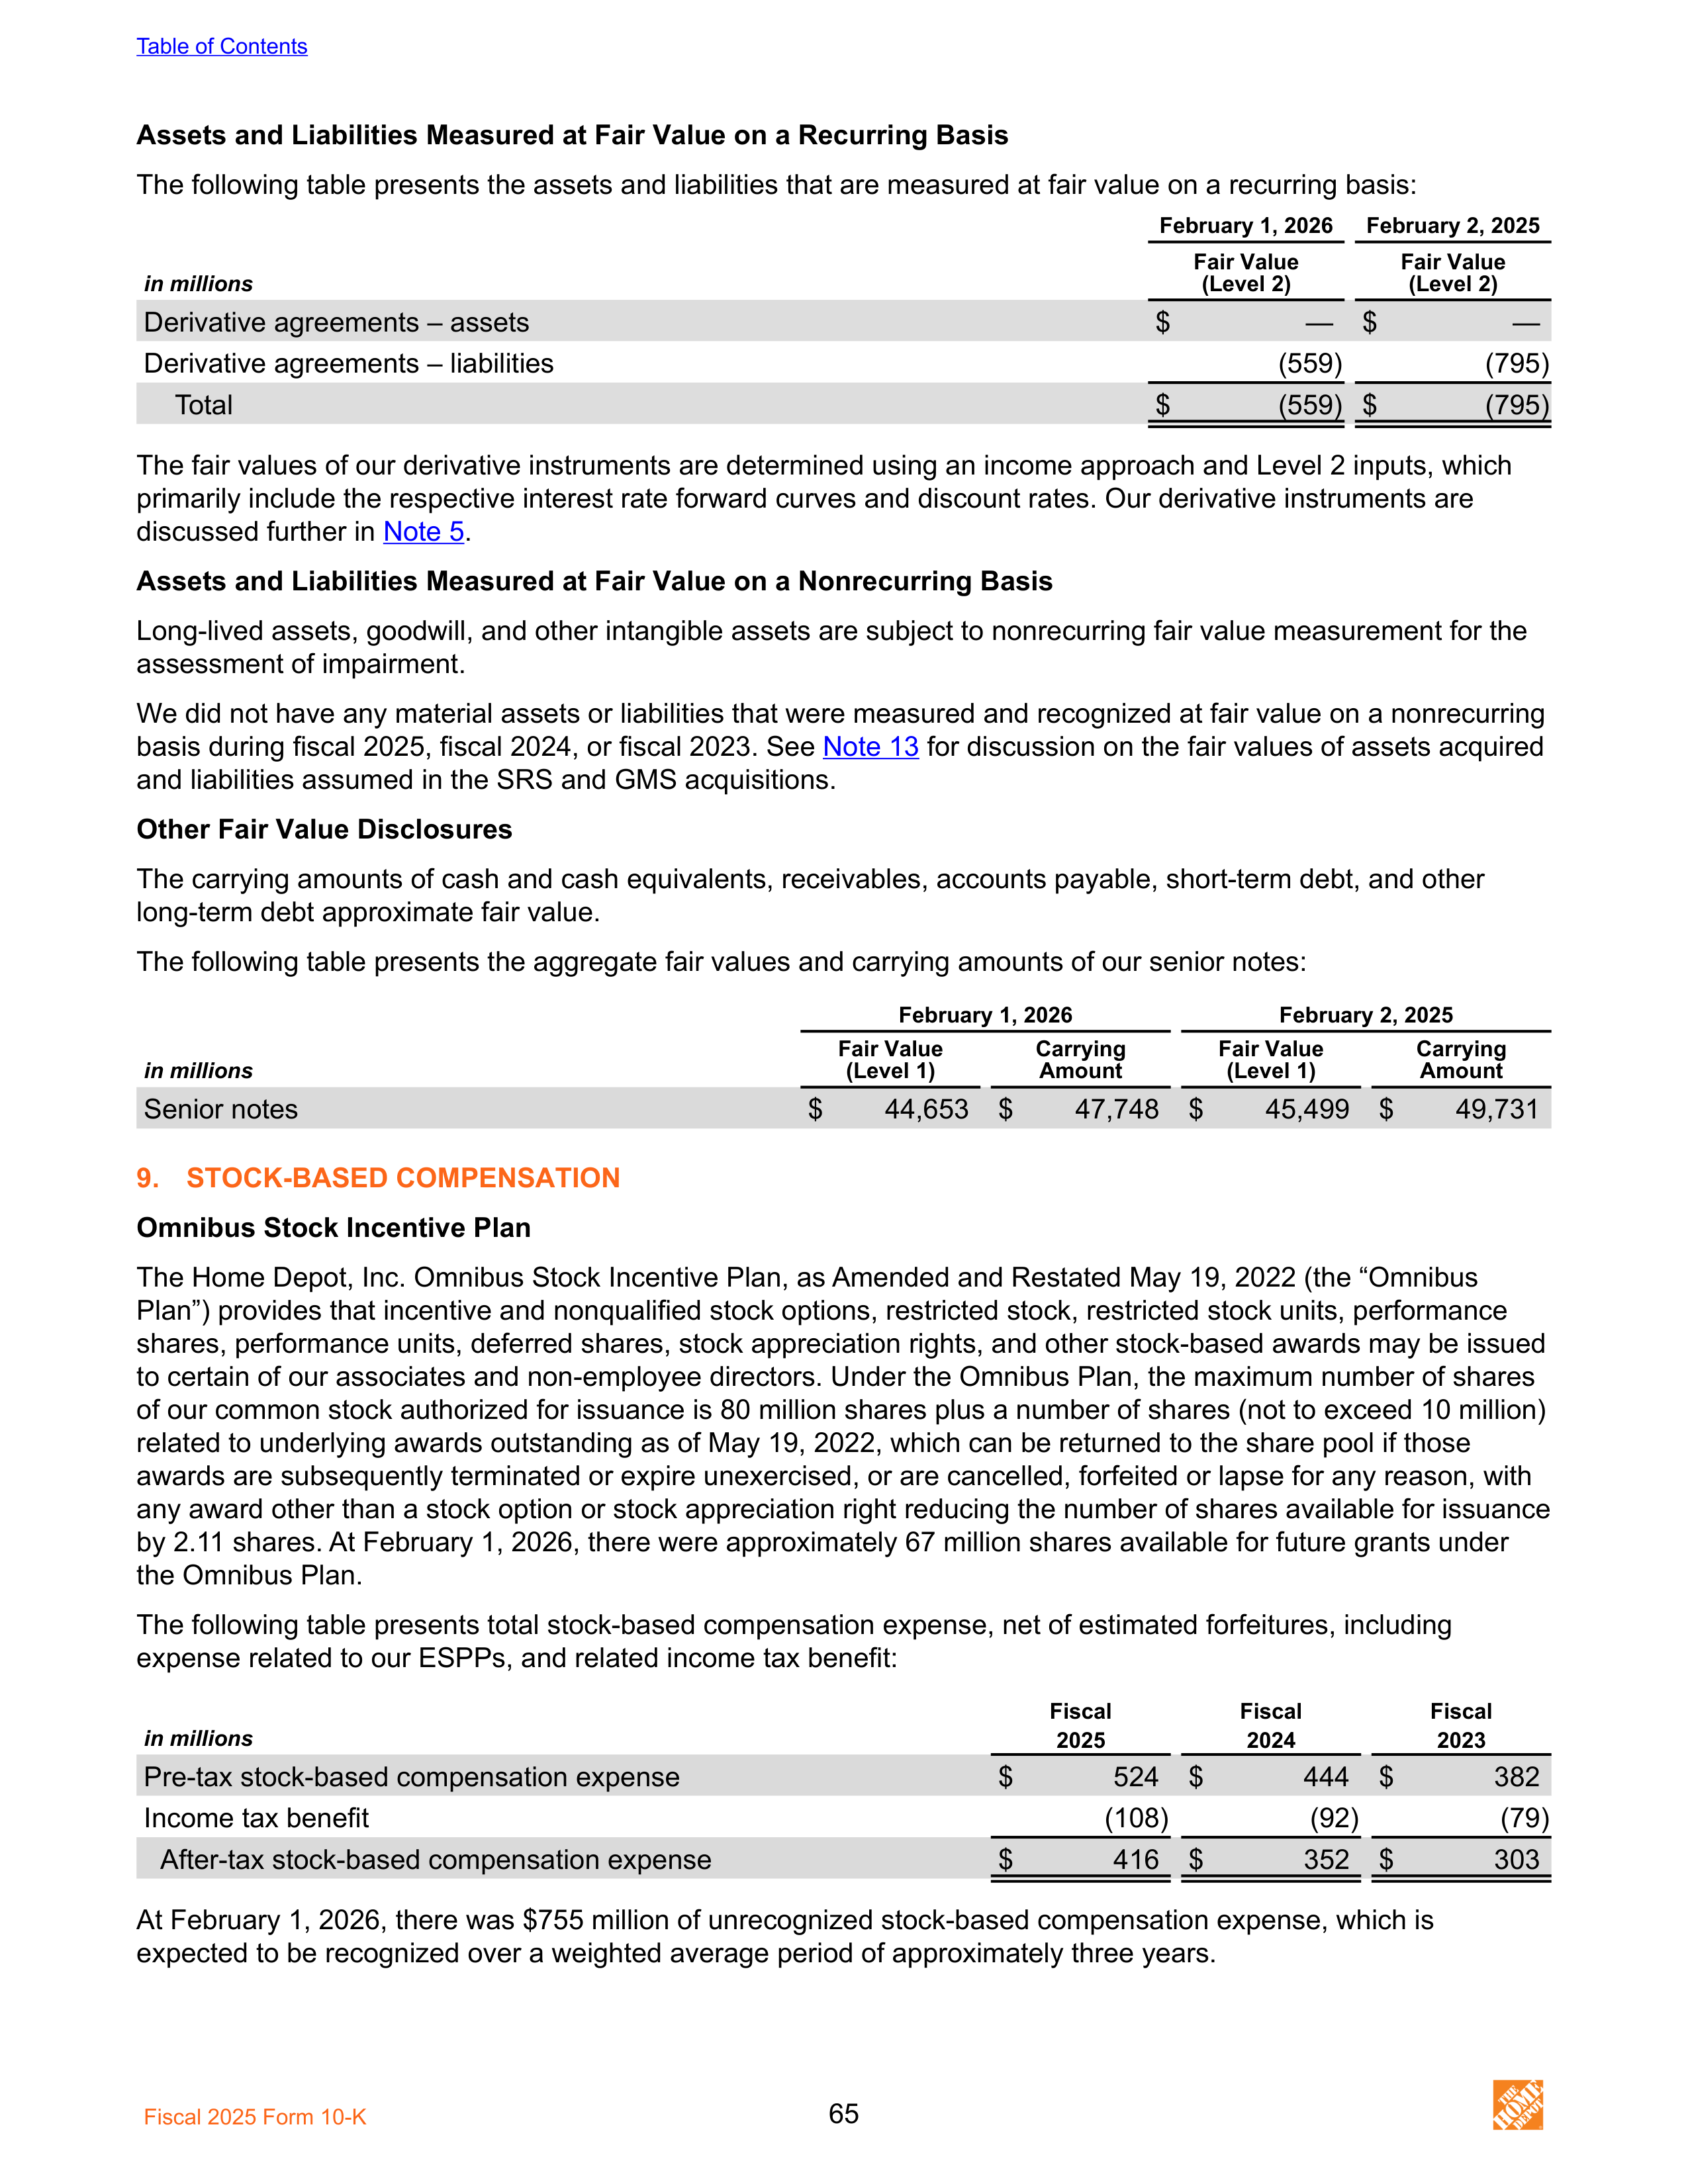
Assets and Liabilities Measured at Fair Value on a Recurring Basis
The following table presents the assets and liabilities that are measured at fair value on a recurring basis:
February 1, 2026
February 2, 2025
in millions
Fair Value
(Level 2)
Fair Value
(Level 2)
Derivative agreements – assets
$
— $
—
Derivative agreements – liabilities
(559)
(795)
Total
$
(559) $
(795)
The fair values of our derivative instruments are determined using an income approach and Level 2 inputs, which
primarily include the respective interest rate forward curves and discount rates. Our derivative instruments are
discussed further in
Note 5
.
Assets and Liabilities Measured at Fair Value on a Nonrecurring Basis
Long-lived assets, goodwill, and other intangible assets are subject to nonrecurring fair value measurement for the
assessment of impairment.
We did not have any material assets or liabilities that were measured and recognized at fair value on a nonrecurring
basis during fiscal 2025, fiscal 2024, or fiscal 2023. See
Note 13
for discussion on the fair values of assets acquired
and liabilities assumed in the SRS and GMS acquisitions.
Other Fair Value Disclosures
The carrying amounts of cash and cash equivalents, receivables, accounts payable, short-term debt, and other
long-term debt approximate fair value.
The following table presents the aggregate fair values and carrying amounts of our senior notes:
February 1, 2026
February 2, 2025
in millions
Fair Value
(Level 1)
Carrying
Amount
Fair Value
(Level 1)
Carrying
Amount
Senior notes
$
44,653 $
47,748 $
45,499 $
49,731
9.
STOCK-BASED COMPENSATION
Omnibus Stock Incentive Plan
The Home Depot, Inc. Omnibus Stock Incentive Plan, as Amended and Restated May 19, 2022 (the “Omnibus
Plan”) provides that incentive and nonqualified stock options, restricted stock, restricted stock units, performance
shares, performance units, deferred shares, stock appreciation rights, and other stock-based awards may be issued
to certain of our associates and non-employee directors. Under the Omnibus Plan, the maximum number of shares
of our common stock authorized for issuance is 80 million shares plus a number of shares (not to exceed 10 million)
related to underlying awards outstanding as of May 19, 2022, which can be returned to the share pool if those
awards are subsequently terminated or expire unexercised, or are cancelled, forfeited or lapse for any reason, with
any award other than a stock option or stock appreciation right reducing the number of shares available for issuance
by 2.11 shares. At February 1, 2026, there were approximately 67 million shares available for future grants under
the Omnibus Plan.
The following table presents total stock-based compensation expense, net of estimated forfeitures, including
expense related to our ESPPs, and related income tax benefit:
in millions
Fiscal
Fiscal
Fiscal
2025
2024
2023
Pre-tax stock-based compensation expense
$
524 $
444 $
382
Income tax benefit
(108)
(92)
(79)
After-tax stock-based compensation expense
$
416 $
352 $
303
At February 1, 2026, there was $755 million of unrecognized stock-based compensation expense, which is
expected to be recognized over a weighted average period of approximately three years.
Table of Contents
Fiscal 2025 Form 10-K
65
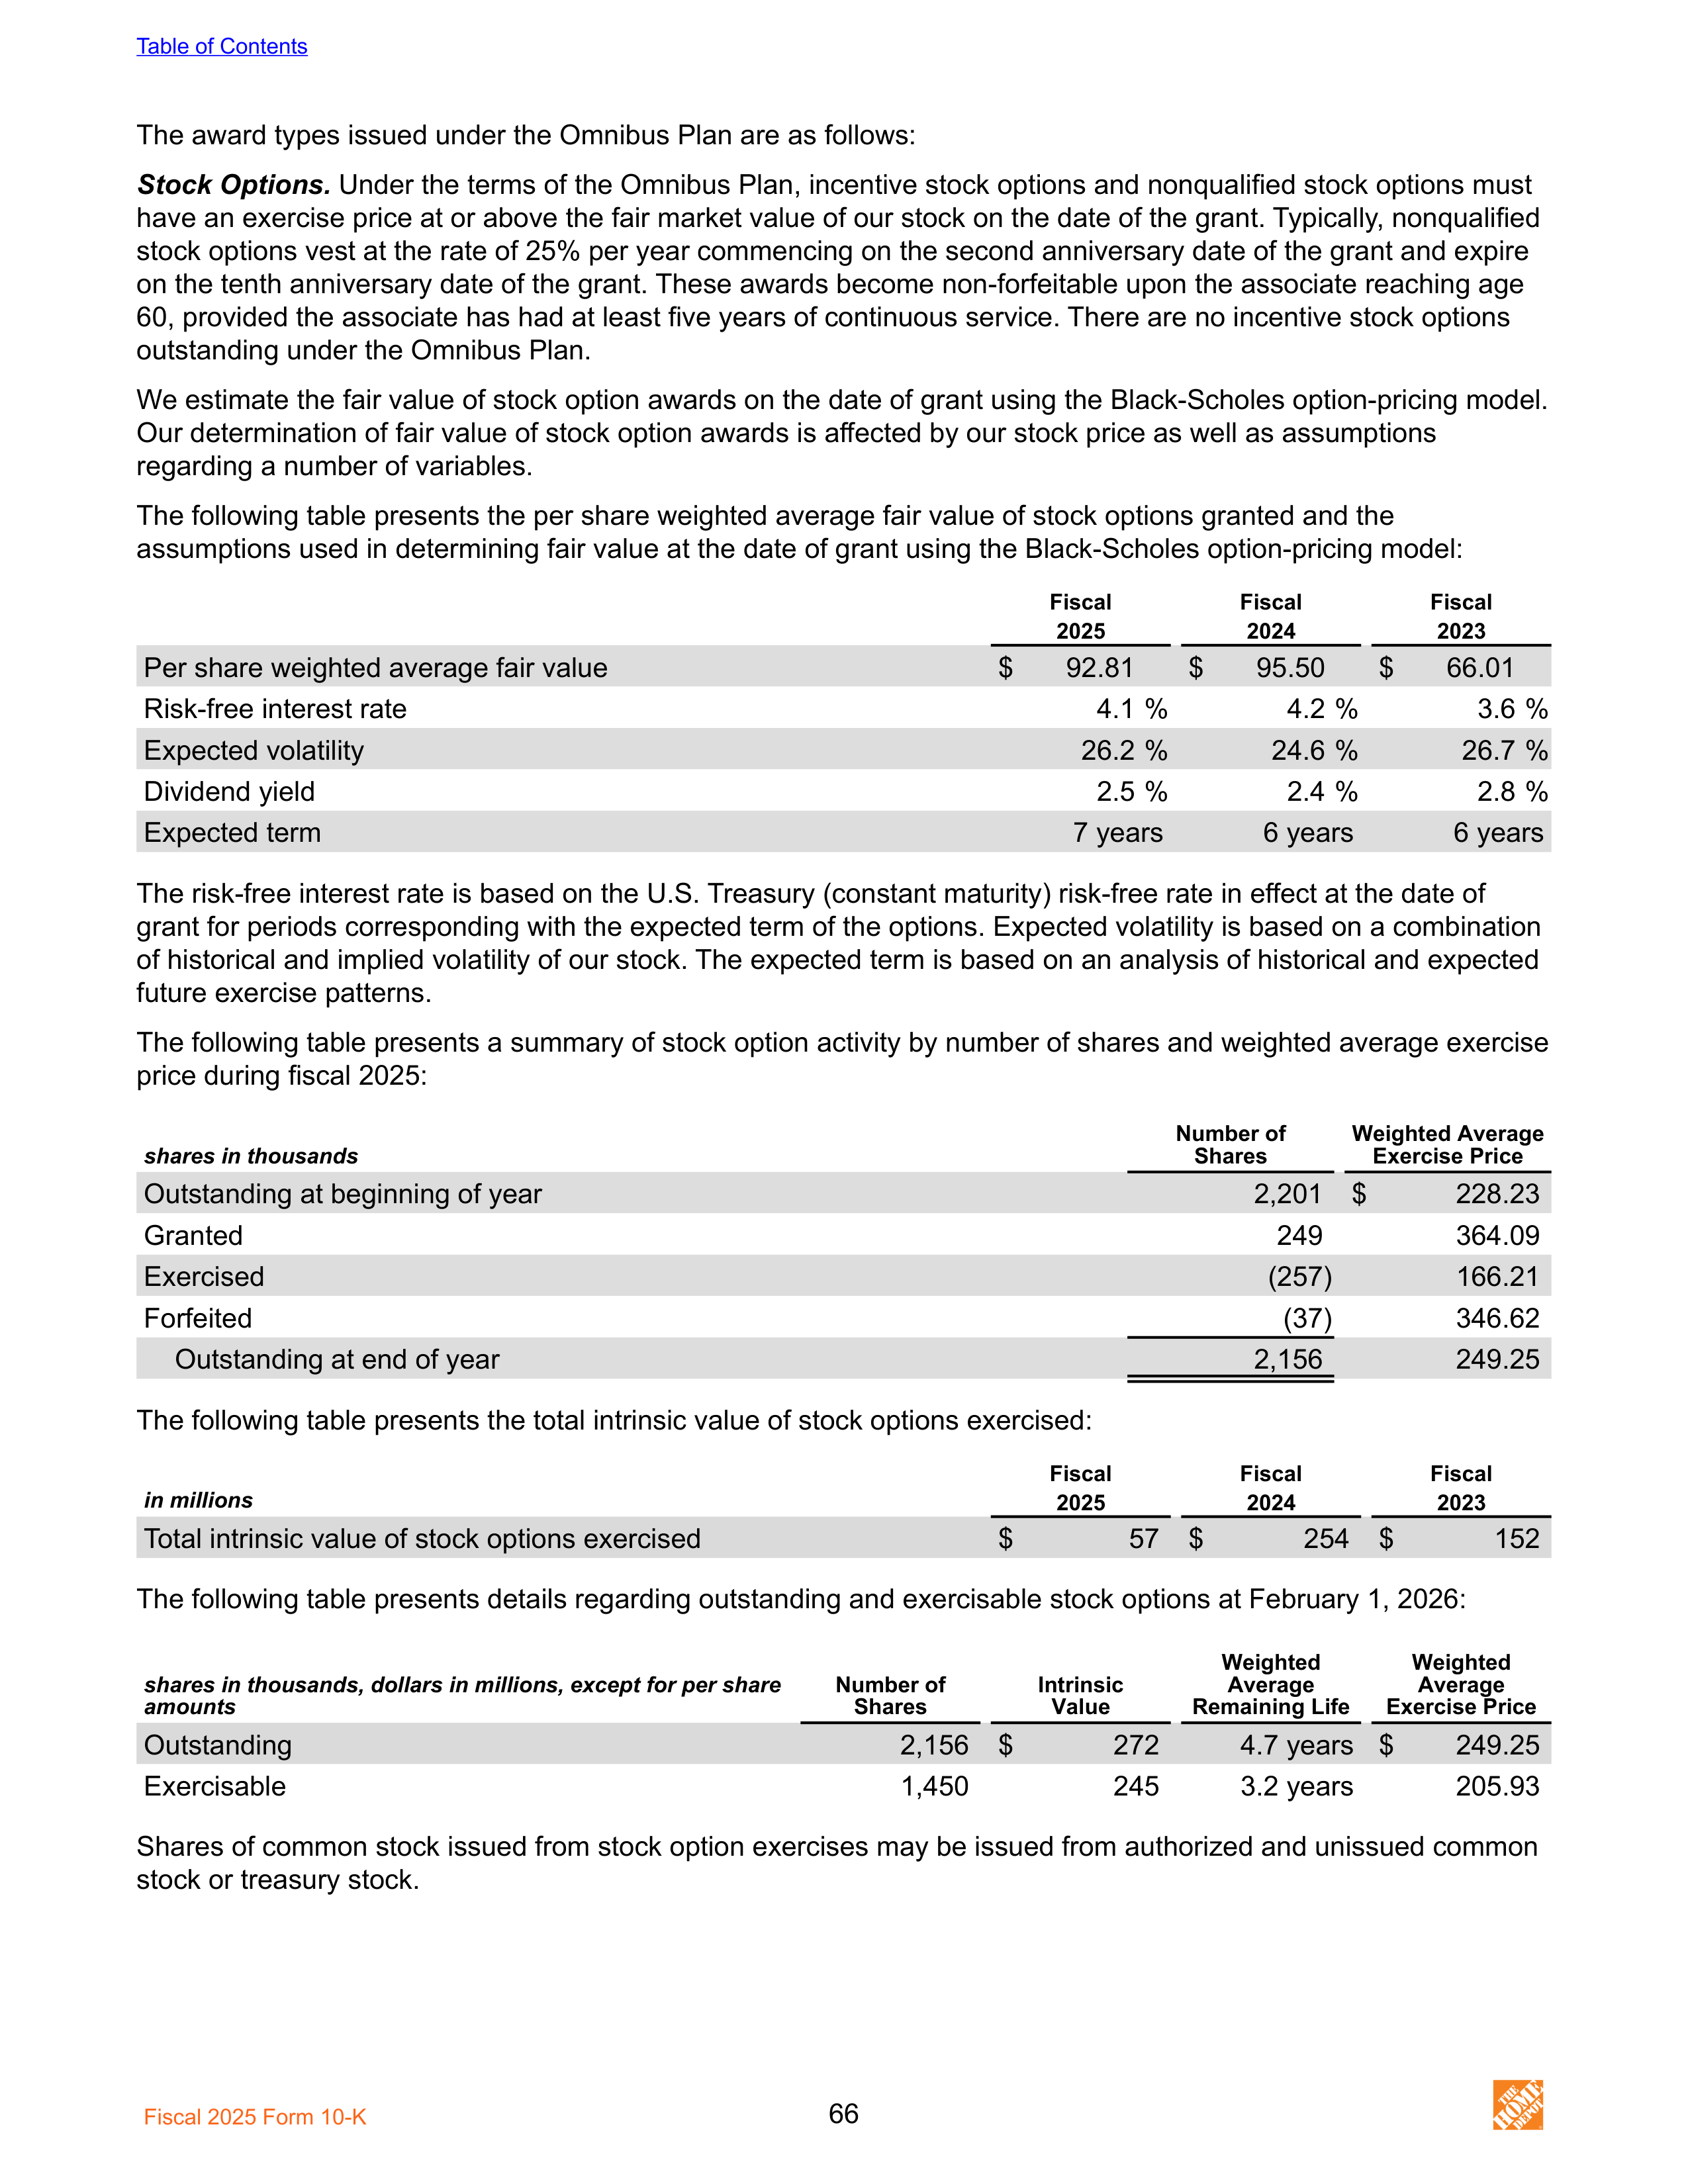
The award types issued under the Omnibus Plan are as follows:
Stock Options.
Under the terms of the Omnibus Plan, incentive stock options and nonqualified stock options must
have an exercise price at or above the fair market value of our stock on the date of the grant. Typically, nonqualified
stock options vest at the rate of 25% per year commencing on the second anniversary date of the grant and expire
on the tenth anniversary date of the grant. These awards become non-forfeitable upon the associate reaching age
60, provided the associate has had at least five years of continuous service. There are no incentive stock options
outstanding under the Omnibus Plan.
We estimate the fair value of stock option awards on the date of grant using the Black-Scholes option-pricing model.
Our determination of fair value of stock option awards is affected by our stock price as well as assumptions
regarding a number of variables.
The following table presents the per share weighted average fair value of stock options granted and the
assumptions used in determining fair value at the date of grant using the Black-Scholes option-pricing model:
Fiscal
Fiscal
Fiscal
2025
2024
2023
Per share weighted average fair value
$
92.81
$
95.50
$
66.01
Risk-free interest rate
4.1 %
4.2 %
3.6 %
Expected volatility
26.2 %
24.6 %
26.7 %
Dividend yield
2.5 %
2.4 %
2.8 %
Expected term
7 years
6 years
6 years
The risk-free interest rate is based on the U.S. Treasury (constant maturity) risk-free rate in effect at the date of
grant for periods corresponding with the expected term of the options. Expected volatility is based on a combination
of historical and implied volatility of our stock. The expected term is based on an analysis of historical and expected
future exercise patterns.
The following table presents a summary of stock option activity by number of shares and weighted average exercise
price during fiscal 2025:
shares in thousands
Number of
Shares
Weighted Average
Exercise Price
Outstanding at beginning of year
2,201 $
228.23
Granted
249
364.09
Exercised
(257)
166.21
Forfeited
(37)
346.62
Outstanding at end of year
2,156
249.25
The following table presents the total intrinsic value of stock options exercised:
in millions
Fiscal
Fiscal
Fiscal
2025
2024
2023
Total intrinsic value of stock options exercised
$
57 $
254 $
152
The following table presents details regarding outstanding and exercisable stock options at February 1, 2026:
shares in thousands, dollars in millions, except for per share
amounts
Number of
Shares
Intrinsic
Value
Weighted
Average
Remaining Life
Weighted
Average
Exercise Price
Outstanding
2,156 $
272
4.7 years
$
249.25
Exercisable
1,450
245
3.2 years
205.93
Shares of common stock issued from stock option exercises may be issued from authorized and unissued common
stock or treasury stock.
Table of Contents
Fiscal 2025 Form 10-K
66
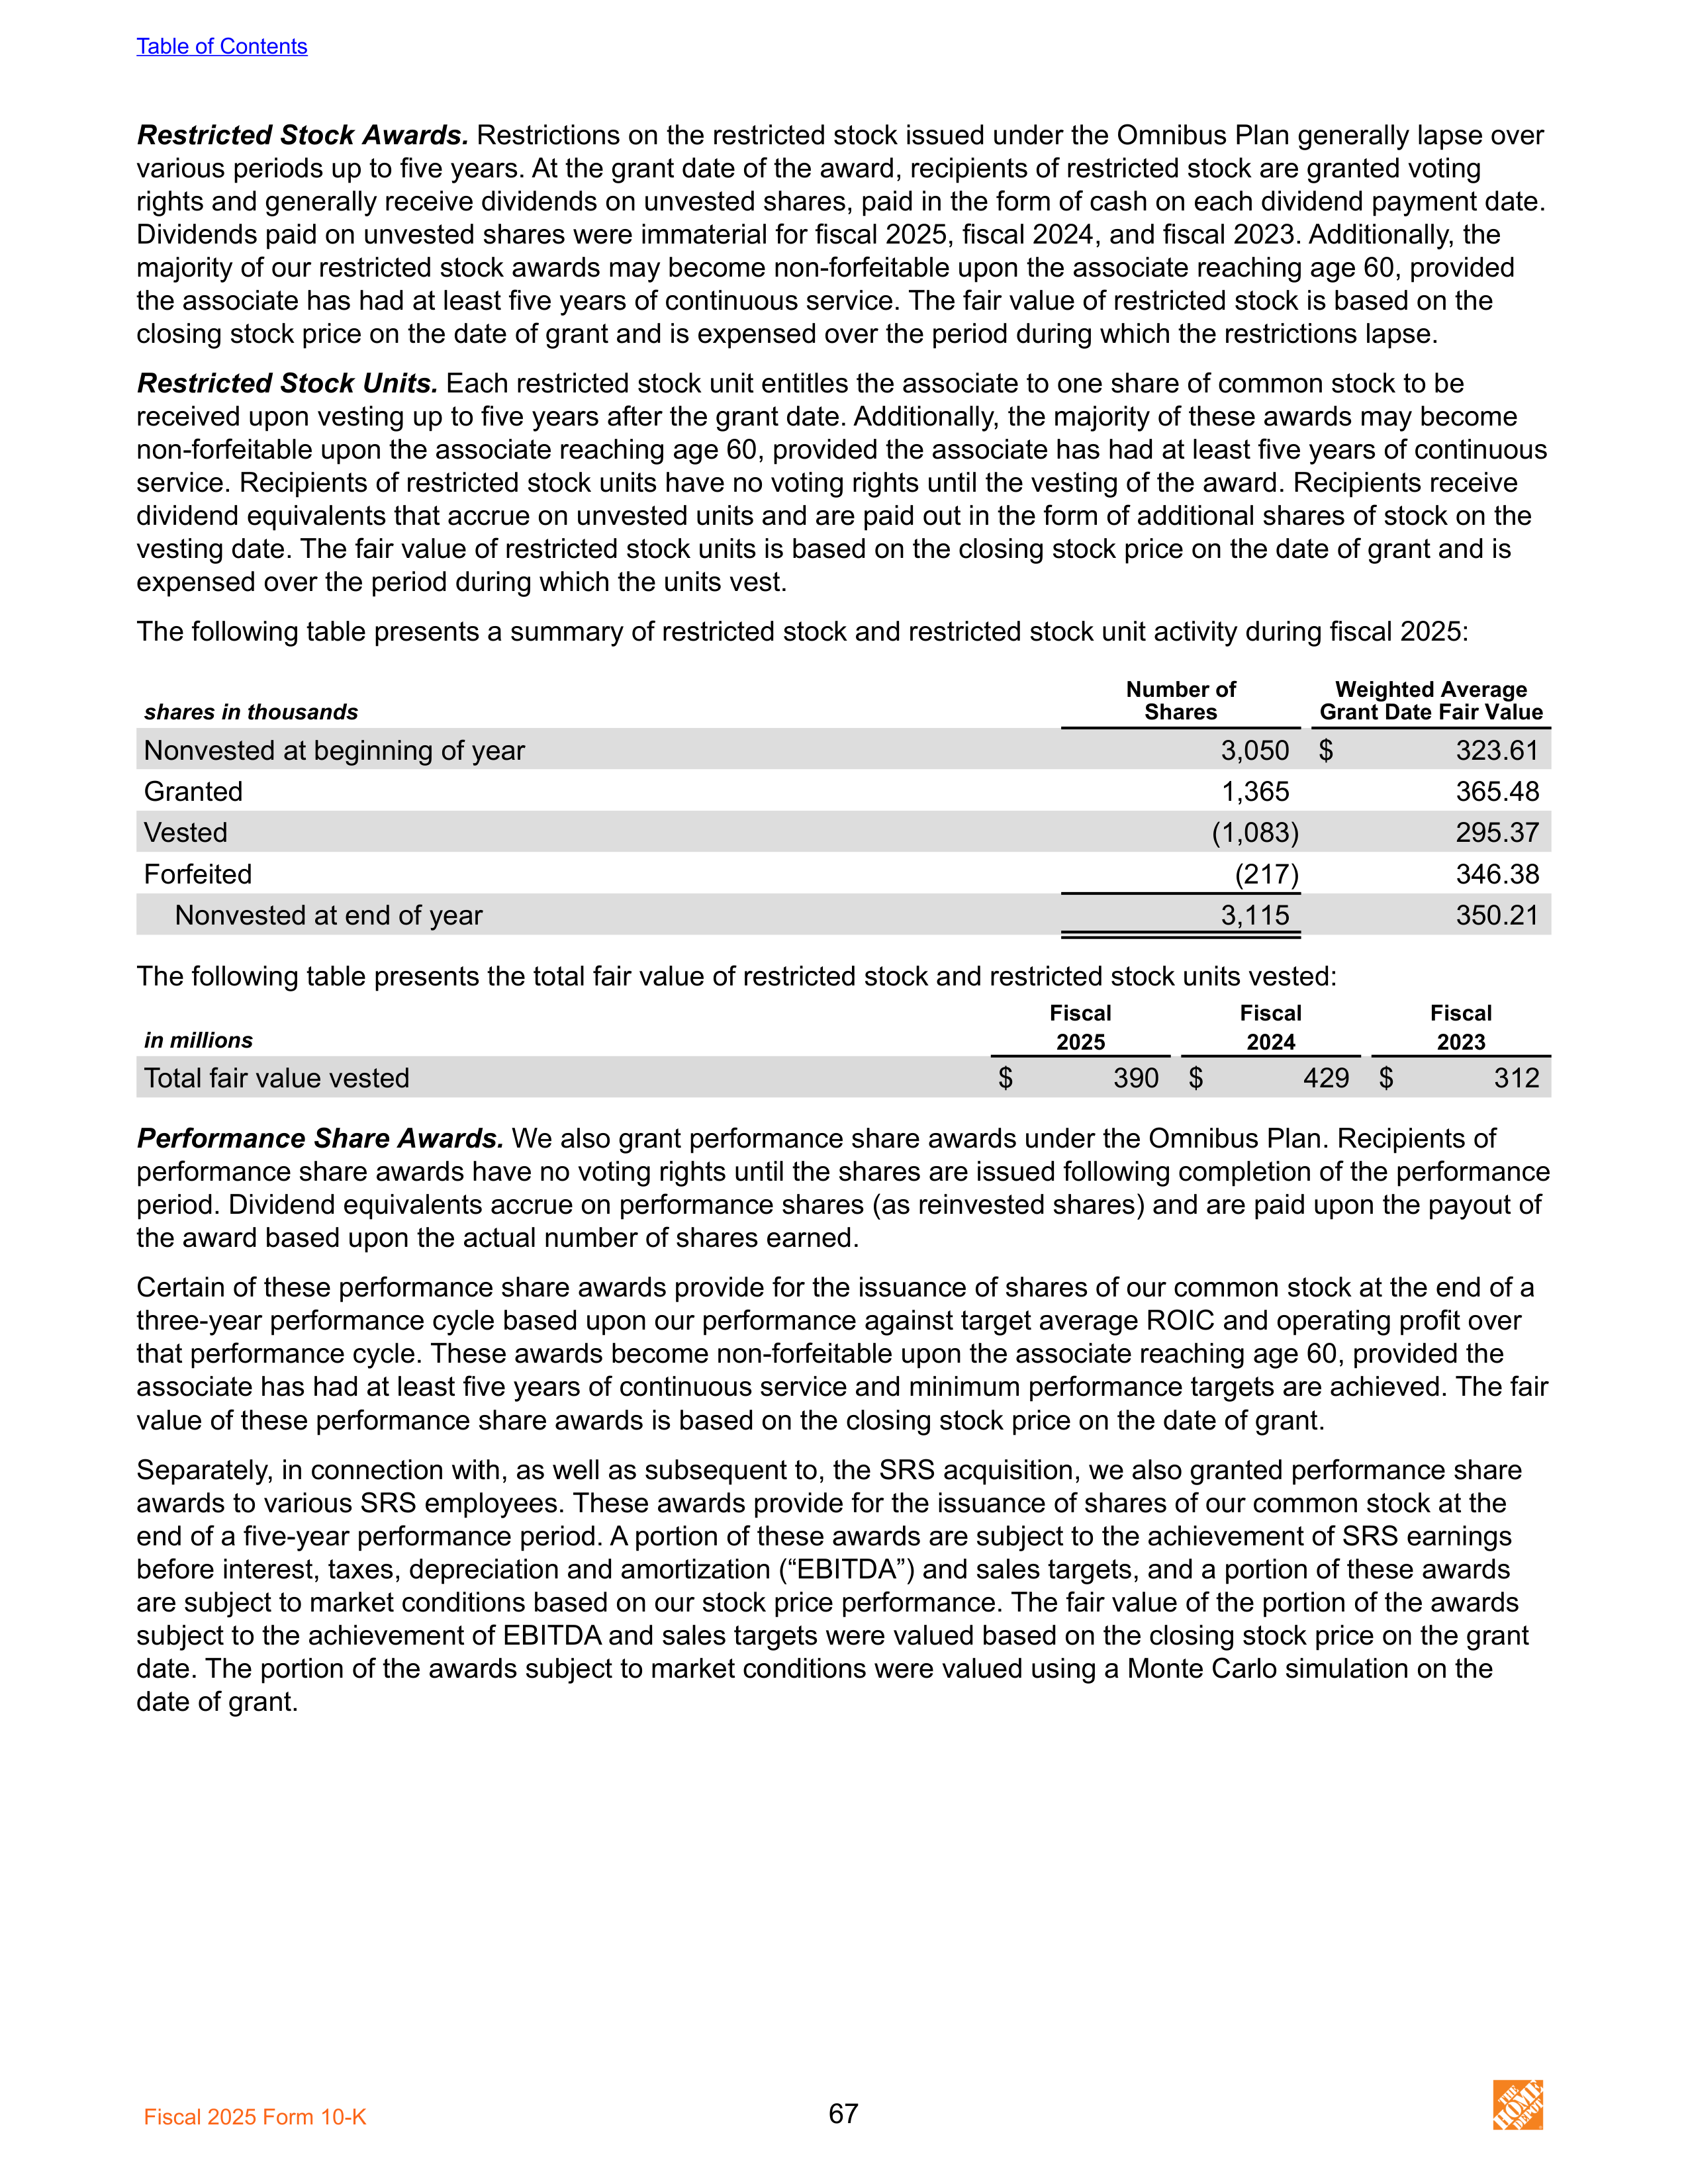
Restricted Stock Awards.
Restrictions on the restricted stock issued under the Omnibus Plan generally lapse over
various periods up to five years. At the grant date of the award, recipients of restricted stock are granted voting
rights and generally receive dividends on unvested shares, paid in the form of cash on each dividend payment date.
Dividends paid on unvested shares were immaterial for fiscal 2025, fiscal 2024, and fiscal 2023. Additionally, the
majority of our restricted stock awards may become non-forfeitable upon the associate reaching age 60, provided
the associate has had at least five years of continuous service. The fair value of restricted stock is based on the
closing stock price on the date of grant and is expensed over the period during which the restrictions lapse.
Restricted Stock Units.
Each restricted stock unit entitles the associate to one share of common stock to be
received upon vesting up to five years after the grant date. Additionally, the majority of these awards may become
non-forfeitable upon the associate reaching age 60, provided the associate has had at least five years of continuous
service. Recipients of restricted stock units have no voting rights until the vesting of the award. Recipients receive
dividend equivalents that accrue on unvested units and are paid out in the form of additional shares of stock on the
vesting date. The fair value of restricted stock units is based on the closing stock price on the date of grant and is
expensed over the period during which the units vest.
The following table presents a summary of restricted stock and restricted stock unit activity during fiscal 2025:
shares in thousands
Number of
Shares
Weighted Average
Grant Date Fair Value
Nonvested at beginning of year
3,050 $
323.61
Granted
1,365
365.48
Vested
(1,083)
295.37
Forfeited
(217)
346.38
Nonvested at end of year
3,115
350.21
The following table presents the total fair value of restricted stock and restricted stock units vested:
in millions
Fiscal
Fiscal
Fiscal
2025
2024
2023
Total fair value vested
$
390 $
429 $
312
Performance Share Awards.
We also grant performance share awards under the Omnibus Plan. Recipients of
performance share awards have no voting rights until the shares are issued following completion of the performance
period. Dividend equivalents accrue on performance shares (as reinvested shares) and are paid upon the payout of
the award based upon the actual number of shares earned.
Certain of these performance share awards provide for the issuance of shares of our common stock at the end of a
three-year performance cycle based upon our performance against target average ROIC and operating profit over
that performance cycle. These awards become non-forfeitable upon the associate reaching age 60, provided the
associate has had at least five years of continuous service and minimum performance targets are achieved. The fair
value of these performance share awards is based on the closing stock price on the date of grant.
Separately, in connection with, as well as subsequent to, the SRS acquisition, we also granted performance share
awards to various SRS employees. These awards provide for the issuance of shares of our common stock at the
end of a five-year performance period. A portion of these awards are subject to the achievement of SRS earnings
before interest, taxes, depreciation and amortization (“EBITDA”) and sales targets, and a portion of these awards
are subject to market conditions based on our stock price performance. The fair value of the portion of the awards
subject to the achievement of EBITDA and sales targets were valued based on the closing stock price on the grant
date. The portion of the awards subject to market conditions were valued using a Monte Carlo simulation on the
date of grant.
Table of Contents
Fiscal 2025 Form 10-K
67
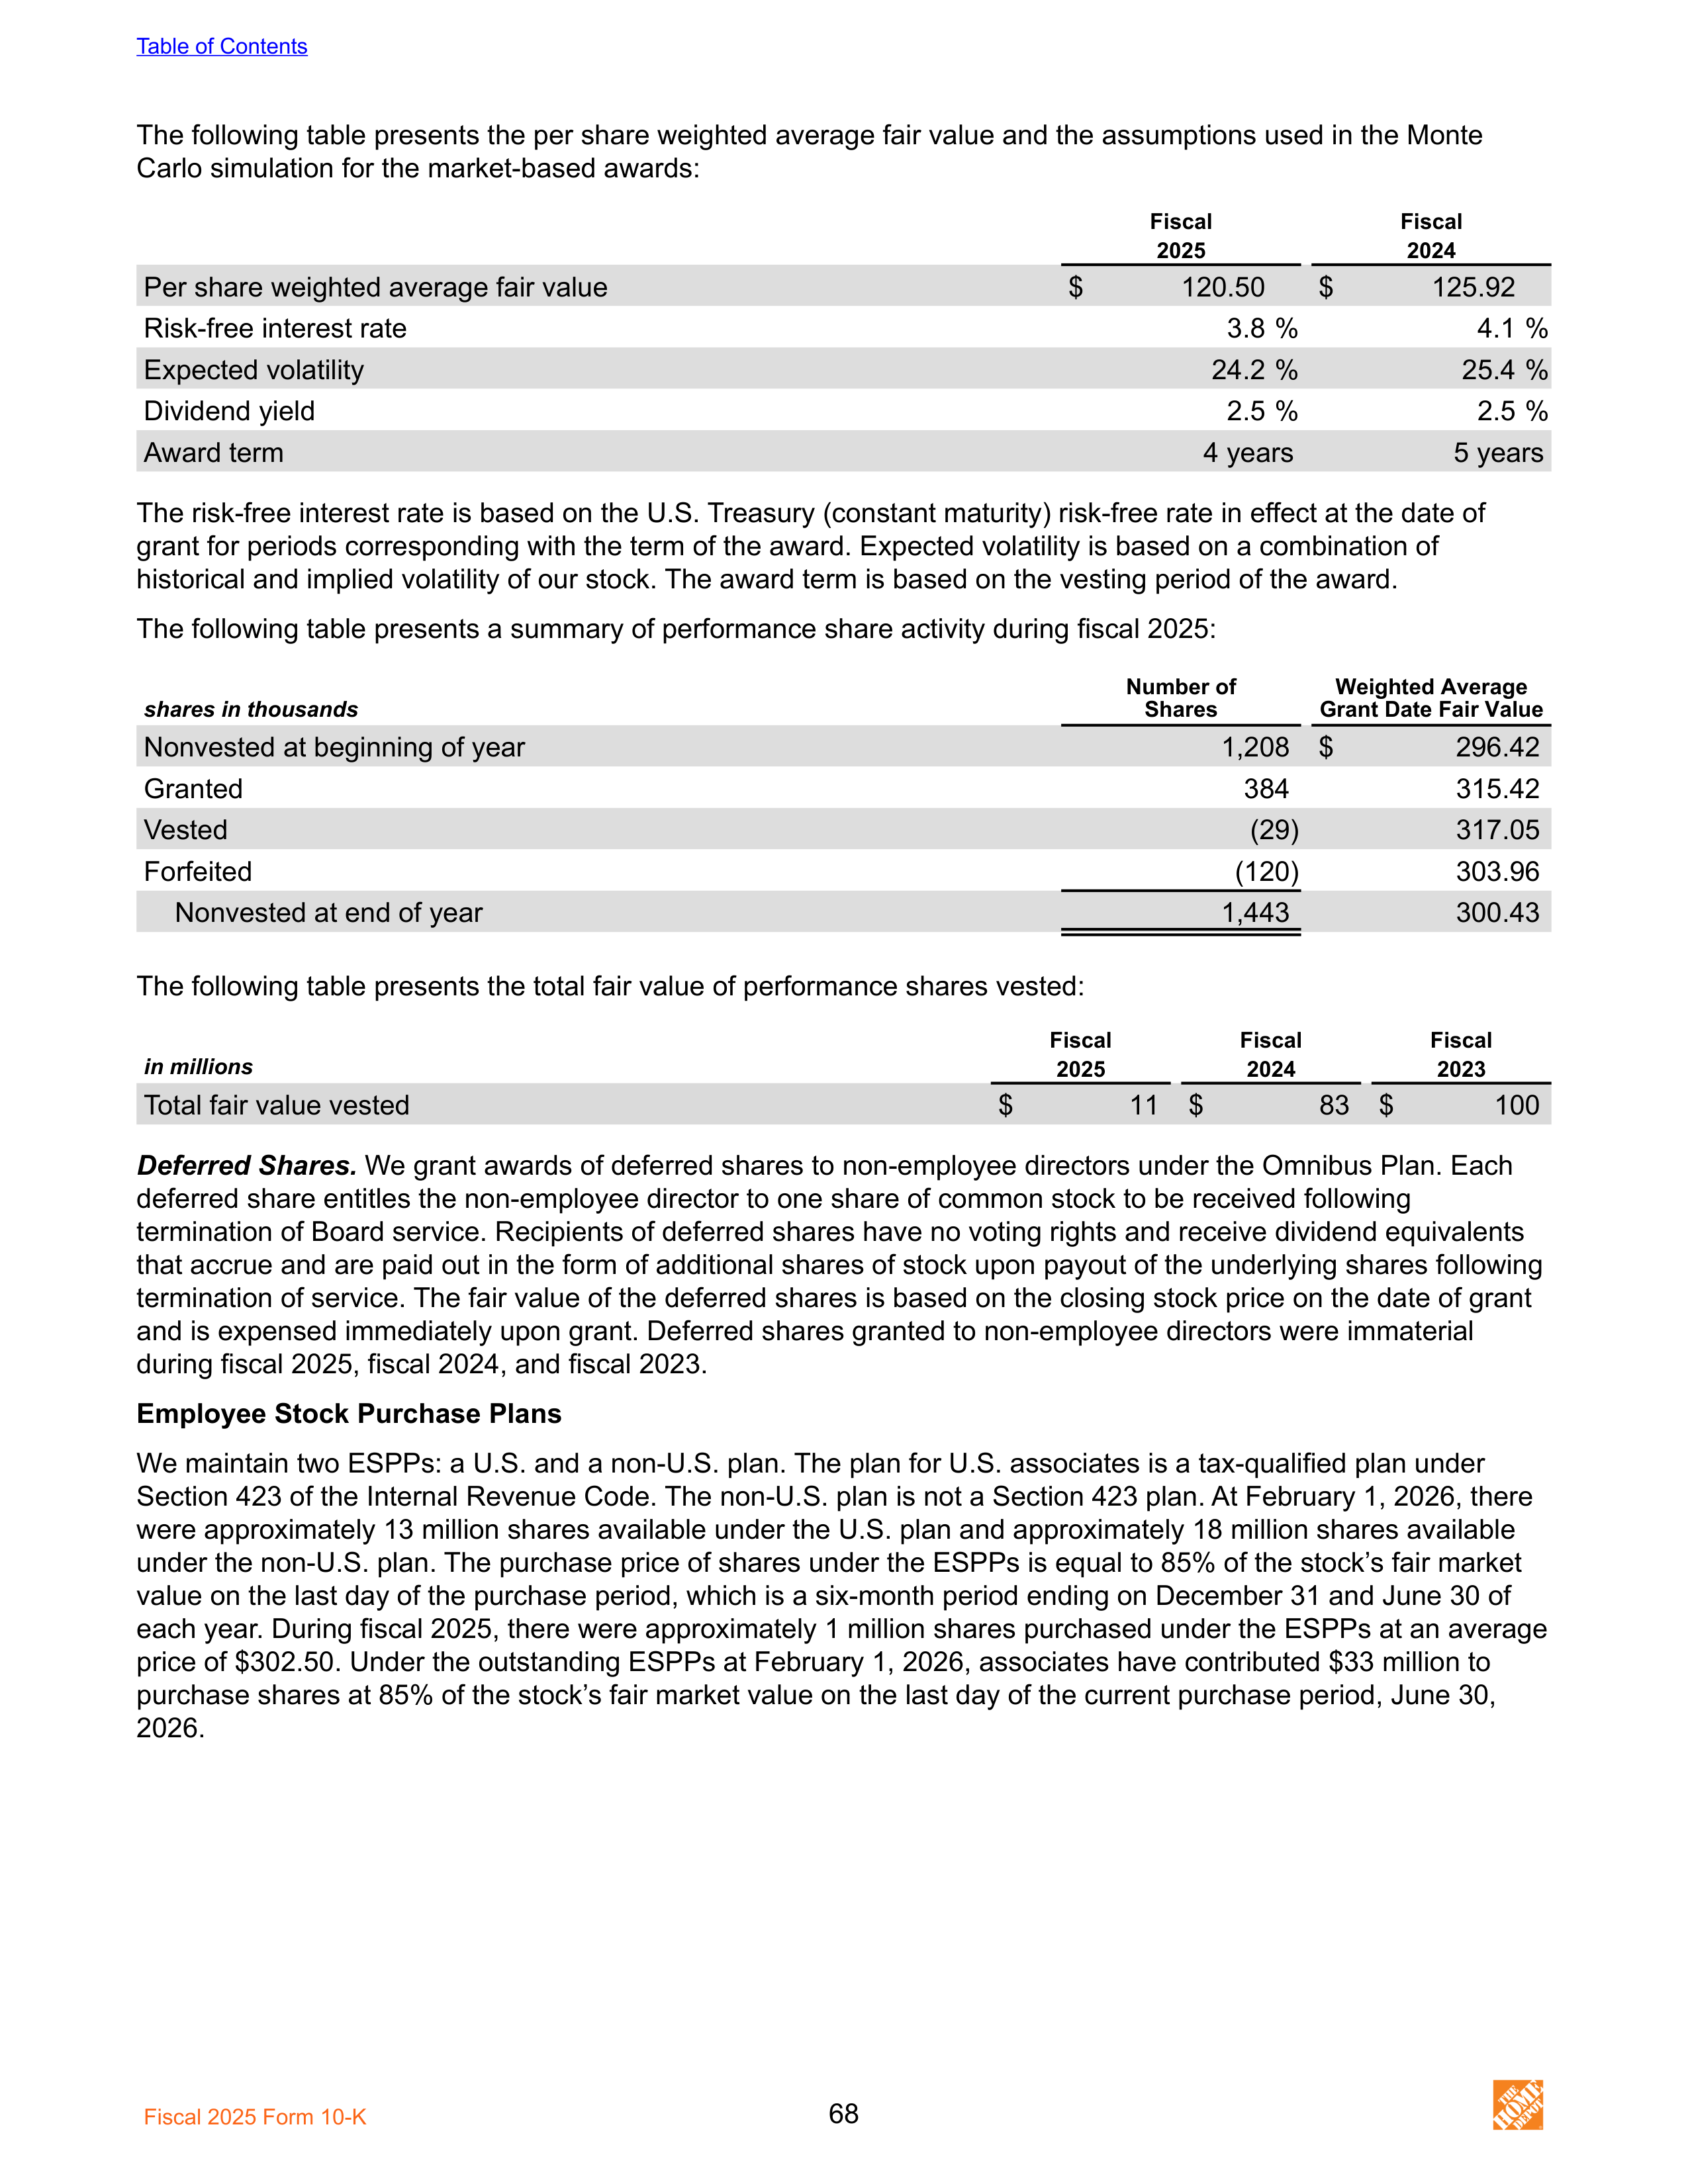
The following table presents the per share weighted average fair value and the assumptions used in the Monte
Carlo simulation for the market-based awards:
Fiscal
Fiscal
2025
2024
Per share weighted average fair value
$
120.50
$
125.92
Risk-free interest rate
3.8 %
4.1 %
Expected volatility
24.2 %
25.4 %
Dividend yield
2.5 %
2.5 %
Award term
4 years
5 years
The risk-free interest rate is based on the U.S. Treasury (constant maturity) risk-free rate in effect at the date of
grant for periods corresponding with the term of the award. Expected volatility is based on a combination of
historical and implied volatility of our stock. The award term is based on the vesting period of the award.
The following table presents a summary of performance share activity during fiscal 2025:
shares in thousands
Number of
Shares
Weighted Average
Grant Date Fair Value
Nonvested at beginning of year
1,208 $
296.42
Granted
384
315.42
Vested
(29)
317.05
Forfeited
(120)
303.96
Nonvested at end of year
1,443
300.43
The following table presents the total fair value of performance shares vested:
in millions
Fiscal
Fiscal
Fiscal
2025
2024
2023
Total fair value vested
$
11 $
83 $
100
Deferred Shares.
We grant awards of deferred shares to non-employee directors under the Omnibus Plan. Each
deferred share entitles the non-employee director to one share of common stock to be received following
termination of Board service. Recipients of deferred shares have no voting rights and receive dividend equivalents
that accrue and are paid out in the form of additional shares of stock upon payout of the underlying shares following
termination of service. The fair value of the deferred shares is based on the closing stock price on the date of grant
and is expensed immediately upon grant. Deferred shares granted to non-employee directors were immaterial
during fiscal 2025, fiscal 2024, and fiscal 2023.
Employee Stock Purchase Plans
We maintain two ESPPs: a U.S. and a non-U.S. plan. The plan for U.S. associates is a tax-qualified plan under
Section 423 of the Internal Revenue Code. The non-U.S. plan is not a Section 423 plan. At February 1, 2026, there
were approximately 13 million shares available under the U.S. plan and approximately 18 million shares available
under the non-U.S. plan. The purchase price of shares under the ESPPs is equal to 85% of the stock’s fair market
value on the last day of the purchase period, which is a six-month period ending on December 31 and June 30 of
each year. During fiscal 2025, there were approximately 1 million shares purchased under the ESPPs at an average
price of $302.50. Under the outstanding ESPPs at February 1, 2026, associates have contributed $33 million to
purchase shares at 85% of the stock’s fair market value on the last day of the current purchase period, June 30,
2026.
Table of Contents
Fiscal 2025 Form 10-K
68
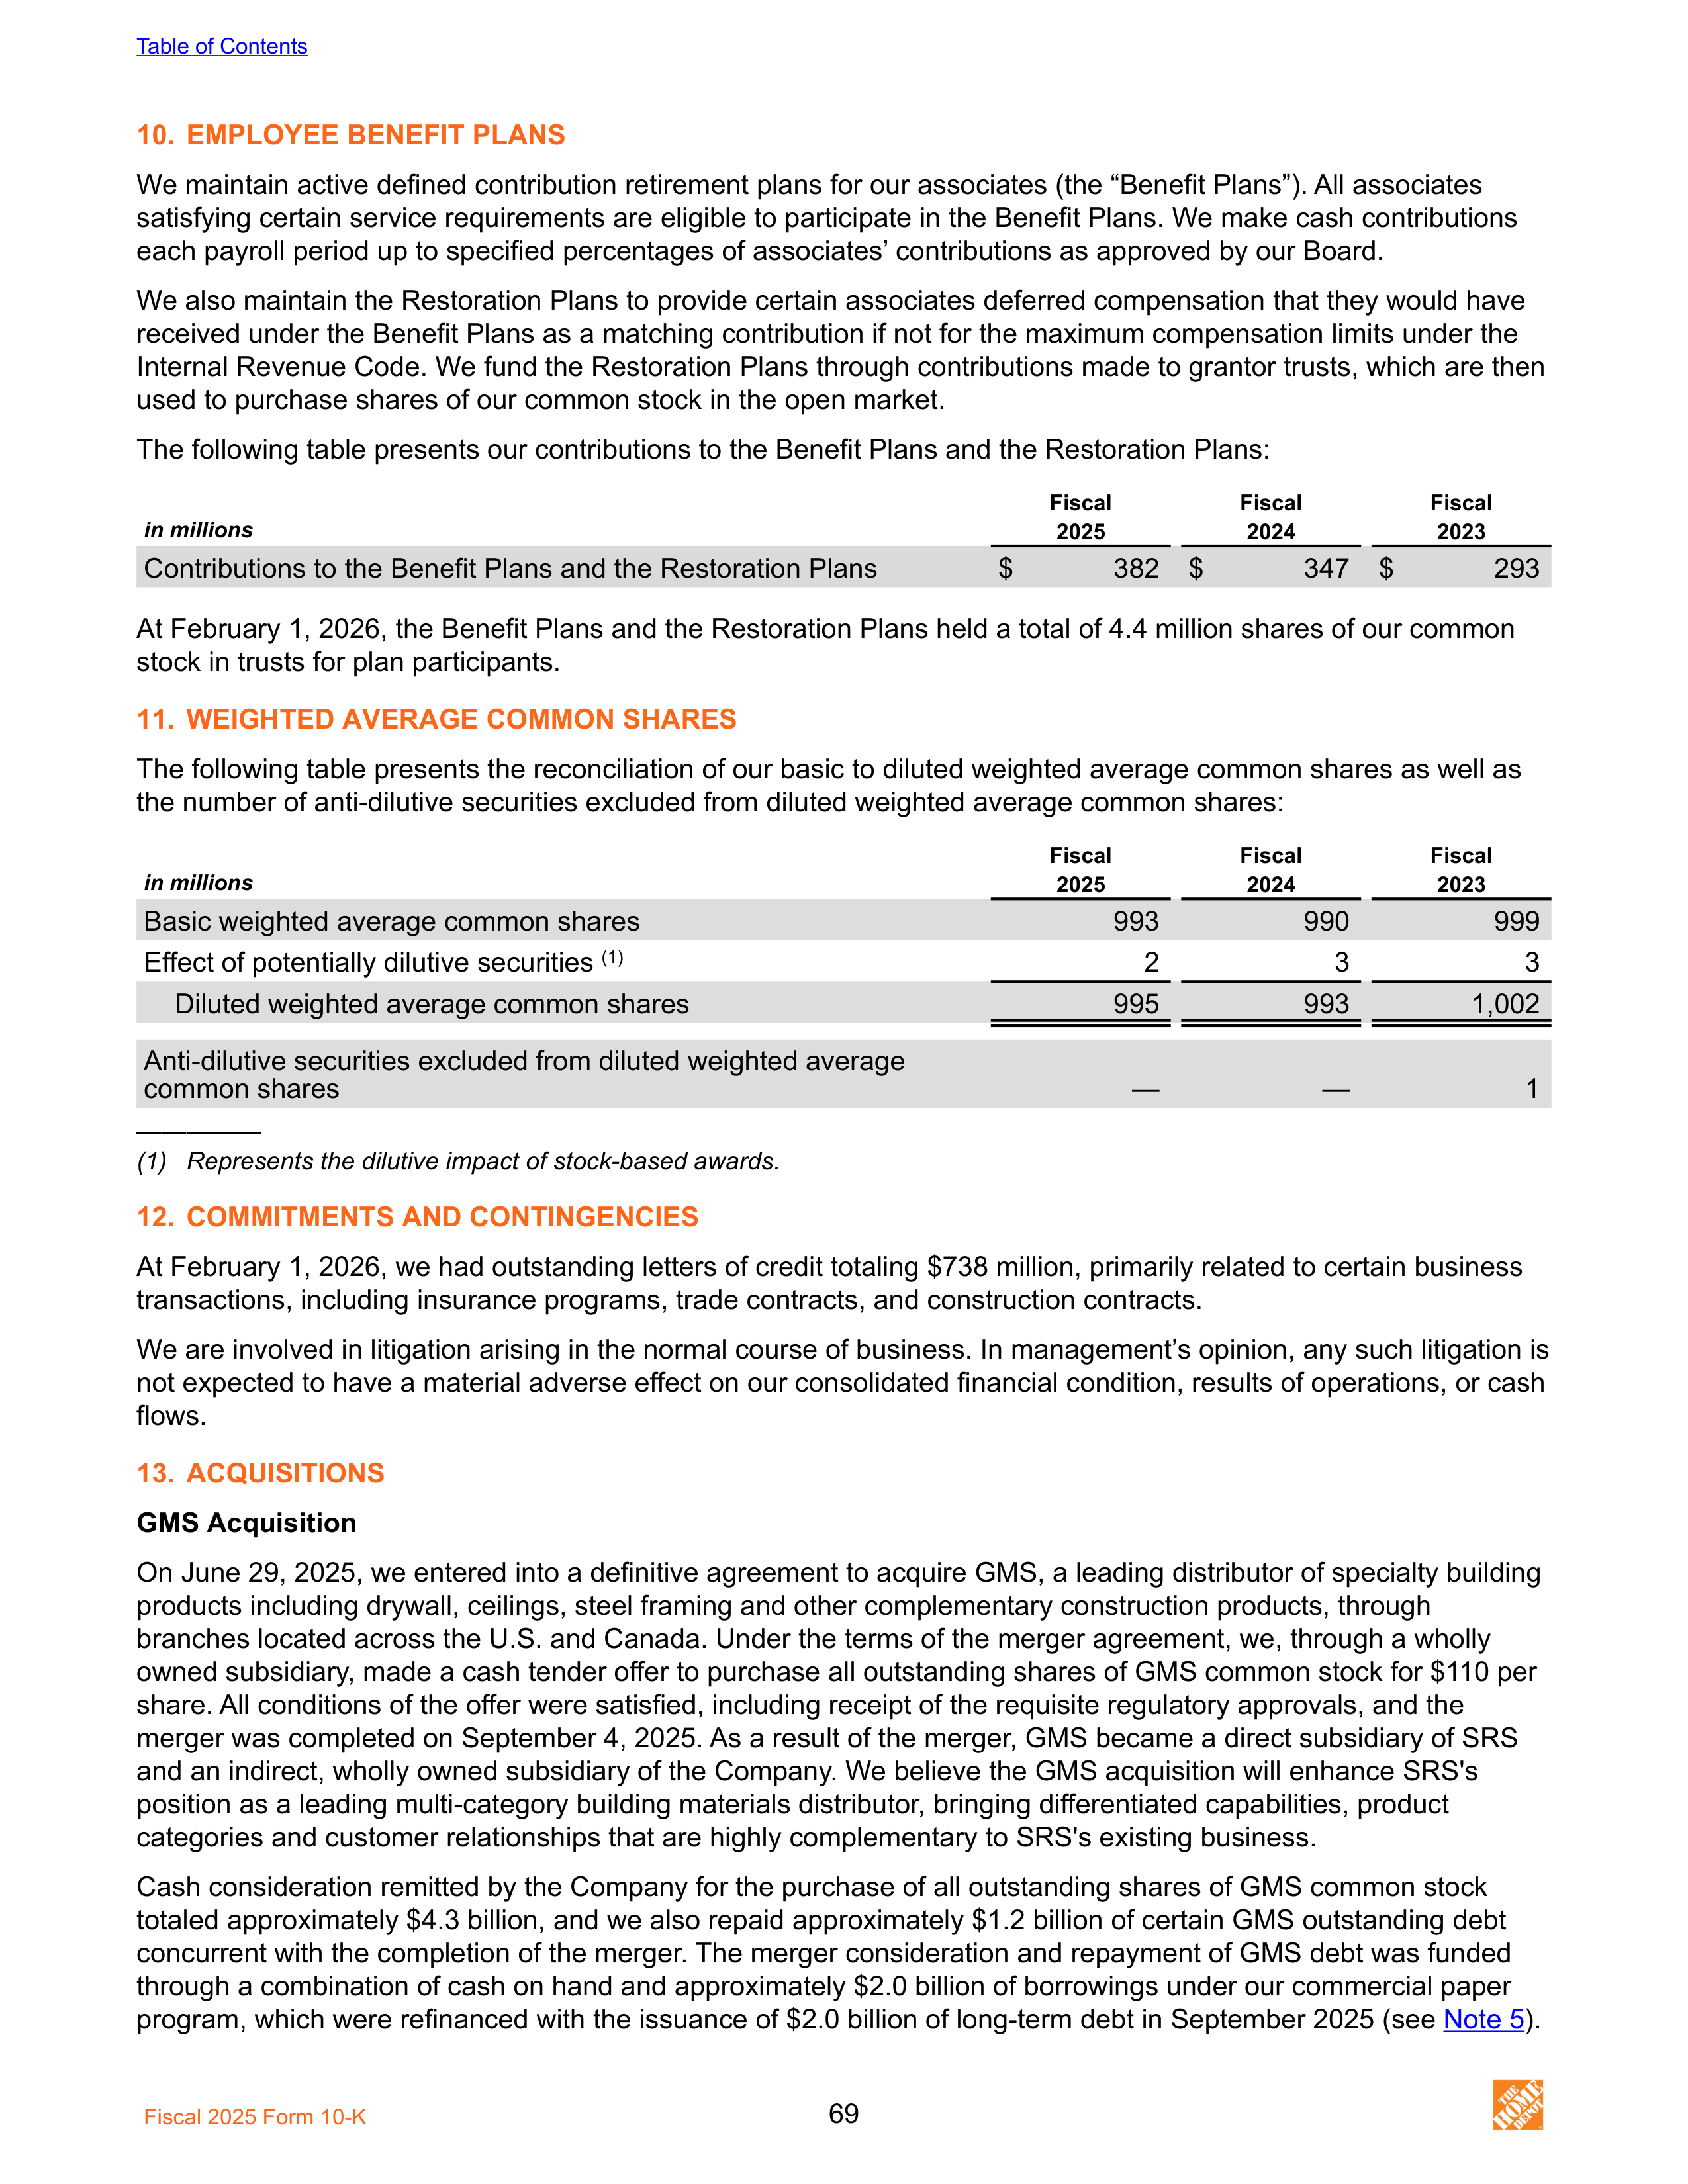
10.
EMPLOYEE BENEFIT PLANS
We maintain active defined contribution retirement plans for our associates (the “Benefit Plans”). All associates
satisfying certain service requirements are eligible to participate in the Benefit Plans. We make cash contributions
each payroll period up to specified percentages of associates’ contributions as approved by our Board.
We also maintain the Restoration Plans to provide certain associates deferred compensation that they would have
received under the Benefit Plans as a matching contribution if not for the maximum compensation limits under the
Internal Revenue Code. We fund the Restoration Plans through contributions made to grantor trusts, which are then
used to purchase shares of our common stock in the open market.
The following table presents our contributions to the Benefit Plans and the Restoration Plans:
in millions
Fiscal
Fiscal
Fiscal
2025
2024
2023
Contributions to the Benefit Plans and the Restoration Plans
$
382 $
347 $
293
At February 1, 2026, the Benefit Plans and the Restoration Plans held a total of 4.4 million shares of our common
stock in trusts for plan participants.
11.
WEIGHTED AVERAGE COMMON SHARES
The following table presents the reconciliation of our basic to diluted weighted average common shares as well as
the number of anti-dilutive securities excluded from diluted weighted average common shares:
in millions
Fiscal
Fiscal
Fiscal
2025
2024
2023
Basic weighted average common shares
993
990
999
Effect of potentially dilutive securities
(1)
2
3
3
Diluted weighted average common shares
995
993
1,002
Anti-dilutive securities excluded from diluted weighted average
common shares
—
—
1
—————
(1) Represents the dilutive impact of stock-based awards.
12.
COMMITMENTS AND CONTINGENCIES
At February 1, 2026, we had outstanding letters of credit totaling $738 million, primarily related to certain business
transactions, including insurance programs, trade contracts, and construction contracts.
We are involved in litigation arising in the normal course of business. In management’s opinion, any such litigation is
not expected to have a material adverse effect on our consolidated financial condition, results of operations, or cash
flows.
13.
ACQUISITIONS
GMS Acquisition
On June 29, 2025, we entered into a definitive agreement to acquire GMS, a leading distributor of specialty building
products including drywall, ceilings, steel framing and other complementary construction products, through
branches located across the U.S. and Canada. Under the terms of the merger agreement, we, through a wholly
owned subsidiary, made a cash tender offer to purchase all outstanding shares of GMS common stock for $110 per
share. All conditions of the offer were satisfied, including receipt of the requisite regulatory approvals, and the
merger was completed on September 4, 2025. As a result of the merger, GMS became a direct subsidiary of SRS
and an indirect, wholly owned subsidiary of the Company. We believe the GMS acquisition will enhance SRS's
position as a leading multi-category building materials distributor, bringing differentiated capabilities, product
categories and customer relationships that are highly complementary to SRS's existing business.
Cash consideration remitted by the Company for the purchase of all outstanding shares of GMS common stock
totaled approximately $4.3 billion, and we also repaid approximately $1.2 billion of certain GMS outstanding debt
concurrent with the completion of the merger. The merger consideration and repayment of GMS debt was funded
through a combination of cash on hand and approximately $2.0 billion of borrowings under our commercial paper
program, which were refinanced with the issuance of $2.0 billion of long-term debt in September 2025 (see
Note 5
).
Table of Contents
Fiscal 2025 Form 10-K
69
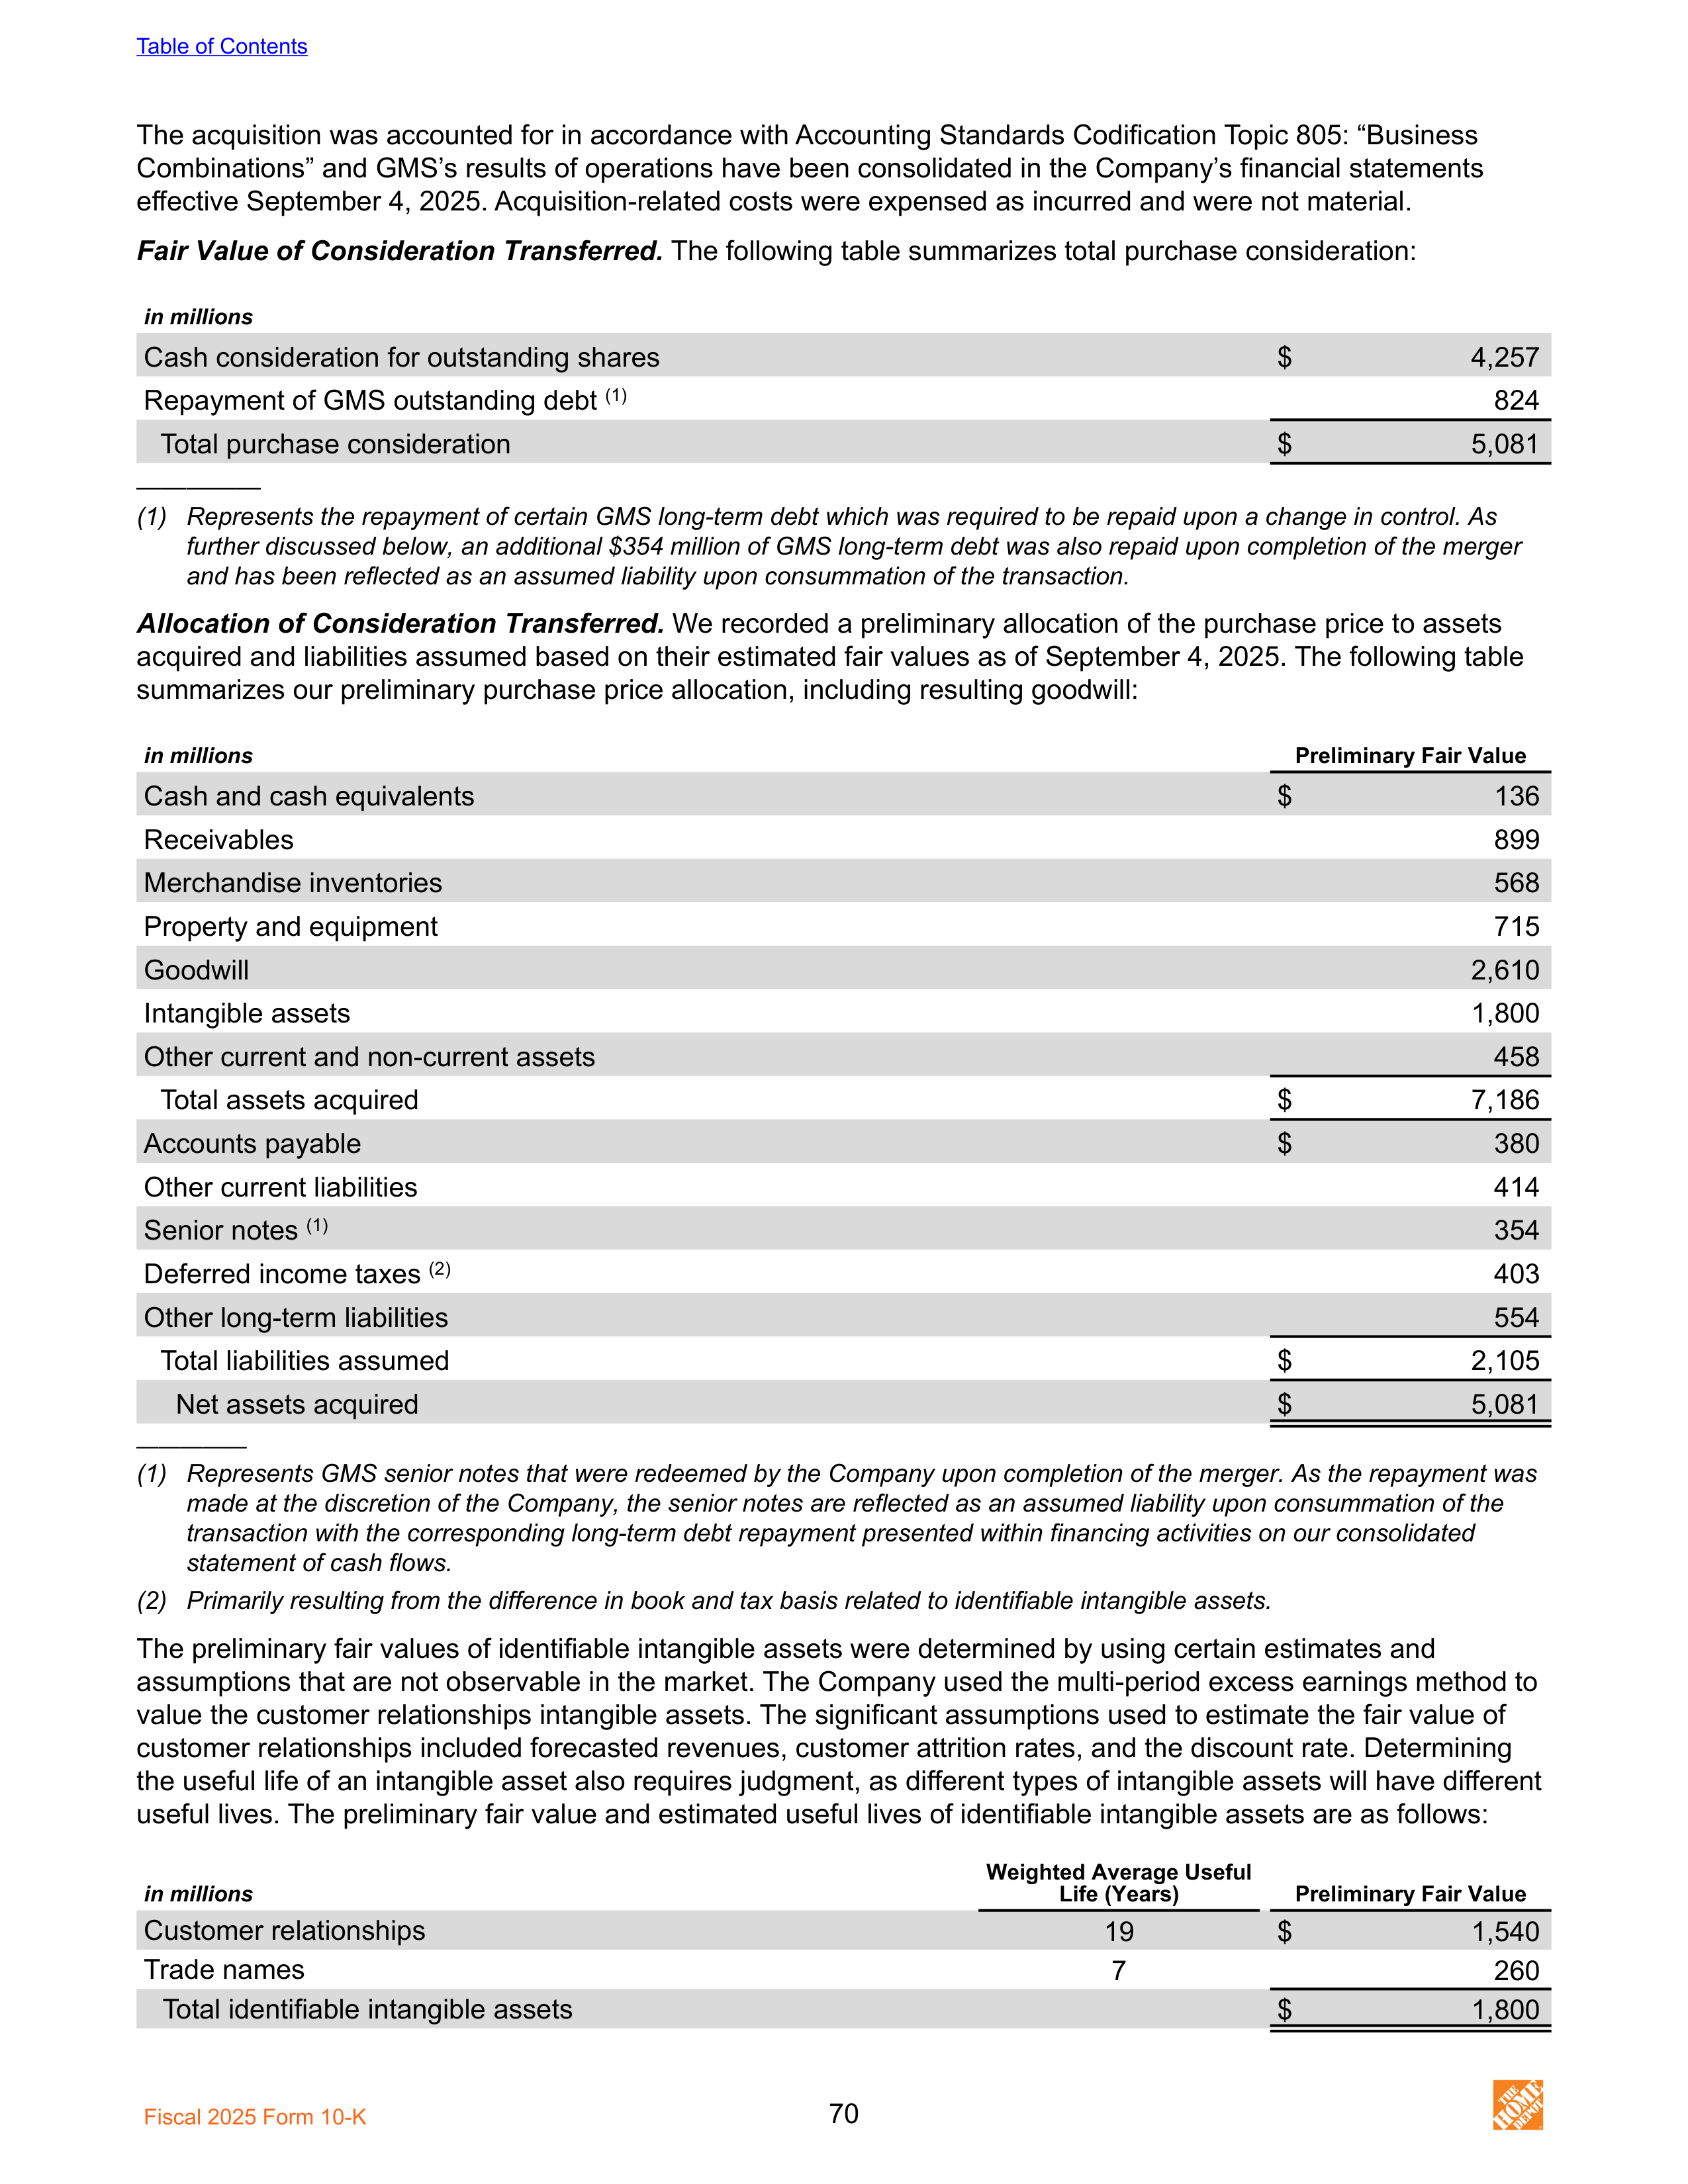
The acquisition was accounted for in accordance with Accounting Standards Codification Topic 805: “Business
Combinations” and GMS’s results of operations have been consolidated in the Company’s financial statements
effective September 4, 2025. Acquisition-related costs were expensed as incurred and were not material.
Fair Value of Consideration Transferred.
The following table summarizes total purchase consideration:
in millions
Cash consideration for outstanding shares
$
4,257
Repayment of GMS outstanding debt
(1)
824
Total purchase consideration
$
5,081
—————
(1) Represents the repayment of certain GMS long-term debt which was required to be repaid upon a change in control. As
further discussed below, an additional $354 million of GMS long-term debt was also repaid upon completion of the merger
and has been reflected as an assumed liability upon consummation of the transaction.
Allocation of Consideration Transferred.
We recorded a preliminary allocation of the purchase price to assets
acquired and liabilities assumed based on their estimated fair values as of September 4, 2025. The following table
summarizes our preliminary purchase price allocation, including resulting goodwill:
in millions
Preliminary Fair Value
Cash and cash equivalents
$
136
Receivables
899
Merchandise inventories
568
Property and equipment
715
Goodwill
2,610
Intangible assets
1,800
Other current and non-current assets
458
Total assets acquired
$
7,186
Accounts payable
$
380
Other current liabilities
414
Senior notes
(1)
354
Deferred income taxes
(2)
403
Other long-term liabilities
554
Total liabilities assumed
$
2,105
Net assets acquired
$
5,081
—————
(1) Represents GMS senior notes that were redeemed by the Company upon completion of the merger. As the repayment was
made at the discretion of the Company, the senior notes are reflected as an assumed liability upon consummation of the
transaction with the corresponding long-term debt repayment presented within financing activities on our consolidated
statement of cash flows.
(2) Primarily resulting from the difference in book and tax basis related to identifiable intangible assets.
The preliminary fair values of identifiable intangible assets were determined by using certain estimates and
assumptions that are not observable in the market. The Company used the multi-period excess earnings method to
value the customer relationships intangible assets. The significant assumptions used to estimate the fair value of
customer relationships included forecasted revenues, customer attrition rates, and the discount rate. Determining
the useful life of an intangible asset also requires judgment, as different types of intangible assets will have different
useful lives. The preliminary fair value and estimated useful lives of identifiable intangible assets are as follows:
in millions
Weighted Average Useful
Life (Years)
Preliminary Fair Value
Customer relationships
19
$
1,540
Trade names
7
260
Total identifiable intangible assets
$
1,800
Table of Contents
Fiscal 2025 Form 10-K
70
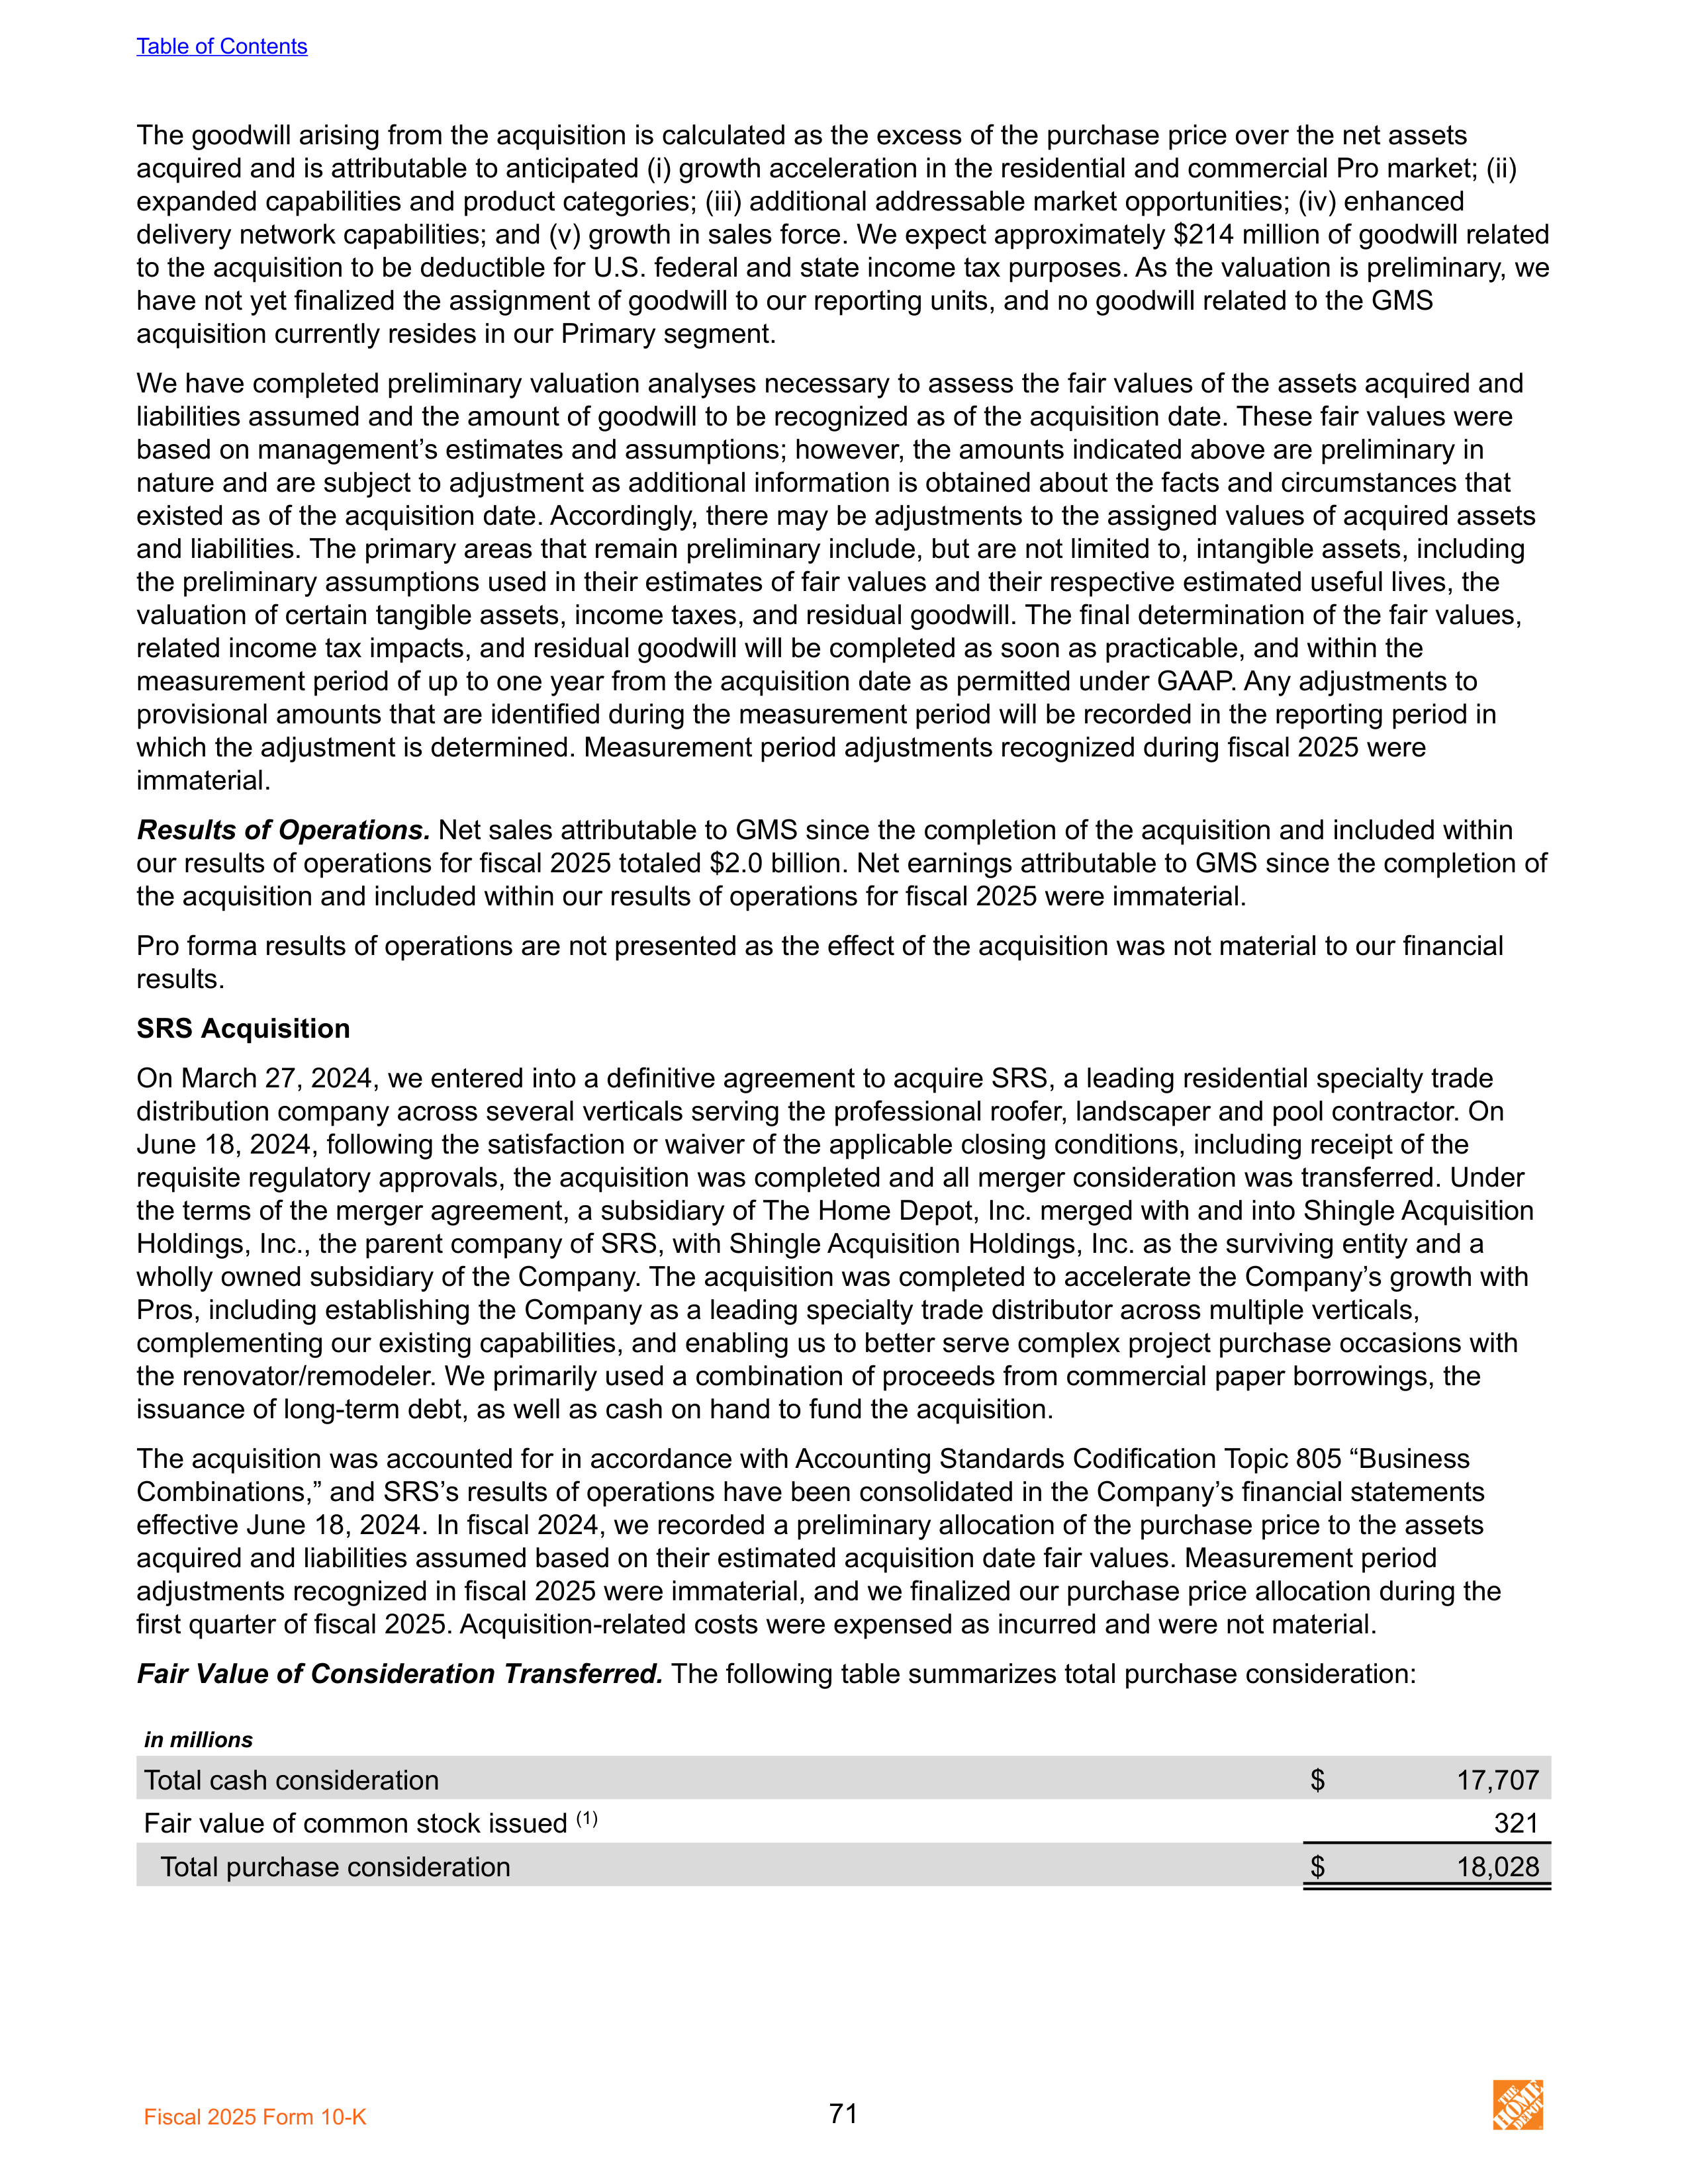
The goodwill arising from the acquisition is calculated as the excess of the purchase price over the net assets
acquired and is attributable to anticipated (i) growth acceleration in the residential and commercial Pro market; (ii)
expanded capabilities and product categories; (iii) additional addressable market opportunities; (iv) enhanced
delivery network capabilities; and (v) growth in sales force. We expect approximately $214 million of goodwill related
to the acquisition to be deductible for U.S. federal and state income tax purposes. As the valuation is preliminary, we
have not yet finalized the assignment of goodwill to our reporting units, and no goodwill related to the GMS
acquisition currently resides in our Primary segment.
We have completed preliminary valuation analyses necessary to assess the fair values of the assets acquired and
liabilities assumed and the amount of goodwill to be recognized as of the acquisition date. These fair values were
based on management’s estimates and assumptions; however, the amounts indicated above are preliminary in
nature and are subject to adjustment as additional information is obtained about the facts and circumstances that
existed as of the acquisition date. Accordingly, there may be adjustments to the assigned values of acquired assets
and liabilities. The primary areas that remain preliminary include, but are not limited to, intangible assets, including
the preliminary assumptions used in their estimates of fair values and their respective estimated useful lives, the
valuation of certain tangible assets, income taxes, and residual goodwill. The final determination of the fair values,
related income tax impacts, and residual goodwill will be completed as soon as practicable, and within the
measurement period of up to one year from the acquisition date as permitted under GAAP. Any adjustments to
provisional amounts that are identified during the measurement period will be recorded in the reporting period in
which the adjustment is determined. Measurement period adjustments recognized during fiscal 2025 were
immaterial.
Results of Operations.
Net sales attributable to GMS since the completion of the acquisition and included within
our results of operations for fiscal 2025 totaled $2.0 billion. Net earnings attributable to GMS since the completion of
the acquisition and included within our results of operations for fiscal 2025 were immaterial.
Pro forma results of operations are not presented as the effect of the acquisition was not material to our financial
results.
SRS Acquisition
On March 27, 2024, we entered into a definitive agreement to acquire SRS, a leading residential specialty trade
distribution company across several verticals serving the professional roofer, landscaper and pool contractor. On
June 18, 2024, following the satisfaction or waiver of the applicable closing conditions, including receipt of the
requisite regulatory approvals, the acquisition was completed and all merger consideration was transferred. Under
the terms of the merger agreement, a subsidiary of The Home Depot, Inc. merged with and into Shingle Acquisition
Holdings, Inc., the parent company of SRS, with Shingle Acquisition Holdings, Inc. as the surviving entity and a
wholly owned subsidiary of the Company. The acquisition was completed to accelerate the Company’s growth with
Pros, including establishing the Company as a leading specialty trade distributor across multiple verticals,
complementing our existing capabilities, and enabling us to better serve complex project purchase occasions with
the renovator/remodeler. We primarily used a combination of proceeds from commercial paper borrowings, the
issuance of long-term debt, as well as cash on hand to fund the acquisition.
The acquisition was accounted for in accordance with Accounting Standards Codification Topic 805 “Business
Combinations,” and SRS’s results of operations have been consolidated in the Company’s financial statements
effective June 18, 2024. In fiscal 2024, we recorded a preliminary allocation of the purchase price to the assets
acquired and liabilities assumed based on their estimated acquisition date fair values. Measurement period
adjustments recognized in fiscal 2025 were immaterial, and we finalized our purchase price allocation during the
first quarter of fiscal 2025. Acquisition-related costs were expensed as incurred and were not material.
Fair Value of Consideration Transferred.
The following table summarizes total purchase consideration:
in millions
Total cash consideration
$
17,707
Fair value of common stock issued
(1)
321
Total purchase consideration
$
18,028
Table of Contents
Fiscal 2025 Form 10-K
71
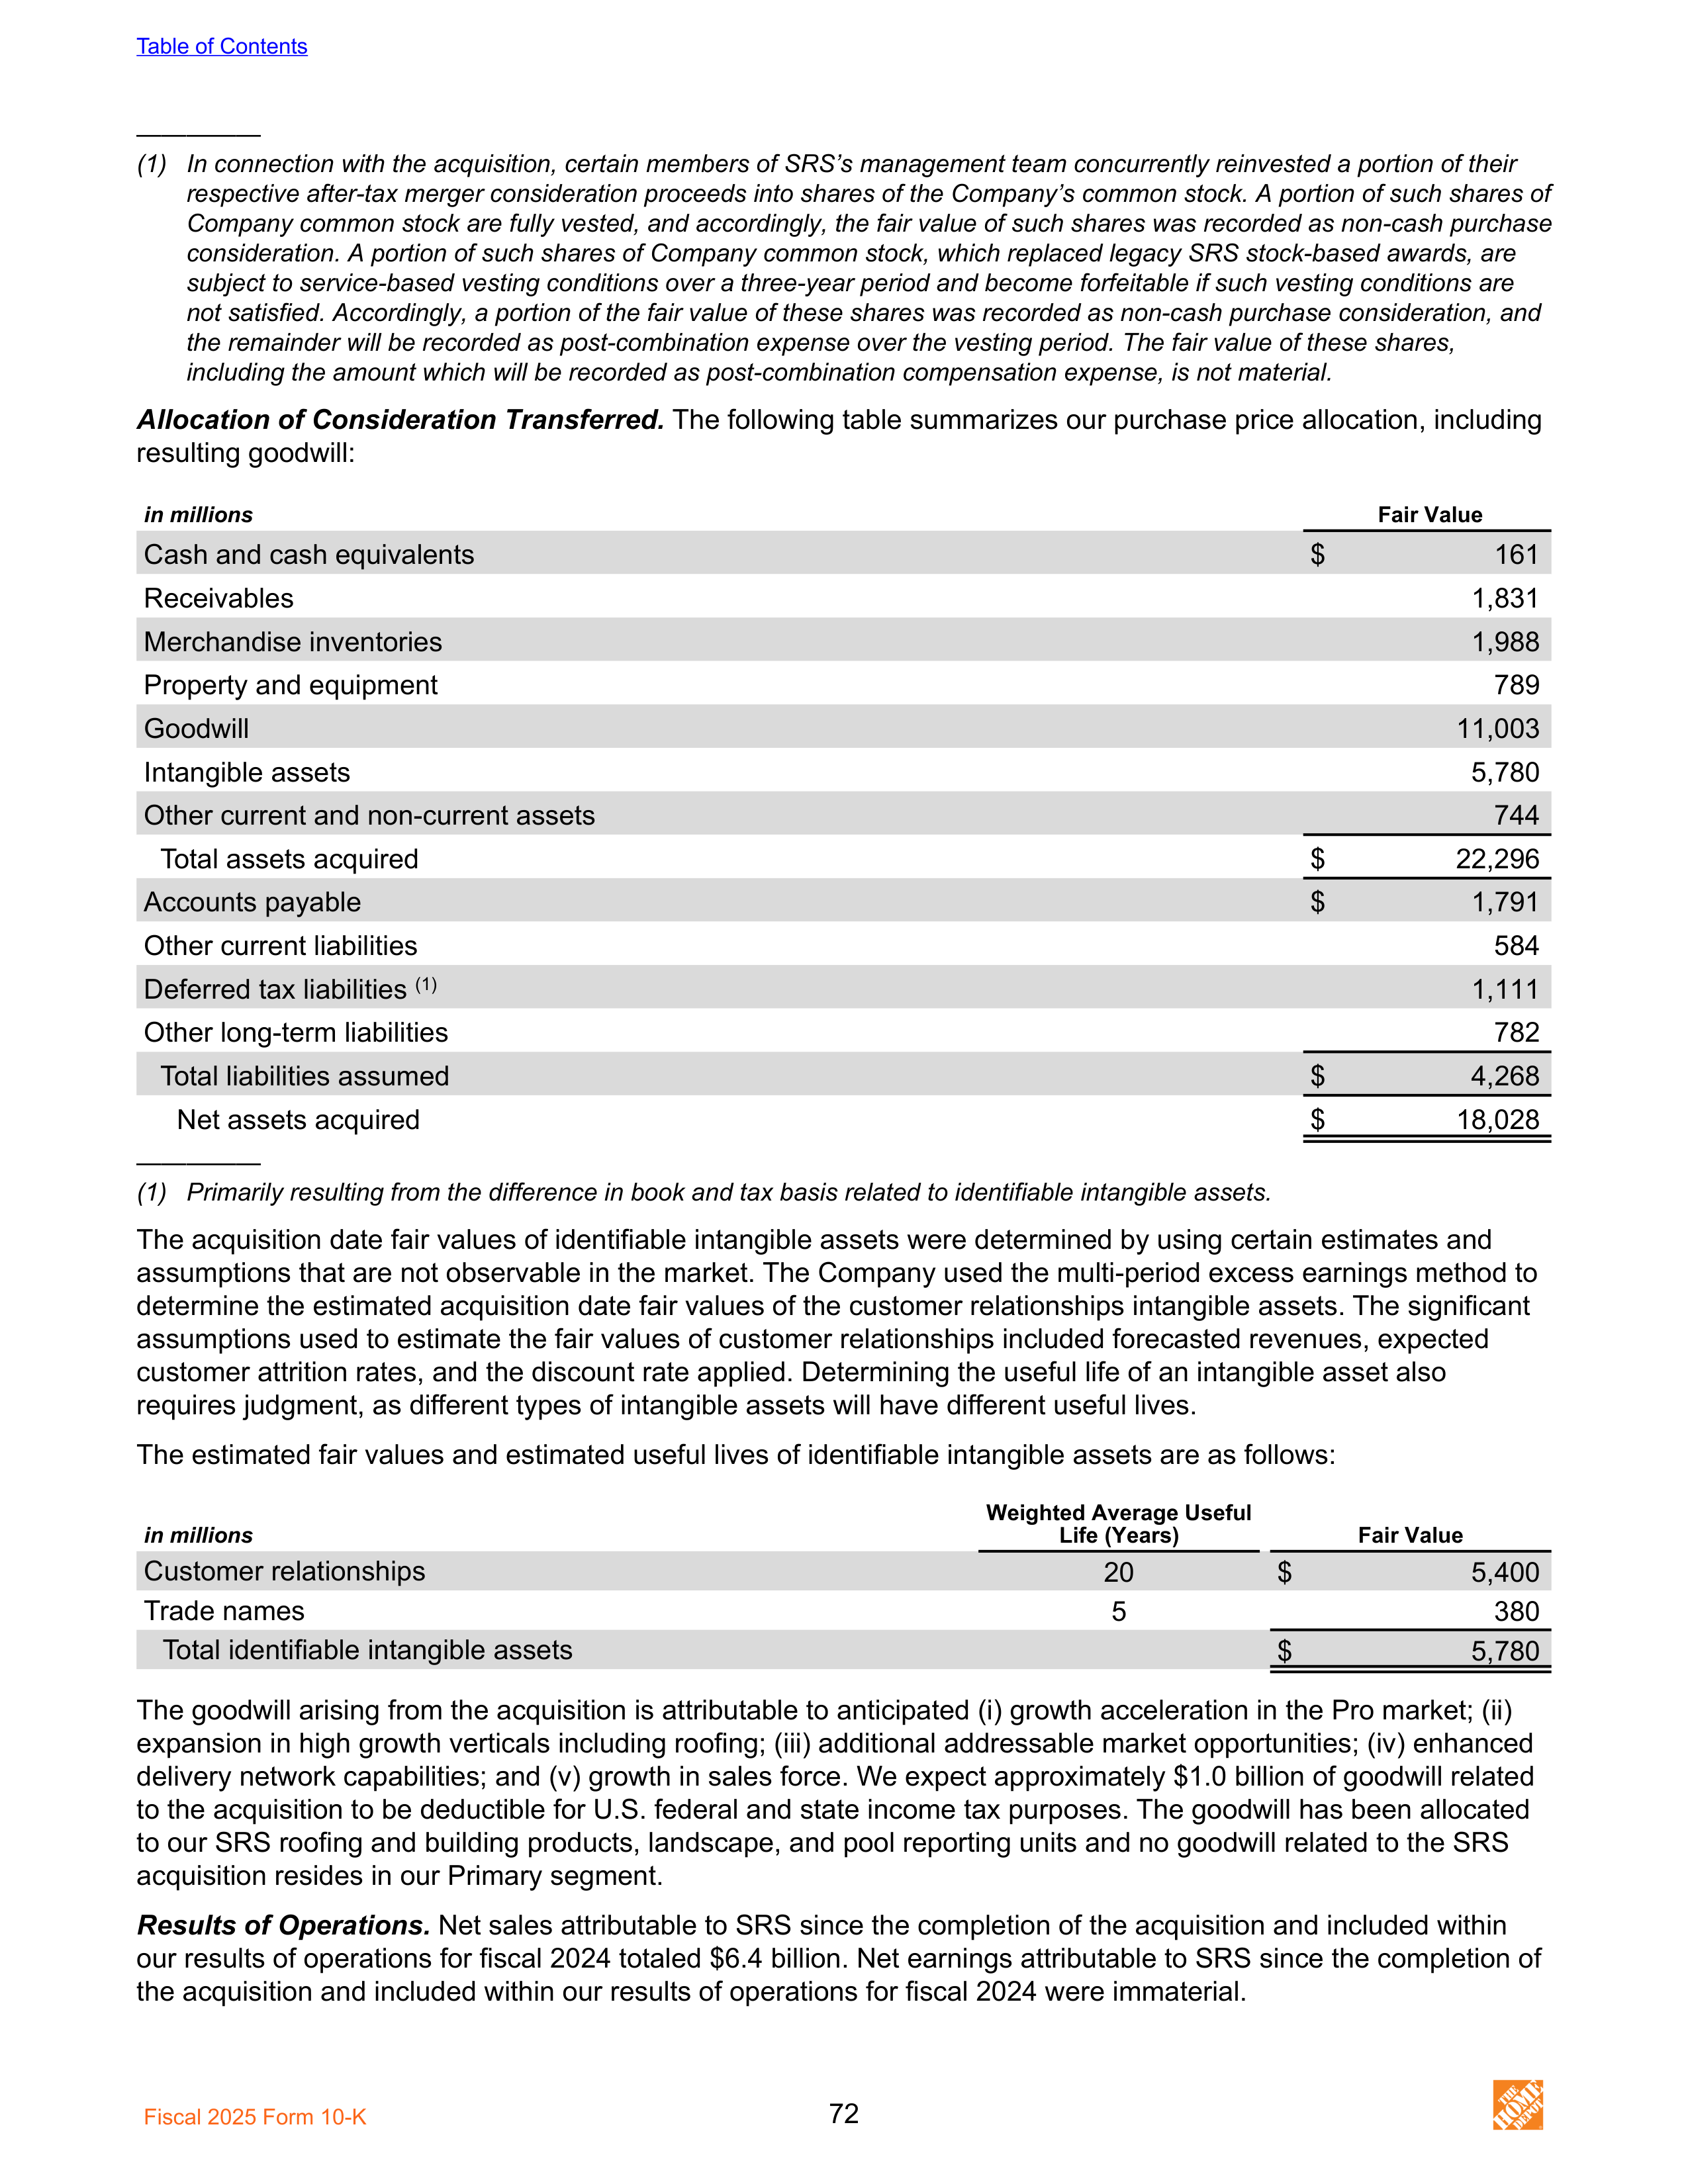
—————
(1) In connection with the acquisition, certain members of SRS’s management team concurrently reinvested a portion of their
respective after-tax merger consideration proceeds into shares of the Company’s common stock. A portion of such shares of
Company common stock are fully vested, and accordingly, the fair value of such shares was recorded as non-cash purchase
consideration. A portion of such shares of Company common stock, which replaced legacy SRS stock-based awards, are
subject to service-based vesting conditions over a three-year period and become forfeitable if such vesting conditions are
not satisfied. Accordingly, a portion of the fair value of these shares was recorded as non-cash purchase consideration, and
the remainder will be recorded as post-combination expense over the vesting period. The fair value of these shares,
including the amount which will be recorded as post-combination compensation expense, is not material.
Allocation of Consideration Transferred.
The following table summarizes our purchase price allocation, including
resulting goodwill:
in millions
Fair Value
Cash and cash equivalents
$
161
Receivables
1,831
Merchandise inventories
1,988
Property and equipment
789
Goodwill
11,003
Intangible assets
5,780
Other current and non-current assets
744
Total assets acquired
$
22,296
Accounts payable
$
1,791
Other current liabilities
584
Deferred tax liabilities
(1)
1,111
Other long-term liabilities
782
Total liabilities assumed
$
4,268
Net assets acquired
$
18,028
—————
(1) Primarily resulting from the difference in book and tax basis related to identifiable intangible assets.
The acquisition date fair values of identifiable intangible assets were determined by using certain estimates and
assumptions that are not observable in the market. The Company used the multi-period excess earnings method to
determine the estimated acquisition date fair values of the customer relationships intangible assets. The significant
assumptions used to estimate the fair values of customer relationships included forecasted revenues, expected
customer attrition rates, and the discount rate applied. Determining the useful life of an intangible asset also
requires judgment, as different types of intangible assets will have different useful lives.
The estimated fair values and estimated useful lives of identifiable intangible assets are as follows:
in millions
Weighted Average Useful
Life (Years)
Fair Value
Customer relationships
20
$
5,400
Trade names
5
380
Total identifiable intangible assets
$
5,780
The goodwill arising from the acquisition is attributable to anticipated (i) growth acceleration in the Pro market; (ii)
expansion in high growth verticals including roofing; (iii) additional addressable market opportunities; (iv) enhanced
delivery network capabilities; and (v) growth in sales force. We expect approximately $1.0 billion of goodwill related
to the acquisition to be deductible for U.S. federal and state income tax purposes. The goodwill has been allocated
to our SRS roofing and building products, landscape, and pool reporting units and no goodwill related to the SRS
acquisition resides in our Primary segment.
Results of Operations.
Net sales attributable to SRS since the completion of the acquisition and included within
our results of operations for fiscal 2024 totaled $6.4 billion. Net earnings attributable to SRS since the completion of
the acquisition and included within our results of operations for fiscal 2024 were immaterial.
Table of Contents
Fiscal 2025 Form 10-K
72
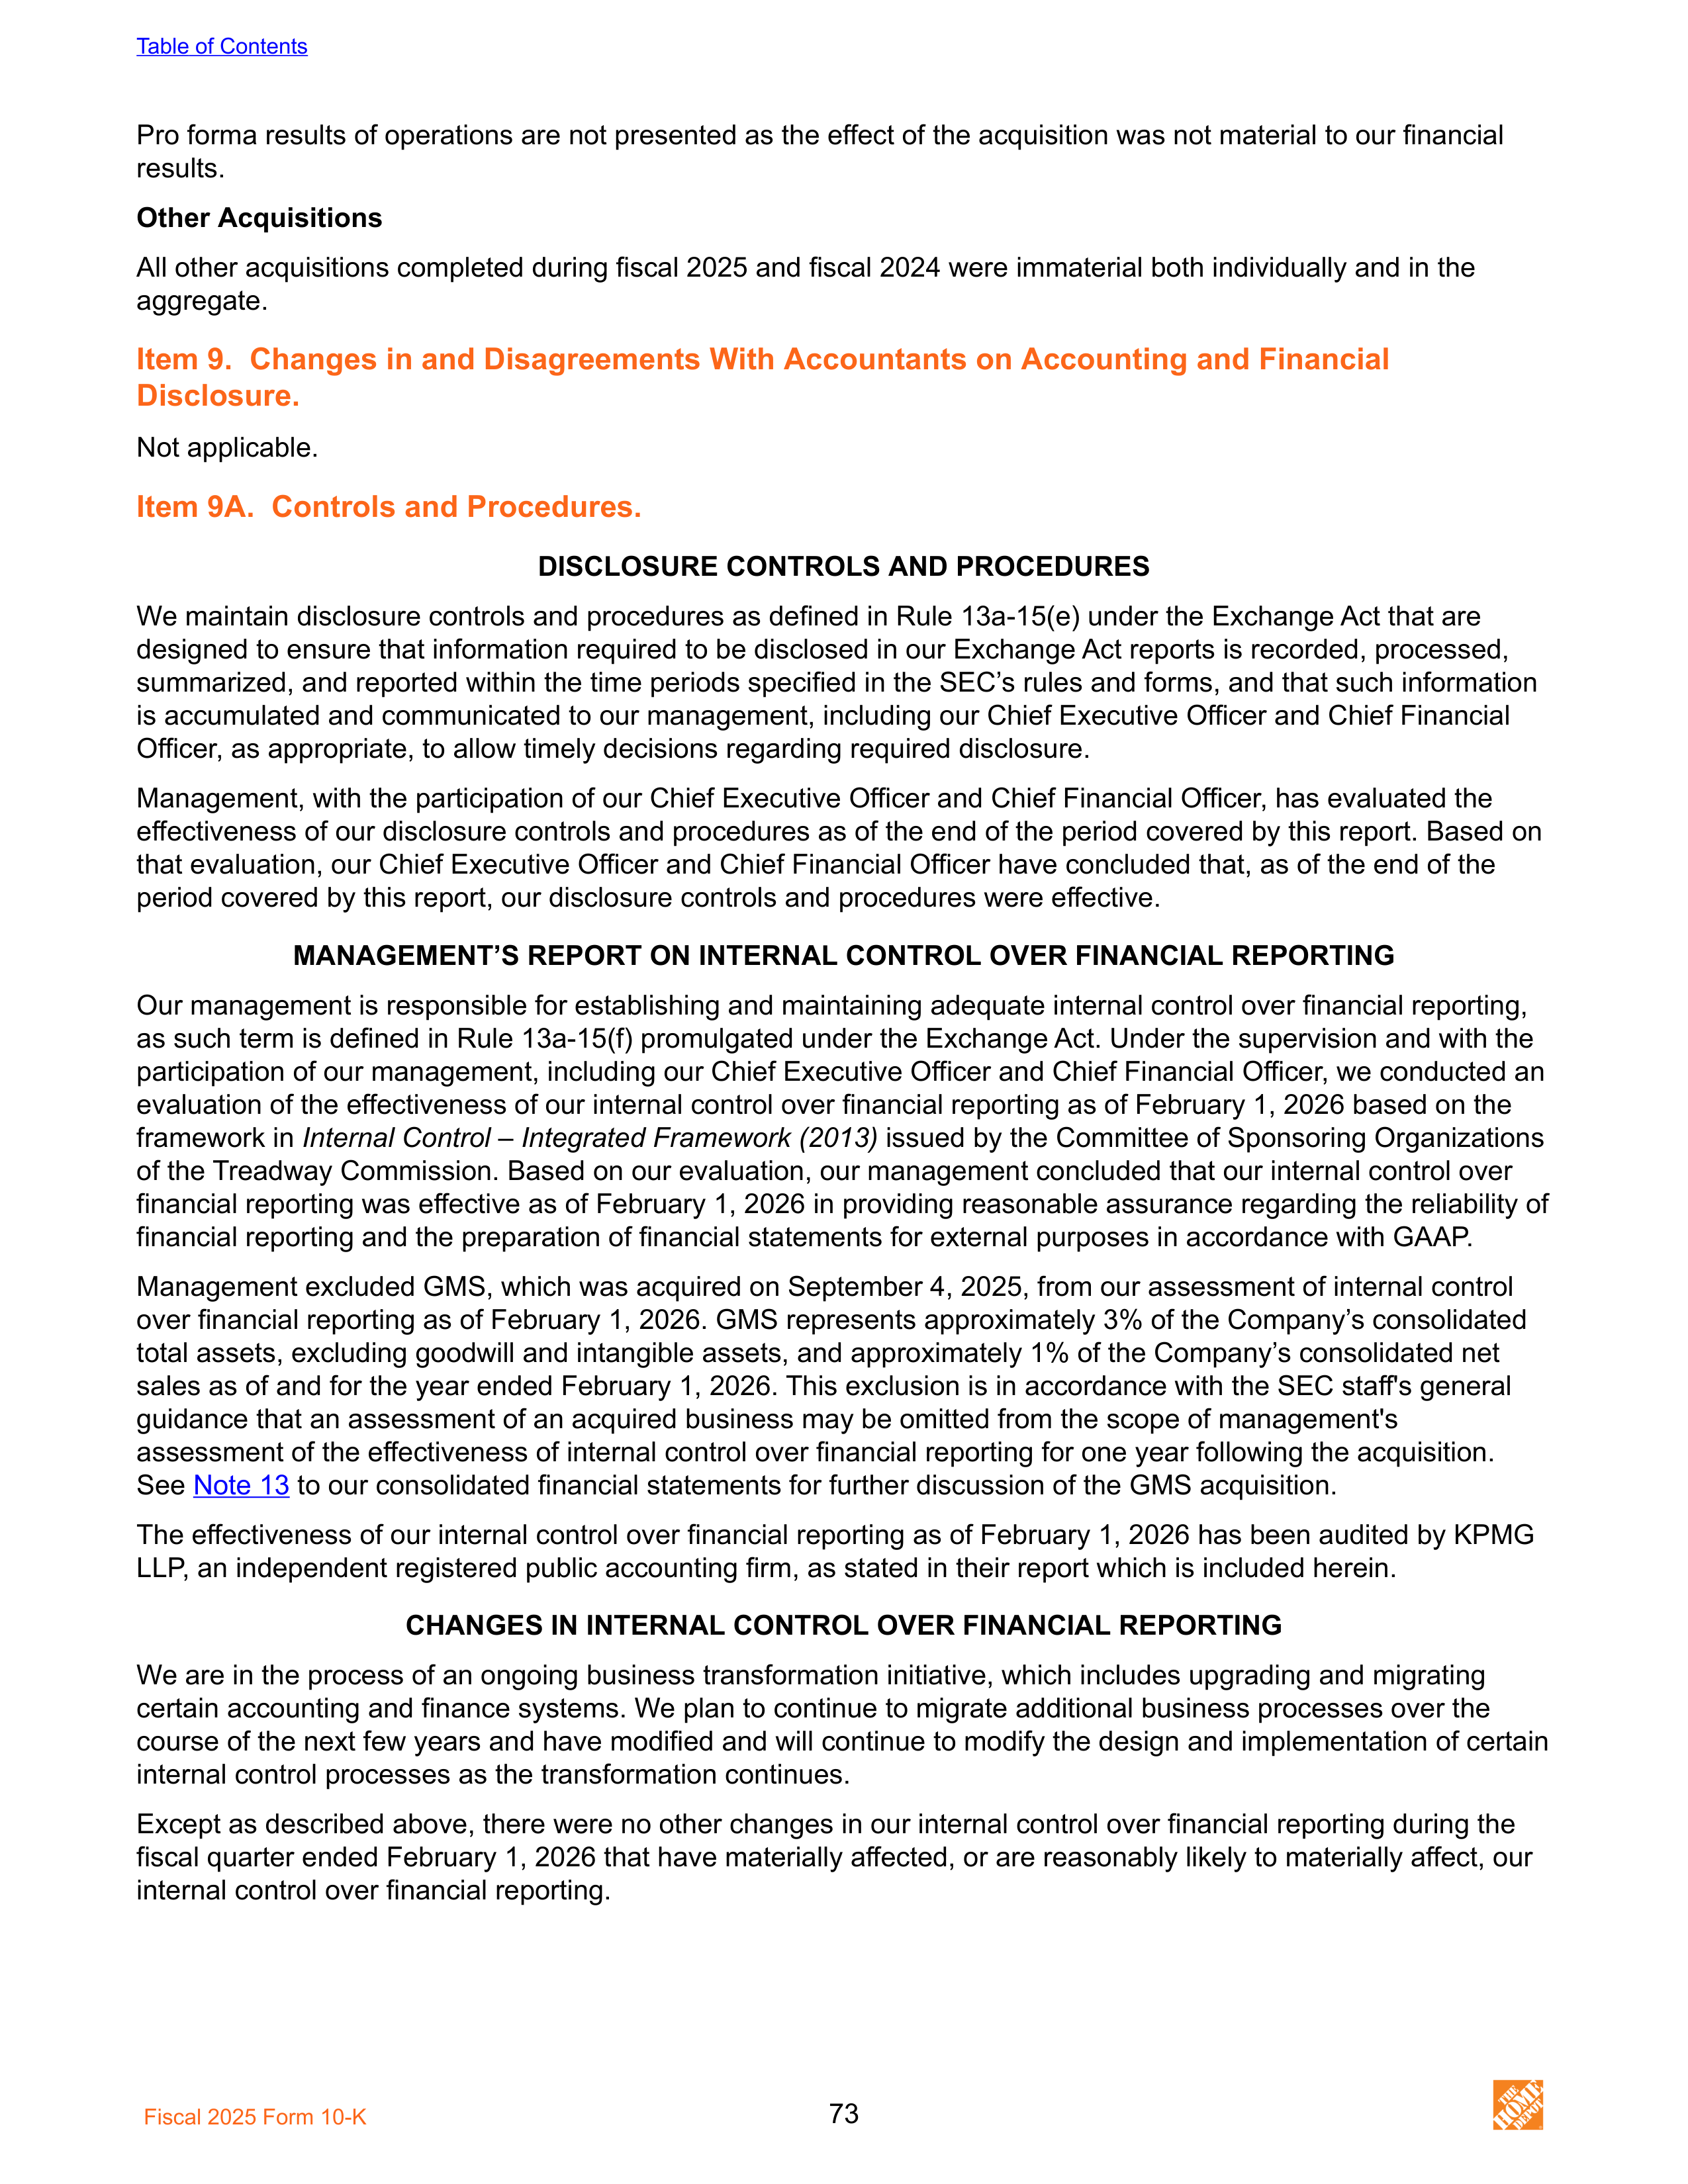
Pro forma results of operations are not presented as the effect of the acquisition was not material to our financial
results.
Other Acquisitions
All other acquisitions completed during fiscal 2025 and fiscal 2024 were immaterial both individually and in the
aggregate.
Item 9. Changes in and Disagreements With Accountants on Accounting and Financial
Disclosure.
Not applicable.
Item 9A. Controls and Procedures.
DISCLOSURE CONTROLS AND PROCEDURES
We maintain disclosure controls and procedures as defined in Rule 13a-15(e) under the Exchange Act that are
designed to ensure that information required to be disclosed in our Exchange Act reports is recorded, processed,
summarized, and reported within the time periods specified in the SEC’s rules and forms, and that such information
is accumulated and communicated to our management, including our Chief Executive Officer and Chief Financial
Officer, as appropriate, to allow timely decisions regarding required disclosure.
Management, with the participation of our Chief Executive Officer and Chief Financial Officer, has evaluated the
effectiveness of our disclosure controls and procedures as of the end of the period covered by this report. Based on
that evaluation, our Chief Executive Officer and Chief Financial Officer have concluded that, as of the end of the
period covered by this report, our disclosure controls and procedures were effective.
MANAGEMENT’S REPORT ON INTERNAL CONTROL OVER FINANCIAL REPORTING
Our management is responsible for establishing and maintaining adequate internal control over financial reporting,
as such term is defined in Rule 13a-15(f) promulgated under the Exchange Act. Under the supervision and with the
participation of our management, including our Chief Executive Officer and Chief Financial Officer, we conducted an
evaluation of the effectiveness of our internal control over financial reporting as of February 1, 2026 based on the
framework in
Internal Control – Integrated Framework (2013)
issued by the Committee of Sponsoring Organizations
of the Treadway Commission. Based on our evaluation, our management concluded that our internal control over
financial reporting was effective as of February 1, 2026 in providing reasonable assurance regarding the reliability of
financial reporting and the preparation of financial statements for external purposes in accordance with GAAP.
Management excluded GMS, which was acquired on September 4, 2025, from our assessment of internal control
over financial reporting as of February 1, 2026. GMS represents approximately 3% of the Company’s consolidated
total assets, excluding goodwill and intangible assets, and approximately 1% of the Company’s consolidated net
sales as of and for the year ended February 1, 2026. This exclusion is in accordance with the SEC staff's general
guidance that an assessment of an acquired business may be omitted from the scope of management's
assessment of the effectiveness of internal control over financial reporting for one year following the acquisition.
See
Note 13
to our consolidated financial statements for further discussion of the GMS acquisition.
The effectiveness of our internal control over financial reporting as of February 1, 2026 has been audited by KPMG
LLP, an independent registered public accounting firm, as stated in their report which is included herein.
CHANGES IN INTERNAL CONTROL OVER FINANCIAL REPORTING
We are in the process of an ongoing business transformation initiative, which includes upgrading and migrating
certain accounting and finance systems. We plan to continue to migrate additional business processes over the
course of the next few years and have modified and will continue to modify the design and implementation of certain
internal control processes as the transformation continues.
Except as described above, there were no other changes in our internal control over financial reporting during the
fiscal quarter ended February 1, 2026 that have materially affected, or are reasonably likely to materially affect, our
internal control over financial reporting.
Table of Contents
Fiscal 2025 Form 10-K
73
REPORT OF INDEPENDENT REGISTERED PUBLIC ACCOUNTING FIRM
To the Stockholders and the Board of Directors
The Home Depot, Inc.:
Opinion on Internal Control Over Financial Reporting
We have audited The Home Depot, Inc. and its subsidiaries' (the Company) internal control over financial reporting
as of February 1, 2026, based on criteria established in
Internal Control – Integrated Framework (2013)
issued by
the Committee of Sponsoring Organizations of the Treadway Commission. In our opinion, the Company maintained,
in all material respects, effective internal control over financial reporting as of February 1, 2026, based on criteria
established in
Internal Control – Integrated Framework (2013)
issued by the Committee of Sponsoring
Organizations of the Treadway Commission.
We also have audited, in accordance with the standards of the Public Company Accounting Oversight Board (United
States) (PCAOB), the consolidated balance sheets of the Company as of February 1, 2026 and February 2, 2025,
the related consolidated statements of earnings, comprehensive income, stockholders’ equity, and cash flows for
each of the fiscal years in the three-year period ended February 1, 2026, and the related notes (collectively, the
consolidated financial statements), and our report dated March 18, 2026 expressed an unqualified opinion on those
consolidated financial statements.
The Company acquired GMS Inc. (GMS) during fiscal 2025, and management excluded GMS from its assessment
of the effectiveness of the Company’s internal control over financial reporting as of February 1, 2026. GMS
represents approximately 3% of the Company’s consolidated total assets, excluding goodwill and intangible assets,
and approximately 1% of the Company’s consolidated net sales as of and for the fiscal year ended February 1,
2026. Our audit of internal control over financial reporting of the Company also excluded an evaluation of the
internal control over financial reporting of GMS.
Basis for Opinion
The Company’s management is responsible for maintaining effective internal control over financial reporting and for
its assessment of the effectiveness of internal control over financial reporting, included in the accompanying
Management’s Report on Internal Control Over Financial Reporting. Our responsibility is to express an opinion on
the Company’s internal control over financial reporting based on our audit. We are a public accounting firm
registered with the PCAOB and are required to be independent with respect to the Company in accordance with the
U.S. federal securities laws and the applicable rules and regulations of the Securities and Exchange Commission
and the PCAOB.
We conducted our audit in accordance with the standards of the PCAOB. Those standards require that we plan and
perform the audit to obtain reasonable assurance about whether effective internal control over financial reporting
was maintained in all material respects. Our audit of internal control over financial reporting included obtaining an
understanding of internal control over financial reporting, assessing the risk that a material weakness exists, and
testing and evaluating the design and operating effectiveness of internal control based on the assessed risk. Our
audit also included performing such other procedures as we considered necessary in the circumstances. We
believe that our audit provides a reasonable basis for our opinion.
Definition and Limitations of Internal Control Over Financial Reporting
A company’s internal control over financial reporting is a process designed to provide reasonable assurance
regarding the reliability of financial reporting and the preparation of financial statements for external purposes in
accordance with generally accepted accounting principles. A company’s internal control over financial reporting
includes those policies and procedures that (1) pertain to the maintenance of records that, in reasonable detail,
accurately and fairly reflect the transactions and dispositions of the assets of the company; (2) provide reasonable
assurance that transactions are recorded as necessary to permit preparation of financial statements in accordance
with generally accepted accounting principles, and that receipts and expenditures of the company are being made
only in accordance with authorizations of management and directors of the company; and (3) provide reasonable
assurance regarding prevention or timely detection of unauthorized acquisition, use, or disposition of the company’s
assets that could have a material effect on the financial statements.
Because of its inherent limitations, internal control over financial reporting may not prevent or detect misstatements.
Also, projections of any evaluation of effectiveness to future periods are subject to the risk that controls may
become inadequate because of changes in conditions, or that the degree of compliance with the policies or
procedures may deteriorate.
/s/ KPMG LLP
Atlanta, Georgia
March 18, 2026
Table of Contents
Fiscal 2025 Form 10-K
74
Item 9B. Other Information.
During the fiscal quarter ended February 1, 2026, no director or executive officer (as defined in the rules under
Section 16 of the Exchange Act) of the Company adopted or terminated a “Rule 10b5-1 trading arrangement” or
“non-Rule 10b5-1 trading arrangement,” as each term is defined in Item 408(a) of Regulation S-K.
Item 9C. Disclosure Regarding Foreign Jurisdictions that Prevent Inspections.
Not applicable.
PART III
Item 10. Directors, Executive Officers and Corporate Governance.
Information required by this item, other than the information regarding the executive officers set forth below, is
incorporated by reference to the sections entitled “Election of Directors,” “Corporate Governance,” “Executive
Compensation,” “General,” and “Audit Committee Report” in our Proxy Statement for the 2026 Annual Meeting of
Shareholders (“Proxy Statement”).
Executive officers are appointed by, and serve at the pleasure of, the Board. Our executive officers are as follows:
WILLIAM D. BASTEK, age 59, has been Executive Vice President – Merchandising, since March 2023. From
January 2019 to March 2023, Mr. Bastek served as Senior Vice President of Merchandising, Hardlines for the
Company, responsible for merchandising and marketing strategies for hardware and garden. Prior to that role, he
was Merchandising Vice President for hardware and tools from December 2013 to January 2019. Mr. Bastek began
his career in 1989 at HD Supply, formerly known as Maintenance Warehouse, which was originally acquired by the
Company in 1997. Mr. Bastek has served in various roles of increasing responsibility, including Global Product
Merchant, Senior Merchant, Divisional Merchandise Manager and Merchandising Vice President for building
materials.
JORDAN BROGGI, age 42, has been Executive Vice President – Customer Experience and President – Online
since June 2024. He served as Senior Vice President and President – Online from May 2022 to June 2024. From
October 2020 through May 2022, he served as Senior Vice President, Finance and from October 2016 to October
2020, he served as Vice President, Finance. Mr. Broggi joined the Company in 2013 and has held roles of
increasing responsibility in merchandising finance, supply chain finance, financial planning and analysis and
strategic business development. Prior to joining the Company, he held various positions in finance and strategy with
LexisNexis, Bain & Company, and General Motors.
ANGELA BROWN, age 50, has been Executive Vice President and Chief Information Officer since May 2025. Since
starting her career with the Company in 1998 as an associate systems engineer, she has held roles of increasing
responsibility in the technology organization. She most recently served as Senior Vice President of Information
Technology from May 2022 to May 2025, where she and her team were responsible for developing technology
solutions for merchandising, online, customer, marketing, Pro and supply chain functions. From 2017 to May 2022,
she served as Vice President, Information Services.
ANN-MARIE CAMPBELL, age 60, has been Senior Executive Vice President since November 2023. Ms. Campbell
began her career with the Company in 1985 as a cashier and has held roles of increasing responsibility during her
tenure. From October 2020 to October 2023, she served as Executive Vice President – U.S. Stores and
International Operations, from February 2016 to October 2020, she served as Executive Vice President –
U.S. Stores, from January 2009 to February 2016, she served as Division President of the Southern Division, and
from December 2005 to January 2009, she served as Vice President – Vendor Services.
JOHN DEATON, age 52, has been Executive Vice President – Supply Chain & Product Development since
November 2021. From April 2021 to October 2021, he served as Senior Vice President – Operations; from May
2017 to April 2021, he served as Senior Vice President – Supply Chain; from July 2011 to April 2017, he served as
Senior Vice President – Brand and Product Development; and from April 2007 to June 2011, he served as Vice
President – Supply Chain.
Table of Contents
Fiscal 2025 Form 10-K
75
EDWARD P. DECKER, age 63, has served as our Chair since October 2022, and as our President and Chief
Executive Officer since March 2022. He served as our President and Chief Operating Officer from October 2020
through February 2022. From August 2014 to October 2020, he served as Executive Vice President –
Merchandising, and from October 2006 through July 2014, he served as Senior Vice President – Retail Finance,
Pricing Analytics, and Assortment Planning. Mr. Decker joined the Company in 2000 and held various strategic
planning roles, including serving as Vice President – Strategic Business Development from November 2002 to April
2006 and Senior Vice President – Strategic Business and Asset Development from April 2006 to September 2006.
Prior to joining the Company, Mr. Decker held various positions in strategic planning, business development,
finance, and treasury at Kimberly-Clark Corp. and Scott Paper Co., both of which are consumer products
companies.
RICHARD V. McPHAIL, age 55, has been Executive Vice President and Chief Financial Officer since September
2019. From August 2017 through August 2019, he served as Senior Vice President, Finance Control and
Administration of the Company, and was responsible for financial planning and analysis, enterprise financial
reporting and operations, commercial financial services, treasury, tax, and international financial operations. From
August 2014 to September 2017, he served as Senior Vice President, Finance, with responsibility for U.S. Retail
finance, strategic and financial planning, and business development activity. Mr. McPhail served as Senior Vice
President, Global FP&A, Strategy, and New Business Development, from March 2013 to August 2014. Mr. McPhail
joined the Company in 2005 and served in roles of increasing responsibility in finance, strategy and business
development from May 2005 to March 2013. Prior to joining the Company, Mr. McPhail served as executive vice
president of corporate finance for Marconi Corporation plc in London, England. Prior to Marconi, Mr. McPhail held
positions with Wachovia Securities and Arthur Andersen.
TERESA WYNN ROSEBOROUGH, age 67, has been Executive Vice President, General Counsel and Corporate
Secretary since November 2011. From April 2006 through November 2011, Ms. Roseborough served in several
legal positions with MetLife, Inc., a provider of insurance and other financial services, including Senior Chief
Counsel – Compliance & Litigation and as Deputy General Counsel. Prior to joining MetLife, Ms. Roseborough was
a partner with the law firm Sutherland Asbill & Brennan LLP from February 1996 through March 2006 and a Deputy
Assistant Attorney General in the Office of Legal Counsel of the United States Department of Justice from January
1994 through February 1996. Ms. Roseborough serves as a director of Hartford Insurance Group, Inc. (formerly
known as The Hartford Financial Services Group, Inc.), an investment and insurance company.
MICHAEL ROWE, age 58, currently serves as Executive Vice President - Pro. He previously served as President of
The Home Depot Canada from October 2020 to February 2025. From November 2016 to October 2020, he served
as Vice President of Online, Marketing and Contractor Services for The Home Depot Canada, where he was
responsible for marketing, advertising, e-commerce, installation services, contractor services, and strategy. Mr.
Rowe joined the Company in 2006, serving in various roles for The Home Depot Canada, including Chief Financial
Officer, Vice President of Finance and Contractor Services, Procurement and Strategic Business Development.
Prior to joining the Company, Mr. Rowe held positions of increasing responsibility at Maple Leaf Foods, Reckitt
Benckiser and Procter & Gamble.
STEPHANIE SMITH, age 49, has served as Executive Vice President – Human Resources since June 2025. She
previously served as Executive Vice President supporting the Human Resources function from February 2025 to
June 2025. Ms. Smith joined the Company in 2003 in store operations and has held roles of increasing
responsibility in store operations, merchandising operations and supply chain since that time. She served as Senior
Vice President of Supply Chain from May 2019 to February 2025. In that role, she was responsible for inventory
management, transportation, delivery, and supply chain analytics functions across all customer-selling channels,
including store, online and Pro. Prior to joining the Company, Ms. Smith was a consultant with Ernst & Young, LLP.
Item 11. Executive Compensation.
The information required by this item is incorporated by reference to the sections entitled “Executive
Compensation,” “Director Compensation,” “Leadership Development and Compensation Committee Report,” and
“CEO Pay Ratio” in our Proxy Statement.
Item 12. Security Ownership of Certain Beneficial Owners and Management and Related
Stockholder Matters.
The information required by this item is incorporated by reference to the sections entitled “Beneficial Ownership of
Common Stock” and “Equity Compensation Plan Information” in our Proxy Statement.
Table of Contents
Fiscal 2025 Form 10-K
76
Item 13. Certain Relationships and Related Transactions, and Director Independence.
The information required by this item is incorporated by reference to the section entitled “Corporate Governance” in
our Proxy Statement.
Item 14. Principal Accountant Fees and Services.
The information required by this item is incorporated by reference to the section entitled “Independent Registered
Public Accounting Firm’s Fees” in our Proxy Statement.
PART IV
Item 15. Exhibits and Financial Statement Schedules.
The following documents are filed as part of this report:
1. Financial Statements
The following financial statements are set forth in Item 8 hereof:
•
Report of Independent Registered Public Accounting Firm (KPMG LLP, Atlanta, GA, Auditor Firm ID: 185);
•
Consolidated Balance Sheets as of February 1, 2026 and February 2, 2025;
•
Consolidated Statements of Earnings for fiscal 2025, fiscal 2024, and fiscal 2023;
•
Consolidated Statements of Comprehensive Income for fiscal 2025, fiscal 2024, and fiscal 2023;
•
Consolidated Statements of Stockholders’ Equity for fiscal 2025, fiscal 2024, and fiscal 2023;
•
Consolidated Statements of Cash Flows for fiscal 2025, fiscal 2024, and fiscal 2023; and
•
Notes to Consolidated Financial Statements.
2. Financial Statement Schedules
All schedules are omitted, as the required information is inapplicable or the information is presented in our
consolidated financial statements or related notes.
3. Exhibits
Exhibits not filed or furnished herewith are incorporated by reference to exhibits previously filed with the SEC, as
reflected in the table below. Our Current, Quarterly, and Annual Reports are filed with the SEC under File
No. 1-8207. Our Registration Statements have the file numbers noted wherever such statements are identified in
the following list of exhibits. We will furnish a copy of any exhibit to shareholders without charge upon written
request to Investor Relations, The Home Depot, Inc., 2455 Paces Ferry Road, Atlanta, Georgia 30339, via the
internet at http://ir.homedepot.com, or by calling Investor Relations at (770) 384-2871.
The Company is not filing any instruments evidencing any indebtedness because the total amount of securities
authorized under any single such instrument does not exceed 10% of the total assets of the Company and its
subsidiaries on a consolidated basis. Copies of such instruments will be furnished to the SEC upon request.
2.1
Agreement and Plan of Merger, dated as of
March 27, 2024 by and among The Home Depot,
Inc., Star Acquisition Merger Sub Inc., Shingle
Acquisition Holdings, Inc. and Shingle
Acquisition, LP
Form 10-Q for the fiscal quarter ended April 28,
2024, Exhibit 2.1
3.1
Amended and Restated Certificate of
Incorporation of The Home Depot, Inc.
Form 10-Q for the fiscal quarter ended July 31,
2011, Exhibit 3.1
3.2
By-Laws of The Home Depot, Inc. (As Amended
and Restated Effective November 20, 2025)
Form 8-K filed November 24, 2025, Exhibit 3.2
4.1
Indenture, dated as of May 4, 2005, between The
Home Depot, Inc. and The Bank of New York
Mellon Trust Company, N.A. (fka The Bank of
New York Trust Company, N.A.), as Trustee
Form S-3 (File No. 333-124699) filed May 6,
2005, Exhibit 4.1
4.2
Indenture, dated as of August 24, 2012, between
The Home Depot, Inc. and Deutsche Bank Trust
Company Americas, as Trustee
Form S-3 (File No. 333-183621) filed August 29,
2012, Exhibit 4.3
Exhibit
Description
Reference
Table of Contents
Fiscal 2025 Form 10-K
77
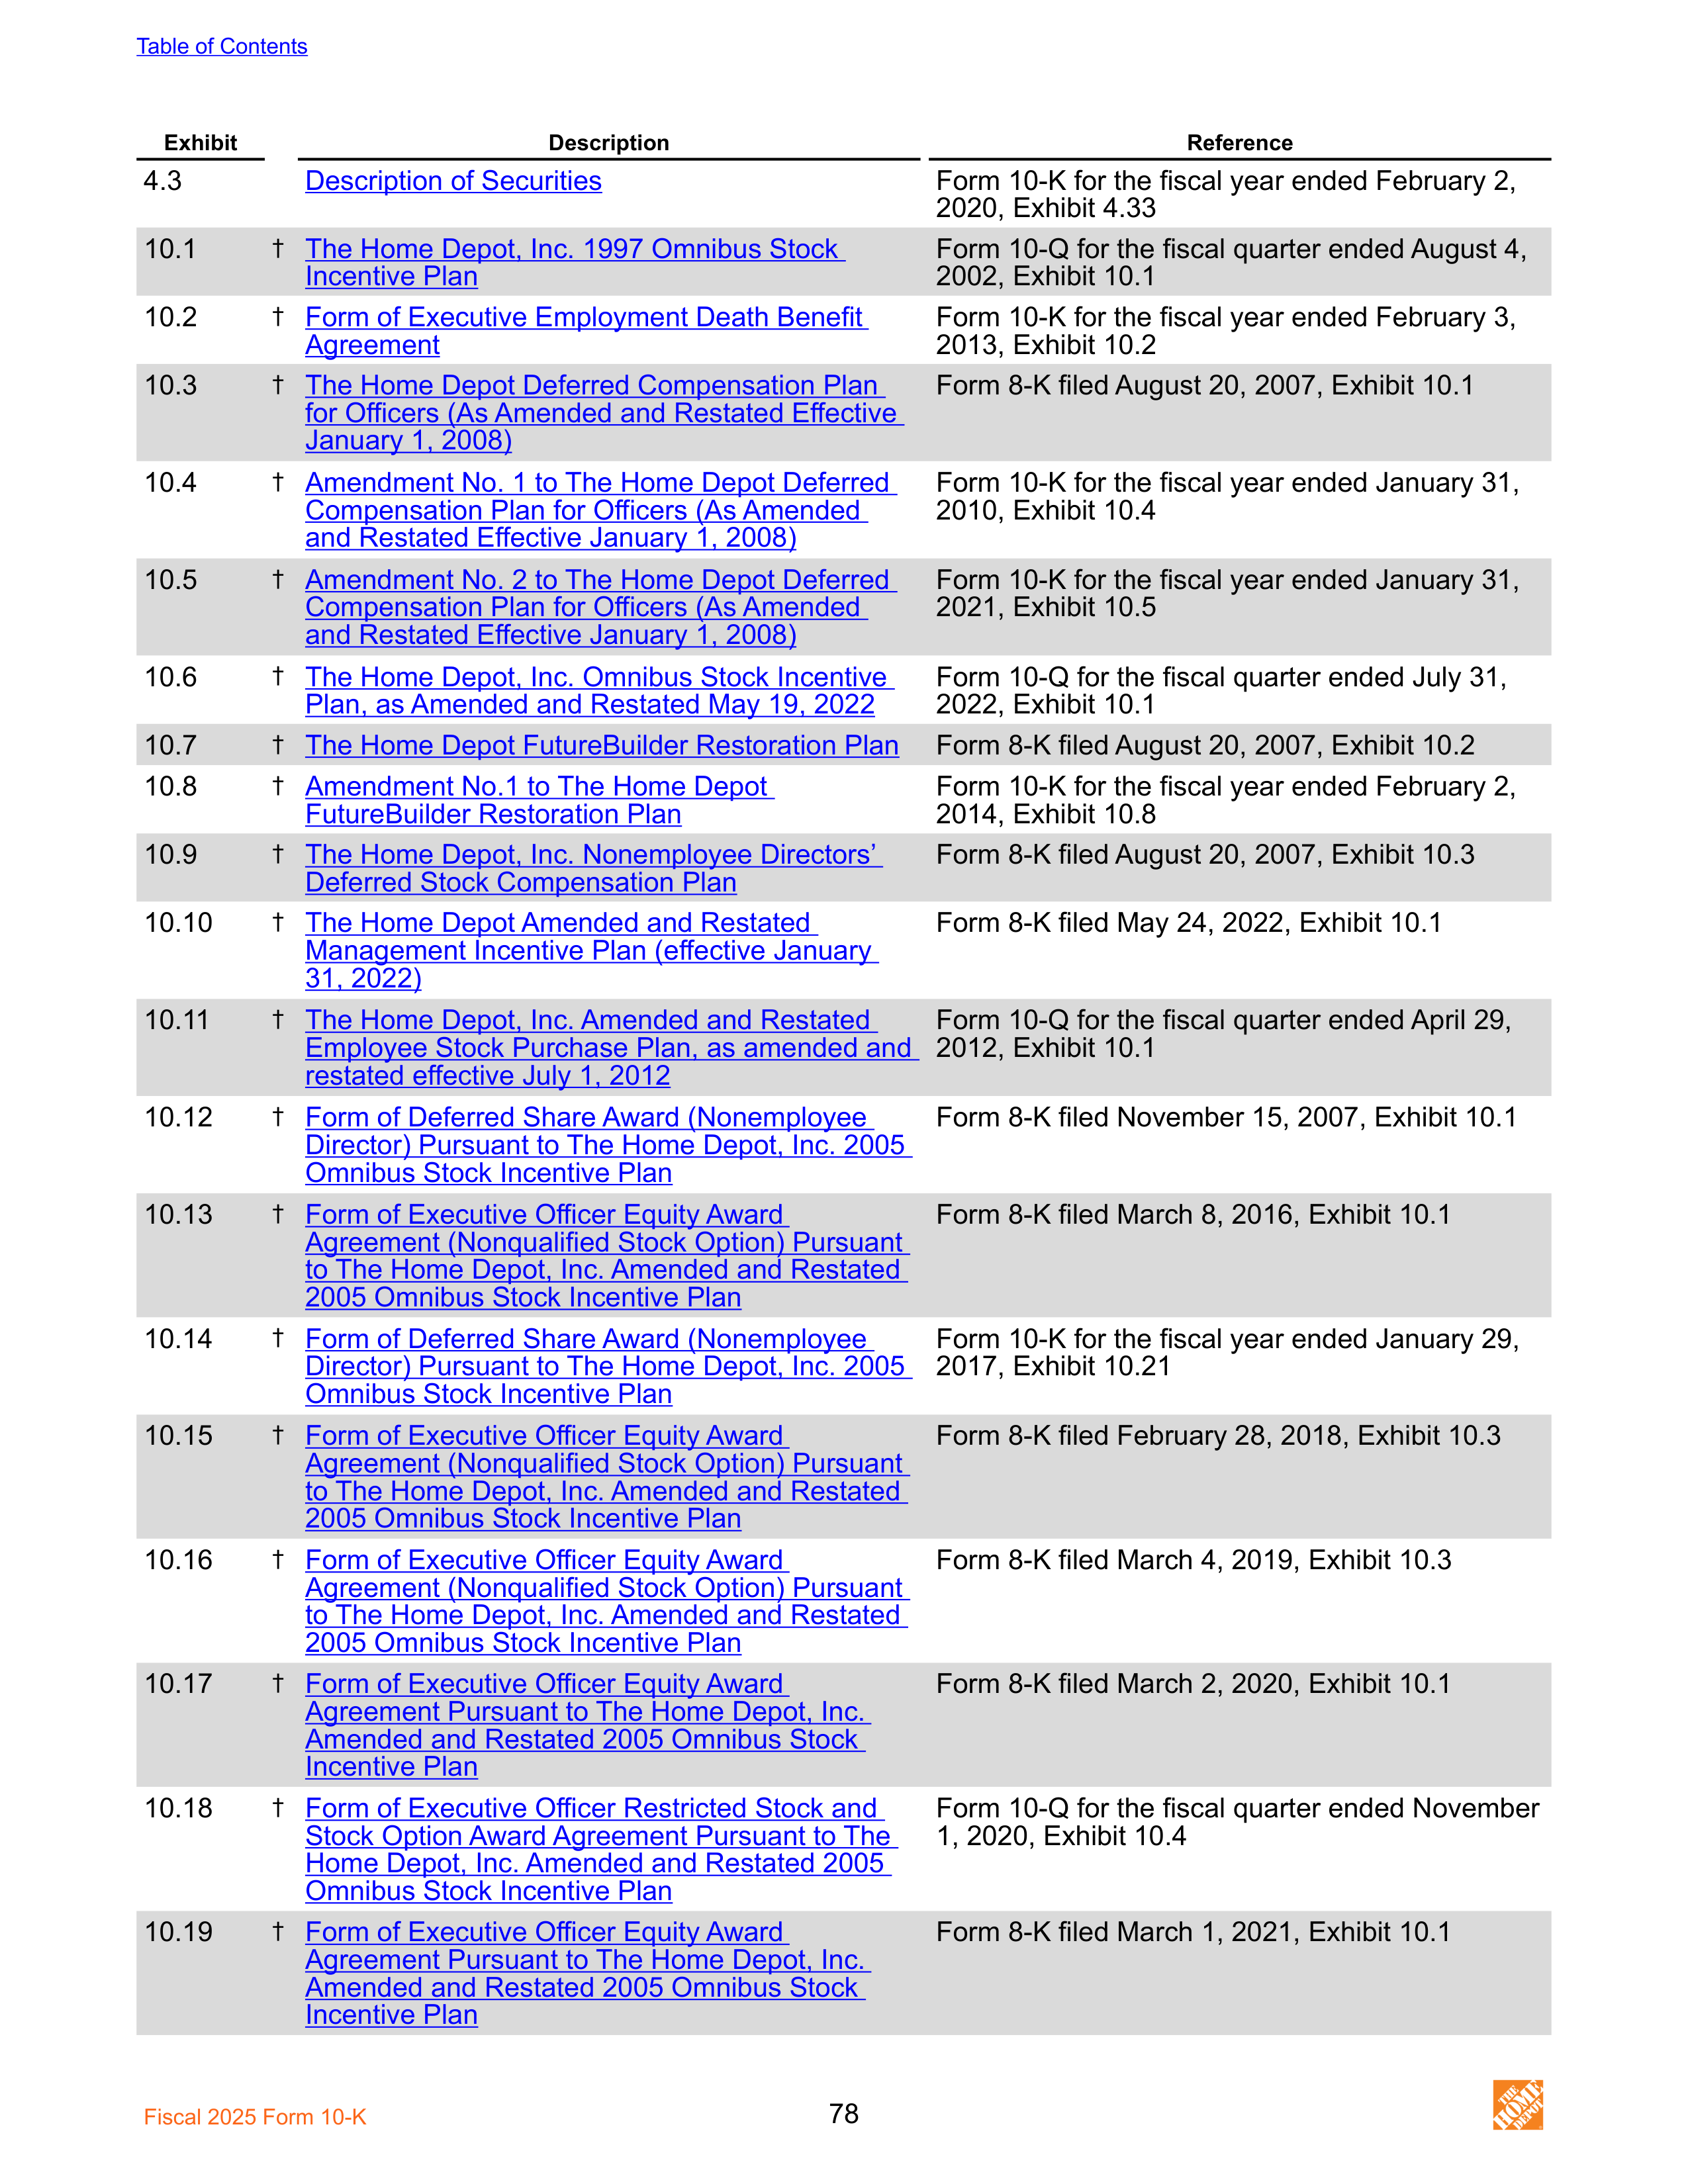
4.3
Description of Securities
Form 10-K for the fiscal year ended February 2,
2020, Exhibit 4.33
10.1
†
The Home Depot, Inc. 1997 Omnibus Stock
Incentive Plan
Form 10-Q for the fiscal quarter ended August 4,
2002, Exhibit 10.1
10.2
†
Form of Executive Employment Death Benefit
Agreement
Form 10-K for the fiscal year ended February 3,
2013, Exhibit 10.2
10.3
†
The Home Depot Deferred Compensation Plan
for Officers (As Amended and Restated Effective
January 1, 2008)
Form 8-K filed August 20, 2007, Exhibit 10.1
10.4
†
Amendment No. 1 to The Home Depot Deferred
Compensation Plan for Officers (As Amended
and Restated Effective January 1, 2008)
Form 10-K for the fiscal year ended January 31,
2010, Exhibit 10.4
10.5
†
Amendment No. 2 to The Home Depot Deferred
Compensation Plan for Officers (As Amended
and Restated Effective January 1, 2008)
Form 10-K for the fiscal year ended January 31,
2021, Exhibit 10.5
10.6
†
The Home Depot, Inc. Omnibus Stock Incentive
Plan, as Amended and Restated May 19, 2022
Form 10-Q for the fiscal quarter ended July 31,
2022, Exhibit 10.1
10.7
†
The Home Depot FutureBuilder Restoration Plan
Form 8-K filed August 20, 2007, Exhibit 10.2
10.8
†
Amendment No.1 to The Home Depot
FutureBuilder Restoration Plan
Form 10-K for the fiscal year ended February 2,
2014, Exhibit 10.8
10.9
†
The Home Depot, Inc. Nonemployee Directors’
Deferred Stock Compensation Plan
Form 8-K filed August 20, 2007, Exhibit 10.3
10.10
†
The Home Depot Amended and Restated
Management Incentive Plan (effective January
31, 2022)
Form 8-K filed May 24, 2022, Exhibit 10.1
10.11
†
The Home Depot, Inc. Amended and Restated
Employee Stock Purchase Plan, as amended and
restated effective July 1, 2012
Form 10-Q for the fiscal quarter ended April 29,
2012, Exhibit 10.1
10.12
†
Form of Deferred Share Award (Nonemployee
Director) Pursuant to The Home Depot, Inc. 2005
Omnibus Stock Incentive Plan
Form 8-K filed November 15, 2007, Exhibit 10.1
10.13
†
Form of Executive Officer Equity Award
Agreement (Nonqualified Stock Option) Pursuant
to The Home Depot, Inc. Amended and Restated
2005 Omnibus Stock Incentive Plan
Form 8-K filed March 8, 2016, Exhibit 10.1
10.14
†
Form of Deferred Share Award (Nonemployee
Director) Pursuant to The Home Depot, Inc. 2005
Omnibus Stock Incentive Plan
Form 10-K for the fiscal year ended January 29,
2017, Exhibit 10.21
10.15
†
Form of Executive Officer Equity Award
Agreement (Nonqualified Stock Option) Pursuant
to The Home Depot, Inc. Amended and Restated
2005 Omnibus Stock Incentive Plan
Form 8-K filed February 28, 2018, Exhibit 10.3
10.16
†
Form of Executive Officer Equity Award
Agreement (Nonqualified Stock Option) Pursuant
to The Home Depot, Inc. Amended and Restated
2005 Omnibus Stock Incentive Plan
Form 8-K filed March 4, 2019, Exhibit 10.3
10.17
†
Form of Executive Officer Equity Award
Agreement Pursuant to The Home Depot, Inc.
Amended and Restated 2005 Omnibus Stock
Incentive Plan
Form 8-K filed March 2, 2020, Exhibit 10.1
10.18
†
Form of Executive Officer Restricted Stock and
Stock Option Award Agreement Pursuant to The
Home Depot, Inc. Amended and Restated 2005
Omnibus Stock Incentive Plan
Form 10-Q for the fiscal quarter ended November
1, 2020, Exhibit 10.4
10.19
†
Form of Executive Officer Equity Award
Agreement Pursuant to The Home Depot, Inc.
Amended and Restated 2005 Omnibus Stock
Incentive Plan
Form 8-K filed March 1, 2021, Exhibit 10.1
Exhibit
Description
Reference
Table of Contents
Fiscal 2025 Form 10-K
78
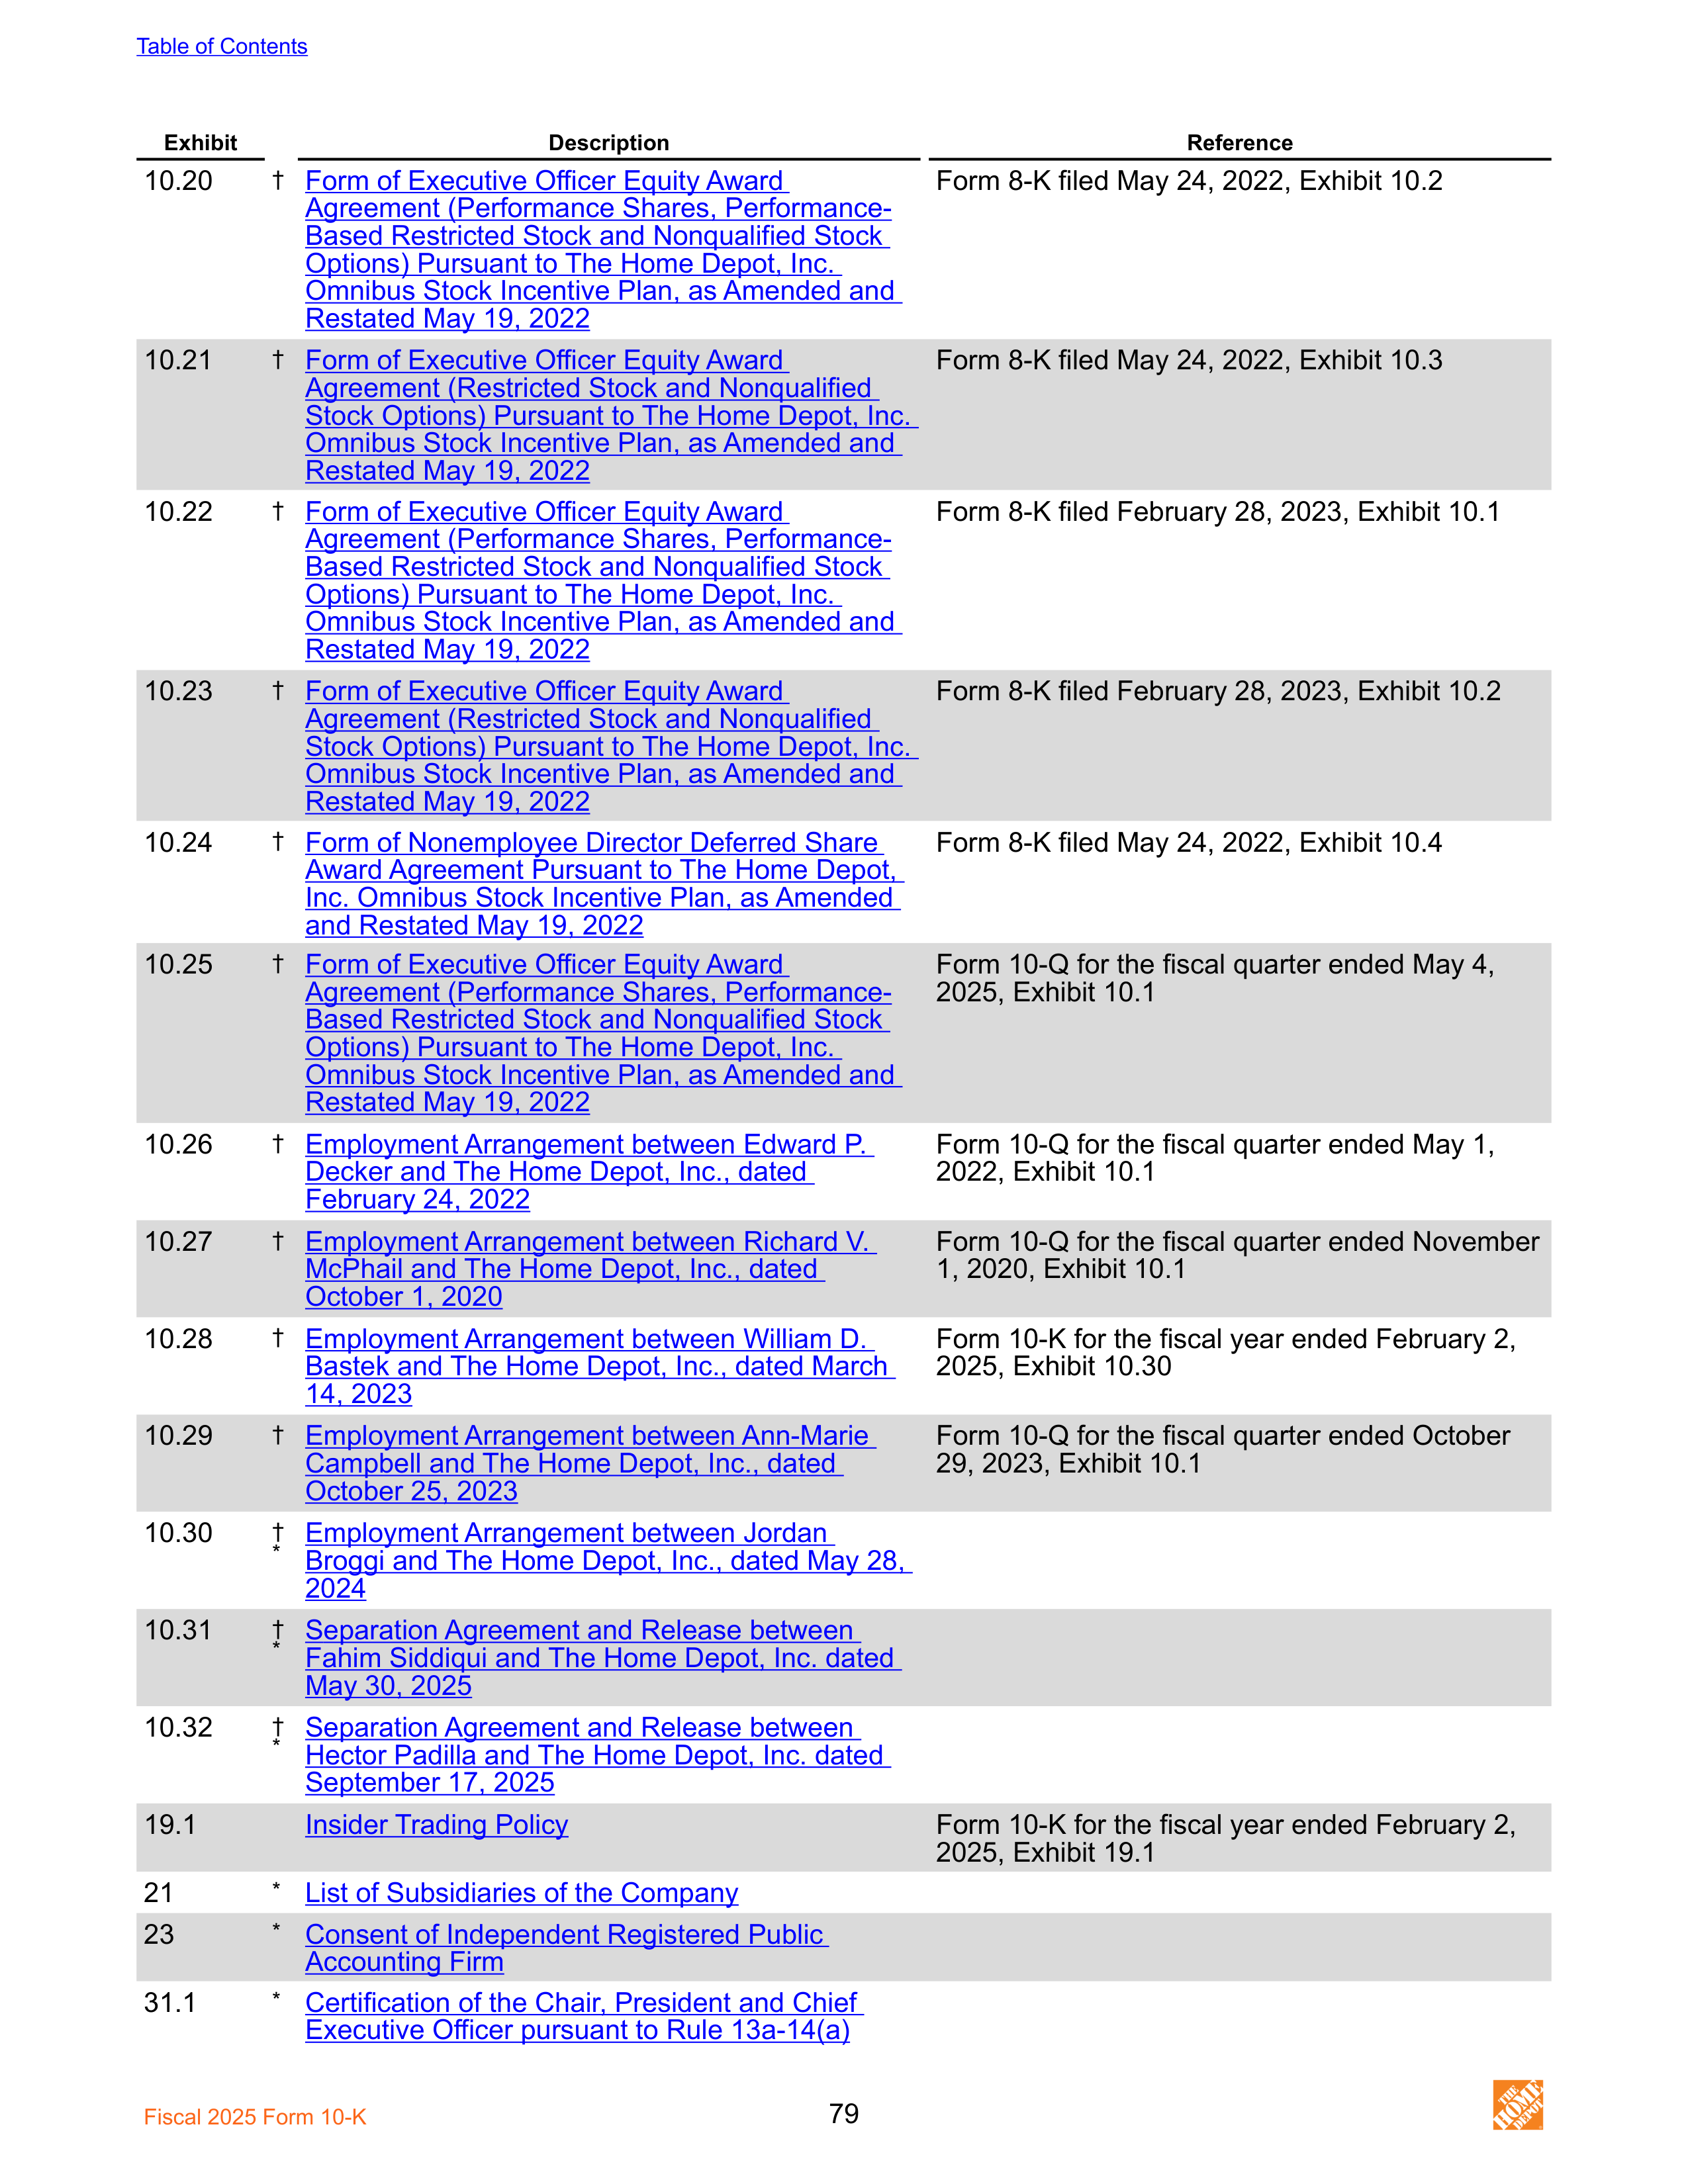
10.20
†
Form of Executive Officer Equity Award
Agreement (Performance Shares, Performance-
Based Restricted Stock and Nonqualified Stock
Options) Pursuant to The Home Depot, Inc.
Omnibus Stock Incentive Plan, as Amended and
Restated May 19, 2022
Form 8-K filed May 24, 2022, Exhibit 10.2
10.21
†
Form of Executive Officer Equity Award
Agreement (Restricted Stock and Nonqualified
Stock Options) Pursuant to The Home Depot, Inc.
Omnibus Stock Incentive Plan, as Amended and
Restated May 19, 2022
Form 8-K filed May 24, 2022, Exhibit 10.3
10.22
†
Form of Executive Officer Equity Award
Agreement (Performance Shares, Performance-
Based Restricted Stock and Nonqualified Stock
Options) Pursuant to The Home Depot, Inc.
Omnibus Stock Incentive Plan, as Amended and
Restated May 19, 2022
Form 8-K filed February 28, 2023, Exhibit 10.1
10.23
†
Form of Executive Officer Equity Award
Agreement (Restricted Stock and Nonqualified
Stock Options) Pursuant to The Home Depot, Inc.
Omnibus Stock Incentive Plan, as Amended and
Restated May 19, 2022
Form 8-K filed February 28, 2023, Exhibit 10.2
10.24
†
Form of Nonemployee Director Deferred Share
Award Agreement Pursuant to The Home Depot,
Inc. Omnibus Stock Incentive Plan, as Amended
and Restated May 19, 2022
Form 8-K filed May 24, 2022, Exhibit 10.4
10.25
†
Form of Executive Officer Equity Award
Agreement (Performance Shares, Performance-
Based Restricted Stock and Nonqualified Stock
Options) Pursuant to The Home Depot, Inc.
Omnibus Stock Incentive Plan, as Amended and
Restated May 19, 2022
Form 10-Q for the fiscal quarter ended May 4,
2025, Exhibit 10.1
10.26
†
Employment Arrangement between Edward P.
Decker and The Home Depot, Inc., dated
February 24, 2022
Form 10-Q for the fiscal quarter ended May 1,
2022, Exhibit 10.1
10.27
†
Employment Arrangement between Richard V.
McPhail and The Home Depot, Inc., dated
October 1, 2020
Form 10-Q for the fiscal quarter ended November
1, 2020, Exhibit 10.1
10.28
†
Employment Arrangement between William D.
Bastek and The Home Depot, Inc., dated March
14, 2023
Form 10-K for the fiscal year ended February 2,
2025, Exhibit 10.30
10.29
†
Employment Arrangement between Ann-Marie
Campbell and The Home Depot, Inc., dated
October 25, 2023
Form 10-Q for the fiscal quarter ended October
29, 2023, Exhibit 10.1
10.30
†
*
Employment Arrangement between Jordan
Broggi and The Home Depot, Inc., dated May 28,
2024
10.31
†
*
Separation Agreement and Release between
Fahim Siddiqui and The Home Depot, Inc. dated
May 30, 2025
10.32
†
*
Separation Agreement and Release between
Hector Padilla and The Home Depot, Inc. dated
September 17, 2025
19.1
Insider Trading Policy
Form 10-K for the fiscal year ended February 2,
2025, Exhibit 19.1
21
*
List of Subsidiaries of the Company
23
*
Consent of Independent Registered Public
Accounting Firm
31.1
*
Certification of the Chair, President and Chief
Executive Officer pursuant to Rule 13a-14(a)
Exhibit
Description
Reference
Table of Contents
Fiscal 2025 Form 10-K
79
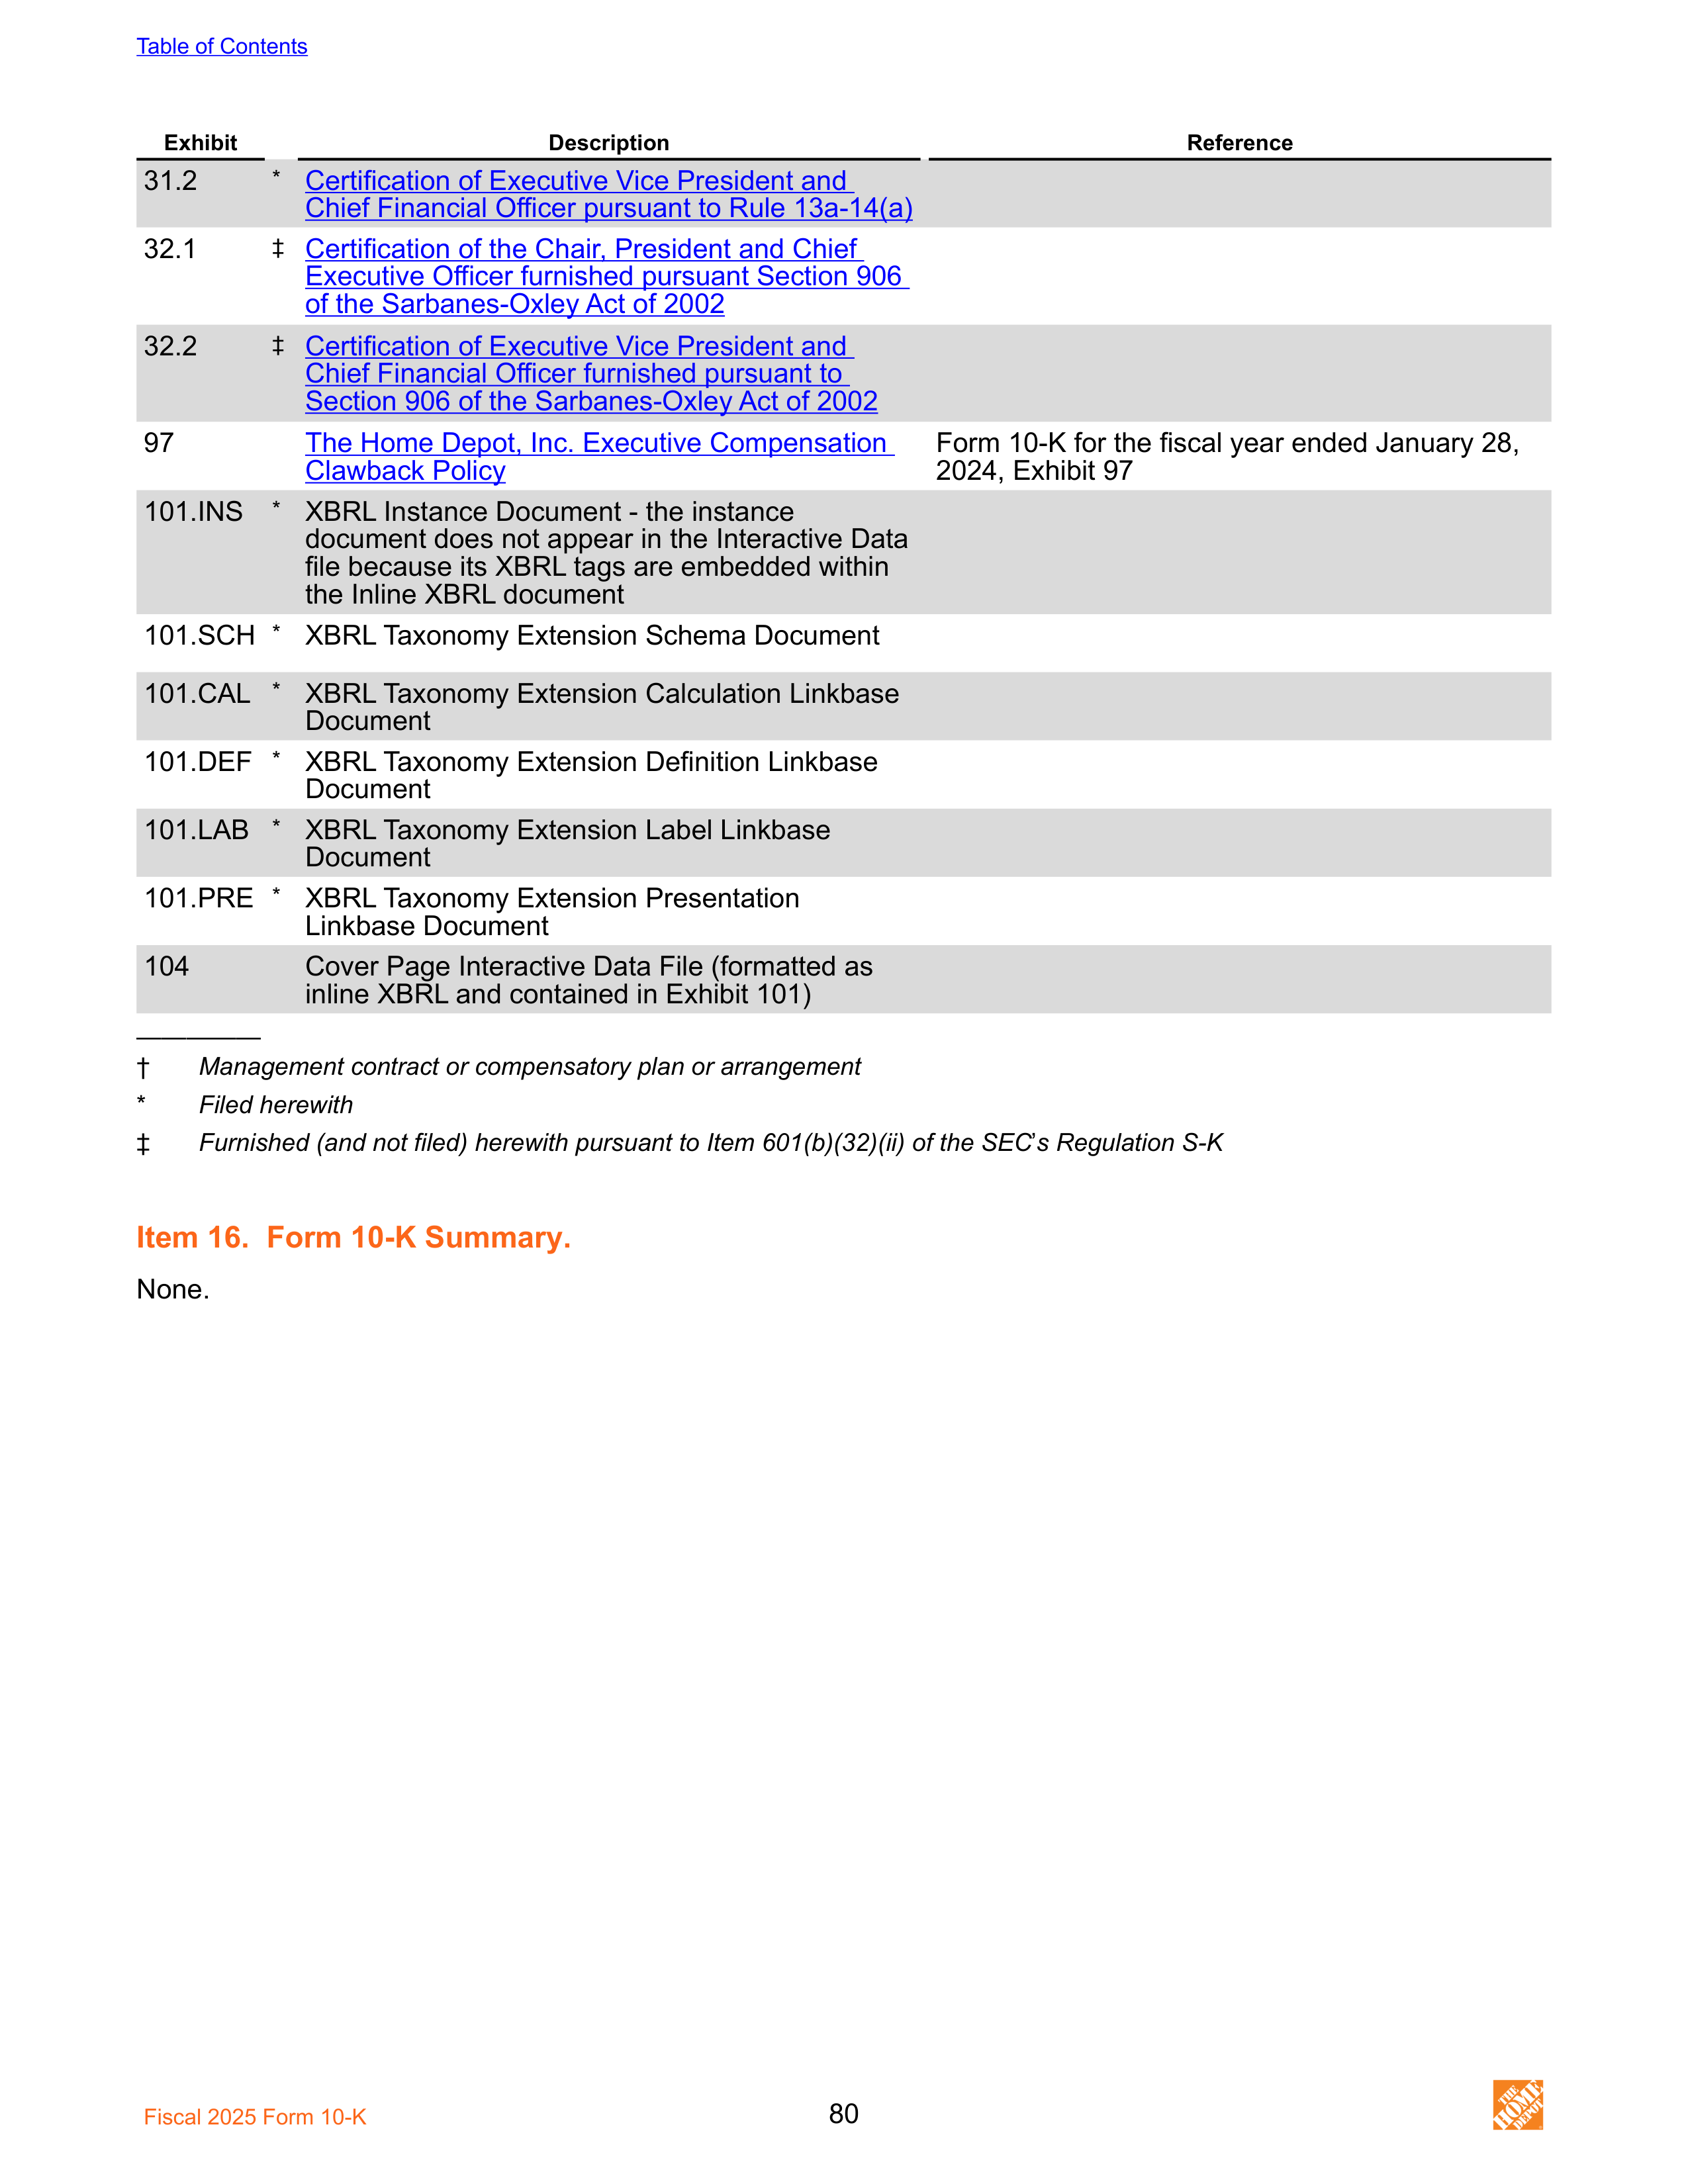
31.2
*
Certification of Executive Vice President and
Chief Financial Officer pursuant to Rule 13a-14(a)
32.1
‡
Certification of the Chair, President and Chief
Executive Officer furnished pursuant Section 906
of the Sarbanes-Oxley Act of 2002
32.2
‡
Certification of Executive Vice President and
Chief Financial Officer furnished pursuant to
Section 906 of the Sarbanes-Oxley Act of 2002
97
The Home Depot, Inc. Executive Compensation
Clawback Policy
Form 10-K for the fiscal year ended January 28,
2024, Exhibit 97
101.INS
*
XBRL Instance Document - the instance
document does not appear in the Interactive Data
file because its XBRL tags are embedded within
the Inline XBRL document
101.SCH
*
XBRL Taxonomy Extension Schema Document
101.CAL
*
XBRL Taxonomy Extension Calculation Linkbase
Document
101.DEF
*
XBRL Taxonomy Extension Definition Linkbase
Document
101.LAB
*
XBRL Taxonomy Extension Label Linkbase
Document
101.PRE
*
XBRL Taxonomy Extension Presentation
Linkbase Document
104
Cover Page Interactive Data File (formatted as
inline XBRL and contained in Exhibit 101)
Exhibit
Description
Reference
—————
†
Management contract or compensatory plan or arrangement
*
Filed herewith
‡
Furnished (and not filed) herewith pursuant to Item 601(b)(32)(ii) of the SEC
’
s Regulation S-K
Item 16. Form 10-K Summary.
None.
Table of Contents
Fiscal 2025 Form 10-K
80
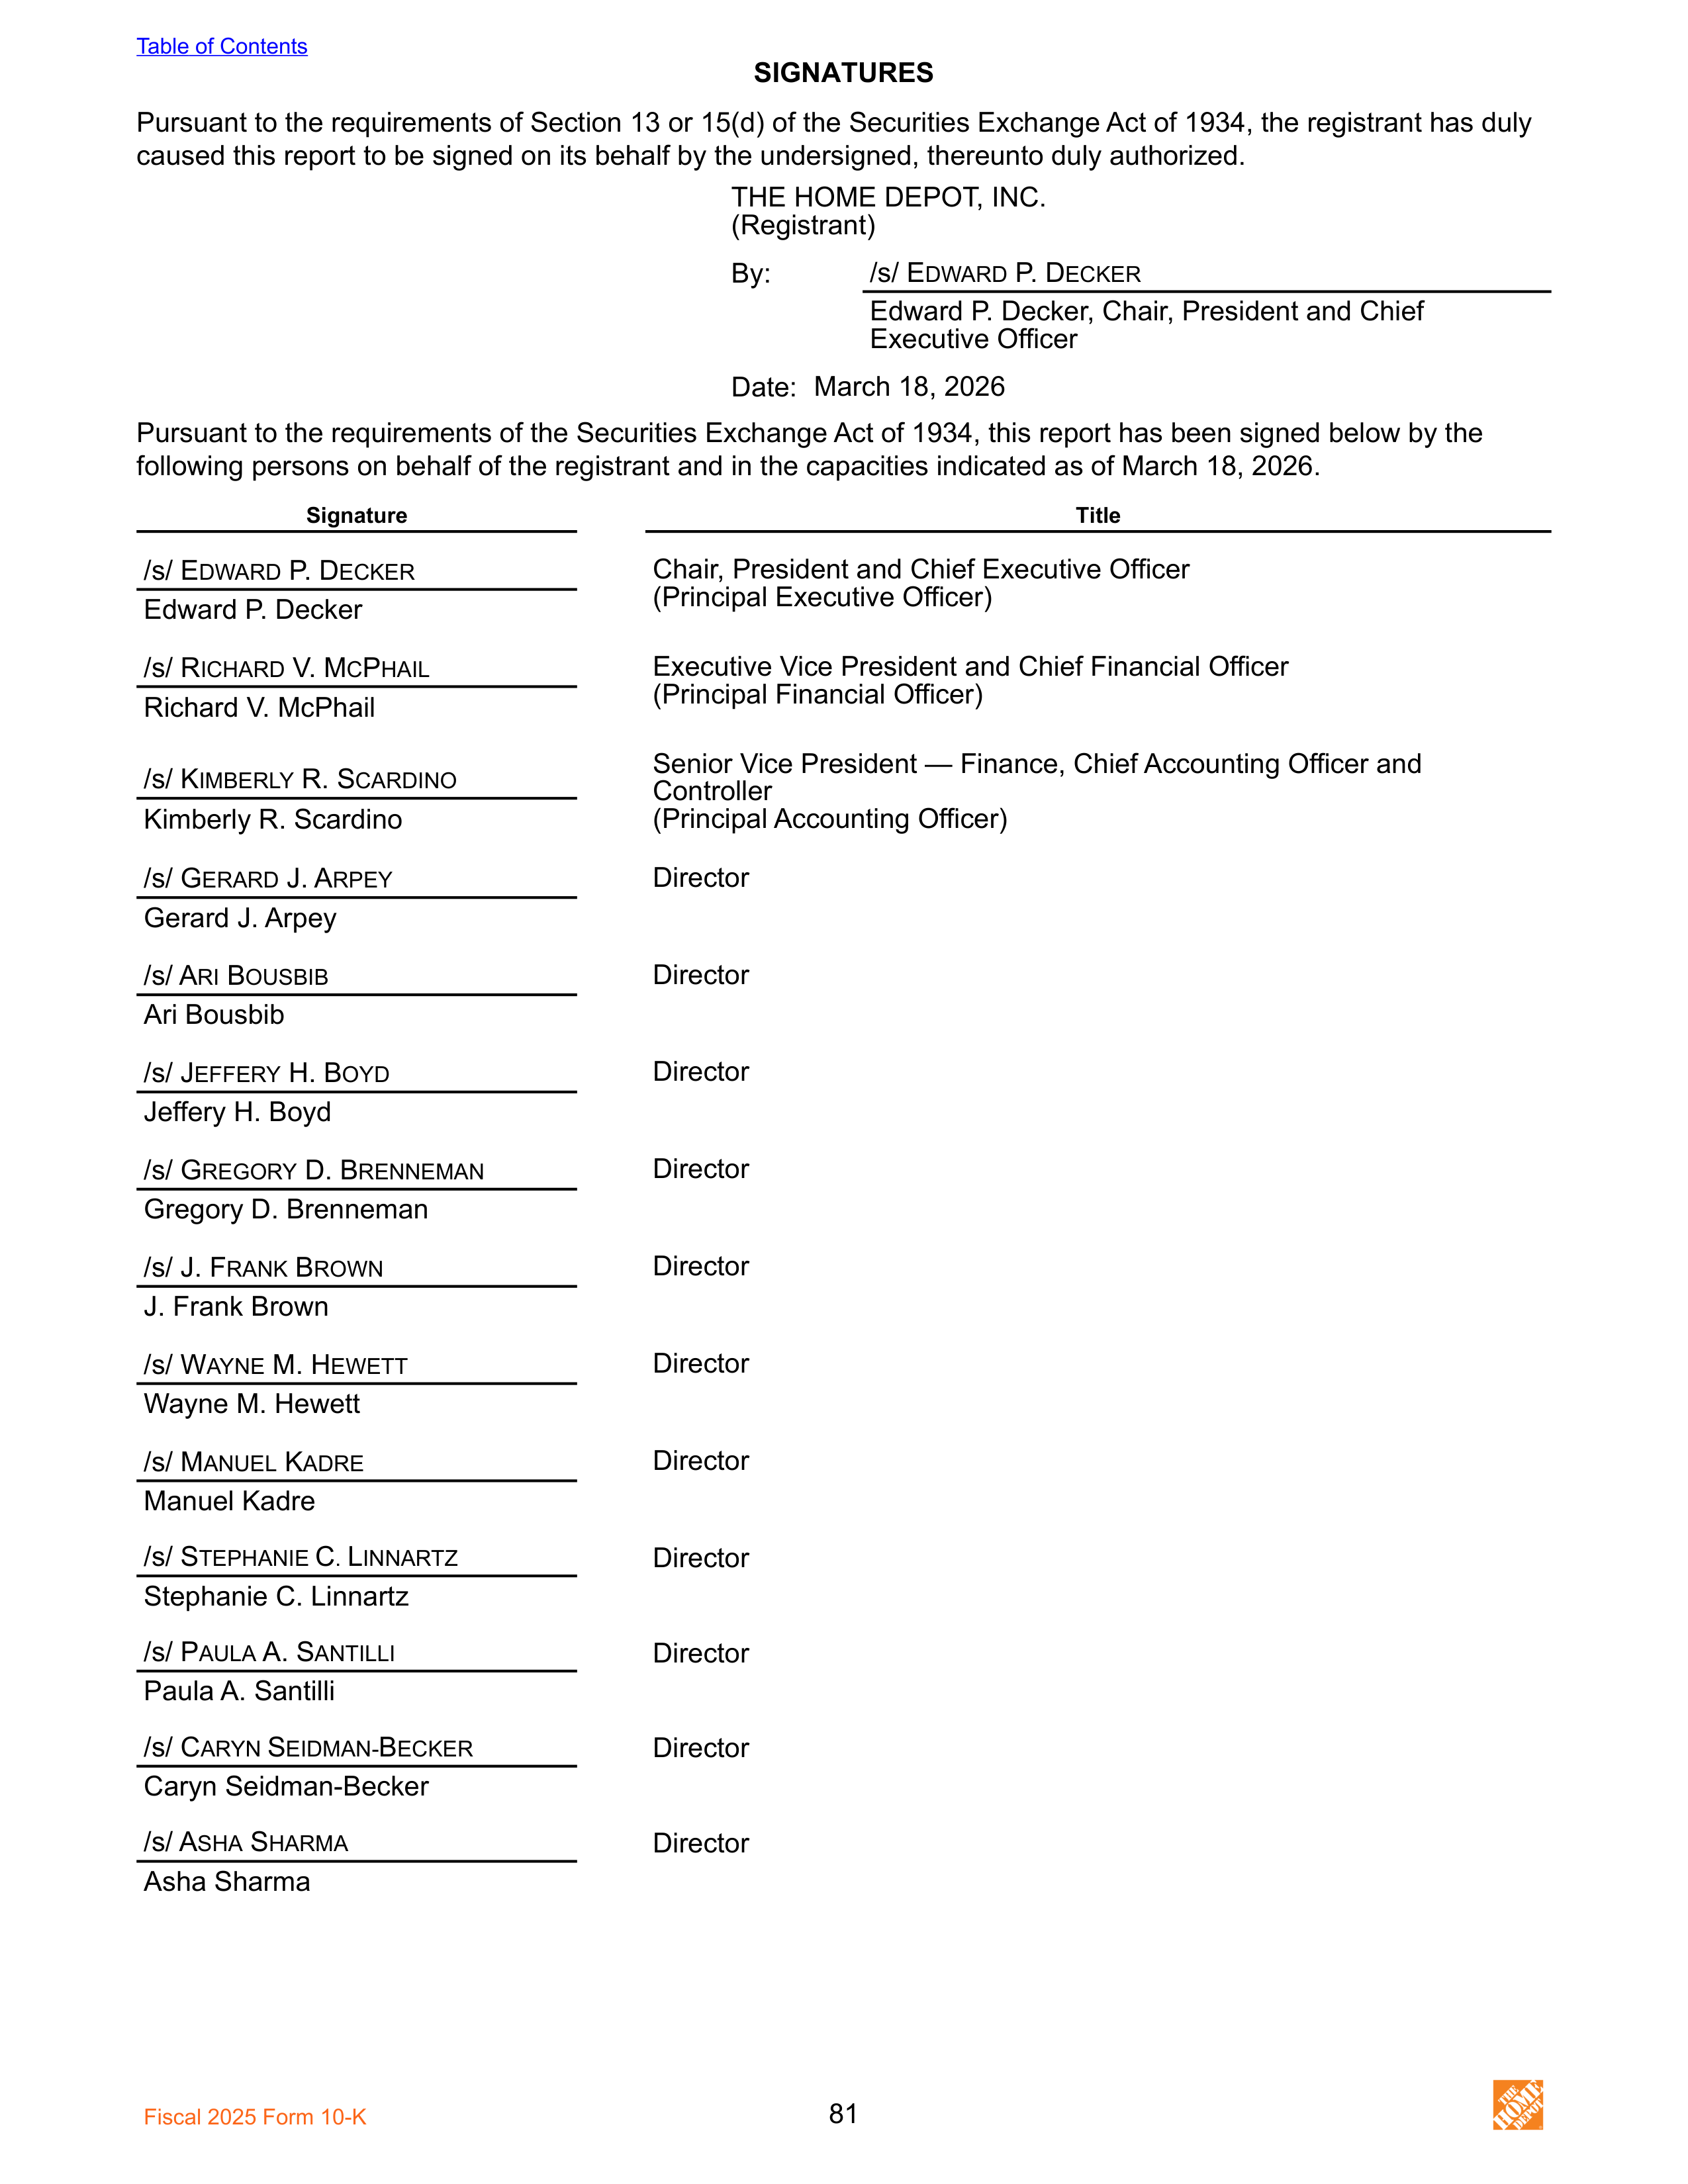
SIGNATURES
Pursuant to the requirements of Section 13 or 15(d) of the Securities Exchange Act of 1934, the registrant has duly
caused this report to be signed on its behalf by the undersigned, thereunto duly authorized.
THE HOME DEPOT, INC.
(Registrant)
By:
/s/ E
DWARD
P. D
ECKER
Edward P. Decker, Chair, President and Chief
Executive Officer
Date:
March 18, 2026
Pursuant to the requirements of the Securities Exchange Act of 1934, this report has been signed below by the
following persons on behalf of the registrant and in the capacities indicated as of March 18, 2026.
Signature
Title
/s/ E
DWARD
P. D
ECKER
Chair, President and Chief Executive Officer
(Principal Executive Officer)
Edward P. Decker
/s/ R
ICHARD
V. M
C
P
HAIL
Executive Vice President and Chief Financial Officer
(Principal Financial Officer)
Richard V. McPhail
/s/ K
IMBERLY
R. S
CARDINO
Senior Vice President — Finance, Chief Accounting Officer and
Controller
(Principal Accounting Officer)
Kimberly R. Scardino
/s/ G
ERARD
J. A
RPEY
Director
Gerard J. Arpey
/s/ A
RI
B
OUSBIB
Director
Ari Bousbib
/s/ J
EFFERY
H. B
OYD
Director
Jeffery H. Boyd
/s/ G
REGORY
D. B
RENNEMAN
Director
Gregory D. Brenneman
/s/ J. F
RANK
B
ROWN
Director
J. Frank Brown
/s/ W
AYNE
M. H
EWETT
Director
Wayne M. Hewett
/s/ M
ANUEL
K
ADRE
Director
Manuel Kadre
/s/ S
TEPHANIE
C
.
L
INNARTZ
Director
Stephanie C. Linnartz
/s/ P
AULA
A. S
ANTILLI
Director
Paula A. Santilli
/s/ C
ARYN
S
EIDMAN-
B
ECKER
Director
Caryn Seidman-Becker
/s/ A
SHA
S
HARMA
Director
Asha Sharma
Table of Contents
Fiscal 2025 Form 10-K
81
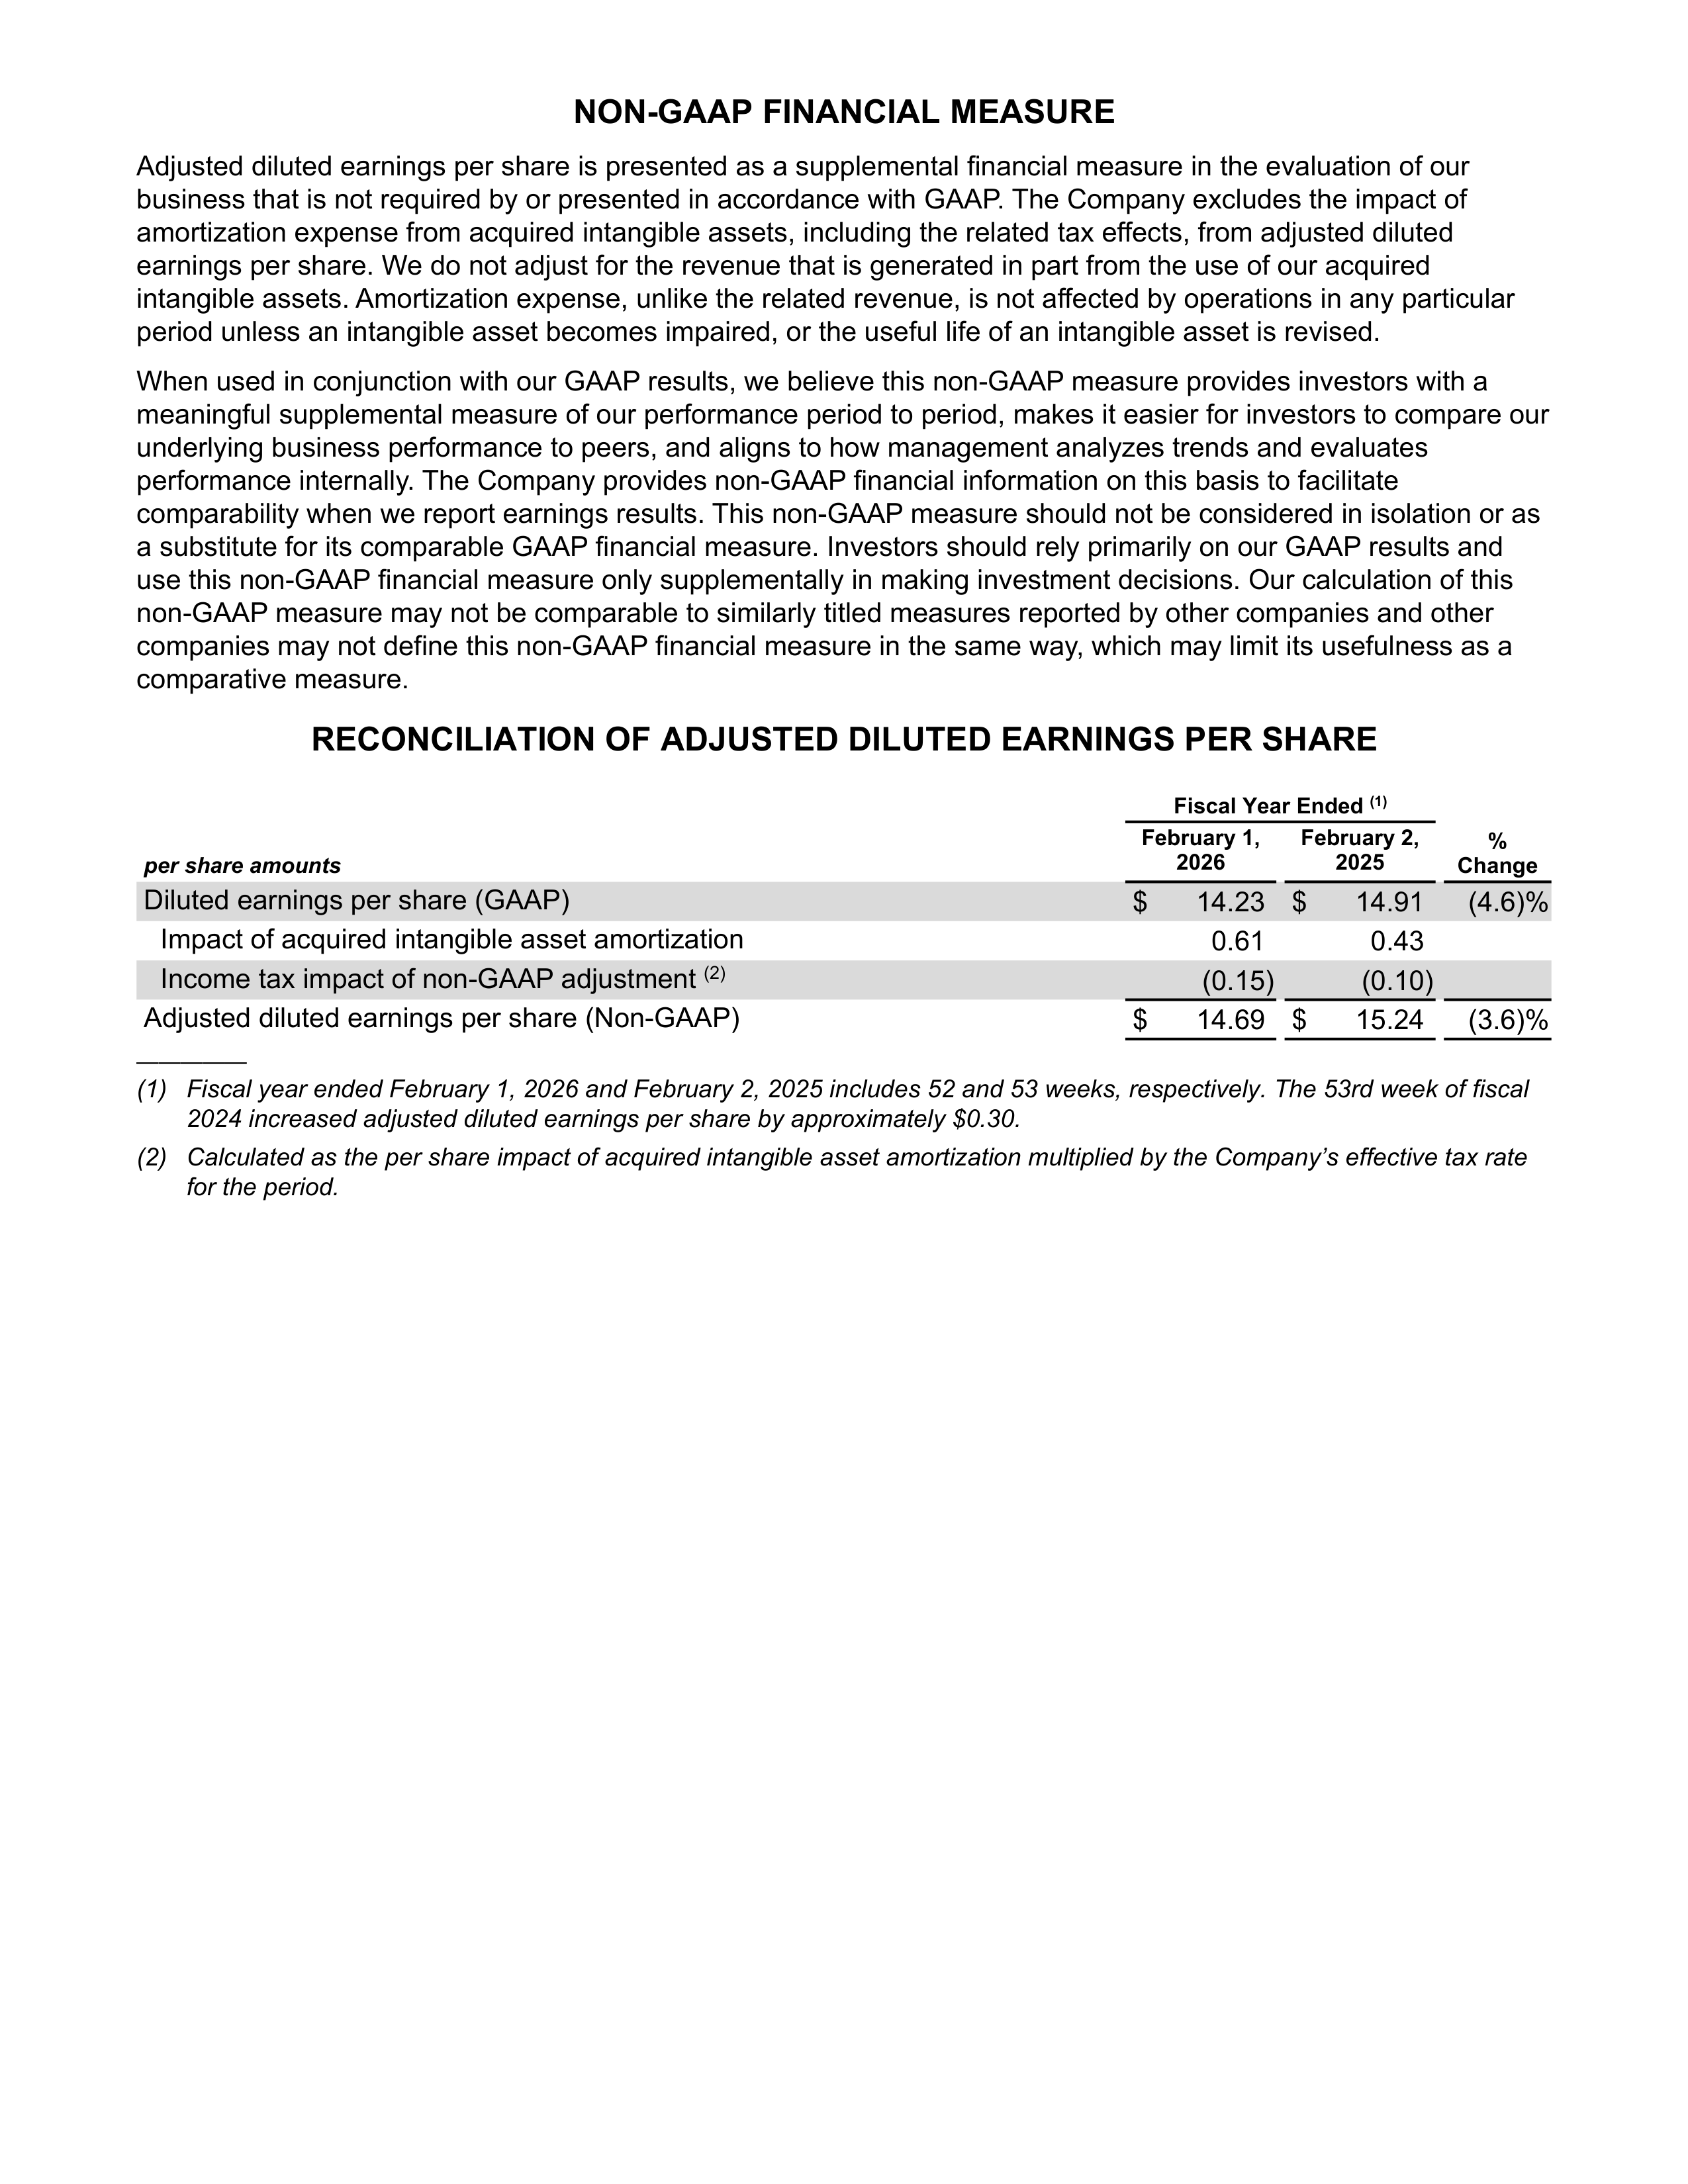
NON-GAAP FINANCIAL MEASURE
Adjusted diluted earnings per share is presented as a supplemental financial measure in the evaluation of our
business that is not required by or presented in accordance with GAAP. The Company excludes the impact of
amortization expense from acquired intangible assets, including the related tax effects, from adjusted diluted
earnings per share. We do not adjust for the revenue that is generated in part from the use of our acquired
intangible assets. Amortization expense, unlike the related revenue, is not affected by operations in any particular
period unless an intangible asset becomes impaired, or the useful life of an intangible asset is revised.
When used in conjunction with our GAAP results, we believe this non-GAAP measure provides investors with a
meaningful supplemental measure of our performance period to period, makes it easier for investors to compare our
underlying business performance to peers, and aligns to how management analyzes trends and evaluates
performance internally. The Company provides non-GAAP financial information on this basis to facilitate
comparability when we report earnings results. This non-GAAP measure should not be considered in isolation or as
a substitute for its comparable GAAP financial measure. Investors should rely primarily on our GAAP results and
use this non-GAAP financial measure only supplementally in making investment decisions. Our calculation of this
non-GAAP measure may not be comparable to similarly titled measures reported by other companies and other
companies may not define this non-GAAP financial measure in the same way, which may limit its usefulness as a
comparative measure.
RECONCILIATION OF ADJUSTED DILUTED EARNINGS PER SHARE
Fiscal Year Ended
(1)
per share amounts
February 1,
2026
February 2,
2025
%
Change
Diluted earnings per share (GAAP)
$
14.23 $
14.91
(4.6) %
Impact of acquired intangible asset amortization
0.61
0.43
Income tax impact of non-GAAP adjustment
(2)
(0.15)
(0.10)
Adjusted diluted earnings per share (Non-GAAP)
$
14.69 $
15.24
(3.6) %
—————
(1) Fiscal year ended February 1, 2026 and February 2, 2025 includes 52 and 53 weeks, respectively. The 53rd week of fiscal
2024 increased adjusted diluted earnings per share by approximately $0.30.
(2) Calculated as the per share impact of acquired intangible asset amortization multiplied by the Company’s effective tax rate
for the period.













Board of Directors Committee Membership as of 2025 fiscal year end:
1. Audit 2. Finance 3. Leadership Development & Compensation 4. Nominating & Corporate Governance
Ari Bousbib
Chairman and Chief
Executive Officer, IQVIA
Holdings, Inc.
Director since 2007
1, 2
Stephanie C. Linnartz
Former President, Chief
Executive Officer and Director,
Under Armour, Inc.
Director since 2018
1, 3
Asha Sharma
Executive Vice President and
CEO, Microsoft Gaming,
Microsoft Corporation
Director since 2025
1, 3
Edward P. Decker
Chair, President and Chief
Executive Officer
Director since 2022
J. Frank Brown
Former Managing Director and
Chief Risk Officer,
General Atlantic LLC
Director since 2011
Audit Committee Financial Expert
1, 2
Jeffery H. Boyd
Former Chairman and Chief
Executive Officer, Booking
Holdings Inc.
Director since 2016
2, 4
Gregory D. Brenneman
Executive Chairman,
CCMP Capital
Advisors, LP
Director since 2000
Lead Director
Wayne M. Hewett
Chairman, Cambrex
Corporation
Director since 2014
1, 3
Paula A. Santilli
Former Chief Executive
Officer, Latin America
Foods, PepsiCo, Inc.
Director since 2022
2, 4
Manuel Kadre
Chairman and Chief
Executive Officer,
Kollective Auto Group
Director since 2018
1, 2
Caryn Seidman-Becker
Chair and Chief Executive
Officer, CLEAR Secure, Inc.
Director since 2022
3, 4
Gerard J. Arpey
Partner, Emerald Creek
Group, LLC
Director since 2015
2, 4
BOARD OF
DIRECTORS
The Home Depot, Inc.
2455 Paces Ferry Road, Atlanta, GA 30339-4024
(770)433-8211
http://ir.homedepot.com
NYSE: HD