

25


1
Annual Report 2025
A note from Sundar, April 2026
To our Shareholders,
2025 was a tremendous year for Alphabet.
We delivered our first-ever $100 billion quarter
in Q3 and saw our annual revenues exceed $400
billion for the first time. We saw strong momentum
across our entire business, including Search, Google
Cloud—which ended the year with an annual run
rate of over $70 billion—and YouTube, whose annual
revenues surpassed $60 billion across Ads and
Subscriptions. Meanwhile, consumer subscriptions
exceeded 325 million. We ended 2025 in a great
position, driven by our AI-first strategy and our
differentiated, full-stack approach.
AI Infrastructure
Our unrivaled technical infrastructure serves as the
bedrock of our AI stack. We are scaling our physical
infrastructure at a stunning pace: In 2026, we plan
to invest around $180 billion in total capex, doubled
from $90 billion last year, and 6x increase in just
four years. We offer the industry’s widest variety of
compute options to our Cloud customers, including
the latest NVIDIA GPUs and our own custom TPUs that
we have been developing for over a decade. We’re
now shipping Ironwood, our seventh-generation TPU,
which delivers a 10x performance improvement over
its predecessor, and we’ve announced TPU 8, coming
later this year. In March 2025 we announced our intent
to acquire Wiz, and the deal was finalized in March
2026. It’s our largest acquisition in our history, and an
investment by Google Cloud to improve cloud security
and enable organizations to build fast and securely
across any cloud or AI platform.
World-Class Research and Models
Our world-class research and models continue to
lead the industry. In December, we launched Gemini 3,
which drove the state of the art in reasoning and
multimodal understanding and swept AI leaderboards.
We also boast the world’s most extensive generative
media model portfolio, including our leading video
model Veo 3.1 and the viral image model sensation
Nano Banana. In our Q4 2025 earnings we shared
that our first party models like Gemini processed over
10 billion tokens per minute via direct API use by our
customers, up from 7 billion the quarter prior.
Our deep computer science roots are accelerating
discoveries, from our Gemma models being used
for cancer research to our Willow quantum chip,
which achieved a new milestone last year with the
first verifiable instance of a quantum computer
outperforming a regular supercomputer on a
computation that paves the way for future practical
applications. This momentum in quantum computing
is built on foundational science, highlighted by our
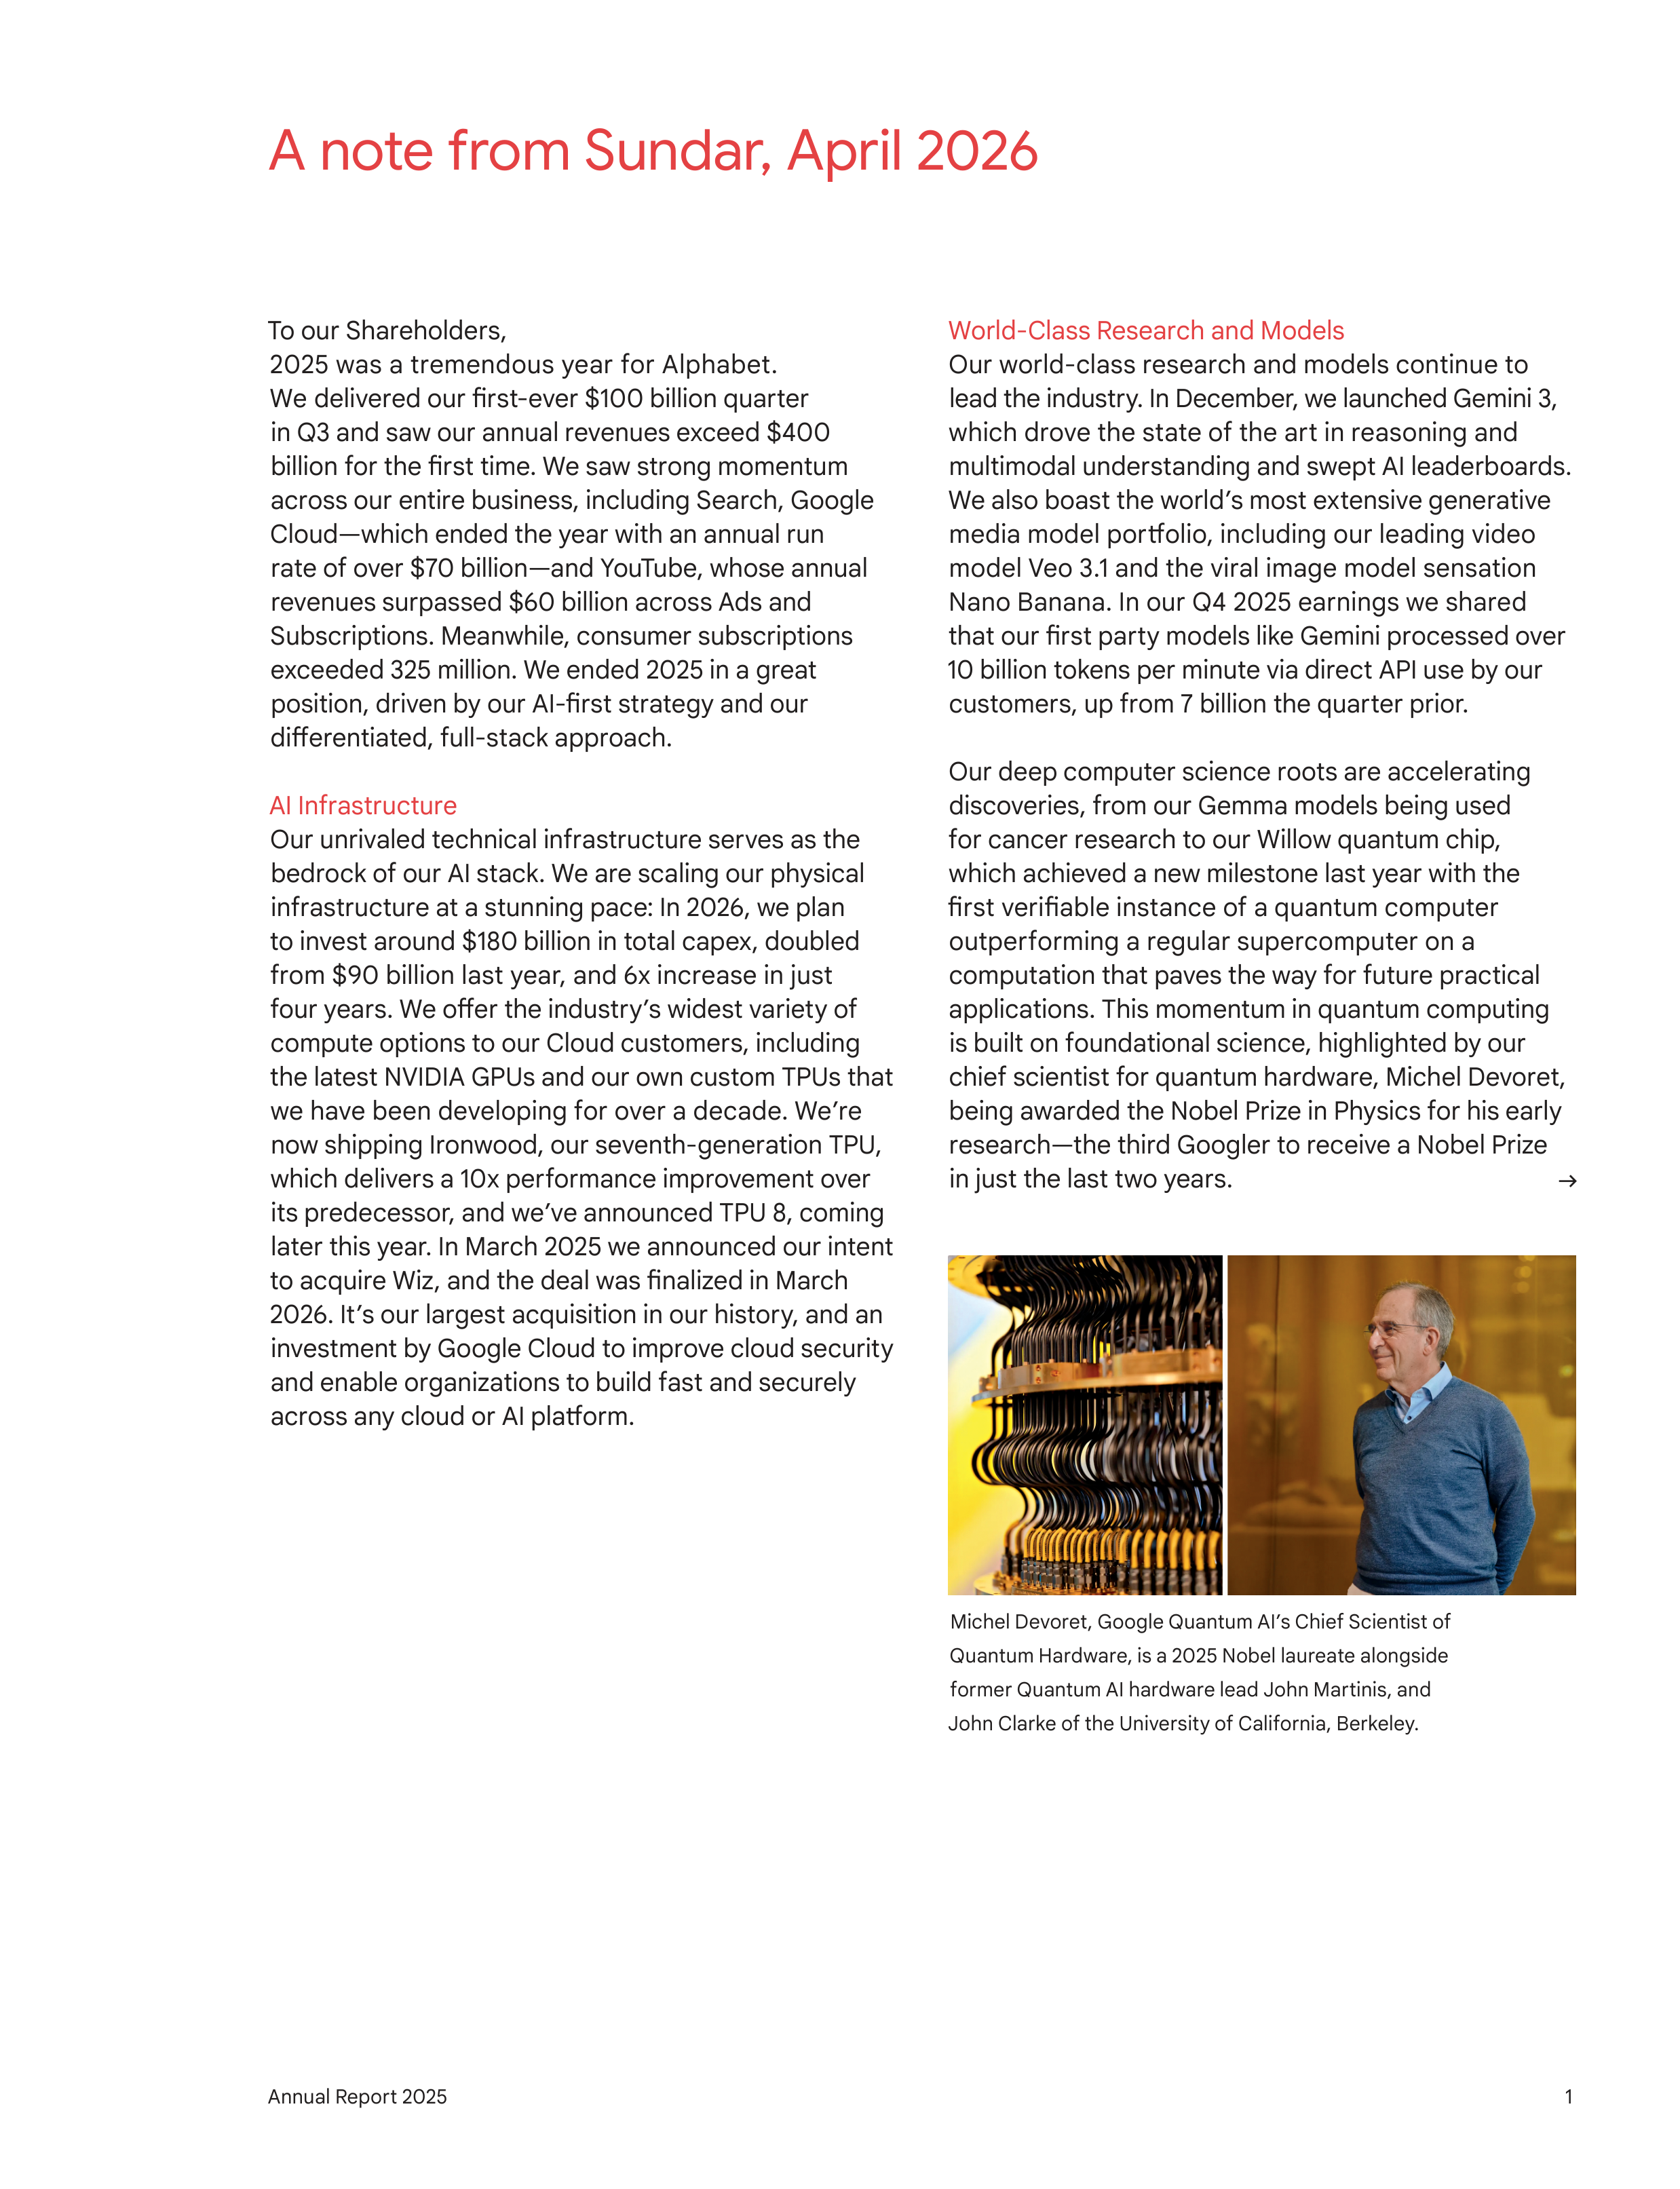
chief scientist for quantum hardware, Michel Devoret,
being awarded the Nobel Prize in Physics for his early
research—the third Googler to receive a Nobel Prize
in just the last two years.
Michel Devoret, Google Quantum AI’s Chief Scientist of
Quantum Hardware, is a 2025 Nobel laureate alongside
former Quantum AI hardware lead John Martinis, and
John Clarke of the University of California, Berkeley.
→

2
On a personal note, I was proud to mark 10 years
as CEO of Google in 2025. My first decisions as CEO
were to pivot the company to be AI-first and to grow
sustainable businesses. Amazing to see the incredible
progress with AI and our businesses since then.
To give a sense of progress, in 2015 all of Alphabet’s
revenue added up to $75 billion. YouTube and Cloud
alone ended 2024 at an annual run rate of $110 billion.
As we look to 2026, we remain laser-focused on
pushing the next frontiers of foundation models
to make AI helpful for everyone: intelligence,
personalization, and agents.
First, model intelligence will continue to accelerate.
With Gemini 3, we are already seeing glimmers of
future capabilities today, unlocking state-of-the-art
reasoning, natively multimodal understanding,
and the ability to process massive contexts.
Second, we are rolling out Personal Intelligence
across products like AI Mode, the Gemini app, Gemini
in Chrome and more. With features like Personalized
Smart Replies in Gmail, our models can use relevant
context across your Google apps to capture your
unique tone and style—always in a way that is private,
transparent, and fully under your control.
Finally, 2026 is officially the year of the agent.
AI agents turn our consumer and enterprise products
into collaborators that can take complex actions on
your behalf. Today, nearly 75% of all new code at
Google is AI-generated and approved by engineers,
up from 50% last fall. We’re also laying the
groundwork for agentic commerce. In January we
introduced the Universal Commerce Protocol (UCP),
an open standard built with industry leaders, so
different agents and systems can work together
easily across the web. Much more to come!
We are just at the beginning of a period of hyper-
progress. We will continue to focus on our mission,
building products people love, and responsibly
advancing this technology so it benefits everyone.
Thank you for your continued support.
- Sundar
Products and Platforms
We are bringing generative AI to billions of people
through our products. In Search, AI is driving an
expansionary moment. In 2025, AI Overviews scaled
to over 2 billion monthly users in more than 200
countries, and in the U.S., we saw daily AI Mode
queries per user double since launch as of Q4 2025.
Our Gemini App has seen incredible growth, reaching
over 750 million monthly active users by the end of
2025. In Q4 2025, we announced that nearly 75%
of Google Cloud customers had used our vertically
optimized AI. At that time, we had sold more than 8
million paid seats for Gemini Enterprise in only a few
months’ time. Beyond our core platforms, Waymo’s
momentum is in overdrive, surpassing 20 million fully
autonomous trips in December 2025, as it looks to
expand to new cities across the U.S., UK, and Japan.
Wing and Isomorphic Labs are also tackling important
challenges, and we continue to manage and invest in
Other Bets responsibly.
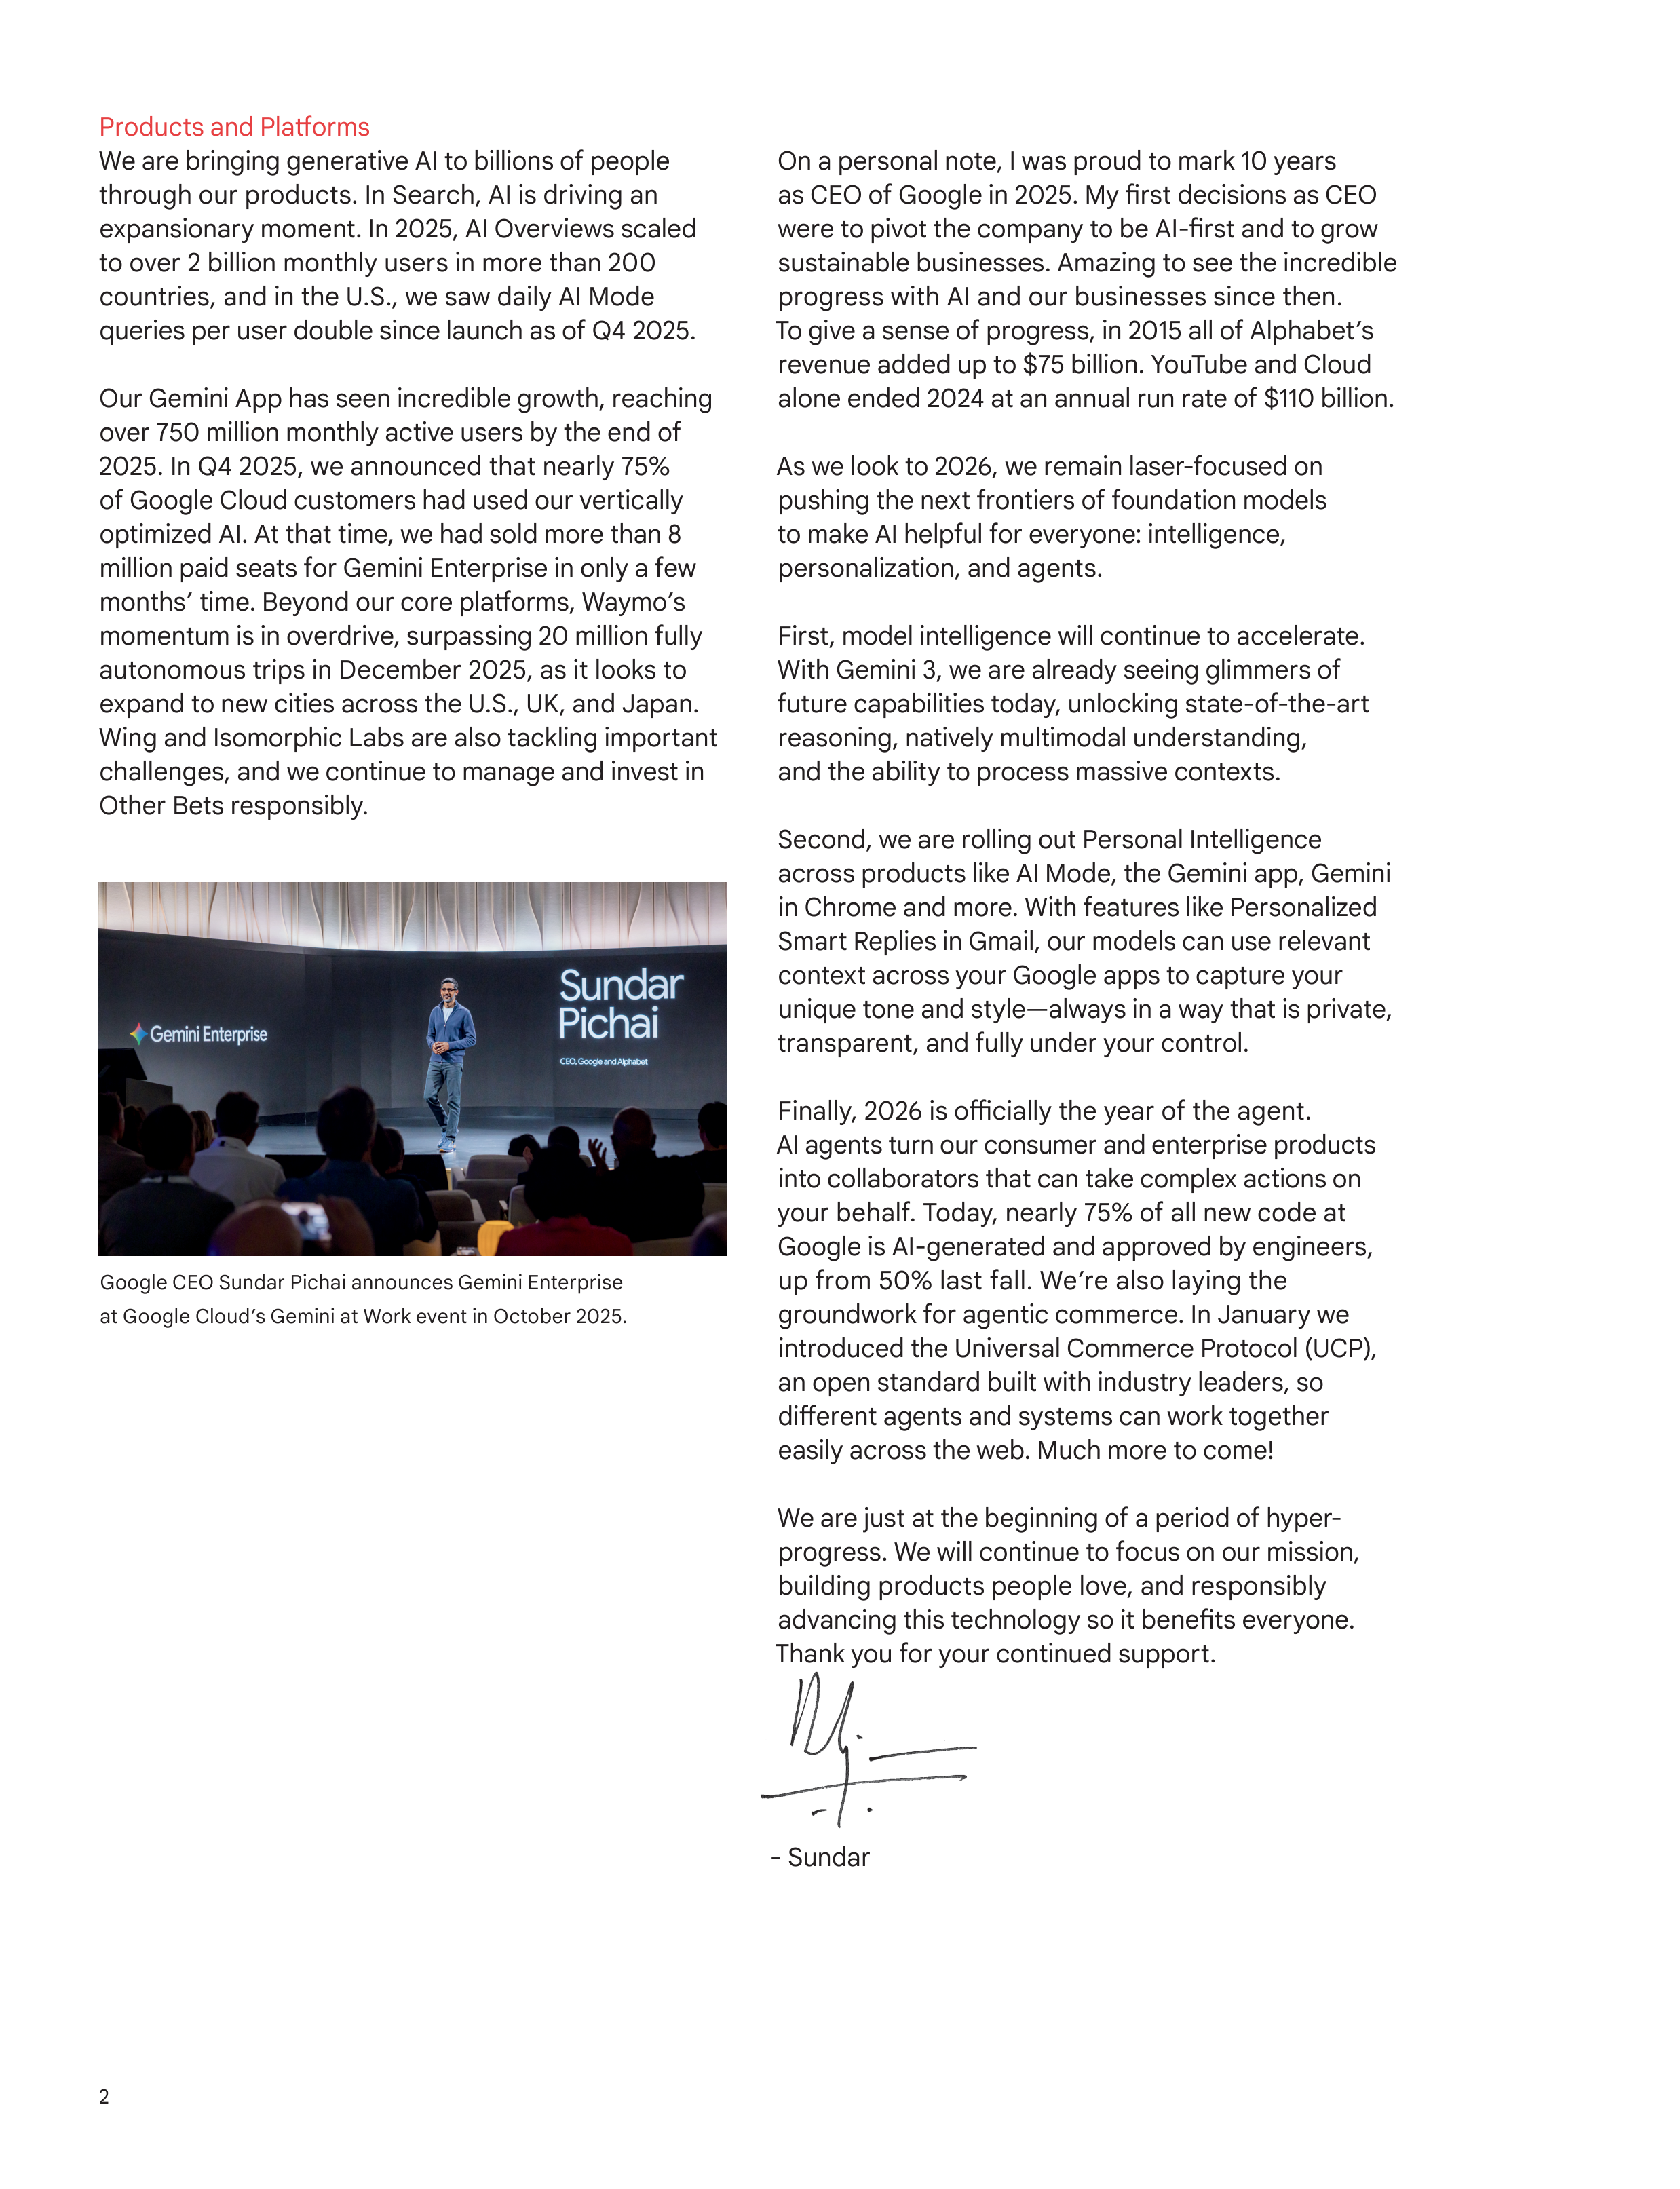
Google CEO Sundar Pichai announces Gemini Enterprise
at Google Cloud’s Gemini at Work event in October 2025.
UNITED STATES
SECURITIES AND EXCHANGE COMMISSION
Washington, D.C. 20549
FORM 10-K
ANNUAL REPORT PURSUANT TO SECTION 13 OR 15(d) OF THE SECURITIES EXCHANGE ACT OF 1934
For the fiscal year ended December 31, 2025
OR
TRANSITION REPORT PURSUANT TO SECTION 13 OR 15(d) OF THE SECURITIES EXCHANGE ACT OF 1934
For the transition period from __________ to __________.
Commission file number: 001-37580
Delaware
(State or other jurisdiction of
incorporation or organization)
ALPHABET INC.
(Exact name of registrant as specified in its charter)
61-1767919
(I.R.S. Employer
Identification No.)
1600 Amphitheatre Parkway
Mountain View, CA 94043
(Address of principal executive offices, including zip code)
(650) 253-0000
(Registrant’s telephone number, including area code)
SECURITIES REGISTERED PURSUANT TO SECTION 12(B) OF THE ACT:
Title of each class
Trading Symbol(s)
Name of each exchange on which registered
Class A Common Stock, $0.001 par value
GOOGL
Nasdaq Stock Market LLC
(Nasdaq Global Select Market)
Class C Capital Stock, $0.001 par value
GOOG
Nasdaq Stock Market LLC
(Nasdaq Global Select Market)
2.375% Senior Notes due 2028
—
Nasdaq Stock Market LLC
2.500% Senior Notes due 2029
—
Nasdaq Stock Market LLC
2.875% Senior Notes due 2031
—
Nasdaq Stock Market LLC
3.000% Senior Notes due 2033
—
Nasdaq Stock Market LLC
3.125% Senior Notes due 2034
—
Nasdaq Stock Market LLC
3.375% Senior Notes due 2037
—
Nasdaq Stock Market LLC
3.500% Senior Notes due 2038
—
Nasdaq Stock Market LLC
4.000% Senior Notes due 2044
—
Nasdaq Stock Market LLC
3.875% Senior Notes due 2045
—
Nasdaq Stock Market LLC
4.000% Senior Notes due 2054
—
Nasdaq Stock Market LLC
4.375% Senior Notes due 2064
—
Nasdaq Stock Market LLC
SECURITIES REGISTERED PURSUANT TO SECTION 12(G) OF THE ACT:
Title of each class
None
Indicate by check mark
Alphabet Inc.
YES
NO
• if the registrant is a well-known seasoned issuer, as defined in Rule 405 of the Securities Act.
• if the registrant is not required to file reports pursuant to Section 13 or Section 15(d) of the Act.
•
whether the registrant (1) has filed all reports required to be filed by Section 13 or 15(d) of the
Securities Exchange Act of 1934 during the preceding 12 months (or for such shorter period that the
registrant was required to file such reports), and (2) has been subject to such filing requirements
for the past 90 days.
•
whether the registrant has submitted electronically every Interactive Data File required to be
submitted pursuant to Rule 405 of Regulation S-T (§232.405 of this chapter) during the preceding
12 months (or for such shorter period that the registrant was required to submit such files).
• whether the registrant is a large accelerated filer, an accelerated filer, a non-accelerated filer, a smaller reporting company, or an
emerging growth company. See the definitions of “large accelerated filer,” “accelerated filer,” “smaller reporting company,” and
“emerging growth company” in Rule 12b-2 of the Exchange Act.
Large accelerated filer
Accelerated filer
Non-accelerated filer
Smaller reporting company
Emerging growth company
ii
Alphabet
2025 Annual Report
•
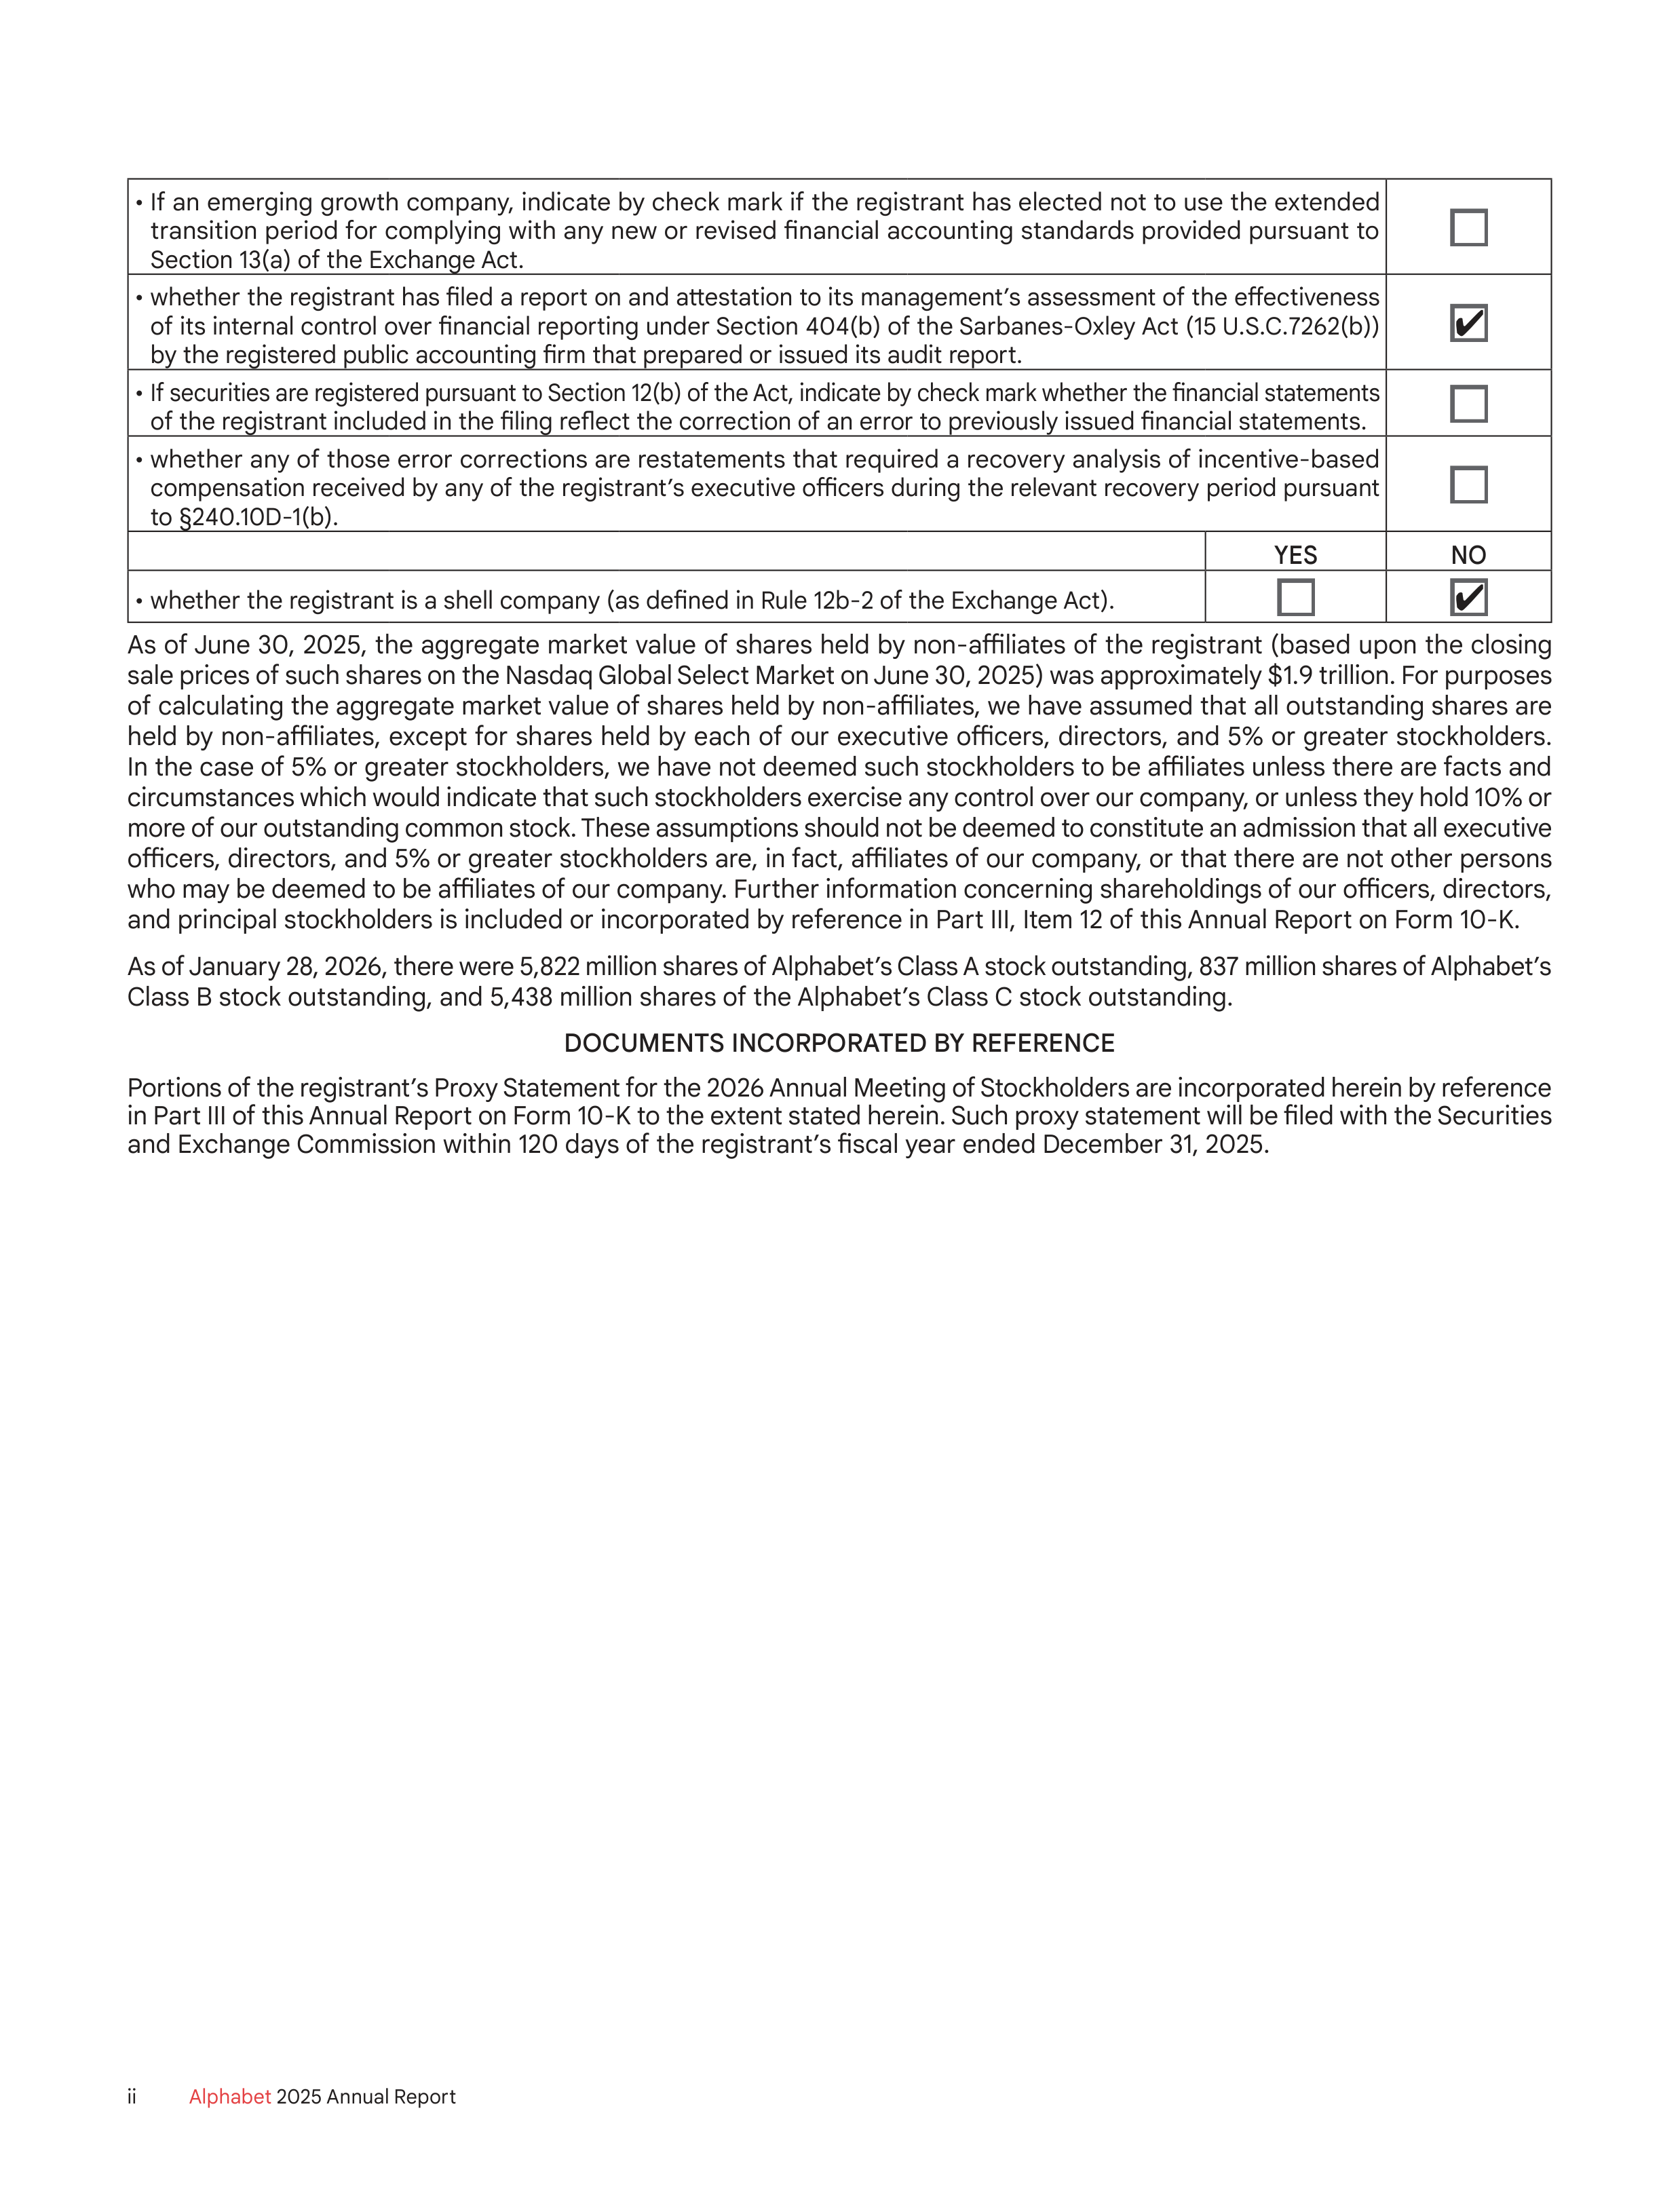
If an emerging growth company, indicate by check mark if the registrant has elected not to use the extended
transition period for complying with any new or revised financial accounting standards provided pursuant to
Section 13(a) of the Exchange Act.
• whether the registrant has filed a report on and attestation to its management’s assessment of the effectiveness
of its internal control over financial reporting under Section 404(b) of the Sarbanes-Oxley Act (15 U.S.C.7262(b))
by the registered public accounting firm that prepared or issued its audit report.
•
If securities are registered pursuant to Section 12(b) of the Act, indicate by check mark whether the financial statements
of the registrant included in the filing reflect the correction of an error to previously issued financial statements.
•
whether any of those error corrections are restatements that required a recovery analysis of incentive-based
compensation received by any of the registrant’s executive officers during the relevant recovery period pursuant
to §240.10D-1(b).
YES
NO
• whether the registrant is a shell company (as defined in Rule 12b-2 of the Exchange Act).
As of June 30, 2025, the aggregate market value of shares held by non-affiliates of the registrant (based upon the closing
sale prices of such shares on the Nasdaq Global Select Market on June 30, 2025) was approximately $1.9 trillion. For purposes
of calculating the aggregate market value of shares held by non-affiliates, we have assumed that all outstanding shares are
held by non-affiliates, except for shares held by each of our executive officers, directors, and 5% or greater stockholders.
In the case of 5% or greater stockholders, we have not deemed such stockholders to be affiliates unless there are facts and
circumstances which would indicate that such stockholders exercise any control over our company, or unless they hold 10% or
more of our outstanding common stock. These assumptions should not be deemed to constitute an admission that all executive
officers, directors, and 5% or greater stockholders are, in fact, affiliates of our company, or that there are not other persons
who may be deemed to be affiliates of our company. Further information concerning shareholdings of our officers, directors,
and principal stockholders is included or incorporated by reference in Part III, Item 12 of this Annual Report on Form 10-K.
As of January 28, 2026, there were 5,822 million shares of Alphabet’s Class A stock outstanding, 837 million shares of Alphabet’s
Class B stock outstanding, and 5,438 million shares of the Alphabet’s Class C stock outstanding.
DOCUMENTS INCORPORATED BY REFERENCE
Portions of the registrant’s Proxy Statement for the 2026 Annual Meeting of Stockholders are incorporated herein by reference
in Part III of this Annual Report on Form 10-K to the extent stated herein. Such proxy statement will be filed with the Securities
and Exchange Commission within 120 days of the registrant’s fiscal year ended December 31, 2025.
iii
Alphabet
2025 Annual Report
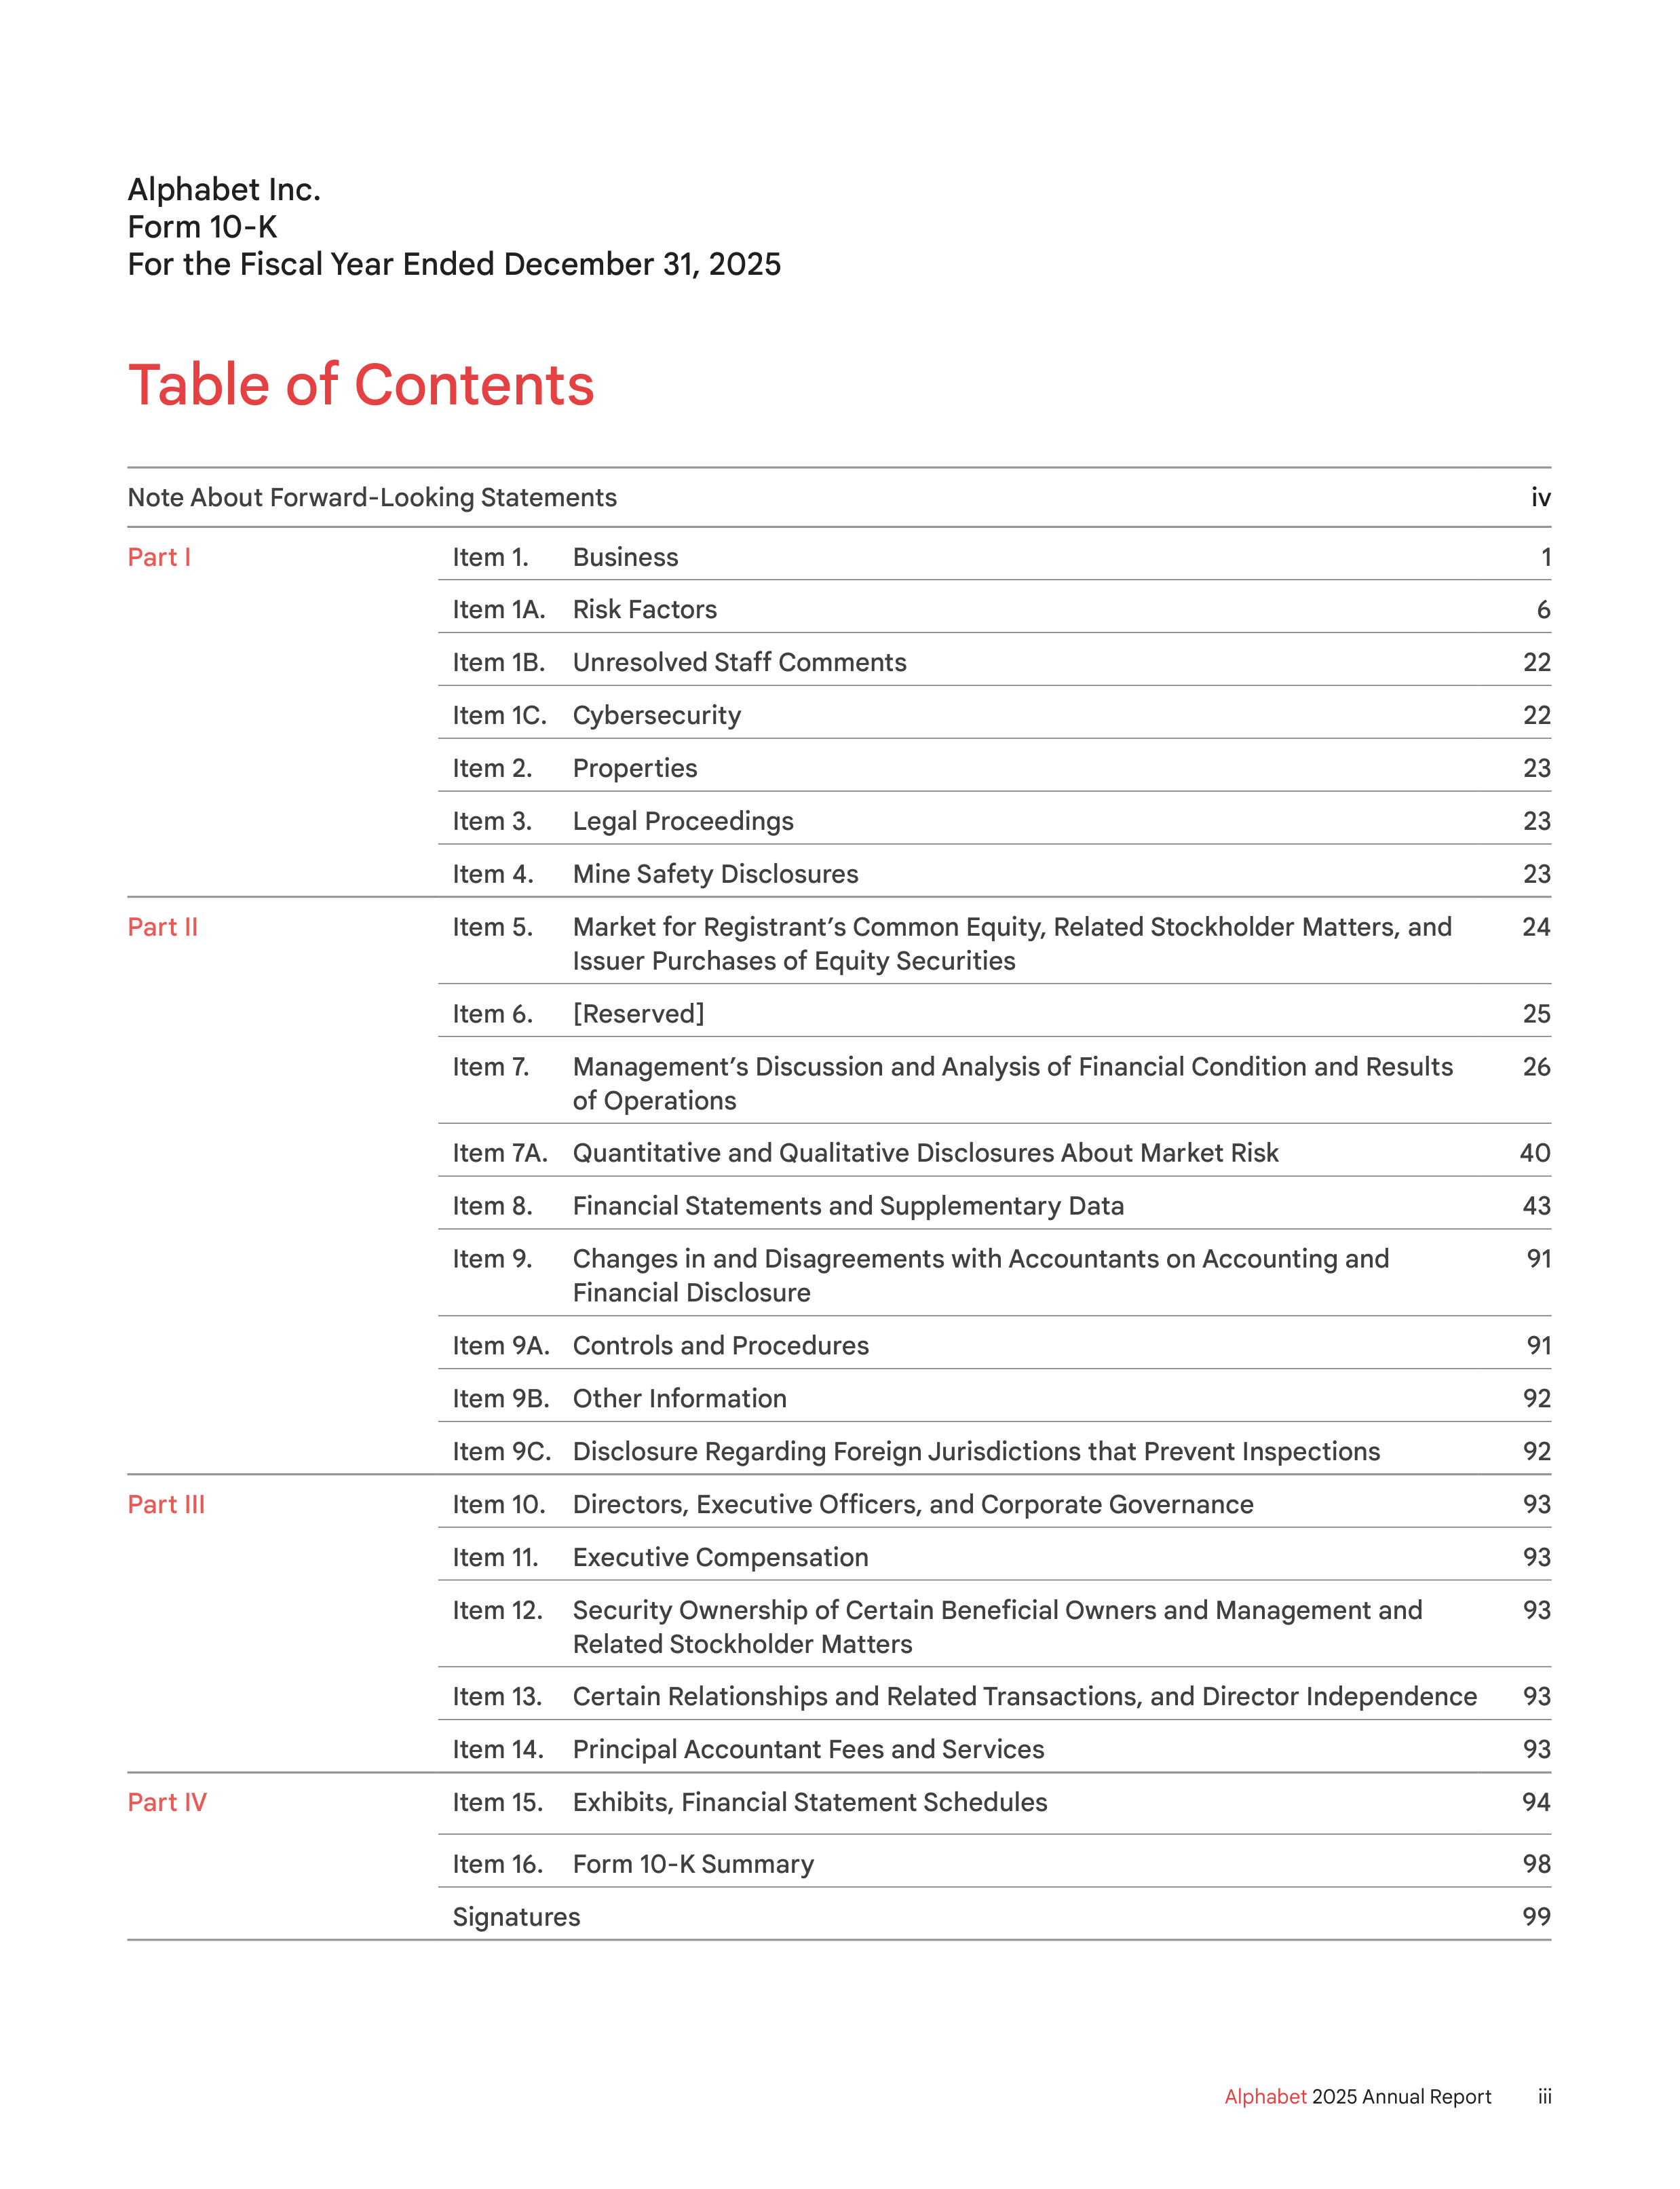
Alphabet Inc.
Form 10-K
For the Fiscal Year Ended December 31, 2025
Table of Contents
Note About Forward-Looking Statements
iv
Part I
Item 1.
Business
1
Item 1A.
Risk Factors
6
Item 1B.
Unresolved Staff Comments
22
Item 1C.
Cybersecurity
22
Item 2.
Properties
23
Item 3.
Legal Proceedings
23
Item 4.
Mine Safety Disclosures
23
Part II
Item 5.
Market for Registrant’s Common Equity, Related Stockholder Matters, and
Issuer Purchases of Equity Securities
24
Item 6.
[Reserved]
25
Item 7.
Management’s Discussion and Analysis of Financial Condition and Results
of Operations
26
Item 7A.
Quantitative and Qualitative Disclosures About Market Risk
40
Item 8.
Financial Statements and Supplementary Data
43
Item 9.
Changes in and Disagreements with Accountants on Accounting and
Financial Disclosure
91
Item 9A.
Controls and Procedures
91
Item 9B.
Other Information
92
Item 9C.
Disclosure Regarding Foreign Jurisdictions that Prevent Inspections
92
Part III
Item 10.
Directors, Executive Officers, and Corporate Governance
93
Item 11.
Executive Compensation
93
Item 12.
Security Ownership of Certain Beneficial Owners and Management and
Related Stockholder Matters
93
Item 13.
Certain Relationships and Related Transactions, and Director Independence
93
Item 14.
Principal Accountant Fees and Services
93
Part IV
Item 15.
Exhibits, Financial Statement Schedules
94
Item 16.
Form 10-K Summary
98
Signatures
99
iv
Alphabet
2025 Annual Report
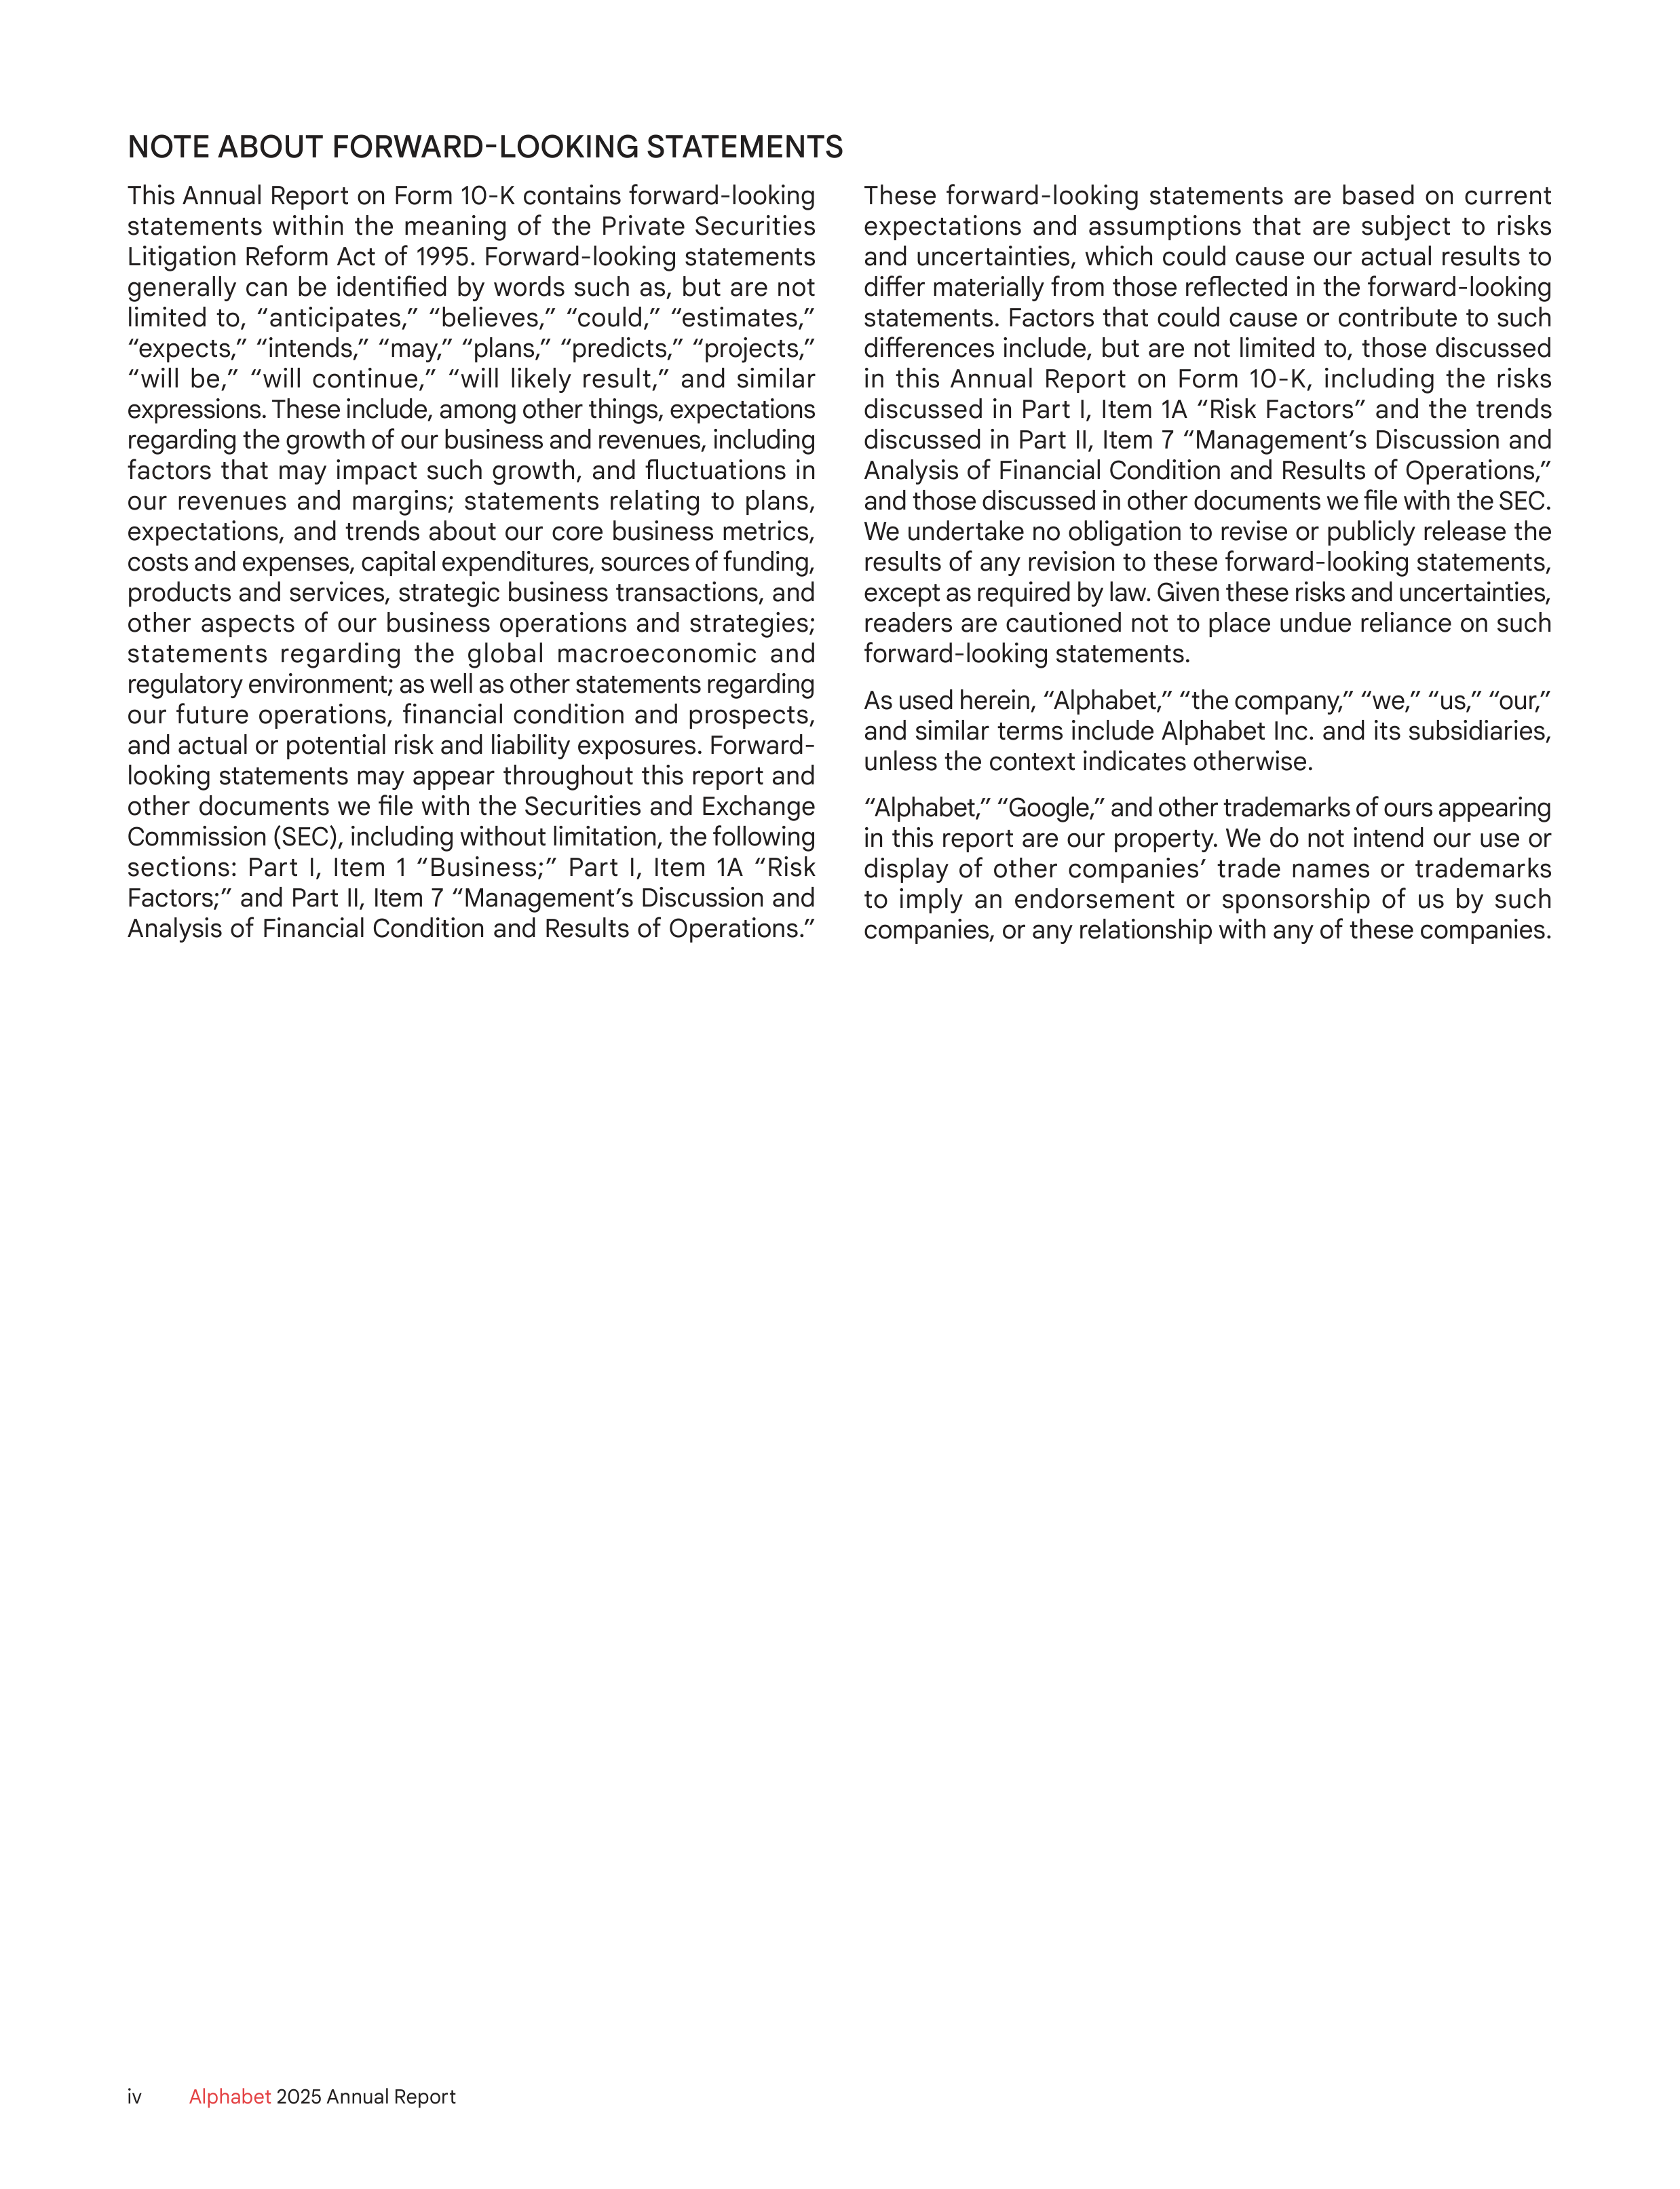
NOTE ABOUT FORWARD-LOOKING STATEMENTS
This Annual Report on Form 10-K contains forward-looking
statements within the meaning of the Private Securities
Litigation Reform Act of 1995. Forward-looking statements
generally can be identified by words such as, but are not
limited to, “anticipates,” “believes,” “could,” “estimates,”
“expects,” “intends,” “may,” “plans,” “predicts,” “projects,”
“will be,” “will continue,” “will likely result,” and similar
expressions. These include, among other things, expectations
regarding the growth of our business and revenues, including
factors that may impact such growth, and fluctuations in
our revenues and margins; statements relating to plans,
expectations, and trends about our core business metrics,
costs and expenses, capital expenditures, sources of funding,
products and services, strategic business transactions, and
other aspects of our business operations and strategies;
statements regarding the global macroeconomic and
regulatory environment; as well as other statements regarding
our future operations, financial condition and prospects,
and actual or potential risk and liability exposures. Forward-
looking statements may appear throughout this report and
other documents we file with the Securities and Exchange
Commission (SEC), including without limitation, the following
sections: Part I, Item 1 “Business;” Part I, Item 1A “Risk
Factors;” and Part II, Item 7 “Management’s Discussion and
Analysis of Financial Condition and Results of Operations.”
These forward-looking statements are based on current
expectations and assumptions that are subject to risks
and uncertainties, which could cause our actual results to
differ materially from those reflected in the forward-looking
statements. Factors that could cause or contribute to such
differences include, but are not limited to, those discussed
in this Annual Report on Form 10-K, including the risks
discussed in Part I, Item 1A “Risk Factors” and the trends
discussed in Part II, Item 7 “Management’s Discussion and
Analysis of Financial Condition and Results of Operations,”
and those discussed in other documents we file with the SEC.
We undertake no obligation to revise or publicly release the
results of any revision to these forward-looking statements,
except as required by law. Given these risks and uncertainties,
readers are cautioned not to place undue reliance on such
forward-looking statements.
As used herein, “Alphabet,” “the company,” “we,” “us,” “our,”
and similar terms include Alphabet Inc. and its subsidiaries,
unless the context indicates otherwise.
“Alphabet,” “Google,” and other trademarks of ours appearing
in this report are our property. We do not intend our use or
display of other companies’ trade names or trademarks
to imply an endorsement or sponsorship of us by such
companies, or any relationship with any of these companies.
Part I
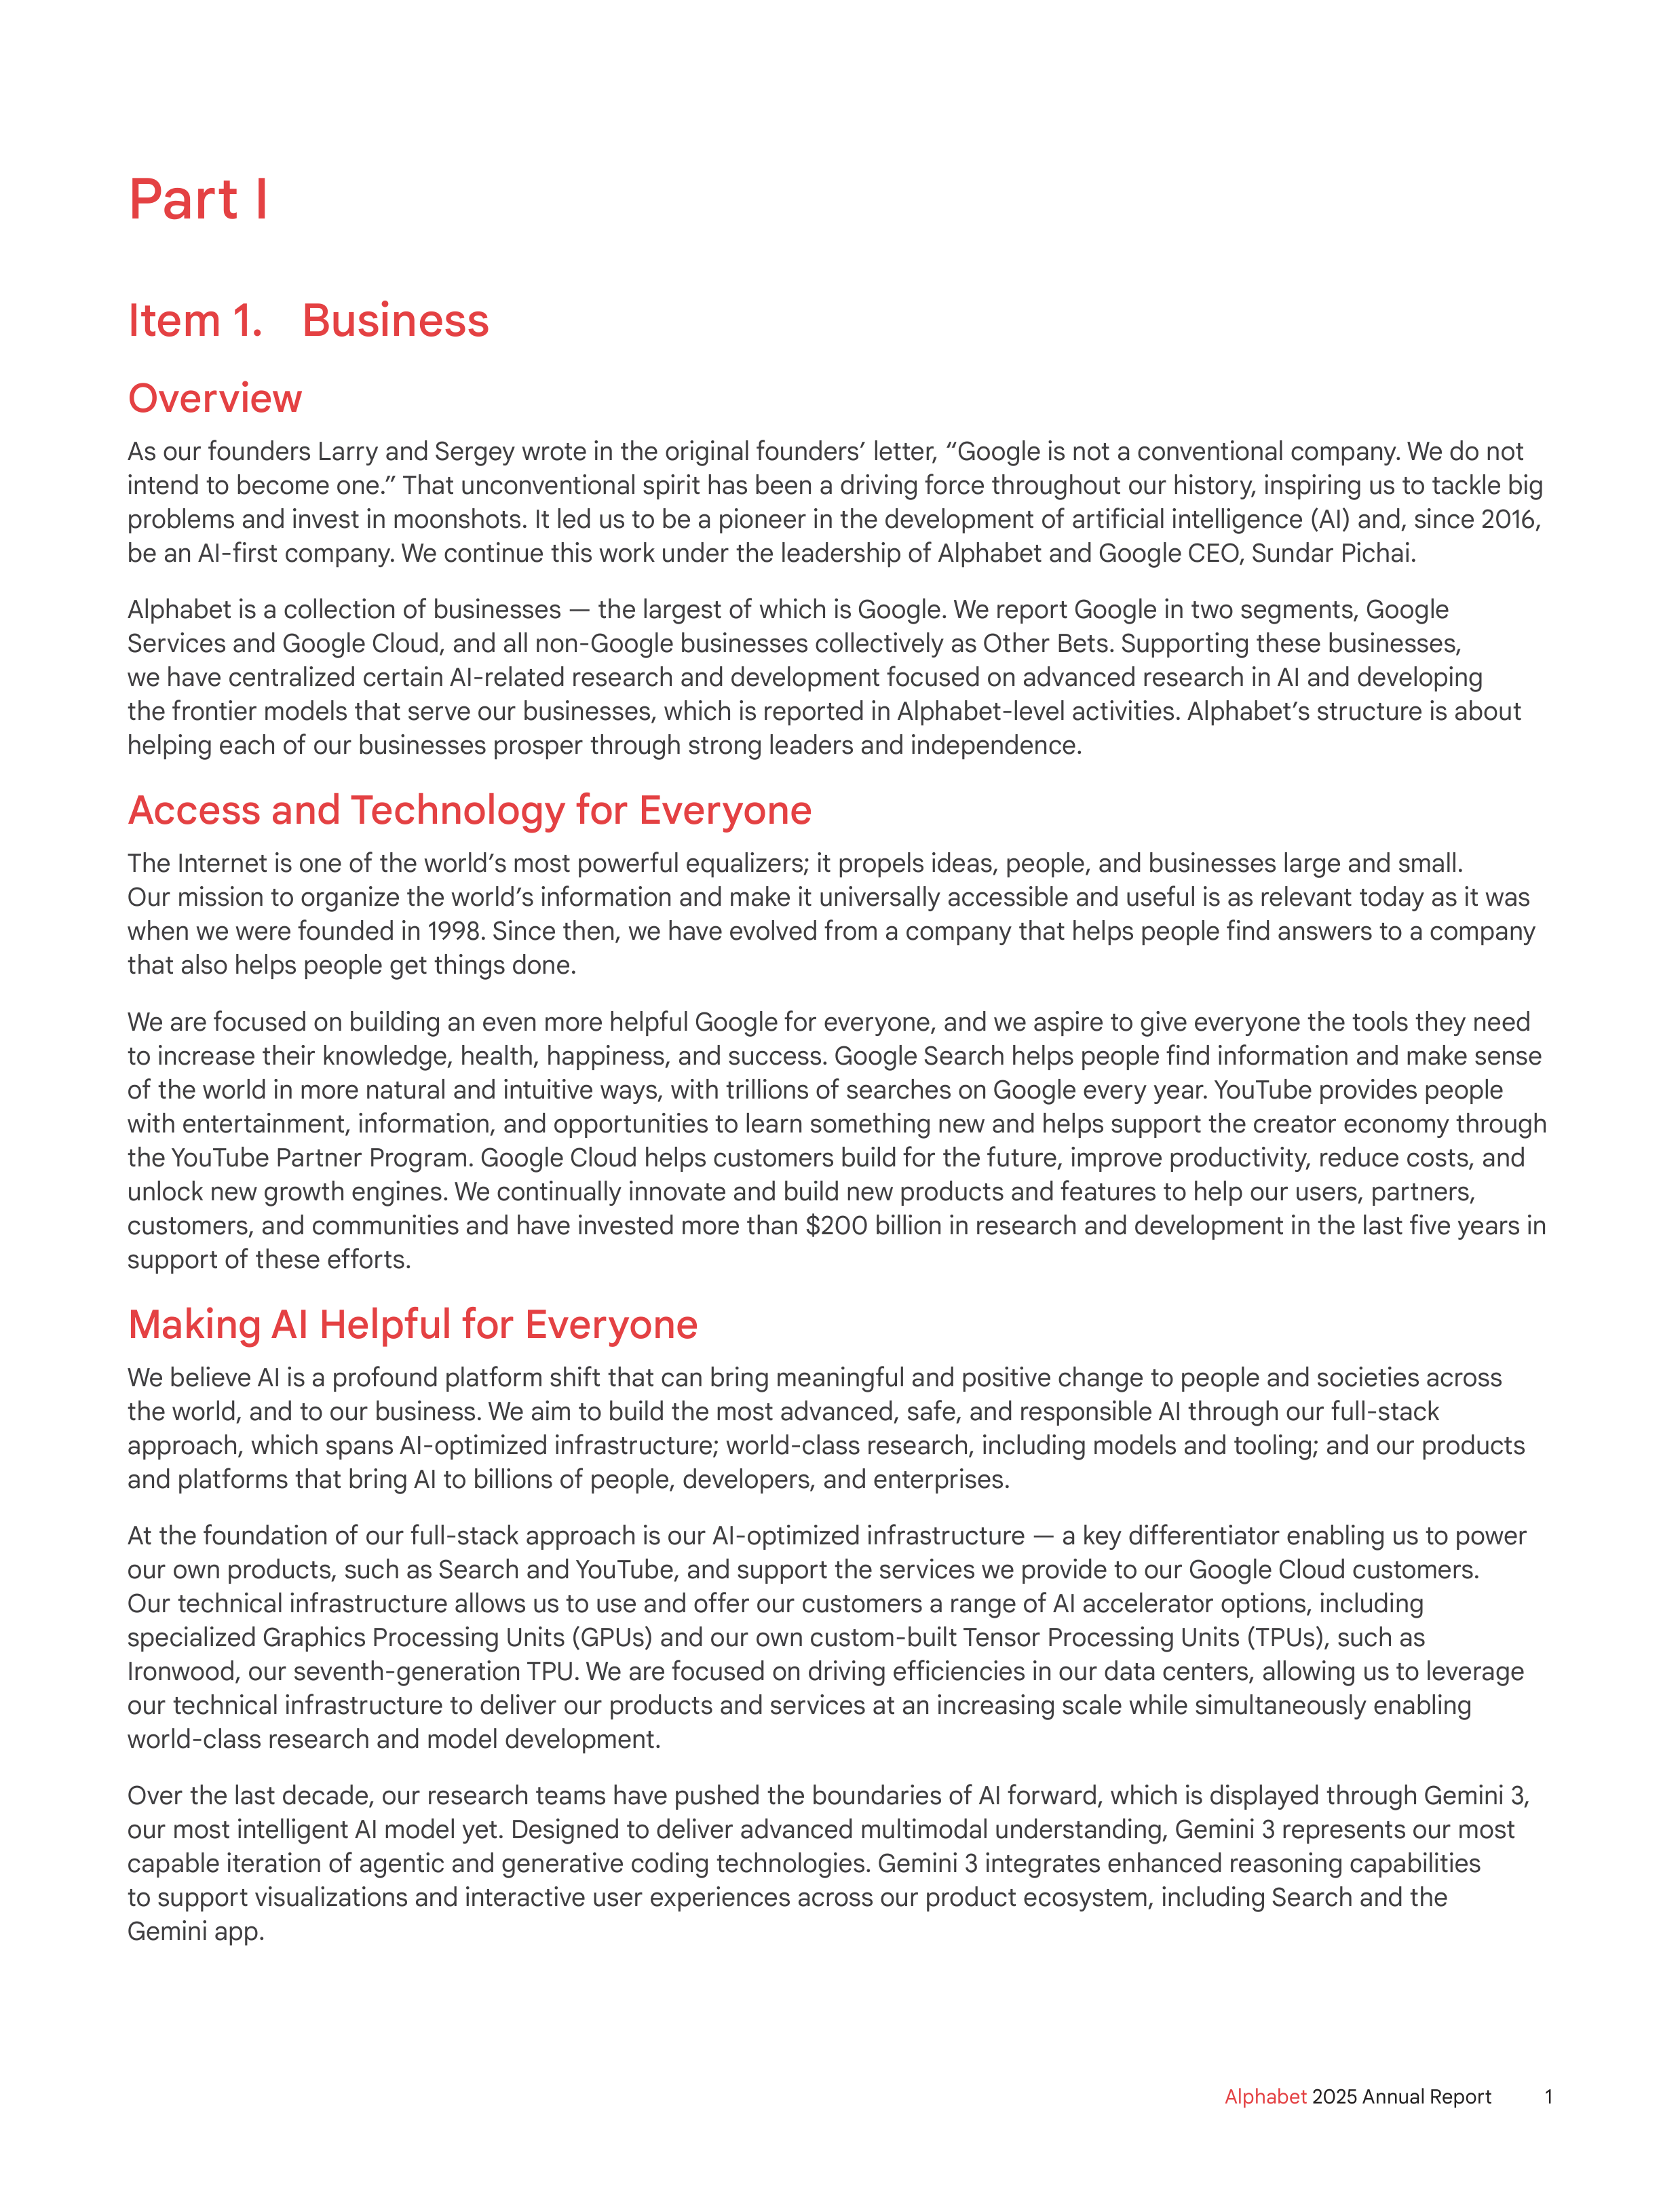
Item 1. Business
Overview
As our founders Larry and Sergey wrote in the original founders’ letter, “Google is not a conventional company. We do not
intend to become one.” That unconventional spirit has been a driving force throughout our history, inspiring us to tackle big
problems and invest in moonshots. It led us to be a pioneer in the development of artificial intelligence (AI) and, since 2016,
be an AI-first company. We continue this work under the leadership of Alphabet and Google CEO, Sundar Pichai.
Alphabet is a collection of businesses — the largest of which is Google. We report Google in two segments, Google
Services and Google Cloud, and all non-Google businesses collectively as Other Bets. Supporting these businesses,
we have centralized certain AI-related research and development focused on advanced research in AI and developing
the frontier models that serve our businesses, which is reported in Alphabet-level activities. Alphabet’s structure is about
helping each of our businesses prosper through strong leaders and independence.
Access and Technology for Everyone
The Internet is one of the world’s most powerful equalizers; it propels ideas, people, and businesses large and small.
Our mission to organize the world’s information and make it universally accessible and useful is as relevant today as it was
when we were founded in 1998. Since then, we have evolved from a company that helps people find answers to a company
that also helps people get things done.
We are focused on building an even more helpful Google for everyone, and we aspire to give everyone the tools they need
to increase their knowledge, health, happiness, and success. Google Search helps people find information and make sense
of the world in more natural and intuitive ways, with trillions of searches on Google every year. YouTube provides people
with entertainment, information, and opportunities to learn something new and helps support the creator economy through
the YouTube Partner Program. Google Cloud helps customers build for the future, improve productivity, reduce costs, and
unlock new growth engines. We continually innovate and build new products and features to help our users, partners,
customers, and communities and have invested more than $200 billion in research and development in the last five years in
support of these efforts.
Making AI Helpful for Everyone
We believe AI is a profound platform shift that can bring meaningful and positive change to people and societies across
the world, and to our business. We aim to build the most advanced, safe, and responsible AI through our full-stack
approach, which spans AI-optimized infrastructure; world-class research, including models and tooling; and our products
and platforms that bring AI to billions of people, developers, and enterprises.
At the foundation of our full-stack approach is our AI-optimized infrastructure — a key differentiator enabling us to power
our own products, such as Search and YouTube, and support the services we provide to our Google Cloud customers.
Our technical infrastructure allows us to use and offer our customers a range of AI accelerator options, including
specialized Graphics Processing Units (GPUs) and our own custom-built Tensor Processing Units (TPUs), such as
Ironwood, our seventh-generation TPU. We are focused on driving efficiencies in our data centers, allowing us to leverage
our technical infrastructure to deliver our products and services at an increasing scale while simultaneously enabling
world‑class research and model development.
Over the last decade, our research teams have pushed the boundaries of AI forward, which is displayed through Gemini 3,
our most intelligent AI model yet. Designed to deliver advanced multimodal understanding, Gemini 3 represents our most
capable iteration of agentic and generative coding technologies. Gemini 3 integrates enhanced reasoning capabilities
to support visualizations and interactive user experiences across our product ecosystem, including Search and the
Gemini app.
1
Alphabet
2025 Annual Report
As technology continues to improve rapidly, we are focused on bringing our latest AI advances to our products and
platforms. We continue to help our users access information and knowledge, express themselves, and get things done by
embedding the power of generative AI and Gemini into our products and platforms. Today, all 15 of our half-billion-user
products — including seven with two billion users — use our Gemini models. For our Google Cloud customers, our offerings
are helping organizations stay at the forefront of innovation with solutions such as Gemini Enterprise and Gemini for
Google Workspace.
Guided by our AI principles, we believe our approach to AI must be both bold and responsible. That means developing AI in
a way that maximizes the positive benefits to society while addressing its potential challenges.
Moonshots
Many companies get comfortable doing what they have always done, making only incremental changes. This
incrementalism leads to irrelevance over time, especially in technology, where change tends to be revolutionary,
not evolutionary.
Our early investments in AI started out as moonshots but are now incorporated into our core products and central to future
developments. In Other Bets, our fully autonomous driving technology company, Waymo, is now providing fully autonomous,
paid ride-hailing services to customers in multiple cities. Isomorphic Labs is reimagining the drug discovery process from
first principles, applying AI to accelerate the development of new medicines. We continue to look toward the future and
to invest for the long term, most notably for the application of AI to our products and services, as well as other frontier
technologies such as quantum computing.
Privacy and Security
We make it a priority to protect the privacy and security of our products, users, and customers, even if there are near-term
financial consequences. We do this by continuously investing in building products that are secure by default; strictly
upholding responsible data practices that emphasize privacy by design; and building easy-to-use settings that put people
in control. We are continually enhancing these efforts over time, whether by enabling users to auto-delete their data,
applying privacy technologies like on-device processing, giving people tools to control their experience, or advancing
anti-malware, anti-phishing, and password security features.
Google
For reporting purposes Google comprises two segments: Google Services and Google Cloud.
Google Services
Serving Our Users
We have always been committed to building helpful products that can improve the lives of millions of people worldwide.
Our product innovations are what make our services widely used, and our brand one of the most recognized in the world.
Google Services’ core products and platforms include ads, Android, Chrome, devices, Gmail, Google Drive, Google Gemini,
Google Maps, Google Photos, Google Play, Search, and YouTube, with broad and growing adoption by users around
the world.
Our products and services have come a long way since the company was founded more than 25 years ago. While Google
Search started as a way to find web pages, organized into ten blue links, we have driven technical advancements and
product innovations that have transformed Google Search into a dynamic, multimodal experience. Large language models
have made it possible to express more natural language queries, vastly improving the types of questions users can ask, and
the quality of results. For example, AI Overviews makes it easier to ask Google anything and get a helpful response. AI Mode
allows users to ask more nuanced questions that might have previously taken multiple searches, using Gemini’s advanced
reasoning, thinking, and multimodal capabilities.
This drive to make information more accessible and helpful has led us over the years to improve the discovery and creation
of digital content both on the web and through platforms like Google Play and YouTube. People are consuming many forms
of digital content, including watching long and short form videos and podcasts, streaming TV, playing games, listening
to music, reading books, and using apps. Working with content creators and partners, we continue to build new ways for
people around the world to create and find great digital content.
2
Alphabet
2025 Annual Report
Part I
Part II
Part III
Part IV
Fueling all of these great digital experiences are extraordinary platforms and devices. That is why we continue to invest in
platforms like our Android mobile operating system, Chrome browser, and Chrome operating system, as well as our family
of devices. We see tremendous potential for devices to be helpful and make people’s lives easier by combining the best of
our AI, software, and hardware. This potential is reflected in our latest generation of devices, such as the new Pixel 10 series
and the Pixel Watch 4. Creating products and services that people rely on every day is a journey that we are investing in for
the long-term.
How We Make Money
We have built world-class advertising technologies for advertisers, agencies, and publishers to power their digital
marketing businesses. Our advertising solutions help millions of companies grow their businesses through our wide
range of products across devices and formats, and we aim to ensure positive user experiences by serving the right ads
at the right time and by building deep partnerships with brands and agencies. AI has been foundational to our advertising
business for more than a decade. Products like Demand Gen, Performance Max, and Product Studio use the full power of
our AI to help advertisers find untapped and incremental conversion opportunities.
Google Services generates revenues primarily by delivering both performance and brand advertising that appears on
Google Search & other properties, YouTube, and Google Network partners’ properties (“Google Network properties”).
We continue to invest in both performance and brand advertising and seek to improve the measurability of advertising so
advertisers understand the effectiveness of their campaigns.
•
Performance advertising
creates and delivers relevant ads that users will click on leading to direct engagement with
advertisers. Performance advertising lets our advertisers connect with users while driving measurable results. Our ads
tools allow performance advertisers to create simple text-based ads.
•
Brand advertising
helps enhance users’ awareness of and affinity for advertisers’ products and services, through
videos, text, images, and other interactive ads that run across various devices. We help brand advertisers deliver digital
videos and other types of ads to specific audiences for their brand-building marketing campaigns.
We have allocated substantial resources to stopping bad advertising practices and protecting users on the web. We focus
on creating the best advertising experiences for our users and advertisers in many ways, including filtering out invalid
traffic, removing billions of bad ads from our systems every year, and closely monitoring the sites, apps, and videos where
ads appear and blocklisting them when necessary to ensure that ads do not fund bad content.
In addition, Google Services generates revenues from products and services beyond advertising, including:
•
consumer subscriptions,
which primarily include revenues from YouTube services, such as YouTube TV, YouTube Music
and Premium, and NFL Sunday Ticket, as well as Google One, which offers access to our most capable Gemini models;
•
platforms,
which primarily include revenues from Google Play sales of apps and in-app purchases; and
•
devices,
which primarily include sales of the Pixel family of devices.
Google Cloud
Through our Google Cloud Platform and Google Workspace offerings, Google Cloud generates revenues primarily from
consumption-based fees and subscriptions for infrastructure, platform, applications, and other cloud services. Customers
use Google Cloud in multiple ways such as:
•
AI-optimized Infrastructure:
runs on our Cloud, at the edge, or in customers’ data centers. It can be used to migrate and
modernize information technology (IT) systems and to train and serve various types of AI models. Our AI infrastructure
delivers cost-performance for AI workloads. We offer a range of AI accelerators, including our custom TPUs and
specialized GPUs, as well as AI-optimized storage offerings, and efficient AI software.
•
Developer Platform:
delivers a fully managed AI development platform, through Vertex AI, for accessing, tuning,
augmenting, and deploying custom models and agents, helping customers build applications with more than 200
foundation models, including our Gemini family, third-party, and open models.
•
Cybersecurity:
provides AI-powered threat intelligence and cybersecurity solutions to help customers detect, analyze,
protect against, and respond to a broad range of cybersecurity threats.
•
Data and Analytics:
enables customers to migrate, clean, prepare, and feed data into their models. Our data platform
also unifies data lakes, data warehouses, data governance, and advanced machine learning into a single platform that
helps users analyze data using AI models across any cloud.
3
Alphabet
2025 Annual Report
Part I
Part II
Part III
Part IV
•
Agents:
•
Gemini Enterprise: empowers teams to discover, create, share, and run AI agents all in one secure platform, bringing
the best of Google AI to employees through an intuitive chat interface, helping to automate workflows and drive
smarter business outcomes.
•
Gemini for Google Workspace: brings our AI-powered agents into Gmail, Docs, Sheets, and more to help users write,
organize, visualize, accelerate workflows, and have more productive meetings.
Other Bets
Across Alphabet, we are also using technology to try to solve big problems that affect a wide variety of industries, including
transportation and health technology. Alphabet’s investment in the portfolio of Other Bets includes businesses that are
at various stages of development, ranging from those in the research and development phase, such as X, our moonshot
factory focused on developing breakthrough technologies, to those that are scaling commercialization, such as Waymo,
which is expanding to more cities domestically, entering international markets, and further scaling operations.
Other Bets operate as independent companies and some of them have their own boards with independent members and
outside investors. While these early-stage businesses naturally come with considerable uncertainty, some of them are
already generating revenue and making important strides in their industries. Revenues from Other Bets are generated
primarily from the sale of autonomous transportation and internet services.
Competition
Our business is characterized by rapid change as well as new and disruptive technologies. We face formidable competition
in every aspect of our business, including but not limited to, from:
•
general purpose search engines and information services;
•
vertical search engines and e-commerce providers for queries on topics such as those related to travel, jobs, and health,
which users may navigate directly to rather than go through Google;
•
online advertising platforms and networks, including online shopping and streaming services;
•
other forms of advertising, such as billboards, magazines, newspapers, radio, and television, as our advertisers typically
advertise in multiple media, both online and offline;
•
digital content and application platform providers;
•
providers of enterprise cloud services;
•
AI model developers and providers of AI products and services;
•
companies that design, manufacture, and market consumer hardware products, including businesses that have
developed proprietary platforms;
•
providers of digital video services;
•
social networks, which users may rely on for product or service referrals, rather than seeking information through
traditional search engines; and
•
providers of workspace communication and connectivity products.
Competing successfully depends heavily on our ability to continually develop and distribute innovative products and
technologies to the marketplace across our businesses. For example, for advertising, competing successfully depends on
attracting and retaining:
•
users, for whom other products and services are literally one click away, on the basis of the relevance of our advertising,
as well as the general usefulness, security, and availability of our products and services;
•
advertisers, primarily based on our ability to generate sales leads, and ultimately customers, and to deliver their
advertisements in an efficient and effective manner across a variety of distribution channels even as trends in
advertising mediums and user preferences change; and
•
content providers, primarily based on the quality of our advertiser base, our ability to help these partners generate
revenues from advertising, and the terms of our agreements with them.
For additional information about competition, see Item 1A Risk Factors of this Annual Report on Form 10-K.
4
Alphabet
2025 Annual Report
Part I
Part II
Part III
Part IV
Culture and Workforce
Our people are critical for our continued success, so we work hard to create an environment where employees can have
fulfilling careers and perform at a high level. We offer industry-leading benefits and programs to take care of the diverse
needs of our employees and their families, including opportunities for career growth and development, resources to
support their financial health, and access to excellent healthcare choices. Our competitive compensation programs
help us to attract and retain key talent, and we will continue to invest in recruiting talented people to technical and
non-technical roles and rewarding them well. We provide a variety of high-quality training and support to managers to build
and strengthen their capabilities — ranging from courses for new managers, to learning resources that help them provide
feedback and manage performance, to coaching and individual support.
As of December 31, 2025, Alphabet had 190,820 employees. We have work councils and statutory employee representation
obligations in certain countries, and we are committed to supporting protected labor rights, maintaining an open culture,
and listening to our employees.
When appropriate we partner with outside companies on a contractual basis to provide a specialized service or to
temporarily cover a short-term need. The employees of our suppliers and staffing partners — vendors and temporary staff,
respectively — and independent contractors who are self-employed, make up our extended workforce. We choose our
partners and staffing agencies carefully, and review their compliance with Google’s Supplier Code of Conduct.
Government Regulation
We are subject to numerous United States (US) federal, state, and local, as well as foreign laws, and regulations covering
a wide variety of subjects, and the scope of this coverage continues to broaden with continuing new legal and regulatory
developments in the US and internationally. Like other companies in the technology industry, we face increasingly
heightened scrutiny from both US and foreign governments with respect to our compliance with laws and regulations. Many
of these laws and regulations are evolving and their applicability and scope, as interpreted by the courts, remain uncertain.
Particularly with regard to AI; competition; consumer protection; content moderation, including access restrictions for
minors; data privacy and security; intellectual property; news publications; and sustainability and other social matters, we
have seen an increase in new and evolving laws and regulations, as well as related enforcement actions and investigations,
being proposed and implemented in recent years by legislative and regulatory bodies around the world. As we have seen in
recent years, different laws and regulations on the same topic may not always have the same requirements (and sometimes
may seem to have conflicting requirements), and even when requirements overlap, the rules are not always consistently
implemented, interpreted, and enforced from jurisdiction to jurisdiction.
Our compliance with these laws and regulations may be onerous and could, individually or in the aggregate, increase our
cost of doing business, make our products and services less useful, limit our ability to pursue certain business practices
or offer certain products and services (either in certain geographies or at all), cause us to change our business models
and operations, affect our competitive position relative to our peers, or otherwise harm our business, reputation, financial
condition, and operating results.
For additional information about government regulation applicable to our business, see Item 1A Risk Factors; Trends in
Our Business and Financial Effect in Part II, Item 7; and Legal Matters in Note 10 of the Notes to Consolidated Financial
Statements included in Part II, Item 8 of this Annual Report on Form 10-K.
Intellectual Property
We rely on intellectual property such as trademarks, copyrights, patents, and trade secrets, as well as confidentiality
procedures and contractual provisions, to protect our proprietary technology and our brand. We have registered, and
applied for the registration of, US and international trademarks, service marks, domain names, and copyrights. We have also
filed patent applications in the US and foreign countries covering certain of our technology, and acquired patent assets to
supplement our portfolio. We have licensed in the past, and expect that we may license in the future, certain of our rights
to other parties. For additional information, see Item 1A Risk Factors of this Annual Report on Form 10-K.
5
Alphabet
2025 Annual Report
Part I
Part II
Part III
Part IV
Available Information
Our website is located at www.abc.xyz, and our investor relations website is located at www.abc.xyz/investor. Access to our
Annual Reports on Form 10-K, Quarterly Reports on Form 10-Q, Current Reports on Form 8-K, and our Proxy Statements,
and any amendments to these reports, is available on our investor relations website, free of charge, after we file or furnish
them with the SEC and they are available on the SEC’s website at www.sec.gov.
We webcast our earnings calls, as well as certain events we participate in or host with members of the investment
community, via our investor relations YouTube channel and website. Our investor relations website also provides
notifications of news or announcements regarding our financial performance and other items that may be material or
of interest to our investors, including SEC filings, investor events, press and earnings releases, and blogs. We also share
Google news and product updates on Google’s Keyword blog at https://www.blog.google/ and News From Google page
on X at x.com/NewsFromGoogle, and our executive officers may also use certain social media channels, such as X and
LinkedIn, to communicate information about earnings results and company updates, which may be of interest or material
to our investors. Further, corporate governance information, including our certificate of incorporation, bylaws, corporate
governance guidelines, board committee charters, and code of conduct, is also available on our investor relations website
under the heading “Governance.” The information contained on, or that may be accessed through our websites or our
executive officers’ social media channels, is not incorporated by reference into this Annual Report on Form 10-K or in any
other report or document we file with the SEC, and any references to our websites are intended to be inactive textual
references only.
Item 1A. Risk Factors
Our operations and financial results are subject to various risks and uncertainties, including but not limited to those
described below, which could harm our business, reputation, financial condition, and operating results, and may affect the
trading price and price volatility of our Class A and Class C stock.
Risks Specific to our Company
We generate a significant portion of our revenues from advertising. Reduced spending by advertisers,
a loss of partners, shifts in online advertising, new and evolving advertising formats, or new or existing
technologies that block ads online or affect our ability to personalize ads could harm our business.
We generated more than 70% of total revenues from online advertising in 2025. Many of our advertisers, companies
that distribute our products and services, digital publishers, and content providers can terminate their contracts with us
at any time. These partners may not continue to do business with us if we do not create more value (such as increased
numbers of users or customers, new sales leads, increased brand awareness, or more effective monetization) than their
available alternatives.
We believe AI is quickly reshaping the advertising industry, including how ads are delivered online, and we and our
competitors are constantly adjusting to meet this shift and provide new and evolving advertising formats. There is no
assurance that we will adapt effectively and competitively to meet this shift, and that such advertising formats, strategies,
and offerings will be successful.
Changes to our advertising policies and data privacy practices, as well as changes to other companies’ advertising or
data privacy practices have in the past, and may in the future, affect the advertising services that we are able to provide.
In addition, technologies have been developed that make personalized ads more difficult, or that block the display of
ads altogether, and some providers of online services have integrated technologies that could impair the availability and
functionality of third-party digital advertising. Failing to provide superior value or deliver advertisements effectively and
competitively could harm our business, reputation, financial condition, and operating results.
Expenditures by advertisers tend to correlate with overall economic conditions. Adverse macroeconomic conditions have
affected, and may in the future affect, the demand for advertising, resulting in fluctuations in the amounts our advertisers
spend on advertising, which could harm our financial condition and operating results.
6
Alphabet
2025 Annual Report
Part I
Part II
Part III
Part IV
Our increasing investment in new businesses, products, services, and technologies is inherently risky, and
could divert management attention and harm our business, financial condition, and operating results.
We have invested and expect to expand our investment in new businesses, products, services, and technologies in a
wide range of industries beyond online advertising. The investments that we are making across our businesses — such
as building AI-optimized infrastructure, including our custom TPUs, and integrating AI capabilities into new and existing
products and services — reflect our ongoing efforts to innovate and provide products and services that are helpful to
users, advertisers, publishers, customers, content providers, and distribution partners. Our investments ultimately may not
be commercially viable or may not result in an adequate return of capital and, in pursuing new strategies, we may incur
unanticipated liabilities.
To meet the compute capacity demands of AI training and inference, as well as traditional cloud computing services, we
are entering into significant leasing arrangements with third party operators, which may increase costs and operational
complexity. We also have a number of large, long-duration commercial agreements, which could increase our liabilities
and obligations in the event of nonperformance by us, our counterparties, or vendors. In such nonperformance or an
industry downturn, we may incur additional liabilities, have excess capacity that we cannot easily redeploy, and not receive
payments from our counterparties or customers.
We have invested and expect to significantly expand our investment in property and equipment, including our technical
infrastructure, and we expect these assets to benefit our business over their estimated useful lives. Changes in facts and
circumstances such as changes to historical asset performance, expected technology advancements, and future network
deployment plans could change the period over which we expect to benefit from the asset and impact our financial
condition and operating results.
Innovations in our products and services could also result in changes to user and customer behavior and affect our revenue
trends. These endeavors involve significant risks and uncertainties, including diversion of resources and management
attention from current operations, different monetization models, and the use of alternative investment, governance,
or compensation structures that may fail to adequately align incentives across the company or otherwise accomplish
their objectives.
Within Google Services, we continue to invest heavily in devices, including our smartphones, home devices, and wearables,
which is a highly competitive market with frequent introduction of new products and services, rapid adoption of
technological advancements by competitors, increased market saturation in developed countries, short product life cycles,
evolving industry standards, continual improvement in performance characteristics, and price and feature sensitivity on the
part of consumers and businesses. There can be no assurance we will be able to provide devices that compete effectively.
Within Google Cloud, we devote significant resources to develop and deploy our enterprise-ready cloud services, including
Google Cloud Platform and Google Workspace, and we are advancing our AI platforms and models to support these
tools and technologies, including the development of our custom TPUs and how we deliver them to our customers. We
are incurring significant and increasing costs and new liabilities, including contingent liabilities, to build and maintain
infrastructure to support cloud computing services, invest in cybersecurity, and hire talent. Meanwhile, our competitors
are rapidly developing and deploying cloud-based services and capacity. Pricing and delivery models, which are subject
to increasing regulatory scrutiny and requirements, are competitive and constantly evolving, and we may therefore not
achieve our business objectives. Further, our business with financial services, healthcare, and public sector customers may
present additional risks, including regulatory compliance risks. For instance, we may be subject to government audits and
cost reviews, and any failure to comply or any deficiencies found may expose us to legal, financial, and reputational risks.
Evolving laws and regulations may require us to make new capital investments, build new products, and seek partners to
deliver localized services in other countries, and we may not be able to meet sovereign operating requirements.
Within Other Bets, we are investing significantly in areas such as life sciences and transportation, among others. These
investment areas face intense competition from large, experienced, and well-funded competitors, and our offerings,
many of which involve the development of new and emerging technologies, may not be successful, or be able to compete
effectively or operate at sufficient levels of profitability.
In addition, new and evolving products and services, including those that use AI, raise ethical, technological, legal,
regulatory, and other challenges, which could harm our brands and demand for our products and services. Because all of
these investment areas are inherently risky, no assurance can be given that such strategies and offerings will be successful
or will not harm our reputation, financial condition, and operating results.
7
Alphabet
2025 Annual Report
Part I
Part II
Part III
Part IV
We face intense competition. If we do not continue to innovate and provide products and services that
are useful to users, customers, and other partners, we may not remain competitive, which could harm our
business, financial condition, and operating results.
Our business environment is rapidly evolving and intensely competitive. Our businesses face changing technologies,
shifting user needs, and frequent introductions of rival products and services. To compete successfully, we must accurately
anticipate technology developments and deliver innovative, relevant, and useful products, services, and technologies in
a timely manner. For example, with the rise of AI in recent years, we have increasingly focused our investments in building
powerful AI tools and AI enhancements to our existing products and services to better cater to our users, customers, and
other partners. As our businesses evolve, the competitive pressure to innovate will encompass a wider range of products
and services. We must continue to invest significant resources in technical infrastructure, including the development of our
custom TPUs, and research and development, including through acquisitions, in order to enhance our technology, products,
and services.
We have many competitors in different industries. Our current and potential domestic and international competitors range
from large and established companies to emerging start-ups. Some competitors have longer operating histories and
well-established relationships in various sectors. They can use their experience and resources in ways that could affect our
competitive position, including by making acquisitions and entering into other strategic arrangements; continuing to invest
heavily in technical infrastructure, research and development, and in talent; initiating intellectual property and competition
claims (whether or not meritorious); and continuing to compete for users, advertisers, customers, and content providers.
Further, discrepancies in enforcement of existing laws may enable our lesser known competitors to aggressively interpret
those laws without commensurate scrutiny, thereby affording them competitive advantages. Our competitors may also be
able to innovate and provide products and services faster or more cost effectively than we can or may foresee the need for
products and services before we do.
We are developing frontier generative AI models and building AI capabilities into products and services across the company,
tailoring them to the evolving preferences of our users and customers. AI technology and services are highly competitive,
rapidly evolving, and require significant investment, including technical infrastructure, development, and operational
costs. Our ability to deploy certain AI technologies critical for our products and services and for our business strategy
may depend on the availability and pricing of third-party equipment and other technical infrastructure operations costs,
including network capacity, energy, and equipment costs. Additionally, other companies may develop AI products and
technologies that are similar or superior to our technologies or more cost-effective to develop or deploy. Other companies
may also have (or in the future may obtain) patents or other proprietary rights that would prevent, limit, or interfere with our
ability to make, use, or sell our own AI products and services.
Our financial condition and operating results may also suffer if our products and services are not responsive in a timely
manner to the evolving needs and desires of our users, advertisers, publishers, customers, and content providers, or if we
miscalculate those needs and desires and invest significantly in areas that fail to gain sufficient market traction. As new
and existing technologies continue to develop, competitors and new entrants may be able to offer experiences that are,
or that are perceived to be, substantially similar to or better than ours, and the consumers may change how they obtain
information online, potentially reducing the utility of our existing products and services. These technologies could reduce
usage of our products and services, and force us to compete in different ways and expend significant resources to develop
and operate equal or better products and services. Competitors’ success in providing compelling products and services
or in attracting and retaining users, advertisers, publishers, customers, and content providers could harm our financial
condition and operating results.
Our revenue growth rate could decline over time, and we may experience downward pressure on our
operating margin in the future.
Our revenue growth rate could decline over time as a result of a number of factors, including changes in customer usage
and demand for our existing products and increasing demand for competing technologies; changes in the devices and
modalities used to access our products and services; changes in geographic mix; deceleration or declines in advertiser
spending; competition; decreases in the pricing of our products and services; ongoing product and policy changes; and
shifts to lower priced products and services.
We may experience downward pressure on our operating margin resulting from a variety of factors. These include
increasing costs for many aspects of our business resulting from a higher level of investment in technical infrastructure,
increasing regulations, and increasing competition. Certain of our costs and expenses are relatively fixed and may not
8
Alphabet
2025 Annual Report
Part I
Part II
Part III
Part IV
correlate to changes in revenue, and we may also not be able to continue to drive efficiencies at the rate we have in
the past. We may also face margin compression from an increase in the mix of lower-margin products and services, in
particular from the continued expansion of our business into new fields, including products and services such as Google
Cloud, our devices, and consumer subscription products, as well as significant investments in Other Bets. For instance,
margins on our devices have had, and may continue to have, an adverse effect on our consolidated margins due to
pricing pressures and higher cost of sales. Due to these factors and the evolving nature of our business, our historical
revenue growth rate and historical operating margin may not be indicative of our future performance. For additional
information, see Trends in Our Business and Financial Effect and Revenues and Monetization Metrics in Part II, Item 7 of this
Annual Report on Form 10-K.
Our intellectual property rights are valuable, and any inability to protect them could reduce the value of
our products, services, and brands as well as affect our ability to compete.
Our patents, trademarks, trade secrets, copyrights, and other intellectual property rights are important assets for us.
Various events outside of our control pose a threat to our intellectual property rights, as well as to our products, services,
and technologies. For example, effective intellectual property protection may not be available in every country in which
our products and services are distributed or made available through the Internet. Also, the efforts we have taken and may
take in the future to protect our proprietary rights, including obtaining copyright and patent protections for our important
innovations, including AI innovations, may not be sufficient or effective. There is also the possibility that an issued patent
may be deemed invalid or unenforceable.
We also seek to maintain certain intellectual property as trade secrets. The confidentiality of such trade secrets and other
sensitive information could be compromised, which could cause us to lose the competitive advantage resulting from these
trade secrets. We also face risks associated with our trademarks. For example, there is a risk that the word “Google” could
become so commonly used that it becomes synonymous with the word “search.” Some courts have ruled that “Google”
is a protectable trademark, but it is possible that other courts, particularly those outside of the US, may reach a different
determination. If this happens, we could lose protection for this trademark.
Any significant impairment of our intellectual property rights could harm our business and ability to compete. Protecting
our intellectual property rights is costly and time consuming; any increase in unauthorized use could make it more
expensive to do business and harm our financial condition and operating results.
Our business depends on strong brands, and failing to maintain and enhance our brands would hurt our
ability to expand our base of users, advertisers, customers, content providers, and other partners.
Our strong brands have significantly contributed to the success of our business. Maintaining and enhancing the brands
within Google Services, Google Cloud, and Other Bets increases our ability to enter new categories and launch new and
innovative products and services that better serve the needs of our users, advertisers, customers, content providers, and
other partners. Our brands have been, and may in the future be, harmed by a number of factors, including, among others,
reputational issues, third-party content shared on our platforms, data privacy and security issues and developments,
issues in delivering age-appropriate experiences to minors, and product or technical performance failures. For example, if
we fail to respond appropriately to the sharing of misinformation or objectionable content on our services or products or
objectionable practices by advertisers, or otherwise to adequately address user concerns, our users may lose confidence
in our brands. Furthermore, failure to maintain and enhance our brands could harm our business, reputation, financial
condition, and operating results. Our success will depend largely on our ability to remain a technology leader and continue
to provide high-quality, trustworthy, innovative products and services that are truly useful and play a valuable role in a
range of settings.
We face a number of manufacturing and supply chain risks that could affect our ability to supply our
products and services and harm our business, financial condition, and operating results.
We rely on contract manufacturers to manufacture or assemble our devices as well as servers and networking equipment
used in our technical infrastructure, certain components of which we may supply. We also rely on third parties to supply
components and distribute our products and services. Our business could be harmed if we are not able to engage
these companies with the necessary capabilities or capacity on reasonable terms, or if those we engage fail to meet their
obligations (whether due to financial difficulties or other reasons), or make adverse changes in the pricing or other material
terms of our arrangements with them.
9
Alphabet
2025 Annual Report
Part I
Part II
Part III
Part IV
We have experienced and may in the future experience supply shortages, price increases, quality issues, or longer lead
times that could harm our operations, driven by raw material or component availability, manufacturing capacity, labor
shortages, industry allocations, logistics capacity, inflation, foreign currency exchange rates, tariffs, sanctions and export
controls, trade disputes and barriers, forced labor concerns, sourcing requirements, geopolitical tensions, armed conflicts,
natural disasters or pandemics, the effects of climate change, power and transmission availability, and significant changes
in the financial or business condition of our suppliers. Some of the components we use in our technical infrastructure
and our devices are available from only one or limited sources, and we may not be able to find replacement vendors on
favorable terms in the event of a supply chain disruption. A significant supply interruption that affects us or our vendors
could delay critical data center or network infrastructure upgrades or expansions and delay consumer product availability.
Our ability to scale our technical infrastructure is increasingly constrained by the availability of power, water, and land.
For example, energy supply is constrained globally due to the significant increase in demand for and limited availability
of energy to power AI compute. Securing this capacity involves entering into complex, long-lead-time arrangements.
Additionally, manufacturing and supply of servers and network equipment for our technical infrastructure, particularly
for specialized AI chips, is limited to a small number of qualified suppliers. Extended or unforeseen disruptions at these
suppliers could impact our ability to meet customer demand. Failure to secure sufficient capacity in a timely manner would
limit our ability to train models and serve Cloud customers.
We may enter into long-term contracts for materials and products that commit us to significant terms and conditions.
We may face costs for materials and products that are not consumed due to market demand, technological change,
excess or obsolete inventory, changed consumer preferences, quality, product recalls, and warranty issues. Certain of our
competitors may negotiate more favorable contractual terms based on volume and other commitments that may provide
them with competitive advantages and may affect our supply. For example, industry supply capacity for AI accelerators,
including GPUs as well as our custom-built TPUs, is highly competitive and rapidly evolving. If we are unable to negotiate
favorable contractual terms or our competitors claim the supply or capacity first, we may face increased costs and supply
constraints, which could harm our business, financial condition, and operating results.
Our devices have had, and in the future may have, quality issues resulting from design, manufacturing, or operations.
Sometimes, these issues may be caused by components we purchase from other manufacturers or suppliers. In addition,
quality issues with equipment used in our technical infrastructure could constrain our capacity to support the delivery
and continued development of our products and services. If the quality of our products and services does not meet
expectations, we lack the capacity to deliver them, or our products or services are defective or require a corrective action
or recall, it could harm our business, reputation, financial condition, and operating results.
We require our suppliers and business partners to comply with laws and, where applicable, our company policies and
practices, such as the Google Supplier Code of Conduct, regarding workplace and employment practices, data security,
environmental compliance, and intellectual property licensing, but we do not control them or their practices. Violations of
law or unethical business practices could result in supply chain disruptions, canceled orders, harm to key relationships, and
damage to our reputation. Their failure to procure necessary license rights to intellectual property could affect our ability to
sell our products or services and expose us to litigation or financial claims.
Interruption to, interference with, or failure of our complex information technology and communications
systems could hurt our ability to effectively provide our products and services, which could harm our
reputation, financial condition, and operating results.
The availability of our products and services and fulfillment of our customer contracts depend on the continuing operation
of our information technology and communications systems. Our systems are vulnerable to damage, interference, or
interruption from modifications or upgrades, terrorist attacks, state-sponsored attacks, natural disasters or pandemics,
geopolitical tensions or armed conflicts, export controls and sanctions, tariffs and non-tariff trade barriers, the effects
of climate change, power and transmission availability challenges, utility outages, telecommunications failures, computer
viruses, software bugs, cyber attacks, supply-chain attacks, computer denial of service attacks, phishing schemes, or
other attempts to harm or access our systems. Some of our data centers are located in areas with a high risk of major
earthquakes or other natural disasters. Our data centers are also subject to break-ins, sabotage, and intentional acts
of vandalism, and, in some cases, to potential disruptions resulting from problems experienced by facility operators or
disruptions as a result of geopolitical tensions and conflicts happening in the area. Some of our systems are not fully
redundant, and disaster recovery planning cannot account for all eventualities. The occurrence of a natural disaster
or pandemic, closure of a facility, or other unanticipated problems affecting our data centers could result in lengthy
10
Alphabet
2025 Annual Report
Part I
Part II
Part III
Part IV
interruptions in our service. In addition, our products and services are highly technical and complex and have contained
in the past, and may contain in the future, errors or vulnerabilities, which could result in interruptions in or failure of our
services or systems. Any of these incidents could impede or prevent us from effectively offering products and providing
services, which could harm our business, reputation, financial condition, and operating results.
Our international operations expose us to additional risks that could harm our business, reputation,
financial condition, and operating results.
Our international operations are significant to our revenues and net income, and we plan to continue growing
internationally. International revenues accounted for approximately 52% of consolidated revenues in 2025. In addition to
risks described elsewhere in this section, our international operations expose us to other risks, including:
•
restrictions on foreign ownership and investments, and stringent foreign exchange controls that might prevent us from
repatriating cash earned in countries outside the US;
•
sanctions, tariffs, import and export controls, other market access barriers, political unrest, geopolitical tensions,
changes in regimes, or armed conflict (such as ongoing conflicts in the Middle East and Ukraine), any of which may
affect our business continuity, increase our operating costs, limit demand for our products and services, limit our ability
to source components or final products, or prevent or impede us from operating in certain jurisdictions, complying with
local laws, or offering products or services;
•
longer payment cycles in some countries, increased credit risk, and higher levels of payment fraud;
•
an evolving foreign policy landscape that could harm our revenues and could subject us to litigation, new regulatory
costs and challenges (including new customer requirements), uncertainty regarding regulatory outcomes, and other
liabilities under local laws that may not offer due process or clear legal precedent;
•
anti-corruption laws, such as the US Foreign Corrupt Practices Act, and other local laws prohibiting certain payments to
government officials, violations of which could result in civil and criminal penalties; and
•
different employee/employer relationships; different labor laws, regulations, and labor practices; and other challenges
caused by distance, language, local expertise, and cultural differences, increasing the complexity of doing business in
multiple jurisdictions.
Because we conduct business in currencies other than US dollars but report our financial results in US dollars, we have
faced, and will continue to face, exposure to fluctuations in foreign currency exchange rates. Although we hedge a portion
of our international currency exposure, significant fluctuations in exchange rates between the US dollar and foreign
currencies have and may in the future adversely affect our revenues and earnings. Hedging programs are also inherently
risky and could expose us to additional risks that could harm our financial condition and operating results.
Disruptions in our ability to access future financing or manage our indebtedness could adversely affect our
ability to execute our strategy and harm our financial condition.
We may from time to time access capital markets for debt or seek to enter into other forms of financing, such as leases.
Any difficulty in accessing capital markets, entering into other forms of financing on favorable terms, or managing our
existing indebtedness could increase our costs of financing and restrict our ability to invest in our business. Furthermore,
the combination of our current and any future indebtedness, including obligations arising under leases, backstops,
guarantees, and potential liabilities from large commercial agreements, could harm our financial condition and reduce our
financial and business flexibility.
We are exposed to fluctuations in the fair values of our investments and, in some instances, our financial
statements incorporate inherently subjective valuation methodologies.
The fair value of our debt and equity investments may in the future be, and certain investments have been in the past,
negatively affected by liquidity, credit deterioration or losses, performance and financial results of the underlying entities,
foreign exchange rates, changes in interest rates, the effect of new or changing regulations, the stock market in general,
or other factors. As a result of these factors, the value of our investments could significantly decline, which could harm our
financial condition and operating results.
We measure certain of our non-marketable equity and debt securities, and certain other instruments including stock-based
compensation (SBC) awards of Other Bet companies, at fair value on a nonrecurring basis, which is inherently subjective
and requires management judgment and estimation. Gains and losses on non-marketable equity securities are recognized
11
Alphabet
2025 Annual Report
Part I
Part II
Part III
Part IV
in other income (expense), net (OI&E), which increases the volatility of our OI&E. The unrealized gains and losses or
impairments we record from fair value remeasurements in any particular period may differ significantly from the gains and
losses we ultimately realize on such investments. Changes in fair value on SBC awards are recognized primarily through
operating expenses.
Risks Related to our Industry
Issues in the development and use of AI may result in reputational harm and increased liability exposure.
Our evolving AI-enabled products and services may give rise to risks related to harmful content, inaccuracies,
discrimination, intellectual property infringement or misappropriation, violation of rights of publicity, defamation, data
privacy, cybersecurity, minor protection, and other issues. As a result of these and other challenges associated with
innovative technologies, our implementation of AI systems could subject us to competitive harm, regulatory action, legal
liability (including under new and proposed legislation and regulations), new applications of existing data protection,
privacy, intellectual property, and other laws, and brand or reputational harm.
Some uses of AI will present ethical issues and may have broad effects on society. In order to implement AI responsibly
and minimize unintended harmful effects, we have already devoted and will continue to invest significant resources to
develop, test, and maintain our products and services, but we may not be able to identify or resolve all AI-related issues,
deficiencies, and failures before they arise. Unintended consequences, uses, or customization of our AI tools and systems
may negatively affect human rights, privacy, employment, or other social concerns, which may result in claims, lawsuits,
brand or reputational harm, and increased regulatory scrutiny, any of which could harm our business, financial condition,
and operating results.
People access our products and services through a variety of platforms and devices that continue to
evolve with the advancement of technology and user preferences. If manufacturers and users do not
widely adopt versions of our products and services developed for these interfaces, our business could
be harmed.
While the modalities used to access information is evolving, people access our products and services through a growing
variety of devices such as phones, laptops and tablets, video game consoles, voice-activated speakers, wearables
(including virtual reality and augmented reality devices), automobiles, and television-streaming devices. Our products
and services may be less popular on some interfaces. Each manufacturer or distributor may establish unique technical
standards for its devices, and our products and services may not be available or may only be available with limited
functionality for our users or our advertisers on these devices as a result. Some manufacturers may also elect not to
include our products on their devices.
It is hard to predict the challenges we may encounter in adapting our products and services and developing competitive
new products and services. We expect to continue to devote significant resources to creating and supporting products and
services across multiple platforms and devices. Failing to attract and retain a substantial number of device manufacturers,
suppliers, distributors, developers, and users, or failing to develop products and technologies that work well on new
devices and platforms, could harm our business, financial condition, and operating results and ability to capture future
business opportunities.
Problematic content on our platforms, including low-quality user-generated content, web spam, content
farms, and other violations of our guidelines could affect the quality of our services, which could harm our
reputation and deter our current and potential users from using our products and services.
We, like others in the industry, face violations of our content guidelines across our platforms, including sophisticated
attempts by bad actors to manipulate our hosting and advertising systems to fraudulently generate revenues, or to
otherwise generate traffic that does not represent genuine user interest or intent. While we invest significantly in efforts to
promote high-quality and relevant results and to detect and prevent low-quality content and invalid traffic, we have been
unable and may continue to be unable to detect and prevent all such abuses or promote uniformly high-quality content.
Increased use of AI in our offerings and internal systems may create new instances of problematic content and increased
potential for misuse and abuse.
Many websites violate or attempt to violate our guidelines, including by seeking to inappropriately rank higher in search
results than our search engine’s assessment of their relevance and utility would rank them. Such efforts have affected, and
may continue to affect, the quality of content on our platforms and lead them to display false, misleading, or undesirable
12
Alphabet
2025 Annual Report
Part I
Part II
Part III
Part IV
content. Although English-language web spam in our search results has been reduced, and web spam in most other
languages is limited, we expect web spammers will continue to seek inappropriate ways to improve their rankings. Although
we continue to invest in and deploy proprietary technology to detect and prevent web spam on our platforms and to evolve
our policies to address emerging threats, there is no guarantee that our technology and policy enforcement will always be
successful, and our users may have negative experiences that make them less likely to use our platforms. We face legal
and regulatory challenges to our efforts to address low-quality content, and our ability to address it may be constrained
or made more costly through added compliance requirements. We also face other challenges to the quality of our search
results from low-quality and irrelevant content websites, including content farms, which are websites that generate large
quantities of low-quality content in an effort to improve their search rankings. We are continually launching algorithmic
changes designed to detect and prevent these efforts, but we may not always be successful. We also face other challenges
on our platforms, including attempted election interference; fraud, content inappropriate for minors, misleading or
deceptive information, and other types of potentially harmful content.
If we fail to either detect and prevent an increase in problematic content or effectively promote high-quality content, it
could hurt our reputation for delivering relevant information or reduce use of our platforms, harming our financial condition
and operating results. It may also subject us to litigation and regulatory actions, which could result in monetary penalties
and damages and divert management’s time and attention.
Data privacy and security concerns relating to our technology and our practices could harm our
reputation, cause us to incur significant liability, and deter current and potential users or customers from
using our products and services. Computer viruses, software bugs or defects, security breaches, and
attacks on our systems could result in the improper disclosure and use of user data and interference with
our users’ and customers’ ability to use our products and services, harming our business and reputation.
Concerns about, including the adequacy of, our practices with regard to the collection, use, governance, disclosure, or
security of personal data or other data-privacy-related matters, even if unfounded, could harm our business, reputation,
financial condition, and operating results. Our policies and practices may change over time as expectations and regulations
regarding privacy and data change.
Our products and services involve the storage, handling, and transmission of proprietary and other sensitive information.
Malicious software such as viruses, software bugs, theft, misuse, defects, vulnerabilities in our products and services, as
well as cyber attacks, phishing schemes, and other types of security attacks, which increasingly use AI, expose us to a risk
of loss or improper use and disclosure of such information, which could result in litigation and other potential liabilities,
including regulatory fines and penalties, as well as reputational harm. Additionally, our products incorporate highly
technical and complex technologies, and thus our technologies and software have contained, and are likely in the future
to contain, undetected errors, bugs, or vulnerabilities. We continue to add new features involving AI to our offerings and
internal systems, and features that rely on AI may be susceptible to unanticipated security threats as our and the market’s
understanding of AI-centric security risks and protection methods continue to develop. We have in the past discovered,
and may in the future discover, some errors in our software code only after we have released the code. Systems and control
failures, security breaches, failure to comply with our privacy policies, and inadvertent disclosure of user data could result
in regulatory and legal exposure, seriously harm our reputation, brand, and business, and impair our ability to attract and
retain users or customers. Such incidents have occurred in the past and may continue to occur due to the scale and nature
of our products and services. While there is no guarantee that such incidents will not cause significant damage, we expect
to continue to expend significant resources to maintain security protections that limit the effect of bugs, theft, misuse, and
security vulnerabilities or breaches.
We experience cyber attacks and other attempts to gain unauthorized access to our systems on a regular basis. Cyber
attacks continue to evolve in sophistication and volume, and inherently may be difficult to detect for long periods of
time. The development and implementation of AI technologies may further increase our exposure to or exacerbate the
risks of cyber attacks or other security incidents, particularly where such technologies are exploited by third parties to
breach our or other parties’ systems, including when such technologies are used to target our employees or impersonate
members of senior management in order to gain unauthorized access to our systems. We have also seen, and will
continue to see, industry-wide software supply chain vulnerabilities and attacks on telecommunications and other critical
infrastructure, which could affect our or other parties’ systems. We expect to continue to experience such incidents or
vulnerabilities in the future. Our efforts to prevent security incidents and address undesirable activity on our platform may
require us to spend additional resources to prepare and defend against such threats, and could also increase the risk of
retaliatory attack. In addition, we face the risk of cyber attacks and data exfiltration or compromise by nation-states and
13
Alphabet
2025 Annual Report
Part I
Part II
Part III
Part IV
state‑sponsored actors. These attacks may target us or our customers, particularly our public sector customers (including
federal, state, and local governments). Geopolitical tensions or armed conflicts, such as the ongoing conflict in the
Middle East and Ukraine, may increase these risks.
We may experience security and privacy issues, whether due to employee or insider error or malfeasance, system errors, or
vulnerabilities in our or other parties’ systems. While we may not determine some of these issues to be material when they
occur and may remedy them quickly, there is no guarantee that these issues will not ultimately result in significant legal,
financial, and reputational harm, including government inquiries, enforcement actions, litigation, and negative publicity.
There is also no guarantee that a series of related issues may not be determined to be material at a later date in the
aggregate, even if they may not be material individually at the time of their occurrence. Because the techniques used to
obtain unauthorized access to, disable, or degrade service provided by or otherwise sabotage systems change frequently
and often are recognized only after being launched against a target, even taking all reasonable precautions, including
those required by law, we have been unable in the past and may continue to be unable to anticipate or detect certain
attacks or vulnerabilities or implement adequate preventative measures.
Further, if any partners with whom we share user or other customer information fail to implement adequate data-security
practices, fail to comply with our terms and policies, or otherwise suffer a network or other security breach, our users’
data may be improperly accessed, used, or disclosed. If an actual or perceived breach of our or our business partners’ or
service providers’ security occurs, the market perception of the effectiveness of our security measures would be harmed,
we could lose users and customers, our trade secrets or those of our business partners may be compromised, and we may
be exposed to significant legal and financial risks, including legal claims (which may include class-action litigation) and
regulatory actions, fines, and penalties. Any of the foregoing consequences could harm our business, reputation, financial
condition, and operating results.
While we have dedicated significant resources to privacy and security incident response capabilities, including dedicated
worldwide incident response teams, our response process, particularly during times of a natural disaster or pandemic,
may not be adequate, may fail to accurately assess the severity of an incident, may not be fast enough to prevent or limit
harm, or may fail to sufficiently remediate an incident. As a result, we may suffer significant legal, reputational, or financial
exposure, which could harm our business, financial condition, and operating results.
For additional information, see also our risk factor on privacy and data protection regulations under ‘Risks Related to Laws,
Regulations, and Policies’ below.
Our ongoing investments in safety, security, and content review will likely continue to identify abuse of our
platforms and misuse of user data.
In addition to our efforts to prevent and mitigate cyber attacks, we are making significant investments in safety, security,
and review efforts to combat misuse of our services and unauthorized access to user data by third parties, including
investigation and review of platform applications that could access the information of users of our services. As a result of
these efforts, we have in the past discovered, and may in the future discover, incidents of unnecessary access to or misuse
of user data or other undesirable activity by third parties. However, we may not have discovered, and may in the future not
discover, all such incidents or activity, whether as a result of our data limitations, including our lack of visibility over our
encrypted services, the scale of activity on our platform, or other factors, including factors outside of our control such as a
natural disaster or pandemic, and we may learn of such incidents or activity via third parties. Such incidents and activities
may include the use of user data or our systems in a manner inconsistent with our terms, contracts, or policies, the existence
of false or undesirable user accounts, election interference, improper ad purchases, activities that threaten people’s safety
on- or off-line, or instances of spamming, scraping, or spreading disinformation. While we may not determine some of these
incidents to be material at the time they occurred and we may remedy them quickly, there is no guarantee that these issues
will not ultimately result in significant legal, financial, and reputational harm, including government inquiries and enforcement
actions, litigation, and negative publicity. There is also no guarantee that a series of related issues may not be determined to
be material at a later date in the aggregate, even if they may not be material individually at the time of their occurrence.
We may also be unsuccessful in our efforts to enforce our policies or otherwise prevent or remediate any such incidents.
Any of the foregoing developments may negatively affect user trust and engagement, harm our reputation and brands,
require us to change our business practices in ways that harm our business operations, and adversely affect our business
and financial results. Any such developments may also subject us to additional litigation and regulatory inquiries,
which could result in monetary penalties and damages, divert management’s time and attention, and lead to enhanced
regulatory oversight.
14
Alphabet
2025 Annual Report
Part I
Part II
Part III
Part IV
Our business depends on continued and unimpeded access to the Internet by us and our users. Internet
access providers may be able to restrict, block, degrade, or charge for access to certain of our products
and services, which could lead to additional expenses and the loss of users and advertisers.
Our products and services depend on the ability of our users to access the Internet, and certain of our products require
significant network capacity to work effectively. Currently, this access is provided by companies that have significant
market power in the broadband and internet access marketplace, including incumbent telephone companies, cable
companies, mobile communications companies, and government-owned service providers. Some of these providers have
taken, or have stated that they may take, measures that could degrade, disrupt, or increase the cost of user access to
certain of our products by restricting or prohibiting the use of their infrastructure to support or facilitate our offerings,
by charging increased fees to us or our users to provide our offerings, or by providing our competitors preferential
access. Some jurisdictions have adopted regulations prohibiting certain forms of discrimination by internet access
providers; however, substantial uncertainty exists in the US and elsewhere regarding such protections. In addition, in some
jurisdictions, our products and services have been subject to government-initiated restrictions or blockages. These could
harm existing key relationships, including with our users, customers, advertisers, and content providers, and impair our
ability to attract new ones; harm our reputation; and increase costs, thereby negatively affecting our business.
Risks Related to Laws, Regulations, and Policies
We are subject to a variety of new, existing, and changing laws and regulations worldwide that could harm
our business, and will likely be subject to an even broader scope of laws and regulations as we continue to
expand our business.
We are subject to numerous US federal and state as well as foreign laws and regulations covering a wide variety of subjects,
and our introduction of new businesses, products, services, and technologies will likely continue to subject us to additional
laws and regulations. In recent years, governments around the world have proposed and adopted a large number of new
laws and regulations relevant to the digital economy, particularly in the areas of data privacy and security, competition, AI,
and online content. The costs of compliance with these measures are high and are likely to increase in the future, including
as a result of differing, and sometimes conflicting, laws and regulations.
New or changing laws and regulations, or interpretations or applications of existing laws and regulations in a manner
inconsistent with our interpretations of such laws and regulations or our practices, have resulted in, and may continue
to result in, less useful products and services, altered business models and operations, limited ability to pursue certain
business practices or offer certain products and services, substantial costs, and civil or criminal liability. Examples include
laws and regulations regarding:
•
Competition and technology platforms’ business practices:
Laws and regulations focused on large technology
platforms, including the Digital Markets Act in the European Union (EU) and the Act on Promotion of Competition for
Specified Smartphone Software in Japan; regulations and legal settlements in the US, South Korea, and elsewhere that
affect Google Play’s billing policies, fees, and business model; as well as litigation and new and expected regulations in a
range of jurisdictions.
•
AI:
Laws and regulations focused on the development, use, and provision of AI technologies and other digital products
and services, which could result in monetary penalties or other regulatory actions. For example, the EU AI Act came
into force on August 1, 2024, and will generally become fully applicable after a two-year transitional period (although
certain obligations have already taken effect). The EU AI Act introduces various requirements for AI systems and
models placed on the market in the EU, including specific transparency, safety, and copyright requirements for general
purpose AI systems and the models on which those systems are based. Various countries, including Brazil, India,
Japan, South Korea, Singapore, and Vietnam, have also enacted or are considering enacting regulations focused on
AI. In the US, an increasing amount of legislative and regulatory activity regarding AI is taking place at the state level.
In 2025, state legislatures considered more than 1,000 AI-related bills, including on fundamental model research and
development, synthetic media, algorithmic decision-making, and many others, and took a variety of approaches to
AI regulation. For instance, in 2025, California and New York passed the Transparency in Frontier Artificial Intelligence
Act and the Responsible AI Safety and Education Act, respectively, each of which imposes safety and reporting
obligations on developers of frontier models. At the same time, the White House’s Executive Order, Removing Barriers to
American Leadership in Artificial Intelligence, prioritizes deregulation, while its AI Action Plan emphasizes accelerating
American innovation leadership.
15
Alphabet
2025 Annual Report
Part I
Part II
Part III
Part IV
•
Data privacy, collection, processing, and portability:
Laws and regulations further restricting the collection, processing,
or sharing of user or advertising-related data, including privacy and data protection laws; laws affecting the processing
of children’s data (as discussed further below), data breach notification laws; laws limiting data transfers (including data
localization laws); laws limiting use of data for AI training; and laws requiring data portability.
•
Copyright and other intellectual property:
Copyright and related laws, including the EU Directive on Copyright in
the Digital Single Market and European Economic Area transpositions, which have introduced new licensing regimes,
increase liability with respect to content uploaded by users or linked to from our platforms, or create property rights in
news publications that could require payments to news agencies and publishers, which may result in other regulatory
actions. The scope of the text and data mining exception is being challenged before courts in the EU, which could harm
some aspects of our business.
•
Content moderation:
Various laws covering content moderation and removal, and related disclosure obligations, such
as the EU’s Digital Services Act, Florida’s Senate Bill 7072 and Texas’ House Bill 20, and laws and proposed legislation in
Singapore, Australia, and the United Kingdom (UK) that impose penalties for failure to remove certain types of content
or require disclosure of information about the operation of our services and algorithms, which may make it harder for
services like Google Search and YouTube to detect and limit low-quality, deceptive, or harmful content, or, on the other
hand, may impinge on the rights of free expression and access to content. Additionally, new regulations apply to online
child safety, including access and content restrictions as well as other limitations for minors, which may also conflict with
rights of free expression and access to information. These regulations could result in our having to modify our products
and services and monitor minors’ experiences on our products and services.
•
Consumer protection:
Consumer protection laws, including the EU’s New Deal for Consumers, which could result in
monetary penalties and create a range of new compliance obligations.
In addition, the applicability and scope of these and other laws and regulations, as interpreted by courts, regulators, or
administrative bodies, remain uncertain and could be interpreted in ways that harm our business. For example, we rely on
statutory safe harbors, like those set forth in the Digital Millennium Copyright Act and Section 230 of the Communications
Decency Act in the US and the Digital Services Act in Europe, to protect against liability for various linking, caching, ranking,
recommending, and hosting activities. Legislation or court rulings affecting these safe harbors may harm us and may
impose significant operational challenges. There are legislative proposals and pending litigation in the US, EU, and around
the world that could diminish or eliminate safe harbor protection for websites and online platforms. Our development,
use, and commercialization of AI products and services (including our implementation of AI in our offerings and internal
systems) could subject us to regulatory action and legal liability, including under specific legislation regulating AI, as well as
new applications of existing data protection, cybersecurity, privacy, intellectual property, and other laws.
Further, we are subject to evolving laws, regulations, policies, and international accords relating to matters beyond our core
products and services, including environmental sustainability, climate change, human capital, and employment matters. In
response, we have implemented robust programs and initiatives and adopted reporting frameworks and principles that may
require considerable investments. For instance, AI’s energy and water demands have made efforts to reduce our emissions
more complex and challenging across every level. We cannot guarantee that our initiatives will be fully realized on the
timelines we expect or at all, and projects that are completed as planned may not achieve the results we anticipate.
We are and may continue to be subject to claims, lawsuits, regulatory and government inquiries and
investigations, enforcement actions, consent orders, and other forms of regulatory scrutiny and legal
liability, including competition matters, that could harm our business, reputation, financial condition, and
operating results.
We are subject to claims, lawsuits, regulatory and government inquiries and investigations, other proceedings, and orders
involving competition, intellectual property, data privacy and security, tax and related compliance, labor and employment,
commercial disputes, content generated by our users, goods and services offered by advertisers or publishers using our
platforms, design of our products and services, personal injury and other tort and nuisance theories, consumer protection
claims, including how we moderate content on our platforms, AI, and other matters.
The US Department of Justice (DOJ), various states, and other plaintiffs have filed, and may continue to file in the future,
several antitrust lawsuits about aspects of our business, including our advertising technologies and practices, the
operation and distribution of Google Search, and the operation and distribution of Android operating system and Play
Store. If we are unsuccessful in these lawsuits, we could face significant expenses to implement the remedies, and such
costs and alterations could harm our business, reputation, financial condition, and operating results.
16
Alphabet
2025 Annual Report
Part I
Part II
Part III
Part IV
For example, the DOJ and a number of state Attorneys General filed a lawsuit concerning our Search and Search
advertising practices and our compliance with US antitrust laws. In August 2024, the US District Court for the District of
Columbia ruled against Google, and in December 2025, entered a final judgment requiring remedies, which, among other
things, imposes restrictions on how we distribute our services and requires us to share certain search data with and
offer syndication services to certain competitors. In January 2026, we appealed the final judgment and moved to pause
implementation of certain remedies. In February 2026, the DOJ and state Attorneys General also appealed.
Furthermore, in December 2020, a number of state Attorneys General, led by the Texas Attorney General, filed a lawsuit
in the US District Court for the Eastern District of Texas concerning our advertising technology and our compliance with
US antitrust laws and other laws. In January 2023, the DOJ and a number of state Attorneys General sued in the Eastern
District of Virginia alleging similar antitrust violations relating to our advertising technology. In April 2025, the presiding
judge issued a mixed decision in the DOJ case against us, ruling that neither our advertiser tools nor the DoubleClick and
AdMeld acquisitions were anticompetitive, but that our publisher tools unfairly excluded rivals. A separate proceeding
to determine remedies, the range of which varies widely, took place in September 2025 with the parties presenting
differing remedy proposals. The DOJ’s remedy proposal includes structural remedies that could harm our business.
Closing arguments were held in November 2025, and we are awaiting a final judgment. After that judgment, we plan to
appeal the adverse portion of the April 2025 decision and potentially aspects of the remedies decision. A trial in the state
Attorneys General case in the Eastern District of Texas will take place after a decision on remedies is issued in the DOJ
advertising technology case, and could result in remedies that could harm our business, reputation, financial condition, and
operating results.
In addition to these regulatory proceedings, private individual and collective actions that overlap with claims pursued by
regulators are pending in the US and in several other jurisdictions. Adverse results in these or similar future lawsuits may
include awards of monetary damages and remedies that could harm our business, reputation, financial condition, and
operating results.
Other regulatory agencies in the US and around the world, including competition enforcers, consumer protection agencies,
and data protection authorities, have challenged and may continue to challenge our business practices and compliance
with laws and regulations. We are cooperating with these investigations and defending litigation or appealing decisions
where appropriate.
We are also subject to a variety of claims including product warranty, product liability, and consumer protection claims
related to product defects, among other litigation, and we may also be subject to claims involving health and safety,
hazardous materials usage, other environmental effects, AI training, development, and commercialization, or service
disruptions or failures. Claims have been brought, and we expect will continue to be brought, against us for defamation,
negligence, breaches of contract, patent, copyright, and trademark infringement, unfair competition, unlawful activity,
torts, privacy rights violations, fraud, or other legal theories based on the nature and content of information available on
or via our services, the design and effect of our products and services, or due to our involvement in hosting, transmitting,
marketing, branding, or providing access to content created by third parties.
Various laws, regulations, investigations, enforcement lawsuits, and regulatory actions have involved in the past, and may in
the future result in substantial fines and penalties, injunctive relief, ongoing monitoring and auditing obligations, changes to
our products and services, alterations to our business models and operations, including divestiture, and collateral related
civil litigation or other adverse consequences. Any of these legal proceedings could also result in legal costs, diversion of
management resources, and negative publicity, all of which could harm our business, reputation, financial condition, and
operating results.
Estimating liabilities for our pending proceedings is a complex, fact-specific, and speculative process that requires
significant judgment, and the amounts we are ultimately liable for may differ from our estimates. The resolution of one or
more such proceedings has resulted in, and may in the future result in, additional substantial fines, penalties, injunctions,
and other sanctions that could harm our business, reputation, financial condition, and operating results.
For additional information about the ongoing material legal proceedings to which we are subject, see Legal Proceedings in
Item 3 of this Annual Report on Form 10-K.
17
Alphabet
2025 Annual Report
Part I
Part II
Part III
Part IV
Privacy, data protection, data usage, and portability regulations are complex and rapidly evolving areas.
Any failure or alleged failure to comply with these laws could harm our business, reputation, financial
condition, and operating results.
Authorities around the world have adopted and are considering a number of legislative and regulatory proposals
concerning data protection, data usage and portability, and encryption of user data. Additionally, the increasing adoption
of AI technologies, which rely on the collection of large amounts of data and use of such data for training purposes,
has led data protection authorities around the world to consider and adopt new and evolving interpretations of data
protection laws, imposing specific obligations with respect to the processing of personal data, including required notices,
consents, and opt-outs. Further, the increased risk of inadvertent disclosure of confidential information or personal data in
connection with the utilization of AI technologies may result in stronger regulatory scrutiny, leading to legal and regulatory
investigations and enforcement actions that could harm our business, even if unfounded. Adverse legal rulings, legislation,
or regulation have resulted in, and may continue to result in, fines and orders requiring that we change our practices, which
have had and could continue to have an adverse effect on how we provide services, harming our business, reputation,
financial condition, and operating results. These laws and regulations are evolving and subject to interpretation, and
compliance obligations could cause us to incur substantial costs or harm the quality and operations of our products and
services in ways that harm our business. Examples of these laws include:
•
The EU General Data Protection Regulation and the UK General Data Protection Regulations, which apply to all of
our activities conducted from an establishment in the EU or the UK, respectively, or related to products and services
that we offer to EU or the UK users or customers, respectively, or the monitoring of their behavior in the EU or
the UK, respectively.
•
Various US federal, US state, and foreign privacy laws related to the processing and security of personal data, including
(1) comprehensive privacy laws that provide data privacy rights (including, in California, a private right of action in
the event of a data breach resulting from our failure to implement and maintain reasonable security procedures and
practices) and impose significant obligations on controllers and processors of consumer data; (2) laws imposing
obligations on businesses that collect or disclose biometric information (including, in Colorado, Illinois, Texas, and
Washington); (3) laws governing the collection and processing of children and minor’s data and how companies
provide age-appropriate online experiences (including, in the US, the Children’s Online Privacy Protection Act of 1998;
the pending Children and Teens’ Online Privacy Protection Act (COPPA 2.0); similar US state laws related to children’s
privacy, such as the New York Child Data Protection Act; and the UK’s Age-Appropriate Design Code); and (4) laws
regulating internet-connected devices (such as, in California, the Internet of Things Security Law).
•
The EU’s Digital Markets Act, which requires in-scope companies to obtain user consent for combining data across
certain products and require search engines to share anonymized data with rival companies, among other changes; and
the EU Data Act, which introduces new data portability requirements with respect to connected products (i.e., ‘internet
of things’ products) and related services, as well as interoperability obligations on data processing services.
Further, we are subject to evolving laws and regulations that dictate whether, how, and under what circumstances we can
transfer, process, or receive personal data, as well as ongoing enforcement actions from supervisory authorities related to
cross-border transfers of personal data. The validity of various data transfer mechanisms we currently rely upon remains
subject to legal, regulatory, and political developments globally, which may require us to adapt our existing arrangements.
We face, and may continue to face, intellectual property infringement or misappropriation, violation of
rights of publicity, and other claims that could be costly to defend, result in significant damage awards or
other costs (including indemnification awards), and limit our ability to use certain technologies.
We, like other internet, technology, and media companies, are frequently subject to litigation based on allegations of
infringement or other violations of intellectual property rights, including patent, copyright, trade secrets, and trademarks.
Parties have also sought broad injunctive relief against us by filing claims in US and international courts and the US
International Trade Commission (ITC) for exclusion and cease-and-desist orders. In addition, patent-holding companies
may frequently seek to generate income from patents they have obtained by bringing claims against us. As we continue to
expand our business, intellectual property claims against us have increased and may continue to increase as we develop
and acquire new products, services, and technologies, including AI technologies.
Adverse results in any of these lawsuits may include awards of monetary damages, costly royalty or licensing agreements
(if licenses are available at all), or orders limiting our ability to sell our products and services in the US or elsewhere,
including by preventing us from offering certain features, functionalities, products, or services in certain jurisdictions.
18
Alphabet
2025 Annual Report
Part I
Part II
Part III
Part IV
They may also cause us to change our business practices in ways that could result in a loss of revenues for us and
otherwise harm our business.
Many of our agreements with our customers and partners, including certain suppliers, require us to defend against certain
intellectual property infringement claims and in some cases indemnify them for certain intellectual property infringement
claims against them, which could result in increased costs for defending such claims or significant damages if there
were an adverse ruling in any such claims. Such customers and partners may also discontinue the use of our products,
services, and technologies, as a result of injunctions or otherwise, which could result in loss of revenues and harm our
business. Moreover, intellectual property indemnities provided to us by our suppliers, when obtainable, may not cover all
damages and losses suffered by us and our customers arising from intellectual property infringement claims. Furthermore,
in connection with our divestitures, we have agreed, and may in the future agree, to provide indemnification for certain
potential liabilities, including those associated with intellectual property claims. Regardless of their merits, intellectual
property claims are often time consuming and expensive to litigate or settle. To the extent such claims are successful, they
could harm our business, including our product and service offerings, financial condition, and operating results.
We could be subject to changes in tax rates, the adoption of new US or international tax legislation, or
exposure to additional tax liabilities.
We are subject to a variety of taxes and tax collection obligations in the US and numerous foreign jurisdictions. Our
effective tax rates are affected by a variety of factors, including changes in the mix of earnings in jurisdictions with different
statutory tax rates, net gains and losses on hedges and related transactions under our foreign exchange risk management
program, changes in our stock price for shares issued as employee compensation, changes in the valuation of our deferred
tax assets or liabilities, and the application of different provisions of tax laws or changes in tax laws, regulations, or
accounting principles (including changes in the interpretation of existing laws). Further, if we are unable or fail to collect
taxes on behalf of customers, employees, and partners as the withholding agent, we could become liable for taxes that are
levied against third parties.
We are subject to regular review and audit by both domestic and foreign tax authorities. As a result, we have received, and
may in the future receive, assessments in multiple jurisdictions, on various tax-related assertions, such as transfer-pricing
adjustments or permanent-establishment claims. Any adverse outcome of such a review or audit could harm our financial
condition and operating results, require adverse changes to our business practices, or subject us to additional litigation
and regulatory inquiries. In addition, the determination of our worldwide provision for income taxes and other tax liabilities
requires significant judgment and often involves uncertainty. Although we believe our estimates are reasonable, the
ultimate tax outcome may differ from the amounts recorded in our financial statements and may affect our financial results
in the period or periods for which such determination is made.
Further, due to shifting economic and political conditions, tax policies, laws, or rates in various jurisdictions may be
subject to significant changes in ways that could harm our financial condition and operating results. For example, various
jurisdictions around the world have enacted or are considering revenue-based taxes such as digital services taxes and
other targeted taxes, which could lead to inconsistent and potentially overlapping international tax regimes. The US has
imposed a 1% excise tax on the fair market value of shares repurchased, which could increase in the future. Over 140
countries are negotiating changes to international tax policies led by the Organization for Economic Cooperation and
Development (OECD), including a 15% global minimum tax rate. In January 2026, the OECD announced a “Side-by-Side
Safe Harbor” that exempts US operations of US-parented companies from global minimum tax rules. Adoption of minimum
tax rules outside the US could increase our effective tax rate and cash tax payments.
Risks Related to Ownership of our Stock
We cannot guarantee that any share repurchase program or dividend program will be continuously active
or fully consummated or will enhance long-term stockholder value, and share repurchases or dividends
could increase the volatility of our stock prices and could diminish our cash reserves.
We engage in share repurchases of our Class A and Class C stock from time to time in accordance with authorizations
from the Board of Directors of Alphabet. Our repurchase program does not have an expiration date and does not obligate
Alphabet to repurchase any specific dollar amount or to acquire any specific number of shares. Our cash dividend program
pays regular cash dividends to our Class A, Class B, and Class C stockholders. Any and all future cash dividends are subject
to declaration by our Board of Directors in its sole discretion, and in accordance with the requirements of any applicable
laws, rules, and regulations, including the Delaware General Corporation Law. Our cash dividend program does not require,
19
Alphabet
2025 Annual Report
Part I
Part II
Part III
Part IV
and our Board of Directors may decide not to declare, a cash dividend each quarter, and does not obligate our Board
of Directors to declare a dividend at any specific dollar amount per share. Any such decision by our Board of Directors
may depend on a variety of factors that it may deem relevant, including but not limited to our earnings, liquidity, financial
condition, other capital deployment opportunities, level of indebtedness, and general market conditions. Our share
repurchases and dividends could affect our share trading prices, increase their volatility, reduce our cash reserves and may
be suspended or terminated at any time, which may result in a decrease in the trading prices of our stock.
The concentration of our stock ownership limits our stockholders’ ability to influence corporate matters.
Our Class B stock has 10 votes per share, our Class A stock has one vote per share, and our Class C stock has no voting
rights. As of December 31, 2025, Larry Page and Sergey Brin beneficially owned approximately 89.3% of our outstanding
Class B stock, which represented approximately 52.7% of the voting power of our outstanding common stock. Through
their stock ownership, Larry and Sergey have significant influence over all matters requiring stockholder approval, including
the election of directors and significant corporate transactions, such as a merger or other sale of our company or our
assets, for the foreseeable future. In addition, because our Class C stock carries no voting rights (except as required by
applicable law), the issuance of the Class C stock, including in future stock-based acquisition transactions and to fund
employee equity incentive programs, could continue Larry and Sergey’s current relative voting power and their ability to
elect all of our directors and to determine the outcome of most matters submitted to a vote of our stockholders. The share
repurchases made pursuant to our repurchase program may also affect Larry and Sergey’s relative voting power. This
concentrated control limits or severely restricts other stockholders’ ability to influence corporate matters and we may take
actions that some of our stockholders do not view as beneficial, which could reduce the market price of our Class A stock
and our Class C stock.
Provisions in our charter documents and under Delaware law could discourage a takeover that
stockholders may consider favorable.
Provisions in Alphabet’s certificate of incorporation and bylaws may have the effect of delaying or preventing a change of
control or changes in our management. These provisions include the following:
•
Our Board of Directors has the right to elect directors to fill a vacancy created by the expansion of the Board of Directors
or the resignation, death, or removal of a director.
•
Our stockholders may not act by written consent, which makes it difficult to take certain actions without holding a
stockholders’ meeting.
•
Our certificate of incorporation prohibits cumulative voting in the election of directors. This limits the ability of minority
stockholders to elect director candidates.
•
Stockholders must provide advance notice to nominate individuals for election to the Board of Directors or to propose
matters that can be acted upon at a stockholders’ meeting. These provisions may discourage or deter a potential
acquirer from conducting a solicitation of proxies to elect the acquirer’s own slate of directors or otherwise attempting
to obtain control of our company.
•
Our Board of Directors may issue, without stockholder approval, shares of undesignated preferred stock, which makes it
possible for our Board of Directors to issue preferred stock with voting or other rights or preferences that could impede
the success of any attempt to acquire us.
As a Delaware corporation, we are also subject to certain Delaware anti-takeover provisions. Under Delaware law, a
corporation may not engage in a business combination with any holder of 15% or more of its outstanding voting stock
unless the holder has held the stock for three years or, among other things, the Board of Directors has approved the
transaction. Our Board of Directors could rely on Delaware law to prevent or delay an acquisition of us.
General Risks
Our operating results may fluctuate, which makes our results difficult to predict and could cause our
results to fall short of expectations.
Our operating results have fluctuated, and may in the future fluctuate, as a result of a number of factors, many outside of
our control, including the cyclical nature and seasonality in our business and geopolitical events. As a result, comparing
our operating results (including our expenses as a percentage of our revenues) on a period-to-period basis may not be
meaningful, and our past results should not be relied on as an indication of our future performance. Consequently, our
operating results in future quarters may fall below expectations.
20
Alphabet
2025 Annual Report
Part I
Part II
Part III
Part IV
Acquisitions, joint ventures, investments, and divestitures could result in operating difficulties, dilution,
and other consequences that could harm our business, financial condition, and operating results.
Acquisitions, joint ventures, investments, and divestitures are important elements of our overall corporate strategy and use
of capital, and these transactions could be material to our financial condition and operating results. We expect to continue
to evaluate and enter into discussions regarding a wide array of such potential strategic arrangements, which could create
unforeseen operating difficulties and expenditures. Some of the areas where we face risks include:
•
diversion of management time and focus from operating our business to challenges related to acquisitions and other
strategic arrangements;
•
failure to obtain required approvals on a timely basis, if at all, from governmental authorities, or conditions placed
upon approval, either of which could, among other things, delay or prevent us from completing a transaction, result in
the payment of fees or penalties to a counterparty, or otherwise restrict our ability to realize the expected financial or
strategic goals of a transaction; or investigations or litigation by governmental authorities related to our acquisitions,
investments, and other strategic arrangements;
•
failure to successfully integrate the acquired operations, technologies, services, and personnel (including cultural
integration and retention of employees) and further develop the acquired business or technology;
•
implementation of controls (or remediation of deficiencies), procedures, and policies at the acquired company;
•
integration of the acquired company’s accounting and other administrative systems, and the coordination of product,
engineering, and sales and marketing functions;
•
transition of operations, users, and customers onto our existing platforms;
•
in the case of foreign acquisitions, the need to integrate operations across different cultures and languages and to
address the particular economic, currency, political, and regulatory risks associated with specific countries;
•
failure to accomplish commercial, strategic, or financial objectives with respect to investments, joint ventures, and other
strategic arrangements;
•
failure to realize the value of investments and joint ventures due to a lack of liquidity or an inability to identify buyers or
negotiate favorable terms for intended divestitures;
•
liability for activities of the acquired company before the acquisition, including intellectual property infringement
claims, data privacy and security issues, violations of laws, commercial disputes, tax liabilities, warranty claims, product
liabilities, and other known and unknown liabilities; and
•
litigation or other claims in connection with the acquired company, including claims from terminated employees,
customers, former stockholders, or other third parties.
Our failure to address these risks or other problems encountered in connection with our past or future acquisitions and
other strategic arrangements could cause us to fail to realize their anticipated benefits, incur unanticipated liabilities, and
harm our business generally.
Our acquisitions and other strategic arrangements could also result in dilutive issuances of our equity securities, the
incurrence of debt, contingent liabilities, or amortization expenses, or impairment of goodwill or purchased long-lived
assets, and restructuring charges, any of which could harm our financial condition and operating results. Also, the
anticipated benefits or value of our acquisitions, investments, and other strategic arrangements may not materialize. In
connection with our divestitures and certain strategic arrangements, we have agreed, and may in the future agree, to
provide indemnification for certain potential liabilities, which could harm our financial condition and operating results.
We rely on highly skilled personnel and, if we are unable to retain or motivate key personnel, hire qualified
personnel, or maintain and continue to adapt our corporate culture, we may not be able to grow or
operate effectively.
Our performance and future success depends in large part upon the continued service of key technical leads as well as
members of our senior management team. For instance, Sundar Pichai is critical to the overall management of Alphabet
and its subsidiaries and plays an important role in the development of our technology, maintaining our culture, and setting
our strategic direction.
21
Alphabet
2025 Annual Report
Part I
Part II
Part III
Part IV
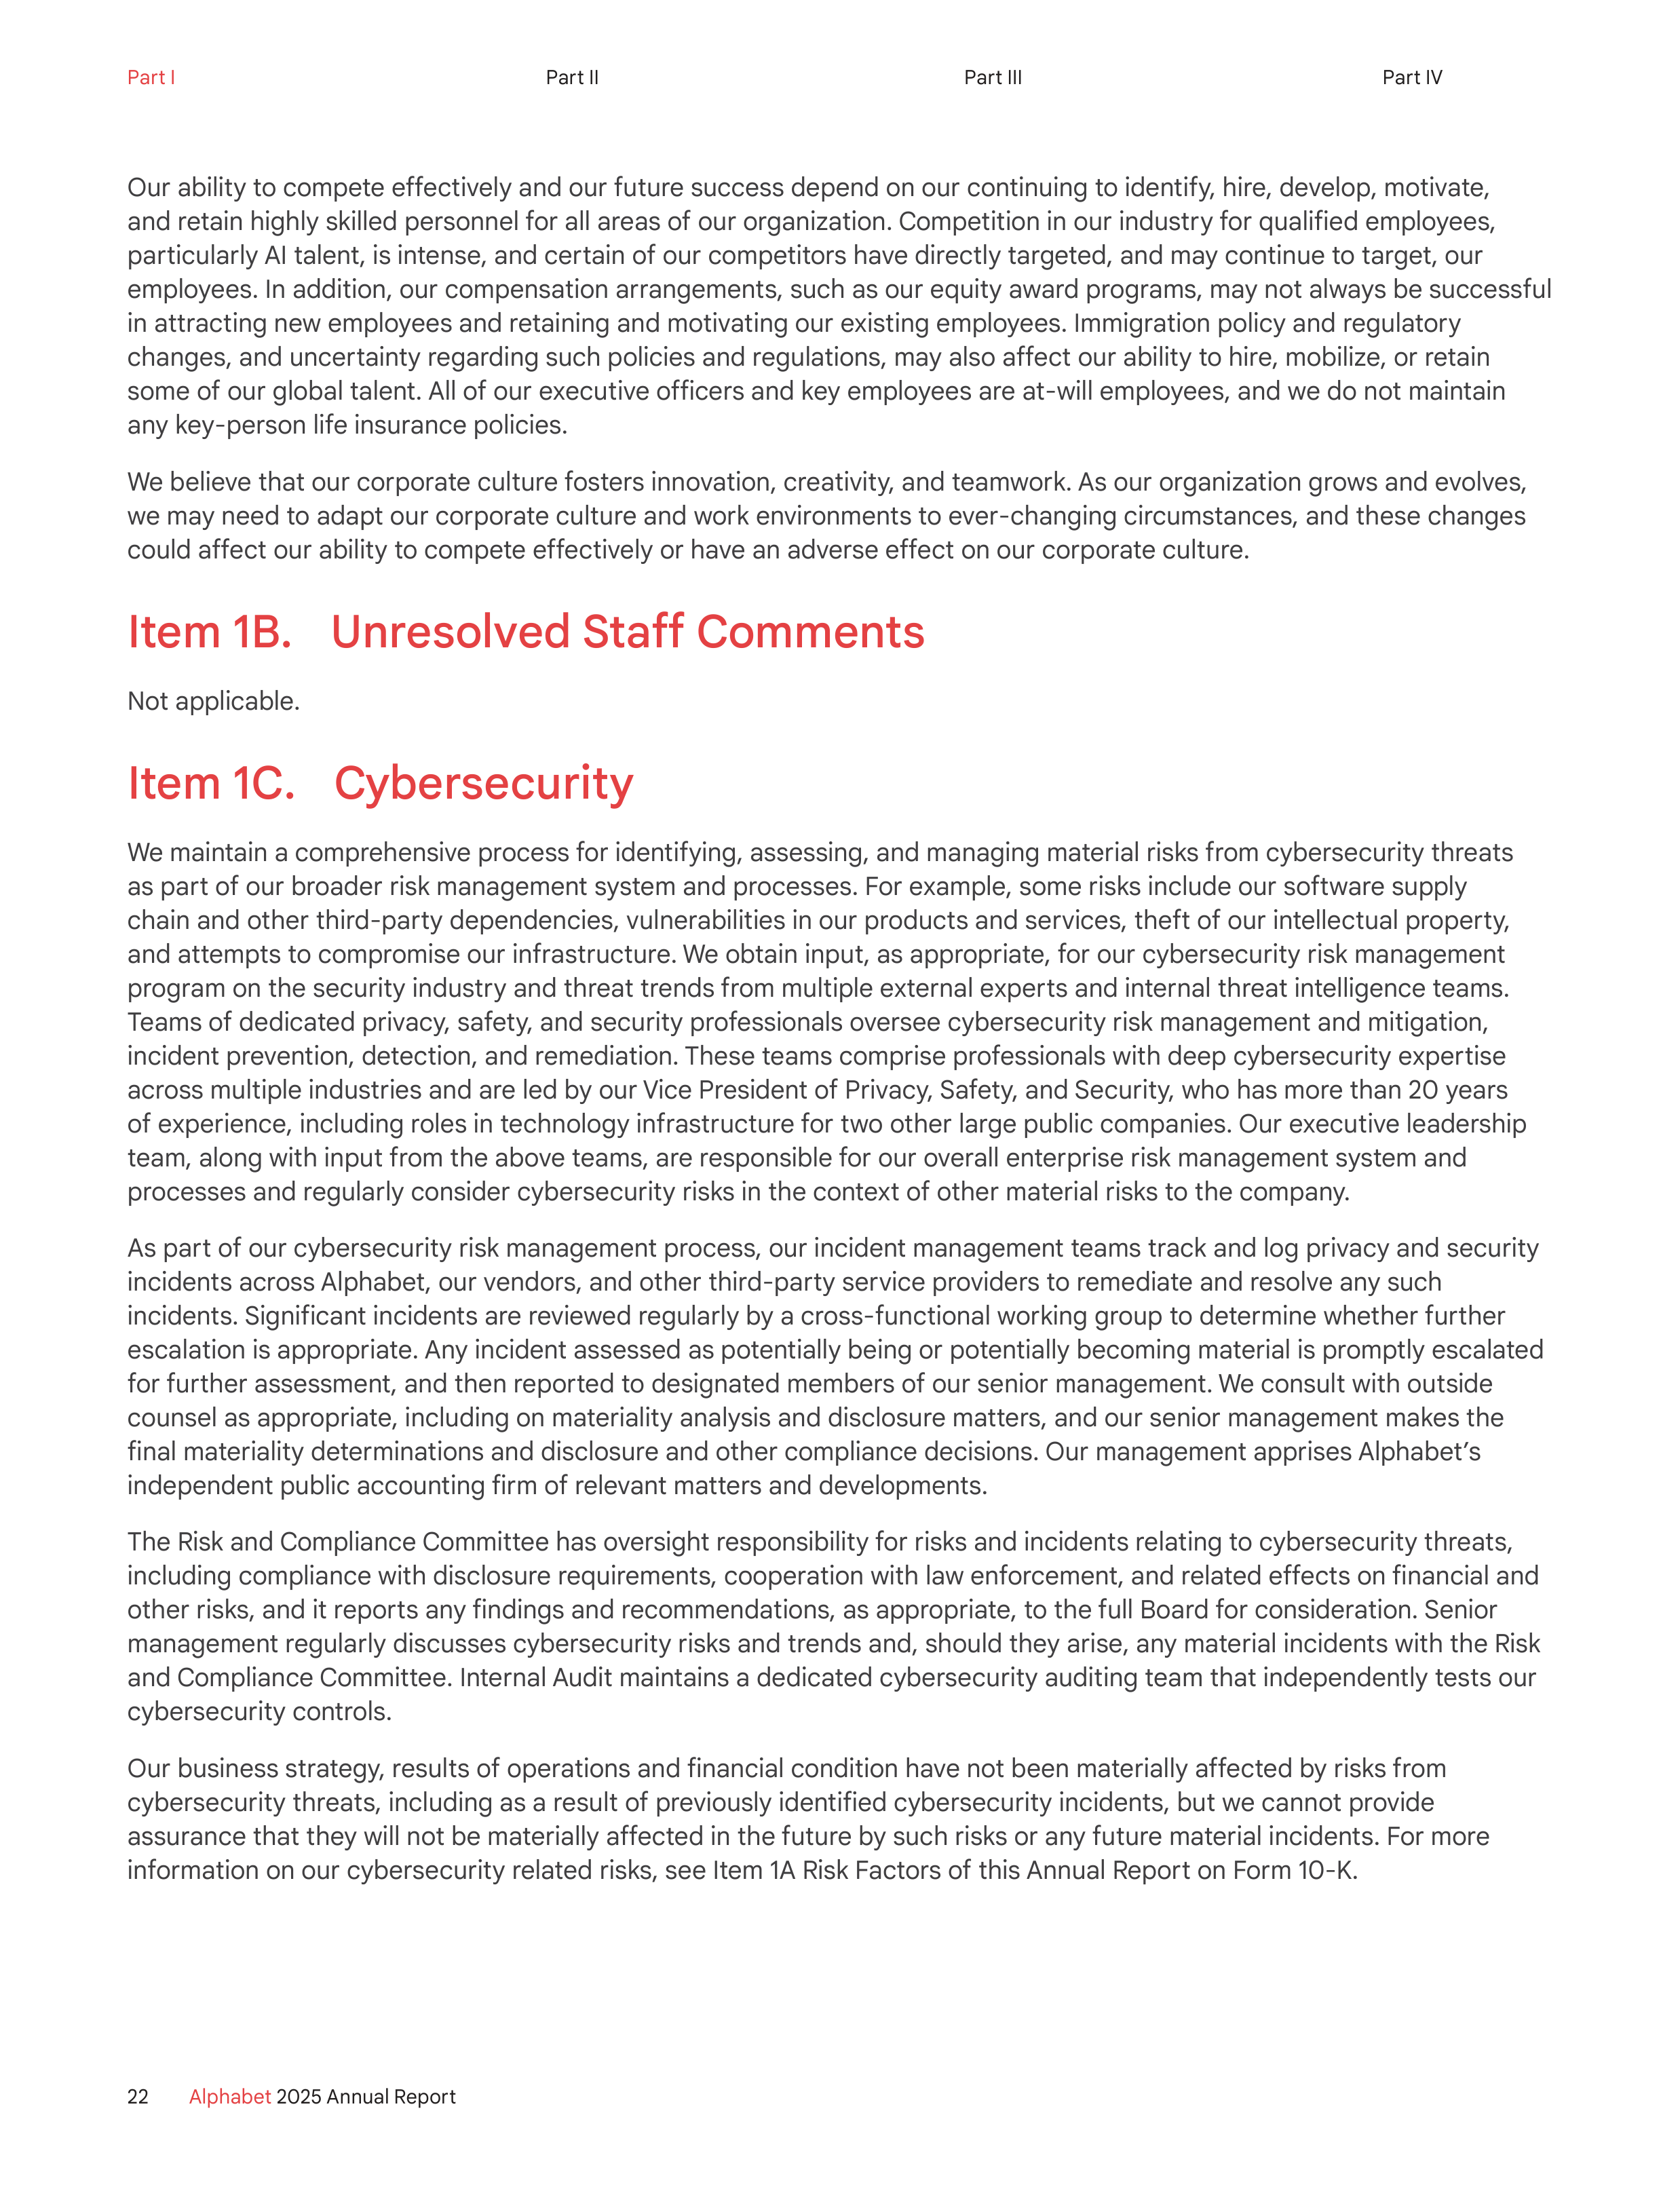
Our ability to compete effectively and our future success depend on our continuing to identify, hire, develop, motivate,
and retain highly skilled personnel for all areas of our organization. Competition in our industry for qualified employees,
particularly AI talent, is intense, and certain of our competitors have directly targeted, and may continue to target, our
employees. In addition, our compensation arrangements, such as our equity award programs, may not always be successful
in attracting new employees and retaining and motivating our existing employees. Immigration policy and regulatory
changes, and uncertainty regarding such policies and regulations, may also affect our ability to hire, mobilize, or retain
some of our global talent. All of our executive officers and key employees are at-will employees, and we do not maintain
any key-person life insurance policies.
We believe that our corporate culture fosters innovation, creativity, and teamwork. As our organization grows and evolves,
we may need to adapt our corporate culture and work environments to ever-changing circumstances, and these changes
could affect our ability to compete effectively or have an adverse effect on our corporate culture.
Item 1B. Unresolved Staff Comments
Not applicable.
Item 1C. Cybersecurity
We maintain a comprehensive process for identifying, assessing, and managing material risks from cybersecurity threats
as part of our broader risk management system and processes. For example, some risks include our software supply
chain and other third-party dependencies, vulnerabilities in our products and services, theft of our intellectual property,
and attempts to compromise our infrastructure. We obtain input, as appropriate, for our cybersecurity risk management
program on the security industry and threat trends from multiple external experts and internal threat intelligence teams.
Teams of dedicated privacy, safety, and security professionals oversee cybersecurity risk management and mitigation,
incident prevention, detection, and remediation. These teams comprise professionals with deep cybersecurity expertise
across multiple industries and are led by our Vice President of Privacy, Safety, and Security, who has more than 20 years
of experience, including roles in technology infrastructure for two other large public companies. Our executive leadership
team, along with input from the above teams, are responsible for our overall enterprise risk management system and
processes and regularly consider cybersecurity risks in the context of other material risks to the company.
As part of our cybersecurity risk management process, our incident management teams track and log privacy and security
incidents across Alphabet, our vendors, and other third-party service providers to remediate and resolve any such
incidents. Significant incidents are reviewed regularly by a cross-functional working group to determine whether further
escalation is appropriate. Any incident assessed as potentially being or potentially becoming material is promptly escalated
for further assessment, and then reported to designated members of our senior management. We consult with outside
counsel as appropriate, including on materiality analysis and disclosure matters, and our senior management makes the
final materiality determinations and disclosure and other compliance decisions. Our management apprises Alphabet’s
independent public accounting firm of relevant matters and developments.
The Risk and Compliance Committee has oversight responsibility for risks and incidents relating to cybersecurity threats,
including compliance with disclosure requirements, cooperation with law enforcement, and related effects on financial and
other risks, and it reports any findings and recommendations, as appropriate, to the full Board for consideration. Senior
management regularly discusses cybersecurity risks and trends and, should they arise, any material incidents with the Risk
and Compliance Committee. Internal Audit maintains a dedicated cybersecurity auditing team that independently tests our
cybersecurity controls.
Our business strategy, results of operations and financial condition have not been materially affected by risks from
cybersecurity threats, including as a result of previously identified cybersecurity incidents, but we cannot provide
assurance that they will not be materially affected in the future by such risks or any future material incidents. For more
information on our cybersecurity related risks, see Item 1A Risk Factors of this Annual Report on Form 10-K.
22
Alphabet
2025 Annual Report
Part I
Part II
Part III
Part IV
Item 2. Properties
Our headquarters are located in Mountain View, California. We own and lease office facilities and data centers around the
world, primarily in Asia, Europe, and North America. We believe our existing facilities are in good condition and suitable for
the conduct of our business.
Item 3. Legal Proceedings
For a description of our material pending legal proceedings, see Legal Matters in Note 10 of the Notes to Consolidated
Financial Statements included in Part II, Item 8 of this Annual Report on Form 10-K, which is incorporated herein
by reference.
Item 4. Mine Safety Disclosures
Not applicable.
23
Alphabet
2025 Annual Report
Part I
Part II
Part III
Part IV
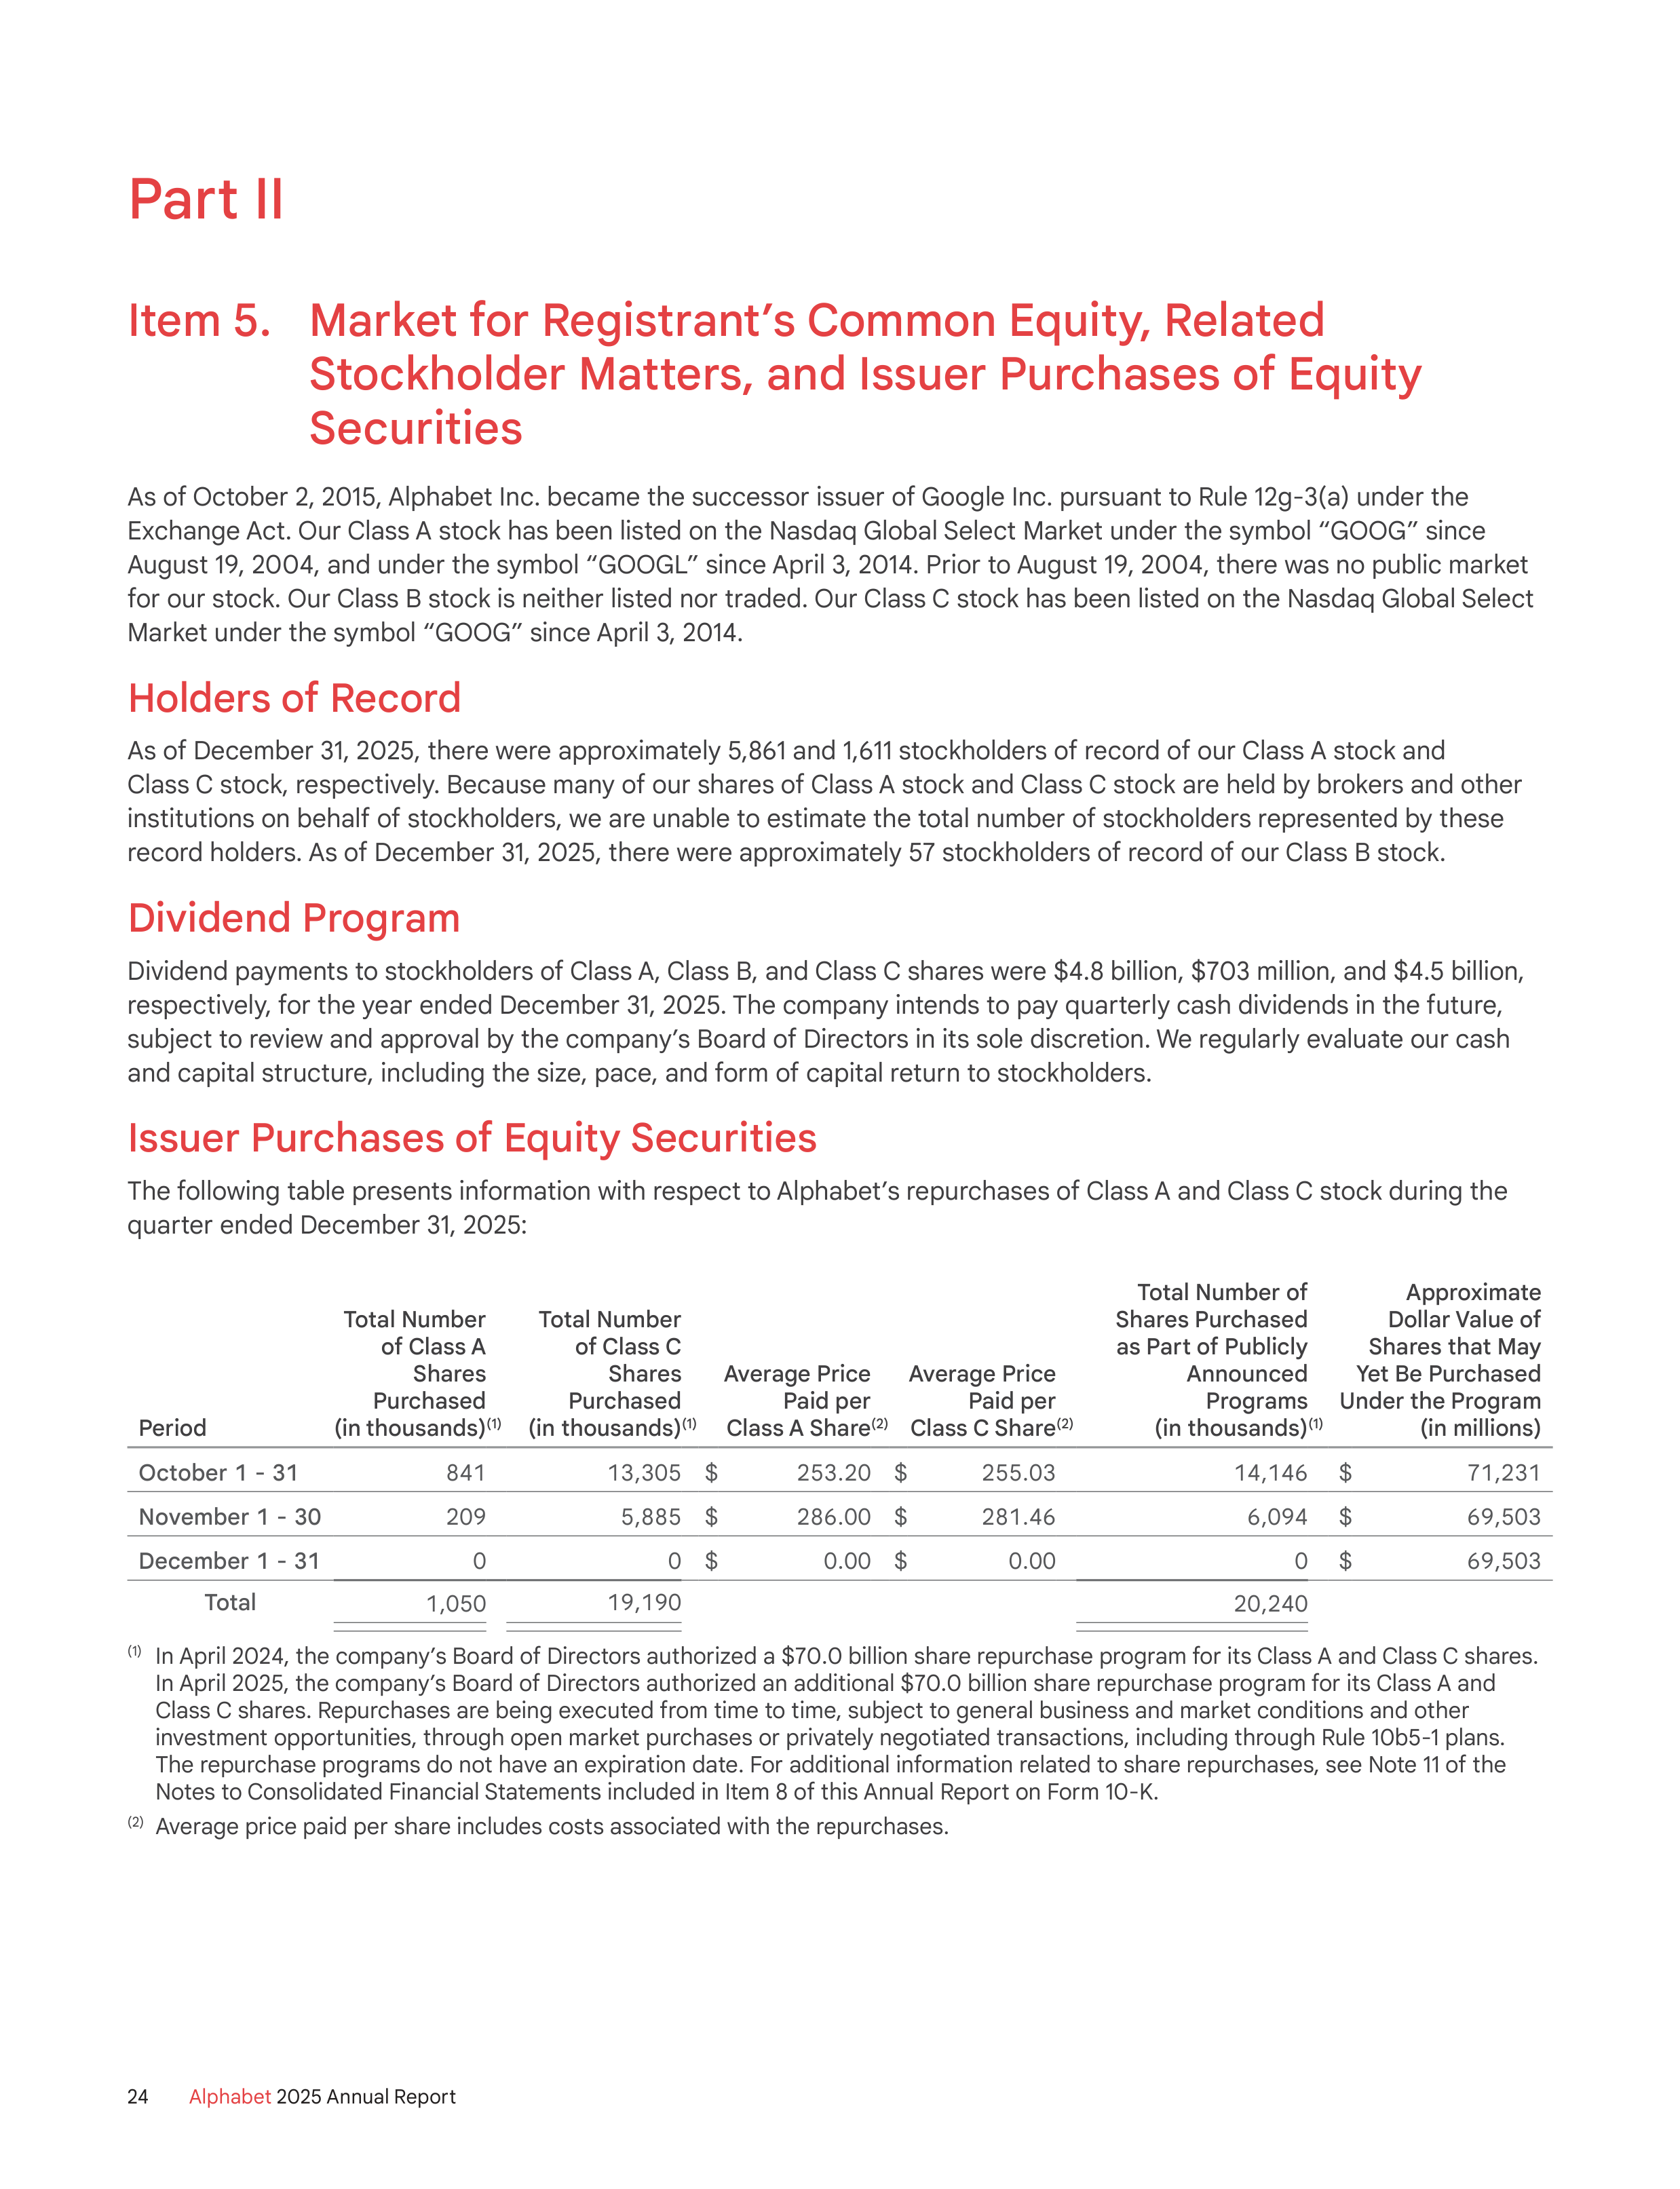
Part II
Item 5. Market for Registrant’s Common Equity, Related
Stockholder Matters, and Issuer Purchases of Equity
Securities
As of October 2, 2015, Alphabet Inc. became the successor issuer of Google Inc. pursuant to Rule 12g-3(a) under the
Exchange Act. Our Class A stock has been listed on the Nasdaq Global Select Market under the symbol “GOOG” since
August 19, 2004, and under the symbol “GOOGL” since April 3, 2014. Prior to August 19, 2004, there was no public market
for our stock. Our Class B stock is neither listed nor traded. Our Class C stock has been listed on the Nasdaq Global Select
Market under the symbol “GOOG” since April 3, 2014.
Holders of Record
As of December 31, 2025, there were approximately 5,861 and 1,611 stockholders of record of our Class A stock and
Class C stock, respectively. Because many of our shares of Class A stock and Class C stock are held by brokers and other
institutions on behalf of stockholders, we are unable to estimate the total number of stockholders represented by these
record holders. As of December 31, 2025, there were approximately 57 stockholders of record of our Class B stock.
Dividend Program
Dividend payments to stockholders of Class A, Class B, and Class C shares were $4.8 billion, $703 million, and $4.5 billion,
respectively, for the year ended December 31, 2025. The company intends to pay quarterly cash dividends in the future,
subject to review and approval by the company’s Board of Directors in its sole discretion. We regularly evaluate our cash
and capital structure, including the size, pace, and form of capital return to stockholders.
Issuer Purchases of Equity Securities
The following table presents information with respect to Alphabet’s repurchases of Class A and Class C stock during the
quarter ended December 31, 2025:
Period
Total Number
of Class A
Shares
Purchased
(in thousands)
(1)
Total Number
of Class C
Shares
Purchased
(in thousands)
(1)
Average Price
Paid per
Class A Share
(2)
Average Price
Paid per
Class C Share
(2)
Total Number of
Shares Purchased
as Part of Publicly
Announced
Programs
(in thousands)
(1)
Approximate
Dollar Value of
Shares that May
Yet Be Purchased
Under the Program
(in millions)
October 1 - 31
841
13,305
$
253.20
$
255.03
14,146
$
71,231
November 1 - 30
209
5,885
$
286.00
$
281.46
6,094
$
69,503
December 1 - 31
0
0
$
0.00
$
0.00
0
$
69,503
Total
1,050
19,190
20,240
(1)
In April 2024, the company’s Board of Directors authorized a $70.0 billion share repurchase program for its Class A and Class C shares.
In April 2025, the company’s Board of Directors authorized an additional $70.0 billion share repurchase program for its Class A and
Class C shares. Repurchases are being executed from time to time, subject to general business and market conditions and other
investment opportunities, through open market purchases or privately negotiated transactions, including through Rule 10b5-1 plans.
The repurchase programs do not have an expiration date. For additional information related to share repurchases, see Note 11 of the
Notes to Consolidated Financial Statements included in Item 8 of this Annual Report on Form 10-K.
(2)
Average price paid per share includes costs associated with the repurchases.
24
Alphabet
2025 Annual Report
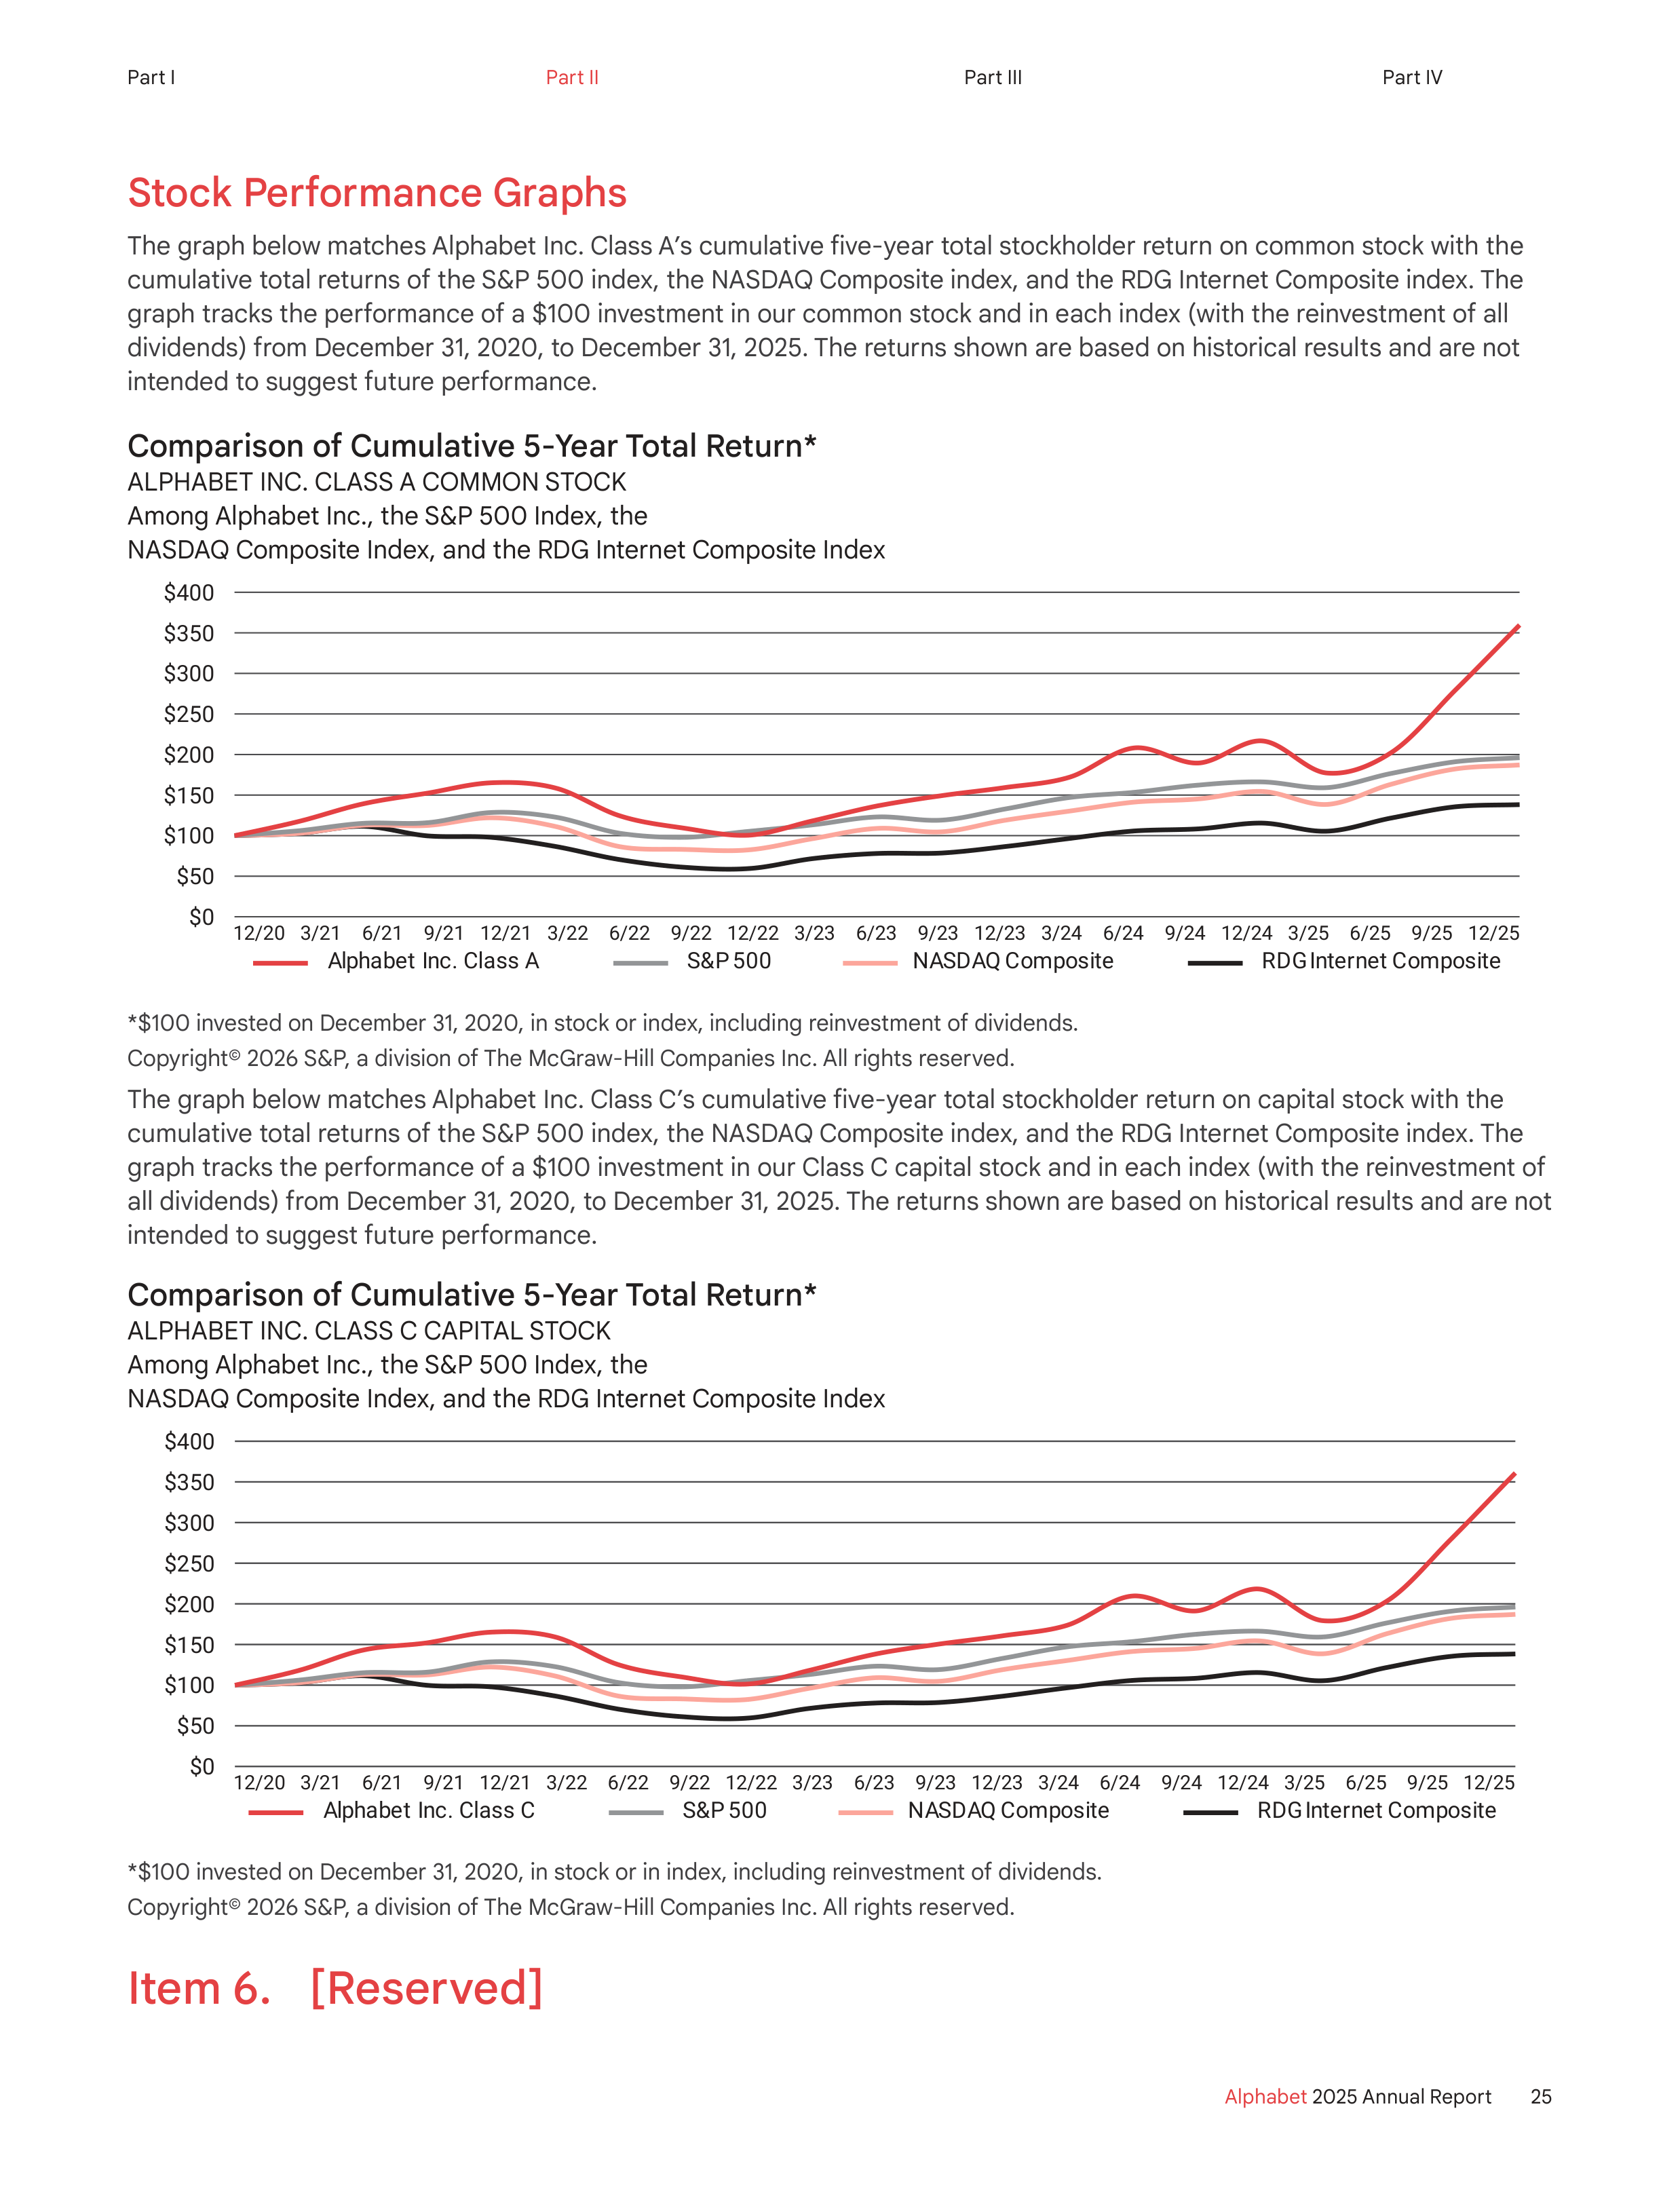
Stock Performance Graphs
The graph below matches Alphabet Inc. Class A’s cumulative five-year total stockholder return on common stock with the
cumulative total returns of the S&P 500 index, the NASDAQ Composite index, and the RDG Internet Composite index. The
graph tracks the performance of a $100 investment in our common stock and in each index (with the reinvestment of all
dividends) from December 31, 2020, to December 31, 2025. The returns shown are based on historical results and are not
intended to suggest future performance.
Comparison of Cumulative 5-Year Total Return*
ALPHABET INC. CLASS A COMMON STOCK
Among Alphabet Inc., the S&P 500 Index, the
NASDAQ Composite Index, and the RDG Internet Composite Index
Alphabet Inc. Class A
S&P 500
NASDAQ Composite
RDG Internet Composite
12/20
3/21
6/21
9/21
12/21
3/22
6/22
9/22
12/22
3/23
6/23
9/23
12/23
3/24
6/24
9/24
12/25
9/25
6/25
3/25
12/24
$0
$50
$100
$150
$200
$300
$250
$400
$350
*$100 invested on December 31, 2020, in stock or index, including reinvestment of dividends.
Copyright© 2026 S&P, a division of The McGraw-Hill Companies Inc. All rights reserved.
The graph below matches Alphabet Inc. Class C’s cumulative five-year total stockholder return on capital stock with the
cumulative total returns of the S&P 500 index, the NASDAQ Composite index, and the RDG Internet Composite index. The
graph tracks the performance of a $100 investment in our Class C capital stock and in each index (with the reinvestment of
all dividends) from December 31, 2020, to December 31, 2025. The returns shown are based on historical results and are not
intended to suggest future performance.
Comparison of Cumulative 5-Year Total Return*
ALPHABET INC. CLASS C CAPITAL STOCK
Among Alphabet Inc., the S&P 500 Index, the
NASDAQ Composite Index, and the RDG Internet Composite Index
12/20
3/21
6/21
9/21
12/21
3/22
6/22
9/22
12/22
3/23
6/23
9/23
12/23
3/24
6/24
9/24
12/25
9/25
6/25
3/25
12/24
$0
$50
$100
$150
$200
$300
$250
$400
$350
Alphabet Inc. Class C
S&P 500
NASDAQ Composite
RDG Internet Composite
*$100 invested on December 31, 2020, in stock or in index, including reinvestment of dividends.
Copyright© 2026 S&P, a division of The McGraw-Hill Companies Inc. All rights reserved.
Item 6. [Reserved]
25
Alphabet
2025 Annual Report
Part I
Part II
Part III
Part IV
Item 7. Management’s Discussion and Analysis of Financial
Condition and Results of Operations
Please read the following discussion and analysis of our financial condition and results of operations together with “Note
about Forward-Looking Statements,” Part I, Item 1 “Business,” Part I, Item 1A “Risk Factors,” and our consolidated financial
statements and related notes included under Item 8 of this Annual Report on Form 10-K.
The following section generally discusses 2025 results compared to 2024 results. Discussion of 2024 results compared to
2023 results to the extent not included in this report can be found in Item 7 of our 2024 Annual Report on Form 10-K.
Understanding Alphabet’s Financial Results
Alphabet is a collection of businesses — the largest of which is Google. We report Google in two segments, Google
Services and Google Cloud, and all non-Google businesses collectively as Other Bets. Supporting these businesses,
we have centralized certain AI-related research and development focused on advanced research in AI and developing
the frontier models that serve our businesses, which is reported in Alphabet-level activities. For further details on our
segments, see Part I, Item 1 Business and Note 15 of the Notes to Consolidated Financial Statements included in Item 8 of
this Annual Report on Form 10-K.
Trends in Our Business and Financial Effect
The following long-term trends have contributed to the results of our consolidated operations, and we anticipate that they
will continue to affect our future results:
•
As we continue to grow our business and meet the evolving behaviors and needs of our users and customers,
our revenue growth and mix along with our cost and margin profiles are being influenced by a number of factors,
including:
Expanded AI Offerings in our Products and Services:
The continuing evolution of the online world has contributed to
the growth of our business. We expect that this evolution, including user engagement with AI products and services, will
continue to benefit our business and our revenues. As we continue to incorporate AI into our products and services, such as
with AI Overviews and AI Mode in Search, and with enterprise AI solutions on our Google Cloud Platform, we may monetize
differently than our historical consumer and enterprise offerings which could affect revenue growth rates and margin
trends. When developing new products and services we generally focus first on user experience and then on monetization.
At the same time, we face increasing competition, including from other developers and providers of AI products and
services, which may affect our revenues.
Increasing Revenues Beyond Advertising:
Revenues from cloud, consumer subscriptions, platforms, and devices, which
may have differing characteristics than our advertising revenues, have grown over time. Certain of these revenues have
been growing at a rate higher than our advertising revenues, becoming a larger percentage of our consolidated revenues,
and we expect this trend to continue. The margins on these revenues vary significantly and are generally lower than the
margins on our advertising revenues.
Increased Investment in Technical Infrastructure:
We continue to invest in capital expenditures as we scale our technical
infrastructure, in particular for AI, to meet the demand of our users and enterprise customers and to support research
internally. We invested heavily in capital expenditures in 2025 and in 2026, we expect to significantly increase, relative
to 2025, our investment in our technical infrastructure, including servers and network equipment, and data centers. The
costs associated with operating our technical infrastructure - depreciation, energy, equipment, and network capacity -
are expected to significantly increase as developing and serving AI offerings require more compute power than our
historical consumer and enterprise offerings. While our technical infrastructure costs increase, we expect to continue
to drive efficiencies in our data centers, for example, through the design of our AI models and our TPU and GPU-based
technical infrastructure.
Continued Investment in Intellectual Property through R&D and Acquisitions:
We continue to make significant research
and development investments in areas of strategic focus as we seek to develop new, innovative offerings, and improve our
existing offerings across our businesses. Acquisitions and strategic investments remain important elements in our use of
capital and contribute to the breadth and depth of our offerings, expand our expertise in engineering and other functional
areas, and build strong partnerships around strategic initiatives.
26
Alphabet
2025 Annual Report
Part I
Part II
Part III
Part IV
Traffic Acquisition Costs Growth and Rate Changes:
We expect traffic acquisition costs (“TAC”) paid to our distribution
partners and Google Network partners to increase as our advertising revenues grow. Our overall TAC as a percentage
of our advertising revenues (“TAC rate”) has been decreasing primarily due to a revenue mix shift from Google Network
properties to Google Search & other properties. Our TAC rate will continue to be affected by changes in device mix;
geographic mix; partner agreement terms; partner mix; the percentage of queries channeled through paid access points;
product mix; the relative revenue growth rates of advertising revenues from different channels; and revenue share terms.
•
We have raised capital through external financing in the form of debt and we may continue to seek debt or other
forms of financing in the future to support our capital and operating needs.
In 2025, we raised capital through the issuance of debt and we expect to continue to assess the use of debt and other
forms of financing in the future. We expect to continue to enter into finance leases, primarily for data centers. Additionally,
in 2025, we provided credit support, such as through backstops and guarantees, to certain infrastructure related
counterparties and may continue to provide additional credit support in the future.
•
We face an evolving regulatory environment, and we are subject to claims, lawsuits, investigations, and other forms
of potential legal liability, which could affect our business practices and financial results.
Changes in social, political, economic, tax, and regulatory conditions or in laws and policies governing a wide range of
topics and related legal matters, including investigations, lawsuits, and regulatory actions, have resulted in fines and caused
us to change our business practices. As the regulatory environment continues to evolve, we may continue to incur fines and
we expect increased costs associated with compliance, modifications to our products and services, and limitations on our
ability to pursue certain business practices. For additional information, see Part I, Item 1A Risk Factors and Legal Matters in
Note 10 of the Notes to Consolidated Financial Statements included in Item 8 of this Annual Report on Form 10-K.
Revenues and Monetization Metrics
We generate revenues by delivering relevant, cost-effective online advertising; cloud-based solutions that provide
enterprise customers of all sizes with infrastructure, platform services, and applications; and sales of other products and
services, such as fees received for subscription-based products, apps and in-app purchases, and devices. For additional
information on how we recognize revenue, see Note 1 of the Notes to Consolidated Financial Statements included in Item 8
of this Annual Report on Form 10-K.
In addition to the long-term trends and their financial effect on our business discussed above, fluctuations in our revenues
have been and may continue to be affected by a combination of factors, including:
•
changes in foreign currency exchange rates;
•
changes in pricing, such as those resulting from changes in fee structures, discounts, and customer incentives;
•
general economic conditions and various external dynamics, including geopolitical events, regulations, and other
measures and their effect on advertiser, consumer, and enterprise spending;
•
new product, service, and market launches; and
•
seasonality.
Additionally, fluctuations in our revenues generated from advertising (“Google advertising”), other sources (“Google
subscriptions, platforms, and devices”), Google Cloud, and Other Bets have been, and may continue to be, affected by
other factors unique to each set of revenues, as described below.
Google Services
Google Services revenues consist of Google advertising as well as Google subscriptions, platforms, and devices revenues.
Google Advertising
Google advertising revenues are comprised of the following:
•
Google Search & other, which includes revenues generated on Google search properties (including revenues from traffic
generated by search distribution partners who use Google.com as their default search in browsers, toolbars, etc.), and
other Google owned and operated properties like Gmail, Google Maps, and Google Play;
27
Alphabet
2025 Annual Report
Part I
Part II
Part III
Part IV
•
YouTube ads, which includes revenues generated on YouTube properties; and
•
Google Network, which includes revenues generated on Google Network properties participating in AdMob, AdSense,
and Google Ad Manager.
We use certain metrics to track how well traffic across various properties is monetized as it relates to our advertising
revenues: paid clicks and cost-per-click pertain to traffic on Google Search & other properties, while impressions and
cost-per-impression pertain to traffic on our Google Network properties.
Paid clicks represent engagement by users and include clicks on advertisements by end-users on Google search properties
and other Google owned and operated properties including Gmail, Google Maps, and Google Play. Cost-per-click is
defined as click-driven revenues divided by our total number of paid clicks and represents the average amount we charge
advertisers for each engagement by users.
Impressions include impressions displayed to users on Google Network properties participating primarily in AdMob,
AdSense, and Google Ad Manager. Cost-per-impression is defined as impression-based and click-based revenues divided
by our total number of impressions, and represents the average amount we charge advertisers for each impression
displayed to users.
As our business evolves, we periodically review, refine, and update our methodologies for monitoring, gathering, and
counting the number of paid clicks and the number of impressions, and for identifying the revenues generated by the
corresponding click and impression activity.
Fluctuations in our advertising revenues, as well as the change in paid clicks and cost-per-click on Google Search & other
properties and the change in impressions and cost-per-impression on Google Network properties and the correlation
between these items have been, and may continue to be, affected by factors in addition to the general factors described
above, such as:
•
advertiser competition for keywords;
•
changes in advertising quality, formats, delivery, or policy;
•
changes in device mix;
•
seasonal fluctuations in internet usage, advertising expenditures, and underlying business trends, such as traditional
retail seasonality; and
•
traffic growth in emerging markets compared to more mature markets and across various verticals and channels.
Google Subscriptions, Platforms, and Devices
Google subscriptions, platforms, and devices revenues are comprised of the following:
•
consumer subscriptions, which primarily include revenues from YouTube services, such as YouTube TV, YouTube Music
and Premium, and NFL Sunday Ticket, as well as Google One, which offers access to our most capable Gemini models;
•
platforms, which primarily include revenues from Google Play sales of apps and in-app purchases;
•
devices, which primarily include sales of the Pixel family of devices; and
•
other products and services.
Fluctuations in our Google subscriptions, platforms, and devices revenues have been, and may continue to be, affected by
factors in addition to the general factors described above, such as changes in customer usage and demand, number of
subscribers, and the timing of product launches.
Google Cloud
Google Cloud revenues are comprised of the following:
•
Google Cloud Platform primarily generates consumption-based fees and subscriptions for infrastructure, platform, and
other services. These services provide access to solutions such as AI offerings including our enterprise AI infrastructure,
Vertex AI platform, and Gemini Enterprise; cybersecurity offerings; and data and analytics solutions;
28
Alphabet
2025 Annual Report
Part I
Part II
Part III
Part IV
•
Google Workspace includes subscriptions for cloud-based communication and collaboration tools for enterprises, such
as Gmail, Docs, Calendar, Drive, and Meet, with integrated features like Gemini for Google Workspace; and
•
other enterprise services.
Fluctuations in our Google Cloud revenues have been, and may continue to be, affected by factors in addition to the
general factors described above, such as changes in customer usage, demand, and supply availability.
Other Bets
Revenues from Other Bets are generated primarily from the sale of autonomous transportation services and
internet services.
Costs and Expenses
Our cost structure has two components: cost of revenues and operating expenses. Our operating expenses include costs
related to research and development, sales and marketing, and general and administrative functions. Certain of our costs
and expenses, including those associated with the operation of our technical infrastructure as well as components of
our operating expenses, are generally less variable in nature and may not correlate to changes in revenue. Additionally,
fluctuations in employee compensation expenses may not directly correlate with changes in headcount, due to factors
such as annual SBC awards that vest over time.
Cost of Revenues
Cost of revenues is comprised of TAC and other costs of revenues.
•
TAC includes:
•
amounts paid to our distribution partners who make available our search access points and other ad-supported
services. Our distribution partners include browser providers, mobile carriers, original equipment manufacturers, and
software developers; and
•
amounts paid to Google Network partners primarily for ads displayed on their properties.
•
Other cost of revenues primarily includes:
•
content acquisition costs, which are payments to content providers from whom we license video and other content
for distribution, primarily related to YouTube (we pay fees to these content providers based on revenues generated,
subscriber counts, or a flat fee);
•
depreciation expense, primarily related to our technical infrastructure;
•
employee compensation expenses related to our technical infrastructure and other operations such as content review
and customer and product support;
•
inventory and other costs related to the devices we sell; and
•
other technical infrastructure operations costs, including energy, equipment, and network capacity costs.
TAC as a percentage of revenues generated from ads placed on Google Network properties are significantly higher than
TAC as a percentage of revenues generated from ads placed on Google Search & other properties, because most of the
advertiser revenues from ads served on Google Network properties are paid as TAC to our Google Network partners.
Operating Expenses
Operating expenses are generally incurred during our normal course of business, which we categorize as either research
and development, sales and marketing, or general and administrative.
The main components of our research and development expenses are:
•
depreciation expense, primarily related to our technical infrastructure;
•
employee compensation expenses for engineering and technical employees responsible for research and development
related to our existing and new products and services;
•
other technical infrastructure operations costs, including energy, equipment, and network capacity costs; and
•
third-party services fees primarily relating to consulting and outsourced services in support of our engineering and
product development efforts.
29
Alphabet
2025 Annual Report
Part I
Part II
Part III
Part IV
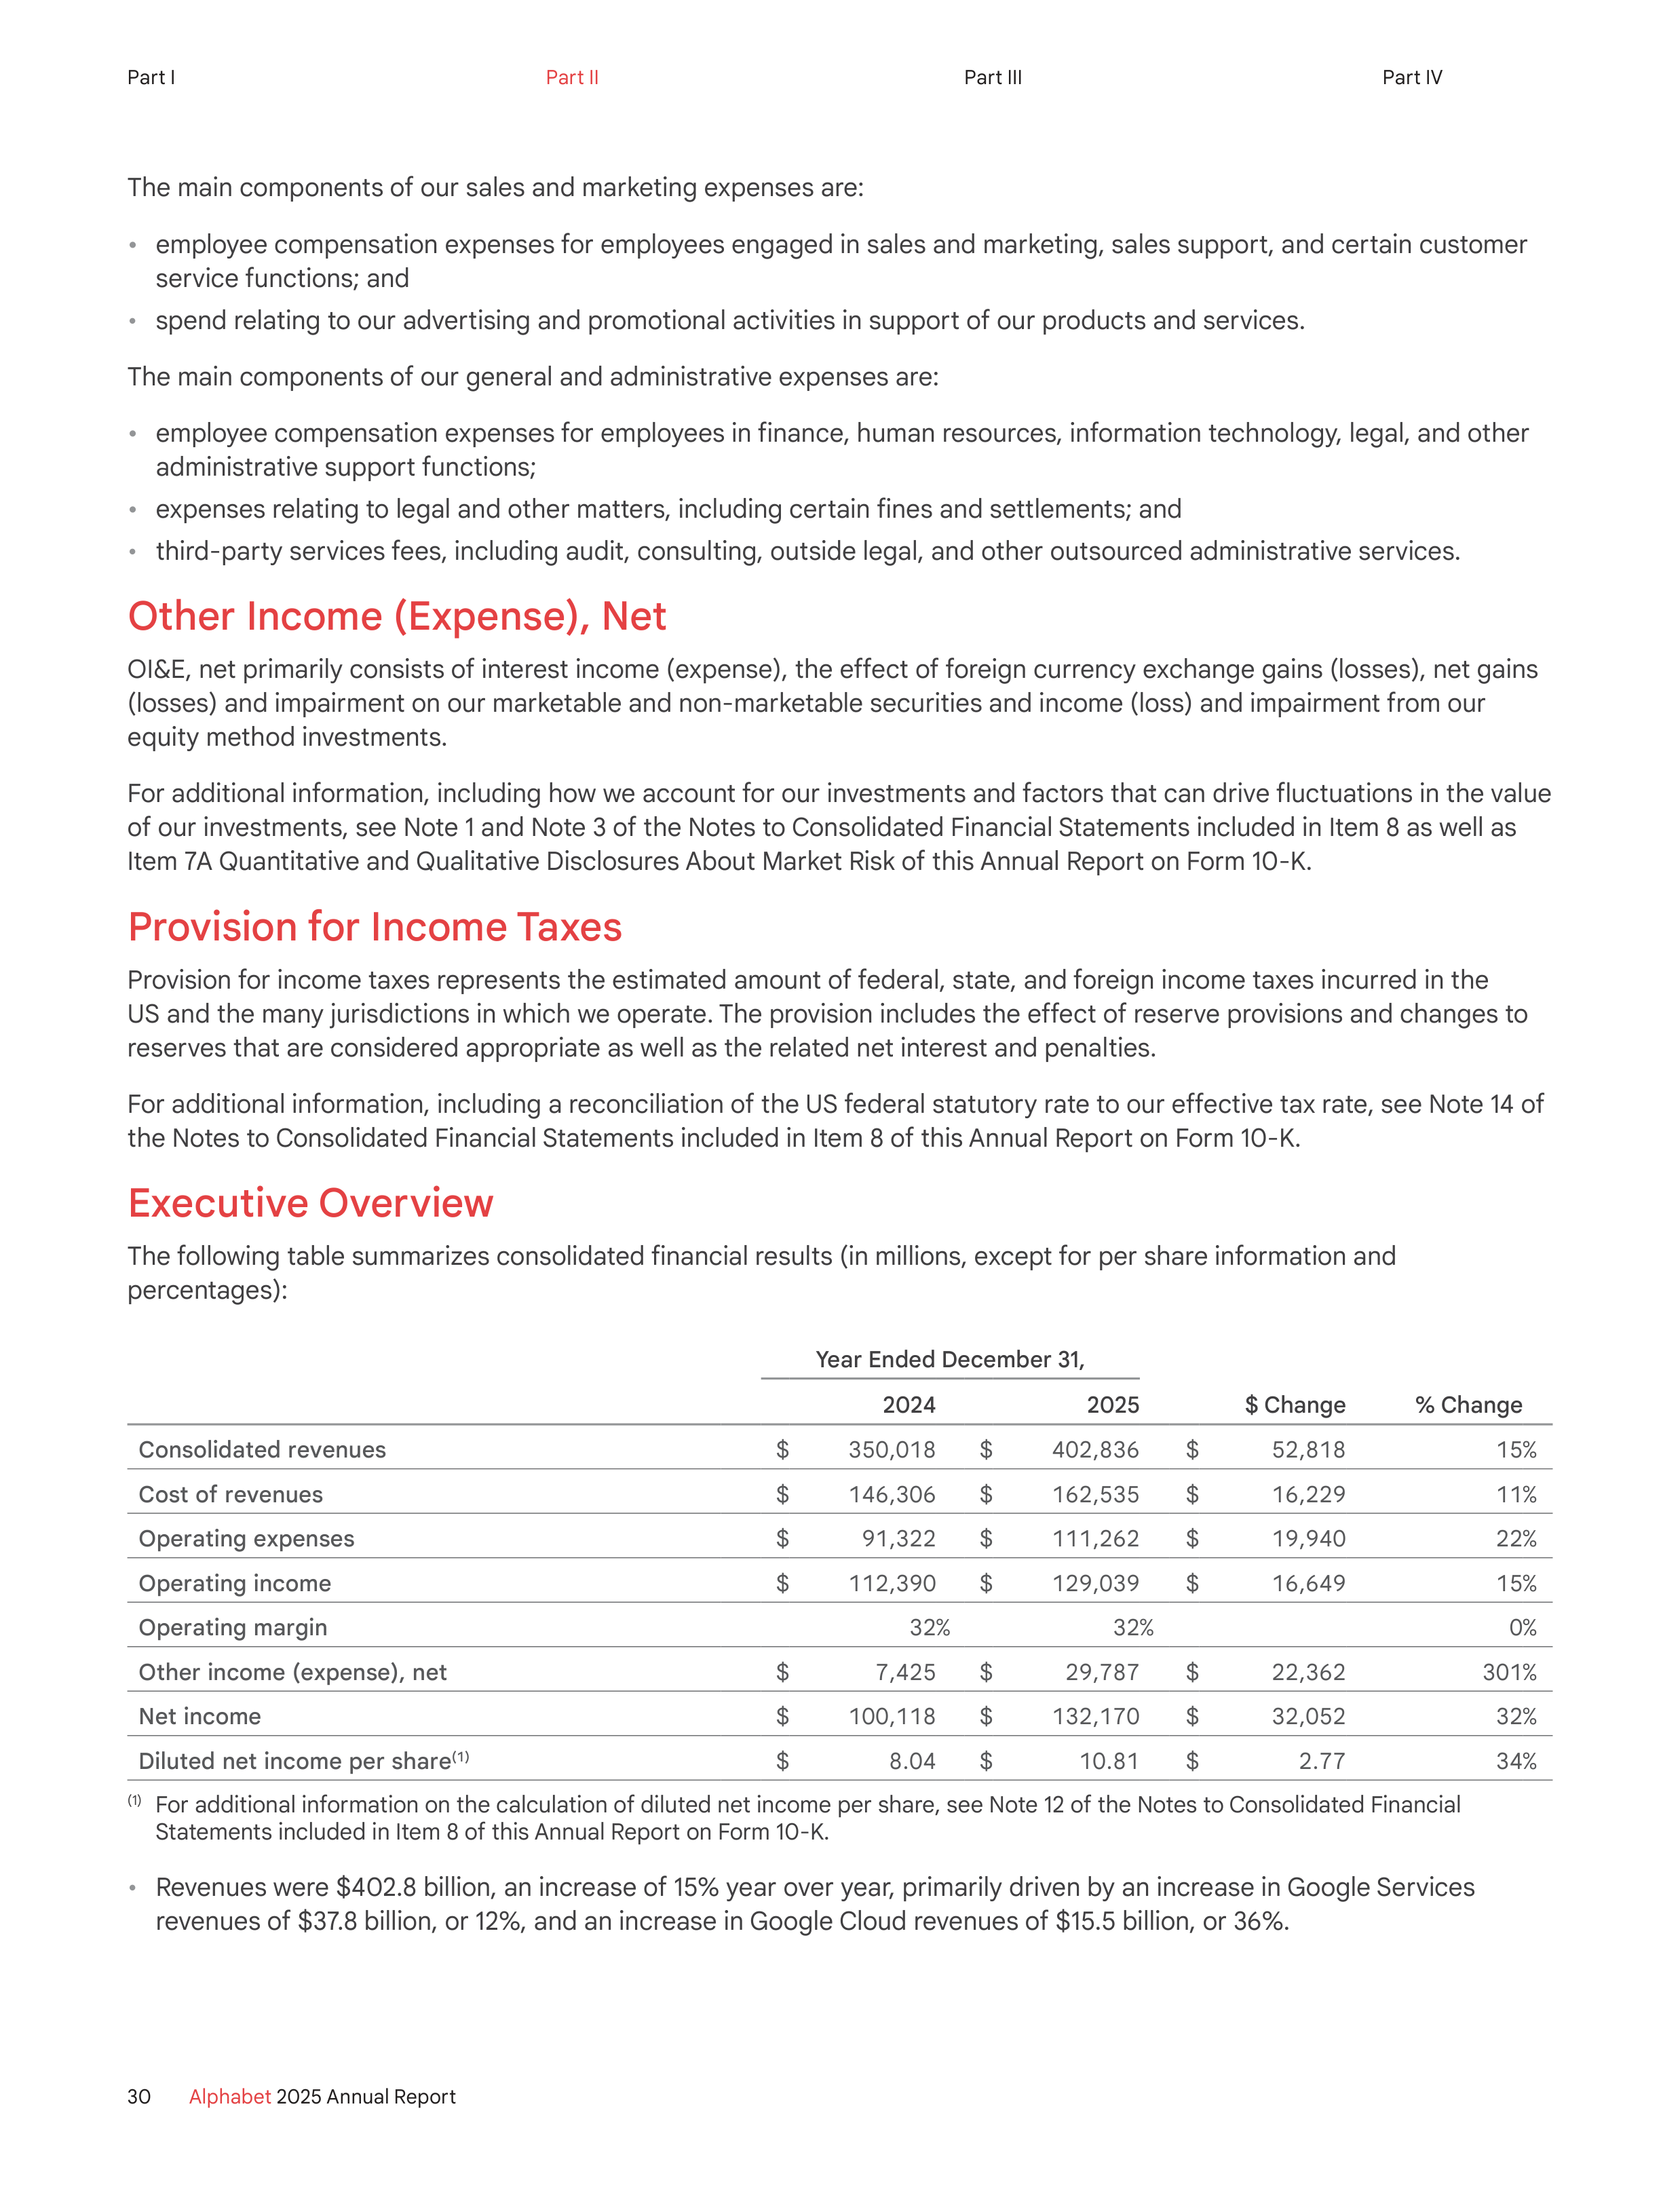
The main components of our sales and marketing expenses are:
•
employee compensation expenses for employees engaged in sales and marketing, sales support, and certain customer
service functions; and
•
spend relating to our advertising and promotional activities in support of our products and services.
The main components of our general and administrative expenses are:
•
employee compensation expenses for employees in finance, human resources, information technology, legal, and other
administrative support functions;
•
expenses relating to legal and other matters, including certain fines and settlements; and
•
third-party services fees, including audit, consulting, outside legal, and other outsourced administrative services.
Other Income (Expense), Net
OI&E, net primarily consists of interest income (expense), the effect of foreign currency exchange gains (losses), net gains
(losses) and impairment on our marketable and non-marketable securities and income (loss) and impairment from our
equity method investments.
For additional information, including how we account for our investments and factors that can drive fluctuations in the value
of our investments, see Note 1 and Note 3 of the Notes to Consolidated Financial Statements included in Item 8 as well as
Item 7A Quantitative and Qualitative Disclosures About Market Risk of this Annual Report on Form 10-K.
Provision for Income Taxes
Provision for income taxes represents the estimated amount of federal, state, and foreign income taxes incurred in the
US and the many jurisdictions in which we operate. The provision includes the effect of reserve provisions and changes to
reserves that are considered appropriate as well as the related net interest and penalties.
For additional information, including a reconciliation of the US federal statutory rate to our effective tax rate, see Note 14 of
the Notes to Consolidated Financial Statements included in Item 8 of this Annual Report on Form 10-K.
Executive Overview
The following table summarizes consolidated financial results (in millions, except for per share information and
percentages):
Year Ended December 31,
2024
2025
$ Change
% Change
Consolidated revenues
$
350,018
$
402,836
$
52,818
15%
Cost of revenues
$
146,306
$
162,535
$
16,229
11%
Operating expenses
$
91,322
$
111,262
$
19,940
22%
Operating income
$
112,390
$
129,039
$
16,649
15%
Operating margin
32%
32%
0%
Other income (expense), net
$
7,425
$
29,787
$
22,362
301%
Net income
$
100,118
$
132,170
$
32,052
32%
Diluted net income per share
(1)
$
8.04
$
10.81
$
2.77
34%
(1)
For additional information on the calculation of diluted net income per share, see Note 12 of the Notes to Consolidated Financial
Statements included in Item 8 of this Annual Report on Form 10-K.
•
Revenues were $402.8 billion, an increase of 15% year over year, primarily driven by an increase in Google Services
revenues of $37.8 billion, or 12%, and an increase in Google Cloud revenues of $15.5 billion, or 36%.
30
Alphabet
2025 Annual Report
Part I
Part II
Part III
Part IV
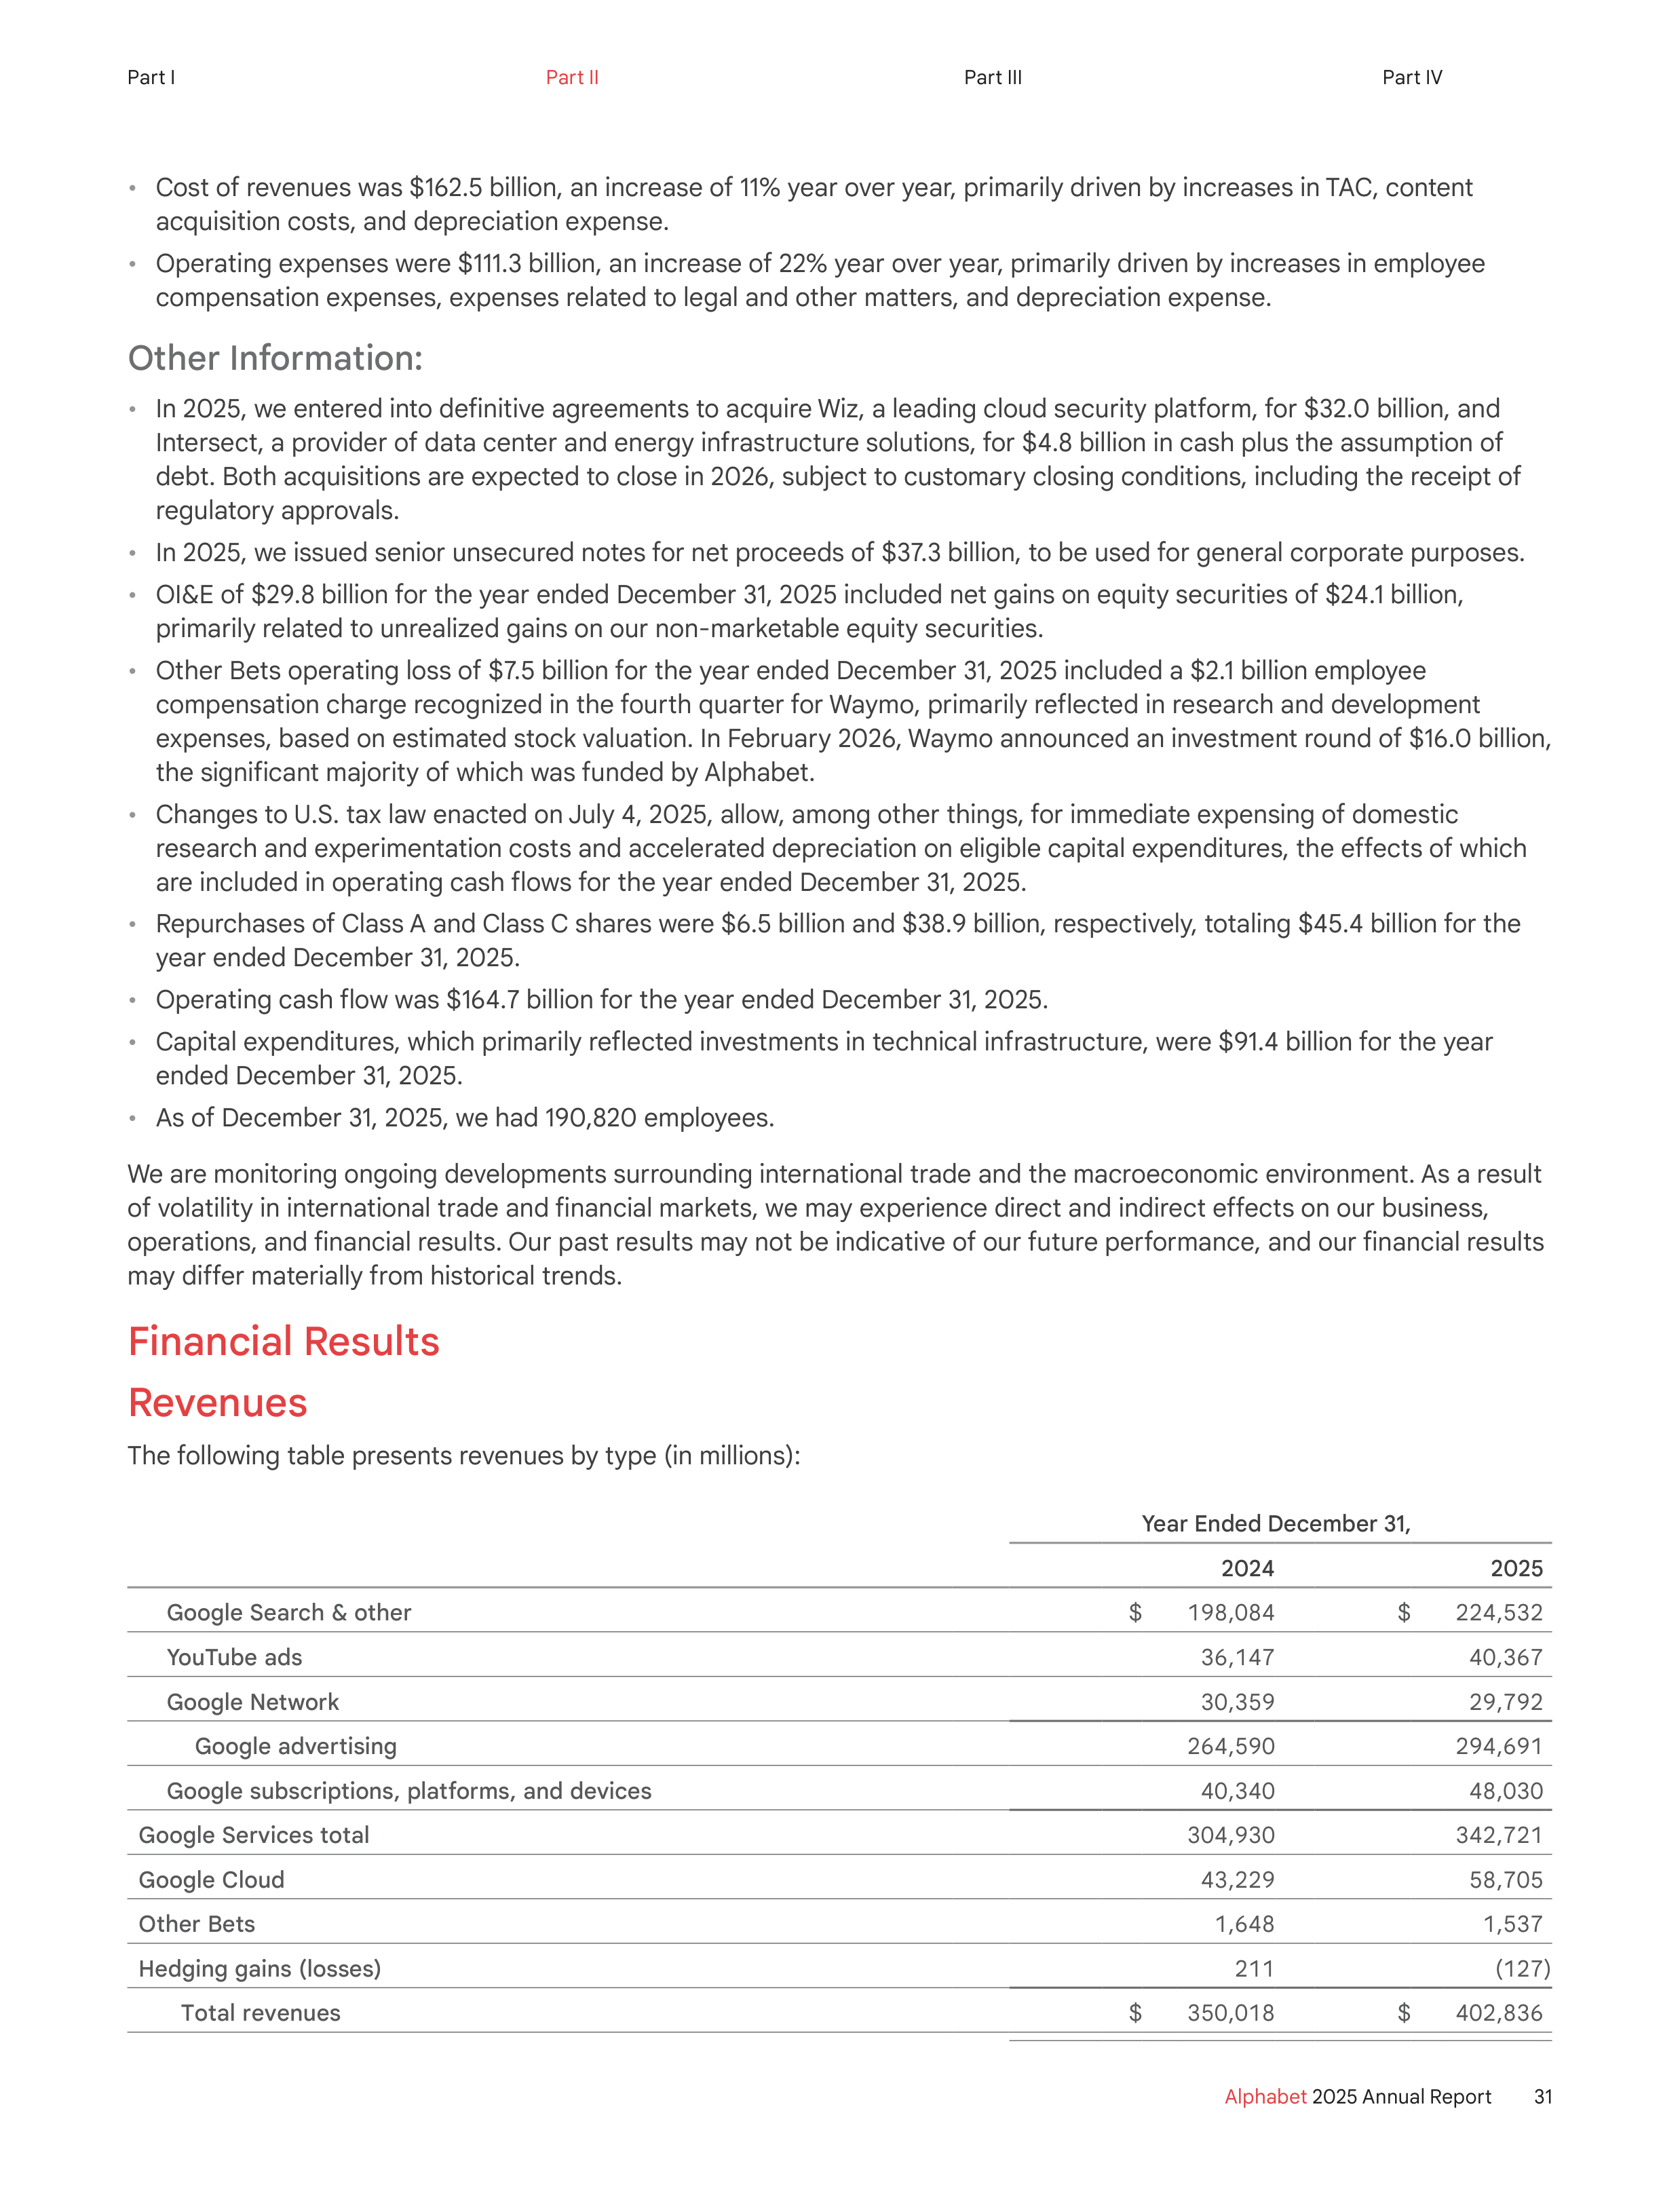
•
Cost of revenues was $162.5 billion, an increase of 11% year over year, primarily driven by increases in TAC, content
acquisition costs, and depreciation expense.
•
Operating expenses were $111.3 billion, an increase of 22% year over year, primarily driven by increases in employee
compensation expenses, expenses related to legal and other matters, and depreciation expense.
Other Information:
•
In 2025, we entered into definitive agreements to acquire Wiz, a leading cloud security platform, for $32.0 billion, and
Intersect, a provider of data center and energy infrastructure solutions, for $4.8 billion in cash plus the assumption of
debt. Both acquisitions are expected to close in 2026, subject to customary closing conditions, including the receipt of
regulatory approvals.
•
In 2025, we issued senior unsecured notes for net proceeds of $37.3 billion, to be used for general corporate purposes.
•
OI&E of $29.8 billion for the year ended December 31, 2025 included net gains on equity securities of $24.1 billion,
primarily related to unrealized gains on our non-marketable equity securities.
•
Other Bets operating loss of $7.5 billion for the year ended December 31, 2025 included a $2.1 billion employee
compensation charge recognized in the fourth quarter for Waymo, primarily reflected in research and development
expenses, based on estimated stock valuation. In February 2026, Waymo announced an investment round of $16.0 billion,
the significant majority of which was funded by Alphabet.
•
Changes to U.S. tax law enacted on July 4, 2025, allow, among other things, for immediate expensing of domestic
research and experimentation costs and accelerated depreciation on eligible capital expenditures, the effects of which
are included in operating cash flows for the year ended December 31, 2025.
•
Repurchases of Class A and Class C shares were $6.5 billion and $38.9 billion, respectively, totaling $45.4 billion for the
year ended December 31, 2025.
•
Operating cash flow was $164.7 billion for the year ended December 31, 2025.
•
Capital expenditures, which primarily reflected investments in technical infrastructure, were $91.4 billion for the year
ended December 31, 2025.
•
As of December 31, 2025, we had 190,820 employees.
We are monitoring ongoing developments surrounding international trade and the macroeconomic environment. As a result
of volatility in international trade and financial markets, we may experience direct and indirect effects on our business,
operations, and financial results. Our past results may not be indicative of our future performance, and our financial results
may differ materially from historical trends.
Financial Results
Revenues
The following table presents revenues by type (in millions):
Year Ended December 31,
2024
2025
Google Search & other
$
198,084
$
224,532
YouTube ads
36,147
40,367
Google Network
30,359
29,792
Google advertising
264,590
294,691
Google subscriptions, platforms, and devices
40,340
48,030
Google Services total
304,930
342,721
Google Cloud
43,229
58,705
Other Bets
1,648
1,537
Hedging gains (losses)
211
(127)
Total revenues
$
350,018
$
402,836
31
Alphabet
2025 Annual Report
Part I
Part II
Part III
Part IV
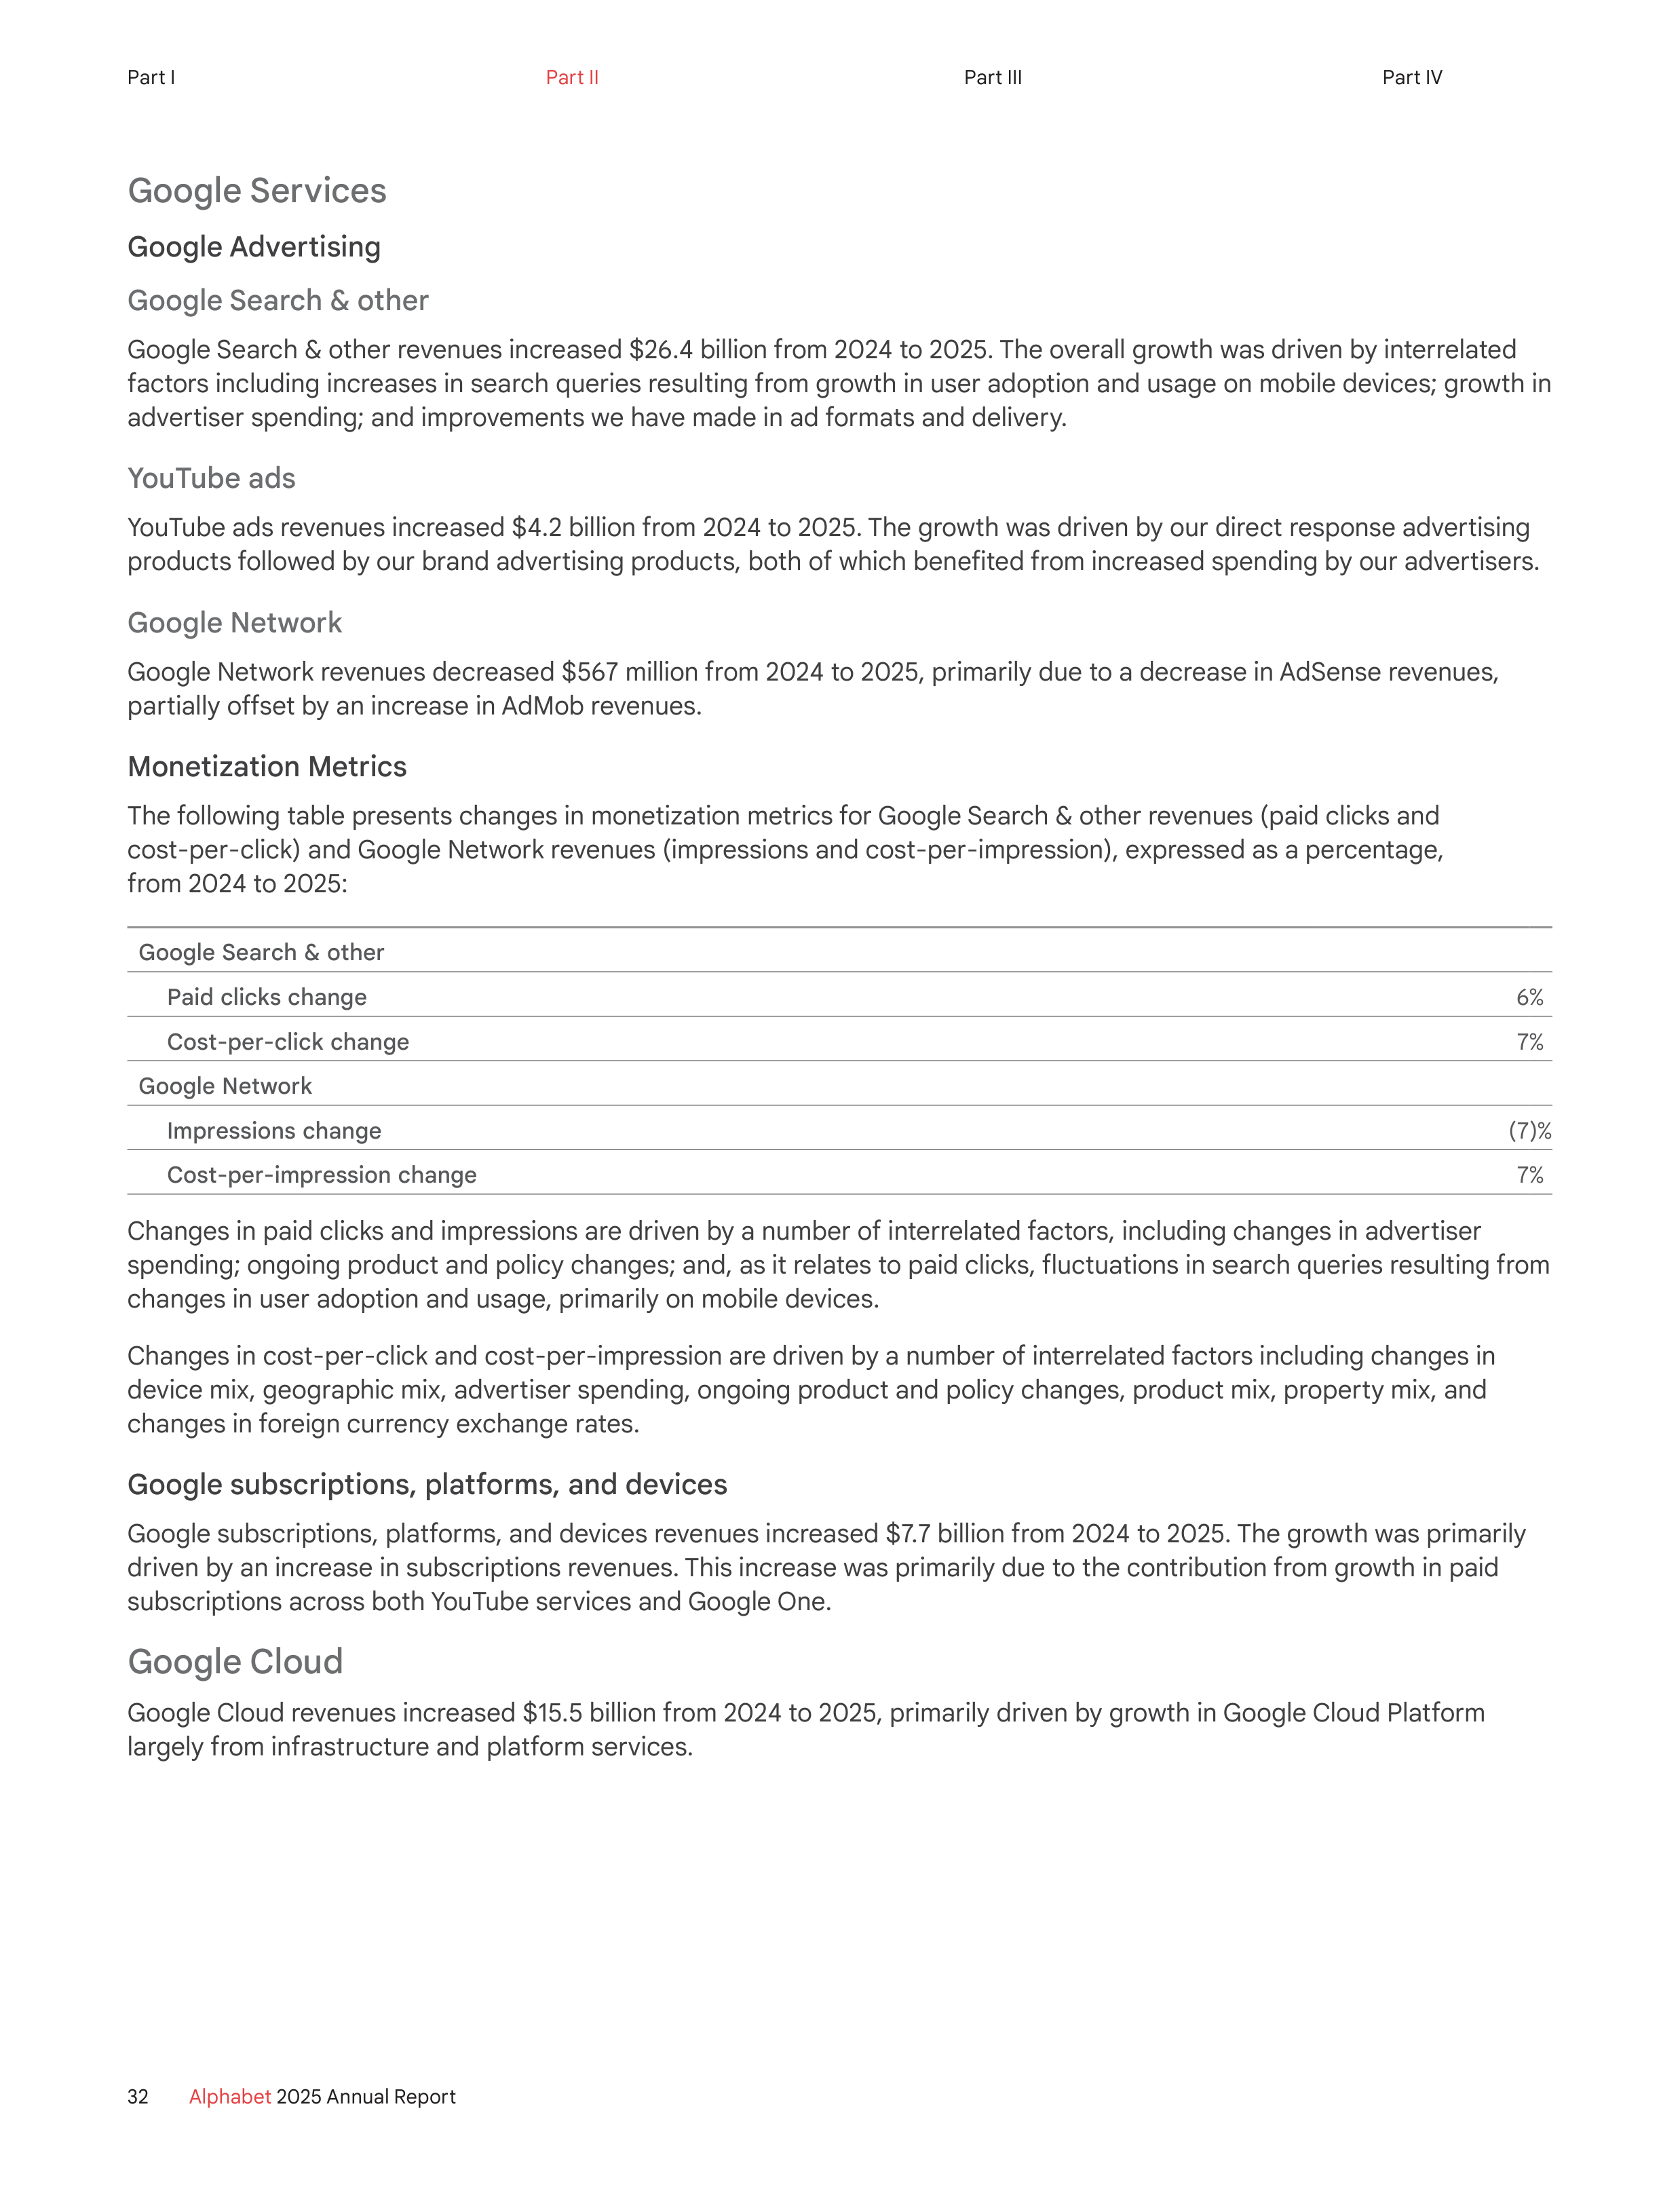
Google Services
Google Advertising
Google Search & other
Google Search & other revenues increased $26.4 billion from 2024 to 2025. The overall growth was driven by interrelated
factors including increases in search queries resulting from growth in user adoption and usage on mobile devices; growth in
advertiser spending; and improvements we have made in ad formats and delivery.
YouTube ads
YouTube ads revenues increased $4.2 billion from 2024 to 2025. The growth was driven by our direct response advertising
products followed by our brand advertising products, both of which benefited from increased spending by our advertisers.
Google Network
Google Network revenues decreased $567 million from 2024 to 2025, primarily due to a decrease in AdSense revenues,
partially offset by an increase in AdMob revenues.
Monetization Metrics
The following table presents changes in monetization metrics for Google Search & other revenues (paid clicks and
cost‑per-click) and Google Network revenues (impressions and cost-per-impression), expressed as a percentage,
from 2024 to 2025:
Google Search & other
Paid clicks change
6%
Cost-per-click change
7%
Google Network
Impressions change
(7)%
Cost-per-impression change
7%
Changes in paid clicks and impressions are driven by a number of interrelated factors, including changes in advertiser
spending; ongoing product and policy changes; and, as it relates to paid clicks, fluctuations in search queries resulting from
changes in user adoption and usage, primarily on mobile devices.
Changes in cost-per-click and cost-per-impression are driven by a number of interrelated factors including changes in
device mix, geographic mix, advertiser spending, ongoing product and policy changes, product mix, property mix, and
changes in foreign currency exchange rates.
Google subscriptions, platforms, and devices
Google subscriptions, platforms, and devices revenues increased $7.7 billion from 2024 to 2025. The growth was primarily
driven by an increase in subscriptions revenues. This increase was primarily due to the contribution from growth in paid
subscriptions across both YouTube services and Google One.
Google Cloud
Google Cloud revenues increased $15.5 billion from 2024 to 2025, primarily driven by growth in Google Cloud Platform
largely from infrastructure and platform services.
32
Alphabet
2025 Annual Report
Part I
Part II
Part III
Part IV
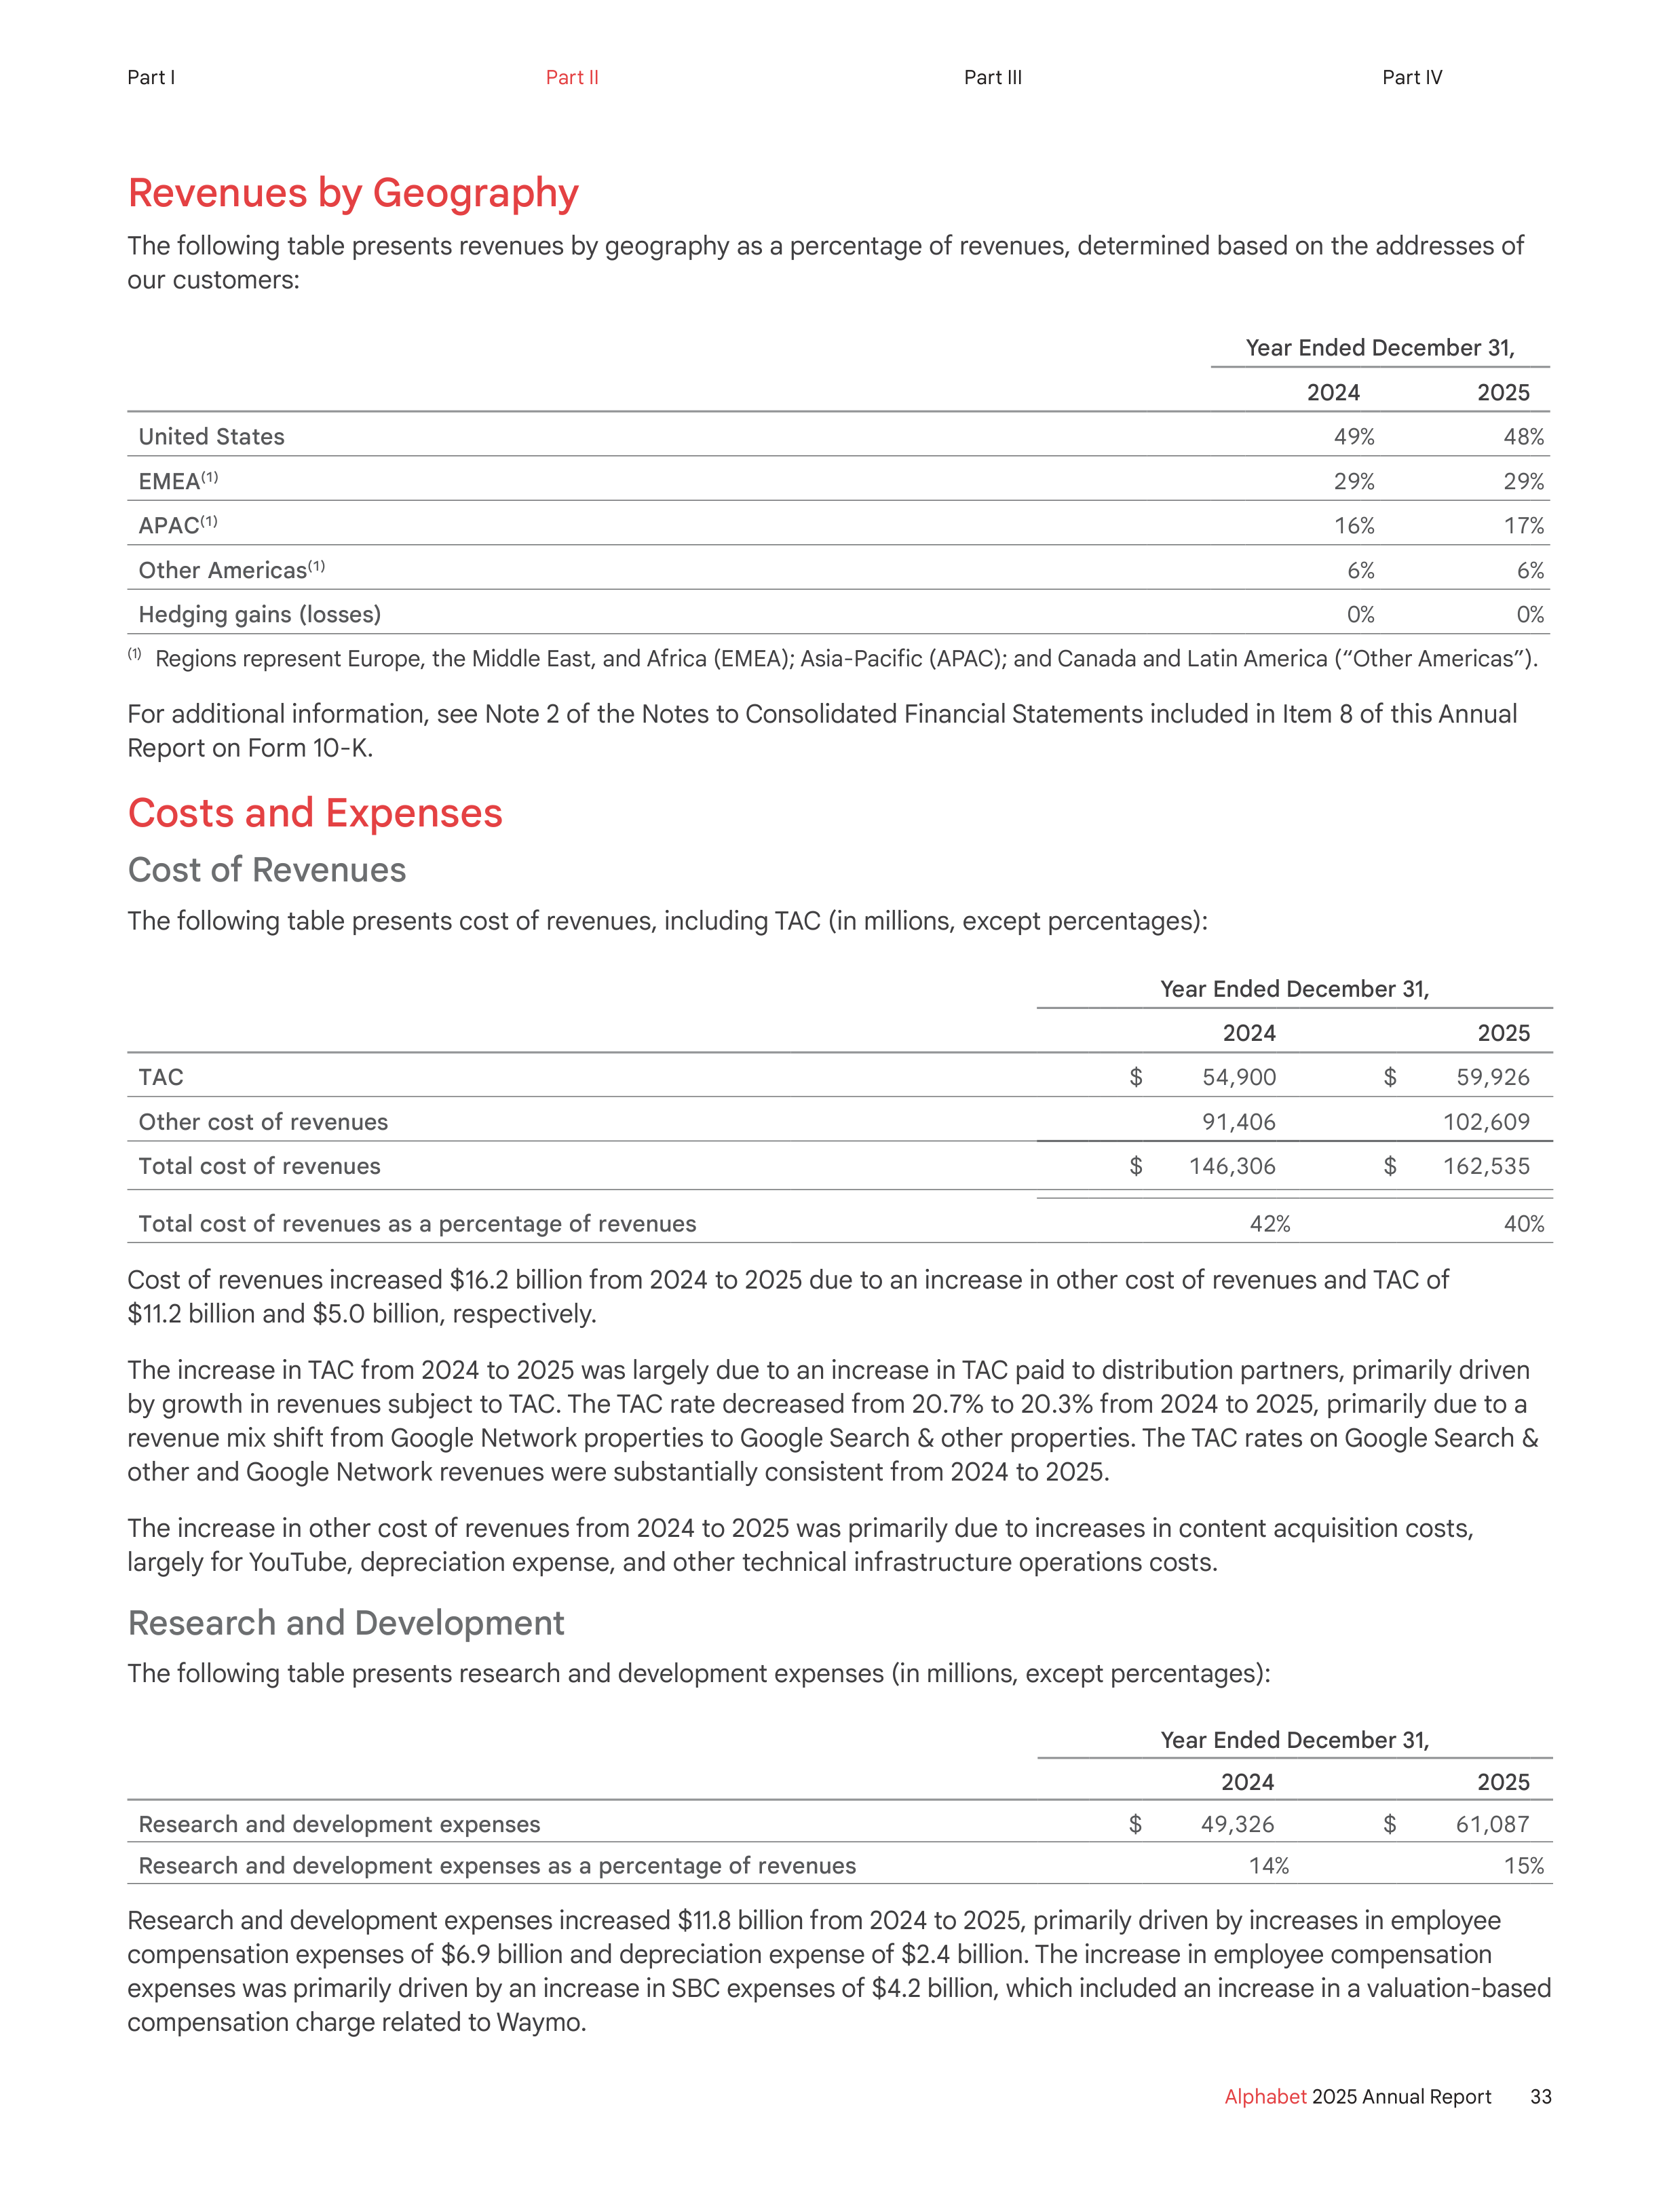
Revenues by Geography
The following table presents revenues by geography as a percentage of revenues, determined based on the addresses of
our customers:
Year Ended December 31,
2024
2025
United States
49%
48%
EMEA
(1)
29%
29%
APAC
(1)
16%
17%
Other Americas
(1)
6%
6%
Hedging gains (losses)
0%
0%
(1)
Regions represent Europe, the Middle East, and Africa (EMEA); Asia-Pacific (APAC); and Canada and Latin America (“Other Americas”).
For additional information, see Note 2 of the Notes to Consolidated Financial Statements included in Item 8 of this Annual
Report on Form 10-K.
Costs and Expenses
Cost of Revenues
The following table presents cost of revenues, including TAC (in millions, except percentages):
Year Ended December 31,
2024
2025
TAC
$
54,900
$
59,926
Other cost of revenues
91,406
102,609
Total cost of revenues
$
146,306
$
162,535
Total cost of revenues as a percentage of revenues
42%
40%
Cost of revenues increased $16.2 billion from 2024 to 2025 due to an increase in other cost of revenues and TAC of
$11.2 billion and $5.0 billion, respectively.
The increase in TAC from 2024 to 2025 was largely due to an increase in TAC paid to distribution partners, primarily driven
by growth in revenues subject to TAC. The TAC rate decreased from 20.7% to 20.3% from 2024 to 2025, primarily due to a
revenue mix shift from Google Network properties to Google Search & other properties. The TAC rates on Google Search &
other and Google Network revenues were substantially consistent from 2024 to 2025.
The increase in other cost of revenues from 2024 to 2025 was primarily due to increases in content acquisition costs,
largely for YouTube, depreciation expense, and other technical infrastructure operations costs.
Research and Development
The following table presents research and development expenses (in millions, except percentages):
Year Ended December 31,
2024
2025
Research and development expenses
$
49,326
$
61,087
Research and development expenses as a percentage of revenues
14%
15%
Research and development expenses increased $11.8 billion from 2024 to 2025, primarily driven by increases in employee
compensation expenses of $6.9 billion and depreciation expense of $2.4 billion. The increase in employee compensation
expenses was primarily driven by an increase in SBC expenses of $4.2 billion, which included an increase in a valuation‑based
compensation charge related to Waymo.
33
Alphabet
2025 Annual Report
Part I
Part II
Part III
Part IV
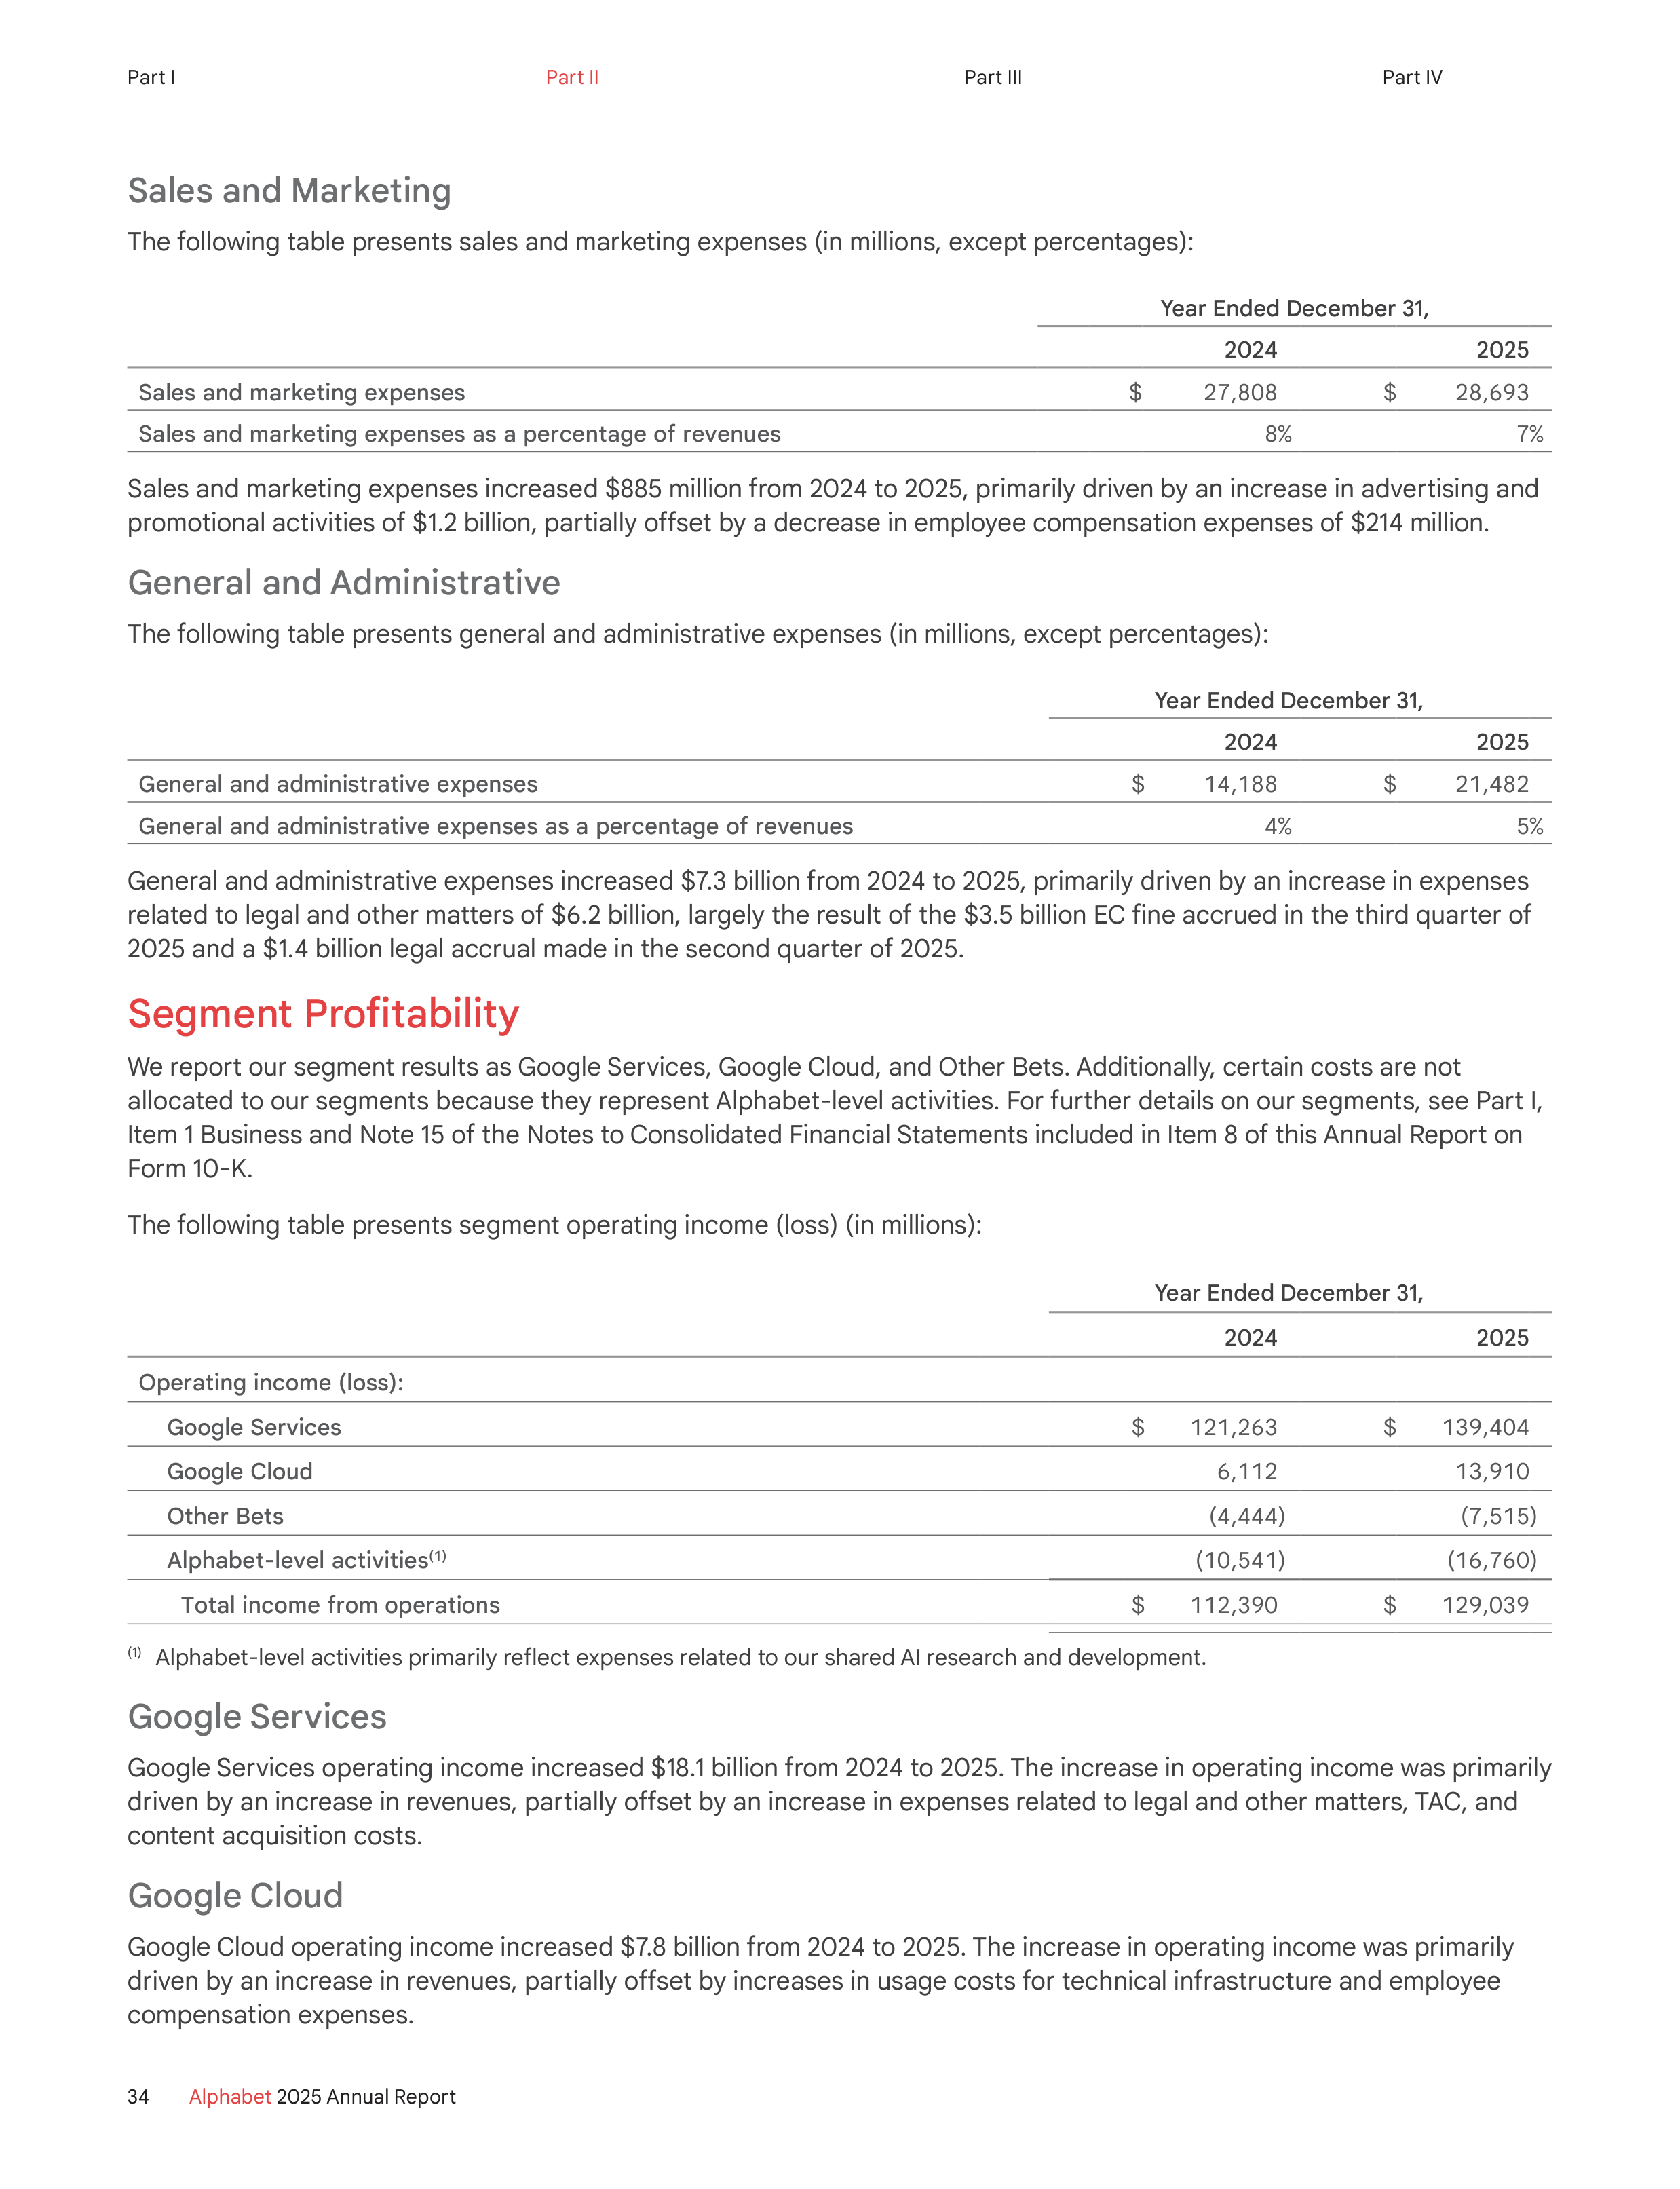
Sales and Marketing
The following table presents sales and marketing expenses (in millions, except percentages):
Year Ended December 31,
2024
2025
Sales and marketing expenses
$
27,808
$
28,693
Sales and marketing expenses as a percentage of revenues
8%
7%
Sales and marketing expenses increased $885 million from 2024 to 2025, primarily driven by an increase in advertising and
promotional activities of $1.2 billion, partially offset by a decrease in employee compensation expenses of $214 million.
General and Administrative
The following table presents general and administrative expenses (in millions, except percentages):
Year Ended December 31,
2024
2025
General and administrative expenses
$
14,188
$
21,482
General and administrative expenses as a percentage of revenues
4%
5%
General and administrative expenses increased $7.3 billion from 2024 to 2025, primarily driven by an increase in expenses
related to legal and other matters of $6.2 billion, largely the result of the $3.5 billion EC fine accrued in the third quarter of
2025 and a $1.4 billion legal accrual made in the second quarter of 2025.
Segment Profitability
We report our segment results as Google Services, Google Cloud, and Other Bets. Additionally, certain costs are not
allocated to our segments because they represent Alphabet-level activities. For further details on our segments, see Part I,
Item 1 Business and Note 15 of the Notes to Consolidated Financial Statements included in Item 8 of this Annual Report on
Form 10-K.
The following table presents segment operating income (loss) (in millions):
Year Ended December 31,
2024
2025
Operating income (loss):
Google Services
$
121,263
$
139,404
Google Cloud
6,112
13,910
Other Bets
(4,444)
(7,515)
Alphabet-level activities
(1)
(10,541)
(16,760)
Total income from operations
$
112,390
$
129,039
(1)
Alphabet-level activities primarily reflect expenses related to our shared AI research and development.
Google Services
Google Services operating income increased $18.1 billion from 2024 to 2025. The increase in operating income was primarily
driven by an increase in revenues, partially offset by an increase in expenses related to legal and other matters, TAC, and
content acquisition costs.
Google Cloud
Google Cloud operating income increased $7.8 billion from 2024 to 2025. The increase in operating income was primarily
driven by an increase in revenues, partially offset by increases in usage costs for technical infrastructure and employee
compensation expenses.
34
Alphabet
2025 Annual Report
Part I
Part II
Part III
Part IV
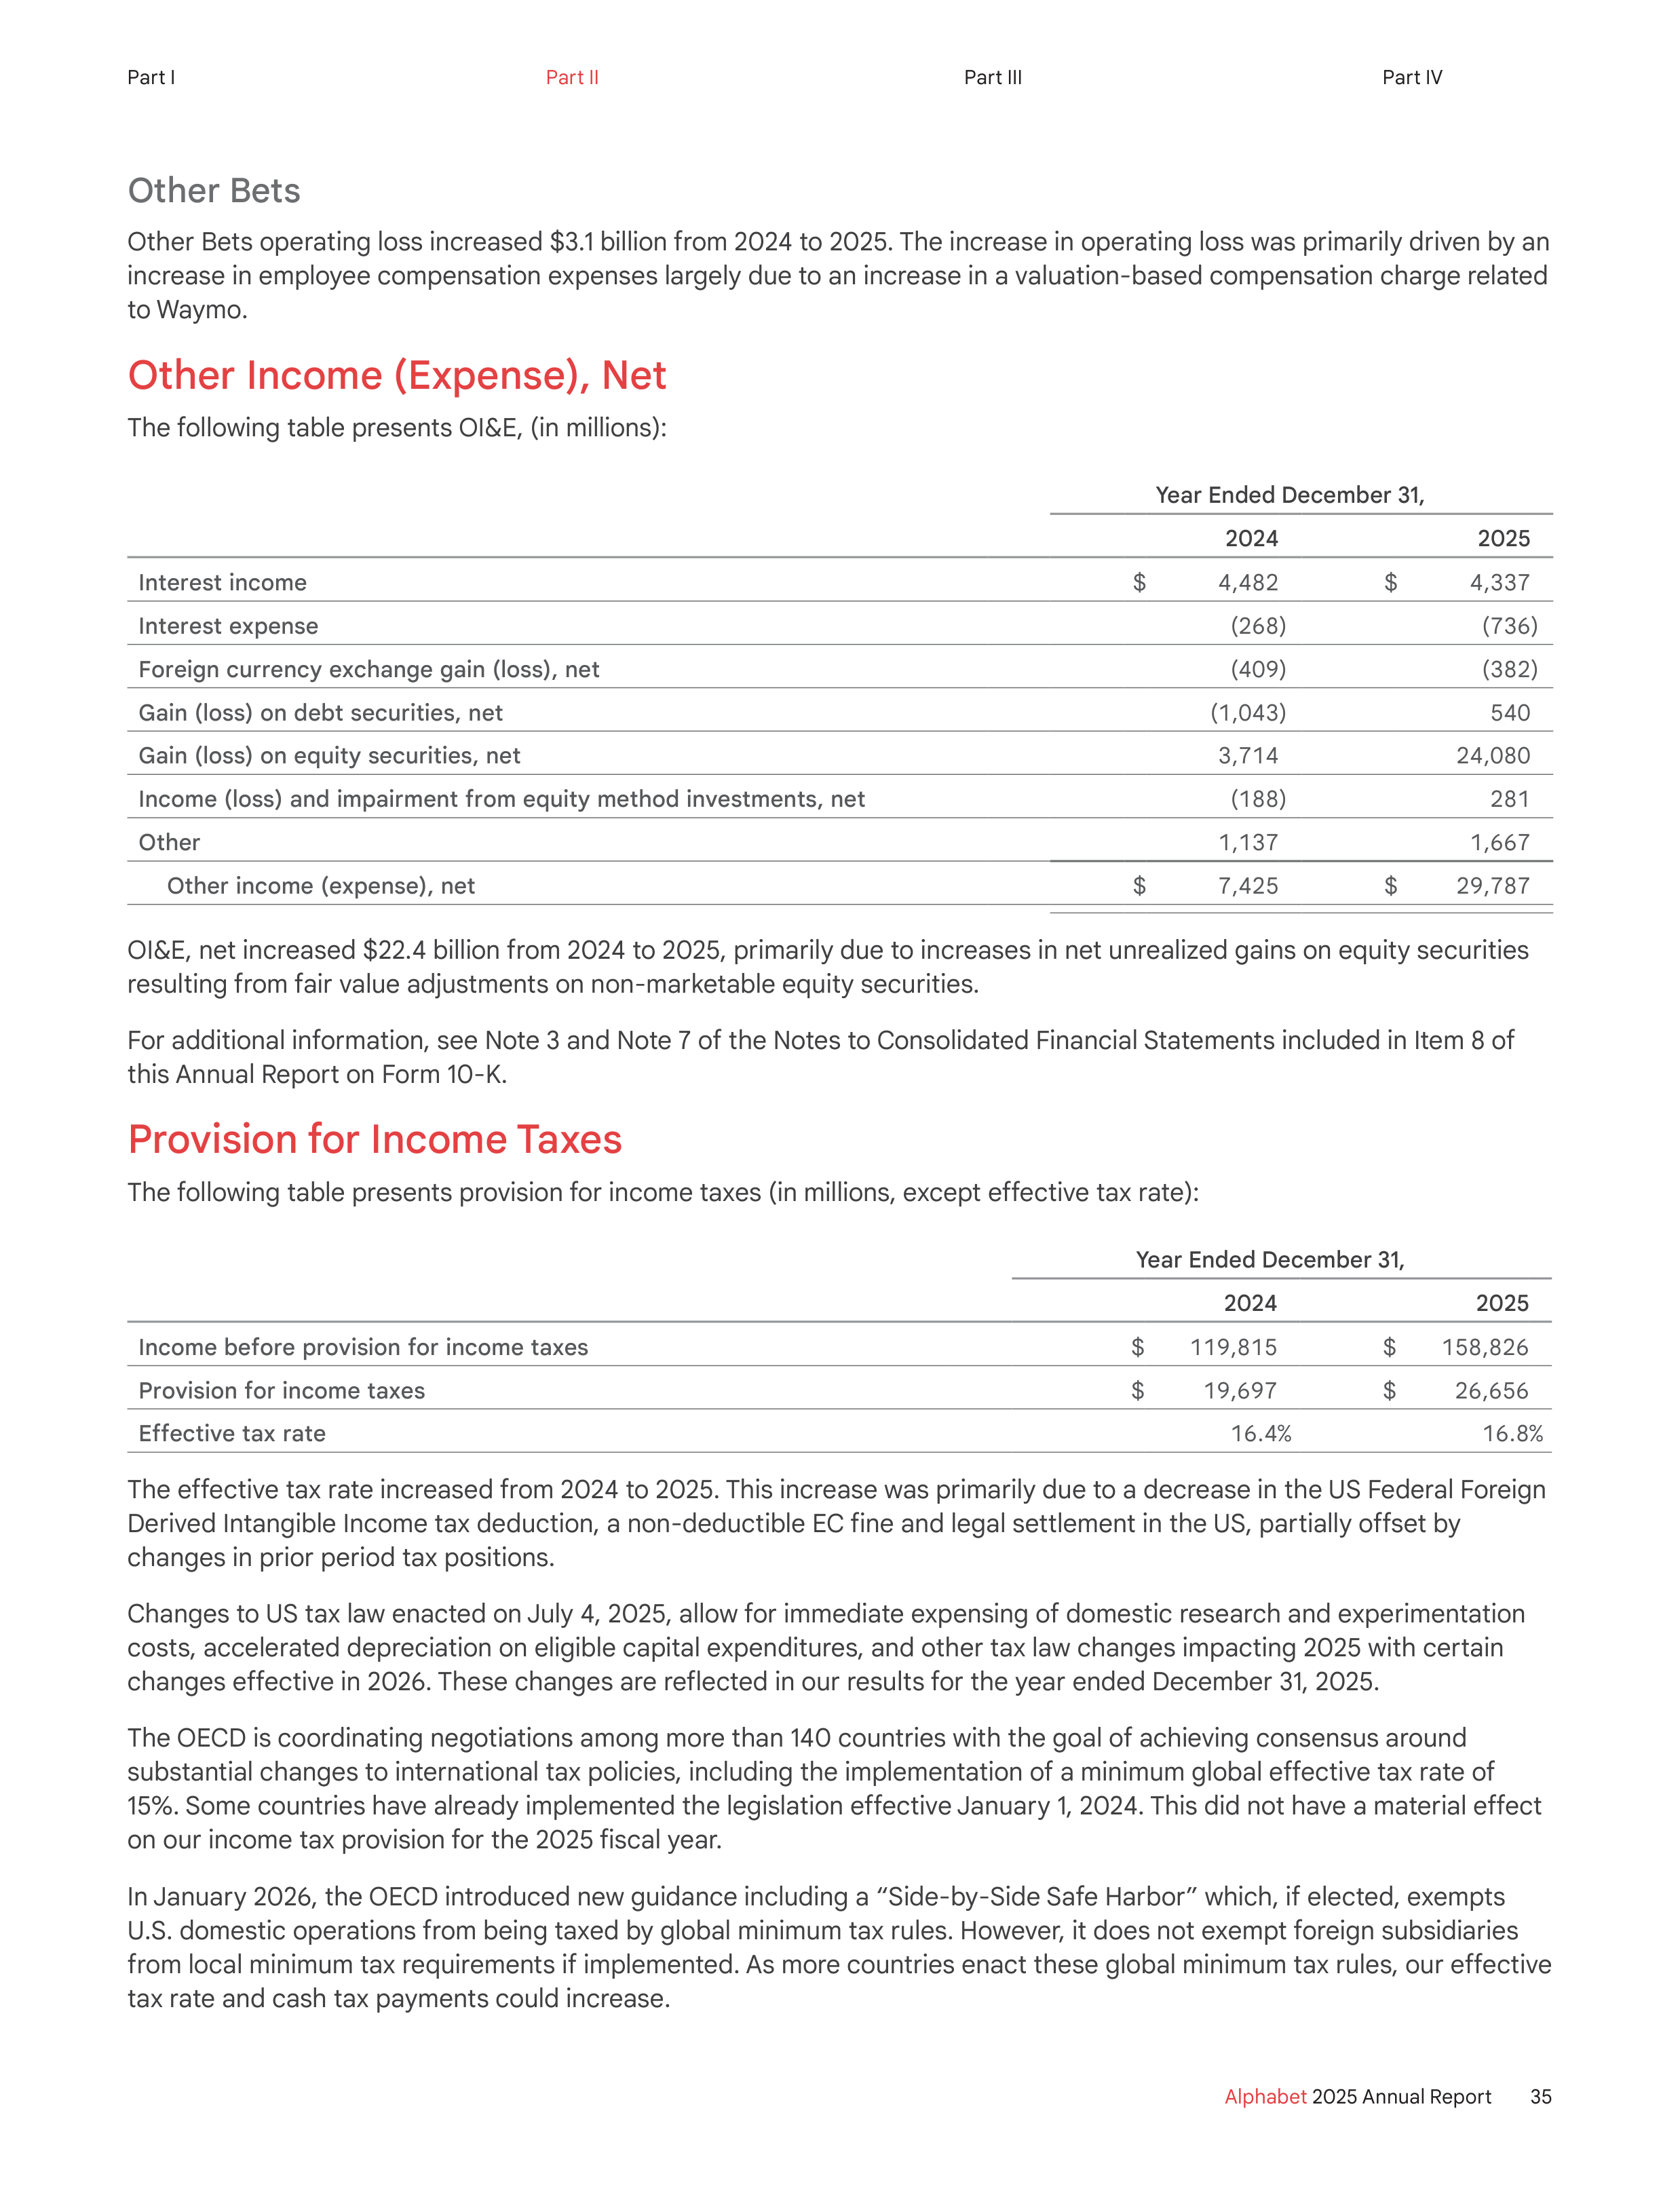
Other Bets
Other Bets operating loss increased $3.1 billion from 2024 to 2025. The increase in operating loss was primarily driven by an
increase in employee compensation expenses largely due to an increase in a valuation-based compensation charge related
to Waymo.
Other Income (Expense), Net
The following table presents OI&E, (in millions):
Year Ended December 31,
2024
2025
Interest income
$
4,482
$
4,337
Interest expense
(268)
(736)
Foreign currency exchange gain (loss), net
(409)
(382)
Gain (loss) on debt securities, net
(1,043)
540
Gain (loss) on equity securities, net
3,714
24,080
Income (loss) and impairment from equity method investments, net
(188)
281
Other
1,137
1,667
Other income (expense), net
$
7,425
$
29,787
OI&E, net increased $22.4 billion from 2024 to 2025, primarily due to increases in net unrealized gains on equity securities
resulting from fair value adjustments on non-marketable equity securities.
For additional information, see Note 3 and Note 7 of the Notes to Consolidated Financial Statements included in Item 8 of
this Annual Report on Form 10-K.
Provision for Income Taxes
The following table presents provision for income taxes (in millions, except effective tax rate):
Year Ended December 31,
2024
2025
Income before provision for income taxes
$
119,815
$
158,826
Provision for income taxes
$
19,697
$
26,656
Effective tax rate
16.4%
16.8%
The effective tax rate increased from 2024 to 2025. This increase was primarily due to a decrease in the US Federal Foreign
Derived Intangible Income tax deduction, a non-deductible EC fine and legal settlement in the US, partially offset by
changes in prior period tax positions.
Changes to US tax law enacted on July 4, 2025, allow for immediate expensing of domestic research and experimentation
costs, accelerated depreciation on eligible capital expenditures, and other tax law changes impacting 2025 with certain
changes effective in 2026. These changes are reflected in our results for the year ended December 31, 2025.
The OECD is coordinating negotiations among more than 140 countries with the goal of achieving consensus around
substantial changes to international tax policies, including the implementation of a minimum global effective tax rate of
15%. Some countries have already implemented the legislation effective January 1, 2024. This did not have a material effect
on our income tax provision for the 2025 fiscal year.
In January 2026, the OECD introduced new guidance including a “Side-by-Side Safe Harbor” which, if elected, exempts
U.S. domestic operations from being taxed by global minimum tax rules. However, it does not exempt foreign subsidiaries
from local minimum tax requirements if implemented. As more countries enact these global minimum tax rules, our effective
tax rate and cash tax payments could increase.
35
Alphabet
2025 Annual Report
Part I
Part II
Part III
Part IV
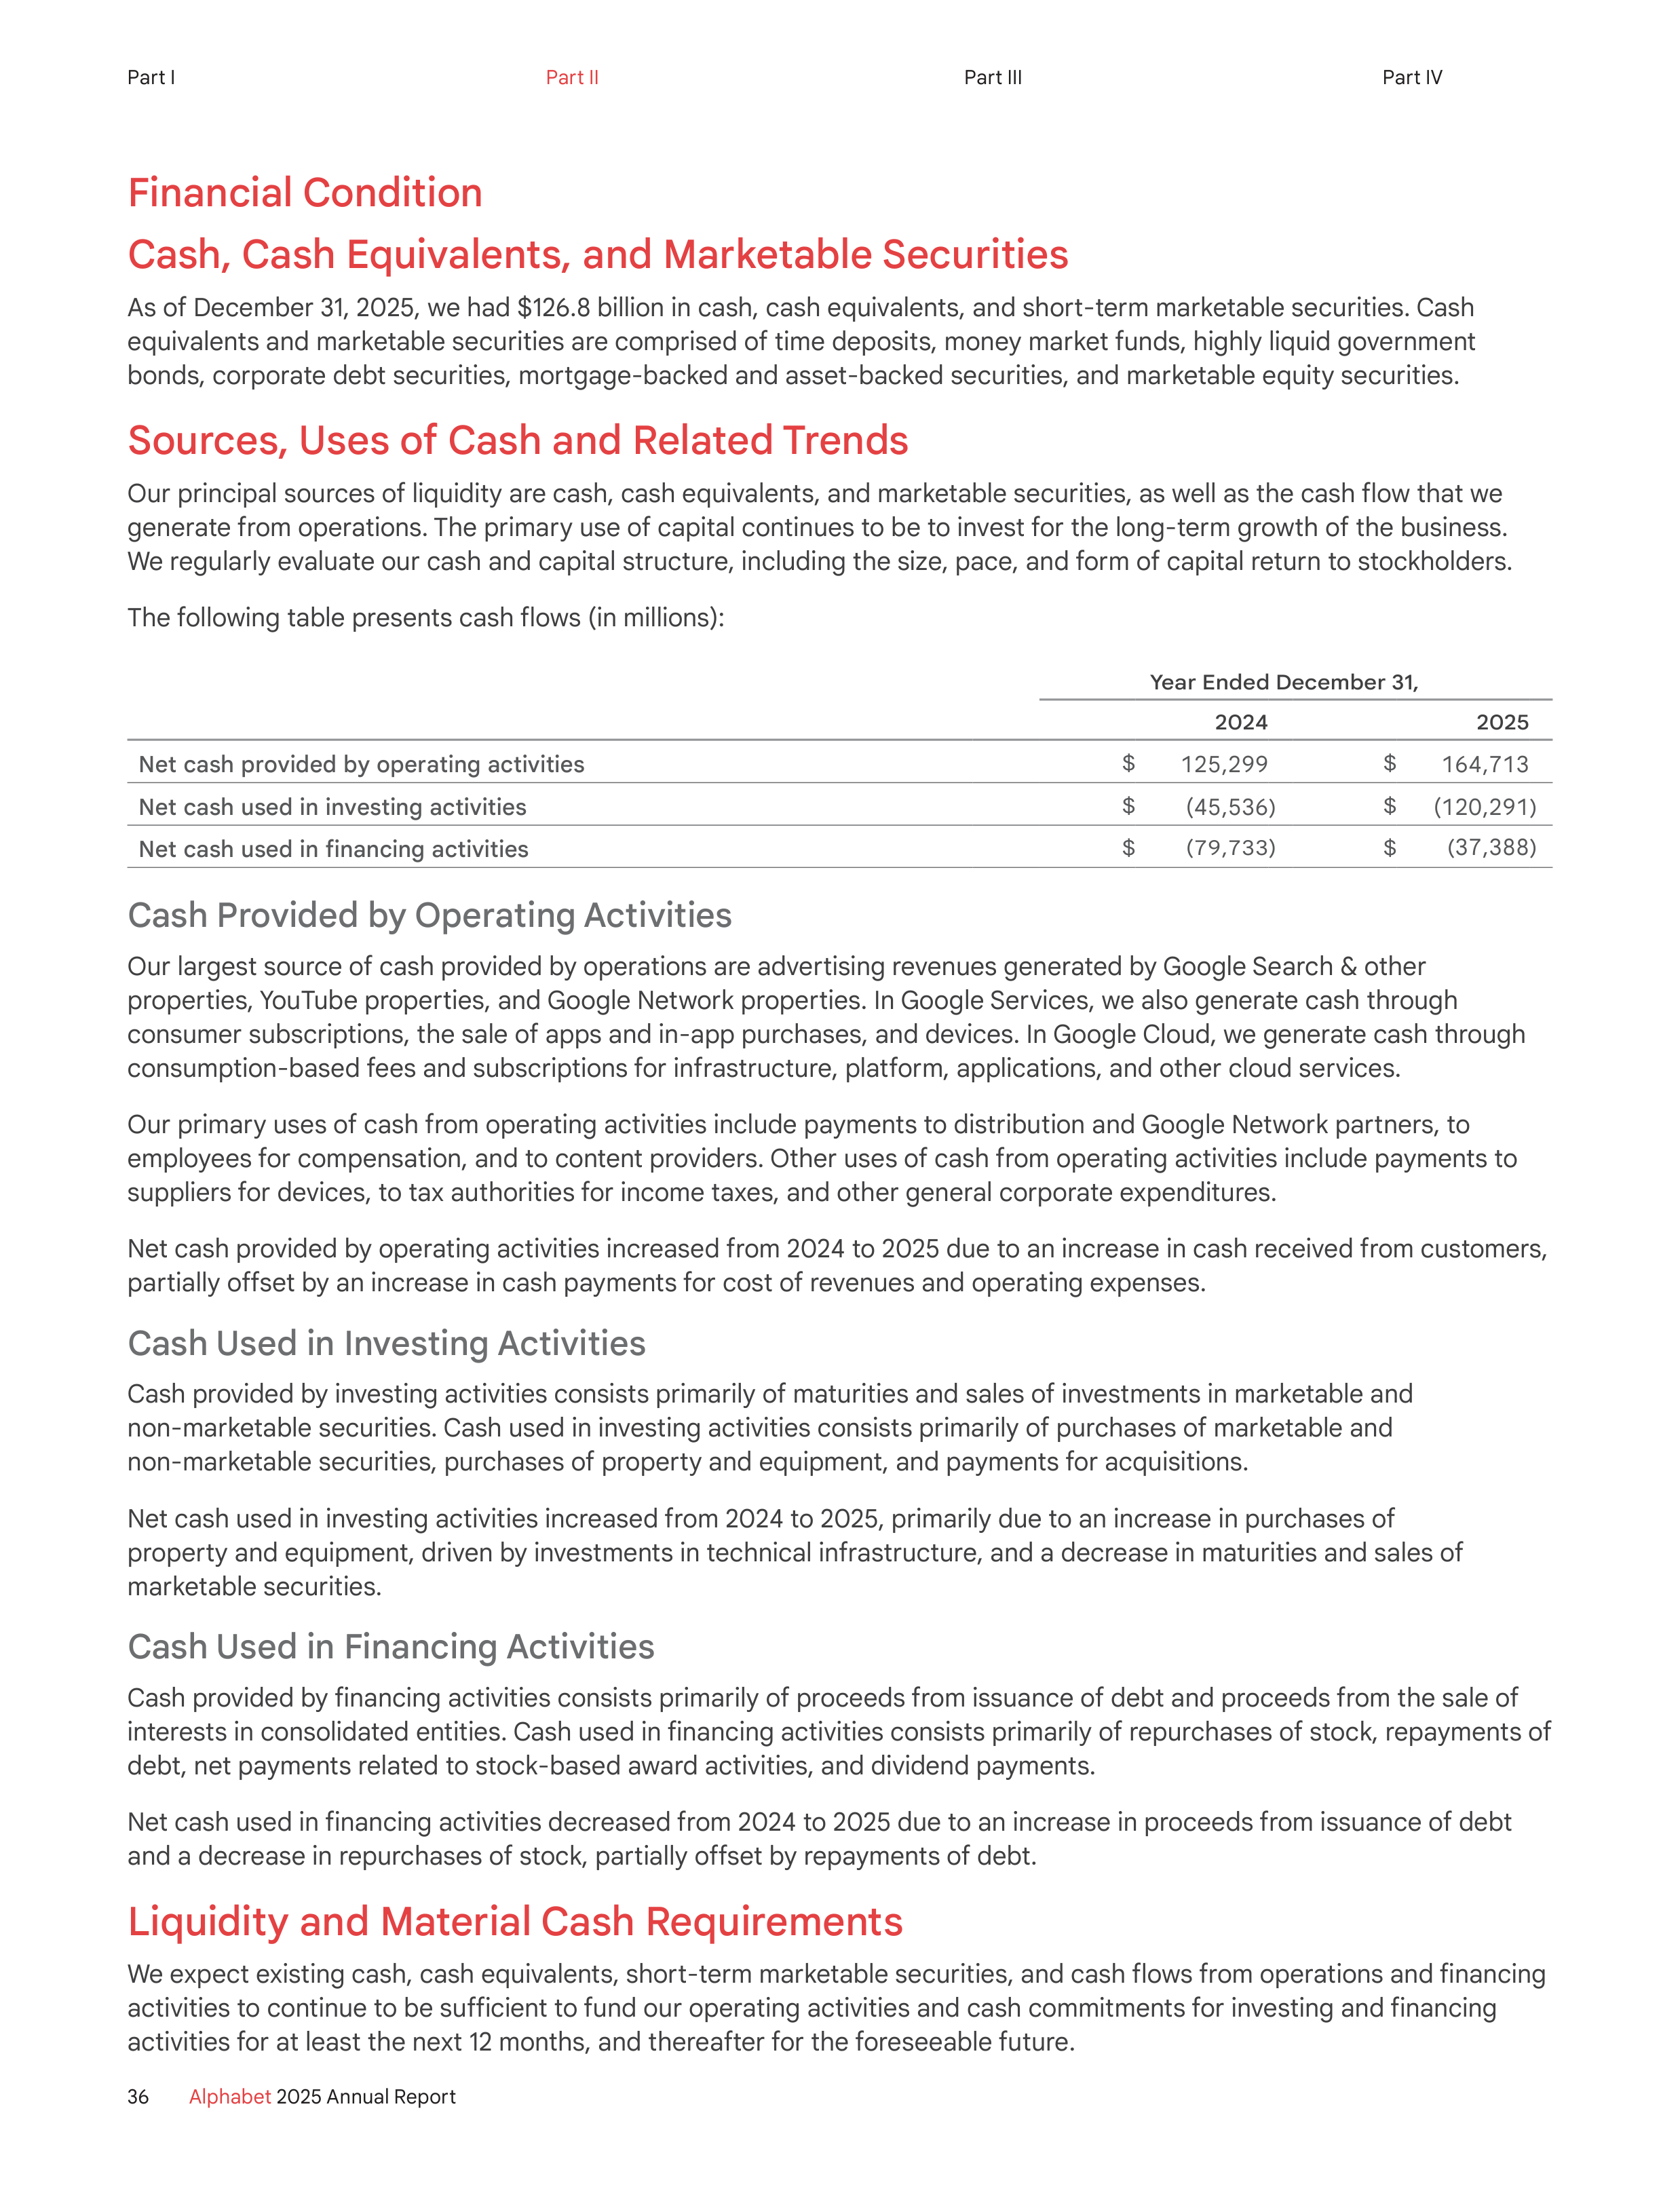
Financial Condition
Cash, Cash Equivalents, and Marketable Securities
As of December 31, 2025, we had $126.8 billion in cash, cash equivalents, and short-term marketable securities. Cash
equivalents and marketable securities are comprised of time deposits, money market funds, highly liquid government
bonds, corporate debt securities, mortgage-backed and asset-backed securities, and marketable equity securities.
Sources, Uses of Cash and Related Trends
Our principal sources of liquidity are cash, cash equivalents, and marketable securities, as well as the cash flow that we
generate from operations. The primary use of capital continues to be to invest for the long-term growth of the business.
We regularly evaluate our cash and capital structure, including the size, pace, and form of capital return to stockholders.
The following table presents cash flows (in millions):
Year Ended December 31,
2024
2025
Net cash provided by operating activities
$
125,299
$
164,713
Net cash used in investing activities
$
(45,536
)
$
(120,291
)
Net cash used in financing activities
$
(79,733)
$
(
37,388
)
Cash Provided by Operating Activities
Our largest source of cash provided by operations are advertising revenues generated by Google Search & other
properties, YouTube properties, and Google Network properties. In Google Services, we also generate cash through
consumer subscriptions, the sale of apps and in-app purchases, and devices. In Google Cloud, we generate cash through
consumption-based fees and subscriptions for infrastructure, platform, applications, and other cloud services.
Our primary uses of cash from operating activities include payments to distribution and Google Network partners, to
employees for compensation, and to content providers. Other uses of cash from operating activities include payments to
suppliers for devices, to tax authorities for income taxes, and other general corporate expenditures.
Net cash provided by operating activities increased from 2024 to 2025 due to an increase in cash received from customers,
partially offset by an increase in cash payments for cost of revenues and operating expenses.
Cash Used in Investing Activities
Cash provided by investing activities consists primarily of maturities and sales of investments in marketable and
non‑marketable securities. Cash used in investing activities consists primarily of purchases of marketable and
non‑marketable securities, purchases of property and equipment, and payments for acquisitions.
Net cash used in investing activities increased from 2024 to 2025, primarily due to an increase in purchases of
property and equipment, driven by investments in technical infrastructure, and a decrease in maturities and sales of
marketable securities.
Cash Used in Financing Activities
Cash provided by financing activities consists primarily of proceeds from issuance of debt and proceeds from the sale of
interests in consolidated entities. Cash used in financing activities consists primarily of repurchases of stock, repayments of
debt, net payments related to stock-based award activities, and dividend payments.
Net cash used in financing activities decreased from 2024 to 2025 due to an increase in proceeds from issuance of debt
and a decrease in repurchases of stock, partially offset by repayments of debt.
Liquidity and Material Cash Requirements
We expect existing cash, cash equivalents, short-term marketable securities, and cash flows from operations and financing
activities to continue to be sufficient to fund our operating activities and cash commitments for investing and financing
activities for at least the next 12 months, and thereafter for the foreseeable future.
36
Alphabet
2025 Annual Report
Part I
Part II
Part III
Part IV
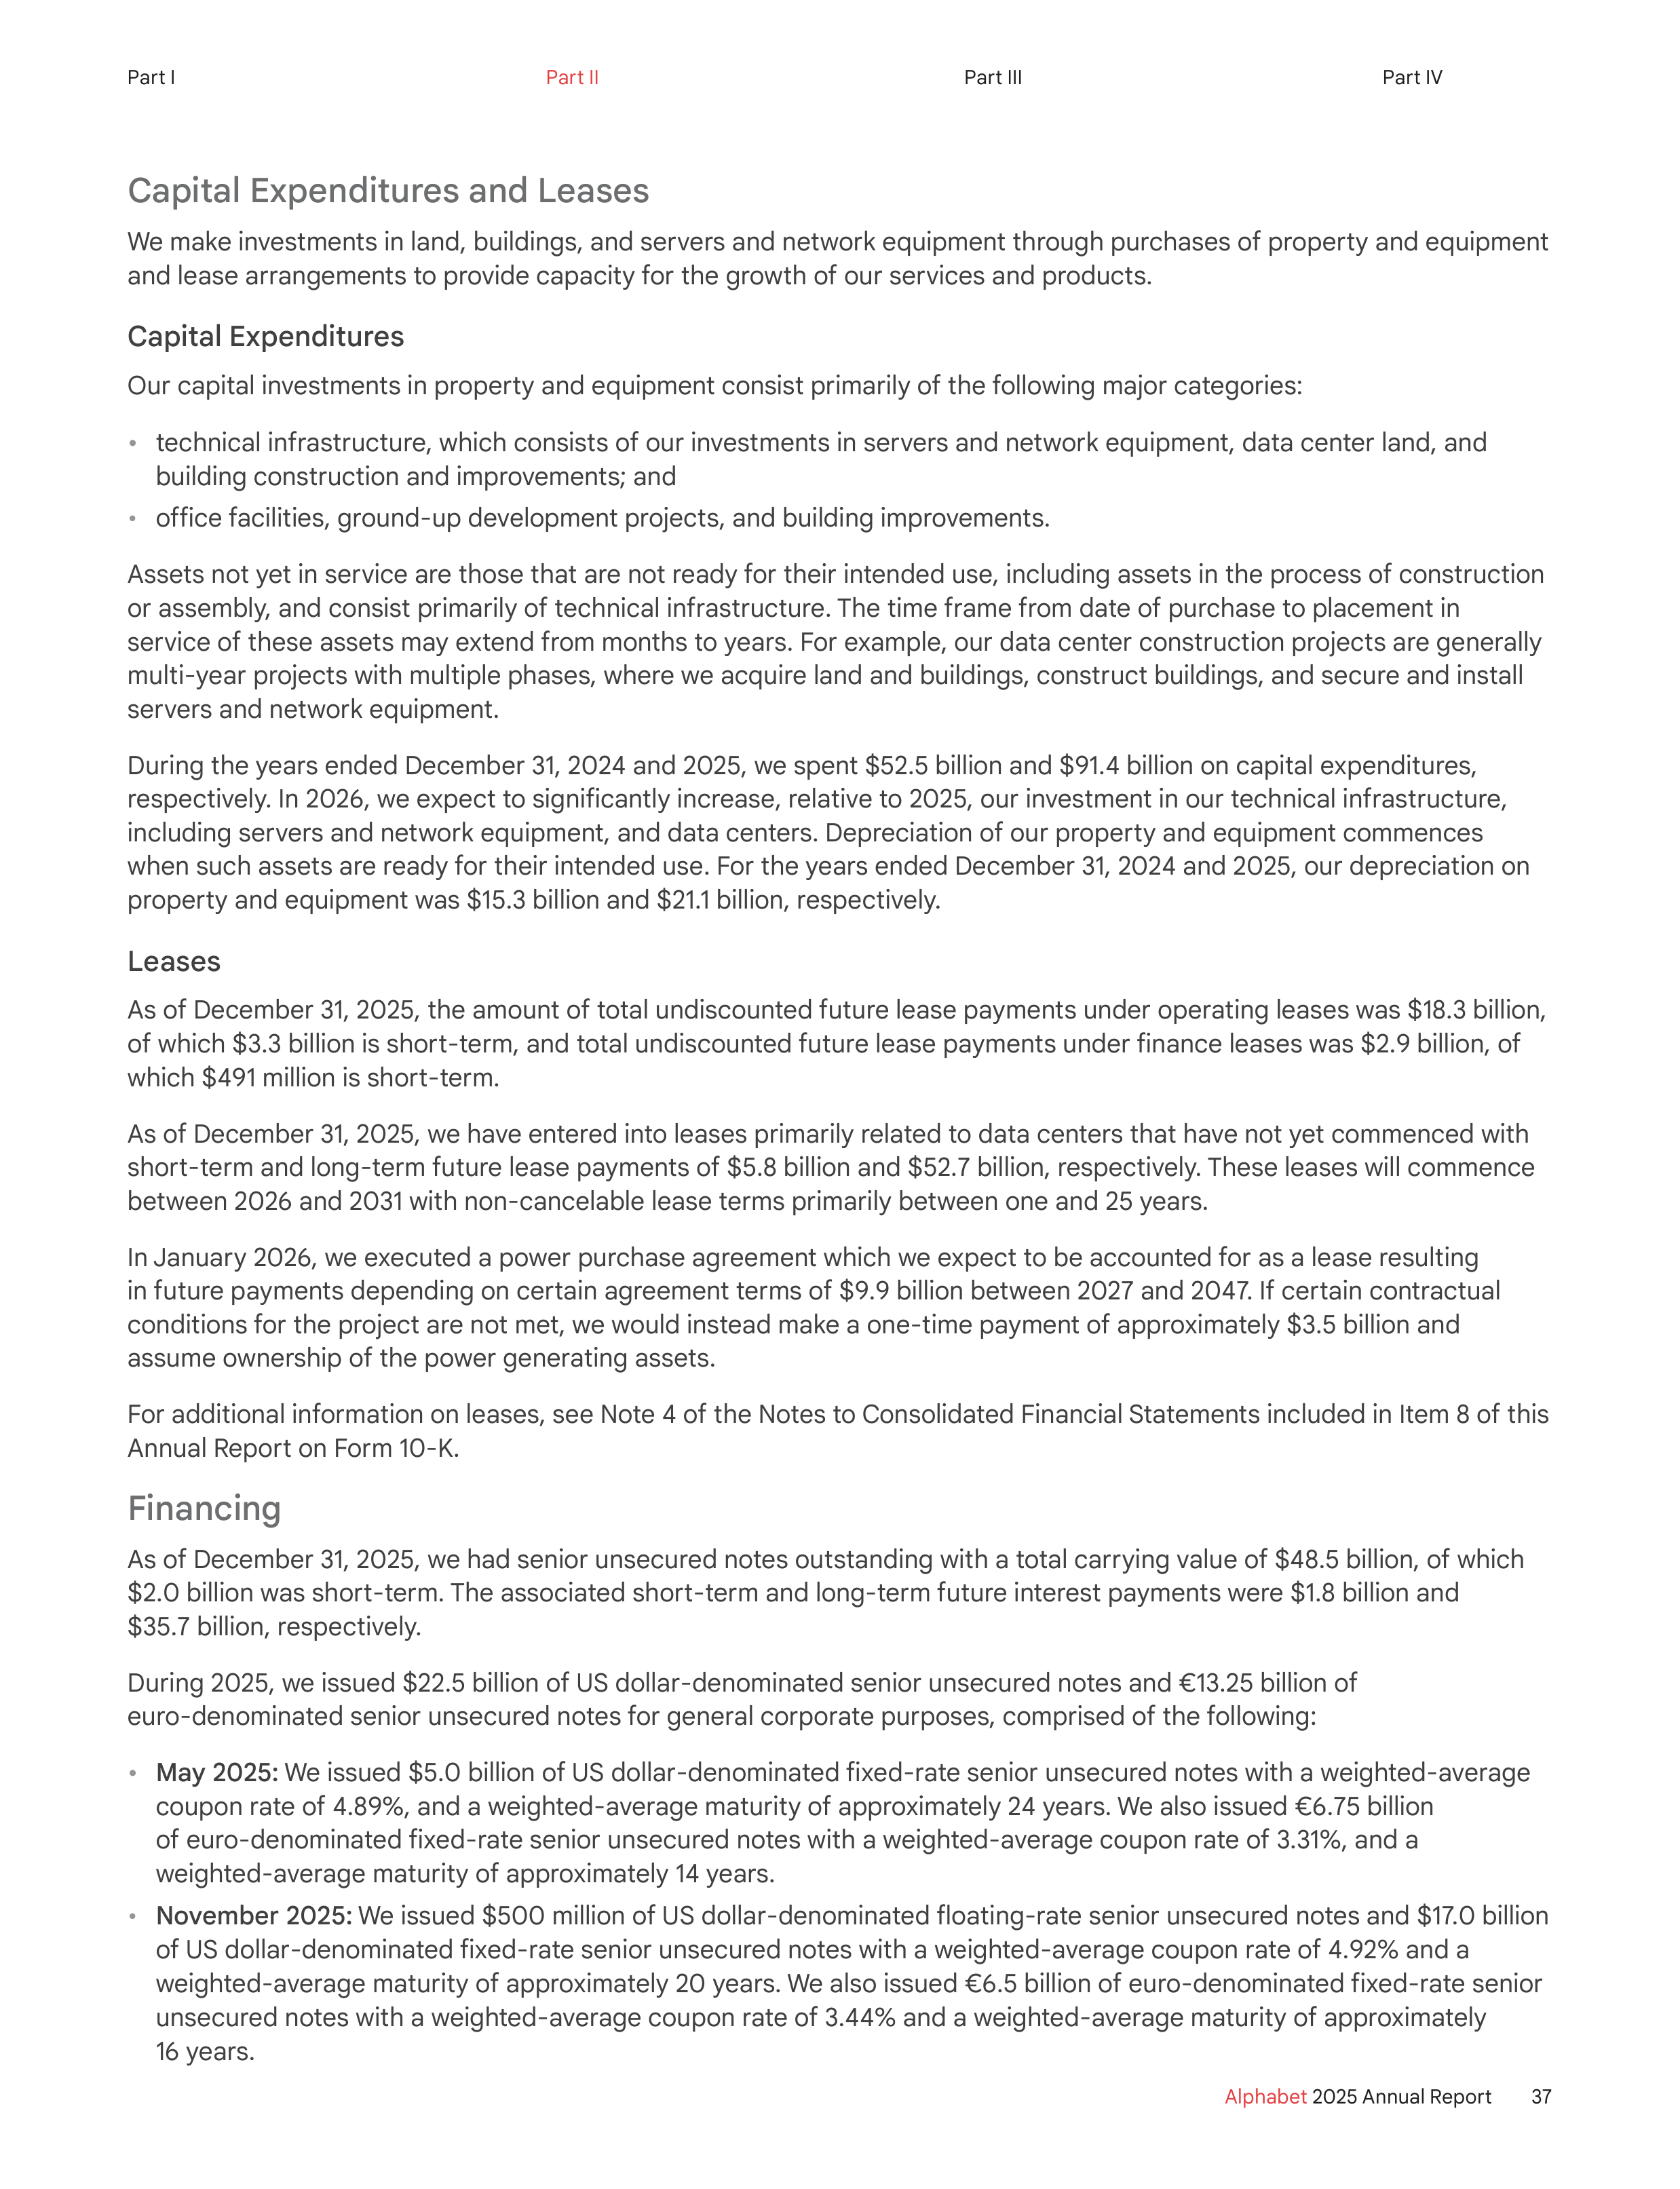
Capital Expenditures and Leases
We make investments in land, buildings, and servers and network equipment through purchases of property and equipment
and lease arrangements to provide capacity for the growth of our services and products.
Capital Expenditures
Our capital investments in property and equipment consist primarily of the following major categories:
•
technical infrastructure, which consists of our investments in servers and network equipment, data center land, and
building construction and improvements; and
•
office facilities, ground-up development projects, and building improvements.
Assets not yet in service are those that are not ready for their intended use, including assets in the process of construction
or assembly, and consist primarily of technical infrastructure. The time frame from date of purchase to placement in
service of these assets may extend from months to years. For example, our data center construction projects are generally
multi-year projects with multiple phases, where we acquire land and buildings, construct buildings, and secure and install
servers and network equipment.
During the years ended December 31, 2024 and 2025, we spent $52.5 billion and $91.4 billion on capital expenditures,
respectively. In 2026, we expect to significantly increase, relative to 2025, our investment in our technical infrastructure,
including servers and network equipment, and data centers. Depreciation of our property and equipment commences
when such assets are ready for their intended use. For the years ended December 31, 2024 and 2025, our depreciation on
property and equipment was $15.3 billion and $21.1 billion, respectively.
Leases
As of December 31, 2025, the amount of total undiscounted future lease payments under operating leases was $18.3 billion,
of which $3.3 billion is short-term, and total undiscounted future lease payments under finance leases was $2.9 billion, of
which $491 million is short-term.
As of December 31, 2025, we have entered into leases primarily related to data centers that have not yet commenced with
short-term and long-term future lease payments of $5.8 billion and $52.7 billion, respectively. These leases will commence
between 2026 and 2031 with non-cancelable lease terms primarily between one and 25 years.
In January 2026, we executed a power purchase agreement which we expect to be accounted for as a lease resulting
in future payments depending on certain agreement terms of $9.9 billion between 2027 and 2047. If certain contractual
conditions for the project are not met, we would instead make a one-time payment of approximately $3.5 billion and
assume ownership of the power generating assets.
For additional information on leases, see Note 4 of the Notes to Consolidated Financial Statements included in Item 8 of this
Annual Report on Form 10-K.
Financing
As of December 31, 2025, we had senior unsecured notes outstanding with a total carrying value of $48.5 billion, of which
$2.0 billion was short-term. The associated short-term and long-term future interest payments were $1.8 billion and
$35.7 billion, respectively.
During 2025, we issued $22.5 billion of US dollar-denominated senior unsecured notes and €13.25 billion of
euro-denominated senior unsecured notes for general corporate purposes, comprised of the following:
•
May 2025:
We issued $5.0 billion of US dollar-denominated fixed-rate senior unsecured notes with a weighted-average
coupon rate of 4.89%, and a weighted-average maturity of approximately 24 years. We also issued €6.75 billion
of euro-denominated fixed-rate senior unsecured notes with a weighted-average coupon rate of 3.31%, and a
weighted-average maturity of approximately 14 years.
•
November 2025:
We issued $500 million of US dollar-denominated floating-rate senior unsecured notes and $17.0 billion
of US dollar-denominated fixed-rate senior unsecured notes with a weighted-average coupon rate of 4.92% and a
weighted-average maturity of approximately 20 years. We also issued €6.5 billion of euro-denominated fixed-rate senior
unsecured notes with a weighted-average coupon rate of 3.44% and a weighted-average maturity of approximately
16 years.
37
Alphabet
2025 Annual Report
Part I
Part II
Part III
Part IV
As of December 31, 2025, we had $10.0 billion of revolving credit facilities, $4.0 billion expiring in April 2026 and $6.0 billion
expiring in April 2030. No amounts have been borrowed under the credit facilities. We also have a commercial paper
program of up to $25.0 billion, which is used for general corporate purposes. As of December 31, 2025, we had no
commercial paper outstanding.
For additional information, see Note 6 of the Notes to Consolidated Financial Statements included in Item 8 of this
Annual Report on Form 10-K.
We use contract manufacturers for our technical infrastructure and device assembly and may supply them with
components purchased directly from suppliers. Certain of these arrangements result in a portion of the cash received from
and paid to contract manufacturers to be presented as financing activities on the Consolidated Statements of Cash Flows
included in Item 8 of this Annual Report on Form 10-K.
Share Repurchase Program
During 2025, we repurchased and subsequently retired 240 million shares for $45.4 billion.
In April 2024, the company’s Board of Directors authorized a $70.0 billion share repurchase program for its Class A and
Class C shares. In April 2025, the company’s Board of Directors authorized an additional $70.0 billion share repurchase
program for its Class A and Class C shares. As of December 31, 2025, $69.5 billion remained available for Class A and
Class C share repurchases.
For additional information, see Note 11 of the Notes to Consolidated Financial Statements included in Item 8 of this
Annual Report on Form 10-K.
Dividend Program
During the year ended December 31, 2025, total cash dividends were $4.8 billion for Class A, $703 million for Class B, and
$4.5 billion for Class C shares, respectively.
In April 2025, the company’s Board of Directors increased the quarterly cash dividend by 5% to $0.21 per share of
outstanding Class A, Class B, and Class C shares.
The company has declared a quarterly cash dividend in the current quarter, and intends to pay quarterly cash dividends in
the future, subject to review and approval by the company’s Board of Directors in its sole discretion.
Accrued Legal and Regulatory
As of December 31, 2025, we had short-term accrued legal and regulatory fines and settlements of $15.6 billion. This
amount primarily included EC fines, in addition to accruals related to other legal matters and regulatory fines and
settlements. For additional information, see Note 10 of the Notes to Consolidated Financial Statements included in Item 8 of
this Annual Report on Form 10-K.
Taxes
As of December 31, 2025, we had long-term income taxes payable of $9.5 billion primarily related to unrecognized tax
benefits. The timing and amount of any payment related to these unrecognized tax benefits are uncertain and cannot
be estimated.
Purchase Commitments and Other Contractual Obligations
We have material purchase commitments and other contractual obligations primarily related to energy take-or-pay
contracts, licenses (including content licenses), and technical infrastructure and inventory orders. As of December 31,
2025, the total for these commitments was $149.1 billion, of which $113.0 billion was short-term, mostly related to technical
infrastructure and inventory orders. These amounts reflect commitments and obligations through open purchase orders
as well as the non-cancelable portion or the minimum cancellation fee in certain agreements. For those agreements with
variable terms, we do not estimate the non-cancelable obligation beyond any minimum quantities and/or pricing as of
December 31, 2025. In certain instances, the amount of our contractual obligations may change based on the expected
timing of order fulfillment from our suppliers. For additional information related to our content licenses, see Note 10 of the
Notes to Consolidated Financial Statements included in Item 8 of this Annual Report on Form 10-K.
38
Alphabet
2025 Annual Report
Part I
Part II
Part III
Part IV
As of December 31, 2025, we provided backstops in the form of financial guarantees and credit derivatives with maximum
potential amount of future payments of $5.7 billion and $16.9 billion, respectively. For additional information on credit
derivatives and financial guarantees, see Note 3 and Note 10 of the Notes to Consolidated Financial Statements included in
Item 8 of this Annual Report on Form 10-K.
In addition, we regularly enter into multi-year, non-cancellable power purchase agreements with third-party suppliers that
do not include a minimum dollar commitment. The amounts to be paid under these agreements are based on the actual
volumes to be generated and are not readily determinable.
We may experience increases in the costs associated with our purchase commitments and other contractual obligations
as a result of ongoing developments surrounding international trade. For details on risks related to our manufacturing and
supply chain and other risks, refer to Part 1, Item 1A, “Risk Factors” of this Annual Report on Form 10-K.
Pending Acquisitions
In March 2025, we entered into a definitive agreement to acquire Wiz, Inc. (“Wiz”), a leading cloud security platform, for
$32.0 billion, subject to closing adjustments, in an all-cash transaction. The acquisition of Wiz is expected to close in 2026,
subject to customary closing conditions, including the receipt of regulatory approvals.
In December 2025, we entered into a definitive agreement to acquire Intersect, which provides data center and energy
infrastructure solutions, for $4.8 billion in cash, plus the assumption of debt. The acquisition of Intersect is expected to
close in the first half of 2026, subject to customary closing conditions.
For additional information, see Note 8 of the Notes to Consolidated Financial Statements included in Item 8 of this Annual
Report on Form 10-K.
Critical Accounting Estimates
We prepare our consolidated financial statements in accordance with GAAP. In doing so, we have to make estimates
and assumptions. Our critical accounting estimates are those estimates that involve a significant level of uncertainty at
the time the estimate was made, and changes in them have had or are reasonably likely to have a material effect on our
financial condition or results of operations. Accordingly, actual results could differ materially from our estimates. We base
our estimates on past experience and other assumptions that we believe are reasonable under the circumstances,
and we evaluate these estimates on an ongoing basis. We have reviewed our critical accounting estimates with the
Audit Committee of our Board of Directors.
For a summary of significant accounting policies and the effect on our financial statements, see Note 1 of the Notes to
Consolidated Financial Statements included in Item 8 of this Annual Report on Form 10-K.
Fair Value Measurements of Non-Marketable Equity Securities
We measure certain financial instruments at fair value on a nonrecurring basis, consisting primarily of our non-marketable
equity securities. These investments are accounted for under the measurement alternative method (“the measurement
alternative”) and are measured at cost, less impairment, subject to upward and downward adjustments resulting from
observable price changes for identical or similar investments of the same issuer. These adjustments require quantitative
assessments of the fair value of our securities, which may require the use of unobservable inputs. Adjustments are
determined primarily based on a market approach as of the transaction date and involve the use of estimates using the
best information available, which may include cash flow projections or other available market data.
Non-marketable equity securities are also evaluated for impairment, based on qualitative factors including the companies’
financial and liquidity position and access to capital resources, among others. When indicators of impairment exist, we
prepare quantitative measurements of the fair value of our equity investments using a market approach or an income
approach, which requires judgment and the use of unobservable inputs, including discount rates, investee revenues and
costs, and comparable market data of private and public companies, among others. When the quantitative remeasurements
of fair value indicate an impairment exists, we write down the investment to its current fair value.
39
Alphabet
2025 Annual Report
Part I
Part II
Part III
Part IV
Property and Equipment
We assess the reasonableness of the useful lives of our property and equipment periodically or when events indicate a
change is necessary. To determine the useful lives of our technical infrastructure, we rely on multiple inputs, including
historical asset performance, expected technology advancements, and our future infrastructure deployment plans.
Any change in the estimated useful lives is recognized on a prospective basis.
Income Taxes
We are subject to income taxes in the US and foreign jurisdictions. Significant judgment is required in evaluating our
uncertain tax positions and determining our provision for income taxes.
Recording an uncertain tax position involves various qualitative considerations, including evaluation of comparable
and resolved tax exposures, applicability of tax laws, and likelihood of settlement. We evaluate uncertain tax positions
periodically, considering changes in facts and circumstances, such as new regulations or recent judicial opinions, as well
as the status of audit activities by taxing authorities. Although we believe we have adequately reserved for our uncertain
tax positions, no assurance can be given that the final tax outcome of these matters will not be different. To the extent that
the final tax outcome of these matters is different than the amounts recorded, such differences will affect the provision for
income taxes and the effective tax rate in the period in which such determination is made.
The provision for income taxes includes the effect of reserve provisions and changes to reserves as well as the related
net interest and penalties. In addition, we are subject to the continuous examination of our income tax returns by the
Internal Revenue Service (IRS) and other tax authorities which may assert assessments against us. We regularly assess
the likelihood of adverse outcomes resulting from these examinations and assessments to determine the adequacy of our
provision for income taxes.
Loss Contingencies
We are subject to claims, lawsuits, regulatory and government inquiries and investigations, other proceedings, and
consent orders involving competition, intellectual property, data privacy and security, tax and related compliance, labor
and employment, commercial disputes, content generated by our users, goods and services offered by advertisers or
publishers using our platforms, personal injury, consumer protection, and other matters. Certain of these matters include
speculative claims for substantial or indeterminate amounts of damages. We record a liability when we believe that it
is probable that a loss has been incurred and the amount can be reasonably estimated. If we determine that a loss is
reasonably possible and the loss or range of loss can be estimated, we disclose the possible loss in Note 10 of the Notes to
Consolidated Financial Statements included in Item 8 of this Annual Report on Form 10-K.
We evaluate, on a regular basis, developments in our legal matters that could affect the amount of liability that has been
previously accrued, and the matters and related reasonably possible losses disclosed, and make adjustments as necessary.
Significant judgment is required to determine both the likelihood and the estimated amount of a loss related to such
matters. Until the final resolution of such matters, there may be an exposure to loss in excess of the amount recorded, and
such amounts could be material.
Item 7A. Quantitative and Qualitative Disclosures About
Market Risk
We are exposed to financial market risks, including changes in foreign currency exchange rates, interest rates, and equity
investment risks.
Foreign Currency Exchange Risk
We transact business globally in multiple currencies. International revenues, foreign-denominated monetary assets
and liabilities, and investments in foreign subsidiaries expose us to the risk of fluctuations in foreign exchange rates
against the US dollar. Principal currency exposures include the Australian dollar, British pound, Canadian dollar, Euro, and
Japanese yen.
40
Alphabet
2025 Annual Report
Part I
Part II
Part III
Part IV
We monitor our foreign currency exposures and hedge foreign exchange risks with derivative and non-derivative
instruments, including forwards, options (including collars), cross-currency swaps, and foreign currency-denominated
debt. Gains or losses on these foreign currency exposures are generally offset by corresponding gains or losses on the
derivative and non-derivative instruments.
Considering historical trends in foreign exchange rates, we determined that it was reasonably possible that adverse
changes in exchange rates of 10% could be experienced. We performed a sensitivity analysis on our foreign currency
exposures to estimate the potential impact of this adverse 10% change. The estimated effects on our financial position
would be as follows (in millions):
Impact
As of December 31,
2024
2025
Foreign currency risk
Foreign denominated monetary assets and liabilities
(1)
OI&E
$
135
$
671
Cash flow hedges of foreign currency revenue
(2)
AOCI
$
1,627
$
2,096
Net investment hedges of investments in foreign subsidiaries
(3)
AOCI
$
660
$
2,942
(1)
After consideration of the effect of derivative contracts.
(2)
The change in accumulated other comprehensive income (AOCI) would be expected to offset a corresponding foreign currency change
in forecasted hedged revenues when recognized.
(3)
The change in AOCI would be expected to offset a corresponding foreign currency translation gain or loss from our investments in
foreign subsidiaries.
Interest Rate Risk
We are exposed to interest rate risk related to our investment portfolio and outstanding debt.
Our Corporate Treasury investment strategy is to achieve a return that will allow us to preserve capital and maintain
liquidity. By policy, we limit the amount of credit exposure within our investment portfolio to any one issuer. Our investments
in both fixed rate and floating rate interest earning securities carry a degree of interest rate risk. Fixed rate securities may
have their fair market value adversely affected due to a rise in interest rates, while floating rate securities may produce
less income than predicted if interest rates fall. Unrealized gains and losses on our marketable debt securities are primarily
due to interest rate fluctuations as compared to interest rates at the time of purchase. For certain fixed and floating rate
debt securities, we have elected the fair value option for which changes in fair value are recorded in OI&E. We measure
securities for which we have not elected the fair value option at fair value with gains and losses recorded in AOCI until the
securities are sold, less any expected credit losses.
We use value-at-risk (VaR) analysis to determine the potential effect of fluctuations in interest rates on the value of our
investment portfolio. The VaR is the expected loss in fair value, for a given confidence interval, for our investment portfolio
due to adverse movements in interest rates. We use a variance/covariance VaR model with 95% confidence interval.
The estimated one-day loss in fair value of our investment portfolio as of December 31, 2024 and 2025 are shown below
(in millions):
As of December 31,
12-Month Average
As of December 31,
2024
2025
2024
2025
Risk category - interest rate
$
208
$
162
$
230
$
184
Actual future gains and losses associated with our investment portfolio may differ materially from the sensitivity analyses
performed as of December 31, 2024 and 2025 due to the inherent limitations associated with predicting the timing and
amount of changes in interest rates and our actual exposures and positions. VaR analysis is not intended to represent
actual losses but is used as a risk estimation.
Additionally, we had senior unsecured notes outstanding with a total carrying value of $11.9 billion and $48.5 billion as
of December 31, 2024 and 2025, respectively. As our senior unsecured notes primarily bear interest at fixed rates and
are recorded at amortized cost, interest rate fluctuations generally do not affect our consolidated financial statements.
However, the fair value of the notes will fluctuate with movement in market interest rates.
41
Alphabet
2025 Annual Report
Part I
Part II
Part III
Part IV
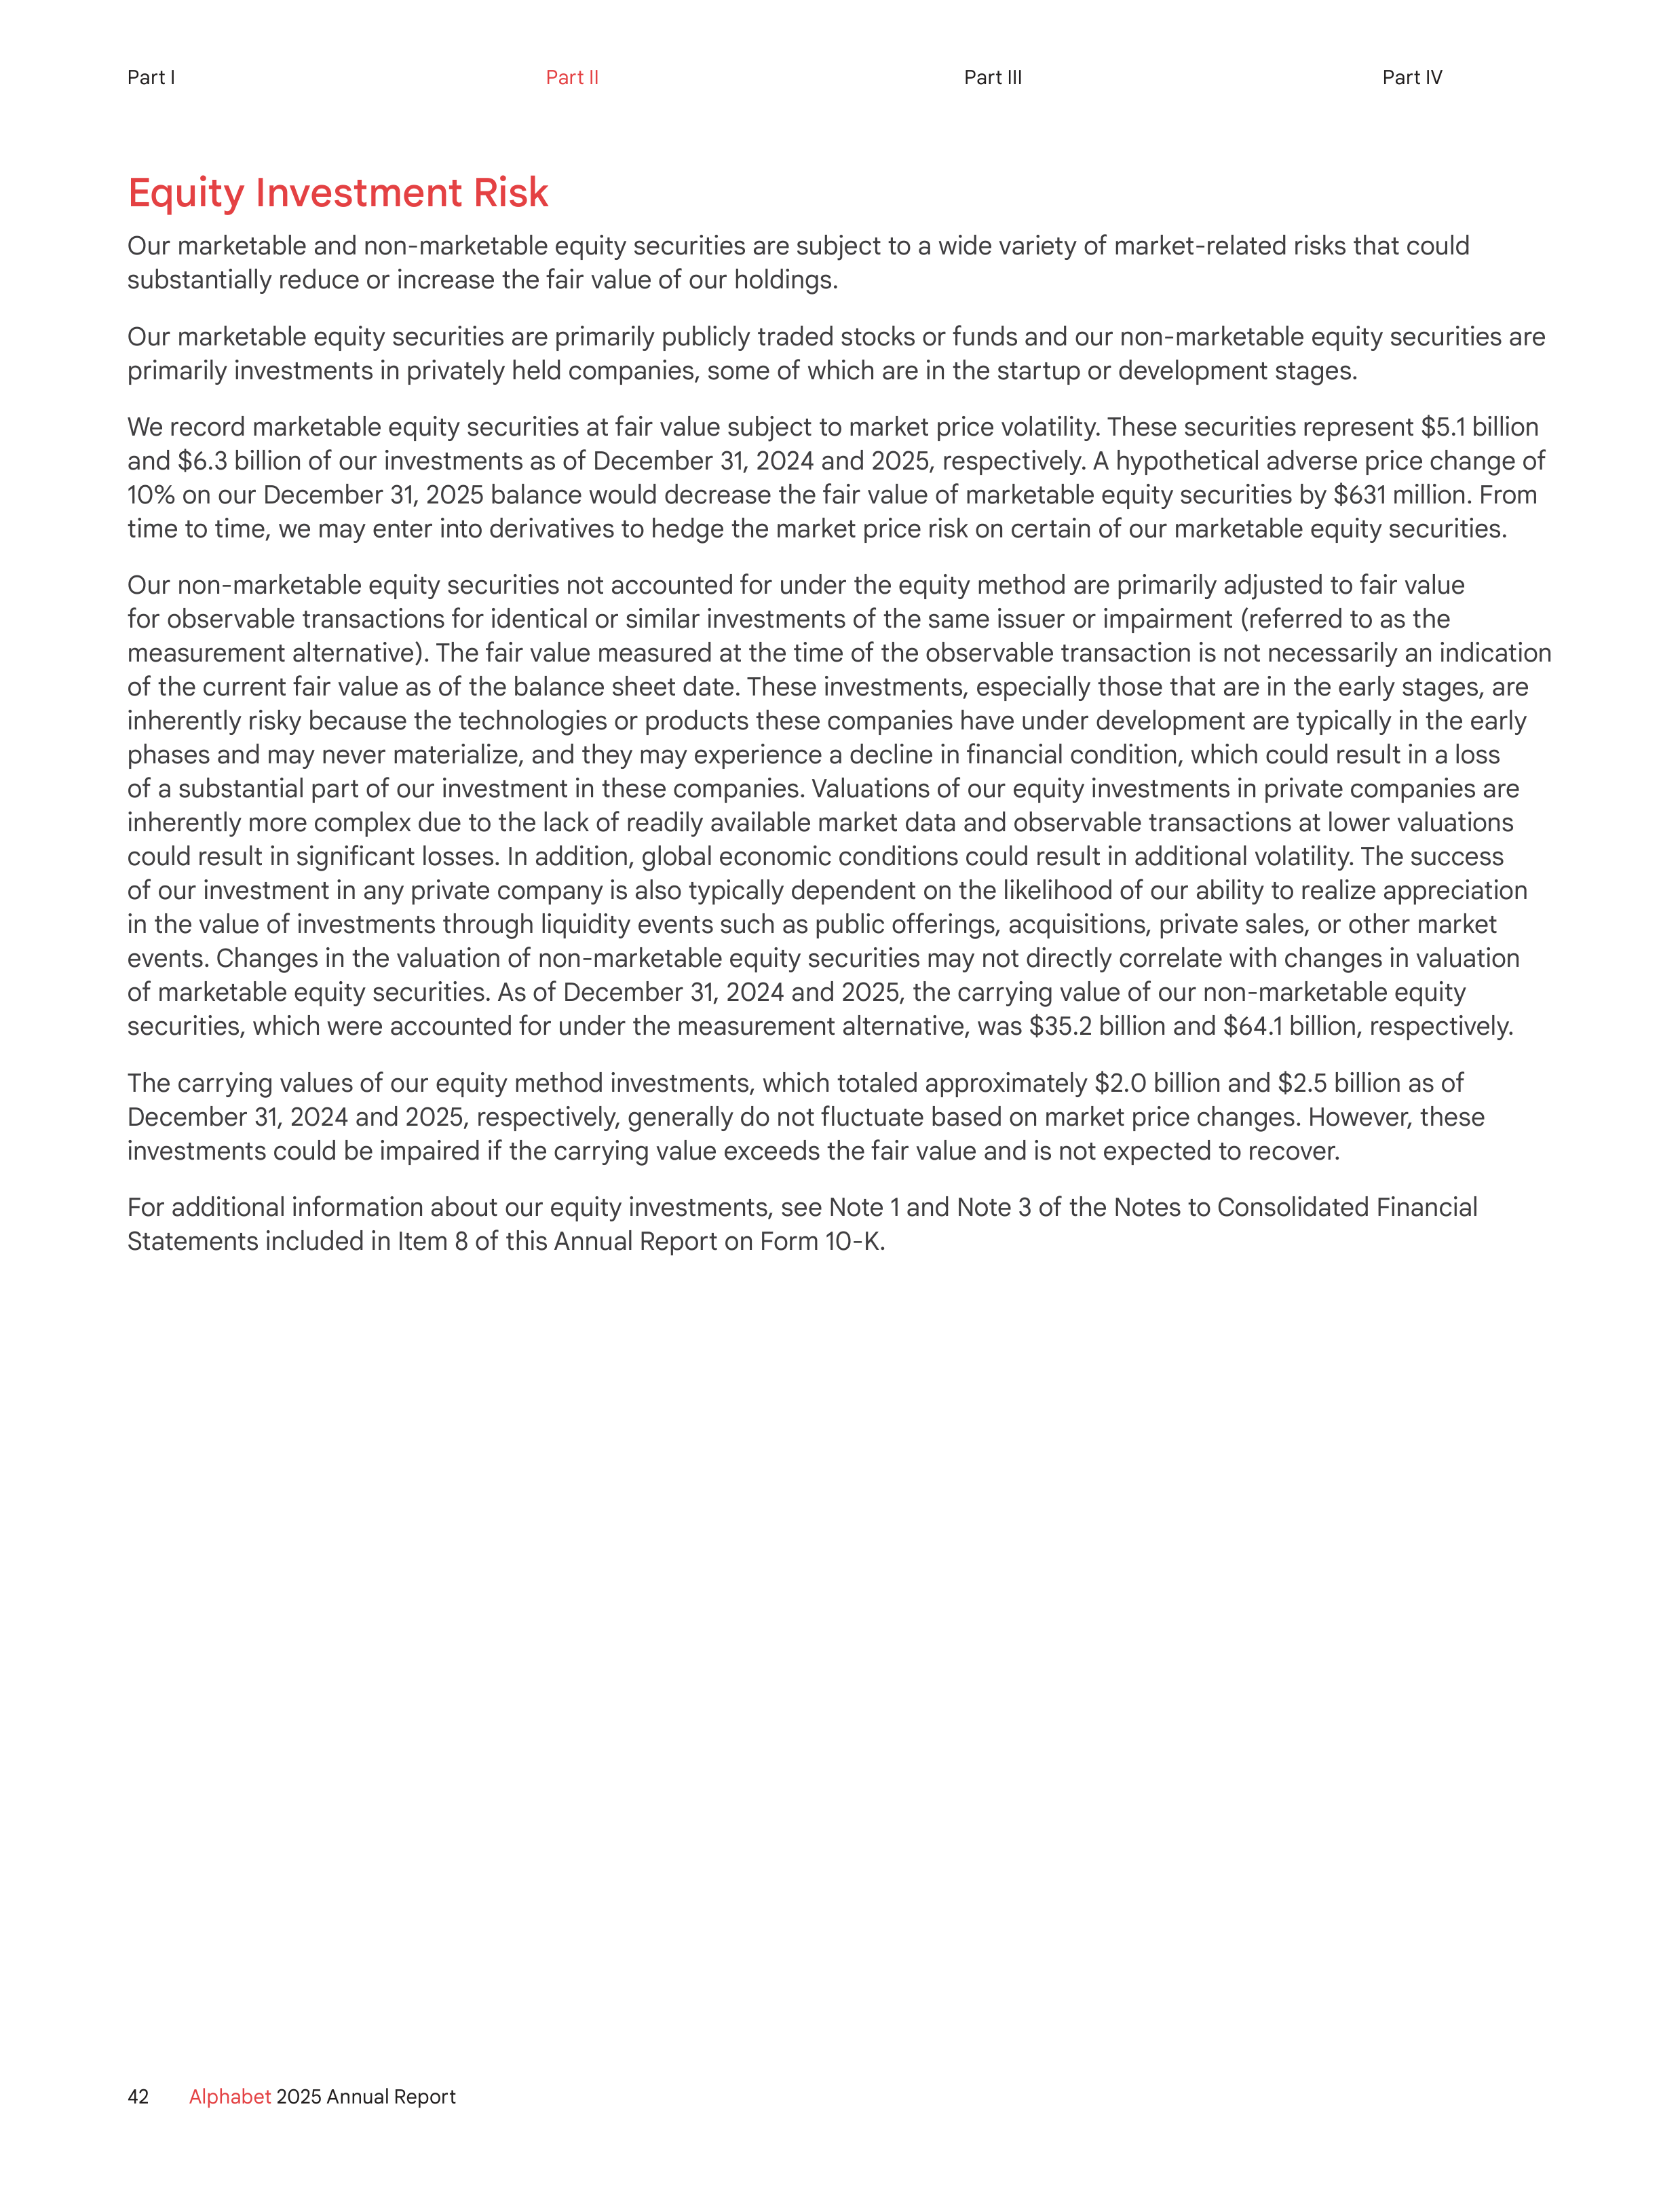
Equity Investment Risk
Our marketable and non-marketable equity securities are subject to a wide variety of market-related risks that could
substantially reduce or increase the fair value of our holdings.
Our marketable equity securities are primarily publicly traded stocks or funds and our non-marketable equity securities are
primarily investments in privately held companies, some of which are in the startup or development stages.
We record marketable equity securities at fair value subject to market price volatility. These securities represent $5.1 billion
and $6.3 billion of our investments as of December 31, 2024 and 2025, respectively. A hypothetical adverse price change of
10% on our December 31, 2025 balance would decrease the fair value of marketable equity securities by $631 million. From
time to time, we may enter into derivatives to hedge the market price risk on certain of our marketable equity securities.
Our non-marketable equity securities not accounted for under the equity method are primarily adjusted to fair value
for observable transactions for identical or similar investments of the same issuer or impairment (referred to as the
measurement alternative). The fair value measured at the time of the observable transaction is not necessarily an indication
of the current fair value as of the balance sheet date. These investments, especially those that are in the early stages, are
inherently risky because the technologies or products these companies have under development are typically in the early
phases and may never materialize, and they may experience a decline in financial condition, which could result in a loss
of a substantial part of our investment in these companies. Valuations of our equity investments in private companies are
inherently more complex due to the lack of readily available market data and observable transactions at lower valuations
could result in significant losses. In addition, global economic conditions could result in additional volatility. The success
of our investment in any private company is also typically dependent on the likelihood of our ability to realize appreciation
in the value of investments through liquidity events such as public offerings, acquisitions, private sales, or other market
events. Changes in the valuation of non-marketable equity securities may not directly correlate with changes in valuation
of marketable equity securities. As of December 31, 2024 and 2025, the carrying value of our non-marketable equity
securities, which were accounted for under the measurement alternative, was $35.2 billion and $64.1 billion, respectively.
The carrying values of our equity method investments, which totaled approximately $2.0 billion and $2.5 billion as of
December 31, 2024 and 2025, respectively, generally do not fluctuate based on market price changes. However, these
investments could be impaired if the carrying value exceeds the fair value and is not expected to recover.
For additional information about our equity investments, see Note 1 and Note 3 of the Notes to Consolidated Financial
Statements included in Item 8 of this Annual Report on Form 10-K.
42
Alphabet
2025 Annual Report
Part I
Part II
Part III
Part IV
Item 8. Financial Statements and Supplementary Data
Alphabet Inc.
Index to Consolidated Financial Statements
Reports of Independent Registered Public Accounting Firm (PCAOB ID: 42)
44
Financial Statements:
Consolidated Balance Sheets
47
Consolidated Statements of Income
48
Consolidated Statements of Comprehensive Income
49
Consolidated Statements of Stockholders’ Equity
50
Consolidated Statements of Cash Flows
51
Notes to Consolidated Financial Statements
52
43
Alphabet
2025 Annual Report
Part I
Part II
Part III
Part IV
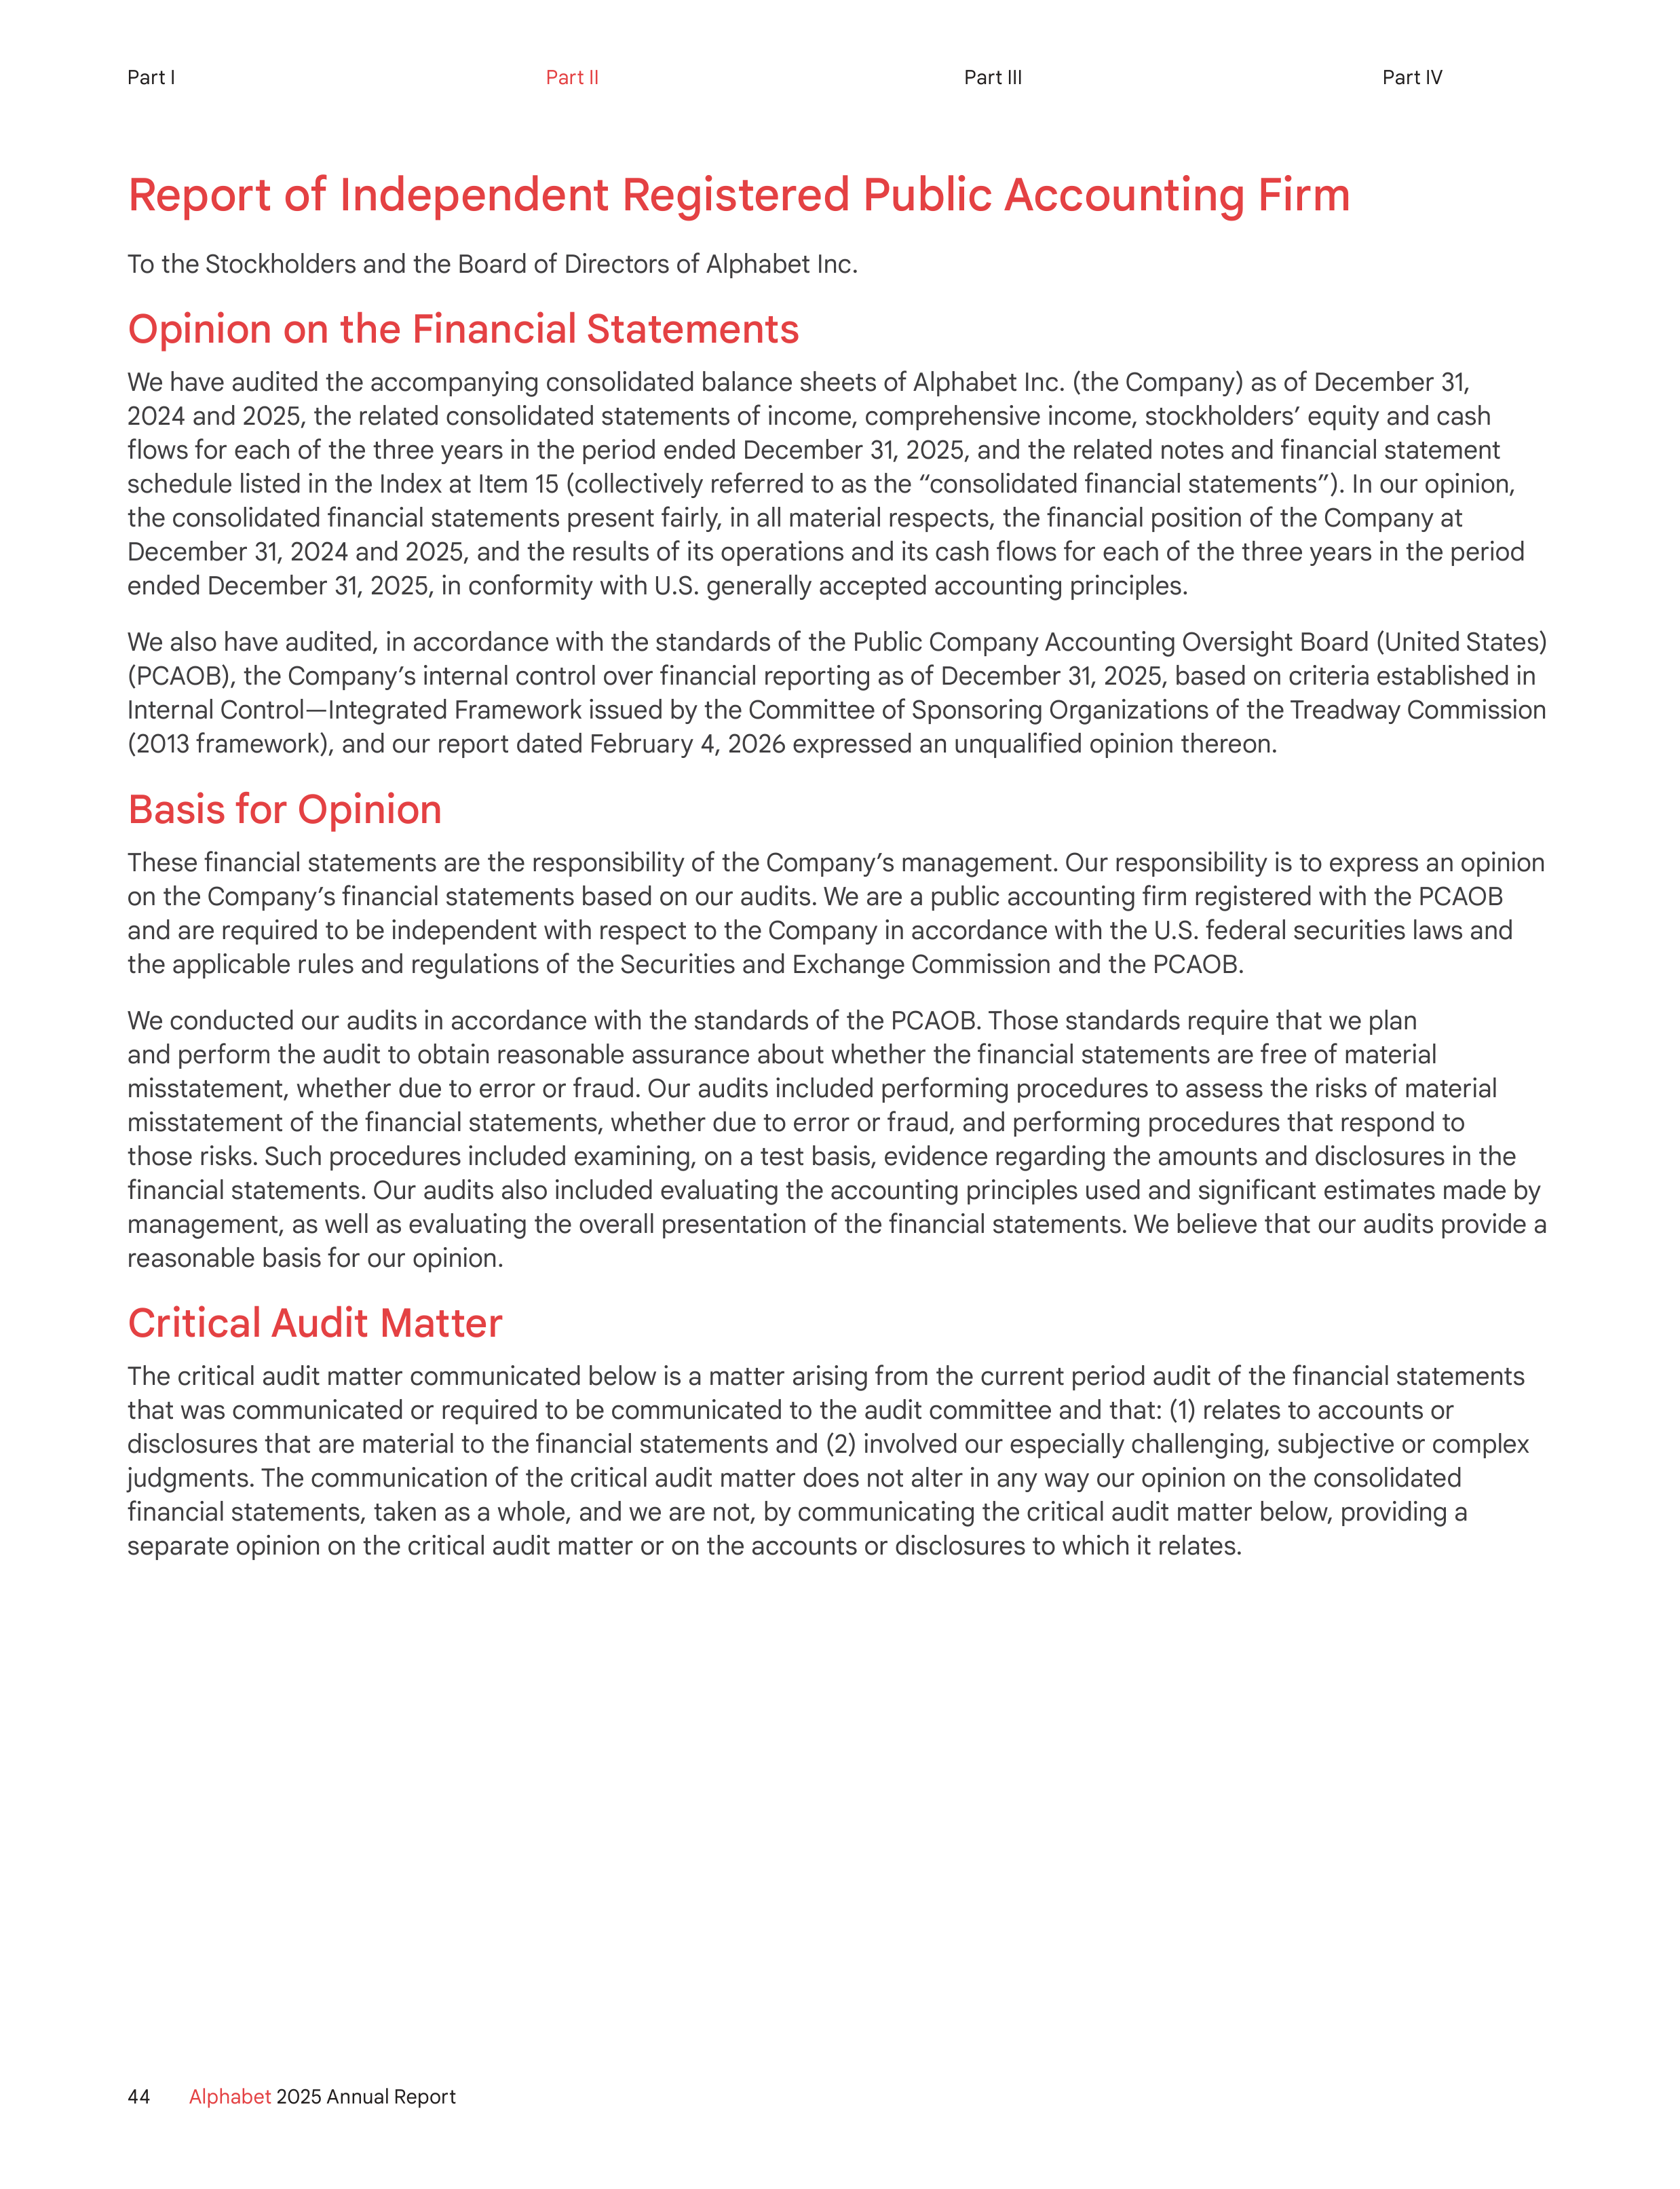
Report of Independent Registered Public Accounting Firm
To the Stockholders and the Board of Directors of Alphabet Inc.
Opinion on the Financial Statements
We have audited the accompanying consolidated balance sheets of Alphabet Inc. (the Company) as of December 31,
2024 and 2025, the related consolidated statements of income, comprehensive income, stockholders’ equity and cash
flows for each of the three years in the period ended December 31, 2025, and the related notes and financial statement
schedule listed in the Index at Item 15 (collectively referred to as the “consolidated financial statements”). In our opinion,
the consolidated financial statements present fairly, in all material respects, the financial position of the Company at
December 31, 2024 and 2025, and the results of its operations and its cash flows for each of the three years in the period
ended December 31, 2025, in conformity with U.S. generally accepted accounting principles.
We also have audited, in accordance with the standards of the Public Company Accounting Oversight Board (United States)
(PCAOB), the Company’s internal control over financial reporting as of December 31, 2025, based on criteria established in
Internal Control—Integrated Framework issued by the Committee of Sponsoring Organizations of the Treadway Commission
(2013 framework), and our report dated February 4, 2026 expressed an unqualified opinion thereon.
Basis for Opinion
These financial statements are the responsibility of the Company’s management. Our responsibility is to express an opinion
on the Company’s financial statements based on our audits. We are a public accounting firm registered with the PCAOB
and are required to be independent with respect to the Company in accordance with the U.S. federal securities laws and
the applicable rules and regulations of the Securities and Exchange Commission and the PCAOB.
We conducted our audits in accordance with the standards of the PCAOB. Those standards require that we plan
and perform the audit to obtain reasonable assurance about whether the financial statements are free of material
misstatement, whether due to error or fraud. Our audits included performing procedures to assess the risks of material
misstatement of the financial statements, whether due to error or fraud, and performing procedures that respond to
those risks. Such procedures included examining, on a test basis, evidence regarding the amounts and disclosures in the
financial statements. Our audits also included evaluating the accounting principles used and significant estimates made by
management, as well as evaluating the overall presentation of the financial statements. We believe that our audits provide a
reasonable basis for our opinion.
Critical Audit Matter
The critical audit matter communicated below is a matter arising from the current period audit of the financial statements
that was communicated or required to be communicated to the audit committee and that: (1) relates to accounts or
disclosures that are material to the financial statements and (2) involved our especially challenging, subjective or complex
judgments. The communication of the critical audit matter does not alter in any way our opinion on the consolidated
financial statements, taken as a whole, and we are not, by communicating the critical audit matter below, providing a
separate opinion on the critical audit matter or on the accounts or disclosures to which it relates.
44
Alphabet
2025 Annual Report
Part I
Part II
Part III
Part IV
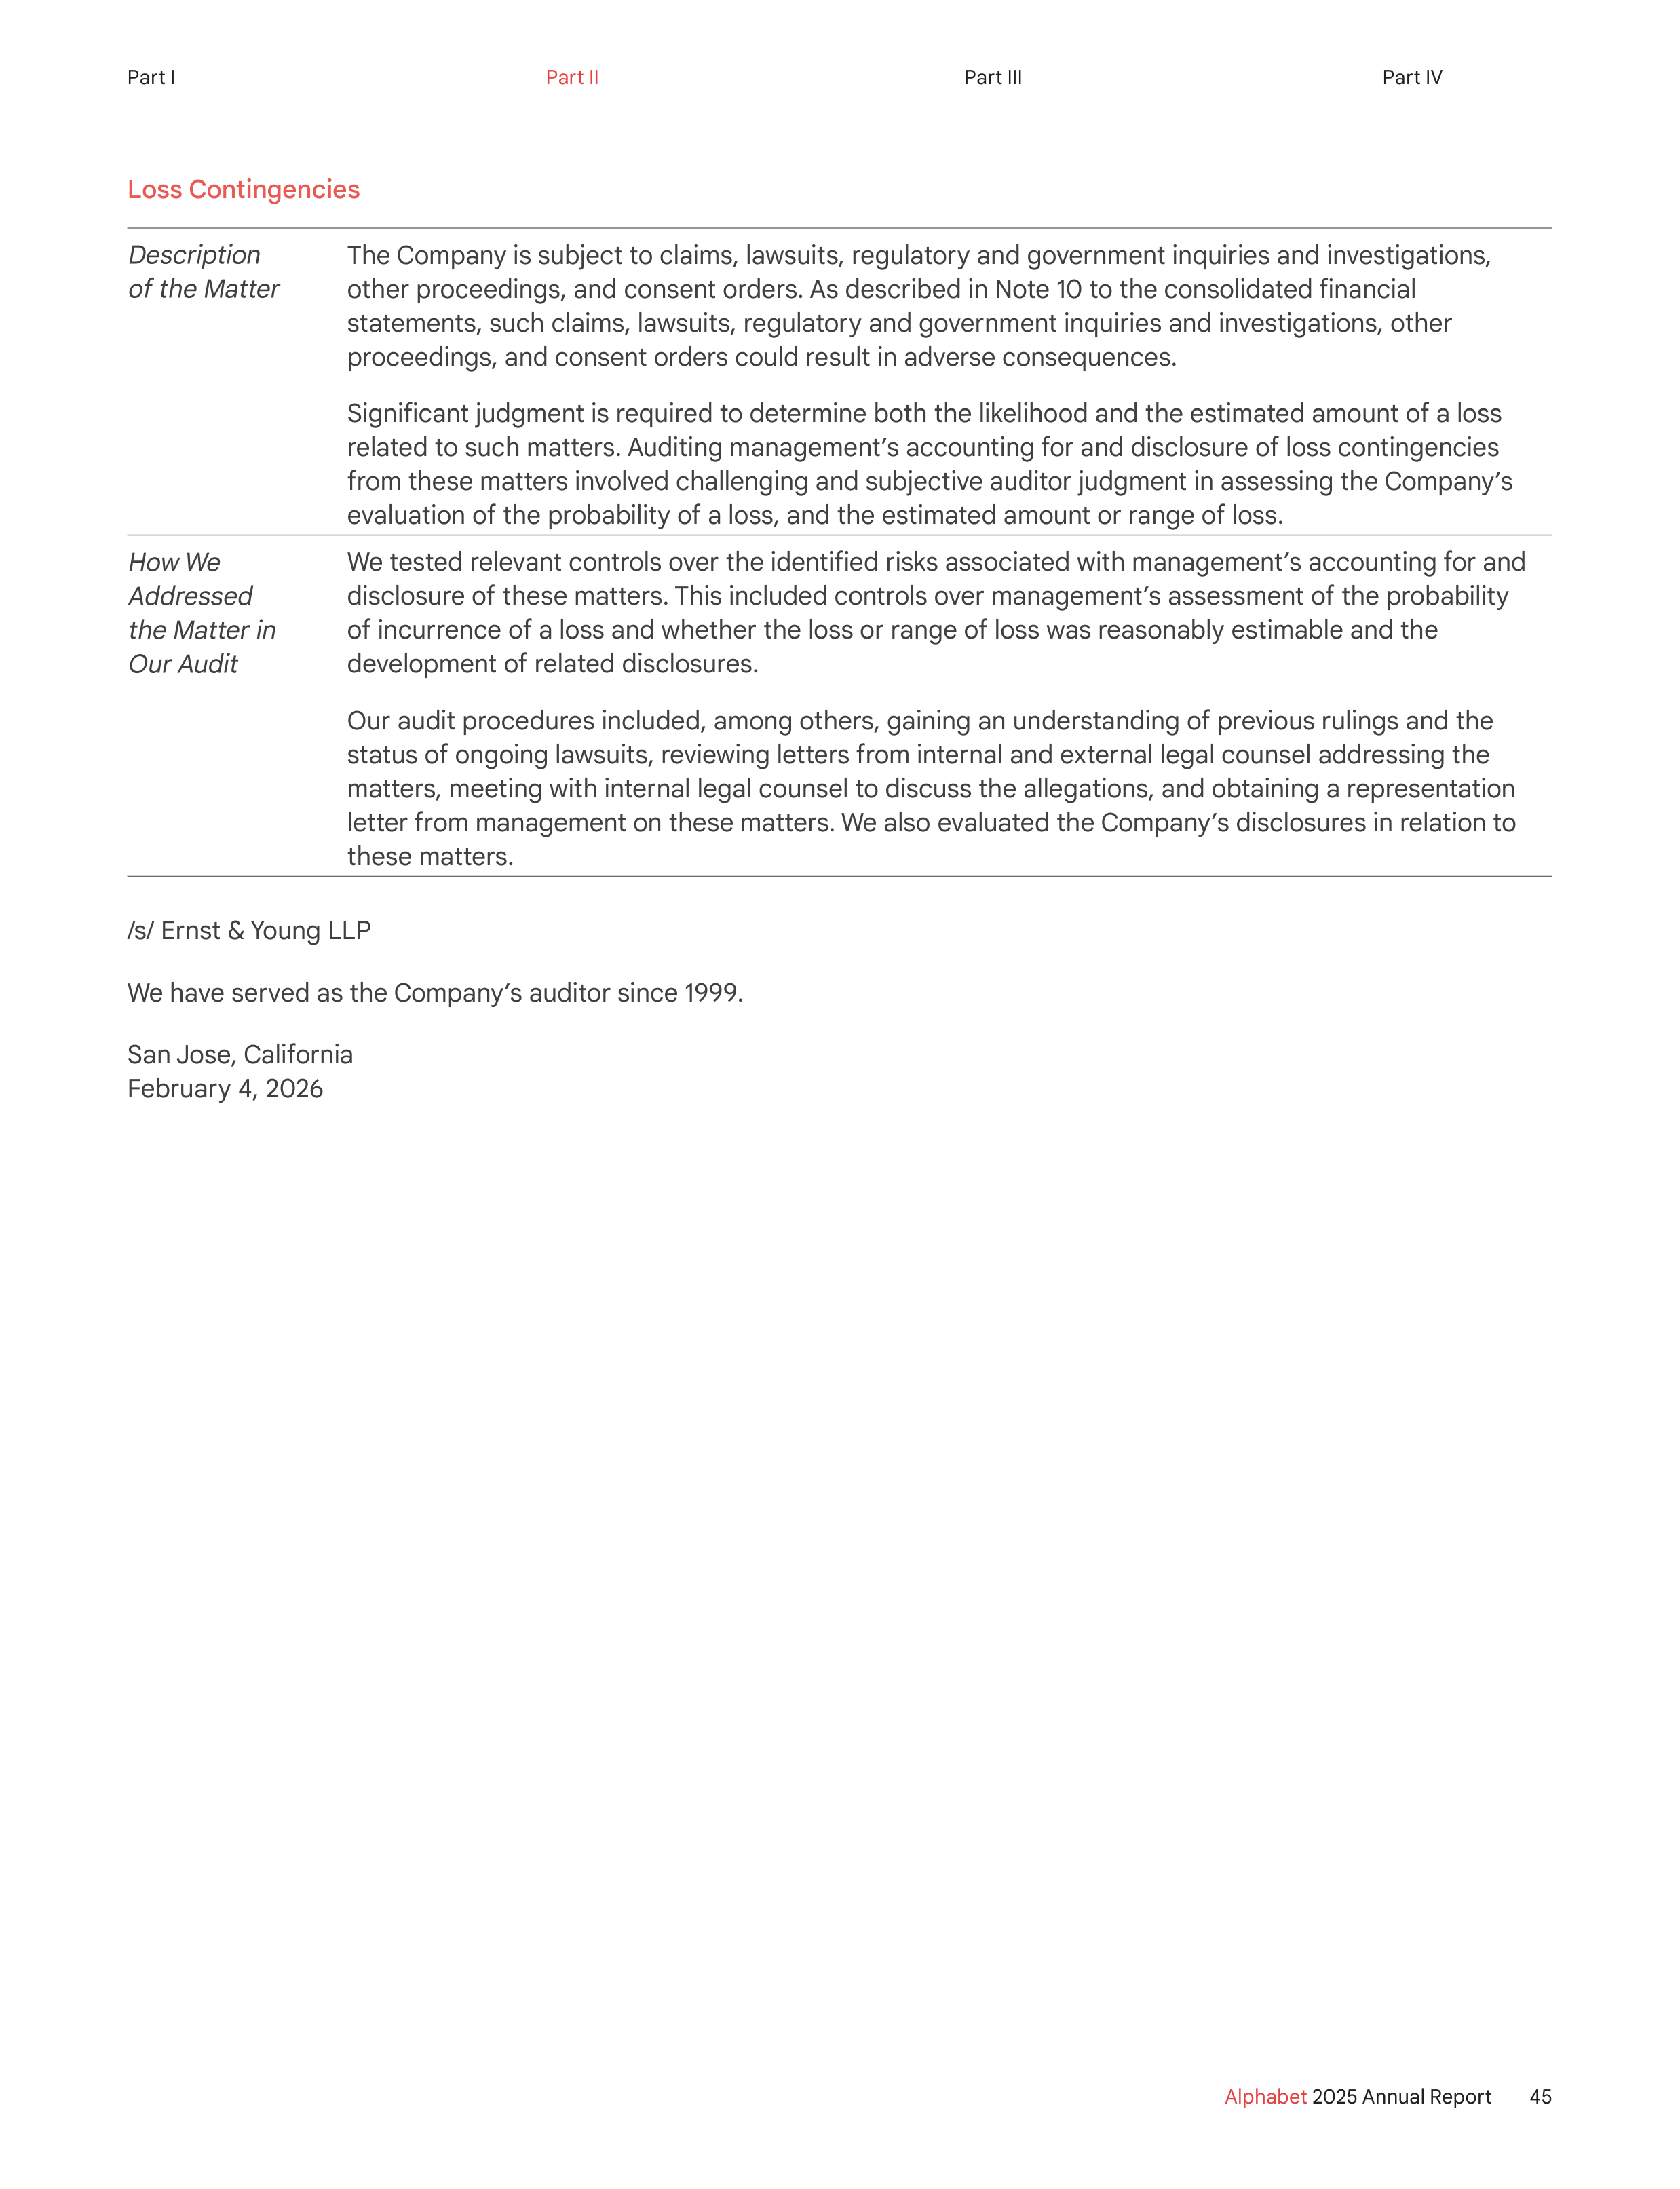
Loss Contingencies
Description
of the Matter
The Company is subject to claims, lawsuits, regulatory and government inquiries and investigations,
other proceedings, and consent orders. As described in Note 10 to the consolidated financial
statements, such claims, lawsuits, regulatory and government inquiries and investigations, other
proceedings, and consent orders could result in adverse consequences.
Significant judgment is required to determine both the likelihood and the estimated amount of a loss
related to such matters. Auditing management’s accounting for and disclosure of loss contingencies
from these matters involved challenging and subjective auditor judgment in assessing the Company’s
evaluation of the probability of a loss, and the estimated amount or range of loss.
How We
Addressed
the Matter in
Our Audit
We tested relevant controls over the identified risks associated with management’s accounting for and
disclosure of these matters. This included controls over management’s assessment of the probability
of incurrence of a loss and whether the loss or range of loss was reasonably estimable and the
development of related disclosures.
Our audit procedures included, among others, gaining an understanding of previous rulings and the
status of ongoing lawsuits, reviewing letters from internal and external legal counsel addressing the
matters, meeting with internal legal counsel to discuss the allegations, and obtaining a representation
letter from management on these matters. We also evaluated the Company’s disclosures in relation to
these matters.
/s/ Ernst & Young LLP
We have served as the Company’s auditor since 1999.
San Jose, California
February 4, 2026
45
Alphabet
2025 Annual Report
Part I
Part II
Part III
Part IV
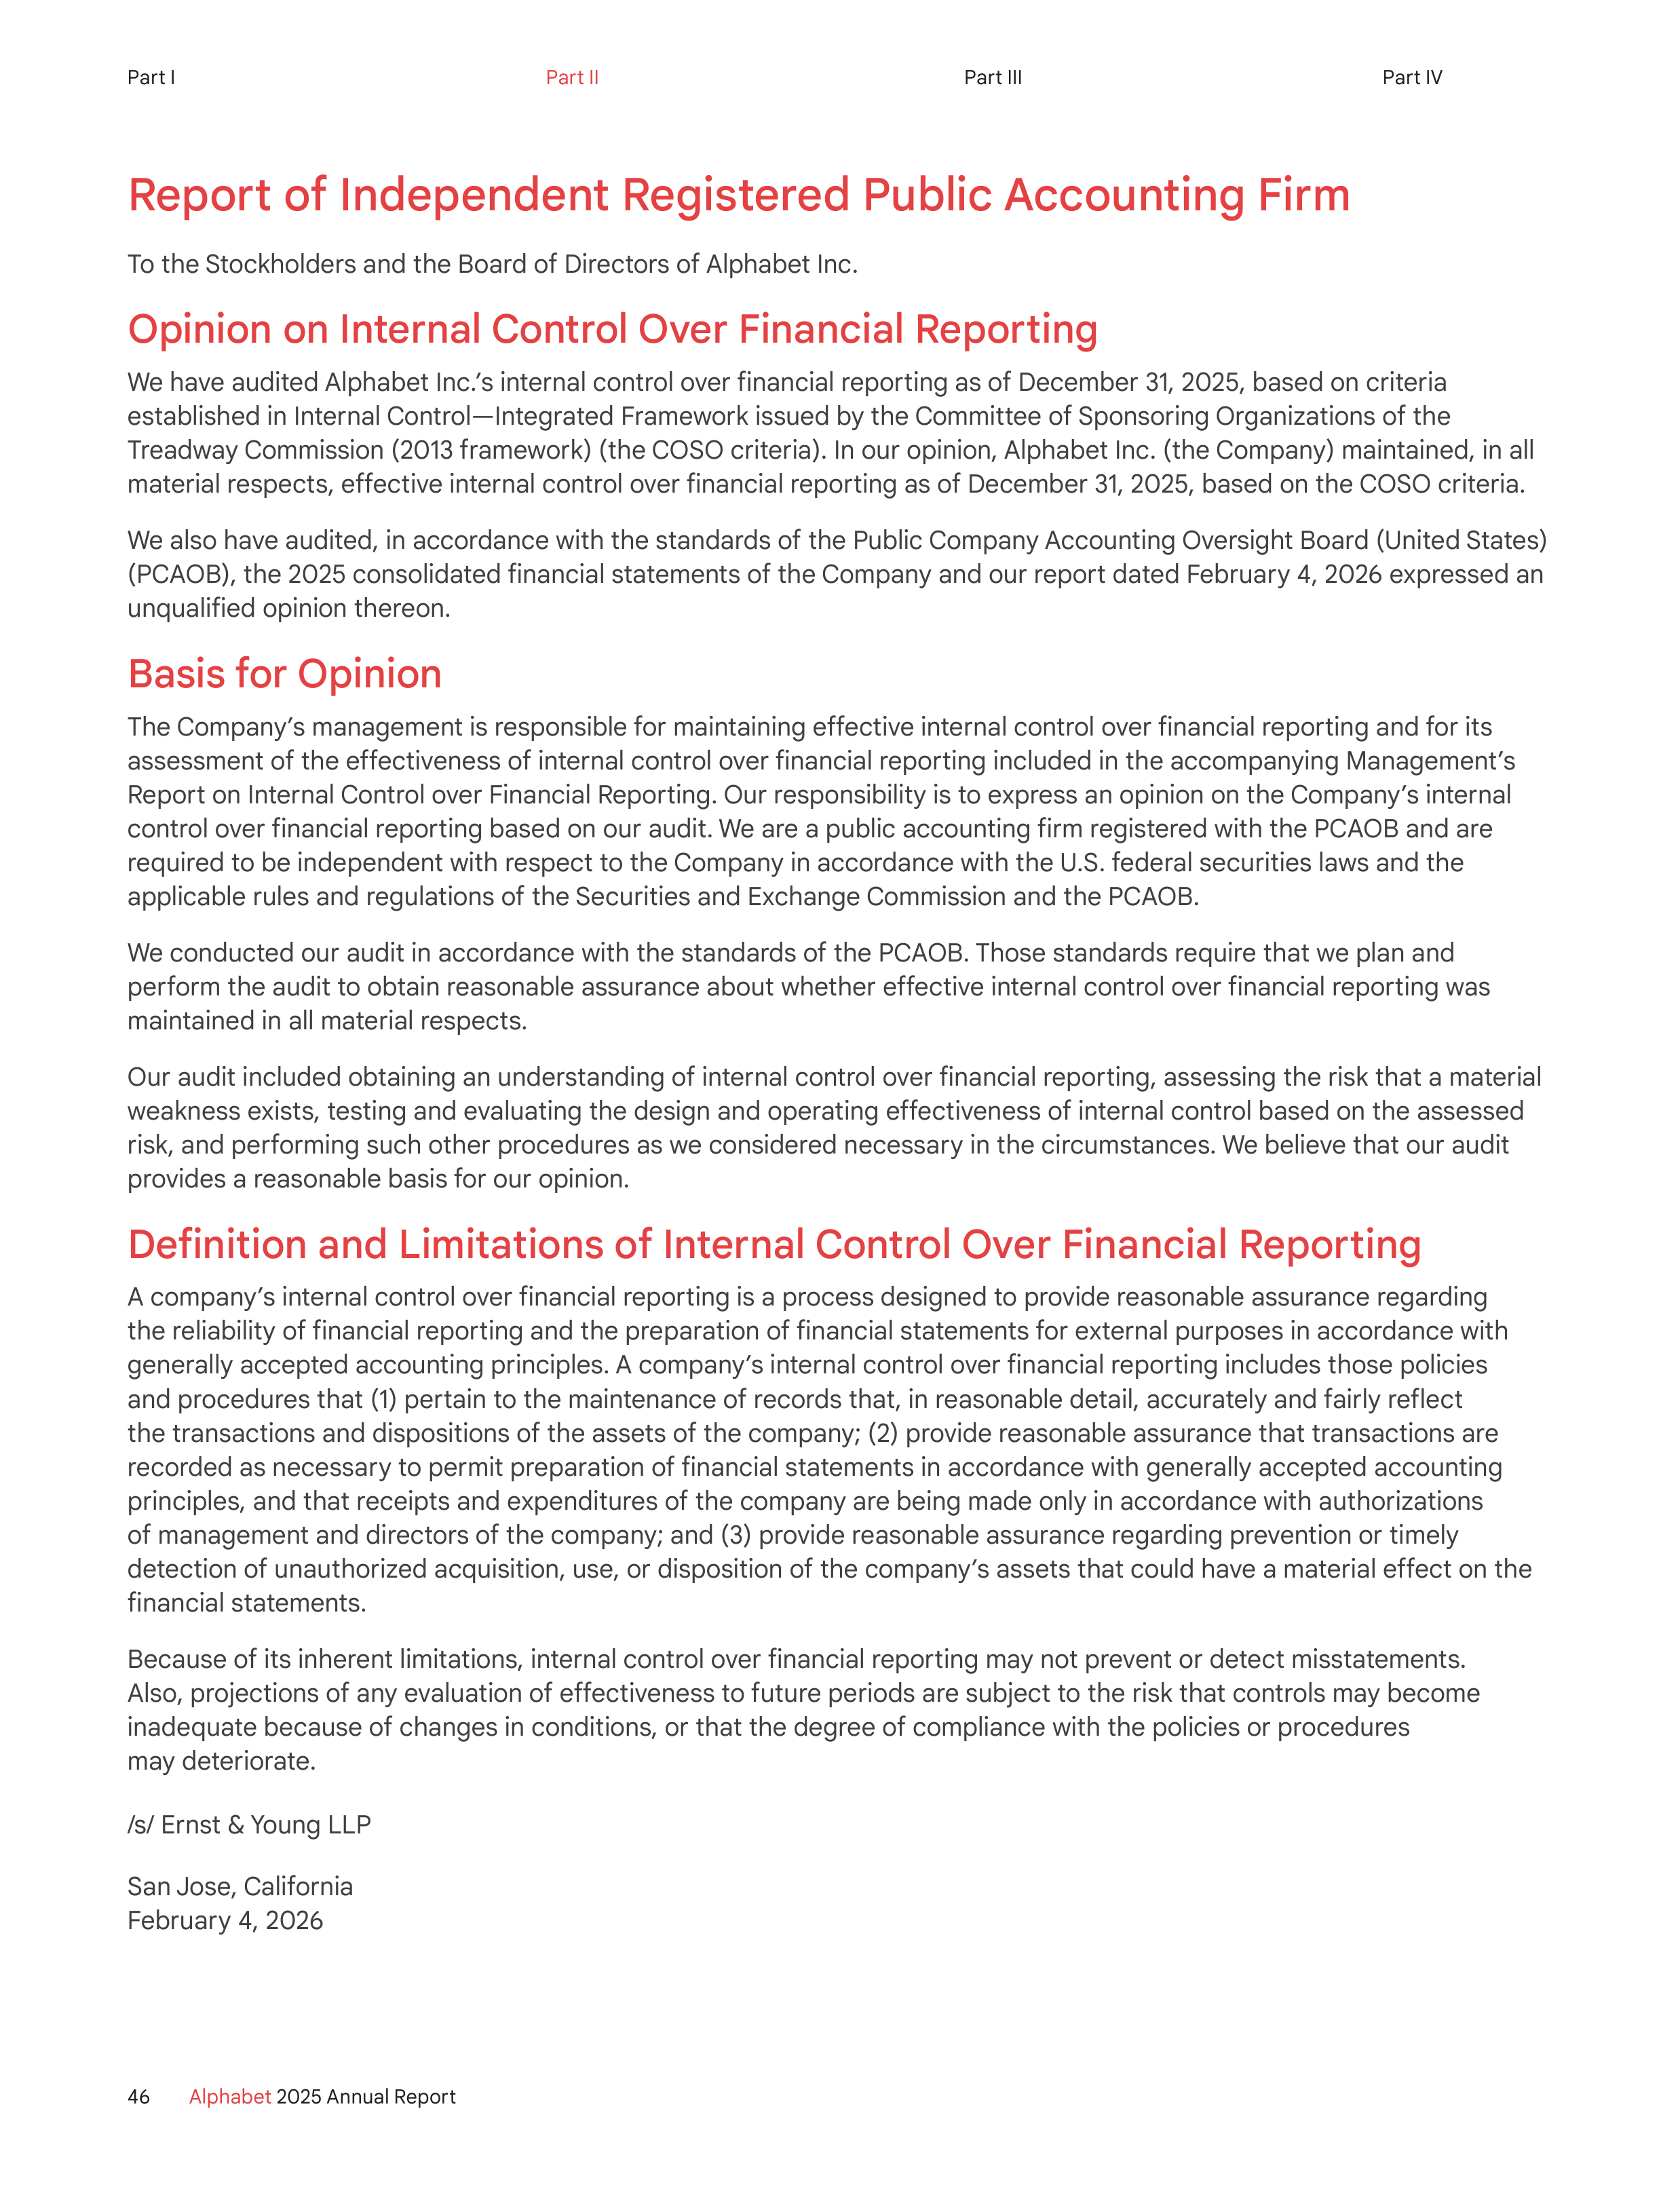
Report of Independent Registered Public Accounting Firm
To the Stockholders and the Board of Directors of Alphabet Inc.
Opinion on Internal Control Over Financial Reporting
We have audited Alphabet Inc.’s internal control over financial reporting as of December 31, 2025, based on criteria
established in Internal Control—Integrated Framework issued by the Committee of Sponsoring Organizations of the
Treadway Commission (2013 framework) (the COSO criteria). In our opinion, Alphabet Inc. (the Company) maintained, in all
material respects, effective internal control over financial reporting as of December 31, 2025, based on the COSO criteria.
We also have audited, in accordance with the standards of the Public Company Accounting Oversight Board (United States)
(PCAOB), the 2025 consolidated financial statements of the Company and our report dated February 4, 2026 expressed an
unqualified opinion thereon.
Basis for Opinion
The Company’s management is responsible for maintaining effective internal control over financial reporting and for its
assessment of the effectiveness of internal control over financial reporting included in the accompanying Management’s
Report on Internal Control over Financial Reporting. Our responsibility is to express an opinion on the Company’s internal
control over financial reporting based on our audit. We are a public accounting firm registered with the PCAOB and are
required to be independent with respect to the Company in accordance with the U.S. federal securities laws and the
applicable rules and regulations of the Securities and Exchange Commission and the PCAOB.
We conducted our audit in accordance with the standards of the PCAOB. Those standards require that we plan and
perform the audit to obtain reasonable assurance about whether effective internal control over financial reporting was
maintained in all material respects.
Our audit included obtaining an understanding of internal control over financial reporting, assessing the risk that a material
weakness exists, testing and evaluating the design and operating effectiveness of internal control based on the assessed
risk, and performing such other procedures as we considered necessary in the circumstances. We believe that our audit
provides a reasonable basis for our opinion.
Definition and Limitations of Internal Control Over Financial Reporting
A company’s internal control over financial reporting is a process designed to provide reasonable assurance regarding
the reliability of financial reporting and the preparation of financial statements for external purposes in accordance with
generally accepted accounting principles. A company’s internal control over financial reporting includes those policies
and procedures that (1) pertain to the maintenance of records that, in reasonable detail, accurately and fairly reflect
the transactions and dispositions of the assets of the company; (2) provide reasonable assurance that transactions are
recorded as necessary to permit preparation of financial statements in accordance with generally accepted accounting
principles, and that receipts and expenditures of the company are being made only in accordance with authorizations
of management and directors of the company; and (3) provide reasonable assurance regarding prevention or timely
detection of unauthorized acquisition, use, or disposition of the company’s assets that could have a material effect on the
financial statements.
Because of its inherent limitations, internal control over financial reporting may not prevent or detect misstatements.
Also, projections of any evaluation of effectiveness to future periods are subject to the risk that controls may become
inadequate because of changes in conditions, or that the degree of compliance with the policies or procedures
may deteriorate.
/s/ Ernst & Young LLP
San Jose, California
February 4, 2026
46
Alphabet
2025 Annual Report
Part I
Part II
Part III
Part IV
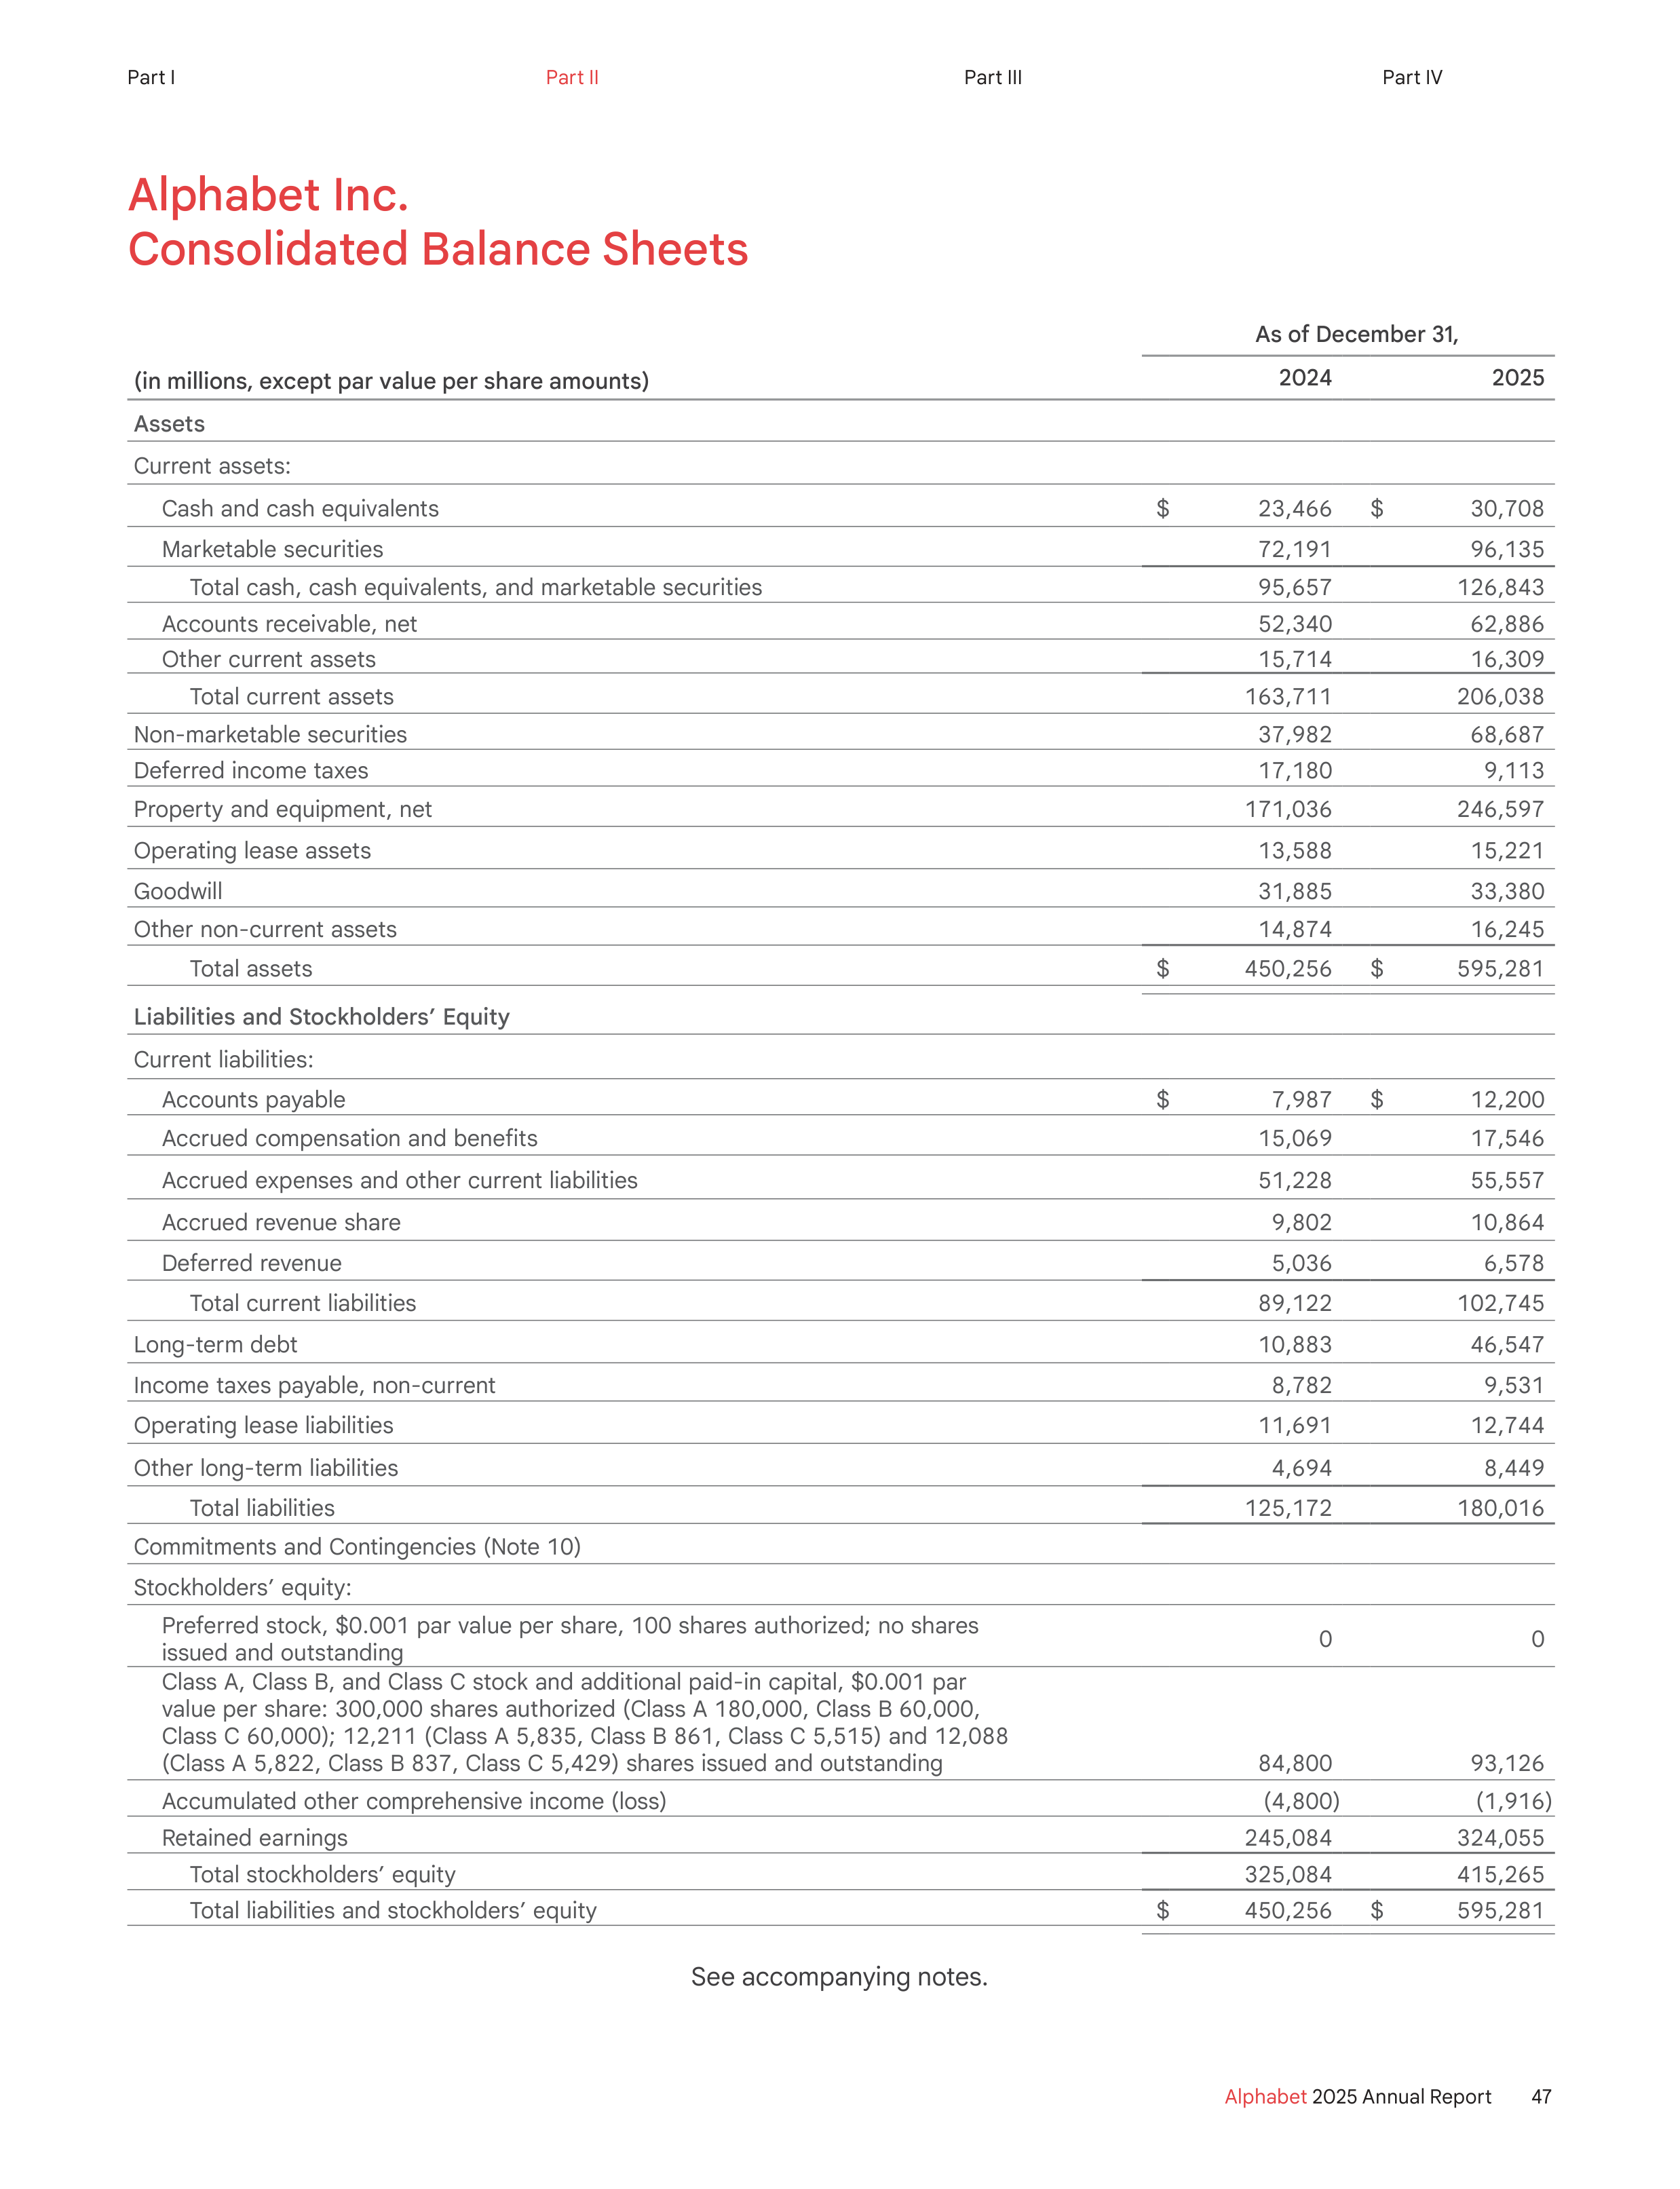
Alphabet Inc.
Consolidated Balance Sheets
As of December 31,
(in millions, except par value per share amounts)
2024
2025
Assets
Current assets:
Cash and cash equivalents
$
23,466
$
30,708
Marketable securities
72,191
96,135
Total cash, cash equivalents, and marketable securities
95,657
126,843
Accounts receivable, net
52,340
62,886
Other current assets
15,714
16,309
Total current assets
163,711
206,038
Non-marketable securities
37,982
68,687
Deferred income taxes
17,180
9,113
Property and equipment, net
171,036
246,597
Operating lease assets
13,588
15,221
Goodwill
31,885
33,380
Other non-current assets
14,874
16,245
Total assets
$
450,256
$
595,281
Liabilities and Stockholders’ Equity
Current liabilities:
Accounts payable
$
7,987
$
12,200
Accrued compensation and benefits
15,069
17,546
Accrued expenses and other current liabilities
51,228
55,557
Accrued revenue share
9,802
10,864
Deferred revenue
5,036
6,578
Total current liabilities
89,122
102,745
Long-term debt
10,883
46,547
Income taxes payable, non-current
8,782
9,531
Operating lease liabilities
11,691
12,744
Other long-term liabilities
4,694
8,449
Total liabilities
125,172
180,016
Commitments and Contingencies (Note 10)
Stockholders’ equity:
Preferred stock, $0.001 par value per share, 100 shares authorized; no shares
issued and outstanding
0
0
Class A, Class B, and Class C stock and additional paid-in capital, $0.001 par
value per share: 300,000 shares authorized (Class A 180,000, Class B 60,000,
Class C 60,000); 12,211 (Class A 5,835, Class B 861, Class C 5,515) and 12,088
(Class A 5,822, Class B 837, Class C 5,429) shares issued and outstanding
84,800
93,126
Accumulated other comprehensive income (loss)
(4,800)
(1,916)
Retained earnings
245,084
324,055
Total stockholders’ equity
325,084
415,265
Total liabilities and stockholders’ equity
$
450,256
$
595,281
See accompanying notes.
47
Alphabet
2025 Annual Report
Part I
Part II
Part III
Part IV
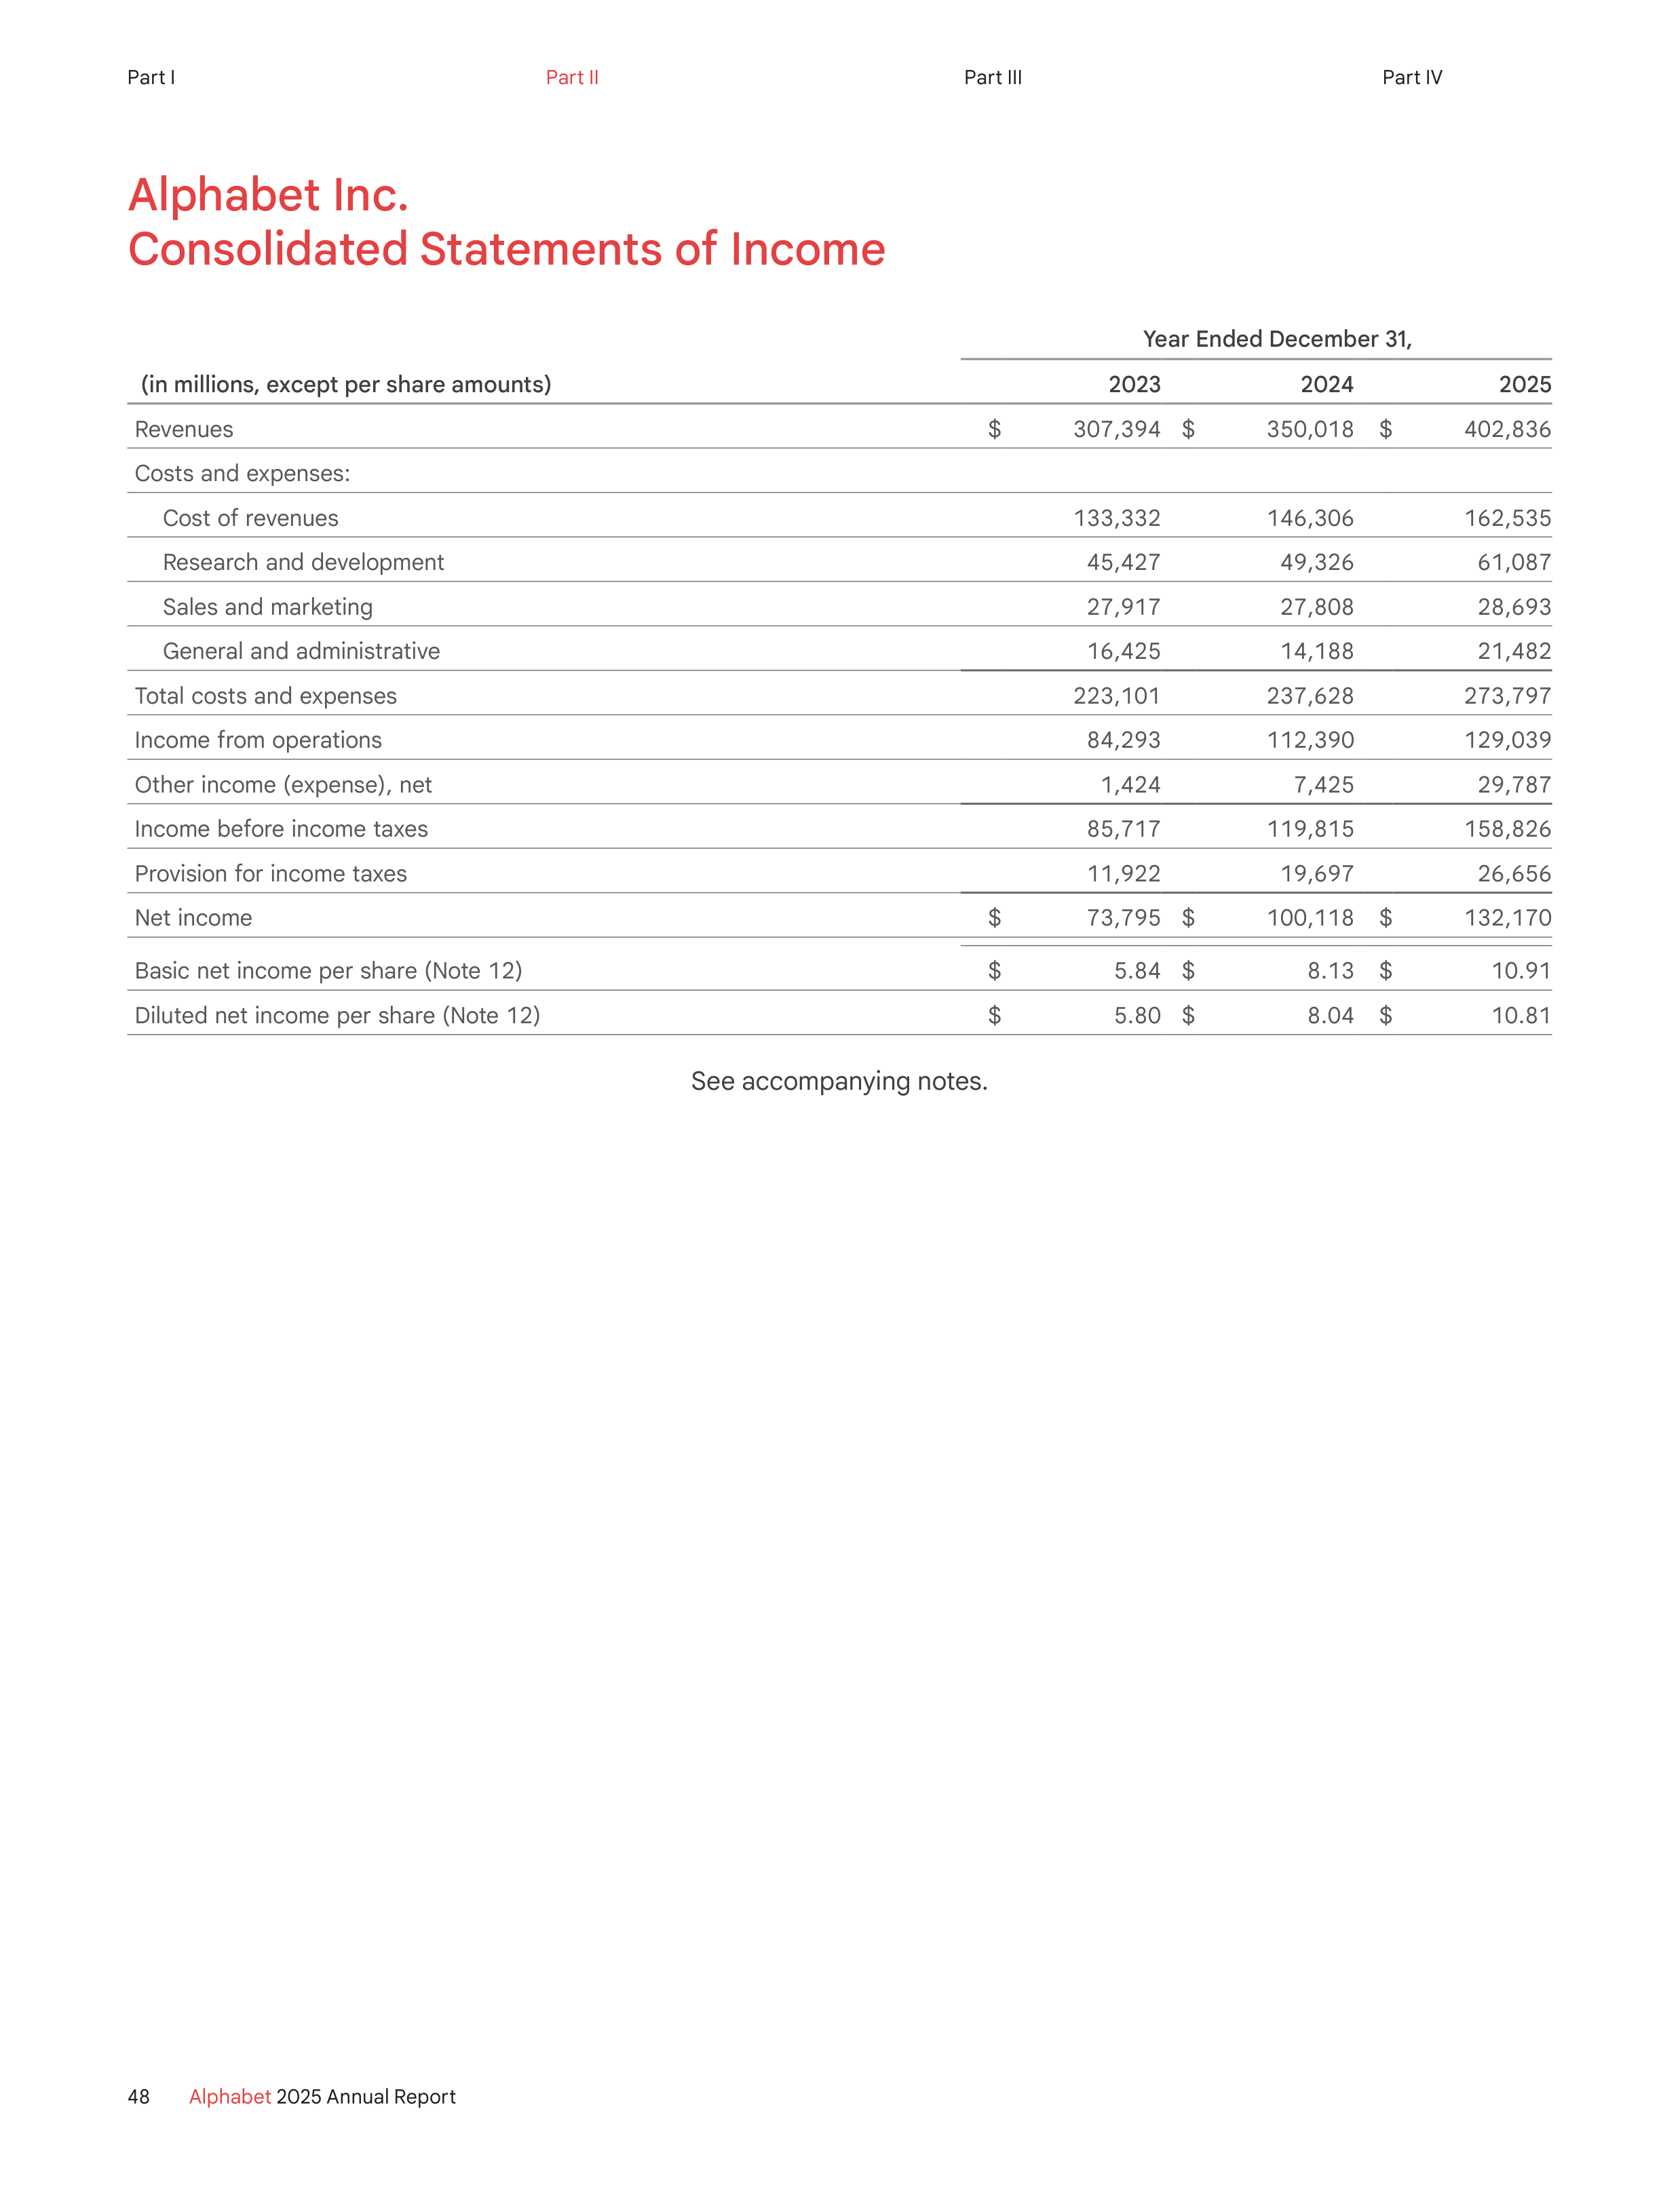
Alphabet Inc.
Consolidated Statements of Income
Year Ended December 31,
(in millions, except per share amounts)
2023
2024
2025
Revenues
$
307,394
$
350,018
$
402,836
Costs and expenses:
Cost of revenues
133,332
146,306
162,535
Research and development
45,427
49,326
61,087
Sales and marketing
27,917
27,808
28,693
General and administrative
16,425
14,188
21,482
Total costs and expenses
223,101
237,628
273,797
Income from operations
84,293
112,390
129,039
Other income (expense), net
1,424
7,425
29,787
Income before income taxes
85,717
119,815
158,826
Provision for income taxes
11,922
19,697
26,656
Net income
$
73,795
$
100,118
$
132,170
Basic net income per share (Note 12)
$
5.84
$
8.13
$
10.91
Diluted net income per share (Note 12)
$
5.80
$
8.04
$
10.81
See accompanying notes.
48
Alphabet
2025 Annual Report
Part I
Part II
Part III
Part IV
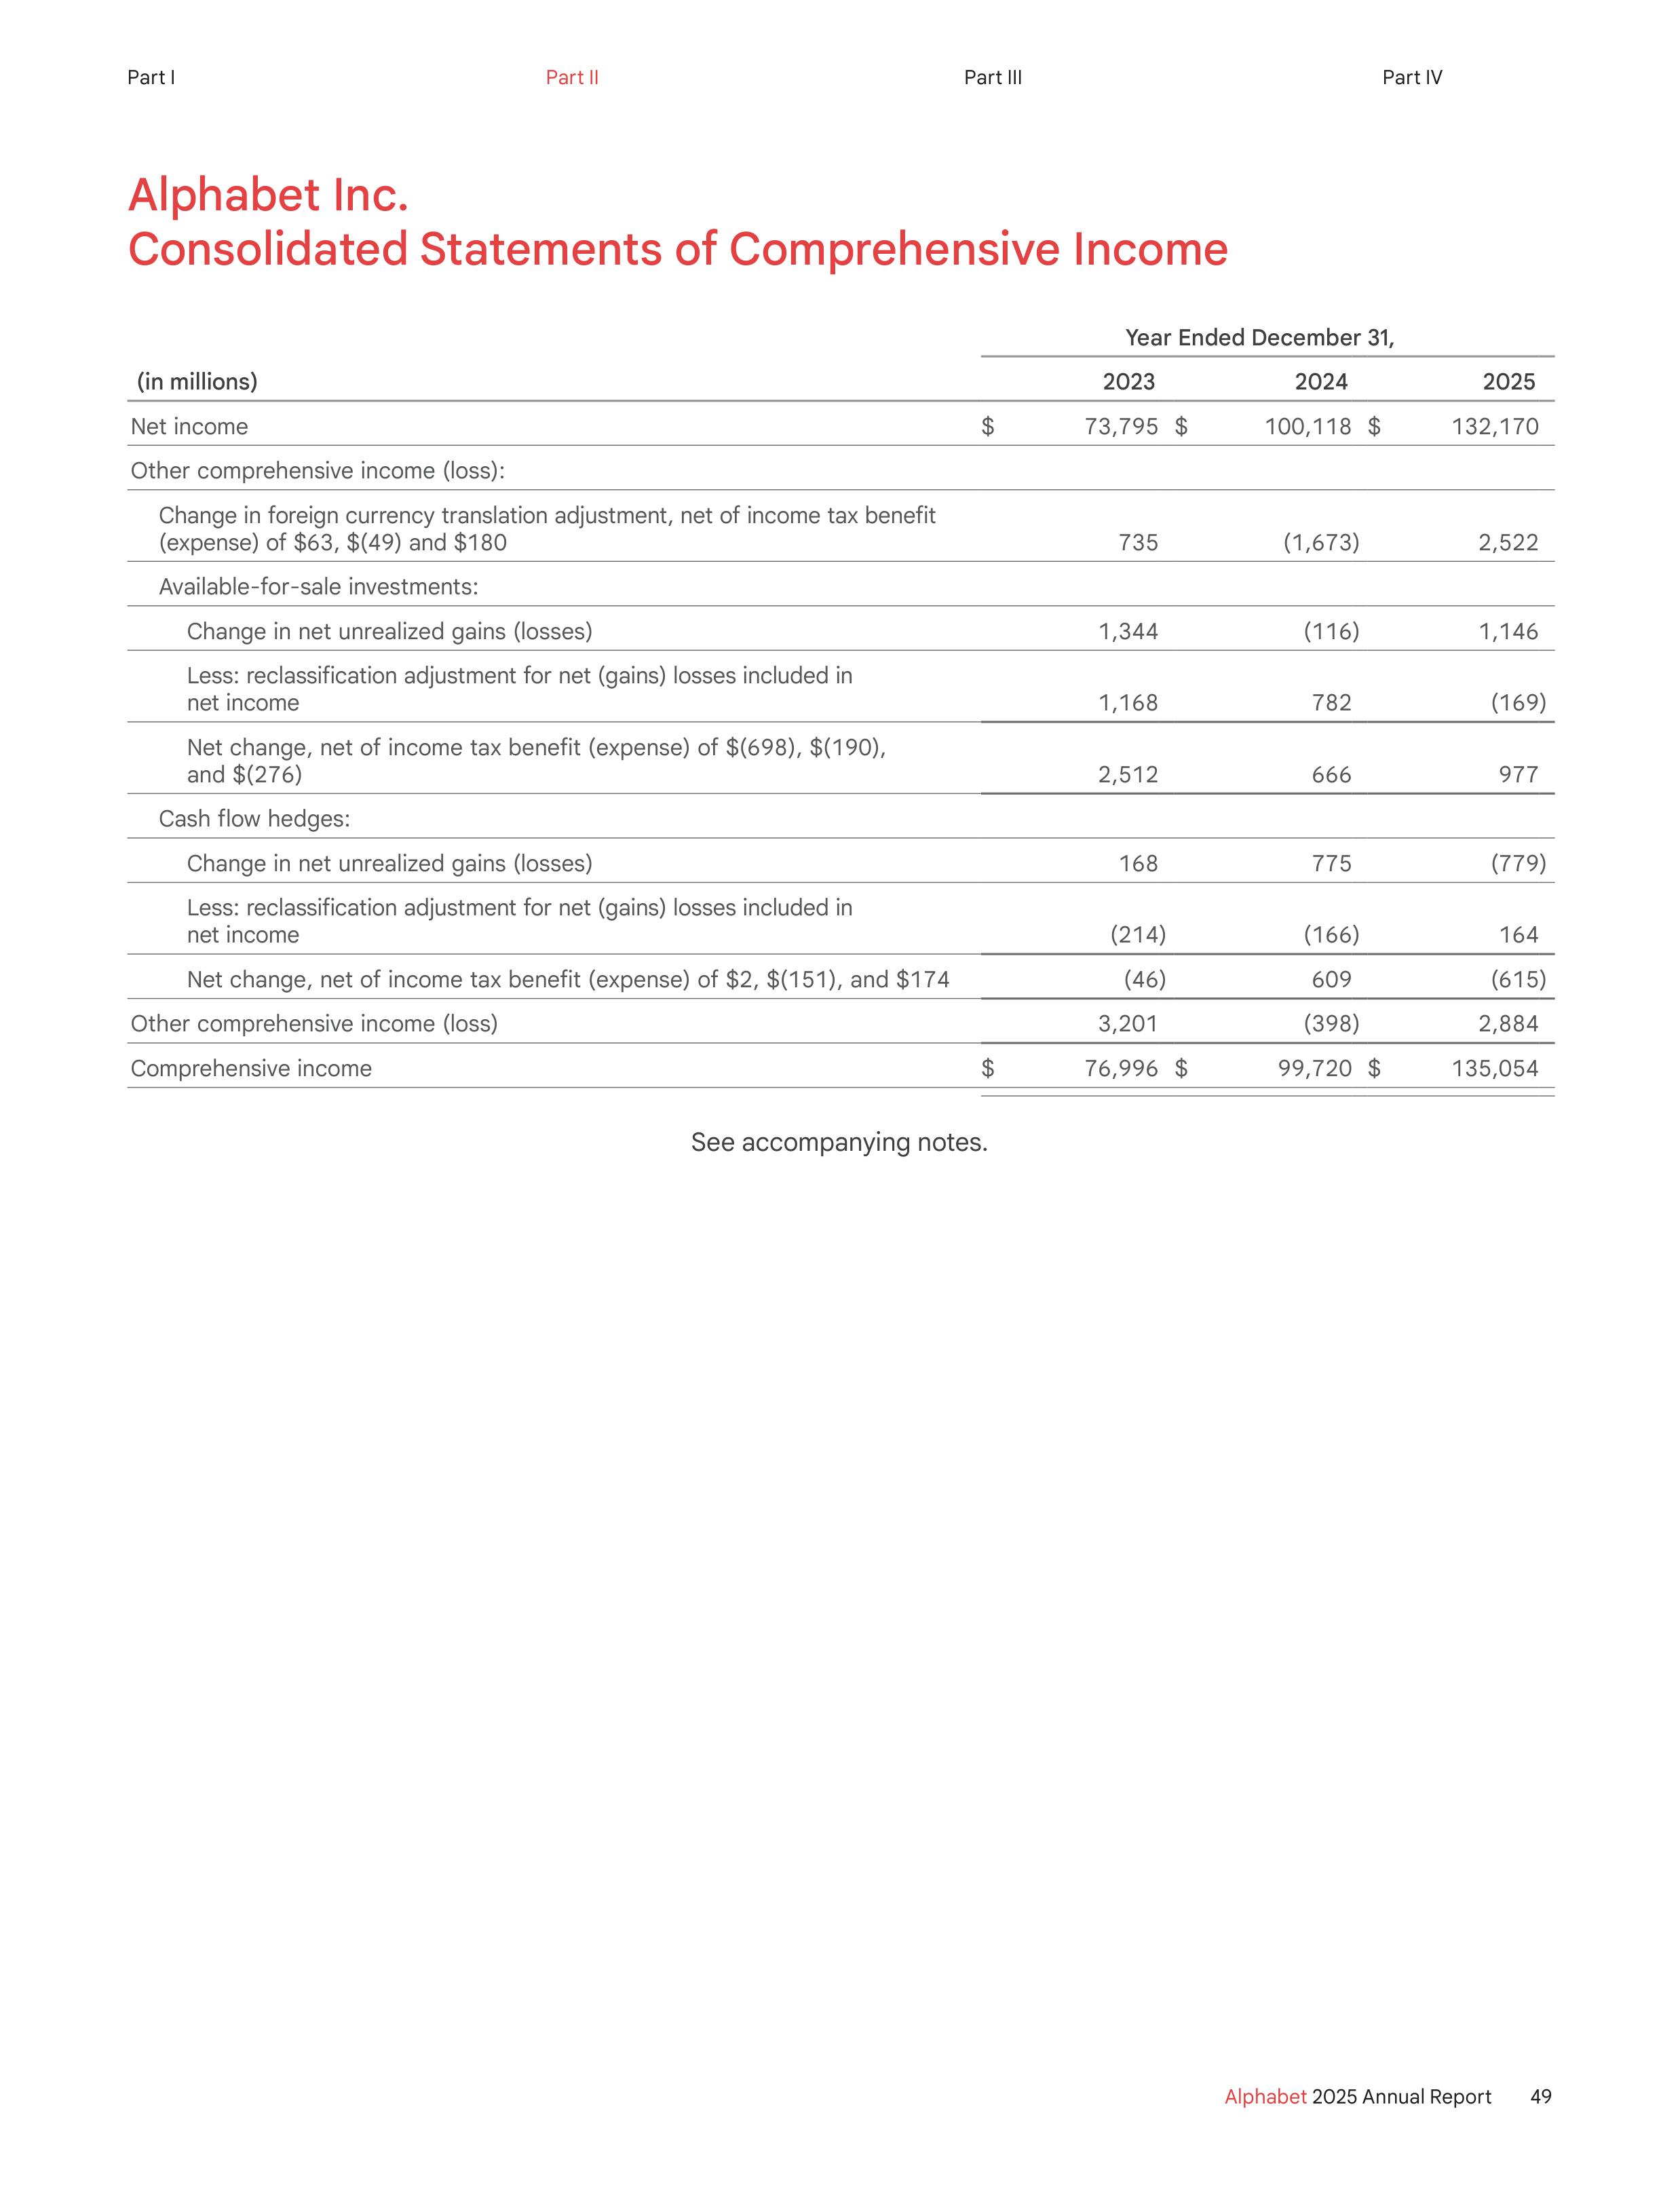
Alphabet Inc.
Consolidated Statements of Comprehensive Income
Year Ended December 31,
(in millions)
2023
2024
2025
Net income
$
73,795
$
100,118
$
132,170
Other comprehensive income (loss):
Change in foreign currency translation adjustment, net of income tax benefit
(expense) of $63, $(49) and $180
735
(1,673)
2,522
Available-for-sale investments:
Change in net unrealized gains (losses)
1,344
(116)
1,146
Less: reclassification adjustment for net (gains) losses included in
net income
1,168
782
(169)
Net change, net of income tax benefit (expense) of $(698), $(190),
and $(276)
2,512
666
977
Cash flow hedges:
Change in net unrealized gains (losses)
168
775
(779)
Less: reclassification adjustment for net (gains) losses included in
net income
(214)
(166)
164
Net change, net of income tax benefit (expense) of $2, $(151), and $174
(46)
609
(615)
Other comprehensive income (loss)
3,201
(398)
2,884
Comprehensive income
$
76,996
$
99,720
$
135,054
See accompanying notes.
49
Alphabet
2025 Annual Report
Part I
Part II
Part III
Part IV
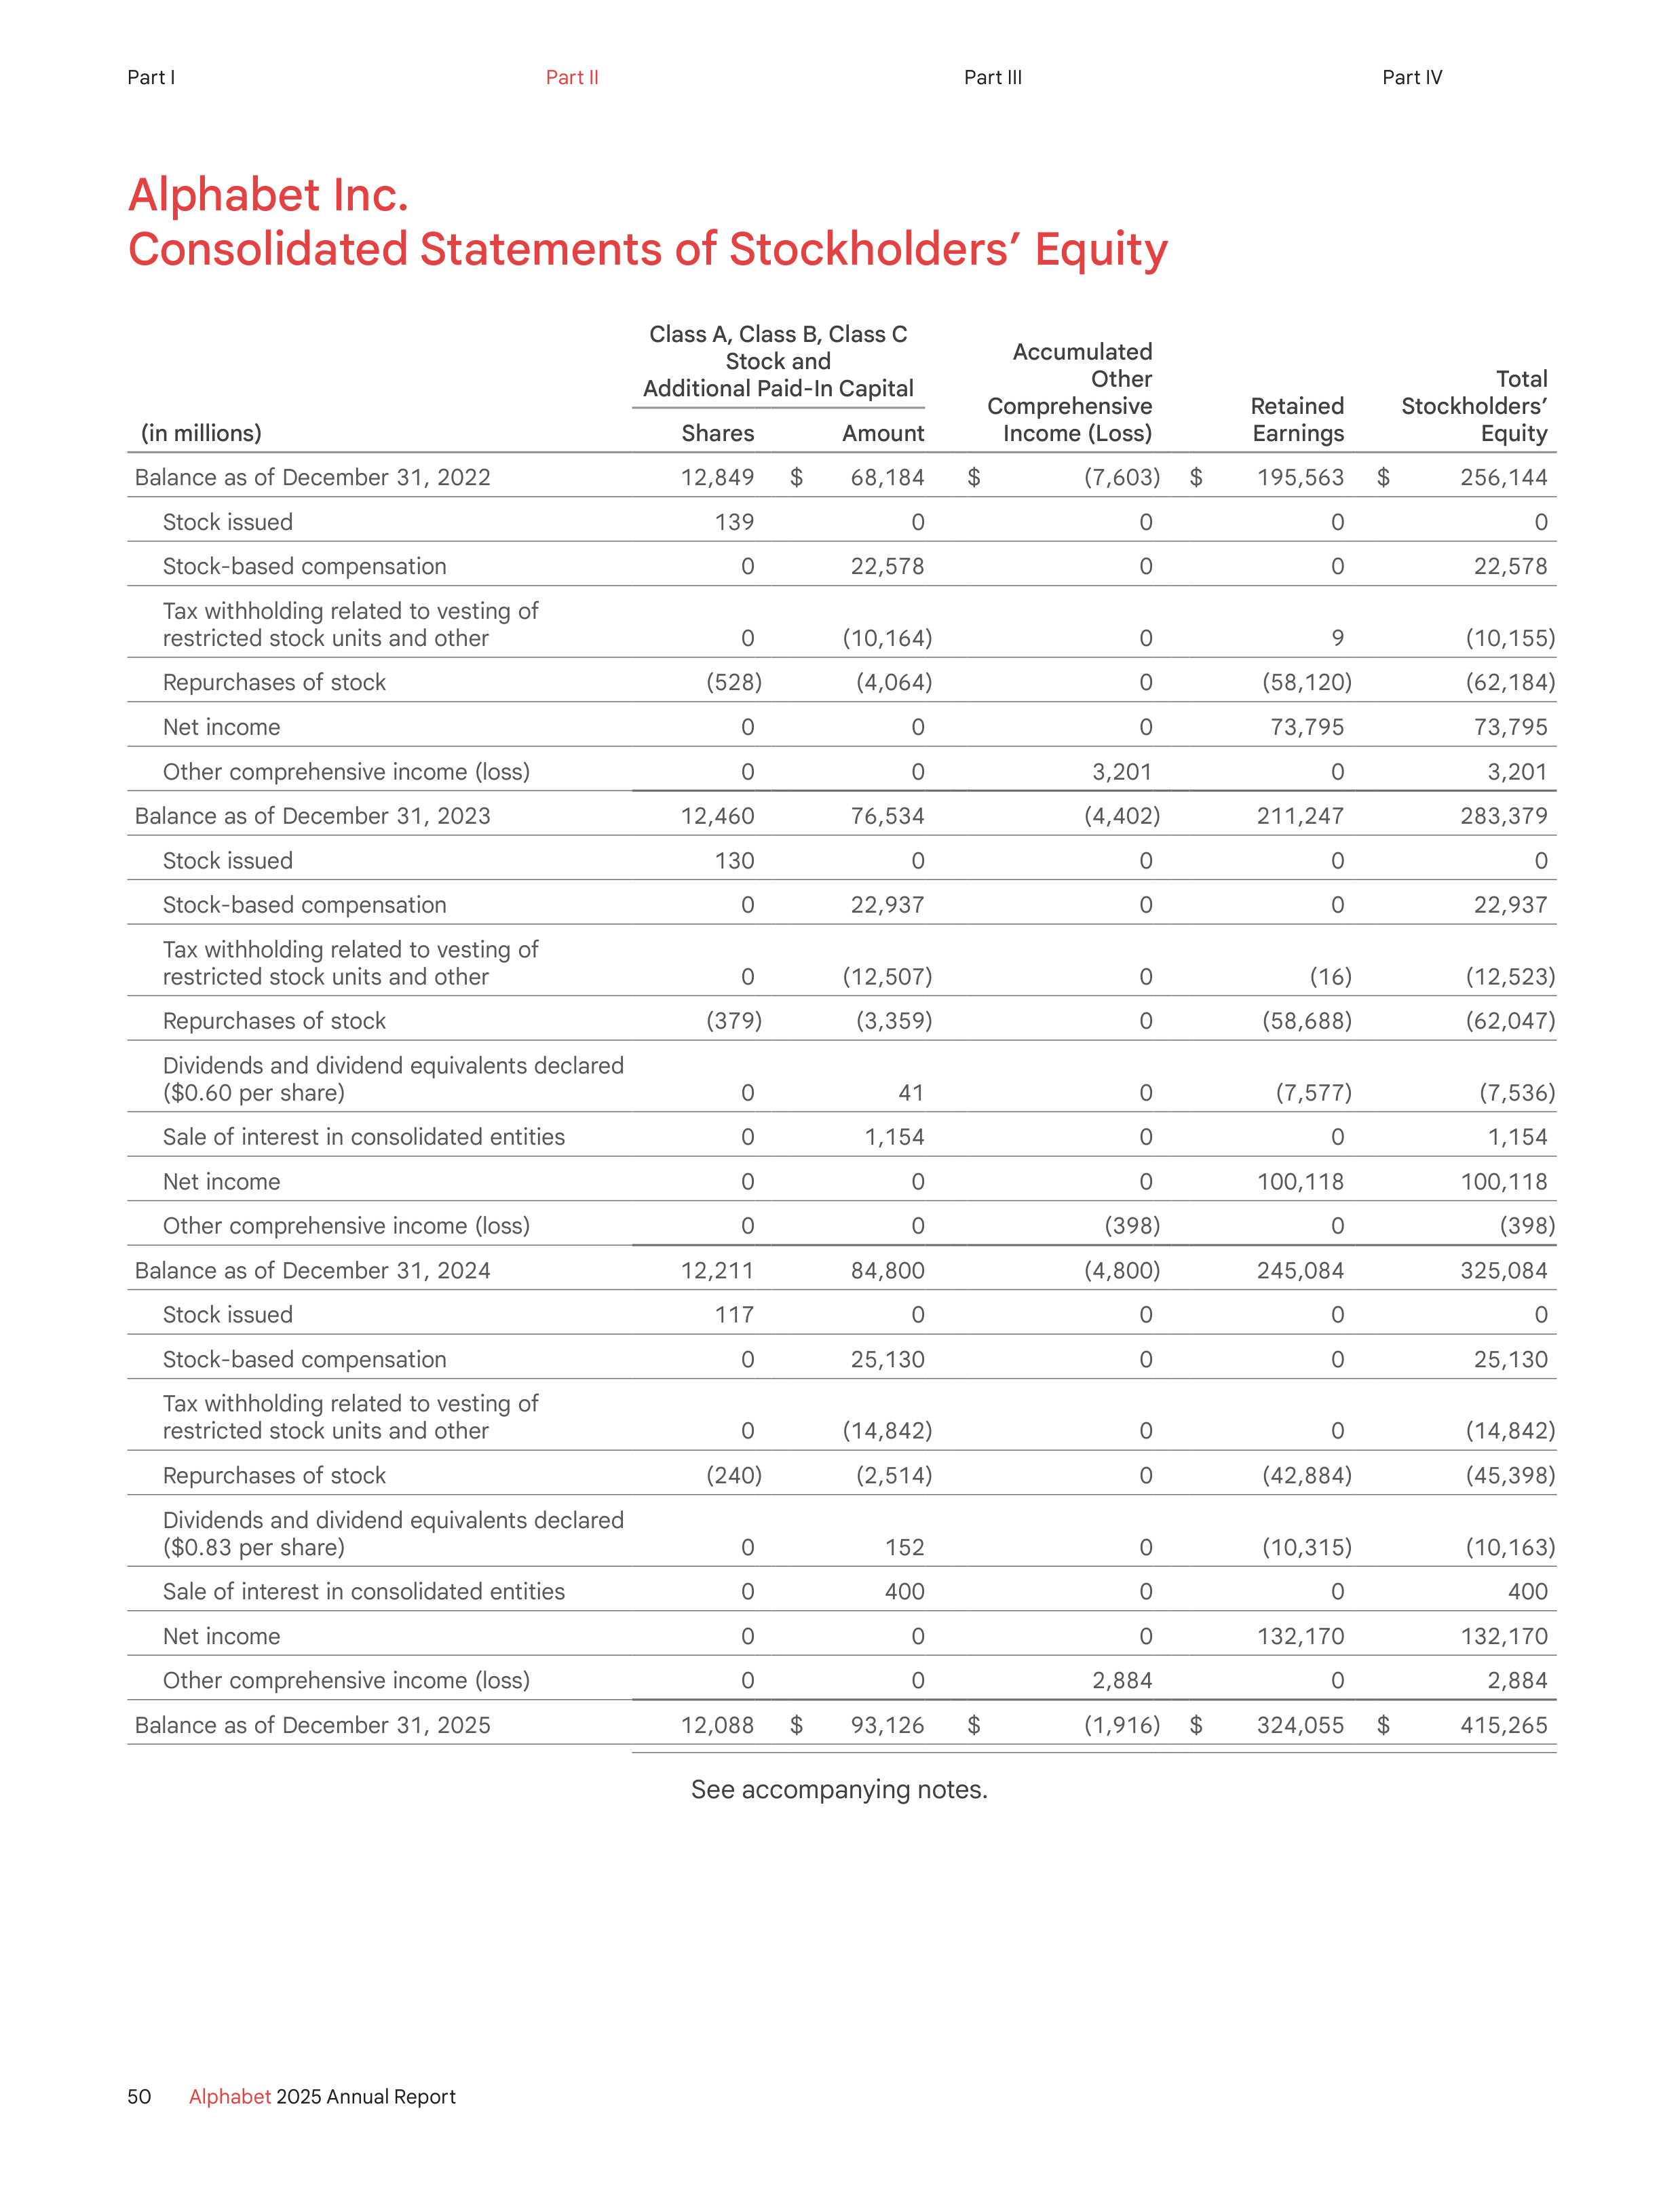
Alphabet Inc.
Consolidated Statements of Stockholders’ Equity
Class A, Class B, Class C
Stock and
Additional Paid-In Capital
Accumulated
Other
Comprehensive
Income (Loss)
Retained
Earnings
Total
Stockholders’
Equity
(in millions)
Shares
Amount
Balance as of December 31, 2022
12,849
$
68,184
$
(7,603 )
$
195,563
$
256,144
Stock issued
139
0
0
0
0
Stock-based compensation
0
22,578
0
0
22,578
Tax withholding related to vesting of
restricted stock units and other
0
(10,164 )
0
9
(10,155 )
Repurchases of stock
(528 )
(4,064 )
0
(58,120 )
(62,184 )
Net income
0
0
0
73,795
73,795
Other comprehensive income (loss)
0
0
3,201
0
3,201
Balance as of December 31, 2023
12,460
76,534
(4,402 )
211,247
283,379
Stock issued
130
0
0
0
0
Stock-based compensation
0
22,937
0
0
22,937
Tax withholding related to vesting of
restricted stock units and other
0
(12,507 )
0
(16 )
(12,523 )
Repurchases of stock
(379 )
(3,359 )
0
(58,688 )
(62,047 )
Dividends and dividend equivalents declared
($0.60 per share)
0
41
0
(7,577 )
(7,536 )
Sale of interest in consolidated entities
0
1,154
0
0
1,154
Net income
0
0
0
100,118
100,118
Other comprehensive income (loss)
0
0
(398 )
0
(398 )
Balance as of December 31, 2024
12,211
84,800
(4,800 )
245,084
325,084
Stock issued
117
0
0
0
0
Stock-based compensation
0
25,130
0
0
25,130
Tax withholding related to vesting of
restricted stock units and other
0
(14,842 )
0
0
(14,842 )
Repurchases of stock
(240 )
(2,514 )
0
(42,884 )
(45,398 )
Dividends and dividend equivalents declared
($0.83 per share)
0
152
0
(10,315 )
(10,163 )
Sale of interest in consolidated entities
0
400
0
0
400
Net income
0
0
0
132,170
132,170
Other comprehensive income (loss)
0
0
2,884
0
2,884
Balance as of December 31, 2025
12,088
$
93,126
$
(1,916 )
$
324,055
$
415,265
See accompanying notes.
50
Alphabet
2025 Annual Report
Part I
Part II
Part III
Part IV
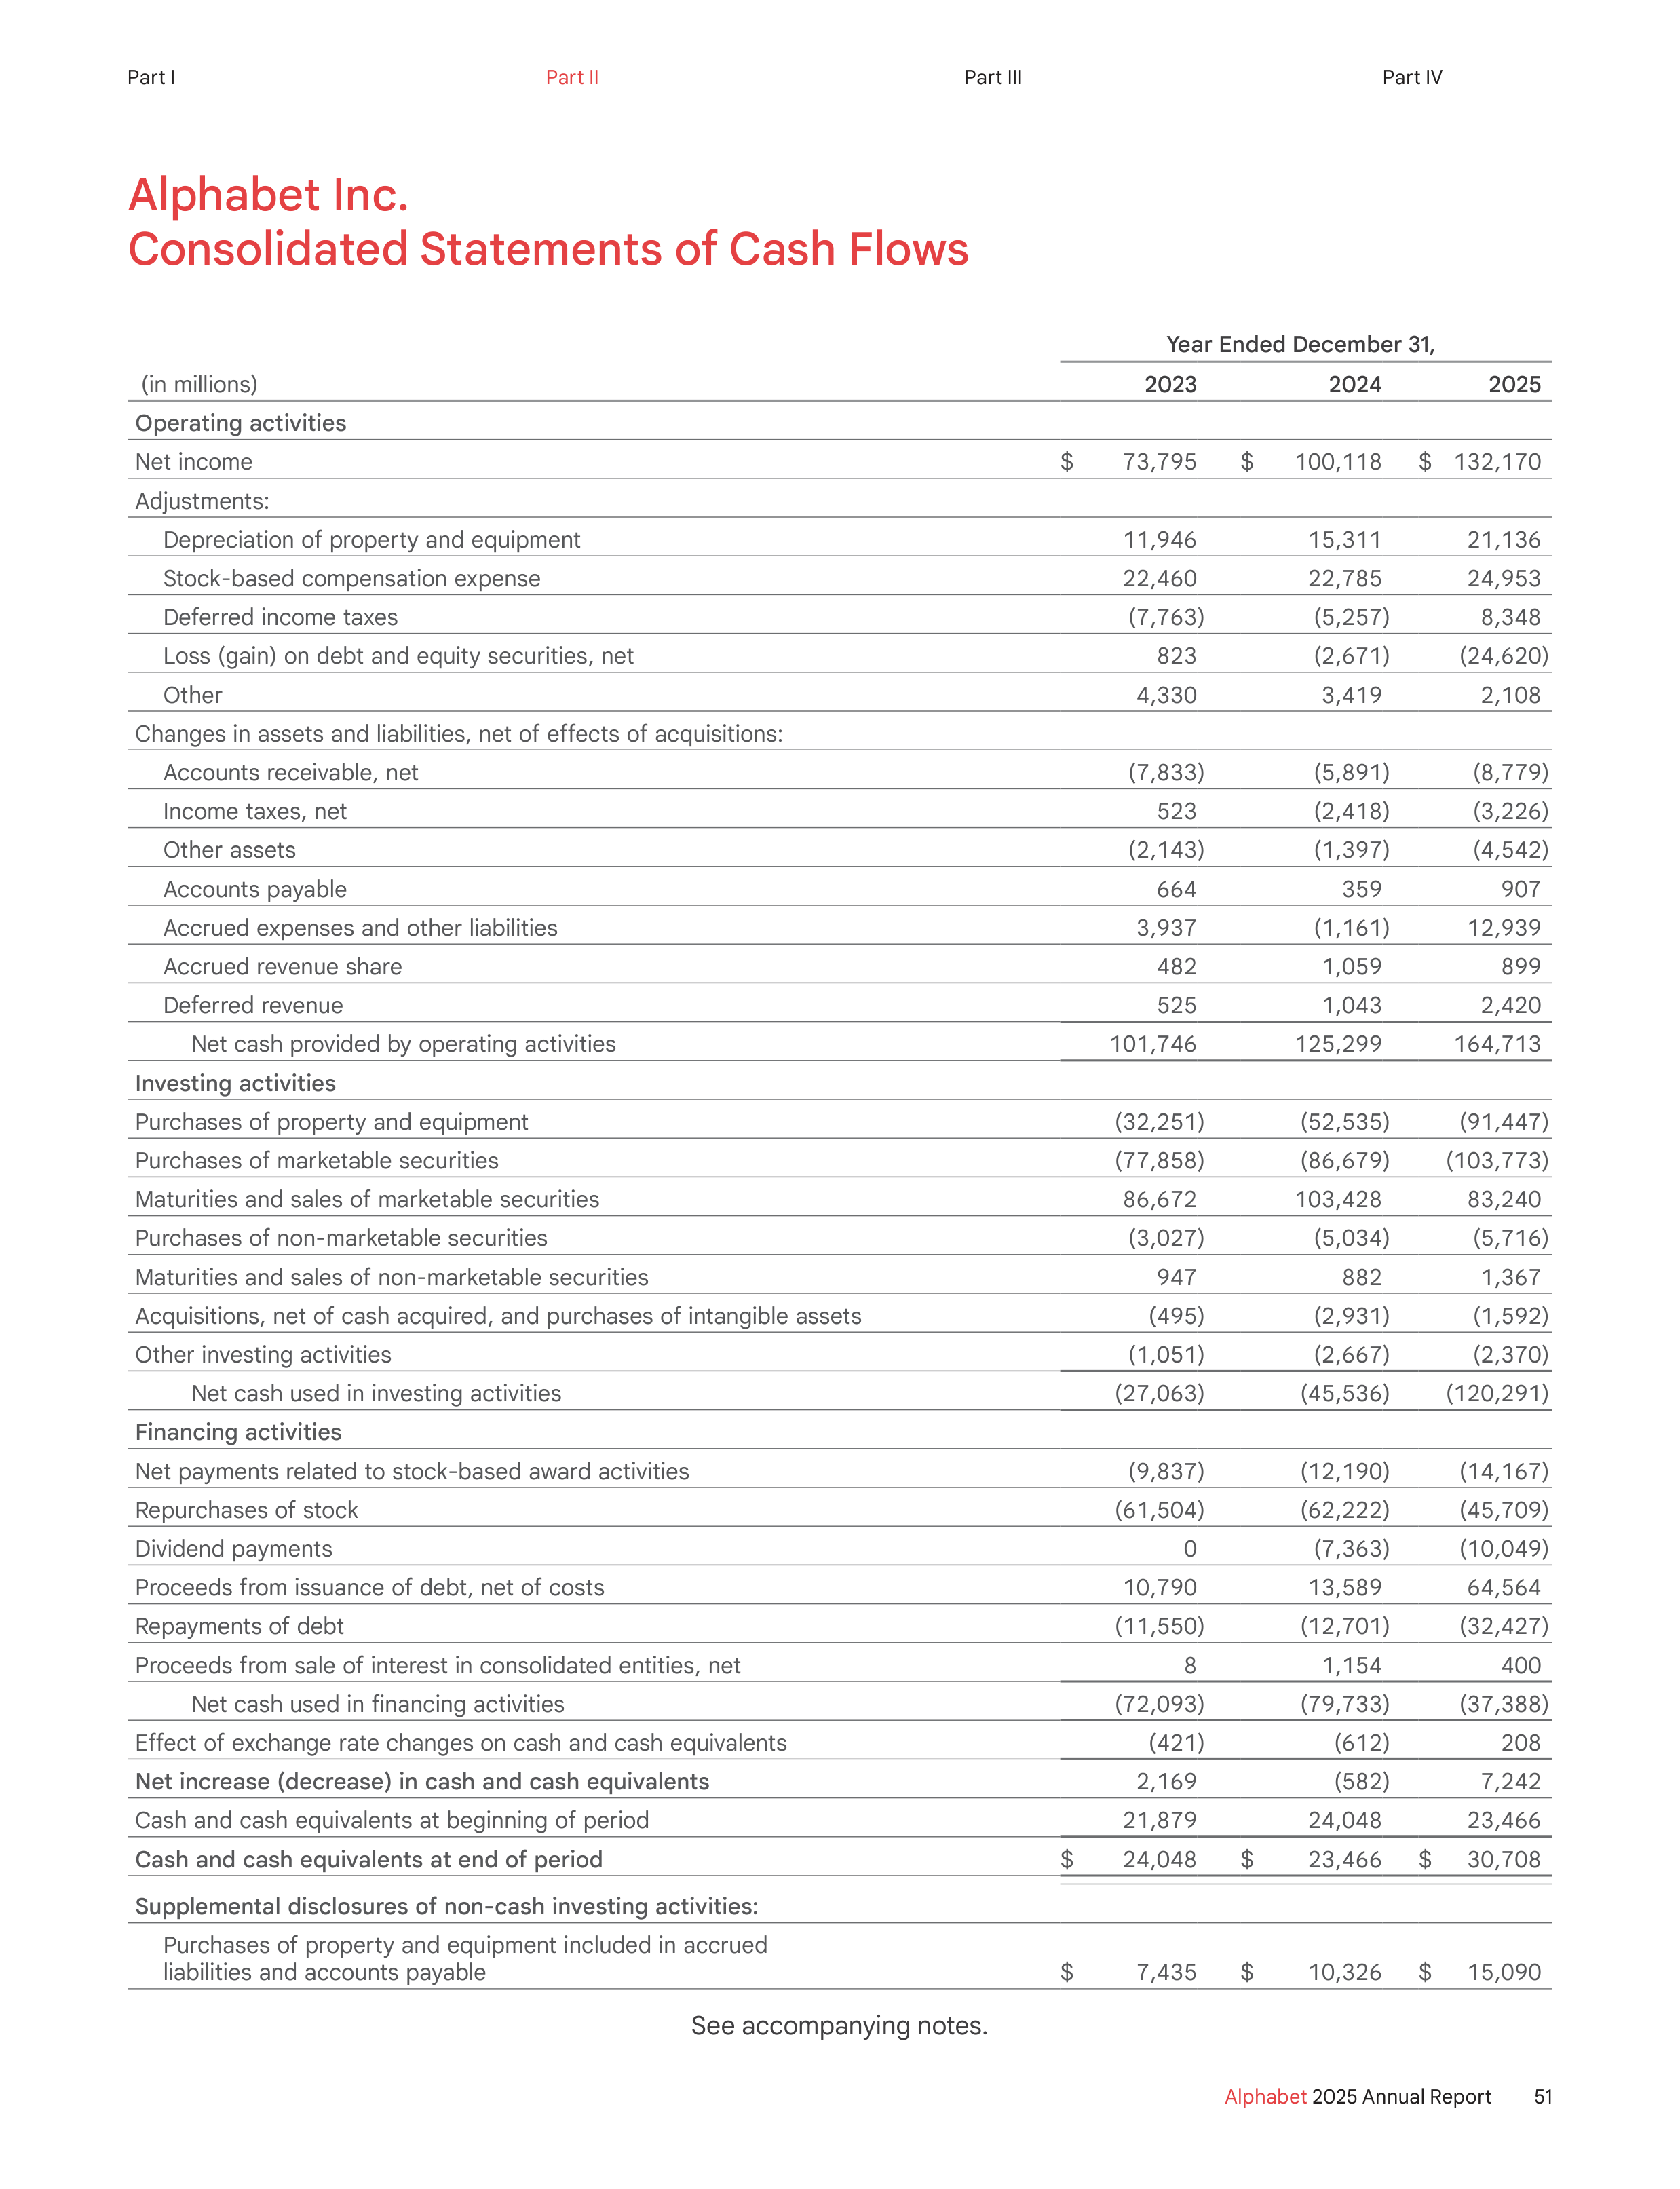
Alphabet Inc.
Consolidated Statements of Cash Flows
Year Ended December 31,
(in millions)
2023
2024
2025
Operating activities
Net income
$
73,795
$
100,118
$ 132,170
Adjustments:
Depreciation of property and equipment
11,946
15,311
21,136
Stock-based compensation expense
22,460
22,785
24,953
Deferred income taxes
(7,763 )
(5,257 )
8,348
Loss (gain) on debt and equity securities, net
823
(2,671 )
(24,620 )
Other
4,330
3,419
2,108
Changes in assets and liabilities, net of effects of acquisitions:
Accounts receivable, net
(7,833 )
(5,891 )
(8,779 )
Income taxes, net
523
(2,418 )
(3,226 )
Other assets
(2,143 )
(1,397 )
(4,542 )
Accounts payable
664
359
907
Accrued expenses and other liabilities
3,937
(1,161 )
12,939
Accrued revenue share
482
1,059
899
Deferred revenue
525
1,043
2,420
Net cash provided by operating activities
101,746
125,299
164,713
Investing activities
Purchases of property and equipment
(32,251 )
(52,535 )
(91,447 )
Purchases of marketable securities
(77,858 )
(86,679 )
(103,773 )
Maturities and sales of marketable securities
86,672
103,428
83,240
Purchases of non-marketable securities
(3,027 )
(5,034 )
(5,716 )
Maturities and sales of non-marketable securities
947
882
1,367
Acquisitions, net of cash acquired, and purchases of intangible assets
(495 )
(2,931 )
(1,592 )
Other investing activities
(1,051 )
(2,667 )
(2,370 )
Net cash used in investing activities
(27,063 )
(45,536 )
(120,291 )
Financing activities
Net payments related to stock-based award activities
(9,837 )
(12,190 )
(14,167 )
Repurchases of stock
(61,504 )
(62,222 )
(45,709 )
Dividend payments
0
(7,363 )
(10,049 )
Proceeds from issuance of debt, net of costs
10,790
13,589
64,564
Repayments of debt
(11,550 )
(12,701 )
(32,427 )
Proceeds from sale of interest in consolidated entities, net
8
1,154
400
Net cash used in financing activities
(72,093 )
(79,733 )
(37,388 )
Effect of exchange rate changes on cash and cash equivalents
(421 )
(612 )
208
Net increase (decrease) in cash and cash equivalents
2,169
(582 )
7,242
Cash and cash equivalents at beginning of period
21,879
24,048
23,466
Cash and cash equivalents at end of period
$
24,048
$
23,466
$
30,708
Supplemental disclosures of non-cash investing activities:
Purchases of property and equipment included in accrued
liabilities and accounts payable
$
7,435
$
10,326
$
15,090
See accompanying notes.
51
Alphabet
2025 Annual Report
Part I
Part II
Part III
Part IV
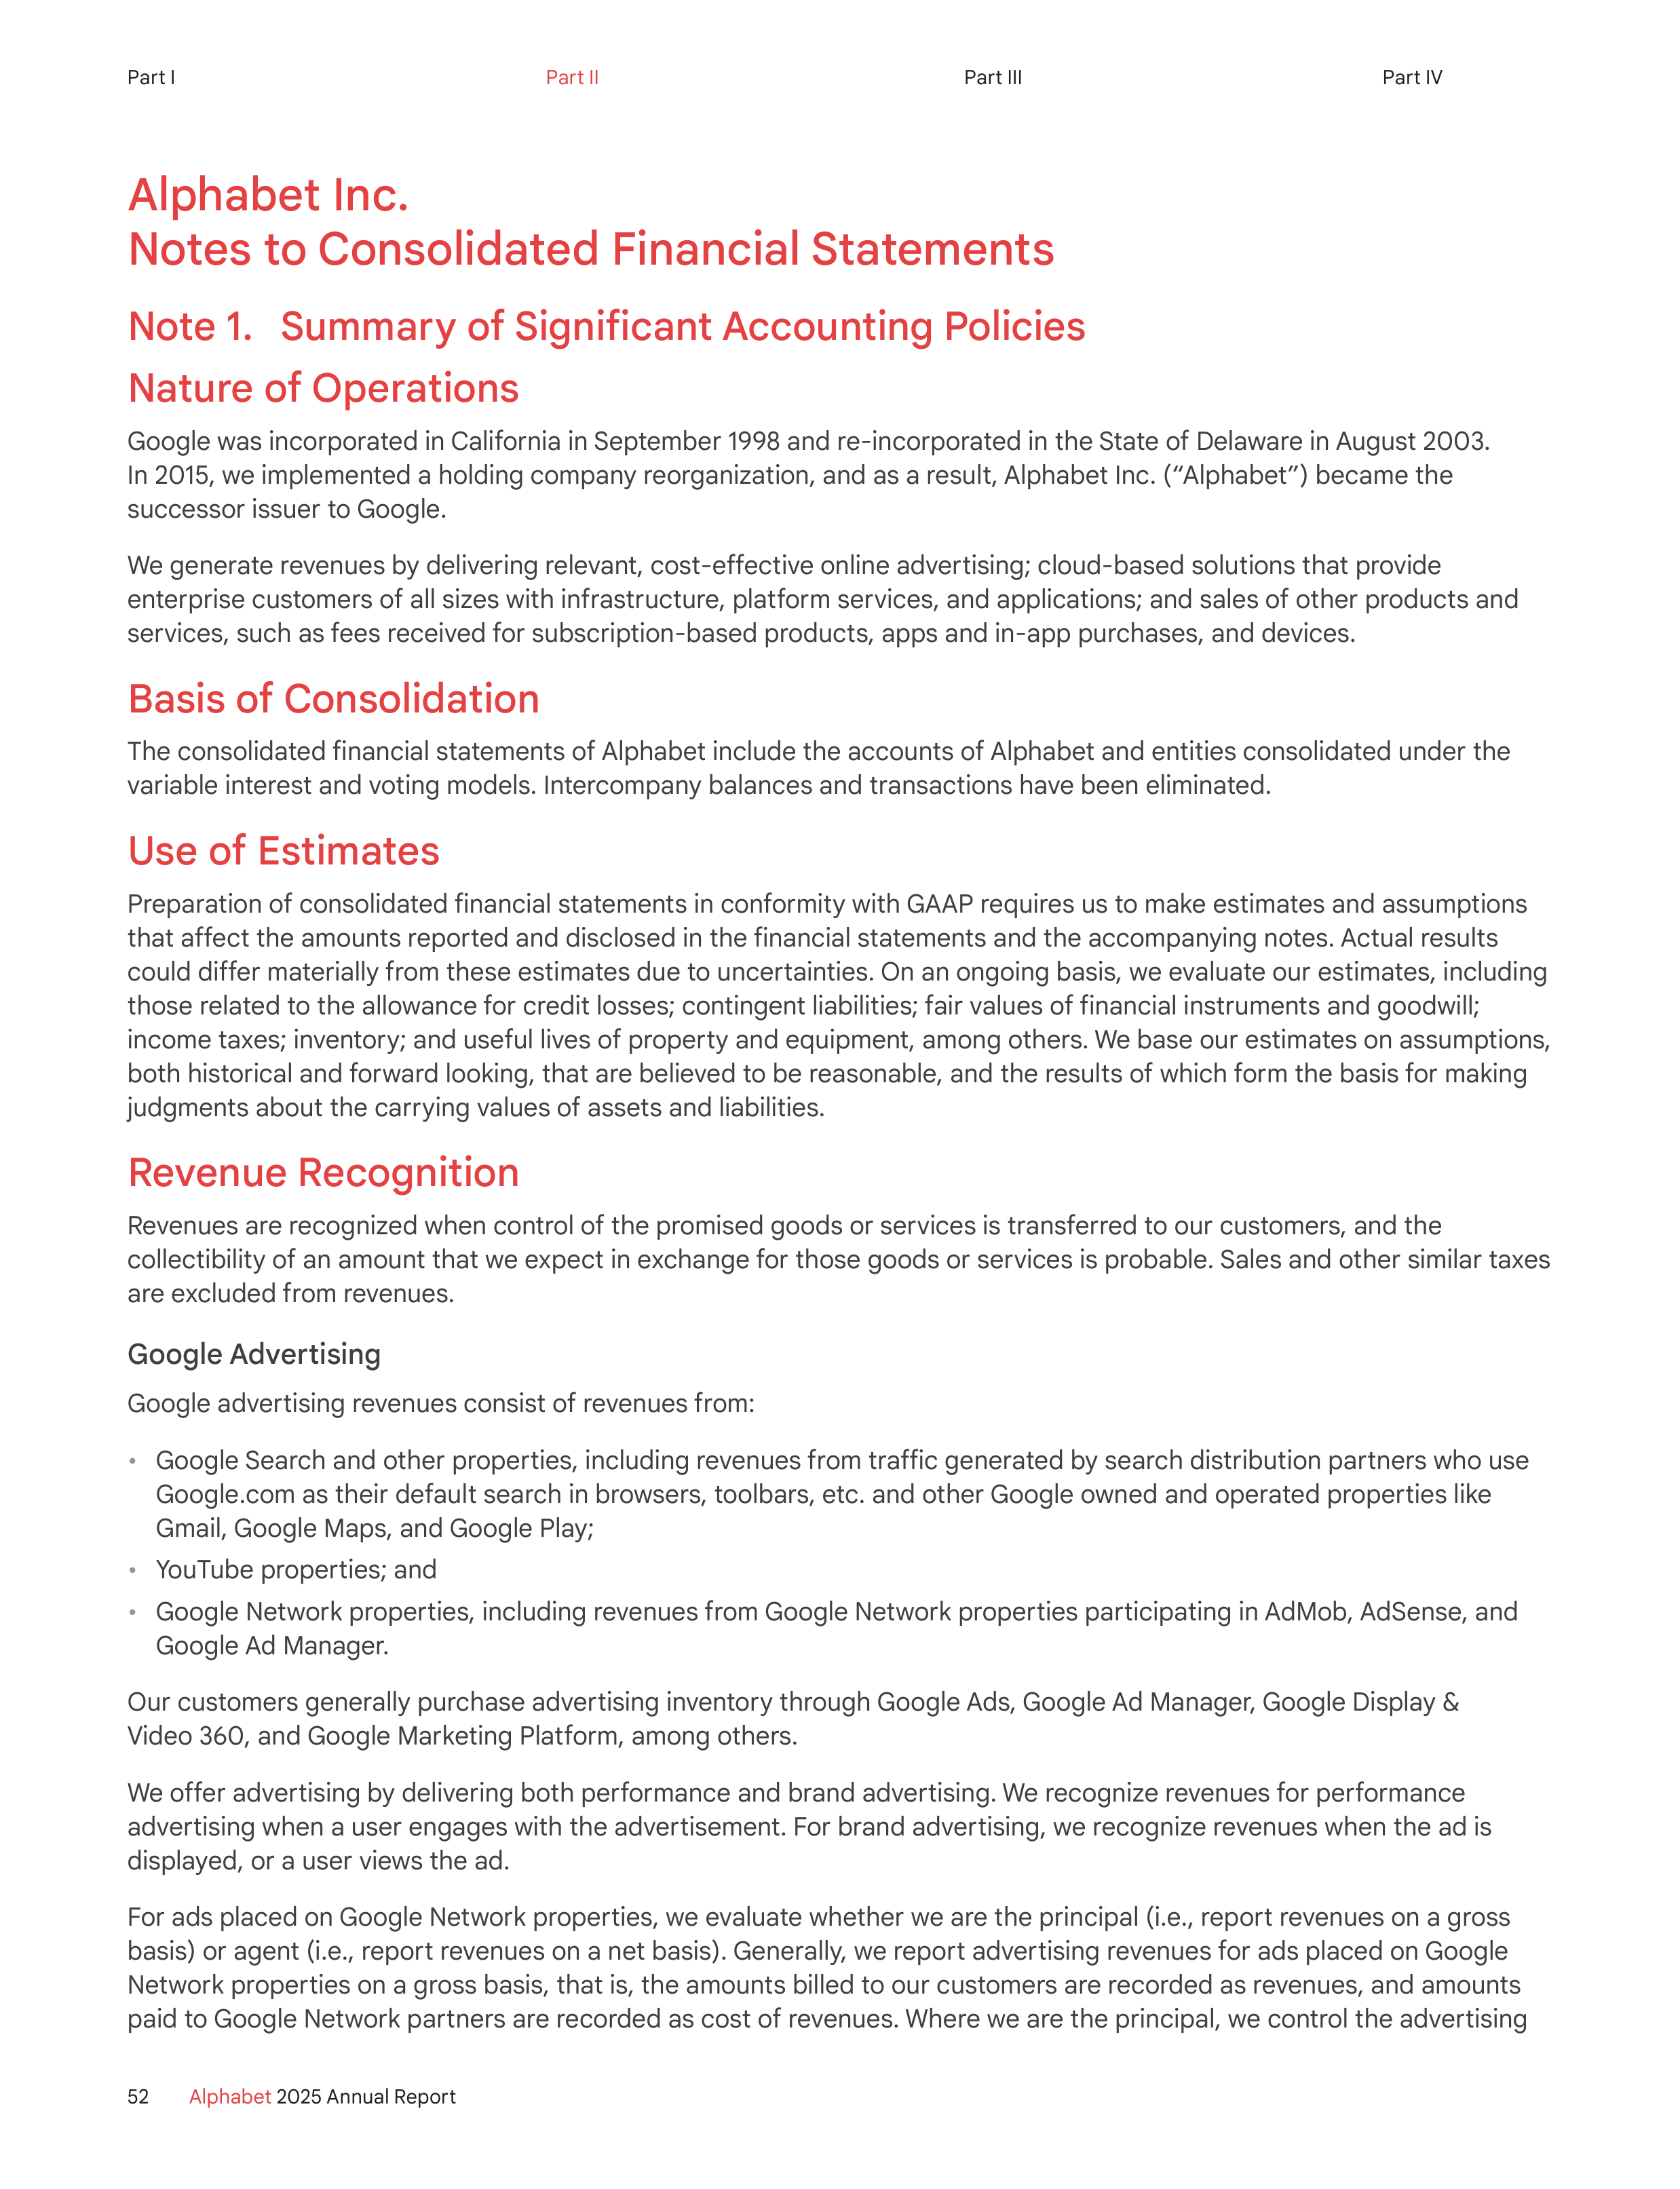
Alphabet Inc.
Notes to Consolidated Financial Statements
Note 1.
Summary of Significant Accounting Policies
Nature of Operations
Google was incorporated in California in September 1998 and re-incorporated in the State of Delaware in August 2003.
In 2015, we implemented a holding company reorganization, and as a result, Alphabet Inc. (“Alphabet”) became the
successor issuer to Google.
We generate revenues by delivering relevant, cost-effective online advertising; cloud-based solutions that provide
enterprise customers of all sizes with infrastructure, platform services, and applications; and sales of other products and
services, such as fees received for subscription-based products, apps and in-app purchases, and devices.
Basis of Consolidation
The consolidated financial statements of Alphabet include the accounts of Alphabet and entities consolidated under the
variable interest and voting models. Intercompany balances and transactions have been eliminated.
Use of Estimates
Preparation of consolidated financial statements in conformity with GAAP requires us to make estimates and assumptions
that affect the amounts reported and disclosed in the financial statements and the accompanying notes. Actual results
could differ materially from these estimates due to uncertainties. On an ongoing basis, we evaluate our estimates, including
those related to the allowance for credit losses; contingent liabilities; fair values of financial instruments and goodwill;
income taxes; inventory; and useful lives of property and equipment, among others. We base our estimates on assumptions,
both historical and forward looking, that are believed to be reasonable, and the results of which form the basis for making
judgments about the carrying values of assets and liabilities.
Revenue Recognition
Revenues are recognized when control of the promised goods or services is transferred to our customers, and the
collectibility of an amount that we expect in exchange for those goods or services is probable. Sales and other similar taxes
are excluded from revenues.
Google Advertising
Google advertising revenues consist of revenues from:
•
Google Search and other properties, including revenues from traffic generated by search distribution partners who use
Google.com as their default search in browsers, toolbars, etc. and other Google owned and operated properties like
Gmail, Google Maps, and Google Play;
•
YouTube properties; and
•
Google Network properties, including revenues from Google Network properties participating in AdMob, AdSense, and
Google Ad Manager.
Our customers generally purchase advertising inventory through Google Ads, Google Ad Manager, Google Display &
Video 360, and Google Marketing Platform, among others.
We offer advertising by delivering both performance and brand advertising. We recognize revenues for performance
advertising when a user engages with the advertisement. For brand advertising, we recognize revenues when the ad is
displayed, or a user views the ad.
For ads placed on Google Network properties, we evaluate whether we are the principal (i.e., report revenues on a gross
basis) or agent (i.e., report revenues on a net basis). Generally, we report advertising revenues for ads placed on Google
Network properties on a gross basis, that is, the amounts billed to our customers are recorded as revenues, and amounts
paid to Google Network partners are recorded as cost of revenues. Where we are the principal, we control the advertising
52
Alphabet
2025 Annual Report
Part I
Part II
Part III
Part IV
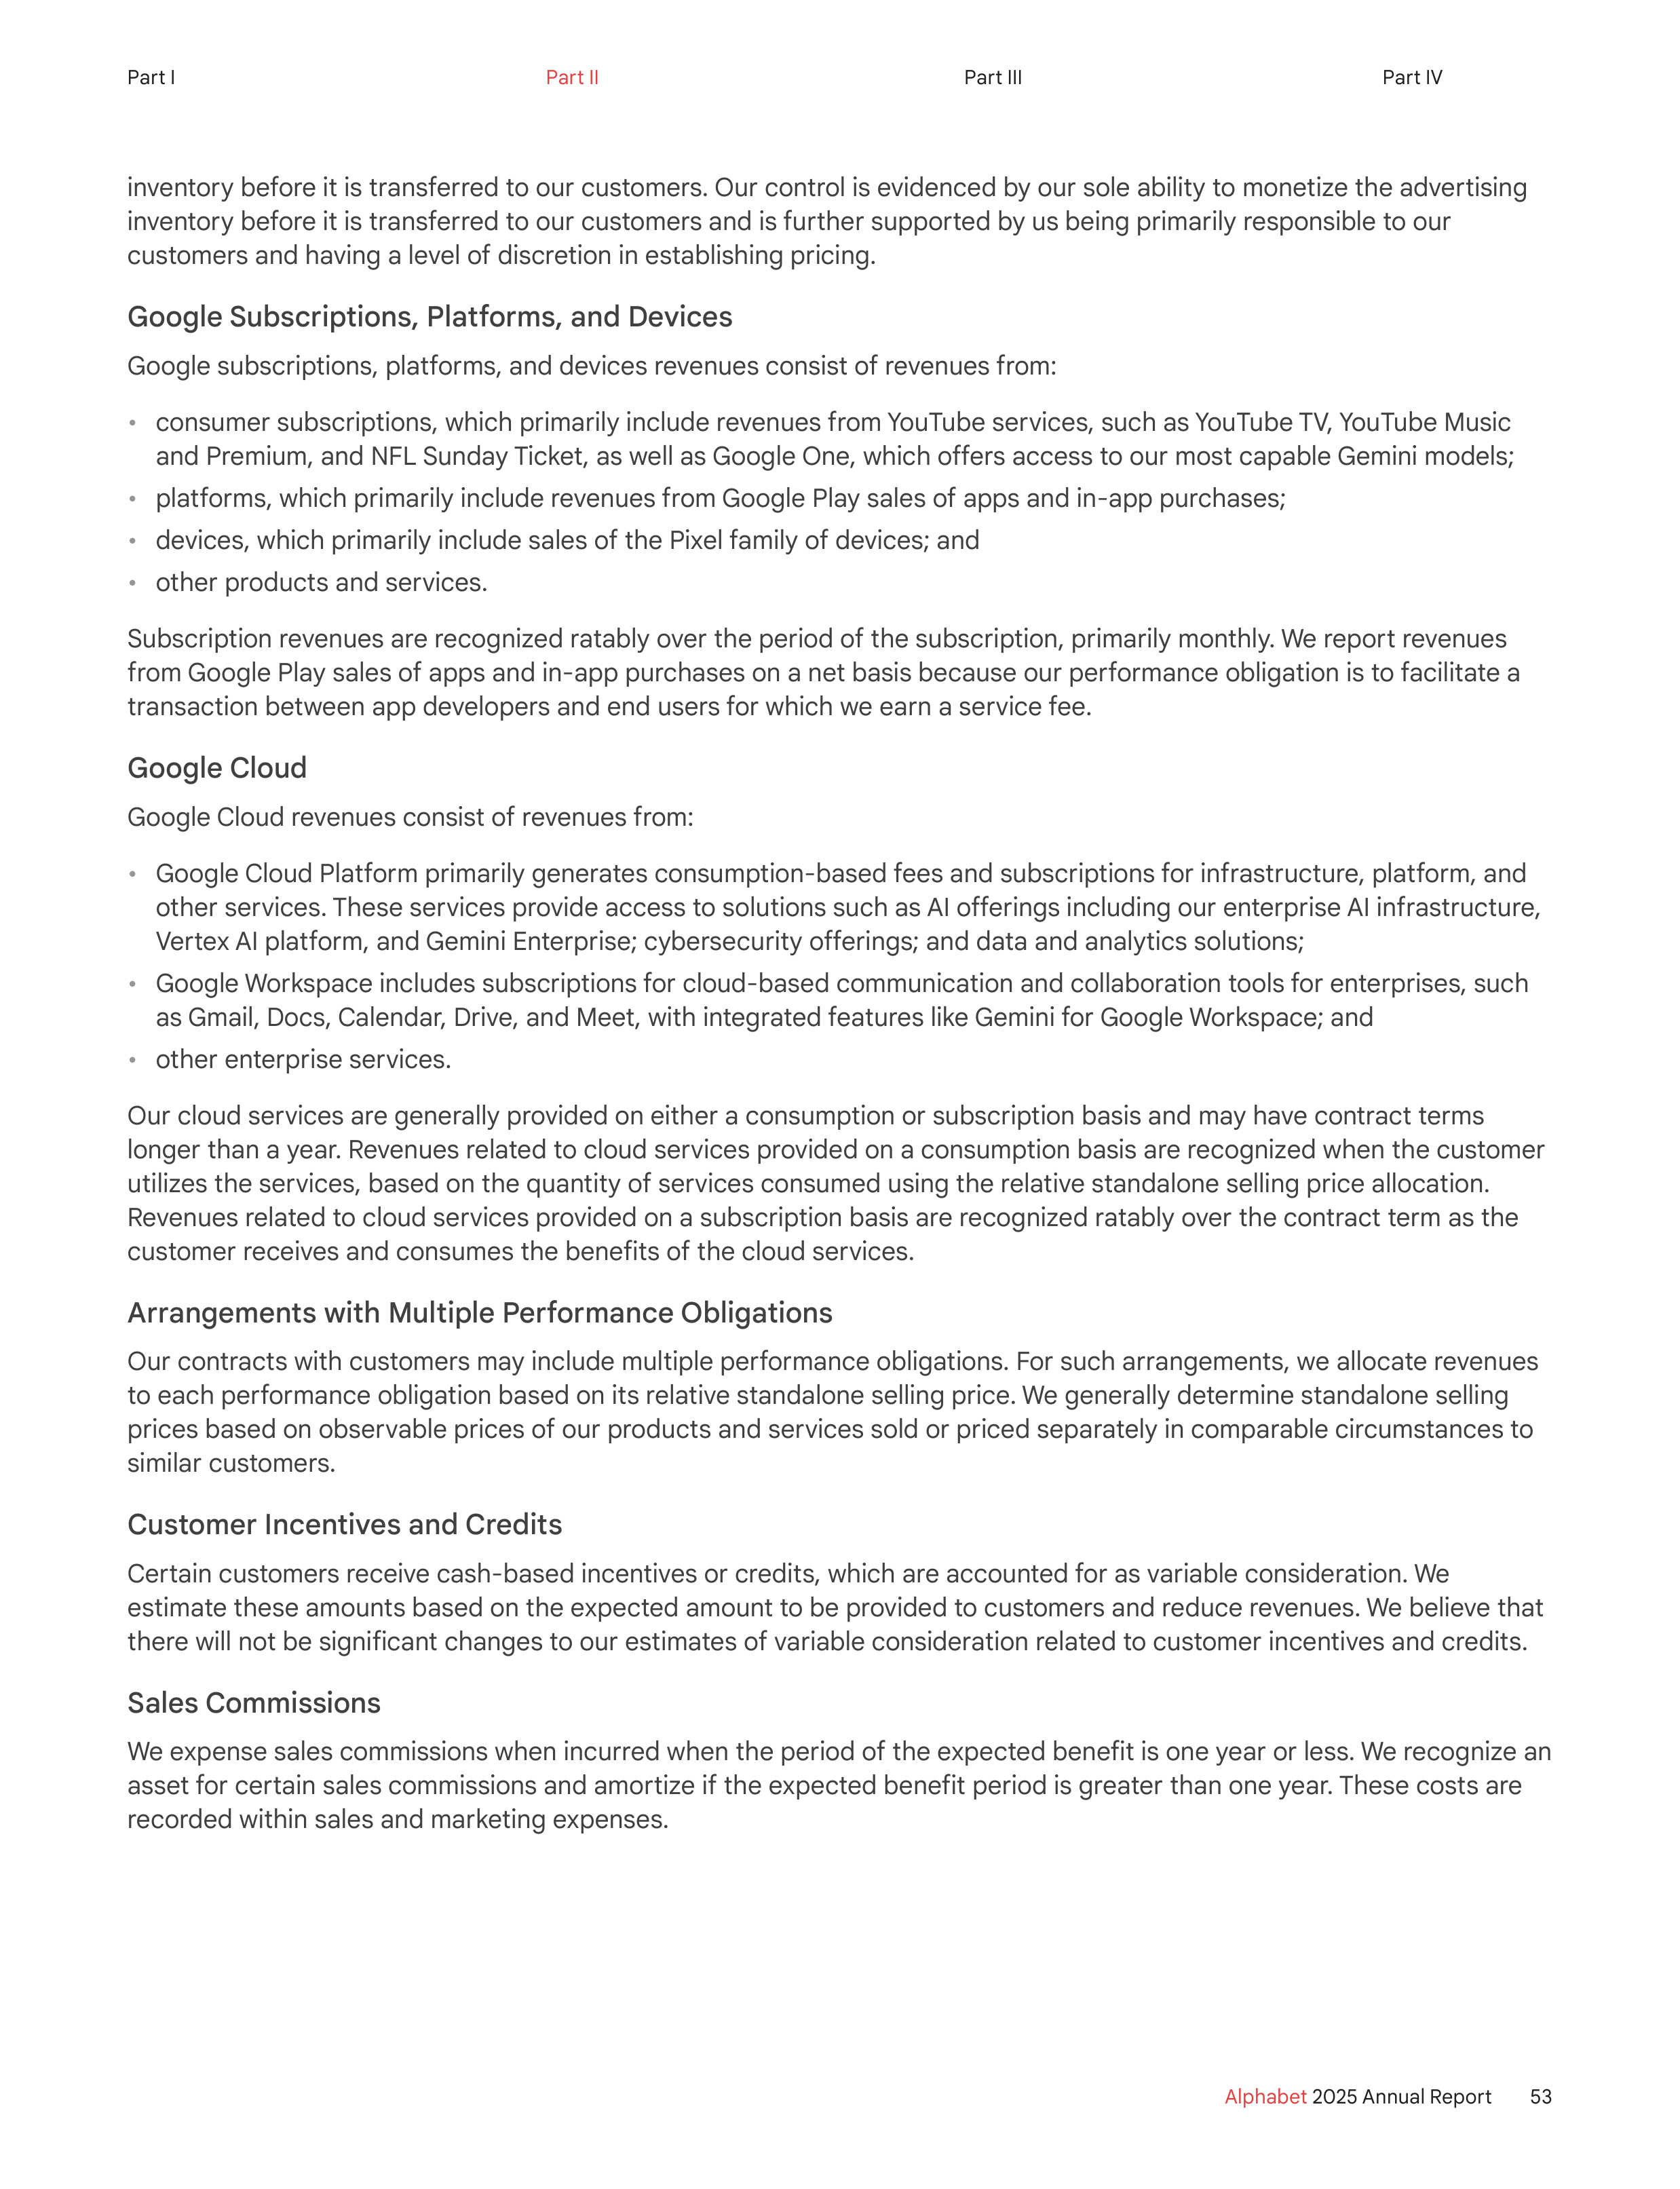
inventory before it is transferred to our customers. Our control is evidenced by our sole ability to monetize the advertising
inventory before it is transferred to our customers and is further supported by us being primarily responsible to our
customers and having a level of discretion in establishing pricing.
Google Subscriptions, Platforms, and Devices
Google subscriptions, platforms, and devices revenues consist of revenues from:
•
consumer subscriptions, which primarily include revenues from YouTube services, such as YouTube TV, YouTube Music
and Premium, and NFL Sunday Ticket, as well as Google One, which offers access to our most capable Gemini models;
•
platforms, which primarily include revenues from Google Play sales of apps and in-app purchases;
•
devices, which primarily include sales of the Pixel family of devices; and
•
other products and services.
Subscription revenues are recognized ratably over the period of the subscription, primarily monthly. We report revenues
from Google Play sales of apps and in-app purchases on a net basis because our performance obligation is to facilitate a
transaction between app developers and end users for which we earn a service fee.
Google Cloud
Google Cloud revenues consist of revenues from:
•
Google Cloud Platform primarily generates consumption-based fees and subscriptions for infrastructure, platform, and
other services. These services provide access to solutions such as AI offerings including our enterprise AI infrastructure,
Vertex AI platform, and Gemini Enterprise; cybersecurity offerings; and data and analytics solutions;
•
Google Workspace includes subscriptions for cloud-based communication and collaboration tools for enterprises, such
as Gmail, Docs, Calendar, Drive, and Meet, with integrated features like Gemini for Google Workspace; and
•
other enterprise services.
Our cloud services are generally provided on either a consumption or subscription basis and may have contract terms
longer than a year. Revenues related to cloud services provided on a consumption basis are recognized when the customer
utilizes the services, based on the quantity of services consumed using the relative standalone selling price allocation.
Revenues related to cloud services provided on a subscription basis are recognized ratably over the contract term as the
customer receives and consumes the benefits of the cloud services.
Arrangements with Multiple Performance Obligations
Our contracts with customers may include multiple performance obligations. For such arrangements, we allocate revenues
to each performance obligation based on its relative standalone selling price. We generally determine standalone selling
prices based on observable prices of our products and services sold or priced separately in comparable circumstances to
similar customers.
Customer Incentives and Credits
Certain customers receive cash-based incentives or credits, which are accounted for as variable consideration. We
estimate these amounts based on the expected amount to be provided to customers and reduce revenues. We believe that
there will not be significant changes to our estimates of variable consideration related to customer incentives and credits.
Sales Commissions
We expense sales commissions when incurred when the period of the expected benefit is one year or less. We recognize an
asset for certain sales commissions and amortize if the expected benefit period is greater than one year. These costs are
recorded within sales and marketing expenses.
53
Alphabet
2025 Annual Report
Part I
Part II
Part III
Part IV
Cost of Revenues
Cost of revenues consists of TAC and other costs of revenues.
•
TAC includes:
•
amounts paid to our distribution partners who make available our search access points and other ad-supported
services. Our distribution partners include browser providers, mobile carriers, original equipment manufacturers, and
software developers; and
•
amounts paid to Google Network partners primarily for ads displayed on their properties.
•
Other cost of revenues includes:
•
content acquisition costs, which are payments to content providers from whom we license video and other content
for distribution, primarily related to YouTube (we pay fees to these content providers based on revenues generated,
subscriber counts, or a flat fee);
•
depreciation expense, primarily related to our technical infrastructure;
•
employee compensation expenses related to our technical infrastructure and other operations such as content review
and customer and product support;
•
inventory and other costs related to the devices we sell; and
•
other technical infrastructure operations costs, including energy, equipment, and network capacity costs.
Software Development Costs
We expense software development costs, including costs to develop software products or the software component of
products to be sold, leased, or marketed to external users, before technological feasibility is reached. Technological
feasibility is typically reached shortly before the release of such products. As a result, development costs that meet the
criteria for capitalization were not material for the periods presented.
Software development costs also include costs to develop software to be used solely to meet internal needs and
cloud-based applications used to deliver our services. We capitalize development costs related to these software
applications once the preliminary project stage is complete and it is probable that the project will be completed and the
software will be used to perform the function intended. Costs capitalized for developing such software applications were
not material for the periods presented.
Stock-Based Compensation
Stock-based compensation (SBC) primarily consists of Alphabet restricted stock units (RSUs). RSUs are equity classified
and measured at the fair market value of the underlying stock at the grant date. We recognize RSU expense using the
straight-line attribution method over the requisite service period and account for forfeitures as they occur. RSUs are
awarded dividend equivalents, which are subject to the same vesting conditions as the underlying award, and settled in
Class C shares.
For RSUs, shares are issued on the vesting dates net of the applicable statutory income tax withholding to be paid by us
on behalf of our employees. As a result, fewer shares are issued than the number of RSUs vested, and the income tax
withholding is recorded as a reduction to additional paid-in capital.
Additionally, SBC includes other stock-based awards, such as performance stock units (PSUs) that include market
conditions and awards that may be settled in cash or the stock of certain Other Bet companies. PSUs and certain awards
granted by Other Bet companies are equity classified and expense is recognized over the requisite service period. Certain
awards granted by Other Bet companies are liability classified and remeasured at fair value through settlement. The fair
value of awards granted by Other Bet companies is based on the equity valuation of the respective Other Bet company.
Advertising and Promotional Expenses
We expense advertising and promotional costs in the period in which they are incurred. For the years ended December 31,
2023, 2024, and 2025, advertising and promotional expenses totaled approximately $8.7 billion, $8.7 billion, and $9.9 billion,
respectively.
54
Alphabet
2025 Annual Report
Part I
Part II
Part III
Part IV
Fair Value Measurements
Fair value is an exit price, representing the amount that would be received to sell an asset or paid to transfer a liability in an
orderly transaction between market participants. Assets and liabilities recorded at fair value are measured and classified
in accordance with a three-tier fair value hierarchy based on the observability of the inputs available in the market used to
measure fair value:
Level 1 - Observable inputs that reflect quoted prices (unadjusted) for identical assets or liabilities in active markets.
Level 2 - Inputs that are based upon quoted prices for similar instruments in active markets, quoted prices for identical
or similar instruments in markets that are not active, and model-based valuation techniques for which all significant
inputs are observable in the market or can be derived from observable market data. Where applicable, these models
project future cash flows and discount the future amounts to a present value using market-based observable inputs
including interest rate curves, foreign exchange rates, and credit ratings.
Level 3 - Unobservable inputs that are supported by little or no market activities.
The fair value hierarchy requires an entity to maximize the use of observable inputs and minimize the use of unobservable
inputs when measuring fair value. The determination of fair value involves the use of appropriate valuation methods and
relevant inputs into valuation models.
Our financial assets and liabilities that are measured at fair value on a recurring basis include cash equivalents, marketable
securities, and derivative financial instruments. Our financial assets measured at fair value on a nonrecurring basis include
non-marketable equity securities. Other financial assets and liabilities are carried at cost with fair value disclosed, if required.
We measure certain other instruments, and certain assets and liabilities acquired in a business combination, also at
fair value on a nonrecurring basis.
Financial Instruments
Our financial instruments include cash, cash equivalents, marketable and non-marketable securities, derivative financial
instruments, financial guarantees, accounts receivable, and convertible notes.
Credit Risks
We are subject to concentration of credit risk primarily from cash equivalents, marketable debt securities, derivative
financial instruments, including foreign exchange contracts, accounts receivable, and convertible notes. We manage the
concentration of our credit risk exposure through timely assessment of our counterparty creditworthiness, credit limits,
and use of collateral management. Foreign exchange contracts are transacted with various financial institutions with
high credit standing. Accounts receivable are typically unsecured and are derived from revenues earned from customers
located around the world. We manage the concentration of our credit risk exposure by performing ongoing evaluations
to determine customer credit and we limit the amount of credit we extend. We generally do not require collateral from
our customers.
Cash Equivalents
We invest excess cash primarily in asset-backed and mortgage-backed securities, corporate debt securities, government
bonds, money market funds, and time deposits.
Marketable Securities
We classify all marketable debt securities that have effective maturities of three months or less from the date of
purchase as cash equivalents and those with effective maturities of greater than three months as marketable securities.
We determine the appropriate classification of our investments in marketable debt securities at the time of purchase
and reevaluate such designation at each balance sheet date. We have classified and accounted for our marketable
debt securities as available-for-sale. After consideration of our risk versus reward objectives, as well as our liquidity
requirements, we may sell these debt securities prior to their effective maturities. As we view these securities as available
to support current operations, we classify highly liquid securities with maturities beyond 12 months as current assets under
the caption marketable securities. We carry these securities at fair value, and report the unrealized gains and losses, net
of taxes, as a component of stockholders’ equity, except for the changes in allowance for expected credit losses, which
55
Alphabet
2025 Annual Report
Part I
Part II
Part III
Part IV
are recorded in OI&E. For certain marketable debt securities we have elected the fair value option, for which changes in
fair value are recorded in OI&E. We determine any realized gains and losses on the sale of marketable debt securities on a
specific identification method, and we record such gains and losses as a component of OI&E.
Our investments in marketable equity securities are measured at fair value with the related gains and losses, including
unrealized, recognized in OI&E.
Non-Marketable Securities
Non-marketable securities primarily consist of equity securities. We account for non-marketable equity securities
through which we exercise significant influence but do not have control over the investee under the equity method. Other
non-marketable equity securities that we hold are primarily accounted for under the measurement alternative. Under the
measurement alternative, the carrying value is measured at cost, less any impairment, plus or minus changes resulting from
observable price changes in orderly transactions for identical or similar investments of the same issuer. Adjustments are
determined primarily based on a market approach as of the transaction date and are recorded as a component of OI&E.
Non-marketable securities that do not have effective contractual maturity dates are classified as other non-current assets.
Derivative Financial Instruments
See Note 3 for the accounting policy pertaining to derivative financial instruments.
Financial Guarantees
In certain arrangements, we provide reimbursements for costs incurred by third parties during power generation project
development phases if specified trigger events occur. We recognize a noncontingent liability for the fair value of our
obligation to stand ready to perform, reported in other long-term liabilities. We also recognize a contingent liability when it
becomes probable that a payment will be required and the amount can be reasonably estimated.
Accounts Receivable
Our payment terms for accounts receivable vary by the types and locations of our customers and the products or services
offered. The term between invoicing and when payment is due is not significant. Additionally, accounts receivable includes
amounts for services performed in advance of the right to invoice the customer.
We maintain an allowance for credit losses for accounts receivable, which is recorded as an offset to accounts receivable,
and changes in such are classified as general and administrative expense. We assess collectibility by reviewing accounts
receivable on a collective basis where similar characteristics exist and on an individual basis when we identify specific
customers with known disputes or collectibility issues. With respect to current accounts receivables, we elected to assume
that current conditions as of the balance sheet date do not change for the remaining life of the asset. In determining the
amount of the allowance for credit losses for those assets, we adjust historical loss information to reflect current market
conditions and customer-specific information to the extent that historical loss information does not reflect current conditions.
Convertible Notes
Our investments in convertible notes are primarily recorded at amortized cost which includes unpaid principal balances,
deferred origination costs, and any related discount or premium, net of allowances for credit losses, and are included within
other non-current assets.
Other
Our financial instruments also include debt and equity investments in companies with which we also entered into
commercial arrangements at or near the same time. For these transactions, judgment is required in assessing
the substance of the arrangements, including assessing whether the components of the arrangements should be
accounted for as separate transactions under the applicable GAAP, and determining the value of the components of the
arrangements, including the fair value of the investments. Additionally, if our investment in such companies becomes
impaired, we may need to re-evaluate the accounting for the commercial arrangement, including reducing any remaining
performance obligations.
56
Alphabet
2025 Annual Report
Part I
Part II
Part III
Part IV
Impairment of Investments
We periodically review our debt securities with unrealized gains and losses recorded as a component of stockholders’
equity and non-marketable equity securities for impairment.
For debt securities in an unrealized loss position, we determine whether a credit loss exists. The credit loss is estimated by
considering available information relevant to the collectibility of the security and information about past events, current
conditions, and reasonable and supportable forecasts. Any credit loss is recorded as a charge to OI&E, not to exceed the
amount of the unrealized loss. Unrealized losses other than the credit loss are recognized in AOCI. If we have an intent
to sell, or if it is more likely than not that we will be required to sell a debt security in an unrealized loss position before
recovery of its amortized cost basis, we will write down the security to its fair value and record the corresponding charge
as a component of OI&E.
For non-marketable equity securities, including equity method investments, we consider whether impairment indicators
exist by evaluating the companies’ financial and liquidity position and access to capital resources, among other indicators.
If the assessment indicates that the investment is impaired, we write down the investment to its fair value by recording
the corresponding charge as a component of OI&E. We prepare quantitative measurements of the fair value of our equity
investments using a market approach or an income approach.
Inventory
Inventory consists primarily of finished goods and is stated at the lower of cost and net realizable value. Cost is generally
computed using the first-in, first-out method.
Variable Interest Entities
We determine at the inception of each arrangement whether an entity in which we have made an investment or in which
we have other variable interests is considered a variable interest entity (VIE). We consolidate VIEs when we are the primary
beneficiary. We are the primary beneficiary of a VIE when we have the power to direct activities that most significantly
affect the economic performance of the VIE and have the obligation to absorb the majority of their losses or benefits. If
we are not the primary beneficiary in a VIE, we account for the investment or other variable interests in a VIE in accordance
with applicable GAAP.
Periodically, we assess whether any changes in our interest or relationship with the entity affect our determination of
whether the entity is a VIE and, if so, whether we are the primary beneficiary.
Property and Equipment
Property and equipment is comprised of technical infrastructure, office space, corporate and other assets currently
in service, and assets not yet in service. Technical infrastructure includes data center land, buildings and leasehold
improvements, and servers and network equipment. Office space includes office land, buildings, and leasehold
improvements. Assets not yet in service are those that are not ready for their intended use, including data center buildings
and servers in the process of construction or assembly.
Property and equipment are stated at cost less accumulated depreciation. Depreciation commences once assets are ready
for their intended use and is recorded using the straight-line method over the estimated useful lives of the assets, which
we regularly evaluate for factors such as technological obsolescence and our planned use and utilization. We depreciate
data center and office buildings over periods of seven to 40 years. We depreciate servers and network equipment generally
over a period of six years. We depreciate corporate and other assets over periods of two to 25 years. We depreciate
leasehold improvements over the shorter of the remaining lease term or the estimated useful lives of the assets. Land is
not depreciated.
Goodwill
We allocate goodwill to reporting units based on the expected benefit from the business combination. We evaluate our
reporting units periodically, as well as when changes in our operating segments occur. For changes in reporting units, we
reassign goodwill using a relative fair value allocation approach. We test our goodwill for impairment at least annually, or
more frequently if events or changes in circumstances indicate that the asset may be impaired. Goodwill impairments were
not material for the periods presented.
57
Alphabet
2025 Annual Report
Part I
Part II
Part III
Part IV
Leases
We determine if an arrangement is a lease at inception. Our lease agreements generally contain lease and non-lease
components. Payments under our lease arrangements are primarily fixed. Non-lease components primarily include
payments for maintenance and utilities. We combine fixed payments for non-lease components with lease payments and
account for them together as a single lease component which increases the amount of our lease assets and liabilities.
Certain lease agreements contain variable payments, which are expensed as incurred and not included in the lease
assets and liabilities. These amounts primarily include payments affected by the Consumer Price Index, and payments for
maintenance and utilities.
Lease assets and liabilities are recognized at the present value of the future lease payments at the lease commencement
date. The interest rate used to determine the present value of the future lease payments is our incremental borrowing
rate, because the interest rate implicit in our leases is not readily determinable. Our incremental borrowing rate is
estimated to approximate the interest rate on a collateralized basis with similar terms and payments, and in economic
environments where the leased asset is located. Our lease terms and payments include periods under options to purchase,
extend, or terminate the lease when it is reasonably certain that we will exercise that option. We generally use the base,
non-cancelable, lease term when determining the lease assets and liabilities. Lease assets also include any prepaid lease
payments and lease incentives.
The current portion of our operating lease liabilities is included in accrued expenses and other current liabilities, and the
long-term portion is included in operating lease liabilities. Finance lease assets are included in property and equipment,
net. Finance lease liabilities are included in accrued expenses and other current liabilities or other long-term liabilities.
Operating lease expense (excluding variable lease costs) is recognized on a straight-line basis over the lease term. Finance
lease expense is recognized on a straight-line basis over the shorter of the lease term or the useful life of the asset, and
interest expense is recognized based on the incremental borrowing rate.
Impairment of Long-Lived Assets
We review leases, property and equipment, and intangible assets, excluding goodwill, for impairment when events or
changes in circumstances indicate the carrying amount may not be recoverable. The evaluation is performed at the lowest
level of identifiable cash flows independent of other assets. We measure recoverability of these assets by comparing the
carrying amounts to the future undiscounted cash flows that the assets or the asset group are expected to generate. If the
carrying value of the assets or asset group is not recoverable, the impairment recognized is measured as the amount by
which the carrying value exceeds its fair value.
Income Taxes
We account for income taxes using the asset and liability method, under which we recognize the amount of taxes payable
or refundable for the current year and deferred tax assets and liabilities for the future tax consequences of events that
have been recognized in our financial statements or tax returns. We measure current and deferred tax assets and liabilities
based on provisions of enacted tax law. We evaluate the likelihood of future realization of our deferred tax assets based on
all available evidence and establish a valuation allowance to reduce deferred tax assets when it is more likely than not that
they will not be realized or release a valuation allowance to increase deferred tax assets when it is more likely than not that
they will be realized. We have elected to account for the tax effects of the global intangible low tax income provision as a
current period expense.
We recognize the financial statement effects of a tax position when it is more likely than not that, based on technical
merits, the position will be sustained upon examination. The tax benefits of the position recognized in the financial
statements are then measured based on the largest amount of benefit that is greater than 50% likely to be realized upon
settlement with a taxing authority. In addition, we recognize interest and penalties related to unrecognized tax benefits as a
component of the income tax provision.
58
Alphabet
2025 Annual Report
Part I
Part II
Part III
Part IV
Business Combinations
We include the results of operations of the businesses that we acquire as of the acquisition date. We allocate the purchase
price of the acquisitions to the assets acquired and liabilities assumed based on their estimated fair values, except for
revenue contracts acquired, which are recognized in accordance with our revenue recognition policy. The excess of the
purchase price over the fair values of identifiable assets and liabilities is recorded as goodwill. Acquisition-related expenses
are recognized separately from the business combination and are expensed as incurred.
Foreign Currency
We translate the financial statements of our international subsidiaries to US dollars using month-end exchange rates for
assets and liabilities, and average rates for the period derived from month-end exchange rates for revenues, costs, and
expenses. We record translation gains and losses in AOCI as a component of stockholders’ equity. We reflect net foreign
exchange transaction gains and losses resulting from the conversion of the transaction currency to functional currency as
a component of foreign currency exchange gain (loss) in OI&E.
Recently Issued Accounting Pronouncements Not Yet Adopted
In November 2024, the Financial Accounting Standards Board (FASB) issued Accounting Standards Update (ASU) 2024-03
“Income Statement: Reporting Comprehensive Income-Expense Disaggregation Disclosures (Subtopic 220-40)” to
improve the disclosures about an entity’s expenses. Upon adoption, we will be required to disclose in the notes to the
financial statements a disaggregation of certain expense categories included within the relevant expense captions on
the consolidated statements of income. The standard is effective for our 2027 annual period, and our interim periods
beginning in 2028, with early adoption permitted. The standard can be applied either prospectively or retrospectively. We
are currently assessing adoption timing, the method of adoption, and the effect that the updated standard will have on our
financial statement disclosures.
In September 2025, the FASB issued ASU 2025-06 “Intangibles: Goodwill and Other-Internal-Use Software (Subtopic 350‑40):
Targeted Improvements to the Accounting for Internal-Use Software” to modernize the accounting for software costs under
Subtopic 350-40, Intangibles-Goodwill and Other-Internal-Use Software (referred to as “internal-use software”). Upon
adoption, we will be required to account for internal-use software under the updated capitalization criteria. The standard
is effective for our interim and annual 2028 periods, with early adoption permitted. The standard can be applied either
prospectively, retrospectively, or under a modified transition approach. We are currently assessing adoption timing, the
method of adoption, and the effect that the updated standard will have on our consolidated financial statements.
Recently Adopted Accounting Pronouncements
In December 2023, the FASB issued ASU 2023-09 “Income Taxes (Topics 740): Improvements to Income Tax Disclosures”
which expands the disclosure requirements for income taxes. We adopted this ASU for our 2025 annual period with the
comparative periods updated to reflect additional disclosures. See Note 14 for the revised disclosures consistent with the
new standard.
Prior Period Reclassifications
Certain amounts in prior periods have been reclassified to conform with current period presentation.
59
Alphabet
2025 Annual Report
Part I
Part II
Part III
Part IV
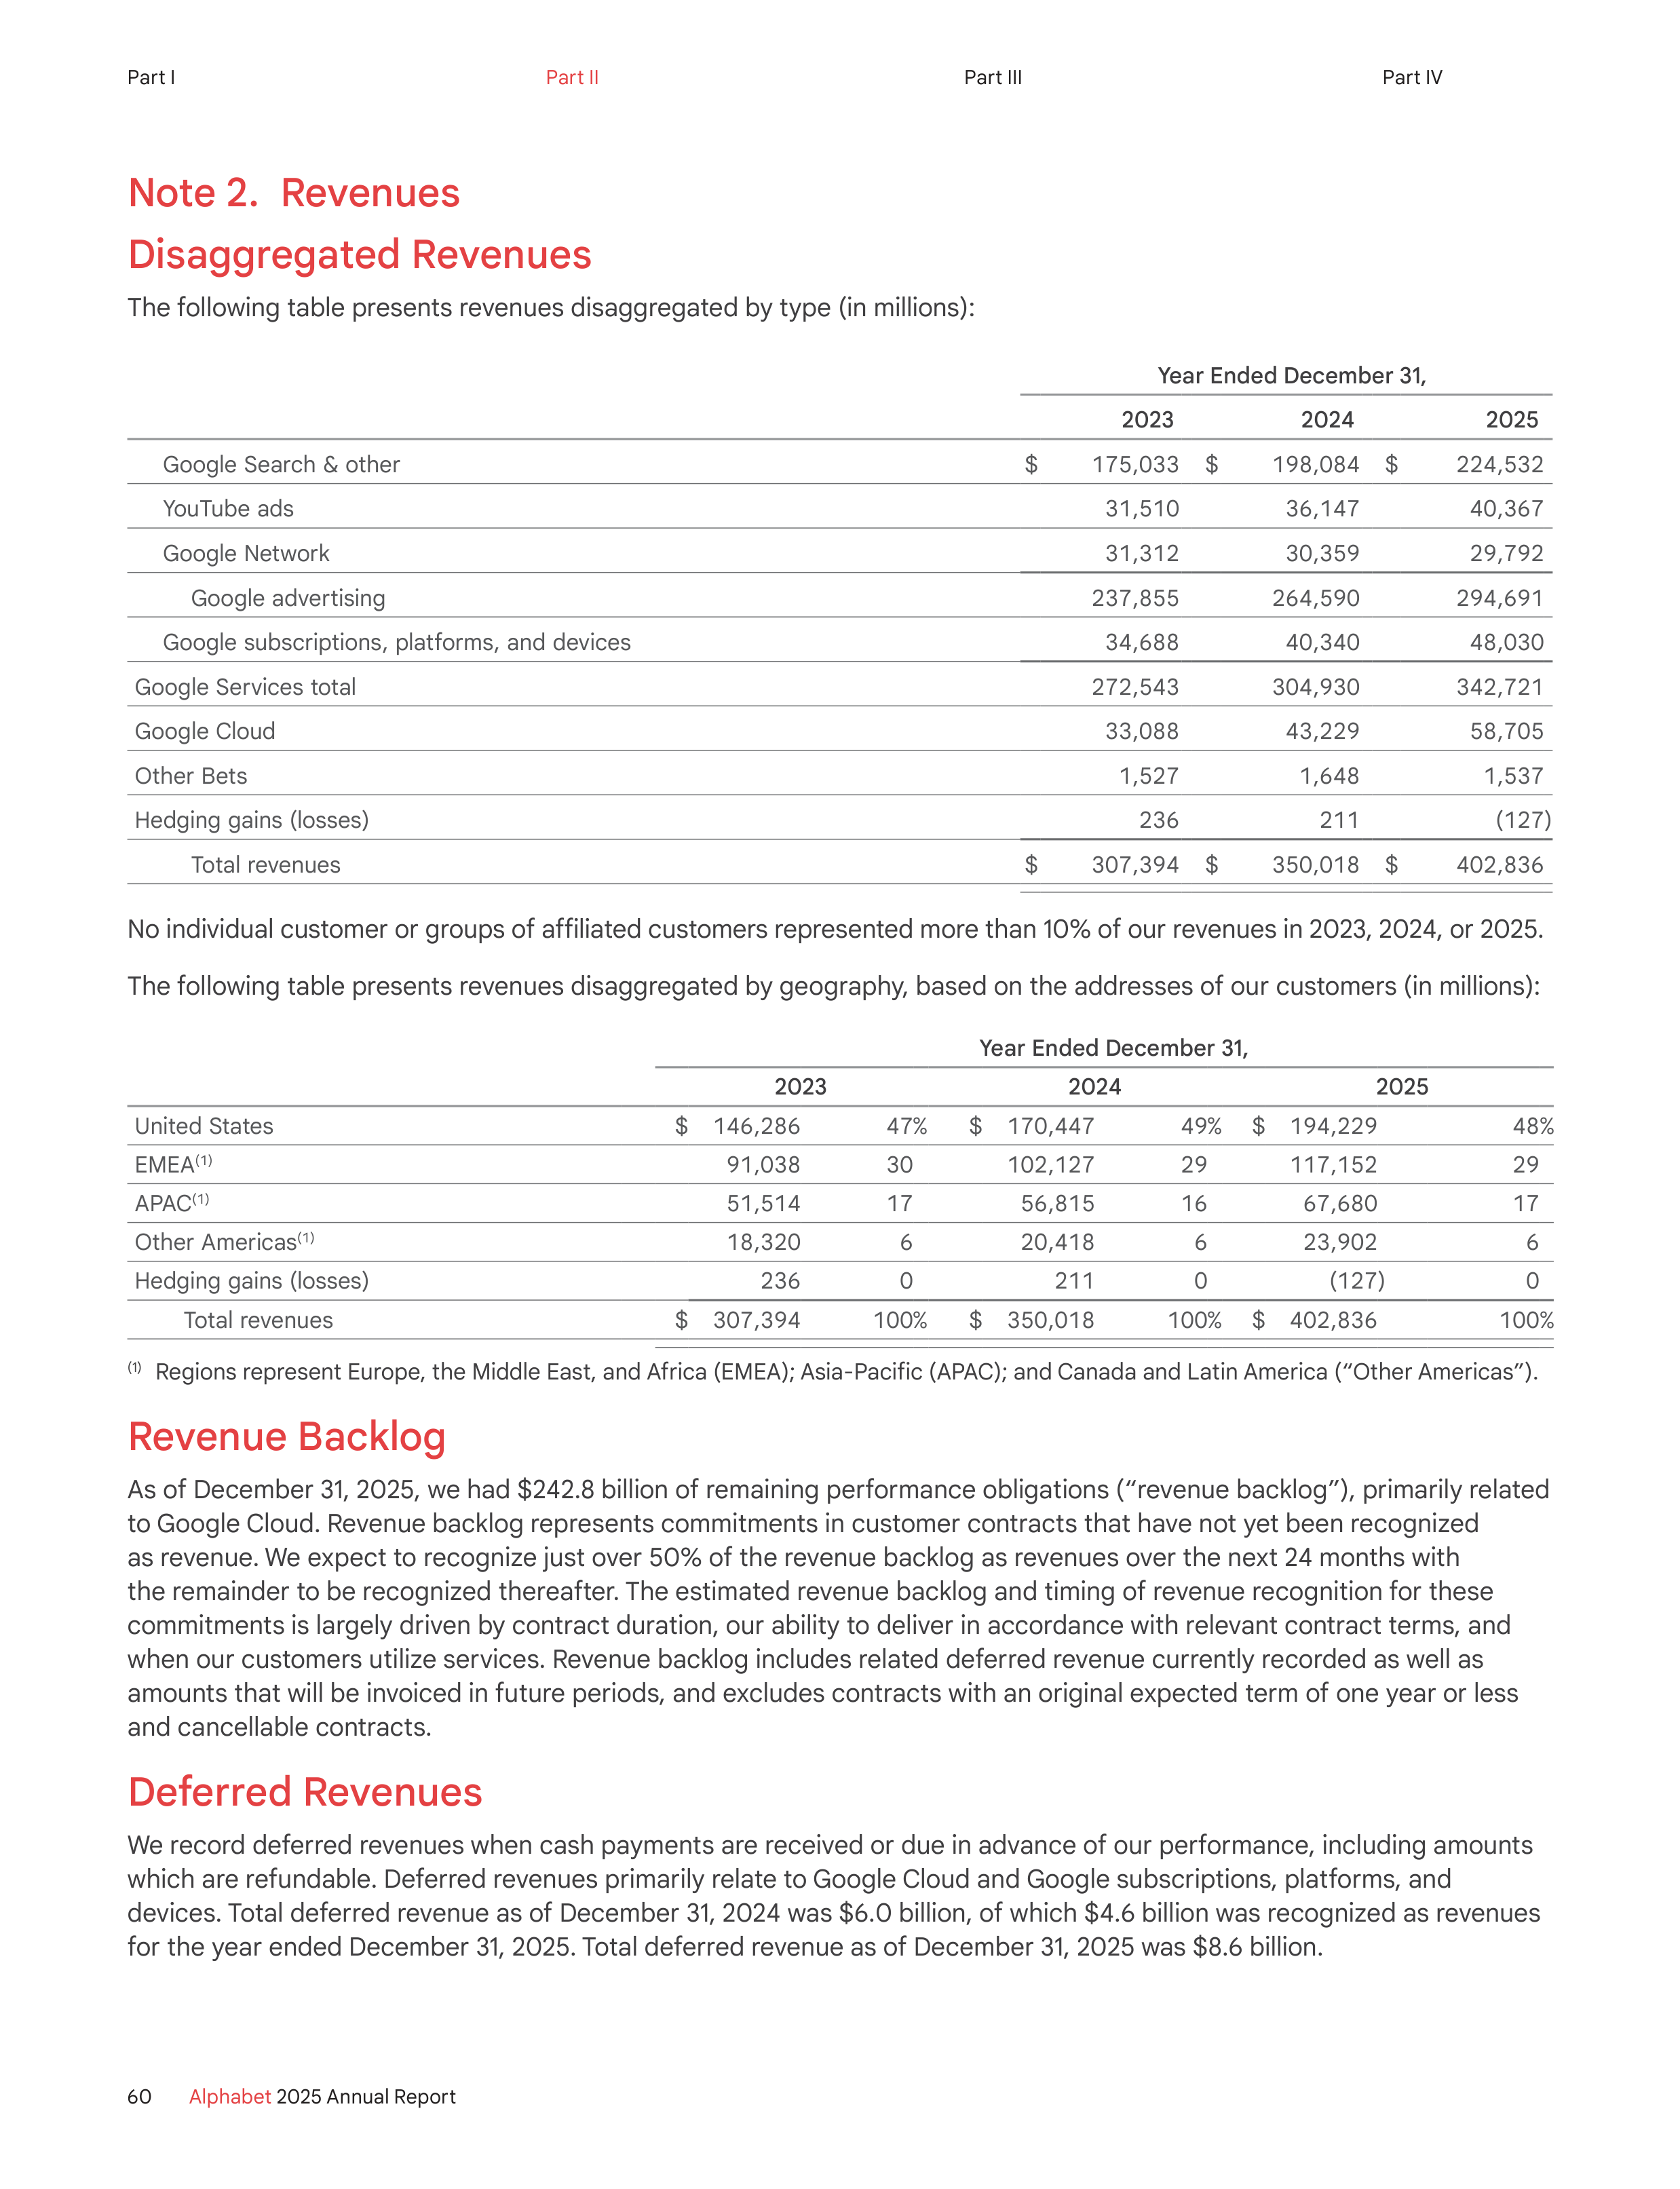
Note 2. Revenues
Disaggregated Revenues
The following table presents revenues disaggregated by type (in millions):
Year Ended December 31,
2023
2024
2025
Google Search & other
$
175,033
$
198,084
$
224,532
YouTube ads
31,510
36,147
40,367
Google Network
31,312
30,359
29,792
Google advertising
237,855
264,590
294,691
Google subscriptions, platforms, and devices
34,688
40,340
48,030
Google Services total
272,543
304,930
342,721
Google Cloud
33,088
43,229
58,705
Other Bets
1,527
1,648
1,537
Hedging gains (losses)
236
211
(127)
Total revenues
$
307,394
$
350,018
$
402,836
No individual customer or groups of affiliated customers represented more than 10% of our revenues in 2023, 2024, or 2025.
The following table presents revenues disaggregated by geography, based on the addresses of our customers (in millions):
Year Ended December 31,
2023
2024
2025
United States
$
146,286
47 %
$
170,447
49 %
$
194,229
48 %
EMEA
(1)
91,038
30
102,127
29
117,152
29
APAC
(1)
51,514
17
56,815
16
67,680
17
Other Americas
(1)
18,320
6
20,418
6
23,902
6
Hedging gains (losses)
236
0
211
0
(127)
0
Total revenues
$
307,394
100 %
$
350,018
100 %
$
402,836
100 %
(1)
Regions represent Europe, the Middle East, and Africa (EMEA); Asia-Pacific (APAC); and Canada and Latin America (“Other Americas”).
Revenue Backlog
As of December 31, 2025, we had $242.8 billion of remaining performance obligations (“revenue backlog”), primarily related
to Google Cloud. Revenue backlog represents commitments in customer contracts that have not yet been recognized
as revenue. We expect to recognize just over 50% of the revenue backlog as revenues over the next 24 months with
the remainder to be recognized thereafter. The estimated revenue backlog and timing of revenue recognition for these
commitments is largely driven by contract duration, our ability to deliver in accordance with relevant contract terms, and
when our customers utilize services. Revenue backlog includes related deferred revenue currently recorded as well as
amounts that will be invoiced in future periods, and excludes contracts with an original expected term of one year or less
and cancellable contracts.
Deferred Revenues
We record deferred revenues when cash payments are received or due in advance of our performance, including amounts
which are refundable. Deferred revenues primarily relate to Google Cloud and Google subscriptions, platforms, and
devices. Total deferred revenue as of December 31, 2024 was $6.0 billion, of which $4.6 billion was recognized as revenues
for the year ended December 31, 2025. Total deferred revenue as of December 31, 2025 was $8.6 billion.
60
Alphabet
2025 Annual Report
Part I
Part II
Part III
Part IV
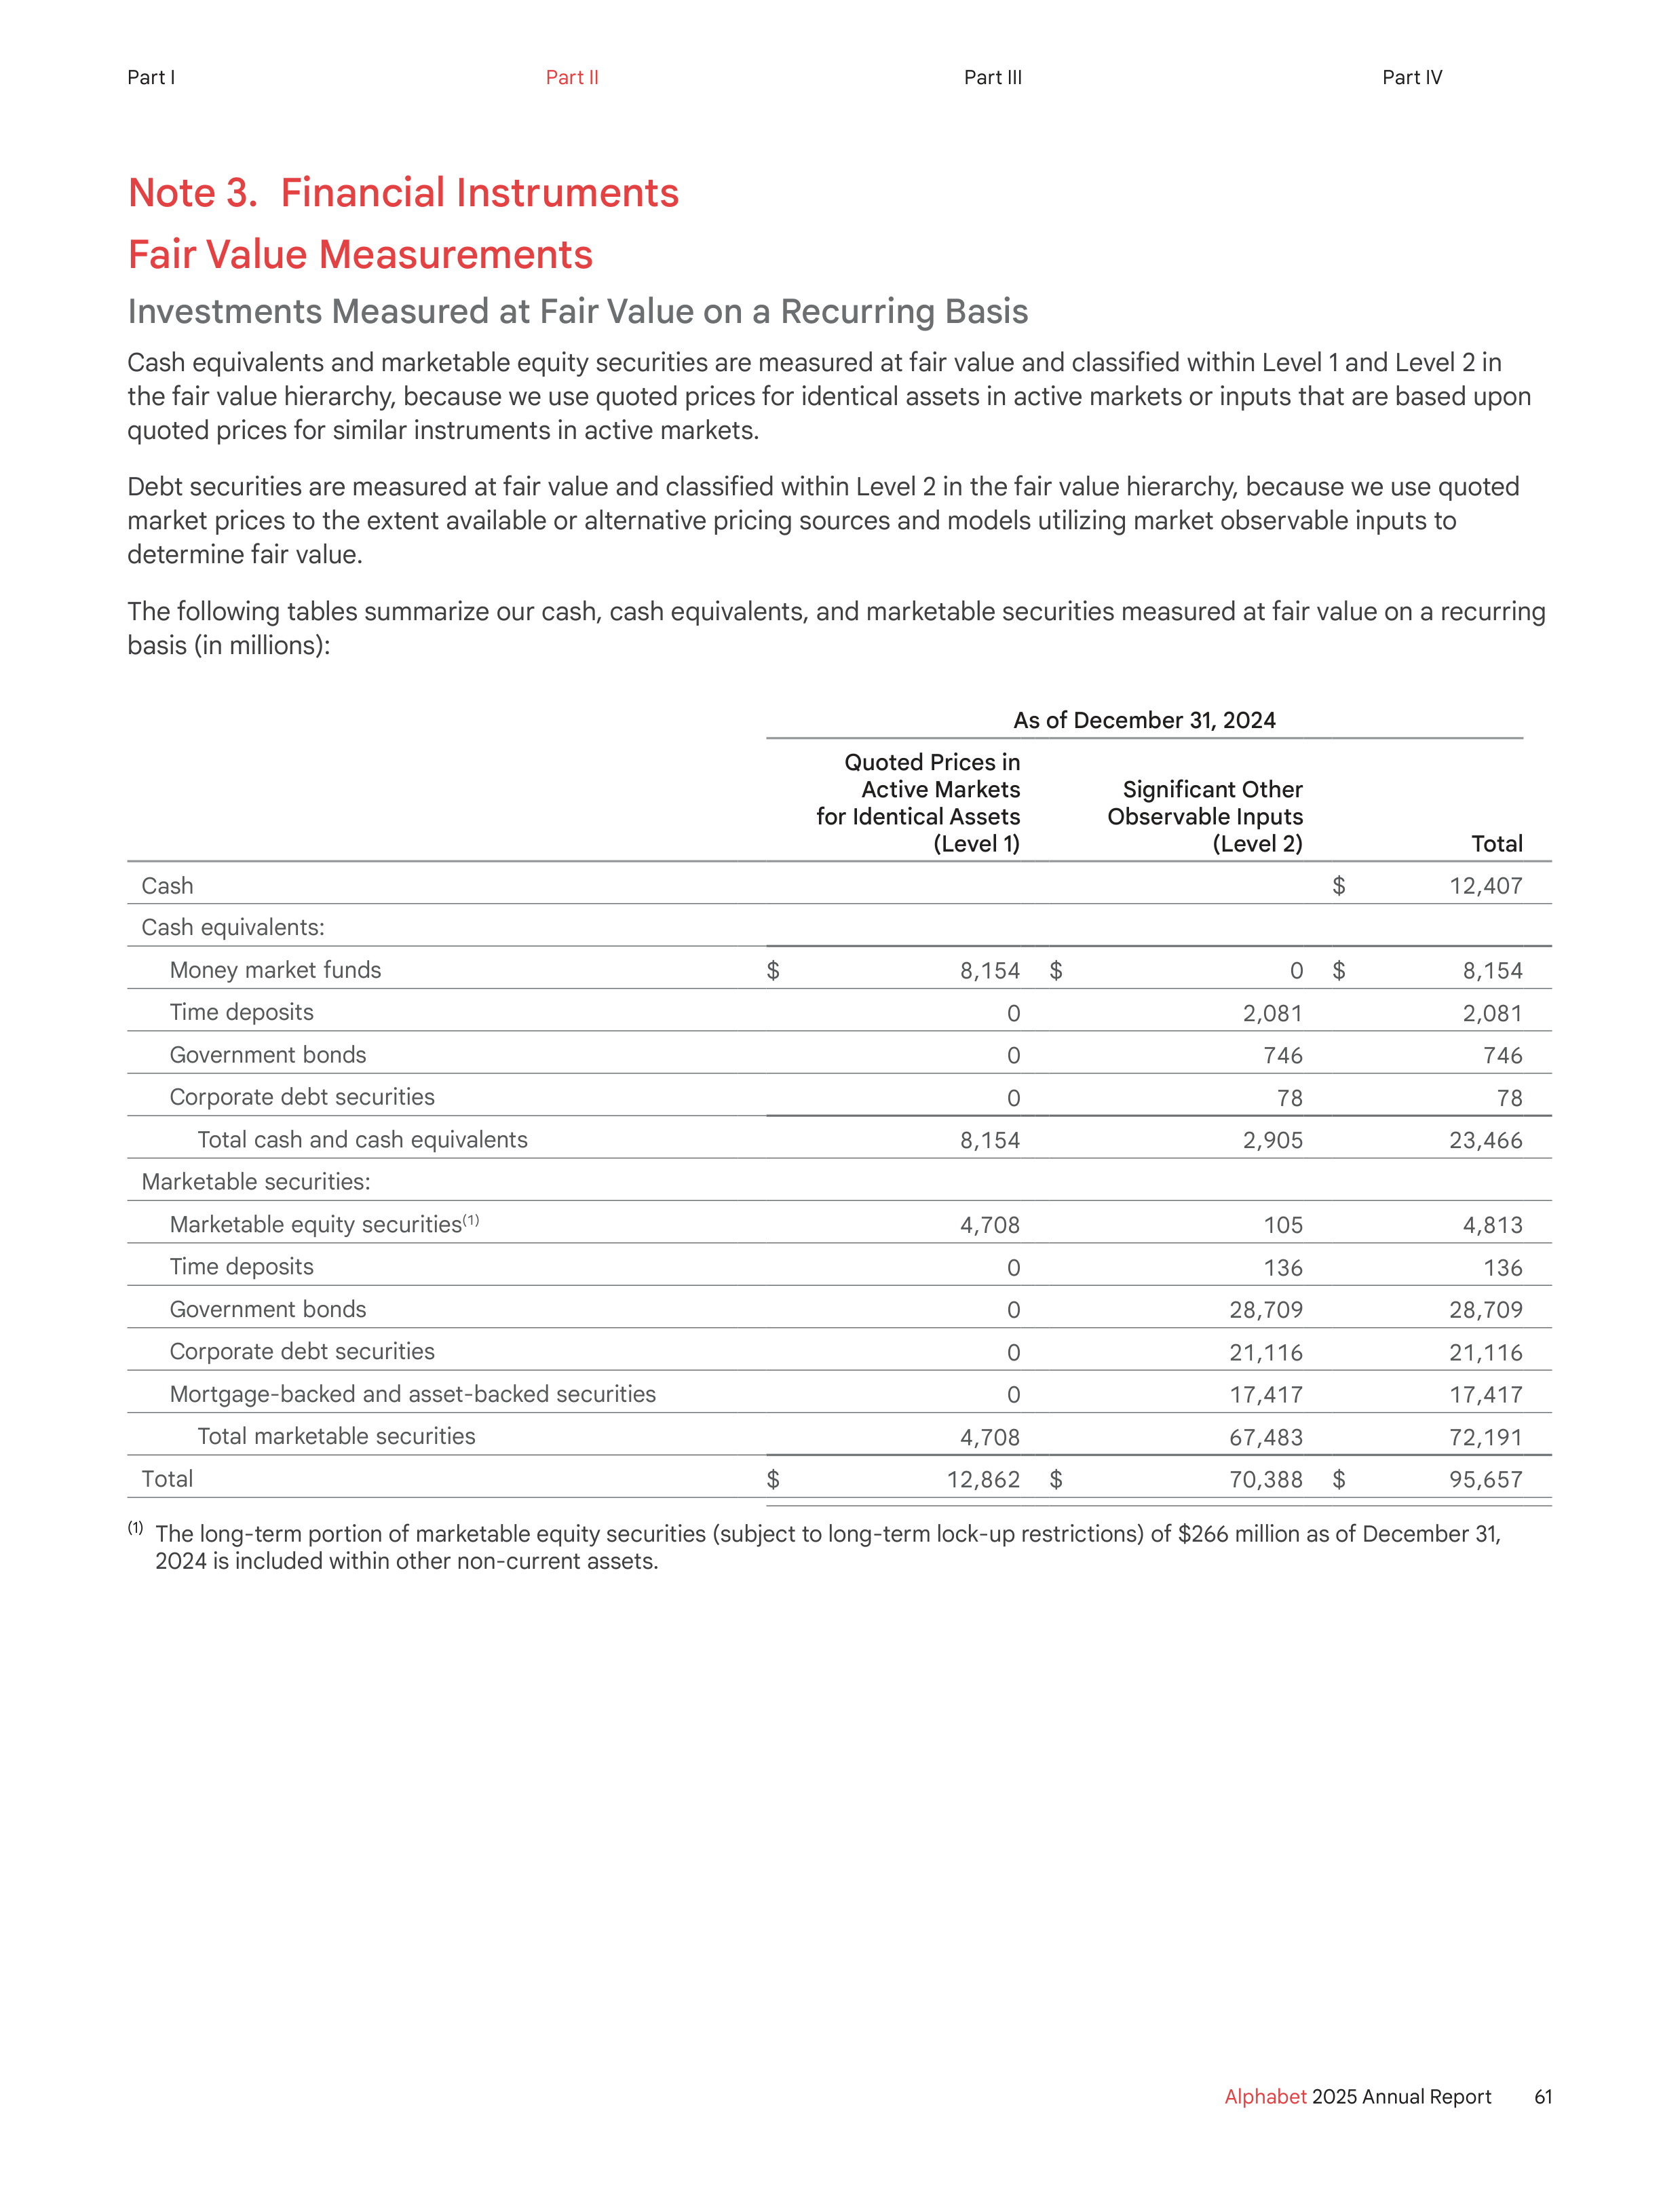
Note 3. Financial Instruments
Fair Value Measurements
Investments Measured at Fair Value on a Recurring Basis
Cash equivalents and marketable equity securities are measured at fair value and classified within Level 1 and Level 2 in
the fair value hierarchy, because we use quoted prices for identical assets in active markets or inputs that are based upon
quoted prices for similar instruments in active markets.
Debt securities are measured at fair value and classified within Level 2 in the fair value hierarchy, because we use quoted
market prices to the extent available or alternative pricing sources and models utilizing market observable inputs to
determine fair value.
The following tables summarize our cash, cash equivalents, and marketable securities measured at fair value on a recurring
basis (in millions):
As of December 31, 2024
Quoted Prices in
Active Markets
for Identical Assets
(Level 1)
Significant Other
Observable Inputs
(Level 2)
Total
Cash
$
12,407
Cash equivalents:
Money market funds
$
8,154
$
0
$
8,154
Time deposits
0
2,081
2,081
Government bonds
0
746
746
Corporate debt securities
0
78
78
Total cash and cash equivalents
8,154
2,905
23,466
Marketable securities:
Marketable equity securities
(1)
4,708
105
4,813
Time deposits
0
136
136
Government bonds
0
28,709
28,709
Corporate debt securities
0
21,116
21,116
Mortgage-backed and asset-backed securities
0
17,417
17,417
Total marketable securities
4,708
67,483
72,191
Total
$
12,862
$
70,388
$
95,657
(1)
The long-term portion of marketable equity securities (subject to long-term lock-up restrictions) of $266 million as of December 31,
2024 is included within other non-current assets.
61
Alphabet
2025 Annual Report
Part I
Part II
Part III
Part IV
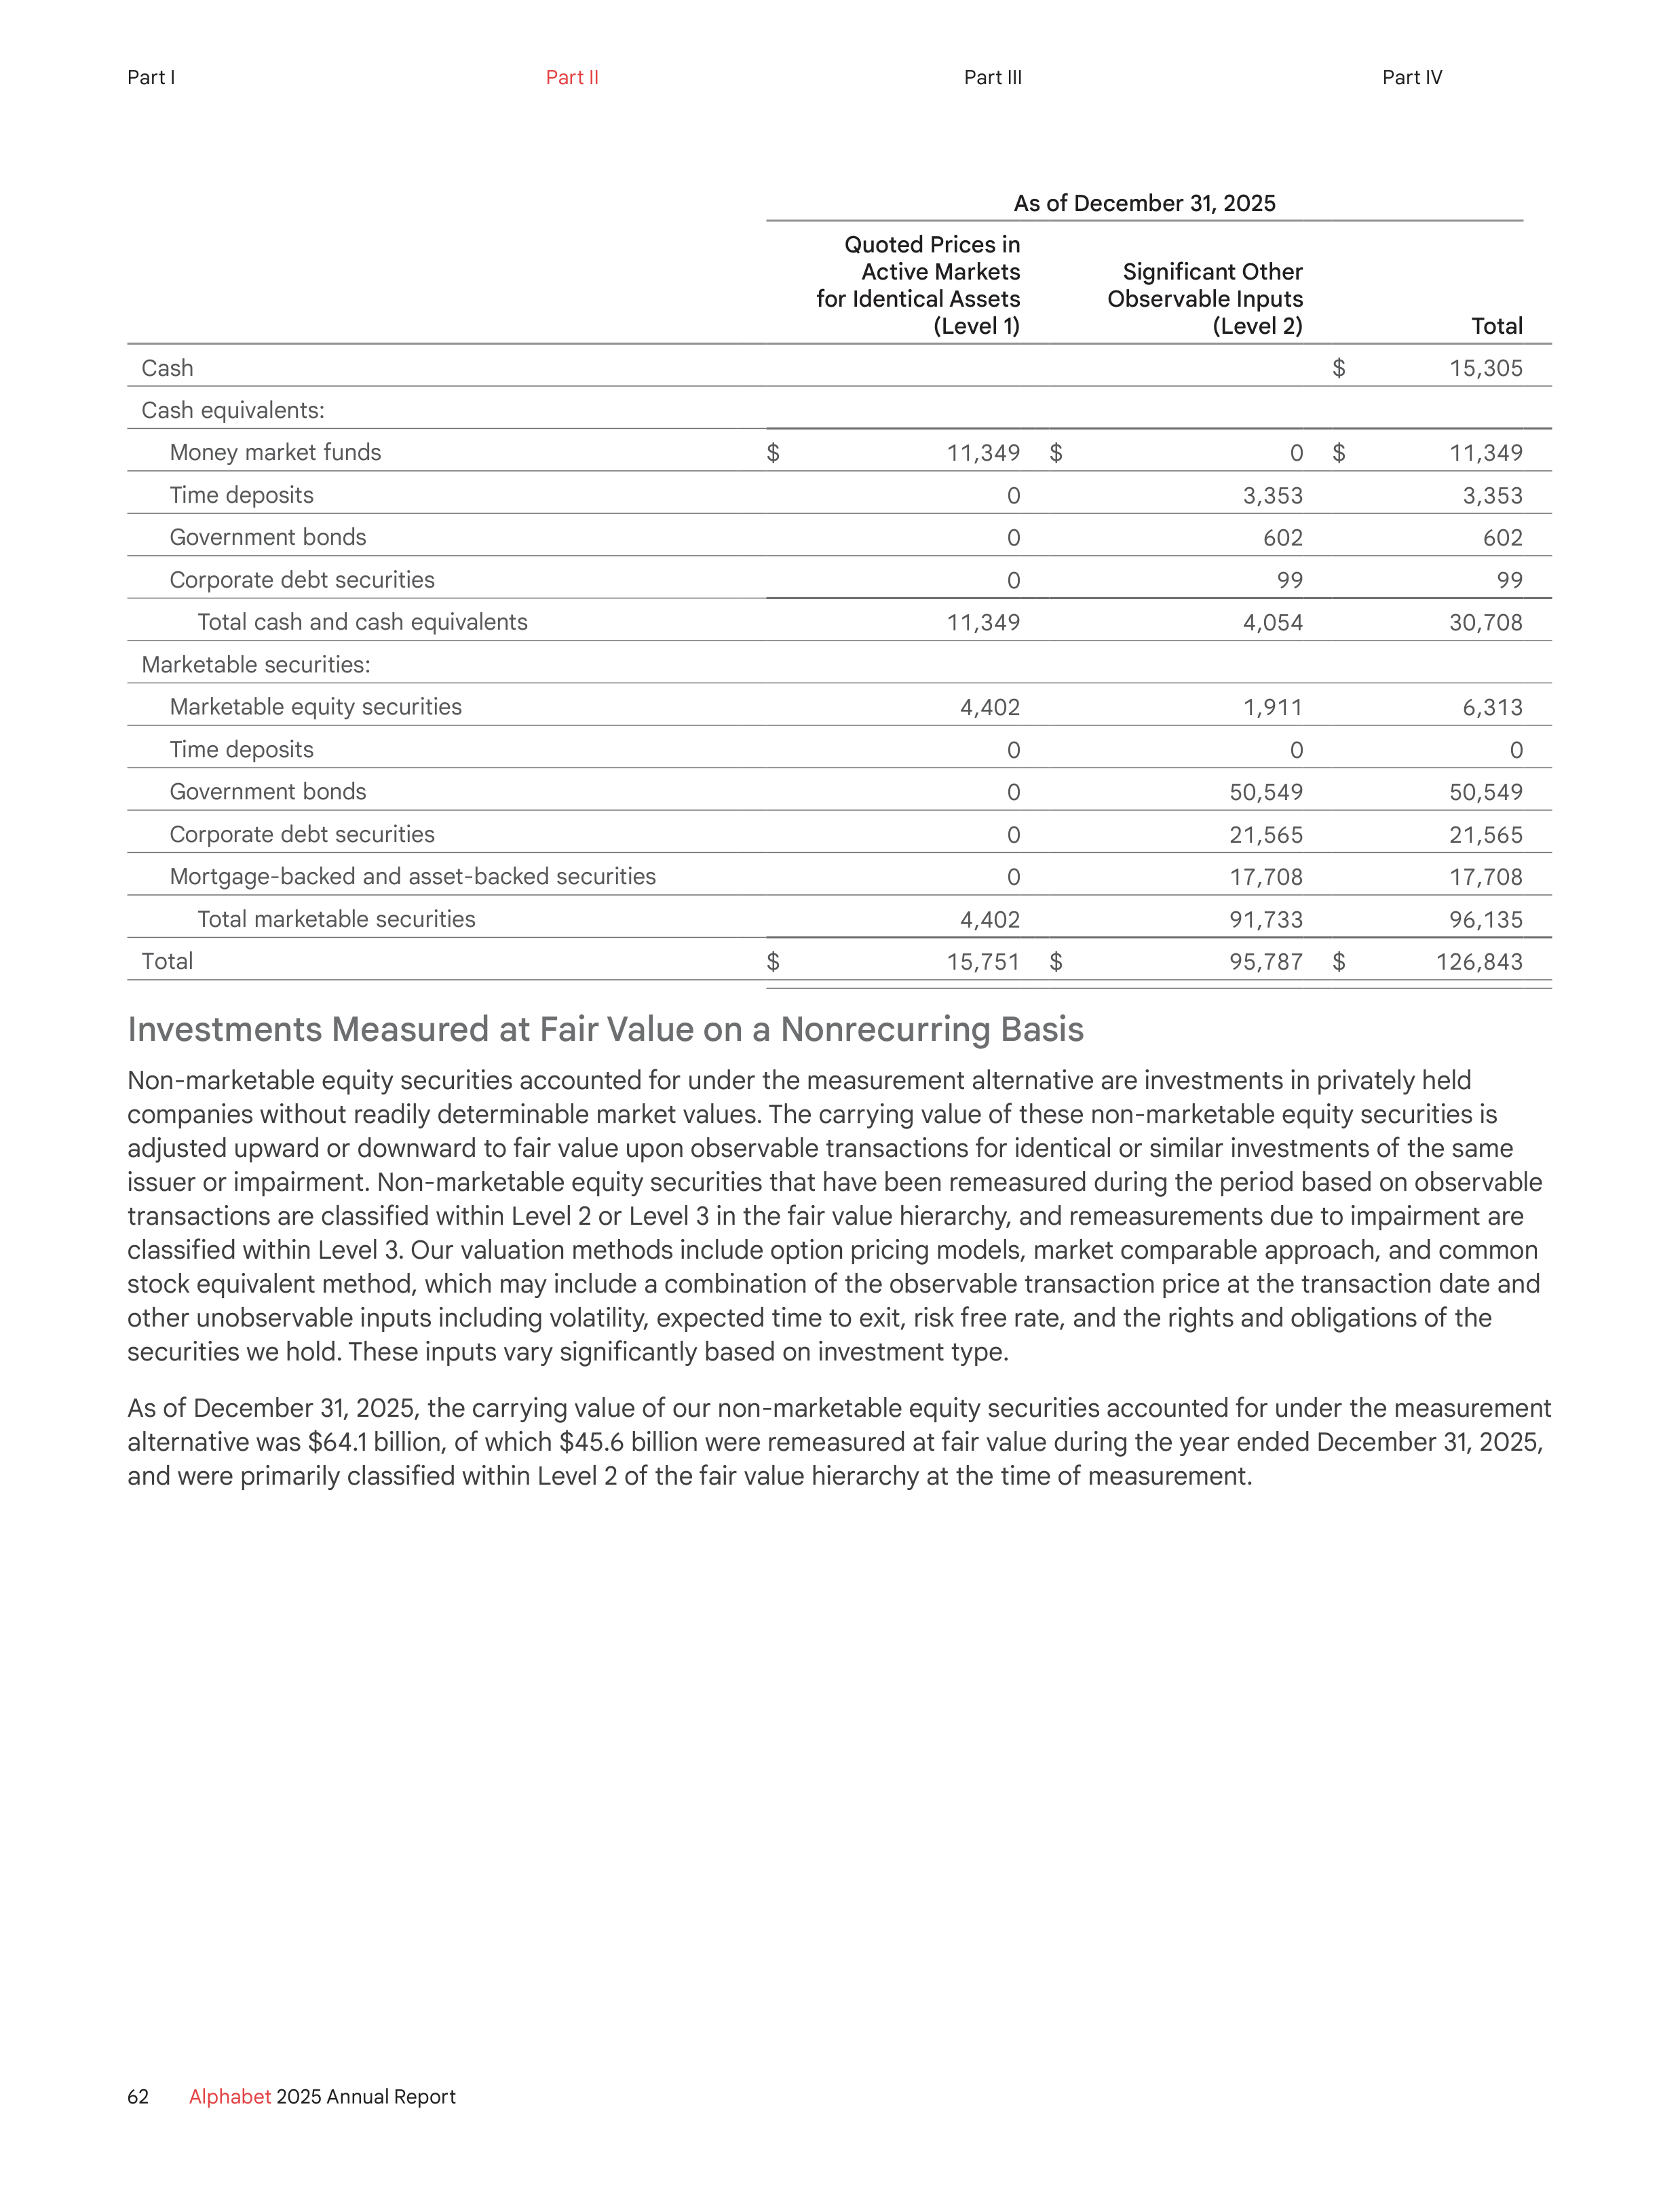
As of December 31, 2025
Quoted Prices in
Active Markets
for Identical Assets
(Level 1)
Significant Other
Observable Inputs
(Level 2)
Total
Cash
$
15,305
Cash equivalents:
Money market funds
$
11,349
$
0
$
11,349
Time deposits
0
3,353
3,353
Government bonds
0
602
602
Corporate debt securities
0
99
99
Total cash and cash equivalents
11,349
4,054
30,708
Marketable securities:
Marketable equity securities
4,402
1,911
6,313
Time deposits
0
0
0
Government bonds
0
50,549
50,549
Corporate debt securities
0
21,565
21,565
Mortgage-backed and asset-backed securities
0
17,708
17,708
Total marketable securities
4,402
91,733
96,135
Total
$
15,751
$
95,787
$
126,843
Investments Measured at Fair Value on a Nonrecurring Basis
Non-marketable equity securities accounted for under the measurement alternative are investments in privately held
companies without readily determinable market values. The carrying value of these non-marketable equity securities is
adjusted upward or downward to fair value upon observable transactions for identical or similar investments of the same
issuer or impairment. Non-marketable equity securities that have been remeasured during the period based on observable
transactions are classified within Level 2 or Level 3 in the fair value hierarchy, and remeasurements due to impairment are
classified within Level 3. Our valuation methods include option pricing models, market comparable approach, and common
stock equivalent method, which may include a combination of the observable transaction price at the transaction date and
other unobservable inputs including volatility, expected time to exit, risk free rate, and the rights and obligations of the
securities we hold. These inputs vary significantly based on investment type.
As of December 31, 2025, the carrying value of our non-marketable equity securities accounted for under the measurement
alternative was $64.1 billion, of which $45.6 billion were remeasured at fair value during the year ended December 31, 2025,
and were primarily classified within Level 2 of the fair value hierarchy at the time of measurement.
62
Alphabet
2025 Annual Report
Part I
Part II
Part III
Part IV
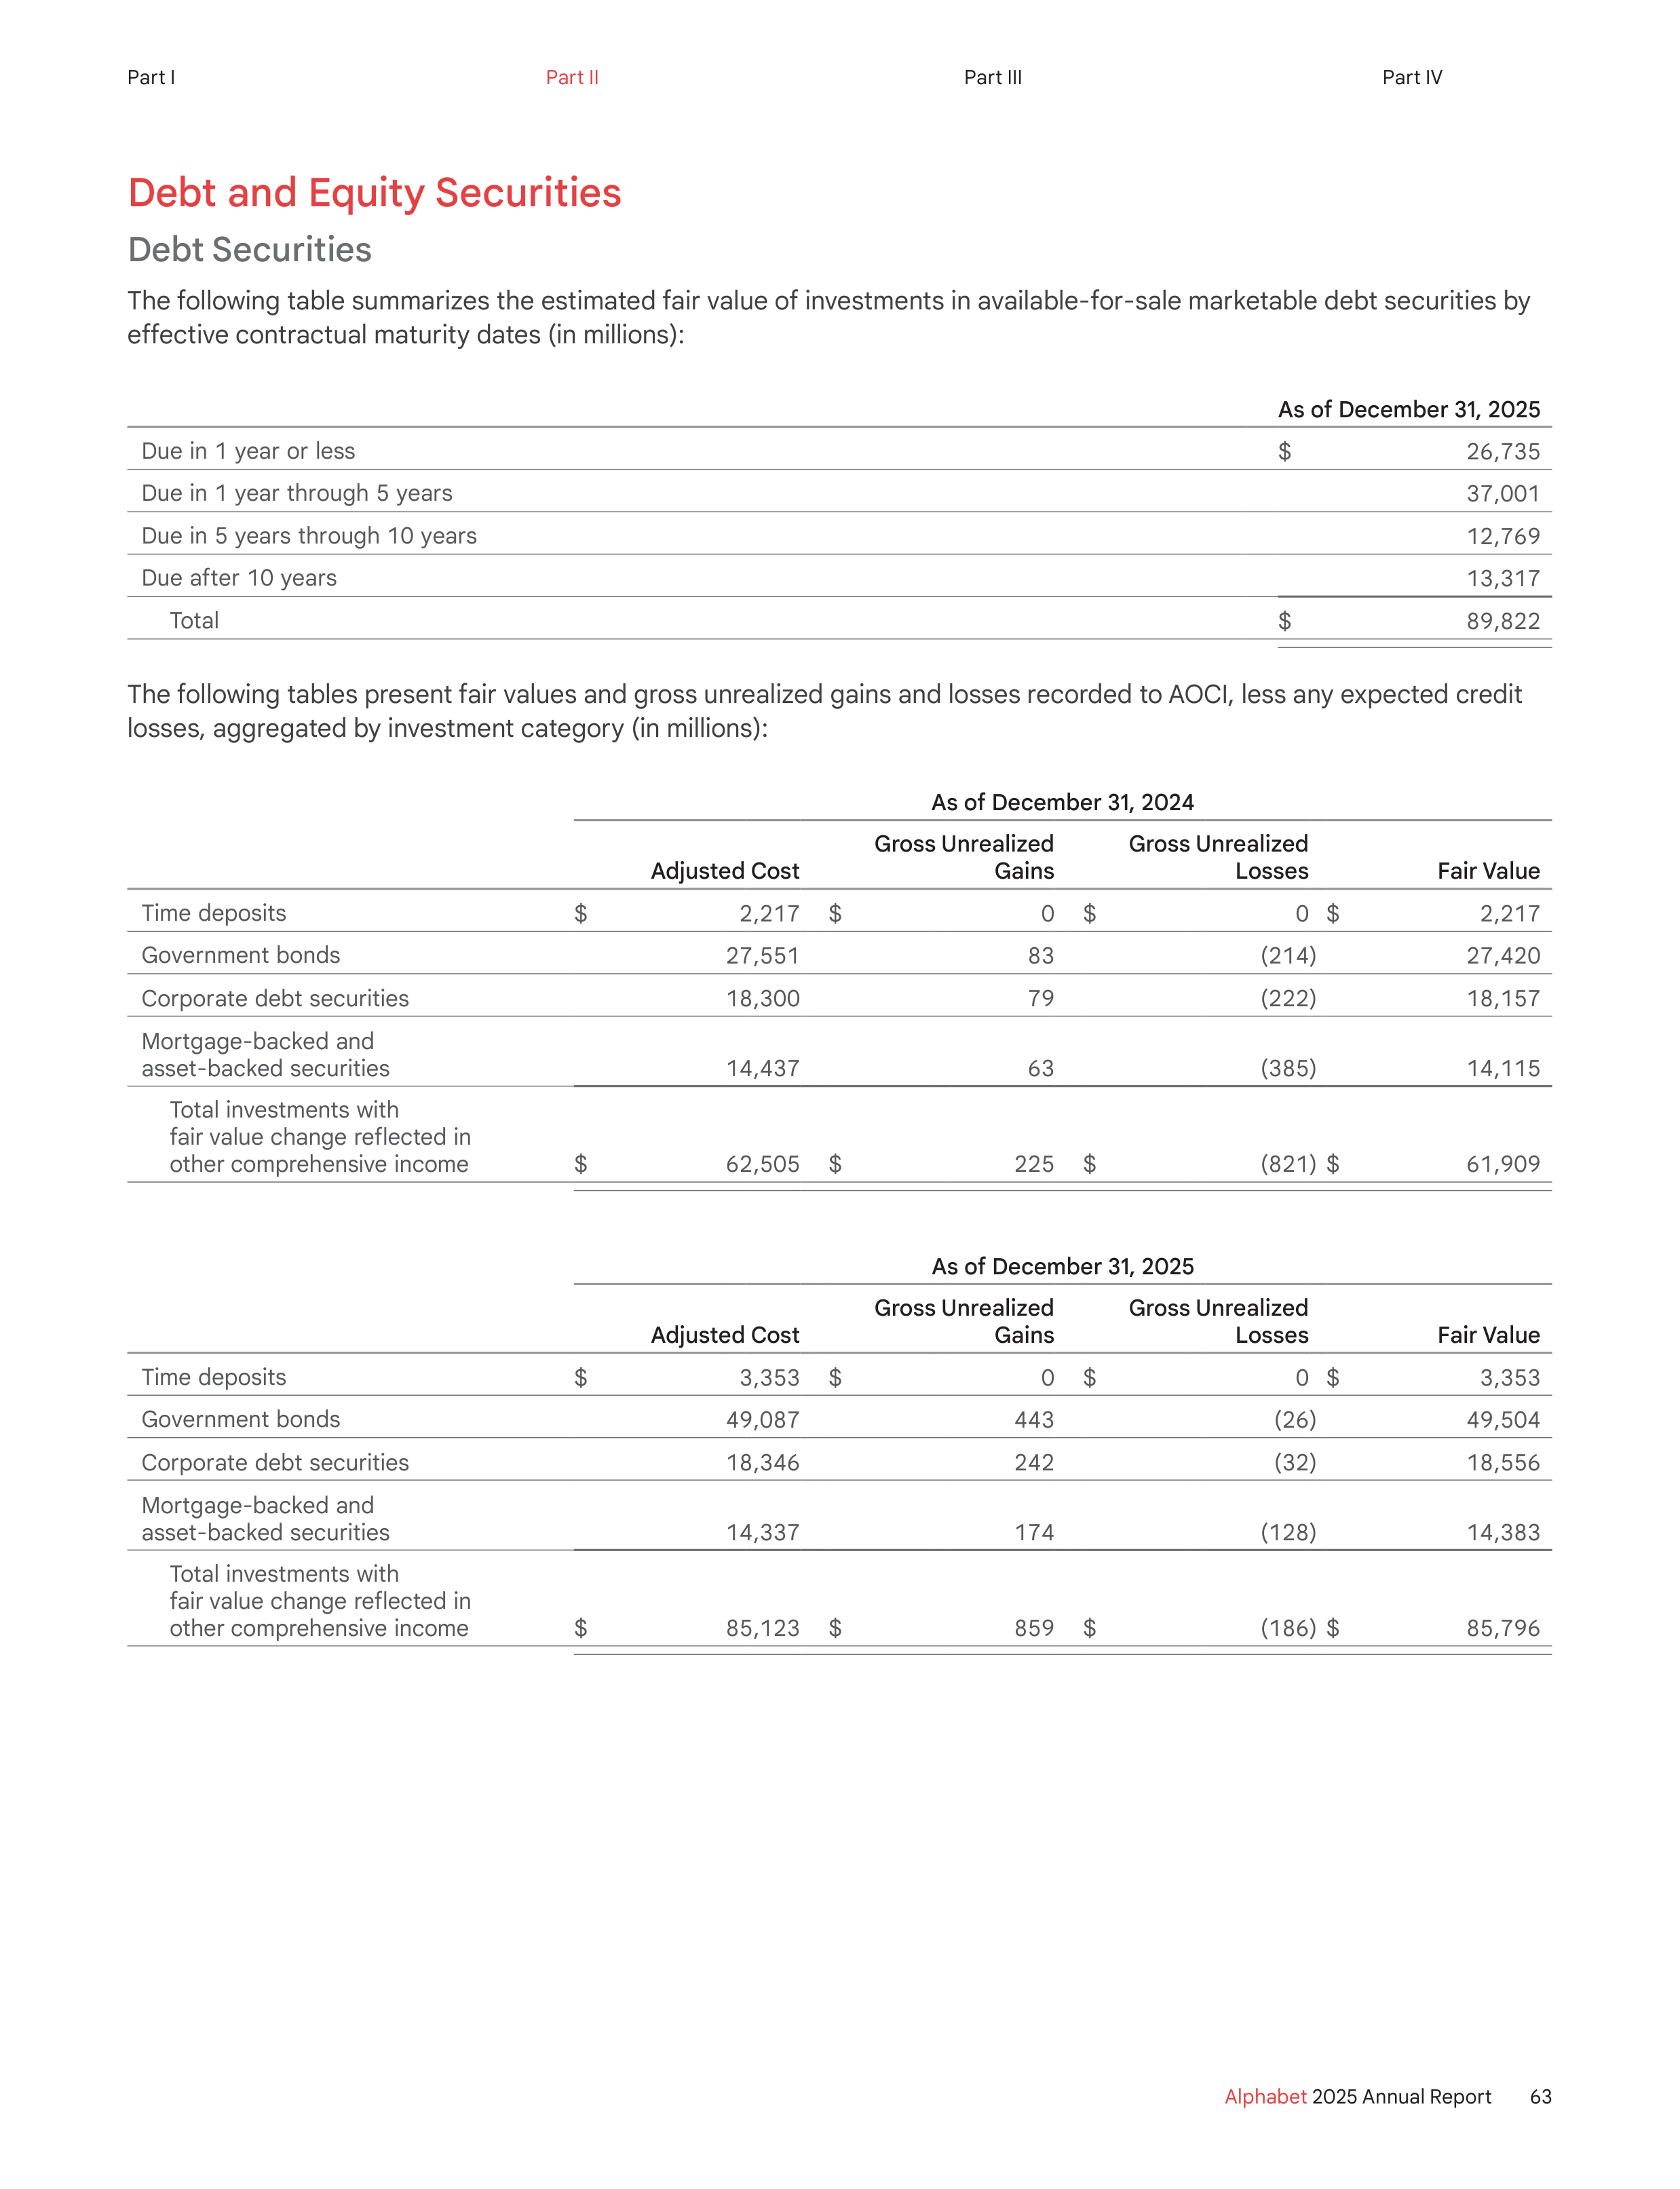
Debt and Equity Securities
Debt Securities
The following table summarizes the estimated fair value of investments in available-for-sale marketable debt securities by
effective contractual maturity dates (in millions):
As of December 31, 2025
Due in 1 year or less
$
26,735
Due in 1 year through 5 years
37,001
Due in 5 years through 10 years
12,769
Due after 10 years
13,317
Total
$
89,822
The following tables present fair values and gross unrealized gains and losses recorded to AOCI, less any expected credit
losses, aggregated by investment category (in millions):
As of December 31, 2024
Adjusted Cost
Gross Unrealized
Gains
Gross Unrealized
Losses
Fair Value
Time deposits
$
2,217
$
0
$
0
$
2,217
Government bonds
27,551
83
(214)
27,420
Corporate debt securities
18,300
79
(222)
18,157
Mortgage-backed and
asset-backed securities
14,437
63
(385)
14,115
Total investments with
fair value change reflected in
other comprehensive income
$
62,505
$
225
$
(821)
$
61,909
As of December 31, 2025
Adjusted Cost
Gross Unrealized
Gains
Gross Unrealized
Losses
Fair Value
Time deposits
$
3,353
$
0
$
0
$
3,353
Government bonds
49,087
443
(26)
49,504
Corporate debt securities
18,346
242
(32)
18,556
Mortgage-backed and
asset-backed securities
14,337
174
(128)
14,383
Total investments with
fair value change reflected in
other comprehensive income
$
85,123
$
859
$
(186)
$
85,796
63
Alphabet
2025 Annual Report
Part I
Part II
Part III
Part IV
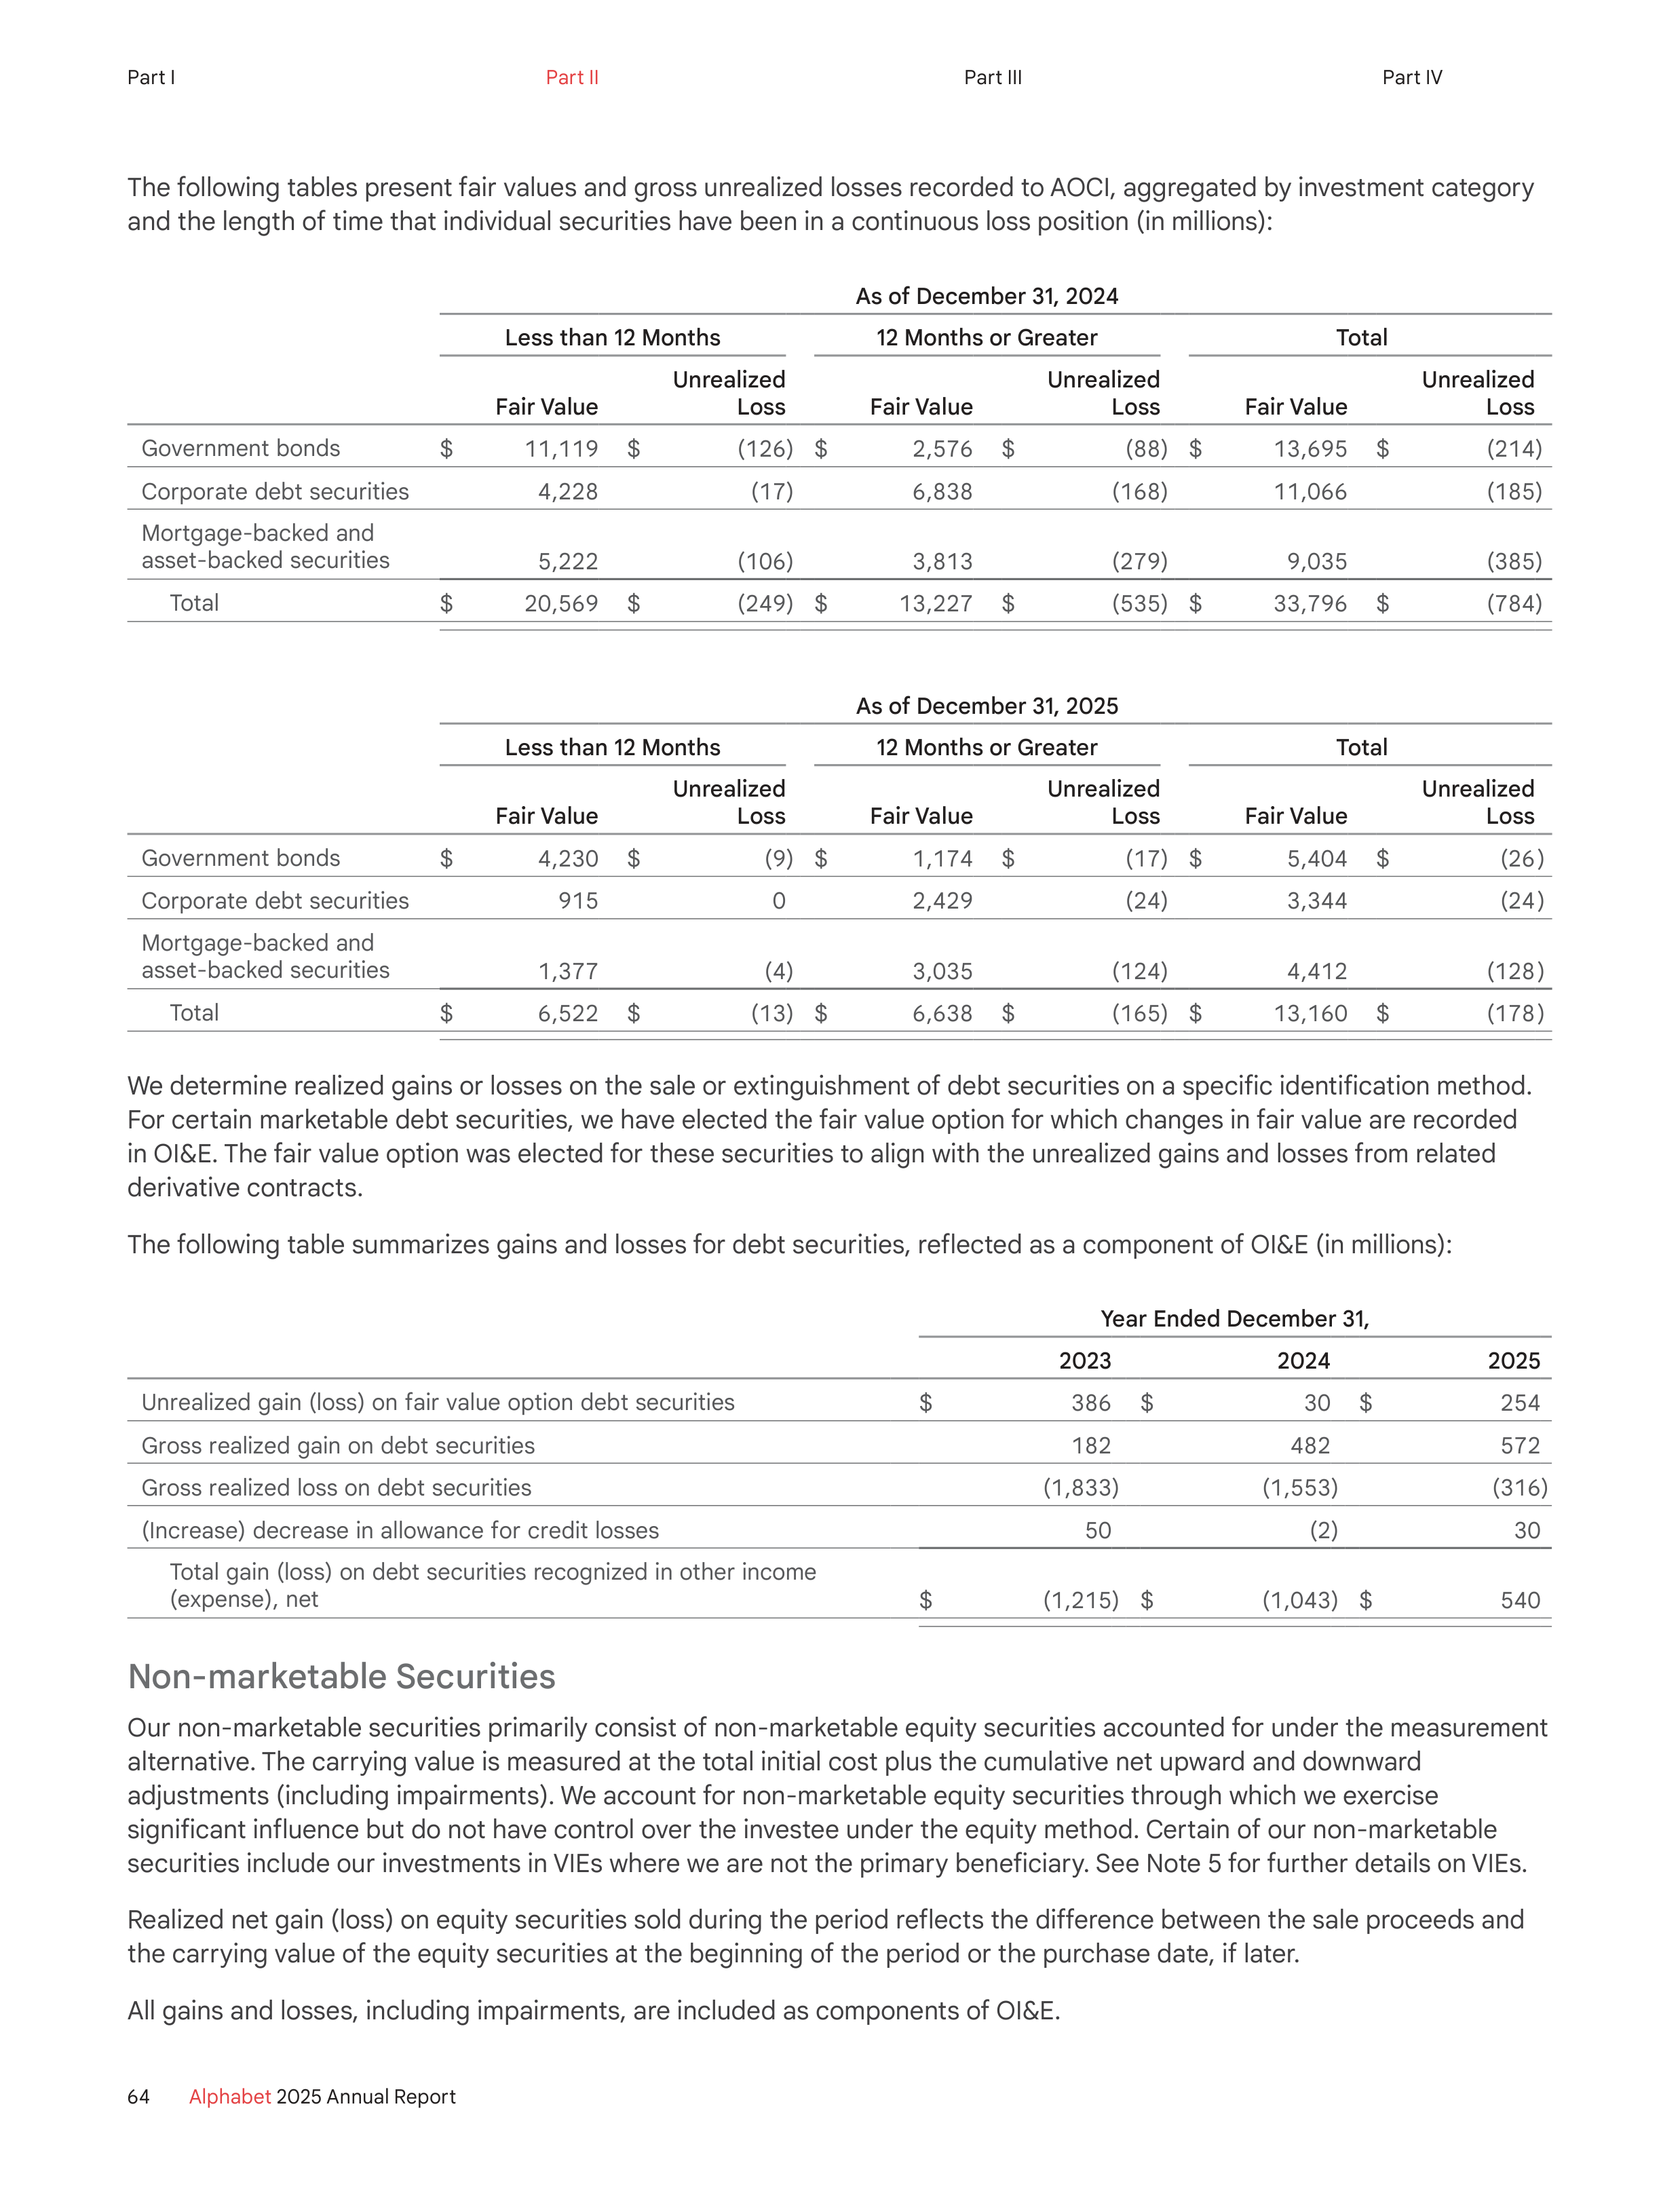
The following tables present fair values and gross unrealized losses recorded to AOCI, aggregated by investment category
and the length of time that individual securities have been in a continuous loss position (in millions):
As of December 31, 2024
Less than 12 Months
12 Months or Greater
Total
Fair Value
Unrealized
Loss
Fair Value
Unrealized
Loss
Fair Value
Unrealized
Loss
Government bonds
$
11,119
$
(126)
$
2,576
$
(88)
$
13,695
$
(214)
Corporate debt securities
4,228
(17)
6,838
(168)
11,066
(185)
Mortgage-backed and
asset-backed securities
5,222
(106)
3,813
(279)
9,035
(385)
Total
$
20,569
$
(249)
$
13,227
$
(535)
$
33,796
$
(784)
As of December 31, 2025
Less than 12 Months
12 Months or Greater
Total
Fair Value
Unrealized
Loss
Fair Value
Unrealized
Loss
Fair Value
Unrealized
Loss
Government bonds
$
4,230
$
(9)
$
1,174
$
(17)
$
5,404
$
(26)
Corporate debt securities
915
0
2,429
(24)
3,344
(24)
Mortgage-backed and
asset-backed securities
1,377
(4)
3,035
(124)
4,412
(128)
Total
$
6,522
$
(13)
$
6,638
$
(165)
$
13,160
$
(178)
We determine realized gains or losses on the sale or extinguishment of debt securities on a specific identification method.
For certain marketable debt securities, we have elected the fair value option for which changes in fair value are recorded
in OI&E. The fair value option was elected for these securities to align with the unrealized gains and losses from related
derivative contracts.
The following table summarizes gains and losses for debt securities, reflected as a component of OI&E (in millions):
Year Ended December 31,
2023
2024
2025
Unrealized gain (loss) on fair value option debt securities
$
386
$
30
$
254
Gross realized gain on debt securities
182
482
572
Gross realized loss on debt securities
(1,833)
(1,553)
(316)
(Increase) decrease in allowance for credit losses
50
(2)
30
Total gain (loss) on debt securities recognized in other income
(expense), net
$
(1,215)
$
(1,043)
$
540
Non-marketable Securities
Our non-marketable securities primarily consist of non-marketable equity securities accounted for under the measurement
alternative. The carrying value is measured at the total initial cost plus the cumulative net upward and downward
adjustments (including impairments). We account for non-marketable equity securities through which we exercise
significant influence but do not have control over the investee under the equity method. Certain of our non-marketable
securities include our investments in VIEs where we are not the primary beneficiary. See Note 5 for further details on VIEs.
Realized net gain (loss) on equity securities sold during the period reflects the difference between the sale proceeds and
the carrying value of the equity securities at the beginning of the period or the purchase date, if later.
All gains and losses, including impairments, are included as components of OI&E.
64
Alphabet
2025 Annual Report
Part I
Part II
Part III
Part IV
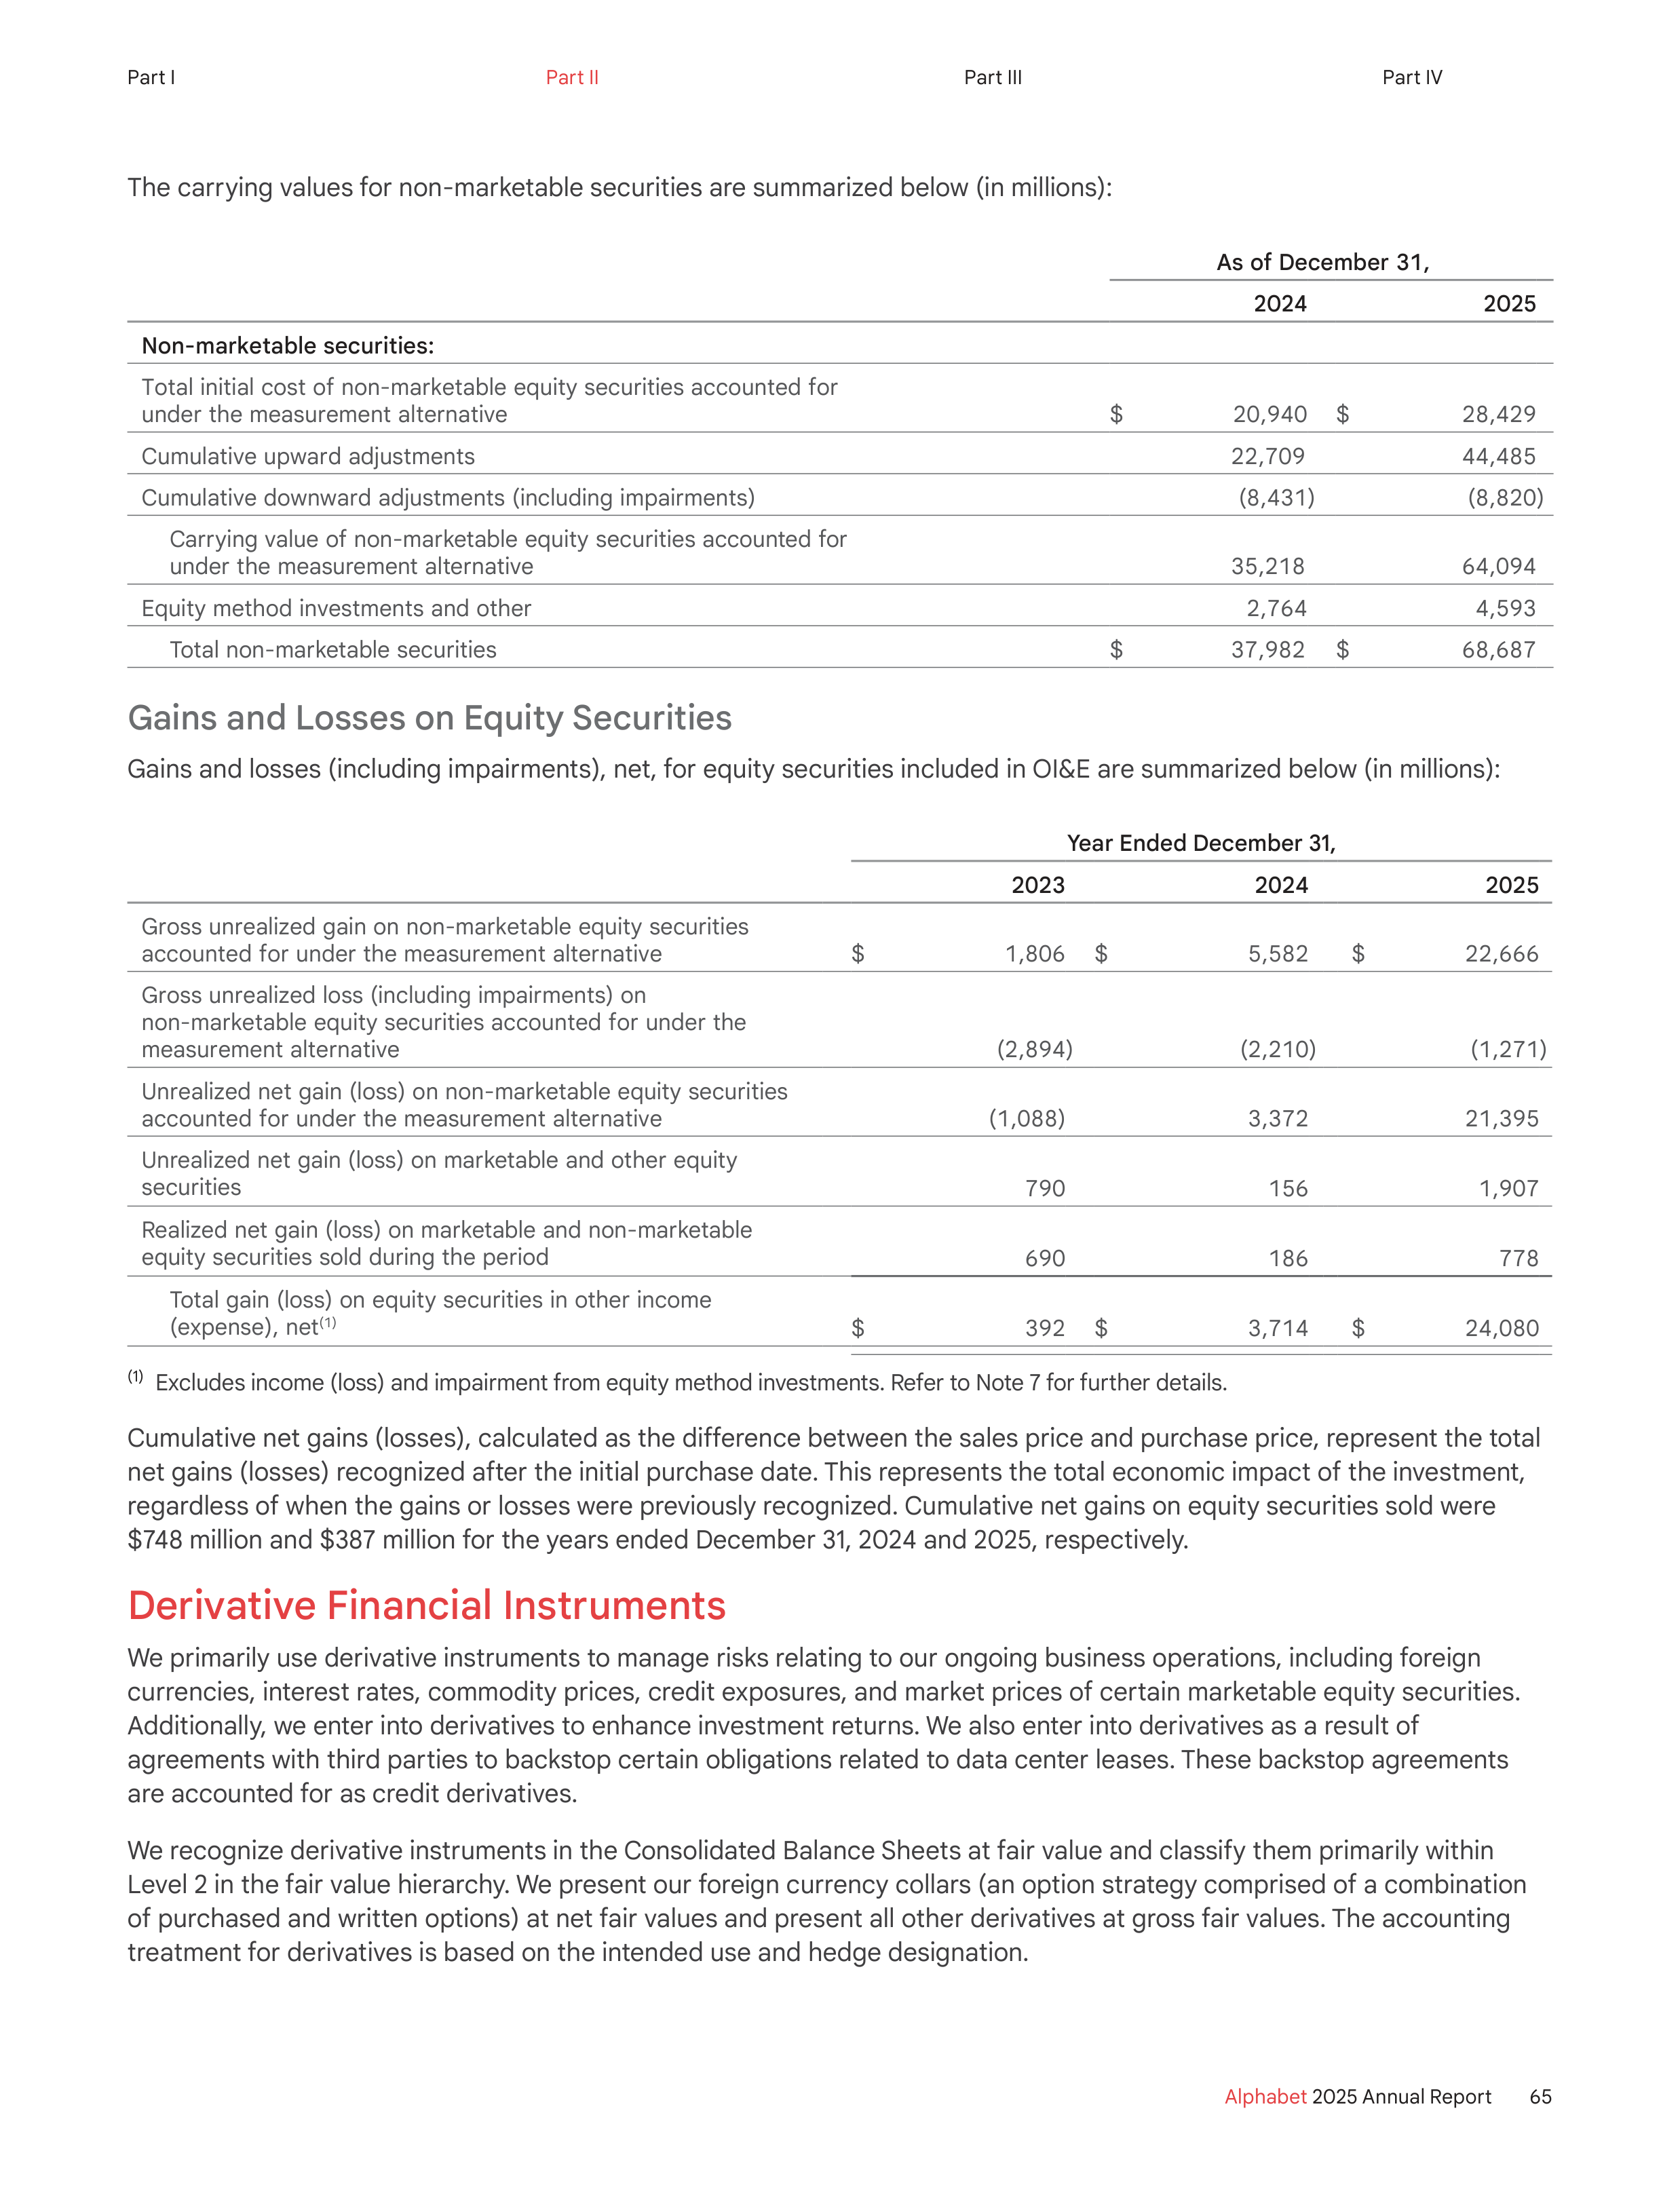
The carrying values for non-marketable securities are summarized below (in millions):
As of December 31,
2024
2025
Non-marketable securities:
Total initial cost of non-marketable equity securities accounted for
under the measurement alternative
$
20,940
$
28,429
Cumulative upward adjustments
22,709
44,485
Cumulative downward adjustments (including impairments)
(8,431)
(8,820)
Carrying value of non-marketable equity securities accounted for
under the measurement alternative
35,218
64,094
Equity method investments and other
2,764
4,593
Total non-marketable securities
$
37,982
$
68,687
Gains and Losses on Equity Securities
Gains and losses (including impairments), net, for equity securities included in OI&E are summarized below (in millions):
Year Ended December 31,
2023
2024
2025
Gross unrealized gain on non-marketable equity securities
accounted for under the measurement alternative
$
1,806
$
5,582
$
22,666
Gross unrealized loss (including impairments) on
non-marketable equity securities accounted for under the
measurement alternative
(2,894)
(2,210)
(1,271)
Unrealized net gain (loss) on non-marketable equity securities
accounted for under the measurement alternative
(1,088)
3,372
21,395
Unrealized net gain (loss) on marketable and other equity
securities
790
156
1,907
Realized net gain (loss) on marketable and non-marketable
equity securities sold during the period
690
186
778
Total gain (loss) on equity securities in other income
(expense), net
(1)
$
392
$
3,714
$
24,080
(1)
Excludes income (loss) and impairment from equity method investments. Refer to Note 7 for further details.
Cumulative net gains (losses), calculated as the difference between the sales price and purchase price, represent the total
net gains (losses) recognized after the initial purchase date. This represents the total economic impact of the investment,
regardless of when the gains or losses were previously recognized. Cumulative net gains on equity securities sold were
$748 million and $387 million for the years ended December 31, 2024 and 2025, respectively.
Derivative Financial Instruments
We primarily use derivative instruments to manage risks relating to our ongoing business operations, including foreign
currencies, interest rates, commodity prices, credit exposures, and market prices of certain marketable equity securities.
Additionally, we enter into derivatives to enhance investment returns. We also enter into derivatives as a result of
agreements with third parties to backstop certain obligations related to data center leases. These backstop agreements
are accounted for as credit derivatives.
We recognize derivative instruments in the Consolidated Balance Sheets at fair value and classify them primarily within
Level 2 in the fair value hierarchy. We present our foreign currency collars (an option strategy comprised of a combination
of purchased and written options) at net fair values and present all other derivatives at gross fair values. The accounting
treatment for derivatives is based on the intended use and hedge designation.
65
Alphabet
2025 Annual Report
Part I
Part II
Part III
Part IV
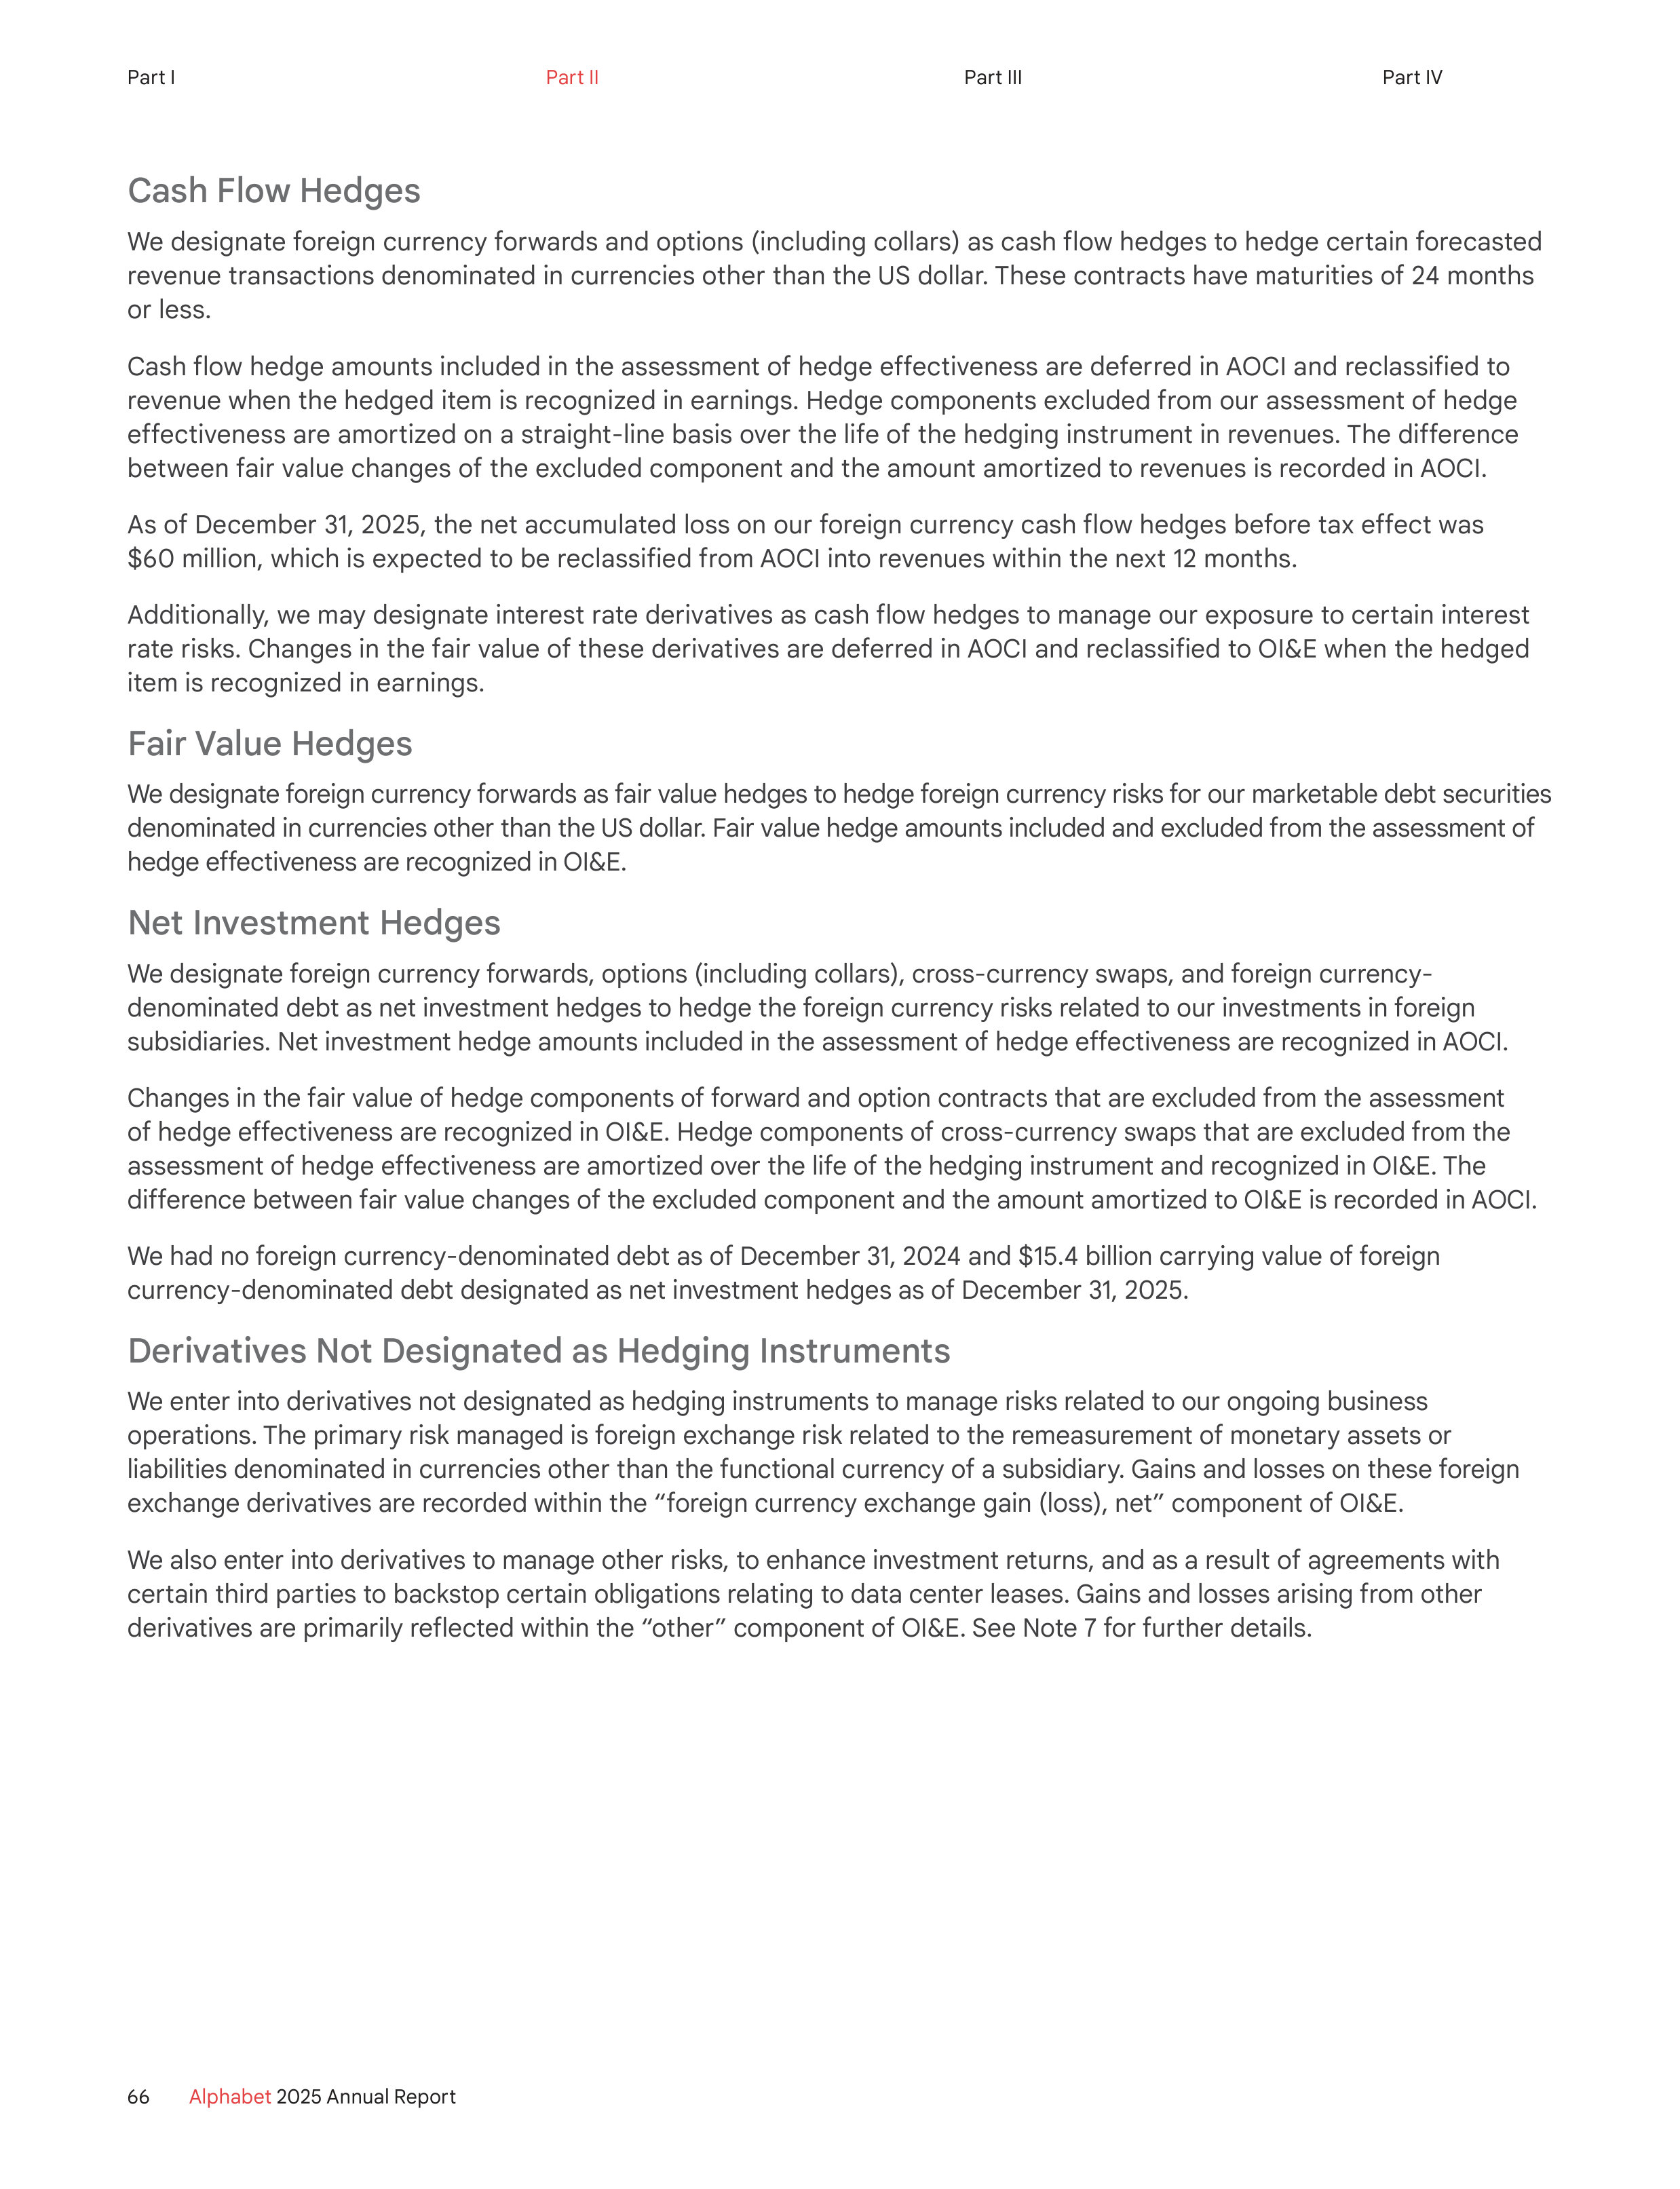
Cash Flow Hedges
We designate foreign currency forwards and options (including collars) as cash flow hedges to hedge certain forecasted
revenue transactions denominated in currencies other than the US dollar. These contracts have maturities of 24 months
or less.
Cash flow hedge amounts included in the assessment of hedge effectiveness are deferred in AOCI and reclassified to
revenue when the hedged item is recognized in earnings. Hedge components excluded from our assessment of hedge
effectiveness are amortized on a straight-line basis over the life of the hedging instrument in revenues. The difference
between fair value changes of the excluded component and the amount amortized to revenues is recorded in AOCI.
As of December 31, 2025, the net accumulated loss on our foreign currency cash flow hedges before tax effect was
$60 million, which is expected to be reclassified from AOCI into revenues within the next 12 months.
Additionally, we may designate interest rate derivatives as cash flow hedges to manage our exposure to certain interest
rate risks. Changes in the fair value of these derivatives are deferred in AOCI and reclassified to OI&E when the hedged
item is recognized in earnings.
Fair Value Hedges
We designate foreign currency forwards as fair value hedges to hedge foreign currency risks for our marketable debt securities
denominated in currencies other than the US dollar. Fair value hedge amounts included and excluded from the assessment of
hedge effectiveness are recognized in OI&E.
Net Investment Hedges
We designate foreign currency forwards, options (including collars), cross-currency swaps, and foreign currency-
denominated debt as net investment hedges to hedge the foreign currency risks related to our investments in foreign
subsidiaries. Net investment hedge amounts included in the assessment of hedge effectiveness are recognized in AOCI.
Changes in the fair value of hedge components of forward and option contracts that are excluded from the assessment
of hedge effectiveness are recognized in OI&E. Hedge components of cross-currency swaps that are excluded from the
assessment of hedge effectiveness are amortized over the life of the hedging instrument and recognized in OI&E. The
difference between fair value changes of the excluded component and the amount amortized to OI&E is recorded in AOCI.
We had no foreign currency-denominated debt as of December 31, 2024 and $15.4 billion carrying value of foreign
currency-denominated debt designated as net investment hedges as of December 31, 2025.
Derivatives Not Designated as Hedging Instruments
We enter into derivatives not designated as hedging instruments to manage risks related to our ongoing business
operations. The primary risk managed is foreign exchange risk related to the remeasurement of monetary assets or
liabilities denominated in currencies other than the functional currency of a subsidiary. Gains and losses on these foreign
exchange derivatives are recorded within the “foreign currency exchange gain (loss), net” component of OI&E.
We also enter into derivatives to manage other risks, to enhance investment returns, and as a result of agreements with
certain third parties to backstop certain obligations relating to data center leases. Gains and losses arising from other
derivatives are primarily reflected within the “other” component of OI&E. See Note 7 for further details.
66
Alphabet
2025 Annual Report
Part I
Part II
Part III
Part IV
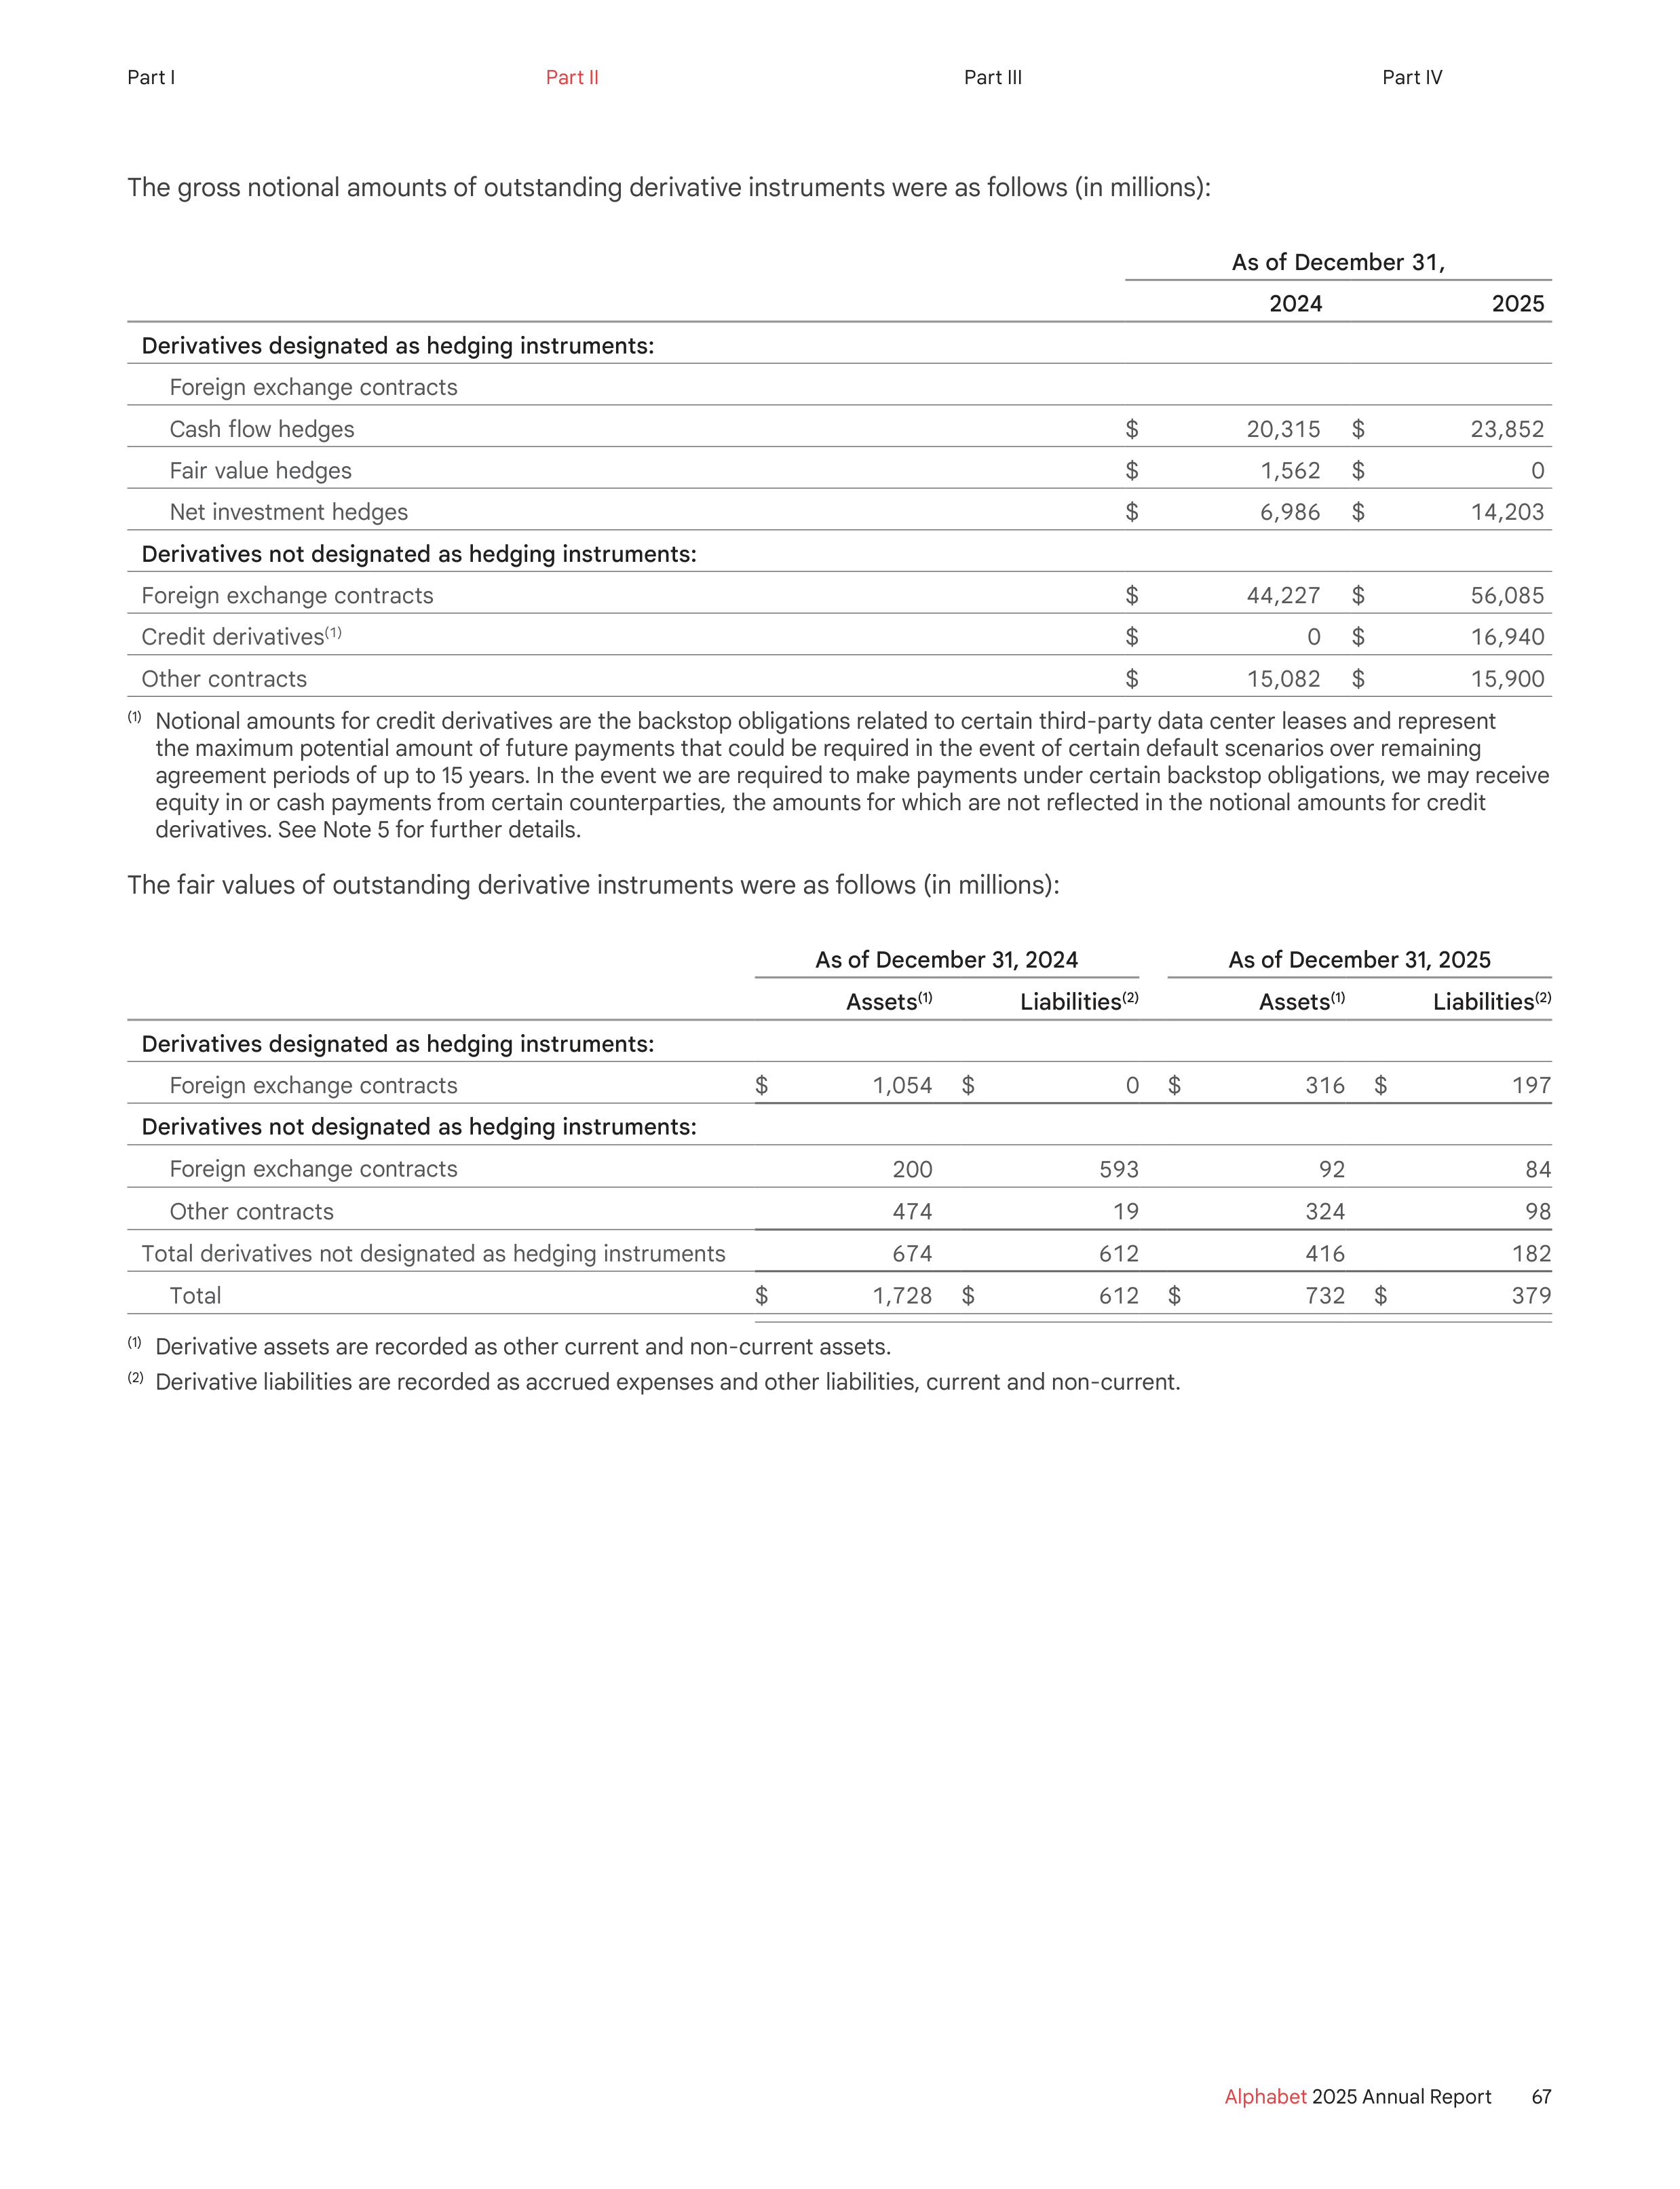
The gross notional amounts of outstanding derivative instruments were as follows (in millions):
As of December 31,
2024
2025
Derivatives designated as hedging instruments:
Foreign exchange contracts
Cash flow hedges
$
20,315
$
23,852
Fair value hedges
$
1,562
$
0
Net investment hedges
$
6,986
$
14,203
Derivatives not designated as hedging instruments:
Foreign exchange contracts
$
44,227
$
56,085
Credit derivatives
(1)
$
0
$
16,940
Other contracts
$
15,082
$
15,900
(1)
Notional amounts for credit derivatives are the backstop obligations related to certain third-party data center leases and represent
the maximum potential amount of future payments that could be required in the event of certain default scenarios over remaining
agreement periods of up to 15 years. In the event we are required to make payments under certain backstop obligations, we may receive
equity in or cash payments from certain counterparties, the amounts for which are not reflected in the notional amounts for credit
derivatives. See Note 5 for further details.
The fair values of outstanding derivative instruments were as follows (in millions):
As of December 31, 2024
As of December 31, 2025
Assets
(1)
Liabilities
(2)
Assets
(1)
Liabilities
(2)
Derivatives designated as hedging instruments:
Foreign exchange contracts
$
1,054
$
0
$
316
$
197
Derivatives not designated as hedging instruments:
Foreign exchange contracts
200
593
92
84
Other contracts
474
19
324
98
Total derivatives not designated as hedging instruments
674
612
416
182
Total
$
1,728
$
612
$
732
$
379
(1)
Derivative assets are recorded as other current and non-current assets.
(2)
Derivative liabilities are recorded as accrued expenses and other liabilities, current and non-current.
67
Alphabet
2025 Annual Report
Part I
Part II
Part III
Part IV
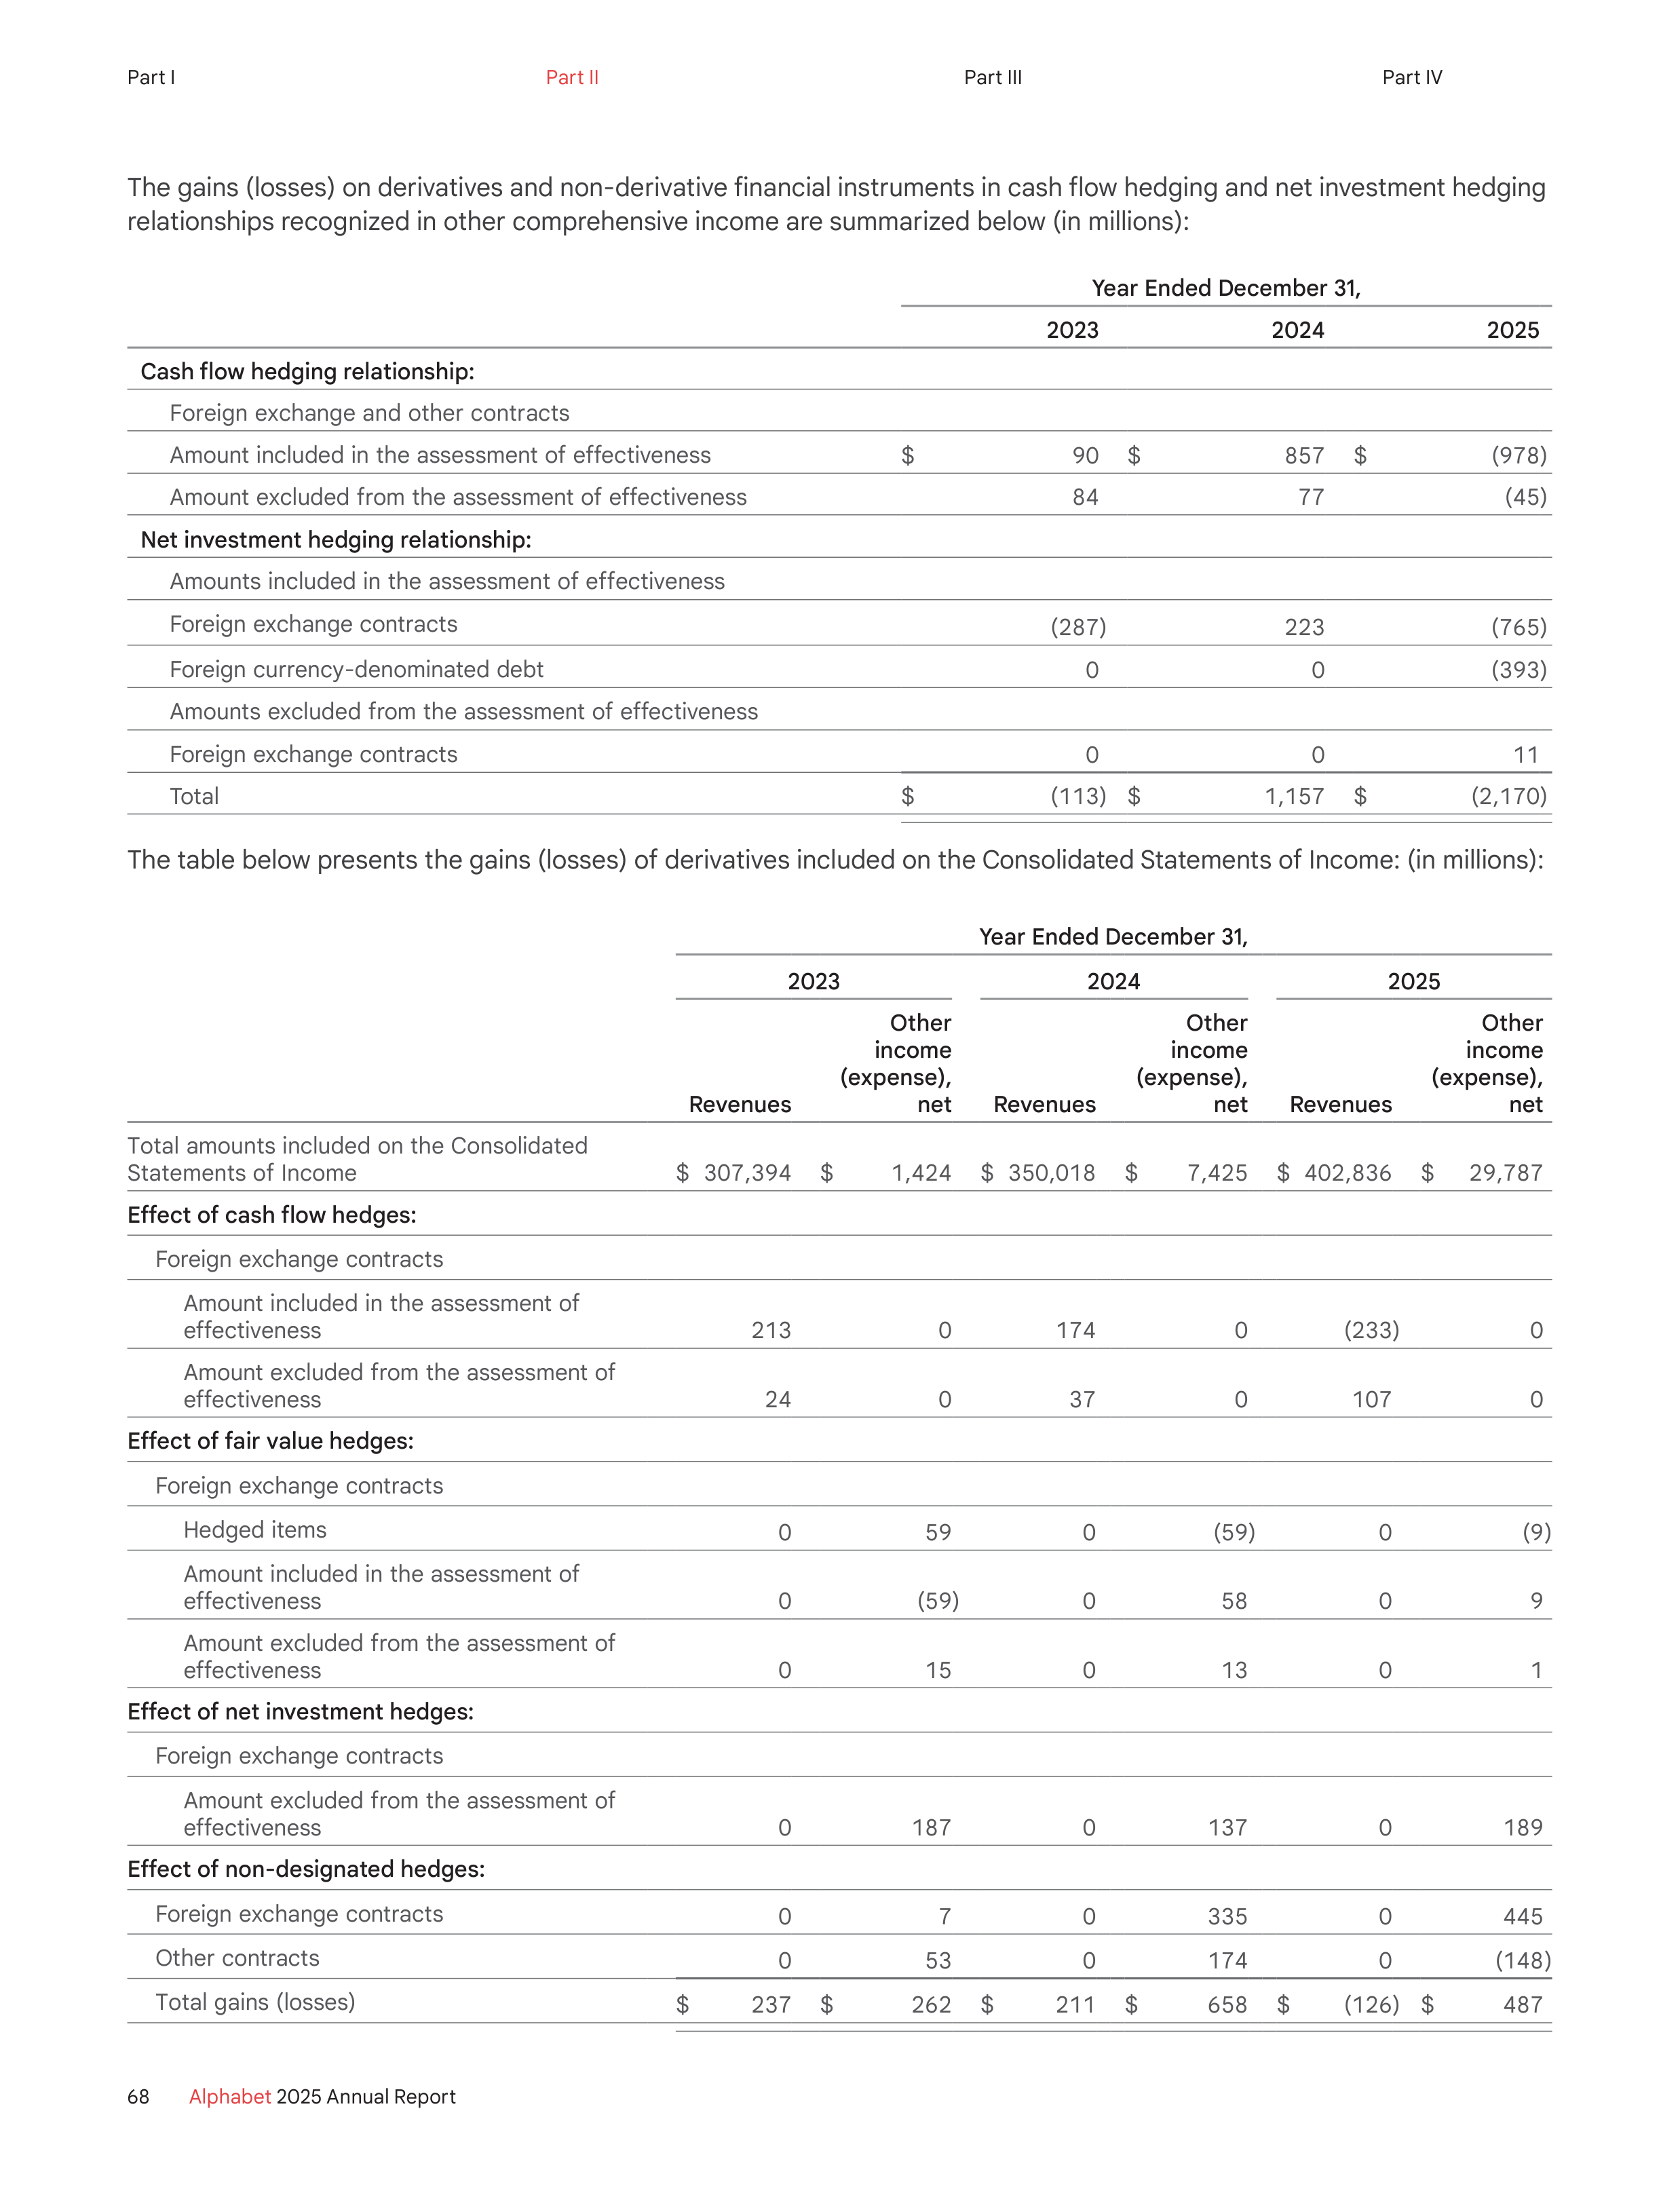
The gains (losses) on derivatives and non-derivative financial instruments in cash flow hedging and net investment hedging
relationships recognized in other comprehensive income are summarized below (in millions):
Year Ended December 31,
2023
2024
2025
Cash flow hedging relationship:
Foreign exchange and other contracts
Amount included in the assessment of effectiveness
$
90
$
857
$
(978)
Amount excluded from the assessment of effectiveness
84
77
(45)
Net investment hedging relationship:
Amounts included in the assessment of effectiveness
Foreign exchange contracts
(287)
223
(765)
Foreign currency-denominated debt
0
0
(393)
Amounts excluded from the assessment of effectiveness
Foreign exchange contracts
0
0
11
Total
$
(113)
$
1,157
$
(2,170)
The table below presents the gains (losses) of derivatives included on the Consolidated Statements of Income: (in millions):
Year Ended December 31,
2023
2024
2025
Revenues
Other
income
(expense),
net
Revenues
Other
income
(expense),
net
Revenues
Other
income
(expense),
net
Total amounts included on the Consolidated
Statements of Income
$
307,394
$
1,424
$
350,018
$
7,425
$
402,836
$
29,787
Effect of cash flow hedges:
Foreign exchange contracts
Amount included in the assessment of
effectiveness
213
0
174
0
(233)
0
Amount excluded from the assessment of
effectiveness
24
0
37
0
107
0
Effect of fair value hedges:
Foreign exchange contracts
Hedged items
0
59
0
(59)
0
(9)
Amount included in the assessment of
effectiveness
0
(59)
0
58
0
9
Amount excluded from the assessment of
effectiveness
0
15
0
13
0
1
Effect of net investment hedges:
Foreign exchange contracts
Amount excluded from the assessment of
effectiveness
0
187
0
137
0
189
Effect of non-designated hedges:
Foreign exchange contracts
0
7
0
335
0
445
Other contracts
0
53
0
174
0
(148)
Total gains (losses)
$
237
$
262
$
211
$
658
$
(126)
$
487
68
Alphabet
2025 Annual Report
Part I
Part II
Part III
Part IV
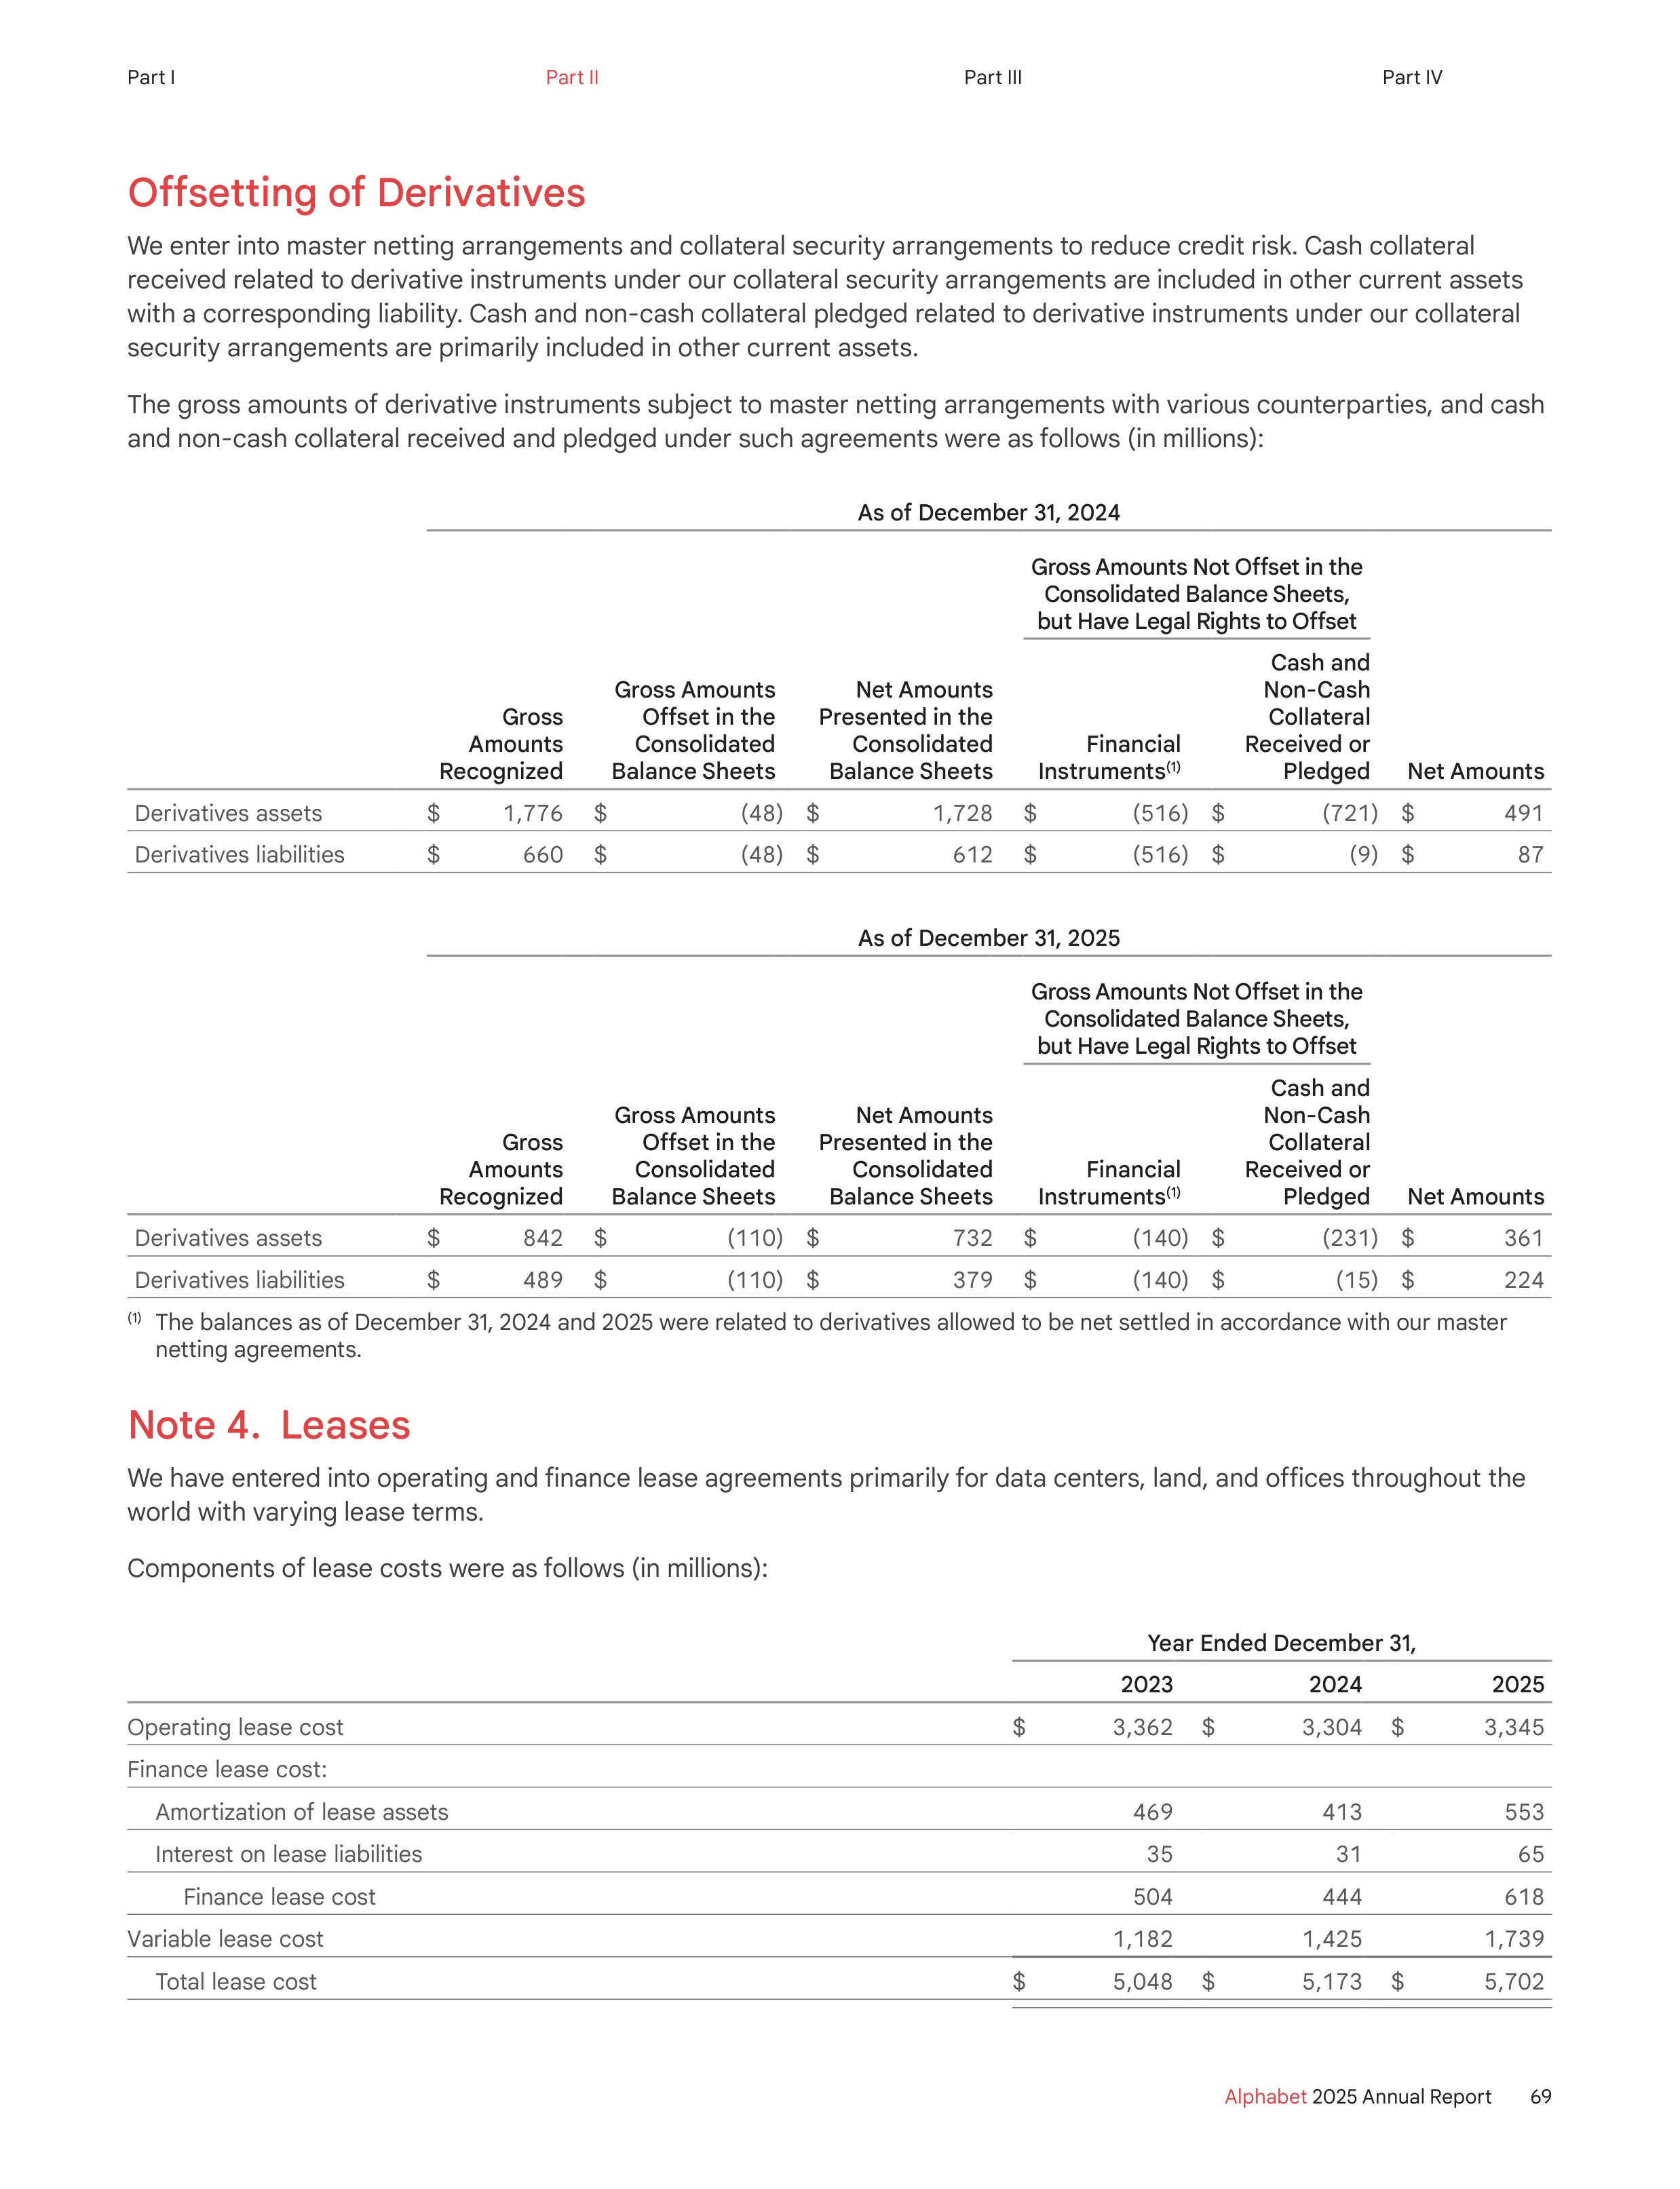
Offsetting of Derivatives
We enter into master netting arrangements and collateral security arrangements to reduce credit risk. Cash collateral
received related to derivative instruments under our collateral security arrangements are included in other current assets
with a corresponding liability. Cash and non-cash collateral pledged related to derivative instruments under our collateral
security arrangements are primarily included in other current assets.
The gross amounts of derivative instruments subject to master netting arrangements with various counterparties, and cash
and non-cash collateral received and pledged under such agreements were as follows (in millions):
As of December 31, 2024
Gross Amounts Not Offset in the
Consolidated Balance Sheets,
but Have Legal Rights to Offset
Gross
Amounts
Recognized
Gross Amounts
Offset in the
Consolidated
Balance Sheets
Net Amounts
Presented in the
Consolidated
Balance Sheets
Financial
Instruments
(1)
Cash and
Non-Cash
Collateral
Received or
Pledged
Net Amounts
Derivatives assets
$
1,776
$
(48)
$
1,728
$
(516)
$
(721)
$
491
Derivatives liabilities
$
660
$
(48)
$
612
$
(516)
$
(9)
$
87
As of December 31, 2025
Gross Amounts Not Offset in the
Consolidated Balance Sheets,
but Have Legal Rights to Offset
Gross
Amounts
Recognized
Gross Amounts
Offset in the
Consolidated
Balance Sheets
Net Amounts
Presented in the
Consolidated
Balance Sheets
Financial
Instruments
(1)
Cash and
Non-Cash
Collateral
Received or
Pledged
Net Amounts
Derivatives assets
$
842
$
(110)
$
732
$
(140)
$
(231)
$
361
Derivatives liabilities
$
489
$
(110)
$
379
$
(140)
$
(15)
$
224
(1)
The balances as of December 31, 2024 and 2025 were related to derivatives allowed to be net settled in accordance with our master
netting agreements.
Note 4. Leases
We have entered into operating and finance lease agreements primarily for data centers, land, and offices throughout the
world with varying lease terms.
Components of lease costs were as follows (in millions):
Year Ended December 31,
2023
2024
2025
Operating lease cost
$
3,362
$
3,304
$
3,345
Finance lease cost:
Amortization of lease assets
469
413
553
Interest on lease liabilities
35
31
65
Finance lease cost
504
444
618
Variable lease cost
1,182
1,425
1,739
Total lease cost
$
5,048
$
5,173
$
5,702
69
Alphabet
2025 Annual Report
Part I
Part II
Part III
Part IV
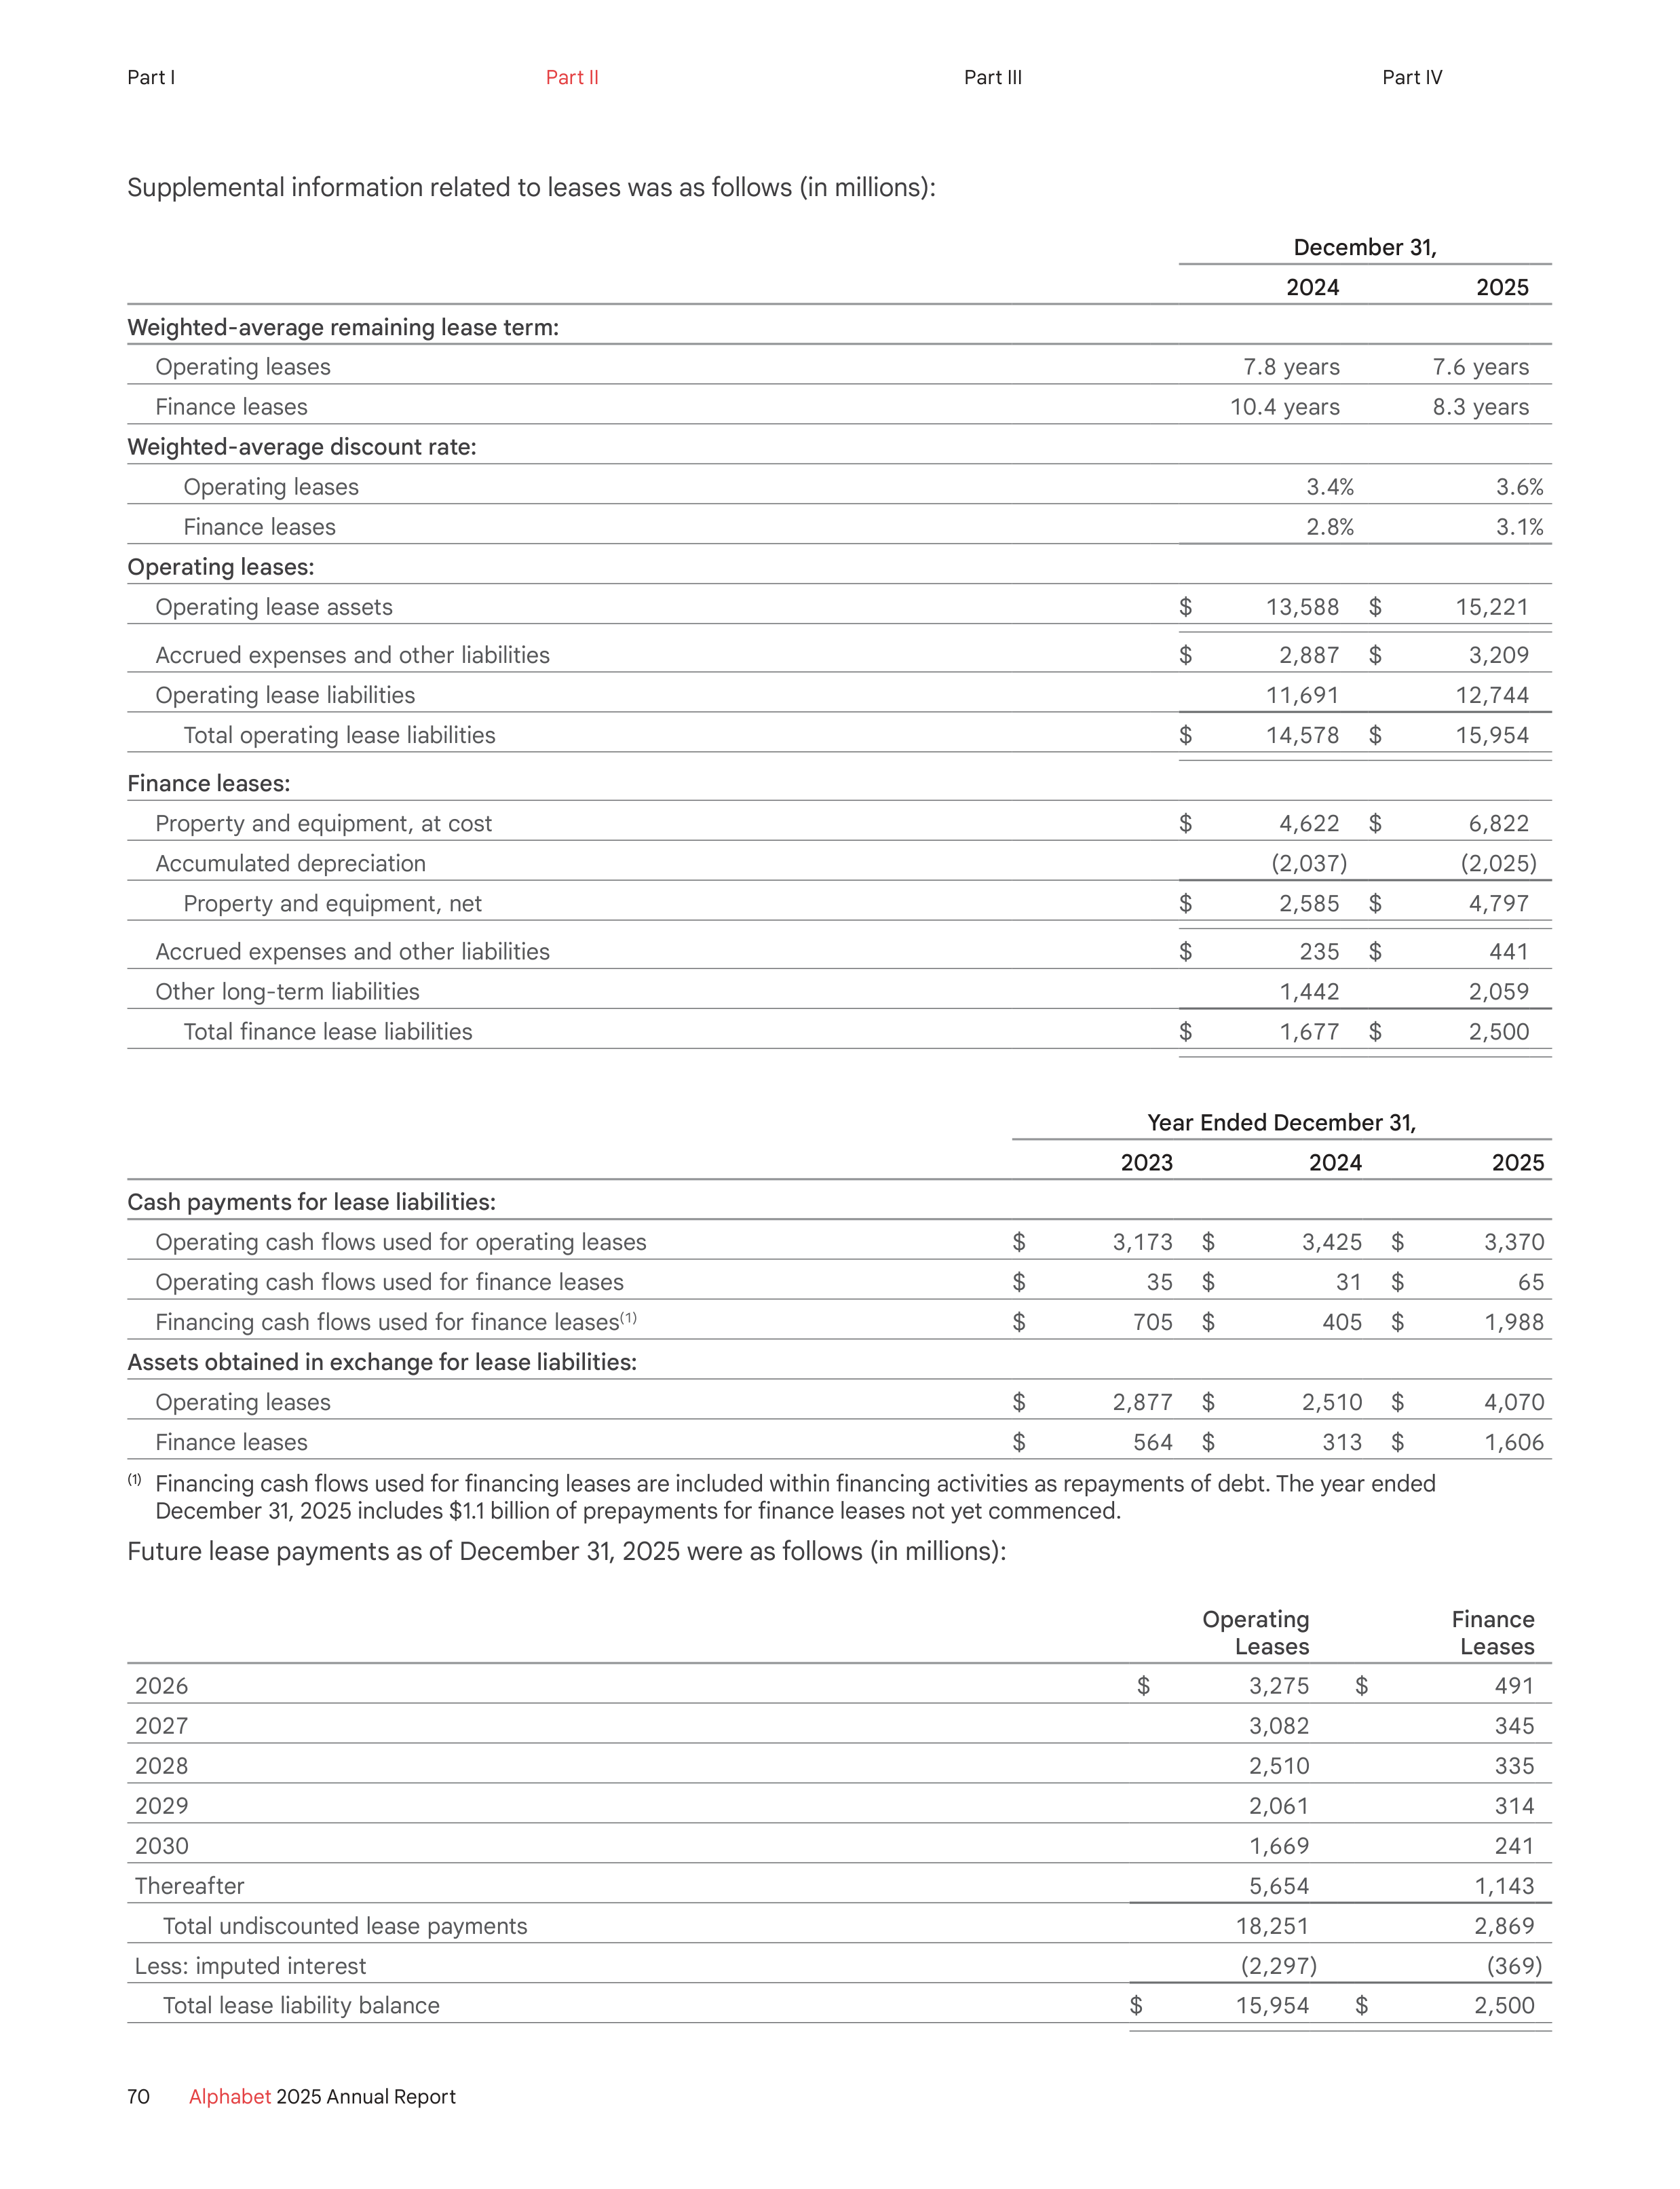
Supplemental information related to leases was as follows (in millions):
December 31,
2024
2025
Weighted-average remaining lease term:
Operating leases
7.8 years
7.6 years
Finance leases
10.4 years
8.3 years
Weighted-average discount rate:
Operating leases
3.4%
3.6%
Finance leases
2.8%
3.1%
Operating leases:
Operating lease assets
$
13,588
$
15,221
Accrued expenses and other liabilities
$
2,887
$
3,209
Operating lease liabilities
11,691
12,744
Total operating lease liabilities
$
14,578
$
15,954
Finance leases:
Property and equipment, at cost
$
4,622
$
6,822
Accumulated depreciation
(2,037)
(2,025)
Property and equipment, net
$
2,585
$
4,797
Accrued expenses and other liabilities
$
235
$
441
Other long-term liabilities
1,442
2,059
Total finance lease liabilities
$
1,677
$
2,500
Year Ended December 31,
2023
2024
2025
Cash payments for lease liabilities:
Operating cash flows used for operating leases
$
3,173
$
3,425
$
3,370
Operating cash flows used for finance leases
$
35
$
31
$
65
Financing cash flows used for finance leases
(1)
$
705
$
405
$
1,988
Assets obtained in exchange for lease liabilities:
Operating leases
$
2,877
$
2,510
$
4,070
Finance leases
$
564
$
313
$
1,606
(1)
Financing cash flows used for financing leases are included within financing activities as repayments of debt. The year ended
December 31, 2025 includes $1.1 billion of prepayments for finance leases not yet commenced.
Future lease payments as of December 31, 2025 were as follows (in millions):
Operating
Leases
Finance
Leases
2026
$
3,275
$
491
2027
3,082
345
2028
2,510
335
2029
2,061
314
2030
1,669
241
Thereafter
5,654
1,143
Total undiscounted lease payments
18,251
2,869
Less: imputed interest
(2,297)
(369)
Total lease liability balance
$
15,954
$
2,500
70
Alphabet
2025 Annual Report
Part I
Part II
Part III
Part IV
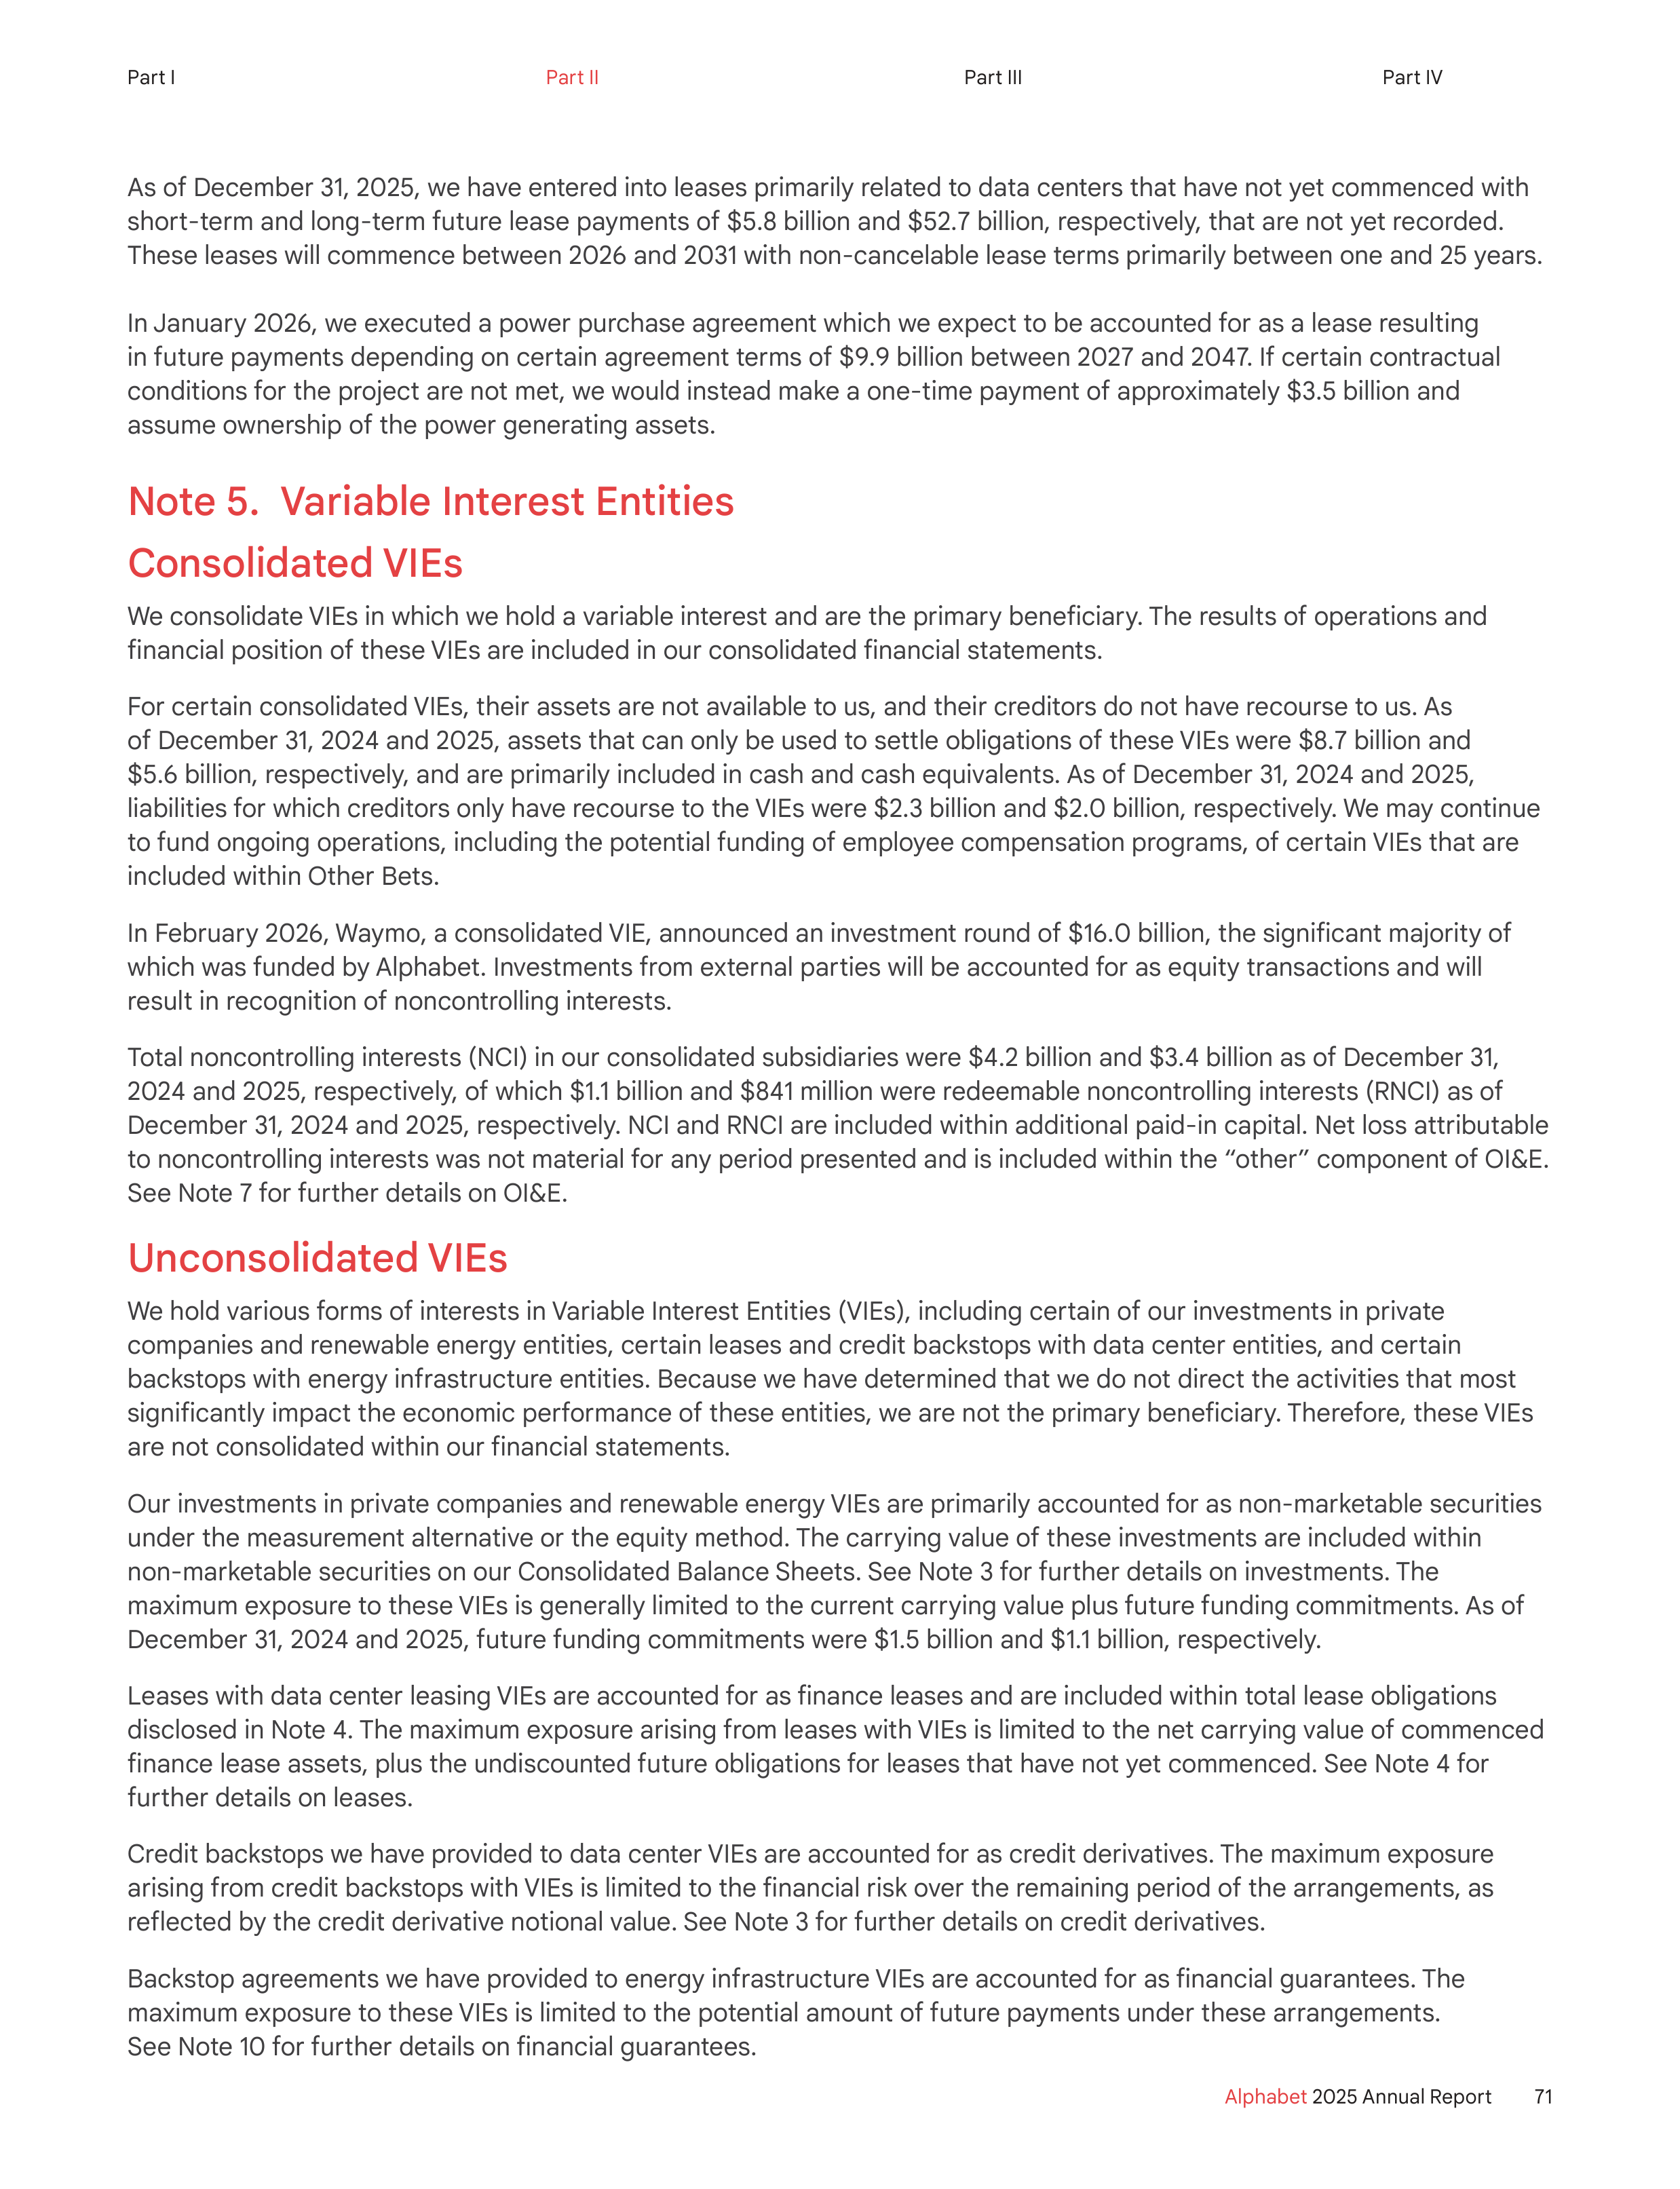
As of December 31, 2025, we have entered into leases primarily related to data centers that have not yet commenced with
short-term and long-term future lease payments of $5.8 billion and $52.7 billion, respectively, that are not yet recorded.
These leases will commence between 2026 and 2031 with non-cancelable lease terms primarily between one and 25 years.
In January 2026, we executed a power purchase agreement which we expect to be accounted for as a lease resulting
in future payments depending on certain agreement terms of $9.9 billion between 2027 and 2047. If certain contractual
conditions for the project are not met, we would instead make a one-time payment of approximately $3.5 billion and
assume ownership of the power generating assets.
Note 5. Variable Interest Entities
Consolidated VIEs
We consolidate VIEs in which we hold a variable interest and are the primary beneficiary. The results of operations and
financial position of these VIEs are included in our consolidated financial statements.
For certain consolidated VIEs, their assets are not available to us, and their creditors do not have recourse to us. As
of December 31, 2024 and 2025, assets that can only be used to settle obligations of these VIEs were $8.7 billion and
$5.6 billion, respectively, and are primarily included in cash and cash equivalents. As of December 31, 2024 and 2025,
liabilities for which creditors only have recourse to the VIEs were $2.3 billion and $2.0 billion, respectively. We may continue
to fund ongoing operations, including the potential funding of employee compensation programs, of certain VIEs that are
included within Other Bets.
In February 2026, Waymo, a consolidated VIE, announced an investment round of $16.0 billion, the significant majority of
which was funded by Alphabet. Investments from external parties will be accounted for as equity transactions and will
result in recognition of noncontrolling interests.
Total noncontrolling interests (NCI) in our consolidated subsidiaries were $4.2 billion and $3.4 billion as of December 31,
2024 and 2025, respectively, of which $1.1 billion and $841 million were redeemable noncontrolling interests (RNCI) as of
December 31, 2024 and 2025, respectively. NCI and RNCI are included within additional paid-in capital. Net loss attributable
to noncontrolling interests was not material for any period presented and is included within the “other” component of OI&E.
See Note 7 for further details on OI&E.
Unconsolidated VIEs
We hold various forms of interests in Variable Interest Entities (VIEs), including certain of our investments in private
companies and renewable energy entities, certain leases and credit backstops with data center entities, and certain
backstops with energy infrastructure entities. Because we have determined that we do not direct the activities that most
significantly impact the economic performance of these entities, we are not the primary beneficiary. Therefore, these VIEs
are not consolidated within our financial statements.
Our investments in private companies and renewable energy VIEs are primarily accounted for as non-marketable securities
under the measurement alternative or the equity method. The carrying value of these investments are included within
non-marketable securities on our Consolidated Balance Sheets. See Note 3 for further details on investments. The
maximum exposure to these VIEs is generally limited to the current carrying value plus future funding commitments. As of
December 31, 2024 and 2025, future funding commitments were $1.5 billion and $1.1 billion, respectively.
Leases with data center leasing VIEs are accounted for as finance leases and are included within total lease obligations
disclosed in Note 4. The maximum exposure arising from leases with VIEs is limited to the net carrying value of commenced
finance lease assets, plus the undiscounted future obligations for leases that have not yet commenced. See Note 4 for
further details on leases.
Credit backstops we have provided to data center VIEs are accounted for as credit derivatives. The maximum exposure
arising from credit backstops with VIEs is limited to the financial risk over the remaining period of the arrangements, as
reflected by the credit derivative notional value. See Note 3 for further details on credit derivatives.
Backstop agreements we have provided to energy infrastructure VIEs are accounted for as financial guarantees. The
maximum exposure to these VIEs is limited to the potential amount of future payments under these arrangements.
See Note 10 for further details on financial guarantees.
71
Alphabet
2025 Annual Report
Part I
Part II
Part III
Part IV
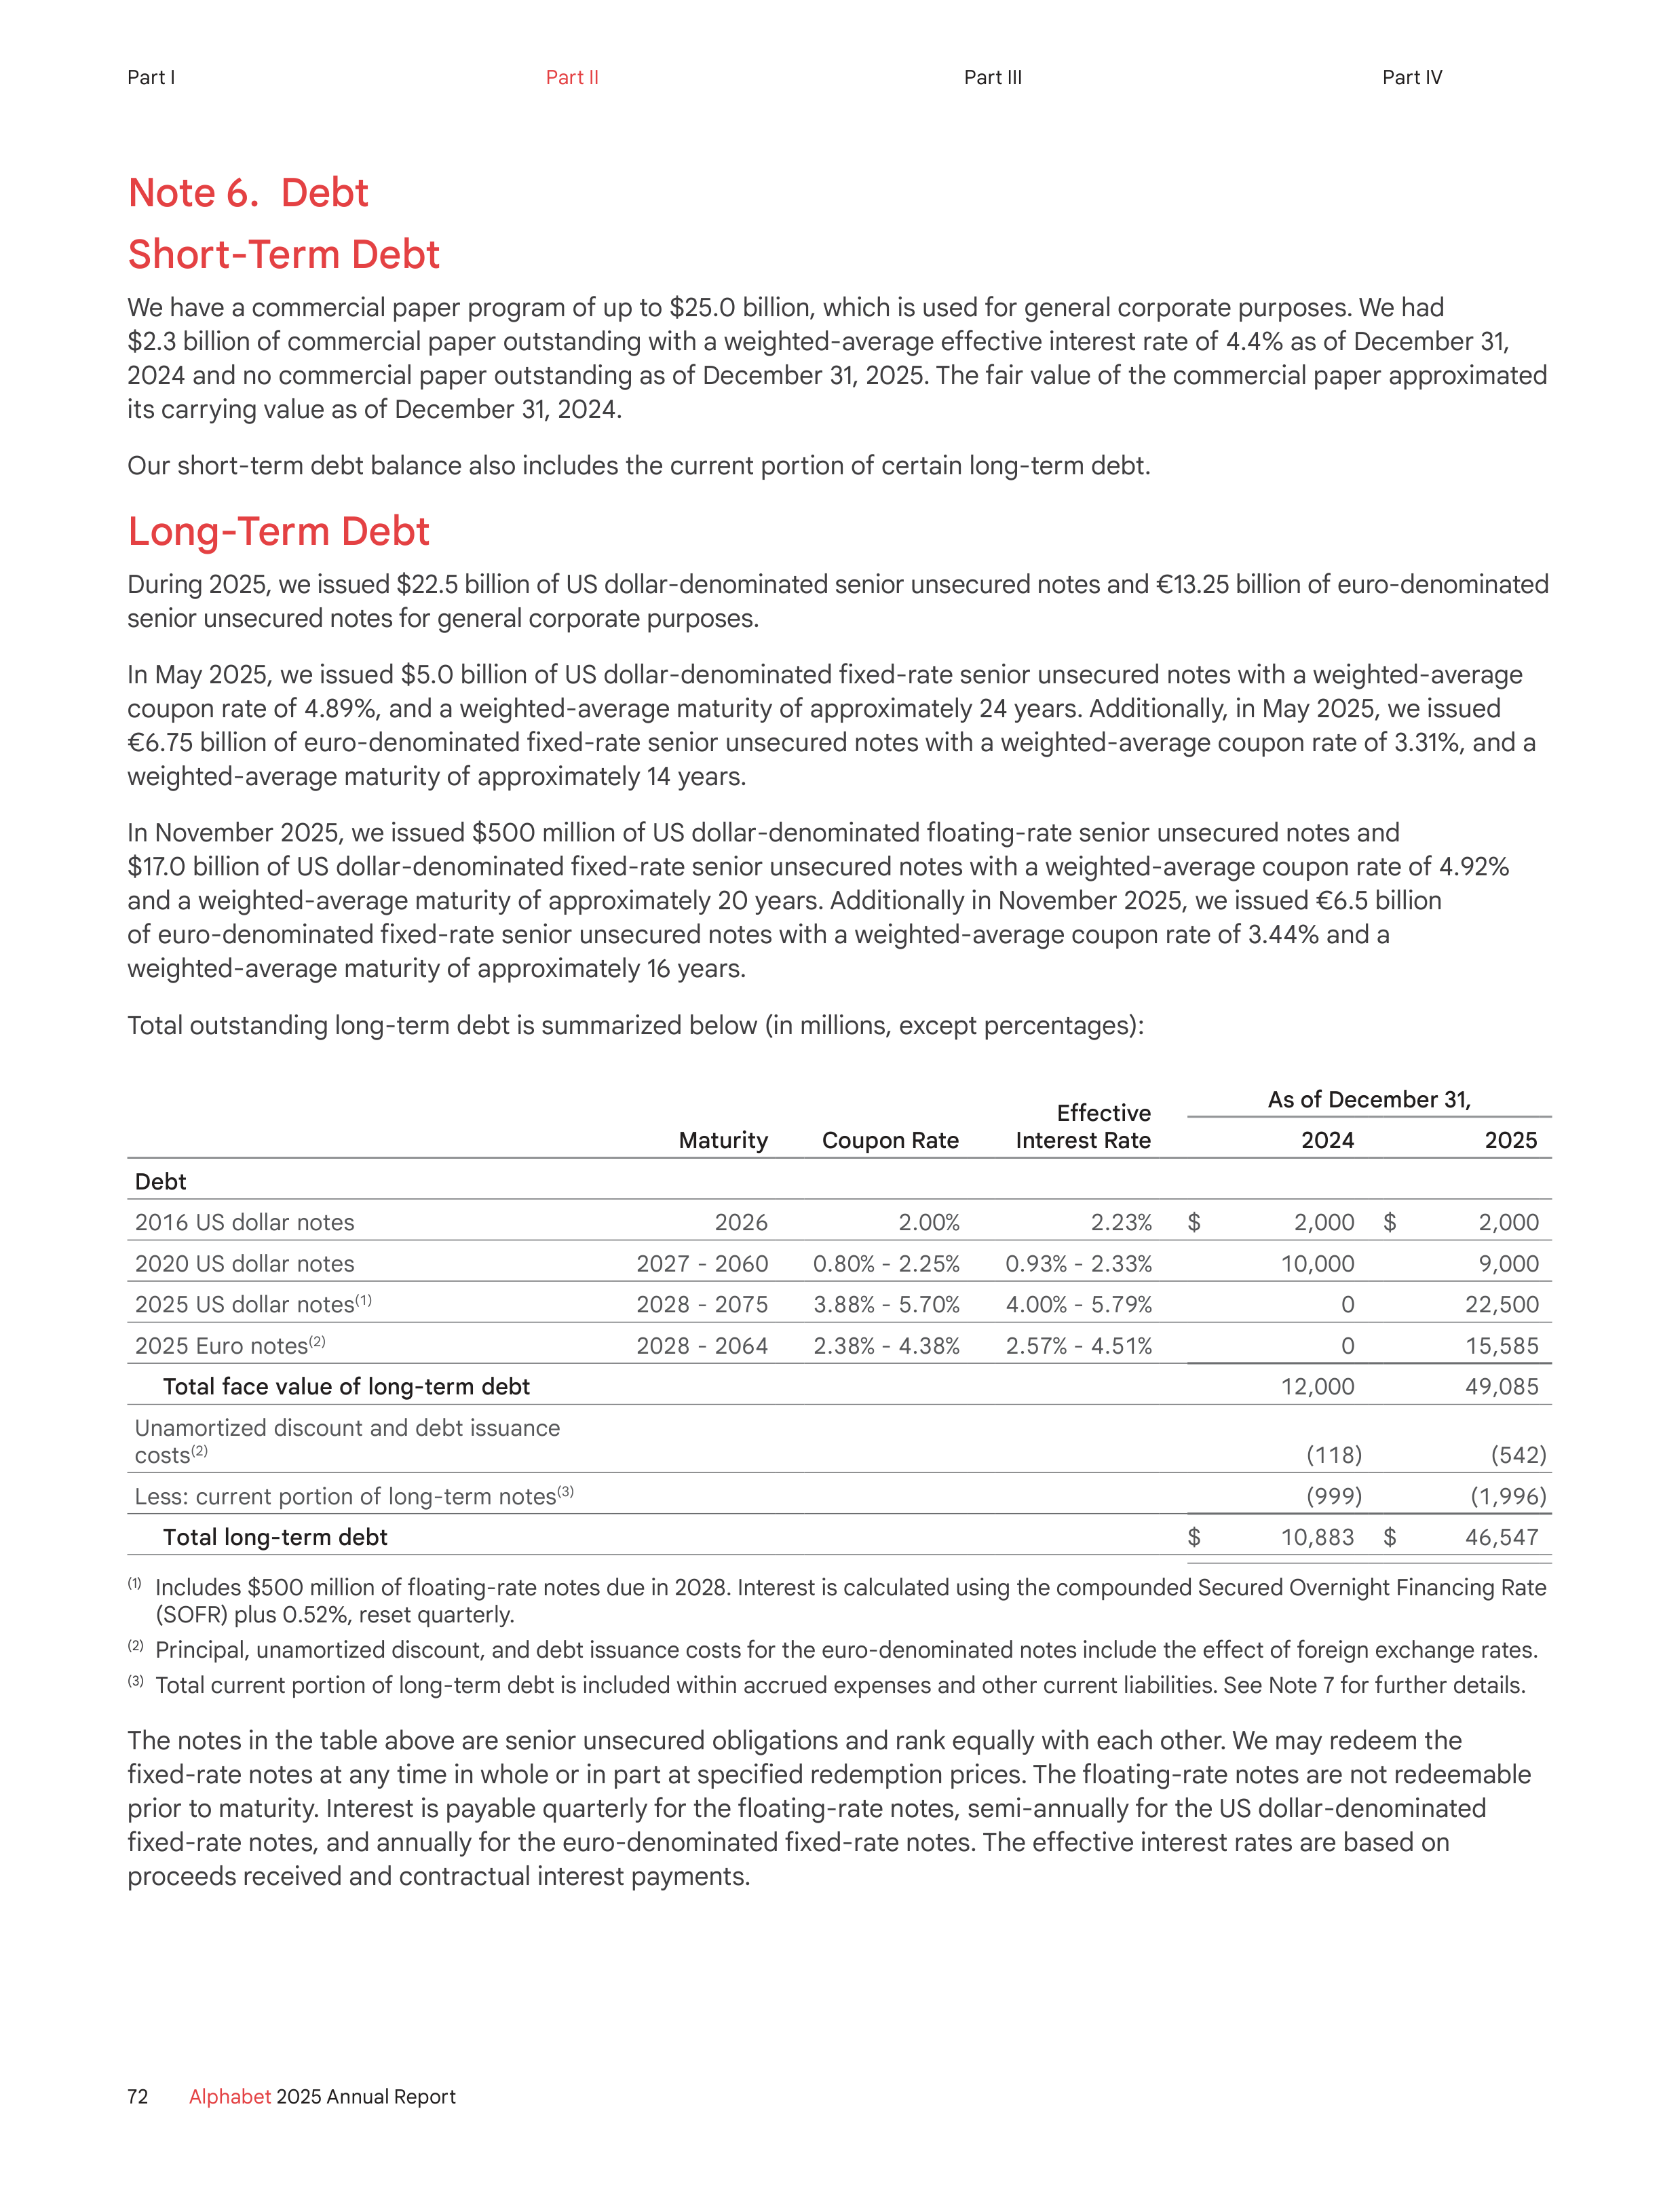
Note 6. Debt
Short-Term Debt
We have a commercial paper program of up to $25.0 billion, which is used for general corporate purposes. We had
$2.3 billion of commercial paper outstanding with a weighted-average effective interest rate of 4.4% as of December 31,
2024 and no commercial paper outstanding as of December 31, 2025. The fair value of the commercial paper approximated
its carrying value as of December 31, 2024.
Our short-term debt balance also includes the current portion of certain long-term debt.
Long-Term Debt
During 2025, we issued $22.5 billion of US dollar-denominated senior unsecured notes and €13.25 billion of euro-denominated
senior unsecured notes for general corporate purposes.
In May 2025, we issued $5.0 billion of US dollar-denominated fixed-rate senior unsecured notes with a weighted-average
coupon rate of 4.89%, and a weighted-average maturity of approximately 24 years. Additionally, in May 2025, we issued
€6.75 billion of euro-denominated fixed-rate senior unsecured notes with a weighted-average coupon rate of 3.31%, and a
weighted-average maturity of approximately 14 years.
In November 2025, we issued $500 million of US dollar-denominated floating-rate senior unsecured notes and
$17.0 billion of US dollar-denominated fixed-rate senior unsecured notes with a weighted-average coupon rate of 4.92%
and a weighted-average maturity of approximately 20 years. Additionally in November 2025, we issued €6.5 billion
of euro-denominated fixed-rate senior unsecured notes with a weighted-average coupon rate of 3.44% and a
weighted-average maturity of approximately 16 years.
Total outstanding long-term debt is summarized below (in millions, except percentages):
Effective
Interest Rate
As of December 31,
Maturity
Coupon Rate
2024
2025
Debt
2016 US dollar notes
2026
2.00%
2.23%
$
2,000
$
2,000
2020 US dollar notes
2027 - 2060
0.80% - 2.25%
0.93% - 2.33%
10,000
9,000
2025 US dollar notes
(1)
2028 - 2075
3.88% - 5.70%
4.00% - 5.79%
0
22,500
2025 Euro notes
(2)
2028 - 2064
2.38% - 4.38%
2.57% - 4.51%
0
15,585
Total face value of long-term debt
12,000
49,085
Unamortized discount and debt issuance
costs
(2)
(118)
(542)
Less: current portion of long-term notes
(3)
(999)
(1,996)
Total long-term debt
$
10,883
$
46,547
(1)
Includes $500 million of floating-rate notes due in 2028. Interest is calculated using the compounded Secured Overnight Financing Rate
(SOFR) plus 0.52%, reset quarterly.
(2)
Principal, unamortized discount, and debt issuance costs for the euro-denominated notes include the effect of foreign exchange rates.
(3)
Total current portion of long-term debt is included within accrued expenses and other current liabilities. See Note 7 for further details.
The notes in the table above are senior unsecured obligations and rank equally with each other. We may redeem the
fixed‑rate notes at any time in whole or in part at specified redemption prices. The floating-rate notes are not redeemable
prior to maturity. Interest is payable quarterly for the floating-rate notes, semi-annually for the US dollar-denominated
fixed-rate notes, and annually for the euro-denominated fixed-rate notes. The effective interest rates are based on
proceeds received and contractual interest payments.
72
Alphabet
2025 Annual Report
Part I
Part II
Part III
Part IV
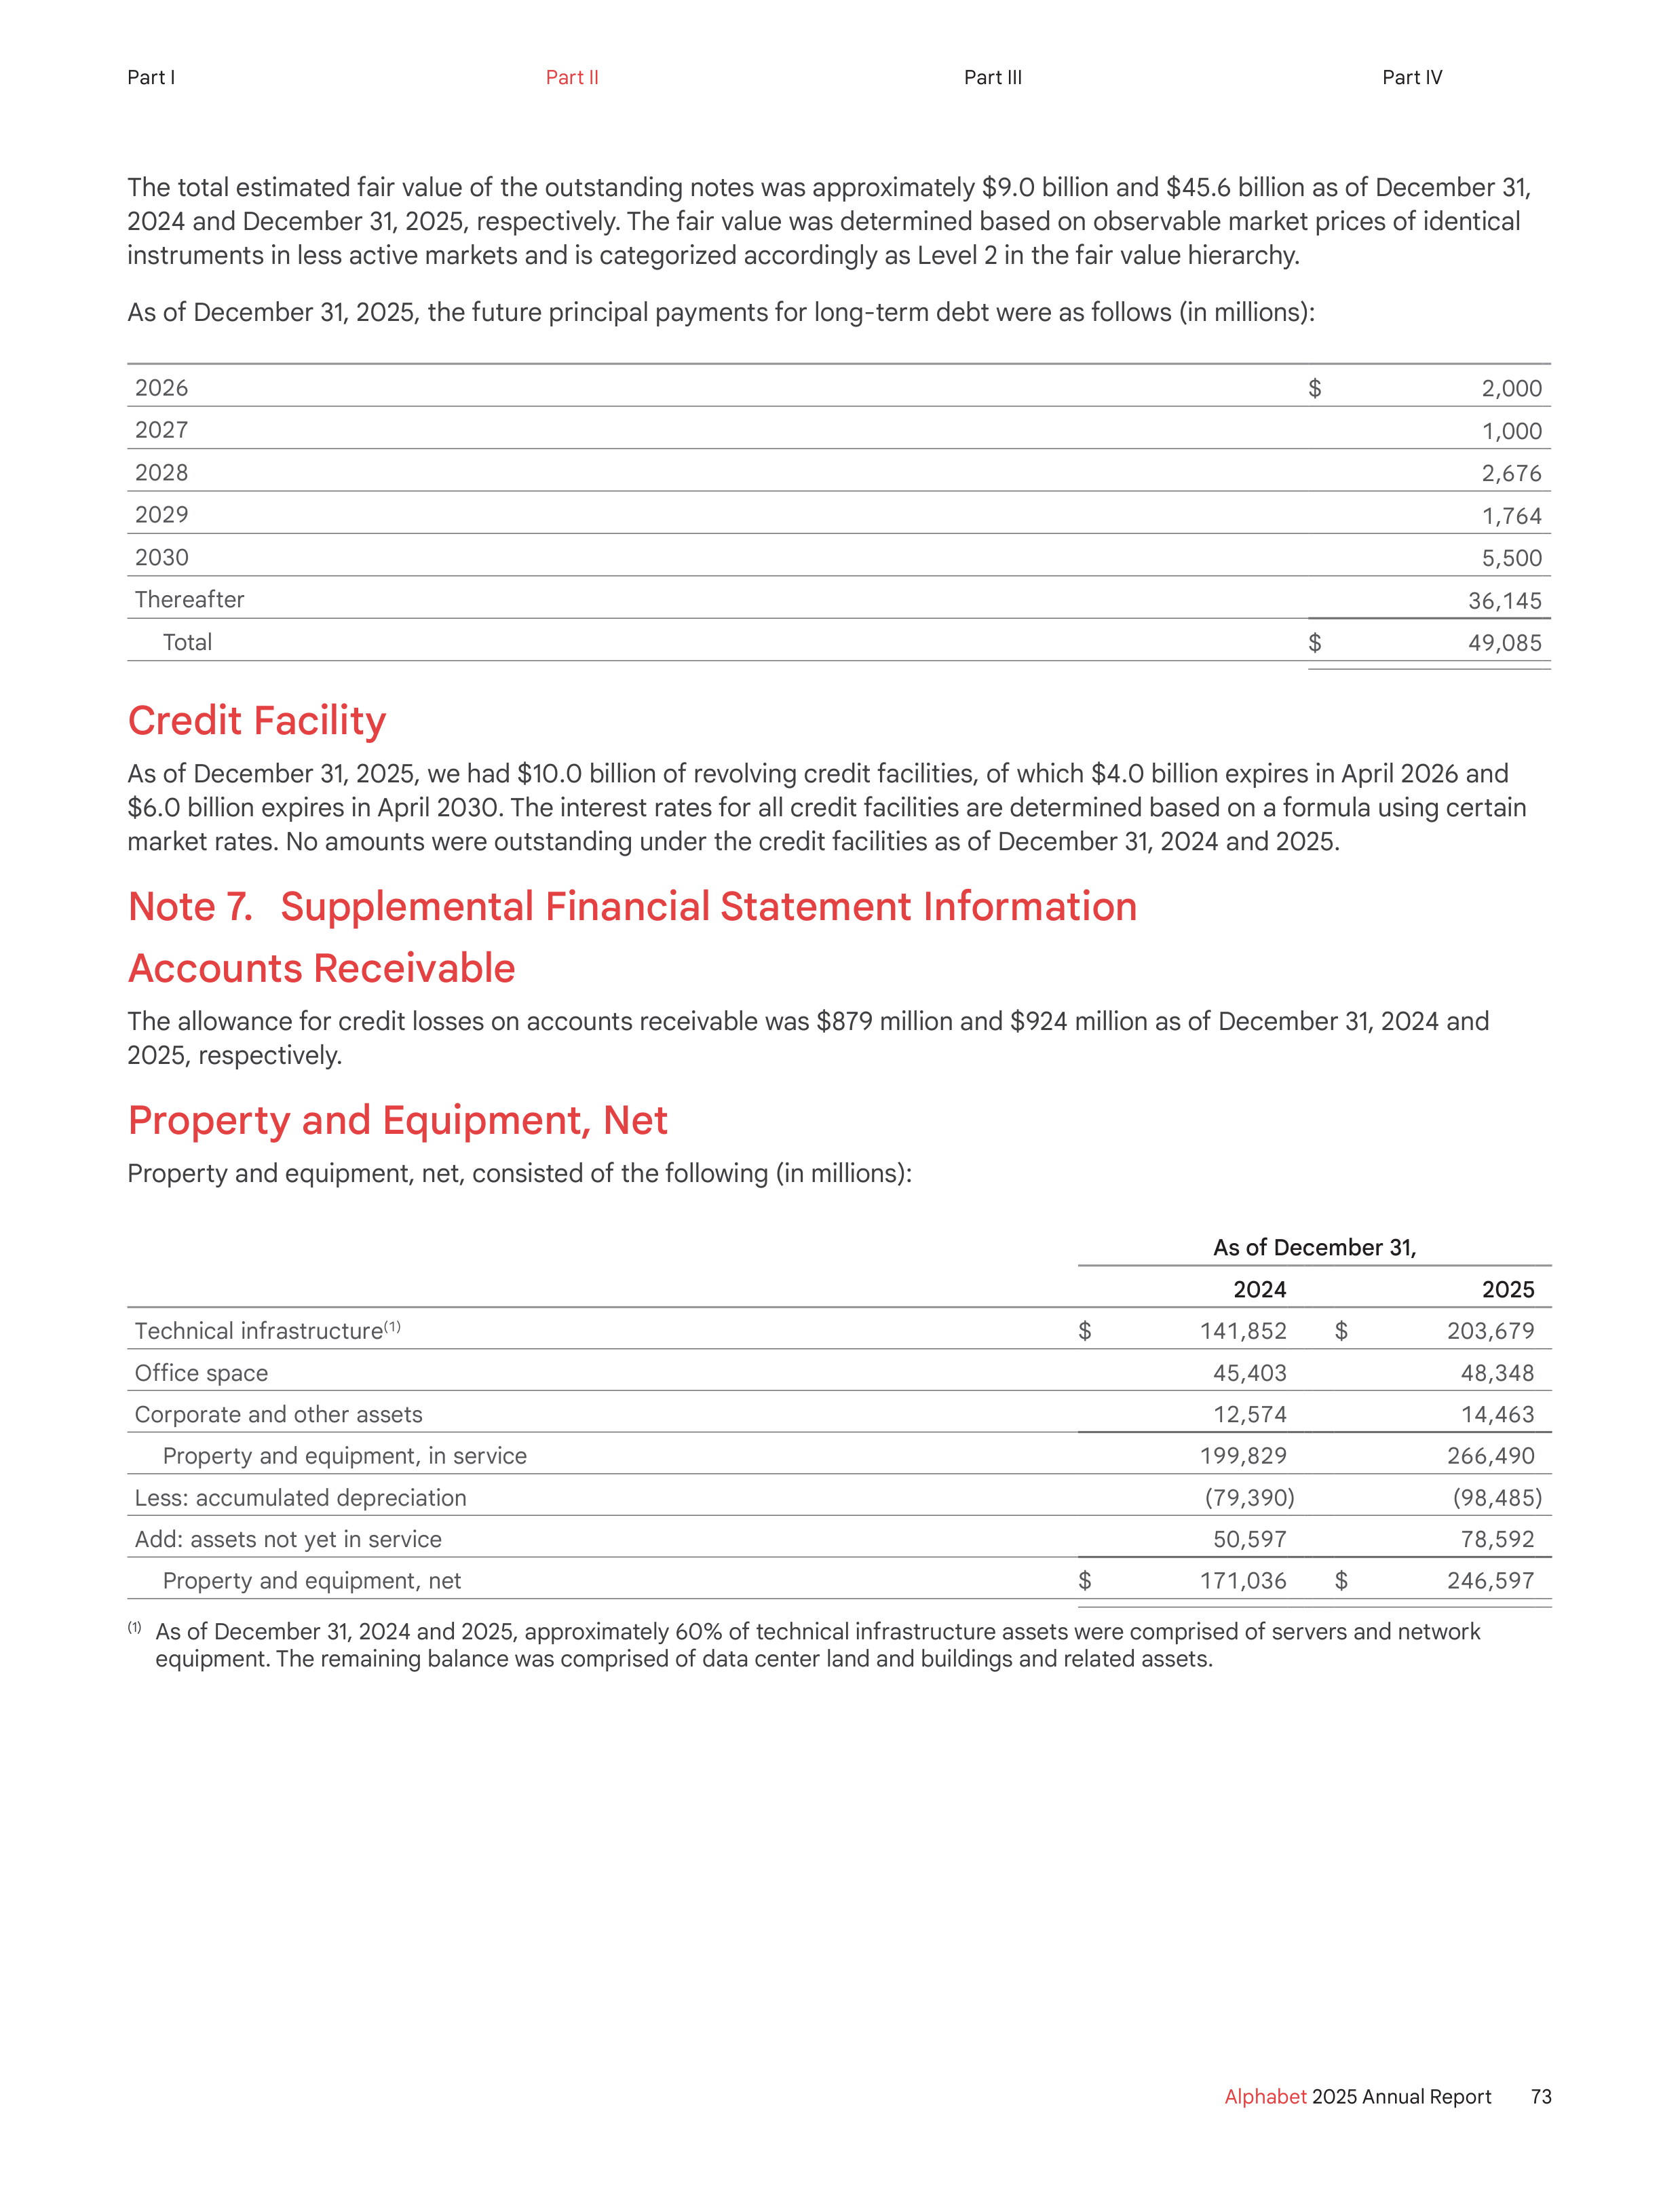
The total estimated fair value of the outstanding notes was approximately $9.0 billion and $45.6 billion as of December 31,
2024 and December 31, 2025, respectively. The fair value was determined based on observable market prices of identical
instruments in less active markets and is categorized accordingly as Level 2 in the fair value hierarchy.
As of December 31, 2025, the future principal payments for long-term debt were as follows (in millions):
2026
$
2,000
2027
1,000
2028
2,676
2029
1,764
2030
5,500
Thereafter
36,145
Total
$
49,085
Credit Facility
As of December 31, 2025, we had $10.0 billion of revolving credit facilities, of which $4.0 billion expires in April 2026 and
$6.0 billion expires in April 2030. The interest rates for all credit facilities are determined based on a formula using certain
market rates. No amounts were outstanding under the credit facilities as of December 31, 2024 and 2025.
Note 7.
Supplemental Financial Statement Information
Accounts Receivable
The allowance for credit losses on accounts receivable was $879 million and $924 million as of December 31, 2024 and
2025, respectively.
Property and Equipment, Net
Property and equipment, net, consisted of the following (in millions):
As of December 31,
2024
2025
Technical infrastructure
(1)
$
141,852
$
203,679
Office space
45,403
48,348
Corporate and other assets
12,574
14,463
Property and equipment, in service
199,829
266,490
Less: accumulated depreciation
(79,390)
(98,485)
Add: assets not yet in service
50,597
78,592
Property and equipment, net
$
171,036
$
246,597
(1)
As of December 31, 2024 and 2025, approximately 60% of technical infrastructure assets were comprised of servers and network
equipment. The remaining balance was comprised of data center land and buildings and related assets.
73
Alphabet
2025 Annual Report
Part I
Part II
Part III
Part IV
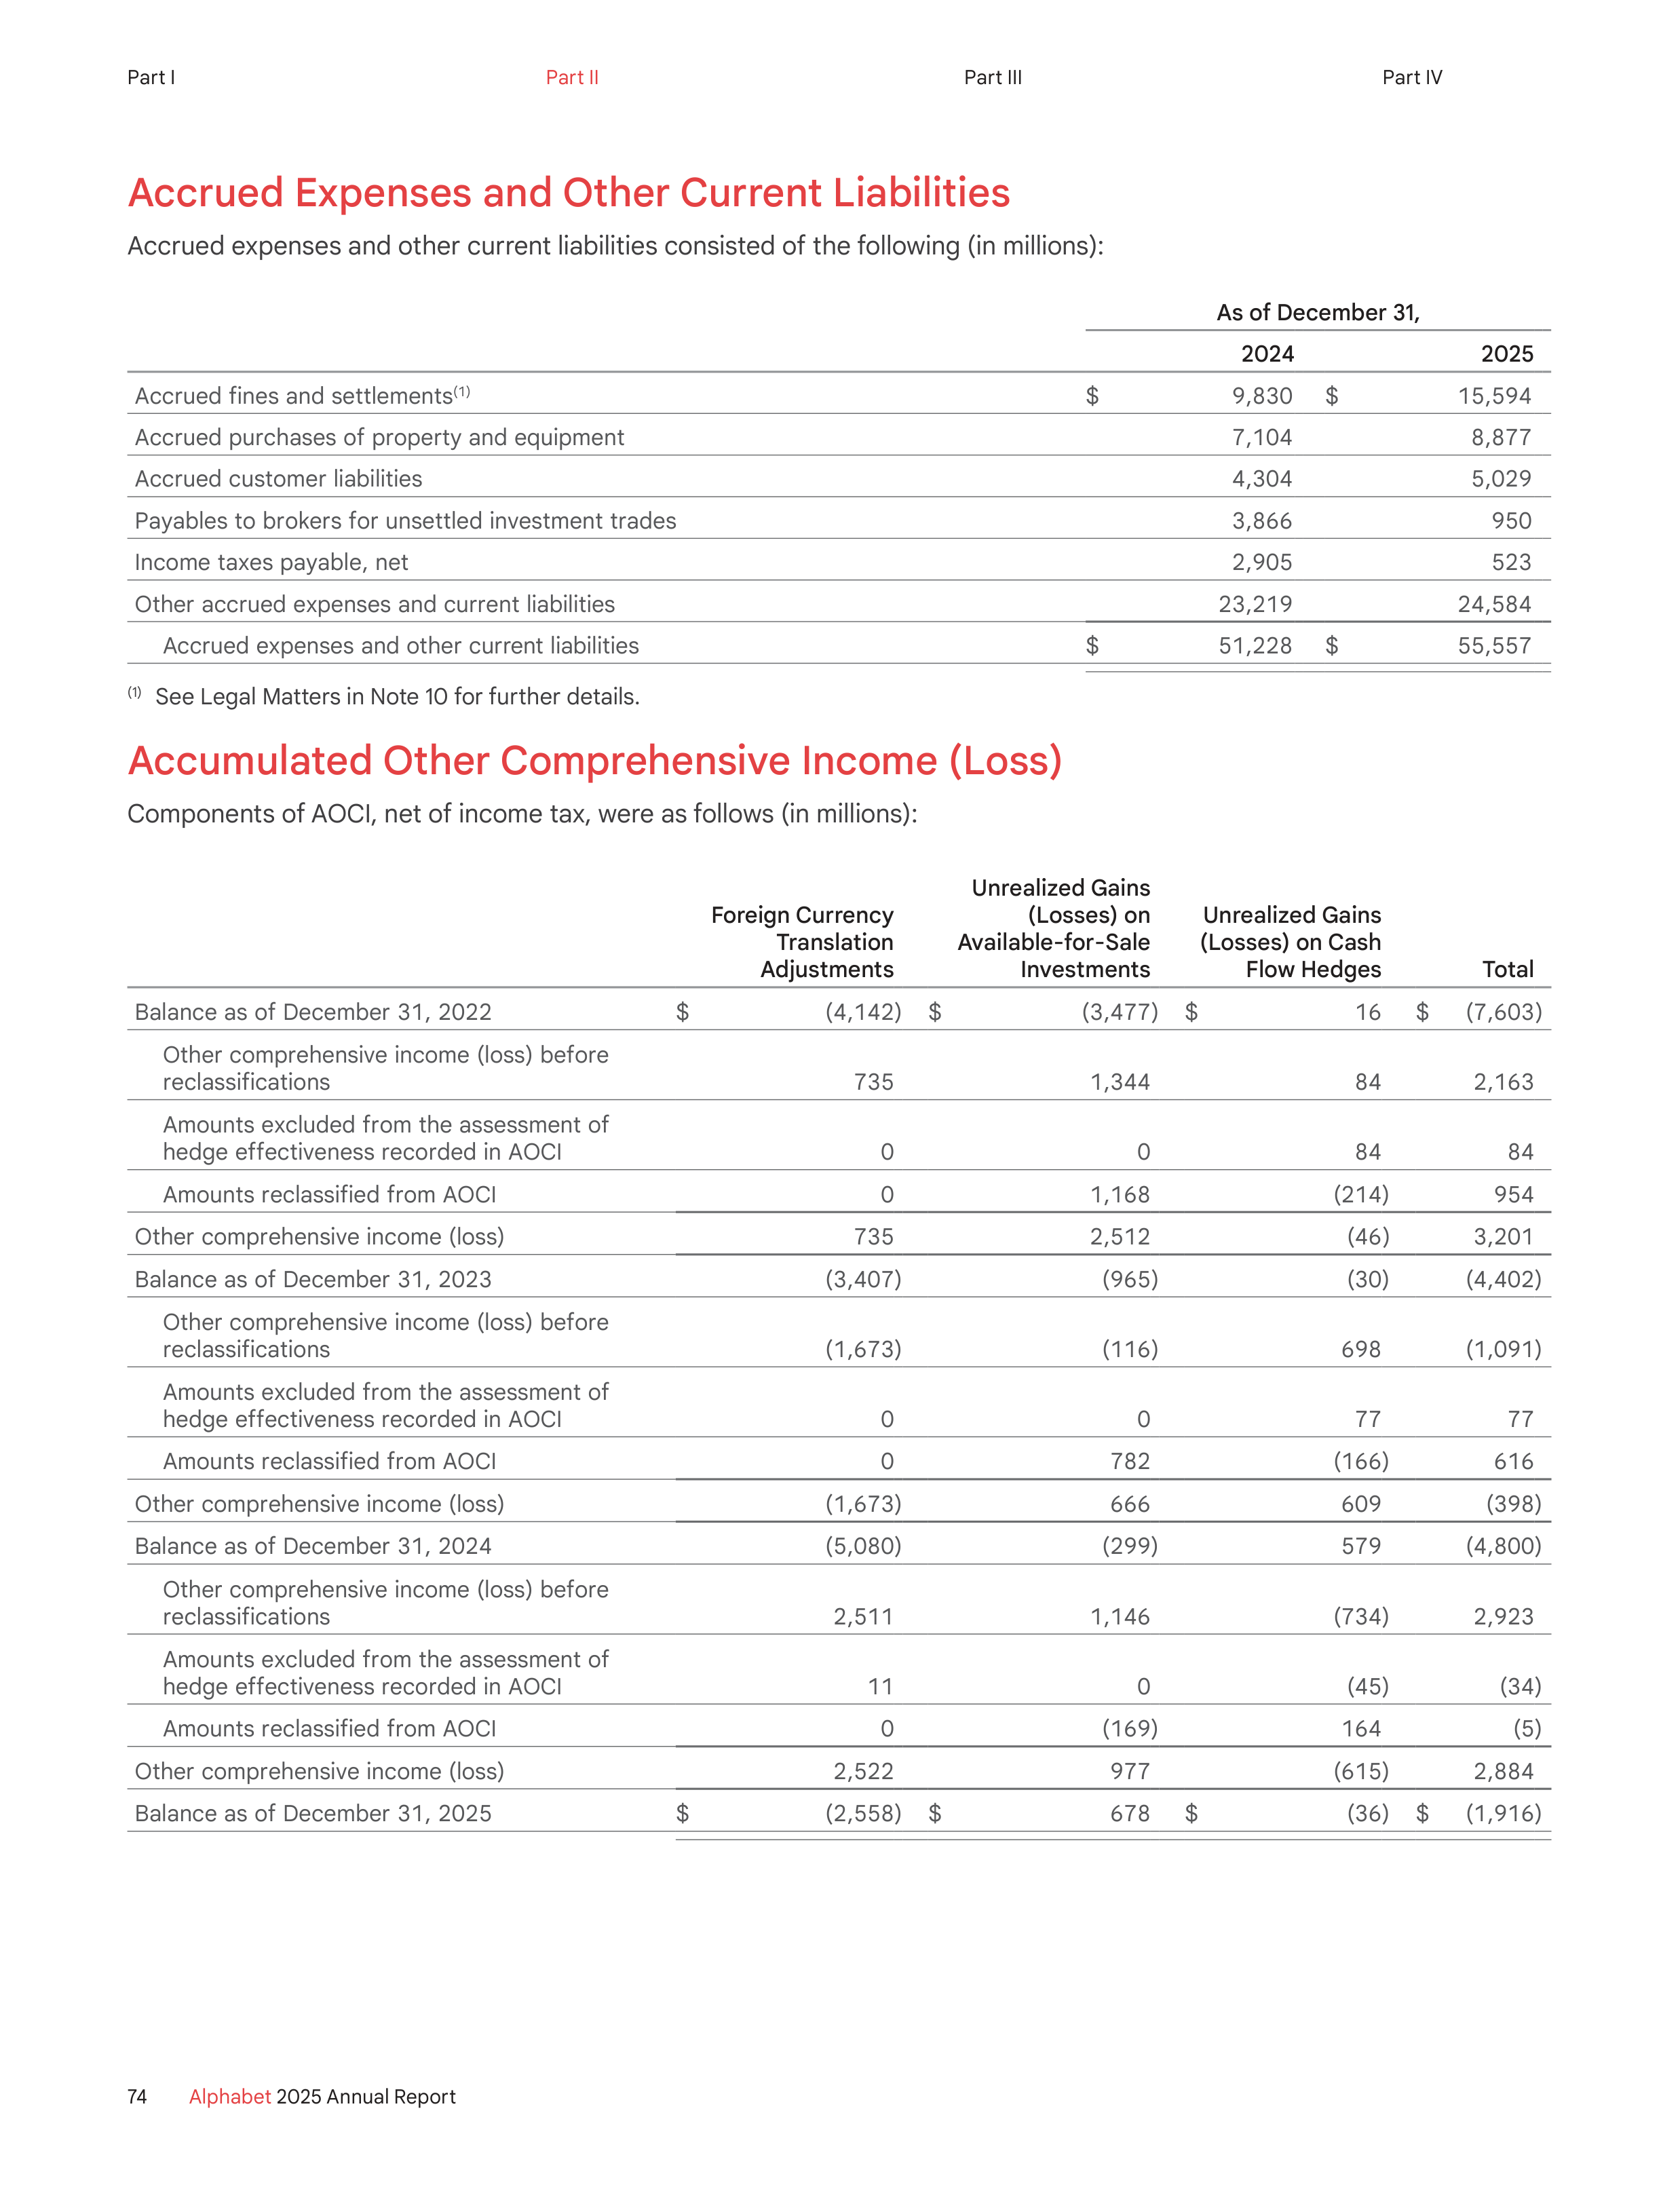
Accrued Expenses and Other Current Liabilities
Accrued expenses and other current liabilities consisted of the following (in millions):
As of December 31,
2024
2025
Accrued fines and settlements
(1)
$
9,830
$
15,594
Accrued purchases of property and equipment
7,104
8,877
Accrued customer liabilities
4,304
5,029
Payables to brokers for unsettled investment trades
3,866
950
Income taxes payable, net
2,905
523
Other accrued expenses and current liabilities
23,219
24,584
Accrued expenses and other current liabilities
$
51,228
$
55,557
(1)
See Legal Matters in Note 10 for further details.
Accumulated Other Comprehensive Income (Loss)
Components of AOCI, net of income tax, were as follows (in millions):
Foreign Currency
Translation
Adjustments
Unrealized Gains
(Losses) on
Available-for-Sale
Investments
Unrealized Gains
(Losses) on Cash
Flow Hedges
Total
Balance as of December 31, 2022
$
(4,142)
$
(3,477)
$
16
$
(7,603)
Other comprehensive income (loss) before
reclassifications
735
1,344
84
2,163
Amounts excluded from the assessment of
hedge effectiveness recorded in AOCI
0
0
84
84
Amounts reclassified from AOCI
0
1,168
(214)
954
Other comprehensive income (loss)
735
2,512
(46)
3,201
Balance as of December 31, 2023
(3,407)
(965)
(30)
(4,402)
Other comprehensive income (loss) before
reclassifications
(1,673)
(116)
698
(1,091)
Amounts excluded from the assessment of
hedge effectiveness recorded in AOCI
0
0
77
77
Amounts reclassified from AOCI
0
782
(166)
616
Other comprehensive income (loss)
(1,673)
666
609
(398)
Balance as of December 31, 2024
(5,080)
(299)
579
(4,800)
Other comprehensive income (loss) before
reclassifications
2,511
1,146
(734)
2,923
Amounts excluded from the assessment of
hedge effectiveness recorded in AOCI
11
0
(45)
(34)
Amounts reclassified from AOCI
0
(169)
164
(5)
Other comprehensive income (loss)
2,522
977
(615)
2,884
Balance as of December 31, 2025
$
(2,558)
$
678
$
(36)
$
(1,916)
74
Alphabet
2025 Annual Report
Part I
Part II
Part III
Part IV
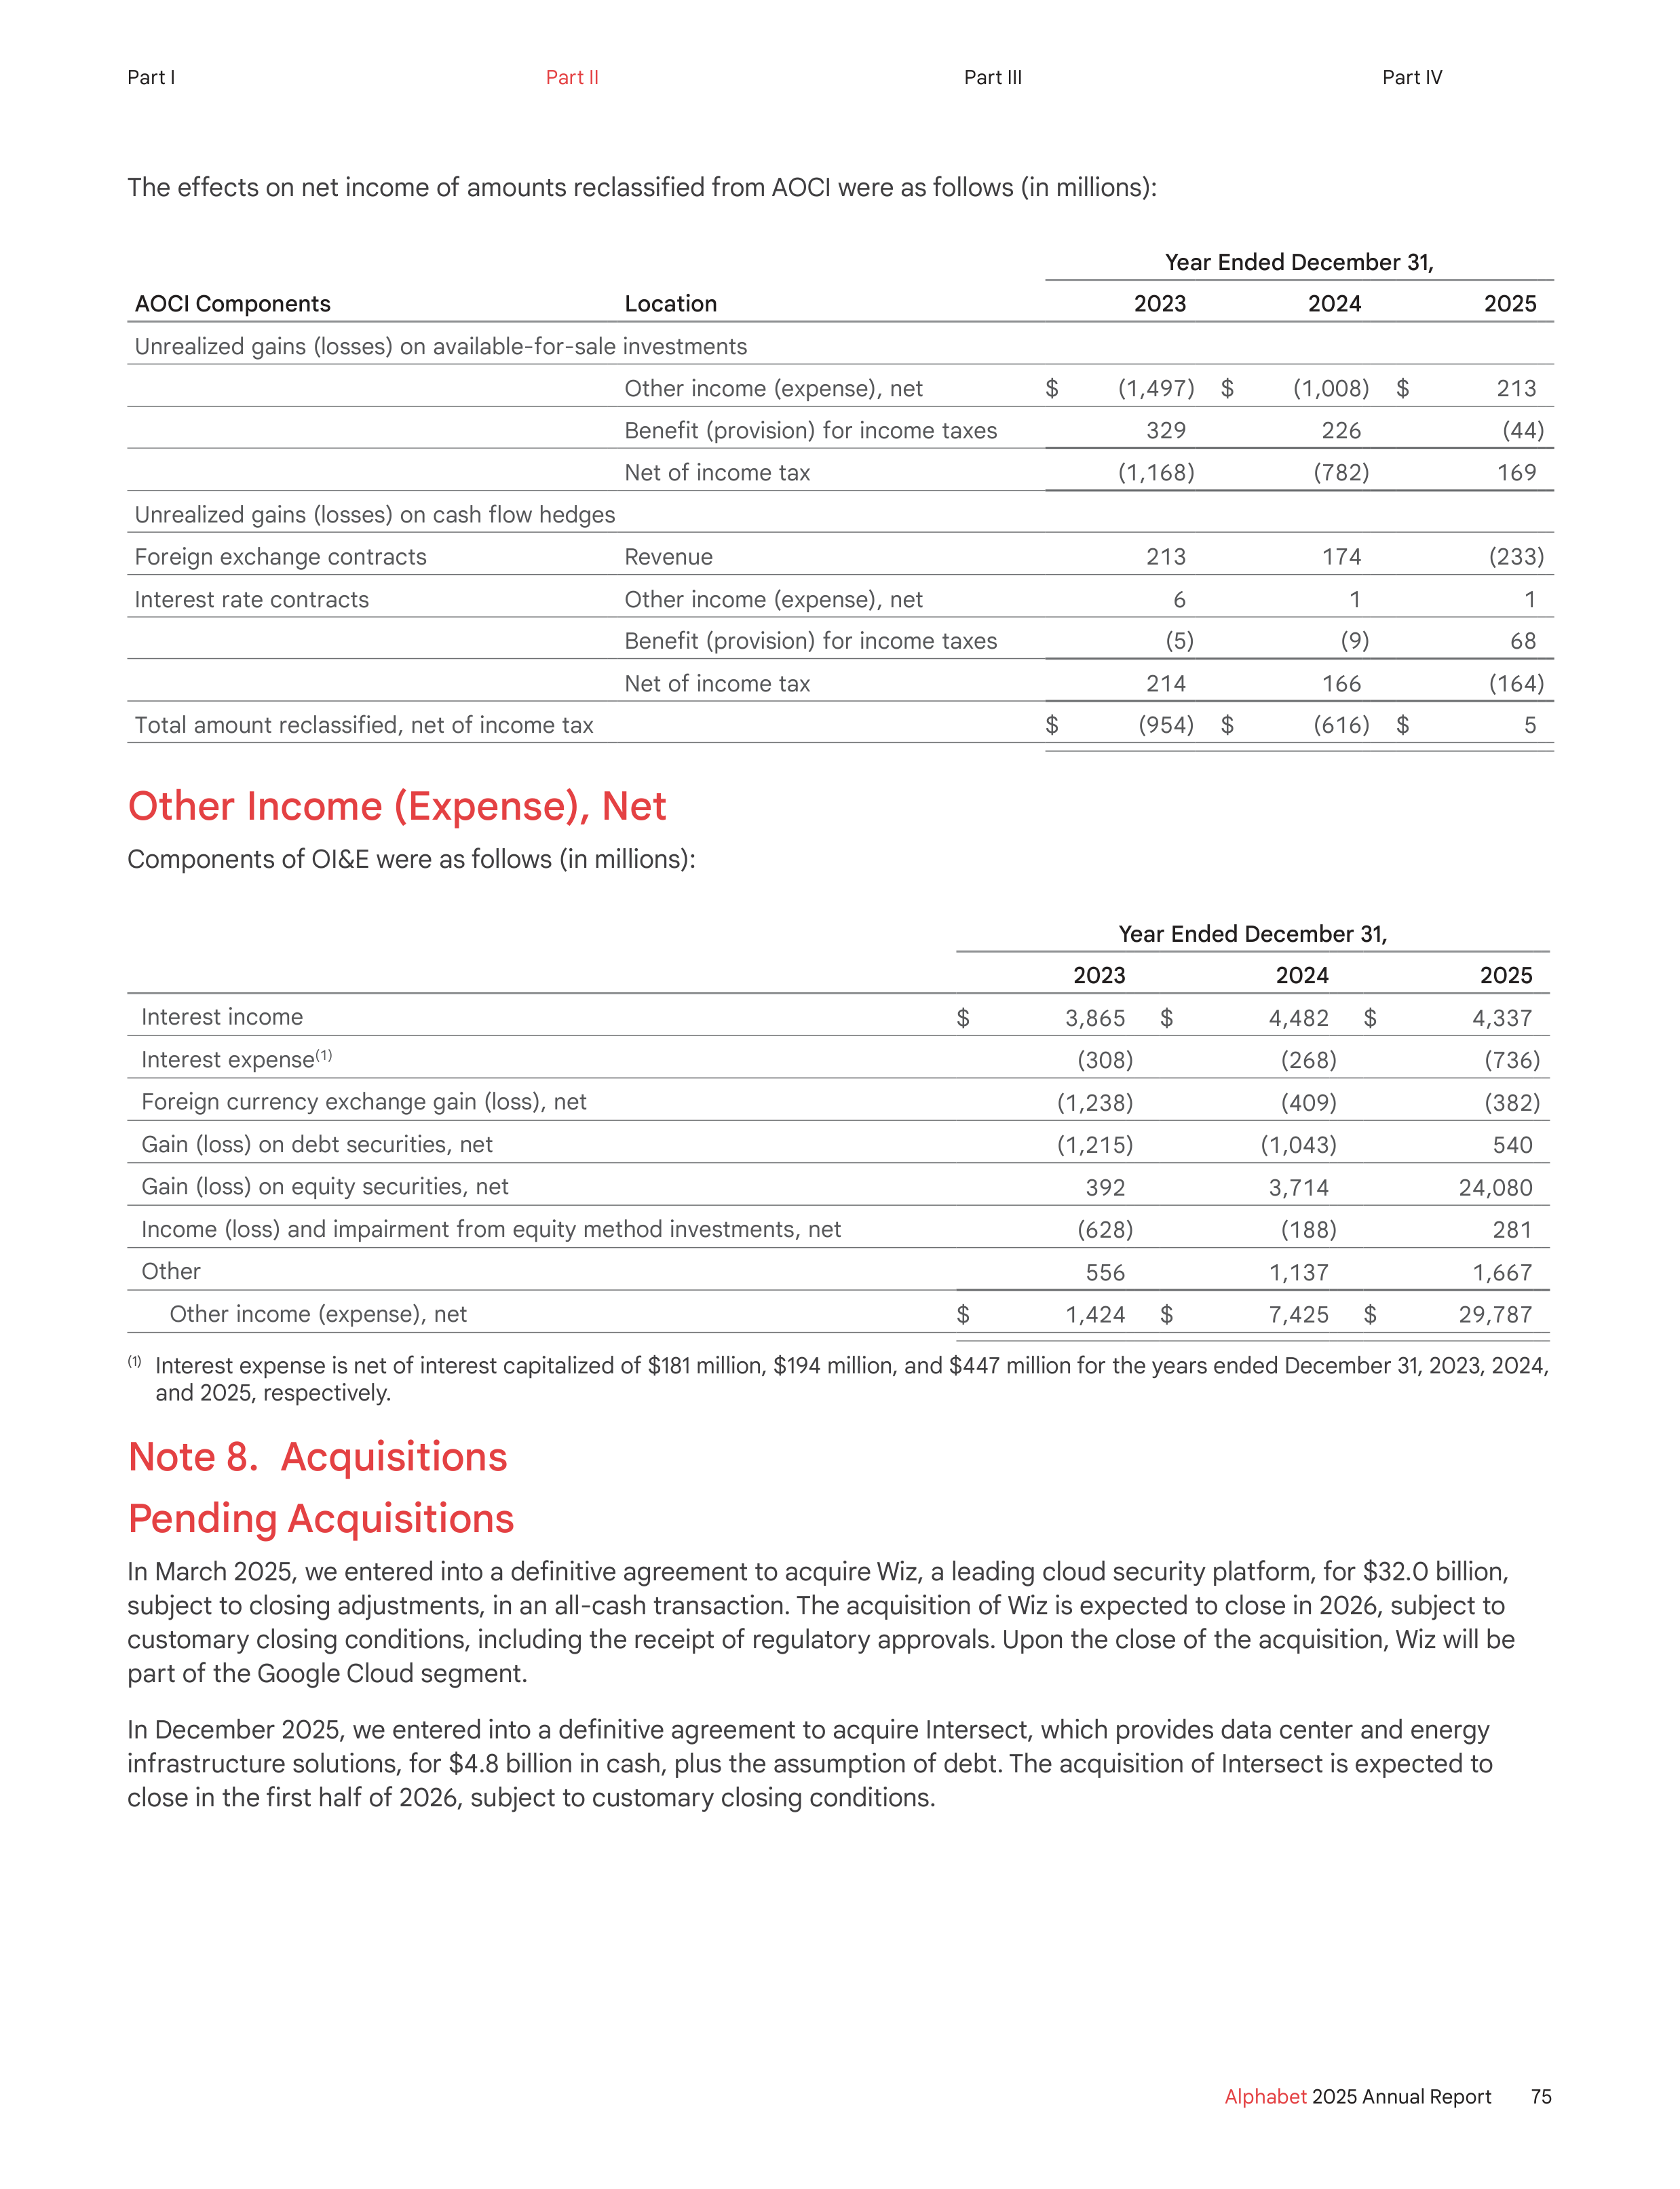
The effects on net income of amounts reclassified from AOCI were as follows (in millions):
Year Ended December 31,
AOCI Components
Location
2023
2024
2025
Unrealized gains (losses) on available-for-sale investments
Other income (expense), net
$
(1,497)
$
(1,008)
$
213
Benefit (provision) for income taxes
329
226
(44)
Net of income tax
(1,168)
(782)
169
Unrealized gains (losses) on cash flow hedges
Foreign exchange contracts
Revenue
213
174
(233)
Interest rate contracts
Other income (expense), net
6
1
1
Benefit (provision) for income taxes
(5)
(9)
68
Net of income tax
214
166
(164)
Total amount reclassified, net of income tax
$
(954)
$
(616)
$
5
Other Income (Expense), Net
Components of OI&E were as follows (in millions):
Year Ended December 31,
2023
2024
2025
Interest income
$
3,865
$
4,482
$
4,337
Interest expense
(1)
(308)
(268)
(736)
Foreign currency exchange gain (loss), net
(1,238)
(409)
(382)
Gain (loss) on debt securities, net
(1,215)
(1,043)
540
Gain (loss) on equity securities, net
392
3,714
24,080
Income (loss) and impairment from equity method investments, net
(628)
(188)
281
Other
556
1,137
1,667
Other income (expense), net
$
1,424
$
7,425
$
29,787
(1)
Interest expense is net of interest capitalized of $181 million, $194 million, and $447 million for the years ended December 31, 2023, 2024,
and 2025, respectively.
Note 8. Acquisitions
Pending Acquisitions
In March 2025, we entered into a definitive agreement to acquire Wiz, a leading cloud security platform, for $32.0 billion,
subject to closing adjustments, in an all-cash transaction. The acquisition of Wiz is expected to close in 2026, subject to
customary closing conditions, including the receipt of regulatory approvals. Upon the close of the acquisition, Wiz will be
part of the Google Cloud segment.
In December 2025, we entered into a definitive agreement to acquire Intersect, which provides data center and energy
infrastructure solutions, for $4.8 billion in cash, plus the assumption of debt. The acquisition of Intersect is expected to
close in the first half of 2026, subject to customary closing conditions.
75
Alphabet
2025 Annual Report
Part I
Part II
Part III
Part IV
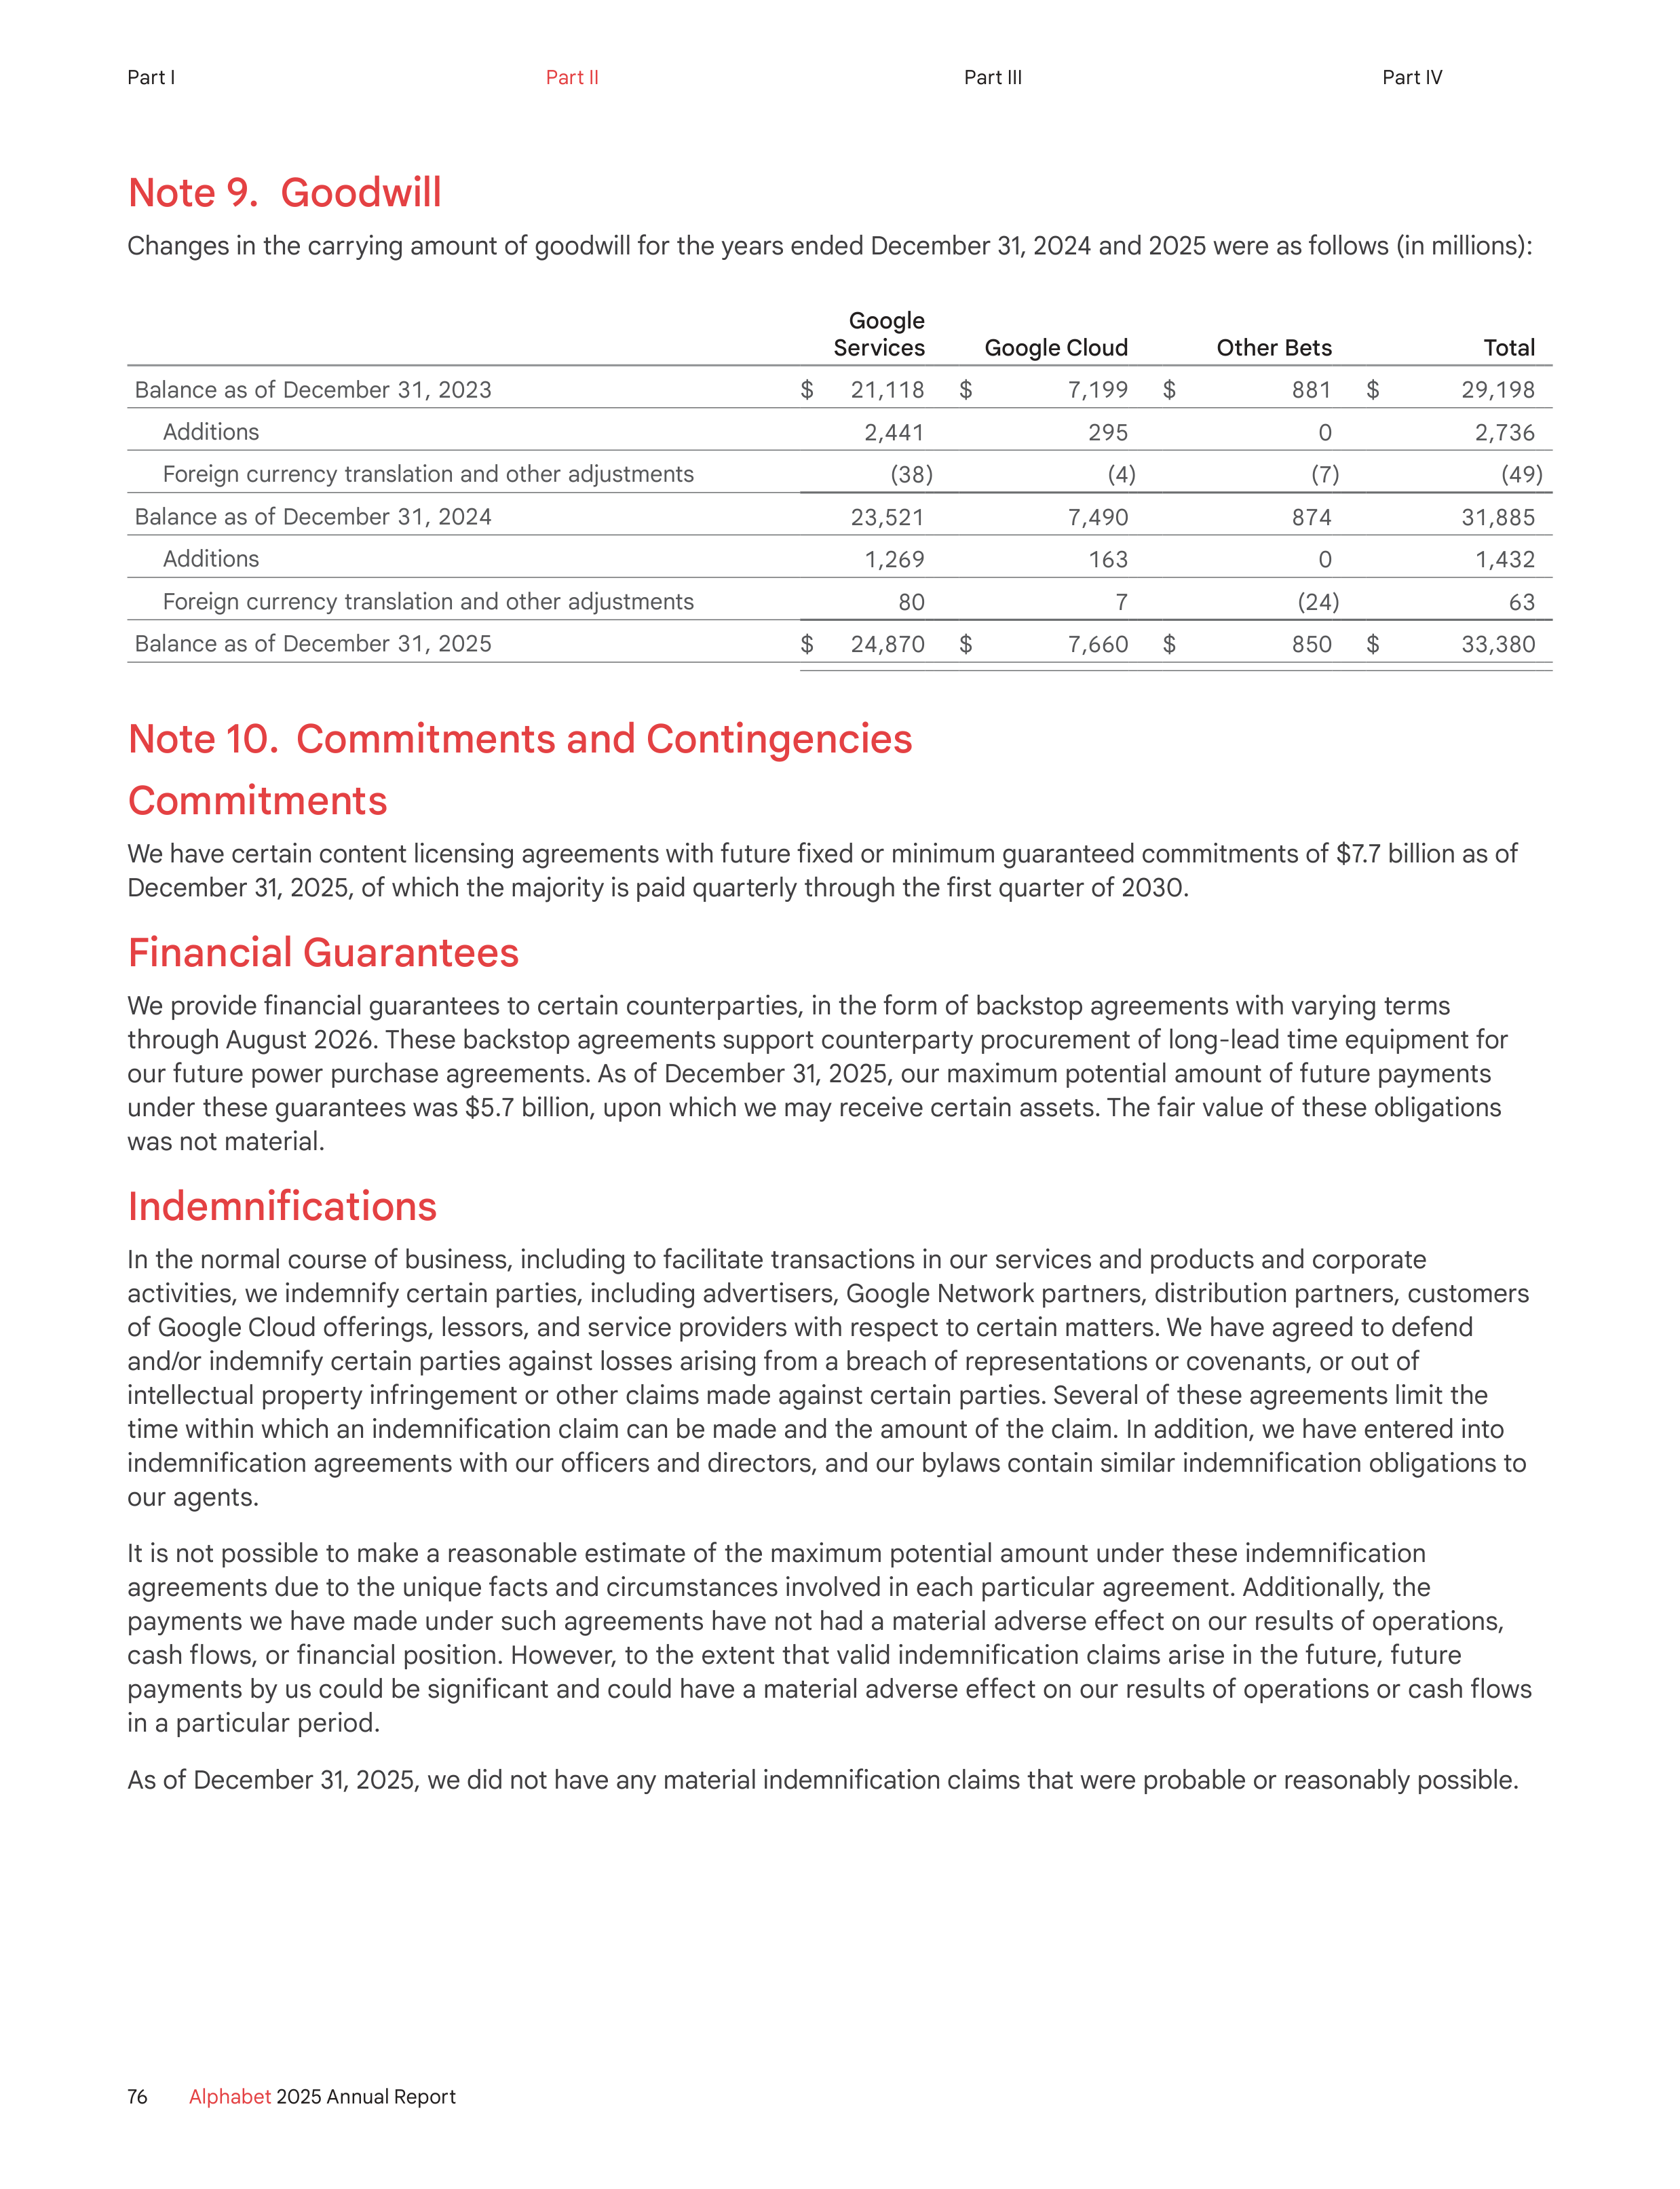
Note 9. Goodwill
Changes in the carrying amount of goodwill for the years ended December 31, 2024 and 2025 were as follows (in millions):
Google
Services
Google Cloud
Other Bets
Total
Balance as of December 31, 2023
$
21,118
$
7,199
$
881
$
29,198
Additions
2,441
295
0
2,736
Foreign currency translation and other adjustments
(38)
(4)
(7)
(49)
Balance as of December 31, 2024
23,521
7,490
874
31,885
Additions
1,269
163
0
1,432
Foreign currency translation and other adjustments
80
7
(24)
63
Balance as of December 31, 2025
$
24,870
$
7,660
$
850
$
33,380
Note 10. Commitments and Contingencies
Commitments
We have certain content licensing agreements with future fixed or minimum guaranteed commitments of $7.7 billion as of
December 31, 2025, of which the majority is paid quarterly through the first quarter of 2030.
Financial Guarantees
We provide financial guarantees to certain counterparties, in the form of backstop agreements with varying terms
through August 2026. These backstop agreements support counterparty procurement of long-lead time equipment for
our future power purchase agreements. As of December 31, 2025, our maximum potential amount of future payments
under these guarantees was $5.7 billion, upon which we may receive certain assets. The fair value of these obligations
was not material.
Indemnifications
In the normal course of business, including to facilitate transactions in our services and products and corporate
activities, we indemnify certain parties, including advertisers, Google Network partners, distribution partners, customers
of Google Cloud offerings, lessors, and service providers with respect to certain matters. We have agreed to defend
and/or indemnify certain parties against losses arising from a breach of representations or covenants, or out of
intellectual property infringement or other claims made against certain parties. Several of these agreements limit the
time within which an indemnification claim can be made and the amount of the claim. In addition, we have entered into
indemnification agreements with our officers and directors, and our bylaws contain similar indemnification obligations to
our agents.
It is not possible to make a reasonable estimate of the maximum potential amount under these indemnification
agreements due to the unique facts and circumstances involved in each particular agreement. Additionally, the
payments we have made under such agreements have not had a material adverse effect on our results of operations,
cash flows, or financial position. However, to the extent that valid indemnification claims arise in the future, future
payments by us could be significant and could have a material adverse effect on our results of operations or cash flows
in a particular period.
As of December 31, 2025, we did not have any material indemnification claims that were probable or reasonably possible.
76
Alphabet
2025 Annual Report
Part I
Part II
Part III
Part IV
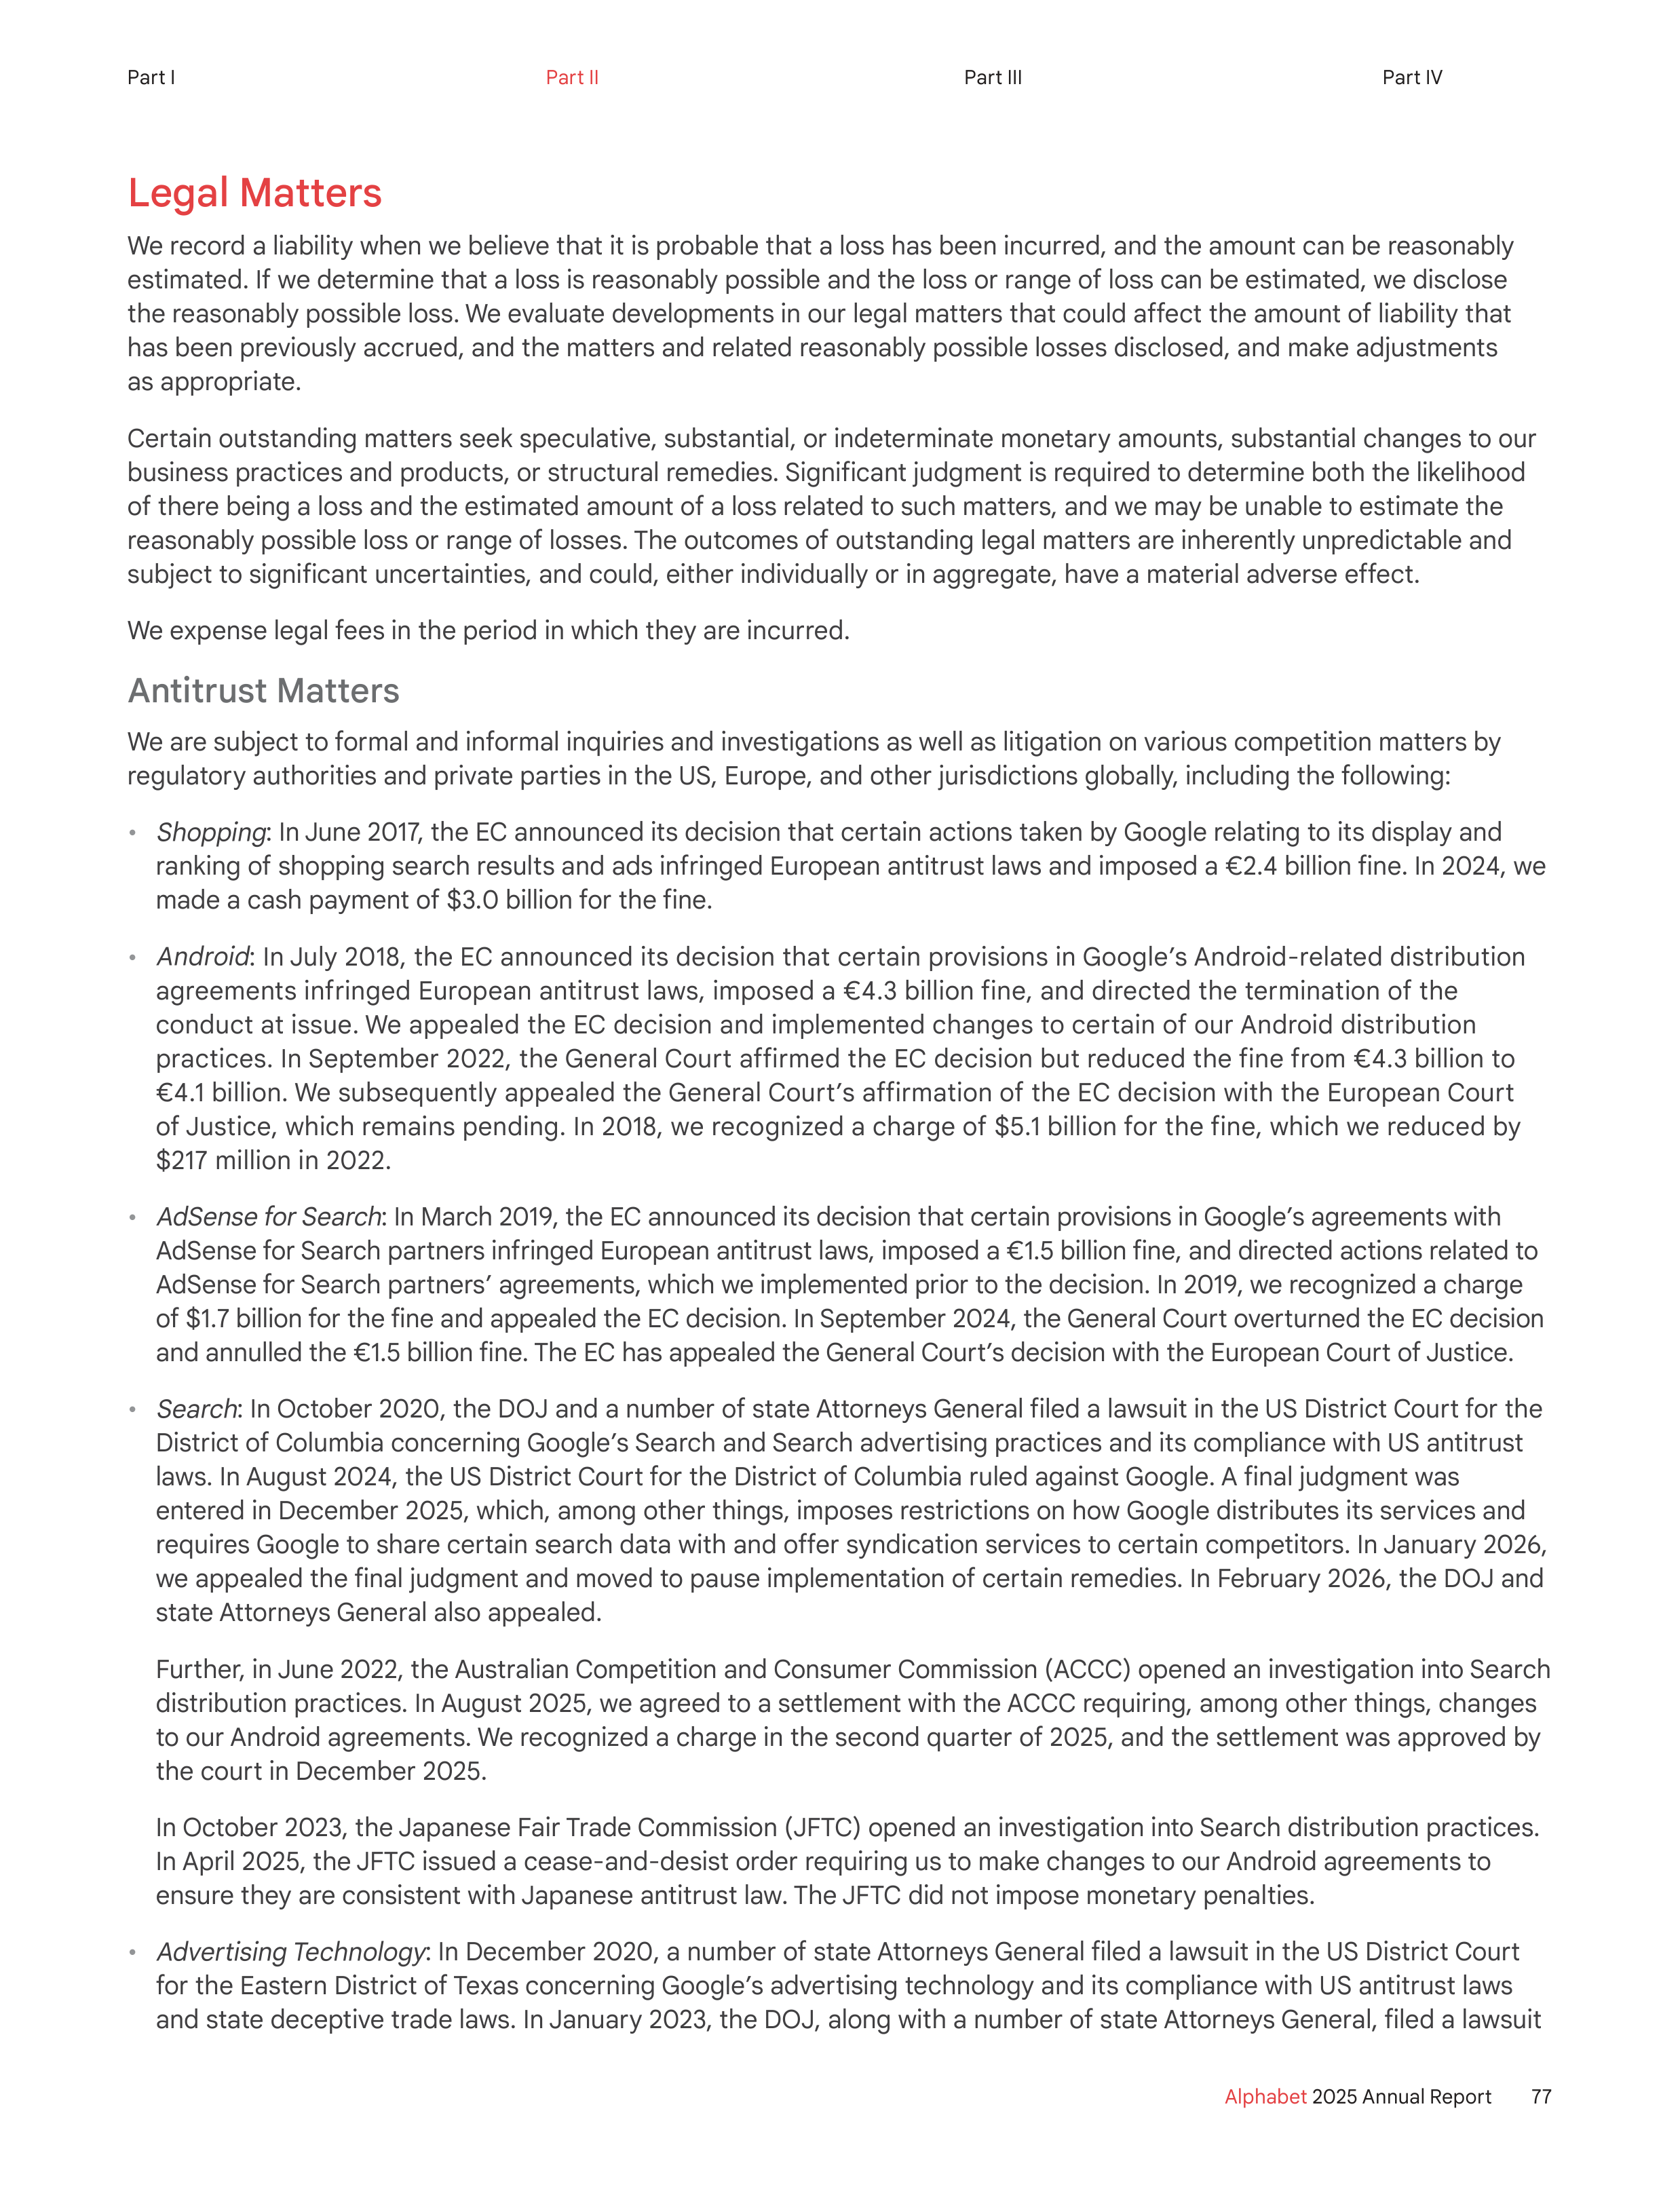
Legal Matters
We record a liability when we believe that it is probable that a loss has been incurred, and the amount can be reasonably
estimated. If we determine that a loss is reasonably possible and the loss or range of loss can be estimated, we disclose
the reasonably possible loss. We evaluate developments in our legal matters that could affect the amount of liability that
has been previously accrued, and the matters and related reasonably possible losses disclosed, and make adjustments
as appropriate.
Certain outstanding matters seek speculative, substantial, or indeterminate monetary amounts, substantial changes to our
business practices and products, or structural remedies. Significant judgment is required to determine both the likelihood
of there being a loss and the estimated amount of a loss related to such matters, and we may be unable to estimate the
reasonably possible loss or range of losses. The outcomes of outstanding legal matters are inherently unpredictable and
subject to significant uncertainties, and could, either individually or in aggregate, have a material adverse effect.
We expense legal fees in the period in which they are incurred.
Antitrust Matters
We are subject to formal and informal inquiries and investigations as well as litigation on various competition matters by
regulatory authorities and private parties in the US, Europe, and other jurisdictions globally, including the following:
•
Shopping: In June 2017, the EC announced its decision that certain actions taken by Google relating to its display and
ranking of shopping search results and ads infringed European antitrust laws and imposed a €2.4 billion fine. In 2024, we
made a cash payment of $3.0 billion for the fine.
•
Android: In July 2018, the EC announced its decision that certain provisions in Google’s Android-related distribution
agreements infringed European antitrust laws, imposed a €4.3 billion fine, and directed the termination of the
conduct at issue. We appealed the EC decision and implemented changes to certain of our Android distribution
practices. In September 2022, the General Court affirmed the EC decision but reduced the fine from €4.3 billion to
€4.1 billion. We subsequently appealed the General Court’s affirmation of the EC decision with the European Court
of Justice, which remains pending. In 2018, we recognized a charge of $5.1 billion for the fine, which we reduced by
$217 million in 2022.
•
AdSense for Search: In March 2019, the EC announced its decision that certain provisions in Google’s agreements with
AdSense for Search partners infringed European antitrust laws, imposed a €1.5 billion fine, and directed actions related to
AdSense for Search partners’ agreements, which we implemented prior to the decision. In 2019, we recognized a charge
of $1.7 billion for the fine and appealed the EC decision. In September 2024, the General Court overturned the EC decision
and annulled the €1.5 billion fine. The EC has appealed the General Court’s decision with the European Court of Justice.
•
Search: In October 2020, the DOJ and a number of state Attorneys General filed a lawsuit in the US District Court for the
District of Columbia concerning Google’s Search and Search advertising practices and its compliance with US antitrust
laws. In August 2024, the US District Court for the District of Columbia ruled against Google. A final judgment was
entered in December 2025, which, among other things, imposes restrictions on how Google distributes its services and
requires Google to share certain search data with and offer syndication services to certain competitors. In January 2026,
we appealed the final judgment and moved to pause implementation of certain remedies. In February 2026, the DOJ and
state Attorneys General also appealed.
Further, in June 2022, the Australian Competition and Consumer Commission (ACCC) opened an investigation into Search
distribution practices. In August 2025, we agreed to a settlement with the ACCC requiring, among other things, changes
to our Android agreements. We recognized a charge in the second quarter of 2025, and the settlement was approved by
the court in December 2025.
In October 2023, the Japanese Fair Trade Commission (JFTC) opened an investigation into Search distribution practices.
In April 2025, the JFTC issued a cease-and-desist order requiring us to make changes to our Android agreements to
ensure they are consistent with Japanese antitrust law. The JFTC did not impose monetary penalties.
•
Advertising Technology: In December 2020, a number of state Attorneys General filed a lawsuit in the US District Court
for the Eastern District of Texas concerning Google’s advertising technology and its compliance with US antitrust laws
and state deceptive trade laws. In January 2023, the DOJ, along with a number of state Attorneys General, filed a lawsuit
77
Alphabet
2025 Annual Report
Part I
Part II
Part III
Part IV
in the US District Court for the Eastern District of Virginia concerning Google’s advertising technology and its compliance
with US antitrust laws, and a number of additional state Attorneys General subsequently joined the lawsuit. In April 2025,
the US District Court for the Eastern District of Virginia issued a mixed decision in the DOJ case against Google, ruling
that neither Google’s advertiser tools nor the DoubleClick and AdMeld acquisitions were anticompetitive, but that
Google’s publisher tools unfairly excluded rivals. A separate proceeding to determine remedies, the range of which
vary widely, took place in September 2025, with the parties presenting differing remedy proposals. The DOJ’s remedy
proposal includes structural remedies that could have a material adverse effect on our business. Closing arguments were
held in November 2025, and we are awaiting a final judgment. After that judgment, we plan to appeal the adverse portion
of the April 2025 decision and potentially aspects of the remedies decision. A trial in the state Attorneys General case in
the Eastern District of Texas will take place after a decision on remedies is issued in the DOJ case. Given the nature of
these matters, we cannot estimate a possible loss.
Further, in September 2025, the EC announced its decision that Google had infringed European competition laws
through “self-preferencing” practices on the buy-side and the sell-side relating to Google’s advertising technology
business. The EC decision imposed a €3.0 billion fine and directed Google to cease and desist the alleged
“self‑preferencing” practices. We appealed the ruling in November 2025. We recognized a charge of $3.5 billion in the
third quarter of 2025, and we placed bank guarantees in the fourth quarter of 2025 in lieu of cash payment.
In September 2024, the UK also issued a Statement of Objections concerning Google’s advertising technology and its
compliance with UK antitrust laws, to which we responded.
•
Google Play: In July 2021, a number of state Attorneys General filed a lawsuit in the US District Court for the Northern
District of California concerning Google’s operation of Android and Google Play and its compliance with US antitrust laws
and state antitrust and consumer protection laws. In September 2023, we reached a settlement in principle with 50 state
Attorneys General and three territories and recognized a charge. The court preliminarily approved the settlement in
November 2025, and final approval remains pending before the court. In May 2024, we funded the settlement amount to
an escrow agent.
In December 2023, a California jury delivered a verdict against Google in Epic Games v. Google related to Google Play’s
business. Epic did not seek monetary damages. The presiding judge issued a remedies decision in October 2024,
ordering a variety of alterations to our business models and operations and contractual agreements for Android and
Google Play. We appealed the judgment, including the jury verdict and aspects of the remedies ordered, and in July 2025,
the Court of Appeals denied our appeal. We are in the process of appealing that decision to the US Supreme Court,
and we implemented the ordered remedies in October 2025 while the appeal is pending. In October 2025, we reached
a settlement with Epic to modify the remedies in this case and resolve certain other lawsuits Epic has filed regarding
Google Play’s business. The settlement is contingent on the court approving a proposed modified injunction. Epic and
Google filed a joint motion to modify the injunction in November 2025, which is currently pending before the court.
•
European Digital Markets Act: In March 2024, the EC opened two investigations regarding Google’s compliance with
certain provisions of the EU’s Digital Markets Act relating to Google Play and Search. In March 2025, the EC issued
preliminary findings of non-compliance in both investigations, to which we responded. Given the nature of this matter,
we cannot estimate a possible loss.
In addition to these antitrust proceedings, private individual and collective actions that overlap with claims pursued by
regulatory authorities are pending in the US and in several other jurisdictions, including across Europe. Given the nature of
these matters, we cannot estimate a possible loss.
We believe we have strong arguments against these open claims and will defend ourselves vigorously. We continue to
cooperate with federal and state regulators in the US, the EC, and other regulators around the world.
Privacy Matters
We are subject to a number of privacy-related laws and regulations, and we currently are party to a number of privacy
investigations and lawsuits ongoing in multiple jurisdictions. For example, there are ongoing investigations and litigation in
the US and the EU, including those relating to our collection and use of location information, the choices we offer users,
and advertising practices, which could result in significant fines, judgments, and product changes. In October 2025, we
finalized a $1.4 billion settlement of certain privacy matters.
78
Alphabet
2025 Annual Report
Part I
Part II
Part III
Part IV
Patent and Intellectual Property Claims
We have had patent, copyright, trade secret, and trademark infringement lawsuits filed against us claiming that certain
of our products, services, and technologies infringe others’ intellectual property rights. Adverse results in these lawsuits
may include awards of substantial monetary damages, costly royalty or licensing agreements, or orders preventing us
from offering certain features, functionalities, products, or services. As a result, we may have to change our business
practices and develop non-infringing products or technologies, which could result in a loss of revenues for us and
otherwise harm our business. In addition, the ITC has increasingly become an important forum to litigate intellectual
property disputes because an ultimate loss in an ITC action can result in a prohibition on importing infringing products
into the US. Because the US is an important market, a prohibition on importation could have an adverse effect on us,
including preventing us from importing many important products into the US or necessitating workarounds that may
limit certain features of our products. Further, our customers and partners may discontinue the use of our products,
services, and technologies, as a result of injunctions or otherwise, which could result in loss of revenues and adversely
affect our business.
Other
We are subject to claims, lawsuits, regulatory and government inquiries and investigations, other proceedings, and
consent orders involving competition, intellectual property, data privacy and security, tax and related compliance, labor
and employment, commercial disputes, content generated by our users, goods and services offered by advertisers or
publishers using our platforms, design of our products and services, personal injury and other tort and nuisance theories,
consumer protection, including how we moderate content on our platforms, AI, and other matters. For example, we
periodically have data incidents that we report to relevant regulators as required by law. Such claims, consent orders,
lawsuits, regulatory and government investigations, and other proceedings could result in substantial fines and penalties,
injunctive relief, ongoing monitoring and auditing obligations, changes to our products and services, alterations to our
business models and operations, and collateral related civil litigation or other adverse consequences, all of which could
harm our business, reputation, financial condition, and operating results.
We have ongoing legal matters relating to Russia. For example, some matters concern civil judgments that include
compounding penalties imposed upon us in connection with disputes regarding the termination of accounts, including
those of sanctioned parties. We do not expect these ongoing legal matters will have a material adverse effect.
Non-Income Taxes
We are under audit by various domestic and foreign tax authorities with regards to non-income tax matters. The subject
matter of non-income tax audits primarily arises from disputes on the tax treatment and tax rate applied to the sale of our
products and services in these jurisdictions and the tax treatment of certain employee benefits. We accrue non-income
taxes that may result from examinations by, or any negotiated agreements with, these tax authorities when a loss is
probable and reasonably estimable. If we determine that a loss is reasonably possible and the loss or range of loss can be
estimated, we disclose the reasonably possible loss. Due to the inherent complexity and uncertainty of these matters and
judicial process in certain jurisdictions, the final outcome may be materially different from our expectations.
See Note 14 for further details regarding income tax contingencies.
Note 11. Stockholders’ Equity
Class A and Class B Common Stock and Class C Capital Stock
Our Board of Directors has authorized three classes of stock, Class A and Class B common stock, and Class C capital stock.
The rights of the holders of each class of our common and capital stock are identical, except with respect to voting. Each
share of Class A common stock is entitled to one vote per share. Each share of Class B common stock is entitled to 10 votes
per share. Class C capital stock has no voting rights, except as required by applicable law. Shares of Class B common stock
may be converted at any time at the option of the stockholder and automatically convert upon sale or transfer to Class A
common stock.
79
Alphabet
2025 Annual Report
Part I
Part II
Part III
Part IV
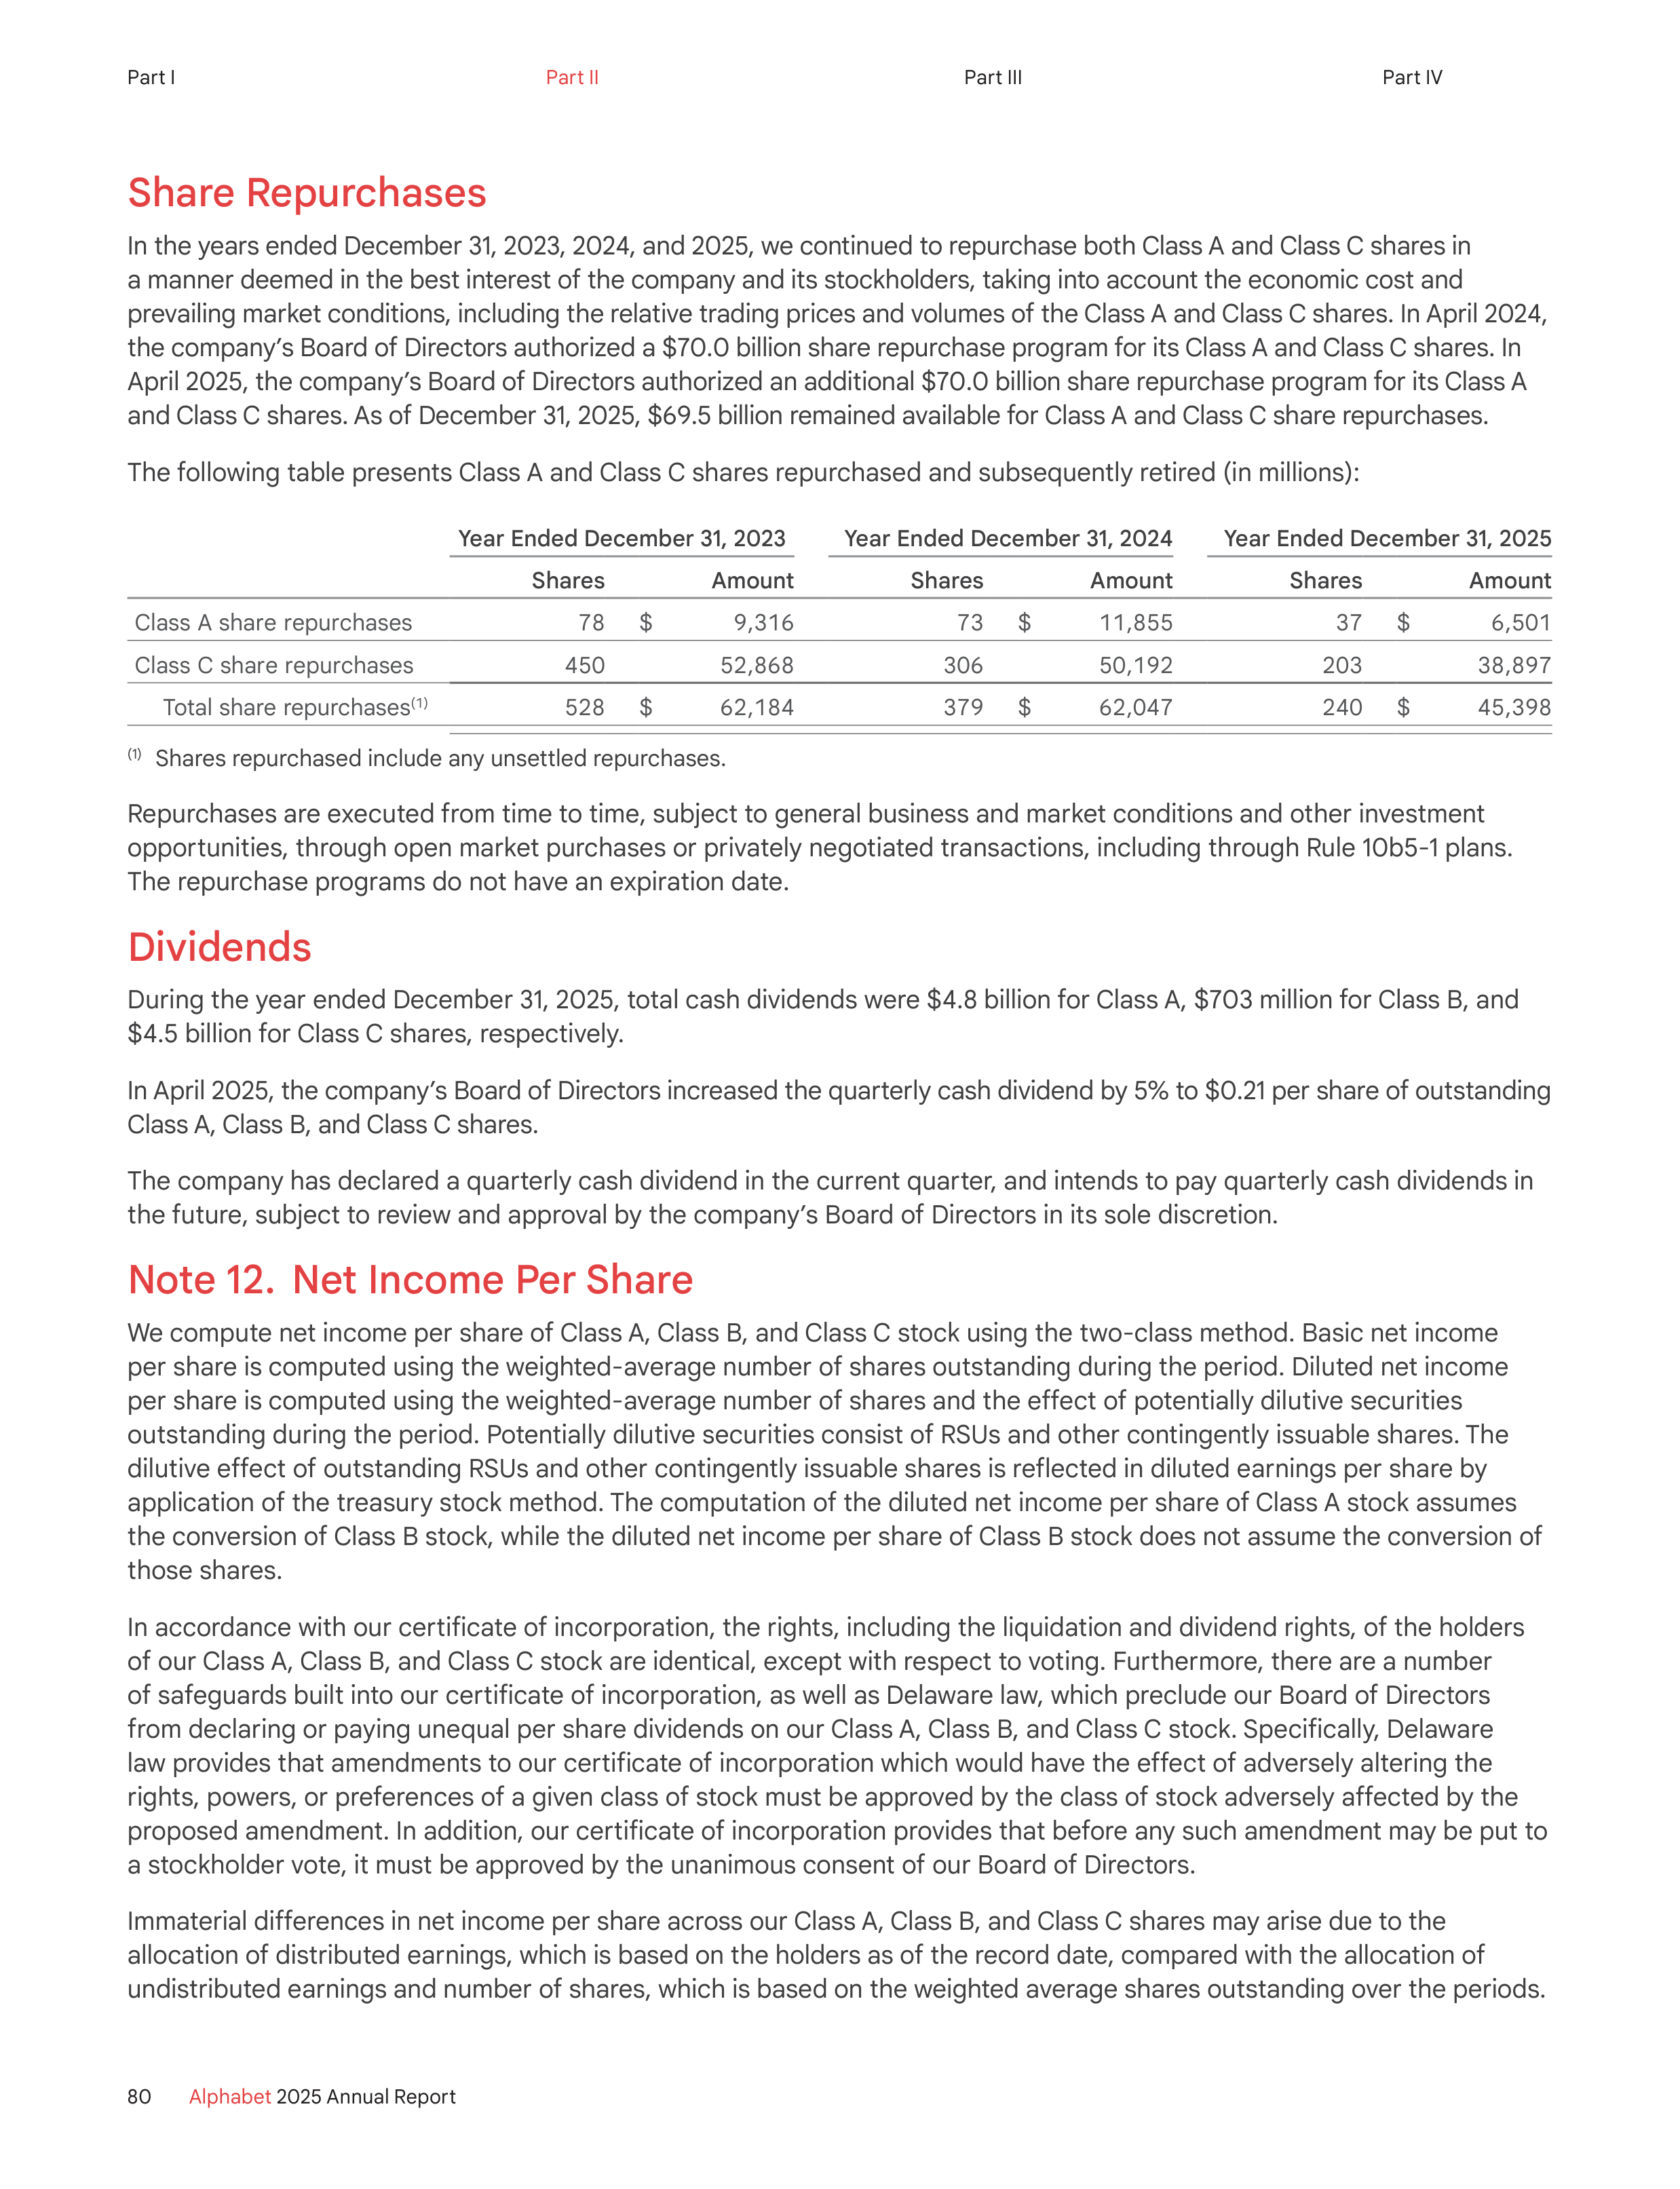
Share Repurchases
In the years ended December 31, 2023, 2024, and 2025, we continued to repurchase both Class A and Class C shares in
a manner deemed in the best interest of the company and its stockholders, taking into account the economic cost and
prevailing market conditions, including the relative trading prices and volumes of the Class A and Class C shares. In April 2024,
the company’s Board of Directors authorized a $70.0 billion share repurchase program for its Class A and Class C shares. In
April 2025, the company’s Board of Directors authorized an additional $70.0 billion share repurchase program for its Class A
and Class C shares. As of December 31, 2025, $69.5 billion remained available for Class A and Class C share repurchases.
The following table presents Class A and Class C shares repurchased and subsequently retired (in millions):
Year Ended December 31, 2023
Year Ended December 31, 2024
Year Ended December 31, 2025
Shares
Amount
Shares
Amount
Shares
Amount
Class A share repurchases
78
$
9,316
73
$
11,855
37
$
6,501
Class C share repurchases
450
52,868
306
50,192
203
38,897
Total share repurchases
(1)
528
$
62,184
379
$
62,047
240
$
45,398
(1)
Shares repurchased include any unsettled repurchases.
Repurchases are executed from time to time, subject to general business and market conditions and other investment
opportunities, through open market purchases or privately negotiated transactions, including through Rule 10b5-1 plans.
The repurchase programs do not have an expiration date.
Dividends
During the year ended December 31, 2025, total cash dividends were $4.8 billion for Class A, $703 million for Class B, and
$4.5 billion for Class C shares, respectively.
In April 2025, the company’s Board of Directors increased the quarterly cash dividend by 5% to $0.21 per share of outstanding
Class A, Class B, and Class C shares.
The company has declared a quarterly cash dividend in the current quarter, and intends to pay quarterly cash dividends in
the future, subject to review and approval by the company’s Board of Directors in its sole discretion.
Note 12. Net Income Per Share
We compute net income per share of Class A, Class B, and Class C stock using the two-class method. Basic net income
per share is computed using the weighted-average number of shares outstanding during the period. Diluted net income
per share is computed using the weighted-average number of shares and the effect of potentially dilutive securities
outstanding during the period. Potentially dilutive securities consist of RSUs and other contingently issuable shares. The
dilutive effect of outstanding RSUs and other contingently issuable shares is reflected in diluted earnings per share by
application of the treasury stock method. The computation of the diluted net income per share of Class A stock assumes
the conversion of Class B stock, while the diluted net income per share of Class B stock does not assume the conversion of
those shares.
In accordance with our certificate of incorporation, the rights, including the liquidation and dividend rights, of the holders
of our Class A, Class B, and Class C stock are identical, except with respect to voting. Furthermore, there are a number
of safeguards built into our certificate of incorporation, as well as Delaware law, which preclude our Board of Directors
from declaring or paying unequal per share dividends on our Class A, Class B, and Class C stock. Specifically, Delaware
law provides that amendments to our certificate of incorporation which would have the effect of adversely altering the
rights, powers, or preferences of a given class of stock must be approved by the class of stock adversely affected by the
proposed amendment. In addition, our certificate of incorporation provides that before any such amendment may be put to
a stockholder vote, it must be approved by the unanimous consent of our Board of Directors.
Immaterial differences in net income per share across our Class A, Class B, and Class C shares may arise due to the
allocation of distributed earnings, which is based on the holders as of the record date, compared with the allocation of
undistributed earnings and number of shares, which is based on the weighted average shares outstanding over the periods.
80
Alphabet
2025 Annual Report
Part I
Part II
Part III
Part IV
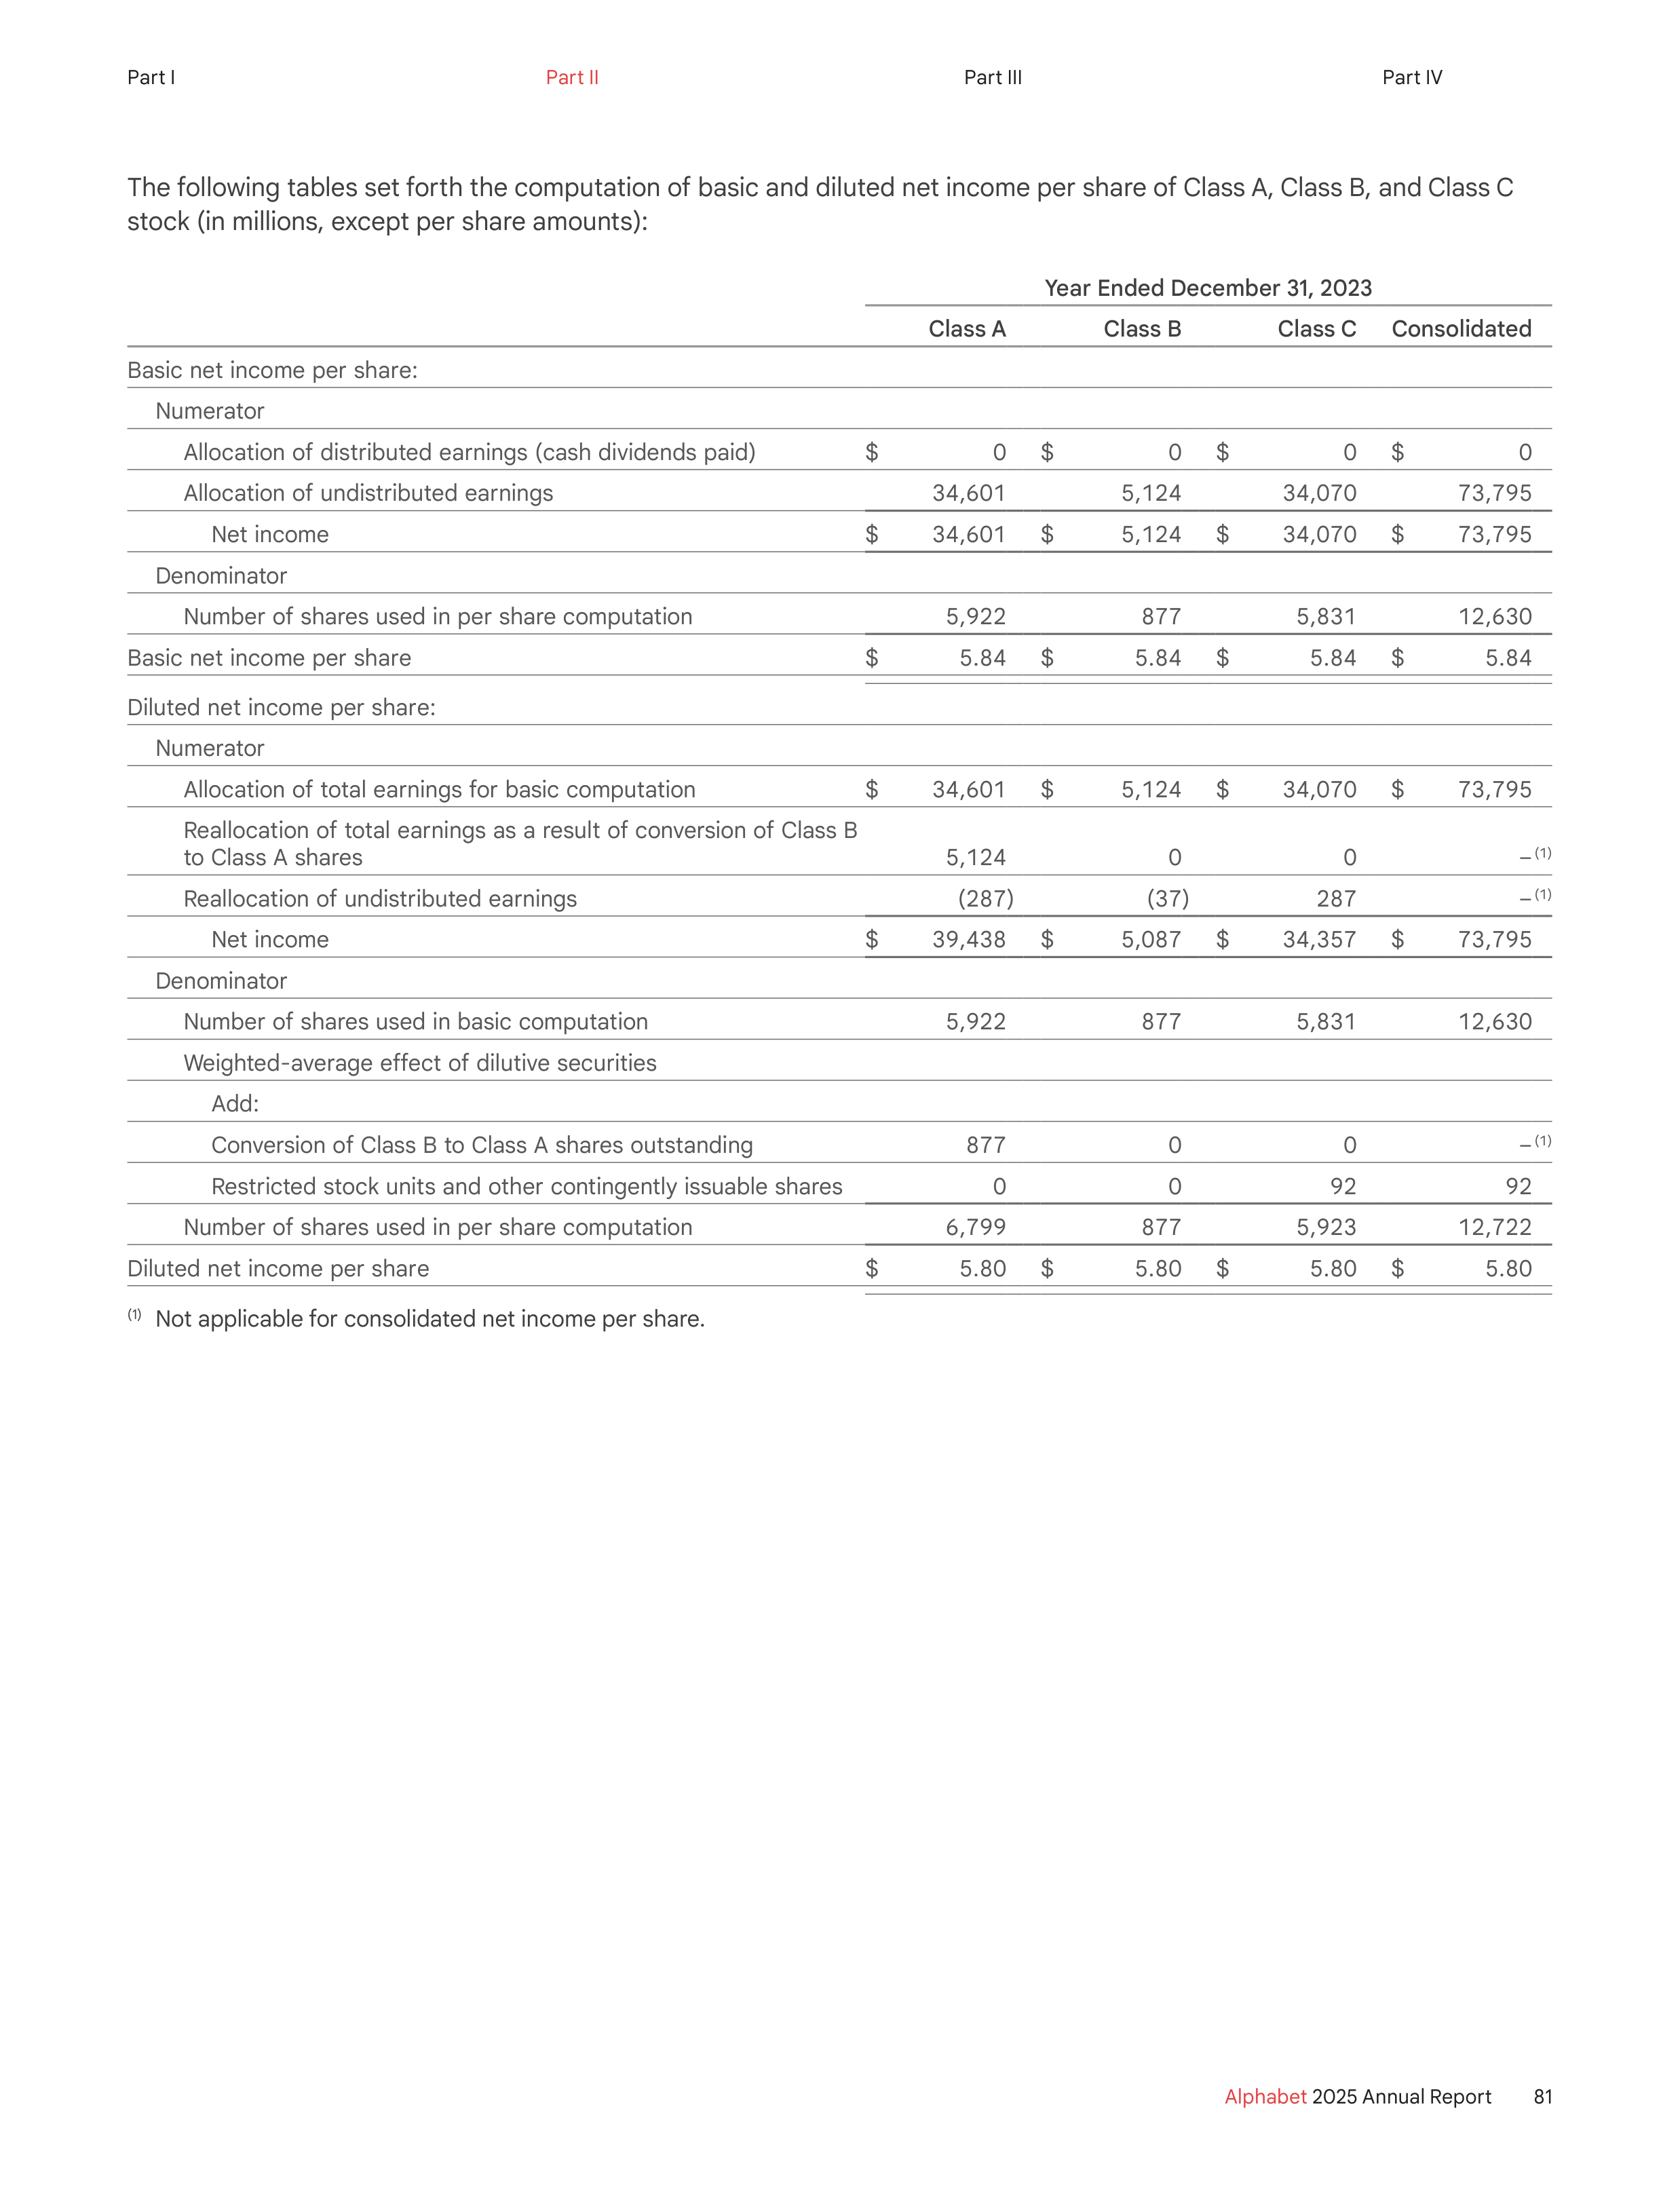
The following tables set forth the computation of basic and diluted net income per share of Class A, Class B, and Class C
stock (in millions, except per share amounts):
Year Ended December 31, 2023
Class A
Class B
Class C
Consolidated
Basic net income per share:
Numerator
Allocation of distributed earnings (cash dividends paid)
$
0
$
0
$
0
$
0
Allocation of undistributed earnings
34,601
5,124
34,070
73,795
Net income
$
34,601
$
5,124
$
34,070
$
73,795
Denominator
Number of shares used in per share computation
5,922
877
5,831
12,630
Basic net income per share
$
5.84
$
5.84
$
5.84
$
5.84
Diluted net income per share:
Numerator
Allocation of total earnings for basic computation
$
34,601
$
5,124
$
34,070
$
73,795
Reallocation of total earnings as a result of conversion of Class B
to Class A shares
5,124
0
0
–
(1)
Reallocation of undistributed earnings
(287)
(37)
287
–
(1)
Net income
$
39,438
$
5,087
$
34,357
$
73,795
Denominator
Number of shares used in basic computation
5,922
877
5,831
12,630
Weighted-average effect of dilutive securities
Add:
Conversion of Class B to Class A shares outstanding
877
0
0
–
(1)
Restricted stock units and other contingently issuable shares
0
0
92
92
Number of shares used in per share computation
6,799
877
5,923
12,722
Diluted net income per share
$
5.80
$
5.80
$
5.80
$
5.80
(1)
Not applicable for consolidated net income per share.
81
Alphabet
2025 Annual Report
Part I
Part II
Part III
Part IV
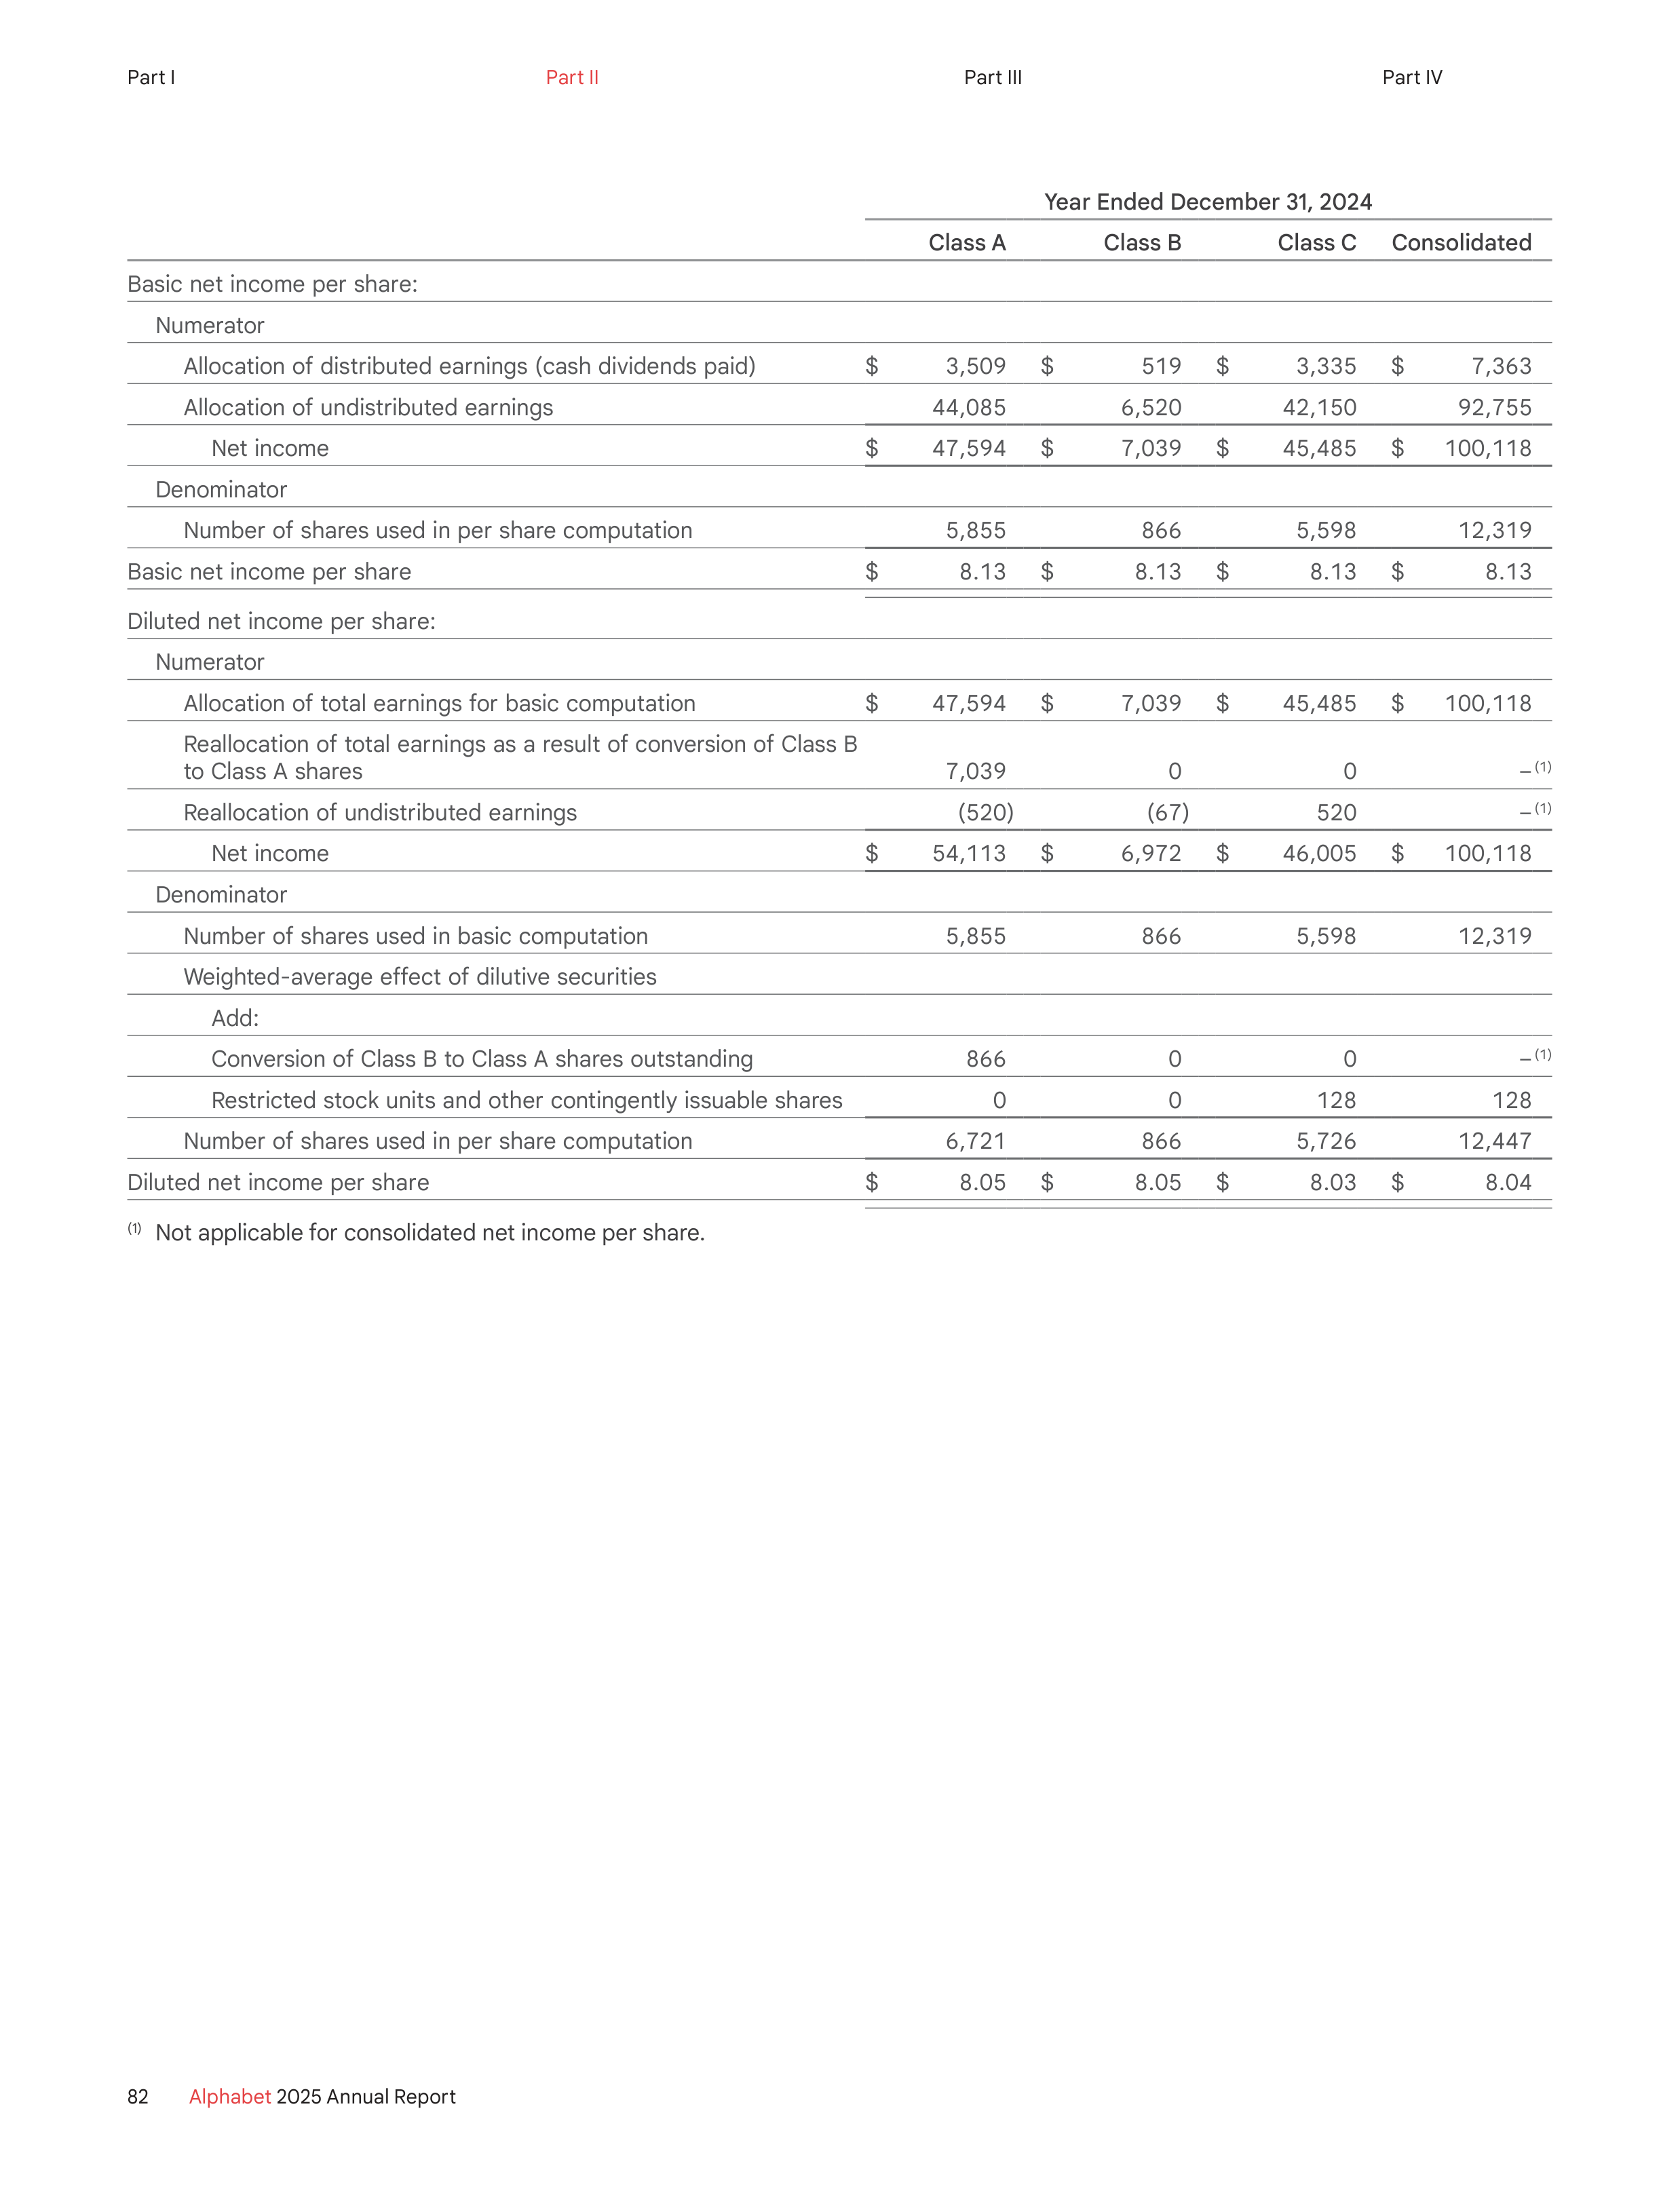
Year Ended December 31, 2024
Class A
Class B
Class C
Consolidated
Basic net income per share:
Numerator
Allocation of distributed earnings (cash dividends paid)
$
3,509
$
519
$
3,335
$
7,363
Allocation of undistributed earnings
44,085
6,520
42,150
92,755
Net income
$
47,594
$
7,039
$
45,485
$
100,118
Denominator
Number of shares used in per share computation
5,855
866
5,598
12,319
Basic net income per share
$
8.13
$
8.13
$
8.13
$
8.13
Diluted net income per share:
Numerator
Allocation of total earnings for basic computation
$
47,594
$
7,039
$
45,485
$
100,118
Reallocation of total earnings as a result of conversion of Class B
to Class A shares
7,039
0
0
–
(1)
Reallocation of undistributed earnings
(520)
(67)
520
–
(1)
Net income
$
54,113
$
6,972
$
46,005
$
100,118
Denominator
Number of shares used in basic computation
5,855
866
5,598
12,319
Weighted-average effect of dilutive securities
Add:
Conversion of Class B to Class A shares outstanding
866
0
0
–
(1)
Restricted stock units and other contingently issuable shares
0
0
128
128
Number of shares used in per share computation
6,721
866
5,726
12,447
Diluted net income per share
$
8.05
$
8.05
$
8.03
$
8.04
(1)
Not applicable for consolidated net income per share.
82
Alphabet
2025 Annual Report
Part I
Part II
Part III
Part IV
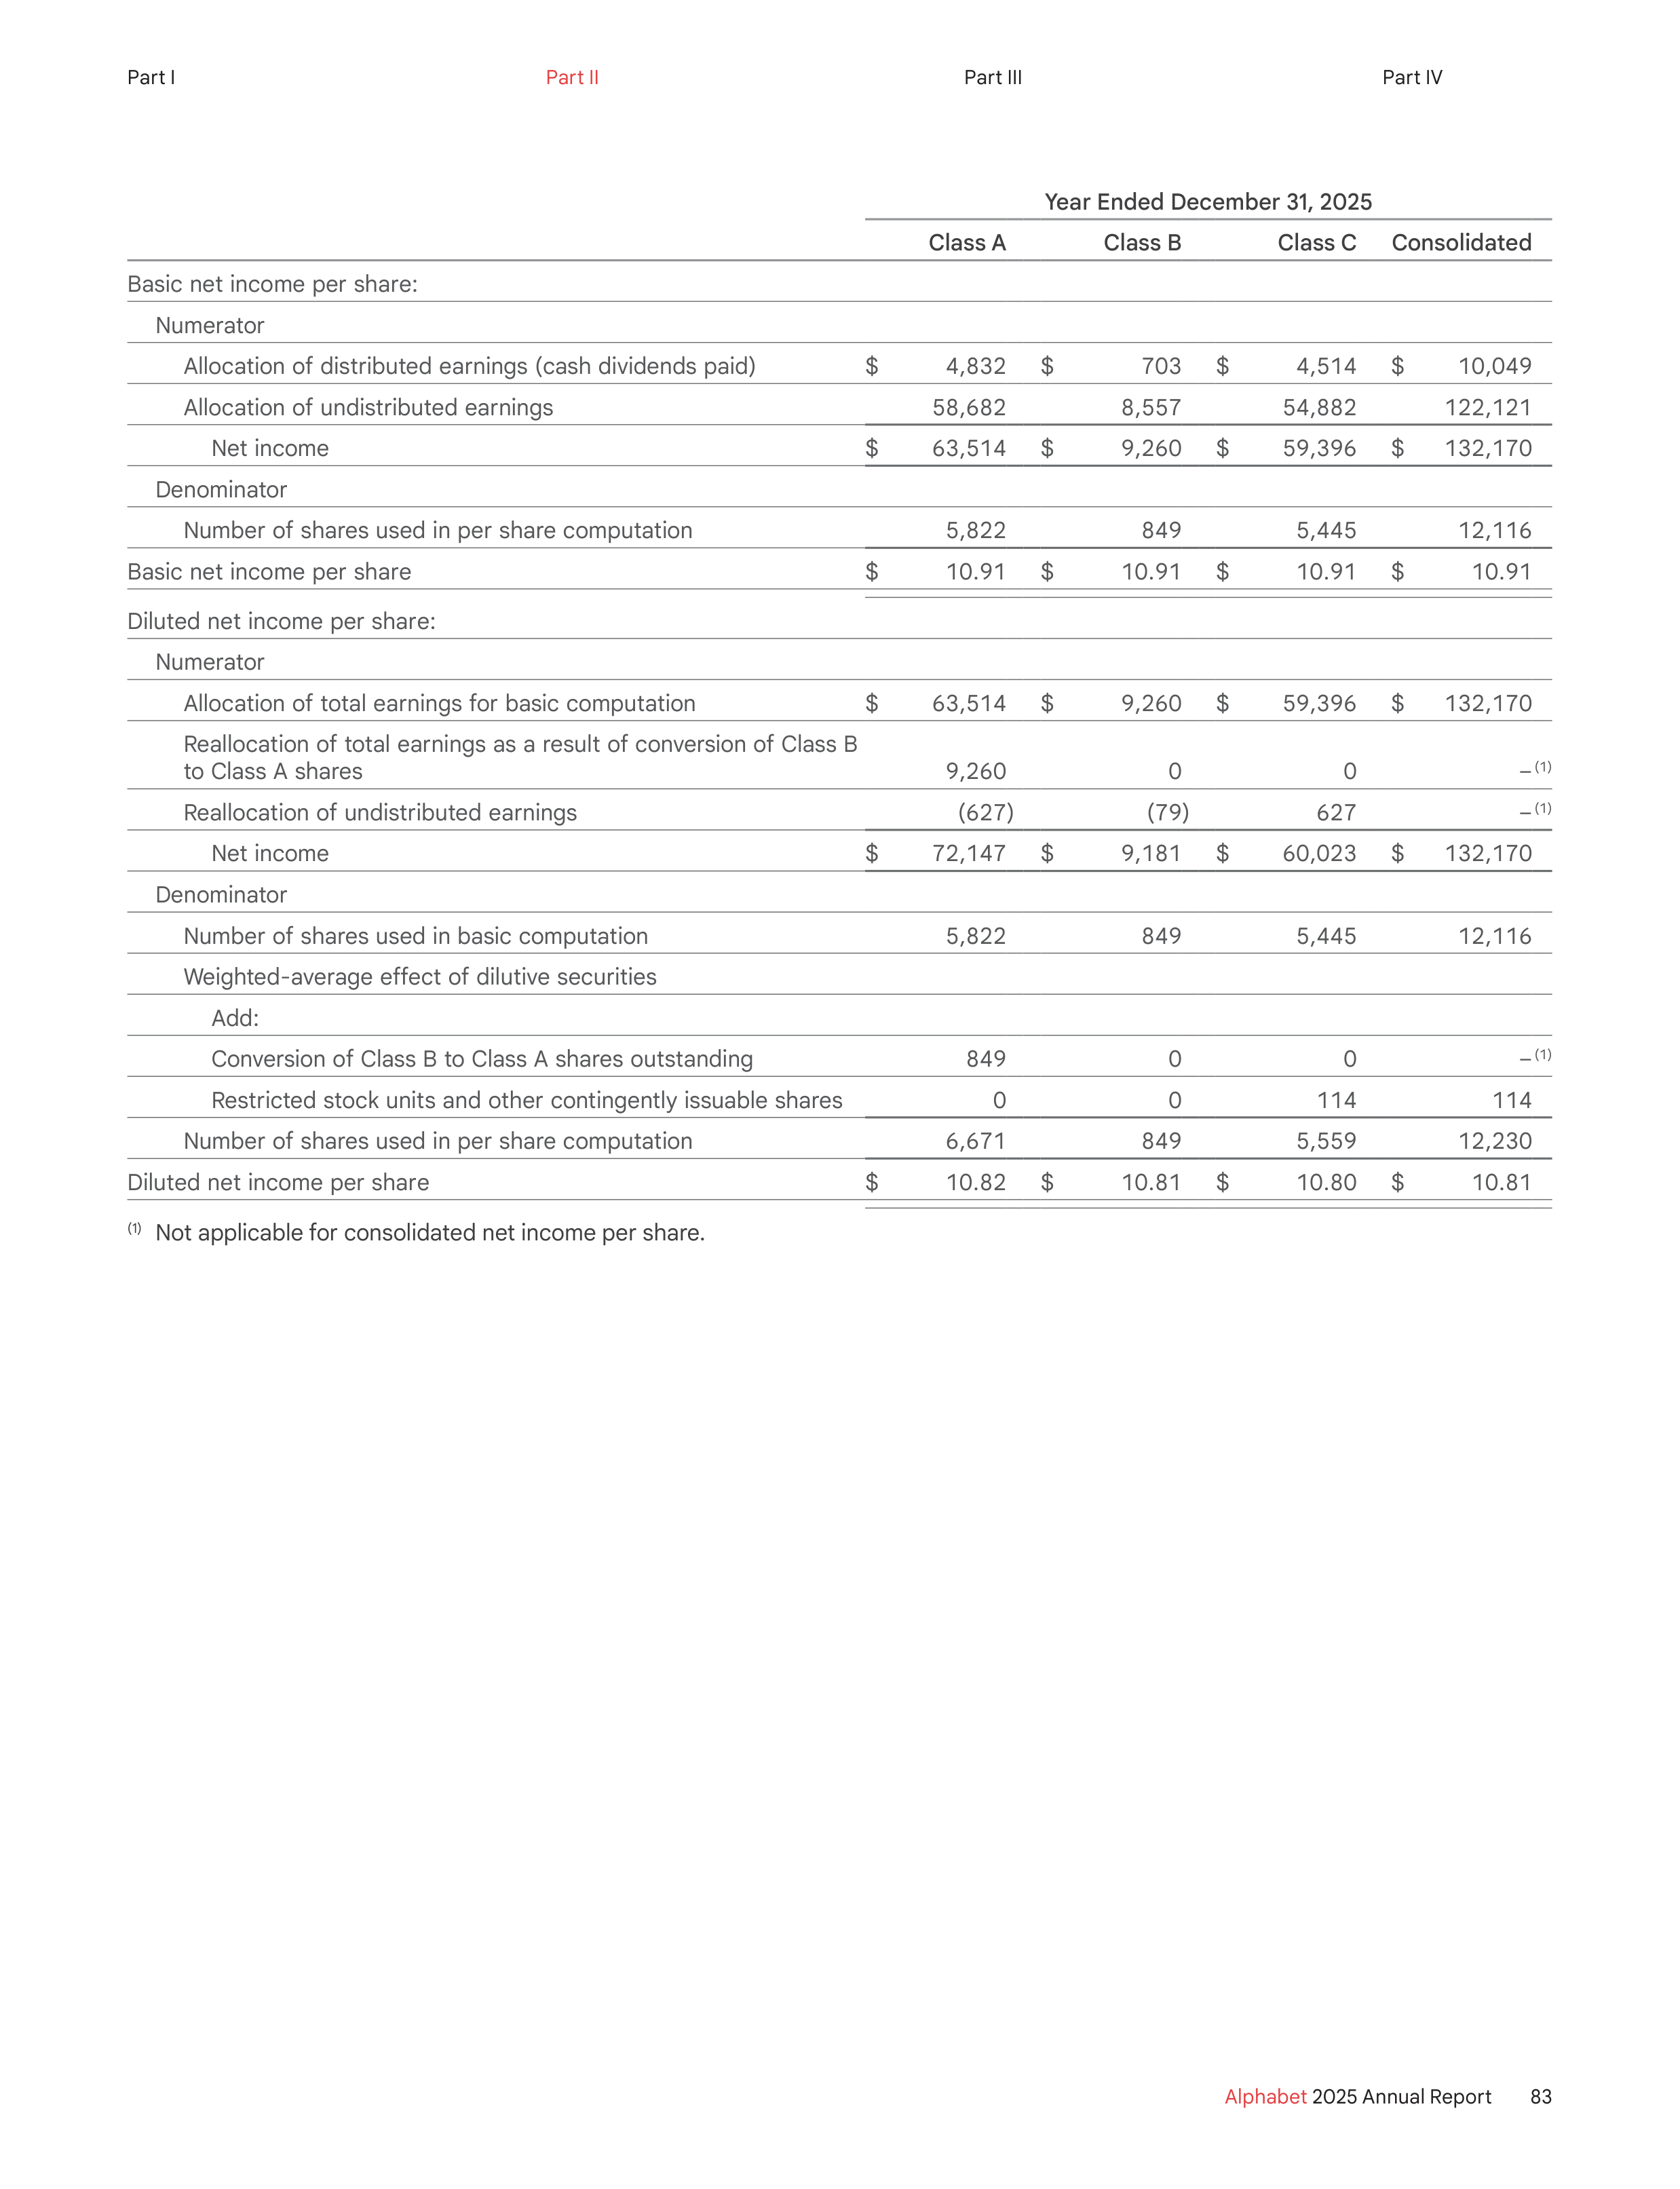
Year Ended December 31, 2025
Class A
Class B
Class C
Consolidated
Basic net income per share:
Numerator
Allocation of distributed earnings (cash dividends paid)
$
4,832
$
703
$
4,514
$
10,049
Allocation of undistributed earnings
58,682
8,557
54,882
122,121
Net income
$
63,514
$
9,260
$
59,396
$
132,170
Denominator
Number of shares used in per share computation
5,822
849
5,445
12,116
Basic net income per share
$
10.91
$
10.91
$
10.91
$
10.91
Diluted net income per share:
Numerator
Allocation of total earnings for basic computation
$
63,514
$
9,260
$
59,396
$
132,170
Reallocation of total earnings as a result of conversion of Class B
to Class A shares
9,260
0
0
–
(1)
Reallocation of undistributed earnings
(627)
(79)
627
–
(1)
Net income
$
72,147
$
9,181
$
60,023
$
132,170
Denominator
Number of shares used in basic computation
5,822
849
5,445
12,116
Weighted-average effect of dilutive securities
Add:
Conversion of Class B to Class A shares outstanding
849
0
0
–
(1)
Restricted stock units and other contingently issuable shares
0
0
114
114
Number of shares used in per share computation
6,671
849
5,559
12,230
Diluted net income per share
$
10.82
$
10.81
$
10.80
$
10.81
(1)
Not applicable for consolidated net income per share.
83
Alphabet
2025 Annual Report
Part I
Part II
Part III
Part IV
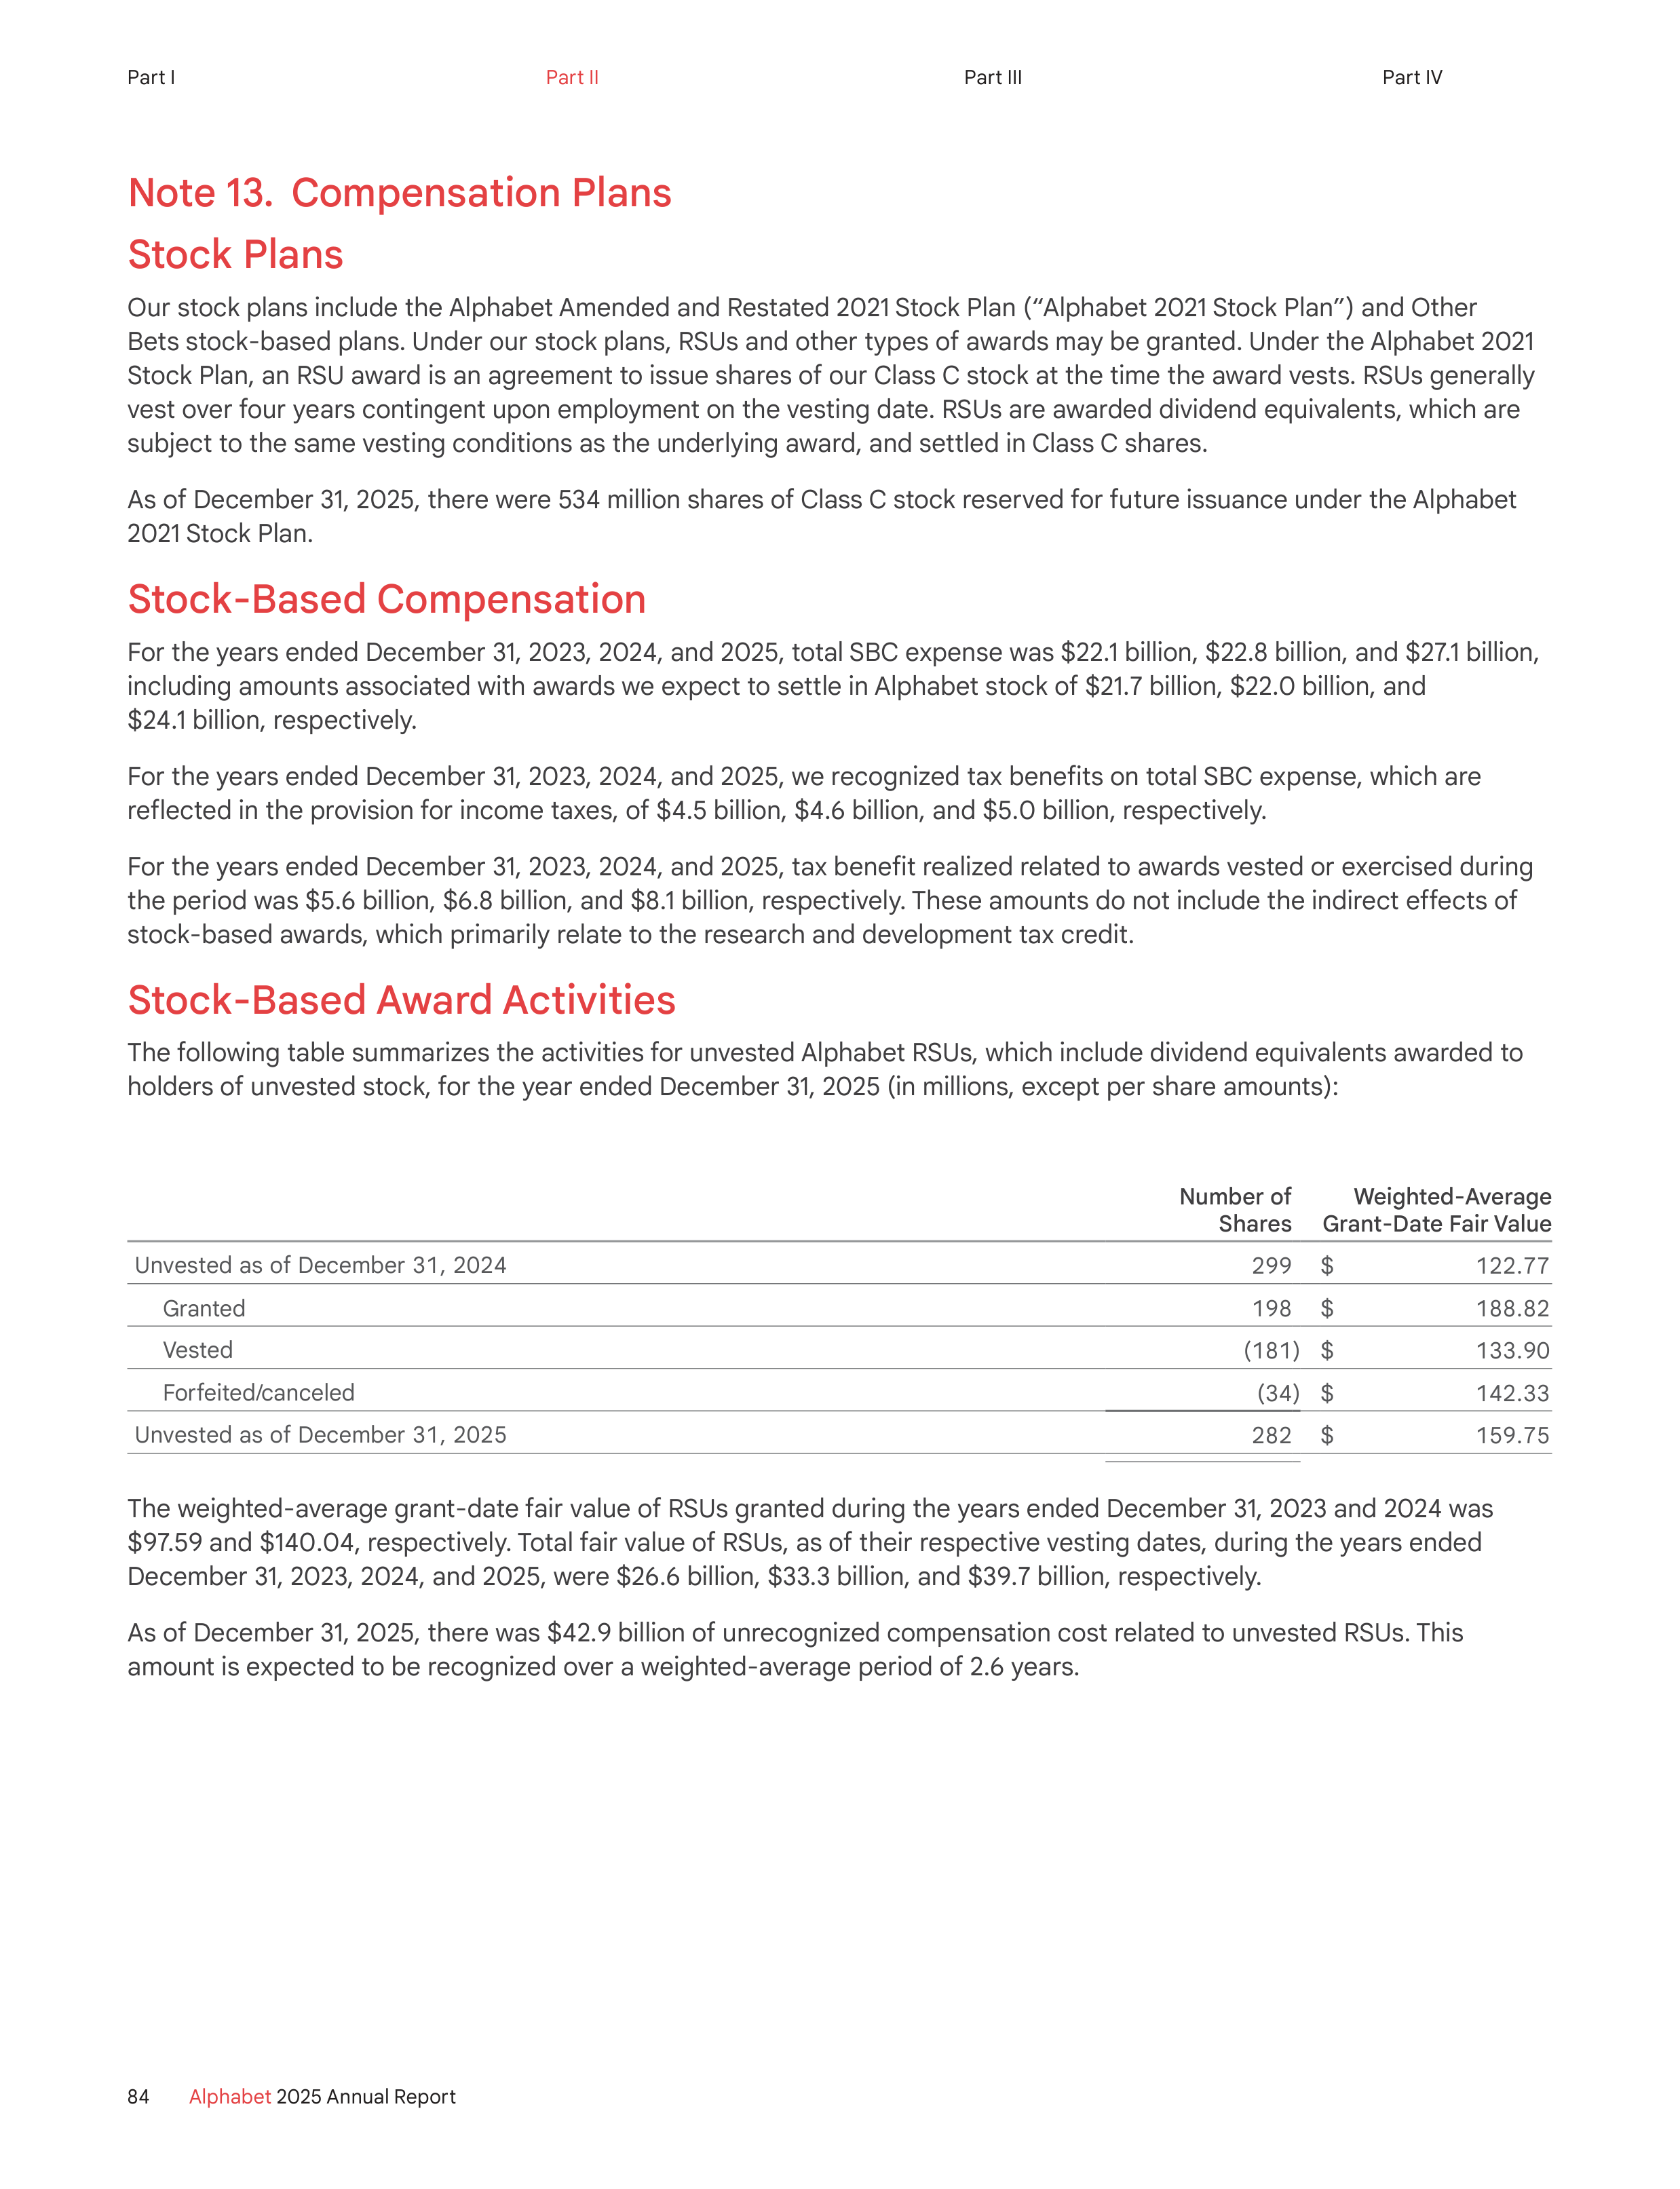
Note 13. Compensation Plans
Stock Plans
Our stock plans include the Alphabet Amended and Restated 2021 Stock Plan (“Alphabet 2021 Stock Plan”) and Other
Bets stock-based plans. Under our stock plans, RSUs and other types of awards may be granted. Under the Alphabet 2021
Stock Plan, an RSU award is an agreement to issue shares of our Class C stock at the time the award vests. RSUs generally
vest over four years contingent upon employment on the vesting date. RSUs are awarded dividend equivalents, which are
subject to the same vesting conditions as the underlying award, and settled in Class C shares.
As of December 31, 2025, there were 534 million shares of Class C stock reserved for future issuance under the Alphabet
2021 Stock Plan.
Stock-Based Compensation
For the years ended December 31, 2023, 2024, and 2025, total SBC expense was $22.1 billion, $22.8 billion, and $27.1 billion,
including amounts associated with awards we expect to settle in Alphabet stock of $21.7 billion, $22.0 billion, and
$24.1 billion, respectively.
For the years ended December 31, 2023, 2024, and 2025, we recognized tax benefits on total SBC expense, which are
reflected in the provision for income taxes, of $4.5 billion, $4.6 billion, and $5.0 billion, respectively.
For the years ended December 31, 2023, 2024, and 2025, tax benefit realized related to awards vested or exercised during
the period was $5.6 billion, $6.8 billion, and $8.1 billion, respectively. These amounts do not include the indirect effects of
stock-based awards, which primarily relate to the research and development tax credit.
Stock-Based Award Activities
The following table summarizes the activities for unvested Alphabet RSUs, which include dividend equivalents awarded to
holders of unvested stock, for the year ended December 31, 2025 (in millions, except per share amounts):
Number of
Shares
Weighted-Average
Grant-Date Fair Value
Unvested as of December 31, 2024
299
$
122.77
Granted
198
$
188.82
Vested
(181)
$
133.90
Forfeited/canceled
(34)
$
142.33
Unvested as of December 31, 2025
282
$
159.75
The weighted-average grant-date fair value of RSUs granted during the years ended December 31, 2023 and 2024 was
$97.59 and $140.04, respectively. Total fair value of RSUs, as of their respective vesting dates, during the years ended
December 31, 2023, 2024, and 2025, were $26.6 billion, $33.3 billion, and $39.7 billion, respectively.
As of December 31, 2025, there was $42.9 billion of unrecognized compensation cost related to unvested RSUs. This
amount is expected to be recognized over a weighted-average period of 2.6 years.
84
Alphabet
2025 Annual Report
Part I
Part II
Part III
Part IV
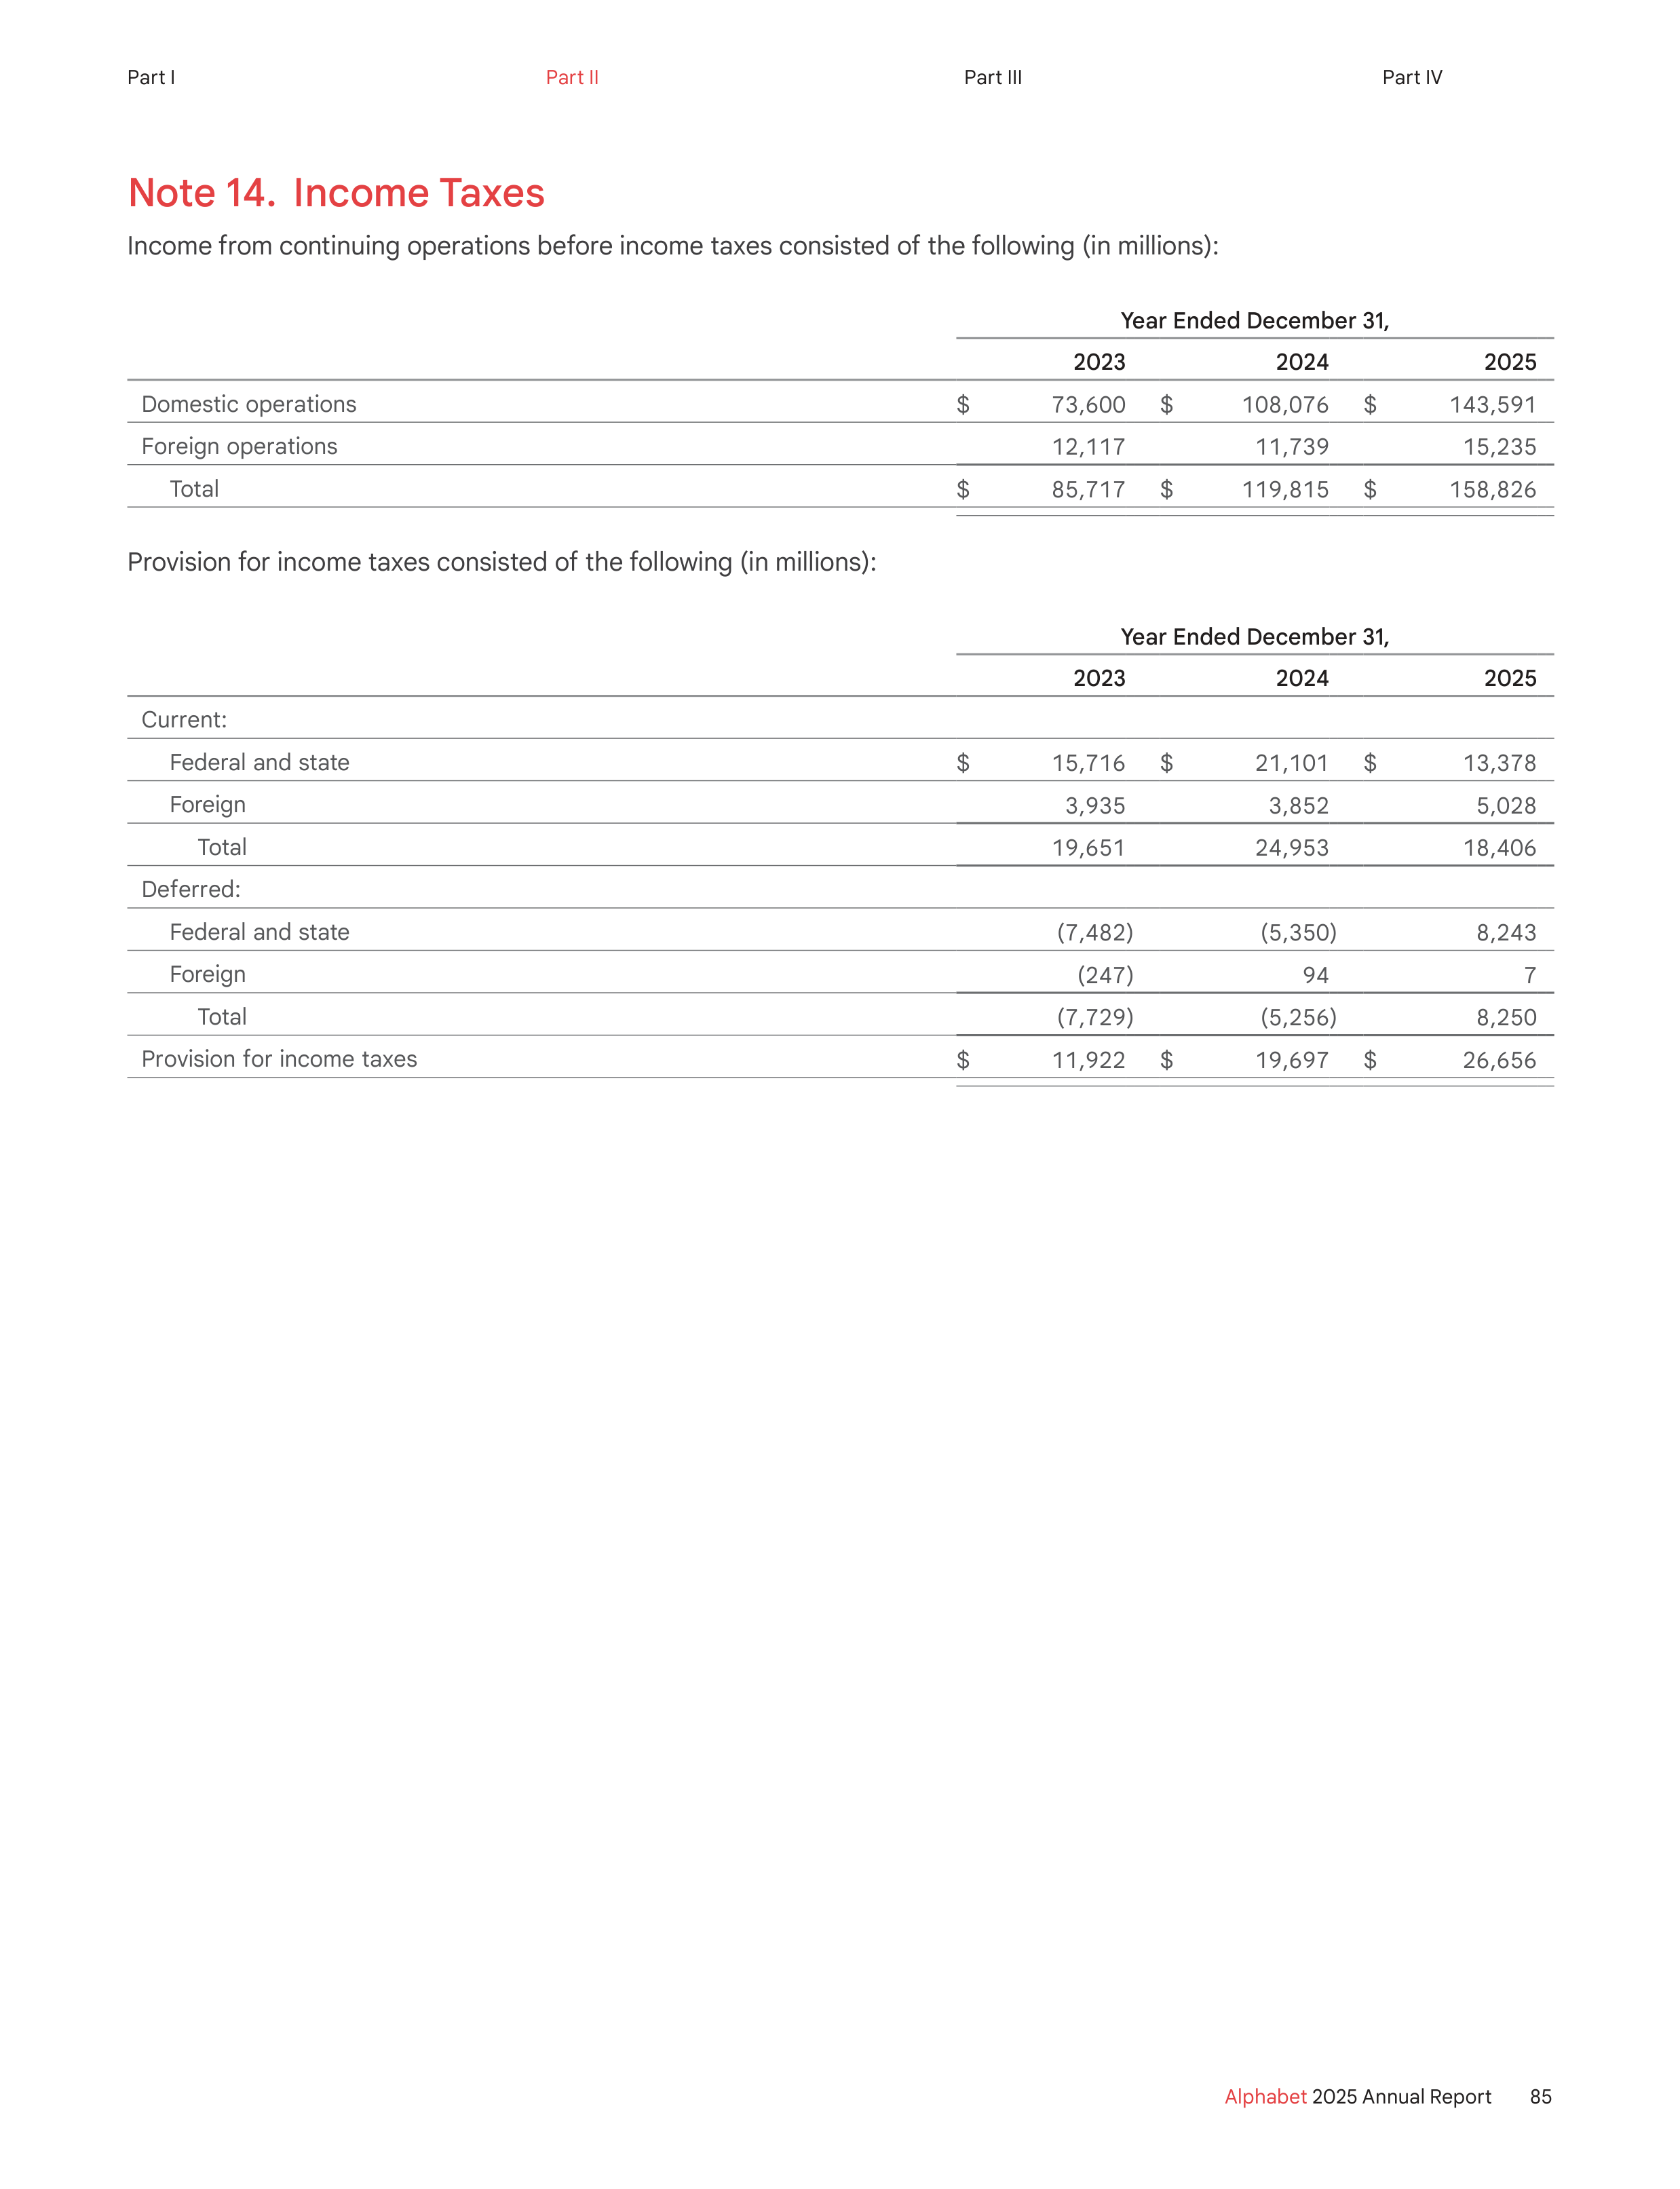
Note 14. Income Taxes
Income from continuing operations before income taxes consisted of the following (in millions):
Year Ended December 31,
2023
2024
2025
Domestic operations
$
73,600
$
108,076
$
143,591
Foreign operations
12,117
11,739
15,235
Total
$
85,717
$
119,815
$
158,826
Provision for income taxes consisted of the following (in millions):
Year Ended December 31,
2023
2024
2025
Current:
Federal and state
$
15,716
$
21,101
$
13,378
Foreign
3,935
3,852
5,028
Total
19,651
24,953
18,406
Deferred:
Federal and state
(7,482)
(5,350)
8,243
Foreign
(247)
94
7
Total
(7,729)
(5,256)
8,250
Provision for income taxes
$
11,922
$
19,697
$
26,656
85
Alphabet
2025 Annual Report
Part I
Part II
Part III
Part IV
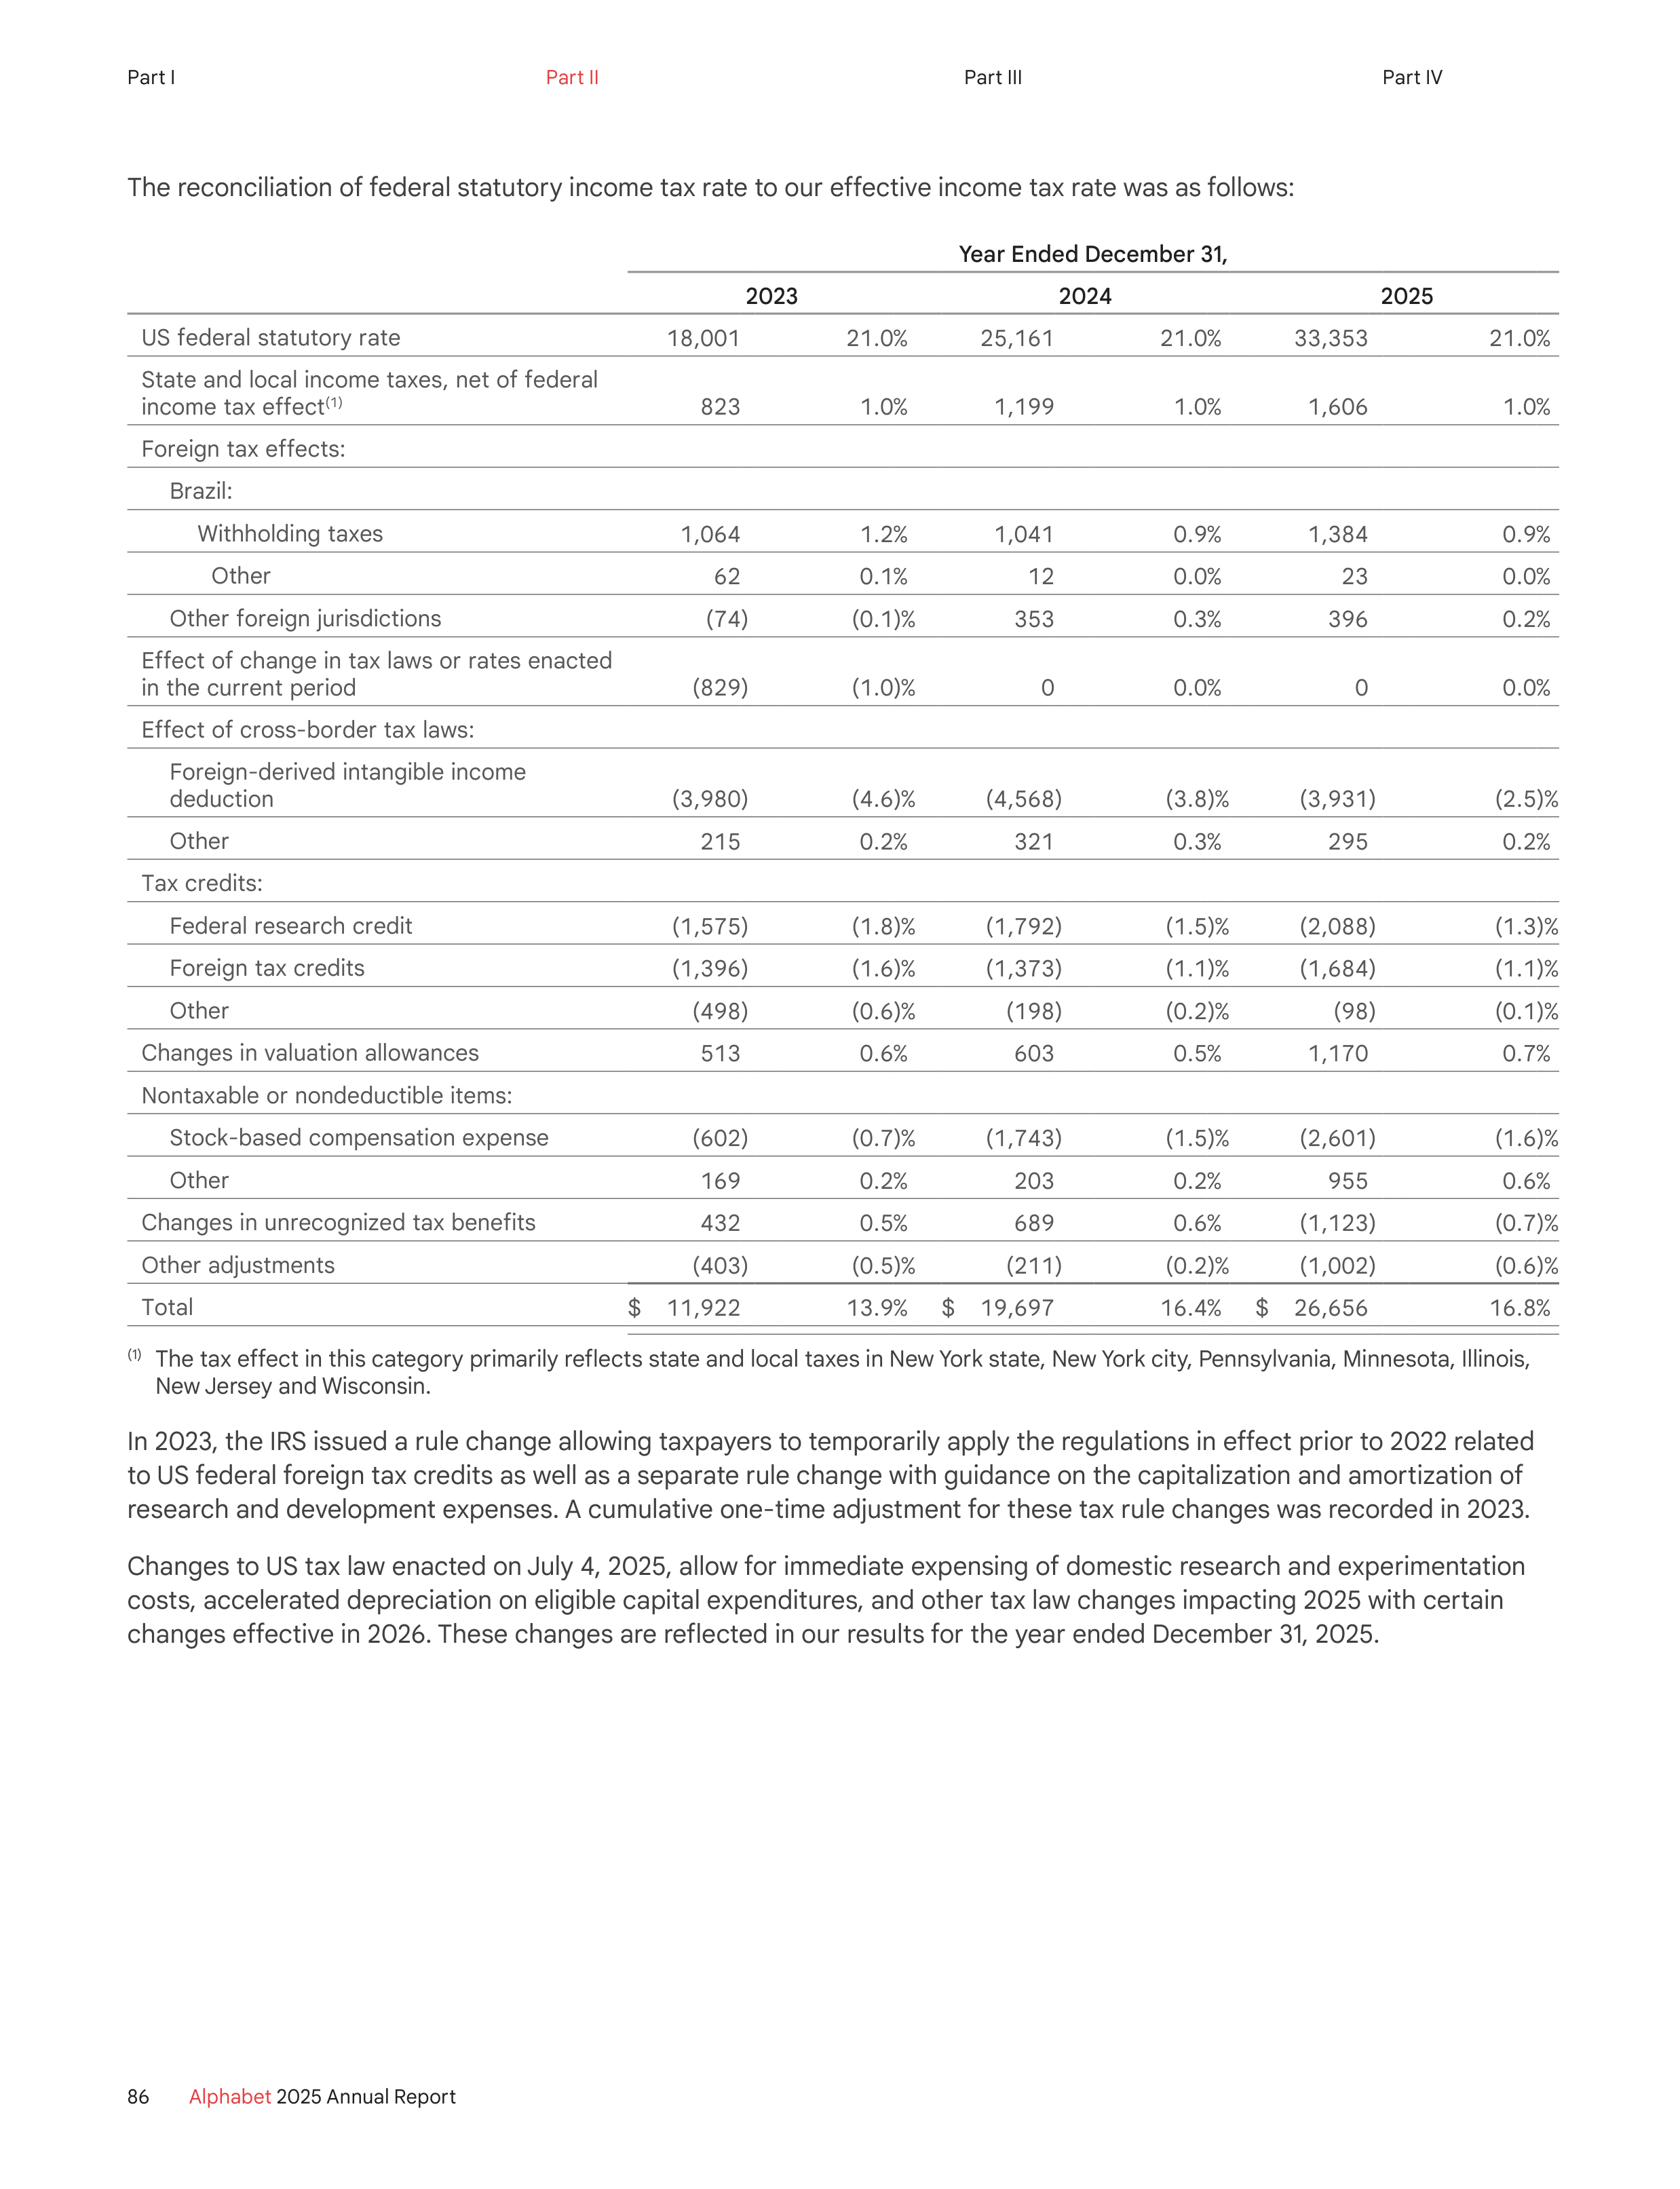
The reconciliation of federal statutory income tax rate to our effective income tax rate was as follows:
Year Ended December 31,
2023
2024
2025
US federal statutory rate
18,001
21.0 %
25,161
21.0 %
33,353
21.0 %
State and local income taxes, net of federal
income tax effect
(1)
823
1.0 %
1,199
1.0 %
1,606
1.0 %
Foreign tax effects:
Brazil:
Withholding taxes
1,064
1.2%
1,041
0.9 %
1,384
0.9%
Other
62
0.1%
12
0.0%
23
0.0%
Other foreign jurisdictions
(74 )
(0.1)%
353
0.3%
396
0.2%
Effect of change in tax laws or rates enacted
in the current period
(829)
(1.0)%
0
0.0%
0
0.0%
Effect of cross-border tax laws:
Foreign-derived intangible income
deduction
(3,980)
(4.6)%
(4,568)
(3.8)%
(3,931)
(2.5)%
Other
215
0.2%
321
0.3%
295
0.2%
Tax credits:
Federal research credit
(1,575)
(1.8)%
(1,792)
(1.5)%
(2,088)
(1.3)%
Foreign tax credits
(1,396)
(1.6)%
(1,373)
(1.1)%
(1,684)
(1.1)%
Other
(498)
(0.6)%
(198)
(0.2)%
(98)
(0.1)%
Changes in valuation allowances
513
0.6%
603
0.5 %
1,170
0.7%
Nontaxable or nondeductible items:
Stock-based compensation expense
(602)
(0.7)%
(1,743)
(1.5)%
(2,601)
(1.6)%
Other
169
0.2%
203
0.2%
955
0.6%
Changes in unrecognized tax benefits
432
0.5%
689
0.6%
(1,123)
(0.7)%
Other adjustments
(403)
(0.5)%
(211)
(0.2)%
(1,002)
(0.6)%
Total
$
11,922
13.9%
$
19,697
16.4%
$
26,656
16.8%
(1)
The tax effect in this category primarily reflects state and local taxes in New York state, New York city, Pennsylvania, Minnesota, Illinois,
New Jersey and Wisconsin.
In 2023, the IRS issued a rule change allowing taxpayers to temporarily apply the regulations in effect prior to 2022 related
to US federal foreign tax credits as well as a separate rule change with guidance on the capitalization and amortization of
research and development expenses. A cumulative one-time adjustment for these tax rule changes was recorded in 2023.
Changes to US tax law enacted on July 4, 2025, allow for immediate expensing of domestic research and experimentation
costs, accelerated depreciation on eligible capital expenditures, and other tax law changes impacting 2025 with certain
changes effective in 2026. These changes are reflected in our results for the year ended December 31, 2025.
86
Alphabet
2025 Annual Report
Part I
Part II
Part III
Part IV
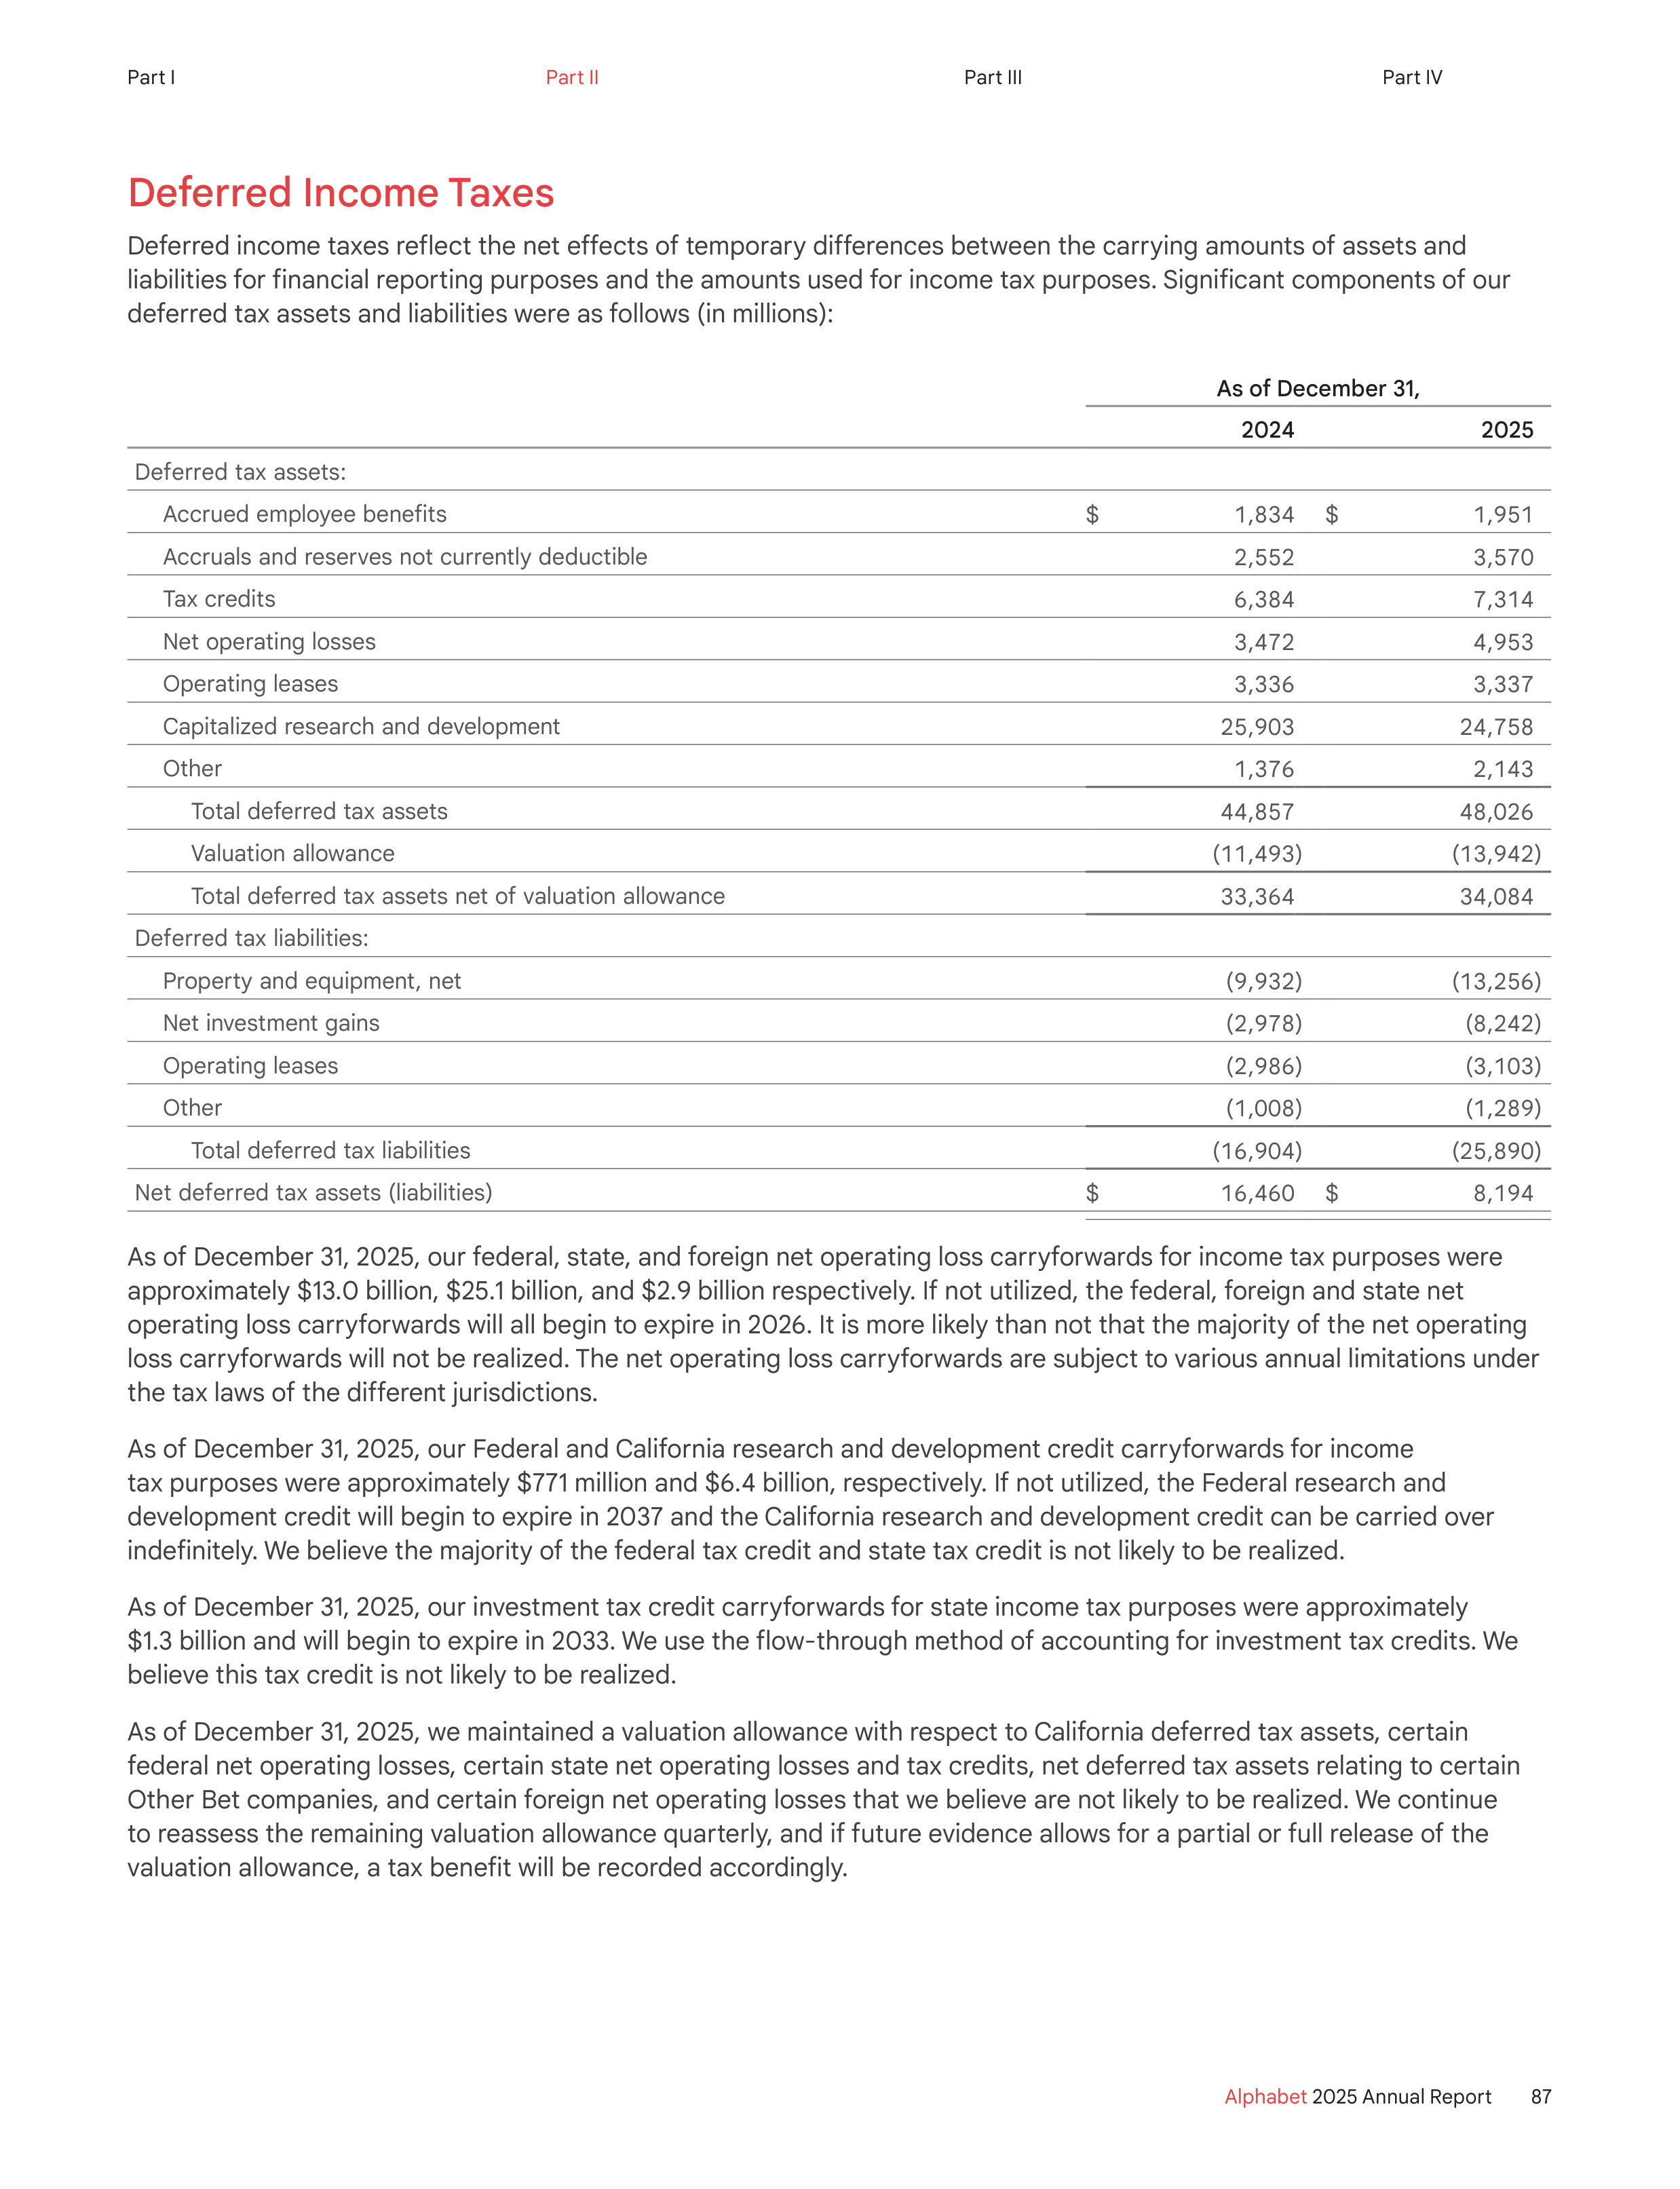
Deferred Income Taxes
Deferred income taxes reflect the net effects of temporary differences between the carrying amounts of assets and
liabilities for financial reporting purposes and the amounts used for income tax purposes. Significant components of our
deferred tax assets and liabilities were as follows (in millions):
As of December 31,
2024
2025
Deferred tax assets:
Accrued employee benefits
$
1,834
$
1,951
Accruals and reserves not currently deductible
2,552
3,570
Tax credits
6,384
7,314
Net operating losses
3,472
4,953
Operating leases
3,336
3,337
Capitalized research and development
25,903
24,758
Other
1,376
2,143
Total deferred tax assets
44,857
48,026
Valuation allowance
(11,493)
(13,942)
Total deferred tax assets net of valuation allowance
33,364
34,084
Deferred tax liabilities:
Property and equipment, net
(9,932)
(13,256)
Net investment gains
(2,978)
(8,242)
Operating leases
(2,986)
(3,103)
Other
(1,008)
(1,289)
Total deferred tax liabilities
(16,904)
(25,890)
Net deferred tax assets (liabilities)
$
16,460
$
8,194
As of December 31, 2025, our federal, state, and foreign net operating loss carryforwards for income tax purposes were
approximately $13.0 billion, $25.1 billion, and $2.9 billion respectively. If not utilized, the federal, foreign and state net
operating loss carryforwards will all begin to expire in 2026. It is more likely than not that the majority of the net operating
loss carryforwards will not be realized. The net operating loss carryforwards are subject to various annual limitations under
the tax laws of the different jurisdictions.
As of December 31, 2025, our Federal and California research and development credit carryforwards for income
tax purposes were approximately $771 million and $6.4 billion, respectively. If not utilized, the Federal research and
development credit will begin to expire in 2037 and the California research and development credit can be carried over
indefinitely. We believe the majority of the federal tax credit and state tax credit is not likely to be realized.
As of December 31, 2025, our investment tax credit carryforwards for state income tax purposes were approximately
$1.3 billion and will begin to expire in 2033. We use the flow-through method of accounting for investment tax credits. We
believe this tax credit is not likely to be realized.
As of December 31, 2025, we maintained a valuation allowance with respect to California deferred tax assets, certain
federal net operating losses, certain state net operating losses and tax credits, net deferred tax assets relating to certain
Other Bet companies, and certain foreign net operating losses that we believe are not likely to be realized. We continue
to reassess the remaining valuation allowance quarterly, and if future evidence allows for a partial or full release of the
valuation allowance, a tax benefit will be recorded accordingly.
87
Alphabet
2025 Annual Report
Part I
Part II
Part III
Part IV
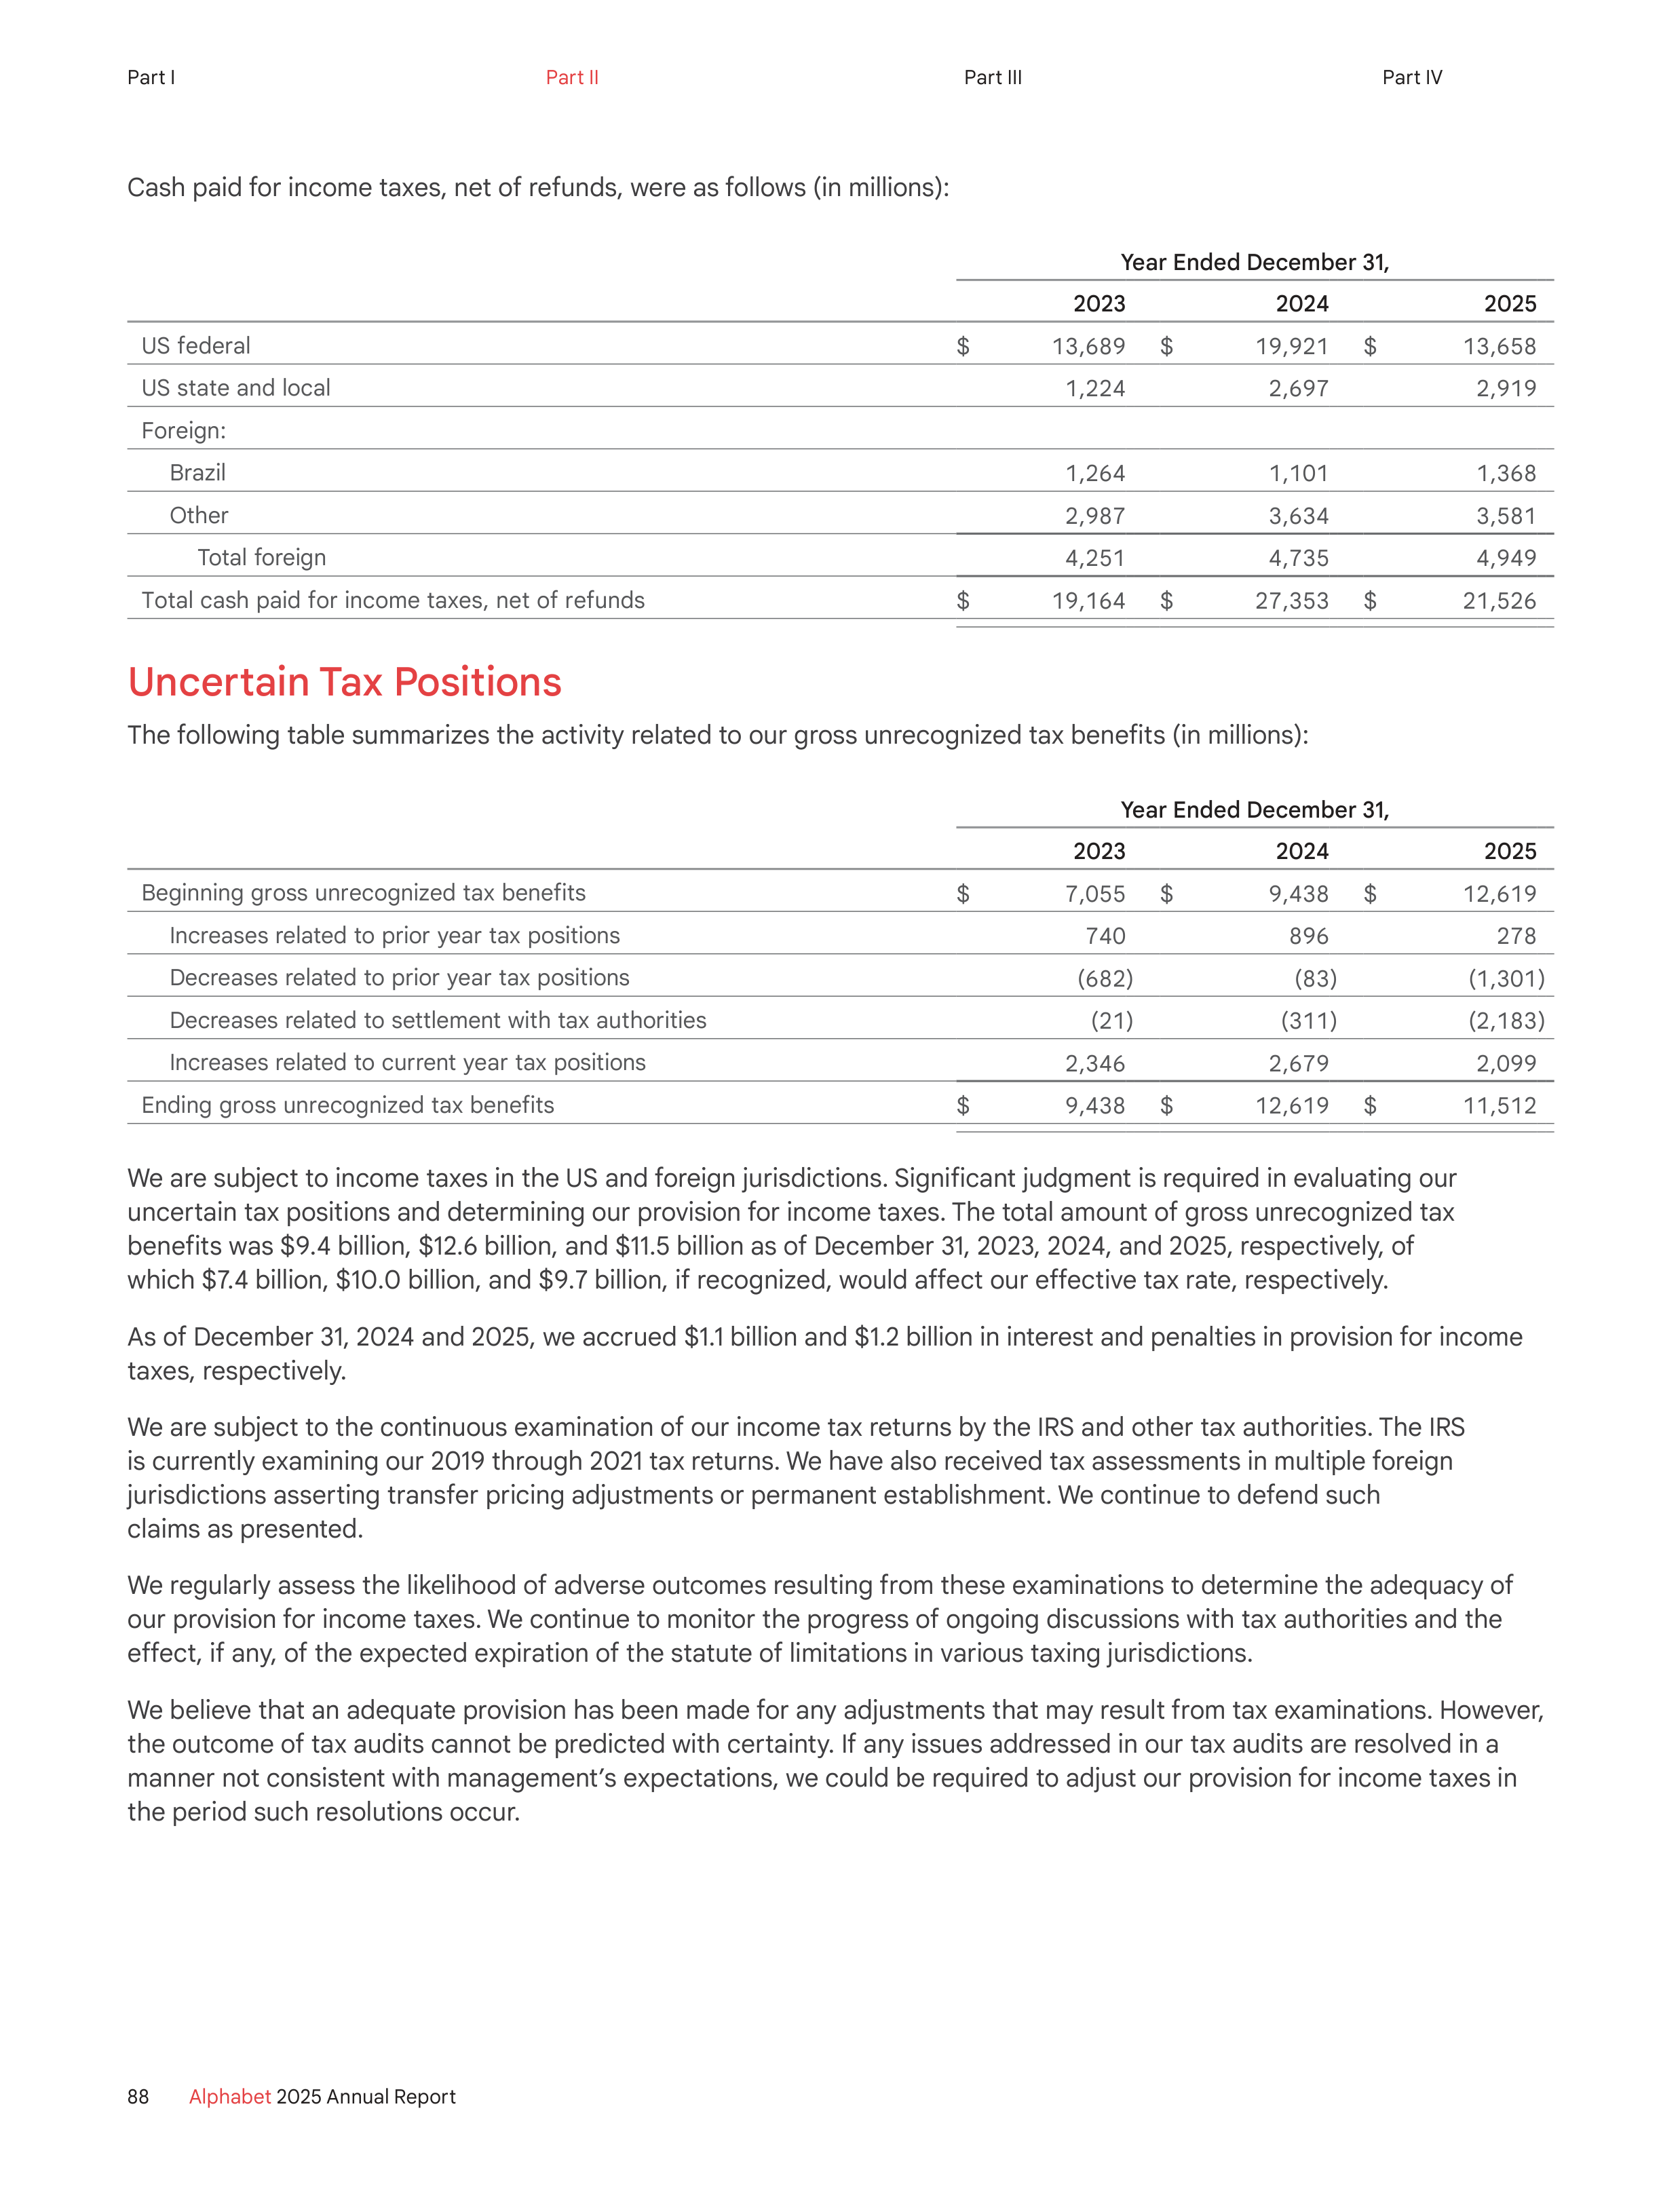
Cash paid for income taxes, net of refunds, were as follows (in millions):
Year Ended December 31,
2023
2024
2025
US federal
$
13,689
$
19,921
$
13,658
US state and local
1,224
2,697
2,919
Foreign:
Brazil
1,264
1,101
1,368
Other
2,987
3,634
3,581
Total foreign
4,251
4,735
4,949
Total cash paid for income taxes, net of refunds
$
19,164
$
27,353
$
21,526
Uncertain Tax Positions
The following table summarizes the activity related to our gross unrecognized tax benefits (in millions):
Year Ended December 31,
2023
2024
2025
Beginning gross unrecognized tax benefits
$
7,055
$
9,438
$
12,619
Increases related to prior year tax positions
740
896
278
Decreases related to prior year tax positions
(682)
(83)
(1,301)
Decreases related to settlement with tax authorities
(21)
(311)
(2,183)
Increases related to current year tax positions
2,346
2,679
2,099
Ending gross unrecognized tax benefits
$
9,438
$
12,619
$
11,512
We are subject to income taxes in the US and foreign jurisdictions. Significant judgment is required in evaluating our
uncertain tax positions and determining our provision for income taxes. The total amount of gross unrecognized tax
benefits was $9.4 billion, $12.6 billion, and $11.5 billion as of December 31, 2023, 2024, and 2025, respectively, of
which $7.4 billion, $10.0 billion, and $9.7 billion, if recognized, would affect our effective tax rate, respectively.
As of December 31, 2024 and 2025, we accrued $1.1 billion and $1.2 billion in interest and penalties in provision for income
taxes, respectively.
We are subject to the continuous examination of our income tax returns by the IRS and other tax authorities. The IRS
is currently examining our 2019 through 2021 tax returns. We have also received tax assessments in multiple foreign
jurisdictions asserting transfer pricing adjustments or permanent establishment. We continue to defend such
claims as presented.
We regularly assess the likelihood of adverse outcomes resulting from these examinations to determine the adequacy of
our provision for income taxes. We continue to monitor the progress of ongoing discussions with tax authorities and the
effect, if any, of the expected expiration of the statute of limitations in various taxing jurisdictions.
We believe that an adequate provision has been made for any adjustments that may result from tax examinations. However,
the outcome of tax audits cannot be predicted with certainty. If any issues addressed in our tax audits are resolved in a
manner not consistent with management’s expectations, we could be required to adjust our provision for income taxes in
the period such resolutions occur.
88
Alphabet
2025 Annual Report
Part I
Part II
Part III
Part IV
Note 15. Information about Segments and Geographic Areas
We report our segment results as Google Services, Google Cloud, and Other Bets:
•
Google Services includes products and services such as ads, Android, Chrome, devices, Google Maps, Google Play,
Search, and YouTube. Google Services generates revenues primarily from advertising; fees received for consumer
subscription-based products such as YouTube TV, YouTube Music and Premium, and NFL Sunday Ticket, as well as
Google One; the sale of apps and in-app purchases; and devices.
•
Google Cloud includes infrastructure and platform services, applications, and other services for enterprise customers.
Google Cloud generates revenues primarily from consumption-based fees and subscriptions received for Google Cloud
Platform services, Google Workspace communication and collaboration tools, and other enterprise services.
•
Other Bets is a combination of multiple operating segments that are not individually material. Revenues from Other Bets
are generated primarily from the sale of autonomous transportation services and internet services.
Revenues, certain costs, such as costs associated with content and traffic acquisition, certain engineering activities, and
devices, as well as certain operating expenses are directly attributable to our segments. Due to the integrated nature
of Alphabet, other costs and expenses, such as technical infrastructure and office facilities, are managed centrally at a
consolidated level. These costs, including the associated depreciation, are allocated to operating segments as a service
cost generally based on usage, headcount, or revenue.
Certain costs are not allocated to our segments because they represent Alphabet-level activities. These costs primarily include:
•
certain AI-focused shared research and development activities, including employee compensation expenses and
technical infrastructure usage costs associated with the development of our general AI models;
•
corporate initiatives such as our philanthropic activities; and
•
corporate shared costs such as certain finance, human resource, and legal costs, including certain fines and
settlements.
Charges associated with employee severance and office space reductions are also not allocated to our segments.
Additionally, hedging gains (losses) related to revenue are not allocated to our segments.
Our Chief Operating Decision Maker (CODM) is our Chief Executive Officer, Sundar Pichai. Our CODM uses segment
operating income (loss) to allocate resources to our segments in our annual planning process and to assess the
performance of our segments, primarily by monitoring actual results versus the annual plan. Our operating segments are
not evaluated using asset information.
89
Alphabet
2025 Annual Report
Part I
Part II
Part III
Part IV
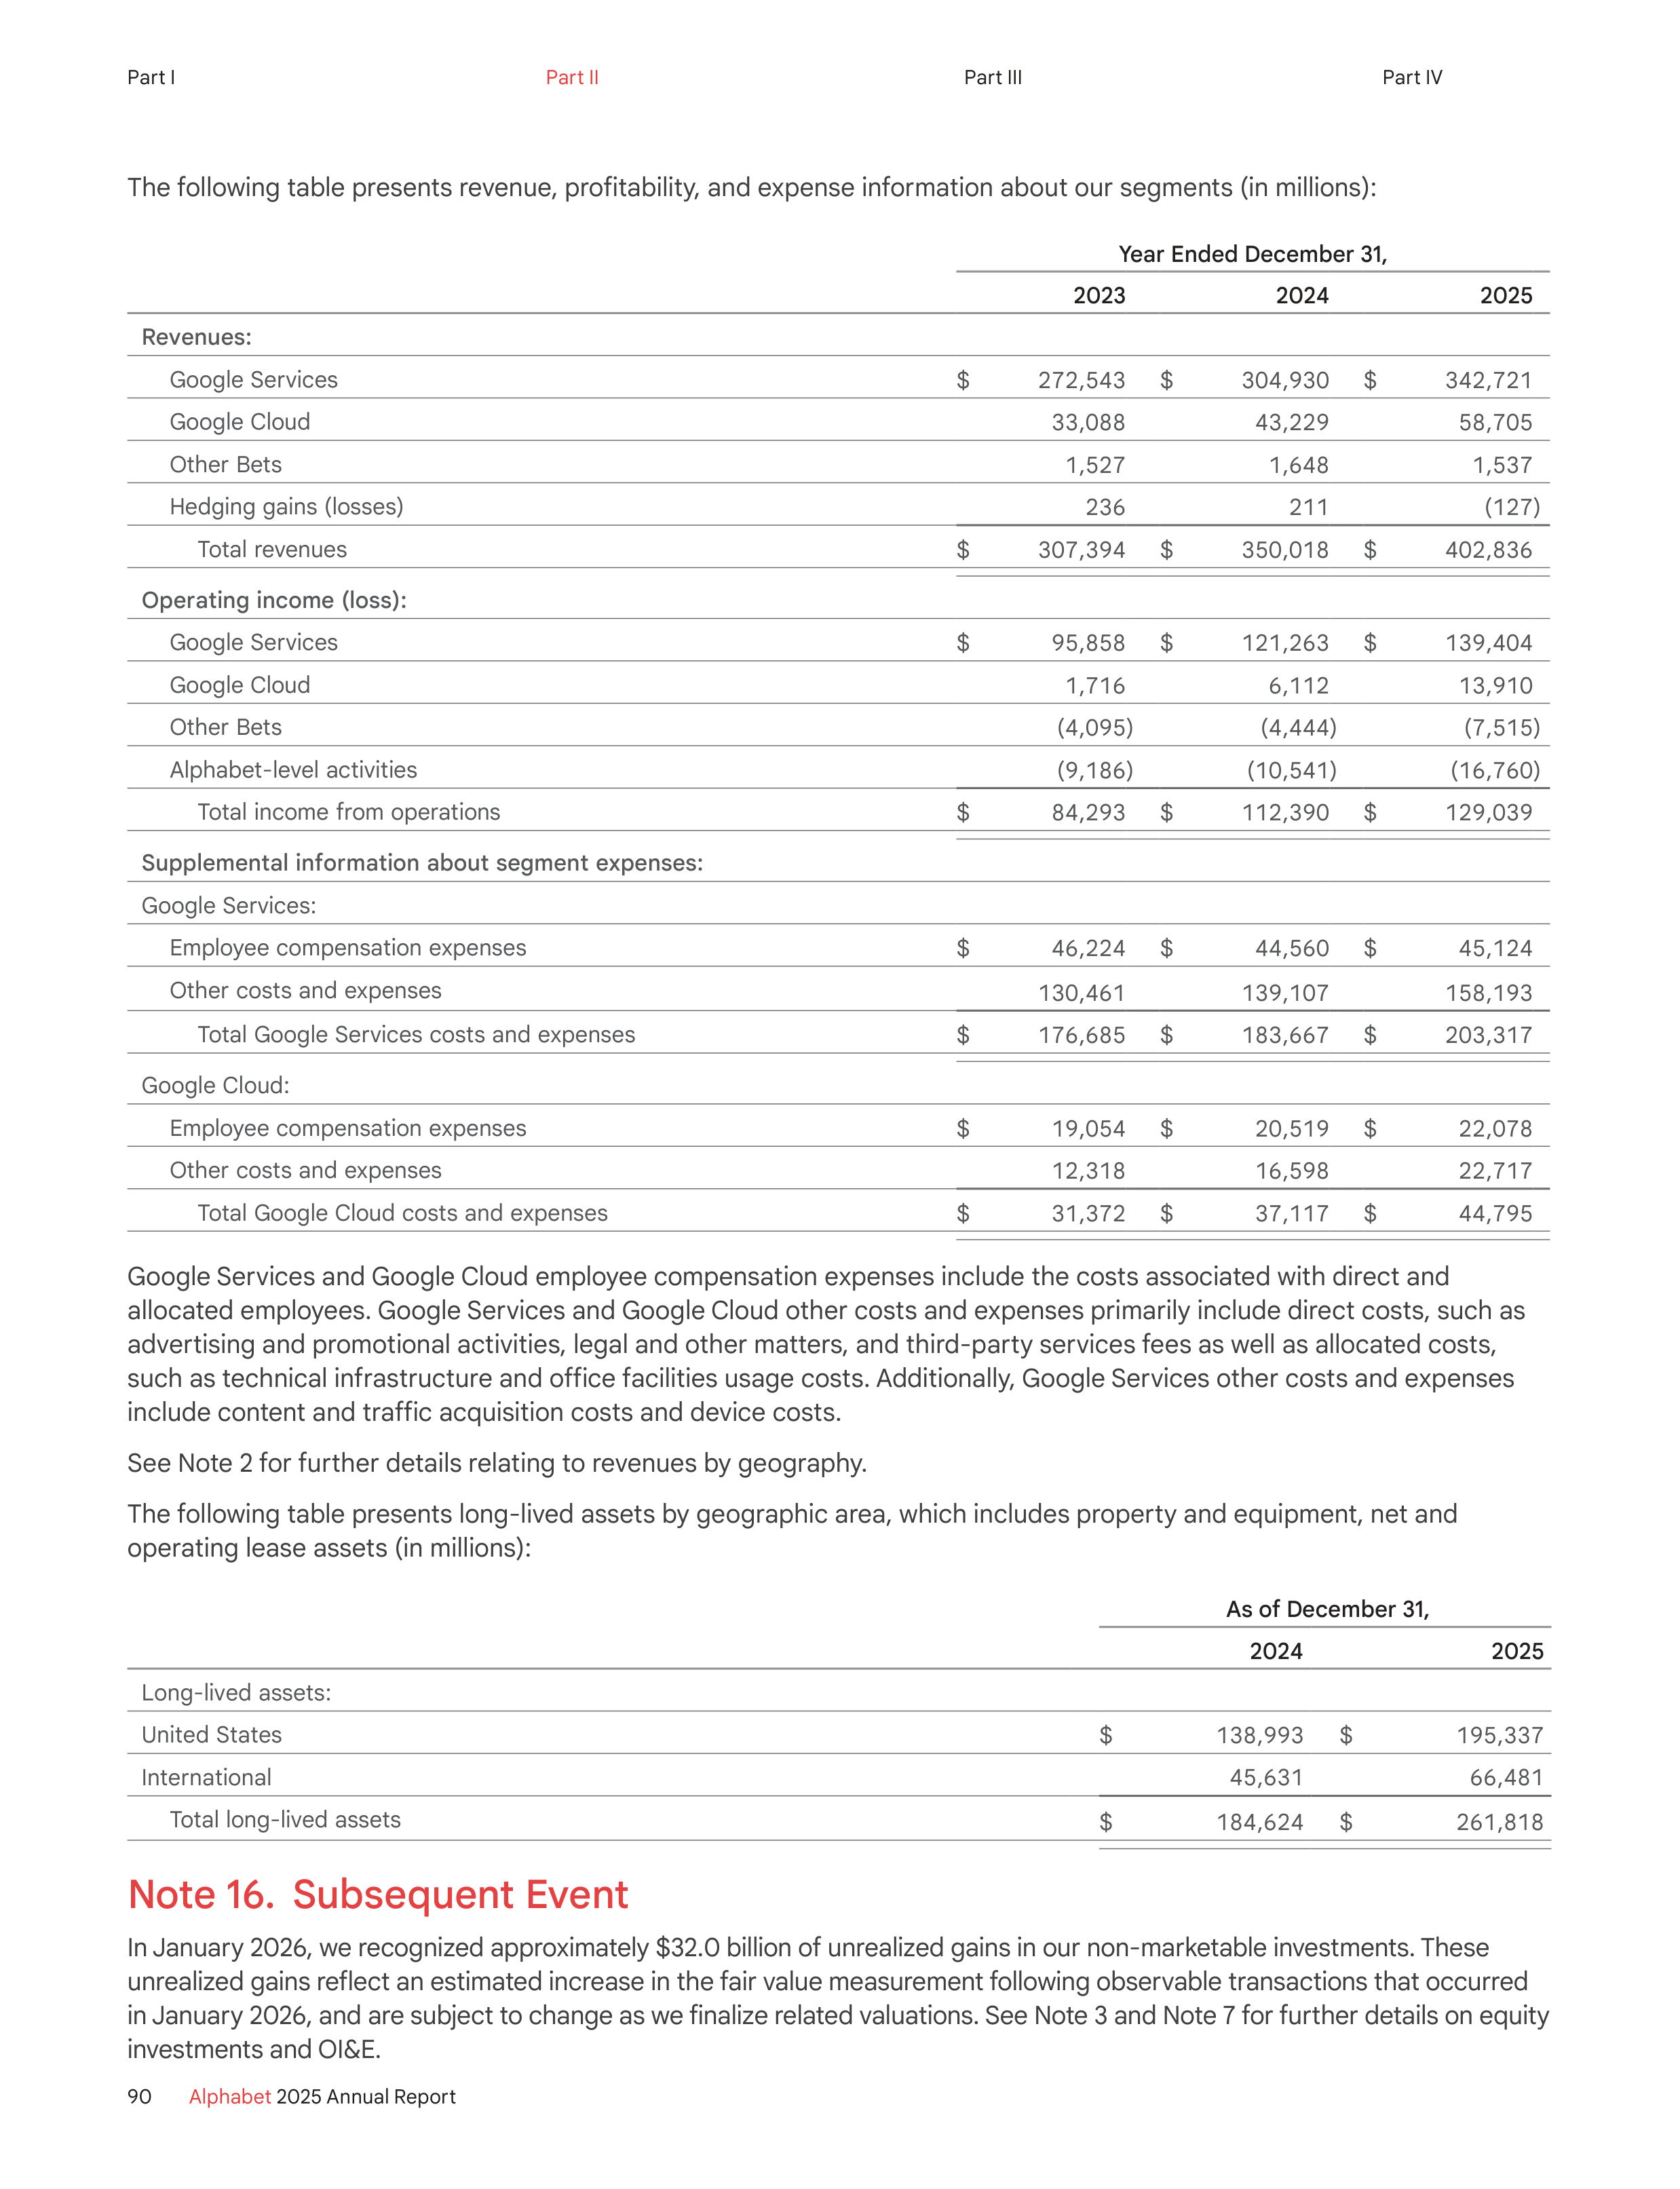
The following table presents revenue, profitability, and expense information about our segments (in millions):
Year Ended December 31,
2023
2024
2025
Revenues:
Google Services
$
272,543
$
304,930
$
342,721
Google Cloud
33,088
43,229
58,705
Other Bets
1,527
1,648
1,537
Hedging gains (losses)
236
211
(127)
Total revenues
$
307,394
$
350,018
$
402,836
Operating income (loss):
Google Services
$
95,858
$
121,263
$
139,404
Google Cloud
1,716
6,112
13,910
Other Bets
(4,095)
(4,444)
(7,515)
Alphabet-level activities
(9,186)
(10,541)
(16,760)
Total income from operations
$
84,293
$
112,390
$
129,039
Supplemental information about segment expenses:
Google Services:
Employee compensation expenses
$
46,224
$
44,560
$
45,124
Other costs and expenses
130,461
139,107
158,193
Total Google Services costs and expenses
$
176,685
$
183,667
$
203,317
Google Cloud:
Employee compensation expenses
$
19,054
$
20,519
$
22,078
Other costs and expenses
12,318
16,598
22,717
Total Google Cloud costs and expenses
$
31,372
$
37,117
$
44,795
Google Services and Google Cloud employee compensation expenses include the costs associated with direct and
allocated employees. Google Services and Google Cloud other costs and expenses primarily include direct costs, such as
advertising and promotional activities, legal and other matters, and third-party services fees as well as allocated costs,
such as technical infrastructure and office facilities usage costs. Additionally, Google Services other costs and expenses
include content and traffic acquisition costs and device costs.
See Note 2 for further details relating to revenues by geography.
The following table presents long-lived assets by geographic area, which includes property and equipment, net and
operating lease assets (in millions):
As of December 31,
2024
2025
Long-lived assets:
United States
$
138,993
$
195,337
International
45,631
66,481
Total long-lived assets
$
184,624
$
261,818
Note 16. Subsequent Event
In January 2026, we recognized approximately $32.0 billion of unrealized gains in our non-marketable investments. These
unrealized gains reflect an estimated increase in the fair value measurement following observable transactions that occurred
in January 2026, and are subject to change as we finalize related valuations. See Note 3 and Note 7 for further details on equity
investments and OI&E.
90
Alphabet
2025 Annual Report
Part I
Part II
Part III
Part IV
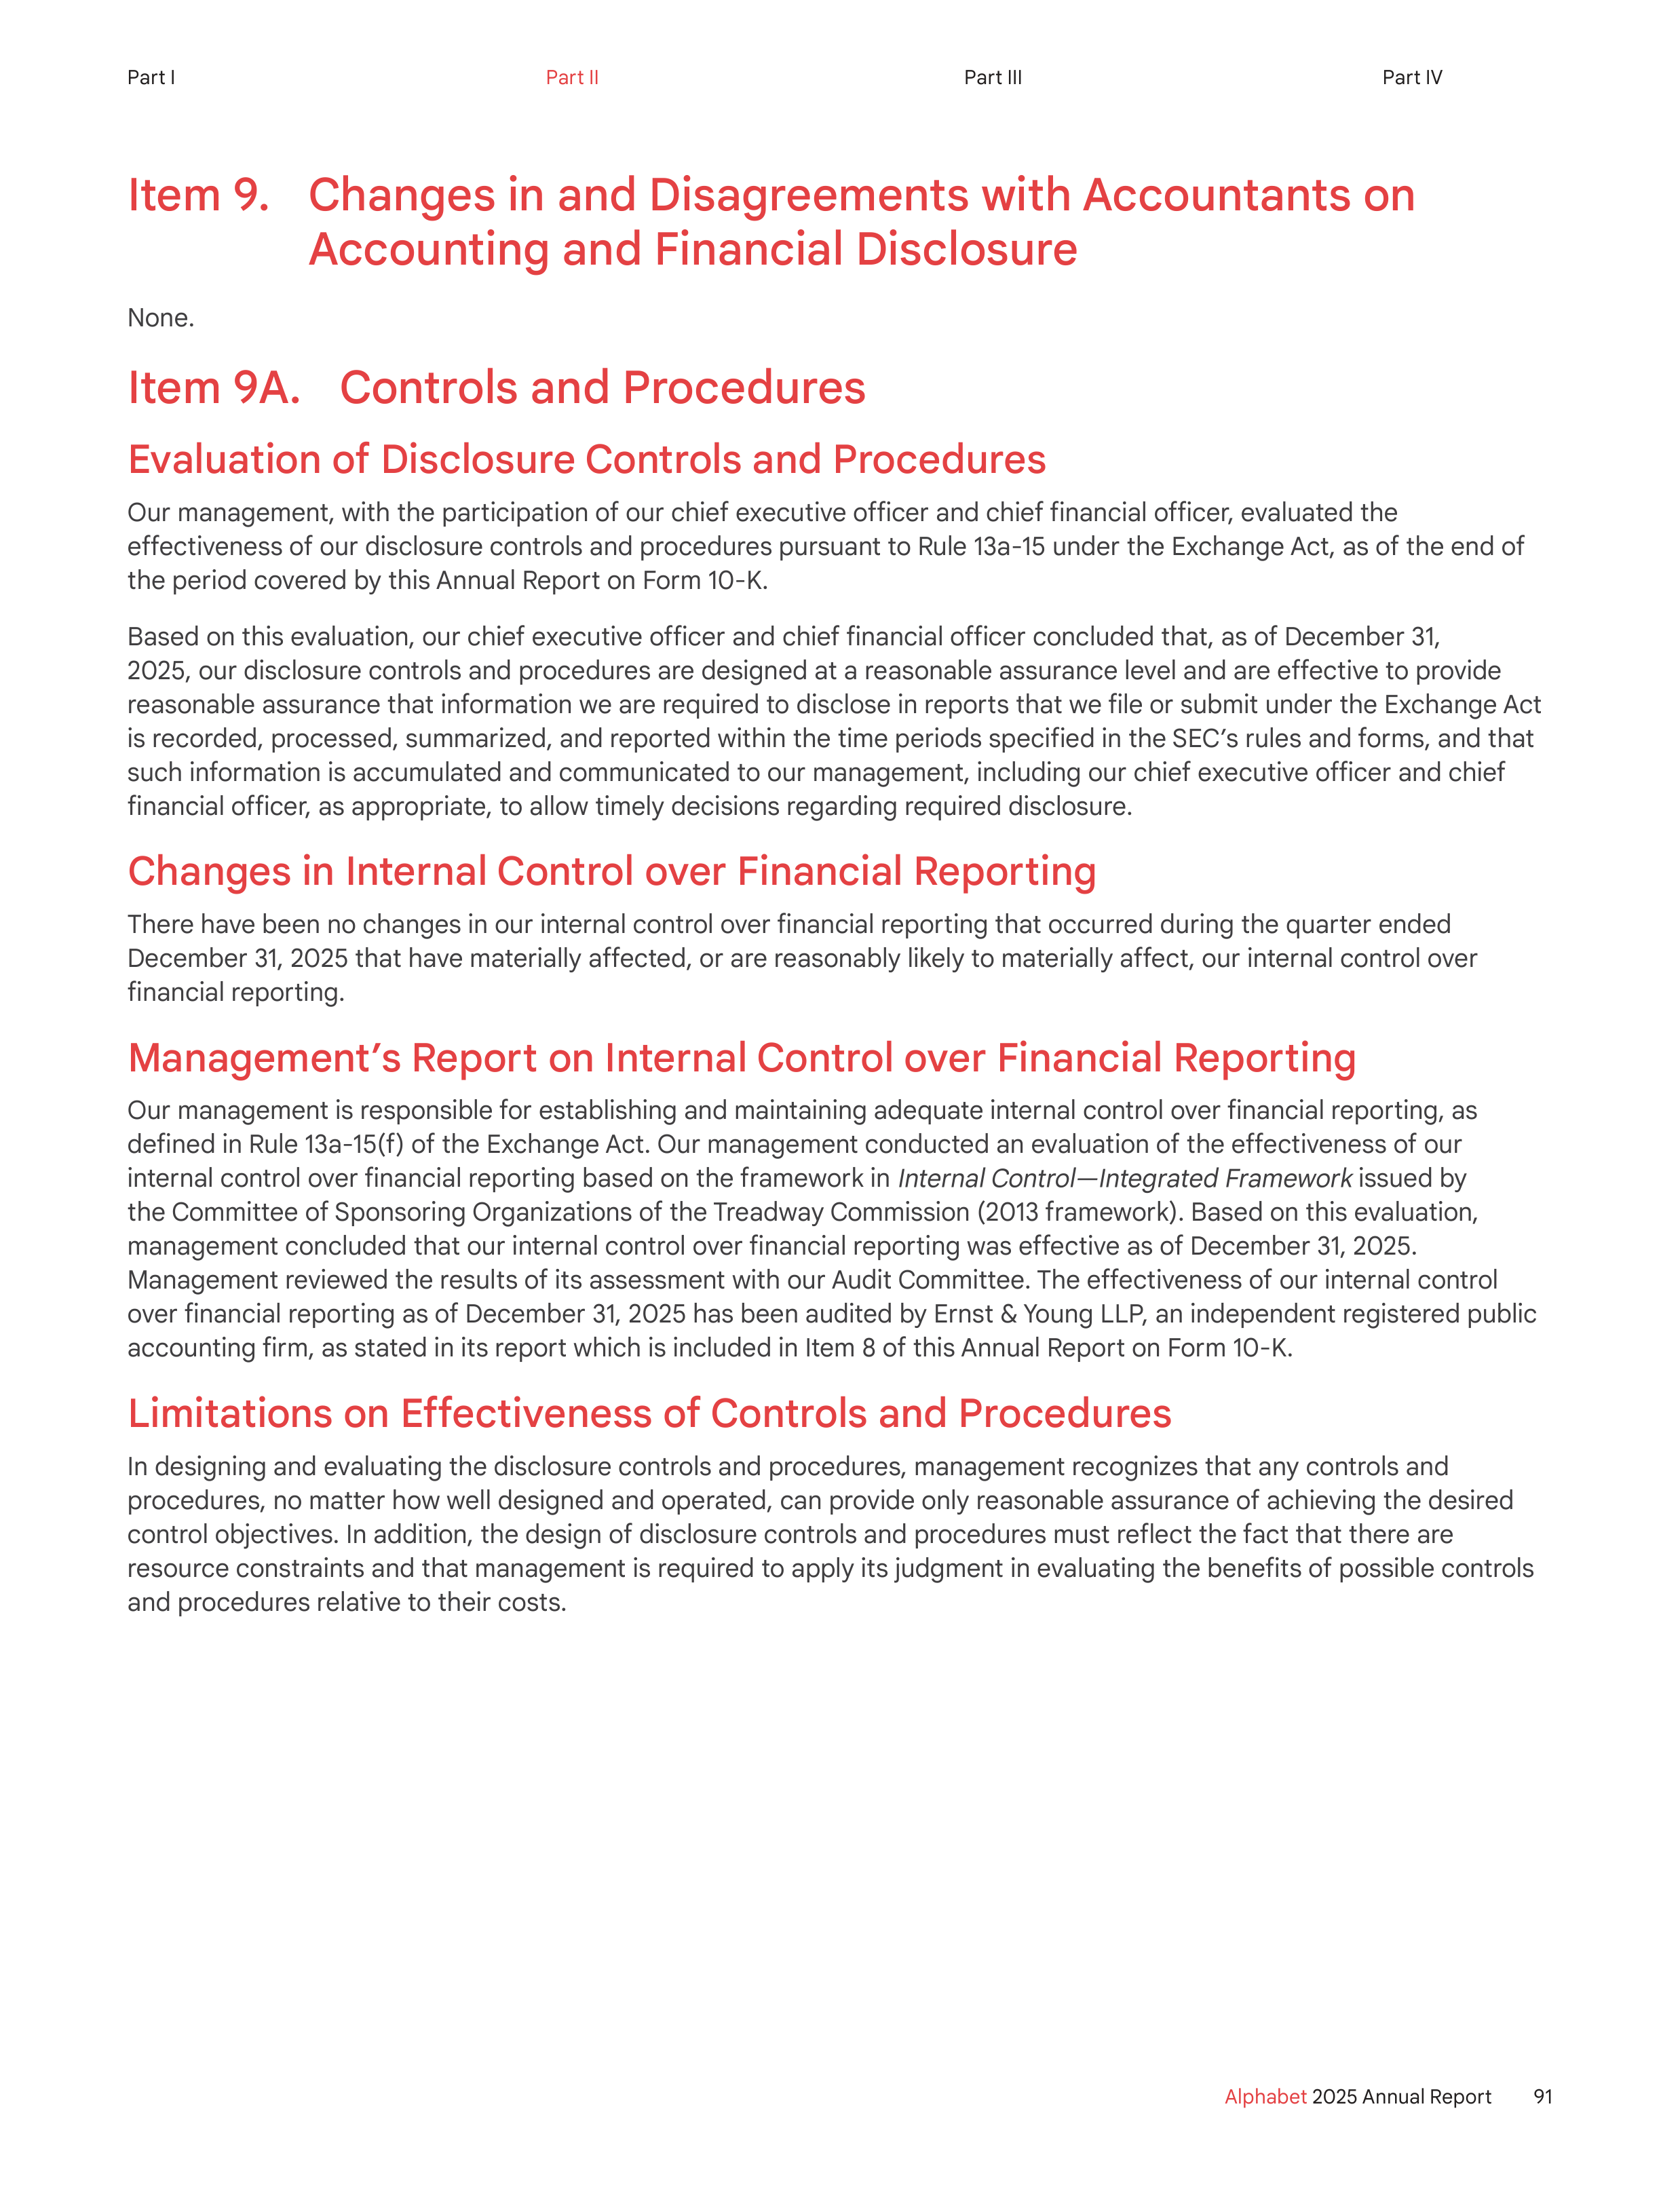
Item 9. Changes in and Disagreements with Accountants on
Accounting and Financial Disclosure
None.
Item 9A. Controls and Procedures
Evaluation of Disclosure Controls and Procedures
Our management, with the participation of our chief executive officer and chief financial officer, evaluated the
effectiveness of our disclosure controls and procedures pursuant to Rule 13a-15 under the Exchange Act, as of the end of
the period covered by this Annual Report on Form 10-K.
Based on this evaluation, our chief executive officer and chief financial officer concluded that, as of December 31,
2025, our disclosure controls and procedures are designed at a reasonable assurance level and are effective to provide
reasonable assurance that information we are required to disclose in reports that we file or submit under the Exchange Act
is recorded, processed, summarized, and reported within the time periods specified in the SEC’s rules and forms, and that
such information is accumulated and communicated to our management, including our chief executive officer and chief
financial officer, as appropriate, to allow timely decisions regarding required disclosure.
Changes in Internal Control over Financial Reporting
There have been no changes in our internal control over financial reporting that occurred during the quarter ended
December 31, 2025 that have materially affected, or are reasonably likely to materially affect, our internal control over
financial reporting.
Management’s Report on Internal Control over Financial Reporting
Our management is responsible for establishing and maintaining adequate internal control over financial reporting, as
defined in Rule 13a-15(f) of the Exchange Act. Our management conducted an evaluation of the effectiveness of our
internal control over financial reporting based on the framework in Internal Control—Integrated Framework issued by
the Committee of Sponsoring Organizations of the Treadway Commission (2013 framework). Based on this evaluation,
management concluded that our internal control over financial reporting was effective as of December 31, 2025.
Management reviewed the results of its assessment with our Audit Committee. The effectiveness of our internal control
over financial reporting as of December 31, 2025 has been audited by Ernst & Young LLP, an independent registered public
accounting firm, as stated in its report which is included in Item 8 of this Annual Report on Form 10-K.
Limitations on Effectiveness of Controls and Procedures
In designing and evaluating the disclosure controls and procedures, management recognizes that any controls and
procedures, no matter how well designed and operated, can provide only reasonable assurance of achieving the desired
control objectives. In addition, the design of disclosure controls and procedures must reflect the fact that there are
resource constraints and that management is required to apply its judgment in evaluating the benefits of possible controls
and procedures relative to their costs.
91
Alphabet
2025 Annual Report
Part I
Part II
Part III
Part IV
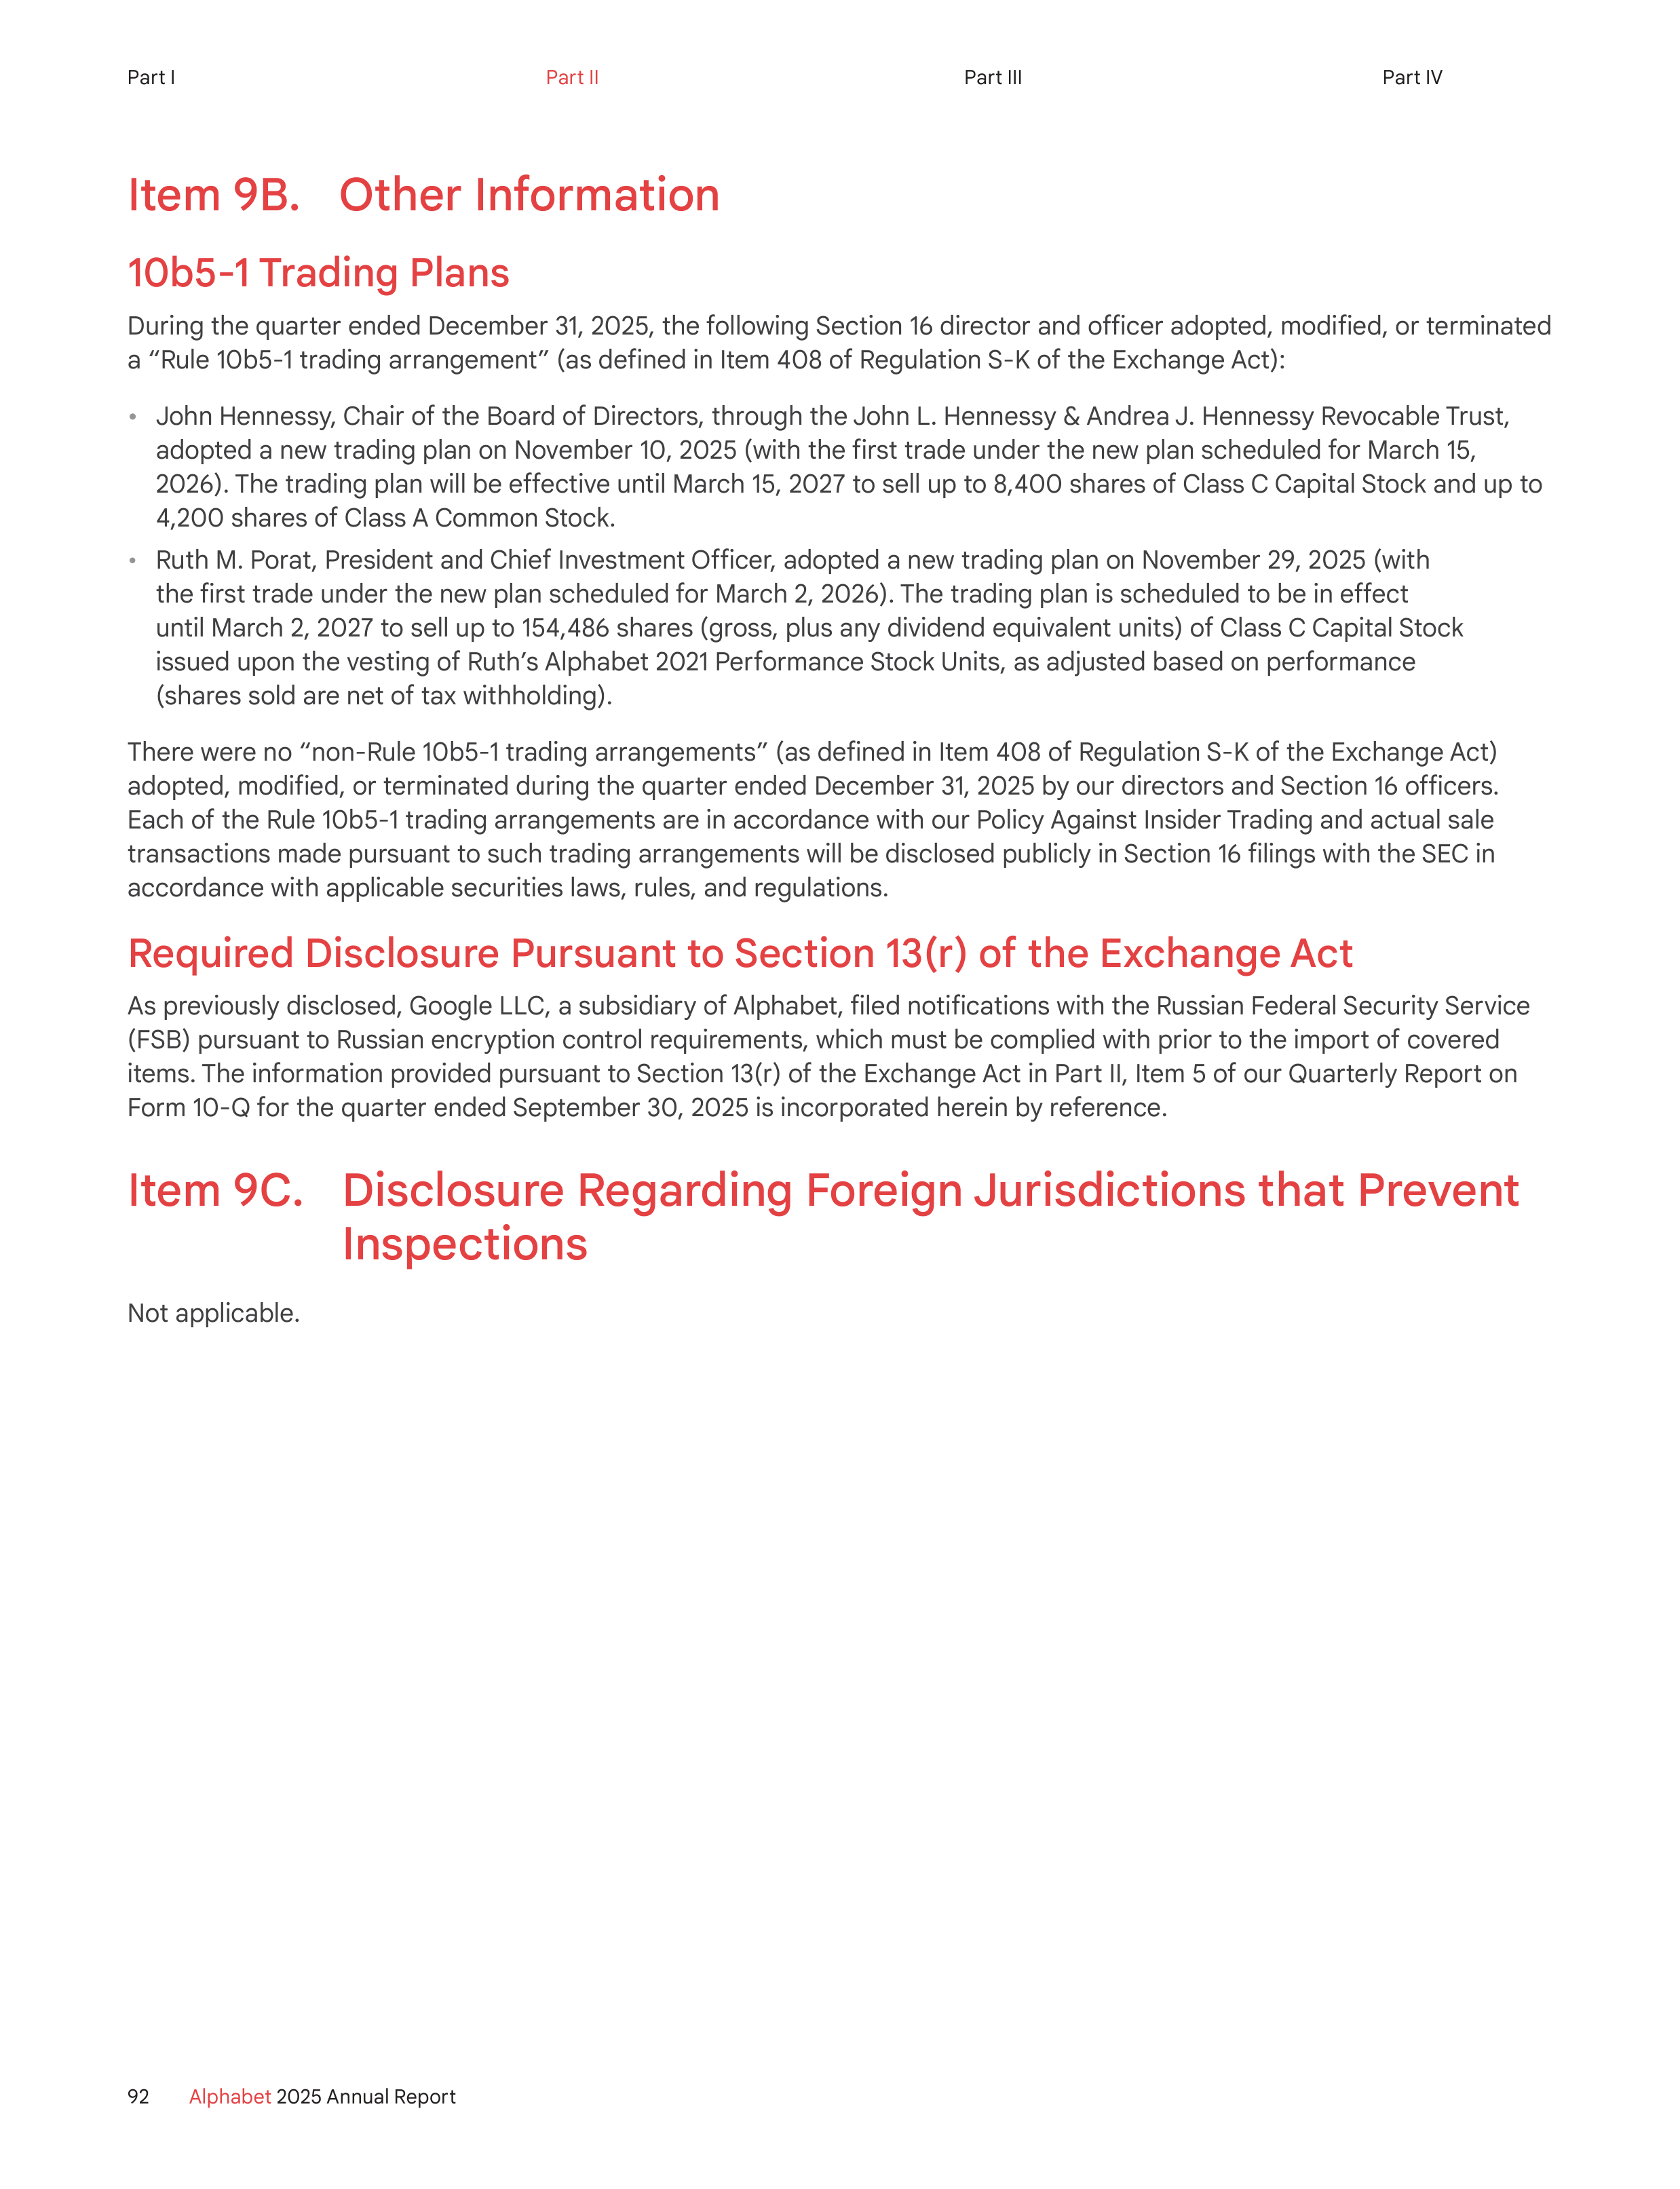
Item 9B. Other Information
10b5-1 Trading Plans
During the quarter ended December 31, 2025, the following Section 16 director and officer adopted, modified, or terminated
a “Rule 10b5-1 trading arrangement” (as defined in Item 408 of Regulation S-K of the Exchange Act):
•
John Hennessy, Chair of the Board of Directors, through the John L. Hennessy & Andrea J. Hennessy Revocable Trust,
adopted a new trading plan on November 10, 2025 (with the first trade under the new plan scheduled for March 15,
2026). The trading plan will be effective until March 15, 2027 to sell up to 8,400 shares of Class C Capital Stock and up to
4,200 shares of Class A Common Stock.
•
Ruth M. Porat, President and Chief Investment Officer, adopted a new trading plan on November 29, 2025 (with
the first trade under the new plan scheduled for March 2, 2026). The trading plan is scheduled to be in effect
until March 2, 2027 to sell up to 154,486 shares (gross, plus any dividend equivalent units) of Class C Capital Stock
issued upon the vesting of Ruth’s Alphabet 2021 Performance Stock Units, as adjusted based on performance
(shares sold are net of tax withholding).
There were no “non-Rule 10b5-1 trading arrangements” (as defined in Item 408 of Regulation S-K of the Exchange Act)
adopted, modified, or terminated during the quarter ended December 31, 2025 by our directors and Section 16 officers.
Each of the Rule 10b5-1 trading arrangements are in accordance with our Policy Against Insider Trading and actual sale
transactions made pursuant to such trading arrangements will be disclosed publicly in Section 16 filings with the SEC in
accordance with applicable securities laws, rules, and regulations.
Required Disclosure Pursuant to Section 13(r) of the Exchange Act
As previously disclosed, Google LLC, a subsidiary of Alphabet, filed notifications with the Russian Federal Security Service
(FSB) pursuant to Russian encryption control requirements, which must be complied with prior to the import of covered
items. The information provided pursuant to Section 13(r) of the Exchange Act in Part II, Item 5 of our Quarterly Report on
Form 10-Q for the quarter ended September 30, 2025 is incorporated herein by reference.
Item 9C. Disclosure Regarding Foreign Jurisdictions that Prevent
Inspections
Not applicable.
92
Alphabet
2025 Annual Report
Part I
Part II
Part III
Part IV
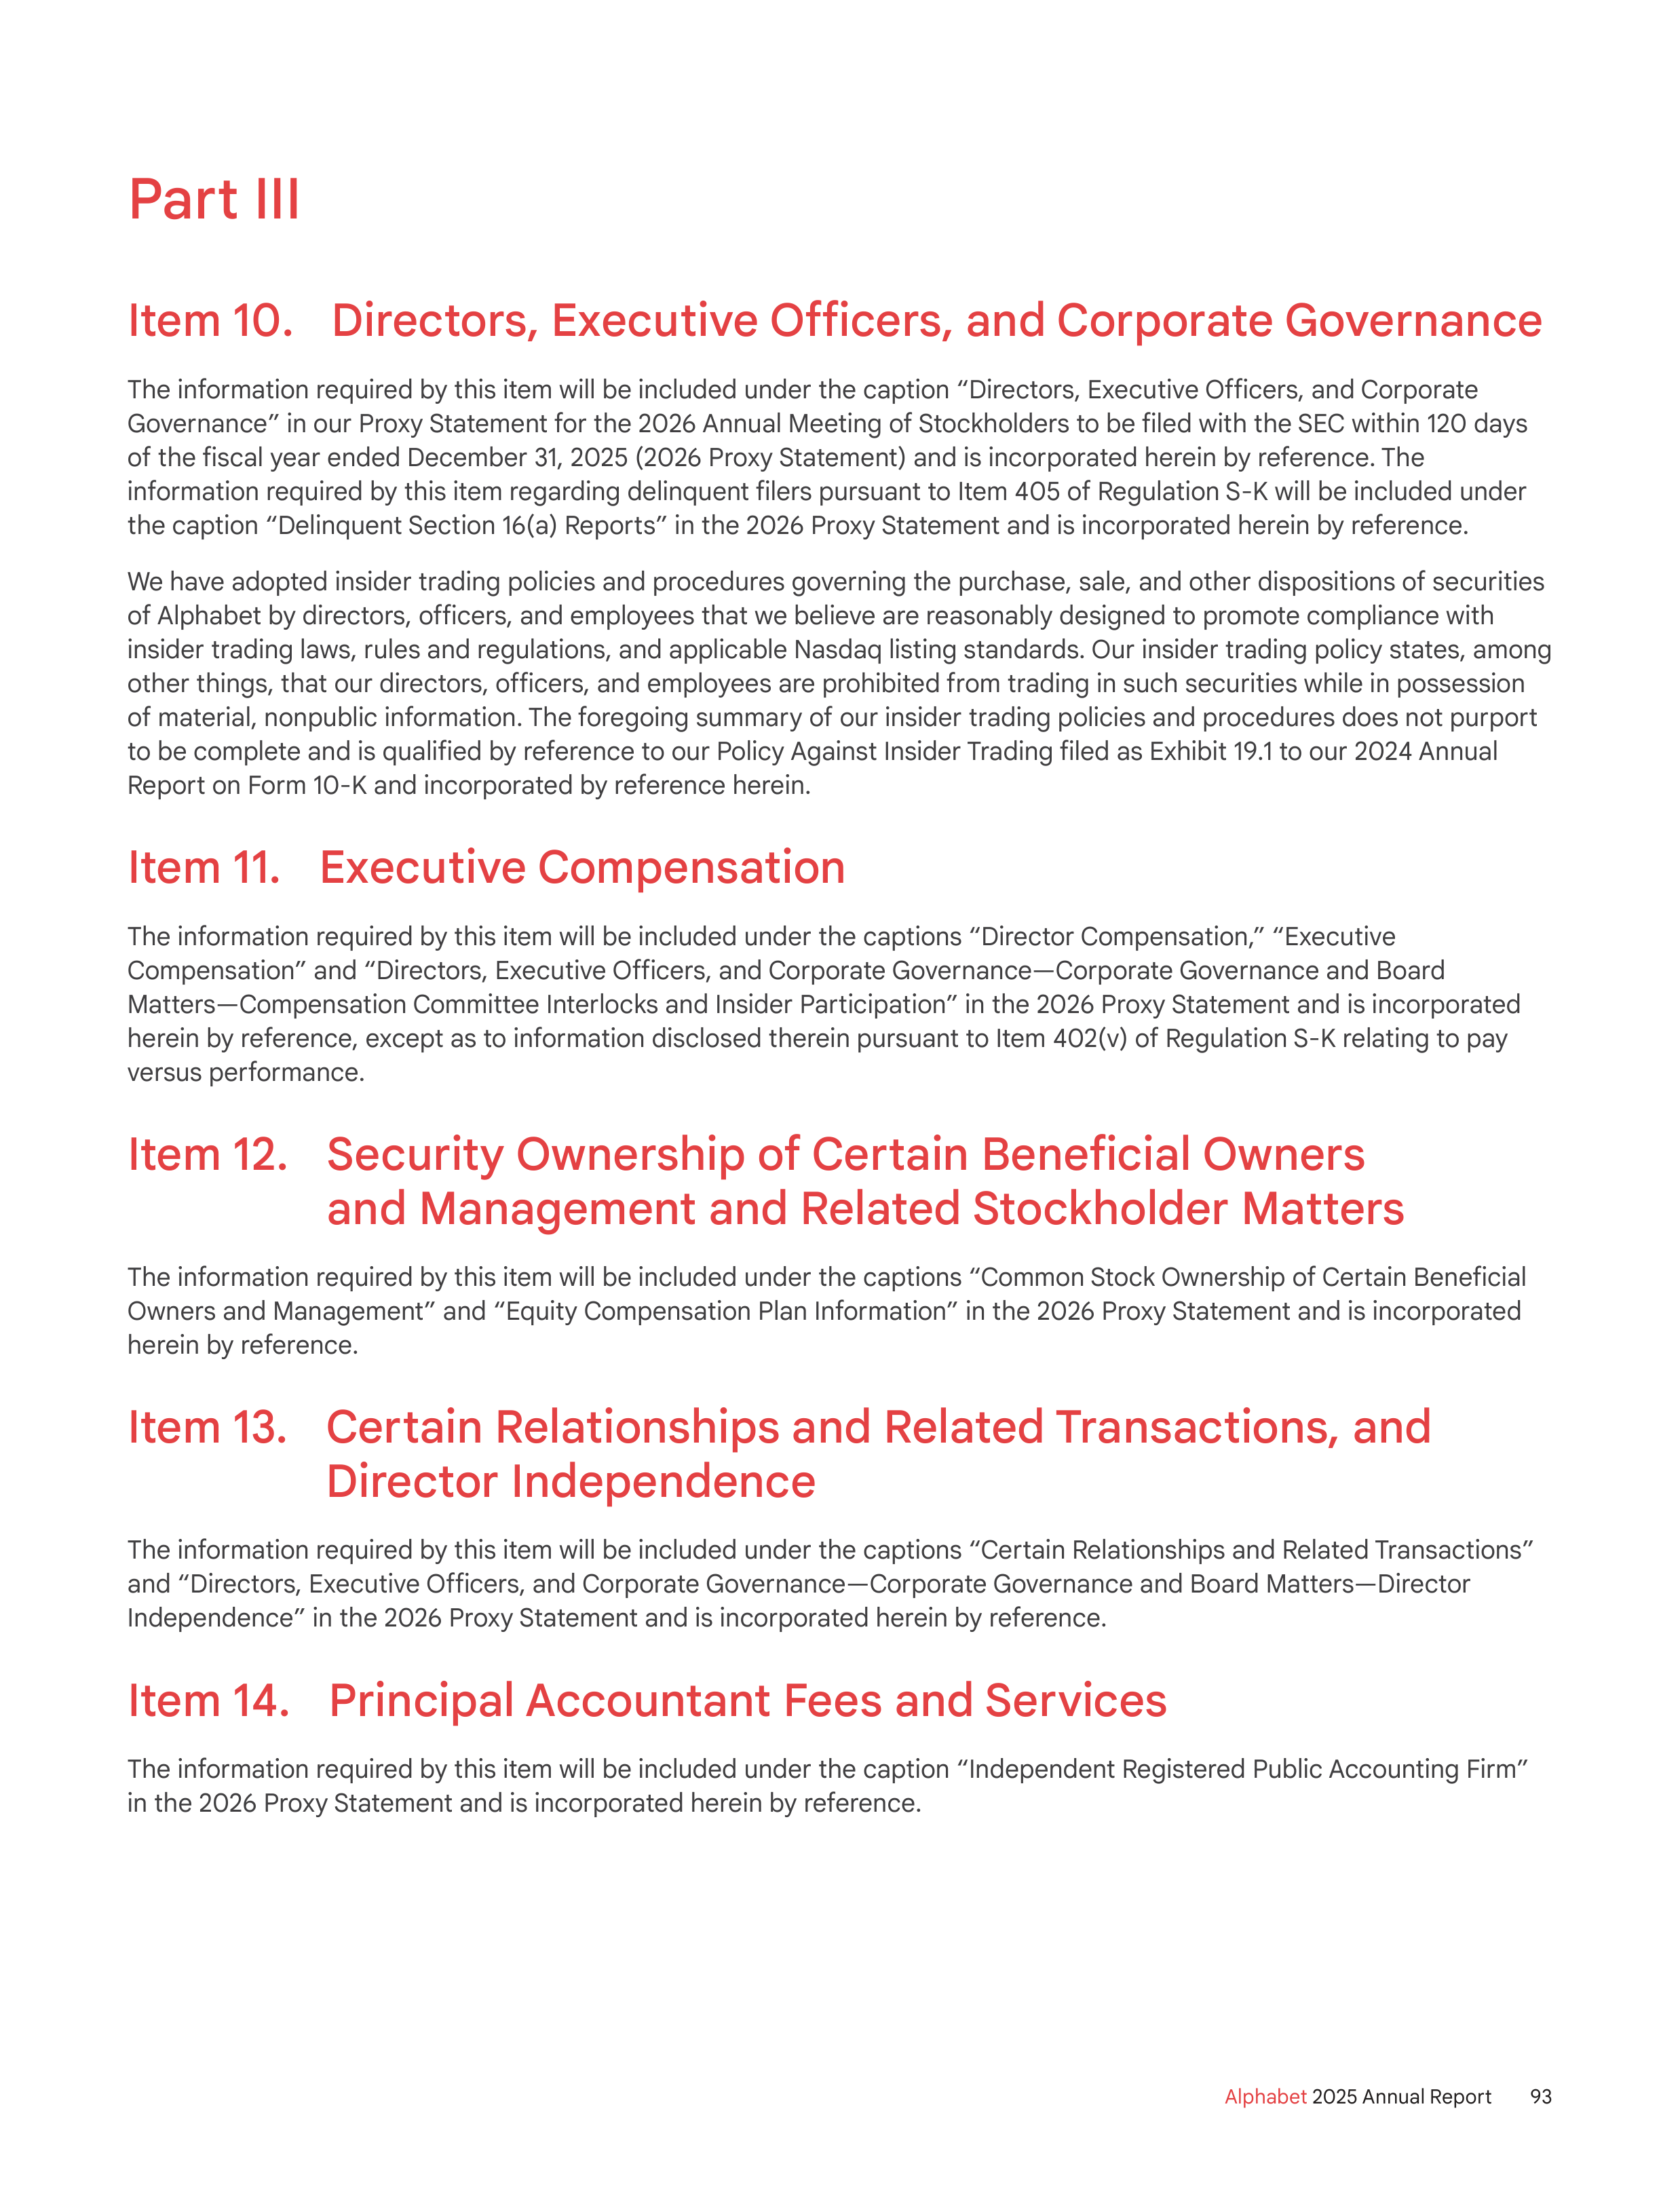
Part III
Item 10. Directors, Executive Officers, and Corporate Governance
The information required by this item will be included under the caption “Directors, Executive Officers, and Corporate
Governance” in our Proxy Statement for the 2026 Annual Meeting of Stockholders to be filed with the SEC within 120 days
of the fiscal year ended December 31, 2025 (2026 Proxy Statement) and is incorporated herein by reference. The
information required by this item regarding delinquent filers pursuant to Item 405 of Regulation S-K will be included under
the caption “Delinquent Section 16(a) Reports” in the 2026 Proxy Statement and is incorporated herein by reference.
We have adopted insider trading policies and procedures governing the purchase, sale, and other dispositions of securities
of Alphabet by directors, officers, and employees that we believe are reasonably designed to promote compliance with
insider trading laws, rules and regulations, and applicable Nasdaq listing standards. Our insider trading policy states, among
other things, that our directors, officers, and employees are prohibited from trading in such securities while in possession
of material, nonpublic information. The foregoing summary of our insider trading policies and procedures does not purport
to be complete and is qualified by reference to our Policy Against Insider Trading filed as Exhibit 19.1 to our 2024 Annual
Report on Form 10-K and incorporated by reference herein.
Item 11. Executive Compensation
The information required by this item will be included under the captions “Director Compensation,” “Executive
Compensation” and “Directors, Executive Officers, and Corporate Governance—Corporate Governance and Board
Matters—Compensation Committee Interlocks and Insider Participation” in the 2026 Proxy Statement and is incorporated
herein by reference, except as to information disclosed therein pursuant to Item 402(v) of Regulation S-K relating to pay
versus performance.
Item 12. Security Ownership of Certain Beneficial Owners
and Management and Related Stockholder Matters
The information required by this item will be included under the captions “Common Stock Ownership of Certain Beneficial
Owners and Management” and “Equity Compensation Plan Information” in the 2026 Proxy Statement and is incorporated
herein by reference.
Item 13. Certain Relationships and Related Transactions, and
Director Independence
The information required by this item will be included under the captions “Certain Relationships and Related Transactions”
and “Directors, Executive Officers, and Corporate Governance—Corporate Governance and Board Matters—Director
Independence” in the 2026 Proxy Statement and is incorporated herein by reference.
Item 14. Principal Accountant Fees and Services
The information required by this item will be included under the caption “Independent Registered Public Accounting Firm”
in the 2026 Proxy Statement and is incorporated herein by reference.
93
Alphabet
2025 Annual Report
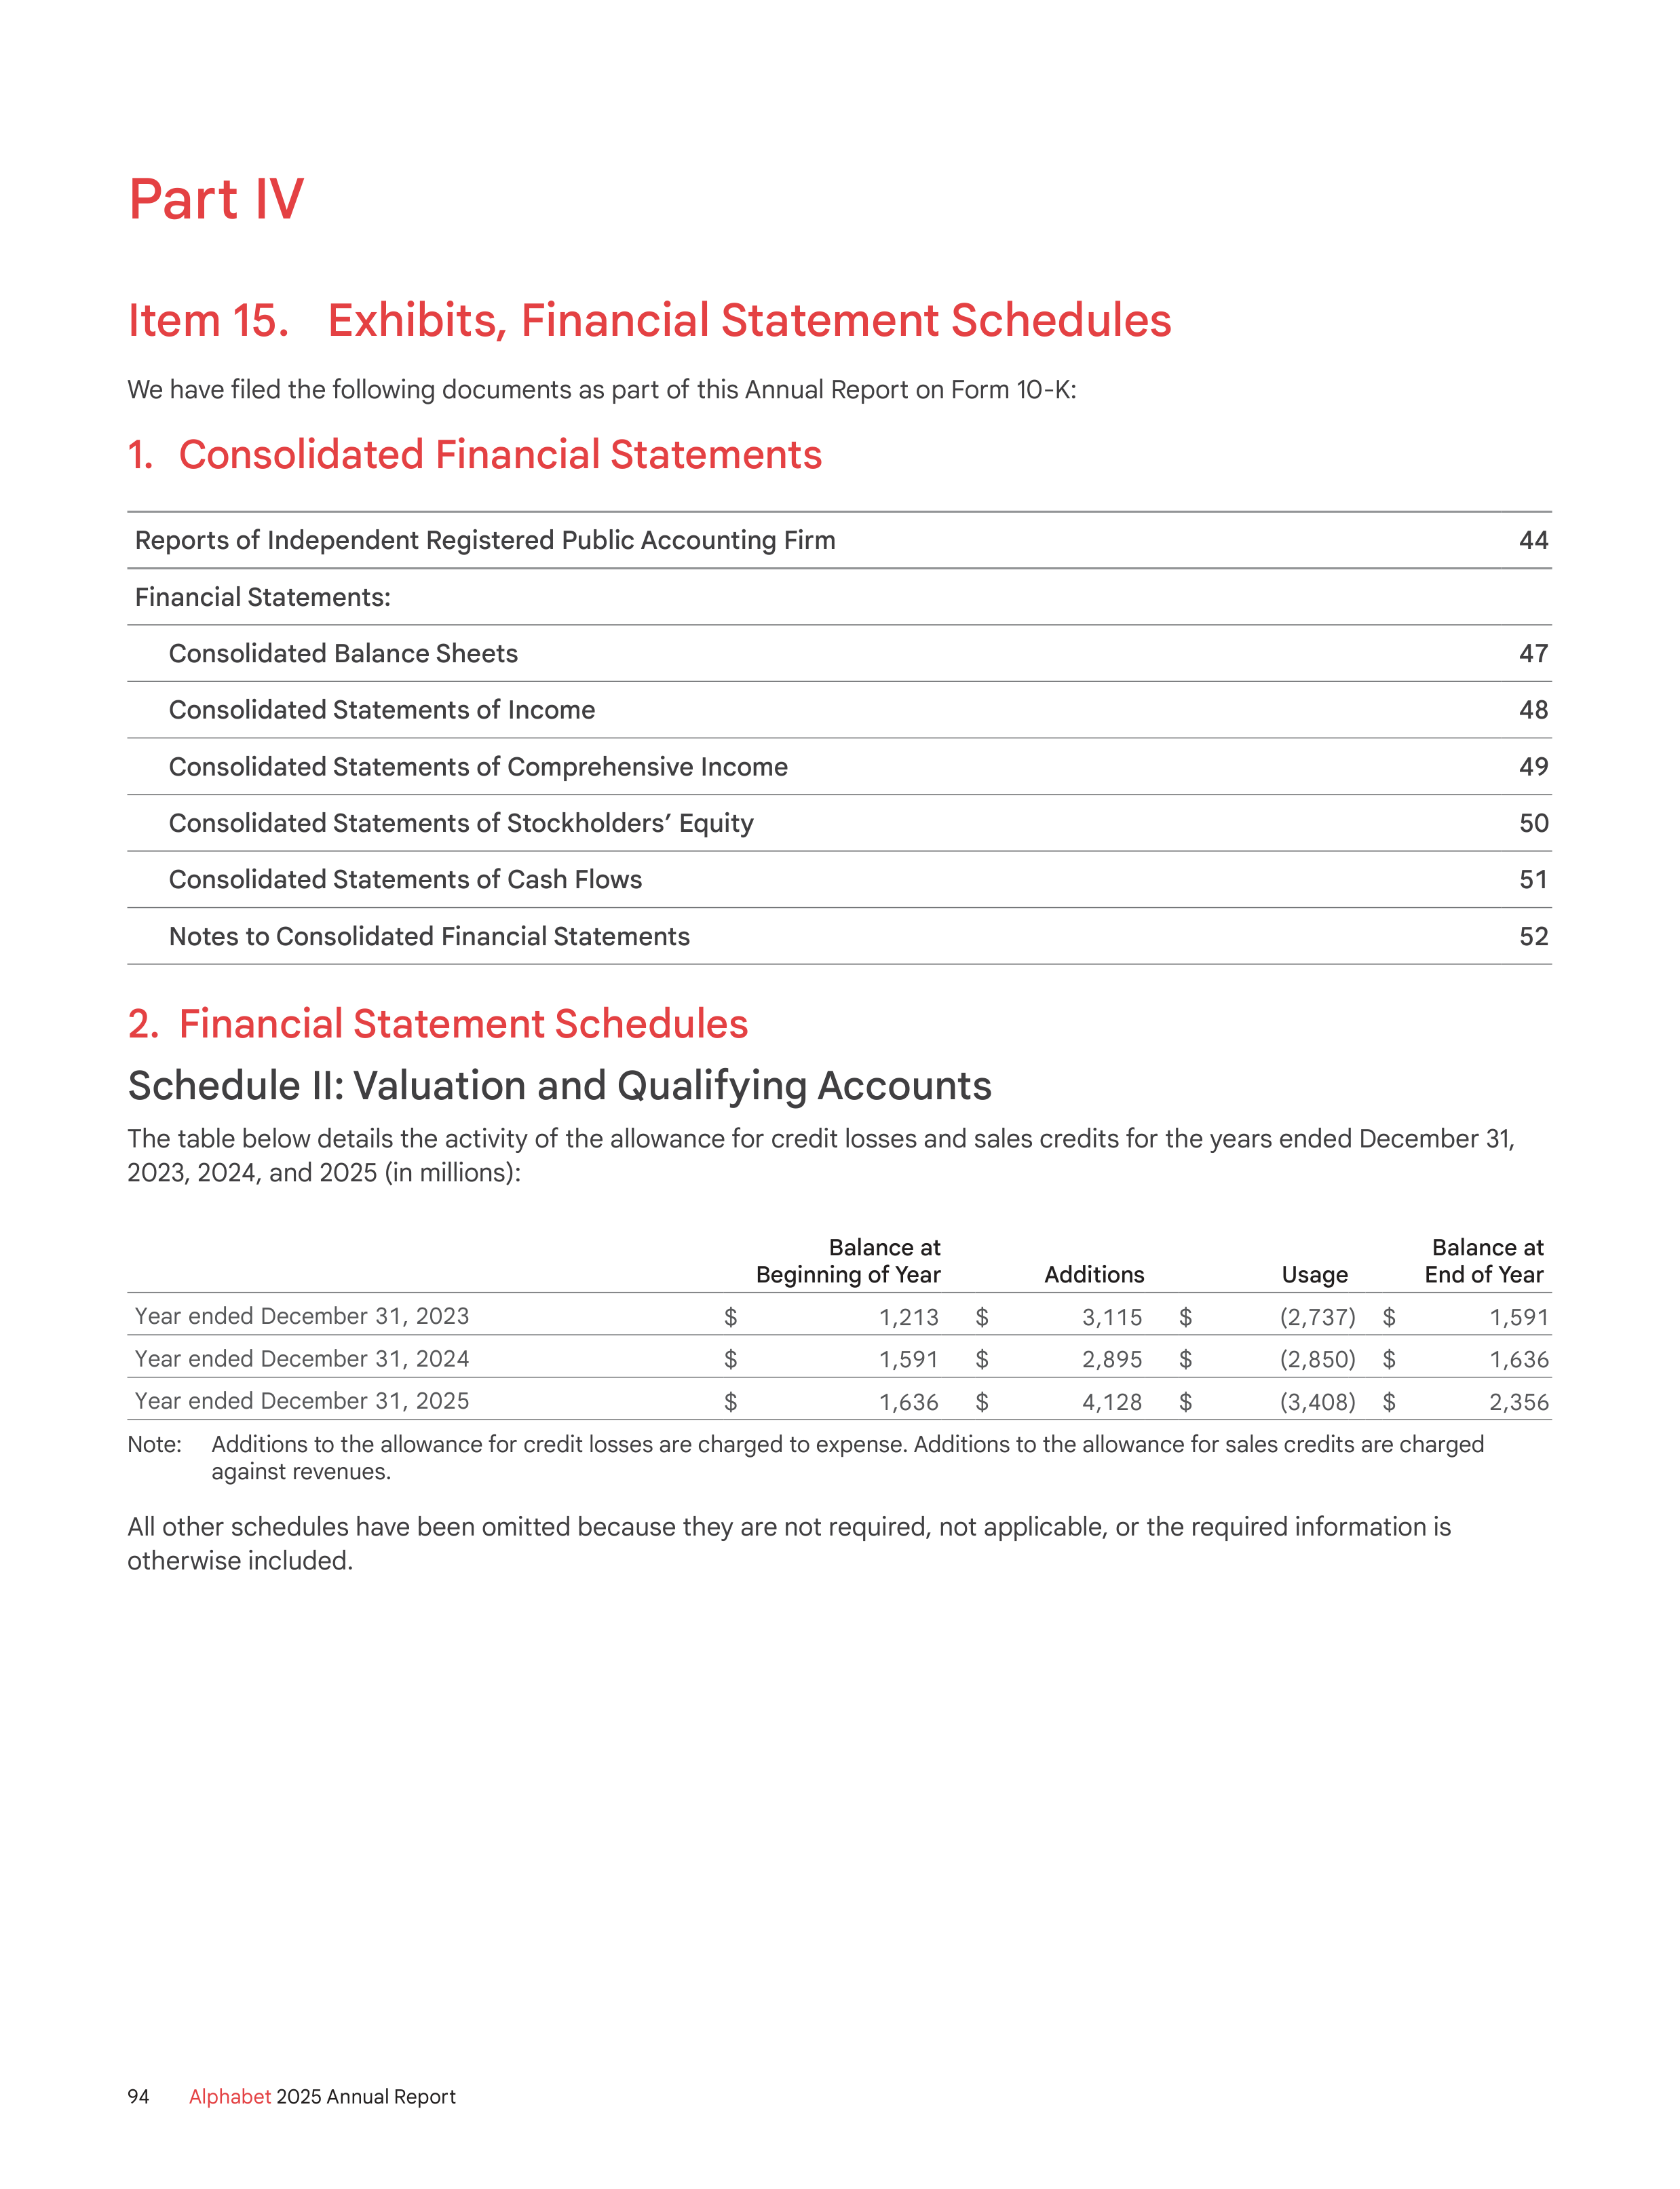
Part IV
Item 15. Exhibits, Financial Statement Schedules
We have filed the following documents as part of this Annual Report on Form 10-K:
1.
Consolidated Financial Statements
Reports of Independent Registered Public Accounting Firm
44
Financial Statements:
Consolidated Balance Sheets
47
Consolidated Statements of Income
48
Consolidated Statements of Comprehensive Income
49
Consolidated Statements of Stockholders’ Equity
50
Consolidated Statements of Cash Flows
51
Notes to Consolidated Financial Statements
52
2. Financial Statement Schedules
Schedule II: Valuation and Qualifying Accounts
The table below details the activity of the allowance for credit losses and sales credits for the years ended December 31,
2023, 2024, and 2025 (in millions):
Balance at
Beginning of Year
Additions
Usage
Balance at
End of Year
Year ended December 31, 2023
$
1,213
$
3,115
$
(2,737)
$
1,591
Year ended December 31, 2024
$
1,591
$
2,895
$
(2,850)
$
1,636
Year ended December 31, 2025
$
1,636
$
4,128
$
(3,408)
$
2,356
Note: Additions to the allowance for credit losses are charged to expense. Additions to the allowance for sales credits are charged
against revenues.
All other schedules have been omitted because they are not required, not applicable, or the required information is
otherwise included.
94
Alphabet
2025 Annual Report
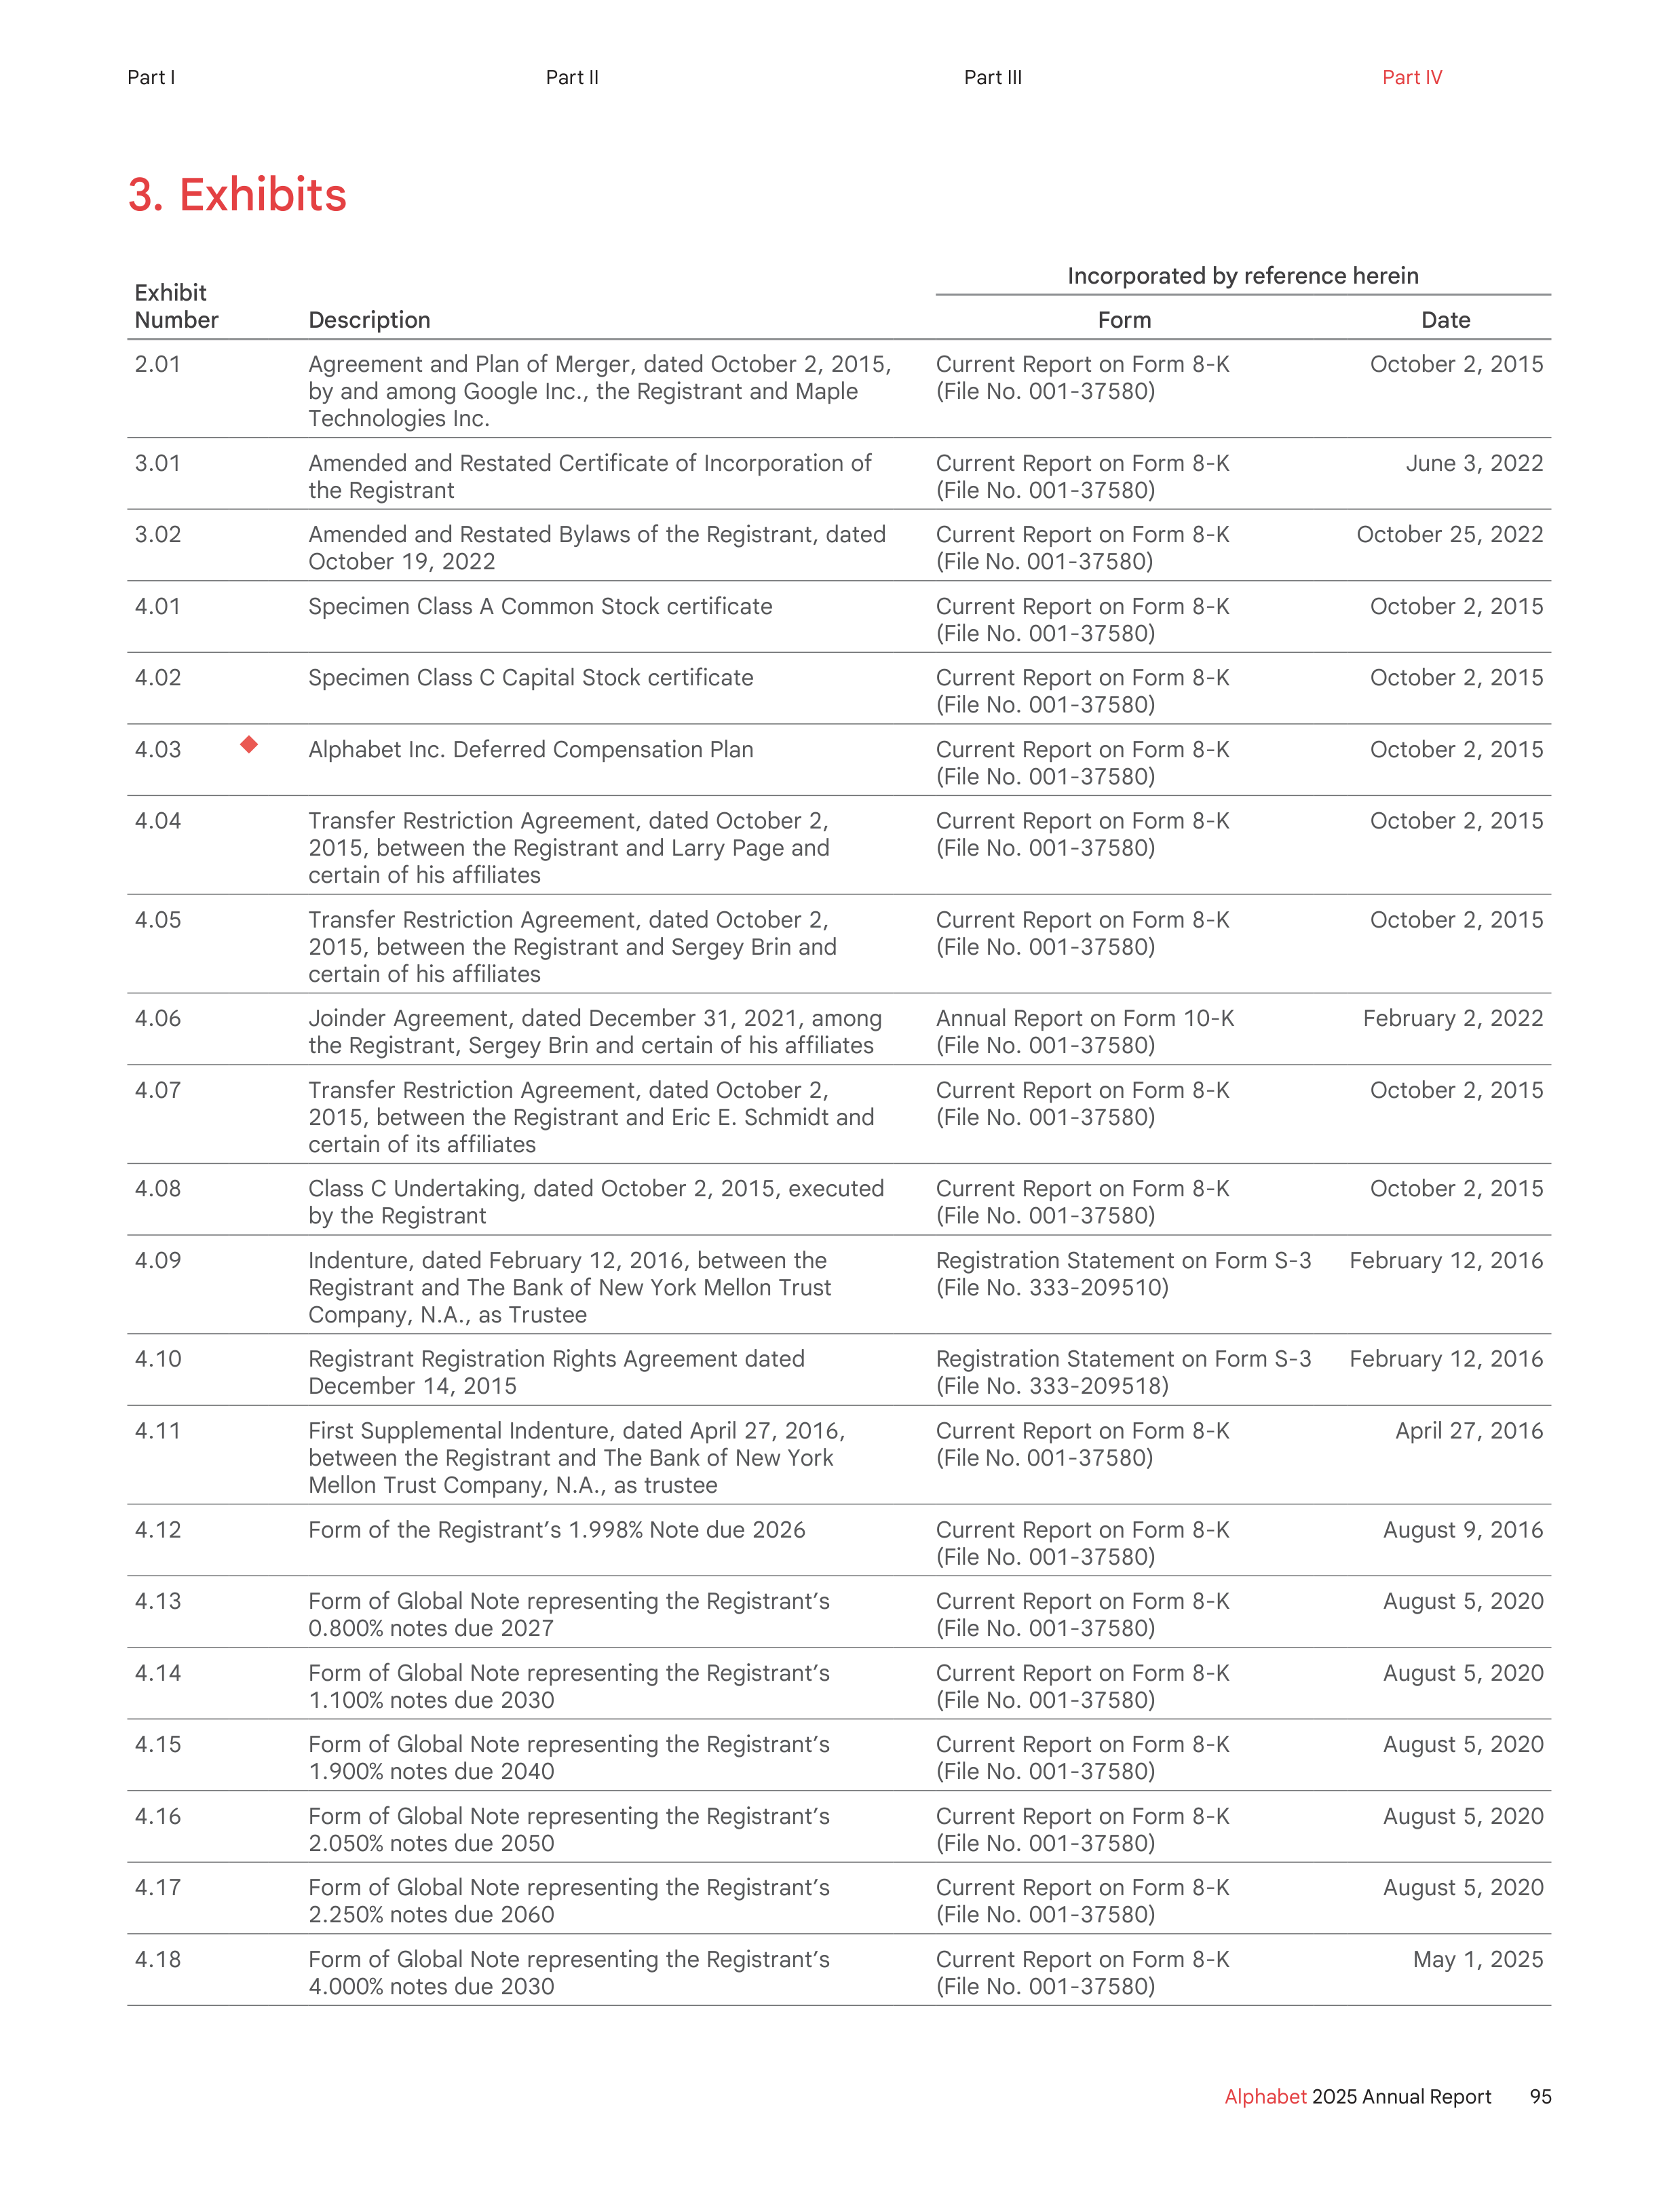
3. Exhibits
Exhibit
Number
Description
Incorporated by reference herein
Form
Date
2.01
Agreement and Plan of Merger, dated October 2, 2015,
by and among Google Inc., the Registrant and Maple
Technologies Inc.
Current Report on Form 8-K
(File No. 001-37580)
October 2, 2015
3.01
Amended and Restated Certificate of Incorporation of
the Registrant
Current Report on Form 8-K
(File No. 001-37580)
June 3, 2022
3.02
Amended and Restated Bylaws of the Registrant, dated
October 19, 2022
Current Report on Form 8-K
(File No. 001-37580)
October 25, 2022
4.01
Specimen Class A Common Stock certificate
Current Report on Form 8-K
(File No. 001-37580)
October 2, 2015
4.02
Specimen Class C Capital Stock certificate
Current Report on Form 8-K
(File No. 001-37580)
October 2, 2015
4.03
u
Alphabet Inc. Deferred Compensation Plan
Current Report on Form 8-K
(File No. 001-37580)
October 2, 2015
4.04
Transfer Restriction Agreement, dated October 2,
2015, between the Registrant and Larry Page and
certain of his affiliates
Current Report on Form 8-K
(File No. 001-37580)
October 2, 2015
4.05
Transfer Restriction Agreement, dated October 2,
2015, between the Registrant and Sergey Brin and
certain of his affiliates
Current Report on Form 8-K
(File No. 001-37580)
October 2, 2015
4.06
Joinder Agreement, dated December 31, 2021, among
the Registrant, Sergey Brin and certain of his affiliates
Annual Report on Form 10-K
(File No. 001-37580)
February 2, 2022
4.07
Transfer Restriction Agreement, dated October 2,
2015, between the Registrant and Eric E. Schmidt and
certain of its affiliates
Current Report on Form 8-K
(File No. 001-37580)
October 2, 2015
4.08
Class C Undertaking, dated October 2, 2015, executed
by the Registrant
Current Report on Form 8-K
(File No. 001-37580)
October 2, 2015
4.09
Indenture, dated February 12, 2016, between the
Registrant and The Bank of New York Mellon Trust
Company, N.A., as Trustee
Registration Statement on Form S-3
(File No. 333-209510)
February 12, 2016
4.10
Registrant Registration Rights Agreement dated
December 14, 2015
Registration Statement on Form S-3
(File No. 333-209518)
February 12, 2016
4.11
First Supplemental Indenture, dated April 27, 2016,
between the Registrant and The Bank of New York
Mellon Trust Company, N.A., as trustee
Current Report on Form 8-K
(File No. 001-37580)
April 27, 2016
4.12
Form of the Registrant’s 1.998% Note due 2026
Current Report on Form 8-K
(File No. 001-37580)
August 9, 2016
4.13
Form of Global Note representing the Registrant’s
0.800% notes due 2027
Current Report on Form 8-K
(File No. 001-37580)
August 5, 2020
4.14
Form of Global Note representing the Registrant’s
1.100% notes due 2030
Current Report on Form 8-K
(File No. 001-37580)
August 5, 2020
4.15
Form of Global Note representing the Registrant’s
1.900% notes due 2040
Current Report on Form 8-K
(File No. 001-37580)
August 5, 2020
4.16
Form of Global Note representing the Registrant’s
2.050% notes due 2050
Current Report on Form 8-K
(File No. 001-37580)
August 5, 2020
4.17
Form of Global Note representing the Registrant’s
2.250% notes due 2060
Current Report on Form 8-K
(File No. 001-37580)
August 5, 2020
4.18
Form of Global Note representing the Registrant’s
4.000% notes due 2030
Current Report on Form 8-K
(File No. 001-37580)
May 1, 2025
95
Alphabet
2025 Annual Report
Part I
Part II
Part III
Part IV
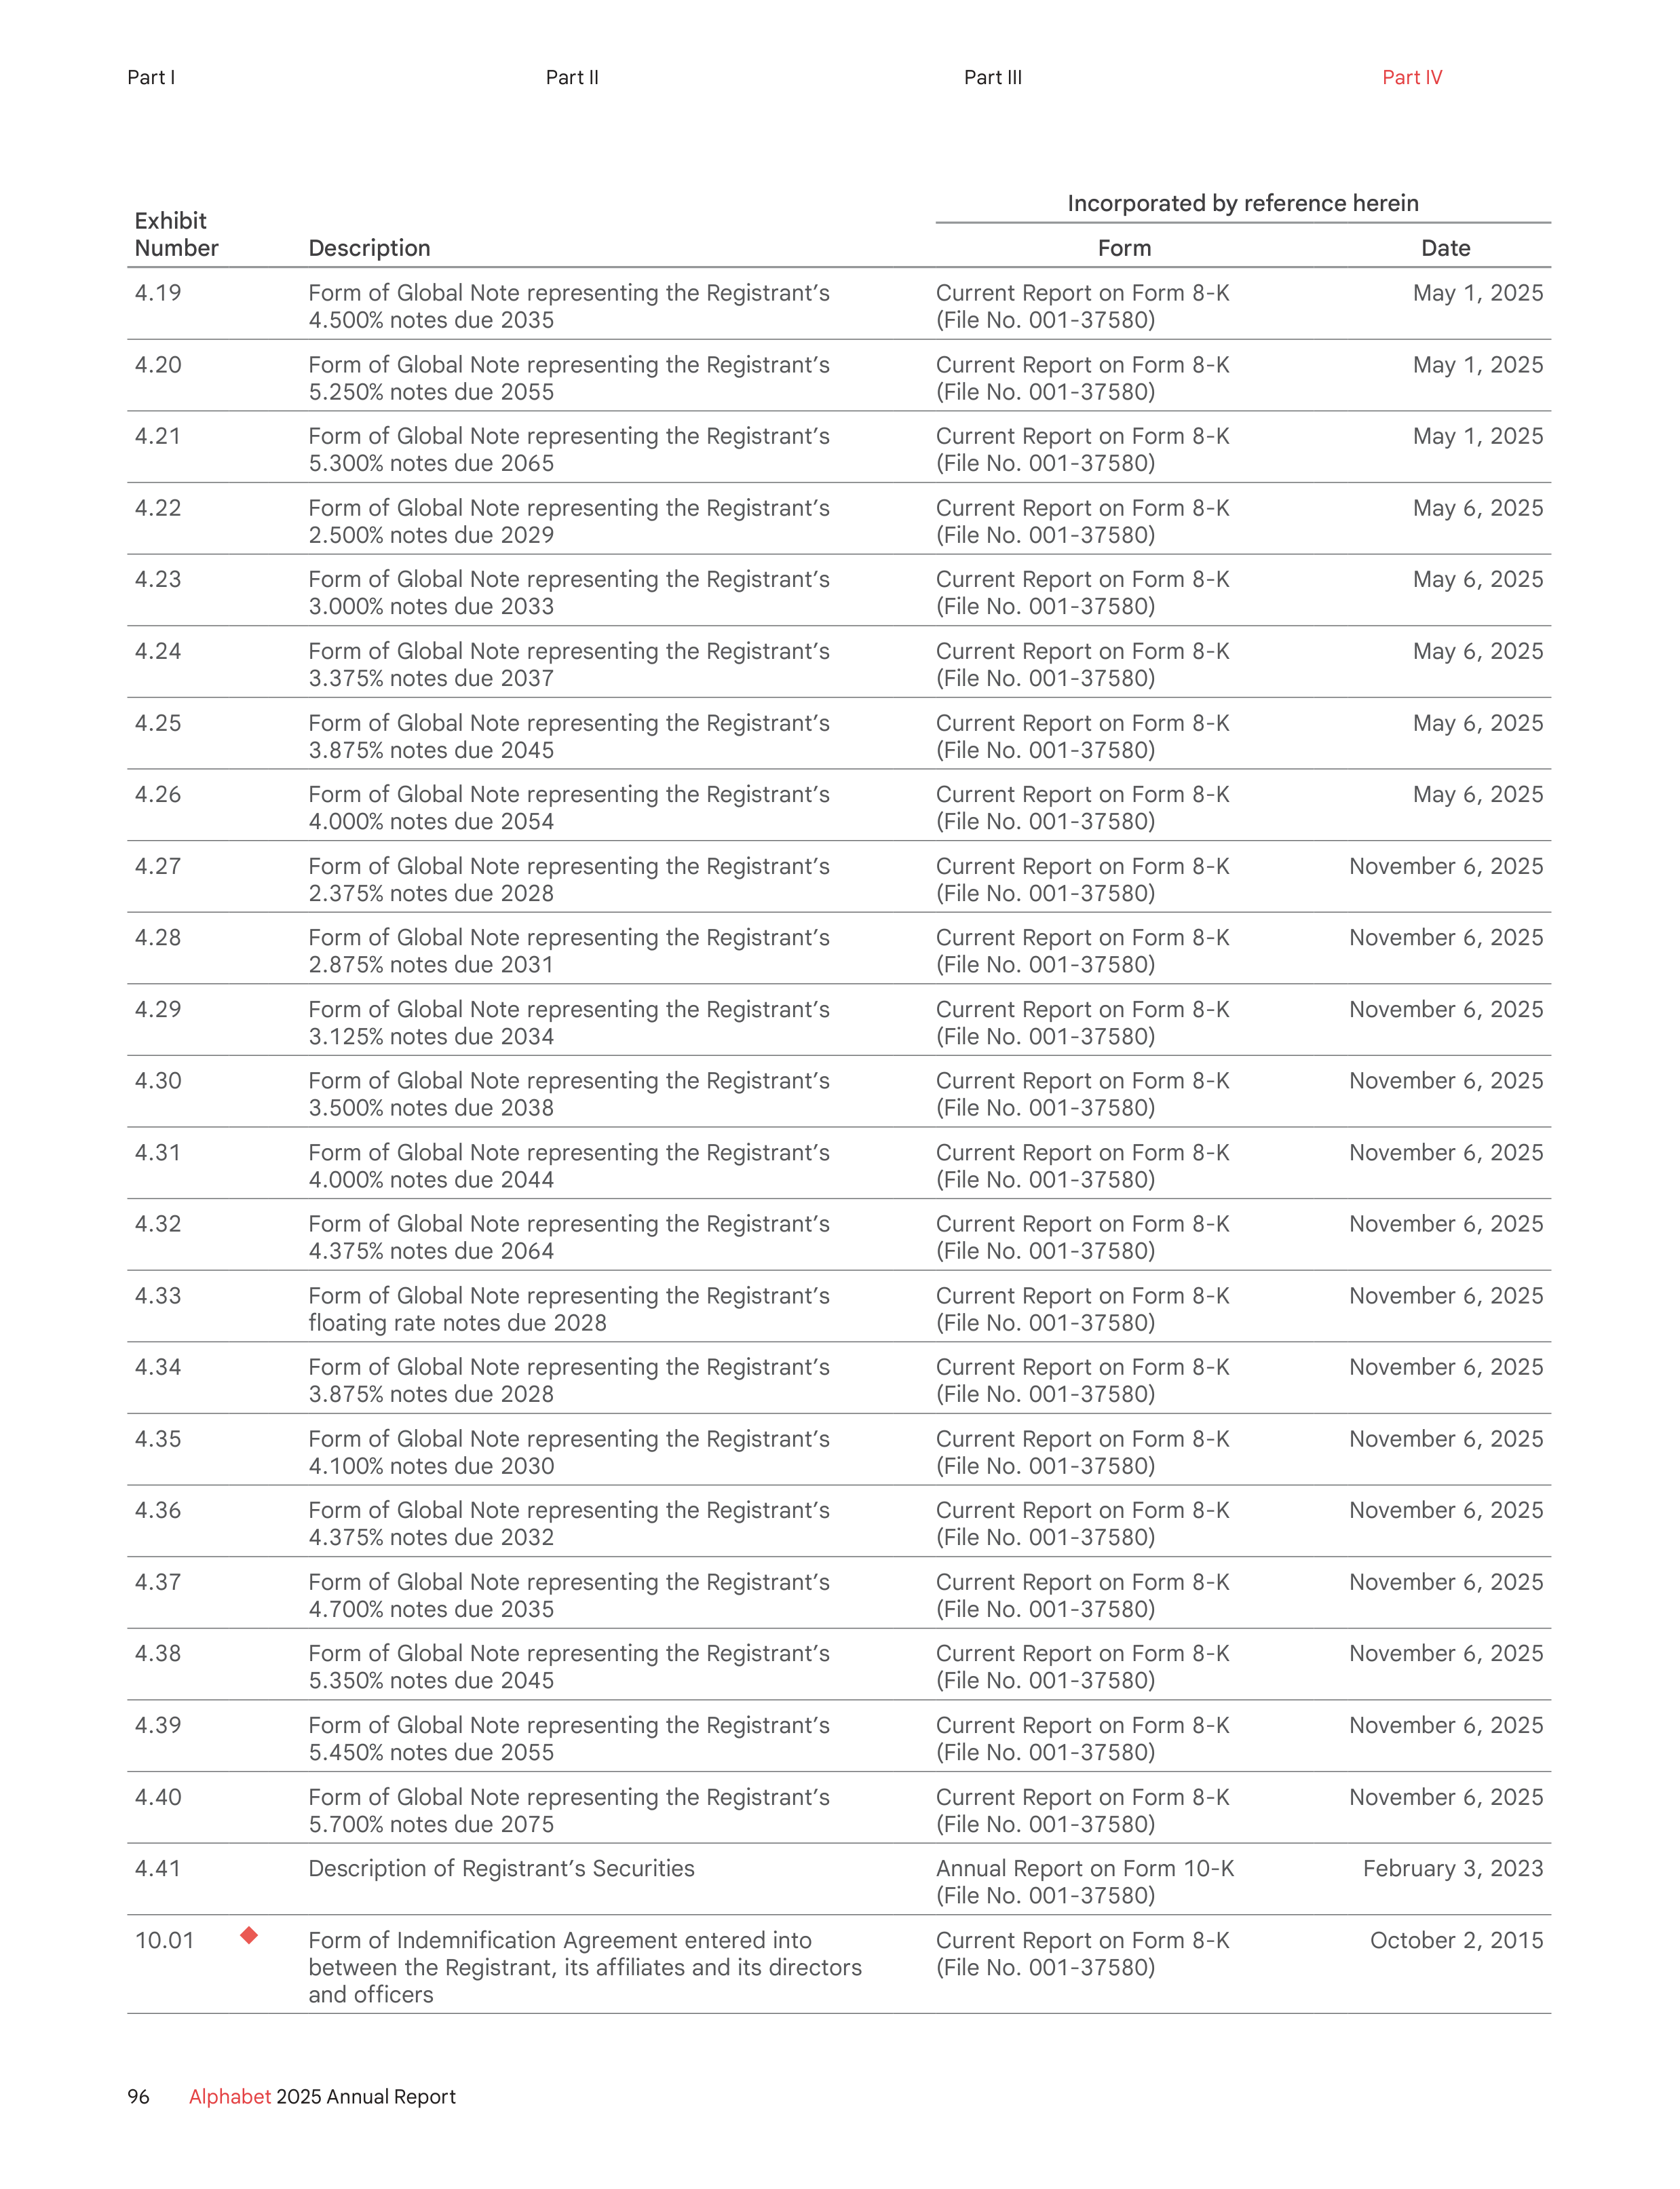
Exhibit
Number
Description
Incorporated by reference herein
Form
Date
4.19
Form of Global Note representing the Registrant’s
4.500% notes due 2035
Current Report on Form 8-K
(File No. 001-37580)
May 1, 2025
4.20
Form of Global Note representing the Registrant’s
5.250% notes due 2055
Current Report on Form 8-K
(File No. 001-37580)
May 1, 2025
4.21
Form of Global Note representing the Registrant’s
5.300% notes due 2065
Current Report on Form 8-K
(File No. 001-37580)
May 1, 2025
4.22
Form of Global Note representing the Registrant’s
2.500% notes due 2029
Current Report on Form 8-K
(File No. 001-37580)
May 6, 2025
4.23
Form of Global Note representing the Registrant’s
3.000% notes due 2033
Current Report on Form 8-K
(File No. 001-37580)
May 6, 2025
4.24
Form of Global Note representing the Registrant’s
3.375% notes due 2037
Current Report on Form 8-K
(File No. 001-37580)
May 6, 2025
4.25
Form of Global Note representing the Registrant’s
3.875% notes due 2045
Current Report on Form 8-K
(File No. 001-37580)
May 6, 2025
4.26
Form of Global Note representing the Registrant’s
4.000% notes due 2054
Current Report on Form 8-K
(File No. 001-37580)
May 6, 2025
4.27
Form of Global Note representing the Registrant’s
2.375% notes due 2028
Current Report on Form 8-K
(File No. 001-37580)
November 6, 2025
4.28
Form of Global Note representing the Registrant’s
2.875% notes due 2031
Current Report on Form 8-K
(File No. 001-37580)
November 6, 2025
4.29
Form of Global Note representing the Registrant’s
3.125% notes due 2034
Current Report on Form 8-K
(File No. 001-37580)
November 6, 2025
4.30
Form of Global Note representing the Registrant’s
3.500% notes due 2038
Current Report on Form 8-K
(File No. 001-37580)
November 6, 2025
4.31
Form of Global Note representing the Registrant’s
4.000% notes due 2044
Current Report on Form 8-K
(File No. 001-37580)
November 6, 2025
4.32
Form of Global Note representing the Registrant’s
4.375% notes due 2064
Current Report on Form 8-K
(File No. 001-37580)
November 6, 2025
4.33
Form of Global Note representing the Registrant’s
floating rate notes due 2028
Current Report on Form 8-K
(File No. 001-37580)
November 6, 2025
4.34
Form of Global Note representing the Registrant’s
3.875% notes due 2028
Current Report on Form 8-K
(File No. 001-37580)
November 6, 2025
4.35
Form of Global Note representing the Registrant’s
4.100% notes due 2030
Current Report on Form 8-K
(File No. 001-37580)
November 6, 2025
4.36
Form of Global Note representing the Registrant’s
4.375% notes due 2032
Current Report on Form 8-K
(File No. 001-37580)
November 6, 2025
4.37
Form of Global Note representing the Registrant’s
4.700% notes due 2035
Current Report on Form 8-K
(File No. 001-37580)
November 6, 2025
4.38
Form of Global Note representing the Registrant’s
5.350% notes due 2045
Current Report on Form 8-K
(File No. 001-37580)
November 6, 2025
4.39
Form of Global Note representing the Registrant’s
5.450% notes due 2055
Current Report on Form 8-K
(File No. 001-37580)
November 6, 2025
4.40
Form of Global Note representing the Registrant’s
5.700% notes due 2075
Current Report on Form 8-K
(File No. 001-37580)
November 6, 2025
4.41
Description of Registrant’s Securities
Annual Report on Form 10-K
(File No. 001-37580)
February 3, 2023
10.01
u
Form of Indemnification Agreement entered into
between the Registrant, its affiliates and its directors
and officers
Current Report on Form 8-K
(File No. 001-37580)
October 2, 2015
96
Alphabet
2025 Annual Report
Part I
Part II
Part III
Part IV
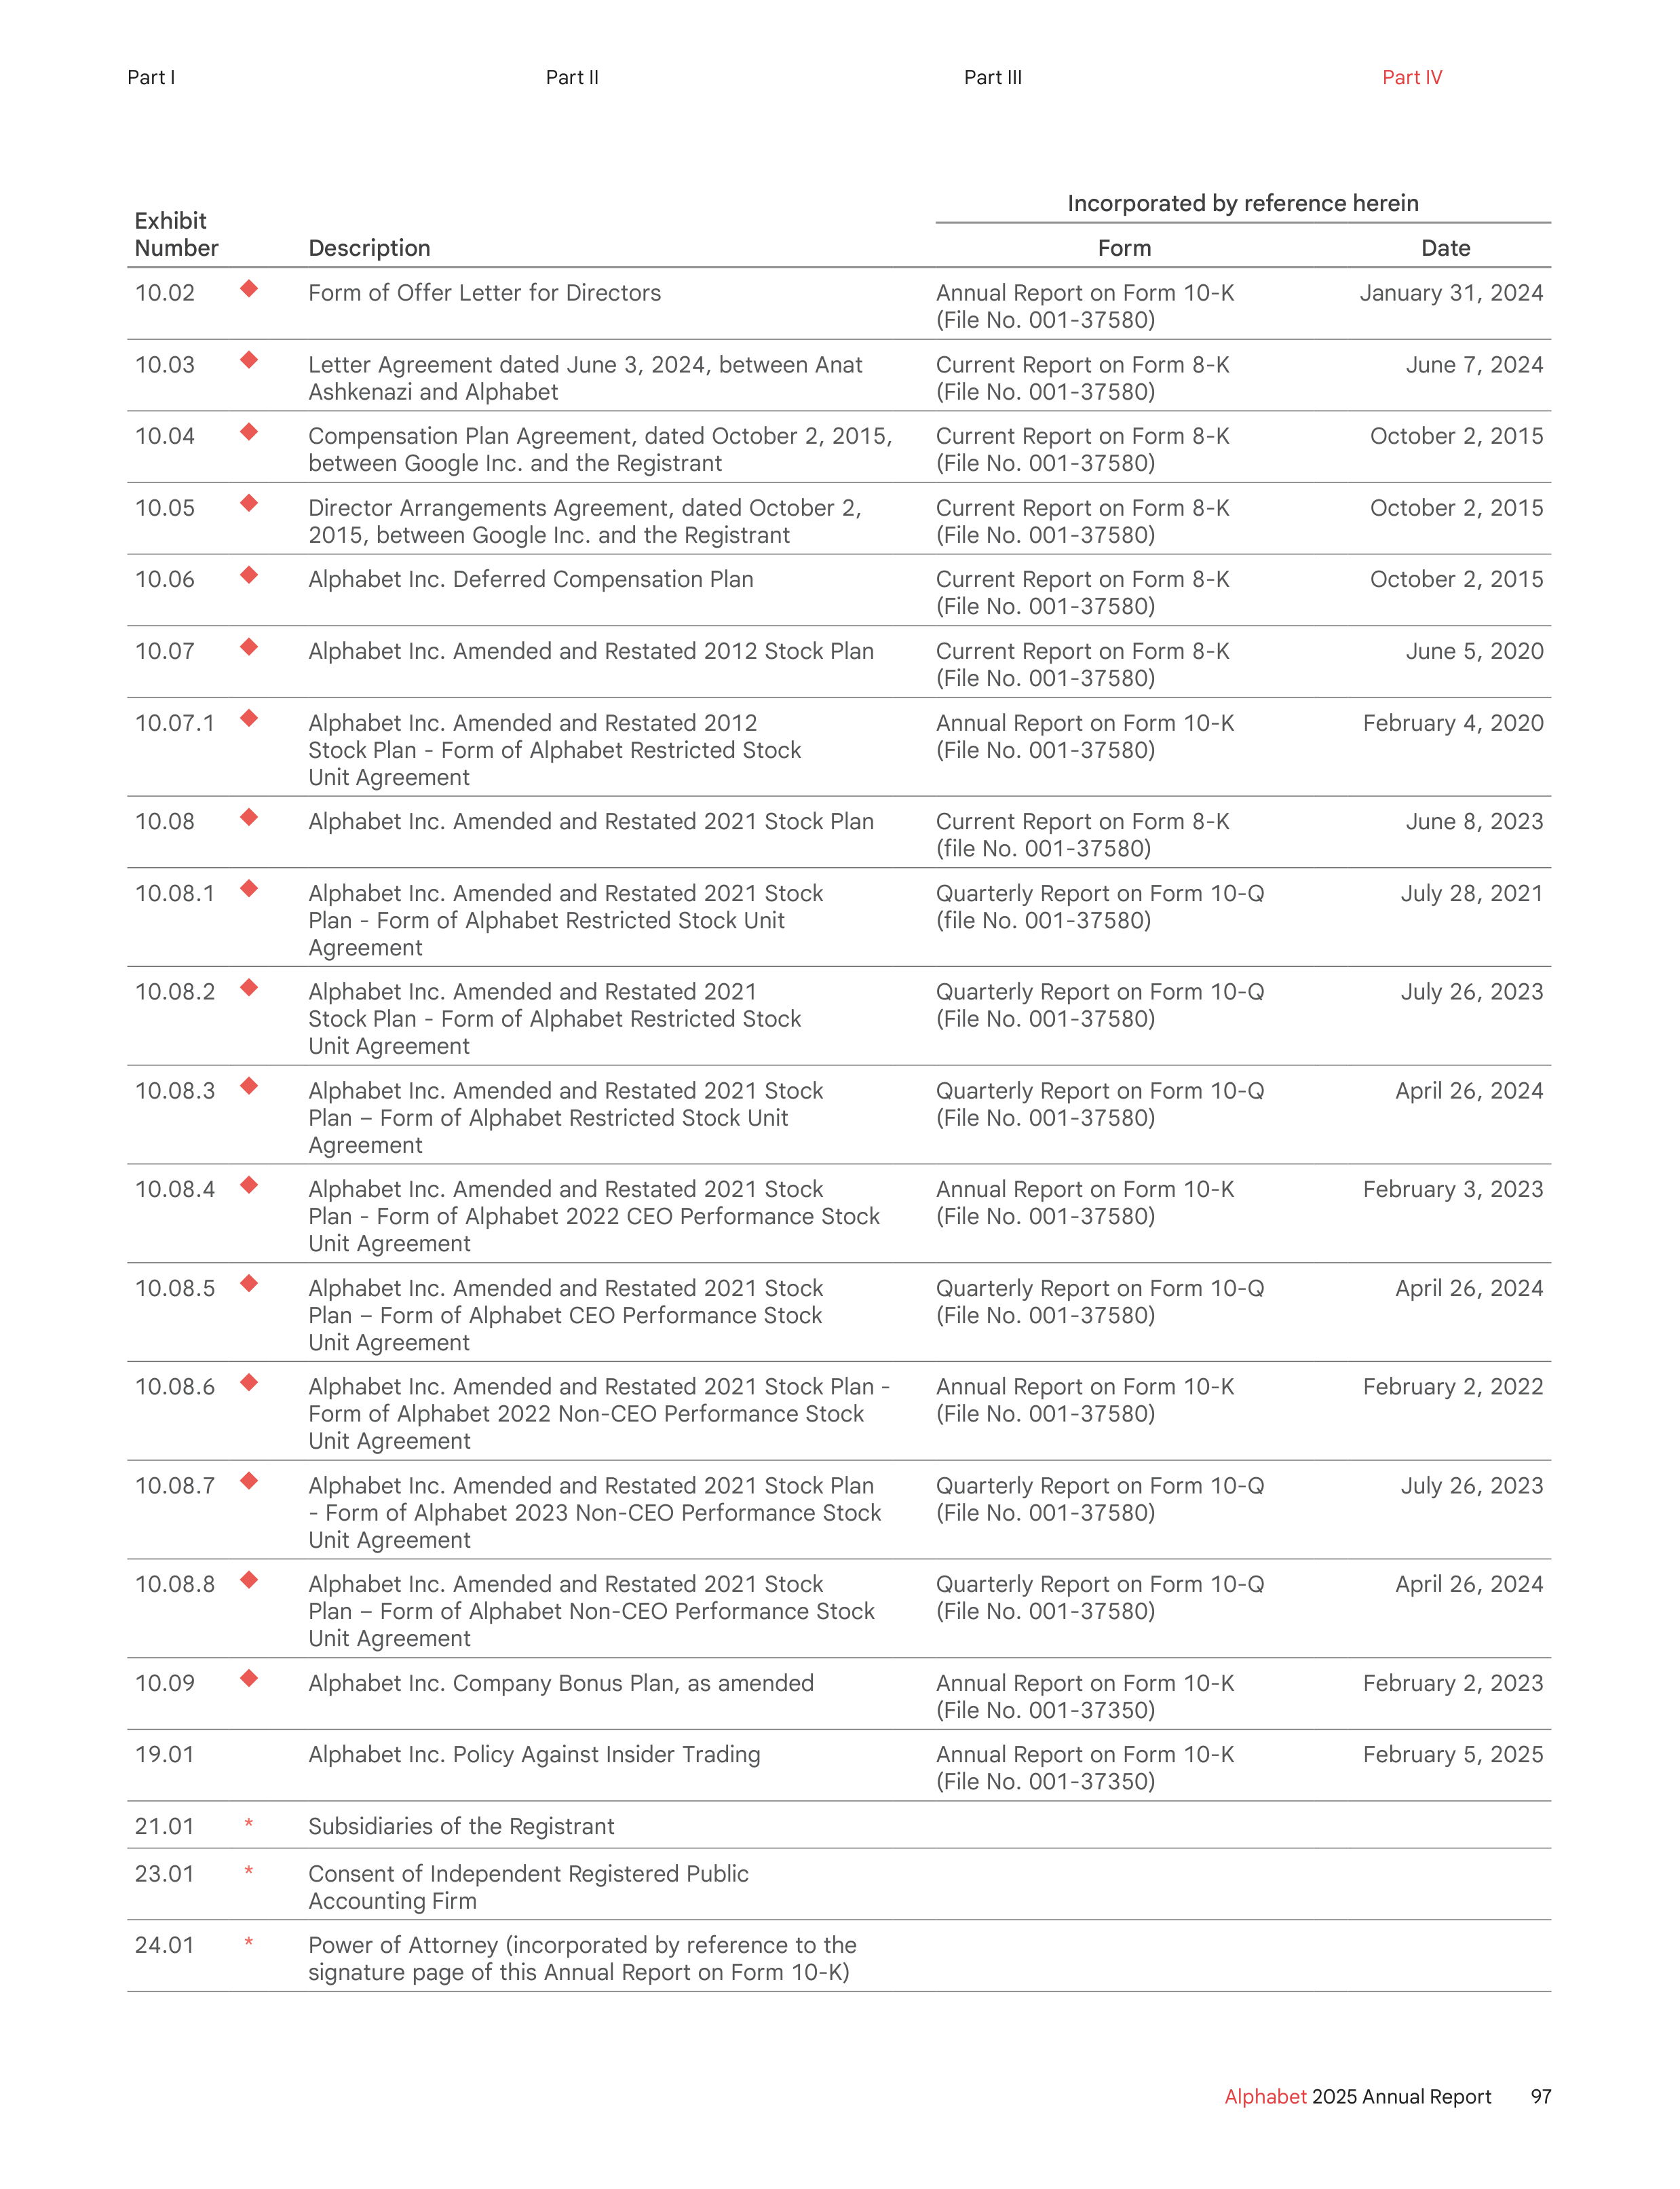
Exhibit
Number
Description
Incorporated by reference herein
Form
Date
10.02
u
Form of Offer Letter for Directors
Annual Report on Form 10-K
(File No. 001-37580)
January 31, 2024
10.03
u
Letter Agreement dated June 3, 2024, between Anat
Ashkenazi and Alphabet
Current Report on Form 8-K
(File No. 001-37580)
June 7, 2024
10.04
u
Compensation Plan Agreement, dated October 2, 2015,
between Google Inc. and the Registrant
Current Report on Form 8-K
(File No. 001-37580)
October 2, 2015
10.05
u
Director Arrangements Agreement, dated October 2,
2015, between Google Inc. and the Registrant
Current Report on Form 8-K
(File No. 001-37580)
October 2, 2015
10.06
u
Alphabet Inc. Deferred Compensation Plan
Current Report on Form 8-K
(File No. 001-37580)
October 2, 2015
10.07
u
Alphabet Inc. Amended and Restated 2012 Stock Plan
Current Report on Form 8-K
(File No. 001-37580)
June 5, 2020
10.07.1
u
Alphabet Inc. Amended and Restated 2012
Stock Plan - Form of Alphabet Restricted Stock
Unit Agreement
Annual Report on Form 10-K
(File No. 001-37580)
February 4, 2020
10.08
u
Alphabet Inc. Amended and Restated 2021 Stock Plan
Current Report on Form 8-K
(file No. 001-37580)
June 8, 2023
10.08.1
u
Alphabet Inc. Amended and Restated 2021 Stock
Plan - Form of Alphabet Restricted Stock Unit
Agreement
Quarterly Report on Form 10-Q
(file No. 001-37580)
July 28, 2021
10.08.2
u
Alphabet Inc. Amended and Restated 2021
Stock Plan - Form of Alphabet Restricted Stock
Unit Agreement
Quarterly Report on Form 10-Q
(File No. 001-37580)
July 26, 2023
10.08.3
u
Alphabet Inc. Amended and Restated 2021 Stock
Plan – Form of Alphabet Restricted Stock Unit
Agreement
Quarterly Report on Form 10-Q
(File No. 001-37580)
April 26, 2024
10.08.4
u
Alphabet Inc. Amended and Restated 2021 Stock
Plan - Form of Alphabet 2022 CEO Performance Stock
Unit Agreement
Annual Report on Form 10-K
(File No. 001-37580)
February 3, 2023
10.08.5
u
Alphabet Inc. Amended and Restated 2021 Stock
Plan – Form of Alphabet CEO Performance Stock
Unit Agreement
Quarterly Report on Form 10-Q
(File No. 001-37580)
April 26, 2024
10.08.6
u
Alphabet Inc. Amended and Restated 2021 Stock Plan -
Form of Alphabet 2022 Non-CEO Performance Stock
Unit Agreement
Annual Report on Form 10-K
(File No. 001-37580)
February 2, 2022
10.08.7
u
Alphabet Inc. Amended and Restated 2021 Stock Plan
- Form of Alphabet 2023 Non-CEO Performance Stock
Unit Agreement
Quarterly Report on Form 10-Q
(File No. 001-37580)
July 26, 2023
10.08.8
u
Alphabet Inc. Amended and Restated 2021 Stock
Plan – Form of Alphabet Non-CEO Performance Stock
Unit Agreement
Quarterly Report on Form 10-Q
(File No. 001-37580)
April 26, 2024
10.09
u
Alphabet Inc. Company Bonus Plan, as amended
Annual Report on Form 10-K
(File No. 001-37350)
February 2, 2023
19.01
Alphabet Inc. Policy Against Insider Trading
Annual Report on Form 10-K
(File No. 001-37350)
February 5, 2025
21.01
*
Subsidiaries of the Registrant
23.01
*
Consent of Independent Registered Public
Accounting Firm
24.01
*
Power of Attorney (incorporated by reference to the
signature page of this Annual Report on Form 10-K)
97
Alphabet
2025 Annual Report
Part I
Part II
Part III
Part IV
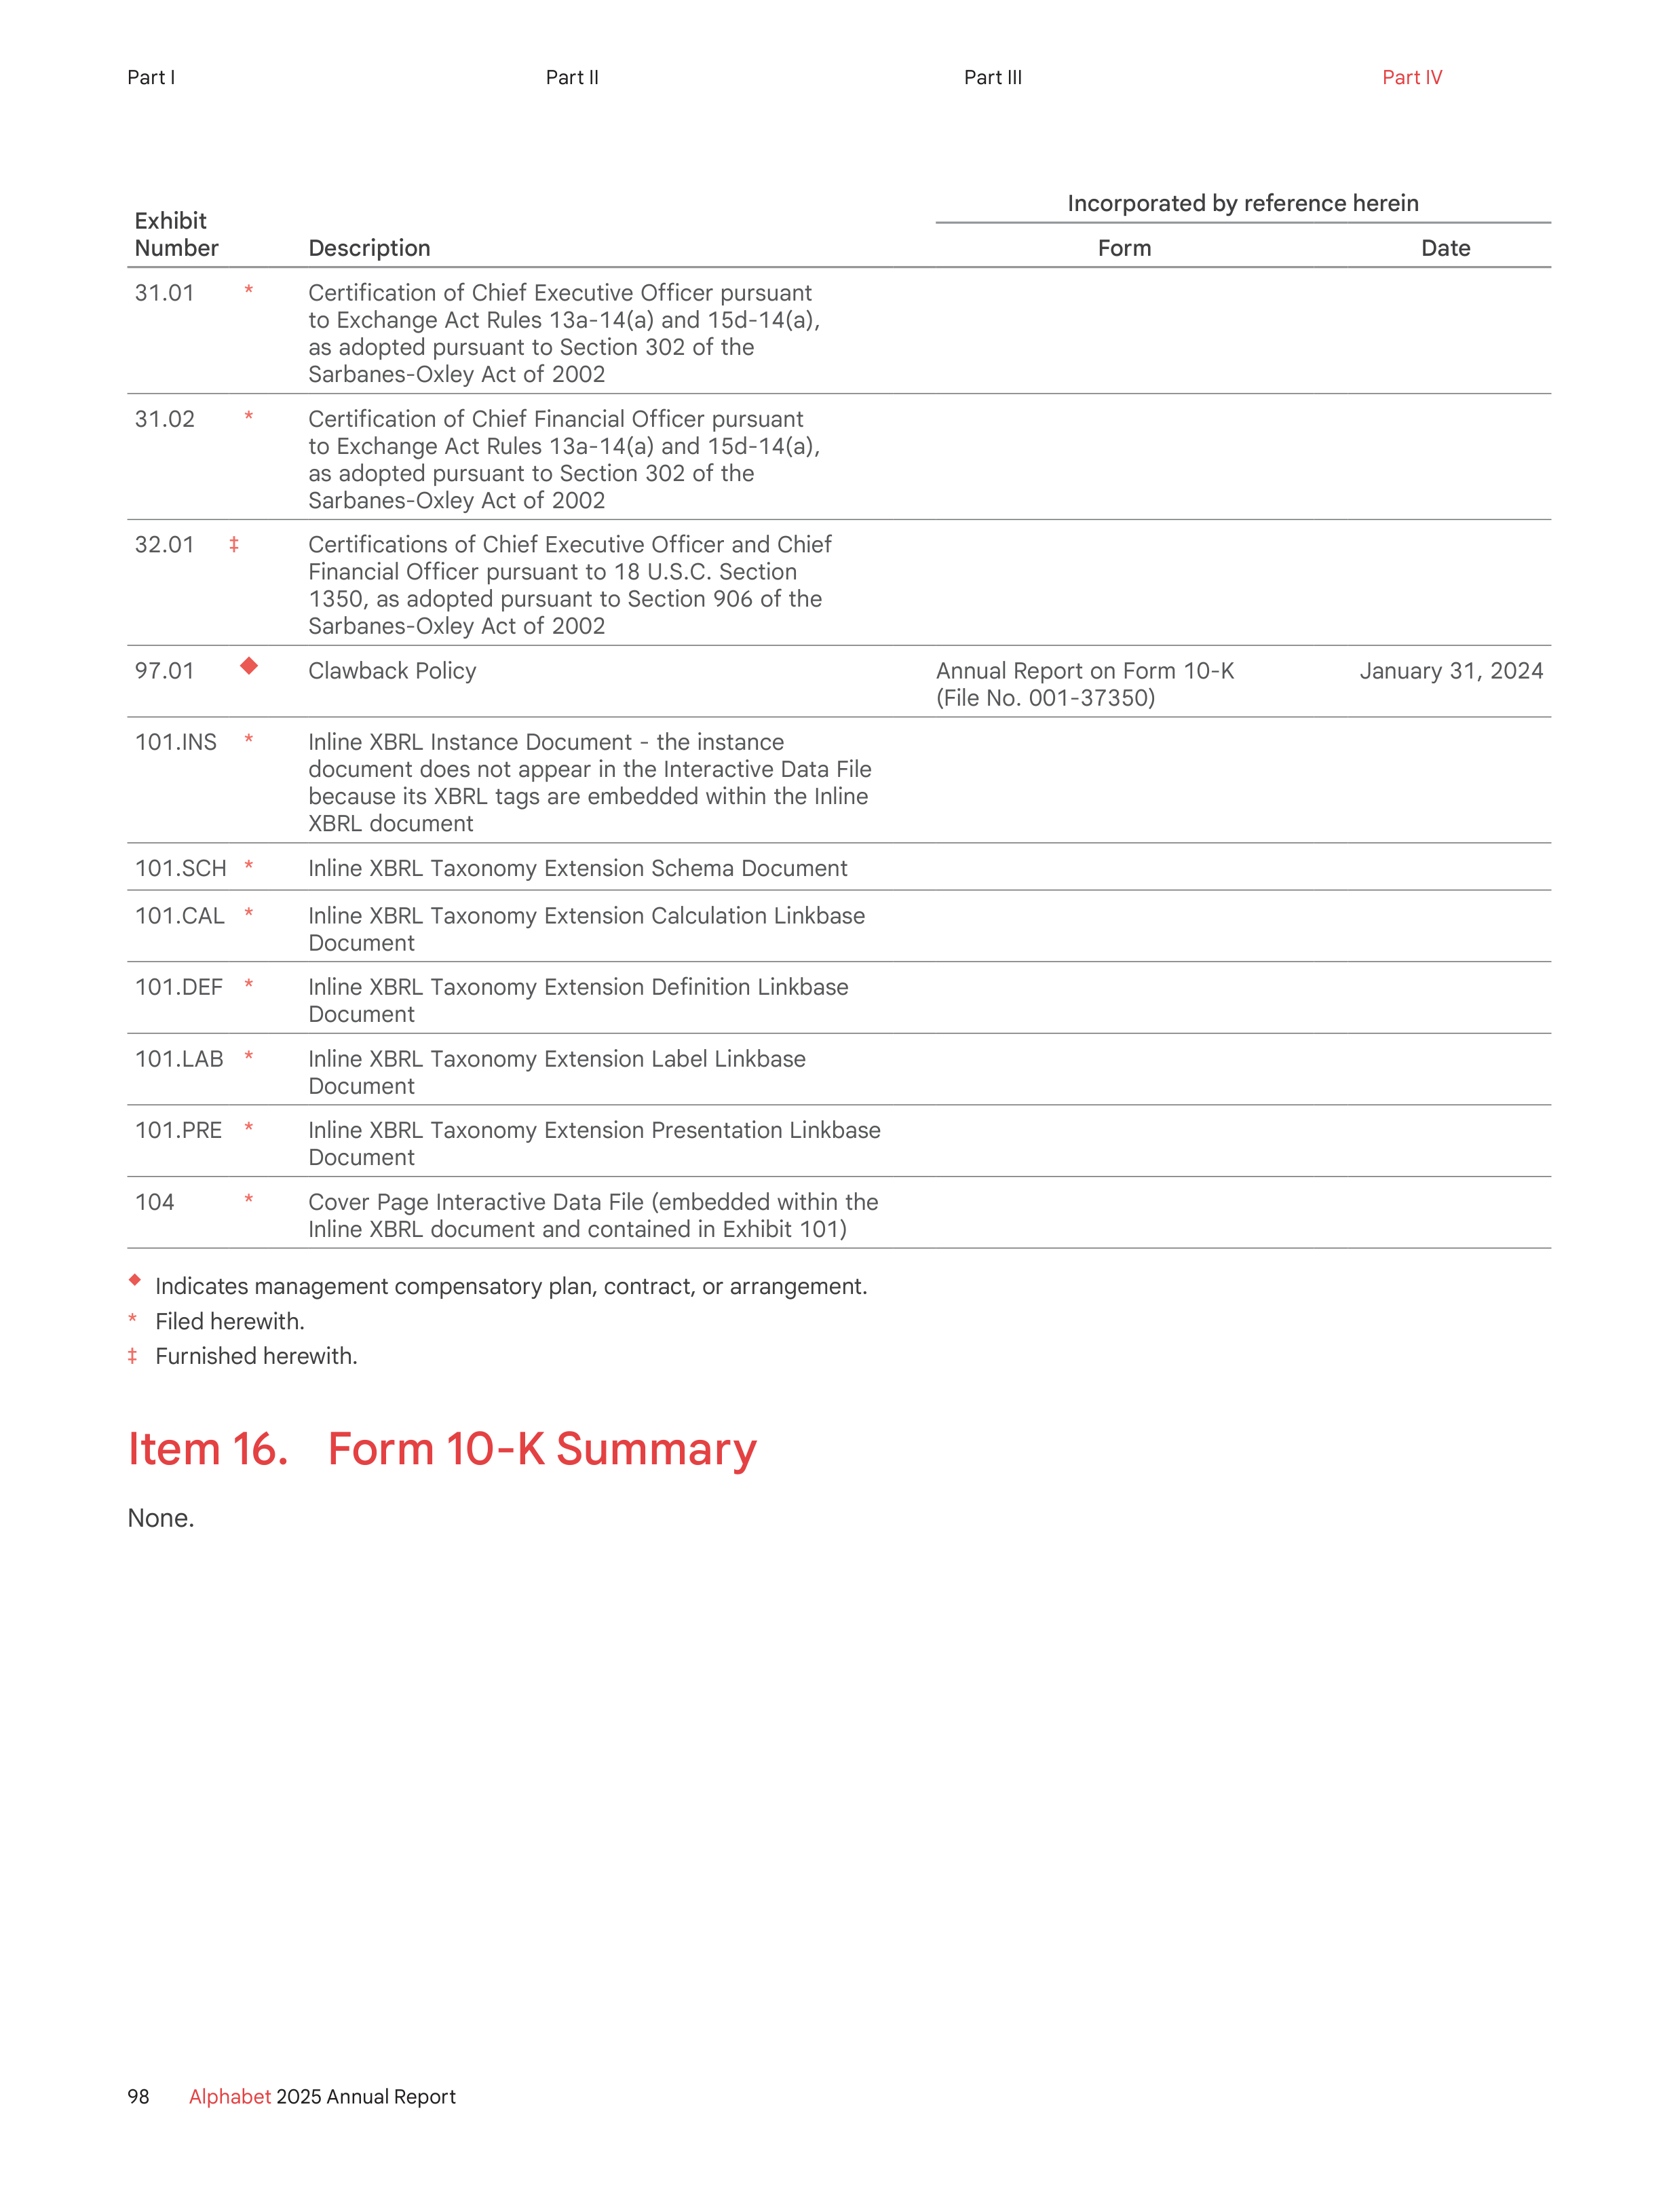
Exhibit
Number
Description
Incorporated by reference herein
Form
Date
31.01
*
Certification of Chief Executive Officer pursuant
to Exchange Act Rules 13a-14(a) and 15d-14(a),
as adopted pursuant to Section 302 of the
Sarbanes-Oxley Act of 2002
31.02
*
Certification of Chief Financial Officer pursuant
to Exchange Act Rules 13a-14(a) and 15d-14(a),
as adopted pursuant to Section 302 of the
Sarbanes-Oxley Act of 2002
32.01
‡
Certifications of Chief Executive Officer and Chief
Financial Officer pursuant to 18 U.S.C. Section
1350, as adopted pursuant to Section 906 of the
Sarbanes-Oxley Act of 2002
97.01
u
Clawback Policy
Annual Report on Form 10-K
(File No. 001-37350)
January 31, 2024
101.INS
*
Inline XBRL Instance Document - the instance
document does not appear in the Interactive Data File
because its XBRL tags are embedded within the Inline
XBRL document
101.SCH
*
Inline XBRL Taxonomy Extension Schema Document
101.CAL
*
Inline XBRL Taxonomy Extension Calculation Linkbase
Document
101.DEF
*
Inline XBRL Taxonomy Extension Definition Linkbase
Document
101.LAB
*
Inline XBRL Taxonomy Extension Label Linkbase
Document
101.PRE
*
Inline XBRL Taxonomy Extension Presentation Linkbase
Document
104
*
Cover Page Interactive Data File (embedded within the
Inline XBRL document and contained in Exhibit 101)
u
Indicates management compensatory plan, contract, or arrangement.
*
Filed herewith.
‡
Furnished herewith.
Item 16. Form 10-K Summary
None.
98
Alphabet
2025 Annual Report
Part I
Part II
Part III
Part IV
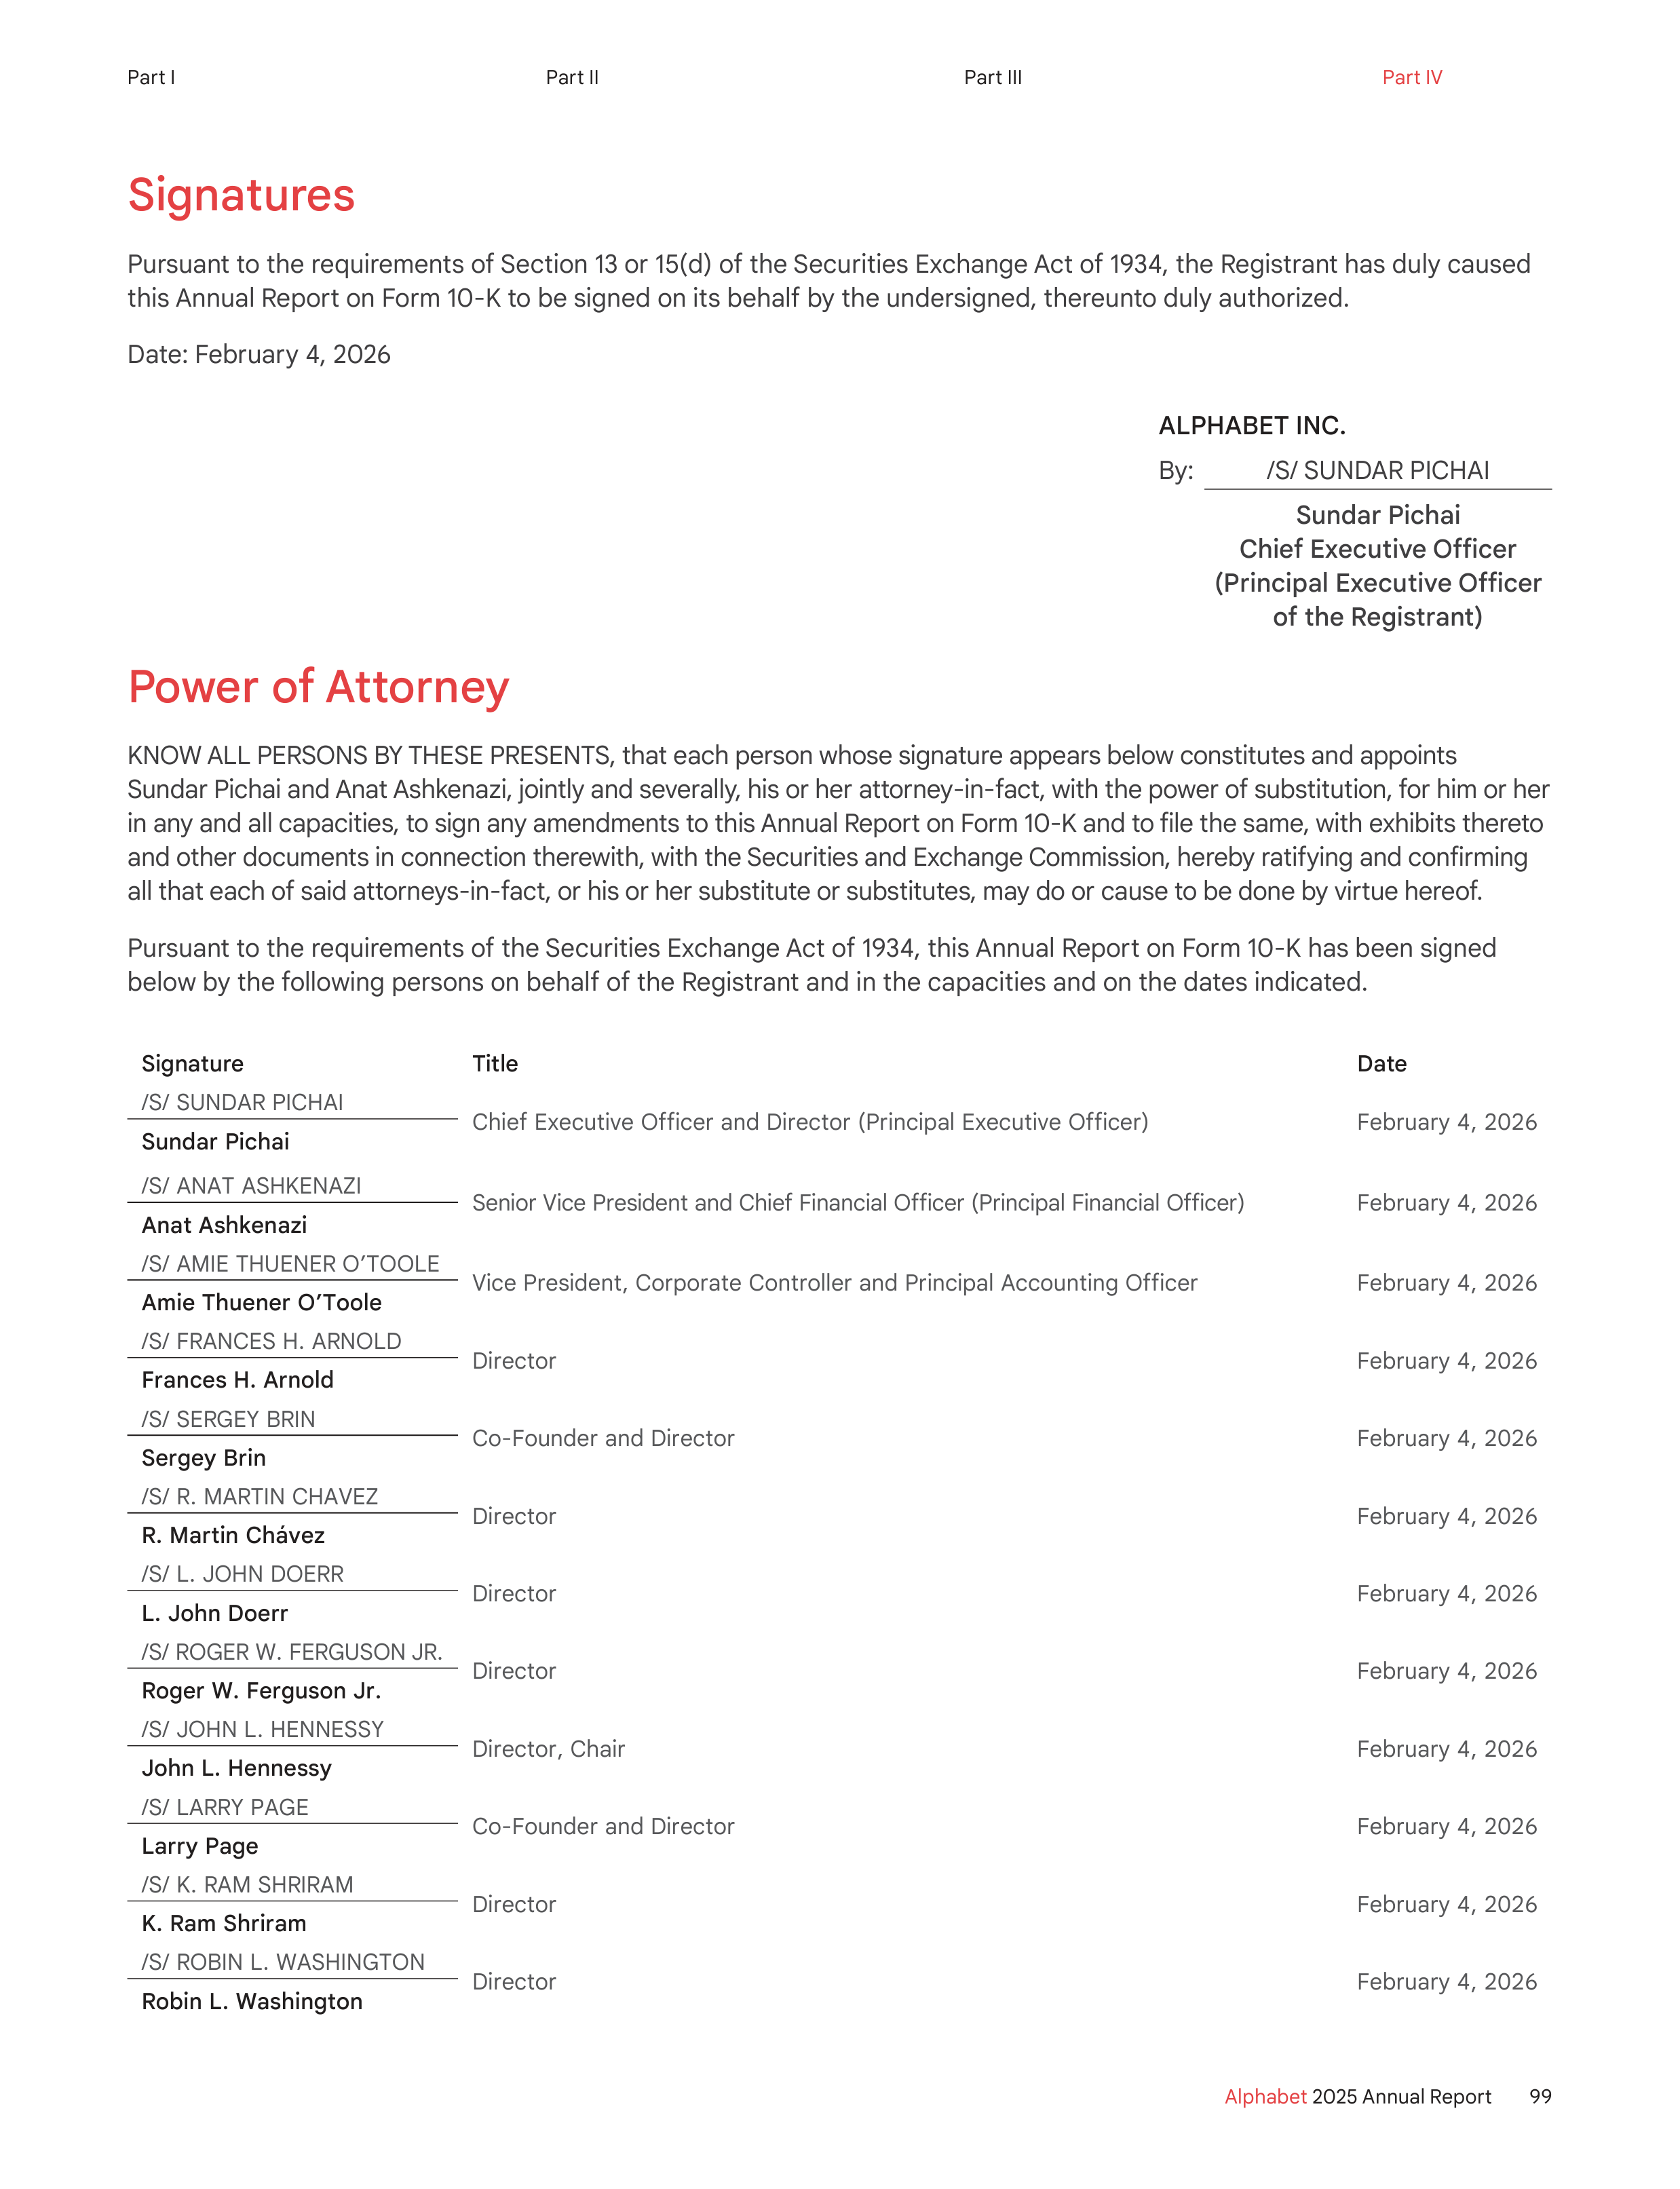
Signatures
Pursuant to the requirements of Section 13 or 15(d) of the Securities Exchange Act of 1934, the Registrant has duly caused
this Annual Report on Form 10-K to be signed on its behalf by the undersigned, thereunto duly authorized.
Date: February 4, 2026
ALPHABET INC.
By:
/S/ SUNDAR PICHAI
Sundar Pichai
Chief Executive Officer
(Principal Executive Officer
of the Registrant)
Power of Attorney
KNOW ALL PERSONS BY THESE PRESENTS, that each person whose signature appears below constitutes and appoints
Sundar Pichai and Anat Ashkenazi, jointly and severally, his or her attorney-in-fact, with the power of substitution, for him or her
in any and all capacities, to sign any amendments to this Annual Report on Form 10-K and to file the same, with exhibits thereto
and other documents in connection therewith, with the Securities and Exchange Commission, hereby ratifying and confirming
all that each of said attorneys-in-fact, or his or her substitute or substitutes, may do or cause to be done by virtue hereof.
Pursuant to the requirements of the Securities Exchange Act of 1934, this Annual Report on Form 10-K has been signed
below by the following persons on behalf of the Registrant and in the capacities and on the dates indicated.
Signature
Title
Date
/S/ SUNDAR PICHAI
Chief Executive Officer and Director (Principal Executive Officer)
February 4, 2026
Sundar Pichai
/S/ ANAT ASHKENAZI
Senior Vice President and Chief Financial Officer (Principal Financial Officer)
February 4, 2026
Anat Ashkenazi
/S/ AMIE THUENER O’TOOLE
Vice President, Corporate Controller and Principal Accounting Officer
February 4, 2026
Amie Thuener O’Toole
/S/ FRANCES H. ARNOLD
Director
February 4, 2026
Frances H. Arnold
/S/ SERGEY BRIN
Co-Founder and Director
February 4, 2026
Sergey Brin
/S/ R. MARTIN CHAVEZ
Director
February 4, 2026
R. Martin Chávez
/S/ L. JOHN DOERR
Director
February 4, 2026
L. John Doerr
/S/ ROGER W. FERGUSON JR.
Director
February 4, 2026
Roger W. Ferguson Jr.
/S/ JOHN L. HENNESSY
Director, Chair
February 4, 2026
John L. Hennessy
/S/ LARRY PAGE
Co-Founder and Director
February 4, 2026
Larry Page
/S/ K. RAM SHRIRAM
Director
February 4, 2026
K. Ram Shriram
/S/ ROBIN L. WASHINGTON
Director
February 4, 2026
Robin L. Washington
99
Alphabet
2025 Annual Report
Part I
Part II
Part III
Part IV

This page intentionally left blank.

This page intentionally left blank.

This page intentionally left blank.
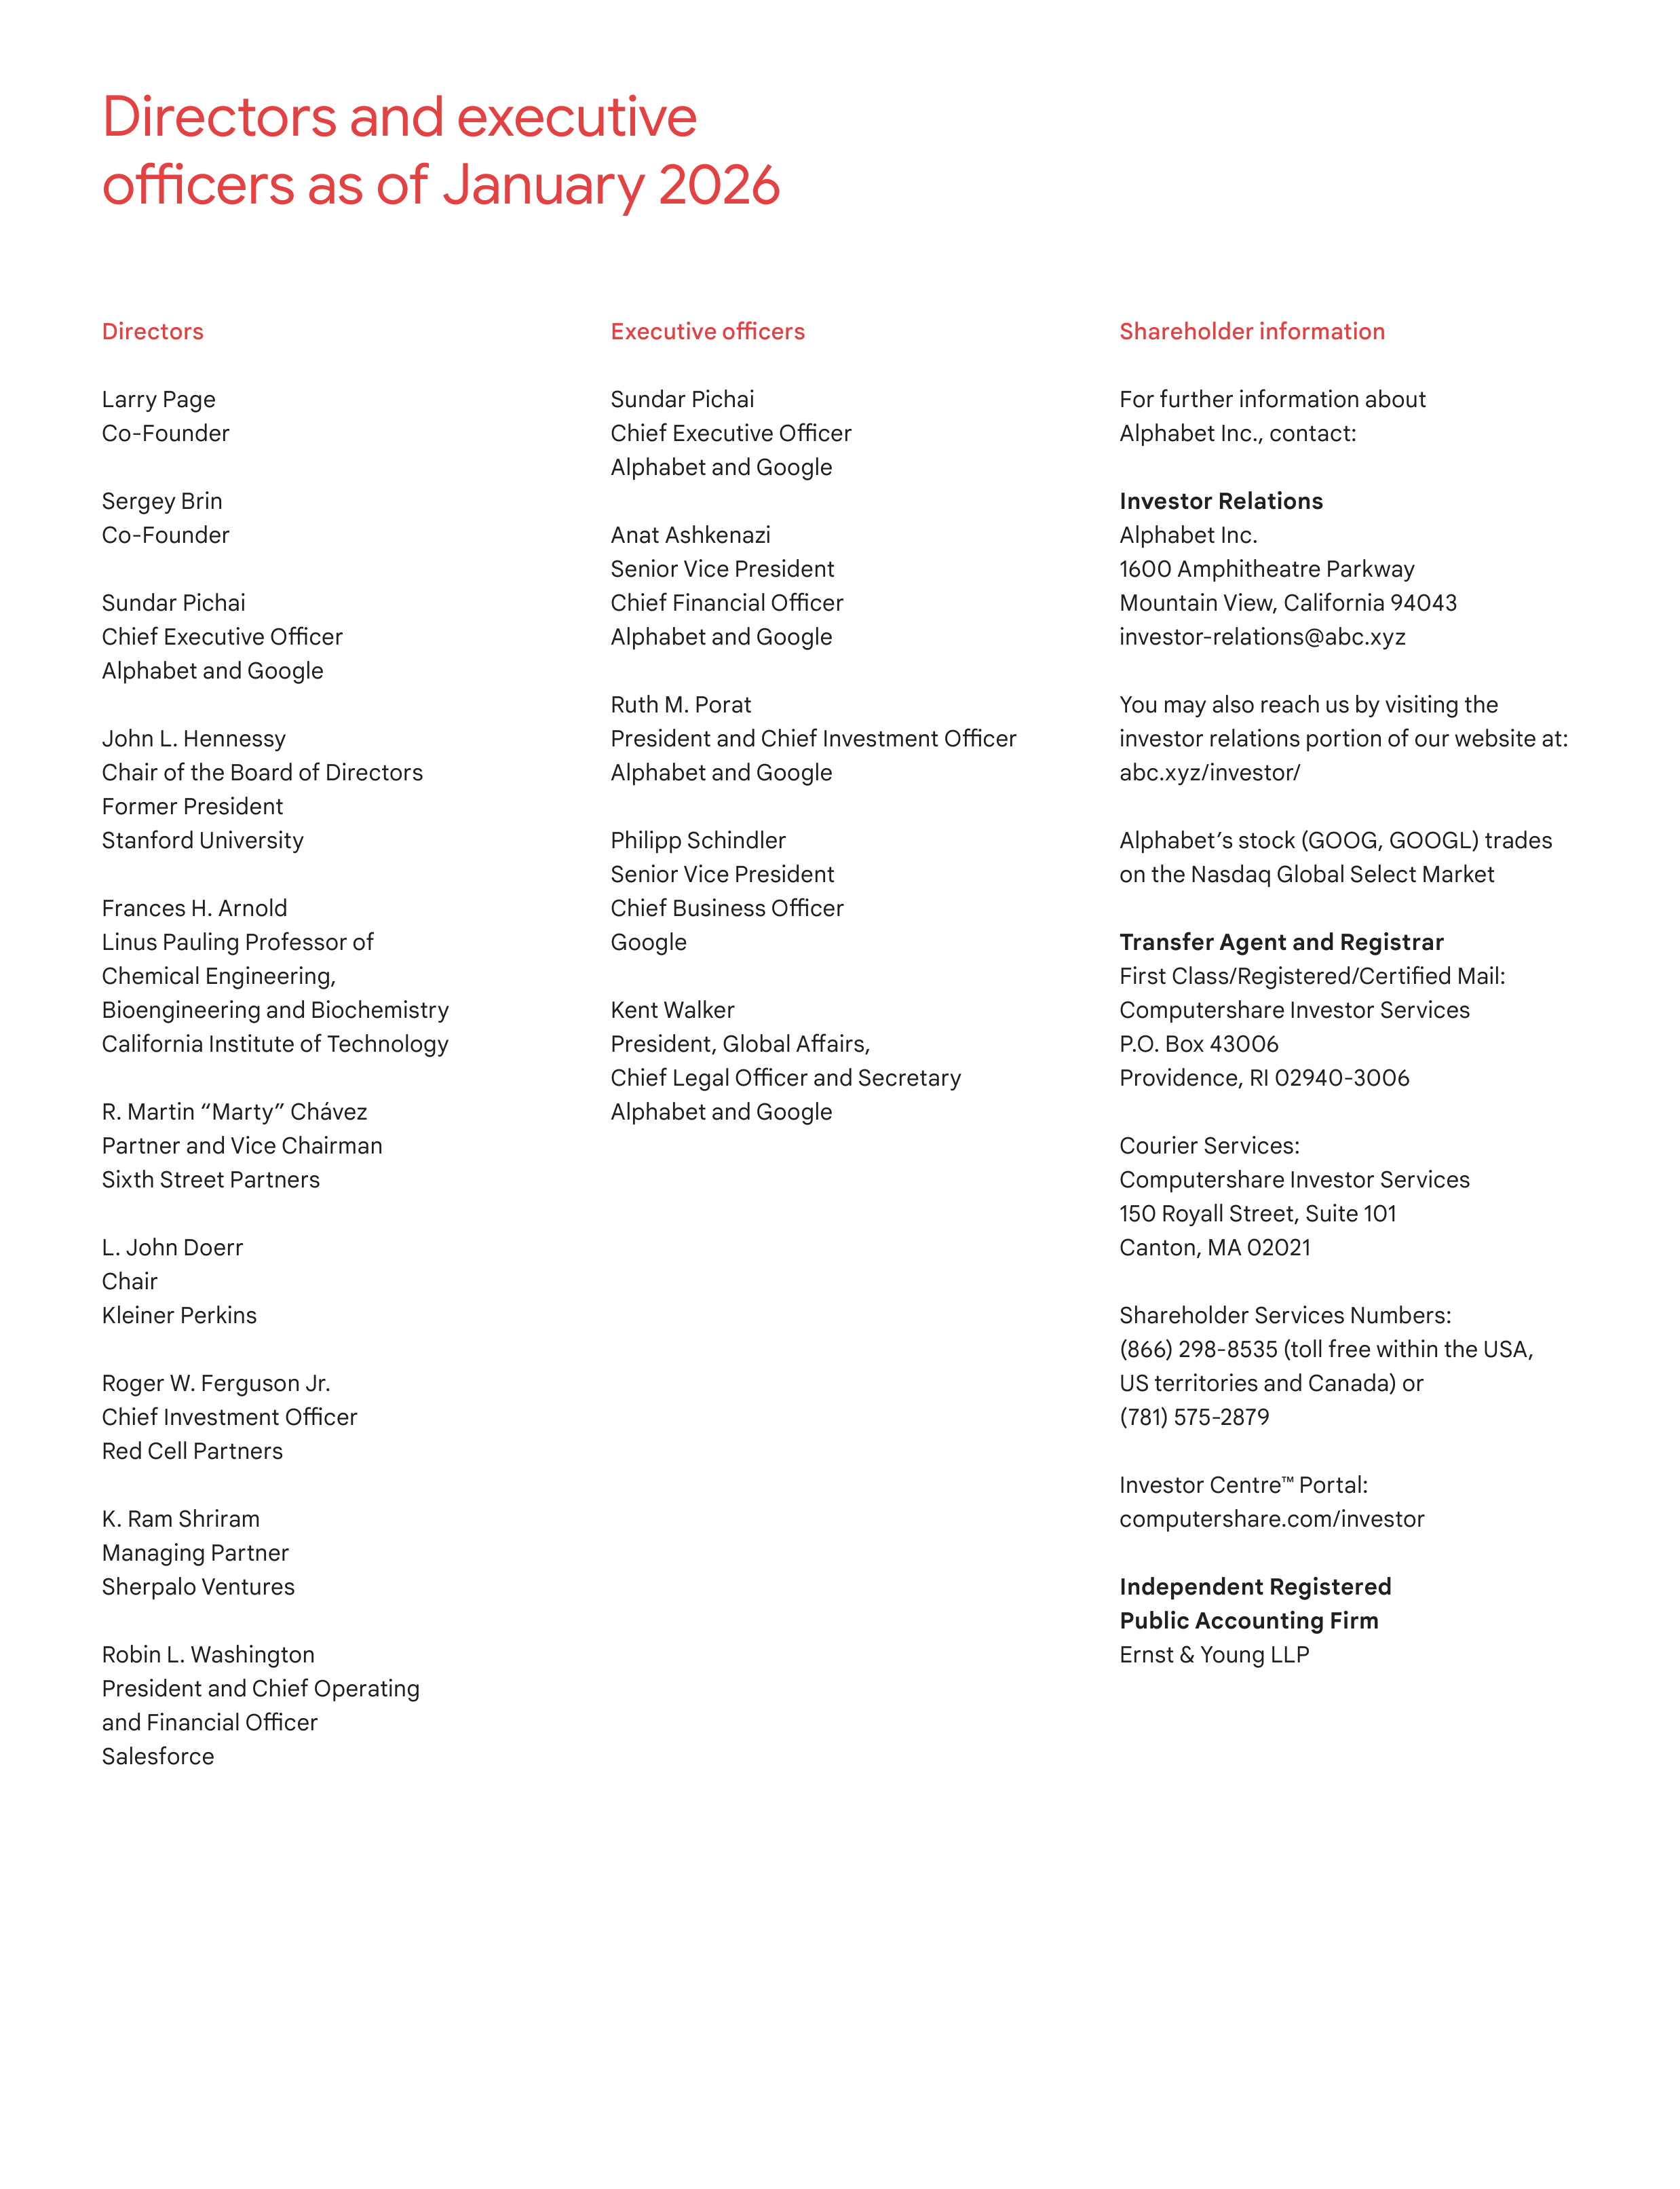
Directors
Larry Page
Co-Founder
Sergey Brin
Co-Founder
Sundar Pichai
Chief Executive Officer
Alphabet and Google
John L. Hennessy
Chair of the Board of Directors
Former President
Stanford University
Frances H. Arnold
Linus Pauling Professor of
Chemical Engineering,
Bioengineering and Biochemistry
California Institute of Technology
R. Martin “Marty” Chávez
Partner and Vice Chairman
Sixth Street Partners
L. John Doerr
Chair
Kleiner Perkins
Roger W. Ferguson Jr.
Chief Investment Officer
Red Cell Partners
K. Ram Shriram
Managing Partner
Sherpalo Ventures
Robin L. Washington
President and Chief Operating
and Financial Officer
Salesforce
Directors and executive
officers as of January 2026
Shareholder information
For further information about
Alphabet Inc., contact:
Investor Relations
Alphabet Inc.
1600 Amphitheatre Parkway
Mountain View, California 94043
investor-relations@abc.xyz
You may also reach us by visiting the
investor relations portion of our website at:
abc.xyz/investor/
Alphabet’s stock (GOOG, GOOGL) trades
on the Nasdaq Global Select Market
Transfer Agent and Registrar
First Class/Registered/Certified Mail:
Computershare Investor Services
P.O. Box 43006
Providence, RI 02940-3006
Courier Services:
Computershare Investor Services
150 Royall Street, Suite 101
Canton, MA 02021
Shareholder Services Numbers:
(866) 298-8535 (toll free within the USA,
US territories and Canada) or
(781) 575-2879
Investor Centre™ Portal:
computershare.com/investor
Independent Registered
Public Accounting Firm
Ernst & Young LLP
Executive officers
Sundar Pichai
Chief Executive Officer
Alphabet and Google
Anat Ashkenazi
Senior Vice President
Chief Financial Officer
Alphabet and Google
Ruth M. Porat
President and Chief Investment Officer
Alphabet and Google
Philipp Schindler
Senior Vice President
Chief Business Officer
Google
Kent Walker
President, Global Affairs,
Chief Legal Officer and Secretary
Alphabet and Google
20