







FISCAL YEAR ENDED AUGUST 31, 2025
2025
ANNUAL REPORT

!
"#
!
"
#
$
%
#&
'##
!
()
#$
!
(*
#
+
(
*,#,
-.#+
(-#/ (/-#
/
/.#0
/.(#)
!
/
,.
#1!
2/'##
3!
4
5
6,/
#
"
7
#8
"
%
!
%
9
#$
"
7
#
$
%
"
5"
#
5"
:
/%
.
#$
)
5"
"
7
!
(,;
#&
!
5"
%
%
"
%%""
#
#$
%
8
!
(
<;
#
=%
!
"
# >
%
!#&
!
%
3
"
"
$
#
$
% #
!
% #; 9
#&
-
#-.
#.
5"
"
/##?
>
0#
@
&"
"
)/
!
/
#3
!
#
03#A
BC=!
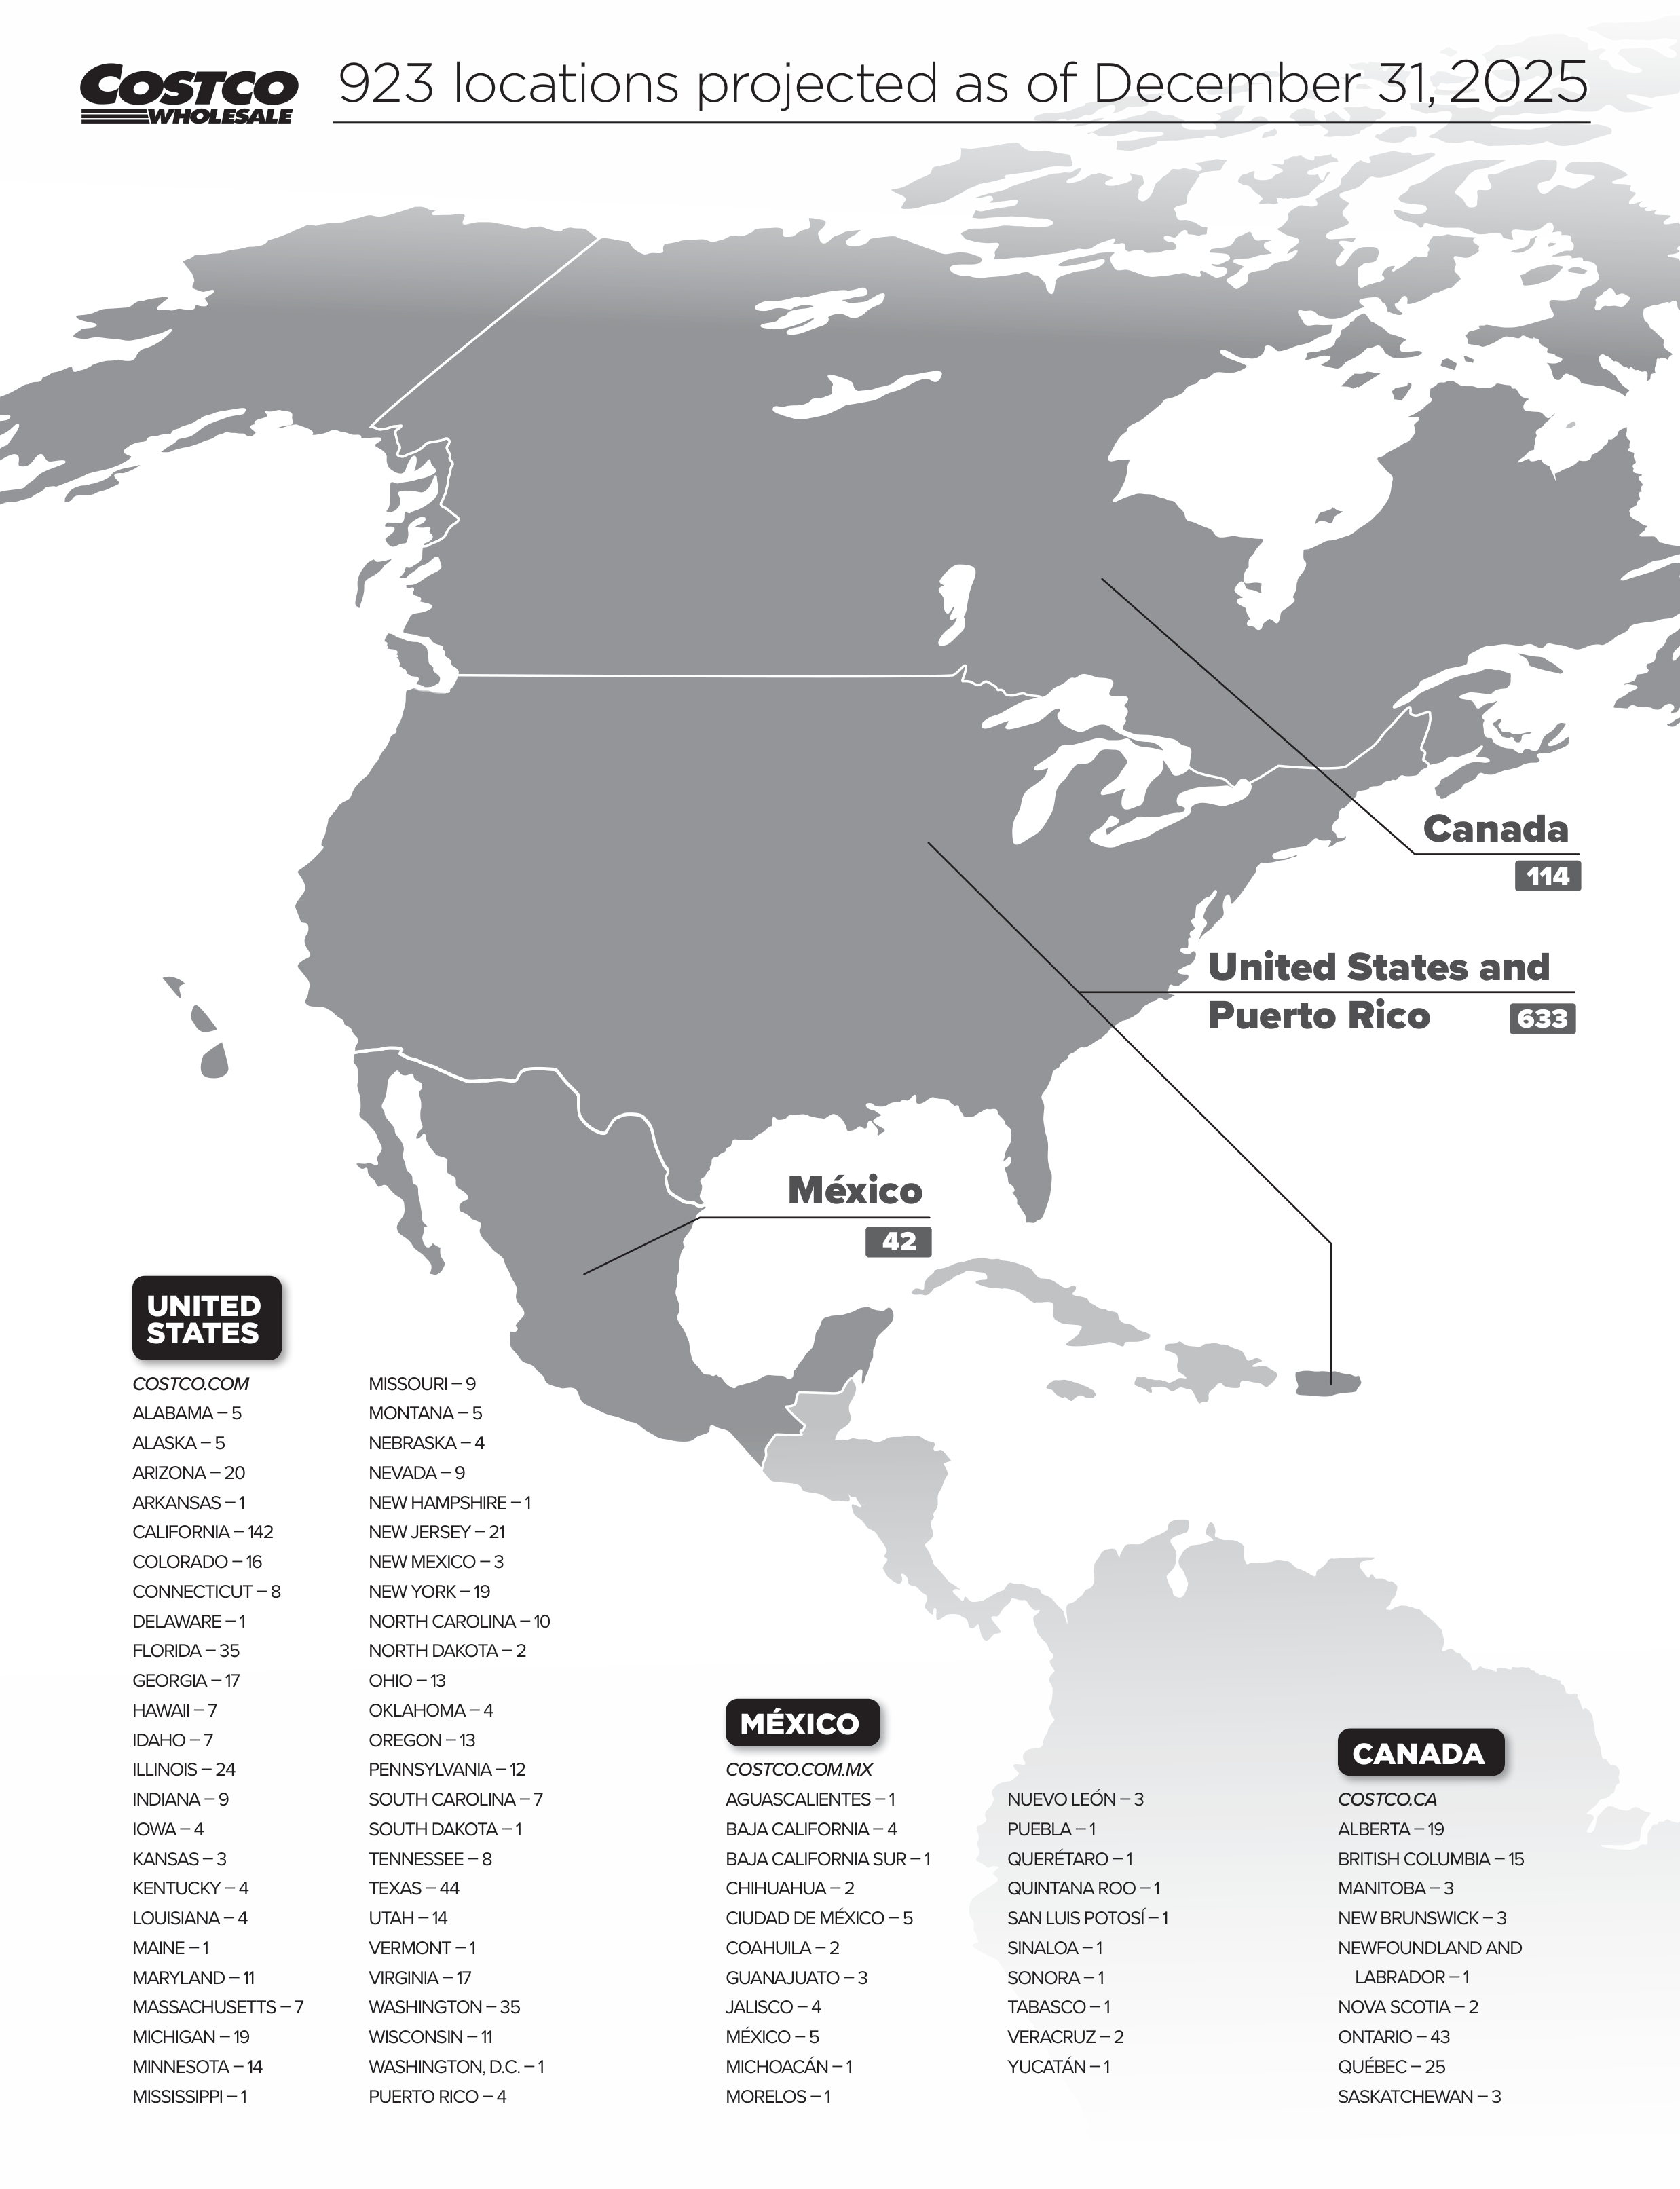
Canada
Puerto Rico
United States and
México
114
633
42
UNITED
STATES
COSTCO.COM
ALABAMA – 5
ALASKA – 5
ARIZONA – 20
ARKANSAS – 1
CALIFORNIA – 142
COLORADO – 16
CONNECTICUT – 8
DELAWARE – 1
FLORIDA – 35
GEORGIA – 17
HAWAII – 7
IDAHO – 7
ILLINOIS – 24
INDIANA – 9
IOWA – 4
KANSAS – 3
KENTUCKY – 4
LOUISIANA – 4
MAINE – 1
MARYLAND – 11
MASSACHUSETTS – 7
MICHIGAN – 19
MINNESOTA – 14
MISSISSIPPI – 1
MISSOURI – 9
MONTANA – 5
NEBRASKA – 4
NEVADA – 9
NEW HAMPSHIRE – 1
NEW JERSEY – 21
NEW MEXICO – 3
NEW YORK – 19
NORTH CAROLINA – 10
NORTH DAKOTA – 2
OHIO – 13
OKLAHOMA – 4
OREGON – 13
PENNSYLVANIA – 12
SOUTH CAROLINA – 7
SOUTH DAKOTA – 1
TENNESSEE – 8
TEXAS – 44
UTAH – 14
VERMONT – 1
VIRGINIA – 17
WASHINGTON – 35
WISCONSIN – 11
WASHINGTON, D.C. – 1
PUERTO RICO – 4
923 locations projected as of December 31,
2025
CANADA
COSTCO.CA
ALBERTA – 19
BRITISH COLUMBIA – 15
MANITOBA – 3
NEW BRUNSWICK – 3
NEWFOUNDLAND AND
LABRADOR – 1
NOVA SCOTIA – 2
ONTARIO – 43
QUÉBEC – 25
SASKATCHEWAN – 3
MÉXICO
COSTCO.COM.MX
AGUASCALIENTES – 1
BAJA CALIFORNIA – 4
BAJA CALIFORNIA SUR – 1
CHIHUAHUA – 2
CIUDAD DE MÉXICO – 5
COAHUILA – 2
GUANAJUATO – 3
JALISCO – 4
MÉXICO – 5
MICHOACÁN – 1
MORELOS – 1
NUEVO LEÓN – 3
PUEBLA – 1
QUERÉTARO – 1
QUINTANA ROO – 1
SAN LUIS POTOSÍ – 1
SINALOA – 1
SONORA – 1
TABASCO – 1
VERACRUZ – 2
YUCATÁN – 1
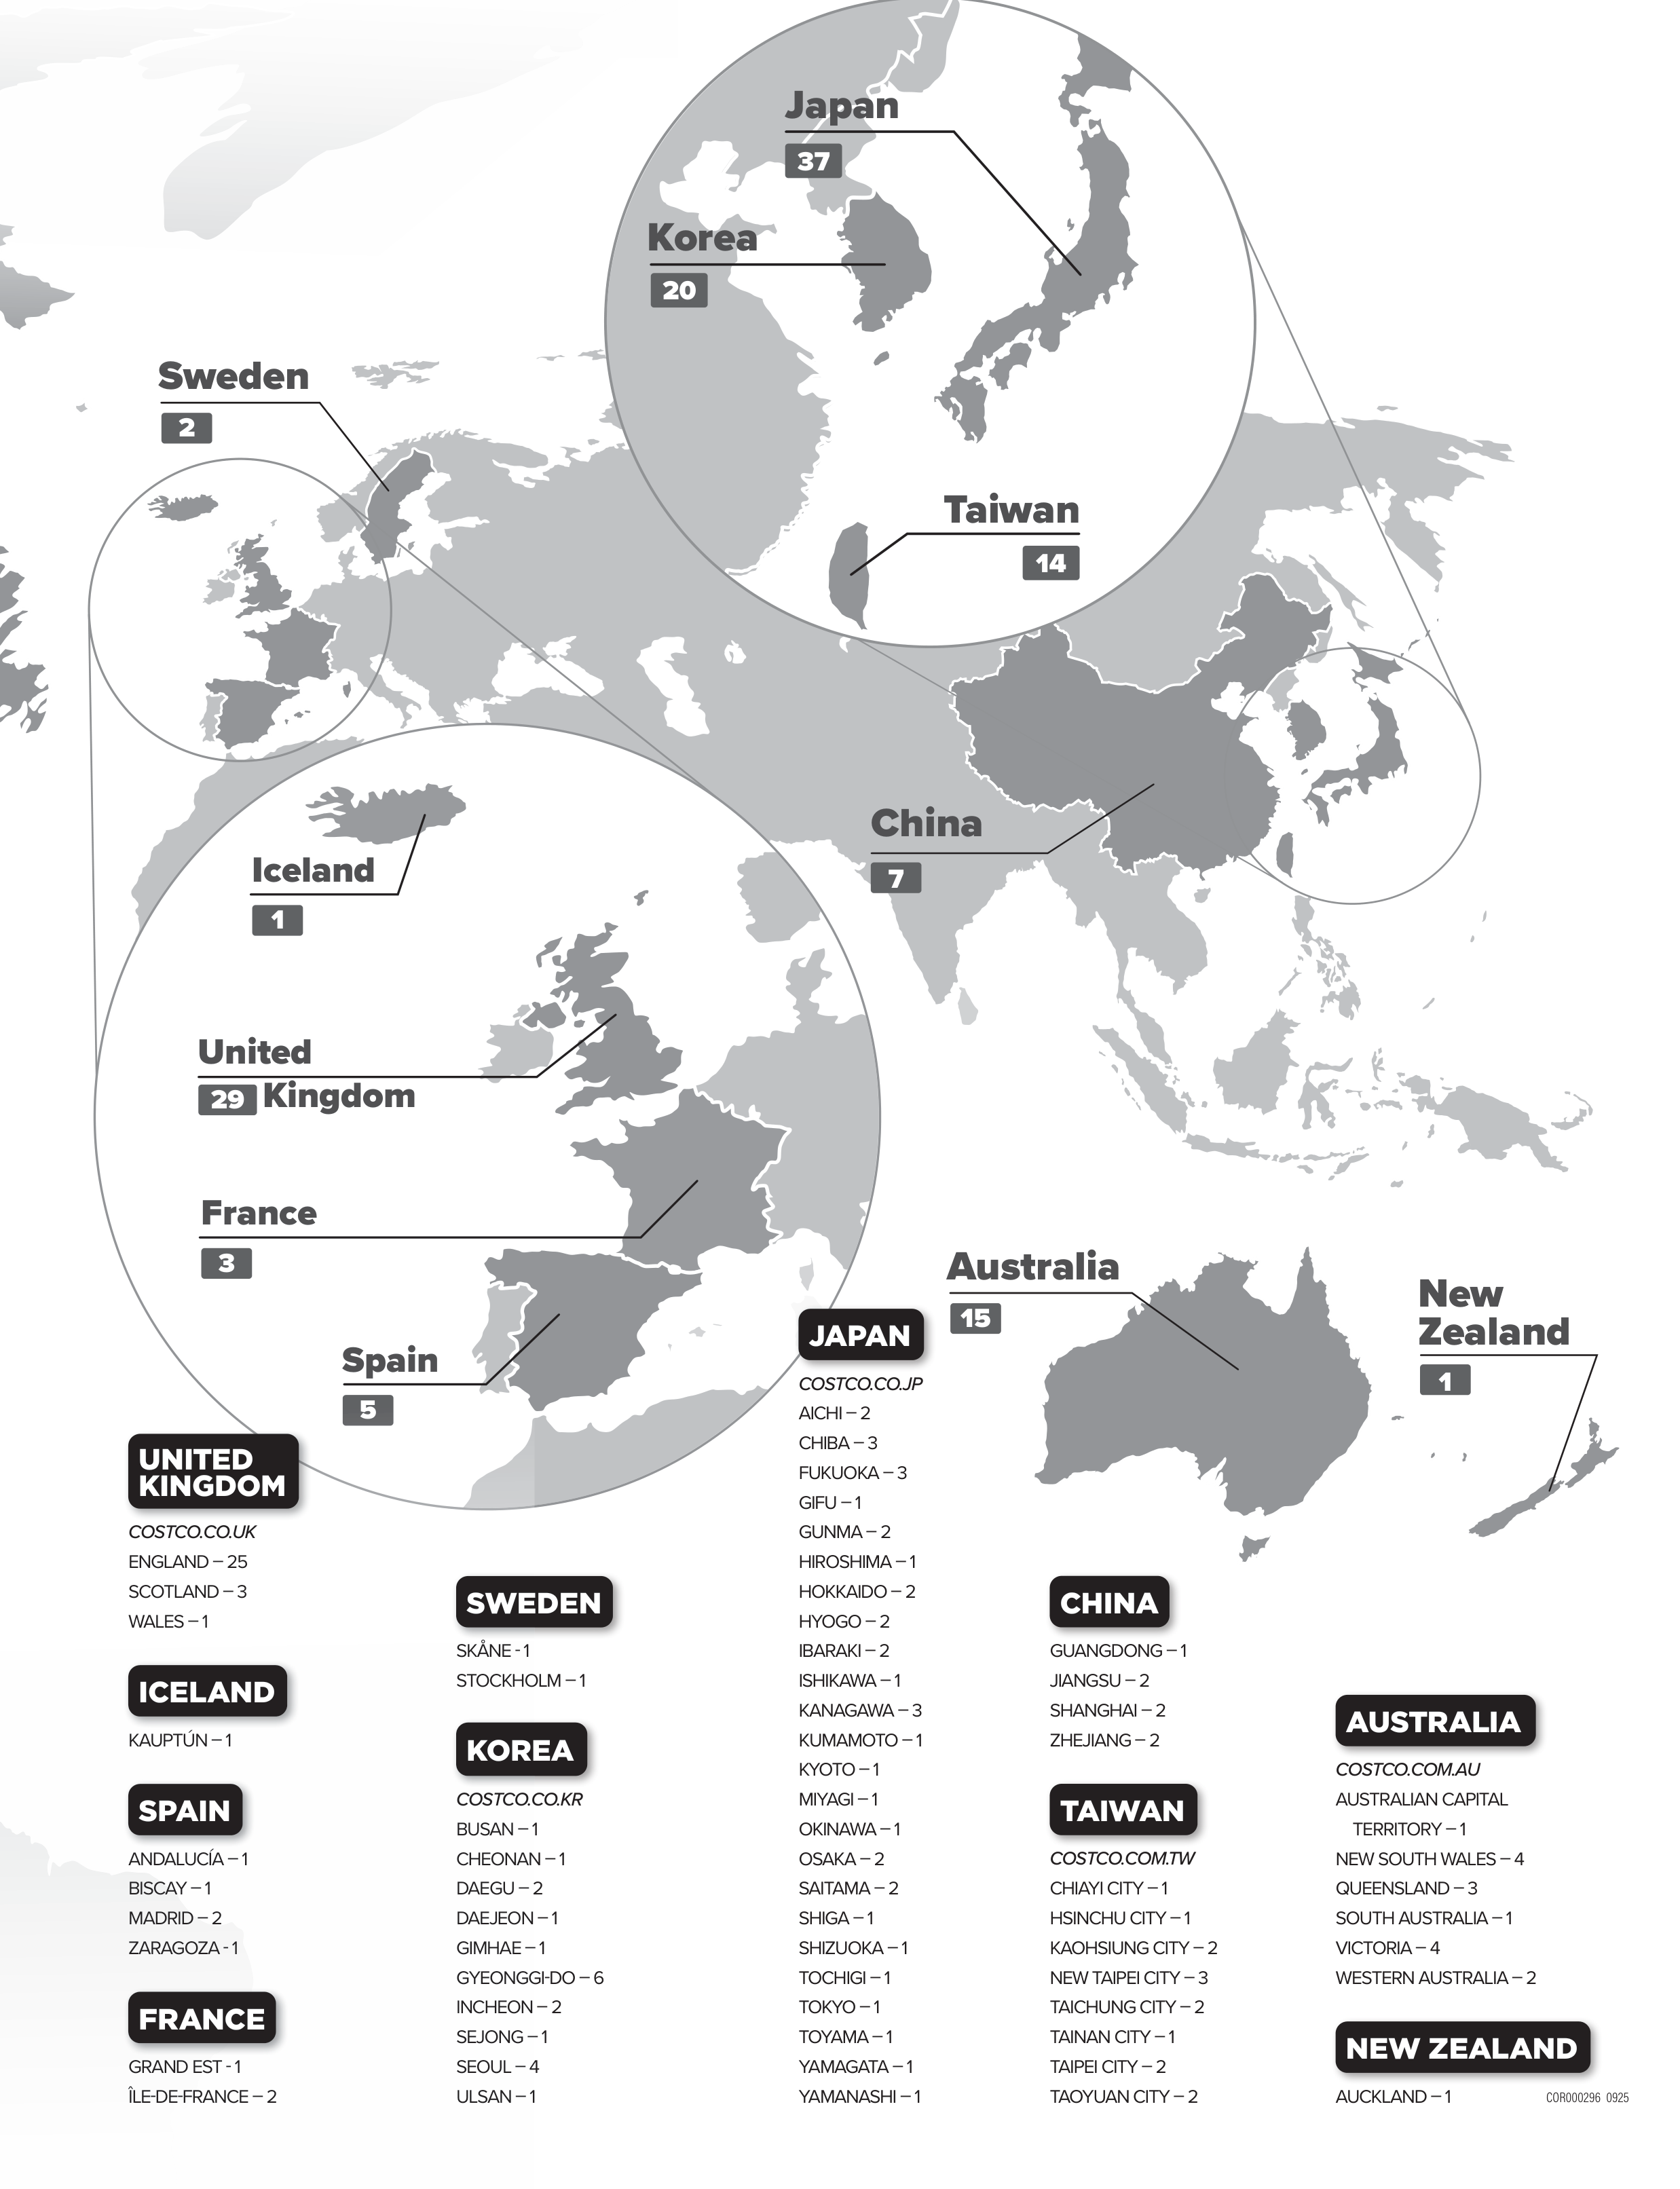
Australia
China
Spain
France
Iceland
United
Kingdom
5
3
1
29
15
Sweden
2
7
New
Zealand
1
Taiwan
Japan
Korea
14
20
37
COR000296 0925
AUSTRALIA
COSTCO.COM.AU
AUSTRALIAN CAPITAL
TERRITORY – 1
NEW SOUTH WALES – 4
QUEENSLAND – 3
SOUTH AUSTRALIA – 1
VICTORIA – 4
WESTERN AUSTRALIA – 2
NEW ZEALAND
AUCKLAND – 1
SHANGHAI – 1
JAPAN
COSTCO.CO.JP
AICHI – 2
CHIBA – 3
FUKUOKA – 3
GIFU – 1
GUNMA – 2
HIROSHIMA – 1
HOKKAIDO – 2
HYOGO – 2
IBARAKI – 2
ISHIKAWA – 1
KANAGAWA – 3
KUMAMOTO – 1
KYOTO – 1
MIYAGI – 1
OKINAWA – 1
OSAKA – 2
SAITAMA – 2
SHIGA – 1
SHIZUOKA – 1
TOCHIGI – 1
TOKYO – 1
TOYAMA – 1
YAMAGATA – 1
YAMANASHI – 1
SWEDEN
SKÅNE - 1
STOCKHOLM – 1
KOREA
COSTCO.CO.KR
BUSAN – 1
CHEONAN – 1
DAEGU – 2
DAEJEON – 1
GIMHAE – 1
GYEONGGI-DO – 6
INCHEON – 2
SEJONG – 1
SEOUL – 4
ULSAN – 1
CHINA
GUANGDONG – 1
JIANGSU – 2
SHANGHAI – 2
ZHEJIANG – 2
TAIWAN
COSTCO.COM.TW
CHIAYI CITY – 1
HSINCHU CITY – 1
KAOHSIUNG CITY – 2
NEW TAIPEI CITY – 3
TAICHUNG CITY – 2
TAINAN CITY – 1
TAIPEI CITY – 2
TAOYUAN CITY – 2
UNITED
KINGDOM
COSTCO.CO.UK
ENGLAND – 25
SCOTLAND – 3
WALES – 1
ICELAND
KAUPTÚN – 1
SPAIN
ANDALUCÍA – 1
BISCAY – 1
MADRID – 2
ZARAGOZA - 1
MADRID – 2
FRANCE
GRAND EST - 1
ÎLE-DE-FRANCE – 2

UNITED STATES
SECURITIES AND EXCHANGE COMMISSION
Washington, D.C. 20549
FORM 10-K
☒
ANNUAL REPORT PURSUANT TO SECTION 13 OR 15(d) OF THE SECURITIES
EXCHANGE ACT OF 1934
For the fiscal year ended August 31, 2025
or
☐
TRANSITION REPORT PURSUANT TO SECTION 13 OR 15(d) OF THE SECURITIES
EXCHANGE ACT OF 1934
Commission file number 0-20355
Costco Wholesale Corporation
(Exact name of registrant as specified in its charter)
Washington
91-1223280
(State or other jurisdiction of
incorporation or organization)
(I.R.S. Employer Identification No.)
999 Lake Drive, Issaquah, WA 98027
(Address of principal executive offices) (Zip Code)
Registrant’s telephone number, including area code:
(425) 313-8100
Securities registered pursuant to Section 12(b) of the Act:
Title of each class
Trading Symbol
Name of each exchange on
which registered
Common Stock, $.005 Par Value
COST
The NASDAQ Global Select Market
Securities registered pursuant to Section 12(g) of the Act: None
Indicate by check mark if the registrant is a well-known seasoned issuer, as defined in Rule 405 of the
Securities Act. Yes
☒
No
☐
Indicate by check mark if the registrant is not required to file reports pursuant to Section 13 or
Section 15(d) of the Act. Yes
☐
No
☒
Indicate by check mark whether the registrant (1) has filed all reports required to be filed by Section 13 or
15(d) of the Securities Exchange Act of 1934 during the preceding 12 months (or for such shorter period
that the registrant was required to file such reports), and (2) has been subject to such filing requirements
for the past 90 days. Yes
☒
No
☐
Indicate by check mark whether the registrant has submitted electronically every Interactive Data File
required to be submitted pursuant to Rule 405 of Regulation S-T (§ 232.405 of this chapter) during the
preceding 12 months (or for such shorter period that the registrant was required to submit such files).
Yes
☒
No
☐
Indicate by check mark whether the registrant is a large accelerated filer, an accelerated filer, a non-
accelerated filer, a smaller reporting company, or an emerging growth company. See the definitions of
“large accelerated filer,” “accelerated filer,” “smaller reporting company,” and “emerging growth company”
in Rule 12b-2 of the Exchange Act.
Large accelerated filer
☒
Accelerated filer
☐
Non-accelerated filer
☐
Smaller reporting company
☐
Emerging growth company
☐
If an emerging growth company, indicate by check mark if the registrant has elected not to use the
extended transition period for complying with any new or revised financial accounting standards provided
pursuant to Section 13(a) of the Exchange Act.
☐
Indicate by check mark whether the registrant has filed a report on and attestation to its management’s
assessment of the effectiveness of its internal control over financial reporting under Section 404(b) of the
Sarbanes-Oxley Act (15 U.S.C. 7262(b)) by the registered public accounting firm that prepared or issued
its audit report.
☒
If securities are registered pursuant to Section 12(b) of the Act, indicate by check mark whether the
financial statements of the registrant included in the filing reflect the correction of an error to previously
issued financials statements.
☐
Indicate by check mark whether any of those error corrections are restatements that required a recovery
analysis of incentive-based compensation received by any of the registrant's executive officers during the
relevant recovery period pursuant to §240.10D-1(b).
☐
Indicate by check mark whether the registrant is a shell company (as defined in Rule 12b-2 of the Act).
Yes
☐
No
☒
The aggregate market value of the voting stock held by non-affiliates of the registrant as of February 16,
2025 was $475.2 billion.
The number of shares outstanding of the registrant’s common stock as of September 30, 2025, was
443,179,176.
DOCUMENTS INCORPORATED BY REFERENCE
Portions of the registrant's Proxy Statement for the Annual Meeting of Shareholders to be held on January
15, 2026, are incorporated by reference into Part III of this Form 10-K.
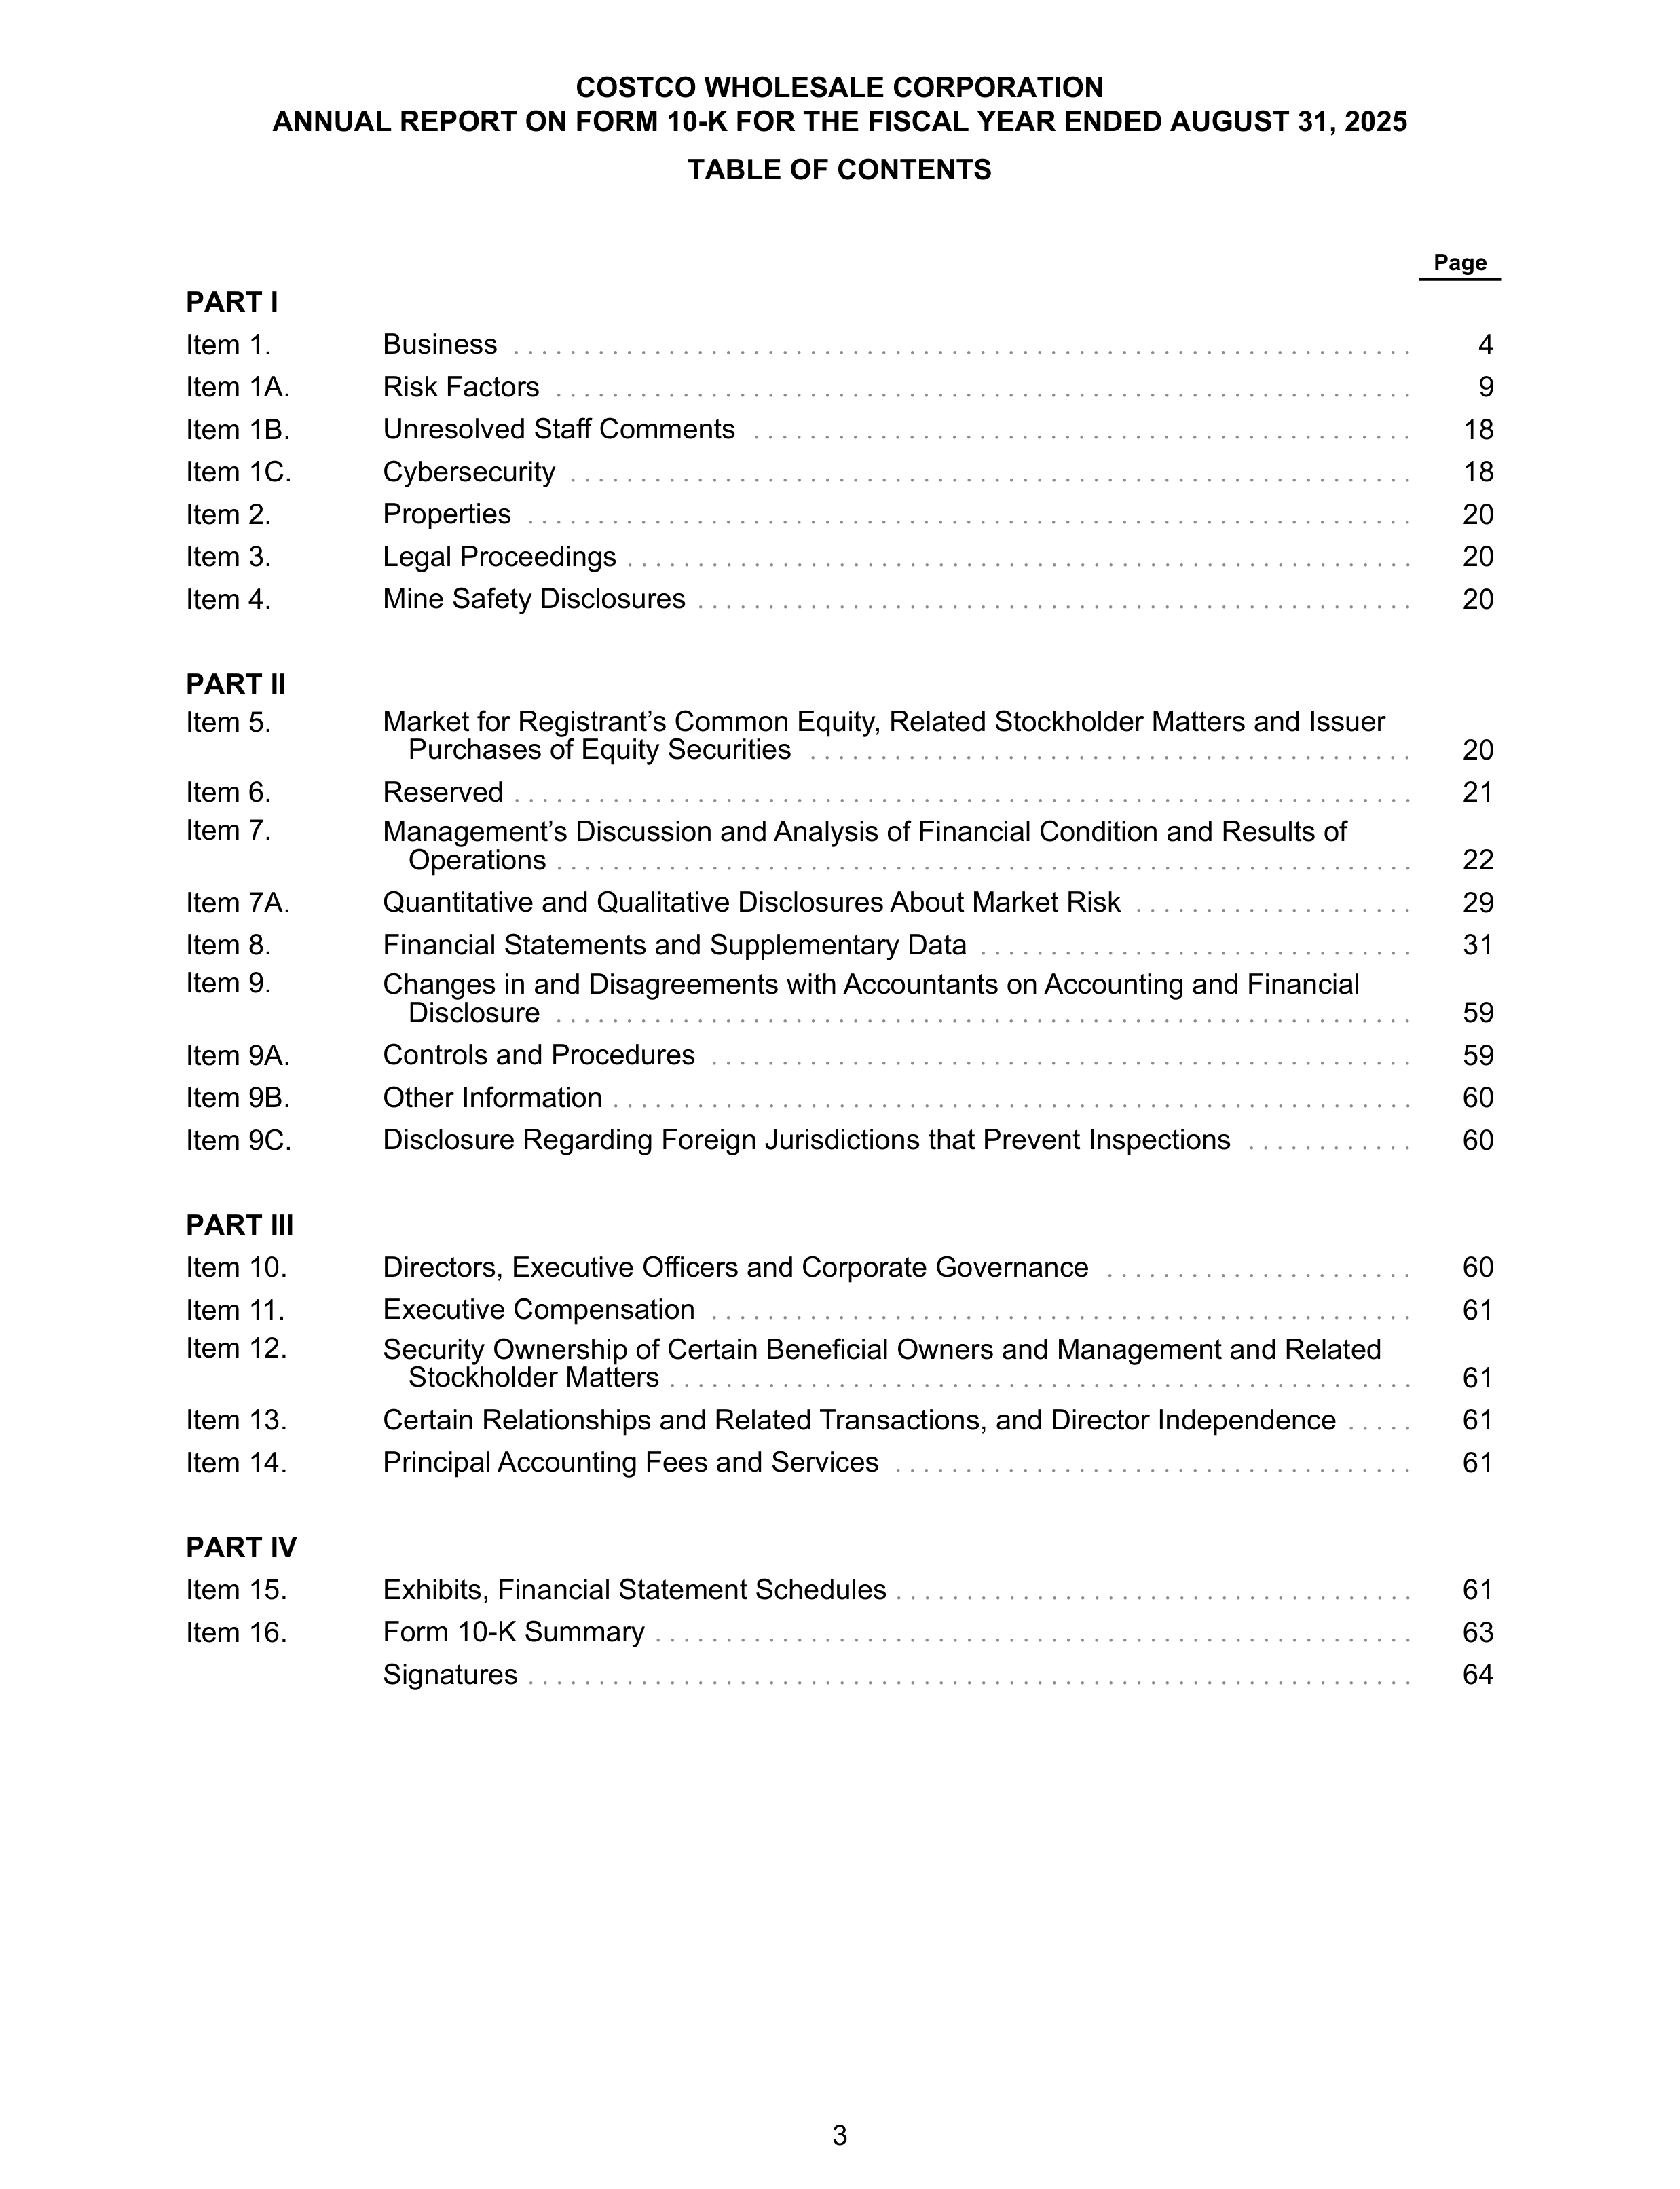
COSTCO WHOLESALE CORPORATION
ANNUAL REPORT ON FORM 10-K FOR THE FISCAL YEAR ENDED AUGUST 31, 2025
TABLE OF CONTENTS
Page
PART I
Item 1.
Business
. . . . . . . . . . . . . . . . . . . . . . . . . . . . . . . . . . . . . . . . . . . . . . . . . . . . . . . . . . . . . . . .
4
Item 1A.
Risk Factors
. . . . . . . . . . . . . . . . . . . . . . . . . . . . . . . . . . . . . . . . . . . . . . . . . . . . . . . . . . . . .
9
Item 1B.
Unresolved Staff Comments
. . . . . . . . . . . . . . . . . . . . . . . . . . . . . . . . . . . . . . . . . . . . . . .
18
Item 1C.
Cybersecurity
. . . . . . . . . . . . . . . . . . . . . . . . . . . . . . . . . . . . . . . . . . . . . . . . . . . . . . . . . . . .
18
Item 2.
Properties
. . . . . . . . . . . . . . . . . . . . . . . . . . . . . . . . . . . . . . . . . . . . . . . . . . . . . . . . . . . . . . .
20
Item 3.
Legal Proceedings
. . . . . . . . . . . . . . . . . . . . . . . . . . . . . . . . . . . . . . . . . . . . . . . . . . . . . . . .
20
Item 4.
Mine Safety Disclosures
. . . . . . . . . . . . . . . . . . . . . . . . . . . . . . . . . . . . . . . . . . . . . . . . . . .
20
PART II
Item 5.
Market for Registrant’s Common Equity, Related Stockholder Matters and Issuer
Purchases of Equity Securities
. . . . . . . . . . . . . . . . . . . . . . . . . . . . . . . . . . . . . . . . . . .
20
Item 6.
Reserved
. . . . . . . . . . . . . . . . . . . . . . . . . . . . . . . . . . . . . . . . . . . . . . . . . . . . . . . . . . . . . . . .
21
Item 7.
Management’s Discussion and Analysis of Financial Condition and Results of
Operations
. . . . . . . . . . . . . . . . . . . . . . . . . . . . . . . . . . . . . . . . . . . . . . . . . . . . . . . . . . . . .
22
Item 7A.
Quantitative and Qualitative Disclosures About Market Risk
. . . . . . . . . . . . . . . . . . . .
29
Item 8.
Financial Statements and Supplementary Data
. . . . . . . . . . . . . . . . . . . . . . . . . . . . . . .
31
Item 9.
Changes in and Disagreements with Accountants on Accounting and Financial
Disclosure
. . . . . . . . . . . . . . . . . . . . . . . . . . . . . . . . . . . . . . . . . . . . . . . . . . . . . . . . . . . . .
59
Item 9A.
Controls and Procedures
. . . . . . . . . . . . . . . . . . . . . . . . . . . . . . . . . . . . . . . . . . . . . . . . . .
59
Item 9B.
Other Information
. . . . . . . . . . . . . . . . . . . . . . . . . . . . . . . . . . . . . . . . . . . . . . . . . . . . . . . . .
60
Item 9C.
Disclosure Regarding Foreign Jurisdictions that Prevent Inspections
. . . . . . . . . . . .
60
PART III
Item 10.
Directors, Executive Officers and Corporate Governance
. . . . . . . . . . . . . . . . . . . . . .
60
Item 11.
Executive Compensation
. . . . . . . . . . . . . . . . . . . . . . . . . . . . . . . . . . . . . . . . . . . . . . . . . .
61
Item 12.
Security Ownership of Certain Beneficial Owners and Management and Related
Stockholder Matters
. . . . . . . . . . . . . . . . . . . . . . . . . . . . . . . . . . . . . . . . . . . . . . . . . . . . .
61
Item 13.
Certain Relationships and Related Transactions, and Director Independence
. . . . .
61
Item 14.
Principal Accounting Fees and Services
. . . . . . . . . . . . . . . . . . . . . . . . . . . . . . . . . . . . .
61
PART IV
Item 15.
Exhibits, Financial Statement Schedules
. . . . . . . . . . . . . . . . . . . . . . . . . . . . . . . . . . . . .
61
Item 16.
Form 10-K Summary
. . . . . . . . . . . . . . . . . . . . . . . . . . . . . . . . . . . . . . . . . . . . . . . . . . . . . .
63
Signatures
. . . . . . . . . . . . . . . . . . . . . . . . . . . . . . . . . . . . . . . . . . . . . . . . . . . . . . . . . . . . . . .
64
3
INFORMATION RELATING TO FORWARD LOOKING STATEMENTS
Certain statements contained in this document constitute forward-looking statements within the meaning
of the Private Securities Litigation Reform Act of 1995. For these purposes, forward-looking statements
are statements that address activities, events, conditions or developments that the Company expects or
anticipates may occur in the future and may relate to such matters as net sales growth, changes in
comparable sales, cannibalization of existing locations by new openings, price or fee changes, earnings
performance, earnings per share, stock-based compensation expense, warehouse openings and
closures, capital spending, the effect of adopting certain accounting standards, future financial reporting,
financing, margins, return on invested capital, investments in technology, strategic direction, expense
controls, membership fee changes, signups, and renewal rates, shopping frequency, litigation, attainment
of sustainability goals, and the demand for our products and services. In some cases, forward-looking
statements can be identified because they contain words such as “anticipate,” “believe,” “continue,”
“could,” “estimate,” “expect,” “intend,” “likely,” “may,” “might,” “plan,” “potential,” “predict,” “project,” “seek,”
“should,” “target,” “will,” “would,” or similar expressions and the negatives of those terms. Such forward-
looking statements involve risks and uncertainties that may cause actual events, results, or performance
to differ materially from those indicated by such statements, including, without limitation, the factors set
forth in the section titled “Item 1A-Risk Factors”, and other factors noted in the section titled “Item 7-
Management's Discussion and Analysis of Financial Condition and Results of Operations” and in the
consolidated financial statements and related notes in Item 8 of this Report. Forward-looking statements
speak only as of the date they are made, and we do not undertake to update these statements, except as
required by law.
PART I
Item 1—Business
Costco Wholesale Corporation and its subsidiaries (Costco or the Company) began operations in 1983, in
Seattle, Washington. We are principally engaged in the operation of membership warehouses in the
United States (U.S.) and Puerto Rico, Canada, Mexico, Japan, the United Kingdom (U.K.), Korea,
Australia, Taiwan, China, Spain, France, Sweden, Iceland, and New Zealand. Costco operated 914, 890,
and 861 warehouses worldwide at August 31, 2025, September 1, 2024, and September 3, 2023. The
Company operates e-commerce sites in the U.S., Canada, Mexico, the U.K., Korea, Taiwan, Japan, and
Australia. Our common stock trades on the NASDAQ Global Select Market, under the symbol “COST.”
We report on a 52/53-week fiscal year, consisting of thirteen four-week periods and ending on the Sunday
nearest the end of August. The first three quarters consist of three periods each, and the fourth quarter
consists of four periods (five weeks in the thirteenth period in a 53-week year). The material seasonal
impact in our operations is increased net sales and earnings during the winter holiday season.
References to 2025 and 2024 relate to the 52-week fiscal years ended August 31, 2025, and September
1, 2024. References to 2023 relate to the 53-week fiscal year ended September 3, 2023.
General
We operate membership warehouses and e-commerce sites based on the concept that offering low prices
on a limited selection of nationally-branded and private-label products in a wide range of categories will
produce high sales volumes and rapid inventory turnover. When combined with the operating efficiencies
achieved by volume purchasing, efficient distribution and reduced handling of merchandise in no-frills,
self-service warehouse facilities, these volumes and turnover enable us to operate profitably at
significantly lower gross margins (net sales less merchandise costs) than most other retailers. We often
sell inventory before we are required to pay for it, even while taking advantage of early payment
discounts.
We buy most of our merchandise directly from suppliers and route it to cross-docking consolidation points
(depots) or directly to our warehouses. Our depots receive large shipments from suppliers and quickly
ship these goods to warehouses. This process creates freight volume and handling efficiencies, lowering
costs associated with traditional multiple-step distribution channels. Our e-commerce operations ship
merchandise through our depots and logistics operations, as well as through drop-ship and other delivery
arrangements with our suppliers.
4
Our average warehouse space is approximately 147,000 square feet, with newer units being slightly
larger. Floor plans are designed for efficiency in the use of selling space, the handling of merchandise,
and the control of inventory. Because shoppers are attracted principally by the quality of merchandise and
low prices, our warehouses are not elaborate. By strictly controlling the entrances and exits and using a
membership format, we believe our inventory losses (shrinkage) are well below those of typical retail
operations.
Our operating hours are shorter than many other retailers, and due to other efficiencies inherent in a
warehouse club operation, we believe labor costs are lower relative to the volume of sales. In the U.S.,
we recently added exclusive shopping hours for our Executive members and our gasoline operations
generally have extended hours. Merchandise is generally stored on racks above the sales floor and
displayed on pallets containing large quantities, reducing labor required. In general, with variations by
country, our warehouses accept certain credit cards, including Costco co-branded cards, debit cards,
cash and checks, Executive member 2% reward certificates, co-brand cardholder rebates, and our
proprietary stored-value card (shop card).
Our strategy is to provide our members with a broad range of high-quality merchandise at prices we
believe are consistently lower than elsewhere. We seek to limit most items to fast-selling models, sizes,
and colors. We carry less than 4,000 active stock keeping units (SKUs) per warehouse in our core
warehouse business, significantly less than other broadline retailers. We average from 9,000 to 10,000
SKUs online, some of which are available in our warehouses. Many consumable products are offered for
sale in case, carton, or multiple-pack quantities only.
To promote member satisfaction, we generally accept returns of merchandise. On certain electronic items,
we have a 90-day return policy and provide, free of charge, technical support services, as well as an
extended warranty. Additional third-party warranty coverage is sold on certain electronic items and major
appliances.
We offer merchandise and services in the following categories:
■
Core Merchandise Categories:
•
Foods and Sundries
(including sundries, dry grocery, candy, cooler, freezer, liquor, and
tobacco)
•
Non-Foods
(including major appliances, small electronics, health and beauty aids,
hardware, lawn and garden, sporting goods, tires, toys and seasonal, automotive, stamps,
tickets, apparel, furniture, domestics, housewares, special order kiosk, and jewelry)
•
Fresh Foods
(including meat, produce, deli, and bakery)
■
Warehouse Ancillary
(includes gasoline, pharmacy, optical, food court, hearing aids, and tire
installation)
■
Other Businesses
(includes e-commerce, business centers, travel, and other)
Warehouse ancillary operate primarily within, next to or near our warehouses, encouraging more frequent
shopping. The number of warehouses with gas stations varies significantly by country. We operated 747
gas stations at the end of 2025. Our gasoline business represented approximately 10% of total net sales
in 2025.
Our other businesses sell products and services that largely complement our warehouse operations. Our
e-commerce operations give members convenience and a broader selection of goods and services. Net
sales for e-commerce represented approximately 7% of total net sales in 2025. Digitally-enabled sales,
which represents sales delivered to members that are initiated through a digital device, whether fulfilled
through a warehouse or distribution center, as well as Costco Travel, represented approximately 10% of
total net sales in 2025. Our business centers carry items tailored for food services, convenience stores
and offices and offer walk-in shopping and deliveries. Business centers are included in our total
warehouse count. Costco Travel offers vacation packages, car rentals, cruises and other travel products
exclusively for Costco members (offered to varying degrees in the U.S., Canada, Australia, and the U.K.).
5
We have direct relationships with many producers of brand-name merchandise. We do not obtain a
significant portion of merchandise from any one supplier. When sources of supply become unavailable,
we seek alternative sources or items. For future product supply need, we pursue diversification in our
supply-chain and seek to expand in-country production. We also purchase and manufacture private-label
merchandise, as long as quality and member demand are high and the value to our members is
significant.
Certain financial information for our segments and geographic areas is included in Note 11 to the
consolidated financial statements included in Item 8 of this Report.
Membership
Our members may utilize their memberships at all of our warehouses and e-commerce sites. Gold Star
memberships are available to individuals; Business memberships are limited to businesses, including
individuals with a business license or comparable document. Business members may add additional
cardholders (affiliates), to which the same annual fee applies. Affiliates are not available for Gold Star
members. Our annual fee for these memberships is $65 in the U.S. and varies in other countries. All paid
memberships include a free household card.
Paid members (except affiliates) are eligible to upgrade to an Executive membership in the U.S., for an
additional annual fee of $65. Executive memberships are also available in Canada, Mexico, the U.K.,
Japan, Korea, Taiwan, and Australia, for which the additional fee varies. Executive members earn a 2%
reward on qualified purchases (generally up to a maximum reward of $1,250 per year), redeemable at
Costco warehouses. The sales penetration of Executive members represented approximately 73.6% of
worldwide net sales in 2025.
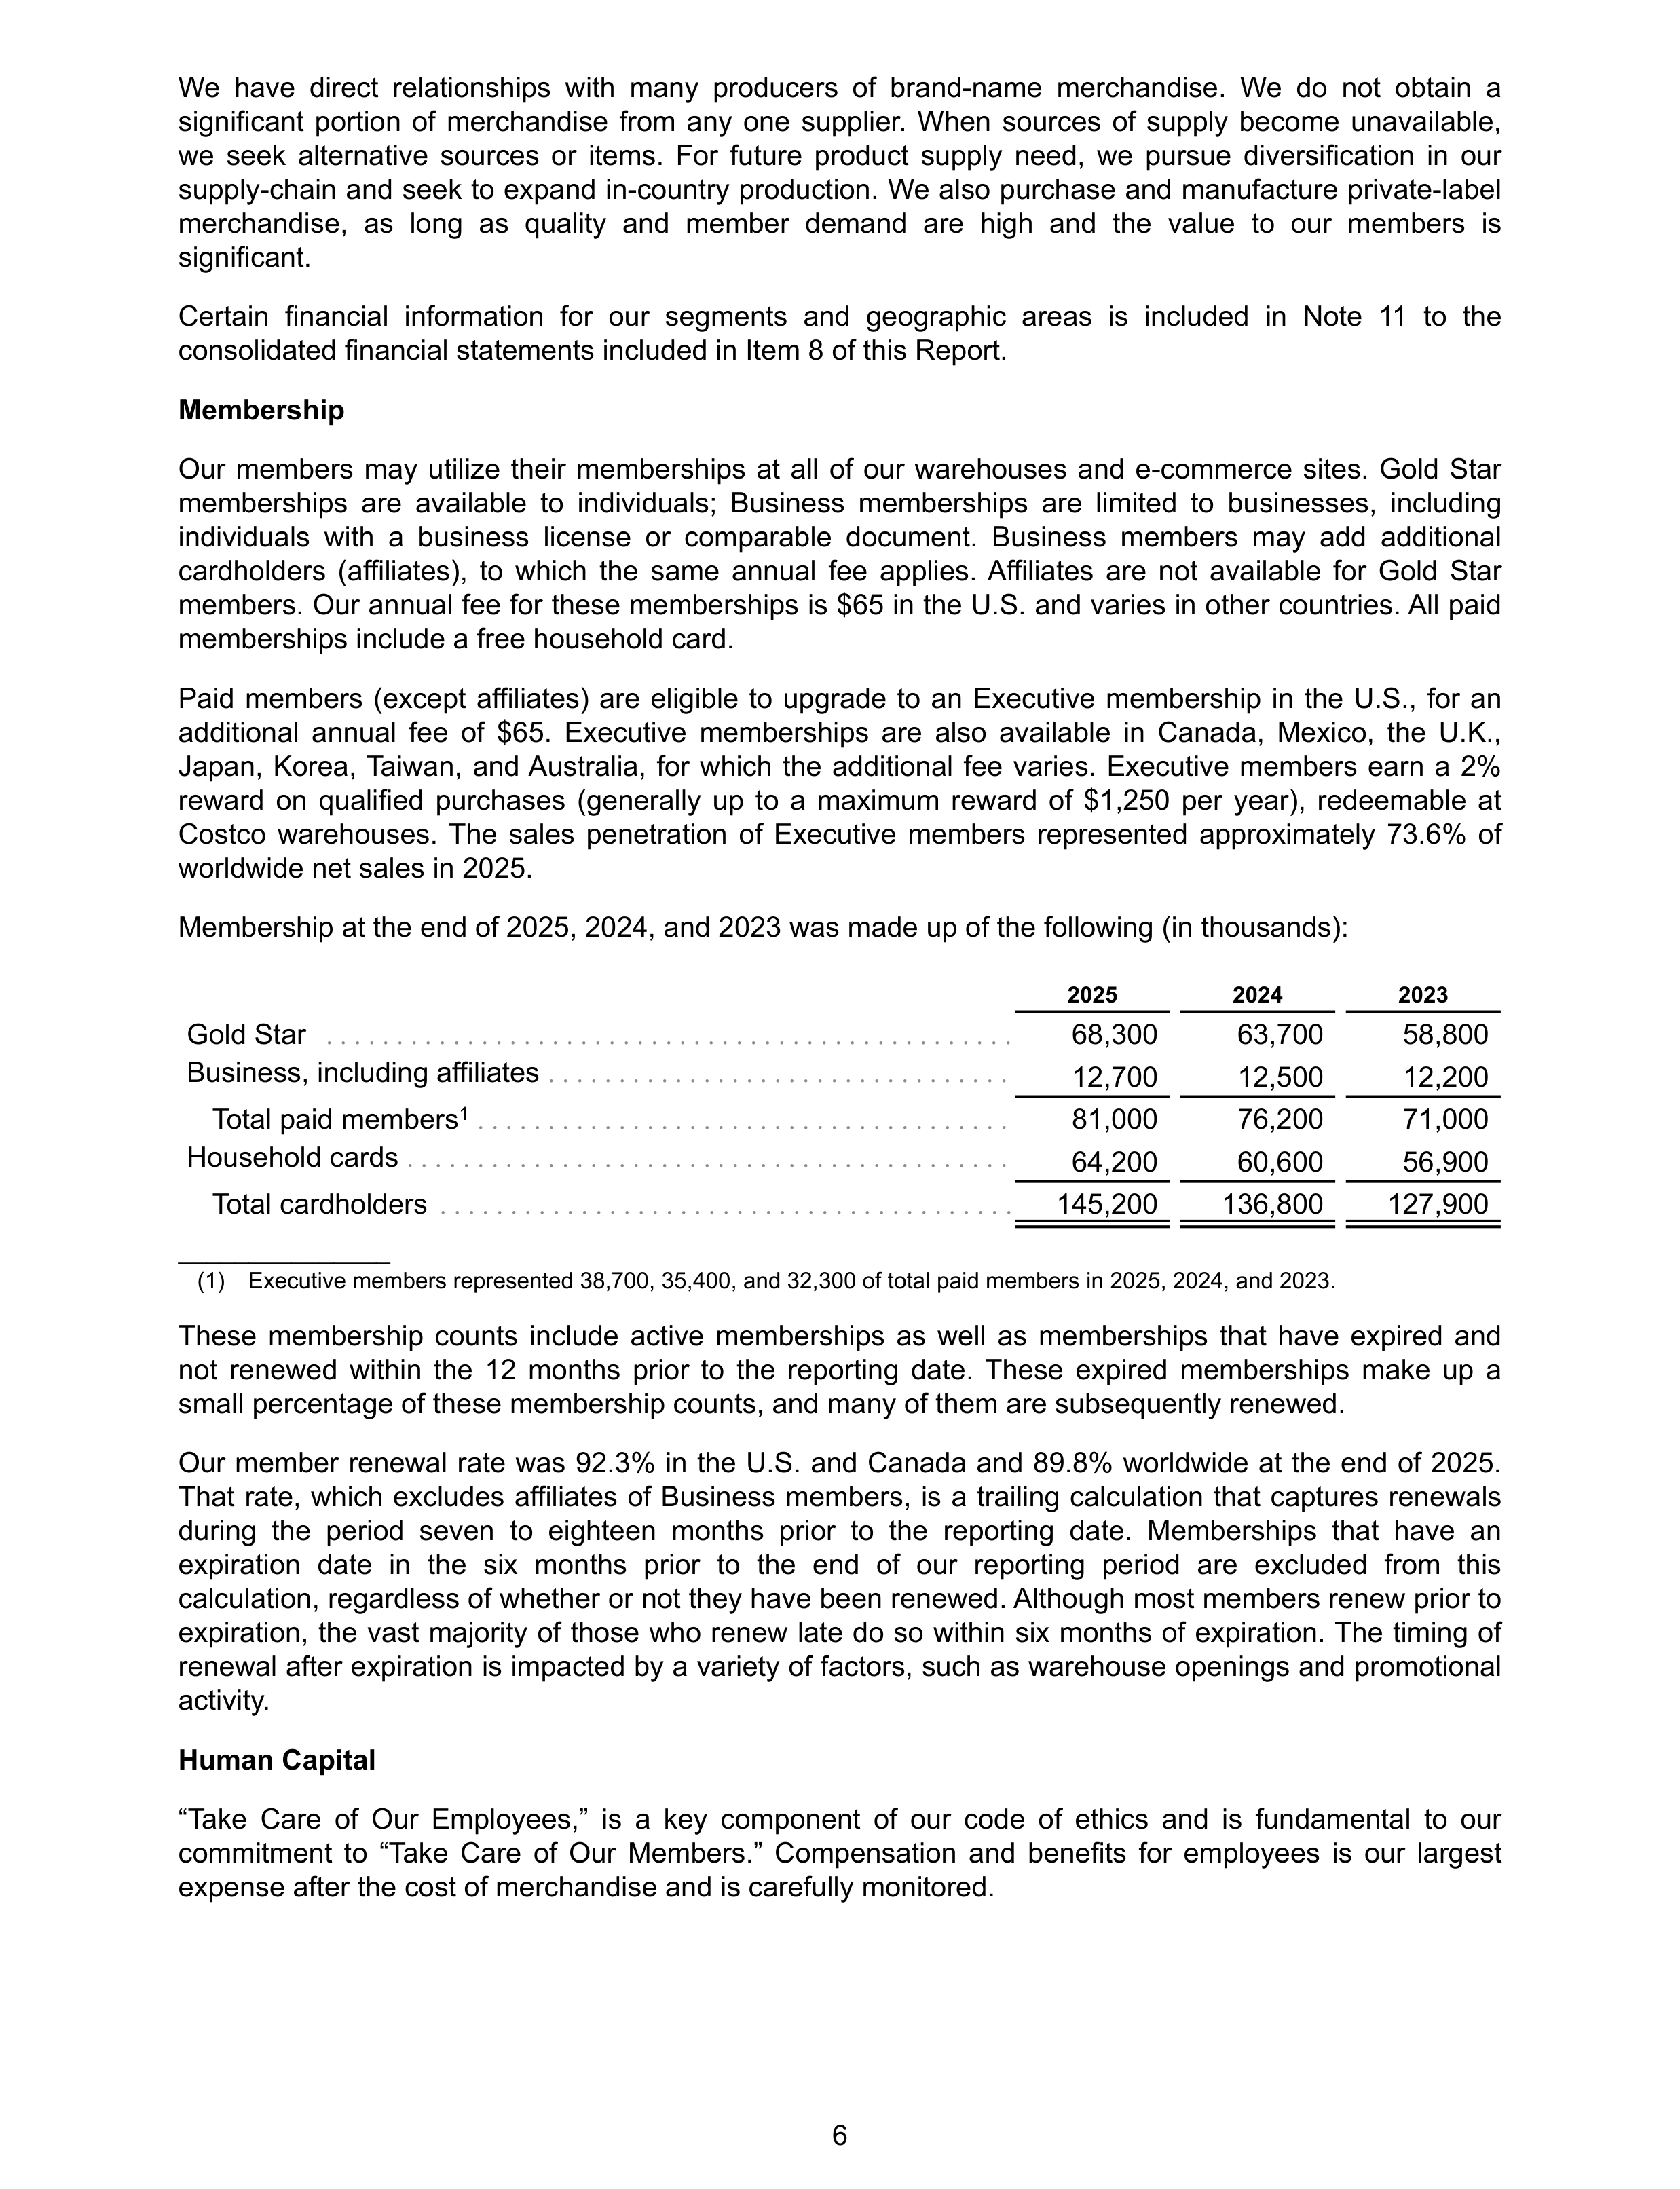
Membership at the end of 2025, 2024, and 2023 was made up of the following (in thousands):
2025
2024
2023
Gold Star
. . . . . . . . . . . . . . . . . . . . . . . . . . . . . . . . . . . . . . . . . . . . . . . . .
68,300
63,700
58,800
Business, including affiliates
. . . . . . . . . . . . . . . . . . . . . . . . . . . . . . . . .
12,700
12,500
12,200
Total paid members
1
. . . . . . . . . . . . . . . . . . . . . . . . . . . . . . . . . . . . . .
81,000
76,200
71,000
Household cards
. . . . . . . . . . . . . . . . . . . . . . . . . . . . . . . . . . . . . . . . . . .
64,200
60,600
56,900
Total cardholders
. . . . . . . . . . . . . . . . . . . . . . . . . . . . . . . . . . . . . . . . .
145,200
136,800
127,900
_______________
(1)
Executive members represented 38,700, 35,400, and 32,300 of total paid members in 2025, 2024, and 2023.
These membership counts include active memberships as well as memberships that have expired and
not renewed within the 12 months prior to the reporting date. These expired memberships make up a
small percentage of these membership counts, and many of them are subsequently renewed.
Our member renewal rate was 92.3% in the U.S. and Canada and 89.8% worldwide at the end of 2025.
That rate, which excludes affiliates of Business members, is a trailing calculation that captures renewals
during the period seven to eighteen months prior to the reporting date. Memberships that have an
expiration date in the six months prior to the end of our reporting period are excluded from this
calculation, regardless of whether or not they have been renewed. Although most members renew prior to
expiration, the vast majority of those who renew late do so within six months of expiration. The timing of
renewal after expiration is impacted by a variety of factors, such as warehouse openings and promotional
activity.
Human Capital
“Take Care of Our Employees,” is a key component of our code of ethics and is fundamental to our
commitment to “Take Care of Our Members.” Compensation and benefits for employees is our largest
expense after the cost of merchandise and is carefully monitored.
6
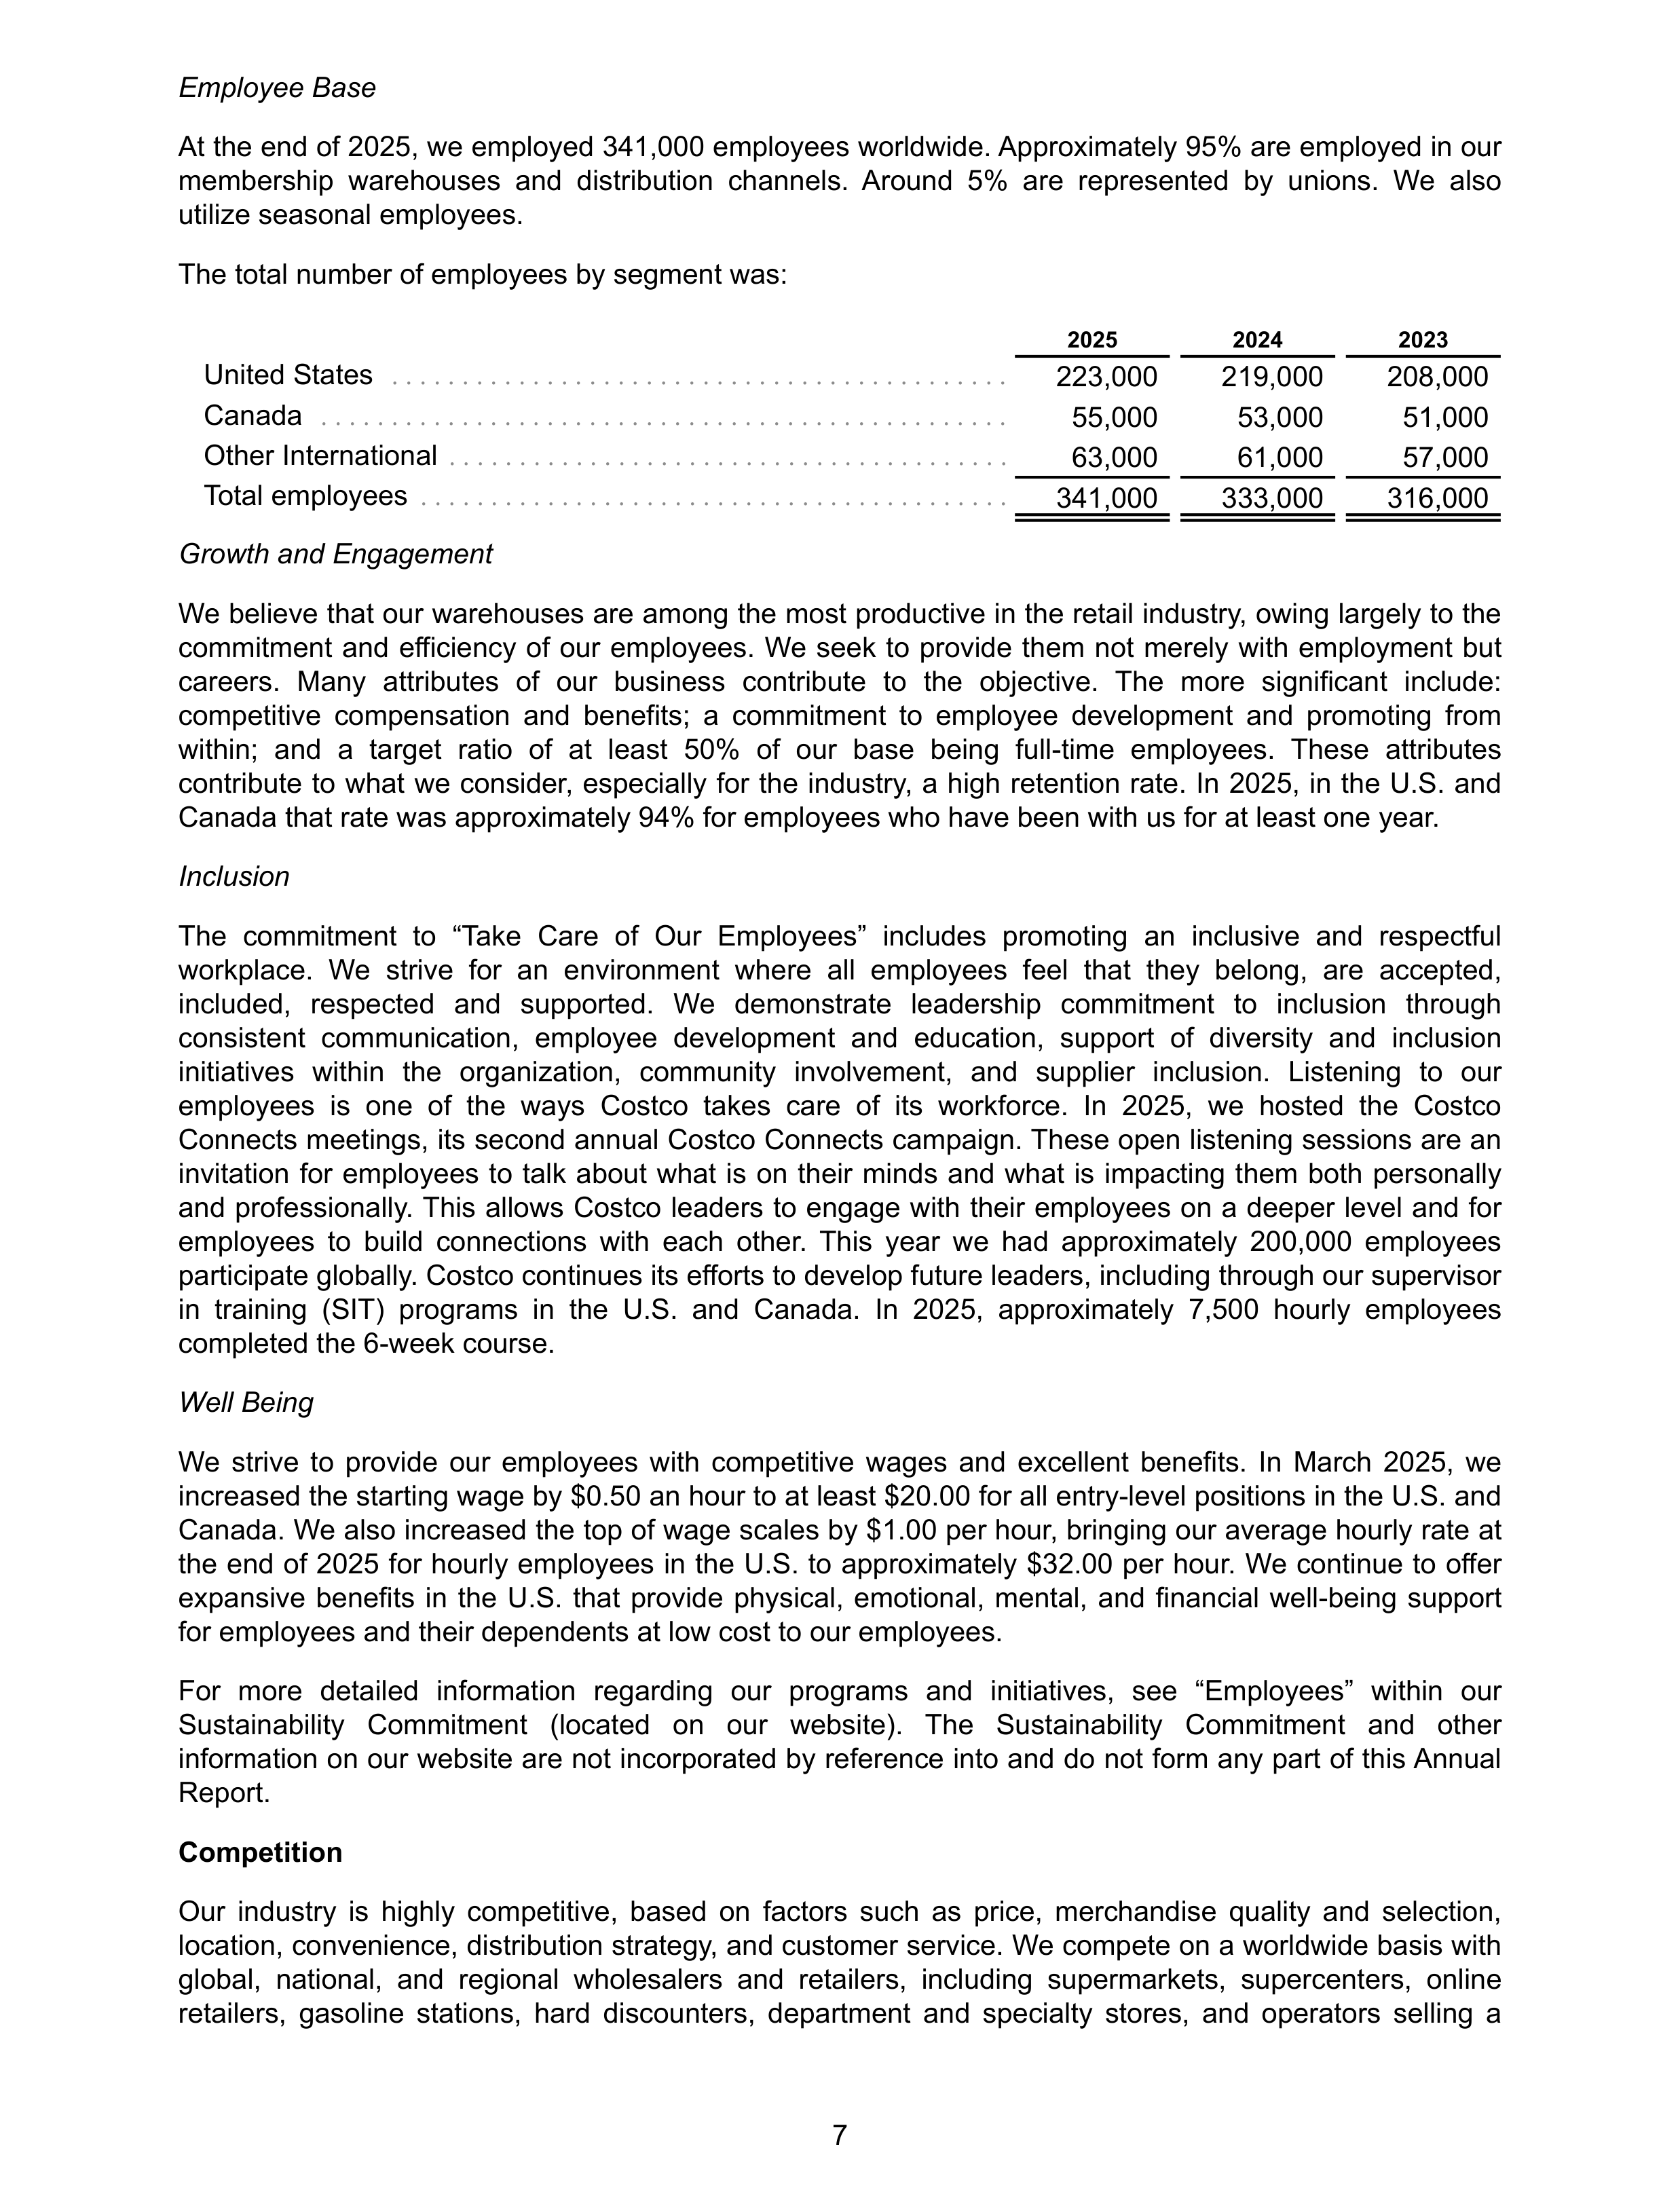
Employee Base
At the end of 2025, we employed 341,000 employees worldwide. Approximately 95% are employed in our
membership warehouses and distribution channels. Around 5% are represented by unions. We also
utilize seasonal employees.
The total number of employees by segment was:
2025
2024
2023
United States
. . . . . . . . . . . . . . . . . . . . . . . . . . . . . . . . . . . . . . . . . . . .
223,000
219,000
208,000
Canada
. . . . . . . . . . . . . . . . . . . . . . . . . . . . . . . . . . . . . . . . . . . . . . . . .
55,000
53,000
51,000
Other International
. . . . . . . . . . . . . . . . . . . . . . . . . . . . . . . . . . . . . . . .
63,000
61,000
57,000
Total employees
. . . . . . . . . . . . . . . . . . . . . . . . . . . . . . . . . . . . . . . . . .
341,000
333,000
316,000
Growth and Engagement
We believe that our warehouses are among the most productive in the retail industry, owing largely to the
commitment and efficiency of our employees. We seek to provide them not merely with employment but
careers. Many attributes of our business contribute to the objective. The more significant include:
competitive compensation and benefits; a commitment to employee development and promoting from
within; and a target ratio of at least 50% of our base being full-time employees. These attributes
contribute to what we consider, especially for the industry, a high retention rate. In 2025, in the U.S. and
Canada that rate was approximately 94% for employees who have been with us for at least one year.
Inclusion
The commitment to “Take Care of Our Employees” includes promoting an inclusive and respectful
workplace. We strive for an environment where all employees feel that they belong, are accepted,
included, respected and supported. We demonstrate leadership commitment to inclusion through
consistent communication, employee development and education, support of diversity and inclusion
initiatives within the organization, community involvement, and supplier inclusion. Listening to our
employees is one of the ways Costco takes care of its workforce. In 2025, we hosted the Costco
Connects meetings, its second annual Costco Connects campaign. These open listening sessions are an
invitation for employees to talk about what is on their minds and what is impacting them both personally
and professionally. This allows Costco leaders to engage with their employees on a deeper level and for
employees to build connections with each other. This year we had approximately 200,000 employees
participate globally. Costco continues its efforts to develop future leaders, including through our supervisor
in training (SIT) programs in the U.S. and Canada. In 2025, approximately 7,500 hourly employees
completed the 6-week course.
Well Being
We strive to provide our employees with competitive wages and excellent benefits. In March 2025, we
increased the starting wage by $0.50 an hour to at least $20.00 for all entry-level positions in the U.S. and
Canada. We also increased the top of wage scales by $1.00 per hour, bringing our average hourly rate at
the end of 2025 for hourly employees in the U.S. to approximately $32.00 per hour. We continue to offer
expansive benefits in the U.S. that provide physical, emotional, mental, and financial well-being support
for employees and their dependents at low cost to our employees.
For more detailed information regarding our programs and initiatives, see “Employees” within our
Sustainability Commitment (located on our website). The Sustainability Commitment and other
information on our website are not incorporated by reference into and do not form any part of this Annual
Report.
Competition
Our industry is highly competitive, based on factors such as price, merchandise quality and selection,
location, convenience, distribution strategy, and customer service. We compete on a worldwide basis with
global, national, and regional wholesalers and retailers, including supermarkets, supercenters, online
retailers, gasoline stations, hard discounters, department and specialty stores, and operators selling a
7
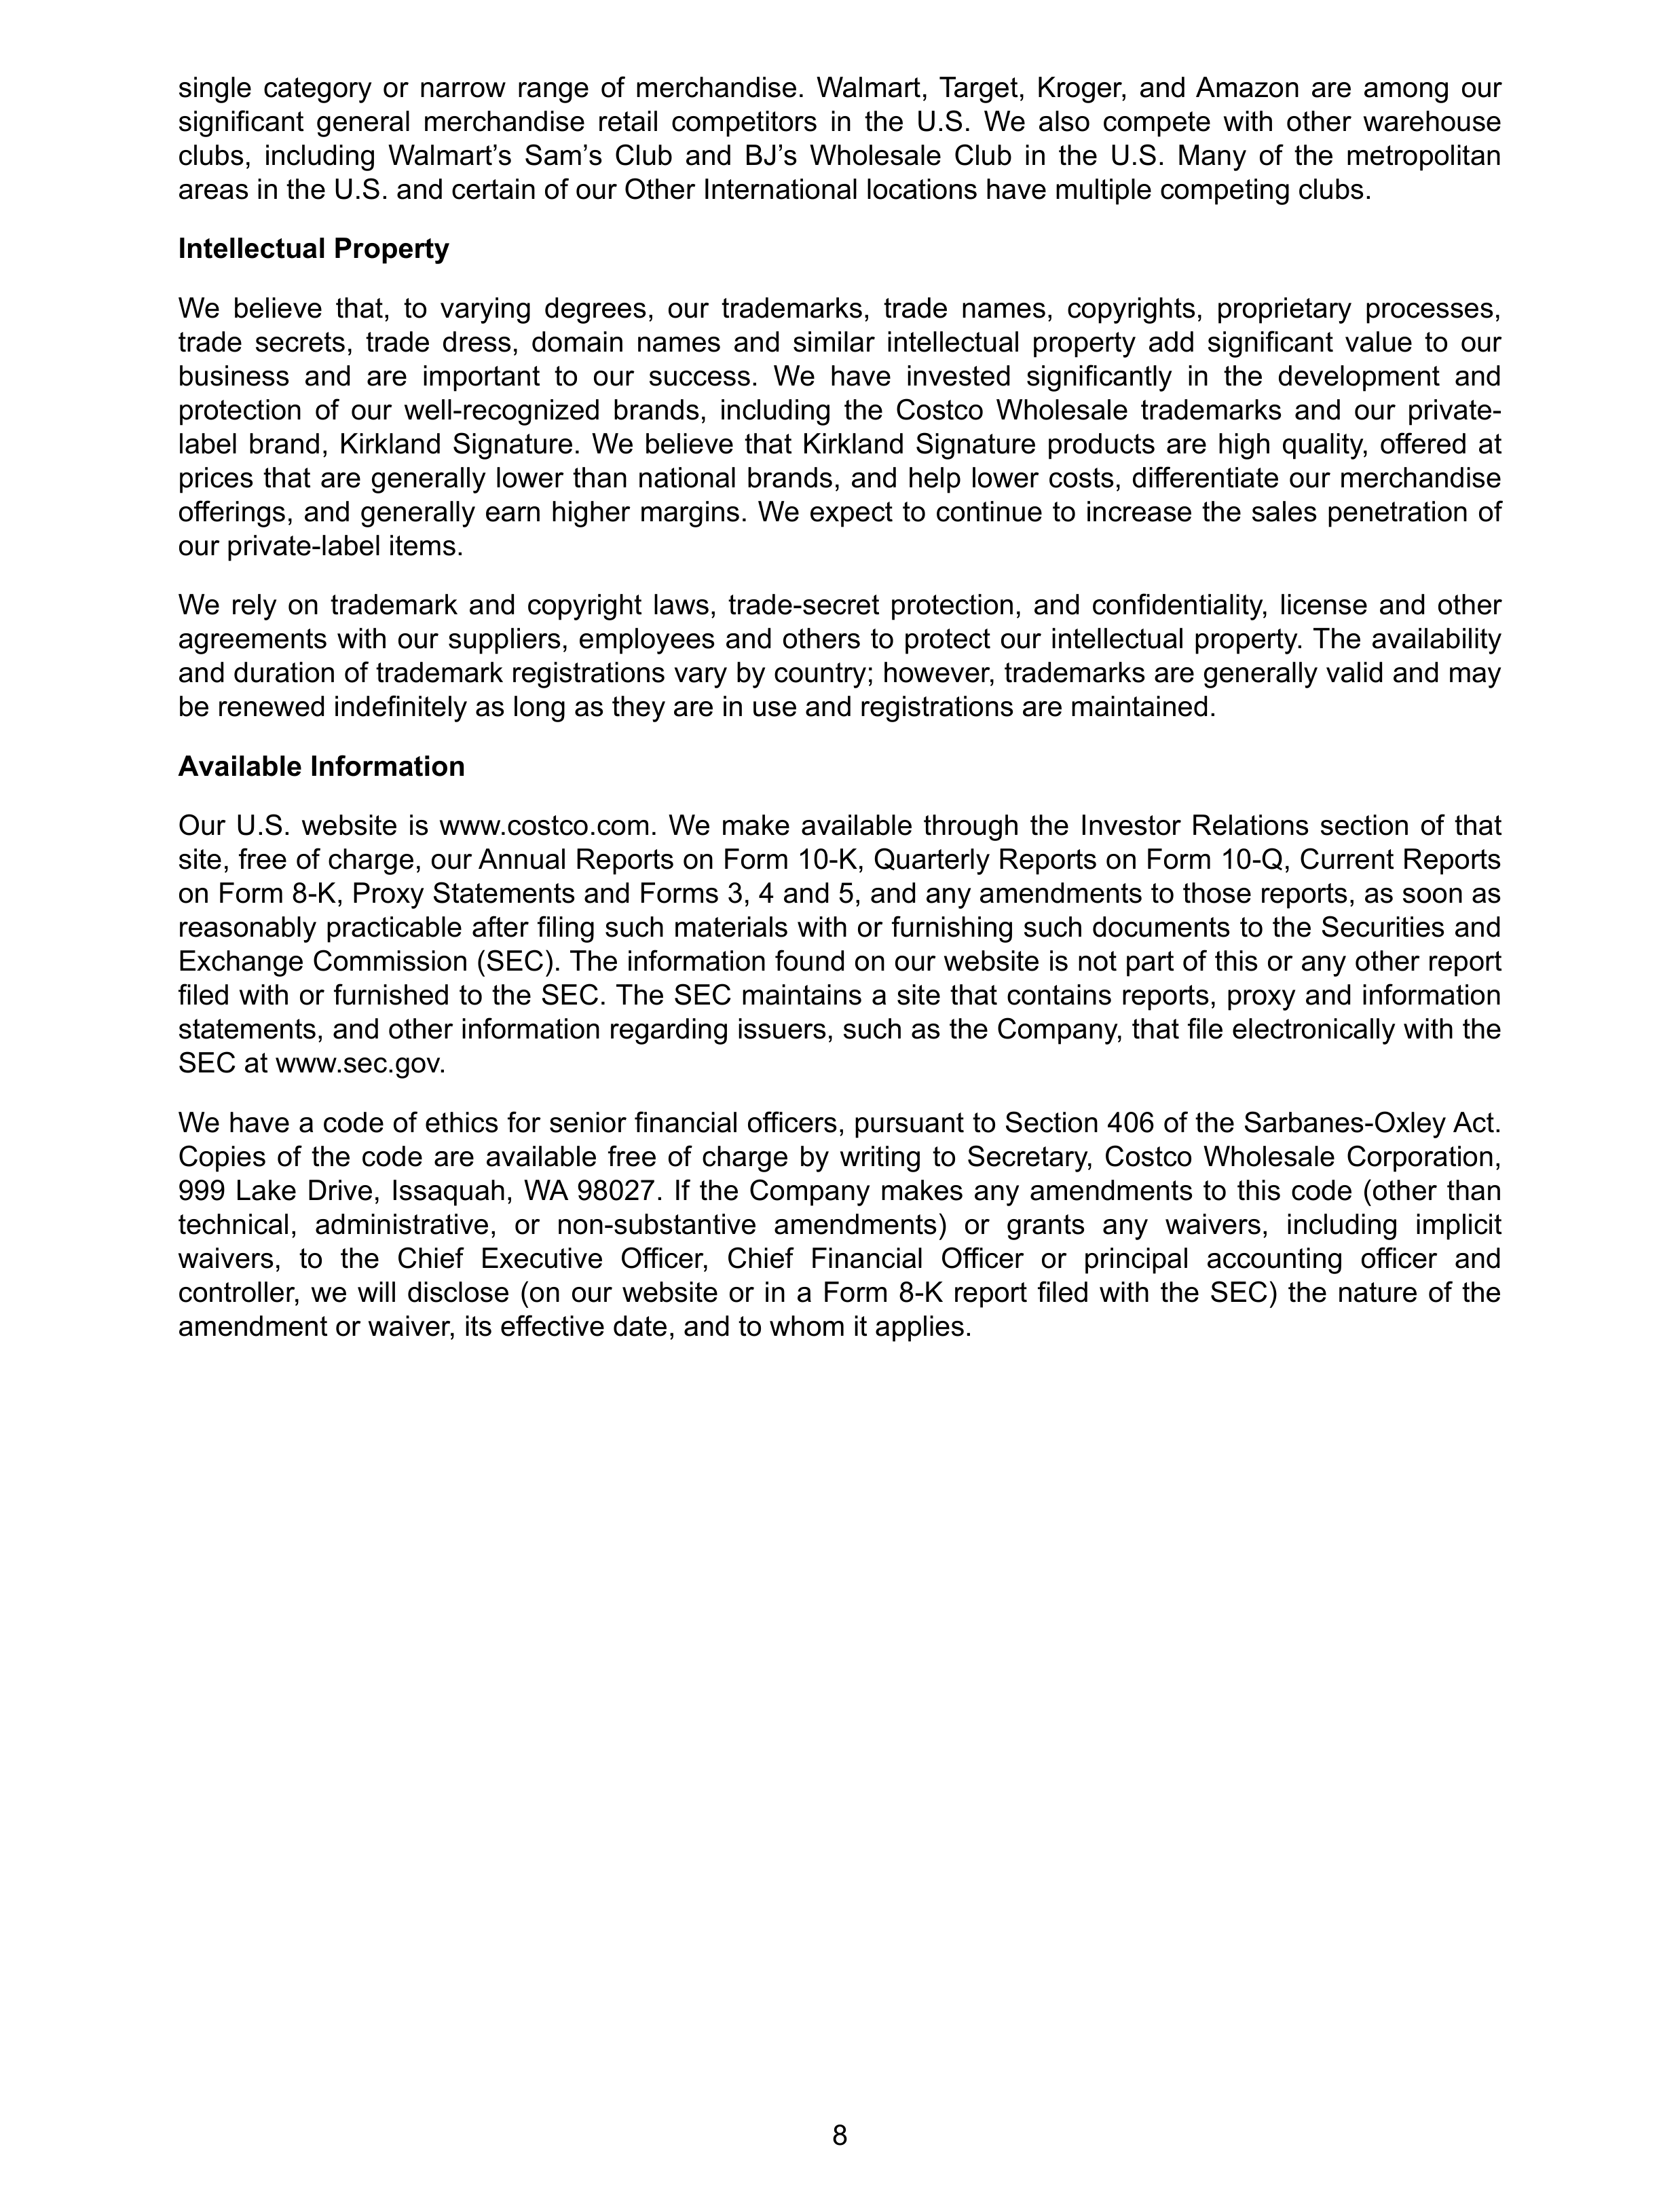
single category or narrow range of merchandise. Walmart, Target, Kroger, and Amazon are among our
significant general merchandise retail competitors in the U.S. We also compete with other warehouse
clubs, including Walmart’s Sam’s Club and BJ’s Wholesale Club in the U.S. Many of the metropolitan
areas in the U.S. and certain of our Other International locations have multiple competing clubs.
Intellectual Property
We believe that, to varying degrees, our trademarks, trade names, copyrights, proprietary processes,
trade secrets, trade dress, domain names and similar intellectual property add significant value to our
business and are important to our success. We have invested significantly in the development and
protection of our well-recognized brands, including the Costco Wholesale trademarks and our private-
label brand, Kirkland Signature. We believe that Kirkland Signature products are high quality, offered at
prices that are generally lower than national brands, and help lower costs, differentiate our merchandise
offerings, and generally earn higher margins. We expect to continue to increase the sales penetration of
our private-label items.
We rely on trademark and copyright laws, trade-secret protection, and confidentiality, license and other
agreements with our suppliers, employees and others to protect our intellectual property. The availability
and duration of trademark registrations vary by country; however, trademarks are generally valid and may
be renewed indefinitely as long as they are in use and registrations are maintained.
Available Information
Our U.S. website is www.costco.com. We make available through the Investor Relations section of that
site, free of charge, our Annual Reports on Form 10-K, Quarterly Reports on Form 10-Q, Current Reports
on Form 8-K, Proxy Statements and Forms 3, 4 and 5, and any amendments to those reports, as soon as
reasonably practicable after filing such materials with or furnishing such documents to the Securities and
Exchange Commission (SEC). The information found on our website is not part of this or any other report
filed with or furnished to the SEC. The SEC maintains a site that contains reports, proxy and information
statements, and other information regarding issuers, such as the Company, that file electronically with the
SEC at www.sec.gov.
We have a code of ethics for senior financial officers, pursuant to Section 406 of the Sarbanes-Oxley Act.
Copies of the code are available free of charge by writing to Secretary, Costco Wholesale Corporation,
999 Lake Drive, Issaquah, WA 98027. If the Company makes any amendments to this code (other than
technical, administrative, or non-substantive amendments) or grants any waivers, including implicit
waivers, to the Chief Executive Officer, Chief Financial Officer or principal accounting officer and
controller, we will disclose (on our website or in a Form 8-K report filed with the SEC) the nature of the
amendment or waiver, its effective date, and to whom it applies.
8
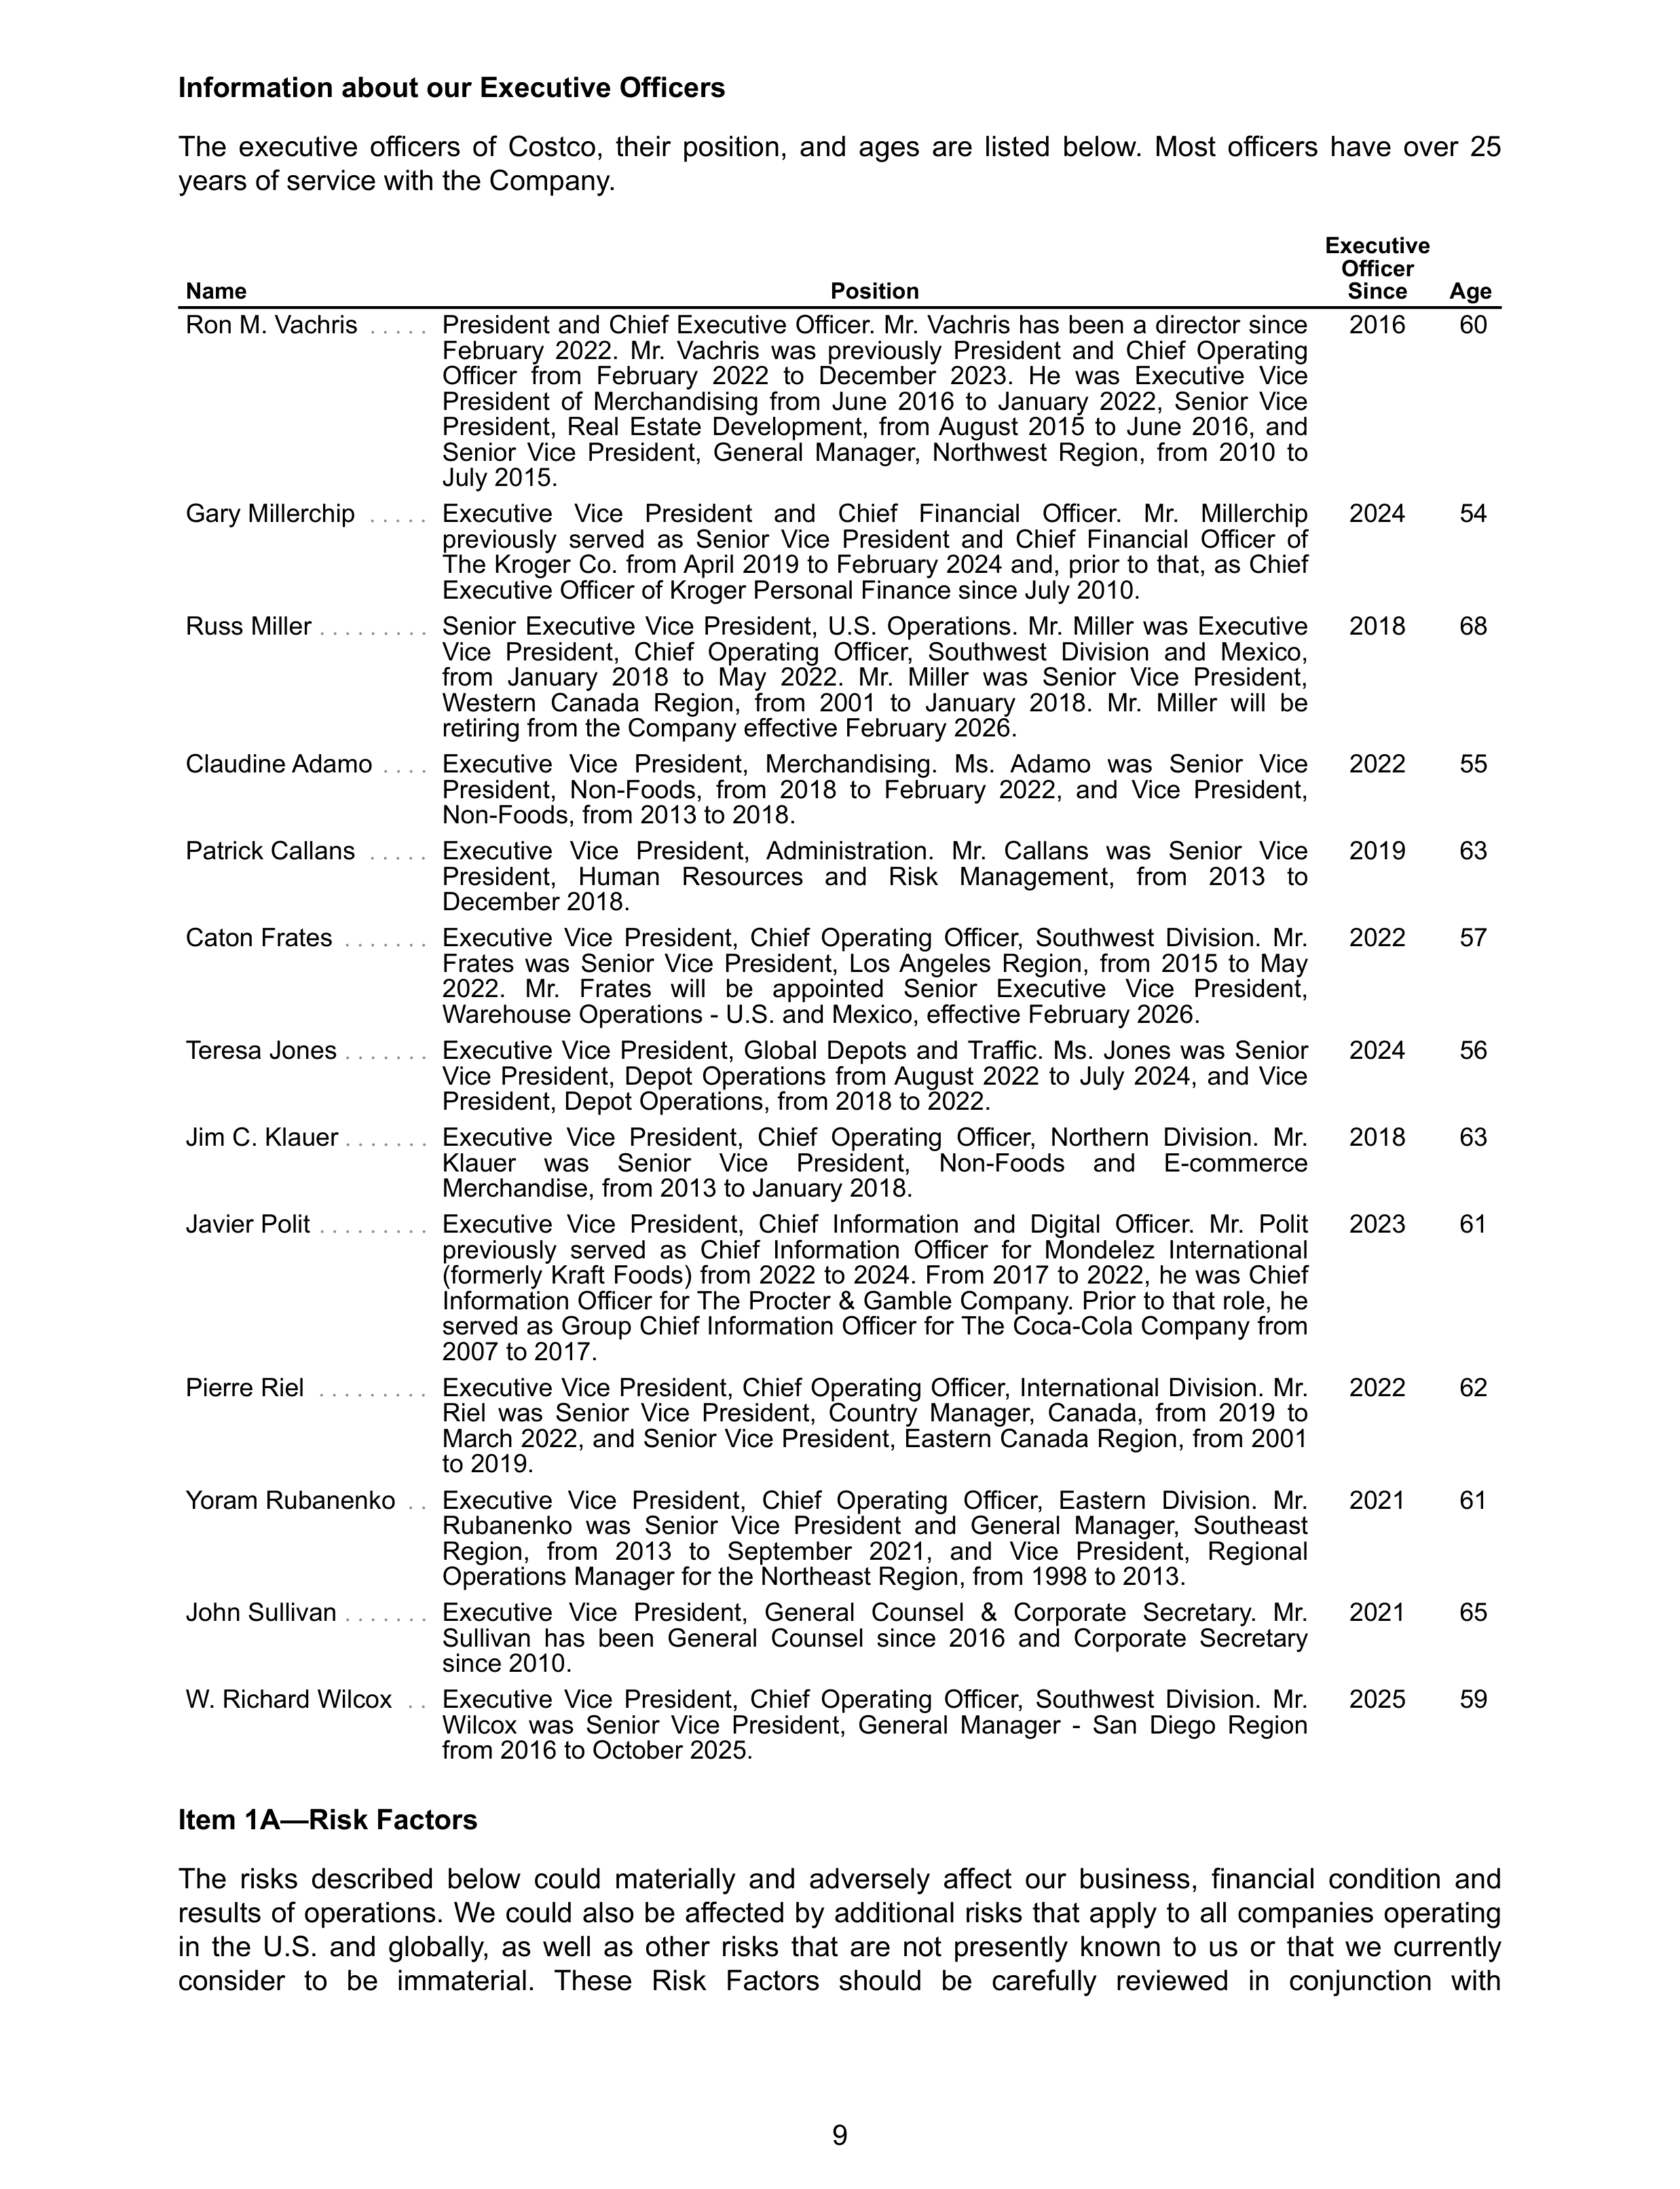
Information about our Executive Officers
The executive officers of Costco, their position, and ages are listed below. Most officers have over 25
years of service with the Company.
Name
Position
Executive
Officer
Since
Age
Ron M. Vachris
. . . . .
President and Chief Executive Officer. Mr. Vachris has been a director since
February 2022. Mr. Vachris was previously President and Chief Operating
Officer from February 2022 to December 2023. He was Executive Vice
President of Merchandising from June 2016 to January 2022, Senior Vice
President, Real Estate Development, from August 2015 to June 2016, and
Senior Vice President, General Manager, Northwest Region, from 2010 to
July 2015.
2016
60
Gary Millerchip
. . . . .
Executive Vice President and Chief Financial Officer. Mr. Millerchip
previously served as Senior Vice President and Chief Financial Officer of
The Kroger Co. from April 2019 to February 2024 and, prior to that, as Chief
Executive Officer of Kroger Personal Finance since July 2010.
2024
54
Russ Miller
. . . . . . . . .
Senior Executive Vice President, U.S. Operations. Mr. Miller was Executive
Vice President, Chief Operating Officer, Southwest Division and Mexico,
from January 2018 to May 2022. Mr. Miller was Senior Vice President,
Western Canada Region, from 2001 to January 2018. Mr. Miller will be
retiring from the Company effective February 2026.
2018
68
Claudine Adamo
. . . .
Executive Vice President, Merchandising. Ms. Adamo was Senior Vice
President, Non-Foods, from 2018 to February 2022, and Vice President,
Non-Foods, from 2013 to 2018.
2022
55
Patrick Callans
. . . . .
Executive Vice President, Administration. Mr. Callans was Senior Vice
President, Human Resources and Risk Management, from 2013 to
December 2018.
2019
63
Caton Frates
. . . . . . .
Executive Vice President, Chief Operating Officer, Southwest Division. Mr.
Frates was Senior Vice President, Los Angeles Region, from 2015 to May
2022. Mr. Frates will be appointed Senior Executive Vice President,
Warehouse Operations - U.S. and Mexico, effective February 2026.
2022
57
Teresa Jones
. . . . . . .
Executive Vice President, Global Depots and Traffic. Ms. Jones was Senior
Vice President, Depot Operations from August 2022 to July 2024, and Vice
President, Depot Operations, from 2018 to 2022.
2024
56
Jim C. Klauer
. . . . . . .
Executive Vice President, Chief Operating Officer, Northern Division. Mr.
Klauer
was
Senior
Vice
President,
Non-Foods
and
E-commerce
Merchandise, from 2013 to January 2018.
2018
63
Javier Polit
. . . . . . . . .
Executive Vice President, Chief Information and Digital Officer. Mr. Polit
previously served as Chief Information Officer for Mondelez International
(formerly Kraft Foods) from 2022 to 2024. From 2017 to 2022, he was Chief
Information Officer for The Procter & Gamble Company. Prior to that role, he
served as Group Chief Information Officer for The Coca-Cola Company from
2007 to 2017.
2023
61
Pierre Riel
. . . . . . . . .
Executive Vice President, Chief Operating Officer, International Division. Mr.
Riel was Senior Vice President, Country Manager, Canada, from 2019 to
March 2022, and Senior Vice President, Eastern Canada Region, from 2001
to 2019.
2022
62
Yoram Rubanenko
. .
Executive Vice President, Chief Operating Officer, Eastern Division. Mr.
Rubanenko was Senior Vice President and General Manager, Southeast
Region, from 2013 to September 2021, and Vice President, Regional
Operations Manager for the Northeast Region, from 1998 to 2013.
2021
61
John Sullivan
. . . . . . .
Executive Vice President, General Counsel & Corporate Secretary. Mr.
Sullivan has been General Counsel since 2016 and Corporate Secretary
since 2010.
2021
65
W. Richard Wilcox
. .
Executive Vice President, Chief Operating Officer, Southwest Division. Mr.
Wilcox was Senior Vice President, General Manager - San Diego Region
from 2016 to October 2025.
2025
59
Item 1A—Risk Factors
The risks described below could materially and adversely affect our business, financial condition and
results of operations. We could also be affected by additional risks that apply to all companies operating
in the U.S. and globally, as well as other risks that are not presently known to us or that we currently
consider to be immaterial. These Risk Factors should be carefully reviewed in conjunction with
9
Management
'
s Discussion and Analysis of Financial Condition and Results of Operations in Item 7 and
our consolidated financial statements and related notes in Item 8 of this Report.
Business and Operating Risks
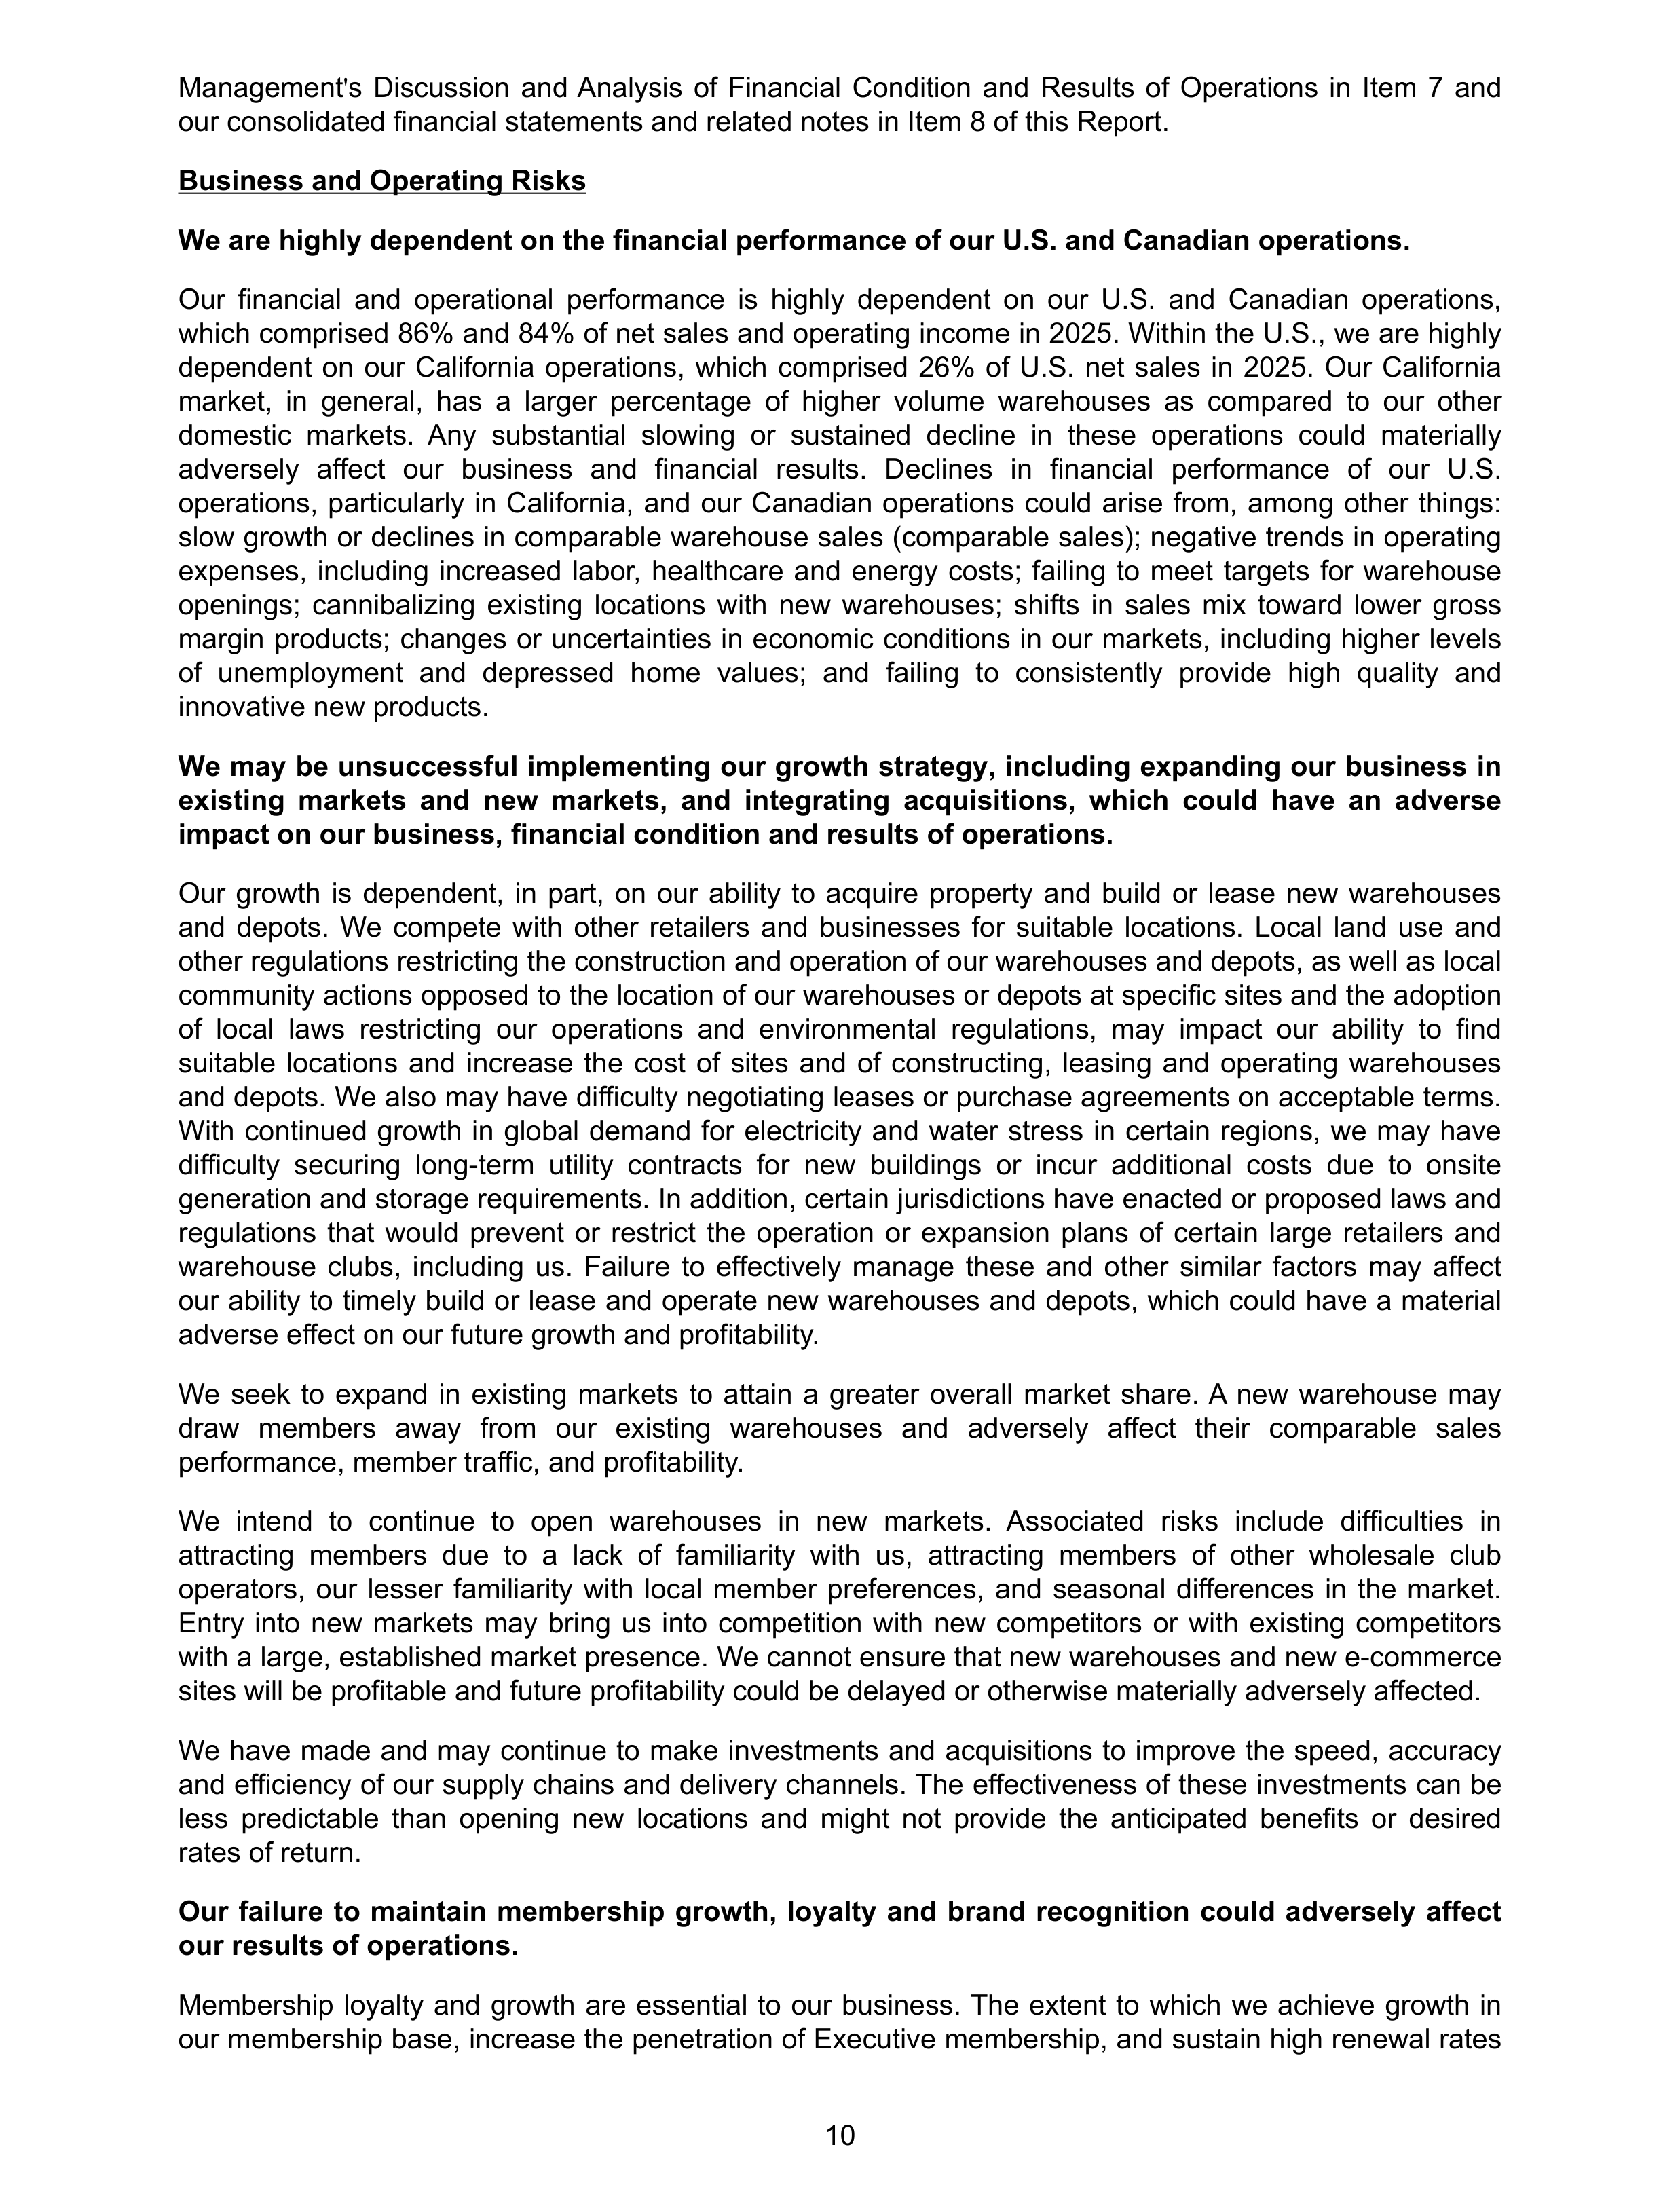
We are highly dependent on the financial performance of our U.S. and Canadian operations.
Our financial and operational performance is highly dependent on our U.S. and Canadian operations,
which comprised 86% and 84% of net sales and operating income in 2025. Within the U.S., we are highly
dependent on our California operations, which comprised 26% of U.S. net sales in 2025. Our California
market, in general, has a larger percentage of higher volume warehouses as compared to our other
domestic markets. Any substantial slowing or sustained decline in these operations could materially
adversely affect our business and financial results. Declines in financial performance of our U.S.
operations, particularly in California, and our Canadian operations could arise from, among other things:
slow growth or declines in comparable warehouse sales (comparable sales); negative trends in operating
expenses, including increased labor, healthcare and energy costs; failing to meet targets for warehouse
openings; cannibalizing existing locations with new warehouses; shifts in sales mix toward lower gross
margin products; changes or uncertainties in economic conditions in our markets, including higher levels
of unemployment and depressed home values; and failing to consistently provide high quality and
innovative new products.
We may be unsuccessful implementing our growth strategy, including expanding our business in
existing markets and new markets, and integrating acquisitions, which could have an adverse
impact on our business, financial condition and results of operations.
Our growth is dependent, in part, on our ability to acquire property and build or lease new warehouses
and depots. We compete with other retailers and businesses for suitable locations. Local land use and
other regulations restricting the construction and operation of our warehouses and depots, as well as local
community actions opposed to the location of our warehouses or depots at specific sites and the adoption
of local laws restricting our operations and environmental regulations, may impact our ability to find
suitable locations and increase the cost of sites and of constructing, leasing and operating warehouses
and depots. We also may have difficulty negotiating leases or purchase agreements on acceptable terms.
With continued growth in global demand for electricity and water stress in certain regions, we may have
difficulty securing long-term utility contracts for new buildings or incur additional costs due to onsite
generation and storage requirements. In addition, certain jurisdictions have enacted or proposed laws and
regulations that would prevent or restrict the operation or expansion plans of certain large retailers and
warehouse clubs, including us. Failure to effectively manage these and other similar factors may affect
our ability to timely build or lease and operate new warehouses and depots, which could have a material
adverse effect on our future growth and profitability.
We seek to expand in existing markets to attain a greater overall market share. A new warehouse may
draw members away from our existing warehouses and adversely affect their comparable sales
performance, member traffic, and profitability.
We intend to continue to open warehouses in new markets. Associated risks include difficulties in
attracting members due to a lack of familiarity with us, attracting members of other wholesale club
operators, our lesser familiarity with local member preferences, and seasonal differences in the market.
Entry into new markets may bring us into competition with new competitors or with existing competitors
with a large, established market presence. We cannot ensure that new warehouses and new e-commerce
sites will be profitable and future profitability could be delayed or otherwise materially adversely affected.
We have made and may continue to make investments and acquisitions to improve the speed, accuracy
and efficiency of our supply chains and delivery channels. The effectiveness of these investments can be
less predictable than opening new locations and might not provide the anticipated benefits or desired
rates of return.
Our failure to maintain membership growth, loyalty and brand recognition could adversely affect
our results of operations.
Membership loyalty and growth are essential to our business. The extent to which we achieve growth in
our membership base, increase the penetration of Executive membership, and sustain high renewal rates
10
materially influences our profitability. Damage to our brands or reputation may negatively impact
comparable sales, diminish member trust, and reduce renewal rates and, accordingly, net sales and
membership fee revenue, negatively impacting our results of operations.
We sell many products under our Kirkland Signature brand. Maintaining consistent product quality,
competitive pricing, and availability of these products is essential to developing and maintaining member
loyalty. These products also generally carry higher margins than national brand products and represent a
growing portion of our overall sales. If the Kirkland Signature brand experiences a loss of member
acceptance or confidence, our sales and gross margin results could be adversely affected.
Disruptions in merchandise distribution or processing, packaging, manufacturing, and other
facilities could adversely affect sales and member satisfaction.
We depend on the orderly operation of the merchandise receiving and distribution process, primarily
through our depots. We also rely upon processing, packaging, manufacturing and other facilities to
support our business, which includes the production of certain private-label items. Although we believe
that our operations are efficient, disruptions due to extreme weather, pandemics or other catastrophic
events, labor issues, work stoppage, or other shipping problems may result in delays in the production
and delivery of merchandise to and the operation of our warehouses, which could adversely affect sales
and the satisfaction of our members. Our e-commerce operations depend heavily on logistics providers,
both internal and external, and are negatively affected when services are unable to be provided in a
timely fashion.
We may not timely identify or effectively respond to consumer tastes and preferences, which
could negatively affect our relationship with our members, the demand for our products and
services, and our market share.
It is difficult to consistently and successfully predict the products and services that our members will
desire. Our success depends, in part, on our ability to identify and respond to trends in demographics and
consumer preferences. Failure to identify timely or effectively respond to changing consumer tastes,
preferences and spending patterns including those related to resource efficiency, environmental
protection, human rights, and the transition to a low-carbon economy could negatively affect our
relationship with our members, the demand for our products and services, and our market share. We sell
a substantial amount of gasoline, the demand for which could be impacted by concerns and regulation
about climate change.
If we are not successful at predicting our sales trends and adjusting our purchases accordingly, we may
have excess inventory, which could result in additional markdowns, or we may experience out-of-stock
positions and delivery delays, which could result in higher costs, both of which would reduce our
operating performance. This could have an adverse effect on net sales, gross margin and operating
income.
Availability and performance of our IT systems are vital to our business. Failure to successfully
execute IT projects and have IT systems available to our business would adversely impact our
operations.
IT systems play a crucial role in conducting our business. These systems are utilized to, among other
things, process a very high volume of transactions, conduct payment transactions, track and value our
inventory and produce reports critical for making business decisions. Failure or disruption of these
systems could have an adverse impact on our ability to buy products and services from our suppliers,
produce goods in our manufacturing plants, move products in an efficient manner to our warehouses, and
sell products to our members. Given the high volume of transactions we process, it is important that we
build strong resiliency to lessen disruption from events such as power outages, computer and
telecommunications failures, viruses, internal or external security breaches and other cybersecurity
incidents, errors by employees, extreme weather, and catastrophic events. Any debilitating failure of our
critical IT systems, data centers and backup systems would require significant investments in resources
to restore services and may cause serious impairment in our business operations, including loss of
business services, increased cost of moving merchandise and failure to provide service to our members.
We are currently making substantial investments in technology and IT projects, including maintaining and
enhancing our digital resiliency, and failure or delay in these projects could be costly and harmful to our
11
business. Failure to deliver IT projects efficiently and effectively could result in the loss of our competitive
position and adversely impact our financial condition and results of operations. Insufficient IT capacity
could also impact our capacity for timely, complete and accurate financial and non-financial reporting
required by law.
We are required to maintain the privacy and security of personal and business information amidst
multiplying threat landscapes and in compliance with increasing privacy and data protection
regulations globally. Failure to do so could damage our business, including our reputation with
members, suppliers and employees, cause us to incur substantial additional costs, and become
subject to litigation and regulatory action.
Increased security threats and more sophisticated cyber misconduct pose a risk to our systems,
networks, products and services. We rely upon IT systems and networks, some of which are managed by
or belong to third parties, including suppliers, partners, vendors, and service providers. Additionally, we
collect, store and process sensitive information relating to our business, members, employees, and other
third parties. Operating these IT systems and networks and processing and maintaining this data in a
secure manner, are critical to our business operations and strategy. Remote work has also expanded
possible attack surfaces. Attempts to gain unauthorized access to systems, networks and data, both ours
and third parties with whom we work, are increasing in frequency and sophistication, and in some cases,
these attempts are successful. Cybersecurity attacks may range from random attempts to coordinated
and targeted attacks, including sophisticated computer crimes and advanced persistent threats. Phishing
attacks have emerged as particularly prominent, including as vectors for ransomware attacks, which have
increased in breadth and frequency. While we train our employees as part of our security efforts, that
training cannot be completely effective. These threats pose a risk to the security of our systems and
networks and the confidentiality, integrity, and availability of our data. Our IT systems and networks, or
those managed by third parties such as cloud providers or suppliers that otherwise host or have access to
confidential information, periodically have vulnerabilities, which may go unnoticed for a period of time. Our
logging capabilities, or the logging capabilities of third parties, are also not always complete or sufficiently
detailed, affecting our ability to fully investigate and understand the scope of security events. While our
cybersecurity and compliance efforts seek to mitigate such risks, there can be no guarantee that the
actions and controls we and our third-party service providers have implemented and are implementing,
will be sufficient to protect our systems, information or other property.
The potential impacts of a cybersecurity attack include reputational damage, litigation, government
enforcement actions, penalties, disruption to systems and operations, unauthorized release of confidential
or otherwise protected information, corruption of data, diminution in the value of our investment in IT
systems and increased cybersecurity protection and remediation costs. This could adversely affect our
competitiveness, results of operations and financial condition and, critically in light of our business model,
loss of member confidence. Further, the insurance coverage we maintain and indemnification
arrangements with third parties may be inadequate to cover claims, costs, and liabilities relating to
cybersecurity incidents. In addition, data we collect, store and process is subject to a variety of U.S. and
international laws and regulations (such as the European Union General Data Protection Regulation,
California Consumer Privacy Act, Health Insurance Portability and Accountability Act, and China's
Personal Information Protection Act), evolving rules concerning artificial intelligence, and other privacy
and cybersecurity laws and restrictions on use of member information that may also impair our ability to
utilize data, consistent with member consents and preferences, which may carry significant potential
penalties for noncompliance.
We are subject to payment-related risks.
We accept payments using a variety of methods, including select credit and debit cards, cash and checks,
co-brand cardholder rebates, Executive member 2% reward certificates, and our shop card. As we offer
new payment options to our members, we may be subject to additional rules, regulations, compliance
requirements, and higher fraud losses. For certain payment methods, we pay interchange and other
related acceptance fees, along with additional transaction processing fees. We rely on third parties to
provide payment transaction processing services for credit and debit cards and our shop card. It could
disrupt our business if these parties become unwilling or unable to provide these services to us. We are
also subject to fee increases by these service providers.
12
We must comply with evolving payment card association and network operating rules, including data
security rules, certification requirements and rules governing electronic funds transfers. For example, we
are subject to Payment Card Industry Data Security Standards, which contain compliance guidelines and
standards with regard to our security surrounding the physical and electronic storage, processing and
transmission of individual cardholder data. If our internal systems are breached or compromised, we may
be liable for card re-issuance costs, subject to fines and higher transaction fees and lose our ability to
accept card payments from our members, and our business and operating results could be adversely
affected. Our failure to offer payment methods desired by our members could create a competitive
disadvantage.
We might sell products that cause illness or injury to our members, harm to our reputation, and
expose us to litigation.
If our merchandise, including food and prepared food products for human consumption, drugs, children
'
s
products, pet products and durable goods, do not meet or are perceived not to meet applicable safety or
labeling standards or our members
'
expectations, we could experience lost sales, increased costs,
litigation or reputational harm. The sale of these items involves the risk of illness or injury to our members.
Such illnesses or injuries could result from tampering by unauthorized third parties, product contamination
or spoilage, including the presence of foreign objects, substances, chemicals, other agents, or residues
introduced during the growing, manufacturing, storage, handling and transportation phases, or faulty
design. Our suppliers are generally contractually required to comply with product safety laws, and we are
dependent on them to ensure that the products we buy comply with safety and other standards. While we
are subject to governmental inspection and regulations and work to comply in all material respects with
applicable laws and regulations, we cannot be sure that consumption or use of our products will not cause
illness or injury or that we will not be subject to claims, lawsuits, or government investigations relating to
such matters, resulting in costly product recalls and other liabilities that could adversely affect our
business and results of operations. Even if a product liability claim is unsuccessful or is not fully pursued,
negative publicity could adversely affect our reputation with existing and potential members and our
corporate and brand image, and these effects could be long-term.
If we do not successfully develop and maintain a relevant and comprehensive digital experience
for our members, our results of operations could be adversely impacted.
We must keep pace with changing member expectations and new developments by our competitors. Our
members are increasingly using mobile phones, tablets, computers, and other devices to shop and
otherwise interact with us. We are making investments in our websites and mobile applications. If we are
unable to make, improve, or develop relevant member-facing technology in a timely manner, our ability to
compete and our results of operations could be adversely affected.
Inability to attract, train and retain qualified employees could adversely impact our business,
financial condition and results of operations.
Our success depends on the continued contributions of our employees, including members of our senior
management and other key operations, IT, merchandising and administrative personnel. Failure to identify
and implement a succession plan for senior management could negatively impact our business. We must
attract, train and retain a large and growing number of qualified employees, while controlling related labor
costs and maintaining our core values. Our ability to control labor and benefit costs is subject to
numerous internal and external factors, including regulatory changes, prevailing wage rates, union
relations and healthcare and other insurance costs. We compete with other retail and non-retail
businesses for these employees and invest significant resources in training and motivating them. There is
no assurance that we will be able to attract or retain highly qualified employees in the future, which could
have a material adverse effect on our business, financial condition and results of operations.
We may incur property, casualty or other losses not covered by our insurance.
Claims for employee health care benefits, workers’ compensation, general liability, property damage,
directors’ and officers’ liability, vehicle liability, inventory loss, and other exposures are funded
predominantly through self-insurance. Insurance coverage is maintained for certain risks to limit
exposures arising from very large losses. The types and amounts of insurance may vary from time to time
based on our decisions with respect to risk retention and regulatory requirements. Significant claims or
13
events, regulatory changes, a substantial rise in costs of health care or costs to maintain our insurance or
the failure to maintain adequate insurance coverage could have an adverse impact on our financial
condition and results of operations.
Although we maintain specific coverages for catastrophic property losses, we still bear a significant
portion of the risk of losses incurred as a result of any physical damage to, or the destruction of, any
warehouses, depots, manufacturing or home office facilities, loss or spoilage of inventory, and business
interruption. Such losses could materially impact our cash flows and results of operations.
Market and Other External Risks
We face strong competition from other retailers and warehouse club operators, which could
adversely affect our business, financial condition and results of operations.
The retail business is highly competitive. We compete for members, employees, sites, products and
services and in other important respects with a wide range of local, regional and national wholesalers and
retailers, both in the United States and in foreign countries, including other warehouse-club operators,
supermarkets, supercenters, online retailers, gasoline stations, pharmacies, hard discounters, department
and specialty stores and operators selling a single category or narrow range of merchandise or services.
Such retailers and warehouse club operators compete vigorously and in a variety of ways, including
pricing, selection and availability, services, location, convenience, store hours, and the attractiveness and
ease of use of websites and mobile applications. The evolution of retailing in online and mobile channels
has improved the ability of customers to comparison shop, which has enhanced competition. Some
competitors have greater financial resources and technology capabilities, including the faster adoption of
artificial intelligence, better access to merchandise, and greater market penetration than we do. Our
inability to respond effectively to competitive pressures, changes in the retail markets or customer
expectations could result in lost market share and negatively affect our financial results.
General economic factors, domestically and internationally, may adversely affect our business,
financial condition, and results of operations.
Higher energy and gasoline costs, inflation, levels of unemployment, healthcare costs, consumer debt
levels, foreign-currency exchange rates, unsettled financial markets, weaknesses in housing and real
estate markets, reduced consumer confidence, changes and uncertainties related to government fiscal,
monetary and tax policies including changes in interest rates, tax rates, duties, tariffs, or other restrictions,
sovereign debt crises, pandemics and other health crises, and other economic factors could adversely
affect demand for our products and services, require a change in product mix, or impact the cost of or
ability to purchase inventory. Additionally, trade-related actions in various countries have affected the
costs of some of our merchandise. The degree of our exposure is dependent on (among other things) the
type of goods, rates imposed, and timing of the tariffs and policy changes. The impact to our net sales
and gross margin is influenced in part by our merchandising and pricing strategies in response to
potential cost increases. Higher tariffs could adversely impact our results.
Prices of certain commodities, including gasoline and consumable goods used in manufacturing and our
warehouse retail operations, are historically volatile and are subject to fluctuations arising from changes in
domestic and international supply and demand, inflationary pressures, labor costs, competition, market
speculation, government regulations, taxes and periodic delays in delivery. Rapid and significant changes
in commodity prices and our ability and desire to pass them through to our members may affect our sales
and profit margins. These factors could also increase our merchandise costs and selling, general and
administrative expenses, and otherwise adversely affect our operations and financial results. General
economic conditions can also be affected by events like the outbreak of hostilities or acts of terrorism.
Inflationary factors such as increases in merchandise costs may adversely affect our business, financial
condition and results of operations. We may not be able to adjust prices to sufficiently offset the effect of
cost increases without negatively impacting consumer demand.
14
Suppliers may be unable to timely supply us with quality merchandise at competitive prices or
may fail to adhere to our high standards, resulting in adverse effects on our business,
merchandise inventories, sales, and profit margins.
We depend heavily on our ability to purchase quality merchandise in sufficient quantities at competitive
prices. As the quantities we require continue to grow, we have no assurances of continued supply,
appropriate pricing or access to new products, and any supplier has the ability to change the terms upon
which they sell to us or discontinue selling to us. Member demands may lead to out-of-stock positions
causing a loss of sales and profits.
We buy from numerous domestic and foreign suppliers and importers. Our inability to acquire suitable
merchandise on acceptable terms or the loss of key suppliers could negatively affect us. We may not be
able to develop relationships with new suppliers, and products from alternative sources, if any, may be of
a lesser quality or more expensive. Because of our efforts to adhere to high-quality standards for which
available supply may be limited, particularly for certain food items, the large volumes we demand may not
be consistently available. Our efforts to secure supply could lead to commitments that prove to be
unsuccessful in the short and long-term.
Our suppliers (and those they depend upon for materials and services) are subject to risks, including
labor disputes, union organizing activities, human and animal rights violations, financial liquidity, climate
change, natural disasters, extreme weather conditions, environmental degradation, public health
emergencies, supply constraints and general economic and political conditions and other risks similar to
those we face that could limit their ability to timely provide us with acceptable merchandise. One or more
of our suppliers might not adhere to our quality control, packaging, legal, regulatory, labor, human rights,
environmental or animal welfare standards. These deficiencies may delay or preclude delivery of
merchandise to us and might not be identified before we sell such merchandise to our members. This
failure could lead to recalls and litigation and otherwise damage our reputation and our brands, increase
costs, and otherwise adversely impact our business.
Fluctuations in foreign-exchange rates may adversely affect our results of operations.
During 2025, our international operations, including Canada, generated 27% and 34% of our net sales
and operating income. Our international operations have accounted for an increasing portion of our
warehouses, and we plan to continue international growth. To prepare our consolidated financial
statements, we translate the financial statements of our international operations from local currencies into
U.S. dollars using current exchange rates. Future fluctuations in exchange rates that are unfavorable to
us may adversely affect the financial performance of our Canadian and Other International operations and
have a corresponding adverse period-over-period effect on our results of operations. As we continue to
expand internationally, our exposure to fluctuations in foreign-exchange rates may increase.
A portion of the products we purchase is paid for in a currency other than the local currency of the country
in which the goods are sold. Currency fluctuations may increase our merchandise costs and may not be
passed on to members and thus may adversely affect our results of operations.
Natural disasters, extreme weather conditions, or other catastrophic events could negatively
affect our business, financial condition, and results of operations.
Natural disasters, extreme weather conditions, and other catastrophic events, including those impacted
by climate change, such as extreme temperatures, hurricanes, typhoons, floods, earthquakes, wildfires,
droughts; acts of terrorism or violence, including active shooter situations; and energy shortages;
particularly in California or Washington state, where our centralized operating systems and administrative
personnel are located, could negatively affect our operations and financial performance. Such events
could result in physical damage to our properties or inventory, additional heating, cooling, and
refrigeration costs, limitations on store operating hours, less frequent visits by members to physical
locations, the temporary closure of warehouses, depots, manufacturing or home office facilities, the
temporary lack of an adequate work force, disruptions to our IT systems, the temporary or long-term
disruption in the supply of products from some local or overseas suppliers, the temporary disruption in the
transport of goods to or from overseas, delays in the delivery of goods to our warehouses or depots,
delays in online merchandise delivery, the temporary reduction in the availability of products in our
warehouses, and long-term disruption or threats to the habitability of key markets in which we operate.
15
These events could also reduce demand for our products or make it difficult or impossible to procure
products. We may be required to suspend operations in some or all of our locations, which could have a
material adverse effect on our business, financial condition and results of operations.
Pandemics and other health crises could affect our business, financial condition and results of
operations in many respects.
The emergence, severity, magnitude and duration of global or regional health crises are uncertain and
difficult to predict. A pandemic could affect certain business operations, demand for our products and
services, in-stock positions, costs of doing business, availability of labor, access to inventory, supply chain
operations, our ability to predict future performance, exposure to litigation, and our financial performance,
among other things. Other factors and uncertainties include, but are not limited to:
•
The severity and duration of pandemics;
•
Evolving macroeconomic factors, including general economic uncertainty, unemployment rates,
and recessionary pressures;
•
Changes in labor markets affecting us and our suppliers;
•
Unknown consequences on our business performance and initiatives stemming from the
substantial investment of time and other resources to the pandemic response;
•
The pace of post-pandemic recovery;
•
The long-term impact of the pandemic on our business, including consumer behaviors; and
•
Disruption and volatility within the financial and credit markets.
Failure to meet financial market expectations could adversely affect the market price and volatility
of our stock.
We believe that the price of our stock currently reflects high market expectations for our future operating
results. Any failure to meet or delay in meeting these expectations, including our comparable sales growth
rates, membership fee revenue, including new member sign-ups and renewal rates, gross margin,
earnings, earnings per share, new warehouse openings, or dividend or stock repurchase policies could
cause the price of our stock to decline.
Legal and Regulatory Risks
Changes in or failure to comply with laws and regulations could adversely impact our business,
financial condition and results of operations.
We are subject to a wide and growing array of federal, state, local and international laws and regulations
relating to (among other things), product and food safety, marketing, information security and privacy,
labor and employment, imports and customs, transportation, intellectual property, anti-corruption, and
environmental or social matters. These laws and regulations may expand mandatory reporting, increase
the scope and complexity of matters that we are required to regulate, assess, and disclose, potentially
limit our sourcing flexibility or require extensive system or other changes that could increase the cost of
doing business. Failure to comply could result in harm to our members, employees, workers in the value
chain or others, significant costs to satisfy environmental compliance, remediation or compensatory
requirements, or the imposition of severe penalties or restrictions on operations by governmental
agencies or courts that could adversely affect our business, financial condition and results of operations.
The impact of changes to or the introduction of new laws, regulations and policies and enforcement
practices, can be unpredictable. These may require extensive system and operational changes, be
difficult to implement, increase the cost of doing business, require significant capital expenditures,
adversely impact the products or services we offer, or result in adverse publicity and harm to our
reputation. If we fail to comply or respond adequately to changes in laws and regulations, our business,
operations and financial performance may be adversely affected.
We are subject to risks associated with the legislative, judicial, accounting, regulatory, political
and economic factors specific to the countries or regions in which we operate, which could
adversely affect our business, financial condition and results of operations.
At the end of 2025, we operated 285 warehouses outside of the U.S. (31% of all warehouse locations),
and we plan to continue expanding our international operations. Future operating results internationally
16
could be negatively affected by a variety of factors, many similar to those we face in the U.S., certain of
which are beyond our control. These factors include political and economic conditions, regulatory
constraints, currency regulations, policy changes, and other matters in any of the countries or regions in
which we operate, now or in the future. Other factors that may impact international operations include
foreign trade (including tariffs and trade sanctions), monetary and fiscal policies and the laws and
regulations of the U.S. and foreign governments, agencies and similar organizations, and risks associated
with having major facilities in locations which have been historically less stable than the U.S. Risks
inherent in international operations also include, among others, the costs and difficulties of managing
international operations, adverse tax consequences, and difficulty in enforcing intellectual property rights.
New reporting obligations globally are increasing the cost and complexity of doing business.
Changes in accounting standards and subjective assumptions, estimates and judgments by
management related to complex accounting matters could significantly affect our financial
condition and results of operations.
Accounting principles and related pronouncements, implementation guidelines, and interpretations we
apply to a wide range of matters that are relevant to our business, including self-insurance liabilities, are
highly complex and involve subjective assumptions, estimates and judgments by our management.
Changes in rules or interpretation or changes in underlying assumptions, estimates or judgments by our
management could significantly change our reported or expected financial performance and have a
material impact on our consolidated financial statements.
We are exposed to risks relating to evaluations of controls required by Section 404 of the
Sarbanes-Oxley Act and otherwise.
Section 404 of the Sarbanes-Oxley Act of 2002 requires management assessments of the effectiveness
of internal control over financial reporting and disclosure controls and procedures. If we are unable to
maintain effective internal control over financial reporting or disclosure controls and procedures, our ability
to record, process and report financial information accurately and to prepare financial statements within
required time periods could be adversely affected, which could subject us to litigation or investigations
requiring management resources and payment of legal and other expenses, negatively affect investor
confidence in our financial statements and adversely impact our stock price. Uncertainties around our
developing systems concerning controls for non-financial reporting also create risks.
Changes in federal, state and foreign tax rates and legislation, could adversely affect our financial
condition and results of operations.
We are subject to a variety of taxes and tax collection and remittance obligations related to federal, state
and foreign jurisdictions. Additionally, at any point in time, we may be under examination for value added,
sales-based, payroll, product, import or other non-income taxes. We may recognize additional tax
expense, be subject to additional tax liabilities, or incur losses and penalties, due to changes in laws,
regulations, administrative practices, principles, assessments by authorities and interpretations related to
tax, including tax rules in various jurisdictions. We compute our income tax provision based on enacted
tax rates in the countries in which we operate. As tax rates vary among countries, a change in earnings
attributable to the various jurisdictions in which we operate could result in an unfavorable change in our
overall tax provision. Additionally, changes in the enacted tax rates or adverse outcomes in tax audits,
including transfer pricing disputes, could have a material adverse effect on our financial condition and
results of operations.
Failure or perceived failure to meet our environmental, social or governance (ESG) goals or
expectations set by changing public interest and government regulation of ESG topics could
result in reputational harm or adversely affect our business.
We are committed to doing what is right for the business, our members, employees and shareholders
over the long-term. Costco has set public targets and disclosed intentions for future action regarding
sustainability. There are dependencies outside of our control impacting our ability to meet our goals,
including but not limited to: economic conditions, ability to access technology at an appropriate cost or
scale, the ability to procure sufficient clean energy at competitive market rates to meet future operational
and supplier needs, unforeseen operational and implementation challenges, termination or contraction of
policies or systems which support our capital investments, and collaboration with third parties. For
17
example, multiple states are implementing extended producer responsibility laws that will require us to
enact policies and processes and will increase expenses in the form of fees paid to the state
governments, else be subject to fines and penalties, among other effects. We may not make adequate
and timely investments or successfully implement strategies that will effectively achieve our sustainability-
related goals. Furthermore, federal, state and local regulatory authorities, private organizations and
individuals may challenge our approach to ESG issues, including allegations that we failed in our efforts,
should not have undertaken such efforts or that we improperly engaged other entities in our approach to
ESG issues. A failure or perceived failure to meet our goals or otherwise meet evolving and diverse
stakeholder expectations could lead to reputational harm.
Our operations require the treatment and disposal of wastewater, stormwater and agricultural and food
processing wastes, the use and maintenance of refrigeration systems, noise, odor and dust management,
the operation of mechanized processing equipment, and other operations that potentially could affect the
environment and public health and safety. Failure to comply with current and future environmental, health
and safety standards could result in the imposition of fines and penalties, illness or injury of our
employees, and claims or lawsuits related to such illnesses or injuries, and temporary closures or limits
on the operations of facilities.
Natural gas, diesel fuel, gasoline, and electricity are used in our operations, distribution channels, and
value chain. Government regulations limiting carbon dioxide and other greenhouse gas emissions and
other environmental restrictions may increase compliance, operations, and merchandise costs, and other
regulations affecting energy inputs could materially affect our profitability.
More stringent fuel economy standards, changing public policies aimed at increasing the adoption of zero-
emission and alternative fuel vehicles, and other regulations related to climate change may affect our
future operations, adversely impact certain elements of our profitability, and require significant capital
expenditures.
We are involved in a number of legal proceedings and audits and some of these outcomes could
adversely affect our business, financial condition and results of operations.
Our business requires compliance with many laws and regulations. Failure to achieve compliance could
subject us to lawsuits and other proceedings and lead to damage awards, fines, penalties, and
remediation costs. We are or may become involved in a number of legal proceedings and audits,
including grand jury investigations, government and agency investigations, and consumer, employment,
tort, unclaimed property laws, and other litigation. We cannot predict with certainty the outcomes of these
proceedings and other contingencies, including environmental remediation and other proceedings
commenced by governmental authorities. The outcome of some of these proceedings, audits, unclaimed
property laws, and other contingencies could require us to take, or refrain from taking, actions which could
negatively affect our operations or could require us to pay substantial amounts of money, adversely
affecting our financial condition and results of operations. Additionally, defending against these lawsuits
and proceedings may involve significant expense and diversion of management
'
s attention and
resources.
Item 1B—Unresolved Staff Comments
None.
Item 1C—Cybersecurity
Risk Management and Global Strategy
We have implemented processes, technologies, and controls to seek to assess, identify, and manage
risks associated with cybersecurity threats. Management considers cybersecurity risks within our overall
approach to enterprise risk management. We evaluate these risks based on several frameworks,
including the National Institute of Standards and Technology (NIST) Cybersecurity Framework (CSF),
Center for Internet Security (CIS) 18 Critical Security Controls, and the Payment Card Industry Data
Security Standard. Our governance policies, including our Information Security Policy, outline high-level
objectives designed to meet compliance and regulatory requirements.
18
We undertake regular NIST CSF and CIS 18 Critical Security Controls assessments, conducted by a
third-party, to measure program maturity. We have implemented a variety of technologies, leveraging
third-party security providers for some, and engage in multiple activities to seek to identify and mitigate
vulnerabilities and risks in systems. These include, among other activities, scanning for common
vulnerabilities and exposures, penetration tests on internal and external networks, code scans on
applications, allowed application listing, configuration management tools, employee awareness and
training, and internal and external audits. We also review with various frequencies and on a risk-based
priority select third parties with whom we do business, in an effort to reduce the likelihood of security
incidents or business interruptions. We maintain cybersecurity insurance that would apply to certain
losses arising from significant security incidents.
We maintain a security operations center, supported by external providers and our employees, which
provides threat detection and incident response capabilities. We maintain cyber incident response plans
and related playbooks in coordination with stakeholders (including legal counsel). Significant incidents will
be escalated to a Cybersecurity Materiality Committee to assess materiality based on qualitative and
quantitative factors. The Committee is composed of a cross-divisional group of executives representing
the core business functions of Information Technology and Security, Operations, Administration, Finance
and Accounting, and Legal. We conduct periodic tabletop exercises, including at the executive level, to
review our response processes and incident management procedures.
Governance
Our Board of Directors has delegated certain responsibilities to the Audit Committee of the Board. The
Audit Committee reviews and discusses with management the identification and mitigation of
cybersecurity risks, including (among other things) the effectiveness of risk-management policies and
practices designed to help safeguard our operations, financial systems, and data. Our Chief Information
and Digital Officer (CIDO) and his executive team, including the Vice President of Information Security
and Chief Information Security Officer (CISO), present cybersecurity-related topics, including program
maturity progress, regularly to the Audit Committee. The Internal Audit team, in its periodic compliance
and risk assessment updates to the Audit Committee, also reports on its reviews of certain of our
cybersecurity risk exposures, controls, and management actions. The full Board also receives
cybersecurity evaluations from time to time.
Our information security organization is led by the CISO. The CISO is responsible for all aspects of our
cybersecurity program, including cybersecurity engineering and architecture, cybersecurity operations,
incident response, threat intelligence, identity and access management, cybersecurity risk and
compliance, and vulnerability management. Our former CISO left the Company in June 2025, and we are
actively sourcing a qualified replacement. In the interim, our Deputy CISO, who has over 20 years of
cybersecurity and leadership experience, is managing the CISO responsibilities. The CISO position
reports to our CIDO, who has more than 30 years experience in which he has led global digital
responsibilities, including leading global cyber teams. Our CIDO reports to the Chief Executive Officer.
Risks from Material Cybersecurity Threats
We and our third-party service and merchandise providers have experienced cybersecurity incidents and
threats. Based on the information available as of the date of this Form 10-K, we are not aware of any risks
from actual cybersecurity incidents that have materially affected us or are reasonably likely to materially
affect us, including our business strategy, results of operations, or financial condition. It is possible that
there have been intrusions into our systems that have not been identified by our controls and procedures
and that might manifest in significant events at a later time. There can be no guarantee that the actions
and controls we and our third-party service providers have implemented and are implementing will be
sufficient to protect our systems, information or other property. See “Risk Factors” in Item 1A of this Form
10-K for more information on our cybersecurity-related risks.
19
Item 2—Properties
Warehouse Properties
At August 31, 2025, we operated 914 membership warehouses:
Own Land
and Building
Lease Land
and/or
Building
(1)
Total
United States and Puerto Rico
. . . . . . . . . . . . . . . . . . . . . . . . . . . . . . .
512
117
629
Canada
. . . . . . . . . . . . . . . . . . . . . . . . . . . . . . . . . . . . . . . . . . . . . . . . . . .
94
16
110
Other International
. . . . . . . . . . . . . . . . . . . . . . . . . . . . . . . . . . . . . . . . .
119
56
175
Total
. . . . . . . . . . . . . . . . . . . . . . . . . . . . . . . . . . . . . . . . . . . . . . . . . .
725
189
914
_______________
(1)
141 of the 189 leases are land-only leases, where Costco owns the building.
At the end of 2025, our warehouses contained approximately 134.7 million square feet of operating floor
space: 93.6 million in the U.S.; 15.9 million in Canada; and 25.2 million in Other International. Total
square feet associated with distribution and logistics facilities were approximately 32.2 million.
Additionally, we operate various processing, packaging, manufacturing and other facilities to support our
business, which includes the production of certain private-label items.
Item 3—Legal Proceedings
See discussion of Legal Proceedings in Note 10 to the consolidated financial statements included in
Item 8 of this Report.
Item 4—Mine Safety Disclosures
Not applicable.
PART II
Item 5—Market for Registrant’s Common Equity, Related Stockholder Matters and Issuer
Purchases of Equity Securities
Market Information and Dividend Policy
Our common stock is traded on the NASDAQ Global Select Market under the symbol “COST.” On
September 30, 2025, we had 10,813 stockholders of record.
Payment of dividends is subject to declaration by the Board of Directors. Factors considered in
determining dividends include our profitability and expected capital needs. Subject to these qualifications,
we presently expect to continue to pay dividends on a quarterly basis.
Issuer Purchases of Equity Securities
The following table sets forth information on our common stock repurchase activity for the fourth quarter
of 2025 (dollars in millions, except per share data):
Period
Total Number
of Shares
Purchased
Average Price
Paid per
Share
Total Number of
Shares Purchased as
Part of Publicly
Announced
Program
(1)
Maximum Dollar
Value of Shares
that May Yet be
Purchased under
the Program
May 12—June 8, 2025
. . . . . . .
69,000 $
1,022.70
69,000 $
2,172
June 9—July 6, 2025
. . . . . . . .
71,000
990.69
71,000
2,102
July 7—August 3, 2025
. . . . . .
73,000
955.59
73,000
2,032
August 4—August 31, 2025
. .
72,000
966.22
72,000
1,962
Total fourth quarter
. . . . . . .
285,000 $
983.13
285,000
_______________
(1)
Our share repurchase program is conducted under a $4,000 authorization approved by our Board of Directors in January
2023, which expires in January 2027.
20
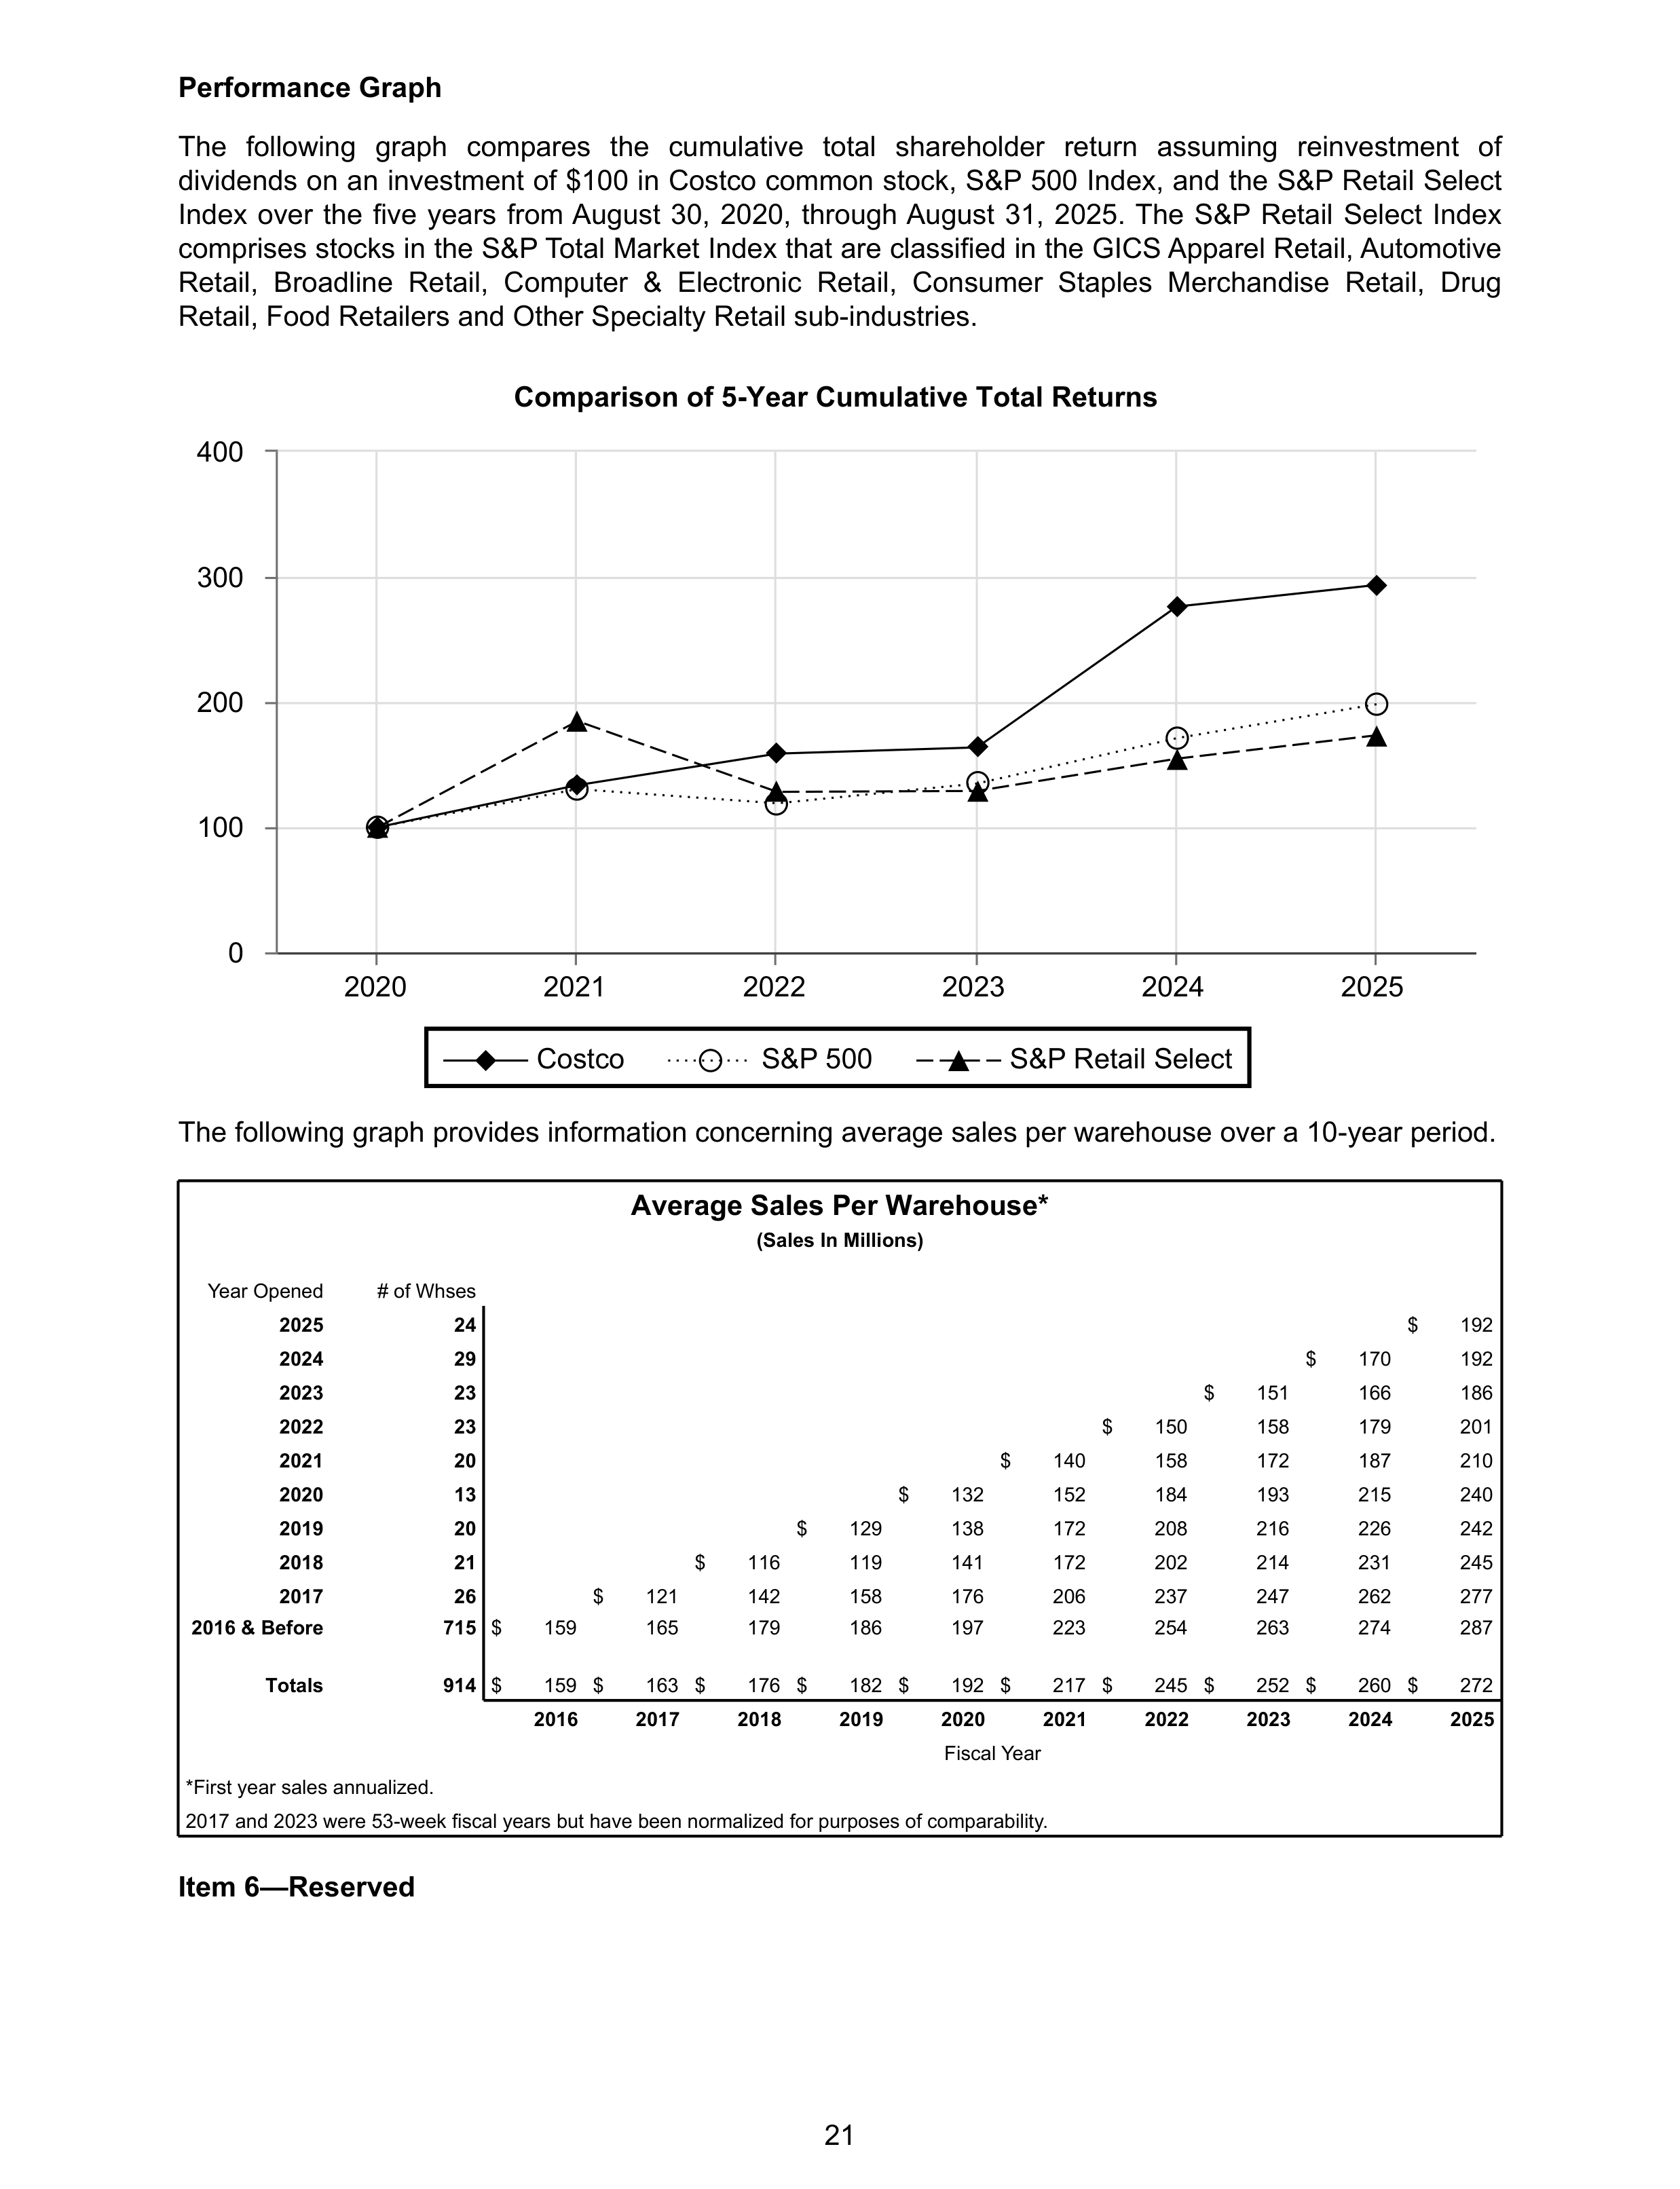
Performance Graph
The following graph compares the cumulative total shareholder return assuming reinvestment of
dividends on an investment of $100 in Costco common stock, S&P 500 Index, and the S&P Retail Select
Index over the five years from August 30, 2020, through August 31, 2025. The S&P Retail Select Index
comprises stocks in the S&P Total Market Index that are classified in the GICS Apparel Retail, Automotive
Retail, Broadline Retail, Computer & Electronic Retail, Consumer Staples Merchandise Retail, Drug
Retail, Food Retailers and Other Specialty Retail sub-industries.
Comparison of 5-Year Cumulative Total Returns
Costco
S&P 500
S&P Retail Select
2020
2021
2022
2023
2024
2025
0
100
200
300
400
The following graph provides information concerning average sales per warehouse over a 10-year period.
Average Sales Per Warehouse*
(Sales In Millions)
Year Opened
# of Whses
2025
24
$
192
2024
29
$
170
192
2023
23
$
151
166
186
2022
23
$
150
158
179
201
2021
20
$
140
158
172
187
210
2020
13
$
132
152
184
193
215
240
2019
20
$
129
138
172
208
216
226
242
2018
21
$
116
119
141
172
202
214
231
245
2017
26
$
121
142
158
176
206
237
247
262
277
2016 & Before
715
$
159
165
179
186
197
223
254
263
274
287
Totals
914
$
159 $
163 $
176 $
182 $
192 $
217 $
245 $
252 $
260 $
272
2016
2017
2018
2019
2020
2021
2022
2023
2024
2025
Fiscal Year
*First year sales annualized.
2017 and 2023 were 53-week fiscal years but have been normalized for purposes of comparability.
Item 6—Reserved
21
Item 7—Management's Discussion and Analysis of Financial Condition and Results of Operations
(amounts in millions, except per share, share, percentages and warehouse count data)
Overview
Management's Discussion and Analysis of Financial Condition and Results of Operations (MD&A) is
intended to promote understanding of the results of operations and financial condition. MD&A is provided
as a supplement to, and should be read in conjunction with, our consolidated financial statements and the
accompanying Notes to Financial Statements (Part II, Item 8 of this Form 10-K). This section generally
discusses the results of operations for 2025 compared to 2024. For discussion related to the results of
operations and changes in financial condition for 2024 compared to 2023 refer to Part II, Item 7,
Management's Discussion and Analysis of Financial Condition and Results of Operations in our fiscal year
2024 Form 10-K, which was filed with the Securities and Exchange Commission (SEC) on October 9,
2024.
We believe that the most important driver of our profitability is increasing net sales, particularly
comparable sales. Net sales includes our core merchandise categories (foods and sundries, non-foods,
and fresh foods), warehouse ancillary (gasoline, pharmacy, optical, food court, hearing aids, and tire
installation) and other businesses (e-commerce, business centers, travel, and other). E-commerce and
business center sales are allocated to the appropriate merchandise categories in the Net Sales
discussion. The 2% reward associated with Executive membership reduces net sales and is allocated to
the category in which the reward is generated (core merchandise categories, warehouse ancillary, and
other businesses). Comparable sales is defined as net sales from warehouses open for more than one
year, including remodels, relocations and expansions, and sales related to e-commerce sites operating for
more than one year. The measure is intended as supplemental information and is not a substitute for net
sales presented in accordance with U.S. generally accepted accounting principles (U.S. GAAP) and
should be reviewed in conjunction with results reported in accordance with U.S. GAAP. Comparable sales
growth is achieved through increasing shopping frequency from new and existing members and the
amount they spend on each visit (average ticket). Sales comparisons can also be particularly influenced
by certain factors that are beyond our control: fluctuations in currency exchange rates (with respect to our
international operations) and inflation or deflation in the cost of gasoline and associated competitive
conditions. The higher our comparable sales exclusive of these items, the more we can leverage our
selling, general and administrative (SG&A) expenses, reducing them as a percentage of sales and
enhancing profitability. Generating comparable sales growth is foremost a question of making available
the right merchandise at the right prices, a skill that we believe we have repeatedly demonstrated over the
long-term. Another substantial factor in net sales growth is the health of the economies in which we do
business, including the effects of inflation or deflation, especially the United States. Net sales growth and
gross margins are also impacted by competition, which is vigorous and widespread, across a wide range
of global, national and regional wholesalers and retailers, including those with e-commerce operations.
While we cannot control or reliably predict general economic health or changes in competition, we believe
that we have been successful historically in adapting our business to these changes, such as through
adjustments to our pricing and merchandise mix, including increasing the penetration of our private-label
items, and through online offerings.
Our philosophy is to provide our members with quality goods and services at competitive prices. We do
not focus in the short-term on maximizing prices charged, but instead seek to maintain what we believe is
a perception among our members of our “pricing authority” – consistently providing the most competitive
values. Our net sales and gross margin are influenced in part by our merchandising and pricing strategies
in response to cost increases. Those strategies can include, but are not limited to, working with our
suppliers to share in absorbing cost increases, earlier-than-usual purchasing and in greater volumes,
sourcing in the countries and regions where items are sold, as well as passing cost increases on to our
members. Our investments in merchandise pricing may include reducing prices on merchandise to drive
sales or meet competition and holding prices steady despite cost increases instead of passing the
increases on to our members, negatively impacting gross margin and gross margin as a percentage of
net sales (gross margin percentage) in the near term. Our e-commerce business, domestically and
internationally, has a lower gross-margin percentage than our warehouse operations.
22
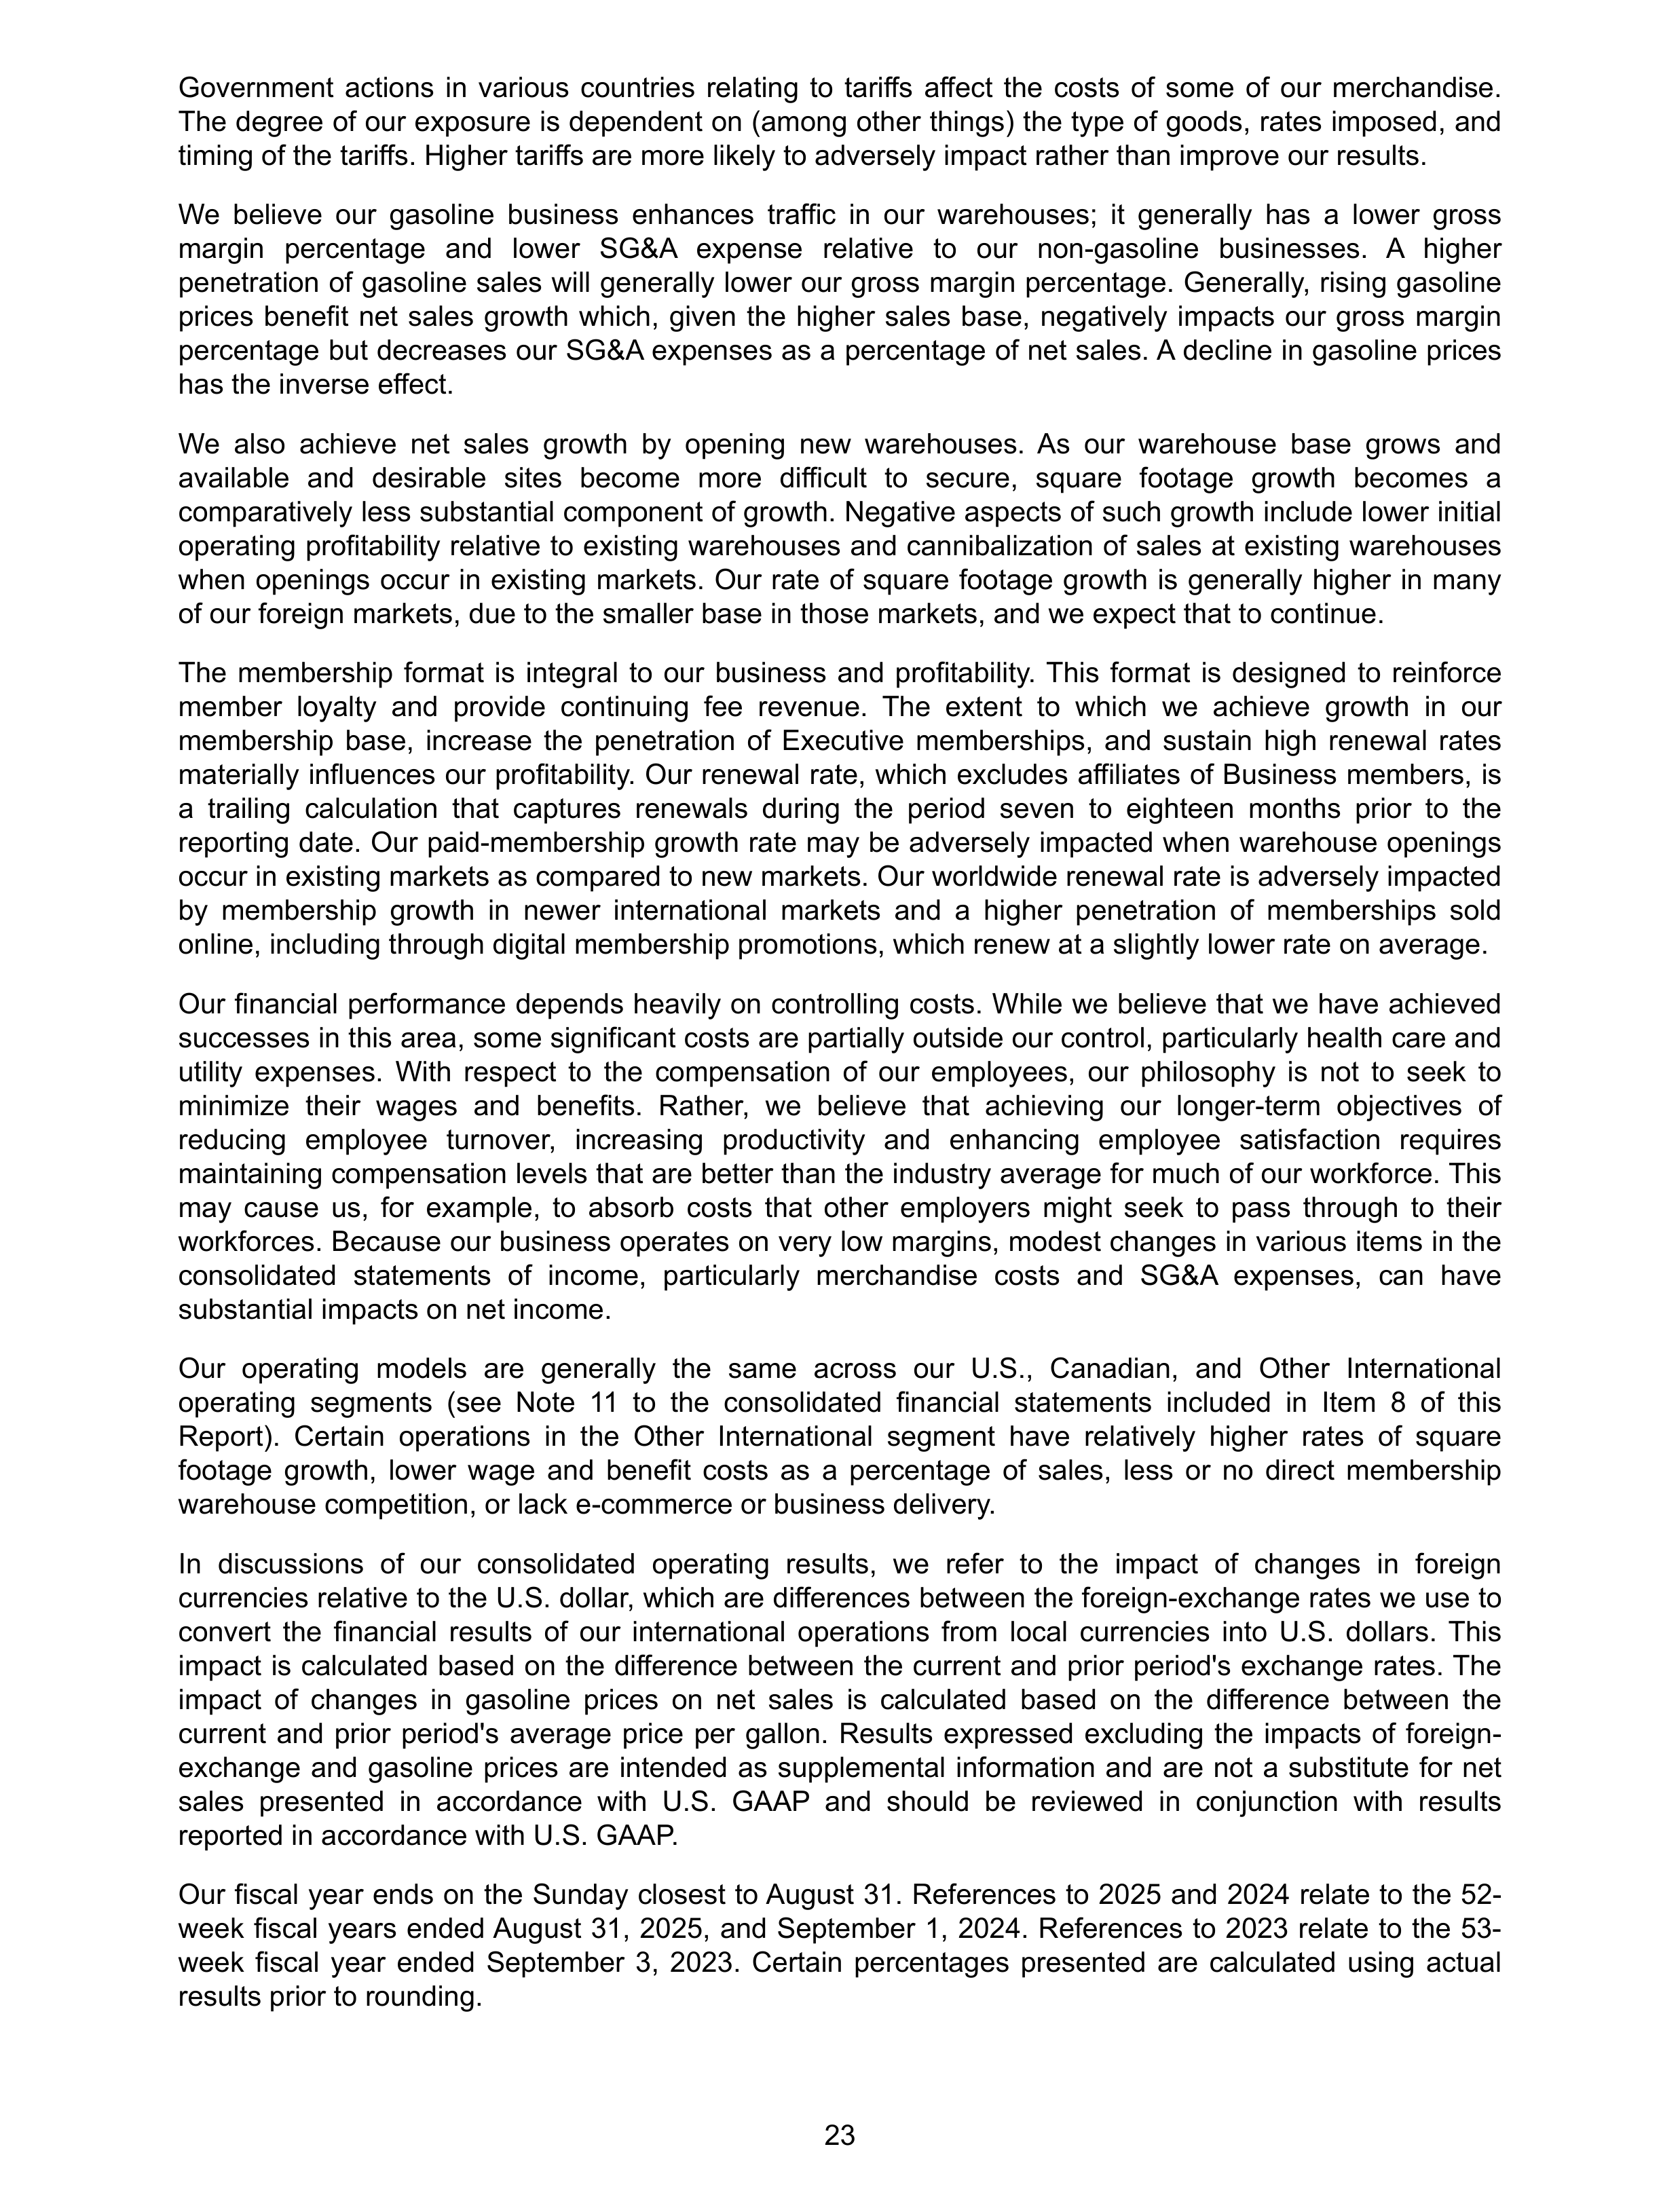
Government actions in various countries relating to tariffs affect the costs of some of our merchandise.
The degree of our exposure is dependent on (among other things) the type of goods, rates imposed, and
timing of the tariffs. Higher tariffs are more likely to adversely impact rather than improve our results.
We believe our gasoline business enhances traffic in our warehouses; it generally has a lower gross
margin percentage and lower SG&A expense relative to our non-gasoline businesses. A higher
penetration of gasoline sales will generally lower our gross margin percentage. Generally, rising gasoline
prices benefit net sales growth which, given the higher sales base, negatively impacts our gross margin
percentage but decreases our SG&A expenses as a percentage of net sales. A decline in gasoline prices
has the inverse effect.
We also achieve net sales growth by opening new warehouses. As our warehouse base grows and
available and desirable sites become more difficult to secure, square footage growth becomes a
comparatively less substantial component of growth. Negative aspects of such growth include lower initial
operating profitability relative to existing warehouses and cannibalization of sales at existing warehouses
when openings occur in existing markets. Our rate of square footage growth is generally higher in many
of our foreign markets, due to the smaller base in those markets, and we expect that to continue.
The membership format is integral to our business and profitability. This format is designed to reinforce
member loyalty and provide continuing fee revenue. The extent to which we achieve growth in our
membership base, increase the penetration of Executive memberships, and sustain high renewal rates
materially influences our profitability. Our renewal rate, which excludes affiliates of Business members, is
a trailing calculation that captures renewals during the period seven to eighteen months prior to the
reporting date. Our paid-membership growth rate may be adversely impacted when warehouse openings
occur in existing markets as compared to new markets. Our worldwide renewal rate is adversely impacted
by membership growth in newer international markets and a higher penetration of memberships sold
online, including through digital membership promotions, which renew at a slightly lower rate on average.
Our financial performance depends heavily on controlling costs. While we believe that we have achieved
successes in this area, some significant costs are partially outside our control, particularly health care and
utility expenses. With respect to the compensation of our employees, our philosophy is not to seek to
minimize their wages and benefits. Rather, we believe that achieving our longer-term objectives of
reducing employee turnover, increasing productivity and enhancing employee satisfaction requires
maintaining compensation levels that are better than the industry average for much of our workforce. This
may cause us, for example, to absorb costs that other employers might seek to pass through to their
workforces. Because our business operates on very low margins, modest changes in various items in the
consolidated statements of income, particularly merchandise costs and SG&A expenses, can have
substantial impacts on net income.
Our operating models are generally the same across our U.S., Canadian, and Other International
operating segments (see Note 11 to the consolidated financial statements included in Item 8 of this
Report). Certain operations in the Other International segment have relatively higher rates of square
footage growth, lower wage and benefit costs as a percentage of sales, less or no direct membership
warehouse competition, or lack e-commerce or business delivery.
In discussions of our consolidated operating results, we refer to the impact of changes in foreign
currencies relative to the U.S. dollar, which are differences between the foreign-exchange rates we use to
convert the financial results of our international operations from local currencies into U.S. dollars. This
impact is calculated based on the difference between the current and prior period's exchange rates. The
impact of changes in gasoline prices on net sales is calculated based on the difference between the
current and prior period's average price per gallon. Results expressed excluding the impacts of foreign-
exchange and gasoline prices are intended as supplemental information and are not a substitute for net
sales presented in accordance with U.S. GAAP and should be reviewed in conjunction with results
reported in accordance with U.S. GAAP.
Our fiscal year ends on the Sunday closest to August 31. References to 2025 and 2024 relate to the 52-
week fiscal years ended August 31, 2025, and September 1, 2024. References to 2023 relate to the 53-
week fiscal year ended September 3, 2023. Certain percentages presented are calculated using actual
results prior to rounding.
23
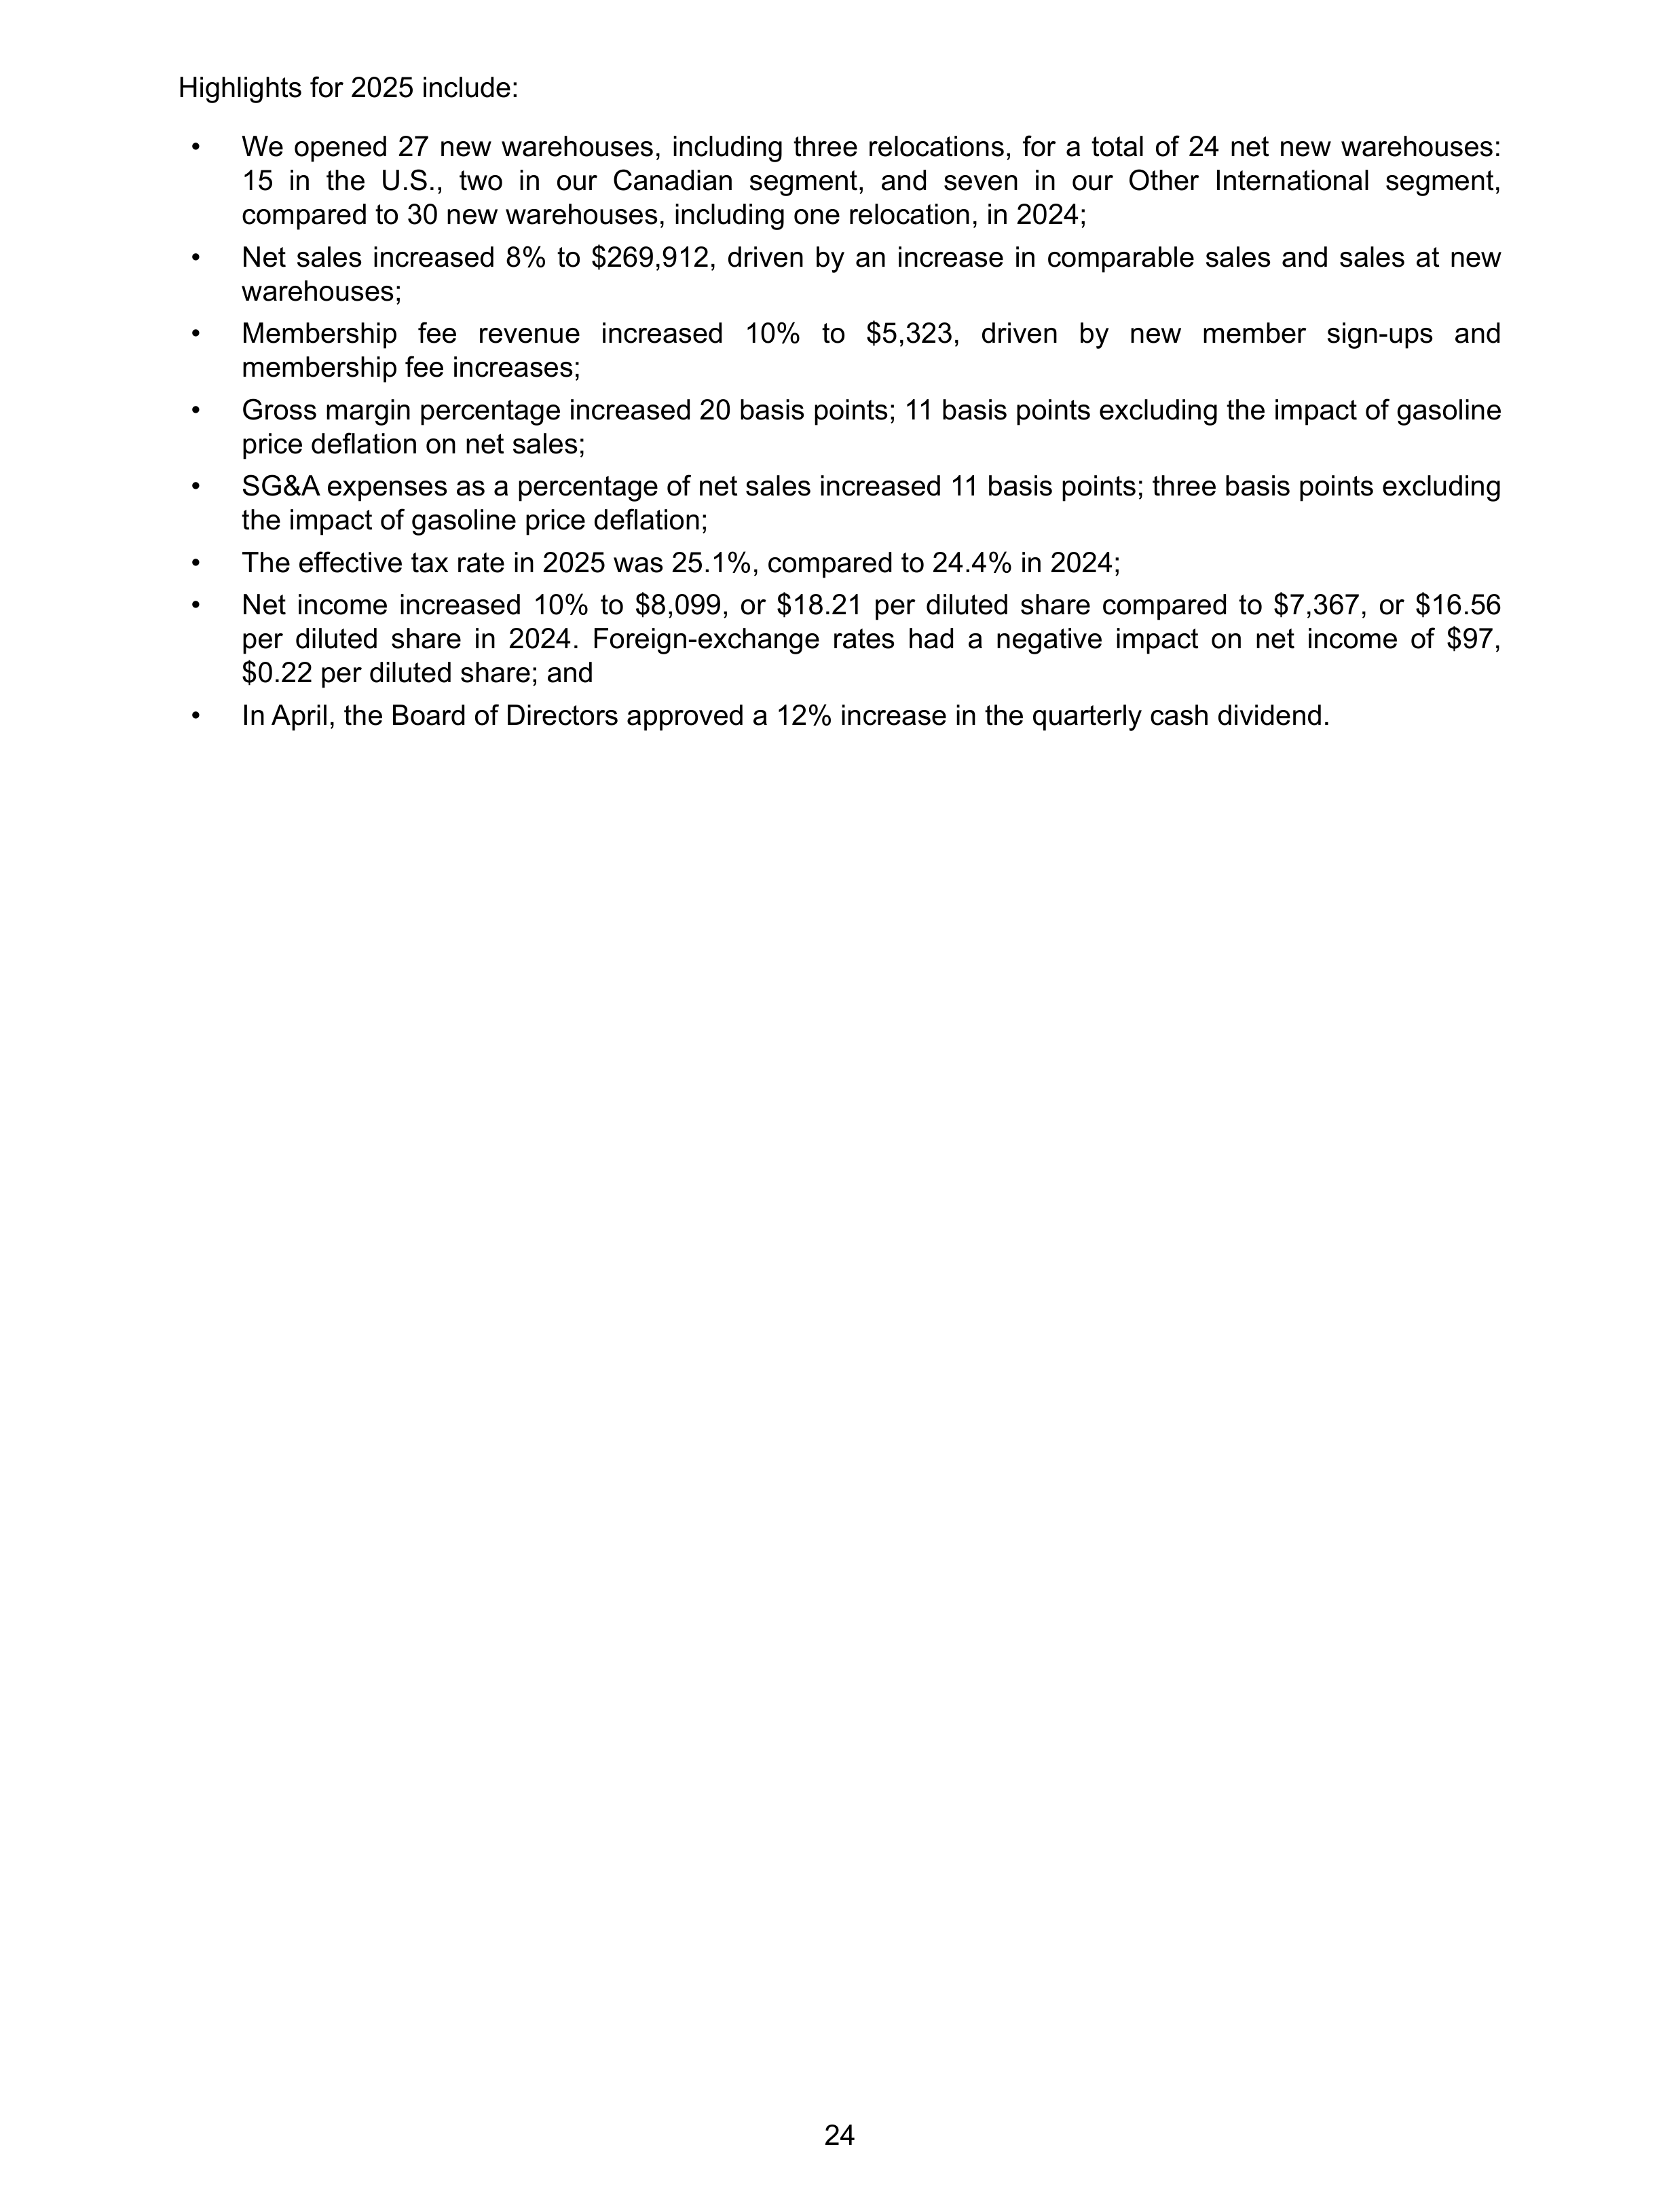
Highlights for 2025 include:
•
We opened 27 new warehouses, including three relocations, for a total of 24 net new warehouses:
15 in the U.S., two in our Canadian segment, and seven in our Other International segment,
compared to 30 new warehouses, including one relocation, in 2024;
•
Net sales increased 8% to $269,912, driven by an increase in comparable sales and sales at new
warehouses;
•
Membership fee revenue increased 10% to $5,323, driven by new member sign-ups and
membership fee increases;
•
Gross margin percentage increased 20 basis points; 11 basis points excluding the impact of gasoline
price deflation on net sales;
•
SG&A expenses as a percentage of net sales increased 11 basis points; three basis points excluding
the impact of gasoline price deflation;
•
The effective tax rate in 2025 was 25.1%, compared to 24.4% in 2024;
•
Net income increased 10% to $8,099, or $18.21 per diluted share compared to $7,367, or $16.56
per diluted share in 2024. Foreign-exchange rates had a negative impact on net income of $97,
$0.22 per diluted share; and
•
In April, the Board of Directors approved a 12% increase in the quarterly cash dividend.
24
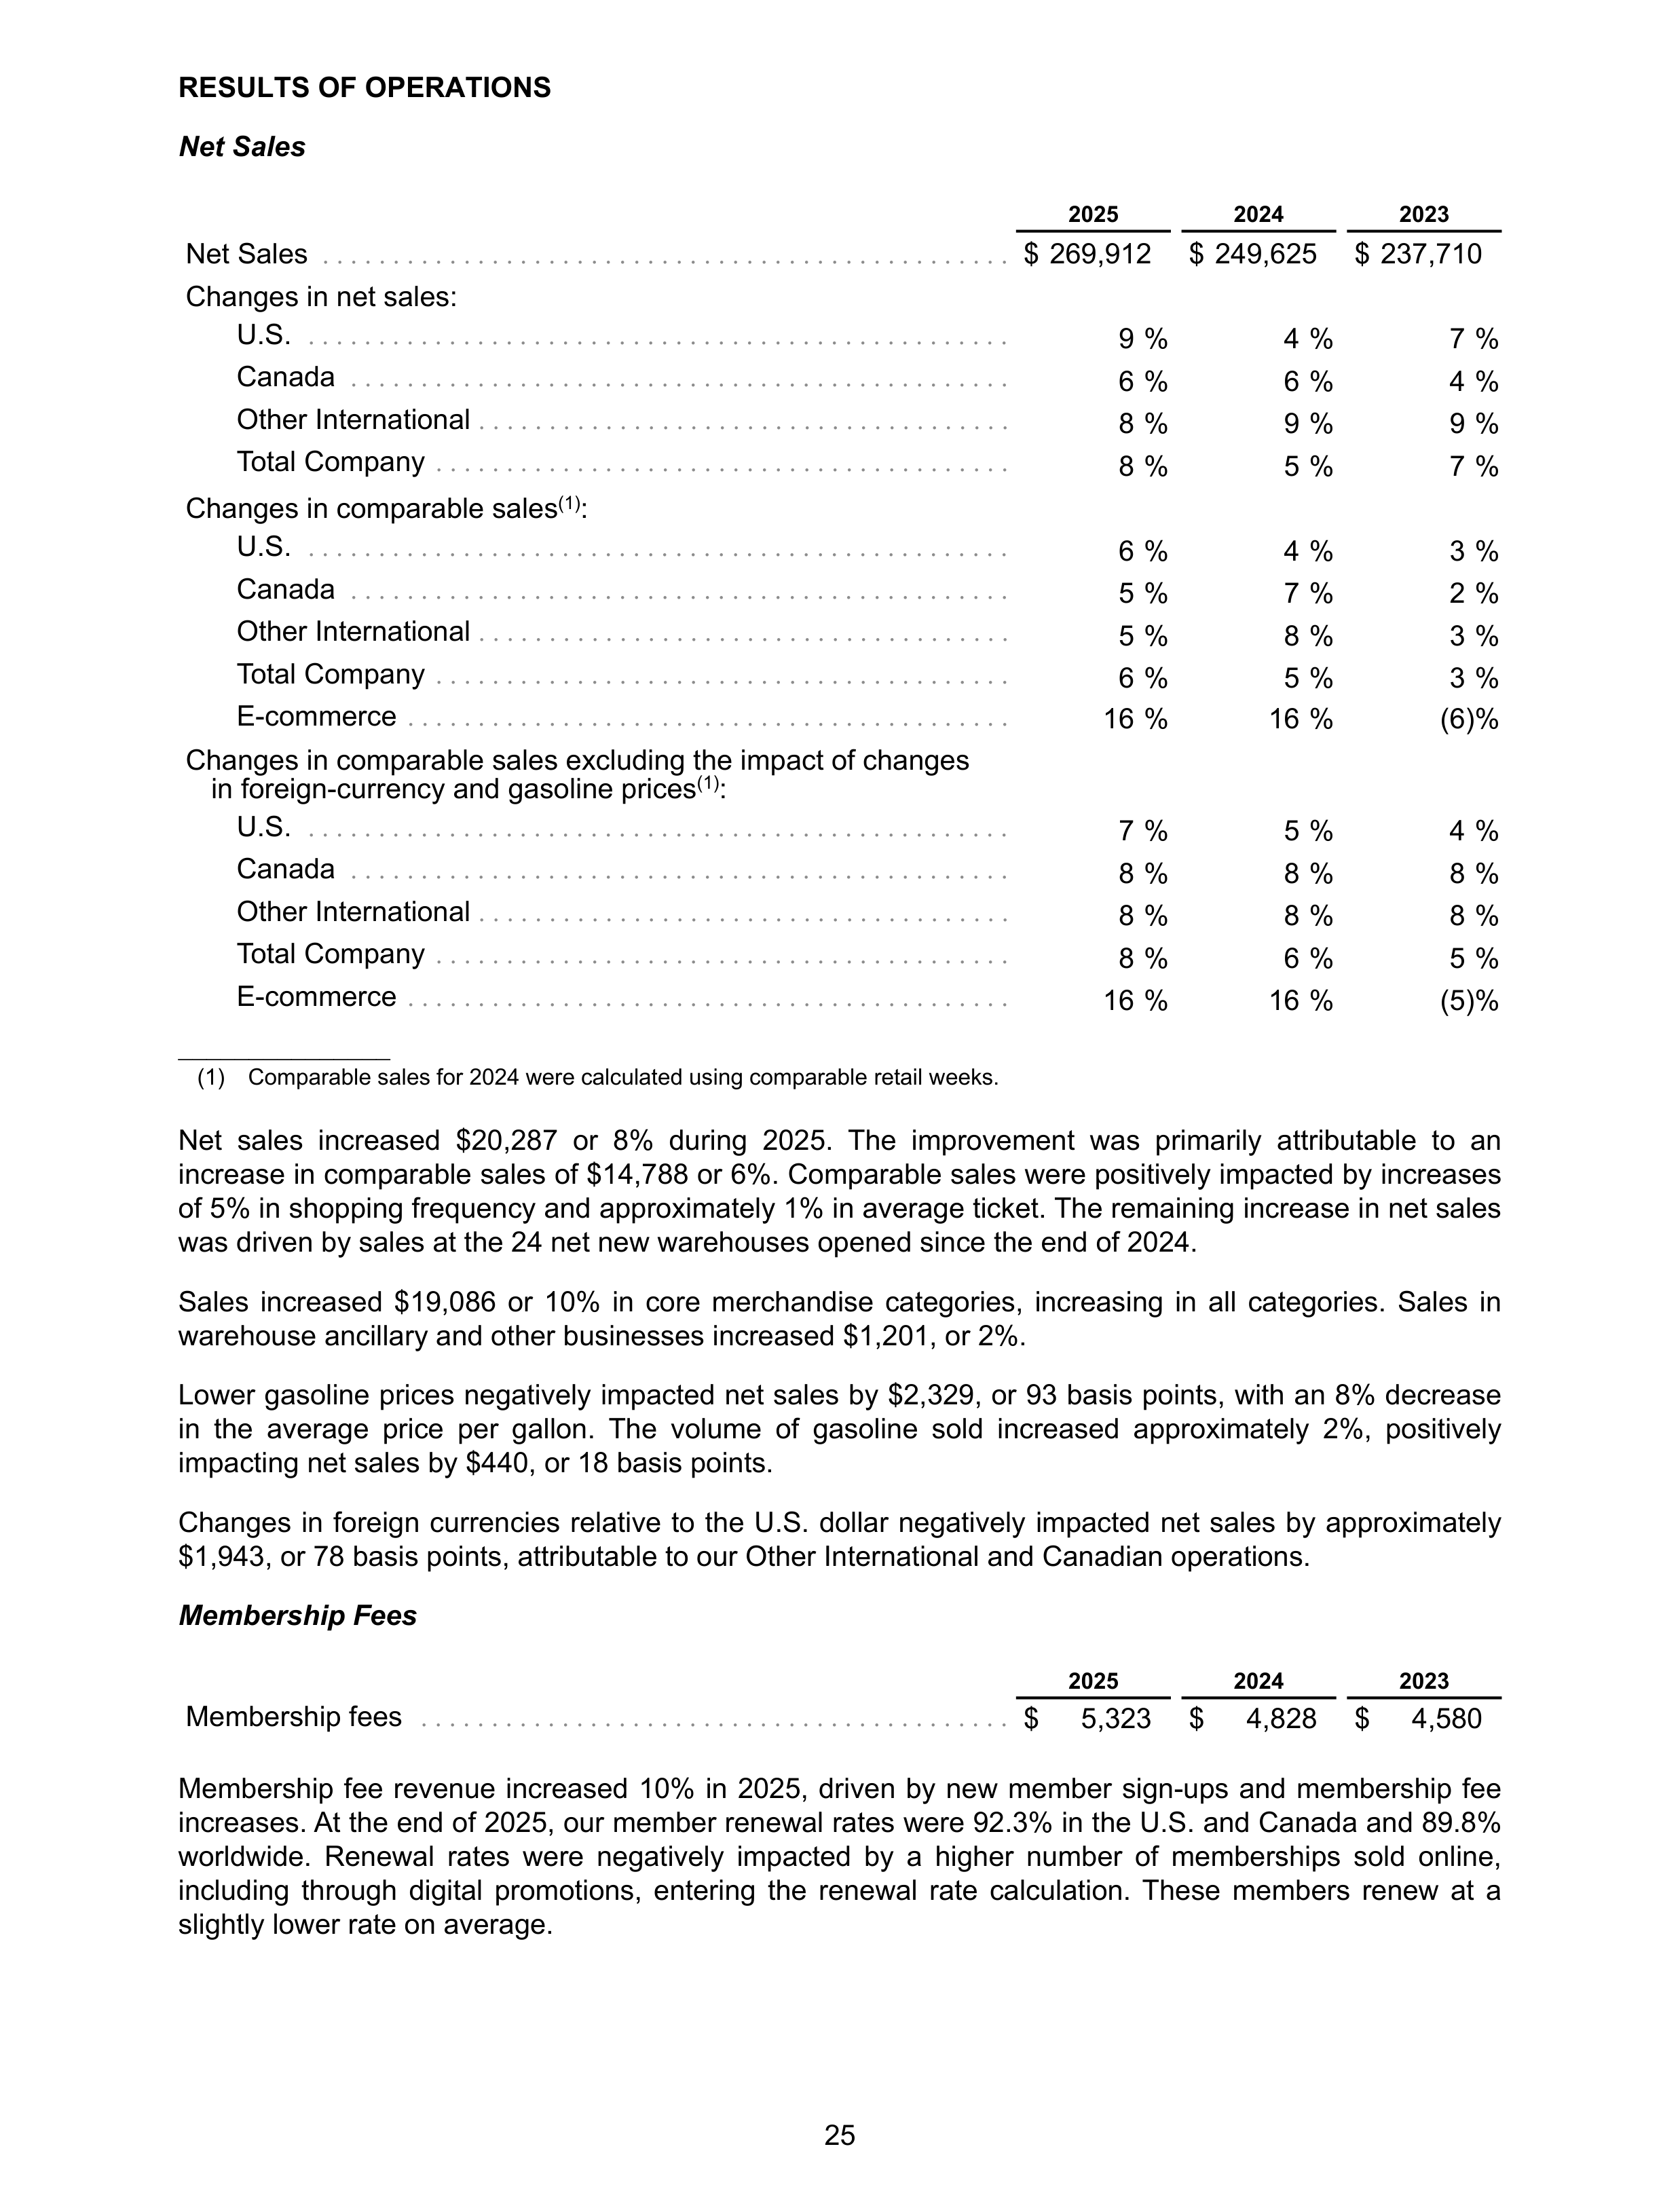
RESULTS OF OPERATIONS
Net Sales
2025
2024
2023
Net Sales
. . . . . . . . . . . . . . . . . . . . . . . . . . . . . . . . . . . . . . . . . . . . . . . . .
$ 269,912
$ 249,625
$ 237,710
Changes in net sales:
U.S.
. . . . . . . . . . . . . . . . . . . . . . . . . . . . . . . . . . . . . . . . . . . . . . . . . .
9 %
4 %
7 %
Canada
. . . . . . . . . . . . . . . . . . . . . . . . . . . . . . . . . . . . . . . . . . . . . . .
6 %
6 %
4 %
Other International
. . . . . . . . . . . . . . . . . . . . . . . . . . . . . . . . . . . . . .
8 %
9 %
9 %
Total Company
. . . . . . . . . . . . . . . . . . . . . . . . . . . . . . . . . . . . . . . . .
8 %
5 %
7 %
Changes in comparable sales
(1)
:
U.S.
. . . . . . . . . . . . . . . . . . . . . . . . . . . . . . . . . . . . . . . . . . . . . . . . . .
6 %
4 %
3 %
Canada
. . . . . . . . . . . . . . . . . . . . . . . . . . . . . . . . . . . . . . . . . . . . . . .
5 %
7 %
2 %
Other International
. . . . . . . . . . . . . . . . . . . . . . . . . . . . . . . . . . . . . .
5 %
8 %
3 %
Total Company
. . . . . . . . . . . . . . . . . . . . . . . . . . . . . . . . . . . . . . . . .
6 %
5 %
3 %
E-commerce
. . . . . . . . . . . . . . . . . . . . . . . . . . . . . . . . . . . . . . . . . . .
16 %
16 %
(6) %
Changes in comparable sales excluding the impact of changes
in foreign-currency and gasoline prices
(1)
:
U.S.
. . . . . . . . . . . . . . . . . . . . . . . . . . . . . . . . . . . . . . . . . . . . . . . . . .
7 %
5 %
4 %
Canada
. . . . . . . . . . . . . . . . . . . . . . . . . . . . . . . . . . . . . . . . . . . . . . .
8 %
8 %
8 %
Other International
. . . . . . . . . . . . . . . . . . . . . . . . . . . . . . . . . . . . . .
8 %
8 %
8 %
Total Company
. . . . . . . . . . . . . . . . . . . . . . . . . . . . . . . . . . . . . . . . .
8 %
6 %
5 %
E-commerce
. . . . . . . . . . . . . . . . . . . . . . . . . . . . . . . . . . . . . . . . . . .
16 %
16 %
(5) %
_______________
(1)
Comparable sales for 2024 were calculated using comparable retail weeks.
Net sales increased $20,287 or 8% during 2025. The improvement was primarily attributable to an
increase in comparable sales of $14,788 or 6%. Comparable sales were positively impacted by increases
of 5% in shopping frequency and approximately 1% in average ticket. The remaining increase in net sales
was driven by sales at the 24 net new warehouses opened since the end of 2024.
Sales increased $19,086 or 10% in core merchandise categories, increasing in all categories. Sales in
warehouse ancillary and other businesses increased $1,201, or 2%.
Lower gasoline prices negatively impacted net sales by $2,329, or 93 basis points, with an 8% decrease
in the average price per gallon. The volume of gasoline sold increased approximately 2%, positively
impacting net sales by $440, or 18 basis points.
Changes in foreign currencies relative to the U.S. dollar negatively impacted net sales by approximately
$1,943, or 78 basis points, attributable to our Other International and Canadian operations.
Membership Fees
2025
2024
2023
Membership fees
. . . . . . . . . . . . . . . . . . . . . . . . . . . . . . . . . . . . . . . . . .
$
5,323
$
4,828
$
4,580
Membership fee revenue increased 10% in 2025, driven by new member sign-ups and membership fee
increases. At the end of 2025, our member renewal rates were 92.3% in the U.S. and Canada and 89.8%
worldwide. Renewal rates were negatively impacted by a higher number of memberships sold online,
including through digital promotions, entering the renewal rate calculation. These members renew at a
slightly lower rate on average.
25
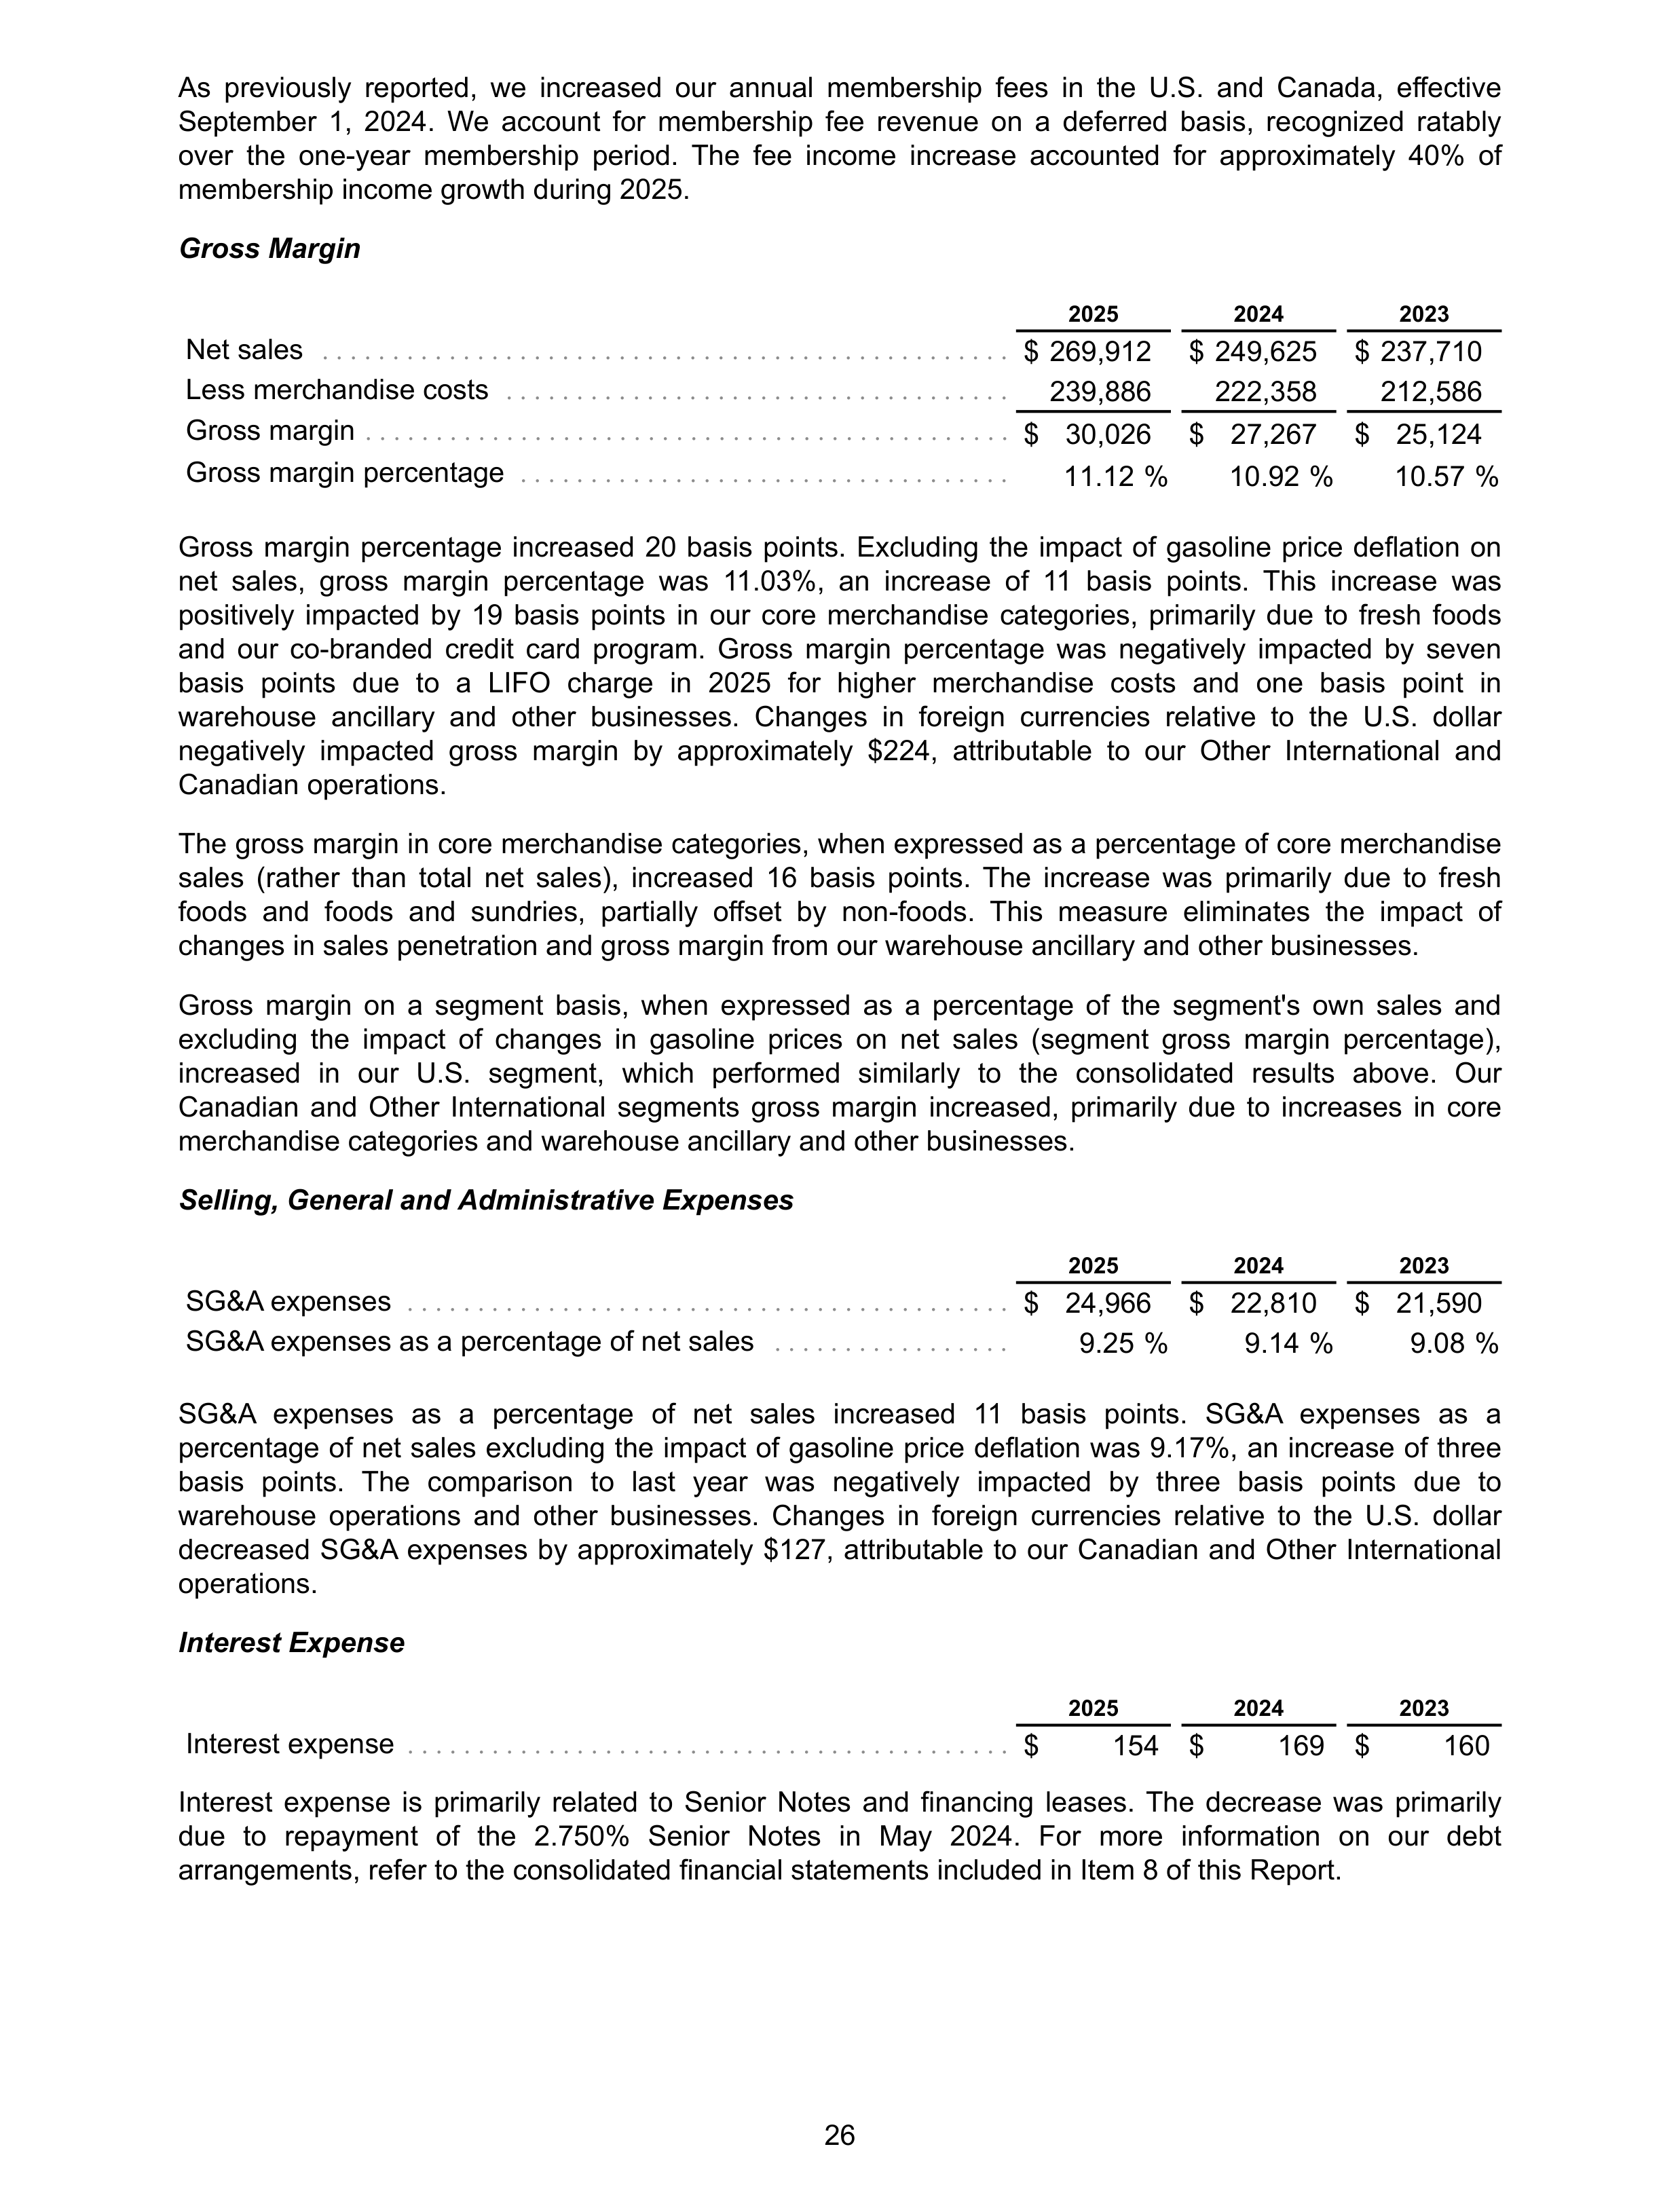
As previously reported, we increased our annual membership fees in the U.S. and Canada, effective
September 1, 2024. We account for membership fee revenue on a deferred basis, recognized ratably
over the one-year membership period. The fee income increase accounted for approximately 40% of
membership income growth during 2025.
Gross Margin
2025
2024
2023
Net sales
. . . . . . . . . . . . . . . . . . . . . . . . . . . . . . . . . . . . . . . . . . . . . . . . .
$ 269,912
$ 249,625
$ 237,710
Less merchandise costs
. . . . . . . . . . . . . . . . . . . . . . . . . . . . . . . . . . . .
239,886
222,358
212,586
Gross margin
. . . . . . . . . . . . . . . . . . . . . . . . . . . . . . . . . . . . . . . . . . . . . .
$ 30,026
$ 27,267
$ 25,124
Gross margin percentage
. . . . . . . . . . . . . . . . . . . . . . . . . . . . . . . . . . .
11.12 %
10.92 %
10.57 %
Gross margin percentage increased 20 basis points. Excluding the impact of gasoline price deflation on
net sales, gross margin percentage was 11.03%, an increase of 11 basis points. This increase was
positively impacted by 19 basis points in our core merchandise categories, primarily due to fresh foods
and our co-branded credit card program. Gross margin percentage was negatively impacted by seven
basis points due to a LIFO charge in 2025 for higher merchandise costs and one basis point in
warehouse ancillary and other businesses. Changes in foreign currencies relative to the U.S. dollar
negatively impacted gross margin by approximately $224, attributable to our Other International and
Canadian operations.
The gross margin in core merchandise categories, when expressed as a percentage of core merchandise
sales (rather than total net sales), increased 16 basis points. The increase was primarily due to fresh
foods and foods and sundries, partially offset by non-foods. This measure eliminates the impact of
changes in sales penetration and gross margin from our warehouse ancillary and other businesses.
Gross margin on a segment basis, when expressed as a percentage of the segment's own sales and
excluding the impact of changes in gasoline prices on net sales (segment gross margin percentage),
increased in our U.S. segment, which performed similarly to the consolidated results above. Our
Canadian and Other International segments gross margin increased, primarily due to increases in core
merchandise categories and warehouse ancillary and other businesses.
Selling, General and Administrative Expenses
2025
2024
2023
SG&A expenses
. . . . . . . . . . . . . . . . . . . . . . . . . . . . . . . . . . . . . . . . . . .
$ 24,966
$ 22,810
$ 21,590
SG&A expenses as a percentage of net sales
. . . . . . . . . . . . . . . . .
9.25 %
9.14 %
9.08 %
SG&A expenses as a percentage of net sales increased 11 basis points. SG&A expenses as a
percentage of net sales excluding the impact of gasoline price deflation was 9.17%, an increase of three
basis points. The comparison to last year was negatively impacted by three basis points due to
warehouse operations and other businesses. Changes in foreign currencies relative to the U.S. dollar
decreased SG&A expenses by approximately $127, attributable to our Canadian and Other International
operations.
Interest Expense
2025
2024
2023
Interest expense
. . . . . . . . . . . . . . . . . . . . . . . . . . . . . . . . . . . . . . . . . . .
$
154 $
169 $
160
Interest expense is primarily related to Senior Notes and financing leases. The decrease was primarily
due to repayment of the 2.750% Senior Notes in May 2024. For more information on our debt
arrangements, refer to the consolidated financial statements included in Item 8 of this Report.
26
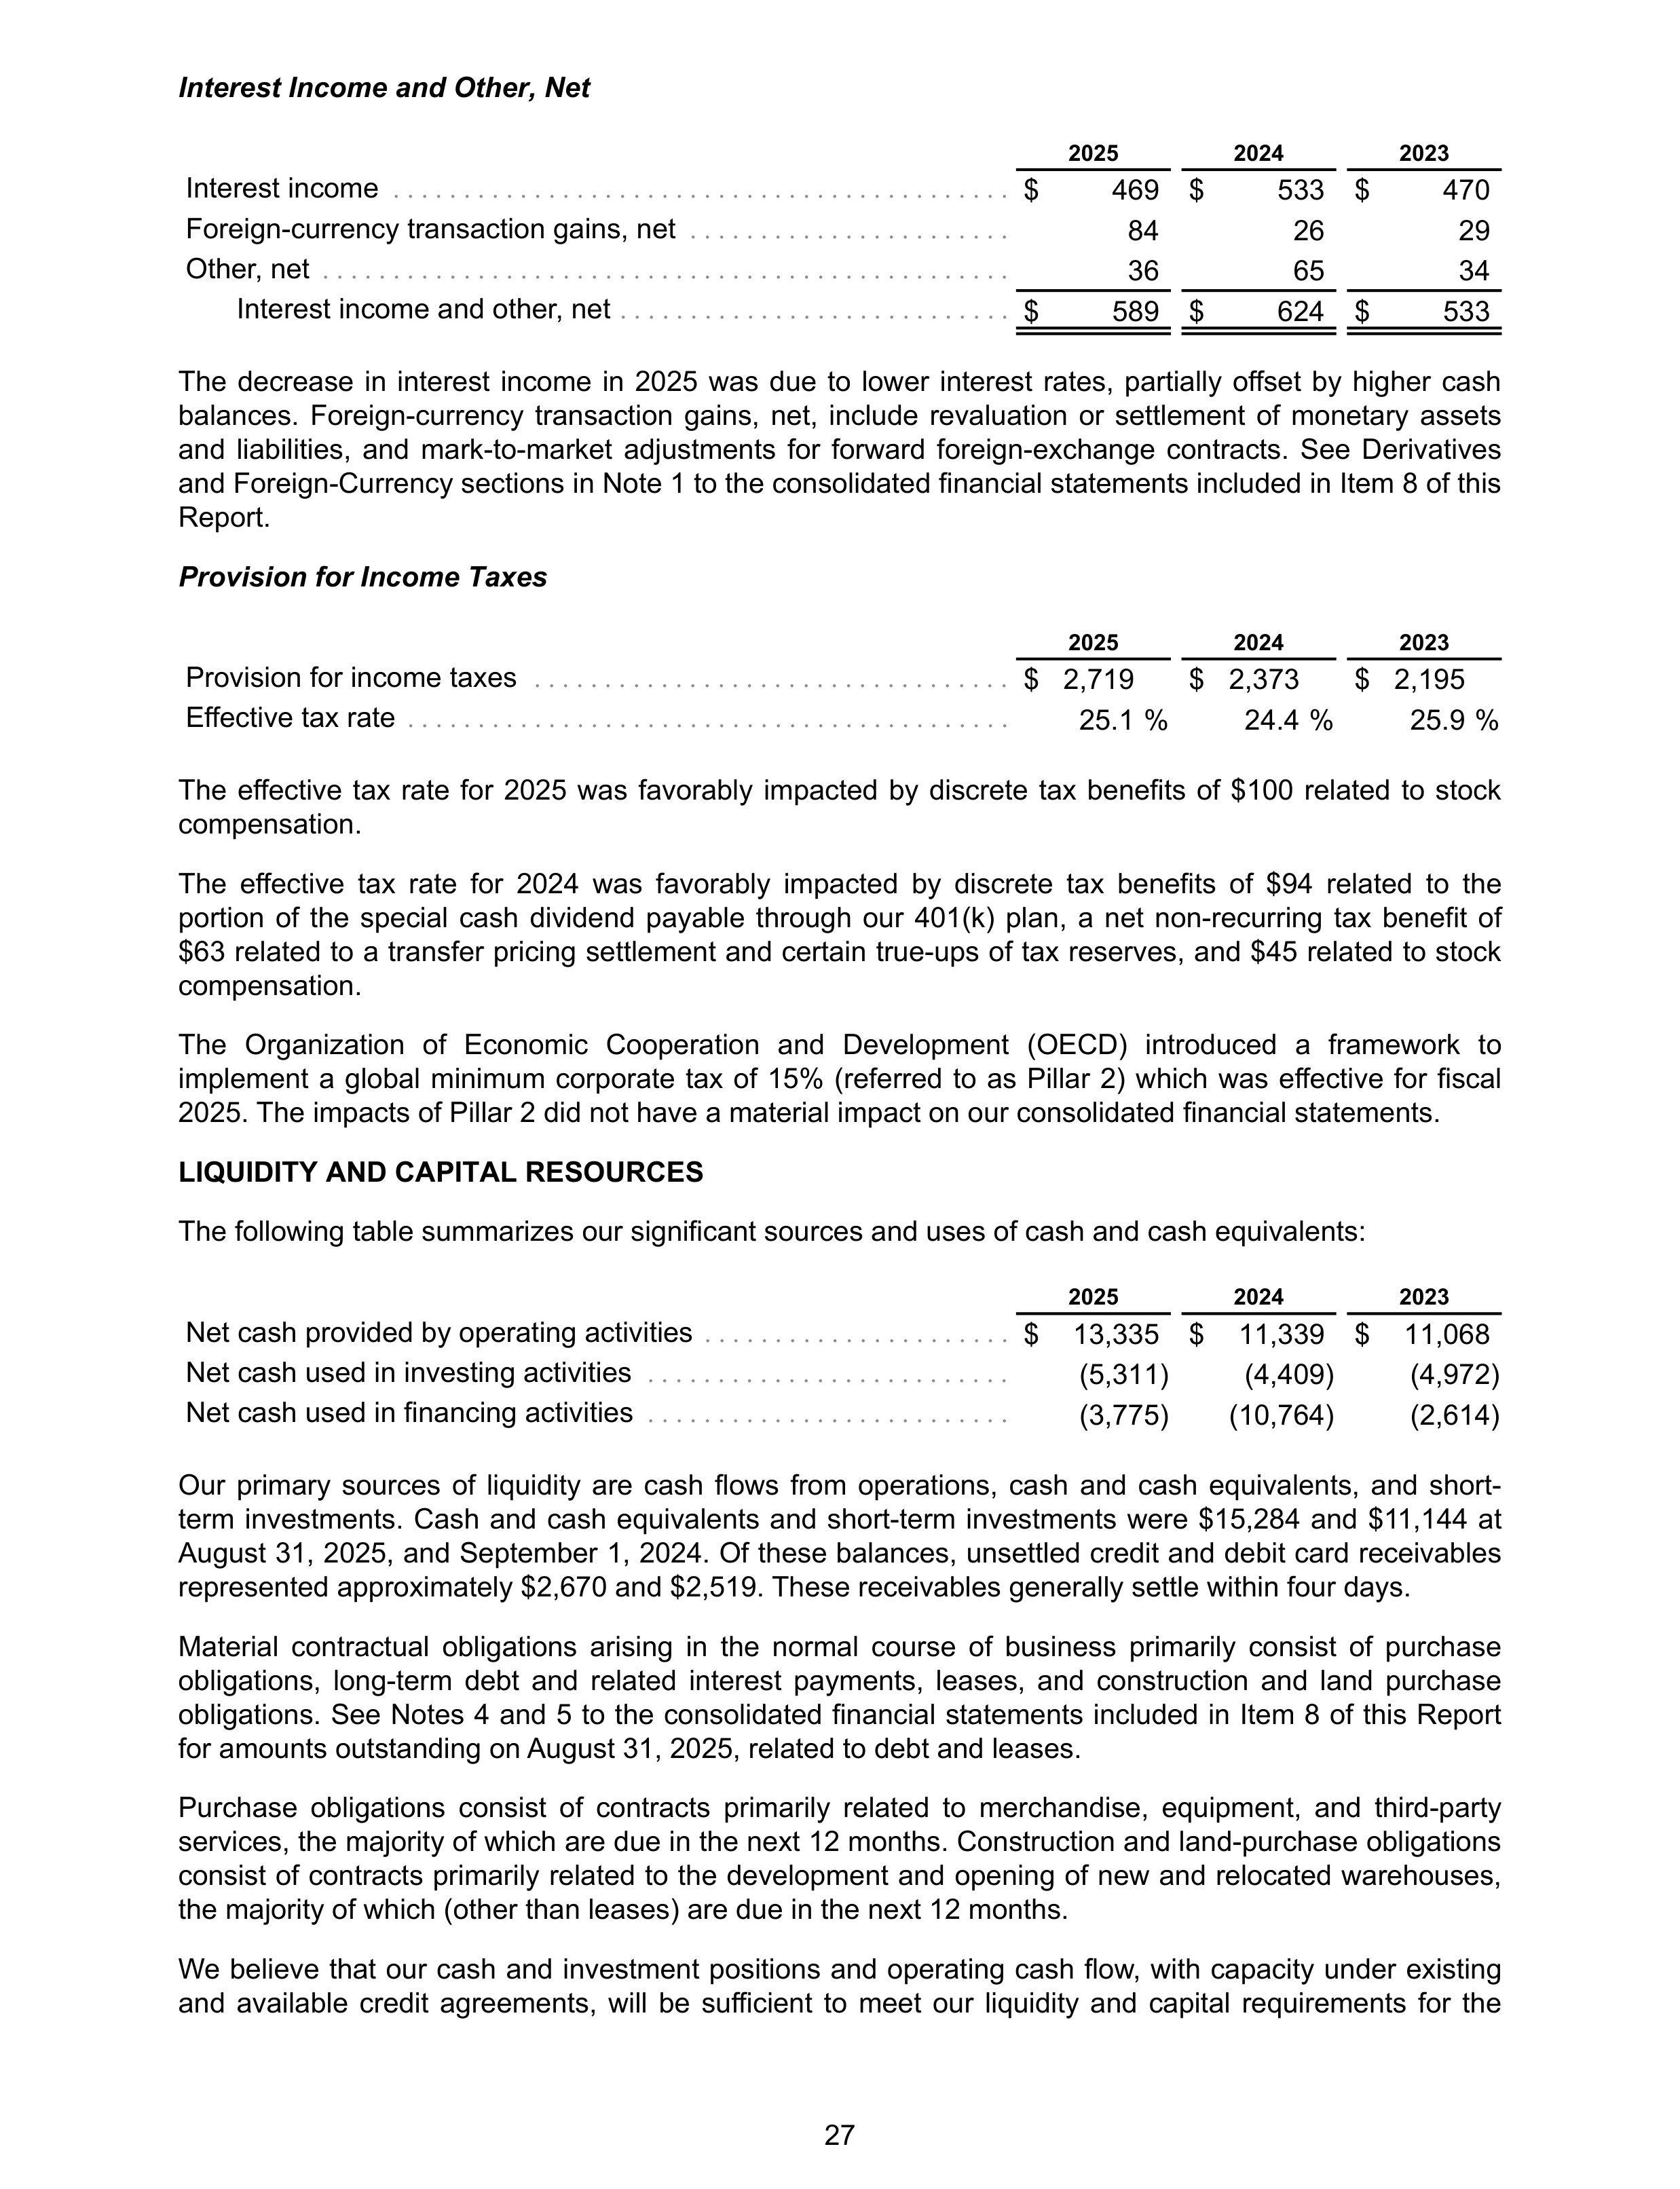
Interest Income and Other, Net
2025
2024
2023
Interest income
. . . . . . . . . . . . . . . . . . . . . . . . . . . . . . . . . . . . . . . . . . . .
$
469 $
533 $
470
Foreign-currency transaction gains, net
. . . . . . . . . . . . . . . . . . . . . . .
84
26
29
Other, net
. . . . . . . . . . . . . . . . . . . . . . . . . . . . . . . . . . . . . . . . . . . . . . . . .
36
65
34
Interest income and other, net
. . . . . . . . . . . . . . . . . . . . . . . . . . . .
$
589 $
624 $
533
The decrease in interest income in 2025 was due to lower interest rates, partially offset by higher cash
balances. Foreign-currency transaction gains, net, include revaluation or settlement of monetary assets
and liabilities, and mark-to-market adjustments for forward foreign-exchange contracts. See Derivatives
and Foreign-Currency sections in Note 1 to the consolidated financial statements included in Item 8 of this
Report.
Provision for Income Taxes
2025
2024
2023
Provision for income taxes
. . . . . . . . . . . . . . . . . . . . . . . . . . . . . . . . . .
$ 2,719
$ 2,373
$ 2,195
Effective tax rate
. . . . . . . . . . . . . . . . . . . . . . . . . . . . . . . . . . . . . . . . . . .
25.1 %
24.4 %
25.9 %
The effective tax rate for 2025 was favorably impacted by discrete tax benefits of $100 related to stock
compensation.
The effective tax rate for 2024 was favorably impacted by discrete tax benefits of $94 related to the
portion of the special cash dividend payable through our 401(k) plan, a net non-recurring tax benefit of
$63 related to a transfer pricing settlement and certain true-ups of tax reserves, and $45 related to stock
compensation.
The Organization of Economic Cooperation and Development (OECD) introduced a framework to
implement a global minimum corporate tax of 15% (referred to as Pillar 2) which was effective for fiscal
2025. The impacts of Pillar 2 did not have a material impact on our consolidated financial statements.
LIQUIDITY AND CAPITAL RESOURCES
The following table summarizes our significant sources and uses of cash and cash equivalents:
2025
2024
2023
Net cash provided by operating activities
. . . . . . . . . . . . . . . . . . . . . .
$
13,335 $
11,339 $
11,068
Net cash used in investing activities
. . . . . . . . . . . . . . . . . . . . . . . . . .
(5,311)
(4,409)
(4,972)
Net cash used in financing activities
. . . . . . . . . . . . . . . . . . . . . . . . . .
(3,775)
(10,764)
(2,614)
Our primary sources of liquidity are cash flows from operations, cash and cash equivalents, and short-
term investments. Cash and cash equivalents and short-term investments were $15,284 and $11,144 at
August 31, 2025, and September 1, 2024. Of these balances, unsettled credit and debit card receivables
represented approximately $2,670 and $2,519. These receivables generally settle within four days.
Material contractual obligations arising in the normal course of business primarily consist of purchase
obligations, long-term debt and related interest payments, leases, and construction and land purchase
obligations. See Notes 4 and 5 to the consolidated financial statements included in Item 8 of this Report
for amounts outstanding on August 31, 2025, related to debt and leases.
Purchase obligations consist of contracts primarily related to merchandise, equipment, and third-party
services, the majority of which are due in the next 12 months. Construction and land-purchase obligations
consist of contracts primarily related to the development and opening of new and relocated warehouses,
the majority of which (other than leases) are due in the next 12 months.
We believe that our cash and investment positions and operating cash flow, with capacity under existing
and available credit agreements, will be sufficient to meet our liquidity and capital requirements for the
27
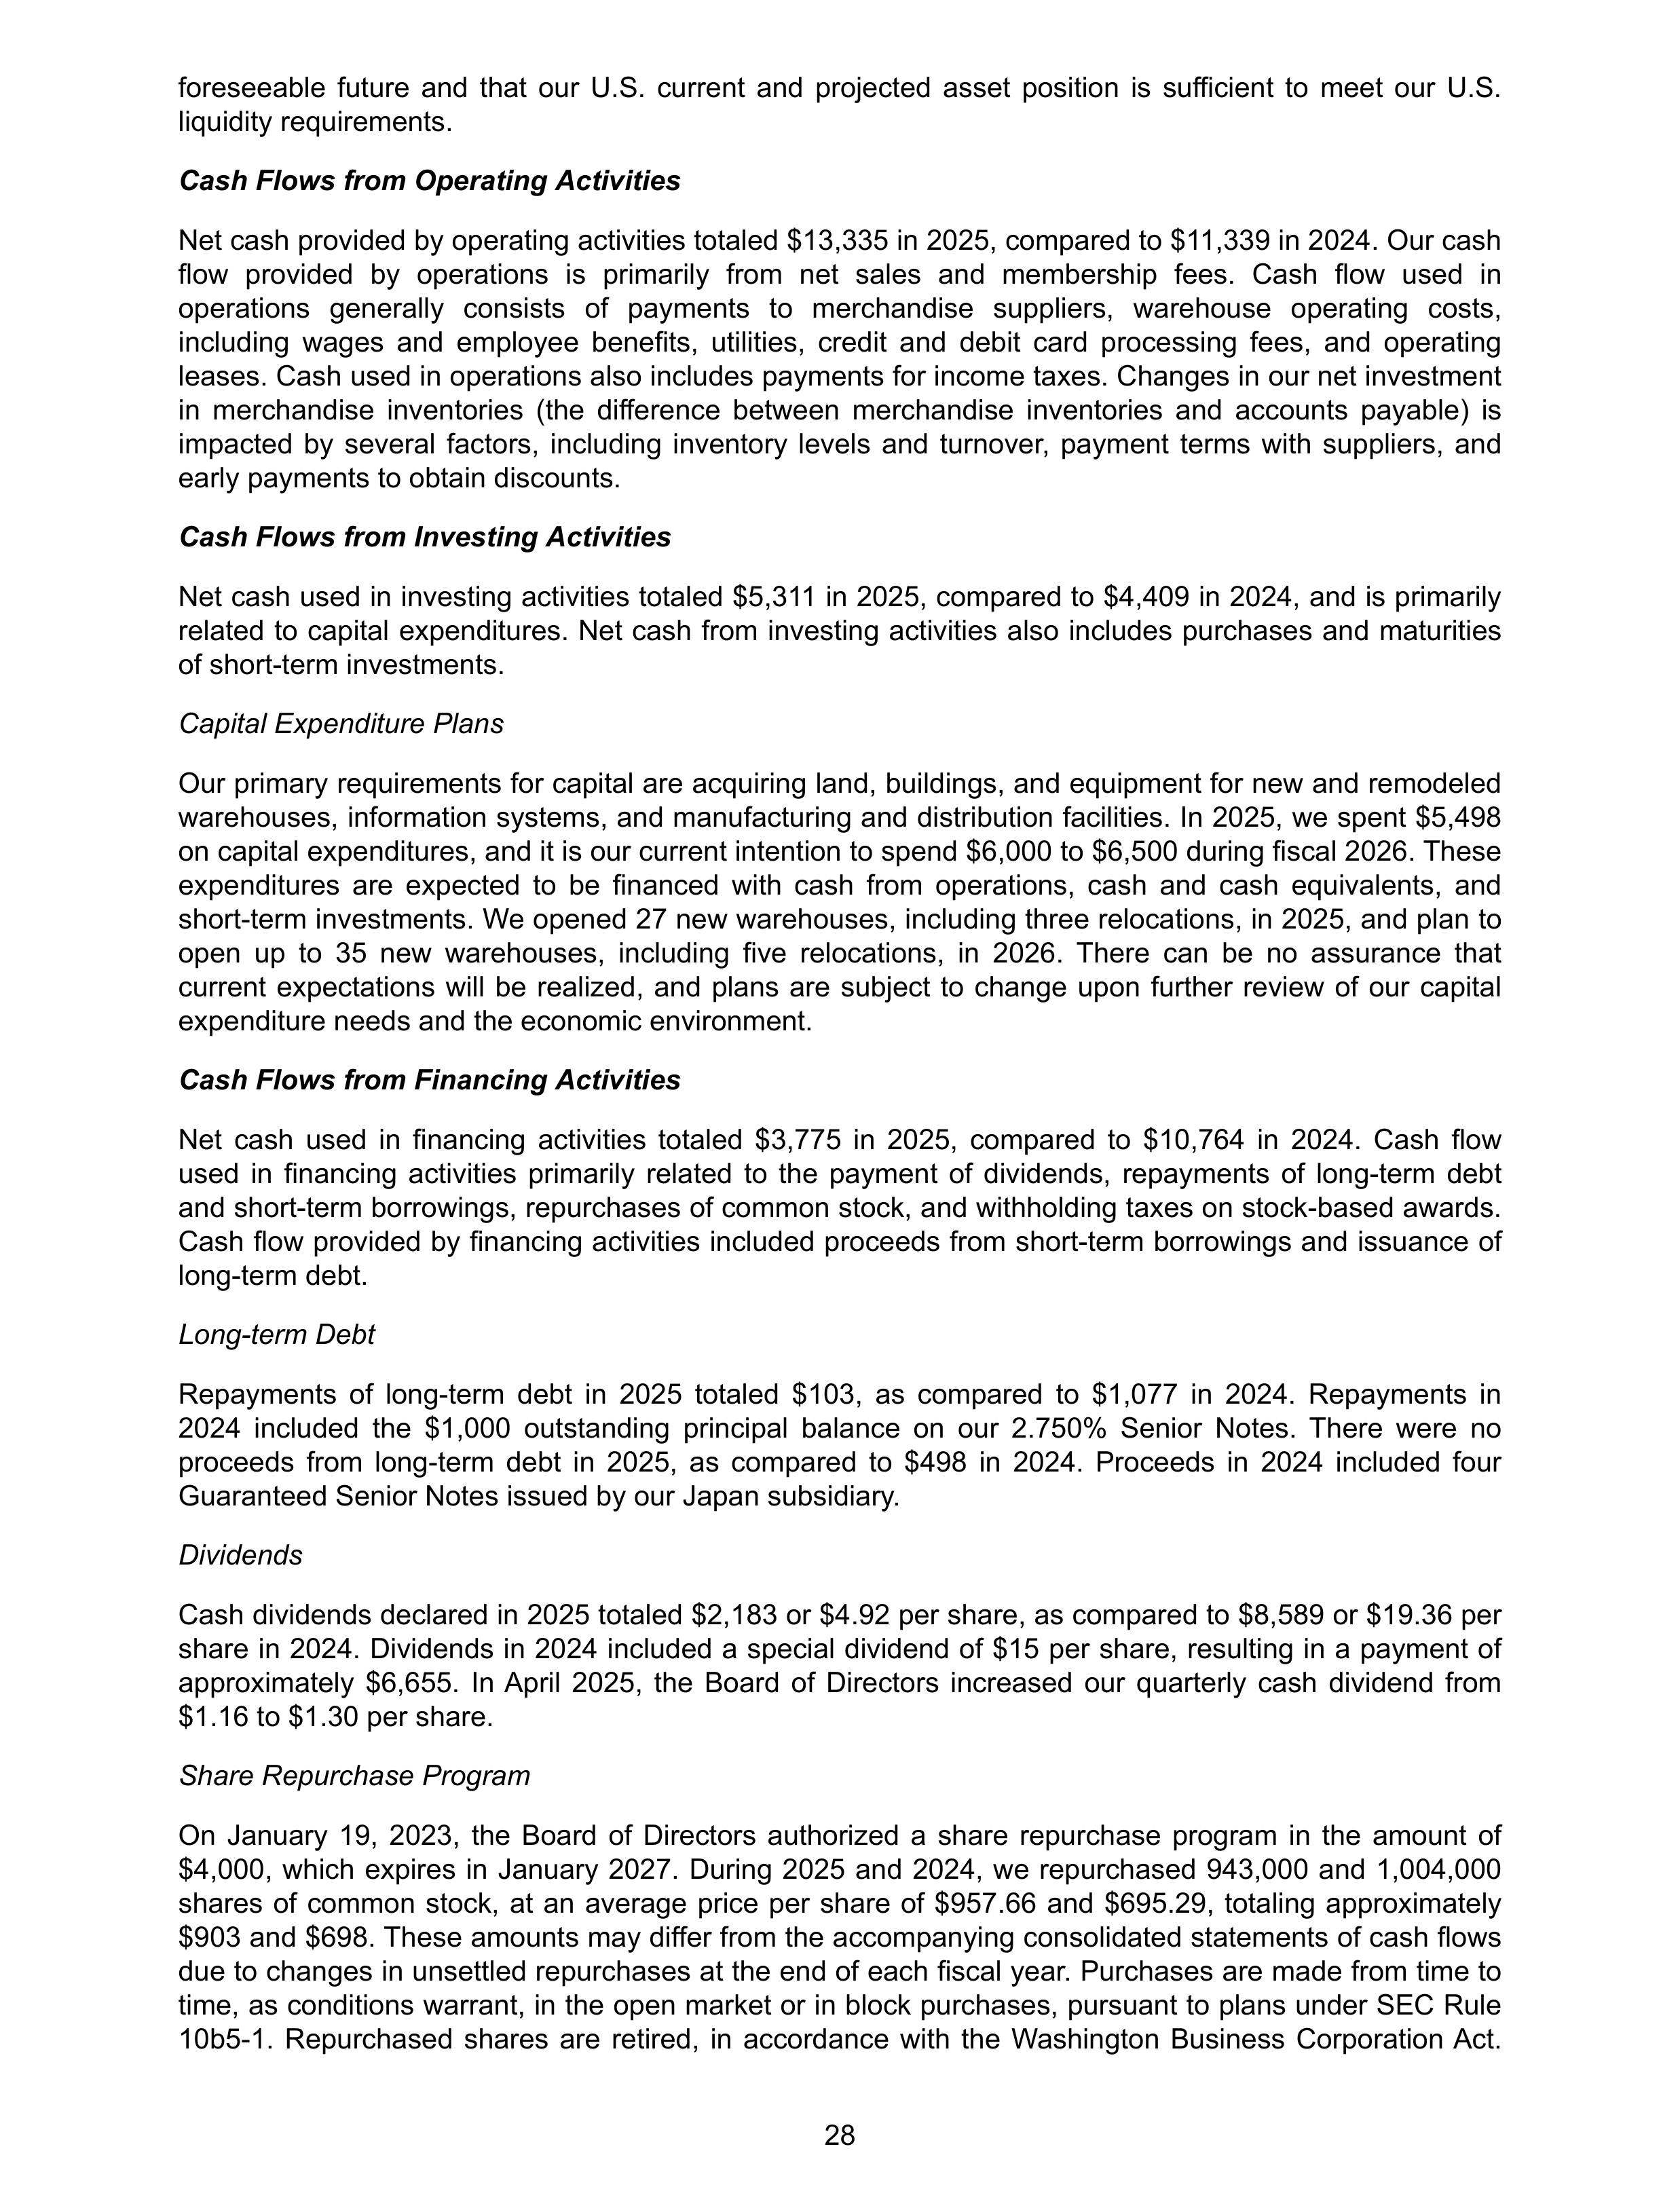
foreseeable future and that our U.S. current and projected asset position is sufficient to meet our U.S.
liquidity requirements.
Cash Flows from Operating Activities
Net cash provided by operating activities totaled $13,335 in 2025, compared to $11,339 in 2024. Our cash
flow provided by operations is primarily from net sales and membership fees. Cash flow used in
operations generally consists of payments to merchandise suppliers, warehouse operating costs,
including wages and employee benefits, utilities, credit and debit card processing fees, and operating
leases. Cash used in operations also includes payments for income taxes. Changes in our net investment
in merchandise inventories (the difference between merchandise inventories and accounts payable) is
impacted by several factors, including inventory levels and turnover, payment terms with suppliers, and
early payments to obtain discounts.
Cash Flows from Investing Activities
Net cash used in investing activities totaled $5,311 in 2025, compared to $4,409 in 2024, and is primarily
related to capital expenditures. Net cash from investing activities also includes purchases and maturities
of short-term investments.
Capital Expenditure Plans
Our primary requirements for capital are acquiring land, buildings, and equipment for new and remodeled
warehouses, information systems, and manufacturing and distribution facilities. In 2025, we spent $5,498
on capital expenditures, and it is our current intention to spend $6,000 to $6,500 during fiscal 2026. These
expenditures are expected to be financed with cash from operations, cash and cash equivalents, and
short-term investments. We opened 27 new warehouses, including three relocations, in 2025, and plan to
open up to 35 new warehouses, including five relocations, in 2026. There can be no assurance that
current expectations will be realized, and plans are subject to change upon further review of our capital
expenditure needs and the economic environment.
Cash Flows from Financing Activities
Net cash used in financing activities totaled $3,775 in 2025, compared to $10,764 in 2024. Cash flow
used in financing activities primarily related to the payment of dividends, repayments of long-term debt
and short-term borrowings, repurchases of common stock, and withholding taxes on stock-based awards.
Cash flow provided by financing activities included proceeds from short-term borrowings and issuance of
long-term debt.
Long-term Debt
Repayments of long-term debt in 2025 totaled $103, as compared to $1,077 in 2024. Repayments in
2024 included the $1,000 outstanding principal balance on our 2.750% Senior Notes. There were no
proceeds from long-term debt in 2025, as compared to $498 in 2024. Proceeds in 2024 included four
Guaranteed Senior Notes issued by our Japan subsidiary.
Dividends
Cash dividends declared in 2025 totaled $2,183 or $4.92 per share, as compared to $8,589 or $19.36 per
share in 2024. Dividends in 2024 included a special dividend of $15 per share, resulting in a payment of
approximately $6,655. In April 2025, the Board of Directors increased our quarterly cash dividend from
$1.16 to $1.30 per share.
Share Repurchase Program
On January 19, 2023, the Board of Directors authorized a share repurchase program in the amount of
$4,000, which expires in January 2027. During 2025 and 2024, we repurchased 943,000 and 1,004,000
shares of common stock, at an average price per share of $957.66 and $695.29, totaling approximately
$903 and $698. These amounts may differ from the accompanying consolidated statements of cash flows
due to changes in unsettled repurchases at the end of each fiscal year. Purchases are made from time to
time, as conditions warrant, in the open market or in block purchases, pursuant to plans under SEC Rule
10b5-1. Repurchased shares are retired, in accordance with the Washington Business Corporation Act.
28
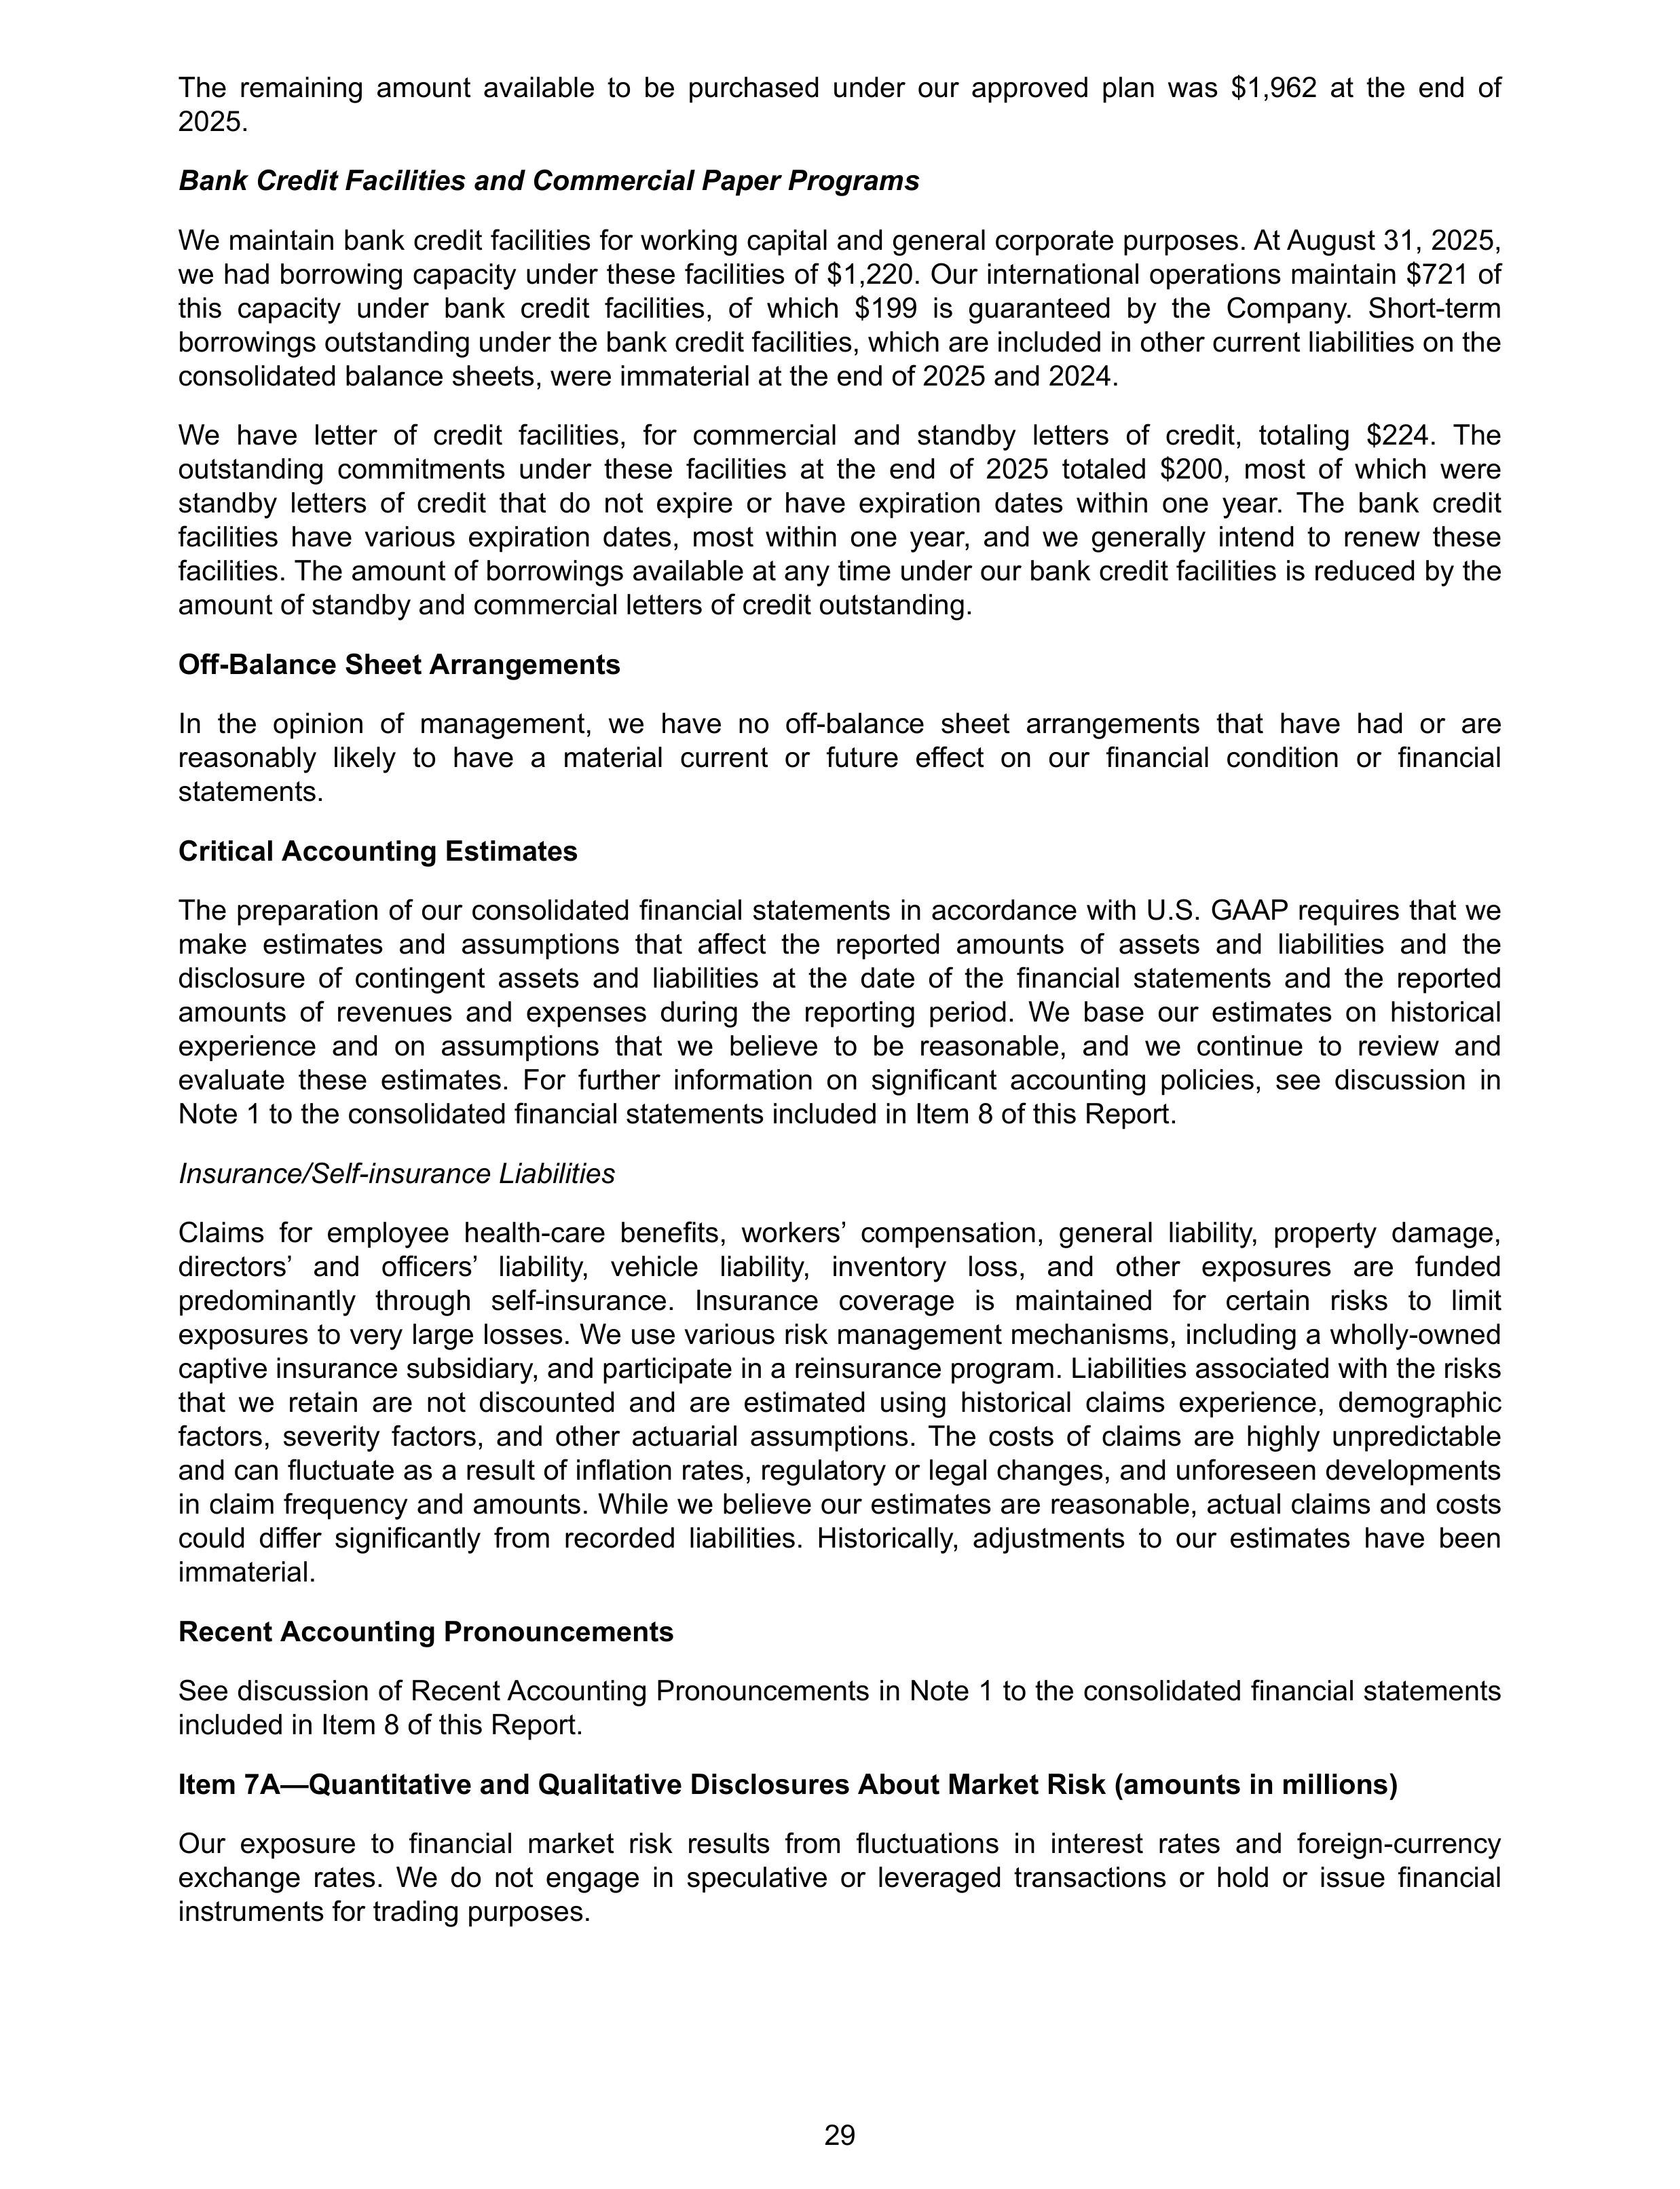
The remaining amount available to be purchased under our approved plan was $1,962 at the end of
2025.
Bank Credit Facilities and Commercial Paper Programs
We maintain bank credit facilities for working capital and general corporate purposes. At August 31, 2025,
we had borrowing capacity under these facilities of $1,220. Our international operations maintain $721 of
this capacity under bank credit facilities, of which $199 is guaranteed by the Company. Short-term
borrowings outstanding under the bank credit facilities, which are included in other current liabilities on the
consolidated balance sheets, were immaterial at the end of 2025 and 2024.
We have letter of credit facilities, for commercial and standby letters of credit, totaling $224. The
outstanding commitments under these facilities at the end of 2025 totaled $200, most of which were
standby letters of credit that do not expire or have expiration dates within one year. The bank credit
facilities have various expiration dates, most within one year, and we generally intend to renew these
facilities. The amount of borrowings available at any time under our bank credit facilities is reduced by the
amount of standby and commercial letters of credit outstanding.
Off-Balance Sheet Arrangements
In the opinion of management, we have no off-balance sheet arrangements that have had or are
reasonably likely to have a material current or future effect on our financial condition or financial
statements.
Critical Accounting Estimates
The preparation of our consolidated financial statements in accordance with U.S. GAAP requires that we
make estimates and assumptions that affect the reported amounts of assets and liabilities and the
disclosure of contingent assets and liabilities at the date of the financial statements and the reported
amounts of revenues and expenses during the reporting period. We base our estimates on historical
experience and on assumptions that we believe to be reasonable, and we continue to review and
evaluate these estimates. For further information on significant accounting policies, see discussion in
Note 1 to the consolidated financial statements included in Item 8 of this Report.
Insurance/Self-insurance Liabilities
Claims for employee health-care benefits, workers’ compensation, general liability, property damage,
directors’ and officers’ liability, vehicle liability, inventory loss, and other exposures are funded
predominantly through self-insurance. Insurance coverage is maintained for certain risks to limit
exposures to very large losses. We use various risk management mechanisms, including a wholly-owned
captive insurance subsidiary, and participate in a reinsurance program. Liabilities associated with the risks
that we retain are not discounted and are estimated using historical claims experience, demographic
factors, severity factors, and other actuarial assumptions. The costs of claims are highly unpredictable
and can fluctuate as a result of inflation rates, regulatory or legal changes, and unforeseen developments
in claim frequency and amounts. While we believe our estimates are reasonable, actual claims and costs
could differ significantly from recorded liabilities. Historically, adjustments to our estimates have been
immaterial.
Recent Accounting Pronouncements
See discussion of Recent Accounting Pronouncements in Note 1 to the consolidated financial statements
included in Item 8 of this Report.
Item 7A—Quantitative and Qualitative Disclosures About Market Risk (amounts in millions)
Our exposure to financial market risk results from fluctuations in interest rates and foreign-currency
exchange rates. We do not engage in speculative or leveraged transactions or hold or issue financial
instruments for trading purposes.
29
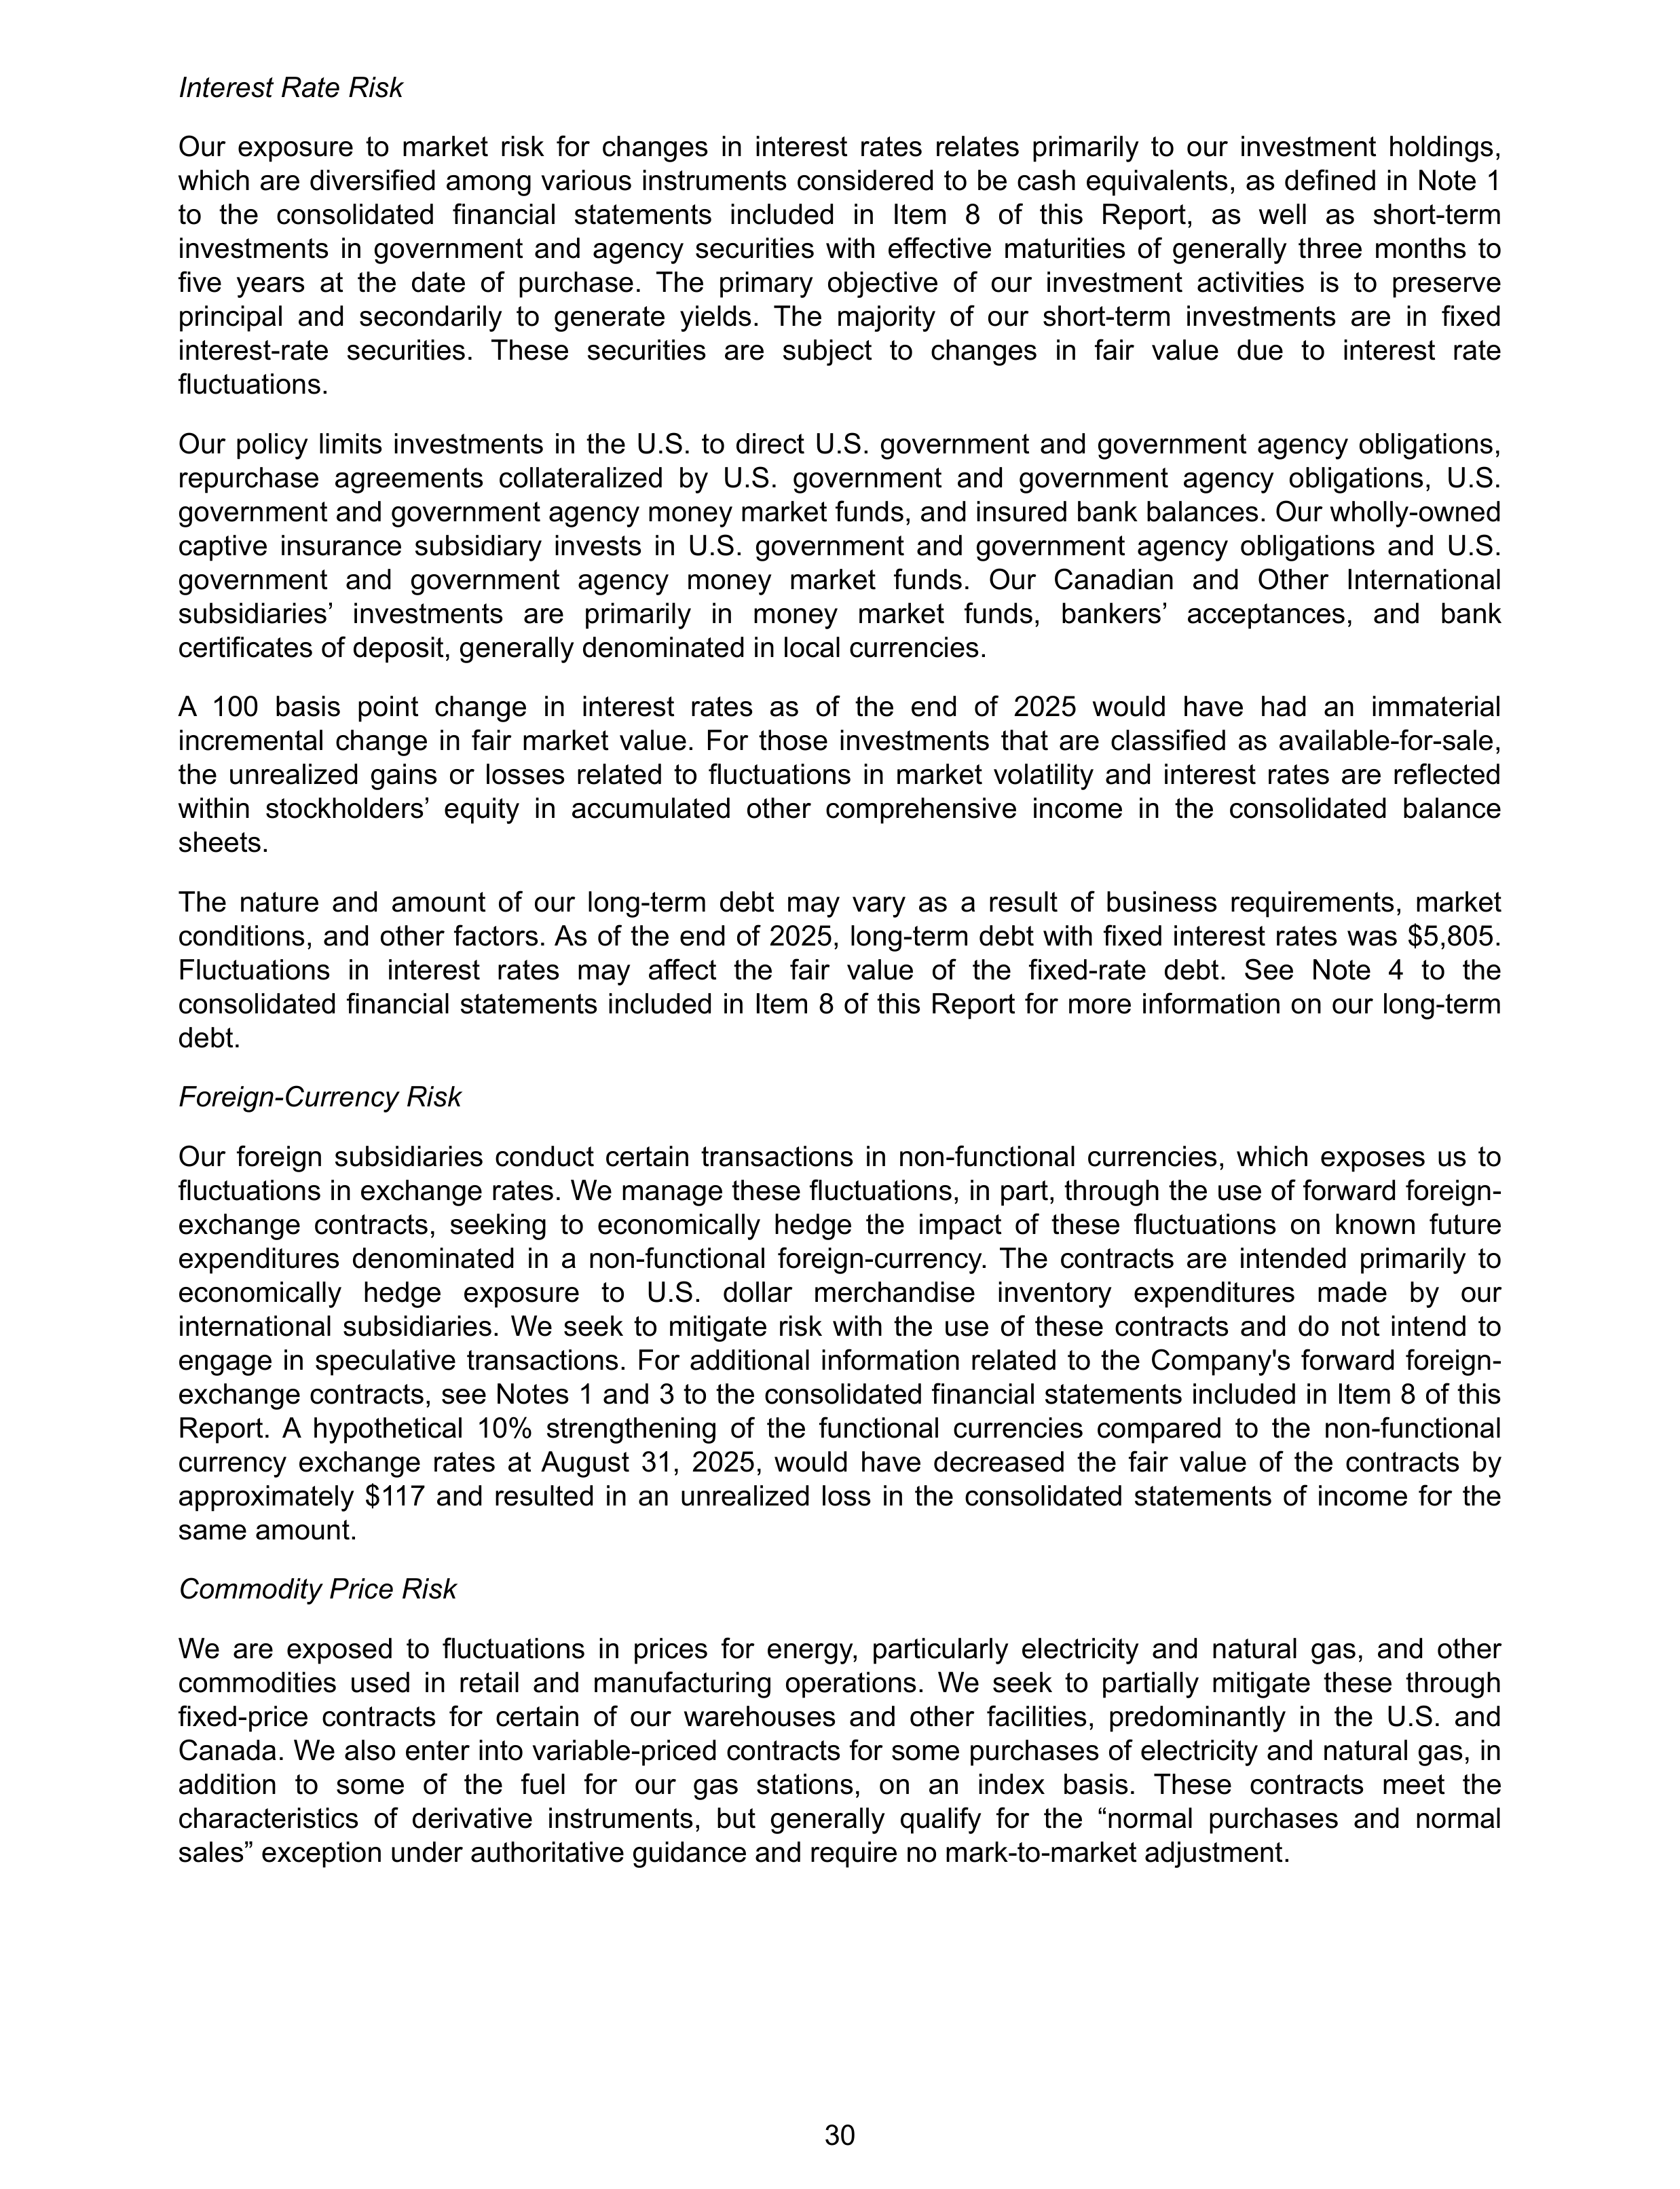
Interest Rate Risk
Our exposure to market risk for changes in interest rates relates primarily to our investment holdings,
which are diversified among various instruments considered to be cash equivalents, as defined in Note 1
to the consolidated financial statements included in Item 8 of this Report, as well as short-term
investments in government and agency securities with effective maturities of generally three months to
five years at the date of purchase. The primary objective of our investment activities is to preserve
principal and secondarily to generate yields. The majority of our short-term investments are in fixed
interest-rate securities. These securities are subject to changes in fair value due to interest rate
fluctuations.
Our policy limits investments in the U.S. to direct U.S. government and government agency obligations,
repurchase agreements collateralized by U.S. government and government agency obligations, U.S.
government and government agency money market funds, and insured bank balances. Our wholly-owned
captive insurance subsidiary invests in U.S. government and government agency obligations and U.S.
government and government agency money market funds. Our Canadian and Other International
subsidiaries’ investments are primarily in money market funds, bankers’ acceptances, and bank
certificates of deposit, generally denominated in local currencies.
A 100 basis point change in interest rates as of the end of 2025 would have had an immaterial
incremental change in fair market value. For those investments that are classified as available-for-sale,
the unrealized gains or losses related to fluctuations in market volatility and interest rates are reflected
within stockholders’ equity in accumulated other comprehensive income in the consolidated balance
sheets.
The nature and amount of our long-term debt may vary as a result of business requirements, market
conditions, and other factors. As of the end of 2025, long-term debt with fixed interest rates was $5,805.
Fluctuations in interest rates may affect the fair value of the fixed-rate debt. See Note 4 to the
consolidated financial statements included in Item 8 of this Report for more information on our long-term
debt.
Foreign-Currency Risk
Our foreign subsidiaries conduct certain transactions in non-functional currencies, which exposes us to
fluctuations in exchange rates. We manage these fluctuations, in part, through the use of forward foreign-
exchange contracts, seeking to economically hedge the impact of these fluctuations on known future
expenditures denominated in a non-functional foreign-currency. The contracts are intended primarily to
economically hedge exposure to U.S. dollar merchandise inventory expenditures made by our
international subsidiaries. We seek to mitigate risk with the use of these contracts and do not intend to
engage in speculative transactions. For additional information related to the Company's forward foreign-
exchange contracts, see Notes 1 and 3 to the consolidated financial statements included in Item 8 of this
Report. A hypothetical 10% strengthening of the functional currencies compared to the non-functional
currency exchange rates at August 31, 2025, would have decreased the fair value of the contracts by
approximately $117 and resulted in an unrealized loss in the consolidated statements of income for the
same amount.
Commodity Price Risk
We are exposed to fluctuations in prices for energy, particularly electricity and natural gas, and other
commodities used in retail and manufacturing operations. We seek to partially mitigate these through
fixed-price contracts for certain of our warehouses and other facilities, predominantly in the U.S. and
Canada. We also enter into variable-priced contracts for some purchases of electricity and natural gas, in
addition to some of the fuel for our gas stations, on an index basis. These contracts meet the
characteristics of derivative instruments, but generally qualify for the “normal purchases and normal
sales” exception under authoritative guidance and require no mark-to-market adjustment.
30
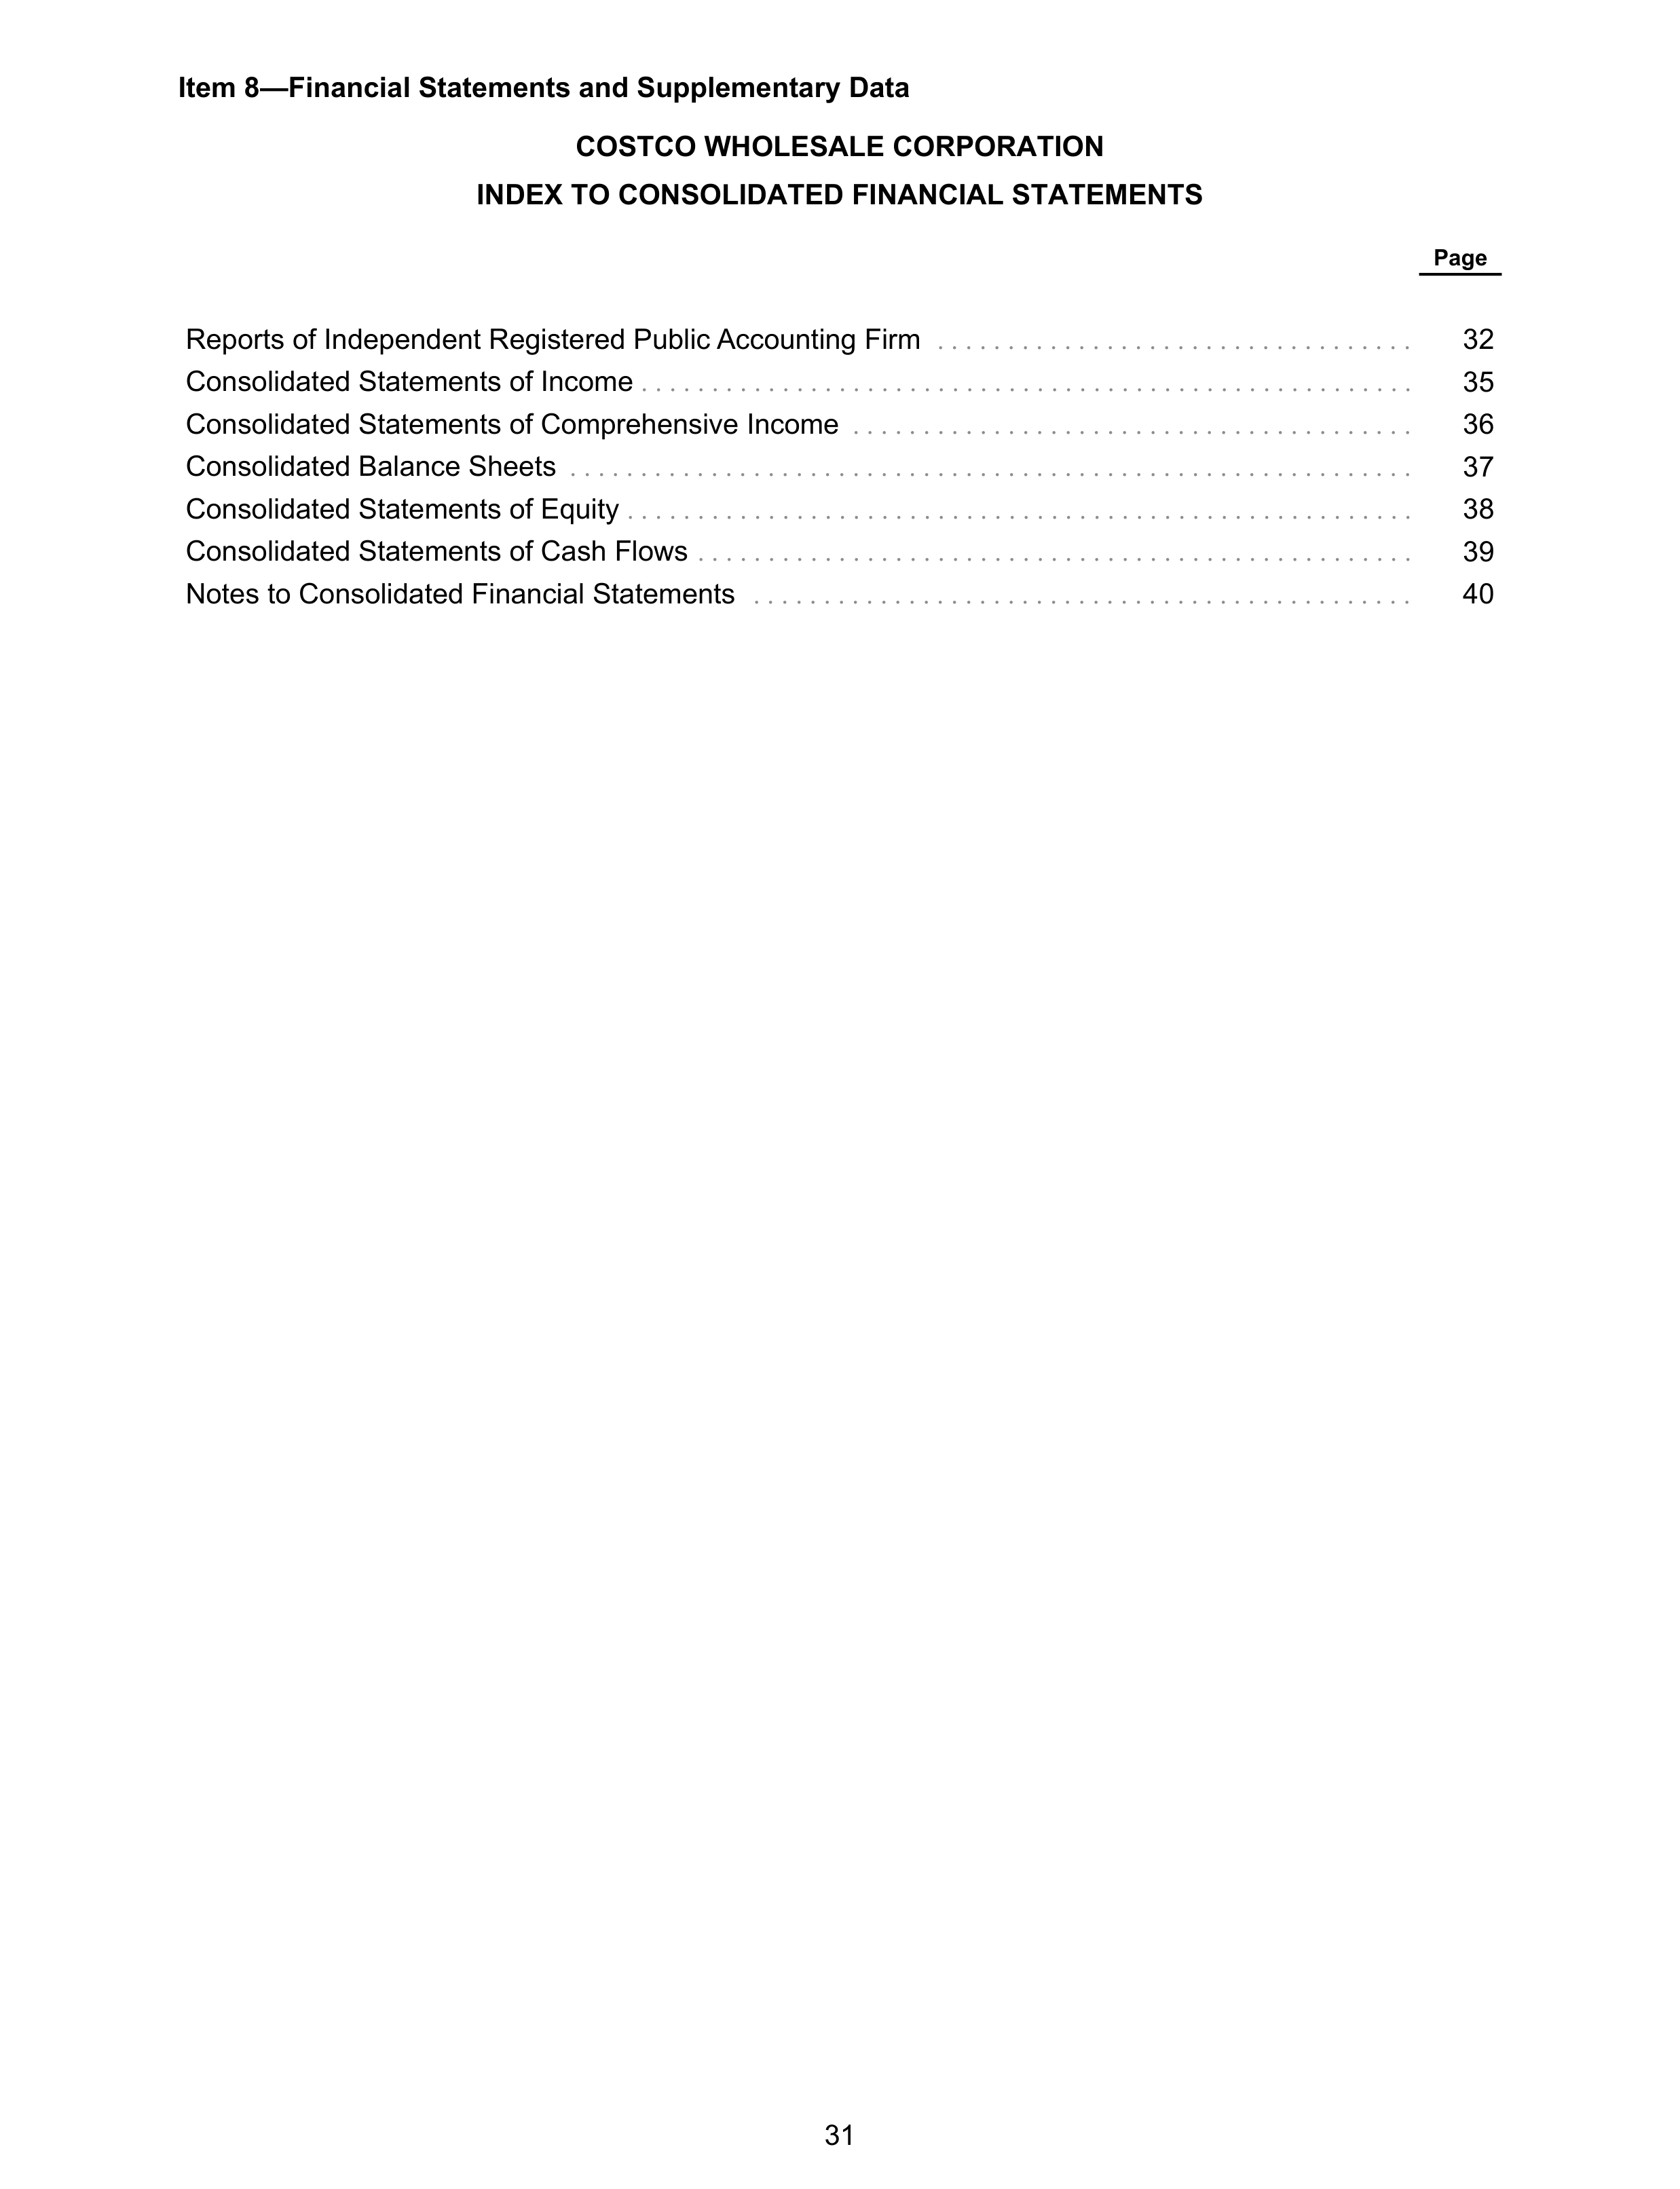
Item 8—Financial Statements and Supplementary Data
COSTCO WHOLESALE CORPORATION
INDEX TO CONSOLIDATED FINANCIAL STATEMENTS
Page
Reports of Independent Registered Public Accounting Firm
. . . . . . . . . . . . . . . . . . . . . . . . . . . . . . . . . .
32
Consolidated Statements of Income
. . . . . . . . . . . . . . . . . . . . . . . . . . . . . . . . . . . . . . . . . . . . . . . . . . . . . . .
35
Consolidated Statements of Comprehensive Income
. . . . . . . . . . . . . . . . . . . . . . . . . . . . . . . . . . . . . . . .
36
Consolidated Balance Sheets
. . . . . . . . . . . . . . . . . . . . . . . . . . . . . . . . . . . . . . . . . . . . . . . . . . . . . . . . . . . .
37
Consolidated Statements of Equity
. . . . . . . . . . . . . . . . . . . . . . . . . . . . . . . . . . . . . . . . . . . . . . . . . . . . . . . .
38
Consolidated Statements of Cash Flows
. . . . . . . . . . . . . . . . . . . . . . . . . . . . . . . . . . . . . . . . . . . . . . . . . . .
39
Notes to Consolidated Financial Statements
. . . . . . . . . . . . . . . . . . . . . . . . . . . . . . . . . . . . . . . . . . . . . . .
40
31
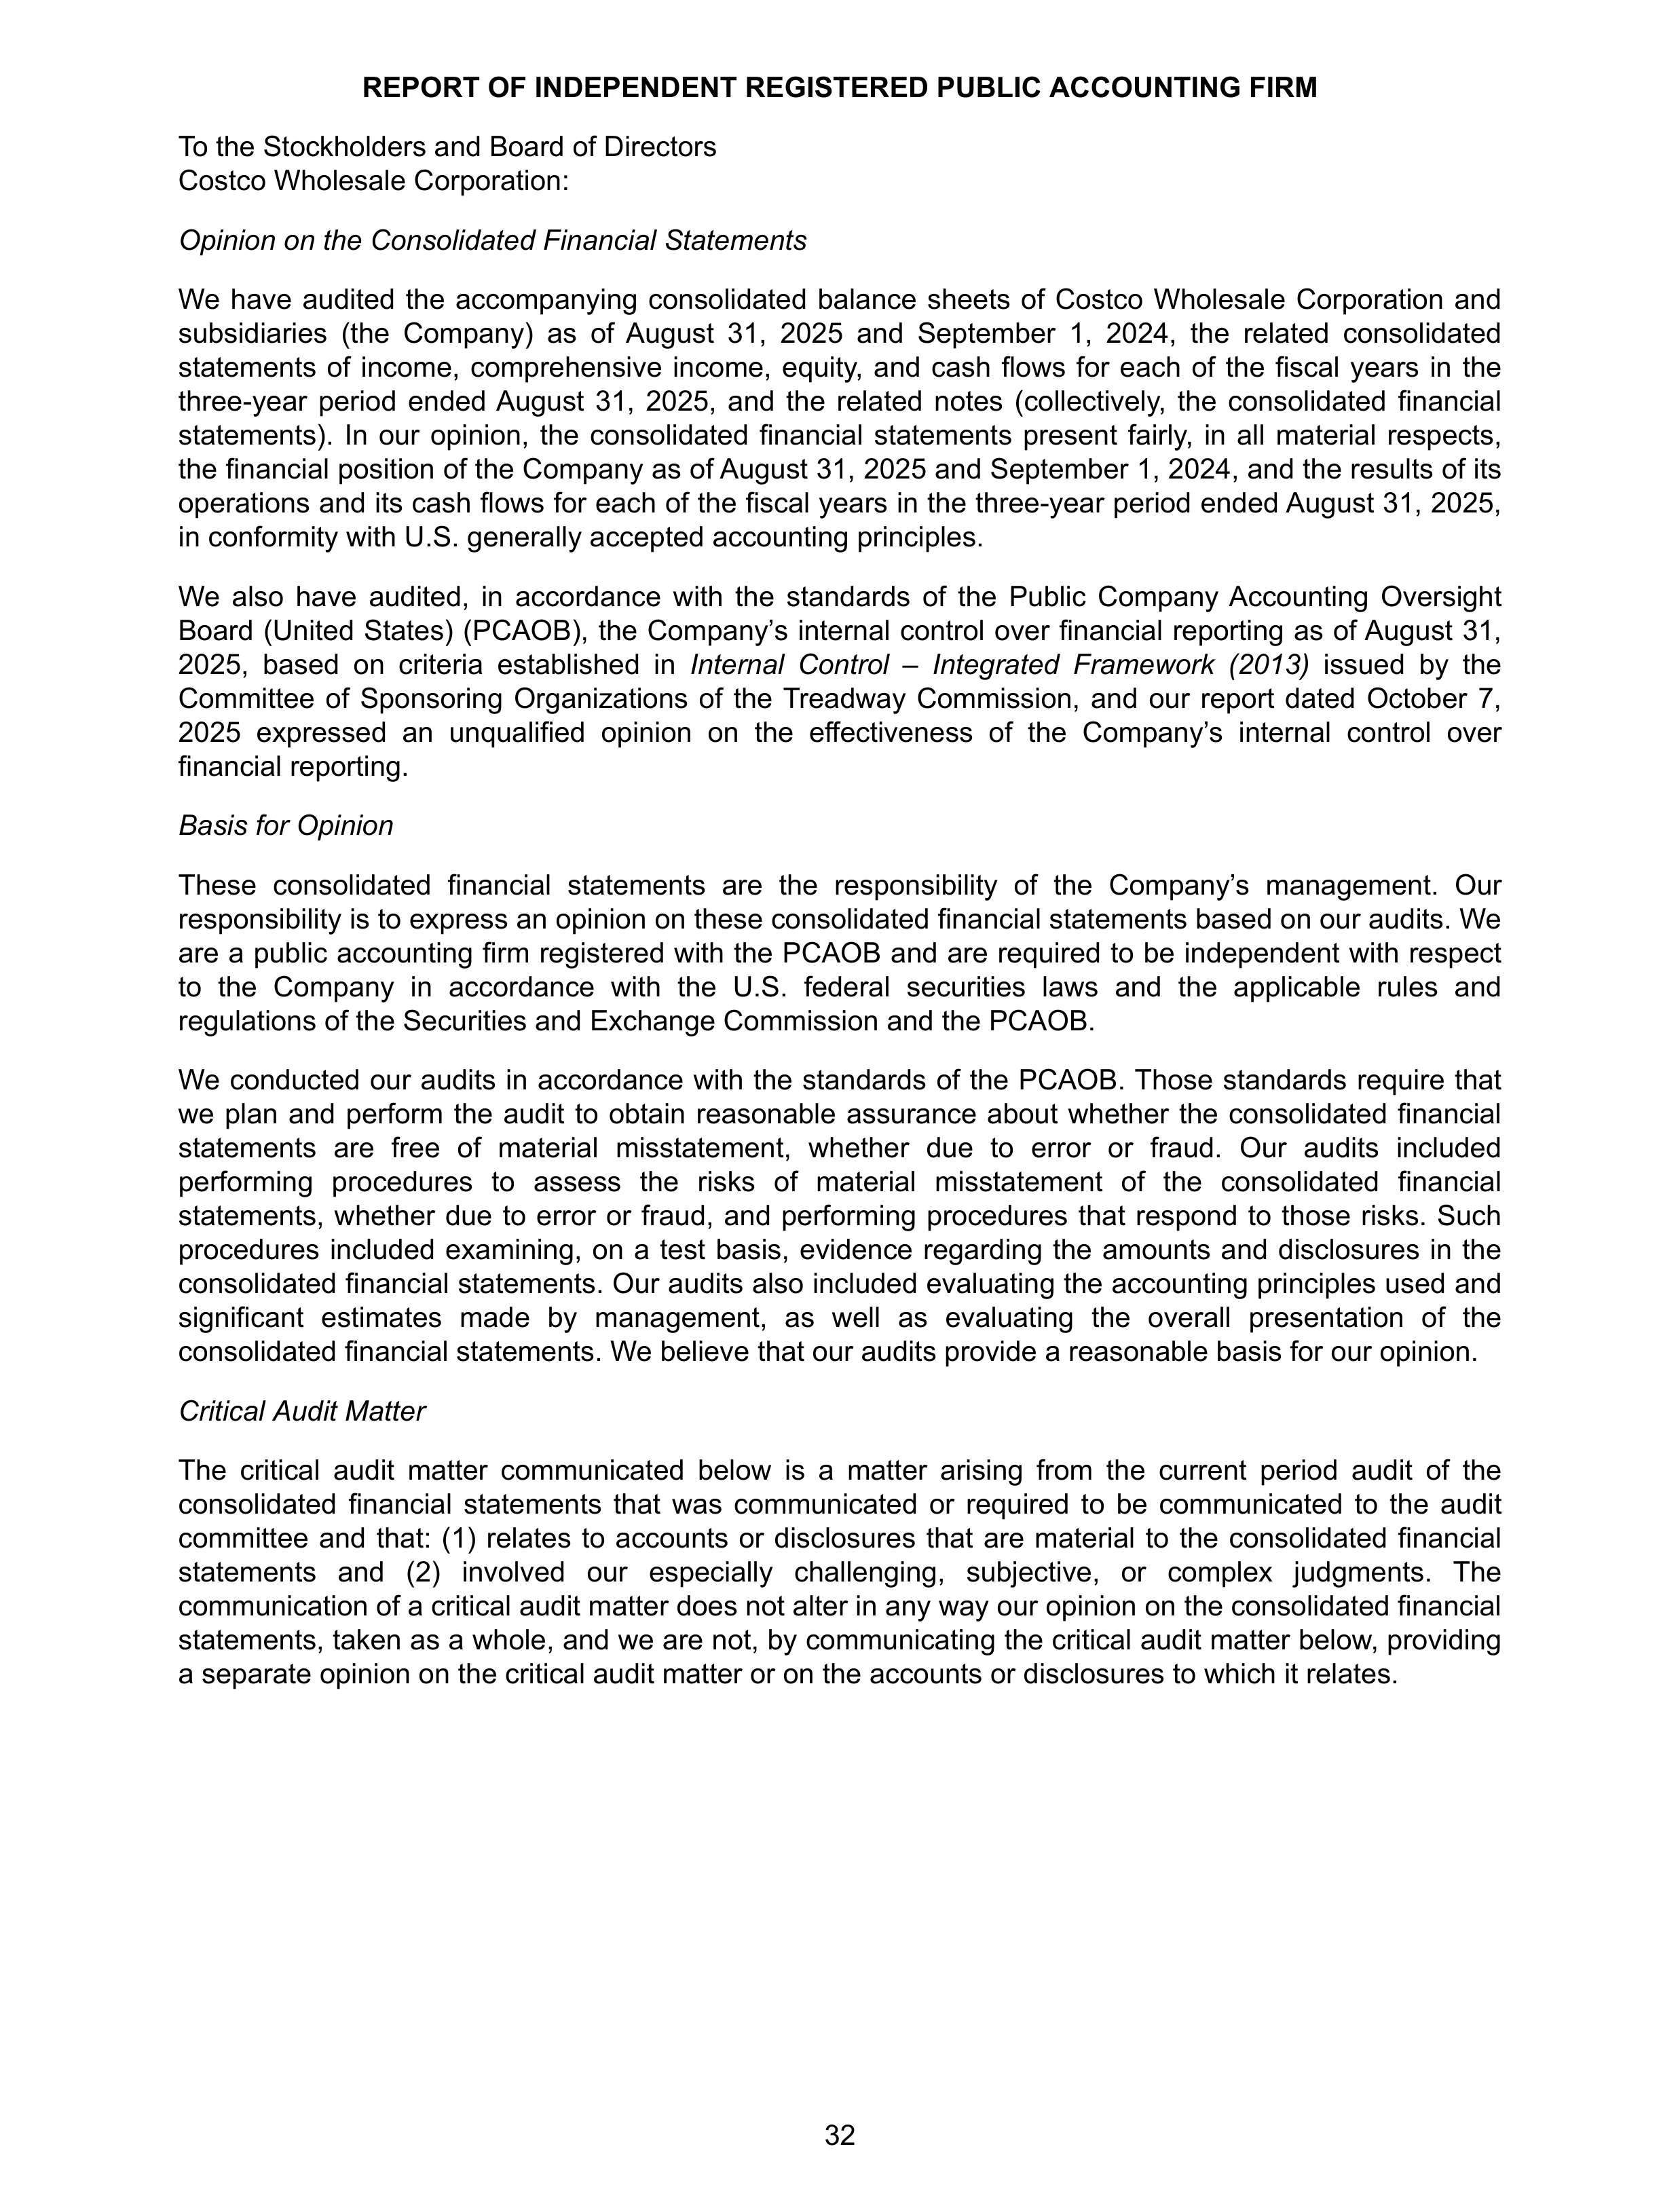
REPORT OF INDEPENDENT REGISTERED PUBLIC ACCOUNTING FIRM
To the Stockholders and Board of Directors
Costco Wholesale Corporation:
Opinion on the Consolidated Financial Statements
We have audited the accompanying consolidated balance sheets of Costco Wholesale Corporation and
subsidiaries (the Company) as of August 31, 2025 and September 1, 2024, the related consolidated
statements of income, comprehensive income, equity, and cash flows for each of the fiscal years in the
three-year period ended August 31, 2025, and the related notes (collectively, the consolidated financial
statements). In our opinion, the consolidated financial statements present fairly, in all material respects,
the financial position of the Company as of August 31, 2025 and September 1, 2024, and the results of its
operations and its cash flows for each of the fiscal years in the three-year period ended August 31, 2025,
in conformity with U.S. generally accepted accounting principles.
We also have audited, in accordance with the standards of the Public Company Accounting Oversight
Board (United States) (PCAOB), the Company’s internal control over financial reporting as of August 31,
2025, based on criteria established in
Internal Control – Integrated Framework (2013)
issued by the
Committee of Sponsoring Organizations of the Treadway Commission, and our report dated October 7,
2025 expressed an unqualified opinion on the effectiveness of the Company’s internal control over
financial reporting.
Basis for Opinion
These consolidated financial statements are the responsibility of the Company’s management. Our
responsibility is to express an opinion on these consolidated financial statements based on our audits. We
are a public accounting firm registered with the PCAOB and are required to be independent with respect
to the Company in accordance with the U.S. federal securities laws and the applicable rules and
regulations of the Securities and Exchange Commission and the PCAOB.
We conducted our audits in accordance with the standards of the PCAOB. Those standards require that
we plan and perform the audit to obtain reasonable assurance about whether the consolidated financial
statements are free of material misstatement, whether due to error or fraud. Our audits included
performing procedures to assess the risks of material misstatement of the consolidated financial
statements, whether due to error or fraud, and performing procedures that respond to those risks. Such
procedures included examining, on a test basis, evidence regarding the amounts and disclosures in the
consolidated financial statements. Our audits also included evaluating the accounting principles used and
significant estimates made by management, as well as evaluating the overall presentation of the
consolidated financial statements. We believe that our audits provide a reasonable basis for our opinion.
Critical Audit Matter
The critical audit matter communicated below is a matter arising from the current period audit of the
consolidated financial statements that was communicated or required to be communicated to the audit
committee and that: (1) relates to accounts or disclosures that are material to the consolidated financial
statements and (2) involved our especially challenging, subjective, or complex judgments. The
communication of a critical audit matter does not alter in any way our opinion on the consolidated financial
statements, taken as a whole, and we are not, by communicating the critical audit matter below, providing
a separate opinion on the critical audit matter or on the accounts or disclosures to which it relates.
32
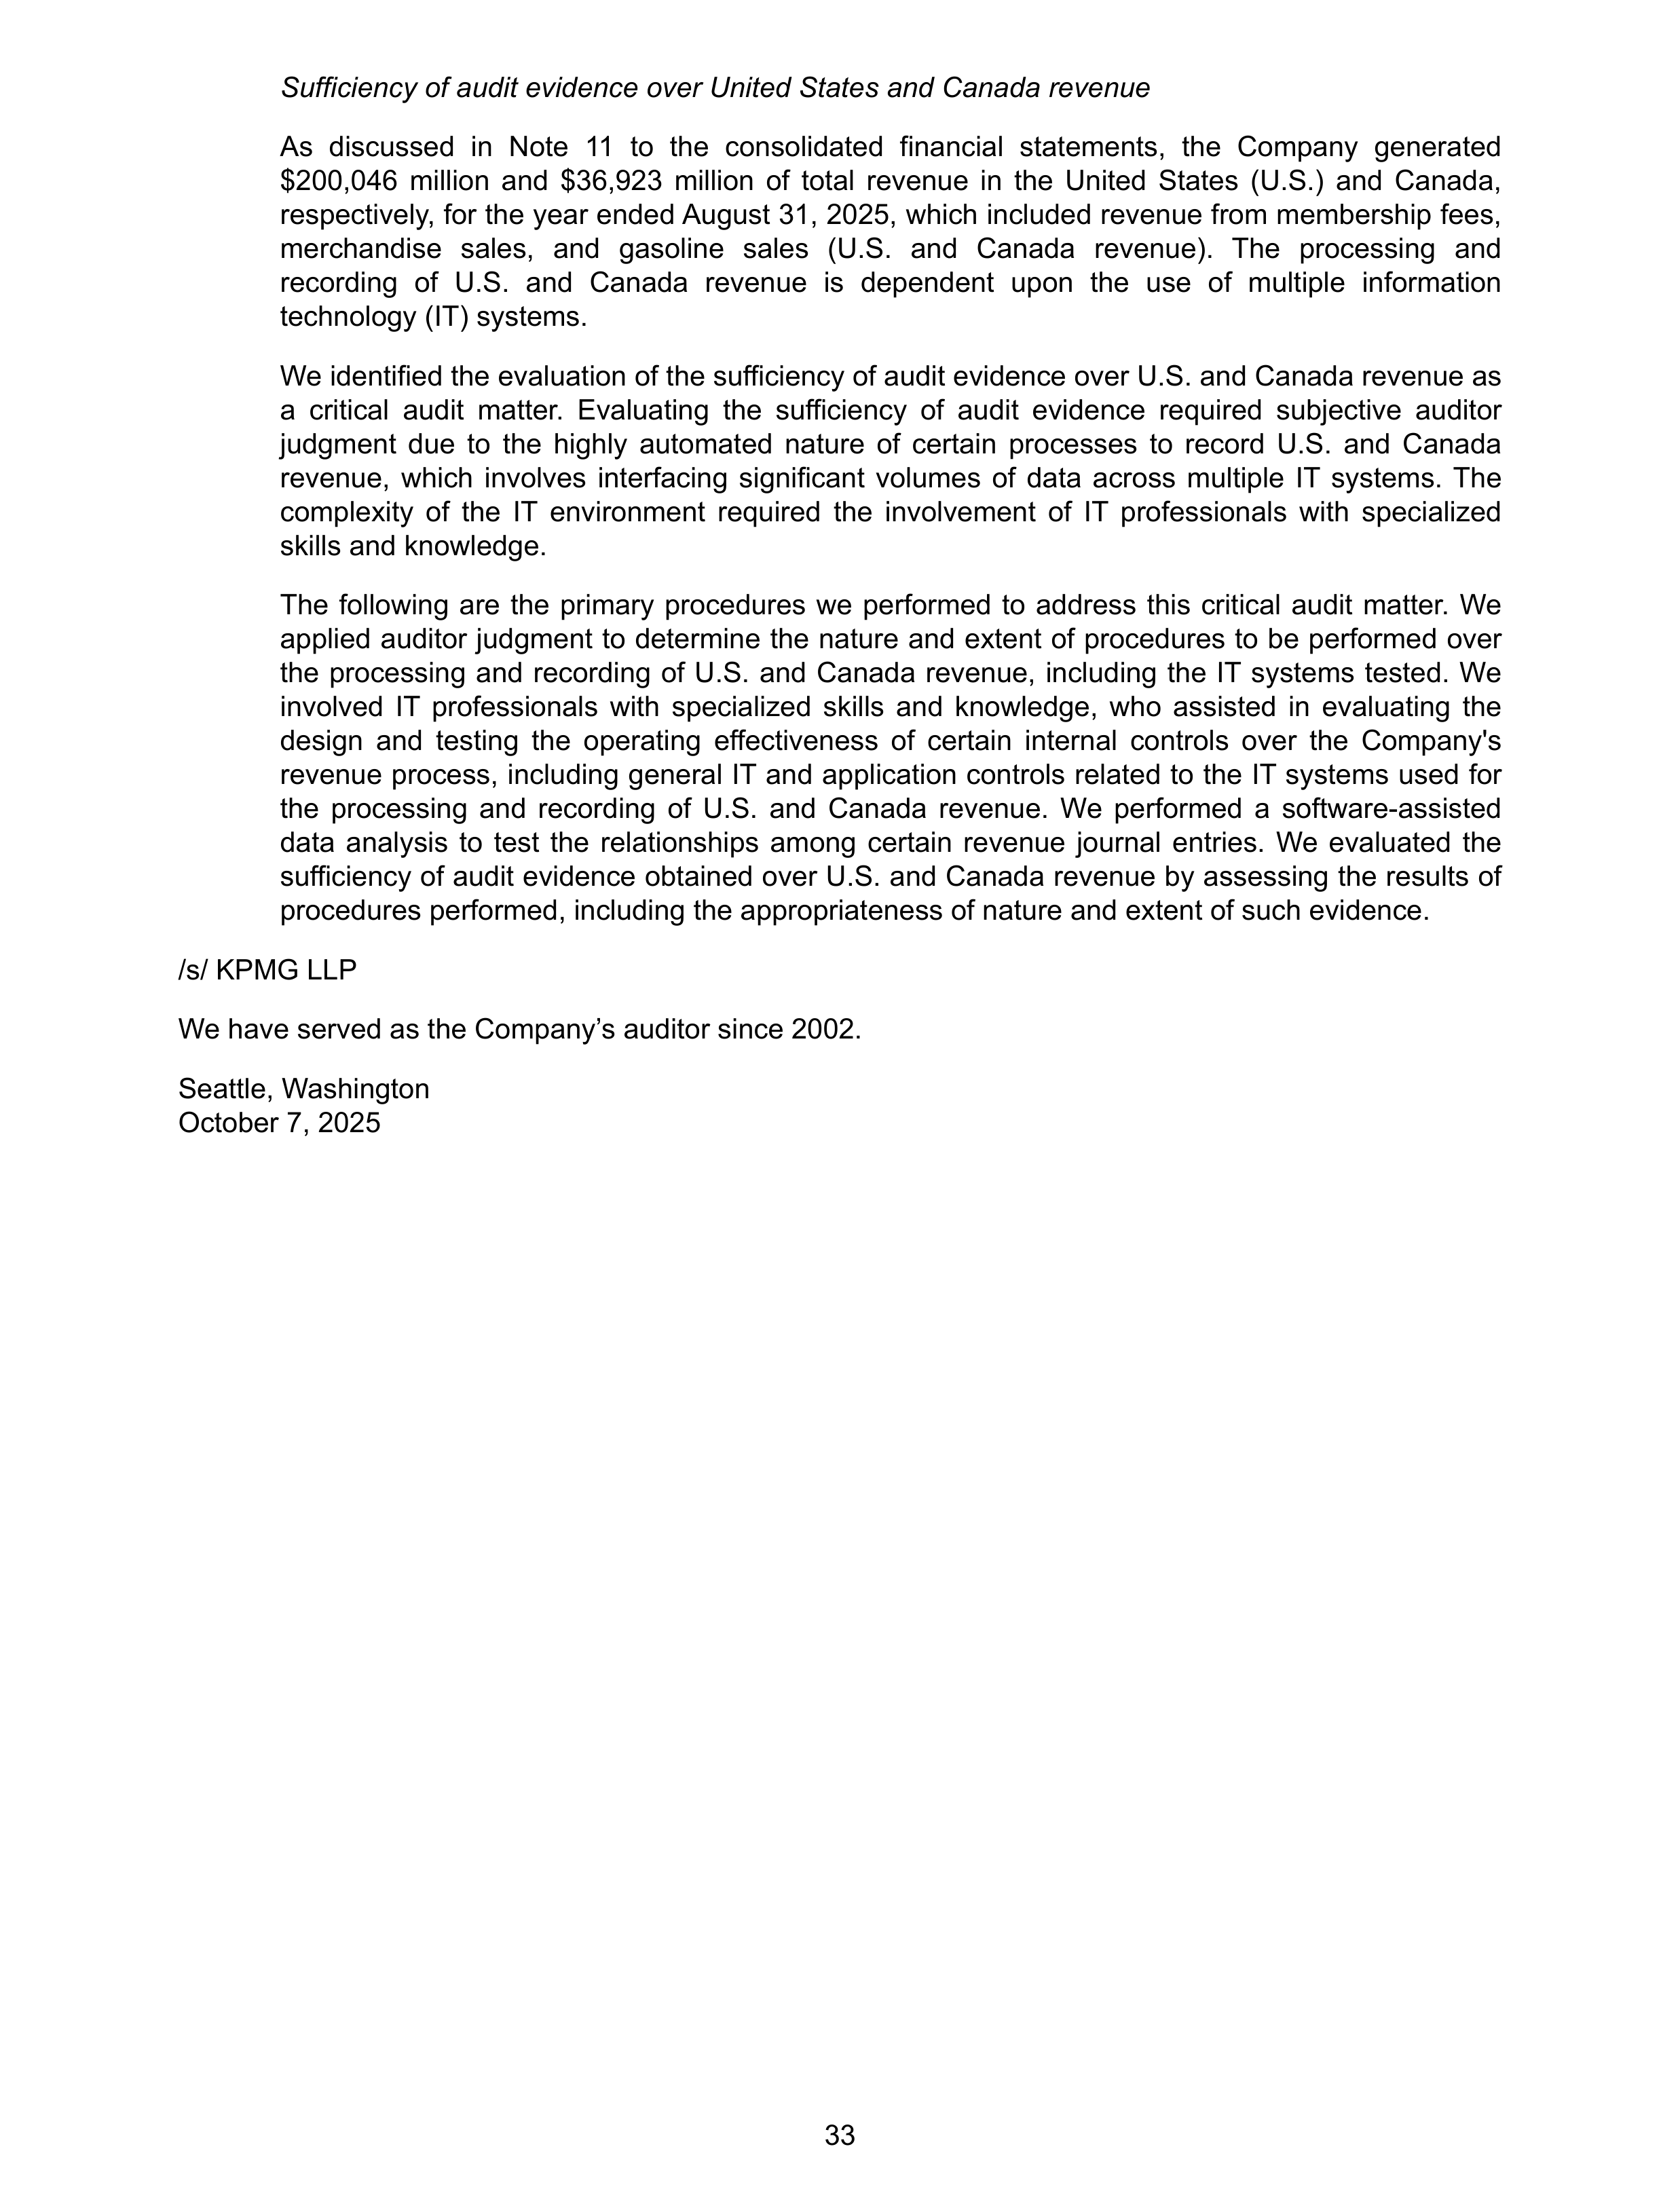
Sufficiency of audit evidence over United States and Canada revenue
As discussed in Note 11 to the consolidated financial statements, the Company generated
$200,046 million and $36,923 million of total revenue in the United States (U.S.) and Canada,
respectively, for the year ended August 31, 2025, which included revenue from membership fees,
merchandise sales, and gasoline sales (U.S. and Canada revenue). The processing and
recording of U.S. and Canada revenue is dependent upon the use of multiple information
technology (IT) systems.
We identified the evaluation of the sufficiency of audit evidence over U.S. and Canada revenue as
a critical audit matter. Evaluating the sufficiency of audit evidence required subjective auditor
judgment due to the highly automated nature of certain processes to record U.S. and Canada
revenue, which involves interfacing significant volumes of data across multiple IT systems. The
complexity of the IT environment required the involvement of IT professionals with specialized
skills and knowledge.
The following are the primary procedures we performed to address this critical audit matter. We
applied auditor judgment to determine the nature and extent of procedures to be performed over
the processing and recording of U.S. and Canada revenue, including the IT systems tested. We
involved IT professionals with specialized skills and knowledge, who assisted in evaluating the
design and testing the operating effectiveness of certain internal controls over the Company's
revenue process, including general IT and application controls related to the IT systems used for
the processing and recording of U.S. and Canada revenue. We performed a software-assisted
data analysis to test the relationships among certain revenue journal entries. We evaluated the
sufficiency of audit evidence obtained over U.S. and Canada revenue by assessing the results of
procedures performed, including the appropriateness of nature and extent of such evidence.
/s/ KPMG LLP
We have served as the Company’s auditor since 2002.
Seattle, Washington
October 7, 2025
33
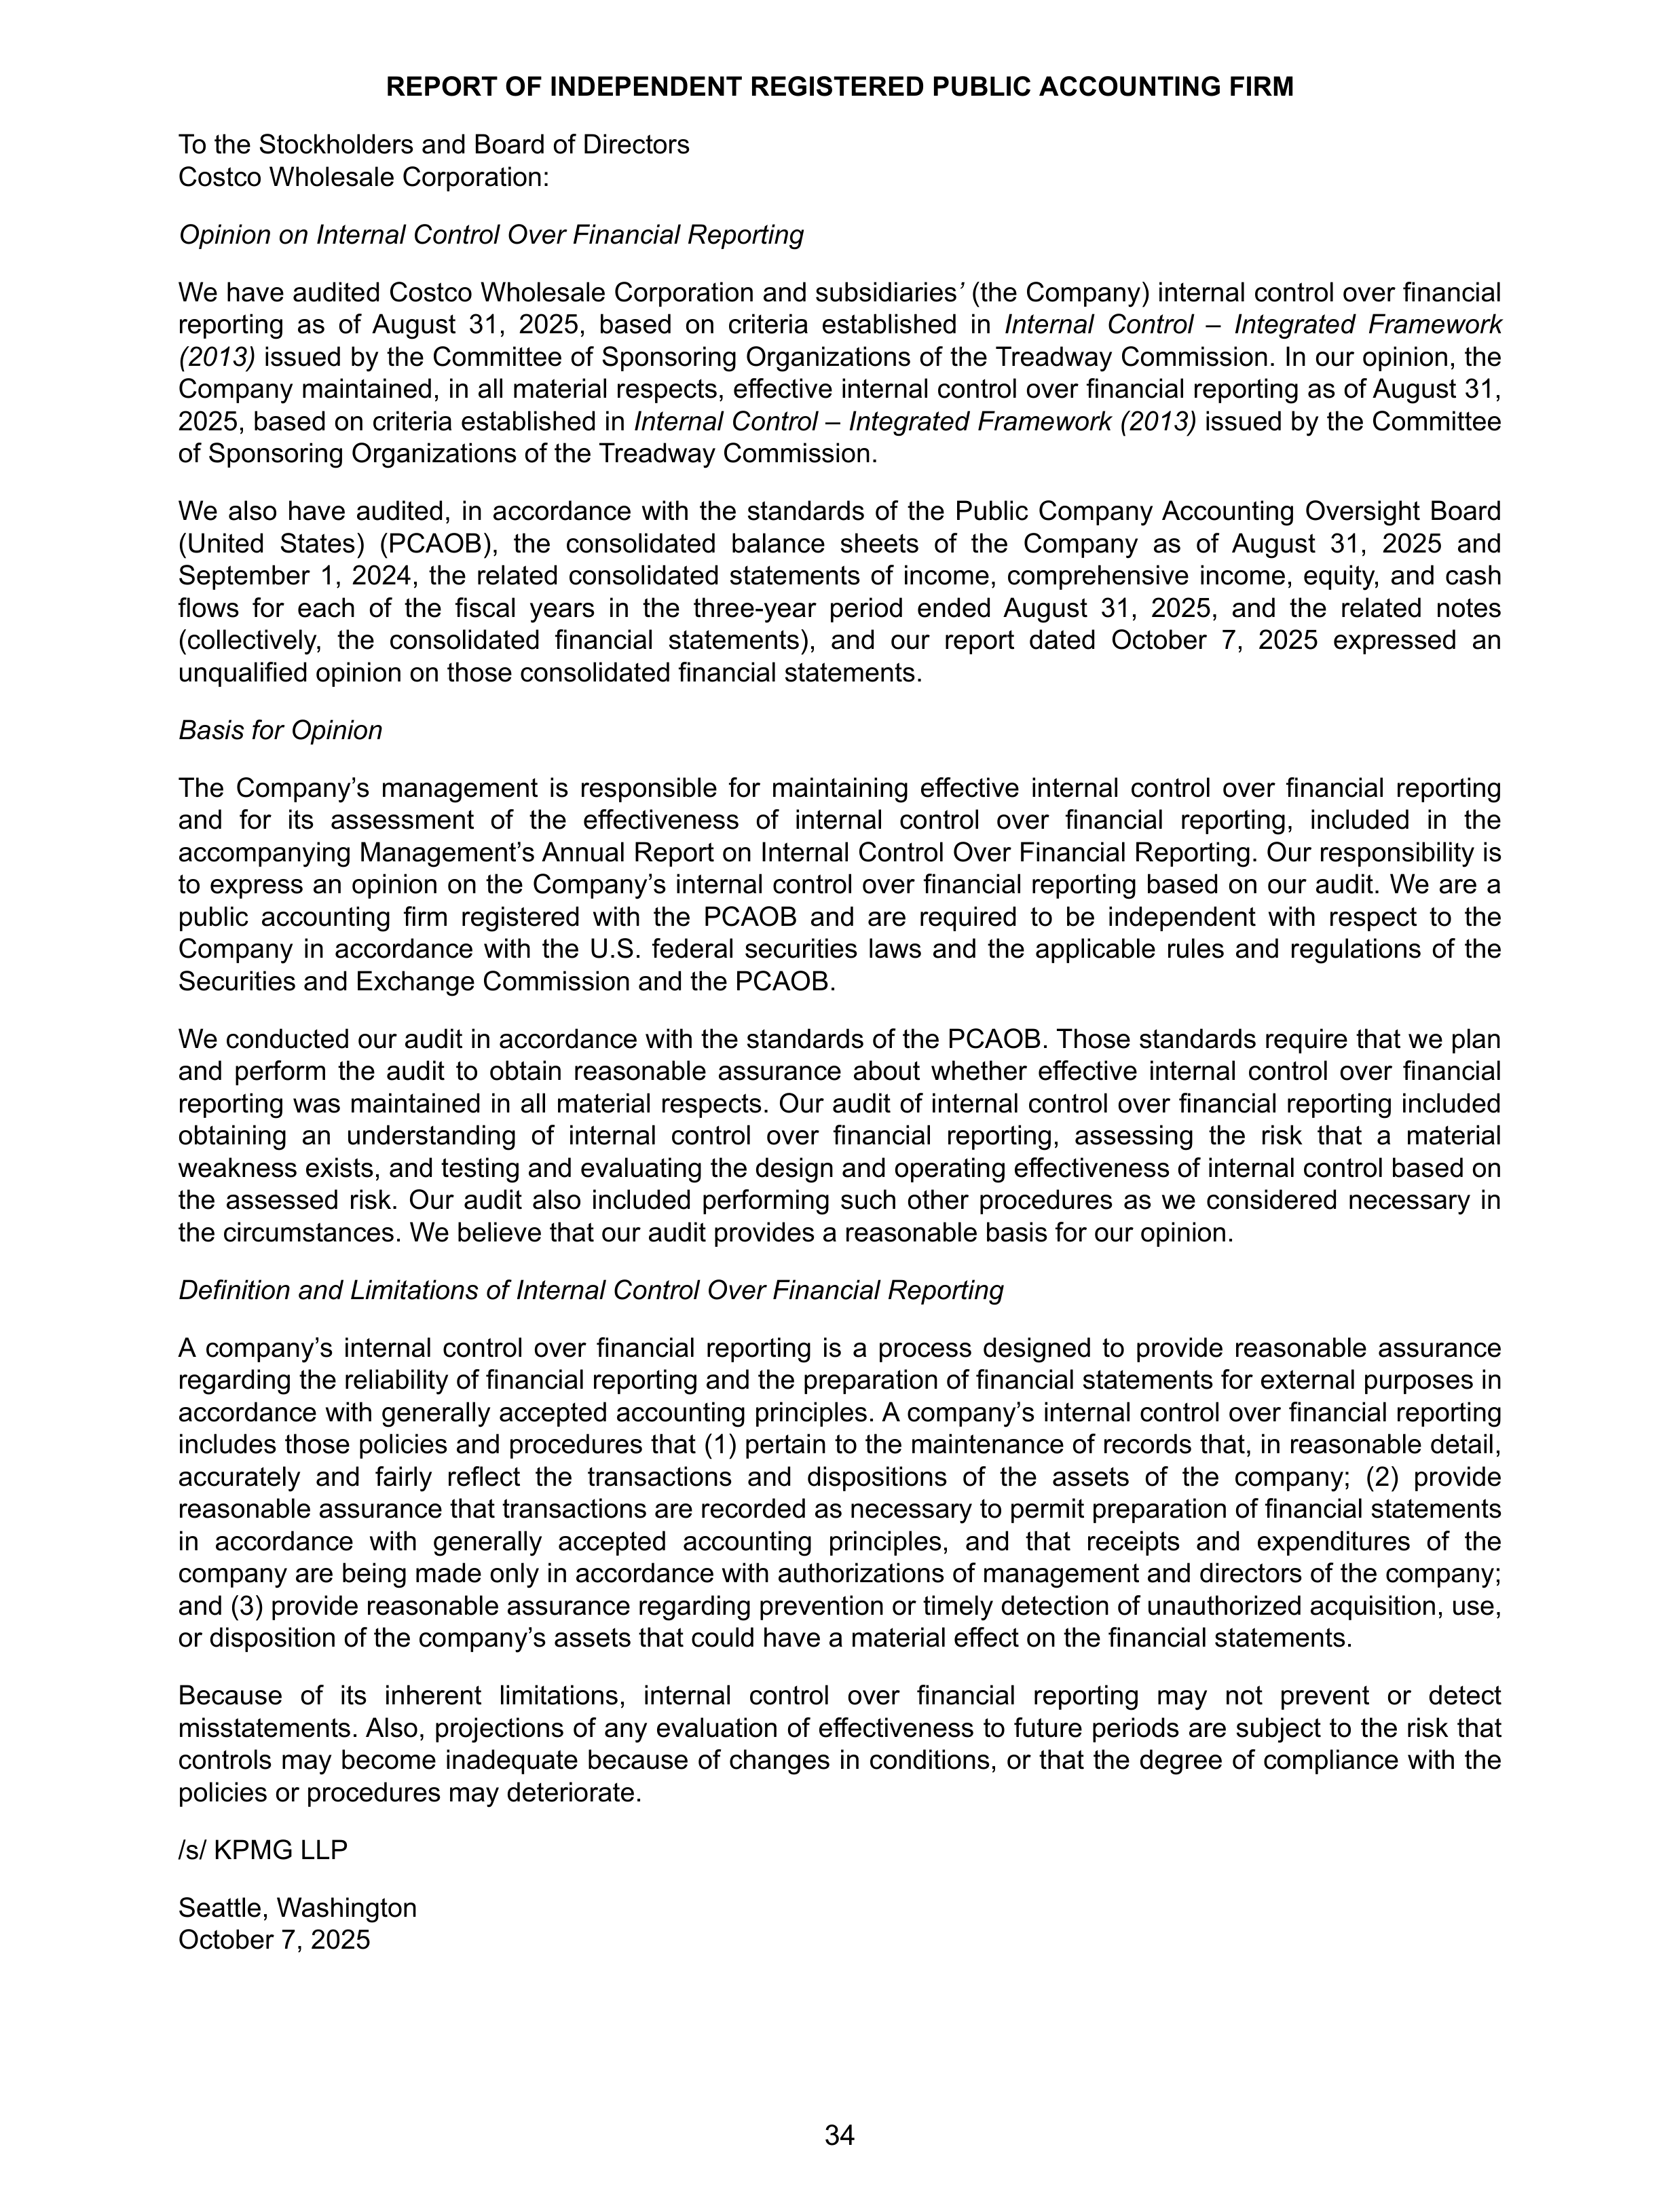
REPORT OF INDEPENDENT REGISTERED PUBLIC ACCOUNTING FIRM
To the Stockholders and Board of Directors
Costco Wholesale Corporation:
Opinion on Internal Control Over Financial Reporting
We have audited Costco Wholesale Corporation and
subsidiaries
’
(the Company) internal control over financial
reporting as of August 31, 2025, based on criteria established in
Internal Control – Integrated Framework
(2013)
issued by the Committee of Sponsoring Organizations of the Treadway Commission. In our opinion, the
Company maintained, in all material respects, effective internal control over financial reporting as of August 31,
2025, based on criteria established in
Internal Control – Integrated Framework (2013)
issued by the Committee
of Sponsoring Organizations of the Treadway Commission.
We also have audited, in accordance with the standards of the Public Company Accounting Oversight Board
(United States) (PCAOB), the consolidated balance sheets of the Company as of August 31, 2025 and
September 1, 2024, the related consolidated statements of income, comprehensive income, equity, and cash
flows for each of the fiscal years in the three-year period ended August 31, 2025, and the related notes
(collectively, the consolidated financial statements), and our report dated October 7, 2025 expressed an
unqualified opinion on those consolidated financial statements.
Basis for Opinion
The Company’s management is responsible for maintaining effective internal control over financial reporting
and for its assessment of the effectiveness of internal control over financial reporting, included in the
accompanying Management’s Annual Report on Internal Control Over Financial Reporting. Our responsibility is
to express an opinion on the Company’s internal control over financial reporting based on our audit. We are a
public accounting firm registered with the PCAOB and are required to be independent with respect to the
Company in accordance with the U.S. federal securities laws and the applicable rules and regulations of the
Securities and Exchange Commission and the PCAOB.
We conducted our audit in accordance with the standards of the PCAOB. Those standards require that we plan
and perform the audit to obtain reasonable assurance about whether effective internal control over financial
reporting was maintained in all material respects. Our audit of internal control over financial reporting included
obtaining an understanding of internal control over financial reporting, assessing the risk that a material
weakness exists, and testing and evaluating the design and operating effectiveness of internal control based on
the assessed risk. Our audit also included performing such other procedures as we considered necessary in
the circumstances. We believe that our audit provides a reasonable basis for our opinion.
Definition and Limitations of Internal Control Over Financial Reporting
A company’s internal control over financial reporting is a process designed to provide reasonable assurance
regarding the reliability of financial reporting and the preparation of financial statements for external purposes in
accordance with generally accepted accounting principles. A company’s internal control over financial reporting
includes those policies and procedures that (1) pertain to the maintenance of records that, in reasonable detail,
accurately and fairly reflect the transactions and dispositions of the assets of the company; (2) provide
reasonable assurance that transactions are recorded as necessary to permit preparation of financial statements
in accordance with generally accepted accounting principles, and that receipts and expenditures of the
company are being made only in accordance with authorizations of management and directors of the company;
and (3) provide reasonable assurance regarding prevention or timely detection of unauthorized acquisition, use,
or disposition of the company’s assets that could have a material effect on the financial statements.
Because of its inherent limitations, internal control over financial reporting may not prevent or detect
misstatements. Also, projections of any evaluation of effectiveness to future periods are subject to the risk that
controls may become inadequate because of changes in conditions, or that the degree of compliance with the
policies or procedures may deteriorate.
/s/ KPMG LLP
Seattle, Washington
October 7, 2025
34
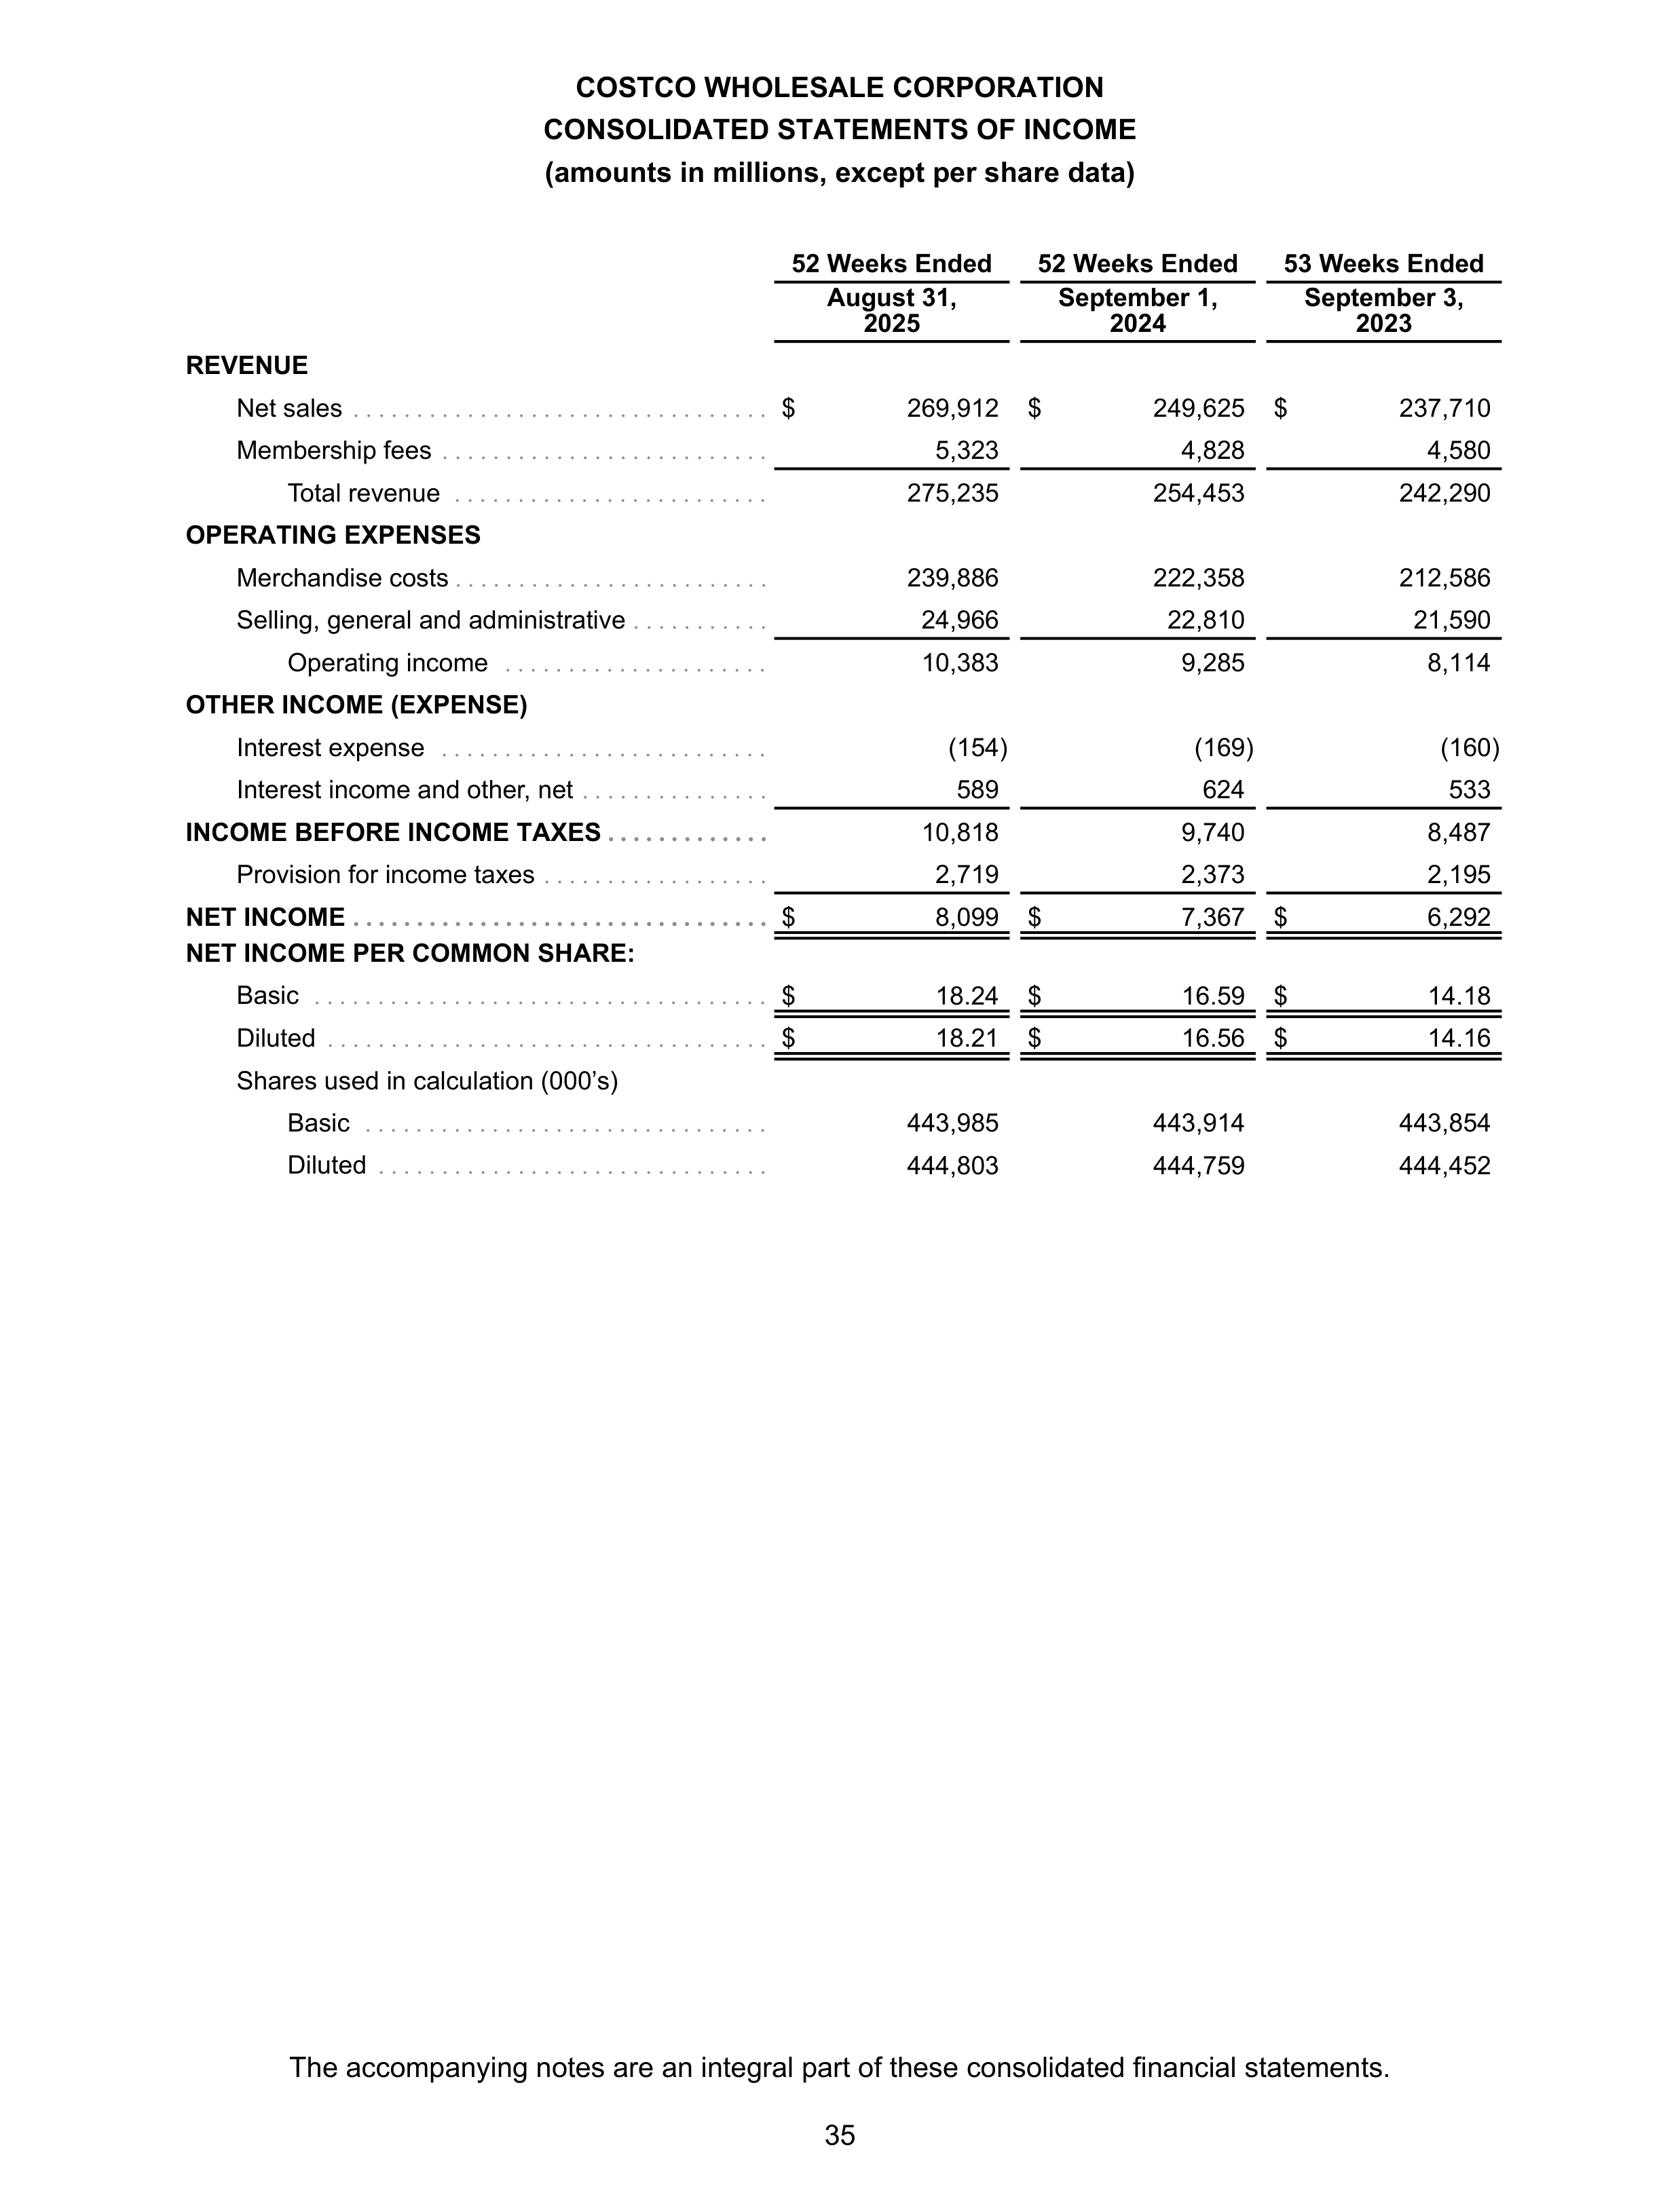
COSTCO WHOLESALE CORPORATION
CONSOLIDATED STATEMENTS OF INCOME
(amounts in millions, except per share data)
52 Weeks Ended
52 Weeks Ended
53 Weeks Ended
August 31,
2025
September 1,
2024
September 3,
2023
REVENUE
Net sales
. . . . . . . . . . . . . . . . . . . . . . . . . . . . . . . . .
$
269,912
$
249,625
$
237,710
Membership fees
. . . . . . . . . . . . . . . . . . . . . . . . . .
5,323
4,828
4,580
Total revenue
. . . . . . . . . . . . . . . . . . . . . . . . .
275,235
254,453
242,290
OPERATING EXPENSES
Merchandise costs
. . . . . . . . . . . . . . . . . . . . . . . . .
239,886
222,358
212,586
Selling, general and administrative
. . . . . . . . . . .
24,966
22,810
21,590
Operating income
. . . . . . . . . . . . . . . . . . . . .
10,383
9,285
8,114
OTHER INCOME (EXPENSE)
Interest expense
. . . . . . . . . . . . . . . . . . . . . . . . . .
(154)
(169)
(160)
Interest income and other, net
. . . . . . . . . . . . . . .
589
624
533
INCOME BEFORE INCOME TAXES
. . . . . . . . . . . . .
10,818
9,740
8,487
Provision for income taxes
. . . . . . . . . . . . . . . . . .
2,719
2,373
2,195
NET INCOME
. . . . . . . . . . . . . . . . . . . . . . . . . . . . . . . . .
$
8,099
$
7,367
$
6,292
NET INCOME PER COMMON SHARE:
Basic
. . . . . . . . . . . . . . . . . . . . . . . . . . . . . . . . . . . .
$
18.24
$
16.59
$
14.18
Diluted
. . . . . . . . . . . . . . . . . . . . . . . . . . . . . . . . . . .
$
18.21
$
16.56
$
14.16
Shares used in calculation (000’s)
Basic
. . . . . . . . . . . . . . . . . . . . . . . . . . . . . . . .
443,985
443,914
443,854
Diluted
. . . . . . . . . . . . . . . . . . . . . . . . . . . . . . .
444,803
444,759
444,452
The accompanying notes are an integral part of these consolidated financial statements.
35
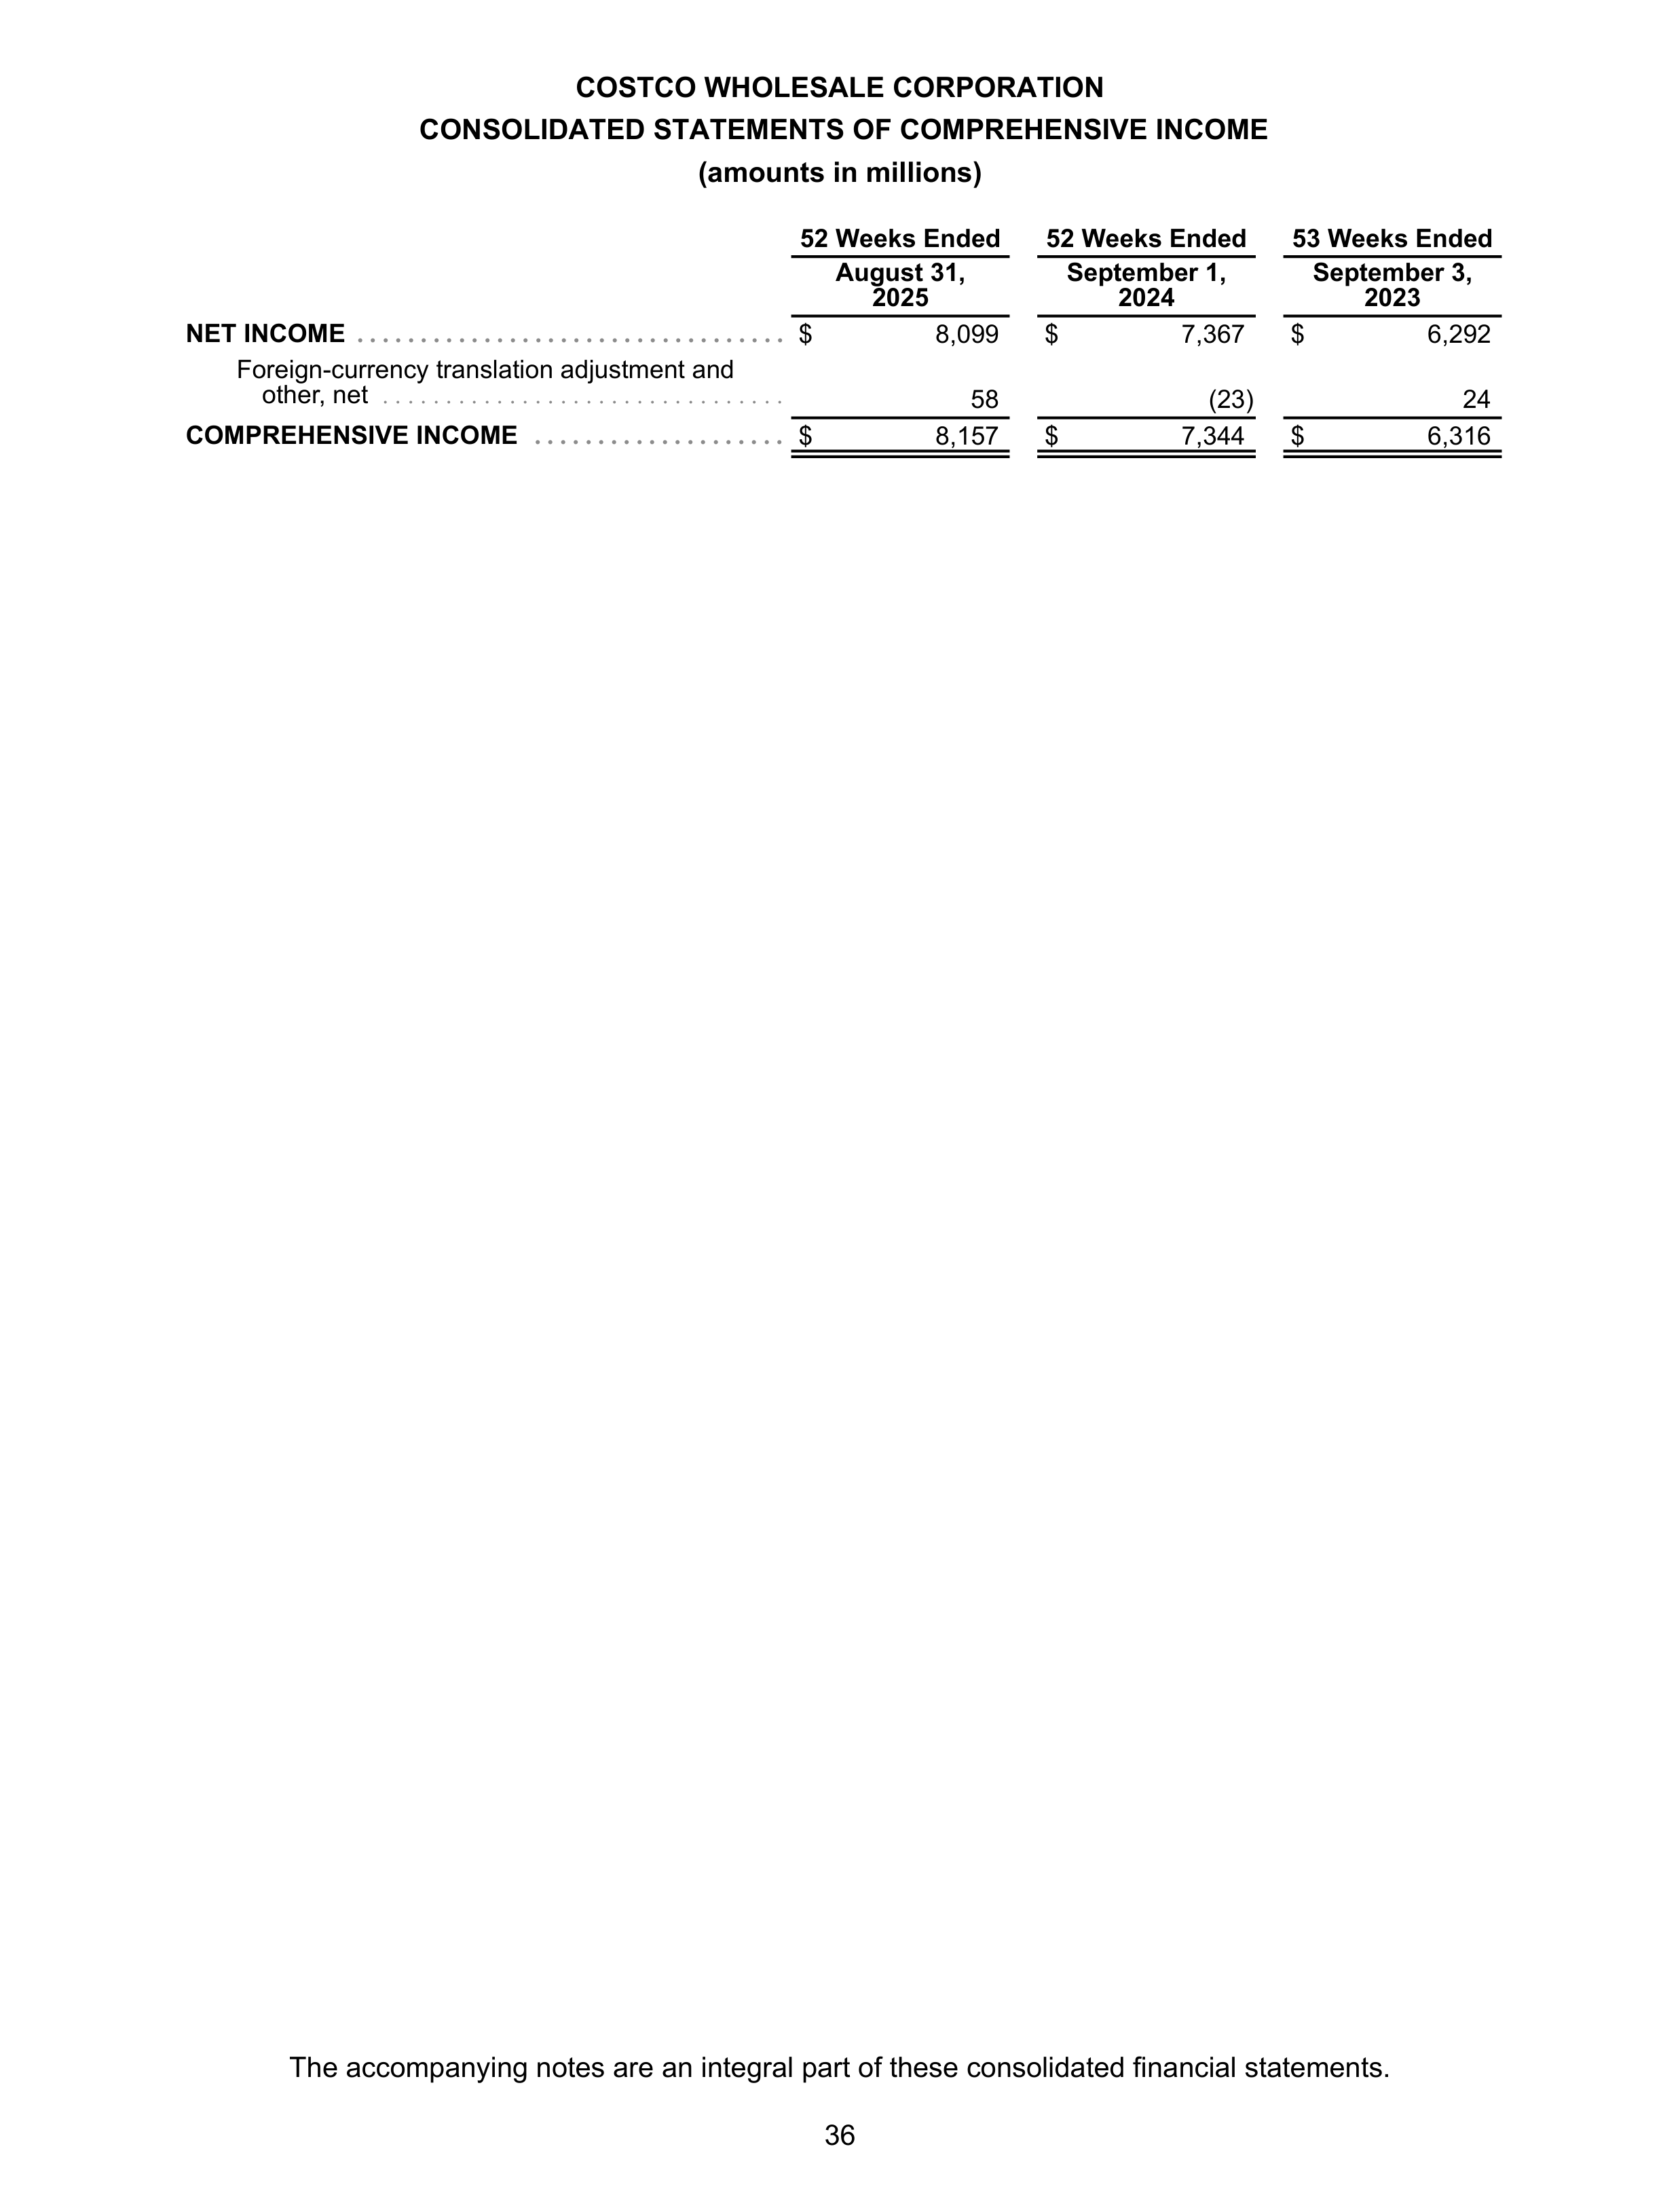
COSTCO WHOLESALE CORPORATION
CONSOLIDATED STATEMENTS OF COMPREHENSIVE INCOME
(amounts in millions)
52 Weeks Ended
52 Weeks Ended
53 Weeks Ended
August 31,
2025
September 1,
2024
September 3,
2023
NET INCOME
. . . . . . . . . . . . . . . . . . . . . . . . . . . . . . . . . .
$
8,099
$
7,367
$
6,292
Foreign-currency translation adjustment and
other, net
. . . . . . . . . . . . . . . . . . . . . . . . . . . . . . . .
58
(23)
24
COMPREHENSIVE INCOME
. . . . . . . . . . . . . . . . . . . .
$
8,157
$
7,344
$
6,316
The accompanying notes are an integral part of these consolidated financial statements.
36
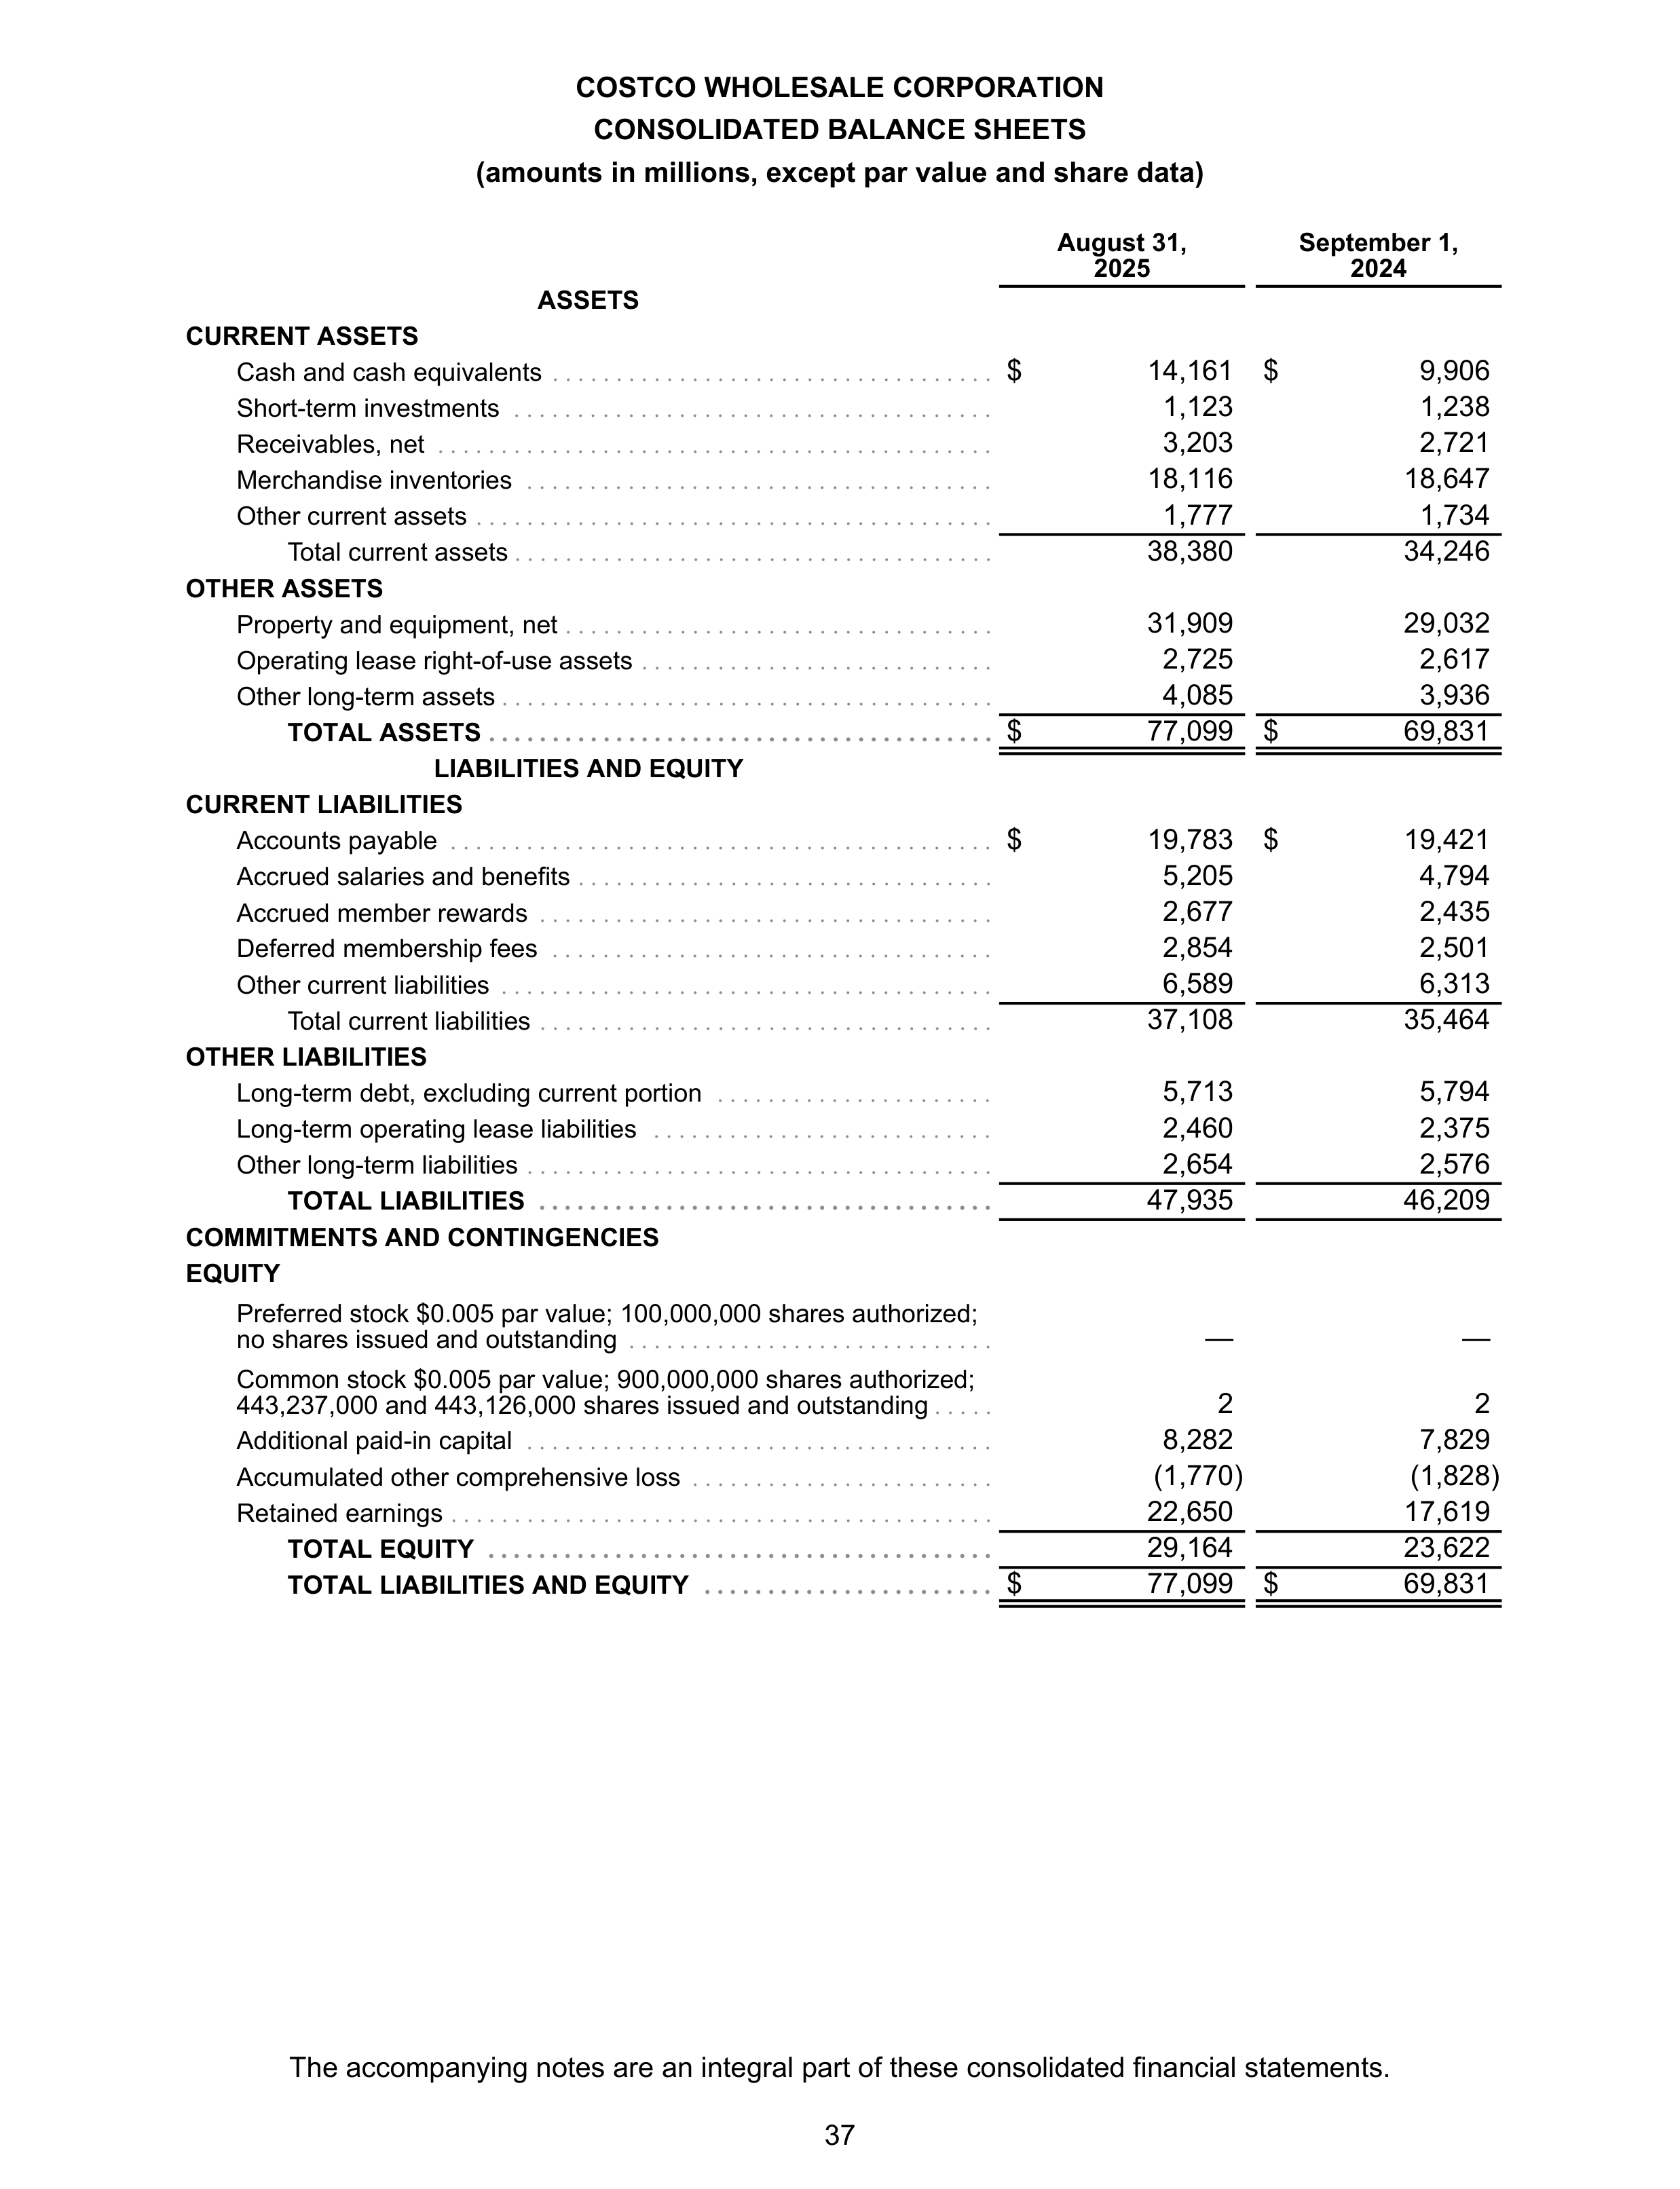
COSTCO WHOLESALE CORPORATION
CONSOLIDATED BALANCE SHEETS
(amounts in millions, except par value and share data)
August 31,
2025
September 1,
2024
ASSETS
CURRENT ASSETS
Cash and cash equivalents
. . . . . . . . . . . . . . . . . . . . . . . . . . . . . . . . . . .
$
14,161 $
9,906
Short-term investments
. . . . . . . . . . . . . . . . . . . . . . . . . . . . . . . . . . . . . .
1,123
1,238
Receivables, net
. . . . . . . . . . . . . . . . . . . . . . . . . . . . . . . . . . . . . . . . . . . .
3,203
2,721
Merchandise inventories
. . . . . . . . . . . . . . . . . . . . . . . . . . . . . . . . . . . . .
18,116
18,647
Other current assets
. . . . . . . . . . . . . . . . . . . . . . . . . . . . . . . . . . . . . . . . .
1,777
1,734
Total current assets
. . . . . . . . . . . . . . . . . . . . . . . . . . . . . . . . . . . . . .
38,380
34,246
OTHER ASSETS
Property and equipment, net
. . . . . . . . . . . . . . . . . . . . . . . . . . . . . . . . . .
31,909
29,032
Operating lease right-of-use assets
. . . . . . . . . . . . . . . . . . . . . . . . . . . .
2,725
2,617
Other long-term assets
. . . . . . . . . . . . . . . . . . . . . . . . . . . . . . . . . . . . . . .
4,085
3,936
TOTAL ASSETS
. . . . . . . . . . . . . . . . . . . . . . . . . . . . . . . . . . . . . . . .
$
77,099 $
69,831
LIABILITIES AND EQUITY
CURRENT LIABILITIES
Accounts payable
. . . . . . . . . . . . . . . . . . . . . . . . . . . . . . . . . . . . . . . . . . .
$
19,783 $
19,421
Accrued salaries and benefits
. . . . . . . . . . . . . . . . . . . . . . . . . . . . . . . . .
5,205
4,794
Accrued member rewards
. . . . . . . . . . . . . . . . . . . . . . . . . . . . . . . . . . . .
2,677
2,435
Deferred membership fees
. . . . . . . . . . . . . . . . . . . . . . . . . . . . . . . . . . .
2,854
2,501
Other current liabilities
. . . . . . . . . . . . . . . . . . . . . . . . . . . . . . . . . . . . . . .
6,589
6,313
Total current liabilities
. . . . . . . . . . . . . . . . . . . . . . . . . . . . . . . . . . . .
37,108
35,464
OTHER LIABILITIES
Long-term debt, excluding current portion
. . . . . . . . . . . . . . . . . . . . . .
5,713
5,794
Long-term operating lease liabilities
. . . . . . . . . . . . . . . . . . . . . . . . . . .
2,460
2,375
Other long-term liabilities
. . . . . . . . . . . . . . . . . . . . . . . . . . . . . . . . . . . . .
2,654
2,576
TOTAL LIABILITIES
. . . . . . . . . . . . . . . . . . . . . . . . . . . . . . . . . . . .
47,935
46,209
COMMITMENTS AND CONTINGENCIES
EQUITY
Preferred stock $0.005 par value; 100,000,000 shares authorized;
no shares issued and outstanding
. . . . . . . . . . . . . . . . . . . . . . . . . . . . .
—
—
Common stock $0.005 par value; 900,000,000 shares authorized;
443,237,000 and 443,126,000 shares issued and outstanding
. . . . .
2
2
Additional paid-in capital
. . . . . . . . . . . . . . . . . . . . . . . . . . . . . . . . . . . . .
8,282
7,829
Accumulated other comprehensive loss
. . . . . . . . . . . . . . . . . . . . . . . .
(1,770)
(1,828)
Retained earnings
. . . . . . . . . . . . . . . . . . . . . . . . . . . . . . . . . . . . . . . . . . .
22,650
17,619
TOTAL EQUITY
. . . . . . . . . . . . . . . . . . . . . . . . . . . . . . . . . . . . . . . .
29,164
23,622
TOTAL LIABILITIES AND EQUITY
. . . . . . . . . . . . . . . . . . . . . . .
$
77,099 $
69,831
The accompanying notes are an integral part of these consolidated financial statements.
37
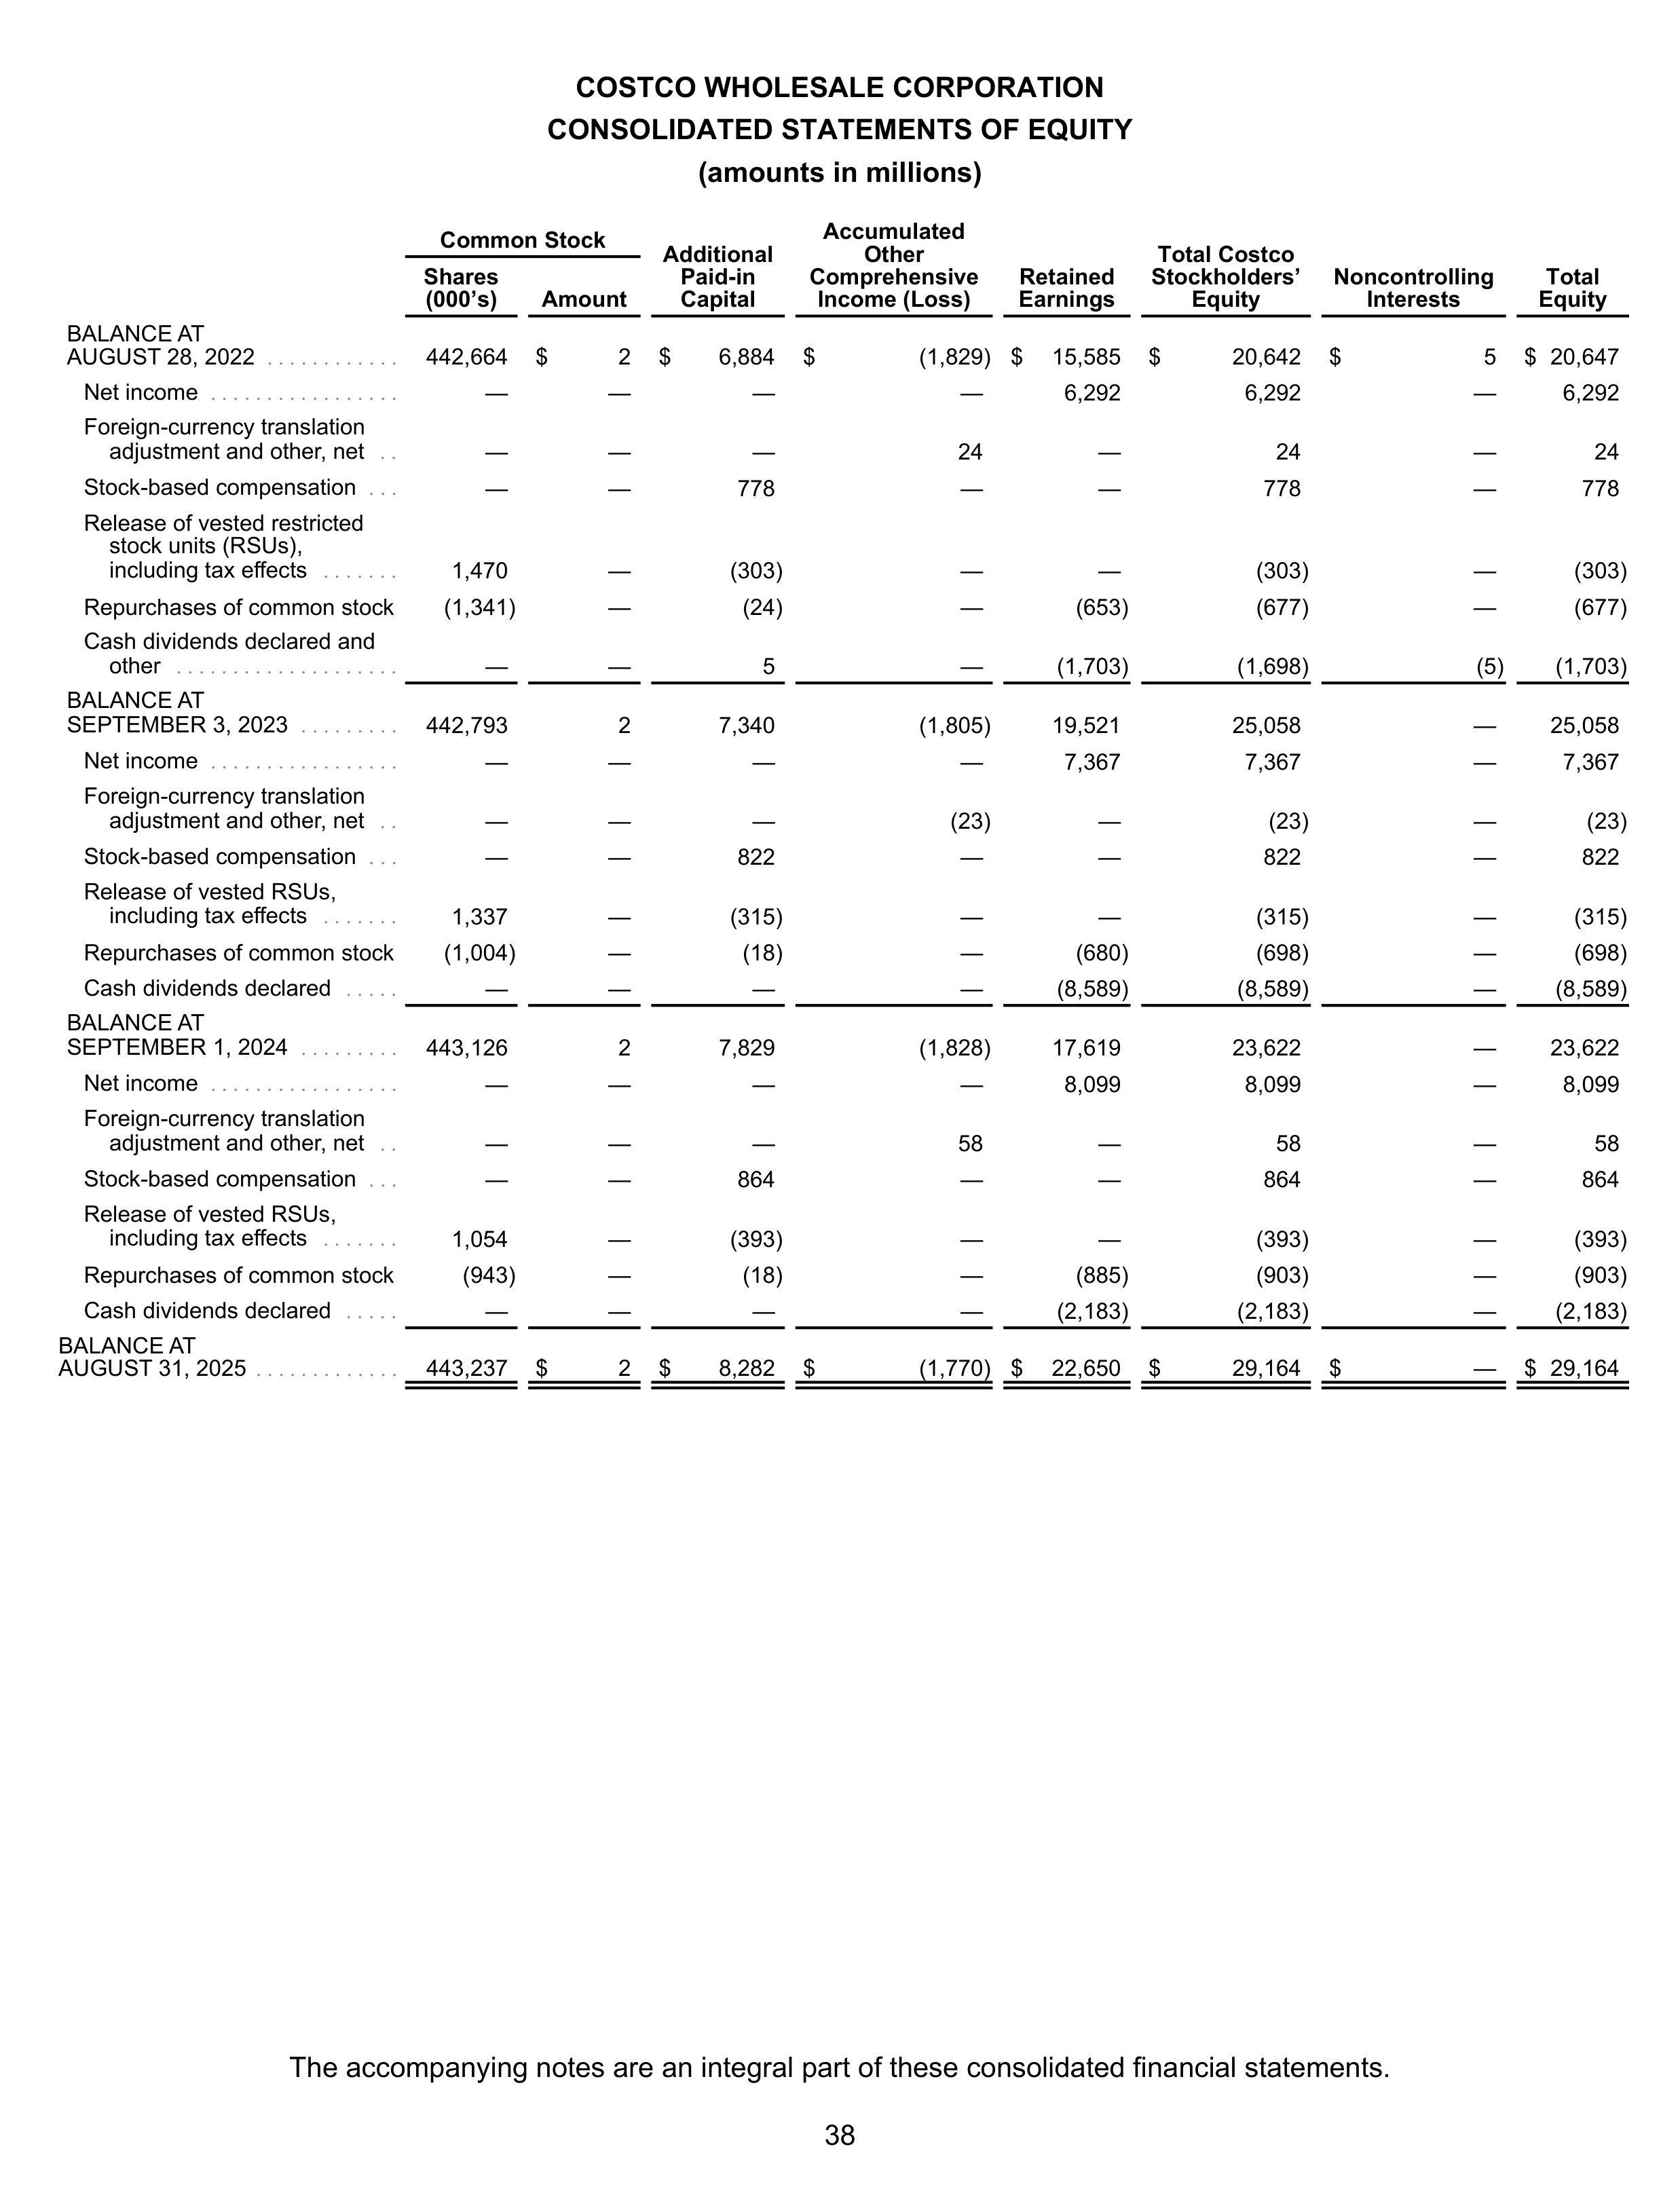
COSTCO WHOLESALE CORPORATION
CONSOLIDATED STATEMENTS OF EQUITY
(amounts in millions)
Common Stock
Additional
Paid-in
Capital
Accumulated
Other
Comprehensive
Income (Loss)
Retained
Earnings
Total Costco
Stockholders’
Equity
Noncontrolling
Interests
Total
Equity
Shares
(000’s)
Amount
BALANCE AT
AUGUST 28, 2022
. . . . . . . . . . . .
442,664
$
2
$
6,884
$
(1,829) $
15,585
$
20,642
$
5
$ 20,647
Net income
. . . . . . . . . . . . . . . . .
—
—
—
—
6,292
6,292
—
6,292
Foreign-currency translation
adjustment and other, net
. .
—
—
—
24
—
24
—
24
Stock-based compensation
. . .
—
—
778
—
—
778
—
778
Release of vested restricted
stock units (RSUs),
including tax effects
. . . . . . .
1,470
—
(303)
—
—
(303)
—
(303)
Repurchases of common stock
(1,341)
—
(24)
—
(653)
(677)
—
(677)
Cash dividends declared and
other
. . . . . . . . . . . . . . . . . . . .
—
—
5
—
(1,703)
(1,698)
(5)
(1,703)
BALANCE AT
SEPTEMBER 3, 2023
. . . . . . . . .
442,793
2
7,340
(1,805)
19,521
25,058
—
25,058
Net income
. . . . . . . . . . . . . . . . .
—
—
—
—
7,367
7,367
—
7,367
Foreign-currency translation
adjustment and other, net
. .
—
—
—
(23)
—
(23)
—
(23)
Stock-based compensation
. . .
—
—
822
—
—
822
—
822
Release of vested RSUs,
including tax effects
. . . . . . .
1,337
—
(315)
—
—
(315)
—
(315)
Repurchases of common stock
(1,004)
—
(18)
—
(680)
(698)
—
(698)
Cash dividends declared
. . . . .
—
—
—
—
(8,589)
(8,589)
—
(8,589)
BALANCE AT
SEPTEMBER 1, 2024
. . . . . . . . .
443,126
2
7,829
(1,828)
17,619
23,622
—
23,622
Net income
. . . . . . . . . . . . . . . . .
—
—
—
—
8,099
8,099
—
8,099
Foreign-currency translation
adjustment and other, net
. .
—
—
—
58
—
58
—
58
Stock-based compensation
. . .
—
—
864
—
—
864
—
864
Release of vested RSUs,
including tax effects
. . . . . . .
1,054
—
(393)
—
—
(393)
—
(393)
Repurchases of common stock
(943)
—
(18)
—
(885)
(903)
—
(903)
Cash dividends declared
. . . . .
—
—
—
—
(2,183)
(2,183)
—
(2,183)
BALANCE AT
AUGUST 31, 2025
. . . . . . . . . . . . .
443,237
$
2
$
8,282
$
(1,770) $
22,650
$
29,164
$
—
$ 29,164
The accompanying notes are an integral part of these consolidated financial statements.
38
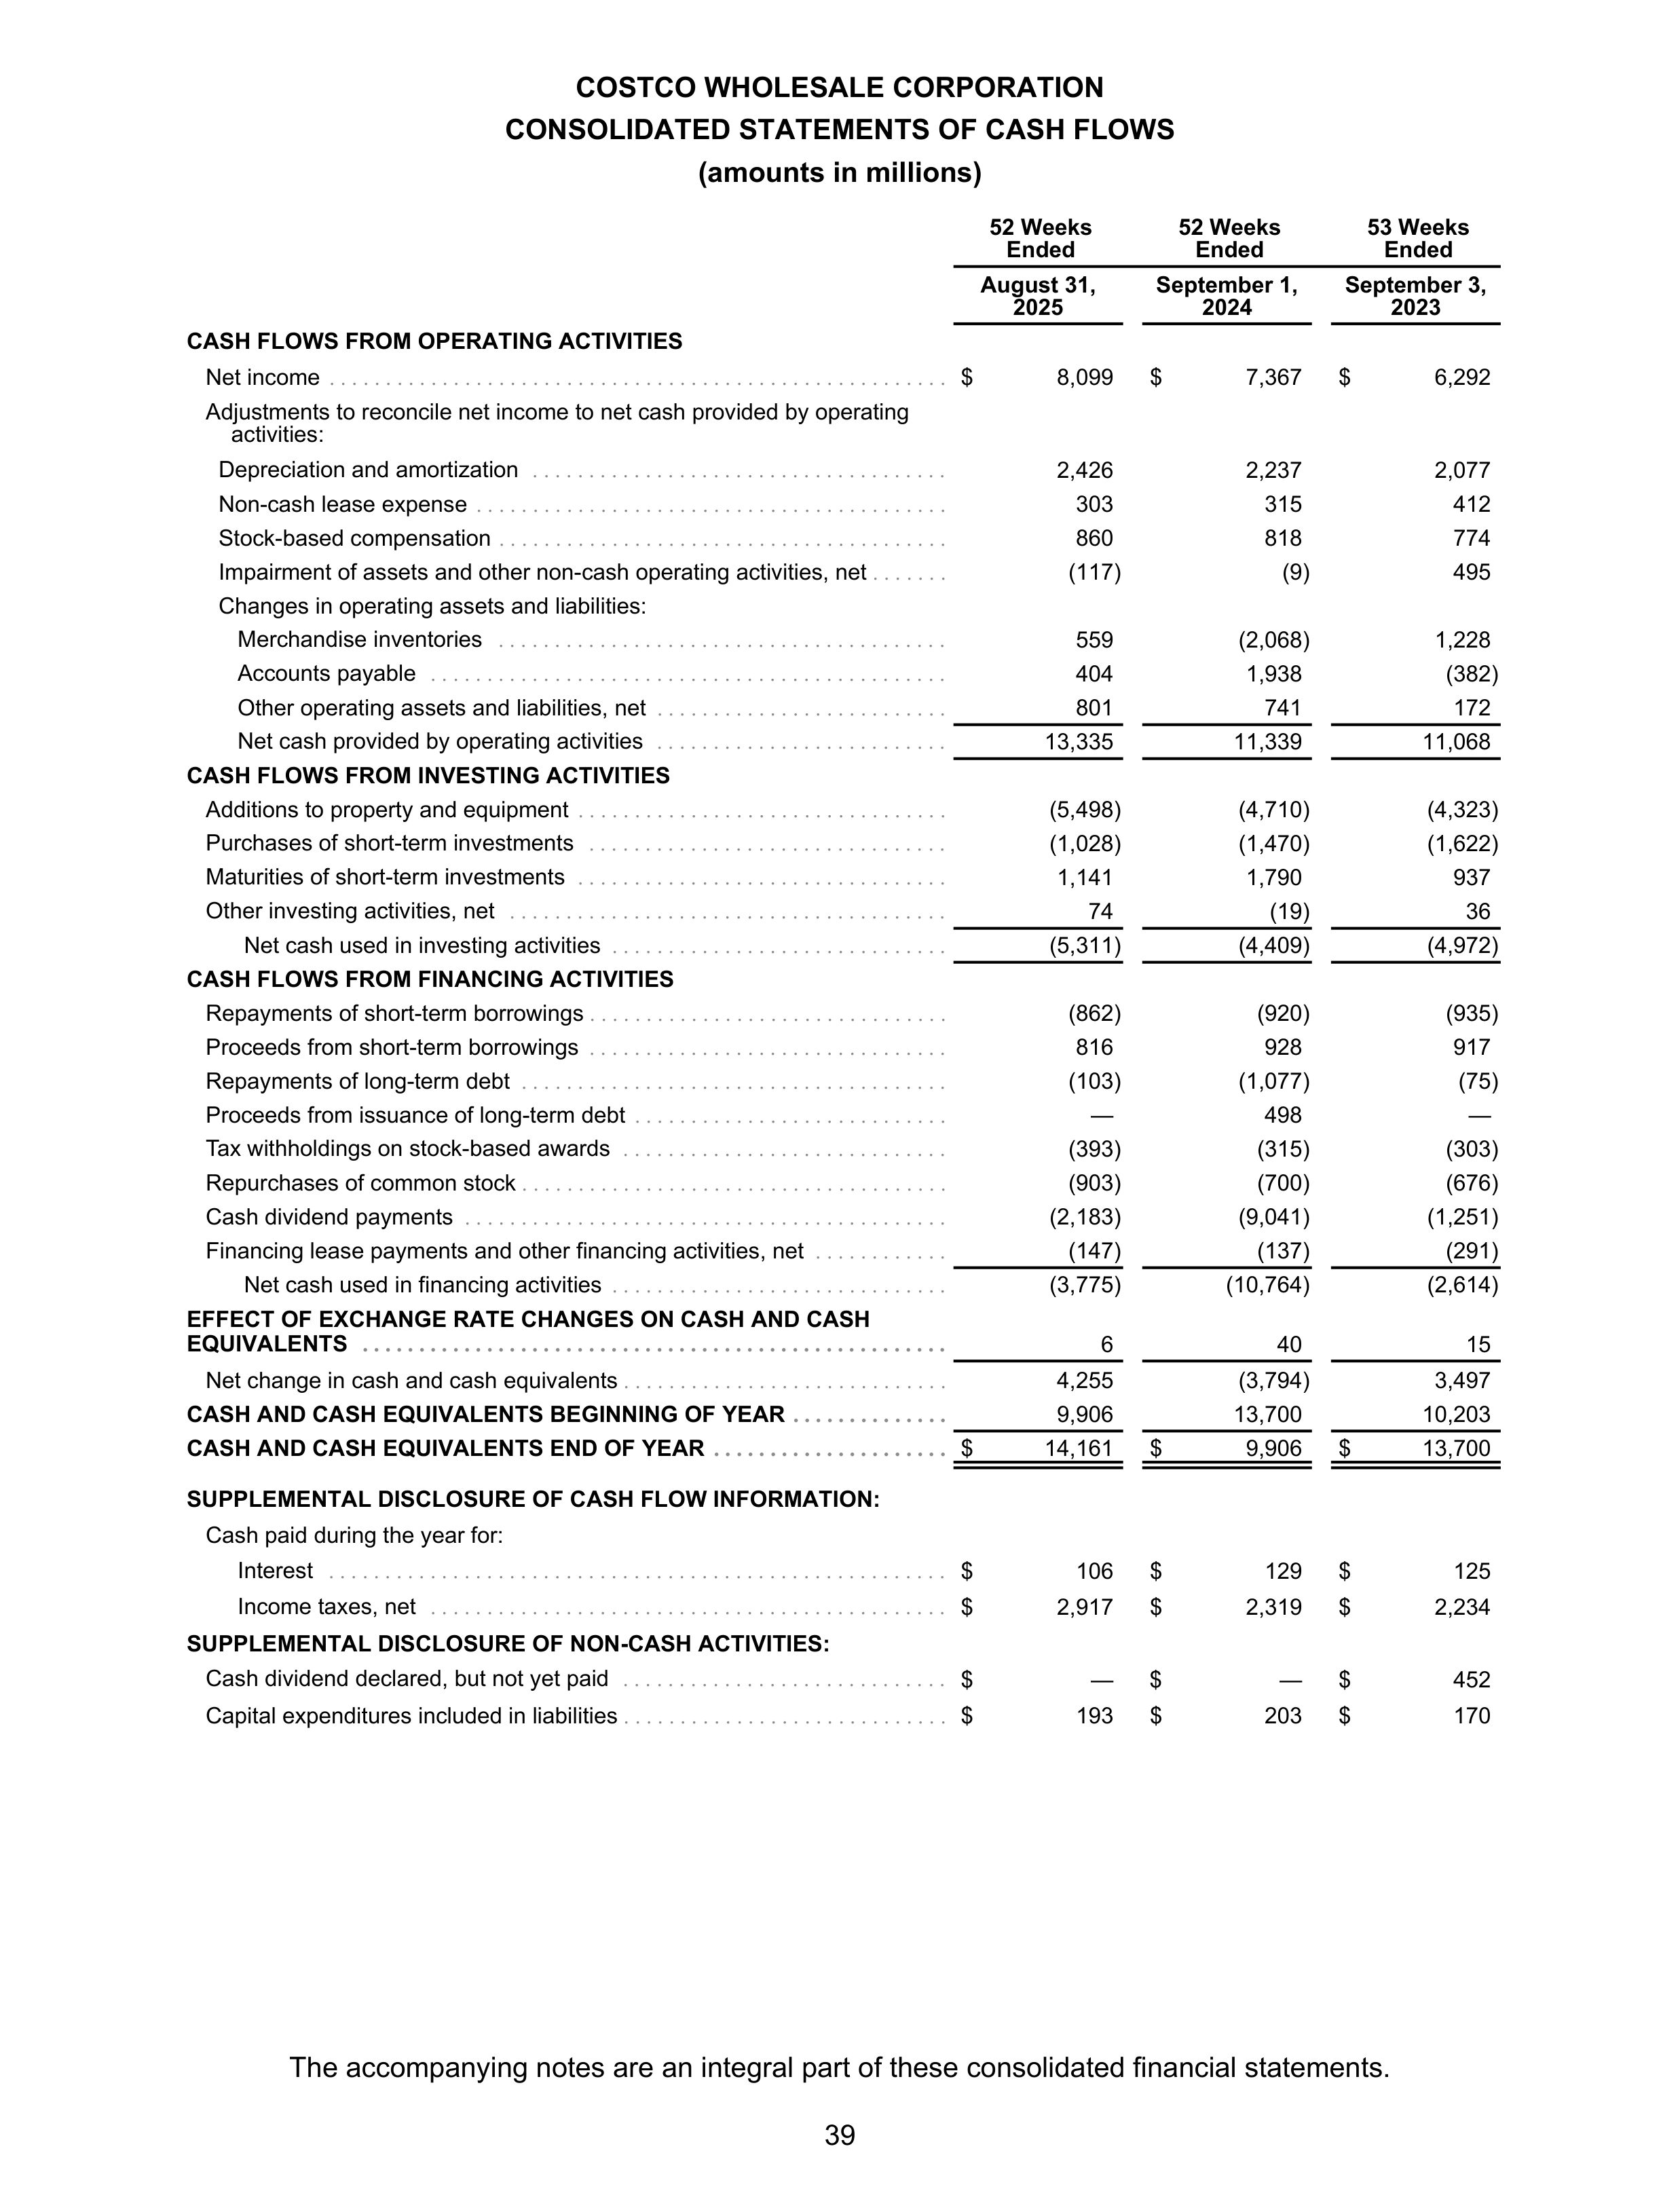
COSTCO WHOLESALE CORPORATION
CONSOLIDATED STATEMENTS OF CASH FLOWS
(amounts in millions)
52 Weeks
Ended
52 Weeks
Ended
53 Weeks
Ended
August 31,
2025
September 1,
2024
September 3,
2023
CASH FLOWS FROM OPERATING ACTIVITIES
Net income
. . . . . . . . . . . . . . . . . . . . . . . . . . . . . . . . . . . . . . . . . . . . . . . . . . . . . . .
$
8,099
$
7,367
$
6,292
Adjustments to reconcile net income to net cash provided by operating
activities:
Depreciation and amortization
. . . . . . . . . . . . . . . . . . . . . . . . . . . . . . . . . . . . .
2,426
2,237
2,077
Non-cash lease expense
. . . . . . . . . . . . . . . . . . . . . . . . . . . . . . . . . . . . . . . . . .
303
315
412
Stock-based compensation
. . . . . . . . . . . . . . . . . . . . . . . . . . . . . . . . . . . . . . . .
860
818
774
Impairment of assets and other non-cash operating activities, net
. . . . . . .
(117)
(9)
495
Changes in operating assets and liabilities:
Merchandise inventories
. . . . . . . . . . . . . . . . . . . . . . . . . . . . . . . . . . . . . . . .
559
(2,068)
1,228
Accounts payable
. . . . . . . . . . . . . . . . . . . . . . . . . . . . . . . . . . . . . . . . . . . . . .
404
1,938
(382)
Other operating assets and liabilities, net
. . . . . . . . . . . . . . . . . . . . . . . . . .
801
741
172
Net cash provided by operating activities
. . . . . . . . . . . . . . . . . . . . . . . . . .
13,335
11,339
11,068
CASH FLOWS FROM INVESTING ACTIVITIES
Additions to property and equipment
. . . . . . . . . . . . . . . . . . . . . . . . . . . . . . . . .
(5,498)
(4,710)
(4,323)
Purchases of short-term investments
. . . . . . . . . . . . . . . . . . . . . . . . . . . . . . . .
(1,028)
(1,470)
(1,622)
Maturities of short-term investments
. . . . . . . . . . . . . . . . . . . . . . . . . . . . . . . . .
1,141
1,790
937
Other investing activities, net
. . . . . . . . . . . . . . . . . . . . . . . . . . . . . . . . . . . . . . .
74
(19)
36
Net cash used in investing activities
. . . . . . . . . . . . . . . . . . . . . . . . . . . . . .
(5,311)
(4,409)
(4,972)
CASH FLOWS FROM FINANCING ACTIVITIES
Repayments of short-term borrowings
. . . . . . . . . . . . . . . . . . . . . . . . . . . . . . . .
(862)
(920)
(935)
Proceeds from short-term borrowings
. . . . . . . . . . . . . . . . . . . . . . . . . . . . . . . .
816
928
917
Repayments of long-term debt
. . . . . . . . . . . . . . . . . . . . . . . . . . . . . . . . . . . . . .
(103)
(1,077)
(75)
Proceeds from issuance of long-term debt
. . . . . . . . . . . . . . . . . . . . . . . . . . . .
—
498
—
Tax withholdings on stock-based awards
. . . . . . . . . . . . . . . . . . . . . . . . . . . . .
(393)
(315)
(303)
Repurchases of common stock
. . . . . . . . . . . . . . . . . . . . . . . . . . . . . . . . . . . . . .
(903)
(700)
(676)
Cash dividend payments
. . . . . . . . . . . . . . . . . . . . . . . . . . . . . . . . . . . . . . . . . . .
(2,183)
(9,041)
(1,251)
Financing lease payments and other financing activities, net
. . . . . . . . . . . .
(147)
(137)
(291)
Net cash used in financing activities
. . . . . . . . . . . . . . . . . . . . . . . . . . . . . .
(3,775)
(10,764)
(2,614)
EFFECT OF EXCHANGE RATE CHANGES ON CASH AND CASH
EQUIVALENTS
. . . . . . . . . . . . . . . . . . . . . . . . . . . . . . . . . . . . . . . . . . . . . . . . . . . .
6
40
15
Net change in cash and cash equivalents
. . . . . . . . . . . . . . . . . . . . . . . . . . . . .
4,255
(3,794)
3,497
CASH AND CASH EQUIVALENTS BEGINNING OF YEAR
. . . . . . . . . . . . . .
9,906
13,700
10,203
CASH AND CASH EQUIVALENTS END OF YEAR
. . . . . . . . . . . . . . . . . . . . .
$
14,161
$
9,906
$
13,700
SUPPLEMENTAL DISCLOSURE OF CASH FLOW INFORMATION:
Cash paid during the year for:
Interest
. . . . . . . . . . . . . . . . . . . . . . . . . . . . . . . . . . . . . . . . . . . . . . . . . . . . . . .
$
106
$
129
$
125
Income taxes, net
. . . . . . . . . . . . . . . . . . . . . . . . . . . . . . . . . . . . . . . . . . . . . .
$
2,917
$
2,319
$
2,234
SUPPLEMENTAL DISCLOSURE OF NON-CASH ACTIVITIES:
Cash dividend declared, but not yet paid
. . . . . . . . . . . . . . . . . . . . . . . . . . . . .
$
—
$
—
$
452
Capital expenditures included in liabilities
. . . . . . . . . . . . . . . . . . . . . . . . . . . . .
$
193
$
203
$
170
The accompanying notes are an integral part of these consolidated financial statements.
39
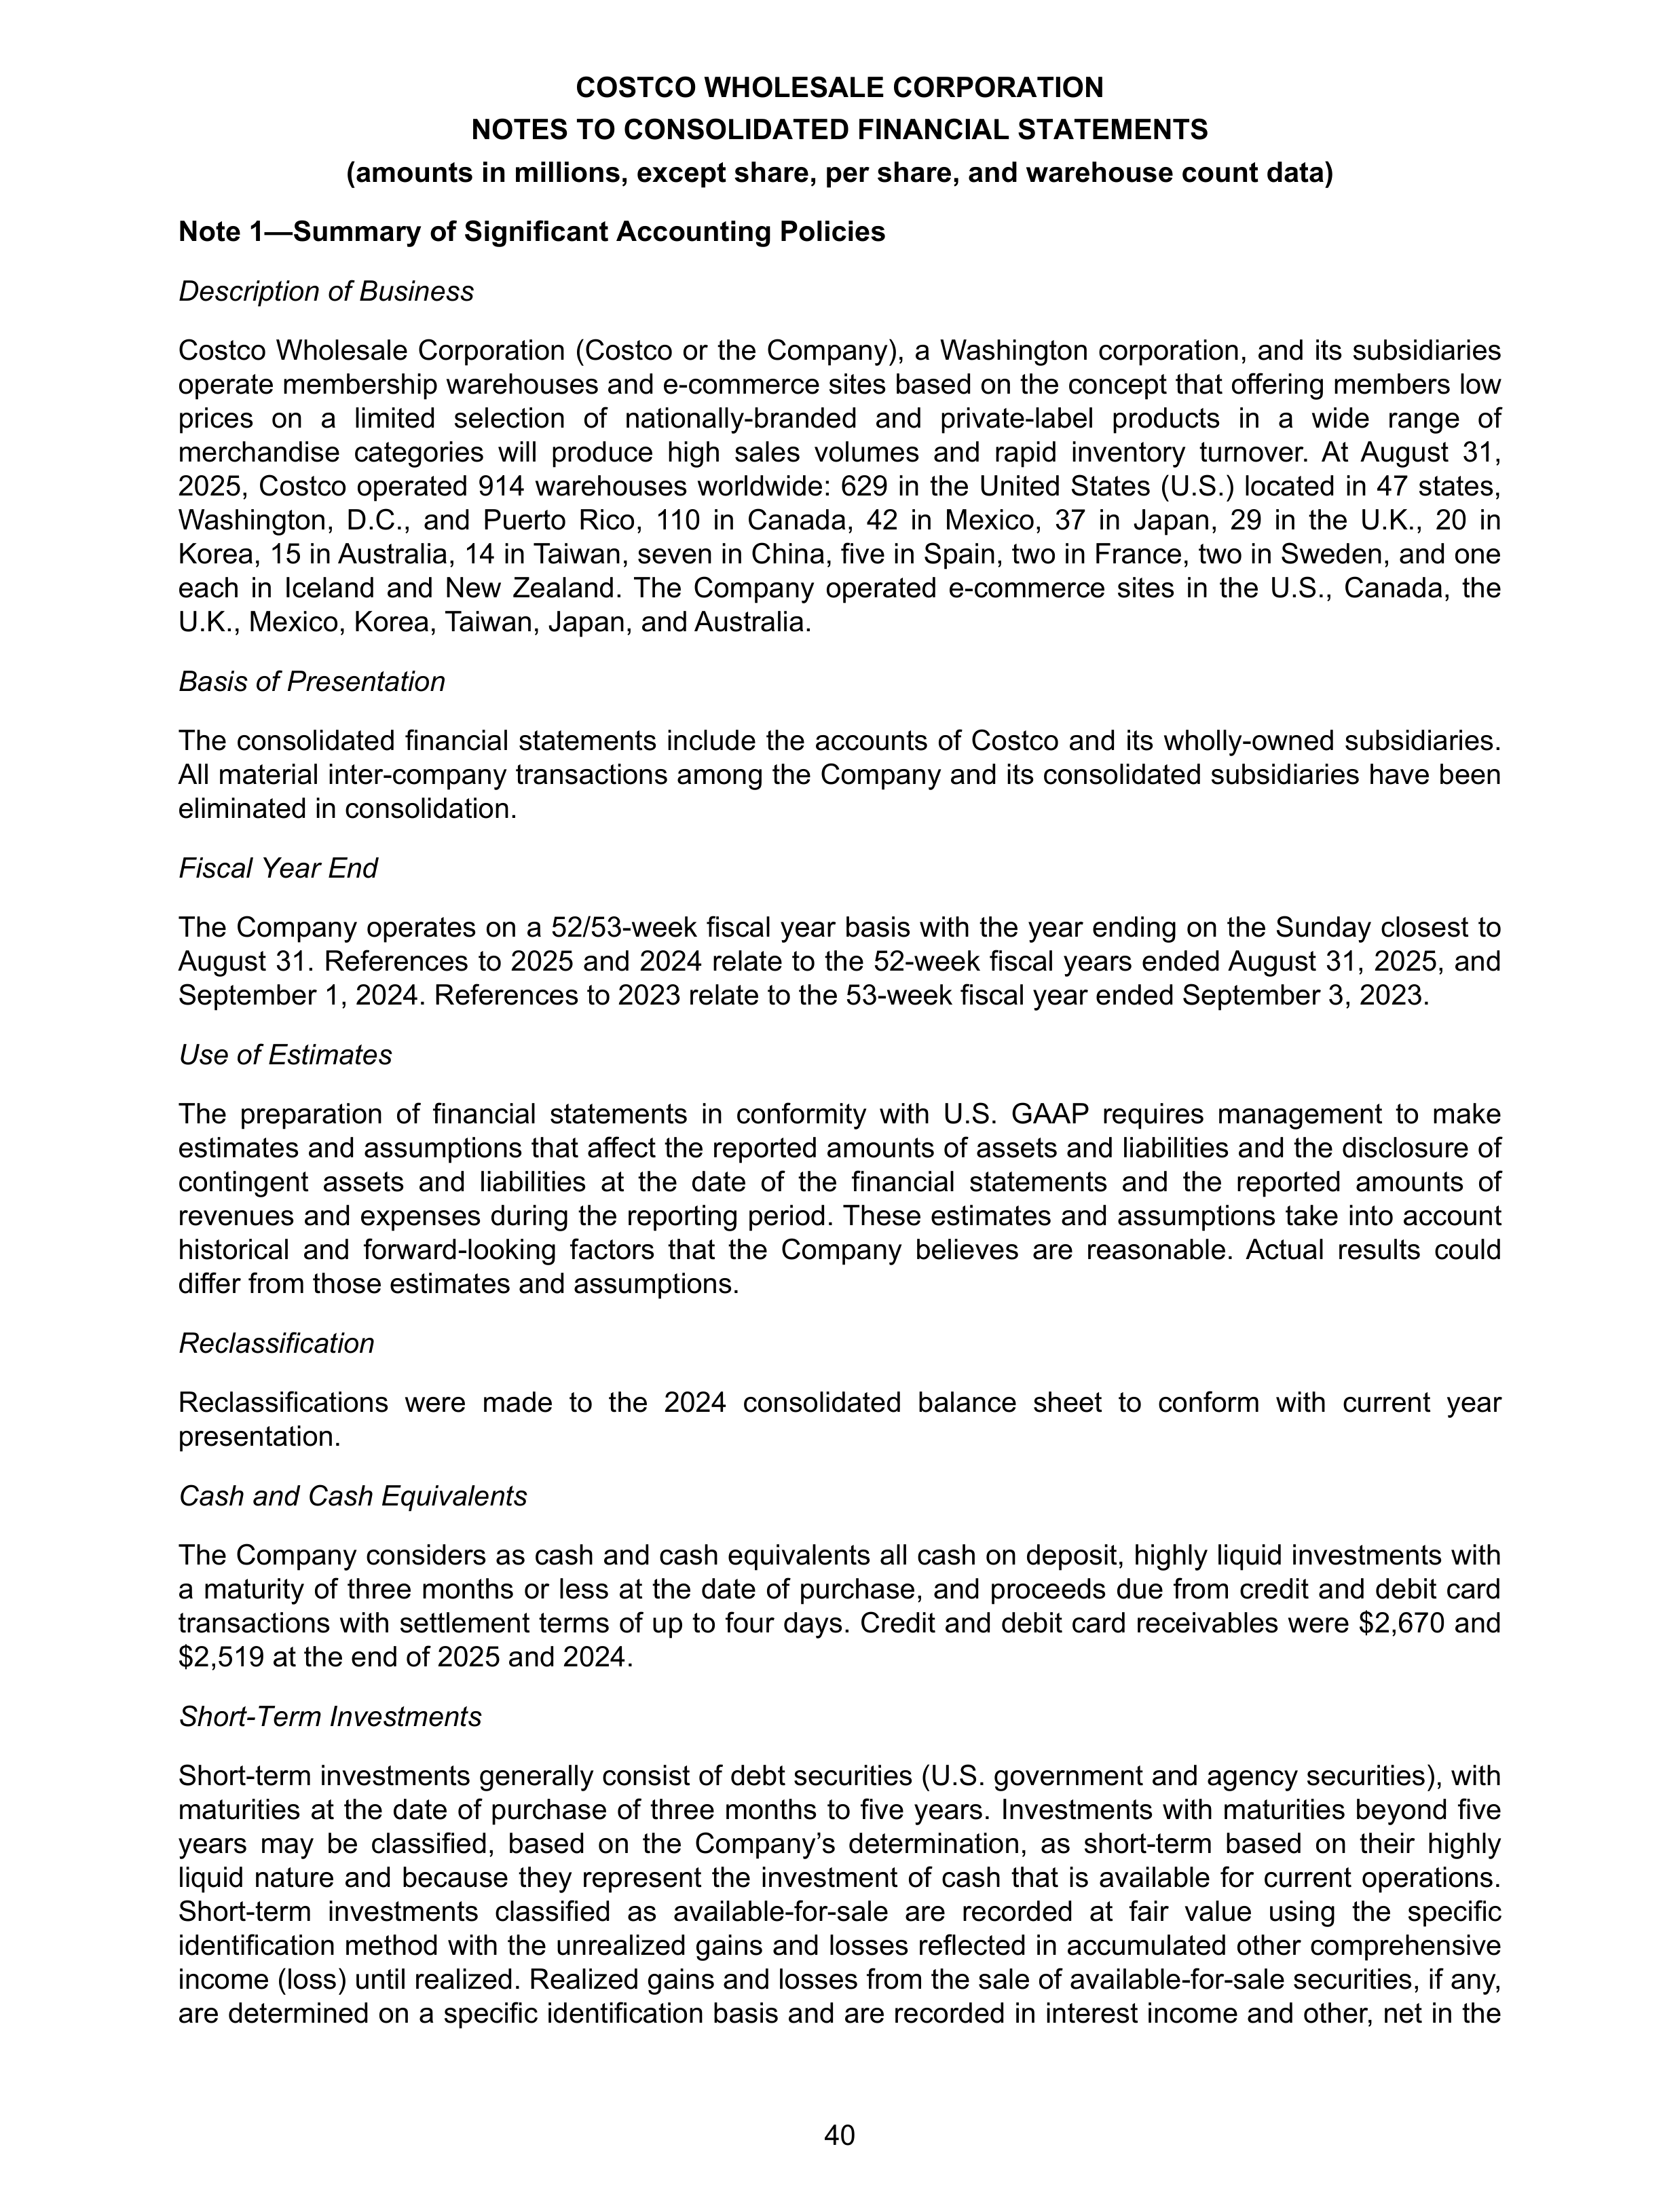
COSTCO WHOLESALE CORPORATION
NOTES TO CONSOLIDATED FINANCIAL STATEMENTS
(amounts in millions, except share, per share, and warehouse count data)
Note 1—Summary of Significant Accounting Policies
Description of Business
Costco Wholesale Corporation (Costco or the Company), a Washington corporation, and its subsidiaries
operate membership warehouses and e-commerce sites based on the concept that offering members low
prices on a limited selection of nationally-branded and private-label products in a wide range of
merchandise categories will produce high sales volumes and rapid inventory turnover. At August 31,
2025, Costco operated 914 warehouses worldwide: 629 in the United States (U.S.) located in 47 states,
Washington, D.C., and Puerto Rico, 110 in Canada, 42 in Mexico, 37 in Japan, 29 in the U.K., 20 in
Korea, 15 in Australia, 14 in Taiwan, seven in China, five in Spain, two in France, two in Sweden, and one
each in Iceland and New Zealand. The Company operated e-commerce sites in the U.S., Canada, the
U.K., Mexico, Korea, Taiwan, Japan, and Australia.
Basis of Presentation
The consolidated financial statements include the accounts of Costco and its wholly-owned subsidiaries.
All material inter-company transactions among the Company and its consolidated subsidiaries have been
eliminated in consolidation.
Fiscal Year End
The Company operates on a 52/53-week fiscal year basis with the year ending on the Sunday closest to
August 31. References to 2025 and 2024 relate to the 52-week fiscal years ended August 31, 2025, and
September 1, 2024. References to 2023 relate to the 53-week fiscal year ended September 3, 2023.
Use of Estimates
The preparation of financial statements in conformity with U.S. GAAP requires management to make
estimates and assumptions that affect the reported amounts of assets and liabilities and the disclosure of
contingent assets and liabilities at the date of the financial statements and the reported amounts of
revenues and expenses during the reporting period. These estimates and assumptions take into account
historical and forward-looking factors that the Company believes are reasonable. Actual results could
differ from those estimates and assumptions.
Reclassification
Reclassifications were made to the 2024 consolidated balance sheet to conform with current year
presentation.
Cash and Cash Equivalents
The Company considers as cash and cash equivalents all cash on deposit, highly liquid investments with
a maturity of three months or less at the date of purchase, and proceeds due from credit and debit card
transactions with settlement terms of up to four days. Credit and debit card receivables were $2,670 and
$2,519 at the end of 2025 and 2024.
Short-Term Investments
Short-term investments generally consist of debt securities (U.S. government and agency securities), with
maturities at the date of purchase of three months to five years. Investments with maturities beyond five
years may be classified, based on the Company’s determination, as short-term based on their highly
liquid nature and because they represent the investment of cash that is available for current operations.
Short-term investments classified as available-for-sale are recorded at fair value using the specific
identification method with the unrealized gains and losses reflected in accumulated other comprehensive
income (loss) until realized. Realized gains and losses from the sale of available-for-sale securities, if any,
are determined on a specific identification basis and are recorded in interest income and other, net in the
40
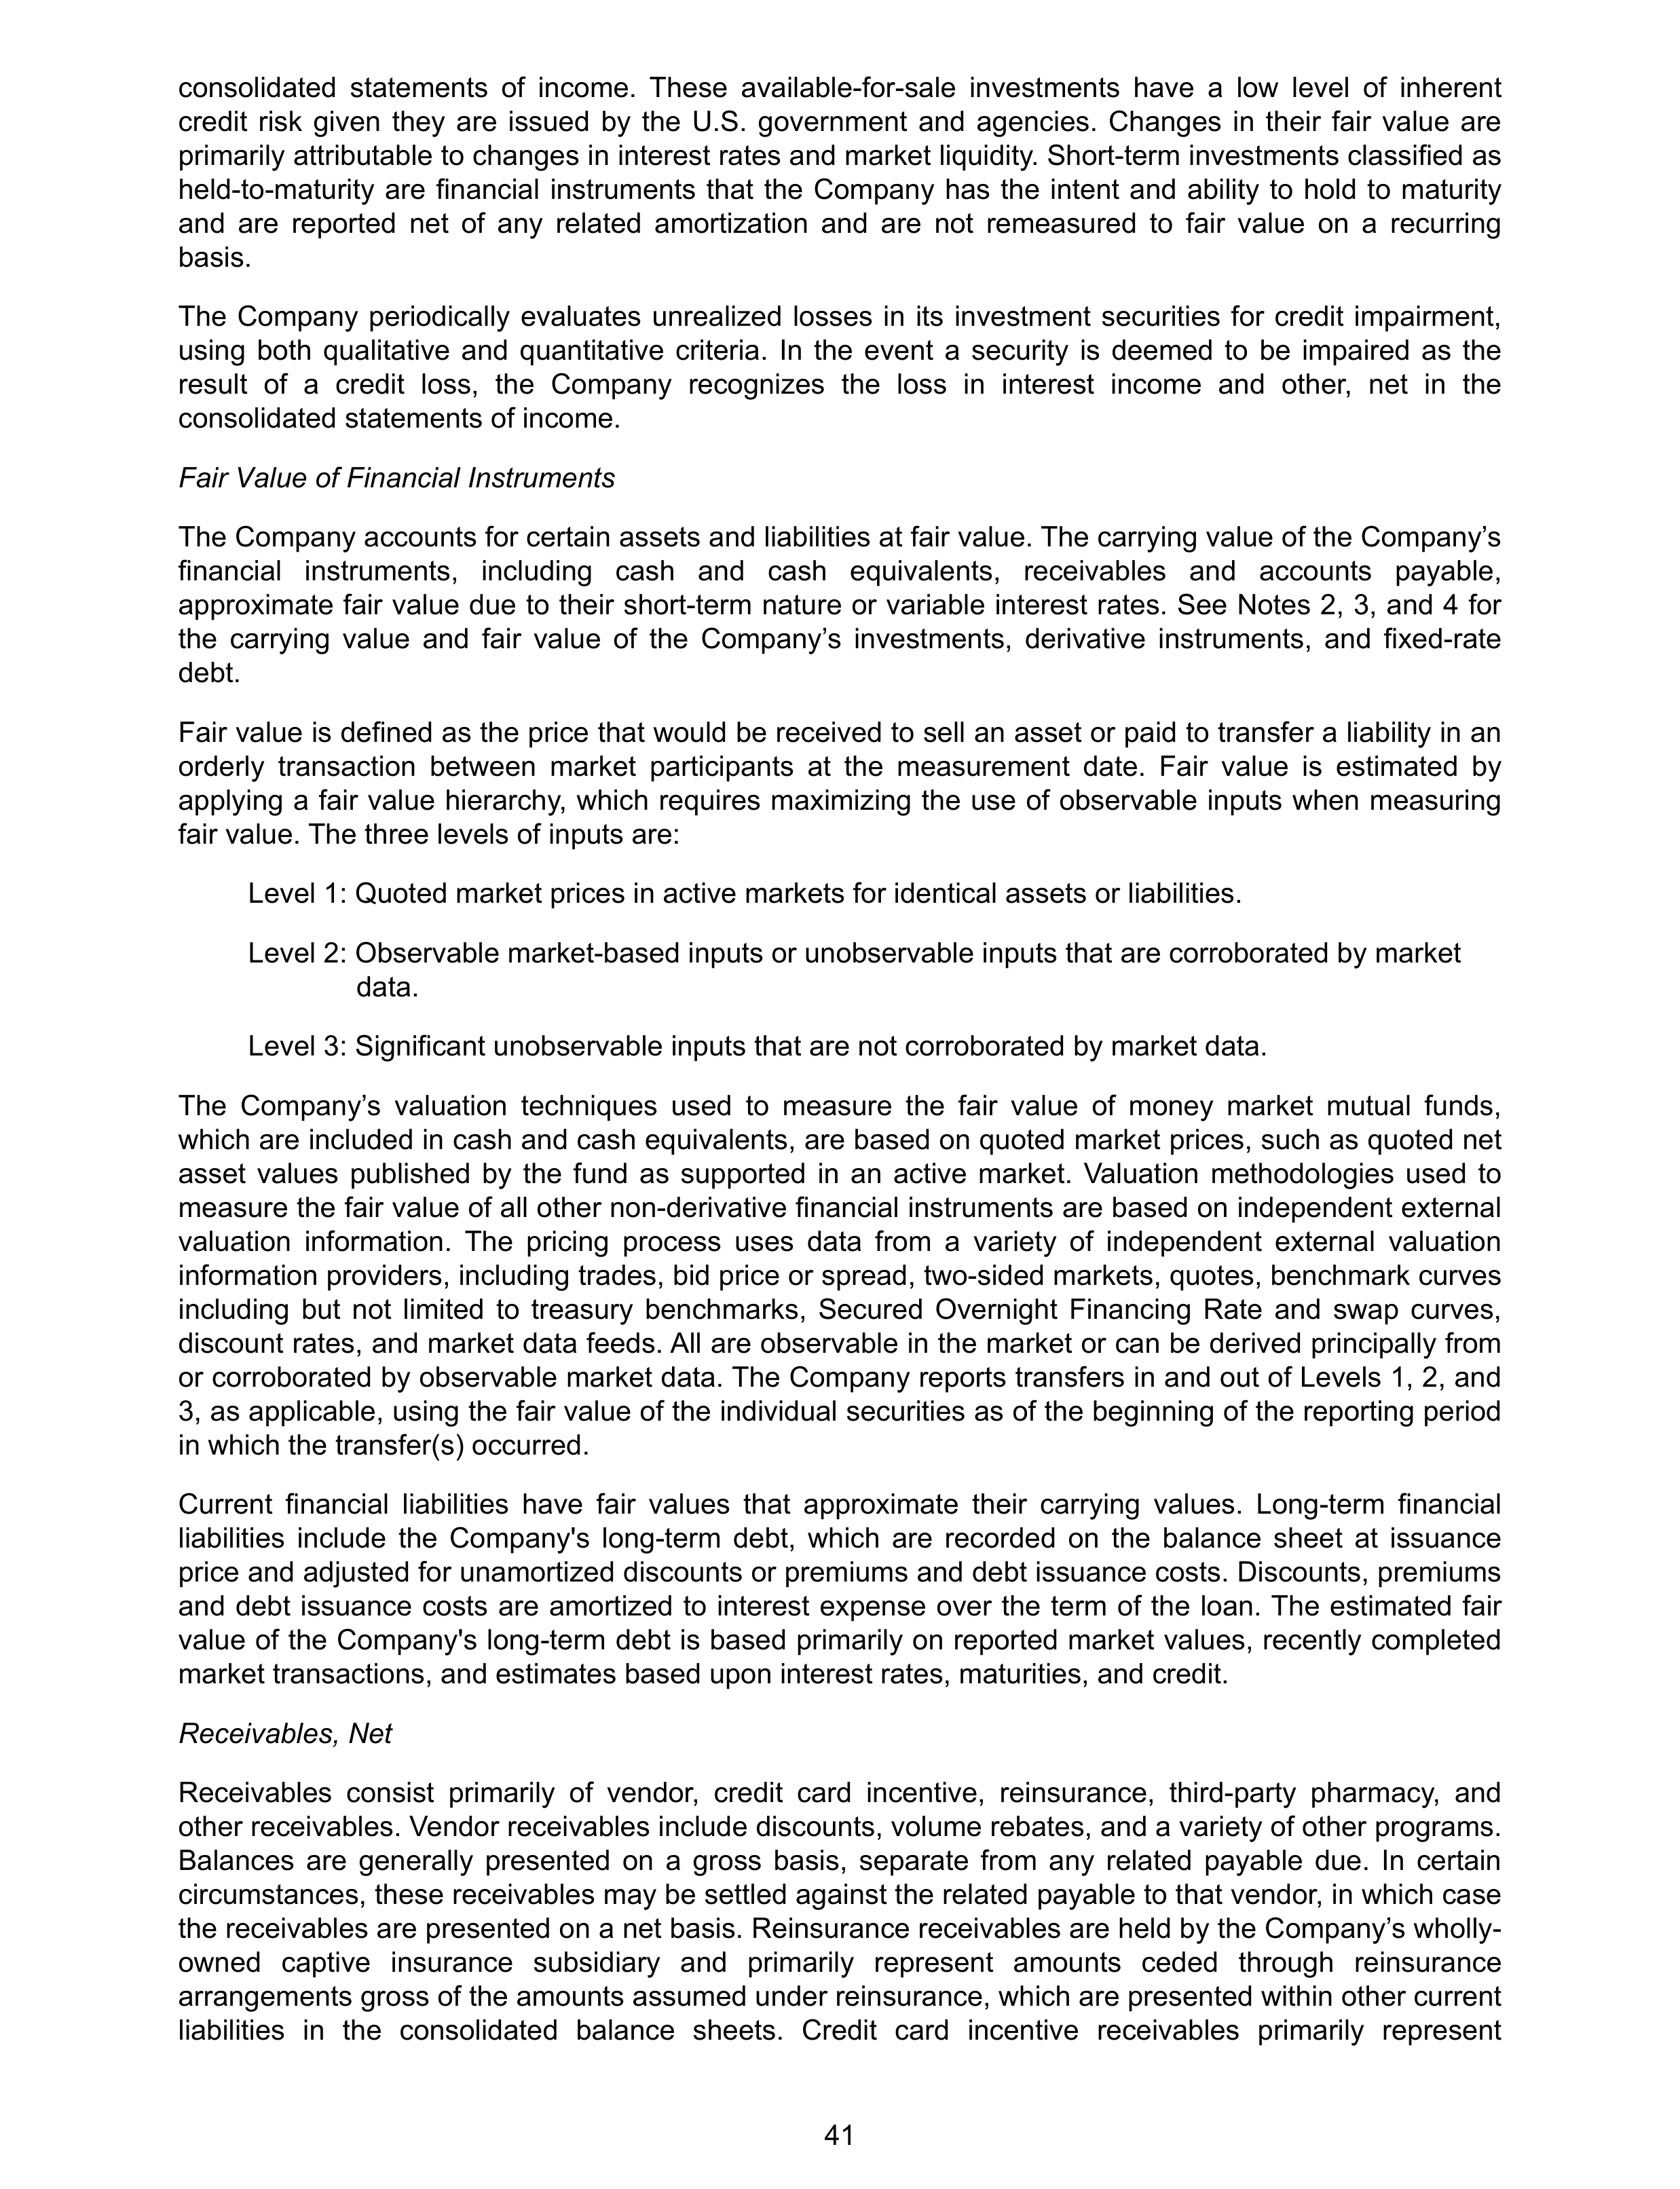
consolidated statements of income. These available-for-sale investments have a low level of inherent
credit risk given they are issued by the U.S. government and agencies. Changes in their fair value are
primarily attributable to changes in interest rates and market liquidity. Short-term investments classified as
held-to-maturity are financial instruments that the Company has the intent and ability to hold to maturity
and are reported net of any related amortization and are not remeasured to fair value on a recurring
basis.
The Company periodically evaluates unrealized losses in its investment securities for credit impairment,
using both qualitative and quantitative criteria. In the event a security is deemed to be impaired as the
result of a credit loss, the Company recognizes the loss in interest income and other, net in the
consolidated statements of income.
Fair Value of Financial Instruments
The Company accounts for certain assets and liabilities at fair value. The carrying value of the Company’s
financial instruments, including cash and cash equivalents, receivables and accounts payable,
approximate fair value due to their short-term nature or variable interest rates. See Notes 2, 3, and 4 for
the carrying value and fair value of the Company’s investments, derivative instruments, and fixed-rate
debt.
Fair value is defined as the price that would be received to sell an asset or paid to transfer a liability in an
orderly transaction between market participants at the measurement date. Fair value is estimated by
applying a fair value hierarchy, which requires maximizing the use of observable inputs when measuring
fair value. The three levels of inputs are:
Level 1: Quoted market prices in active markets for identical assets or liabilities.
Level 2: Observable market-based inputs or unobservable inputs that are corroborated by market
data.
Level 3: Significant unobservable inputs that are not corroborated by market data.
The Company’s valuation techniques used to measure the fair value of money market mutual funds,
which are included in cash and cash equivalents, are based on quoted market prices, such as quoted net
asset values published by the fund as supported in an active market. Valuation methodologies used to
measure the fair value of all other non-derivative financial instruments are based on independent external
valuation information. The pricing process uses data from a variety of independent external valuation
information providers, including trades, bid price or spread, two-sided markets, quotes, benchmark curves
including but not limited to treasury benchmarks, Secured Overnight Financing Rate and swap curves,
discount rates, and market data feeds. All are observable in the market or can be derived principally from
or corroborated by observable market data. The Company reports transfers in and out of Levels 1, 2, and
3, as applicable, using the fair value of the individual securities as of the beginning of the reporting period
in which the transfer(s) occurred.
Current financial liabilities have fair values that approximate their carrying values. Long-term financial
liabilities include the Company's long-term debt, which are recorded on the balance sheet at issuance
price and adjusted for unamortized discounts or premiums and debt issuance costs. Discounts, premiums
and debt issuance costs are amortized to interest expense over the term of the loan. The estimated fair
value of the Company's long-term debt is based primarily on reported market values, recently completed
market transactions, and estimates based upon interest rates, maturities, and credit.
Receivables, Net
Receivables consist primarily of vendor, credit card incentive, reinsurance, third-party pharmacy, and
other receivables. Vendor receivables include discounts, volume rebates, and a variety of other programs.
Balances are generally presented on a gross basis, separate from any related payable due. In certain
circumstances, these receivables may be settled against the related payable to that vendor, in which case
the receivables are presented on a net basis. Reinsurance receivables are held by the Company’s wholly-
owned captive insurance subsidiary and primarily represent amounts ceded through reinsurance
arrangements gross of the amounts assumed under reinsurance, which are presented within other current
liabilities in the consolidated balance sheets. Credit card incentive receivables primarily represent
41
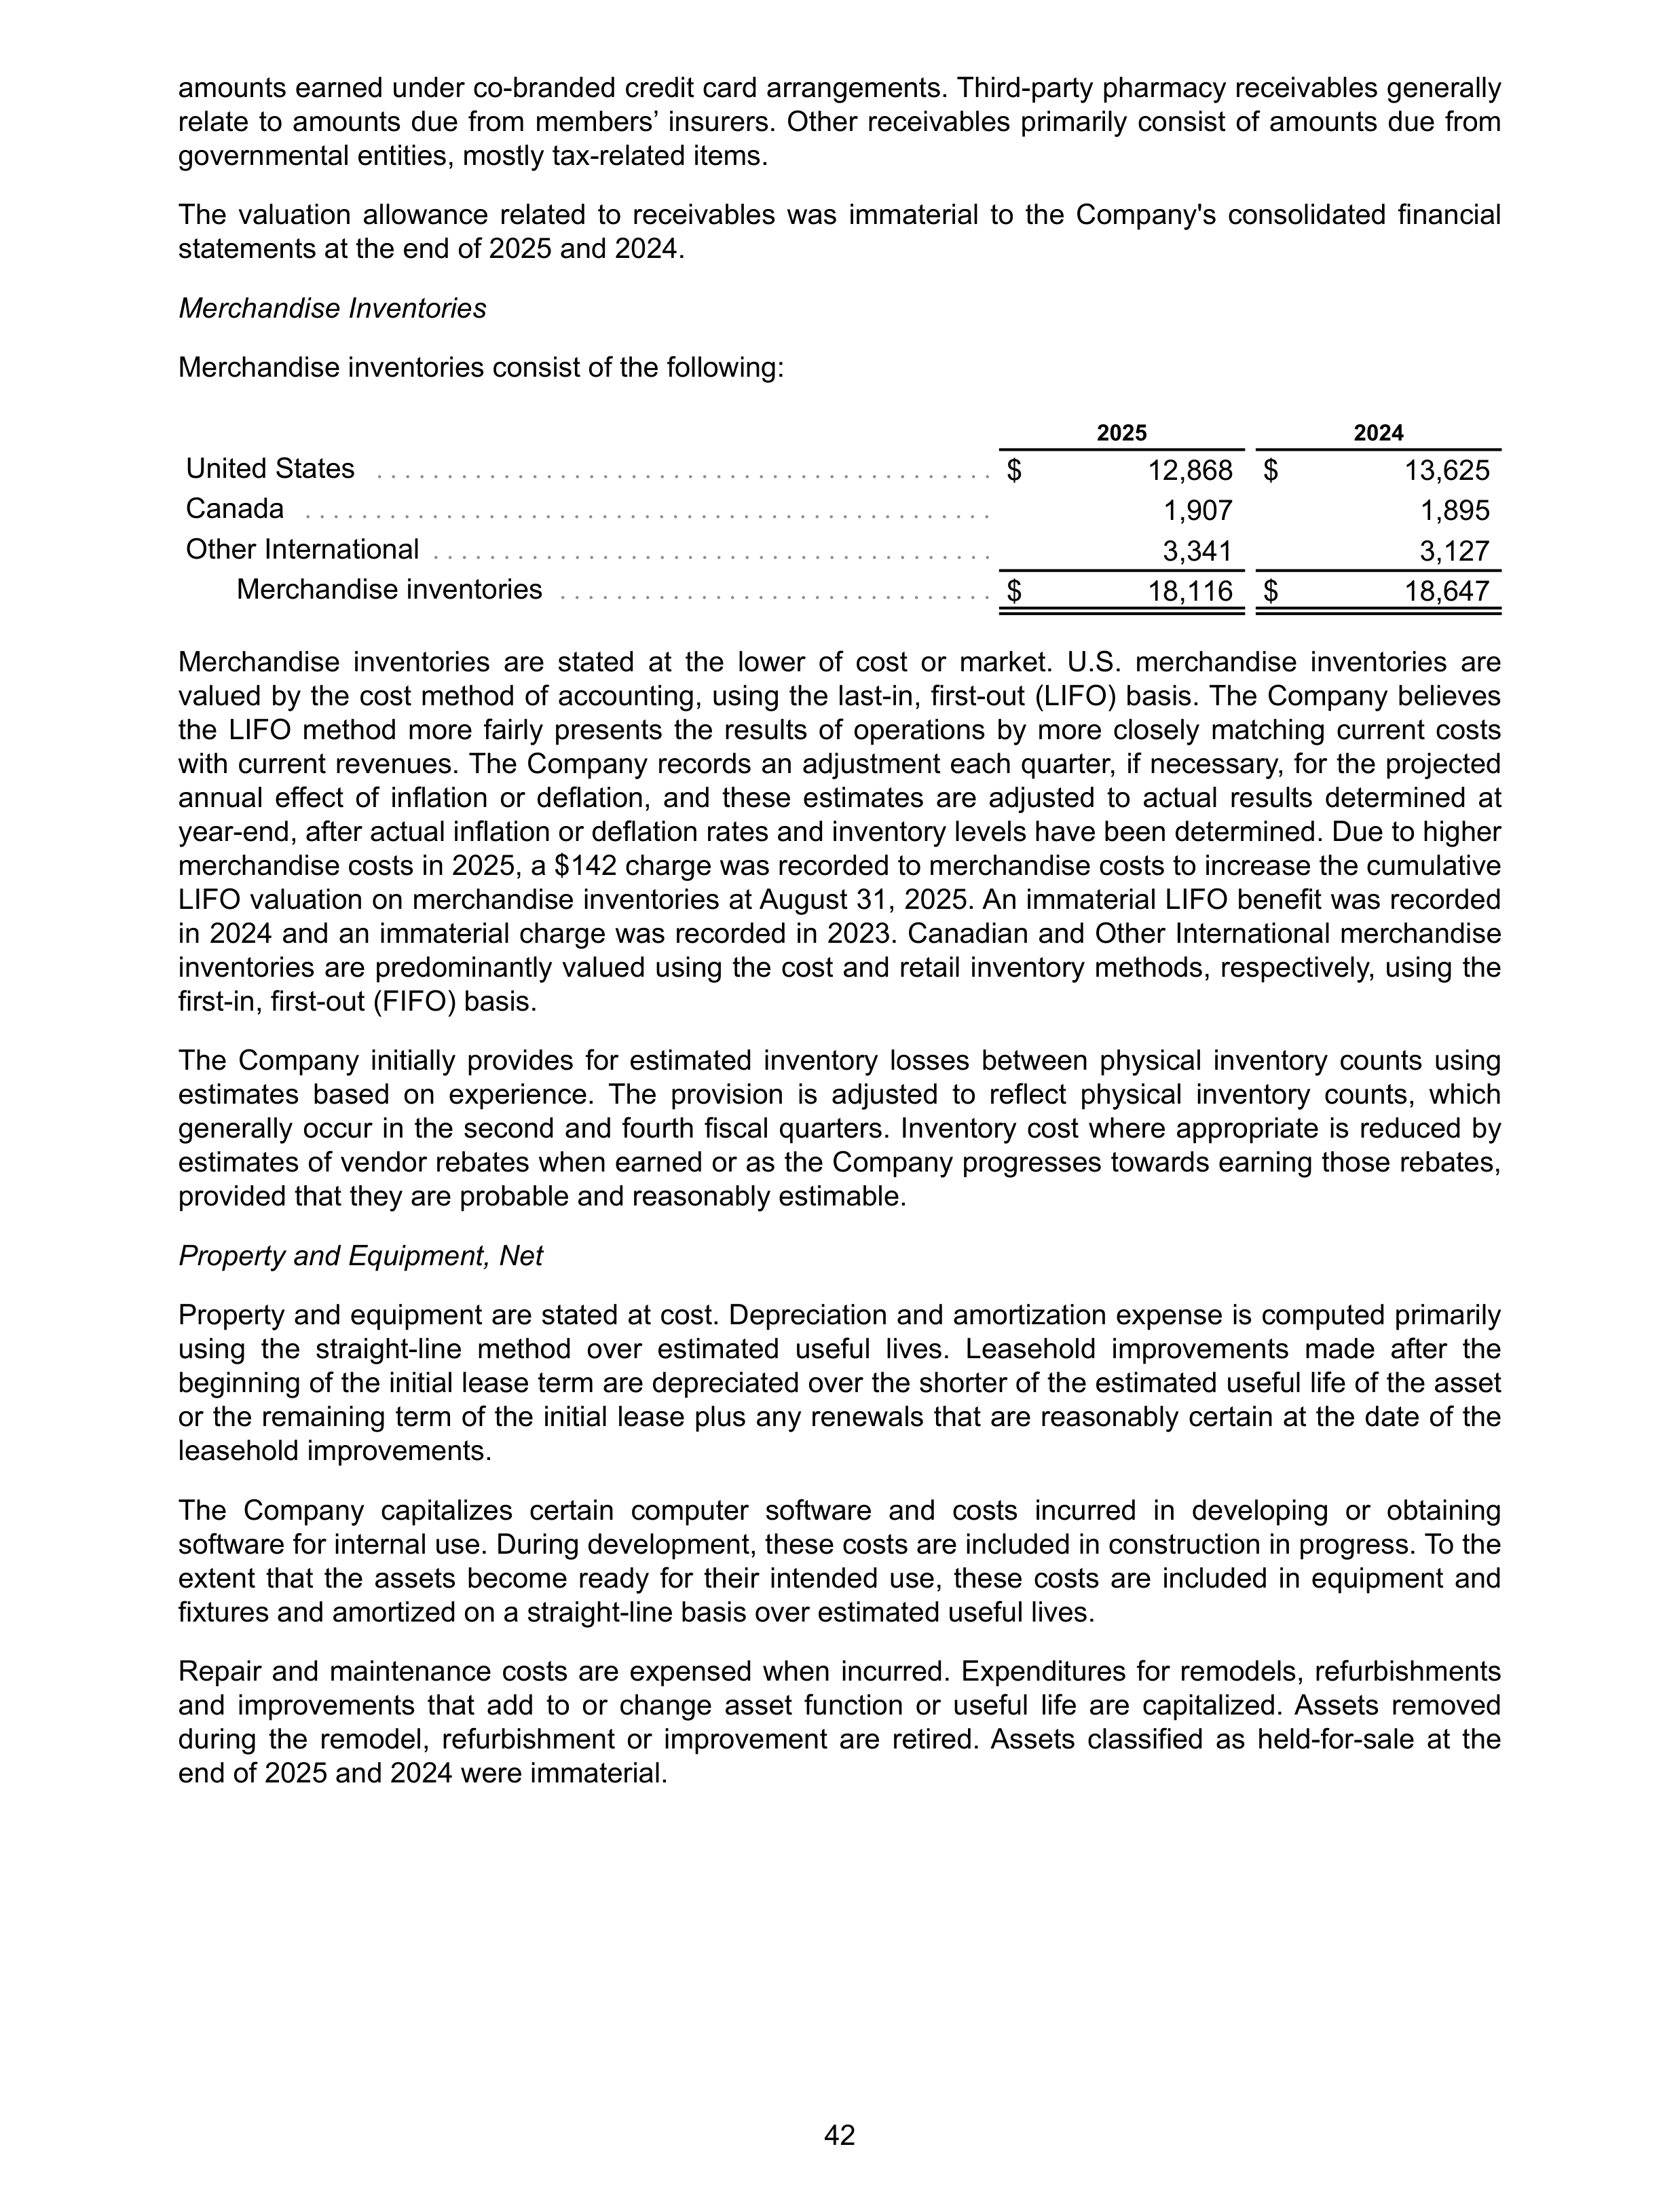
amounts earned under co-branded credit card arrangements. Third-party pharmacy receivables generally
relate to amounts due from members’ insurers. Other receivables primarily consist of amounts due from
governmental entities, mostly tax-related items.
The valuation allowance related to receivables was immaterial to the Company's consolidated financial
statements at the end of 2025 and 2024.
Merchandise Inventories
Merchandise inventories consist of the following:
2025
2024
United States
. . . . . . . . . . . . . . . . . . . . . . . . . . . . . . . . . . . . . . . . . . . .
$
12,868 $
13,625
Canada
. . . . . . . . . . . . . . . . . . . . . . . . . . . . . . . . . . . . . . . . . . . . . . . . .
1,907
1,895
Other International
. . . . . . . . . . . . . . . . . . . . . . . . . . . . . . . . . . . . . . . .
3,341
3,127
Merchandise inventories
. . . . . . . . . . . . . . . . . . . . . . . . . . . . . . .
$
18,116 $
18,647
Merchandise inventories are stated at the lower of cost or market. U.S. merchandise inventories are
valued by the cost method of accounting, using the last-in, first-out (LIFO) basis. The Company believes
the LIFO method more fairly presents the results of operations by more closely matching current costs
with current revenues. The Company records an adjustment each quarter, if necessary, for the projected
annual effect of inflation or deflation, and these estimates are adjusted to actual results determined at
year-end, after actual inflation or deflation rates and inventory levels have been determined. Due to higher
merchandise costs in 2025, a $142 charge was recorded to merchandise costs to increase the cumulative
LIFO valuation on merchandise inventories at August 31, 2025. An immaterial LIFO benefit was recorded
in 2024 and an immaterial charge was recorded in 2023. Canadian and Other International merchandise
inventories are predominantly valued using the cost and retail inventory methods, respectively, using the
first-in, first-out (FIFO) basis.
The Company initially provides for estimated inventory losses between physical inventory counts using
estimates based on experience. The provision is adjusted to reflect physical inventory counts, which
generally occur in the second and fourth fiscal quarters. Inventory cost where appropriate is reduced by
estimates of vendor rebates when earned or as the Company progresses towards earning those rebates,
provided that they are probable and reasonably estimable.
Property and Equipment, Net
Property and equipment are stated at cost. Depreciation and amortization expense is computed primarily
using the straight-line method over estimated useful lives. Leasehold improvements made after the
beginning of the initial lease term are depreciated over the shorter of the estimated useful life of the asset
or the remaining term of the initial lease plus any renewals that are reasonably certain at the date of the
leasehold improvements.
The Company capitalizes certain computer software and costs incurred in developing or obtaining
software for internal use. During development, these costs are included in construction in progress. To the
extent that the assets become ready for their intended use, these costs are included in equipment and
fixtures and amortized on a straight-line basis over estimated useful lives.
Repair and maintenance costs are expensed when incurred. Expenditures for remodels, refurbishments
and improvements that add to or change asset function or useful life are capitalized. Assets removed
during the remodel, refurbishment or improvement are retired. Assets classified as held-for-sale at the
end of 2025 and 2024 were immaterial.
42
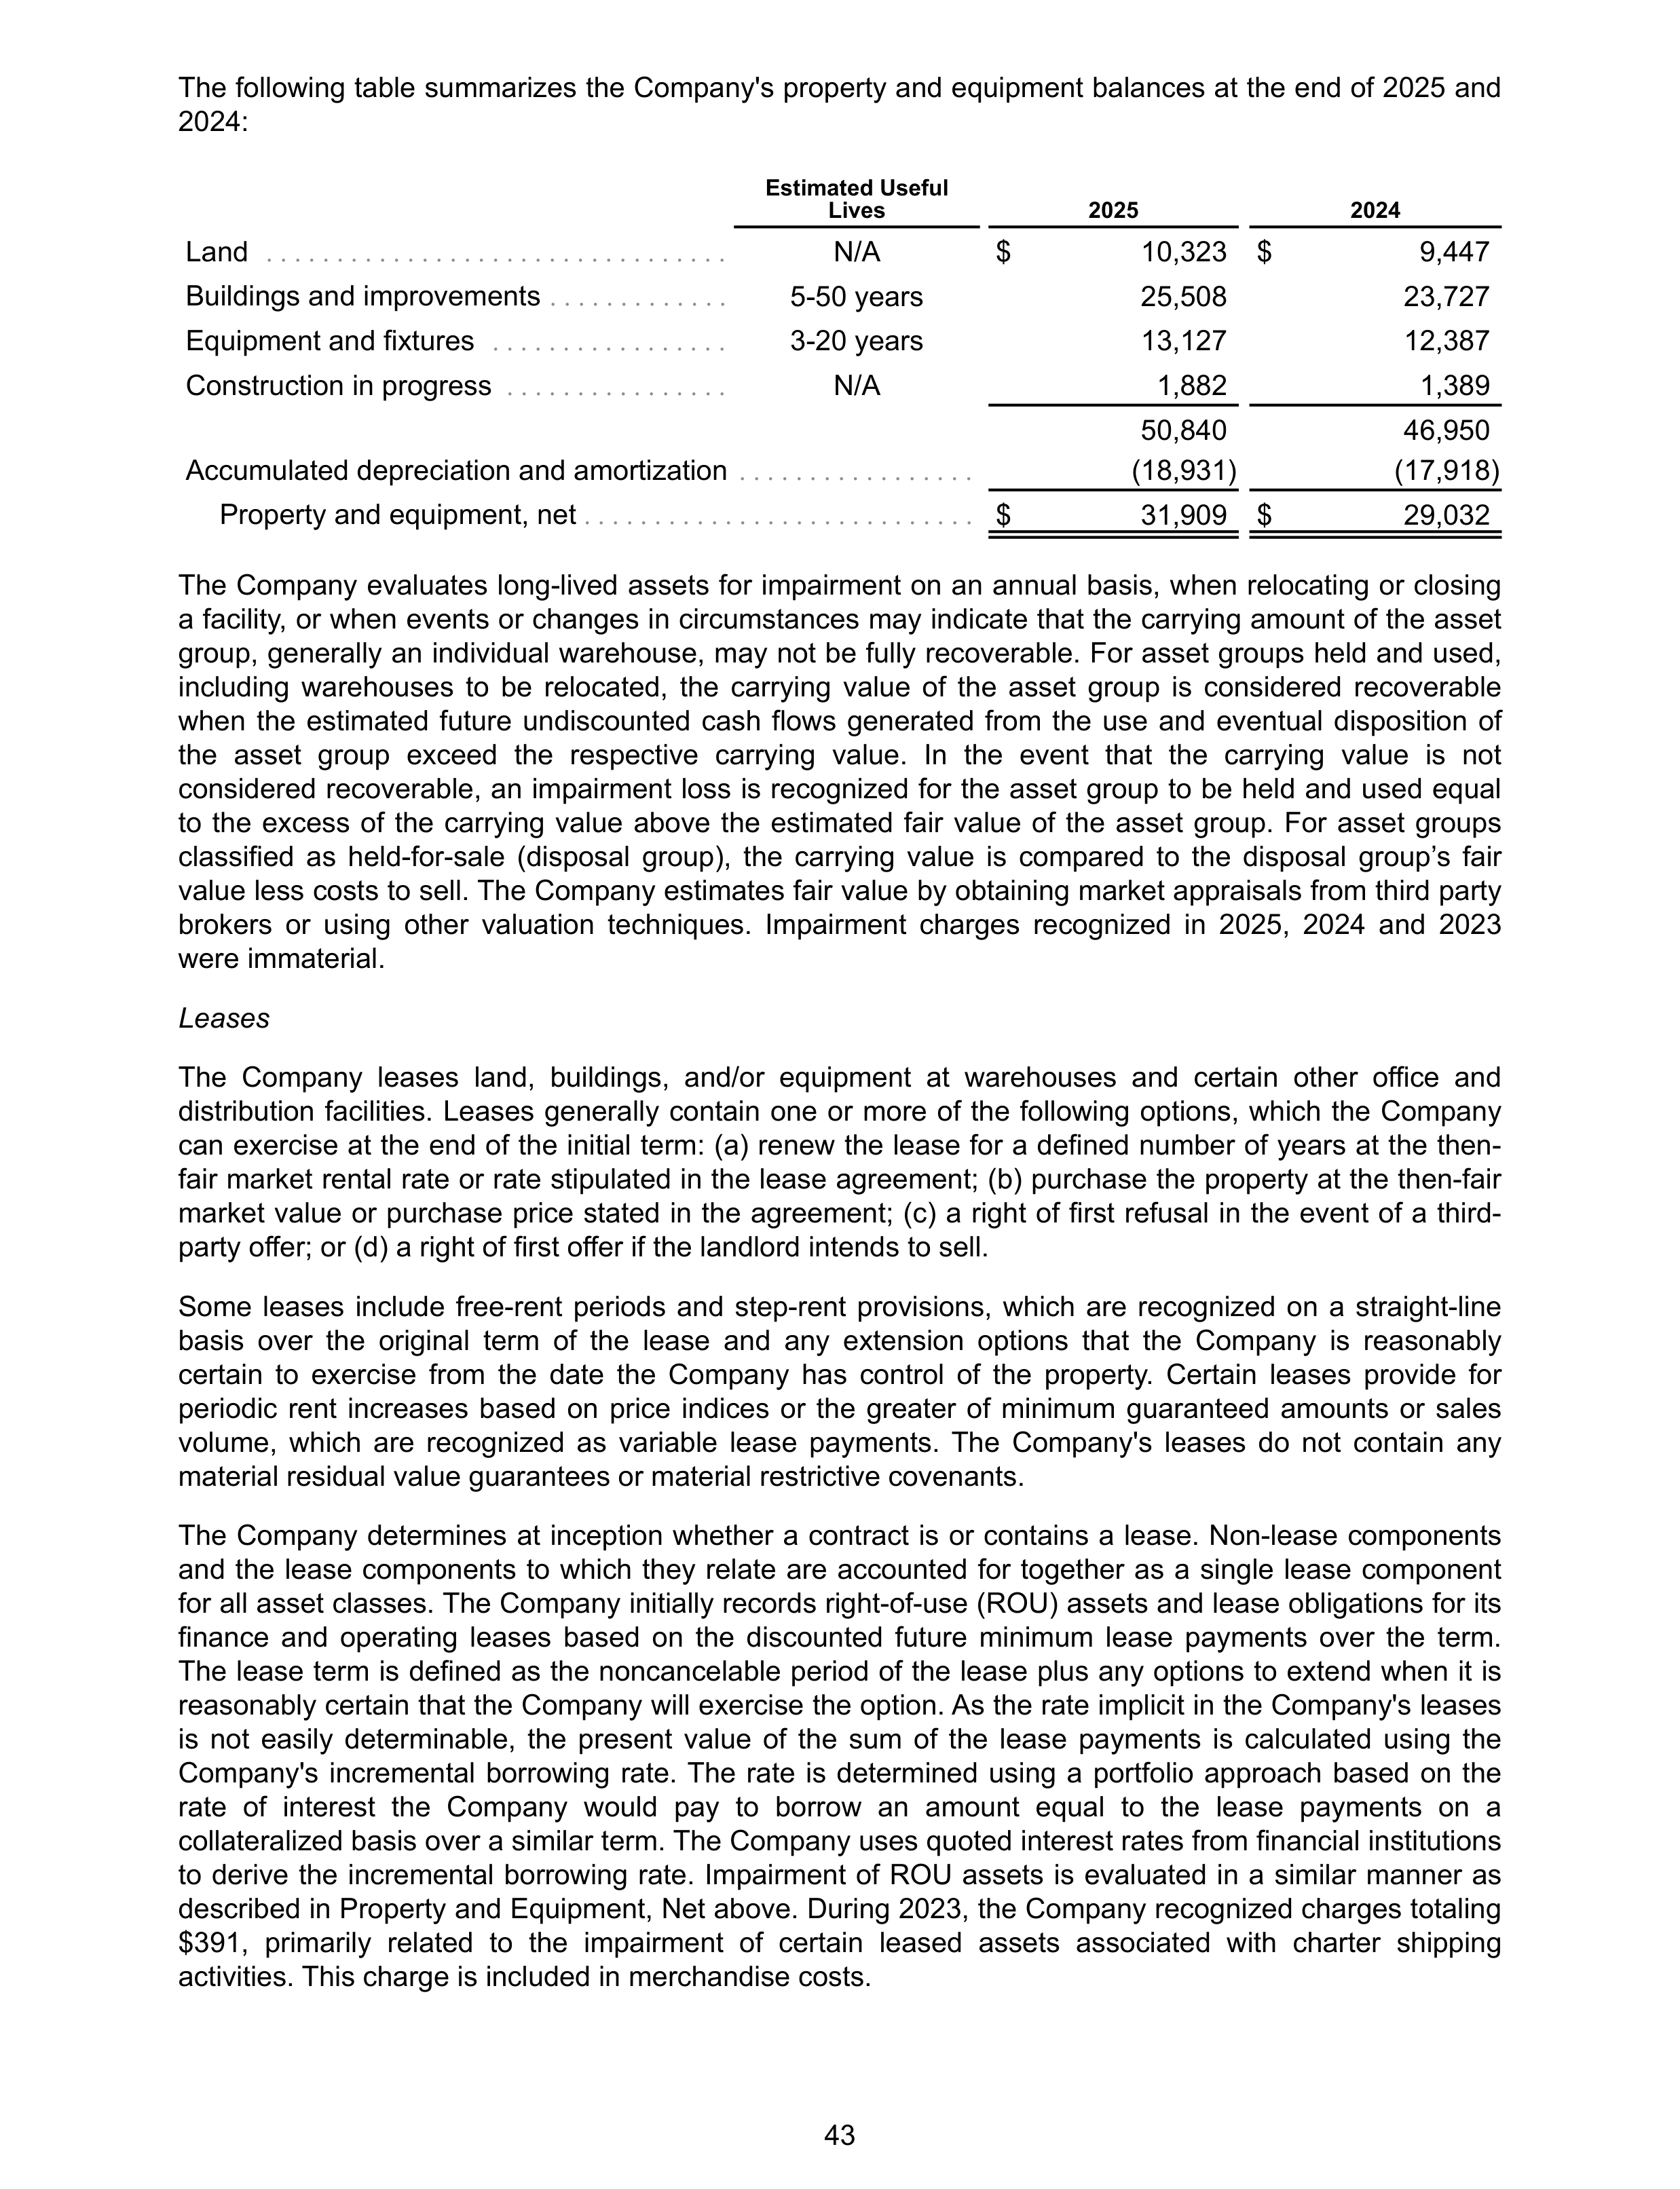
The following table summarizes the Company's property and equipment balances at the end of 2025 and
2024:
Estimated Useful
Lives
2025
2024
Land
. . . . . . . . . . . . . . . . . . . . . . . . . . . . . . . . .
N/A
$
10,323 $
9,447
Buildings and improvements
. . . . . . . . . . . . .
5-50 years
25,508
23,727
Equipment and fixtures
. . . . . . . . . . . . . . . . .
3-20 years
13,127
12,387
Construction in progress
. . . . . . . . . . . . . . . .
N/A
1,882
1,389
50,840
46,950
Accumulated depreciation and amortization
. . . . . . . . . . . . . . . . .
(18,931)
(17,918)
Property and equipment, net
. . . . . . . . . . . . . . . . . . . . . . . . . . . .
$
31,909 $
29,032
The Company evaluates long-lived assets for impairment on an annual basis, when relocating or closing
a facility, or when events or changes in circumstances may indicate that the carrying amount of the asset
group, generally an individual warehouse, may not be fully recoverable. For asset groups held and used,
including warehouses to be relocated, the carrying value of the asset group is considered recoverable
when the estimated future undiscounted cash flows generated from the use and eventual disposition of
the asset group exceed the respective carrying value. In the event that the carrying value is not
considered recoverable, an impairment loss is recognized for the asset group to be held and used equal
to the excess of the carrying value above the estimated fair value of the asset group. For asset groups
classified as held-for-sale (disposal group), the carrying value is compared to the disposal group’s fair
value less costs to sell. The Company estimates fair value by obtaining market appraisals from third party
brokers or using other valuation techniques. Impairment charges recognized in 2025, 2024 and 2023
were immaterial.
Leases
The Company leases land, buildings, and/or equipment at warehouses and certain other office and
distribution facilities. Leases generally contain one or more of the following options, which the Company
can exercise at the end of the initial term: (a) renew the lease for a defined number of years at the then-
fair market rental rate or rate stipulated in the lease agreement; (b) purchase the property at the then-fair
market value or purchase price stated in the agreement; (c) a right of first refusal in the event of a third-
party offer; or (d) a right of first offer if the landlord intends to sell.
Some leases include free-rent periods and step-rent provisions, which are recognized on a straight-line
basis over the original term of the lease and any extension options that the Company is reasonably
certain to exercise from the date the Company has control of the property. Certain leases provide for
periodic rent increases based on price indices or the greater of minimum guaranteed amounts or sales
volume, which are recognized as variable lease payments. The Company's leases do not contain any
material residual value guarantees or material restrictive covenants.
The Company determines at inception whether a contract is or contains a lease. Non-lease components
and the lease components to which they relate are accounted for together as a single lease component
for all asset classes. The Company initially records right-of-use (ROU) assets and lease obligations for its
finance and operating leases based on the discounted future minimum lease payments over the term.
The lease term is defined as the noncancelable period of the lease plus any options to extend when it is
reasonably certain that the Company will exercise the option. As the rate implicit in the Company's leases
is not easily determinable, the present value of the sum of the lease payments is calculated using the
Company's incremental borrowing rate. The rate is determined using a portfolio approach based on the
rate of interest the Company would pay to borrow an amount equal to the lease payments on a
collateralized basis over a similar term. The Company uses quoted interest rates from financial institutions
to derive the incremental borrowing rate. Impairment of ROU assets is evaluated in a similar manner as
described in Property and Equipment, Net above. During 2023, the Company recognized charges totaling
$391, primarily related to the impairment of certain leased assets associated with charter shipping
activities. This charge is included in merchandise costs.
43
The Company's asset retirement obligations (ARO) primarily relate to leasehold improvements that must
be removed at the end of a lease. These obligations are recorded as a discounted liability, with an
offsetting asset, based upon the estimated fair value of the costs to remove the improvements. These
liabilities are accreted over time to the projected future value of the obligation. The ARO assets are
depreciated using the same depreciation method as the leasehold improvement assets and are included
in buildings and improvements. Estimated ARO liabilities associated with these leases are included in
other long-term liabilities in the consolidated balance sheet.
Goodwill and Acquired Intangible Assets
Goodwill represents the excess of acquisition cost over the fair value of the net assets acquired and is not
subject to amortization. The Company reviews goodwill annually in the fourth quarter for impairment or
when circumstances indicate carrying value may exceed the fair value. This evaluation is performed at
the reporting unit level. If a qualitative assessment indicates that it is more likely than not that the fair
value is less than carrying value, a quantitative analysis is completed using either the income or market
approach, or a combination of both. The income approach estimates fair value based on expected
discounted future cash flows, while the market approach uses comparable public companies and
transactions to develop metrics to be applied to historical and expected future operating results.
Goodwill is included in other long-term assets in the consolidated balance sheets. At the end of 2025,
2024, and 2023 goodwill balances in the Company's U.S., Canadian, and Other International operations
were $953, $26, and $15. No impairment charges were recorded in 2025, 2024, or 2023.
Definite-lived intangible assets, which are immaterial, are included in other long-term assets on the
consolidated balance sheets and are amortized on a straight-line basis over their estimated lives, which
approximates the pattern of expected economic benefit.
Insurance/Self-insurance Liabilities
Claims for employee health-care benefits, workers’ compensation, general liability, property damage,
directors’ and officers’ liability, vehicle liability, inventory loss, and other exposures are funded
predominantly through self-insurance. Insurance coverage is maintained for certain risks to limit
exposures to very large losses. The Company uses various risk management mechanisms, including a
wholly-owned captive insurance subsidiary and participates in a reinsurance program. Liabilities
associated with the risks that are retained by the Company are not discounted and are estimated using
historical claims experience, demographic factors, severity factors, and other actuarial assumptions. The
estimated accruals for these liabilities could be significantly affected if future occurrences, claims, or
expenses differ from these assumptions and historical trends. At the end of 2025 and 2024, these
insurance liabilities were $1,878 and $1,612 in the aggregate, and were included in accrued salaries and
benefits and other current liabilities in the consolidated balance sheets, classified based on their nature.
The captive receives direct premiums, which are netted against the Company’s premium costs in SG&A
expenses in the consolidated statements of income. The captive participates in a reinsurance program
that includes third-party participants. The participant agreements and practices of the reinsurance
program are designed to limit a participating members’ individual risk. Income statement adjustments
related to the reinsurance program and related impacts to the consolidated balance sheets are
recognized as information becomes known. In the event the Company leaves the reinsurance program,
the Company retains its primary obligation to the participants for prior activity.
Derivatives
The Company is exposed to foreign-currency exchange-rate fluctuations in the normal course of
business. It manages these fluctuations, in part, through the use of forward foreign-exchange contracts,
seeking to economically hedge the impact of fluctuations of foreign-exchange on known future
expenditures denominated in a non-functional foreign-currency. The contracts relate primarily to U.S.
dollar merchandise inventory expenditures made by the Company’s international subsidiaries with
functional currencies other than the U.S. dollar. These contracts either do not qualify for or the Company
has not elected derivative hedge accounting. The Company seeks to mitigate risk with the use of these
contracts and does not intend to engage in speculative transactions. Some of these contracts contain
credit-risk-related contingent features that require settlement of outstanding contracts upon certain
44
triggering events. The aggregate fair value amounts of derivative instruments in a net liability position and
the amount needed to settle the instruments immediately if the credit-risk-related contingent features were
triggered were immaterial at the end of 2025 and 2024. The aggregate notional amounts of open,
unsettled forward foreign-exchange contracts were $1,184 and $1,212 at the end of 2025 and 2024. See
Note 3 for information on the fair value of unsettled forward foreign-exchange contracts at the end of 2025
and 2024.
The unrealized gains or losses recognized in interest income and other, net in the consolidated
statements of income relating to the net changes in the fair value of unsettled forward foreign-exchange
contracts were immaterial in
2025,
2024 and 2023.
The Company is exposed to fluctuations in prices for energy, particularly electricity and natural gas, and
other commodities used in retail and manufacturing operations, which it seeks to partially mitigate through
the use of fixed-price contracts for certain of its warehouses and other facilities, primarily in the U.S. and
Canada. The Company also enters into variable-priced contracts for some purchases of natural gas, in
addition to fuel for its gas stations, on an index basis. These contracts meet the characteristics of
derivative instruments, but generally qualify for the “normal purchases and normal sales” exception under
authoritative guidance and require no mark-to-market adjustment.
Foreign-Currency
The functional currencies of the Company’s international subsidiaries are their local currencies. Assets
and liabilities recorded in foreign currencies are translated at the exchange rate on the balance sheet
date. Translation adjustments are recorded in accumulated other comprehensive loss. Revenues and
expenses of the Company’s consolidated foreign operations are translated at average exchange rates
prevailing during the year.
The Company recognizes foreign-currency transaction gains and losses related to revaluing or settling
monetary assets and liabilities denominated in currencies other than the functional currency in interest
income and other, net in the consolidated statements of income. Generally, these include the U.S. dollar
cash and cash equivalents and the U.S. dollar payables of consolidated subsidiaries revalued to their
functional currency. Also included are realized foreign-currency gains or losses from settlements of
forward foreign-exchange contracts. These items were immaterial in 2025, 2024, and 2023.
Revenue Recognition
The Company recognizes sales for the amount of consideration collected from the member, which
includes gross shipping fees where applicable, and is net of sales taxes collected and remitted to
government agencies and member returns. The Company reserves for estimated returns based on
historical trends and reduces sales and merchandise costs accordingly. The Company records on a gross
basis a refund liability and an asset for recovery, which are included in other current liabilities and other
current assets, respectively, in the consolidated balance sheets.
The Company offers merchandise in the following core merchandise categories: foods and sundries, non-
foods, and fresh foods. The Company also provides expanded products and services through warehouse
ancillary and other businesses. The Company is the principal for the majority of its transactions and
recognizes revenue on a gross basis. The Company is the principal when it has control of the
merchandise or service before it is transferred to the member. The majority of revenue from merchandise
sales is recognized at the point of sale. Revenue generated through e-commerce or special orders is
generally recognized upon shipment to the member. For merchandise shipped directly to the member,
shipping and handling costs are expensed as incurred as fulfillment costs and included in merchandise
costs in the consolidated statements of income. In certain ancillary businesses, revenue is deferred until
the member picks up merchandise at the warehouse. Deferred sales are included in other current
liabilities in the consolidated balance sheets.
The Company accounts for membership fee revenue, net of refunds, on a deferred basis, ratably over the
one-year membership period. Deferred membership fees at the end of 2025 and 2024 were $2,854 and
$2,501.
In most countries, the Company's Executive members qualify for a 2% reward on qualified purchases,
subject to an annual maximum value, which does not expire and is redeemable at Costco warehouses.
45
The Company accounts for this reward as a reduction in sales, net of the estimated impact of non-
redemptions (breakage), with the corresponding liability classified as accrued member rewards in the
consolidated balance sheets. Estimated breakage is computed based on redemption data. For 2025,
2024, and 2023, the net reduction in sales was $3,007, $2,804, and $2,576.
The Company sells and otherwise provides proprietary shop cards that do not expire and are redeemable
at the warehouse or online for merchandise or membership. Revenue from shop cards is recognized
upon redemption, and estimated breakage is recognized based on redemption data. The Company
accounts for outstanding shop card balances as a liability, net of estimated breakage. Shop card liabilities
are included in other current liabilities in the consolidated balance sheets.
Citibank, N.A. is the exclusive issuer of co-branded credit cards to U.S. members. The Company receives
various forms of consideration from Citibank, including a royalty on purchases made on the card outside
of Costco. A portion of the royalty is used to fund the rebate that cardholders receive, after taking into
consideration breakage, which is calculated based on rebate redemption data. The rebates are issued in
February and expire on December 31. The Company also maintains varying co-branded credit card
arrangements in Canada and certain other International subsidiaries.
Merchandise Costs
Merchandise costs consist of the purchase price or manufacturing costs of inventory sold, inbound and
outbound shipping charges and all costs related to the Company’s depot, fulfillment and manufacturing
operations, and are reduced by vendor consideration. Merchandise costs also include salaries, benefits,
depreciation, and utilities in fresh foods departments and certain ancillary businesses.
Vendor Consideration
The Company receives funds from vendors for discounts and a variety of other programs. These
programs are evidenced by agreements that are reflected in the carrying value of the inventory when
earned or as the Company progresses towards earning the rebate or discount, and as a component of
merchandise costs as the merchandise is sold. Other vendor consideration is generally recorded as a
reduction of merchandise costs upon completion of contractual milestones, agreement terms, or other
systematic approaches.
Selling, General and Administrative Expenses
Selling, general and administrative expenses consist primarily of salaries, benefits and workers’
compensation costs for warehouse employees (other than fresh foods departments and certain ancillary
businesses, which are reflected in merchandise costs), as well as all regional and home office employees,
including buying personnel. Selling, general and administrative expenses also include substantially all
building and equipment depreciation, stock compensation expense, credit and debit card processing fees,
utilities, preopening, as well as other operating costs incurred to support warehouse and e-commerce
operations.
Retirement Plans
The Company's 401(k) retirement plan is available to all U.S. employees over the age of 18 who have
completed 90 days of employment. The plan allows participants to make wage deferral contributions, a
portion of which the Company matches. In addition, the Company provides each eligible participant an
annual discretionary contribution. The Company also has a defined contribution plan for employees in
Canada and contributes a percentage of each employee's wages. Certain subsidiaries in the Company's
Other International operations have defined benefit and defined contribution plans, which are immaterial.
Amounts expensed under all plans were $1,061, $963, and $914 for 2025, 2024, and 2023, and are
predominantly included in SG&A expenses in the consolidated statements of income.
Stock-Based Compensation
The Company grants stock-based compensation, primarily to employees and non-employee directors.
Grants to executive officers are generally performance-based. Through a series of shareholder approvals,
there have been amended and restated plans and new provisions implemented by the Company.
Restricted Stock Units (RSUs) granted to employees and to non-employee directors generally vest over
46
five years and three years and are subject to quarterly vesting in the event of retirement or voluntary
termination. Employees who attain at least 25 years of service with the Company and non-employee
directors with five or more years may receive shares under accelerated vesting provisions. Recipients are
not entitled to vote or receive dividends on unvested and undelivered shares.
In May 2025, the Compensation Committee approved changes to the vesting schedule applicable only to
future grants. Existing participants in the Plan had the option to make a one-time election to remain under
the five-year vesting schedule with acceleration for long service or to change to a three-year vesting
schedule with no such acceleration. RSUs granted to new participants will vest over the three-year term
with no such acceleration. This has no impact on RSUs outstanding or the related disclosures in Note 7.
Compensation expense for awards is predominantly recognized using the straight-line method over the
requisite service period for the entire award and forfeitures are recognized as they occur. Under
accelerated vesting provisions, compensation expense is recognized upon achievement of the long-
service term. The cumulative amount of compensation cost recognized at any point in time equals at least
the portion of the grant-date fair value of the award that is vested at that date. The fair value of RSUs is
calculated as the market value of the common stock on the measurement date less the present value of
the expected dividends forgone during the vesting period.
Stock-based compensation expense is predominantly included in SG&A expenses in the consolidated
statements of income. Certain stock-based compensation costs are capitalized or included in the cost of
merchandise. See Note 7 for additional information.
Income Taxes
The Company accounts for income taxes using the asset and liability method. Deferred tax assets and
liabilities are recognized for the future tax consequences attributed to differences between the financial
statement carrying amounts of existing assets and liabilities and their tax bases, credits and loss carry-
forwards. Deferred tax assets and liabilities are measured using tax rates expected to apply to taxable
income in the years in which those temporary differences and carry-forwards are expected to be
recovered or settled. The effect on deferred tax assets and liabilities of a change in tax rates is recognized
in income in the period that includes the enactment date. A valuation allowance is established when
necessary to reduce deferred tax assets to amounts that are more likely than not expected to be realized.
The timing and amounts of deductible and taxable items and the probability of sustaining uncertain tax
positions requires significant judgment. The benefits of uncertain tax positions are recorded in the
Company’s consolidated financial statements only after determining a more-likely-than-not probability that
the uncertain tax positions will withstand challenge from tax authorities. When facts and circumstances
change, the Company reassesses these probabilities and records changes as appropriate.
Net Income per Common Share
The computation of basic net income per share uses the weighted average number of shares that were
outstanding during the period. The computation of diluted net income per share uses the weighted
average number of shares in the basic net income per share calculation plus the number of common
shares that would be issued assuming vesting of all potentially dilutive common shares outstanding using
the treasury stock method for shares subject to RSUs.
Stock Repurchase Programs
Repurchased shares of common stock are retired, in accordance with the Washington Business
Corporation Act. The par value of repurchased shares is deducted from common stock and the excess
repurchase price over par value is deducted by allocation to additional paid-in capital and retained
earnings. The amount allocated to additional paid-in capital is the current value of additional paid-in
capital per share outstanding and is applied to the number of shares repurchased. Any remaining amount
is allocated to retained earnings. See Note 6 for additional information.
Recent Accounting Pronouncements Adopted
In November 2023, the Financial Accounting Standards Board (FASB) issued Accounting Standards
Update (ASU) 2023-07, which is intended to improve reportable segment disclosure requirements,
47
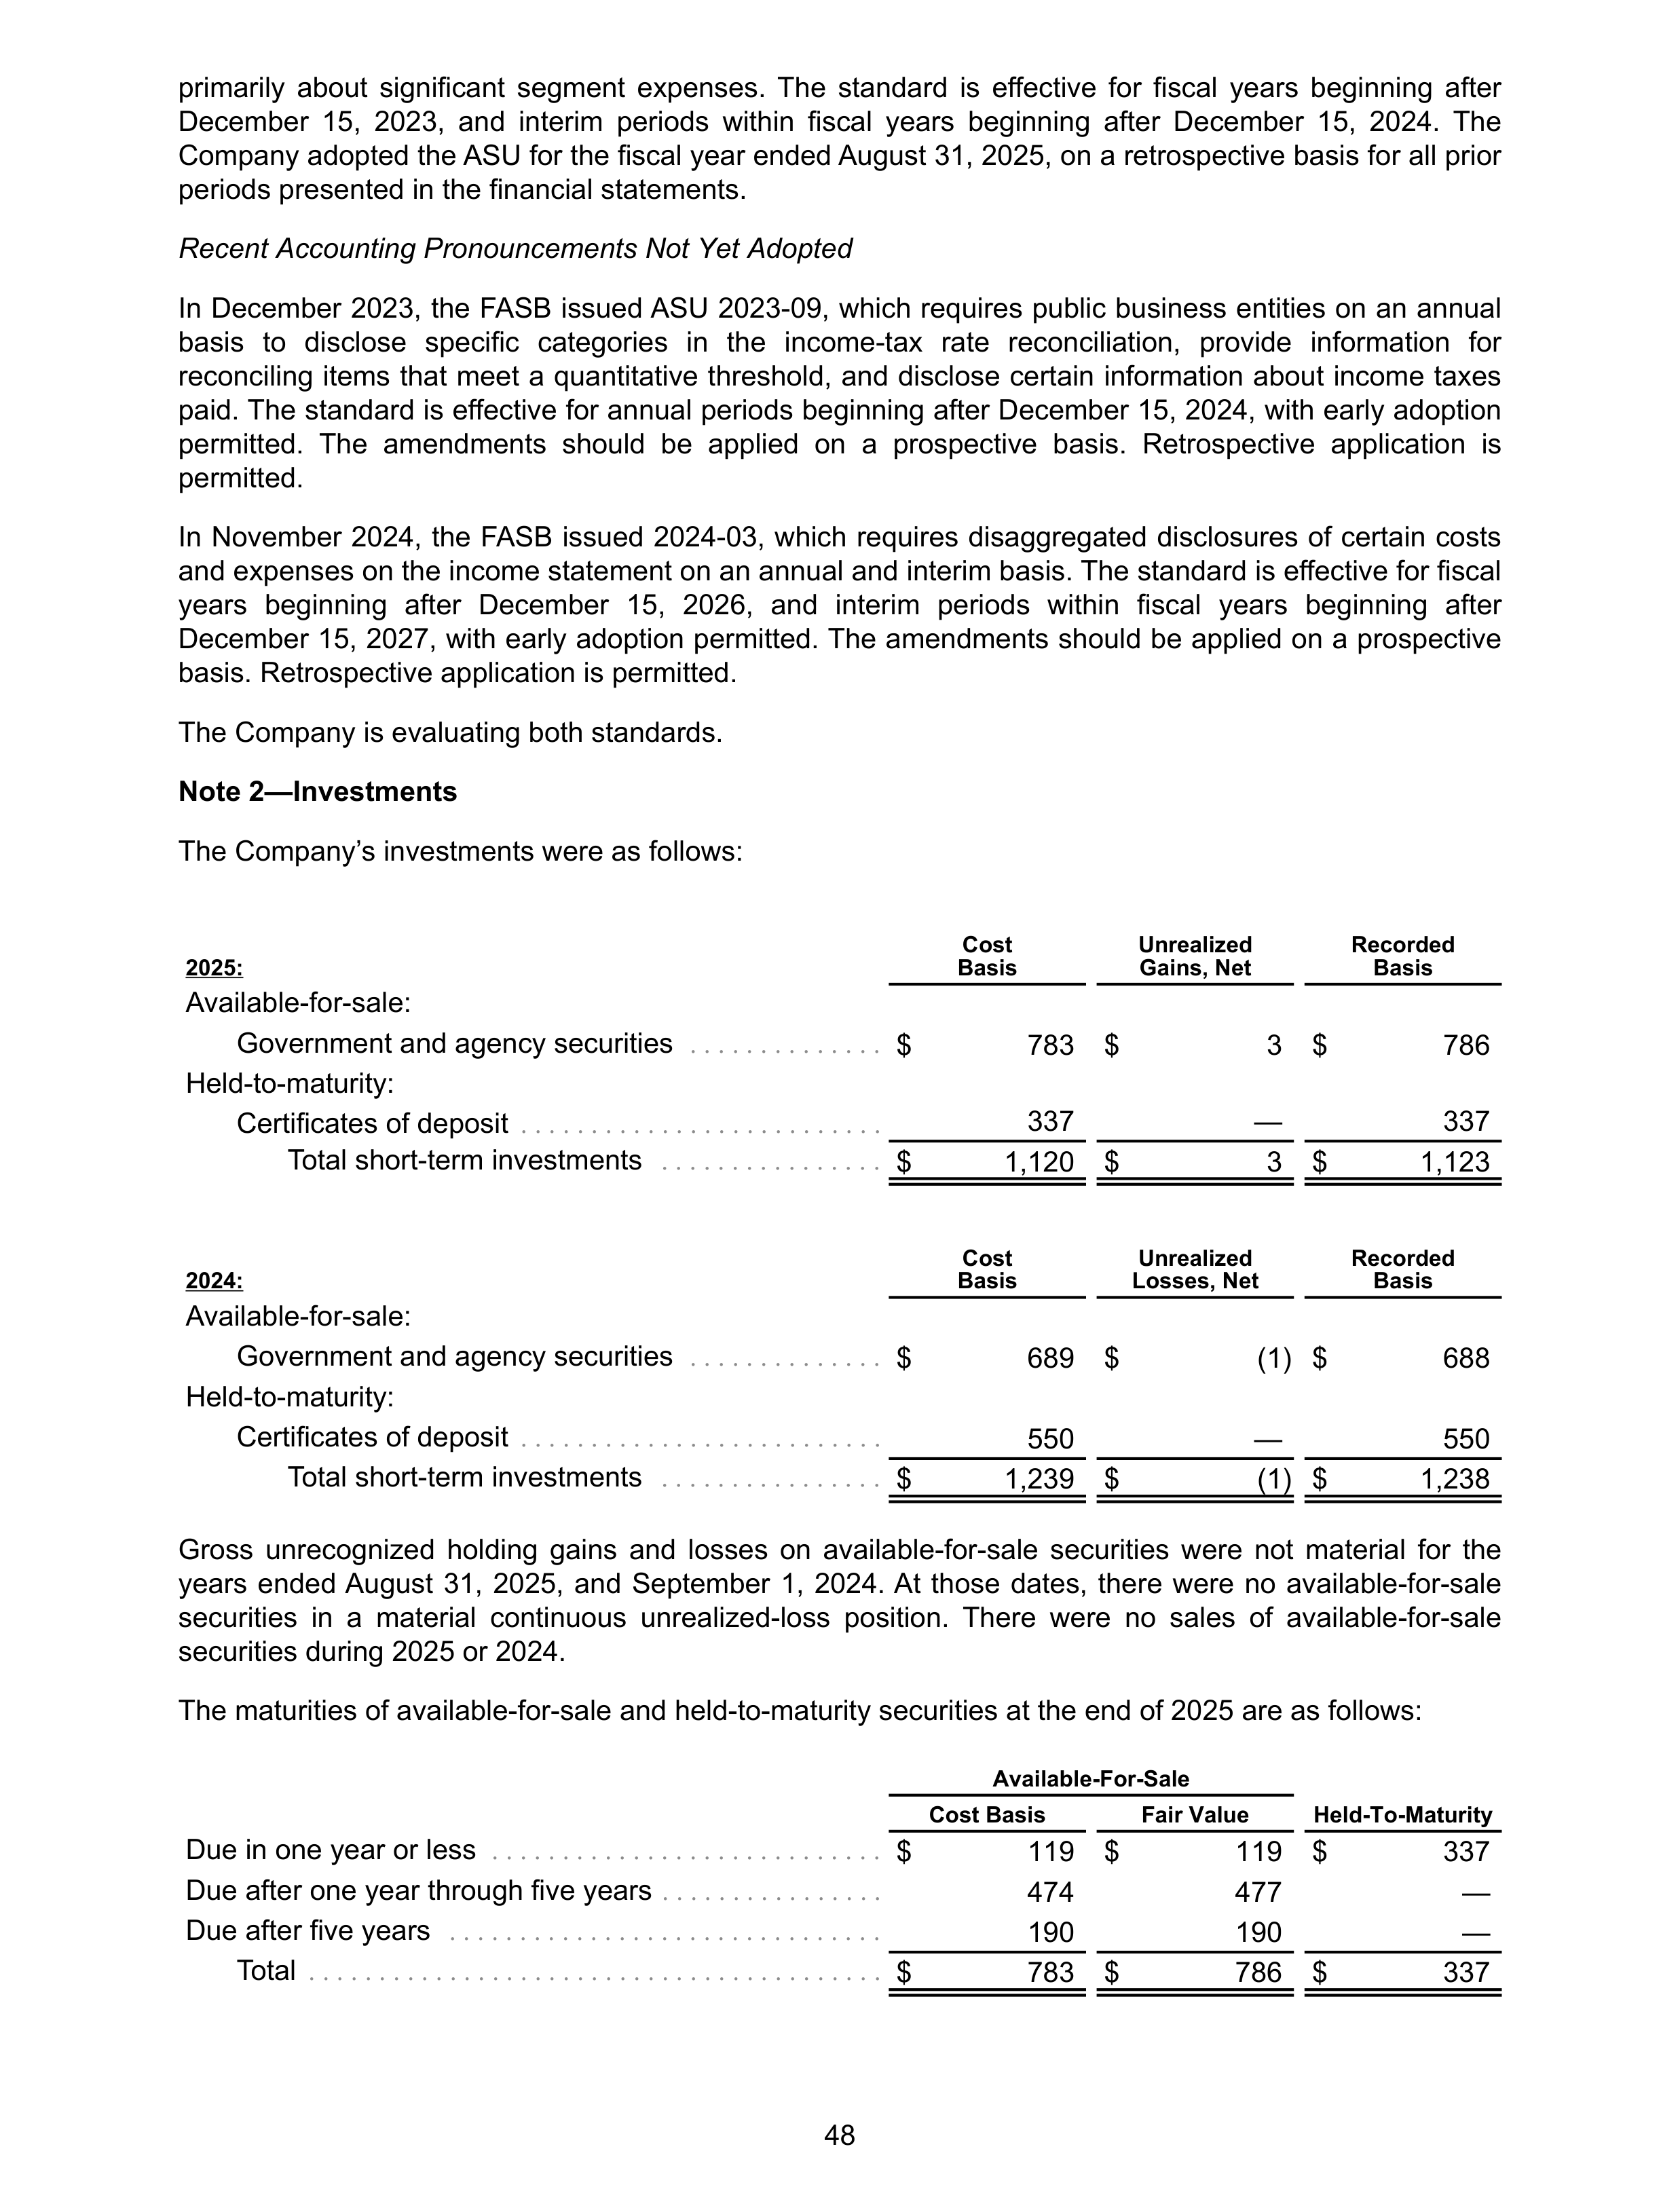
primarily about significant segment expenses. The standard is effective for fiscal years beginning after
December 15, 2023, and interim periods within fiscal years beginning after December 15, 2024. The
Company adopted the ASU for the fiscal year ended August 31, 2025, on a retrospective basis for all prior
periods presented in the financial statements.
Recent Accounting Pronouncements Not Yet Adopted
In December 2023, the FASB issued ASU 2023-09, which requires public business entities on an annual
basis to disclose specific categories in the income-tax rate reconciliation, provide information for
reconciling items that meet a quantitative threshold, and disclose certain information about income taxes
paid. The standard is effective for annual periods beginning after December 15, 2024, with early adoption
permitted. The amendments should be applied on a prospective basis. Retrospective application is
permitted.
In November 2024, the FASB issued 2024-03, which requires disaggregated disclosures of certain costs
and expenses on the income statement on an annual and interim basis. The standard is effective for fiscal
years beginning after December 15, 2026, and interim periods within fiscal years beginning after
December 15, 2027, with early adoption permitted. The amendments should be applied on a prospective
basis. Retrospective application is permitted.
The Company is evaluating both standards.
Note 2—Investments
The Company’s investments were as follows:
2025:
Cost
Basis
Unrealized
Gains, Net
Recorded
Basis
Available-for-sale:
Government and agency securities
. . . . . . . . . . . . . .
$
783 $
3 $
786
Held-to-maturity:
Certificates of deposit
. . . . . . . . . . . . . . . . . . . . . . . . . .
337
—
337
Total short-term investments
. . . . . . . . . . . . . . . .
$
1,120 $
3 $
1,123
2024:
Cost
Basis
Unrealized
Losses, Net
Recorded
Basis
Available-for-sale:
Government and agency securities
. . . . . . . . . . . . . .
$
689 $
(1) $
688
Held-to-maturity:
Certificates of deposit
. . . . . . . . . . . . . . . . . . . . . . . . . .
550
—
550
Total short-term investments
. . . . . . . . . . . . . . . .
$
1,239 $
(1) $
1,238
Gross unrecognized holding gains and losses on available-for-sale securities were not material for the
years ended August 31, 2025, and September 1, 2024. At those dates, there were no available-for-sale
securities in a material continuous unrealized-loss position. There were no sales of available-for-sale
securities during 2025 or 2024.
The maturities of available-for-sale and held-to-maturity securities at the end of 2025 are as follows:
Available-For-Sale
Held-To-Maturity
Cost Basis
Fair Value
Due in one year or less
. . . . . . . . . . . . . . . . . . . . . . . . . . . .
$
119 $
119 $
337
Due after one year through five years
. . . . . . . . . . . . . . . .
474
477
—
Due after five years
. . . . . . . . . . . . . . . . . . . . . . . . . . . . . . .
190
190
—
Total
. . . . . . . . . . . . . . . . . . . . . . . . . . . . . . . . . . . . . . . . .
$
783 $
786 $
337
48
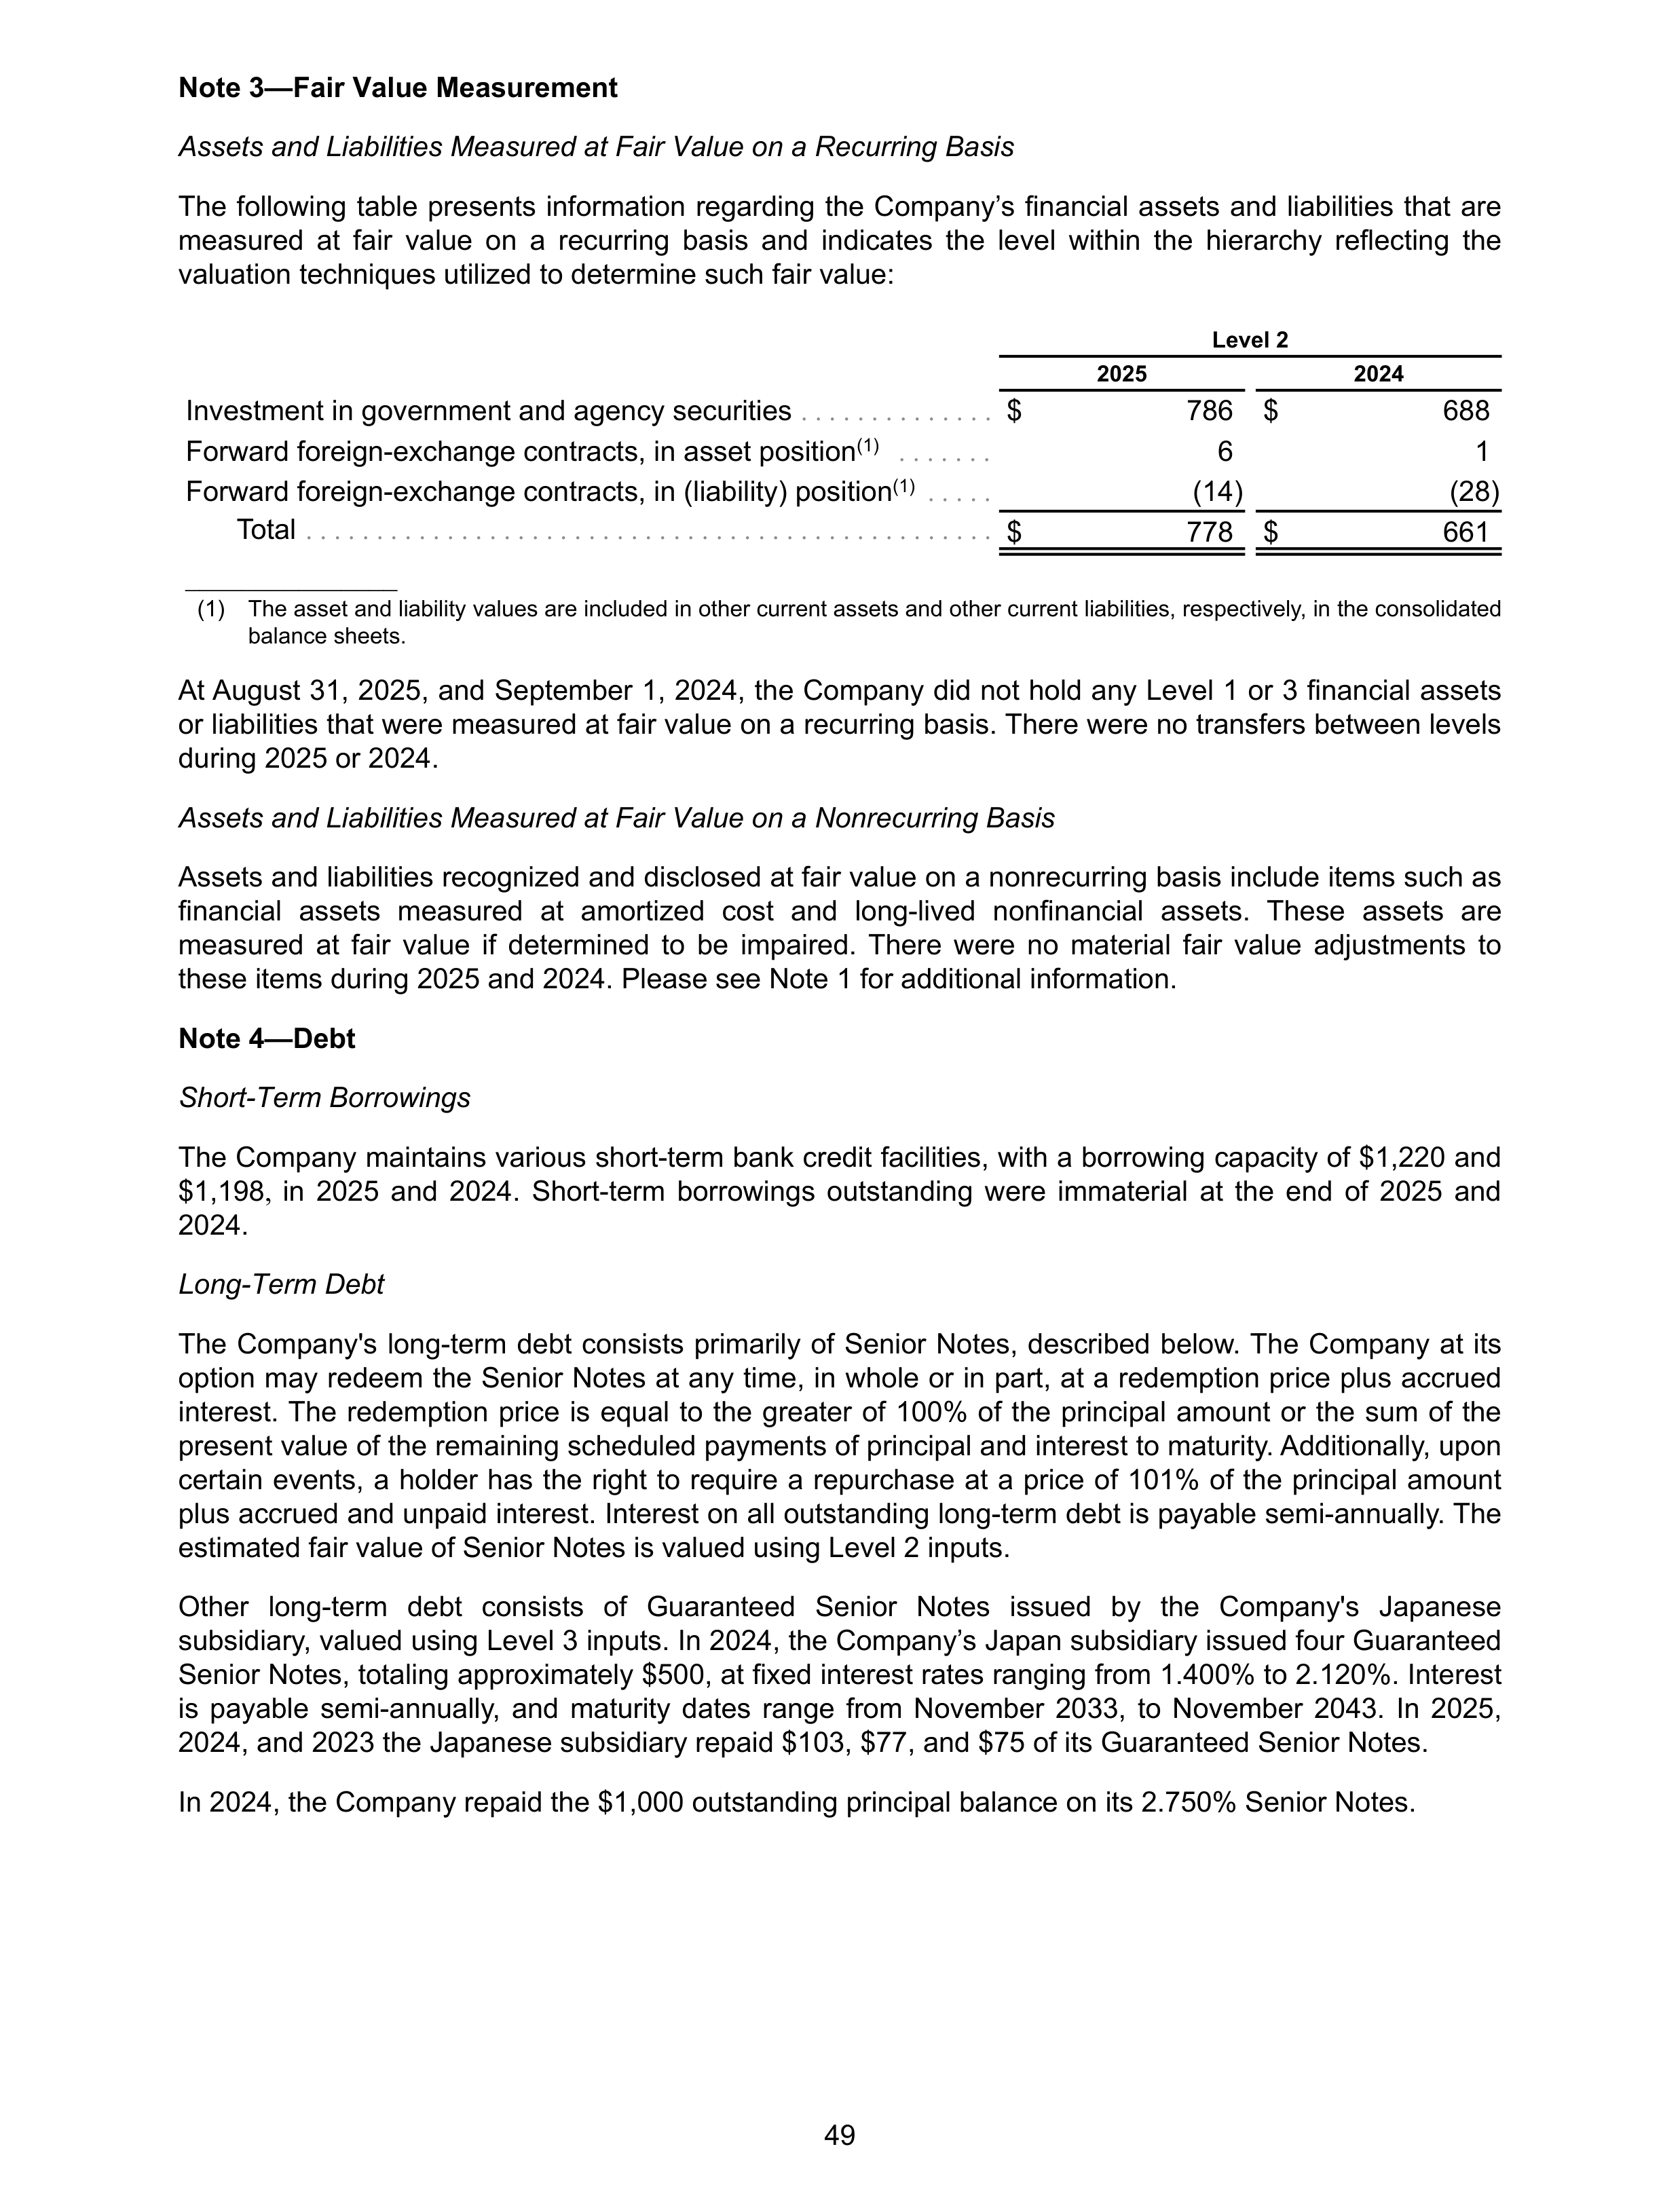
Note 3—Fair Value Measurement
Assets and Liabilities Measured at Fair Value on a Recurring Basis
The following table presents information regarding the Company’s financial assets and liabilities that are
measured at fair value on a recurring basis and indicates the level within the hierarchy reflecting the
valuation techniques utilized to determine such fair value:
Level 2
2025
2024
Investment in government and agency securities
. . . . . . . . . . . . . .
$
786 $
688
Forward foreign-exchange contracts, in asset position
(1)
. . . . . . .
6
1
Forward foreign-exchange contracts, in (liability) position
(1)
. . . . .
(14)
(28)
Total
. . . . . . . . . . . . . . . . . . . . . . . . . . . . . . . . . . . . . . . . . . . . . . . . .
$
778 $
661
_______________
(1)
The asset and liability values are included in other current assets and other current liabilities, respectively, in the consolidated
balance sheets.
At August 31, 2025, and September 1, 2024, the Company did not hold any Level 1 or 3 financial assets
or liabilities that were measured at fair value on a recurring basis. There were no transfers between levels
during 2025 or 2024.
Assets and Liabilities Measured at Fair Value on a Nonrecurring Basis
Assets and liabilities recognized and disclosed at fair value on a nonrecurring basis include items such as
financial assets measured at amortized cost and long-lived nonfinancial assets. These assets are
measured at fair value if determined to be impaired. There were no material fair value adjustments to
these items during 2025 and 2024. Please see Note 1 for additional information.
Note 4—Debt
Short-Term Borrowings
The Company maintains various short-term bank credit facilities, with a borrowing capacity of $1,220 and
$1,198
,
in 2025 and 2024. Short-term borrowings outstanding were immaterial at the end of 2025 and
2024.
Long-Term Debt
The Company's long-term debt consists primarily of Senior Notes, described below. The Company at its
option may redeem the Senior Notes at any time, in whole or in part, at a redemption price plus accrued
interest. The redemption price is equal to the greater of 100% of the principal amount or the sum of the
present value of the remaining scheduled payments of principal and interest to maturity. Additionally, upon
certain events, a holder has the right to require a repurchase at a price of 101% of the principal amount
plus accrued and unpaid interest. Interest on all outstanding long-term debt is payable semi-annually. The
estimated fair value of Senior Notes is valued using Level 2 inputs.
Other long-term debt consists of Guaranteed Senior Notes issued by the Company's Japanese
subsidiary, valued using Level 3 inputs. In 2024, the Company’s Japan subsidiary issued four Guaranteed
Senior Notes, totaling approximately $500, at fixed interest rates ranging from 1.400% to 2.120%. Interest
is payable semi-annually, and maturity dates range from November 2033, to November 2043. In 2025,
2024, and 2023 the Japanese subsidiary repaid $103, $77, and $75 of its Guaranteed Senior Notes.
In 2024, the Company repaid the $1,000 outstanding principal balance on its 2.750% Senior Notes.
49
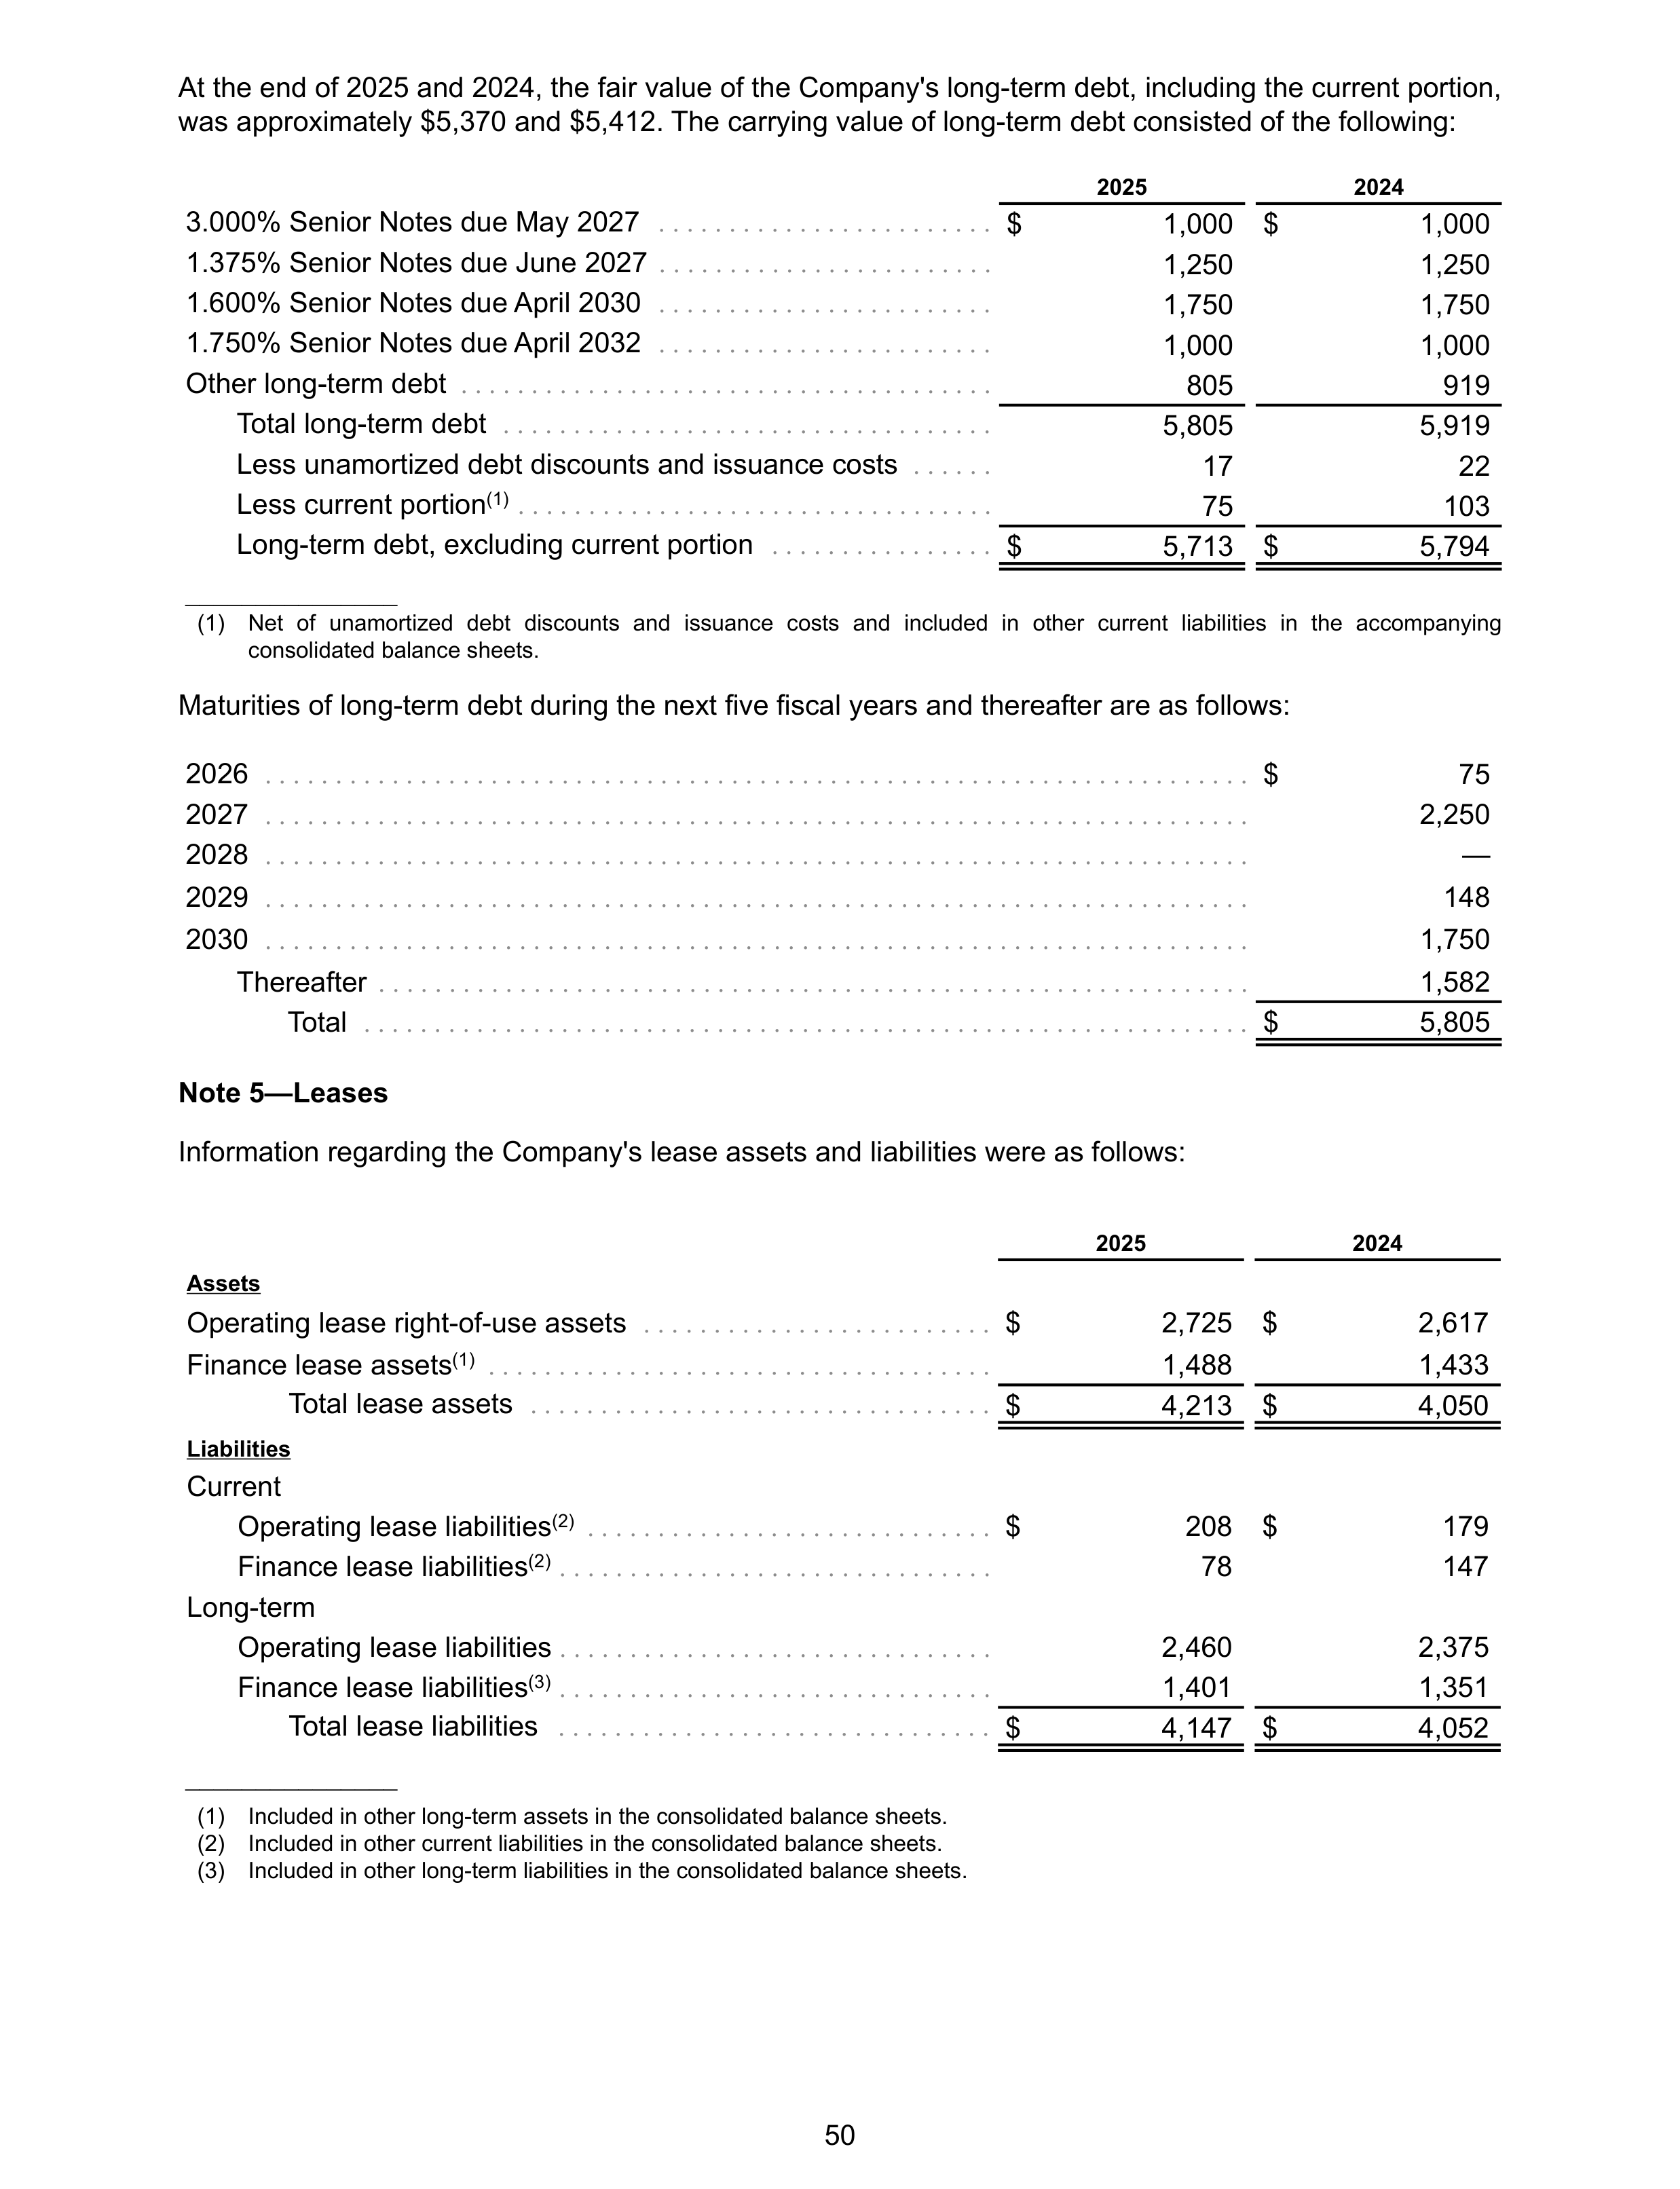
At the end of 2025 and 2024, the fair value of the Company's long-term debt, including the current portion,
was approximately $5,370 and $5,412. The carrying value of long-term debt consisted of the following:
2025
2024
3.000% Senior Notes due May 2027
. . . . . . . . . . . . . . . . . . . . . . . .
$
1,000 $
1,000
1.375% Senior Notes due June 2027
. . . . . . . . . . . . . . . . . . . . . . . .
1,250
1,250
1.600% Senior Notes due April 2030
. . . . . . . . . . . . . . . . . . . . . . . .
1,750
1,750
1.750% Senior Notes due April 2032
. . . . . . . . . . . . . . . . . . . . . . . .
1,000
1,000
Other long-term debt
. . . . . . . . . . . . . . . . . . . . . . . . . . . . . . . . . . . . . .
805
919
Total long-term debt
. . . . . . . . . . . . . . . . . . . . . . . . . . . . . . . . . . .
5,805
5,919
Less unamortized debt discounts and issuance costs
. . . . . .
17
22
Less current portion
(1)
. . . . . . . . . . . . . . . . . . . . . . . . . . . . . . . . . .
75
103
Long-term debt, excluding current portion
. . . . . . . . . . . . . . . .
$
5,713 $
5,794
_______________
(1)
Net of unamortized debt discounts and issuance costs and included in other current liabilities in the accompanying
consolidated balance sheets.
Maturities of long-term debt during the next five fiscal years and thereafter are as follows:
2026
. . . . . . . . . . . . . . . . . . . . . . . . . . . . . . . . . . . . . . . . . . . . . . . . . . . . . . . . . . . . . . . . . . . . . .
$
75
2027
. . . . . . . . . . . . . . . . . . . . . . . . . . . . . . . . . . . . . . . . . . . . . . . . . . . . . . . . . . . . . . . . . . . . . .
2,250
2028
. . . . . . . . . . . . . . . . . . . . . . . . . . . . . . . . . . . . . . . . . . . . . . . . . . . . . . . . . . . . . . . . . . . . . .
—
2029
. . . . . . . . . . . . . . . . . . . . . . . . . . . . . . . . . . . . . . . . . . . . . . . . . . . . . . . . . . . . . . . . . . . . . .
148
2030
. . . . . . . . . . . . . . . . . . . . . . . . . . . . . . . . . . . . . . . . . . . . . . . . . . . . . . . . . . . . . . . . . . . . . .
1,750
Thereafter
. . . . . . . . . . . . . . . . . . . . . . . . . . . . . . . . . . . . . . . . . . . . . . . . . . . . . . . . . . . . . .
1,582
Total
. . . . . . . . . . . . . . . . . . . . . . . . . . . . . . . . . . . . . . . . . . . . . . . . . . . . . . . . . . . . . . .
$
5,805
Note 5—Leases
Information regarding the Company's lease assets and liabilities were as follows:
2025
2024
Assets
Operating lease right-of-use assets
. . . . . . . . . . . . . . . . . . . . . . . . .
$
2,725 $
2,617
Finance lease assets
(1)
. . . . . . . . . . . . . . . . . . . . . . . . . . . . . . . . . . . .
1,488
1,433
Total lease assets
. . . . . . . . . . . . . . . . . . . . . . . . . . . . . . . . .
$
4,213 $
4,050
Liabilities
Current
Operating lease liabilities
(2)
. . . . . . . . . . . . . . . . . . . . . . . . . . . . .
$
208 $
179
Finance lease liabilities
(2)
. . . . . . . . . . . . . . . . . . . . . . . . . . . . . . .
78
147
Long-term
Operating lease liabilities
. . . . . . . . . . . . . . . . . . . . . . . . . . . . . . .
2,460
2,375
Finance lease liabilities
(3)
. . . . . . . . . . . . . . . . . . . . . . . . . . . . . . .
1,401
1,351
Total lease liabilities
. . . . . . . . . . . . . . . . . . . . . . . . . . . . . . .
$
4,147 $
4,052
_______________
(1)
Included in other long-term assets in the consolidated balance sheets.
(2)
Included in other current liabilities in the consolidated balance sheets.
(3)
Included in other long-term liabilities in the consolidated balance sheets.
50
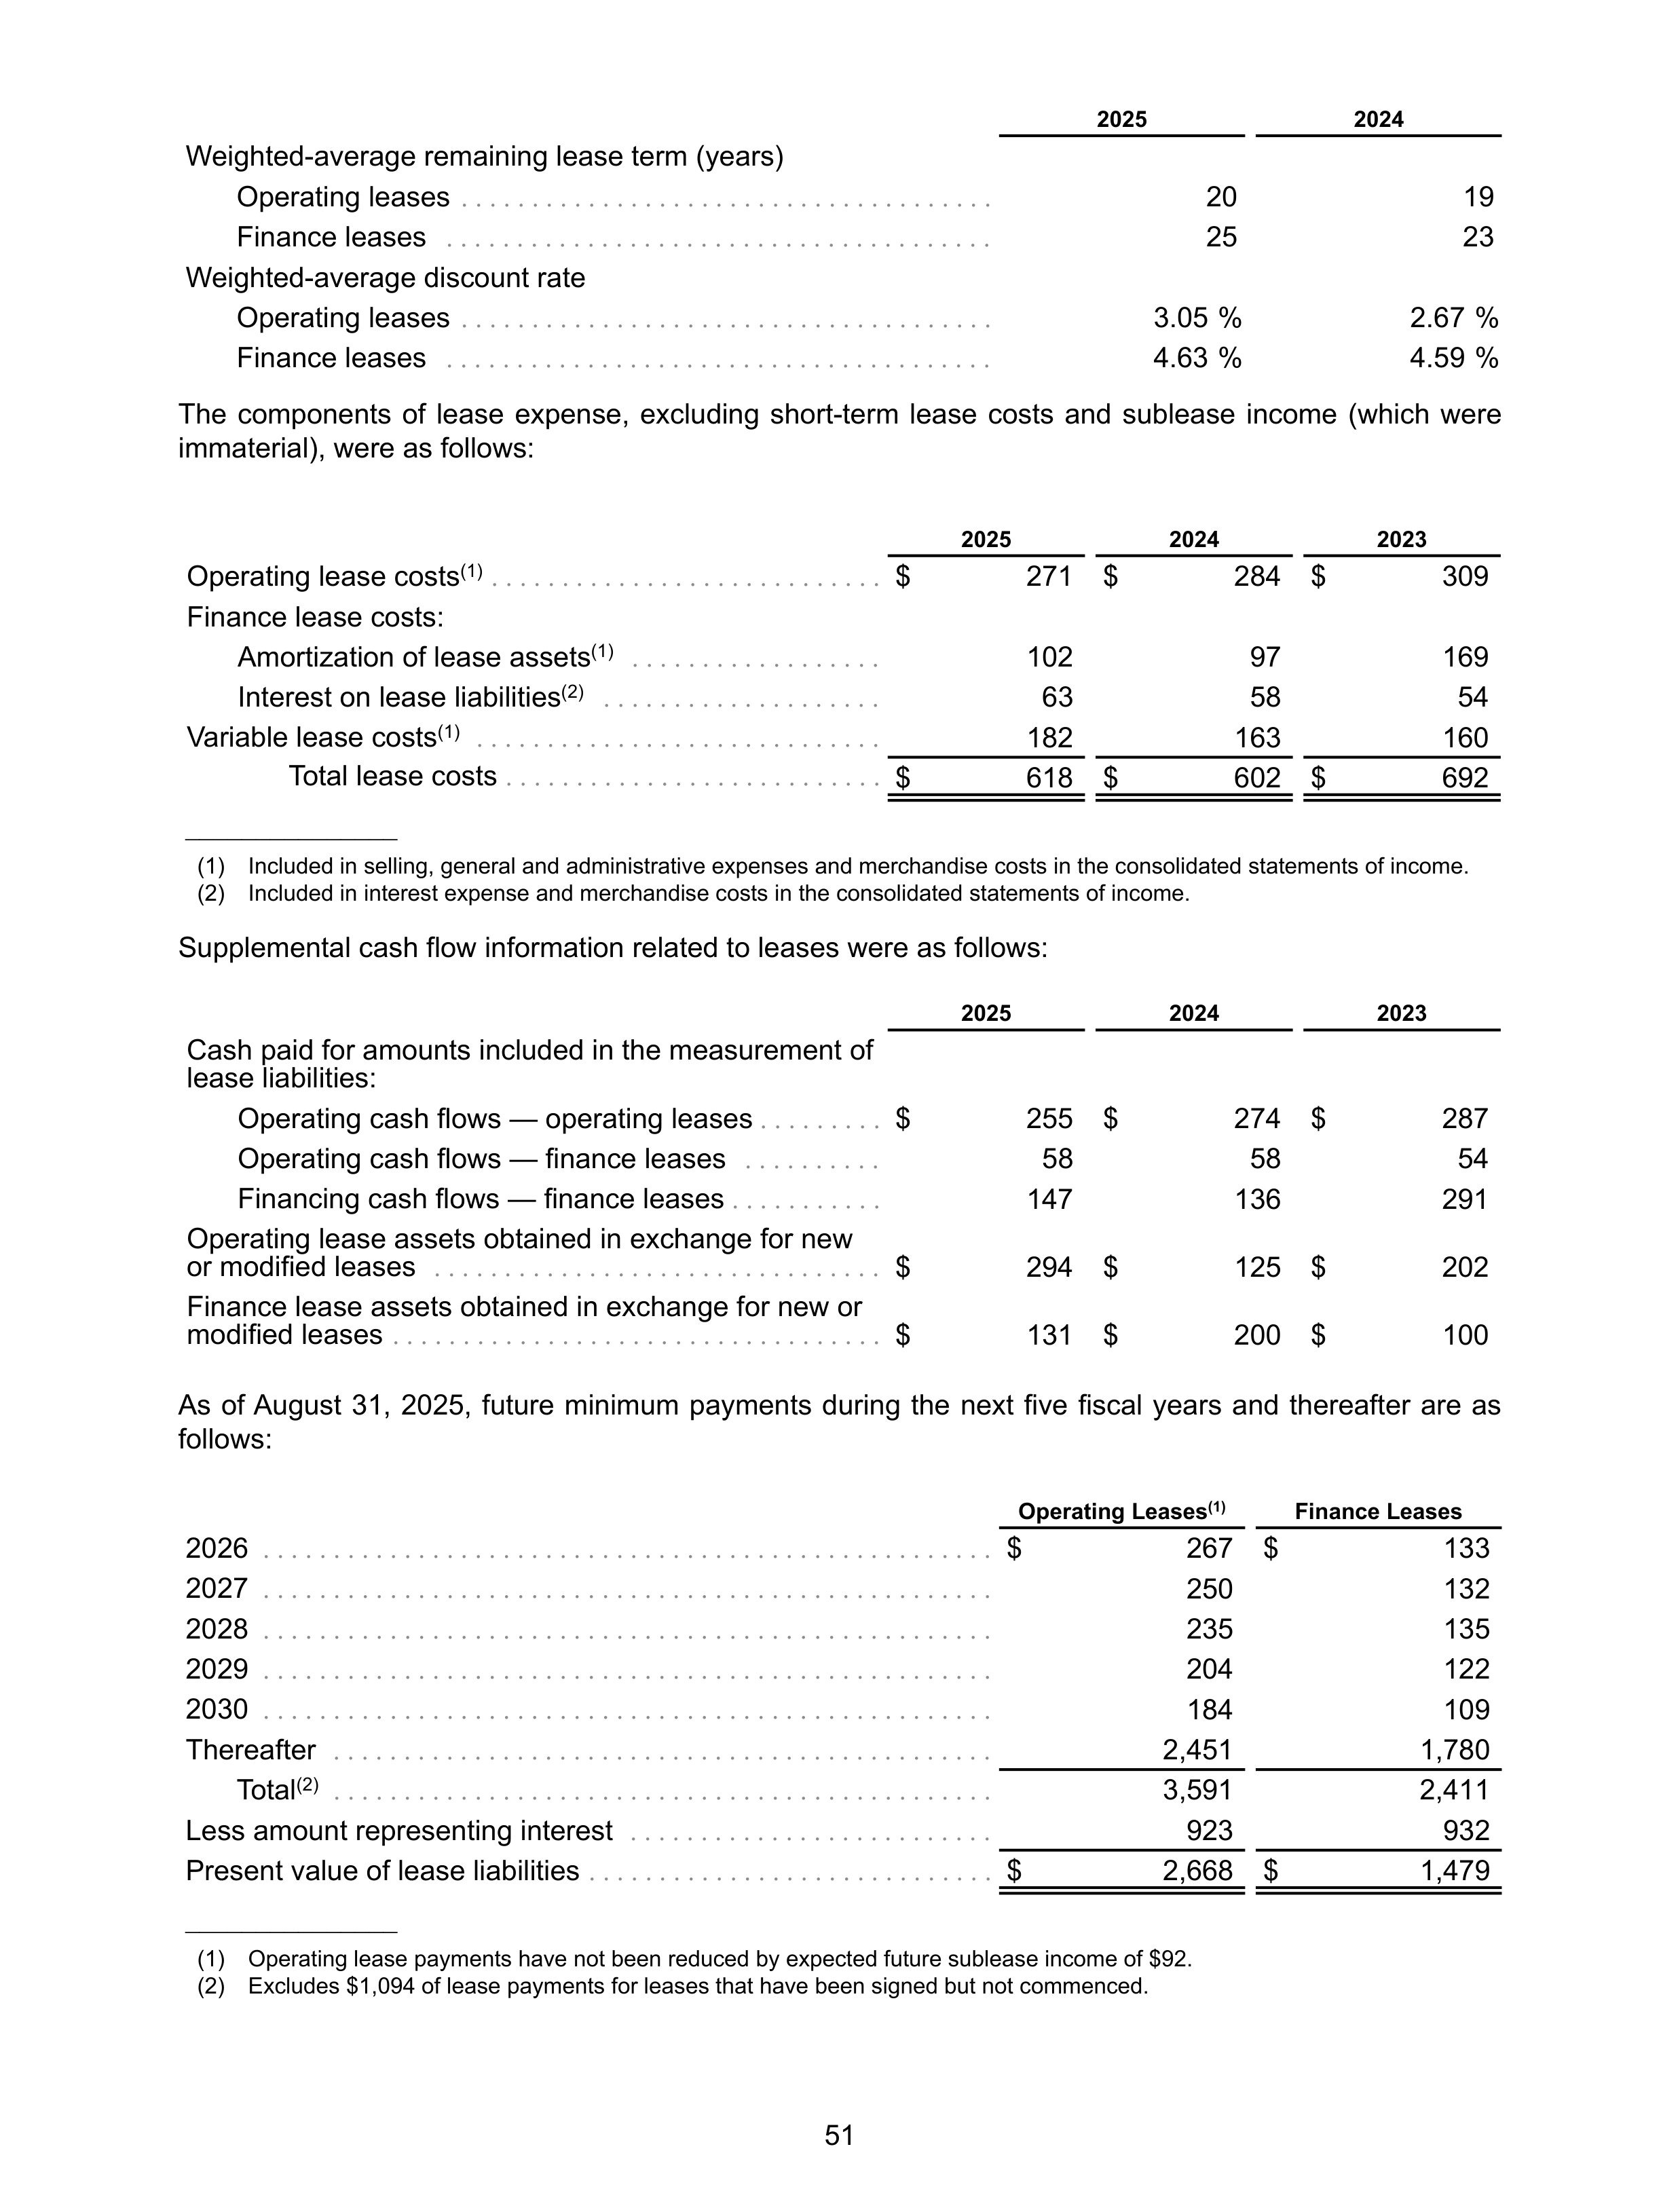
2025
2024
Weighted-average remaining lease term (years)
Operating leases
. . . . . . . . . . . . . . . . . . . . . . . . . . . . . . . . . . . . . .
20
19
Finance leases
. . . . . . . . . . . . . . . . . . . . . . . . . . . . . . . . . . . . . . .
25
23
Weighted-average discount rate
Operating leases
. . . . . . . . . . . . . . . . . . . . . . . . . . . . . . . . . . . . . .
3.05 %
2.67 %
Finance leases
. . . . . . . . . . . . . . . . . . . . . . . . . . . . . . . . . . . . . . .
4.63 %
4.59 %
The components of lease expense, excluding short-term lease costs and sublease income (which were
immaterial), were as follows:
2025
2024
2023
Operating lease costs
(1)
. . . . . . . . . . . . . . . . . . . . . . . . . . . .
$
271 $
284 $
309
Finance lease costs:
Amortization of lease assets
(1)
. . . . . . . . . . . . . . . . . .
102
97
169
Interest on lease liabilities
(2)
. . . . . . . . . . . . . . . . . . . .
63
58
54
Variable lease costs
(1)
. . . . . . . . . . . . . . . . . . . . . . . . . . . . .
182
163
160
Total lease costs
. . . . . . . . . . . . . . . . . . . . . . . . . . .
$
618 $
602 $
692
_______________
(1)
Included in selling, general and administrative expenses and merchandise costs in the consolidated statements of income.
(2)
Included in interest expense and merchandise costs in the consolidated statements of income.
Supplemental cash flow information related to leases were as follows:
2025
2024
2023
Cash paid for amounts included in the measurement of
lease liabilities:
Operating cash flows — operating leases
. . . . . . . . .
$
255 $
274 $
287
Operating cash flows — finance leases
. . . . . . . . . .
58
58
54
Financing cash flows — finance leases
. . . . . . . . . . .
147
136
291
Operating lease assets obtained in exchange for new
or modified leases
. . . . . . . . . . . . . . . . . . . . . . . . . . . . . . . .
$
294 $
125 $
202
Finance lease assets obtained in exchange for new or
modified leases
. . . . . . . . . . . . . . . . . . . . . . . . . . . . . . . . . . .
$
131 $
200 $
100
As of August 31, 2025, future minimum payments during the next five fiscal years and thereafter are as
follows:
Operating Leases
(1)
Finance Leases
2026
. . . . . . . . . . . . . . . . . . . . . . . . . . . . . . . . . . . . . . . . . . . . . . . . . . . .
$
267 $
133
2027
. . . . . . . . . . . . . . . . . . . . . . . . . . . . . . . . . . . . . . . . . . . . . . . . . . . .
250
132
2028
. . . . . . . . . . . . . . . . . . . . . . . . . . . . . . . . . . . . . . . . . . . . . . . . . . . .
235
135
2029
. . . . . . . . . . . . . . . . . . . . . . . . . . . . . . . . . . . . . . . . . . . . . . . . . . . .
204
122
2030
. . . . . . . . . . . . . . . . . . . . . . . . . . . . . . . . . . . . . . . . . . . . . . . . . . . .
184
109
Thereafter
. . . . . . . . . . . . . . . . . . . . . . . . . . . . . . . . . . . . . . . . . . . . . . .
2,451
1,780
Total
(2)
. . . . . . . . . . . . . . . . . . . . . . . . . . . . . . . . . . . . . . . . . . . . . . .
3,591
2,411
Less amount representing interest
. . . . . . . . . . . . . . . . . . . . . . . . . .
923
932
Present value of lease liabilities
. . . . . . . . . . . . . . . . . . . . . . . . . . . . .
$
2,668 $
1,479
_______________
(1)
Operating lease payments have not been reduced by expected future sublease income of $92.
(2)
Excludes $1,094 of lease payments for leases that have been signed but not commenced.
51
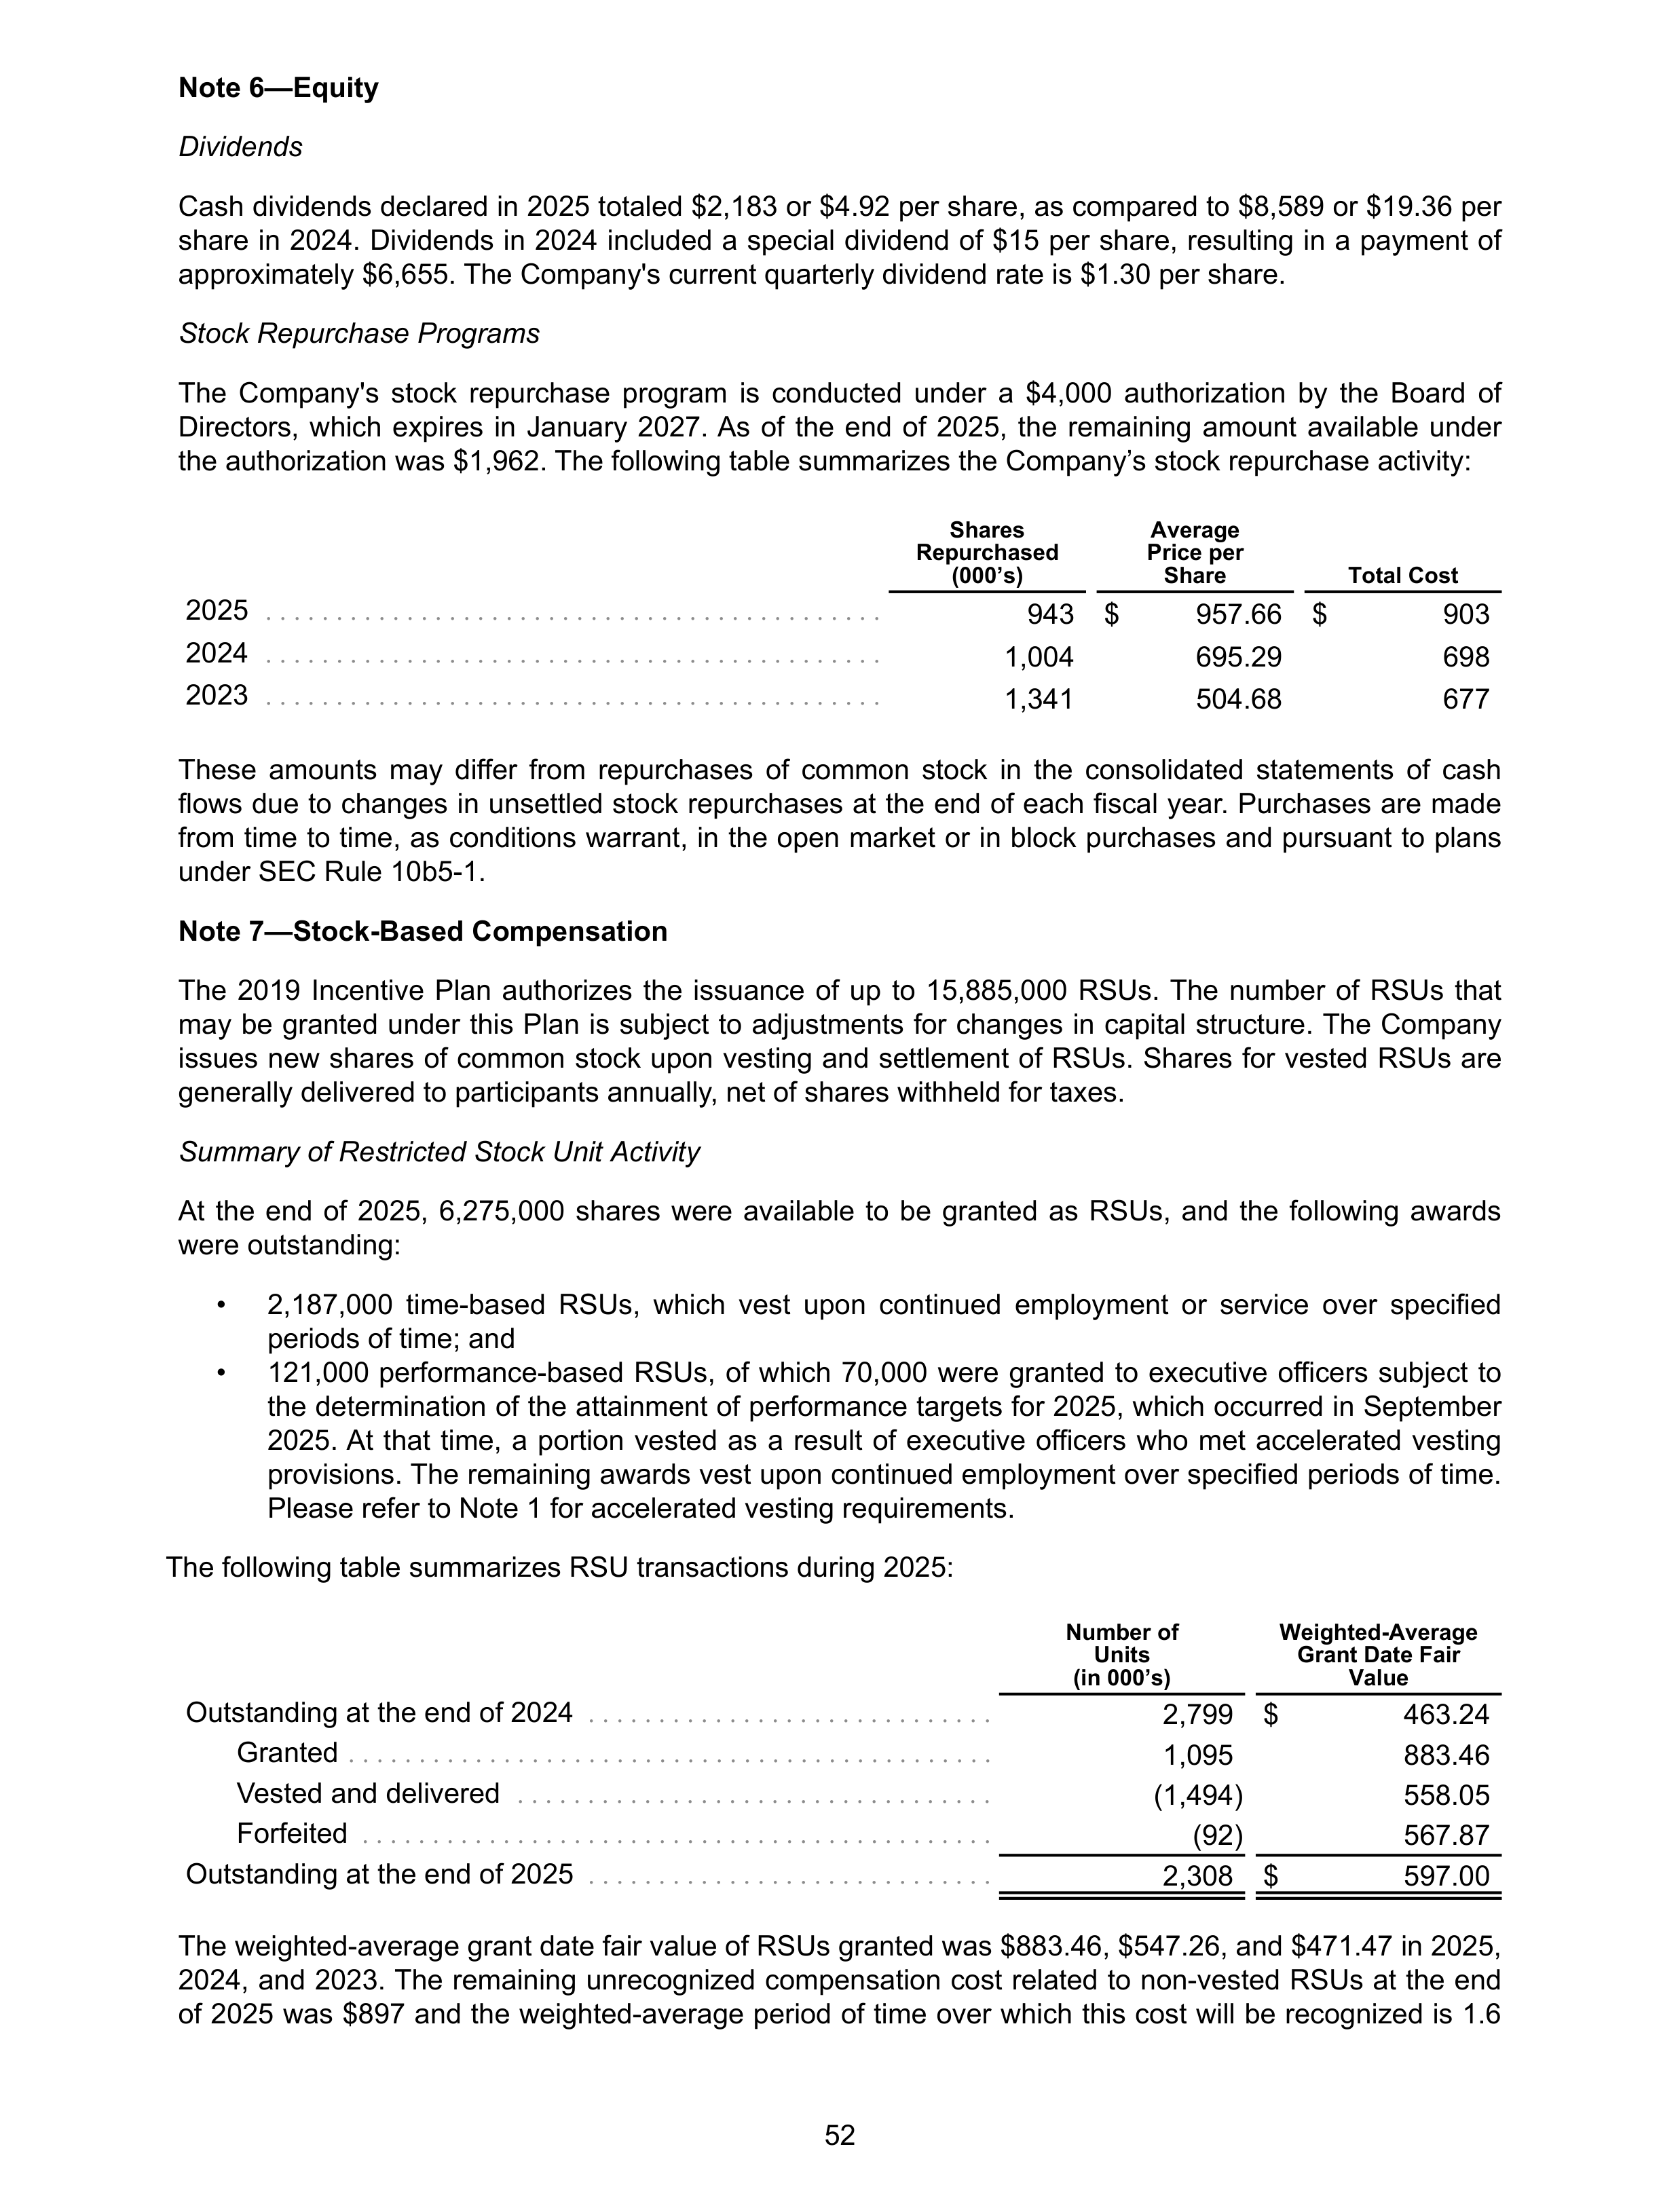
Note 6—Equity
Dividends
Cash dividends declared in 2025 totaled $2,183 or $4.92 per share, as compared to $8,589 or $19.36 per
share in 2024. Dividends in 2024 included a special dividend of $15 per share, resulting in a payment of
approximately $6,655. The Company's current quarterly dividend rate is $1.30 per share.
Stock Repurchase Programs
The Company's stock repurchase program is conducted under a $4,000 authorization by the Board of
Directors, which expires in January 2027. As of the end of 2025, the remaining amount available under
the authorization was $1,962. The following table summarizes the Company’s stock repurchase activity:
Shares
Repurchased
(000’s)
Average
Price per
Share
Total Cost
2025
. . . . . . . . . . . . . . . . . . . . . . . . . . . . . . . . . . . . . . . . . . . .
943 $
957.66 $
903
2024
. . . . . . . . . . . . . . . . . . . . . . . . . . . . . . . . . . . . . . . . . . . .
1,004
695.29
698
2023
. . . . . . . . . . . . . . . . . . . . . . . . . . . . . . . . . . . . . . . . . . . .
1,341
504.68
677
These amounts may differ from repurchases of common stock in the consolidated statements of cash
flows due to changes in unsettled stock repurchases at the end of each fiscal year. Purchases are made
from time to time, as conditions warrant, in the open market or in block purchases and pursuant to plans
under SEC Rule 10b5-1.
Note 7—Stock-Based Compensation
The 2019 Incentive Plan authorizes the issuance of up to 15,885,000 RSUs. The number of RSUs that
may be granted under this Plan is subject to adjustments for changes in capital structure. The Company
issues new shares of common stock upon vesting and settlement of RSUs. Shares for vested RSUs are
generally delivered to participants annually, net of shares withheld for taxes.
Summary of Restricted Stock Unit Activity
At the end of 2025, 6,275,000 shares were available to be granted as RSUs, and the following awards
were outstanding:
•
2,187,000 time-based RSUs, which vest upon continued employment or service over specified
periods of time; and
•
121,000
performance-based RSUs, of which 70,000 were granted to executive officers subject to
the determination of the attainment of performance targets for 2025, which occurred in September
2025. At that time, a portion vested as a result of executive officers who met accelerated vesting
provisions. The remaining awards vest upon continued employment over specified periods of time.
Please refer to Note 1 for accelerated vesting requirements.
The following table summarizes RSU transactions during 2025:
Number of
Units
(in 000’s)
Weighted-Average
Grant Date Fair
Value
Outstanding at the end of 2024
. . . . . . . . . . . . . . . . . . . . . . . . . . . . .
2,799 $
463.24
Granted
. . . . . . . . . . . . . . . . . . . . . . . . . . . . . . . . . . . . . . . . . . . . . .
1,095
883.46
Vested and delivered
. . . . . . . . . . . . . . . . . . . . . . . . . . . . . . . . . .
(1,494)
558.05
Forfeited
. . . . . . . . . . . . . . . . . . . . . . . . . . . . . . . . . . . . . . . . . . . . .
(92)
567.87
Outstanding at the end of 2025
. . . . . . . . . . . . . . . . . . . . . . . . . . . . .
2,308 $
597.00
The weighted-average grant date fair value of RSUs granted was $883.46, $547.26, and $471.47 in 2025,
2024, and 2023. The remaining unrecognized compensation cost related to non-vested RSUs at the end
of 2025 was $897 and the weighted-average period of time over which this cost will be recognized is 1.6
52
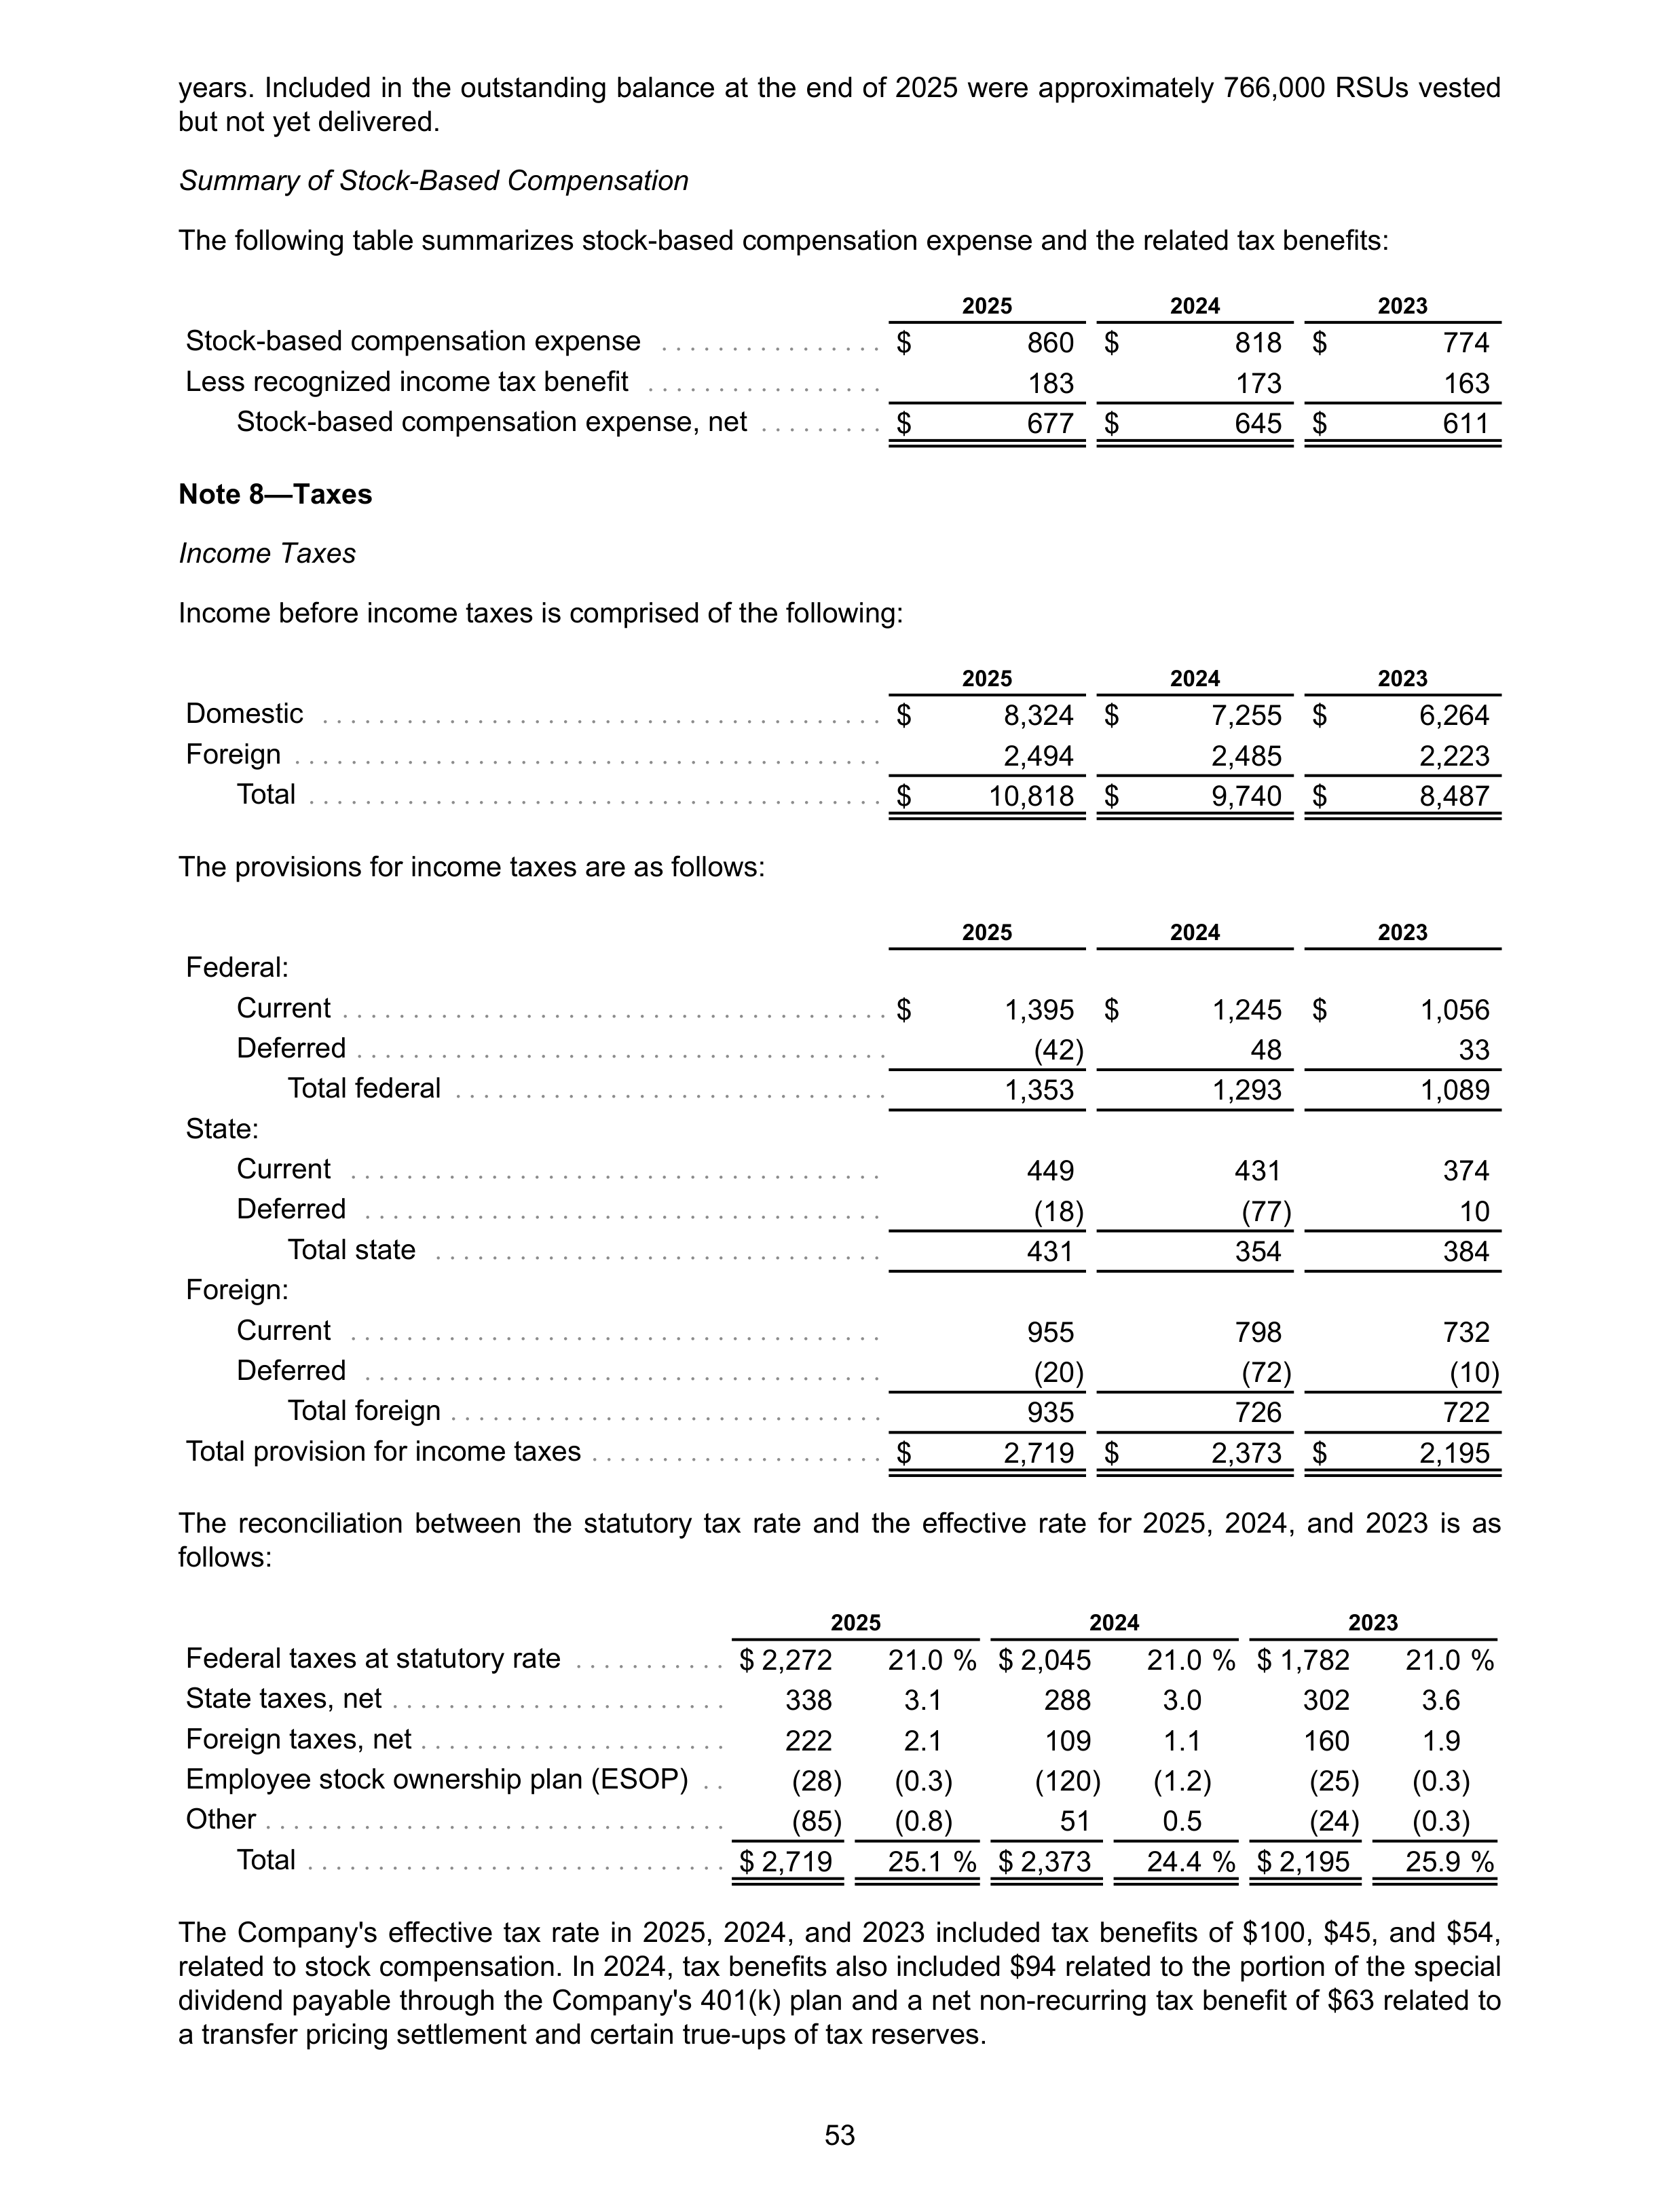
years. Included in the outstanding balance at the end of 2025 were approximately 766,000 RSUs vested
but not yet delivered.
Summary of Stock-Based Compensation
The following table summarizes stock-based compensation expense and the related tax benefits:
2025
2024
2023
Stock-based compensation expense
. . . . . . . . . . . . . . . .
$
860 $
818 $
774
Less recognized income tax benefit
. . . . . . . . . . . . . . . . .
183
173
163
Stock-based compensation expense, net
. . . . . . . . .
$
677 $
645 $
611
Note 8—Taxes
Income Taxes
Income before income taxes is comprised of the following:
2025
2024
2023
Domestic
. . . . . . . . . . . . . . . . . . . . . . . . . . . . . . . . . . . . . . . .
$
8,324 $
7,255 $
6,264
Foreign
. . . . . . . . . . . . . . . . . . . . . . . . . . . . . . . . . . . . . . . . . .
2,494
2,485
2,223
Total
. . . . . . . . . . . . . . . . . . . . . . . . . . . . . . . . . . . . . . . . .
$
10,818 $
9,740 $
8,487
The provisions for income taxes are as follows:
2025
2024
2023
Federal:
Current
. . . . . . . . . . . . . . . . . . . . . . . . . . . . . . . . . . . . . . .
$
1,395 $
1,245 $
1,056
Deferred
. . . . . . . . . . . . . . . . . . . . . . . . . . . . . . . . . . . . . .
(42)
48
33
Total federal
. . . . . . . . . . . . . . . . . . . . . . . . . . . . . . .
1,353
1,293
1,089
State:
Current
. . . . . . . . . . . . . . . . . . . . . . . . . . . . . . . . . . . . . .
449
431
374
Deferred
. . . . . . . . . . . . . . . . . . . . . . . . . . . . . . . . . . . . .
(18)
(77)
10
Total state
. . . . . . . . . . . . . . . . . . . . . . . . . . . . . . . .
431
354
384
Foreign:
Current
. . . . . . . . . . . . . . . . . . . . . . . . . . . . . . . . . . . . . .
955
798
732
Deferred
. . . . . . . . . . . . . . . . . . . . . . . . . . . . . . . . . . . . .
(20)
(72)
(10)
Total foreign
. . . . . . . . . . . . . . . . . . . . . . . . . . . . . . .
935
726
722
Total provision for income taxes
. . . . . . . . . . . . . . . . . . . . .
$
2,719 $
2,373 $
2,195
The reconciliation between the statutory tax rate and the effective rate for 2025, 2024, and 2023 is as
follows:
2025
2024
2023
Federal taxes at statutory rate
. . . . . . . . . . .
$ 2,272
21.0 %
$ 2,045
21.0 %
$ 1,782
21.0 %
State taxes, net
. . . . . . . . . . . . . . . . . . . . . . . .
338
3.1
288
3.0
302
3.6
Foreign taxes, net
. . . . . . . . . . . . . . . . . . . . . .
222
2.1
109
1.1
160
1.9
Employee stock ownership plan (ESOP)
. .
(28)
(0.3)
(120)
(1.2)
(25)
(0.3)
Other
. . . . . . . . . . . . . . . . . . . . . . . . . . . . . . . . .
(85)
(0.8)
51
0.5
(24)
(0.3)
Total
. . . . . . . . . . . . . . . . . . . . . . . . . . . . . .
$ 2,719
25.1 %
$ 2,373
24.4 %
$ 2,195
25.9 %
The Company's effective tax rate in 2025, 2024, and 2023 included tax benefits of $100, $45, and $54,
related to stock compensation. In 2024, tax benefits also included $94 related to the portion of the special
dividend payable through the Company's 401(k) plan and a net non-recurring tax benefit of $63 related to
a transfer pricing settlement and certain true-ups of tax reserves.
53
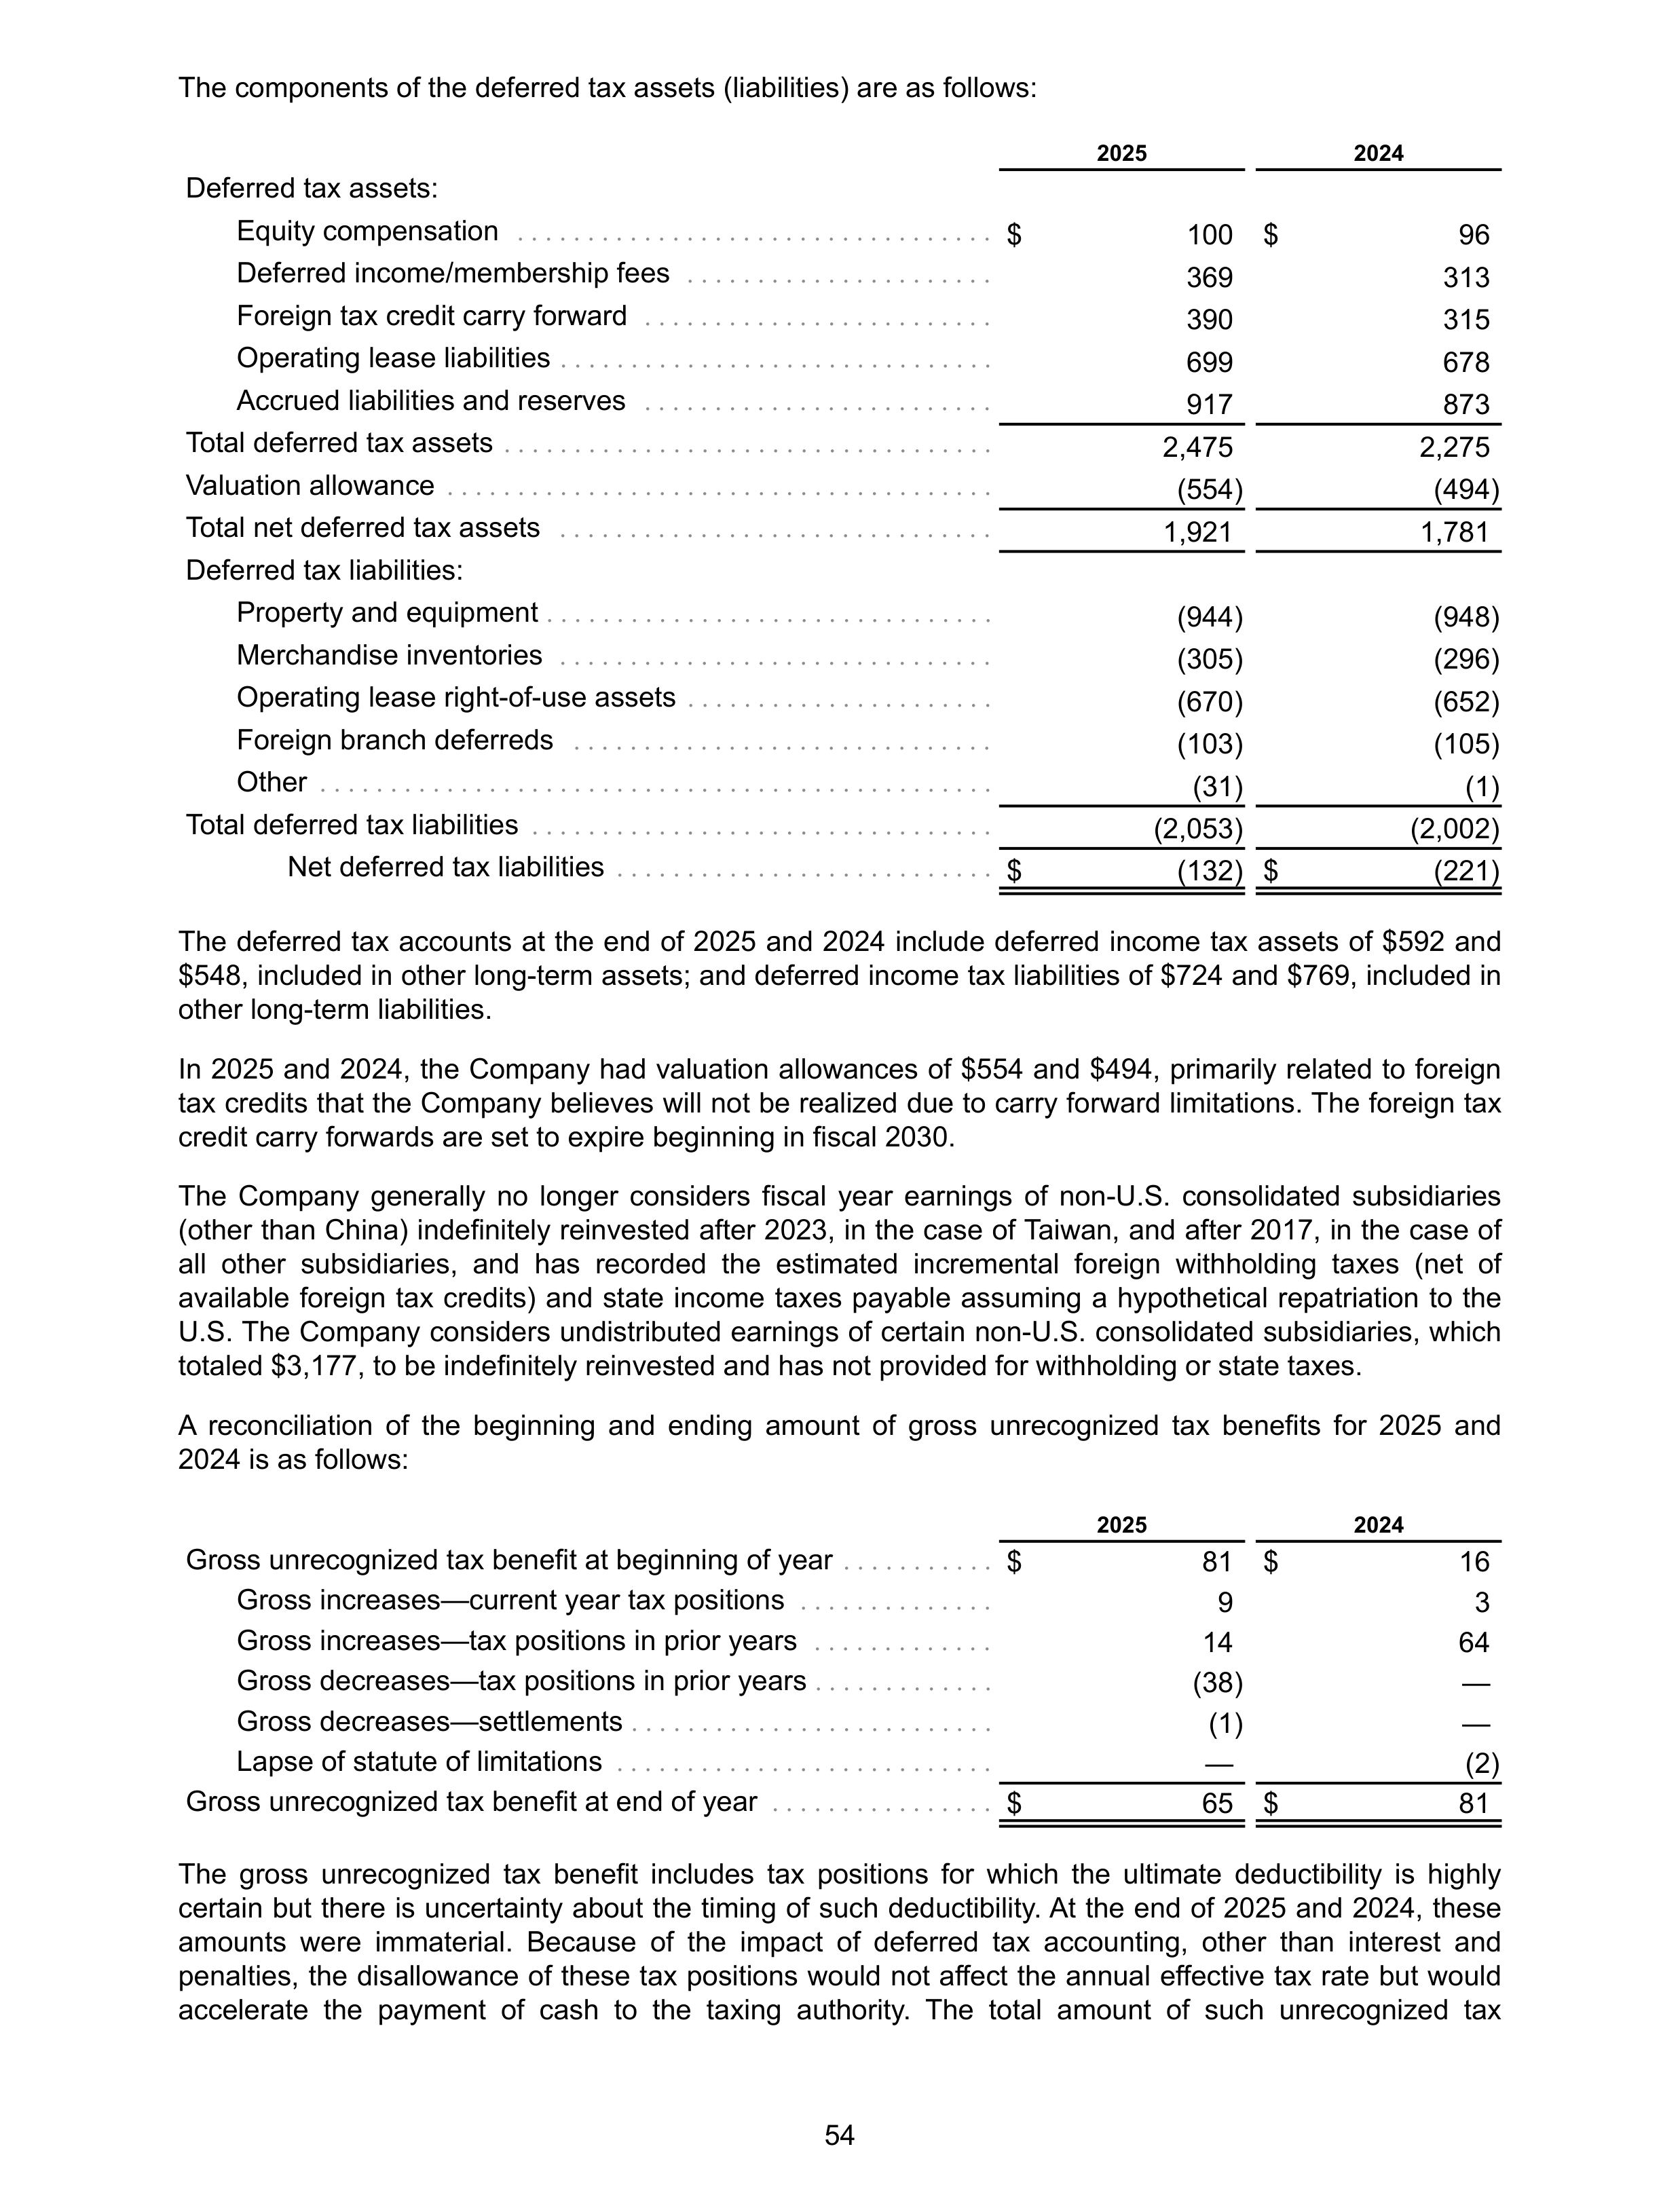
The components of the deferred tax assets (liabilities) are as follows:
2025
2024
Deferred tax assets:
Equity compensation
. . . . . . . . . . . . . . . . . . . . . . . . . . . . . . . . . .
$
100 $
96
Deferred income/membership fees
. . . . . . . . . . . . . . . . . . . . . .
369
313
Foreign tax credit carry forward
. . . . . . . . . . . . . . . . . . . . . . . . .
390
315
Operating lease liabilities
. . . . . . . . . . . . . . . . . . . . . . . . . . . . . . .
699
678
Accrued liabilities and reserves
. . . . . . . . . . . . . . . . . . . . . . . . .
917
873
Total deferred tax assets
. . . . . . . . . . . . . . . . . . . . . . . . . . . . . . . . . . .
2,475
2,275
Valuation allowance
. . . . . . . . . . . . . . . . . . . . . . . . . . . . . . . . . . . . . . .
(554)
(494)
Total net deferred tax assets
. . . . . . . . . . . . . . . . . . . . . . . . . . . . . . .
1,921
1,781
Deferred tax liabilities:
Property and equipment
. . . . . . . . . . . . . . . . . . . . . . . . . . . . . . . .
(944)
(948)
Merchandise inventories
. . . . . . . . . . . . . . . . . . . . . . . . . . . . . . .
(305)
(296)
Operating lease right-of-use assets
. . . . . . . . . . . . . . . . . . . . . .
(670)
(652)
Foreign branch deferreds
. . . . . . . . . . . . . . . . . . . . . . . . . . . . . .
(103)
(105)
Other
. . . . . . . . . . . . . . . . . . . . . . . . . . . . . . . . . . . . . . . . . . . . . . . .
(31)
(1)
Total deferred tax liabilities
. . . . . . . . . . . . . . . . . . . . . . . . . . . . . . . . .
(2,053)
(2,002)
Net deferred tax liabilities
. . . . . . . . . . . . . . . . . . . . . . . . . . .
$
(132) $
(221)
The deferred tax accounts at the end of 2025 and 2024 include deferred income tax assets of $592 and
$548, included in other long-term assets; and deferred income tax liabilities of $724 and $769, included in
other long-term liabilities.
In 2025 and 2024, the Company had valuation allowances of $554 and $494, primarily related to foreign
tax credits that the Company believes will not be realized due to carry forward limitations. The foreign tax
credit carry forwards are set to expire beginning in fiscal 2030.
The Company generally no longer considers fiscal year earnings of non-U.S. consolidated subsidiaries
(other than China) indefinitely reinvested after 2023, in the case of Taiwan, and after 2017, in the case of
all other subsidiaries, and has recorded the estimated incremental foreign withholding taxes (net of
available foreign tax credits) and state income taxes payable assuming a hypothetical repatriation to the
U.S. The Company considers undistributed earnings of certain non-U.S. consolidated subsidiaries, which
totaled $3,177, to be indefinitely reinvested and has not provided for withholding or state taxes.
A reconciliation of the beginning and ending amount of gross unrecognized tax benefits for 2025 and
2024 is as follows:
2025
2024
Gross unrecognized tax benefit at beginning of year
. . . . . . . . . . .
$
81 $
16
Gross increases—current year tax positions
. . . . . . . . . . . . . .
9
3
Gross increases—tax positions in prior years
. . . . . . . . . . . . .
14
64
Gross decreases—tax positions in prior years
. . . . . . . . . . . . .
(38)
—
Gross decreases—settlements
. . . . . . . . . . . . . . . . . . . . . . . . . .
(1)
—
Lapse of statute of limitations
. . . . . . . . . . . . . . . . . . . . . . . . . . .
—
(2)
Gross unrecognized tax benefit at end of year
. . . . . . . . . . . . . . . .
$
65 $
81
The gross unrecognized tax benefit includes tax positions for which the ultimate deductibility is highly
certain but there is uncertainty about the timing of such deductibility. At the end of 2025 and 2024, these
amounts were immaterial. Because of the impact of deferred tax accounting, other than interest and
penalties, the disallowance of these tax positions would not affect the annual effective tax rate but would
accelerate the payment of cash to the taxing authority. The total amount of such unrecognized tax
54
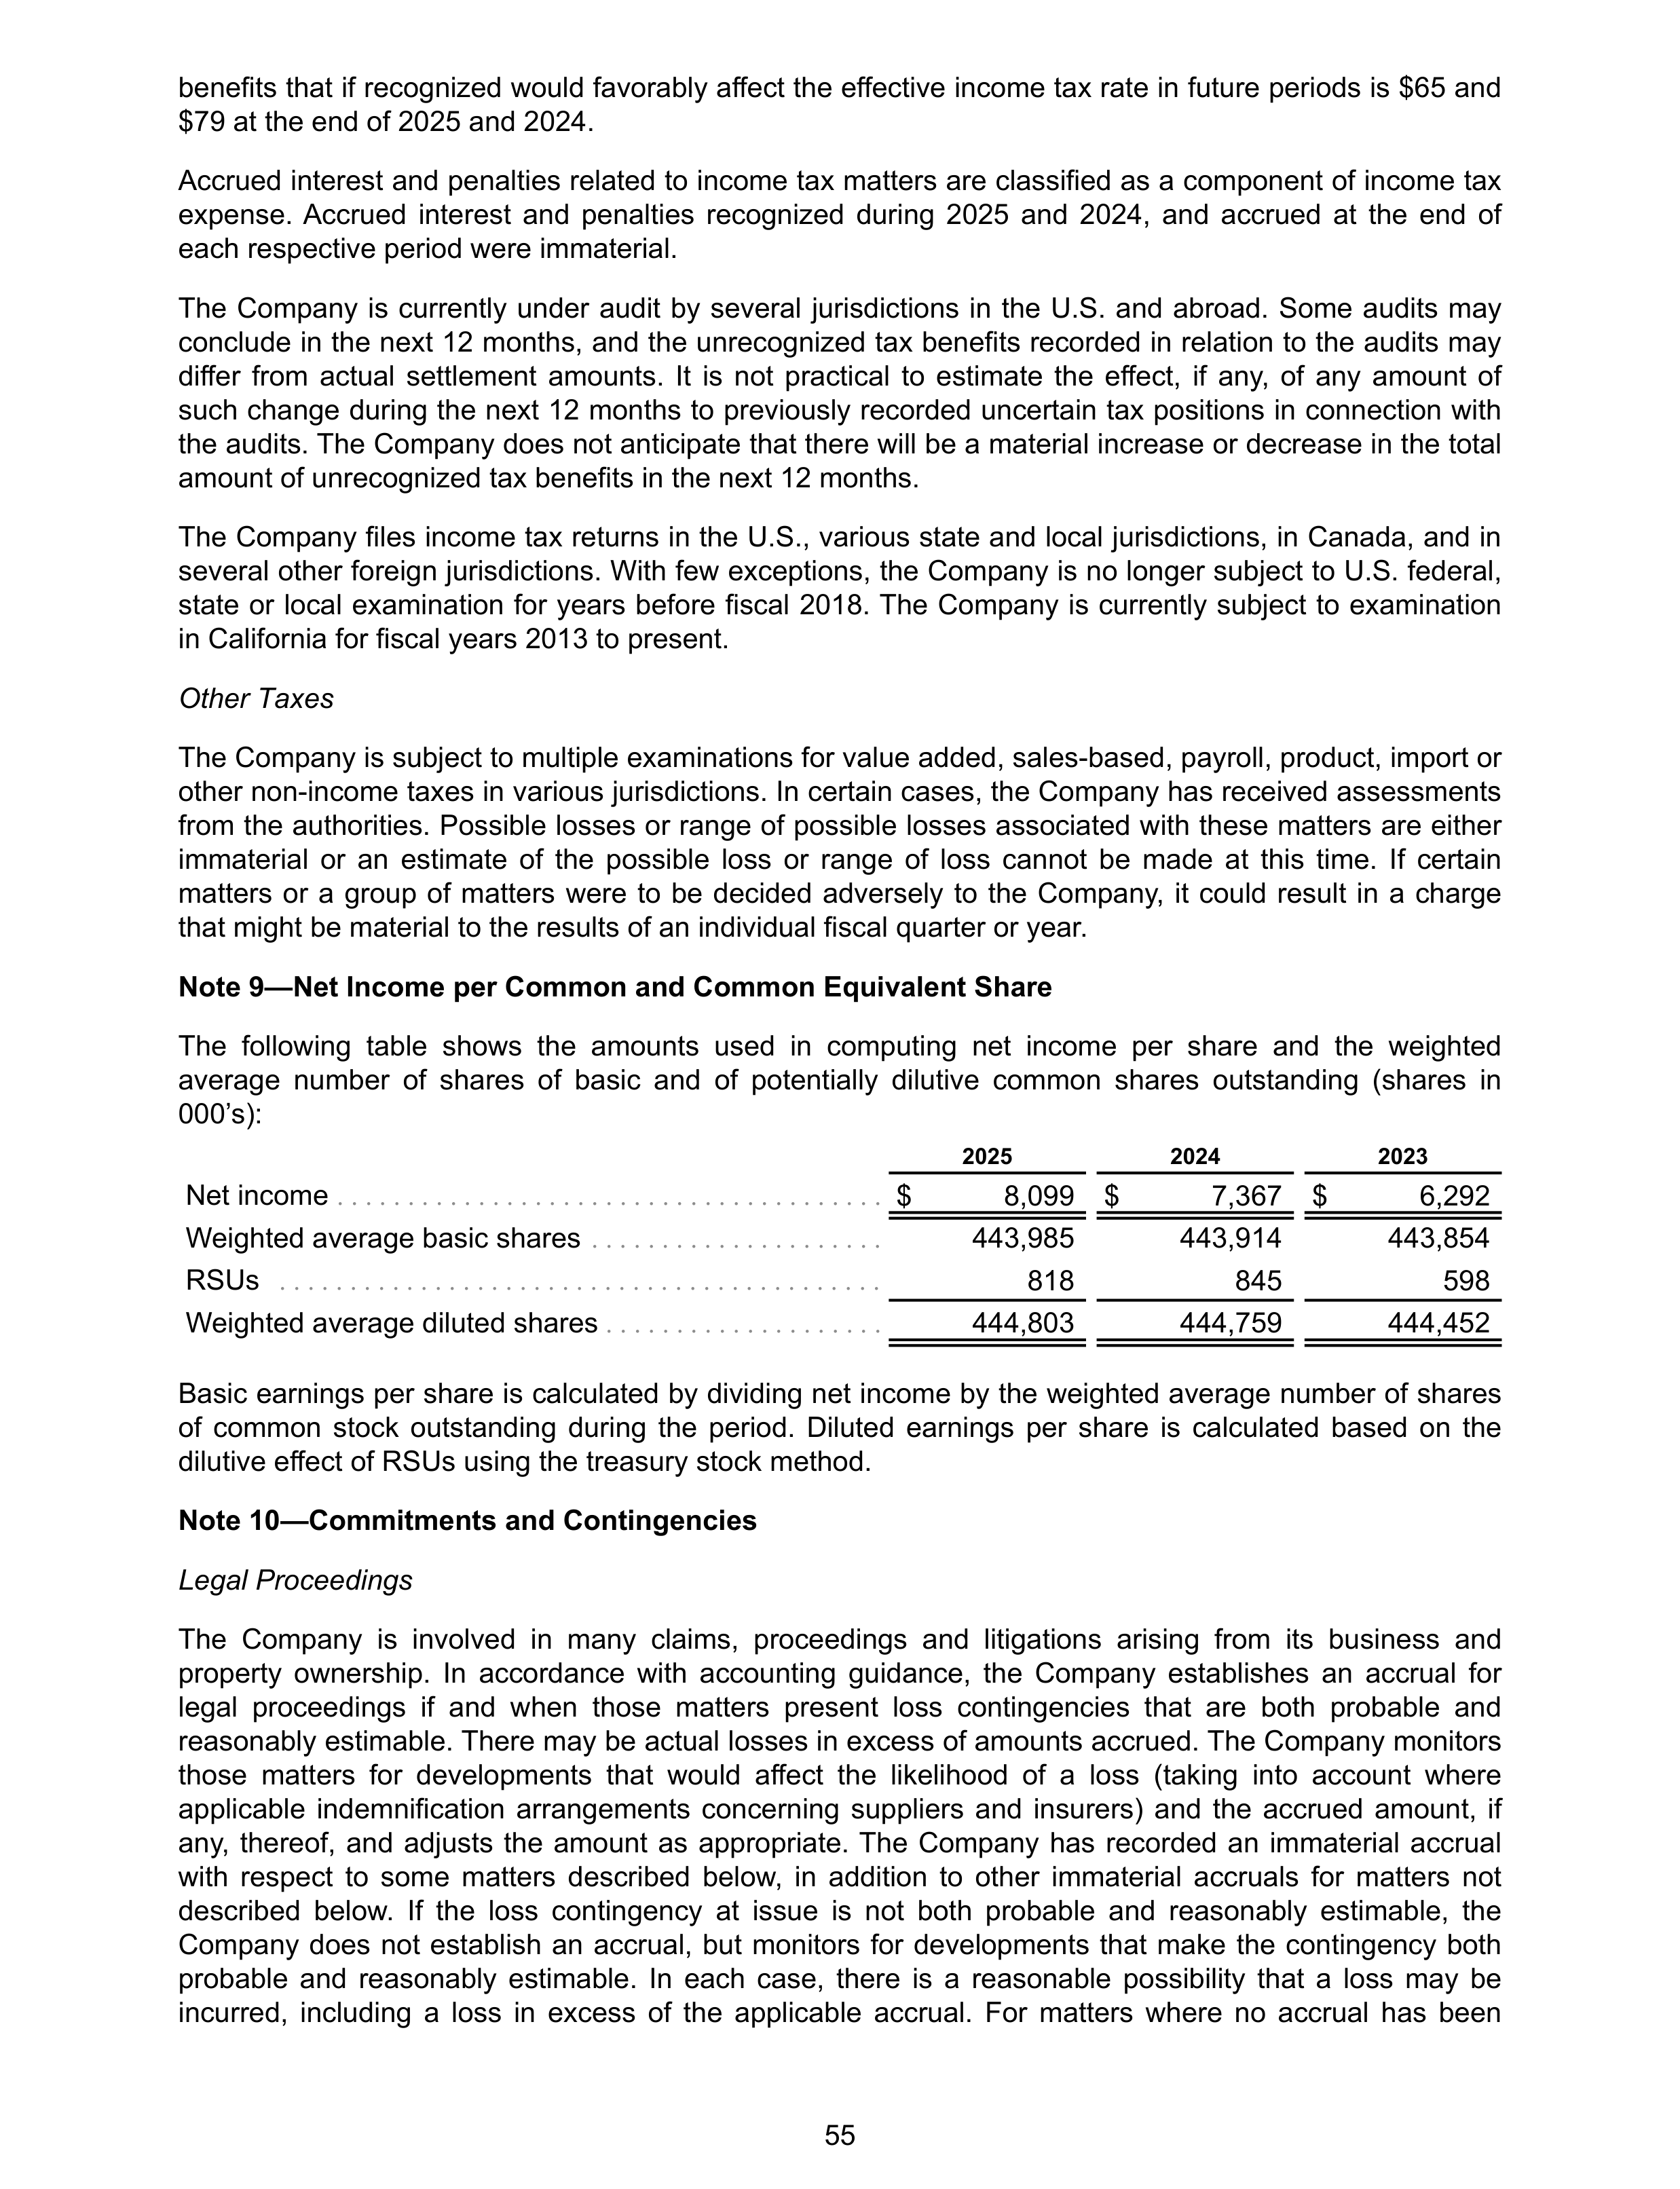
benefits that if recognized would favorably affect the effective income tax rate in future periods is $65 and
$79 at the end of 2025 and 2024.
Accrued interest and penalties related to income tax matters are classified as a component of income tax
expense. Accrued interest and penalties recognized during 2025 and 2024, and accrued at the end of
each respective period were immaterial.
The Company is currently under audit by several jurisdictions in the U.S. and abroad. Some audits may
conclude in the next 12 months, and the unrecognized tax benefits recorded in relation to the audits may
differ from actual settlement amounts. It is not practical to estimate the effect, if any, of any amount of
such change during the next 12 months to previously recorded uncertain tax positions in connection with
the audits. The Company does not anticipate that there will be a material increase or decrease in the total
amount of unrecognized tax benefits in the next 12 months.
The Company files income tax returns in the U.S., various state and local jurisdictions, in Canada, and in
several other foreign jurisdictions. With few exceptions, the Company is no longer subject to U.S. federal,
state or local examination for years before fiscal 2018. The Company is currently subject to examination
in California for fiscal years 2013 to present.
Other Taxes
The Company is subject to multiple examinations for value added, sales-based, payroll, product, import or
other non-income taxes in various jurisdictions. In certain cases, the Company has received assessments
from the authorities. Possible losses or range of possible losses associated with these matters are either
immaterial or an estimate of the possible loss or range of loss cannot be made at this time. If certain
matters or a group of matters were to be decided adversely to the Company, it could result in a charge
that might be material to the results of an individual fiscal quarter or year.
Note 9—Net Income per Common and Common Equivalent Share
The following table shows the amounts used in computing net income per share and the weighted
average number of shares of basic and of potentially dilutive common shares outstanding (shares in
000’s):
2025
2024
2023
Net income
. . . . . . . . . . . . . . . . . . . . . . . . . . . . . . . . . . . . . . .
$
8,099 $
7,367 $
6,292
Weighted average basic shares
. . . . . . . . . . . . . . . . . . . . .
443,985
443,914
443,854
RSUs
. . . . . . . . . . . . . . . . . . . . . . . . . . . . . . . . . . . . . . . . . . .
818
845
598
Weighted average diluted shares
. . . . . . . . . . . . . . . . . . . .
444,803
444,759
444,452
Basic earnings per share is calculated by dividing net income by the weighted average number of shares
of common stock outstanding during the period. Diluted earnings per share is calculated based on the
dilutive effect of RSUs using the treasury stock method.
Note 10—Commitments and Contingencies
Legal Proceedings
The Company is involved in many claims, proceedings and litigations arising from its business and
property ownership. In accordance with accounting guidance, the Company establishes an accrual for
legal proceedings if and when those matters present loss contingencies that are both probable and
reasonably estimable. There may be actual losses in excess of amounts accrued. The Company monitors
those matters for developments that would affect the likelihood of a loss (taking into account where
applicable indemnification arrangements concerning suppliers and insurers) and the accrued amount, if
any, thereof, and adjusts the amount as appropriate. The Company has recorded an immaterial accrual
with respect to some matters described below, in addition to other immaterial accruals for matters not
described below. If the loss contingency at issue is not both probable and reasonably estimable, the
Company does not establish an accrual, but monitors for developments that make the contingency both
probable and reasonably estimable. In each case, there is a reasonable possibility that a loss may be
incurred, including a loss in excess of the applicable accrual. For matters where no accrual has been
55
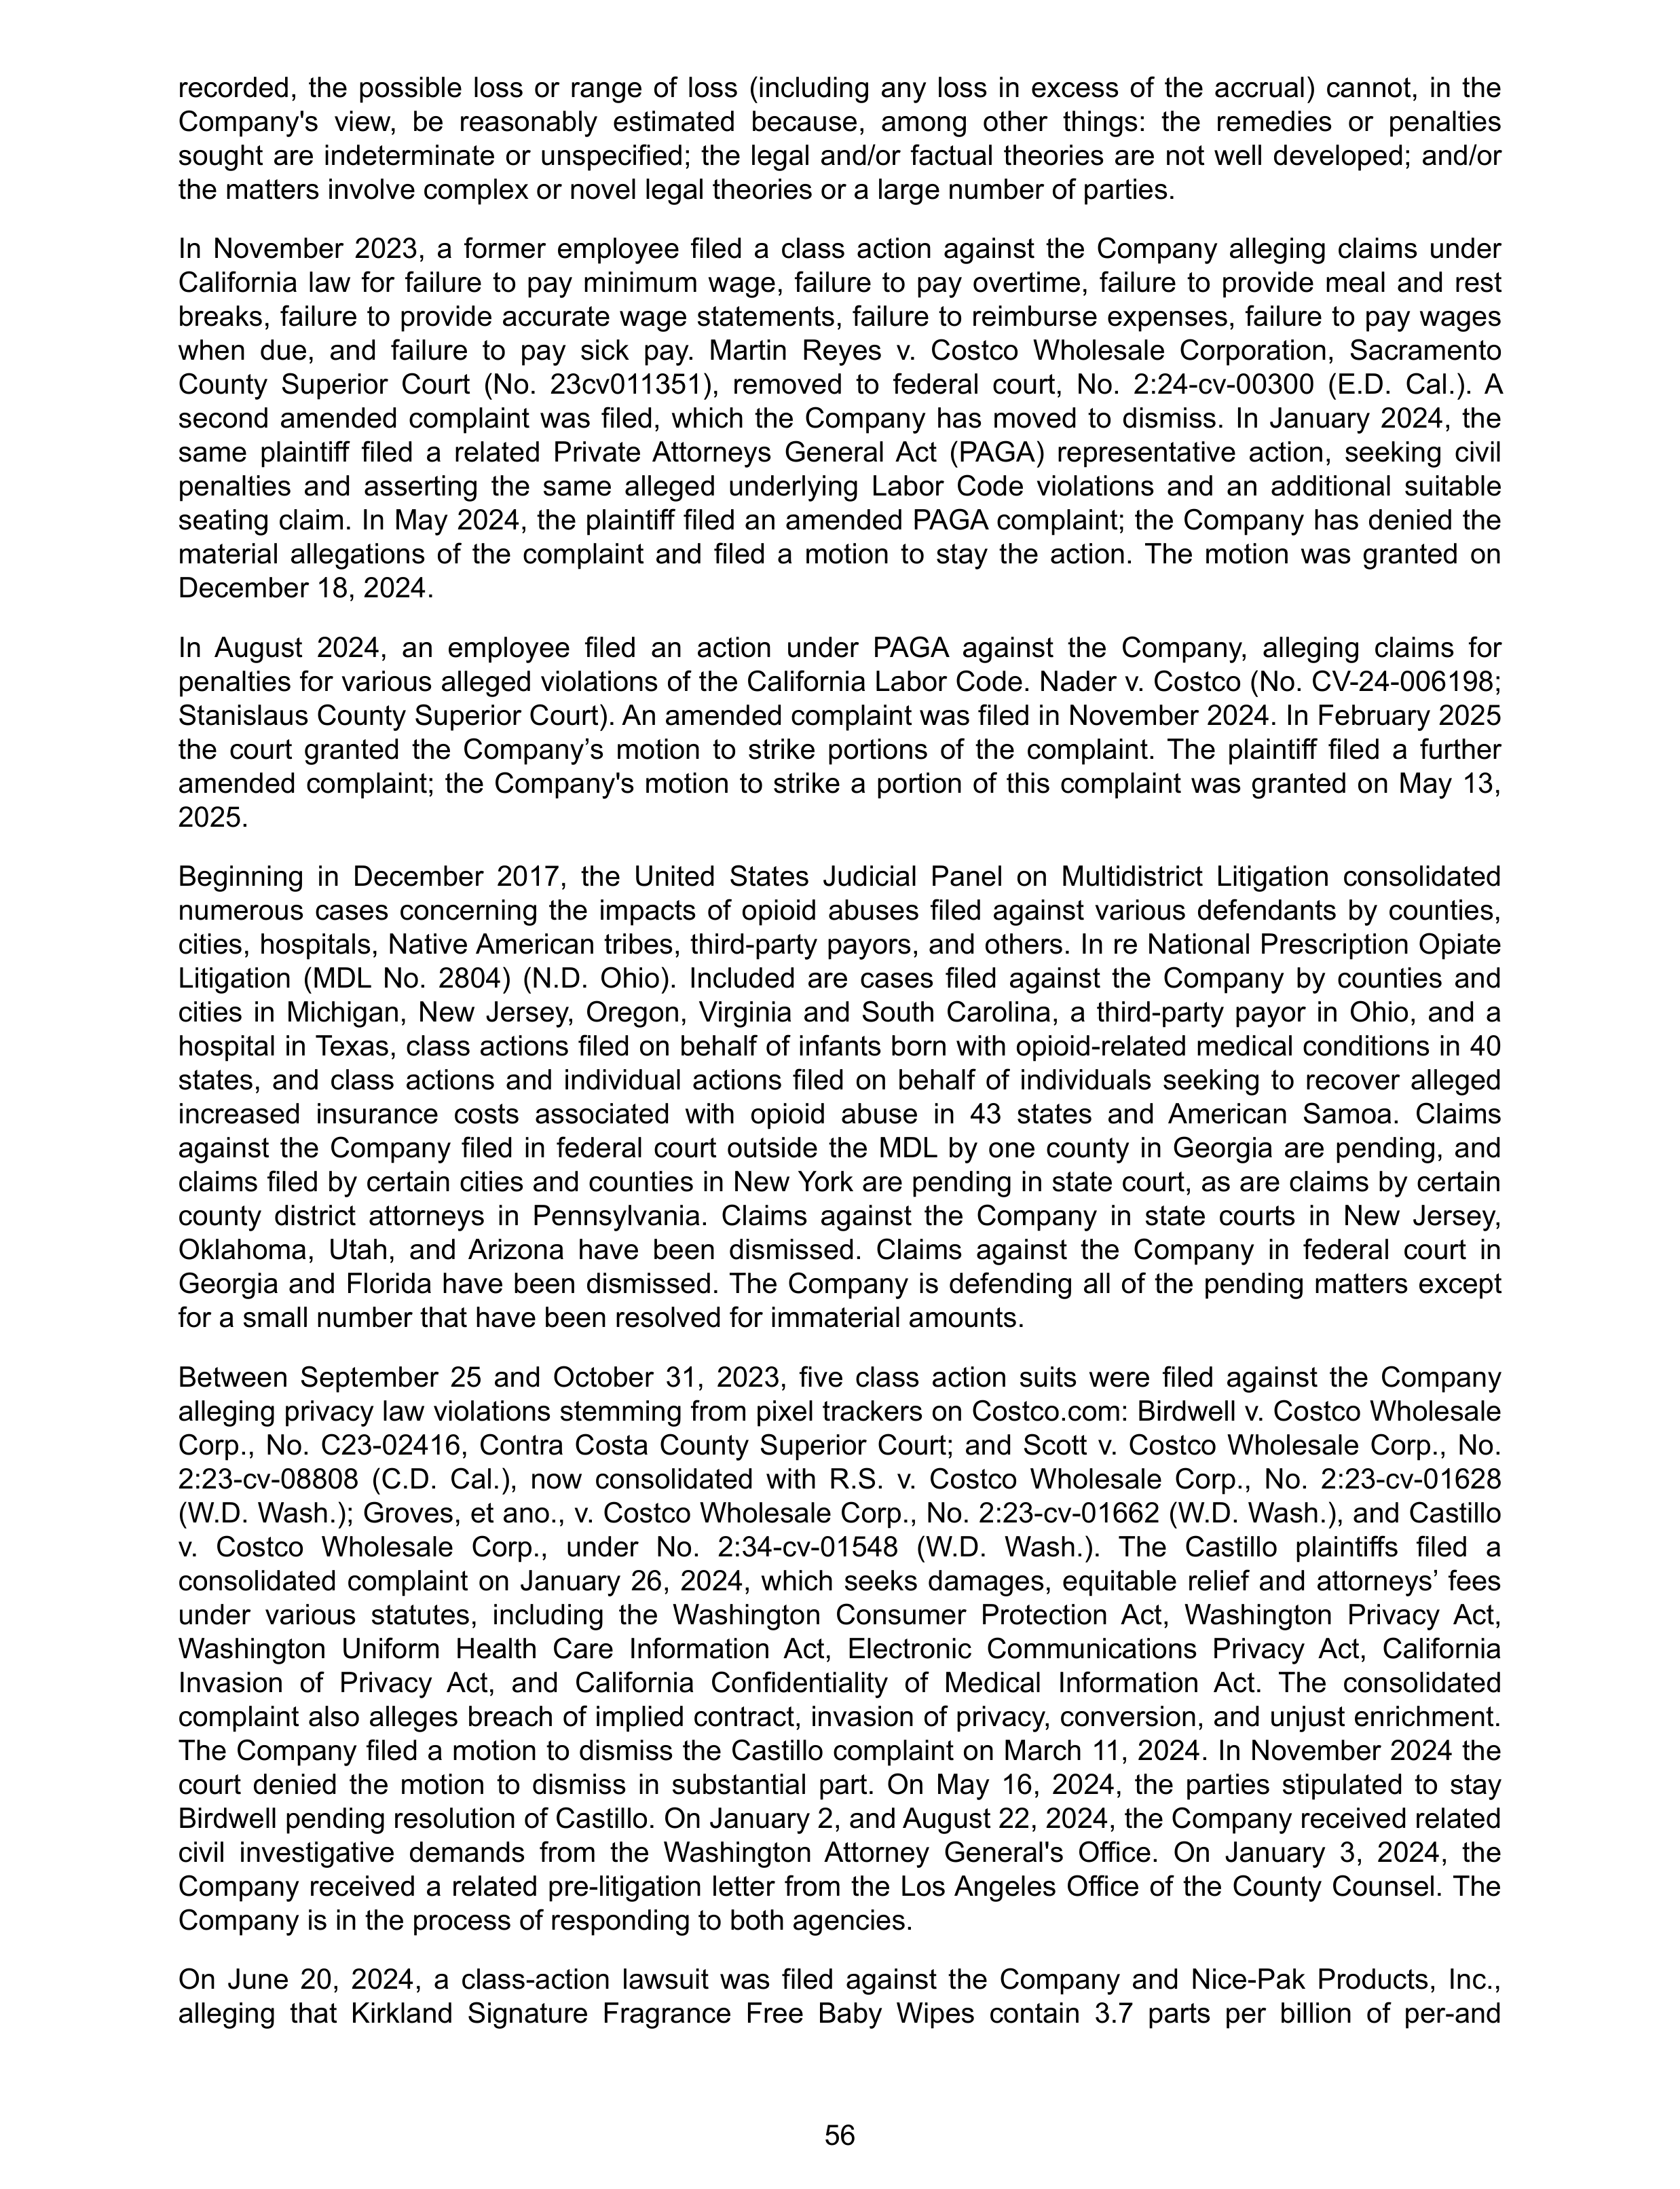
recorded, the possible loss or range of loss (including any loss in excess of the accrual) cannot, in the
Company's view, be reasonably estimated because, among other things: the remedies or penalties
sought are indeterminate or unspecified; the legal and/or factual theories are not well developed; and/or
the matters involve complex or novel legal theories or a large number of parties.
In November 2023, a former employee filed a class action against the Company alleging claims under
California law for failure to pay minimum wage, failure to pay overtime, failure to provide meal and rest
breaks, failure to provide accurate wage statements, failure to reimburse expenses, failure to pay wages
when due, and failure to pay sick pay. Martin Reyes v. Costco Wholesale Corporation, Sacramento
County Superior Court (No. 23cv011351), removed to federal court, No. 2:24-cv-00300 (E.D. Cal.). A
second amended complaint was filed, which the Company has moved to dismiss. In January 2024, the
same plaintiff filed a related Private Attorneys General Act (PAGA) representative action, seeking civil
penalties and asserting the same alleged underlying Labor Code violations and an additional suitable
seating claim. In May 2024, the plaintiff filed an amended PAGA complaint; the Company has denied the
material allegations of the complaint and filed a motion to stay the action. The motion was granted on
December 18, 2024.
In August 2024, an employee filed an action under PAGA against the Company, alleging claims for
penalties for various alleged violations of the California Labor Code. Nader v. Costco (No. CV-24-006198;
Stanislaus County Superior Court). An amended complaint was filed in November 2024. In February 2025
the court granted the Company’s motion to strike portions of the complaint. The plaintiff filed a further
amended complaint; the Company's motion to strike a portion of this complaint was granted on May 13,
2025.
Beginning in December 2017, the United States Judicial Panel on Multidistrict Litigation consolidated
numerous cases concerning the impacts of opioid abuses filed against various defendants by counties,
cities, hospitals, Native American tribes, third-party payors, and others. In re National Prescription Opiate
Litigation (MDL No. 2804) (N.D. Ohio). Included are cases filed against the Company by counties and
cities in Michigan, New Jersey, Oregon, Virginia and South Carolina, a third-party payor in Ohio, and a
hospital in Texas, class actions filed on behalf of infants born with opioid-related medical conditions in 40
states, and class actions and individual actions filed on behalf of individuals seeking to recover alleged
increased insurance costs associated with opioid abuse in 43 states and American Samoa. Claims
against the Company filed in federal court outside the MDL by one county in Georgia are pending, and
claims filed by certain cities and counties in New York are pending in state court, as are claims by certain
county district attorneys in Pennsylvania. Claims against the Company in state courts in New Jersey,
Oklahoma, Utah, and Arizona have been dismissed. Claims against the Company in federal court in
Georgia and Florida have been dismissed. The Company is defending all of the pending matters except
for a small number that have been resolved for immaterial amounts.
Between September 25 and October 31, 2023, five class action suits were filed against the Company
alleging privacy law violations stemming from pixel trackers on Costco.com: Birdwell v. Costco Wholesale
Corp., No. C23-02416, Contra Costa County Superior Court; and Scott v. Costco Wholesale Corp., No.
2:23-cv-08808 (C.D. Cal.), now consolidated with R.S. v. Costco Wholesale Corp., No. 2:23-cv-01628
(W.D. Wash.); Groves, et ano., v. Costco Wholesale Corp., No. 2:23-cv-01662 (W.D. Wash.), and Castillo
v. Costco Wholesale Corp., under No. 2:34-cv-01548 (W.D. Wash.). The Castillo plaintiffs filed a
consolidated complaint on January 26, 2024, which seeks damages, equitable relief and attorneys’ fees
under various statutes, including the Washington Consumer Protection Act, Washington Privacy Act,
Washington Uniform Health Care Information Act, Electronic Communications Privacy Act, California
Invasion of Privacy Act, and California Confidentiality of Medical Information Act. The consolidated
complaint also alleges breach of implied contract, invasion of privacy, conversion, and unjust enrichment.
The Company filed a motion to dismiss the Castillo complaint on March 11, 2024. In November 2024 the
court denied the motion to dismiss in substantial part. On May 16, 2024, the parties stipulated to stay
Birdwell pending resolution of Castillo. On January 2, and August 22, 2024, the Company received related
civil investigative demands from the Washington Attorney General's Office. On January 3, 2024, the
Company received a related pre-litigation letter from the Los Angeles Office of the County Counsel. The
Company is in the process of responding to both agencies.
On June 20, 2024, a class-action lawsuit was filed against the Company and Nice-Pak Products, Inc.,
alleging that Kirkland Signature Fragrance Free Baby Wipes contain 3.7 parts per billion of per-and
56
polyfluoroalkyl substances. The complaint alleges that the label claim that the wipes are “made with
naturally derived ingredients” thus violates various state consumer protection and false advertising laws.
The complaint seeks unspecified damages, including punitive damages, as well as equitable relief and
attorneys' fees and costs. The defendants filed a motion to dismiss on August 9, 2024. Bullard, et ano., v.
Costco Wholesale Corp., et ano., No. 3:24-cv-03714 (N.D. Cal.). On February 14, 2025, the court granted
the motion. An amended complaint was filed; defendants' motion to dismiss this complaint was denied on
May 14, 2025.
In January 2023 the Company received a Civil Investigative Demand from the U.S. Attorney's Office,
Western District of Washington, requesting documents. The government is conducting a False Claims Act
investigation concerning whether the Company presented or caused to be presented to the federal
government for payment false claims relating to prescription medications.
In May 2024 the Company received a Notice of Intent to File Administrative Complaint for Violations of the
Federal Insecticide, Fungicide and Rodenticide Act (FIFRA) from the U.S. Environmental Protection
Agency (EPA). The EPA is seeking administrative fines for importation, sale and distribution of
misbranded devices and unregistered products the government asserts are pesticides under FIFRA. An
agreement has been reached to settle the matter for an immaterial amount.
The Company does not believe that any pending claim, proceeding or litigation, either alone or in the
aggregate, will have a material adverse effect on the Company’s financial position, results of operations or
cash flows; it is possible that an unfavorable outcome of some or all of the matters, however unlikely,
could result in a charge that might be material to the results of an individual fiscal quarter or year.
57
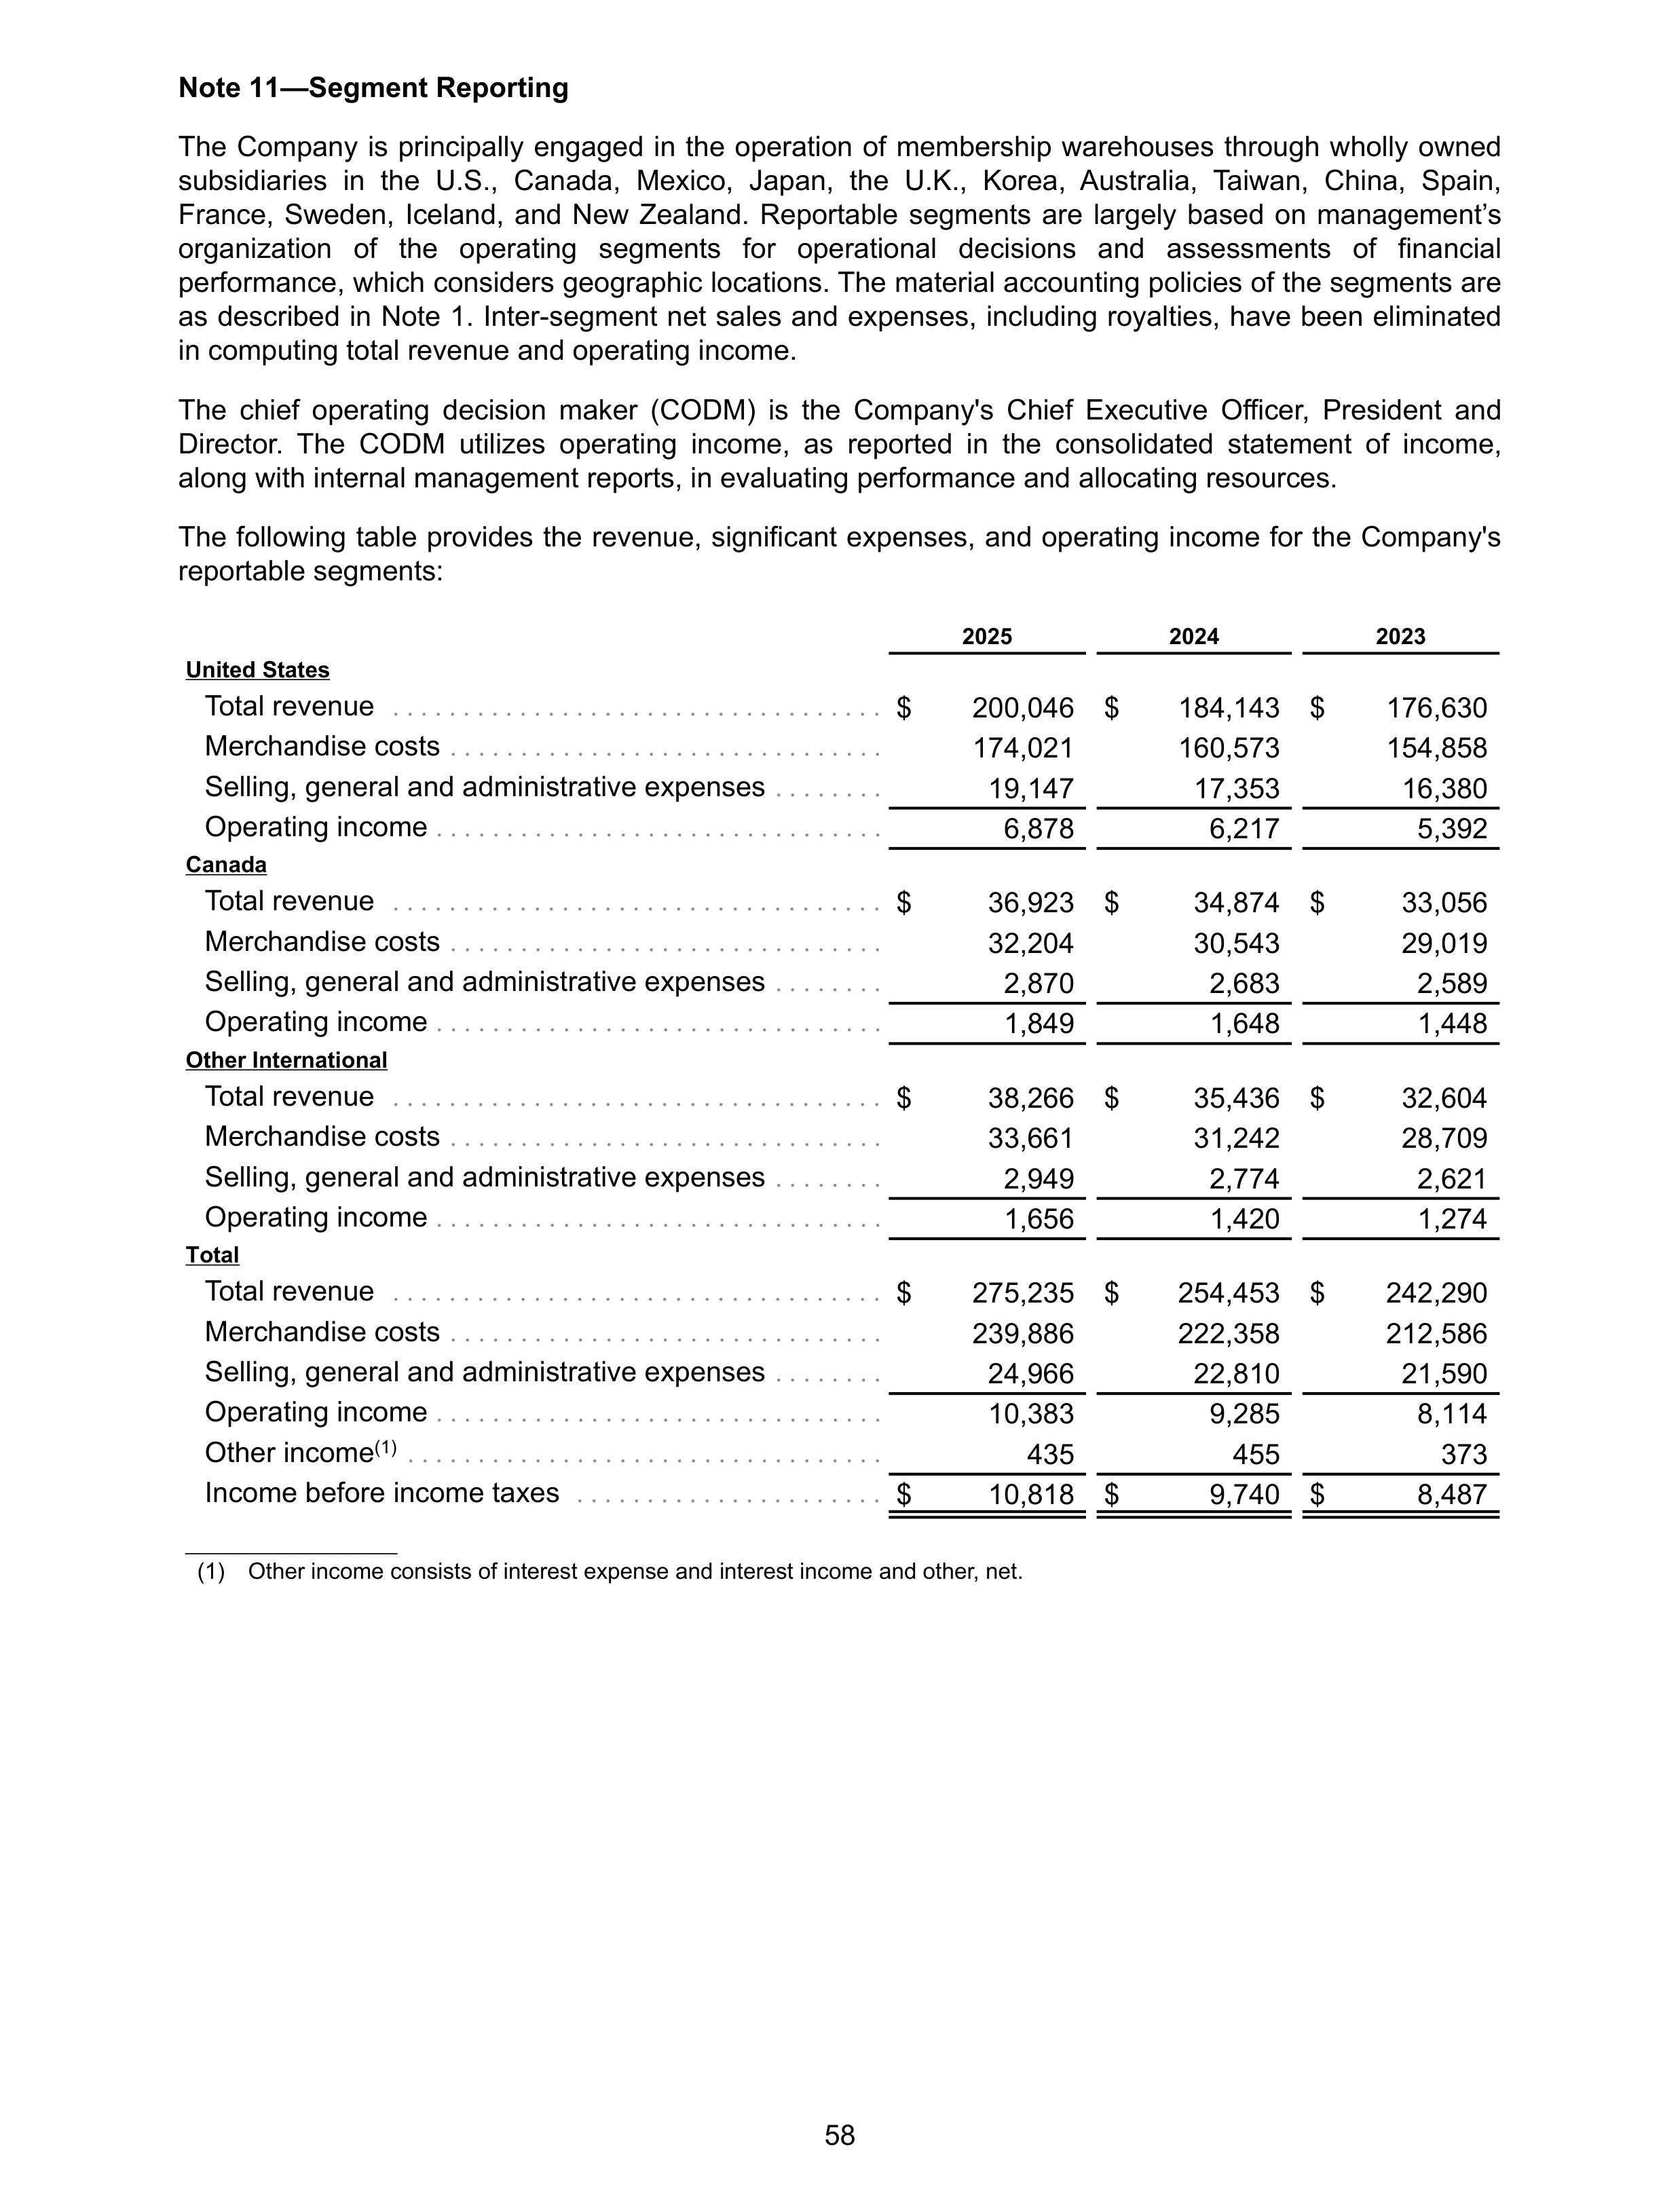
Note 11—Segment Reporting
The Company is principally engaged in the operation of membership warehouses through wholly owned
subsidiaries in the U.S., Canada, Mexico, Japan, the U.K., Korea, Australia, Taiwan, China, Spain,
France, Sweden, Iceland, and New Zealand. Reportable segments are largely based on management’s
organization of the operating segments for operational decisions and assessments of financial
performance, which considers geographic locations. The material accounting policies of the segments are
as described in Note 1. Inter-segment net sales and expenses, including royalties, have been eliminated
in computing total revenue and operating income.
The chief operating decision maker (CODM) is the Company's Chief Executive Officer, President and
Director. The CODM utilizes operating income, as reported in the consolidated statement of income,
along with internal management reports, in evaluating performance and allocating resources.
The following table provides the revenue, significant expenses, and operating income for the Company's
reportable segments:
2025
2024
2023
United States
Total revenue
. . . . . . . . . . . . . . . . . . . . . . . . . . . . . . . . . . .
$
200,046 $
184,143 $
176,630
Merchandise costs
. . . . . . . . . . . . . . . . . . . . . . . . . . . . . . .
174,021
160,573
154,858
Selling, general and administrative expenses
. . . . . . . .
19,147
17,353
16,380
Operating income
. . . . . . . . . . . . . . . . . . . . . . . . . . . . . . . .
6,878
6,217
5,392
Canada
Total revenue
. . . . . . . . . . . . . . . . . . . . . . . . . . . . . . . . . . .
$
36,923 $
34,874 $
33,056
Merchandise costs
. . . . . . . . . . . . . . . . . . . . . . . . . . . . . . .
32,204
30,543
29,019
Selling, general and administrative expenses
. . . . . . . .
2,870
2,683
2,589
Operating income
. . . . . . . . . . . . . . . . . . . . . . . . . . . . . . . .
1,849
1,648
1,448
Other International
Total revenue
. . . . . . . . . . . . . . . . . . . . . . . . . . . . . . . . . . .
$
38,266 $
35,436 $
32,604
Merchandise costs
. . . . . . . . . . . . . . . . . . . . . . . . . . . . . . .
33,661
31,242
28,709
Selling, general and administrative expenses
. . . . . . . .
2,949
2,774
2,621
Operating income
. . . . . . . . . . . . . . . . . . . . . . . . . . . . . . . .
1,656
1,420
1,274
Total
Total revenue
. . . . . . . . . . . . . . . . . . . . . . . . . . . . . . . . . . .
$
275,235 $
254,453 $
242,290
Merchandise costs
. . . . . . . . . . . . . . . . . . . . . . . . . . . . . . .
239,886
222,358
212,586
Selling, general and administrative expenses
. . . . . . . .
24,966
22,810
21,590
Operating income
. . . . . . . . . . . . . . . . . . . . . . . . . . . . . . . .
10,383
9,285
8,114
Other income
(1)
. . . . . . . . . . . . . . . . . . . . . . . . . . . . . . . . . .
435
455
373
Income before income taxes
. . . . . . . . . . . . . . . . . . . . . .
$
10,818 $
9,740 $
8,487
_______________
(1)
Other income consists of interest expense and interest income and other, net.
58
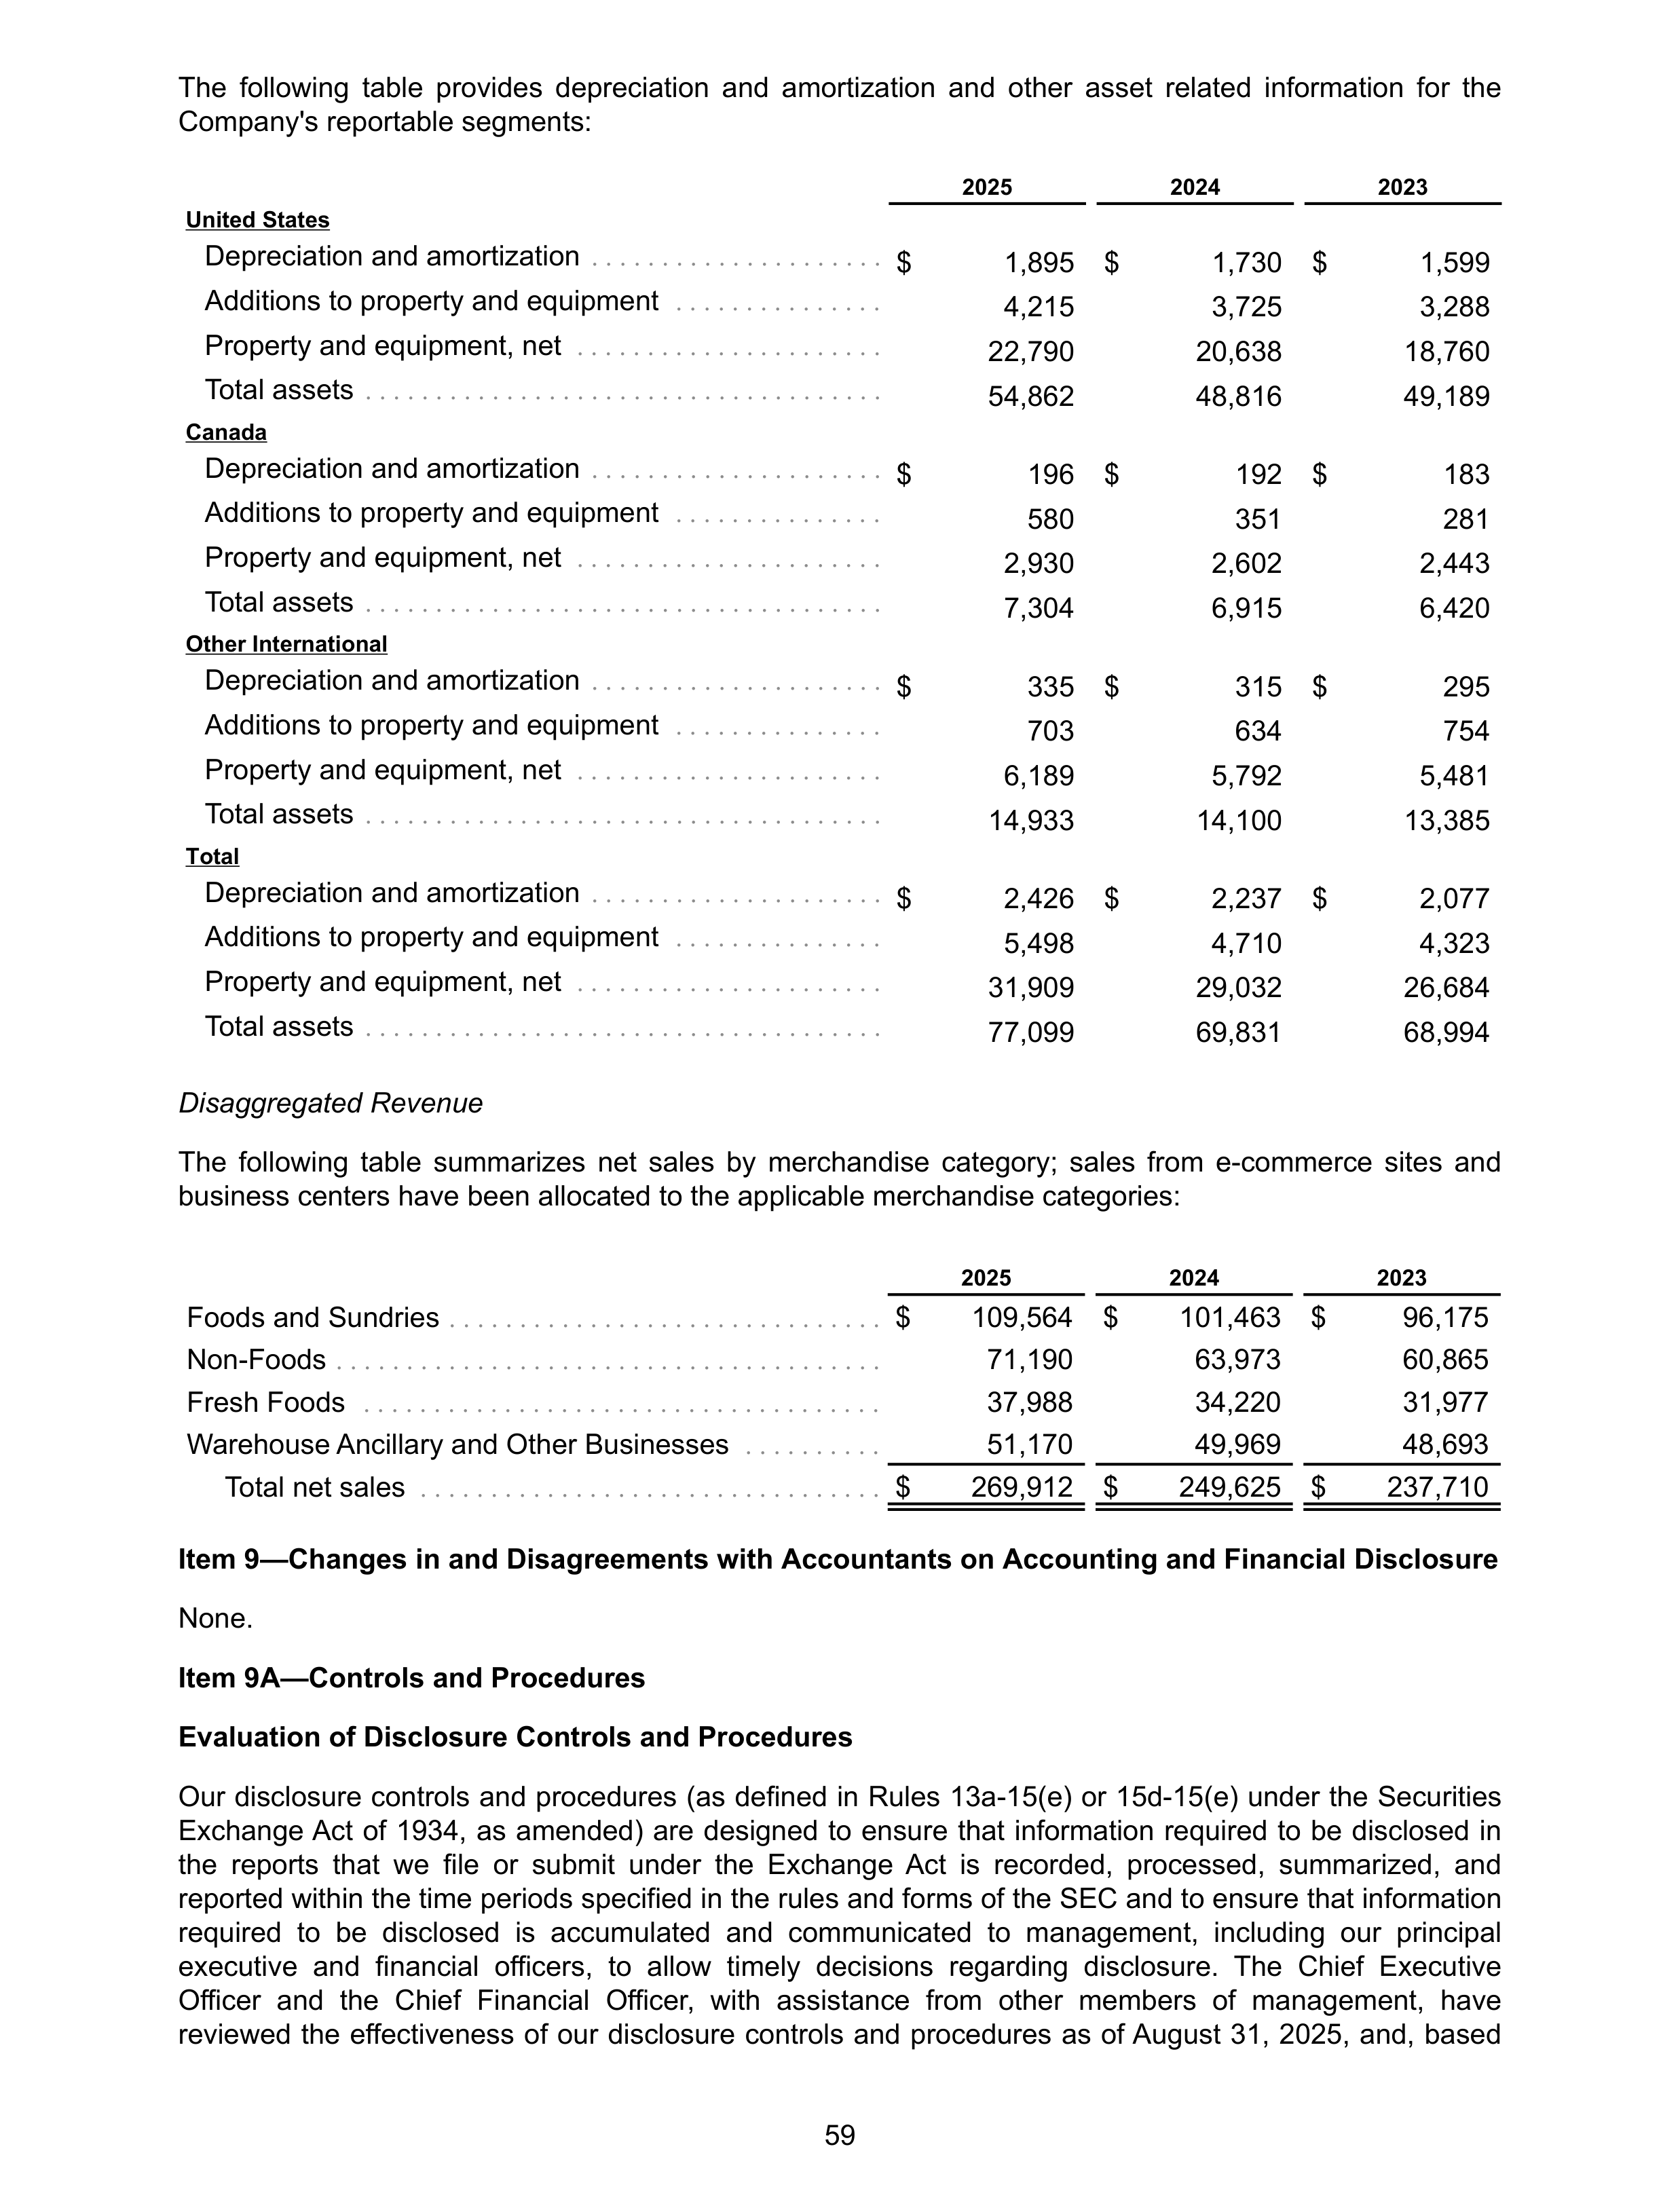
The following table provides depreciation and amortization and other asset related information for the
Company's reportable segments:
2025
2024
2023
United States
Depreciation and amortization
. . . . . . . . . . . . . . . . . . . . .
$
1,895 $
1,730 $
1,599
Additions to property and equipment
. . . . . . . . . . . . . . .
4,215
3,725
3,288
Property and equipment, net
. . . . . . . . . . . . . . . . . . . . . .
22,790
20,638
18,760
Total assets
. . . . . . . . . . . . . . . . . . . . . . . . . . . . . . . . . . . . .
54,862
48,816
49,189
Canada
Depreciation and amortization
. . . . . . . . . . . . . . . . . . . . .
$
196 $
192 $
183
Additions to property and equipment
. . . . . . . . . . . . . . .
580
351
281
Property and equipment, net
. . . . . . . . . . . . . . . . . . . . . .
2,930
2,602
2,443
Total assets
. . . . . . . . . . . . . . . . . . . . . . . . . . . . . . . . . . . . .
7,304
6,915
6,420
Other International
Depreciation and amortization
. . . . . . . . . . . . . . . . . . . . .
$
335 $
315 $
295
Additions to property and equipment
. . . . . . . . . . . . . . .
703
634
754
Property and equipment, net
. . . . . . . . . . . . . . . . . . . . . .
6,189
5,792
5,481
Total assets
. . . . . . . . . . . . . . . . . . . . . . . . . . . . . . . . . . . . .
14,933
14,100
13,385
Total
Depreciation and amortization
. . . . . . . . . . . . . . . . . . . . .
$
2,426 $
2,237 $
2,077
Additions to property and equipment
. . . . . . . . . . . . . . .
5,498
4,710
4,323
Property and equipment, net
. . . . . . . . . . . . . . . . . . . . . .
31,909
29,032
26,684
Total assets
. . . . . . . . . . . . . . . . . . . . . . . . . . . . . . . . . . . . .
77,099
69,831
68,994
Disaggregated Revenue
The following table summarizes net sales by merchandise category; sales from e-commerce sites and
business centers have been allocated to the applicable merchandise categories:
2025
2024
2023
Foods and Sundries
. . . . . . . . . . . . . . . . . . . . . . . . . . . . . . .
$
109,564 $
101,463 $
96,175
Non-Foods
. . . . . . . . . . . . . . . . . . . . . . . . . . . . . . . . . . . . . . .
71,190
63,973
60,865
Fresh Foods
. . . . . . . . . . . . . . . . . . . . . . . . . . . . . . . . . . . . .
37,988
34,220
31,977
Warehouse Ancillary and Other Businesses
. . . . . . . . . .
51,170
49,969
48,693
Total net sales
. . . . . . . . . . . . . . . . . . . . . . . . . . . . . . . . .
$
269,912 $
249,625 $
237,710
Item 9—Changes in and Disagreements with Accountants on Accounting and Financial Disclosure
None.
Item 9A—Controls and Procedures
Evaluation of Disclosure Controls and Procedures
Our disclosure controls and procedures (as defined in Rules 13a-15(e) or 15d-15(e) under the Securities
Exchange Act of 1934, as amended) are designed to ensure that information required to be disclosed in
the reports that we file or submit under the Exchange Act is recorded, processed, summarized, and
reported within the time periods specified in the rules and forms of the SEC and to ensure that information
required to be disclosed is accumulated and communicated to management, including our principal
executive and financial officers, to allow timely decisions regarding disclosure. The Chief Executive
Officer and the Chief Financial Officer, with assistance from other members of management, have
reviewed the effectiveness of our disclosure controls and procedures as of August 31, 2025, and, based
59
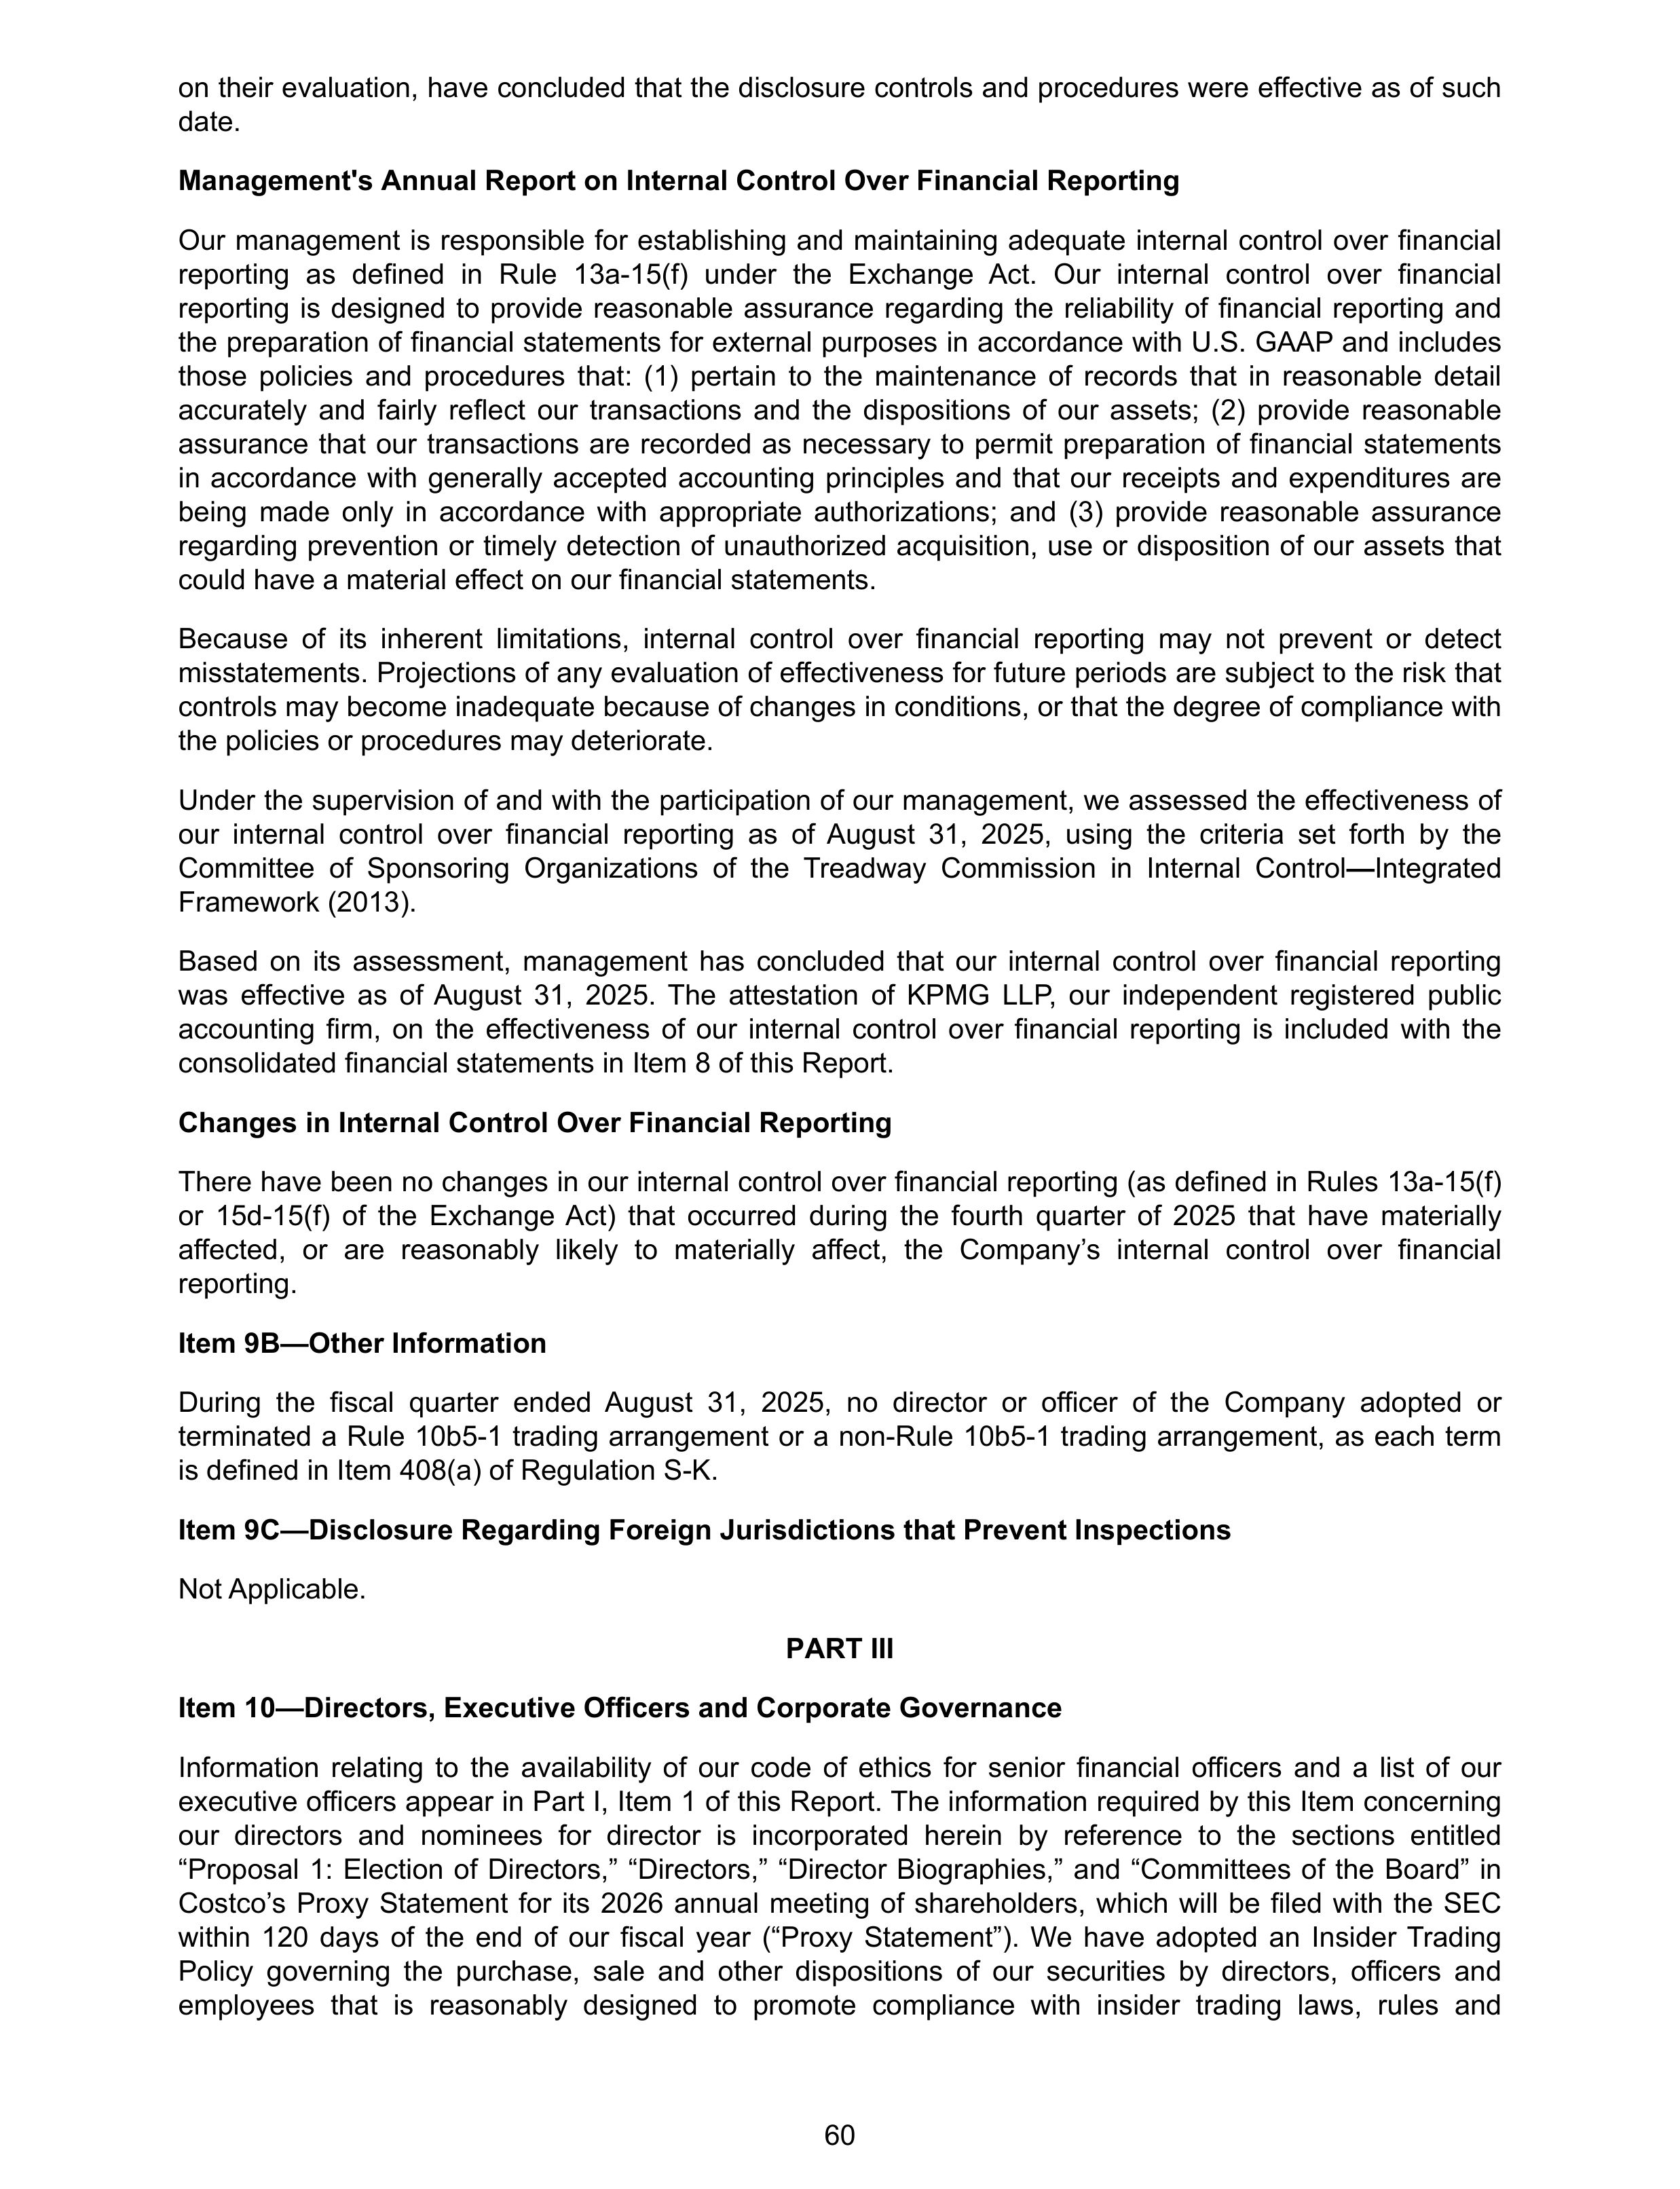
on their evaluation, have concluded that the disclosure controls and procedures were effective as of such
date.
Management's Annual Report on Internal Control Over Financial Reporting
Our management is responsible for establishing and maintaining adequate internal control over financial
reporting as defined in Rule 13a-15(f) under the Exchange Act. Our internal control over financial
reporting is designed to provide reasonable assurance regarding the reliability of financial reporting and
the preparation of financial statements for external purposes in accordance with U.S. GAAP and includes
those policies and procedures that: (1) pertain to the maintenance of records that in reasonable detail
accurately and fairly reflect our transactions and the dispositions of our assets; (2) provide reasonable
assurance that our transactions are recorded as necessary to permit preparation of financial statements
in accordance with generally accepted accounting principles and that our receipts and expenditures are
being made only in accordance with appropriate authorizations; and (3) provide reasonable assurance
regarding prevention or timely detection of unauthorized acquisition, use or disposition of our assets that
could have a material effect on our financial statements.
Because of its inherent limitations, internal control over financial reporting may not prevent or detect
misstatements. Projections of any evaluation of effectiveness for future periods are subject to the risk that
controls may become inadequate because of changes in conditions, or that the degree of compliance with
the policies or procedures may deteriorate.
Under the supervision of and with the participation of our management, we assessed the effectiveness of
our internal control over financial reporting as of August 31, 2025, using the criteria set forth by the
Committee of Sponsoring Organizations of the Treadway Commission in Internal Control
—
Integrated
Framework (2013).
Based on its assessment, management has concluded that our internal control over financial reporting
was effective as of August 31, 2025. The attestation of KPMG LLP, our independent registered public
accounting firm, on the effectiveness of our internal control over financial reporting is included with the
consolidated financial statements in Item 8 of this Report.
Changes in Internal Control Over Financial Reporting
There have been no changes in our internal control over financial reporting (as defined in Rules 13a-15(f)
or 15d-15(f) of the Exchange Act) that occurred during the fourth quarter of 2025 that have materially
affected, or are reasonably likely to materially affect, the Company’s internal control over financial
reporting.
Item 9B—Other Information
During the fiscal quarter ended August 31, 2025, no director or officer of the Company adopted or
terminated a Rule 10b5-1 trading arrangement or a non-Rule 10b5-1 trading arrangement, as each term
is defined in Item 408(a) of Regulation S-K.
Item 9C—Disclosure Regarding Foreign Jurisdictions that Prevent Inspections
Not Applicable.
PART III
Item 10—Directors, Executive Officers and Corporate Governance
Information relating to the availability of our code of ethics for senior financial officers and a list of our
executive officers appear in Part I, Item 1 of this Report. The information required by this Item concerning
our directors and nominees for director is incorporated herein by reference to the sections entitled
“Proposal 1: Election of Directors,” “Directors,” “Director Biographies,” and “Committees of the Board” in
Costco’s Proxy Statement for its 2026 annual meeting of shareholders, which will be filed with the SEC
within 120 days of the end of our fiscal year (“Proxy Statement”). We have adopted an Insider Trading
Policy governing the purchase, sale and other dispositions of our securities by directors, officers and
employees that is reasonably designed to promote compliance with insider trading laws, rules and
60
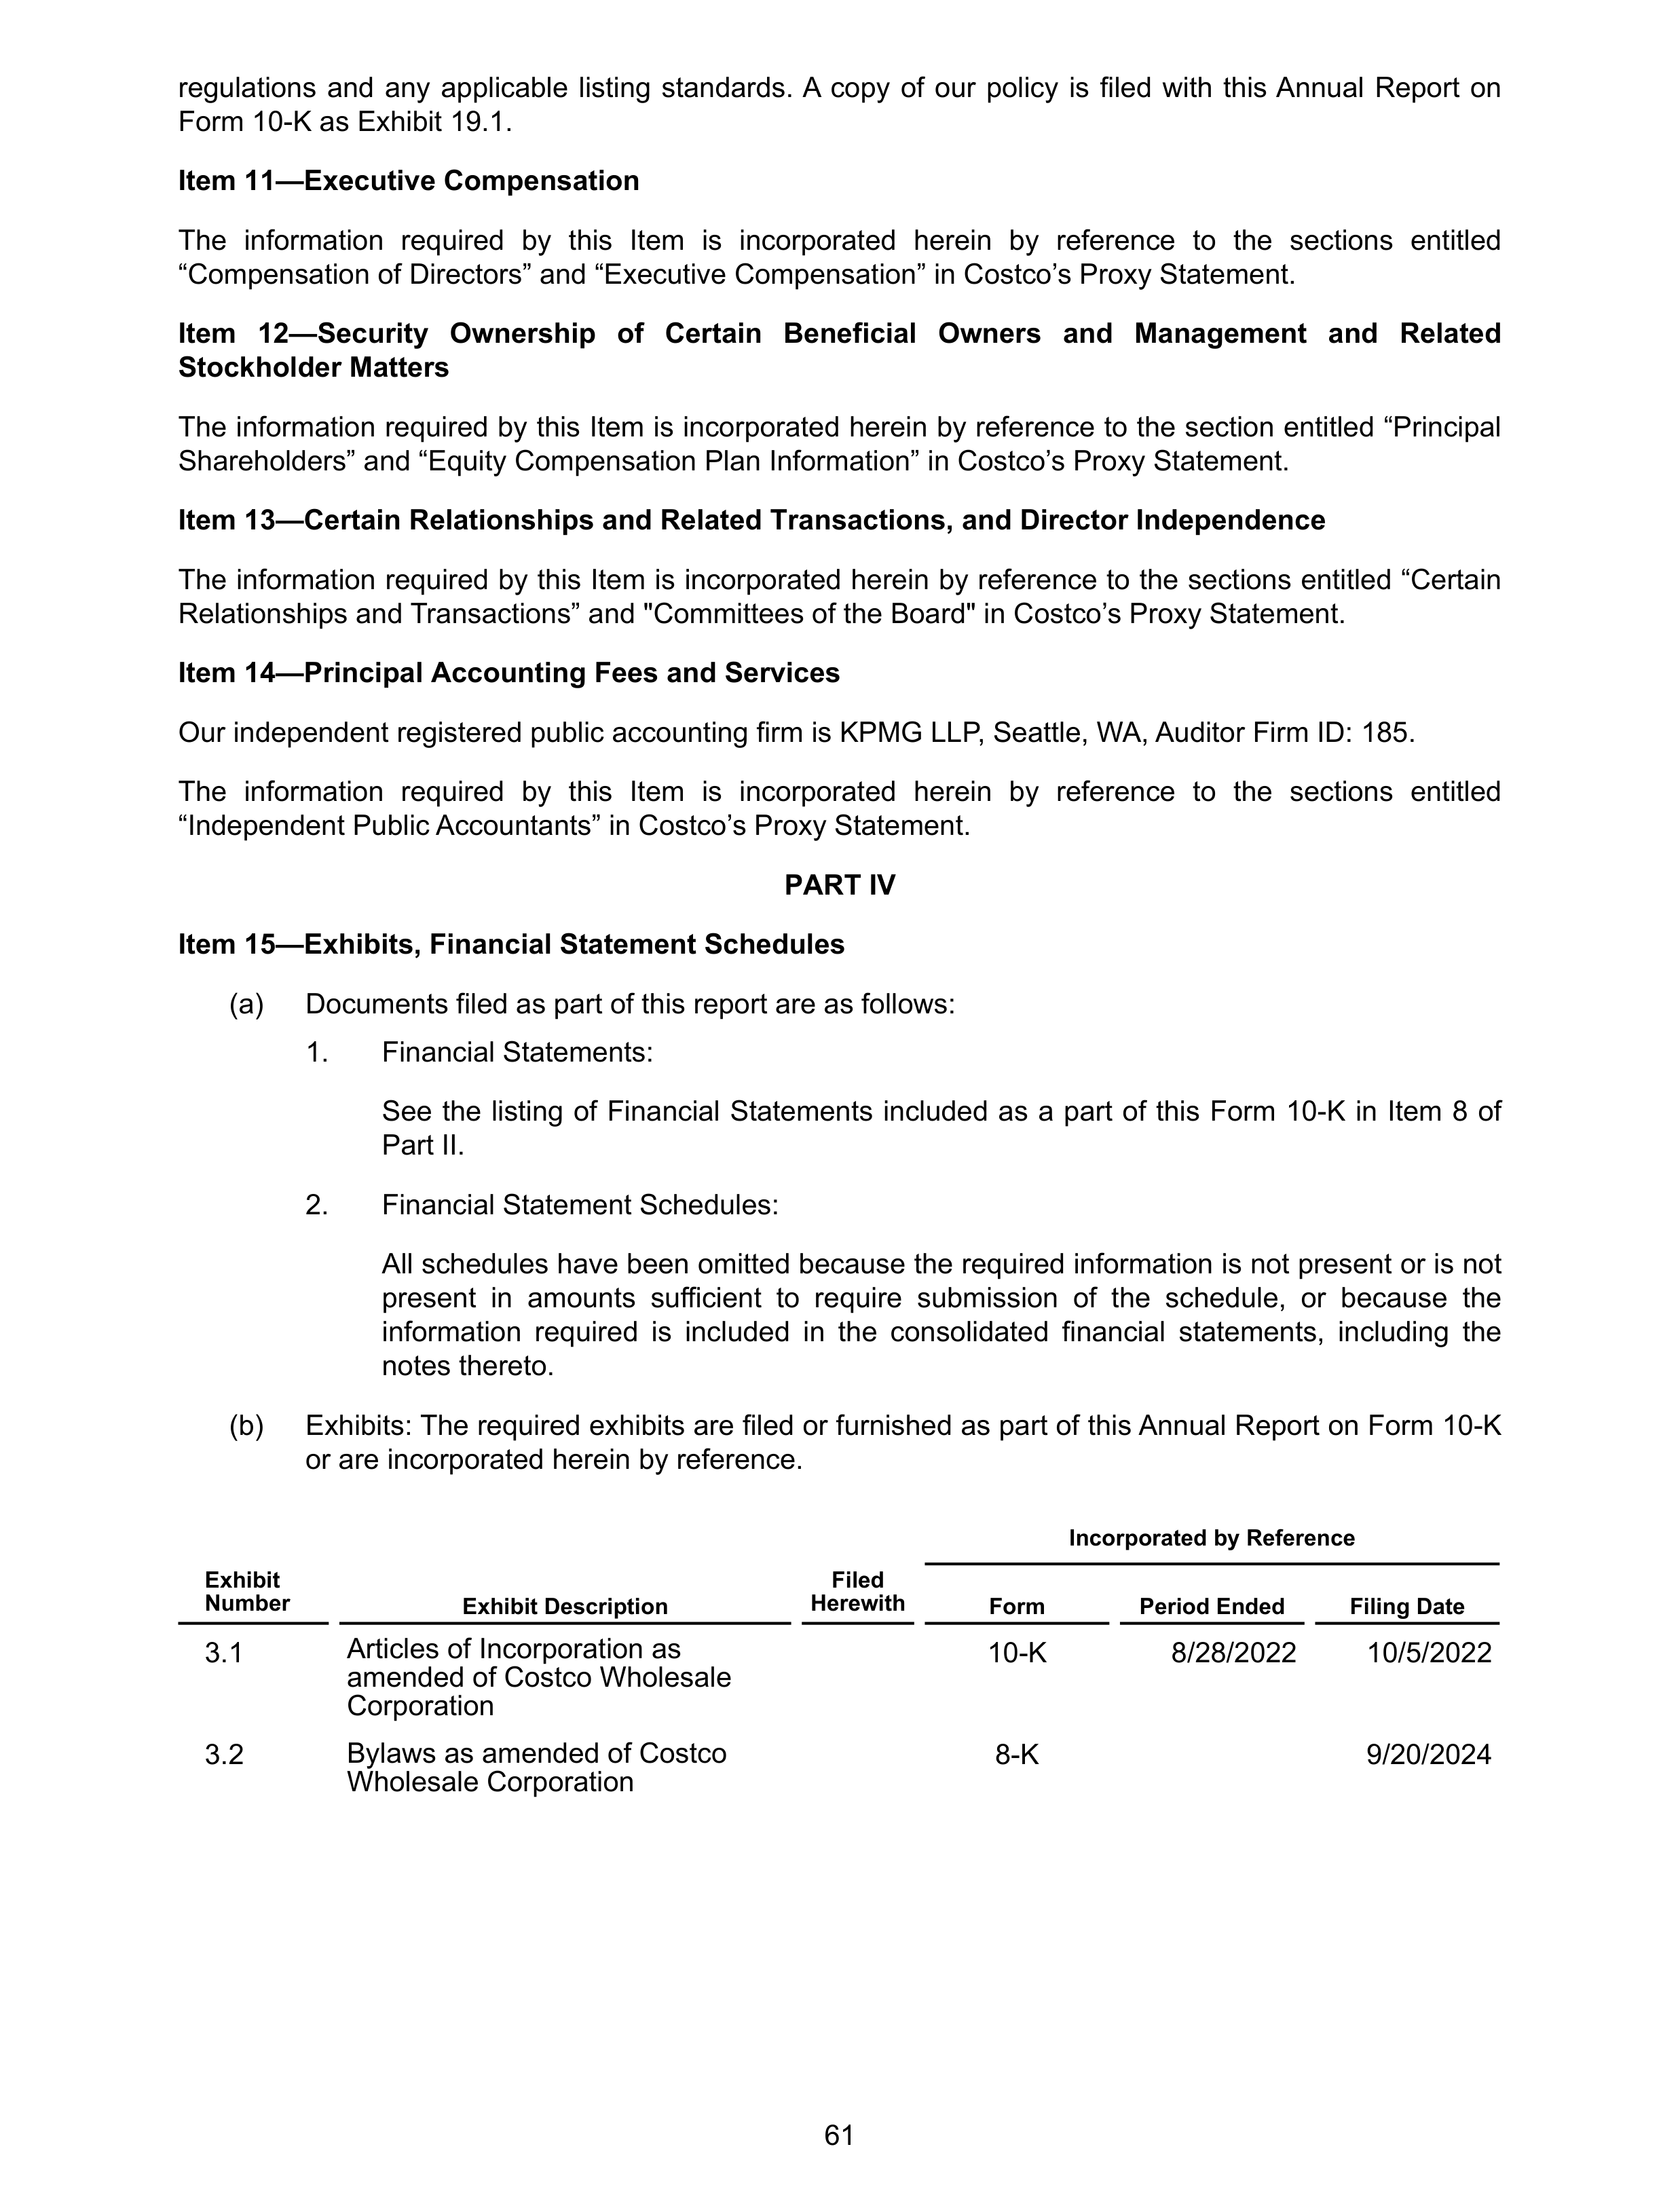
regulations and any applicable listing standards. A copy of our policy is filed with this Annual Report on
Form 10-K as Exhibit 19.1.
Item 11—Executive Compensation
The information required by this Item is incorporated herein by reference to the sections entitled
“Compensation of Directors” and “Executive Compensation” in Costco’s Proxy Statement.
Item 12—Security Ownership of Certain Beneficial Owners and Management and Related
Stockholder Matters
The information required by this Item is incorporated herein by reference to the section entitled “Principal
Shareholders” and “Equity Compensation Plan Information” in Costco’s Proxy Statement.
Item 13—Certain Relationships and Related Transactions, and Director Independence
The information required by this Item is incorporated herein by reference to the sections entitled “Certain
Relationships and Transactions” and "Committees of the Board" in Costco’s Proxy Statement.
Item 14—Principal Accounting Fees and Services
Our independent registered public accounting firm is KPMG LLP, Seattle, WA, Auditor Firm ID: 185.
The information required by this Item is incorporated herein by reference to the sections entitled
“Independent Public Accountants” in Costco’s Proxy Statement.
PART IV
Item 15—Exhibits, Financial Statement Schedules
(a)
Documents filed as part of this report are as follows:
1.
Financial Statements:
See the listing of Financial Statements included as a part of this Form 10-K in Item 8 of
Part II.
2.
Financial Statement Schedules:
All schedules have been omitted because the required information is not present or is not
present in amounts sufficient to require submission of the schedule, or because the
information required is included in the consolidated financial statements, including the
notes thereto.
(b)
Exhibits: The required exhibits are filed or furnished as part of this Annual Report on Form 10-K
or are incorporated herein by reference.
3.1
Articles of Incorporation as
amended of Costco Wholesale
Corporation
10-K
8/28/2022
10/5/2022
3.2
Bylaws as amended of Costco
Wholesale Corporation
8-K
9/20/2024
Incorporated by Reference
Exhibit
Number
Exhibit Description
Filed
Herewith
Form
Period Ended
Filing Date
61
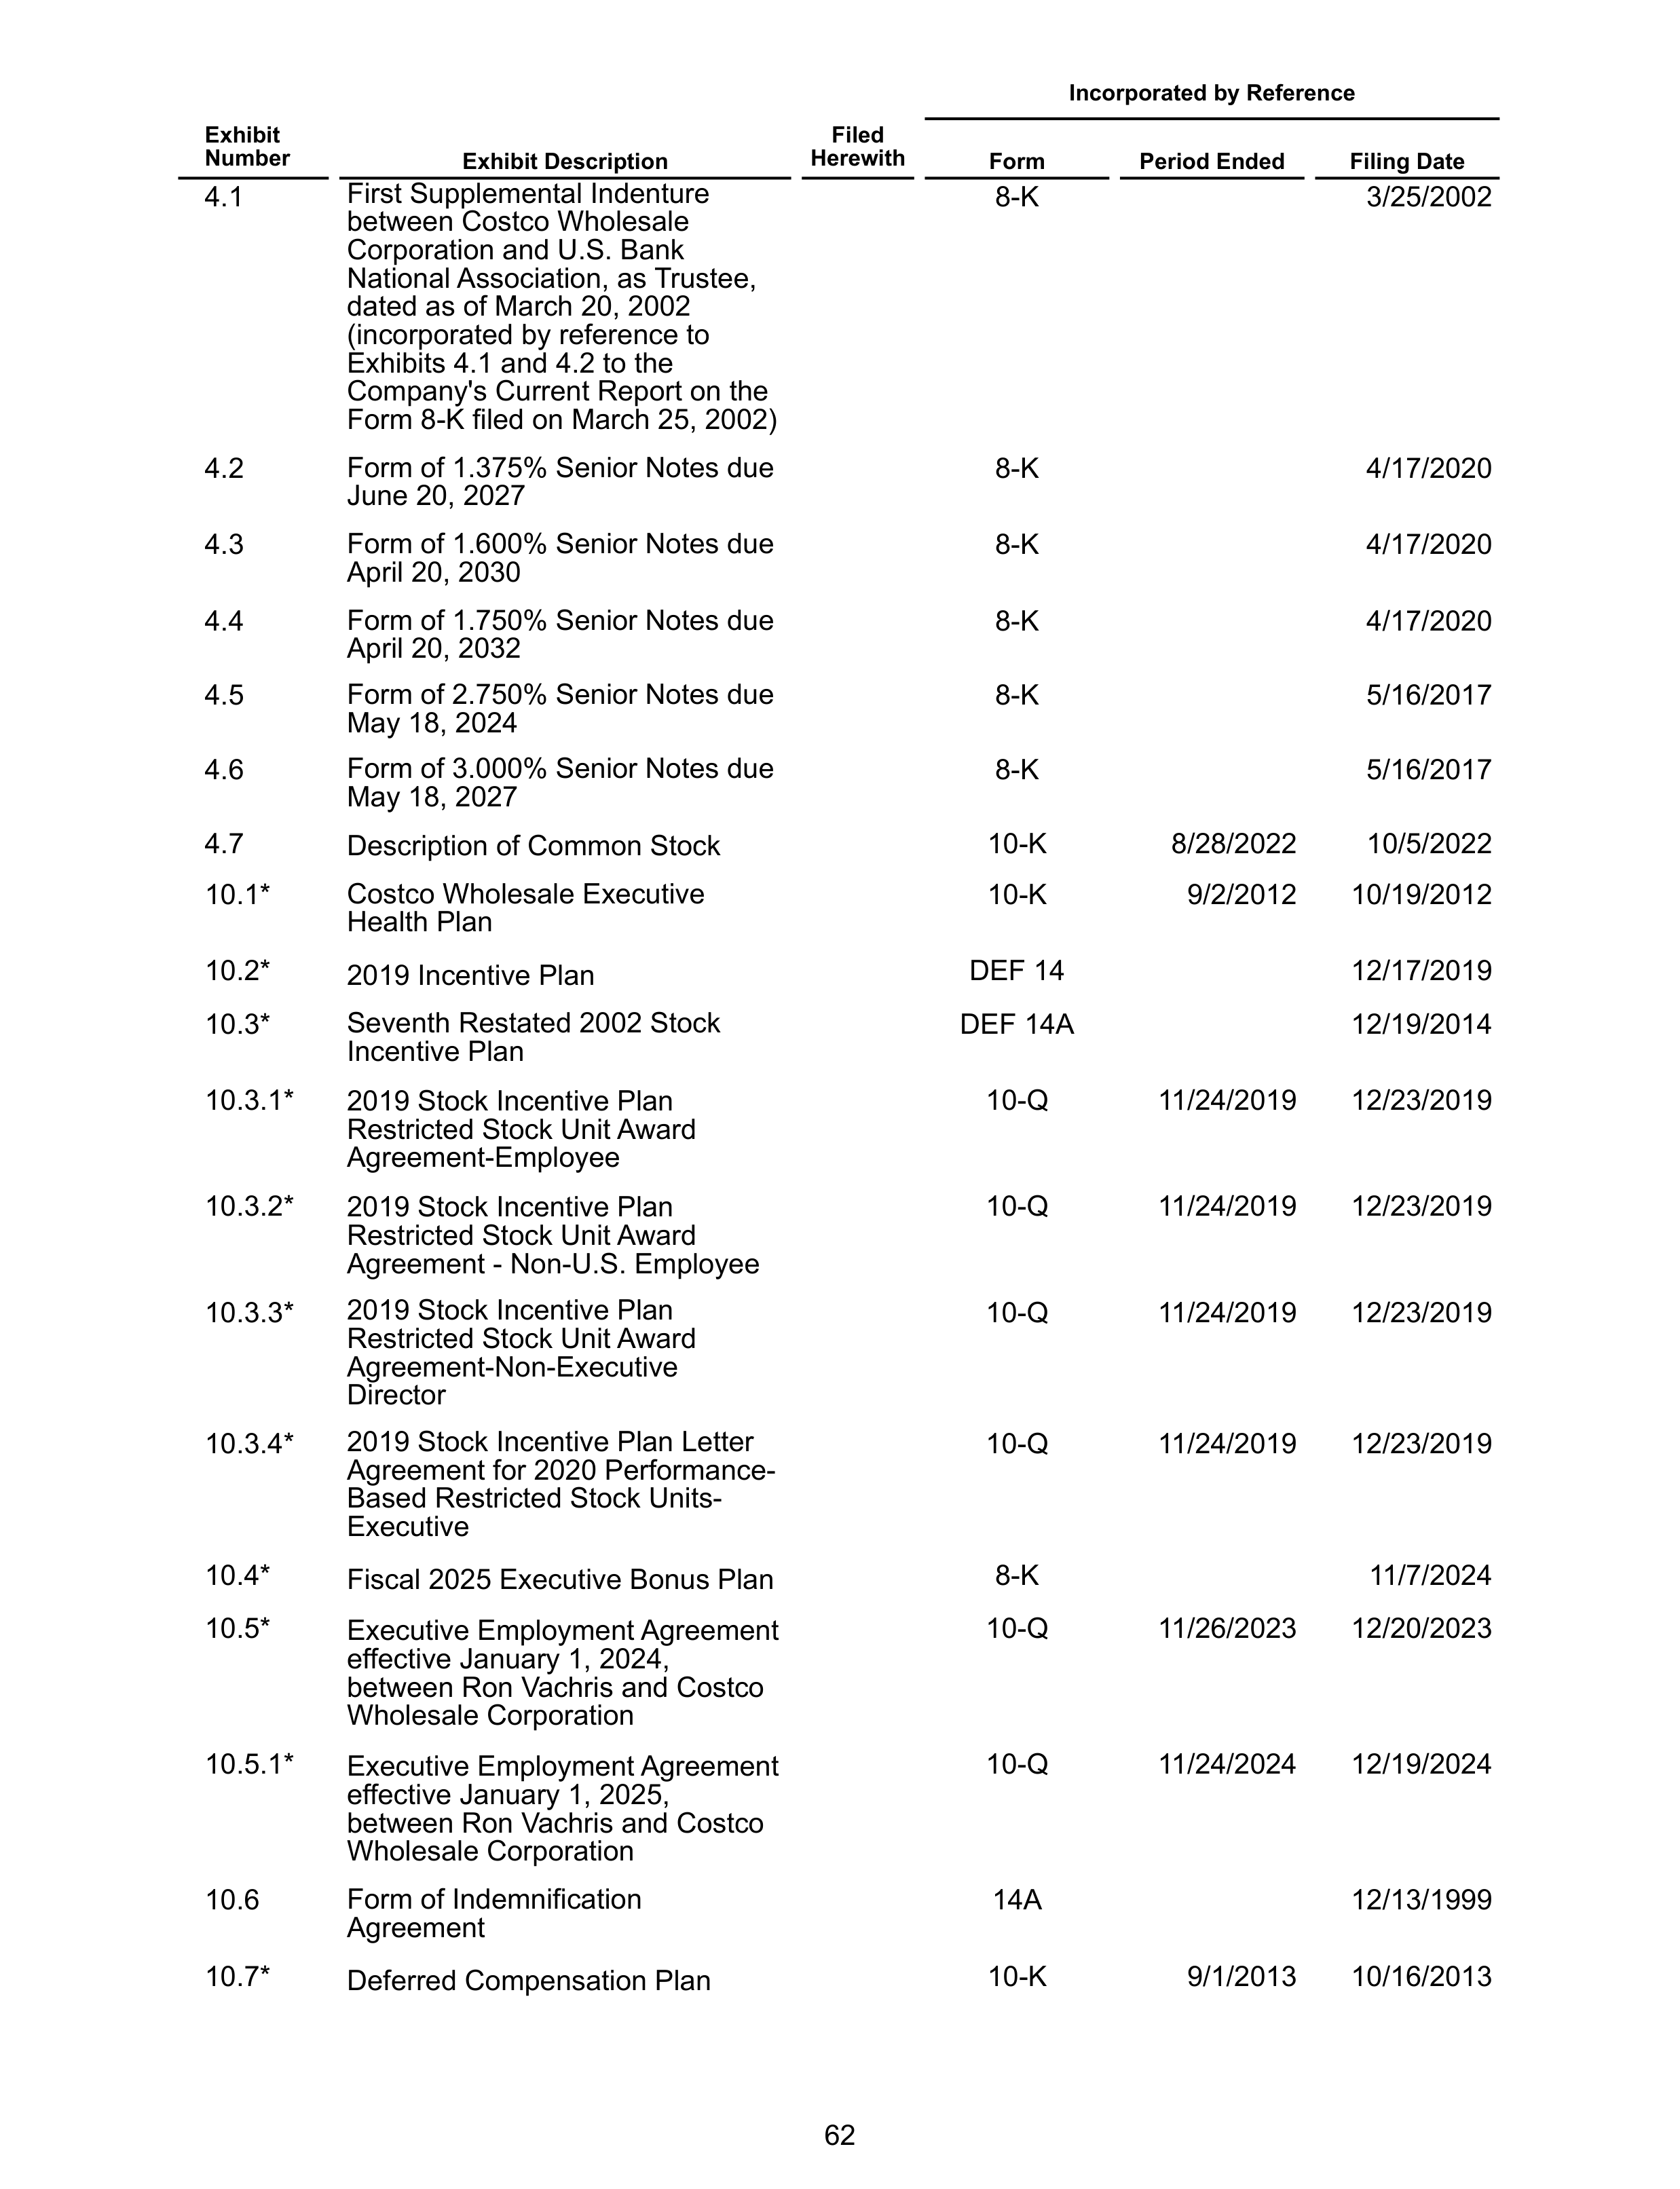
4.1
First Supplemental Indenture
between Costco Wholesale
Corporation and U.S. Bank
National Association, as Trustee,
dated as of March 20, 2002
(incorporated by reference to
Exhibits 4.1 and 4.2 to the
Company's Current Report on the
Form 8-K filed on March 25, 2002)
8-K
3/25/2002
4.2
Form of 1.375% Senior Notes due
June 20, 2027
8-K
4/17/2020
4.3
Form of 1.600% Senior Notes due
April 20, 2030
8-K
4/17/2020
4.4
Form of 1.750% Senior Notes due
April 20, 2032
8-K
4/17/2020
4.5
Form of 2.750% Senior Notes due
May 18, 2024
8-K
5/16/2017
4.6
Form of 3.000% Senior Notes due
May 18, 2027
8-K
5/16/2017
4.7
Description of Common Stock
10-K
8/28/2022
10/5/2022
10.1*
Costco Wholesale Executive
Health Plan
10-K
9/2/2012
10/19/2012
10.2*
2019 Incentive Plan
DEF 14
12/17/2019
10.3*
Seventh Restated 2002 Stock
Incentive Plan
DEF 14A
12/19/2014
10.3.1*
2019 Stock Incentive Plan
Restricted Stock Unit Award
Agreement-Employee
10-Q
11/24/2019
12/23/2019
10.3.2*
2019 Stock Incentive Plan
Restricted Stock Unit Award
Agreement - Non-U.S. Employee
10-Q
11/24/2019
12/23/2019
10.3.3*
2019 Stock Incentive Plan
Restricted Stock Unit Award
Agreement-Non-Executive
Director
10-Q
11/24/2019
12/23/2019
10.3.4*
2019 Stock Incentive Plan Letter
Agreement for 2020 Performance-
Based Restricted Stock Units-
Executive
10-Q
11/24/2019
12/23/2019
10.4*
Fiscal 2025 Executive Bonus Plan
8-K
11/7/2024
10.5*
Executive Employment Agreement
effective January 1, 2024,
between Ron Vachris and Costco
Wholesale Corporation
10-Q
11/26/2023
12/20/2023
10.5.1*
Executive Employment Agreement
effective January 1, 2025,
between Ron Vachris and Costco
Wholesale Corporation
10-Q
11/24/2024
12/19/2024
10.6
Form of Indemnification
Agreement
14A
12/13/1999
10.7*
Deferred Compensation Plan
10-K
9/1/2013
10/16/2013
Incorporated by Reference
Exhibit
Number
Exhibit Description
Filed
Herewith
Form
Period Ended
Filing Date
62
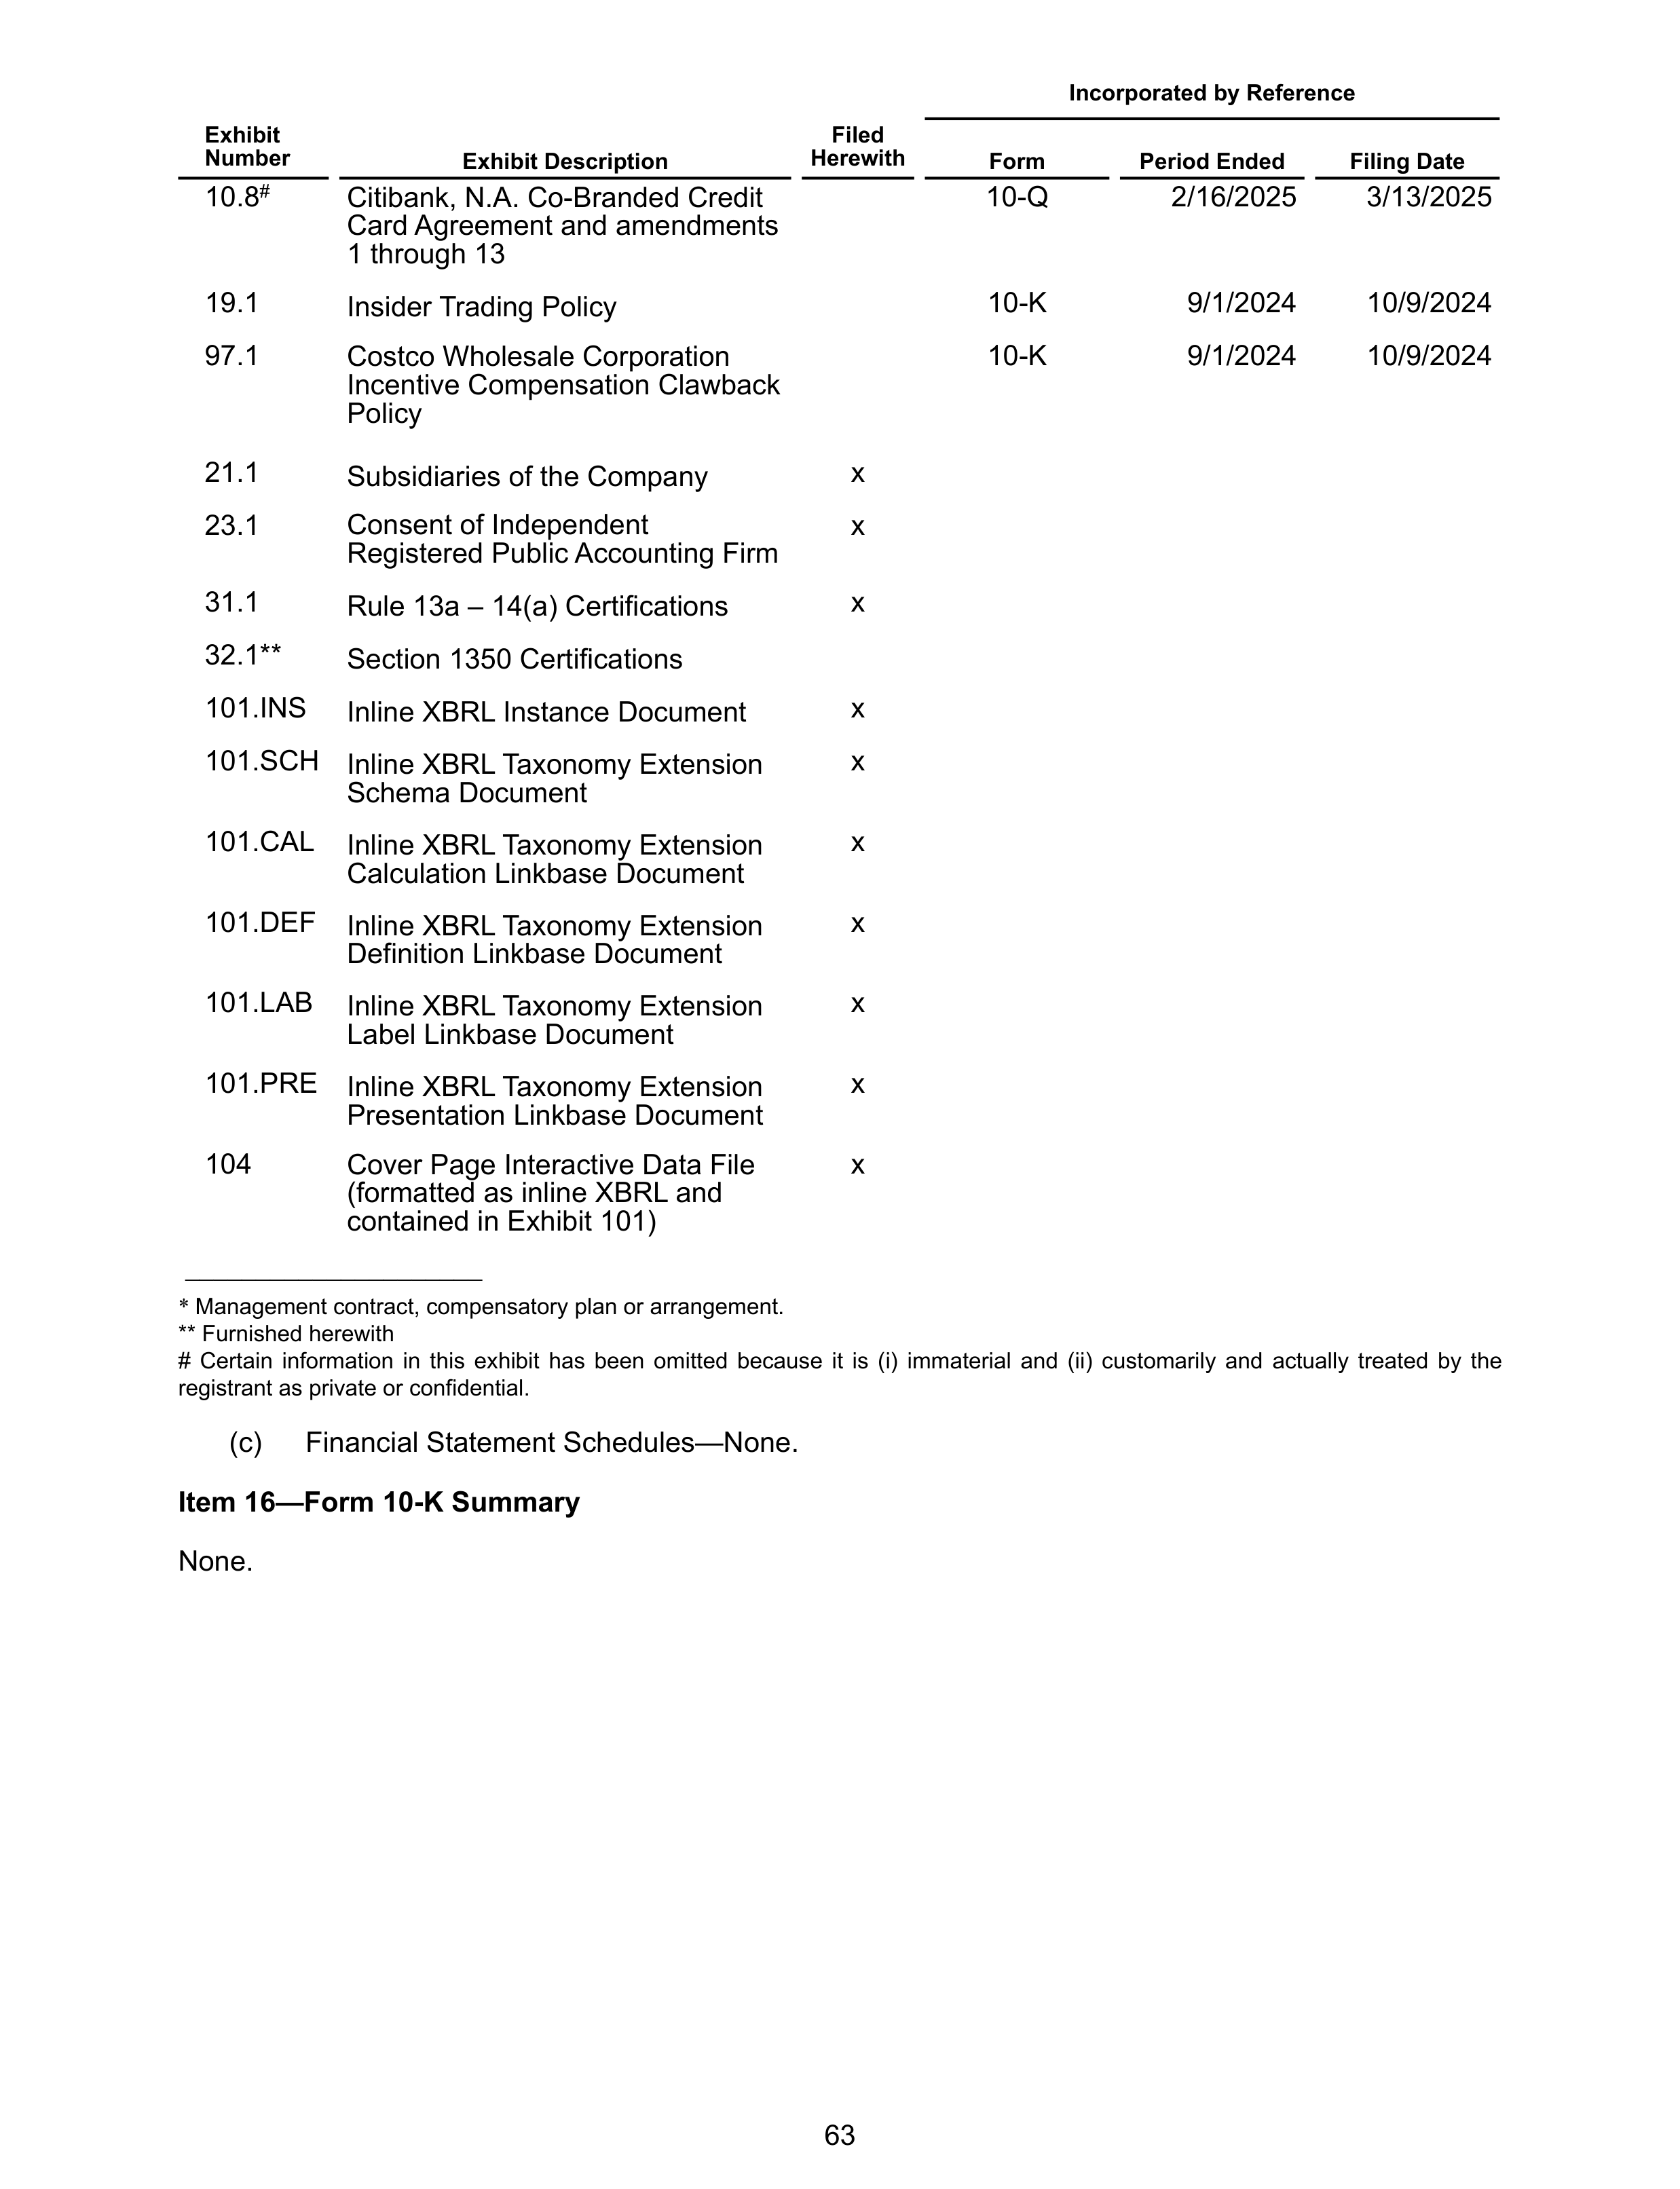
10.8
#
Citibank, N.A. Co-Branded Credit
Card Agreement and amendments
1 through 13
10-Q
2/16/2025
3/13/2025
19.1
Insider Trading Policy
10-K
9/1/2024
10/9/2024
97.1
Costco Wholesale Corporation
Incentive Compensation Clawback
Policy
10-K
9/1/2024
10/9/2024
21.1
Subsidiaries of the Company
x
23.1
Consent of Independent
Registered Public Accounting Firm
x
31.1
Rule 13a – 14(a) Certifications
x
32.1**
Section 1350 Certifications
101.INS
Inline XBRL Instance Document
x
101.SCH
Inline XBRL Taxonomy Extension
Schema Document
x
101.CAL
Inline XBRL Taxonomy Extension
Calculation Linkbase Document
x
101.DEF
Inline XBRL Taxonomy Extension
Definition Linkbase Document
x
101.LAB
Inline XBRL Taxonomy Extension
Label Linkbase Document
x
101.PRE
Inline XBRL Taxonomy Extension
Presentation Linkbase Document
x
104
Cover Page Interactive Data File
(formatted as inline XBRL and
contained in Exhibit 101)
x
Incorporated by Reference
Exhibit
Number
Exhibit Description
Filed
Herewith
Form
Period Ended
Filing Date
_____________________
*
Management contract, compensatory plan or arrangement.
** Furnished herewith
# Certain information in this exhibit has been omitted because it is (i) immaterial and (ii) customarily and actually treated by the
registrant as private or confidential.
(c)
Financial Statement Schedules—None.
Item 16—Form 10-K Summary
None.
63
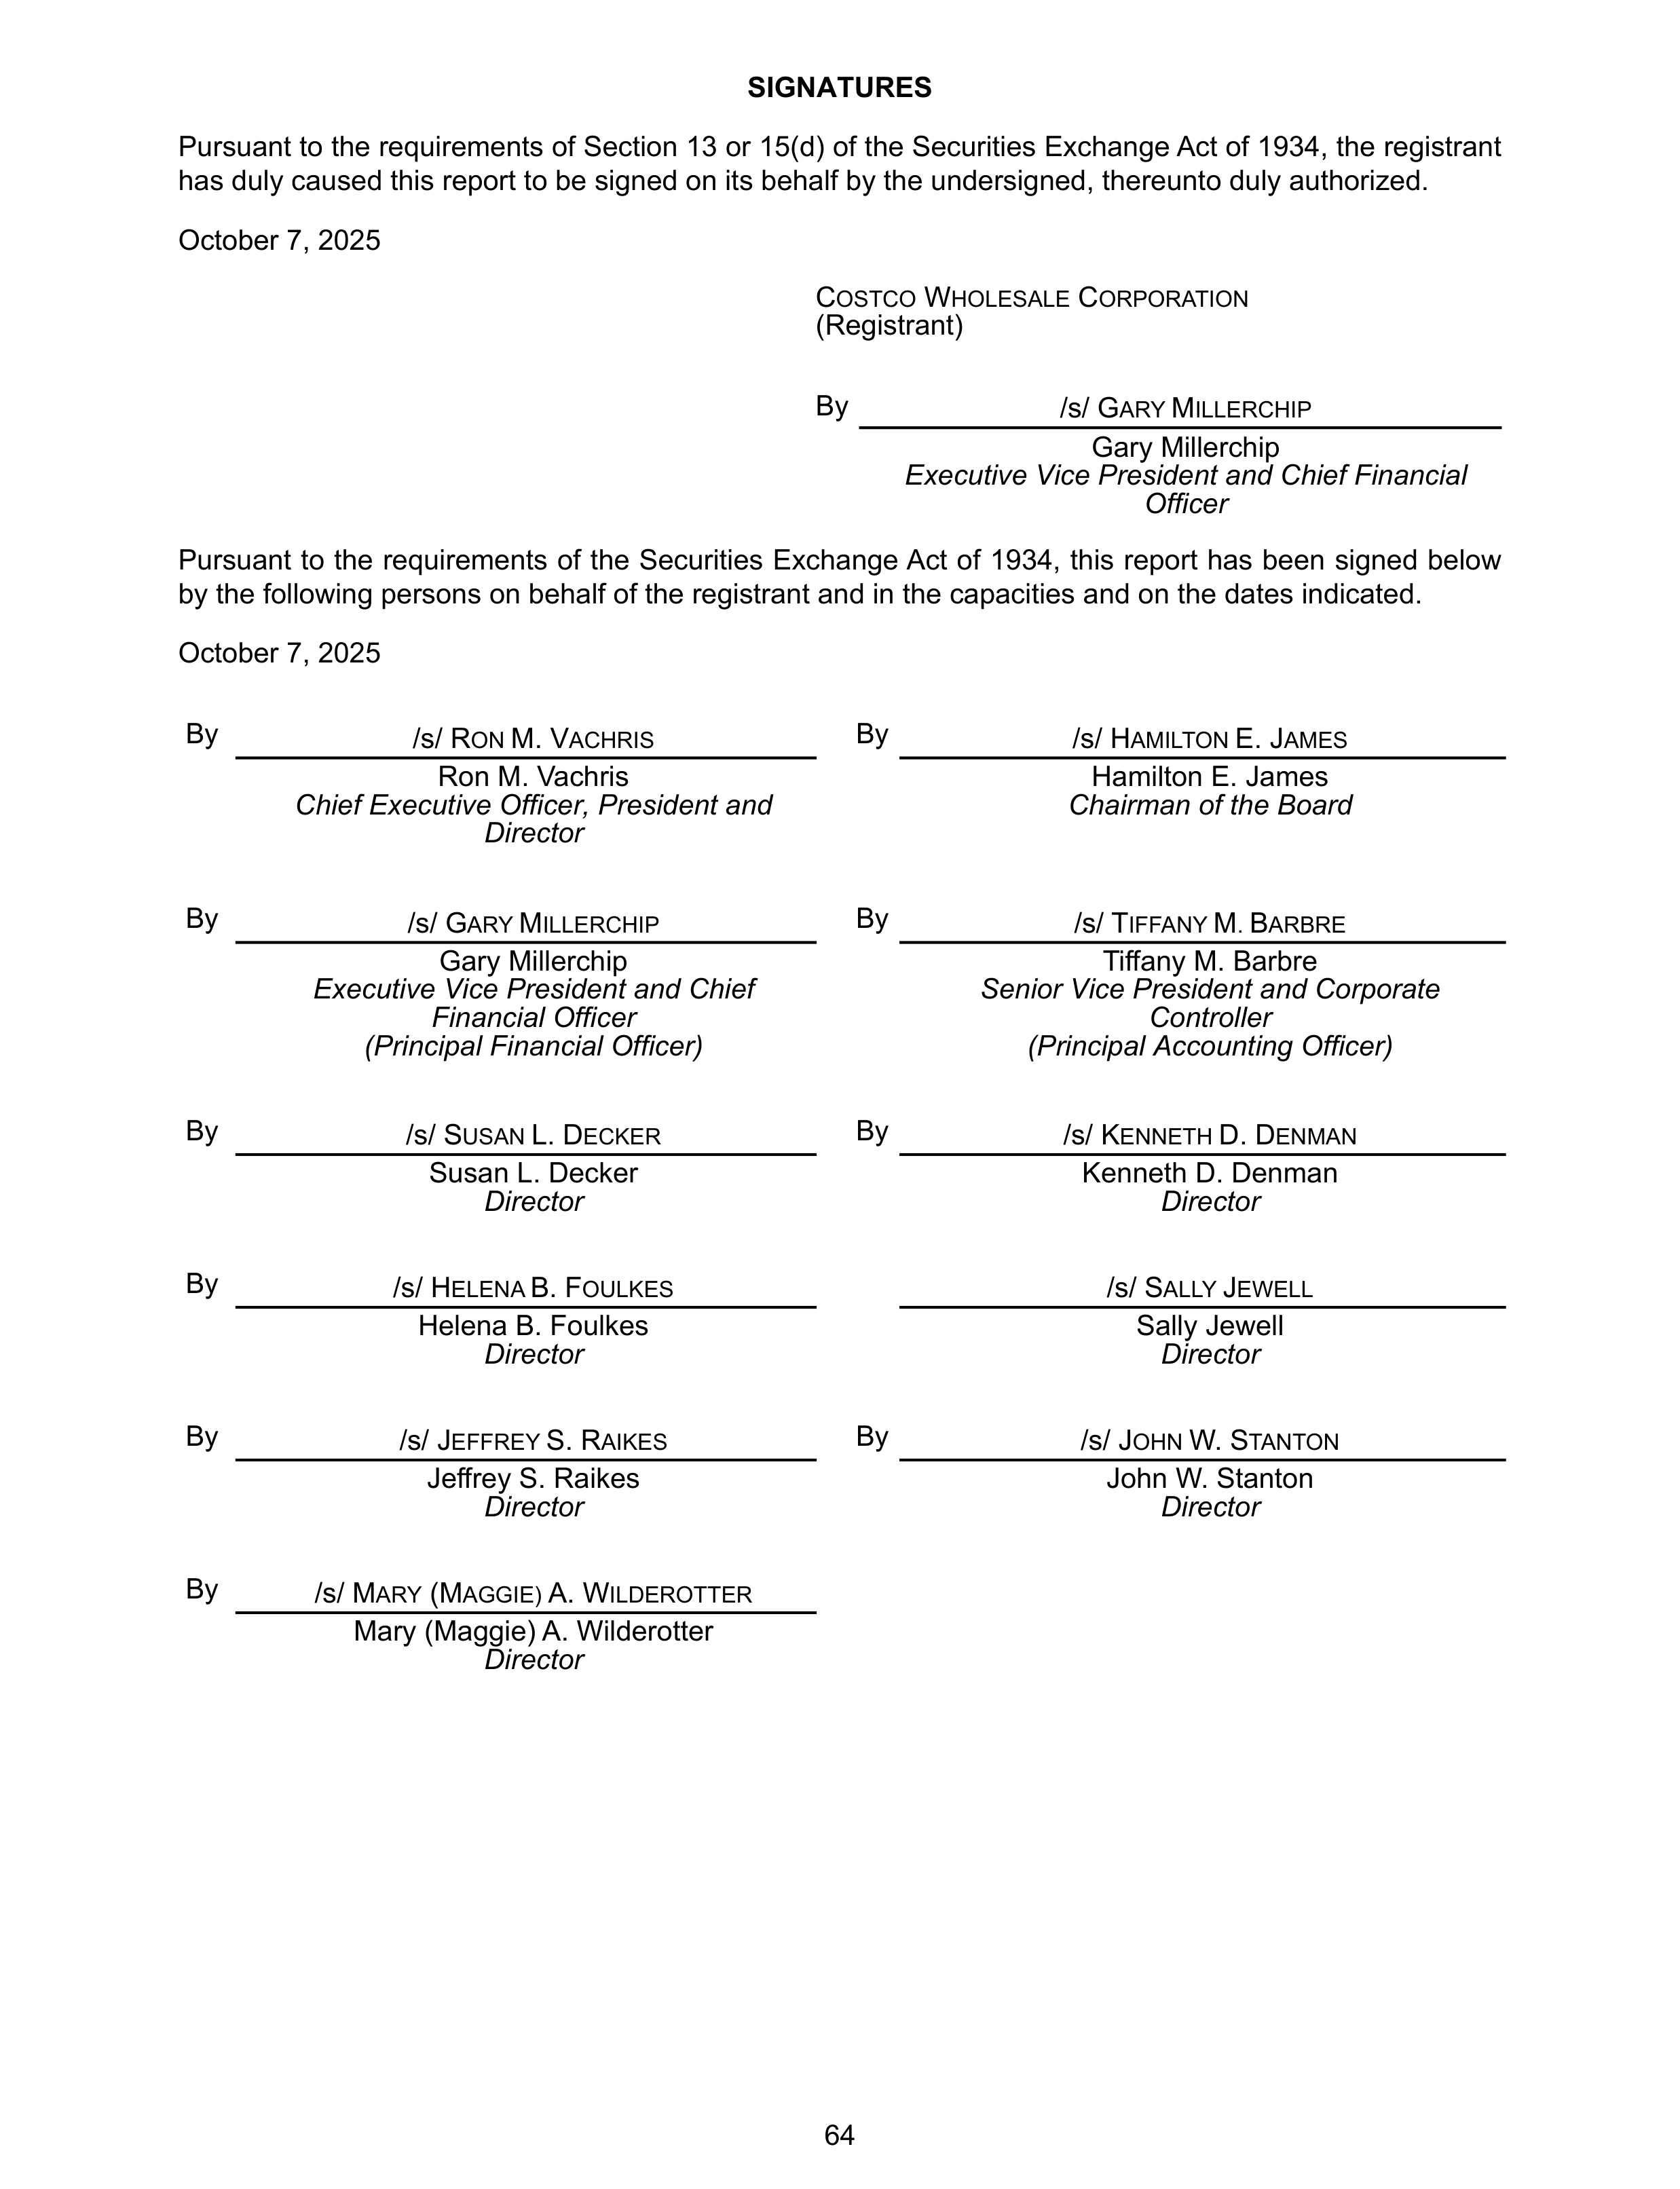
SIGNATURES
Pursuant to the requirements of Section 13 or 15(d) of the Securities Exchange Act of 1934, the registrant
has duly caused this report to be signed on its behalf by the undersigned, thereunto duly authorized.
October 7, 2025
C
OSTCO
W
HOLESALE
C
ORPORATION
(Registrant)
By
/s/ G
ARY
M
ILLERCHIP
Gary Millerchip
Executive Vice President and Chief Financial
Officer
Pursuant to the requirements of the Securities Exchange Act of 1934, this report has been signed below
by the following persons on behalf of the registrant and in the capacities and on the dates indicated.
October 7, 2025
By
/s/ R
ON
M. V
ACHRIS
By
/s/ H
AMILTON
E. J
AMES
Ron M. Vachris
Chief Executive Officer, President and
Director
Hamilton E. James
Chairman of the Board
By
/s/ G
ARY
M
ILLERCHIP
By
/s/ T
IFFANY
M
.
B
ARBRE
Gary Millerchip
Executive Vice President and Chief
Financial Officer
(Principal Financial Officer)
Tiffany M. Barbre
Senior Vice President and Corporate
Controller
(Principal Accounting Officer)
By
/s/ S
USAN
L. D
ECKER
By
/s/ K
ENNETH
D. D
ENMAN
Susan L. Decker
Director
Kenneth D. Denman
Director
By
/s/ H
ELENA
B. F
OULKES
/s/ S
ALLY
J
EWELL
Helena B. Foulkes
Director
Sally Jewell
Director
By
/s/ J
EFFREY
S. R
AIKES
By
/s/ J
OHN
W. S
TANTON
Jeffrey S. Raikes
Director
John W. Stanton
Director
By
/s/ M
ARY
(M
AGGIE)
A. W
ILDEROTTER
Mary (Maggie) A. Wilderotter
Director
64
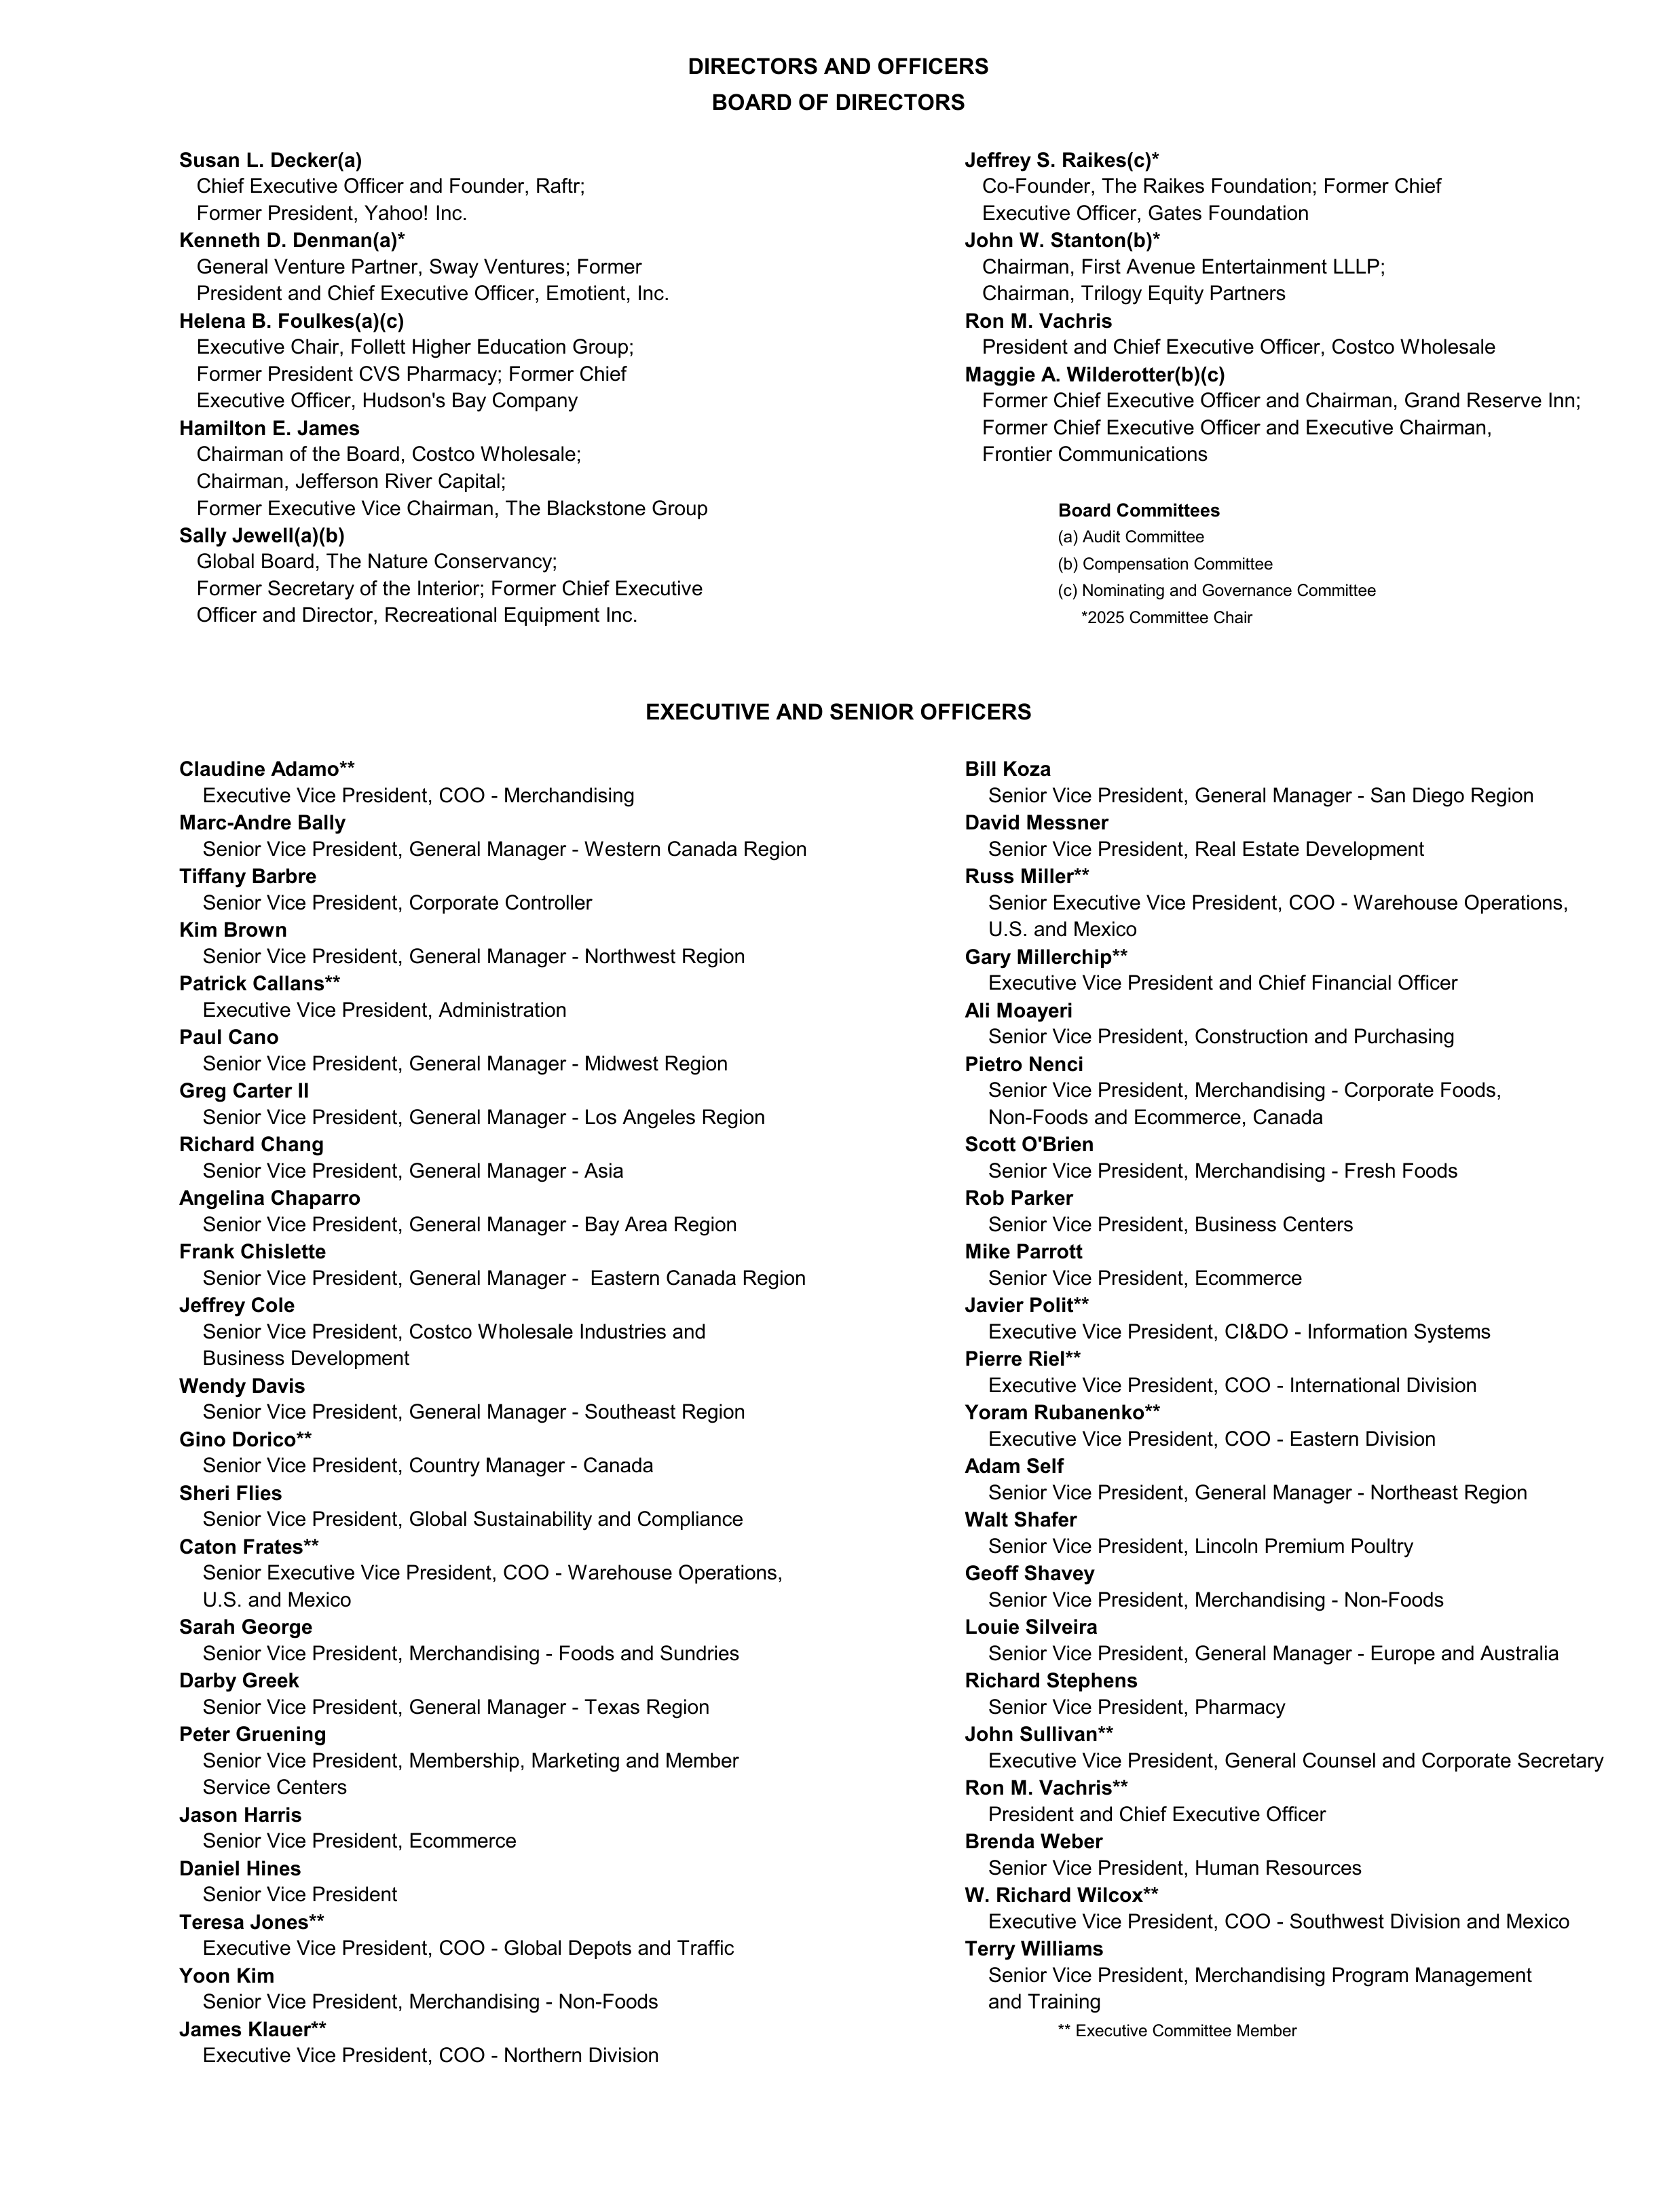
Susan L. Decker(a)
Chief Executive Officer and Founder, Raftr;
Co-Founder, The Raikes Foundation; Former Chief
Former President, Yahoo! Inc.
Kenneth D. Denman(a)*
General Venture Partner, Sway Ventures; Former
President and Chief Executive Officer, Emotient, Inc.
Chairman, Trilogy Equity Partners
Helena B. Foulkes(a)(c)
Ron M. Vachris
Executive Chair, Follett Higher Education Group;
President and Chief Executive Officer, Costco Wholesale
Former President CVS Pharmacy; Former Chief
Maggie A. Wilderotter(b)(c)
Executive Officer, Hudson's Bay Company
Former Chief Executive Officer and Chairman, Grand Reserve Inn;
Hamilton E. James
Former Chief Executive Officer and Executive Chairman,
Chairman of the Board, Costco Wholesale;
Frontier Communications
Chairman, Jefferson River Capital;
Former Executive Vice Chairman, The Blackstone Group
Board Committees
(a) Audit Committee
Global Board, The Nature Conservancy;
(b) Compensation Committee
(c) Nominating and Governance Committee
*2025 Committee Chair
Claudine Adamo**
Bill Koza
Executive Vice President, COO - Merchandising
Senior Vice President, General Manager - San Diego Region
Marc-Andre Bally
Senior Vice President, General Manager - Western Canada Region
Tiffany Barbre
Senior Vice President, Corporate Controller
Kim Brown
Senior Vice President, General Manager - Northwest Region
Patrick Callans**
Executive Vice President and Chief Financial Officer
Executive Vice President, Administration
Paul Cano
Senior Vice President, General Manager - Midwest Region
Pietro Nenci
Greg Carter II
Senior Vice President, General Manager - Los Angeles Region
Non-Foods and Ecommerce, Canada
Richard Chang
Scott O'Brien
Senior Vice President, General Manager - Asia
Angelina Chaparro
Rob Parker
Senior Vice President, General Manager - Bay Area Region
Senior Vice President, Business Centers
Frank Chislette
Mike Parrott
Senior Vice President, General Manager - Eastern Canada Region
Senior Vice President, Ecommerce
Jeffrey Cole
Javier Polit**
Senior Vice President, Costco Wholesale Industries and
Executive Vice President, CI&DO - Information Systems
Business Development
Pierre Riel**
Wendy Davis
Executive Vice President, COO - International Division
Senior Vice President, General Manager - Southeast Region
Yoram Rubanenko**
Gino Dorico**
Executive Vice President, COO - Eastern Division
Senior Vice President, Country Manager - Canada
Adam Self
Sheri Flies
Senior Vice President, General Manager - Northeast Region
Senior Vice President, Global Sustainability and Compliance
Walt Shafer
Caton Frates**
Senior Vice President, Lincoln Premium Poultry
Senior Executive Vice President, COO - Warehouse Operations,
Geoff Shavey
U.S. and Mexico
Senior Vice President, Merchandising - Non-Foods
Sarah George
Louie Silveira
Senior Vice President, Merchandising - Foods and Sundries
Senior Vice President, General Manager - Europe and Australia
Darby Greek
Richard Stephens
Senior Vice President, General Manager - Texas Region
Senior Vice President, Pharmacy
Peter Gruening
John Sullivan**
Senior Vice President, Membership, Marketing and Member
Executive Vice President, General Counsel and Corporate Secretary
Service Centers
Ron M. Vachris**
Jason Harris
President and Chief Executive Officer
Senior Vice President, Ecommerce
Brenda Weber
Daniel Hines
Senior Vice President, Human Resources
Senior Vice President
W. Richard Wilcox**
Teresa Jones**
Executive Vice President, COO - Southwest Division and Mexico
Executive Vice President, COO - Global Depots and Traffic
Terry Williams
Yoon Kim
Senior Vice President, Merchandising Program Management
Senior Vice President, Merchandising - Non-Foods
and Training
James Klauer**
** Executive Committee Member
Executive Vice President, COO - Northern Division
David Messner
Senior Vice President, Real Estate Development
Russ Miller**
Jeffrey S. Raikes(c)*
Executive Officer, Gates Foundation
EXECUTIVE AND SENIOR OFFICERS
Sally Jewell(a)(b)
Former Secretary of the Interior; Former Chief Executive
Officer and Director, Recreational Equipment Inc.
DIRECTORS AND OFFICERS
BOARD OF DIRECTORS
John W. Stanton(b)*
Chairman, First Avenue Entertainment LLLP;
Senior Vice President, Merchandising - Fresh Foods
Senior Vice President, Construction and Purchasing
Ali Moayeri
U.S. and Mexico
Senior Executive Vice President, COO - Warehouse Operations,
Senior Vice President, Merchandising - Corporate Foods,
Gary Millerchip**

[This page intentionally left blank]

[This page intentionally left blank]

[This page intentionally left blank]
ADDITIONAL INFORMATION
Shareholder Information
Copies of Costco's Annual Report on Form 10-K and Quarterly Reports on Form 10-Q will be provided to any
shareholder upon written request to Investor Relations, Costco Wholesale Corporation, 999 Lake Drive, Issaquah,
Washington 98027. Internet users can access recent sales and earnings releases, the annual report and SEC filings,
as well as our Costco website, at www.costco.com. E-mail users can direct investor relations questions
to investor@costco.com. The SEC maintains a site that contains reports, proxy and information statements, and
other information regarding issuers, such as the Company, that file electronically with the SEC, at www.sec.gov.
Annual Meeting
Thursday, January 15, 2026 at 2:00 PM Pacific
www.virtualshareholdermeeting.com/COST2026
Independent Public Accountants
KPMG LLP
401 Union Street, Suite 2800
Seattle, WA 98101
Stock Exchange Listing
The Nasdaq Global Select Market
Stock Symbol:
COST
Transfer Agent
Computershare
Costco Shareholder Relations
Correspondence should be mailed to:
P.O. Box 43006
Providence RI 02940
Overnight correspondence should be sent
to: 150 Royall St., Suite 101
Canton, MA 02021
Telephone: (800) 249-8982
TDD for Hearing Impaired: (800) 490-1493
Outside U.S.: (201) 680-6578
Website: https://www.computershare.com/investor

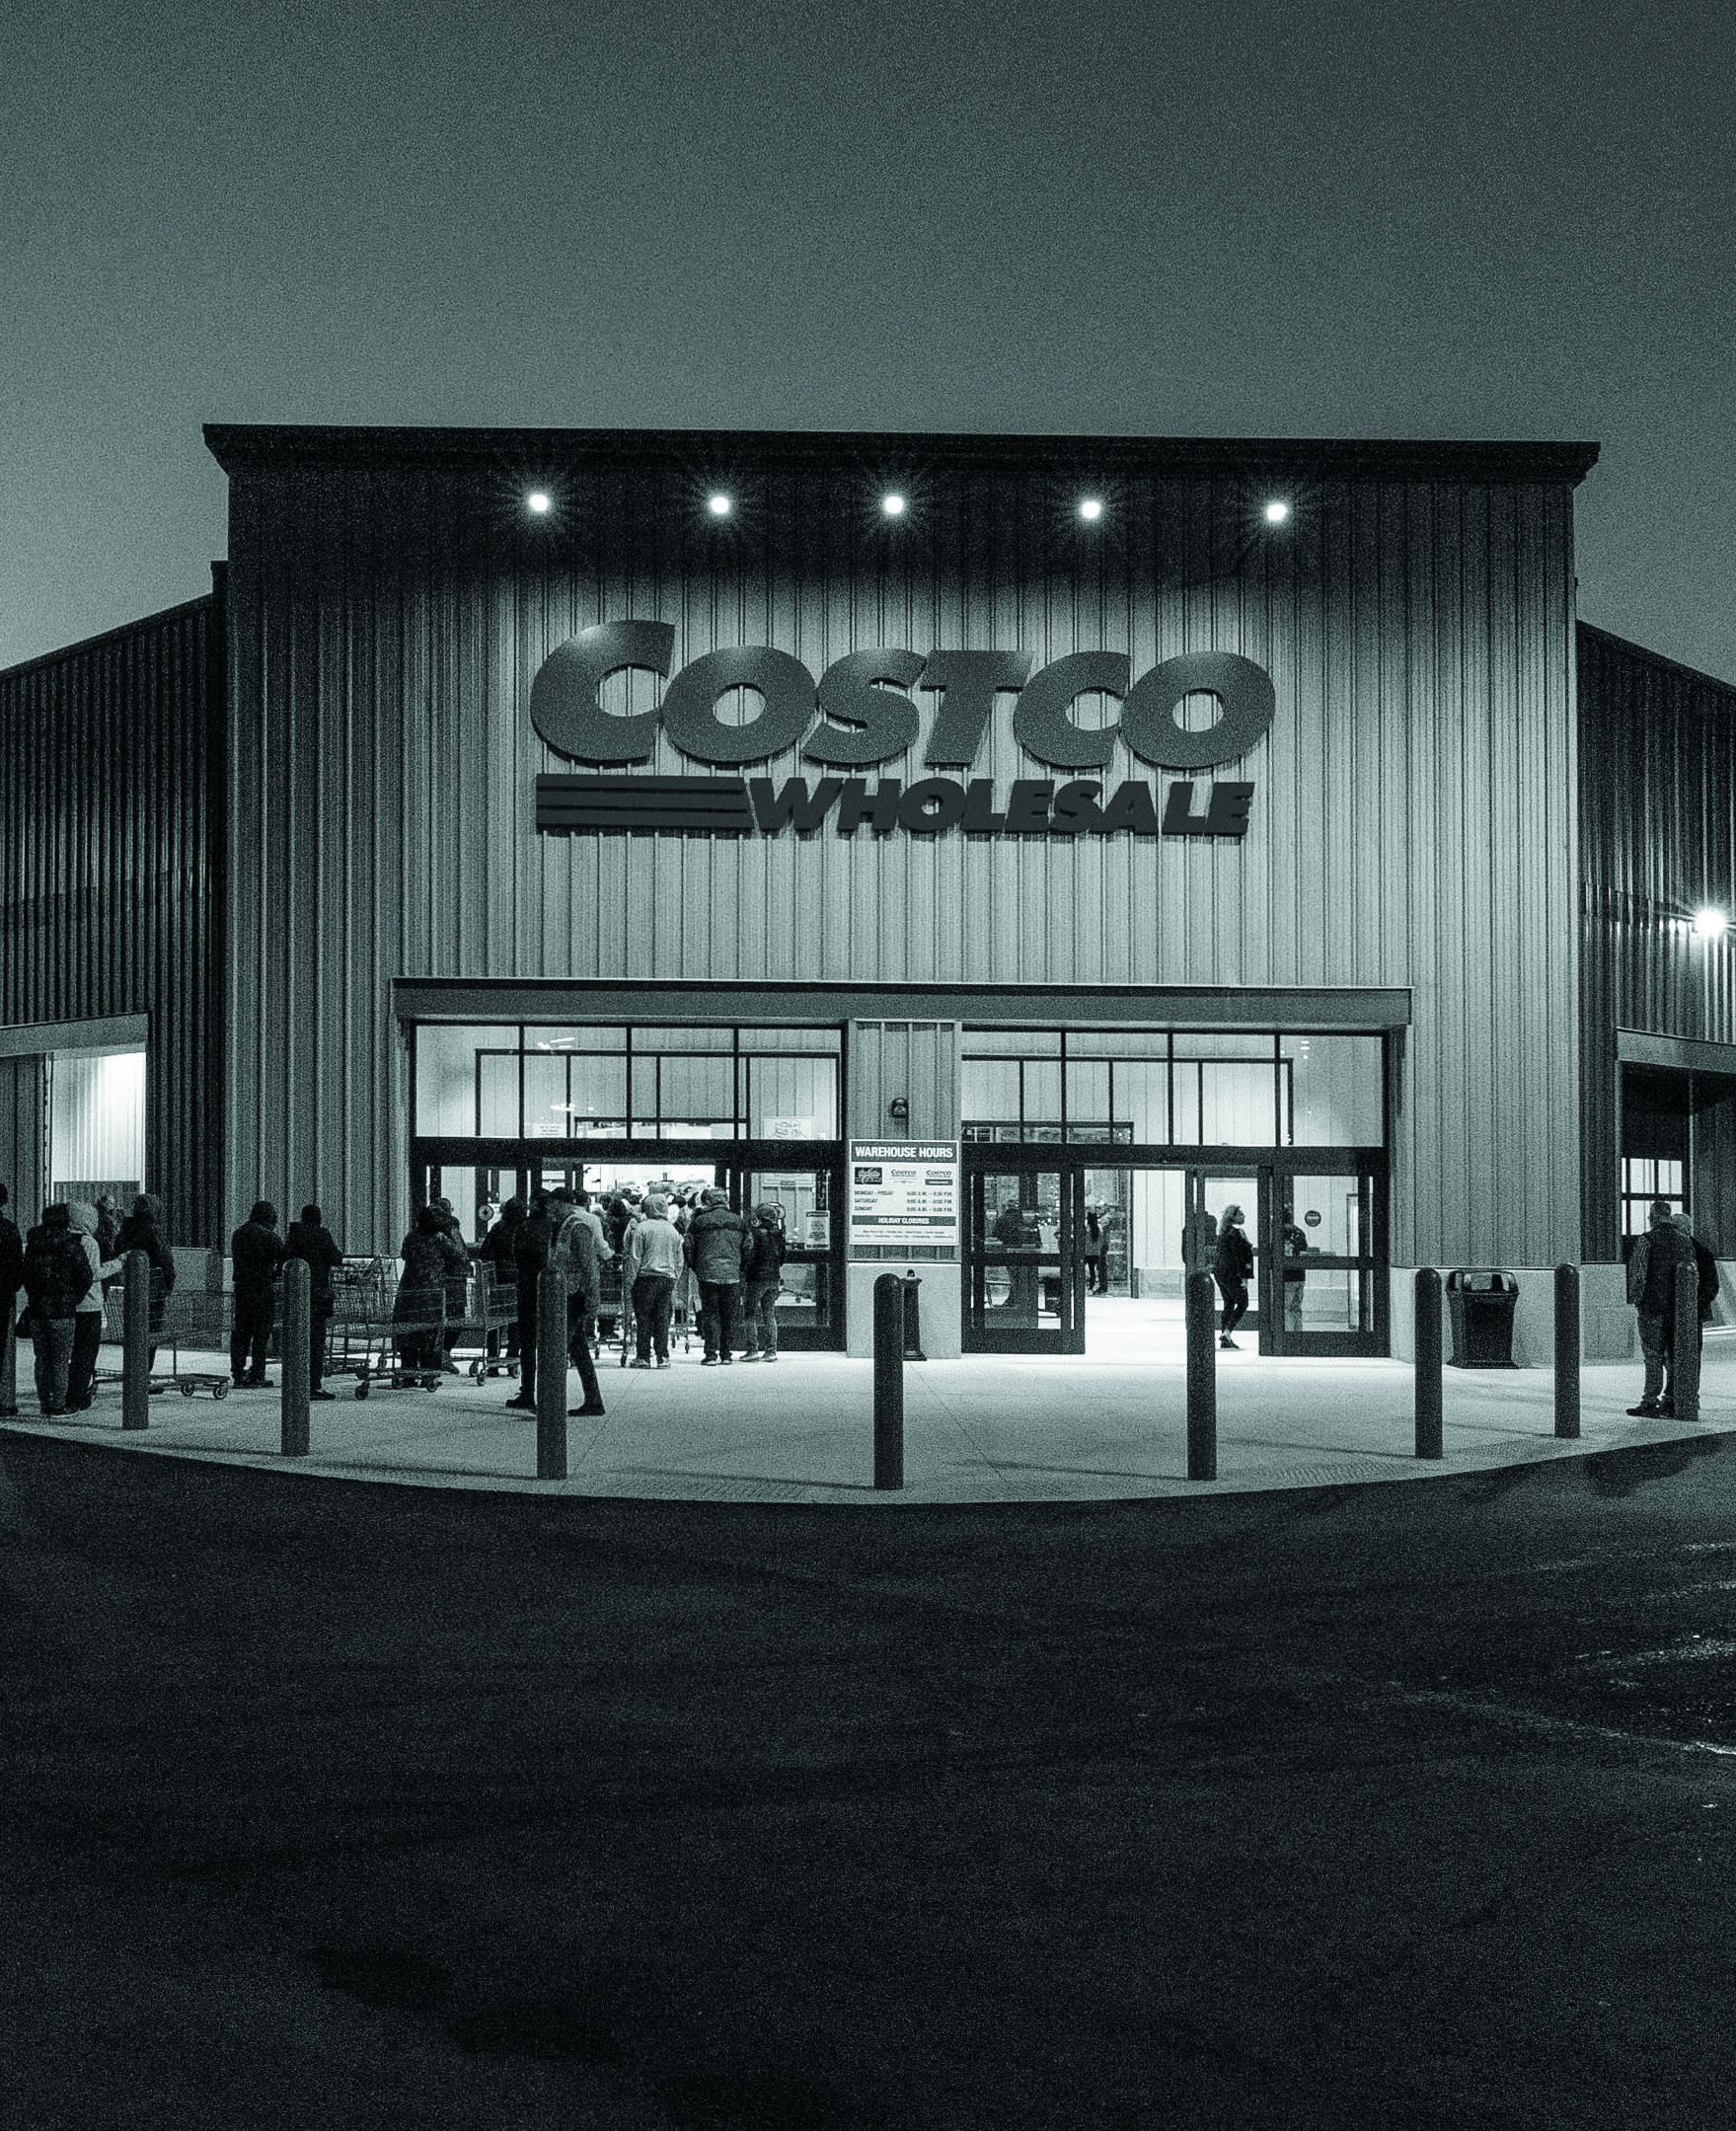
COR000075 1025
A commitment to quality and value at
923 locations and on Costco.com