


2025
Annual
Report
FORD MOTOR COMPANY

UNITED STATES
SECURITIES AND EXCHANGE COMMISSION
Washington, DC 20549
FORM 10-K
☑
Annual report pursuant to Section 13 or 15(d) of the Securities Exchange Act of 1934
For the fiscal year ended December 31, 2025
or
☐
Transition report pursuant to Section 13 or 15(d) of the Securities Exchange Act of 1934
For the transition period from __________ to __________
Commission file number 1-3950
Ford Motor Company
(Exact name of Registrant as specified in its charter)
Delaware
38-0549190
(State of incorporation)
(I.R.S. Employer Identification No.)
One American Road
Dearborn,
Michigan
48126
(Address of principal executive offices)
(Zip Code)
313-322-3000
(Registrant’s telephone number, including area code)
Securities registered pursuant to Section 12(b) of the Act:
Title of each class
Trading symbols
Name of each exchange on which registered
Common Stock, par value $.01 per share
F
New York Stock Exchange
6.200% Notes due June 1, 2059
FPRB
New York Stock Exchange
6.000% Notes due December 1, 2059
FPRC
New York Stock Exchange
6.500% Notes due August 15, 2062
FPRD
New York Stock Exchange
Securities registered pursuant to Section 12(g) of the Act:
None.
Indicate by check mark if the registrant is a well-known seasoned issuer, as defined in Rule 405 of the Securities Act.
Yes
☑
No
☐
Indicate by check mark if the registrant is not required to file reports pursuant to Section 13 or Section 15(d) of the Act.
Yes
☐
No
☑
Indicate by check mark whether the registrant (1) has filed all reports required to be filed by Section 13 or 15(d) of the
Securities Exchange Act of 1934 during the preceding 12 months (or for such shorter period that the registrant was
required to file such reports), and (2) has been subject to such filing requirements for the past 90 days. Yes
☑
No
☐
Indicate by check mark whether the registrant has submitted electronically every Interactive Data File required to be
submitted pursuant to Rule 405 of Regulation S-T (§ 232.405 of this chapter) during the preceding 12 months (or for such
shorter period that the registrant was required to submit such files). Yes
☑
No
☐
Indicate by check mark whether the registrant is a large accelerated filer, an accelerated filer, a non-accelerated filer,
a smaller reporting company, or emerging growth company. See the definitions of “large accelerated filer,” “accelerated
filer,” “smaller reporting company,” and “emerging growth company” in Rule 12b-2 of the Exchange Act.
Large accelerated filer
☑
Accelerated filer
☐
Non-accelerated filer
☐
Smaller reporting company
☐
Emerging growth company
☐
If an emerging growth company, indicate by check mark if the registrant has elected not to use the extended transition
period for complying with any new or revised financial accounting standards provided pursuant to Section 13(a) of the
Exchange Act.
☐
Indicate by check mark whether the registrant has filed a report on and attestation to its management’s assessment of
the effectiveness of its internal control over financial reporting under Section 404(b) of the Sarbanes-Oxley Act (15 U.S.C.
7262(b)) by the registered public accounting firm that prepared or issued its audit report.
☑
If securities are registered pursuant to Section 12(b) of the Act, indicate by check mark whether the financial
statements of the registrant included in the filing reflect the correction of an error to previously issued financial statements.
☐
Indicate by check mark whether any of those error corrections are restatements that required recovery analysis of
incentive-based compensation received by any of the registrant’s executive officers during the relevant recovery period
pursuant to §240.10D-1(b).
☐
Indicate by check mark whether the registrant is a shell company (as defined in Rule 12b-2 of the Act). Yes
☐
No
☑
As of June 30, 2025, Ford had outstanding 3,908,928,344 shares of Common Stock and 70,852,076 shares of
Class B Stock. Based on the New York Stock Exchange Composite Transaction closing price of the Common Stock on
that date ($10.85 per share), the aggregate market value of such Common Stock was $42,411,872,532. Although there is
no quoted market for our Class B Stock, shares of Class B Stock may be converted at any time into an equal number of
shares of Common Stock for the purpose of effecting the sale or other disposition of such shares of Common Stock. The
shares of Common Stock and Class B Stock outstanding at June 30, 2025 included shares owned by persons who may
be deemed to be “affiliates” of Ford. We do not believe, however, that any such person should be considered to be an
affiliate. For information concerning ownership of outstanding Common Stock and Class B Stock, see the Proxy
Statement for Ford’s Annual Meeting of Stockholders currently scheduled to be held on May 14, 2026 (our “Proxy
Statement”), which is incorporated by reference under various Items of this Report as indicated below.
As of February 6, 2026, Ford had outstanding 3,918,623,149 shares of Common Stock and 70,852,076 shares of
Class B Stock. Based on the New York Stock Exchange Composite Transaction closing price of the Common Stock on
that date ($13.80 per share), the aggregate market value of such Common Stock was $54,076,999,456.
DOCUMENTS INCORPORATED BY REFERENCE
Document
Where Incorporated
Proxy Statement*
Part III (Items 10, 11, 12, 13, and 14)
__________
*
As stated under various Items of this Report, only certain specified portions of such document are incorporated by
reference in this Report.
Exhibit Index begins on page 101
FORD MOTOR COMPANY
ANNUAL REPORT ON FORM 10-K
For the Year Ended December 31, 2025
Table of Contents
Page
Part I
Item 1
Business
1
Overview
2
Ford Blue, Ford Model e, and Ford Pro Segment
2
Ford Credit Segment
6
Corporate Other
7
Interest on Debt
7
Governmental Standards
7
Human Capital Resources
14
Item 1A
Risk Factors
18
Item 1B
Unresolved Staff Comments
33
Item 1C
Cybersecurity
33
Item 2
Properties
35
Item 3
Legal Proceedings
36
Item 4
Mine Safety Disclosures
38
Item 4A
Information about our Executive Officers
39
Part II
Item 5
Market for Registrant’s Common Equity, Related Stockholder Matters and Issuer Purchases of
Equity Securities
41
Item 6
[Reserved]
42
Item 7
Management’s Discussion and Analysis of Financial Condition and Results of Operations
43
Key Trends and Economic Factors Affecting Ford and the Automotive Industry
43
Results of Operations - 2025
47
Ford Blue Segment
49
Ford Model e Segment
50
Ford Pro Segment
50
Ford Credit Segment
52
Corporate Other
55
Interest on Debt
55
Taxes
55
Results of Operations - 2024
56
Ford Blue Segment
58
Ford Model e Segment
59
Ford Pro Segment
59
Ford Credit Segment
60
Corporate Other
61
Interest on Debt
61
Taxes
61
Liquidity and Capital Resources
62
Credit Ratings
73
Outlook
74
Cautionary Note on Forward-Looking Statements
75
Non-GAAP Financial Measures That Supplement GAAP Measures
77
Table of Contents
(continued)
Non-GAAP Financial Measure Reconciliations
79
2025 Supplemental Financial Information
81
Critical Accounting Estimates
85
Accounting Standards Issued But Not Yet Adopted
93
Item 7A
Quantitative and Qualitative Disclosures About Market Risk
94
Item 8
Financial Statements and Supplementary Data
97
Item 9
Changes in and Disagreements with Accountants on Accounting and Financial Disclosure
97
Item 9A
Controls and Procedures
98
Item 9B
Other Information
98
Item 9C
Disclosure Regarding Foreign Jurisdictions that Prevent Inspections
98
Part III
Item 10
Directors, Executive Officers of Ford, and Corporate Governance
99
Item 11
Executive Compensation
99
Item 12
Security Ownership of Certain Beneficial Owners and Management and Related Stockholder
Matters
99
Item 13
Certain Relationships and Related Transactions, and Director Independence
99
Item 14
Principal Accounting Fees and Services
99
Part IV
Item 15
Exhibits and Financial Statement Schedules
100
Item 16
Form 10-K Summary
105
Signatures
106
Ford Motor Company and Subsidiaries Financial Statements
Report of Independent Registered Public Accounting Firm
108
Consolidated Income Statements
111
Consolidated Statements of Comprehensive Income
111
Consolidated Balance Sheets
112
Consolidated Statements of Cash Flows
113
Consolidated Statements of Equity
114
Notes to the Financial Statements
115
Schedule II — Valuation and Qualifying Accounts
176
PART I.
ITEM 1.
Business.
Ford Motor Company was incorporated in Delaware in 1919. We acquired the business of a Michigan company, also
known as Ford Motor Company, which had been incorporated in 1903 to produce and sell automobiles designed and
engineered by Henry Ford. We are a global company based in Dearborn, Michigan. With about 169,000 employees
worldwide, the Company is committed to helping build a better world, where every person is free to move and pursue their
dreams. The Company’s Ford+ plan for growth and value creation combines existing strengths, new capabilities, and
always-on relationships with customers to enrich experiences for customers and deepen their loyalty. Ford develops and
delivers innovative, must-have Ford trucks, sport utility vehicles, commercial vans and cars, and Lincoln luxury vehicles,
along with connected services, including BlueCruise (ADAS) and security. The Company offers freedom of choice through
three customer-centered business segments: Ford Blue, engineering iconic gas-powered and hybrid vehicles; Ford
Model e, inventing breakthrough electric vehicles (“EVs”), including extended range electric vehicles (“EREVs”), along with
embedded software that defines always-on digital experiences for all customers; and Ford Pro, helping commercial
customers transform and expand their businesses with vehicles and services tailored to their needs. Additionally, the
Company provides financial services through Ford Motor Credit Company LLC (“Ford Credit”).
In addition to the information about Ford and our subsidiaries contained in this Annual Report on Form 10-K for the
year ended December 31, 2025 (“2025 Form 10-K Report” or “Report”), extensive information about our Company can be
found at https://corporate.ford.com, including information about our management team, brands, products, services, and
corporate governance principles.
The corporate governance information on our website includes our Corporate Governance Principles, Code of Ethics
for Senior Financial Personnel, Code of Ethics for the Board of Directors, Code of Corporate Conduct for all employees,
and the Charters for each of the Committees of our Board of Directors. In addition, any amendments to our Code of
Ethics or waivers granted to our directors and executive officers will be posted on our corporate website. All of these
documents may be accessed by going to our corporate website, or may be obtained free of charge by writing to our
Shareholder Relations Department, Ford Motor Company, One American Road, P.O. Box 1899, Dearborn, Michigan
48126-1899.
Our recent periodic reports filed with the Securities and Exchange Commission (“SEC”) pursuant to Section 13(a) or
15(d) of the Securities Exchange Act of 1934, as amended, are available free of charge at https://shareholder.ford.com.
This includes recent Annual Reports on Form 10-K, Quarterly Reports on Form 10-Q, and Current Reports on Form 8-K,
as well as any amendments to those reports, and our Section 16 filings. We post each of these documents on our
website as soon as reasonably practicable after it is electronically filed with the SEC. Our reports filed with the SEC also
may be found on the SEC’s website at www.sec.gov.
Our Integrated Sustainability and Financial Report, which details our performance and progress toward our
sustainability and corporate responsibility goals, is available at https://sustainability.ford.com.
The foregoing information regarding our websites and their content is for convenience only and not deemed to be
incorporated by reference into this Report nor filed with the SEC.
1
OVERVIEW
Below is a description of our reportable segments and other activities as of December 31, 2025.
FORD BLUE SEGMENT
Ford Blue primarily includes the sale of Ford and Lincoln internal combustion engine (“ICE”) and hybrid (excluding
EREVs) vehicles, service parts, accessories, and digital services for retail customers, together with the associated costs
of development, manufacture, and distribution of the vehicles, parts, accessories, and services. This segment focuses on
developing Ford and Lincoln ICE and hybrid vehicles. Additionally, this segment provides hardware engineering and
manufacturing capabilities to Ford Model e and manufactures vehicles on behalf of Ford Pro and, in certain cases, Ford
Model e. Ford Blue also includes:
•
All sales for markets not presently in scope for Ford Model e or Ford Pro (as further described below)
•
In markets outside of the United States and Canada, sales to commercial, government, and rental customers of
ICE and hybrid vehicles not considered core to Ford Pro
•
Sales of EVs, including EREVs, by our unconsolidated affiliates in China
•
All sales of vehicles manufactured and sold to other OEMs
FORD MODEL E SEGMENT
Ford Model e primarily includes the sale of our EVs (including EREVs), service parts, accessories, and digital services
for retail customers, together with the associated costs of development, manufacture, and distribution of the vehicles,
parts, accessories, and services. This segment focuses on developing EV and digital vehicle technologies, as well as
software development. Additionally, Ford Model e provides software and connected vehicle technologies on behalf of the
enterprise, and manufactures certain EVs, including for Ford Pro. Ford Model e operates in North America, Europe, and
China. Ford Model e also includes EV and related sales not considered core to Ford Pro to commercial, government, and
rental customers in Europe, China, and Mexico.
FORD PRO SEGMENT
Ford Pro primarily includes the sale of Ford and Lincoln vehicles, service parts, accessories, and services for
commercial, government, and rental customers. Included in this segment are sales of all core Ford Pro vehicles, such as
Super Duty and the Transit range of vans in North America and Europe and all sales of Ranger in Europe. In the United
States and Canada, Ford Pro also includes all vehicle sales to commercial, government, and rental customers. This
segment focuses on selling ICE, hybrid, and electric vehicles, and providing digital and physical services to optimize and
maintain fleets, including telematics and EV charging solutions. This segment reflects external sales of vehicles produced
by Ford Blue and Ford Model e and the costs (including intersegment markup) associated with acquiring vehicles for sale
and providing services. Ford Pro operates in North America and Europe.
General
Our vehicle brands are Ford and Lincoln. In 2025, we sold approximately 4,395,000 vehicles at wholesale throughout
the world. See “Item 7. Management’s Discussion and Analysis of Financial Condition and Results of
Operations” (“Item 7”) for a discussion of our calculation of wholesale unit volumes.
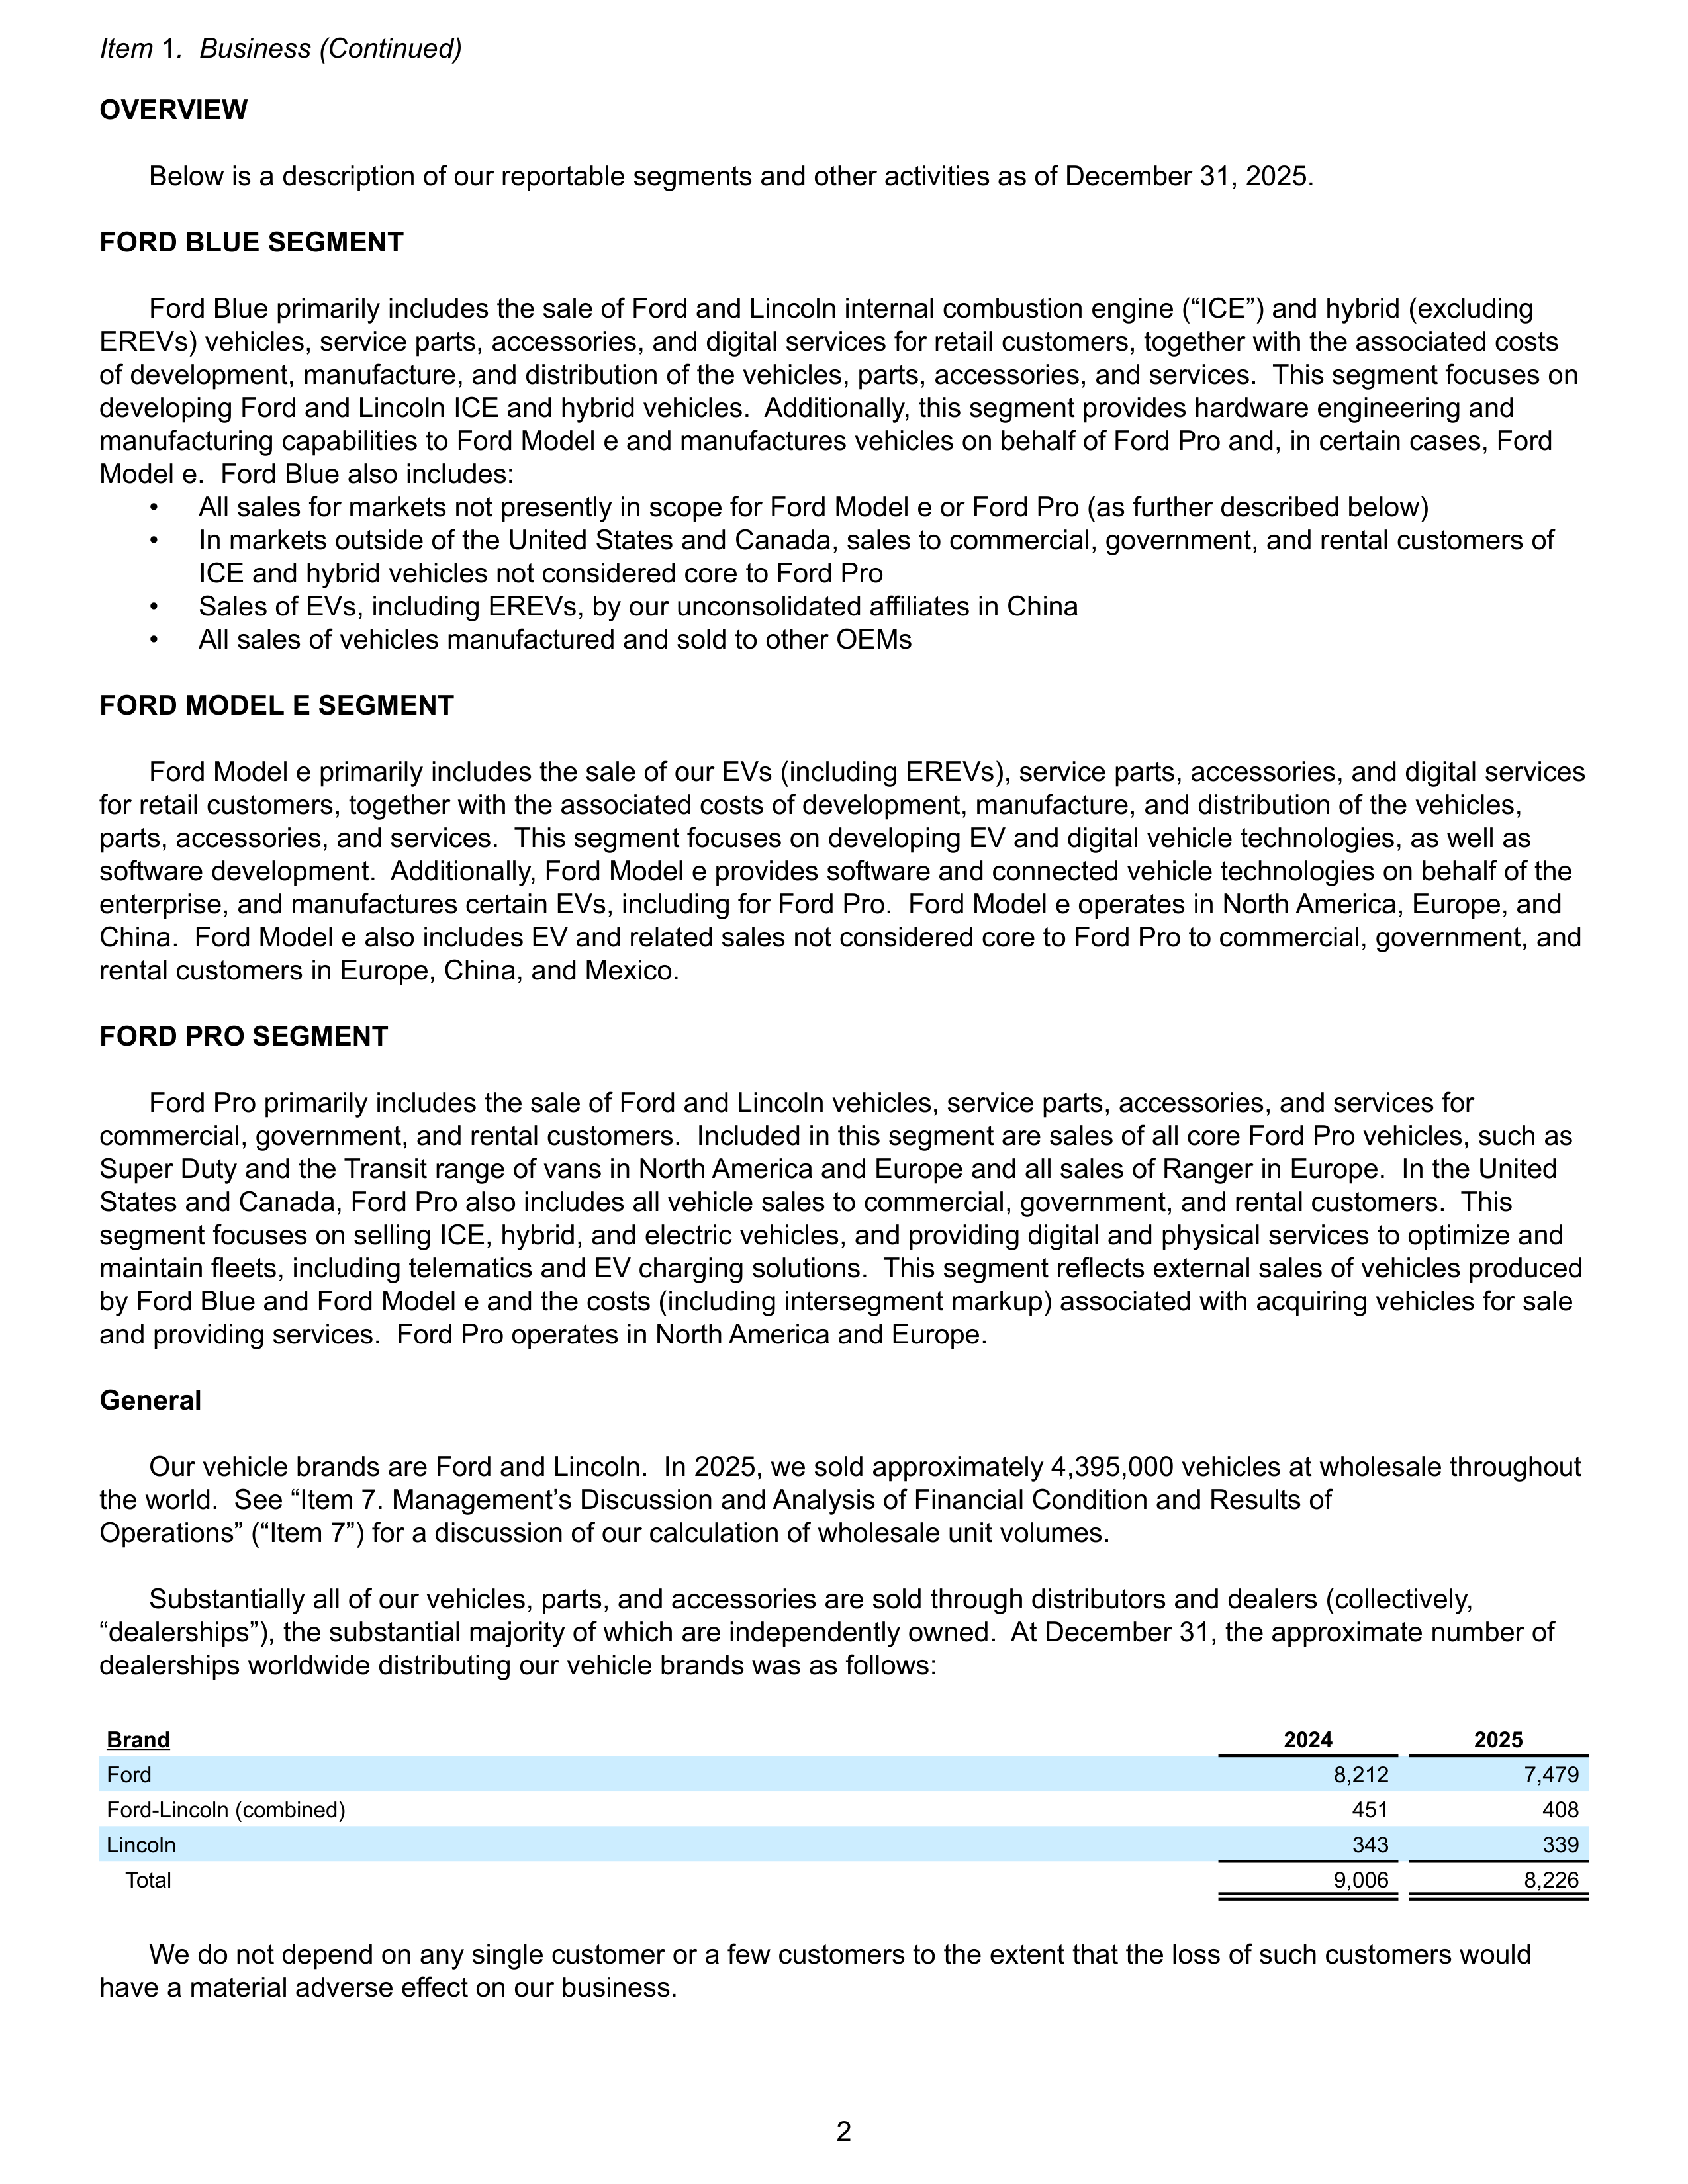
Substantially all of our vehicles, parts, and accessories are sold through distributors and dealers (collectively,
“dealerships”), the substantial majority of which are independently owned. At December 31, the approximate number of
dealerships worldwide distributing our vehicle brands was as follows:
Brand
2024
2025
Ford
8,212
7,479
Ford-Lincoln (combined)
451
408
Lincoln
343
339
Total
9,006
8,226
We do not depend on any single customer or a few customers to the extent that the loss of such customers would
have a material adverse effect on our business.
Item
1
. Business (Continued)
2
In addition to the products we sell to our dealerships for retail sale, we also sell vehicles to our dealerships for sale to
fleet customers, including commercial fleet customers, daily rental car companies, and governments. We also sell parts
and accessories, primarily to our dealerships (which, in turn, sell these products to retail customers) and to authorized
parts distributors (which, in turn, primarily sell these products to retailers). We also offer extended service contracts.
The worldwide automotive industry is affected significantly by general economic and political conditions over which we
have little control. Vehicles are durable goods, and consumers and businesses have latitude in determining whether and
when to replace an existing vehicle. The decision whether to purchase a vehicle may be affected significantly by slowing
economic growth, geopolitical events, and other factors (including the cost of purchasing and operating cars, trucks, and
utility vehicles, the availability and cost of financing, cost of fuel, and EV charging availability and cost). As a result, the
number of cars, trucks, and utility vehicles sold may vary substantially from year to year. Further, the automotive industry
is a highly competitive business that has a wide and growing variety of product and service offerings from a growing
number of manufacturers.
Our wholesale unit volumes vary with the level of total industry demand and our share of that industry demand. Our
wholesale unit volumes also are influenced by the level of dealer inventory, and our ability to maintain sufficient production
levels to support desired dealer inventory in the event of supplier disruptions or other types of disruptions affecting our
production. Our share is influenced by how our products are perceived by customers in comparison to those offered by
other manufacturers based on many factors, including price, quality, styling, reliability, safety, fuel efficiency, functionality,
sustainability, and reputation. Our share also is affected by the timing and frequency of new model introductions. Our
ability to satisfy changing consumer and business preferences with respect to type or size of vehicle, as well as design
and performance characteristics and the services our vehicles offer, affects our sales and earnings significantly.
As with other manufacturers, the profitability of our business is affected by many factors, including:
•
Wholesale unit volumes
•
Margin of profit on each vehicle sold - which, in turn, is affected by many factors, such as:
◦
Market factors - volume and mix of vehicles and options sold, and net pricing (reflecting, among other factors,
incentive programs)
◦
Costs of components and raw materials necessary for production of vehicles
◦
Costs for customer warranty claims and additional service actions
◦
Costs for safety, emissions, and fuel economy technology and equipment
•
A high proportion of relatively fixed structural costs, so that small changes in wholesale unit volumes can
significantly affect overall profitability
Although supply disruptions have resulted in a higher level of new vehicle prices, our industry has historically had a
very competitive pricing environment, driven in part by excess capacity. For the past several decades, manufacturers
typically have offered price discounts and other marketing incentives to provide value for customers and maintain market
share and production levels, and we saw some of these actions resume as industry production and inventories increased
in recent quarters, especially with waning policy support for EVs leading to excess supply in that market segment. The
decline in value of foreign currencies can also contribute significantly to competitive pressures in many of our markets.
Competitive Position.
The worldwide automotive industry consists of many producers, with no single dominant
producer. Certain manufacturers, however, account for the major percentage of total sales within particular countries,
especially their countries of origin.
Seasonality.
We manage our vehicle production schedule based on a number of factors, including retail sales
(i.e., units sold by our dealerships to their customers at retail) and dealer stock levels (i.e., the number of units held in
inventory by our dealerships for sale to their customers). Historically, we have experienced some seasonal fluctuation in
the business, with production in many markets tending to be higher in the first half of the year to meet demand in the
spring and summer (typically the strongest sales months of the year); however, that may not be the case in a particular
year depending on the circumstances, e.g., if we have a higher number of vehicle launches (particularly for our higher
volume vehicles) in the first half of the year, we would expect production in the second half of the year to be higher.
Item
1
. Business (Continued)
3
Raw Materials.
We purchase a wide variety of raw materials from numerous suppliers around the world for use in the
production of, and development of technologies in, our vehicles. These materials include base metals (e.g., steel and
aluminum), precious metals (e.g., palladium), energy (e.g., natural gas), plastics/resins (e.g., polypropylene), battery raw
materials (e.g., lithium, cobalt, nickel), and rare earth minerals (e.g., magnets, neodymium, dysprosium). We expect to
have adequate supplies or sources of availability of raw materials necessary to meet our needs; however, there always
are risks and uncertainties with respect to the supply of raw materials that could impact availability in sufficient quantities
and at cost effective prices to meet our needs. See “Item 1A. Risk Factors” for a discussion of the risks associated with a
shortage of components or raw materials, supplier disruptions, and inflationary pressures, the “Key Trends and Economic
Factors Affecting Ford and the Automotive Industry” section of Item 7 for a discussion of commodity and energy price
changes, and “Item 7A. Quantitative and Qualitative Disclosures about Market Risk” (“Item 7A”) for a discussion of
commodity price risks.
Intellectual Property.
We own or hold licenses to use numerous patents, trade secrets, copyrights, and trademarks on
a global basis. We expect to continue building this portfolio as we actively pursue innovation in every part of our
business. We also own numerous trademarks and service marks that contribute to the identity and recognition of our
Company and its products and services globally. While our intellectual property rights in the aggregate are important to
the operation of each of our businesses, we do not believe that our business would be materially affected by the expiration
of any particular intellectual property right or termination of any particular intellectual property agreement.
Warranty Coverage, Field Service Actions, and Customer Satisfaction Actions.
We provide warranties on vehicles we
sell. Warranties are offered for specific periods of time and/or mileage and vary depending upon the type of product and
the geographic location of its sale. Pursuant to these warranties, we will repair, replace, or adjust parts on a vehicle that
are defective in factory-supplied materials or workmanship during the specified warranty period. In addition to the costs
associated with this warranty coverage provided on our vehicles, we also incur costs as a result of field service actions
(i.e., safety recalls, emission recalls, and other product campaigns) and for customer satisfaction actions. Software
updates are increasingly a component of vehicle service and may be performed during warranty coverage repairs,
through field service actions, or through over-the-air updates.
For additional information regarding warranty and related costs, see “Critical Accounting Estimates” in Item 7 and
Note 24 of the Notes to the Financial Statements.
Wholesales
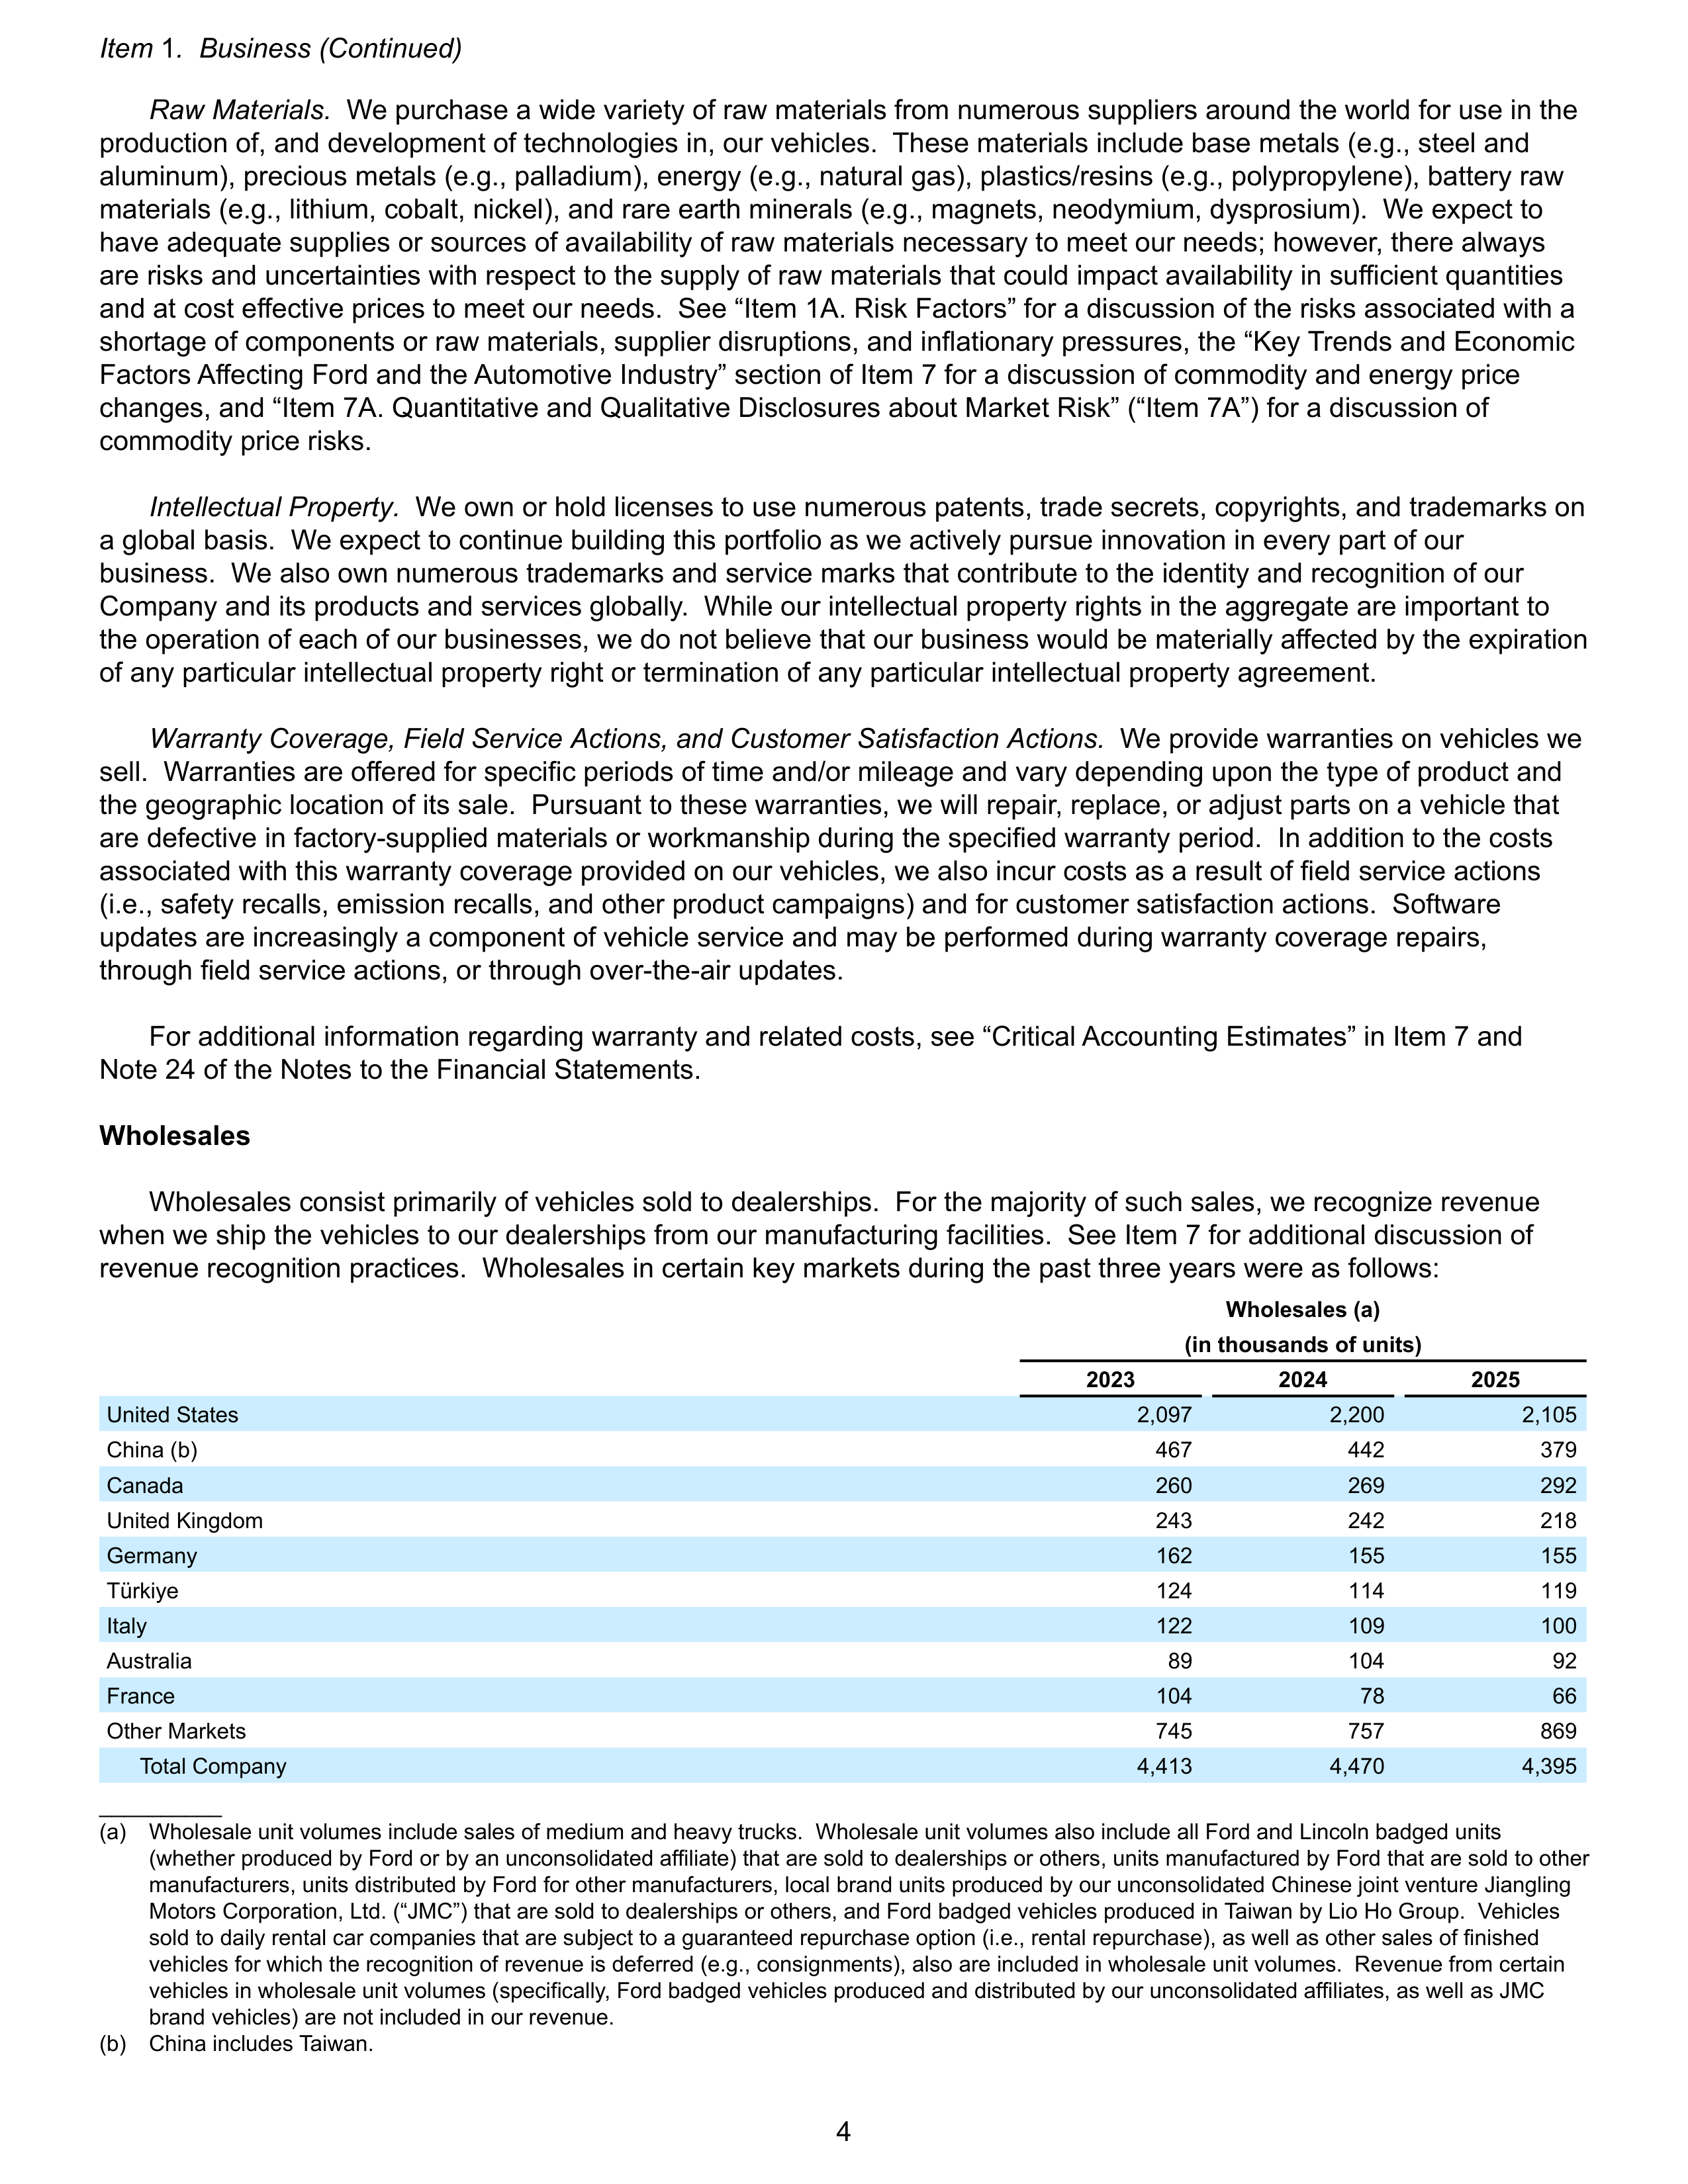
Wholesales consist primarily of vehicles sold to dealerships. For the majority of such sales, we recognize revenue
when we ship the vehicles to our dealerships from our manufacturing facilities. See Item 7 for additional discussion of
revenue recognition practices. Wholesales in certain key markets during the past three years were as follows:
Wholesales (a)
(in thousands of units)
2023
2024
2025
United States
2,097
2,200
2,105
China (b)
467
442
379
Canada
260
269
292
United Kingdom
243
242
218
Germany
162
155
155
Türkiye
124
114
119
Italy
122
109
100
Australia
89
104
92
France
104
78
66
Other Markets
745
757
869
Total Company
4,413
4,470
4,395
__________
(a)
Wholesale unit volumes include sales of medium and heavy trucks. Wholesale unit volumes also include all Ford and Lincoln badged units
(whether produced by Ford or by an unconsolidated affiliate) that are sold to dealerships or others, units manufactured by Ford that are sold to other
manufacturers, units distributed by Ford for other manufacturers, local brand units produced by our unconsolidated Chinese joint venture Jiangling
Motors Corporation, Ltd. (“JMC”) that are sold to dealerships or others, and Ford badged vehicles produced in Taiwan by Lio Ho Group. Vehicles
sold to daily rental car companies that are subject to a guaranteed repurchase option (i.e., rental repurchase), as well as other sales of finished
vehicles for which the recognition of revenue is deferred (e.g., consignments), also are included in wholesale unit volumes. Revenue from certain
vehicles in wholesale unit volumes (specifically, Ford badged vehicles produced and distributed by our unconsolidated affiliates, as well as JMC
brand vehicles) are not included in our revenue.
(b)
China includes Taiwan.
Item
1
. Business (Continued)
4
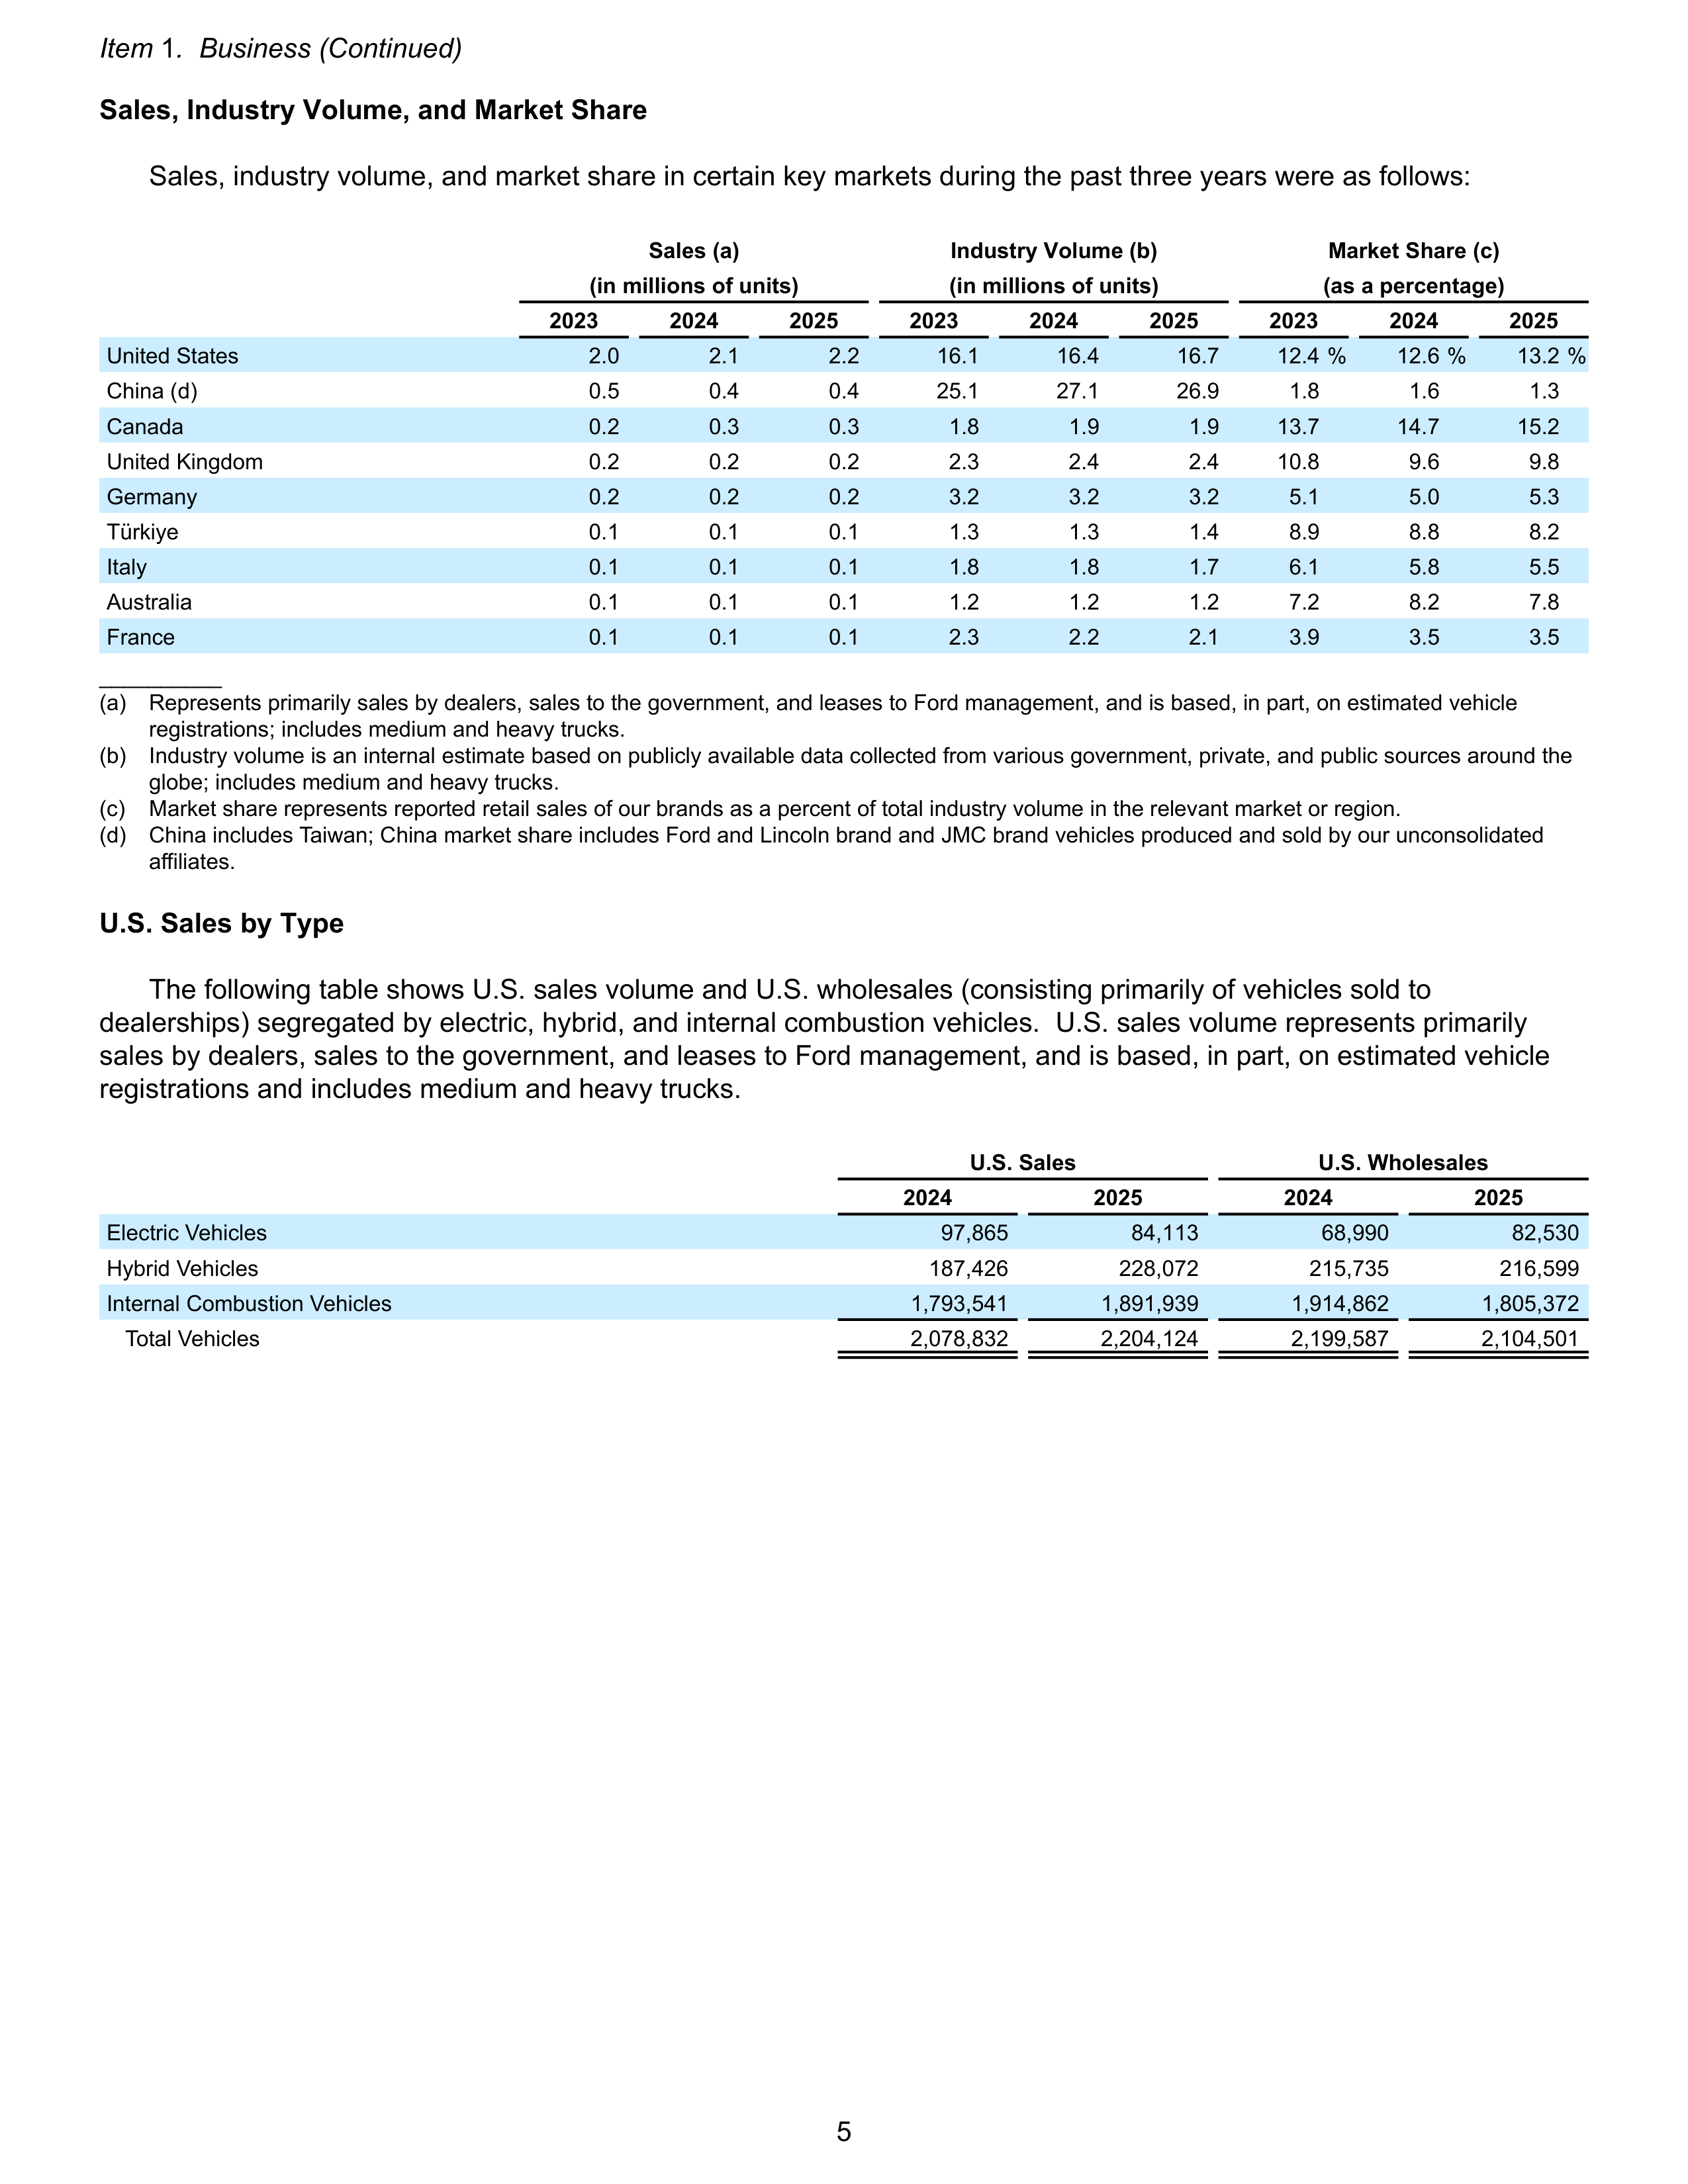
Sales, Industry Volume, and Market Share
Sales, industry volume, and market share in certain key markets during the past three years were as follows:
Sales (a)
Industry Volume (b)
Market Share (c)
(in millions of units)
(in millions of units)
(as a percentage)
2023
2024
2025
2023
2024
2025
2023
2024
2025
United States
2.0
2.1
2.2
16.1
16.4
16.7
12.4 %
12.6 %
13.2 %
China (d)
0.5
0.4
0.4
25.1
27.1
26.9
1.8
1.6
1.3
Canada
0.2
0.3
0.3
1.8
1.9
1.9
13.7
14.7
15.2
United Kingdom
0.2
0.2
0.2
2.3
2.4
2.4
10.8
9.6
9.8
Germany
0.2
0.2
0.2
3.2
3.2
3.2
5.1
5.0
5.3
Türkiye
0.1
0.1
0.1
1.3
1.3
1.4
8.9
8.8
8.2
Italy
0.1
0.1
0.1
1.8
1.8
1.7
6.1
5.8
5.5
Australia
0.1
0.1
0.1
1.2
1.2
1.2
7.2
8.2
7.8
France
0.1
0.1
0.1
2.3
2.2
2.1
3.9
3.5
3.5
__________
(a)
Represents primarily sales by dealers, sales to the government, and leases to Ford management, and is based, in part, on estimated vehicle
registrations; includes medium and heavy trucks.
(b)
Industry volume is an internal estimate based on publicly available data collected from various government, private, and public sources around the
globe; includes medium and heavy trucks.
(c)
Market share represents reported retail sales of our brands as a percent of total industry volume in the relevant market or region.
(d)
China includes Taiwan; China market share includes Ford and Lincoln brand and JMC brand vehicles produced and sold by our unconsolidated
affiliates.
U.S. Sales by Type
The following table shows U.S. sales volume and U.S. wholesales (consisting primarily of vehicles sold to
dealerships) segregated by electric, hybrid, and internal combustion vehicles. U.S. sales volume represents primarily
sales by dealers, sales to the government, and leases to Ford management, and is based, in part, on estimated vehicle
registrations and includes medium and heavy trucks.
U.S. Sales
U.S. Wholesales
2024
2025
2024
2025
Electric Vehicles
97,865
84,113
68,990
82,530
Hybrid Vehicles
187,426
228,072
215,735
216,599
Internal Combustion Vehicles
1,793,541
1,891,939
1,914,862
1,805,372
Total Vehicles
2,078,832
2,204,124
2,199,587
2,104,501
Item
1
. Business (Continued)
5
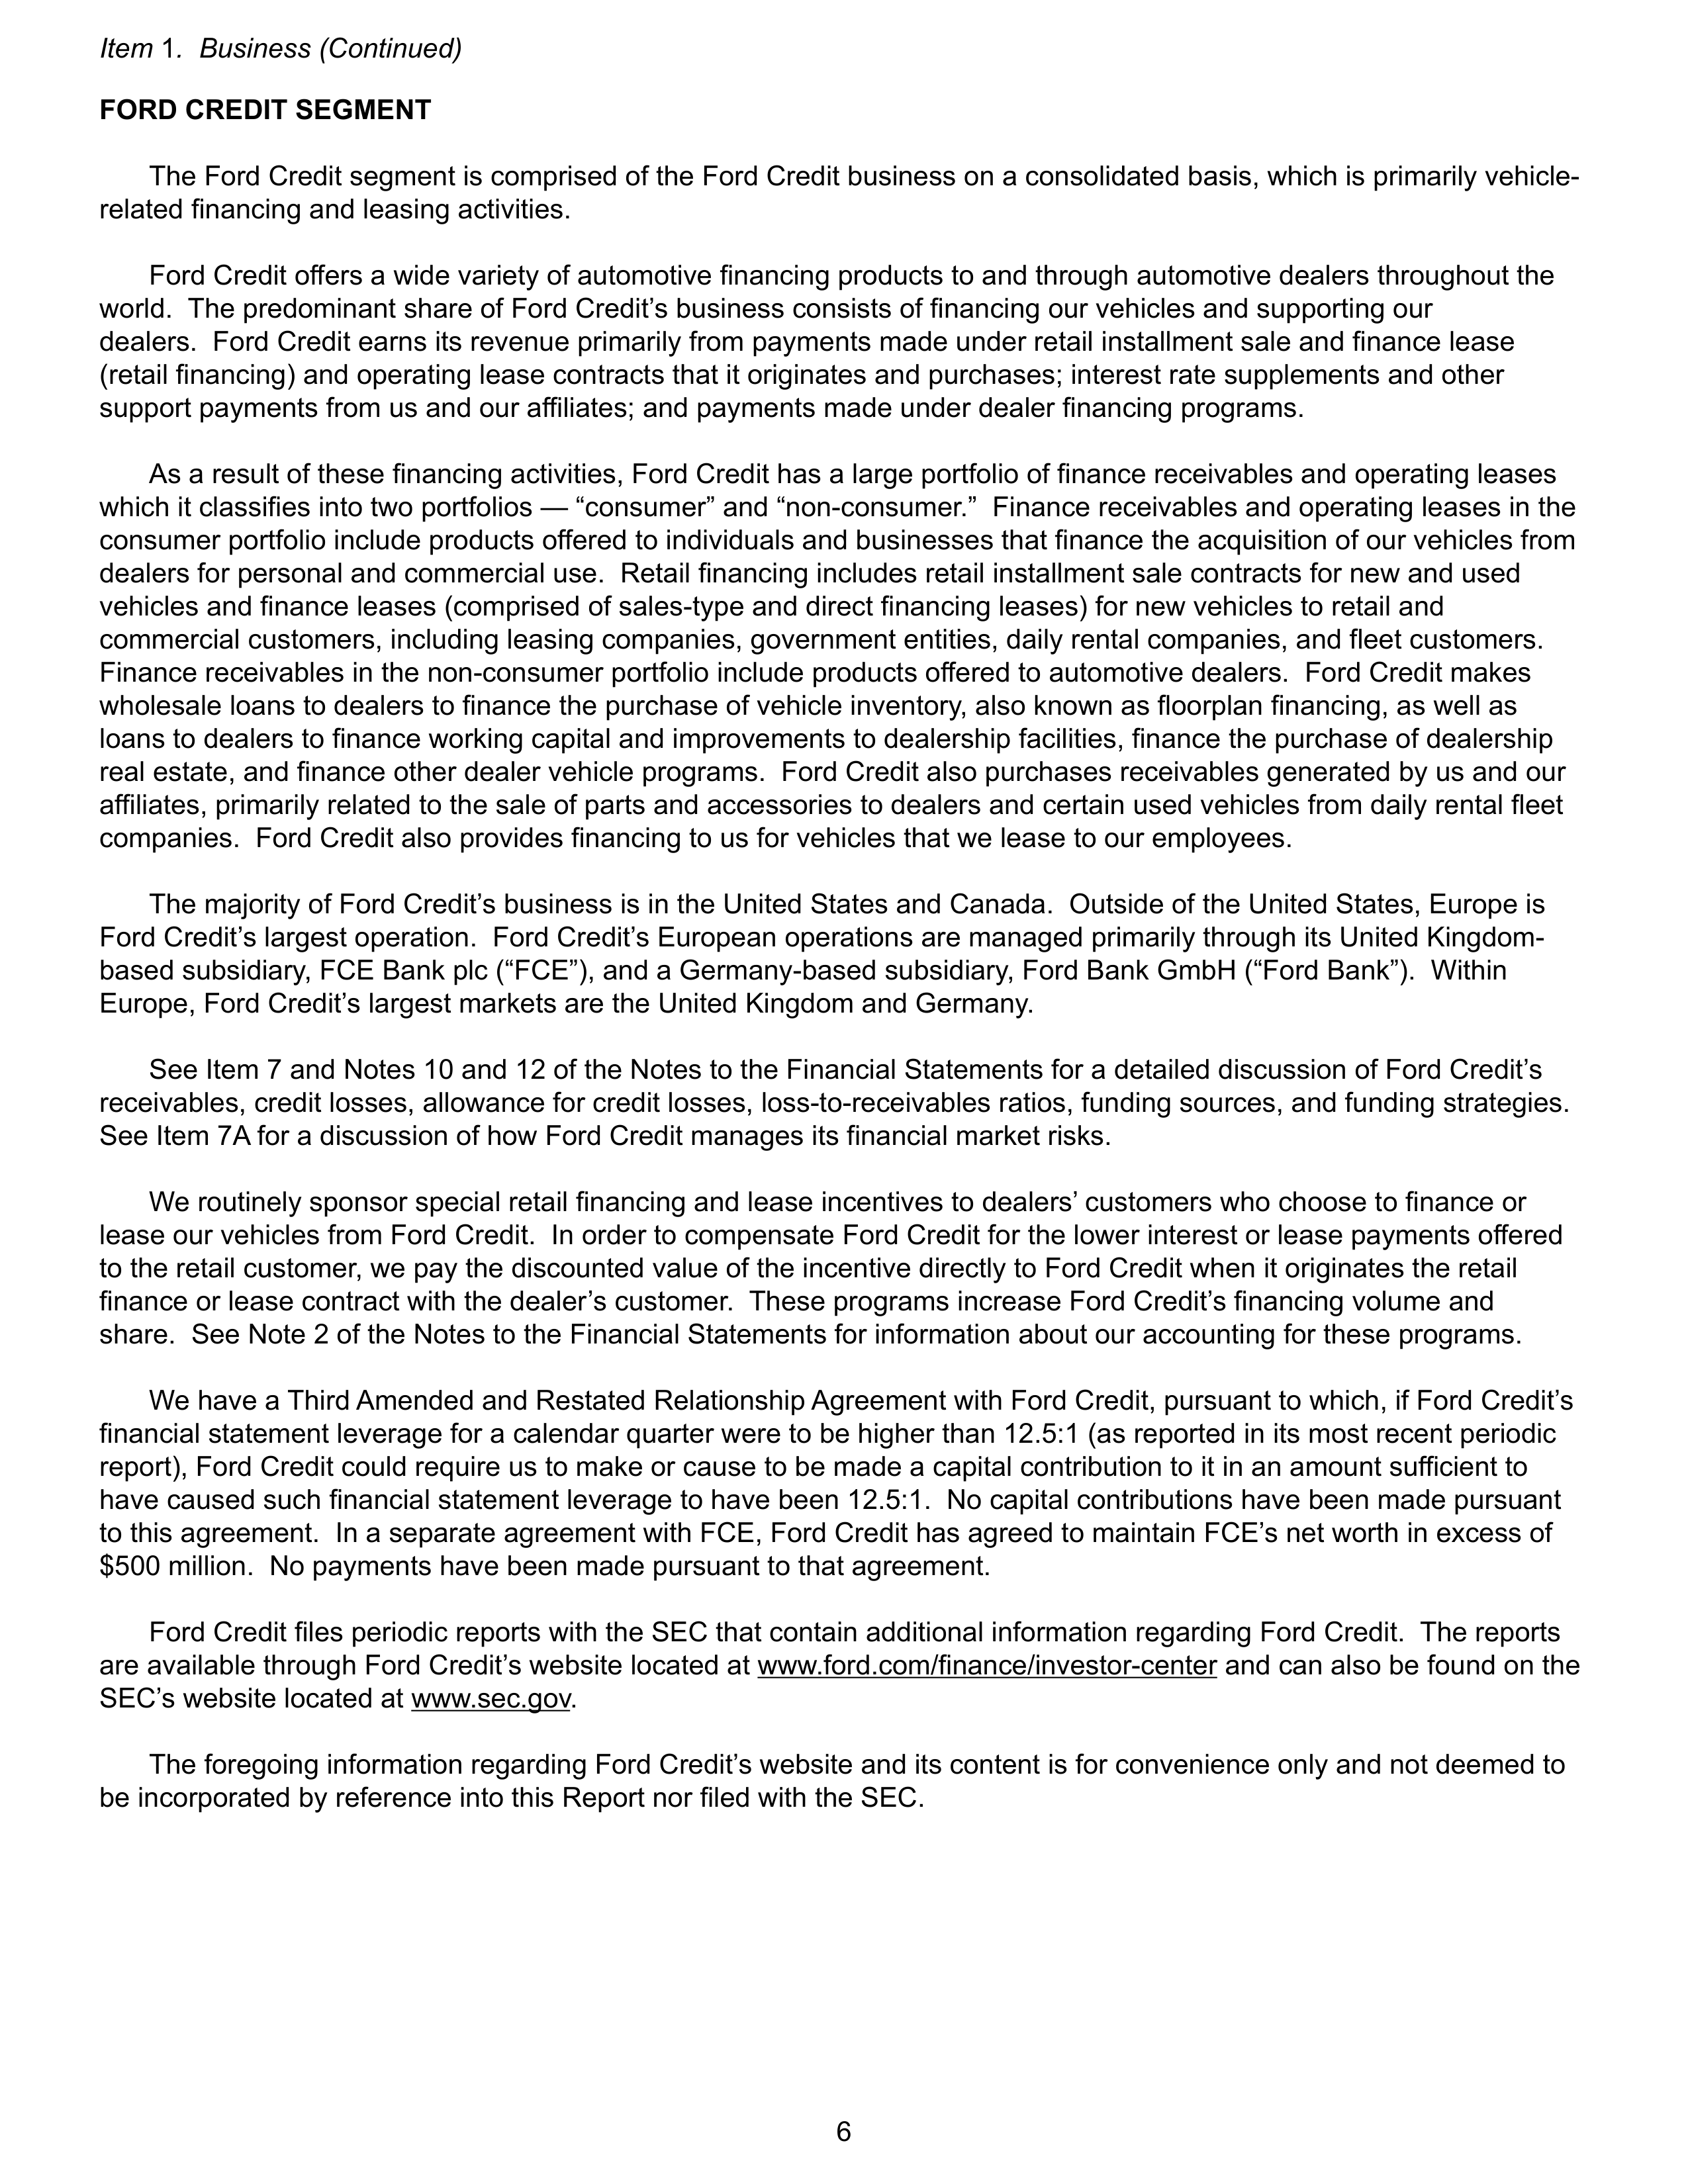
FORD CREDIT SEGMENT
The Ford Credit segment is comprised of the Ford Credit business on a consolidated basis, which is primarily vehicle-
related financing and leasing activities.
Ford Credit offers a wide variety of automotive financing products to and through automotive dealers throughout the
world. The predominant share of Ford Credit’s business consists of financing our vehicles and supporting our
dealers. Ford Credit earns its revenue primarily from payments made under retail installment sale and finance lease
(retail financing) and operating lease contracts that it originates and purchases; interest rate supplements and other
support payments from us and our affiliates; and payments made under dealer financing programs.
As a result of these financing activities, Ford Credit has a large portfolio of finance receivables and operating leases
which it classifies into two portfolios — “consumer” and “non-consumer.” Finance receivables and operating leases in the
consumer portfolio include products offered to individuals and businesses that finance the acquisition of our vehicles from
dealers for personal and commercial use. Retail financing includes retail installment sale contracts for new and used
vehicles and finance leases (comprised of sales-type and direct financing leases) for new vehicles to retail and
commercial customers, including leasing companies, government entities, daily rental companies, and fleet customers.
Finance receivables in the non-consumer portfolio include products offered to automotive dealers. Ford Credit makes
wholesale loans to dealers to finance the purchase of vehicle inventory, also known as floorplan financing, as well as
loans to dealers to finance working capital and improvements to dealership facilities, finance the purchase of dealership
real estate, and finance other dealer vehicle programs. Ford Credit also purchases receivables generated by us and our
affiliates, primarily related to the sale of parts and accessories to dealers and certain used vehicles from daily rental fleet
companies. Ford Credit also provides financing to us for vehicles that we lease to our employees.
The majority of Ford Credit’s business is in the United States and Canada. Outside of the United States, Europe is
Ford Credit’s largest operation. Ford Credit’s European operations are managed primarily through its United Kingdom-
based subsidiary, FCE Bank plc (“FCE”), and a Germany-based subsidiary, Ford Bank GmbH (“Ford Bank”). Within
Europe, Ford Credit’s largest markets are the United Kingdom and Germany.
See Item 7 and Notes 10 and 12 of the Notes to the Financial Statements for a detailed discussion of Ford Credit’s
receivables, credit losses, allowance for credit losses, loss-to-receivables ratios, funding sources, and funding strategies.
See Item 7A for a discussion of how Ford Credit manages its financial market risks.
We routinely sponsor special retail financing and lease incentives to dealers’ customers who choose to finance or
lease our vehicles from Ford Credit. In order to compensate Ford Credit for the lower interest or lease payments offered
to the retail customer, we pay the discounted value of the incentive directly to Ford Credit when it originates the retail
finance or lease contract with the dealer’s customer. These programs increase Ford Credit’s financing volume and
share. See Note 2 of the Notes to the Financial Statements for information about our accounting for these programs.
We have a Third Amended and Restated Relationship Agreement with Ford Credit, pursuant to which, if Ford Credit’s
financial statement leverage for a calendar quarter were to be higher than 12.5:1 (as reported in its most recent periodic
report), Ford Credit could require us to make or cause to be made a capital contribution to it in an amount sufficient to
have caused such financial statement leverage to have been 12.5:1. No capital contributions have been made pursuant
to this agreement. In a separate agreement with FCE, Ford Credit has agreed to maintain FCE’s net worth in excess of
$500 million. No payments have been made pursuant to that agreement.
Ford Credit files periodic reports with the SEC that contain additional information regarding Ford Credit. The reports
are available through Ford Credit’s website located at www.ford.com/finance/investor-center and can also be found on the
SEC’s website located at www.sec.gov.
The foregoing information regarding Ford Credit’s website and its content is for convenience only and not deemed to
be incorporated by reference into this Report nor filed with the SEC.
Item
1
. Business (Continued)
6
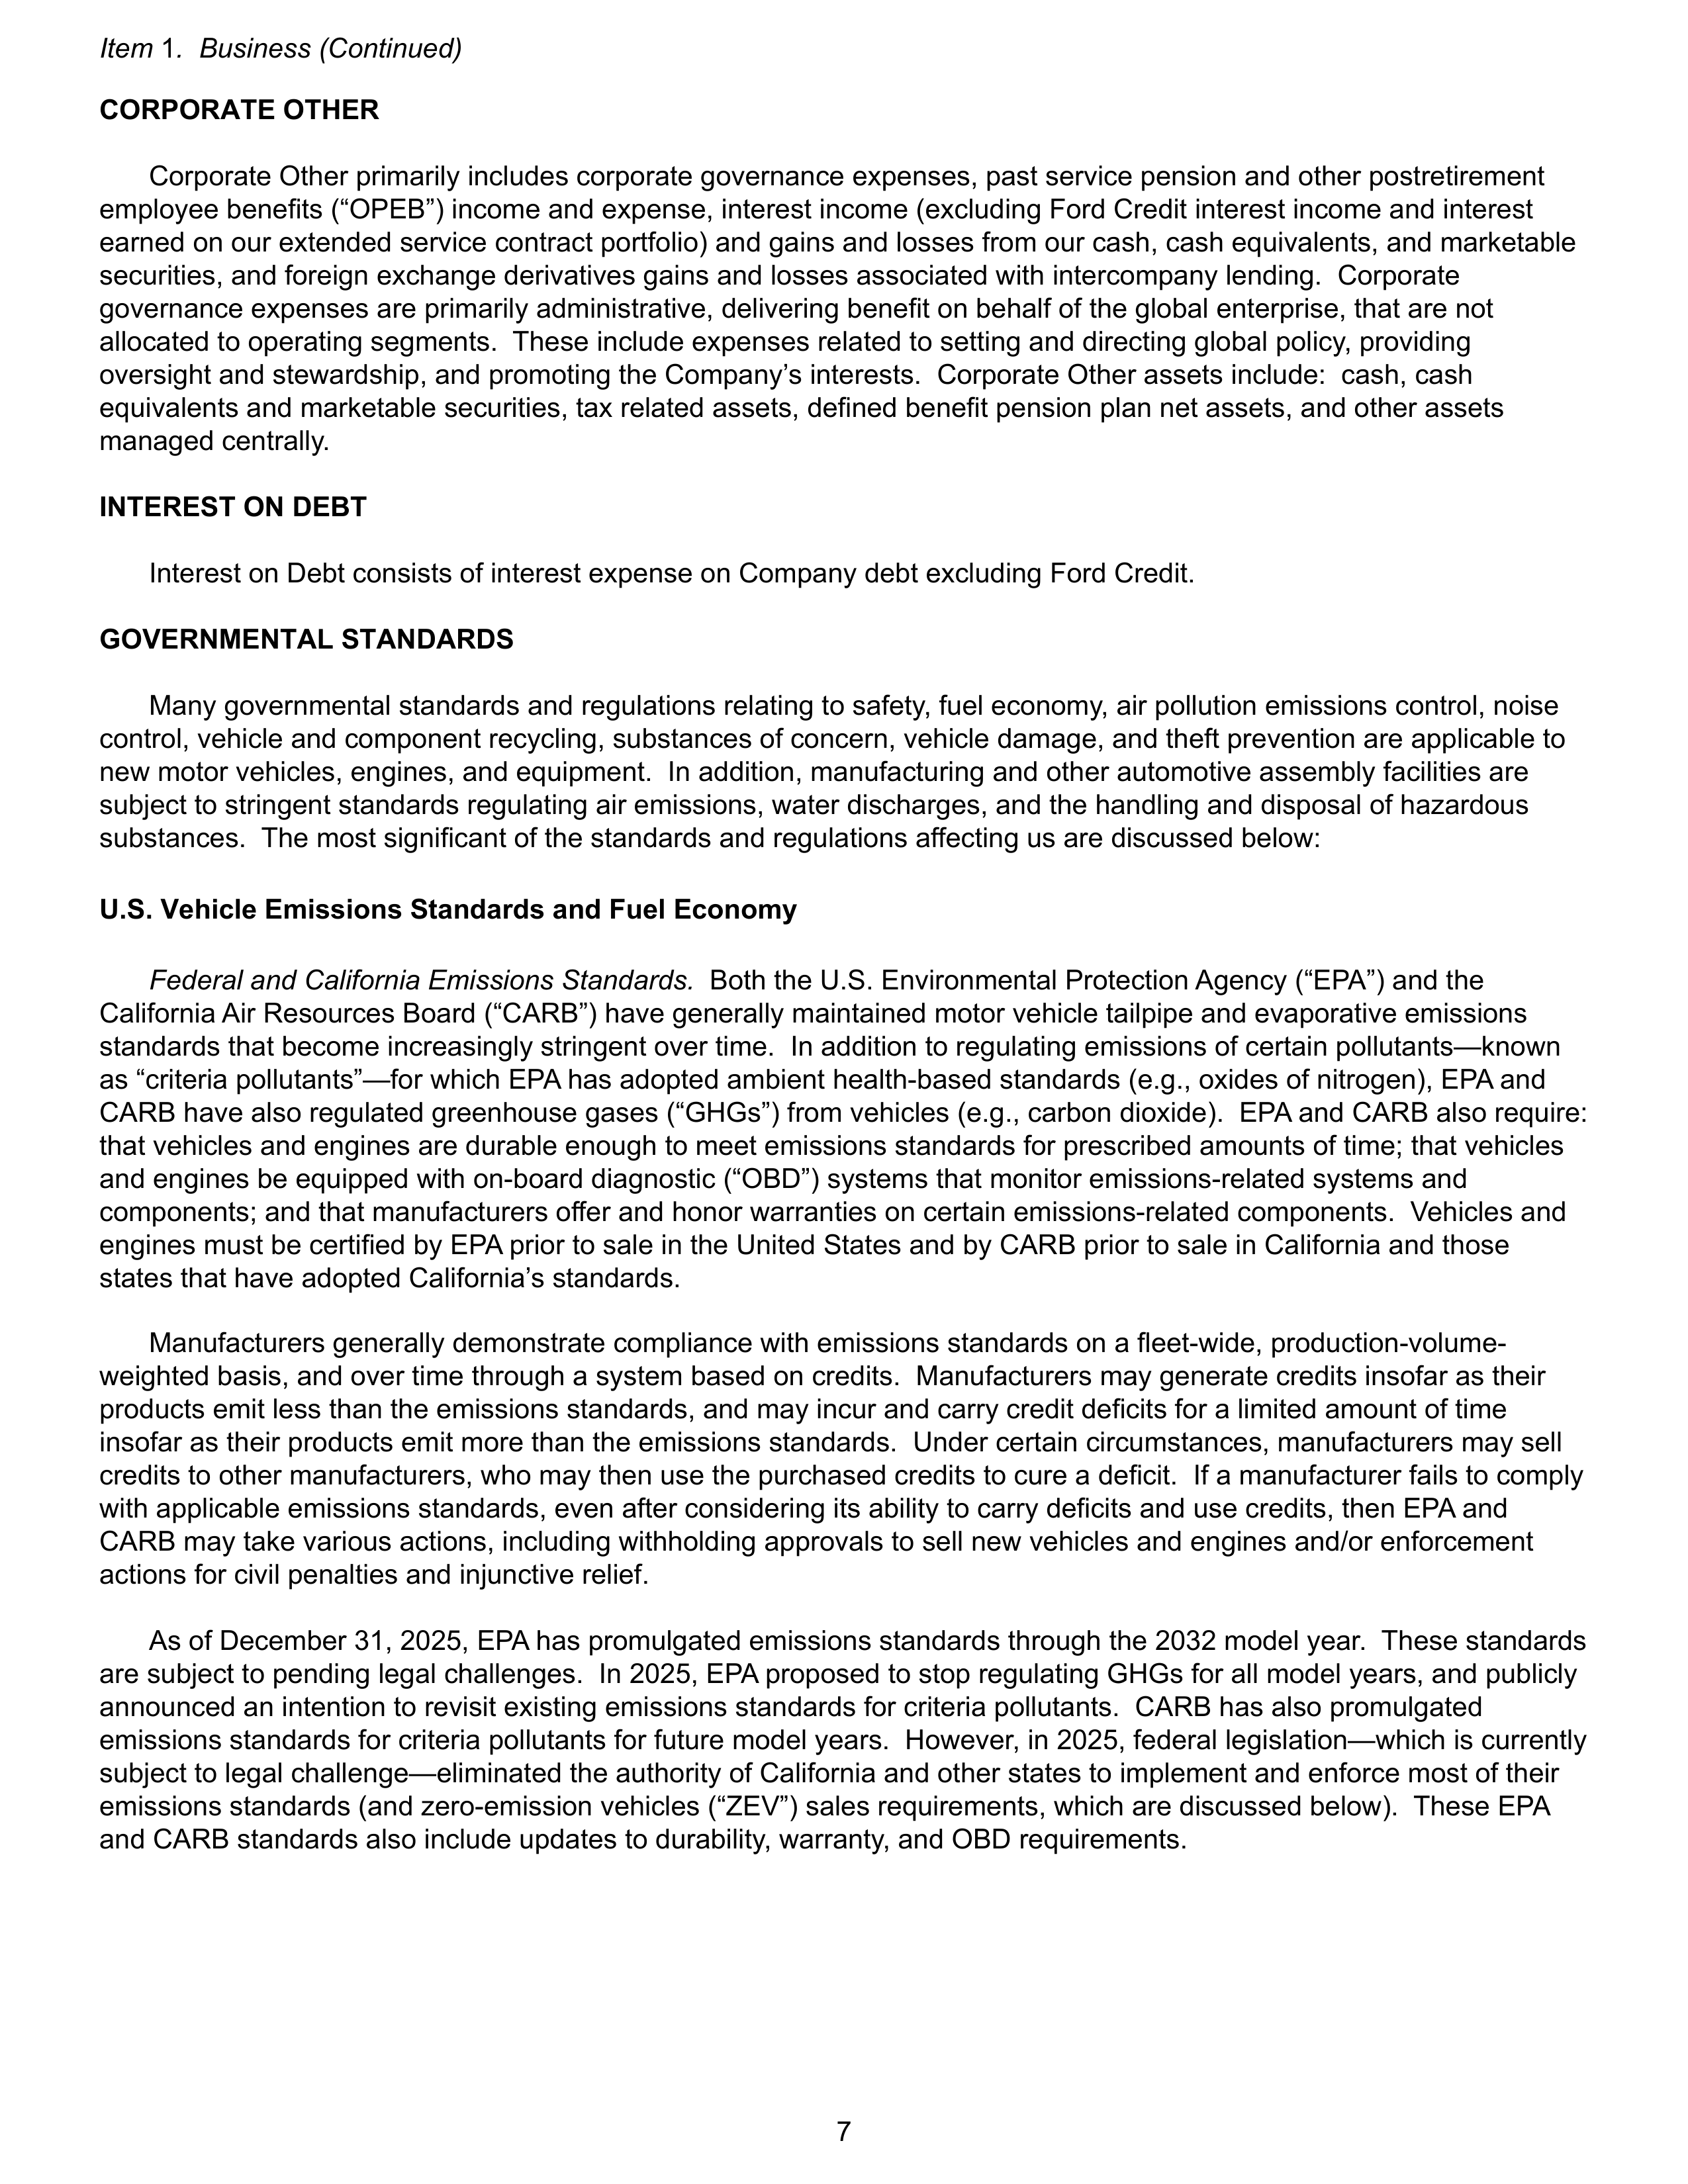
CORPORATE OTHER
Corporate Other primarily includes corporate governance expenses, past service pension and other postretirement
employee benefits (“OPEB”) income and expense, interest income (excluding Ford Credit interest income and interest
earned on our extended service contract portfolio) and gains and losses from our cash, cash equivalents, and marketable
securities, and foreign exchange derivatives gains and losses associated with intercompany lending. Corporate
governance expenses are primarily administrative, delivering benefit on behalf of the global enterprise, that are not
allocated to operating segments. These include expenses related to setting and directing global policy, providing
oversight and stewardship, and promoting the Company’s interests. Corporate Other assets include: cash, cash
equivalents and marketable securities, tax related assets, defined benefit pension plan net assets, and other assets
managed centrally.
INTEREST ON DEBT
Interest on Debt consists of interest expense on Company debt excluding Ford Credit.
GOVERNMENTAL STANDARDS
Many governmental standards and regulations relating to safety, fuel economy, air pollution emissions control, noise
control, vehicle and component recycling, substances of concern, vehicle damage, and theft prevention are applicable to
new motor vehicles, engines, and equipment. In addition, manufacturing and other automotive assembly facilities are
subject to stringent standards regulating air emissions, water discharges, and the handling and disposal of hazardous
substances. The most significant of the standards and regulations affecting us are discussed below:
U.S. Vehicle Emissions Standards and Fuel Economy
Federal and California Emissions Standards.
Both the U.S. Environmental Protection Agency (“EPA”) and the
California Air Resources Board (“CARB”) have generally maintained motor vehicle tailpipe and evaporative emissions
standards that become increasingly stringent over time. In addition to regulating emissions of certain pollutants—known
as “criteria pollutants”—for which EPA has adopted ambient health-based standards (e.g., oxides of nitrogen), EPA and
CARB have also regulated greenhouse gases (“GHGs”) from vehicles (e.g., carbon dioxide). EPA and CARB also require:
that vehicles and engines are durable enough to meet emissions standards for prescribed amounts of time; that vehicles
and engines be equipped with on-board diagnostic (“OBD”) systems that monitor emissions-related systems and
components; and that manufacturers offer and honor warranties on certain emissions-related components. Vehicles and
engines must be certified by EPA prior to sale in the United States and by CARB prior to sale in California and those
states that have adopted California’s standards.
Manufacturers generally demonstrate compliance with emissions standards on a fleet-wide, production-volume-
weighted basis, and over time through a system based on credits. Manufacturers may generate credits insofar as their
products emit less than the emissions standards, and may incur and carry credit deficits for a limited amount of time
insofar as their products emit more than the emissions standards. Under certain circumstances, manufacturers may sell
credits to other manufacturers, who may then use the purchased credits to cure a deficit. If a manufacturer fails to comply
with applicable emissions standards, even after considering its ability to carry deficits and use credits, then EPA and
CARB may take various actions, including withholding approvals to sell new vehicles and engines and/or enforcement
actions for civil penalties and injunctive relief.
As of December 31, 2025, EPA has promulgated emissions standards through the 2032 model year. These standards
are subject to pending legal challenges. In 2025, EPA proposed to stop regulating GHGs for all model years, and publicly
announced an intention to revisit existing emissions standards for criteria pollutants. CARB has also promulgated
emissions standards for criteria pollutants for future model years. However, in 2025, federal legislation—which is currently
subject to legal challenge—eliminated the authority of California and other states to implement and enforce most of their
emissions standards (and zero-emission vehicles (“ZEV”) sales requirements, which are discussed below). These EPA
and CARB standards also include updates to durability, warranty, and OBD requirements.
Item
1
. Business (Continued)
7
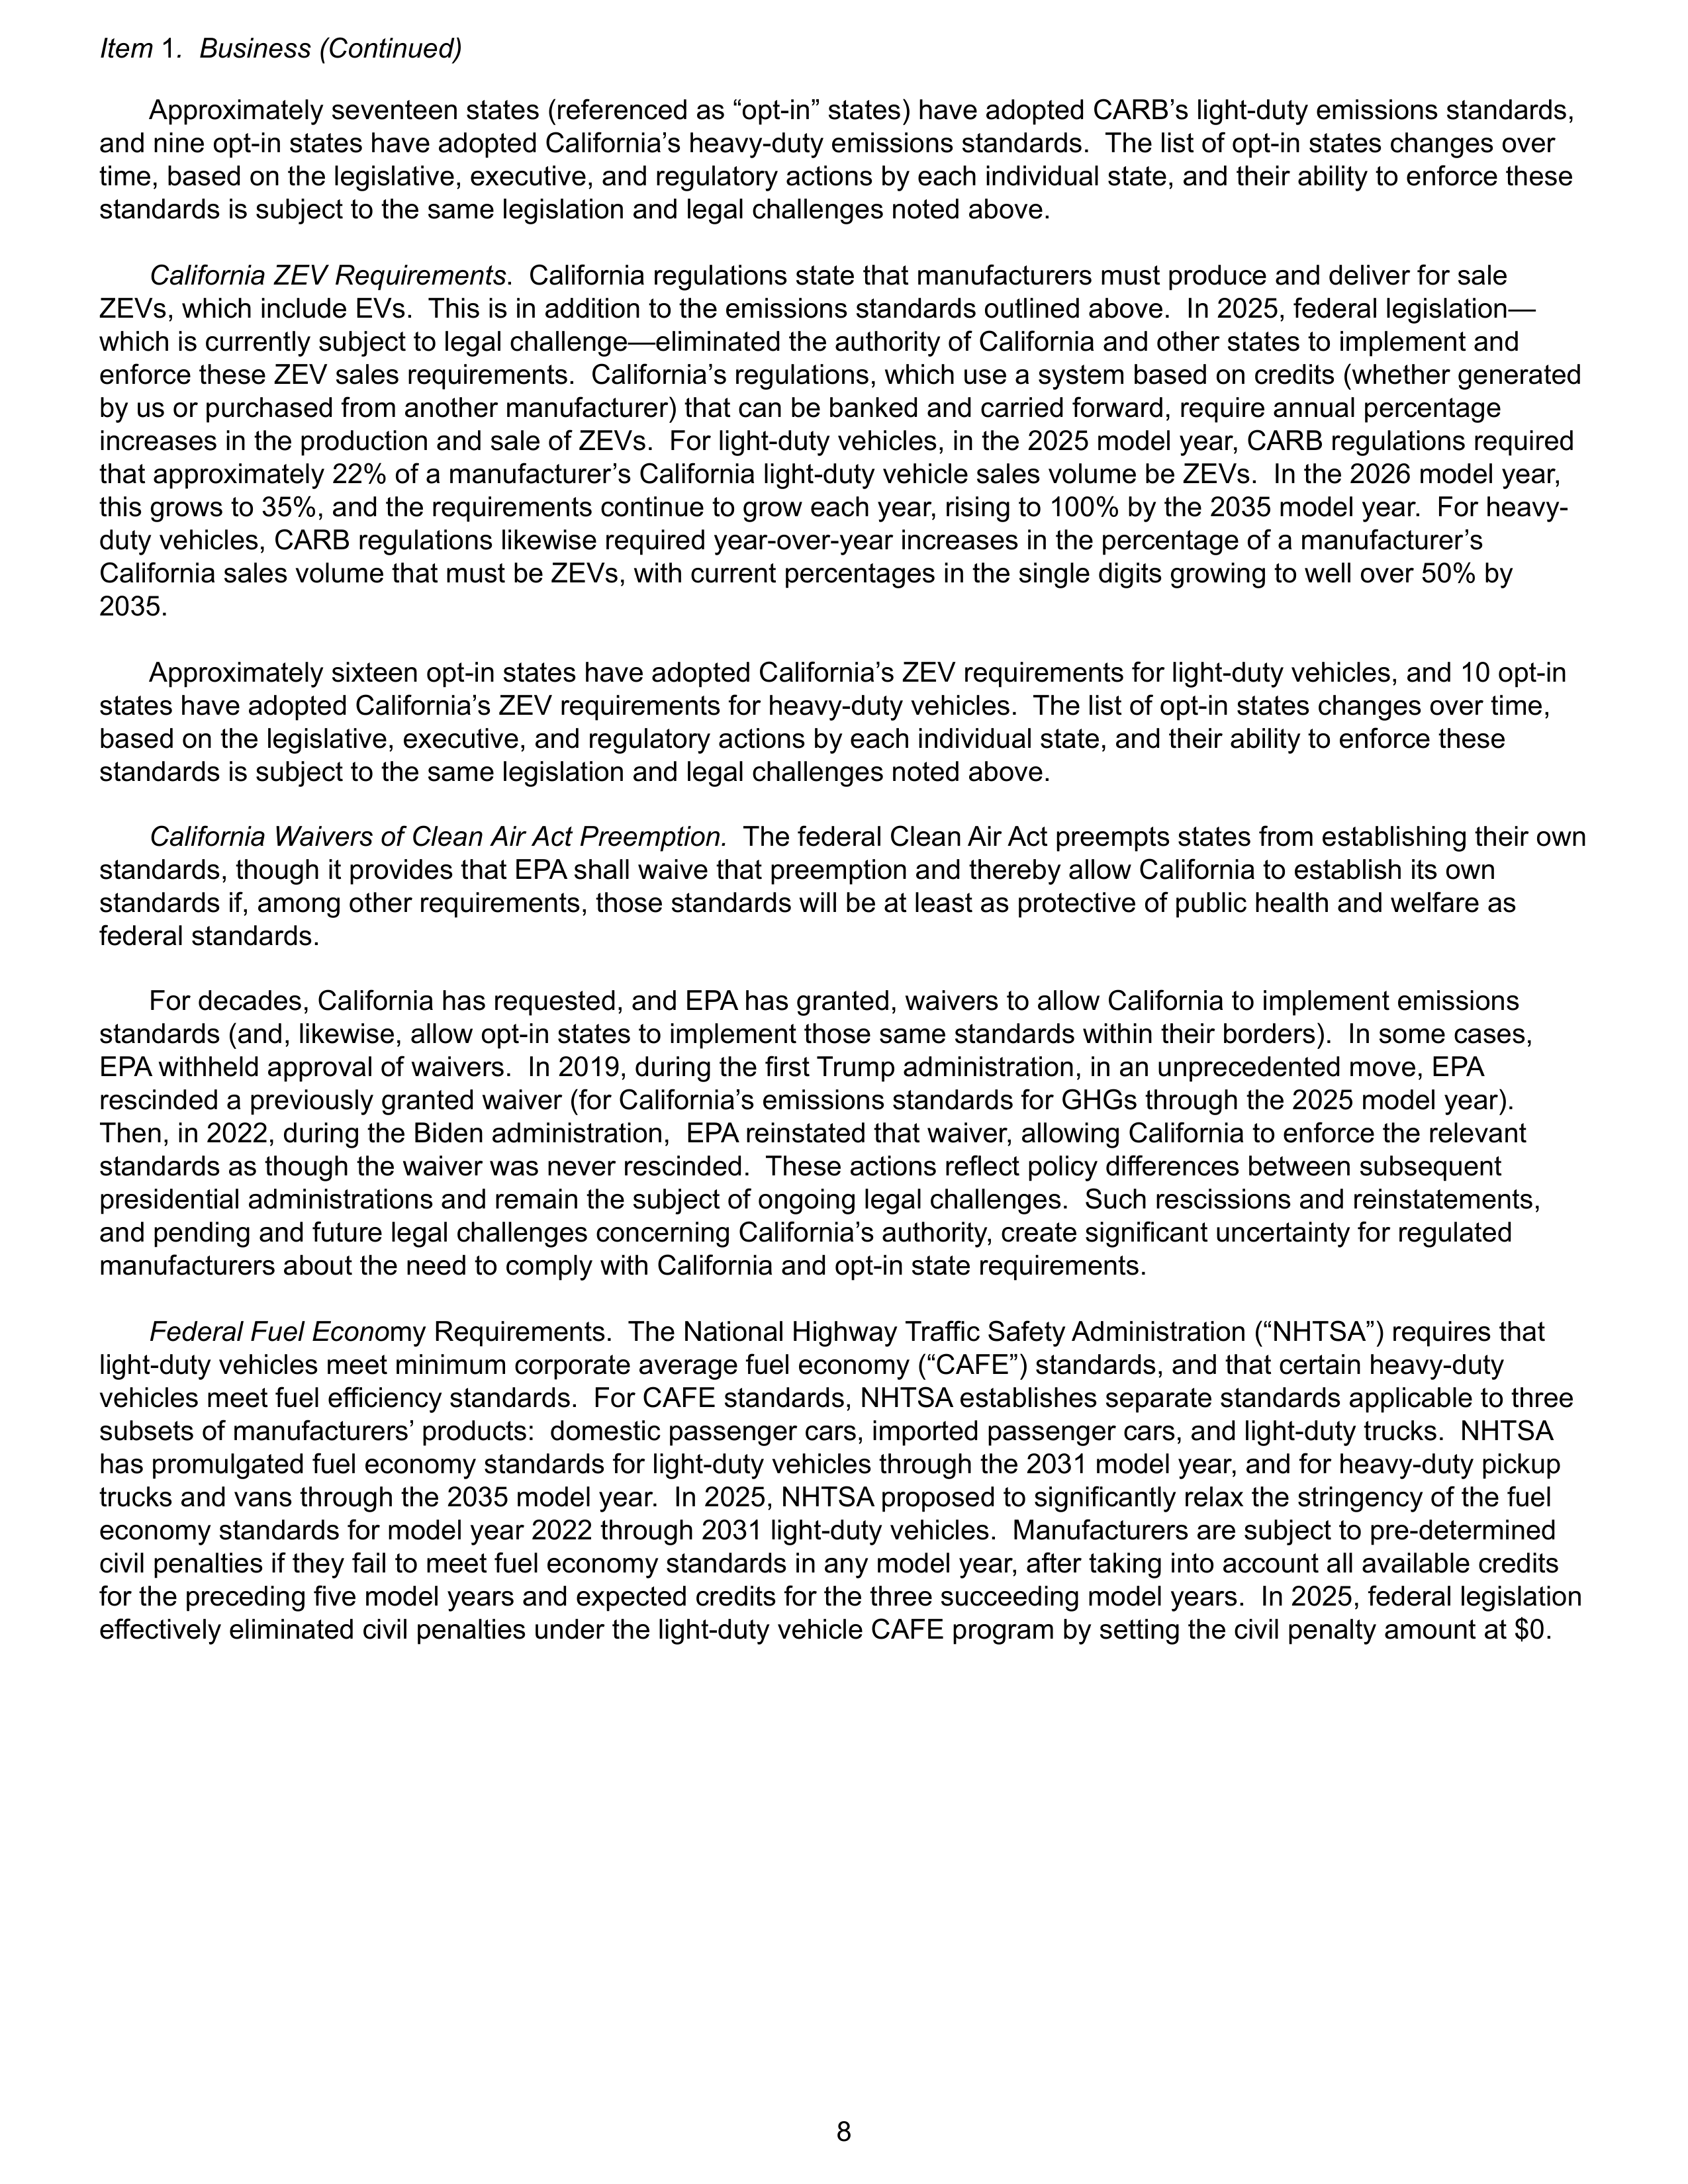
Approximately seventeen states (referenced as “opt-in” states) have adopted CARB’s light-duty emissions standards,
and nine opt-in states have adopted California’s heavy-duty emissions standards. The list of opt-in states changes over
time, based on the legislative, executive, and regulatory actions by each individual state, and their ability to enforce these
standards is subject to the same legislation and legal challenges noted above.
California ZEV Requirements
. California regulations state that manufacturers must produce and deliver for sale
ZEVs, which include EVs. This is in addition to the emissions standards outlined above. In 2025, federal legislation—
which is currently subject to legal challenge—eliminated the authority of California and other states to implement and
enforce these ZEV sales requirements. California’s regulations, which use a system based on credits (whether generated
by us or purchased from another manufacturer) that can be banked and carried forward, require annual percentage
increases in the production and sale of ZEVs. For light-duty vehicles, in the 2025 model year, CARB regulations required
that approximately 22% of a manufacturer’s California light-duty vehicle sales volume be ZEVs. In the 2026 model year,
this grows to 35%, and the requirements continue to grow each year, rising to 100% by the 2035 model year. For heavy-
duty vehicles, CARB regulations likewise required year-over-year increases in the percentage of a manufacturer’s
California sales volume that must be ZEVs, with current percentages in the single digits growing to well over 50% by
2035.
Approximately sixteen opt-in states have adopted California’s ZEV requirements for light-duty vehicles, and 10 opt-in
states have adopted California’s ZEV requirements for heavy-duty vehicles. The list of opt-in states changes over time,
based on the legislative, executive, and regulatory actions by each individual state, and their ability to enforce these
standards is subject to the same legislation and legal challenges noted above.
California Waivers of Clean Air Act Preemption.
The federal Clean Air Act preempts states from establishing their own
standards, though it provides that EPA shall waive that preemption and thereby allow California to establish its own
standards if, among other requirements, those standards will be at least as protective of public health and welfare as
federal standards.
For decades, California has requested, and EPA has granted, waivers to allow California to implement emissions
standards (and, likewise, allow opt-in states to implement those same standards within their borders). In some cases,
EPA withheld approval of waivers. In 2019, during the first Trump administration, in an unprecedented move, EPA
rescinded a previously granted waiver (for California’s emissions standards for GHGs through the 2025 model year).
Then, in 2022, during the Biden administration, EPA reinstated that waiver, allowing California to enforce the relevant
standards as though the waiver was never rescinded. These actions reflect policy differences between subsequent
presidential administrations and remain the subject of ongoing legal challenges. Such rescissions and reinstatements,
and pending and future legal challenges concerning California’s authority, create significant uncertainty for regulated
manufacturers about the need to comply with California and opt-in state requirements.
Federal Fuel Econo
my Requirements. The National Highway Traffic Safety Administration (“NHTSA”) requires that
light-duty vehicles meet minimum corporate average fuel economy (“CAFE”) standards, and that certain heavy-duty
vehicles meet fuel efficiency standards. For CAFE standards, NHTSA establishes separate standards applicable to three
subsets of manufacturers’ products: domestic passenger cars, imported passenger cars, and light-duty trucks. NHTSA
has promulgated fuel economy standards for light-duty vehicles through the 2031 model year, and for heavy-duty pickup
trucks and vans through the 2035 model year. In 2025, NHTSA proposed to significantly relax the stringency of the fuel
economy standards for model year 2022 through 2031 light-duty vehicles. Manufacturers are subject to pre-determined
civil penalties if they fail to meet fuel economy standards in any model year, after taking into account all available credits
for the preceding five model years and expected credits for the three succeeding model years. In 2025, federal legislation
effectively eliminated civil penalties under the light-duty vehicle CAFE program by setting the civil penalty amount at $0.
Item
1
. Business (Continued)
8
Alignment and Misalignment of Standards
. Because the vast majority of GHGs emitted by a vehicle are the result of
fuel combustion, GHG emissions correspond closely with fuel economy. Before approximately the 2020 model year,
NHTSA and EPA aligned their standards, and California agreed that compliance with the federal program would satisfy
compliance with its own GHG requirements, thereby avoiding a patchwork of federal and state standards. Since
approximately the 2021 model year, EPA and NHTSA have independently promulgated GHG and fuel economy standards,
and while they generally avoided material inconsistencies between the standards, they nonetheless created complexity
and redundancy for manufacturers that must meet both sets of standards. Also since approximately the 2021 model year,
California and opt-in states have maintained emissions standards and ZEV requirements, outlined above, which are not
aligned with and are generally more stringent than the federal requirements. Recent proposals from EPA and NHTSA and
federal legislation passed in 2025 may alleviate the misalignment, but these proposals and new legislation are subject to
legal challenge.
Implications for Ford
. The requirements for light-duty vehicles outlined above apply to most cars, sport utility vehicles,
and light-duty pickup trucks that Ford sells in the United States. The requirements for heavy-duty vehicles and engines
outlined above apply to most heavy-duty pickup trucks, vans, cab-chassis products, and vocational vehicles that Ford
sells in the United States. Ford is subject to each separate regulatory regime, and in general, this means separate
compliance measures for each regulator and for each regulated pollutant and performance standard. EPA, NHTSA, and
CARB have requirements that govern the same aspects of the same products at the same time, as outlined above.
Different standards pose additional compliance burdens, including complexity and costs, and these burdens are
heightened when these various requirements are misaligned or change, e.g., when there is a change in administration or
as a result of a legal challenge.
Compliance with emissions standards, ZEV requirements, fuel economy standards, OBD requirements, emissions
warranty requirements, and related regulations can be challenging and can drive increased product development costs,
production costs, higher retail prices, warranty costs, and vehicle recalls. Compliance depends in part on the widespread
availability of high-quality and consistent automotive fuels that internal combustion vehicles are designed to use. Insofar
as regulatory requirements get increasingly stringent, manufacturers must comply by increasing their sales of EVs and
other ZEVs, as a portion of overall sales. This is directly required by California’s ZEV requirements, insofar as those
requirements are not preempted by the 2025 federal legislation described above, but is also required to comply with the
emissions and fuel economy standards promulgated in recent years, which are not achievable solely through sales of
internal combustion engines with today’s technology. There are factors limiting faster and future growth of EV sales,
including: supportive public policy; consumer acceptance and understanding of EVs; upfront costs; technology cost and
readiness; battery raw material availability and cost; and the availability of adequate infrastructure to support vehicle
charging.
Stringent requirements that are misaligned with market conditions could force Ford to take various product-led actions
that could have substantial adverse effects on its sales volumes and operations. Such actions could include: restricting
offerings of certain products and popular options; taking actions to increase sales of Ford’s lowest-emitting and most fuel-
efficient vehicles; and curtailing the production and sale of certain internal combustion vehicles.
To some extent, Ford can manage and is managing these risks in the United States and elsewhere by purchasing
emissions credits from other vehicle manufacturers when the cost of those credits is less than the financial impact of the
product-led actions listed above. Such credits are available only from other manufacturers and only to the extent those
manufacturers exceed compliance requirements. Credits have limited availability and may not be adequate to completely
eliminate the need for product-led actions. Accordingly, we have made a strategic decision to enter into agreements to
purchase regulatory compliance credits for current and future model years in various regions. Our obligations under these
agreements are dependent on the continued existence of an underlying regulatory compliance requirement in the
applicable jurisdiction. For example, in 2025, Ford terminated some of its obligations to purchase credits as a result of the
reduction in stringency of, or elimination of, compliance requirements. As of December 31, 2025, our outstanding
purchase obligations under our compliance credit purchase agreements totaled about $1.6 billion. During 2025, we
recorded about $700 million of expense for our estimated utilization of regulatory compliance credits related to current
compliance period volumes (e.g., model year, calendar year), which was allocated to Ford Blue and Ford Pro results.
Ford’s ability to optimize investments and planning for compliance is made more difficult by sudden or frequent
changes in applicable emissions and fuel economy standards and ZEV requirements. Such changes can include
reinstatements and rescissions of Clean Air Act waivers for California, court decisions that change applicable regulatory
requirements, and significant changes to the stringency of federal requirements with each subsequent administration.
Item
1
. Business (Continued)
9
Global Vehicle Emissions Standards and Fuel Economy
European Emissions Standards.
EU and U.K. regulations, directives, and related legislation limit the amount of
regulated pollutants that may be emitted by new motor vehicles and engines sold in the European Union and the United
Kingdom. Regulatory stringency has increased significantly with the application of Stage VI emission standards (first
introduced in 2014) and the implementation of a laboratory test cycle for CO
2
and emissions and the introduction of on-
road emission testing using portable emission analyzers (Real Driving Emission or “RDE”). These on-road emission tests
are in addition to the laboratory-based tests (first introduced in 2017). The divergence between the regulatory limit that is
tested in laboratory conditions and the allowed values measured in RDE tests will ultimately be reduced to zero as the
regulatory demands increase. In addition, new requirements for tailpipe and non-tailpipe emissions will be included in the
upcoming Euro 7 regulation and will be phased in beginning in November 2026 for new vehicle types and for all vehicles
in November 2027. The costs associated with complying with all of these requirements are significant, and following the
EU Commission’s indication of its intent to accelerate emissions rules in its road map publication “EU Green Deal” as well
as the EU sustainable mobility action plan, these challenges will continue in European markets, including the United
Kingdom. In addition, the Whole Vehicle Type Approval (“WVTA”) regulation has been updated to increase the stringency
of in-market surveillance. Moreover, following the U.K.’s withdrawal from the European Union in 2020, we have been and
may continue to be subject to diverging requirements in our European markets, which could increase vehicle complexity
and duties.
There continues to be an increasing trend of city access restrictions for internal combustion engine powered vehicles.
These access rules are developed by individual cities based on their specific concerns, resulting in rapid deployment of
access rules that differ greatly among cities. The speed of implementation of access rules may directly influence
customer vehicle residual values and choice of next purchase. In an effort to support the Paris Accord, some countries
are adopting yearly increases in CO
2
taxes, where such a system is in place, and publishing dates by when internal
combustion powered vehicles may no longer be registered, e.g., Netherlands in 2030.
Other National Emissions Control Requirements
. Many countries, in an effort to address air quality and climate
change concerns, have adopted previous versions of European or United Nations Economic Commission for Europe
(“UN-ECE”) mobile source emission regulations. Some countries have adopted more advanced regulations based on the
most recent version of European or U.S. regulations. For example, the China Stage VI light-duty vehicle emission
standards, based on European Stage VI emission standards for light-duty vehicles, U.S. evaporative and refueling
emissions standards, and CARB OBD II requirements, incorporate two levels of stringency for tailpipe emissions. Under
the level one (VI(a)) standard, the emissions limits are comparable to the EU Stage VI limits, except for carbon monoxide,
which is 30% lower than the EU Stage VI limit. The more stringent level two (VI(b)) standard’s emissions limits, which are
currently in place nationwide in China, are approximately 30-50% lower than the EU Stage VI limits, depending on the
pollutants. China Stage VII emission standards are in development, a draft of which is expected to be available in the first
quarter of 2026, while the official standard is expected to be published at the end of 2026 and implemented in January
2029. The Worldwide Harmonized Light Vehicles Test Cycle remains the testing standard, some pollutant standards
remain the same and other pollutants will become newly regulated, and fuel evaporation and OBD monitoring
requirements will refer to relevant U.S. emission standards. Mexico and most countries in Central America, the
Caribbean, and South America continue to evolve and implement more stringent requirements accepting Europe and U.S.
regulations, except Brazil, which has a unique local process called PROCONVE based on U.S. regulations for light-duty
vehicles, including RDE-unique requirements with targets starting in 2025, and European regulations for heavy-duty
vehicles. Other countries across Southeast Asia, the Middle East, and Australasia (e.g., Australia, New Zealand, UAE)
have introduced or expect to introduce regulations based on EU Stage VI standards in the near term. Canadian criteria
emissions regulations are largely aligned with U.S. requirements, and Canada accepts U.S. EPA certifications of vehicles
and engines prior to their sale or importation into Canada.
Elsewhere, there is a mix of regulations and processes based on U.S. and EU standards. Not all countries have
adopted appropriate fuel quality standards to accompany the stringent emission standards adopted. This could lead to
compliance problems, particularly if OBD or in-use surveillance requirements are implemented.
Global Developments.
Vehicle emissions regulators continue to focus on the use of “defeat devices.” Defeat devices
are elements of design (typically embedded in software) that improperly cause the emission control system to function
less effectively during normal on-road driving than during an official laboratory emissions test, without justification. They
are prohibited by law in many jurisdictions, and we do not use defeat devices in our vehicles.
Item
1
. Business (Continued)
10
Regulators around the world continue to scrutinize automakers’ emission testing, which has led to a number of defeat
device settlements by various manufacturers. EPA is carrying out additional non-standard tests as part of its vehicle
certification program. CARB has also been conducting extensive non-standard emission tests, which in some cases have
resulted in certification delays for diesel vehicles. In the past, several European countries have conducted non-standard
emission tests and published the results, and, in some cases, this supplemental testing has triggered investigations of
manufacturers for possible defeat devices. Testing is expected to continue on an ongoing basis, with new testing methods
continually under development. In addition, plaintiffs’ attorneys are pursuing consumer class action lawsuits based on
alleged excessive emissions from cars and trucks, which could, in turn, prompt further investigations by regulators.
European GHG Requirements.
The European Union regulates passenger car and light commercial vehicle CO
2
emissions using sliding scales with different CO
2
targets for each manufacturer based on the respective average vehicle
weight for its fleet of vehicles first registered in a calendar year, with separate targets for passenger cars and light
commercial vehicles. A penalty system applies to manufacturers failing to meet the individual CO
2
targets. Pooling
agreements between manufacturers to utilize credits are possible under certain conditions, and Ford has entered into
such pooling agreements in order to comply with fuel economy regulations without paying a penalty and to enable other
manufacturers to benefit from our positive CO
2
performance. For “multi-stage vehicles” (e.g., Ford’s Transit chassis cabs),
the base manufacturer (e.g., Ford) is fully responsible for the CO
2
performance of the final up-fitted vehicles. The initial
target levels get significantly more stringent every five years (2025, 2030, and 2035), after which all new passenger cars
and light commercial vehicles must be zero emission, requiring significant investments in alternative propulsion
technologies and extensive fleet management to enable low CO
2
emissions for our fleet. EU heavy-duty CO
2
regulations
are being finalized and will also limit CO
2
fleet performance, with slightly different requirements. In December 2025, the
EU Commission proposed revised CO
2
emission standards for cars and vans through 2035 and decarbonizing corporate
fleets with binding national targets for zero- and low-emission vehicles. Both proposals are expected to be adopted by the
fourth quarter of 2026.
The United Kingdom has introduced the Vehicle Emission Trading Schemes (“VETS”), which is applicable to
manufacturers and establishes ZEV mandates of 80% for cars and 70% for light commercial vehicles by 2030, with a ban
on ICE passenger vehicles beginning in 2030 and light commercial vehicles beginning in 2035.
The EU Commission has introduced mandatory requirements for national authorities to conduct in-service verification
testing on vehicles to measure their actual CO
2
emissions in the field. It is also investigating the introduction of Real
Driving CO
2
and Life Cycle Assessment elements, and heavy-duty vehicles are addressed in separate regulations with
analogous requirements and challenges. As discussed above, the EU Commission has announced a “Green Deal” with
more stringent requirements for CO
2
emissions (including stricter CO
2
fleet regulations) and other regulated emissions
and include recycling and substance restrictions. The EU Commission targets net climate neutrality by 2050 and an
ambitious 2030 interim target (a 55% CO
2
reduction across all industries compared to 1990). In December 2025, the EU
Commission set a legally-binding target of 90% reduction in net GHG emissions for 2040, with the possibility to use high-
quality international credits toward the 2040 target, starting in 2036. This amount can be up to 5% of 1990 EU net GHG
emissions, corresponding to a domestic reduction of net GHG emissions by 85% compared to 1990 levels by 2040.
Ford also faces the risk of additional compliance-related costs for both passenger cars and light commercial vehicles
in all European markets due to, for example, unexpected market fluctuations and shorter lead times impacting average
fleet performance.
The United Nations developed a technical regulation for passenger car emissions and CO
2
. This world light-duty test
procedure (“WLTP”) is focused primarily on better aligning laboratory CO
2
and fuel consumption figures with customer-
reported figures. The introduction of WLTP in Europe started in September 2017 and requires updates to CO
2
labeling,
thereby impacting taxes in countries with a CO
2
tax scheme as well as CO
2
fleet regulations for passenger cars and light
commercial vehicles. Costs associated with new or incremental testing for WLTP are significant.
Some European countries have implemented or are considering other initiatives for reducing CO
2
vehicle emissions,
including fiscal measures and CO
2
labeling to address country specific targets associated with the Paris Accord. For
example, the United Kingdom, France, Germany, Spain, Portugal, and the Netherlands, among others, have introduced
taxation based on CO
2
emissions. The EU CO
2
requirements have led to further measures, and we expect that trend to
continue. In addition, delayed vehicle launches and supply shortages, as well as an insufficient charging infrastructure
and lower demand for ZEV and low CO
2
emission vehicles as certain EV incentives are reduced or eliminated or for other
reasons, can trigger compliance risks in all European markets.
Item
1
. Business (Continued)
11
European regulators are also starting to look beyond tailpipe CO
2
emissions with new requirements for battery EVs
and life cycle assessments. For example, the EU Battery Regulation, which came into effect in 2023, introduces a range
of new requirements, including that manufacturers calculate and declare the carbon footprint of their EV batteries and
track their environmental performance throughout their life cycles. Maximum carbon footprint thresholds are expected to
be set in 2028. The passage of secondary legislation under the EU Battery Regulation, referred to as the Battery Carbon
Footprint Delegated Act, has faced significant delays due to technical issues relating to carbon footprint methodology.
Compliance with regulations like these will require manufacturers to navigate complex data collection, calculation, and
reporting processes.
In addition to imposing strict emissions requirements, European regulations are increasingly expanding to include
broader sustainability obligations, such as reporting requirements and supply chain due diligence. Although these rules
originate in European jurisdictions, they often apply to global corporations across markets and can require costly
adjustments to corporate processes, policies, and strategies. This trend is also emerging beyond Europe, with country-
specific sustainability reporting requirements in place in Australia and others forthcoming. For example, the EU Corporate
Sustainability Reporting Directive and Australia’s Sustainability Reporting Standard both require expanded sustainability-
related disclosures, including how companies manage climate risks and align their strategies with global climate goals.
Noncompliance can result in monetary penalties and reputational harm.
In 2023, the EU adopted the Carbon Border Adjustment Mechanism (“CBAM”), which will subject certain imported
materials (such as iron, steel, and aluminum) to a carbon levy linked to the carbon price payable on domestic goods under
the European Trading Scheme. The EU CBAM is expected to increase our costs of importing such materials from 2026
onwards and/or limit our ability to import lower cost materials from non-EU countries. A similar CBAM is expected to be
introduced in the United Kingdom in 2027.
Other National GHG
and Fuel Economy Requirements.
The Canadian federal government regulates vehicle GHG
emissions under the Canadian Environmental Protection Act. A majority of the U.S. EPA light-duty vehicle standards are
automatically adopted in Canada by reference to the United States Code of Federal Regulations, with a few standalone
administrative elements. Similarly, heavy-duty vehicle and engine GHG emissions regulations in Canada also incorporate
U.S. EPA rules by reference; however, while currently aligned, model year emission targets are standalone in Canada’s
heavy-duty vehicle and engine regulations and, therefore, are not automatically updated with any updates to U.S. law.
Due to the anticipated changes to U.S. EPA GHG standards, the Canadian federal government will end its longstanding
regulatory alignment with the United States on GHG requirements, and in February 2026, Canada announced its intention
to introduce GHG emission standards for light-duty vehicles to achieve a goal of 75% EV sales by 2035 and 90% by 2040.
With such GHG standards, Canada also announced it will repeal the light-duty ZEV sales requirements that would have
commenced in the 2027 model year under the Electric Vehicle Availability Standard.
Simultaneously, Quebec and British Columbia are reviewing their provincial regulations, which currently mandate
100% ZEV sales by 2035. While both provinces began developing heavy-duty ZEV mandates, there were no new
developments in 2025. Additionally, Quebec announced plans in September 2025 to repeal its regulation banning the sale
of light-duty internal combustion engine vehicles as of 2035. Ultimately, compliance with these shifting ZEV and
emissions requirements depends heavily on market conditions that drive consumer demand for EVs, including technology
readiness, purchase incentives, affordability, and the availability and reliability of a charging infrastructure. The prospect
of maintaining stringent Canada-specific federal GHG requirements and provincial ZEV sales mandates presents
significant challenges.
Regional governments across the globe have adopted or are considering implementing, and in some cases
introducing, emissions regulations that align with CAFE standards. For example, China’s Corporate Average Fuel
Consumption and New Energy Vehicle (“NEV”) Credits Administrative Rules contain fuel consumption requirements as
well as credit mandates for NEV passenger vehicles, i.e., plug-in hybrids, EVs, or fuel cell vehicles. The fuel consumption
requirement, which is based on the WLTP, uses a weight-based approach to establish targets, with year-over-year target
reductions. The credit mandates require OEMs to generate a specific amount of NEV credits each year based on a
percentage of the OEM’s annual ICE vehicle production or import volume, with the percentage increasing year over year.
China also imposes a national standard governing fuel consumption limits for passenger vehicles that are produced and to
be sold domestically in China. An updated version of this national standard, which will impose more stringent fuel
consumption limits, was implemented in January 2026. China is developing a new mandatory national standard to impose
limits on fuel consumption and electric energy consumption by PHEVs, detailed proposals of which are expected to be
available in the second quarter of 2026. China also released a new mandatory national standard to regulate the limits of
electric energy consumption by battery EVs that was implemented in January 2026.
Item
1
. Business (Continued)
12
Australia implemented a unique fleet CO
2
standard in 2025 for light-duty and mid-size cars, SUVs, pickups, and vans,
which is expected to remain in effect until 2029. Governmental reviews of national standards in Australia, New Zealand,
and Saudi Arabia are expected to occur in 2026.
South American countries are implementing stricter standards for vehicle energy efficiency and sustainability as well.
For example, in 2024, Brazil introduced its MOVER Program (formerly the Rota 2030 Program), which aims to significantly
reduce carbon emissions from Brazil’s automotive fleet through financial incentives for investments in sustainable
technologies. In addition to setting stricter fuel economy targets starting in 2027, MOVER mandates new requirements,
applicable to all commercial vehicles, for recyclability and reporting for each vehicle’s carbon footprint over its full lifecycle.
As discussed above and below in Item 1A. Risk Factors under “
Ford may need to substantially modify its product
plans and facilities to comply with safety, emissions, fuel economy, autonomous driving technology, environmental, and
other regulations,”
in addition to the rates of EV growth, production disruptions, stop ships, supply chain limitations, lower-
than-planned market acceptance of our vehicles, and/or other circumstances may cause us to modify product plans or, in
some cases, purchase credits in order to comply with emissions standards, fuel economy standards, or ZEV
requirements.
Vehicle Safety
U.S. Requirements.
The National Traffic and Motor Vehicle Safety Act of 1966 (the “Safety Act”) regulates vehicles
and vehicle equipment in two primary ways. First, the Safety Act prohibits the sale in the United States of any new vehicle
or equipment that does not conform to applicable vehicle safety standards established by NHTSA. Meeting or exceeding
many safety standards is costly and has continued to evolve as global compliance requirements and public domain (e.g.,
New Car Assessment Programs (“NCAPs”), Insurance Institute for Highway Safety (“IIHS”), and the China Insurance Auto
Safety Index) ratings and assessments continue to evolve, are increasing in demands, and lack harmonization globally.
As we expand our business priorities to include autonomous vehicle technologies and broader mobility products and
services, our financial exposure has increased. Similarly, federal and state regulatory requirements are growing as
lawmakers and regulators adapt to advancements in automation, ranging from driver-assistance technologies such as
automatic braking to fully autonomous vehicles. Autonomous vehicle and driver assist technologies continue to be
scrutinized by the government, and actual or perceived failures or misuse of these technologies and features have led to
government investigations and inquiries, including of Ford, which has responded to information requests from NHTSA and
the National Transportation Safety Board about our hands-free highway driving system, BlueCruise. Ford and other
OEMs are required to report to NHTSA any crashes that meet NHTSA-defined criteria and occur when certain advanced
driver assistance system features are in use. Second, the Safety Act requires that defects related to motor vehicle safety
be remedied through safety recall campaigns. A manufacturer is obligated to recall vehicles if it or NHTSA determines the
vehicles contain a non-compliance or a defect resulting in an unreasonable risk to safety. Should we or NHTSA determine
that either a safety defect or noncompliance issue exists with respect to any of our vehicles, the cost of such recall
campaigns could be substantial. Ford is also subject to a consent order we entered into with NHTSA in 2024, pursuant to
which we have retained an independent third party selected by NHTSA to assess the Company’s adherence to the
consent order and Safety Act over the term of the consent order and to report on Ford’s progress to NHTSA.
European Requirements.
The EU has established vehicle safety standards and regulations and is likely to adopt
additional or more stringent requirements in the future, especially in the areas of access to in-vehicle data, artificial
intelligence, and autonomous vehicle technologies.
The European General Safety Regulation (“GSR”) introduced UN-ECE regulations, which are required for the
European Type Approval process. The GSR includes the mandatory introduction of multiple active and passive safety
features, including cybersecurity requirements for all registrations, which began in 2024. EU regulators are focusing on
active safety features, such as lane departure warning systems, electronic stability control, and automatic brake assist.
EV safety continues to be an active area of regulation in the EU, with UN-ECE Regulation No. 100 establishing safety
requirements for EVs and mandating certain testing of electrical powertrains. Furthermore, mobile network providers in
certain EU Member States have begun shutting down their 2G and 3G networks, which form the basis for e-Call system
functionality in existing vehicles. The e-Call systems in existing vehicles may need to be updated as these systems are
phased out. It is also possible that the EU may mandate Member States to maintain these networks to allow for the
continued functionality of existing e-Call systems.
Item
1
. Business (Continued)
13
Other National Requirements.
Globally, governments generally have been adopting UN-ECE based regulations with
minor variations to address local concerns. Any difference between North American and UN-ECE based regulations can
add complexity and costs to the development of global platform vehicles, and we continue to support efforts to harmonize
regulations to reduce vehicle design complexity while providing a common level of safety performance; we are seeking
new opportunities in bilateral negotiations that can potentially contribute to this goal.
Safety and recall requirements in Brazil, China, India, South Korea, and Gulf Cooperation Council (“GCC”) countries
may add substantial costs and complexity to our global recall process. Brazil has set mandatory fleet safety targets and
penalties are applied if these levels are not maintained, while a tax reduction may be available for over-performance. In
Canada, regulatory requirements are mostly aligned with U.S. regulations; however, under the Canadian Motor Vehicle
Safety Act, the Minister of Transport has broad powers to order manufacturers to submit a notice of defect or non-
compliance when the Minister considers it to be in the interest of safety. In 2021, Canada started preliminary
consultations on several new proposed regulations. Final regulations for Administrative Monetary Penalties took effect in
2023. Draft regulations for Analysis of Technical Information for Vehicles and Equipment were delayed; they are now
expected to be released in 2026 and will likely contain some reporting requirements unique to Canada. In China, new
standards for AECS (Accident Emergency Call System) related to electronic architecture and devices are expected to take
effect in July 2027. Additionally, mandatory national standards for intelligent connected vehicles governing vehicle
cybersecurity, software updates, and autonomous driving data recording systems are currently under development in
China and will take effect in July 2026. New mandatory national standards with an accident-driven focus, including safety
requirements for driver assistance systems, are under development and are expected to take effect in January 2027.
Similarly, in the Middle East and Southeast Asia, legislators are focusing on regulating driver assistance and autonomous
driving technologies, as well as cyber and data security for connected vehicles. In Malaysia and South Korea, mandatory
e-Call requirements are being drafted. E-Call is mandatory in the UAE for new vehicles, and, following an update to its
next generation e-Call regulations, will be required in Saudi Arabia beginning with the 2027 model year. The next
generation of e-Call regulations are expected to be expanded across the GCC region in the near future with efforts to draft
a regional e-Call regulation commenced in 2025.
New Car Assessment Programs.
Organizations around the world rate and compare motor vehicles in NCAPs to
provide consumers and businesses with additional information about the safety of new vehicles. NCAPs use crash tests
and other evaluations that are different and often more stringent than what is required by applicable regulations. Vehicle
safety is rated using stars, with five stars awarded for the highest safety rating and one for the lowest. Achieving high
NCAP ratings, which may vary by country or region, can add complexity and cost to vehicles. Similarly, environmental
rating systems exist in various regions, e.g., Green NCAP in Europe. In China, updated NCAP protocols were
implemented in 2024, requiring more stringent assessment methods for both passive and active safety technologies and
expanding the scope of such assessments to pick-up trucks and commercial vans. In Southeast Asia and Latin America,
an updated NCAP test and rating protocol is similarly forecast to be effective beginning in 2026 and is expected to put
greater emphasis on assessment of driver assistance technologies. In Australia and New Zealand, the Australasian
NCAP published protocols that are expected to be effective from 2026 to 2028 and harmonize with other protocols
adopted in the EU, but with distinct local e-Call and child restraint specifications. These protocols impose additional
requirements relating to testing, evaluation, and mandatory safety features, and compliance with them (or any subsequent
updates to them) may be costly.
Item
1
. Business (Continued)
14
HUMAN CAPITAL RESOURCES
People Strategy and Governance
We strive to create an employee experience that enables an inclusive environment of excellence, focus, and
collaboration among team members, allowing us to deliver short- and long-term business success. Ford maintains an
Executive People Forum consisting of the CEO and top leadership team that meets monthly with a specific focus on
people and organizational topics that will enable and accelerate delivery of our Ford+ plan. Key topic areas include
Compensation & Retention; Organization Design; Talent Planning & Development; and Inclusion and Culture.
Our Board of Directors and Board committees provide important oversight on human capital matters, including items
discussed at the Executive People Forum. The Compensation, Talent and Culture Committee maintains responsibility to
review, discuss, and set strategic direction for various people-related business strategies, including: compensation and
benefit programs, leadership succession planning, inclusive culture, and talent development programs. The Sustainability,
Innovation and Policy Committee is responsible for discussing and advising management on maintaining and improving
sustainability strategies, the implementation of which creates value consistent with the long-term preservation and
enhancement of shareholder value and social wellbeing, including human rights, working conditions, and responsible
sourcing. Collective recommendations to the Board and its committees are an important part of how we proactively
manage our human capital and create an employee experience that allows employees and our organization to thrive.
Employee Health and Safety
Nothing is more important than the health, safety, and wellbeing of our employees, and we consistently strive to
achieve world-class levels of safety through the application of sound policies and best practices. We maintain a robust
safety culture designed to reduce workplace injuries, supported by effective communication, reporting, and external
benchmarking.
We verify compliance with regulatory requirements as well as our internal safety standards. To prevent recurrence of
workplace injuries, regular updates are provided to Company management on key safety issues, including safety key
performance indicators, significant incidents, and high potential near misses. As a Company, we participate in multi-
industry benchmarking groups, within and outside the automotive sector, to share safety best practices and collaborate on
common health and safety concerns.
In 2025, there were zero employee fatality incidents globally. Proactive initiatives and leading safety metrics have
been implemented as we strive to prevent workplace injuries and reduce risk to our employees and contractors.
Building a Diverse and Inclusive Workplace
At Ford, we are committed to supporting and sustaining a respectful, inclusive, and safe workplace for all employees.
We believe this empowers every person to do their best work and ultimately achieve the Ford+ plan. We actively recruit
and hire the best talent and are proud that our workforce is made up of people with different backgrounds, perspectives,
and experiences so we can deliver the best products and services for our customers around the world.
Ford offers 10 global Employee Resource Groups (“ERGs”) that represent various dimensions of our employee
population, including race, ethnicity, gender, religion, LGBTQ+, disability, veterans, and generation with chapters
throughout the world. All ERGs are open to all employees and are instrumental in providing a voice to our global
workforce, while also providing valuable insights into the employee experience and product and service development.
We work to strengthen collaboration across the organization by embedding inclusion in the leadership behaviors that
support the Ford operating system. We also leverage the benefit of diversity by listening to the voices of our employees
and stakeholders, which strengthens our workplace, systems, and offerings and ultimately drives value for the business.
Our workforce statistics include the following as of December 31, 2025: 27.9% of our salaried employees worldwide
are women; 25.5% of our total salaried and hourly employees in the United States are women; and 36.7% of our total
salaried and hourly employees in the United States are underrepresented racial and ethnic groups.
Item
1
. Business (Continued)
15
Talent Attraction, Growth, and Capability Assessment
Talent attraction at Ford is evolving with the transformation of our business. We are sourcing and attracting
candidates from multiple industries and regions of the world. We continue to recruit talent from traditional industries, such
as manufacturing and consulting, and have been successful in attracting talent from non-traditional industries, specifically
the technology industry. This is important as we build our expertise in growth areas such as software, electrification and
adjacent technologies, and integrated services.
From a capability perspective, we leverage best practices in assessments and talent management to strengthen our
current capabilities and future pipeline while reinforcing a culture of excellence, focus, and collaboration. The
performance management process is reviewed regularly to ensure we set clear expectations, measure individual
performance, and reward appropriately. Our process includes a semi-annual review of each individual’s performance to
objectives and demonstration of expected behaviors of excellence, focus, and collaboration.
Finally, the extent to which our people leaders are equipped to drive our transformation plays a vital role in our
strategy, and we are committed to helping our leaders strengthen their capabilities with dedicated traditional and non-
traditional learning opportunities. Our leadership strategy equips our leaders with the capabilities to deliver business
results and grow the talent needed to meet our organizational needs.
Competitive Benefit Programs
We provide employees with a competitive, comprehensive, and flexible set of benefits and resources to support their
financial, social, mental/emotional, physical, and professional health. Our comprehensive global benefits programs are
designed to attract and retain top talent worldwide. These programs include a wide range of resources and solutions to
educate, empower, and support individual and organizational goals while being tailored to local regulations and employee
needs across our diverse global workforce. This comprehensive approach is integral to our total rewards strategy,
addressing business and employee challenges through a multi-channel approach that provides diverse populations and
global regions with flexible options to meet their specific goals.
We use data-driven insights gathered through surveys, focus groups, and claims data to understand employee
challenges and prioritize our programs and resources. Our benefits are regularly reviewed and adjusted to remain
competitive within our respective markets and reflect evolving employee expectations. We are committed to creating an
environment where employees and People Leaders respect and value each other as we deliver Ford+.
Employee Sentiment Strategy
We gather feedback from our employees through a variety of channels throughout the year. Our approach is
designed to capture sentiment and make it actionable for managers, leadership, and for the teams designing the tools,
processes, and policies that impact the employee experience. We use a mix of annual and real-time surveys designed to
understand employee sentiment in areas such as people leader effectiveness, job satisfaction, inclusion, wellbeing,
overall satisfaction, strategy and execution, and Ford Operating System behaviors.
A critical element of measuring sentiment is ensuring the data gets to those who are best positioned to use it to drive
improvements in the employee experience. We design dashboards and tools for managers to view the results from their
teams, help them to generate meaningful insights, and convert those insights into guided actions. We share the results
with senior executives to identify broader trends and themes and to inform larger strategic decisions across the Company.
Item
1
. Business (Continued)
16
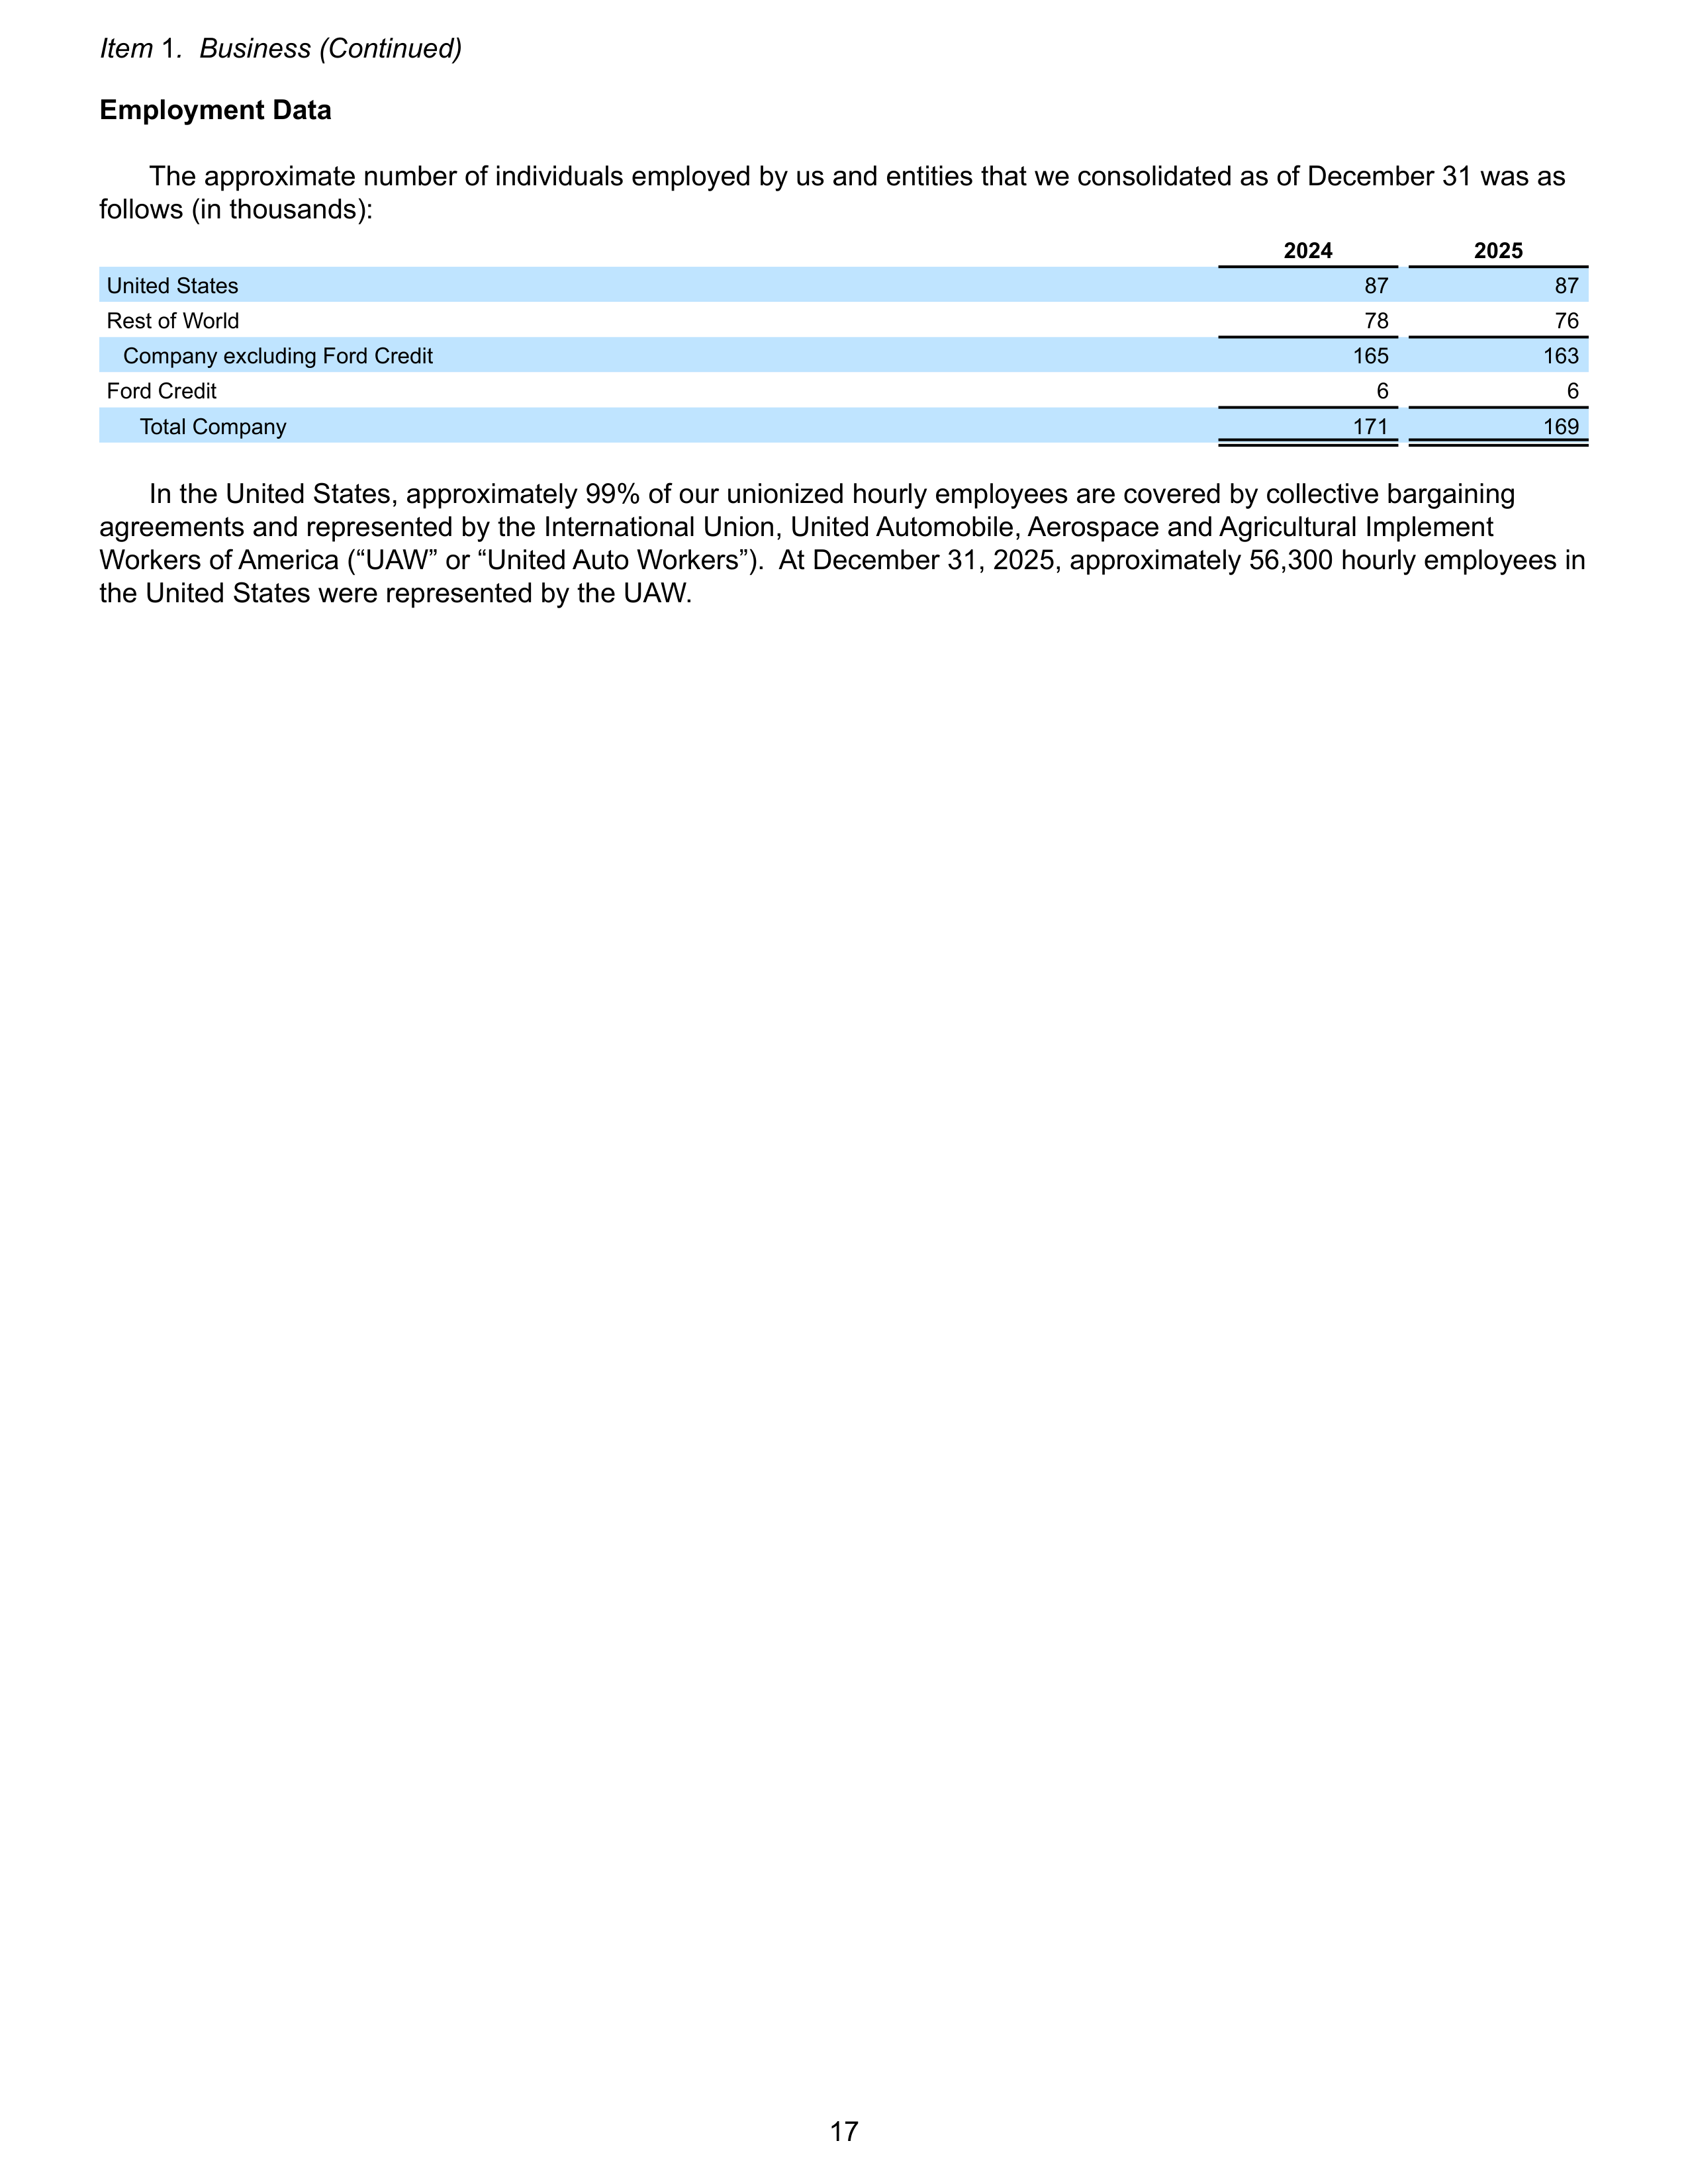
Employment Data
The approximate number of individuals employed by us and entities that we consolidated as of December 31 was as
follows (in thousands):
2024
2025
United States
87
87
Rest of World
78
76
Company excluding Ford Credit
165
163
Ford Credit
6
6
Total Company
171
169
In the United States, approximately 99% of our unionized hourly employees are covered by collective bargaining
agreements and represented by the International Union, United Automobile, Aerospace and Agricultural Implement
Workers of America (“UAW” or “United Auto Workers”). At December 31, 2025, approximately 56,300 hourly employees in
the United States were represented by the UAW.
Item
1
. Business (Continued)
17
ITEM 1A.
Risk Factors.
We have listed below the material risk factors applicable to us grouped into the following categories: Operational
Risks; Macroeconomic, Market, and Strategic Risks; Financial Risks; and Legal and Regulatory Risks. Some of the risks
and contingencies discussed herein may have previously occurred. These risk factors are not representations as to
whether or not such matters have occurred in the past and instead reflect our opinions on material factors that may
materially and adversely affect our business in the future. We have a global business, and conditions in our industry and
the regions where we operate and sell our products and services may change quickly. Accordingly, institutional stability is
crucial to businesses like Ford as we make hiring and investment decisions, as well as to the smooth functioning of
financial markets on which we depend. Rapid policy change in our home market, the United States, is creating
uncertainty in our operations and business outlook, and may remain a source of volatility in the future.
Operational Risks
Ford’s long-term success depends on delivering the Ford+ plan, including improving cost competitiveness.
We previously announced our plan for growth and value creation – Ford+. Ford+ is our plan to thrive at the intersection of
great vehicles, iconic brands, and innovative software and service, building Ford into a higher growth, higher margin, more
capital efficient, and more durable company. Our Ford+ plan is designed to leverage our foundational strengths with
enhanced capabilities – enriching customer experiences and deepening loyalty. As we progress this transformation of our
business, we must integrate our strategic initiatives into a cohesive business model, modernize our systems, processes,
and technologies, and balance competing priorities, or we will not be successful. To facilitate this transformation, we are
making substantial investments, recruiting new talent, and modernizing and optimizing our business model, management
and IT systems, and organization. Our strategy involves providing customers freedom of choice to select the powertrain
that best suits their needs and maintaining manufacturing flexibility at Ford to meet shifting customer demand.
Accordingly, maintaining discipline in our capital allocation continues to be important, as a strong core business and a
balance sheet that provides the flexibility to invest in these opportunities are critical to the success of our Ford+ plan. If
we are unable to optimize our capital allocation among vehicles (and propulsion systems among our vehicles), services,
technology, and other calls on capital, make sufficient and timely progress to become competitive on cost and quality and
ensure that progress is sustainable, or we are otherwise not successful in executing Ford+ (or are delayed for reasons
outside of our control), we may not be able to realize the full benefits of our plan, which could have an adverse effect on
our financial condition or results of operations. Furthermore, if we fail to make progress on our plan at the pace that
shareholders expect, it may lead to an increase in shareholder activism, which may disrupt the conduct of our business
and divert management’s attention and resources. As described elsewhere herein, global political instability and volatility
in government regulations and unpredictable trade policy (including tariffs) in the United States and around the world limit
our ability to conduct effective long-term planning and make capital allocation decisions.
Ford’s products have been and could continue to be affected by defects that result in recall campaigns,
increased warranty costs, or delays in new model launches, and the time it takes to improve the quality of our
products and services and reduce the costs associated therewith could continue to have an adverse effect on
our business.
Government safety standards require manufacturers to remedy defects related to vehicle safety through
safety recall campaigns, and a manufacturer is obligated to recall vehicles if it determines that the vehicles do not comply
with a safety standard. We may also be obligated to remedy defects or potentially recall our products due to defective
components provided to us by our suppliers, arising from their quality issues or otherwise.
NHTSA’s enforcement strategy has resulted in significant civil penalties being levied and the use of consent orders,
including at Ford, requiring direct oversight by NHTSA of certain manufacturers’ safety processes, a strategy that could
continue. For example, as part of a consent order we entered into with NHTSA in 2024, we have retained an independent
third party selected by NHTSA to assess the Company’s adherence to the consent order and Safety Act over the term of
the consent order and to report on Ford’s progress to NHTSA. Should we or government safety regulators determine that
a safety or other defect or a noncompliance exists with respect to certain of our products prior to the start of production,
the launch of such product could be delayed until such defect is remedied. The cost of recall and customer satisfaction
actions to remedy defects in vehicles that have been sold could be substantial, particularly if the actions relate to global
platforms or involve defects that are identified years after production. For example, NHTSA and the automotive industry
are currently engaged in a study of the safety of approximately 56 million Takata desiccated airbag inflators in the United
States. Of these, approximately 3.5 million of the inflators are in our vehicles. In addition, NHTSA is considering action
related to 52 million vehicles containing inflators from ARC Automotive and Delphi Automotive in the United States. Ford
has 2.5 million vehicles within this population. Should NHTSA determine that these inflators contain a safety defect, Ford
and other manufacturers could potentially face significant incremental recall costs. Further, to the extent recall and
customer satisfaction actions relate to defective components we receive from suppliers, our ability to recover from the
suppliers may be limited by the suppliers’ financial condition.
18
Ford is also subject to environmental regulatory compliance requirements, and in many jurisdictions (including the
United States), we are required to report on and correct certain emissions-related defects. Similarly, where required by
regulation, we are obligated to honor certain warranties on emissions-related components, which can impose additional
obligations beyond our standard warranties and increase our costs.
We accrue the estimated cost of both base warranty coverages and field service actions at the time a vehicle is sold,
and we reevaluate the adequacy of our accruals on a regular basis. In addition, from time to time, we issue extended
warranties at our expense, the estimated cost of which is accrued at the time of issuance. The impact of such accruals
will be reflected in our results of operations for the period in which the accrual is made, which could cause variability in our
financial performance, while the cash flow impact may be reflected in a later period or periods. For additional information
regarding warranty and field service action costs, including our process for establishing our reserves, see “Critical
Accounting Estimates” in Item 7 and Note 24 of the Notes to the Financial Statements. If warranty costs are greater than
anticipated as a result of increased vehicle and component complexity, the adoption of new technologies, the time it takes
to improve the quality of our products and services (or if such efforts are unsuccessful), implementation of additional
remedies in the event the initial one is ineffective or parts are unavailable, or otherwise (including as a result of higher
repair costs driven by inflation or other economic factors), such costs could continue to have an adverse effect on our
financial condition or results of operations.
Furthermore, launch delays, recall actions, and increased warranty costs have generated negative publicity and
adversely affected and could continue to adversely affect our reputation or the public perception and market acceptance
of our products and services as discussed elsewhere herein. In an effort to improve quality, we have slowed down and
may continue to slow down launches, which may result in lost sales, revenue, and profits and could have an adverse
effect on our financial condition or results of operations. From time to time, our inventory levels may be higher due to a
number of different factors, including as a result of vehicles on hold for quality control, which may cause us to incur
additional costs associated with those vehicles, e.g., repair costs for weather-related damage.
Ford is highly dependent on its suppliers to deliver components in accordance with Ford’s production
schedule and specifications, and a shortage of or inability to timely acquire key components or raw materials has
previously disrupted and may, in the future, disrupt Ford’s operations.
Our products contain many components that
we source globally from a complex network of suppliers, who, in turn, source components from their suppliers. If there is
a shortage of a key component in our supply chain or a supplier is unable to deliver a component to us in accordance with
our specifications and at the cost contracted for, because of a production issue, a disruption at a supplier’s facility (e.g.,
fire, explosion, equipment failure, or natural disaster), limited availability of materials, shipping problems, restrictions on
transactions with certain countries or companies, implementation of tariffs, or other reason, and the component cannot be
easily sourced from a different supplier, or we are unable to obtain a component on a timely basis, the shortage may
disrupt our operations or increase our costs of production and our ability to recoup lost production volume may be limited.
For example, in 2025, our production was disrupted by fires at one of our major aluminum suppliers, the effects of which
are ongoing.
For the manufacture of our electrified products, we are dependent on the supply of batteries and the raw materials
(e.g., lithium, cobalt, and nickel) used by our suppliers to produce those batteries. Some of these resources are limited,
and, as a result, we may be unable to acquire raw materials needed for our products in sufficient amounts that are
responsibly sourced or at reasonable prices. As described in the Liquidity and Capital Resources section in Item 7 below,
and elsewhere herein, we have entered into and we may, in the future, enter into offtake agreements and other long-term
purchase contracts that obligate us, subject to certain conditions such as quality or minimum output, to purchase a certain
percentage or minimum amount of output from certain raw materials suppliers. In the event the supplier under those
agreements or any of our or our suppliers’ raw material supply contracts is unable to deliver sufficient quantities of raw
materials needed for our or our suppliers’ production operations, e.g., if a mine does not produce at expected levels, or
the raw materials do not otherwise satisfy our requirements, and we or our suppliers are unable to find an alternative
resource that satisfies our technical requirements and with sufficient quantities, at reasonable prices, responsibly sourced,
and in a timely manner, it could impact our ability to manufacture products. Further, suppliers who fail to comply with our
requirements for ethical business practices could lead us to seek alternative suppliers, which may result in delayed
deliveries or increased costs.
A shortage of, or our inability to acquire or find adequate suppliers of, key components or raw materials as a result of
disruptions in the supply chain, import and export bans or tariffs imposed by the U.S. or foreign governments, capacity
constraints, limited availability, competition for those items within the automotive industry and other sectors, or otherwise
can cause a significant disruption to our production schedule and have a substantial adverse effect on our financial
condition or results of operations. For example, China’s restriction on the export of rare earth minerals, which we and our
suppliers utilize for a number of components, has impacted (e.g., rescheduling production, changing operating patterns)
Item 1A. Risk Factors (Continued)
19
and caused disruptions in our production operations, increases the risk of future production disruptions, and has increased
and may further increase costs (e.g., premium freight and expedited shipping costs to make up for delays in component
availability). Moreover, as the industry evolves, suppliers of traditional or EV-specific components may face financial
distress or choose to exit certain lines of business, further narrowing our sourcing options and potentially leading to higher
prices or supply shortages that could have a substantial adverse effect on our results of operations and reputation.
Ford’s production, as well as Ford’s suppliers’ production, and/or the ability to deliver products to
consumers could be disrupted by labor issues, public health issues, natural or man-made disasters, adverse
effects of climate change, financial distress, production difficulties, capacity limitations, or other factors.
A work
stoppage or other limitation on production has occurred, and could in the future occur, at Ford’s facilities, at a facility in its
supply chain, or at one of its logistics providers for any number of reasons, including as a result of labor issues, such as
shortages of available employees, disputes under existing collective bargaining agreements with labor unions or in
connection with negotiation of new collective bargaining agreements, absenteeism, public health issues (e.g., COVID),
stay-at-home orders, or in response to potential restructuring actions (e.g., plant closures); as a result of supplier financial
distress or other production constraints, such as limited quantities of components or raw materials, quality issues, capacity
limitations, or other difficulties; as a result of a natural disaster (including climate-related physical risk); social unrest;
cybersecurity incidents; or for other reasons. A suspension or substantial curtailment of our manufacturing operations
could have a significant adverse effect on our financial condition and results of operations. The duration of a suspension
of manufacturing operations and a return to our full production schedule will vary. Our Ford Blue, Ford Model e, and Ford
Pro operations generally do not realize revenue while our manufacturing operations are suspended, but we continue to
incur operating and non-operating expenses, resulting in a deterioration of our cash flow. Accordingly, any significant
future disruption to our production schedule, regionally or globally, whether as a result of our own or a supplier’s
suspension of operations, could have a substantial adverse effect on our financial condition, liquidity, and results of
operations. Moreover, our supply and distribution chains may be disrupted by supplier or dealer bankruptcies or their
permanent discontinuation of operations. In addition, broader changes in the supplier landscape, including supplier
consolidation and suppliers’ decisions to no longer participate in a particular line of business, pose a risk of supply
shortages and/or price increases.
The limited availability of components, labor shortages, public health emergencies, and supplier operating issues
have led to intermittent interruptions in our supply chain and an inconsistent production schedule at our facilities. This has
exacerbated the disruption to our suppliers’ operations, which, in turn, has led to higher costs and production shortfalls.
As a result of this disrupted production schedule, we have received and continue to receive claims from our supply base
for reimbursement of costs beyond our original agreed terms. Upon receipt, we evaluate those claims, and, in certain
circumstances, we have made payments to our suppliers, and this trend may continue.
Given the worldwide scope of our supply chain and operations, we and our suppliers face a risk of disruption or
operating inefficiencies that may increase costs due to the adverse physical effects of climate change, which are predicted
to increase the frequency and severity of weather and other natural events, e.g., wildfires, extended droughts, flooding,
and extreme temperatures. In addition, in the event a weather-related event, strike, international conflict, or other
occurrence limits the ability of freight carriers to deliver components or other materials to us, or logistics providers are
unable to transport our products for an extended period of time, it may increase our costs and delay or otherwise impact
our production operations and customers’ ability to receive our products.
Many components used in our products are available only from a single or limited number of suppliers and, therefore,
cannot be re-sourced quickly or inexpensively to another supplier (due to long lead times, specialized tooling, rigorous
validation requirements, and new contractual commitments that may be required by another supplier before ramping up to
provide the components or materials, etc.). Such suppliers also could threaten to disrupt our production as leverage in
negotiations. In addition, when we undertake a model changeover, significant downtime at one or more of our production
facilities may be required, and our ability to return to full production may be delayed if we experience production difficulties
at one of our facilities or a supplier’s facility. Moreover, as vehicles, components, and their integration become more
complex, we may face an increased risk of a delay in production of new vehicles. Regardless of the cause, our ability to
recoup lost production volume may be limited. Accordingly, as we have experienced in the past, and may again
experience in the future, a significant disruption to our production schedule could have a substantial adverse effect on our
financial condition or results of operations and may impact our strategy to comply with fuel economy standards as
discussed elsewhere herein.
Item 1A. Risk Factors (Continued)
20
Ford may not realize the anticipated benefits of existing or pending strategic alliances, joint ventures,
acquisitions, divestitures, commercial relationships, or business strategies or the benefits may take longer than
expected to materialize.
We have invested in, formed strategic alliances or entered into commercial relationships with,
and announced or formed joint ventures with a number of companies, and we may expand those relationships or enter
into similar relationships with additional companies. These initiatives typically involve enormous complexity, may require a
significant amount of capital, and may involve a lengthy regulatory approval process. As a result, we may not be able to
complete anticipated transactions, the anticipated benefits of these transactions may not be realized, or the benefits may
be delayed. For example, we may not successfully integrate an alliance or joint venture with our operations, including the
implementation of our controls, systems, procedures, and policies, we may be unable to retain key employees, or
unforeseen expenses or liabilities may arise that were not discovered during due diligence prior to an investment or entry
into a strategic alliance, or a misalignment of interests may develop between us and the other party. Further, to the extent
we share ownership, control, or management with another party in a joint venture, our ability to influence the joint venture
may be limited, and we may be unable to prevent misconduct or implement our compliance or internal control systems.
Moreover, negative publicity, government investigations, or litigation involving a company with which we have a business
or supply relationship, including licensing intellectual property, may have an adverse effect on our reputation. In order to
secure critical materials to manufacture our products, we have entered into and may, in the future, enter into offtake
agreements and other long-term purchase contracts with raw materials and other suppliers and make investments in
certain raw material, battery, and suppliers; however, we may not realize the anticipated benefits of these actions and our
efforts to have our suppliers, particularly those in less developed markets, adopt Ford’s sustainability and other standards
may be unsuccessful, which could have an adverse impact on our reputation and may expose us to litigation or
investigations as a result of our relationships with such suppliers.
In addition, the implementation of a new or different business strategy may not be successful or may lead to the
disruption of our existing business operations, including distracting management from current operations. For example,
the new battery energy storage business we announced in the fourth quarter of 2025 or our efforts to evaluate and
implement alternative distribution models and channels for our products and services from those we have traditionally
used may be challenged or may not succeed or be as successful as our historical arrangements. External factors may
also impact the success of our initiatives. For example, our business and strategy are susceptible to tensions in U.S.-
China relations and the rapid development of the Chinese electrified vehicle industry, with domestic Chinese producers
exporting to some key markets in which we operate. In addition, as we implement our strategy to provide customers
freedom of choice to select the powertrain that best suits their needs and maintain manufacturing flexibility to meet shifting
customer demand, we have in the past taken, and may in the future take, actions such as adjusting our investments and
spending, not fully utilizing or reducing the capacity of our existing or future plants, reducing production hours or shifts,
cancelling programs or deciding to no longer produce vehicles already in production, or delaying vehicle and technology
launches, and we have in the past and may in the future become subject to claims by suppliers or other parties, incur
charges related to impairments, asset write-downs, or inventory adjustments, or lose or become obligated to repay
government incentives as a result. For example, we have taken, and may in the future take, such actions to better match
the pace of EV adoption, which has been lower than anticipated industrywide. Results of operations from new activities
may be lower than anticipated or our existing activities, and, if a strategy is unsuccessful, we may not recoup our
investments, which may be significant, in that strategy. Further, as our strategy evolves in an area, we may be unable to
utilize or redeploy our existing assets or investments in that or other areas, which may lead to impairments and other cash
and non-cash charges. Moreover, we have in the past incurred and may in the future incur charges and continue to have
financial exposure following a change in strategy, a strategic divestiture, a cessation of operations in a market, or a
decision to unwind an existing venture or relationship. For example, in December 2025, we announced our updated EV
strategy, the expected disposition of our investment in BlueOval SK, LLC, and the charges we expected to record related
to those items. Failure to successfully and timely realize the anticipated benefits of the transactions or strategies
described herein could have an adverse effect on our financial condition or results of operations.
Ford may not realize the anticipated benefits of restructuring actions and such actions may cause Ford to
incur significant charges, disrupt our operations, or harm our reputation.
We continually review and evaluate our
business to find opportunities to make our operations more efficient and reduce costs. In doing so, we have taken, and
may in the future take, restructuring actions, such as strategic divestitures, unwinding an existing venture or relationship,
or ceasing operations in a market, particularly for those businesses where a path to sustained profitability is not feasible in
light of the capital allocation requirements or for other reasons. Our plans for implementing such actions may be
accelerated by shifting industry dynamics and new entrants to our industries with which we must compete. These actions
may include employee separations, a reduced footprint (e.g., plant closures or smaller operations at existing plants or
plants that are not yet on-line), operating our plants at less than full capacity (e.g., reducing shifts), cancelling products or
programs, or shifting our strategy for the deployment of technologies. Such restructuring actions have caused us and may
in the future cause us to incur significant costs; record impairments or other charges; subject us to potential claims from
employees, suppliers, dealers, other counterparties, or governmental authorities (including a reduction or clawback of
Item 1A. Risk Factors (Continued)
21
incentives); disrupt our operations; distract management from current operations; or harm our reputation. Further, we may
not realize the expected benefits of such restructuring actions (e.g., anticipated cost savings), such benefits may be
delayed, or market dynamics or other factors may have evolved such that we cannot obtain the original intended results of
an action.
Failure to develop and deploy secure digital services that appeal to customers, retain existing subscribers,
and grow our subscription rates could have a negative impact on Ford’s business.
A growing part of our business
involves connectivity, digital and physical services, and integrated software services, and we are devoting significant
resources to develop this business. Further, we have announced our plans and expectations for integrated services to
become a larger portion of our revenue and earnings by offering new and differentiated products, retaining existing
subscribers, and growing subscription rates with new customers. If we do not develop, deliver, and make available
standardized technologies that customers can easily adopt and use, fail to generate sufficient demand for our integrated
software and digital services, or if customers do not opt to activate the modems in our vehicles, which would hinder our
ability to offer and sell such services, we may not grow revenue in line with the costs we are investing or achieve
profitability on our increasingly digitally-connected products. Shifting public policy regarding data privacy and the effects
of artificial intelligence has caused and may in the future cause us to incur substantial costs to modify our operations or
business practices, reduce consumers’ willingness to engage with our offerings, or cause delays or lapses in the
availability of our products or services in various jurisdictions. We must convince prospective users of the benefits of our
subscription services and our existing users of the continued value thereof. This depends in large part on our ability to
offer exceptional services, competitive pricing, integrated functionality, and a satisfying user experience. Further
discussion of risks associated with market acceptance of our services and the evolving regulatory landscape is provided
elsewhere herein.
We contract with third parties to offer digital content to customers and license technologies for use in our software and
digital services. This includes the right to sell, or offer subscriptions to, third-party content, as well as the right to
incorporate specific content into our own services; however, continuation of these third-party licensing and other
arrangements, or their renewal on commercially reasonable terms, is not guaranteed or may be unavailable. Moreover,
while we seek to grow our share of this business, third parties may be less inclined to continue developing or licensing
software for Ford’s products or permit the Company to distribute their content, or such providers may offer competing
products and services to the detriment of our business. If we are unable to offer integrated software applications and
digital services on competitive terms, it may reduce customer demand or increase our costs to provide such applications
and services, which we may be unable to pass on to customers. Alternatively, we may have to develop or license new
content or technology to provide digital services, and there can be no assurance we would be able to develop or license
such content or technology at a reasonable cost or in a timely manner, either of which could have a negative impact on
our financial condition, results of operations, or reputation.
Sophisticated software integration may have issues that can unexpectedly interfere with the intended operation of
hardware or other software products and services. In addition, the services we offer can have quality issues and may,
from time to time, experience outages, service slowdowns, or errors. Moreover, the reliance of our services on cloud-
based systems and other digital infrastructure owned by third parties creates particular risk. Any outage, misconfiguration,
or loss of data within the systems or infrastructure of these third parties could impair the performance of our services from
time to time. As a result, these services may not always perform as anticipated and may not meet customer expectations.
There can be no assurance we will be able to detect and remedy all issues and defects in the hardware, software, and
services we offer, or successfully deliver over-the-air (“OTA”) updates. Failure to do so on a timely basis could result in
widespread technical and performance issues affecting our products and services. Further discussion of the risks
associated with product defects, quality issues, or delays in product launches and availability is provided elsewhere
herein.
We continue to increase the number of BlueCruise (our hands-free highway driving system) enabled vehicles on the
road and its growth and expansion remains an important part of our strategy. We also face substantial competition in that
area. In addition, autonomous vehicle and driver assist technologies, including BlueCruise, continue to be scrutinized by
government regulators and consumers, and actual or perceived failures or misuse of these technologies and features
have led to government investigations and inquiries, including of Ford. Such negative publicity of our products or those of
our competitors could undermine consumer trust and negatively impact our subscription rates. If we are unable to
successfully develop and grow BlueCruise and other subscription services or build and maintain consumer trust in those
offerings, we may be unable to recoup the investments we have made in those technologies and it could negatively
impact our reputation, financial condition, and results of operations.
Item 1A. Risk Factors (Continued)
22
While we continue to invest in direct-to-consumer sales methods for our connectivity, digital and physical services,
and integrated software services offerings, we are dependent on the efforts of third-party dealers for the majority of our
sales in this space. We have invested and will continue to invest in programs to enhance sales through dealers, including
education programs for dealership employees on the benefits of our services offerings and developing and making
available digital marketing assets to dealers. These efforts may require a substantial investment of time and capital while
providing no assurance of incremental sales.
The actions of end users are generally beyond our control and some users may engage in fraudulent or abusive
activities that involve our digital services. These include unauthorized use of accounts through stolen credentials, failure
to pay for services accessed, or other activities that violate our terms of service. While we have implemented security
measures intended to prevent unauthorized access to our digital services and related information systems, malicious
entities have and will continue to attempt to gain unauthorized access to them. If our efforts to detect such violations or
our actions to control these types of fraud and abuse are not effective or timely, it may have an adverse effect on our
financial condition, results of operations, or reputation. Further discussion of the risks associated with operational
information systems and our cybersecurity posture is provided elsewhere herein.
Ford’s ability to maintain a competitive cost structure could be affected by labor or other constraints.
The
vast majority of the hourly employees in our manufacturing operations in the United States and Canada are represented
by unions and covered by collective bargaining agreements. These agreements provide guaranteed wage and benefit
levels throughout the contract term and some degree of income security, subject to certain conditions. Our recent labor
contracts, including those with the International Union, United Automobile, Aerospace and Agricultural Implement Workers
of America (“UAW”) in the United States and Unifor in Canada, have resulted in significant cost increases. If we are
unable to offset these costs, it could have a significant adverse effect on our business. Some of our competitors do not
have such collective bargaining agreements and are not subject to the same constraints. Further, a substantial number of
our employees in other regions are represented by unions or government councils, and legislation or custom promoting
retention of manufacturing or other employment in the state, country, or region may constrain as a practical matter our
ability to sell or close manufacturing or other facilities or increase the cost of doing so. These agreements in the United
States, Canada, Europe, and other regions may restrict our ability to close plants and divest businesses. In addition, to
the extent companies in our global supply chain that are not currently parties to collective bargaining agreements enter
into such agreements or otherwise increase their employees’ wages and benefits, any increased costs incurred by those
suppliers may, in turn, increase our costs.
Ford’s ability to attract, develop, grow, support, and reward talent is critical to its success and
competitiveness.
Our success depends on our ability to continue to attract, develop, grow, support, and reward talented
and diverse employees with domain expertise in engineering, software, technology, integrated services, supply chain,
marketing, and finance, among other areas. While we have been successful in attracting talent in recent years, as with
any company, the ability to continue to attract talent is important, particularly in growth areas vital to our success such as
software, electrification and adjacent technologies, and integrated services. Competition for such talent is intense, which
has led to an increase in compensation throughout a tight labor market, and, accordingly, may increase costs for
companies. In addition to attracting talent, we must also retain the talent needed to deliver our business objectives. If we
lose existing employees, are unable to attract talent with needed skills, or we are unable to develop existing employees,
particularly with the introduction of new technologies and our focus on operational efficiency and quality, it could have a
substantial adverse effect on our business.
Operational information systems, security systems, products, and services could be affected by
cybersecurity incidents, ransomware attacks, and other disruptions and impact Ford, Ford Credit, their suppliers,
and dealers.
We rely on information technology networks and information systems, including in-vehicle systems and
mobile devices, some of which are managed by suppliers, some of which are provided by third-party service providers,
and some of which ultimately rely on other services provided to these third parties by unaffiliated service providers, to
process, transmit, and store electronic information that is important to the operation of our business, our vehicles, and the
services we offer. Despite devoting significant resources to our cybersecurity program, we are at risk for interruptions,
outages, and compromises of: (i) operational information systems (including business, financial, accounting, product
development, consumer receivables, data processing, or manufacturing processes); (ii) facility security systems; and/or
(iii) in-vehicle systems or mobile devices, whether caused by a ransomware or other cybersecurity incident, security
breach, or other reason (e.g., a natural disaster, fire, acts of terrorism or war, or an overburdened infrastructure system).
Additionally, any outage, security breach, misconfiguration, or loss of data within networks and systems managed by or
reliant on the products and services of unaffiliated third parties could lead to similar compromises. Such incidents could
materially disrupt operational information systems; result in loss or unwilling publication of trade secrets or other
proprietary or competitively sensitive information; compromise the privacy of personal information of consumers,
employees, or others; jeopardize the security of our facilities; disrupt or degrade service or our operations; affect the
Item 1A. Risk Factors (Continued)
23
performance of in-vehicle systems or services we offer; and/or impact the safety of our vehicles. This risk exposure rises
as we continue to develop and produce vehicles with increased connectivity. Moreover, we, our suppliers, service
providers, and dealers have been the target of cybersecurity incidents and such threats are continuing and evolving,
which may cause cybersecurity incidents to be more difficult to detect for periods of time. Our networks and in-vehicle
systems, sharing similar architectures, could also be impacted by, or a cybersecurity incident may result from, the
negligence or misconduct of insiders or third parties who have access to our networks and systems. We employ
capabilities, processes, and other security measures we believe are reasonably designed to detect, reduce, and mitigate
the risk of cybersecurity incidents, and have requirements for our suppliers and service providers to do the same;
however, we may not be aware of all vulnerabilities or might not accurately assess the risks of incidents, and such
preventative measures cannot provide absolute security and may not be sufficient in all circumstances or mitigate all
potential risks, including potential production disruption or the loss or disclosure of sensitive information. Moreover, a
cybersecurity incident could harm our reputation, cause customers to lose trust in our security measures, and/or subject
us to regulatory actions or litigation, which may result in fines, penalties, judgments, or injunctions, and a cybersecurity
incident involving us or one of our suppliers or service providers could impact our production, internal operations, business
strategy, results of operations, financial condition, or our ability to deliver products and services to our customers.
To facilitate access to the raw materials and other components necessary for the manufacture of electrified
products, Ford has entered into and may, in the future, enter into multi-year commitments to raw material and
other suppliers that subject Ford to risks associated with lower future demand for such items as well as costs
that fluctuate and are difficult to accurately forecast.
Our ability to manufacture electrified products is dependent
upon the availability of raw materials and other components necessary for the production of batteries, e.g., lithium, cobalt,
nickel. As described in the Liquidity and Capital Resources section in Item 7 below, and elsewhere herein, to facilitate our
access to such raw materials, we have entered into and we may, in the future, enter into offtake agreements and other
long-term purchase contracts. Such agreements obligate us, subject to certain conditions such as quality or minimum
output, to purchase a certain percentage or minimum amount of output from raw material suppliers over an agreed upon
period of time pursuant to agreed upon purchase price mechanisms that are typically based on the market price of the
material at the time of delivery.
Unlike our standard arrangements with suppliers, under multi-year offtake agreements and other long-term purchase
contracts, the risks associated with lower-than-expected electrified vehicle production volumes or changes in battery
technology that reduce the need for certain raw materials, batteries, or their components are borne by Ford rather than
our suppliers. In the event we do not purchase the materials or components pursuant to the terms of these agreements,
we may nevertheless be obligated to pay the purchase price or otherwise compensate the supplier in an amount
determined by the contract or reimburse the supplier for costs or losses it incurs. We have incurred and we may continue
to incur such charges. This may be the case even if the supplier finds another purchaser, as we may be responsible for
the costs of finding the new purchaser as well as any lost revenue attributable to the replacement purchaser paying a
lower price than required under the pricing mechanism in our agreement.
As a result of the competition for and limited availability of the raw materials needed for our electrified vehicle
business, the costs of such materials are difficult to accurately forecast as they may fluctuate during the term of the offtake
agreements and other long-term purchase contracts based on market conditions. Accordingly, we may be subject to
increases in the prices we pay for those raw materials, and our ability to recoup such costs through increased pricing to
our customers may be limited. As a result, our margins, results of operations, financial condition, and reputation may be
adversely impacted by commitments we make pursuant to offtake agreements and other long-term purchase contracts.
Macroeconomic, Market, and Strategic Risks
With a global footprint and supply chain, Ford’s results and operations have been and could continue to be
adversely affected by economic or geopolitical developments, including protectionist trade policies such as
tariffs, or other events.
Because of the interconnectedness of the global economy, financial crises, economic downturns
or recessions (including reduced consumer spending), pandemics, natural disasters, wars, social unrest, geopolitical
crises, or other significant events in one market can have an immediate and material adverse impact on other markets
where Ford operates. Unprecedented trade policy (including tariffs) in the United States and foreign governments’
reactions limit our ability to conduct effective long-term planning and make capital allocation decisions. The continued
strain in U.S.-China relations presents unique risks to U.S. automakers, as does China’s unique regulatory landscape, the
level of integration with key components in our global supply chain, the limited availability of various components and
materials (including certain rare earth minerals and related products from China), and the rapid development of the
Chinese EV industry, with Chinese electrified vehicle manufacturers exporting their products to some key markets in which
we operate.
Item 1A. Risk Factors (Continued)
24
Changes in international trade policy can also have a substantial adverse effect on our financial condition, results of
operations, or our business in general. To the extent governments in various regions implement or intensify restrictions or
barriers to trade, such as tariff or non-tariff barriers, export controls, currency manipulation, or policies that otherwise favor
domestic companies, there can be a significant negative impact on manufacturers based in other markets. Steps taken by
governments to implement local content requirements, restrict export and import activities, or apply or consider applying
additional or new tariffs on automobiles, parts, and other products and materials have disrupted supply chains, imposed
additional costs on our business, and led to other countries attempting to retaliate by imposing tariffs or other barriers,
which make our products more expensive for customers, and, in turn, our products less competitive, and this trend may
continue. Tariffs implemented to date in the United States and elsewhere have caused significant disruption, increased
costs, and uncertainty in the automotive industry, including for Ford, other OEMs, suppliers, and dealers, as well as
customers. Moreover, tariffs implemented or increased in the United States and elsewhere in the future may exacerbate
these impacts. The U.S. government has implemented limited tariff relief for qualifying parties based on certain criteria,
which could include prospective avoidance and retroactive relief through refunds. This relief is subject to periodic
approval by the U.S. Department of Commerce and may be revised based on factors such as U.S. production and import
content levels. Although we may be entitled to relief under these programs, and we may carry a receivable on our
balance sheet reflecting tariffs paid but for which we expect, but have not yet received, refunds, the timing of our receipt of
these amounts (and whether we will ultimately receive a refund) is uncertain and is subject to changes in trade policy.
Accordingly, any delay in receiving the refunds could have a negative impact on our cash flow, and in the event we do not
ultimately receive a refund, it could have an adverse impact on our financial condition or results of operations.
In addition, instability in the supply chain exacerbated by tariffs and other industry concerns, such as China’s
restriction on the export of rare earth minerals and various components, has resulted in production disruptions and
increased costs and heightens the risk of future production disruptions and further cost increases. Although there is
uncertainty regarding the application, scope, and duration of tariffs, those that have been implemented have had a
significant adverse effect, both operationally and financially, on the overall automotive industry, Ford, and our supply
chain. Any additional tariffs or other measures that are implemented in the United States and any retaliatory tariffs or
other measures or restrictions that are implemented by other governments, and the potential related market impacts,
should they be sustained for an extended period of time, may have a significant adverse effect.
With operations in various markets with volatile economic or political environments and our global supply chain and
utilization of transportation routes and logistics providers around the world, we are exposed to heightened risks as a result
of economic, geopolitical, or other events. This could include governmental takeover (i.e., nationalization) of our
manufacturing facilities or intellectual property, restrictive exchange or import controls, changes to international trade
agreements, disruption of operations as a result of systemic political or economic instability, social unrest, outbreak of war
or expansion of hostilities, and acts of terrorism, each of which could impact our supply chain as well as our operations.
These events could also have a substantial adverse effect on our financial condition, results of operations, or our business
in general. Changes in trade policy may also restrict or limit the ability of logistics providers and customs brokers to
process imports timely, which may delay or disrupt our operations and increase our costs. Further, the U.S. government,
other governments, and international organizations could impose additional sanctions or export controls that could restrict
us from doing business directly or indirectly in or with certain countries or parties, which could include affiliates, disrupt our
supply chain and production, and potentially impact the repatriation of earnings.
Ford’s new and existing products and digital, software, and physical services are subject to market
acceptance and face significant competition from existing and new entrants in the automotive and digital and
software services industries, and Ford’s reputation may be harmed based on positions it takes or if it is unable to
achieve the initiatives it has announced.
Although we conduct extensive market research before launching new or
refreshed products and introducing new services, many factors both within and outside our control affect the success of
new or existing products and services in the marketplace, and we may not be able to accurately predict or identify
emerging trends or preferences or the success of new products or services in the market. It takes years to design and
develop a new vehicle or change an existing vehicle. Because customers’ preferences may change quickly, our new and
existing products may not generate sales in sufficient quantities and at costs low enough to be profitable and recoup
investment costs. Offering products and services that customers want and value can mitigate the risks of increasing price
competition, price sensitive customers, and declining demand, but products and services that are perceived to be less
desirable (whether in terms of price, quality, styling, safety, overall value, fuel efficiency, or other attributes) can
exacerbate these risks. For example, if we are unable to differentiate our products and services from those of our
competitors in a manner that appeals to customers, develop innovative new products and services, or sufficiently tailor our
products and services to customers in other markets, there could be insufficient demand for our products and services,
which could have an adverse impact on our financial condition or results of operations. Insufficient demand for our
products may also result in higher inventory levels, which may lead to downward pricing pressure, or reduced
Item 1A. Risk Factors (Continued)
25
manufacturing efficiencies, which may reduce margins. In the event of a shortage of available products, customers may
elect to purchase from our competitors and may not return to Ford in the future.
With increased consumer interconnectedness through the internet, social media, and other media, mere allegations
relating to quality, safety, reliability, fuel efficiency, sustainability, corporate social responsibility, or other key attributes can
negatively impact our reputation or market acceptance of our products or services, even where such allegations prove to
be inaccurate or unfounded. Further, our ability to successfully grow through capacity expansion and investments in the
areas of electrification, connectivity, digital and physical services, and software services depends on many factors,
including advancements in technology, regulatory changes (e.g., new or revised government mandates and incentives),
infrastructure development (e.g., a widespread vehicle charging network), and other factors that are difficult to predict, that
have affected and may continue to affect significantly the future of electrified vehicles, autonomous and driver assistance
technologies, digital and physical services, and software services. The automotive, software, and digital service
businesses are very competitive and change rapidly. Traditional competitors are expanding their offerings, and new types
of competitors (particularly in our areas of strength, e.g., pickup trucks, utilities, and commercial vehicles) that may
possess superior technology, may have business models with certain aspects that are more efficient, are not subject to
the same level of fixed costs as us, and/or have the support of domestic government mandates that advantage them and
hinder our ability to compete, are entering the market. For example, Chinese electrified vehicle producers are exporting
their products to some key markets in which we operate. This level of competition necessitates that we invest in and
integrate emerging technologies into our business and increases the importance of our ability to anticipate, develop, and
deliver products and services that customers desire on a timely basis, in quantities in line with demand, with the quality
they expect, and at costs low enough to be profitable. Moreover, if we do not meet customer expectations for quickly and
effectively addressing and remedying issues that may develop with or that improve our products and services, e.g.,
successfully delivering OTA updates, it would have an adverse effect on our business.
Although we recently scaled back our EV investments to redeploy that capital to other areas of the business, we
intend to continue making significant investments in electrification and software services. Our plans continue to include
offering electrified versions of many of our vehicles as well as solely electric nameplates, although we have observed
lower than initially anticipated industrywide EV adoption rates. Low EV adoption rates may persist, including as a result of
the regulatory framework in various markets shifting away from supporting the adoption of electrified vehicles (as was the
case in the United States in 2025); any negative perception of our electrified vehicles or EVs in general; an inability to or
delay in developing or embracing new technologies or processes; or shifts in consumer preference. As a result, there has
been, and could in the future be, an adverse impact on our financial condition and results of operations. Further, as
discussed elsewhere herein, lower than planned market acceptance of our vehicles may impact our strategy to comply
with fuel economy standards in certain markets.
Ford is addressing its impact on climate change aligned with the United Nations Framework Convention on Climate
Change (Paris Agreement) by working to reduce our carbon footprint over time across our vehicles, operations, and
supply chain. We have announced interim emissions targets approved by the Science Based Targets initiative (“SBTi”)
and made other statements about similar initiatives. As we navigate a complex global environment and align with the
normal SBTi five-year target review process, we are reassessing our near-term decarbonization strategy and putting great
emphasis on public choice. Achievement of these initiatives will require significant investments and the implementation of
new processes; however, there is no assurance that the desired outcomes will be achieved. To the extent we are unable
to achieve these initiatives, it may harm our reputation or we may not otherwise receive the expected return on the
investment. For example, we are exposed to reputational risk if we do not reduce vehicle CO
2
emissions in line with our
targets or in compliance with applicable regulations. Further, our customers, investors, and other stakeholders evaluate
how well we are progressing on our announced climate goals and aspirations, and if we are not on track to achieve those
goals and aspirations on a timely basis, or if the expectations of our customers and investors change and we do not
adequately address their expectations, our reputation could be impacted, and customers may choose to purchase the
products and services of, investors may choose to invest in, and suppliers and vendors may choose to do business with
other companies. Other parties may object to the positions we have or are perceived to have taken and may, in the
future, take or be perceived to take on sustainability, social, or other issues, or in the event we change our position on
such issues, which may result in a loss of customers, a boycott of our products or services, litigation, investigations,
information requests, or other actions that may impact not only our brand and reputation but also our results of operations,
financial condition, and the price of our Common Stock.
Moreover, new offerings, including those related to electrified vehicles and autonomous driving technologies, may
present technological challenges that could be costly to implement and overcome and have subjected us and may
continue to subject us to customer claims, government investigations, and recalls of our vehicles if they do not operate as
anticipated. In addition, since new technologies are subject to market acceptance, a malfunction involving any
Item 1A. Risk Factors (Continued)
26
manufacturer’s vehicle using autonomous or driver assist technologies may negatively impact the perception of such
technologies and erode customer trust.
Ford may face increased price competition for its products and services, including pricing pressure resulting
from industry excess capacity, currency fluctuations, competitive actions, legal and policy changes, or economic
or other factors, particularly for electrified vehicles.
The global automotive industry is intensely competitive, with
installed manufacturing capacity generally exceeding current demand. Historically, industry overcapacity has resulted in
many manufacturers offering marketing incentives on vehicles in an attempt to maintain and grow market share; these
incentives historically have included a combination of subsidized financing or leasing programs, price rebates and
reductions, and other incentives. As a result, we are not necessarily able to set our prices to offset higher marketing
incentives, commodity or other cost increases, tariffs, or the impact of adverse currency fluctuations. This risk includes
cost advantages foreign competitors may have because of their weaker home market currencies, which may, in turn,
enable those competitors to offer their products at lower prices. Further, higher inventory levels put downward pressure
on pricing, which may have an adverse effect on our financial condition and results of operations.
Although we are investing in our EV strategy, we anticipate that the EV market will continue to evolve. To date, we
have observed lower-than-anticipated industrywide EV adoption rates due to changes in consumer sentiment, competitive
dynamics, legal and policy changes, and significant developments in vehicle pricing dynamics, among other factors that
we continue to monitor. This environment has led us, and may in the future lead us, to adjust our investments, spending,
production, and product and future technology launches to better match the pace of EV adoption. The trend may be
further exacerbated as recent policy changes in the United States have reduced or eliminated supply- and demand-side
EV incentives, which may further slow the adoption of EVs. As a result of the lower-than-anticipated adoption rates, near-
term pricing pressures, and other factors, we have recorded and may continue to incur charges related to payments to our
EV-related suppliers (battery, raw material, or otherwise), inventory adjustments, impairments, or other matters.
Significant unexpected changes in the EV demand environment have led, and may in the future lead, to incremental
competitive pricing actions. Battery costs remain high, which is detrimental to EVs reaching pricing parity with ICE
vehicles and further exacerbates the pricing pressures on EVs. Furthermore, given our existing and continued investment
in battery production, if we are unable to operate battery facilities at their expected capacity because EV adoption rates or
the demand for such batteries is lower-than-anticipated or otherwise, we may be unable to recoup our investments.
Conversely, should EV adoption rates increase again in the future, the risk of excess capacity, particularly for internal
combustion engine trucks and utilities, may be exacerbated. This excess capacity may further increase price competition
in that segment of the market, which could have a substantial adverse effect on our financial condition or results of
operations.
Inflationary pressure and fluctuations in commodity and energy prices, foreign currency exchange rates,
interest rates, and market value of Ford or Ford Credit’s investments, including marketable securities, can have a
significant effect on results.
We and our suppliers are exposed to inflationary pressure and a variety of market risks,
including the effects of changes in commodity and energy prices, foreign currency exchange rates, and interest rates. We
monitor and attempt to manage these exposures as an integral part of our overall risk management program, which
recognizes the unpredictability of markets and seeks to reduce potentially adverse effects on our business. Changes in
commodity and energy prices (from tariffs, geopolitical developments, or otherwise), currency exchange rates, and
interest rates cannot always be predicted, hedged, or offset with price increases to eliminate earnings volatility. As a
result, significant changes in commodity and energy prices, foreign currency exchange rates, or interest rates as well as
increased material, freight, logistics, and similar costs could have a substantial adverse effect on our financial condition or
results of operations. See Item 7 and Item 7A for additional discussion of currency, commodity and energy price, and
interest rate risks. These market forces have caused us to incur higher material costs, which may continue, and our
warranty costs have increased, in part, due to inflationary cost pressures at our dealers. Moreover, due to inflationary
pressure, some of our suppliers have submitted claims to us for reimbursement of costs beyond our original agreed terms.
Upon receipt, we evaluate those claims, and, in certain circumstances, we have made payments to our suppliers, and this
trend may continue. Further, despite some recent rate cuts, over the last several years interest rates have increased
significantly as central banks in developed countries attempt to subdue inflation, and, as inflation risks remain elevated,
there is no assurance that interest rates will ultimately return to their prior low levels. At the same time, government
deficits and debt remain at high levels in many global markets. Elevated interest rates would make government debt more
expensive to finance, and in that environment, businesses would face a higher cost of capital, impacting capital intensive
businesses such as Ford. At Ford Credit, a high interest rate environment may impact Ford Credit’s ability to source
funding and offer financing at competitive rates, which could reduce its financing margin. In addition, our results are
impacted by fluctuations in the market value of our investments, with unrealized gains and losses that could be material in
any period.
Item 1A. Risk Factors (Continued)
27
Ford’s results are dependent on sales of larger, more profitable vehicles, particularly in the United States.
A
shift in consumer preferences away from larger, more profitable vehicles with internal combustion engines (including
trucks and utilities) to other vehicles in our portfolio that may be less profitable could result in an adverse effect on our
financial condition or results of operations. Despite recent trends, if demand for electrified vehicles grows at a rate greater
than our plan or ability to increase our production capacity for those vehicles, lower market share and revenue, as well as
facility and other asset-related charges (e.g., accelerated depreciation) associated with the production of internal
combustion vehicles, may result. In addition, government regulations aimed at reducing emissions and increasing fuel
efficiency (e.g., ZEV mandates and low emission zones) and other factors that accelerate the transition to EVs in various
markets may increase the cost of vehicles by more than the perceived benefit to consumers and dampen margins.
Moreover, governmental restrictions on the sale, purchase, or use of internal combustion engine vehicles (e.g., city access
restrictions) may limit our ability to sell some of our more profitable vehicles in various markets.
While a suspension or disruption of our manufacturing operations at any facility could have an adverse effect on our
financial condition, results of operations, and cash flow, such an occurrence at one of our facilities where our larger, more
profitable vehicles are produced, or in the event a launch is delayed or a stop ship is initiated for those vehicles, the
impact may be particularly significant.
Industry sales volume can be volatile and could decline if there is a financial crisis, recession, public health
emergency, or significant geopolitical event.
Because we, like other manufacturers, have a higher proportion of fixed
structural costs, relatively small changes in industry sales volume can have a substantial effect on our cash flow and
results of operations. Vehicle sales are affected by overall economic and market conditions (e.g., the level of interest
rates and tariffs; the impact of higher-than-anticipated inflation on vehicle affordability), consumer sentiment and behavior,
and other trends such as shared vehicle ownership and ridesharing services. If industry vehicle sales were to decline to
levels significantly below our planning assumption, the decline could have a substantial adverse effect on our financial
condition, results of operations, and cash flow. For a discussion of economic trends, see Item 7.
Financial Risks
The impact of government incentives on Ford’s business has been and could continue to be significant, and
Ford’s receipt of government incentives could be subject to reduction, termination, or clawback.
We receive
economic benefits from national, state, and local governments in various regions of the world in the form of incentives
designed to encourage manufacturers to establish, maintain, or increase investment, workforce, or production. These
incentives may take various forms, including grants, forgivable loans and loan subsidies, or tax abatements or credits.
The impact of these incentives can be significant in a particular market during a reporting period. A decrease in, expiration
without renewal of, or other cessation or clawback of government incentives for any of our operations or that impact
consumers of our products and services (e.g., the termination of U.S. tax credits intended to incentivize the purchase of
EVs), as a result of administrative decision or otherwise, has had and could in the future have a substantial adverse
impact on the operation of our business, financial condition, or results of operations. Further, we may lose or be required
to repay incentives or forgivable loans as a result of a change we make to our business strategy, e.g., if we elect not to
proceed with a previously planned program or project or do not create as many jobs as initially anticipated.
For example, until 2021, most of our manufacturing facilities in South America were located in Brazil, where the state
or federal governments historically offered significant incentives to manufacturers to encourage capital investment,
increase manufacturing production, and create jobs. As a result, the performance of our South American operations had
been impacted favorably by government incentives to a substantial extent. The federal government in Brazil has levied
assessments against us concerning the federal incentives we previously received, and the State of São Paulo has
challenged the grant to us of tax incentives by the State of Bahia. See Note 2 of the Notes to the Financial Statements for
a discussion of our accounting for government incentives, and “Item 3. Legal Proceedings” for a discussion of tax
proceedings in Brazil, the collateral we have posted related to those proceedings, and the potential requirement for us to
post additional collateral.
Additionally, as noted above, U.S. federal tax incentives for purchasers of plug-in vehicles have changed in recent
years. In 2022, Congress established these incentives and many retail and commercial vehicle purchasers were eligible
for a tax credit of up to $7,500 per vehicle, increasing market demand for plug-in vehicles. Further, to make vehicles
eligible for the tax incentive for retail purchasers, Ford and other manufacturers structured battery supply chains to comply
with the “foreign entity of concern” criteria, which were aimed at reducing dependence on China and companies based in
or operating in China. In 2025, Congress eliminated these credits, ending the incentives for purchasers and likewise
changing the business rationale to use and create battery supply chains with less control by China.
Item 1A. Risk Factors (Continued)
28
The 2025 legislation preserved the advanced manufacturing production tax credit for the domestic manufacture of
batteries and battery components (first established in the 2022 legislation), but restricted the eligibility criteria going
forward, most notably by imposing criteria for “prohibited foreign entities,” which concern China and other countries. As a
manufacturer that intends to engage in large-scale production of batteries in the United States for vehicles and energy
storage, this tax credit influences our decisions concerning the location, scale, supply chain, and operations of our
domestic battery manufacturing business. Such decisions involve substantial lead time, and it may take years before Ford
can satisfy any new or changed eligibility criteria. Accordingly, the termination of or a change to such incentives could
have a significant impact on our financial condition, results of operations, or the operation of our business.
Ford and Ford Credit’s access to debt, securitization, or derivative markets around the world at competitive
rates or in sufficient amounts could be affected by credit rating downgrades, market volatility, market disruption,
regulatory requirements, asset portfolios, or other factors.
Ford and Ford Credit’s ability to obtain unsecured funding
at a reasonable cost is dependent on their credit ratings or their perceived creditworthiness. Further, Ford Credit’s ability
to obtain securitized funding under its committed asset-backed liquidity programs and certain other asset-backed
securitization transactions is subject to having a sufficient amount of assets eligible for these programs, as well as Ford
Credit’s ability to obtain appropriate credit ratings for those transactions and, for certain committed programs, derivatives
to manage the interest rate risk. Over time, and particularly in the event of credit rating downgrades, market volatility,
market disruption, or other factors, Ford Credit may reduce the amount of receivables it purchases or originates because
of funding constraints. In addition, Ford Credit may reduce the amount of receivables it purchases or originates if there is
a significant decline in the demand for the types of securities it offers or Ford Credit is unable to obtain derivatives to
manage the interest rate risk associated with its securitization transactions. A significant reduction in the amount of
receivables Ford Credit purchases or originates would significantly reduce its ongoing results of operations and could
adversely affect its ability to support the sale of Ford vehicles.
An increasing interest rate environment may have an adverse effect on borrowing costs for Ford Credit, making it
more expensive to fund our operations or leading to higher rates charged to our customers if these costs are passed on.
Ford Credit could experience higher-than-expected credit losses, lower-than-anticipated residual values, or
higher-than-expected return volumes for leased vehicles.
Credit risk is the possibility of loss from a customer’s or
dealer’s failure to make payments according to contract terms. Credit risk (which is heavily dependent upon economic
factors including unemployment, consumer debt service burden, personal income growth, dealer profitability, and used car
prices) has a significant impact on Ford Credit’s business. The level of credit losses Ford Credit may experience could
exceed its expectations and adversely affect its financial condition or results of operations. In addition, Ford Credit
projects expected residual values (including residual value support payments from Ford) and return volumes for the
vehicles it leases. Actual proceeds realized by Ford Credit upon the sale of returned leased vehicles at lease termination
may be lower than the amount projected, which would reduce Ford Credit’s return on the lease transaction. Among the
factors that can affect the value of returned lease vehicles are the volume and mix of vehicles returned industrywide,
economic conditions, marketing programs, and quality or perceived quality, safety, fuel efficiency, or reliability of the
vehicles, or changes in propulsion technology and related legislative or regulatory changes. Actual return volumes may
be influenced by these factors, as well as by contractual lease-end values relative to auction values. If auction values
decrease significantly in the future, return volumes could exceed Ford Credit’s expectations. Each of these factors, alone
or in combination, has the potential to adversely affect Ford Credit’s results of operations if actual results were to differ
significantly from Ford Credit’s projections. See “Critical Accounting Estimates” in Item 7 for additional discussion.
Economic and demographic experience for pension and OPEB plans (e.g., discount rates or investment
returns) could be worse than Ford has assumed
.
The measurement of our obligations, costs, and liabilities associated
with benefits pursuant to our pension and OPEB plans requires that we estimate the present value of projected future
payments to all participants. We use many assumptions in calculating these estimates, including assumptions related to
discount rates, investment returns on designated plan assets, and demographic experience (e.g., mortality and retirement
rates). We generally remeasure these estimates at each year end and recognize any gains or losses associated with
changes to our plan assets and liabilities in the year incurred. To the extent actual results are less favorable than our
assumptions, we may recognize a remeasurement loss in our results, which could be substantial. For additional
information regarding our assumptions, see “Critical Accounting Estimates” in Item 7 and Note 16 of the Notes to the
Financial Statements.
Item 1A. Risk Factors (Continued)
29
Pension and other postretirement liabilities could adversely affect Ford’s liquidity and financial condition.
We have defined benefit retirement plans in the United States that cover many of our hourly and salaried employees. We
also provide pension benefits to non-U.S. employees and retirees, primarily in Europe. In addition, we sponsor plans to
provide OPEB for retired employees (primarily health care and life insurance benefits). See Note 16 of the Notes to the
Financial Statements for more information about these plans. These benefit plans impose significant liabilities on us and
could require us to make additional cash contributions, which could impair our liquidity. If our cash flows and capital
resources are insufficient to meet any pension or OPEB obligations, we could be forced to reduce or delay investments
and capital expenditures, suspend dividend payments, seek additional capital, or restructure or refinance our
indebtedness.
Legal and Regulatory Risks
Ford and Ford Credit have experienced and could continue to experience unusual or significant litigation,
governmental investigations, or adverse publicity arising out of alleged defects in products, services, perceived
environmental impacts, or otherwise.
We spend substantial resources to comply with governmental safety regulations,
environmental regulatory obligations concerning our products and operations, consumer and automotive financial
regulations, labor and employment regulations and practices, and other standards, but we have experienced employees,
contractors, agents, and other individuals affiliated with us violating such laws or regulations from time to time, which at
times has resulted in civil or criminal liability, and we cannot ensure that any such violations have not occurred or will not
occur in the future, which may further result in civil or criminal liability. In addition, as discussed more fully elsewhere
herein, the adoption of new regulations or executive orders, modifications to existing regulations, changes to
interpretations of those regulations, and changes to enforcement priorities and directives of various governmental
agencies, sometimes on short notice, may impact our compliance status.
Government investigations against Ford or Ford Credit have resulted in, and may in the future result in, fines,
penalties, orders, customer remuneration, or other resolutions, through litigation, administrative proceedings, settlement,
or otherwise, which have in the past had, and could in the future have, an adverse impact on our financial condition,
results of operations, or the operation of our business, including oversight by regulators or a government-appointed
monitor or independent third party. For example, as part of a consent order we entered into with NHTSA in 2024, we have
retained an independent third party selected by NHTSA to assess the Company’s adherence to the consent order and
Safety Act over the term of the consent order and to report on Ford’s progress to NHTSA.
Moreover, compliance with governmental standards does not necessarily prevent individual or class action lawsuits,
which can entail significant cost and risk, in addition to defending litigation and claims concerning instances of alleged
non-compliance. In certain circumstances, courts may permit civil actions even where our products, services, and
financial products comply with federal and/or other applicable law. Furthermore, simply responding to actual or threatened
litigation, government investigations, subpoenas, or information requests concerning our compliance with regulatory
standards, whether related to our products, services, or business or commercial relationships, requires significant
expenditures of time and other resources and may be disruptive to our operations. Litigation also is inherently uncertain,
and we have in the past experienced, and could in the future experience, significant adverse results, including
compensatory and punitive damage awards, a disgorgement of profits or revenue, or injunctive relief, any of which could
have an adverse effect on our financial condition, results of operations, or our business in general, particularly with larger
jury verdicts becoming more prevalent. We may decide to settle a matter in anticipation of or during litigation, which may
require a monetary or non-monetary payment, a change to our business practices (e.g., to undertake or cease a particular
activity), or other remedies. However, a settlement on acceptable terms may not always be feasible. Furthermore,
regulatory investigations and litigation, including class actions, are becoming more prevalent in some international
markets, potentially leading to increasing fines, damage awards, and settlement costs. While we have an insurance
program that provides coverage for certain claims, it may not be sufficient to cover the losses incurred. In addition,
adverse publicity surrounding an allegation, litigation, or investigation, even if there is no merit to the matter, may cause
significant reputational harm or create a negative public perception of our products and services, which could have a
significant adverse effect on our sales.
Ford may need to substantially modify its product plans and facilities to respond to shifting consumer
sentiment and competitive dynamics as a result of policy changes affecting, or otherwise to comply with, safety,
emissions, fuel economy, autonomous driving technology, environmental, and other regulations.
The automotive
industry is subject to regulations worldwide that govern product characteristics and that differ by global region, country,
and sometimes within national boundaries. Regulators have enacted and are proposing standards to address concerns
regarding the environment (including concerns about global climate change and air quality), vehicle safety, and energy
independence, and the regulatory landscape can change on short notice. These regulations vary, but generally require
that over time motor vehicles and engines emit less air pollution, including GHG emissions, oxides of nitrogen,
Item 1A. Risk Factors (Continued)
30
hydrocarbons, carbon monoxide, and particulate matter, and there are associated increased reporting requirements.
Similarly, we are making substantial investments in our facilities and revising our processes to not only comply with
applicable regulations but also to make our operations more efficient and sustainable. As our suppliers make similar
investments, any higher costs may be passed on to us. In the United States, legal and policy debates on environmental
regulations are continuing, with a recent primary trend toward rescinding federal and state regulations aimed at reducing
GHG emissions and increasing vehicle electrification. However, different federal administrations have either sought to
make standards more strict or to make them less strict, with one administration often replacing the regulations enacted by
the last. Various third parties routinely seek judicial review of these federal regulatory and deregulatory efforts. In parallel,
California continues to enact increasingly strict emissions standards and requirements for ZEVs (standards that some
other states are adopting), and those actions are also the subject of legal challenges. In 2025, federal legislation, which is
currently subject to challenge, eliminated the authority of California and other states to implement and enforce most of
their standards and ZEV sales requirements. Court rulings regarding regulatory actions by federal, California, and other
state regulators create uncertainty and the potential for applicable regulatory standards to change quickly. Volatility in
government regulations regarding emissions and safety creates an environment where companies such as Ford must
focus on near-term issues, which challenges our ability to develop and implement long-term plans for compliance and our
business in general. In addition, many governments regulate local product content or impose import requirements with
the aim of creating jobs, protecting domestic producers, and influencing the balance of payments.
We regularly refine our product cycle plan to improve the fuel economy of our internal combustion vehicles and to
offer more propulsion choices, such as hybrid and electrified vehicles, that generate lower GHG emissions. Electrification,
including hybrids, plug-in hybrids, EREVs, and battery electric vehicles, is core to our global strategy to comply with
current and anticipated environmental laws and regulations in major markets. However, there are limits to our ability to
reduce emissions and increase fuel economy over given time frames and many factors that could delay or impede our
plans. Those factors primarily relate to the cost and effectiveness of available technologies; consumer acceptance of new
technologies and their costs; changes in industrial policy, including incentives for electrified vehicles and battery
manufacturing and requirements for battery supply chains; changes in trade policy, which may affect the profitability of
certain products; changes in vehicle mix (as described in more detail elsewhere herein); the appropriateness (or lack
thereof) of certain technologies for use in particular vehicles; the widespread availability (or lack thereof) of supporting
infrastructure for new technologies, including charging for electrified vehicles; the availability (or lack thereof) of the raw
materials and component supply to make affordable batteries and other elements of electrified vehicles; and the human,
engineering, and financial resources necessary to deploy new technologies across a wide range of products and
powertrains in a short time. If fuel prices are relatively low and market conditions or the consumer attributes of our
vehicles do not lead consumers to purchase electrified vehicles and other highly fuel-efficient vehicles in sufficient
numbers, it may be difficult to meet applicable environmental standards in various markets and may constrain our ability to
sell internal combustion engine vehicles, including some of the more profitable vehicles in our portfolio. Our obligations
under the regulatory compliance credit purchase agreements we have entered into, including the ultimate number of
credits we may purchase under those agreements, are dependent on the sellers’ delivery of the credits. If the seller under
a credit purchase agreement does not deliver the credits contracted for, it may cause us to be out of compliance with
emissions standards or other requirements. Such noncompliance may result in fines, penalties, or other costs, and/or we
may need to modify our product plans and be unable to sell certain products. In the event we are obligated to purchase
credits under those agreements, the cash impact of such purchases may be significant. In addition, we have written off,
and may in the future write off, compliance credits we are no longer able to use as a result of legal and policy changes.
Moreover, the rates of EV growth, production disruptions, stop ships, supply chain limitations, lower-than-planned
market acceptance of our vehicles, and/or other circumstances may cause us to modify product plans, or, in some cases,
purchase credits, which we have done, in order to comply with emissions standards, fuel economy standards, or ZEV
requirements, which could have an adverse effect on our financial condition and results of operations and cause
reputational harm.
Increased scrutiny of automaker emission compliance by regulators around the world has led to new regulations,
more stringent enforcement programs, additional field actions, demands for reporting on the field performance of
emissions components and higher scrutiny of field data, and delays in regulatory approvals. The cost to comply with
government regulations concerning new vehicle standards and in-use vehicle requirements, including field service
actions, is substantial. New, additional, and changing regulations, regulatory interpretations, legislation, executive orders,
directives, and enforcement priorities, or changes in consumer preferences that affect vehicle mix, as well as any non-
compliance with applicable laws and regulations, which, in some jurisdictions, may include criminal liability due to the
absence of civil or administrative enforcement regimes, could have a substantial adverse impact on our financial
condition, results of operations, operations, or reputation. In addition, a number of governments, as well as non-
governmental organizations, publicly assess vehicles to their own protocols. Any negative perception regarding the
performance of our vehicles subjected to such tests could reduce future sales. Court decisions arising out of consumer
Item 1A. Risk Factors (Continued)
31
and investor litigation could give rise to
de facto
changes in the interpretation of existing emission laws and regulations,
thereby imposing new burdens on manufacturers. For more discussion of the impact of standards on our global business,
see the “Governmental Standards” discussion in “Item 1. Business” above.
We and other companies continue to develop autonomous vehicle and driver assist technologies, and the U.S. and
foreign governments are continuing to develop the regulatory framework that will govern autonomous vehicles and related
technologies. Governmental restrictions on such technologies may limit our ability to provide these features to
consumers, and manufacturers are facing increased scrutiny from regulators at the state and federal level on system
misuse by customers, feature capabilities, and whether advertising for this technology contains false or misleading
information. Some states are developing their own regulations that impact the testing and design of autonomous vehicles.
This patchwork approach without federal guidance may subject Ford to additional compliance costs. Further, autonomous
vehicle and driver assist technologies continue to be scrutinized by the government and consumers, and actual or
perceived failures or misuse of these technologies and features have led to government investigations and inquiries,
including of Ford, which has responded to information requests from NHTSA and the National Transportation Safety Board
about our BlueCruise system. We and other OEMs are required to report to NHTSA crashes that meet NHTSA-defined
criteria and occur when certain advanced driver assistance system features are in use. Such events involving our
vehicles and technologies could require safety recalls and/or subject us to fines, penalties, damages, investigations, and
reputational harm. In addition, the demand for these services by consumers is fluctuating as the technology is rolled out
in various stages and with mixed industry results.
Ford and Ford Credit could be affected by the continued development of more stringent privacy, data use,
data protection, data access, and artificial intelligence laws and regulations as well as consumers’ heightened
expectations to safeguard their personal information.
We are subject to laws, rules, guidelines from privacy and other
regulators, and regulations in the United States and other countries relating to the collection, use, transfer, and security of
data and the personal information of consumers, employees, or others, including laws that may require us to notify
regulators and affected individuals of a data security incident. Such laws, rules, and regulations, also apply to our vendors
and/or may hold us liable for any violations by our vendors. Existing and newly developed laws and regulations may apply
broadly to our operations within the relevant jurisdiction, are subject to change and uncertain interpretations by courts and
regulators, and may be inconsistent across jurisdictions. Accordingly, complying with such laws and regulations may lead
to a decline in consumer engagement or cause us to incur substantial costs to modify our operations or business
practices. Moreover, regulatory actions seeking to impose significant financial penalties for noncompliance and/or legal
actions (including pursuant to laws providing for private rights of action by consumers) could be brought against us in the
event of a data compromise, misuse of consumer information, or perceived or actual non-compliance with data protection,
data access, privacy, or artificial intelligence requirements. The rapid evolution and increased adoption of artificial
intelligence technologies may intensify these risks. Further, any unauthorized release of personal information could harm
our reputation, disrupt our business, cause us to expend significant resources, and lead to a loss of consumer confidence
resulting in an adverse impact on our business and/or consumers deciding to withhold or withdraw consent for our
collection or use of data.
Ford Credit could be subject to new or increased credit regulations, consumer protection regulations, or
other regulations.
As a finance company, Ford Credit is highly regulated by governmental authorities in the locations in
which it operates, which can impose significant additional costs and/or restrictions on its business. In the United States,
for example, Ford Credit’s operations are subject to regulation and supervision under various federal, state, and local
laws, including the federal Truth-in-Lending Act, Consumer Leasing Act, Equal Credit Opportunity Act, and Fair Credit
Reporting Act.
The Dodd-Frank Act directs federal agencies to adopt rules to regulate the finance industry and the capital markets
and gives the Consumer Financial Protection Bureau (“CFPB”) broad rule-making and enforcement authority for a wide
range of consumer financial protection laws that regulate consumer finance businesses, such as Ford Credit’s automotive
financing business. Exercise of these powers by the CFPB may increase the costs of, impose additional restrictions on,
or otherwise adversely affect companies in the automotive finance business. The CFPB has authority to supervise and
examine the largest nonbank automotive finance companies, such as Ford Credit, for compliance with consumer financial
protection laws.
Failure to comply with applicable laws and regulations could subject Ford Credit to regulatory enforcement actions,
including consent orders or similar orders where Ford Credit may be required to revise practices, remunerate customers,
or pay fines. An enforcement action against Ford Credit or publicity around even an allegation that Ford Credit has not
complied with applicable laws or regulations could harm Ford Credit’s reputation or lead to further litigation. Moreover, in
response to audits, inspections, or investigations conducted by regulatory authorities, Ford Credit has in the past modified
and may in the future modify its operations or take other actions, such as remunerating customers.
Item 1A. Risk Factors (Continued)
32
ITEM 1B.
Unresolved Staff Comments.
None.
ITEM 1C.
Cybersecurity.
Cybersecurity Strategy and Risk Management
We devote significant resources to our cybersecurity program that we believe is reasonably designed to mitigate our
cybersecurity and information technology risks. We believe our cybersecurity program is reasonably designed to protect
our information systems, software, networks, and other assets against, and mitigate the effects of incidents where
unauthorized parties attempt, among other things, to disrupt or degrade service or our operations; misuse or abuse
technology and information systems; make unauthorized disclosure of data; or otherwise cause harm to the Company, our
customers, suppliers, or dealers, or other key stakeholders. We employ capabilities, processes, and other security
measures we believe are reasonably designed to reduce and mitigate these risks, and have requirements for our
suppliers and service providers to do the same. Despite having thorough due diligence, onboarding, and cybersecurity
assessment processes in place for our suppliers and service providers, the responsibility ultimately rests with those
parties to establish and maintain their respective cybersecurity programs. Our ability to monitor the cybersecurity
practices of third parties is limited and there can be no assurance that we can prevent or mitigate the risk of any
compromise or failure in the information systems, software, networks, and other assets owned or controlled by each of
them. When we become aware that a supplier or service provider’s cybersecurity has been compromised, we attempt to
mitigate the risk to the Company, including, if appropriate and feasible, by terminating the supplier’s connection to our
information systems.
In an effort to effectively prevent, detect, and respond to cybersecurity threats, we employ a multi-layered
cybersecurity risk management program supervised by our Chief Information Security Officer, whose team is responsible
for leading enterprise-wide cybersecurity strategy, policy, architecture, and processes. This responsibility includes
identifying, considering, and assessing potentially material cybersecurity incidents on an ongoing basis, establishing
processes designed to prevent and monitor potential cybersecurity risks, implementing mitigation and remedial measures,
and maintaining our cybersecurity program. Our program is informed by and designed to comply with the National
Institute of Standards and Technology (NIST) Cybersecurity Framework (CSF). Our program leverages both internal and
external techniques and expertise. Internally, we perform penetration tests, internal tests/code reviews, and red team
exercises, among other things, to evaluate aspects of our cybersecurity program. We also perform phishing and social
engineering simulations with, and provide cybersecurity training for, personnel with Company email and access to
Company assets, and regularly circulate security awareness newsletters to employees. Externally, we monitor
notifications from the U.S. Computer Emergency Readiness Team (“CERT”) and various Information Sharing and Analysis
Centers (each an “ISAC”); review customer, media, and third-party cybersecurity reports; and operate a bug bounty
program. Our cybersecurity program also includes disaster recovery and incident response plans, including a
ransomware response plan which is regularly tested and evaluated in tabletop simulations.
The Company’s global cybersecurity incident response is also overseen by our Chief Information Security Officer. Our
Chief Information Security Officer has served in that role for over 8 years and has over a decade of engineering and
operations expertise with cybersecurity technologies and services. Our Chief Information Security Officer reports to our
Chief Enterprise Technology Officer who has spent over two decades managing cybersecurity risks as a leader at
enterprise software and
Fortune 50
companies. Our Chief Enterprise Technology Officer reports directly to our Chief
Executive Officer.
When a cybersecurity threat or incident is identified, our policy is to review and triage the threat or incident, and to
then manage it to conclusion in accordance with our cybersecurity incident response processes. When a cybersecurity
incident is determined to be significant, it is addressed by management committees using processes that leverage
subject-matter expertise from across the Company. Further, we have in the past and may in the future engage with third-
party advisors and government and law enforcement agencies as part of our incident management processes. All
cybersecurity incidents that are believed to reasonably have the potential to be significant to the Company are brought to
the attention of both the Chief Enterprise Technology Officer and Chief Policy Officer and General Counsel by the Chief
Information Security Officer as part of our cybersecurity incident response processes.
33
Cybersecurity Governance and Oversight
Cybersecurity risk identification, assessment, and management are integrated into our overall enterprise risk
management program. As part of its enterprise risk management efforts, the Board meets with senior management,
including the executive leadership team, to assess and respond to critical business risks. These critical enterprise risks
are assessed by senior management annually and discussed with the Board. Then each of the top risks are validated,
prioritized, and assigned risk owners who are responsible to oversee risk assessment, develop and implement mitigation
plans, and provide regular updates to the Board (and/or Board committee assigned to the risk). In this way, critical
business risks, including cybersecurity risk, benefit from both top-down and bottom-up risk management efforts that we
believe are reasonably designed to escalate key risk and control issues to senior management and the Board.
As a result of this enterprise risk management process, cybersecurity threats have been and continue to be identified
as one of the Company’s critical business risks, with our Chief Enterprise Technology Officer and Chief Information
Security Officer assigned as the executive risk owners. The Chief Enterprise Technology Officer and Chief Information
Security Officer monitor the prevention, mitigation, detection, and remediation of cybersecurity incidents through their
management of, and participation in, the cybersecurity risk management and strategy processes described above,
including through the operation of the Company’s global cybersecurity incident response plans, which include provisions
for escalation to the Chief Policy Officer and General Counsel, as well as the Board and its committees, as appropriate.
As discussed below, the executive risk owners for cybersecurity risk report out to the Audit Committee and, in some
cases, the Board, on a regular basis as part of our enterprise risk management process.
The Board has delegated primary responsibility for the oversight of cybersecurity and information technology risks,
and the Company’s preparedness for these risks, to the Audit Committee. As part of its oversight responsibilities, the
Audit Committee receives regular updates on our cybersecurity practices as well as cybersecurity and information
technology risks from our Chief Information Security Officer. These updates include topics related to cybersecurity
practices, cyber risks, and risk management processes, such as updates to our cybersecurity programs and mitigation
strategies, and other cybersecurity developments. In addition to these regular updates, as part of our incident response
processes, the Chief Enterprise Technology Officer, in collaboration with the Chief Information Security Officer and Chief
Policy Officer and General Counsel, provides updates on certain cybersecurity incidents to the Audit Committee and, in
some cases, the Board. The Audit Committee reviews and provides input into and oversight of our cybersecurity
processes, and in the event Ford determines it has experienced a material cybersecurity incident, the Audit Committee is
notified about the incident in advance of filing a Current Report on Form 8-K.
In 2025, we did not identify any cybersecurity threats that have materially affected or are reasonably likely to
materially affect our business strategy, results of operations, or financial condition. For a discussion of whether and how
cybersecurity incidents, ransomware attacks, and other disruptions to our operational information systems, security
systems, vehicles, and services could reasonably be expected to affect the Company, including its business strategy,
results of operations or financial condition, see our risk factors above in Item 1A. generally and, in particular, “
Operational
information systems, security systems, products, and services could be affected by cybersecurity incidents, ransomware
attacks, and other disruptions and impact Ford, Ford Credit, their suppliers, and dealers
” on page 23.
ITEM 1C. Cybersecurity (Continued)
34
ITEM 2.
Properties.
Our principal properties include manufacturing and assembly facilities, distribution centers, warehouses, sales or
administrative offices, and testing, prototype, and operations space.
We own substantially all of our U.S. manufacturing and assembly facilities. Our facilities are situated in various
sections of the country and include assembly plants, engine plants, casting plants, metal stamping plants, transmission
plants, and other component plants. Most of our distribution centers are leased, though some of the larger locations are
owned (we own approximately 37% of the total square footage and lease the balance). The majority of the warehouses
that we operate are leased, though some of the larger warehouses are owned and many of our manufacturing and
assembly facilities contain some warehousing space. Substantially all of our sales offices are leased space.
Approximately 84% of the total square footage of our testing, prototype, and operations space is owned by us.
In addition, we maintain and operate manufacturing plants, assembly facilities, parts distribution centers, and
engineering centers outside of the United States. We own substantially all of our non-U.S. manufacturing plants,
assembly facilities, and engineering centers. The majority of our parts distribution centers outside of the United States are
either leased or provided by vendors under service contracts.
We and the entities that we consolidated as of December 31, 2025 use over 409 operations facilities globally,
including testing and prototype, across 27 countries, and 42 manufacturing and assembly plants, which includes plants
that are operated by us or our consolidated joint venture that support our Ford Blue, Ford Model e, and Ford Pro
segments.
We have one consolidated joint venture with manufacturing operations, which is in our Ford Blue segment:
•
Ford Vietnam Limited
— a joint venture between Ford (75%) and Diesel Song Cong One Member Limited Liability
Company (a subsidiary of the Vietnam Engine and Agricultural Machinery Corporation, which, in turn, is majority
owned (87.43%) by the State of Vietnam represented by the Ministry of Industry and Trade) (25%). Ford Vietnam
Limited assembles and distributes a variety of Ford passenger and commercial vehicle models. The joint venture
operates one plant in Vietnam.
In addition to the plants that we operate directly or that are operated by our consolidated joint venture, additional
plants that support our Ford Blue, Ford Model e, and Ford Pro segments are operated by unconsolidated joint ventures of
which we are a partner. The most significant of those unconsolidated joint ventures are as follows:
•
AutoAlliance (Thailand) Co., Ltd. (“AAT”)
— a 50/50 joint venture between Ford and Mazda that owns and
operates a manufacturing plant in Rayong, Thailand. AAT produces Ford and Mazda products for domestic and
export sales.
•
BlueOval SK, LLC (“BOSK”)
— a 50/50 joint venture among Ford, SK On Co., Ltd. (“SK On”), and SK Battery
America, Inc. (“SKBA,” a wholly owned subsidiary of SK On) formed to build and operate an EV battery plant in
Tennessee and two EV battery plants in Kentucky to supply batteries to Ford and Ford affiliates. On
December 9, 2025, Ford, SK On, SKBA and BOSK entered into a Joint Venture Disposition Agreement, pursuant
to which Ford’s membership interest in BOSK will be redeemed and a Ford subsidiary will receive the two BOSK
plants and related assets in Kentucky and will assume the related liabilities. Closing on the transactions
contemplated by the Joint Venture Disposition Agreement is expected in the first half of 2026.
•
Changan Ford Automobile Corporation, Ltd. (“CAF”)
— a 50/50 joint venture between Ford and Chongqing
Changan Automobile Co., Ltd. (“Changan”). CAF operates four assembly plants, an engine plant, and a
transmission plant in China where it produces and distributes a variety of Ford and Lincoln brand passenger
vehicle models.
•
Ford Otomotiv Sanayi Anonim Sirketi (“Ford Otosan”)
— a joint venture in Türkiye among Ford (41%), the Koc
Group of Türkiye (41%), and public investors (18%) that is the sole supplier to us of the Transit, Transit Custom,
and Transit Courier commercial vehicles and the Puma for Europe and the sole distributor of Ford vehicles in
Türkiye. Ford Otosan also manufactures Ford heavy trucks for global distribution, except for markets in the
Americas, China, and Taiwan. The joint venture owns three plants, a parts distribution depot, and a research and
development center in Türkiye, and a combined vehicle and engine plant in Romania.
35
•
JMC
— a publicly-traded company in China with Ford (32%) and Nanchang Jiangling Investment Co., Ltd. (41%)
as its controlling shareholders. Nanchang Jiangling Investment Co., Ltd. is a 50/50 joint venture between
Changan and Jiangling Motors Company Group. The public investors in JMC own 27% of its total outstanding
shares. JMC assembles Ford Transit, Ford Ranger, a series of Ford SUVs, Ford engines, and non-Ford vehicles
and engines for distribution in China and, for certain products, other export markets. JMC operates two assembly
plants and one engine plant in Nanchang.
The facilities described above are, in the opinion of management, suitable and adequate for the manufacture and
assembly of our and our joint ventures’ products.
The furniture, equipment, and other physical property owned by our Ford Credit operations are not material in relation
to the operations’ total assets.
ITEM 3.
Legal Proceedings.
The litigation process is subject to many uncertainties, and the outcome of individual matters is not predictable with
assurance. See Note 24 of the Notes to the Financial Statements for a discussion of loss contingencies. Following is a
discussion of our significant pending legal proceedings:
PRODUCT LIABILITY MATTERS
We are a defendant in numerous actions in state and federal courts within and outside of the United States alleging
damages from injuries resulting from (or aggravated by) alleged defects in our vehicles. In many actions, no monetary
amount of damages is specified or the specific amount alleged is the jurisdictional minimum. Our experience with
litigation alleging a specific amount of damages suggests that such amounts, on average, bear little relation to the actual
amount of damages, if any, that we will pay in resolving such matters.
In addition to pending actions, we assess the likelihood of incidents that likely have occurred but not yet been reported
to us. We also take into consideration specific matters that have been raised as claims but have not yet proceeded to
litigation. Individual product liability matters that have more than a remote risk of loss and such loss would likely be
significant if the matter is resolved unfavorably to us would be described herein. Currently, there is one such matter to
report:
Hetsler v. Ford.
Plaintiff, Robert Hetsler, filed this product liability action against Ford in the Circuit Court of the Fourth
Judicial Circuit in and for Duval County, Florida on April 24, 2020 alleging that a 2016 Roush Mustang had a
manufacturing defect in an unidentified component of the engine compartment that resulted in a fire. After a trial in
February 2024, a jury found Ford liable and awarded plaintiff $103 million in damages. On August 22, 2024, Ford
appealed the judgment to the Fifth District Court of Appeal. Ford believes a new trial is warranted based on the trial
court’s improper instructions to the jury and the trial court’s improper admission of undisclosed expert opinions. On
November 18, 2025, the Fifth District Court of Appeal issued a per curiam affirmance with no written opinion. On
December 3, 2025, Ford filed a Motion for Issuance of a Written Opinion, Including a Certification to the Florida Supreme
Court, or in the Alternative, for Rehearing En Banc. The Fifth District Court of Appeal has not ruled on Ford’s motion.
ASBESTOS MATTERS
Asbestos was used in some brakes, clutches, and other automotive components from the early 1900s. Along with
other vehicle manufacturers, we have been the target of asbestos litigation and, as a result, are a defendant in various
actions for injuries claimed to have resulted from alleged exposure to Ford parts and other products containing asbestos.
Plaintiffs in these personal injury cases allege various health problems as a result of asbestos exposure, either from
component parts found in older vehicles, insulation or other asbestos products in our facilities, or asbestos aboard our
former maritime fleet. We believe that we are targeted more aggressively in asbestos suits because many previously
targeted companies have filed for bankruptcy or emerged from bankruptcy relieved of liability for such claims.
Item 2. Properties (Continued)
36
Most of the asbestos litigation we face involves individuals who claim to have worked on the brakes of our vehicles.
We are prepared to defend these cases and believe that the scientific evidence confirms our long-standing position that
there is no increased risk of asbestos-related disease as a result of exposure to the type of asbestos formerly used in the
brakes on our vehicles. The extent of our financial exposure to asbestos litigation remains very difficult to estimate and
could include both compensatory and punitive damage awards. The majority of our asbestos cases do not specify a dollar
amount for damages; in many of the other cases the dollar amount specified is the jurisdictional minimum, and the vast
majority of these cases involve multiple defendants. Some of these cases may also involve multiple plaintiffs, and we may
be unable to tell from the pleadings which plaintiffs are making claims against us (as opposed to other defendants).
Annual payout and defense costs may become significant in the future. Our accrual for asbestos matters includes
probable losses for both asserted and unasserted claims.
CONSUMER MATTERS
We provide warranties on the vehicles we sell. Warranties are offered for specific periods of time and/or mileage and
vary depending upon the type of product and the geographic location of its sale. Pursuant to these warranties, we will
repair, replace, or adjust parts on a vehicle that are defective in factory-supplied materials or workmanship during the
specified warranty period. Software updates are increasingly a component of vehicle service and may be performed
during warranty coverage repairs, through field service actions, or through over-the-air updates. We are a defendant in
numerous actions in state and federal courts alleging breach of warranty and claiming damages based on state and
federal consumer protection laws. Remedies under these statutes may include vehicle repurchase, civil penalties, and
payment by Ford of the plaintiff’s attorneys’ fees. In some cases, plaintiffs also include an allegation of fraud. Remedies
for a fraud claim may include contract rescission, vehicle repurchase, and punitive damages. Annual payout and defense
costs may become significant in the future.
The cost of these litigation matters is included in our warranty costs. We accrue obligations for warranty costs at the
time of sale using a patterned estimation model that includes historical information regarding the nature, frequency, and
average cost of claims for each vehicle line by model year. We reevaluate the adequacy of our accruals on a regular
basis.
We are currently a defendant in a significant number of litigation matters relating to the performance of vehicles,
including those equipped with DPS6 transmissions.
ENVIRONMENTAL MATTERS
We have received notices under various federal and state environmental laws that we (along with others) are or may
be a potentially responsible party for the costs associated with remediating numerous hazardous substance storage,
recycling, or disposal sites in many states and, in some instances, for natural resource damages. We also may have
been a generator of hazardous substances at a number of other sites. The amount of any such costs or damages for
which we may be held responsible could be significant. Any legal proceeding arising under any federal, state, or local
provisions that have been enacted or adopted regulating the discharge of materials into the environment or primarily for
the purpose of protecting the environment, in which (i) a governmental authority is a party, and (ii) we believe there is the
possibility of monetary sanctions (exclusive of interest and costs) in excess of $1,000,000 is described herein.
On June 16, 2022, the New Jersey Department of Environmental Protection (“NJDEP”) filed a complaint in the
Superior Court of New Jersey (Bergen County) seeking natural resource damages and other claims related to the
Ringwood Mines/Landfill Site located in Ringwood, New Jersey. On February 21, 2023, the court denied our motion to
dismiss. We continue to defend against the NJDEP’s allegations.
CLASS ACTIONS
In light of the fact that few of the purported class actions filed against us in the past have been certified by the courts
as class actions, in general we list those actions that (i) have been certified as a class action by a court of competent
jurisdiction (and any additional purported class actions that raise allegations substantially similar to an existing and
certified class), and (ii) have more than a remote risk of loss, and such loss would likely be significant if the action is
resolved unfavorably to us. At this time, we have no such class actions filed against us.
Item 3. Legal Proceedings (Continued)
37
OTHER MATTERS
Brazilian Tax Matters.
One Brazilian state (São Paulo) and the Brazilian federal tax authority currently have
outstanding substantial tax assessments against Ford Motor Company Brasil Ltda. (“Ford Brazil”) related to state and
federal tax incentives Ford Brazil received for its operations in the Brazilian state of Bahia. The São Paulo assessment is
part of a broader conflict among various states in Brazil. The federal legislature enacted laws designed to encourage the
states to end that conflict, and in 2017 the states reached an agreement on a framework for resolution. Ford Brazil
continues to pursue a resolution under the framework and expects the amount of any remaining assessments by the
states to be resolved under that framework. The federal assessments are outside the scope of the legislation.
All of the outstanding assessments have been appealed to the relevant administrative court of each jurisdiction and
some appeals are now pending in the judicial court system. To proceed with an appeal within the judicial court system, an
appellant may be required to post collateral. If we are required to post collateral, which could be in excess of $1 billion for
all the cases in the aggregate, we expect it to be in the form of fixed assets, surety bonds, and/or letters of credit, but we
may be required to post cash collateral. To date, we have received collateral waivers for most of the cases that have been
appealed to the judicial court system, although we have been required to post less than $100 million of collateral.
Although the ultimate resolution of these matters may take many years, we consider our overall risk of loss to be remote.
ITEM 4.
Mine Safety Disclosures.
Not applicable.
Item 3. Legal Proceedings (Continued)
38
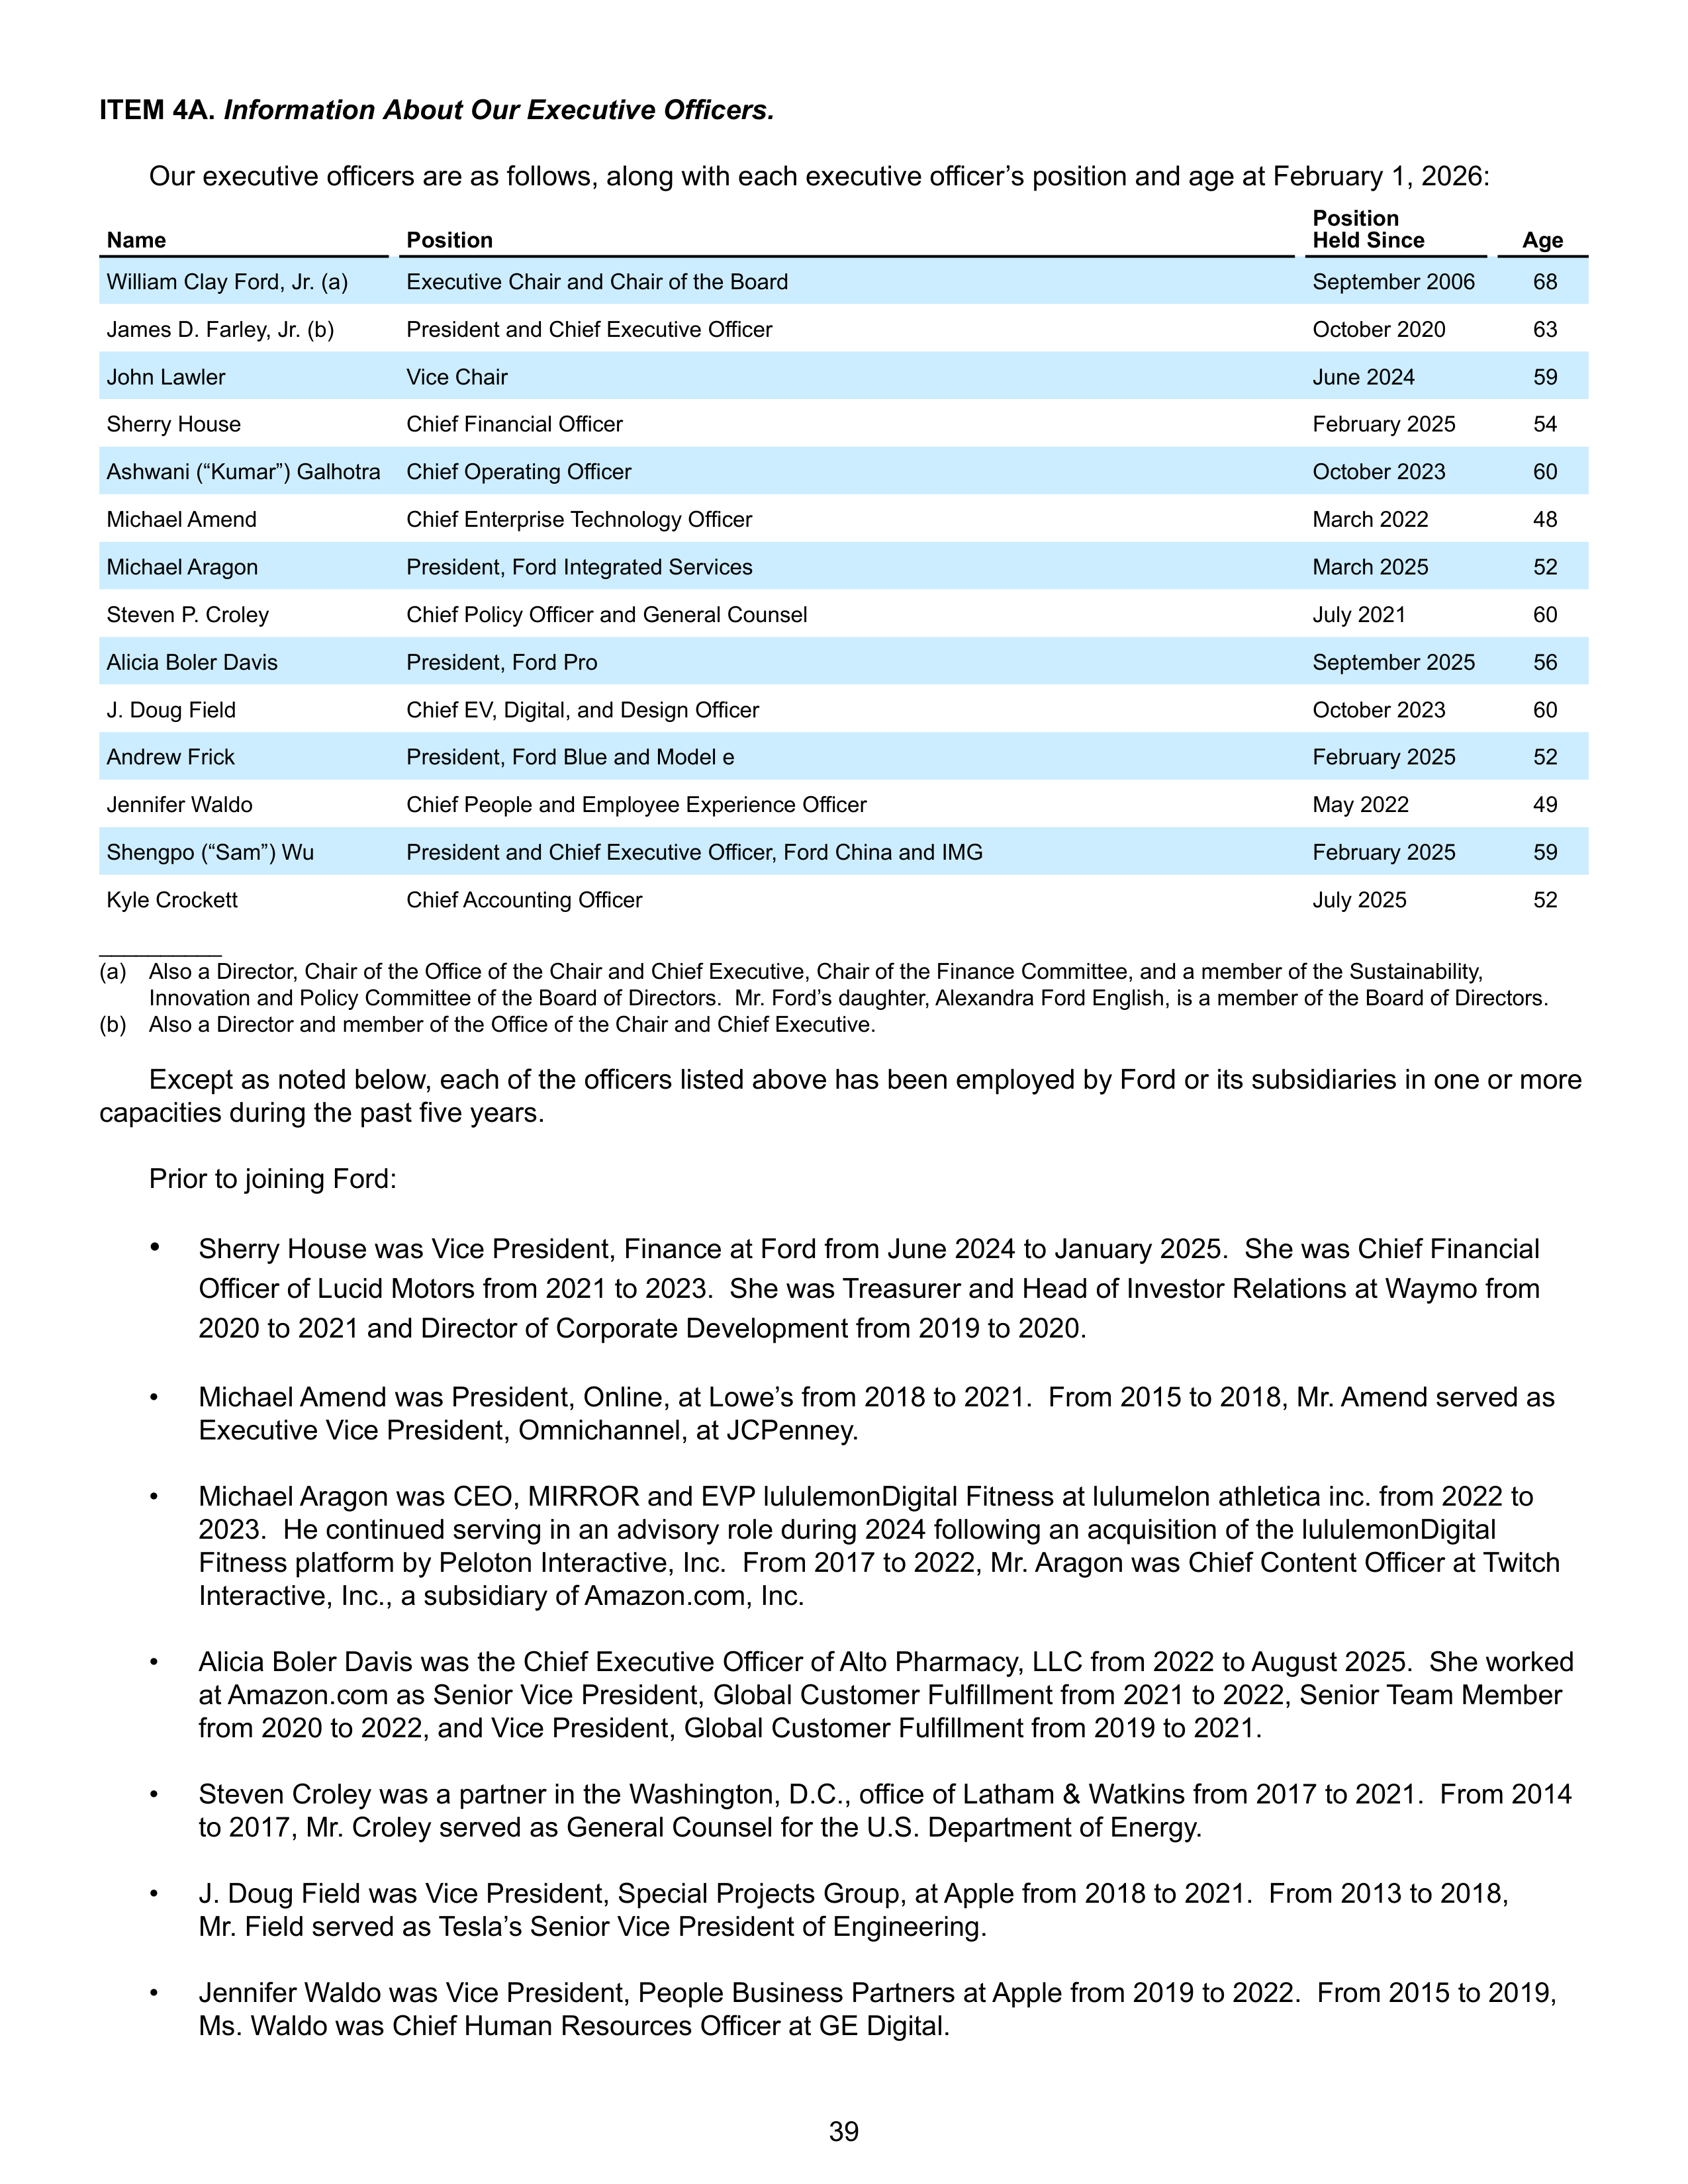
ITEM 4A.
Information About Our Executive Officers.
Our executive officers are as follows, along with each executive officer’s position and age at February 1, 2026:
Name
Position
Position
Held Since
Age
William Clay Ford, Jr. (a)
Executive Chair and Chair of the Board
September 2006
68
James D. Farley, Jr. (b)
President and Chief Executive Officer
October 2020
63
John Lawler
Vice Chair
June 2024
59
Sherry House
Chief Financial Officer
February 2025
54
Ashwani (“Kumar”) Galhotra
Chief Operating Officer
October 2023
60
Michael Amend
Chief Enterprise Technology Officer
March 2022
48
Michael Aragon
President, Ford Integrated Services
March 2025
52
Steven P. Croley
Chief Policy Officer and General Counsel
July 2021
60
Alicia Boler Davis
President, Ford Pro
September 2025
56
J. Doug Field
Chief EV, Digital, and Design Officer
October 2023
60
Andrew Frick
President, Ford Blue and Model e
February 2025
52
Jennifer Waldo
Chief People and Employee Experience Officer
May 2022
49
Shengpo (“Sam”) Wu
President and Chief Executive Officer, Ford China and IMG
February 2025
59
Kyle Crockett
Chief Accounting Officer
July 2025
52
__________
(a)
Also a Director, Chair of the Office of the Chair and Chief Executive, Chair of the Finance Committee, and a member of the Sustainability,
Innovation and Policy Committee of the Board of Directors. Mr. Ford’s daughter, Alexandra Ford English, is a member of the Board of Directors.
(b)
Also a Director and member of the Office of the Chair and Chief Executive.
Except as noted below, each of the officers listed above has been employed by Ford or its subsidiaries in one or more
capacities during the past five years.
Prior to joining Ford:
•
Sherry House was Vice President, Finance at Ford from June 2024 to January 2025. She was Chief Financial
Officer of Lucid Motors from 2021 to 2023. She was Treasurer and Head of Investor Relations at Waymo from
2020 to 2021 and Director of Corporate Development from 2019 to 2020.
•
Michael Amend was President, Online, at Lowe’s from 2018 to 2021. From 2015 to 2018, Mr. Amend served as
Executive Vice President, Omnichannel, at JCPenney.
•
Michael Aragon was CEO, MIRROR and EVP lululemonDigital Fitness at lulumelon athletica inc. from 2022 to
2023. He continued serving in an advisory role during 2024 following an acquisition of the lululemonDigital
Fitness platform by Peloton Interactive, Inc. From 2017 to 2022, Mr. Aragon was Chief Content Officer at Twitch
Interactive, Inc., a subsidiary of Amazon.com, Inc.
•
Alicia Boler Davis was the Chief Executive Officer of Alto Pharmacy, LLC from 2022 to August 2025. She worked
at Amazon.com as Senior Vice President, Global Customer Fulfillment from 2021 to 2022, Senior Team Member
from 2020 to 2022, and Vice President, Global Customer Fulfillment from 2019 to 2021.
•
Steven Croley was a partner in the Washington, D.C., office of Latham & Watkins from 2017 to 2021. From 2014
to 2017, Mr. Croley served as General Counsel for the U.S. Department of Energy.
•
J. Doug Field was Vice President, Special Projects Group, at Apple from 2018 to 2021. From 2013 to 2018,
Mr. Field served as Tesla’s Senior Vice President of Engineering.
•
Jennifer Waldo was Vice President, People Business Partners at Apple from 2019 to 2022. From 2015 to 2019,
Ms. Waldo was Chief Human Resources Officer at GE Digital.
39

•
Shengpo “Sam” Wu was Executive Vice President and President, Whirlpool Asia from 2019 until he retired from
that position in 2022. He served in an advisory role and as the Vice-Chairman of Whirlpool China Co., Ltd. from
2022 to 2023. Mr. Wu joined Whirlpool Corporation in 2017 as President, Whirlpool Asia and a member of the
company’s Executive Committee.
•
Kyle Crockett was Vice President, Controller and Chief Accounting Officer of Carrier Global Corporation from
January 2020 to May 2025.
Under our by-laws, executive officers are elected by the Board of Directors at an annual meeting of the Board held for
this purpose or by a resolution to fill a vacancy. Each officer is elected to hold office until a successor is chosen or as
otherwise provided in the by-laws.
ITEM 4A. Information About Our Executive Officers (Continued)
40
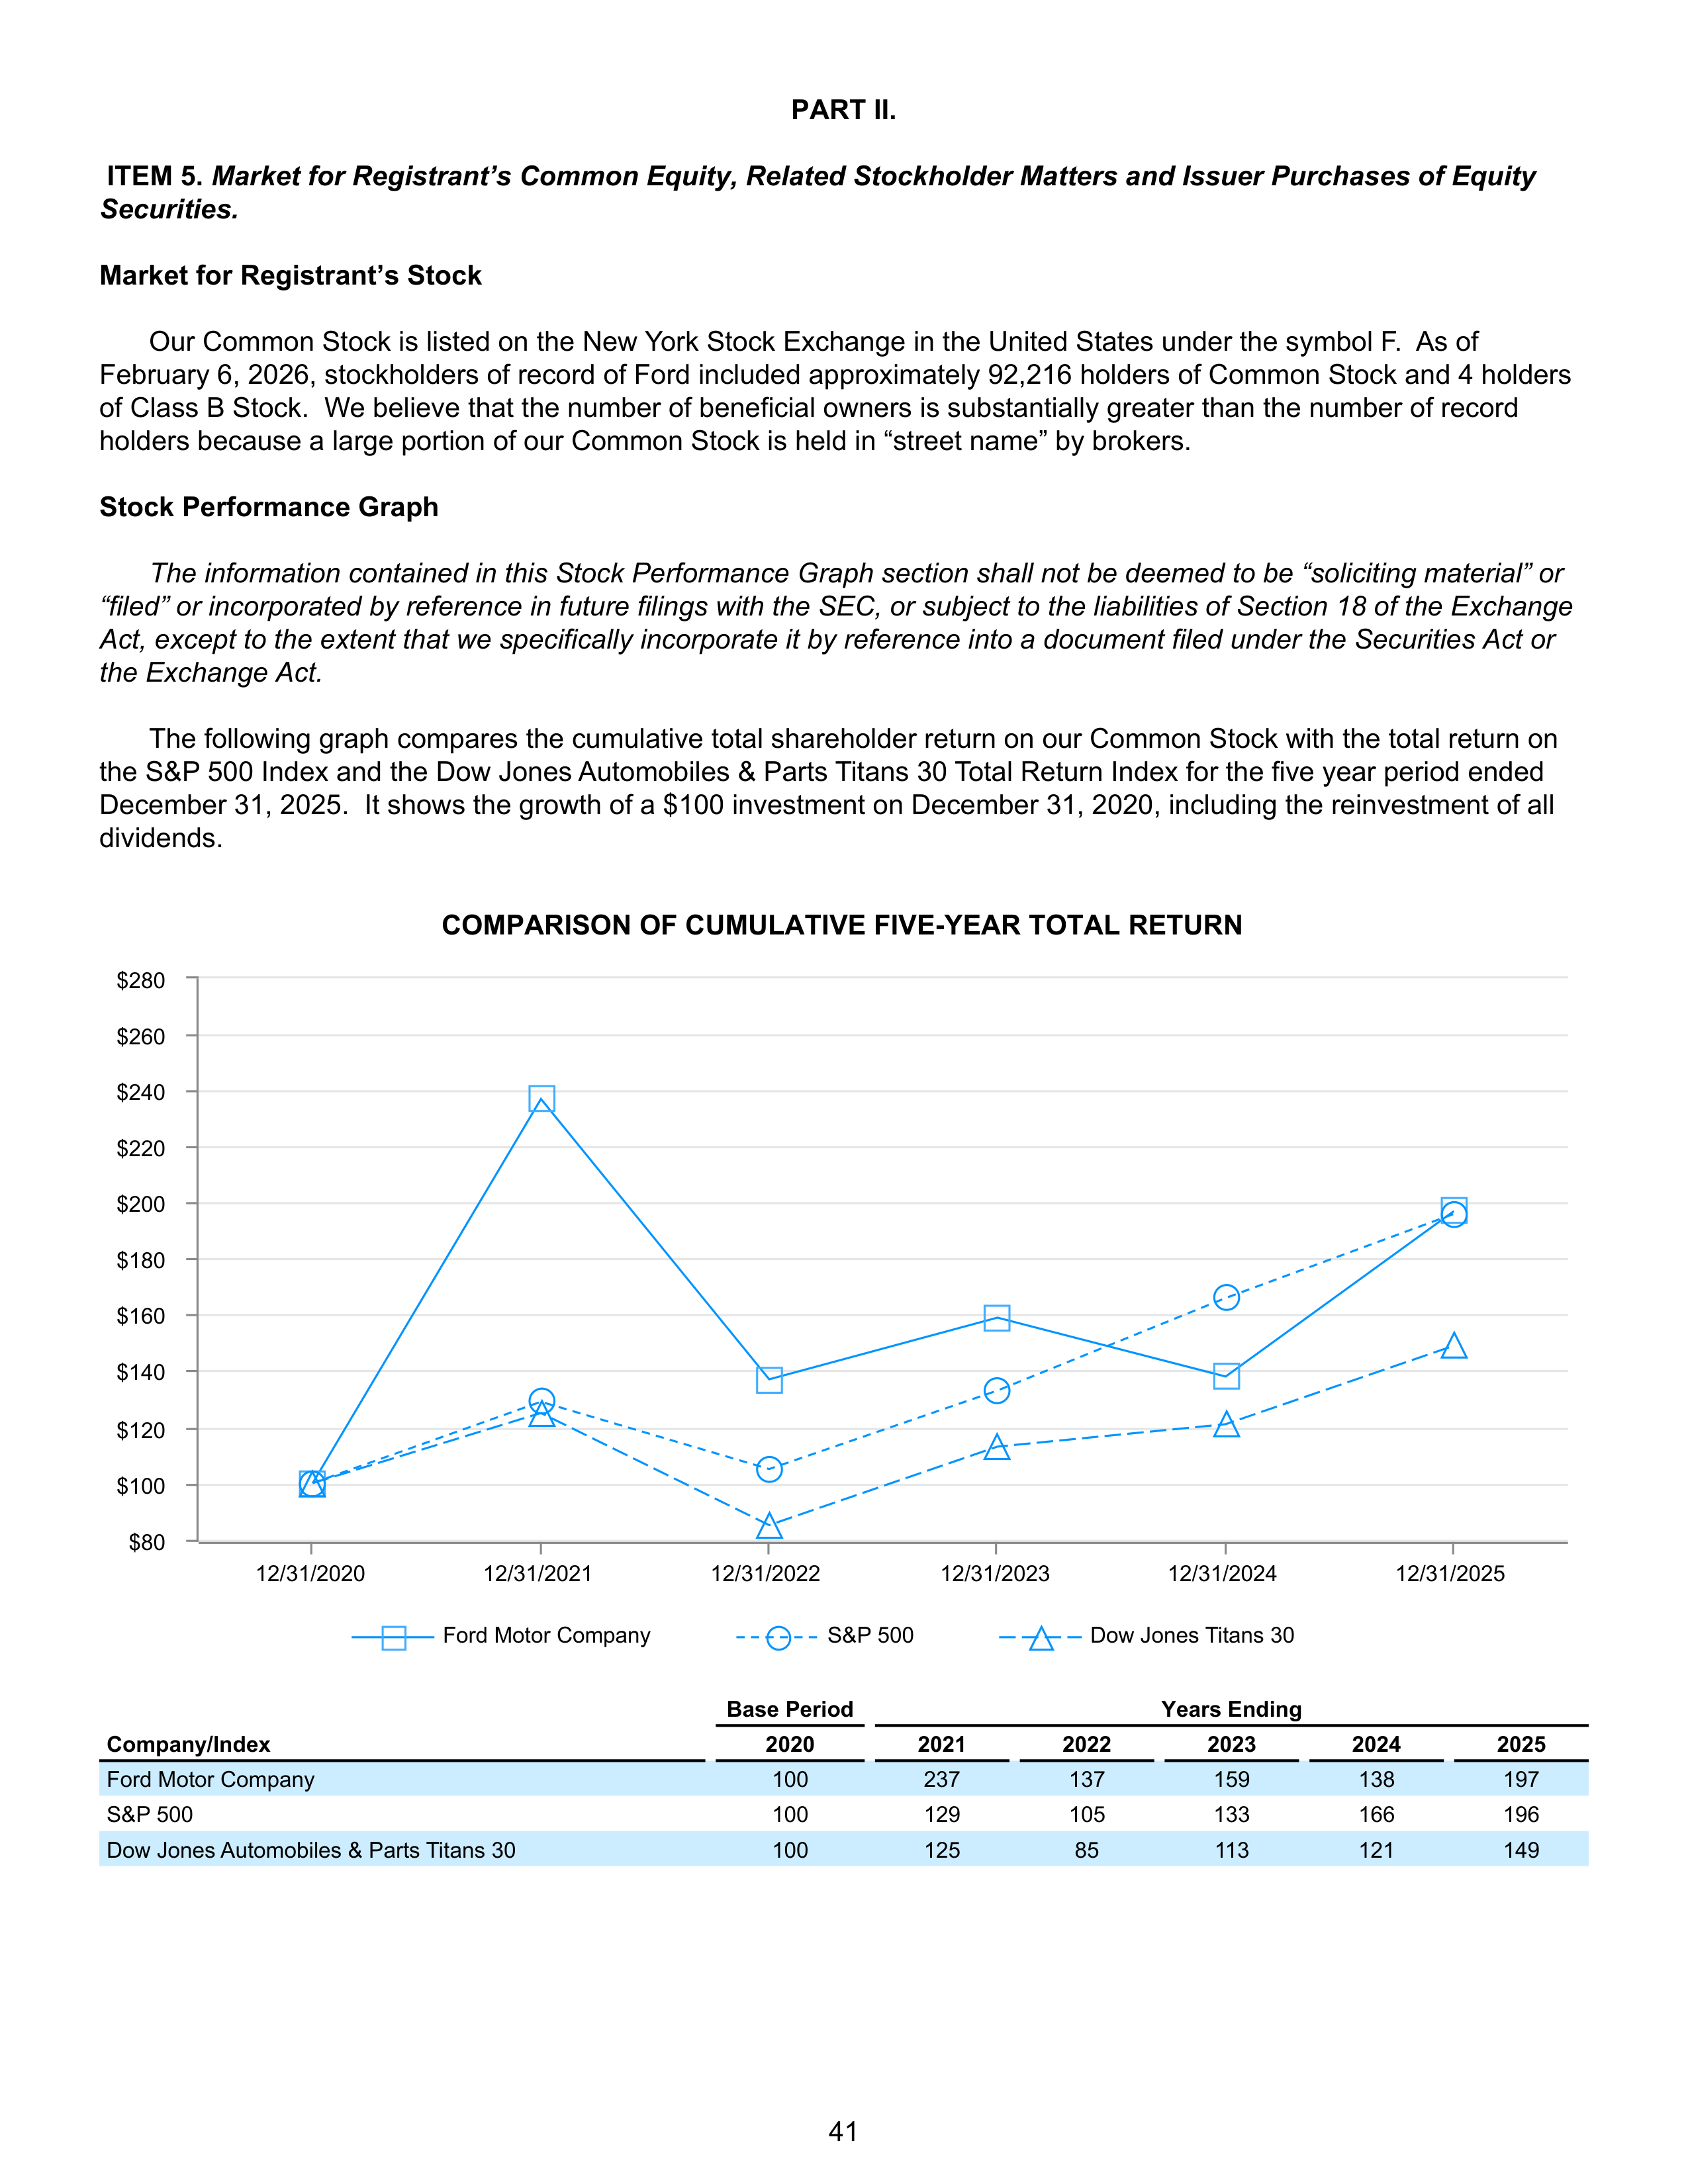
PART II.
ITEM 5.
Market for Registrant’s Common Equity, Related Stockholder Matters and Issuer Purchases of Equity
Securities.
Market for Registrant’s Stock
Our Common Stock is listed on the New York Stock Exchange in the United States under the symbol F. As of
February 6, 2026, stockholders of record of Ford included approximately 92,216 holders of Common Stock and 4 holders
of Class B Stock. We believe that the number of beneficial owners is substantially greater than the number of record
holders because a large portion of our Common Stock is held in “street name” by brokers.
Stock Performance Graph
The information contained in this Stock Performance Graph section shall not be deemed to be “soliciting material” or
“filed” or incorporated by reference in future filings with the SEC, or subject to the liabilities of Section 18 of the Exchange
Act, except to the extent that we specifically incorporate it by reference into a document filed under the Securities Act or
the Exchange Act.
The following graph compares the cumulative total shareholder return on our Common Stock with the total return on
the S&P 500 Index and the Dow Jones Automobiles & Parts Titans 30 Total Return Index for the five year period ended
December 31, 2025. It shows the growth of a $100 investment on December 31, 2020, including the reinvestment of all
dividends.
COMPARISON OF CUMULATIVE FIVE-YEAR TOTAL RETURN
Ford Motor Company
S&P 500
Dow Jones Titans 30
12/31/2020
12/31/2021
12/31/2022
12/31/2023
12/31/2024
12/31/2025
$80
$100
$120
$140
$160
$180
$200
$220
$240
$260
$280
Base Period
Years Ending
Company/Index
2020
2021
2022
2023
2024
2025
Ford Motor Company
100
237
137
159
138
197
S&P 500
100
129
105
133
166
196
Dow Jones Automobiles & Parts Titans 30
100
125
85
113
121
149
41
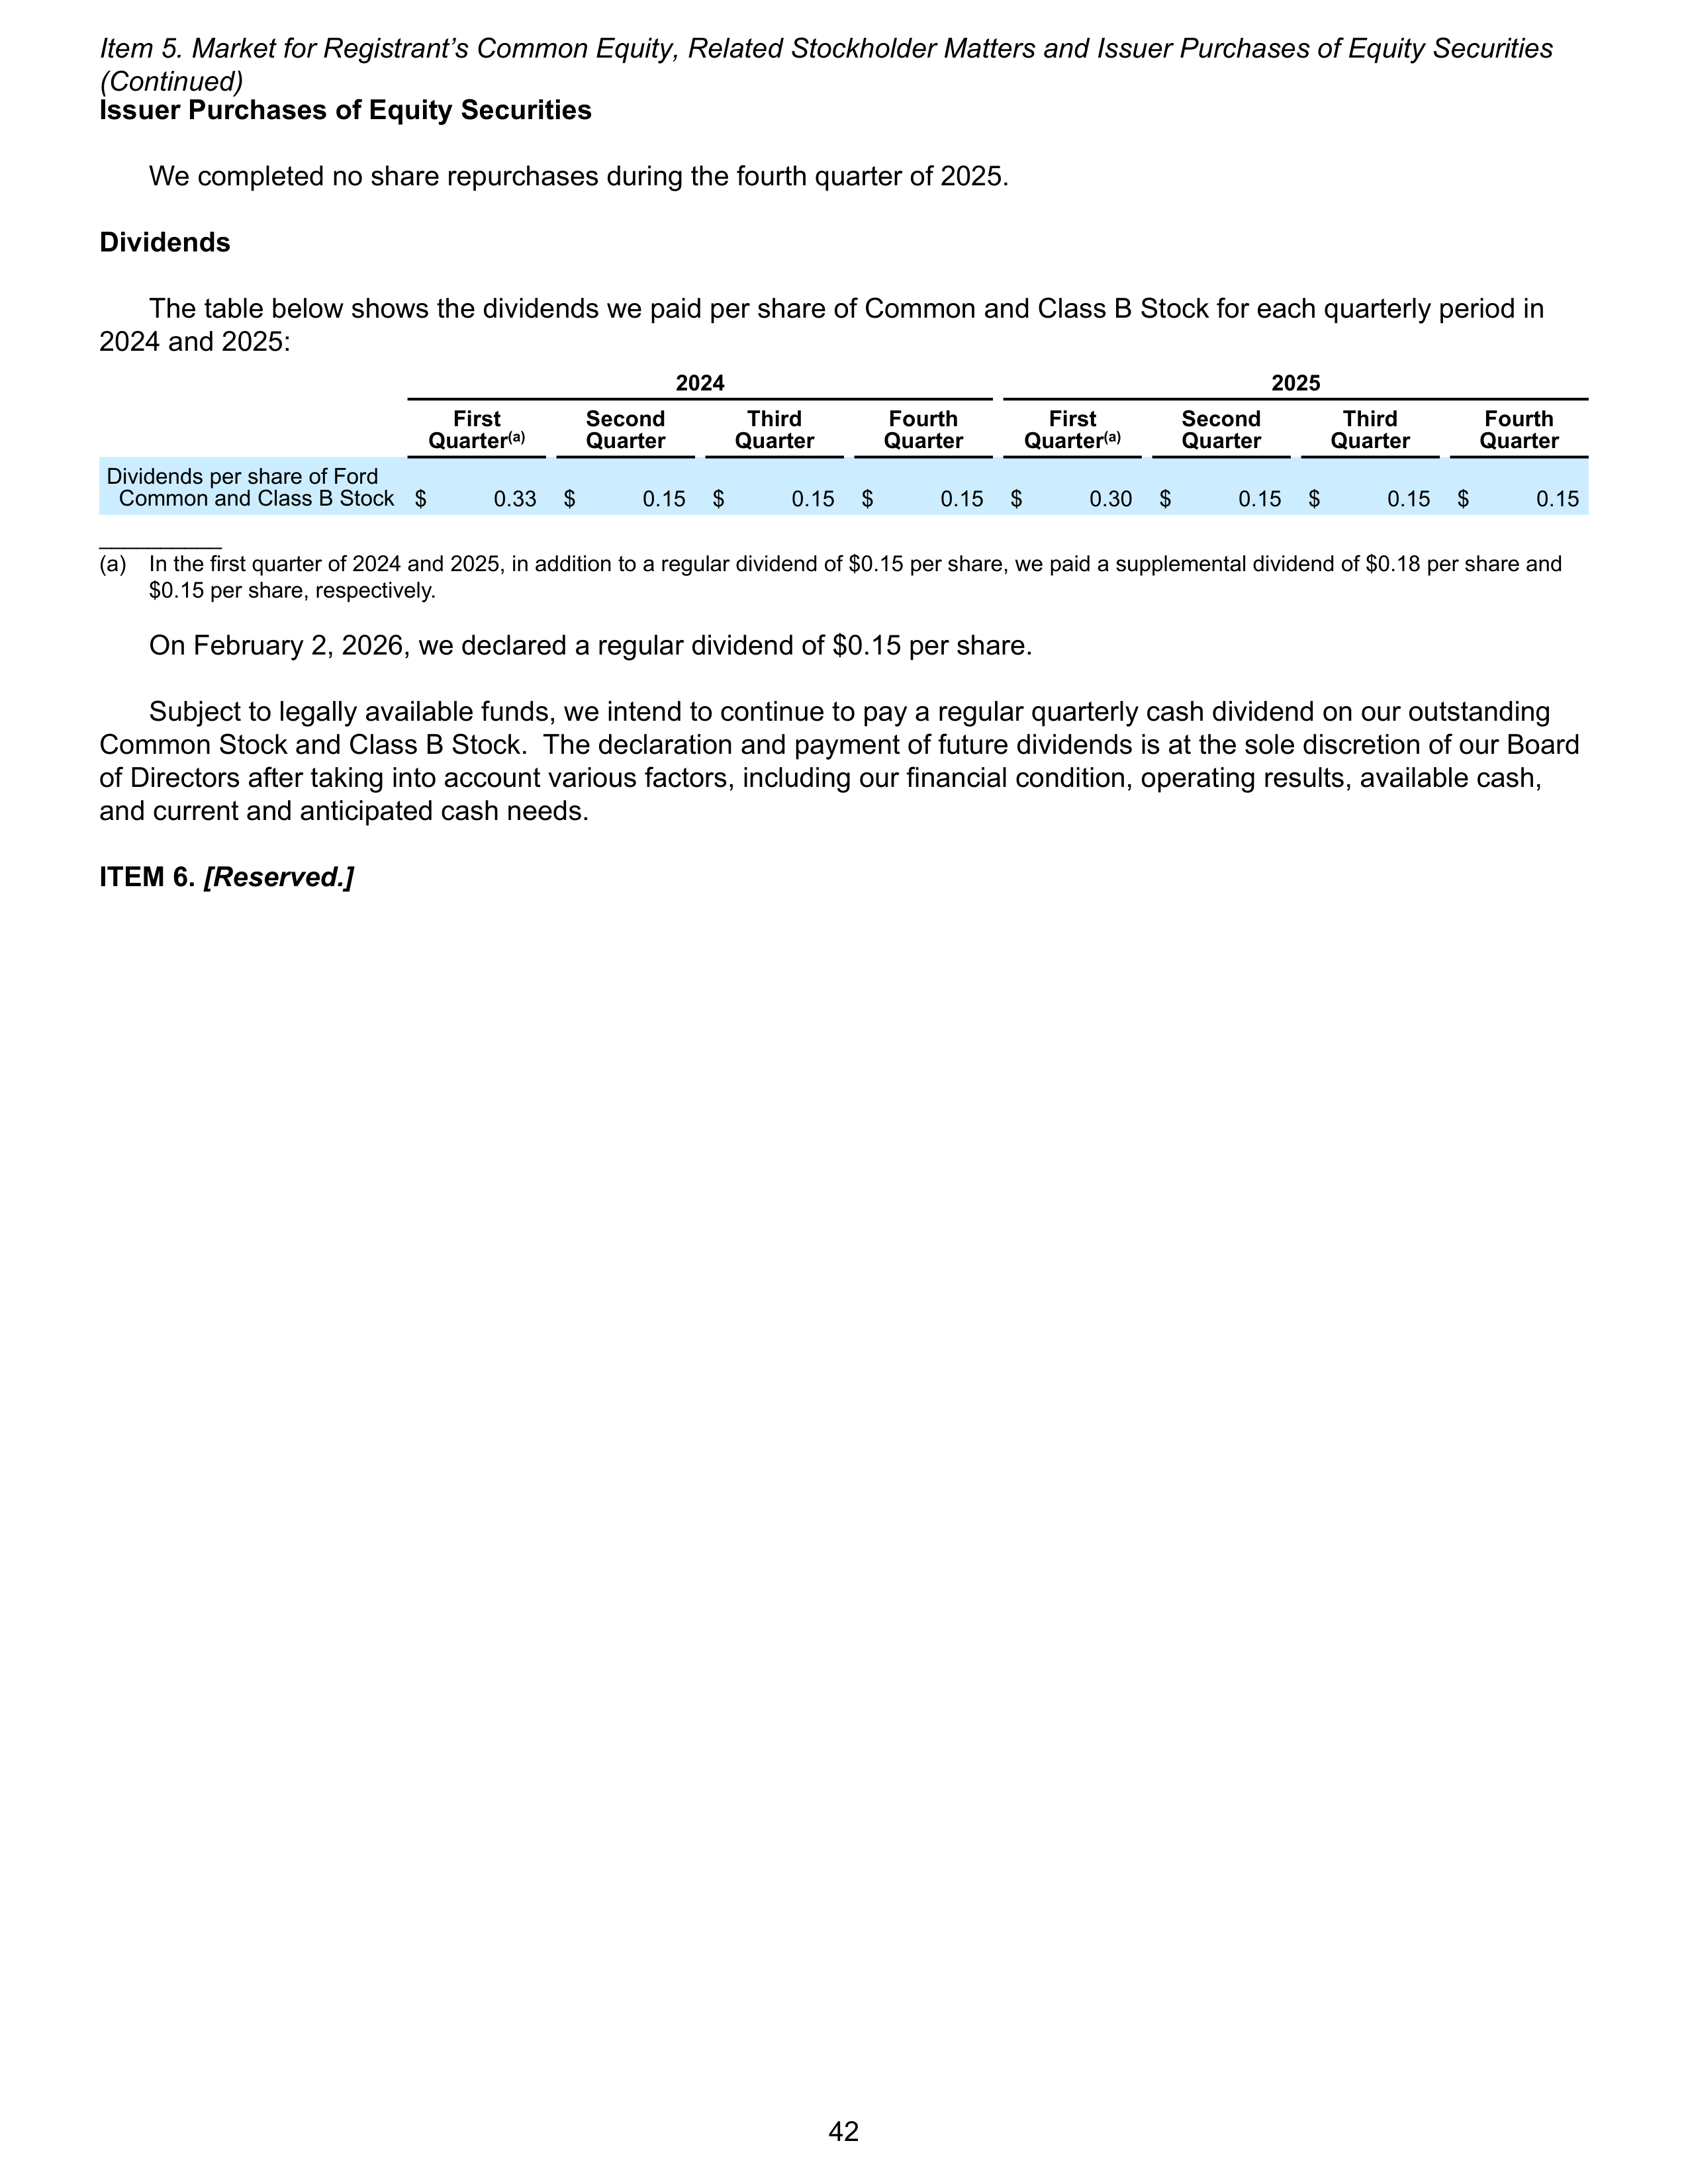
Issuer Purchases of Equity Securities
We completed no share repurchases during the fourth quarter of 2025.
Dividends
The table below shows the dividends we paid per share of Common and Class B Stock for each quarterly period in
2024 and 2025:
2024
2025
First
Quarter
(a)
Second
Quarter
Third
Quarter
Fourth
Quarter
First
Quarter
(a)
Second
Quarter
Third
Quarter
Fourth
Quarter
Dividends per share of Ford
Common and Class B Stock
$
0.33
$
0.15
$
0.15
$
0.15
$
0.30
$
0.15
$
0.15
$
0.15
__________
(a)
In the first quarter of 2024 and 2025, in addition to a regular dividend of $0.15 per share, we paid a supplemental dividend of $0.18 per share and
$0.15 per share, respectively.
On February 2, 2026, we declared a regular dividend of $0.15 per share.
Subject to legally available funds, we intend to continue to pay a regular quarterly cash dividend on our outstanding
Common Stock and Class B Stock. The declaration and payment of future dividends is at the sole discretion of our Board
of Directors after taking into account various factors, including our financial condition, operating results, available cash,
and current and anticipated cash needs.
ITEM 6.
[Reserved.]
Item 5. Market for Registrant’s Common Equity, Related Stockholder Matters and Issuer Purchases of Equity Securities
(Continued)
42
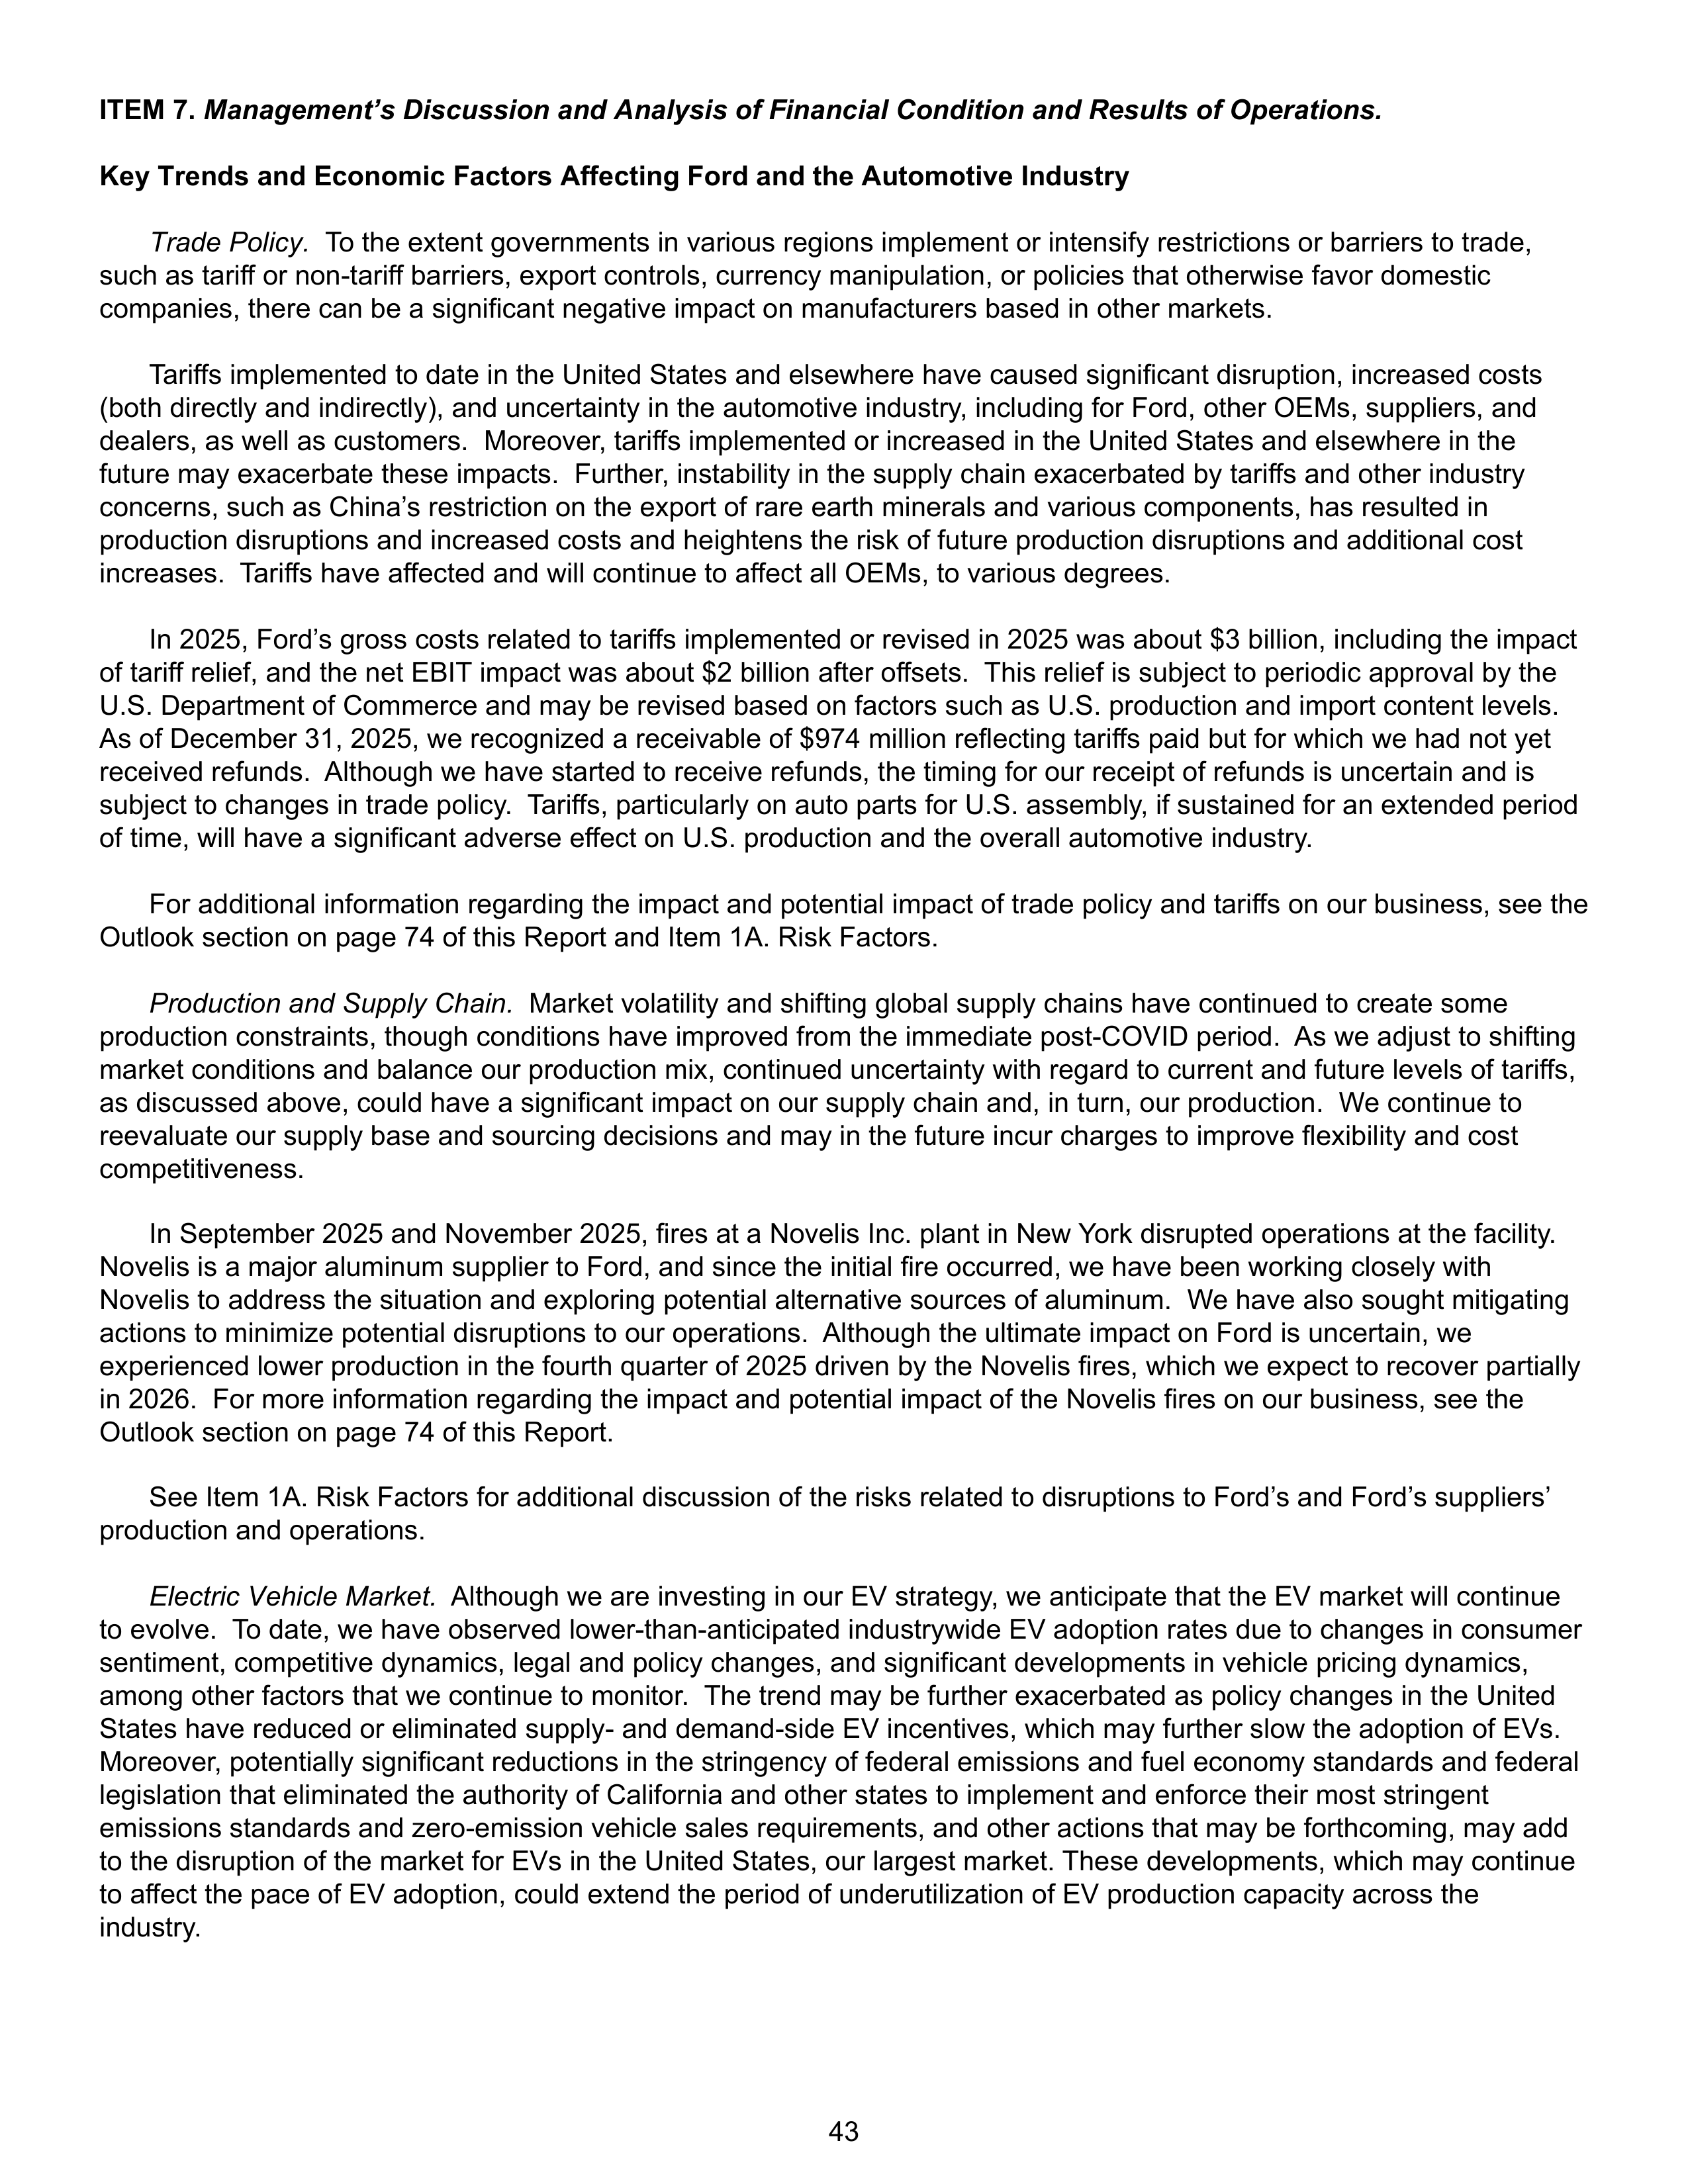
ITEM 7.
Management’s Discussion and Analysis of Financial Condition and Results of Operations.
Key Trends and Economic Factors Affecting Ford and the Automotive Industry
Trade Policy.
To the extent governments in various regions implement or intensify restrictions or barriers to trade,
such as tariff or non-tariff barriers, export controls, currency manipulation, or policies that otherwise favor domestic
companies, there can be a significant negative impact on manufacturers based in other markets.
Tariffs implemented to date in the United States and elsewhere have caused significant disruption, increased costs
(both directly and indirectly), and uncertainty in the automotive industry, including for Ford, other OEMs, suppliers, and
dealers, as well as customers. Moreover, tariffs implemented or increased in the United States and elsewhere in the
future may exacerbate these impacts. Further, instability in the supply chain exacerbated by tariffs and other industry
concerns, such as China’s restriction on the export of rare earth minerals and various components, has resulted in
production disruptions and increased costs and heightens the risk of future production disruptions and additional cost
increases. Tariffs have affected and will continue to affect all OEMs, to various degrees.
In 2025, Ford’s gross costs related to tariffs implemented or revised in 2025 was about $3 billion, including the impact
of tariff relief, and the net EBIT impact was about $2 billion after offsets. This relief is subject to periodic approval by the
U.S. Department of Commerce and may be revised based on factors such as U.S. production and import content levels.
As of December 31, 2025, we recognized a receivable of $974 million reflecting tariffs paid but for which we had not yet
received refunds. Although we have started to receive refunds, the timing for our receipt of refunds is uncertain and is
subject to changes in trade policy. Tariffs, particularly on auto parts for U.S. assembly, if sustained for an extended period
of time, will have a significant adverse effect on U.S. production and the overall automotive industry.
For additional information regarding the impact and potential impact of trade policy and tariffs on our business, see the
Outlook section on page 74 of this Report and Item 1A. Risk Factors.
Production and Supply Chain.
Market volatility and shifting global supply chains have continued to create some
production constraints, though conditions have improved from the immediate post-COVID period. As we adjust to shifting
market conditions and balance our production mix, continued uncertainty with regard to current and future levels of tariffs,
as discussed above, could have a significant impact on our supply chain and, in turn, our production. We continue to
reevaluate our supply base and sourcing decisions and may in the future incur charges to improve flexibility and cost
competitiveness.
In September 2025 and November 2025, fires at a Novelis Inc. plant in New York disrupted operations at the facility.
Novelis is a major aluminum supplier to Ford, and since the initial fire occurred, we have been working closely with
Novelis to address the situation and exploring potential alternative sources of aluminum. We have also sought mitigating
actions to minimize potential disruptions to our operations. Although the ultimate impact on Ford is uncertain, we
experienced lower production in the fourth quarter of 2025 driven by the Novelis fires, which we expect to recover partially
in 2026. For more information regarding the impact and potential impact of the Novelis fires on our business, see the
Outlook section on page 74 of this Report.
See Item 1A. Risk Factors for additional discussion of the risks related to disruptions to Ford’s and Ford’s suppliers’
production and operations.
Electric Vehicle Market.
Although we are investing in our EV strategy, we anticipate that the EV market will continue
to evolve. To date, we have observed lower-than-anticipated industrywide EV adoption rates due to changes in consumer
sentiment, competitive dynamics, legal and policy changes, and significant developments in vehicle pricing dynamics,
among other factors that we continue to monitor. The trend may be further exacerbated as policy changes in the United
States have reduced or eliminated supply- and demand-side EV incentives, which may further slow the adoption of EVs.
Moreover, potentially significant reductions in the stringency of federal emissions and fuel economy standards and federal
legislation that eliminated the authority of California and other states to implement and enforce their most stringent
emissions standards and zero-emission vehicle sales requirements, and other actions that may be forthcoming, may add
to the disruption of the market for EVs in the United States, our largest market. These developments, which may continue
to affect the pace of EV adoption, could extend the period of underutilization of EV production capacity across the
industry.
43
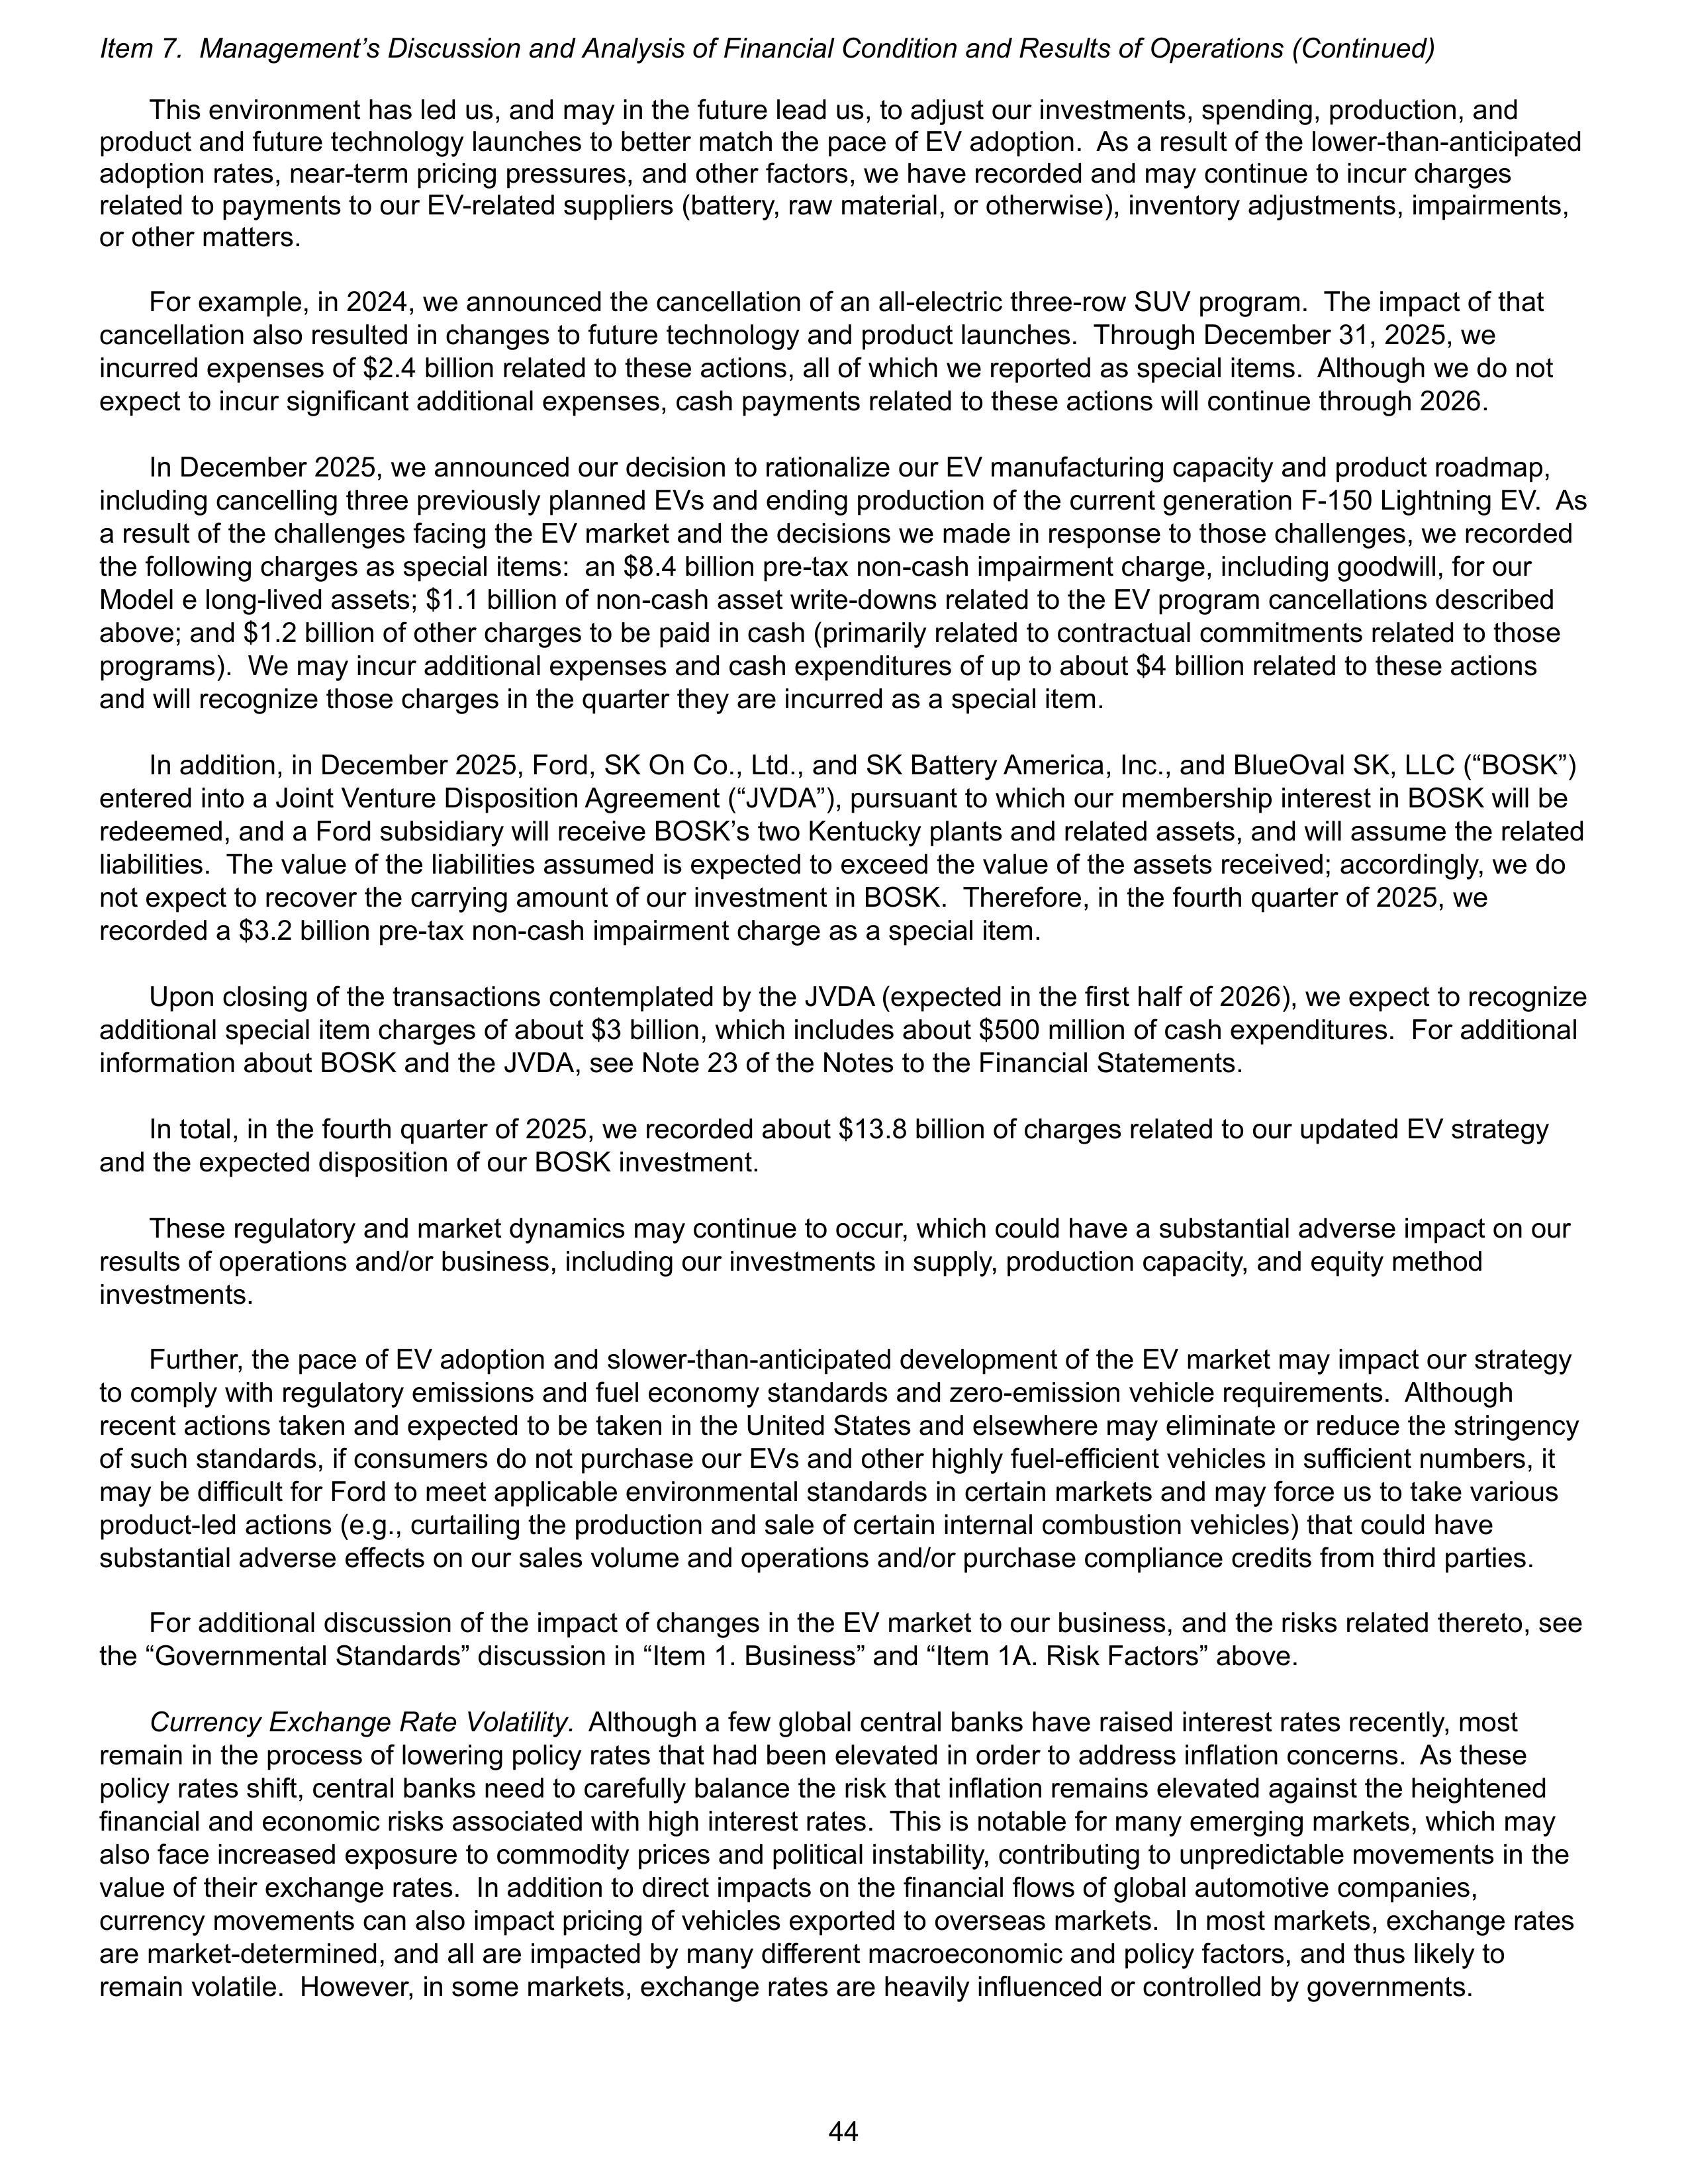
This environment has led us, and may in the future lead us, to adjust our investments, spending, production, and
product and future technology launches to better match the pace of EV adoption. As a result of the lower-than-anticipated
adoption rates, near-term pricing pressures, and other factors, we have recorded and may continue to incur charges
related to payments to our EV-related suppliers (battery, raw material, or otherwise), inventory adjustments, impairments,
or other matters.
For example, in 2024, we announced the cancellation of an all-electric three-row SUV program. The impact of that
cancellation also resulted in changes to future technology and product launches. Through December 31, 2025, we
incurred expenses of $2.4 billion related to these actions, all of which we reported as special items. Although we do not
expect to incur significant additional expenses, cash payments related to these actions will continue through 2026.
In December 2025, we announced our decision to rationalize our EV manufacturing capacity and product roadmap,
including cancelling three previously planned EVs and ending production of the current generation F-150 Lightning EV. As
a result of the challenges facing the EV market and the decisions we made in response to those challenges, we recorded
the following charges as special items: an $8.4 billion pre-tax non-cash impairment charge, including goodwill, for our
Model e long-lived assets; $1.1 billion of non-cash asset write-downs related to the EV program cancellations described
above; and $1.2 billion of other charges to be paid in cash (primarily related to contractual commitments related to those
programs). We may incur additional expenses and cash expenditures of up to about $4 billion related to these actions
and will recognize those charges in the quarter they are incurred as a special item.
In addition, in December 2025, Ford, SK On Co., Ltd., and SK Battery America, Inc., and BlueOval SK, LLC (“BOSK”)
entered into a Joint Venture Disposition Agreement (“JVDA”), pursuant to which our membership interest in BOSK will be
redeemed, and a Ford subsidiary will receive BOSK’s two Kentucky plants and related assets, and will assume the related
liabilities. The value of the liabilities assumed is expected to exceed the value of the assets received; accordingly, we do
not expect to recover the carrying amount of our investment in BOSK. Therefore, in the fourth quarter of 2025, we
recorded a $3.2 billion pre-tax non-cash impairment charge as a special item.
Upon closing of the transactions contemplated by the JVDA (expected in the first half of 2026), we expect to recognize
additional special item charges of about $3 billion, which includes about $500 million of cash expenditures. For additional
information about BOSK and the JVDA, see Note 23 of the Notes to the Financial Statements.
In total, in the fourth quarter of 2025, we recorded about $13.8 billion of charges related to our updated EV strategy
and the expected disposition of our BOSK investment.
These regulatory and market dynamics may continue to occur, which could have a substantial adverse impact on our
results of operations and/or business, including our investments in supply, production capacity, and equity method
investments.
Further, the pace of EV adoption and slower-than-anticipated development of the EV market may impact our strategy
to comply with regulatory emissions and fuel economy standards and zero-emission vehicle requirements. Although
recent actions taken and expected to be taken in the United States and elsewhere may eliminate or reduce the stringency
of such standards, if consumers do not purchase our EVs and other highly fuel-efficient vehicles in sufficient numbers, it
may be difficult for Ford to meet applicable environmental standards in certain markets and may force us to take various
product-led actions (e.g., curtailing the production and sale of certain internal combustion vehicles) that could have
substantial adverse effects on our sales volume and operations and/or purchase compliance credits from third parties.
For additional discussion of the impact of changes in the EV market to our business, and the risks related thereto, see
the “Governmental Standards” discussion in “Item 1. Business” and “Item 1A. Risk Factors” above.
Currency Exchange Rate Volatility.
Although a few global central banks have raised interest rates recently, most
remain in the process of lowering policy rates that had been elevated in order to address inflation concerns. As these
policy rates shift, central banks need to carefully balance the risk that inflation remains elevated against the heightened
financial and economic risks associated with high interest rates. This is notable for many emerging markets, which may
also face increased exposure to commodity prices and political instability, contributing to unpredictable movements in the
value of their exchange rates. In addition to direct impacts on the financial flows of global automotive companies,
currency movements can also impact pricing of vehicles exported to overseas markets. In most markets, exchange rates
are market-determined, and all are impacted by many different macroeconomic and policy factors, and thus likely to
remain volatile. However, in some markets, exchange rates are heavily influenced or controlled by governments.
Item 7. Management’s Discussion and Analysis of Financial Condition and Results of Operations (Continued)
44
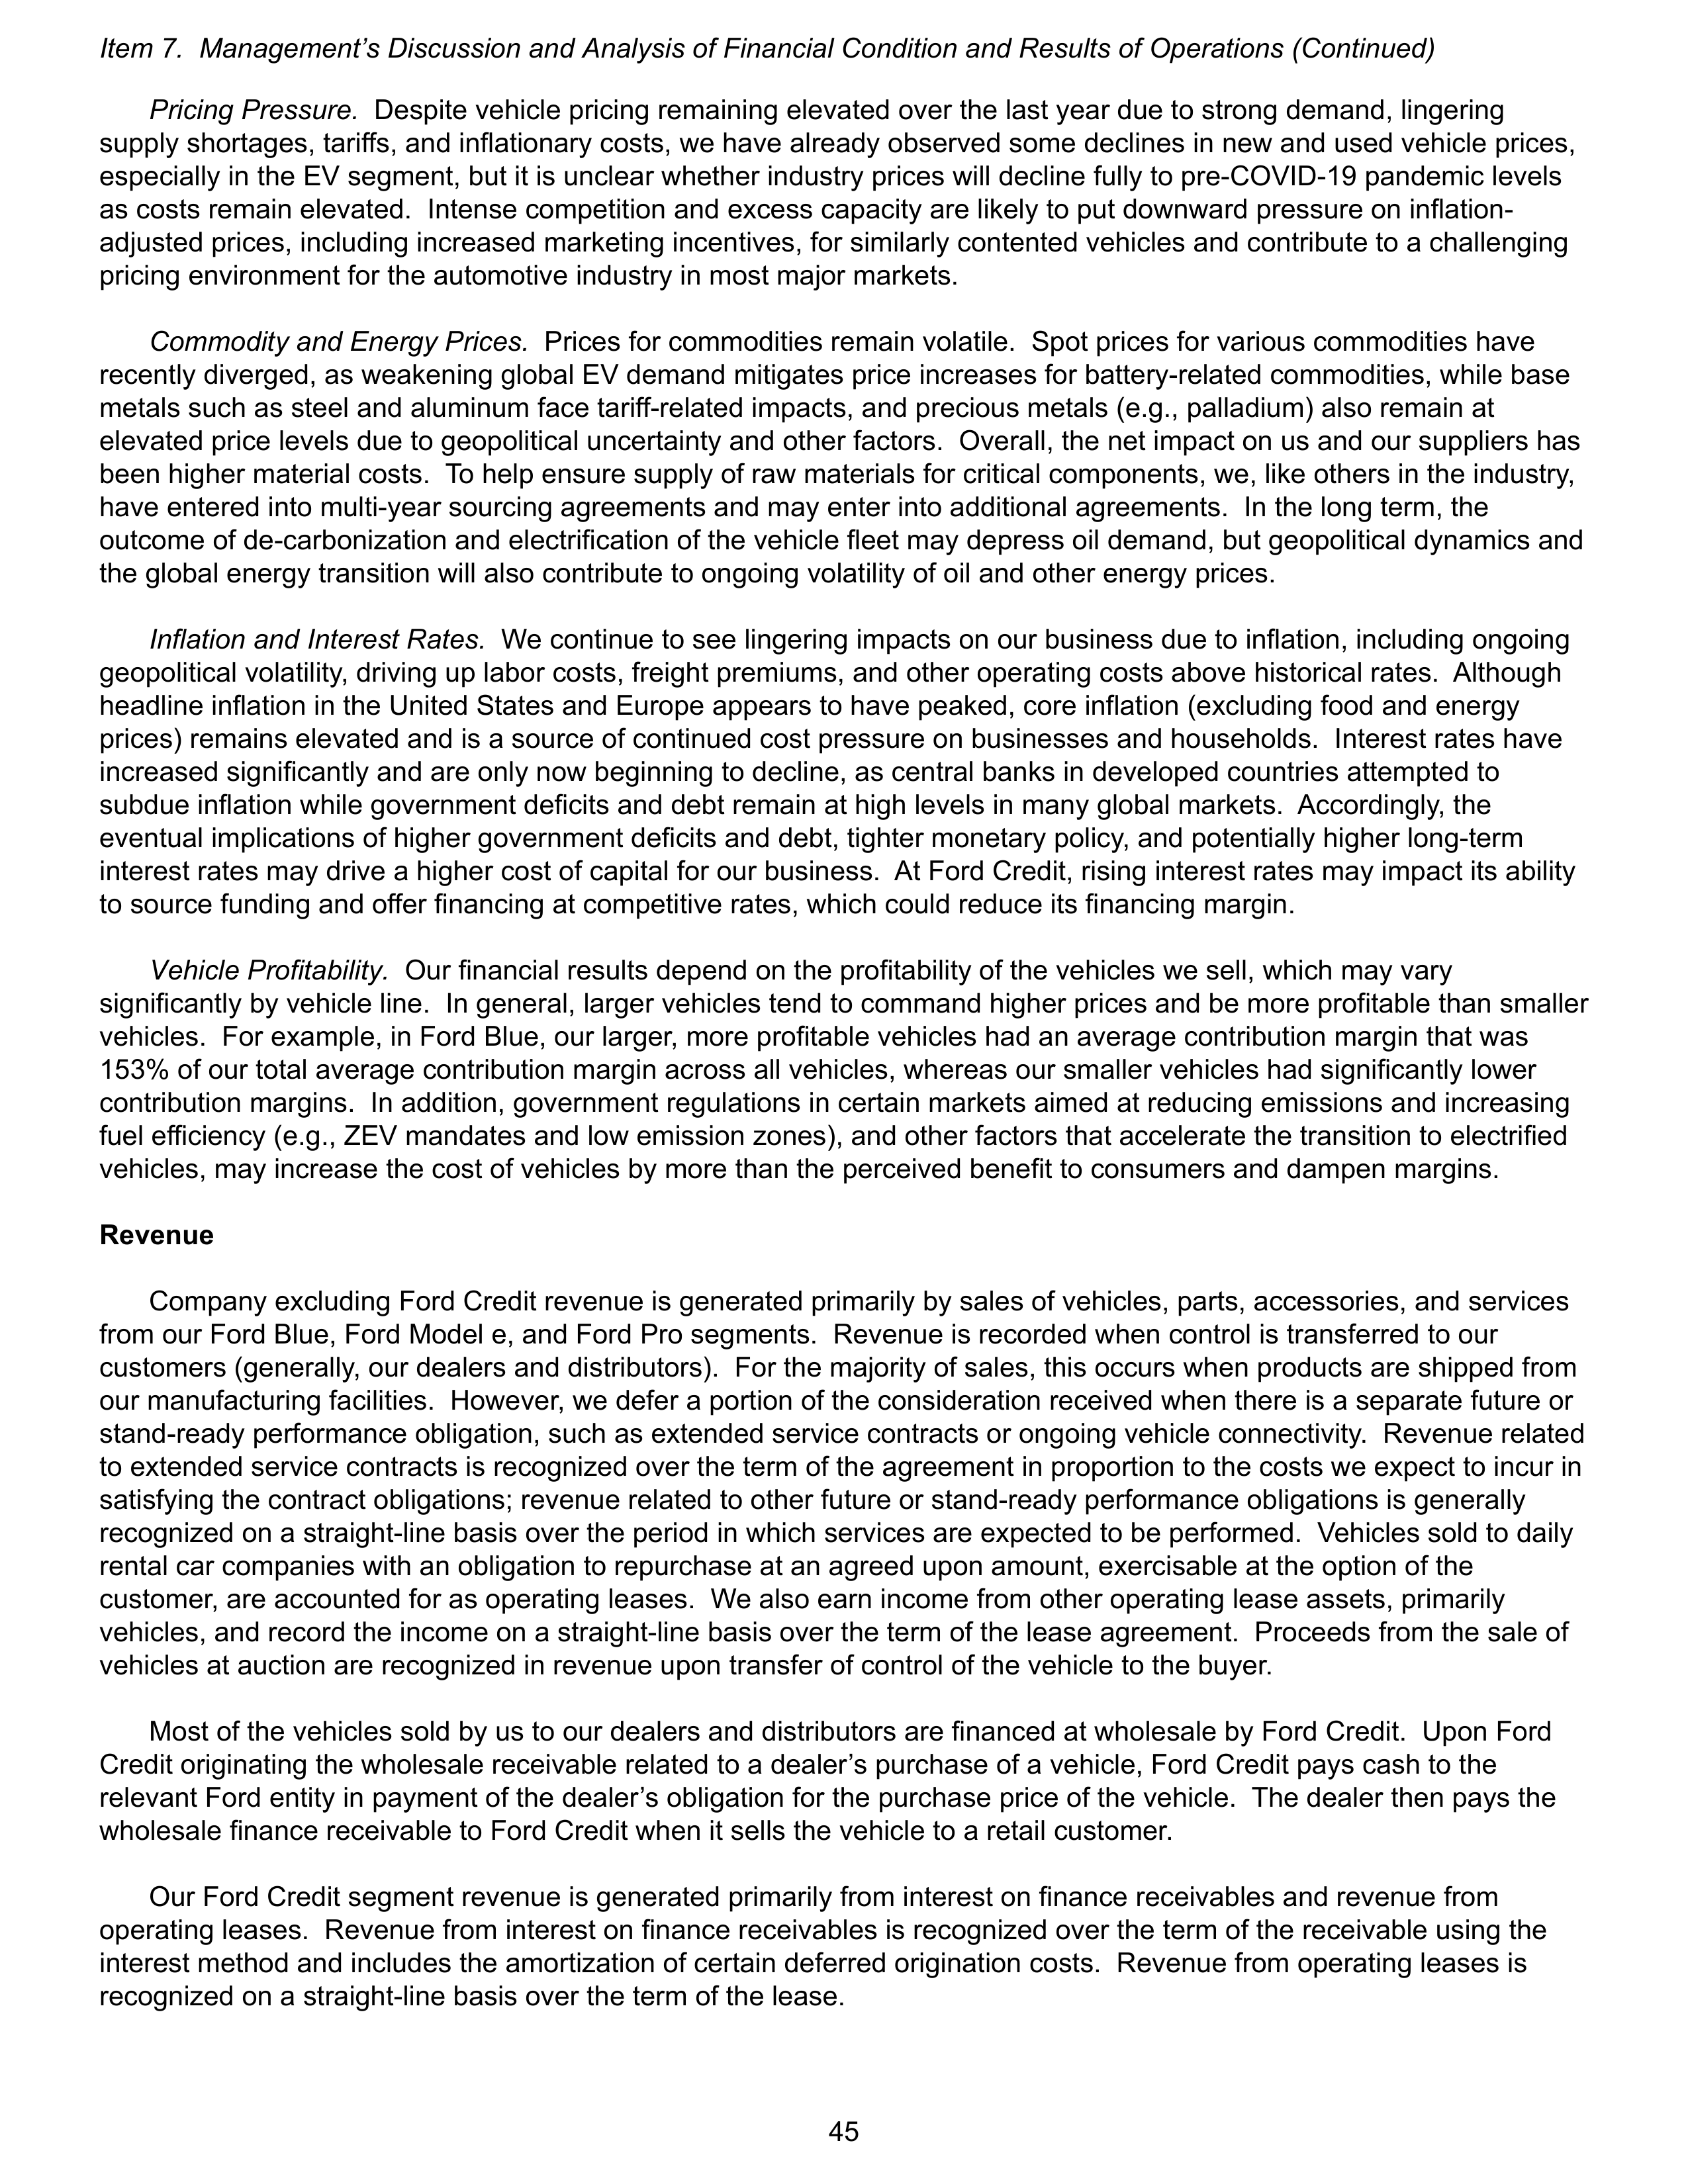
Pricing Pressure.
Despite vehicle pricing remaining elevated over the last year due to strong demand, lingering
supply shortages, tariffs, and inflationary costs, we have already observed some declines in new and used vehicle prices,
especially in the EV segment, but it is unclear whether industry prices will decline fully to pre-COVID-19 pandemic levels
as costs remain elevated. Intense competition and excess capacity are likely to put downward pressure on inflation-
adjusted prices, including increased marketing incentives, for similarly contented vehicles and contribute to a challenging
pricing environment for the automotive industry in most major markets.
Commodity and Energy Prices.
Prices for commodities remain volatile. Spot prices for various commodities have
recently diverged, as weakening global EV demand mitigates price increases for battery-related commodities, while base
metals such as steel and aluminum face tariff-related impacts, and precious metals (e.g., palladium) also remain at
elevated price levels due to geopolitical uncertainty and other factors. Overall, the net impact on us and our suppliers has
been higher material costs. To help ensure supply of raw materials for critical components, we, like others in the industry,
have entered into multi-year sourcing agreements and may enter into additional agreements. In the long term, the
outcome of de-carbonization and electrification of the vehicle fleet may depress oil demand, but geopolitical dynamics and
the global energy transition will also contribute to ongoing volatility of oil and other energy prices.
Inflation and Interest Rates.
We continue to see lingering impacts on our business due to inflation, including ongoing
geopolitical volatility, driving up labor costs, freight premiums, and other operating costs above historical rates. Although
headline inflation in the United States and Europe appears to have peaked, core inflation (excluding food and energy
prices) remains elevated and is a source of continued cost pressure on businesses and households. Interest rates have
increased significantly and are only now beginning to decline, as central banks in developed countries attempted to
subdue inflation while government deficits and debt remain at high levels in many global markets. Accordingly, the
eventual implications of higher government deficits and debt, tighter monetary policy, and potentially higher long-term
interest rates may drive a higher cost of capital for our business. At Ford Credit, rising interest rates may impact its ability
to source funding and offer financing at competitive rates, which could reduce its financing margin.
Vehicle Profitability.
Our financial results depend on the profitability of the vehicles we sell, which may vary
significantly by vehicle line. In general, larger vehicles tend to command higher prices and be more profitable than smaller
vehicles. For example, in Ford Blue, our larger, more profitable vehicles had an average contribution margin that was
153% of our total average contribution margin across all vehicles, whereas our smaller vehicles had significantly lower
contribution margins. In addition, government regulations in certain markets aimed at reducing emissions and increasing
fuel efficiency (e.g., ZEV mandates and low emission zones), and other factors that accelerate the transition to electrified
vehicles, may increase the cost of vehicles by more than the perceived benefit to consumers and dampen margins.
Revenue
Company excluding Ford Credit revenue is generated primarily by sales of vehicles, parts, accessories, and services
from our Ford Blue, Ford Model e, and Ford Pro segments. Revenue is recorded when control is transferred to our
customers (generally, our dealers and distributors). For the majority of sales, this occurs when products are shipped from
our manufacturing facilities. However, we defer a portion of the consideration received when there is a separate future or
stand-ready performance obligation, such as extended service contracts or ongoing vehicle connectivity. Revenue related
to extended service contracts is recognized over the term of the agreement in proportion to the costs we expect to incur in
satisfying the contract obligations; revenue related to other future or stand-ready performance obligations is generally
recognized on a straight-line basis over the period in which services are expected to be performed. Vehicles sold to daily
rental car companies with an obligation to repurchase at an agreed upon amount, exercisable at the option of the
customer, are accounted for as operating leases. We also earn income from other operating lease assets, primarily
vehicles, and record the income on a straight-line basis over the term of the lease agreement. Proceeds from the sale of
vehicles at auction are recognized in revenue upon transfer of control of the vehicle to the buyer.
Most of the vehicles sold by us to our dealers and distributors are financed at wholesale by Ford Credit. Upon Ford
Credit originating the wholesale receivable related to a dealer’s purchase of a vehicle, Ford Credit pays cash to the
relevant Ford entity in payment of the dealer’s obligation for the purchase price of the vehicle. The dealer then pays the
wholesale finance receivable to Ford Credit when it sells the vehicle to a retail customer.
Our Ford Credit segment revenue is generated primarily from interest on finance receivables and revenue from
operating leases. Revenue from interest on finance receivables is recognized over the term of the receivable using the
interest method and includes the amortization of certain deferred origination costs. Revenue from operating leases is
recognized on a straight-line basis over the term of the lease.
Item 7. Management’s Discussion and Analysis of Financial Condition and Results of Operations (Continued)
45
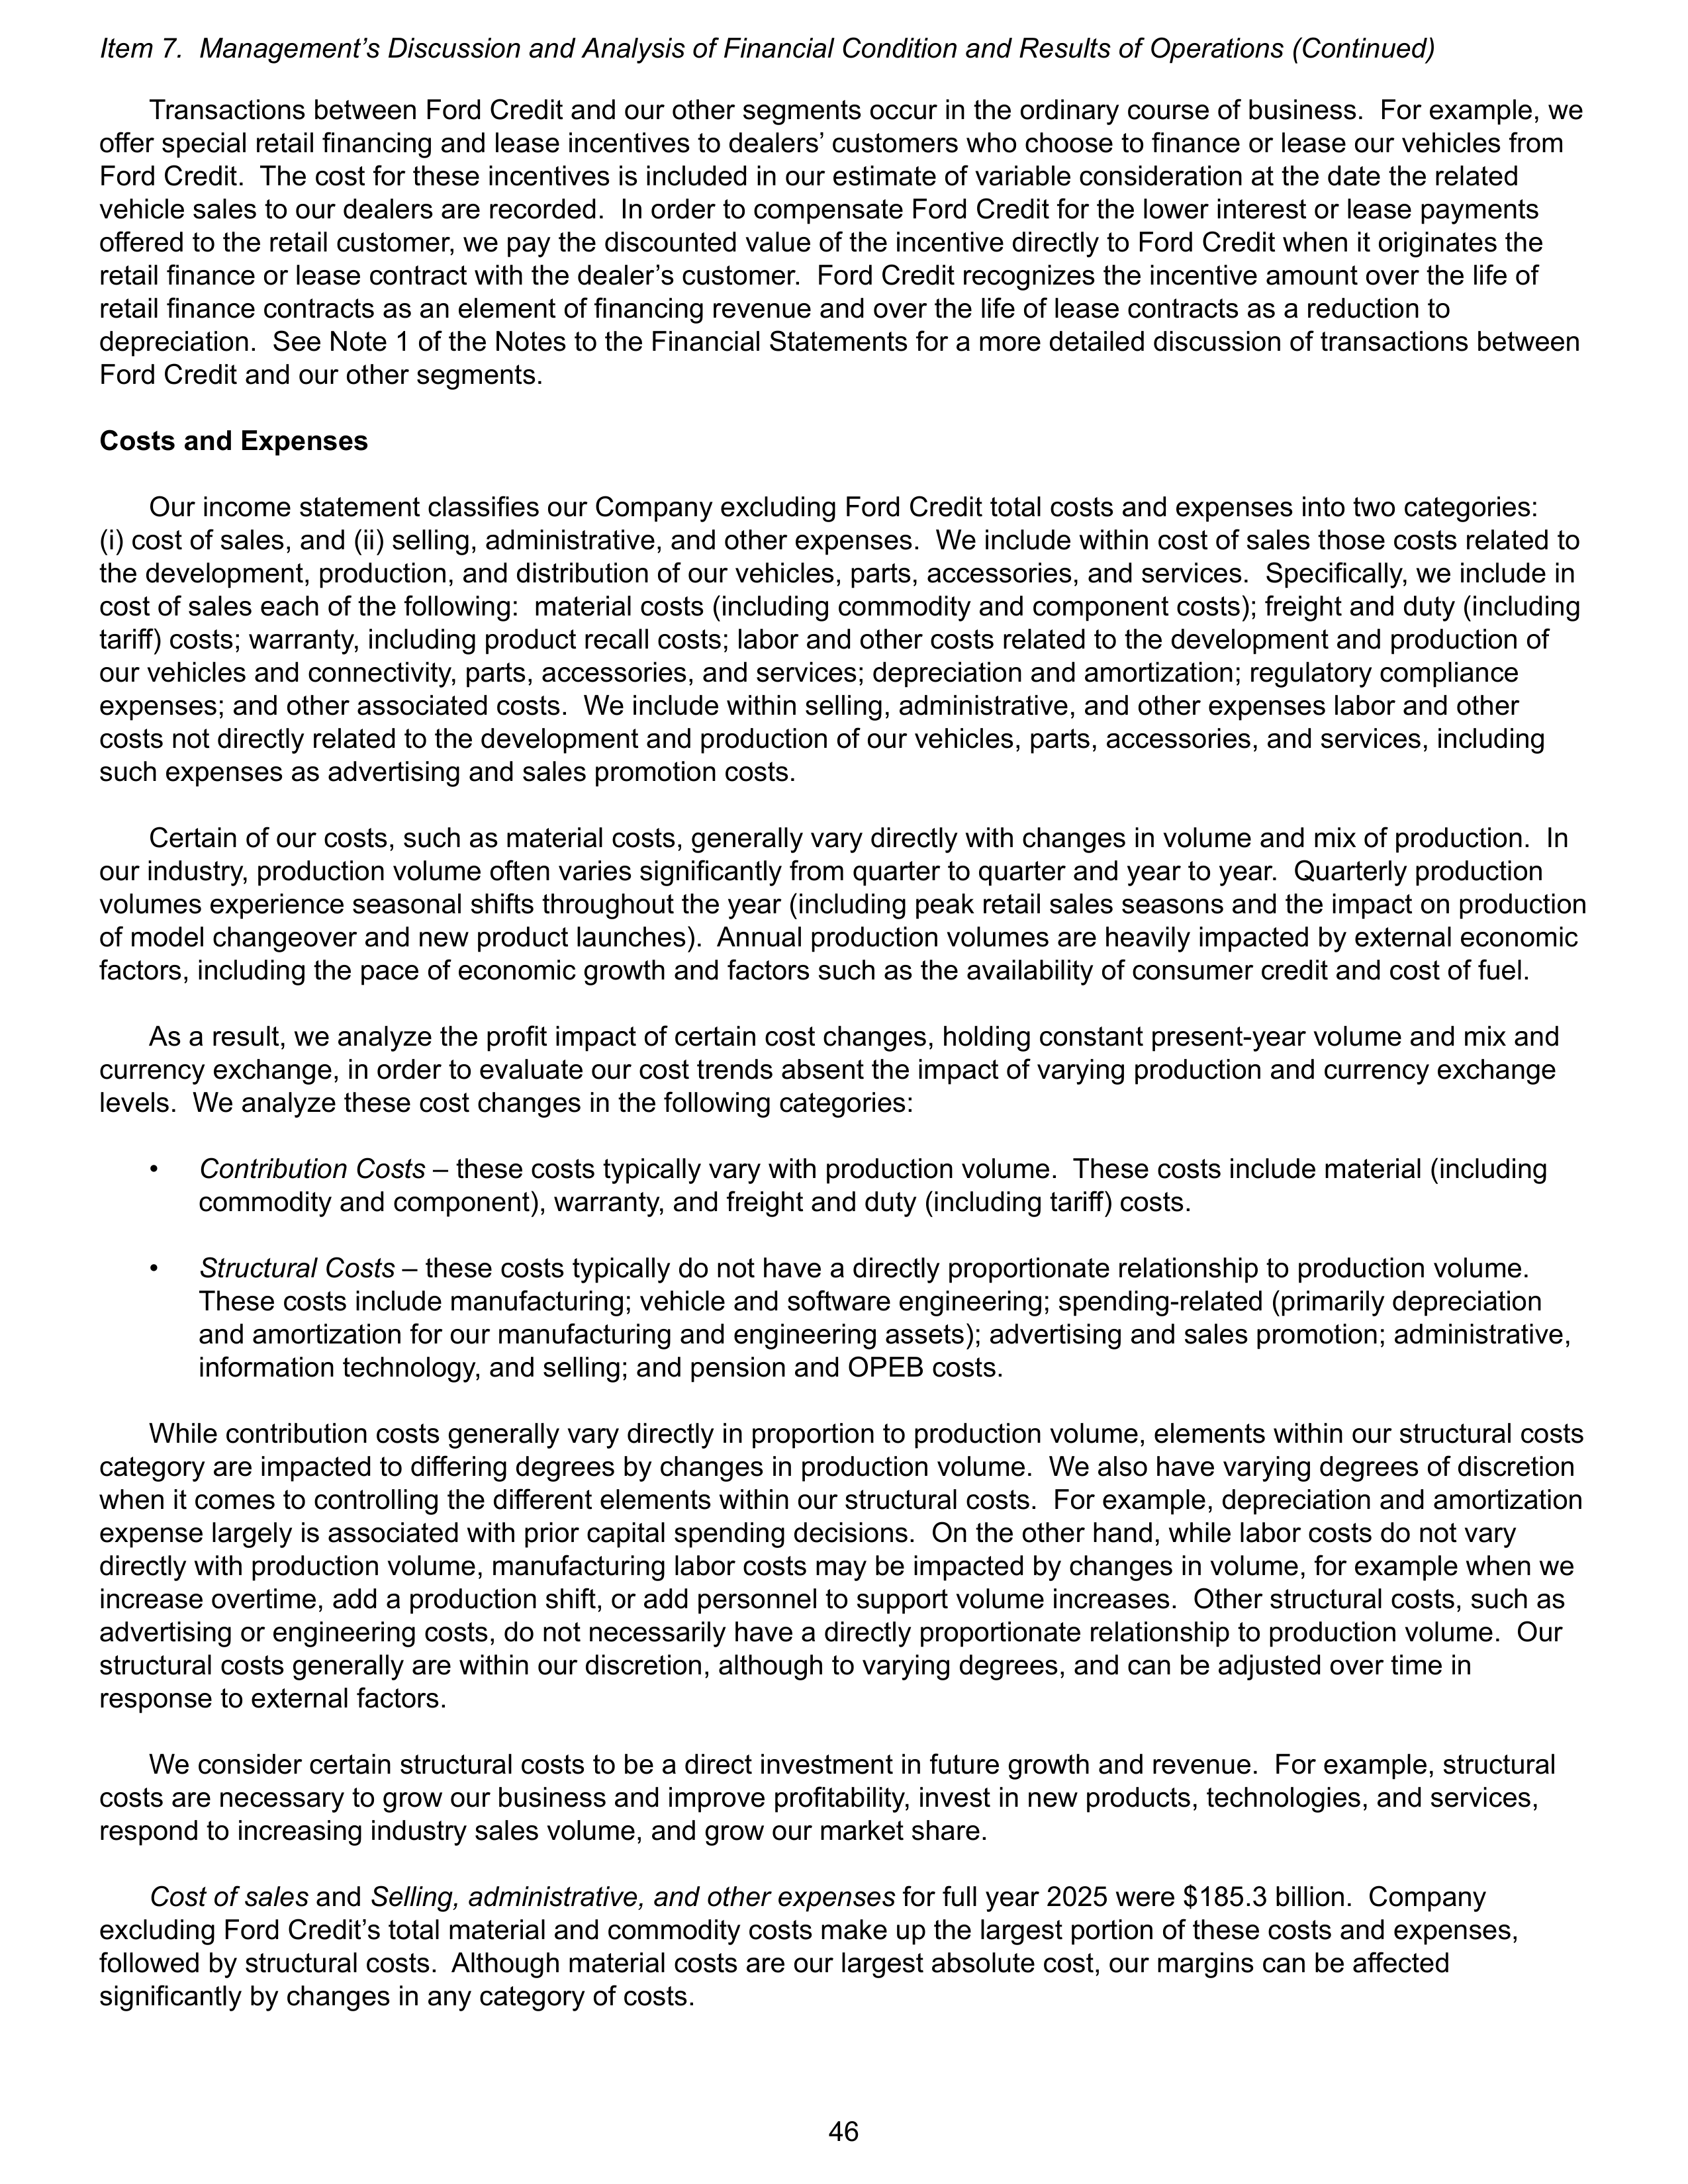
Transactions between Ford Credit and our other segments occur in the ordinary course of business. For example, we
offer special retail financing and lease incentives to dealers’ customers who choose to finance or lease our vehicles from
Ford Credit. The cost for these incentives is included in our estimate of variable consideration at the date the related
vehicle sales to our dealers are recorded. In order to compensate Ford Credit for the lower interest or lease payments
offered to the retail customer, we pay the discounted value of the incentive directly to Ford Credit when it originates the
retail finance or lease contract with the dealer’s customer. Ford Credit recognizes the incentive amount over the life of
retail finance contracts as an element of financing revenue and over the life of lease contracts as a reduction to
depreciation. See Note 1 of the Notes to the Financial Statements for a more detailed discussion of transactions between
Ford Credit and our other segments.
Costs and Expenses
Our income statement classifies our Company excluding Ford Credit total costs and expenses into two categories:
(i) cost of sales, and (ii) selling, administrative, and other expenses. We include within cost of sales those costs related to
the development, production, and distribution of our vehicles, parts, accessories, and services. Specifically, we include in
cost of sales each of the following: material costs (including commodity and component costs); freight and duty (including
tariff) costs; warranty, including product recall costs; labor and other costs related to the development and production of
our vehicles and connectivity, parts, accessories, and services; depreciation and amortization; regulatory compliance
expenses; and other associated costs. We include within selling, administrative, and other expenses labor and other
costs not directly related to the development and production of our vehicles, parts, accessories, and services, including
such expenses as advertising and sales promotion costs.
Certain of our costs, such as material costs, generally vary directly with changes in volume and mix of production. In
our industry, production volume often varies significantly from quarter to quarter and year to year. Quarterly production
volumes experience seasonal shifts throughout the year (including peak retail sales seasons and the impact on production
of model changeover and new product launches). Annual production volumes are heavily impacted by external economic
factors, including the pace of economic growth and factors such as the availability of consumer credit and cost of fuel.
As a result, we analyze the profit impact of certain cost changes, holding constant present-year volume and mix and
currency exchange, in order to evaluate our cost trends absent the impact of varying production and currency exchange
levels. We analyze these cost changes in the following categories:
•
Contribution Costs
– these costs typically vary with production volume. These costs include material (including
commodity and component), warranty, and freight and duty (including tariff) costs.
•
Structural Costs
– these costs typically do not have a directly proportionate relationship to production volume.
These costs include manufacturing; vehicle and software engineering; spending-related (primarily depreciation
and amortization for our manufacturing and engineering assets); advertising and sales promotion; administrative,
information technology, and selling; and pension and OPEB costs.
While contribution costs generally vary directly in proportion to production volume, elements within our structural costs
category are impacted to differing degrees by changes in production volume. We also have varying degrees of discretion
when it comes to controlling the different elements within our structural costs. For example, depreciation and amortization
expense largely is associated with prior capital spending decisions. On the other hand, while labor costs do not vary
directly with production volume, manufacturing labor costs may be impacted by changes in volume, for example when we
increase overtime, add a production shift, or add personnel to support volume increases. Other structural costs, such as
advertising or engineering costs, do not necessarily have a directly proportionate relationship to production volume. Our
structural costs generally are within our discretion, although to varying degrees, and can be adjusted over time in
response to external factors.
We consider certain structural costs to be a direct investment in future growth and revenue. For example, structural
costs are necessary to grow our business and improve profitability, invest in new products, technologies, and services,
respond to increasing industry sales volume, and grow our market share.
Cost of sales
and
Selling, administrative, and other expenses
for full year 2025 were $185.3 billion. Company
excluding Ford Credit’s total material and commodity costs make up the largest portion of these costs and expenses,
followed by structural costs. Although material costs are our largest absolute cost, our margins can be affected
significantly by changes in any category of costs.
Item 7. Management’s Discussion and Analysis of Financial Condition and Results of Operations (Continued)
46
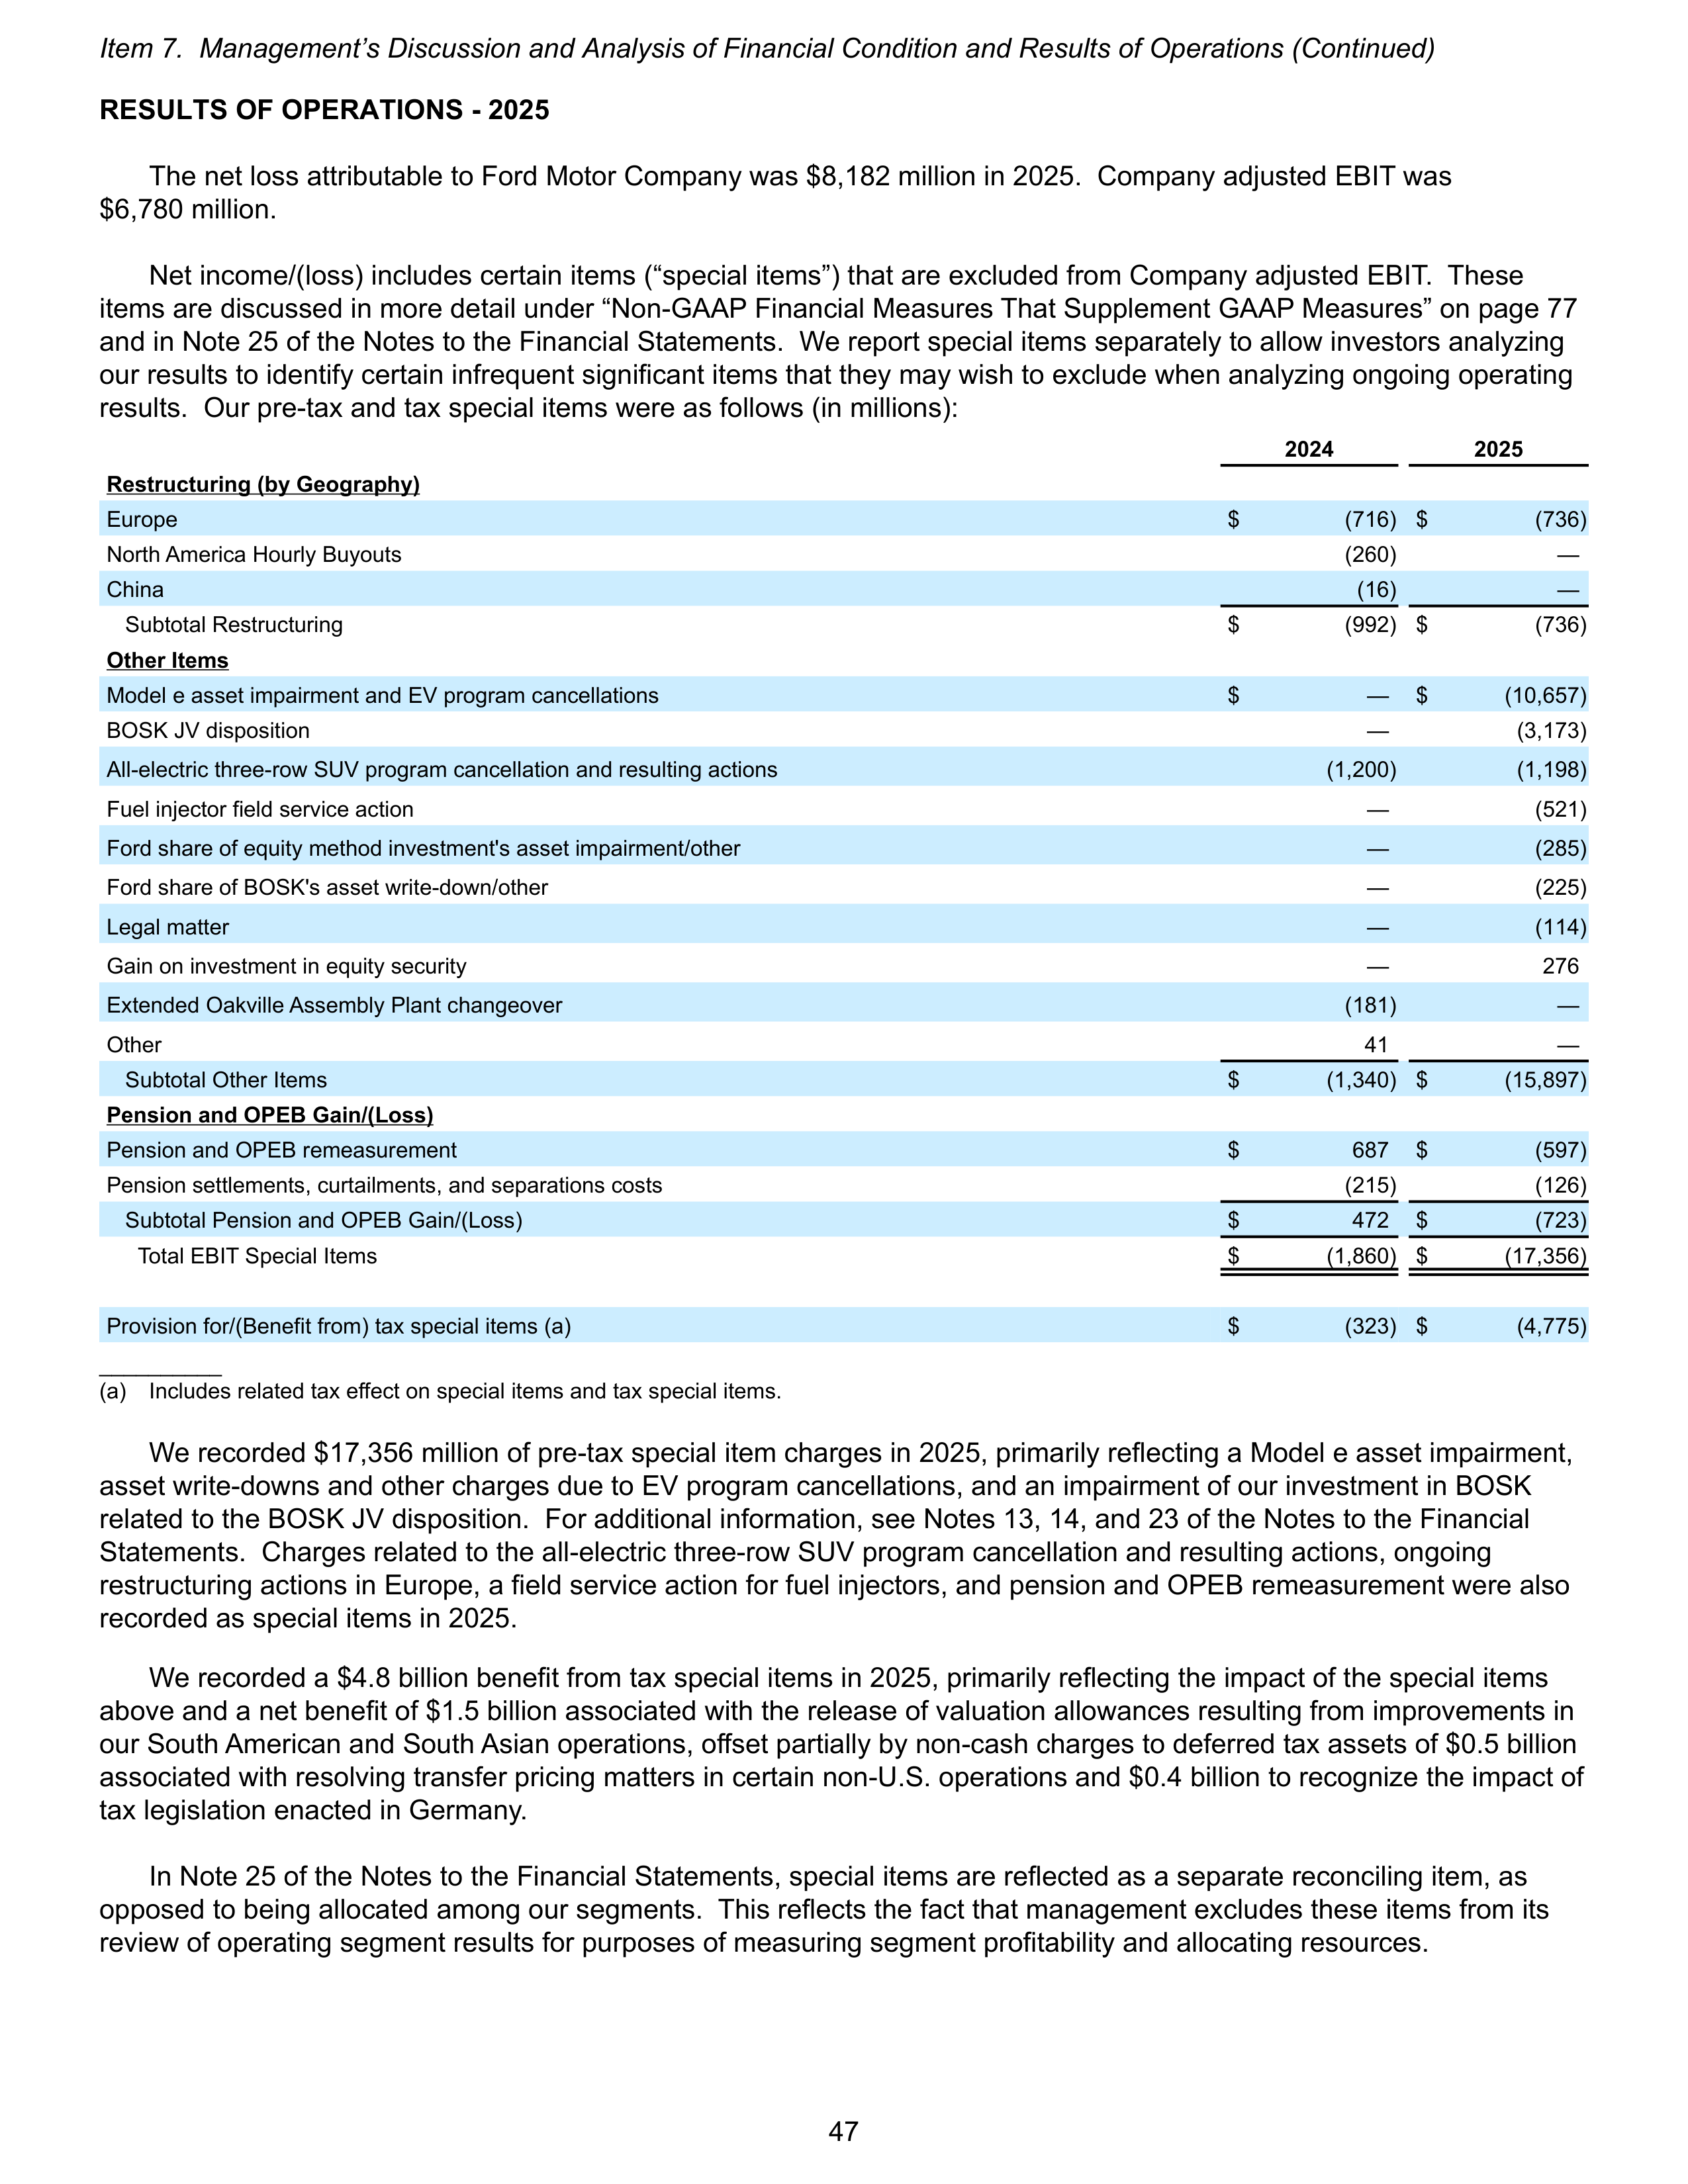
RESULTS OF OPERATIONS - 2025
The net loss attributable to Ford Motor Company was $8,182 million in 2025. Company adjusted EBIT was
$6,780 million.
Net income/(loss) includes certain items (“special items”) that are excluded from Company adjusted EBIT. These
items are discussed in more detail under “Non-GAAP Financial Measures That Supplement GAAP Measures” on page 77
and in Note 25 of the Notes to the Financial Statements. We report special items separately to allow investors analyzing
our results to identify certain infrequent significant items that they may wish to exclude when analyzing ongoing operating
results. Our pre-tax and tax special items were as follows (in millions):
2024
2025
Restructuring (by Geography)
Europe
$
(716) $
(736)
North America Hourly Buyouts
(260)
—
China
(16)
—
Subtotal Restructuring
$
(992) $
(736)
Other Items
Model e asset impairment and EV program cancellations
$
—
$
(10,657)
BOSK JV disposition
—
(3,173)
All-electric three-row SUV program cancellation and resulting actions
(1,200)
(1,198)
Fuel injector field service action
—
(521)
Ford share of equity method investment's asset impairment/other
—
(285)
Ford share of BOSK's asset write-down/other
—
(225)
Legal matter
—
(114)
Gain on investment in equity security
—
276
Extended Oakville Assembly Plant changeover
(181)
—
Other
41
—
Subtotal Other Items
$
(1,340) $
(15,897)
Pension and OPEB Gain/(Loss)
Pension and OPEB remeasurement
$
687
$
(597)
Pension settlements, curtailments, and separations costs
(215)
(126)
Subtotal Pension and OPEB Gain/(Loss)
$
472
$
(723)
Total EBIT Special Items
$
(1,860) $
(17,356)
Provision for/(Benefit from) tax special items (a)
$
(323) $
(4,775)
__________
(a)
Includes related tax effect on special items and tax special items.
We recorded $17,356 million of pre-tax special item charges in 2025, primarily reflecting a Model e asset impairment,
asset write-downs and other charges due to EV program cancellations, and an impairment of our investment in BOSK
related to the BOSK JV disposition. For additional information, see Notes 13, 14, and 23 of the Notes to the Financial
Statements. Charges related to the all-electric three-row SUV program cancellation and resulting actions, ongoing
restructuring actions in Europe, a field service action for fuel injectors, and pension and OPEB remeasurement were also
recorded as special items in 2025.
We recorded a $4.8 billion benefit from tax special items in 2025, primarily reflecting the impact of the special items
above and a net benefit of $1.5 billion associated with the release of valuation allowances resulting from improvements in
our South American and South Asian operations, offset partially by non-cash charges to deferred tax assets of $0.5 billion
associated with resolving transfer pricing matters in certain non-U.S. operations and $0.4 billion to recognize the impact of
tax legislation enacted in Germany.
In Note 25 of the Notes to the Financial Statements, special items are reflected as a separate reconciling item, as
opposed to being allocated among our segments. This reflects the fact that management excludes these items from its
review of operating segment results for purposes of measuring segment profitability and allocating resources.
Item 7. Management’s Discussion and Analysis of Financial Condition and Results of Operations (Continued)
47
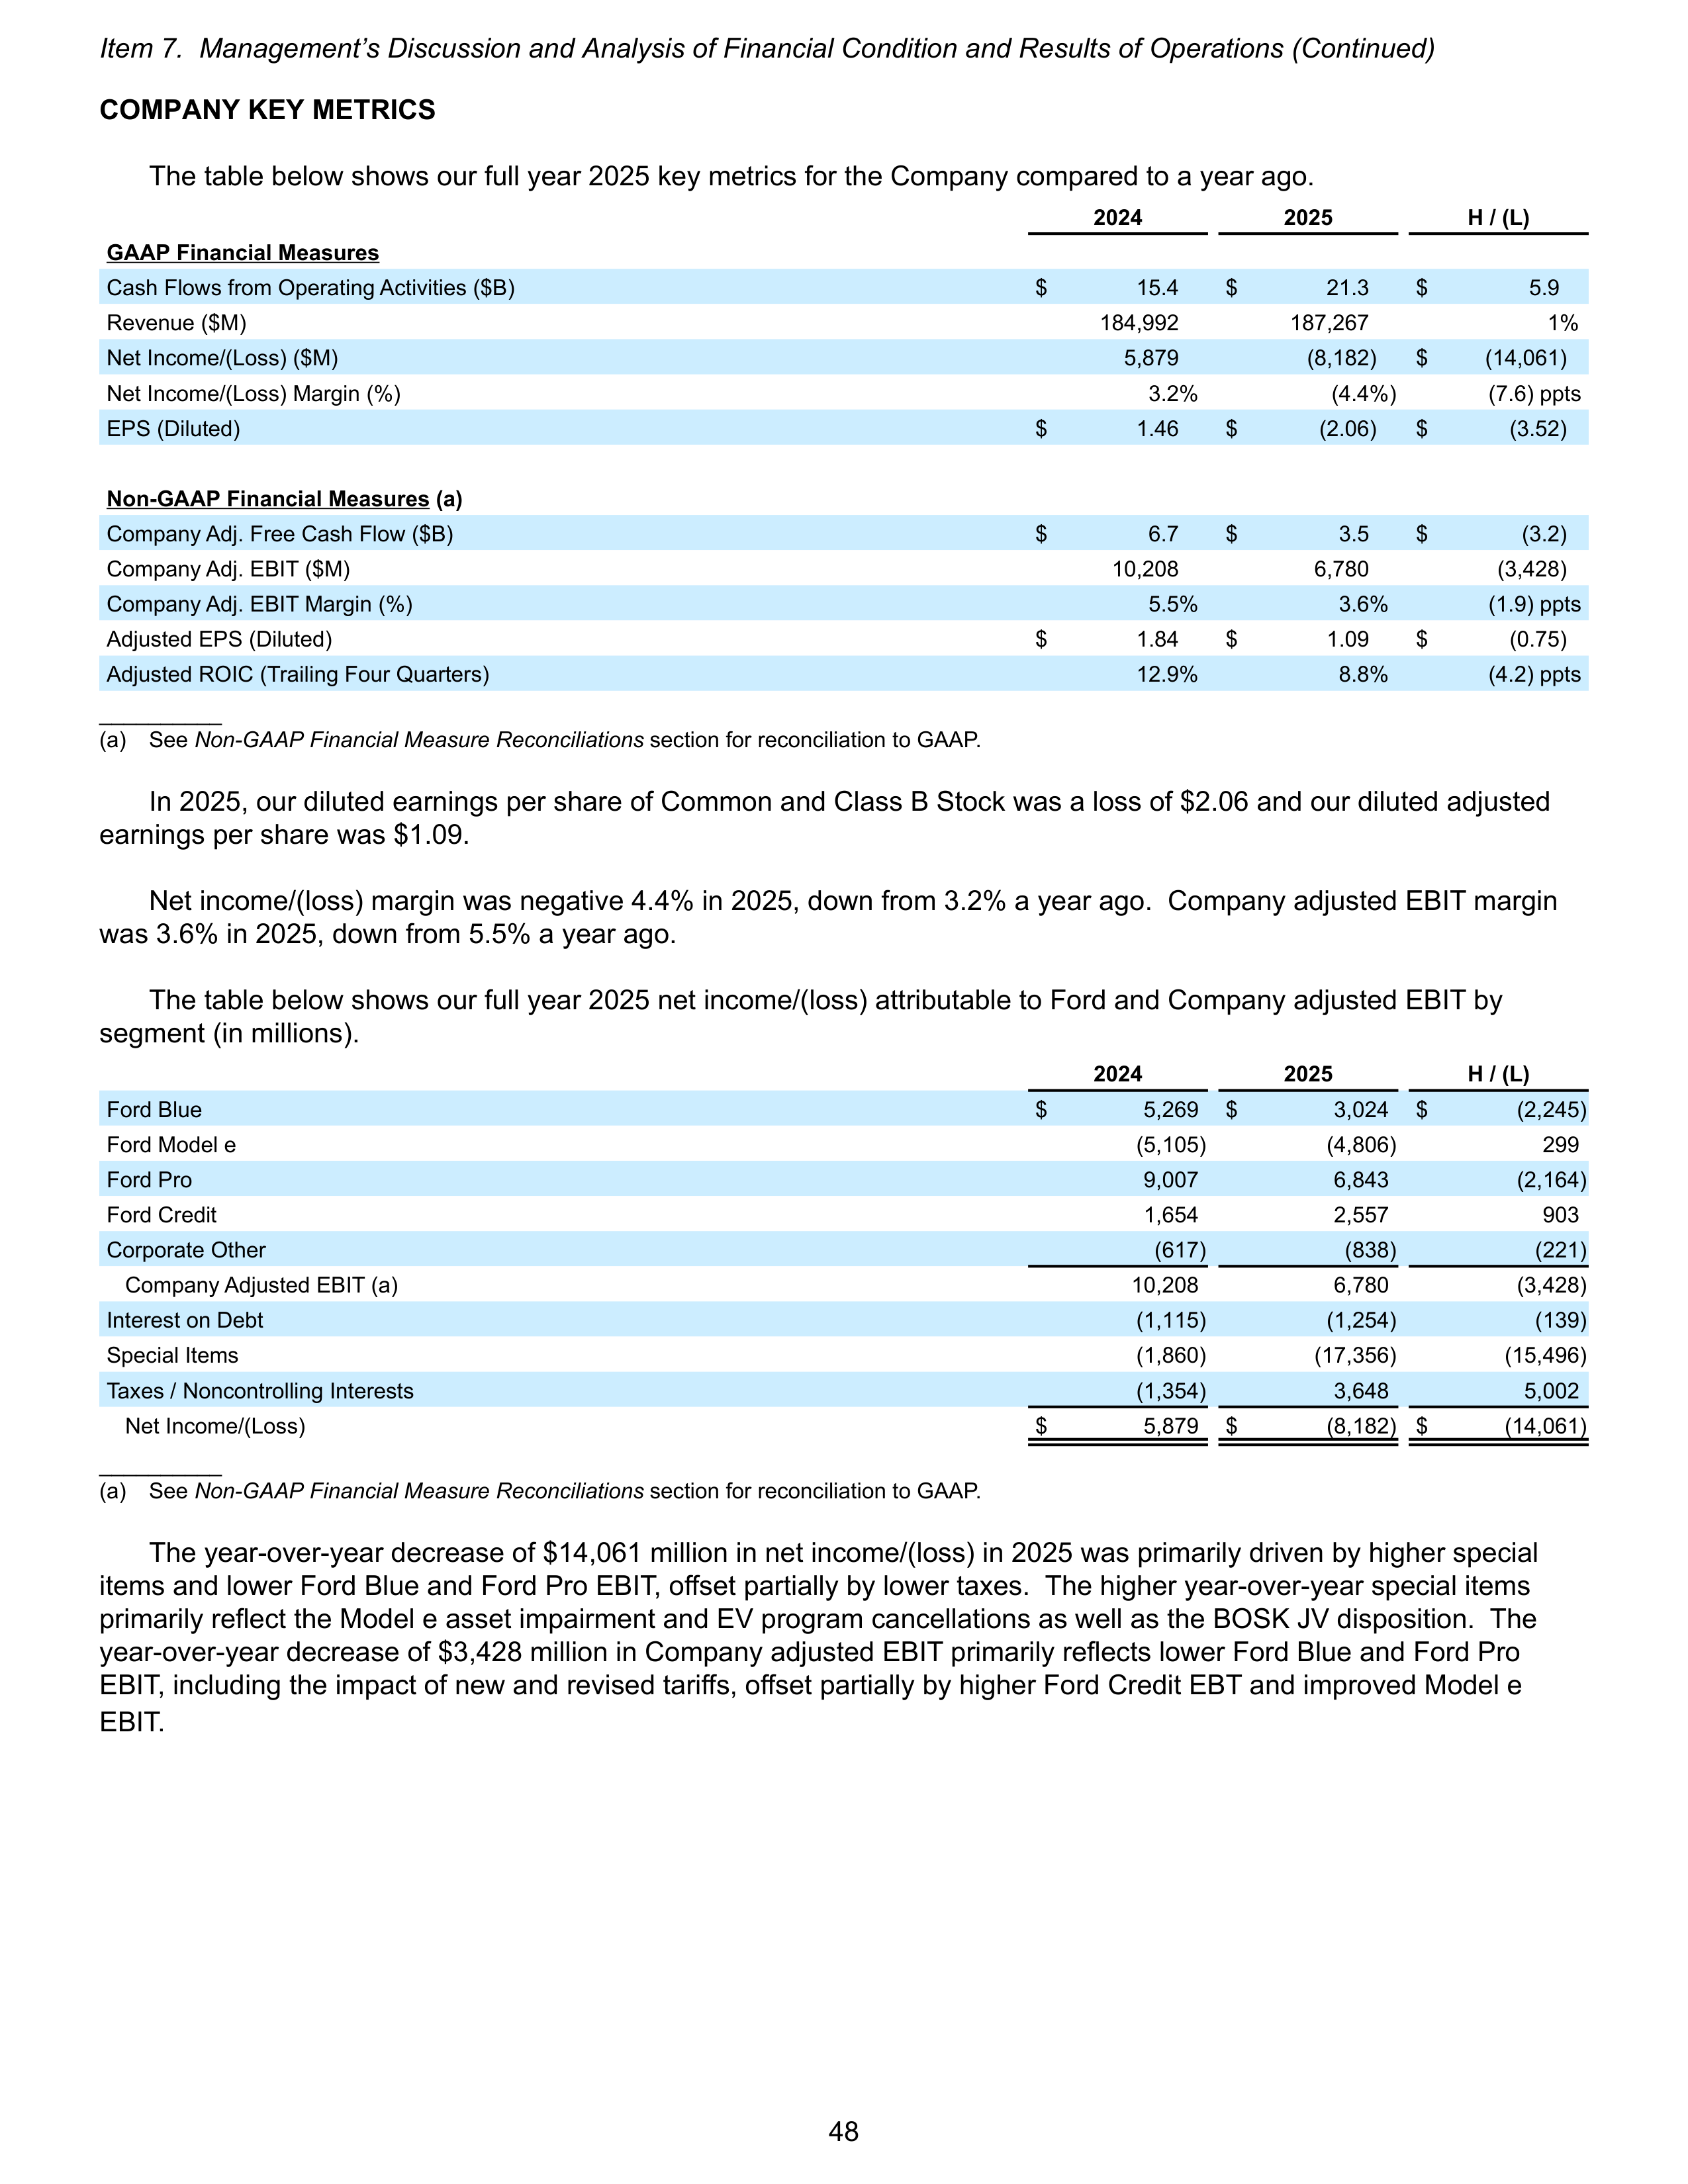
COMPANY KEY METRICS
The table below shows our full year 2025 key metrics for the Company compared to a year ago.
2024
2025
H / (L)
GAAP Financial Measures
Cash Flows from Operating Activities ($B)
$
15.4
$
21.3
$
5.9
Revenue ($M)
184,992
187,267
1%
Net Income/(Loss) ($M)
5,879
(8,182)
$
(14,061)
Net Income/(Loss) Margin (%)
3.2%
(4.4%)
(7.6) ppts
EPS (Diluted)
$
1.46
$
(2.06)
$
(3.52)
Non-GAAP Financial Measures (a)
Company Adj. Free Cash Flow ($B)
$
6.7
$
3.5
$
(3.2)
Company Adj. EBIT ($M)
10,208
6,780
(3,428)
Company Adj. EBIT Margin (%)
5.5%
3.6%
(1.9) ppts
Adjusted EPS (Diluted)
$
1.84
$
1.09
$
(0.75)
Adjusted ROIC (Trailing Four Quarters)
12.9%
8.8%
(4.2) ppts
__________
(a)
See
Non-GAAP Financial Measure Reconciliations
section for reconciliation to GAAP.
In 2025, our diluted earnings per share of Common and Class B Stock was a loss of $2.06 and our diluted adjusted
earnings per share was $1.09.
Net income/(loss) margin was negative 4.4% in 2025, down from 3.2% a year ago. Company adjusted EBIT margin
was 3.6% in 2025, down from 5.5% a year ago.
The table below shows our full year 2025 net income/(loss) attributable to Ford and Company adjusted EBIT by
segment (in millions).
2024
2025
H / (L)
Ford Blue
$
5,269
$
3,024
$
(2,245)
Ford Model e
(5,105)
(4,806)
299
Ford Pro
9,007
6,843
(2,164)
Ford Credit
1,654
2,557
903
Corporate Other
(617)
(838)
(221)
Company Adjusted EBIT (a)
10,208
6,780
(3,428)
Interest on Debt
(1,115)
(1,254)
(139)
Special Items
(1,860)
(17,356)
(15,496)
Taxes / Noncontrolling Interests
(1,354)
3,648
5,002
Net Income/(Loss)
$
5,879
$
(8,182) $
(14,061)
__________
(a)
See
Non-GAAP Financial Measure Reconciliations
section for reconciliation to GAAP.
The year-over-year decrease of $14,061 million in net income/(loss) in 2025 was primarily driven by higher special
items and lower Ford Blue and Ford Pro EBIT, offset partially by lower taxes. The higher year-over-year special items
primarily reflect the Model e asset impairment and EV program cancellations as well as the BOSK JV disposition. The
year-over-year decrease of $3,428 million in Company adjusted EBIT primarily reflects lower Ford Blue and Ford Pro
EBIT, including the impact of new and revised tariffs, offset partially by higher Ford Credit EBT and improved Model e
EBIT.
Item 7. Management’s Discussion and Analysis of Financial Condition and Results of Operations (Continued)
48
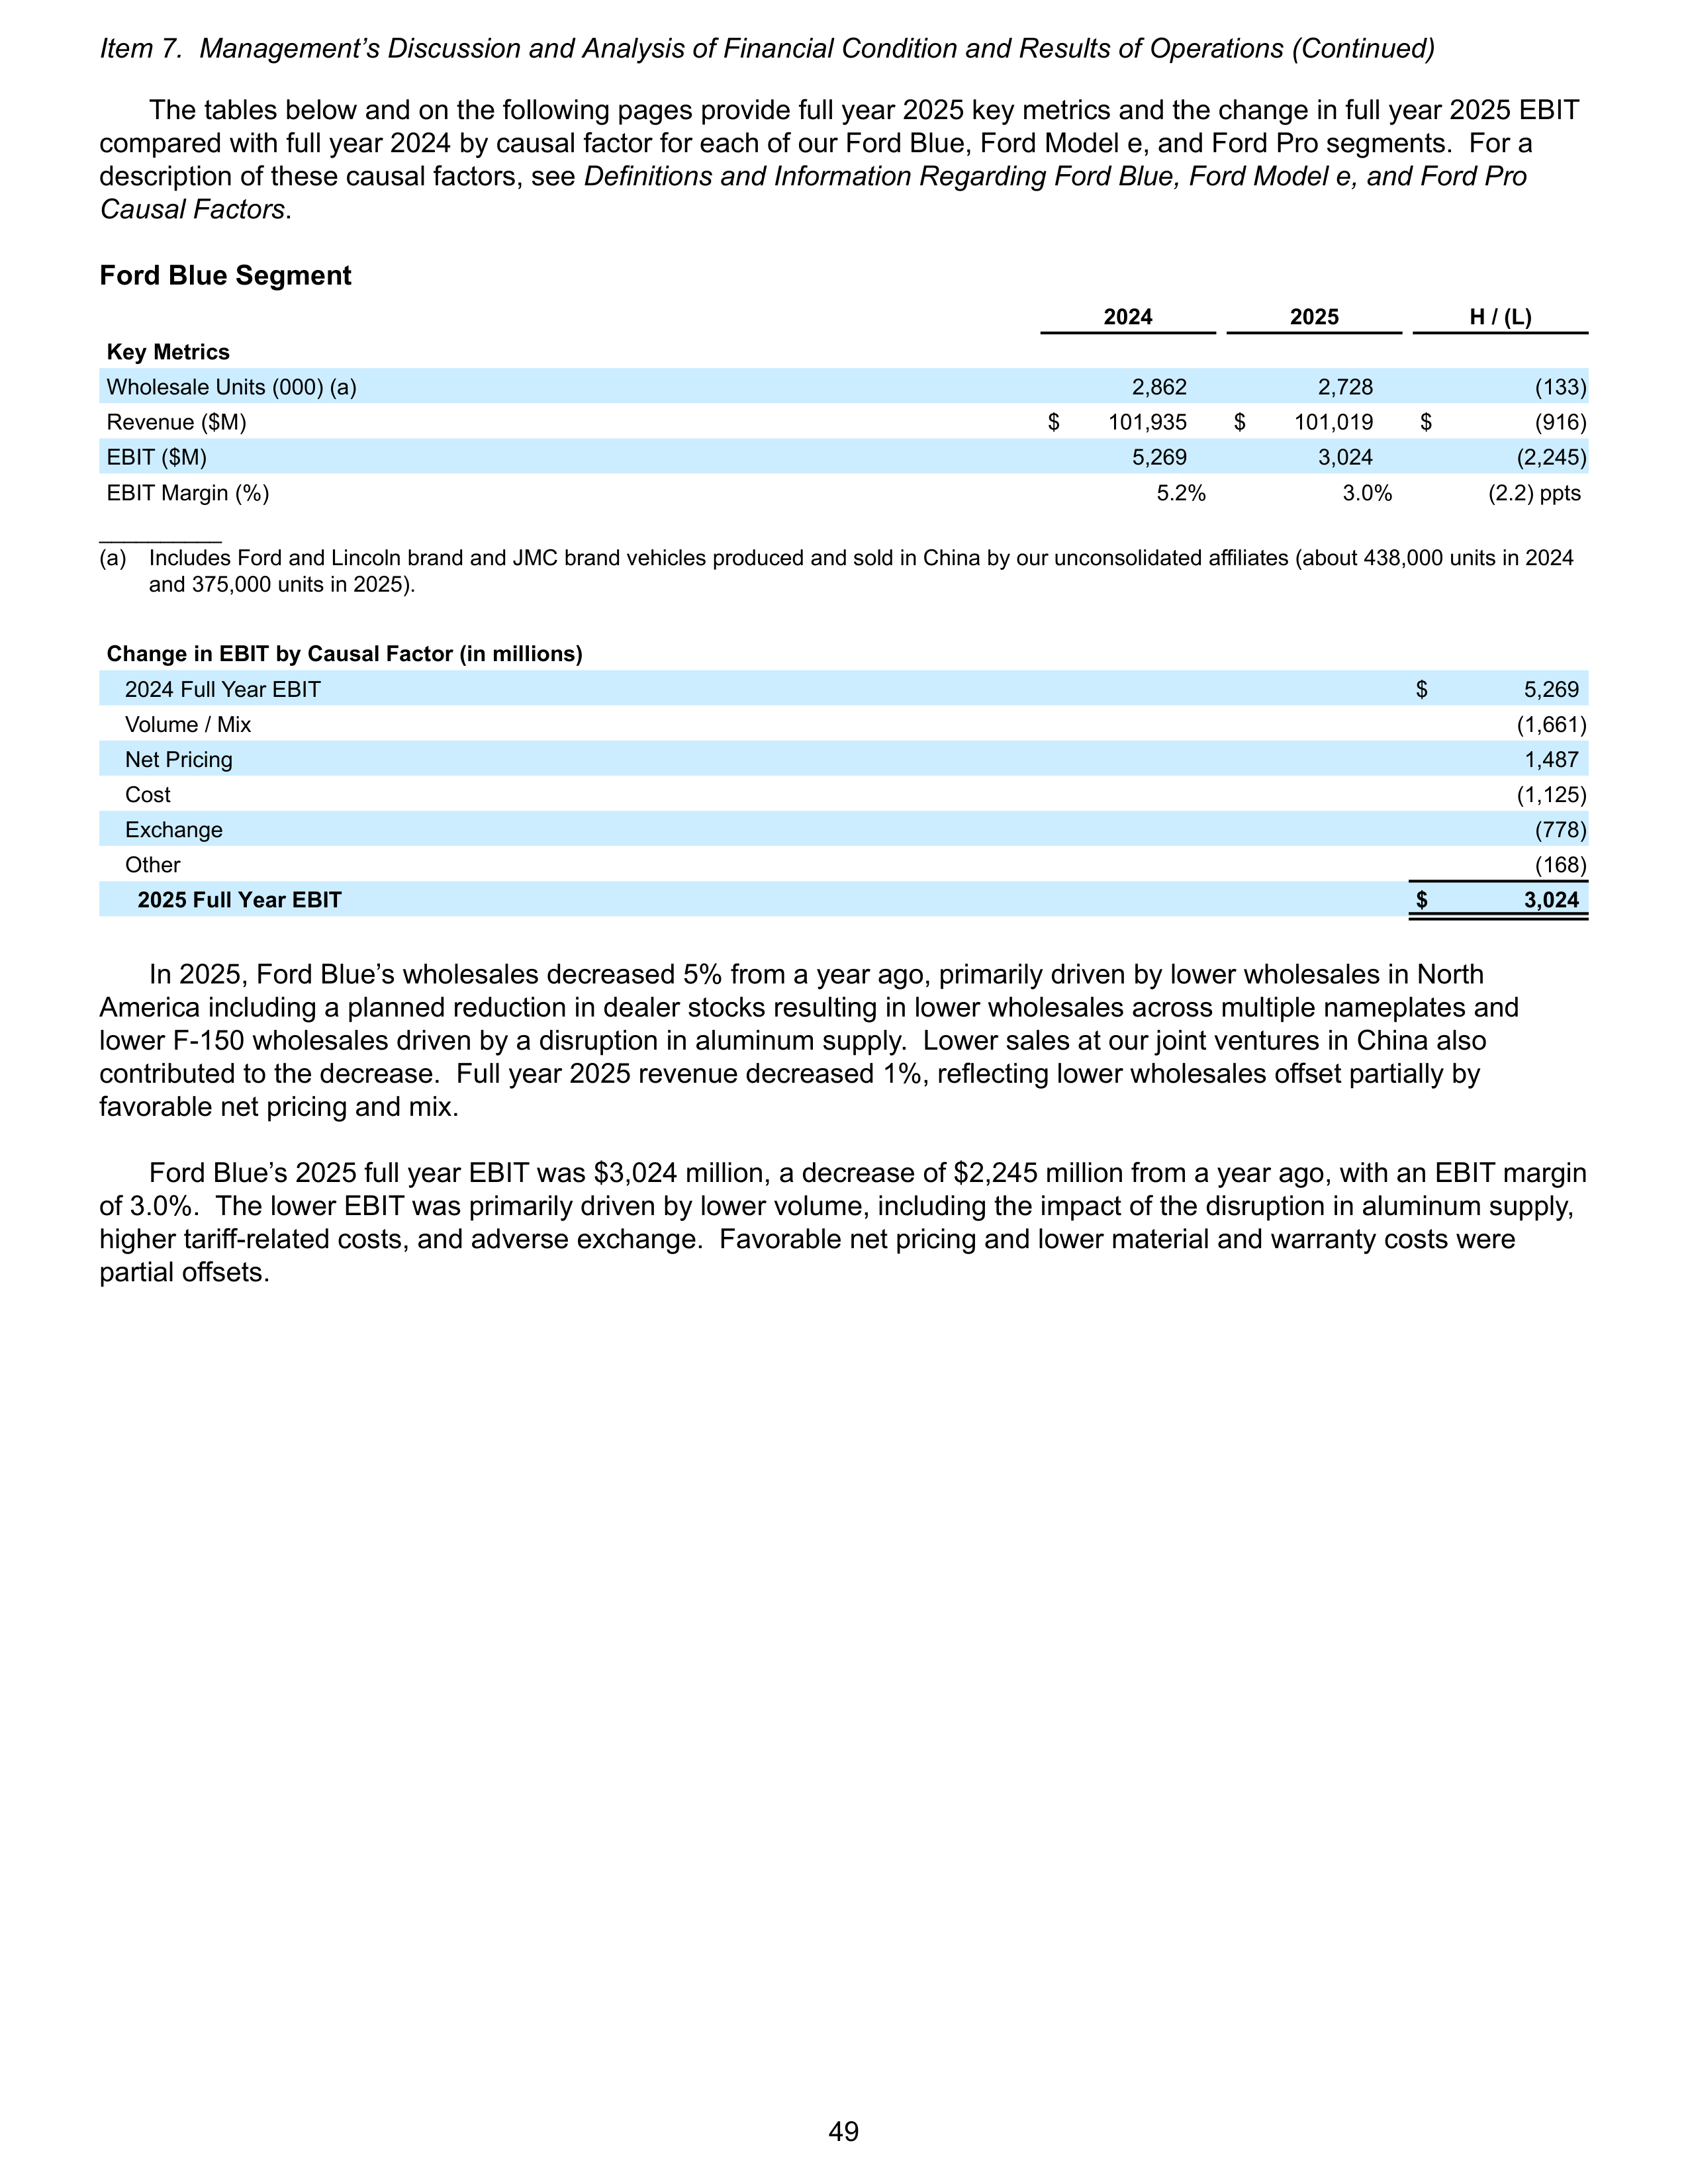
The tables below and on the following pages provide full year 2025 key metrics and the change in full year 2025 EBIT
compared with full year 2024 by causal factor for each of our Ford Blue, Ford Model e, and Ford Pro segments. For a
description of these causal factors, see
Definitions and Information Regarding Ford Blue, Ford Model e, and Ford Pro
Causal Factors
.
Ford Blue Segment
2024
2025
H / (L)
Key Metrics
Wholesale Units (000) (a)
2,862
2,728
(133)
Revenue ($M)
$
101,935
$
101,019
$
(916)
EBIT ($M)
5,269
3,024
(2,245)
EBIT Margin (%)
5.2%
3.0%
(2.2) ppts
__________
(a)
Includes Ford and Lincoln brand and JMC brand vehicles produced and sold in China by our unconsolidated affiliates (about 438,000 units in 2024
and 375,000 units in 2025).
Change in EBIT by Causal Factor (in millions)
2024 Full Year EBIT
$
5,269
Volume / Mix
(1,661)
Net Pricing
1,487
Cost
(1,125)
Exchange
(778)
Other
(168)
2025 Full Year EBIT
$
3,024
In 2025, Ford Blue’s wholesales decreased 5% from a year ago, primarily driven by lower wholesales in North
America including a planned reduction in dealer stocks resulting in lower wholesales across multiple nameplates and
lower F-150 wholesales driven by a disruption in aluminum supply. Lower sales at our joint ventures in China also
contributed to the decrease. Full year 2025 revenue decreased 1%, reflecting lower wholesales offset partially by
favorable net pricing and mix.
Ford Blue’s 2025 full year EBIT was $3,024 million, a decrease of $2,245 million from a year ago, with an EBIT margin
of 3.0%. The lower EBIT was primarily driven by lower volume, including the impact of the disruption in aluminum supply,
higher tariff-related costs, and adverse exchange. Favorable net pricing and lower material and warranty costs were
partial offsets.
Item 7. Management’s Discussion and Analysis of Financial Condition and Results of Operations (Continued)
49
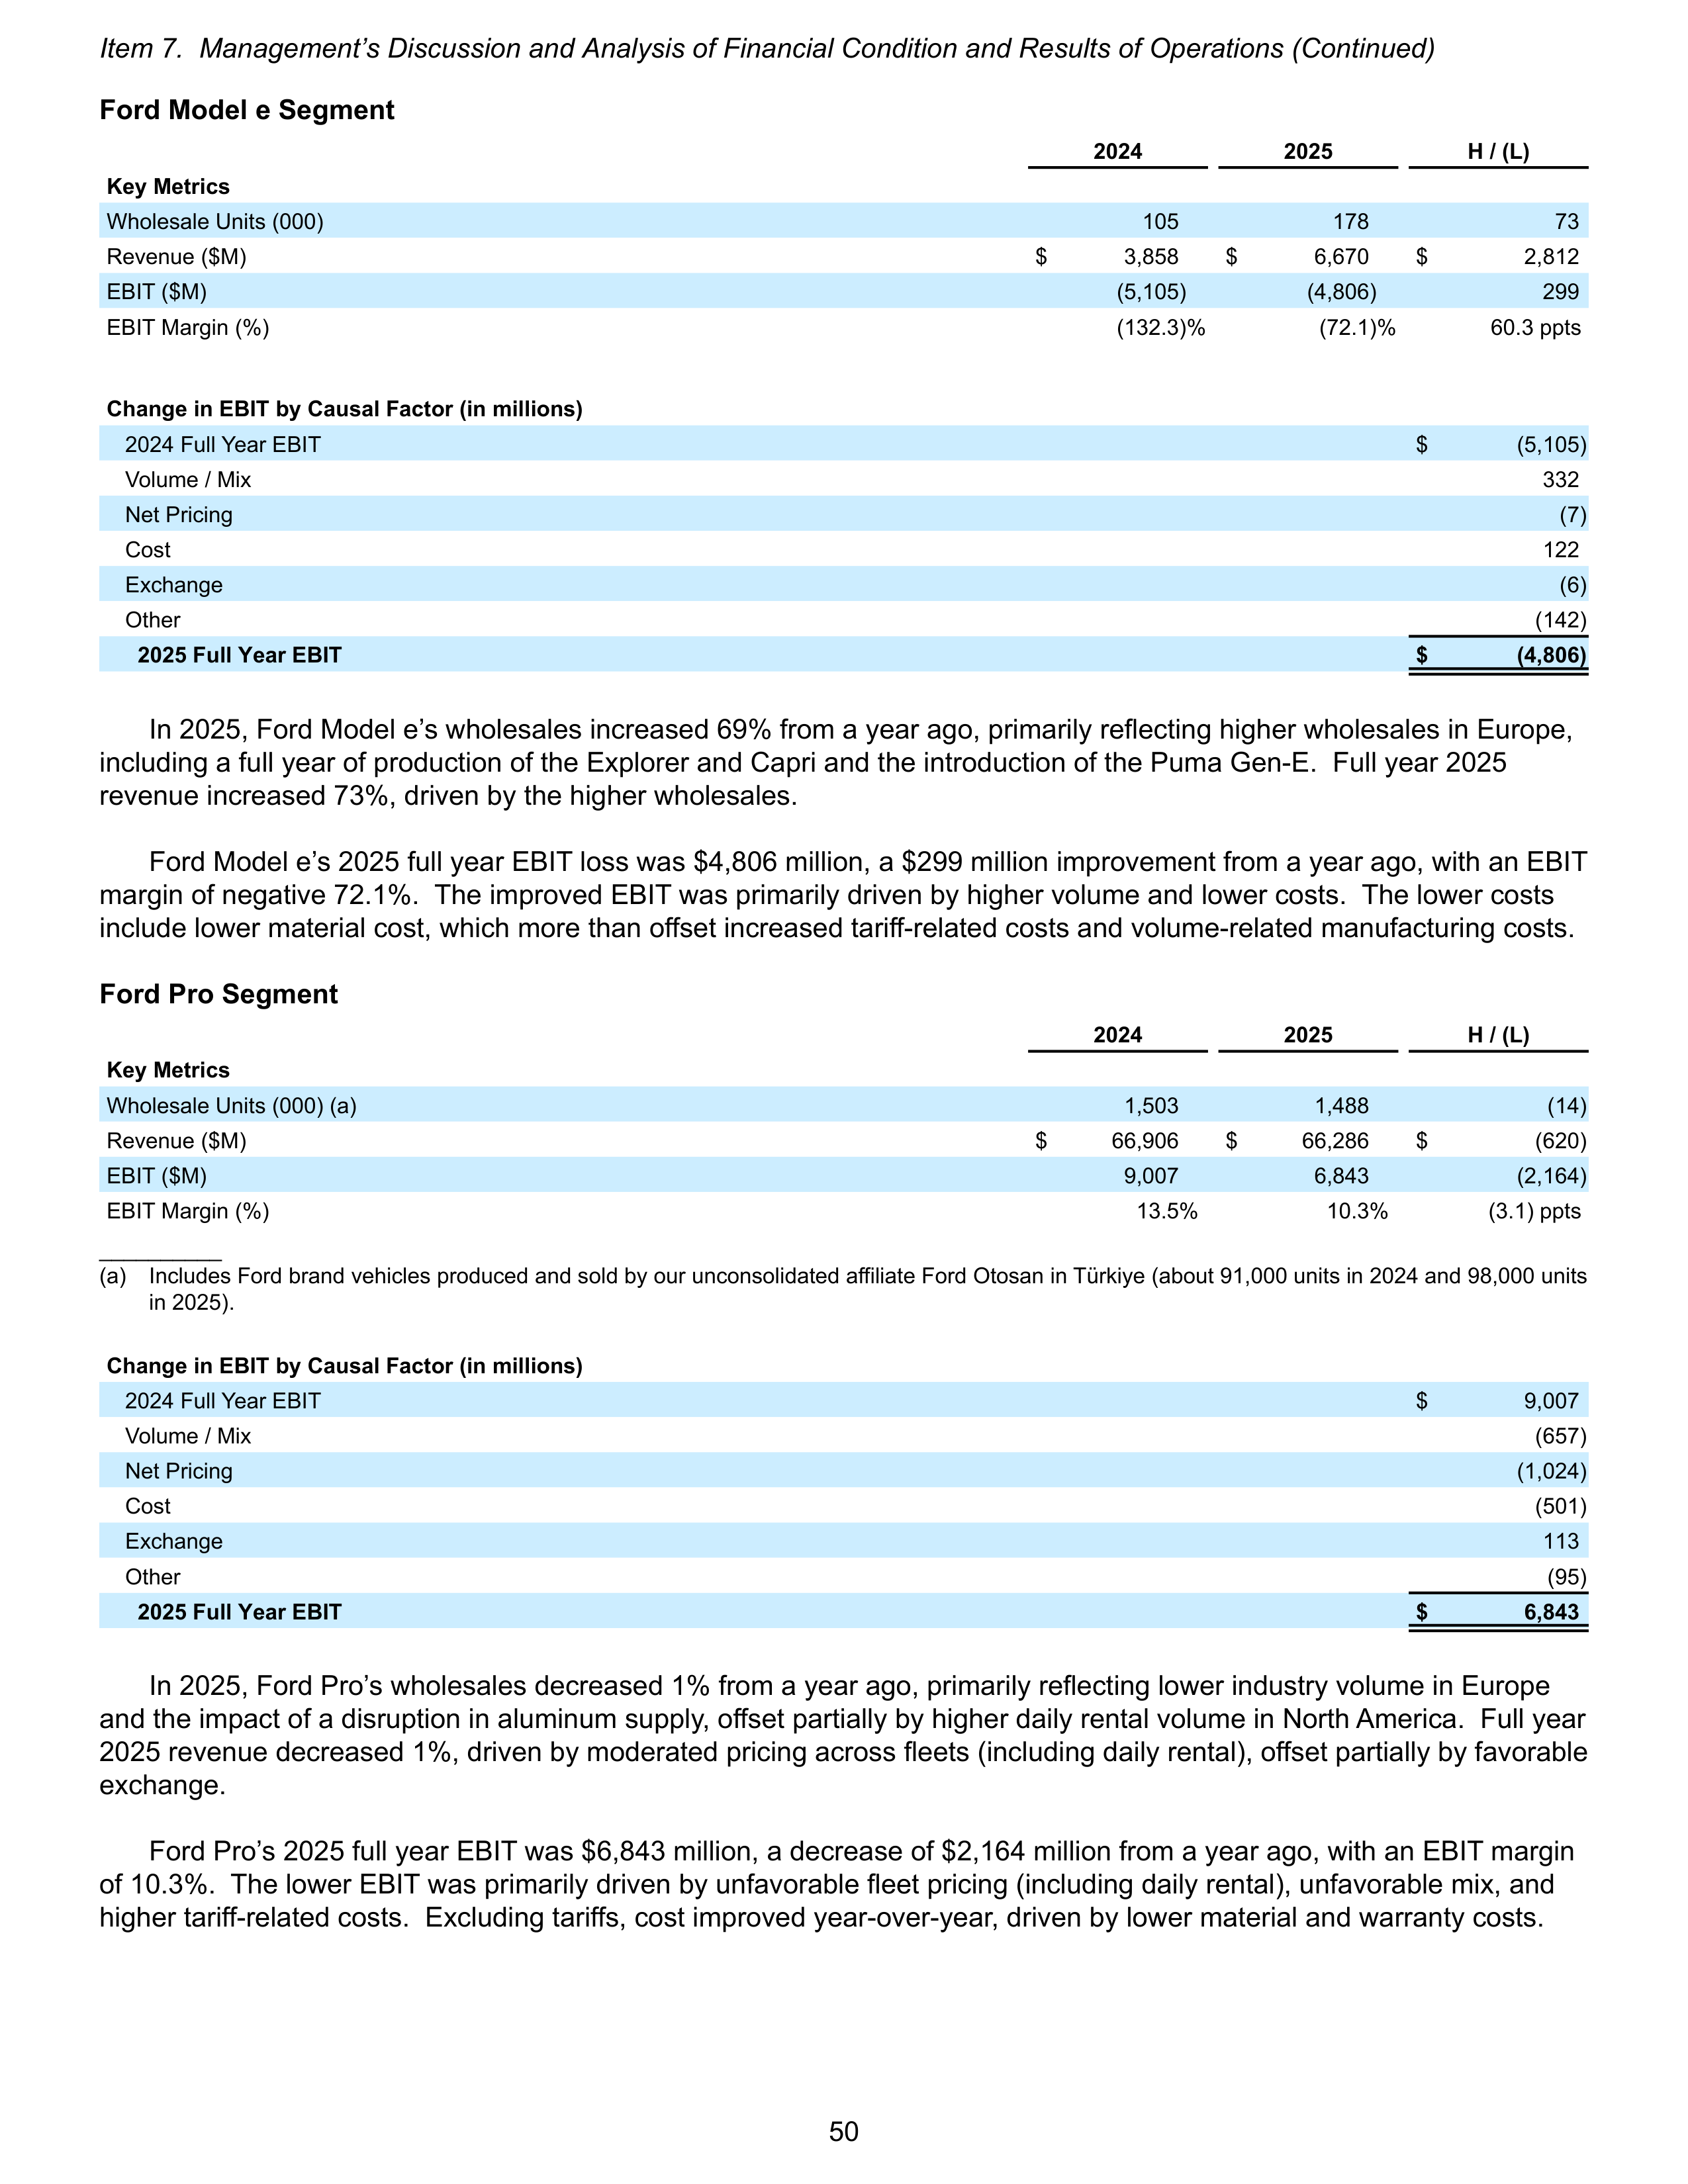
Ford Model e Segment
2024
2025
H / (L)
Key Metrics
Wholesale Units (000)
105
178
73
Revenue ($M)
$
3,858
$
6,670
$
2,812
EBIT ($M)
(5,105)
(4,806)
299
EBIT Margin (%)
(132.3) %
(72.1) %
60.3 ppts
Change in EBIT by Causal Factor (in millions)
2024 Full Year EBIT
$
(5,105)
Volume / Mix
332
Net Pricing
(7)
Cost
122
Exchange
(6)
Other
(142)
2025 Full Year EBIT
$
(4,806)
In 2025, Ford Model e’s wholesales increased 69% from a year ago, primarily reflecting higher wholesales in Europe,
including a full year of production of the Explorer and Capri and the introduction of the Puma Gen-E. Full year 2025
revenue increased 73%, driven by the higher wholesales.
Ford Model e’s 2025 full year EBIT loss was $4,806 million, a $299 million improvement from a year ago, with an EBIT
margin of negative 72.1%. The improved EBIT was primarily driven by higher volume and lower costs. The lower costs
include lower material cost, which more than offset increased tariff-related costs and volume-related manufacturing costs.
Ford Pro Segment
2024
2025
H / (L)
Key Metrics
Wholesale Units (000) (a)
1,503
1,488
(14)
Revenue ($M)
$
66,906
$
66,286
$
(620)
EBIT ($M)
9,007
6,843
(2,164)
EBIT Margin (%)
13.5%
10.3%
(3.1) ppts
__________
(a)
Includes Ford brand vehicles produced and sold by our unconsolidated affiliate Ford Otosan in Türkiye (about 91,000 units in 2024 and 98,000 units
in 2025).
Change in EBIT by Causal Factor (in millions)
2024 Full Year EBIT
$
9,007
Volume / Mix
(657)
Net Pricing
(1,024)
Cost
(501)
Exchange
113
Other
(95)
2025 Full Year EBIT
$
6,843
In 2025, Ford Pro’s wholesales decreased 1% from a year ago, primarily reflecting lower industry volume in Europe
and the impact of a disruption in aluminum supply, offset partially by higher daily rental volume in North America. Full year
2025 revenue decreased 1%, driven by moderated pricing across fleets (including daily rental), offset partially by favorable
exchange.
Ford Pro’s 2025 full year EBIT was $6,843 million, a decrease of $2,164 million from a year ago, with an EBIT margin
of 10.3%. The lower EBIT was primarily driven by unfavorable fleet pricing (including daily rental), unfavorable mix, and
higher tariff-related costs. Excluding tariffs, cost improved year-over-year, driven by lower material and warranty costs.
Item 7. Management’s Discussion and Analysis of Financial Condition and Results of Operations (Continued)
50
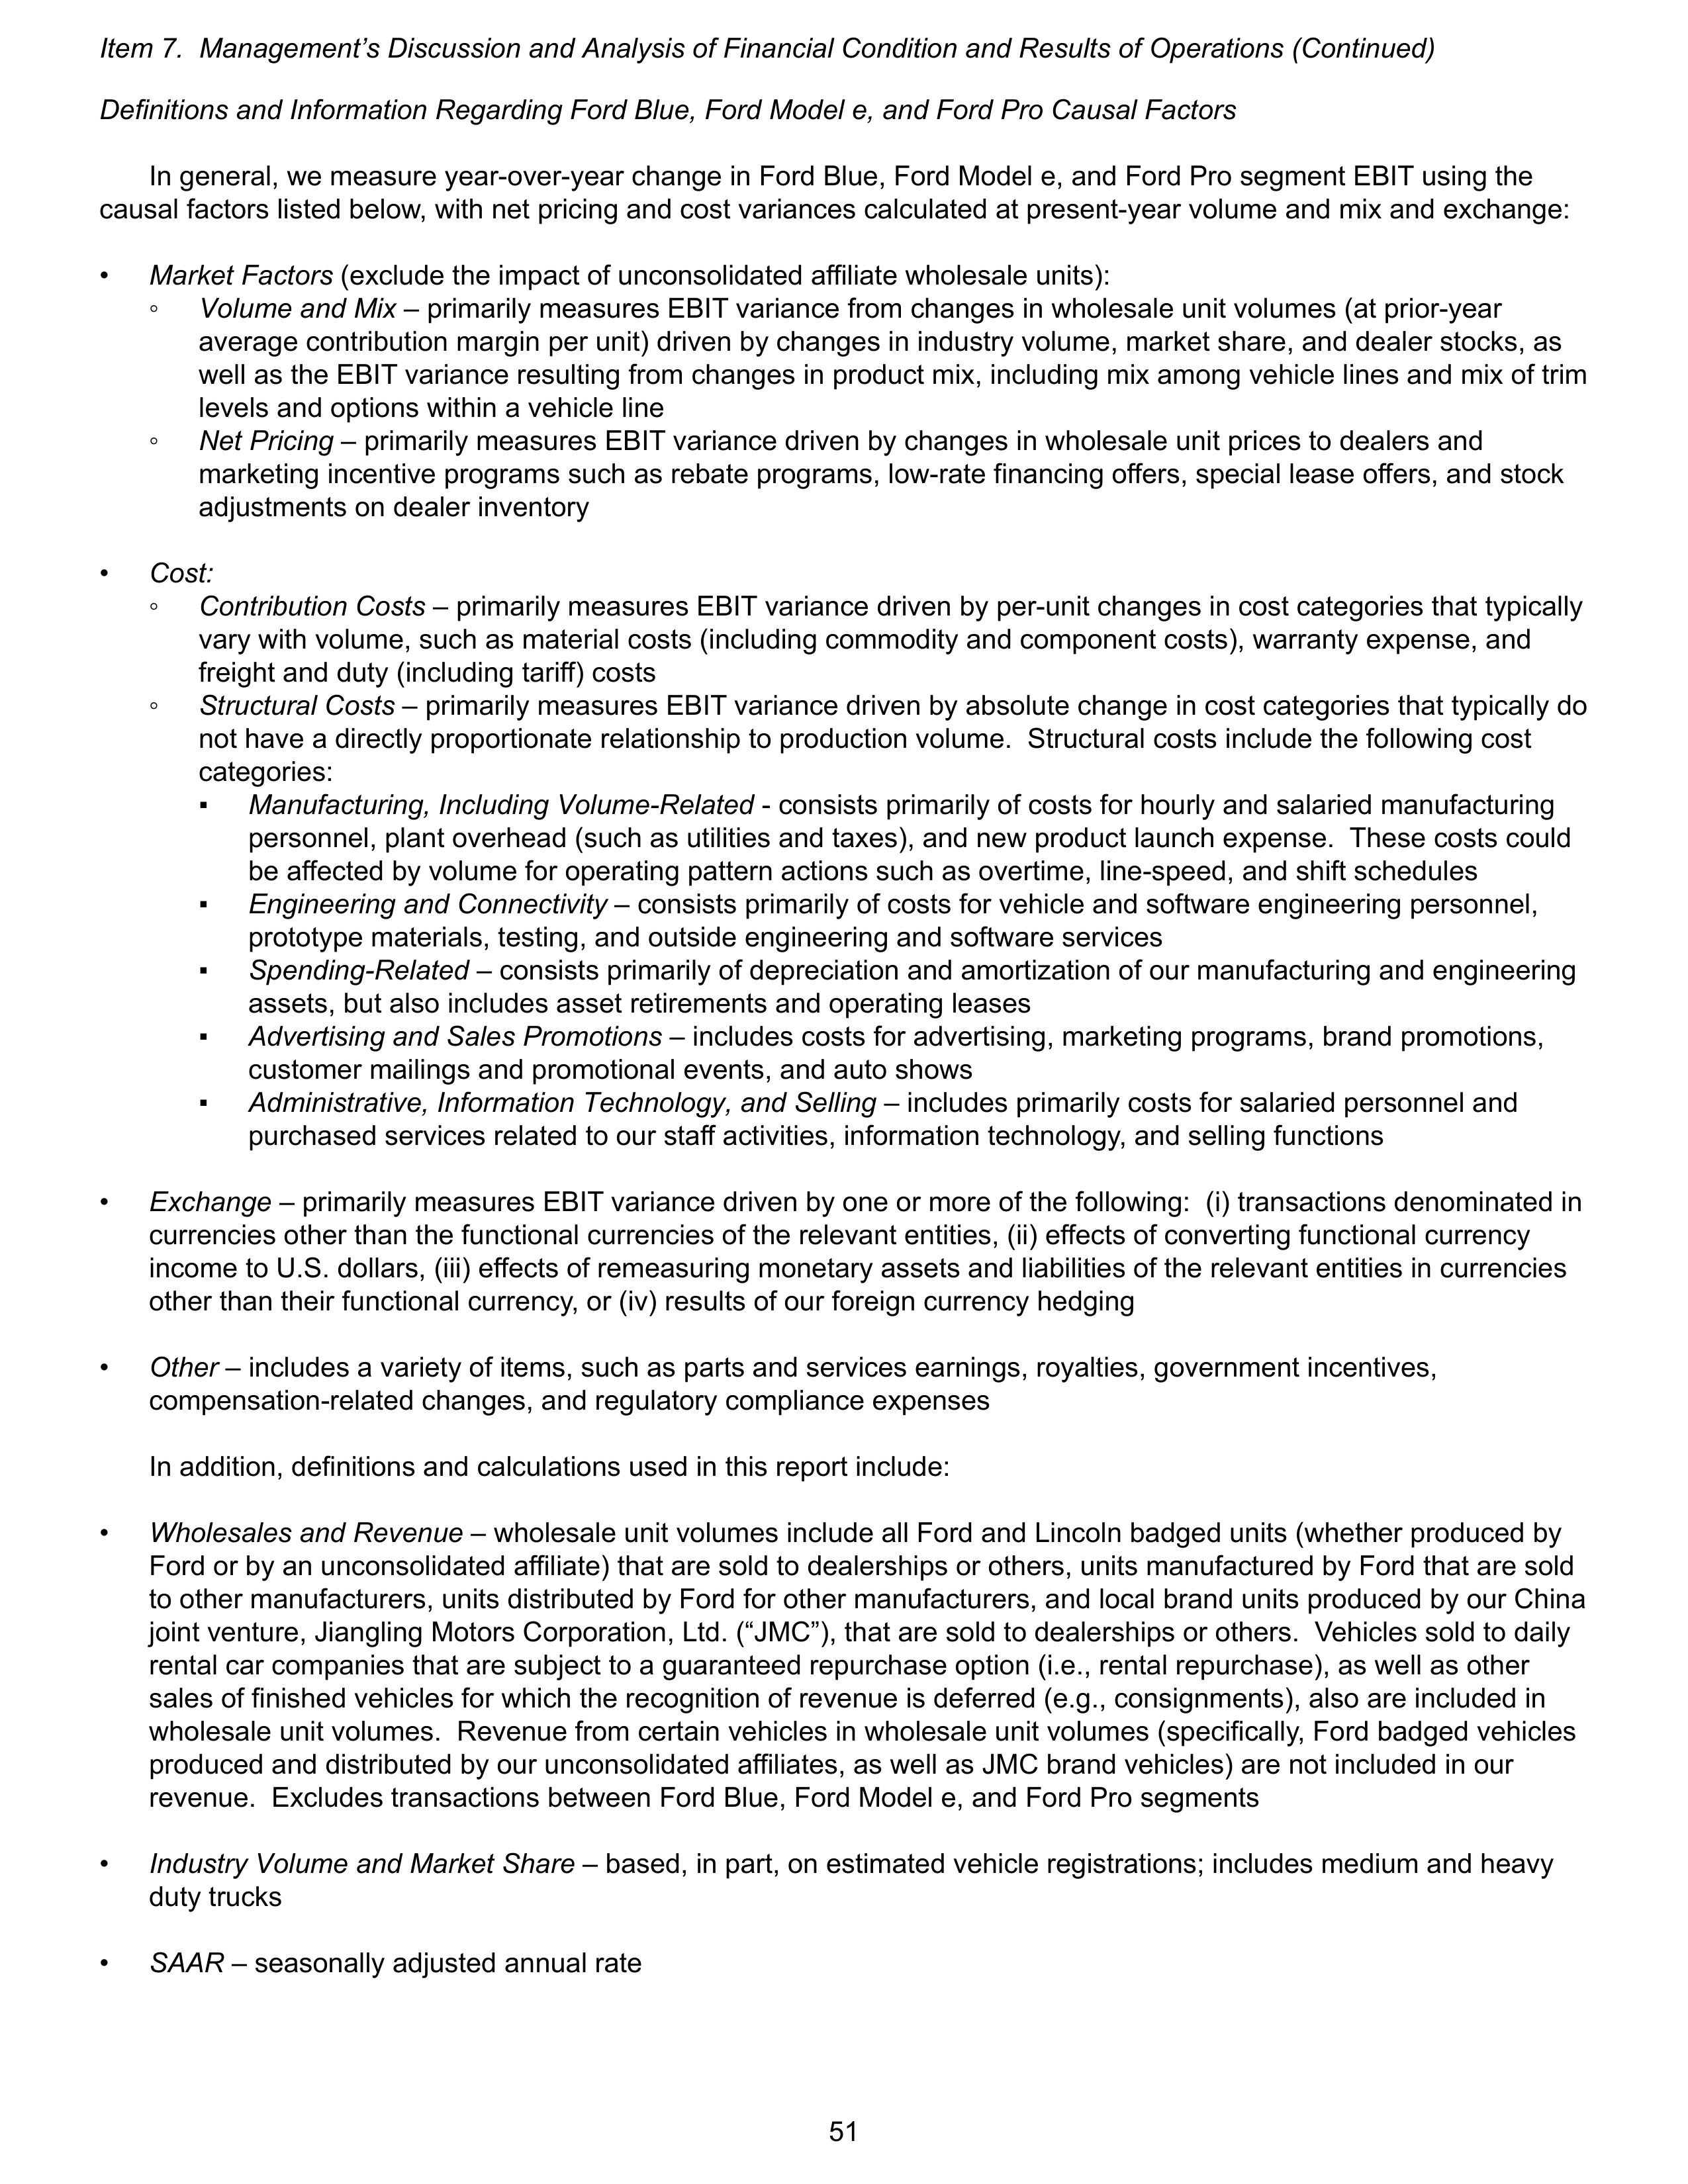
Definitions and Information Regarding Ford Blue, Ford Model e, and Ford Pro Causal Factors
In general, we measure year-over-year change in Ford Blue, Ford Model e, and Ford Pro segment EBIT using the
causal factors listed below, with net pricing and cost variances calculated at present-year volume and mix and exchange:
•
Market Factors
(exclude the impact of unconsolidated affiliate wholesale units):
◦
Volume and Mix
– primarily measures EBIT variance from changes in wholesale unit volumes (at prior-year
average contribution margin per unit) driven by changes in industry volume, market share, and dealer stocks, as
well as the EBIT variance resulting from changes in product mix, including mix among vehicle lines and mix of trim
levels and options within a vehicle line
◦
Net Pricing
– primarily measures EBIT variance driven by changes in wholesale unit prices to dealers and
marketing incentive programs such as rebate programs, low-rate financing offers, special lease offers, and stock
adjustments on dealer inventory
•
Cost:
◦
Contribution Costs
– primarily measures EBIT variance driven by per-unit changes in cost categories that typically
vary with volume, such as material costs (including commodity and component costs), warranty expense, and
freight and duty (including tariff) costs
◦
Structural Costs
– primarily measures EBIT variance driven by absolute change in cost categories that typically do
not have a directly proportionate relationship to production volume. Structural costs include the following cost
categories:
▪
Manufacturing, Including Volume-Related
- consists primarily of costs for hourly and salaried manufacturing
personnel, plant overhead (such as utilities and taxes), and new product launch expense. These costs could
be affected by volume for operating pattern actions such as overtime, line-speed, and shift schedules
▪
Engineering and Connectivity
–
consists primarily of costs for vehicle and software engineering personnel,
prototype materials, testing, and outside engineering and software services
▪
Spending-Related
–
consists primarily of depreciation and amortization of our manufacturing and engineering
assets, but also includes asset retirements and operating leases
▪
Advertising and Sales Promotions
–
includes costs for advertising, marketing programs, brand promotions,
customer mailings and promotional events, and auto shows
▪
Administrative, Information Technology, and Selling
–
includes primarily costs for salaried personnel and
purchased services related to our staff activities, information technology, and selling functions
•
Exchange
– primarily measures EBIT variance driven by one or more of the following: (i) transactions denominated in
currencies other than the functional currencies of the relevant entities, (ii) effects of converting functional currency
income to U.S. dollars, (iii) effects of remeasuring monetary assets and liabilities of the relevant entities in currencies
other than their functional currency, or (iv) results of our foreign currency hedging
•
Other
–
includes a variety of items, such as parts and services earnings, royalties, government incentives,
compensation-related changes, and regulatory compliance expenses
In addition, definitions and calculations used in this report include:
•
Wholesales and Revenue
– wholesale unit volumes include all Ford and Lincoln badged units (whether produced by
Ford or by an unconsolidated affiliate) that are sold to dealerships or others, units manufactured by Ford that are sold
to other manufacturers, units distributed by Ford for other manufacturers, and local brand units produced by our China
joint venture, Jiangling Motors Corporation, Ltd. (“JMC”), that are sold to dealerships or others. Vehicles sold to daily
rental car companies that are subject to a guaranteed repurchase option (i.e., rental repurchase), as well as other
sales of finished vehicles for which the recognition of revenue is deferred (e.g., consignments), also are included in
wholesale unit volumes. Revenue from certain vehicles in wholesale unit volumes (specifically, Ford badged vehicles
produced and distributed by our unconsolidated affiliates, as well as JMC brand vehicles) are not included in our
revenue. Excludes transactions between Ford Blue, Ford Model e, and Ford Pro segments
•
Industry Volume and Market Share
– based, in part, on estimated vehicle registrations; includes medium and heavy
duty trucks
•
SAAR
– seasonally adjusted annual rate
Item 7. Management’s Discussion and Analysis of Financial Condition and Results of Operations (Continued)
51
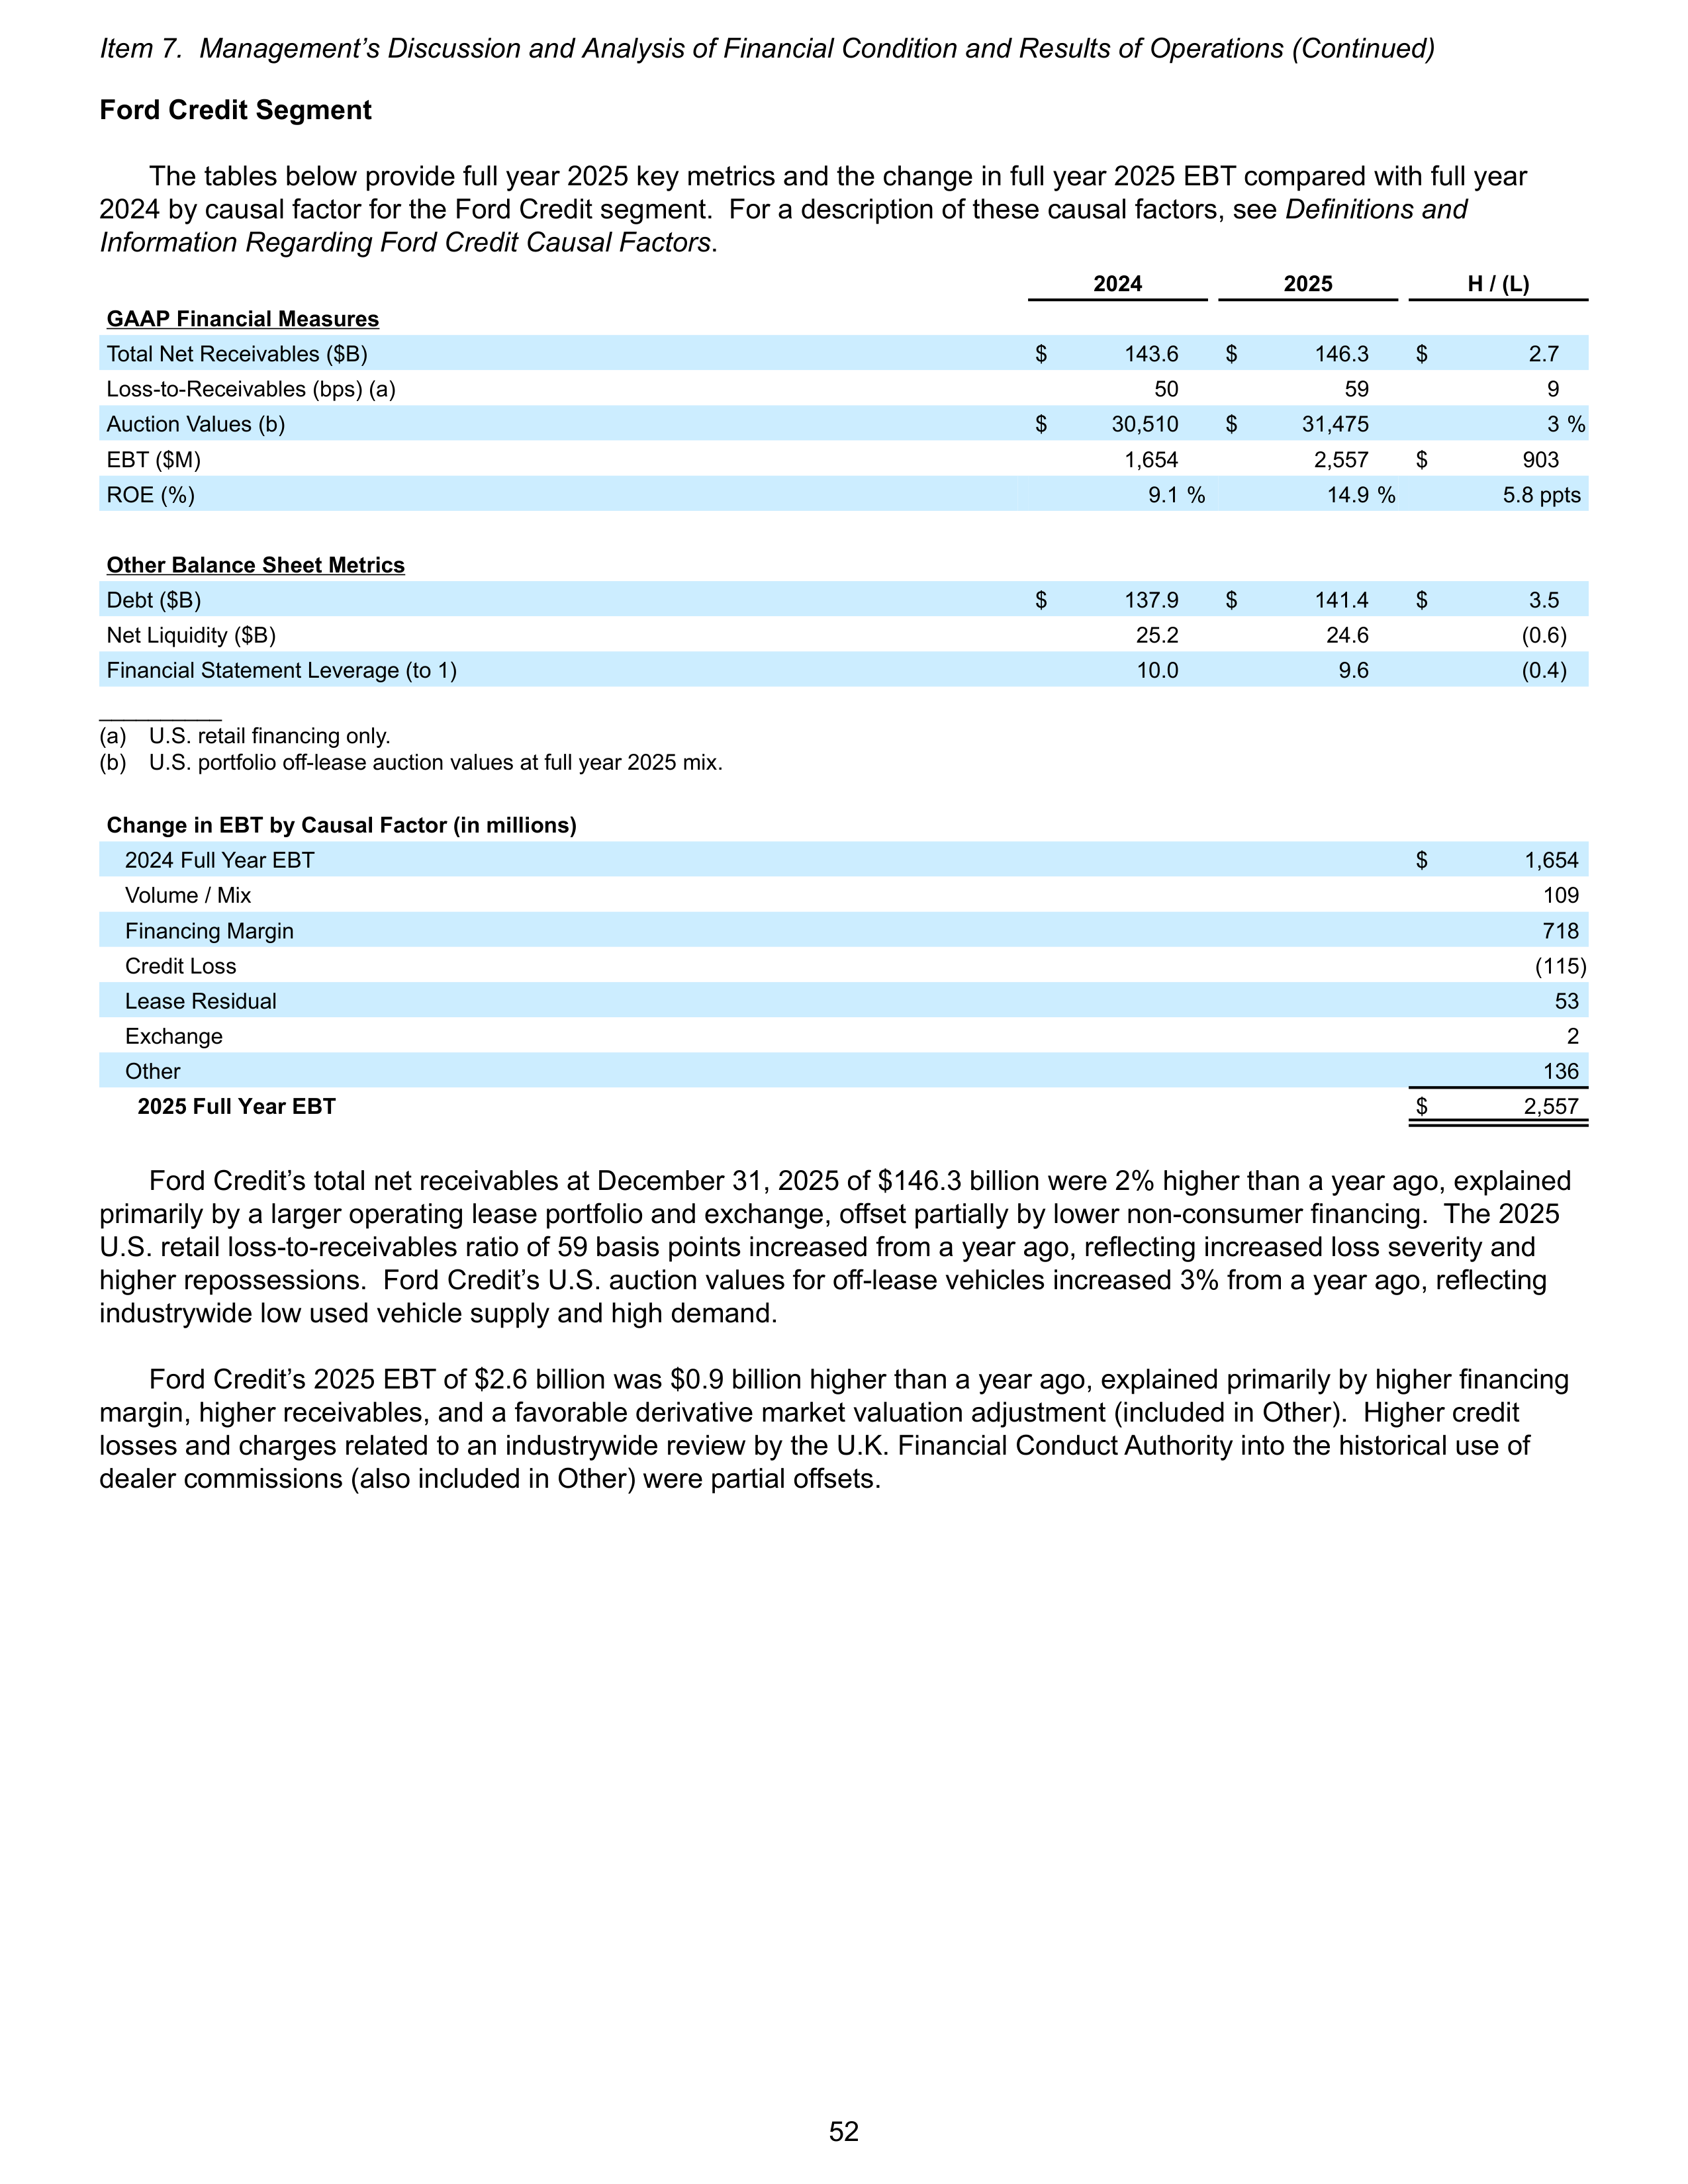
Ford Credit Segment
The tables below provide full year 2025 key metrics and the change in full year 2025 EBT compared with full year
2024 by causal factor for the Ford Credit segment. For a description of these causal factors, see
Definitions and
Information Regarding Ford Credit Causal Factors
.
2024
2025
H / (L)
GAAP Financial Measures
Total Net Receivables ($B)
$
143.6
$
146.3
$
2.7
Loss-to-Receivables (bps) (a)
50
59
9
Auction Values (b)
$
30,510
$
31,475
3 %
EBT ($M)
1,654
2,557
$
903
ROE (%)
9.1 %
14.9 %
5.8 ppts
Other Balance Sheet Metrics
Debt ($B)
$
137.9
$
141.4
$
3.5
Net Liquidity ($B)
25.2
24.6
(0.6)
Financial Statement Leverage (to 1)
10.0
9.6
(0.4)
__________
(a)
U.S. retail financing only.
(b)
U.S. portfolio off-lease auction values at full year 2025 mix.
Change in EBT by Causal Factor (in millions)
2024 Full Year EBT
$
1,654
Volume / Mix
109
Financing Margin
718
Credit Loss
(115)
Lease Residual
53
Exchange
2
Other
136
2025 Full Year EBT
$
2,557
Ford Credit’s total net receivables at December 31, 2025 of $146.3 billion were 2% higher than a year ago, explained
primarily by a larger operating lease portfolio and exchange, offset partially by lower non-consumer financing. The 2025
U.S. retail loss-to-receivables ratio of 59 basis points increased from a year ago, reflecting increased loss severity and
higher repossessions. Ford Credit’s U.S. auction values for off-lease vehicles increased 3% from a year ago, reflecting
industrywide low used vehicle supply and high demand.
Ford Credit’s 2025 EBT of $2.6 billion was $0.9 billion higher than a year ago, explained primarily by higher financing
margin, higher receivables, and a favorable derivative market valuation adjustment (included in Other). Higher credit
losses and charges related to an industrywide review by the U.K. Financial Conduct Authority into the historical use of
dealer commissions (also included in Other) were partial offsets.
Item 7. Management’s Discussion and Analysis of Financial Condition and Results of Operations (Continued)
52
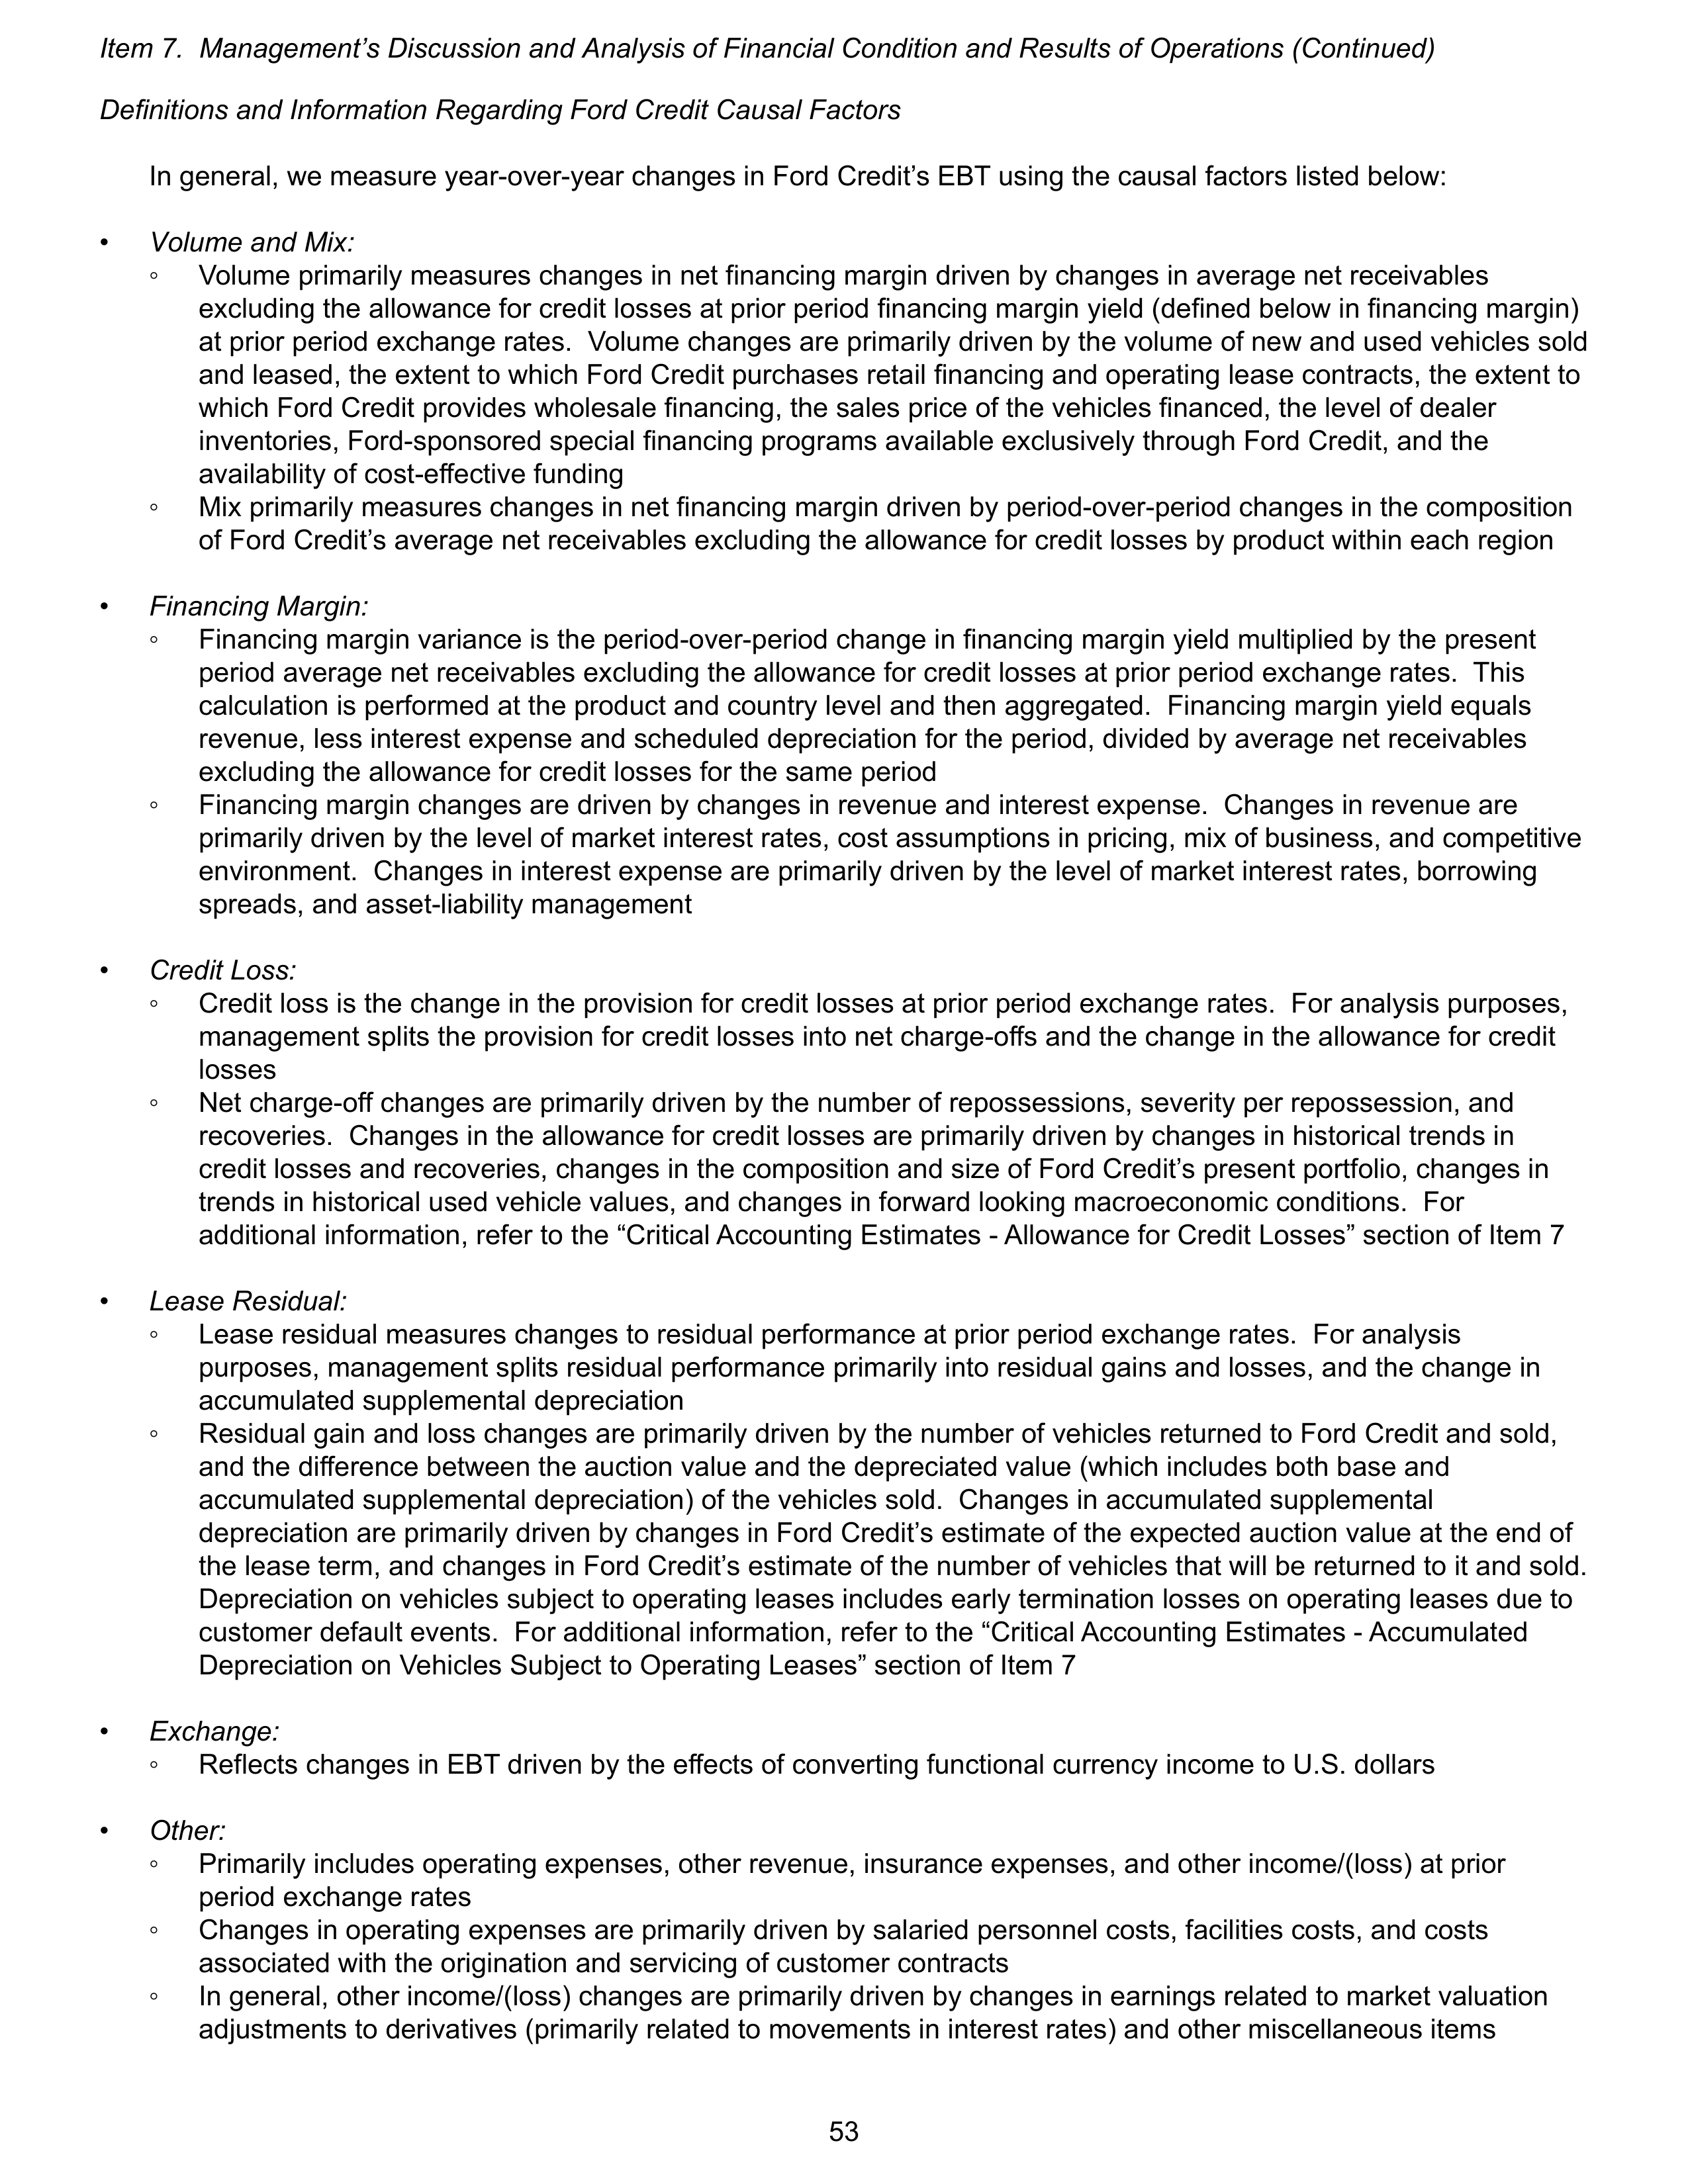
Definitions and Information Regarding Ford Credit Causal Factors
In general, we measure year-over-year changes in Ford Credit’s EBT using the causal factors listed below:
•
Volume and Mix:
◦
Volume primarily measures changes in net financing margin driven by changes in average net receivables
excluding the allowance for credit losses at prior period financing margin yield (defined below in financing margin)
at prior period exchange rates. Volume changes are primarily driven by the volume of new and used vehicles sold
and leased, the extent to which Ford Credit purchases retail financing and operating lease contracts, the extent to
which Ford Credit provides wholesale financing, the sales price of the vehicles financed, the level of dealer
inventories, Ford-sponsored special financing programs available exclusively through Ford Credit, and the
availability of cost-effective funding
◦
Mix primarily measures changes in net financing margin driven by period-over-period changes in the composition
of Ford Credit’s average net receivables excluding the allowance for credit losses by product within each region
•
Financing Margin:
◦
Financing margin variance is the period-over-period change in financing margin yield multiplied by the present
period average net receivables excluding the allowance for credit losses at prior period exchange rates. This
calculation is performed at the product and country level and then aggregated. Financing margin yield equals
revenue, less interest expense and scheduled depreciation for the period, divided by average net receivables
excluding the allowance for credit losses for the same period
◦
Financing margin changes are driven by changes in revenue and interest expense. Changes in revenue are
primarily driven by the level of market interest rates, cost assumptions in pricing, mix of business, and competitive
environment. Changes in interest expense are primarily driven by the level of market interest rates, borrowing
spreads, and asset-liability management
•
Credit Loss:
◦
Credit loss is the change in the provision for credit losses at prior period exchange rates. For analysis purposes,
management splits the provision for credit losses into net charge-offs and the change in the allowance for credit
losses
◦
Net charge-off changes are primarily driven by the number of repossessions, severity per repossession, and
recoveries. Changes in the allowance for credit losses are primarily driven by changes in historical trends in
credit losses and recoveries, changes in the composition and size of Ford Credit’s present portfolio, changes in
trends in historical used vehicle values, and changes in forward looking macroeconomic conditions. For
additional information, refer to the “Critical Accounting Estimates - Allowance for Credit Losses” section of Item 7
•
Lease Residual:
◦
Lease residual measures changes to residual performance at prior period exchange rates. For analysis
purposes, management splits residual performance primarily into residual gains and losses, and the change in
accumulated supplemental depreciation
◦
Residual gain and loss changes are primarily driven by the number of vehicles returned to Ford Credit and sold,
and the difference between the auction value and the depreciated value (which includes both base and
accumulated supplemental depreciation) of the vehicles sold. Changes in accumulated supplemental
depreciation are primarily driven by changes in Ford Credit’s estimate of the expected auction value at the end of
the lease term, and changes in Ford Credit’s estimate of the number of vehicles that will be returned to it and sold.
Depreciation on vehicles subject to operating leases includes early termination losses on operating leases due to
customer default events. For additional information, refer to the “Critical Accounting Estimates - Accumulated
Depreciation on Vehicles Subject to Operating Leases” section of Item 7
•
Exchange:
◦
Reflects changes in EBT driven by the effects of converting functional currency income to U.S. dollars
•
Other:
◦
Primarily includes operating expenses, other revenue, insurance expenses, and other income/(loss) at prior
period exchange rates
◦
Changes in operating expenses are primarily driven by salaried personnel costs, facilities costs, and costs
associated with the origination and servicing of customer contracts
◦
In general, other income/(loss) changes are primarily driven by changes in earnings related to market valuation
adjustments to derivatives (primarily related to movements in interest rates) and other miscellaneous items
Item 7. Management’s Discussion and Analysis of Financial Condition and Results of Operations (Continued)
53
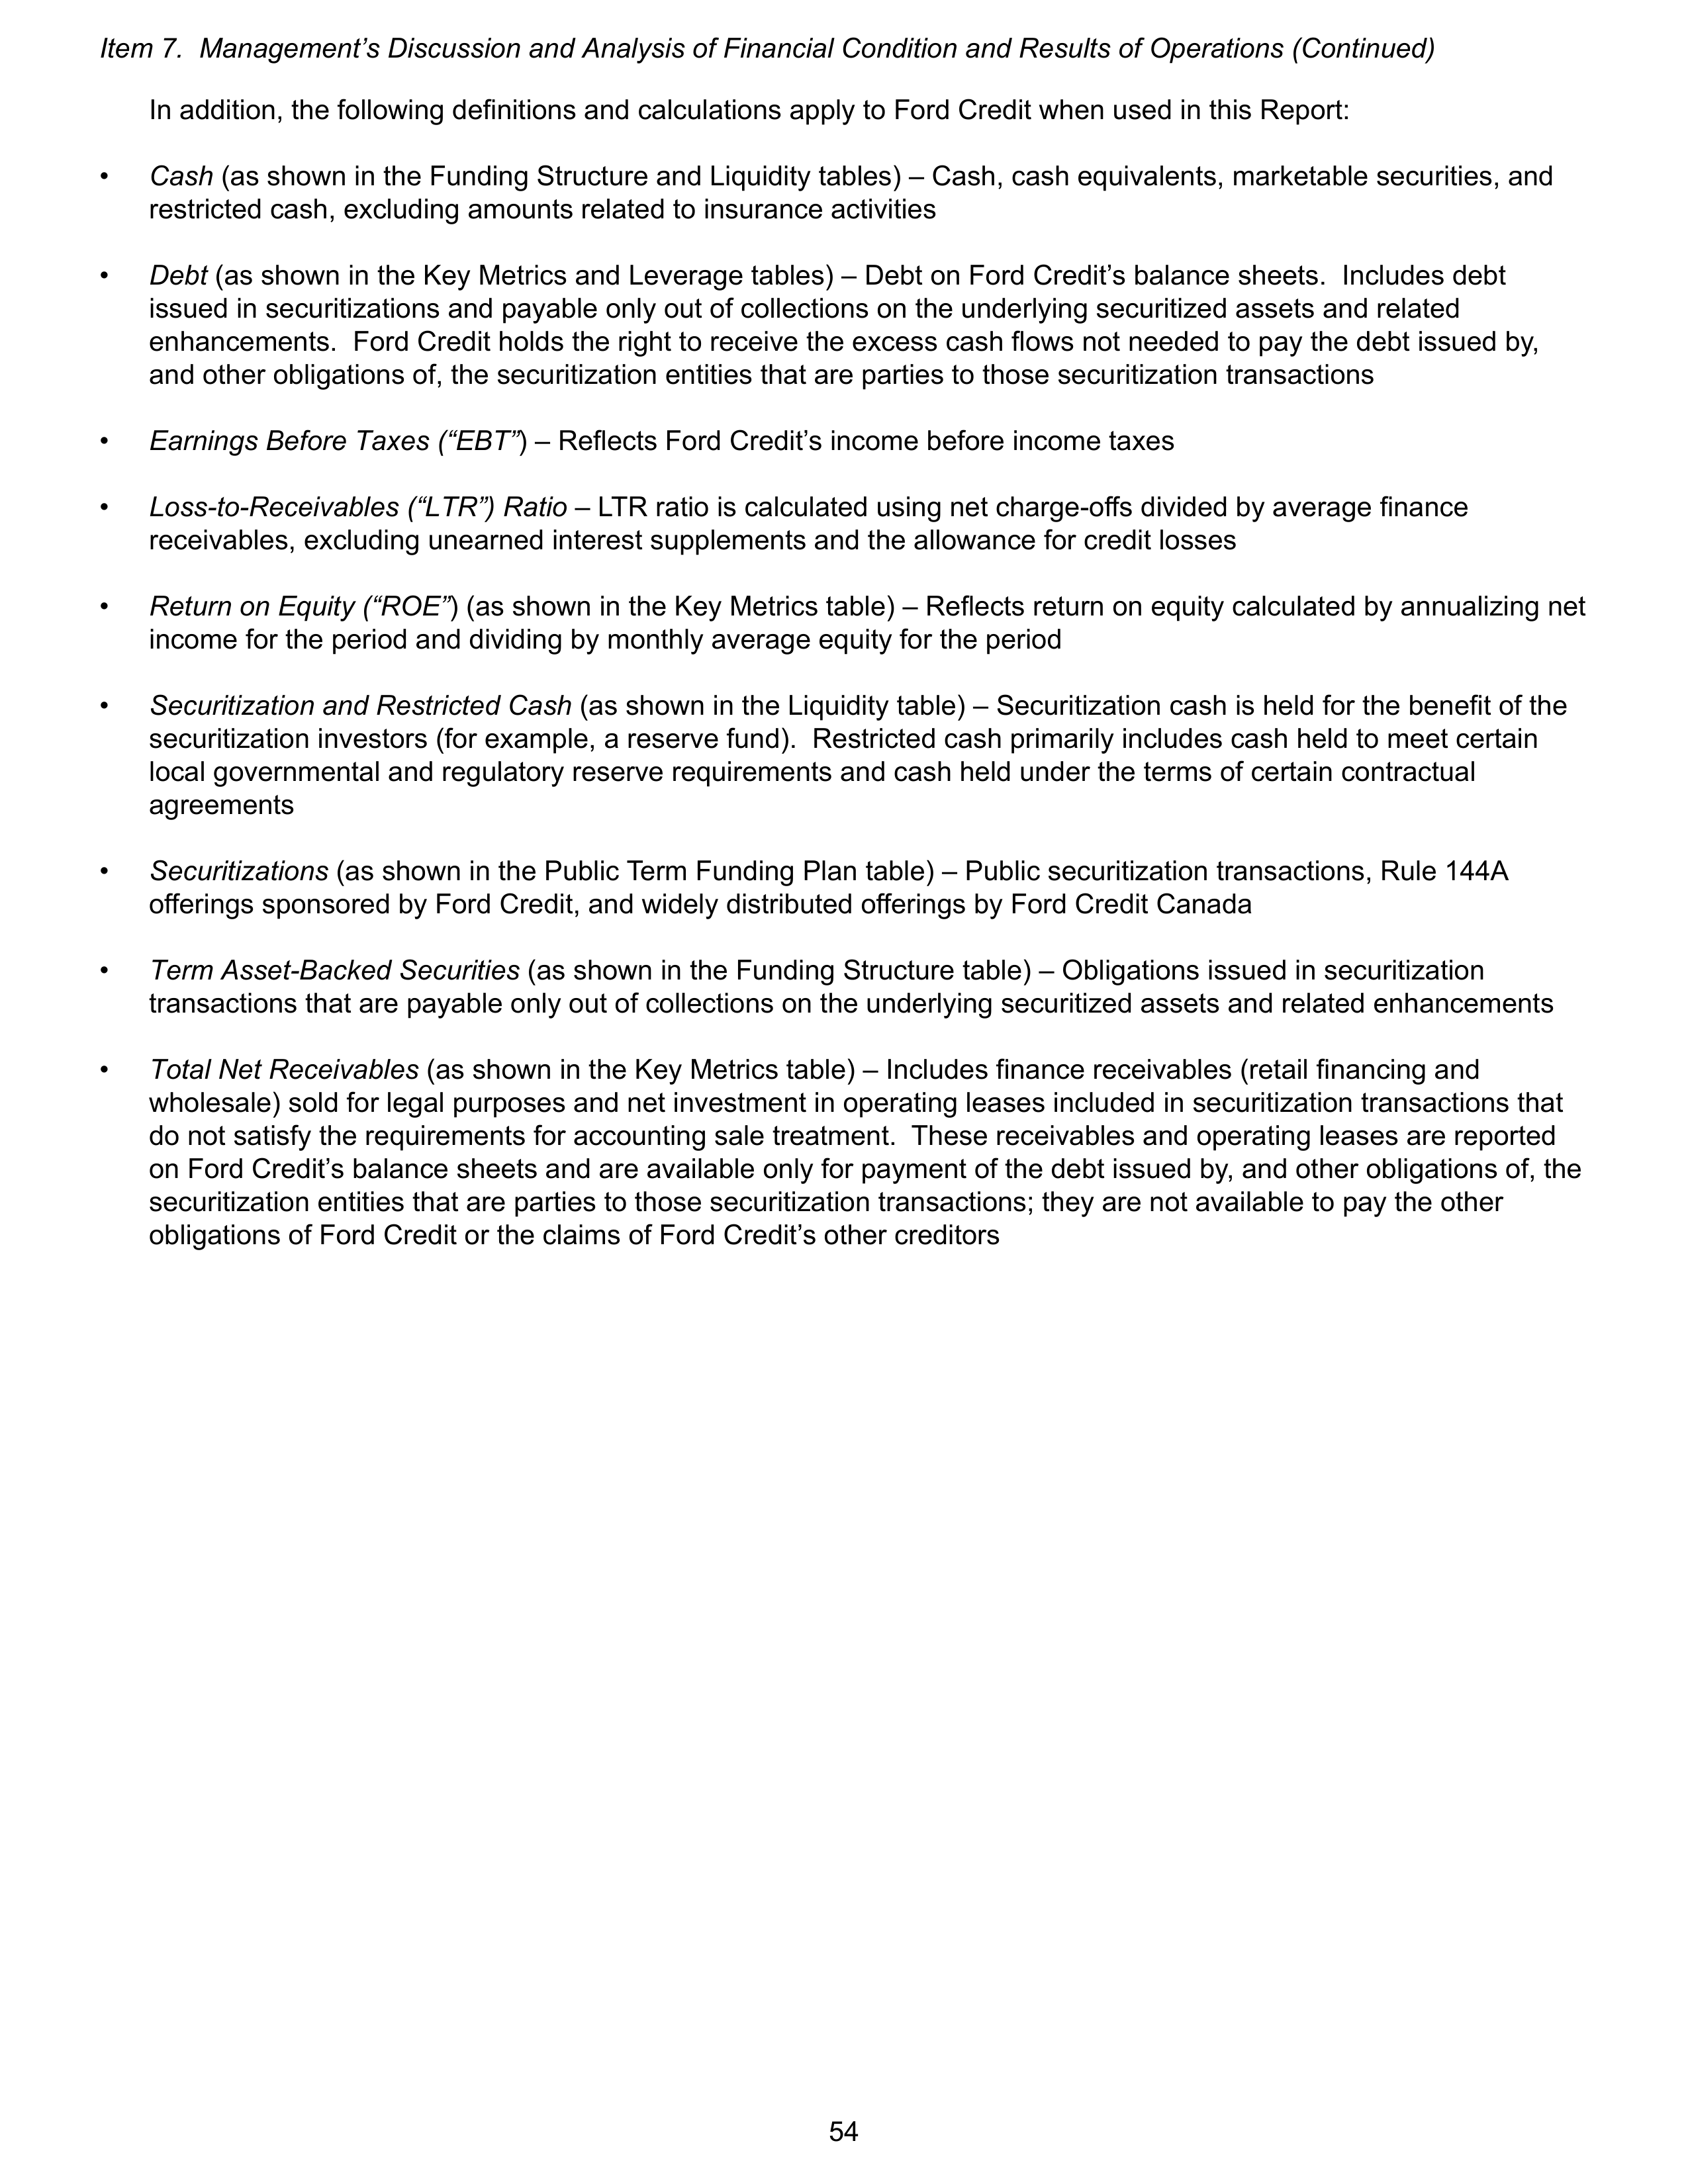
In addition, the following definitions and calculations apply to Ford Credit when used in this Report:
•
Cash
(as shown in the Funding Structure and Liquidity tables) – Cash, cash equivalents, marketable securities, and
restricted cash, excluding amounts related to insurance activities
•
Debt
(as shown in the Key Metrics and Leverage tables) – Debt on Ford Credit’s balance sheets. Includes debt
issued in securitizations and payable only out of collections on the underlying securitized assets and related
enhancements. Ford Credit holds the right to receive the excess cash flows not needed to pay the debt issued by,
and other obligations of, the securitization entities that are parties to those securitization transactions
•
Earnings Before Taxes (“EBT”
) – Reflects Ford Credit’s income before income taxes
•
Loss-to-Receivables (“LTR”) Ratio
– LTR ratio is calculated using net charge-offs divided by average finance
receivables, excluding unearned interest supplements and the allowance for credit losses
•
Return on Equity (“ROE”
) (as shown in the Key Metrics table) – Reflects return on equity calculated by annualizing net
income for the period and dividing by monthly average equity for the period
•
Securitization and Restricted Cash
(as shown in the Liquidity table) – Securitization cash is held for the benefit of the
securitization investors (for example, a reserve fund). Restricted cash primarily includes cash held to meet certain
local governmental and regulatory reserve requirements and cash held under the terms of certain contractual
agreements
•
Securitizations
(as shown in the Public Term Funding Plan table) – Public securitization transactions, Rule 144A
offerings sponsored by Ford Credit, and widely distributed offerings by Ford Credit Canada
•
Term Asset-Backed Securities
(as shown in the Funding Structure table) – Obligations issued in securitization
transactions that are payable only out of collections on the underlying securitized assets and related enhancements
•
Total Net Receivables
(as shown in the Key Metrics table) – Includes finance receivables (retail financing and
wholesale) sold for legal purposes and net investment in operating leases included in securitization transactions that
do not satisfy the requirements for accounting sale treatment. These receivables and operating leases are reported
on Ford Credit’s balance sheets and are available only for payment of the debt issued by, and other obligations of, the
securitization entities that are parties to those securitization transactions; they are not available to pay the other
obligations of Ford Credit or the claims of Ford Credit’s other creditors
Item 7. Management’s Discussion and Analysis of Financial Condition and Results of Operations (Continued)
54
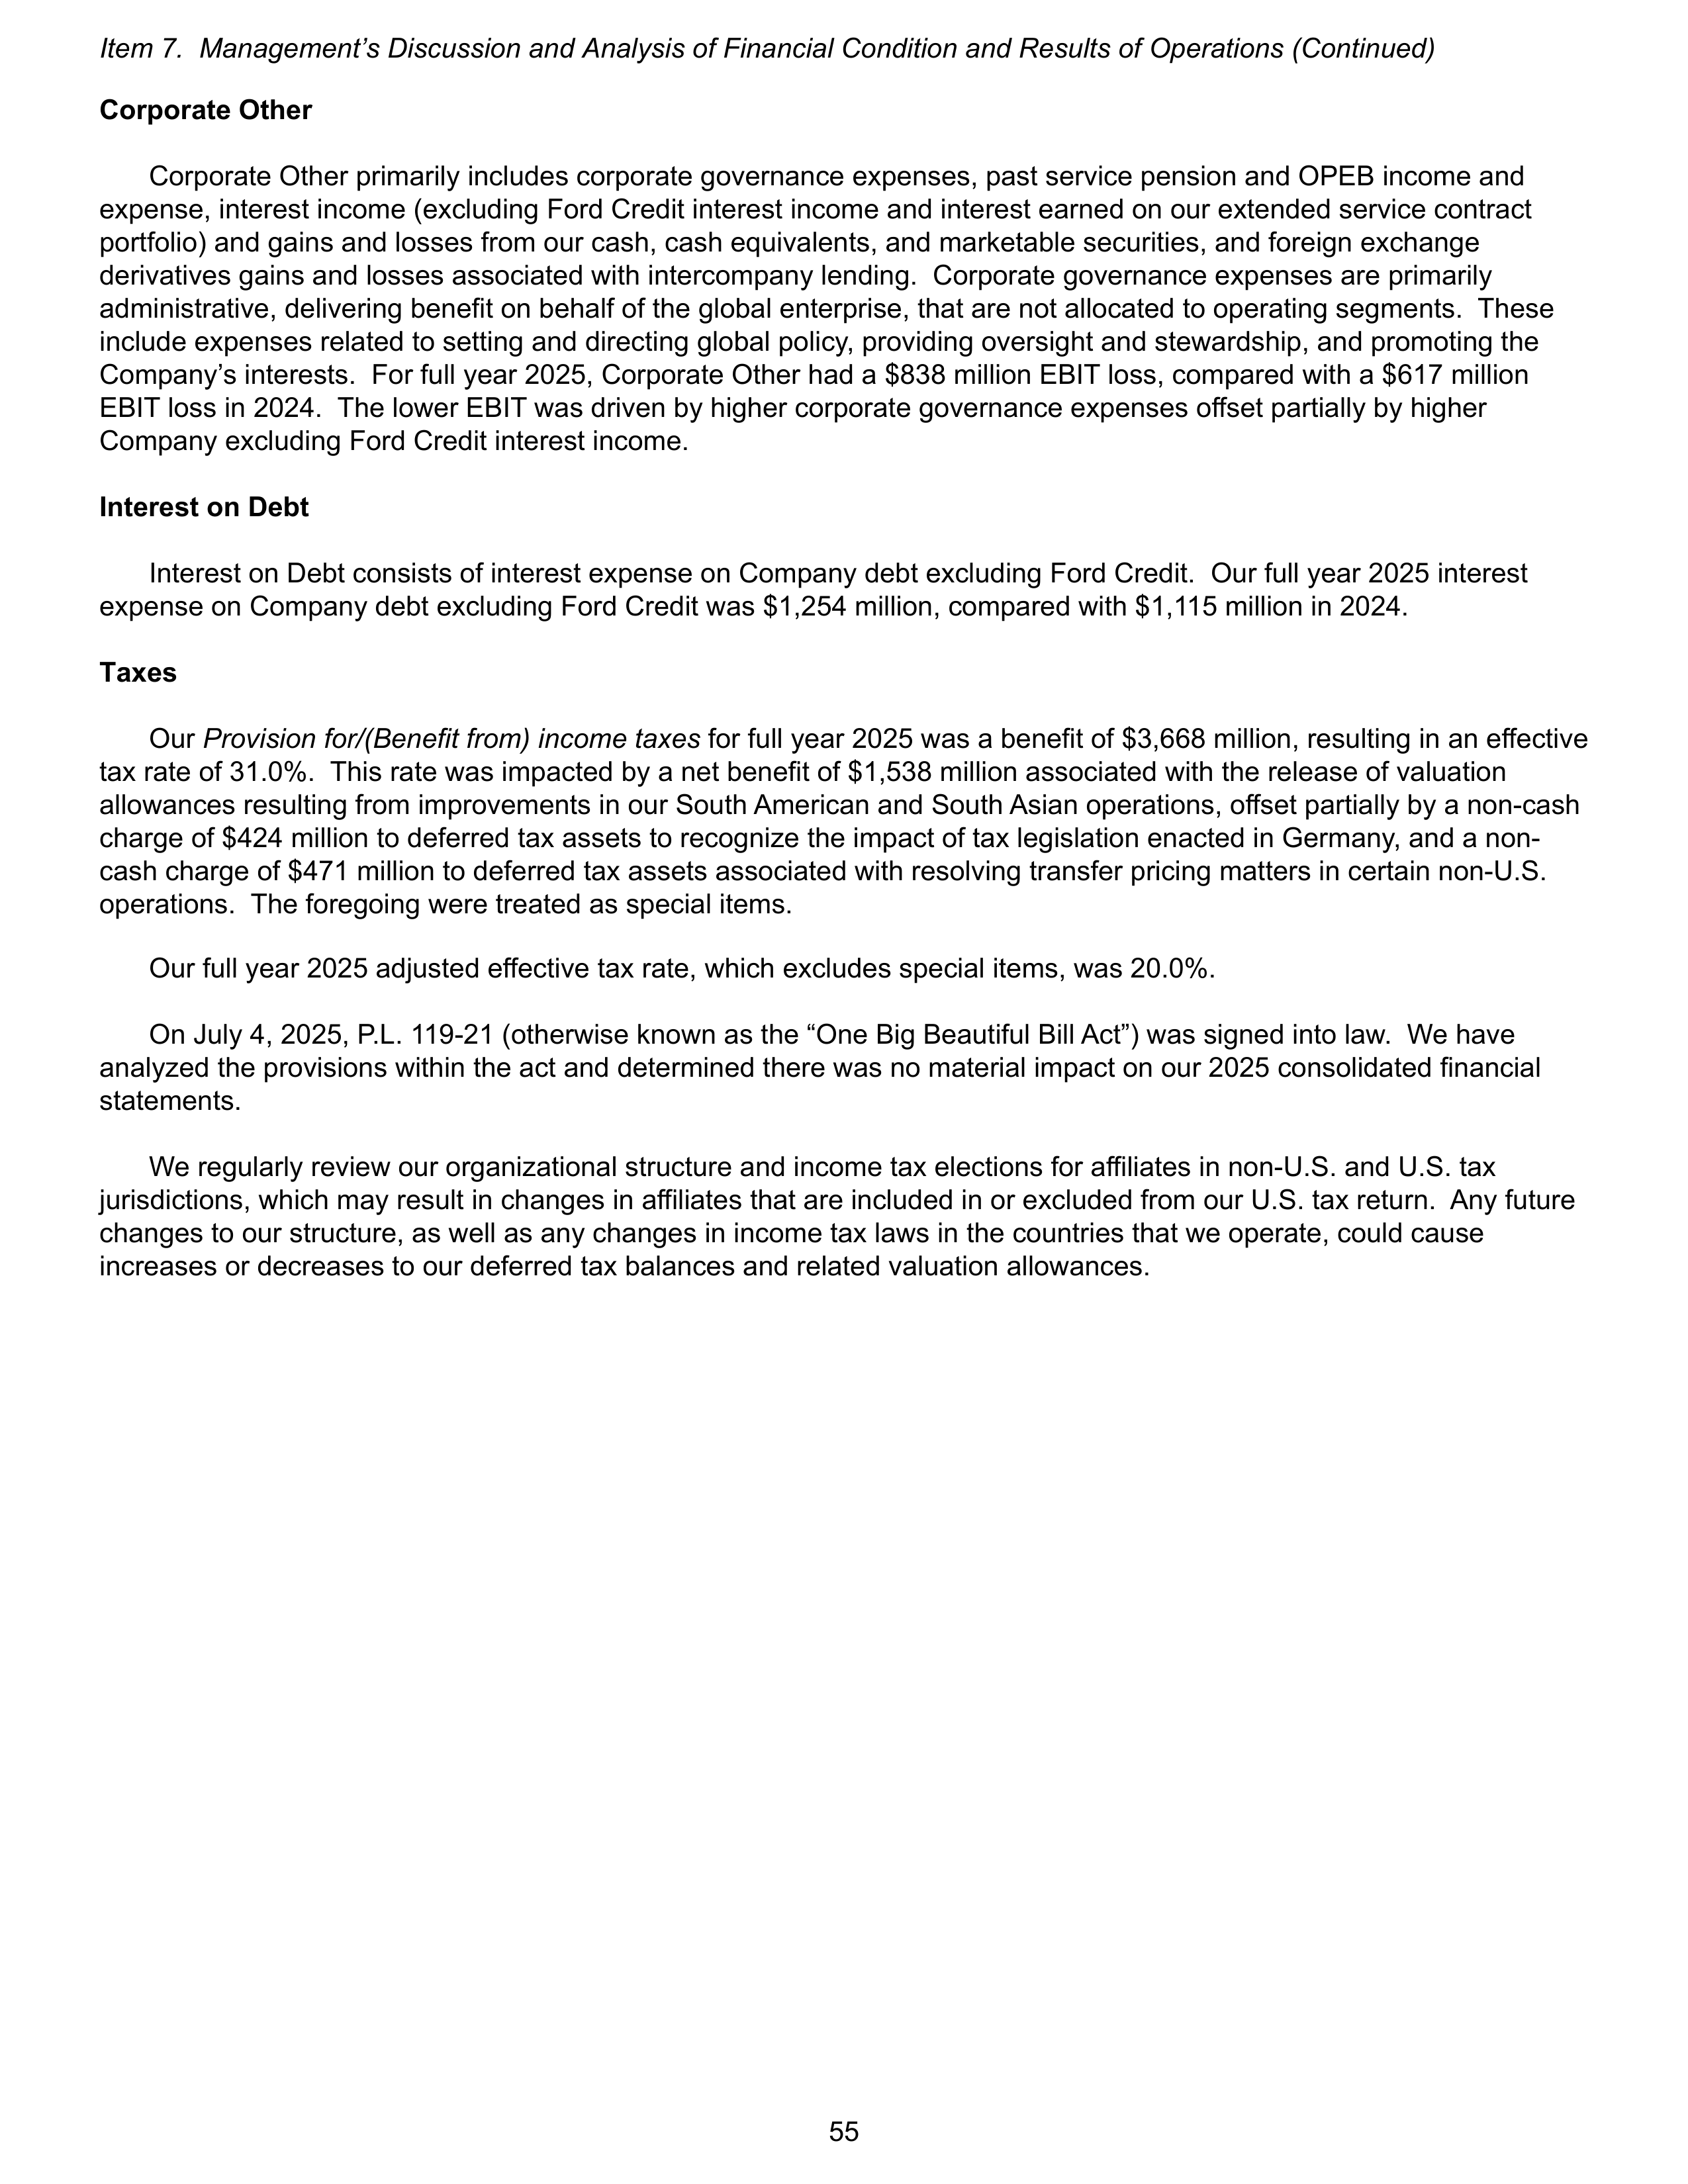
Corporate Other
Corporate Other primarily includes corporate governance expenses, past service pension and OPEB income and
expense, interest income (excluding Ford Credit interest income and interest earned on our extended service contract
portfolio) and gains and losses from our cash, cash equivalents, and marketable securities, and foreign exchange
derivatives gains and losses associated with intercompany lending. Corporate governance expenses are primarily
administrative, delivering benefit on behalf of the global enterprise, that are not allocated to operating segments. These
include expenses related to setting and directing global policy, providing oversight and stewardship, and promoting the
Company’s interests. For full year 2025, Corporate Other had a $838 million EBIT loss, compared with a $617 million
EBIT loss in 2024. The lower EBIT was driven by higher corporate governance expenses offset partially by higher
Company excluding Ford Credit interest income.
Interest on Debt
Interest on Debt consists of interest expense on Company debt excluding Ford Credit. Our full year 2025 interest
expense on Company debt excluding Ford Credit was $1,254 million, compared with $1,115 million in 2024.
Taxes
Our
Provision for/(Benefit from) income taxes
for full year 2025 was a benefit of $3,668 million, resulting in an effective
tax rate of 31.0%. This rate was impacted by a net benefit of $1,538 million associated with the release of valuation
allowances resulting from improvements in our South American and South Asian operations, offset partially by a non-cash
charge of $424 million to deferred tax assets to recognize the impact of tax legislation enacted in Germany, and a non-
cash charge of $471 million to deferred tax assets associated with resolving transfer pricing matters in certain non-U.S.
operations. The foregoing were treated as special items.
Our full year 2025 adjusted effective tax rate, which excludes special items, was 20.0%.
On July 4, 2025, P.L. 119-21 (otherwise known as the “One Big Beautiful Bill Act”) was signed into law. We have
analyzed the provisions within the act and determined there was no material impact on our 2025 consolidated financial
statements.
We regularly review our organizational structure and income tax elections for affiliates in non-U.S. and U.S. tax
jurisdictions, which may result in changes in affiliates that are included in or excluded from our U.S. tax return. Any future
changes to our structure, as well as any changes in income tax laws in the countries that we operate, could cause
increases or decreases to our deferred tax balances and related valuation allowances.
Item 7. Management’s Discussion and Analysis of Financial Condition and Results of Operations (Continued)
55
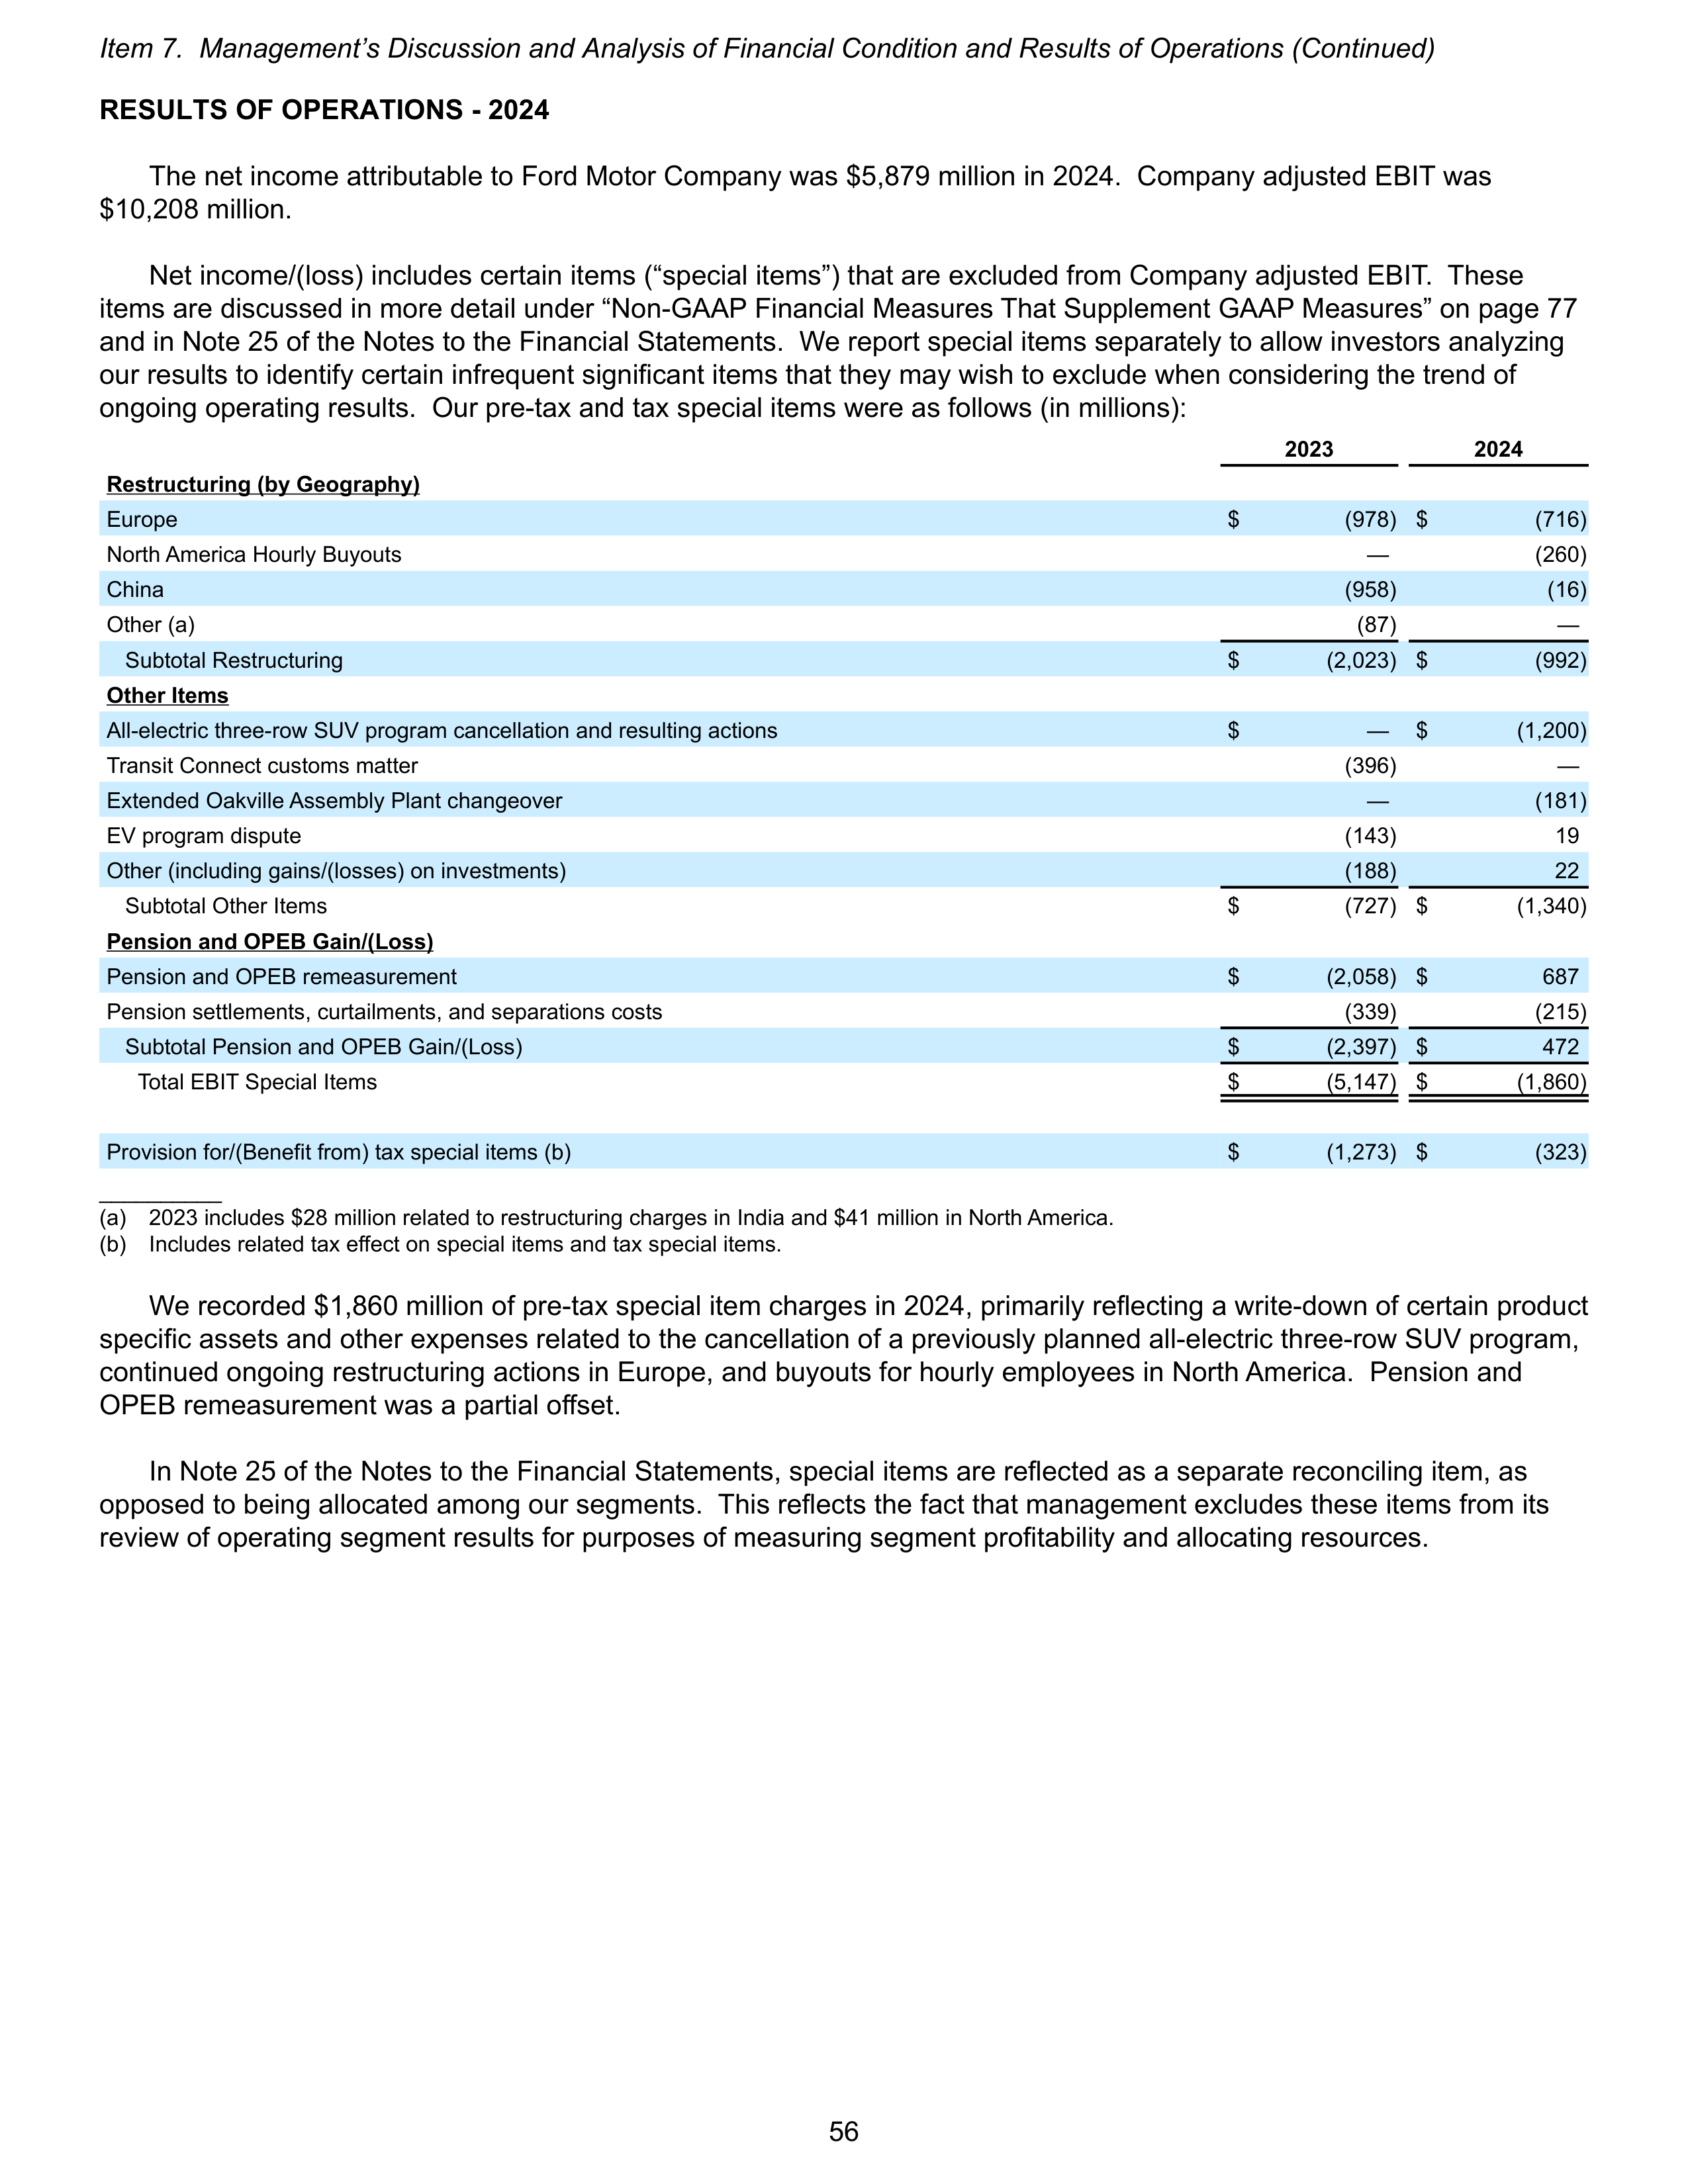
RESULTS OF OPERATIONS - 2024
The net income attributable to Ford Motor Company was $5,879 million in 2024. Company adjusted EBIT was
$10,208 million.
Net income/(loss) includes certain items (“special items”) that are excluded from Company adjusted EBIT. These
items are discussed in more detail under “Non-GAAP Financial Measures That Supplement GAAP Measures” on page 77
and in Note 25 of the Notes to the Financial Statements. We report special items separately to allow investors analyzing
our results to identify certain infrequent significant items that they may wish to exclude when considering the trend of
ongoing operating results. Our pre-tax and tax special items were as follows (in millions):
2023
2024
Restructuring (by Geography)
Europe
$
(978) $
(716)
North America Hourly Buyouts
—
(260)
China
(958)
(16)
Other (a)
(87)
—
Subtotal Restructuring
$
(2,023) $
(992)
Other Items
All-electric three-row SUV program cancellation and resulting actions
$
—
$
(1,200)
Transit Connect customs matter
(396)
—
Extended Oakville Assembly Plant changeover
—
(181)
EV program dispute
(143)
19
Other (including gains/(losses) on investments)
(188)
22
Subtotal Other Items
$
(727) $
(1,340)
Pension and OPEB Gain/(Loss)
Pension and OPEB remeasurement
$
(2,058) $
687
Pension settlements, curtailments, and separations costs
(339)
(215)
Subtotal Pension and OPEB Gain/(Loss)
$
(2,397) $
472
Total EBIT Special Items
$
(5,147) $
(1,860)
Provision for/(Benefit from) tax special items (b)
$
(1,273) $
(323)
__________
(a)
2023 includes $28 million related to restructuring charges in India and $41 million in North America.
(b)
Includes related tax effect on special items and tax special items.
We recorded $1,860 million of pre-tax special item charges in 2024, primarily reflecting a write-down of certain product
specific assets and other expenses related to the cancellation of a previously planned all-electric three-row SUV program,
continued ongoing restructuring actions in Europe, and buyouts for hourly employees in North America. Pension and
OPEB remeasurement was a partial offset.
In Note 25 of the Notes to the Financial Statements, special items are reflected as a separate reconciling item, as
opposed to being allocated among our segments. This reflects the fact that management excludes these items from its
review of operating segment results for purposes of measuring segment profitability and allocating resources.
Item 7. Management’s Discussion and Analysis of Financial Condition and Results of Operations (Continued)
56
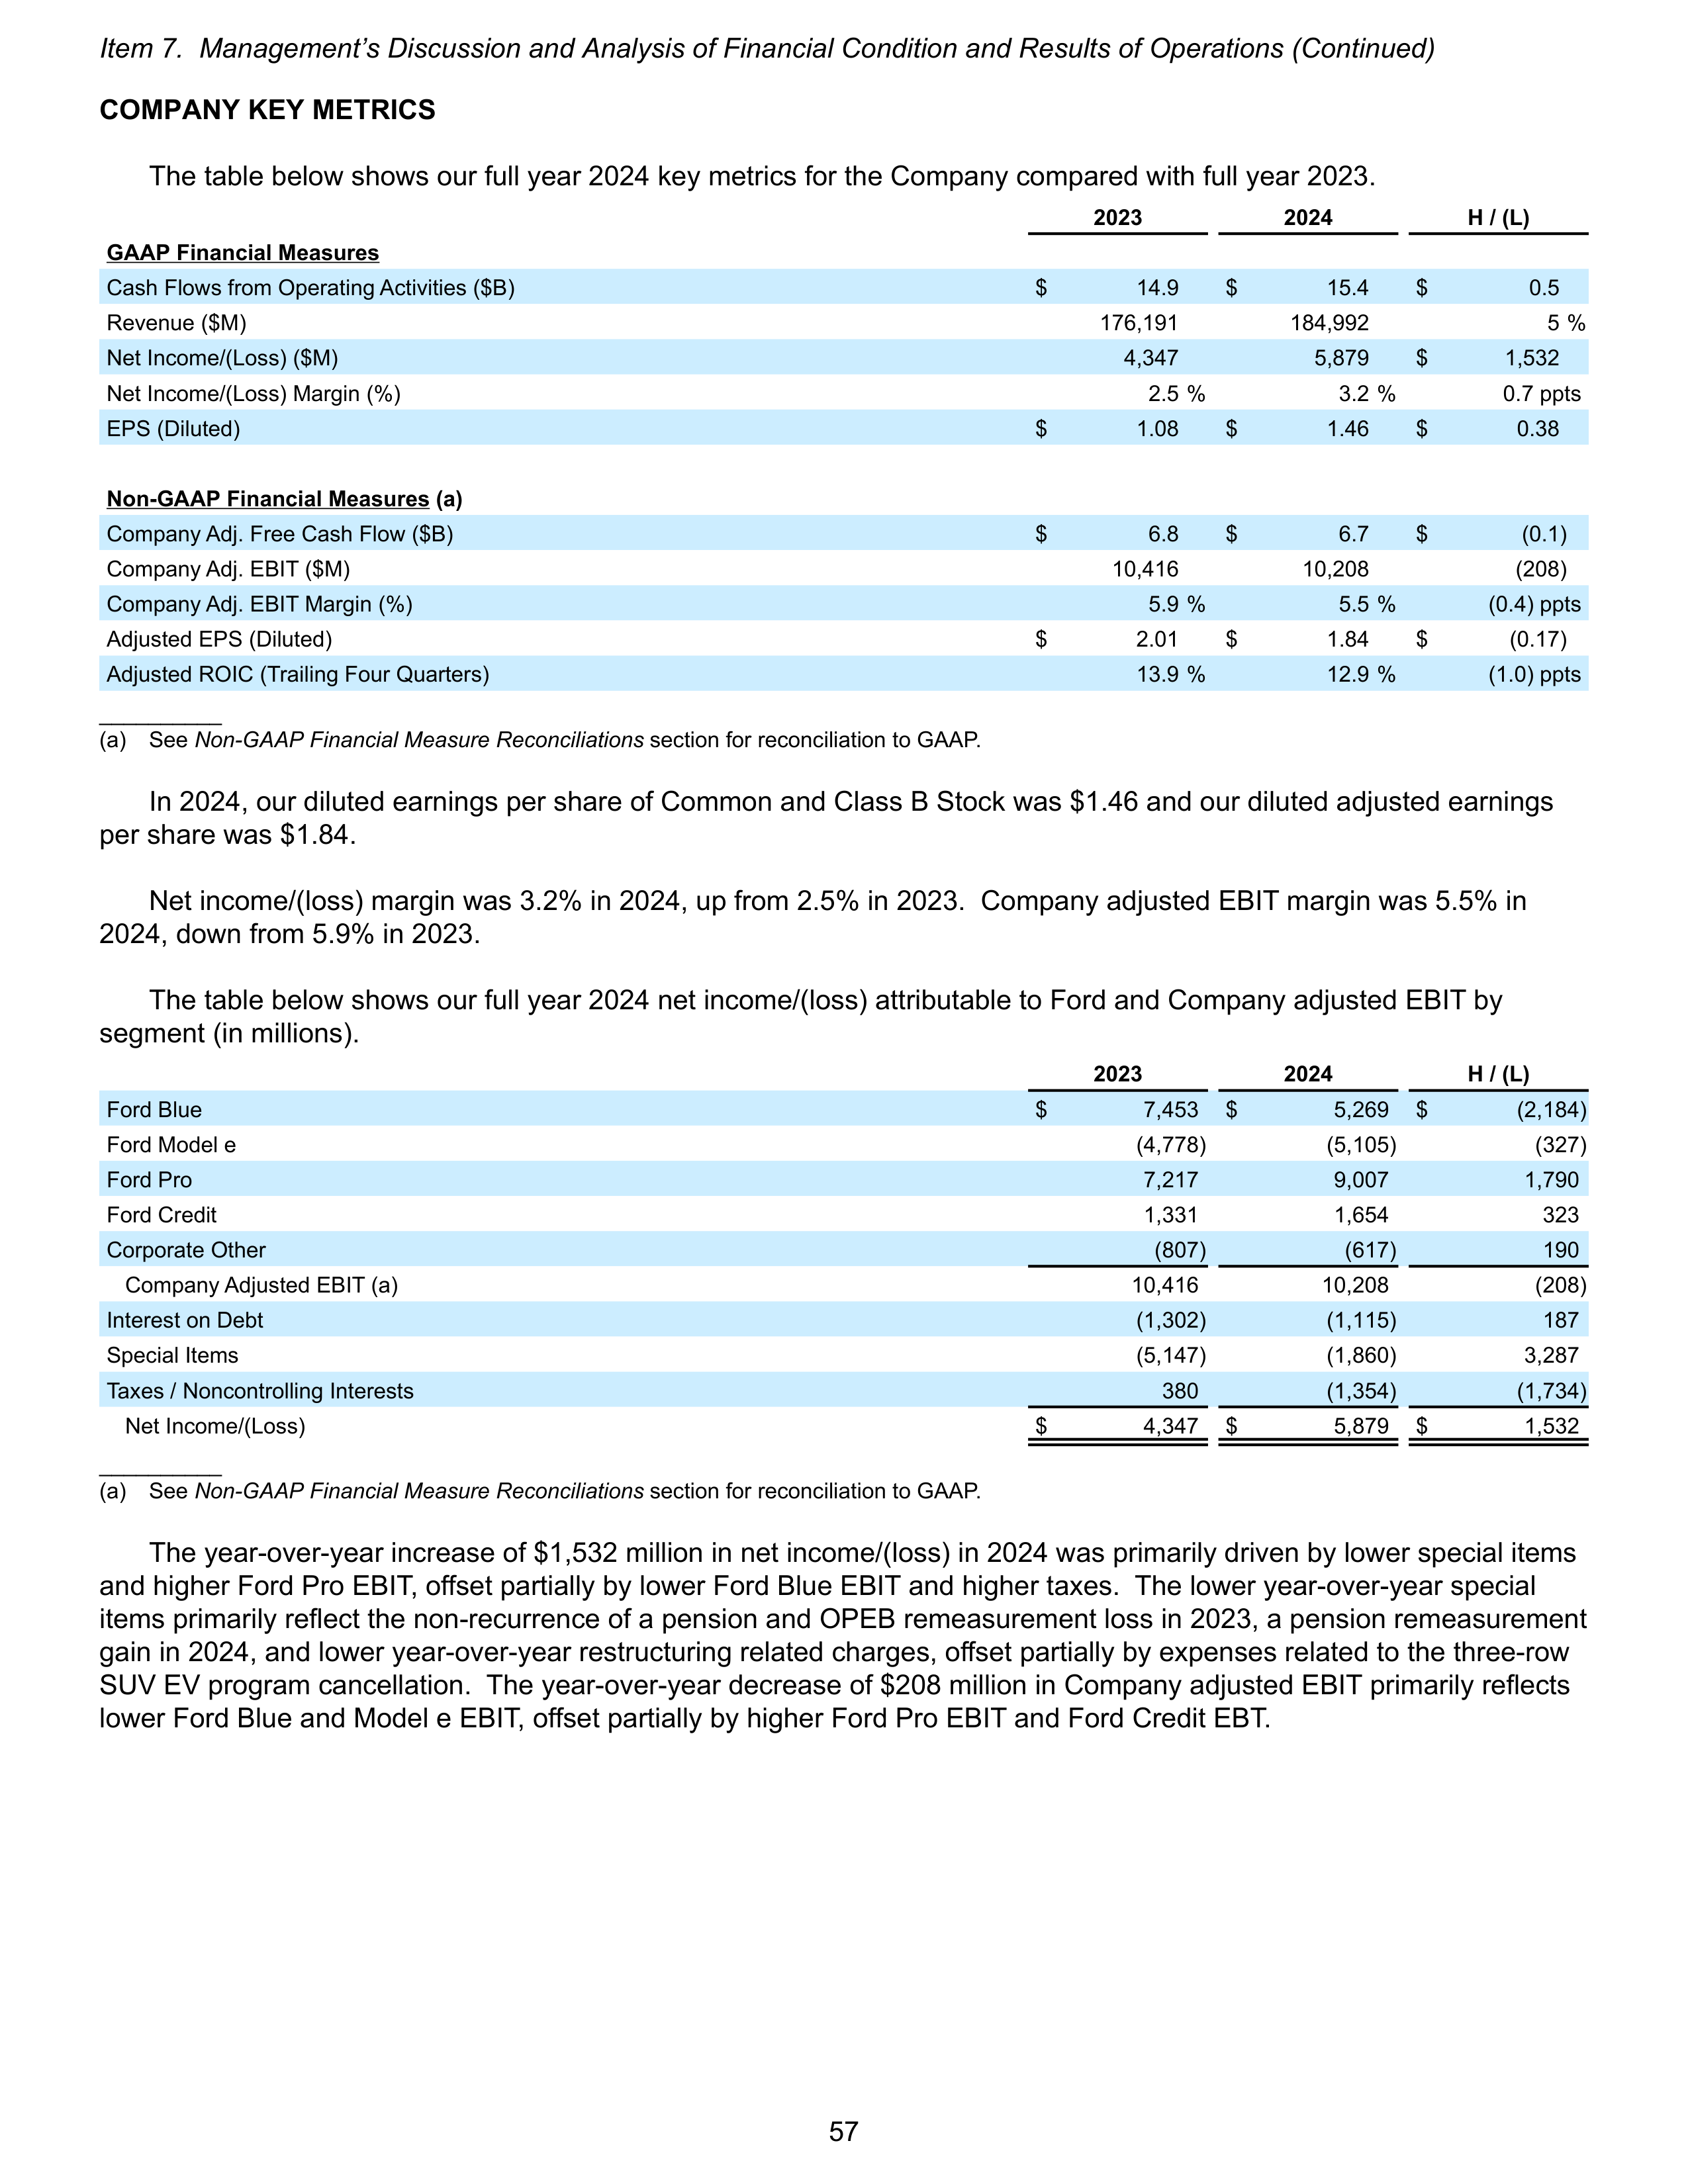
COMPANY KEY METRICS
The table below shows our full year 2024 key metrics for the Company compared with full year 2023.
2023
2024
H / (L)
GAAP Financial Measures
Cash Flows from Operating Activities ($B)
$
14.9
$
15.4
$
0.5
Revenue ($M)
176,191
184,992
5 %
Net Income/(Loss) ($M)
4,347
5,879
$
1,532
Net Income/(Loss) Margin (%)
2.5 %
3.2 %
0.7 ppts
EPS (Diluted)
$
1.08
$
1.46
$
0.38
Non-GAAP Financial Measures (a)
Company Adj. Free Cash Flow ($B)
$
6.8
$
6.7
$
(0.1)
Company Adj. EBIT ($M)
10,416
10,208
(208)
Company Adj. EBIT Margin (%)
5.9 %
5.5 %
(0.4) ppts
Adjusted EPS (Diluted)
$
2.01
$
1.84
$
(0.17)
Adjusted ROIC (Trailing Four Quarters)
13.9 %
12.9 %
(1.0) ppts
__________
(a)
See
Non-GAAP Financial Measure Reconciliations
section for reconciliation to GAAP.
In 2024, our diluted earnings per share of Common and Class B Stock was $1.46 and our diluted adjusted earnings
per share was $1.84.
Net income/(loss) margin was 3.2% in 2024, up from 2.5% in 2023. Company adjusted EBIT margin was 5.5% in
2024, down from 5.9% in 2023.
The table below shows our full year 2024 net income/(loss) attributable to Ford and Company adjusted EBIT by
segment (in millions).
2023
2024
H / (L)
Ford Blue
$
7,453
$
5,269
$
(2,184)
Ford Model e
(4,778)
(5,105)
(327)
Ford Pro
7,217
9,007
1,790
Ford Credit
1,331
1,654
323
Corporate Other
(807)
(617)
190
Company Adjusted EBIT (a)
10,416
10,208
(208)
Interest on Debt
(1,302)
(1,115)
187
Special Items
(5,147)
(1,860)
3,287
Taxes / Noncontrolling Interests
380
(1,354)
(1,734)
Net Income/(Loss)
$
4,347
$
5,879
$
1,532
__________
(a)
See
Non-GAAP Financial Measure Reconciliations
section for reconciliation to GAAP.
The year-over-year increase of $1,532 million in net income/(loss) in 2024 was primarily driven by lower special items
and higher Ford Pro EBIT, offset partially by lower Ford Blue EBIT and higher taxes. The lower year-over-year special
items primarily reflect the non-recurrence of a pension and OPEB remeasurement loss in 2023, a pension remeasurement
gain in 2024, and lower year-over-year restructuring related charges, offset partially by expenses related to the three-row
SUV EV program cancellation. The year-over-year decrease of $208 million in Company adjusted EBIT primarily reflects
lower Ford Blue and Model e EBIT, offset partially by higher Ford Pro EBIT and Ford Credit EBT.
Item 7. Management’s Discussion and Analysis of Financial Condition and Results of Operations (Continued)
57
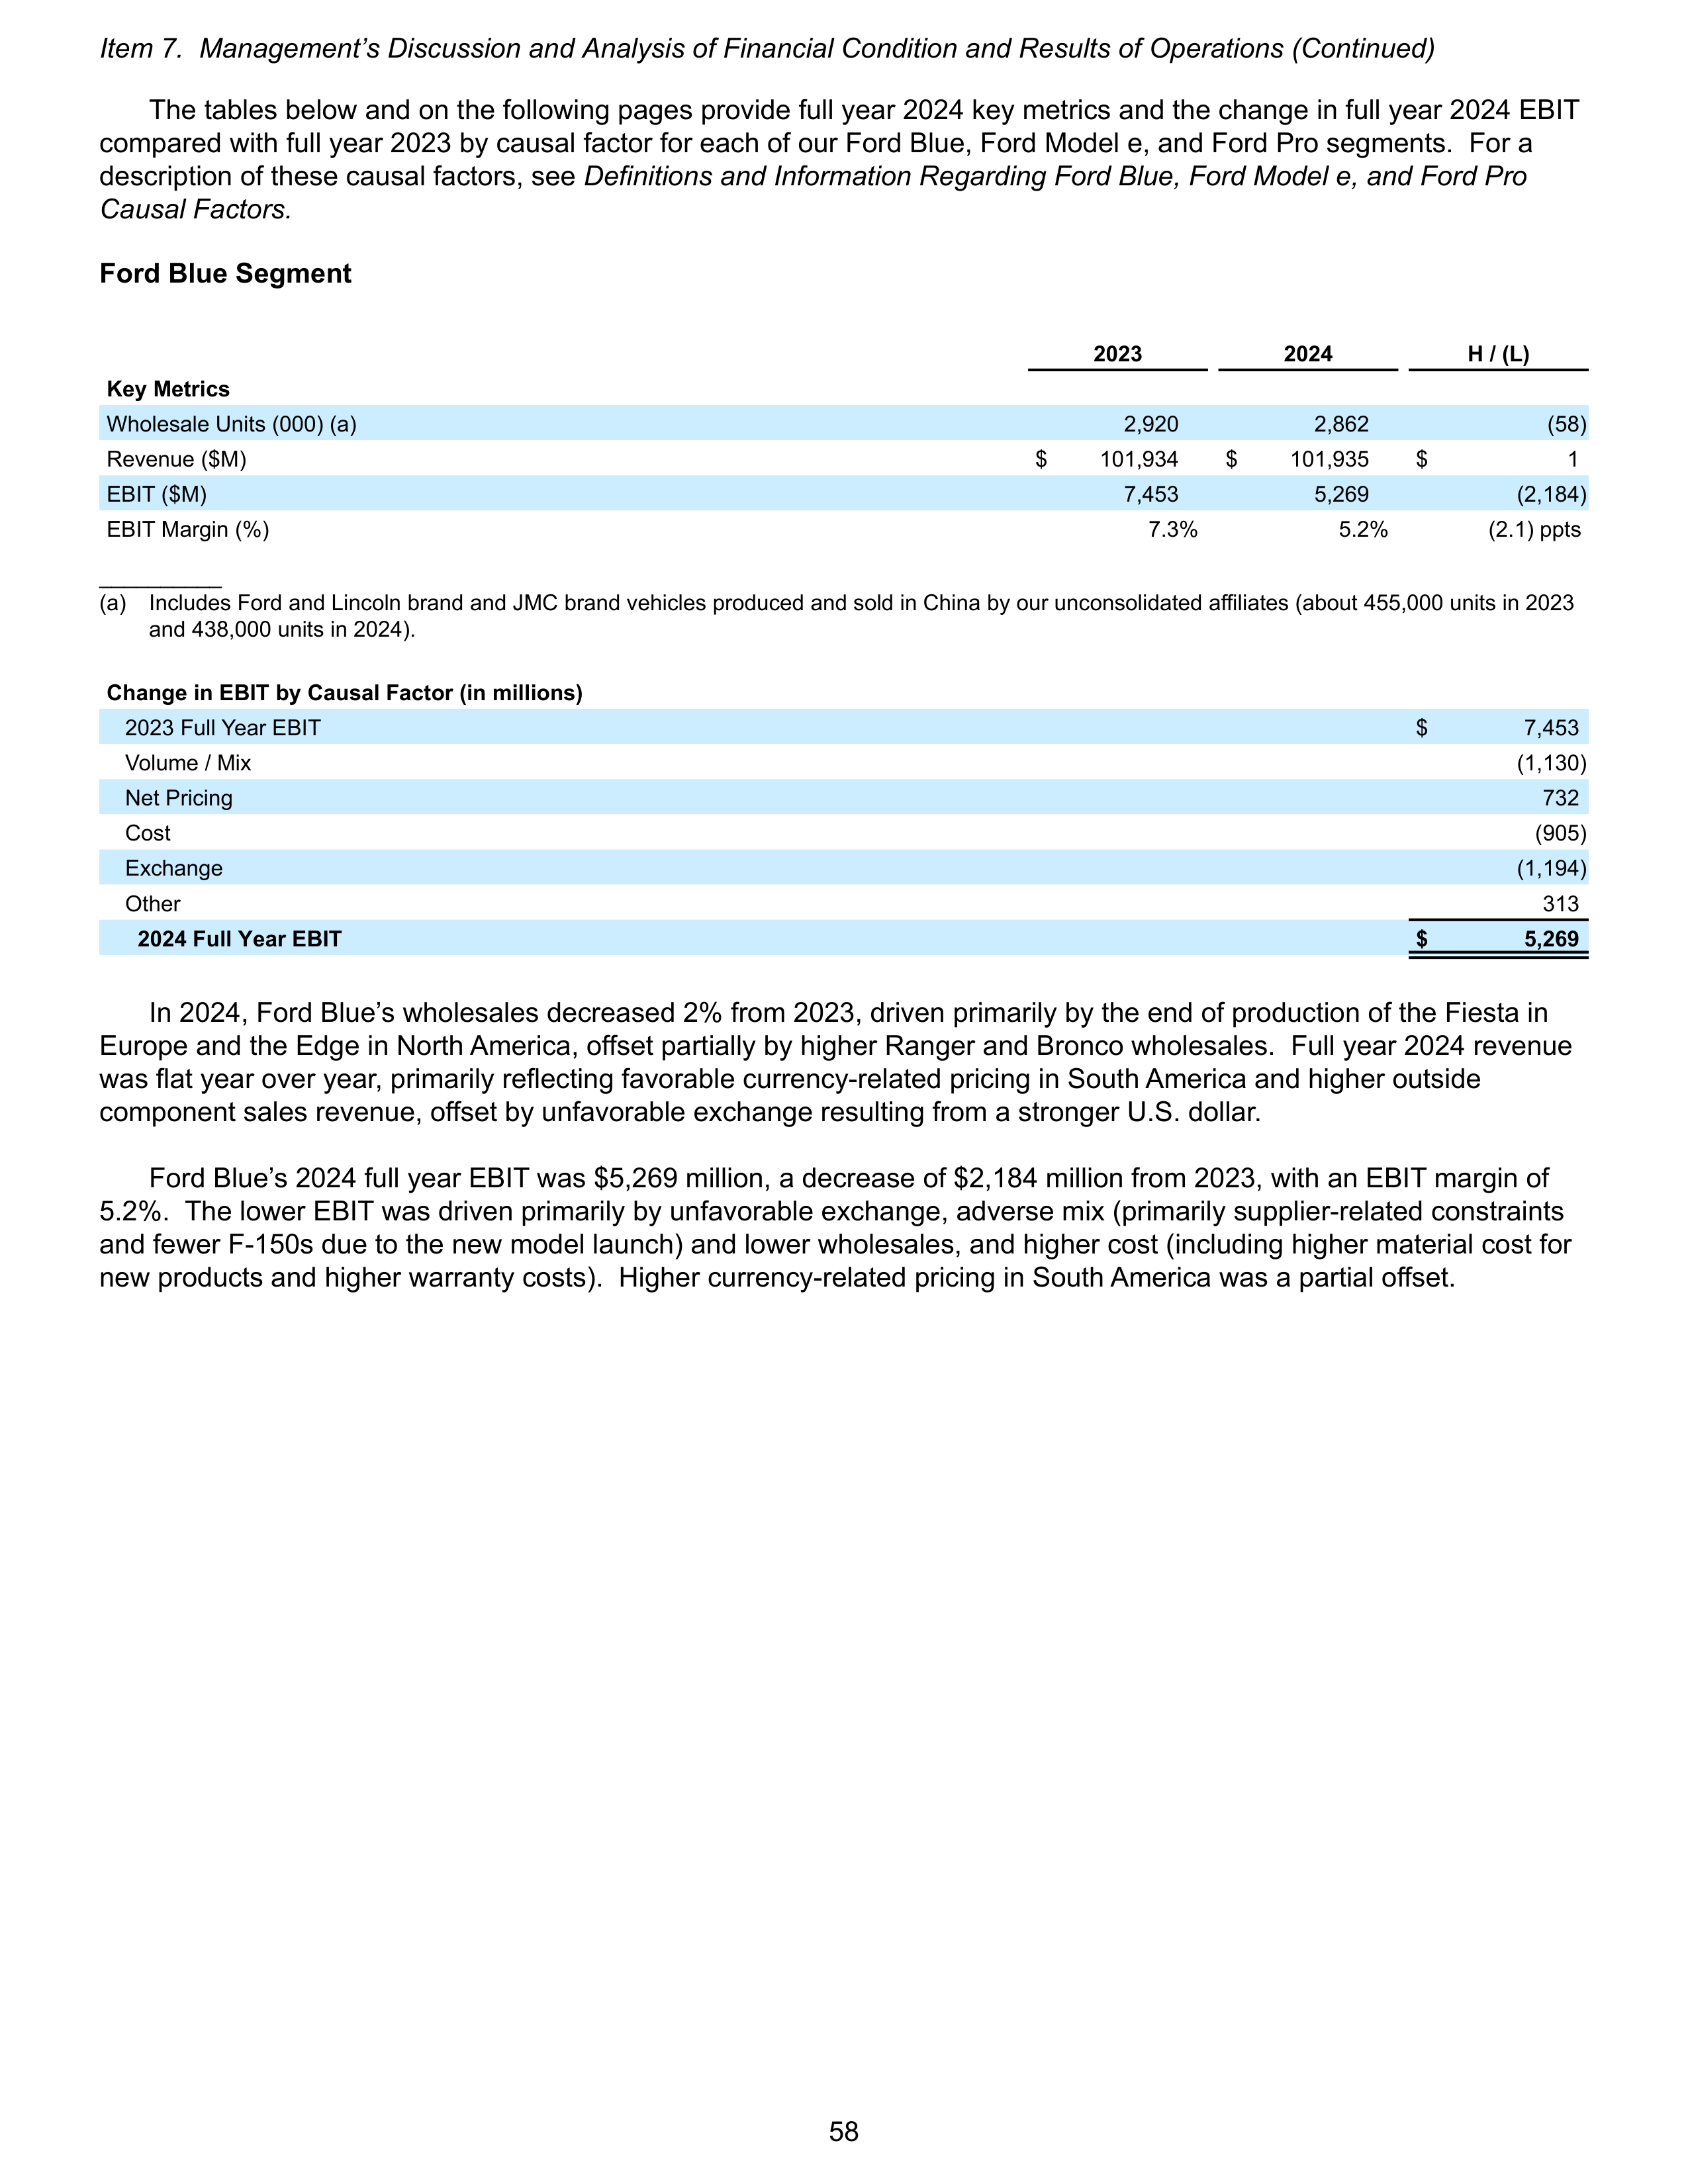
The tables below and on the following pages provide full year 2024 key metrics and the change in full year 2024 EBIT
compared with full year 2023 by causal factor for each of our Ford Blue, Ford Model e, and Ford Pro segments. For a
description of these causal factors, see
Definitions and Information Regarding Ford Blue, Ford Model e, and Ford Pro
Causal Factors.
Ford Blue Segment
2023
2024
H / (L)
Key Metrics
Wholesale Units (000) (a)
2,920
2,862
(58)
Revenue ($M)
$
101,934
$
101,935
$
1
EBIT ($M)
7,453
5,269
(2,184)
EBIT Margin (%)
7.3%
5.2%
(2.1) ppts
__________
(a)
Includes Ford and Lincoln brand and JMC brand vehicles produced and sold in China by our unconsolidated affiliates (about 455,000 units in 2023
and 438,000 units in 2024).
Change in EBIT by Causal Factor (in millions)
2023 Full Year EBIT
$
7,453
Volume / Mix
(1,130)
Net Pricing
732
Cost
(905)
Exchange
(1,194)
Other
313
2024 Full Year EBIT
$
5,269
In 2024, Ford Blue’s wholesales decreased 2% from 2023, driven primarily by the end of production of the Fiesta in
Europe and the Edge in North America, offset partially by higher Ranger and Bronco wholesales. Full year 2024 revenue
was flat year over year, primarily reflecting favorable currency-related pricing in South America and higher outside
component sales revenue, offset by unfavorable exchange resulting from a stronger U.S. dollar.
Ford Blue’s 2024 full year EBIT was $5,269 million, a decrease of $2,184 million from 2023, with an EBIT margin of
5.2%. The lower EBIT was driven primarily by unfavorable exchange, adverse mix (primarily supplier-related constraints
and fewer F-150s due to the new model launch) and lower wholesales, and higher cost (including higher material cost for
new products and higher warranty costs). Higher currency-related pricing in South America was a partial offset.
Item 7. Management’s Discussion and Analysis of Financial Condition and Results of Operations (Continued)
58
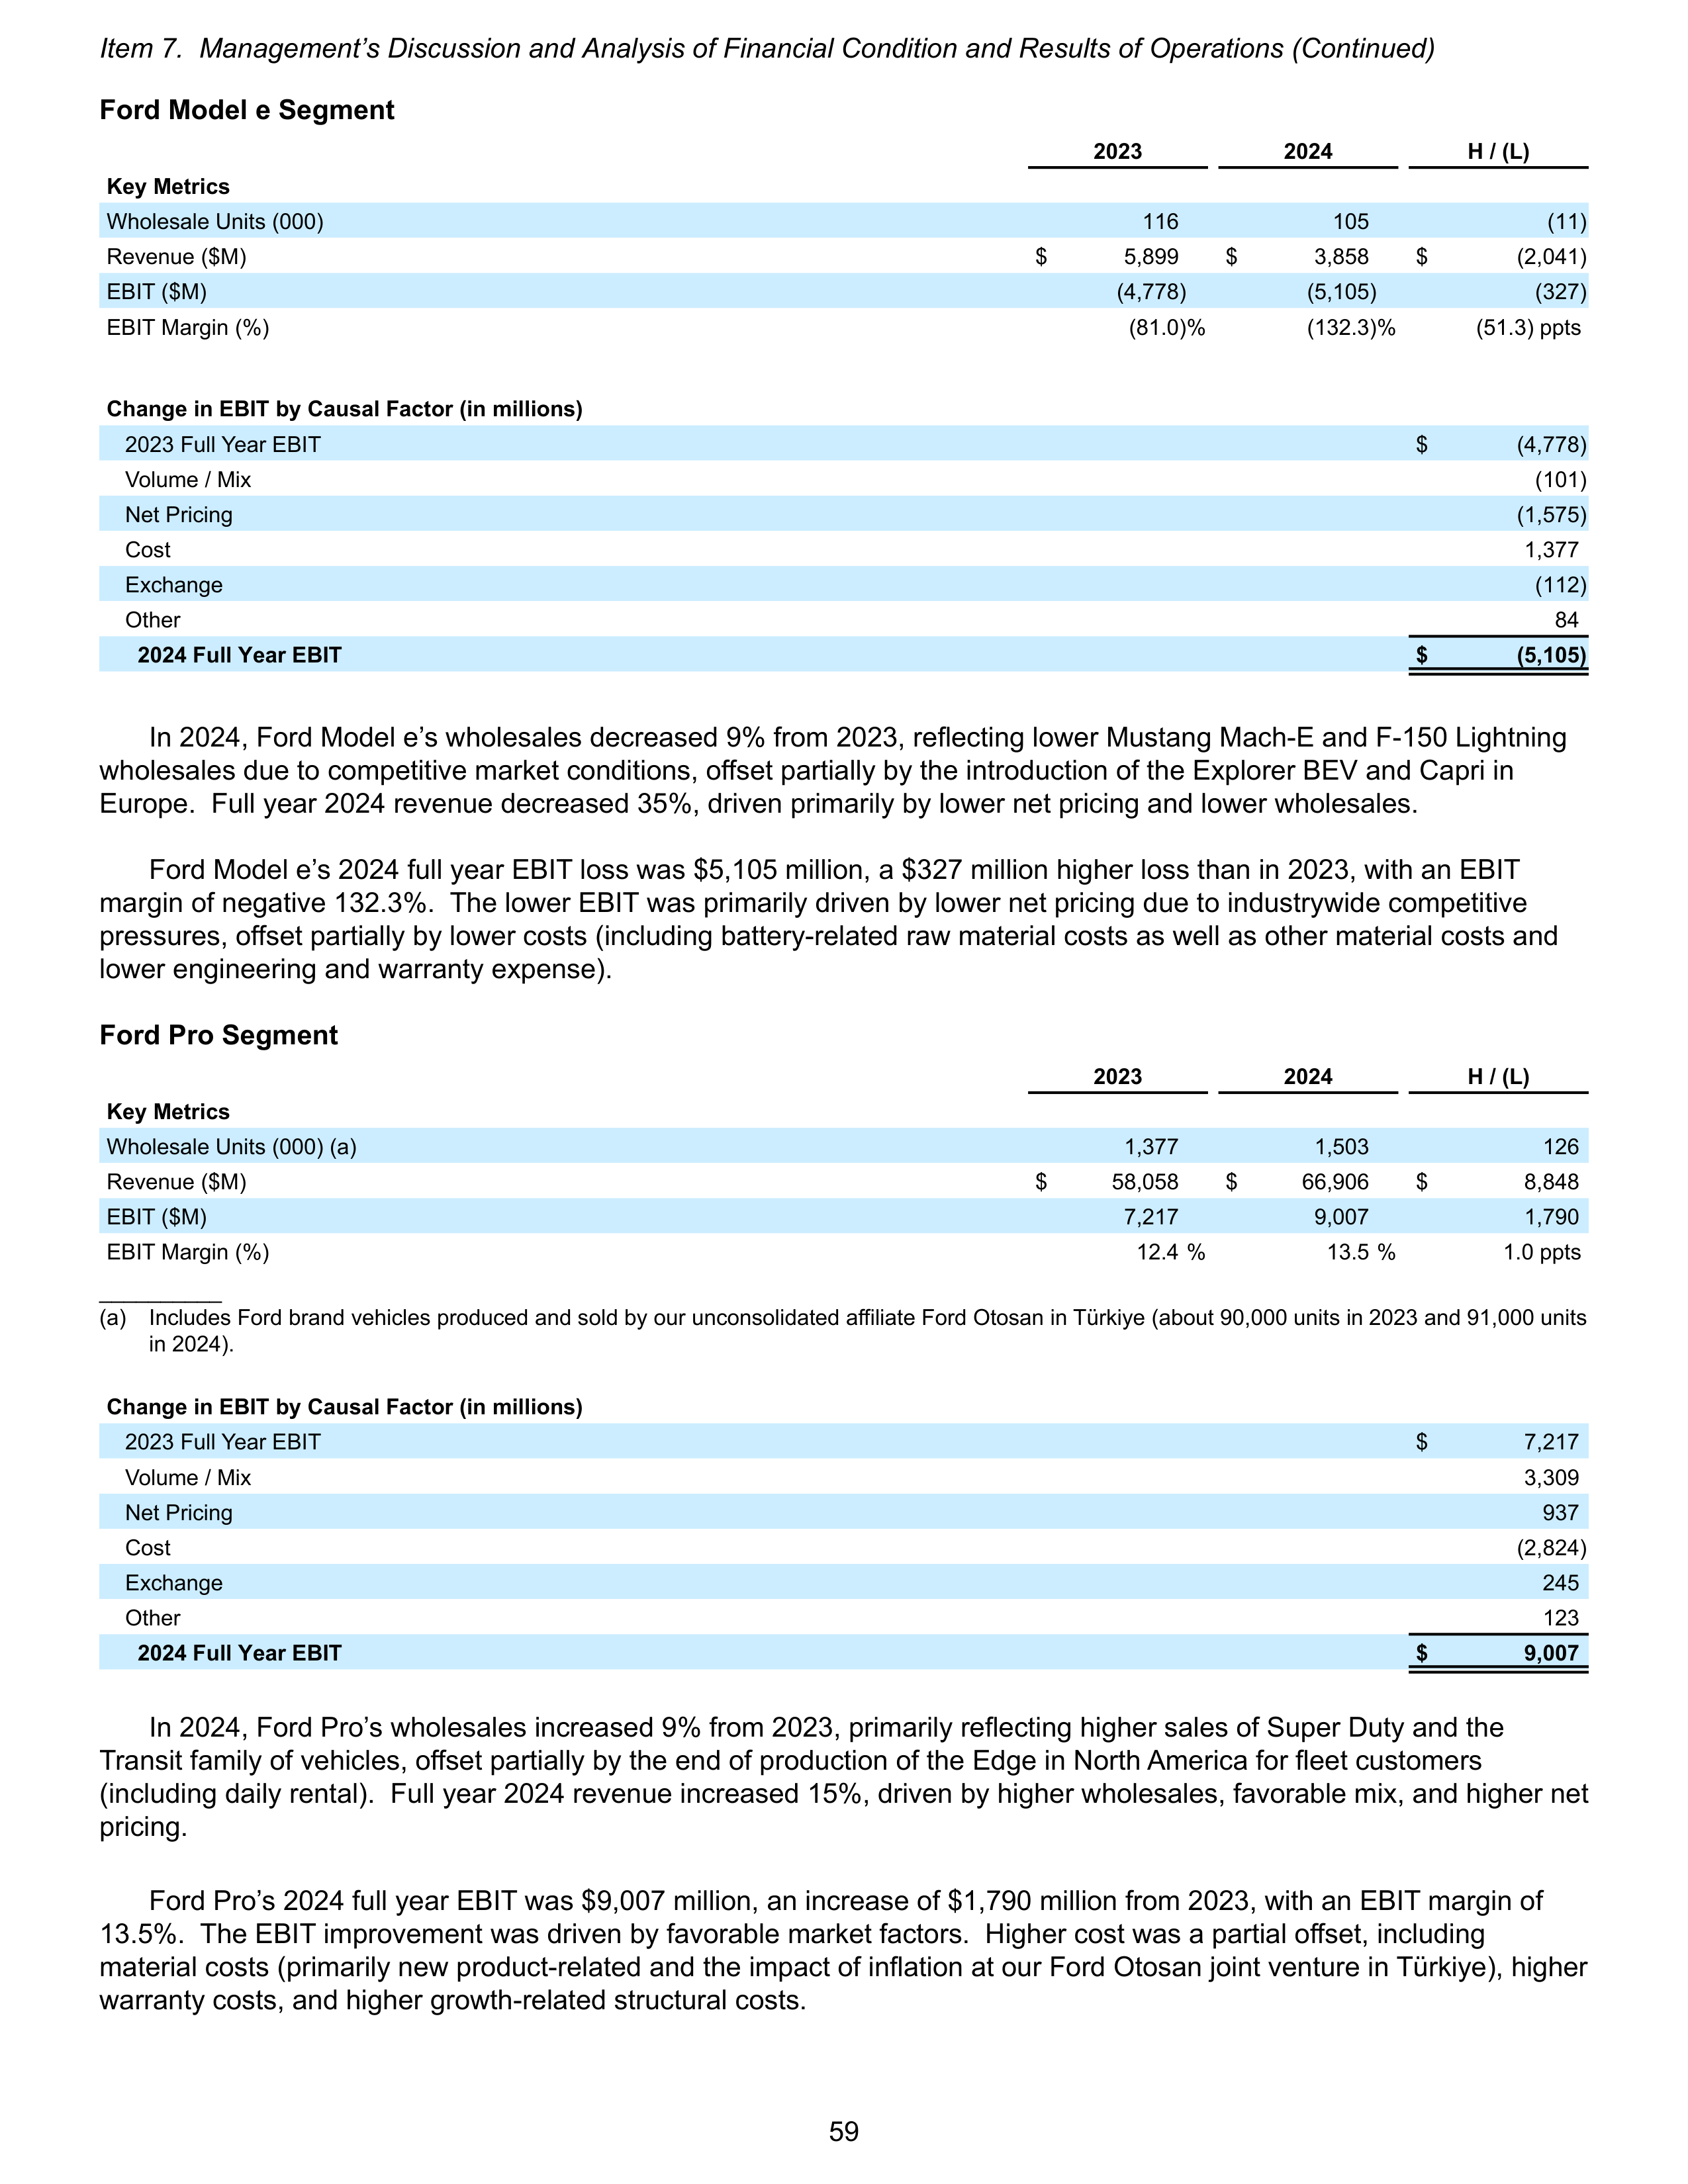
Ford Model e Segment
2023
2024
H / (L)
Key Metrics
Wholesale Units (000)
116
105
(11)
Revenue ($M)
$
5,899
$
3,858
$
(2,041)
EBIT ($M)
(4,778)
(5,105)
(327)
EBIT Margin (%)
(81.0) %
(132.3) %
(51.3) ppts
Change in EBIT by Causal Factor (in millions)
2023 Full Year EBIT
$
(4,778)
Volume / Mix
(101)
Net Pricing
(1,575)
Cost
1,377
Exchange
(112)
Other
84
2024 Full Year EBIT
$
(5,105)
In 2024, Ford Model e’s wholesales decreased 9% from 2023, reflecting lower Mustang Mach-E and F-150 Lightning
wholesales due to competitive market conditions, offset partially by the introduction of the Explorer BEV and Capri in
Europe. Full year 2024 revenue decreased 35%, driven primarily by lower net pricing and lower wholesales.
Ford Model e’s 2024 full year EBIT loss was $5,105 million, a $327 million higher loss than in 2023, with an EBIT
margin of negative 132.3%. The lower EBIT was primarily driven by lower net pricing due to industrywide competitive
pressures, offset partially by lower costs (including battery-related raw material costs as well as other material costs and
lower engineering and warranty expense).
Ford Pro Segment
2023
2024
H / (L)
Key Metrics
Wholesale Units (000) (a)
1,377
1,503
126
Revenue ($M)
$
58,058
$
66,906
$
8,848
EBIT ($M)
7,217
9,007
1,790
EBIT Margin (%)
12.4 %
13.5 %
1.0 ppts
__________
(a)
Includes Ford brand vehicles produced and sold by our unconsolidated affiliate Ford Otosan in Türkiye (about 90,000 units in 2023 and 91,000 units
in 2024).
Change in EBIT by Causal Factor (in millions)
2023 Full Year EBIT
$
7,217
Volume / Mix
3,309
Net Pricing
937
Cost
(2,824)
Exchange
245
Other
123
2024 Full Year EBIT
$
9,007
In 2024, Ford Pro’s wholesales increased 9% from 2023, primarily reflecting higher sales of Super Duty and the
Transit family of vehicles, offset partially by the end of production of the Edge in North America for fleet customers
(including daily rental). Full year 2024 revenue increased 15%, driven by higher wholesales, favorable mix, and higher net
pricing.
Ford Pro’s 2024 full year EBIT was $9,007 million, an increase of $1,790 million from 2023, with an EBIT margin of
13.5%. The EBIT improvement was driven by favorable market factors. Higher cost was a partial offset, including
material costs (primarily new product-related and the impact of inflation at our Ford Otosan joint venture in Türkiye), higher
warranty costs, and higher growth-related structural costs.
Item 7. Management’s Discussion and Analysis of Financial Condition and Results of Operations (Continued)
59
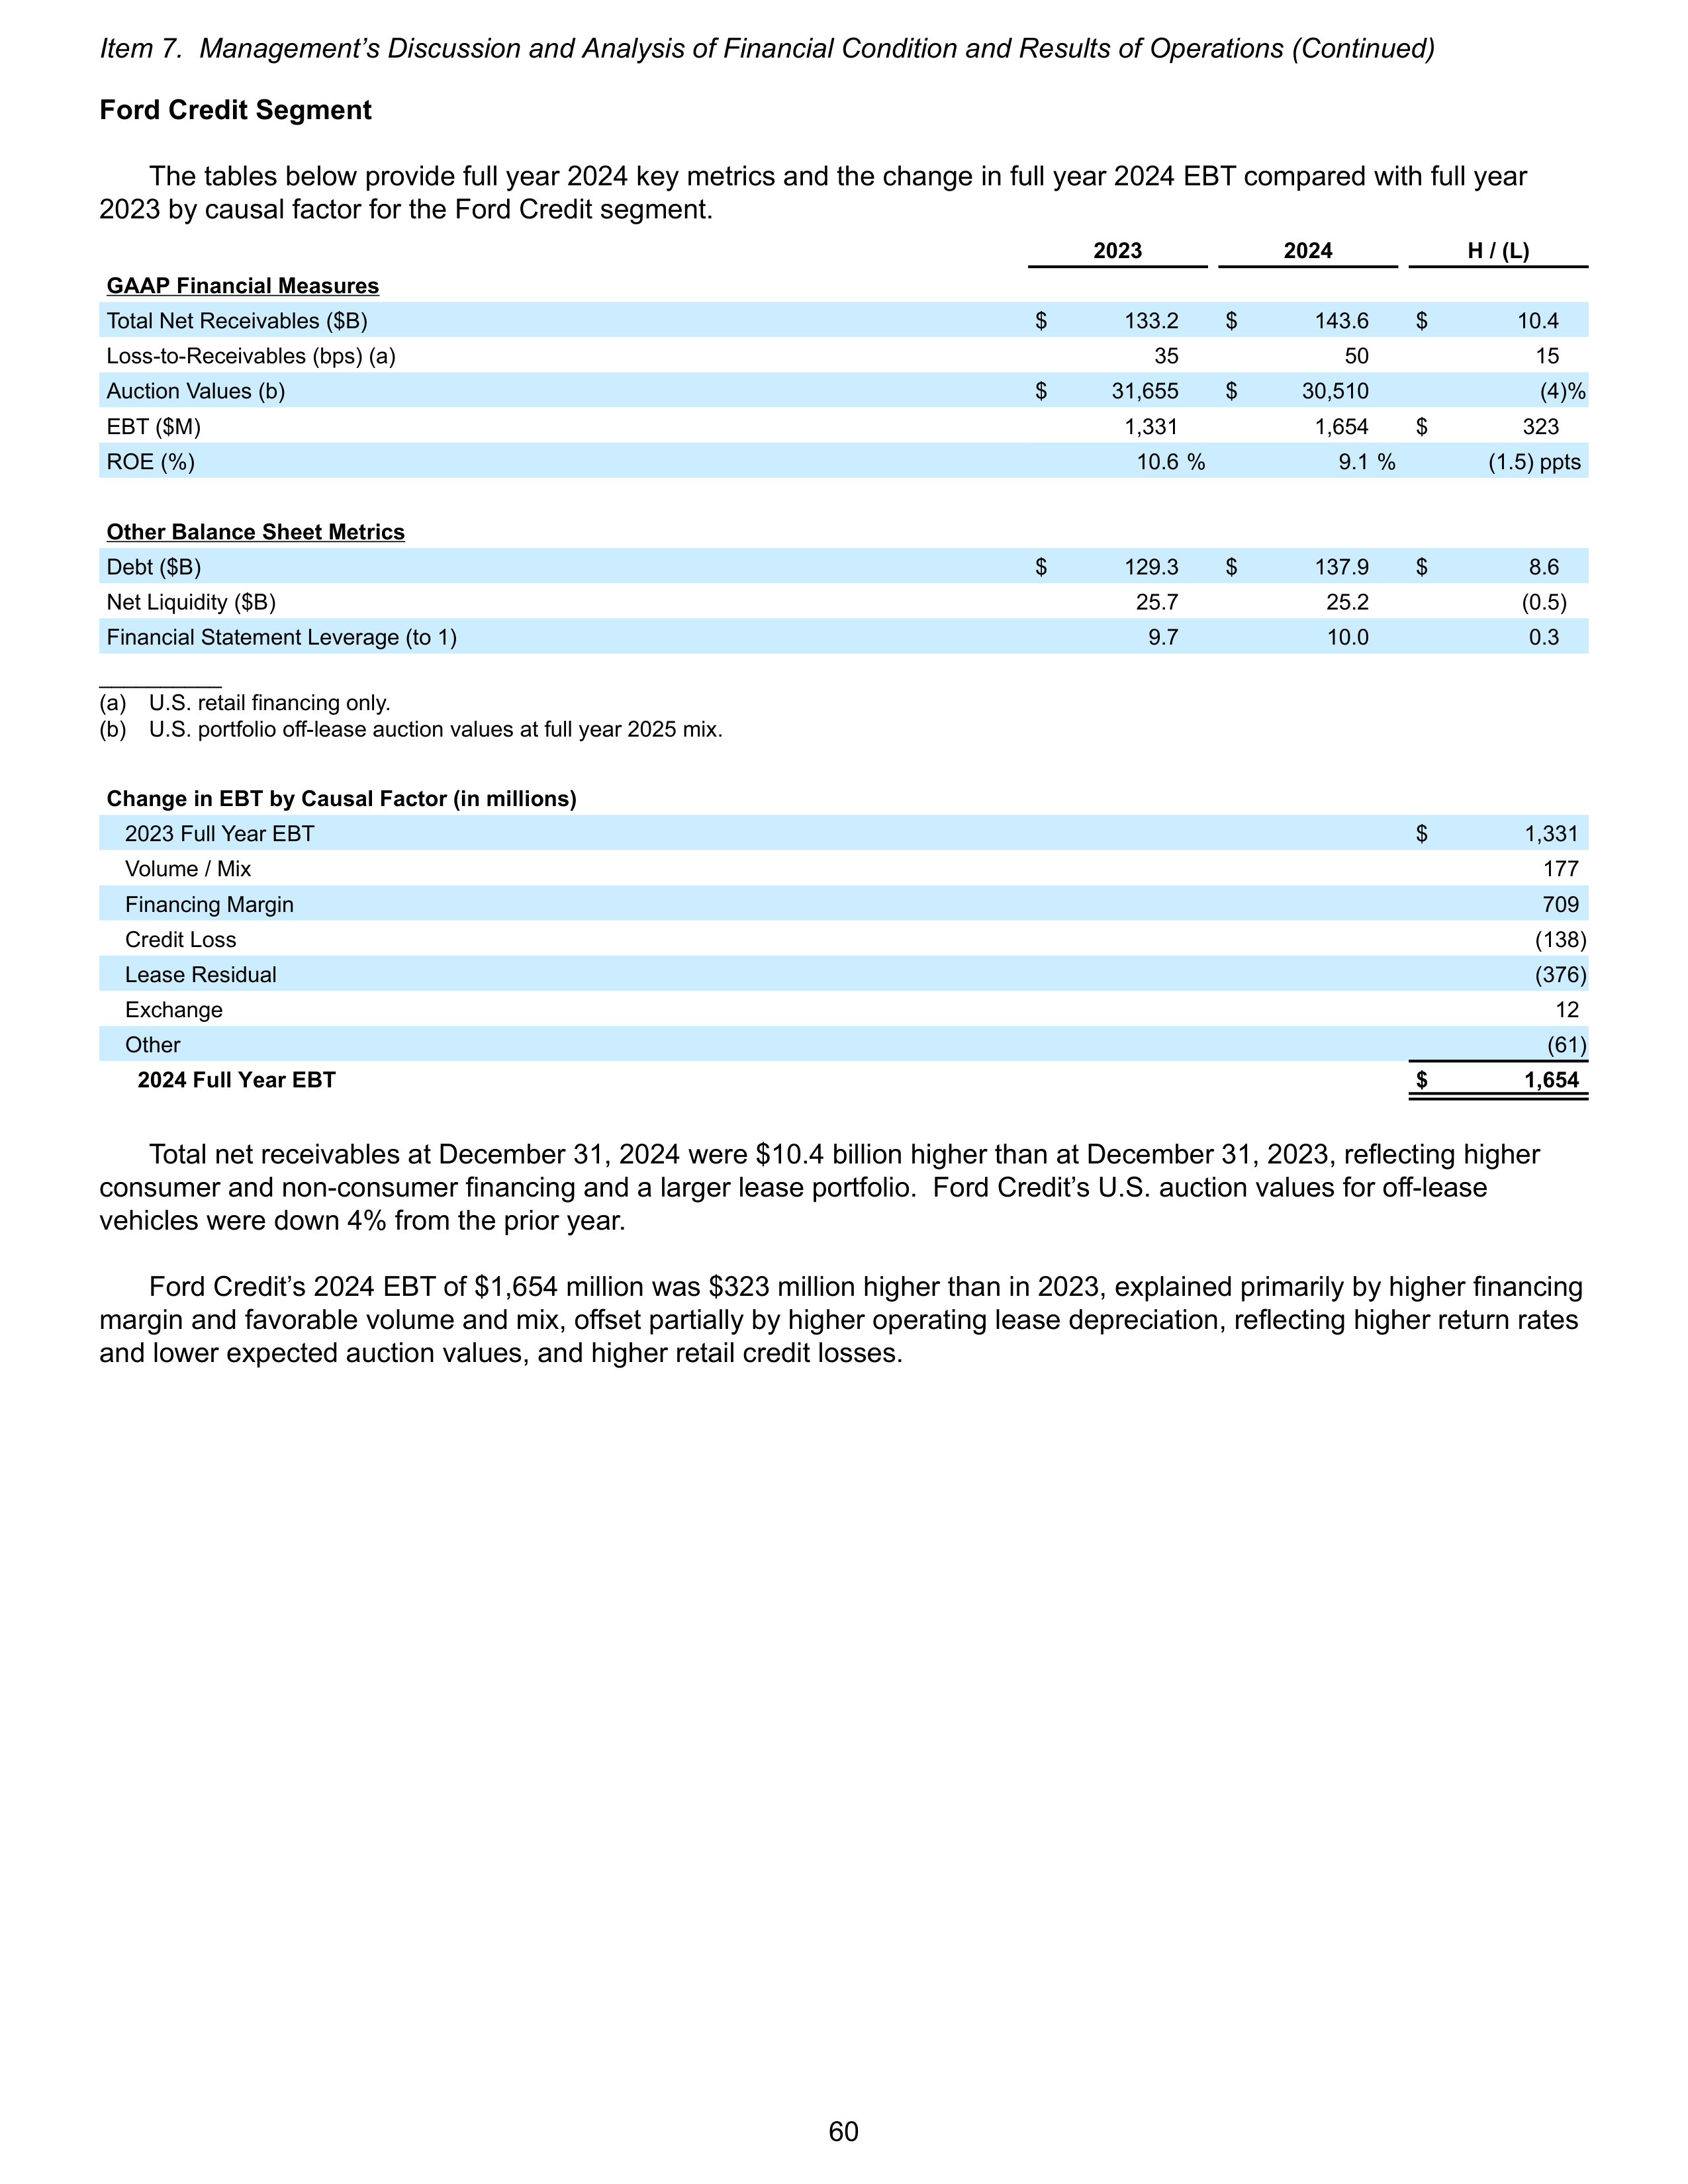
Ford Credit Segment
The tables below provide full year 2024 key metrics and the change in full year 2024 EBT compared with full year
2023 by causal factor for the Ford Credit segment.
2023
2024
H / (L)
GAAP Financial Measures
Total Net Receivables ($B)
$
133.2
$
143.6
$
10.4
Loss-to-Receivables (bps) (a)
35
50
15
Auction Values (b)
$
31,655
$
30,510
(4) %
EBT ($M)
1,331
1,654
$
323
ROE (%)
10.6 %
9.1 %
(1.5) ppts
Other Balance Sheet Metrics
Debt ($B)
$
129.3
$
137.9
$
8.6
Net Liquidity ($B)
25.7
25.2
(0.5)
Financial Statement Leverage (to 1)
9.7
10.0
0.3
__________
(a)
U.S. retail financing only.
(b)
U.S. portfolio off-lease auction values at full year 2025 mix.
Change in EBT by Causal Factor (in millions)
2023 Full Year EBT
$
1,331
Volume / Mix
177
Financing Margin
709
Credit Loss
(138)
Lease Residual
(376)
Exchange
12
Other
(61)
2024 Full Year EBT
$
1,654
Total net receivables at December 31, 2024 were $10.4 billion higher than at December 31, 2023, reflecting higher
consumer and non-consumer financing and a larger lease portfolio. Ford Credit’s U.S. auction values for off-lease
vehicles were down 4% from the prior year.
Ford Credit’s 2024 EBT of $1,654 million was $323 million higher than in 2023, explained primarily by higher financing
margin and favorable volume and mix, offset partially by higher operating lease depreciation, reflecting higher return rates
and lower expected auction values, and higher retail credit losses.
Item 7. Management’s Discussion and Analysis of Financial Condition and Results of Operations (Continued)
60
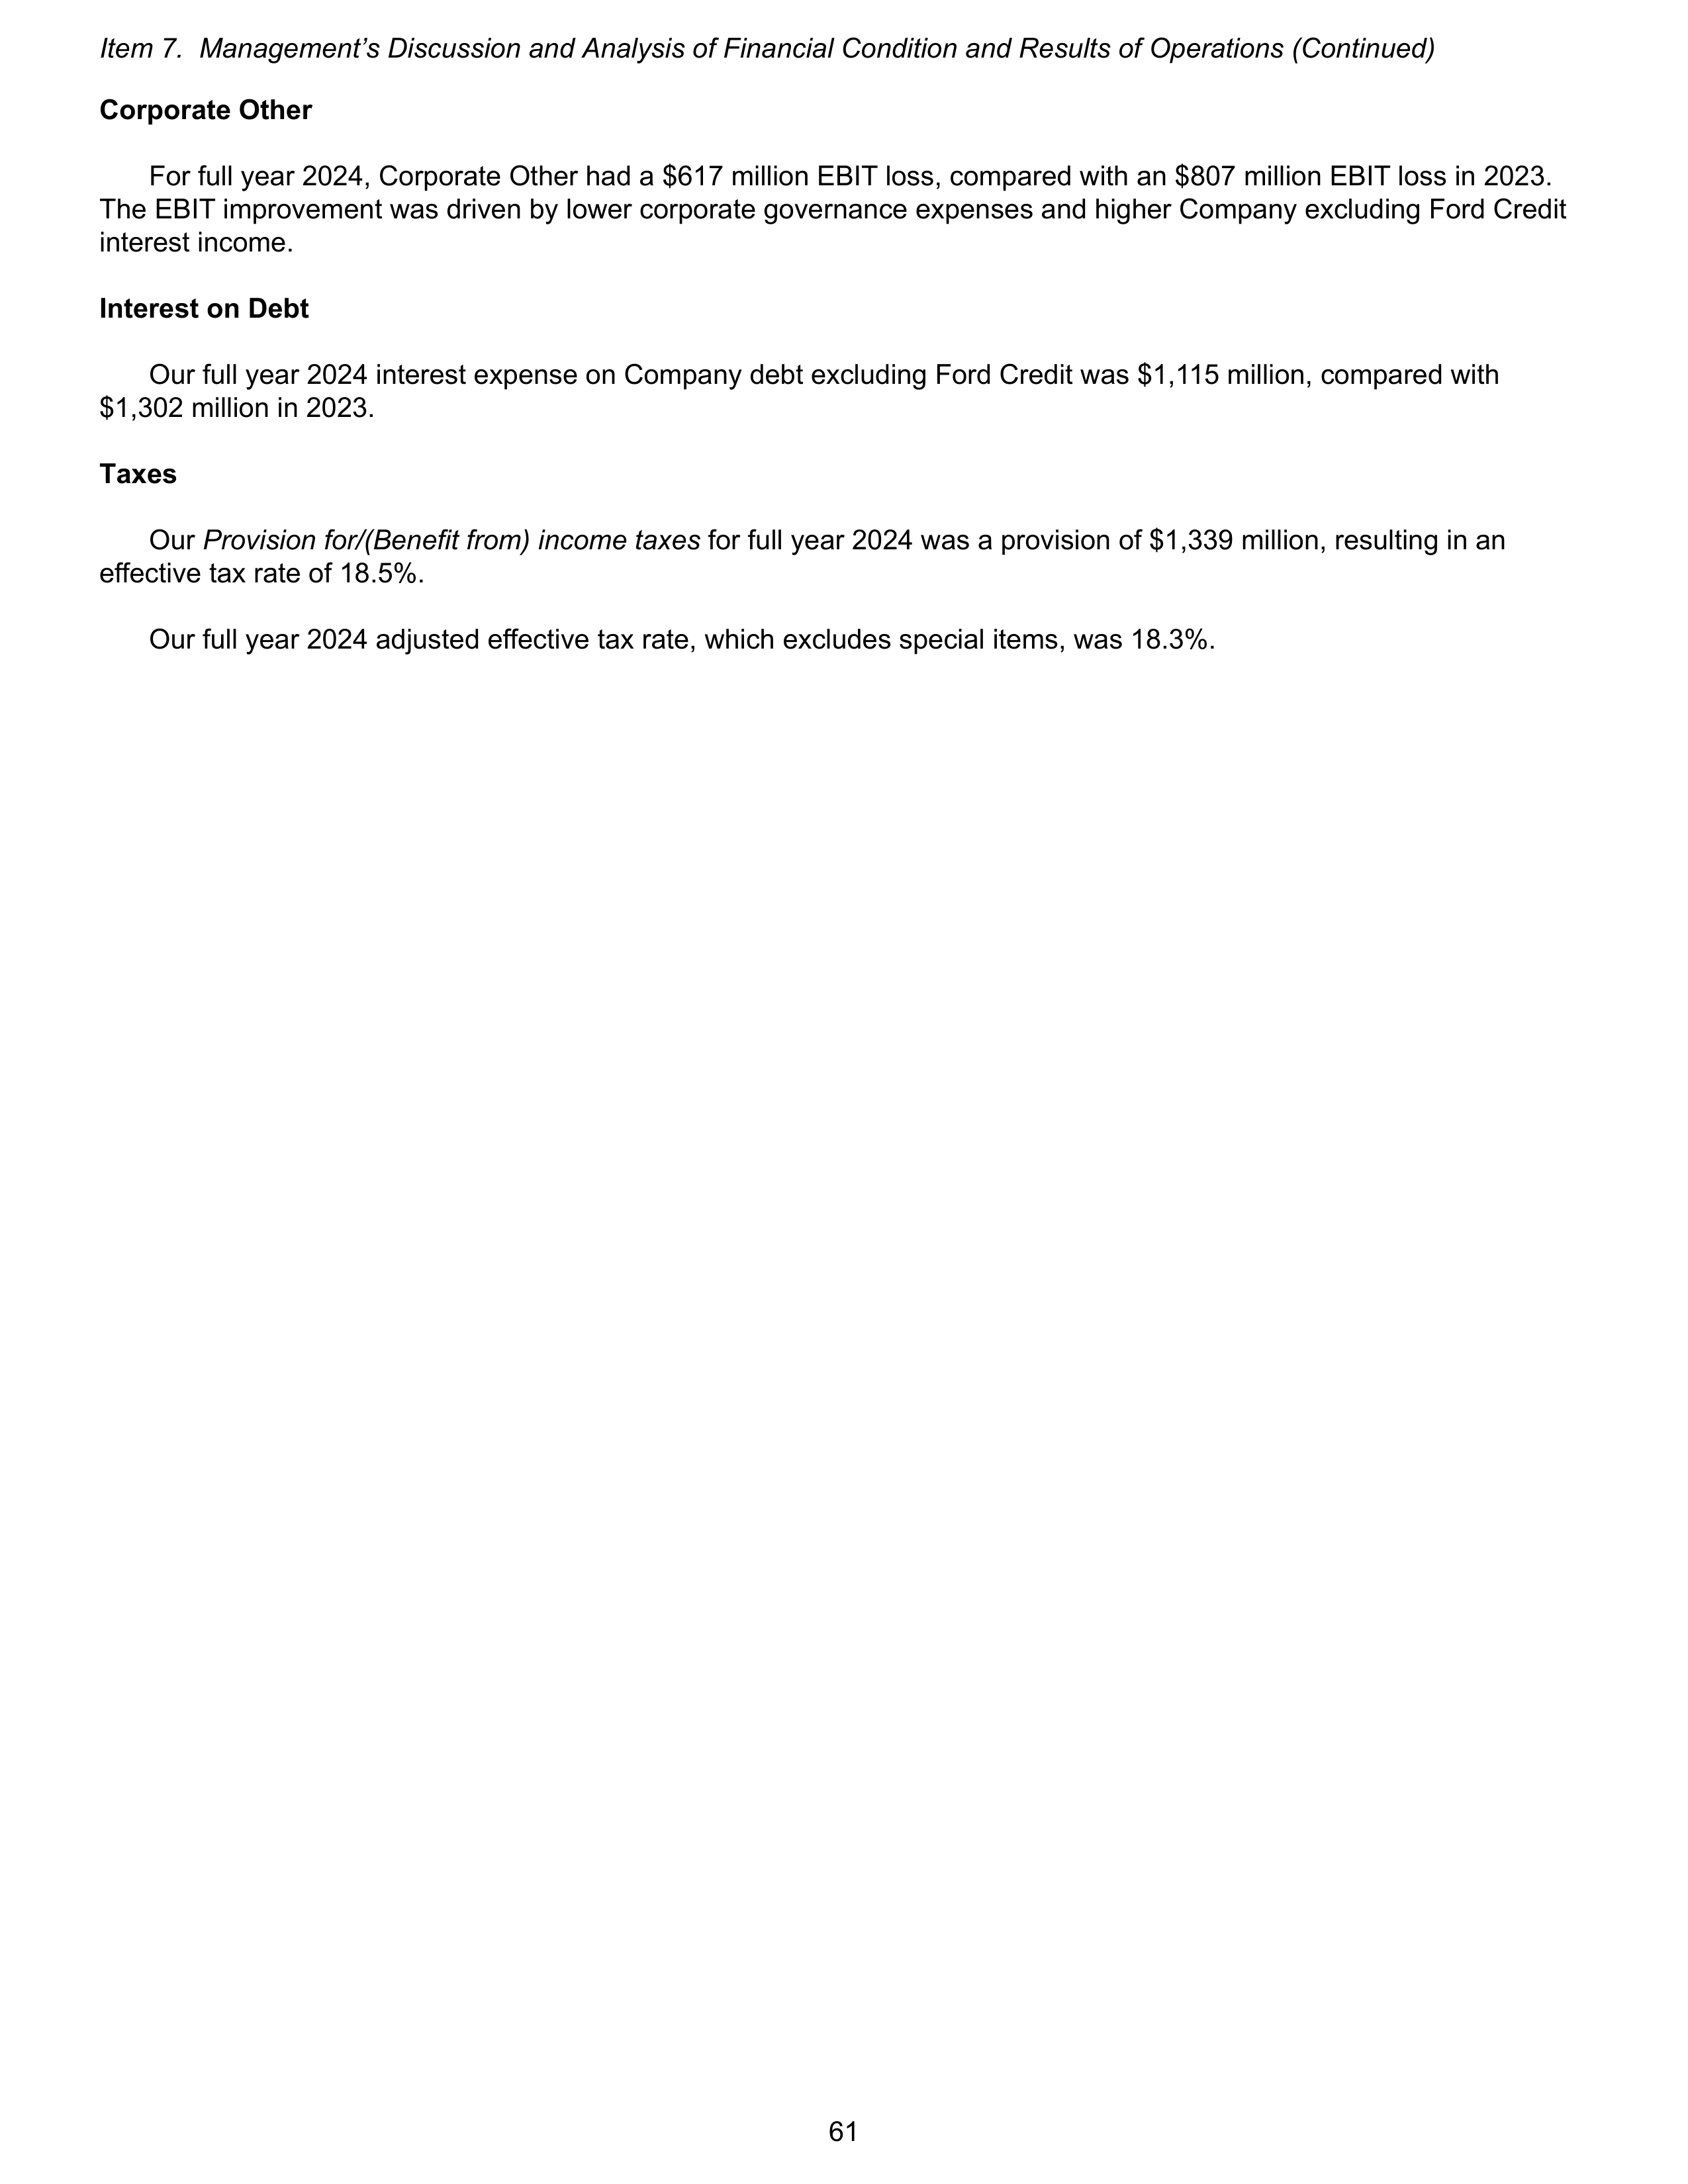
Corporate Other
For full year 2024, Corporate Other had a $617 million EBIT loss, compared with an $807 million EBIT loss in 2023.
The EBIT improvement was driven by lower corporate governance expenses and higher Company excluding Ford Credit
interest income.
Interest on Debt
Our full year 2024 interest expense on Company debt excluding Ford Credit was $1,115 million, compared with
$1,302 million in 2023.
Taxes
Our
Provision for/(Benefit from) income taxes
for full year 2024 was a provision of $1,339 million, resulting in an
effective tax rate of 18.5%.
Our full year 2024 adjusted effective tax rate, which excludes special items, was 18.3%.
Item 7. Management’s Discussion and Analysis of Financial Condition and Results of Operations (Continued)
61
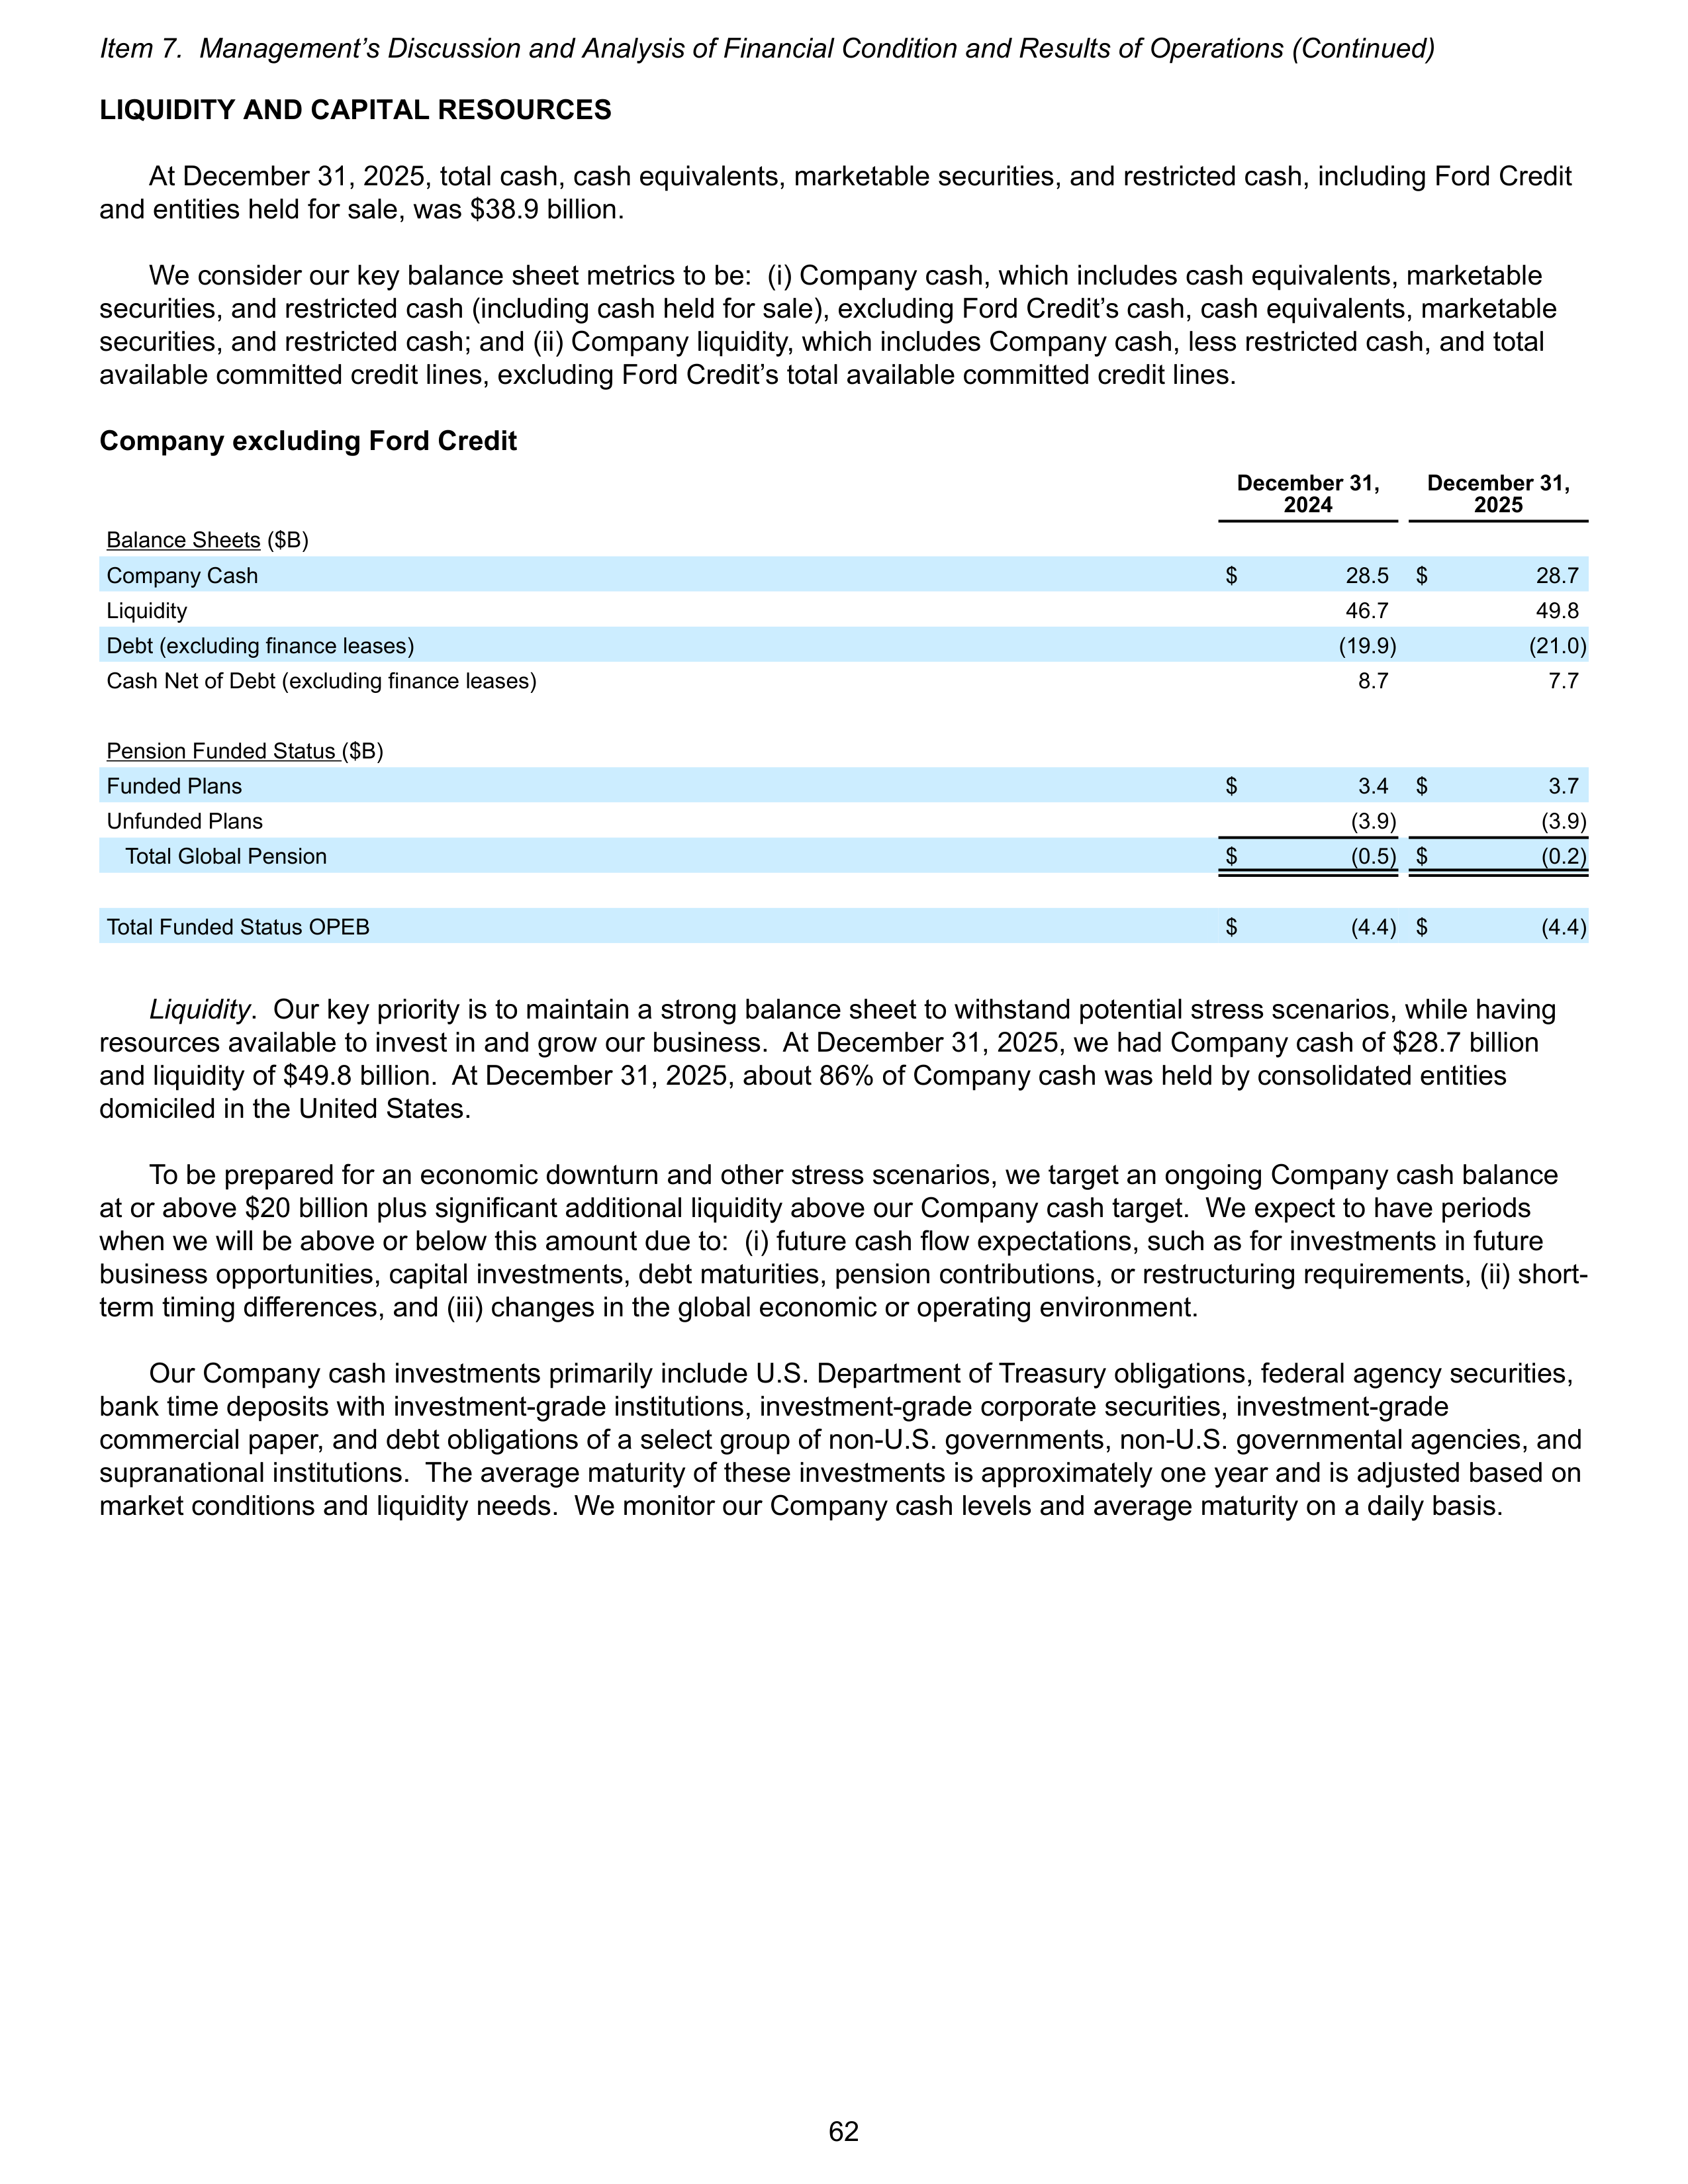
LIQUIDITY AND CAPITAL RESOURCES
At December 31, 2025, total cash, cash equivalents, marketable securities, and restricted cash, including Ford Credit
and entities held for sale, was $38.9 billion.
We consider our key balance sheet metrics to be: (i) Company cash, which includes cash equivalents, marketable
securities, and restricted cash (including cash held for sale), excluding Ford Credit’s cash, cash equivalents, marketable
securities, and restricted cash; and (ii) Company liquidity, which includes Company cash, less restricted cash, and total
available committed credit lines, excluding Ford Credit’s total available committed credit lines.
Company excluding Ford Credit
December 31,
2024
December 31,
2025
Balance Sheets ($B)
Company Cash
$
28.5
$
28.7
Liquidity
46.7
49.8
Debt (excluding finance leases)
(19.9)
(21.0)
Cash Net of Debt (excluding finance leases)
8.7
7.7
Pension Funded Status ($B)
Funded Plans
$
3.4
$
3.7
Unfunded Plans
(3.9)
(3.9)
Total Global Pension
$
(0.5) $
(0.2)
Total Funded Status OPEB
$
(4.4) $
(4.4)
Liquidity
. Our key priority is to maintain a strong balance sheet to withstand potential stress scenarios, while having
resources available to invest in and grow our business. At December 31, 2025, we had Company cash of $28.7 billion
and liquidity of $49.8 billion. At December 31, 2025, about 86% of Company cash was held by consolidated entities
domiciled in the United States.
To be prepared for an economic downturn and other stress scenarios, we target an ongoing Company cash balance
at or above $20 billion plus significant additional liquidity above our Company cash target. We expect to have periods
when we will be above or below this amount due to: (i) future cash flow expectations, such as for investments in future
business opportunities, capital investments, debt maturities, pension contributions, or restructuring requirements, (ii) short-
term timing differences, and (iii) changes in the global economic or operating environment.
Our Company cash investments primarily include U.S. Department of Treasury obligations, federal agency securities,
bank time deposits with investment-grade institutions, investment-grade corporate securities, investment-grade
commercial paper, and debt obligations of a select group of non-U.S. governments, non-U.S. governmental agencies, and
supranational institutions. The average maturity of these investments is approximately one year and is adjusted based on
market conditions and liquidity needs. We monitor our Company cash levels and average maturity on a daily basis.
Item 7. Management’s Discussion and Analysis of Financial Condition and Results of Operations (Continued)
62
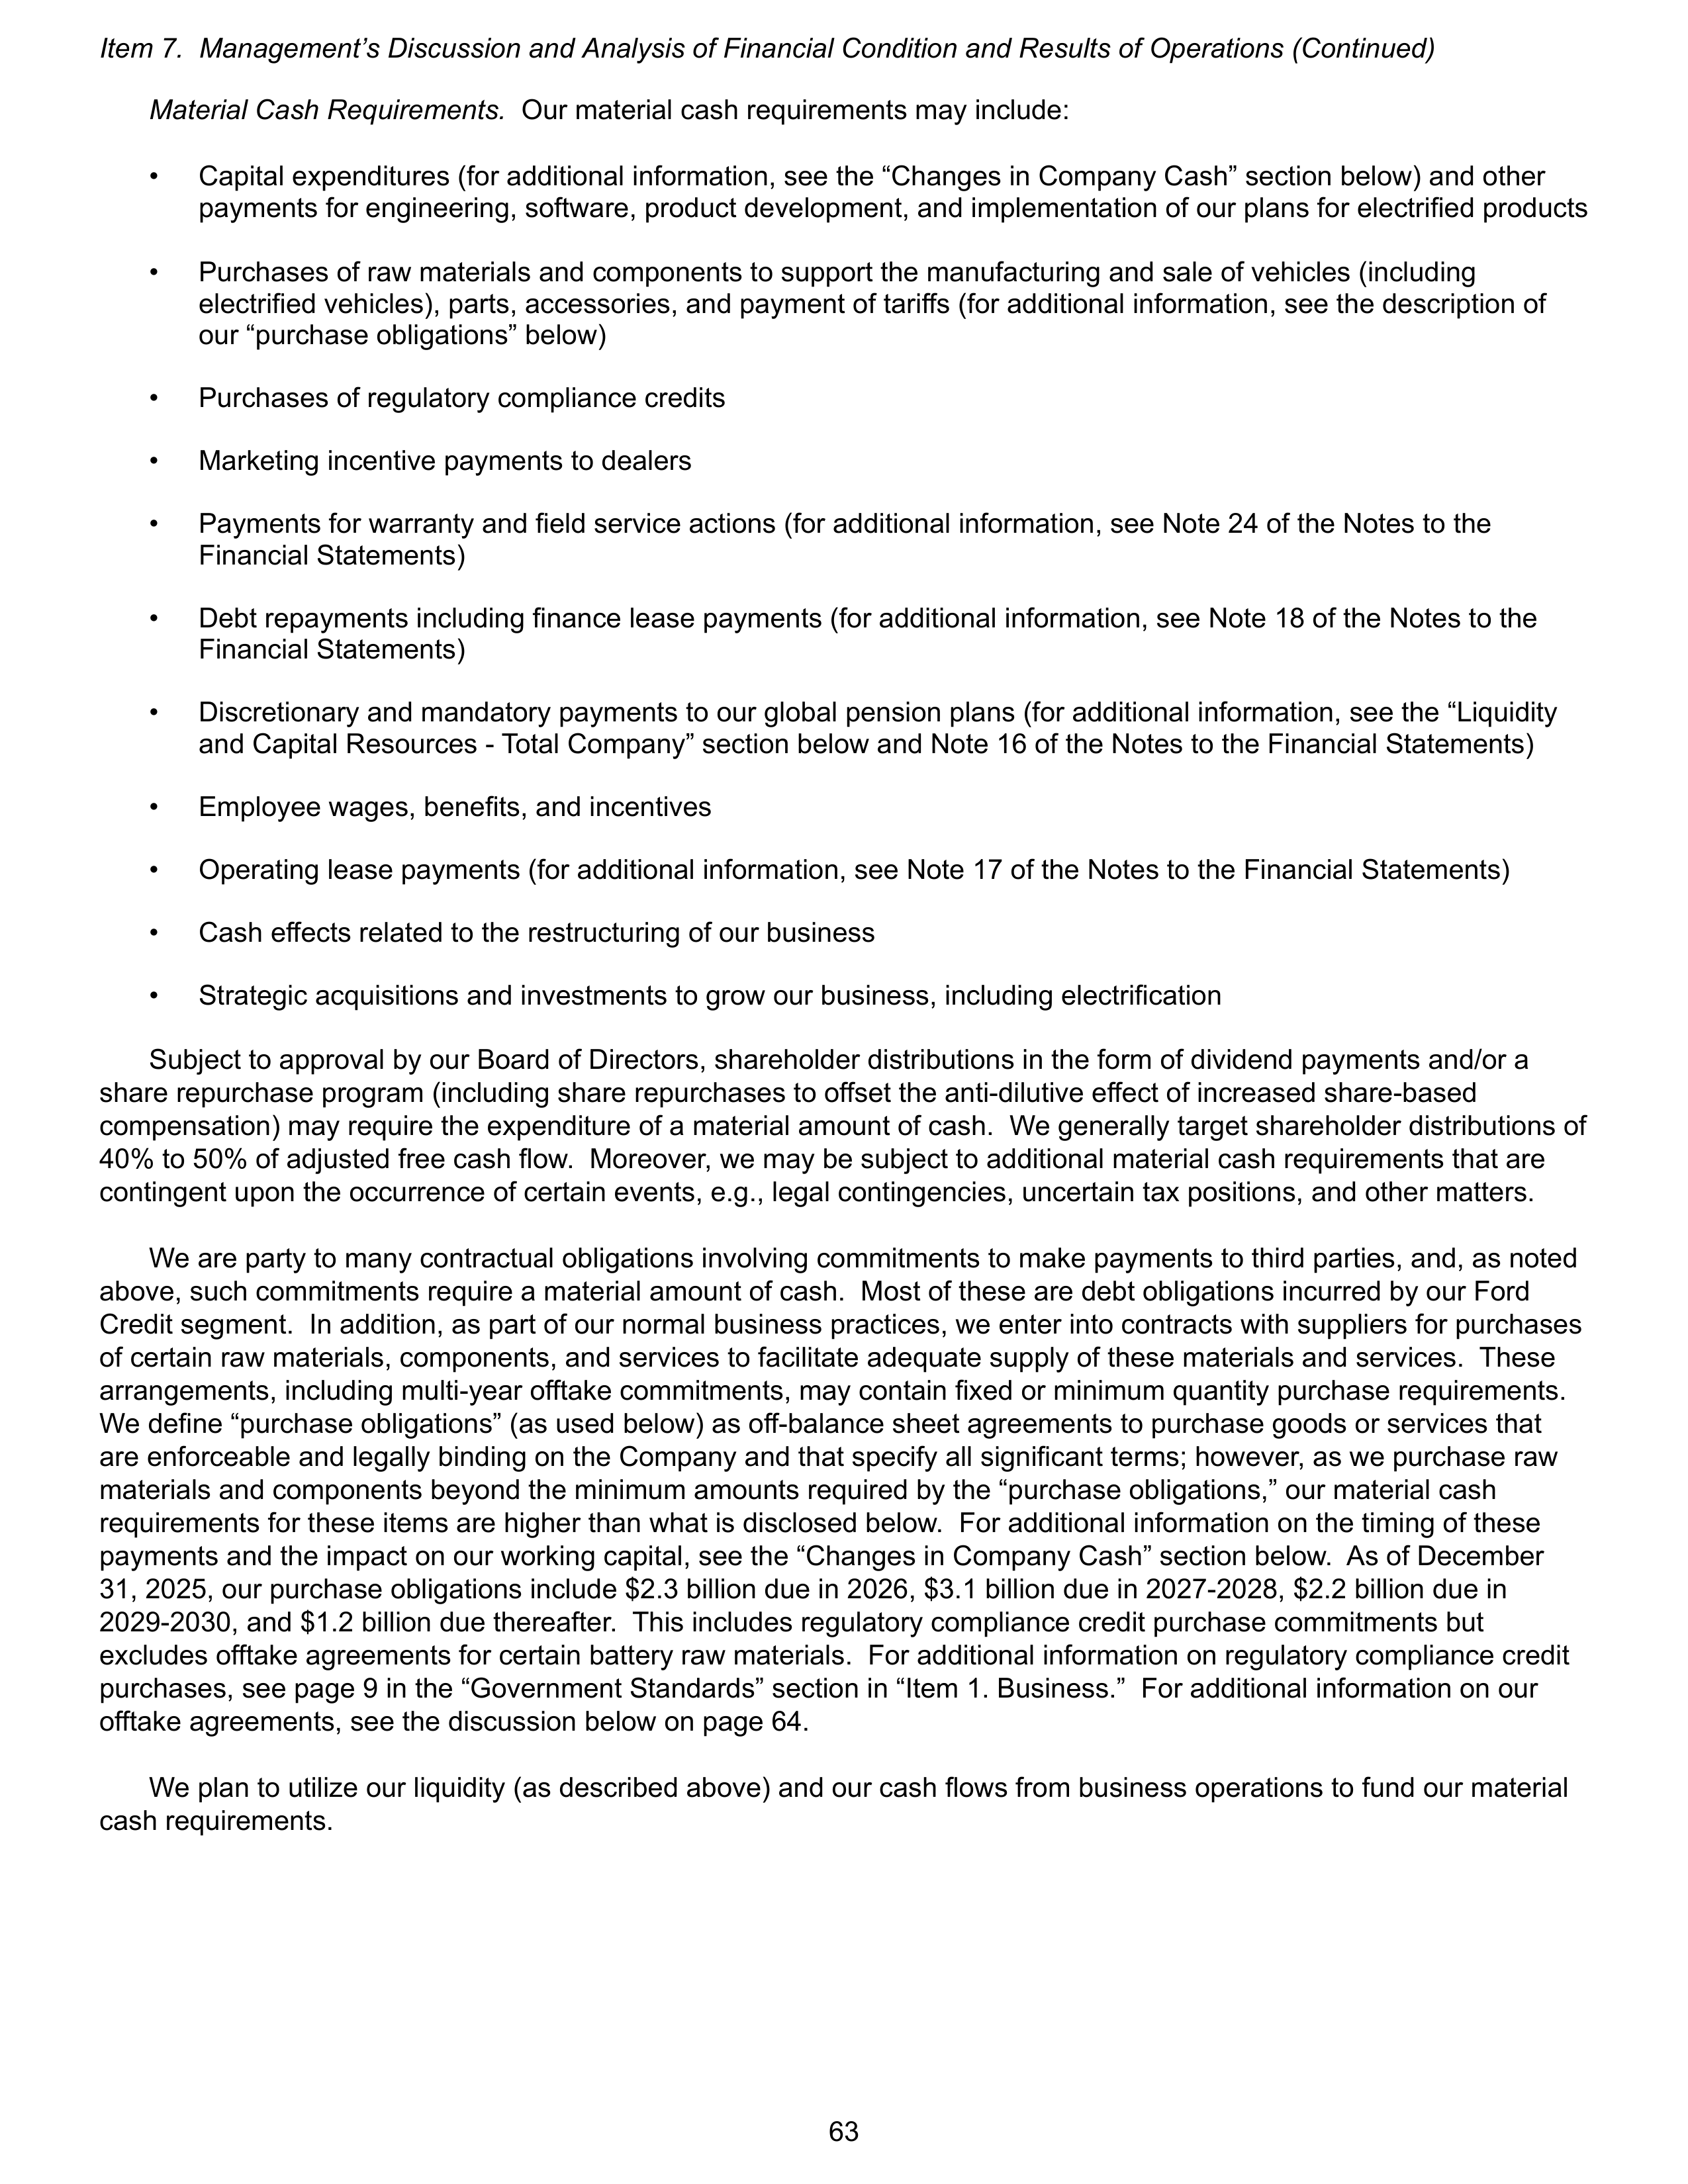
Material Cash Requirements.
Our material cash requirements may include:
•
Capital expenditures (for additional information, see the “Changes in Company Cash” section below) and other
payments for engineering, software, product development, and implementation of our plans for electrified products
•
Purchases of raw materials and components to support the manufacturing and sale of vehicles (including
electrified vehicles), parts, accessories, and payment of tariffs (for additional information, see the description of
our “purchase obligations” below)
•
Purchases of regulatory compliance credits
•
Marketing incentive payments to dealers
•
Payments for warranty and field service actions (for additional information, see Note 24 of the Notes to the
Financial Statements)
•
Debt repayments including finance lease payments (for additional information, see Note 18 of the Notes to the
Financial Statements)
•
Discretionary and mandatory payments to our global pension plans (for additional information, see the “Liquidity
and Capital Resources - Total Company” section below and Note 16 of the Notes to the Financial Statements)
•
Employee wages, benefits, and incentives
•
Operating lease payments (for additional information, see Note 17 of the Notes to the Financial Statements)
•
Cash effects related to the restructuring of our business
•
Strategic acquisitions and investments to grow our business, including electrification
Subject to approval by our Board of Directors, shareholder distributions in the form of dividend payments and/or a
share repurchase program (including share repurchases to offset the anti-dilutive effect of increased share-based
compensation) may require the expenditure of a material amount of cash. We generally target shareholder distributions of
40% to 50% of adjusted free cash flow. Moreover, we may be subject to additional material cash requirements that are
contingent upon the occurrence of certain events, e.g., legal contingencies, uncertain tax positions, and other matters.
We are party to many contractual obligations involving commitments to make payments to third parties, and, as noted
above, such commitments require a material amount of cash. Most of these are debt obligations incurred by our Ford
Credit segment. In addition, as part of our normal business practices, we enter into contracts with suppliers for purchases
of certain raw materials, components, and services to facilitate adequate supply of these materials and services. These
arrangements, including multi-year offtake commitments, may contain fixed or minimum quantity purchase requirements.
We define “purchase obligations” (as used below) as off-balance sheet agreements to purchase goods or services that
are enforceable and legally binding on the Company and that specify all significant terms; however, as we purchase raw
materials and components beyond the minimum amounts required by the “purchase obligations,” our material cash
requirements for these items are higher than what is disclosed below. For additional information on the timing of these
payments and the impact on our working capital, see the “Changes in Company Cash” section below. As of December
31, 2025, our purchase obligations include $2.3 billion due in 2026, $3.1 billion due in 2027-2028, $2.2 billion due in
2029-2030, and $1.2 billion due thereafter. This includes regulatory compliance credit purchase commitments but
excludes offtake agreements for certain battery raw materials. For additional information on regulatory compliance credit
purchases, see page 9 in the “Government Standards” section in “Item 1. Business.” For additional information on our
offtake agreements, see the discussion below on page 64.
We plan to utilize our liquidity (as described above) and our cash flows from business operations to fund our material
cash requirements.
Item 7. Management’s Discussion and Analysis of Financial Condition and Results of Operations (Continued)
63
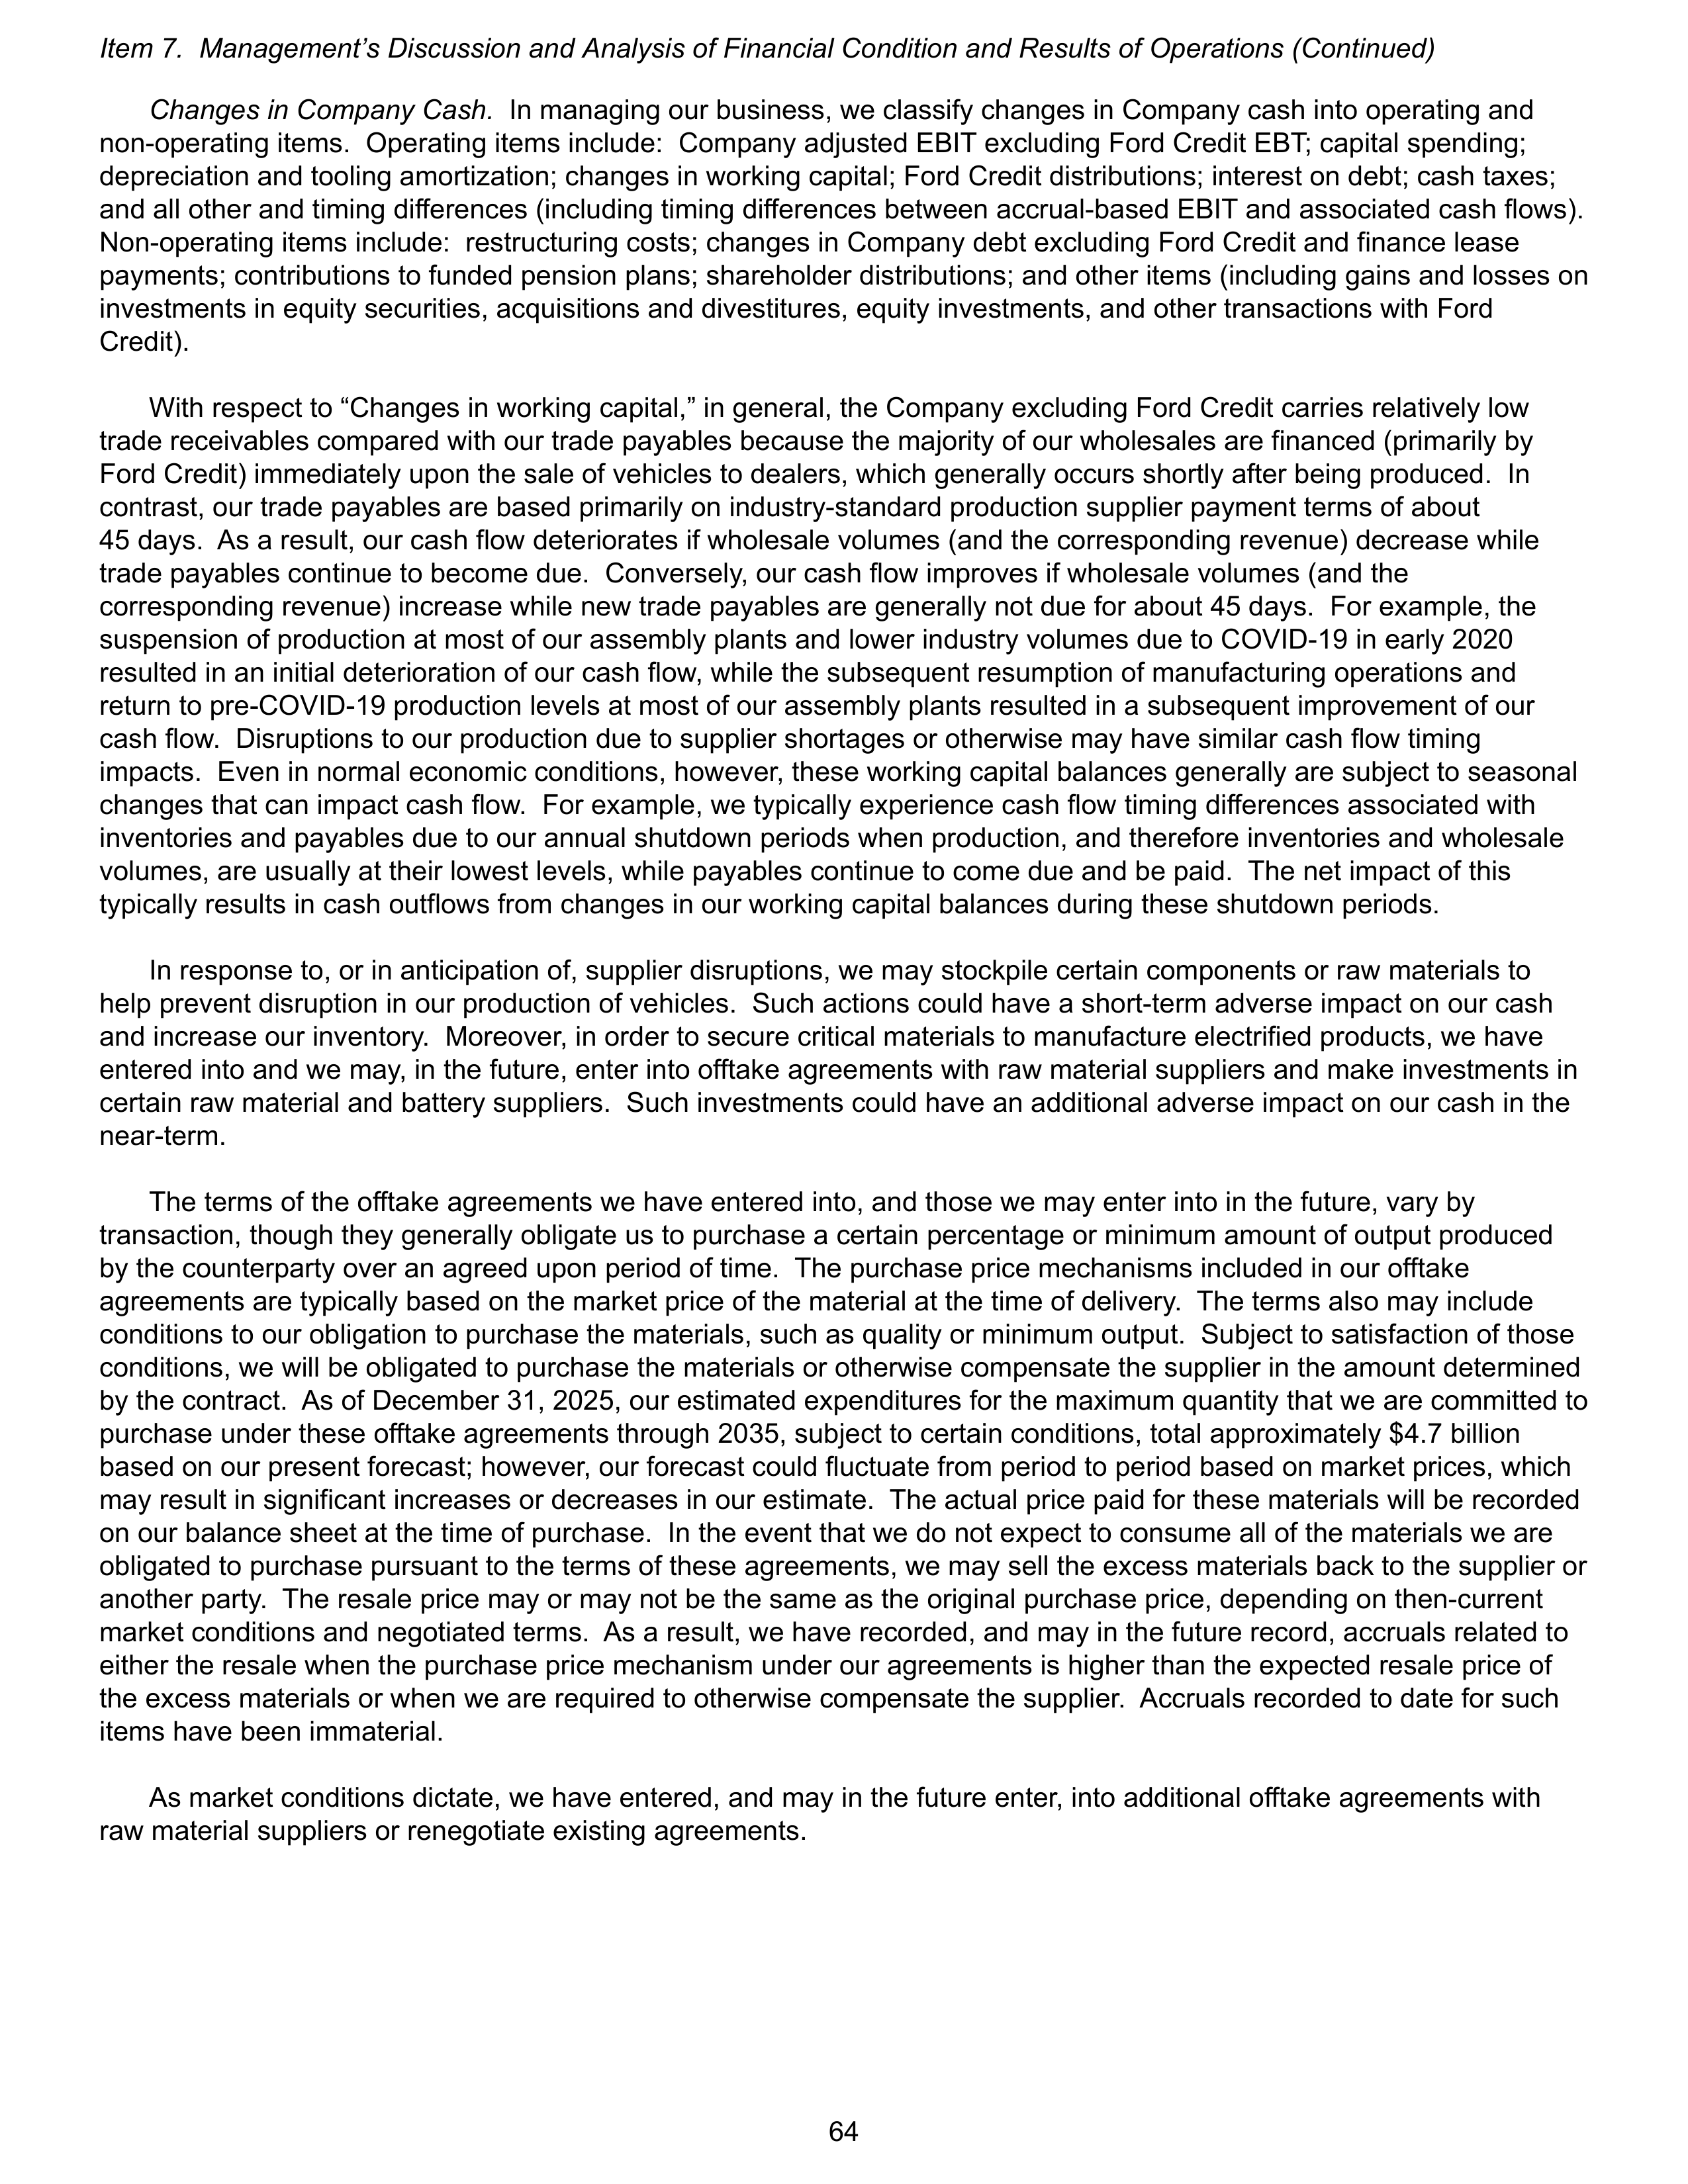
Changes in Company Cash.
In managing our business, we classify changes in Company cash into operating and
non-operating items. Operating items include: Company adjusted EBIT excluding Ford Credit EBT; capital spending;
depreciation and tooling amortization; changes in working capital; Ford Credit distributions; interest on debt; cash taxes;
and all other and timing differences (including timing differences between accrual-based EBIT and associated cash flows).
Non-operating items include: restructuring costs; changes in Company debt excluding Ford Credit and finance lease
payments; contributions to funded pension plans; shareholder distributions; and other items (including gains and losses on
investments in equity securities, acquisitions and divestitures, equity investments, and other transactions with Ford
Credit).
With respect to “Changes in working capital,” in general, the Company excluding Ford Credit carries relatively low
trade receivables compared with our trade payables because the majority of our wholesales are financed (primarily by
Ford Credit) immediately upon the sale of vehicles to dealers, which generally occurs shortly after being produced. In
contrast, our trade payables are based primarily on industry-standard production supplier payment terms of about
45 days. As a result, our cash flow deteriorates if wholesale volumes (and the corresponding revenue) decrease while
trade payables continue to become due. Conversely, our cash flow improves if wholesale volumes (and the
corresponding revenue) increase while new trade payables are generally not due for about 45 days. For example, the
suspension of production at most of our assembly plants and lower industry volumes due to COVID-19 in early 2020
resulted in an initial deterioration of our cash flow, while the subsequent resumption of manufacturing operations and
return to pre-COVID-19 production levels at most of our assembly plants resulted in a subsequent improvement of our
cash flow. Disruptions to our production due to supplier shortages or otherwise may have similar cash flow timing
impacts. Even in normal economic conditions, however, these working capital balances generally are subject to seasonal
changes that can impact cash flow. For example, we typically experience cash flow timing differences associated with
inventories and payables due to our annual shutdown periods when production, and therefore inventories and wholesale
volumes, are usually at their lowest levels, while payables continue to come due and be paid. The net impact of this
typically results in cash outflows from changes in our working capital balances during these shutdown periods.
In response to, or in anticipation of, supplier disruptions, we may stockpile certain components or raw materials to
help prevent disruption in our production of vehicles. Such actions could have a short-term adverse impact on our cash
and increase our inventory. Moreover, in order to secure critical materials to manufacture electrified products, we have
entered into and we may, in the future, enter into offtake agreements with raw material suppliers and make investments in
certain raw material and battery suppliers. Such investments could have an additional adverse impact on our cash in the
near-term.
The terms of the offtake agreements we have entered into, and those we may enter into in the future, vary by
transaction, though they generally obligate us to purchase a certain percentage or minimum amount of output produced
by the counterparty over an agreed upon period of time. The purchase price mechanisms included in our offtake
agreements are typically based on the market price of the material at the time of delivery. The terms also may include
conditions to our obligation to purchase the materials, such as quality or minimum output. Subject to satisfaction of those
conditions, we will be obligated to purchase the materials or otherwise compensate the supplier in the amount determined
by the contract. As of December 31, 2025, our estimated expenditures for the maximum quantity that we are committed to
purchase under these offtake agreements through 2035, subject to certain conditions, total approximately $4.7 billion
based on our present forecast; however, our forecast could fluctuate from period to period based on market prices, which
may result in significant increases or decreases in our estimate. The actual price paid for these materials will be recorded
on our balance sheet at the time of purchase. In the event that we do not expect to consume all of the materials we are
obligated to purchase pursuant to the terms of these agreements, we may sell the excess materials back to the supplier or
another party. The resale price may or may not be the same as the original purchase price, depending on then-current
market conditions and negotiated terms. As a result, we have recorded, and may in the future record, accruals related to
either the resale when the purchase price mechanism under our agreements is higher than the expected resale price of
the excess materials or when we are required to otherwise compensate the supplier. Accruals recorded to date for such
items have been immaterial.
As market conditions dictate, we have entered, and may in the future enter, into additional offtake agreements with
raw material suppliers or renegotiate existing agreements.
Item 7. Management’s Discussion and Analysis of Financial Condition and Results of Operations (Continued)
64
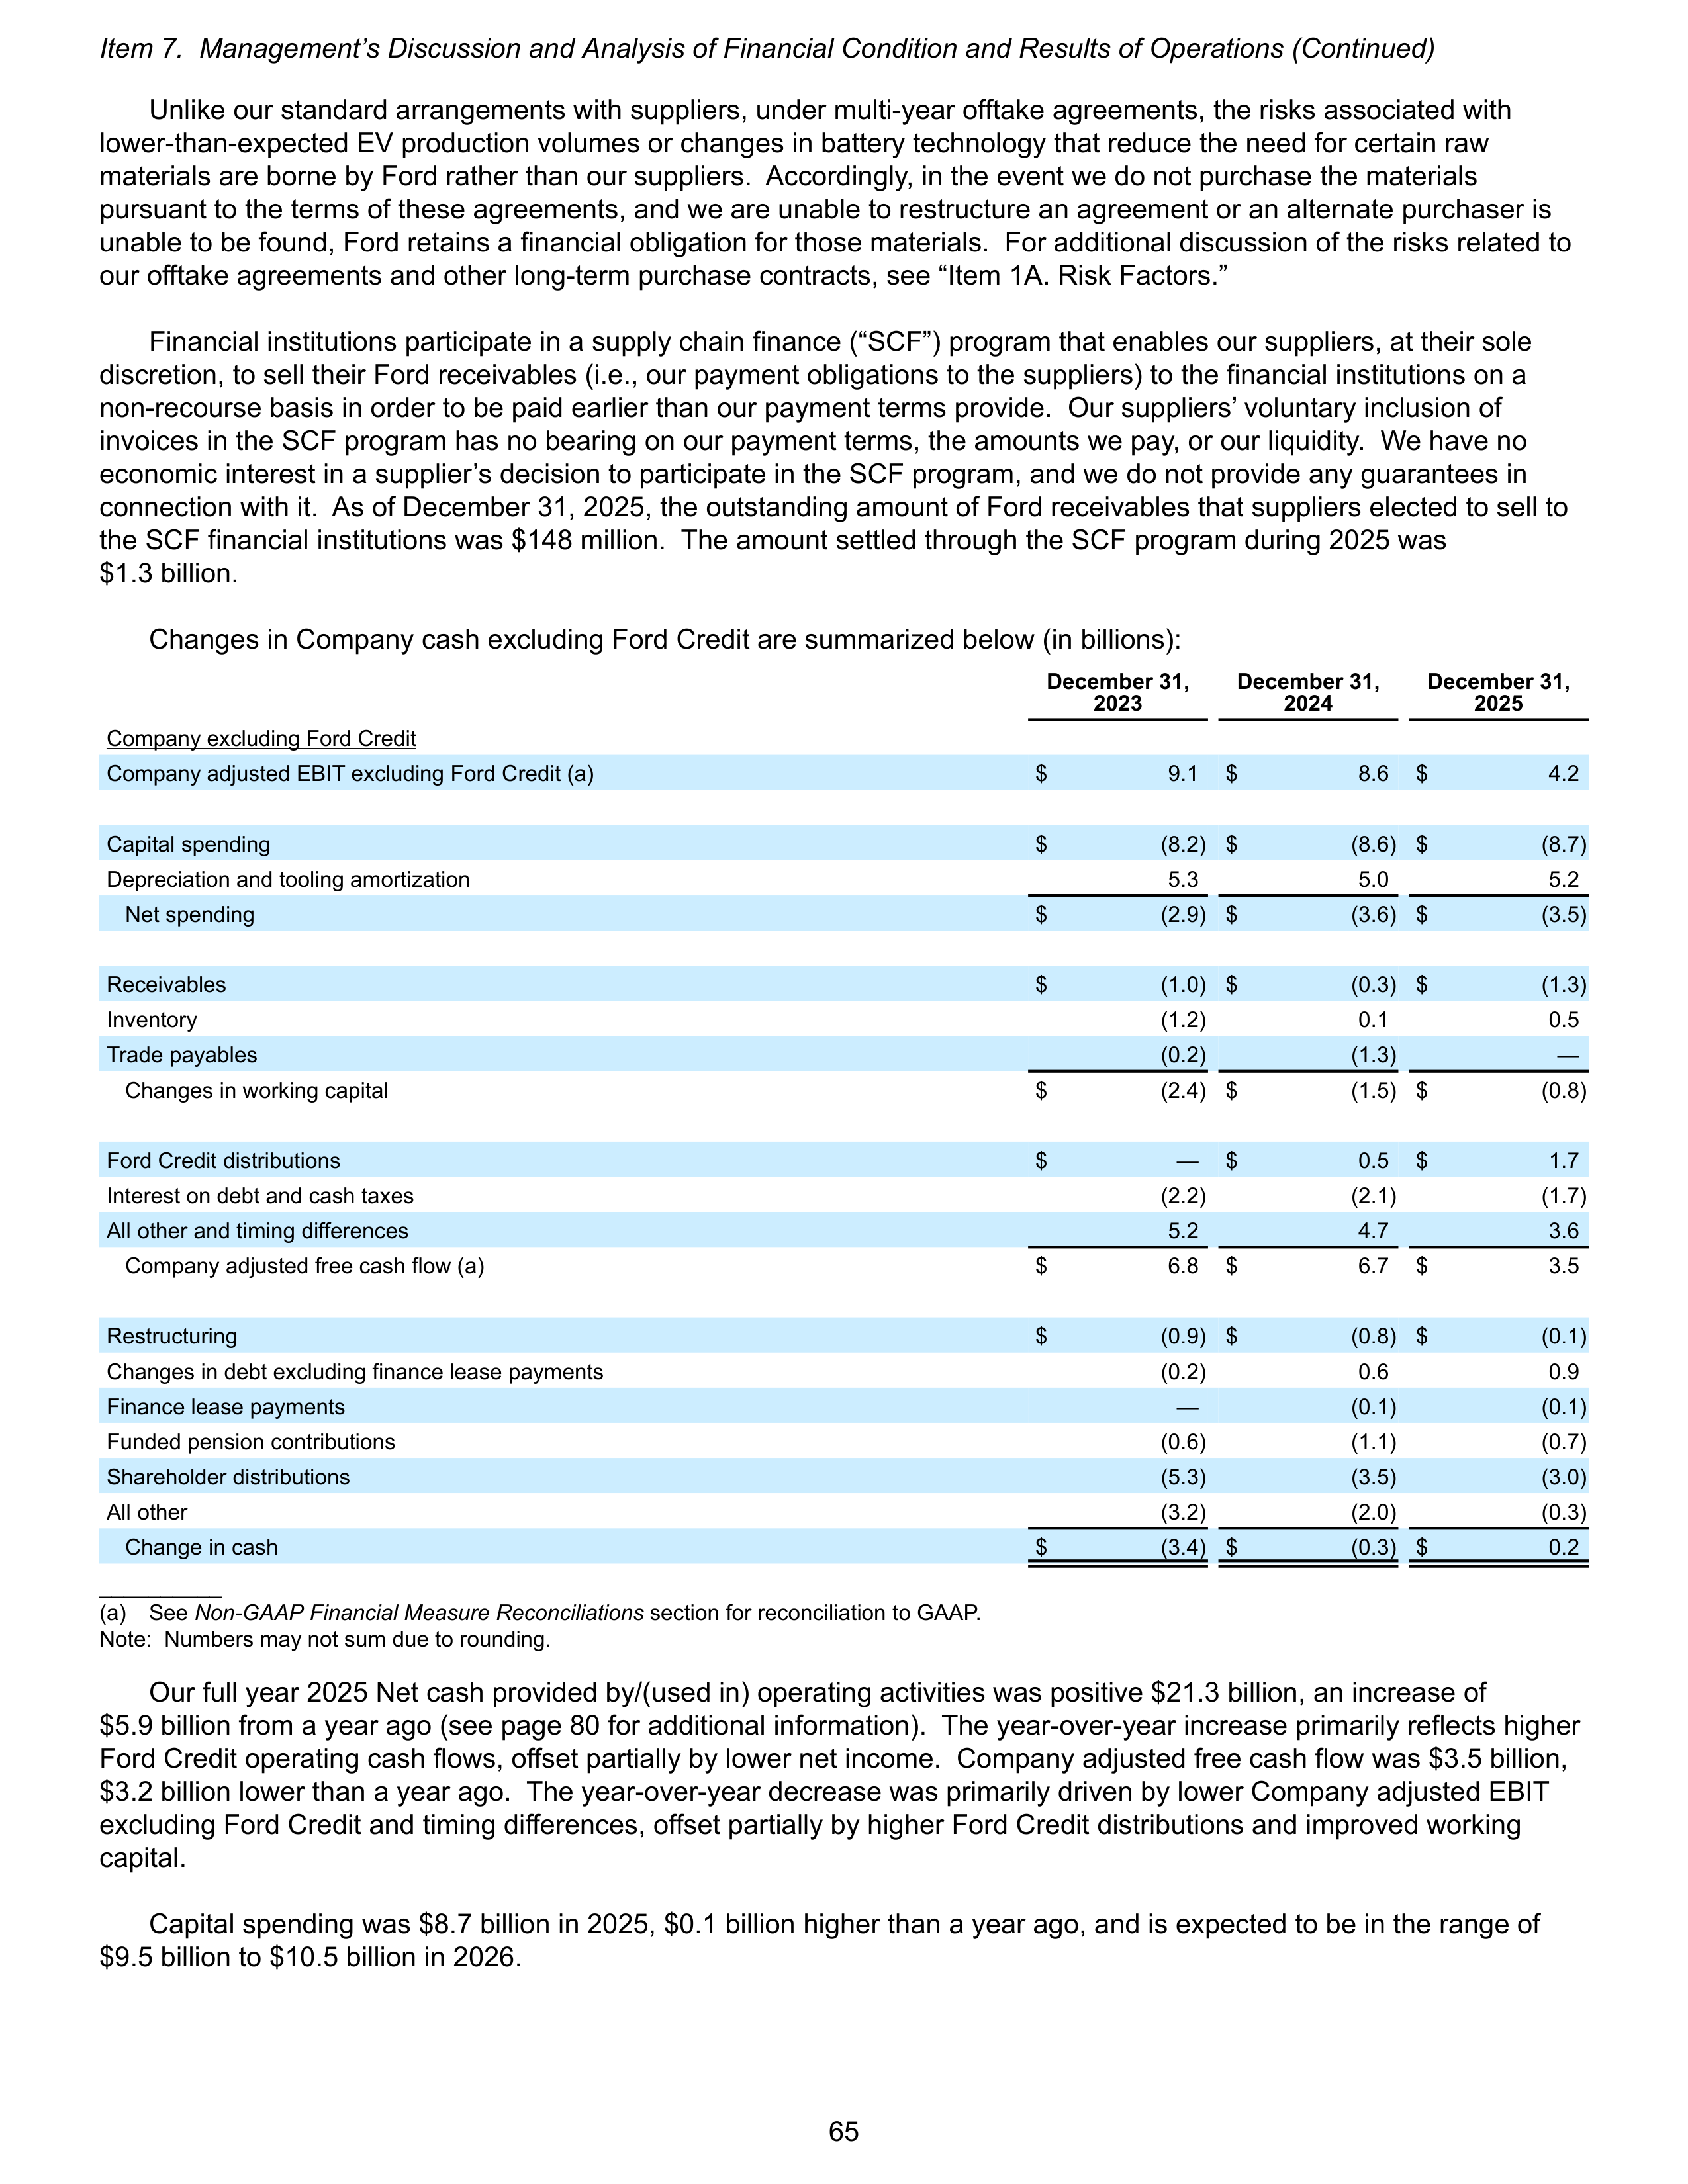
Unlike our standard arrangements with suppliers, under multi-year offtake agreements, the risks associated with
lower-than-expected EV production volumes or changes in battery technology that reduce the need for certain raw
materials are borne by Ford rather than our suppliers. Accordingly, in the event we do not purchase the materials
pursuant to the terms of these agreements, and we are unable to restructure an agreement or an alternate purchaser is
unable to be found, Ford retains a financial obligation for those materials. For additional discussion of the risks related to
our offtake agreements and other long-term purchase contracts, see “Item 1A. Risk Factors.”
Financial institutions participate in a supply chain finance (“SCF”) program that enables our suppliers, at their sole
discretion, to sell their Ford receivables (i.e., our payment obligations to the suppliers) to the financial institutions on a
non-recourse basis in order to be paid earlier than our payment terms provide. Our suppliers’ voluntary inclusion of
invoices in the SCF program has no bearing on our payment terms, the amounts we pay, or our liquidity. We have no
economic interest in a supplier’s decision to participate in the SCF program, and we do not provide any guarantees in
connection with it. As of December 31, 2025, the outstanding amount of Ford receivables that suppliers elected to sell to
the SCF financial institutions was $148 million. The amount settled through the SCF program during 2025 was
$1.3 billion.
Changes in Company cash excluding Ford Credit are summarized below (in billions):
December 31,
2023
December 31,
2024
December 31,
2025
Company excluding Ford Credit
Company adjusted EBIT excluding Ford Credit (a)
$
9.1
$
8.6
$
4.2
Capital spending
$
(8.2) $
(8.6) $
(8.7)
Depreciation and tooling amortization
5.3
5.0
5.2
Net spending
$
(2.9) $
(3.6) $
(3.5)
Receivables
$
(1.0) $
(0.3) $
(1.3)
Inventory
(1.2)
0.1
0.5
Trade payables
(0.2)
(1.3)
—
Changes in working capital
$
(2.4) $
(1.5) $
(0.8)
Ford Credit distributions
$
—
$
0.5
$
1.7
Interest on debt and cash taxes
(2.2)
(2.1)
(1.7)
All other and timing differences
5.2
4.7
3.6
Company adjusted free cash flow (a)
$
6.8
$
6.7
$
3.5
Restructuring
$
(0.9) $
(0.8) $
(0.1)
Changes in debt excluding finance lease payments
(0.2)
0.6
0.9
Finance lease payments
—
(0.1)
(0.1)
Funded pension contributions
(0.6)
(1.1)
(0.7)
Shareholder distributions
(5.3)
(3.5)
(3.0)
All other
(3.2)
(2.0)
(0.3)
Change in cash
$
(3.4) $
(0.3) $
0.2
__________
(a)
See
Non-GAAP Financial Measure Reconciliations
section for reconciliation to GAAP.
Note: Numbers may not sum due to rounding.
Our full year 2025 Net cash provided by/(used in) operating activities was positive $21.3 billion, an increase of
$5.9 billion from a year ago (see page 80 for additional information). The year-over-year increase primarily reflects higher
Ford Credit operating cash flows, offset partially by lower net income. Company adjusted free cash flow was $3.5 billion,
$3.2 billion lower than a year ago. The year-over-year decrease was primarily driven by lower Company adjusted EBIT
excluding Ford Credit and timing differences, offset partially by higher Ford Credit distributions and improved working
capital.
Capital spending was $8.7 billion in 2025, $0.1 billion higher than a year ago, and is expected to be in the range of
$9.5 billion to $10.5 billion in 2026.
Item 7. Management’s Discussion and Analysis of Financial Condition and Results of Operations (Continued)
65
The full year 2025 working capital impact was negative $0.8 billion, driven by an increase in receivables (including
tariff receivables), offset partially by lower inventory. All other and timing differences were positive $3.6 billion. Timing
differences include differences between accrual-based EBIT and the associated cash flows (e.g., marketing incentive and
warranty payments to dealers, JV equity income, compensation payments, and pension and OPEB income or expense).
Cash outflows related to our warranty accruals are expected to occur over several years.
Shareholder distributions were $3.0 billion in 2025, all of which was attributable to our regular and supplemental
dividends. On February 2, 2026, we declared a regular dividend of $0.15 per share.
Available Credit Lines
.
Total Company committed credit lines, excluding Ford Credit, at December 31, 2025 were
$23.7 billion, consisting of $13.5 billion of our corporate credit facility, $2.0 billion of our supplemental revolving credit
facility, $2.5 billion of our 364-day revolving credit facility, $3.0 billion of our delayed draw term loan facility, and $2.7 billion
of local credit facilities. At December 31, 2025, $2.4 billion of committed Company credit lines, excluding Ford Credit, was
utilized under local credit facilities for our affiliates, and the full amount under each of our corporate, supplemental, 364-
day, and delayed draw term loan credit facilities was available.
Lenders under our corporate credit facility have $3.4 billion of commitments maturing on April 17, 2028 and
$10.1 billion of commitments maturing on April 17, 2030. Lenders under our supplemental revolving credit facility have
$2.0 billion of commitments maturing on April 17, 2028. Lenders under our 364-day revolving credit facility have
$2.5 billion of commitments maturing on April 16, 2026. Lenders under our delayed draw term loan facility have
$3.0 billion of commitments available through July 28, 2026. Any unused commitments shall automatically terminate after
July 28, 2026, and any loans drawn under the facility will mature on December 31, 2028.
The corporate, supplemental, and 364-day credit agreements include certain sustainability-linked targets, pursuant to
which the applicable margin and facility fees may be adjusted if Ford achieves, or fails to achieve, the specified targets
related to global manufacturing facility greenhouse gas emissions, carbon-free electricity consumption, and Ford Europe
CO
2
tailpipe emissions. For the most recent performance period, Ford outperformed the global manufacturing facility
greenhouse gas emissions and carbon-free electricity consumption metrics, and it was on target for the Ford Europe CO
2
tailpipe emissions metric.
The corporate credit facility is unsecured and free of material adverse change conditions to borrowing, restrictive
financial covenants (for example, interest or fixed-charge coverage ratio, debt-to-equity ratio, and minimum net worth
requirements), and credit rating triggers that could limit our ability to obtain funding or trigger early repayment. The
corporate credit facility contains a liquidity covenant that requires us to maintain a minimum of $4 billion in aggregate of
domestic cash, cash equivalents, and loaned and marketable securities and/or availability under the corporate credit
facility, supplemental revolving credit facility, and 364-day revolving credit facility. If our senior, unsecured, long-term debt
does not maintain at least two investment grade ratings from Fitch, Moody’s, and S&P, the guarantees of certain
subsidiaries will be required. The terms and conditions of the supplemental and 364-day revolving credit facilities and the
delayed draw term loan facility are consistent with our corporate credit facility. Ford Credit has been designated as a
subsidiary borrower under the corporate credit facility and the 364-day revolving credit facility.
Debt.
As shown in Note 18 of the Notes to the Financial Statements, at December 31, 2025, Company debt excluding
Ford Credit was $21.9 billion (including $0.9 billion of finance leases). This balance is $1.3 billion higher than at
December 31, 2024.
Leverage.
We manage Company debt (excluding Ford Credit) levels with a leverage framework that targets
investment grade credit ratings through a normal business cycle. The leverage framework includes a ratio of total
Company debt (excluding Ford Credit), underfunded pension liabilities, operating leases, and other adjustments, divided
by Company adjusted EBIT (excluding Ford Credit EBT), and further adjusted to exclude depreciation and tooling
amortization (excluding Ford Credit).
Ford Credit’s leverage is calculated separately as described in the “Liquidity and Capital Resources - Ford Credit
Segment” section of Item 7. Ford Credit is self-funding and its debt, which is used to fund its operations, is separate from
our Company debt excluding Ford Credit.
Item 7. Management’s Discussion and Analysis of Financial Condition and Results of Operations (Continued)
66
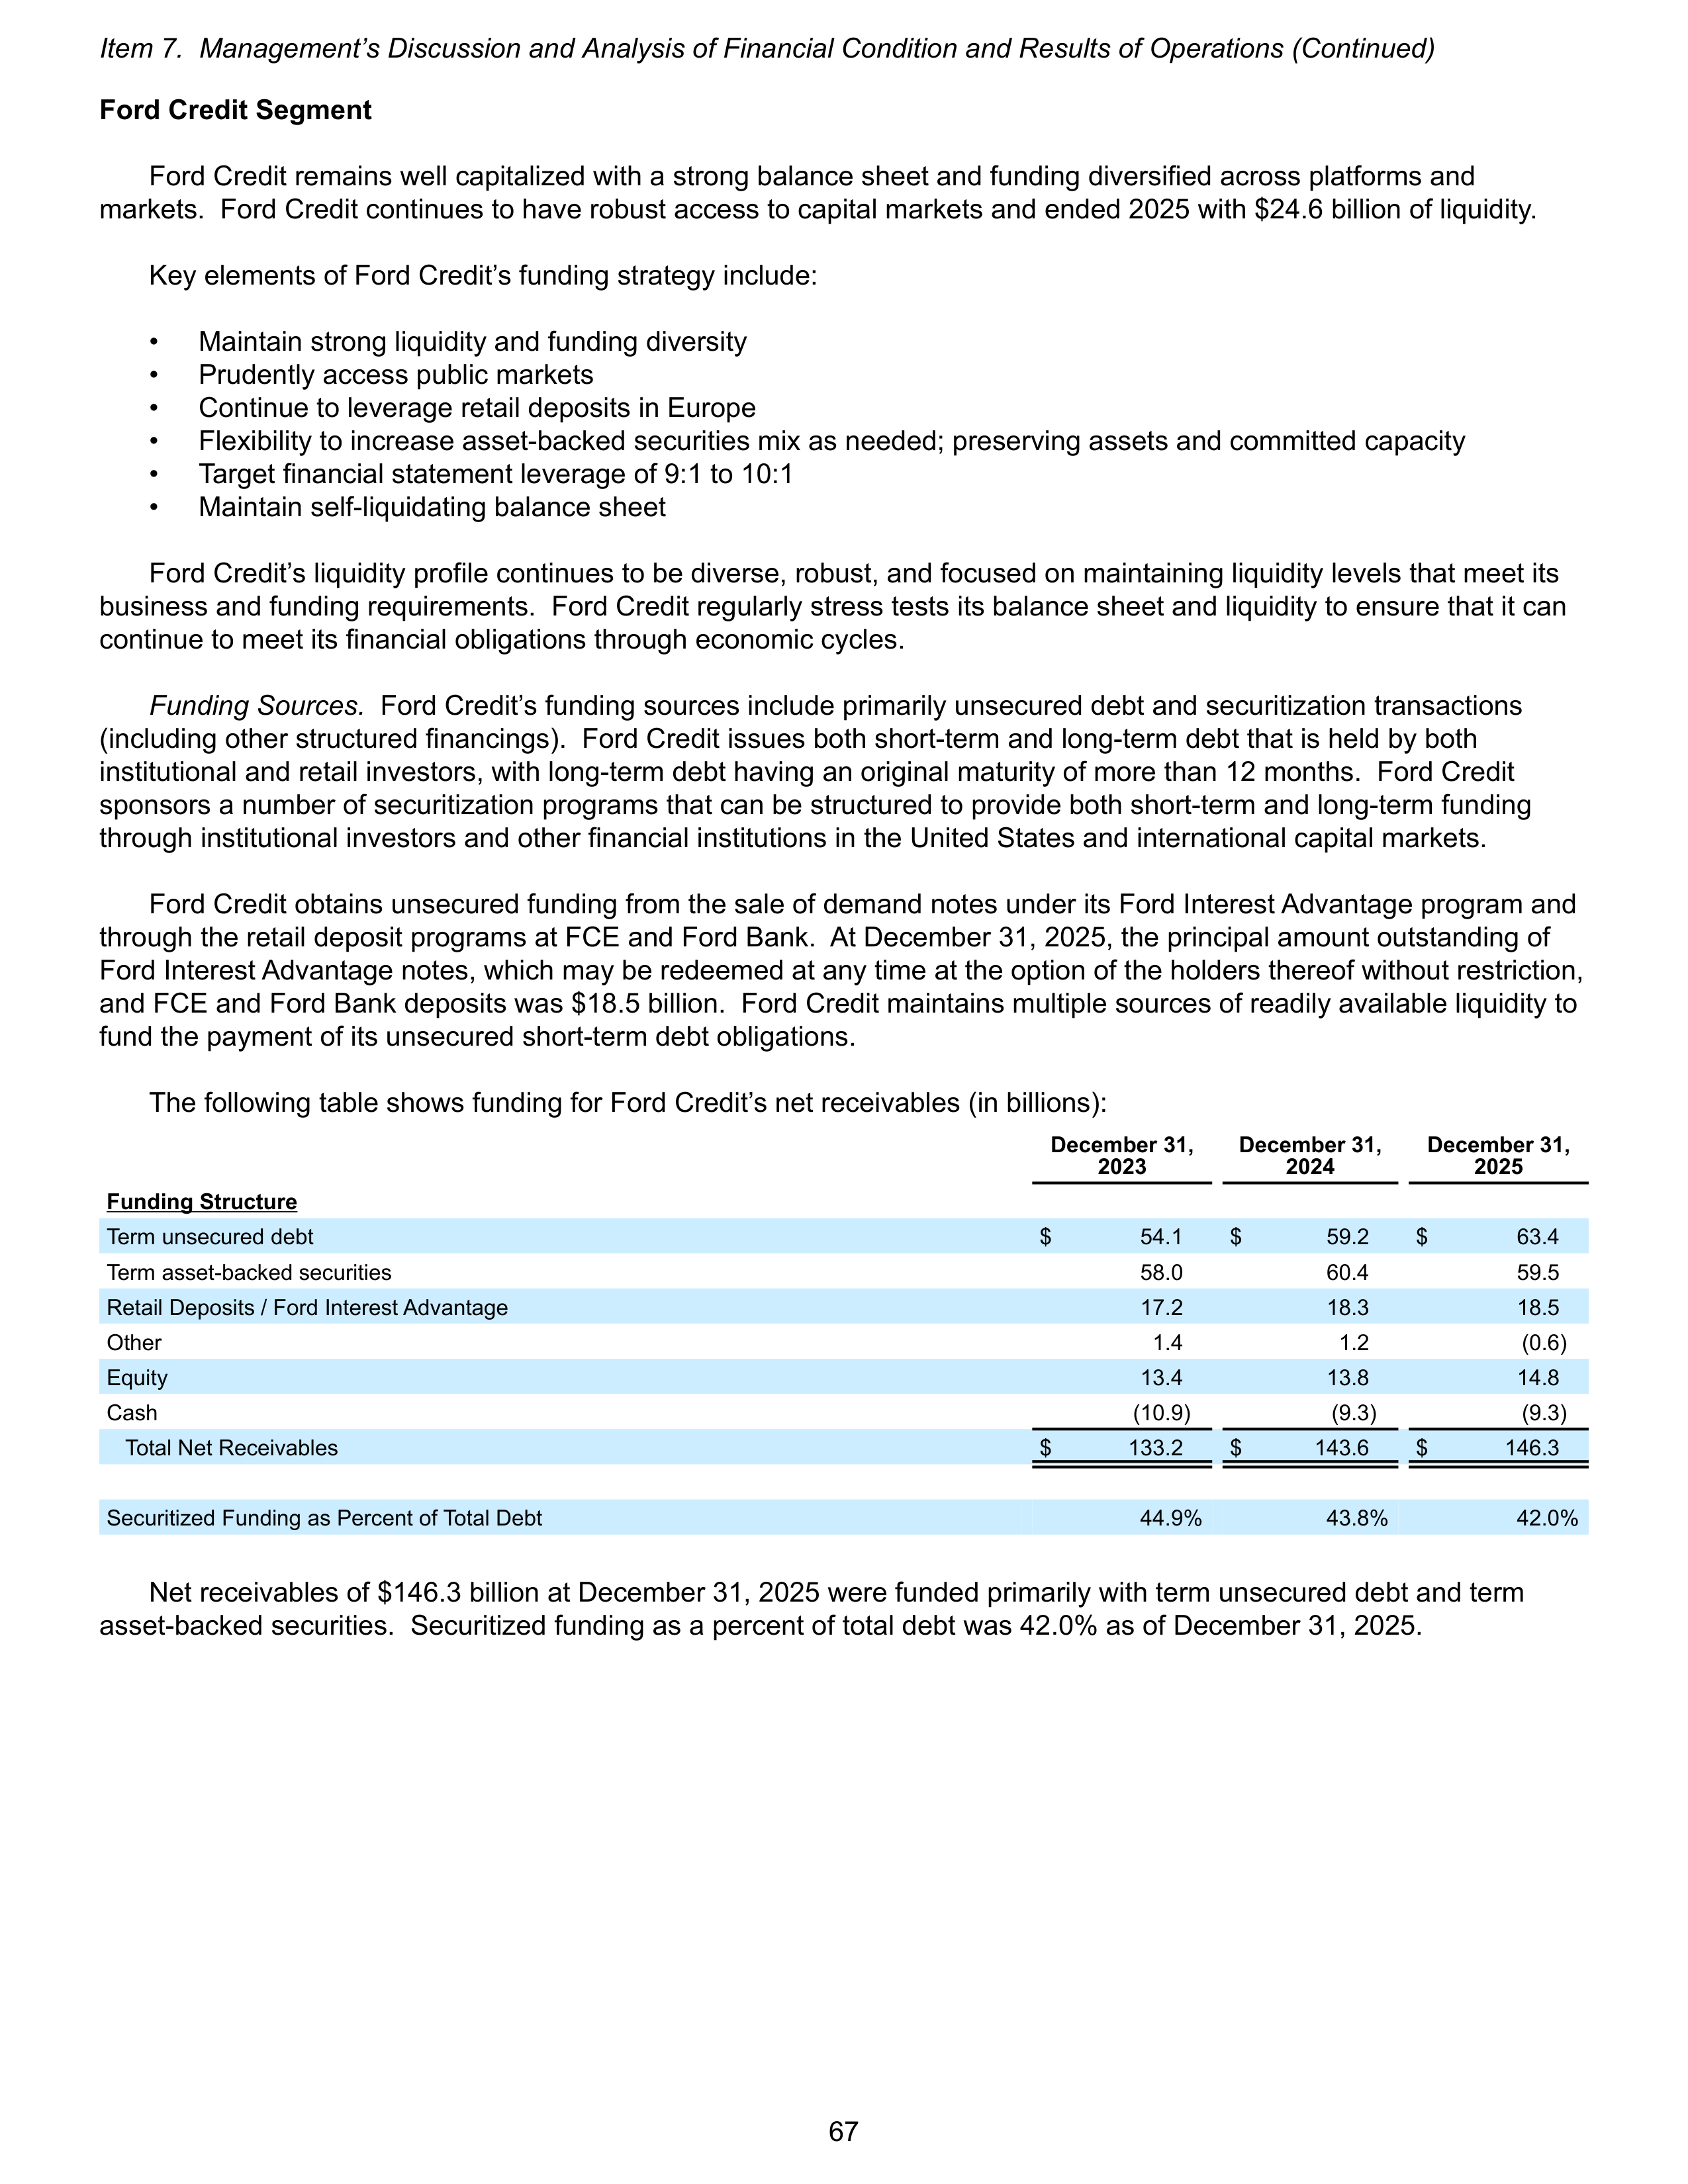
Ford Credit Segment
Ford Credit remains well capitalized with a strong balance sheet and funding diversified across platforms and
markets. Ford Credit continues to have robust access to capital markets and ended 2025 with $24.6 billion of liquidity.
Key elements of Ford Credit’s funding strategy include:
•
Maintain strong liquidity and funding diversity
•
Prudently access public markets
•
Continue to leverage retail deposits in Europe
•
Flexibility to increase asset-backed securities mix as needed; preserving assets and committed capacity
•
Target financial statement leverage of 9:1 to 10:1
•
Maintain self-liquidating balance sheet
Ford Credit’s liquidity profile continues to be diverse, robust, and focused on maintaining liquidity levels that meet its
business and funding requirements. Ford Credit regularly stress tests its balance sheet and liquidity to ensure that it can
continue to meet its financial obligations through economic cycles.
Funding Sources.
Ford Credit’s funding sources include primarily unsecured debt and securitization transactions
(including other structured financings). Ford Credit issues both short-term and long-term debt that is held by both
institutional and retail investors, with long-term debt having an original maturity of more than 12 months. Ford Credit
sponsors a number of securitization programs that can be structured to provide both short-term and long-term funding
through institutional investors and other financial institutions in the United States and international capital markets.
Ford Credit obtains unsecured funding from the sale of demand notes under its Ford Interest Advantage program and
through the retail deposit programs at FCE and Ford Bank. At December 31, 2025, the principal amount outstanding of
Ford Interest Advantage notes, which may be redeemed at any time at the option of the holders thereof without restriction,
and FCE and Ford Bank deposits was $18.5 billion. Ford Credit maintains multiple sources of readily available liquidity to
fund the payment of its unsecured short-term debt obligations.
The following table shows funding for Ford Credit’s net receivables (in billions):
December 31,
2023
December 31,
2024
December 31,
2025
Funding Structure
Term unsecured debt
$
54.1
$
59.2
$
63.4
Term asset-backed securities
58.0
60.4
59.5
Retail Deposits / Ford Interest Advantage
17.2
18.3
18.5
Other
1.4
1.2
(0.6)
Equity
13.4
13.8
14.8
Cash
(10.9)
(9.3)
(9.3)
Total Net Receivables
$
133.2
$
143.6
$
146.3
Securitized Funding as Percent of Total Debt
44.9%
43.8%
42.0%
Net receivables of $146.3 billion at December 31, 2025 were funded primarily with term unsecured debt and term
asset-backed securities. Securitized funding as a percent of total debt was 42.0% as of December 31, 2025.
Item 7. Management’s Discussion and Analysis of Financial Condition and Results of Operations (Continued)
67
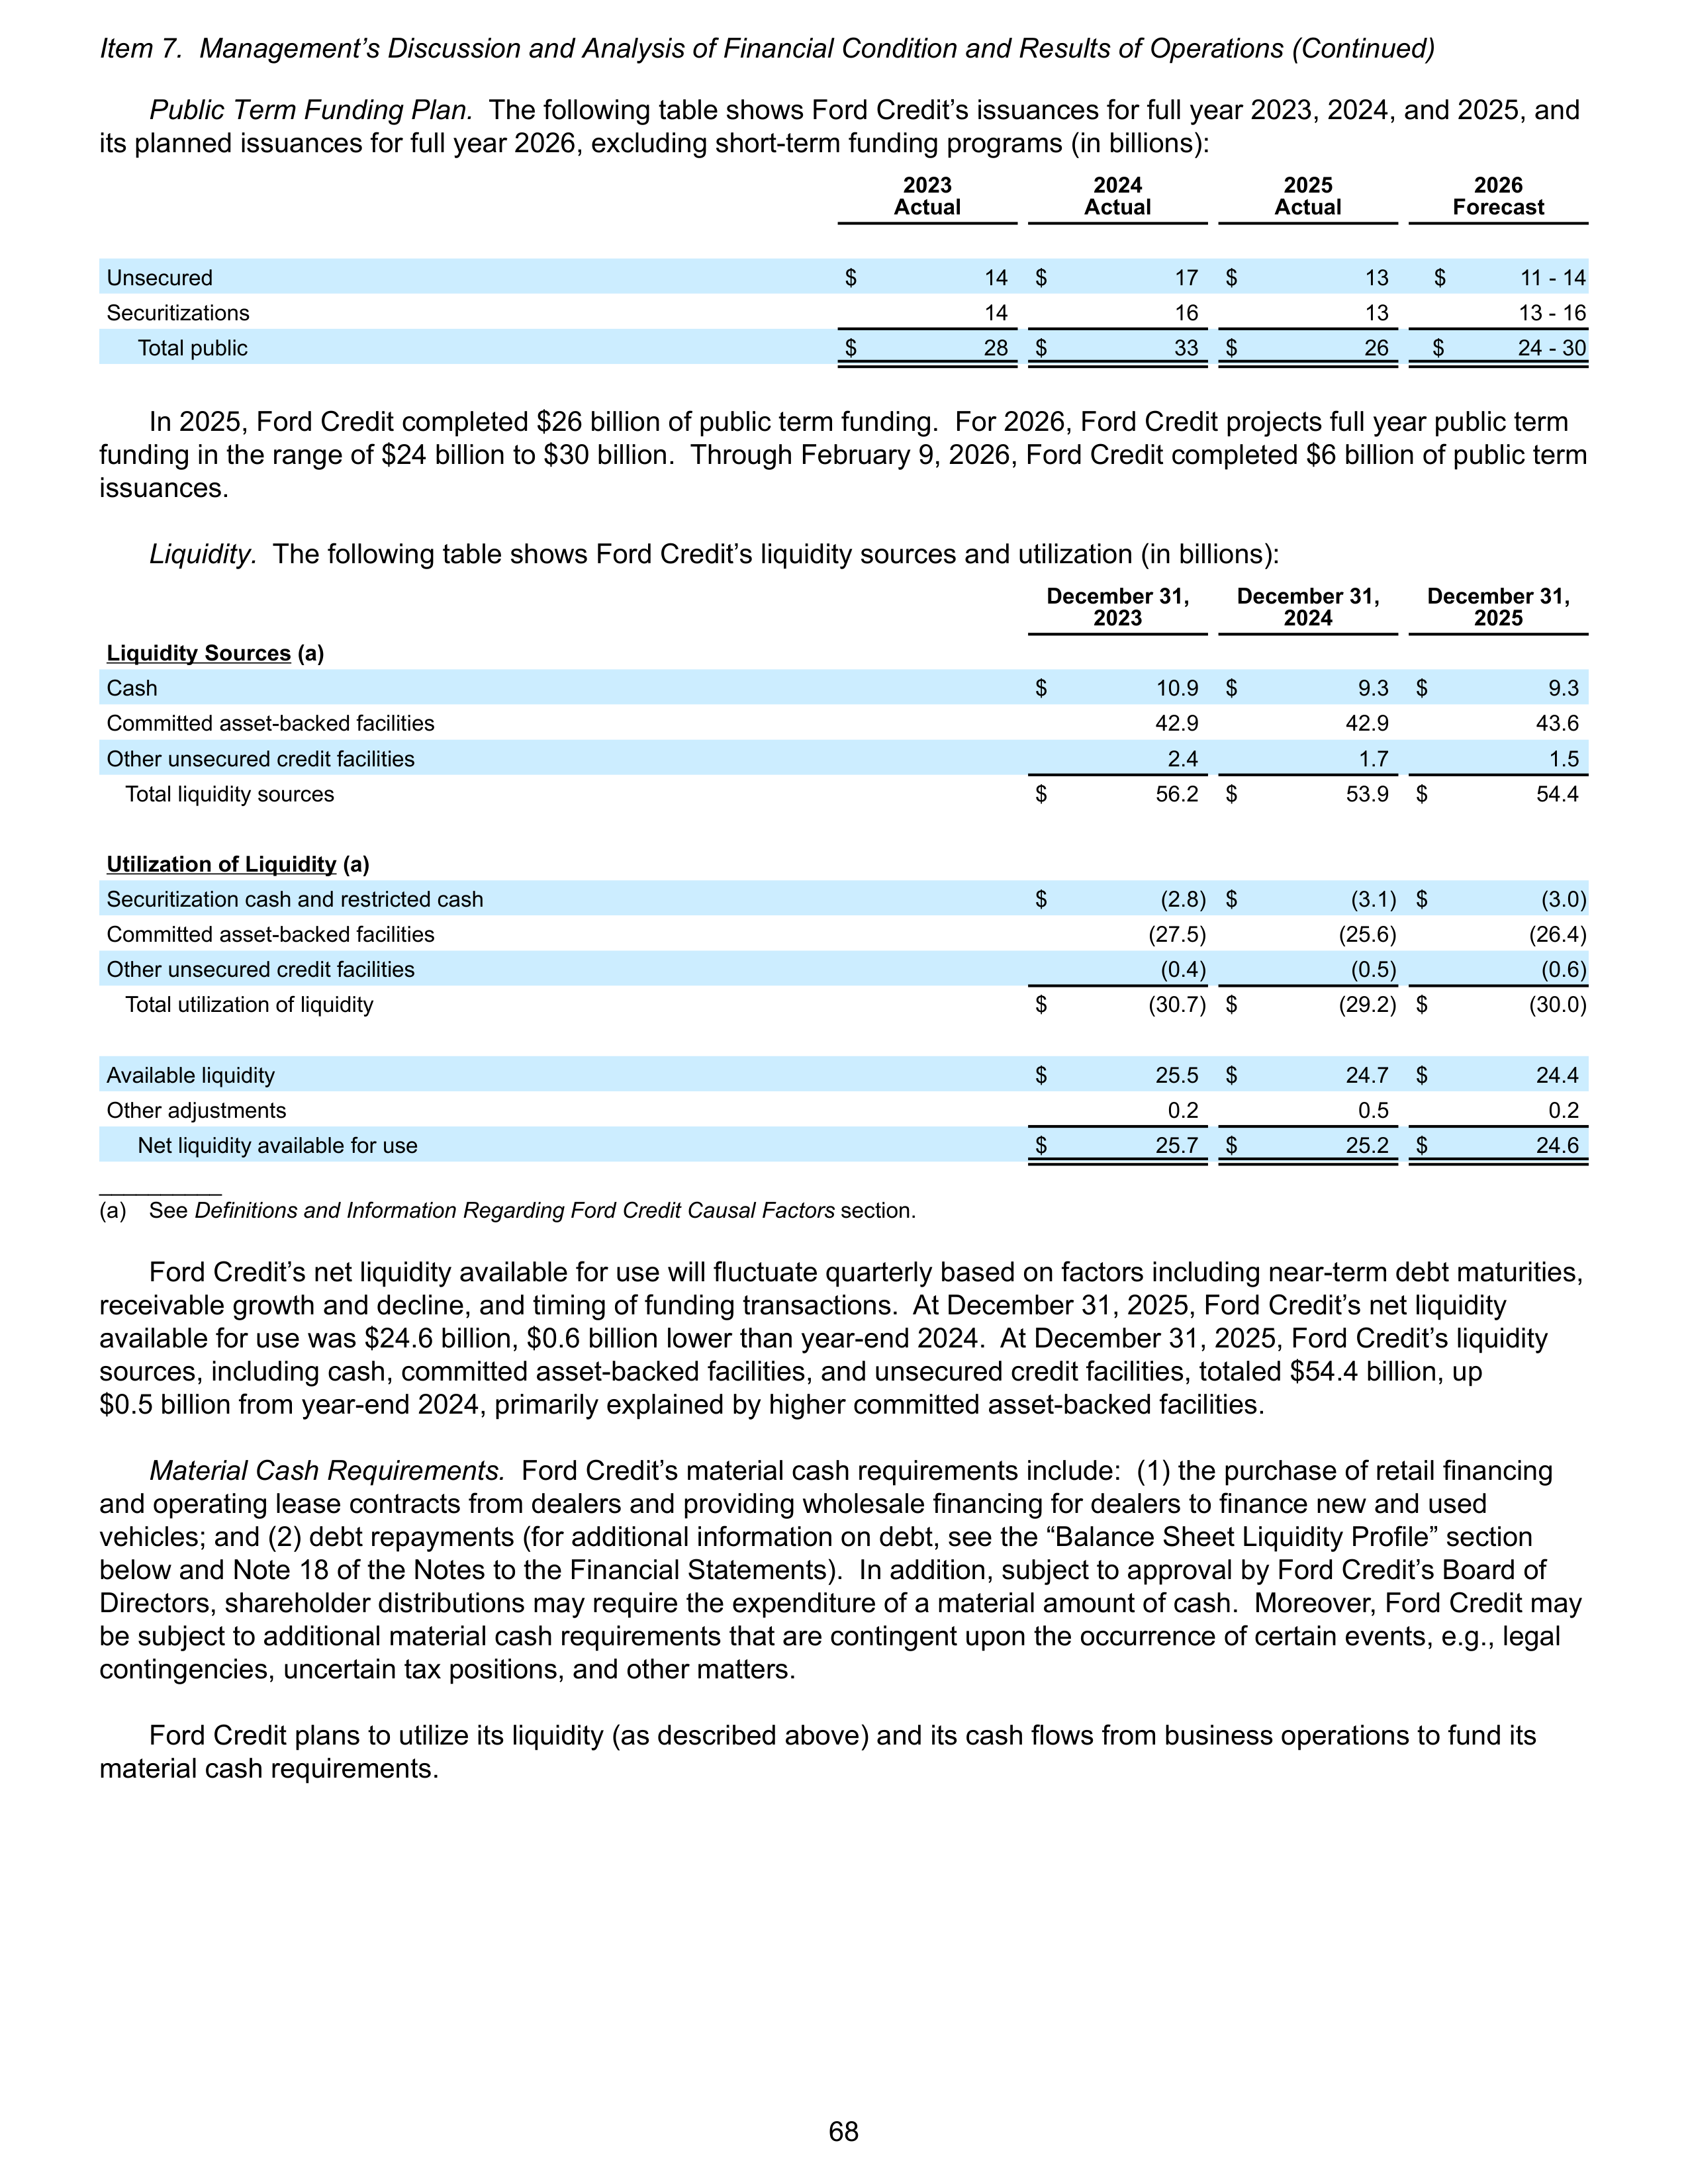
Public Term Funding Plan.
The following table shows Ford Credit’s issuances for full year 2023, 2024, and 2025, and
its planned issuances for full year 2026, excluding short-term funding programs (in billions):
2023
Actual
2024
Actual
2025
Actual
2026
Forecast
Unsecured
$
14
$
17
$
13
$ 11 - 14
Securitizations
14
16
13
13 - 16
Total public
$
28
$
33
$
26
$ 24 - 30
In 2025, Ford Credit completed $26 billion of public term funding. For 2026, Ford Credit projects full year public term
funding in the range of $24 billion to $30 billion. Through February 9, 2026, Ford Credit completed $6 billion of public term
issuances.
Liquidity.
The following table shows Ford Credit’s liquidity sources and utilization (in billions):
December 31,
2023
December 31,
2024
December 31,
2025
Liquidity Sources (a)
Cash
$
10.9
$
9.3
$
9.3
Committed asset-backed facilities
42.9
42.9
43.6
Other unsecured credit facilities
2.4
1.7
1.5
Total liquidity sources
$
56.2
$
53.9
$
54.4
Utilization of Liquidity (a)
Securitization cash and restricted cash
$
(2.8) $
(3.1) $
(3.0)
Committed asset-backed facilities
(27.5)
(25.6)
(26.4)
Other unsecured credit facilities
(0.4)
(0.5)
(0.6)
Total utilization of liquidity
$
(30.7) $
(29.2) $
(30.0)
Available liquidity
$
25.5
$
24.7
$
24.4
Other adjustments
0.2
0.5
0.2
Net liquidity available for use
$
25.7
$
25.2
$
24.6
__________
(a)
See
Definitions and Information Regarding Ford Credit Causal Factors
section.
Ford Credit’s net liquidity available for use will fluctuate quarterly based on factors including near-term debt maturities,
receivable growth and decline, and timing of funding transactions. At December 31, 2025, Ford Credit’s net liquidity
available for use was $24.6 billion, $0.6 billion lower than year-end 2024. At December 31, 2025, Ford Credit’s liquidity
sources, including cash, committed asset-backed facilities, and unsecured credit facilities, totaled $54.4 billion, up
$0.5 billion from year-end 2024, primarily explained by higher committed asset-backed facilities.
Material Cash Requirements.
Ford Credit’s material cash requirements include: (1) the purchase of retail financing
and operating lease contracts from dealers and providing wholesale financing for dealers to finance new and used
vehicles; and (2) debt repayments (for additional information on debt, see the “Balance Sheet Liquidity Profile” section
below and Note 18 of the Notes to the Financial Statements). In addition, subject to approval by Ford Credit’s Board of
Directors, shareholder distributions may require the expenditure of a material amount of cash. Moreover, Ford Credit may
be subject to additional material cash requirements that are contingent upon the occurrence of certain events, e.g., legal
contingencies, uncertain tax positions, and other matters.
Ford Credit plans to utilize its liquidity (as described above) and its cash flows from business operations to fund its
material cash requirements.
Item 7. Management’s Discussion and Analysis of Financial Condition and Results of Operations (Continued)
68
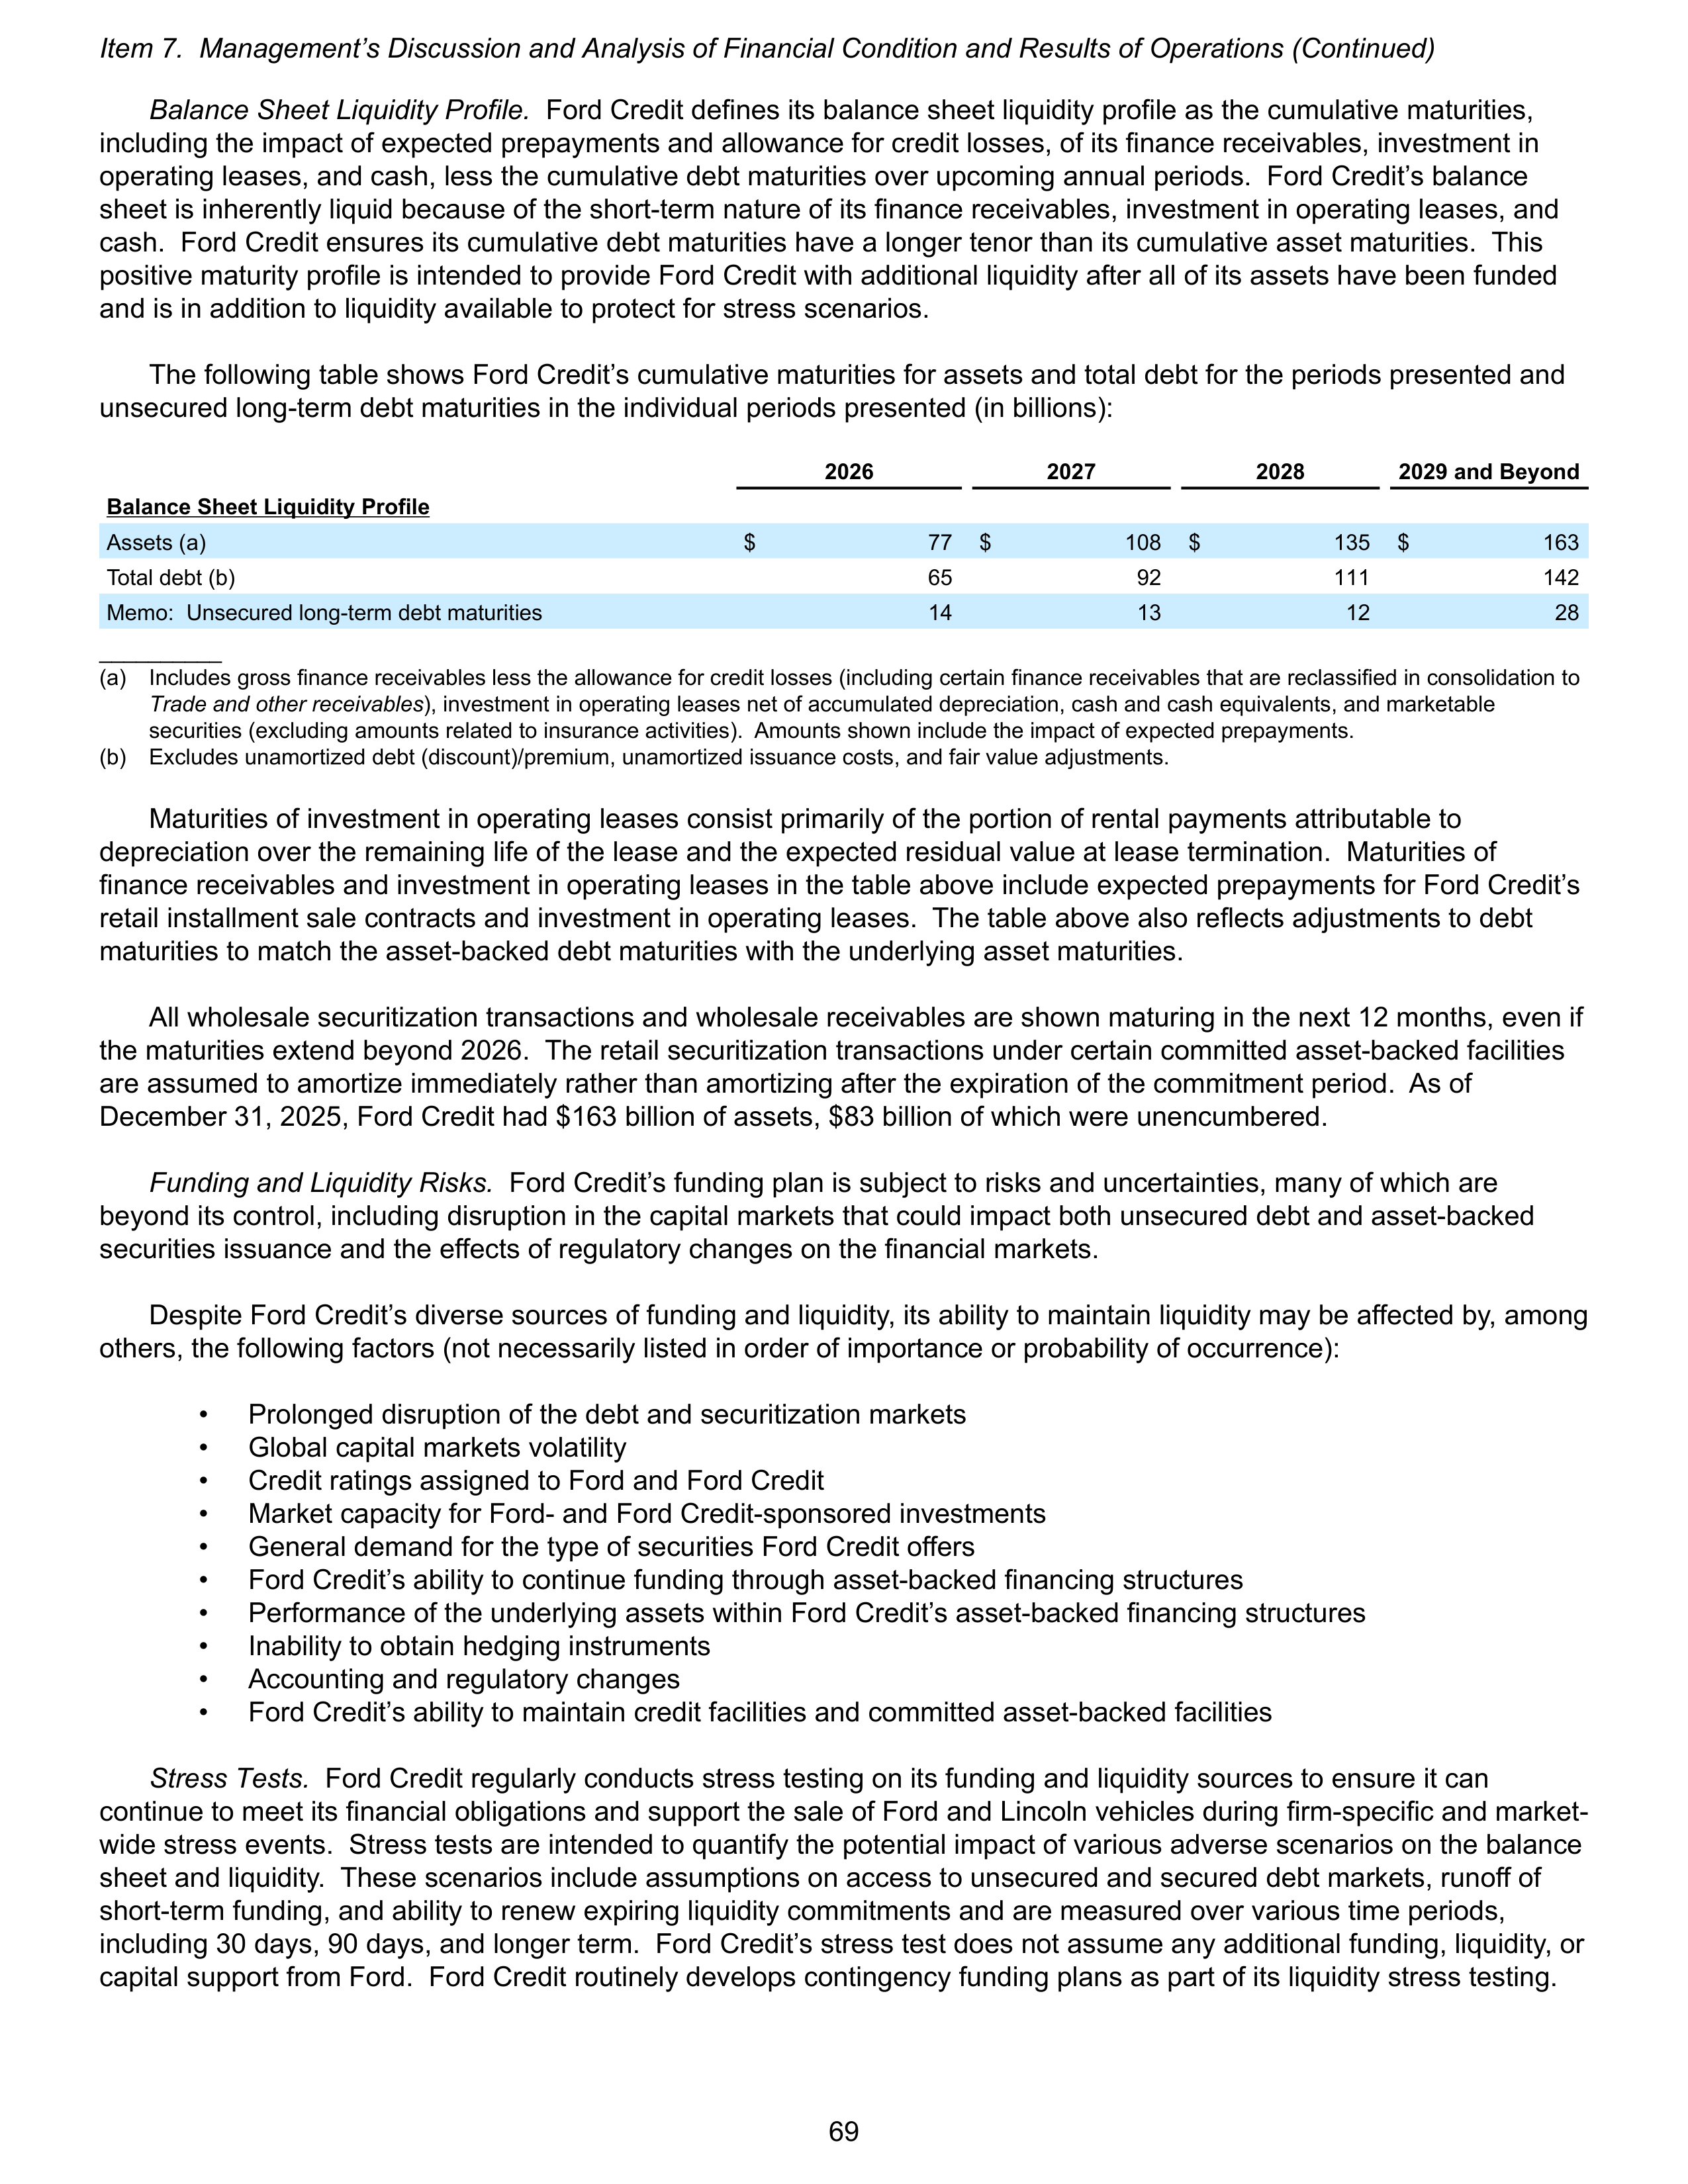
Balance Sheet Liquidity Profile.
Ford Credit defines its balance sheet liquidity profile as the cumulative maturities,
including the impact of expected prepayments and allowance for credit losses, of its finance receivables, investment in
operating leases, and cash, less the cumulative debt maturities over upcoming annual periods. Ford Credit’s balance
sheet is inherently liquid because of the short-term nature of its finance receivables, investment in operating leases, and
cash. Ford Credit ensures its cumulative debt maturities have a longer tenor than its cumulative asset maturities. This
positive maturity profile is intended to provide Ford Credit with additional liquidity after all of its assets have been funded
and is in addition to liquidity available to protect for stress scenarios.
The following table shows Ford Credit’s cumulative maturities for assets and total debt for the periods presented and
unsecured long-term debt maturities in the individual periods presented (in billions):
2026
2027
2028
2029 and Beyond
Balance Sheet Liquidity Profile
Assets (a)
$
77
$
108
$
135
$
163
Total debt (b)
65
92
111
142
Memo: Unsecured long-term debt maturities
14
13
12
28
__________
(a)
Includes gross finance receivables less the allowance for credit losses (including certain finance receivables that are reclassified in consolidation to
Trade and other receivables
), investment in operating leases net of accumulated depreciation, cash and cash equivalents, and marketable
securities (excluding amounts related to insurance activities). Amounts shown include the impact of expected prepayments.
(b)
Excludes unamortized debt (discount)/premium, unamortized issuance costs, and fair value adjustments.
Maturities of investment in operating leases consist primarily of the portion of rental payments attributable to
depreciation over the remaining life of the lease and the expected residual value at lease termination. Maturities of
finance receivables and investment in operating leases in the table above include expected prepayments for Ford Credit’s
retail installment sale contracts and investment in operating leases. The table above also reflects adjustments to debt
maturities to match the asset-backed debt maturities with the underlying asset maturities.
All wholesale securitization transactions and wholesale receivables are shown maturing in the next 12 months, even if
the maturities extend beyond 2026. The retail securitization transactions under certain committed asset-backed facilities
are assumed to amortize immediately rather than amortizing after the expiration of the commitment period. As of
December 31, 2025, Ford Credit had $163 billion of assets, $83 billion of which were unencumbered.
Funding and Liquidity Risks.
Ford Credit’s funding plan is subject to risks and uncertainties, many of which are
beyond its control, including disruption in the capital markets that could impact both unsecured debt and asset-backed
securities issuance and the effects of regulatory changes on the financial markets.
Despite Ford Credit’s diverse sources of funding and liquidity, its ability to maintain liquidity may be affected by, among
others, the following factors (not necessarily listed in order of importance or probability of occurrence):
•
Prolonged disruption of the debt and securitization markets
•
Global capital markets volatility
•
Credit ratings assigned to Ford and Ford Credit
•
Market capacity for Ford- and Ford Credit-sponsored investments
•
General demand for the type of securities Ford Credit offers
•
Ford Credit’s ability to continue funding through asset-backed financing structures
•
Performance of the underlying assets within Ford Credit’s asset-backed financing structures
•
Inability to obtain hedging instruments
•
Accounting and regulatory changes
•
Ford Credit’s ability to maintain credit facilities and committed asset-backed facilities
Stress Tests.
Ford Credit regularly conducts stress testing on its funding and liquidity sources to ensure it can
continue to meet its financial obligations and support the sale of Ford and Lincoln vehicles during firm-specific and market-
wide stress events. Stress tests are intended to quantify the potential impact of various adverse scenarios on the balance
sheet and liquidity. These scenarios include assumptions on access to unsecured and secured debt markets, runoff of
short-term funding, and ability to renew expiring liquidity commitments and are measured over various time periods,
including 30 days, 90 days, and longer term. Ford Credit’s stress test does not assume any additional funding, liquidity, or
capital support from Ford. Ford Credit routinely develops contingency funding plans as part of its liquidity stress testing.
Item 7. Management’s Discussion and Analysis of Financial Condition and Results of Operations (Continued)
69
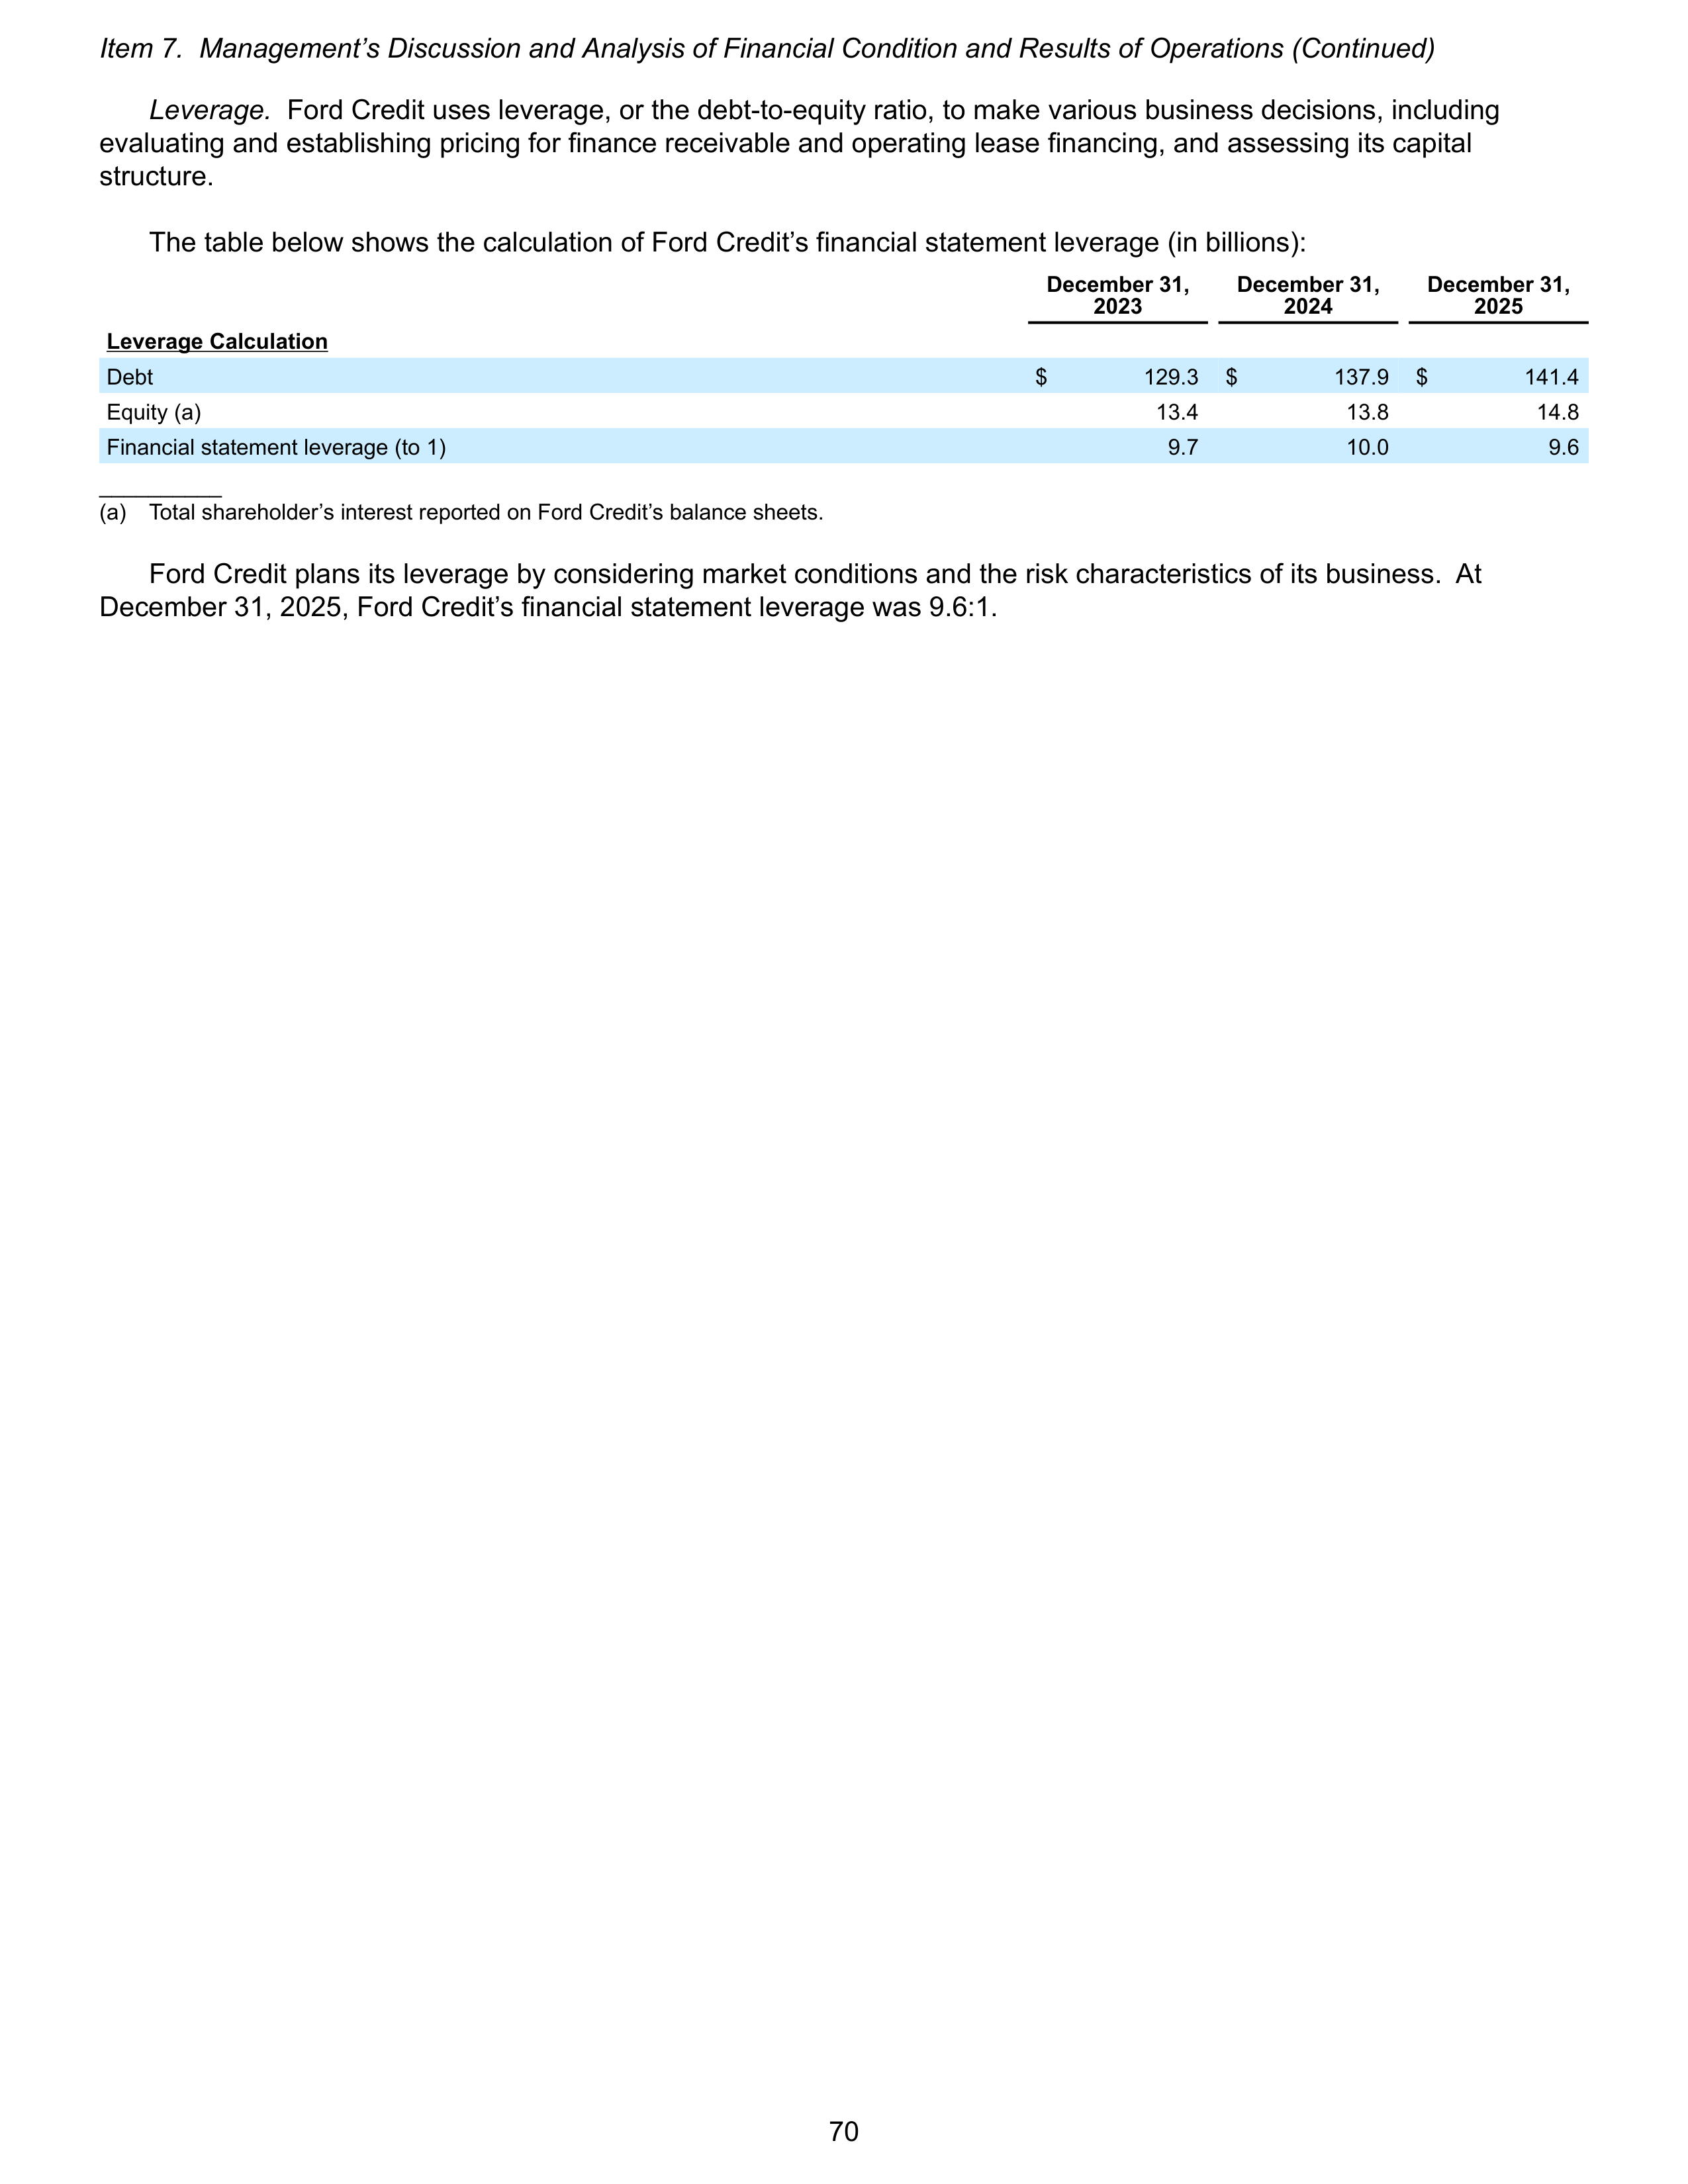
Leverage.
Ford Credit uses leverage, or the debt-to-equity ratio, to make various business decisions, including
evaluating and establishing pricing for finance receivable and operating lease financing, and assessing its capital
structure.
The table below shows the calculation of Ford Credit’s financial statement leverage (in billions):
December 31,
2023
December 31,
2024
December 31,
2025
Leverage Calculation
Debt
$
129.3
$
137.9
$
141.4
Equity (a)
13.4
13.8
14.8
Financial statement leverage (to 1)
9.7
10.0
9.6
__________
(a)
Total shareholder’s interest reported on Ford Credit’s balance sheets.
Ford Credit plans its leverage by considering market conditions and the risk characteristics of its business. At
December 31, 2025, Ford Credit’s financial statement leverage was 9.6:1.
Item 7. Management’s Discussion and Analysis of Financial Condition and Results of Operations (Continued)
70
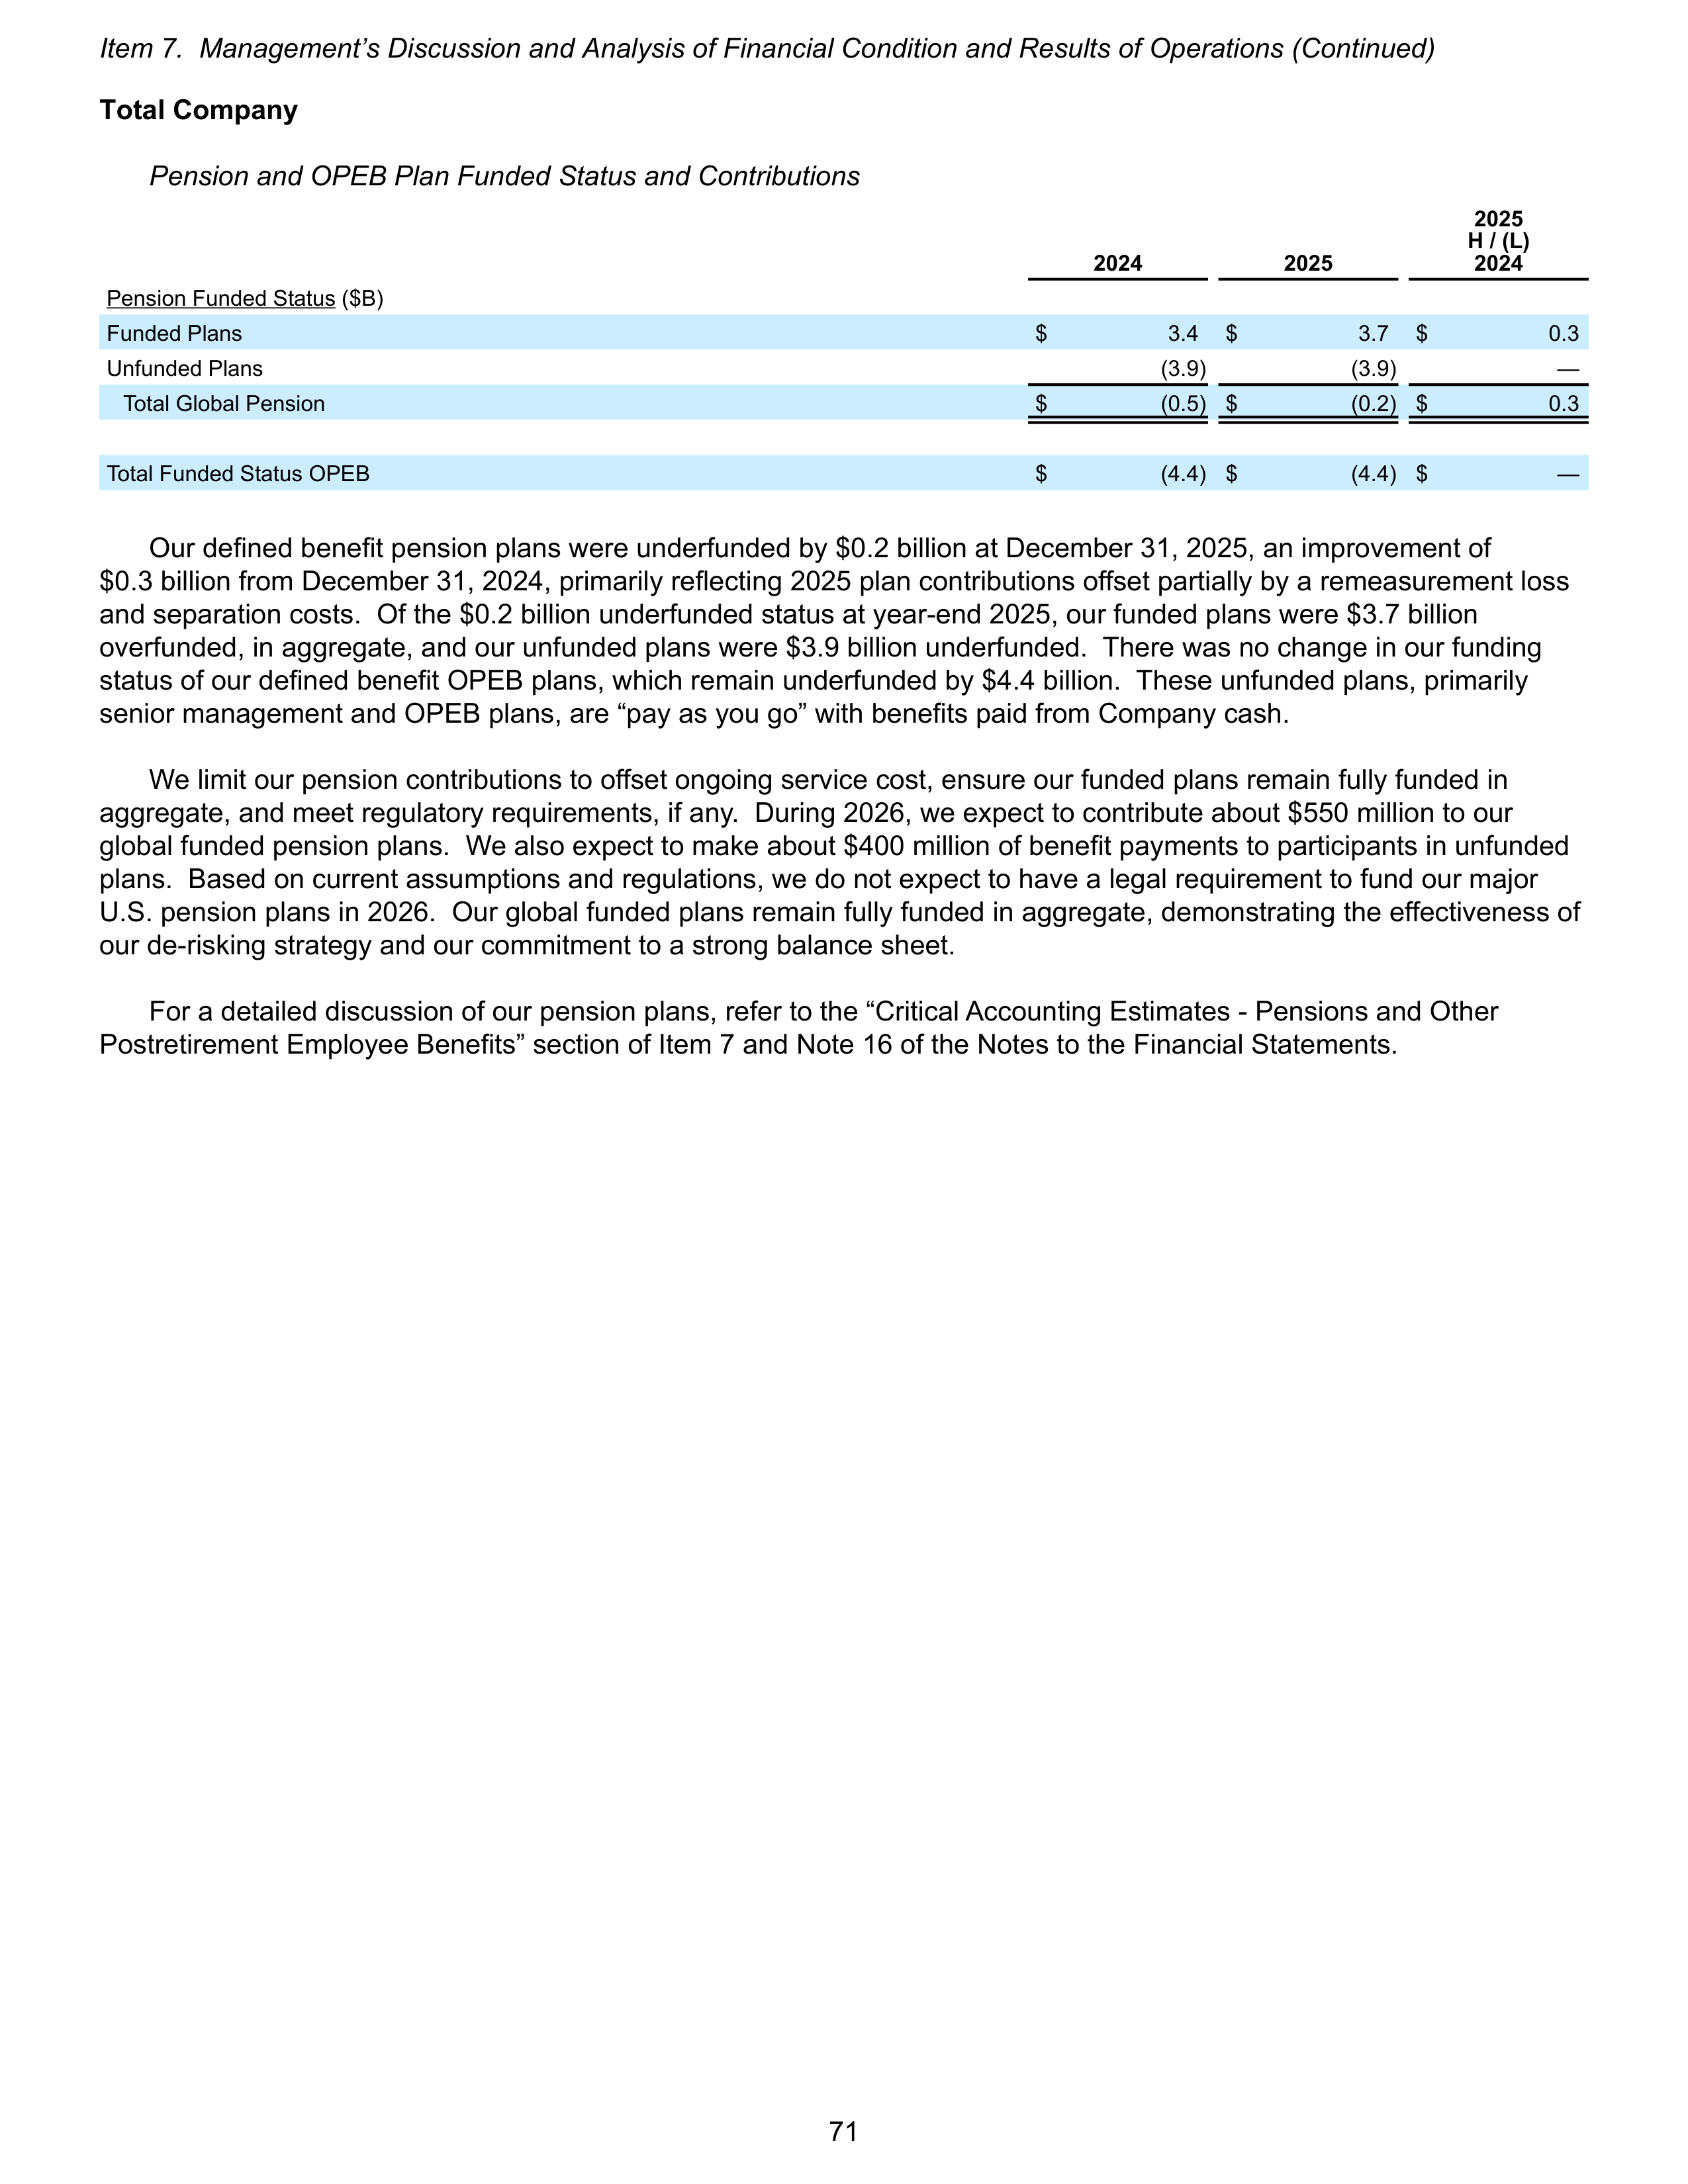
Total Company
Pension and OPEB Plan Funded Status and Contributions
2024
2025
2025
H / (L)
2024
Pension Funded Status ($B)
Funded Plans
$
3.4
$
3.7
$
0.3
Unfunded Plans
(3.9)
(3.9)
—
Total Global Pension
$
(0.5) $
(0.2) $
0.3
Total Funded Status OPEB
$
(4.4) $
(4.4) $
—
Our defined benefit pension plans were underfunded by $0.2 billion at December 31, 2025, an improvement of
$0.3 billion from December 31, 2024, primarily reflecting 2025 plan contributions offset partially by a remeasurement loss
and separation costs. Of the $0.2 billion underfunded status at year-end 2025, our funded plans were $3.7 billion
overfunded, in aggregate, and our unfunded plans were $3.9 billion underfunded. There was no change in our funding
status of our defined benefit OPEB plans, which remain underfunded by $4.4 billion. These unfunded plans, primarily
senior management and OPEB plans, are “pay as you go” with benefits paid from Company cash.
We limit our pension contributions to offset ongoing service cost, ensure our funded plans remain fully funded in
aggregate, and meet regulatory requirements, if any. During 2026, we expect to contribute about $550 million to our
global funded pension plans. We also expect to make about $400 million of benefit payments to participants in unfunded
plans. Based on current assumptions and regulations, we do not expect to have a legal requirement to fund our major
U.S. pension plans in 2026. Our global funded plans remain fully funded in aggregate, demonstrating the effectiveness of
our de-risking strategy and our commitment to a strong balance sheet.
For a detailed discussion of our pension plans, refer to the “Critical Accounting Estimates - Pensions and Other
Postretirement Employee Benefits” section of Item 7 and Note 16 of the Notes to the Financial Statements.
Item 7. Management’s Discussion and Analysis of Financial Condition and Results of Operations (Continued)
71
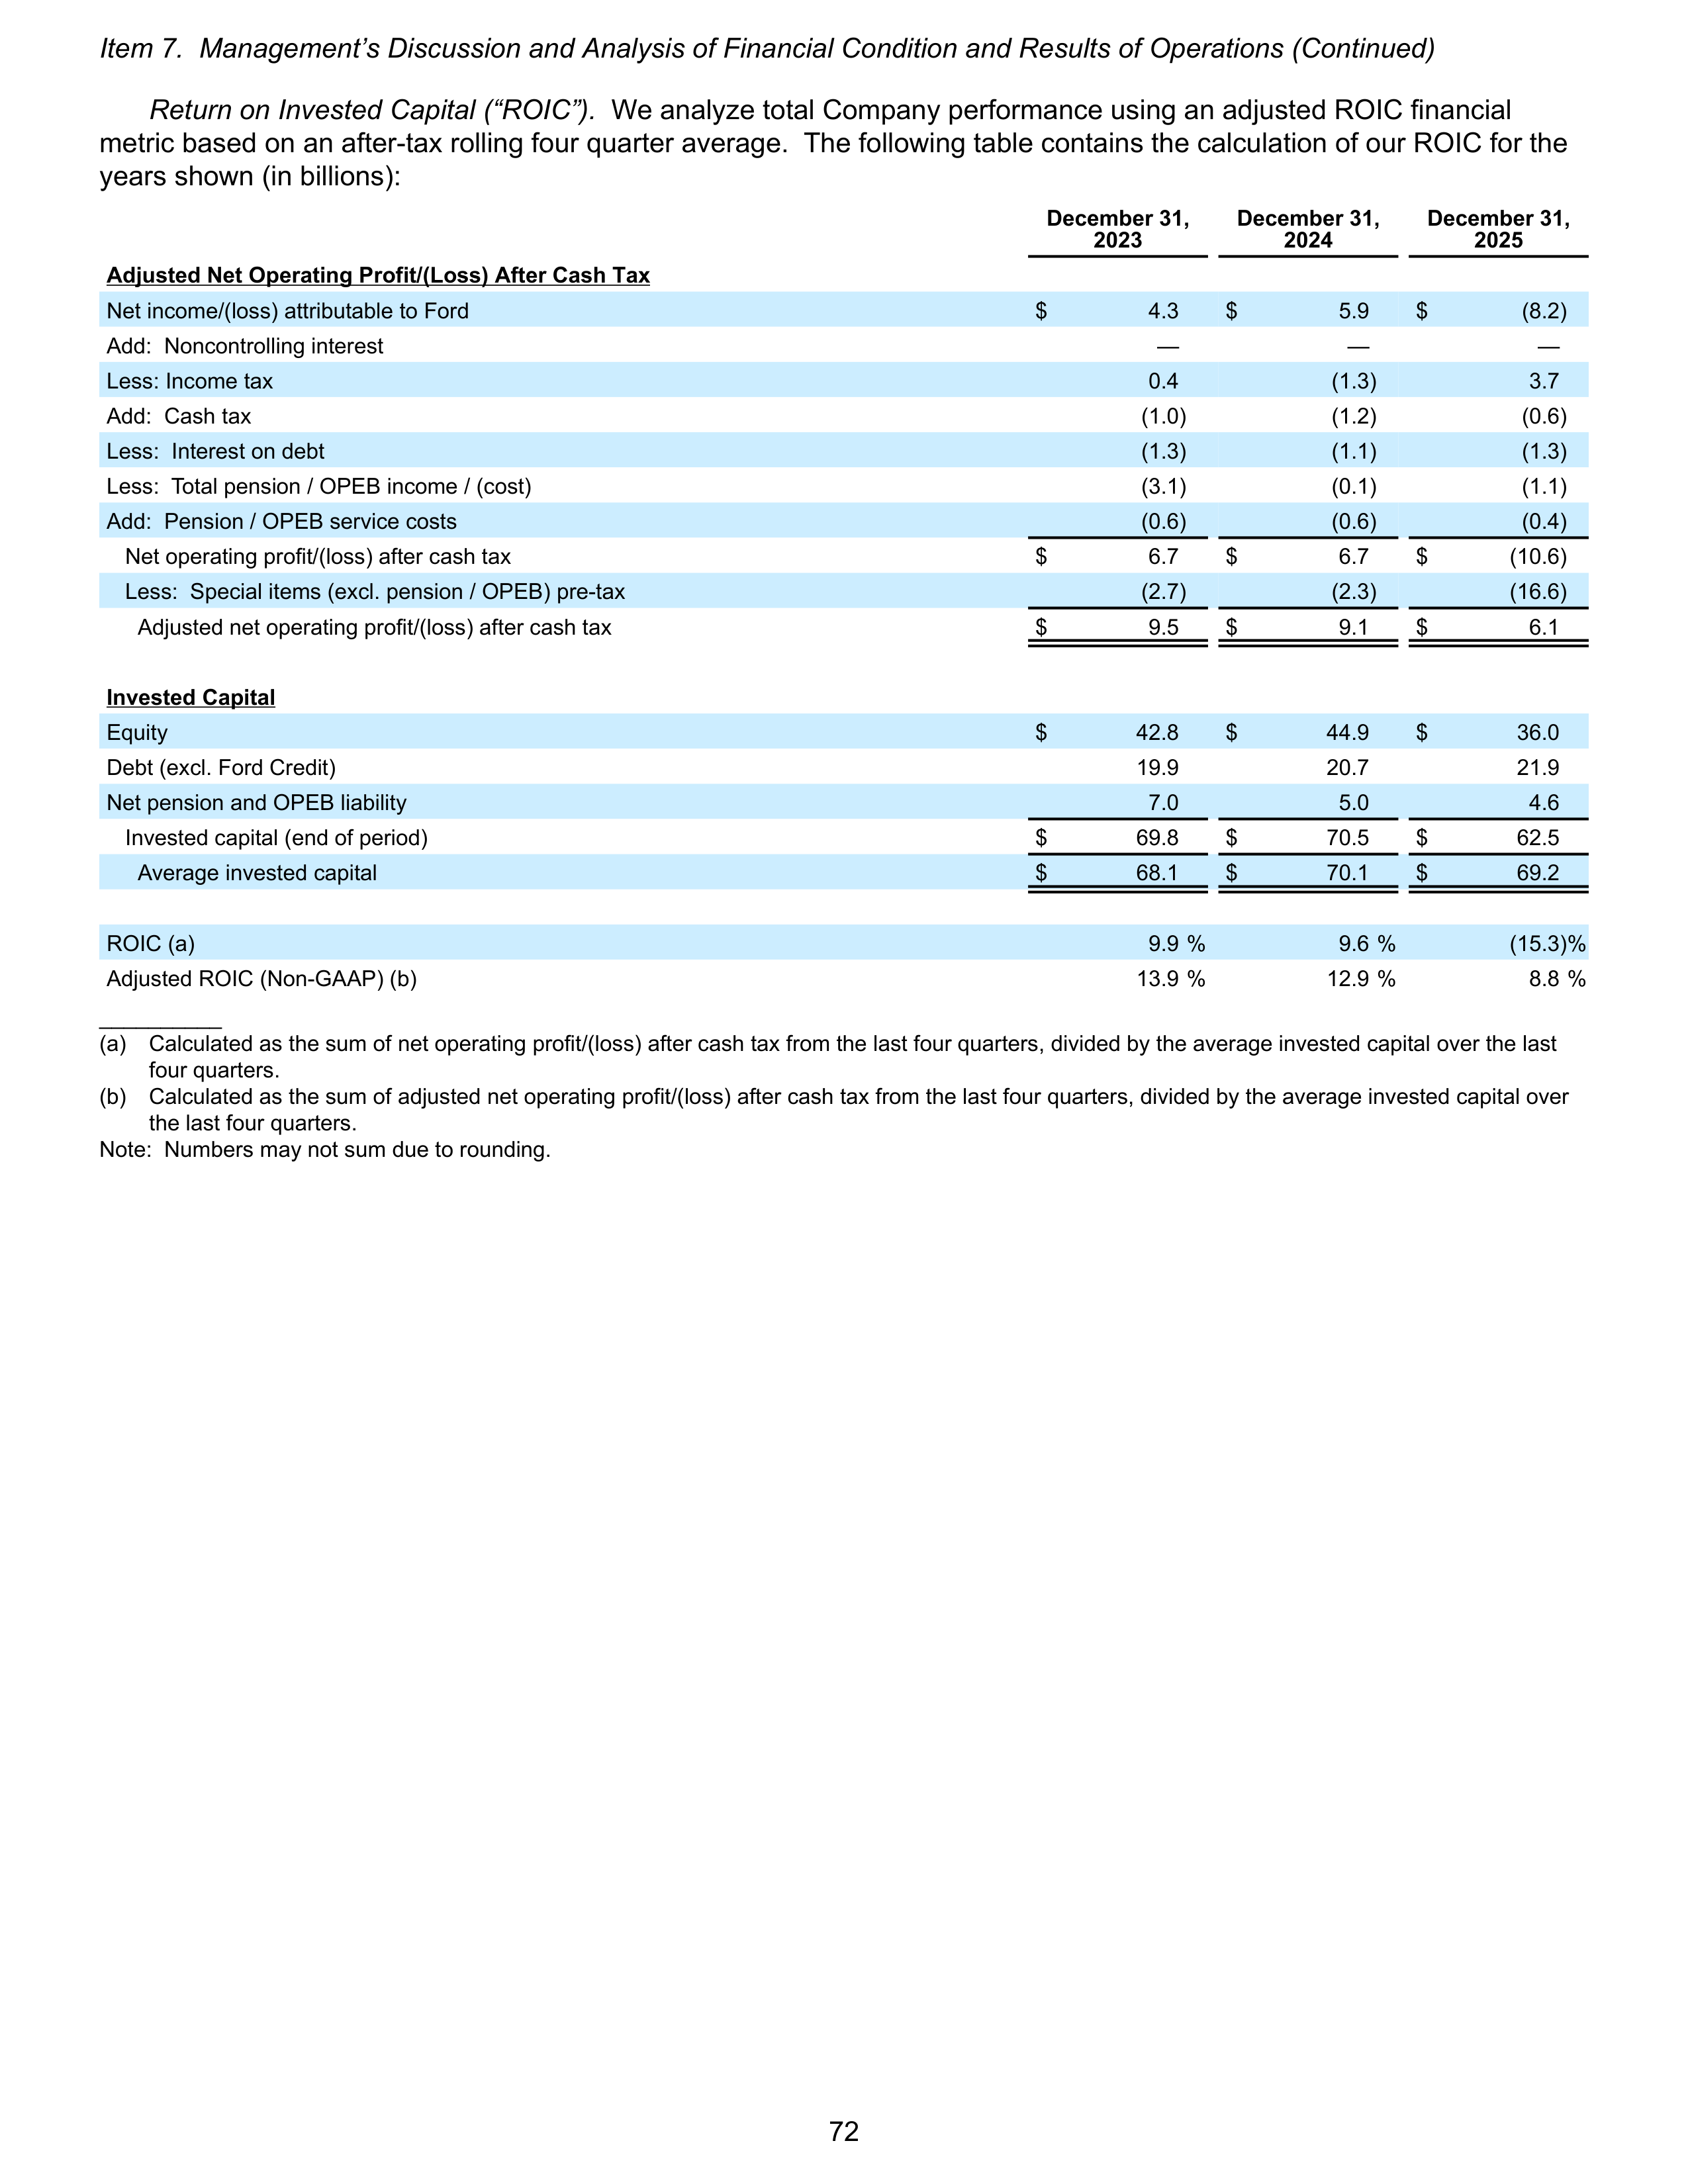
Return on Invested Capital (“ROIC”).
We analyze total Company performance using an adjusted ROIC financial
metric based on an after-tax rolling four quarter average. The following table contains the calculation of our ROIC for the
years shown (in billions):
December 31,
2023
December 31,
2024
December 31,
2025
Adjusted Net Operating Profit/(Loss) After Cash Tax
Net income/(loss) attributable to Ford
$
4.3
$
5.9
$
(8.2)
Add: Noncontrolling interest
—
—
—
Less: Income tax
0.4
(1.3)
3.7
Add: Cash tax
(1.0)
(1.2)
(0.6)
Less: Interest on debt
(1.3)
(1.1)
(1.3)
Less: Total pension / OPEB income / (cost)
(3.1)
(0.1)
(1.1)
Add: Pension / OPEB service costs
(0.6)
(0.6)
(0.4)
Net operating profit/(loss) after cash tax
$
6.7
$
6.7
$
(10.6)
Less: Special items (excl. pension / OPEB) pre-tax
(2.7)
(2.3)
(16.6)
Adjusted net operating profit/(loss) after cash tax
$
9.5
$
9.1
$
6.1
Invested Capital
Equity
$
42.8
$
44.9
$
36.0
Debt (excl. Ford Credit)
19.9
20.7
21.9
Net pension and OPEB liability
7.0
5.0
4.6
Invested capital (end of period)
$
69.8
$
70.5
$
62.5
Average invested capital
$
68.1
$
70.1
$
69.2
ROIC (a)
9.9 %
9.6 %
(15.3) %
Adjusted ROIC (Non-GAAP) (b)
13.9 %
12.9 %
8.8 %
__________
(a)
Calculated as the sum of net operating profit/(loss) after cash tax from the last four quarters, divided by the average invested capital over the last
four quarters.
(b)
Calculated as the sum of adjusted net operating profit/(loss) after cash tax from the last four quarters, divided by the average invested capital over
the last four quarters.
Note: Numbers may not sum due to rounding.
Item 7. Management’s Discussion and Analysis of Financial Condition and Results of Operations (Continued)
72
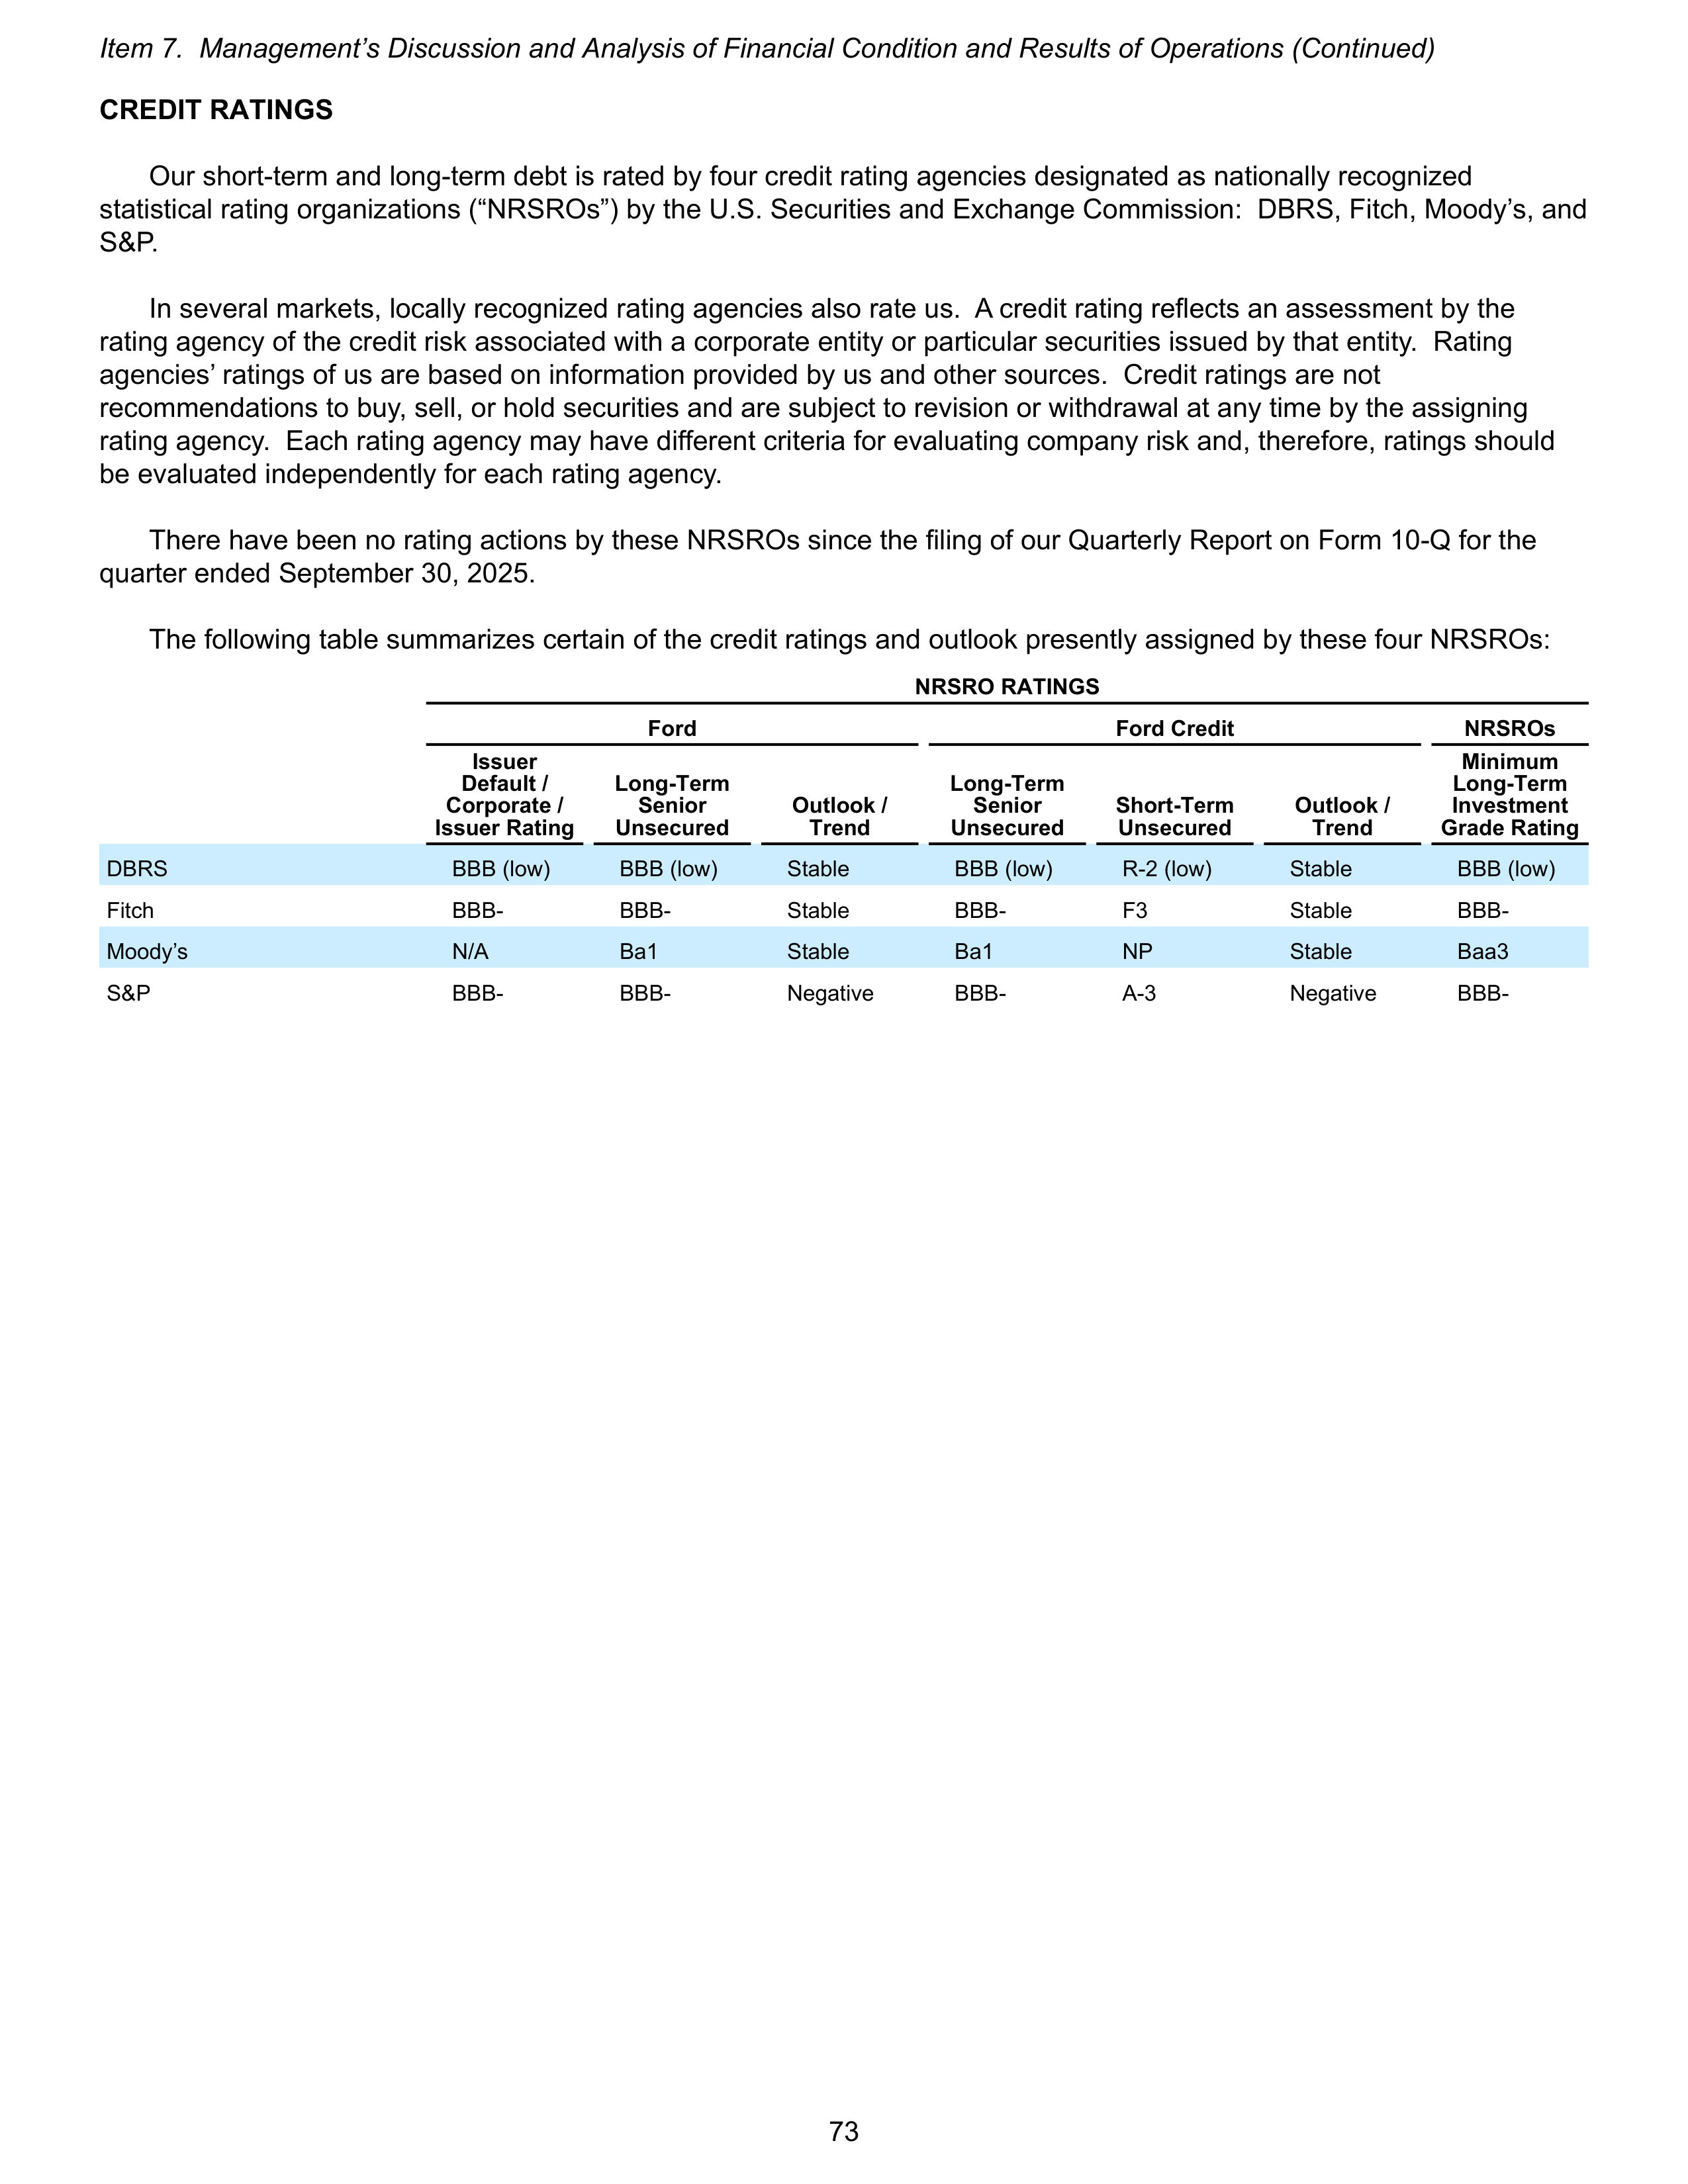
CREDIT RATINGS
Our short-term and long-term debt is rated by four credit rating agencies designated as nationally recognized
statistical rating organizations (“NRSROs”) by the U.S. Securities and Exchange Commission: DBRS, Fitch, Moody’s, and
S&P.
In several markets, locally recognized rating agencies also rate us. A credit rating reflects an assessment by the
rating agency of the credit risk associated with a corporate entity or particular securities issued by that entity. Rating
agencies’ ratings of us are based on information provided by us and other sources. Credit ratings are not
recommendations to buy, sell, or hold securities and are subject to revision or withdrawal at any time by the assigning
rating agency. Each rating agency may have different criteria for evaluating company risk and, therefore, ratings should
be evaluated independently for each rating agency.
There have been no rating actions by these NRSROs since the filing of our Quarterly Report on Form 10-Q for the
quarter ended September 30, 2025.
The following table summarizes certain of the credit ratings and outlook presently assigned by these four NRSROs:
NRSRO RATINGS
Ford
Ford Credit
NRSROs
Issuer
Default /
Corporate /
Issuer Rating
Long-Term
Senior
Unsecured
Outlook /
Trend
Long-Term
Senior
Unsecured
Short-Term
Unsecured
Outlook /
Trend
Minimum
Long-Term
Investment
Grade Rating
DBRS
BBB (low)
BBB (low)
Stable
BBB (low)
R-2 (low)
Stable
BBB (low)
Fitch
BBB-
BBB-
Stable
BBB-
F3
Stable
BBB-
Moody’s
N/A
Ba1
Stable
Ba1
NP
Stable
Baa3
S&P
BBB-
BBB-
Negative
BBB-
A-3
Negative
BBB-
Item 7. Management’s Discussion and Analysis of Financial Condition and Results of Operations (Continued)
73
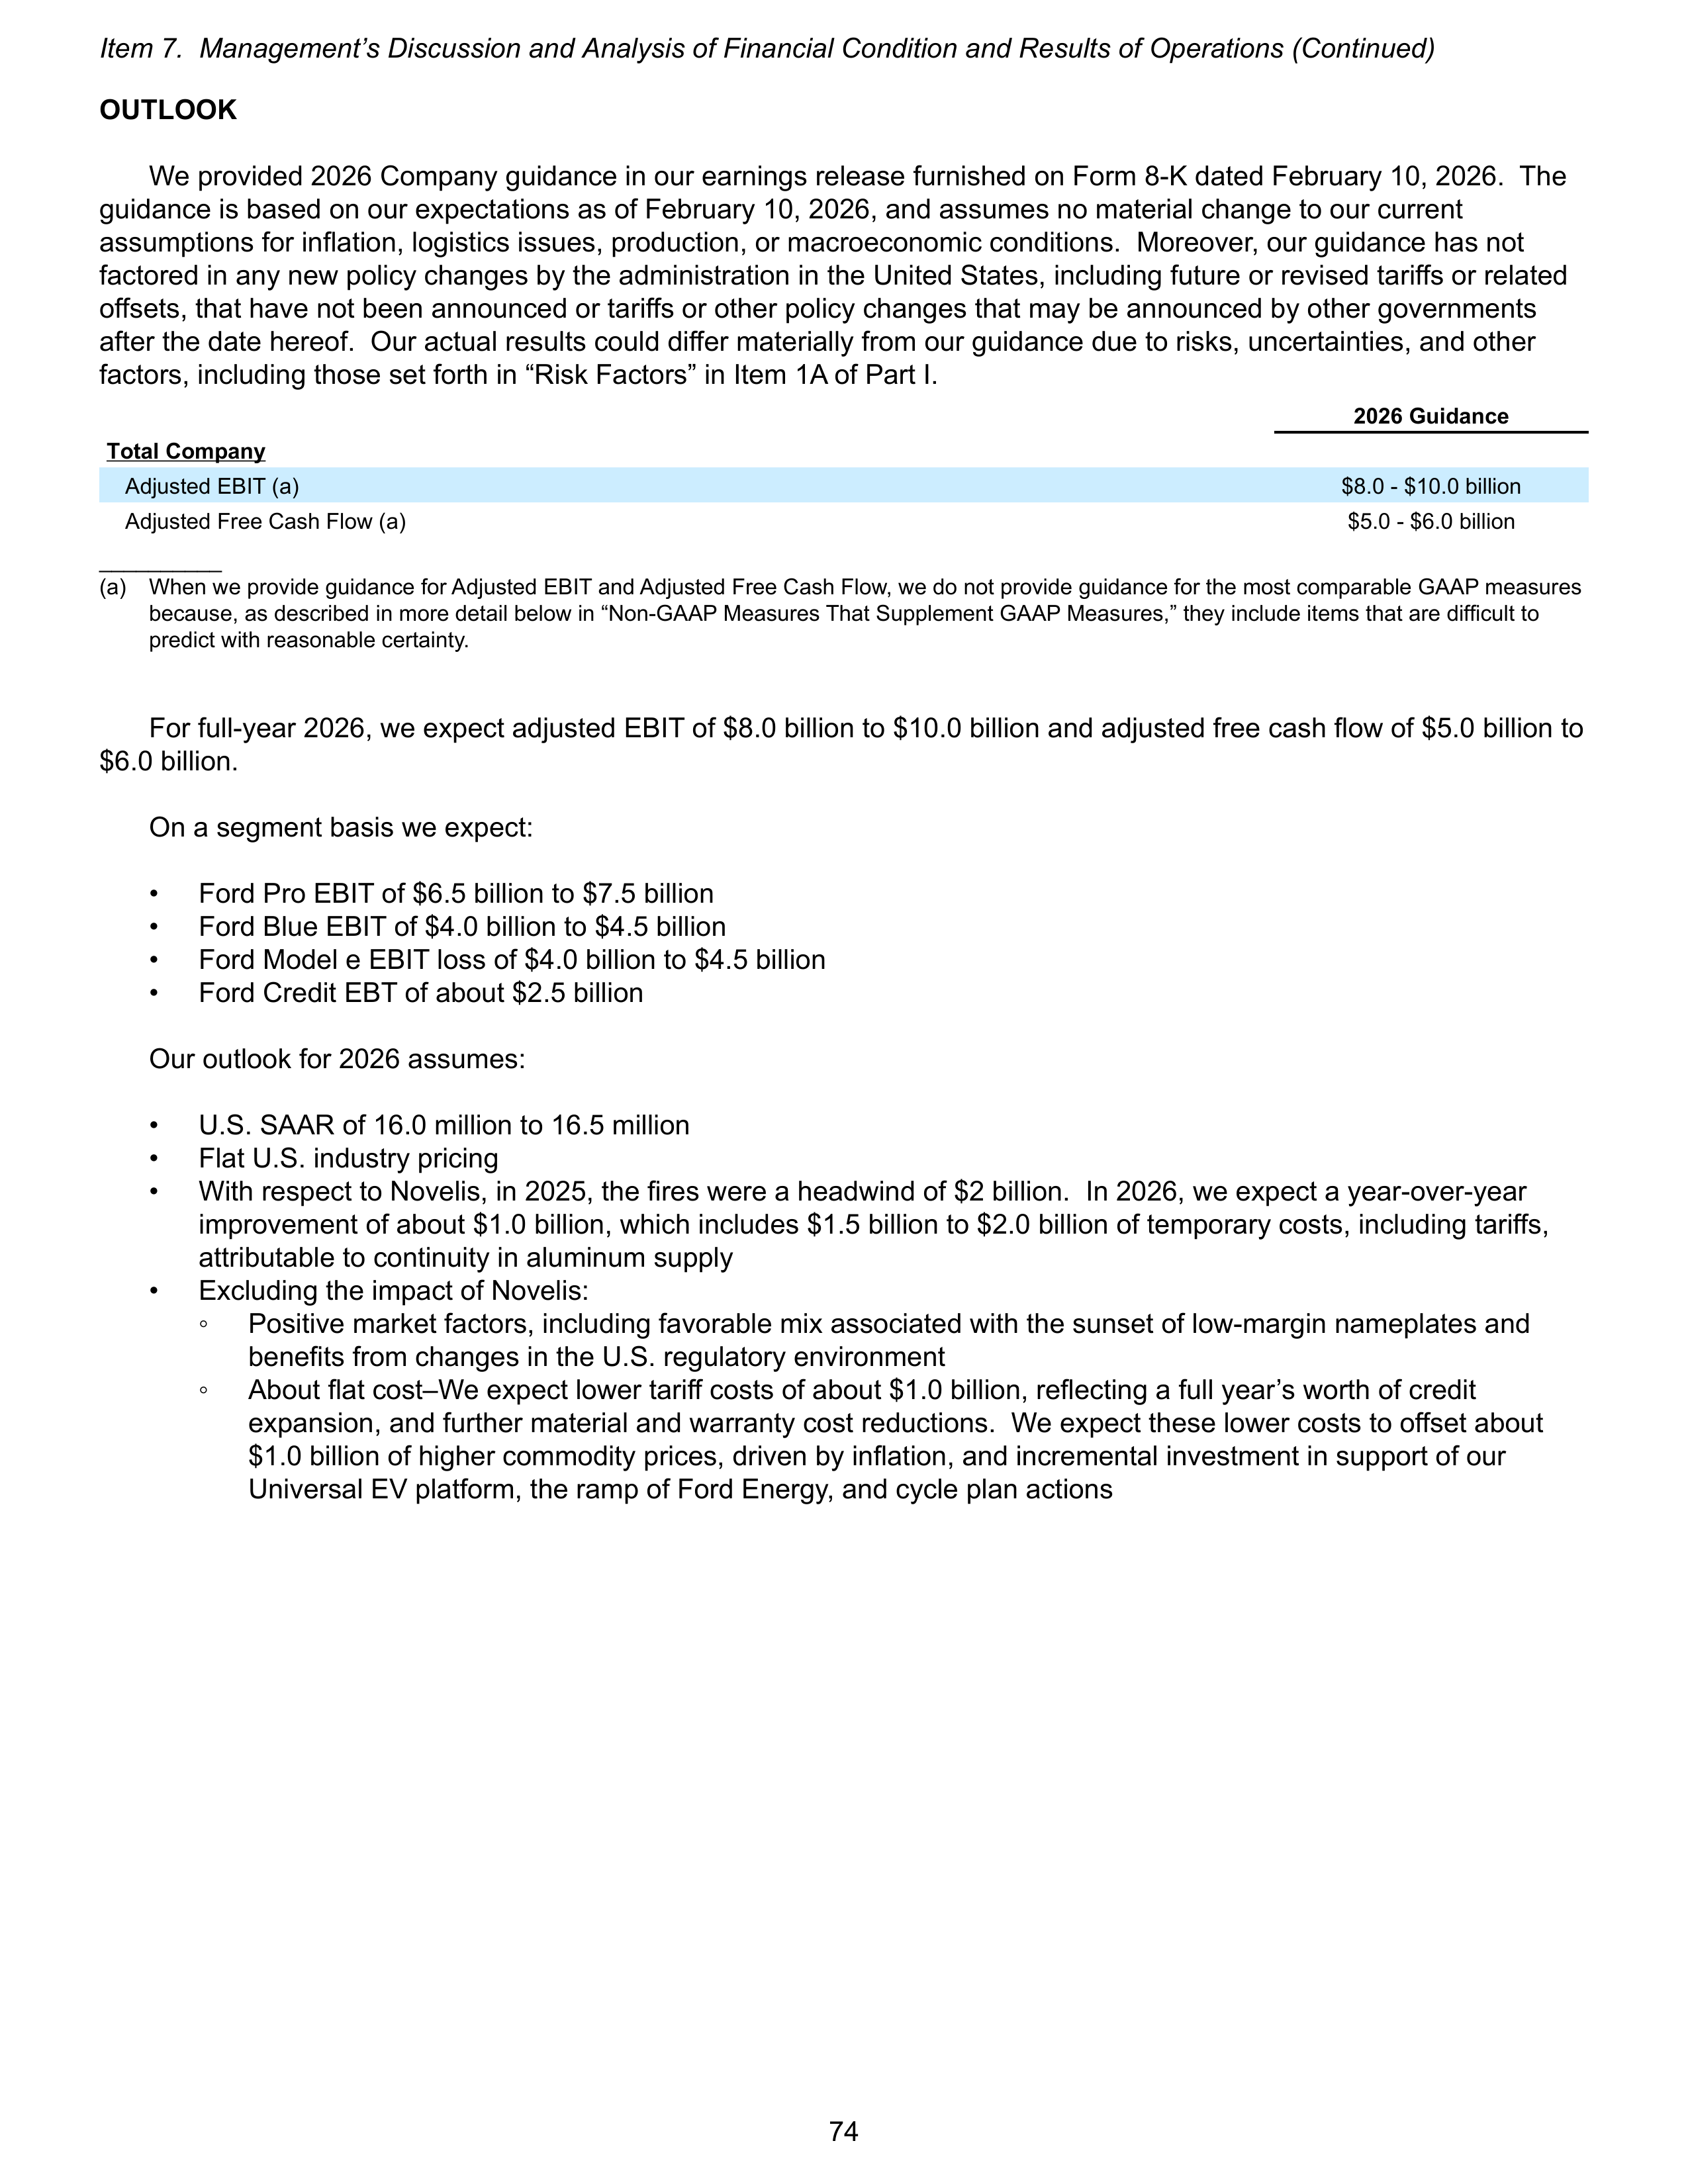
OUTLOOK
We provided 2026 Company guidance in our earnings release furnished on Form 8-K dated February 10, 2026. The
guidance is based on our expectations as of February 10, 2026, and assumes no material change to our current
assumptions for inflation, logistics issues, production, or macroeconomic conditions. Moreover, our guidance has not
factored in any new policy changes by the administration in the United States, including future or revised tariffs or related
offsets, that have not been announced or tariffs or other policy changes that may be announced by other governments
after the date hereof. Our actual results could differ materially from our guidance due to risks, uncertainties, and other
factors, including those set forth in “Risk Factors” in Item 1A of Part I.
2026 Guidance
Total Company
Adjusted EBIT (a)
$8.0 - $10.0 billion
Adjusted Free Cash Flow (a)
$5.0 - $6.0 billion
__________
(a)
When we provide guidance for Adjusted EBIT and Adjusted Free Cash Flow, we do not provide guidance for the most comparable GAAP measures
because, as described in more detail below in “Non-GAAP Measures That Supplement GAAP Measures,” they include items that are difficult to
predict with reasonable certainty.
For full-year 2026, we expect adjusted EBIT of $8.0 billion to $10.0 billion and adjusted free cash flow of $5.0 billion to
$6.0 billion.
On a segment basis we expect:
•
Ford Pro EBIT of $6.5 billion to $7.5 billion
•
Ford Blue EBIT of $4.0 billion to $4.5 billion
•
Ford Model e EBIT loss of $4.0 billion to $4.5 billion
•
Ford Credit EBT of about $2.5 billion
Our outlook for 2026 assumes:
•
U.S. SAAR of 16.0 million to 16.5 million
•
Flat U.S. industry pricing
•
With respect to Novelis, in 2025, the fires were a headwind of $2 billion. In 2026, we expect a year-over-year
improvement of about $1.0 billion, which includes $1.5 billion to $2.0 billion of temporary costs, including tariffs,
attributable to continuity in aluminum supply
•
Excluding the impact of Novelis:
◦
Positive market factors, including favorable mix associated with the sunset of low-margin nameplates and
benefits from changes in the U.S. regulatory environment
◦
About flat cost–We expect lower tariff costs of about $1.0 billion, reflecting a full year’s worth of credit
expansion, and further material and warranty cost reductions. We expect these lower costs to offset about
$1.0 billion of higher commodity prices, driven by inflation, and incremental investment in support of our
Universal EV platform, the ramp of Ford Energy, and cycle plan actions
Item 7. Management’s Discussion and Analysis of Financial Condition and Results of Operations (Continued)
74
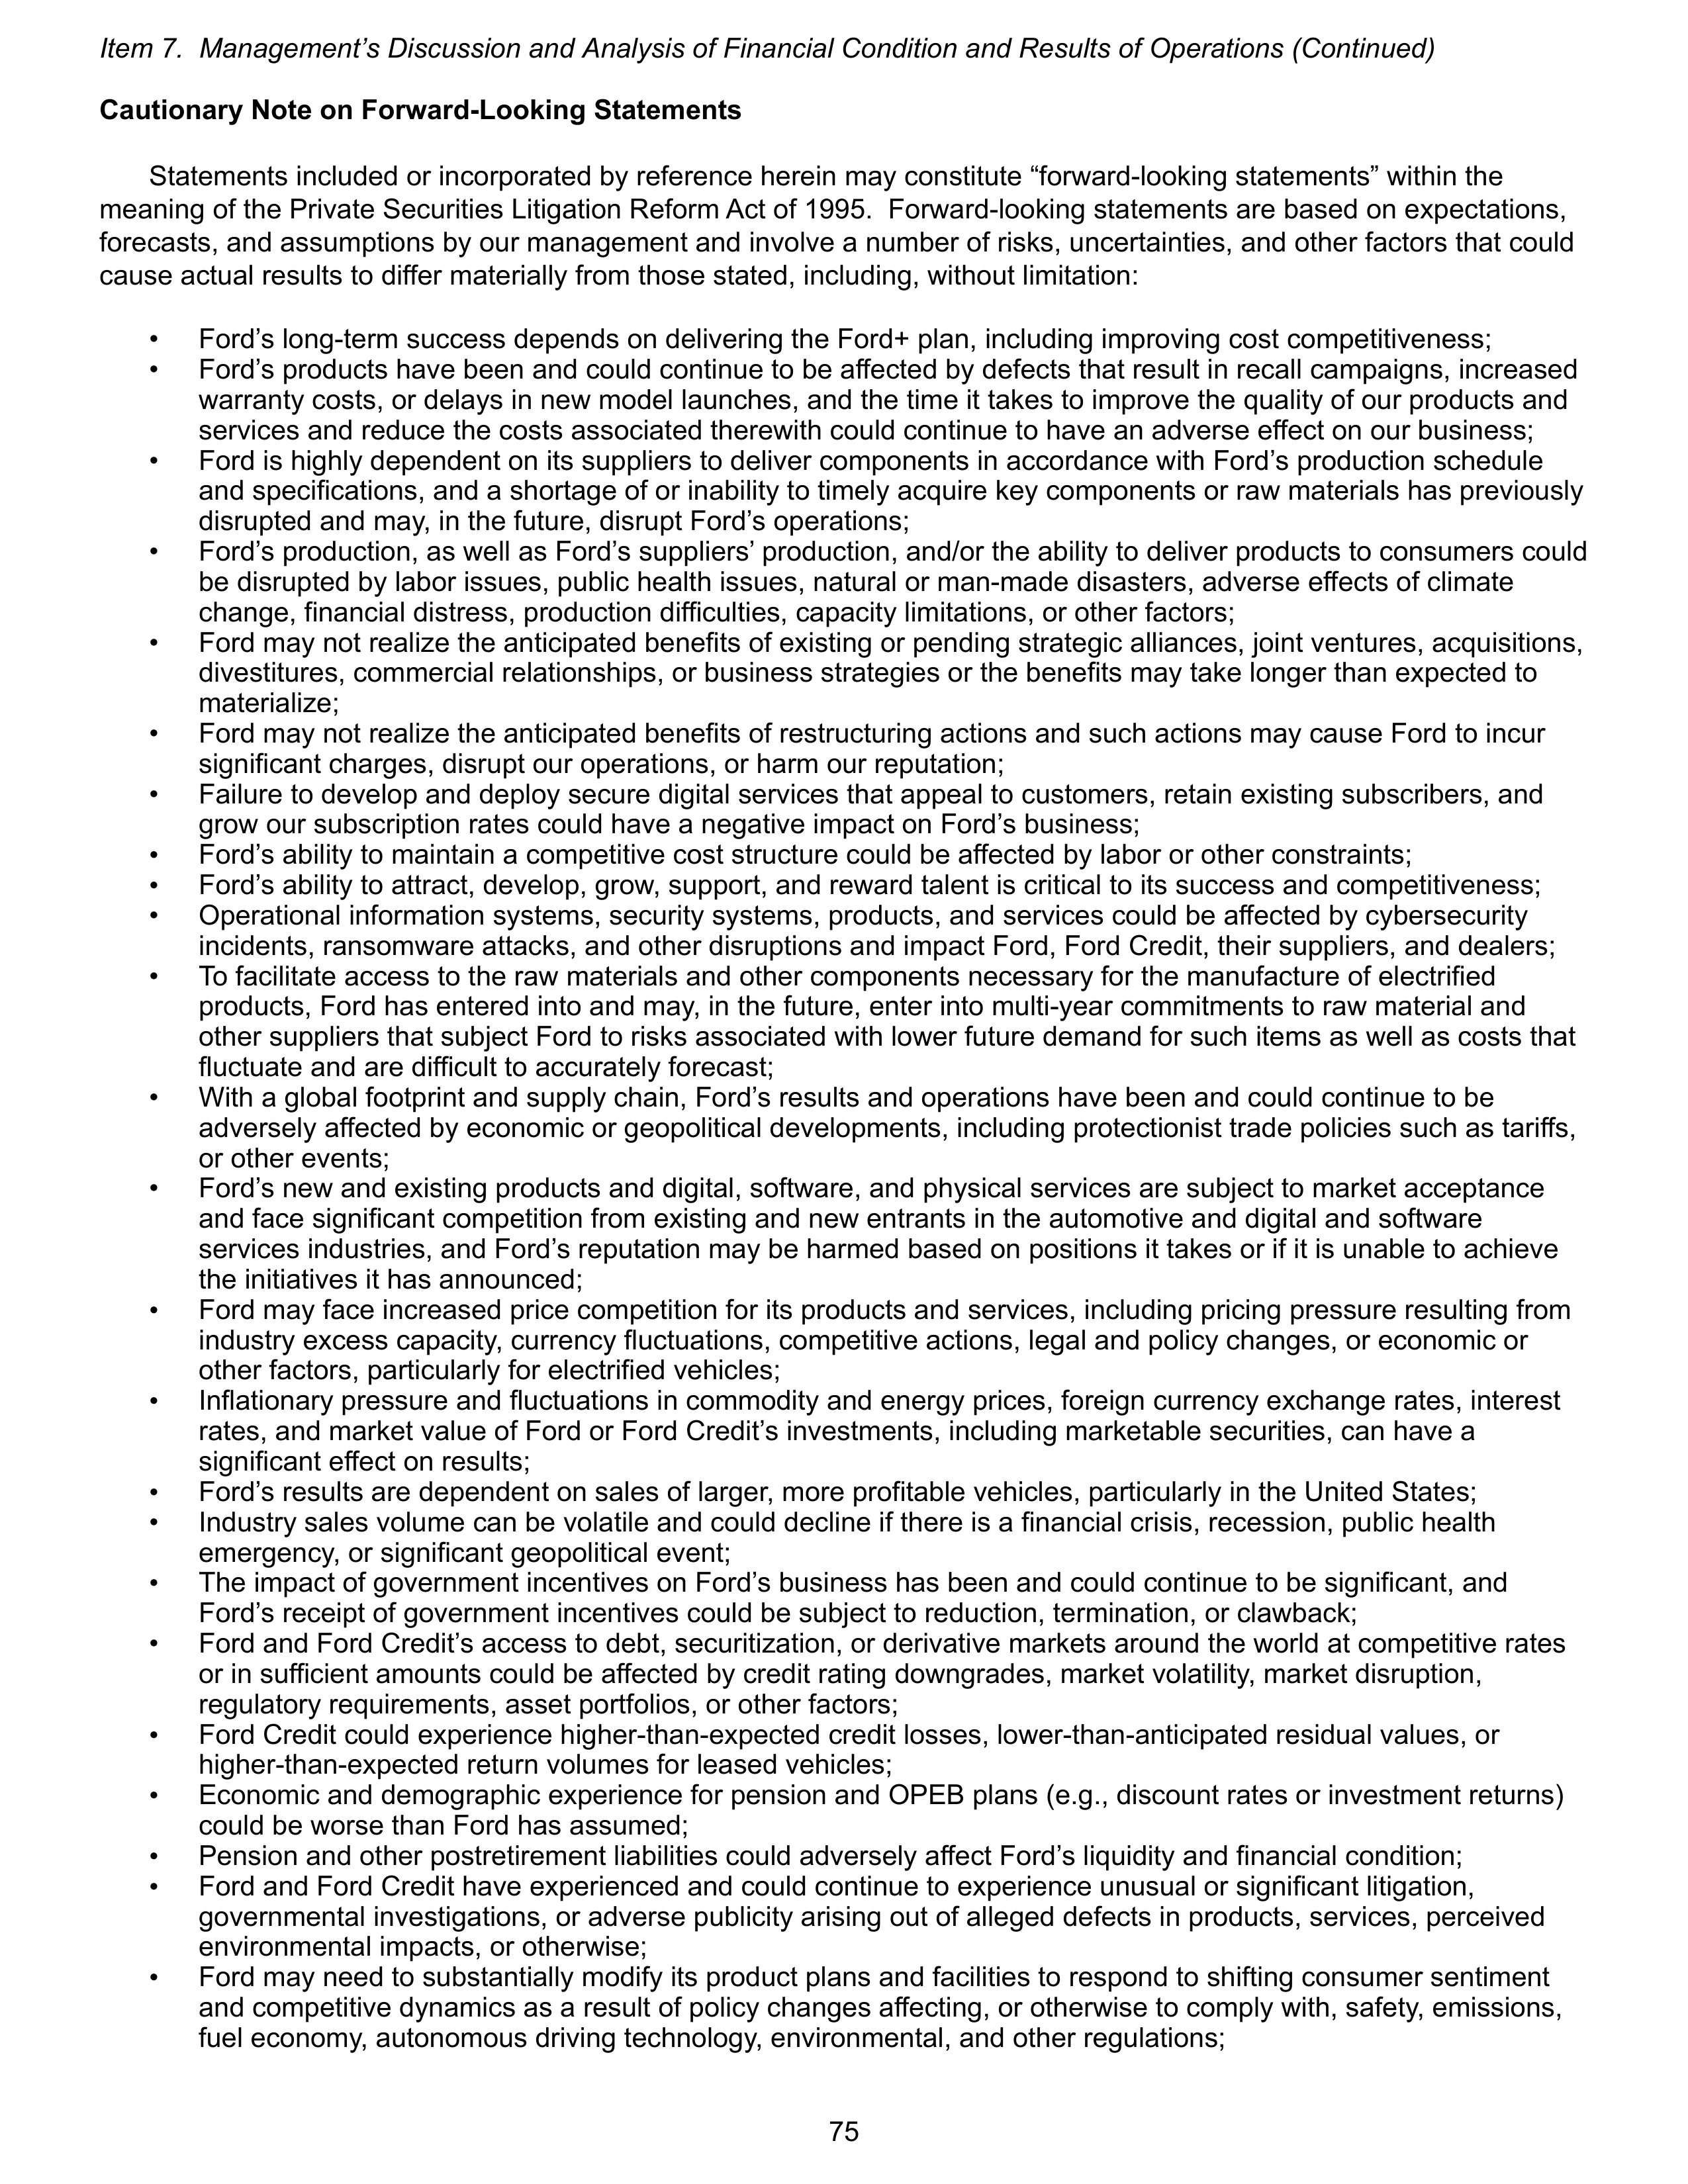
Cautionary Note on Forward-Looking Statements
Statements included or incorporated by reference herein may constitute “forward-looking statements” within the
meaning of the Private Securities Litigation Reform Act of 1995. Forward-looking statements are based on expectations,
forecasts, and assumptions by our management and involve a number of risks, uncertainties, and other factors that could
cause actual results to differ materially from those stated, including, without limitation:
•
Ford’s long-term success depends on delivering the Ford+ plan, including improving cost competitiveness;
•
Ford’s products have been and could continue to be affected by defects that result in recall campaigns, increased
warranty costs, or delays in new model launches, and the time it takes to improve the quality of our products and
services and reduce the costs associated therewith could continue to have an adverse effect on our business;
•
Ford is highly dependent on its suppliers to deliver components in accordance with Ford’s production schedule
and specifications, and a shortage of or inability to timely acquire key components or raw materials has previously
disrupted and may, in the future, disrupt Ford’s operations;
•
Ford’s production, as well as Ford’s suppliers’ production, and/or the ability to deliver products to consumers could
be disrupted by labor issues, public health issues, natural or man-made disasters, adverse effects of climate
change, financial distress, production difficulties, capacity limitations, or other factors;
•
Ford may not realize the anticipated benefits of existing or pending strategic alliances, joint ventures, acquisitions,
divestitures, commercial relationships, or business strategies or the benefits may take longer than expected to
materialize;
•
Ford may not realize the anticipated benefits of restructuring actions and such actions may cause Ford to incur
significant charges, disrupt our operations, or harm our reputation;
•
Failure to develop and deploy secure digital services that appeal to customers, retain existing subscribers, and
grow our subscription rates could have a negative impact on Ford’s business;
•
Ford’s ability to maintain a competitive cost structure could be affected by labor or other constraints;
•
Ford’s ability to attract, develop, grow, support, and reward talent is critical to its success and competitiveness;
•
Operational information systems, security systems, products, and services could be affected by cybersecurity
incidents, ransomware attacks, and other disruptions and impact Ford, Ford Credit, their suppliers, and dealers;
•
To facilitate access to the raw materials and other components necessary for the manufacture of electrified
products, Ford has entered into and may, in the future, enter into multi-year commitments to raw material and
other suppliers that subject Ford to risks associated with lower future demand for such items as well as costs that
fluctuate and are difficult to accurately forecast;
•
With a global footprint and supply chain, Ford’s results and operations have been and could continue to be
adversely affected by economic or geopolitical developments, including protectionist trade policies such as tariffs,
or other events;
•
Ford’s new and existing products and digital, software, and physical services are subject to market acceptance
and face significant competition from existing and new entrants in the automotive and digital and software
services industries, and Ford’s reputation may be harmed based on positions it takes or if it is unable to achieve
the initiatives it has announced;
•
Ford may face increased price competition for its products and services, including pricing pressure resulting from
industry excess capacity, currency fluctuations, competitive actions, legal and policy changes, or economic or
other factors, particularly for electrified vehicles;
•
Inflationary pressure and fluctuations in commodity and energy prices, foreign currency exchange rates, interest
rates, and market value of Ford or Ford Credit’s investments, including marketable securities, can have a
significant effect on results;
•
Ford’s results are dependent on sales of larger, more profitable vehicles, particularly in the United States;
•
Industry sales volume can be volatile and could decline if there is a financial crisis, recession, public health
emergency, or significant geopolitical event;
•
The impact of government incentives on Ford’s business has been and could continue to be significant, and
Ford’s receipt of government incentives could be subject to reduction, termination, or clawback;
•
Ford and Ford Credit’s access to debt, securitization, or derivative markets around the world at competitive rates
or in sufficient amounts could be affected by credit rating downgrades, market volatility, market disruption,
regulatory requirements, asset portfolios, or other factors;
•
Ford Credit could experience higher-than-expected credit losses, lower-than-anticipated residual values, or
higher-than-expected return volumes for leased vehicles;
•
Economic and demographic experience for pension and OPEB plans (e.g., discount rates or investment returns)
could be worse than Ford has assumed;
•
Pension and other postretirement liabilities could adversely affect Ford’s liquidity and financial condition;
•
Ford and Ford Credit have experienced and could continue to experience unusual or significant litigation,
governmental investigations, or adverse publicity arising out of alleged defects in products, services, perceived
environmental impacts, or otherwise;
•
Ford may need to substantially modify its product plans and facilities to respond to shifting consumer sentiment
and competitive dynamics as a result of policy changes affecting, or otherwise to comply with, safety, emissions,
fuel economy, autonomous driving technology, environmental, and other regulations;
Item 7. Management’s Discussion and Analysis of Financial Condition and Results of Operations (Continued)
75

•
Ford and Ford Credit could be affected by the continued development of more stringent privacy, data use, data
protection, data access, and artificial intelligence laws and regulations as well as consumers’ heightened
expectations to safeguard their personal information; and
•
Ford Credit could be subject to new or increased credit regulations, consumer protection regulations, or other
regulations.
We cannot be certain that any expectation, forecast, or assumption made in preparing forward-looking statements will
prove accurate, or that any projection will be realized. It is to be expected that there may be differences between
projected and actual results. Our forward-looking statements speak only as of the date of their initial issuance, and we do
not undertake, and expressly disclaim to the extent permitted by law, any obligation to update or revise publicly any
forward-looking statement, whether as a result of new information, future events, or otherwise. For additional discussion,
see “Item 1A. Risk Factors” above.
Item 7. Management’s Discussion and Analysis of Financial Condition and Results of Operations (Continued)
76
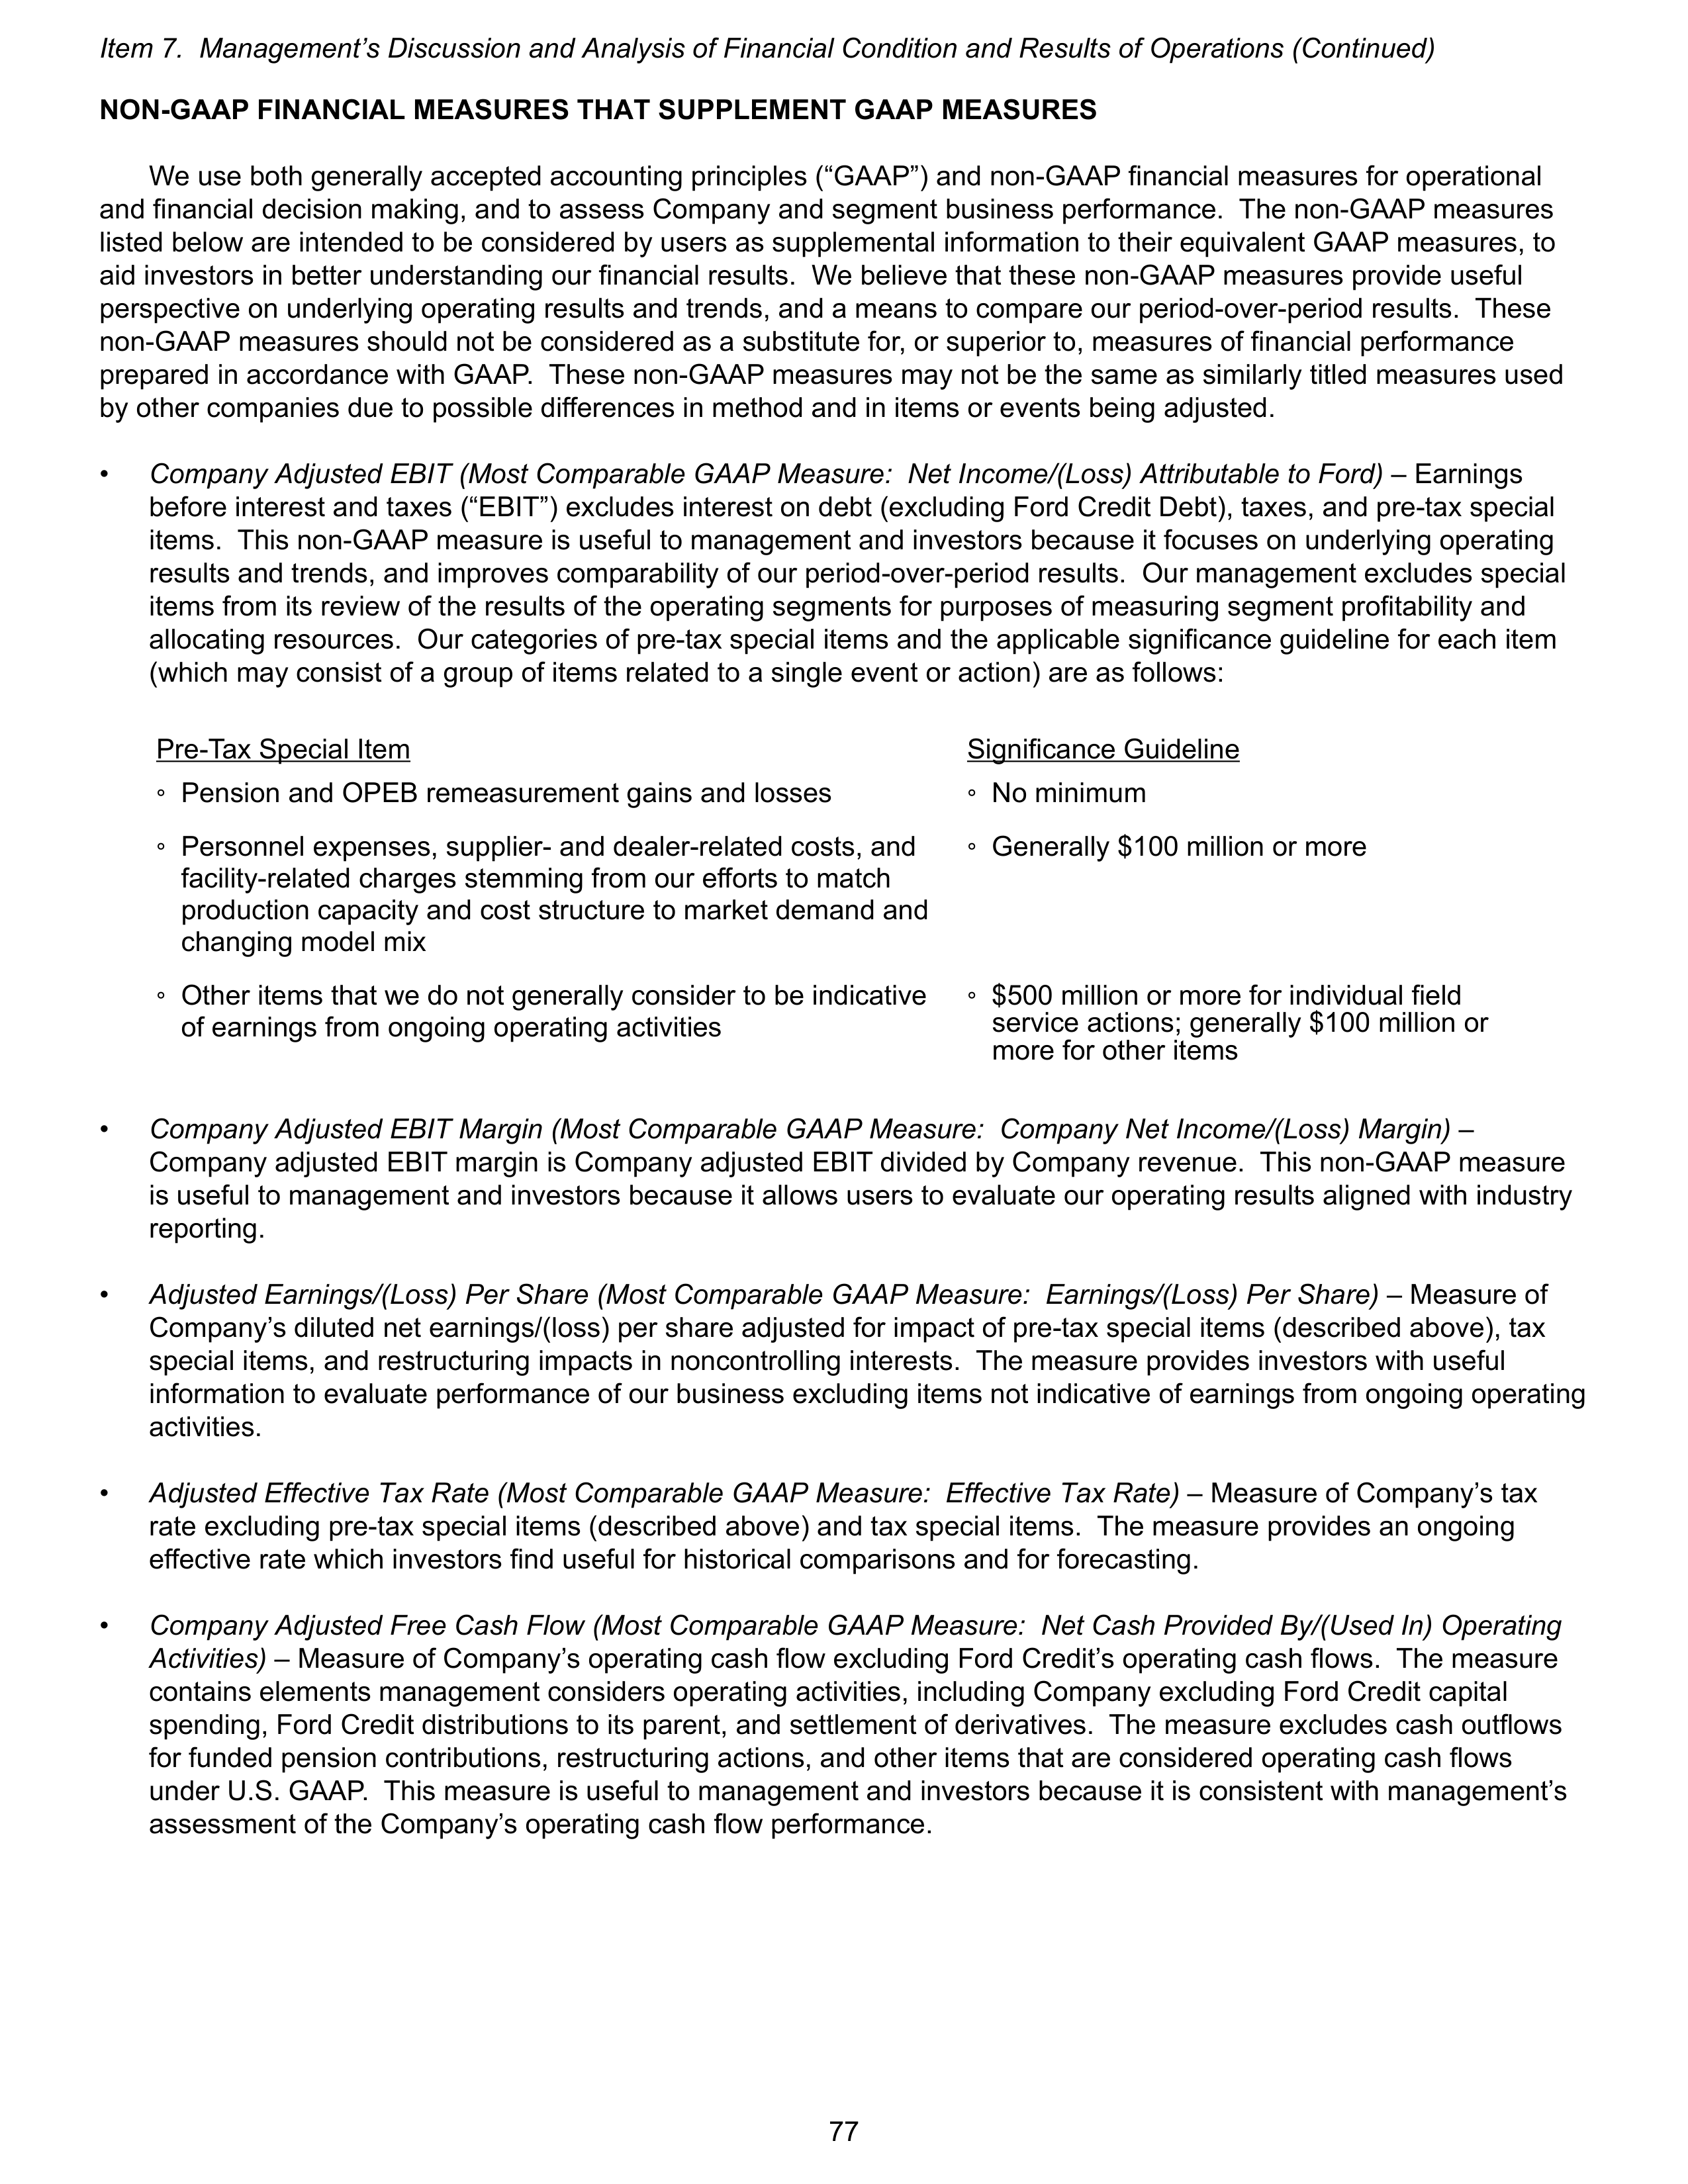
NON-GAAP FINANCIAL MEASURES THAT SUPPLEMENT GAAP MEASURES
We use both generally accepted accounting principles (“GAAP”) and non-GAAP financial measures for operational
and financial decision making, and to assess Company and segment business performance. The non-GAAP measures
listed below are intended to be considered by users as supplemental information to their equivalent GAAP measures, to
aid investors in better understanding our financial results. We believe that these non-GAAP measures provide useful
perspective on underlying operating results and trends, and a means to compare our period-over-period results. These
non-GAAP measures should not be considered as a substitute for, or superior to, measures of financial performance
prepared in accordance with GAAP. These non-GAAP measures may not be the same as similarly titled measures used
by other companies due to possible differences in method and in items or events being adjusted.
•
Company Adjusted EBIT (Most Comparable GAAP Measure: Net Income/(Loss) Attributable to Ford)
– Earnings
before interest and taxes (“EBIT”) excludes interest on debt (excluding Ford Credit Debt), taxes, and pre-tax special
items. This non-GAAP measure is useful to management and investors because it focuses on underlying operating
results and trends, and improves comparability of our period-over-period results. Our management excludes special
items from its review of the results of the operating segments for purposes of measuring segment profitability and
allocating resources. Our categories of pre-tax special items and the applicable significance guideline for each item
(which may consist of a group of items related to a single event or action) are as follows:
Pre-Tax Special Item
Significance Guideline
∘
Pension and OPEB remeasurement gains and losses
∘
No minimum
∘
Personnel expenses, supplier- and dealer-related costs, and
facility-related charges stemming from our efforts to match
production capacity and cost structure to market demand and
changing model mix
∘
Generally $100 million or more
∘
Other items that we do not generally consider to be indicative
of earnings from ongoing operating activities
∘
$500 million or more for individual field
service actions; generally $100 million or
more for other items
•
Company Adjusted EBIT Margin (Most Comparable GAAP Measure: Company Net Income/(Loss) Margin)
–
Company adjusted EBIT margin is Company adjusted EBIT divided by Company revenue. This non-GAAP measure
is useful to management and investors because it allows users to evaluate our operating results aligned with industry
reporting.
•
Adjusted Earnings/(Loss) Per Share (Most Comparable GAAP Measure: Earnings/(Loss) Per Share)
– Measure of
Company’s diluted net earnings/(loss) per share adjusted for impact of pre-tax special items (described above), tax
special items, and restructuring impacts in noncontrolling interests. The measure provides investors with useful
information to evaluate performance of our business excluding items not indicative of earnings from ongoing operating
activities.
•
Adjusted Effective Tax Rate (Most Comparable GAAP Measure: Effective Tax Rate)
– Measure of Company’s tax
rate excluding pre-tax special items (described above) and tax special items. The measure provides an ongoing
effective rate which investors find useful for historical comparisons and for forecasting.
•
Company Adjusted Free Cash Flow (Most Comparable GAAP Measure: Net Cash Provided By/(Used In) Operating
Activities)
– Measure of Company’s operating cash flow excluding Ford Credit’s operating cash flows. The measure
contains elements management considers operating activities, including Company excluding Ford Credit capital
spending, Ford Credit distributions to its parent, and settlement of derivatives. The measure excludes cash outflows
for funded pension contributions, restructuring actions, and other items that are considered operating cash flows
under U.S. GAAP. This measure is useful to management and investors because it is consistent with management’s
assessment of the Company’s operating cash flow performance.
Item 7. Management’s Discussion and Analysis of Financial Condition and Results of Operations (Continued)
77
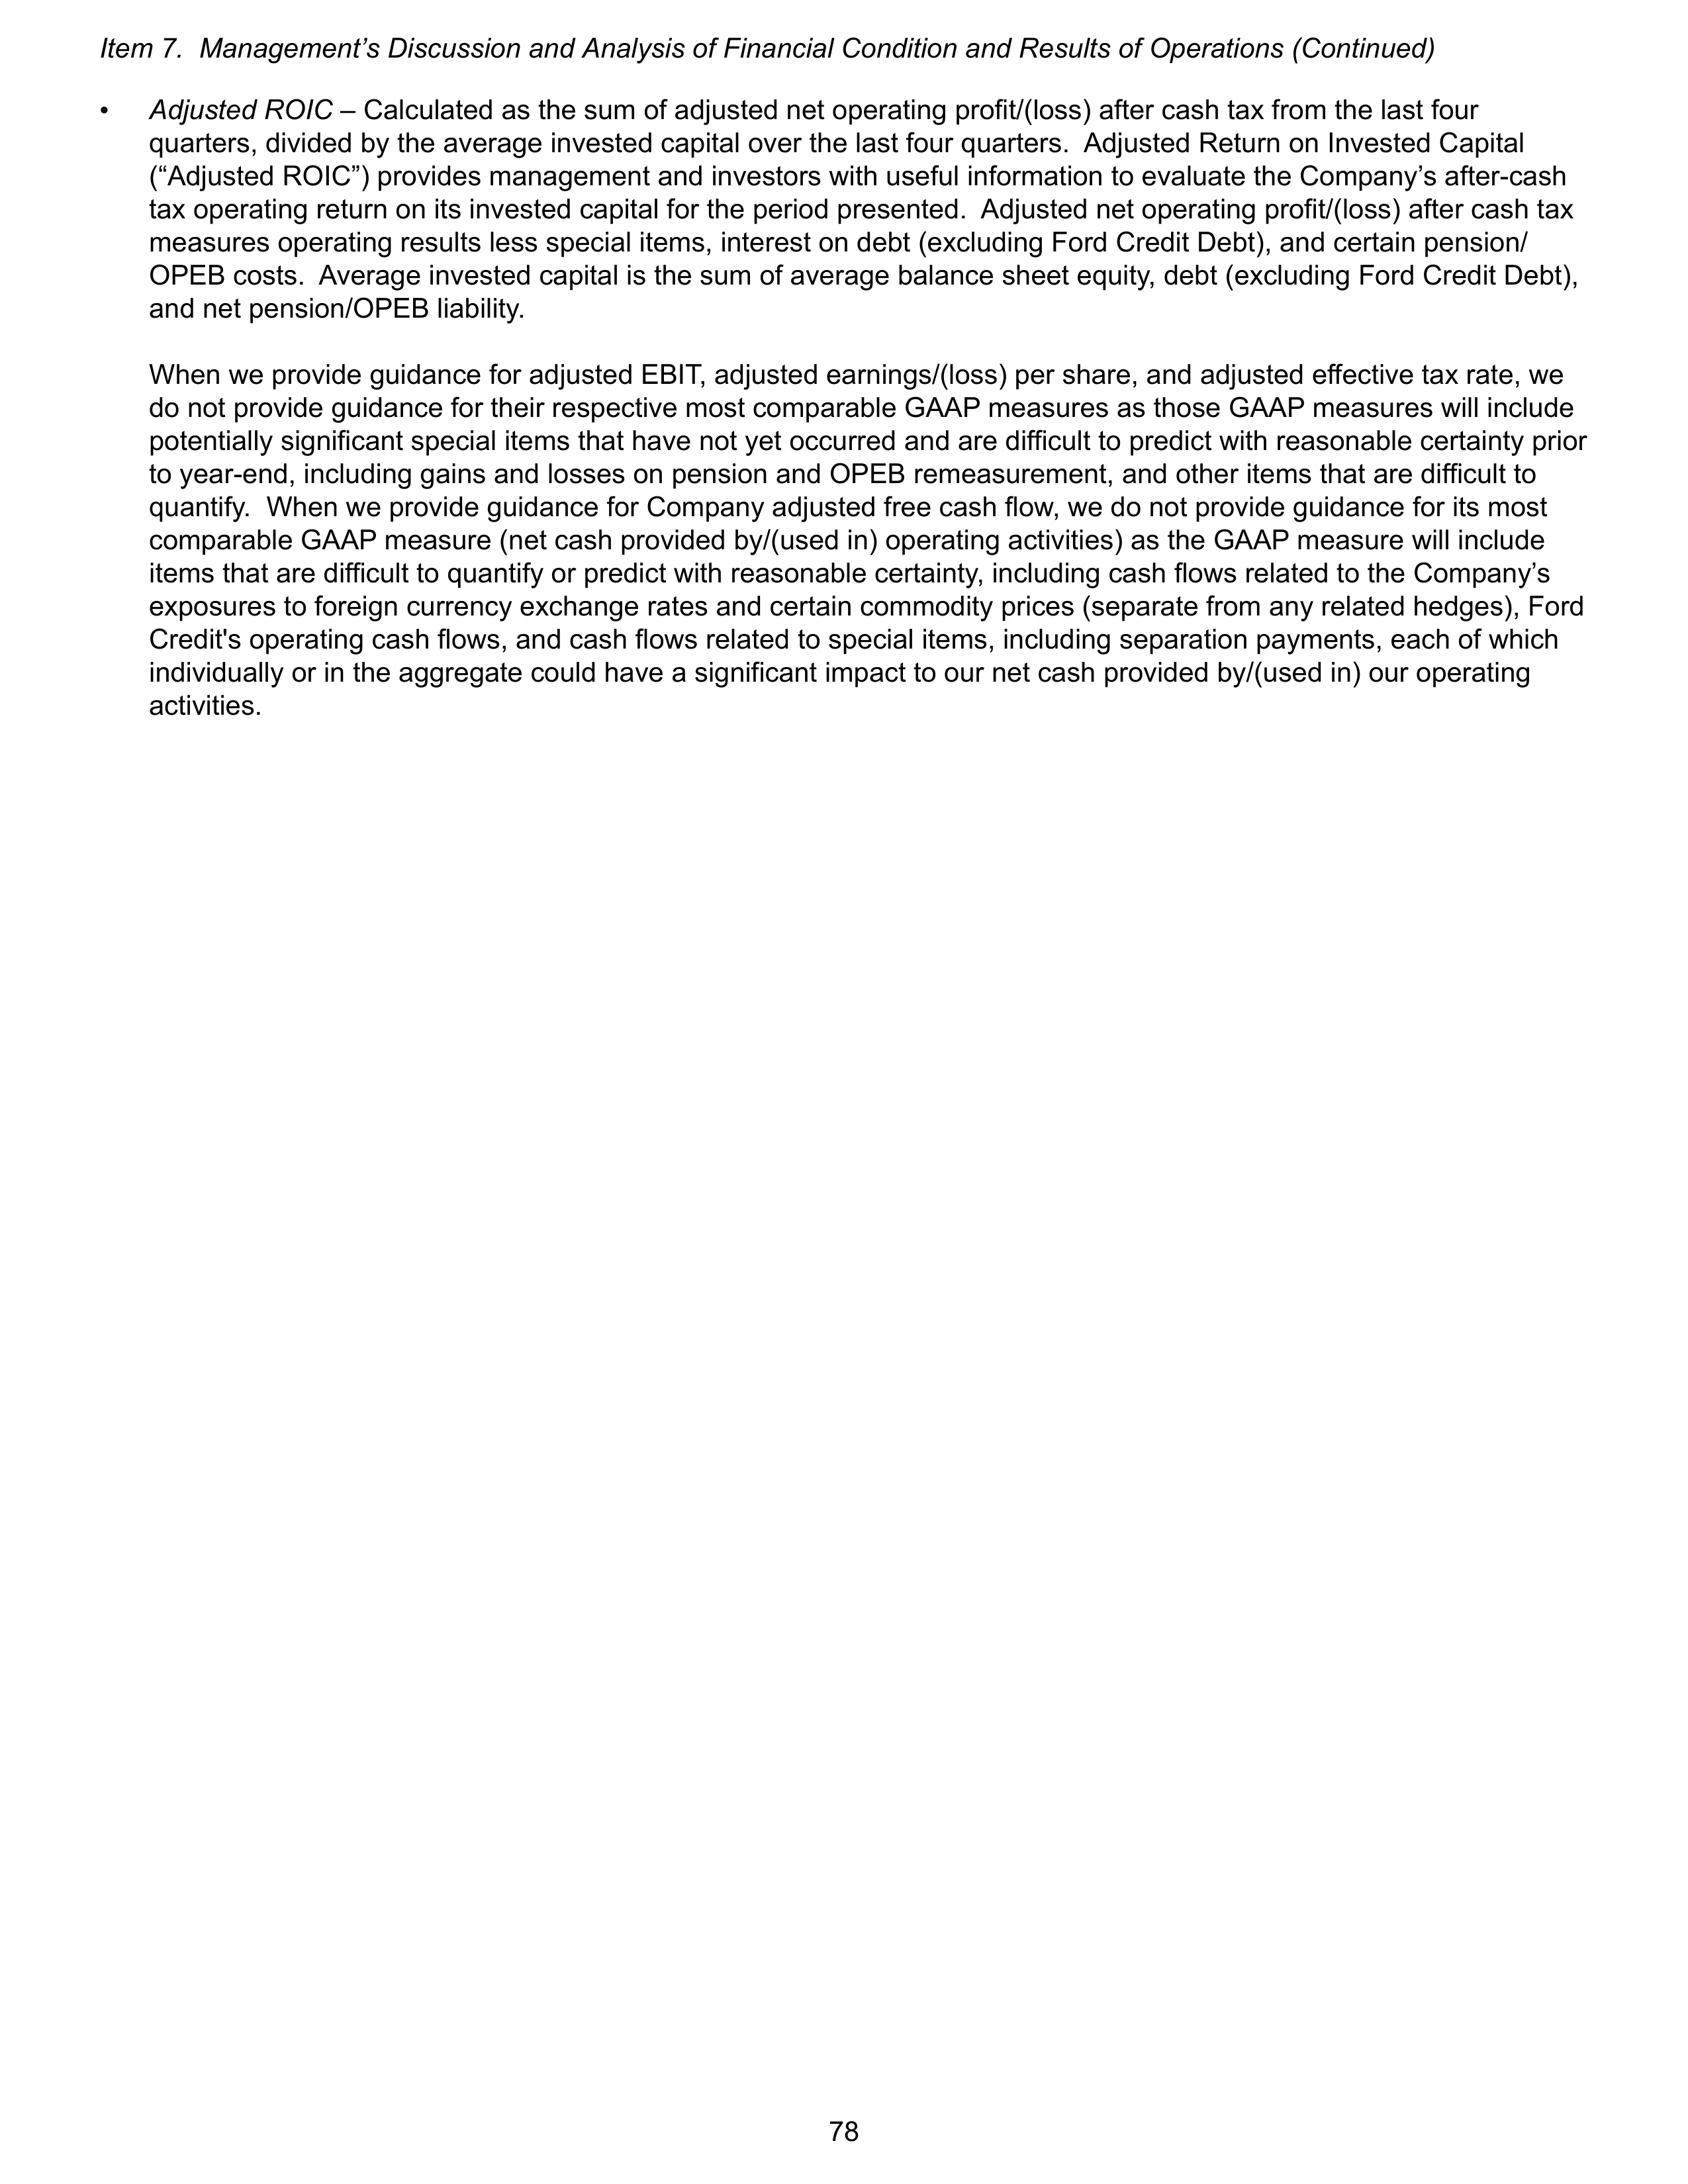
•
Adjusted ROIC
– Calculated as the sum of adjusted net operating profit/(loss) after cash tax from the last four
quarters, divided by the average invested capital over the last four quarters. Adjusted Return on Invested Capital
(“Adjusted ROIC”) provides management and investors with useful information to evaluate the Company’s after-cash
tax operating return on its invested capital for the period presented. Adjusted net operating profit/(loss) after cash tax
measures operating results less special items, interest on debt (excluding Ford Credit Debt), and certain pension/
OPEB costs. Average invested capital is the sum of average balance sheet equity, debt (excluding Ford Credit Debt),
and net pension/OPEB liability.
When we provide guidance for adjusted EBIT, adjusted earnings/(loss) per share, and adjusted effective tax rate, we
do not provide guidance for their respective most comparable GAAP measures as those GAAP measures will include
potentially significant special items that have not yet occurred and are difficult to predict with reasonable certainty prior
to year-end, including gains and losses on pension and OPEB remeasurement, and other items that are difficult to
quantify. When we provide guidance for Company adjusted free cash flow, we do not provide guidance for its most
comparable GAAP measure (net cash provided by/(used in) operating activities) as the GAAP measure will include
items that are difficult to quantify or predict with reasonable certainty, including cash flows related to the Company’s
exposures to foreign currency exchange rates and certain commodity prices (separate from any related hedges), Ford
Credit's operating cash flows, and cash flows related to special items, including separation payments, each of which
individually or in the aggregate could have a significant impact to our net cash provided by/(used in) our operating
activities.
Item 7. Management’s Discussion and Analysis of Financial Condition and Results of Operations (Continued)
78
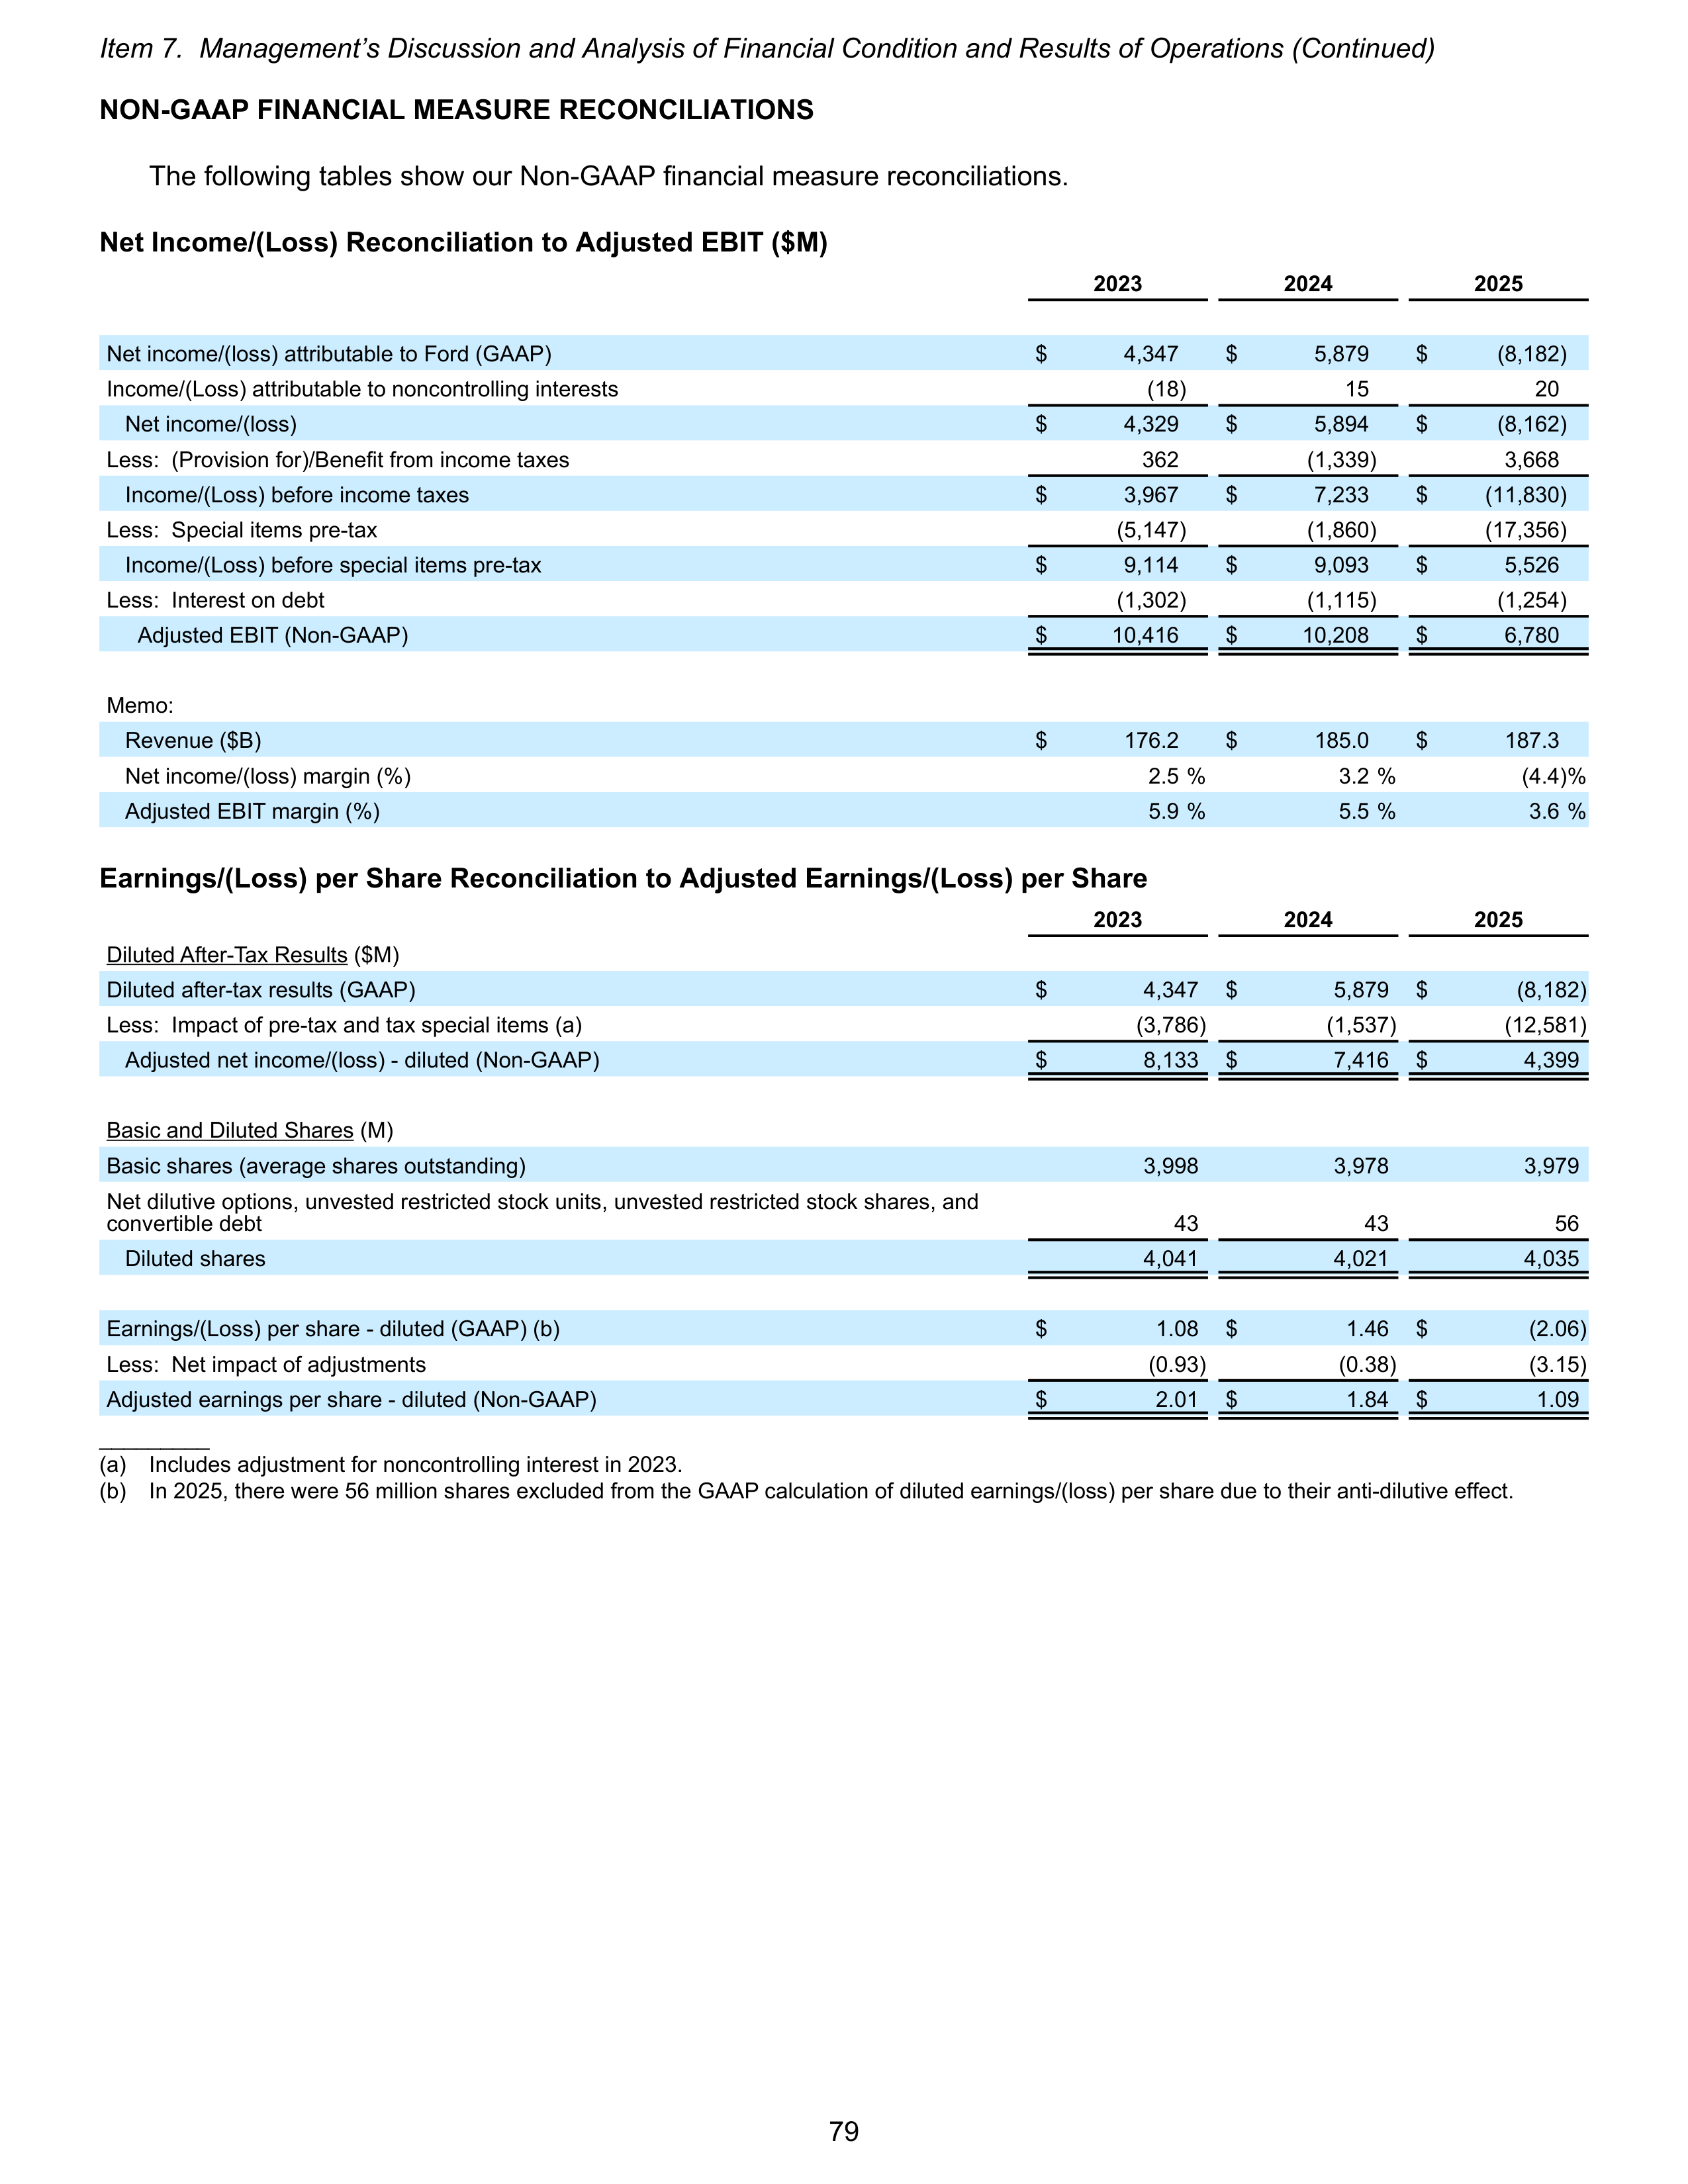
NON-GAAP FINANCIAL MEASURE RECONCILIATIONS
The following tables show our Non-GAAP financial measure reconciliations.
Net Income/(Loss) Reconciliation to Adjusted EBIT ($M)
2023
2024
2025
Net income/(loss) attributable to Ford (GAAP)
$
4,347
$
5,879
$
(8,182)
Income/(Loss) attributable to noncontrolling interests
(18)
15
20
Net income/(loss)
$
4,329
$
5,894
$
(8,162)
Less: (Provision for)/Benefit from income taxes
362
(1,339)
3,668
Income/(Loss) before income taxes
$
3,967
$
7,233
$
(11,830)
Less: Special items pre-tax
(5,147)
(1,860)
(17,356)
Income/(Loss) before special items pre-tax
$
9,114
$
9,093
$
5,526
Less: Interest on debt
(1,302)
(1,115)
(1,254)
Adjusted EBIT (Non-GAAP)
$
10,416
$
10,208
$
6,780
Memo:
Revenue ($B)
$
176.2
$
185.0
$
187.3
Net income/(loss) margin (%)
2.5 %
3.2 %
(4.4) %
Adjusted EBIT margin (%)
5.9 %
5.5 %
3.6 %
Earnings/(Loss) per Share Reconciliation to Adjusted Earnings/(Loss) per Share
2023
2024
2025
Diluted After-Tax Results ($M)
Diluted after-tax results (GAAP)
$
4,347
$
5,879
$
(8,182)
Less: Impact of pre-tax and tax special items (a)
(3,786)
(1,537)
(12,581)
Adjusted net income/(loss) - diluted (Non-GAAP)
$
8,133
$
7,416
$
4,399
Basic and Diluted Shares (M)
Basic shares (average shares outstanding)
3,998
3,978
3,979
Net dilutive options, unvested restricted stock units, unvested restricted stock shares, and
convertible debt
43
43
56
Diluted shares
4,041
4,021
4,035
Earnings/(Loss) per share - diluted (GAAP) (b)
$
1.08
$
1.46
$
(2.06)
Less: Net impact of adjustments
(0.93)
(0.38)
(3.15)
Adjusted earnings per share - diluted (Non-GAAP)
$
2.01
$
1.84
$
1.09
_________
(a)
Includes adjustment for noncontrolling interest in 2023.
(b)
In 2025, there were 56 million shares excluded from the GAAP calculation of diluted earnings/(loss) per share due to their anti-dilutive effect.
Item 7. Management’s Discussion and Analysis of Financial Condition and Results of Operations (Continued)
79
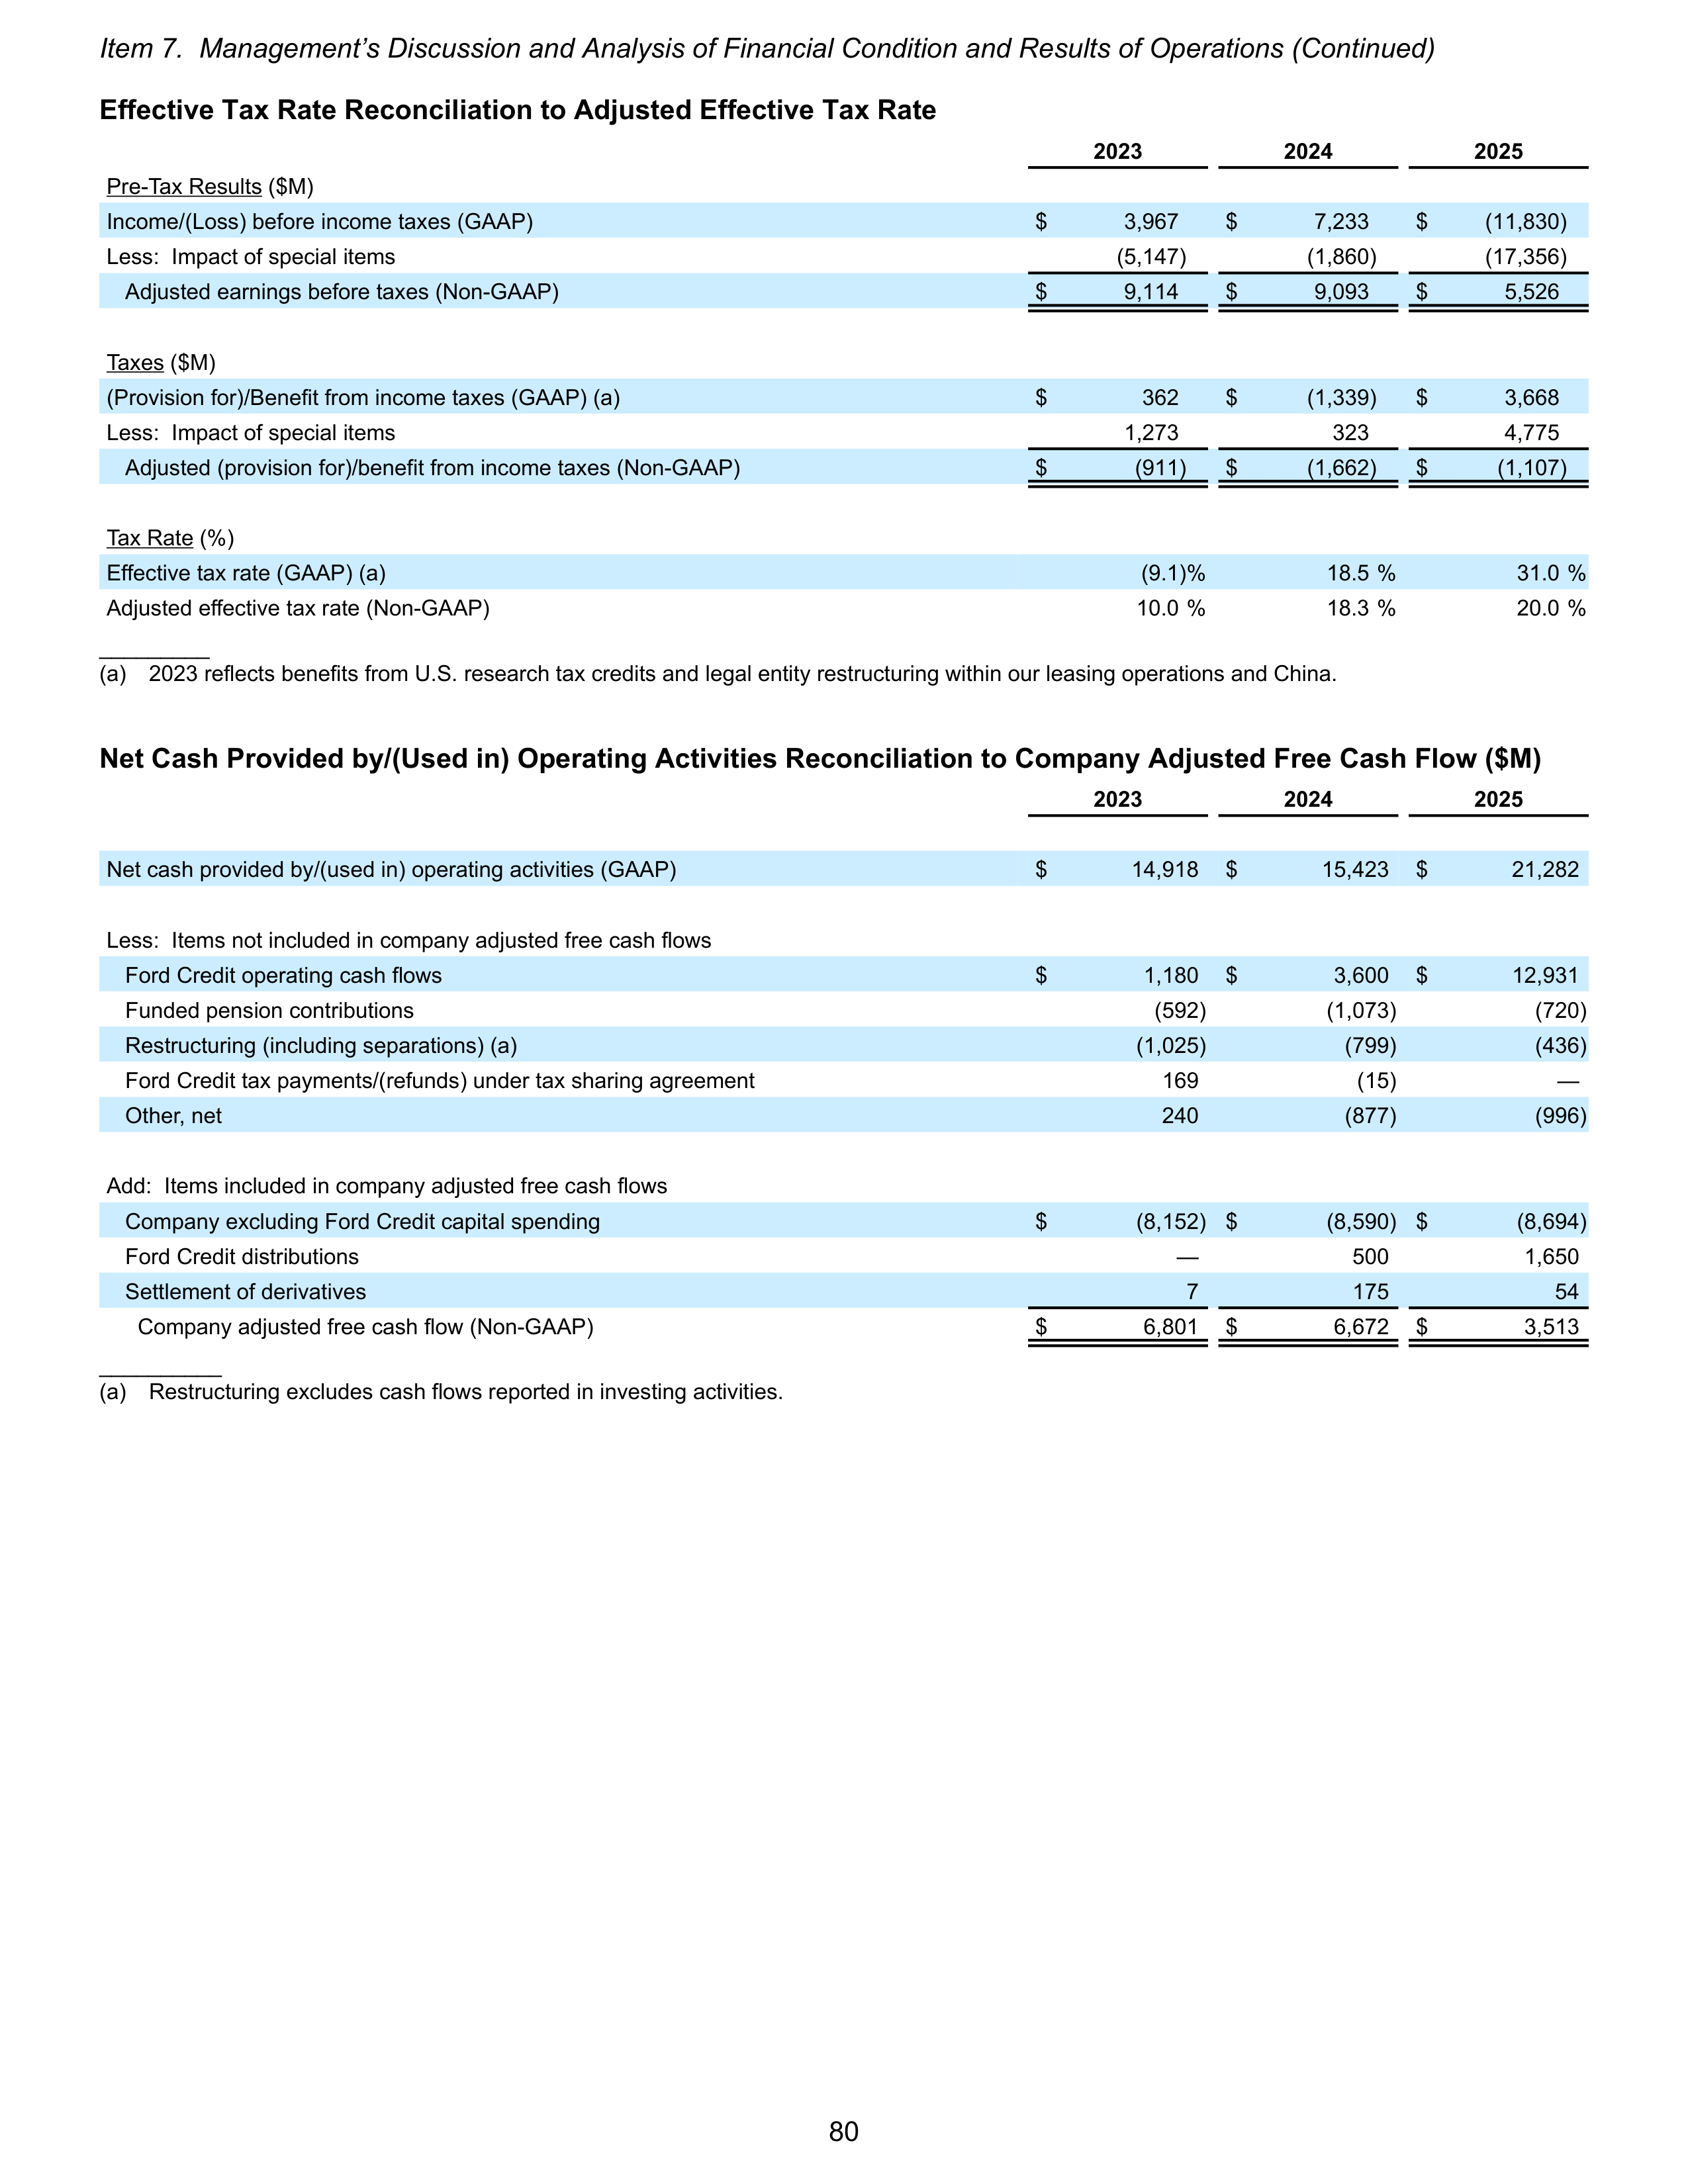
Effective Tax Rate Reconciliation to Adjusted Effective Tax Rate
2023
2024
2025
Pre-Tax Results ($M)
Income/(Loss) before income taxes (GAAP)
$
3,967
$
7,233
$
(11,830)
Less: Impact of special items
(5,147)
(1,860)
(17,356)
Adjusted earnings before taxes (Non-GAAP)
$
9,114
$
9,093
$
5,526
Taxes ($M)
(Provision for)/Benefit from income taxes (GAAP) (a)
$
362
$
(1,339)
$
3,668
Less: Impact of special items
1,273
323
4,775
Adjusted (provision for)/benefit from income taxes (Non-GAAP)
$
(911)
$
(1,662)
$
(1,107)
Tax Rate (%)
Effective tax rate (GAAP) (a)
(9.1) %
18.5 %
31.0 %
Adjusted effective tax rate (Non-GAAP)
10.0 %
18.3 %
20.0 %
_________
(a)
2023 reflects benefits from U.S. research tax credits and legal entity restructuring within our leasing operations and China.
Net Cash Provided by/(Used in) Operating Activities Reconciliation to Company Adjusted Free Cash Flow ($M)
2023
2024
2025
Net cash provided by/(used in) operating activities (GAAP)
$
14,918
$
15,423
$
21,282
Less: Items not included in company adjusted free cash flows
Ford Credit operating cash flows
$
1,180
$
3,600
$
12,931
Funded pension contributions
(592)
(1,073)
(720)
Restructuring (including separations) (a)
(1,025)
(799)
(436)
Ford Credit tax payments/(refunds) under tax sharing agreement
169
(15)
—
Other, net
240
(877)
(996)
Add: Items included in company adjusted free cash flows
Company excluding Ford Credit capital spending
$
(8,152) $
(8,590) $
(8,694)
Ford Credit distributions
—
500
1,650
Settlement of derivatives
7
175
54
Company adjusted free cash flow (Non-GAAP)
$
6,801
$
6,672
$
3,513
__________
(a)
Restructuring excludes cash flows reported in investing activities.
Item 7. Management’s Discussion and Analysis of Financial Condition and Results of Operations (Continued)
80
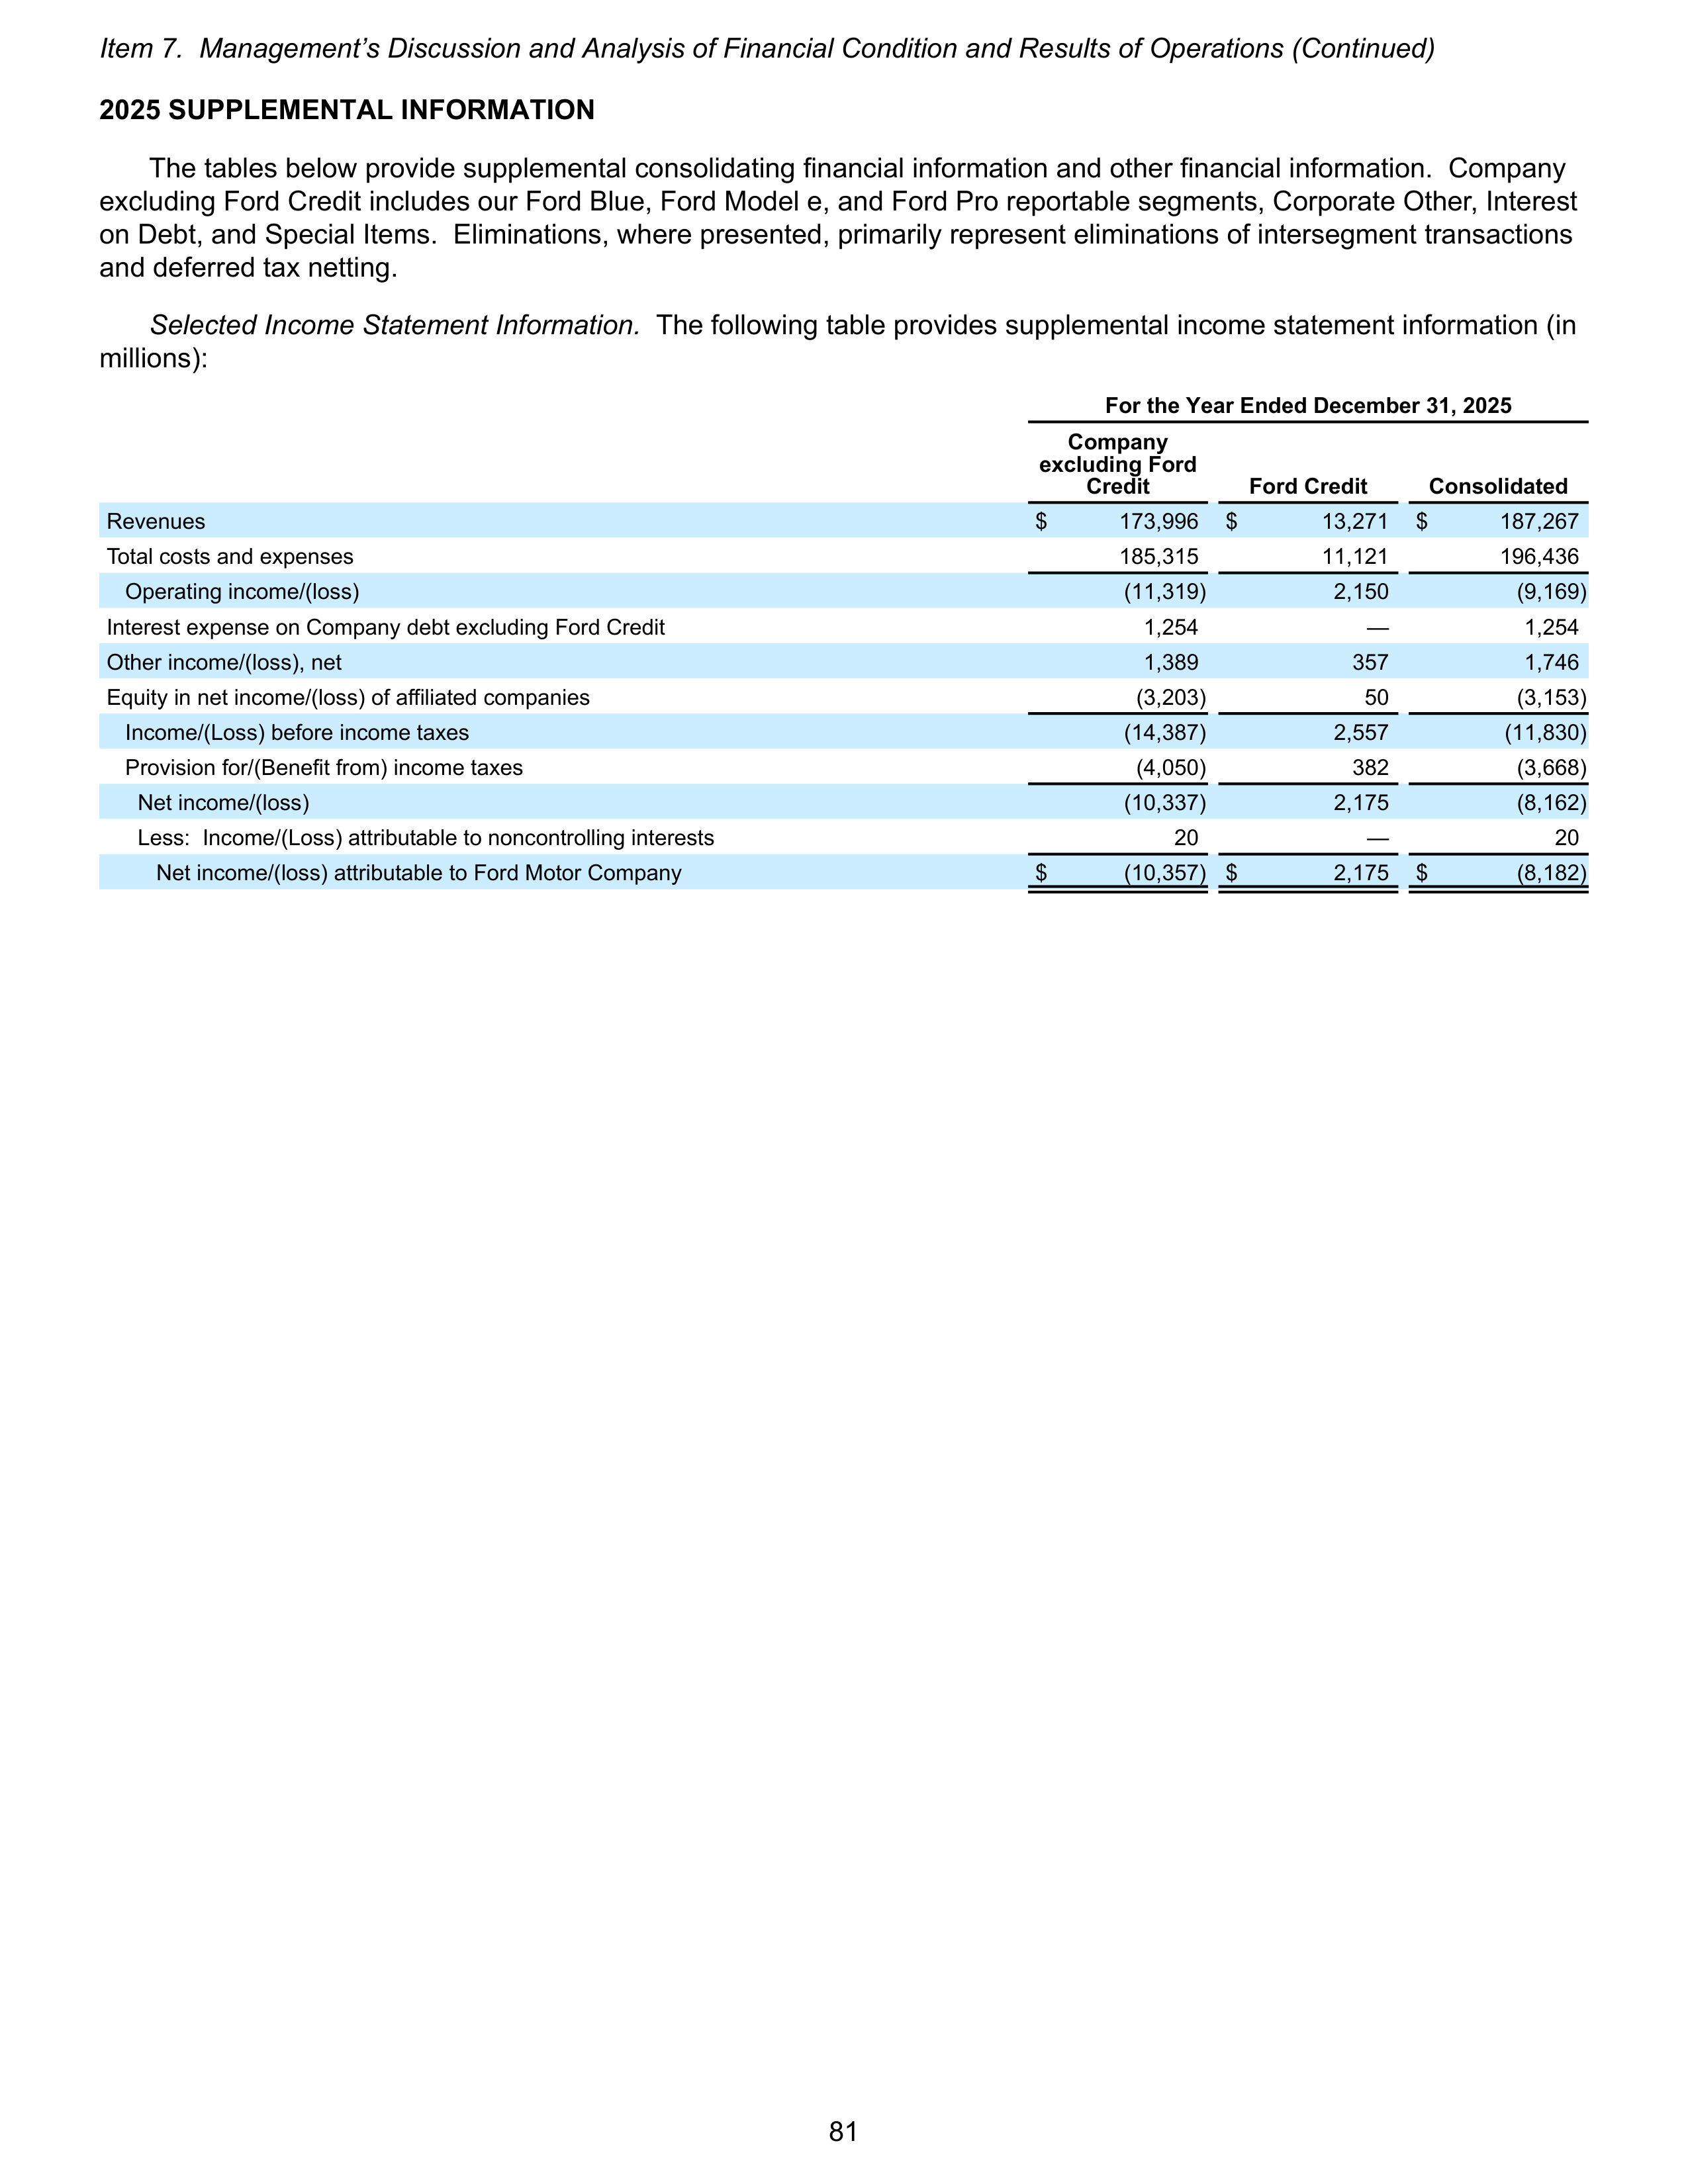
2025 SUPPLEMENTAL INFORMATION
The tables below provide supplemental consolidating financial information and other financial information. Company
excluding Ford Credit includes our Ford Blue, Ford Model e, and Ford Pro reportable segments, Corporate Other, Interest
on Debt, and Special Items. Eliminations, where presented, primarily represent eliminations of intersegment transactions
and deferred tax netting.
Selected Income Statement Information.
The following table provides supplemental income statement information (in
millions):
For the Year Ended December 31, 2025
Company
excluding Ford
Credit
Ford Credit
Consolidated
Revenues
$
173,996
$
13,271
$
187,267
Total costs and expenses
185,315
11,121
196,436
Operating income/(loss)
(11,319)
2,150
(9,169)
Interest expense on Company debt excluding Ford Credit
1,254
—
1,254
Other income/(loss), net
1,389
357
1,746
Equity in net income/(loss) of affiliated companies
(3,203)
50
(3,153)
Income/(Loss) before income taxes
(14,387)
2,557
(11,830)
Provision for/(Benefit from) income taxes
(4,050)
382
(3,668)
Net income/(loss)
(10,337)
2,175
(8,162)
Less: Income/(Loss) attributable to noncontrolling interests
20
—
20
Net income/(loss) attributable to Ford Motor Company
$
(10,357) $
2,175
$
(8,182)
Item 7. Management’s Discussion and Analysis of Financial Condition and Results of Operations (Continued)
81
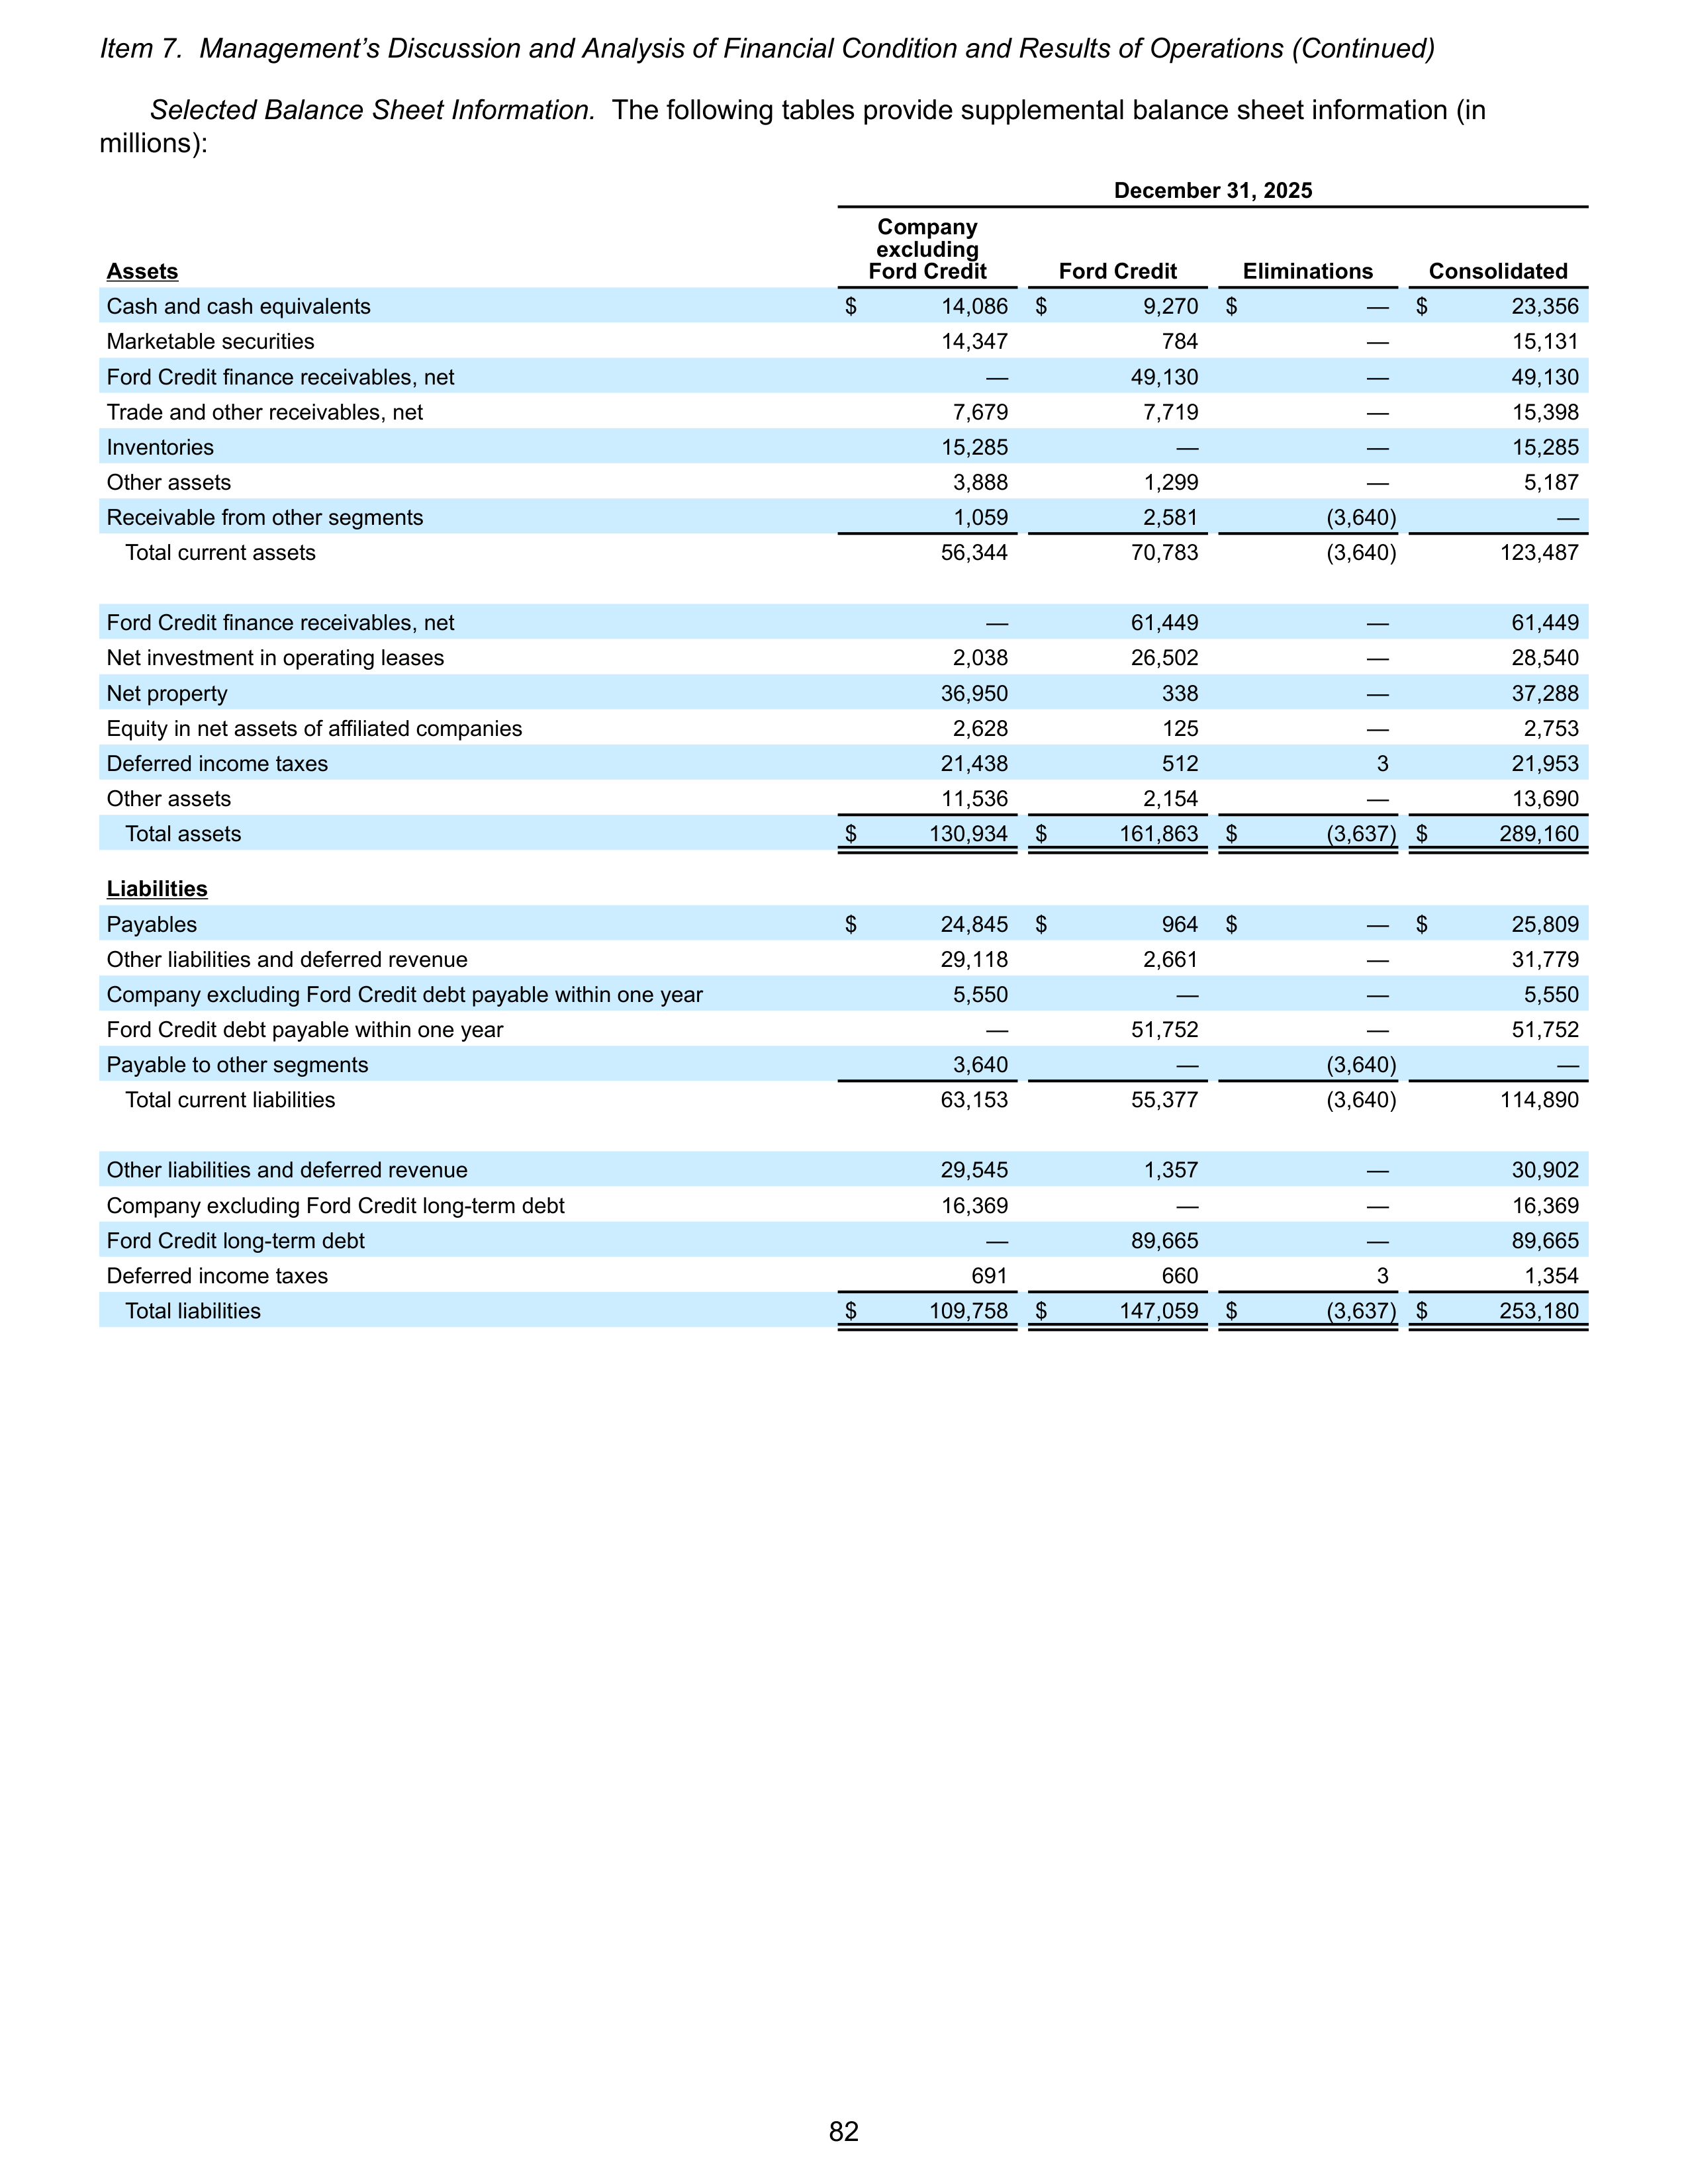
Selected Balance Sheet Information.
The following tables provide supplemental balance sheet information (in
millions):
December 31, 2025
Assets
Company
excluding
Ford Credit
Ford Credit
Eliminations
Consolidated
Cash and cash equivalents
$
14,086
$
9,270
$
—
$
23,356
Marketable securities
14,347
784
—
15,131
Ford Credit finance receivables, net
—
49,130
—
49,130
Trade and other receivables, net
7,679
7,719
—
15,398
Inventories
15,285
—
—
15,285
Other assets
3,888
1,299
—
5,187
Receivable from other segments
1,059
2,581
(3,640)
—
Total current assets
56,344
70,783
(3,640)
123,487
Ford Credit finance receivables, net
—
61,449
—
61,449
Net investment in operating leases
2,038
26,502
—
28,540
Net property
36,950
338
—
37,288
Equity in net assets of affiliated companies
2,628
125
—
2,753
Deferred income taxes
21,438
512
3
21,953
Other assets
11,536
2,154
—
13,690
Total assets
$
130,934
$
161,863
$
(3,637) $
289,160
Liabilities
Payables
$
24,845
$
964
$
—
$
25,809
Other liabilities and deferred revenue
29,118
2,661
—
31,779
Company excluding Ford Credit debt payable within one year
5,550
—
—
5,550
Ford Credit debt payable within one year
—
51,752
—
51,752
Payable to other segments
3,640
—
(3,640)
—
Total current liabilities
63,153
55,377
(3,640)
114,890
Other liabilities and deferred revenue
29,545
1,357
—
30,902
Company excluding Ford Credit long-term debt
16,369
—
—
16,369
Ford Credit long-term debt
—
89,665
—
89,665
Deferred income taxes
691
660
3
1,354
Total liabilities
$
109,758
$
147,059
$
(3,637) $
253,180
Item 7. Management’s Discussion and Analysis of Financial Condition and Results of Operations (Continued)
82
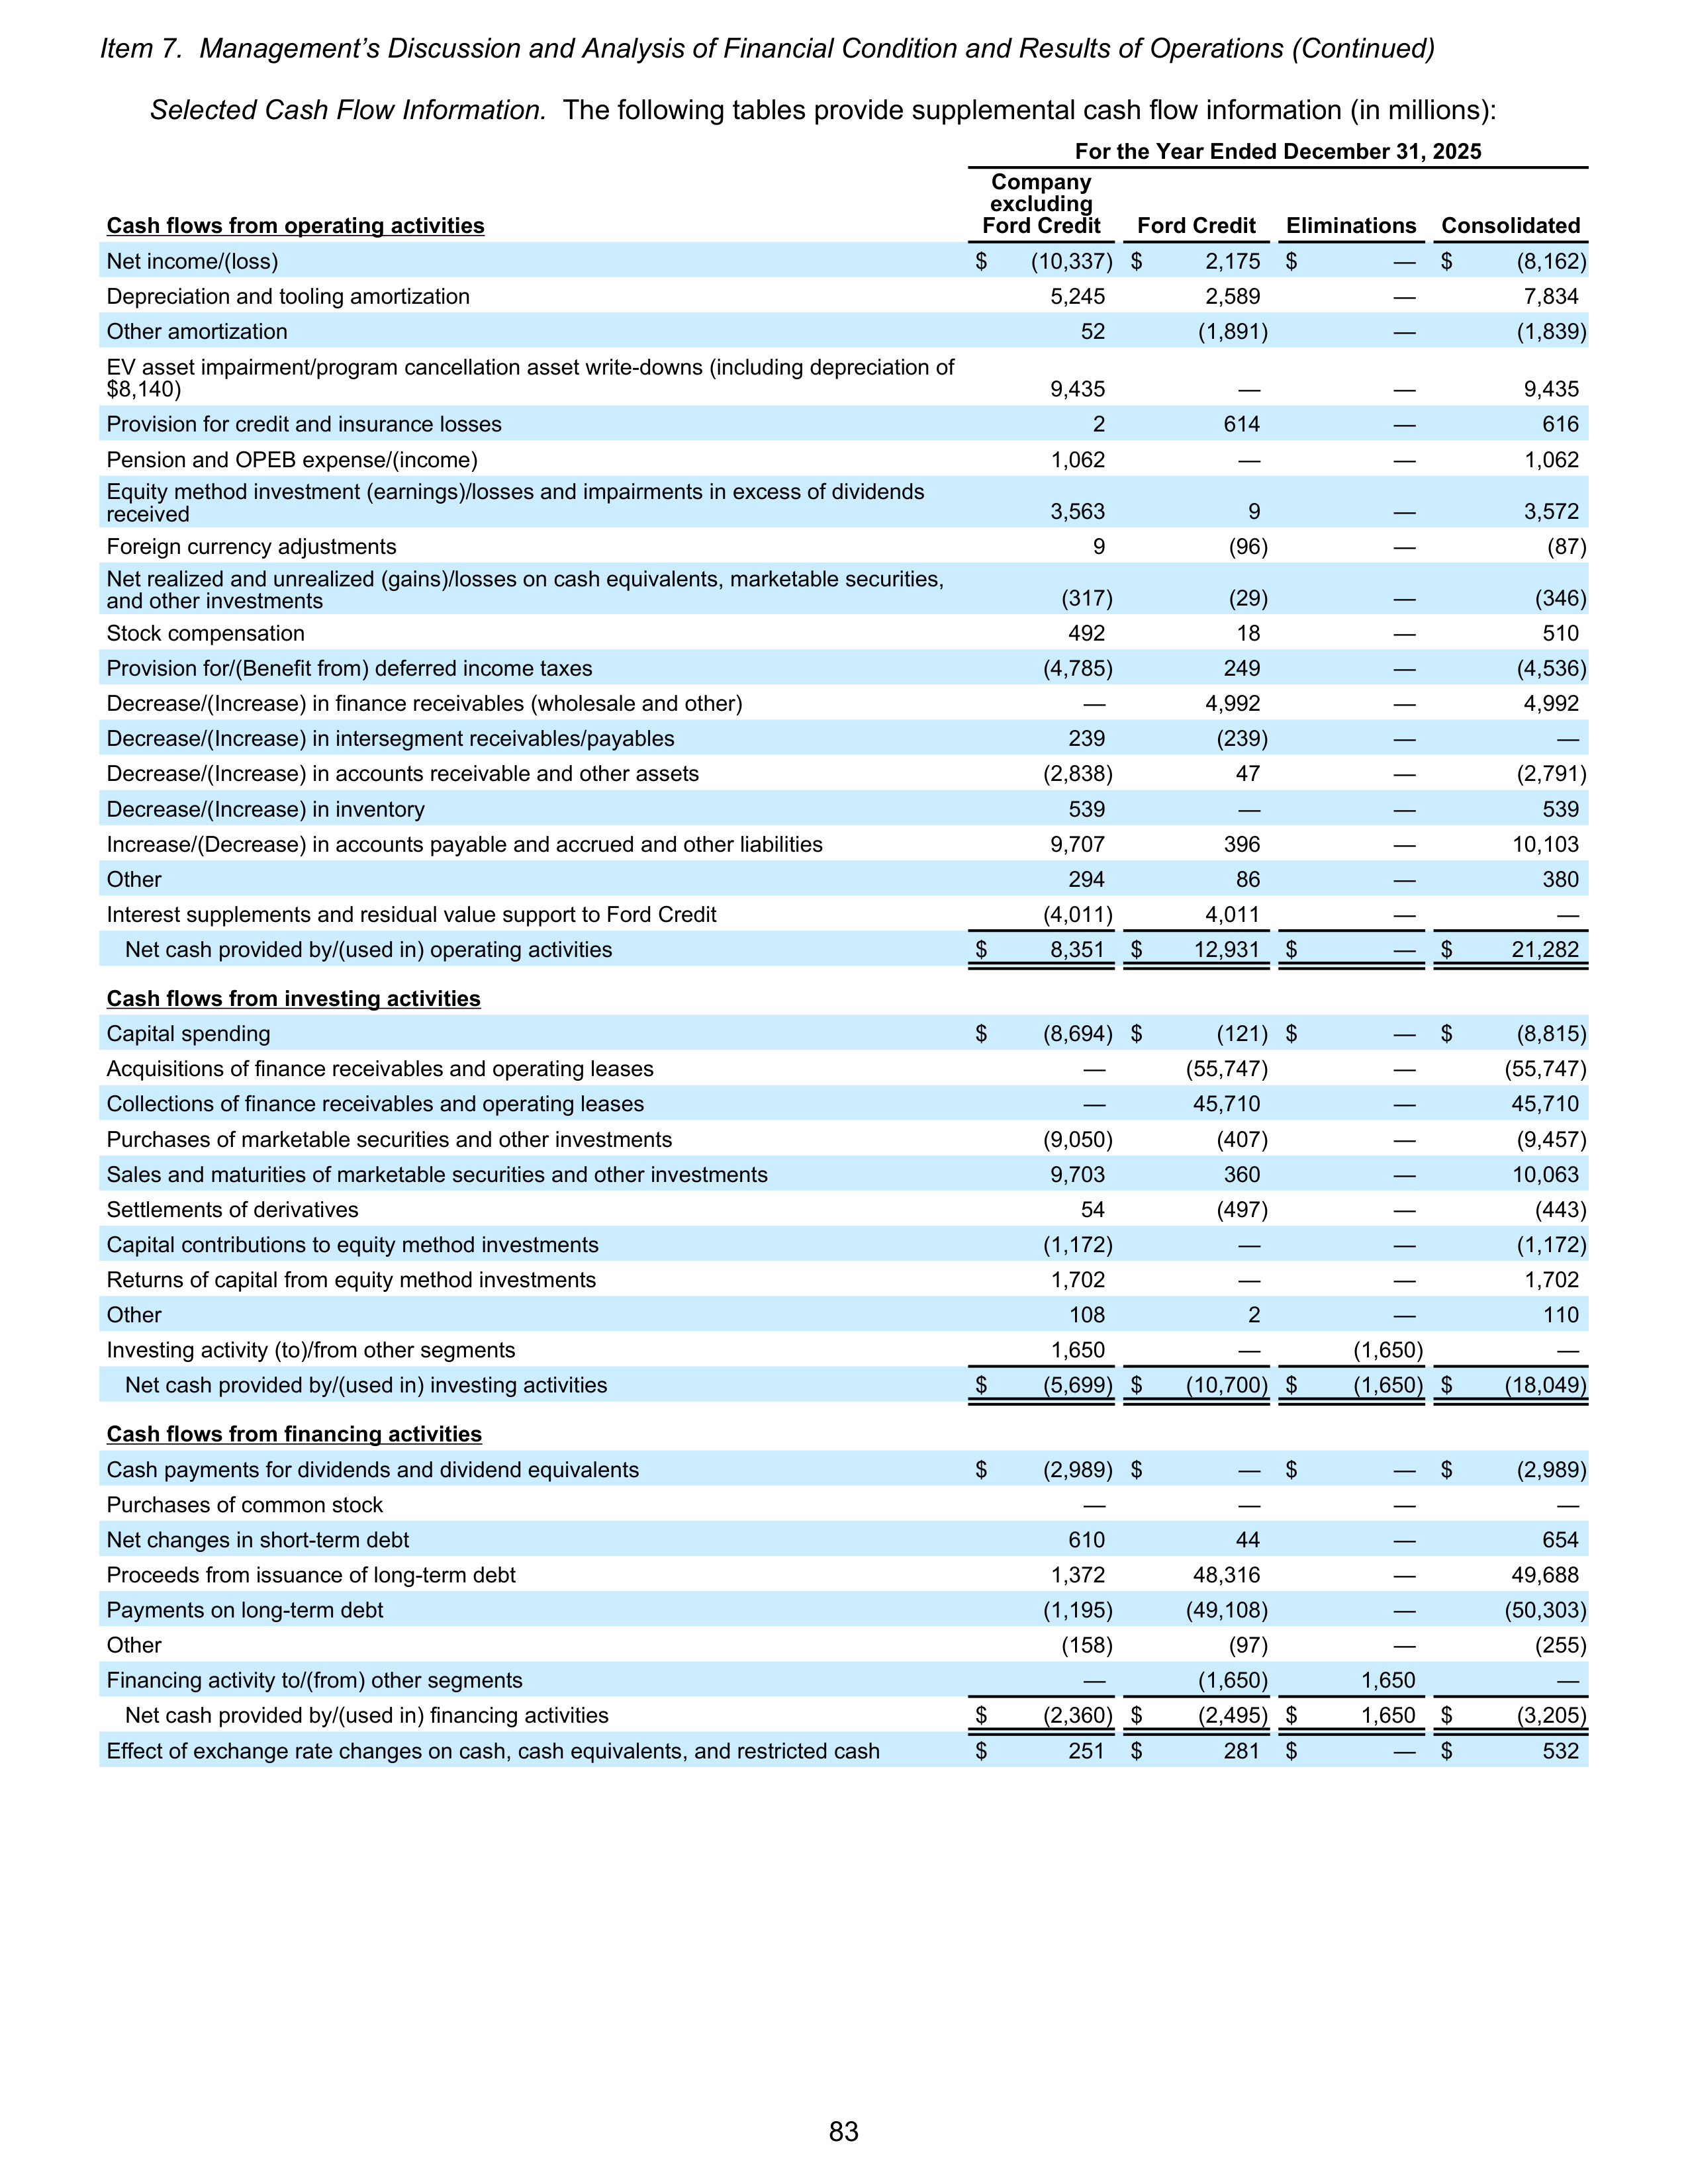
Selected Cash Flow Information.
The following tables provide supplemental cash flow information (in millions):
For the Year Ended December 31, 2025
Cash flows from operating activities
Company
excluding
Ford Credit
Ford Credit
Eliminations
Consolidated
Net income/(loss)
$
(10,337) $
2,175
$
—
$
(8,162)
Depreciation and tooling amortization
5,245
2,589
—
7,834
Other amortization
52
(1,891)
—
(1,839)
EV asset impairment/program cancellation asset write-downs (including depreciation of
$8,140)
9,435
—
—
9,435
Provision for credit and insurance losses
2
614
—
616
Pension and OPEB expense/(income)
1,062
—
—
1,062
Equity method investment (earnings)/losses and impairments in excess of dividends
received
3,563
9
—
3,572
Foreign currency adjustments
9
(96)
—
(87)
Net realized and unrealized (gains)/losses on cash equivalents, marketable securities,
and other investments
(317)
(29)
—
(346)
Stock compensation
492
18
—
510
Provision for/(Benefit from) deferred income taxes
(4,785)
249
—
(4,536)
Decrease/(Increase) in finance receivables (wholesale and other)
—
4,992
—
4,992
Decrease/(Increase) in intersegment receivables/payables
239
(239)
—
—
Decrease/(Increase) in accounts receivable and other assets
(2,838)
47
—
(2,791)
Decrease/(Increase) in inventory
539
—
—
539
Increase/(Decrease) in accounts payable and accrued and other liabilities
9,707
396
—
10,103
Other
294
86
—
380
Interest supplements and residual value support to Ford Credit
(4,011)
4,011
—
—
Net cash provided by/(used in) operating activities
$
8,351
$
12,931
$
—
$
21,282
Cash flows from investing activities
Capital spending
$
(8,694) $
(121) $
—
$
(8,815)
Acquisitions of finance receivables and operating leases
—
(55,747)
—
(55,747)
Collections of finance receivables and operating leases
—
45,710
—
45,710
Purchases of marketable securities and other investments
(9,050)
(407)
—
(9,457)
Sales and maturities of marketable securities and other investments
9,703
360
—
10,063
Settlements of derivatives
54
(497)
—
(443)
Capital contributions to equity method investments
(1,172)
—
—
(1,172)
Returns of capital from equity method investments
1,702
—
—
1,702
Other
108
2
—
110
Investing activity (to)/from other segments
1,650
—
(1,650)
—
Net cash provided by/(used in) investing activities
$
(5,699) $
(10,700) $
(1,650) $
(18,049)
Cash flows from financing activities
Cash payments for dividends and dividend equivalents
$
(2,989) $
—
$
—
$
(2,989)
Purchases of common stock
—
—
—
—
Net changes in short-term debt
610
44
—
654
Proceeds from issuance of long-term debt
1,372
48,316
—
49,688
Payments on long-term debt
(1,195)
(49,108)
—
(50,303)
Other
(158)
(97)
—
(255)
Financing activity to/(from) other segments
—
(1,650)
1,650
—
Net cash provided by/(used in) financing activities
$
(2,360) $
(2,495) $
1,650
$
(3,205)
Effect of exchange rate changes on cash, cash equivalents, and restricted cash
$
251
$
281
$
—
$
532
Item 7. Management’s Discussion and Analysis of Financial Condition and Results of Operations (Continued)
83
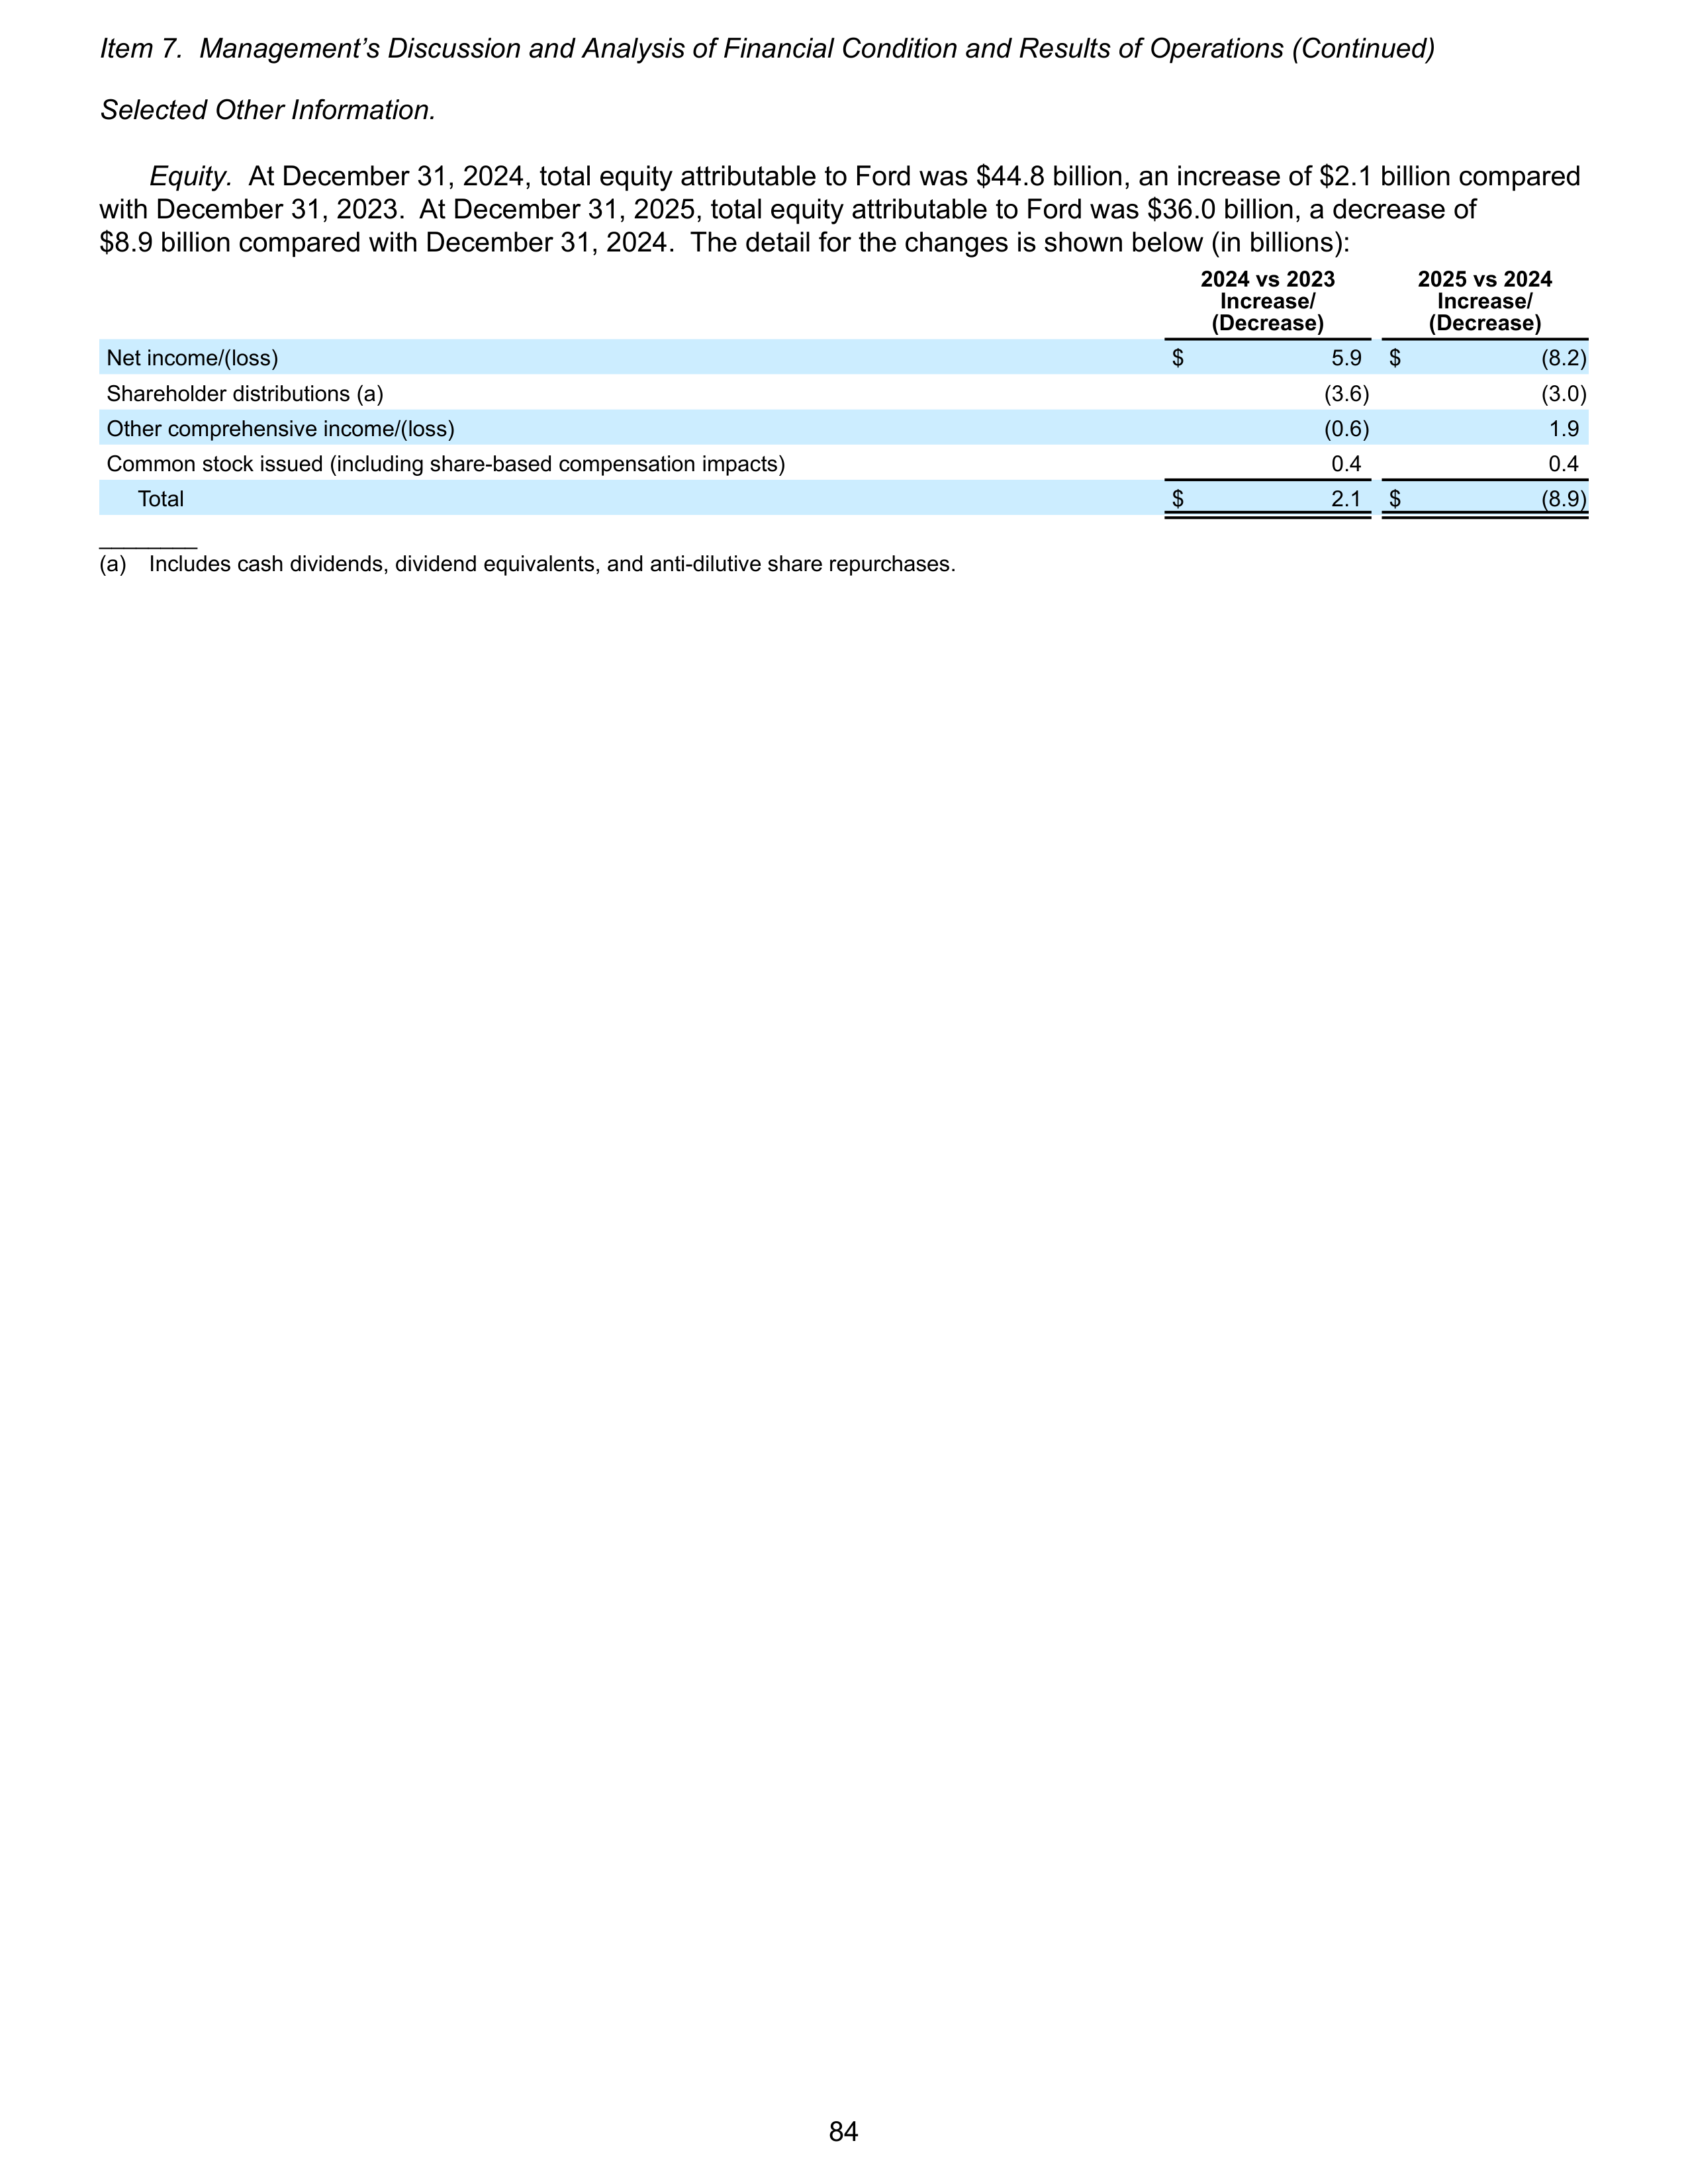
Selected Other Information.
Equity.
At December 31, 2024, total equity attributable to Ford was $44.8 billion, an increase of $2.1 billion compared
with December 31, 2023. At December 31, 2025, total equity attributable to Ford was $36.0 billion, a decrease of
$8.9 billion compared with December 31, 2024. The detail for the changes is shown below (in billions):
2024 vs 2023
Increase/
(Decrease)
2025 vs 2024
Increase/
(Decrease)
Net income/(loss)
$
5.9
$
(8.2)
Shareholder distributions (a)
(3.6)
(3.0)
Other comprehensive income/(loss)
(0.6)
1.9
Common stock issued (including share-based compensation impacts)
0.4
0.4
Total
$
2.1
$
(8.9)
________
(a)
Includes cash dividends, dividend equivalents, and anti-dilutive share repurchases.
Item 7. Management’s Discussion and Analysis of Financial Condition and Results of Operations (Continued)
84
CRITICAL ACCOUNTING ESTIMATES
We consider an accounting estimate to be critical if: (1) the accounting estimate requires us to make assumptions
about matters that were highly uncertain at the time the accounting estimate was made, and (2) changes in the estimate
that are reasonably likely to occur from period to period, or use of different estimates that we reasonably could have used
in the current period, would have a material impact on our financial condition or results of operations.
Management has discussed the development and selection of these critical accounting estimates with the Audit
Committee of our Board of Directors. In addition, there are other items within our financial statements that require
estimation, but are not deemed critical as defined above. Changes in estimates used in these and other items could have
a material impact on our financial statements.
Warranties and Field Service Actions
Nature of Estimates Required.
We provide base warranties on the products we sell for specific periods of time and/or
mileage, which vary depending upon the type of product and the geographic location of its sale. Separately, we also
periodically perform field service actions related to safety recalls, emission recalls, and other product campaigns.
Software updates are increasingly a component of vehicle service and may be performed during warranty coverage
repairs, through field service actions, or through over-the-air updates. We accrue the estimated cost of both base
warranty coverages and field service actions at the time of sale. In addition, from time to time, we issue extended
warranties at our expense, the estimated cost of which is accrued at the time of issuance.
Assumptions and Approach Used.
We establish our estimate of base warranty obligations using a patterned
estimation model. We use historical information regarding the nature, frequency, and average cost of claims for each
vehicle line by model year. We reevaluate our estimate of base warranty obligations on a quarterly basis. Experience has
shown that initial data for any given model year may be volatile; therefore, our process relies on long-term historical
averages until sufficient data are available. With actual experience, we use the data to update the historical averages.
We then compare the resulting accruals with present spending rates to assess whether the balances are adequate to
meet expected future obligations. Based on this data, we update our estimates as necessary.
Field service actions may occur in periods beyond the base warranty coverage period. We establish our estimates of
field service action obligations using a patterned estimation model. We use historical information regarding the nature,
frequency, severity, and average cost of claims for each model year. We assess our obligation for field service actions on
a regular basis using actual claims experience and update our estimates as necessary.
We disclose our estimate of reasonably possible costs in excess of our accruals for material field service actions and
customer satisfaction actions. The estimate we provide is presented on a gross cost basis, and we do not reduce or net
our estimate to eliminate any unrealized profit Ford may earn associated with part sales to dealers.
Due to the uncertainty and potential volatility of the factors used in establishing our estimates, changes in our
assumptions could materially affect our financial condition and results of operations. See Note 24 of the Notes to the
Financial Statements for information regarding warranty and field service action costs.
Pensions and Other Postretirement Employee Benefits
Nature of Estimates Required.
The estimation of our defined benefit pension and OPEB plan obligations and
expenses requires that we utilize the calculated present value of the projected future payments to all participants, taking
into consideration valuation assumptions specific to each plan. Plan obligations and expenses are based on existing
retirement plan provisions. No assumption is made regarding any potential future changes to benefit provisions beyond
those to which we are presently committed (e.g., in existing labor contracts).
Item 7. Management’s Discussion and Analysis of Financial Condition and Results of Operations (Continued)
85
Assumptions and Approach Used.
The assumptions used in developing the required estimates include the following
key factors:
•
Discount rates.
Our discount rate assumptions are based primarily on the results of cash flow matching analyses,
which match the future cash outflows for each major plan to a yield curve based on high-quality bonds specific to
the country of the plan. Benefit payments are discounted at the rates on the curve to determine the year-end
obligations.
•
Expected long-term rate of return on plan assets.
Our expected long-term rate of return considers inputs from a
range of advisors for capital market returns, adjusted for specific aspects of our investment strategy by plan.
Historical returns also are considered when appropriate. The assumption is based on consideration of all inputs,
with a focus on long-term trends to avoid short-term market influences.
•
Salary growth.
Our salary growth assumption reflects our actual experience, long-term outlook, and assumed
inflation.
•
Inflation.
Our inflation assumption is based on an evaluation of external market indicators, including real gross
domestic product growth and central bank inflation targets.
•
Retirement rates.
Retirement rates are developed to reflect actual and projected plan experience.
•
Mortality rates.
Mortality rates are developed to reflect actual and projected plan experience.
•
Health care cost trends
. Our health care cost trend assumptions are developed based on historical cost data, the
near-term outlook, and an assessment of likely long-term trends.
•
Expected contributions.
Our expected amount and timing of contributions are based on an assessment of
minimum requirements, cash availability, and other considerations (e.g., funded status, avoidance of regulatory
premiums and levies, and tax efficiency).
Assumptions are set at each year-end and are generally not changed during the year unless there is a major plan
event, such as a curtailment or settlement that would trigger a plan remeasurement.
See Note 16 of the Notes to the Financial Statements for more information regarding pension and OPEB costs and
assumptions.
Pension Plans
Effect of Actual Results
. The year-end 2025 weighted average discount rate was 5.34% for U.S. plans and 4.80% for
non-U.S. plans, reflecting a decrease of 31 basis points and an increase of 29 basis points, respectively, compared with
year-end 2024. Lower discount rates increased the valuations of U.S. plans, while higher discount rates decreased the
valuations of non-U.S. plans. In 2025, the U.S. actual return on assets was 9.37%, which was higher than the expected
long-term rate of return of 6.37%. Non-U.S. actual return on assets was 0.30%, which was lower than the expected long-
term rate of return of 5.23%. The combination of lower discount rates and higher asset returns for our U.S. plans and
higher discount rates and lower asset returns for our non-U.S. plans had offsetting effects and minimal impact to our net
remeasurement. In 2025, we recorded a remeasurement loss of $616 million. For U.S. plans, the remeasurement loss
was primarily from actuarial losses compared to plan assumptions. For non-U.S. plans, the remeasurement loss was
from changes in key measurement assumptions, primarily improved life expectancy. This loss has been recognized within
net periodic benefit cost and reported as a special item.
For 2026, the expected long-term rate of return on assets is 6.20% for U.S. plans, down 17 basis points from 2025,
and 5.15% for non-U.S. plans, down 8 basis points compared with a year ago, reflecting lower expected capital market
return assumptions.
Item 7. Management’s Discussion and Analysis of Financial Condition and Results of Operations (Continued)
86
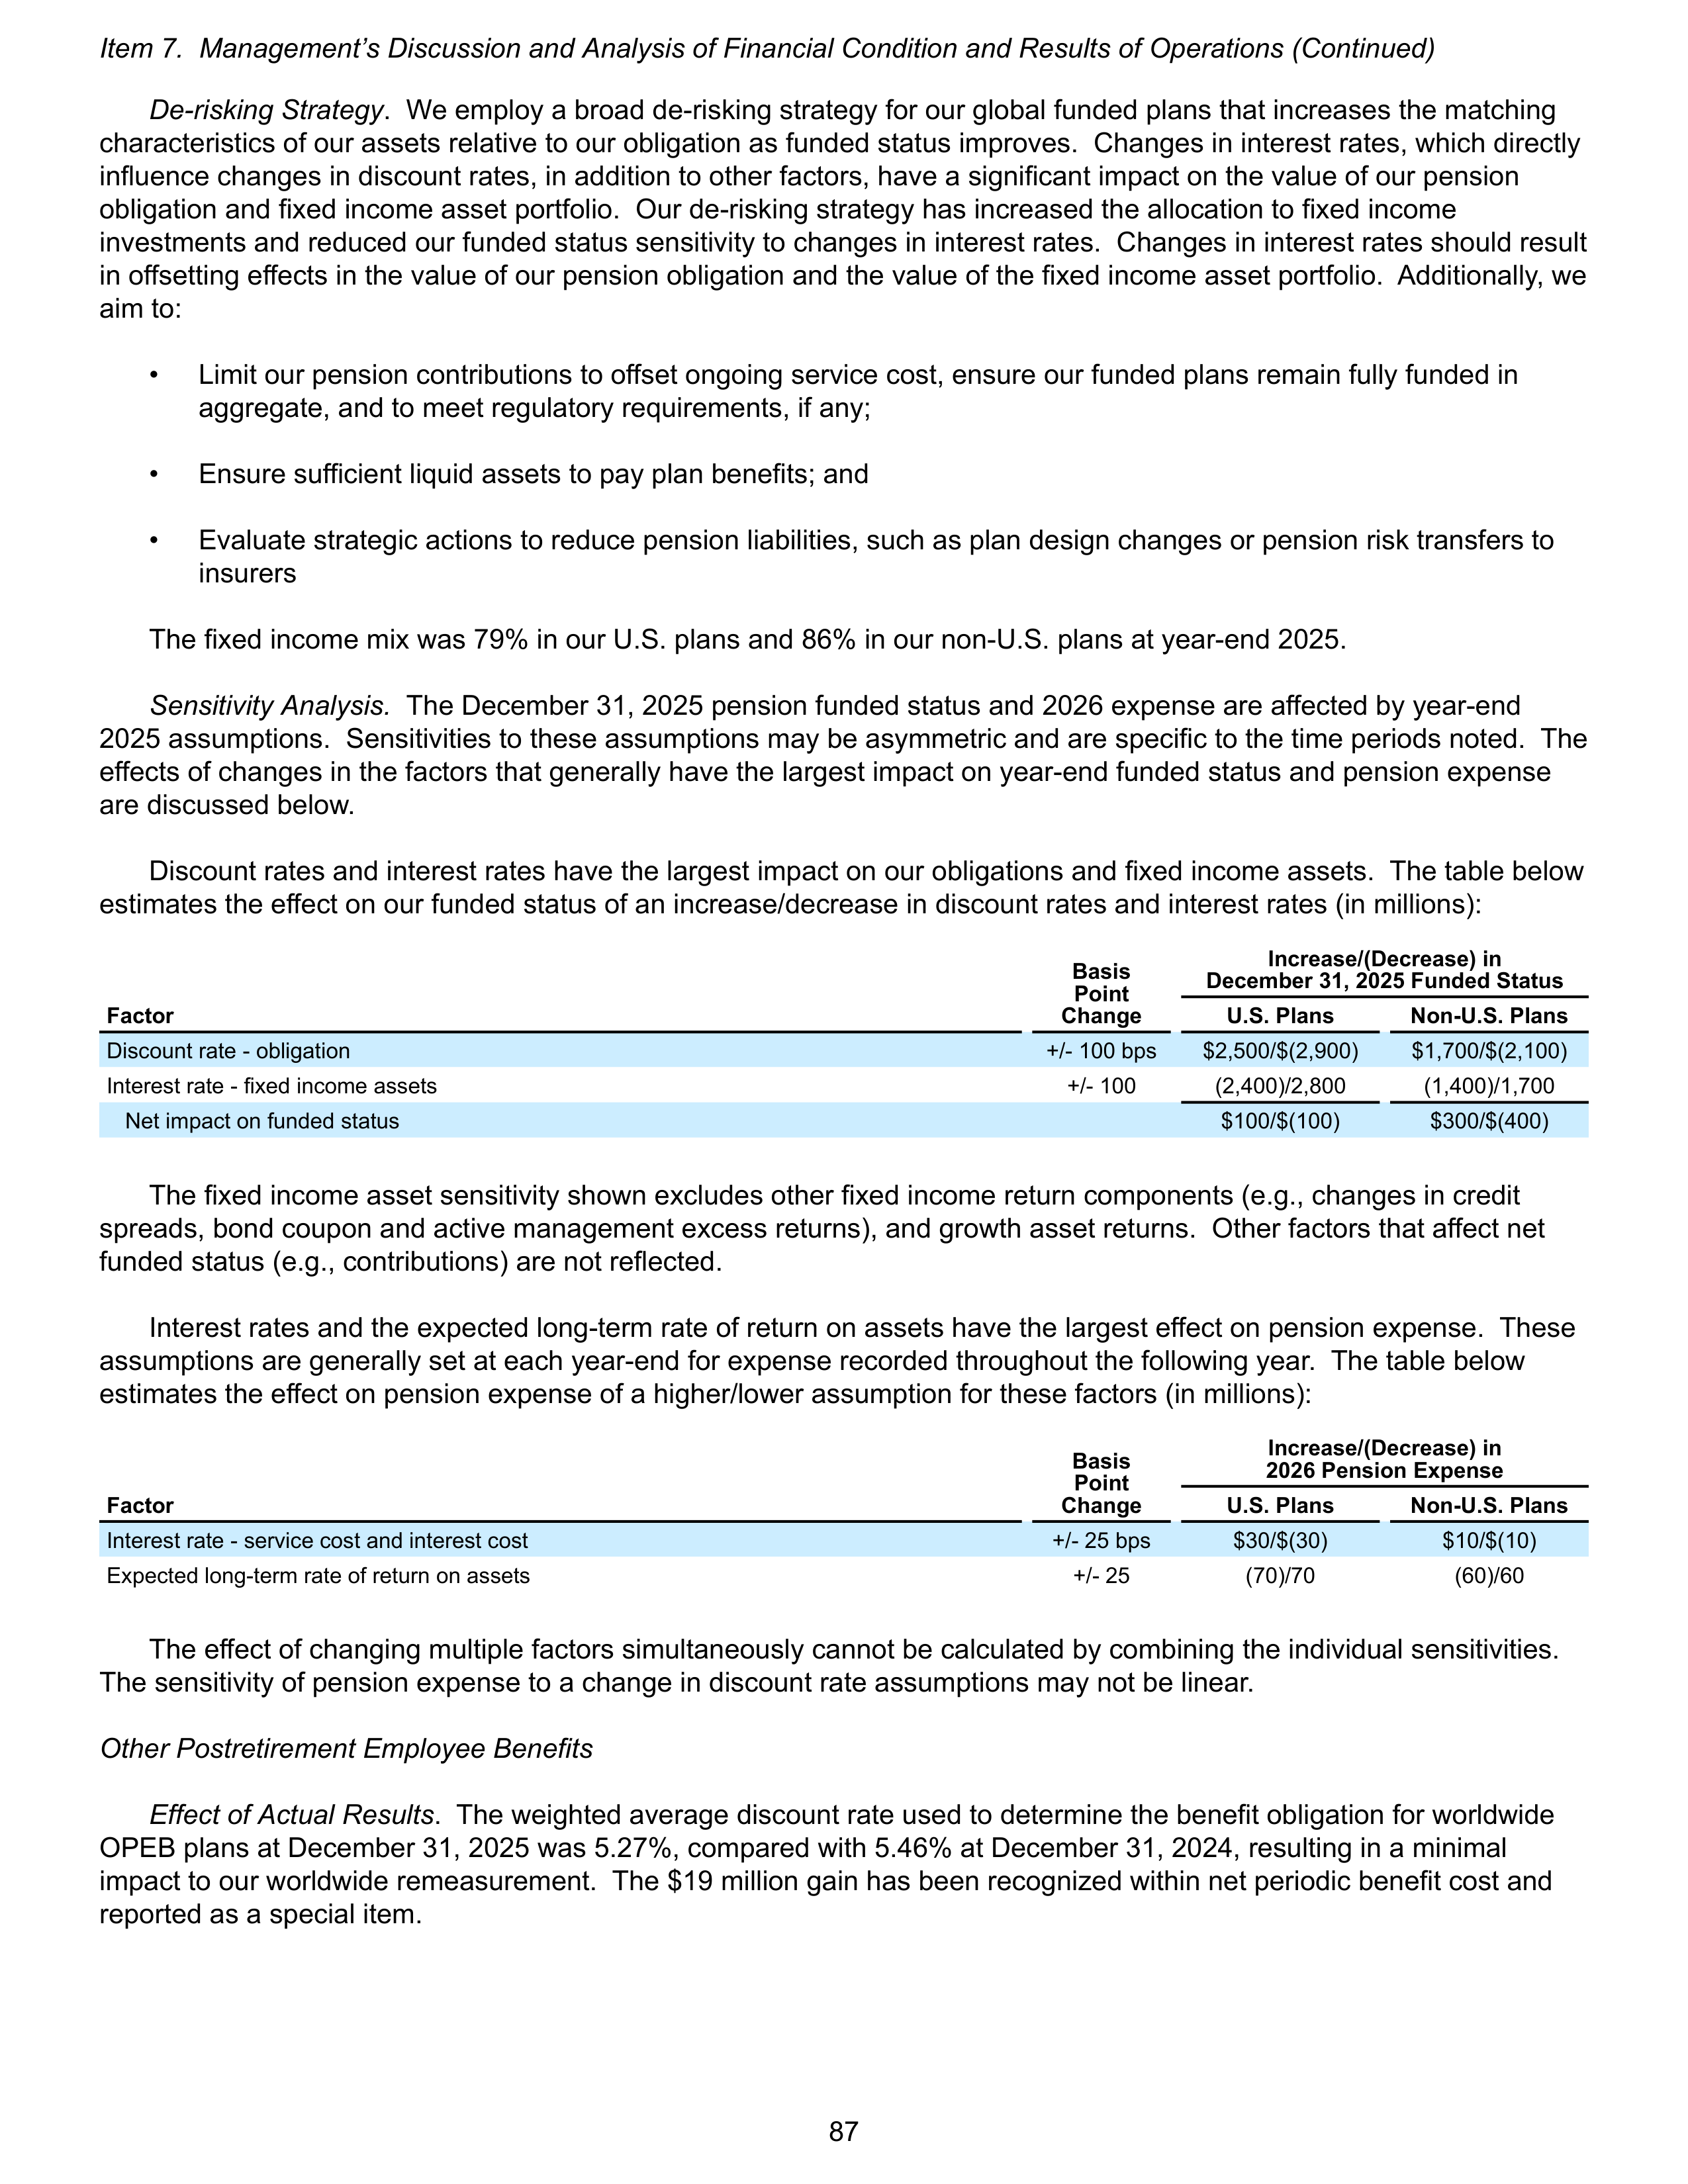
De-risking Strategy
. We employ a broad de-risking strategy for our global funded plans that increases the matching
characteristics of our assets relative to our obligation as funded status improves. Changes in interest rates, which directly
influence changes in discount rates, in addition to other factors, have a significant impact on the value of our pension
obligation and fixed income asset portfolio. Our de-risking strategy has increased the allocation to fixed income
investments and reduced our funded status sensitivity to changes in interest rates. Changes in interest rates should result
in offsetting effects in the value of our pension obligation and the value of the fixed income asset portfolio. Additionally, we
aim to:
•
Limit our pension contributions to offset ongoing service cost, ensure our funded plans remain fully funded in
aggregate, and to meet regulatory requirements, if any;
•
Ensure sufficient liquid assets to pay plan benefits; and
•
Evaluate strategic actions to reduce pension liabilities, such as plan design changes or pension risk transfers to
insurers
The fixed income mix was 79% in our U.S. plans and 86% in our non-U.S. plans at year-end 2025.
Sensitivity Analysis.
The December 31, 2025 pension funded status and 2026 expense are affected by year-end
2025 assumptions. Sensitivities to these assumptions may be asymmetric and are specific to the time periods noted. The
effects of changes in the factors that generally have the largest impact on year-end funded status and pension expense
are discussed below.
Discount rates and interest rates have the largest impact on our obligations and fixed income assets. The table below
estimates the effect on our funded status of an increase/decrease in discount rates and interest rates (in millions):
Basis
Point
Change
Increase/(Decrease) in
December 31, 2025 Funded Status
Factor
U.S. Plans
Non-U.S. Plans
Discount rate - obligation
+/- 100 bps
$2,500/$(2,900)
$1,700/$(2,100)
Interest rate - fixed income assets
+/- 100
(2,400)/2,800
(1,400)/1,700
Net impact on funded status
$100/$(100)
$300/$(400)
The fixed income asset sensitivity shown excludes other fixed income return components (e.g., changes in credit
spreads, bond coupon and active management excess returns), and growth asset returns. Other factors that affect net
funded status (e.g., contributions) are not reflected.
Interest rates and the expected long-term rate of return on assets have the largest effect on pension expense. These
assumptions are generally set at each year-end for expense recorded throughout the following year. The table below
estimates the effect on pension expense of a higher/lower assumption for these factors (in millions):
Basis
Point
Change
Increase/(Decrease) in
2026 Pension Expense
Factor
U.S. Plans
Non-U.S. Plans
Interest rate - service cost and interest cost
+/- 25 bps
$30/$(30)
$10/$(10)
Expected long-term rate of return on assets
+/- 25
(70)/70
(60)/60
The effect of changing multiple factors simultaneously cannot be calculated by combining the individual sensitivities.
The sensitivity of pension expense to a change in discount rate assumptions may not be linear.
Other Postretirement Employee Benefits
Effect of Actual Results
. The weighted average discount rate used to determine the benefit obligation for worldwide
OPEB plans at December 31, 2025 was 5.27%, compared with 5.46% at December 31, 2024, resulting in a minimal
impact to our worldwide remeasurement. The $19 million gain has been recognized within net periodic benefit cost and
reported as a special item.
Item 7. Management’s Discussion and Analysis of Financial Condition and Results of Operations (Continued)
87
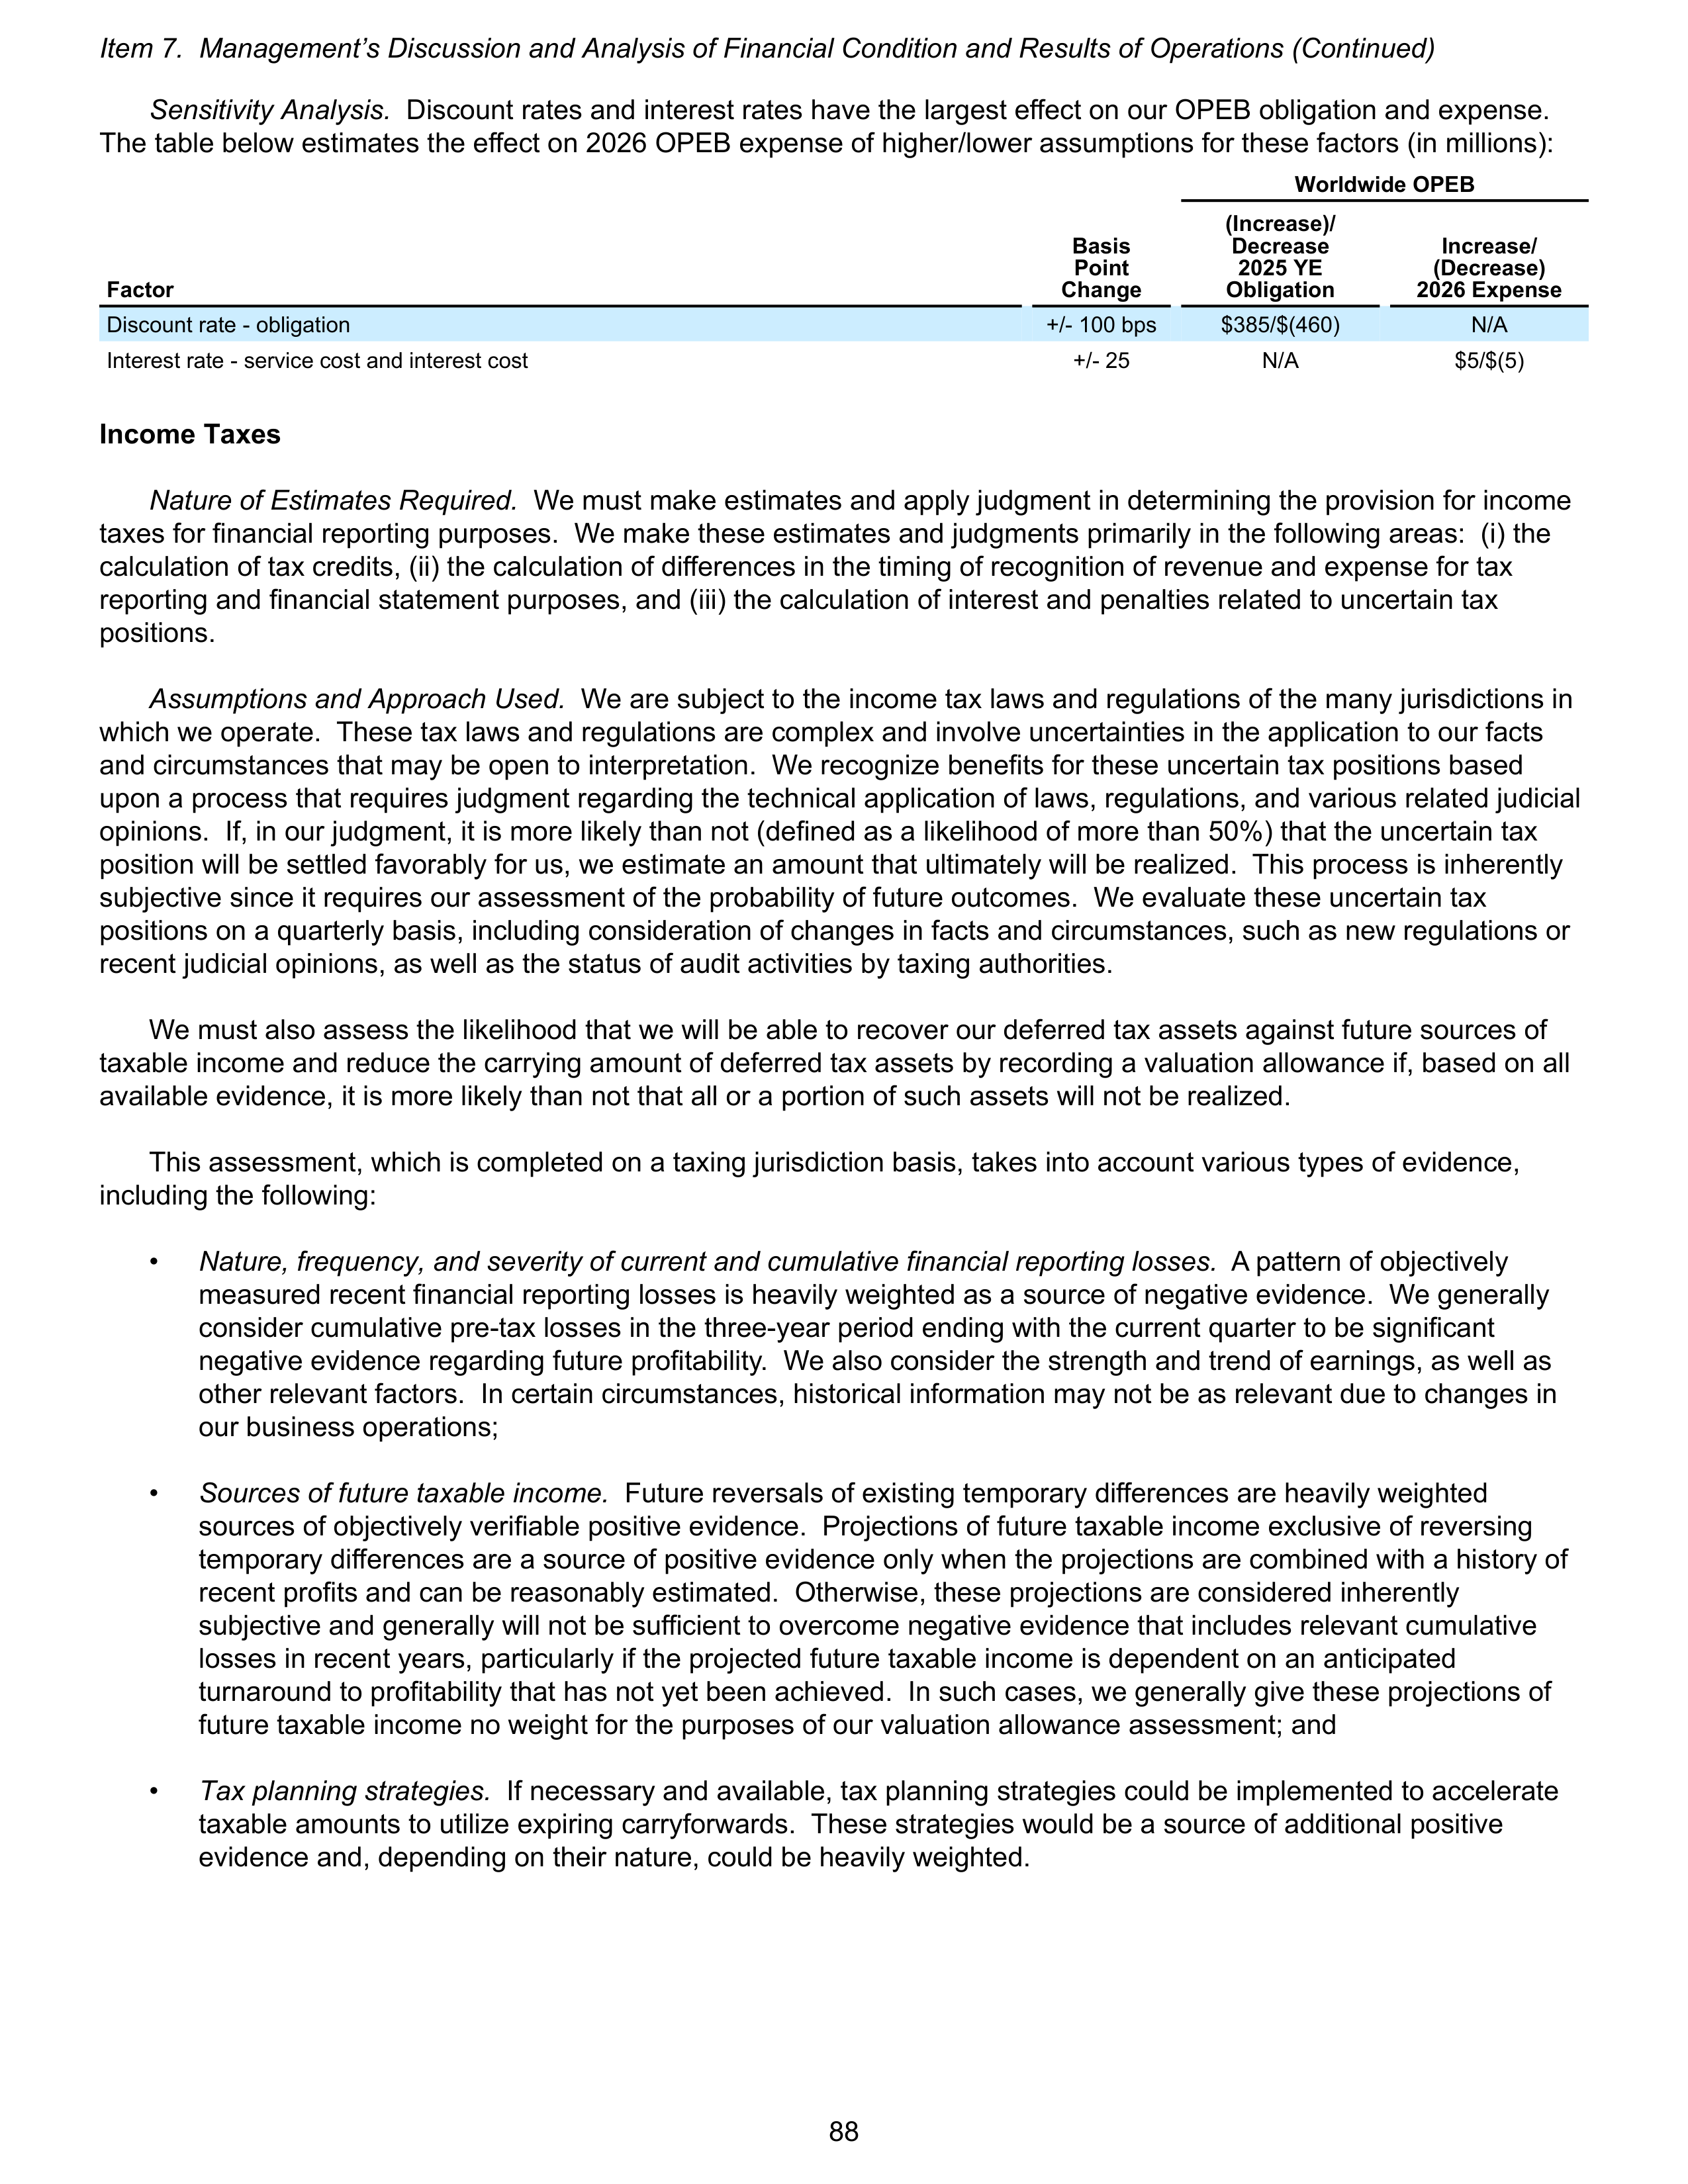
Sensitivity Analysis.
Discount rates and interest rates have the largest effect on our OPEB obligation and expense.
The table below estimates the effect on 2026 OPEB expense of higher/lower assumptions for these factors (in millions):
Worldwide OPEB
Basis
Point
Change
(Increase)/
Decrease
2025 YE
Obligation
Increase/
(Decrease)
2026 Expense
Factor
Discount rate - obligation
+/- 100 bps
$385/$(460)
N/A
Interest rate - service cost and interest cost
+/- 25
N/A
$5/$(5)
Income Taxes
Nature of Estimates Required.
We must make estimates and apply judgment in determining the provision for income
taxes for financial reporting purposes. We make these estimates and judgments primarily in the following areas: (i) the
calculation of tax credits, (ii) the calculation of differences in the timing of recognition of revenue and expense for tax
reporting and financial statement purposes, and (iii) the calculation of interest and penalties related to uncertain tax
positions.
Assumptions and Approach Used.
We are subject to the income tax laws and regulations of the many jurisdictions in
which we operate. These tax laws and regulations are complex and involve uncertainties in the application to our facts
and circumstances that may be open to interpretation. We recognize benefits for these uncertain tax positions based
upon a process that requires judgment regarding the technical application of laws, regulations, and various related judicial
opinions. If, in our judgment, it is more likely than not (defined as a likelihood of more than 50%) that the uncertain tax
position will be settled favorably for us, we estimate an amount that ultimately will be realized. This process is inherently
subjective since it requires our assessment of the probability of future outcomes. We evaluate these uncertain tax
positions on a quarterly basis, including consideration of changes in facts and circumstances, such as new regulations or
recent judicial opinions, as well as the status of audit activities by taxing authorities.
We must also assess the likelihood that we will be able to recover our deferred tax assets against future sources of
taxable income and reduce the carrying amount of deferred tax assets by recording a valuation allowance if, based on all
available evidence, it is more likely than not that all or a portion of such assets will not be realized.
This assessment, which is completed on a taxing jurisdiction basis, takes into account various types of evidence,
including the following:
•
Nature, frequency, and severity of current and cumulative financial reporting losses.
A pattern of objectively
measured recent financial reporting losses is heavily weighted as a source of negative evidence. We generally
consider cumulative pre-tax losses in the three-year period ending with the current quarter to be significant
negative evidence regarding future profitability. We also consider the strength and trend of earnings, as well as
other relevant factors. In certain circumstances, historical information may not be as relevant due to changes in
our business operations;
•
Sources of future taxable income.
Future reversals of existing temporary differences are heavily weighted
sources of objectively verifiable positive evidence. Projections of future taxable income exclusive of reversing
temporary differences are a source of positive evidence only when the projections are combined with a history of
recent profits and can be reasonably estimated. Otherwise, these projections are considered inherently
subjective and generally will not be sufficient to overcome negative evidence that includes relevant cumulative
losses in recent years, particularly if the projected future taxable income is dependent on an anticipated
turnaround to profitability that has not yet been achieved. In such cases, we generally give these projections of
future taxable income no weight for the purposes of our valuation allowance assessment; and
•
Tax planning strategies.
If necessary and available, tax planning strategies could be implemented to accelerate
taxable amounts to utilize expiring carryforwards. These strategies would be a source of additional positive
evidence and, depending on their nature, could be heavily weighted.
Item 7. Management’s Discussion and Analysis of Financial Condition and Results of Operations (Continued)
88
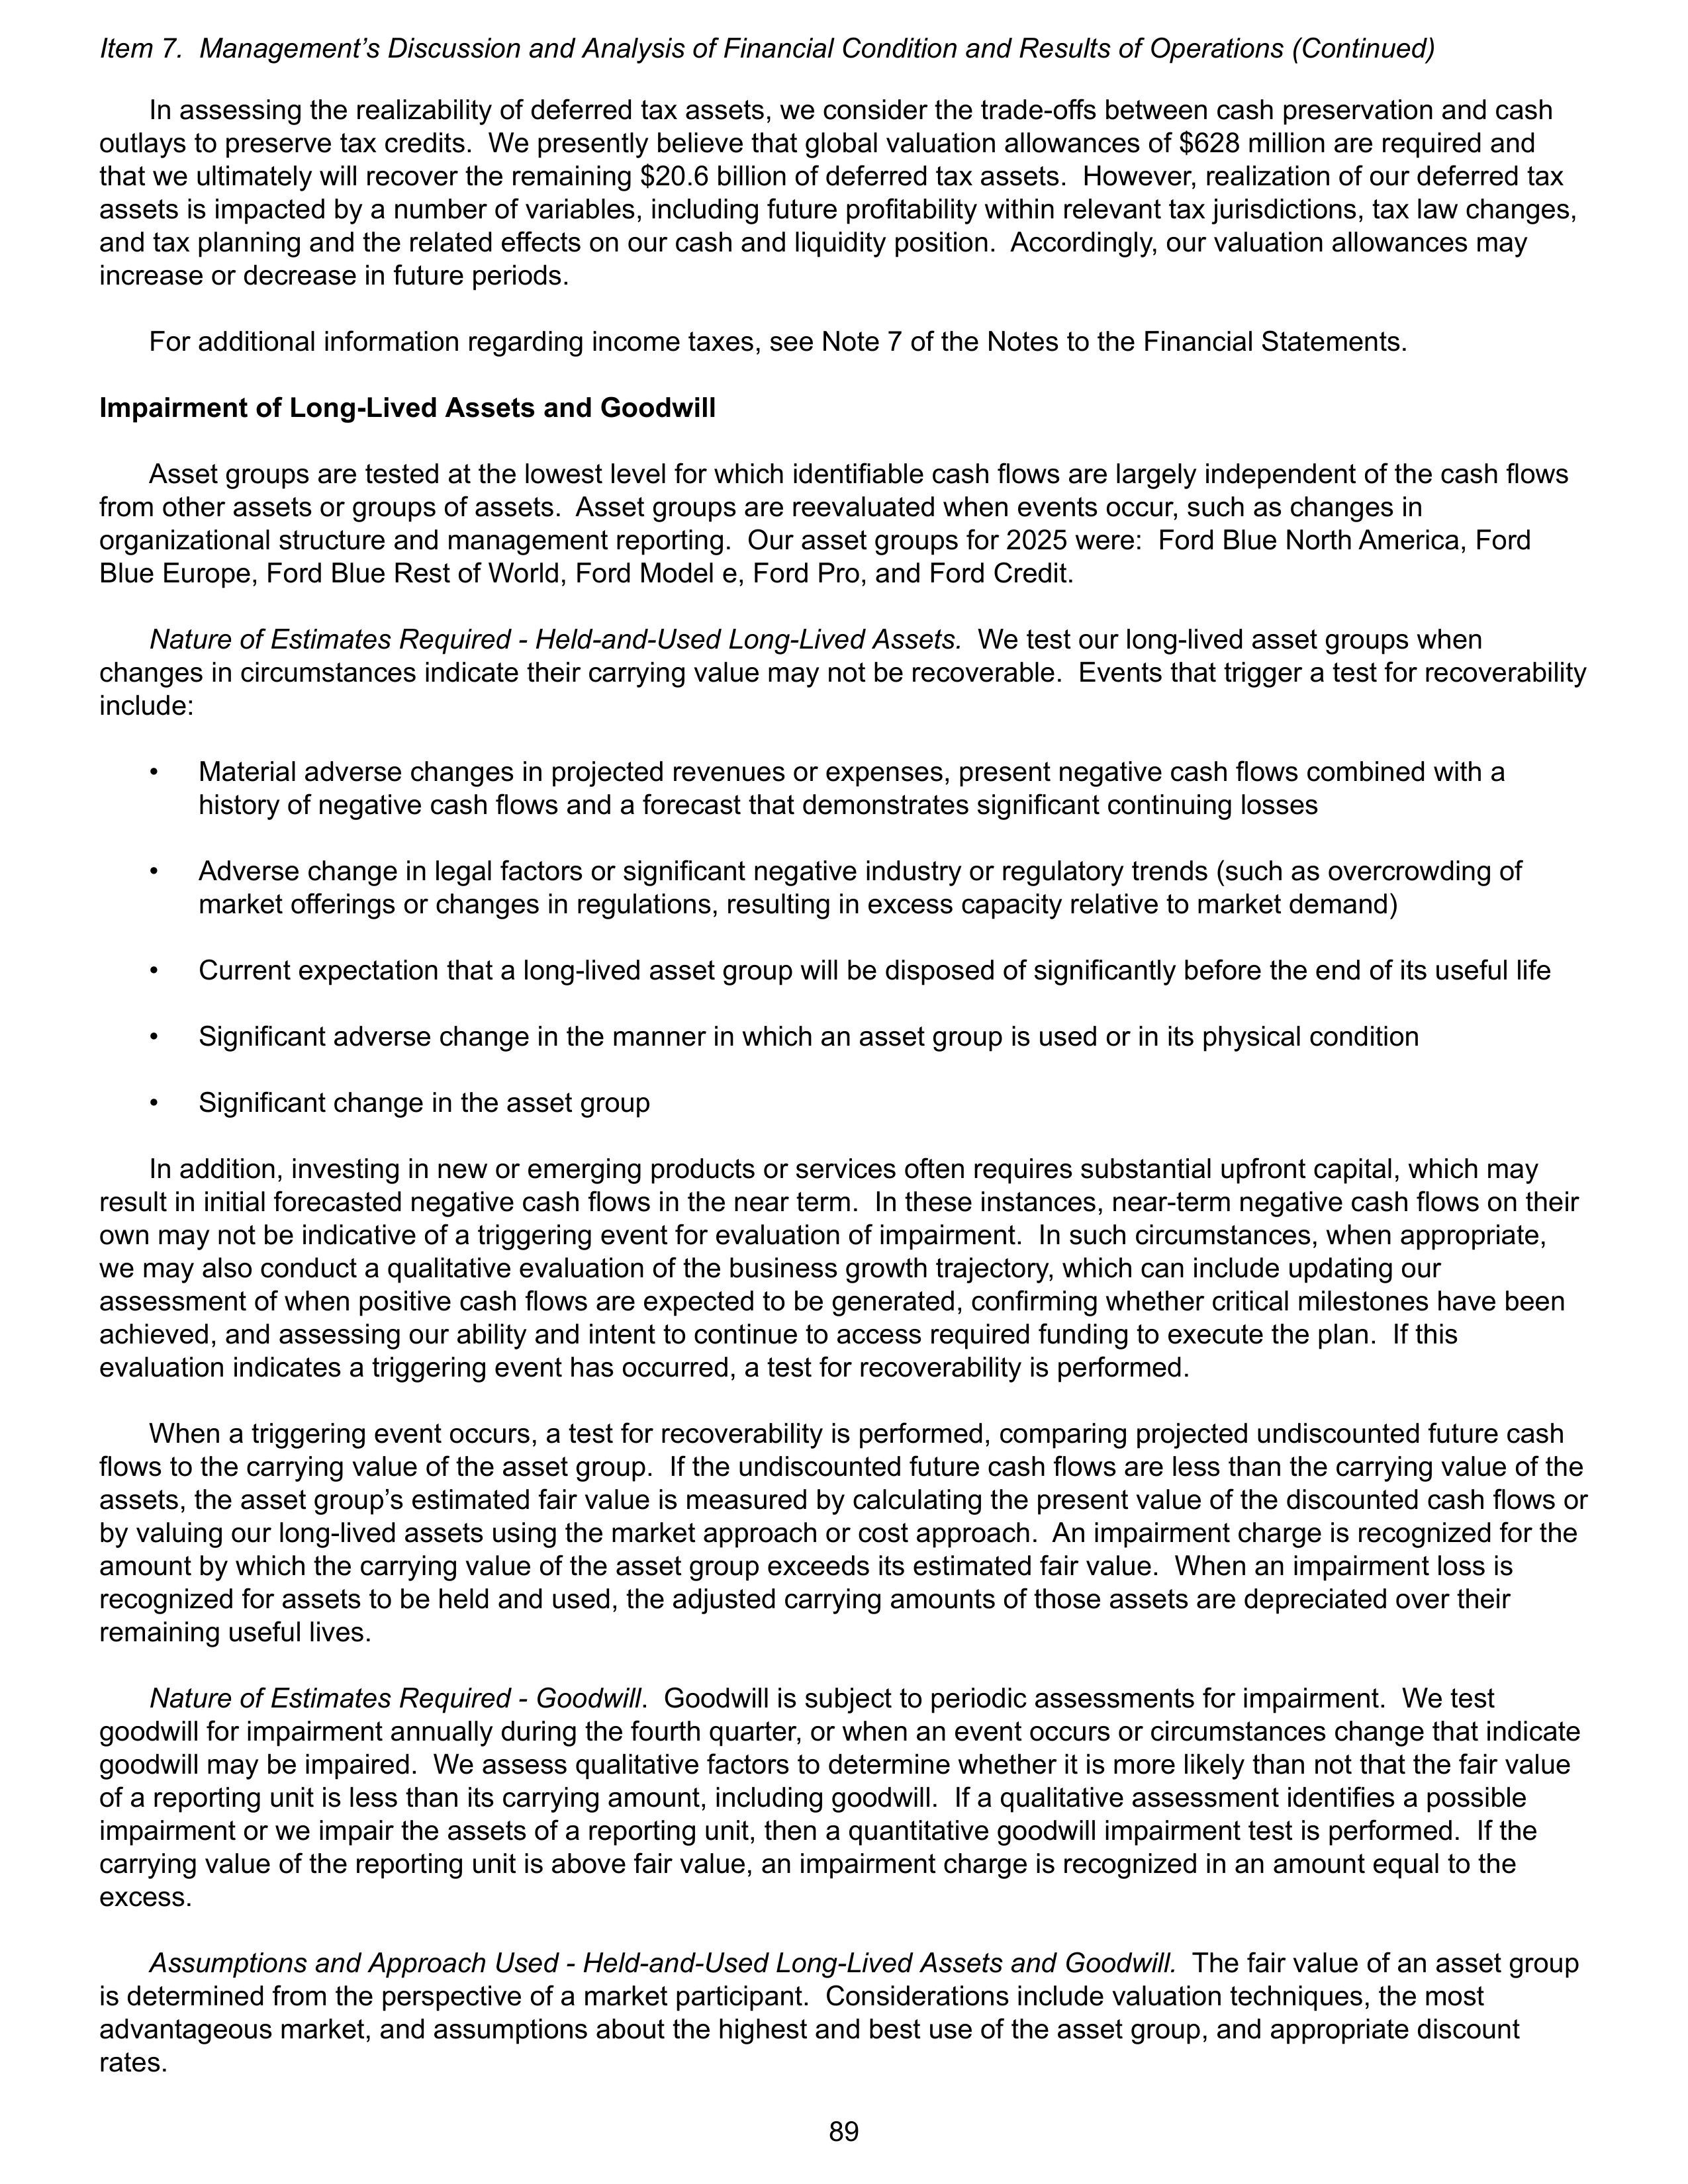
In assessing the realizability of deferred tax assets, we consider the trade-offs between cash preservation and cash
outlays to preserve tax credits. We presently believe that global valuation allowances of $628 million are required and
that we ultimately will recover the remaining $20.6 billion of deferred tax assets. However, realization of our deferred tax
assets is impacted by a number of variables, including future profitability within relevant tax jurisdictions, tax law changes,
and tax planning and the related effects on our cash and liquidity position. Accordingly, our valuation allowances may
increase or decrease in future periods.
For additional information regarding income taxes, see Note 7 of the Notes to the Financial Statements.
Impairment of Long-Lived Assets and Goodwill
Asset groups are tested at the lowest level for which identifiable cash flows are largely independent of the cash flows
from other assets or groups of assets. Asset groups are reevaluated when events occur, such as changes in
organizational structure and management reporting. Our asset groups for 2025 were: Ford Blue North America, Ford
Blue Europe, Ford Blue Rest of World, Ford Model e, Ford Pro, and Ford Credit.
Nature of Estimates Required - Held-and-Used Long-Lived Assets.
We test our long-lived asset groups when
changes in circumstances indicate their carrying value may not be recoverable. Events that trigger a test for recoverability
include:
•
Material adverse changes in projected revenues or expenses, present negative cash flows combined with a
history of negative cash flows and a forecast that demonstrates significant continuing losses
•
Adverse change in legal factors or significant negative industry or regulatory trends (such as overcrowding of
market offerings or changes in regulations, resulting in excess capacity relative to market demand)
•
Current expectation that a long-lived asset group will be disposed of significantly before the end of its useful life
•
Significant adverse change in the manner in which an asset group is used or in its physical condition
•
Significant change in the asset group
In addition, investing in new or emerging products or services often requires substantial upfront capital, which may
result in initial forecasted negative cash flows in the near term. In these instances, near-term negative cash flows on their
own may not be indicative of a triggering event for evaluation of impairment. In such circumstances, when appropriate,
we may also conduct a qualitative evaluation of the business growth trajectory, which can include updating our
assessment of when positive cash flows are expected to be generated, confirming whether critical milestones have been
achieved, and assessing our ability and intent to continue to access required funding to execute the plan. If this
evaluation indicates a triggering event has occurred, a test for recoverability is performed.
When a triggering event occurs, a test for recoverability is performed, comparing projected undiscounted future cash
flows to the carrying value of the asset group. If the undiscounted future cash flows are less than the carrying value of the
assets, the asset group’s estimated fair value is measured by calculating the present value of the discounted cash flows or
by valuing our long-lived assets using the market approach or cost approach. An impairment charge is recognized for the
amount by which the carrying value of the asset group exceeds its estimated fair value. When an impairment loss is
recognized for assets to be held and used, the adjusted carrying amounts of those assets are depreciated over their
remaining useful lives.
Nature of Estimates Required - Goodwill
. Goodwill is subject to periodic assessments for impairment. We test
goodwill for impairment annually during the fourth quarter, or when an event occurs or circumstances change that indicate
goodwill may be impaired. We assess qualitative factors to determine whether it is more likely than not that the fair value
of a reporting unit is less than its carrying amount, including goodwill. If a qualitative assessment identifies a possible
impairment or we impair the assets of a reporting unit, then a quantitative goodwill impairment test is performed. If the
carrying value of the reporting unit is above fair value, an impairment charge is recognized in an amount equal to the
excess.
Assumptions and Approach Used - Held-and-Used Long-Lived Assets and Goodwill.
The fair value of an asset group
is determined from the perspective of a market participant. Considerations include valuation techniques, the most
advantageous market, and assumptions about the highest and best use of the asset group, and appropriate discount
rates.
Item 7. Management’s Discussion and Analysis of Financial Condition and Results of Operations (Continued)
89
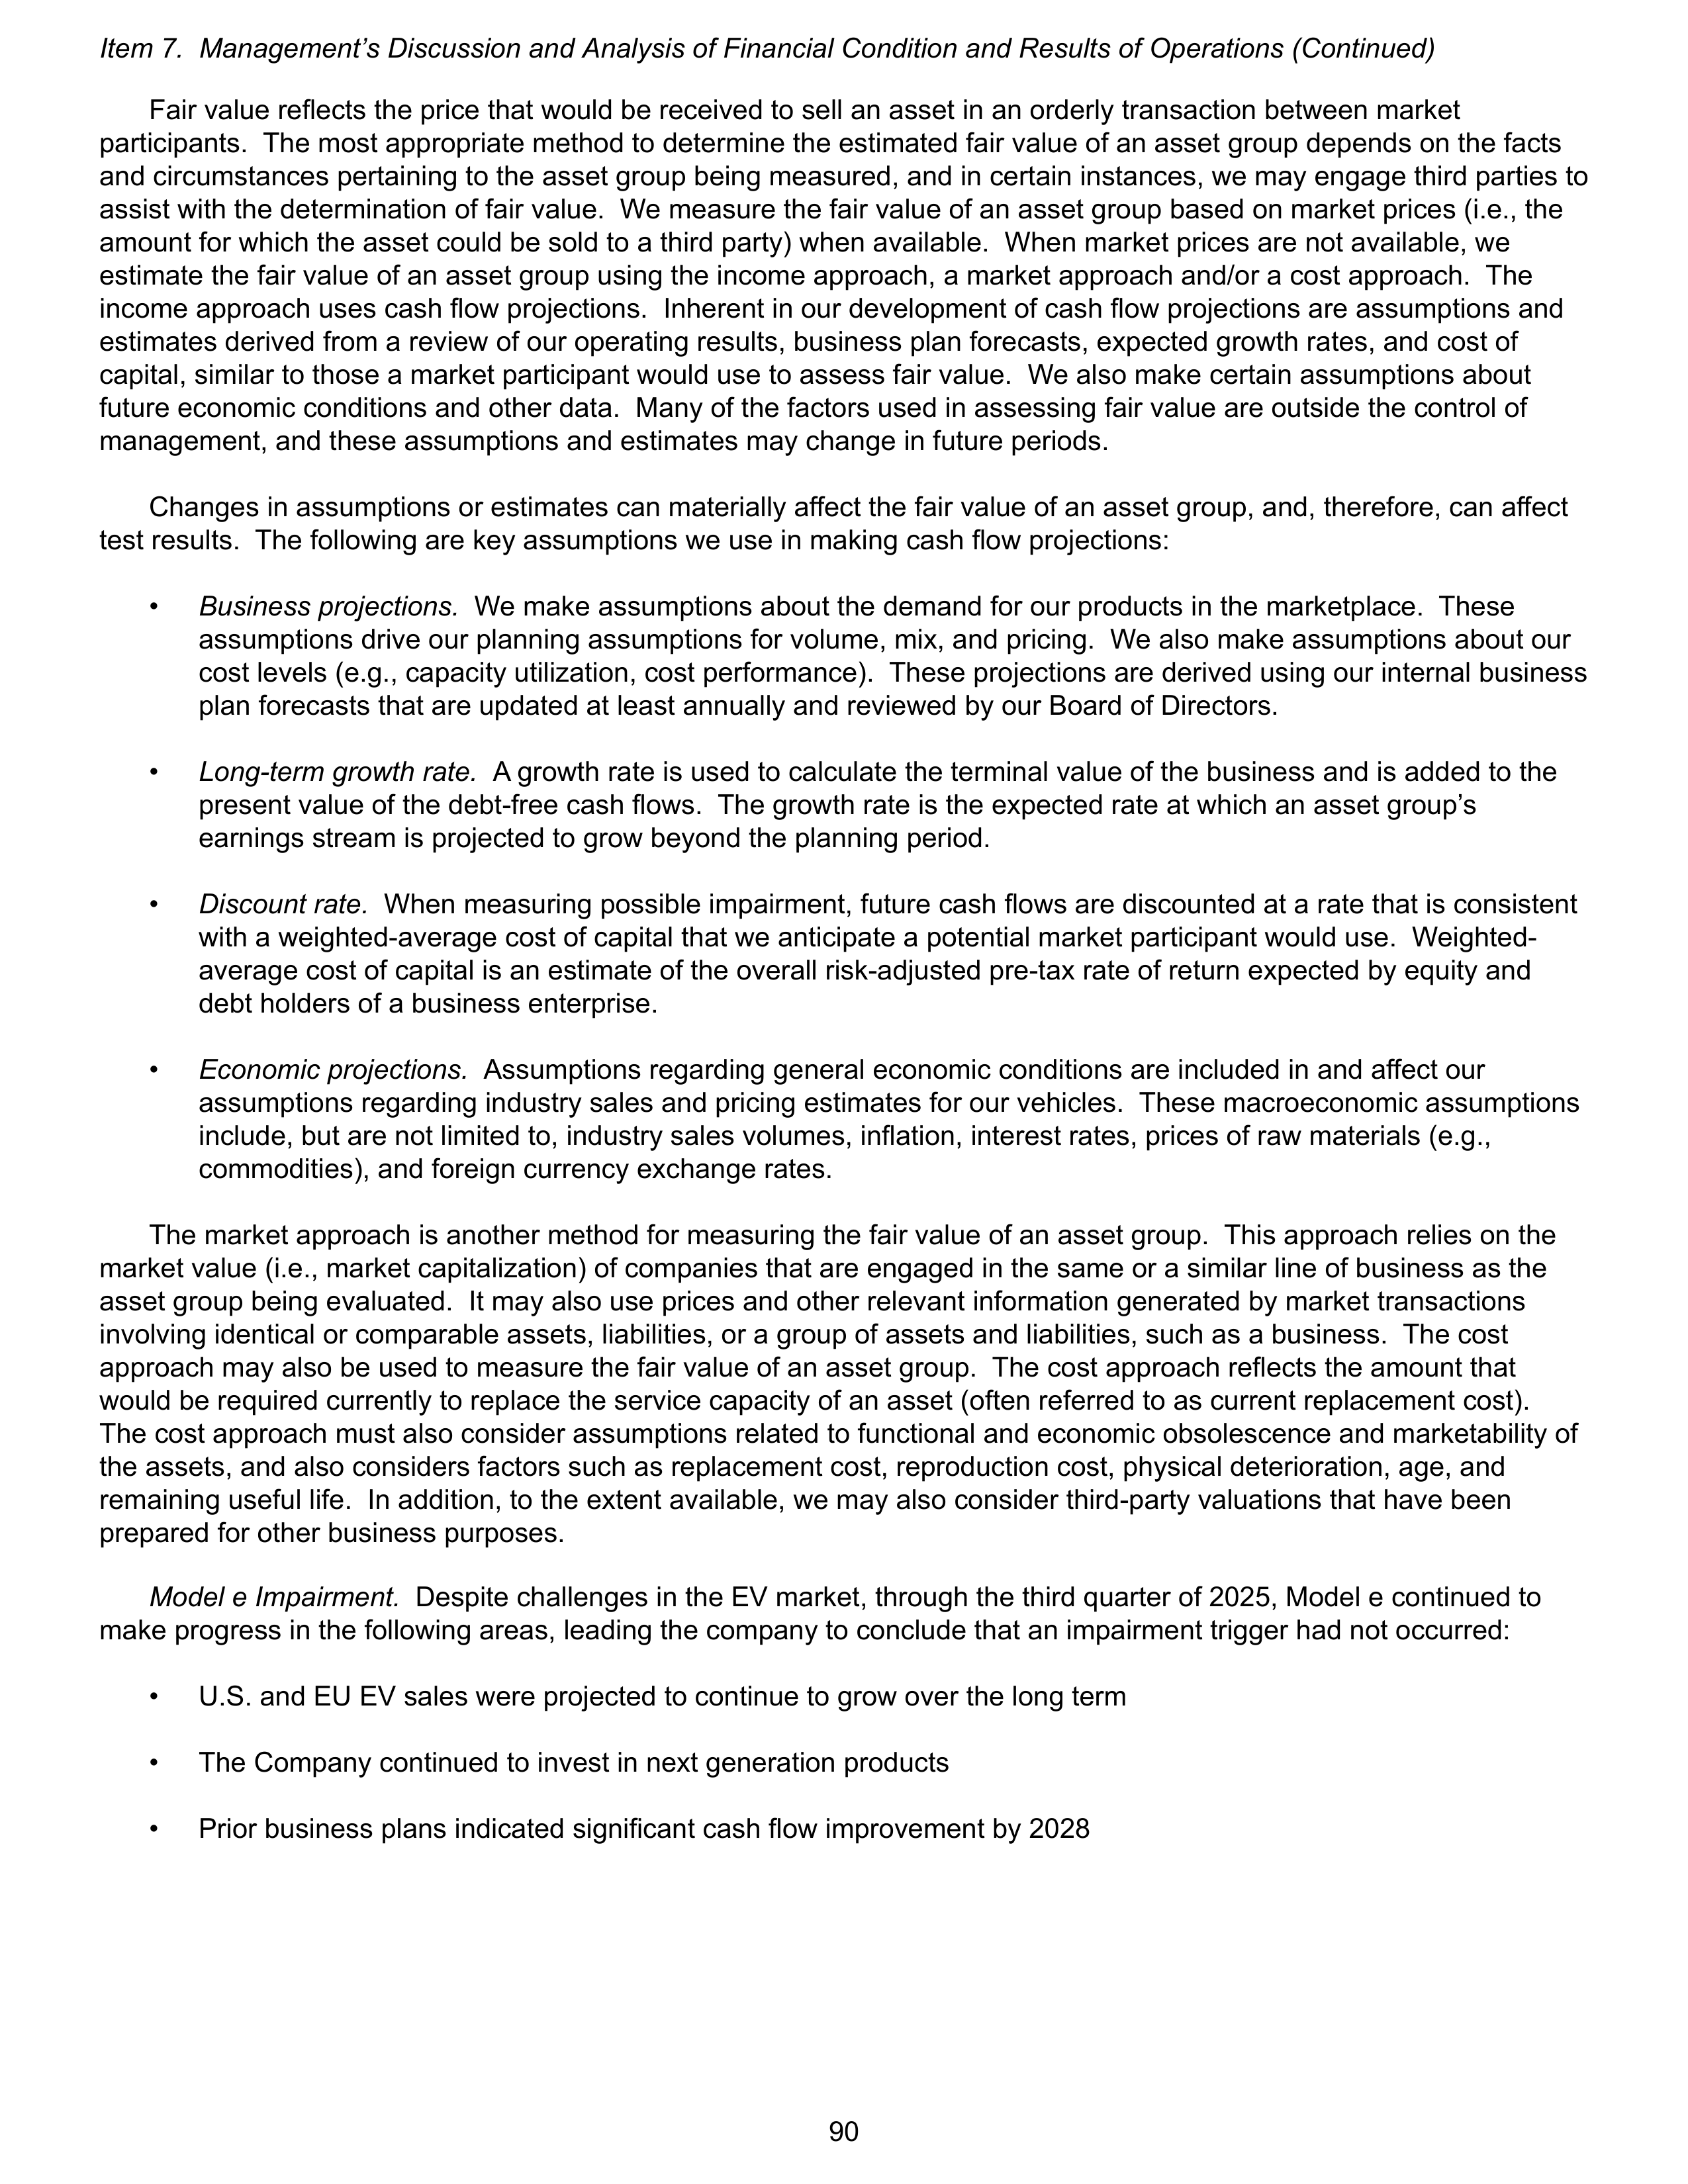
Fair value reflects the price that would be received to sell an asset in an orderly transaction between market
participants. The most appropriate method to determine the estimated fair value of an asset group depends on the facts
and circumstances pertaining to the asset group being measured, and in certain instances, we may engage third parties to
assist with the determination of fair value. We measure the fair value of an asset group based on market prices (i.e., the
amount for which the asset could be sold to a third party) when available. When market prices are not available, we
estimate the fair value of an asset group using the income approach, a market approach and/or a cost approach. The
income approach uses cash flow projections. Inherent in our development of cash flow projections are assumptions and
estimates derived from a review of our operating results, business plan forecasts, expected growth rates, and cost of
capital, similar to those a market participant would use to assess fair value. We also make certain assumptions about
future economic conditions and other data. Many of the factors used in assessing fair value are outside the control of
management, and these assumptions and estimates may change in future periods.
Changes in assumptions or estimates can materially affect the fair value of an asset group, and, therefore, can affect
test results. The following are key assumptions we use in making cash flow projections:
•
Business projections.
We make assumptions about the demand for our products in the marketplace. These
assumptions drive our planning assumptions for volume, mix, and pricing. We also make assumptions about our
cost levels (e.g., capacity utilization, cost performance). These projections are derived using our internal business
plan forecasts that are updated at least annually and reviewed by our Board of Directors.
•
Long-term growth rate.
A growth rate is used to calculate the terminal value of the business and is added to the
present value of the debt-free cash flows. The growth rate is the expected rate at which an asset group’s
earnings stream is projected to grow beyond the planning period.
•
Discount rate.
When measuring possible impairment, future cash flows are discounted at a rate that is consistent
with a weighted-average cost of capital that we anticipate a potential market participant would use. Weighted-
average cost of capital is an estimate of the overall risk-adjusted pre-tax rate of return expected by equity and
debt holders of a business enterprise.
•
Economic projections.
Assumptions regarding general economic conditions are included in and affect our
assumptions regarding industry sales and pricing estimates for our vehicles. These macroeconomic assumptions
include, but are not limited to, industry sales volumes, inflation, interest rates, prices of raw materials (e.g.,
commodities), and foreign currency exchange rates.
The market approach is another method for measuring the fair value of an asset group. This approach relies on the
market value (i.e., market capitalization) of companies that are engaged in the same or a similar line of business as the
asset group being evaluated. It may also use prices and other relevant information generated by market transactions
involving identical or comparable assets, liabilities, or a group of assets and liabilities, such as a business. The cost
approach may also be used to measure the fair value of an asset group. The cost approach reflects the amount that
would be required currently to replace the service capacity of an asset (often referred to as current replacement cost).
The cost approach must also consider assumptions related to functional and economic obsolescence and marketability of
the assets, and also considers factors such as replacement cost, reproduction cost, physical deterioration, age, and
remaining useful life. In addition, to the extent available, we may also consider third-party valuations that have been
prepared for other business purposes.
Model e Impairment.
Despite challenges in the EV market, through the third quarter of 2025, Model e continued to
make progress in the following areas, leading the company to conclude that an impairment trigger had not occurred:
•
U.S. and EU EV sales were projected to continue to grow over the long term
•
The Company continued to invest in next generation products
•
Prior business plans indicated significant cash flow improvement by 2028
Item 7. Management’s Discussion and Analysis of Financial Condition and Results of Operations (Continued)
90
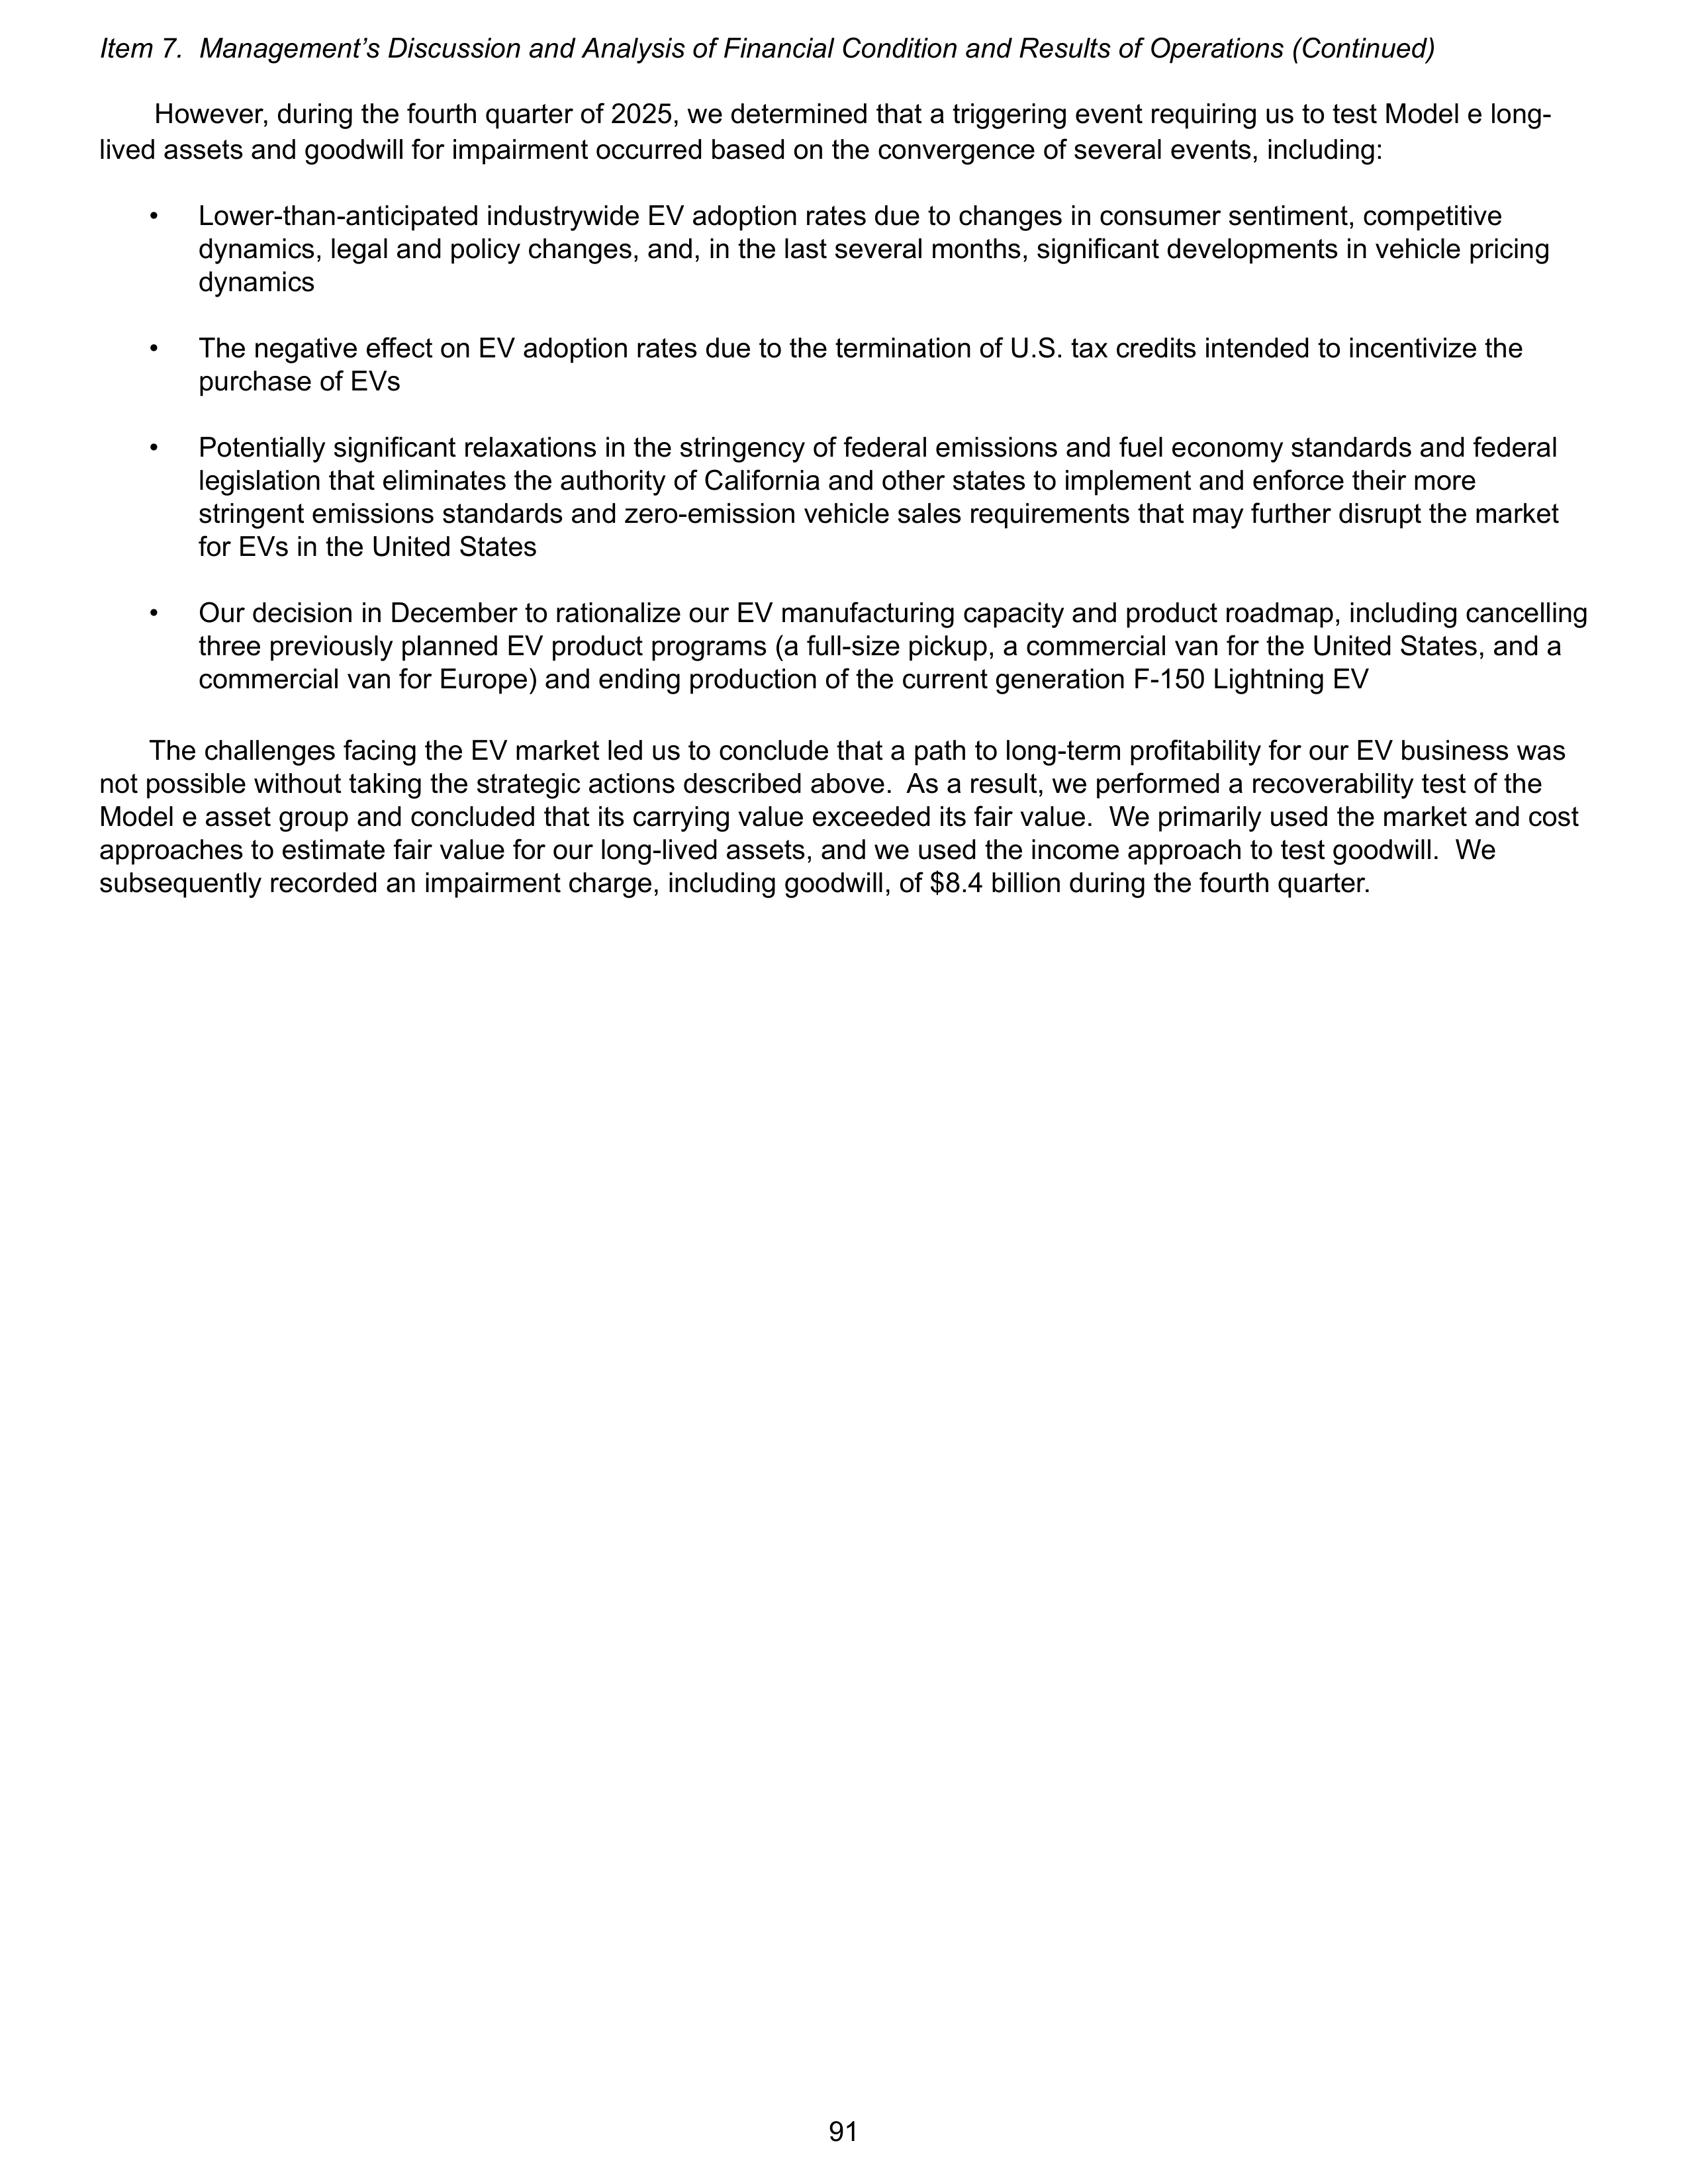
However, during the fourth quarter of 2025, we determined that a triggering event requiring us to test Model e long-
lived assets and goodwill for impairment occurred based on the convergence of several events, including:
•
Lower-than-anticipated industrywide EV adoption rates due to changes in consumer sentiment, competitive
dynamics, legal and policy changes, and, in the last several months, significant developments in vehicle pricing
dynamics
•
The negative effect on EV adoption rates due to the termination of U.S. tax credits intended to incentivize the
purchase of EVs
•
Potentially significant relaxations in the stringency of federal emissions and fuel economy standards and federal
legislation that eliminates the authority of California and other states to implement and enforce their more
stringent emissions standards and zero-emission vehicle sales requirements that may further disrupt the market
for EVs in the United States
•
Our decision in December to rationalize our EV manufacturing capacity and product roadmap, including cancelling
three previously planned EV product programs (a full-size pickup, a commercial van for the United States, and a
commercial van for Europe) and ending production of the current generation F-150 Lightning EV
The challenges facing the EV market led us to conclude that a path to long-term profitability for our EV business was
not possible without taking the strategic actions described above. As a result, we performed a recoverability test of the
Model e asset group and concluded that its carrying value exceeded its fair value. We primarily used the market and cost
approaches to estimate fair value for our long-lived assets, and we used the income approach to test goodwill. We
subsequently recorded an impairment charge, including goodwill, of $8.4 billion during the fourth quarter.
Item 7. Management’s Discussion and Analysis of Financial Condition and Results of Operations (Continued)
91
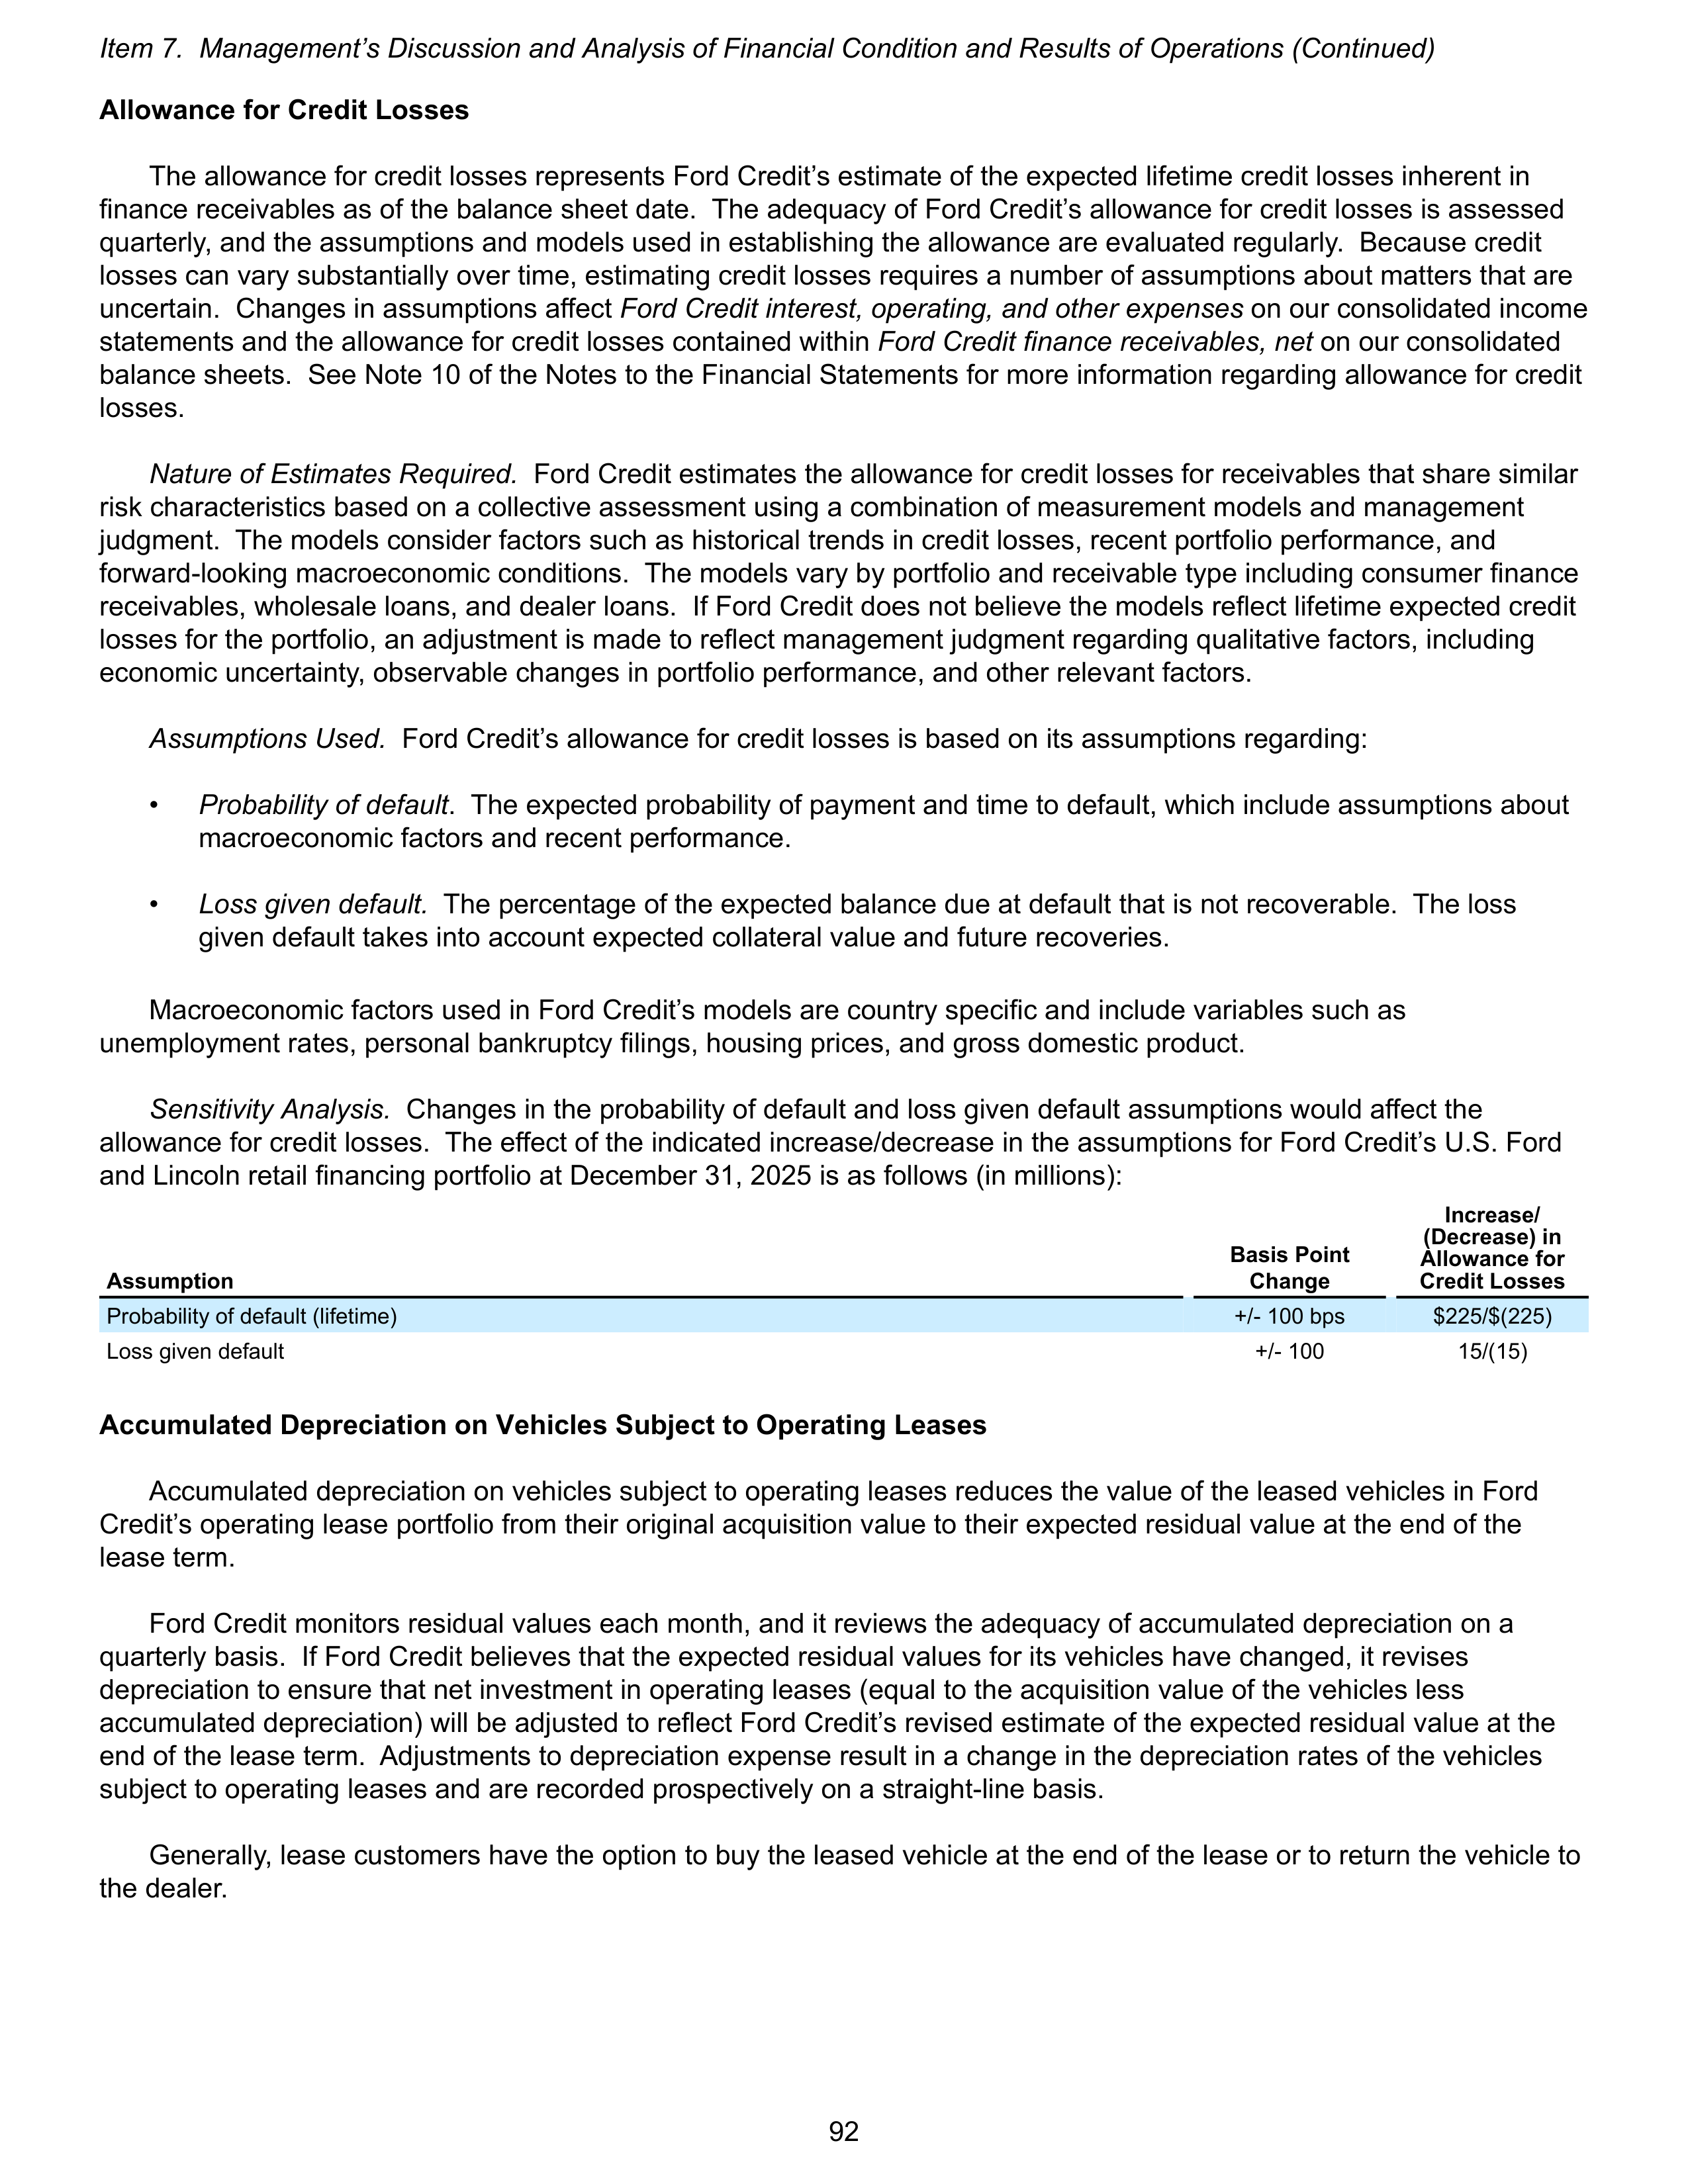
Allowance for Credit Losses
The allowance for credit losses represents Ford Credit’s estimate of the expected lifetime credit losses inherent in
finance receivables as of the balance sheet date. The adequacy of Ford Credit’s allowance for credit losses is assessed
quarterly, and the assumptions and models used in establishing the allowance are evaluated regularly. Because credit
losses can vary substantially over time, estimating credit losses requires a number of assumptions about matters that are
uncertain. Changes in assumptions affect
Ford Credit interest, operating, and other expenses
on our consolidated income
statements and the allowance for credit losses contained within
Ford Credit finance receivables, net
on our consolidated
balance sheets. See Note 10 of the Notes to the Financial Statements for more information regarding allowance for credit
losses.
Nature of Estimates Required.
Ford Credit estimates the allowance for credit losses for receivables that share similar
risk characteristics based on a collective assessment using a combination of measurement models and management
judgment. The models consider factors such as historical trends in credit losses, recent portfolio performance, and
forward-looking macroeconomic conditions. The models vary by portfolio and receivable type including consumer finance
receivables, wholesale loans, and dealer loans. If Ford Credit does not believe the models reflect lifetime expected credit
losses for the portfolio, an adjustment is made to reflect management judgment regarding qualitative factors, including
economic uncertainty, observable changes in portfolio performance, and other relevant factors.
Assumptions Used.
Ford Credit’s allowance for credit losses is based on its assumptions regarding:
•
Probability of default
. The expected probability of payment and time to default, which include assumptions about
macroeconomic factors and recent performance.
•
Loss given default.
The percentage of the expected balance due at default that is not recoverable. The loss
given default takes into account expected collateral value and future recoveries.
Macroeconomic factors used in Ford Credit’s models are country specific and include variables such as
unemployment rates, personal bankruptcy filings, housing prices, and gross domestic product.
Sensitivity Analysis.
Changes in the probability of default and loss given default assumptions would affect the
allowance for credit losses. The effect of the indicated increase/decrease in the assumptions for Ford Credit’s U.S. Ford
and Lincoln retail financing portfolio at December 31, 2025 is as follows (in millions):
Assumption
Basis Point
Change
Increase/
(Decrease) in
Allowance for
Credit Losses
Probability of default (lifetime)
+/- 100 bps
$225/$(225)
Loss given default
+/- 100
15/(15)
Accumulated Depreciation on Vehicles Subject to Operating Leases
Accumulated depreciation on vehicles subject to operating leases reduces the value of the leased vehicles in Ford
Credit’s operating lease portfolio from their original acquisition value to their expected residual value at the end of the
lease term.
Ford Credit monitors residual values each month, and it reviews the adequacy of accumulated depreciation on a
quarterly basis. If Ford Credit believes that the expected residual values for its vehicles have changed, it revises
depreciation to ensure that net investment in operating leases (equal to the acquisition value of the vehicles less
accumulated depreciation) will be adjusted to reflect Ford Credit’s revised estimate of the expected residual value at the
end of the lease term. Adjustments to depreciation expense result in a change in the depreciation rates of the vehicles
subject to operating leases and are recorded prospectively on a straight-line basis.
Generally, lease customers have the option to buy the leased vehicle at the end of the lease or to return the vehicle to
the dealer.
Item 7. Management’s Discussion and Analysis of Financial Condition and Results of Operations (Continued)
92
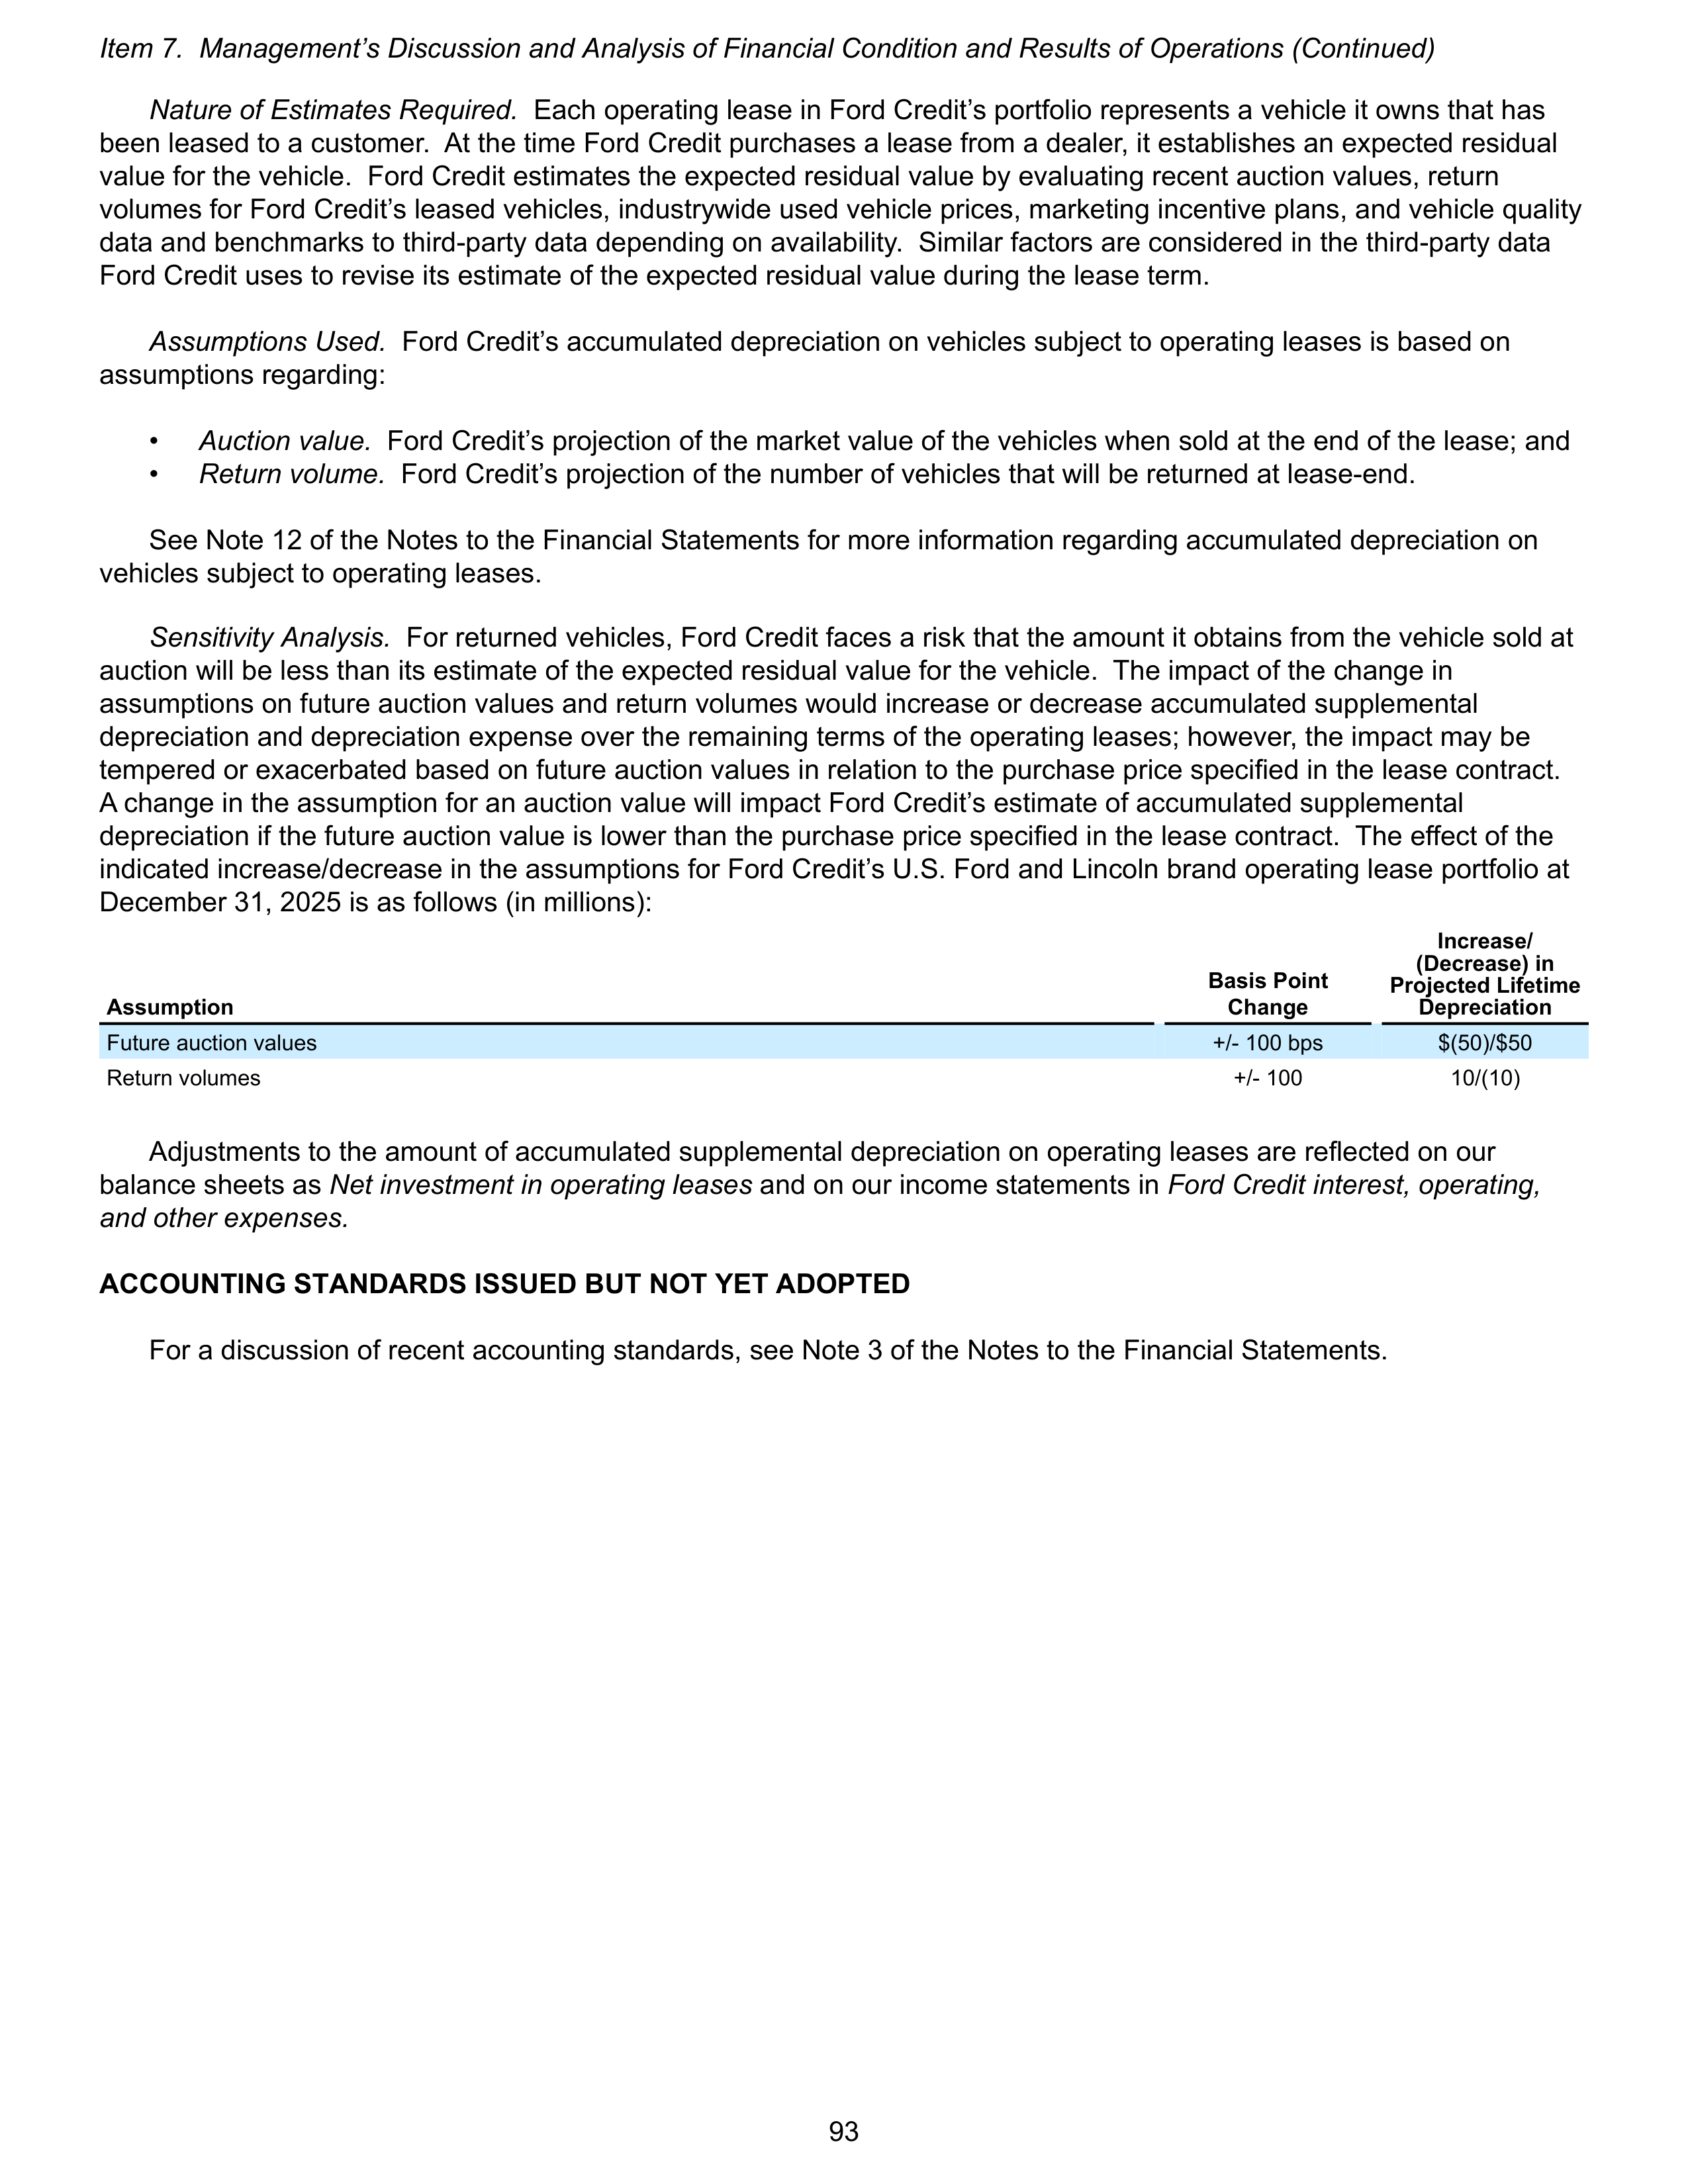
Nature of Estimates Required.
Each operating lease in Ford Credit’s portfolio represents a vehicle it owns that has
been leased to a customer. At the time Ford Credit purchases a lease from a dealer, it establishes an expected residual
value for the vehicle. Ford Credit estimates the expected residual value by evaluating recent auction values, return
volumes for Ford Credit’s leased vehicles, industrywide used vehicle prices, marketing incentive plans, and vehicle quality
data and benchmarks to third-party data depending on availability. Similar factors are considered in the third-party data
Ford Credit uses to revise its estimate of the expected residual value during the lease term.
Assumptions Used.
Ford Credit’s accumulated depreciation on vehicles subject to operating leases is based on
assumptions regarding:
•
Auction value.
Ford Credit’s projection of the market value of the vehicles when sold at the end of the lease; and
•
Return volume.
Ford Credit’s projection of the number of vehicles that will be returned at lease-end.
See Note 12 of the Notes to the Financial Statements for more information regarding accumulated depreciation on
vehicles subject to operating leases.
Sensitivity Analysis.
For returned vehicles, Ford Credit faces a risk that the amount it obtains from the vehicle sold at
auction will be less than its estimate of the expected residual value for the vehicle. The impact of the change in
assumptions on future auction values and return volumes would increase or decrease accumulated supplemental
depreciation and depreciation expense over the remaining terms of the operating leases; however, the impact may be
tempered or exacerbated based on future auction values in relation to the purchase price specified in the lease contract.
A change in the assumption for an auction value will impact Ford Credit’s estimate of accumulated supplemental
depreciation if the future auction value is lower than the purchase price specified in the lease contract. The effect of the
indicated increase/decrease in the assumptions for Ford Credit’s U.S. Ford and Lincoln brand operating lease portfolio at
December 31, 2025 is as follows (in millions):
Assumption
Basis Point
Change
Increase/
(Decrease) in
Projected Lifetime
Depreciation
Future auction values
+/- 100 bps
$(50)/$50
Return volumes
+/- 100
10/(10)
Adjustments to the amount of accumulated supplemental depreciation on operating leases are reflected on our
balance sheets as
Net investment in operating leases
and on our income statements in
Ford Credit interest, operating,
and other expenses.
ACCOUNTING STANDARDS ISSUED BUT NOT YET ADOPTED
For a discussion of recent accounting standards, see Note 3 of the Notes to the Financial Statements.
Item 7. Management’s Discussion and Analysis of Financial Condition and Results of Operations (Continued)
93
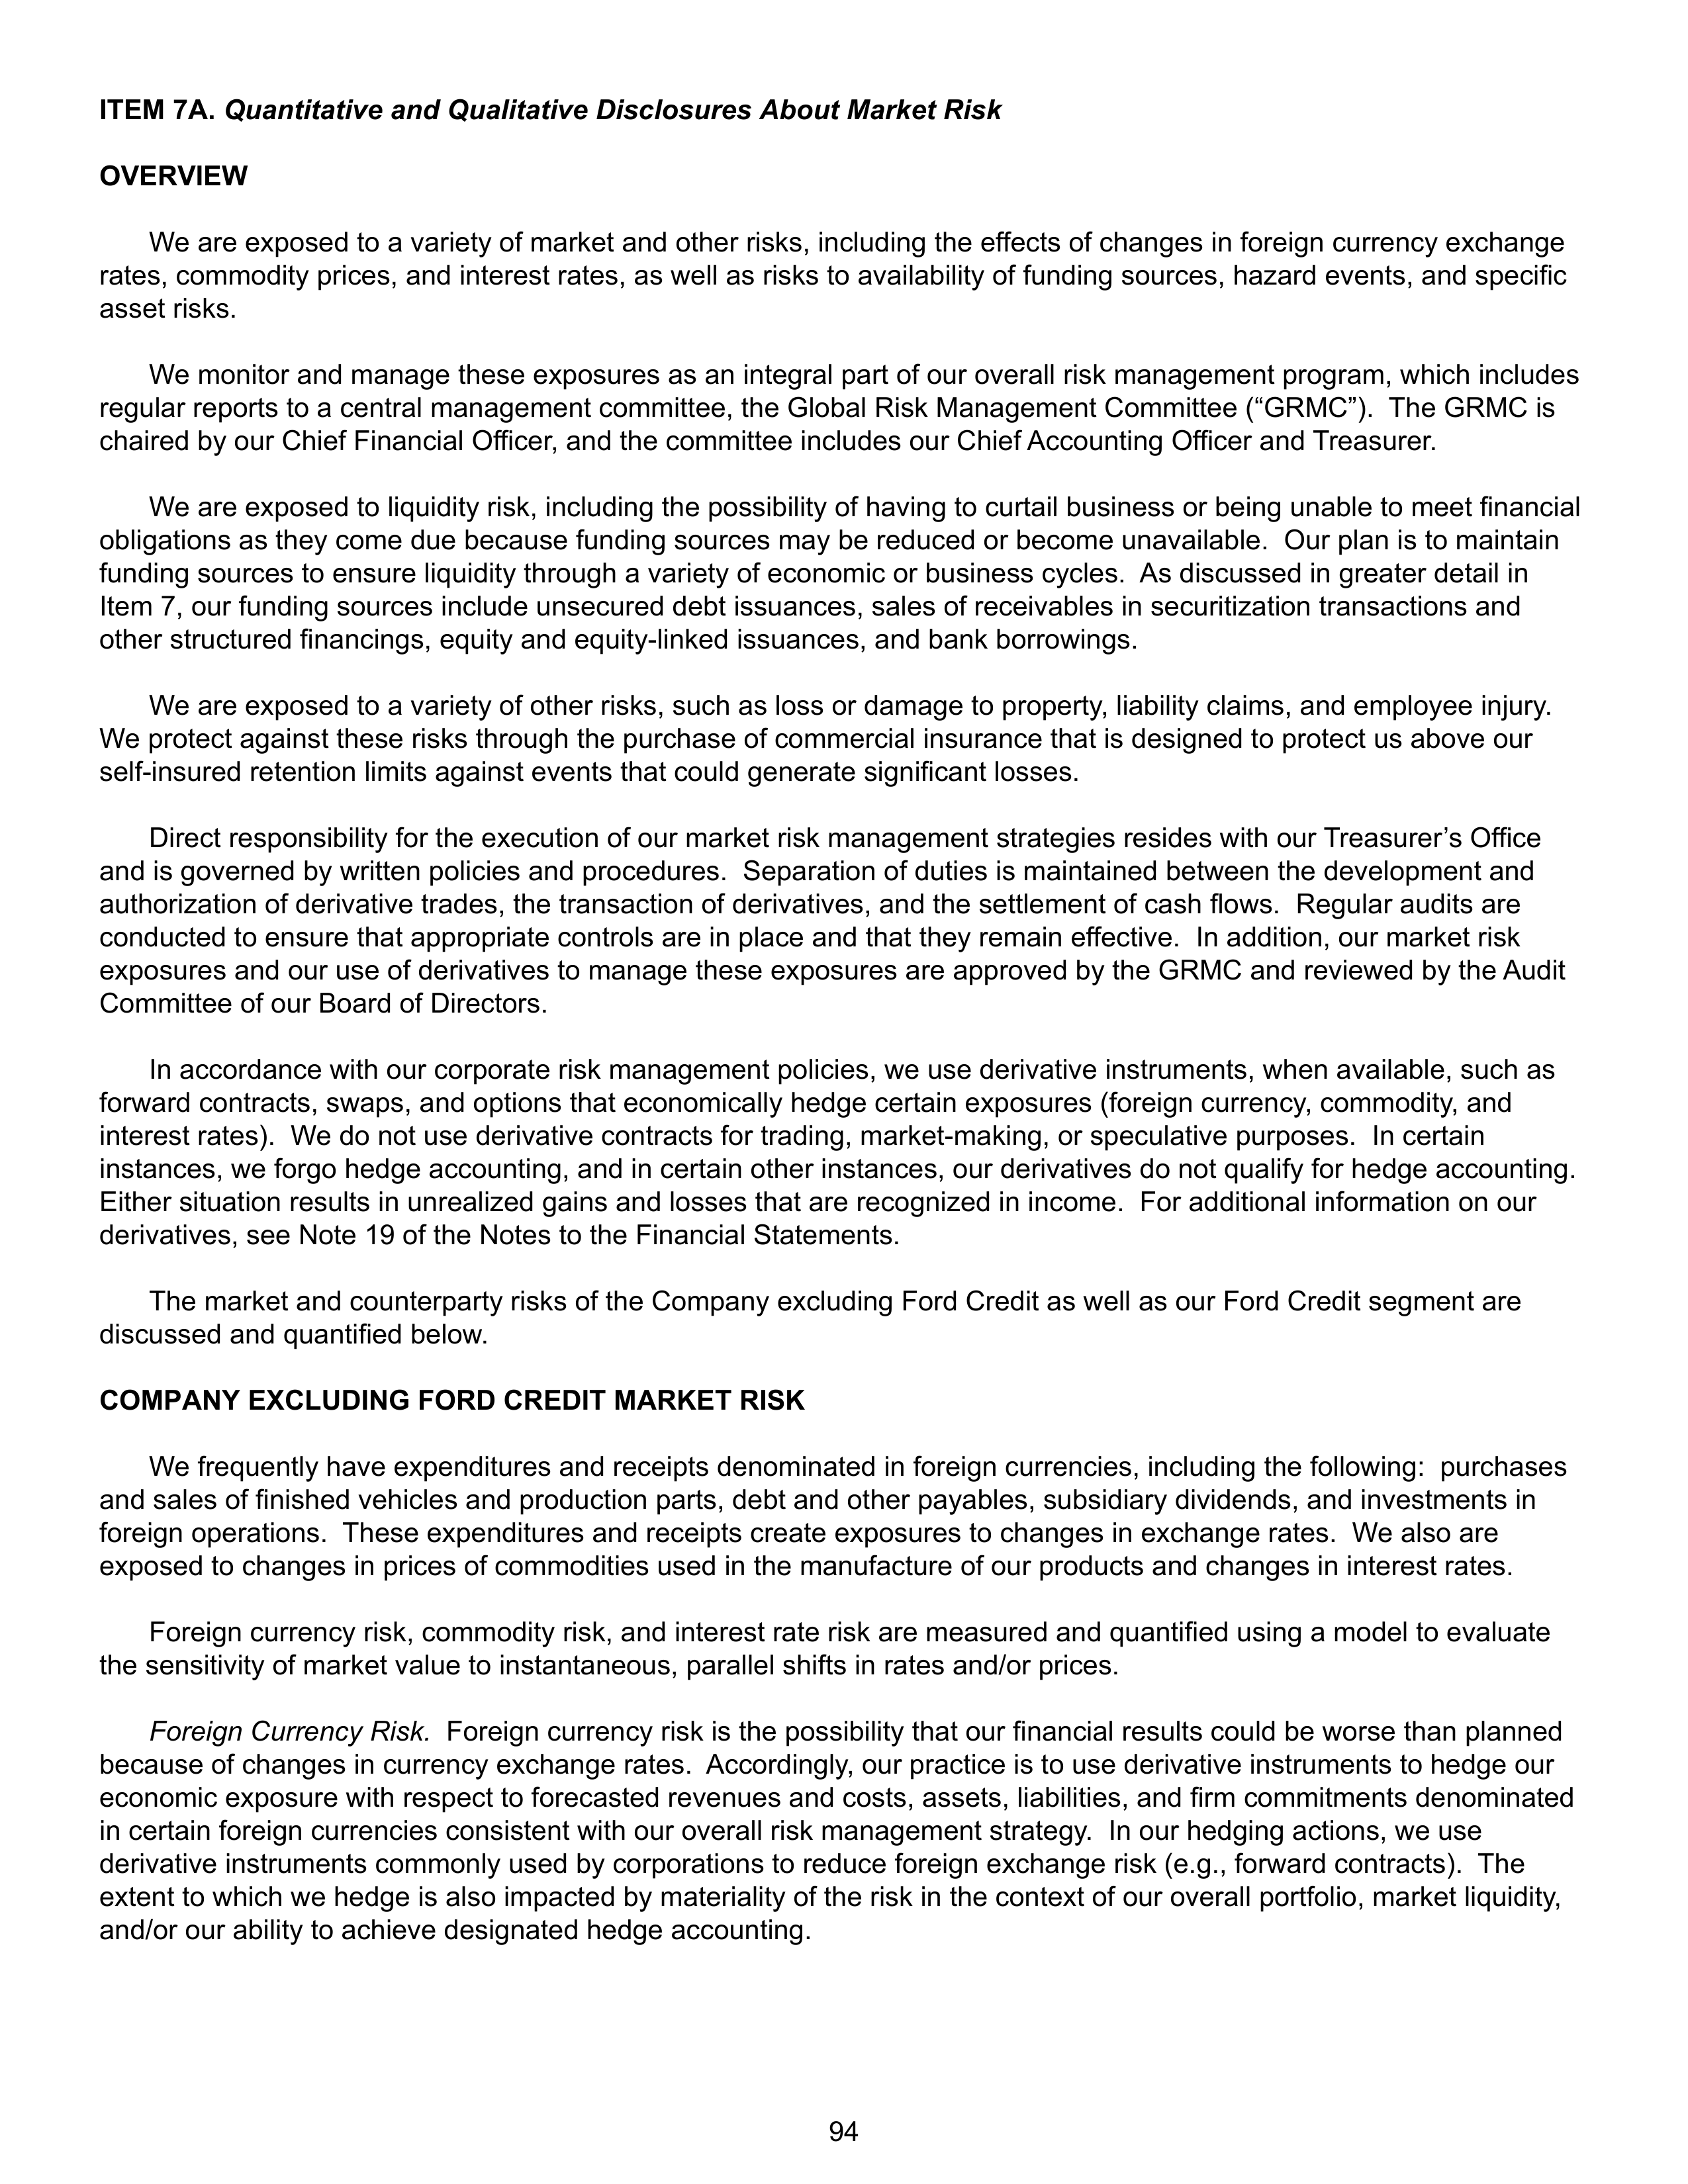
ITEM 7A.
Quantitative and Qualitative Disclosures About Market Risk
OVERVIEW
We are exposed to a variety of market and other risks, including the effects of changes in foreign currency exchange
rates, commodity prices, and interest rates, as well as risks to availability of funding sources, hazard events, and specific
asset risks.
We monitor and manage these exposures as an integral part of our overall risk management program, which includes
regular reports to a central management committee, the Global Risk Management Committee (“GRMC”). The GRMC is
chaired by our Chief Financial Officer, and the committee includes our Chief Accounting Officer and Treasurer.
We are exposed to liquidity risk, including the possibility of having to curtail business or being unable to meet financial
obligations as they come due because funding sources may be reduced or become unavailable. Our plan is to maintain
funding sources to ensure liquidity through a variety of economic or business cycles. As discussed in greater detail in
Item 7, our funding sources include unsecured debt issuances, sales of receivables in securitization transactions and
other structured financings, equity and equity-linked issuances, and bank borrowings.
We are exposed to a variety of other risks, such as loss or damage to property, liability claims, and employee injury.
We protect against these risks through the purchase of commercial insurance that is designed to protect us above our
self-insured retention limits against events that could generate significant losses.
Direct responsibility for the execution of our market risk management strategies resides with our Treasurer’s Office
and is governed by written policies and procedures. Separation of duties is maintained between the development and
authorization of derivative trades, the transaction of derivatives, and the settlement of cash flows. Regular audits are
conducted to ensure that appropriate controls are in place and that they remain effective. In addition, our market risk
exposures and our use of derivatives to manage these exposures are approved by the GRMC and reviewed by the Audit
Committee of our Board of Directors.
In accordance with our corporate risk management policies, we use derivative instruments, when available, such as
forward contracts, swaps, and options that economically hedge certain exposures (foreign currency, commodity, and
interest rates). We do not use derivative contracts for trading, market-making, or speculative purposes. In certain
instances, we forgo hedge accounting, and in certain other instances, our derivatives do not qualify for hedge accounting.
Either situation results in unrealized gains and losses that are recognized in income. For additional information on our
derivatives, see Note 19 of the Notes to the Financial Statements.
The market and counterparty risks of the Company excluding Ford Credit as well as our Ford Credit segment are
discussed and quantified below.
COMPANY EXCLUDING FORD CREDIT MARKET RISK
We frequently have expenditures and receipts denominated in foreign currencies, including the following: purchases
and sales of finished vehicles and production parts, debt and other payables, subsidiary dividends, and investments in
foreign operations. These expenditures and receipts create exposures to changes in exchange rates. We also are
exposed to changes in prices of commodities used in the manufacture of our products and changes in interest rates.
Foreign currency risk, commodity risk, and interest rate risk are measured and quantified using a model to evaluate
the sensitivity of market value to instantaneous, parallel shifts in rates and/or prices.
Foreign Currency Risk.
Foreign currency risk is the possibility that our financial results could be worse than planned
because of changes in currency exchange rates. Accordingly, our practice is to use derivative instruments to hedge our
economic exposure with respect to forecasted revenues and costs, assets, liabilities, and firm commitments denominated
in certain foreign currencies consistent with our overall risk management strategy. In our hedging actions, we use
derivative instruments commonly used by corporations to reduce foreign exchange risk (e.g., forward contracts). The
extent to which we hedge is also impacted by materiality of the risk in the context of our overall portfolio, market liquidity,
and/or our ability to achieve designated hedge accounting.
94
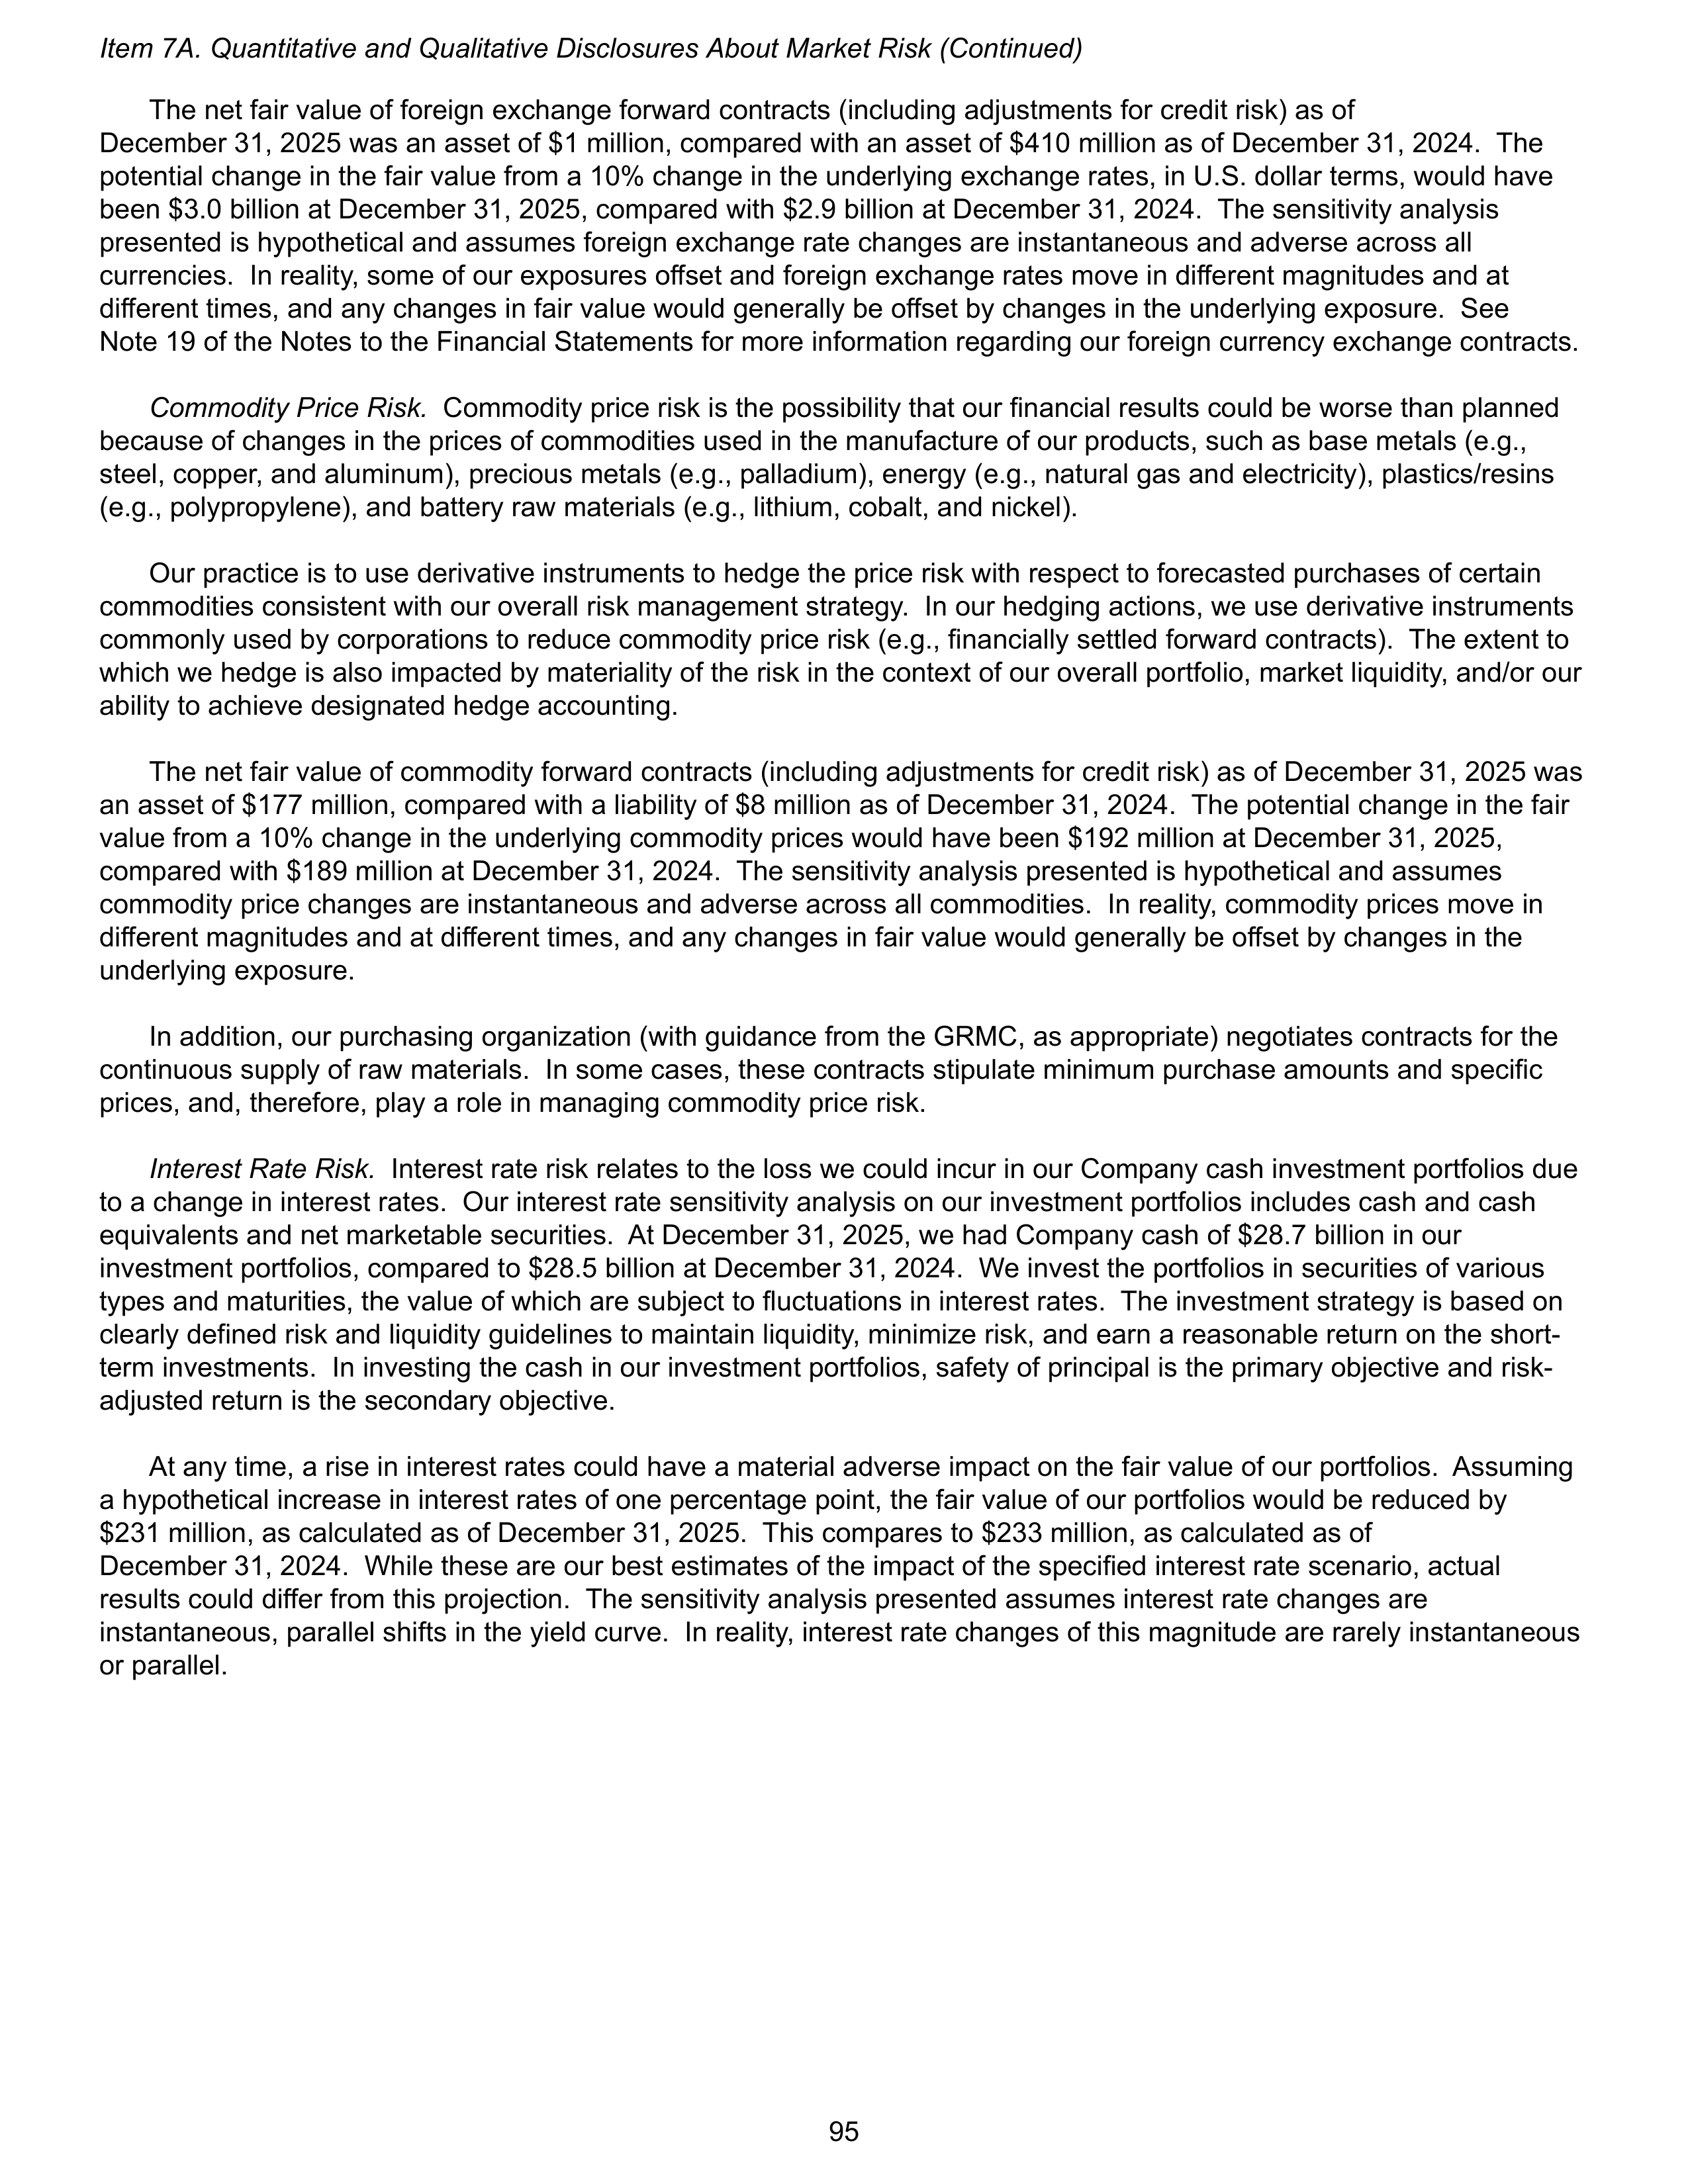
The net fair value of foreign exchange forward contracts (including adjustments for credit risk) as of
December 31, 2025 was an asset of $1 million, compared with an asset of $410 million as of December 31, 2024. The
potential change in the fair value from a 10% change in the underlying exchange rates, in U.S. dollar terms, would have
been $3.0 billion at December 31, 2025, compared with $2.9 billion at December 31, 2024. The sensitivity analysis
presented is hypothetical and assumes foreign exchange rate changes are instantaneous and adverse across all
currencies. In reality, some of our exposures offset and foreign exchange rates move in different magnitudes and at
different times, and any changes in fair value would generally be offset by changes in the underlying exposure. See
Note 19 of the Notes to the Financial Statements for more information regarding our foreign currency exchange contracts.
Commodity Price Risk.
Commodity price risk is the possibility that our financial results could be worse than planned
because of changes in the prices of commodities used in the manufacture of our products, such as base metals (e.g.,
steel, copper, and aluminum), precious metals (e.g., palladium), energy (e.g., natural gas and electricity), plastics/resins
(e.g., polypropylene), and battery raw materials (e.g., lithium, cobalt, and nickel).
Our practice is to use derivative instruments to hedge the price risk with respect to forecasted purchases of certain
commodities consistent with our overall risk management strategy. In our hedging actions, we use derivative instruments
commonly used by corporations to reduce commodity price risk (e.g., financially settled forward contracts). The extent to
which we hedge is also impacted by materiality of the risk in the context of our overall portfolio, market liquidity, and/or our
ability to achieve designated hedge accounting.
The net fair value of commodity forward contracts (including adjustments for credit risk) as of December 31, 2025 was
an asset of $177 million, compared with a liability of $8 million as of December 31, 2024. The potential change in the fair
value from a 10% change in the underlying commodity prices would have been $192 million at December 31, 2025,
compared with $189 million at December 31, 2024. The sensitivity analysis presented is hypothetical and assumes
commodity price changes are instantaneous and adverse across all commodities. In reality, commodity prices move in
different magnitudes and at different times, and any changes in fair value would generally be offset by changes in the
underlying exposure.
In addition, our purchasing organization (with guidance from the GRMC, as appropriate) negotiates contracts for the
continuous supply of raw materials. In some cases, these contracts stipulate minimum purchase amounts and specific
prices, and, therefore, play a role in managing commodity price risk.
Interest Rate Risk.
Interest rate risk relates to the loss we could incur in our Company cash investment portfolios due
to a change in interest rates. Our interest rate sensitivity analysis on our investment portfolios includes cash and cash
equivalents and net marketable securities. At December 31, 2025, we had Company cash of $28.7 billion in our
investment portfolios, compared to $28.5 billion at December 31, 2024. We invest the portfolios in securities of various
types and maturities, the value of which are subject to fluctuations in interest rates. The investment strategy is based on
clearly defined risk and liquidity guidelines to maintain liquidity, minimize risk, and earn a reasonable return on the short-
term investments. In investing the cash in our investment portfolios, safety of principal is the primary objective and risk-
adjusted return is the secondary objective.
At any time, a rise in interest rates could have a material adverse impact on the fair value of our portfolios. Assuming
a hypothetical increase in interest rates of one percentage point, the fair value of our portfolios would be reduced by
$231 million, as calculated as of December 31, 2025. This compares to $233 million, as calculated as of
December 31, 2024. While these are our best estimates of the impact of the specified interest rate scenario, actual
results could differ from this projection. The sensitivity analysis presented assumes interest rate changes are
instantaneous, parallel shifts in the yield curve. In reality, interest rate changes of this magnitude are rarely instantaneous
or parallel.
Item 7A. Quantitative and Qualitative Disclosures About Market Risk (Continued)
95
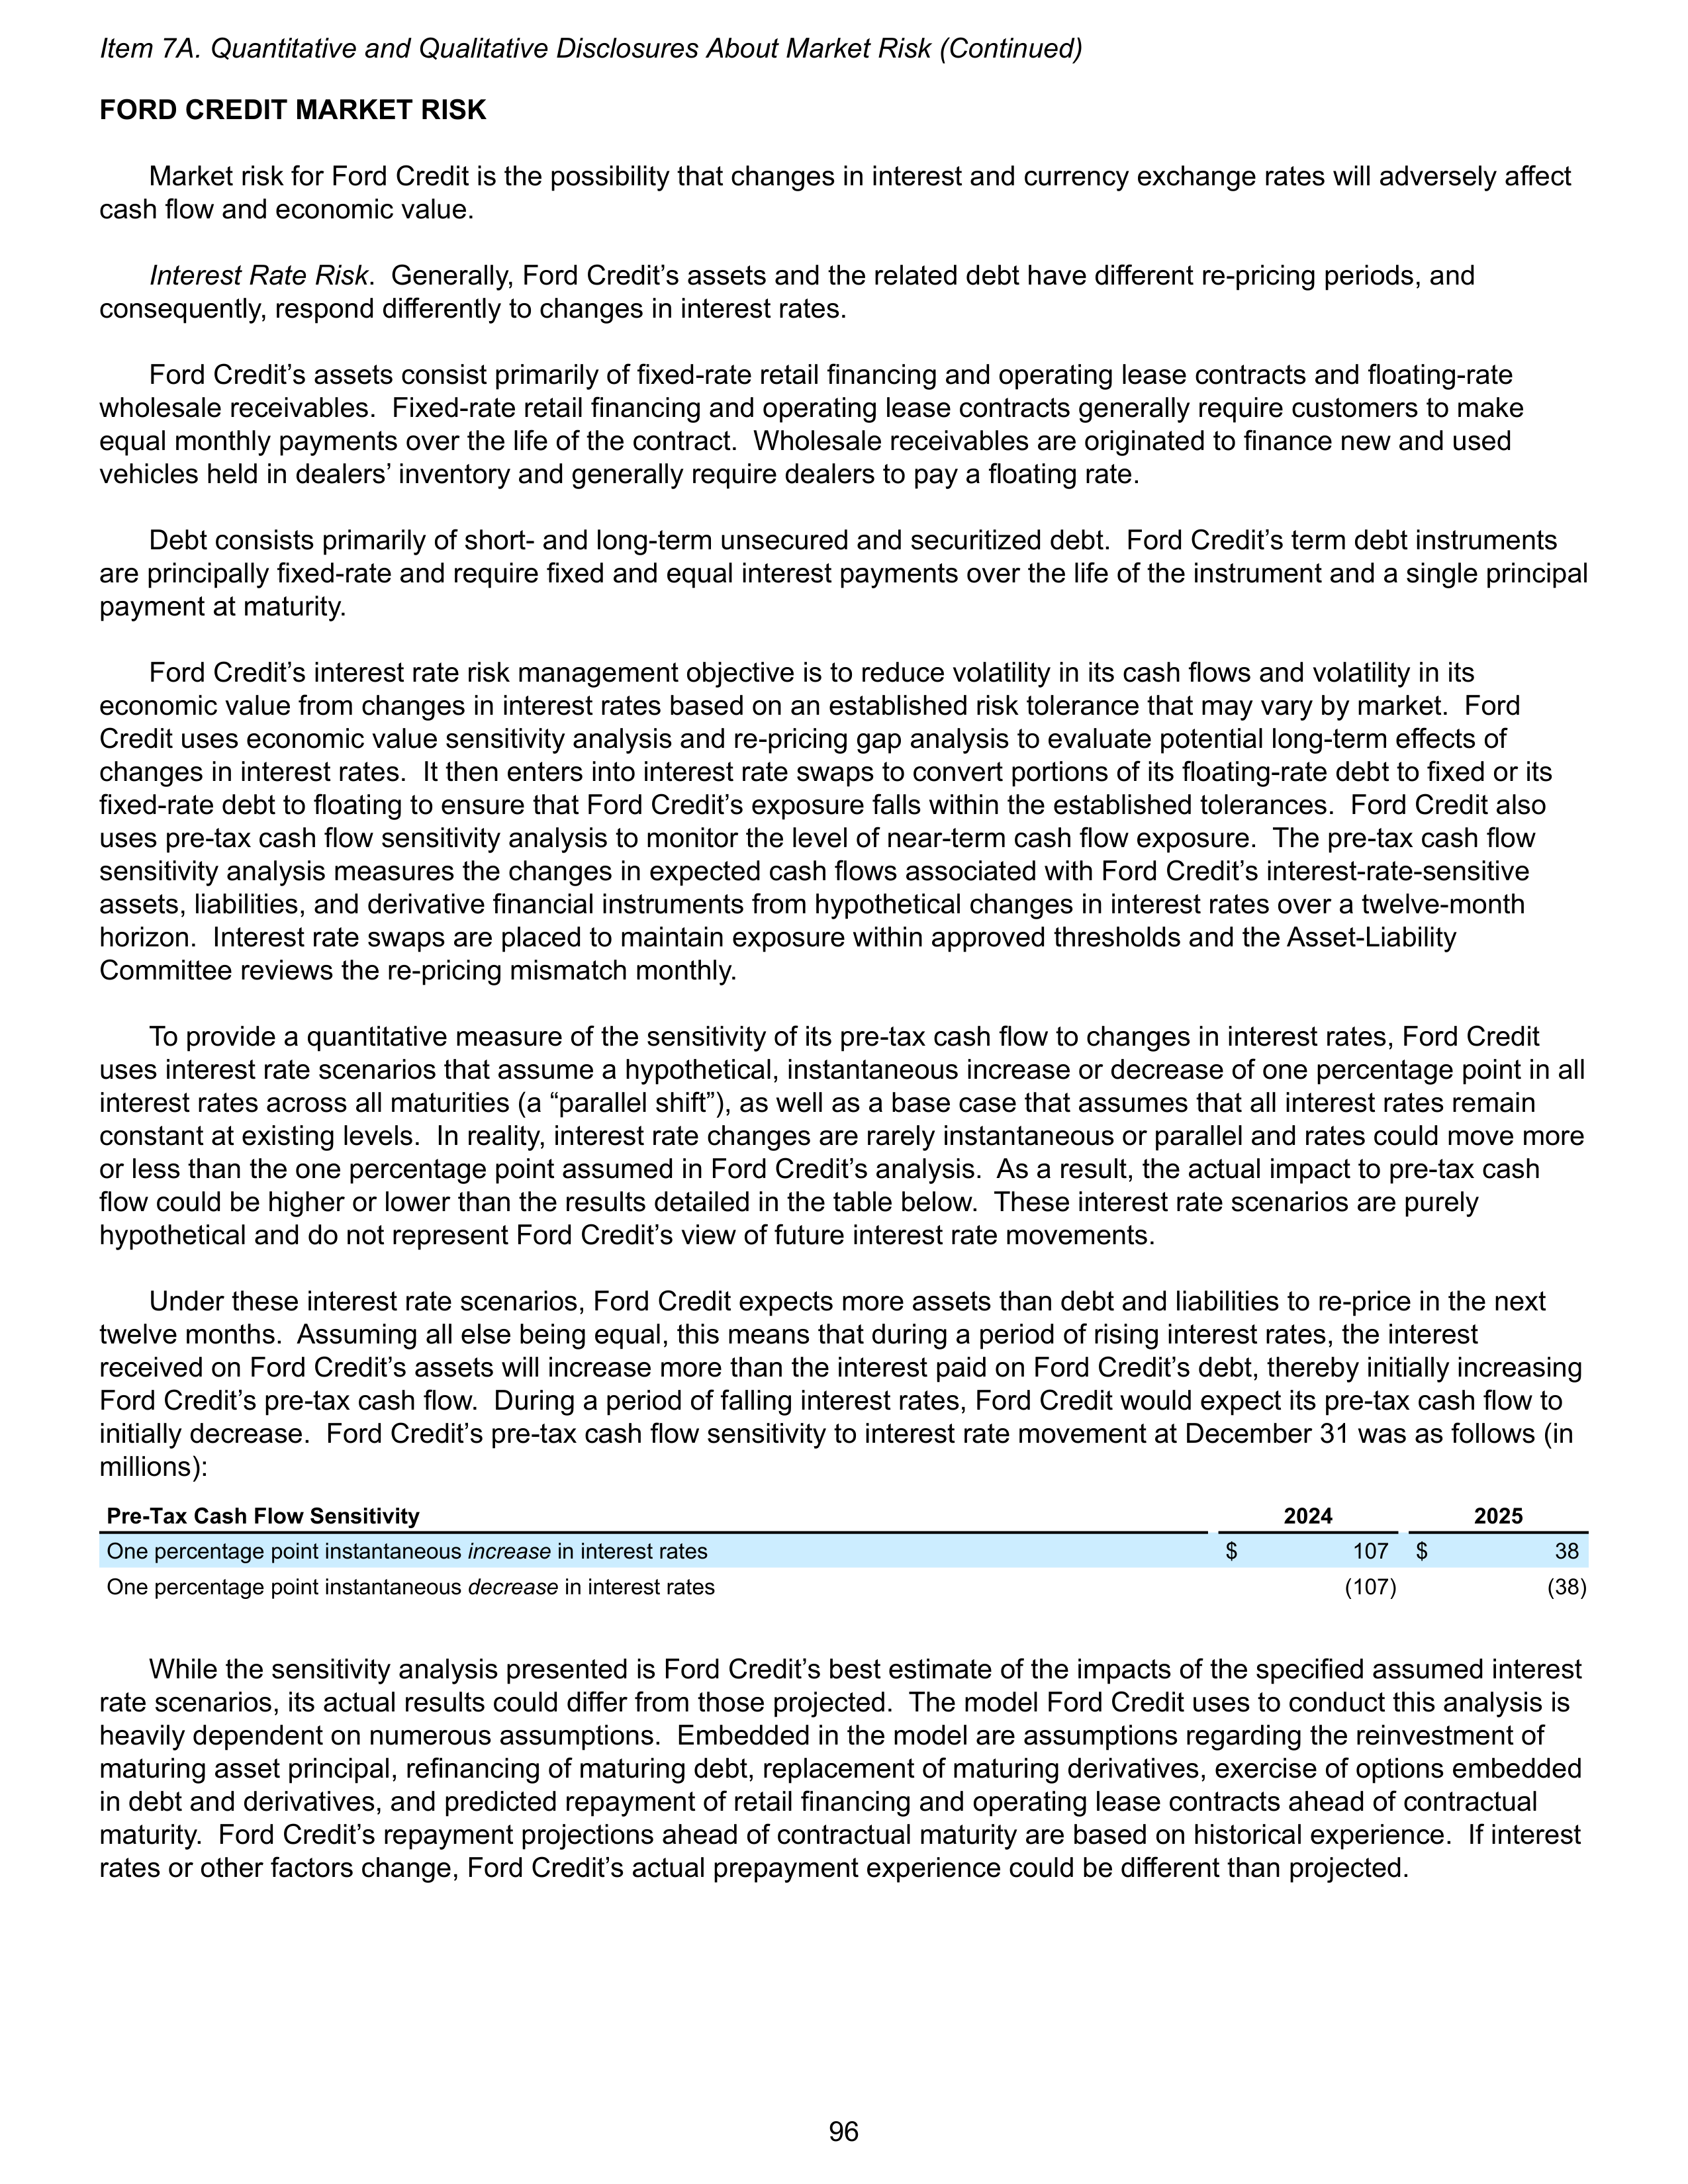
FORD CREDIT MARKET RISK
Market risk for Ford Credit is the possibility that changes in interest and currency exchange rates will adversely affect
cash flow and economic value.
Interest Rate Risk
. Generally, Ford Credit’s assets and the related debt have different re-pricing periods, and
consequently, respond differently to changes in interest rates.
Ford Credit’s assets consist primarily of fixed-rate retail financing and operating lease contracts and floating-rate
wholesale receivables. Fixed-rate retail financing and operating lease contracts generally require customers to make
equal monthly payments over the life of the contract. Wholesale receivables are originated to finance new and used
vehicles held in dealers’ inventory and generally require dealers to pay a floating rate.
Debt consists primarily of short- and long-term unsecured and securitized debt. Ford Credit’s term debt instruments
are principally fixed-rate and require fixed and equal interest payments over the life of the instrument and a single principal
payment at maturity.
Ford Credit’s interest rate risk management objective is to reduce volatility in its cash flows and volatility in its
economic value from changes in interest rates based on an established risk tolerance that may vary by market. Ford
Credit uses economic value sensitivity analysis and re-pricing gap analysis to evaluate potential long-term effects of
changes in interest rates. It then enters into interest rate swaps to convert portions of its floating-rate debt to fixed or its
fixed-rate debt to floating to ensure that Ford Credit’s exposure falls within the established tolerances. Ford Credit also
uses pre-tax cash flow sensitivity analysis to monitor the level of near-term cash flow exposure. The pre-tax cash flow
sensitivity analysis measures the changes in expected cash flows associated with Ford Credit’s interest-rate-sensitive
assets, liabilities, and derivative financial instruments from hypothetical changes in interest rates over a twelve-month
horizon. Interest rate swaps are placed to maintain exposure within approved thresholds and the Asset-Liability
Committee reviews the re-pricing mismatch monthly.
To provide a quantitative measure of the sensitivity of its pre-tax cash flow to changes in interest rates, Ford Credit
uses interest rate scenarios that assume a hypothetical, instantaneous increase or decrease of one percentage point in all
interest rates across all maturities (a “parallel shift”), as well as a base case that assumes that all interest rates remain
constant at existing levels. In reality, interest rate changes are rarely instantaneous or parallel and rates could move more
or less than the one percentage point assumed in Ford Credit’s analysis. As a result, the actual impact to pre-tax cash
flow could be higher or lower than the results detailed in the table below. These interest rate scenarios are purely
hypothetical and do not represent Ford Credit’s view of future interest rate movements.
Under these interest rate scenarios, Ford Credit expects more assets than debt and liabilities to re-price in the next
twelve months. Assuming all else being equal, this means that during a period of rising interest rates, the interest
received on Ford Credit’s assets will increase more than the interest paid on Ford Credit’s debt, thereby initially increasing
Ford Credit’s pre-tax cash flow. During a period of falling interest rates, Ford Credit would expect its pre-tax cash flow to
initially decrease. Ford Credit’s pre-tax cash flow sensitivity to interest rate movement at December 31 was as follows (in
millions):
Pre-Tax Cash Flow Sensitivity
2024
2025
One percentage point instantaneous
increase
in interest rates
$
107
$
38
One percentage point instantaneous
decrease
in interest rates
(107)
(38)
While the sensitivity analysis presented is Ford Credit’s best estimate of the impacts of the specified assumed interest
rate scenarios, its actual results could differ from those projected. The model Ford Credit uses to conduct this analysis is
heavily dependent on numerous assumptions. Embedded in the model are assumptions regarding the reinvestment of
maturing asset principal, refinancing of maturing debt, replacement of maturing derivatives, exercise of options embedded
in debt and derivatives, and predicted repayment of retail financing and operating lease contracts ahead of contractual
maturity. Ford Credit’s repayment projections ahead of contractual maturity are based on historical experience. If interest
rates or other factors change, Ford Credit’s actual prepayment experience could be different than projected.
Item 7A. Quantitative and Qualitative Disclosures About Market Risk (Continued)
96
Foreign Currency Risk.
Ford Credit’s policy is to minimize exposure to changes in currency exchange rates. To meet
funding objectives, Ford Credit borrows in a variety of currencies, principally U.S. dollars, Canadian dollars, euros,
sterling, and renminbi. Ford Credit faces exposure to currency exchange rates if a mismatch exists between the currency
of receivables and the currency of the debt funding those receivables. When possible, receivables are funded with debt in
the same currency, minimizing exposure to exchange rate movements. When a different currency is used, Ford Credit
may use foreign currency swaps and foreign currency forwards to convert substantially all of its foreign currency debt
obligations to the local country currency of the receivables. As a result of this policy, Ford Credit believes its market risk
exposure, relating to changes in currency exchange rates at December 31, 2025, is insignificant.
Derivative Fair Values.
The net fair value of Ford Credit’s derivative financial instruments at December 31, 2025 was
an asset of $581 million, compared to a liability of $1.2 billion at December 31, 2024.
COUNTERPARTY RISK
Counterparty risk relates to the loss we could incur if an obligor or counterparty defaulted on an investment or a
derivative contract. We enter into master agreements with counterparties that allow netting of certain exposures in order
to manage this risk. Exposures primarily relate to investments in fixed income instruments and derivative contracts used
for managing interest rate, foreign currency exchange rate, and commodity price risk. We, together with Ford Credit,
establish exposure limits for each counterparty to minimize risk and provide counterparty diversification.
Our approach to managing counterparty risk is forward-looking and proactive, allowing us to take risk mitigation
actions before risks become losses. Exposure limits are established based on our overall risk tolerance, which is
calculated from counterparty credit ratings and market-based credit default swap (“CDS”) spreads. The exposure limits
are lower for smaller and lower-rated counterparties, counterparties that have relatively higher CDS spreads, and for
longer dated exposures. Our exposures are monitored on a regular basis and included in periodic reports to our
Treasurer.
Substantially all of our counterparty exposures are with counterparties that have an investment grade rating.
Investment grade is our guideline for minimum counterparty long-term ratings.
ITEM 8.
Financial Statements and Supplementary Data.
The Report of Independent Registered Public Accounting Firm, our Financial Statements, the accompanying Notes to
the Financial Statements, and the Financial Statement Schedule that are filed as part of this Report are listed under
“Item 15. Exhibits and Financial Statement Schedules” and are set forth beginning on page
108
immediately following the
signature pages of this Report.
ITEM 9.
Changes in and Disagreements with Accountants on Accounting and Financial Disclosure.
None.
Item 7A. Quantitative and Qualitative Disclosures About Market Risk (Continued)
97
ITEM 9A.
Controls and Procedures.
Evaluation of Disclosure Controls and Procedures.
James D. Farley, Jr., our Chief Executive Officer (“CEO”), and
Sherry A. House, our Chief Financial Officer (“CFO”), have performed an evaluation of the Company’s disclosure controls
and procedures, as that term is defined in Rule 13a-15(e) or 15d-15(e) of the Securities Exchange Act of 1934, as
amended (“Exchange Act”), as of December 31, 2025, and each has concluded that such disclosure controls and
procedures are effective to ensure that information required to be disclosed in our periodic reports filed under the
Exchange Act is recorded, processed, summarized, and reported within the time periods specified by SEC rules and
forms, and that such information is accumulated and communicated to the CEO and CFO to allow timely decisions
regarding required disclosures.
Management’s Report on Internal Control Over Financial Reporting.
Our management is responsible for establishing
and maintaining adequate internal control over financial reporting, as such term is defined in Exchange Act Rule 13a-15(f)
or 15d-15(f). The Company’s internal control over financial reporting is a process designed to provide reasonable
assurance regarding the reliability of financial reporting and the preparation of financial statements for external purposes
in accordance with generally accepted accounting principles.
Because of its inherent limitations, internal control over financial reporting may not prevent or detect misstatements.
Also, projections of any evaluation of effectiveness to future periods are subject to the risk that controls may become
inadequate because of changes in conditions or because the degree of compliance with policies or procedures may
deteriorate.
Under the supervision and with the participation of our management, including our CEO and CFO, we conducted an
assessment of the effectiveness of our internal control over financial reporting as of December 31, 2025. The assessment
was based on criteria established in the framework
Internal Control - Integrated Framework (2013)
, issued by the
Committee of Sponsoring Organizations of the Treadway Commission. Based on this assessment, management
concluded that our internal control over financial reporting was effective as of December 31, 2025.
The effectiveness of the Company’s internal control over financial reporting as of December 31, 2025 has been
audited by PricewaterhouseCoopers LLP (PCAOB ID 238), an independent registered public accounting firm, as stated in
its report included herein.
Changes in Internal Control Over Financial Reporting.
There were no changes in internal control over financial
reporting during the quarter ended December 31, 2025 that have materially affected, or are reasonably likely to materially
affect, our internal control over financial reporting.
ITEM 9B.
Other Information.
During the quarter ended December 31, 2025, no director or officer (as defined in Rule 16a-1(f) under the Exchange
Act) of the Company adopted, modified, or terminated a “Rule 10b5-1 trading arrangement” or a “non-Rule 10b5-1 trading
arrangement” as each term is defined in Item 408(a) of Regulation S-K.
ITEM 9C.
Disclosure Regarding Foreign Jurisdictions that Prevent Inspections.
Not applicable.
98
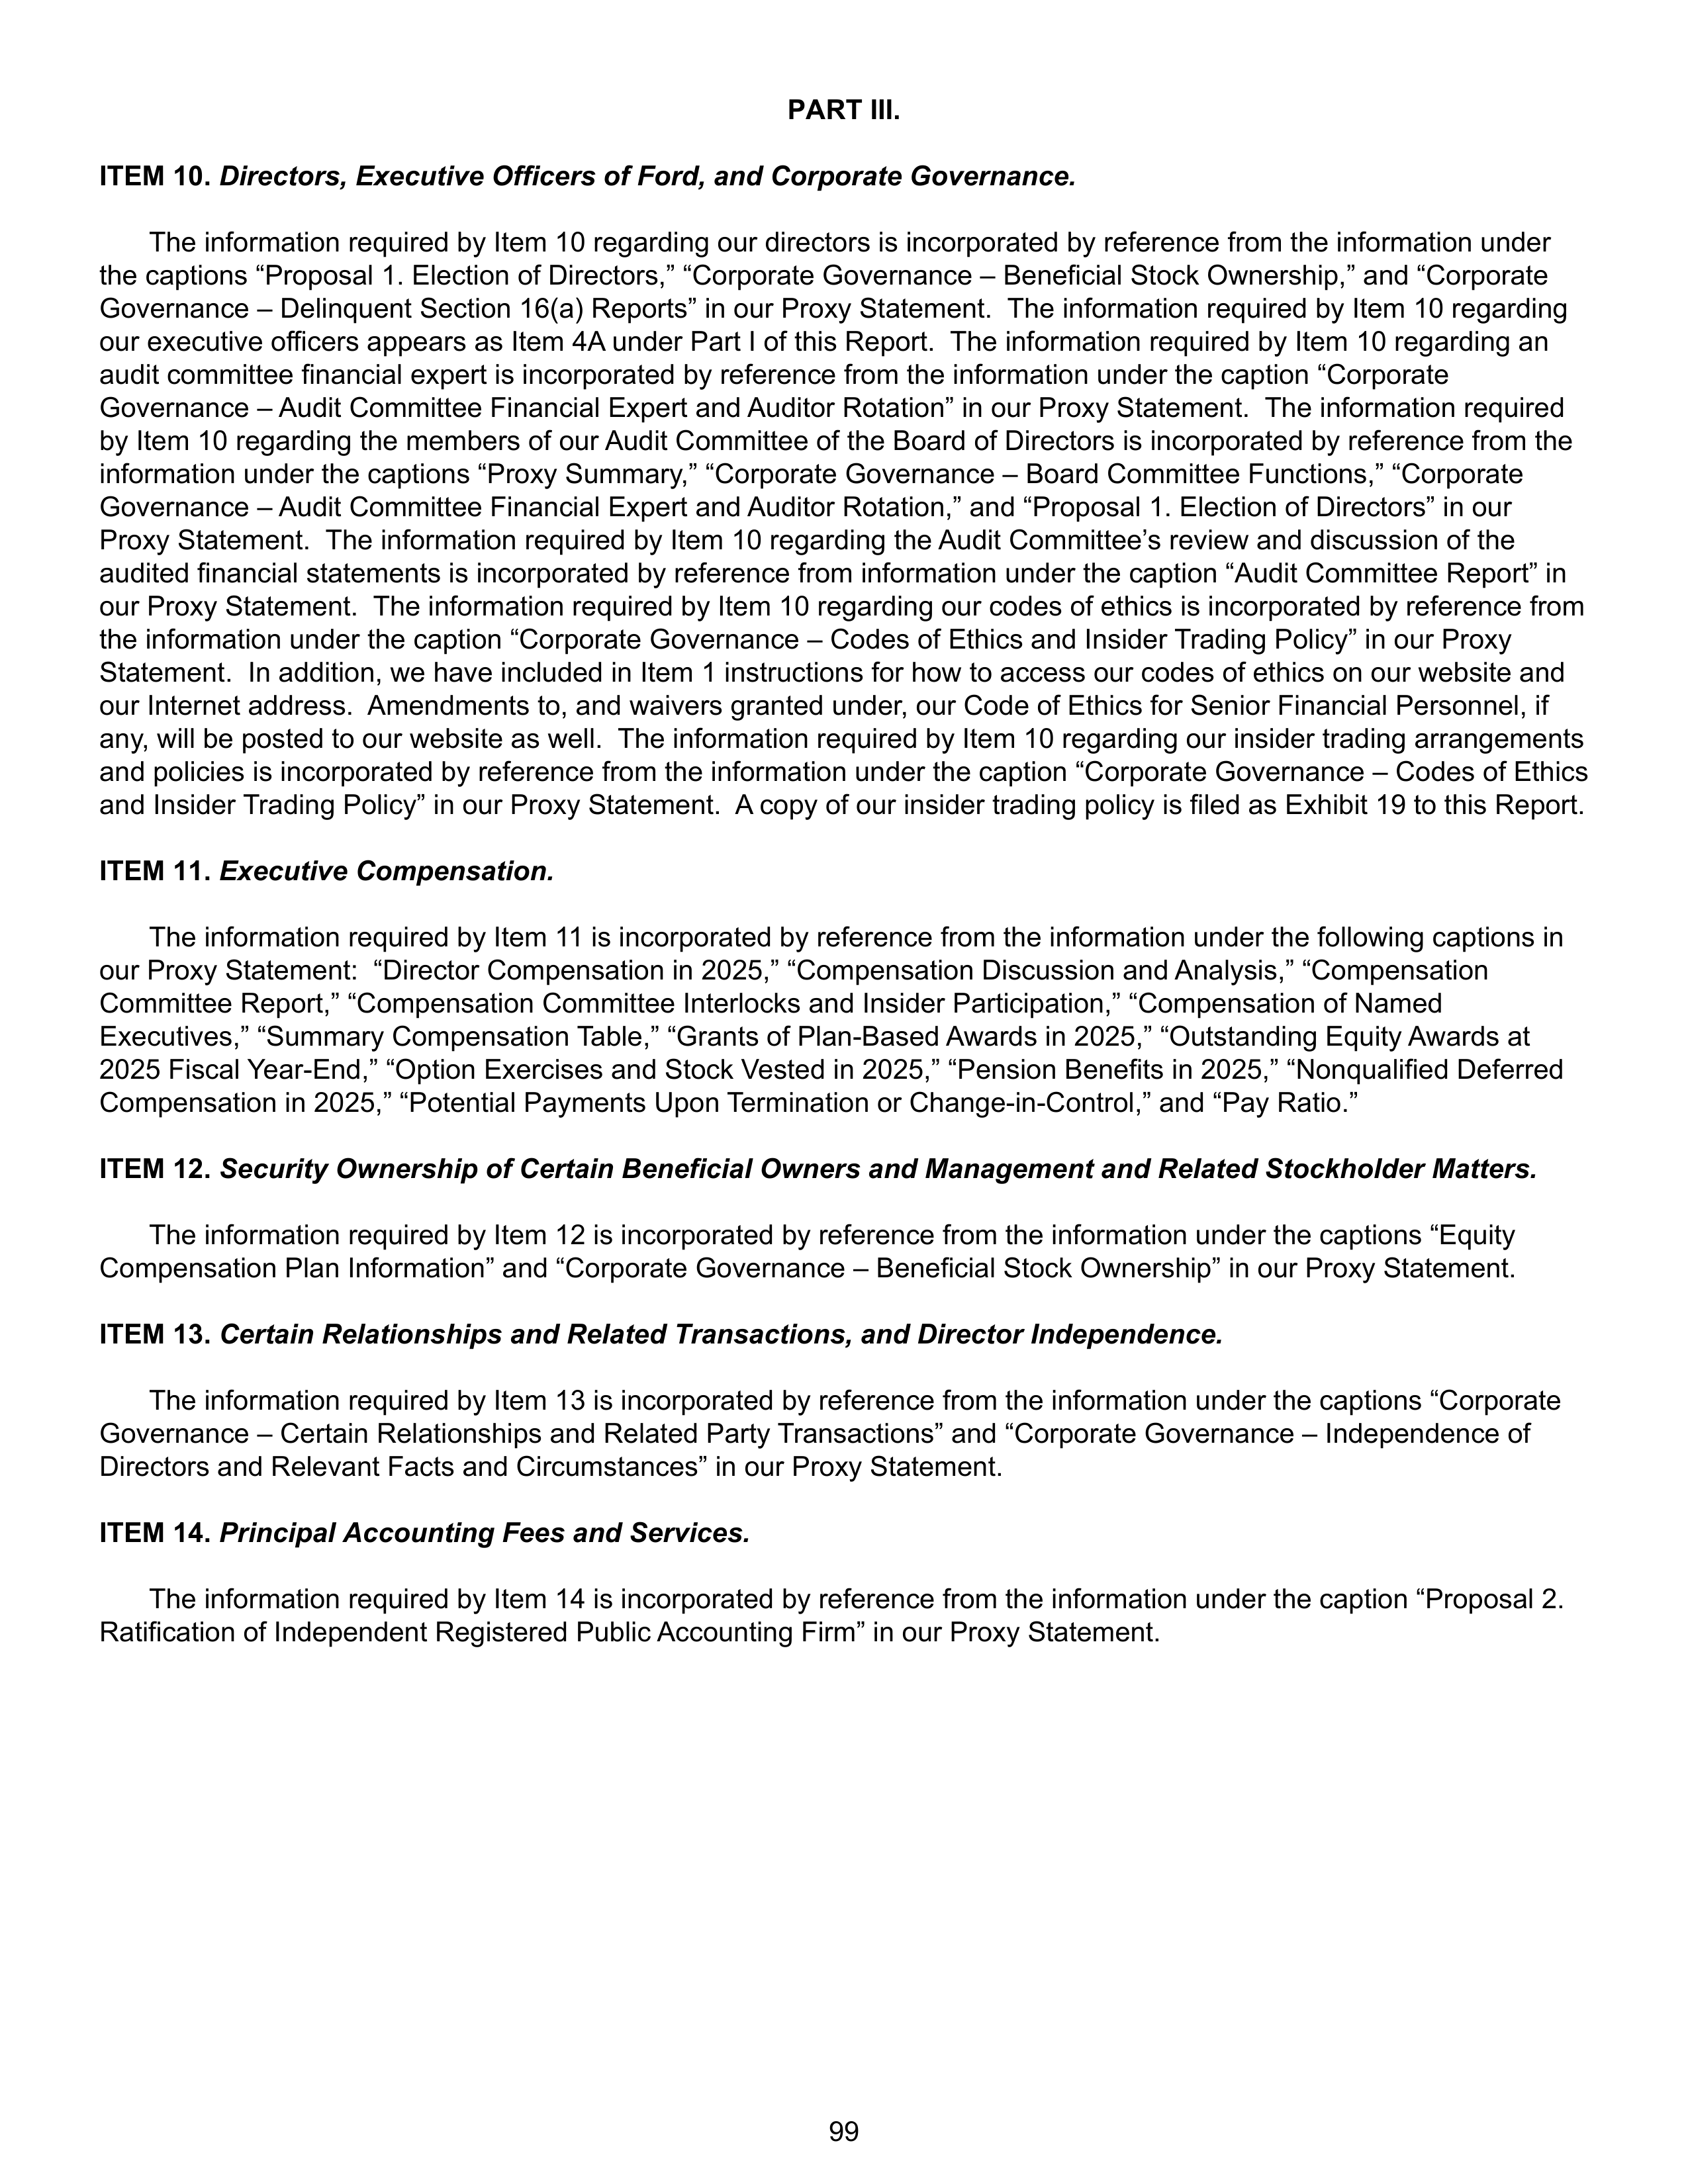
PART III.
ITEM 10.
Directors, Executive Officers of Ford, and Corporate Governance.
The information required by Item 10 regarding our directors is incorporated by reference from the information under
the captions “Proposal 1. Election of Directors,” “Corporate Governance – Beneficial Stock Ownership,” and “Corporate
Governance – Delinquent Section 16(a) Reports” in our Proxy Statement. The information required by Item 10 regarding
our executive officers appears as Item 4A under Part I of this Report. The information required by Item 10 regarding an
audit committee financial expert is incorporated by reference from the information under the caption “Corporate
Governance – Audit Committee Financial Expert and Auditor Rotation” in our Proxy Statement. The information required
by Item 10 regarding the members of our Audit Committee of the Board of Directors is incorporated by reference from the
information under the captions “Proxy Summary,” “Corporate Governance – Board Committee Functions,” “Corporate
Governance – Audit Committee Financial Expert and Auditor Rotation,” and “Proposal 1. Election of Directors” in our
Proxy Statement. The information required by Item 10 regarding the Audit Committee’s review and discussion of the
audited financial statements is incorporated by reference from information under the caption “Audit Committee Report” in
our Proxy Statement. The information required by Item 10 regarding our codes of ethics is incorporated by reference from
the information under the caption “Corporate Governance – Codes of Ethics and Insider Trading Policy” in our Proxy
Statement. In addition, we have included in Item 1 instructions for how to access our codes of ethics on our website and
our Internet address. Amendments to, and waivers granted under, our Code of Ethics for Senior Financial Personnel, if
any, will be posted to our website as well. The information required by Item 10 regarding our insider trading arrangements
and policies is incorporated by reference from the information under the caption “Corporate Governance – Codes of Ethics
and Insider Trading Policy” in our Proxy Statement. A copy of our insider trading policy is filed as Exhibit 19 to this Report.
ITEM 11.
Executive Compensation.
The information required by Item 11 is incorporated by reference from the information under the following captions in
our Proxy Statement: “Director Compensation in 2025,” “Compensation Discussion and Analysis,” “Compensation
Committee Report,” “Compensation Committee Interlocks and Insider Participation,” “Compensation of Named
Executives,” “Summary Compensation Table,” “Grants of Plan-Based Awards in 2025,” “Outstanding Equity Awards at
2025 Fiscal Year-End,” “Option Exercises and Stock Vested in 2025,” “Pension Benefits in 2025,” “Nonqualified Deferred
Compensation in 2025,” “Potential Payments Upon Termination or Change-in-Control,” and “Pay Ratio.”
ITEM 12.
Security Ownership of Certain Beneficial Owners and Management and Related Stockholder Matters.
The information required by Item 12 is incorporated by reference from the information under the captions “Equity
Compensation Plan Information” and “Corporate Governance – Beneficial Stock Ownership” in our Proxy Statement.
ITEM 13.
Certain Relationships and Related Transactions, and Director Independence.
The information required by Item 13 is incorporated by reference from the information under the captions “Corporate
Governance – Certain Relationships and Related Party Transactions” and “Corporate Governance – Independence of
Directors and Relevant Facts and Circumstances” in our Proxy Statement.
ITEM 14.
Principal Accounting Fees and Services.
The information required by Item 14 is incorporated by reference from the information under the caption “Proposal 2.
Ratification of Independent Registered Public Accounting Firm” in our Proxy Statement.
99
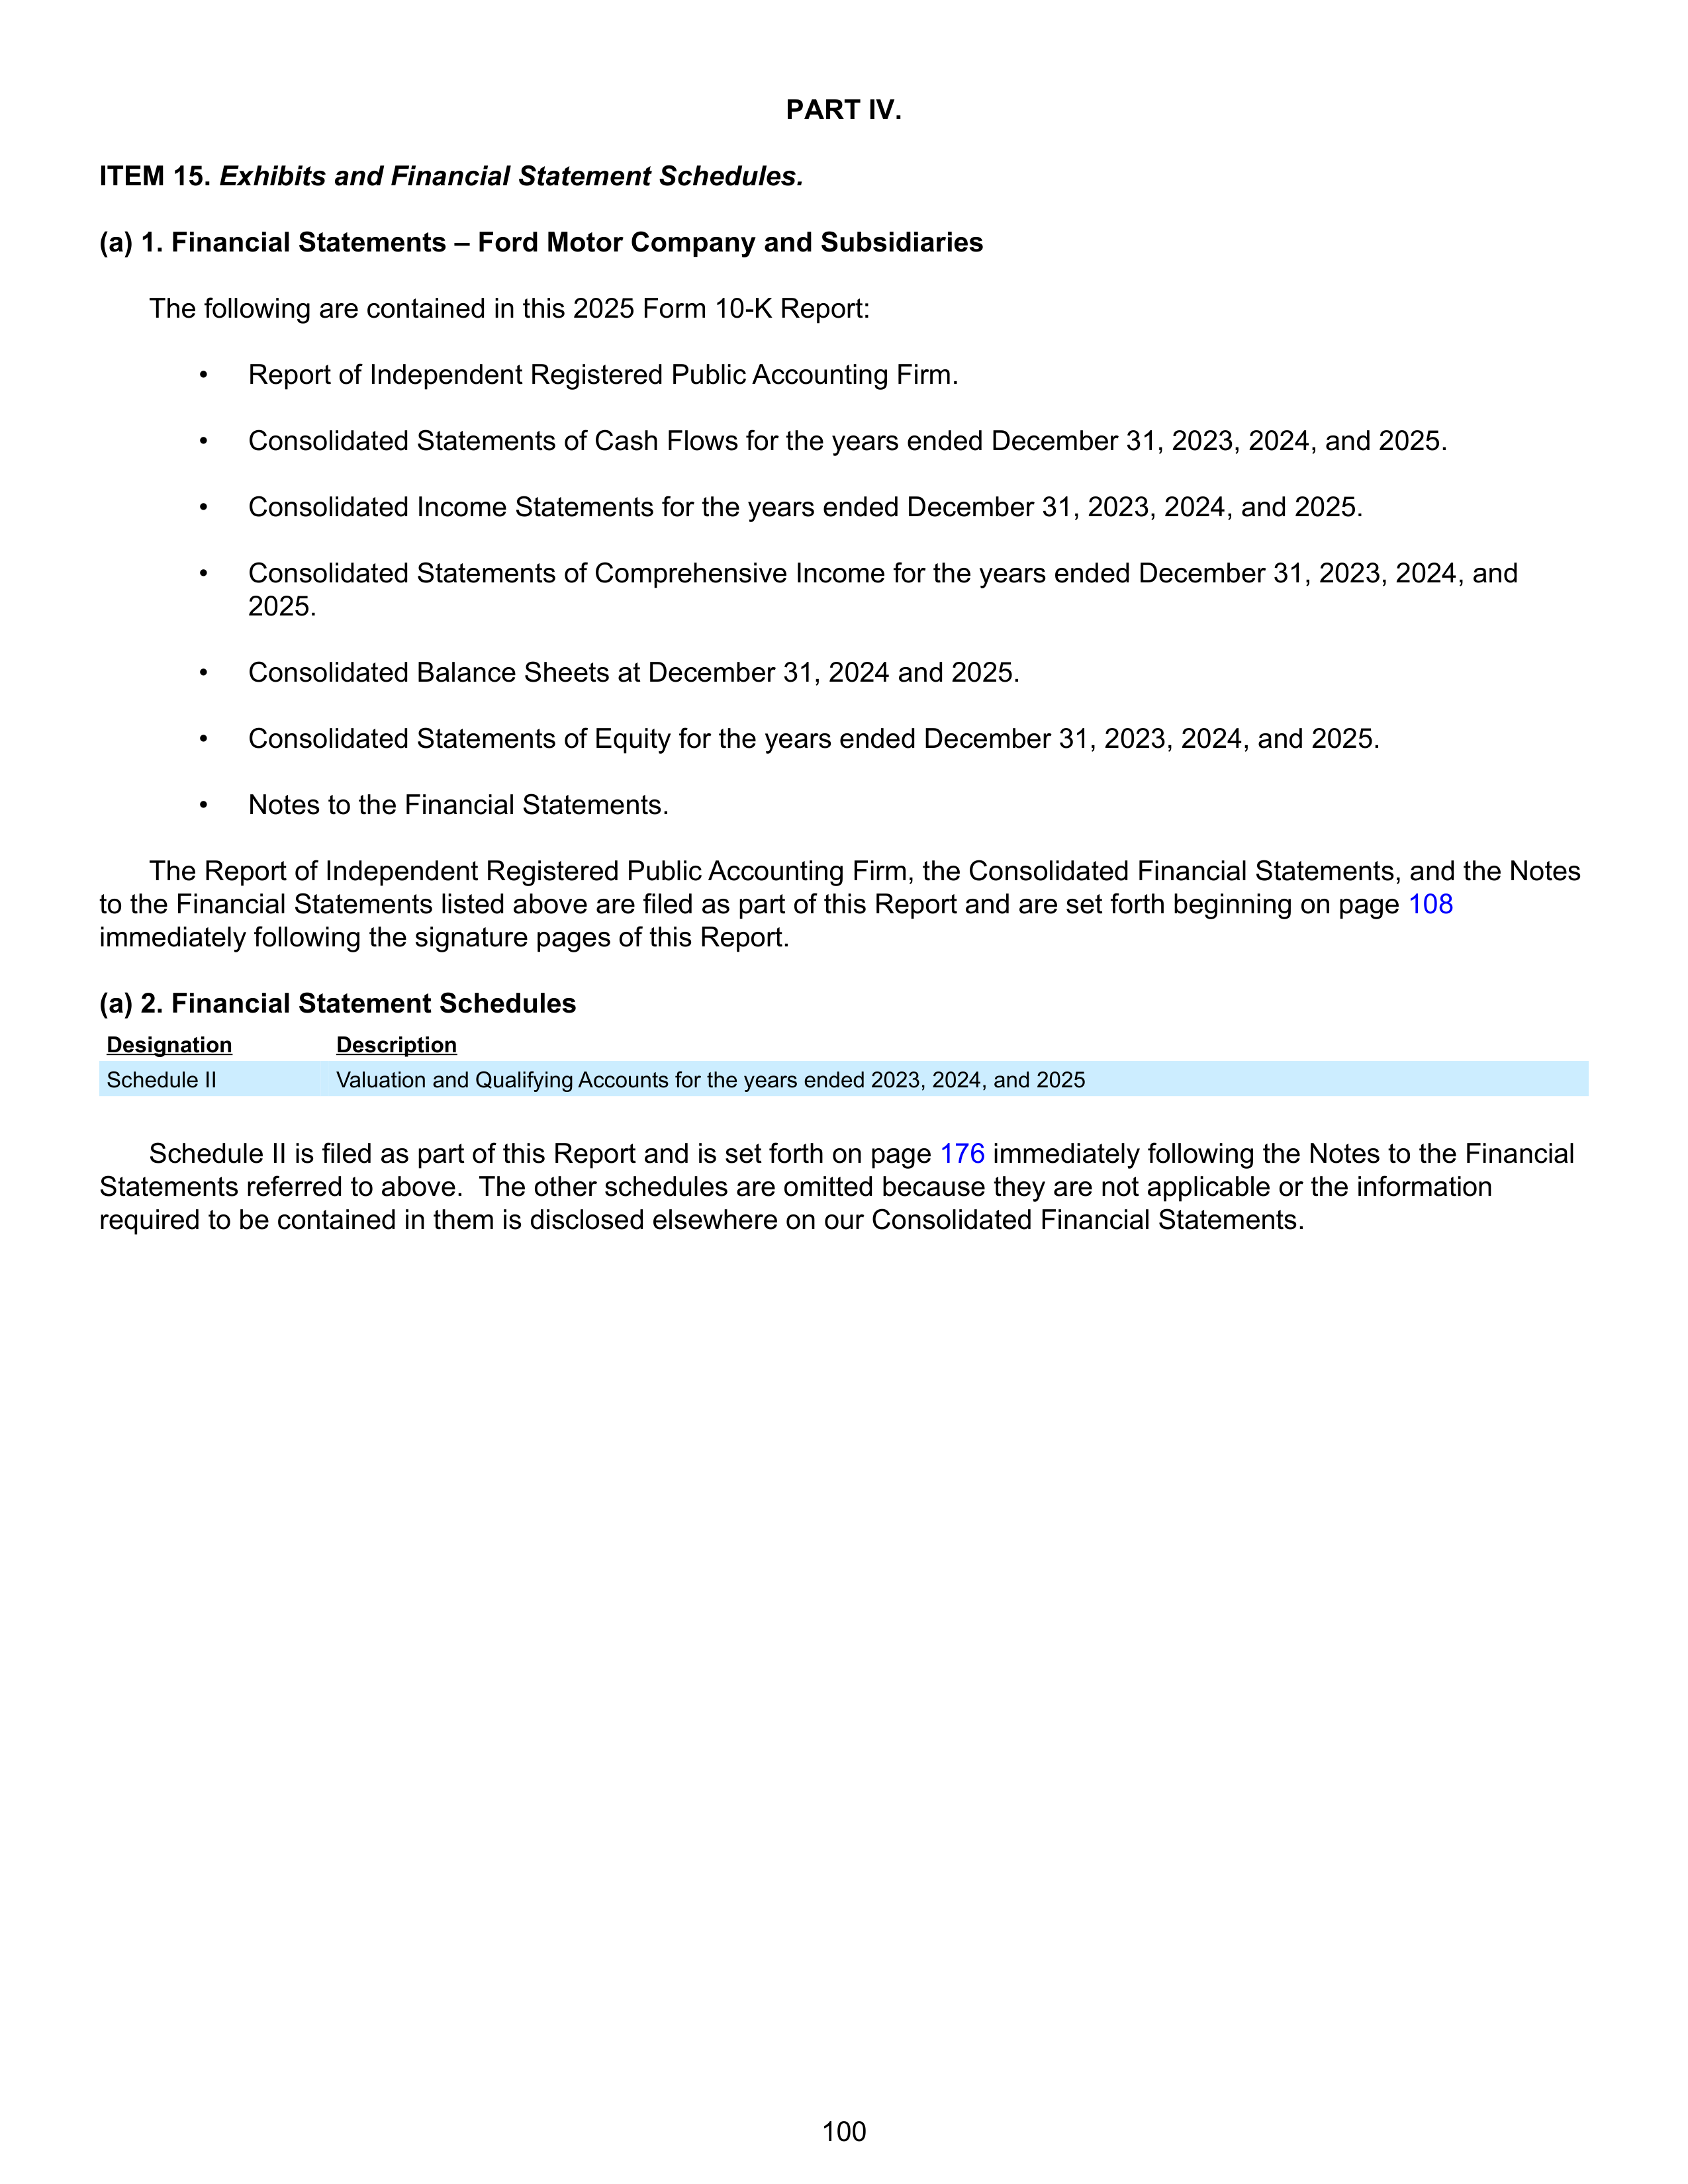
PART IV.
ITEM 15.
Exhibits and Financial Statement Schedules.
(a) 1. Financial Statements – Ford Motor Company and Subsidiaries
The following are contained in this 2025 Form 10-K Report:
•
Report of Independent Registered Public Accounting Firm.
•
Consolidated Statements of Cash Flows for the years ended December 31, 2023, 2024, and 2025.
•
Consolidated Income Statements for the years ended December 31, 2023, 2024, and 2025.
•
Consolidated Statements of Comprehensive Income for the years ended December 31, 2023, 2024, and
2025.
•
Consolidated Balance Sheets at December 31, 2024 and 2025.
•
Consolidated Statements of Equity for the years ended December 31, 2023, 2024, and 2025.
•
Notes to the Financial Statements.
The Report of Independent Registered Public Accounting Firm, the Consolidated Financial Statements, and the Notes
to the Financial Statements listed above are filed as part of this Report and are set forth beginning on page
108
immediately following the signature pages of this Report.
(a) 2. Financial Statement Schedules
Designation
Description
Schedule II
Valuation and Qualifying Accounts for the years ended 2023, 2024, and 2025
Schedule II is filed as part of this Report and is set forth on page
176
immediately following the Notes to the Financial
Statements referred to above. The other schedules are omitted because they are not applicable or the information
required to be contained in them is disclosed elsewhere on our Consolidated Financial Statements.
100
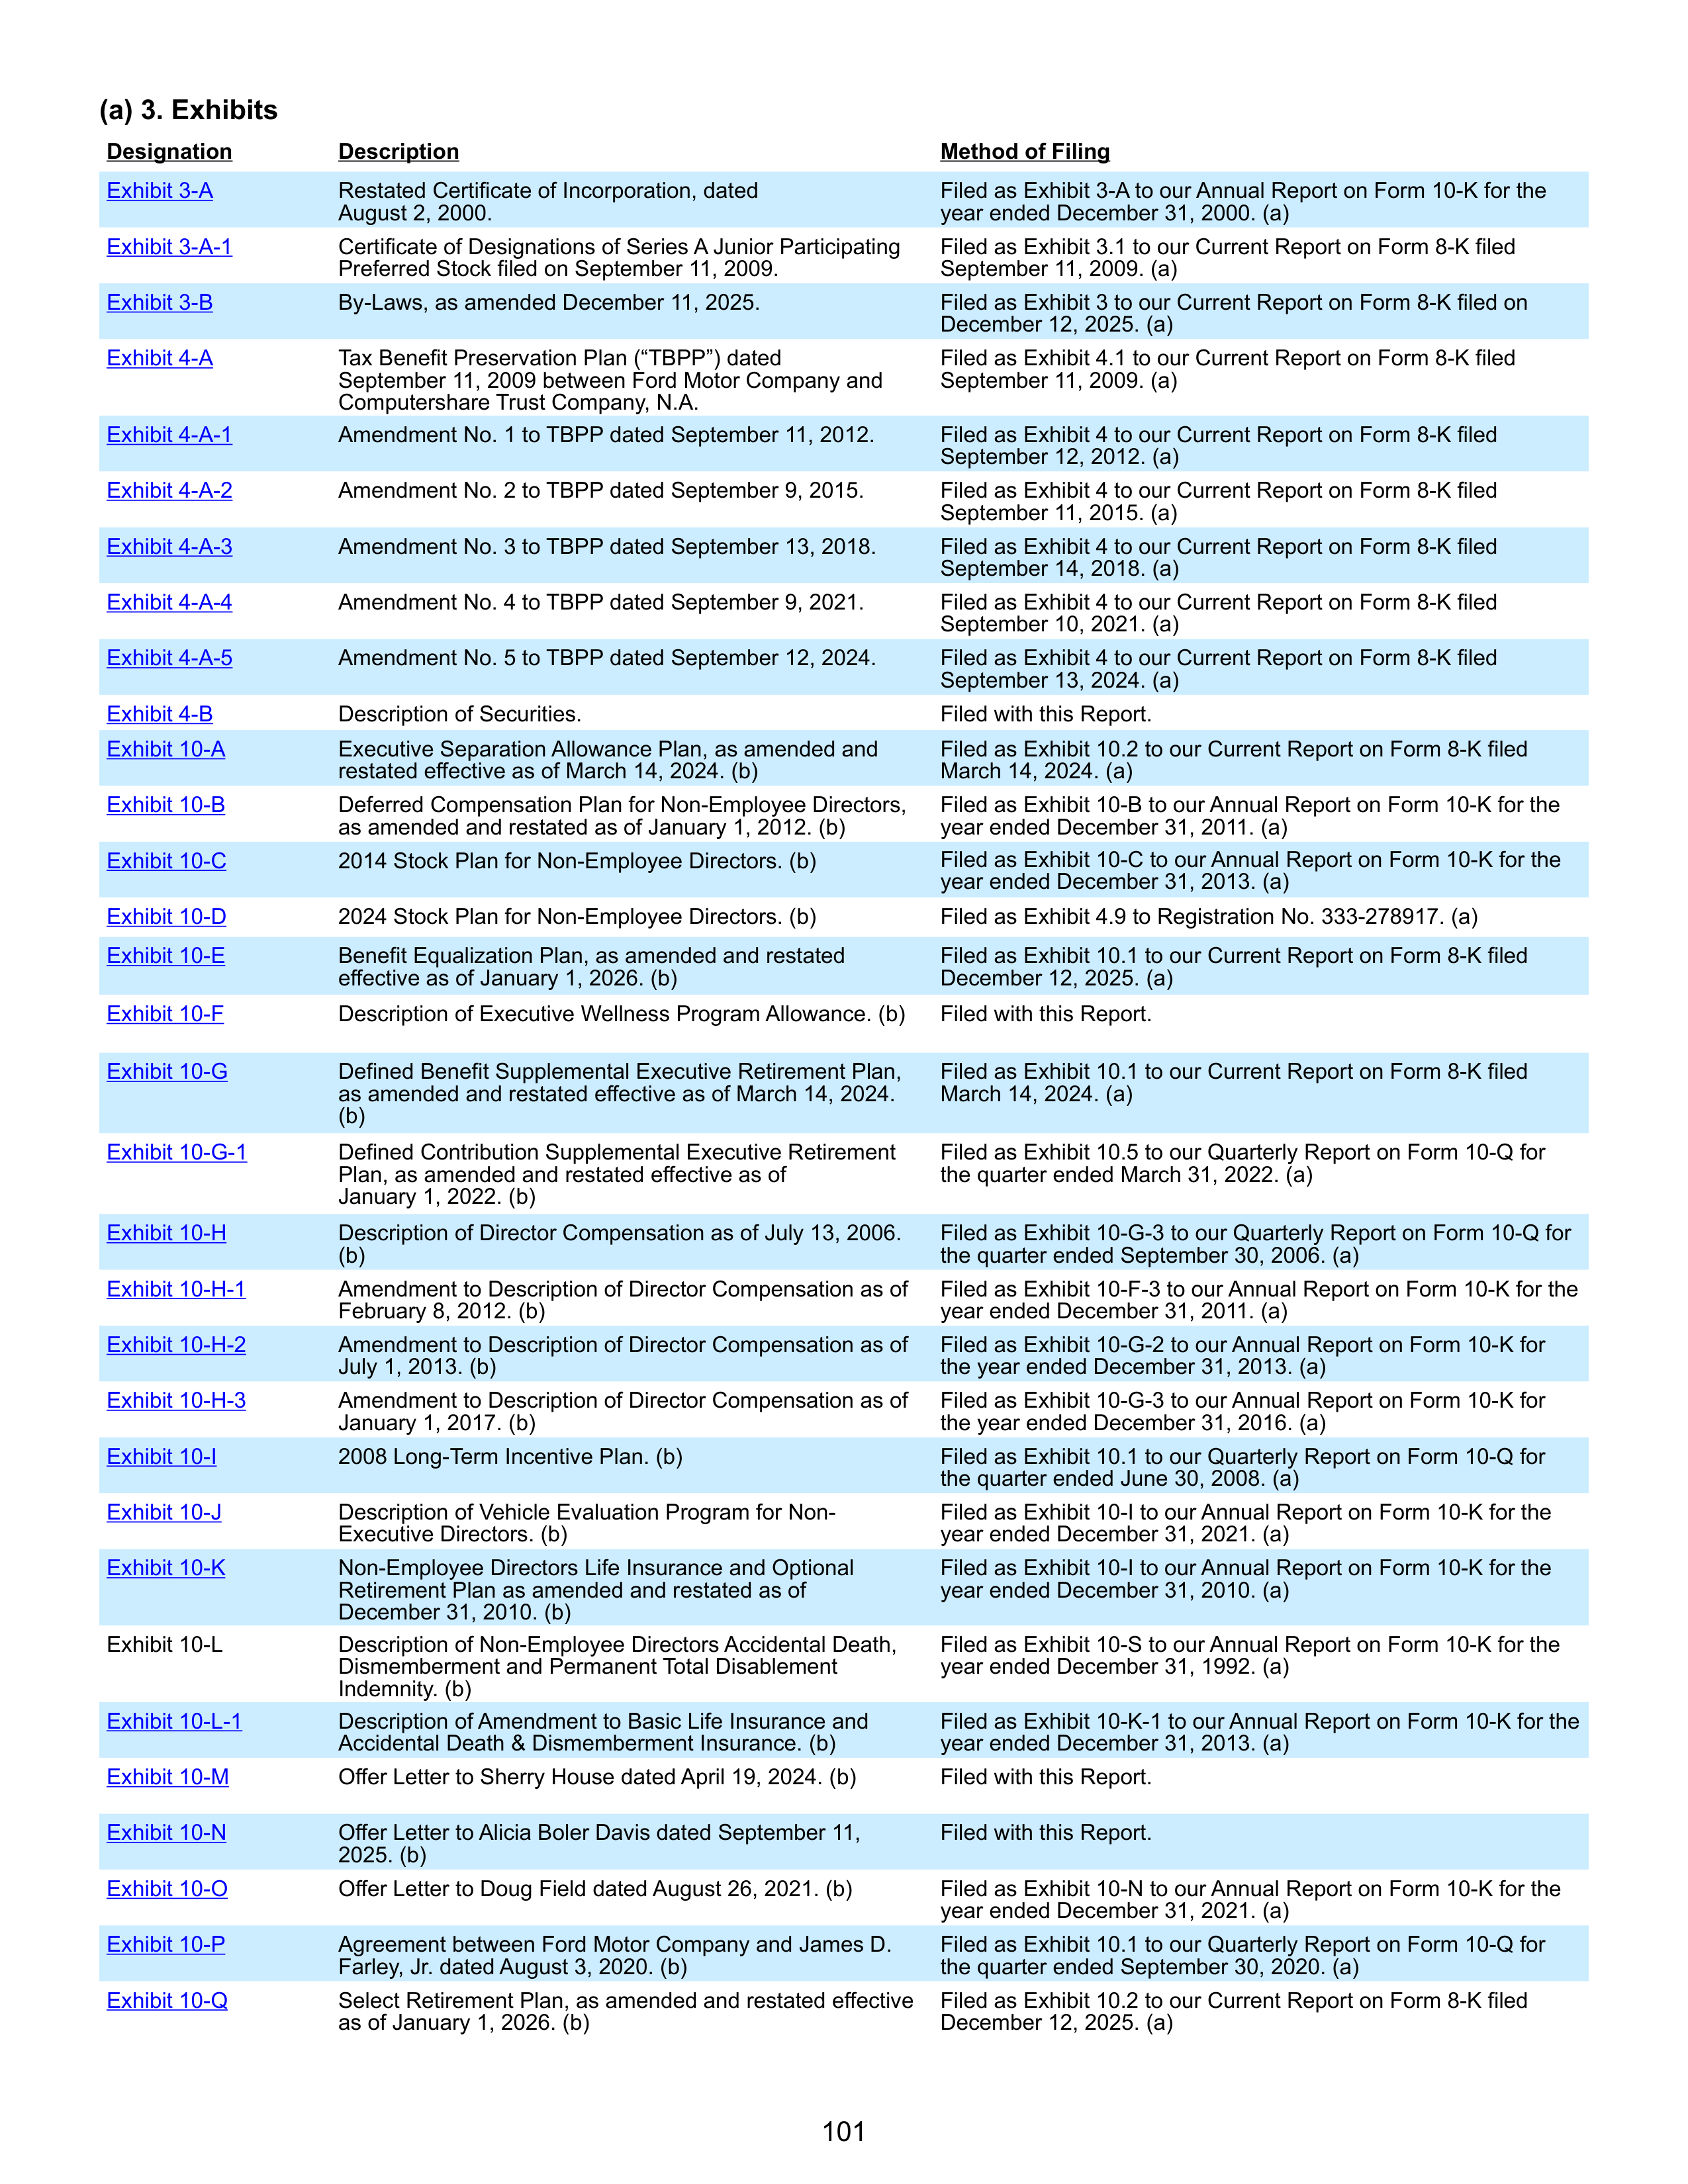
(a) 3. Exhibits
Exhibit 3-A
Restated Certificate of Incorporation, dated
August 2, 2000.
Filed as Exhibit 3-A to our Annual Report on Form 10-K for the
year ended December 31, 2000. (a)
Exhibit 3-A-1
Certificate of Designations of Series A Junior Participating
Preferred Stock filed on September 11, 2009.
Filed as Exhibit 3.1 to our Current Report on Form 8-K filed
September 11, 2009. (a)
Exhibit 3-B
By-Laws, as amended December 11, 2025.
Filed as Exhibit 3 to our Current Report on Form 8-K filed on
December 12, 2025. (a)
Exhibit 4-A
Tax Benefit Preservation Plan (“TBPP”) dated
September 11, 2009 between Ford Motor Company and
Computershare Trust Company, N.A.
Filed as Exhibit 4.1 to our Current Report on Form 8-K filed
September 11, 2009. (a)
Exhibit 4-A-1
Amendment No. 1 to TBPP dated September 11, 2012.
Filed as Exhibit 4 to our Current Report on Form 8-K filed
September 12, 2012. (a)
Exhibit 4-A-2
Amendment No. 2 to TBPP dated September 9, 2015.
Filed as Exhibit 4 to our Current Report on Form 8-K filed
September 11, 2015. (a)
Exhibit 4-A-3
Amendment No. 3 to TBPP dated September 13, 2018.
Filed as Exhibit 4 to our Current Report on Form 8-K filed
September 14, 2018. (a)
Exhibit 4-A-4
Amendment No. 4 to TBPP dated September 9, 2021.
Filed as Exhibit 4 to our Current Report on Form 8-K filed
September 10, 2021. (a)
Exhibit 4-A-5
Amendment No. 5 to TBPP dated September 12, 2024.
Filed as Exhibit 4 to our Current Report on Form 8-K filed
September 13, 2024. (a)
Exhibit 4-B
Description of Securities.
Filed with this Report.
Exhibit 10-A
Executive Separation Allowance Plan, as amended and
restated effective as of March 14, 2024. (b)
Filed as Exhibit 10.2 to our Current Report on Form 8-K filed
March 14, 2024. (a)
Exhibit 10-B
Deferred Compensation Plan for Non-Employee Directors,
as amended and restated as of January 1, 2012. (b)
Filed as Exhibit 10-B to our Annual Report on Form 10-K for the
year ended December 31, 2011. (a)
Exhibit 10-C
2014 Stock Plan for Non-Employee Directors. (b)
Filed as Exhibit 10-C to our Annual Report on Form 10-K for the
year ended December 31, 2013. (a)
Exhibit 10-D
2024 Stock Plan for Non-Employee Directors. (b)
Filed as Exhibit 4.9 to Registration No. 333-278917. (a)
Exhibit 10-E
Benefit Equalization Plan, as amended and restated
effective as of January 1, 2026. (b)
Filed as Exhibit 10.1 to our Current Report on Form 8-K filed
December 12, 2025. (a)
Exhibit 10-F
Description of Executive Wellness Program Allowance. (b)
Filed with this Report.
Exhibit 10-G
Defined Benefit Supplemental Executive Retirement Plan,
as amended and restated effective as of March 14, 2024.
(b)
Filed as Exhibit 10.1 to our Current Report on Form 8-K filed
March 14, 2024. (a)
Exhibit 10-G-1
Defined Contribution Supplemental Executive Retirement
Plan, as amended and restated effective as of
January 1, 2022. (b)
Filed as Exhibit 10.5 to our Quarterly Report on Form 10-Q for
the quarter ended March 31, 2022. (a)
Exhibit 10-H
Description of Director Compensation as of July 13, 2006.
(b)
Filed as Exhibit 10-G-3 to our Quarterly Report on Form 10-Q for
the quarter ended September 30, 2006. (a)
Exhibit 10-H-1
Amendment to Description of Director Compensation as of
February 8, 2012. (b)
Filed as Exhibit 10-F-3 to our Annual Report on Form 10-K for the
year ended December 31, 2011. (a)
Exhibit 10-H-2
Amendment to Description of Director Compensation as of
July 1, 2013. (b)
Filed as Exhibit 10-G-2 to our Annual Report on Form 10-K for
the year ended December 31, 2013. (a)
Exhibit 10-H-3
Amendment to Description of Director Compensation as of
January 1, 2017. (b)
Filed as Exhibit 10-G-3 to our Annual Report on Form 10-K for
the year ended December 31, 2016. (a)
Exhibit 10-I
2008 Long-Term Incentive Plan. (b)
Filed as Exhibit 10.1 to our Quarterly Report on Form 10-Q for
the quarter ended June 30, 2008. (a)
Exhibit 10-J
Description of Vehicle Evaluation Program for Non-
Executive Directors. (b)
Filed as Exhibit 10-I to our Annual Report on Form 10-K for the
year ended December 31, 2021. (a)
Exhibit 10-K
Non-Employee Directors Life Insurance and Optional
Retirement Plan as amended and restated as of
December 31, 2010. (b)
Filed as Exhibit 10-I to our Annual Report on Form 10-K for the
year ended December 31, 2010. (a)
Exhibit 10-L
Description of Non-Employee Directors Accidental Death,
Dismemberment and Permanent Total Disablement
Indemnity. (b)
Filed as Exhibit 10-S to our Annual Report on Form 10-K for the
year ended December 31, 1992. (a)
Exhibit 10-L-1
Description of Amendment to Basic Life Insurance and
Accidental Death & Dismemberment Insurance. (b)
Filed as Exhibit 10-K-1 to our Annual Report on Form 10-K for the
year ended December 31, 2013. (a)
Exhibit 10-M
Offer Letter to Sherry House dated April 19, 2024. (b)
Filed with this Report.
Exhibit 10-N
Offer Letter to Alicia Boler Davis dated September 11,
2025. (b)
Filed with this Report.
Exhibit 10-O
Offer Letter to Doug Field dated August 26, 2021. (b)
Filed as Exhibit 10-N to our Annual Report on Form 10-K for the
year ended December 31, 2021. (a)
Exhibit 10-P
Agreement between Ford Motor Company and James D.
Farley, Jr. dated August 3, 2020. (b)
Filed as Exhibit 10.1 to our Quarterly Report on Form 10-Q for
the quarter ended September 30, 2020. (a)
Exhibit 10-Q
Select Retirement Plan, as amended and restated effective
as of January 1, 2026. (b)
Filed as Exhibit 10.2 to our Current Report on Form 8-K filed
December 12, 2025. (a)
Designation
Description
Method of Filing
101
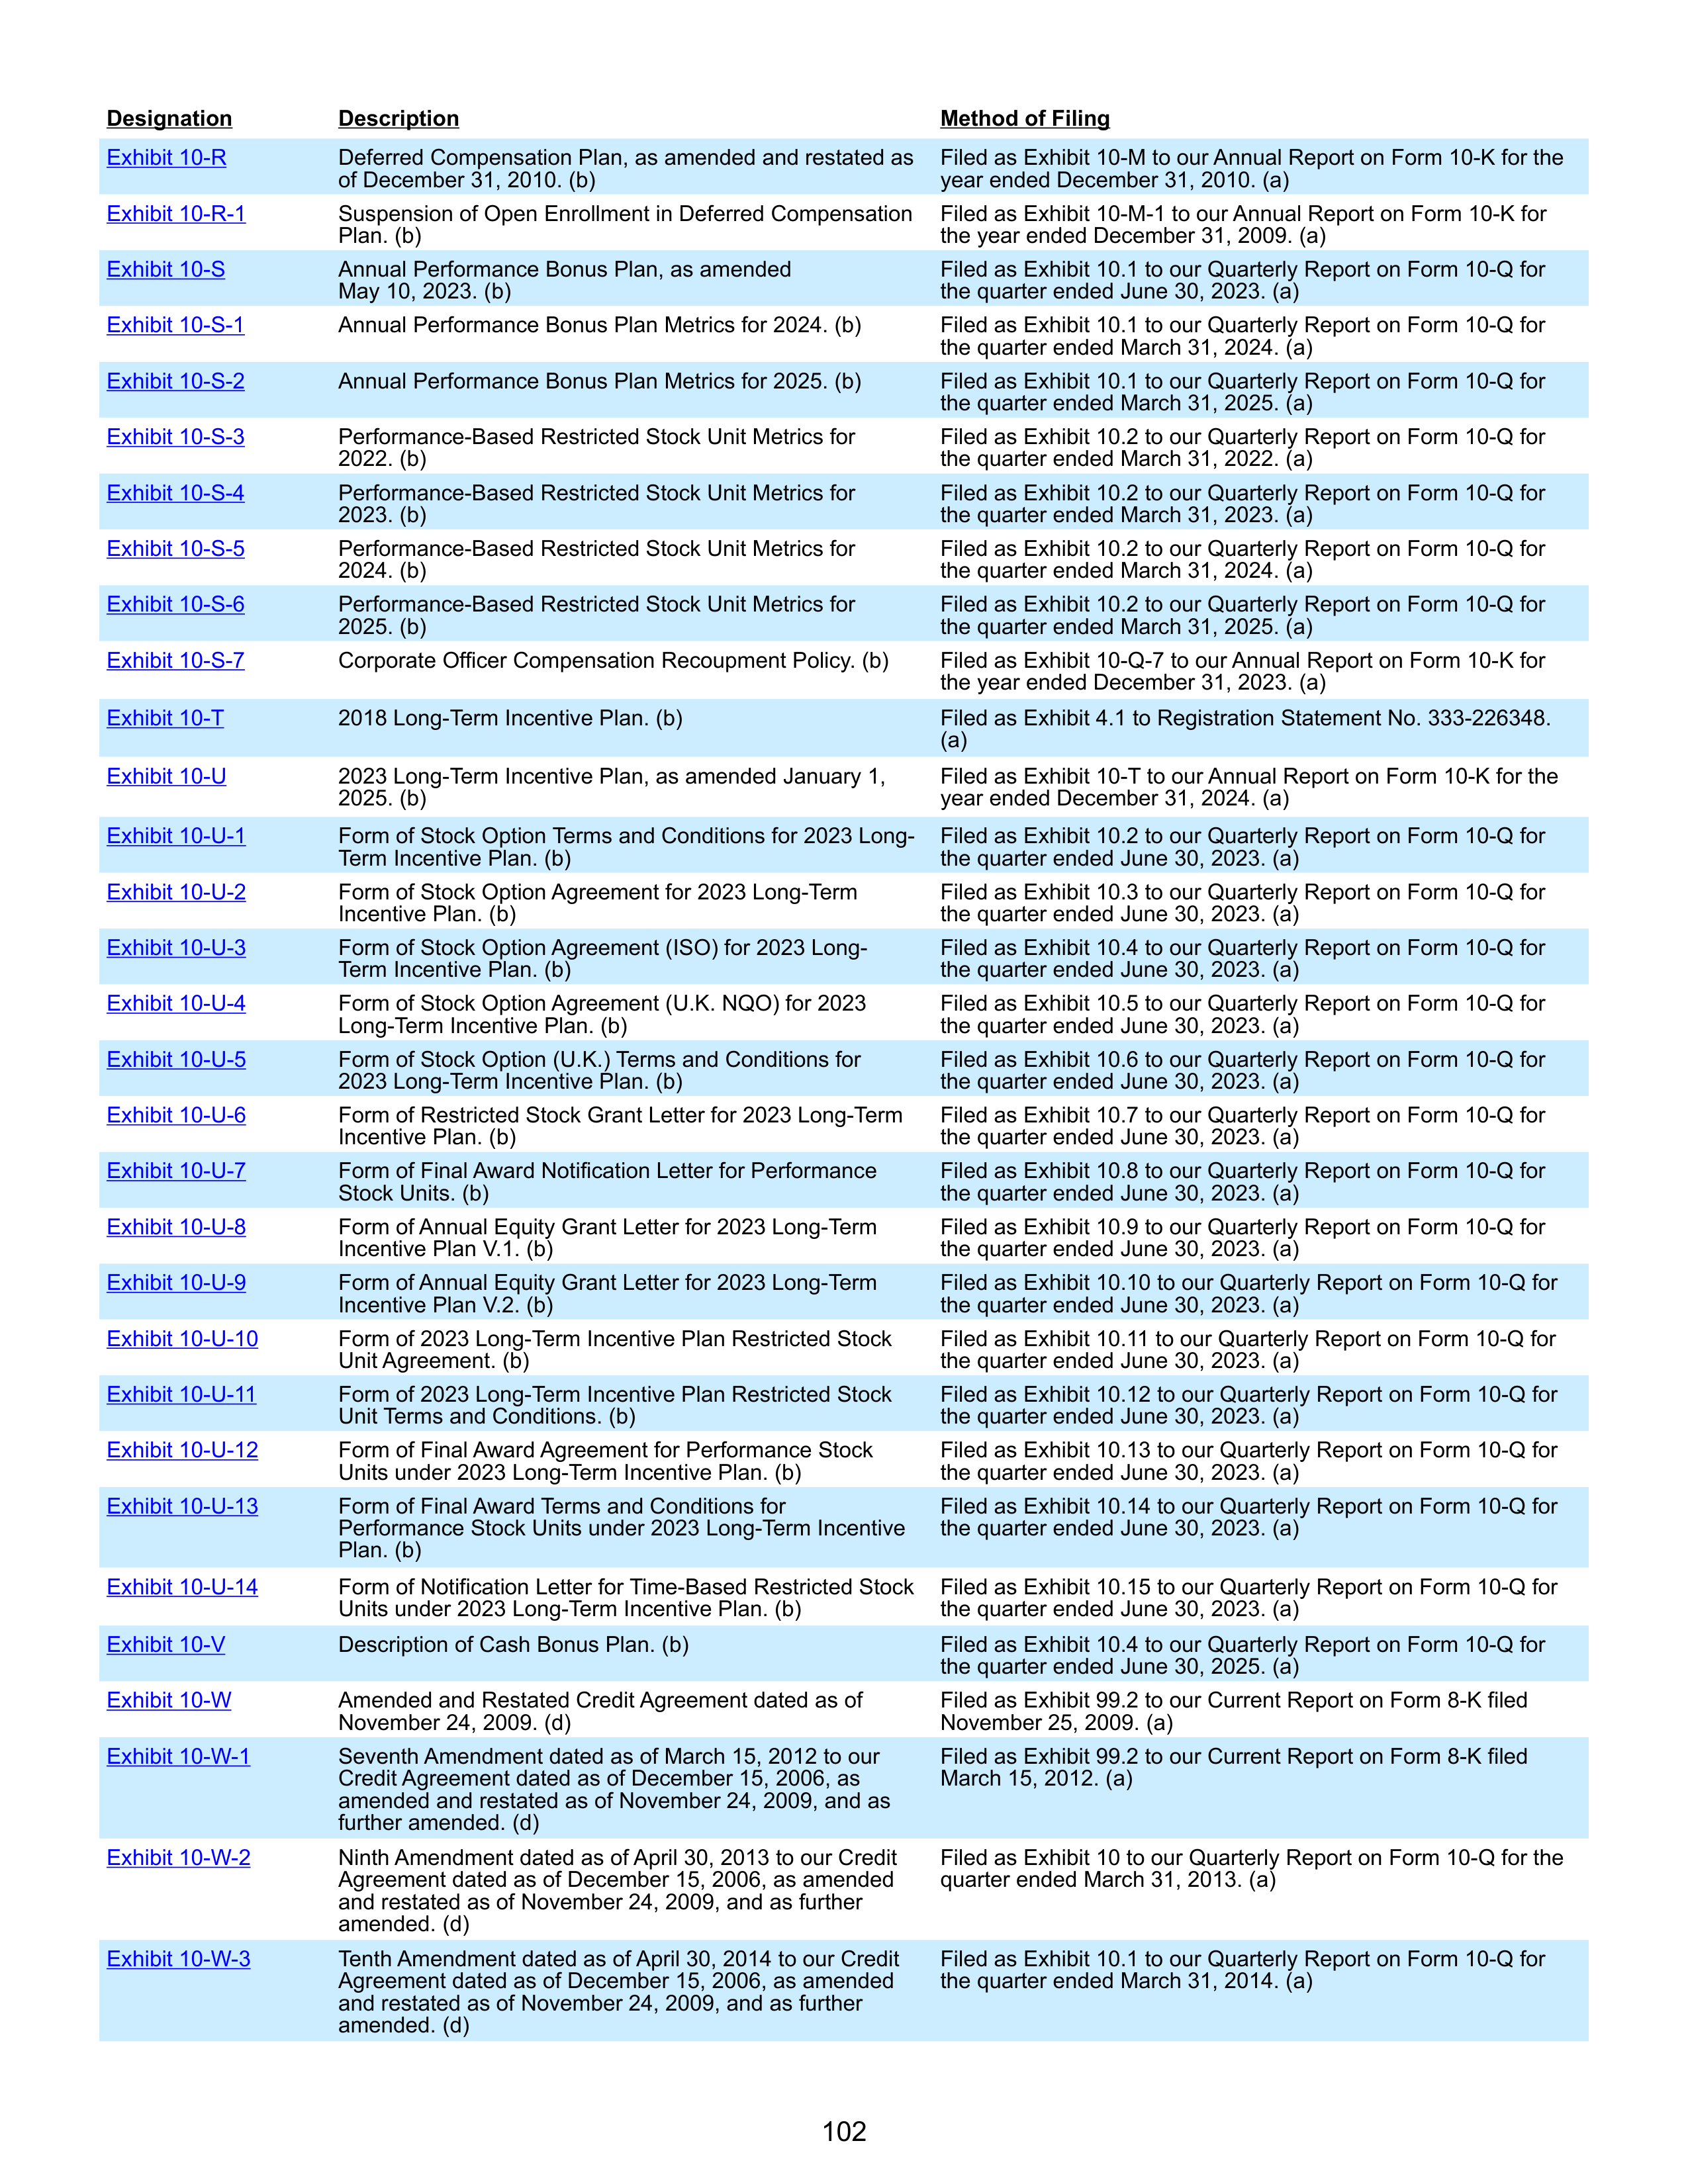
Exhibit 10-R
Deferred Compensation Plan, as amended and restated as
of December 31, 2010. (b)
Filed as Exhibit 10-M to our Annual Report on Form 10-K for the
year ended December 31, 2010. (a)
Exhibit 10-R-1
Suspension of Open Enrollment in Deferred Compensation
Plan. (b)
Filed as Exhibit 10-M-1 to our Annual Report on Form 10-K for
the year ended December 31, 2009. (a)
Exhibit 10-S
Annual Performance Bonus Plan, as amended
May 10, 2023. (b)
Filed as Exhibit 10.1 to our Quarterly Report on Form 10-Q for
the quarter ended June 30, 2023. (a)
Exhibit 10-S-1
Annual Performance Bonus Plan Metrics for 2024. (b)
Filed as Exhibit 10.1 to our Quarterly Report on Form 10-Q for
the quarter ended March 31, 2024. (a)
Exhibit 10-S-2
Annual Performance Bonus Plan Metrics for 2025. (b)
Filed as Exhibit 10.1 to our Quarterly Report on Form 10-Q for
the quarter ended March 31, 2025. (a)
Exhibit 10-S-3
Performance-Based Restricted Stock Unit Metrics for
2022. (b)
Filed as Exhibit 10.2 to our Quarterly Report on Form 10-Q for
the quarter ended March 31, 2022. (a)
Exhibit 10-S-4
Performance-Based Restricted Stock Unit Metrics for
2023. (b)
Filed as Exhibit 10.2 to our Quarterly Report on Form 10-Q for
the quarter ended March 31, 2023. (a)
Exhibit 10-S-5
Performance-Based Restricted Stock Unit Metrics for
2024. (b)
Filed as Exhibit 10.2 to our Quarterly Report on Form 10-Q for
the quarter ended March 31, 2024. (a)
Exhibit 10-S-6
Performance-Based Restricted Stock Unit Metrics for
2025. (b)
Filed as Exhibit 10.2 to our Quarterly Report on Form 10-Q for
the quarter ended March 31, 2025. (a)
Exhibit 10-S-7
Corporate Officer Compensation Recoupment Policy. (b)
Filed as Exhibit 10-Q-7 to our Annual Report on Form 10-K for
the year ended December 31, 2023. (a)
Exhibit 10-T
2018 Long-Term Incentive Plan. (b)
Filed as Exhibit 4.1 to Registration Statement No. 333-226348.
(a)
Exhibit 10-U
2023 Long-Term Incentive Plan, as amended January 1,
2025. (b)
Filed as Exhibit 10-T to our Annual Report on Form 10-K for the
year ended December 31, 2024. (a)
Exhibit 10-U-1
Form of Stock Option Terms and Conditions for 2023 Long-
Term Incentive Plan. (b)
Filed as Exhibit 10.2 to our Quarterly Report on Form 10-Q for
the quarter ended June 30, 2023. (a)
Exhibit 10-U-2
Form of Stock Option Agreement for 2023 Long-Term
Incentive Plan. (b)
Filed as Exhibit 10.3 to our Quarterly Report on Form 10-Q for
the quarter ended June 30, 2023. (a)
Exhibit 10-U-3
Form of Stock Option Agreement (ISO) for 2023 Long-
Term Incentive Plan. (b)
Filed as Exhibit 10.4 to our Quarterly Report on Form 10-Q for
the quarter ended June 30, 2023. (a)
Exhibit 10-U-4
Form of Stock Option Agreement (U.K. NQO) for 2023
Long-Term Incentive Plan. (b)
Filed as Exhibit 10.5 to our Quarterly Report on Form 10-Q for
the quarter ended June 30, 2023. (a)
Exhibit 10-U-5
Form of Stock Option (U.K.) Terms and Conditions for
2023 Long-Term Incentive Plan. (b)
Filed as Exhibit 10.6 to our Quarterly Report on Form 10-Q for
the quarter ended June 30, 2023. (a)
Exhibit 10-U-6
Form of Restricted Stock Grant Letter for 2023 Long-Term
Incentive Plan. (b)
Filed as Exhibit 10.7 to our Quarterly Report on Form 10-Q for
the quarter ended June 30, 2023. (a)
Exhibit 10-U-7
Form of Final Award Notification Letter for Performance
Stock Units. (b)
Filed as Exhibit 10.8 to our Quarterly Report on Form 10-Q for
the quarter ended June 30, 2023. (a)
Exhibit 10-U-8
Form of Annual Equity Grant Letter for 2023 Long-Term
Incentive Plan V.1. (b)
Filed as Exhibit 10.9 to our Quarterly Report on Form 10-Q for
the quarter ended June 30, 2023. (a)
Exhibit 10-U-9
Form of Annual Equity Grant Letter for 2023 Long-Term
Incentive Plan V.2. (b)
Filed as Exhibit 10.10 to our Quarterly Report on Form 10-Q for
the quarter ended June 30, 2023. (a)
Exhibit 10-U-10
Form of 2023 Long-Term Incentive Plan Restricted Stock
Unit Agreement. (b)
Filed as Exhibit 10.11 to our Quarterly Report on Form 10-Q for
the quarter ended June 30, 2023. (a)
Exhibit 10-U-11
Form of 2023 Long-Term Incentive Plan Restricted Stock
Unit Terms and Conditions. (b)
Filed as Exhibit 10.12 to our Quarterly Report on Form 10-Q for
the quarter ended June 30, 2023. (a)
Exhibit 10-U-12
Form of Final Award Agreement for Performance Stock
Units under 2023 Long-Term Incentive Plan. (b)
Filed as Exhibit 10.13 to our Quarterly Report on Form 10-Q for
the quarter ended June 30, 2023. (a)
Exhibit 10-U-13
Form of Final Award Terms and Conditions for
Performance Stock Units under 2023 Long-Term Incentive
Plan. (b)
Filed as Exhibit 10.14 to our Quarterly Report on Form 10-Q for
the quarter ended June 30, 2023. (a)
Exhibit 10-U-14
Form of Notification Letter for Time-Based Restricted Stock
Units under 2023 Long-Term Incentive Plan. (b)
Filed as Exhibit 10.15 to our Quarterly Report on Form 10-Q for
the quarter ended June 30, 2023. (a)
Exhibit 10-V
Description of Cash Bonus Plan. (b)
Filed as Exhibit 10.4 to our Quarterly Report on Form 10-Q for
the quarter ended June 30, 2025. (a)
Exhibit 10-W
Amended and Restated Credit Agreement dated as of
November 24, 2009. (d)
Filed as Exhibit 99.2 to our Current Report on Form 8-K filed
November 25, 2009. (a)
Exhibit 10-W-1
Seventh Amendment dated as of March 15, 2012 to our
Credit Agreement dated as of December 15, 2006, as
amended and restated as of November 24, 2009, and as
further amended. (d)
Filed as Exhibit 99.2 to our Current Report on Form 8-K filed
March 15, 2012. (a)
Exhibit 10-W-2
Ninth Amendment dated as of April 30, 2013 to our Credit
Agreement dated as of December 15, 2006, as amended
and restated as of November 24, 2009, and as further
amended. (d)
Filed as Exhibit 10 to our Quarterly Report on Form 10-Q for the
quarter ended March 31, 2013. (a)
Exhibit 10-W-3
Tenth Amendment dated as of April 30, 2014 to our Credit
Agreement dated as of December 15, 2006, as amended
and restated as of November 24, 2009, and as further
amended. (d)
Filed as Exhibit 10.1 to our Quarterly Report on Form 10-Q for
the quarter ended March 31, 2014. (a)
Designation
Description
Method of Filing
102
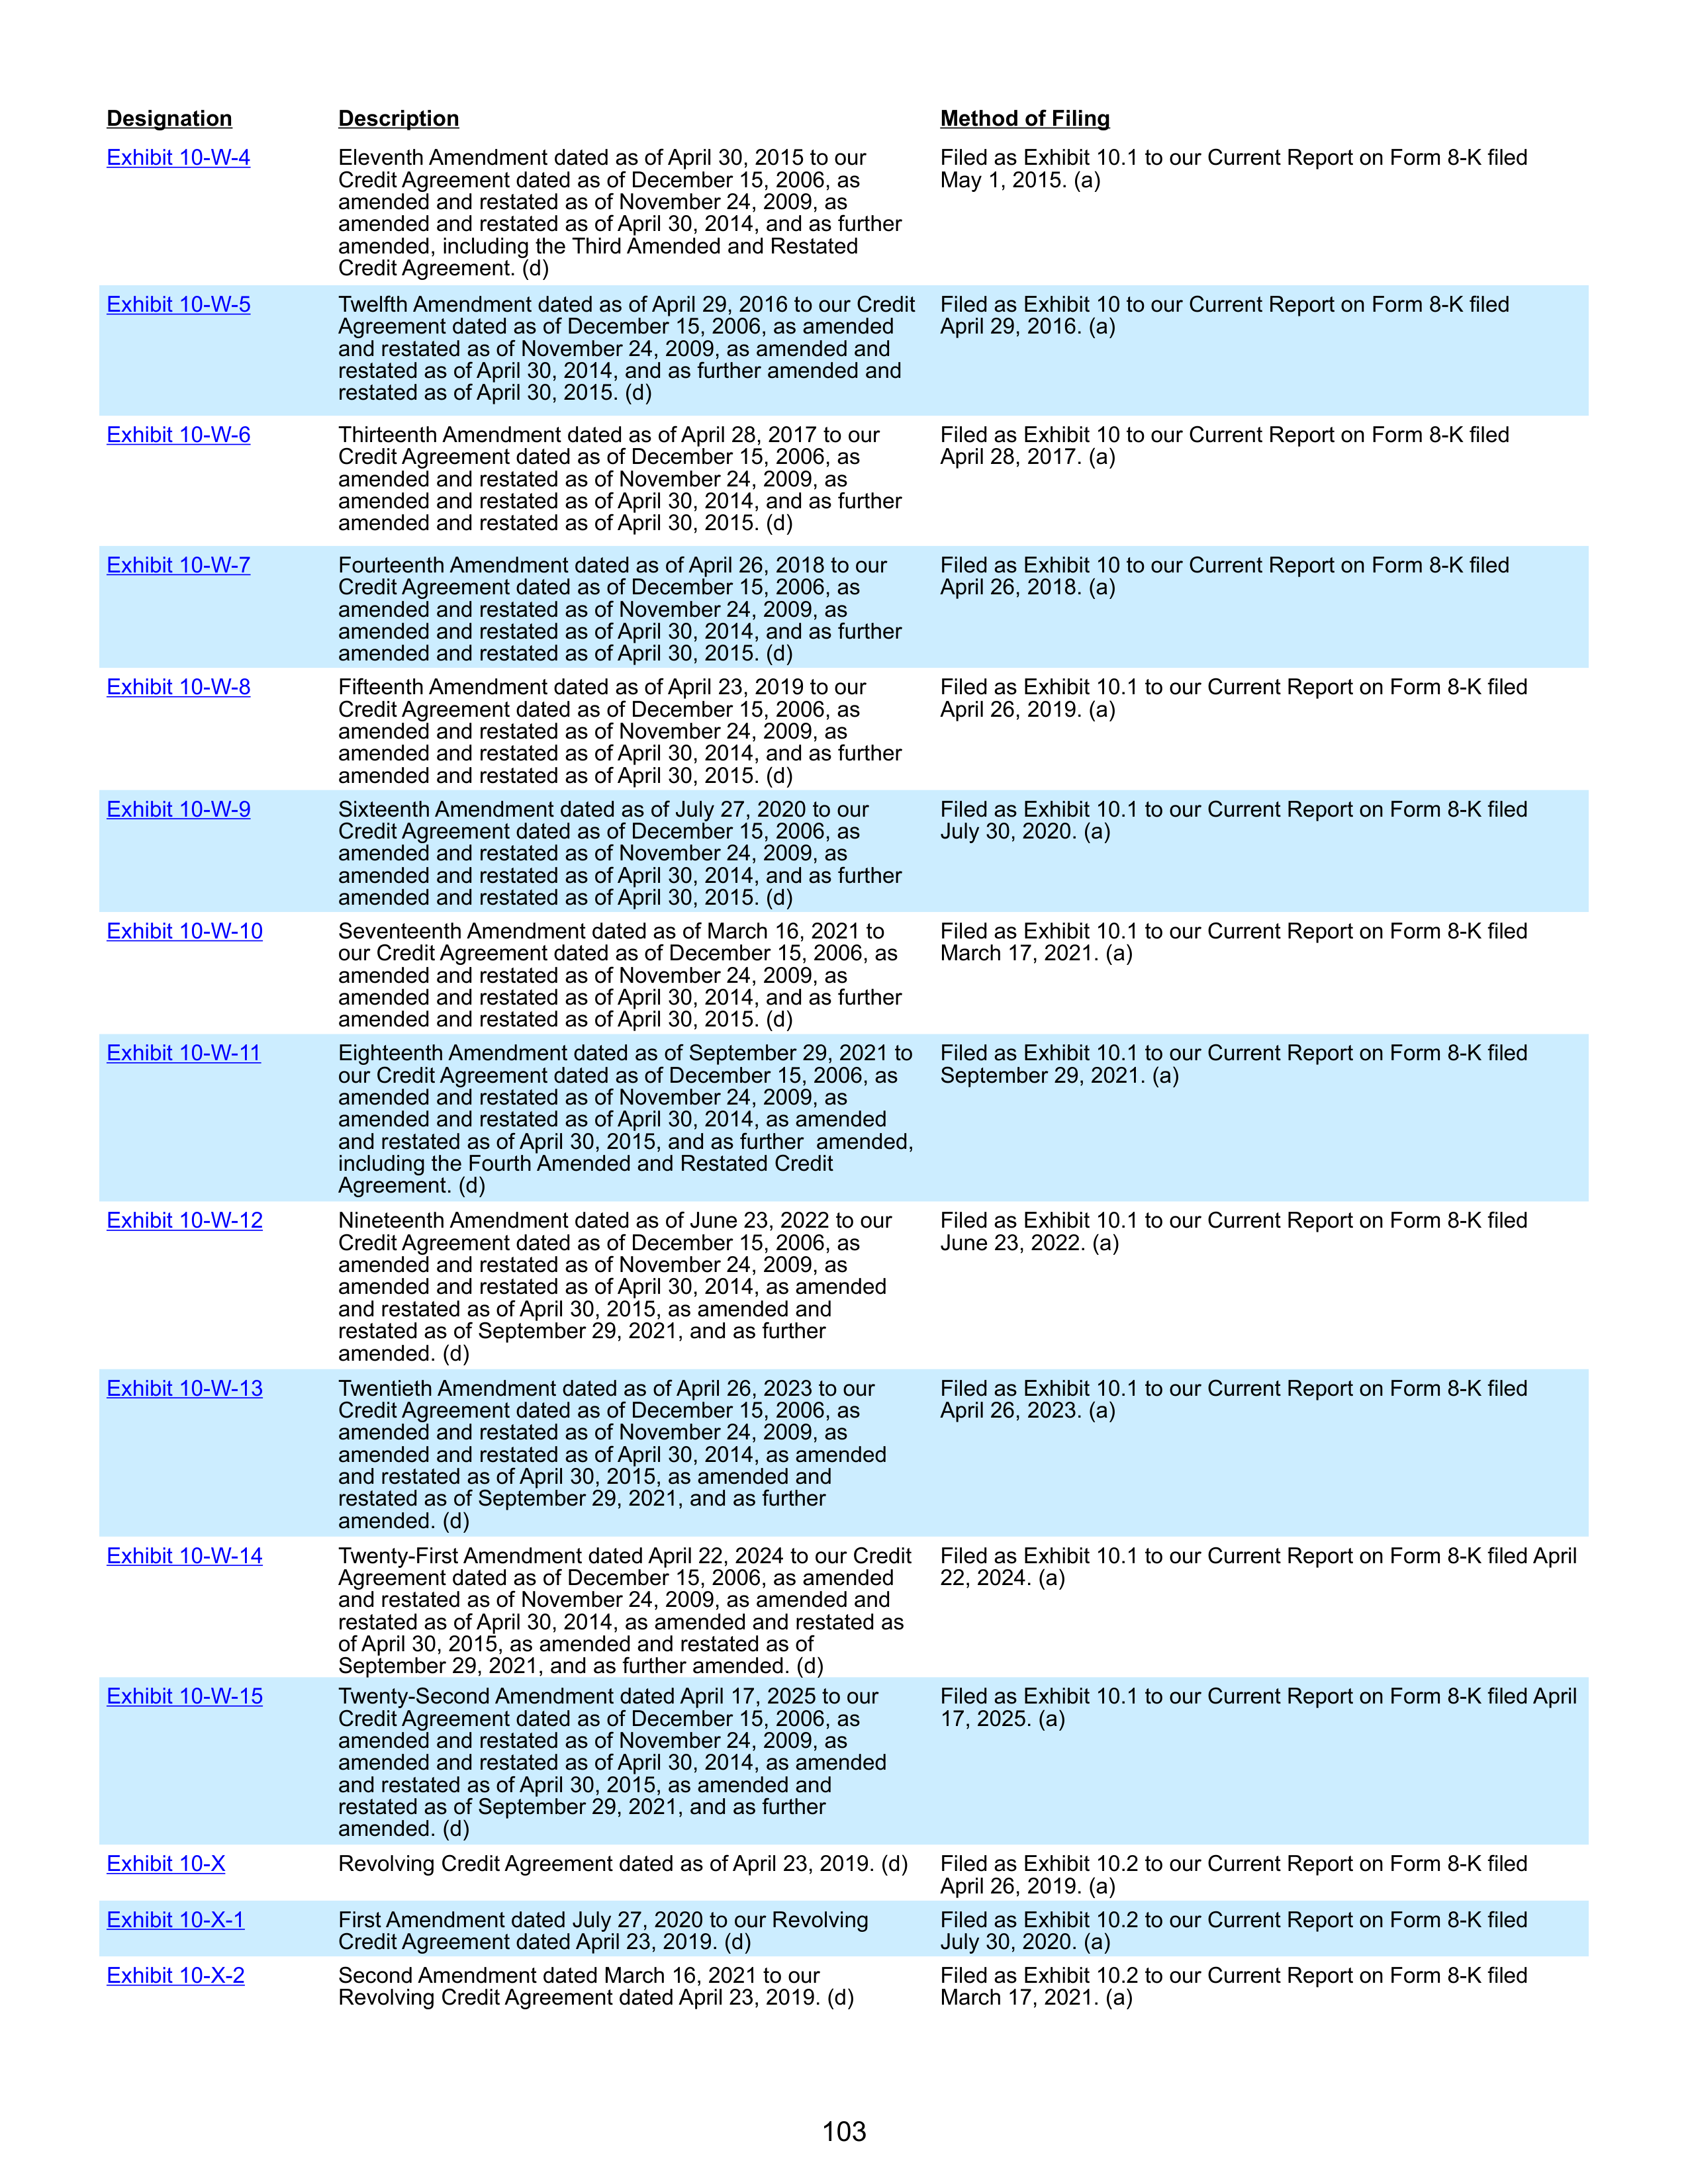
Exhibit 10-W-4
Eleventh Amendment dated as of April 30, 2015 to our
Credit Agreement dated as of December 15, 2006, as
amended and restated as of November 24, 2009, as
amended and restated as of April 30, 2014, and as further
amended, including the Third Amended and Restated
Credit Agreement. (d)
Filed as Exhibit 10.1 to our Current Report on Form 8-K filed
May 1, 2015. (a)
Exhibit 10-W-5
Twelfth Amendment dated as of April 29, 2016 to our Credit
Agreement dated as of December 15, 2006, as amended
and restated as of November 24, 2009, as amended and
restated as of April 30, 2014, and as further amended and
restated as of April 30, 2015. (d)
Filed as Exhibit 10 to our Current Report on Form 8-K filed
April 29, 2016. (a)
Exhibit 10-W-6
Thirteenth Amendment dated as of April 28, 2017 to our
Credit Agreement dated as of December 15, 2006, as
amended and restated as of November 24, 2009, as
amended and restated as of April 30, 2014, and as further
amended and restated as of April 30, 2015. (d)
Filed as Exhibit 10 to our Current Report on Form 8-K filed
April 28, 2017. (a)
Exhibit 10-W-7
Fourteenth Amendment dated as of April 26, 2018 to our
Credit Agreement dated as of December 15, 2006, as
amended and restated as of November 24, 2009, as
amended and restated as of April 30, 2014, and as further
amended and restated as of April 30, 2015. (d)
Filed as Exhibit 10 to our Current Report on Form 8-K filed
April 26, 2018. (a)
Exhibit 10-W-8
Fifteenth Amendment dated as of April 23, 2019 to our
Credit Agreement dated as of December 15, 2006, as
amended and restated as of November 24, 2009, as
amended and restated as of April 30, 2014, and as further
amended and restated as of April 30, 2015. (d)
Filed as Exhibit 10.1 to our Current Report on Form 8-K filed
April 26, 2019. (a)
Exhibit 10-W-9
Sixteenth Amendment dated as of July 27, 2020 to our
Credit Agreement dated as of December 15, 2006, as
amended and restated as of November 24, 2009, as
amended and restated as of April 30, 2014, and as further
amended and restated as of April 30, 2015. (d)
Filed as Exhibit 10.1 to our Current Report on Form 8-K filed
July 30, 2020. (a)
Exhibit 10-W-10
Seventeenth Amendment dated as of March 16, 2021 to
our Credit Agreement dated as of December 15, 2006, as
amended and restated as of November 24, 2009, as
amended and restated as of April 30, 2014, and as further
amended and restated as of April 30, 2015. (d)
Filed as Exhibit 10.1 to our Current Report on Form 8-K filed
March 17, 2021. (a)
Exhibit 10-W-11
Eighteenth Amendment dated as of September 29, 2021 to
our Credit Agreement dated as of December 15, 2006, as
amended and restated as of November 24, 2009, as
amended and restated as of April 30, 2014, as amended
and restated as of April 30, 2015, and as further amended,
including the Fourth Amended and Restated Credit
Agreement. (d)
Filed as Exhibit 10.1 to our Current Report on Form 8-K filed
September 29, 2021. (a)
Exhibit 10-W-12
Nineteenth Amendment dated as of June 23, 2022 to our
Credit Agreement dated as of December 15, 2006, as
amended and restated as of November 24, 2009, as
amended and restated as of April 30, 2014, as amended
and restated as of April 30, 2015, as amended and
restated as of September 29, 2021, and as further
amended. (d)
Filed as Exhibit 10.1 to our Current Report on Form 8-K filed
June 23, 2022. (a)
Exhibit 10-W-13
Twentieth Amendment dated as of April 26, 2023 to our
Credit Agreement dated as of December 15, 2006, as
amended and restated as of November 24, 2009, as
amended and restated as of April 30, 2014, as amended
and restated as of April 30, 2015, as amended and
restated as of September 29, 2021, and as further
amended. (d)
Filed as Exhibit 10.1 to our Current Report on Form 8-K filed
April 26, 2023. (a)
Exhibit 10-W-14
Twenty-First Amendment dated April 22, 2024 to our Credit
Agreement dated as of December 15, 2006, as amended
and restated as of November 24, 2009, as amended and
restated as of April 30, 2014, as amended and restated as
of April 30, 2015, as amended and restated as of
September 29, 2021, and as further amended. (d)
Filed as Exhibit 10.1 to our Current Report on Form 8-K filed April
22, 2024. (a)
Exhibit 10-W-15
Twenty-Second Amendment dated April 17, 2025 to our
Credit Agreement dated as of December 15, 2006, as
amended and restated as of November 24, 2009, as
amended and restated as of April 30, 2014, as amended
and restated as of April 30, 2015, as amended and
restated as of September 29, 2021, and as further
amended. (d)
Filed as Exhibit 10.1 to our Current Report on Form 8-K filed April
17, 2025. (a)
Exhibit 10-X
Revolving Credit Agreement dated as of April 23, 2019. (d)
Filed as Exhibit 10.2 to our Current Report on Form 8-K filed
April 26, 2019. (a)
Exhibit 10-X-1
First Amendment dated July 27, 2020 to our Revolving
Credit Agreement dated April 23, 2019. (d)
Filed as Exhibit 10.2 to our Current Report on Form 8-K filed
July 30, 2020. (a)
Exhibit 10-X-2
Second Amendment dated March 16, 2021 to our
Revolving Credit Agreement dated April 23, 2019. (d)
Filed as Exhibit 10.2 to our Current Report on Form 8-K filed
March 17, 2021. (a)
Designation
Description
Method of Filing
103
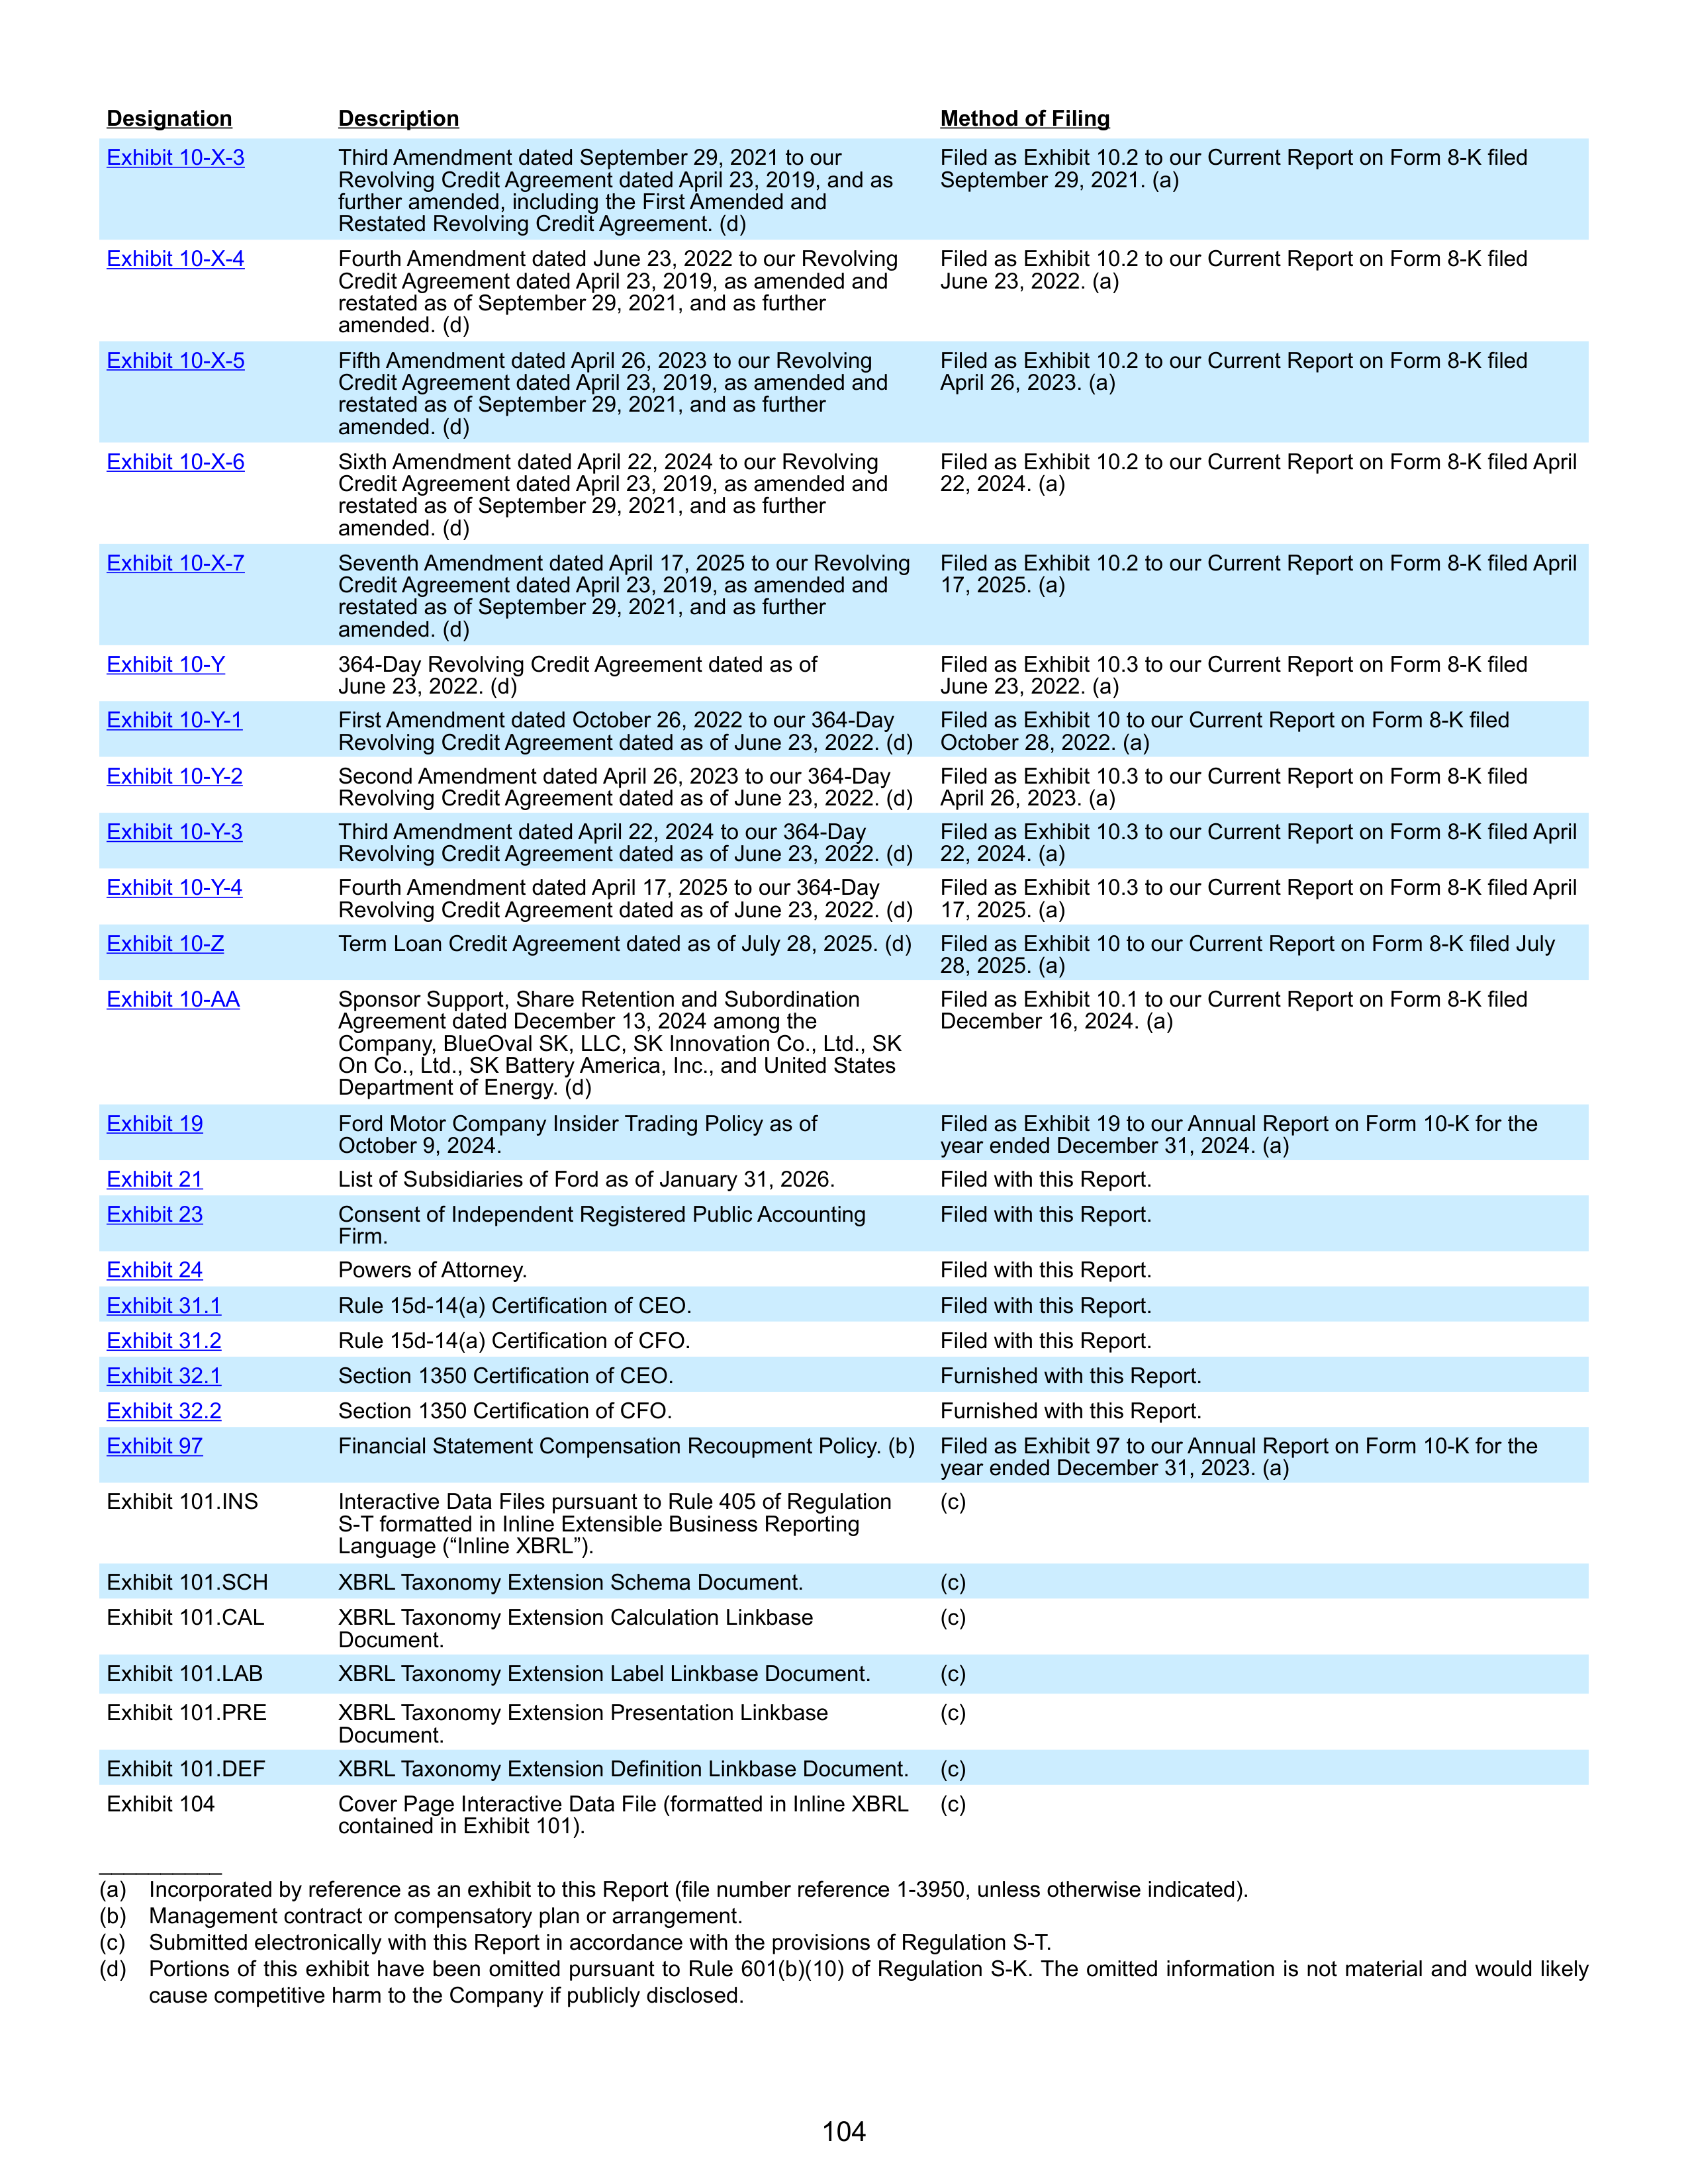
Exhibit 10-X-3
Third Amendment dated September 29, 2021 to our
Revolving Credit Agreement dated April 23, 2019, and as
further amended, including the First Amended and
Restated Revolving Credit Agreement. (d)
Filed as Exhibit 10.2 to our Current Report on Form 8-K filed
September 29, 2021. (a)
Exhibit 10-X-4
Fourth Amendment dated June 23, 2022 to our Revolving
Credit Agreement dated April 23, 2019, as amended and
restated as of September 29, 2021, and as further
amended. (d)
Filed as Exhibit 10.2 to our Current Report on Form 8-K filed
June 23, 2022. (a)
Exhibit 10-X-5
Fifth Amendment dated April 26, 2023 to our Revolving
Credit Agreement dated April 23, 2019, as amended and
restated as of September 29, 2021, and as further
amended. (d)
Filed as Exhibit 10.2 to our Current Report on Form 8-K filed
April 26, 2023. (a)
Exhibit 10-X-6
Sixth Amendment dated April 22, 2024 to our Revolving
Credit Agreement dated April 23, 2019, as amended and
restated as of September 29, 2021, and as further
amended. (d)
Filed as Exhibit 10.2 to our Current Report on Form 8-K filed April
22, 2024. (a)
Exhibit 10-X-7
Seventh Amendment dated April 17, 2025 to our Revolving
Credit Agreement dated April 23, 2019, as amended and
restated as of September 29, 2021, and as further
amended. (d)
Filed as Exhibit 10.2 to our Current Report on Form 8-K filed April
17, 2025. (a)
Exhibit 10-Y
364-Day Revolving Credit Agreement dated as of
June 23, 2022. (d)
Filed as Exhibit 10.3 to our Current Report on Form 8-K filed
June 23, 2022. (a)
Exhibit 10-Y-1
First Amendment dated October 26, 2022 to our 364-Day
Revolving Credit Agreement dated as of June 23, 2022. (d)
Filed as Exhibit 10 to our Current Report on Form 8-K filed
October 28, 2022. (a)
Exhibit 10-Y-2
Second Amendment dated April 26, 2023 to our 364-Day
Revolving Credit Agreement dated as of June 23, 2022. (d)
Filed as Exhibit 10.3 to our Current Report on Form 8-K filed
April 26, 2023. (a)
Exhibit 10-Y-3
Third Amendment dated April 22, 2024 to our 364-Day
Revolving Credit Agreement dated as of June 23, 2022. (d)
Filed as Exhibit 10.3 to our Current Report on Form 8-K filed April
22, 2024. (a)
Exhibit 10-Y-4
Fourth Amendment dated April 17, 2025 to our 364-Day
Revolving Credit Agreement dated as of June 23, 2022. (d)
Filed as Exhibit 10.3 to our Current Report on Form 8-K filed April
17, 2025. (a)
Exhibit 10-Z
Term Loan Credit Agreement dated as of July 28, 2025. (d)
Filed as Exhibit 10 to our Current Report on Form 8-K filed July
28, 2025. (a)
Exhibit 10-AA
Sponsor Support, Share Retention and Subordination
Agreement dated December 13, 2024 among the
Company, BlueOval SK, LLC, SK Innovation Co., Ltd., SK
On Co., Ltd., SK Battery America, Inc., and United States
Department of Energy. (d)
Filed as Exhibit 10.1 to our Current Report on Form 8-K filed
December 16, 2024. (a)
Exhibit 19
Ford Motor Company Insider Trading Policy as of
October 9, 2024.
Filed as Exhibit 19 to our Annual Report on Form 10-K for the
year ended December 31, 2024. (a)
Exhibit 21
List of Subsidiaries of Ford as of January 31, 2026.
Filed with this Report.
Exhibit 23
Consent of Independent Registered Public Accounting
Firm.
Filed with this Report.
Exhibit 24
Powers of Attorney.
Filed with this Report.
Exhibit 31.1
Rule 15d-14(a) Certification of CEO.
Filed with this Report.
Exhibit 31.2
Rule 15d-14(a) Certification of CFO.
Filed with this Report.
Exhibit 32.1
Section 1350 Certification of CEO.
Furnished with this Report.
Exhibit 32.2
Section 1350 Certification of CFO.
Furnished with this Report.
Exhibit 97
Financial Statement Compensation Recoupment Policy. (b)
Filed as Exhibit 97 to our Annual Report on Form 10-K for the
year ended December 31, 2023. (a)
Exhibit 101.INS
Interactive Data Files pursuant to Rule 405 of Regulation
S-T formatted in Inline Extensible Business Reporting
Language (“Inline XBRL”).
(c)
Exhibit 101.SCH
XBRL Taxonomy Extension Schema Document.
(c)
Exhibit 101.CAL
XBRL Taxonomy Extension Calculation Linkbase
Document.
(c)
Exhibit 101.LAB
XBRL Taxonomy Extension Label Linkbase Document.
(c)
Exhibit 101.PRE
XBRL Taxonomy Extension Presentation Linkbase
Document.
(c)
Exhibit 101.DEF
XBRL Taxonomy Extension Definition Linkbase Document.
(c)
Exhibit 104
Cover Page Interactive Data File (formatted in Inline XBRL
contained in Exhibit 101).
(c)
Designation
Description
Method of Filing
__________
(a)
Incorporated by reference as an exhibit to this Report (file number reference 1-3950, unless otherwise indicated).
(b)
Management contract or compensatory plan or arrangement.
(c)
Submitted electronically with this Report in accordance with the provisions of Regulation S-T.
(d)
Portions of this exhibit have been omitted pursuant to Rule 601(b)(10) of Regulation S-K. The omitted information is not material and would likely
cause competitive harm to the Company if publicly disclosed.
104

Instruments defining the rights of holders of certain issues of long-term debt of Ford and of certain consolidated
subsidiaries and of any unconsolidated subsidiary, for which financial statements are required to be filed with this Report,
have not been filed as exhibits to this Report because the authorized principal amount of any one of such issues does not
exceed 10% of the total assets of Ford and our subsidiaries on a consolidated basis. Ford agrees to furnish a copy of
each of such instrument to the Securities and Exchange Commission upon request.
ITEM 16.
Form 10-K Summary.
None.
105
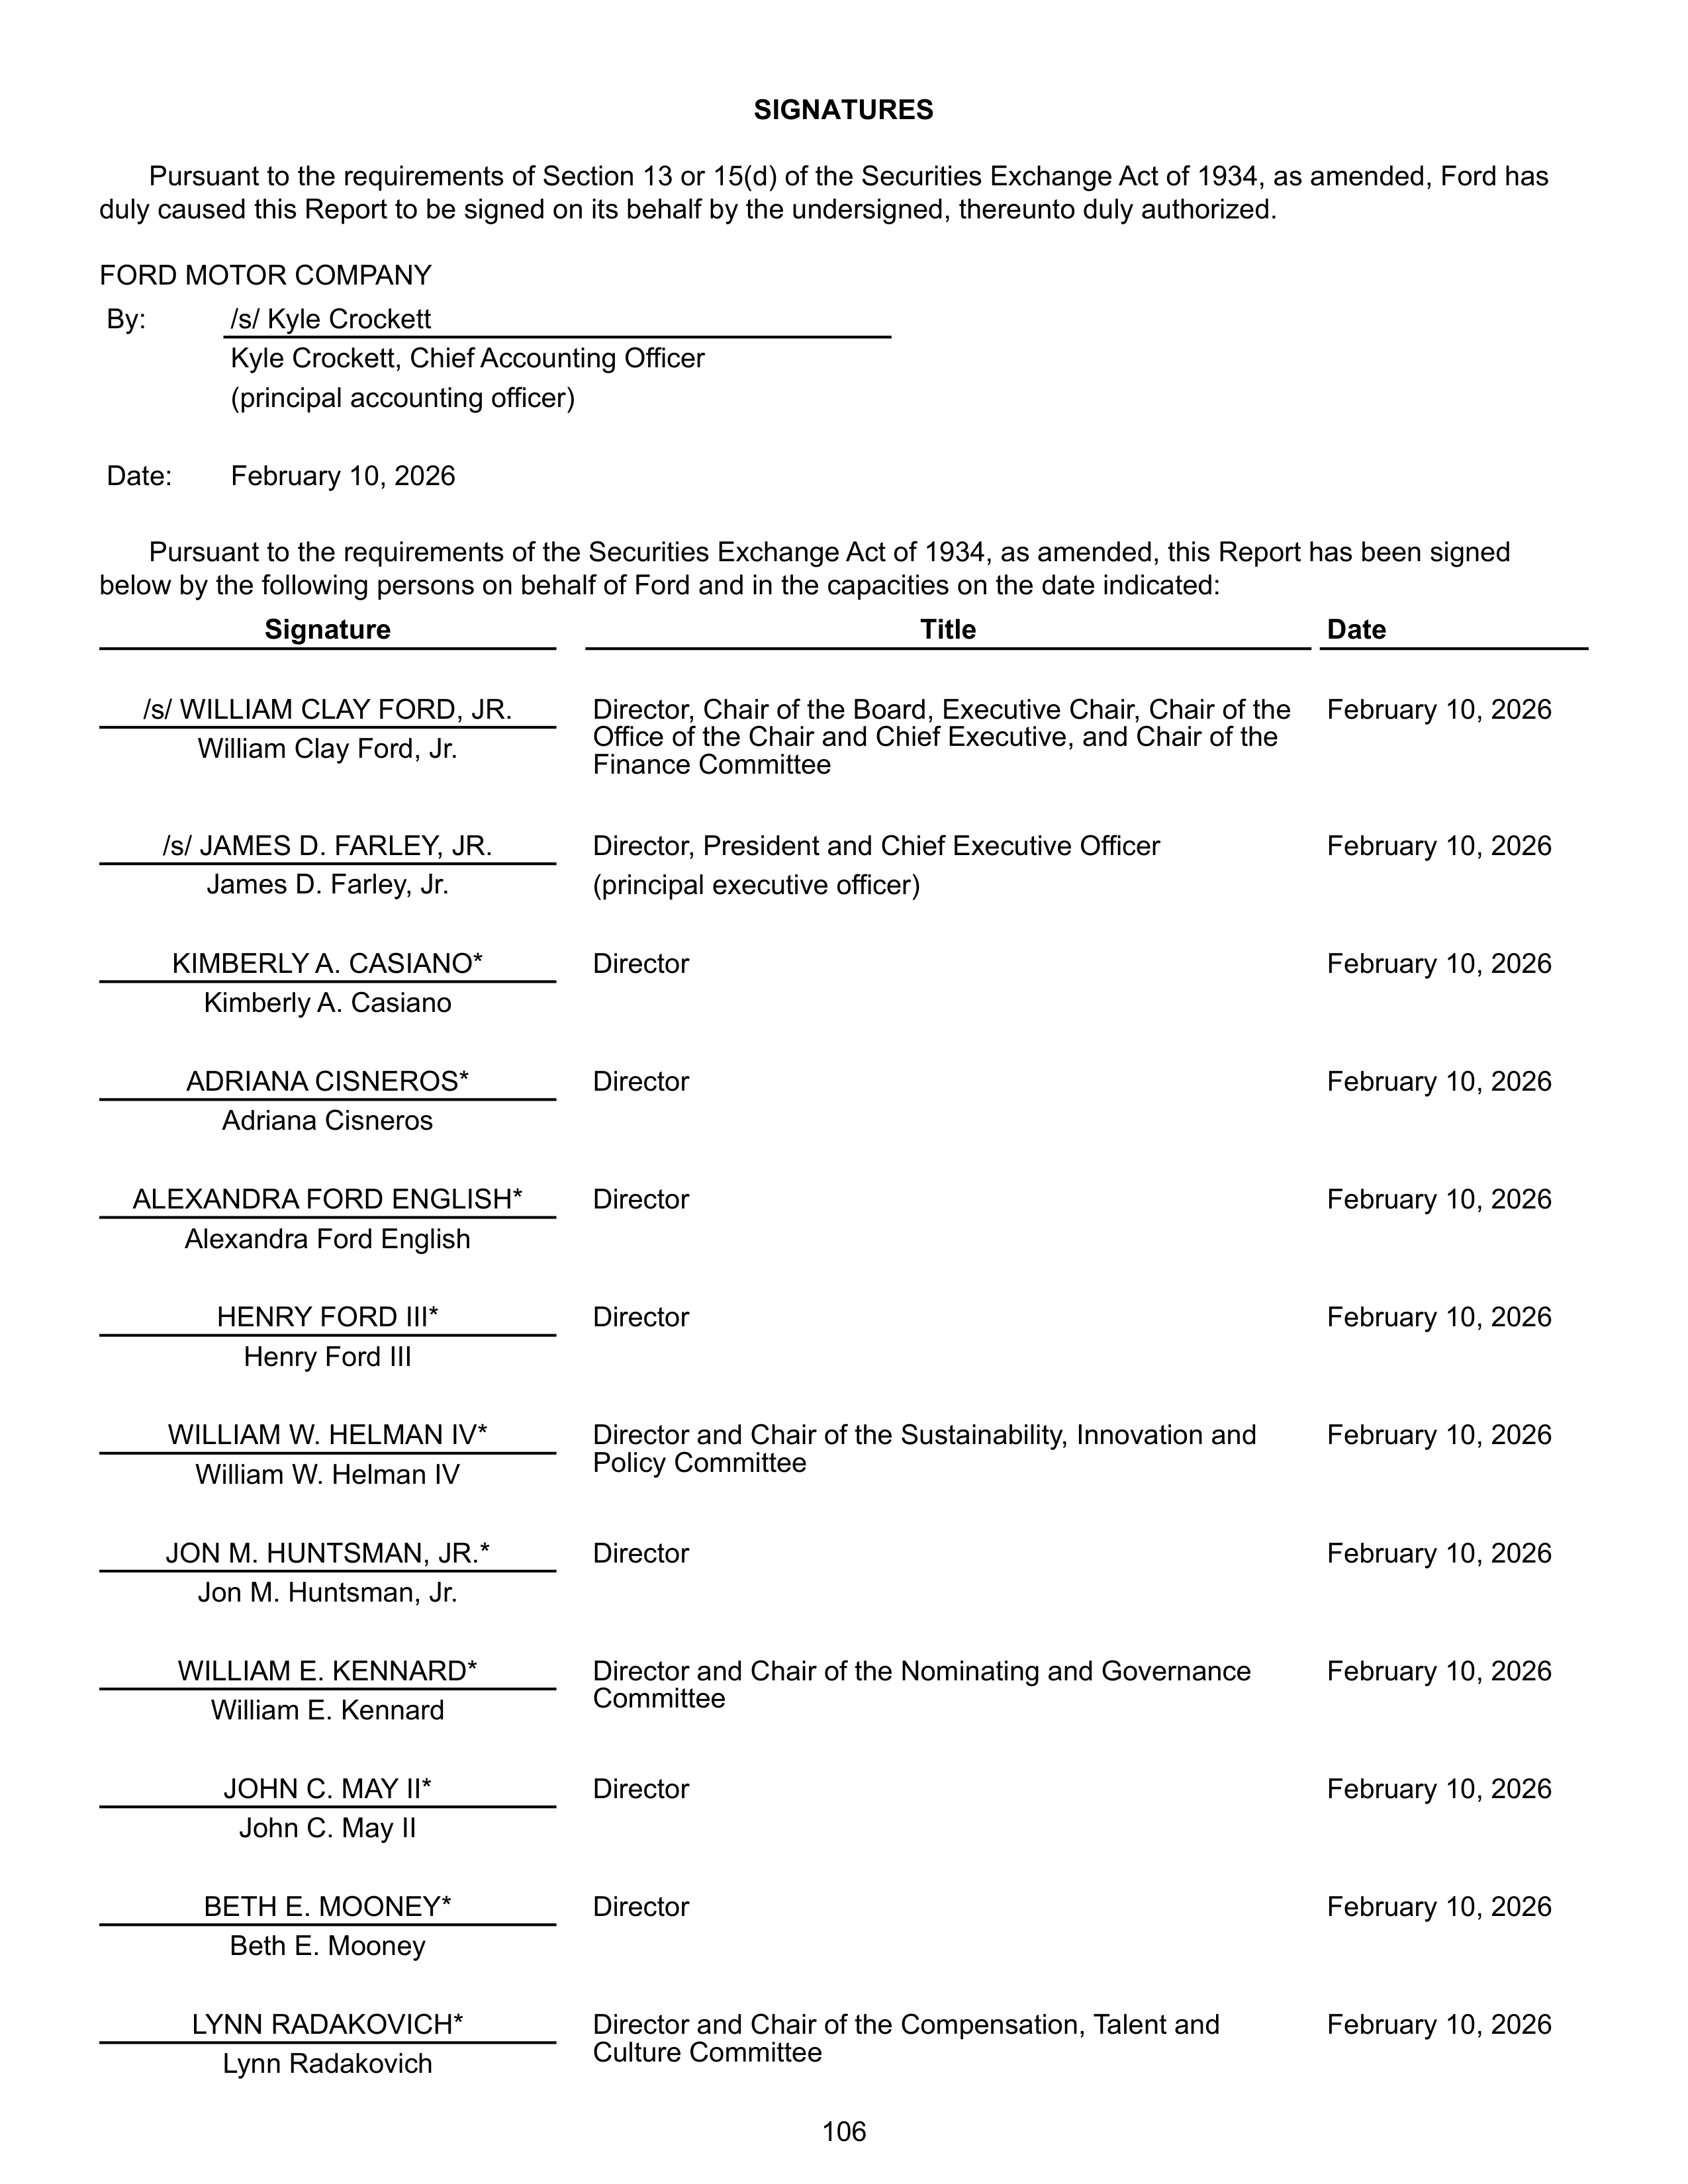
SIGNATURES
Pursuant to the requirements of Section 13 or 15(d) of the Securities Exchange Act of 1934, as amended, Ford has
duly caused this Report to be signed on its behalf by the undersigned, thereunto duly authorized.
FORD MOTOR COMPANY
By:
/s/ Kyle Crockett
Kyle Crockett, Chief Accounting Officer
(principal accounting officer)
Date:
February 10, 2026
Pursuant to the requirements of the Securities Exchange Act of 1934, as amended, this Report has been signed
below by the following persons on behalf of Ford and in the capacities on the date indicated:
/s/ WILLIAM CLAY FORD, JR.
Director, Chair of the Board, Executive Chair, Chair of the
Office of the Chair and Chief Executive, and Chair of the
Finance Committee
February 10, 2026
William Clay Ford, Jr.
/s/ JAMES D. FARLEY, JR.
Director, President and Chief Executive Officer
February 10, 2026
James D. Farley, Jr.
(principal executive officer)
KIMBERLY A. CASIANO*
Director
February 10, 2026
Kimberly A. Casiano
ADRIANA CISNEROS*
Director
February 10, 2026
Adriana Cisneros
ALEXANDRA FORD ENGLISH*
Director
February 10, 2026
Alexandra Ford English
HENRY FORD III*
Director
February 10, 2026
Henry Ford III
WILLIAM W. HELMAN IV*
Director and Chair of the Sustainability, Innovation and
Policy Committee
February 10, 2026
William W. Helman IV
JON M. HUNTSMAN, JR.*
Director
February 10, 2026
Jon M. Huntsman, Jr.
WILLIAM E. KENNARD*
Director and Chair of the Nominating and Governance
Committee
February 10, 2026
William E. Kennard
JOHN C. MAY II*
Director
February 10, 2026
John C. May II
BETH E. MOONEY*
Director
February 10, 2026
Beth E. Mooney
LYNN RADAKOVICH*
Director and Chair of the Compensation, Talent and
Culture Committee
February 10, 2026
Lynn Radakovich
Signature
Title
Date
106
JOHN L. THORNTON*
Director
February 10, 2026
John L. Thornton
JOHN B. VEIHMEYER*
Director and Chair of the Audit Committee
February 10, 2026
John B. Veihmeyer
JOHN S. WEINBERG*
Director
February 10, 2026
John S. Weinberg
/s/ SHERRY A. HOUSE
Chief Financial Officer
February 10, 2026
Sherry A. House
(principal financial officer)
/s/ KYLE CROCKETT
Chief Accounting Officer
February 10, 2026
Kyle Crockett
(principal accounting officer)
*By: /s/ SARAH E. FORTT
February 10, 2026
Sarah E. Fortt
Attorney-in-Fact
Signature
Title
Date
107
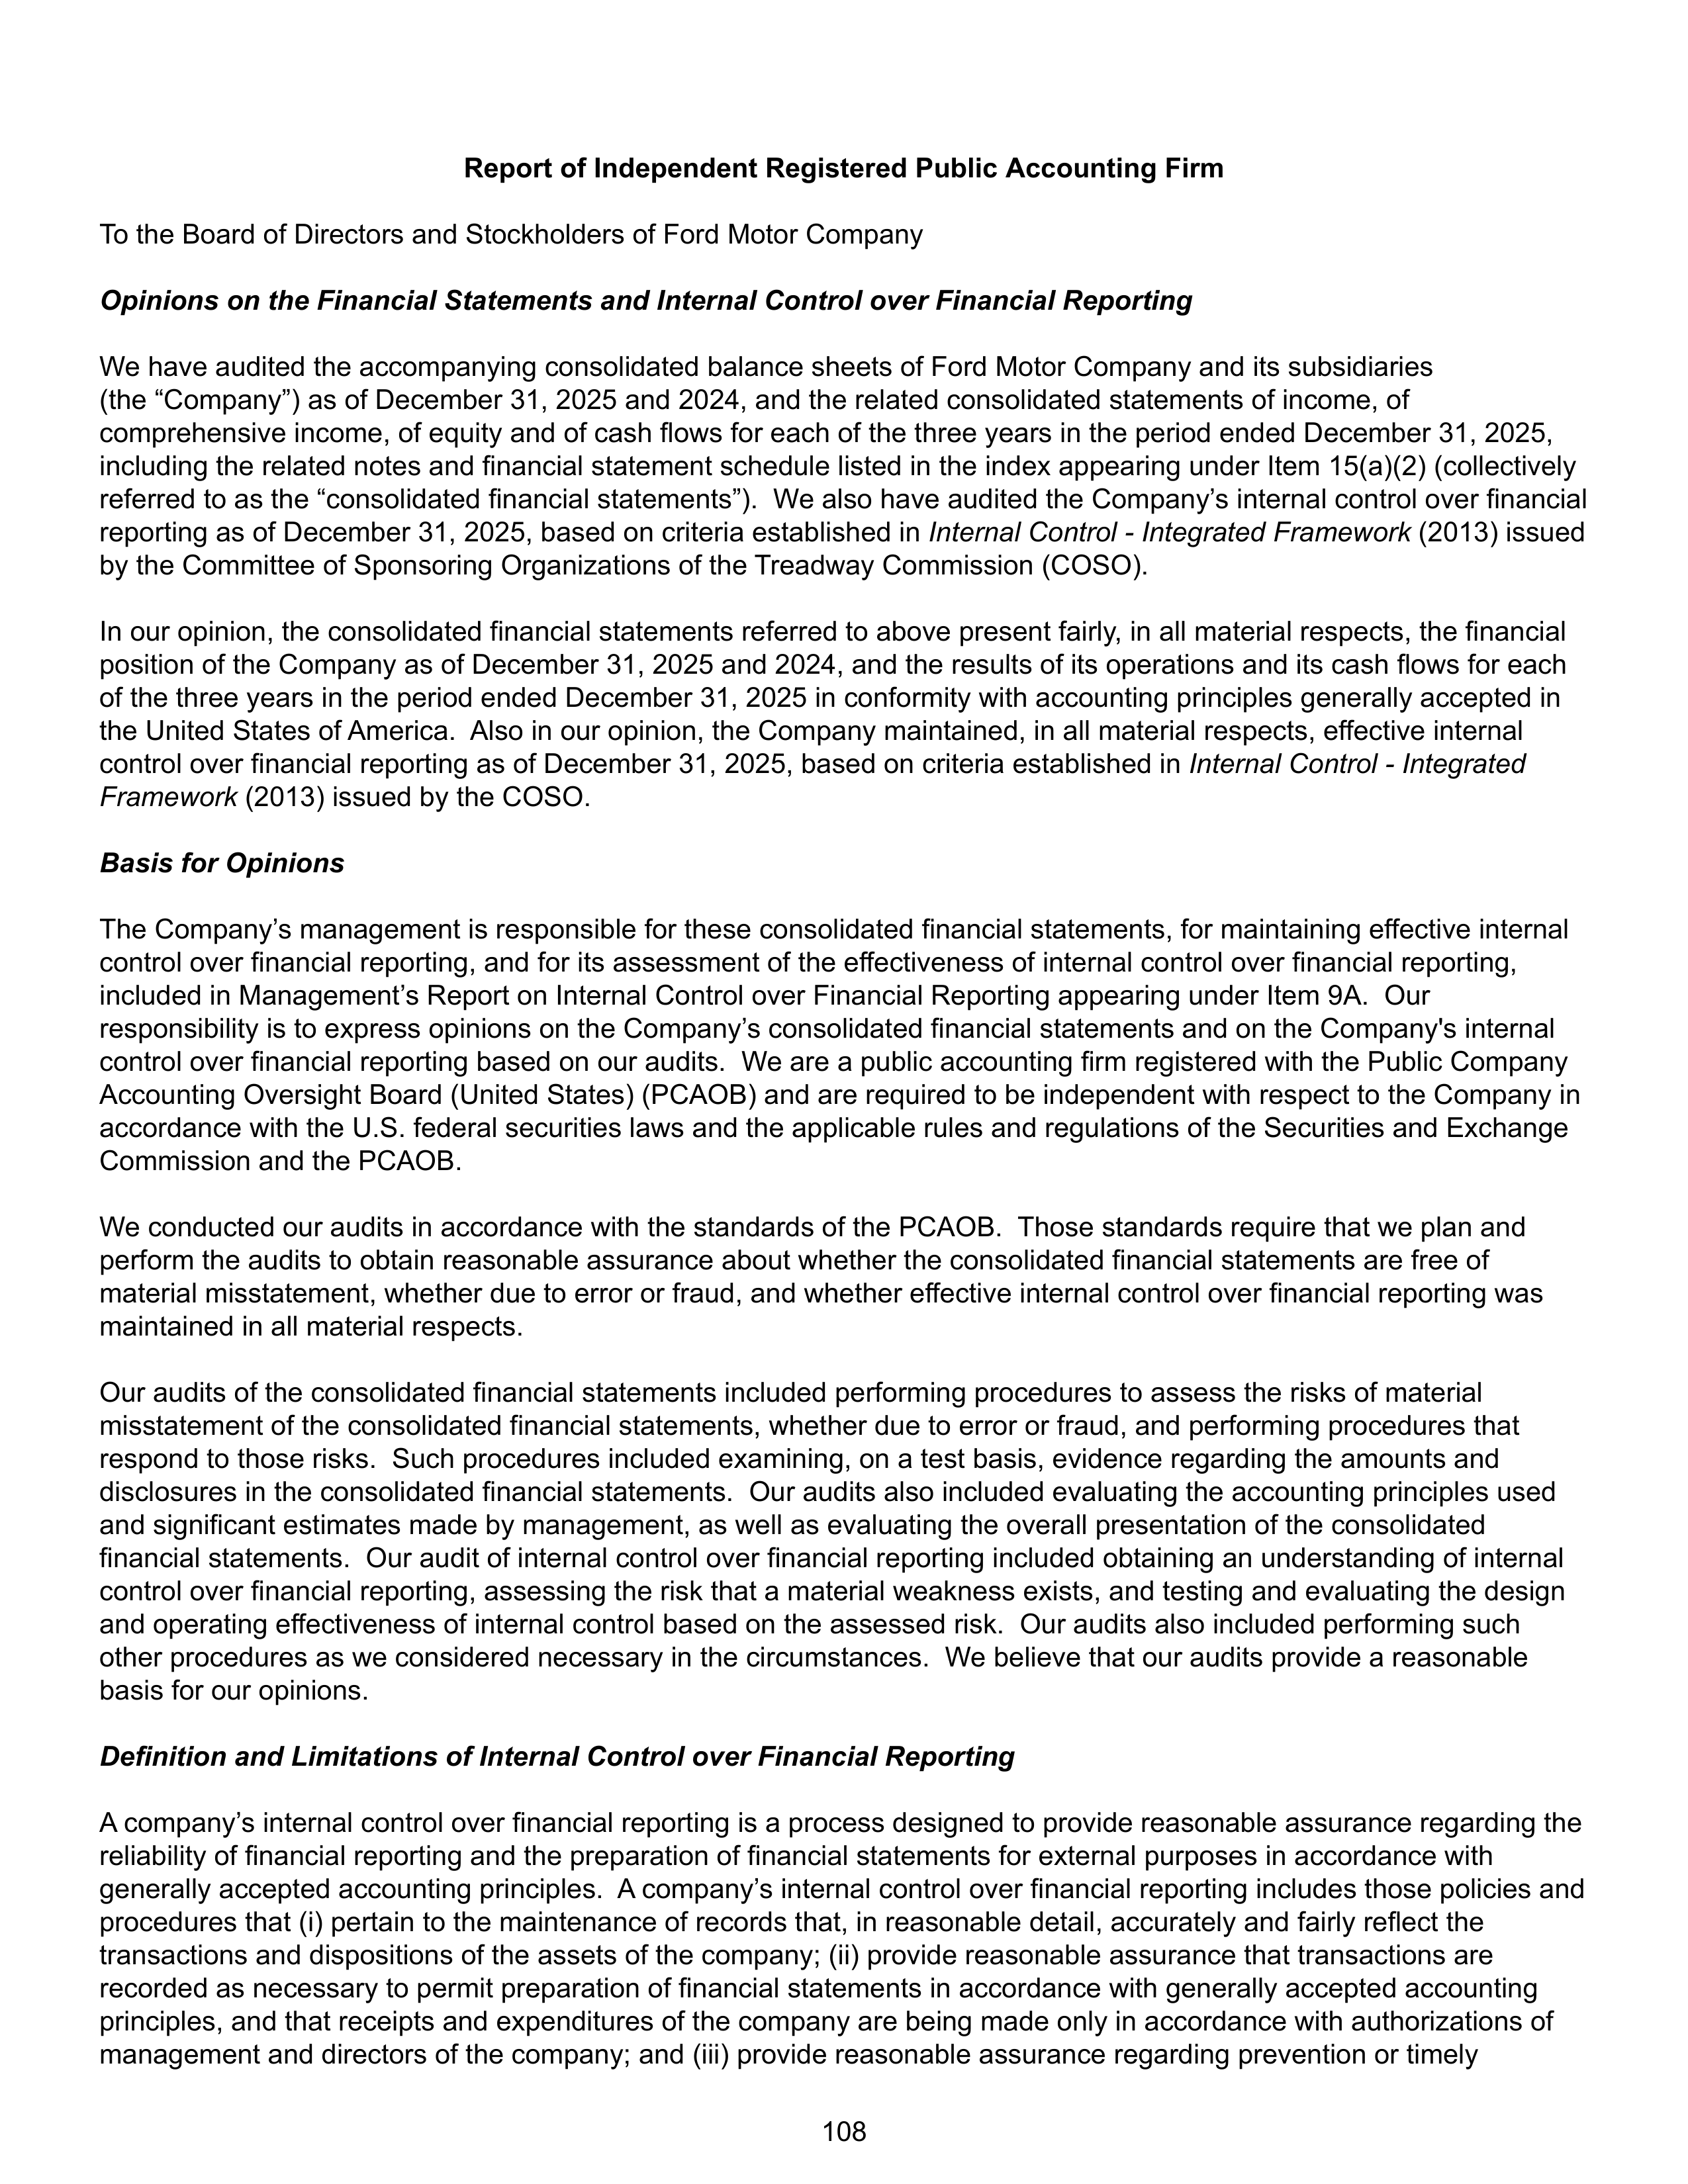
Report of Independent Registered Public Accounting Firm
To the Board of Directors and Stockholders of Ford Motor Company
Opinions on the Financial Statements and Internal Control over Financial Reporting
We have audited the accompanying consolidated balance sheets of Ford Motor Company and its subsidiaries
(the “Company”) as of December 31, 2025 and 2024, and the related consolidated statements of income, of
comprehensive income, of equity and of cash flows for each of the three years in the period ended December 31, 2025,
including the related notes and financial statement schedule listed in the index appearing under Item 15(a)(2) (collectively
referred to as the “consolidated financial statements”). We also have audited the Company’s internal control over financial
reporting as of December 31, 2025, based on criteria established in
Internal Control - Integrated Framework
(2013)
issued
by the Committee of Sponsoring Organizations of the Treadway Commission (COSO).
In our opinion, the consolidated financial statements referred to above present fairly, in all material respects, the financial
position of the Company as of December 31, 2025 and 2024, and the results of its operations and its cash flows for each
of the three years in the period ended December 31, 2025 in conformity with accounting principles generally accepted in
the United States of America. Also in our opinion, the Company maintained, in all material respects, effective internal
control over financial reporting as of December 31, 2025, based on criteria established in
Internal Control - Integrated
Framework
(2013) issued by the COSO.
Basis for Opinions
The Company’s management is responsible for these consolidated financial statements, for maintaining effective internal
control over financial reporting, and for its assessment of the effectiveness of internal control over financial reporting,
included in Management’s Report on Internal Control over Financial Reporting appearing under Item 9A. Our
responsibility is to express opinions on the Company’s consolidated financial statements and on the Company's internal
control over financial reporting based on our audits. We are a public accounting firm registered with the Public Company
Accounting Oversight Board (United States) (PCAOB) and are required to be independent with respect to the Company in
accordance with the U.S. federal securities laws and the applicable rules and regulations of the Securities and Exchange
Commission and the PCAOB.
We conducted our audits in accordance with the standards of the PCAOB. Those standards require that we plan and
perform the audits to obtain reasonable assurance about whether the consolidated financial statements are free of
material misstatement, whether due to error or fraud, and whether effective internal control over financial reporting was
maintained in all material respects.
Our audits of the consolidated financial statements included performing procedures to assess the risks of material
misstatement of the consolidated financial statements, whether due to error or fraud, and performing procedures that
respond to those risks. Such procedures included examining, on a test basis, evidence regarding the amounts and
disclosures in the consolidated financial statements. Our audits also included evaluating the accounting principles used
and significant estimates made by management, as well as evaluating the overall presentation of the consolidated
financial statements. Our audit of internal control over financial reporting included obtaining an understanding of internal
control over financial reporting, assessing the risk that a material weakness exists, and testing and evaluating the design
and operating effectiveness of internal control based on the assessed risk. Our audits also included performing such
other procedures as we considered necessary in the circumstances. We believe that our audits provide a reasonable
basis for our opinions.
Definition and Limitations of Internal Control over Financial Reporting
A company’s internal control over financial reporting is a process designed to provide reasonable assurance regarding the
reliability of financial reporting and the preparation of financial statements for external purposes in accordance with
generally accepted accounting principles. A company’s internal control over financial reporting includes those policies and
procedures that (i) pertain to the maintenance of records that, in reasonable detail, accurately and fairly reflect the
transactions and dispositions of the assets of the company; (ii) provide reasonable assurance that transactions are
recorded as necessary to permit preparation of financial statements in accordance with generally accepted accounting
principles, and that receipts and expenditures of the company are being made only in accordance with authorizations of
management and directors of the company; and (iii) provide reasonable assurance regarding prevention or timely
108
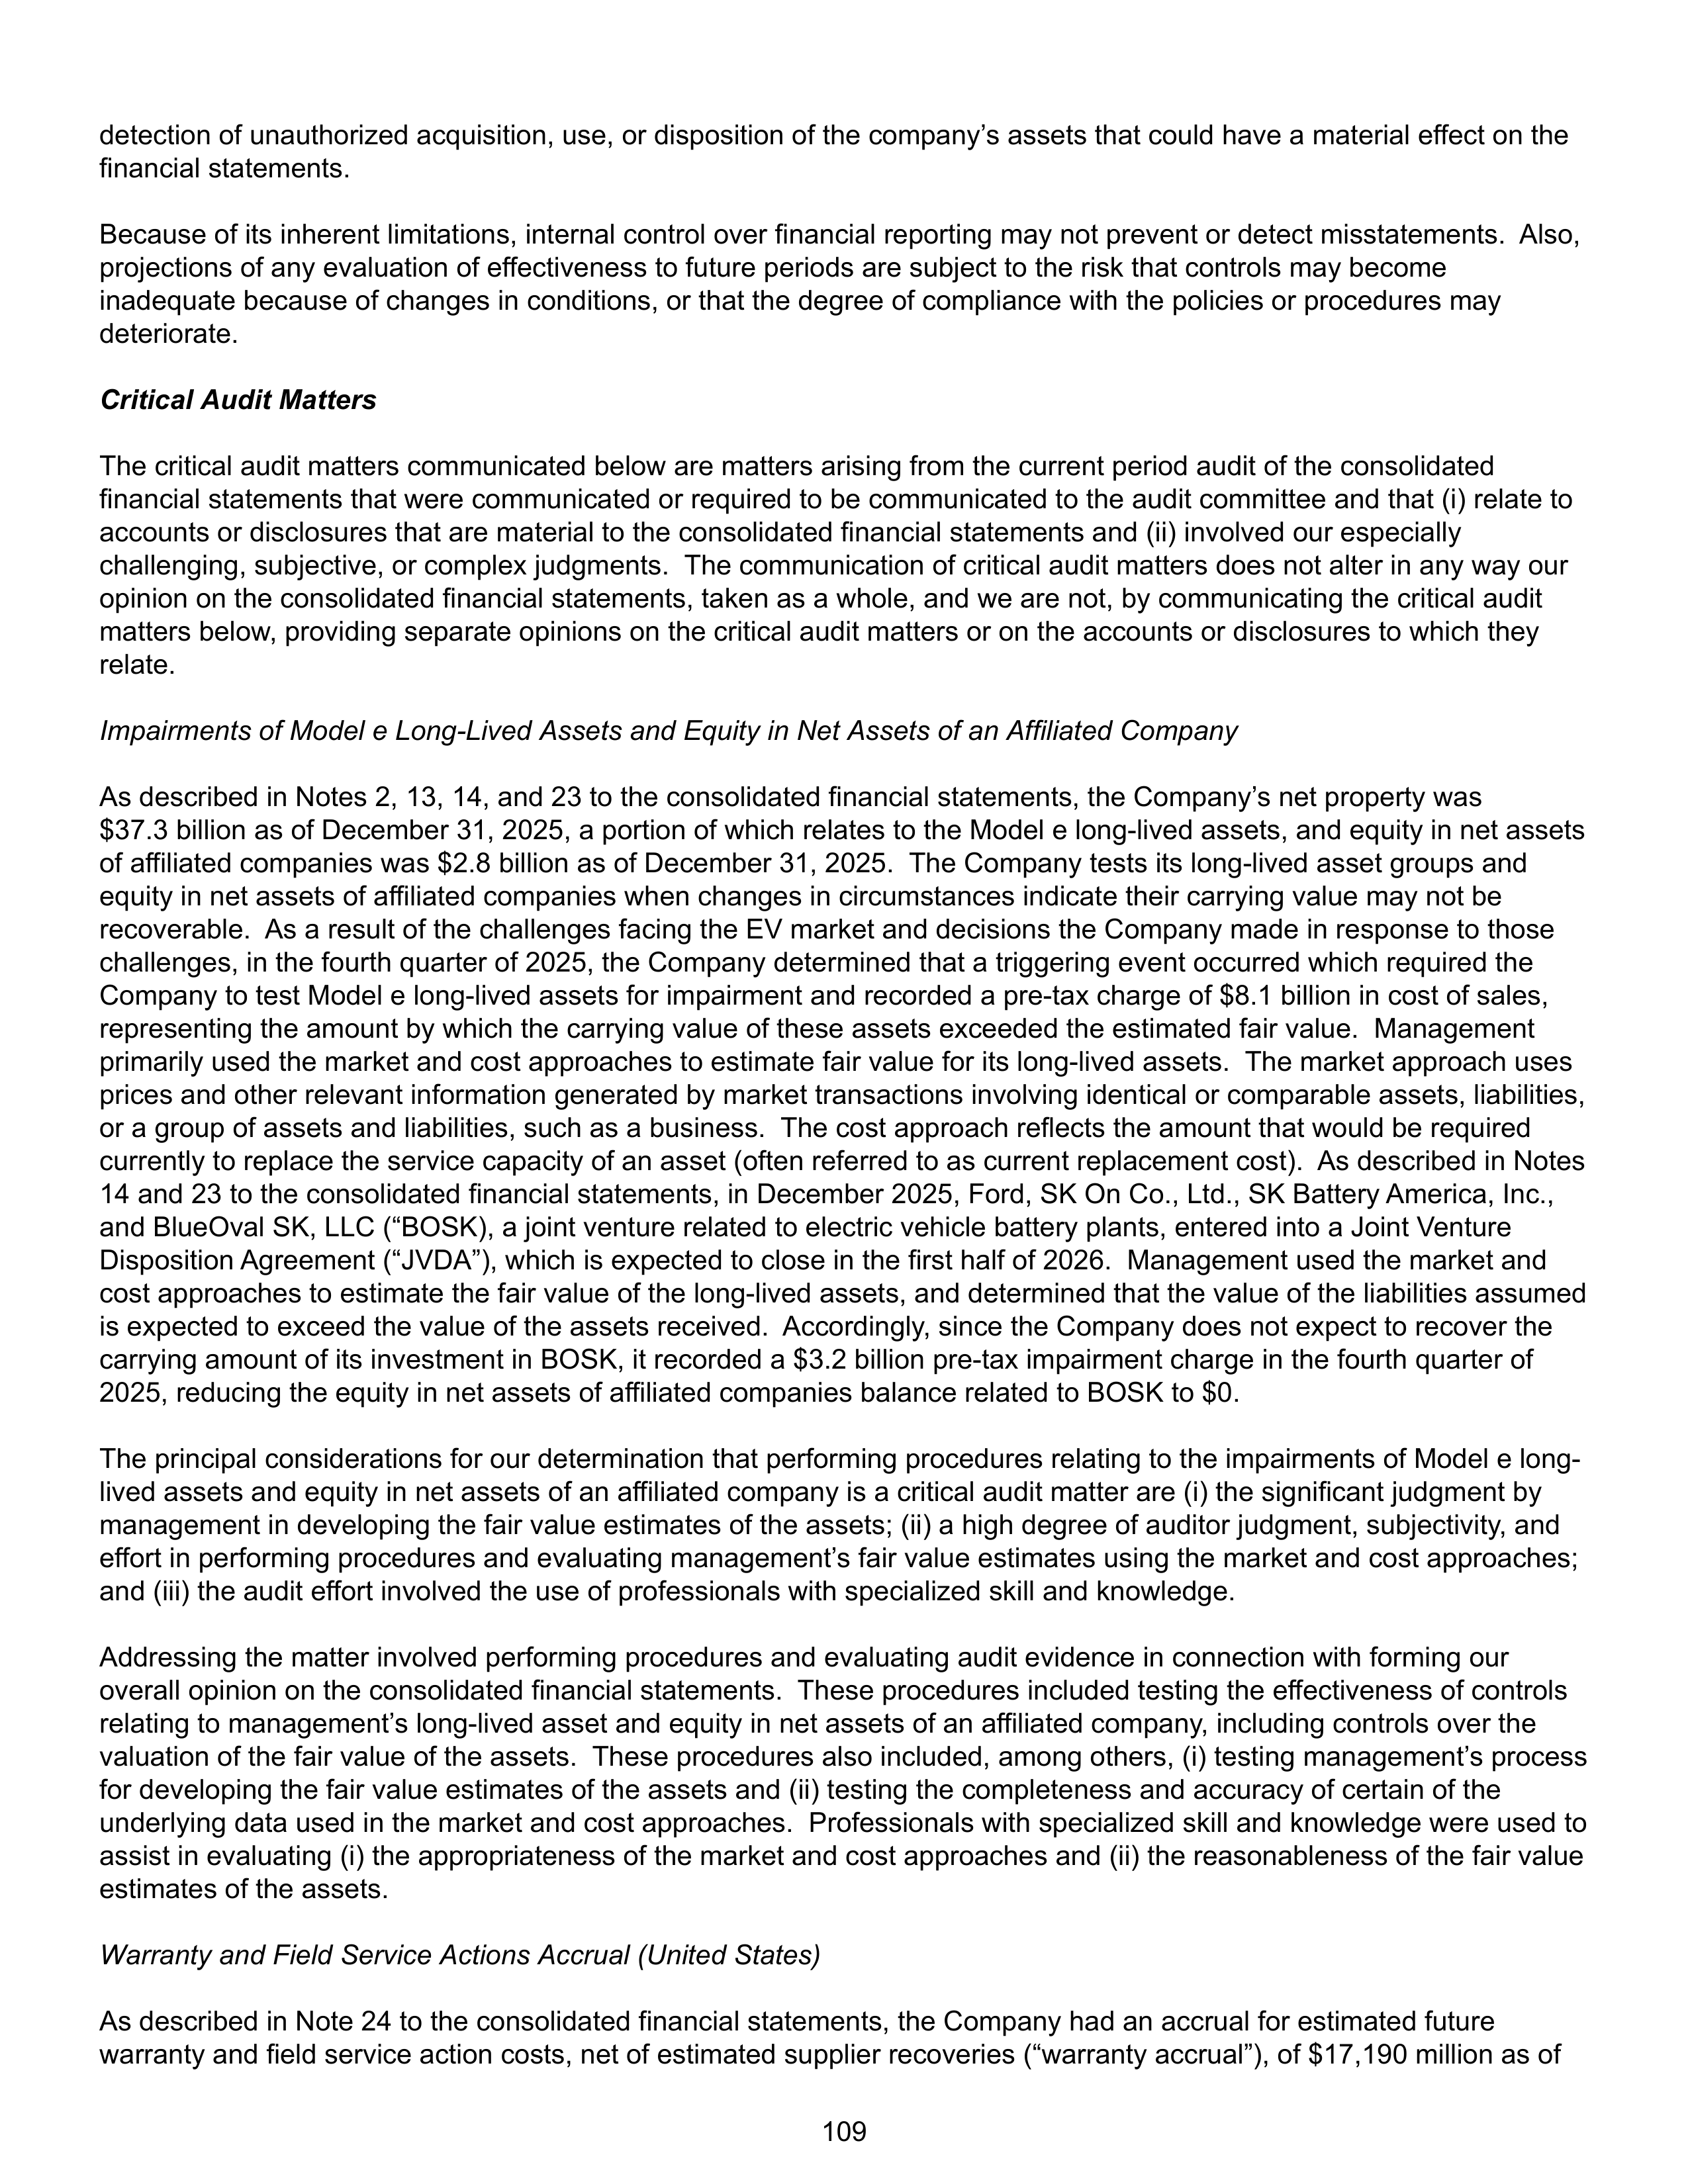
detection of unauthorized acquisition, use, or disposition of the company’s assets that could have a material effect on the
financial statements.
Because of its inherent limitations, internal control over financial reporting may not prevent or detect misstatements. Also,
projections of any evaluation of effectiveness to future periods are subject to the risk that controls may become
inadequate because of changes in conditions, or that the degree of compliance with the policies or procedures may
deteriorate.
Critical Audit Matters
The critical audit matters communicated below are matters arising from the current period audit of the consolidated
financial statements that were communicated or required to be communicated to the audit committee and that (i) relate to
accounts or disclosures that are material to the consolidated financial statements and (ii) involved our especially
challenging, subjective, or complex judgments. The communication of critical audit matters does not alter in any way our
opinion on the consolidated
financial statements, taken as a whole, and we are not, by communicating the critical audit
matters below, providing separate opinions on the critical audit matters or on the accounts or disclosures to which they
relate.
Impairments of Model e Long-Lived Assets and Equity in Net Assets of an Affiliated Company
As described in Notes 2, 13, 14, and 23 to the consolidated financial statements, the Company’s net property was
$37.3 billion as of December 31, 2025, a portion of which relates to the Model e long-lived assets, and equity in net assets
of affiliated companies was $2.8 billion as of December 31, 2025. The Company tests its long-lived asset groups and
equity in net assets of affiliated companies when changes in circumstances indicate their carrying value may not be
recoverable. As a result of the challenges facing the EV market and decisions the Company made in response to those
challenges, in the fourth quarter of 2025, the Company determined that a triggering event occurred which required the
Company to test Model e long-lived assets for impairment and recorded a pre-tax charge of $8.1 billion in cost of sales,
representing the amount by which the carrying value of these assets exceeded the estimated fair value. Management
primarily used the market and cost approaches to estimate fair value for its long-lived assets. The market approach uses
prices and other relevant information generated by market transactions involving identical or comparable assets, liabilities,
or a group of assets and liabilities, such as a business. The cost approach reflects the amount that would be required
currently to replace the service capacity of an asset (often referred to as current replacement cost). As described in Notes
14 and 23 to the consolidated financial statements, in December 2025, Ford, SK On Co., Ltd., SK Battery America, Inc.,
and BlueOval SK, LLC (“BOSK), a joint venture related to electric vehicle battery plants, entered into a Joint Venture
Disposition Agreement (“JVDA”), which is expected to close in the first half of 2026. Management used the market and
cost approaches to estimate the fair value of the long-lived assets, and determined that the value of the liabilities assumed
is expected to exceed the value of the assets received. Accordingly, since the Company does not expect to recover the
carrying amount of its investment in BOSK, it recorded a $3.2 billion pre-tax impairment charge in the fourth quarter of
2025, reducing the equity in net assets of affiliated companies balance related to BOSK to $0.
The principal considerations for our determination that performing procedures relating to the impairments of Model e long-
lived assets and equity in net assets of an affiliated company is a critical audit matter are (i) the significant judgment by
management in developing the fair value estimates of the assets; (ii) a high degree of auditor judgment, subjectivity, and
effort in performing procedures and evaluating management’s fair value estimates using the market and cost approaches;
and (iii) the audit effort involved the use of professionals with specialized skill and knowledge.
Addressing the matter involved performing procedures and evaluating audit evidence in connection with forming our
overall opinion on the consolidated financial statements. These procedures included testing the effectiveness of controls
relating to management’s long-lived asset and equity in net assets of an affiliated company, including controls over the
valuation of the fair value of the assets. These procedures also included, among others, (i) testing management’s process
for developing the fair value estimates of the assets and (ii) testing the completeness and accuracy of certain of the
underlying data used in the market and cost approaches. Professionals with specialized skill and knowledge were used to
assist in evaluating (i) the appropriateness of the market and cost approaches and (ii) the reasonableness of the fair value
estimates of the assets.
Warranty and Field Service Actions Accrual (United States)
As described in Note 24 to the consolidated financial statements, the Company had an accrual for estimated future
warranty and field service action costs, net of estimated supplier recoveries (“warranty accrual”), of $17,190 million as of
109
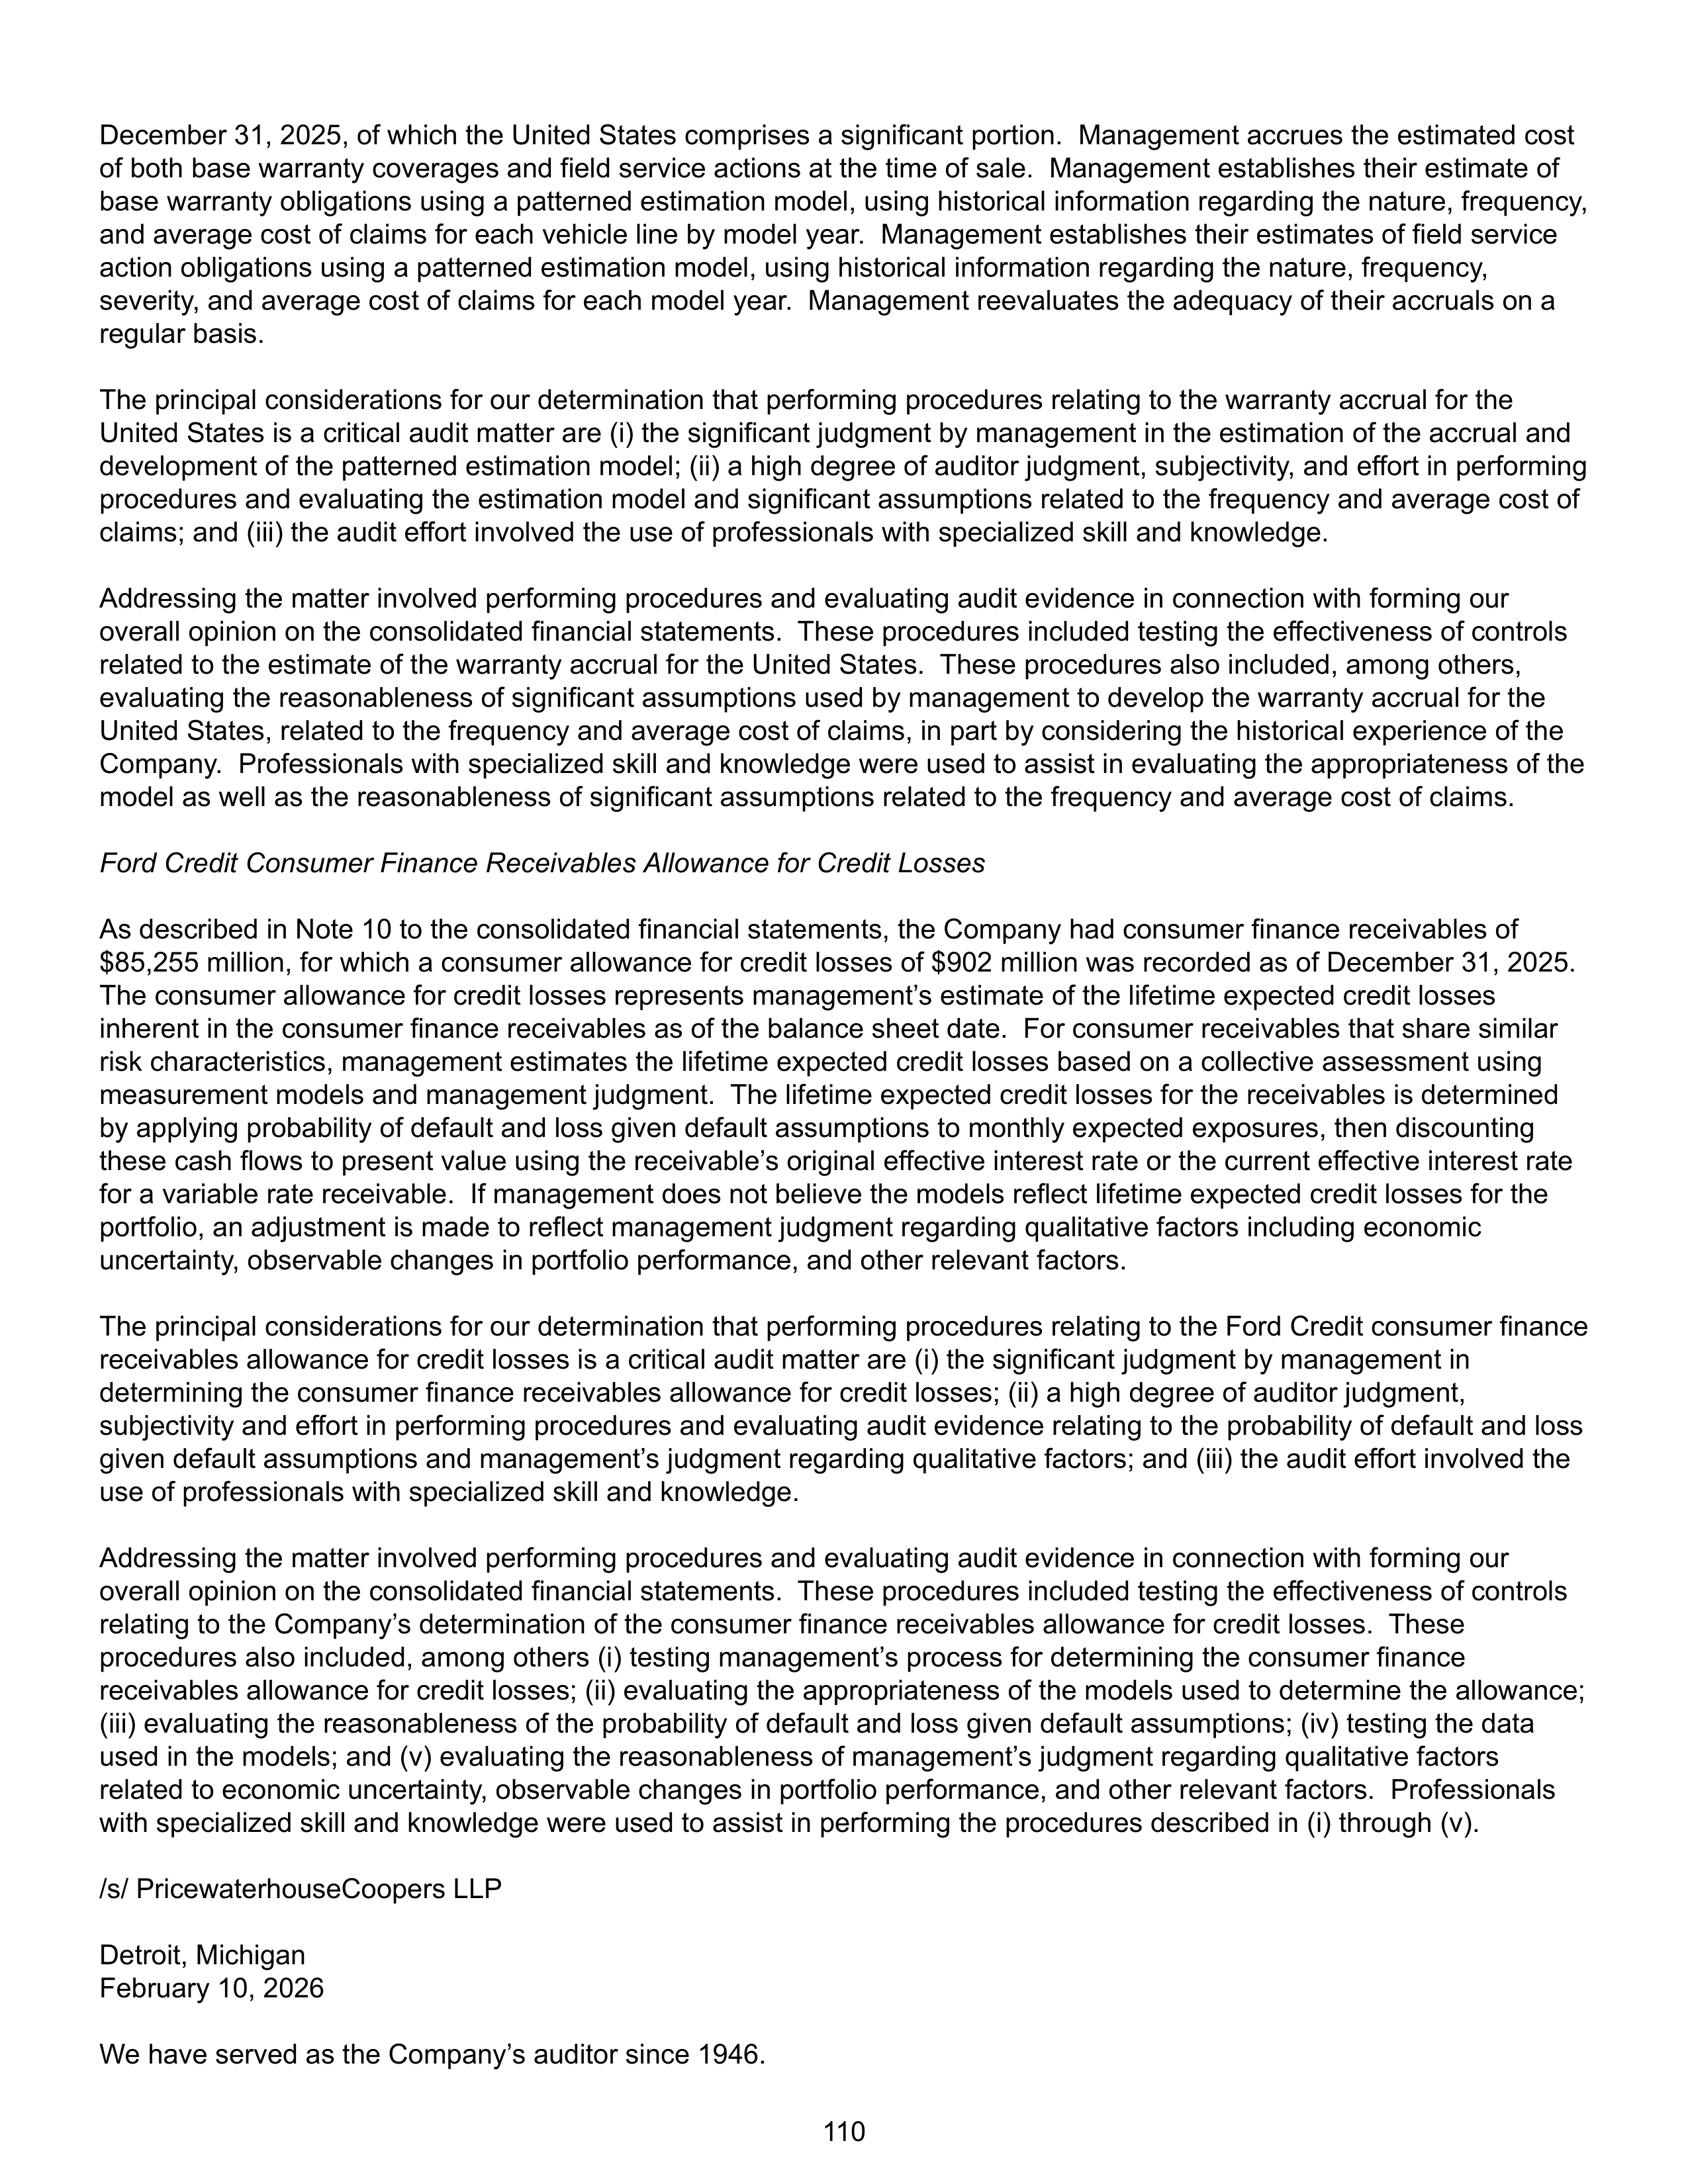
December 31, 2025, of which the United States comprises a significant portion. Management accrues the estimated cost
of both base warranty coverages and field service actions at the time of sale. Management establishes their estimate of
base warranty obligations using a patterned estimation model, using historical information regarding the nature, frequency,
and average cost of claims for each vehicle line by model year. Management establishes their estimates of field service
action obligations using a patterned estimation model, using historical information regarding the nature, frequency,
severity, and average cost of claims for each model year. Management reevaluates the adequacy of their accruals on a
regular basis.
The principal considerations for our determination that performing procedures relating to the warranty accrual for the
United States is a critical audit matter are (i) the significant judgment by management in the estimation of the accrual and
development of the patterned estimation model; (ii) a high degree of auditor judgment, subjectivity, and effort in performing
procedures and evaluating the estimation model and significant assumptions related to the frequency and average cost of
claims; and (iii) the audit effort involved the use of professionals with specialized skill and knowledge.
Addressing the matter involved performing procedures and evaluating audit evidence in connection with forming our
overall opinion on the consolidated financial statements. These procedures included testing the effectiveness of controls
related to the estimate of the warranty accrual for the United States. These procedures also included, among others,
evaluating the reasonableness of significant assumptions used by management to develop the warranty accrual for the
United States, related to the frequency and average cost of claims, in part by considering the historical experience of the
Company. Professionals with specialized skill and knowledge were used to assist in evaluating the appropriateness of the
model as well as the reasonableness of significant assumptions related to the frequency and average cost of claims.
Ford Credit Consumer Finance Receivables Allowance for Credit Losses
As described in Note 10 to the consolidated financial statements, the Company had consumer finance receivables of
$85,255 million, for which a consumer allowance for credit losses of $902 million was recorded as of December 31, 2025.
The consumer allowance for credit losses represents management’s estimate of the lifetime expected credit losses
inherent in the consumer finance receivables as of the balance sheet date. For consumer receivables that share similar
risk characteristics, management estimates the lifetime expected credit losses based on a collective assessment using
measurement models and management judgment. The lifetime expected credit losses for the receivables is determined
by applying probability of default and loss given default assumptions to monthly expected exposures, then discounting
these cash flows to present value using the receivable’s original effective interest rate or the current effective interest rate
for a variable rate receivable. If management does not believe the models reflect lifetime expected credit losses for the
portfolio, an adjustment is made to reflect management judgment regarding qualitative factors including economic
uncertainty, observable changes in portfolio performance, and other relevant factors.
The principal considerations for our determination that performing procedures relating to the Ford Credit consumer finance
receivables allowance for credit losses is a critical audit matter are (i) the significant judgment by management in
determining the consumer finance receivables allowance for credit losses; (ii) a high degree of auditor judgment,
subjectivity and effort in performing procedures and evaluating audit evidence relating to the probability of default and loss
given default assumptions and management’s judgment regarding qualitative factors; and (iii) the audit effort involved the
use of professionals with specialized skill and knowledge.
Addressing the matter involved performing procedures and evaluating audit evidence in connection with forming our
overall opinion on the consolidated financial statements. These procedures included testing the effectiveness of controls
relating to the Company’s determination of the consumer finance receivables allowance for credit losses. These
procedures also included, among others (i) testing management’s process for determining the consumer finance
receivables allowance for credit losses; (ii) evaluating the appropriateness of the models used to determine the allowance;
(iii) evaluating the reasonableness of the probability of default and loss given default assumptions; (iv) testing the data
used in the models; and (v) evaluating the reasonableness of management’s judgment regarding qualitative factors
related to economic uncertainty, observable changes in portfolio performance, and other relevant factors. Professionals
with specialized skill and knowledge were used to assist in performing the procedures described in (i) through (v).
/s/ PricewaterhouseCoopers LLP
Detroit, Michigan
February 10, 2026
We have served as the Company’s auditor since 1946.
110
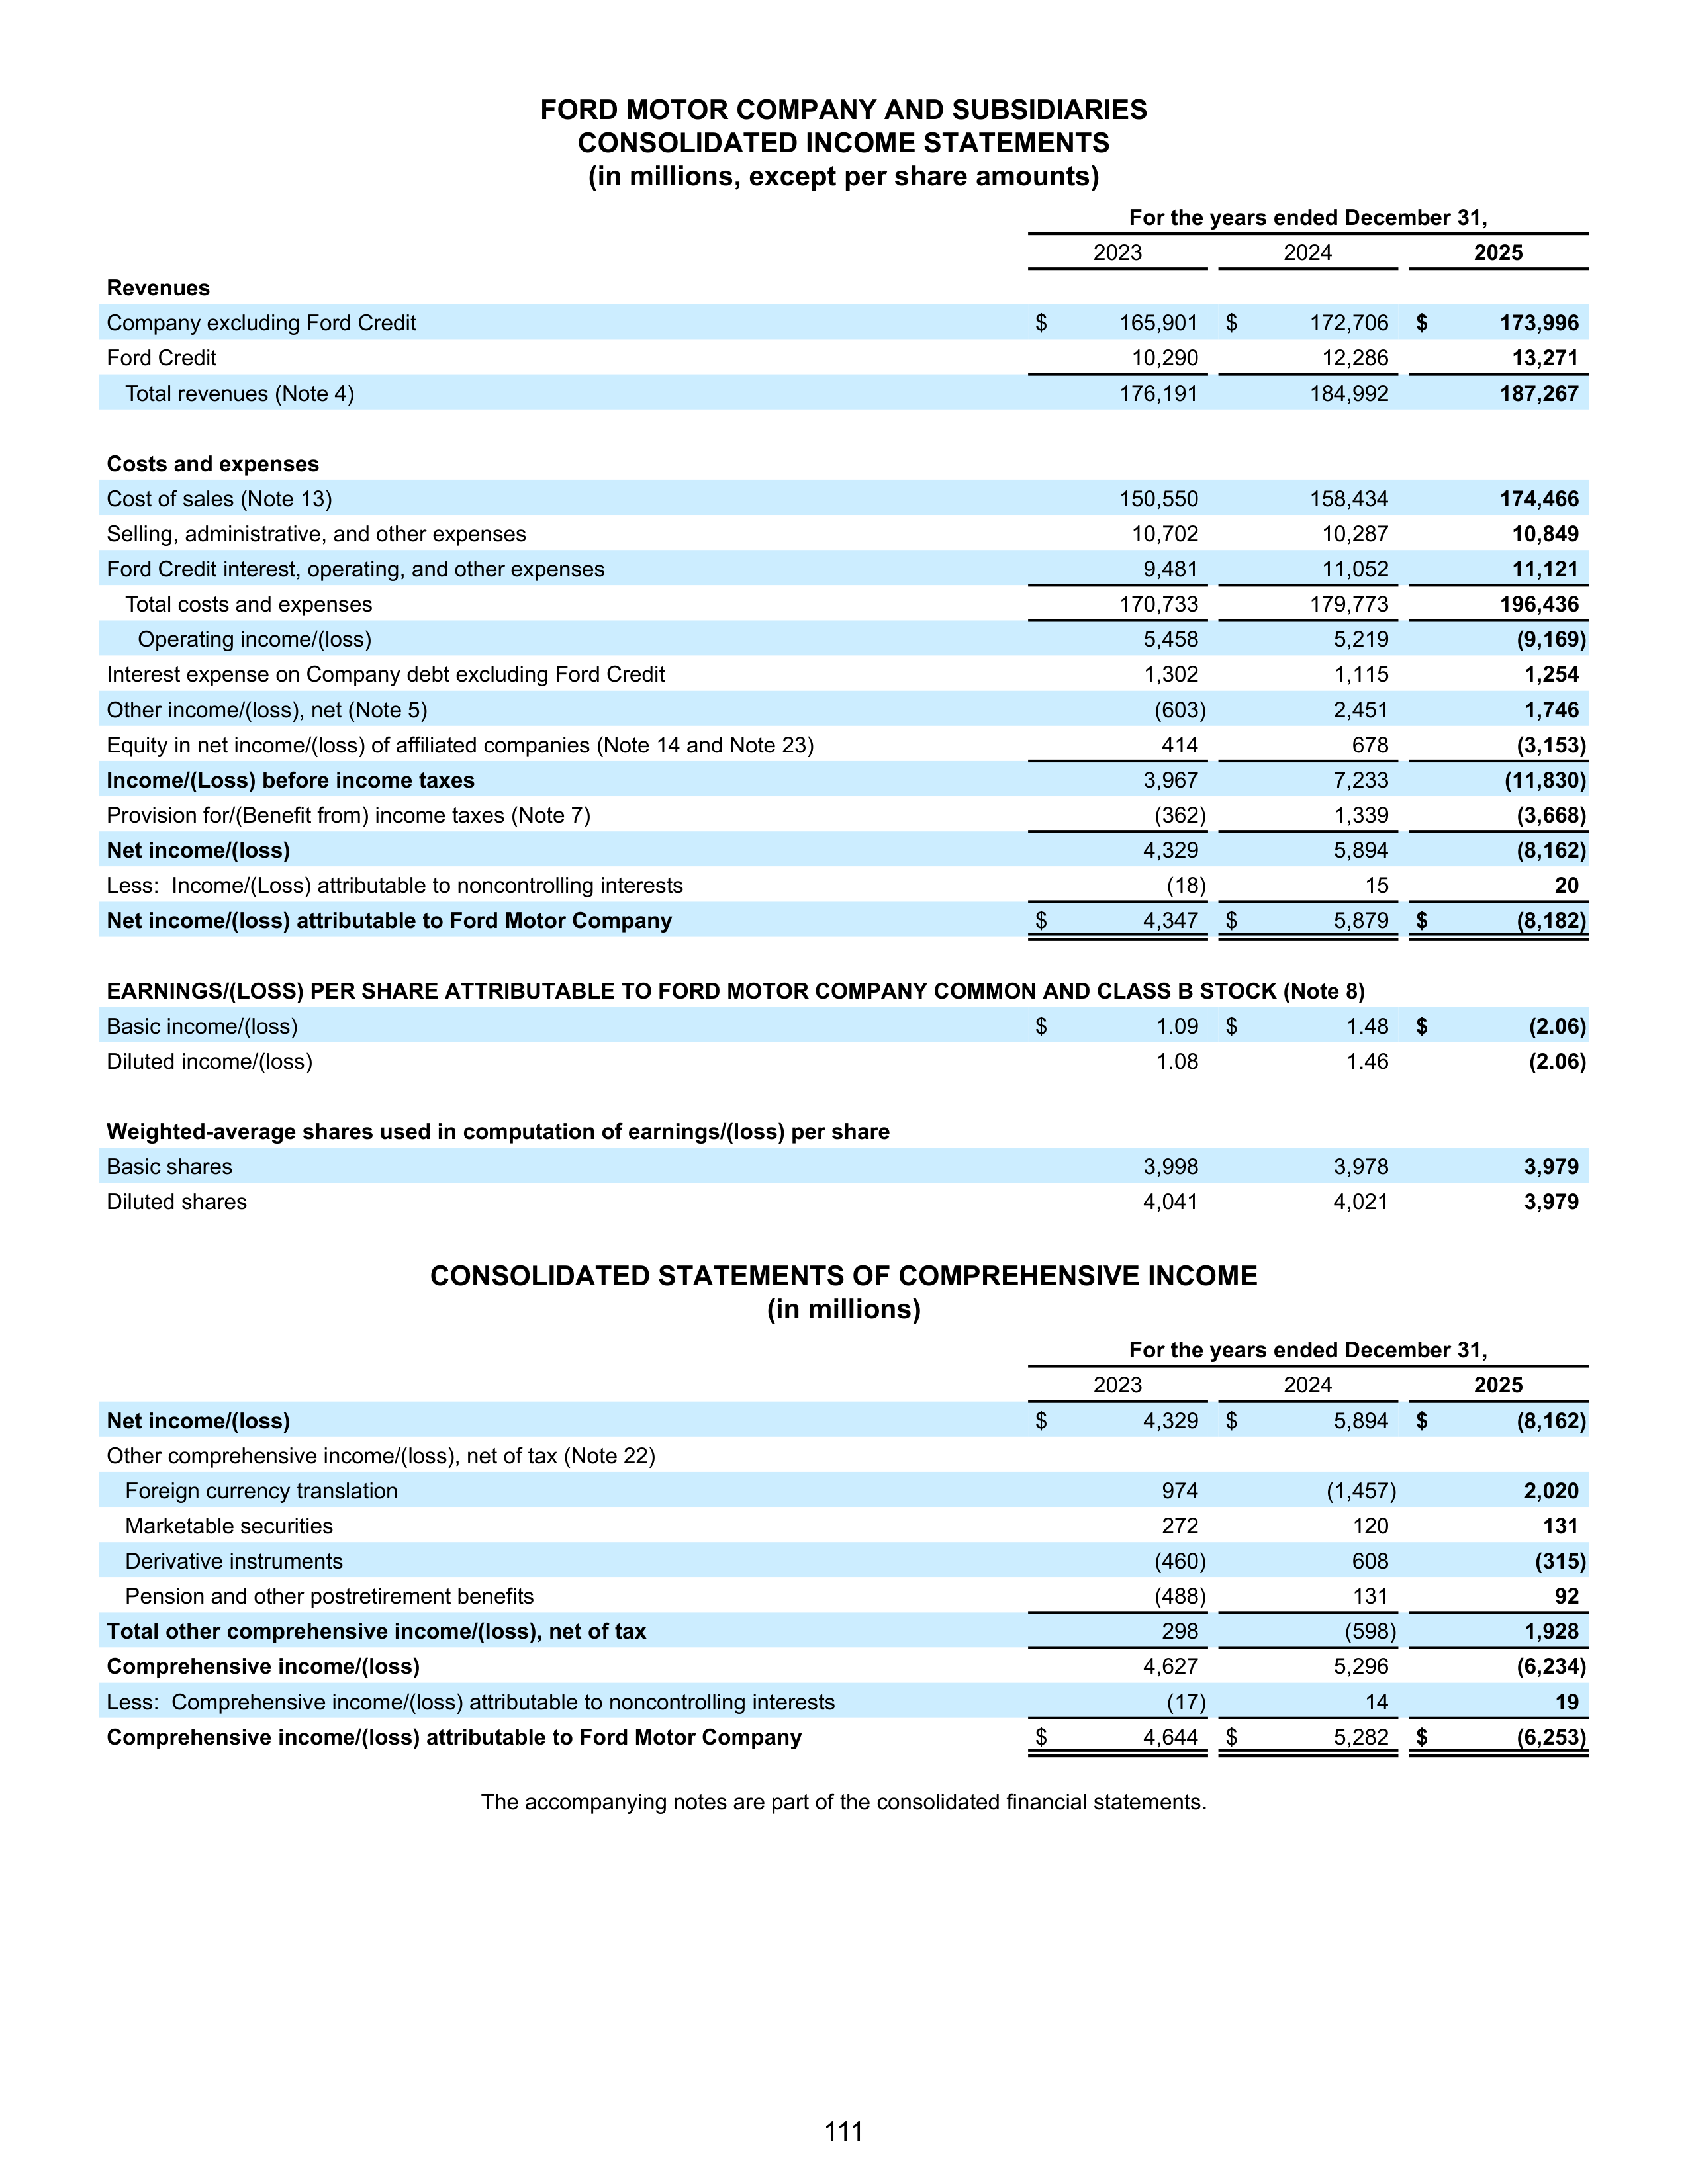
FORD MOTOR COMPANY AND SUBSIDIARIES
CONSOLIDATED INCOME STATEMENTS
(in millions, except per share amounts)
For the years ended December 31,
2023
2024
2025
Revenues
Company excluding Ford Credit
$
165,901
$
172,706
$
173,996
Ford Credit
10,290
12,286
13,271
Total revenues (Note 4)
176,191
184,992
187,267
Costs and expenses
Cost of sales (Note 13)
150,550
158,434
174,466
Selling, administrative, and other expenses
10,702
10,287
10,849
Ford Credit interest, operating, and other expenses
9,481
11,052
11,121
Total costs and expenses
170,733
179,773
196,436
Operating income/(loss)
5,458
5,219
(9,169)
Interest expense on Company debt excluding Ford Credit
1,302
1,115
1,254
Other income/(loss), net (Note 5)
(603)
2,451
1,746
Equity in net income/(loss) of affiliated companies (Note 14 and Note 23)
414
678
(3,153)
Income/(Loss) before income taxes
3,967
7,233
(11,830)
Provision for/(Benefit from) income taxes (Note 7)
(362)
1,339
(3,668)
Net income/(loss)
4,329
5,894
(8,162)
Less: Income/(Loss) attributable to noncontrolling interests
(18)
15
20
Net income/(loss) attributable to Ford Motor Company
$
4,347
$
5,879
$
(8,182)
EARNINGS/(LOSS) PER SHARE ATTRIBUTABLE TO FORD MOTOR COMPANY COMMON AND CLASS B STOCK (Note 8)
Basic income/(loss)
$
1.09
$
1.48
$
(2.06)
Diluted income/(loss)
1.08
1.46
(2.06)
Weighted-average shares used in computation of earnings/(loss) per share
Basic shares
3,998
3,978
3,979
Diluted shares
4,041
4,021
3,979
CONSOLIDATED STATEMENTS OF COMPREHENSIVE INCOME
(in millions)
For the years ended December 31,
2023
2024
2025
Net income/(loss)
$
4,329
$
5,894
$
(8,162)
Other comprehensive income/(loss), net of tax (Note 22)
Foreign currency translation
974
(1,457)
2,020
Marketable securities
272
120
131
Derivative instruments
(460)
608
(315)
Pension and other postretirement benefits
(488)
131
92
Total other comprehensive income/(loss), net of tax
298
(598)
1,928
Comprehensive income/(loss)
4,627
5,296
(6,234)
Less: Comprehensive income/(loss) attributable to noncontrolling interests
(17)
14
19
Comprehensive income/(loss) attributable to Ford Motor Company
$
4,644
$
5,282
$
(6,253)
The accompanying notes are part of the consolidated financial statements.
111
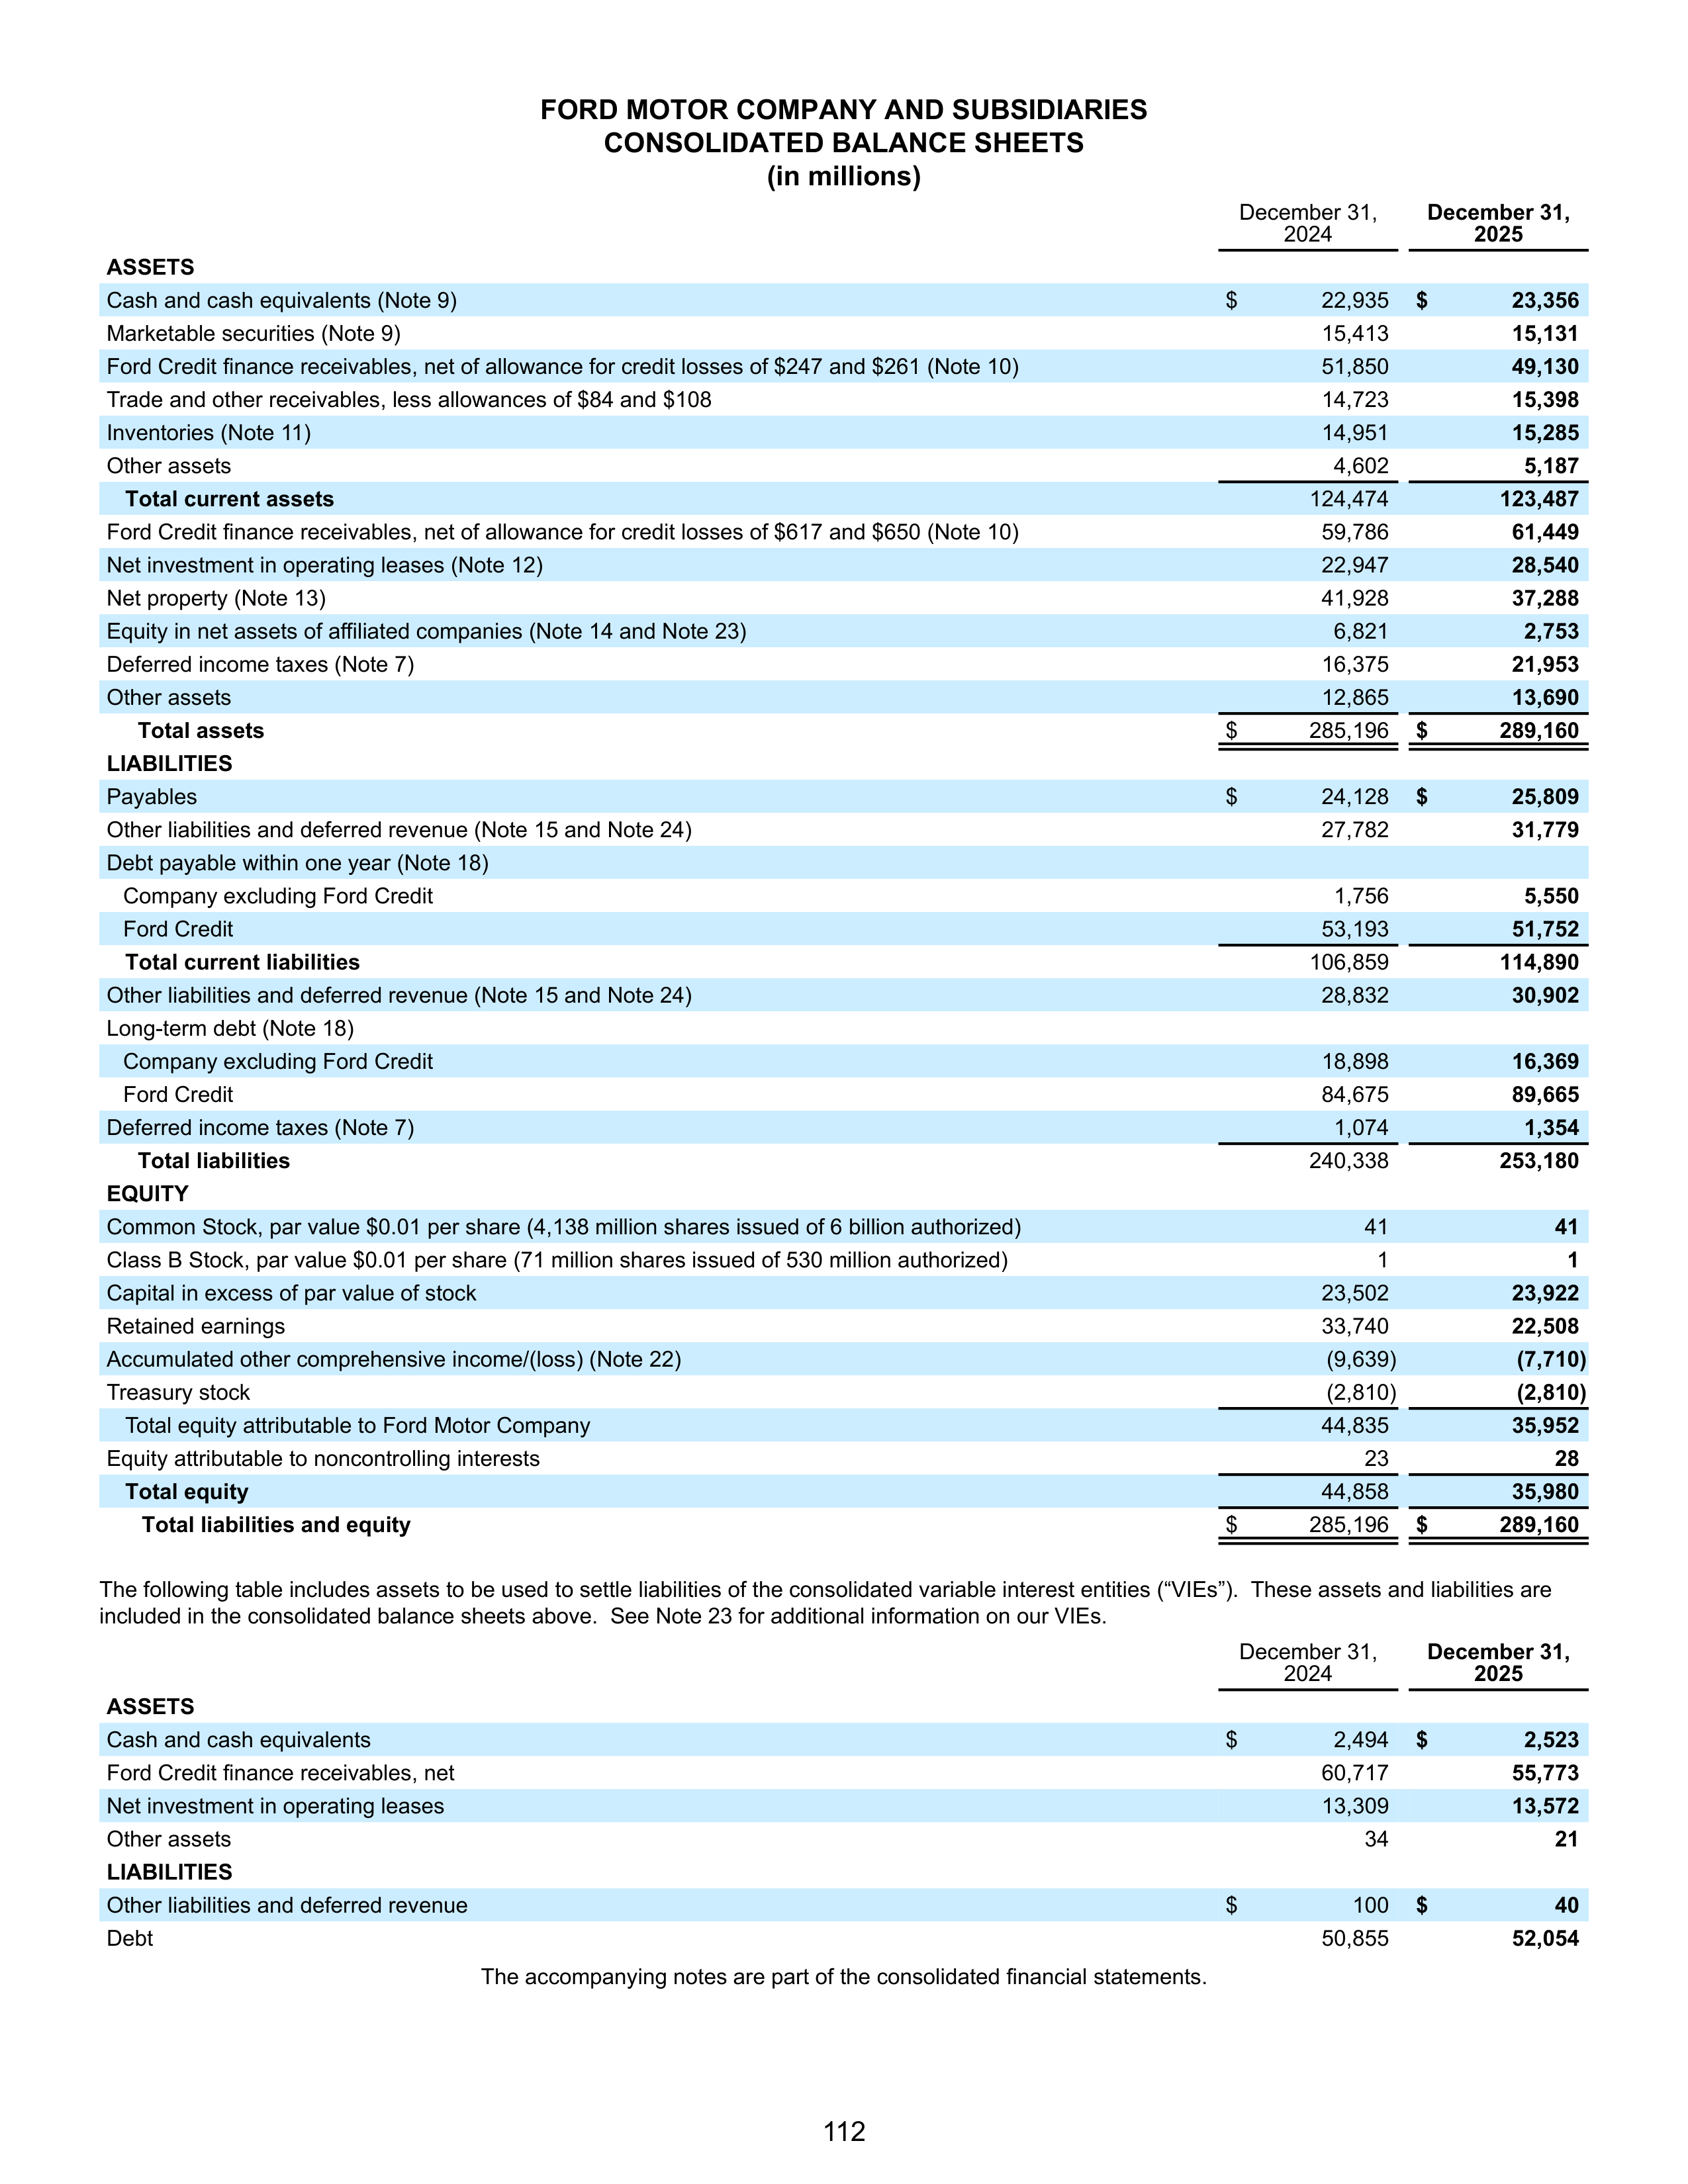
FORD MOTOR COMPANY AND SUBSIDIARIES
CONSOLIDATED BALANCE SHEETS
(in millions)
December 31,
2024
December 31,
2025
ASSETS
Cash and cash equivalents (Note 9)
$
22,935
$
23,356
Marketable securities (Note 9)
15,413
15,131
Ford Credit finance receivables, net of allowance for credit losses of $247 and $261 (Note 10)
51,850
49,130
Trade and other receivables, less allowances of $84 and $108
14,723
15,398
Inventories (Note 11)
14,951
15,285
Other assets
4,602
5,187
Total current assets
124,474
123,487
Ford Credit finance receivables, net of allowance for credit losses of $617 and $650 (Note 10)
59,786
61,449
Net investment in operating leases (Note 12)
22,947
28,540
Net property (Note 13)
41,928
37,288
Equity in net assets of affiliated companies (Note 14 and Note 23)
6,821
2,753
Deferred income taxes (Note 7)
16,375
21,953
Other assets
12,865
13,690
Total assets
$
285,196
$
289,160
LIABILITIES
Payables
$
24,128
$
25,809
Other liabilities and deferred revenue (Note 15 and Note 24)
27,782
31,779
Debt payable within one year (Note 18)
Company excluding Ford Credit
1,756
5,550
Ford Credit
53,193
51,752
Total current liabilities
106,859
114,890
Other liabilities and deferred revenue (Note 15 and Note 24)
28,832
30,902
Long-term debt (Note 18)
Company excluding Ford Credit
18,898
16,369
Ford Credit
84,675
89,665
Deferred income taxes (Note 7)
1,074
1,354
Total liabilities
240,338
253,180
EQUITY
Common Stock, par value $0.01 per share (4,138 million shares issued of 6 billion authorized)
41
41
Class B Stock, par value $0.01 per share (71 million shares issued of 530 million authorized)
1
1
Capital in excess of par value of stock
23,502
23,922
Retained earnings
33,740
22,508
Accumulated other comprehensive income/(loss) (Note 22)
(9,639)
(7,710)
Treasury stock
(2,810)
(2,810)
Total equity attributable to Ford Motor Company
44,835
35,952
Equity attributable to noncontrolling interests
23
28
Total equity
44,858
35,980
Total liabilities and equity
$
285,196
$
289,160
The following table includes assets to be used to settle liabilities of the consolidated variable interest entities (“VIEs”). These assets and liabilities are
included in the consolidated balance sheets above. See Note 23 for additional information on our VIEs.
December 31,
2024
December 31,
2025
ASSETS
Cash and cash equivalents
$
2,494
$
2,523
Ford Credit finance receivables, net
60,717
55,773
Net investment in operating leases
13,309
13,572
Other assets
34
21
LIABILITIES
Other liabilities and deferred revenue
$
100
$
40
Debt
50,855
52,054
The accompanying notes are part of the consolidated financial statements.
112
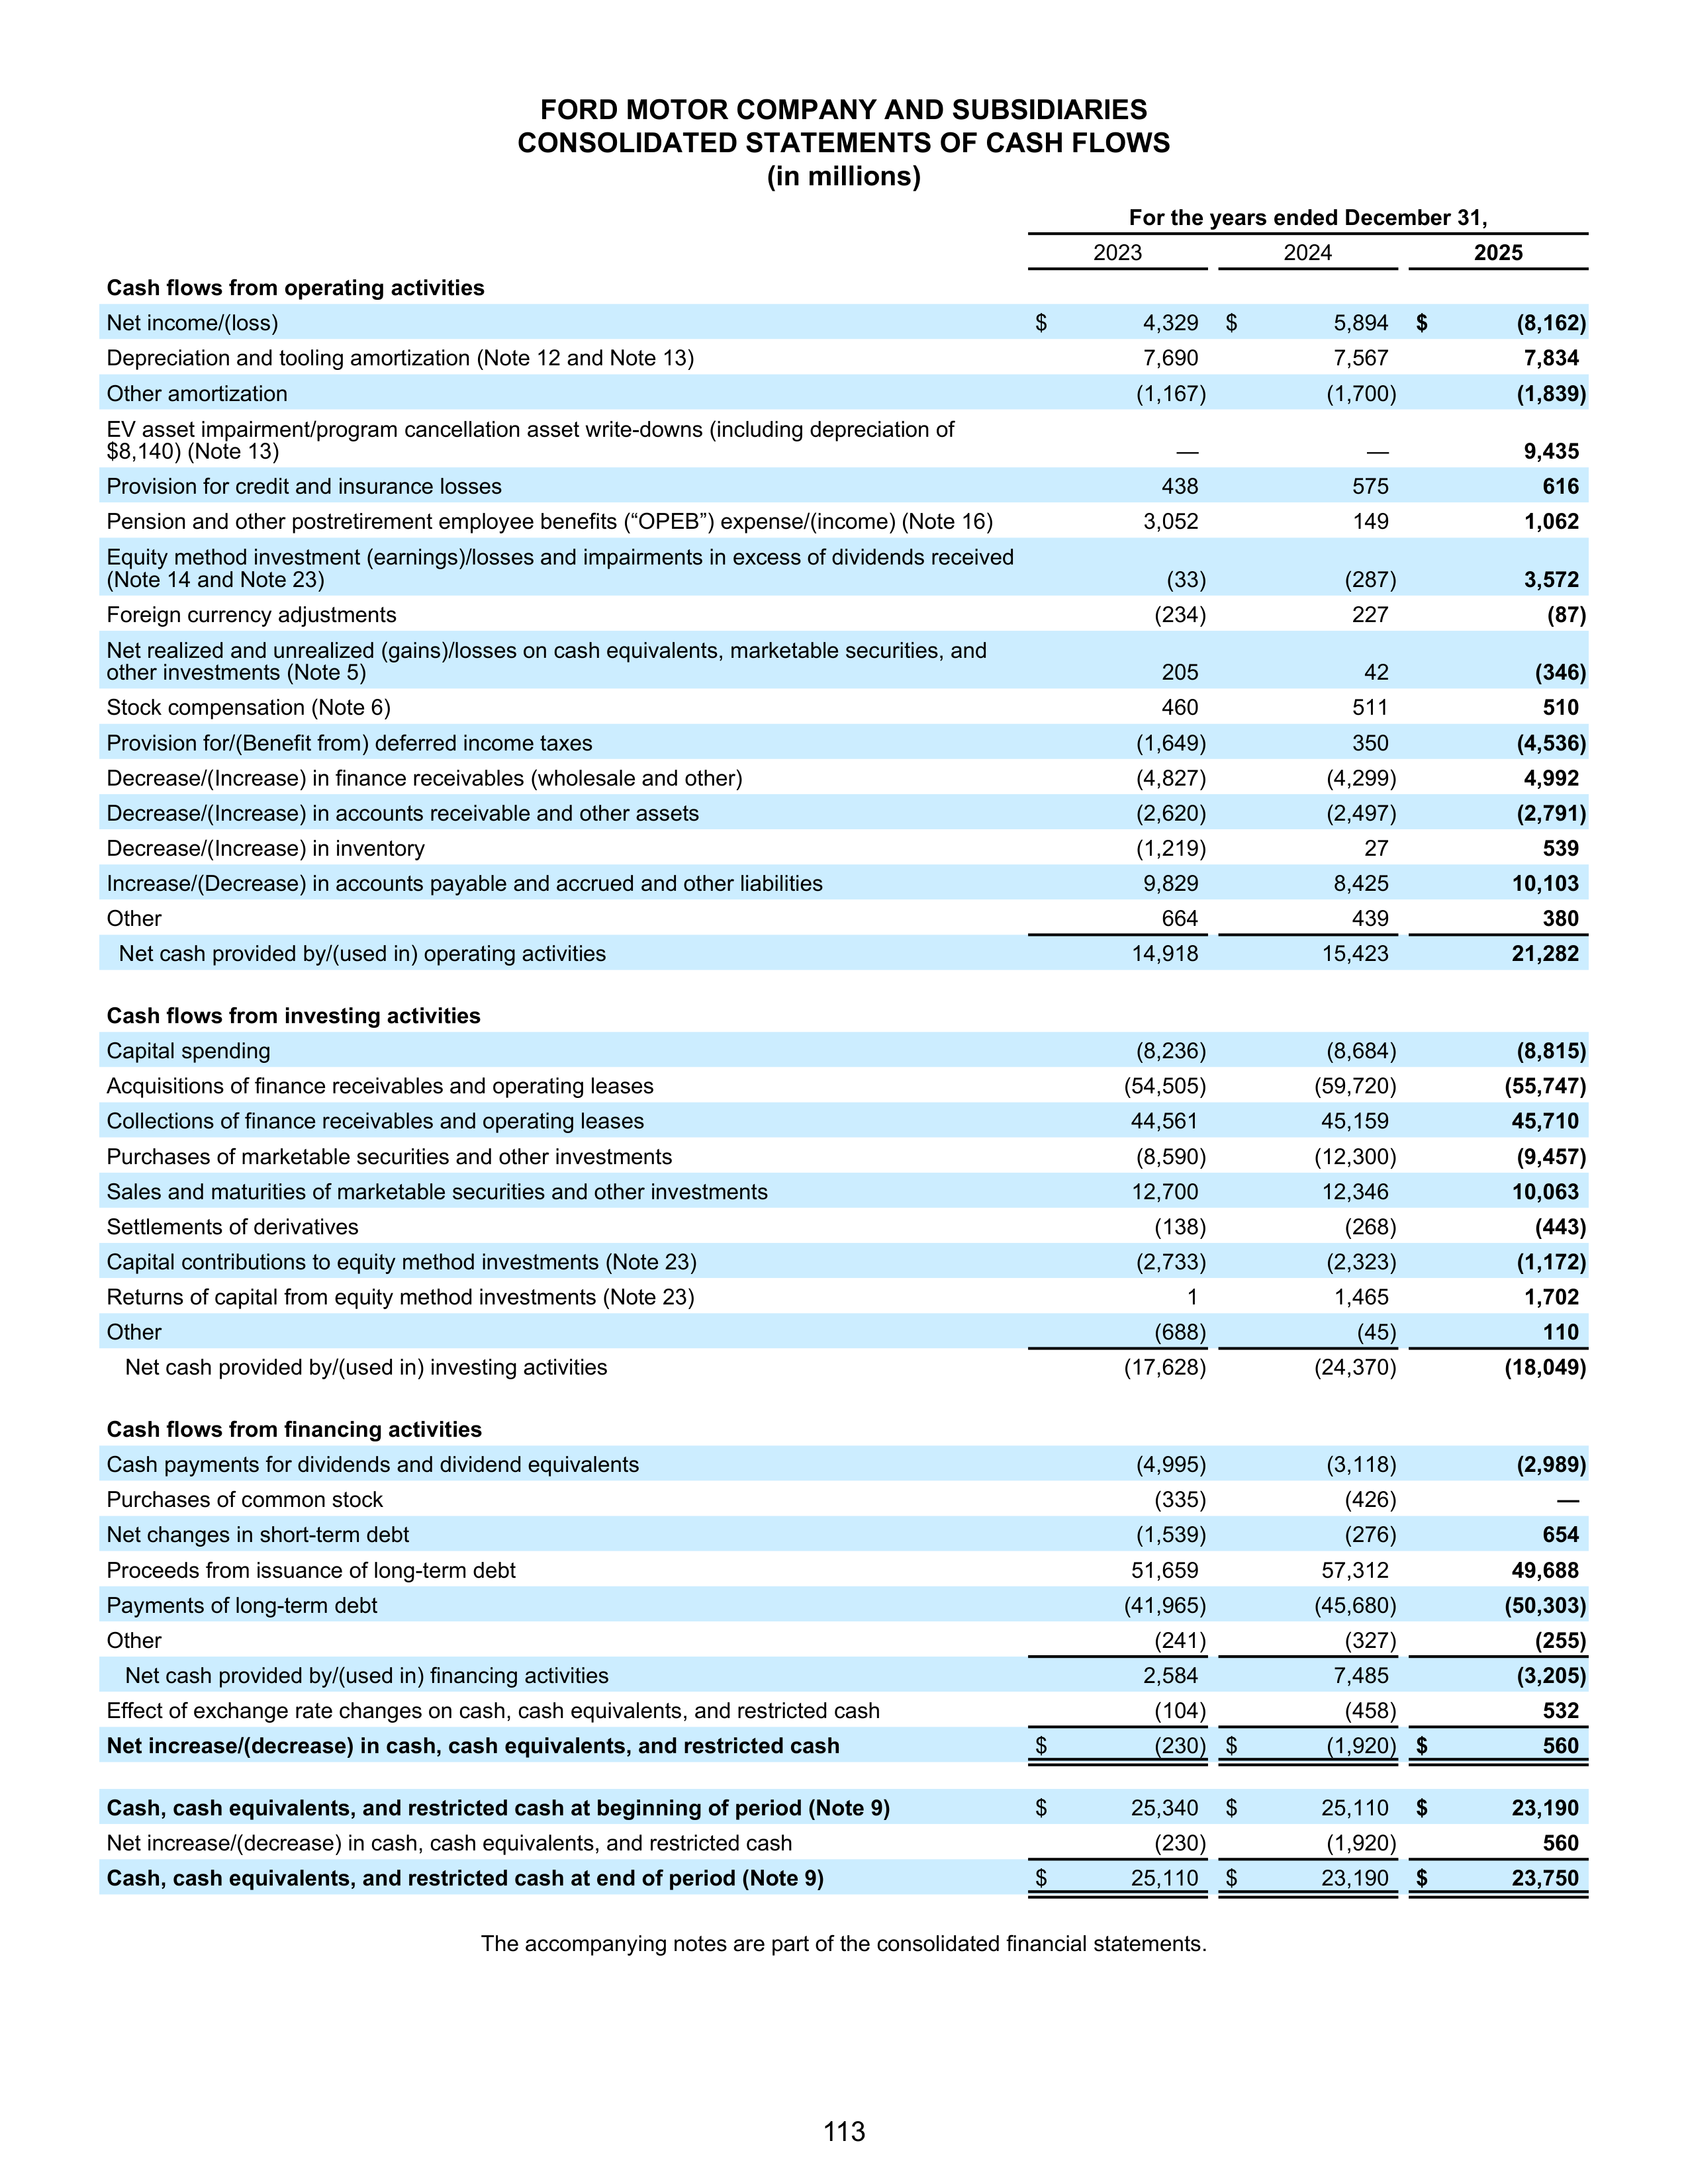
FORD MOTOR COMPANY AND SUBSIDIARIES
CONSOLIDATED STATEMENTS OF CASH FLOWS
(in millions)
For the years ended December 31,
2023
2024
2025
Cash flows from operating activities
Net income/(loss)
$
4,329
$
5,894
$
(8,162)
Depreciation and tooling amortization (Note 12 and Note 13)
7,690
7,567
7,834
Other amortization
(1,167)
(1,700)
(1,839)
EV asset impairment/program cancellation asset write-downs (including depreciation of
$8,140) (Note 13)
—
—
9,435
Provision for credit and insurance losses
438
575
616
Pension and other postretirement employee benefits (“OPEB”) expense/(income) (Note 16)
3,052
149
1,062
Equity method investment (earnings)/losses and impairments in excess of dividends received
(Note 14 and Note 23)
(33)
(287)
3,572
Foreign currency adjustments
(234)
227
(87)
Net realized and unrealized (gains)/losses on cash equivalents, marketable securities, and
other investments (Note 5)
205
42
(346)
Stock compensation (Note 6)
460
511
510
Provision for/(Benefit from) deferred income taxes
(1,649)
350
(4,536)
Decrease/(Increase) in finance receivables (wholesale and other)
(4,827)
(4,299)
4,992
Decrease/(Increase) in accounts receivable and other assets
(2,620)
(2,497)
(2,791)
Decrease/(Increase) in inventory
(1,219)
27
539
Increase/(Decrease) in accounts payable and accrued and other liabilities
9,829
8,425
10,103
Other
664
439
380
Net cash provided by/(used in) operating activities
14,918
15,423
21,282
Cash flows from investing activities
Capital spending
(8,236)
(8,684)
(8,815)
Acquisitions of finance receivables and operating leases
(54,505)
(59,720)
(55,747)
Collections of finance receivables and operating leases
44,561
45,159
45,710
Purchases of marketable securities and other investments
(8,590)
(12,300)
(9,457)
Sales and maturities of marketable securities and other investments
12,700
12,346
10,063
Settlements of derivatives
(138)
(268)
(443)
Capital contributions to equity method investments (Note 23)
(2,733)
(2,323)
(1,172)
Returns of capital from equity method investments (Note 23)
1
1,465
1,702
Other
(688)
(45)
110
Net cash provided by/(used in) investing activities
(17,628)
(24,370)
(18,049)
Cash flows from financing activities
Cash payments for dividends and dividend equivalents
(4,995)
(3,118)
(2,989)
Purchases of common stock
(335)
(426)
—
Net changes in short-term debt
(1,539)
(276)
654
Proceeds from issuance of long-term debt
51,659
57,312
49,688
Payments of long-term debt
(41,965)
(45,680)
(50,303)
Other
(241)
(327)
(255)
Net cash provided by/(used in) financing activities
2,584
7,485
(3,205)
Effect of exchange rate changes on cash, cash equivalents, and restricted cash
(104)
(458)
532
Net increase/(decrease) in cash, cash equivalents, and restricted cash
$
(230) $
(1,920)
$
560
Cash, cash equivalents, and restricted cash at beginning of period (Note 9)
$
25,340
$
25,110
$
23,190
Net increase/(decrease) in cash, cash equivalents, and restricted cash
(230)
(1,920)
560
Cash, cash equivalents, and restricted cash at end of period (Note 9)
$
25,110
$
23,190
$
23,750
The accompanying notes are part of the consolidated financial statements.
113
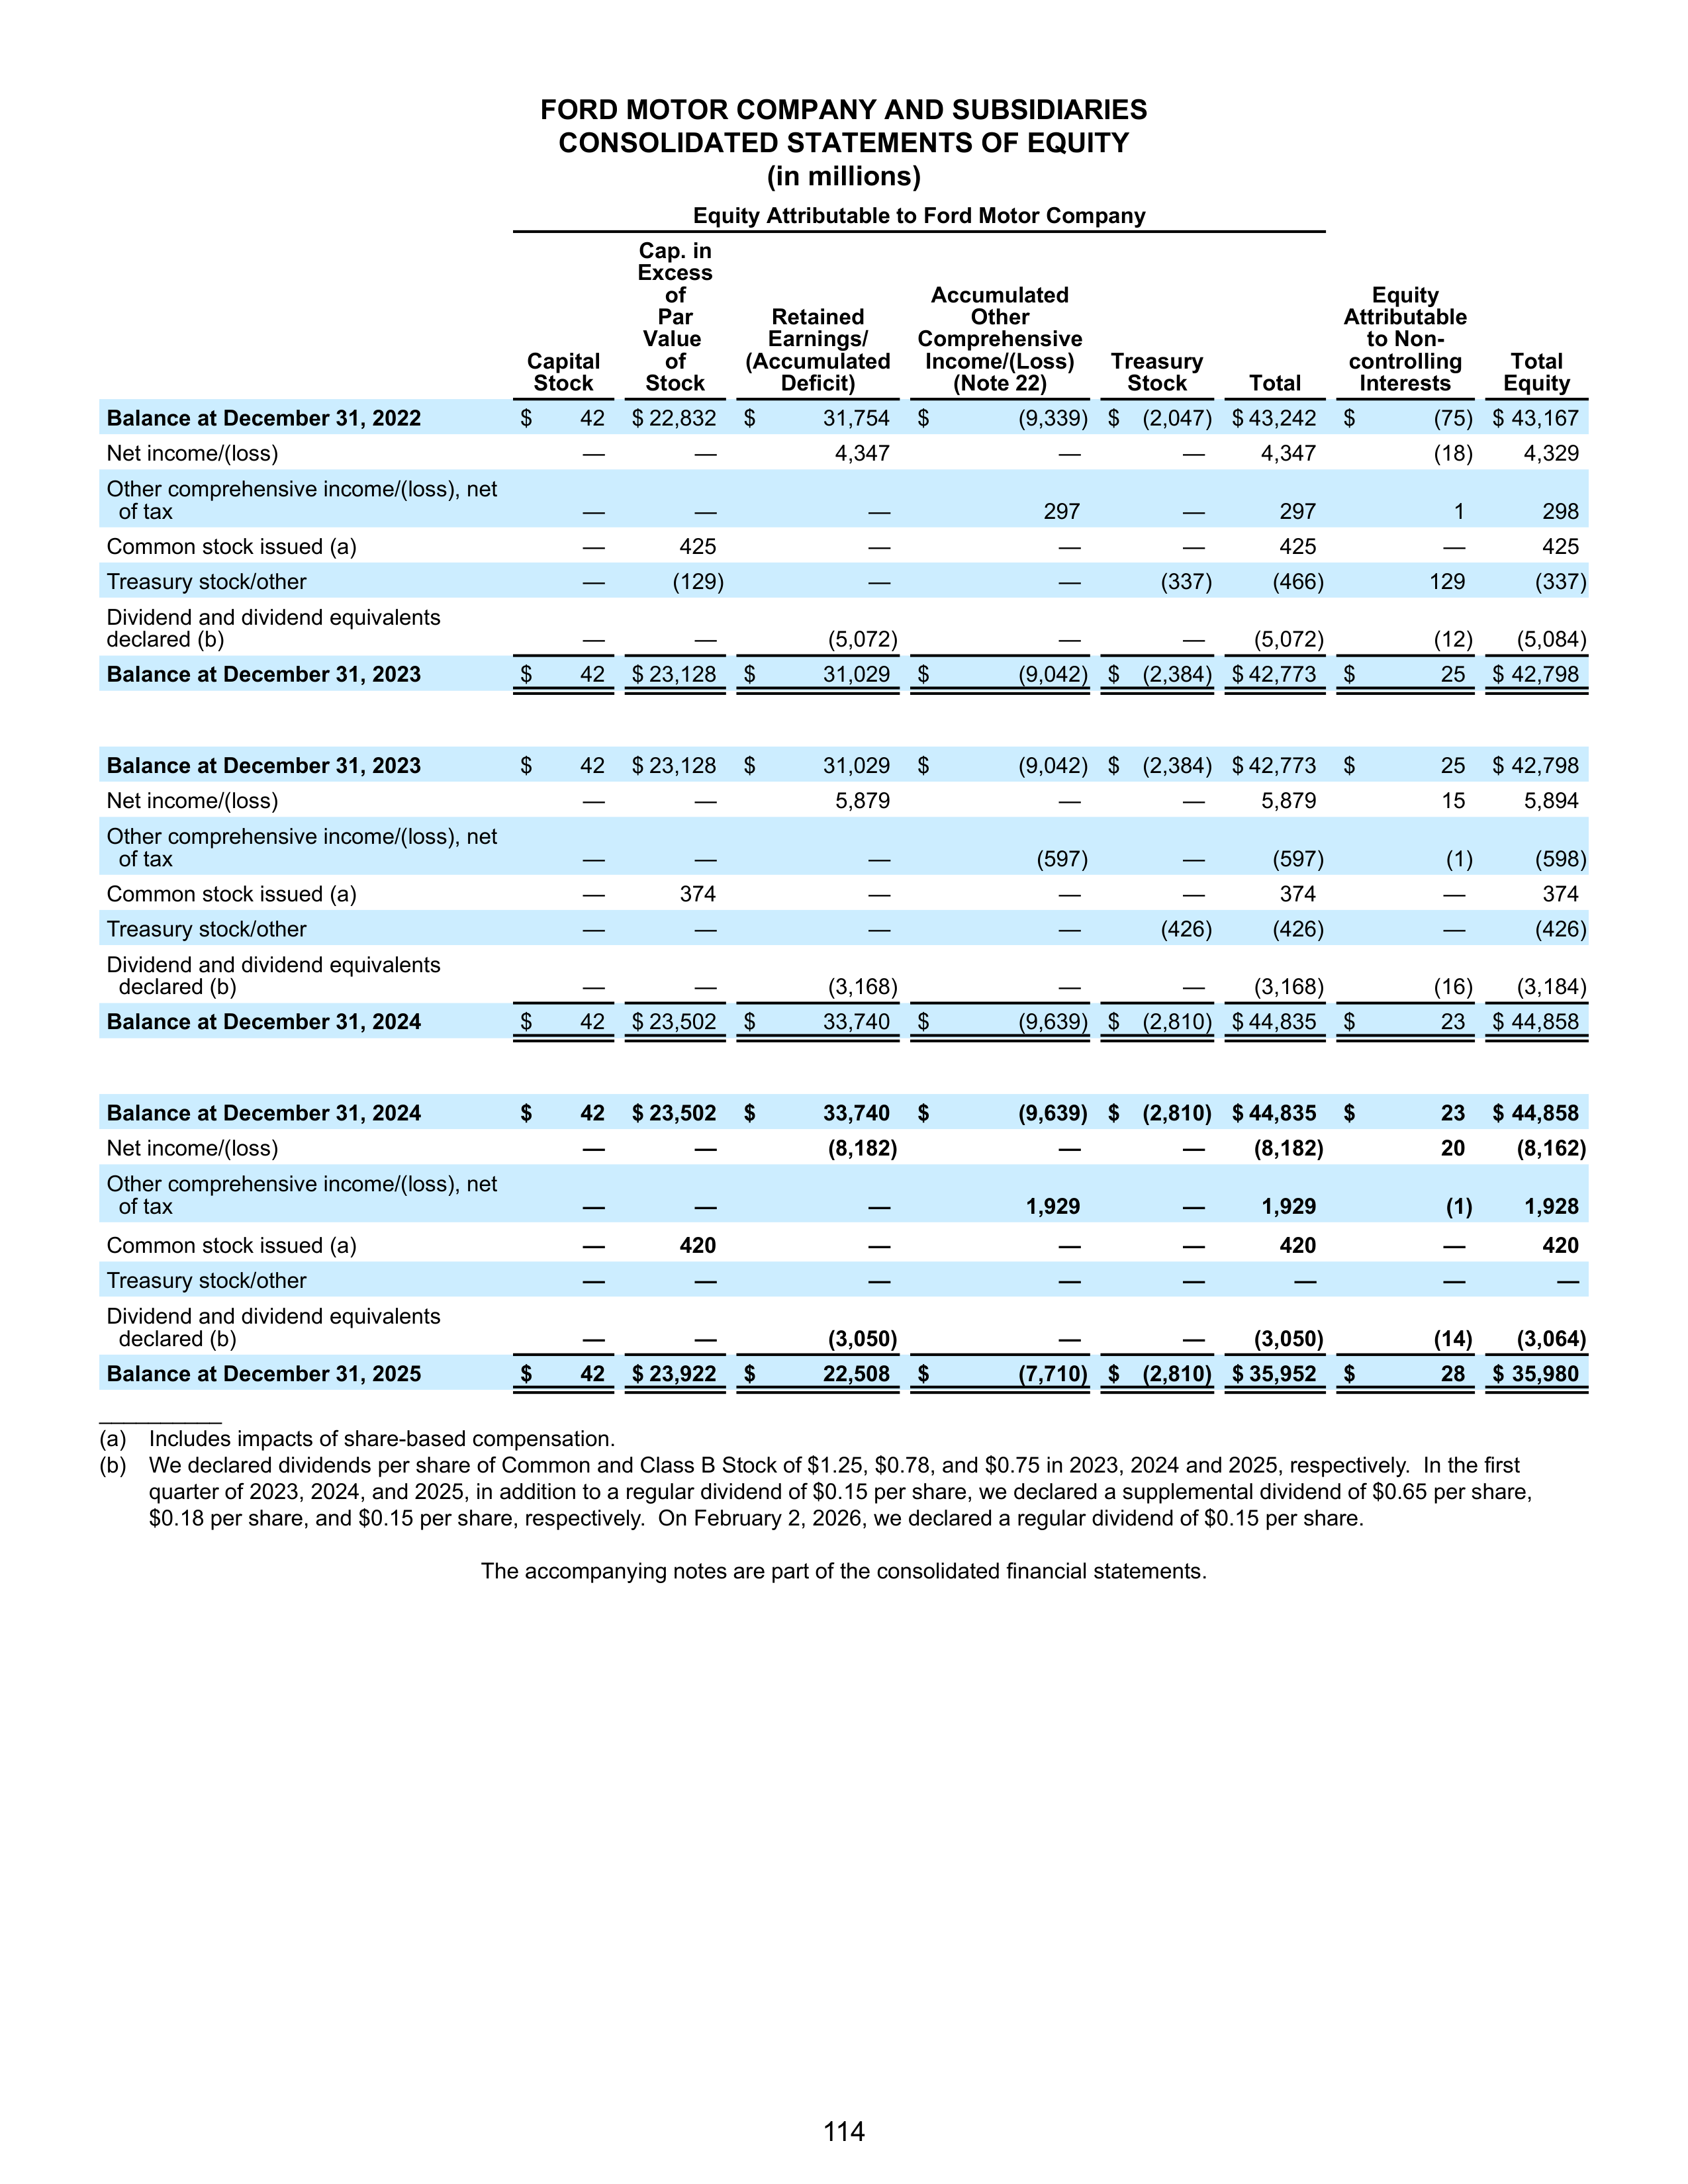
FORD MOTOR COMPANY AND SUBSIDIARIES
CONSOLIDATED STATEMENTS OF EQUITY
(in millions)
Balance at December 31, 2022
$
42
$ 22,832
$
31,754
$
(9,339) $ (2,047) $ 43,242
$
(75) $ 43,167
Net income/(loss)
—
—
4,347
—
—
4,347
(18)
4,329
Other comprehensive income/(loss), net
of tax
—
—
—
297
—
297
1
298
Common stock issued (a)
—
425
—
—
—
425
—
425
Treasury stock/other
—
(129)
—
—
(337)
(466)
129
(337)
Dividend and dividend equivalents
declared (b)
—
—
(5,072)
—
—
(5,072)
(12)
(5,084)
Balance at December 31, 2023
$
42
$ 23,128
$
31,029
$
(9,042) $ (2,384) $ 42,773
$
25
$ 42,798
Balance at December 31, 2023
$
42
$ 23,128
$
31,029
$
(9,042) $ (2,384) $ 42,773
$
25
$ 42,798
Net income/(loss)
—
—
5,879
—
—
5,879
15
5,894
Other comprehensive income/(loss), net
of tax
—
—
—
(597)
—
(597)
(1)
(598)
Common stock issued (a)
—
374
—
—
—
374
—
374
Treasury stock/other
—
—
—
—
(426)
(426)
—
(426)
Dividend and dividend equivalents
declared (b)
—
—
(3,168)
—
—
(3,168)
(16)
(3,184)
Balance at December 31, 2024
$
42
$ 23,502
$
33,740
$
(9,639) $ (2,810) $ 44,835
$
23
$ 44,858
Balance at December 31, 2024
$
42
$ 23,502
$
33,740
$
(9,639) $ (2,810) $ 44,835
$
23
$ 44,858
Net income/(loss)
—
—
(8,182)
—
—
(8,182)
20
(8,162)
Other comprehensive income/(loss), net
of tax
—
—
—
1,929
—
1,929
(1)
1,928
Common stock issued (a)
—
420
—
—
—
420
—
420
Treasury stock/other
—
—
—
—
—
—
—
—
Dividend and dividend equivalents
declared (b)
—
—
(3,050)
—
—
(3,050)
(14)
(3,064)
Balance at December 31, 2025
$
42
$ 23,922
$
22,508
$
(7,710) $ (2,810) $ 35,952
$
28
$ 35,980
Equity Attributable to Ford Motor Company
Capital
Stock
Cap. in
Excess
of
Par
Value
of
Stock
Retained
Earnings/
(Accumulated
Deficit)
Accumulated
Other
Comprehensive
Income/(Loss)
(Note 22)
Treasury
Stock
Total
Equity
Attributable
to Non-
controlling
Interests
Total
Equity
__________
(a)
Includes impacts of share-based compensation.
(b)
We declared dividends per share of Common and Class B Stock of $1.25, $0.78, and $0.75 in 2023, 2024 and 2025, respectively. In the first
quarter of 2023, 2024, and 2025, in addition to a regular dividend of $0.15 per share, we declared a supplemental dividend of $0.65 per share,
$0.18 per share, and $0.15 per share, respectively. On February 2, 2026, we declared a regular dividend of $0.15 per share.
The accompanying notes are part of the consolidated financial statements.
114
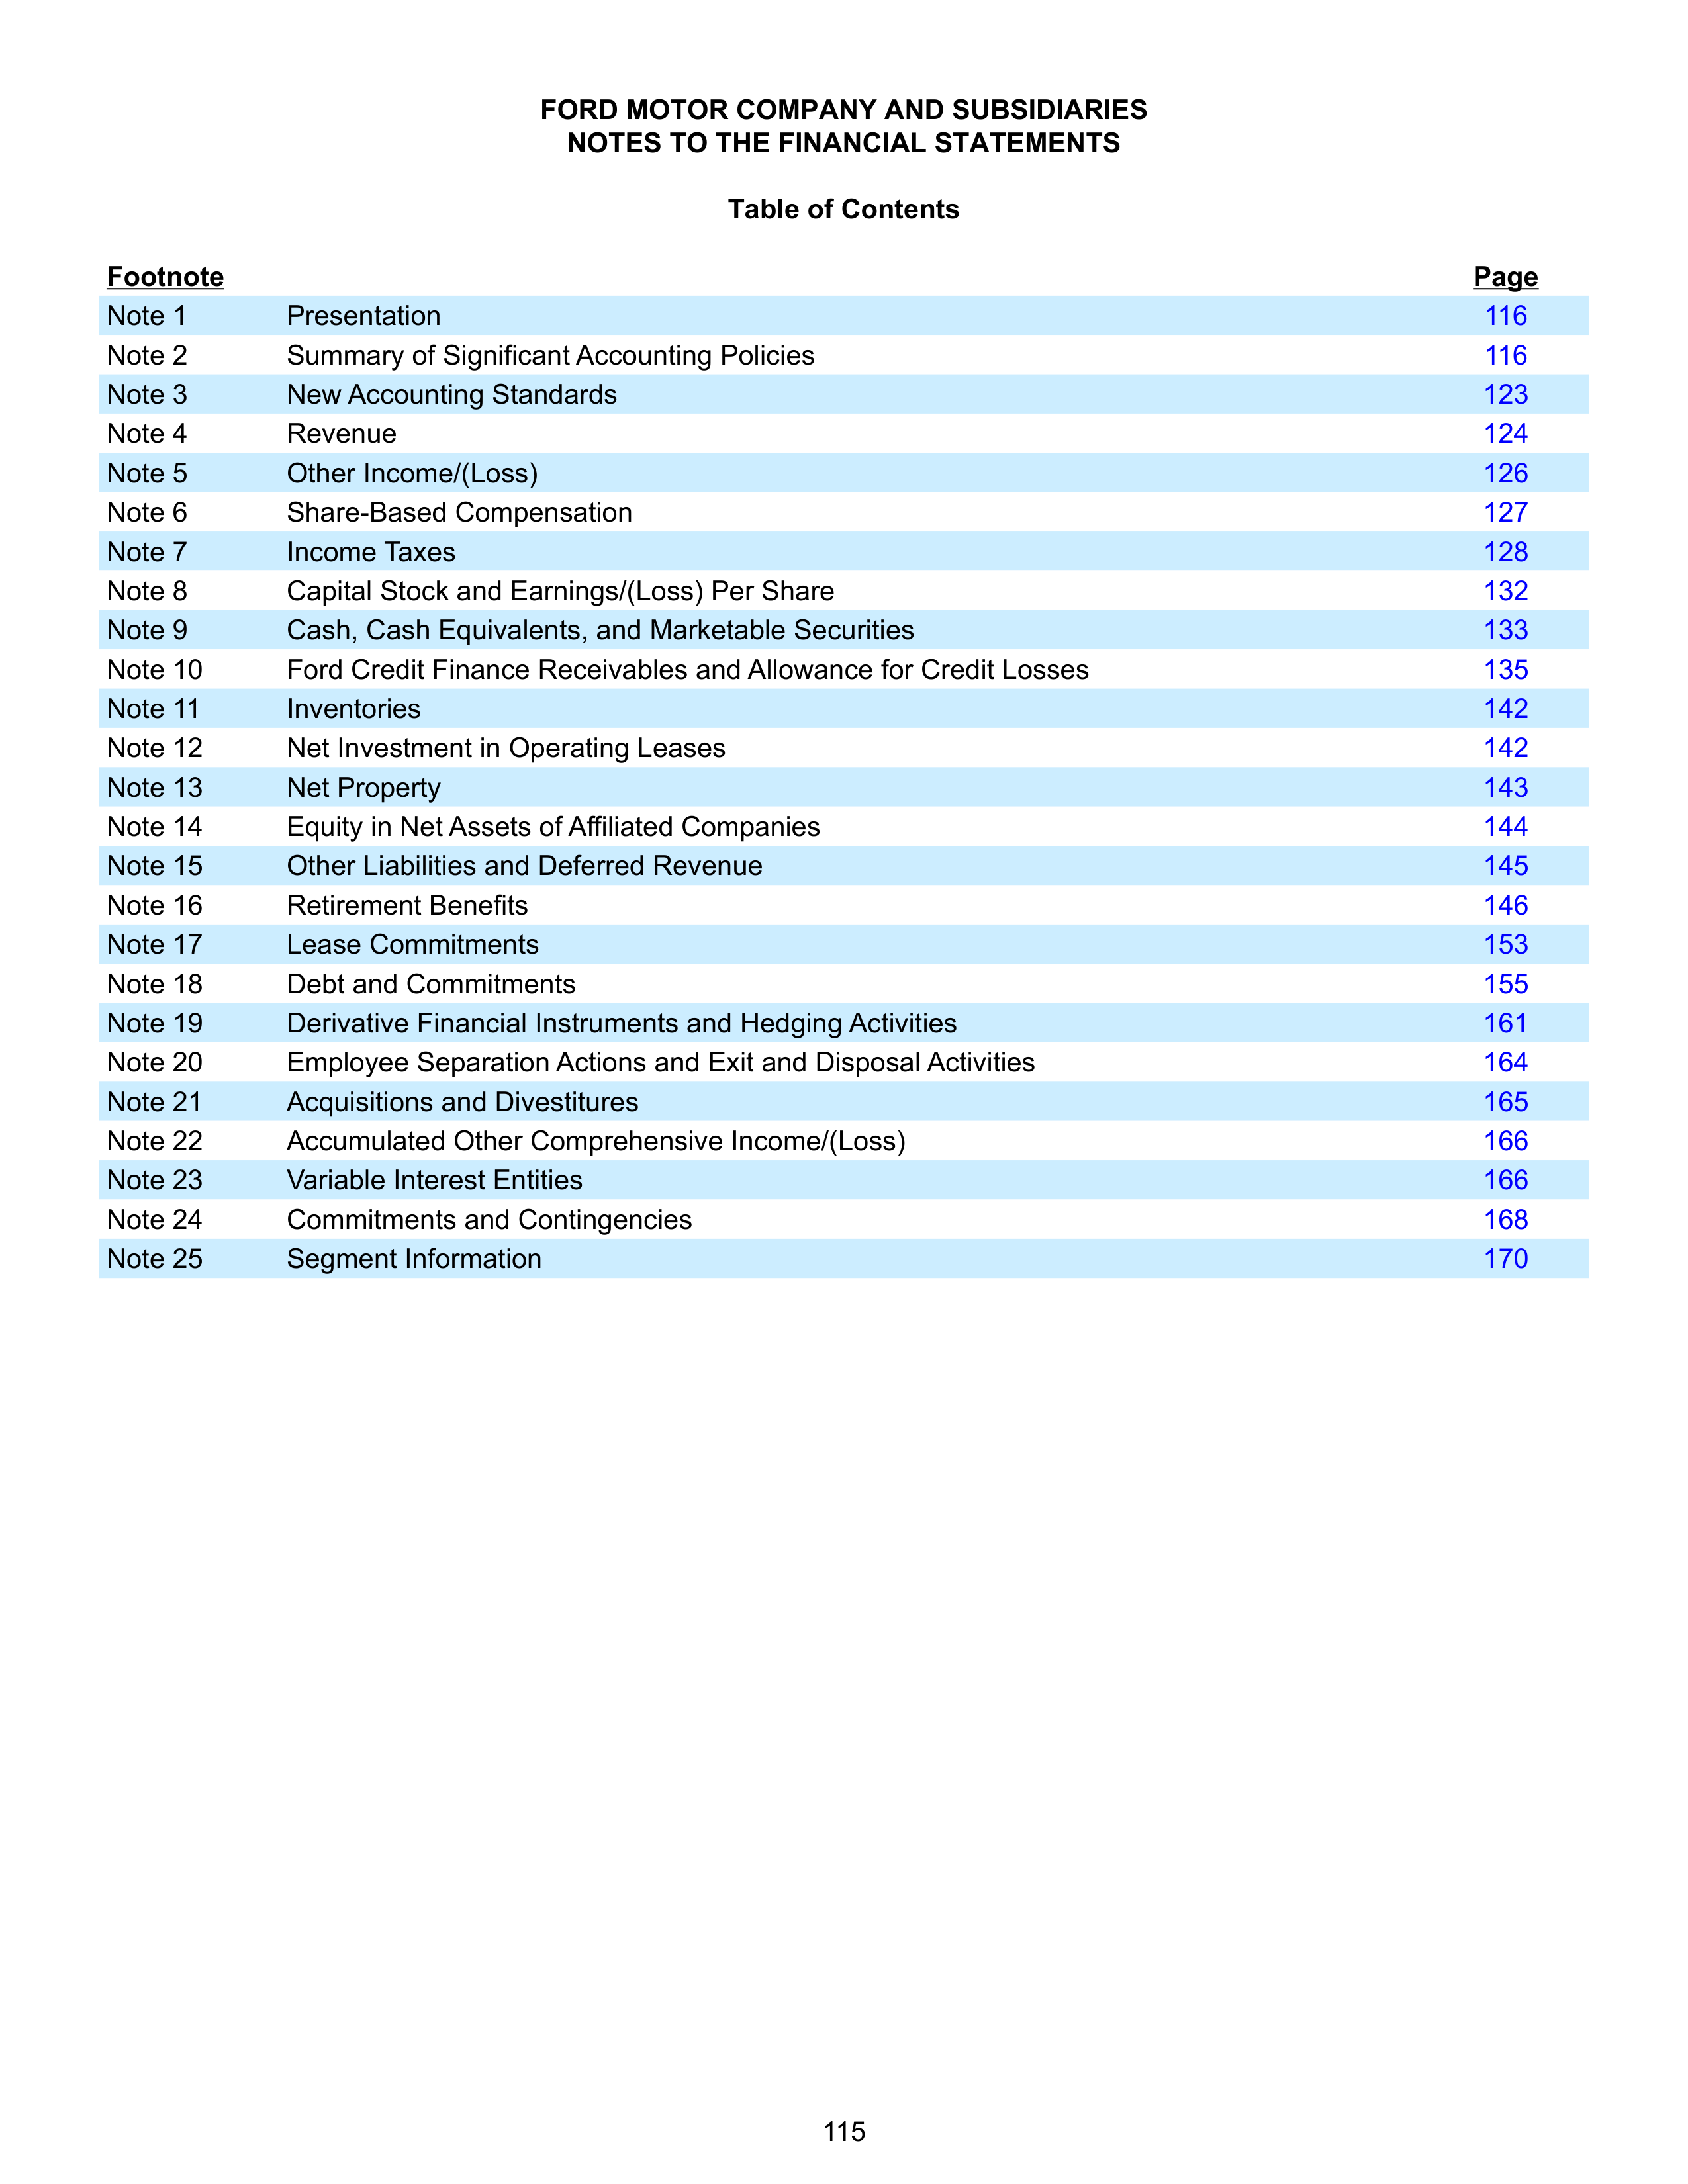
FORD MOTOR COMPANY AND SUBSIDIARIES
NOTES TO THE FINANCIAL STATEMENTS
Table of Contents
Footnote
Page
Note 1
Presentation
116
Note 2
Summary of Significant Accounting Policies
116
Note 3
New Accounting Standards
123
Note 4
Revenue
124
Note 5
Other Income/(Loss)
126
Note 6
Share-Based Compensation
127
Note 7
Income Taxes
128
Note 8
Capital Stock and Earnings/(Loss) Per Share
132
Note 9
Cash, Cash Equivalents, and Marketable Securities
133
Note 10
Ford Credit Finance Receivables and Allowance for Credit Losses
135
Note 11
Inventories
142
Note 12
Net Investment in Operating Leases
142
Note 13
Net Property
143
Note 14
Equity in Net Assets of Affiliated Companies
144
Note 15
Other Liabilities and Deferred Revenue
145
Note 16
Retirement Benefits
146
Note 17
Lease Commitments
153
Note 18
Debt and Commitments
155
Note 19
Derivative Financial Instruments and Hedging Activities
161
Note 20
Employee Separation Actions and Exit and Disposal Activities
164
Note 21
Acquisitions and Divestitures
165
Note 22
Accumulated Other Comprehensive Income/(Loss)
166
Note 23
Variable Interest Entities
166
Note 24
Commitments and Contingencies
168
Note 25
Segment Information
170
115
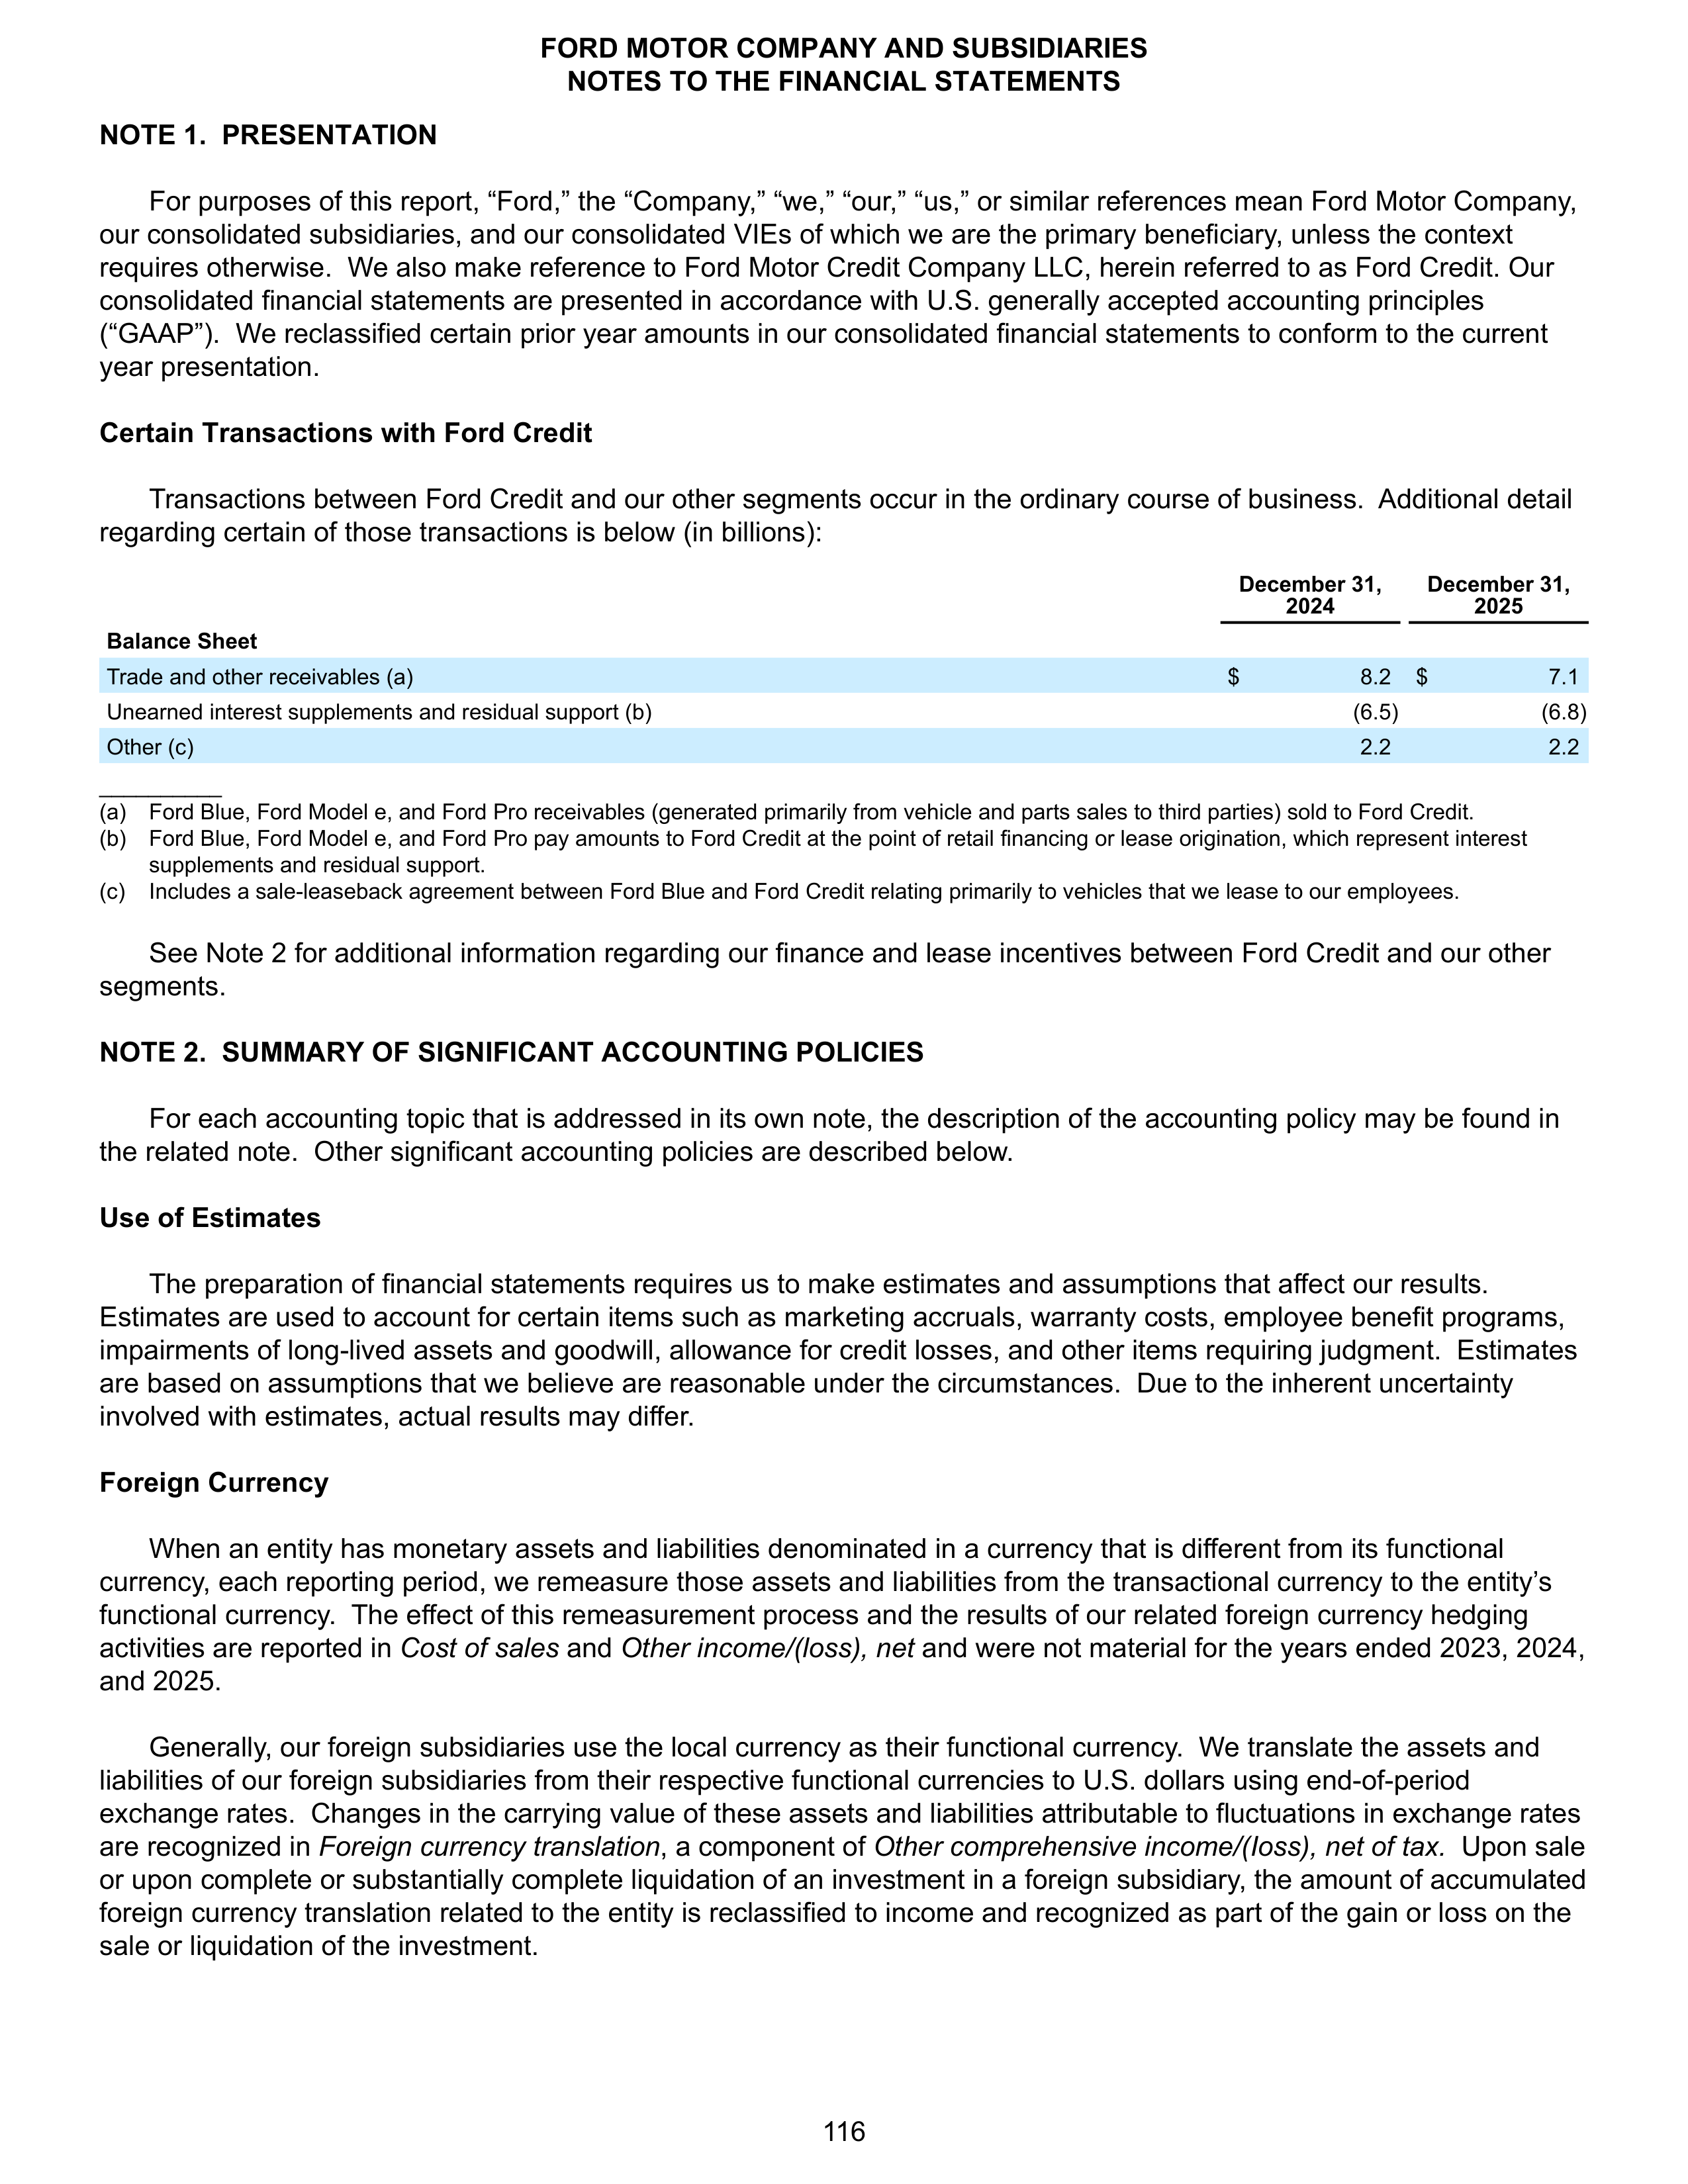
NOTE 1. PRESENTATION
For purposes of this report, “Ford,” the “Company,” “we,” “our,” “us,” or similar references mean Ford Motor Company,
our consolidated subsidiaries, and our consolidated VIEs of which we are the primary beneficiary, unless the context
requires otherwise. We also make reference to Ford Motor Credit Company LLC, herein referred to as Ford Credit. Our
consolidated financial statements are presented in accordance with U.S. generally accepted accounting principles
(“GAAP”). We reclassified certain prior year amounts in our consolidated financial statements to conform to the current
year presentation.
Certain Transactions with Ford Credit
Transactions between Ford Credit and our other segments occur in the ordinary course of business. Additional detail
regarding certain of those transactions is below (in billions):
December 31,
2024
December 31,
2025
Balance Sheet
Trade and other receivables (a)
$
8.2
$
7.1
Unearned interest supplements and residual support (b)
(6.5)
(6.8)
Other (c)
2.2
2.2
__________
(a)
Ford Blue, Ford Model e, and Ford Pro receivables (generated primarily from vehicle and parts sales to third parties) sold to Ford Credit.
(b)
Ford Blue, Ford Model e, and Ford Pro pay amounts to Ford Credit at the point of retail financing or lease origination, which represent interest
supplements and residual support.
(c)
Includes a sale-leaseback agreement between Ford Blue and Ford Credit relating primarily to vehicles that we lease to our employees.
See Note 2 for additional information regarding our finance and lease incentives between Ford Credit and our other
segments.
NOTE 2. SUMMARY OF SIGNIFICANT ACCOUNTING POLICIES
For each accounting topic that is addressed in its own note, the description of the accounting policy may be found in
the related note. Other significant accounting policies are described below.
Use of Estimates
The preparation of financial statements requires us to make estimates and assumptions that affect our results.
Estimates are used to account for certain items such as marketing accruals, warranty costs, employee benefit programs,
impairments of long-lived assets and goodwill, allowance for credit losses, and other items requiring judgment. Estimates
are based on assumptions that we believe are reasonable under the circumstances. Due to the inherent uncertainty
involved with estimates, actual results may differ.
Foreign Currency
When an entity has monetary assets and liabilities denominated in a currency that is different from its functional
currency, each reporting period, we remeasure those assets and liabilities from the transactional currency to the entity’s
functional currency. The effect of this remeasurement process and the results of our related foreign currency hedging
activities are reported in
Cost of sales
and
Other income/(loss), net
and were not material for the years ended 2023, 2024,
and 2025.
Generally, our foreign subsidiaries use the local currency as their functional currency. We translate the assets and
liabilities of our foreign subsidiaries from their respective functional currencies to U.S. dollars using end-of-period
exchange rates. Changes in the carrying value of these assets and liabilities attributable to fluctuations in exchange rates
are recognized in
Foreign currency translation
, a component of
Other comprehensive income/(Ioss), net of tax.
Upon sale
or upon complete or substantially complete liquidation of an investment in a foreign subsidiary, the amount of accumulated
foreign currency translation related to the entity is reclassified to income and recognized as part of the gain or loss on the
sale or liquidation of the investment.
FORD MOTOR COMPANY AND SUBSIDIARIES
NOTES TO THE FINANCIAL STATEMENTS
116
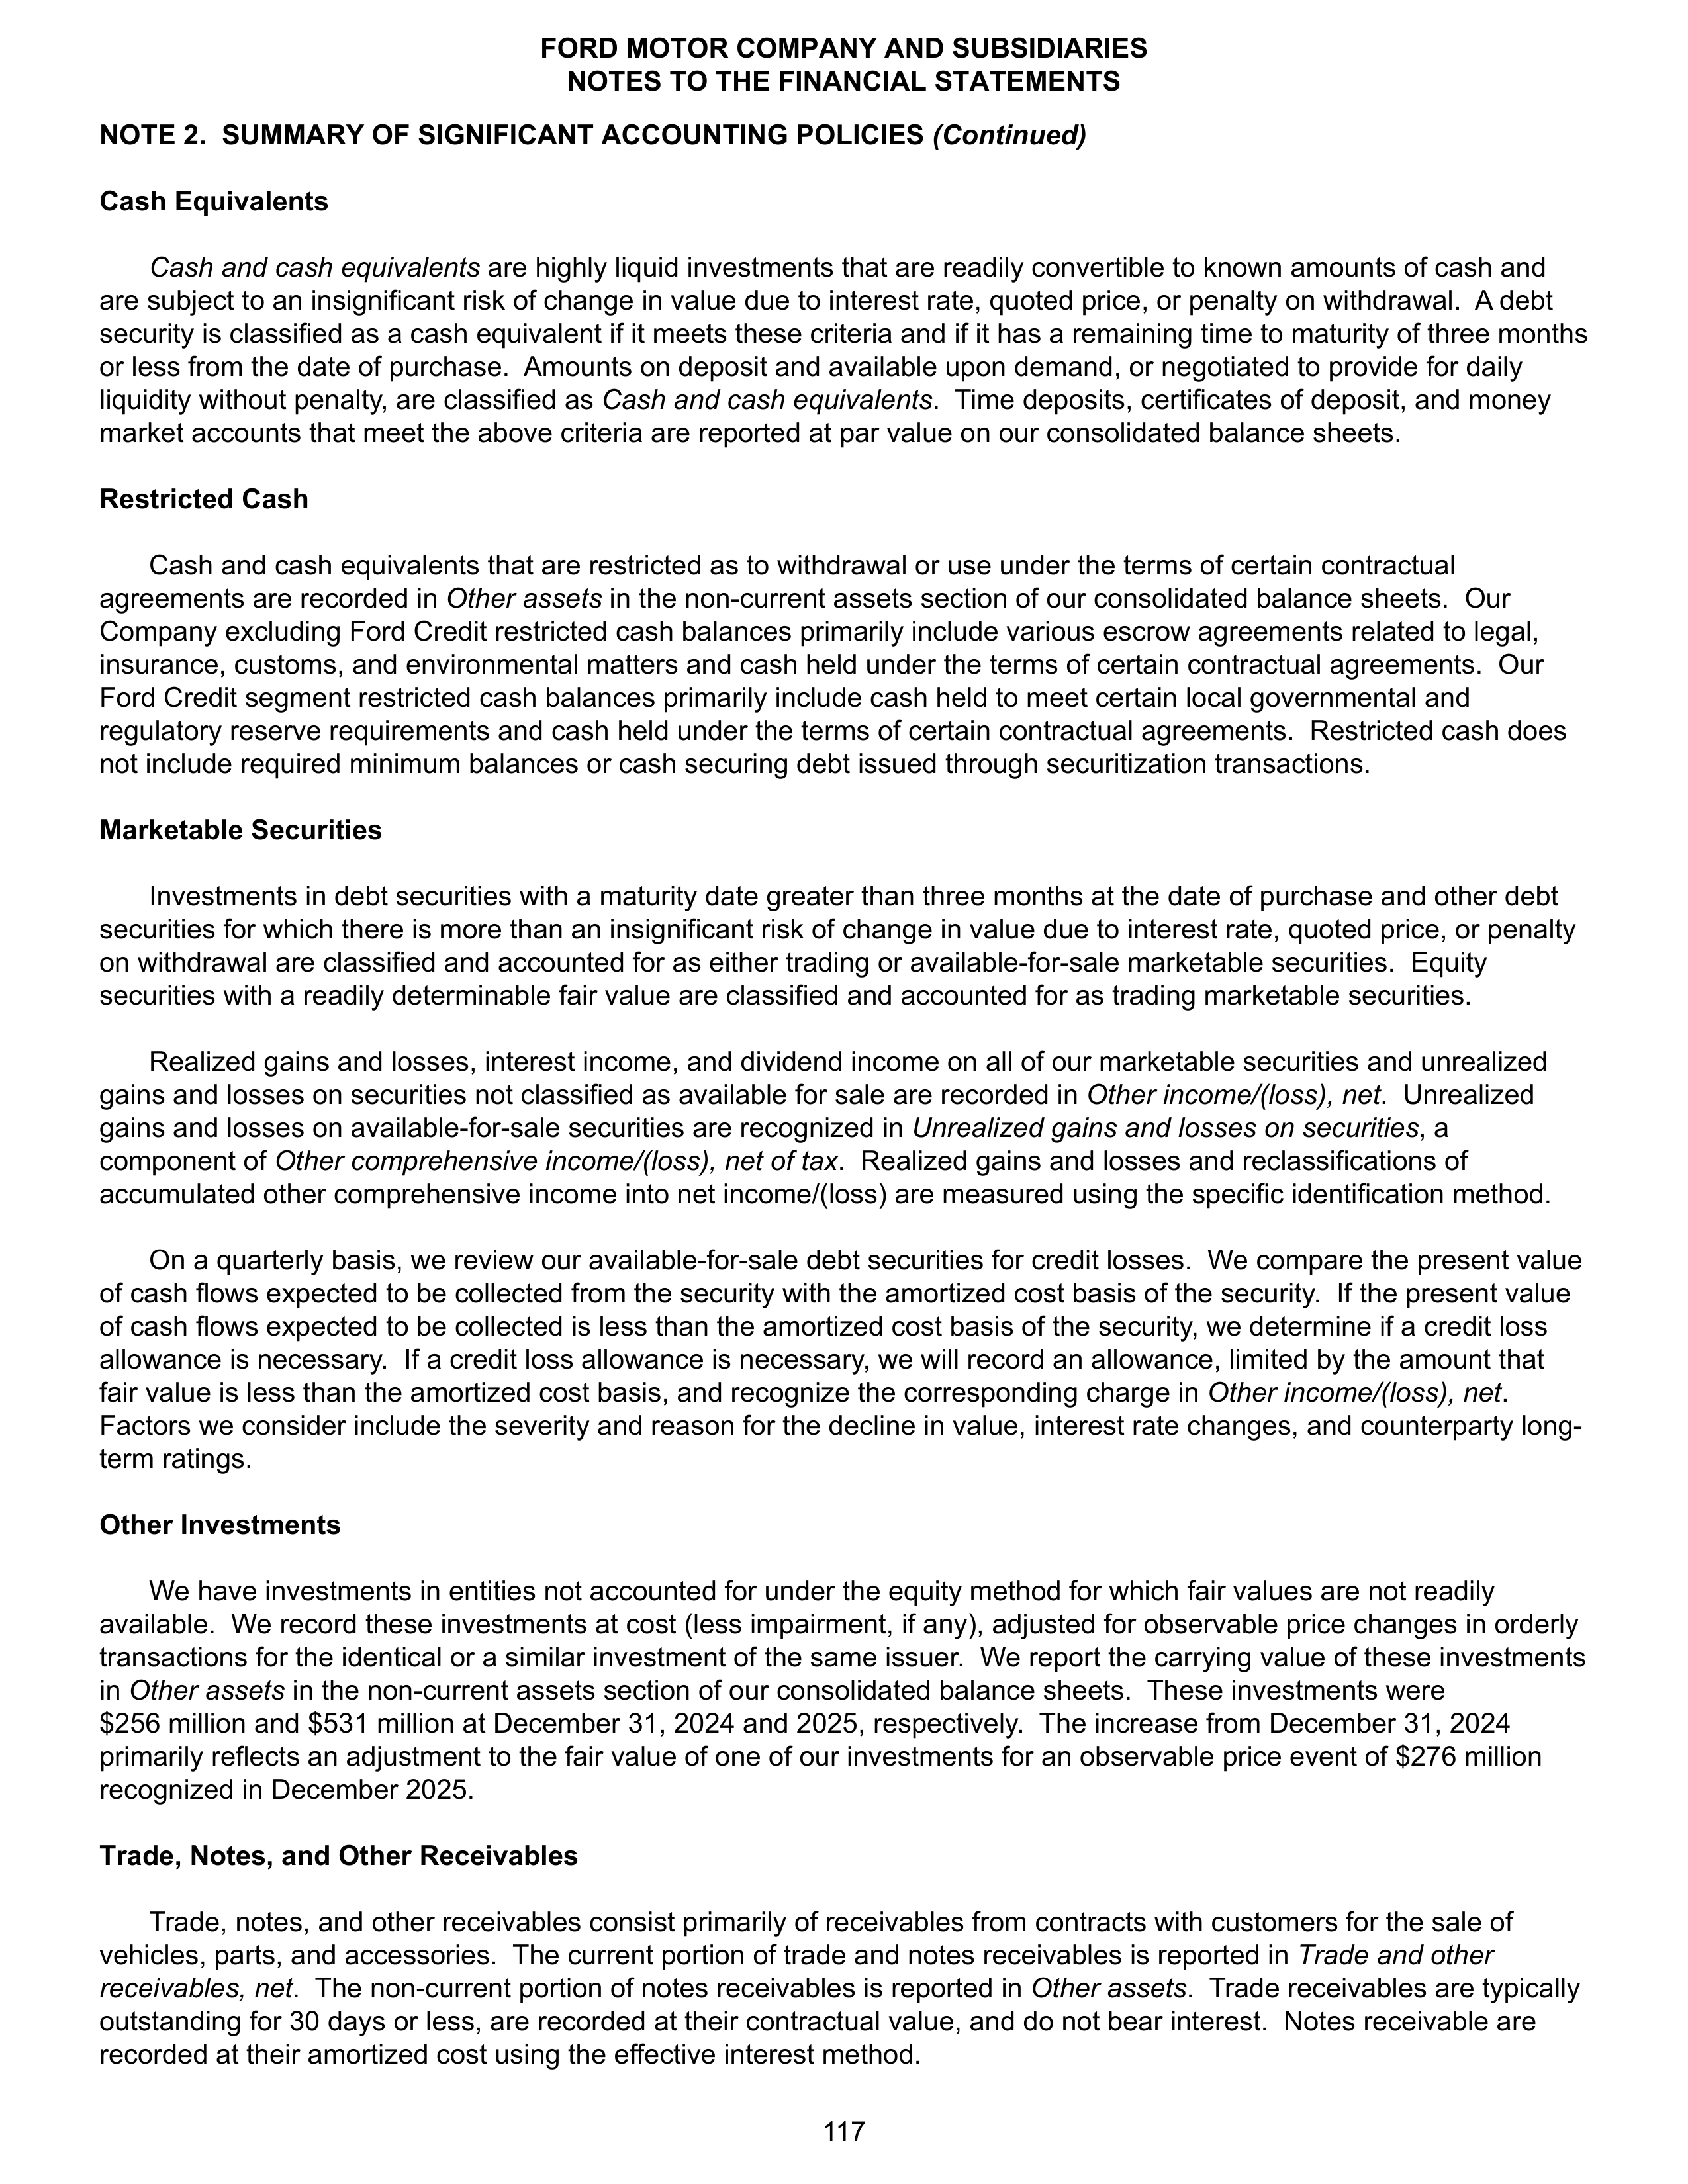
NOTE 2. SUMMARY OF SIGNIFICANT ACCOUNTING POLICIES
(Continued)
Cash Equivalents
Cash and cash equivalents
are highly liquid investments that are readily convertible to known amounts of cash and
are subject to an insignificant risk of change in value due to interest rate, quoted price, or penalty on withdrawal. A debt
security is classified as a cash equivalent if it meets these criteria and if it has a remaining time to maturity of three months
or less from the date of purchase. Amounts on deposit and available upon demand, or negotiated to provide for daily
liquidity without penalty, are classified as
Cash and cash equivalents
. Time deposits, certificates of deposit, and money
market accounts that meet the above criteria are reported at par value on our consolidated balance sheets.
Restricted Cash
Cash and cash equivalents that are restricted as to withdrawal or use under the terms of certain contractual
agreements are recorded in
Other assets
in the non-current assets section of our consolidated balance
sheets. Our
Company excluding Ford Credit restricted cash balances primarily include various escrow agreements related to legal,
insurance, customs, and environmental matters and cash held under the terms of certain contractual agreements. Our
Ford Credit segment restricted cash balances primarily include cash held to meet certain local governmental and
regulatory
reserve requirements and cash held under the terms of certain contractual agreements. Restricted cash does
not include required minimum balances or cash securing debt issued through securitization transactions.
Marketable Securities
Investments in debt securities with a maturity date greater than three months at the date of purchase and other debt
securities for which there is more than an insignificant risk of change in value due to interest rate, quoted price, or penalty
on withdrawal are classified and accounted for as either trading or available-for-sale marketable securities. Equity
securities with a readily determinable fair value are classified and accounted for as trading marketable securities.
Realized gains and losses, interest income, and dividend income on all of our marketable securities and unrealized
gains and losses on securities not classified as available for sale are recorded in
Other income/(loss), net
. Unrealized
gains and losses on available-for-sale securities are recognized in
Unrealized gains and losses on securities
, a
component of
Other comprehensive income/(loss), net of tax
. Realized gains and losses and reclassifications of
accumulated other comprehensive income into net income/(loss) are measured using the specific identification method.
On a quarterly basis, we review our available-for-sale debt securities for credit losses. We compare the present value
of cash flows expected to be collected from the security with the amortized cost basis of the security. If the present value
of cash flows expected to be collected is less than the amortized cost basis of the security, we determine if a credit loss
allowance is necessary. If a credit loss allowance is necessary, we will record an allowance, limited by the amount that
fair value is less than the amortized cost basis, and recognize the corresponding charge in
Other income/(loss), net
.
Factors we consider include the severity and reason for the decline in value, interest rate changes, and counterparty long-
term ratings.
Other Investments
We have investments in entities not accounted for under the equity method for which fair values are not readily
available. We record these investments at cost (less impairment, if any), adjusted for observable price changes in orderly
transactions for the identical or a similar investment of the same issuer. We report the carrying value of these investments
in
Other assets
in the non-current assets section of our consolidated balance sheets. These investments were
$256 million and $531 million at December 31, 2024 and 2025, respectively. The increase from December 31, 2024
primarily reflects an adjustment to the fair value of one of our investments for an observable price event of $276 million
recognized in December 2025.
Trade, Notes, and Other Receivables
Trade, notes, and other receivables consist primarily of receivables from contracts with customers for the sale of
vehicles, parts, and accessories. The current portion of trade and notes receivables is reported in
Trade and other
receivables, net
. The non-current portion of notes receivables is reported in
Other assets
. Trade receivables are typically
outstanding for 30 days or less, are recorded at their contractual value, and do not bear interest. Notes receivable are
recorded at their amortized cost using the effective interest method.
FORD MOTOR COMPANY AND SUBSIDIARIES
NOTES TO THE FINANCIAL STATEMENTS
117
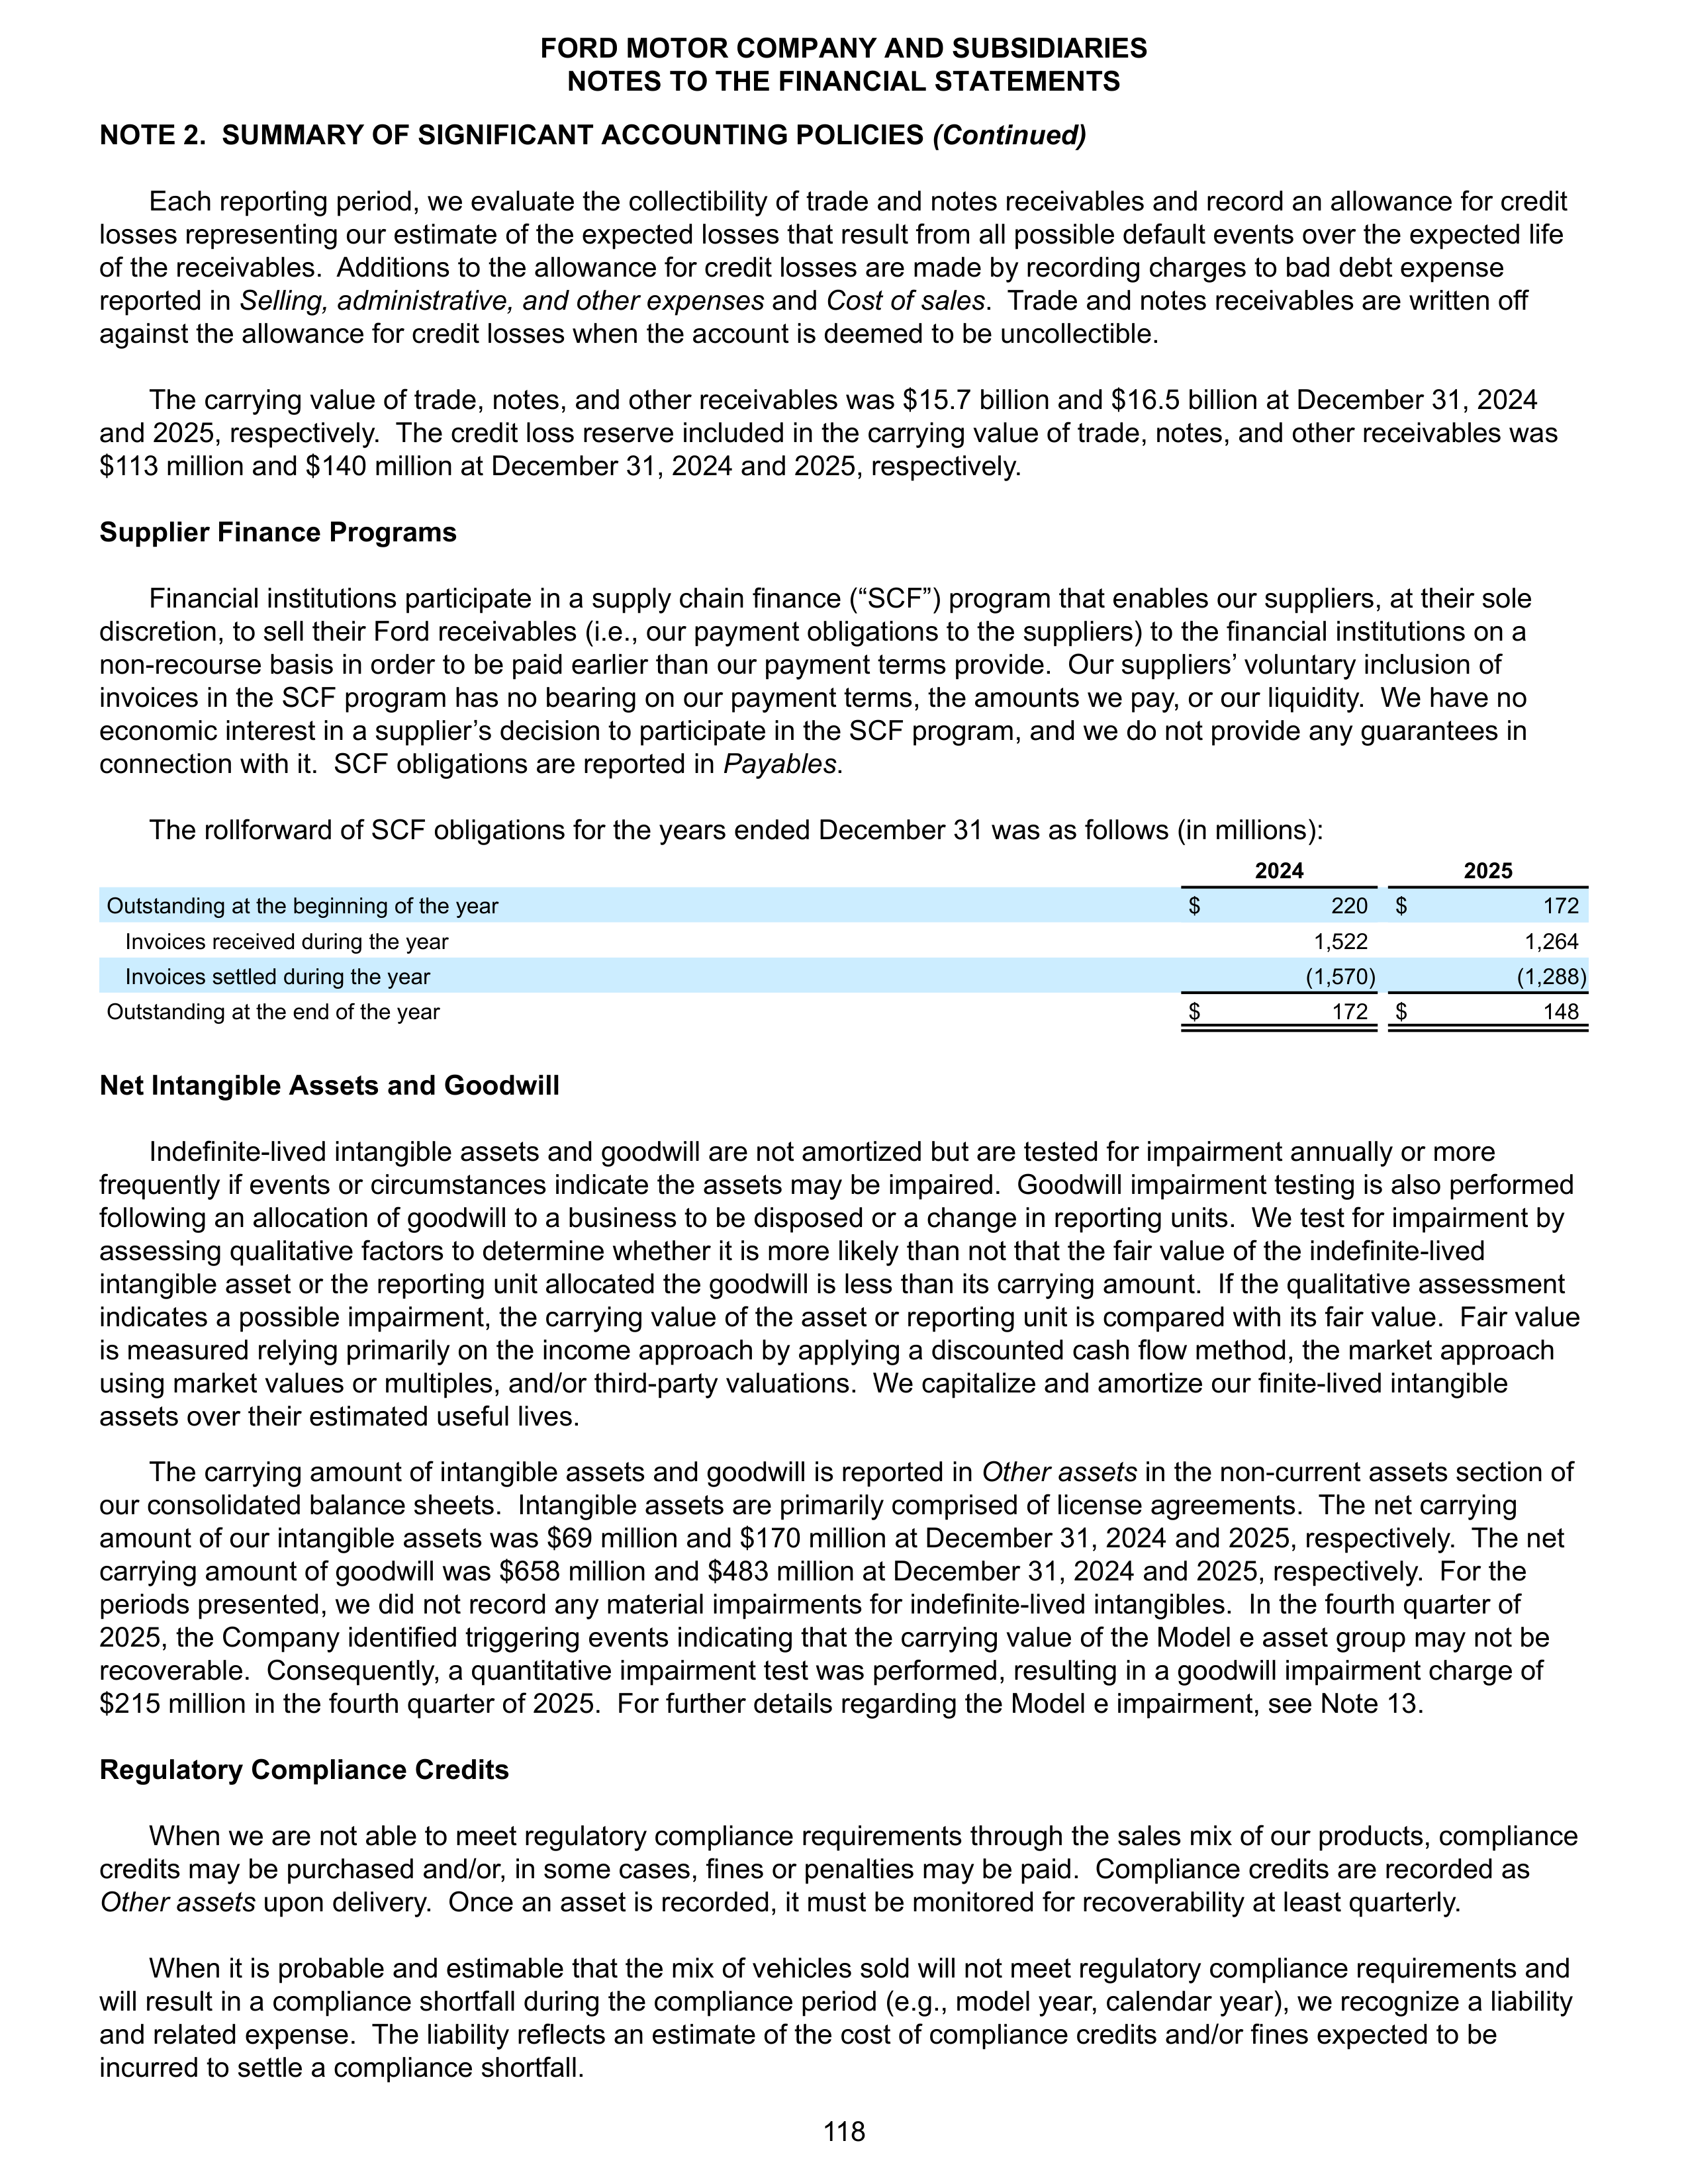
NOTE 2. SUMMARY OF SIGNIFICANT ACCOUNTING POLICIES
(Continued)
Each reporting period, we evaluate the collectibility of trade and notes receivables and record an allowance for credit
losses representing our estimate of the expected losses that result from all possible default events over the expected life
of the receivables. Additions to the allowance for credit losses are made by recording charges to bad debt expense
reported in
Selling, administrative, and other expenses
and
Cost of sales
. Trade and notes receivables are written off
against the allowance for credit losses when the account is deemed to be uncollectible.
The carrying value of trade, notes, and other receivables was $15.7 billion and $16.5 billion at December 31, 2024
and 2025, respectively. The credit loss reserve included in the carrying value of trade, notes, and other receivables was
$113 million and $140 million at December 31, 2024 and 2025, respectively.
Supplier Finance Programs
Financial institutions participate in a supply chain finance (“SCF”) program that enables our suppliers, at their sole
discretion, to sell their Ford receivables (i.e., our payment obligations to the suppliers) to the financial institutions on a
non-recourse basis in order to be paid earlier than our payment terms provide. Our suppliers’ voluntary inclusion of
invoices in the SCF program has no bearing on our payment terms, the amounts we pay, or our liquidity. We have no
economic interest in a supplier’s decision to participate in the SCF program, and we do not provide any guarantees in
connection with it. SCF obligations are reported in
Payables
.
The rollforward of SCF obligations for the years ended December 31 was as follows (in millions):
2024
2025
Outstanding at the beginning of the year
$
220
$
172
Invoices received during the year
1,522
1,264
Invoices settled during the year
(1,570)
(1,288)
Outstanding at the end of the year
$
172
$
148
Net Intangible Assets and Goodwill
Indefinite-lived intangible assets and goodwill are not amortized but are tested for impairment annually or more
frequently if events or circumstances indicate the assets may be impaired. Goodwill impairment testing is also performed
following an allocation of goodwill to a business to be disposed or a change in reporting units. We test for impairment by
assessing qualitative factors to determine whether it is more likely than not that the fair value of the indefinite-lived
intangible asset or the reporting unit allocated the goodwill is less than its carrying amount. If the qualitative assessment
indicates a possible impairment, the carrying value of the asset or reporting unit is compared with its fair value. Fair value
is measured relying primarily on the income approach by applying a discounted cash flow method, the market approach
using market values or multiples, and/or third-party valuations. We capitalize and amortize our finite-lived intangible
assets over their estimated useful lives.
The carrying amount of intangible assets and goodwill is reported in
Other assets
in the non-current assets section of
our consolidated balance sheets. Intangible assets are primarily comprised of license agreements. The net carrying
amount of our intangible assets was $69 million and $170 million at December 31, 2024 and 2025, respectively. The net
carrying amount of goodwill was $658 million and $483 million at December 31, 2024 and 2025, respectively. For the
periods presented, we did not record any material impairments for indefinite-lived intangibles. In the fourth quarter of
2025, the Company identified triggering events indicating that the carrying value of the Model e asset group may not be
recoverable. Consequently, a quantitative impairment test was performed, resulting in a goodwill impairment charge of
$215 million in the fourth quarter of 2025. For further details regarding the Model e impairment, see Note 13.
Regulatory Compliance Credits
When we are not able to meet regulatory compliance requirements through the sales mix of our products, compliance
credits may be purchased and/or, in some cases, fines or penalties may be paid. Compliance credits are recorded as
Other assets
upon delivery. Once an asset is recorded, it must be monitored for recoverability at least quarterly.
When it is probable and estimable that the mix of vehicles sold will not meet regulatory compliance requirements and
will result in a compliance shortfall during the compliance period (e.g., model year, calendar year), we recognize a liability
and related expense. The liability reflects an estimate of the cost of compliance credits and/or fines expected to be
incurred to settle a compliance shortfall.
FORD MOTOR COMPANY AND SUBSIDIARIES
NOTES TO THE FINANCIAL STATEMENTS
118
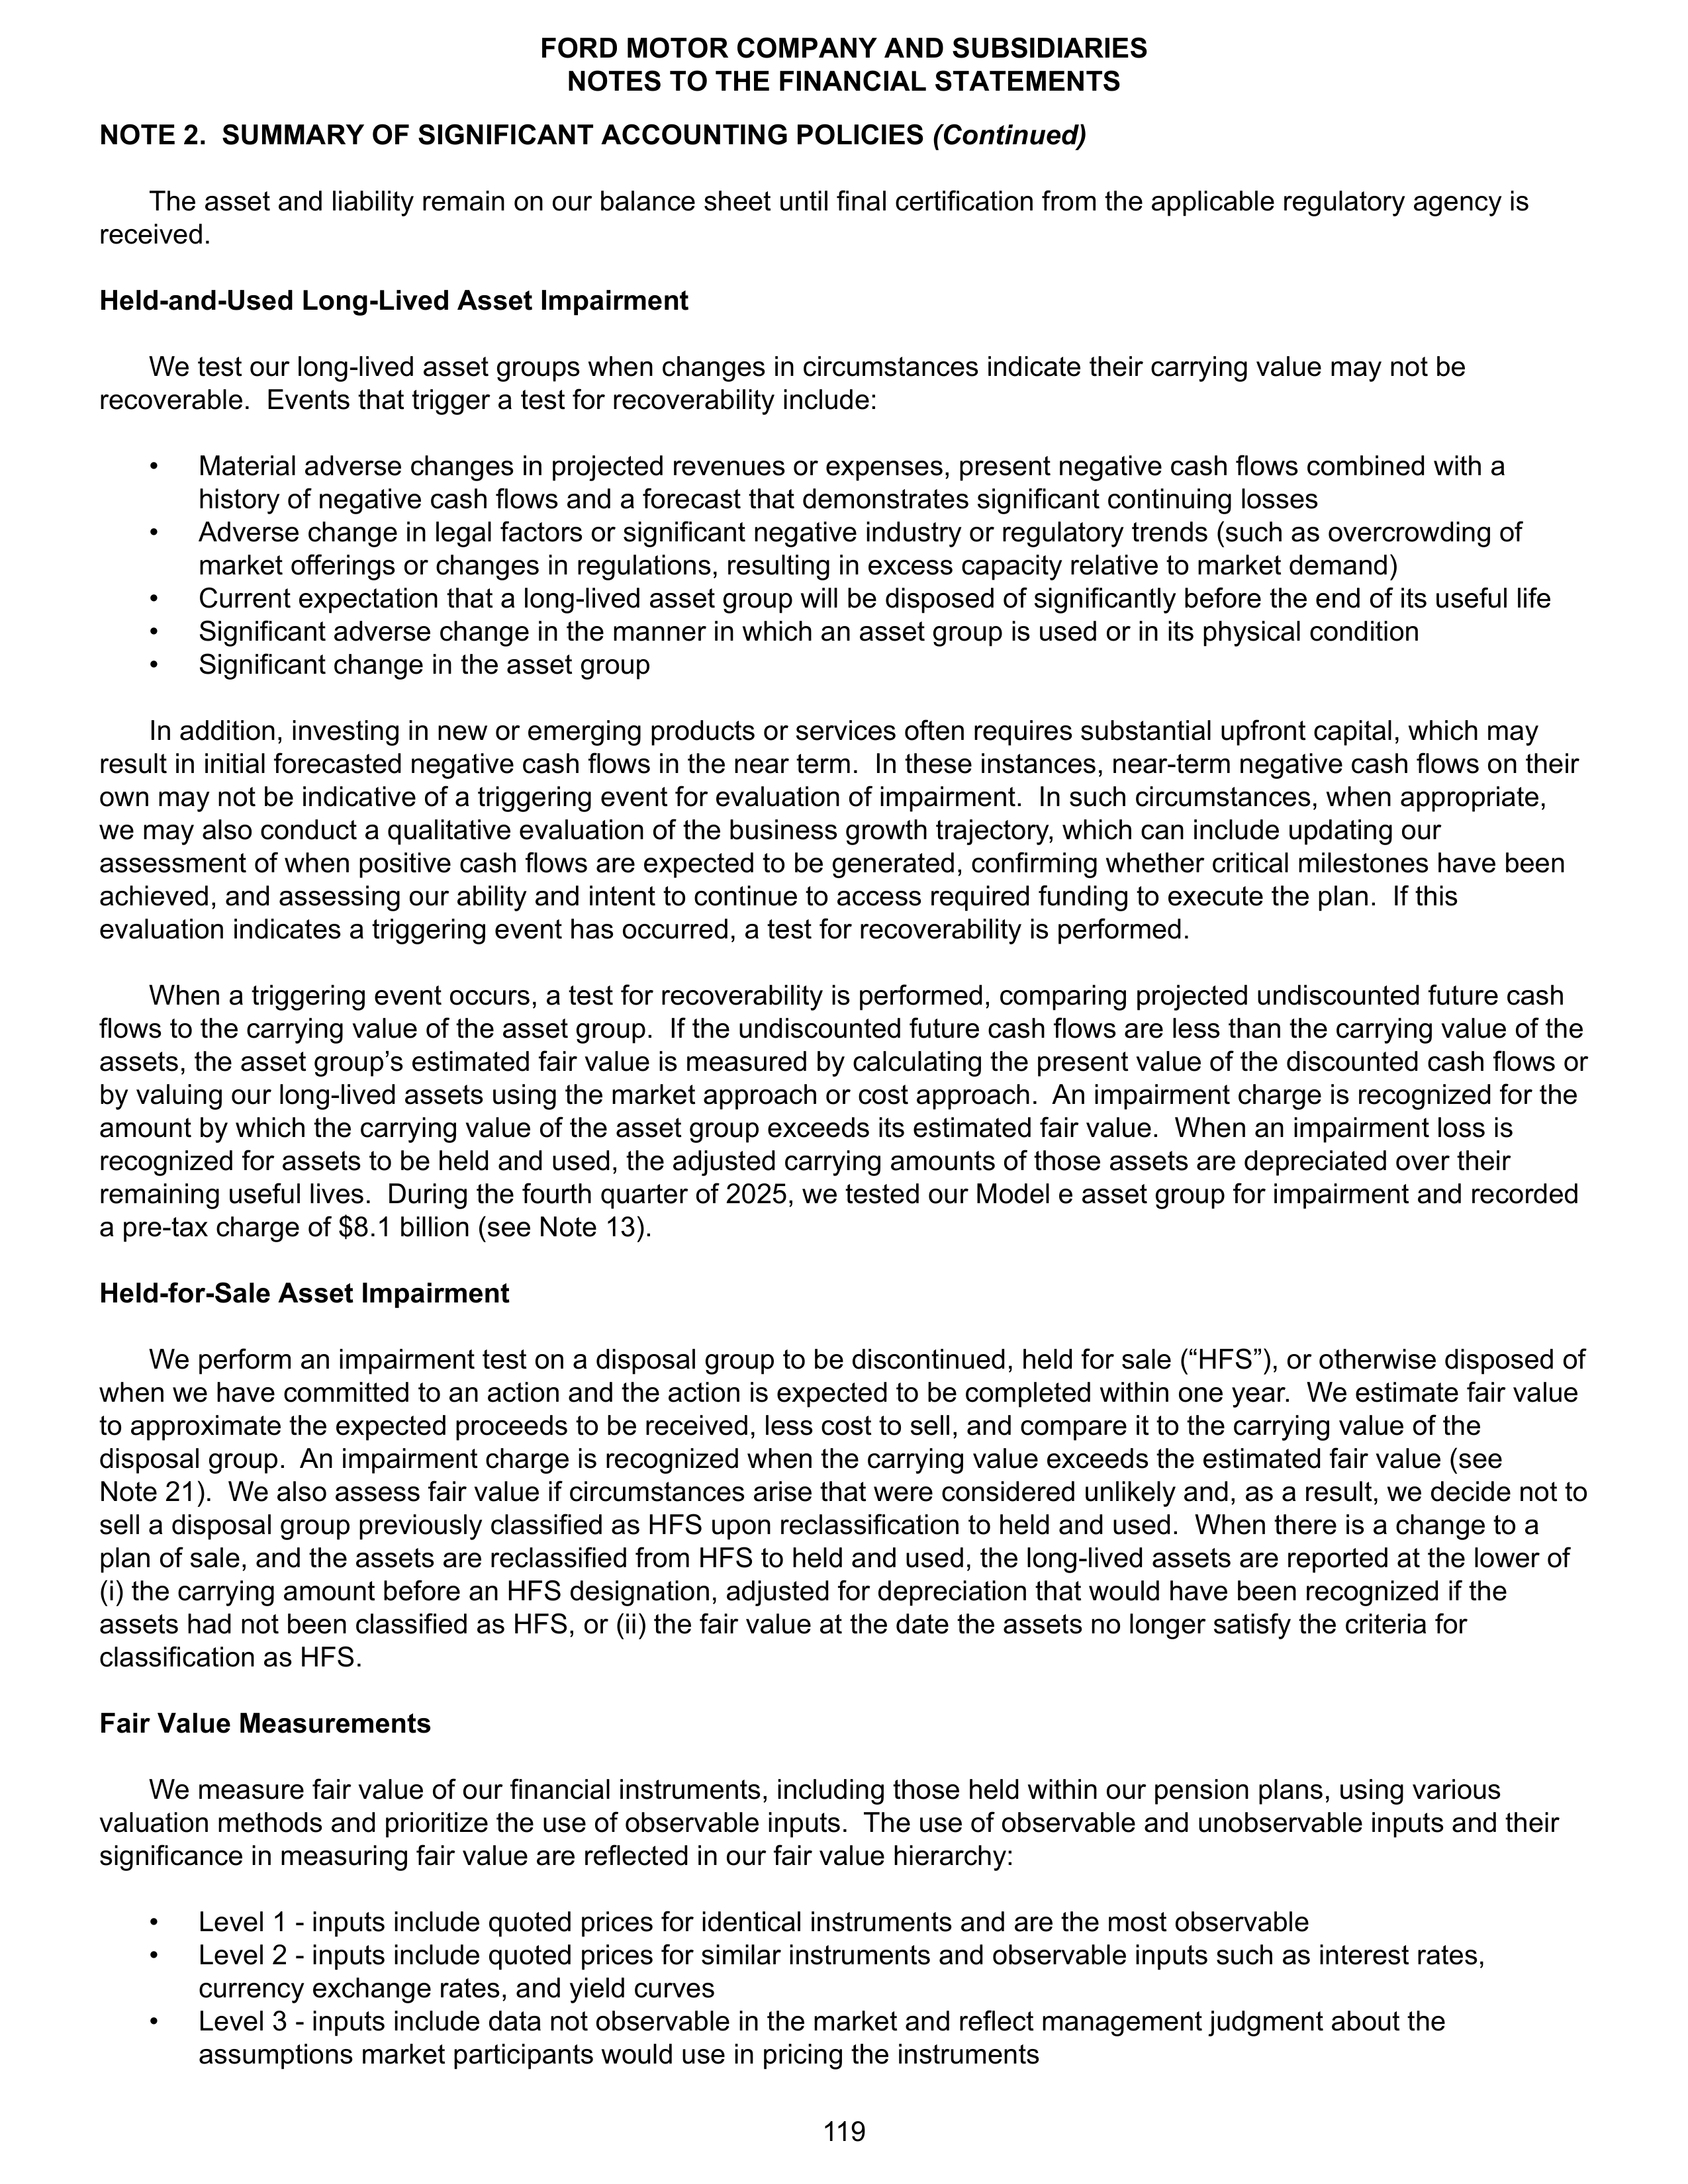
NOTE 2. SUMMARY OF SIGNIFICANT ACCOUNTING POLICIES
(Continued)
The asset and liability remain on our balance sheet until final certification from the applicable regulatory agency is
received.
Held-and-Used Long-Lived Asset Impairment
We test our long-lived asset groups when changes in circumstances indicate their carrying value may not be
recoverable. Events that trigger a test for recoverability include:
•
Material adverse changes in projected revenues or expenses, present negative cash flows combined with a
history of negative cash flows and a forecast that demonstrates significant continuing losses
•
Adverse change in legal factors or significant negative industry or regulatory trends (such as overcrowding of
market offerings or changes in regulations, resulting in excess capacity relative to market demand)
•
Current expectation that a long-lived asset group will be disposed of significantly before the end of its useful life
•
Significant adverse change in the manner in which an asset group is used or in its physical condition
•
Significant change in the asset group
In addition, investing in new or emerging products or services often requires substantial upfront capital, which may
result in initial forecasted negative cash flows in the near term. In these instances, near-term negative cash flows on their
own may not be indicative of a triggering event for evaluation of impairment. In such circumstances, when appropriate,
we may also conduct a qualitative evaluation of the business growth trajectory, which can include updating our
assessment of when positive cash flows are expected to be generated, confirming whether critical milestones have been
achieved, and assessing our ability and intent to continue to access required funding to execute the plan. If this
evaluation indicates a triggering event has occurred, a test for recoverability is performed.
When a triggering event occurs, a test for recoverability is performed, comparing projected undiscounted future cash
flows to the carrying value of the asset group. If the undiscounted future cash flows are less than the carrying value of the
assets, the asset group’s estimated fair value is measured by calculating the present value of the discounted cash flows or
by valuing our long-lived assets using the market approach or cost approach. An impairment charge is recognized for the
amount by which the carrying value of the asset group exceeds its estimated fair value. When an impairment loss is
recognized for assets to be held and used, the adjusted carrying amounts of those assets are depreciated over their
remaining useful lives. During the fourth quarter of 2025, we tested our Model e asset group for impairment and recorded
a pre-tax charge of $8.1 billion (see Note 13).
Held-for-Sale Asset Impairment
We perform an impairment test on a disposal group to be discontinued, held for sale (“HFS”), or otherwise disposed of
when we have committed to an action and the action is expected to be completed within one year. We estimate fair value
to approximate the expected proceeds to be received, less cost to sell, and compare it to the carrying value of the
disposal group. An impairment charge is recognized when the carrying value exceeds the estimated fair value (see
Note 21). We also assess fair value if circumstances arise that were considered unlikely and, as a result, we decide not to
sell a disposal group previously classified as HFS upon reclassification to held and used. When there is a change to a
plan of sale, and the assets are reclassified from HFS to held and used, the long-lived assets are reported at the lower of
(i) the carrying amount before an HFS designation, adjusted for depreciation that would have been recognized if the
assets had not been classified as HFS, or (ii) the fair value at the date the assets no longer satisfy the criteria for
classification as HFS.
Fair Value Measurements
We measure fair value of our financial instruments, including those held within our pension plans, using various
valuation methods and prioritize the use of observable inputs. The use of observable and unobservable inputs and their
significance in measuring fair value are reflected in our fair value hierarchy:
•
Level 1 - inputs include quoted prices for identical instruments and are the most observable
•
Level 2 - inputs include quoted prices for similar instruments and observable inputs such as interest rates,
currency exchange rates, and yield curves
•
Level 3 - inputs include data not observable in the market and reflect management judgment about the
assumptions market participants would use in pricing the instruments
FORD MOTOR COMPANY AND SUBSIDIARIES
NOTES TO THE FINANCIAL STATEMENTS
119
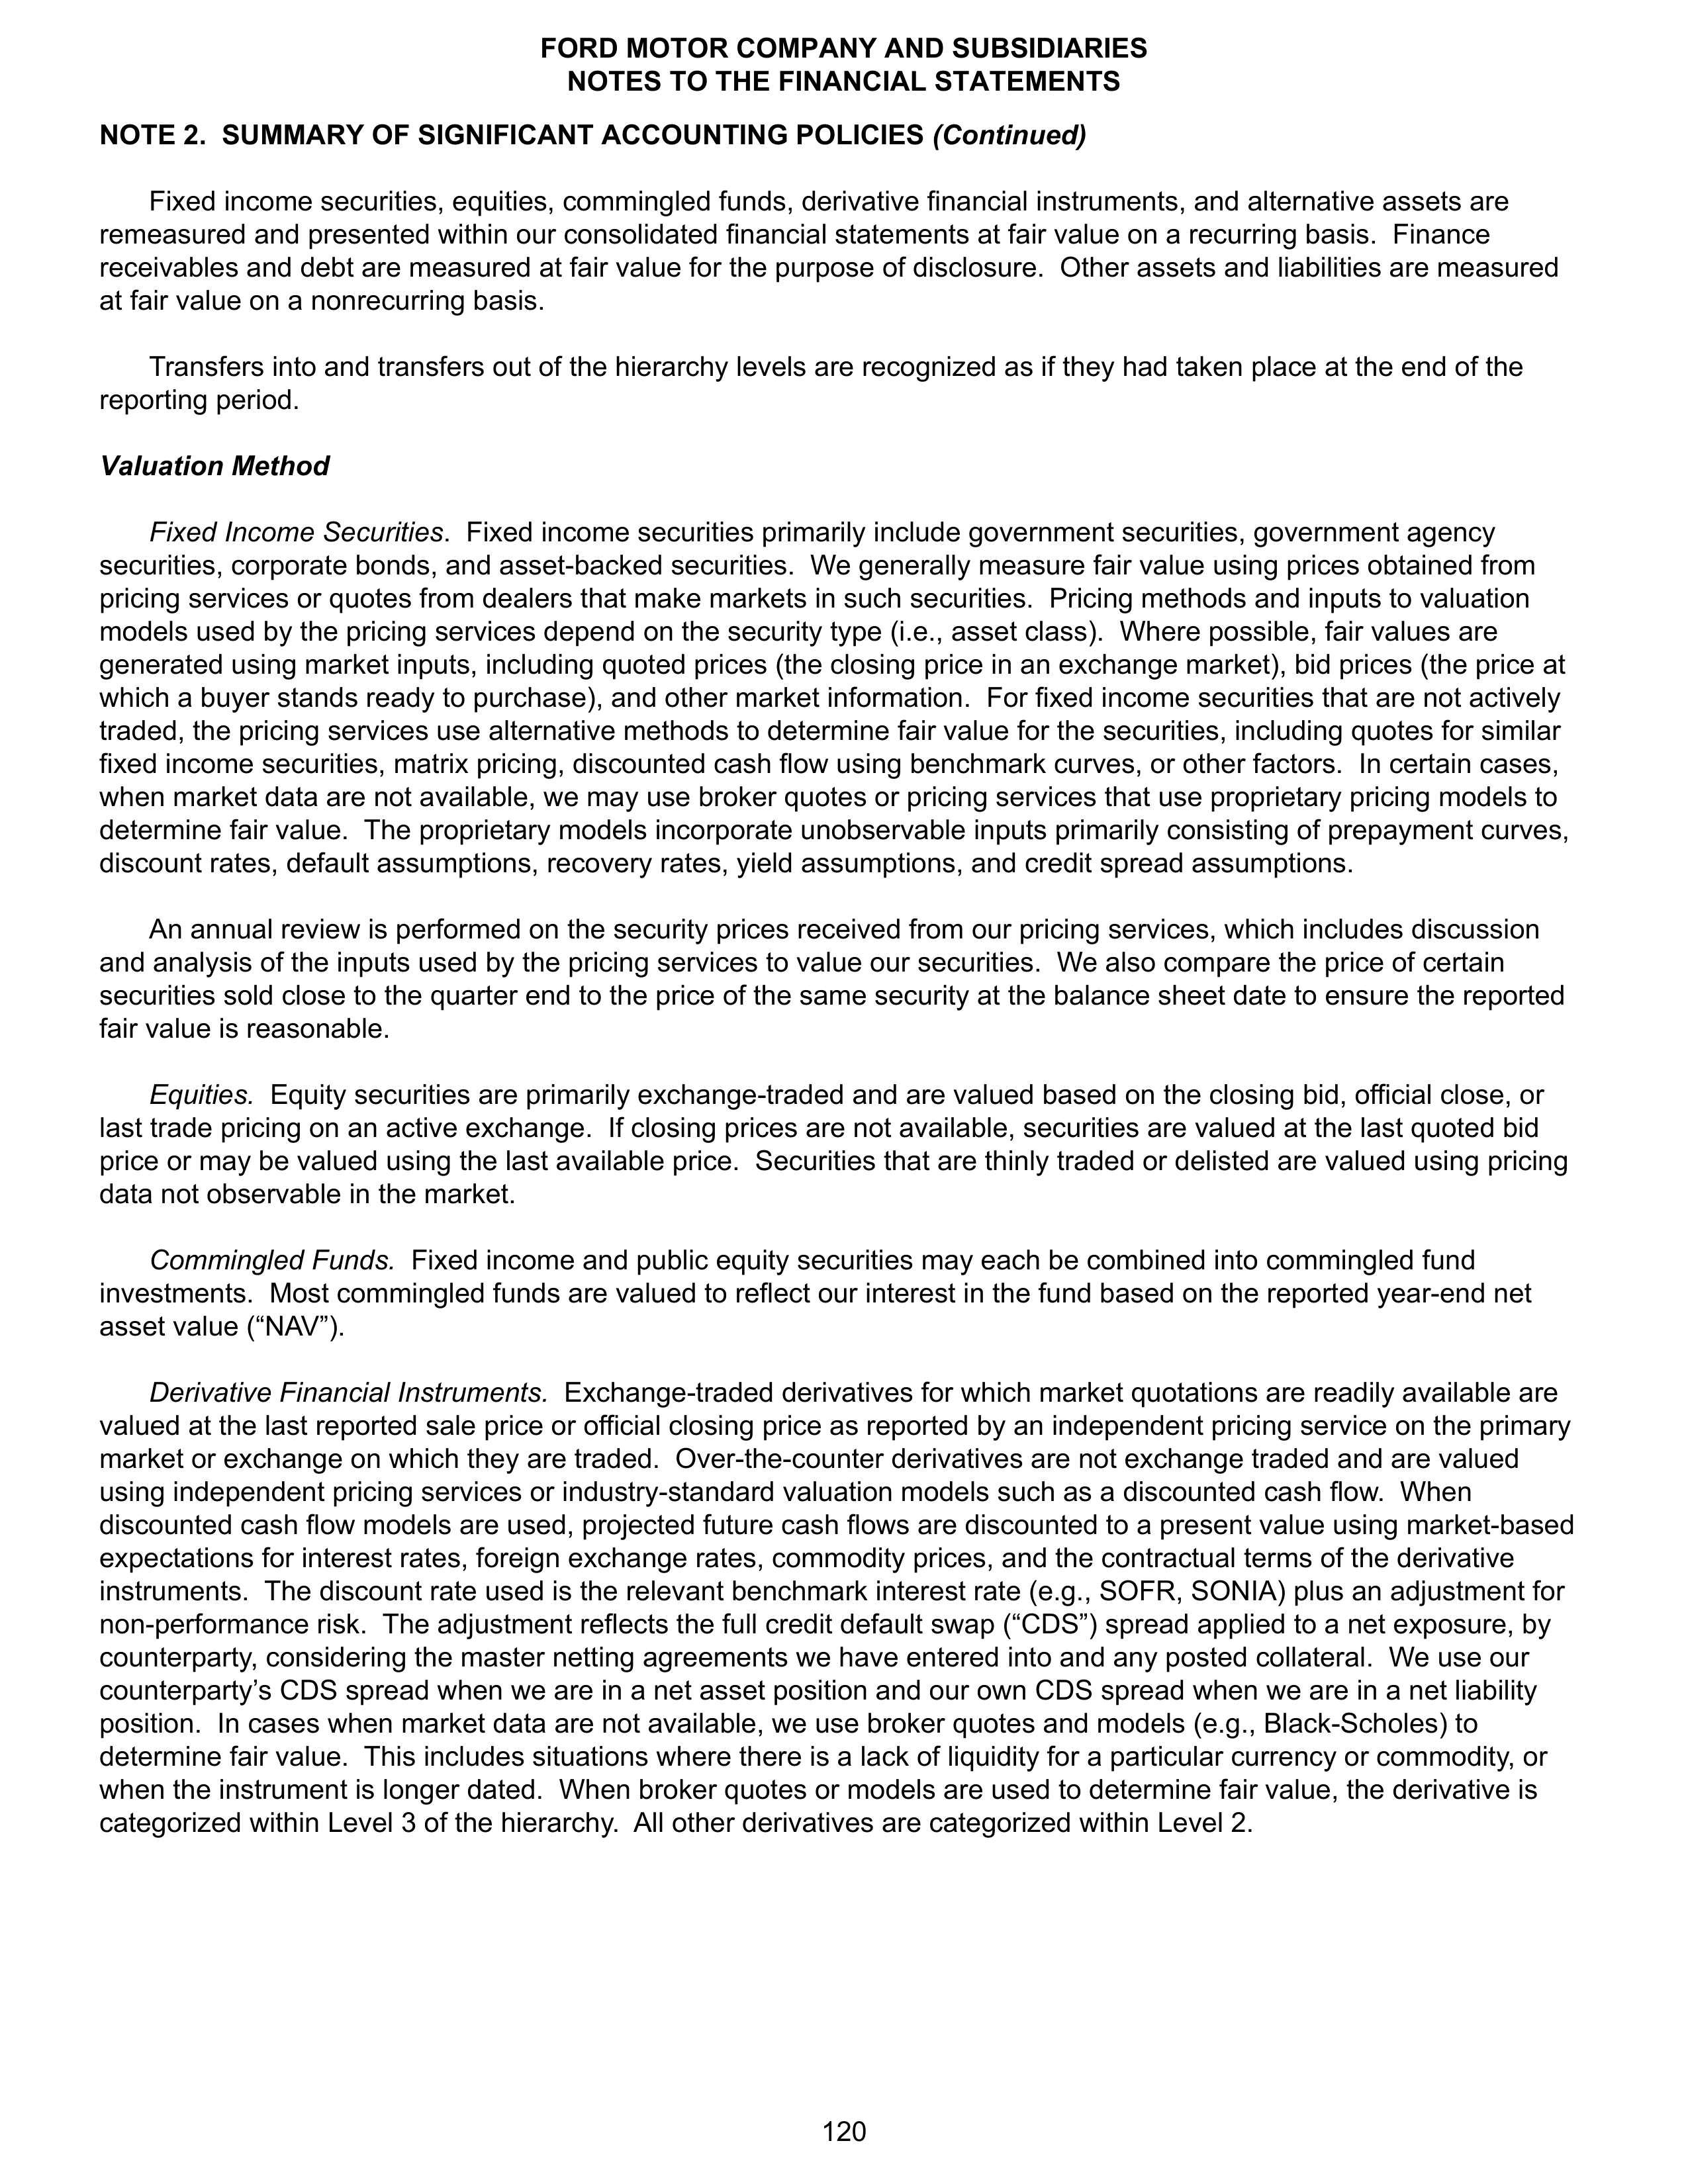
NOTE 2. SUMMARY OF SIGNIFICANT ACCOUNTING POLICIES
(Continued)
Fixed income securities, equities, commingled funds, derivative financial instruments, and alternative assets are
remeasured and presented within our consolidated financial statements at fair value on a recurring basis. Finance
receivables and debt are measured at fair value for the purpose of disclosure. Other assets and liabilities are measured
at fair value on a nonrecurring basis.
Transfers into and transfers out of the hierarchy levels are recognized as if they had taken place at the end of the
reporting period.
Valuation Method
Fixed Income Securities
. Fixed income securities primarily include government securities, government agency
securities, corporate bonds, and asset-backed securities. We generally measure fair value using prices obtained from
pricing services or quotes from dealers that make markets in such securities. Pricing methods and inputs to valuation
models used by the pricing services depend on the security type (i.e., asset class). Where possible, fair values are
generated using market inputs, including quoted prices (the closing price in an exchange market), bid prices (the price at
which a buyer stands ready to purchase), and other market information. For fixed income securities that are not actively
traded, the pricing services use alternative methods to determine fair value for the securities, including quotes for similar
fixed income securities, matrix pricing, discounted cash flow using benchmark curves, or other factors. In certain cases,
when market data are not available, we may use broker quotes or pricing services that use proprietary pricing models to
determine fair value. The proprietary models incorporate unobservable inputs primarily consisting of prepayment curves,
discount rates, default assumptions, recovery rates, yield assumptions, and credit spread assumptions.
An annual review is performed on the security prices received from our pricing services, which includes discussion
and analysis of the inputs used by the pricing services to value our securities. We also compare the price of certain
securities sold close to the quarter end to the price of the same security at the balance sheet date to ensure the reported
fair value is reasonable.
Equities.
Equity securities are primarily exchange-traded and are valued based on the closing bid, official close, or
last trade pricing on an active exchange. If closing prices are not available, securities are valued at the last quoted bid
price or may be valued using the last available price. Securities that are thinly traded or delisted are valued using pricing
data not observable in the market.
Commingled Funds.
Fixed income and public equity securities may each be combined into commingled fund
investments. Most commingled funds are valued to reflect our interest in the fund based on the reported year-end net
asset value (“NAV”).
Derivative Financial Instruments.
Exchange-traded derivatives for which market quotations are readily available are
valued at the last reported sale price or official closing price as reported by an independent pricing service on the primary
market or exchange on which they are traded. Over-the-counter derivatives are not exchange traded and are valued
using independent pricing services or industry-standard valuation models such as a discounted cash flow. When
discounted cash flow models are used, projected future cash flows are discounted to a present value using market-based
expectations for interest rates, foreign exchange rates, commodity prices, and the contractual terms of the derivative
instruments. The discount rate used is the relevant benchmark interest rate (e.g., SOFR, SONIA) plus an adjustment for
non-performance risk. The adjustment reflects the full credit default swap (“CDS”) spread applied to a net exposure, by
counterparty, considering the master netting agreements we have entered into and any posted collateral. We use our
counterparty’s CDS spread when we are in a net asset position and our own CDS spread when we are in a net liability
position. In cases when market data are not available, we use broker quotes and models (e.g., Black-Scholes) to
determine fair value. This includes situations where there is a lack of liquidity for a particular currency or commodity, or
when the instrument is longer dated. When broker quotes or models are used to determine fair value, the derivative is
categorized within Level 3 of the hierarchy. All other derivatives are categorized within Level 2.
FORD MOTOR COMPANY AND SUBSIDIARIES
NOTES TO THE FINANCIAL STATEMENTS
120
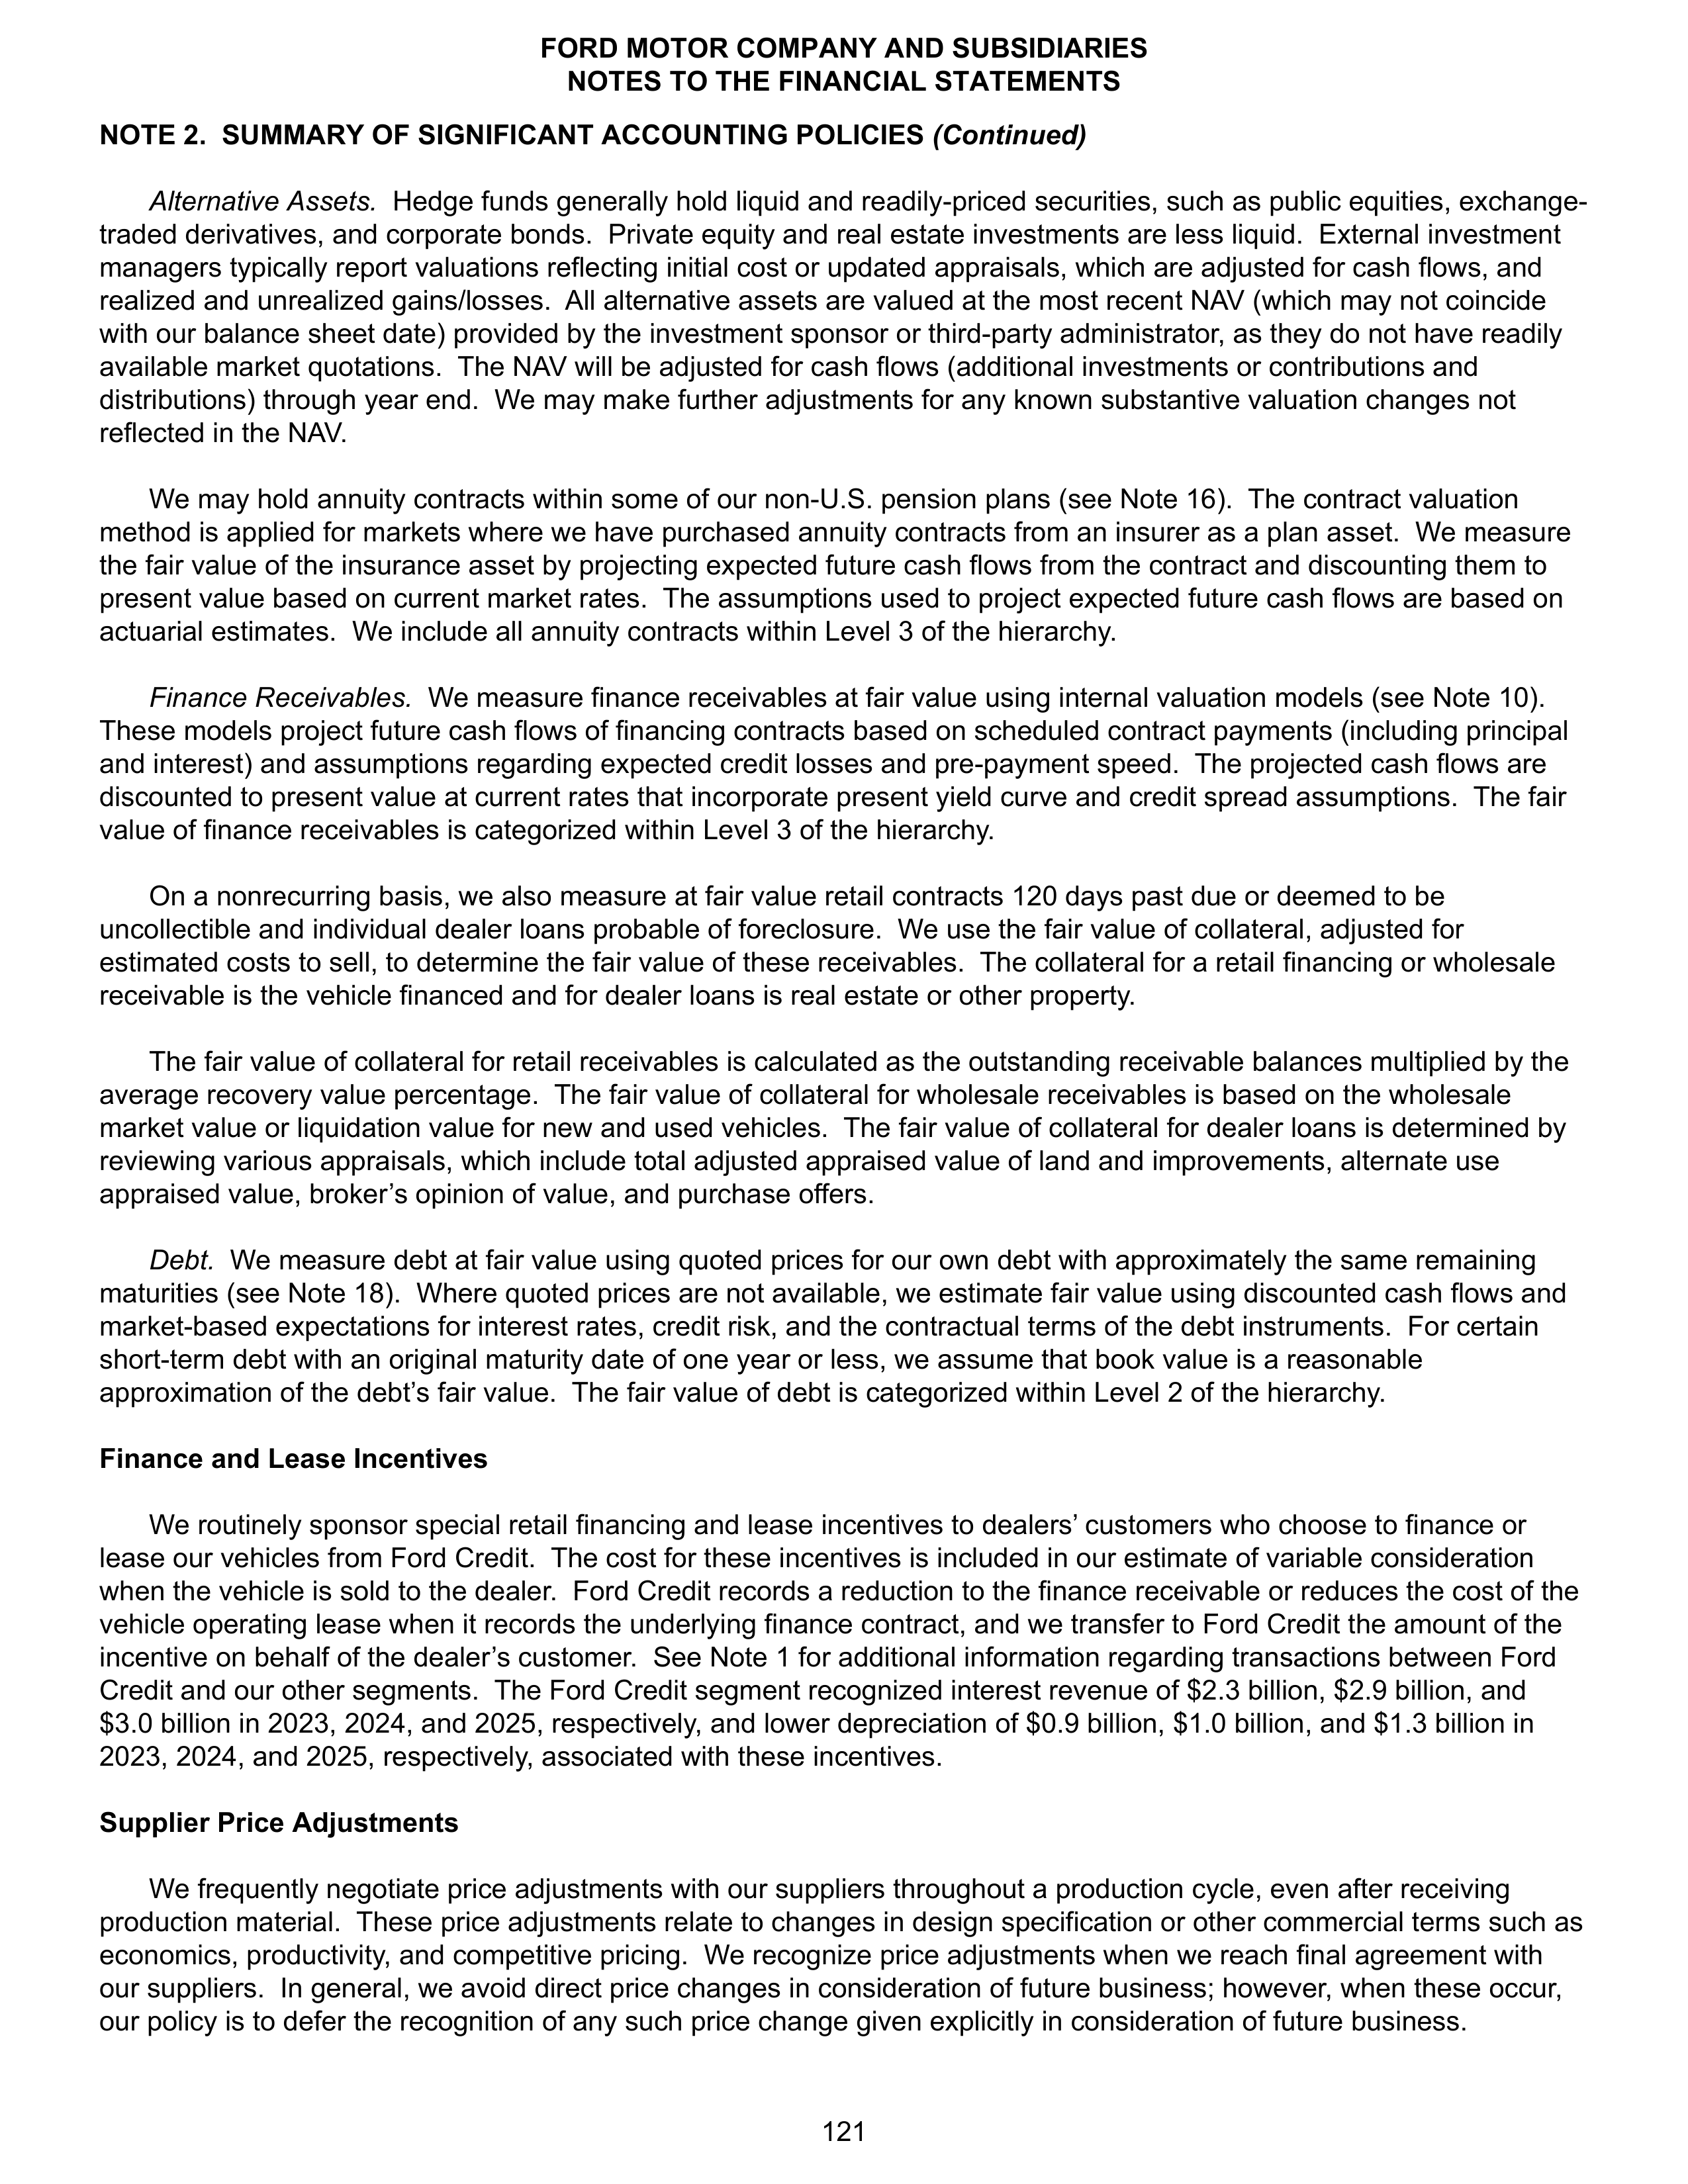
NOTE 2. SUMMARY OF SIGNIFICANT ACCOUNTING POLICIES
(Continued)
Alternative Assets.
Hedge funds generally hold liquid and readily-priced securities, such as public equities, exchange-
traded derivatives, and corporate bonds. Private equity and real estate investments are less liquid. External investment
managers typically report valuations reflecting initial cost or updated appraisals, which are adjusted for cash flows, and
realized and unrealized gains/losses. All alternative assets are valued at the most recent NAV (which may not coincide
with our balance sheet date) provided by the investment sponsor or third-party administrator, as they do not have readily
available market quotations. The NAV will be adjusted for cash flows (additional investments or contributions and
distributions) through year end. We may make further adjustments for any known substantive valuation changes not
reflected in the NAV.
We may hold annuity contracts within some of our non-U.S. pension plans (see Note 16). The contract valuation
method is applied for markets where we have purchased annuity contracts from an insurer as a plan asset. We measure
the fair value of the insurance asset by projecting expected future cash flows from the contract and discounting them to
present value based on current market rates. The assumptions used to project expected future cash flows are based on
actuarial estimates. We include all annuity contracts within Level 3 of the hierarchy.
Finance Receivables.
We measure finance receivables at fair value using internal valuation models (see Note 10).
These models project future cash flows of financing contracts based on scheduled contract payments (including principal
and interest) and assumptions regarding expected credit losses and pre-payment speed. The projected cash flows are
discounted to present value at current rates that incorporate present yield curve and credit spread assumptions. The fair
value of finance receivables is categorized within Level 3 of the hierarchy.
On a nonrecurring basis, we also measure at fair value retail contracts 120 days past due or deemed to be
uncollectible and individual dealer loans probable of foreclosure. We use the fair value of collateral, adjusted for
estimated costs to sell, to determine the fair value of these receivables. The collateral for a retail financing or wholesale
receivable is the vehicle financed and for dealer loans is real estate or other property.
The fair value of collateral for retail receivables is calculated as the outstanding receivable balances multiplied by the
average recovery value percentage. The fair value of collateral for wholesale receivables is based on the wholesale
market value or liquidation value for new and used vehicles. The fair value of collateral for dealer loans is determined by
reviewing various appraisals, which include total adjusted appraised value of land and improvements, alternate use
appraised value, broker’s opinion of value, and purchase offers.
Debt.
We measure debt at fair value using quoted prices for our own debt with approximately the same remaining
maturities (see Note 18). Where quoted prices are not available, we estimate fair value using discounted cash flows and
market-based expectations for interest rates, credit risk, and the contractual terms of the debt instruments. For certain
short-term debt with an original maturity date of one year or less, we assume that book value is a reasonable
approximation of the debt’s fair value. The fair value of debt is categorized within Level 2 of the hierarchy.
Finance and Lease Incentives
We routinely sponsor special retail financing and lease incentives to dealers’ customers who choose to finance or
lease our vehicles from Ford Credit. The cost for these incentives is included in our estimate of variable consideration
when the vehicle is sold to the dealer. Ford Credit records a reduction to the finance receivable or reduces the cost of the
vehicle operating lease when it records the underlying finance contract, and we transfer to Ford Credit the amount of the
incentive on behalf of the dealer’s customer. See Note 1 for additional information regarding transactions between Ford
Credit and our other segments. The Ford Credit segment recognized interest revenue of $2.3 billion, $2.9 billion, and
$3.0 billion in 2023, 2024, and 2025, respectively, and lower depreciation of $0.9 billion, $1.0 billion, and $1.3 billion in
2023, 2024, and 2025, respectively, associated with these incentives.
Supplier Price Adjustments
We frequently negotiate price adjustments with our suppliers throughout a production cycle, even after receiving
production material. These price adjustments relate to changes in design specification or other commercial terms such as
economics, productivity, and competitive pricing. We recognize price adjustments when we reach final agreement with
our suppliers. In general, we avoid direct price changes in consideration of future business; however, when these occur,
our policy is to defer the recognition of any such price change given explicitly in consideration of future business.
FORD MOTOR COMPANY AND SUBSIDIARIES
NOTES TO THE FINANCIAL STATEMENTS
121
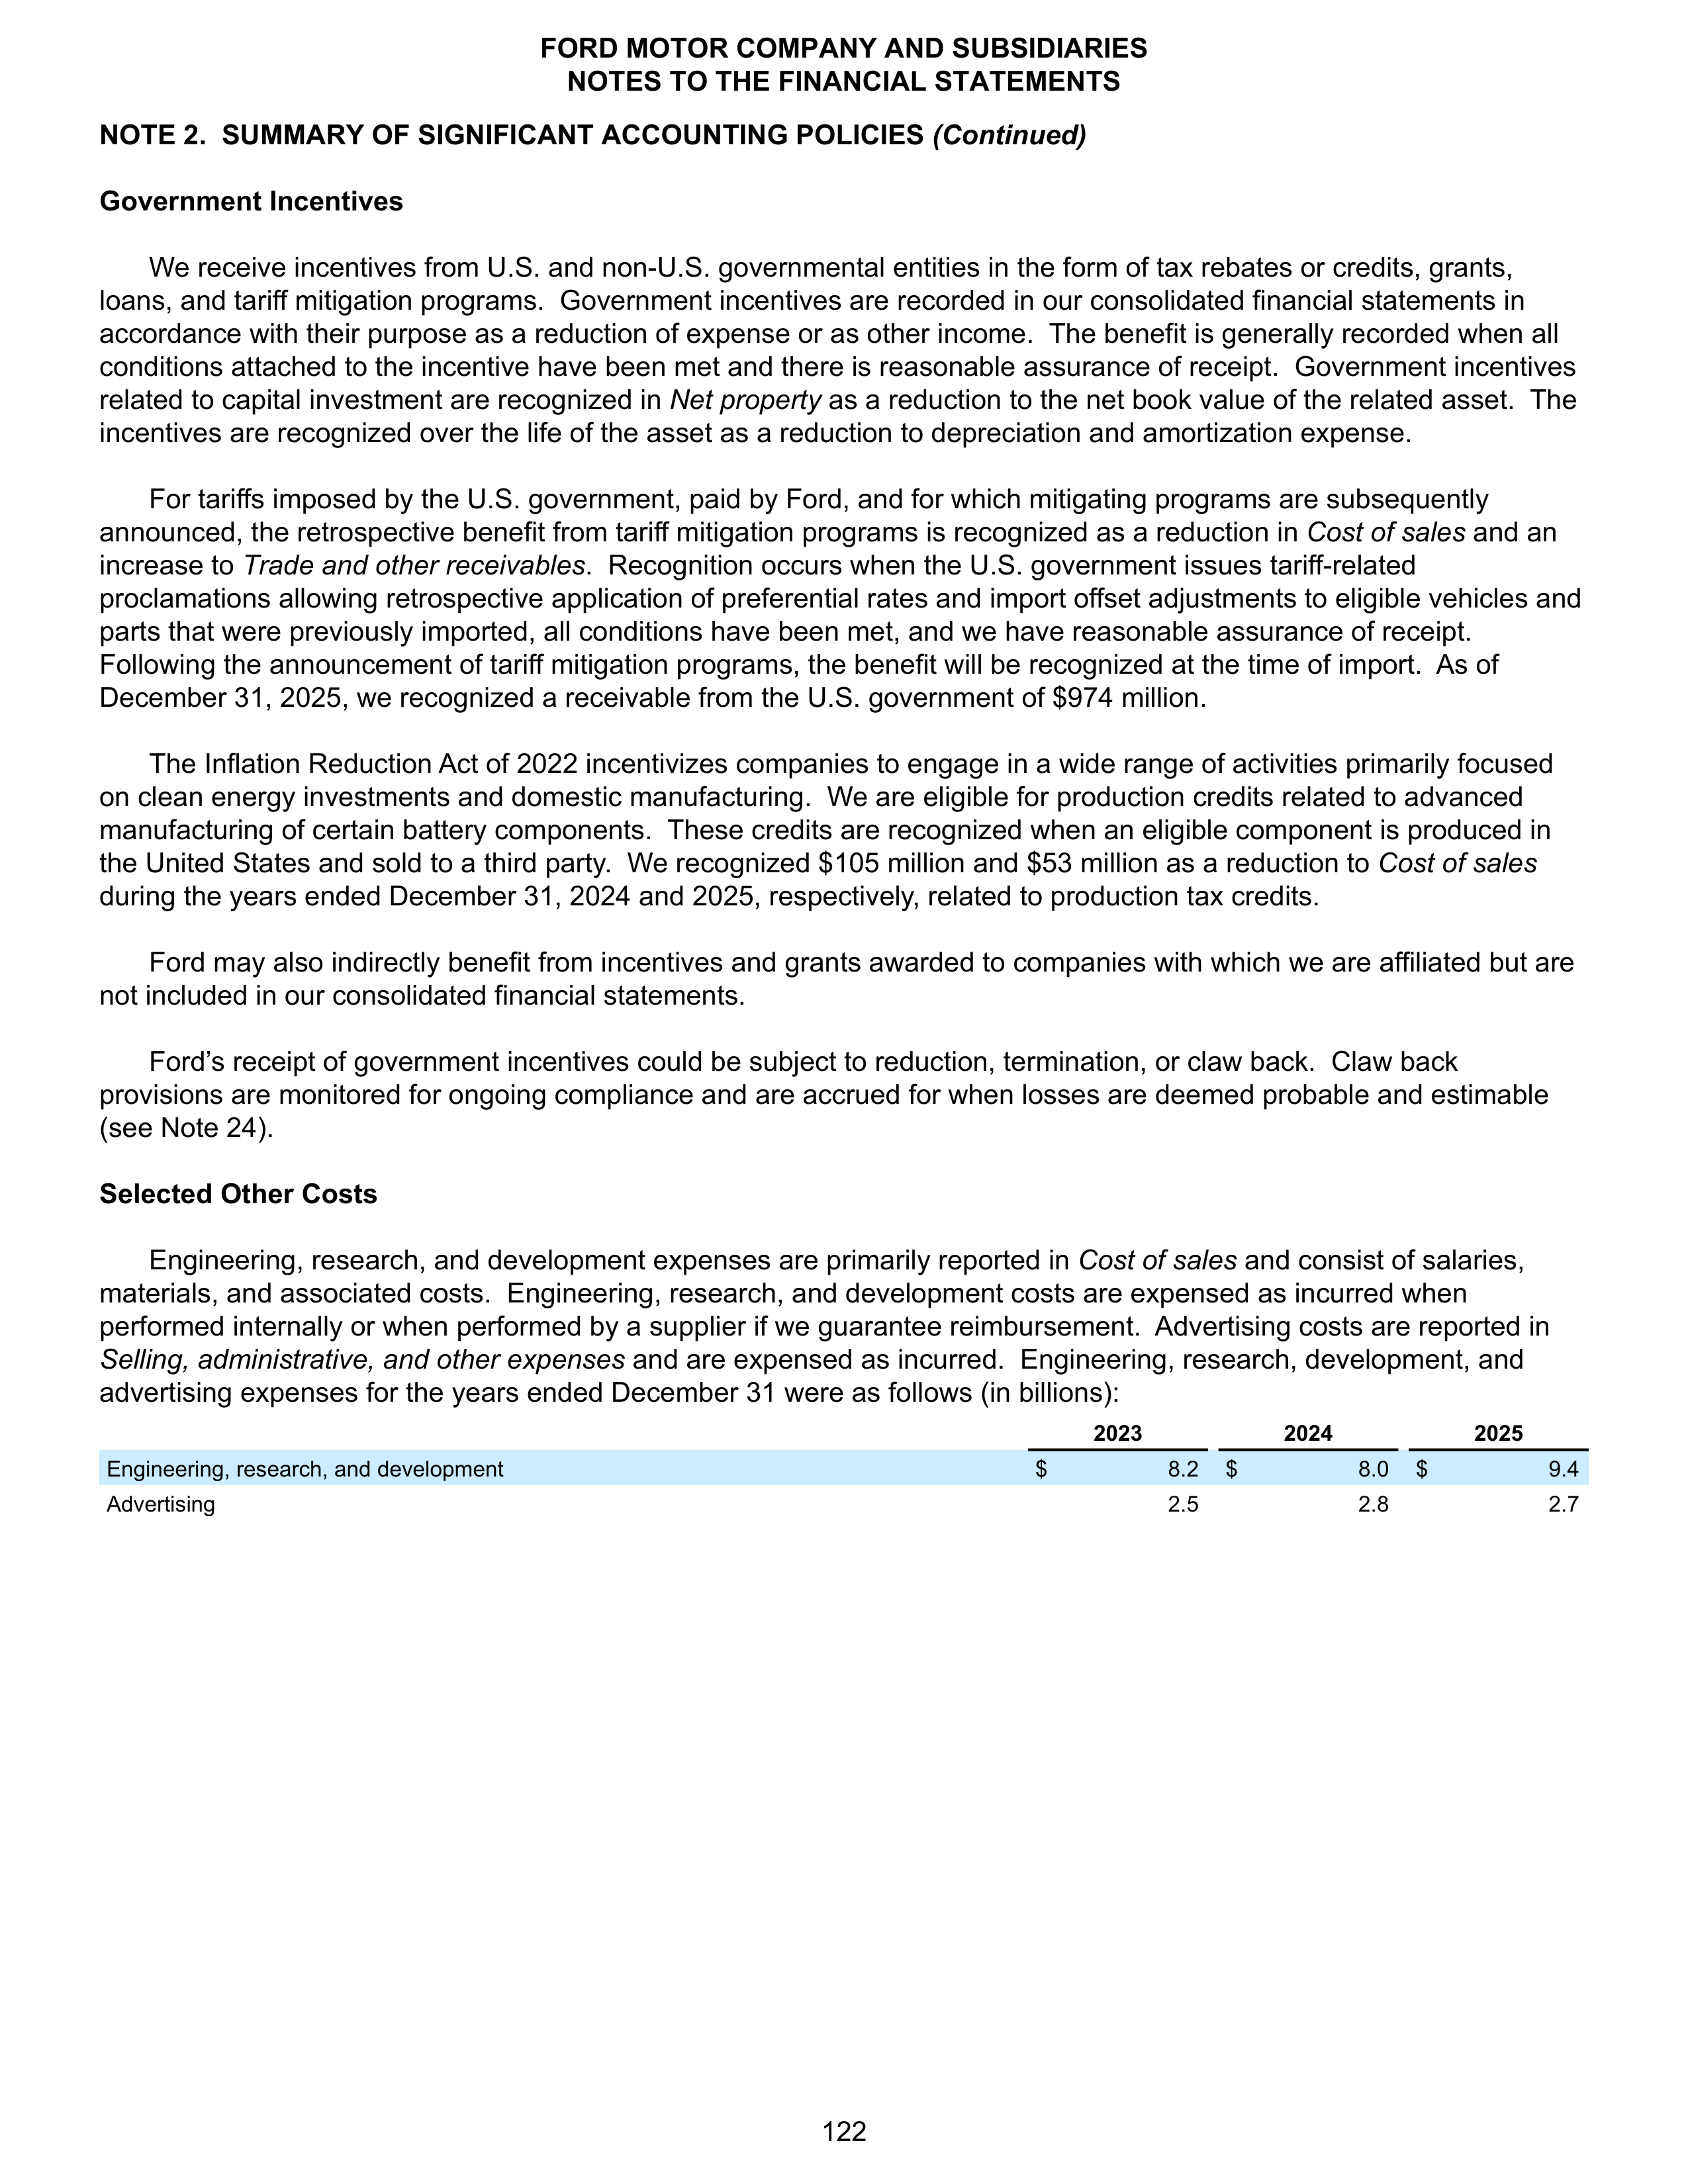
NOTE 2. SUMMARY OF SIGNIFICANT ACCOUNTING POLICIES
(Continued)
Government Incentives
We receive incentives from U.S. and non-U.S. governmental entities in the form of tax rebates or credits, grants,
loans, and tariff mitigation programs. Government incentives are recorded in our consolidated financial statements in
accordance with their purpose as a reduction of expense or as other income. The benefit is generally recorded when all
conditions attached to the incentive have been met and there is reasonable assurance of receipt. Government incentives
related to capital investment are recognized in
Net property
as a reduction to the net book value of the related asset. The
incentives are recognized over the life of the asset as a reduction to depreciation and amortization expense.
For tariffs imposed by the U.S. government, paid by Ford, and for which mitigating programs are subsequently
announced, the retrospective benefit from tariff mitigation programs is recognized as a reduction in
Cost of sales
and an
increase to
Trade and other receivables
. Recognition occurs when the U.S. government issues tariff-related
proclamations allowing retrospective application of preferential rates and import offset adjustments to eligible vehicles and
parts that were previously imported, all conditions have been met, and we have reasonable assurance of receipt.
Following the announcement of tariff mitigation programs, the benefit will be recognized at the time of import. As of
December 31, 2025, we recognized a receivable from the U.S. government of $974 million.
The Inflation Reduction Act of 2022 incentivizes companies to engage in a wide range of activities primarily focused
on clean energy investments and domestic manufacturing. We are eligible for production credits related to advanced
manufacturing of certain battery components. These credits are recognized when an eligible component is produced in
the United States and sold to a third party. We recognized $105 million and $53 million as a reduction to
Cost of sales
during the years ended December 31, 2024 and 2025, respectively, related to production tax credits.
Ford may also indirectly benefit from incentives and grants awarded to companies with which we are affiliated but are
not included in our consolidated financial statements.
Ford’s receipt of government incentives could be subject to reduction, termination, or claw back. Claw back
provisions are monitored for ongoing compliance and are accrued for when losses are deemed probable and estimable
(see Note 24).
Selected Other Costs
Engineering, research, and development expenses are primarily reported in
Cost of sales
and consist of salaries,
materials, and associated costs. Engineering, research, and development costs are expensed as incurred when
performed internally or when performed by a supplier if we guarantee reimbursement. Advertising costs are reported in
Selling, administrative, and other expenses
and are expensed as incurred. Engineering, research, development, and
advertising expenses for the years ended December 31 were as follows (in billions):
2023
2024
2025
Engineering, research, and development
$
8.2
$
8.0
$
9.4
Advertising
2.5
2.8
2.7
FORD MOTOR COMPANY AND SUBSIDIARIES
NOTES TO THE FINANCIAL STATEMENTS
122
NOTE 3. NEW ACCOUNTING STANDARDS
Adoption of New Accounting Standards
Accounting Standards Update (“ASU”)
2023-09,
Improvements to Income Tax Disclosures
. We adopted the new
standard, which requires additional income tax disclosures for annual reporting periods, and applied the amendments
prospectively. Adoption of the new standard did not impact our consolidated income statements, balance sheets, or
statements of cash flows. Refer to Note 7 for the additional disclosures required under the standard.
All other ASUs adopted during 2025 did not have a material impact to our consolidated financial statements or
financial statement disclosures.
Accounting Standards Issued But Not Yet Adopted
ASU 2024-03, Disaggregation of Income Statement Expenses (“DISE”)
. In November 2024, the Financial Accounting
Standards Board (“FASB”) issued a new accounting standard to improve the disclosures about an entity’s expenses and
address requests from investors for more detailed information about the types of expenses included in commonly
presented expense captions. The new standard is effective for annual reporting periods beginning after
December 15, 2026, and interim reporting periods beginning after December 15, 2027, with retrospective application
permitted. We are assessing the effect on our consolidated financial statement disclosures; however, adoption will not
impact our consolidated income statements, balance sheets, or statements of cash flows.
All other ASUs issued but not yet adopted were assessed and determined to be not applicable or are not expected to
have a material impact on our consolidated financial statements or financial statement disclosures.
FORD MOTOR COMPANY AND SUBSIDIARIES
NOTES TO THE FINANCIAL STATEMENTS
123
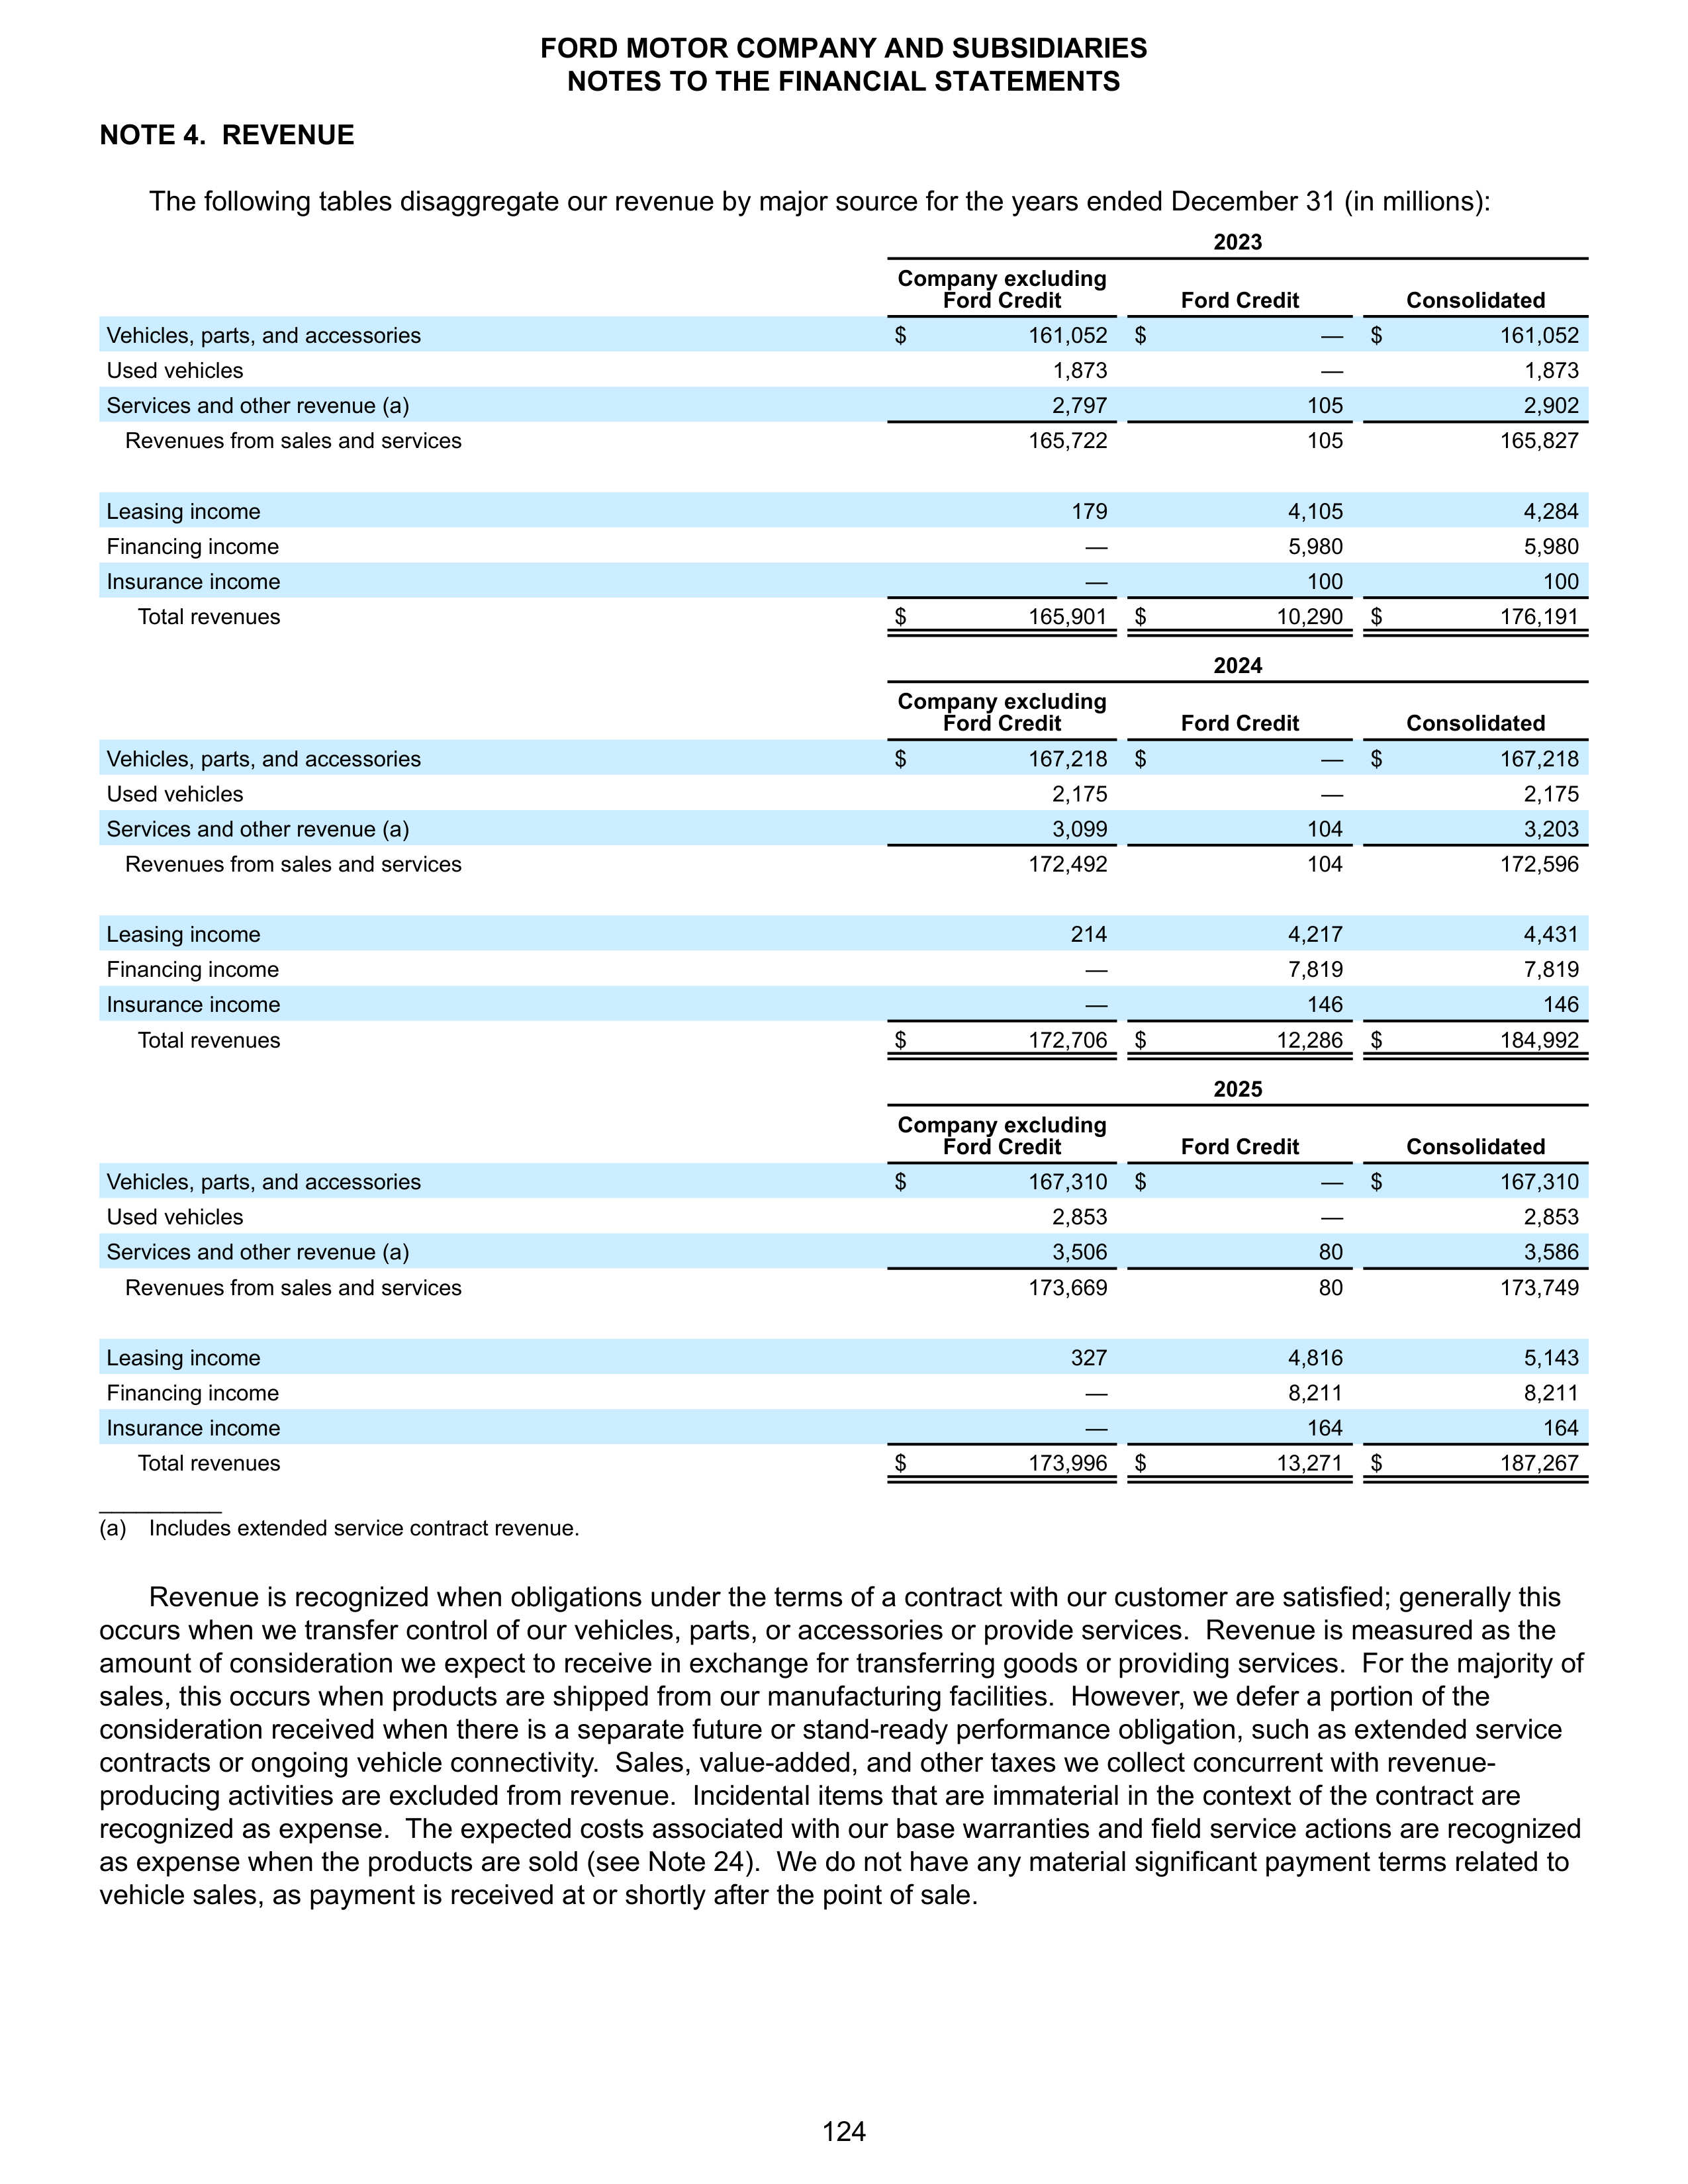
NOTE 4. REVENUE
The following tables disaggregate our revenue by major source for the years ended December 31 (in millions):
2023
Company excluding
Ford Credit
Ford Credit
Consolidated
Vehicles, parts, and accessories
$
161,052
$
—
$
161,052
Used vehicles
1,873
—
1,873
Services and other revenue (a)
2,797
105
2,902
Revenues from sales and services
165,722
105
165,827
Leasing income
179
4,105
4,284
Financing income
—
5,980
5,980
Insurance income
—
100
100
Total revenues
$
165,901
$
10,290
$
176,191
2024
Company excluding
Ford Credit
Ford Credit
Consolidated
Vehicles, parts, and accessories
$
167,218
$
—
$
167,218
Used vehicles
2,175
—
2,175
Services and other revenue (a)
3,099
104
3,203
Revenues from sales and services
172,492
104
172,596
Leasing income
214
4,217
4,431
Financing income
—
7,819
7,819
Insurance income
—
146
146
Total revenues
$
172,706
$
12,286
$
184,992
2025
Company excluding
Ford Credit
Ford Credit
Consolidated
Vehicles, parts, and accessories
$
167,310
$
—
$
167,310
Used vehicles
2,853
—
2,853
Services and other revenue (a)
3,506
80
3,586
Revenues from sales and services
173,669
80
173,749
Leasing income
327
4,816
5,143
Financing income
—
8,211
8,211
Insurance income
—
164
164
Total revenues
$
173,996
$
13,271
$
187,267
__________
(a)
Includes extended service contract revenue.
Revenue is recognized when obligations under the terms of a contract with our customer are satisfied; generally this
occurs when we transfer control of our vehicles, parts, or accessories or provide services. Revenue is measured as the
amount of consideration we expect to receive in exchange for transferring goods or providing services. For the majority of
sales, this occurs when products are shipped from our manufacturing facilities. However, we defer a portion of the
consideration received when there is a separate future or stand-ready performance obligation, such as extended service
contracts or ongoing vehicle connectivity. Sales, value-added, and other taxes we collect concurrent with revenue-
producing activities are excluded from revenue. Incidental items that are immaterial in the context of the contract are
recognized as expense. The expected costs associated with our base warranties and field service actions are recognized
as expense when the products are sold (see Note 24). We do not have any material significant payment terms related to
vehicle sales, as payment is received at or shortly after the point of sale.
FORD MOTOR COMPANY AND SUBSIDIARIES
NOTES TO THE FINANCIAL STATEMENTS
124
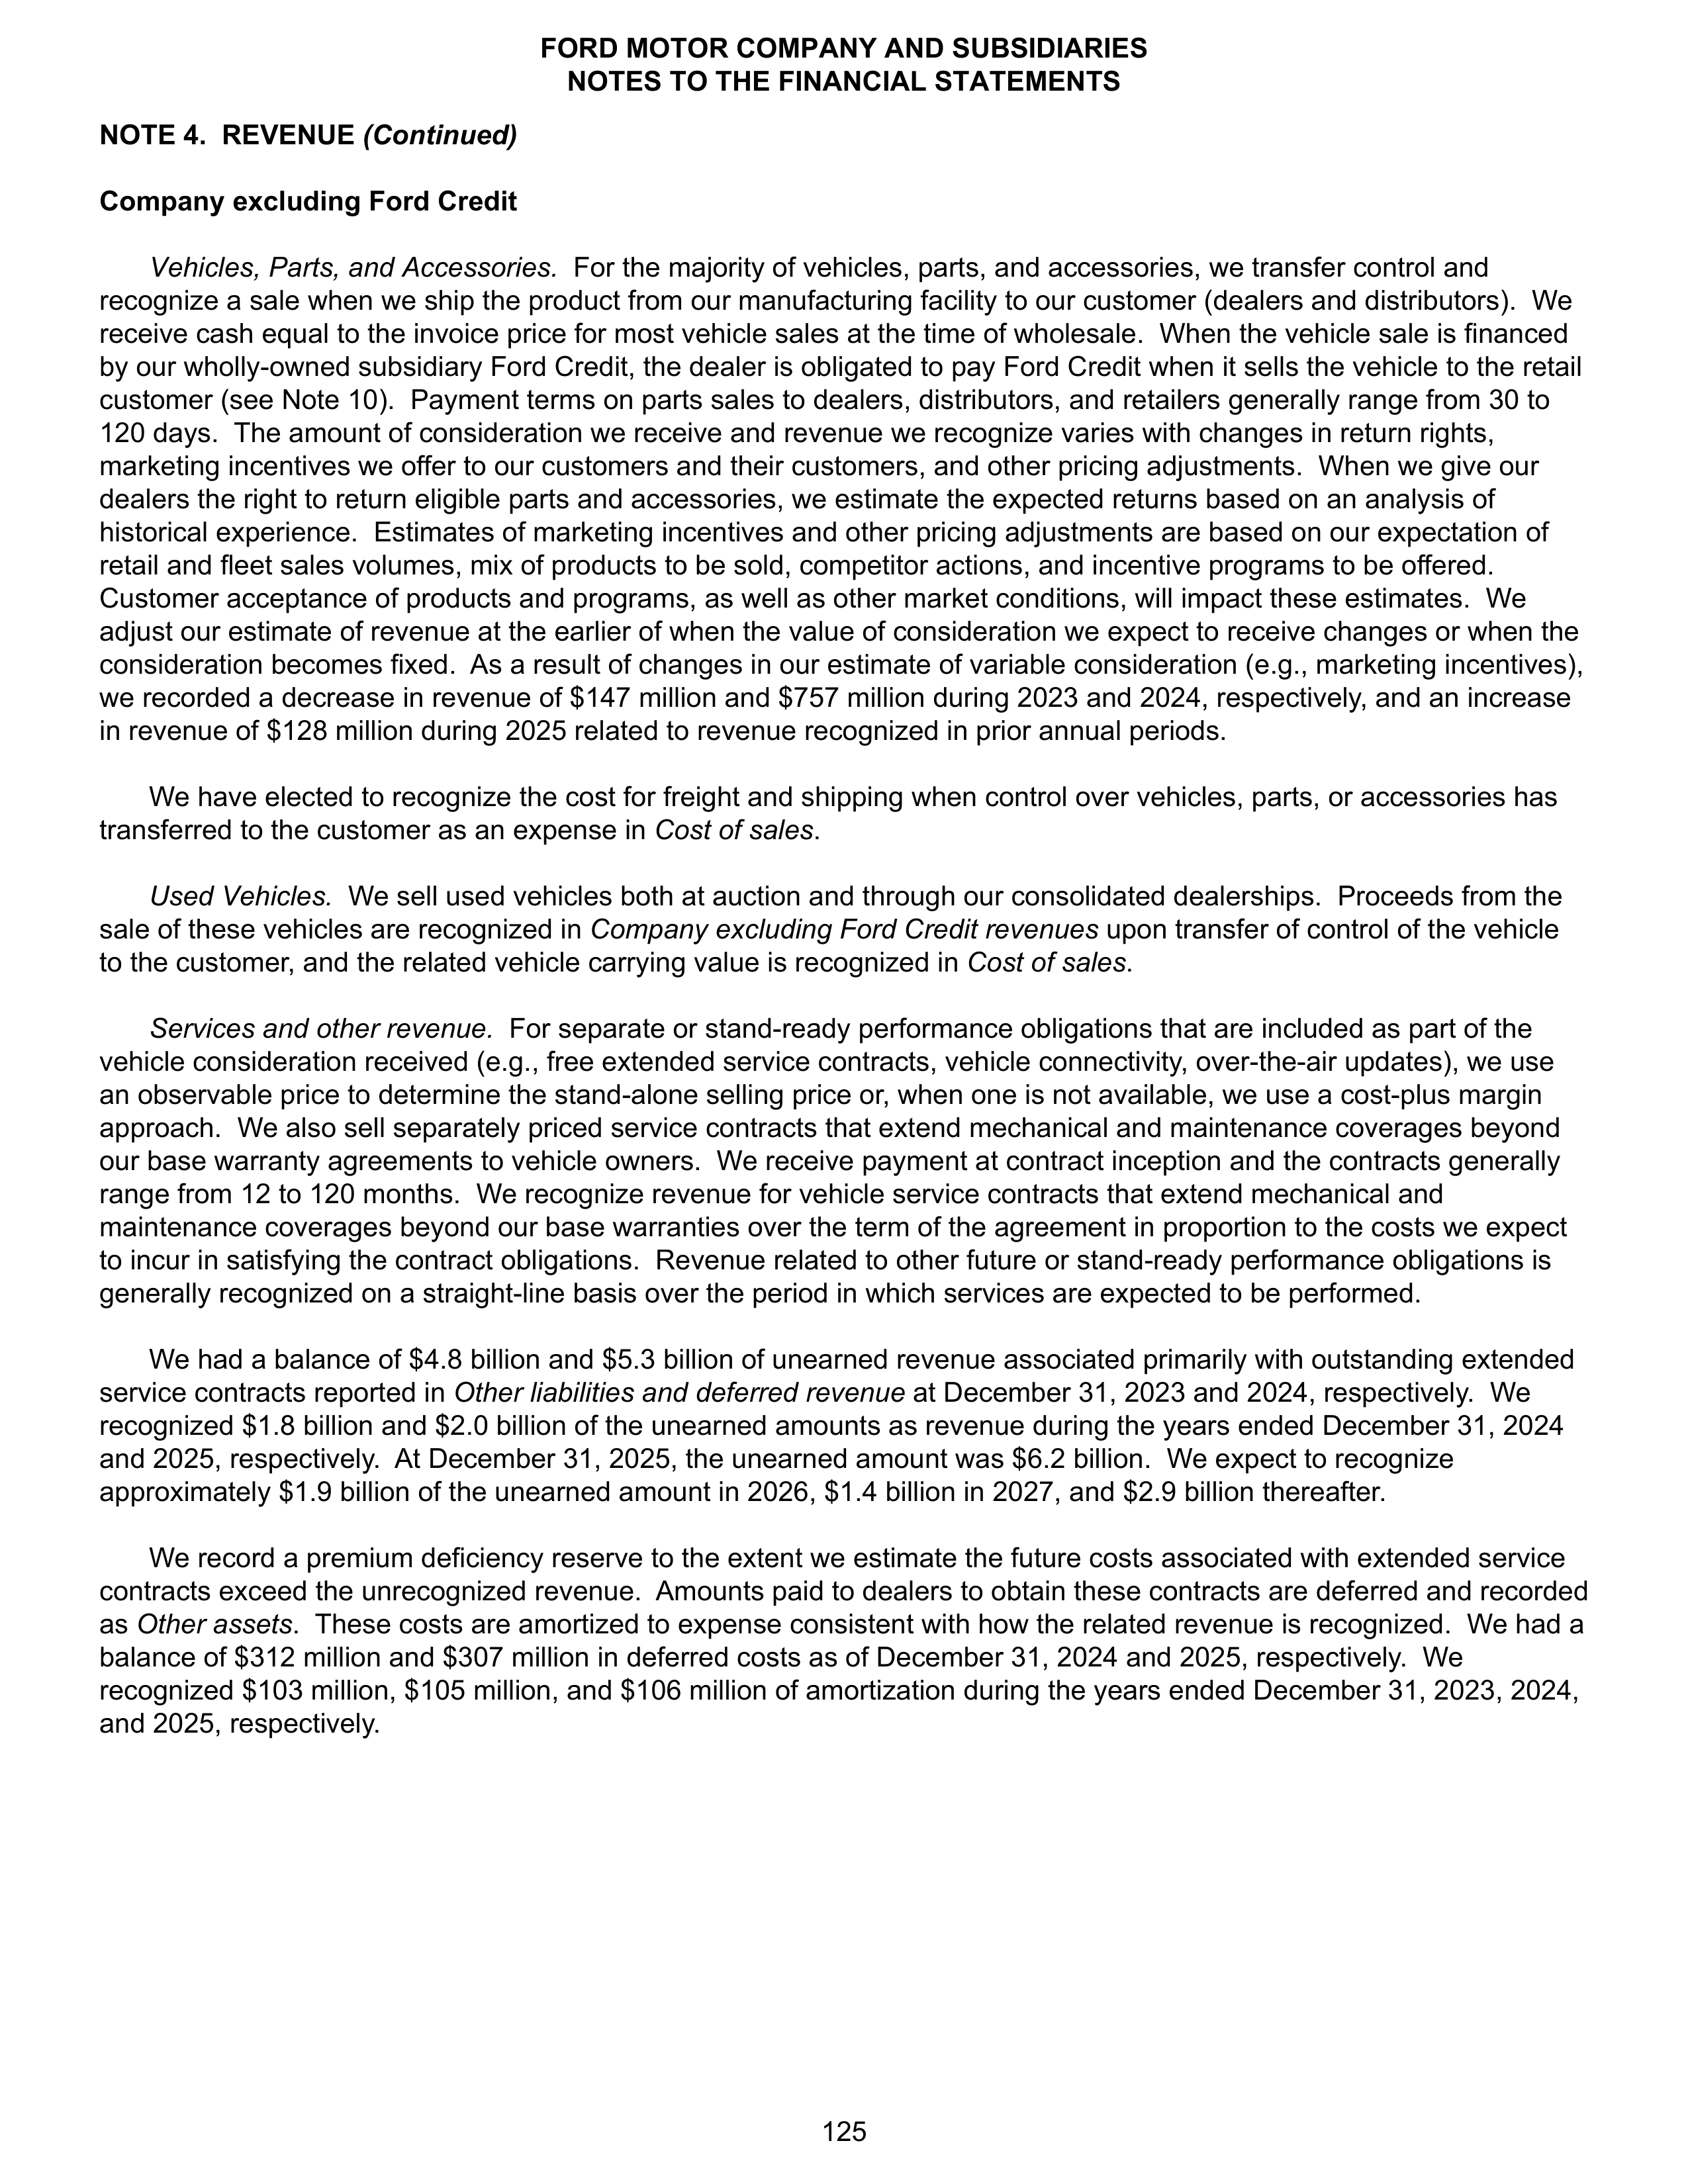
NOTE 4. REVENUE
(Continued)
Company excluding Ford Credit
Vehicles, Parts, and Accessories.
For the majority of vehicles, parts, and accessories, we transfer control and
recognize a sale when we ship the product from our manufacturing facility to our customer (dealers and distributors). We
receive cash equal to the invoice price for most vehicle sales at the time of wholesale. When the vehicle sale is financed
by our wholly-owned subsidiary Ford Credit, the dealer is obligated to pay Ford Credit when it sells the vehicle to the retail
customer (see Note 10). Payment terms on parts sales to dealers, distributors, and retailers generally range from 30 to
120 days. The amount of consideration we receive and revenue we recognize varies with changes in return rights,
marketing incentives we offer to our customers and their customers, and other pricing adjustments. When we give our
dealers the right to return eligible parts and accessories, we estimate the expected returns based on an analysis of
historical experience. Estimates of marketing incentives and other pricing adjustments are based on our expectation of
retail and fleet sales volumes, mix of products to be sold, competitor actions, and incentive programs to be offered.
Customer acceptance of products and programs, as well as other market conditions, will impact these estimates. We
adjust our estimate of revenue at the earlier of when the value of consideration we expect to receive changes or when the
consideration becomes fixed. As a result of changes in our estimate of variable consideration (e.g., marketing incentives),
we recorded a decrease in revenue of $147 million and $757 million during 2023 and 2024, respectively, and an increase
in revenue of $128 million during 2025 related to revenue recognized in prior annual periods.
We have elected to recognize the cost for freight and shipping when control over vehicles, parts, or accessories has
transferred to the customer as an expense in
Cost of sales
.
Used Vehicles.
We sell used vehicles both at auction and through our consolidated dealerships. Proceeds from the
sale of these vehicles are recognized in
Company excluding Ford Credit revenues
upon transfer of control of the vehicle
to the customer, and the related vehicle carrying value is recognized in
Cost of sales
.
Services and other revenue.
For separate or stand-ready performance obligations that are included as part of the
vehicle consideration received (e.g., free extended service contracts, vehicle connectivity, over-the-air updates), we use
an observable price to determine the stand-alone selling price or, when one is not available, we use a cost-plus margin
approach. We also sell separately priced service contracts that extend mechanical and maintenance coverages beyond
our base warranty agreements to vehicle owners. We receive payment at contract inception and the contracts generally
range from 12 to 120 months. We recognize revenue for vehicle service contracts that extend mechanical and
maintenance coverages beyond our base warranties over the term of the agreement in proportion to the costs we expect
to incur in satisfying the contract obligations. Revenue related to other future or stand-ready performance obligations is
generally recognized on a straight-line basis over the period in which services are expected to be performed.
We had a balance of $4.8 billion and $5.3 billion of unearned revenue associated primarily with outstanding extended
service contracts reported in
Other liabilities and deferred revenue
at December 31, 2023 and 2024, respectively. We
recognized
$1.8 billion and $2.0 billion of the unearned amounts as revenue during the years ended December 31, 2024
and 2025, respectively. At December 31, 2025, the unearned amount was $6.2 billion. We expect to recognize
approximately $1.9 billion of the unearned amount in 2026, $1.4 billion in 2027, and $2.9 billion thereafter.
We record a premium deficiency reserve to the extent we estimate the future costs associated with extended service
contracts exceed the unrecognized revenue. Amounts paid to dealers to obtain these contracts are deferred and recorded
as
Other assets
. These costs are amortized to expense consistent with how the related revenue is recognized. We had a
balance of $312 million and $307 million in deferred costs as of December 31, 2024 and 2025, respectively. We
recognized $103 million, $105 million, and $106 million of amortization during the years ended December 31, 2023, 2024,
and 2025, respectively.
FORD MOTOR COMPANY AND SUBSIDIARIES
NOTES TO THE FINANCIAL STATEMENTS
125
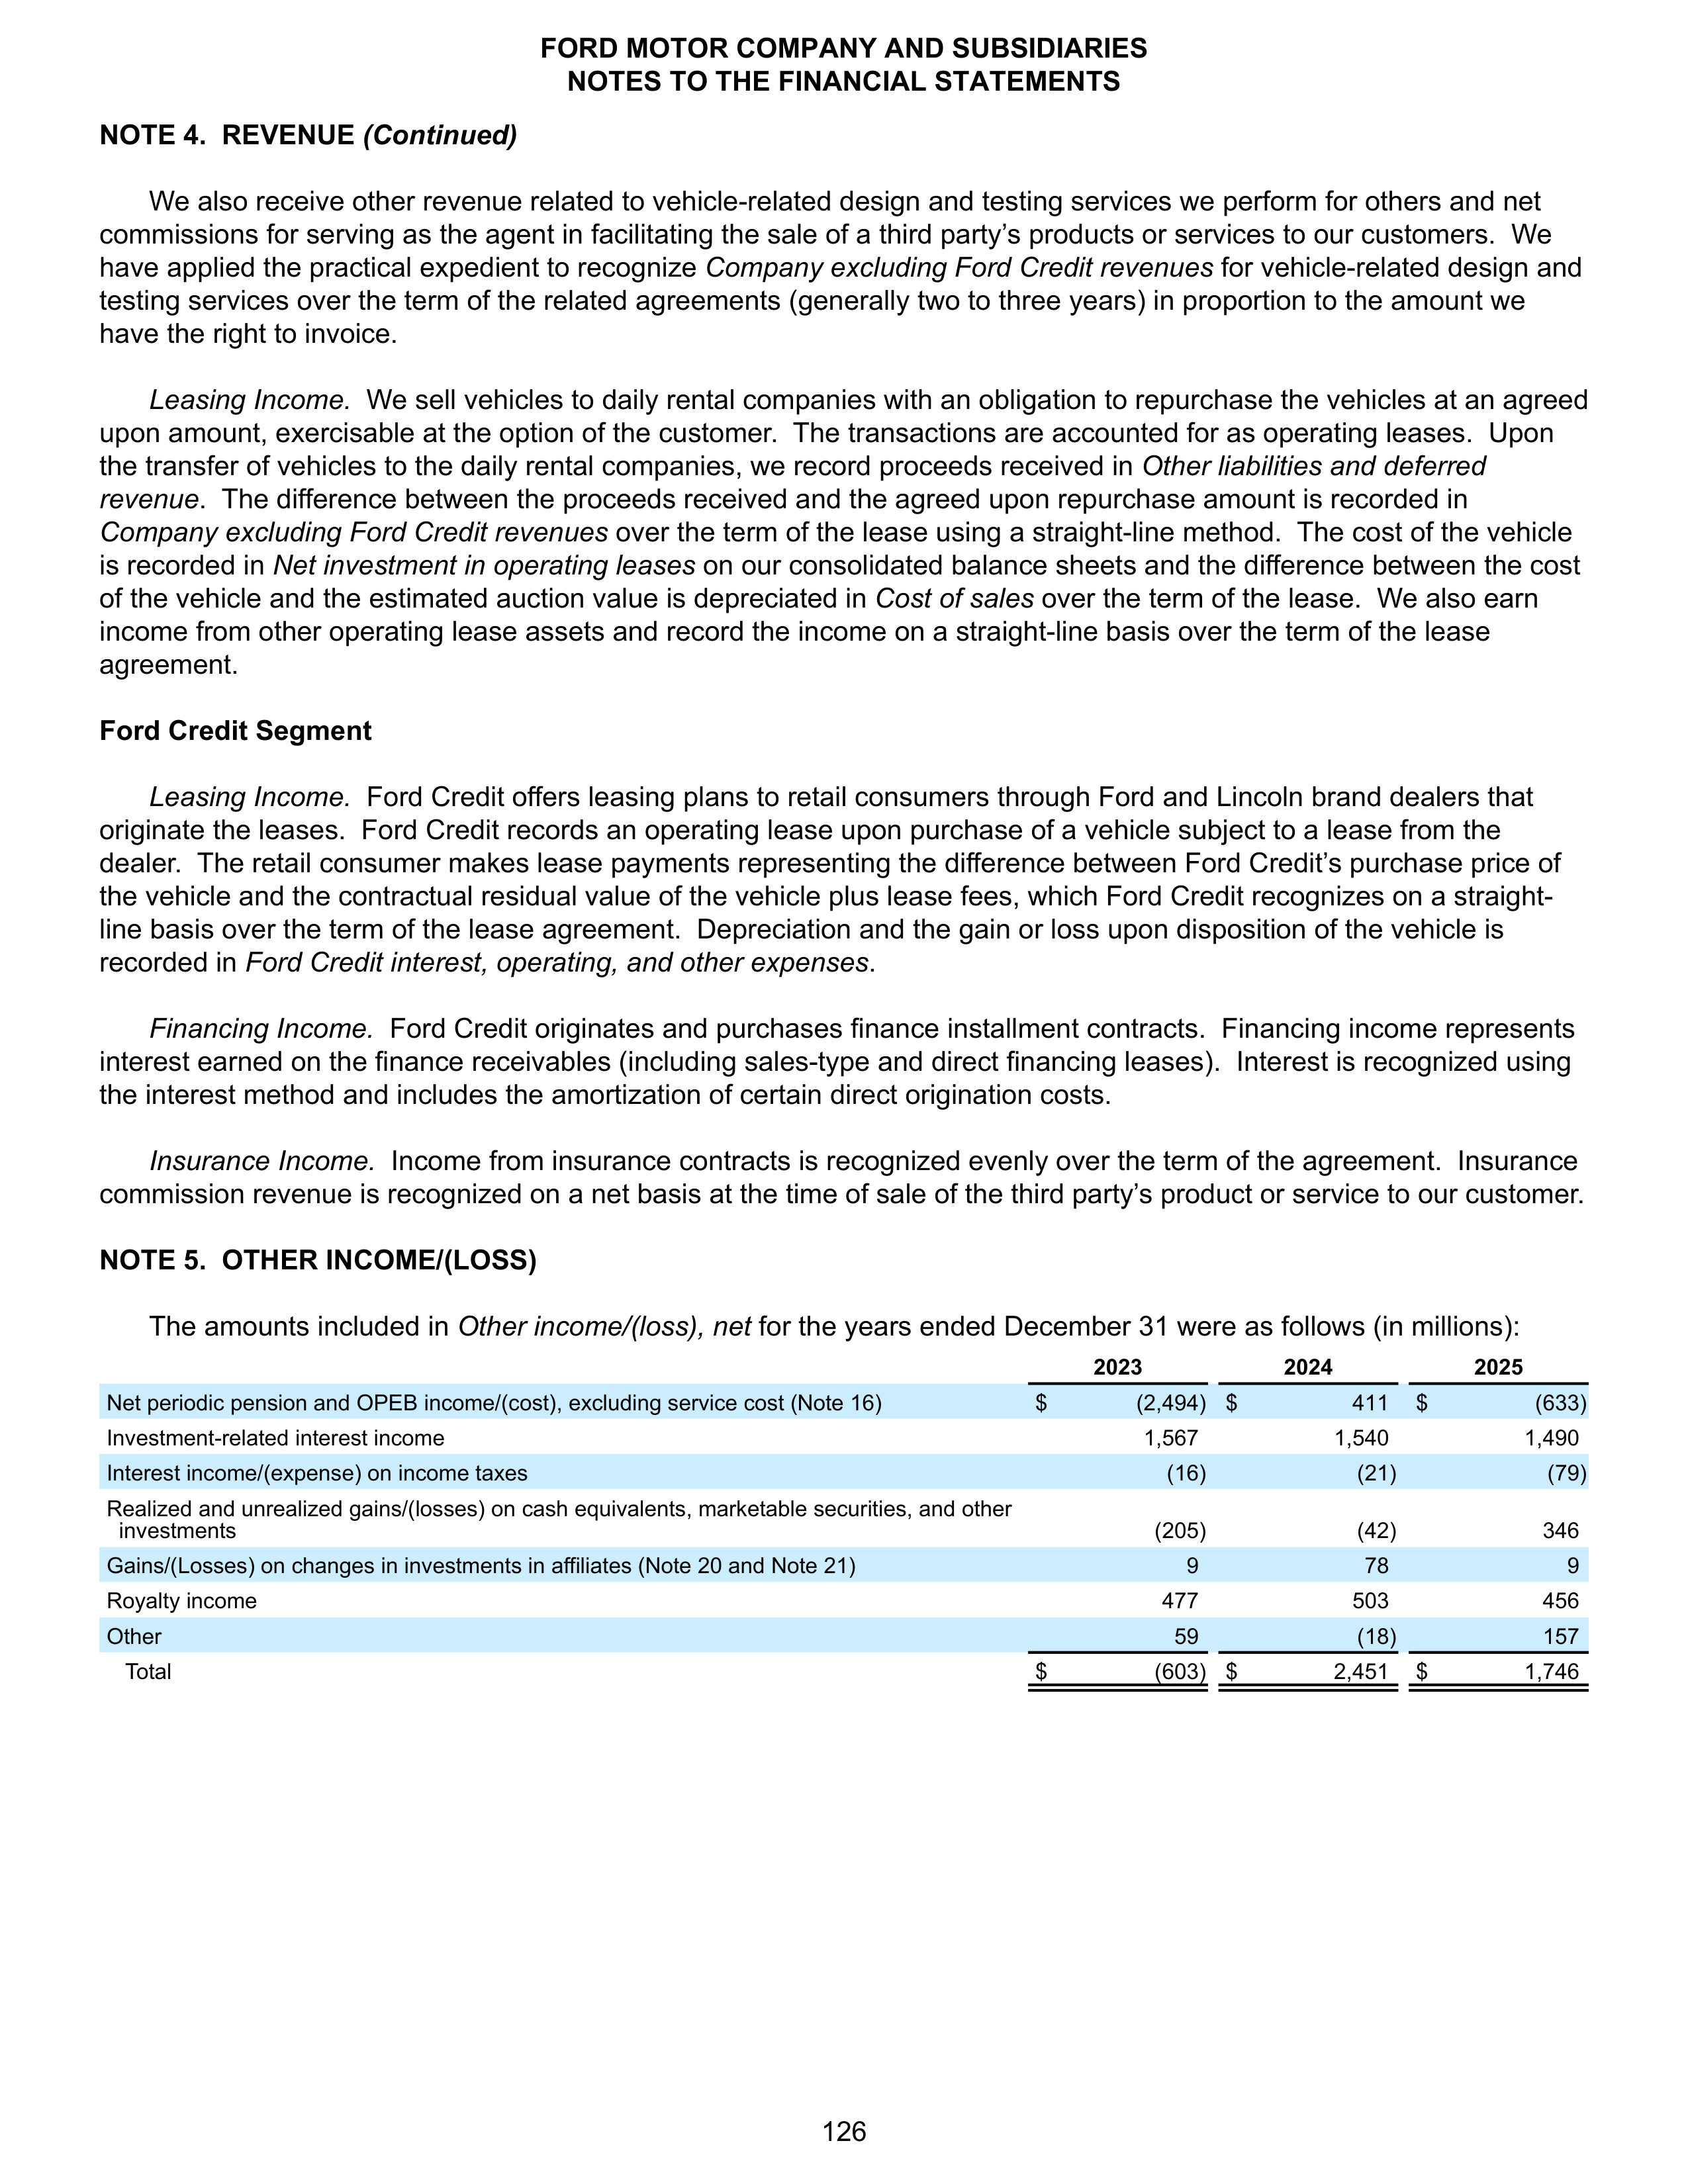
NOTE 4. REVENUE
(Continued)
We also receive other revenue related to vehicle-related design and testing services we perform for others and net
commissions for serving as the agent in facilitating the sale of a third party’s products or services to our customers. We
have applied the practical expedient to recognize
Company excluding Ford Credit revenues
for vehicle-related design and
testing services over the term of the related agreements (generally two to three years) in proportion to the amount we
have the right to invoice.
Leasing Income.
We sell vehicles to daily rental companies with an obligation to repurchase the vehicles at an agreed
upon amount, exercisable at the option of the customer. The transactions are accounted for as operating leases. Upon
the transfer of vehicles to the daily rental companies, we record proceeds received in
Other liabilities and deferred
revenue
. The difference between the proceeds received and the agreed upon repurchase amount is recorded in
Company excluding Ford Credit revenues
over the term of the lease using a straight-line method. The cost of the vehicle
is recorded in
Net investment in operating leases
on our consolidated balance sheets and the difference between the cost
of the vehicle and the estimated auction value is depreciated in
Cost of sales
over the term of the lease. We also earn
income from other operating lease assets and record the income on a straight-line basis over the term of the lease
agreement.
Ford Credit Segment
Leasing Income.
Ford Credit offers leasing plans to retail consumers through Ford and Lincoln brand dealers that
originate the leases. Ford Credit records an operating lease upon purchase of a vehicle subject to a lease from the
dealer. The retail consumer makes lease payments representing the difference between Ford Credit’s purchase price of
the vehicle and the contractual residual value of the vehicle plus lease fees, which Ford Credit recognizes on a straight-
line basis over the term of the lease agreement. Depreciation and the gain or loss upon disposition of the vehicle is
recorded in
Ford Credit interest, operating, and other expenses
.
Financing Income.
Ford Credit originates and purchases finance installment contracts. Financing income represents
interest earned on the finance receivables (including sales-type and direct financing leases). Interest is recognized using
the interest method and includes the amortization of certain direct origination costs.
Insurance Income.
Income from insurance contracts is recognized evenly over the term of the agreement. Insurance
commission revenue is recognized on a net basis at the time of sale of the third party’s product or service to our customer.
NOTE 5. OTHER INCOME/(LOSS)
The amounts included in
Other income/(loss), net
for the years ended December 31 were as follows (in millions):
2023
2024
2025
Net periodic pension and OPEB income/(cost), excluding service cost (Note 16)
$
(2,494) $
411
$
(633)
Investment-related interest income
1,567
1,540
1,490
Interest income/(expense) on income taxes
(16)
(21)
(79)
Realized and unrealized gains/(losses) on cash equivalents, marketable securities, and other
investments
(205)
(42)
346
Gains/(Losses) on changes in investments in affiliates (Note 20 and Note 21)
9
78
9
Royalty income
477
503
456
Other
59
(18)
157
Total
$
(603) $
2,451
$
1,746
FORD MOTOR COMPANY AND SUBSIDIARIES
NOTES TO THE FINANCIAL STATEMENTS
126
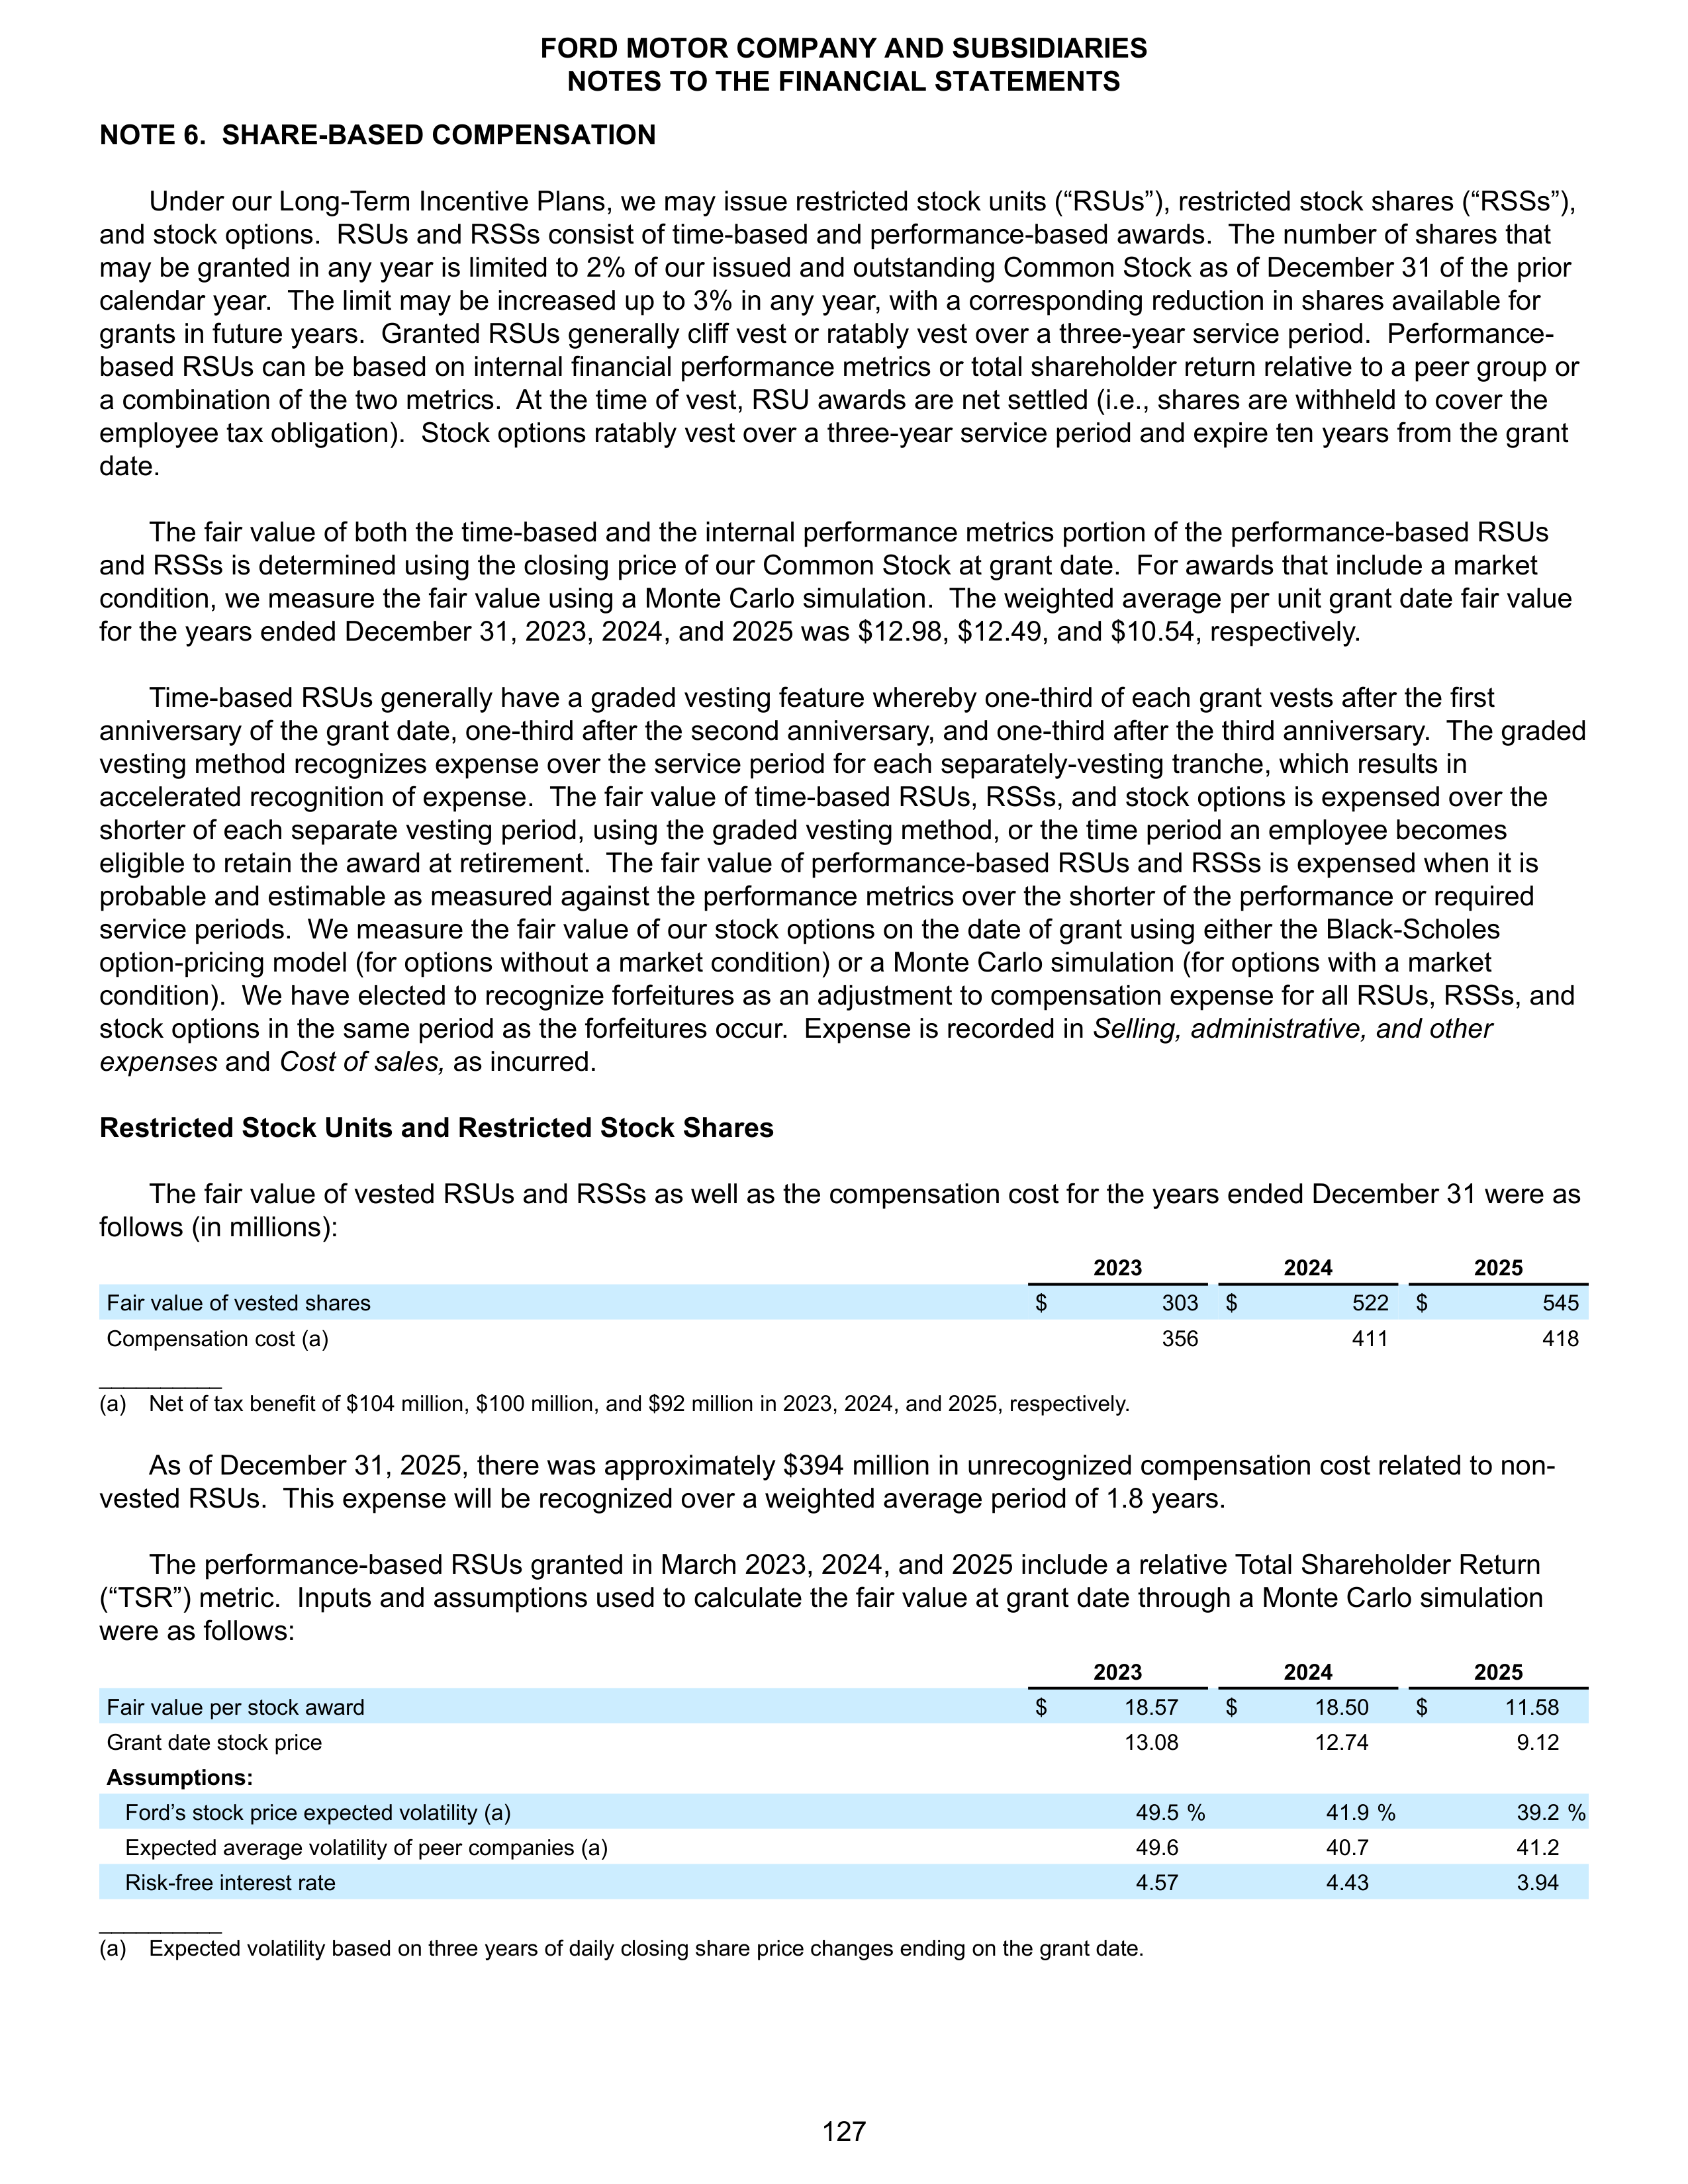
NOTE 6. SHARE-BASED COMPENSATION
Under our Long-Term Incentive Plans, we may issue restricted stock units (“RSUs”), restricted stock shares (“RSSs”),
and stock options. RSUs and RSSs consist of time-based and performance-based awards. The number of shares that
may be granted in any year is limited to 2% of our issued and outstanding Common Stock as of December 31 of the prior
calendar year. The limit may be increased up to 3% in any year, with a corresponding reduction in shares available for
grants in future years. Granted RSUs generally cliff vest or ratably vest over a three-year service period. Performance-
based RSUs can be based on internal financial performance metrics or total shareholder return relative to a peer group or
a combination of the two metrics. At the time of vest, RSU awards are net settled (i.e., shares are withheld to cover the
employee tax obligation). Stock options ratably vest over a three-year service period and expire ten years from the grant
date.
The fair value of both the time-based and the internal performance metrics portion of the performance-based RSUs
and RSSs is determined using the closing price of our Common Stock at grant date. For awards that include a market
condition, we measure the fair value using a Monte Carlo simulation. The weighted average per unit grant date fair value
for the years ended December 31, 2023, 2024, and 2025 was $12.98, $12.49, and $10.54, respectively.
Time-based RSUs generally have a graded vesting feature whereby one-third of each grant vests after the first
anniversary of the grant date, one-third after the second anniversary, and one-third after the third anniversary. The graded
vesting method recognizes expense over the service period for each separately-vesting tranche, which results in
accelerated recognition of expense. The fair value of time-based RSUs, RSSs, and stock options is expensed over the
shorter of each separate vesting period, using the graded vesting method, or the time period an employee becomes
eligible to retain the award at retirement. The fair value of performance-based RSUs and RSSs is expensed when it is
probable and estimable as measured against the performance metrics over the shorter of the performance or required
service periods. We measure the fair value of our stock options on the date of grant using either the Black-Scholes
option-pricing model (for options without a market condition) or a Monte Carlo simulation (for options with a market
condition). We have elected to recognize forfeitures as an adjustment to compensation expense for all RSUs, RSSs, and
stock options in the same period as the forfeitures occur. Expense is recorded in
Selling, administrative, and other
expenses
and
Cost of sales,
as incurred.
Restricted Stock Units and Restricted Stock Shares
The fair value of vested RSUs and RSSs as well as the compensation cost for the years ended December 31 were as
follows (in millions):
2023
2024
2025
Fair value of vested shares
$
303
$
522
$
545
Compensation cost (a)
356
411
418
__________
(a) Net of tax benefit of $104 million, $100 million, and $92 million in 2023, 2024, and 2025, respectively.
As of December 31, 2025, there was approximately $394 million in unrecognized compensation cost related to non-
vested RSUs. This expense will be recognized over a weighted average period of 1.8 years.
The performance-based RSUs granted in March 2023, 2024, and 2025 include a relative Total Shareholder Return
(“TSR”) metric. Inputs and assumptions used to calculate the fair value at grant date through a Monte Carlo simulation
were as follows:
2023
2024
2025
Fair value per stock award
$
18.57
$
18.50
$
11.58
Grant date stock price
13.08
12.74
9.12
Assumptions:
Ford’s stock price expected volatility (a)
49.5 %
41.9 %
39.2 %
Expected average volatility of peer companies (a)
49.6
40.7
41.2
Risk-free interest rate
4.57
4.43
3.94
__________
(a)
Expected volatility based on three years of daily closing share price changes ending on the grant date.
FORD MOTOR COMPANY AND SUBSIDIARIES
NOTES TO THE FINANCIAL STATEMENTS
127
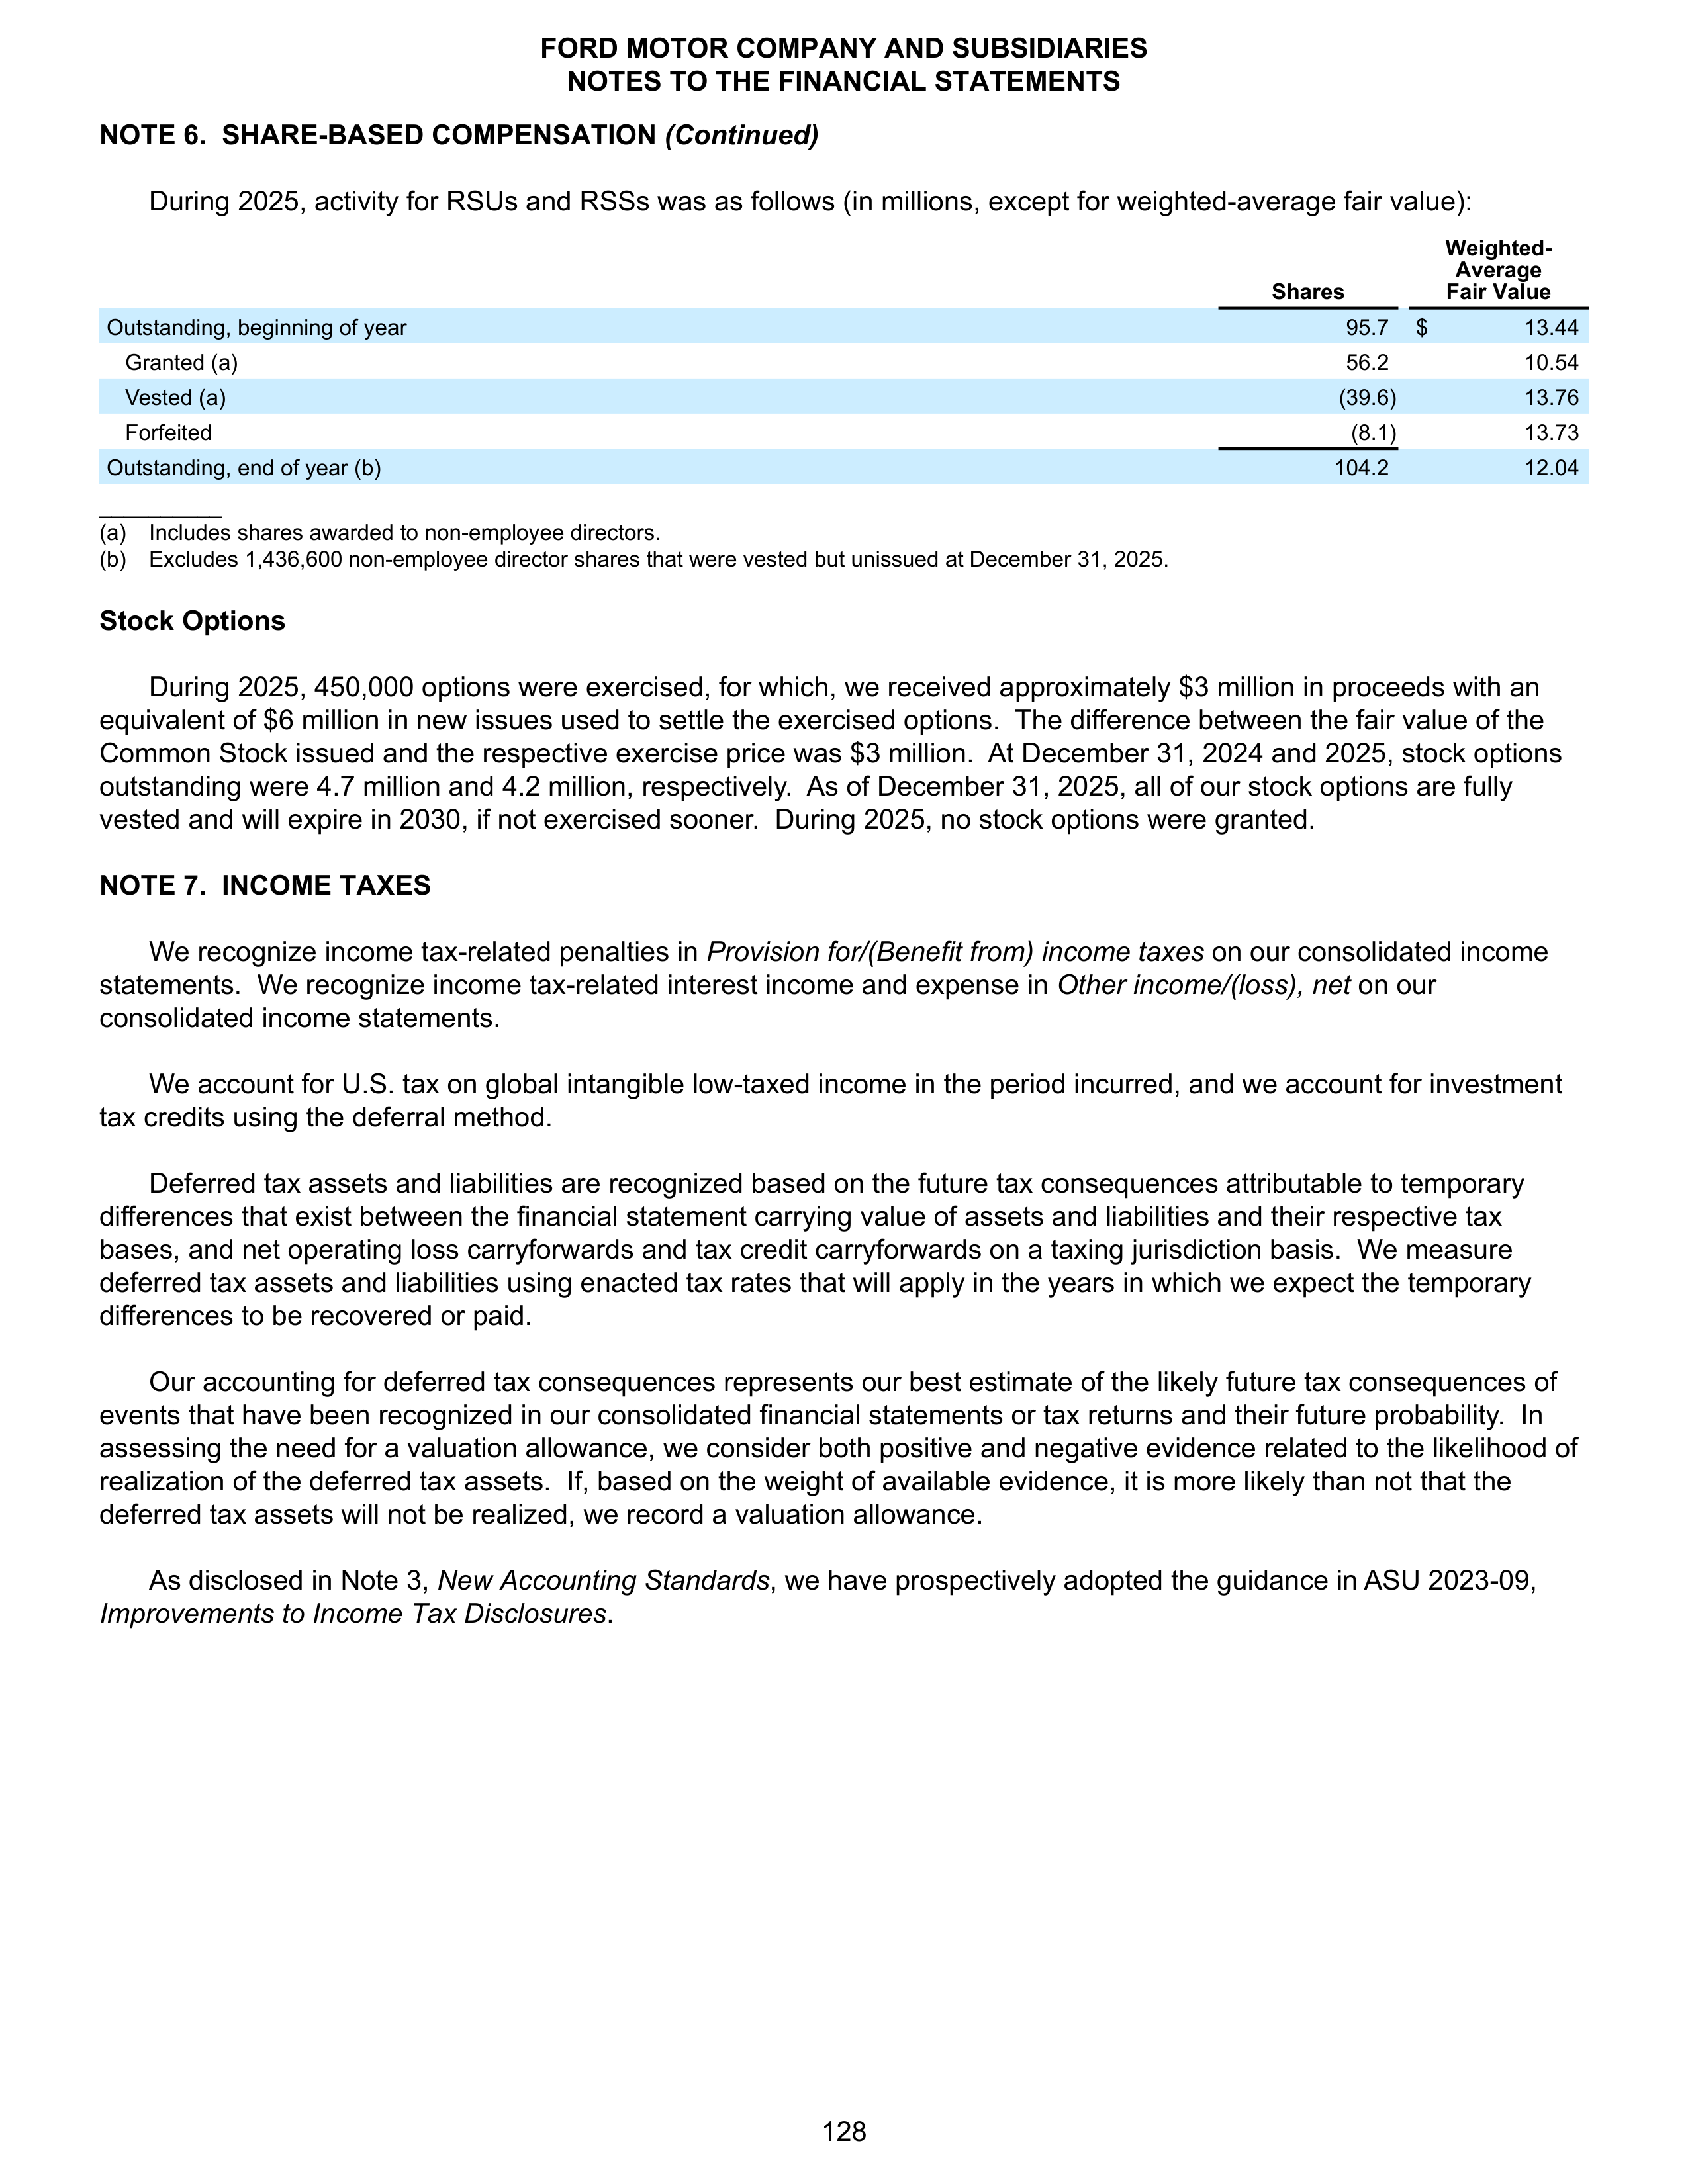
NOTE 6. SHARE-BASED COMPENSATION
(Continued)
During 2025, activity for RSUs and RSSs was as follows (in millions, except for weighted-average fair value):
Shares
Weighted-
Average
Fair Value
Outstanding, beginning of year
95.7
$
13.44
Granted (a)
56.2
10.54
Vested (a)
(39.6)
13.76
Forfeited
(8.1)
13.73
Outstanding, end of year (b)
104.2
12.04
__________
(a)
Includes shares awarded to non-employee directors.
(b)
Excludes 1,436,600 non-employee director shares that were vested but unissued at December 31, 2025.
Stock Options
During 2025, 450,000 options were exercised, for which, we received approximately $3 million in proceeds with an
equivalent of $6 million in new issues used to settle the exercised options. The difference between the fair value of the
Common Stock issued and the respective exercise price was $3 million. At December 31, 2024 and 2025, stock options
outstanding were 4.7 million and 4.2 million, respectively. As of December 31, 2025, all of our stock options are fully
vested and will expire in 2030, if not exercised sooner. During 2025, no stock options were granted.
NOTE 7. INCOME TAXES
We recognize income tax-related penalties in
Provision for/(Benefit from) income taxes
on our consolidated income
statements. We recognize income tax-related interest income and expense in
Other income/(loss), net
on our
consolidated income statements.
We account for U.S. tax on global intangible low-taxed income in the period incurred, and we account for investment
tax credits using the deferral method.
Deferred tax assets and liabilities are recognized based on the future tax consequences attributable to temporary
differences that exist between the financial statement carrying value of assets and liabilities and their respective tax
bases, and net operating loss carryforwards and tax credit carryforwards on a taxing jurisdiction basis. We measure
deferred tax assets and liabilities using enacted tax rates that will apply in the years in which we expect the temporary
differences to be recovered or paid.
Our accounting for deferred tax consequences represents our best estimate of the likely future tax consequences of
events that have been recognized in our consolidated financial statements or tax returns and their future probability. In
assessing the need for a valuation allowance, we consider both positive and negative evidence related to the likelihood of
realization of the deferred tax assets. If, based on the weight of available evidence, it is more likely than not that the
deferred tax assets will not be realized, we record a valuation allowance.
As disclosed in Note 3,
New Accounting Standards
, we have prospectively adopted the guidance in ASU 2023-09,
Improvements to Income Tax Disclosures
.
FORD MOTOR COMPANY AND SUBSIDIARIES
NOTES TO THE FINANCIAL STATEMENTS
128
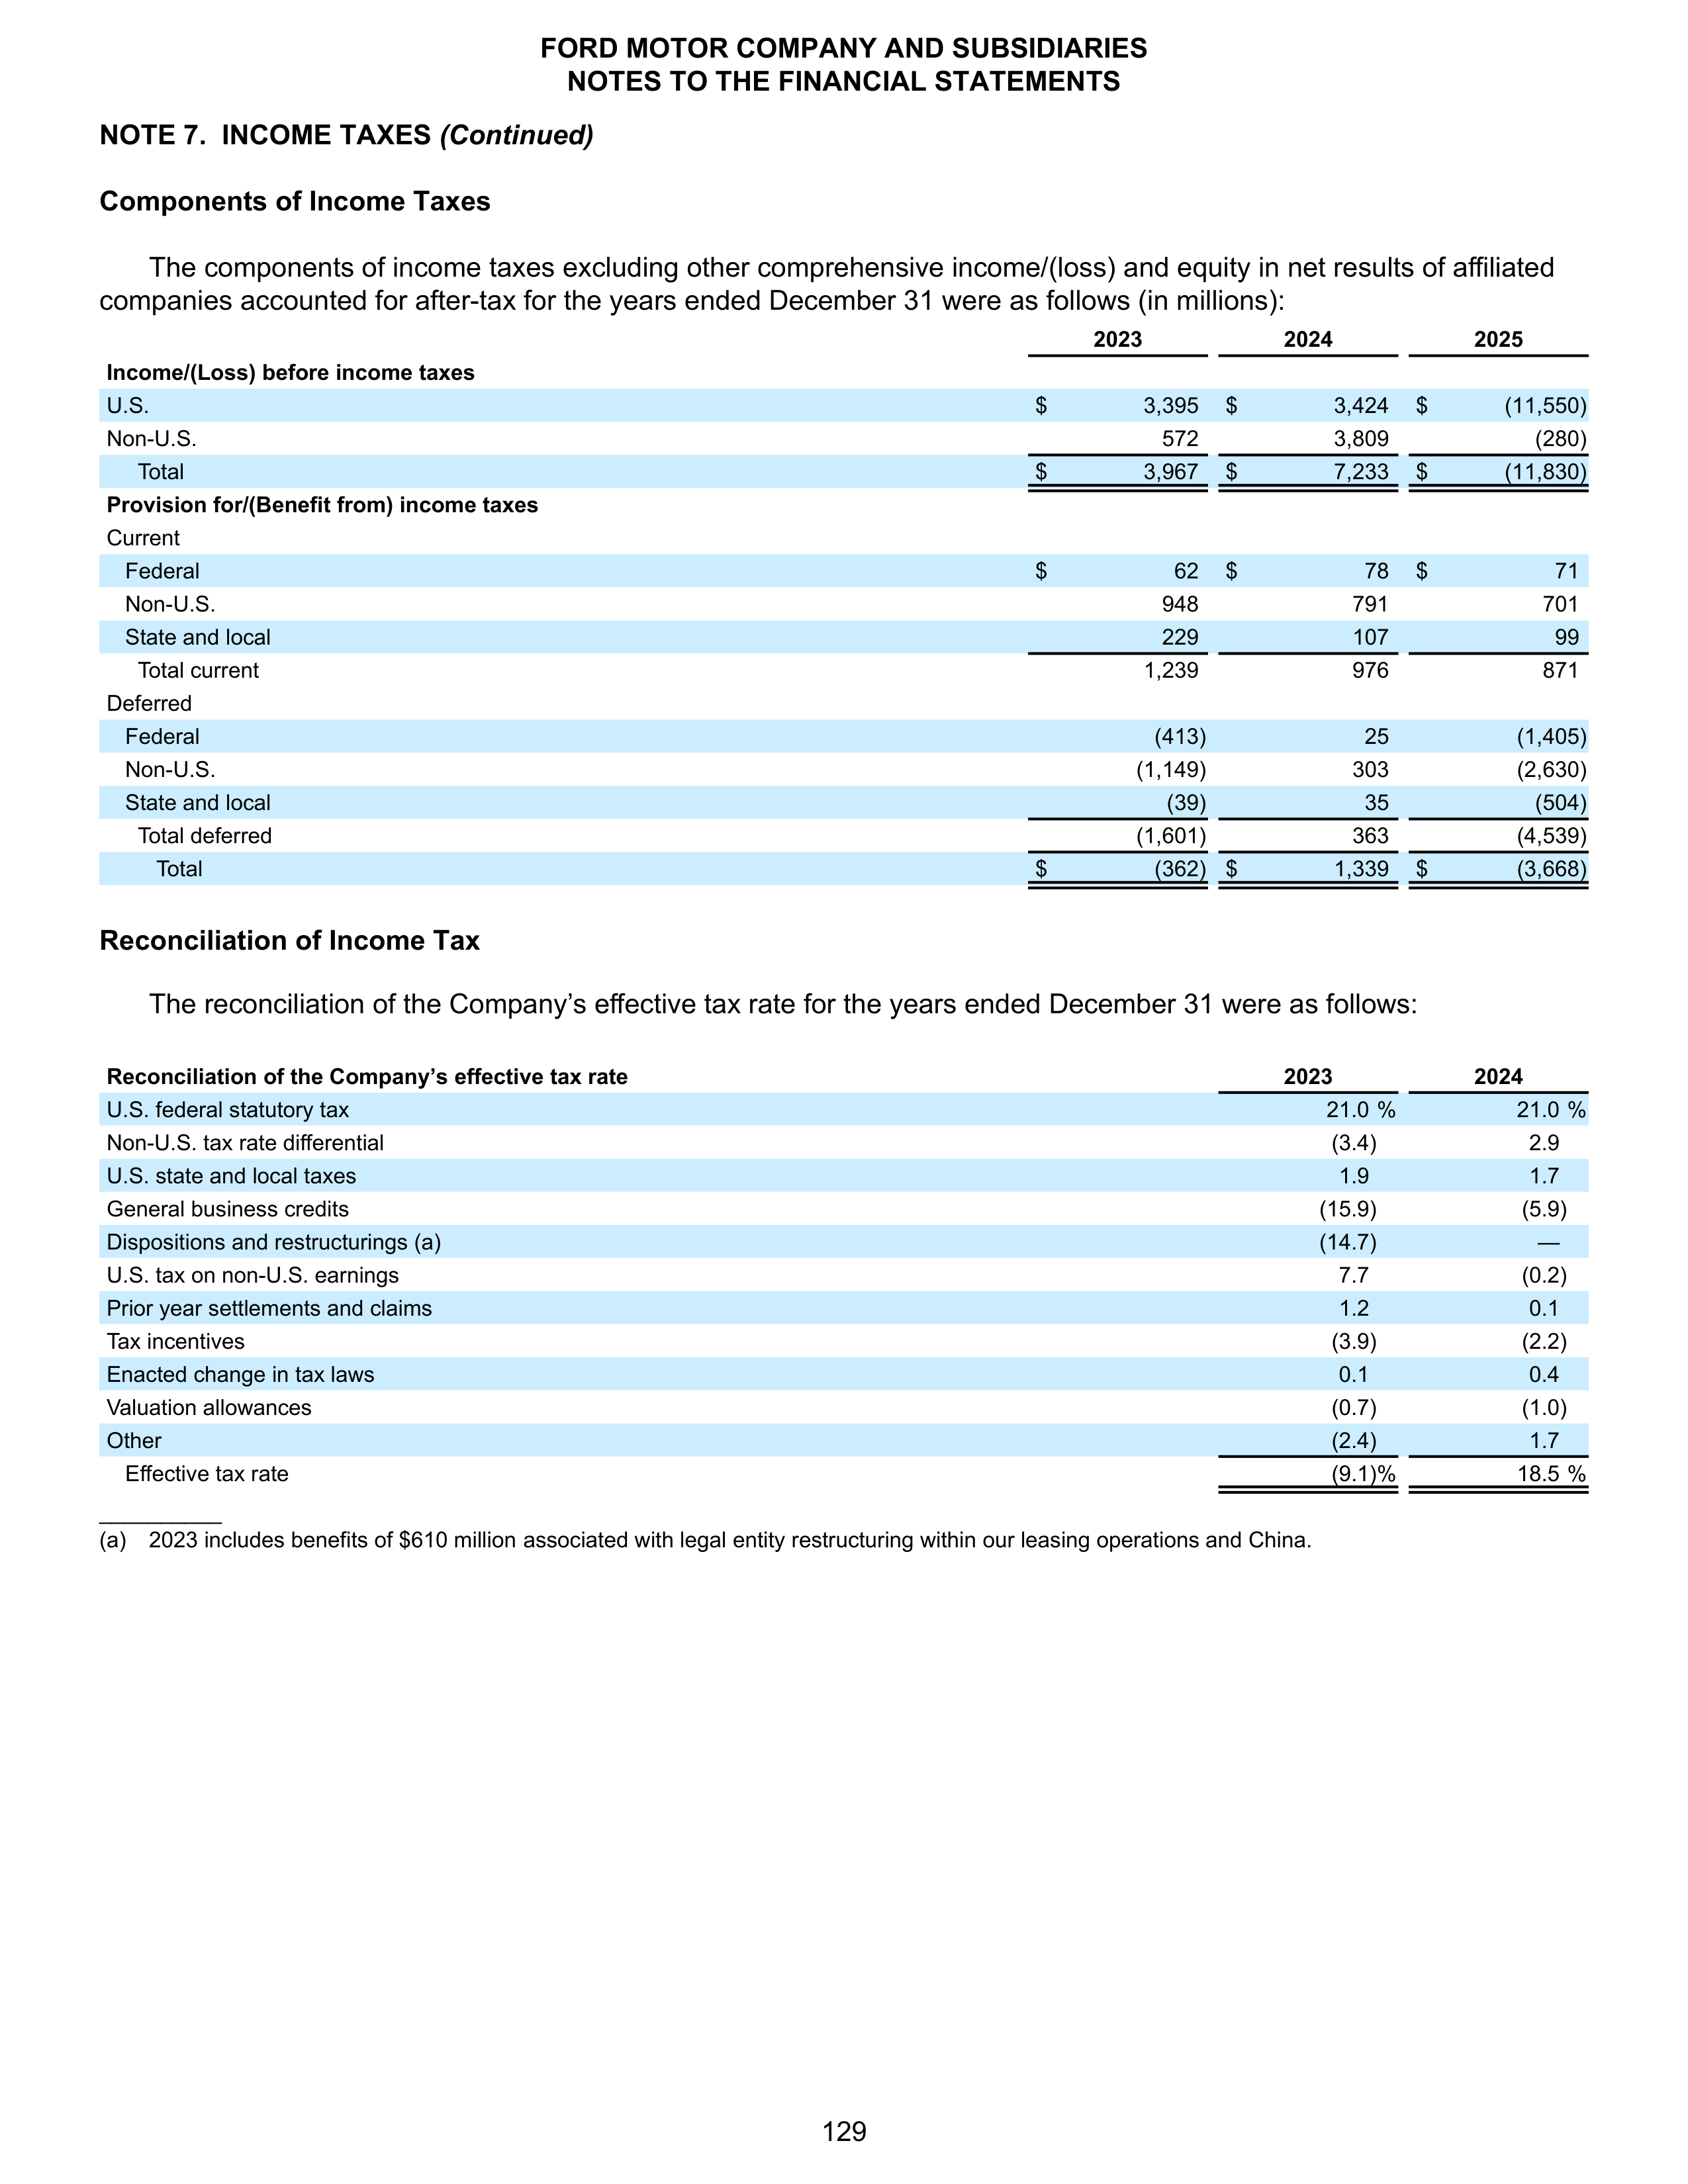
NOTE 7. INCOME TAXES
(Continued)
Components of Income Taxes
The components of income taxes excluding other comprehensive income/(loss) and equity in net results of affiliated
companies accounted for after-tax for the years ended December 31 were as follows (in millions):
2023
2024
2025
Income/(Loss) before income taxes
U.S.
$
3,395
$
3,424
$
(11,550)
Non-U.S.
572
3,809
(280)
Total
$
3,967
$
7,233
$
(11,830)
Provision for/(Benefit from) income taxes
Current
Federal
$
62
$
78
$
71
Non-U.S.
948
791
701
State and local
229
107
99
Total current
1,239
976
871
Deferred
Federal
(413)
25
(1,405)
Non-U.S.
(1,149)
303
(2,630)
State and local
(39)
35
(504)
Total deferred
(1,601)
363
(4,539)
Total
$
(362) $
1,339
$
(3,668)
Reconciliation of Income Tax
The reconciliation of the Company’s effective tax rate for the years ended December 31 were as follows:
Reconciliation of the Company’s effective tax rate
2023
2024
U.S. federal statutory tax
21.0 %
21.0 %
Non-U.S. tax rate differential
(3.4)
2.9
U.S. state and local taxes
1.9
1.7
General business credits
(15.9)
(5.9)
Dispositions and restructurings (a)
(14.7)
—
U.S. tax on non-U.S. earnings
7.7
(0.2)
Prior year settlements and claims
1.2
0.1
Tax incentives
(3.9)
(2.2)
Enacted change in tax laws
0.1
0.4
Valuation allowances
(0.7)
(1.0)
Other
(2.4)
1.7
Effective tax rate
(9.1) %
18.5 %
__________
(a)
2023 includes benefits of $610 million
associated with legal entity restructuring within our leasing operations and China.
FORD MOTOR COMPANY AND SUBSIDIARIES
NOTES TO THE FINANCIAL STATEMENTS
129
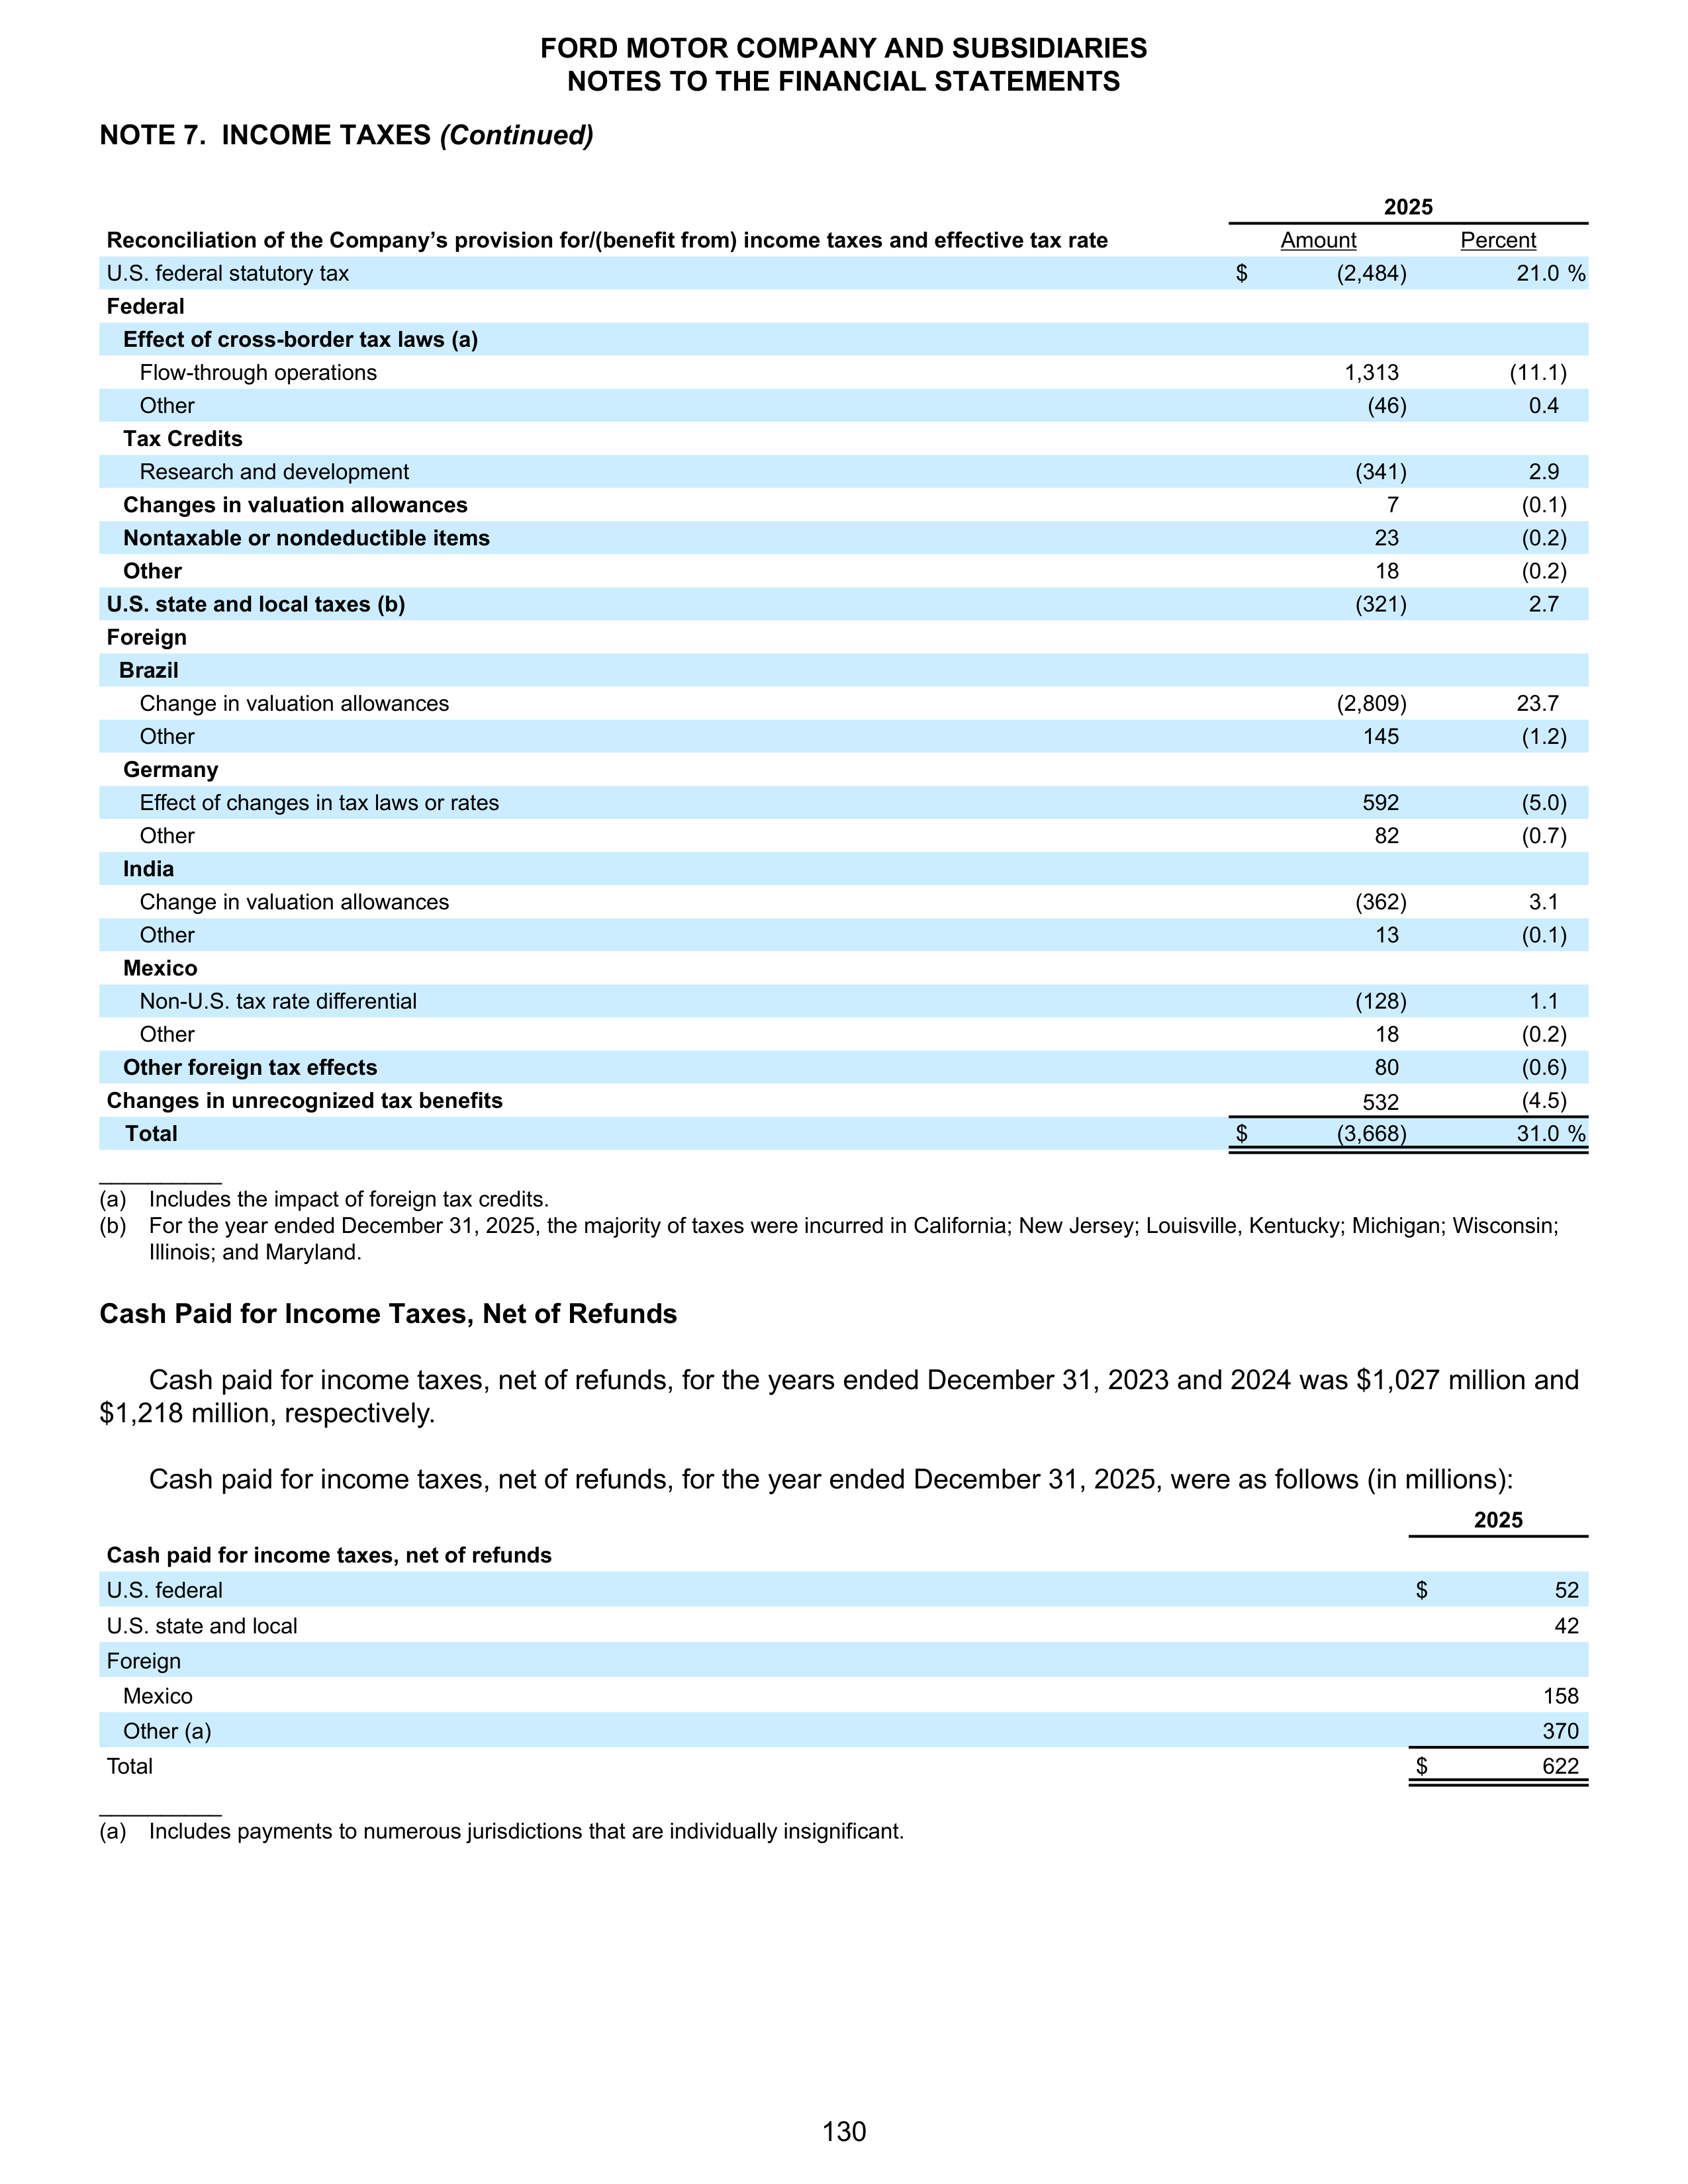
NOTE 7. INCOME TAXES
(Continued)
2025
Reconciliation of the Company’s provision for/(benefit from) income taxes and effective tax rate
Amount
Percent
U.S. federal statutory tax
$
(2,484)
21.0 %
Federal
Effect of cross-border tax laws (a)
Flow-through operations
1,313
(11.1)
Other
(46)
0.4
Tax Credits
Research and development
(341)
2.9
Changes in valuation allowances
7
(0.1)
Nontaxable or nondeductible items
23
(0.2)
Other
18
(0.2)
U.S. state and local taxes (b)
(321)
2.7
Foreign
Brazil
Change in valuation allowances
(2,809)
23.7
Other
145
(1.2)
Germany
Effect of changes in tax laws or rates
592
(5.0)
Other
82
(0.7)
India
Change in valuation allowances
(362)
3.1
Other
13
(0.1)
Mexico
Non-U.S. tax rate differential
(128)
1.1
Other
18
(0.2)
Other foreign tax effects
80
(0.6)
Changes in unrecognized tax benefits
532
(4.5)
Total
$
(3,668)
31.0 %
__________
(a) Includes the impact of foreign tax credits.
(b) For the year ended December 31, 2025, the majority of taxes were incurred in California; New Jersey; Louisville, Kentucky; Michigan; Wisconsin;
Illinois; and Maryland.
Cash Paid for Income Taxes, Net of Refunds
Cash paid for income taxes, net of refunds, for the years ended December 31, 2023 and 2024 was $1,027 million and
$1,218 million, respectively.
Cash paid for income taxes, net of refunds, for the year ended December 31, 2025, were as follows (in millions):
2025
Cash paid for income taxes, net of refunds
U.S. federal
$
52
U.S. state and local
42
Foreign
Mexico
158
Other (a)
370
Total
$
622
__________
(a) Includes payments to numerous jurisdictions that are individually insignificant.
FORD MOTOR COMPANY AND SUBSIDIARIES
NOTES TO THE FINANCIAL STATEMENTS
130
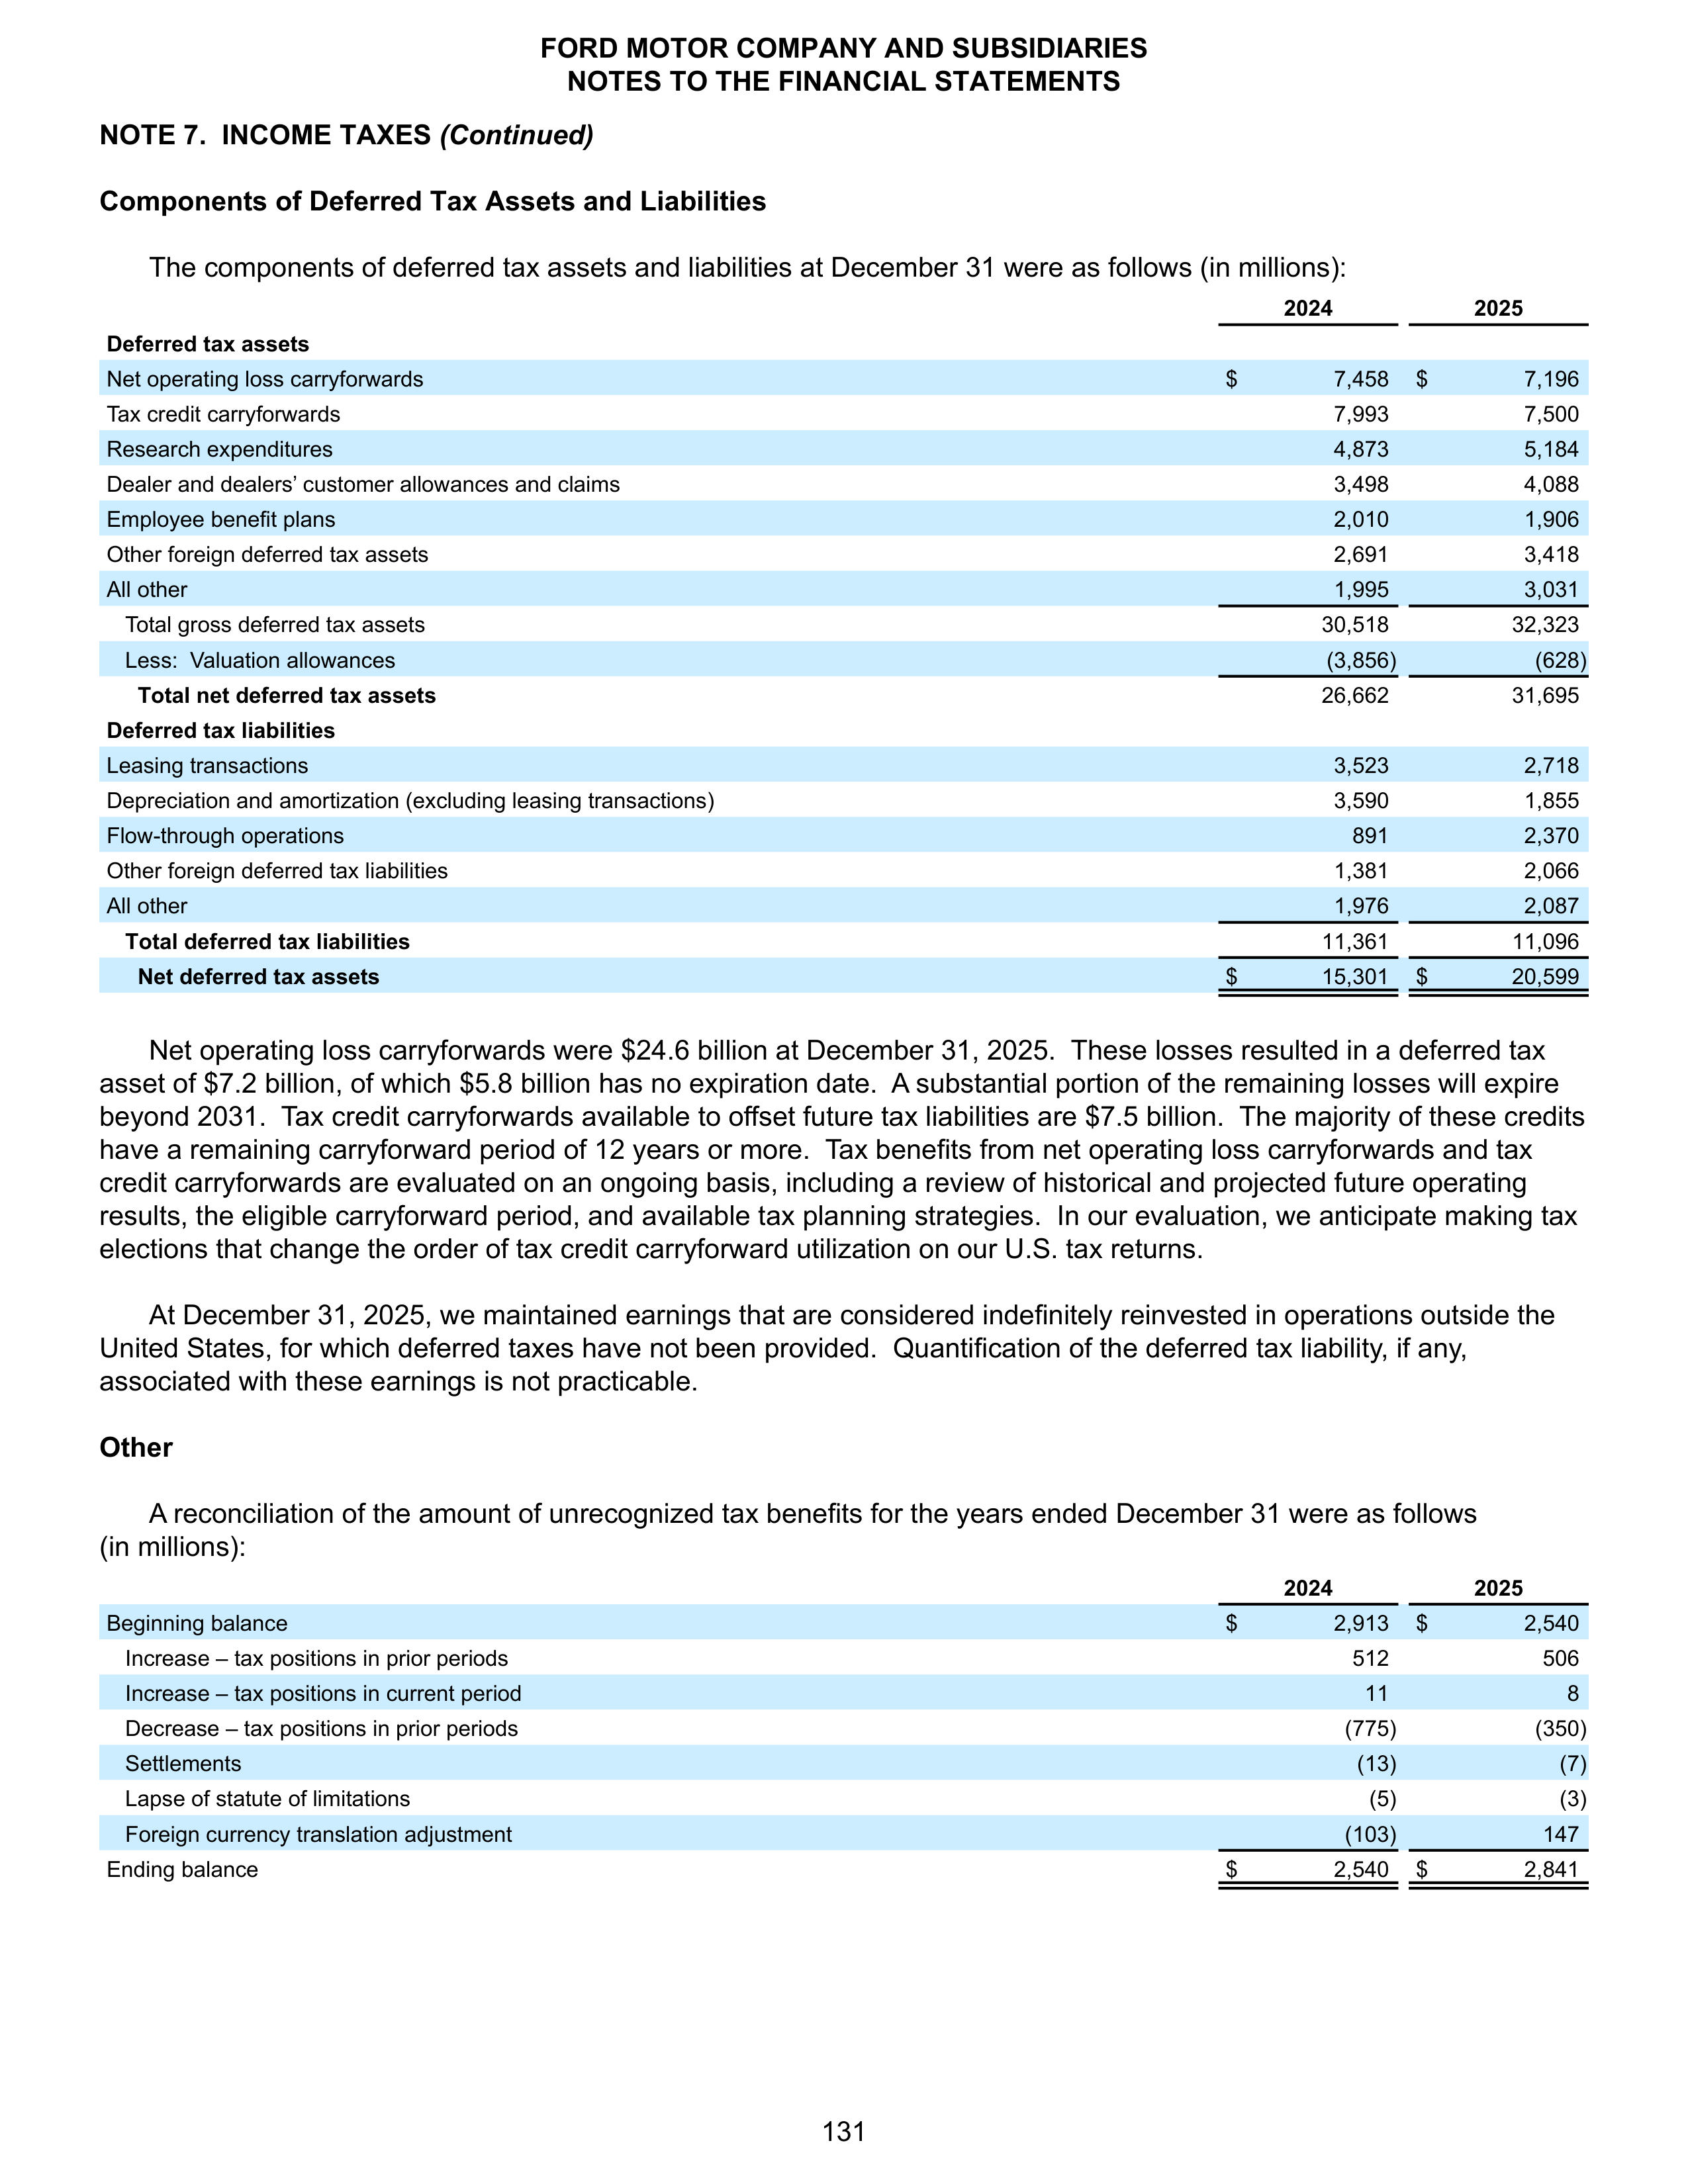
NOTE 7. INCOME TAXES
(Continued)
Components of Deferred Tax Assets and Liabilities
The components of deferred tax assets and liabilities at December 31 were as follows (in millions):
2024
2025
Deferred tax assets
Net operating loss carryforwards
$
7,458
$
7,196
Tax credit carryforwards
7,993
7,500
Research expenditures
4,873
5,184
Dealer and dealers’ customer allowances and claims
3,498
4,088
Employee benefit plans
2,010
1,906
Other foreign deferred tax assets
2,691
3,418
All other
1,995
3,031
Total gross deferred tax assets
30,518
32,323
Less: Valuation allowances
(3,856)
(628)
Total net deferred tax assets
26,662
31,695
Deferred tax liabilities
Leasing transactions
3,523
2,718
Depreciation and amortization (excluding leasing transactions)
3,590
1,855
Flow-through operations
891
2,370
Other foreign deferred tax liabilities
1,381
2,066
All other
1,976
2,087
Total deferred tax liabilities
11,361
11,096
Net deferred tax assets
$
15,301
$
20,599
Net operating loss carryforwards were $24.6 billion at December 31, 2025. These losses resulted in a deferred tax
asset of $7.2 billion, of which $5.8 billion has no expiration date. A substantial portion of the remaining losses will expire
beyond 2031. Tax credit carryforwards available to offset future tax liabilities are $7.5 billion. The majority of these credits
have a remaining carryforward period of 12 years or more. Tax benefits from net operating loss carryforwards and tax
credit carryforwards are evaluated on an ongoing basis, including a review of historical and projected future operating
results, the eligible carryforward period, and available tax planning strategies. In our evaluation, we anticipate making tax
elections that change the order of tax credit carryforward utilization on our U.S. tax returns.
At December 31, 2025, we maintained earnings that are considered indefinitely reinvested in operations outside the
United States, for which deferred taxes have not been provided. Quantification of the deferred tax liability, if any,
associated with these earnings is not practicable.
Other
A reconciliation of the amount of unrecognized tax benefits for the years ended December 31 were as follows
(in millions):
2024
2025
Beginning balance
$
2,913
$
2,540
Increase – tax positions in prior periods
512
506
Increase – tax positions in current period
11
8
Decrease – tax positions in prior periods
(775)
(350)
Settlements
(13)
(7)
Lapse of statute of limitations
(5)
(3)
Foreign currency translation adjustment
(103)
147
Ending balance
$
2,540
$
2,841
FORD MOTOR COMPANY AND SUBSIDIARIES
NOTES TO THE FINANCIAL STATEMENTS
131
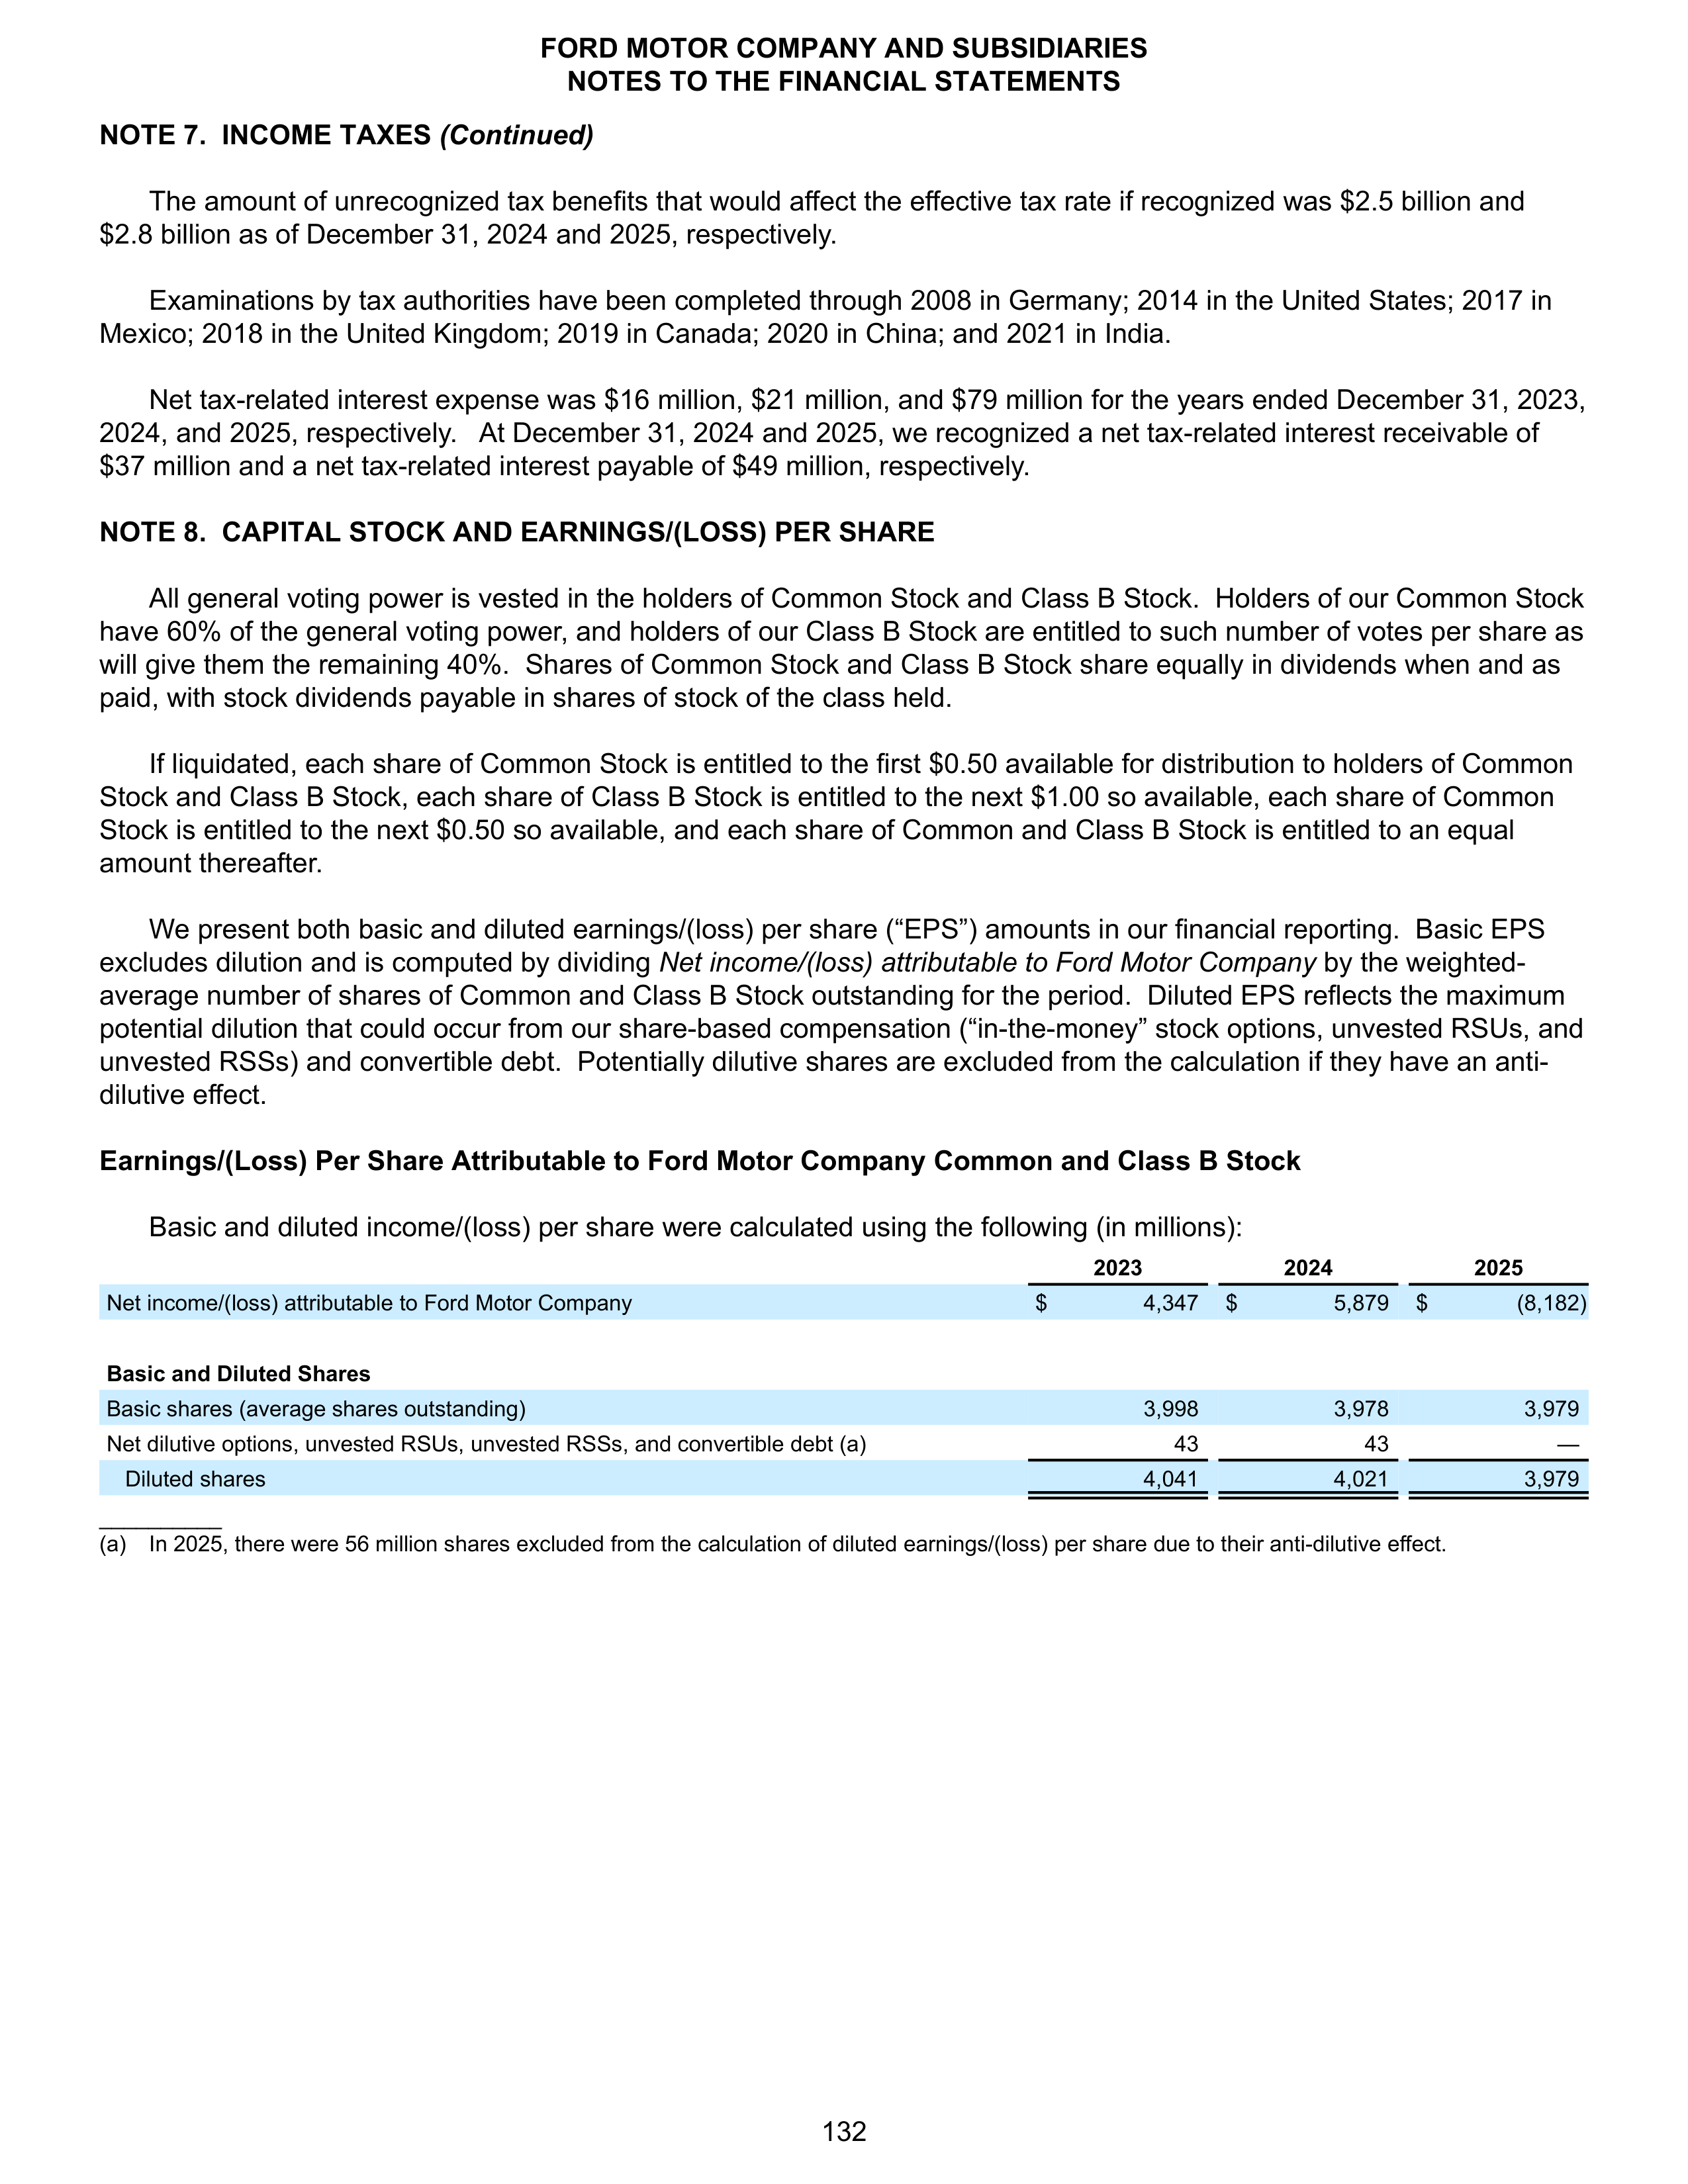
NOTE 7. INCOME TAXES
(Continued)
The amount of unrecognized tax benefits that would affect the effective tax rate if recognized was $2.5 billion and
$2.8 billion as of December 31, 2024 and 2025, respectively.
Examinations by tax authorities have been completed through 2008 in Germany; 2014 in the United States; 2017 in
Mexico; 2018 in the United Kingdom; 2019 in Canada; 2020 in China; and 2021 in India.
Net tax-related interest expense was $16 million, $21 million, and $79 million for the years ended December 31, 2023,
2024, and 2025, respectively. At December 31, 2024 and 2025, we recognized a net tax-related interest receivable of
$37 million and a net tax-related interest payable of $49 million, respectively.
NOTE 8. CAPITAL STOCK AND EARNINGS/(LOSS) PER SHARE
All general voting power is vested in the holders of Common Stock and Class B Stock. Holders of our Common Stock
have 60% of the general voting power, and holders of our Class B Stock are entitled to such number of votes per share as
will give them the remaining 40%. Shares of Common Stock and Class B Stock share equally in dividends when and as
paid, with stock dividends payable in shares of stock of the class held.
If liquidated, each share of Common Stock is entitled to the first $0.50 available for distribution to holders of Common
Stock and Class B Stock, each share of Class B Stock is entitled to the next $1.00 so available, each share of Common
Stock is entitled to the next $0.50 so available, and each share of Common and Class B Stock is entitled to an equal
amount thereafter.
We present both basic and diluted earnings/(loss) per share (“EPS”) amounts in our financial reporting. Basic EPS
excludes dilution and is computed by dividing
Net income/(loss) attributable to Ford Motor Company
by the weighted-
average number of shares of Common and Class B Stock outstanding for the period. Diluted EPS reflects the maximum
potential dilution that could occur from our share-based compensation (“in-the-money” stock options, unvested RSUs, and
unvested RSSs) and convertible debt. Potentially dilutive shares are excluded from the calculation if they have an anti-
dilutive effect.
Earnings/(Loss) Per Share Attributable to Ford Motor Company Common and Class B Stock
Basic and diluted income/(loss) per share were calculated using the following (in millions):
2023
2024
2025
Net income/(loss) attributable to Ford Motor Company
$
4,347
$
5,879
$
(8,182)
Basic and Diluted Shares
Basic shares (average shares outstanding)
3,998
3,978
3,979
Net dilutive options, unvested RSUs, unvested RSSs, and convertible debt (a)
43
43
—
Diluted shares
4,041
4,021
3,979
__________
(a) In 2025, there were 56 million shares excluded from the calculation of diluted earnings/(loss) per share due to their anti-dilutive effect.
FORD MOTOR COMPANY AND SUBSIDIARIES
NOTES TO THE FINANCIAL STATEMENTS
132
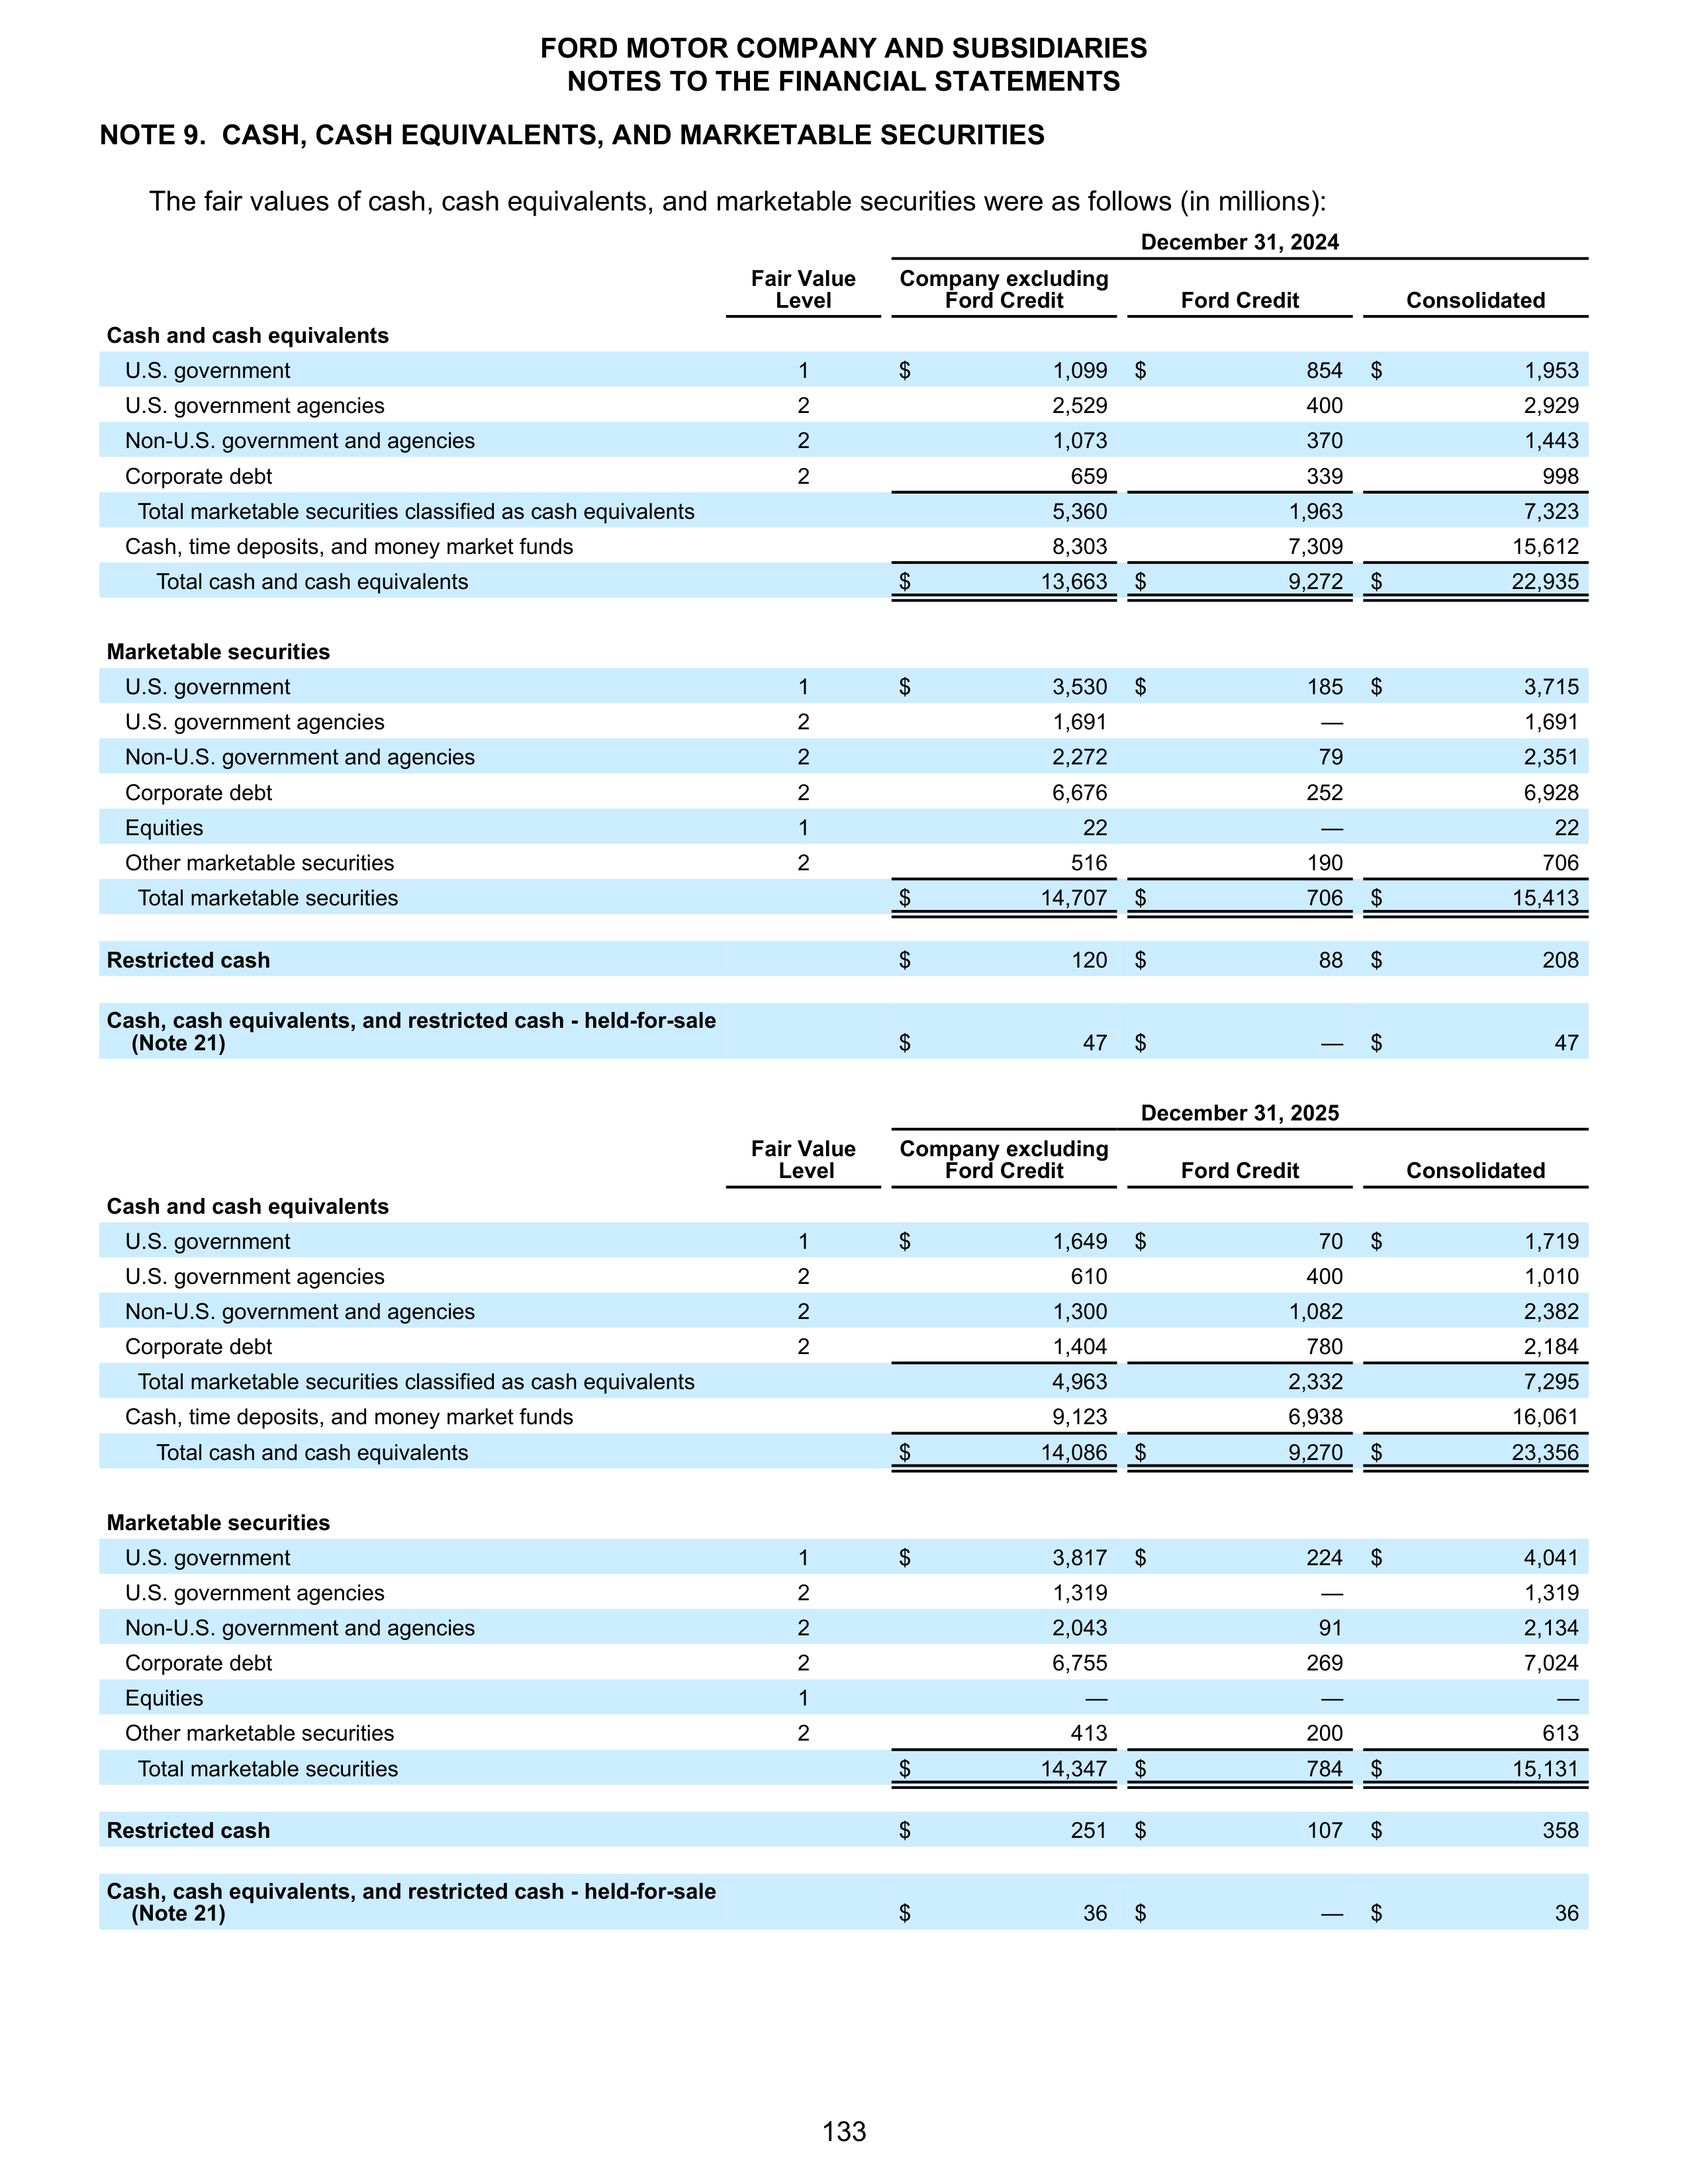
NOTE 9. CASH, CASH EQUIVALENTS, AND MARKETABLE SECURITIES
The fair values of cash, cash equivalents, and marketable securities were as follows (in millions):
December 31, 2024
Fair Value
Level
Company excluding
Ford Credit
Ford Credit
Consolidated
Cash and cash equivalents
U.S. government
1
$
1,099
$
854
$
1,953
U.S. government agencies
2
2,529
400
2,929
Non-U.S. government and agencies
2
1,073
370
1,443
Corporate debt
2
659
339
998
Total marketable securities classified as cash equivalents
5,360
1,963
7,323
Cash, time deposits, and money market funds
8,303
7,309
15,612
Total cash and cash equivalents
$
13,663
$
9,272
$
22,935
Marketable securities
U.S. government
1
$
3,530
$
185
$
3,715
U.S. government agencies
2
1,691
—
1,691
Non-U.S. government and agencies
2
2,272
79
2,351
Corporate debt
2
6,676
252
6,928
Equities
1
22
—
22
Other marketable securities
2
516
190
706
Total marketable securities
$
14,707
$
706
$
15,413
Restricted cash
$
120
$
88
$
208
Cash, cash equivalents, and restricted cash - held-for-sale
(Note 21)
$
47
$
—
$
47
December 31, 2025
Fair Value
Level
Company excluding
Ford Credit
Ford Credit
Consolidated
Cash and cash equivalents
U.S. government
1
$
1,649
$
70
$
1,719
U.S. government agencies
2
610
400
1,010
Non-U.S. government and agencies
2
1,300
1,082
2,382
Corporate debt
2
1,404
780
2,184
Total marketable securities classified as cash equivalents
4,963
2,332
7,295
Cash, time deposits, and money market funds
9,123
6,938
16,061
Total cash and cash equivalents
$
14,086
$
9,270
$
23,356
Marketable securities
U.S. government
1
$
3,817
$
224
$
4,041
U.S. government agencies
2
1,319
—
1,319
Non-U.S. government and agencies
2
2,043
91
2,134
Corporate debt
2
6,755
269
7,024
Equities
1
—
—
—
Other marketable securities
2
413
200
613
Total marketable securities
$
14,347
$
784
$
15,131
Restricted cash
$
251
$
107
$
358
Cash, cash equivalents, and restricted cash - held-for-sale
(Note 21)
$
36
$
—
$
36
FORD MOTOR COMPANY AND SUBSIDIARIES
NOTES TO THE FINANCIAL STATEMENTS
133
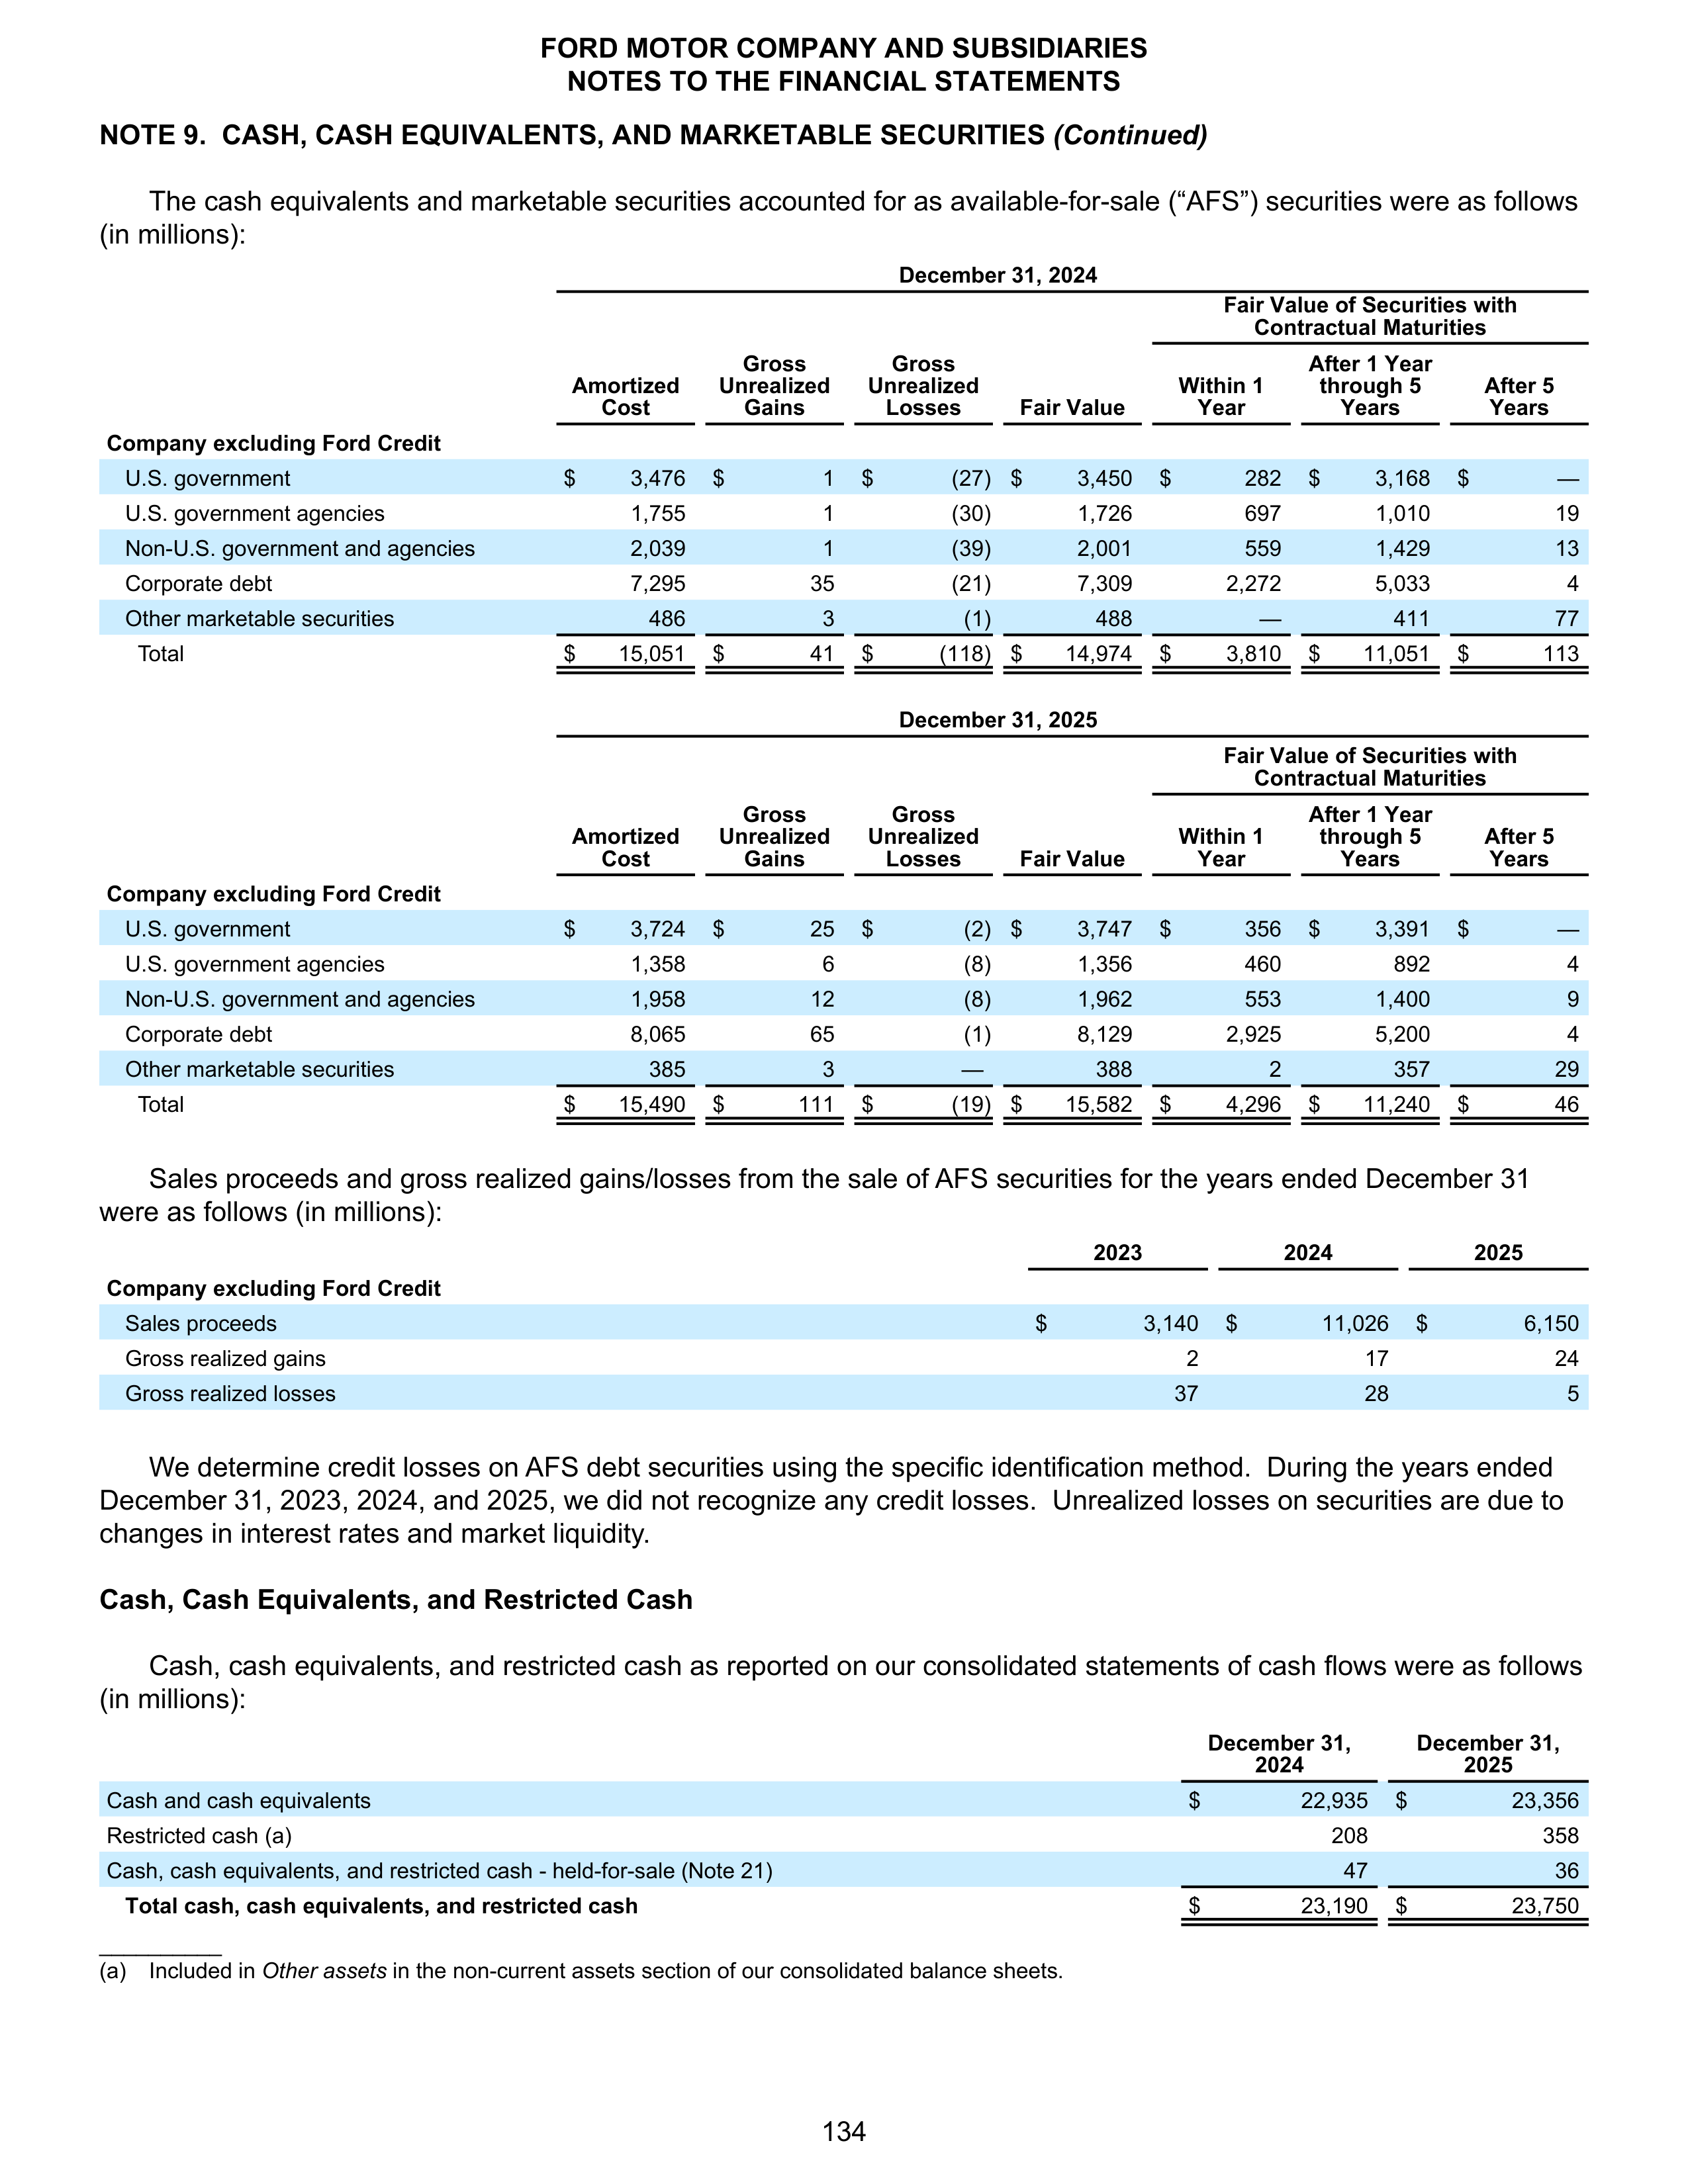
NOTE 9. CASH, CASH EQUIVALENTS, AND MARKETABLE SECURITIES
(Continued)
The cash equivalents and marketable securities accounted for as available-for-sale (“AFS”) securities were as follows
(in millions):
December 31, 2024
Fair Value of Securities with
Contractual Maturities
Amortized
Cost
Gross
Unrealized
Gains
Gross
Unrealized
Losses
Fair Value
Within 1
Year
After 1 Year
through 5
Years
After 5
Years
Company excluding Ford Credit
U.S. government
$
3,476
$
1
$
(27) $
3,450
$
282
$
3,168
$
—
U.S. government agencies
1,755
1
(30)
1,726
697
1,010
19
Non-U.S. government and agencies
2,039
1
(39)
2,001
559
1,429
13
Corporate debt
7,295
35
(21)
7,309
2,272
5,033
4
Other marketable securities
486
3
(1)
488
—
411
77
Total
$
15,051
$
41
$
(118) $
14,974
$
3,810
$
11,051
$
113
December 31, 2025
Fair Value of Securities with
Contractual Maturities
Amortized
Cost
Gross
Unrealized
Gains
Gross
Unrealized
Losses
Fair Value
Within 1
Year
After 1 Year
through 5
Years
After 5
Years
Company excluding Ford Credit
U.S. government
$
3,724
$
25
$
(2) $
3,747
$
356
$
3,391
$
—
U.S. government agencies
1,358
6
(8)
1,356
460
892
4
Non-U.S. government and agencies
1,958
12
(8)
1,962
553
1,400
9
Corporate debt
8,065
65
(1)
8,129
2,925
5,200
4
Other marketable securities
385
3
—
388
2
357
29
Total
$
15,490
$
111
$
(19) $
15,582
$
4,296
$
11,240
$
46
Sales proceeds and gross realized gains/losses from the sale of AFS securities for the years ended December 31
were as follows (in millions):
2023
2024
2025
Company excluding Ford Credit
Sales proceeds
$
3,140
$
11,026
$
6,150
Gross realized gains
2
17
24
Gross realized losses
37
28
5
We determine credit losses on AFS debt securities using the specific identification method. During the years ended
December 31, 2023, 2024, and 2025, we did not recognize any credit losses. Unrealized losses on securities are due to
changes in interest rates and market liquidity.
Cash, Cash Equivalents, and Restricted Cash
Cash, cash equivalents, and restricted cash as reported on our consolidated statements of cash flows were as follows
(in millions):
December 31,
2024
December 31,
2025
Cash and cash equivalents
$
22,935
$
23,356
Restricted cash (a)
208
358
Cash, cash equivalents, and restricted cash - held-for-sale (Note 21)
47
36
Total cash, cash equivalents, and restricted cash
$
23,190
$
23,750
__________
(a)
Included in
Other assets
in the non-current assets section of our consolidated balance sheets.
FORD MOTOR COMPANY AND SUBSIDIARIES
NOTES TO THE FINANCIAL STATEMENTS
134
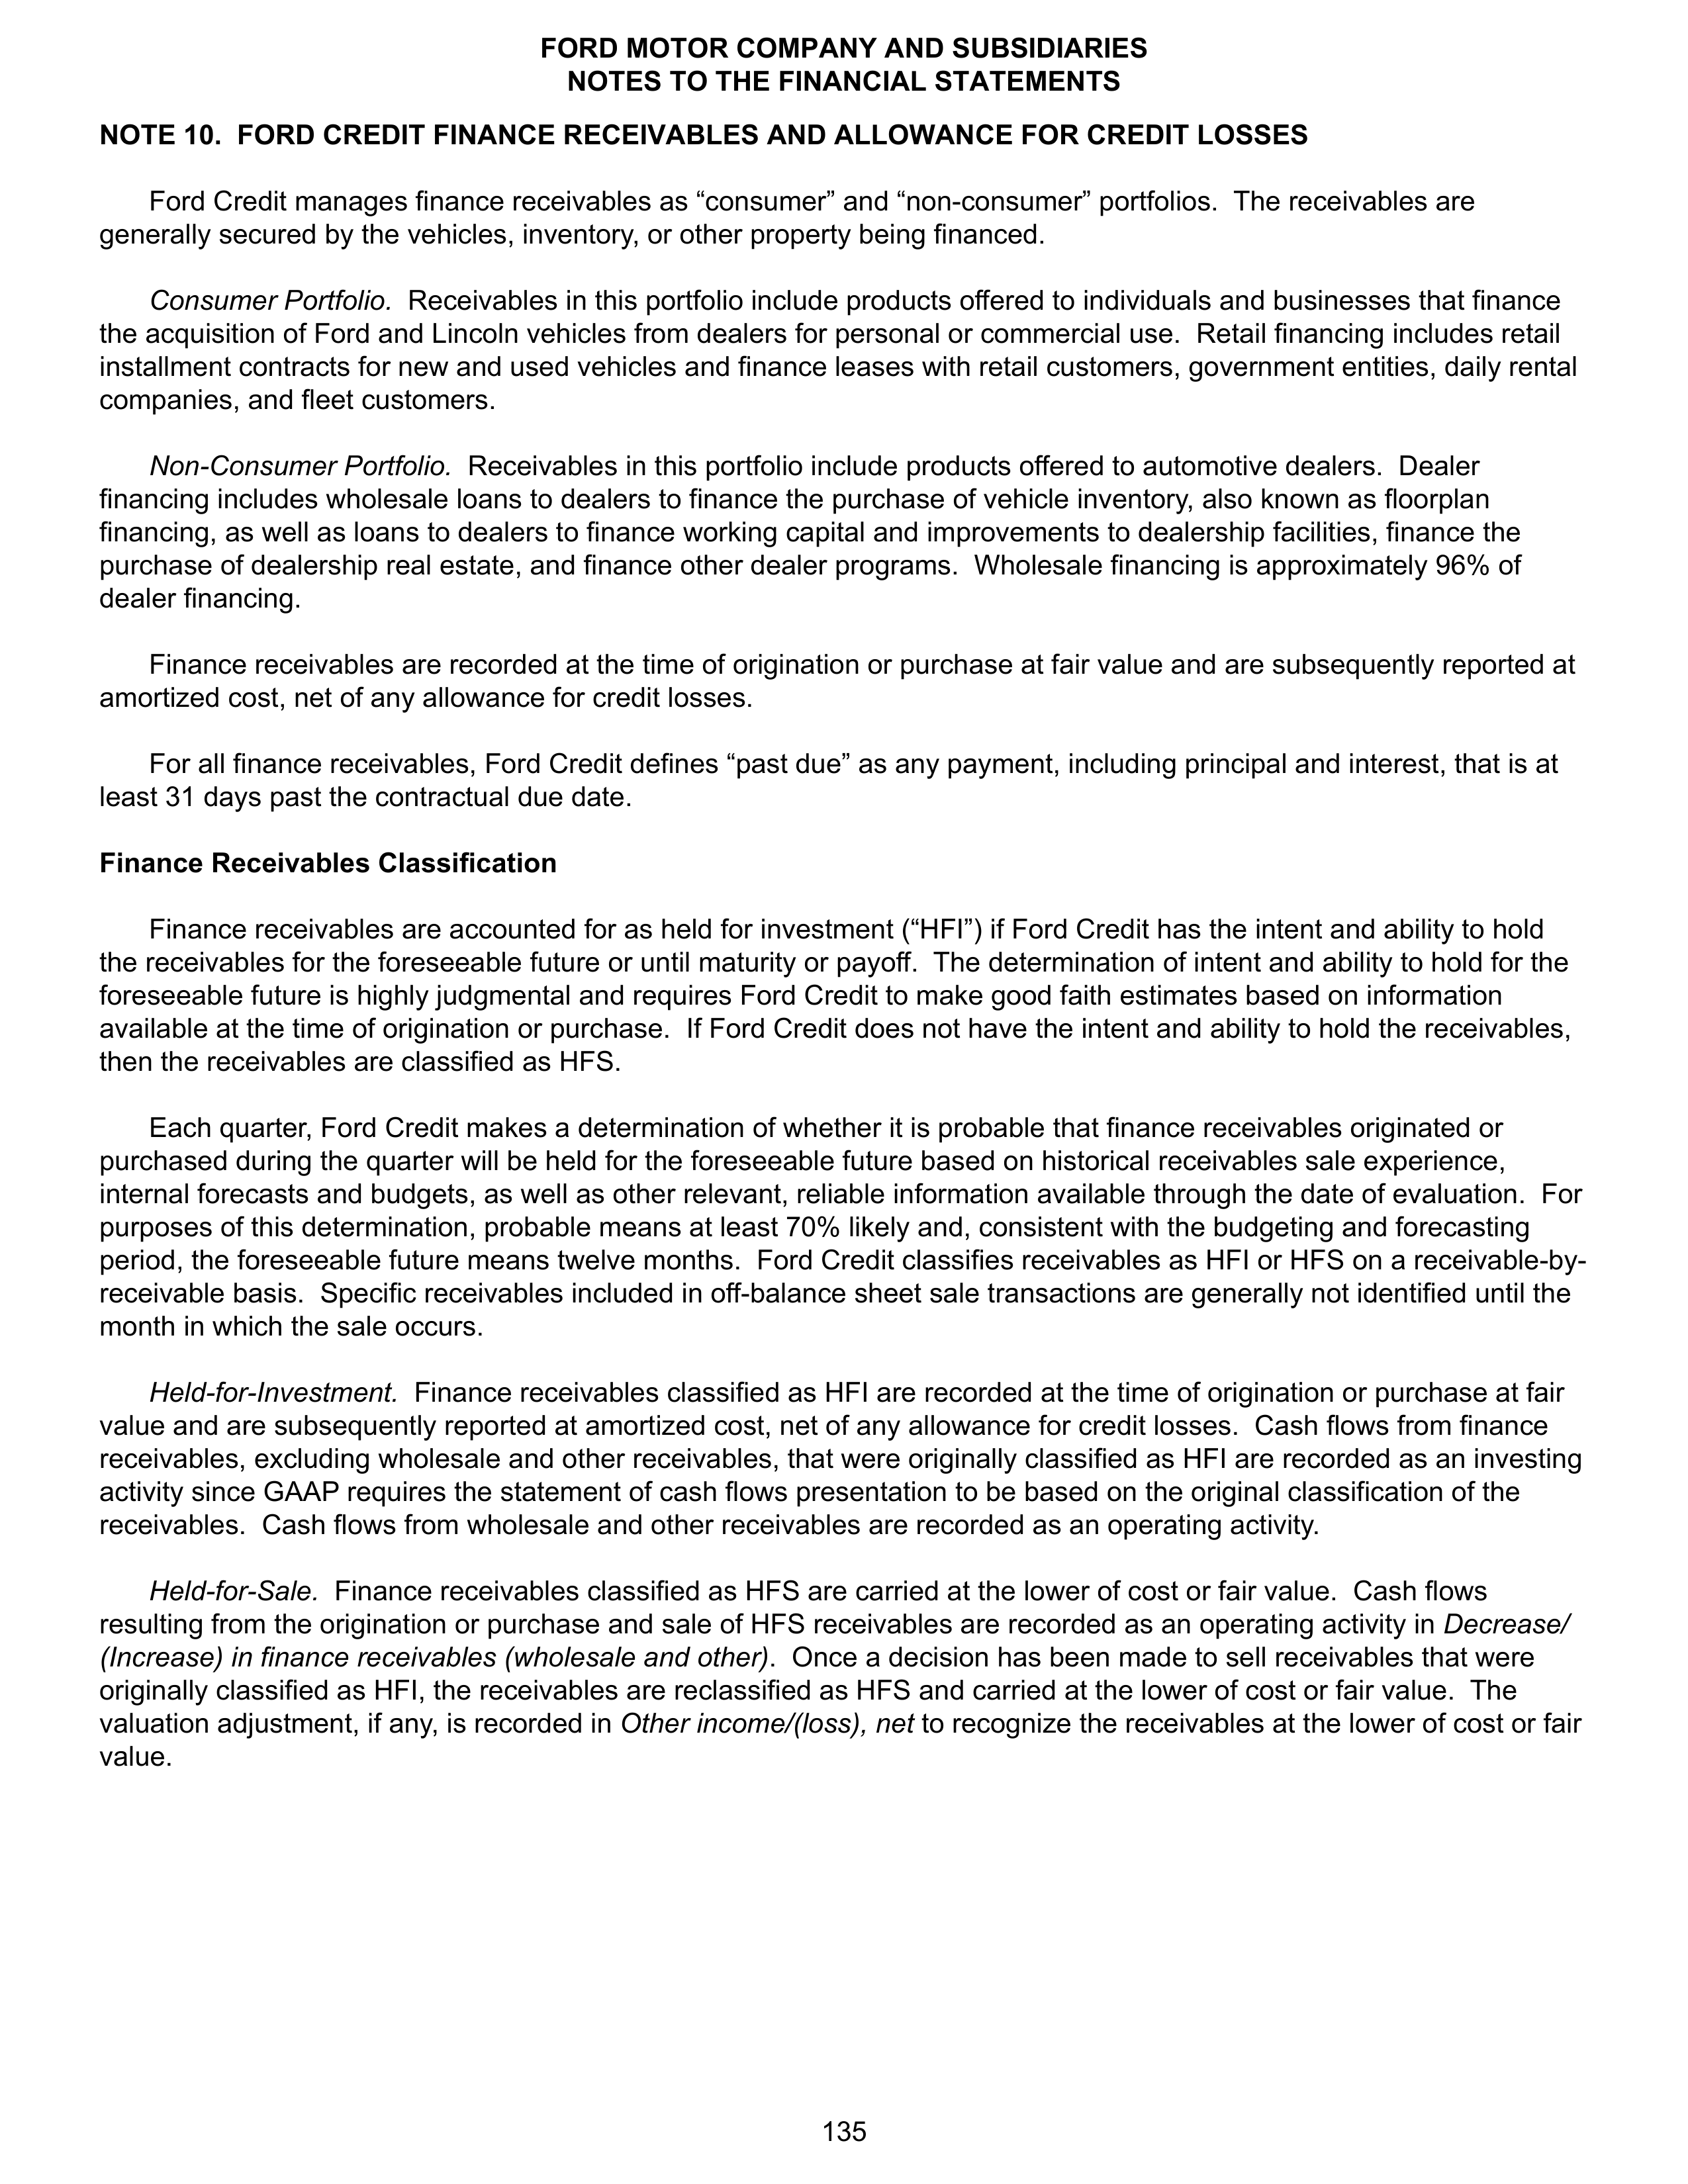
NOTE 10. FORD CREDIT FINANCE RECEIVABLES AND ALLOWANCE FOR CREDIT LOSSES
Ford Credit manages finance receivables as “consumer” and “non-consumer” portfolios. The receivables are
generally secured by the vehicles, inventory, or other property being financed.
Consumer Portfolio.
Receivables in this portfolio include products offered to individuals and businesses that finance
the acquisition of Ford and Lincoln vehicles from dealers for personal or commercial use. Retail financing includes retail
installment contracts for new and used vehicles and finance leases with retail customers, government entities, daily rental
companies, and fleet customers.
Non-Consumer Portfolio.
Receivables in this portfolio include products offered to automotive dealers. Dealer
financing includes wholesale loans to dealers to finance the purchase of vehicle inventory, also known as floorplan
financing, as well as loans to dealers to finance working capital and improvements to dealership facilities, finance the
purchase of dealership real estate, and finance other dealer programs. Wholesale financing is approximately 96% of
dealer financing.
Finance receivables are recorded at the time of origination or purchase at fair value and are subsequently reported at
amortized cost, net of any allowance for credit losses.
For all finance receivables, Ford Credit defines “past due” as any payment, including principal and interest, that is at
least 31 days past the contractual due date.
Finance Receivables Classification
Finance receivables are accounted for as held for investment (“HFI”) if Ford Credit has the intent and ability to hold
the receivables for the foreseeable future or until maturity or payoff. The determination of intent and ability to hold for the
foreseeable future is highly judgmental and requires Ford Credit to make good faith estimates based on information
available at the time of origination or purchase. If Ford Credit does not have the intent and ability to hold the receivables,
then the receivables are classified as HFS.
Each quarter, Ford Credit makes a determination of whether it is probable that finance receivables originated or
purchased during the quarter will be held for the foreseeable future based on historical receivables sale experience,
internal forecasts and budgets, as well as other relevant, reliable information available through the date of evaluation. For
purposes of this determination, probable means at least 70% likely and, consistent with the budgeting and forecasting
period, the foreseeable future means twelve months. Ford Credit classifies receivables as HFI or HFS on a receivable-by-
receivable basis. Specific receivables included in off-balance sheet sale transactions are generally not identified until the
month in which the sale occurs.
Held-for-Investment.
Finance receivables classified as HFI are recorded at the time of origination or purchase at fair
value and are subsequently reported at amortized cost, net of any allowance for credit losses. Cash flows from finance
receivables, excluding wholesale and other receivables, that were originally classified as HFI are recorded as an investing
activity since GAAP requires the statement of cash flows presentation to be based on the original classification of the
receivables. Cash flows from wholesale and other receivables are recorded as an operating activity.
Held-for-Sale.
Finance receivables classified as HFS are carried at the lower of cost or fair value. Cash flows
resulting from the origination or purchase and sale of HFS receivables are recorded as an operating activity in
Decrease/
(Increase) in finance receivables (wholesale and other)
. Once a decision has been made to sell receivables that were
originally classified as HFI, the receivables are reclassified as HFS and carried at the lower of cost or fair value. The
valuation adjustment, if any, is recorded in
Other income/(loss), net
to recognize the receivables at the lower of cost or fair
value.
FORD MOTOR COMPANY AND SUBSIDIARIES
NOTES TO THE FINANCIAL STATEMENTS
135
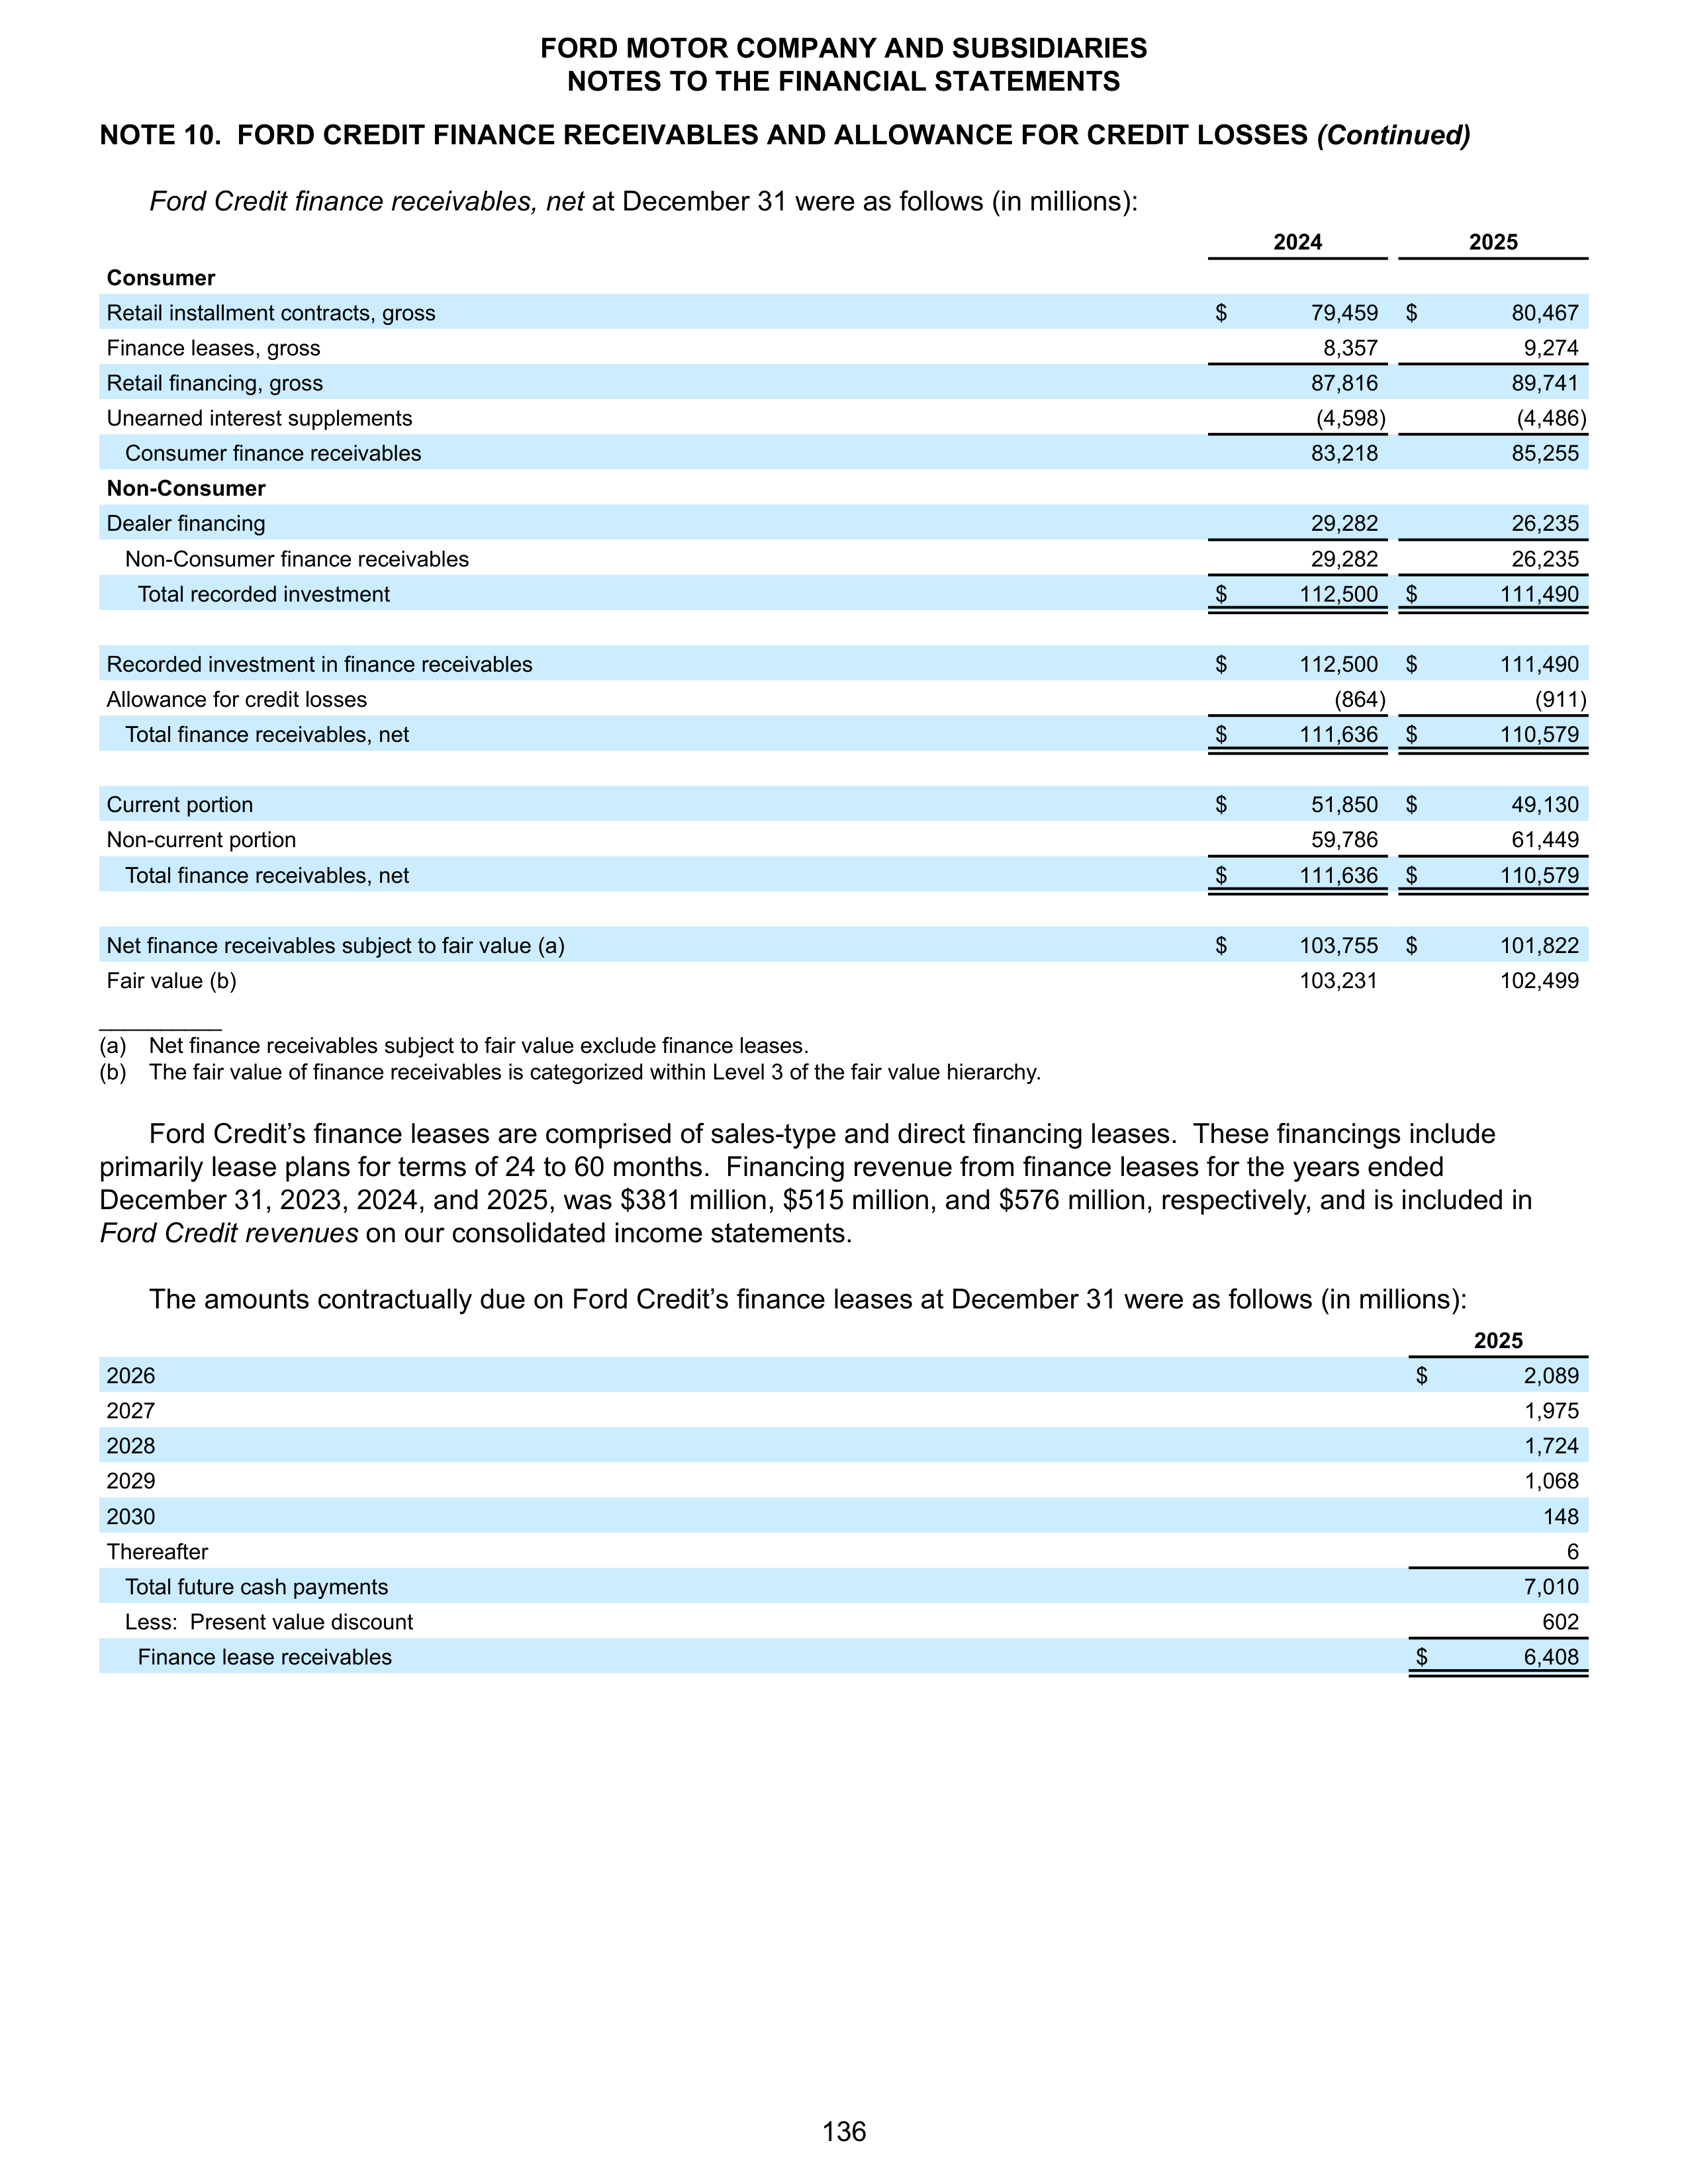
NOTE 10. FORD CREDIT FINANCE RECEIVABLES AND ALLOWANCE FOR CREDIT LOSSES
(Continued)
Ford Credit finance receivables, net
at December 31 were as follows (in millions):
2024
2025
Consumer
Retail installment contracts, gross
$
79,459
$
80,467
Finance leases, gross
8,357
9,274
Retail financing, gross
87,816
89,741
Unearned interest supplements
(4,598)
(4,486)
Consumer finance receivables
83,218
85,255
Non-Consumer
Dealer financing
29,282
26,235
Non-Consumer finance receivables
29,282
26,235
Total recorded investment
$
112,500
$
111,490
Recorded investment in finance receivables
$
112,500
$
111,490
Allowance for credit losses
(864)
(911)
Total finance receivables, net
$
111,636
$
110,579
Current portion
$
51,850
$
49,130
Non-current portion
59,786
61,449
Total finance receivables, net
$
111,636
$
110,579
Net finance receivables subject to fair value (a)
$
103,755
$
101,822
Fair value (b)
103,231
102,499
__________
(a)
Net finance receivables subject to fair value exclude finance leases.
(b)
The fair value of finance receivables is categorized within Level 3 of the fair value hierarchy.
Ford Credit’s finance leases are comprised of sales-type and direct financing leases. These financings include
primarily lease plans for terms of 24 to 60 months. Financing revenue from finance leases for the years ended
December 31, 2023, 2024, and
2025, was $381 million, $515 million, and $576 million, respectively, and is included in
Ford Credit revenues
on our consolidated income statements.
The amounts contractually due on Ford Credit’s finance leases at December 31 were as follows (in millions):
2025
2026
$
2,089
2027
1,975
2028
1,724
2029
1,068
2030
148
Thereafter
6
Total future cash payments
7,010
Less: Present value discount
602
Finance lease receivables
$
6,408
FORD MOTOR COMPANY AND SUBSIDIARIES
NOTES TO THE FINANCIAL STATEMENTS
136
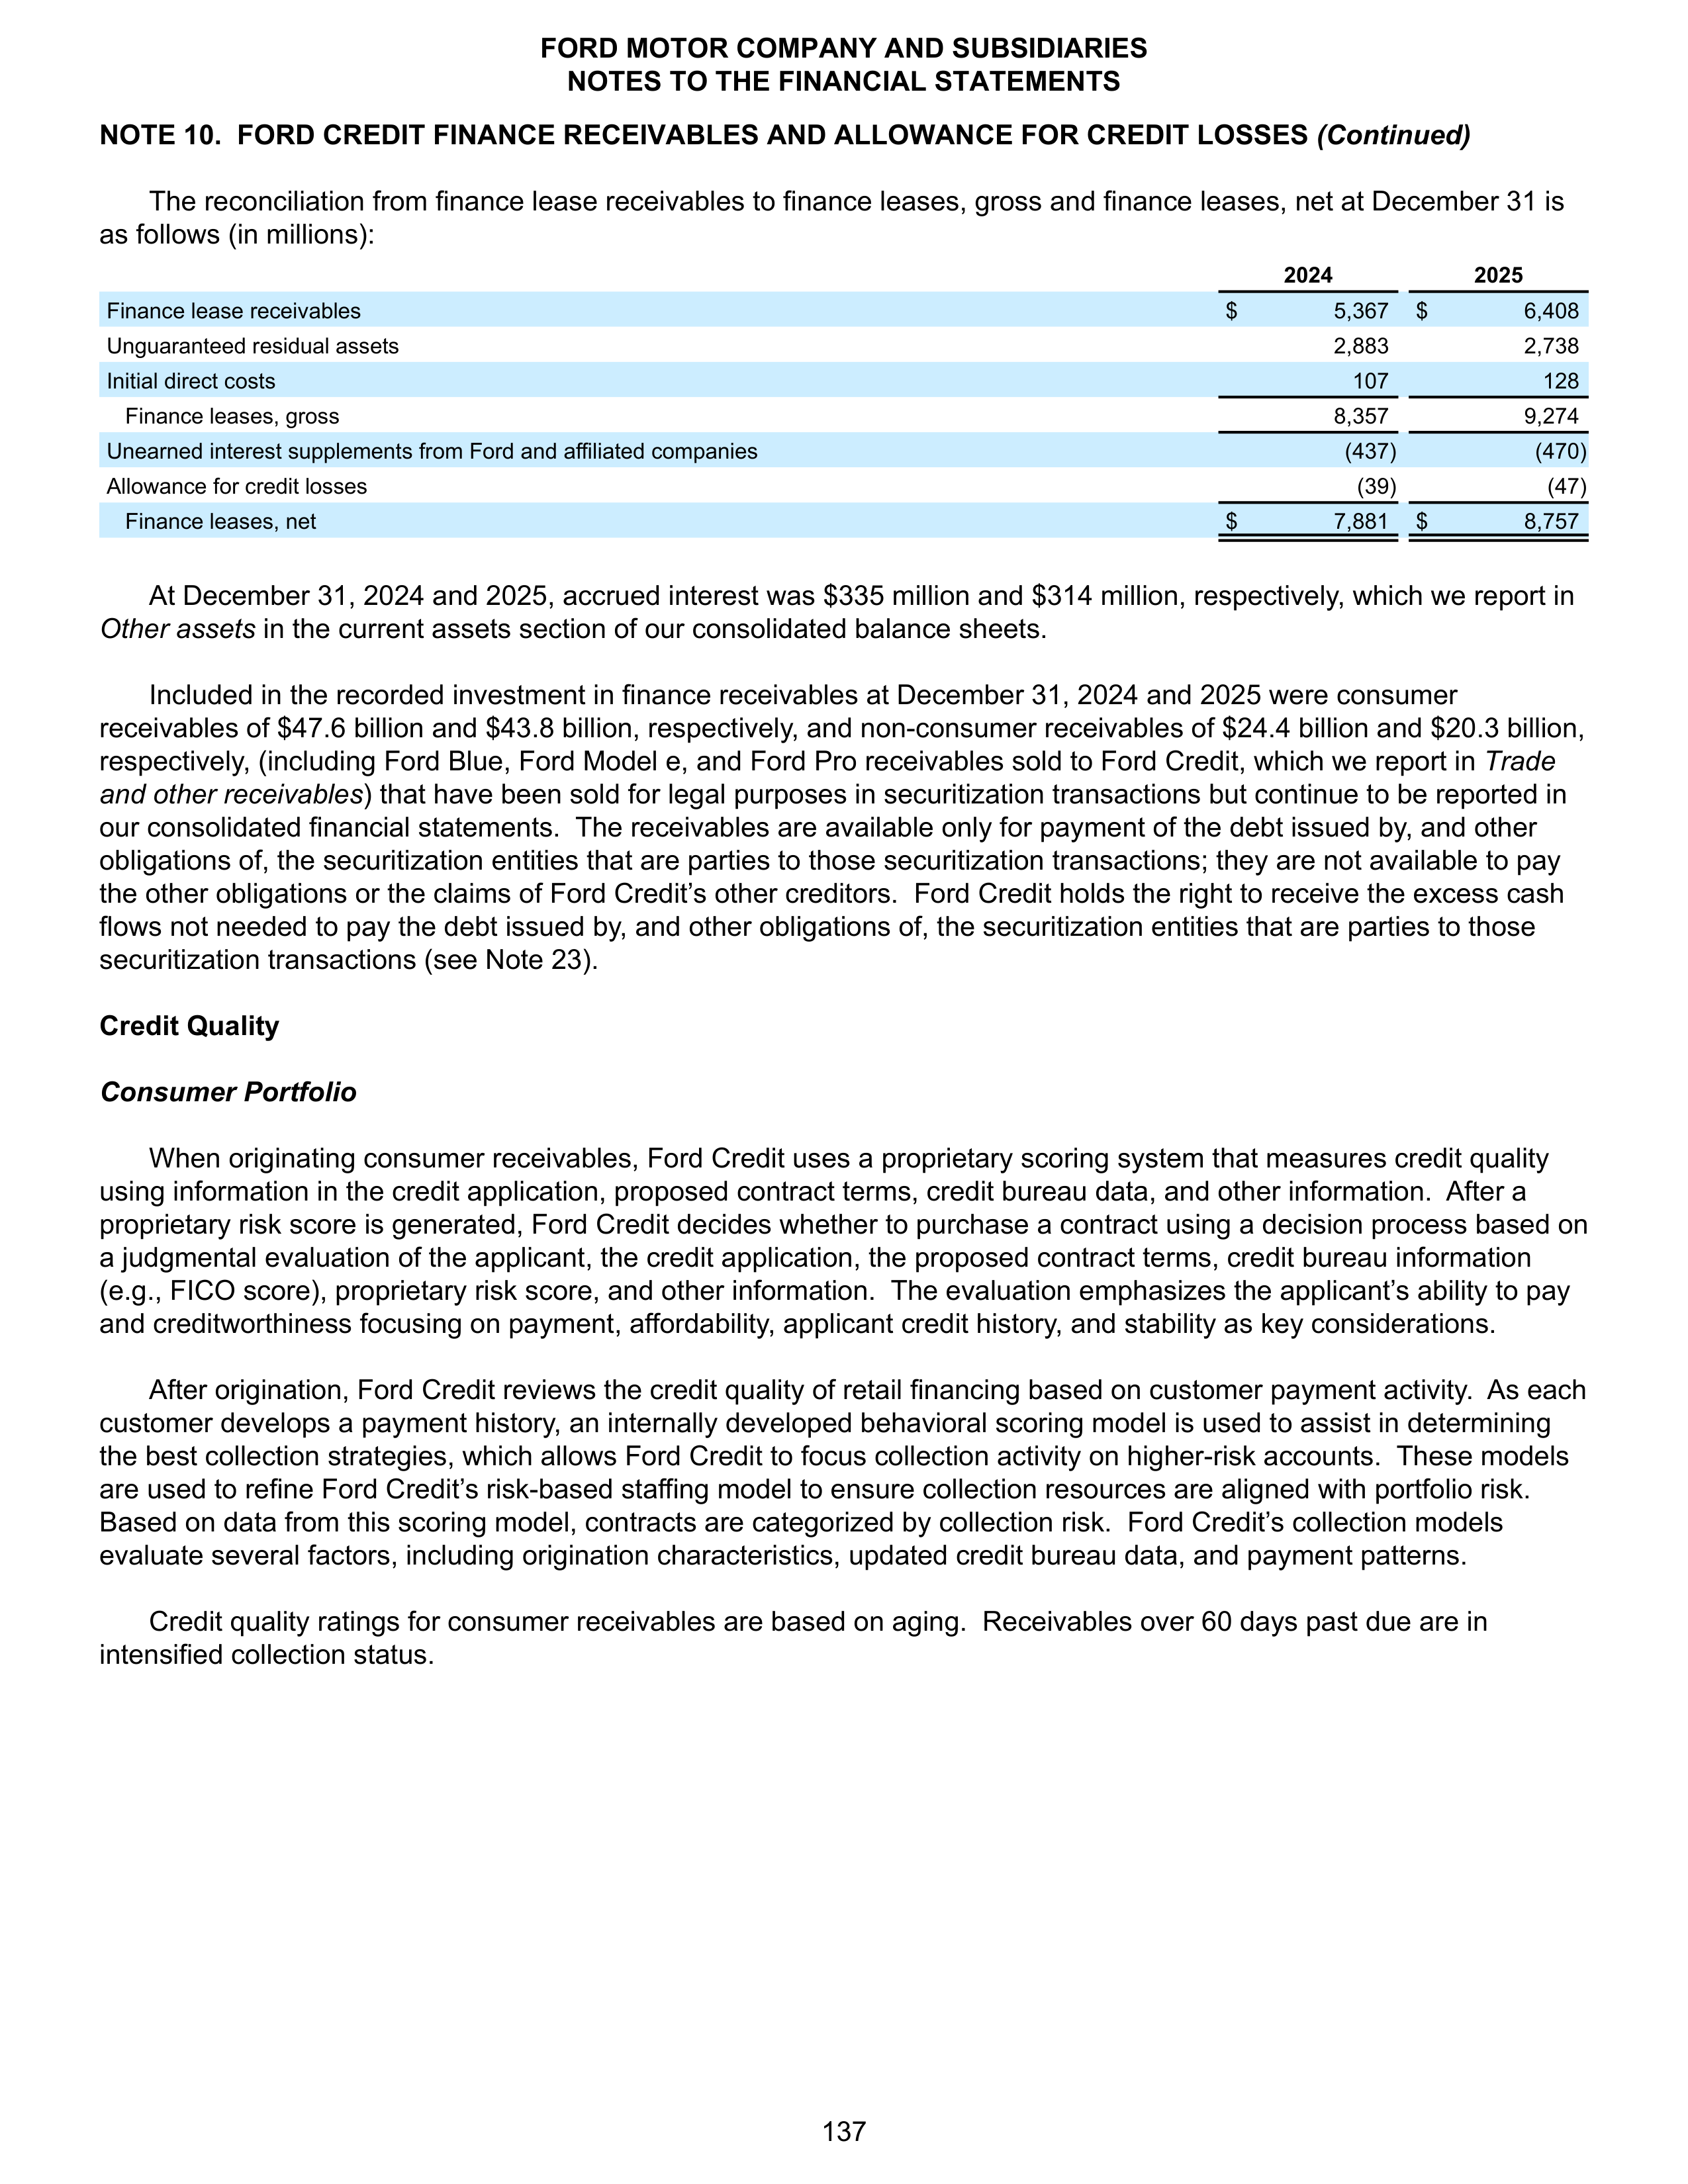
NOTE 10. FORD CREDIT FINANCE RECEIVABLES AND ALLOWANCE FOR CREDIT LOSSES
(Continued)
The reconciliation from finance lease receivables to finance leases, gross and finance leases, net at December 31 is
as follows (in millions):
2024
2025
Finance lease receivables
$
5,367
$
6,408
Unguaranteed residual assets
2,883
2,738
Initial direct costs
107
128
Finance leases, gross
8,357
9,274
Unearned interest supplements from Ford and affiliated companies
(437)
(470)
Allowance for credit losses
(39)
(47)
Finance leases, net
$
7,881
$
8,757
At December 31, 2024
and
2025, accrued interest was $335 million and $314 million, respectively, which we report in
Other assets
in the current assets section of our consolidated balance sheets.
Included in the recorded investment in finance receivables at December 31, 2024
and
2025 were consumer
receivables of $47.6 billion and $43.8 billion, respectively, and non-consumer receivables of $24.4 billion and $20.3 billion,
respectively, (including Ford Blue, Ford Model e, and Ford Pro receivables sold to Ford Credit, which we report in
Trade
and other receivables
) that have been sold for legal purposes in securitization transactions but continue to be reported in
our consolidated financial statements. The receivables are available only for payment of the debt issued by, and other
obligations of, the securitization entities that are parties to those securitization transactions; they are not available to pay
the other obligations or the claims of Ford Credit’s other creditors. Ford Credit holds the right to receive the excess cash
flows not needed to pay the debt issued by, and other obligations of, the securitization entities that are parties to those
securitization transactions (see Note 23).
Credit Quality
Consumer Portfolio
When originating consumer receivables, Ford Credit uses a proprietary scoring system that measures credit quality
using information in the credit application, proposed contract terms, credit bureau data, and other information. After a
proprietary risk score is generated, Ford Credit decides whether to purchase a contract using a decision process based on
a judgmental evaluation of the applicant, the credit application, the proposed contract terms, credit bureau information
(e.g., FICO score), proprietary risk score, and other information. The evaluation emphasizes the applicant’s ability to pay
and creditworthiness focusing on payment, affordability, applicant credit history, and stability as key considerations.
After origination, Ford Credit reviews the credit quality of retail financing based on customer payment activity. As each
customer develops a payment history, an internally developed behavioral scoring model is used to assist in determining
the best collection strategies, which allows Ford Credit to focus collection activity on higher-risk accounts. These models
are used to refine Ford Credit’s risk-based staffing model to ensure collection resources are aligned with portfolio risk.
Based on data from this scoring model, contracts are categorized by collection risk. Ford Credit’s collection models
evaluate several factors, including origination characteristics, updated credit bureau data, and payment patterns.
Credit quality ratings for consumer receivables are based on aging. Receivables over 60 days past due are in
intensified collection status.
FORD MOTOR COMPANY AND SUBSIDIARIES
NOTES TO THE FINANCIAL STATEMENTS
137
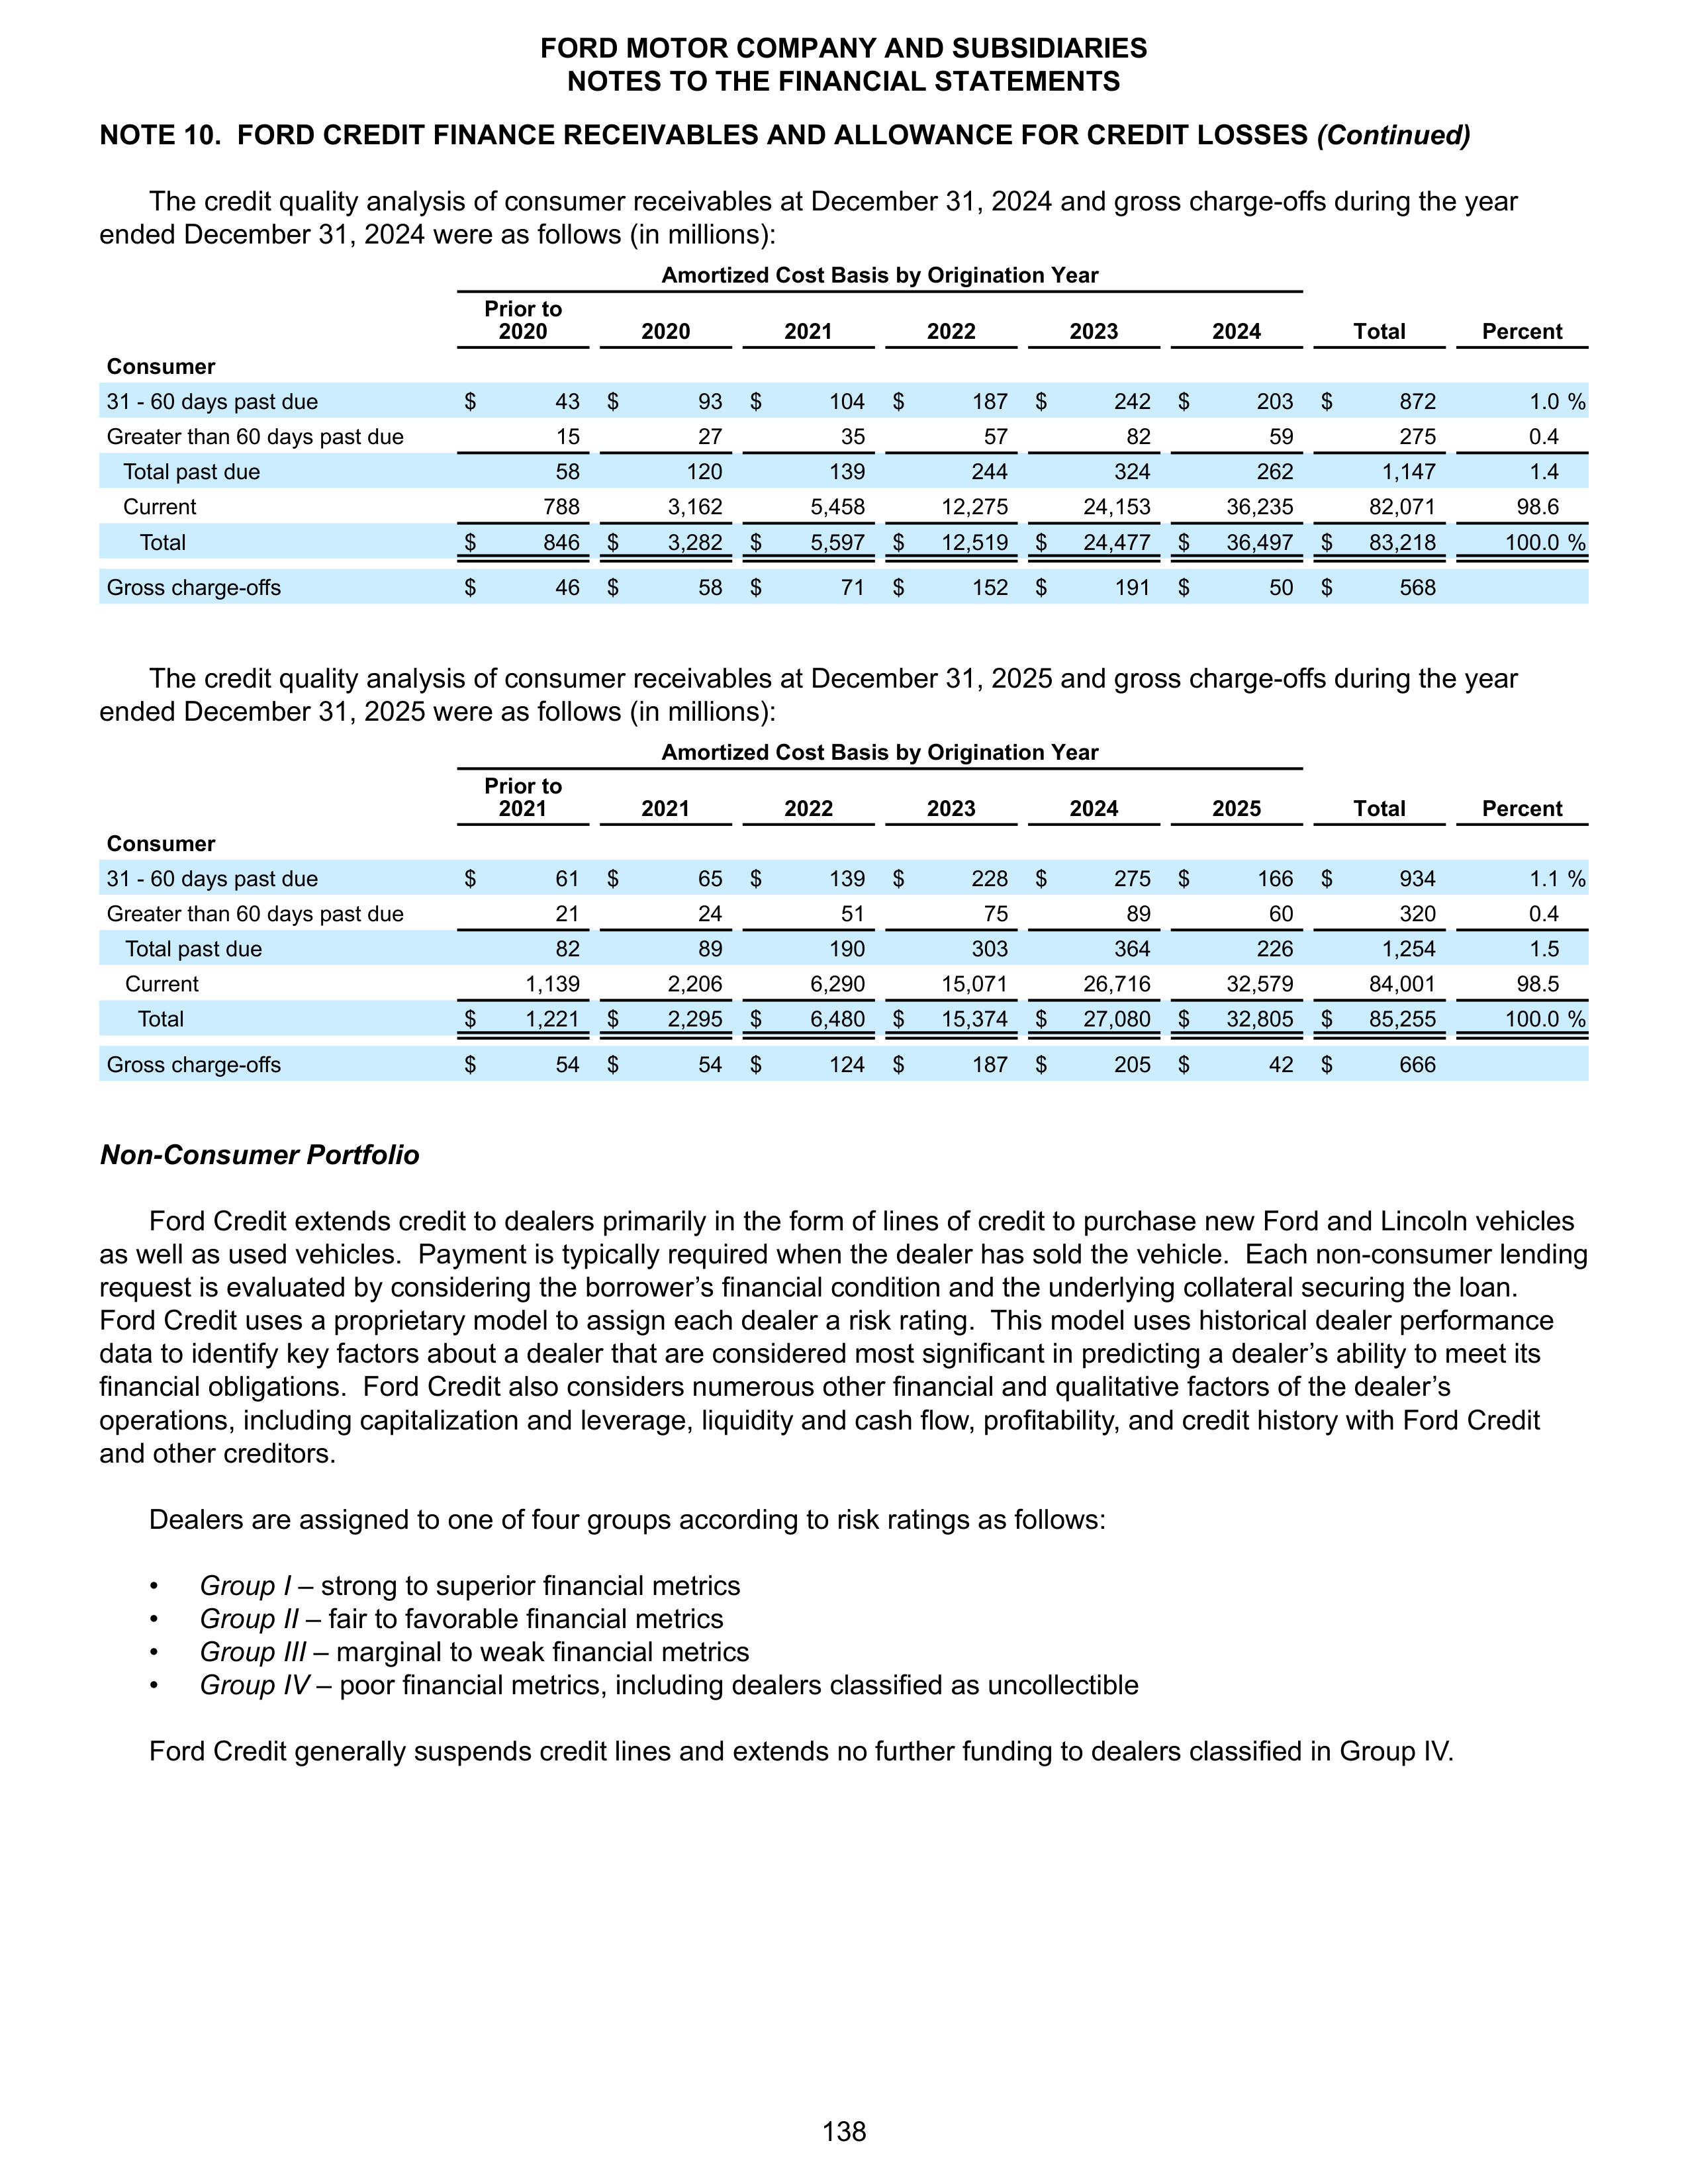
NOTE 10. FORD CREDIT FINANCE RECEIVABLES AND ALLOWANCE FOR CREDIT LOSSES
(Continued)
The credit quality analysis of consumer receivables at December 31, 2024 and gross charge-offs during the year
ended December 31, 2024 were as follows (in millions):
Amortized Cost Basis by Origination Year
Prior to
2020
2020
2021
2022
2023
2024
Total
Percent
Consumer
31 - 60 days past due
$
43
$
93
$
104
$
187
$
242
$
203
$
872
1.0 %
Greater than 60 days past due
15
27
35
57
82
59
275
0.4
Total past due
58
120
139
244
324
262
1,147
1.4
Current
788
3,162
5,458
12,275
24,153
36,235
82,071
98.6
Total
$
846
$
3,282
$
5,597
$
12,519
$
24,477
$
36,497
$
83,218
100.0 %
Gross charge-offs
$
46
$
58
$
71
$
152
$
191
$
50
$
568
The credit quality analysis of consumer receivables at December 31, 2025 and gross charge-offs during the year
ended December 31, 2025 were as follows (in millions):
Amortized Cost Basis by Origination Year
Prior to
2021
2021
2022
2023
2024
2025
Total
Percent
Consumer
31 - 60 days past due
$
61
$
65
$
139
$
228
$
275
$
166
$
934
1.1 %
Greater than 60 days past due
21
24
51
75
89
60
320
0.4
Total past due
82
89
190
303
364
226
1,254
1.5
Current
1,139
2,206
6,290
15,071
26,716
32,579
84,001
98.5
Total
$
1,221
$
2,295
$
6,480
$
15,374
$
27,080
$
32,805
$
85,255
100.0 %
Gross charge-offs
$
54
$
54
$
124
$
187
$
205
$
42
$
666
Non-Consumer Portfolio
Ford Credit extends credit to dealers primarily in the form of lines of credit to purchase new Ford and Lincoln vehicles
as well as used vehicles. Payment is typically required when the dealer has sold the vehicle. Each non-consumer lending
request is evaluated by considering the borrower’s financial condition and the underlying collateral securing the loan.
Ford Credit uses a proprietary model to assign each dealer a risk rating. This model uses historical dealer performance
data to identify key factors about a dealer that are considered most significant in predicting a dealer’s ability to meet its
financial obligations. Ford Credit also considers numerous other financial and qualitative factors of the dealer’s
operations, including capitalization and leverage, liquidity and cash flow, profitability, and credit history with Ford Credit
and other creditors.
Dealers are assigned to one of four groups according to risk ratings as follows:
•
Group I
– strong to superior financial metrics
•
Group II
– fair to favorable financial metrics
•
Group III
– marginal to weak financial metrics
•
Group IV
– poor financial metrics, including dealers classified as uncollectible
Ford Credit generally suspends credit lines and extends no further funding to dealers classified in Group IV.
FORD MOTOR COMPANY AND SUBSIDIARIES
NOTES TO THE FINANCIAL STATEMENTS
138
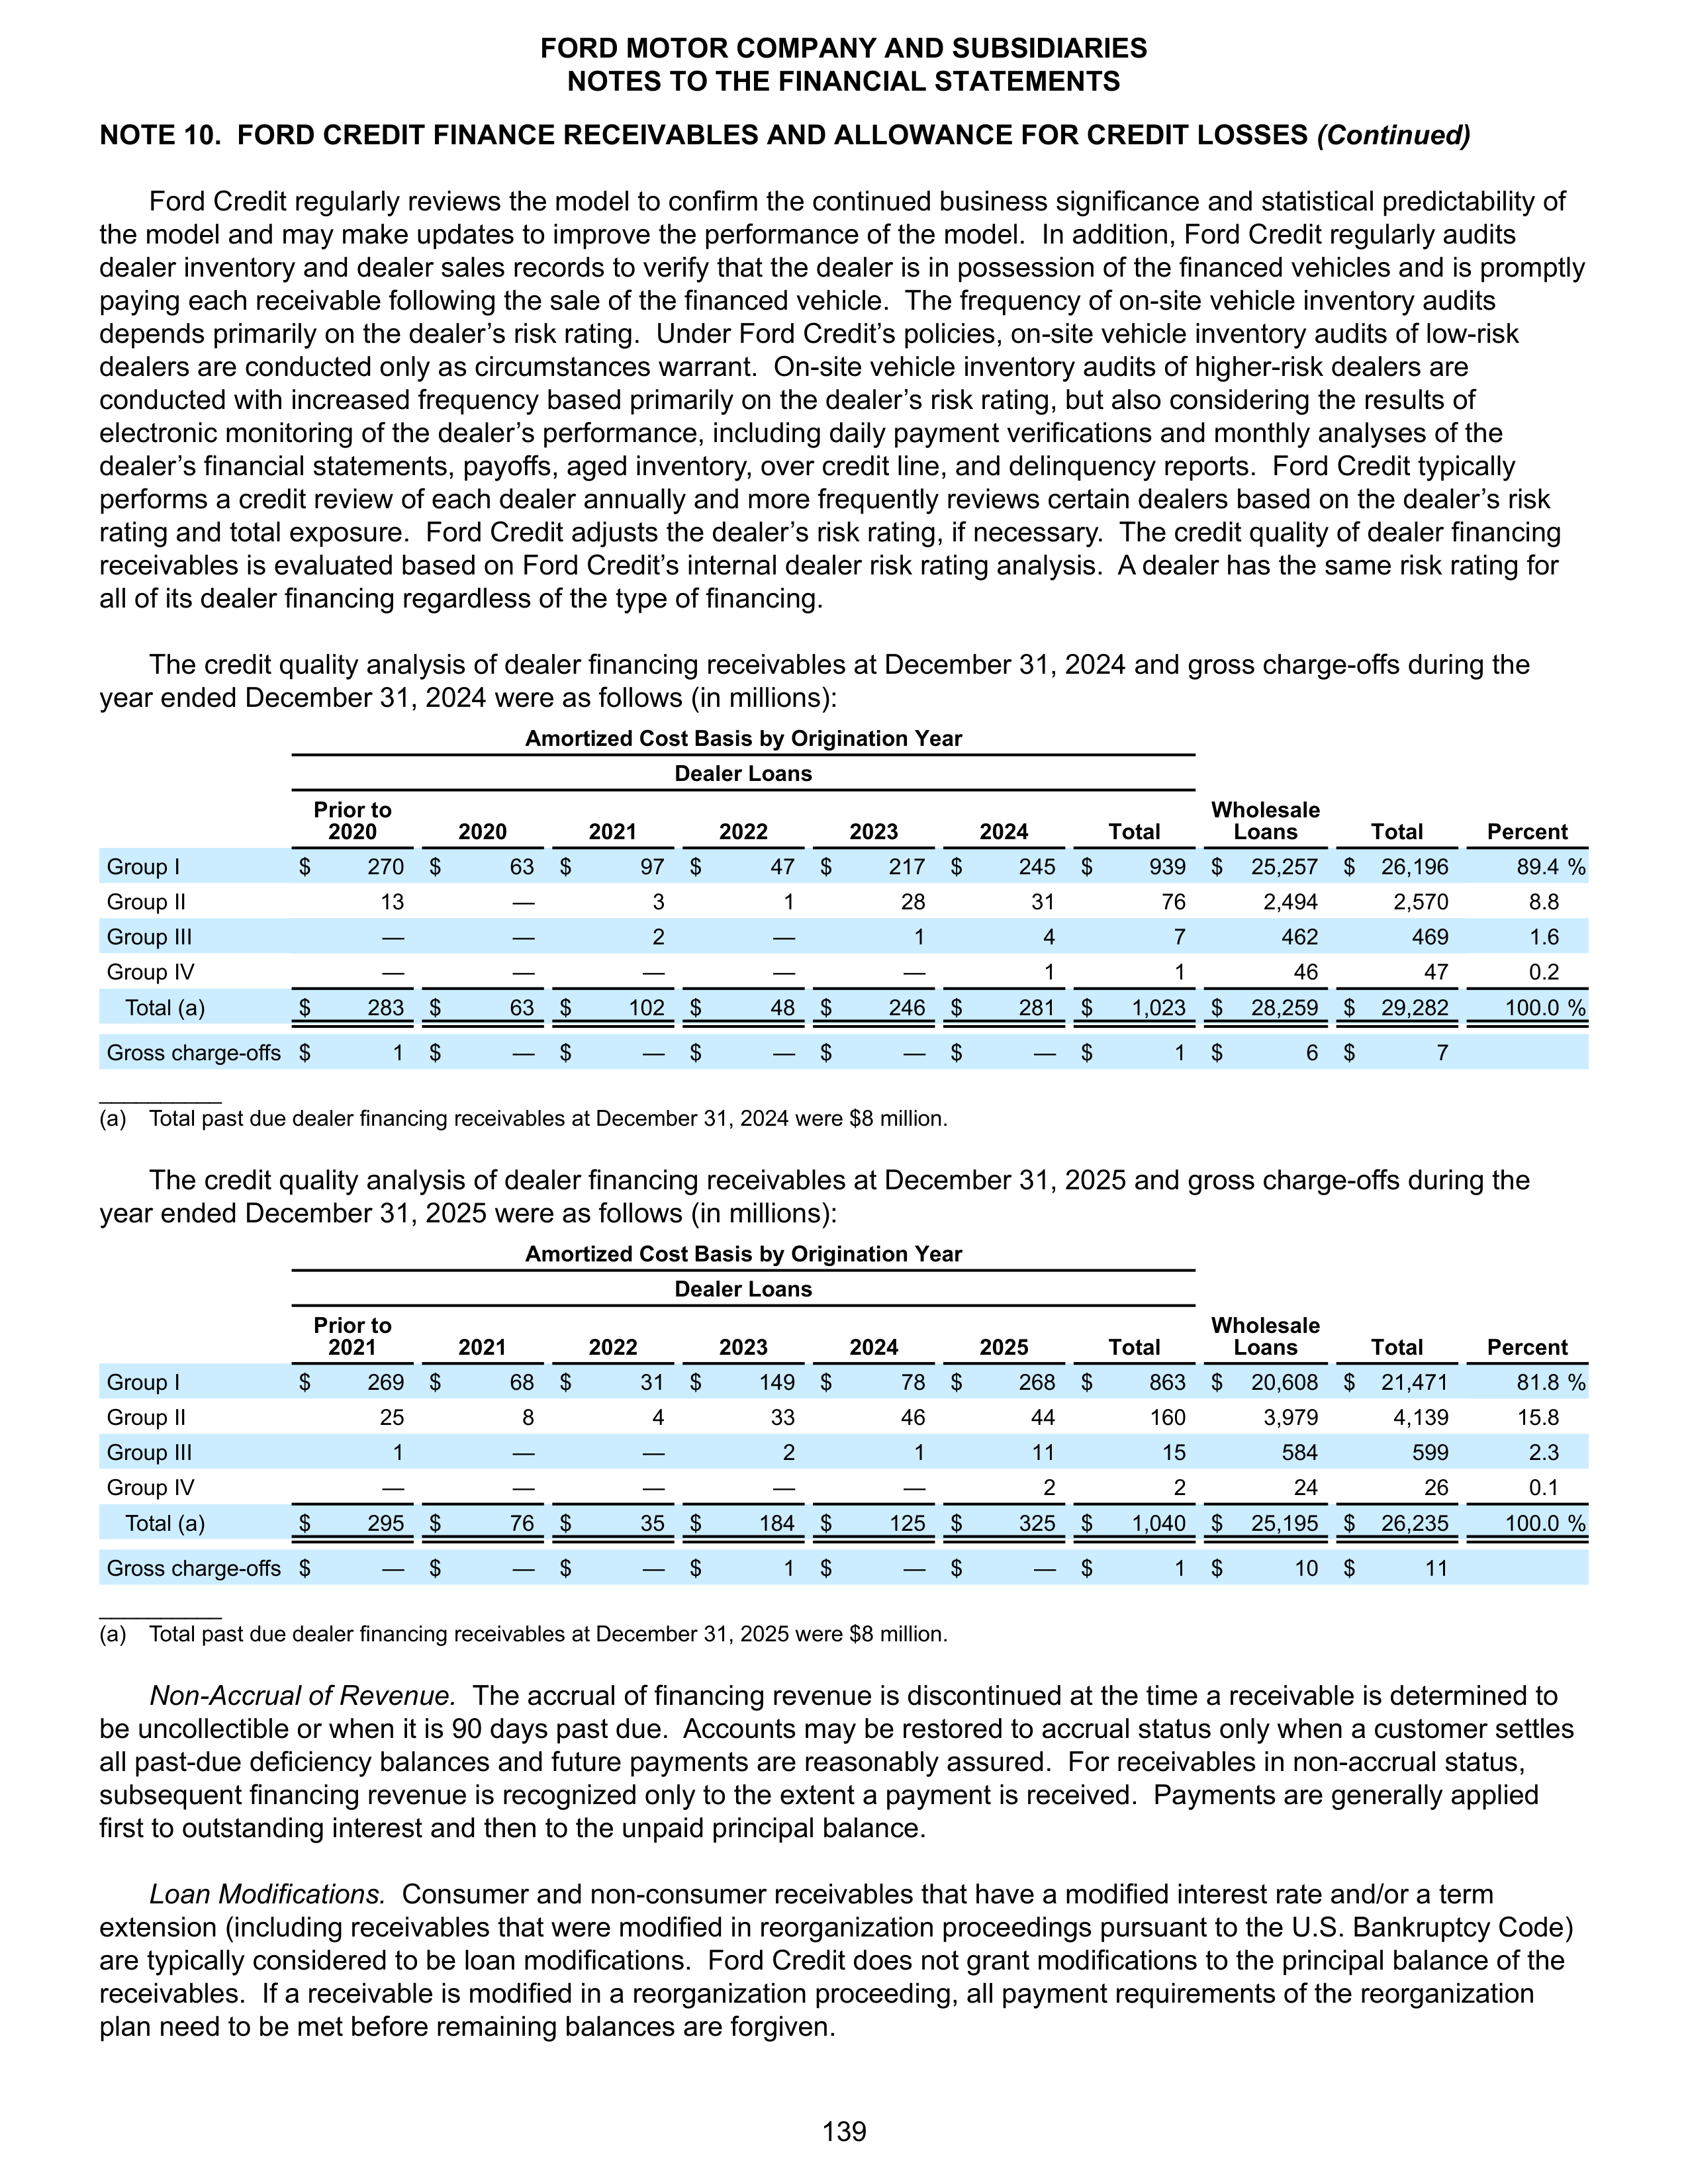
NOTE 10. FORD CREDIT FINANCE RECEIVABLES AND ALLOWANCE FOR CREDIT LOSSES
(Continued)
Ford Credit regularly reviews the model to confirm the continued business significance and statistical predictability of
the model and may make updates to improve the performance of the model. In addition, Ford Credit regularly audits
dealer inventory and dealer sales records to verify that the dealer is in possession of the financed vehicles and is promptly
paying each receivable following the sale of the financed vehicle. The frequency of on-site vehicle inventory audits
depends primarily on the dealer’s risk rating. Under Ford Credit’s policies, on-site vehicle inventory audits of low-risk
dealers are conducted only as circumstances warrant. On-site vehicle inventory audits of higher-risk dealers are
conducted with increased frequency based primarily on the dealer’s risk rating, but also considering the results of
electronic monitoring of the dealer’s performance, including daily payment verifications and monthly analyses of the
dealer’s financial statements, payoffs, aged inventory, over credit line, and delinquency reports. Ford Credit typically
performs a credit review of each dealer annually and more frequently reviews certain dealers based on the dealer’s risk
rating and total exposure. Ford Credit adjusts the dealer’s risk rating, if necessary. The credit quality of dealer financing
receivables is evaluated based on Ford Credit’s internal dealer risk rating analysis. A dealer has the same risk rating for
all of its dealer financing regardless of the type of financing.
The credit quality analysis of dealer financing receivables at December 31, 2024 and gross charge-offs during the
year ended December 31, 2024 were as follows (in millions):
Amortized Cost Basis by Origination Year
Wholesale
Loans
Dealer Loans
Prior to
2020
2020
2021
2022
2023
2024
Total
Total
Percent
Group I
$
270
$
63
$
97
$
47
$
217
$
245
$
939
$
25,257
$
26,196
89.4 %
Group II
13
—
3
1
28
31
76
2,494
2,570
8.8
Group III
—
—
2
—
1
4
7
462
469
1.6
Group IV
—
—
—
—
—
1
1
46
47
0.2
Total (a)
$
283
$
63
$
102
$
48
$
246
$
281
$
1,023
$
28,259
$
29,282
100.0 %
Gross charge-offs
$
1
$
—
$
—
$
—
$
—
$
—
$
1
$
6
$
7
__________
(a)
Total past due dealer financing receivables at December 31, 2024 were $8 million.
The credit quality analysis of dealer financing receivables at December 31, 2025 and gross charge-offs during the
year ended December 31, 2025 were as follows (in millions):
Amortized Cost Basis by Origination Year
Wholesale
Loans
Dealer Loans
Prior to
2021
2021
2022
2023
2024
2025
Total
Total
Percent
Group I
$
269
$
68
$
31
$
149
$
78
$
268
$
863
$
20,608
$
21,471
81.8 %
Group II
25
8
4
33
46
44
160
3,979
4,139
15.8
Group III
1
—
—
2
1
11
15
584
599
2.3
Group IV
—
—
—
—
—
2
2
24
26
0.1
Total (a)
$
295
$
76
$
35
$
184
$
125
$
325
$
1,040
$
25,195
$
26,235
100.0 %
Gross charge-offs
$
—
$
—
$
—
$
1
$
—
$
—
$
1
$
10
$
11
__________
(a)
Total past due dealer financing receivables at December 31, 2025 were $8 million.
Non-Accrual of Revenue.
The accrual of financing revenue is discontinued at the time a receivable is determined to
be uncollectible or when it is 90 days past due. Accounts may be restored to accrual status only when a customer settles
all past-due deficiency balances and future payments are reasonably assured. For receivables in non-accrual status,
subsequent financing revenue is recognized only to the extent a payment is received. Payments are generally applied
first to outstanding interest and then to the unpaid principal balance.
Loan Modifications.
Consumer and non-consumer receivables that have a modified interest rate and/or a term
extension (including receivables that were modified in reorganization proceedings pursuant to the U.S. Bankruptcy Code)
are typically considered to be loan modifications. Ford Credit does not grant modifications to the principal balance of the
receivables. If a receivable is modified in a reorganization proceeding, all payment requirements of the reorganization
plan need to be met before remaining balances are forgiven.
FORD MOTOR COMPANY AND SUBSIDIARIES
NOTES TO THE FINANCIAL STATEMENTS
139
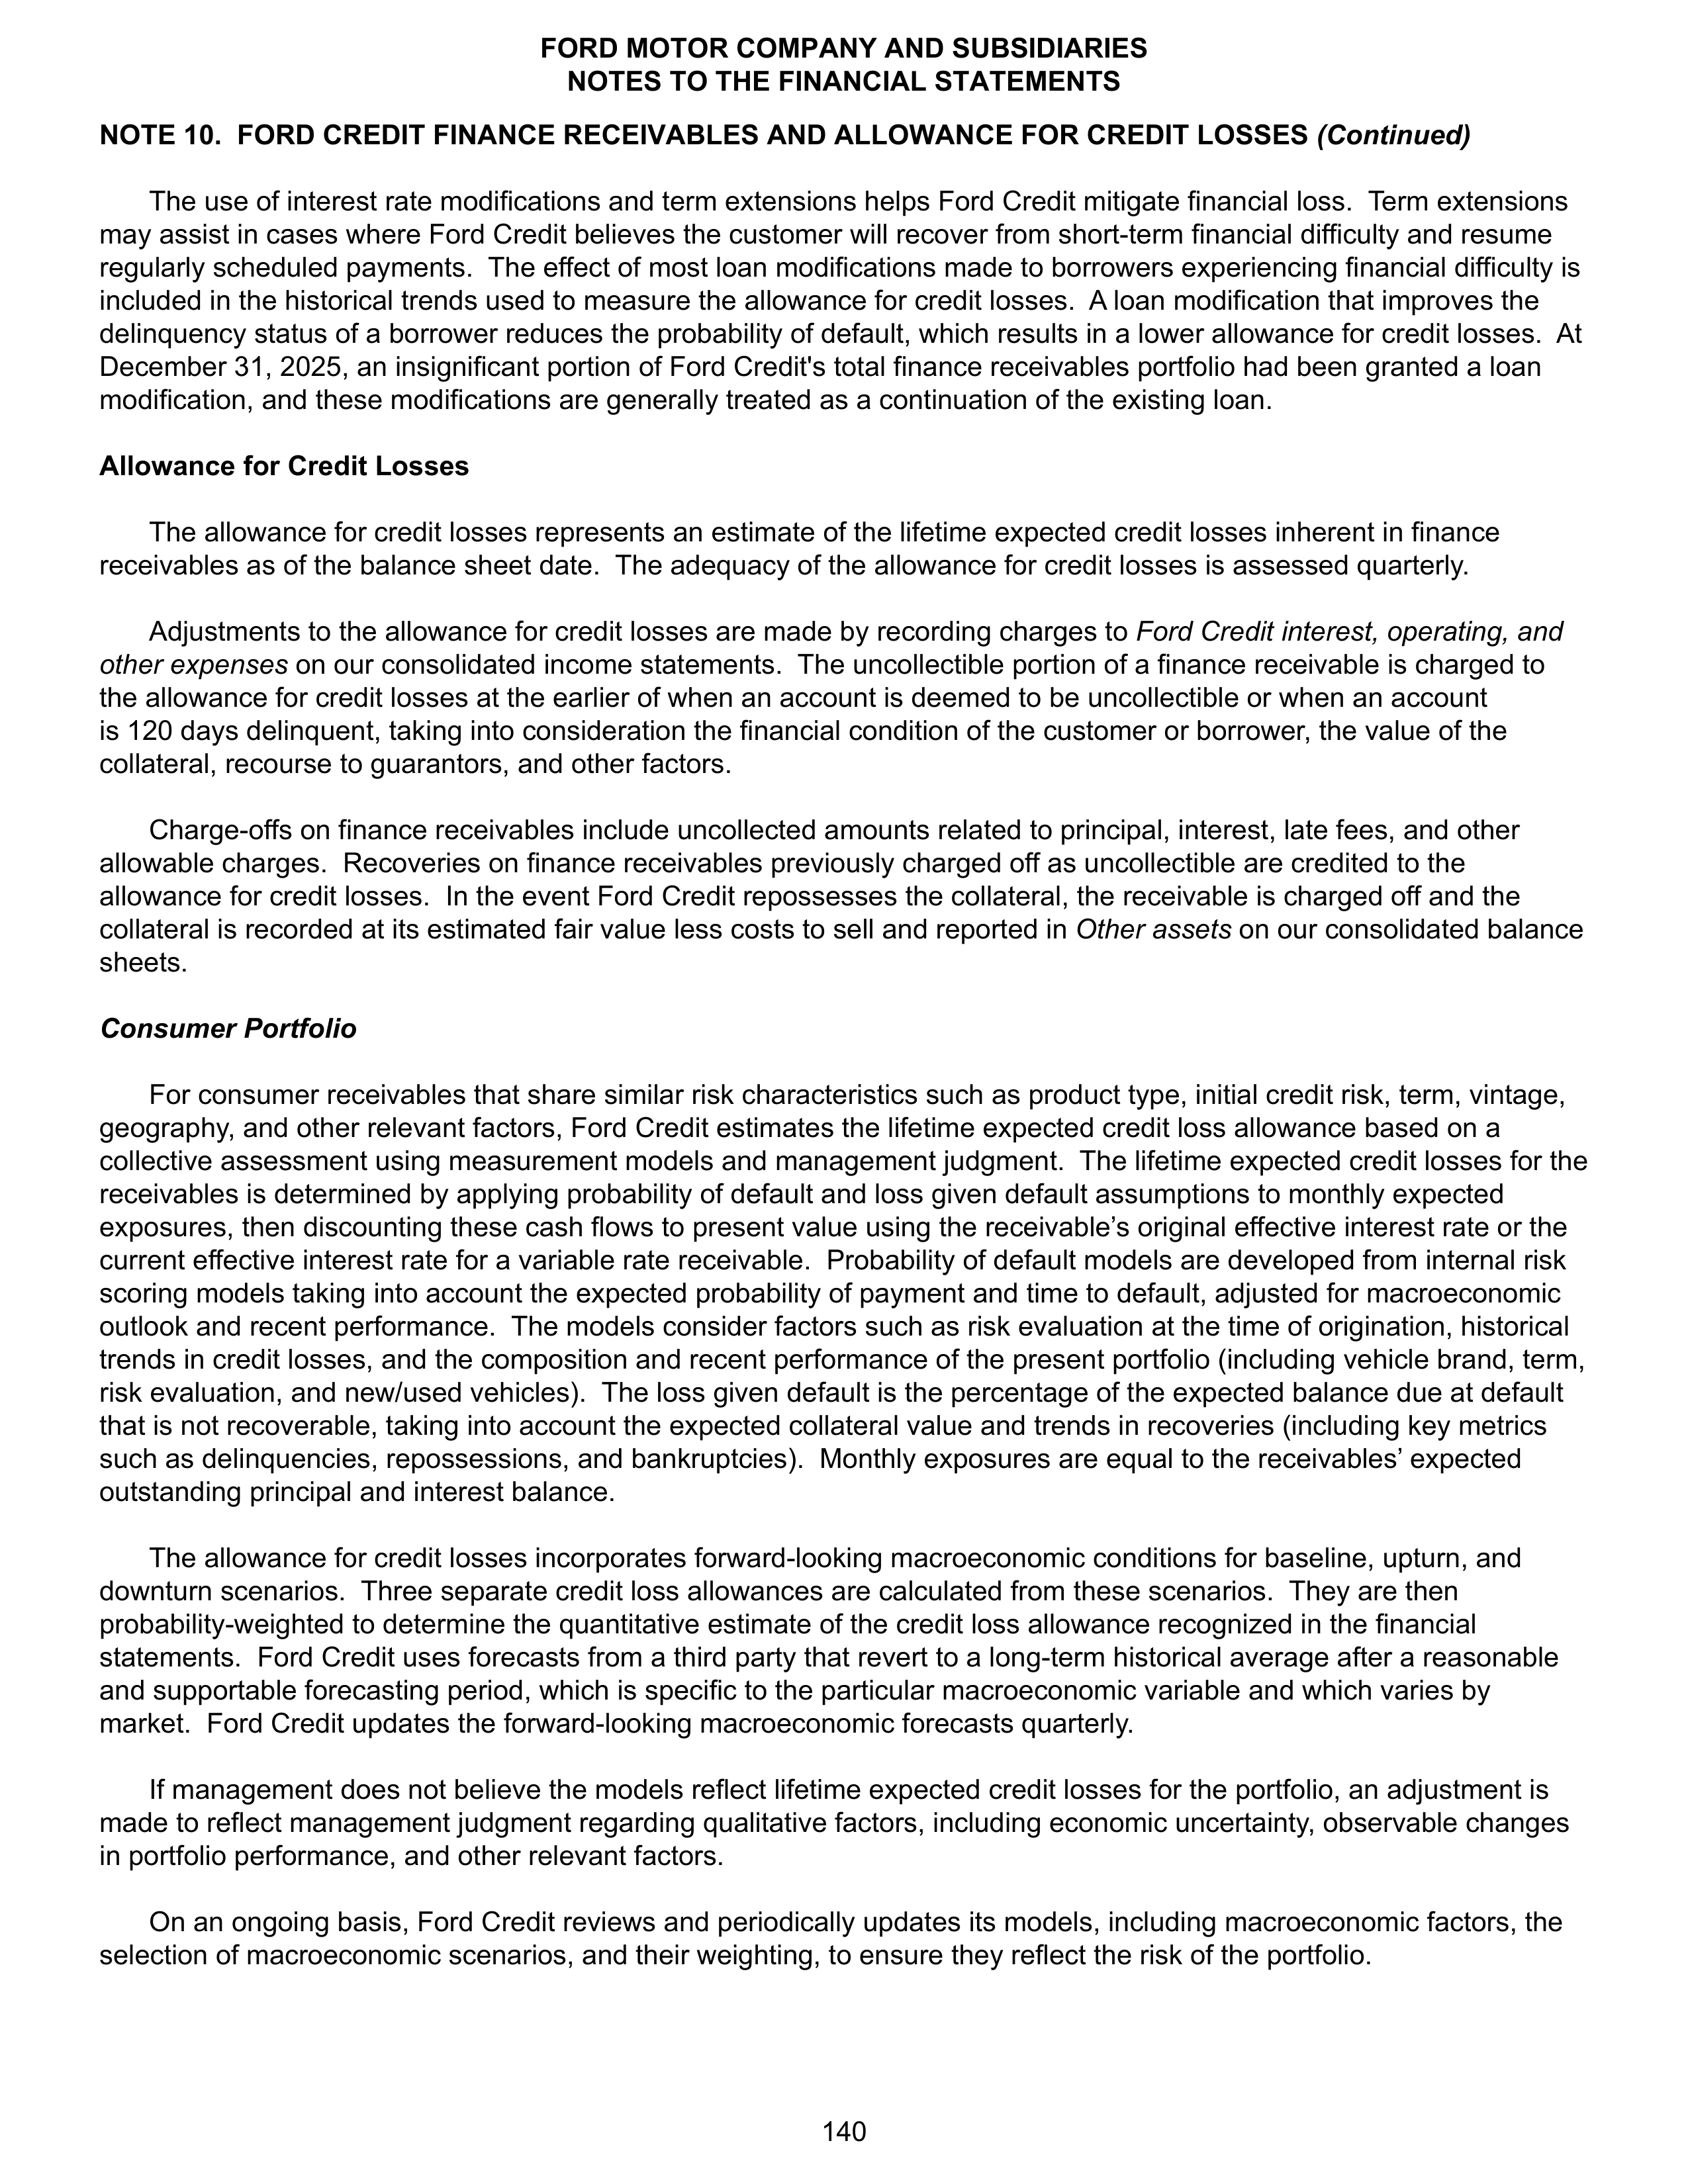
NOTE 10. FORD CREDIT FINANCE RECEIVABLES AND ALLOWANCE FOR CREDIT LOSSES
(Continued)
The use of interest rate modifications and term extensions helps Ford Credit mitigate financial loss. Term extensions
may assist in cases where Ford Credit believes the customer will recover from short-term financial difficulty and resume
regularly scheduled payments. The effect of most loan modifications made to borrowers experiencing financial difficulty is
included in the historical trends used to measure the allowance for credit losses. A loan modification that improves the
delinquency status of a borrower reduces the probability of default, which results in a lower allowance for credit losses. At
December 31, 2025, an insignificant portion of Ford Credit's total finance receivables portfolio had been granted a loan
modification, and these modifications are generally treated as a continuation of the existing loan.
Allowance for Credit Losses
The allowance for credit losses represents an estimate of the lifetime expected credit losses inherent in finance
receivables as of the balance sheet date. The adequacy of the allowance for credit losses is assessed quarterly.
Adjustments to the allowance for credit losses are made by recording charges to
Ford Credit interest, operating, and
other expenses
on our consolidated income statements. The uncollectible portion of a finance receivable is charged to
the allowance for credit losses at the earlier of when an account is deemed to be uncollectible or when an account
is 120 days delinquent, taking into consideration the financial condition of the customer or borrower, the value of the
collateral, recourse to guarantors, and other factors.
Charge-offs on finance receivables include uncollected amounts related to principal, interest, late fees, and other
allowable charges. Recoveries on finance receivables previously charged off as uncollectible are credited to the
allowance for credit losses. In the event Ford Credit repossesses the collateral, the receivable is charged off and the
collateral is recorded at its estimated fair value less costs to sell and reported in
Other assets
on our consolidated balance
sheets.
Consumer Portfolio
For consumer receivables that share similar risk characteristics such as product type, initial credit risk, term, vintage,
geography, and other relevant factors, Ford Credit estimates the lifetime expected credit loss allowance based on a
collective assessment
using measurement models and management judgment. The lifetime expected credit losses for the
receivables is determined by applying probability of default and loss given default assumptions to monthly expected
exposures, then discounting these cash flows to present value using the receivable’s original effective interest rate or the
current effective interest rate for a variable rate receivable. Probability of default models are developed from internal risk
scoring models taking into account the expected probability of payment and time to default, adjusted for macroeconomic
outlook and recent performance. The models consider factors such as risk evaluation at the time of origination, historical
trends in credit losses, and the composition and recent performance of the present portfolio (including vehicle brand, term,
risk evaluation, and new/used vehicles). The loss given default is the percentage of the expected balance due at default
that is not recoverable, taking into account the expected collateral value and trends in recoveries (including key metrics
such as delinquencies, repossessions, and bankruptcies). Monthly exposures are equal to the receivables’ expected
outstanding principal and interest balance.
The allowance for credit losses incorporates forward-looking macroeconomic conditions for baseline, upturn, and
downturn scenarios. Three separate credit loss allowances are calculated from these scenarios. They are then
probability-weighted to determine the quantitative estimate of the credit loss allowance recognized in the financial
statements. Ford Credit uses forecasts from a third party that revert to a long-term historical average after a reasonable
and supportable forecasting period, which is specific to the particular macroeconomic variable and which varies by
market. Ford Credit updates the forward-looking macroeconomic forecasts quarterly.
If management does not believe the models reflect lifetime expected credit losses for the portfolio, an adjustment is
made to reflect management judgment regarding qualitative factors, including economic uncertainty, observable changes
in portfolio performance, and other relevant factors.
On an ongoing basis, Ford Credit reviews and periodically updates its models, including macroeconomic factors, the
selection of macroeconomic scenarios, and their weighting, to ensure they reflect the risk of the portfolio.
FORD MOTOR COMPANY AND SUBSIDIARIES
NOTES TO THE FINANCIAL STATEMENTS
140
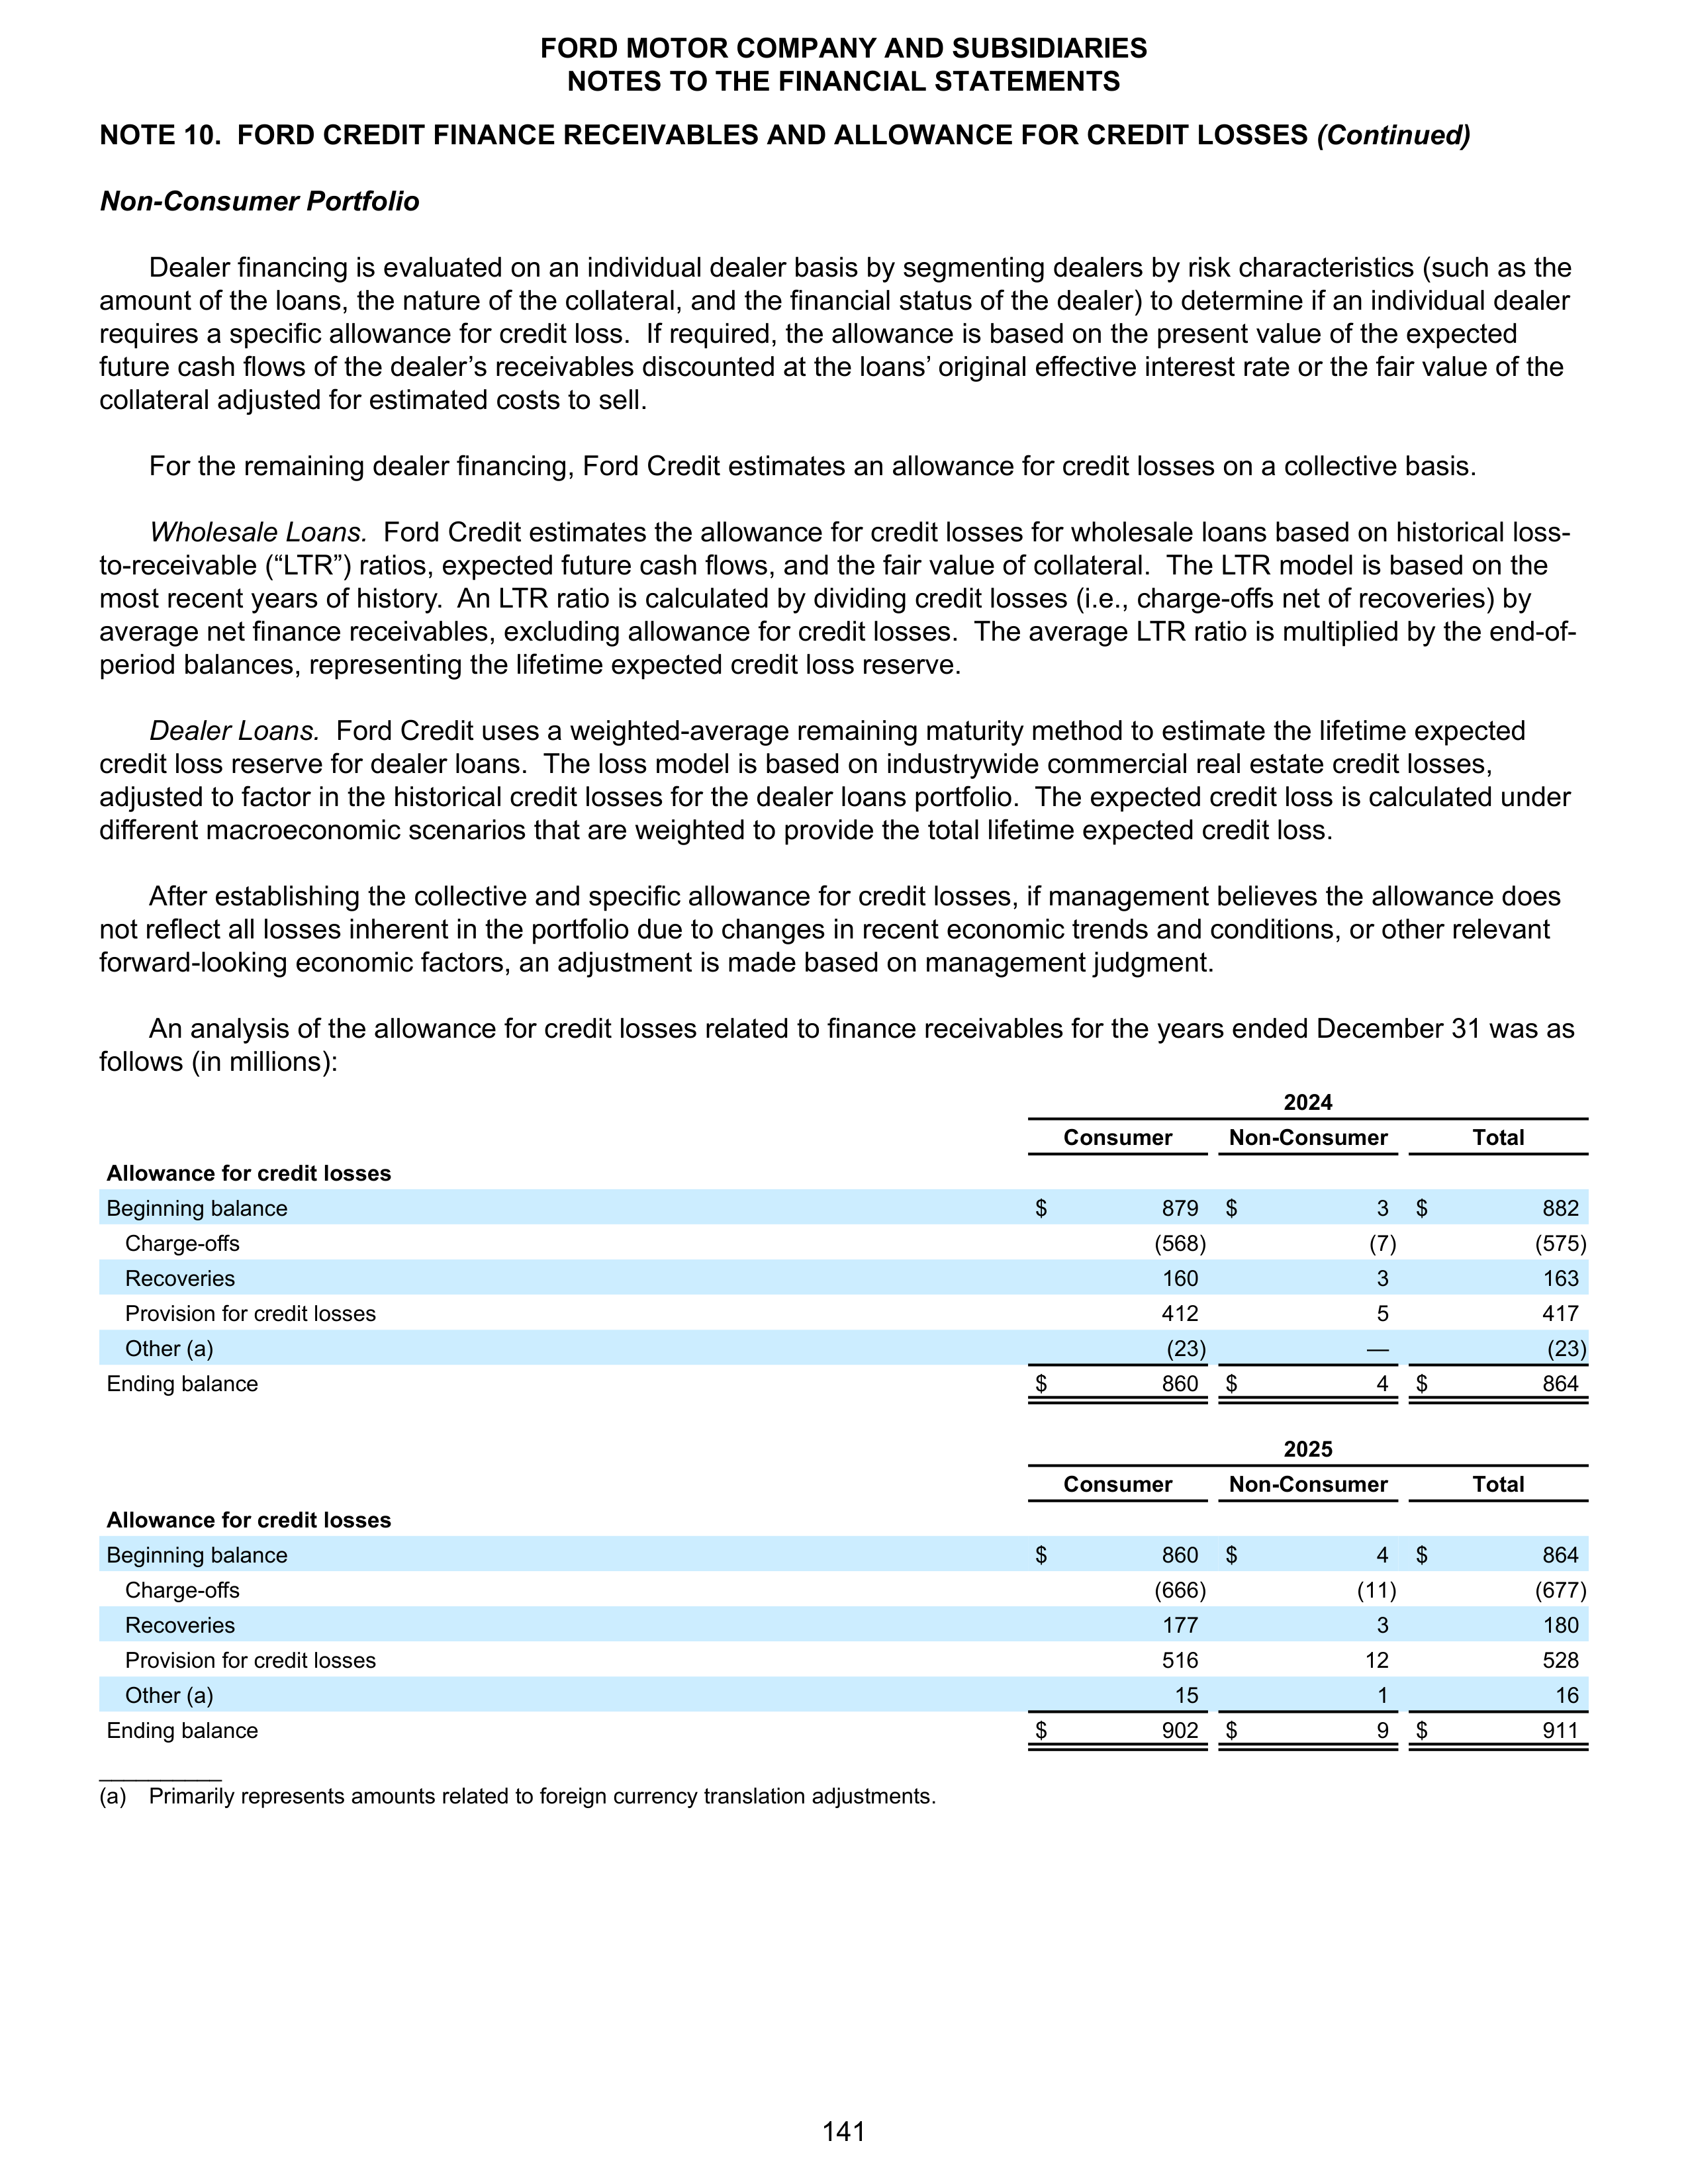
NOTE 10. FORD CREDIT FINANCE RECEIVABLES AND ALLOWANCE FOR CREDIT LOSSES
(Continued)
Non-Consumer Portfolio
Dealer financing is evaluated on an individual dealer basis by segmenting dealers by risk characteristics (such as the
amount of the loans, the nature of the collateral, and the financial status of the dealer) to determine if an individual dealer
requires a specific allowance for credit loss. If required, the allowance is based on the present value of the expected
future cash flows of the dealer’s receivables discounted at the loans’ original effective interest rate or the fair value of the
collateral adjusted for estimated costs to sell.
For the remaining dealer financing, Ford Credit estimates an allowance for credit losses on a collective basis.
Wholesale Loans.
Ford Credit estimates the allowance for credit losses for wholesale loans based on historical loss-
to-receivable (“LTR”) ratios, expected future cash flows, and the fair value of collateral. The LTR model is based on the
most recent years of history. An LTR ratio is calculated by dividing credit losses (i.e., charge-offs net of recoveries) by
average net finance receivables, excluding allowance for credit losses. The average LTR ratio is multiplied by the end-of-
period balances, representing the lifetime expected credit loss reserve.
Dealer Loans.
Ford Credit uses a weighted-average remaining maturity method to estimate the lifetime expected
credit loss reserve for dealer loans. The loss model is based on industrywide commercial real estate credit losses,
adjusted to factor in the historical credit losses for the dealer loans portfolio. The expected credit loss is calculated under
different macroeconomic scenarios that are weighted to provide the total lifetime expected credit loss.
After establishing the collective and specific allowance for credit losses, if management believes the allowance does
not reflect all losses inherent in the portfolio due to changes in recent economic trends and conditions, or other relevant
forward-looking economic factors, an adjustment is made based on management judgment.
An analysis of the allowance for credit losses related to finance receivables for the years ended December 31 was as
follows (in millions):
2024
Consumer
Non-Consumer
Total
Allowance for credit losses
Beginning balance
$
879
$
3
$
882
Charge-offs
(568)
(7)
(575)
Recoveries
160
3
163
Provision for credit losses
412
5
417
Other (a)
(23)
—
(23)
Ending balance
$
860
$
4
$
864
2025
Consumer
Non-Consumer
Total
Allowance for credit losses
Beginning balance
$
860
$
4
$
864
Charge-offs
(666)
(11)
(677)
Recoveries
177
3
180
Provision for credit losses
516
12
528
Other (a)
15
1
16
Ending balance
$
902
$
9
$
911
__________
(a)
Primarily represents amounts related to foreign currency translation adjustments.
FORD MOTOR COMPANY AND SUBSIDIARIES
NOTES TO THE FINANCIAL STATEMENTS
141
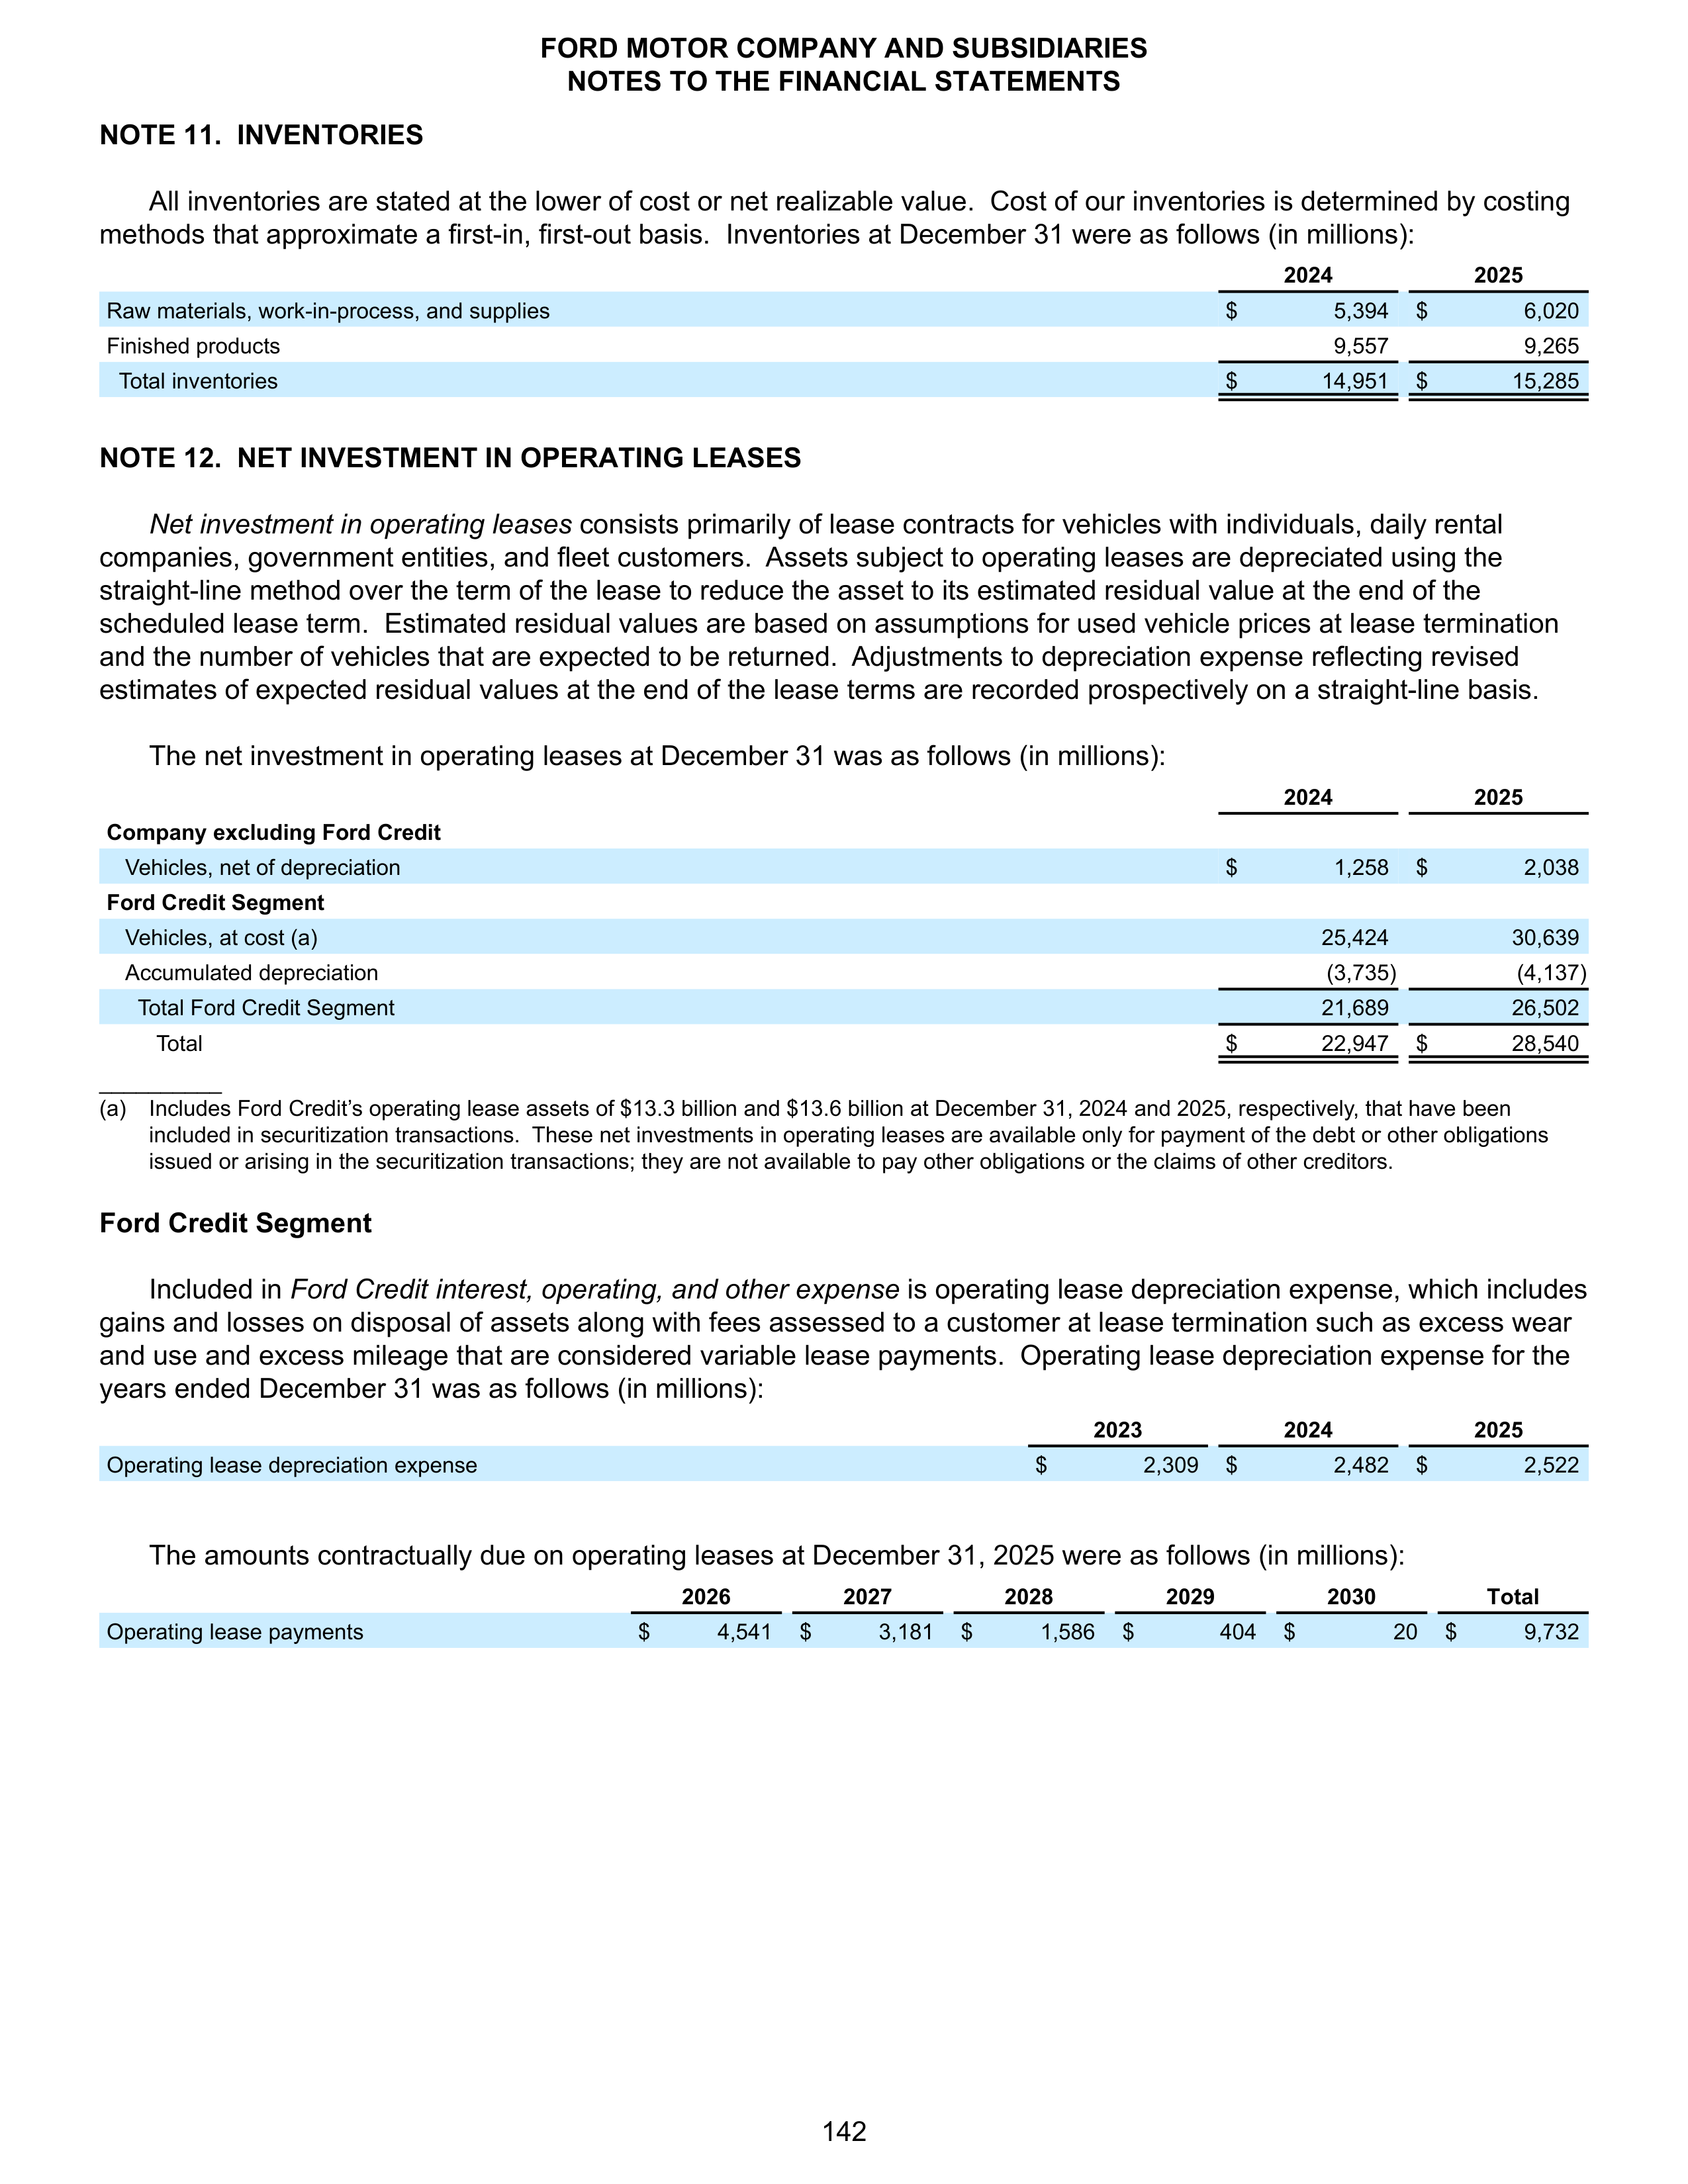
NOTE 11. INVENTORIES
All inventories are stated at the lower of cost or net realizable value. Cost of our inventories is determined by costing
methods that approximate a first-in, first-out basis. Inventories at December 31 were as follows (in millions):
2024
2025
Raw materials, work-in-process, and supplies
$
5,394
$
6,020
Finished products
9,557
9,265
Total inventories
$
14,951
$
15,285
NOTE 12. NET INVESTMENT IN OPERATING LEASES
Net investment in operating leases
consists primarily of lease contracts for vehicles with individuals, daily rental
companies, government entities, and fleet customers. Assets subject to operating leases are depreciated using the
straight-line method over the term of the lease to reduce the asset to its estimated residual value at the end of the
scheduled lease term. Estimated residual values are based on assumptions for used vehicle prices at lease termination
and the number of vehicles that are expected to be returned. Adjustments to depreciation expense reflecting revised
estimates of expected residual values at the end of the lease terms are recorded prospectively on a straight-line basis.
The net investment in operating leases at December 31 was as follows (in millions):
2024
2025
Company excluding Ford Credit
Vehicles, net of depreciation
$
1,258
$
2,038
Ford Credit Segment
Vehicles, at cost (a)
25,424
30,639
Accumulated depreciation
(3,735)
(4,137)
Total Ford Credit Segment
21,689
26,502
Total
$
22,947
$
28,540
__________
(a)
Includes Ford Credit’s operating lease assets of $13.3 billion and $13.6 billion at December 31, 2024
and
2025, respectively, that have been
included in securitization transactions. These net investments in operating leases are available only for payment of the debt or other obligations
issued or arising in the securitization transactions; they are not available to pay other obligations or the claims of other creditors.
Ford Credit Segment
Included in
Ford Credit interest, operating, and other expense
is operating lease depreciation expense, which includes
gains and losses on disposal of assets along with fees assessed to a customer at lease termination such as excess wear
and use and excess mileage that are considered variable lease payments. Operating lease depreciation expense for the
years ended December 31 was as follows (in millions):
2023
2024
2025
Operating lease depreciation expense
$
2,309
$
2,482
$
2,522
The amounts contractually due on operating leases at December 31, 2025 were as follows (in millions):
2026
2027
2028
2029
2030
Total
Operating lease payments
$
4,541
$
3,181
$
1,586
$
404
$
20
$
9,732
FORD MOTOR COMPANY AND SUBSIDIARIES
NOTES TO THE FINANCIAL STATEMENTS
142
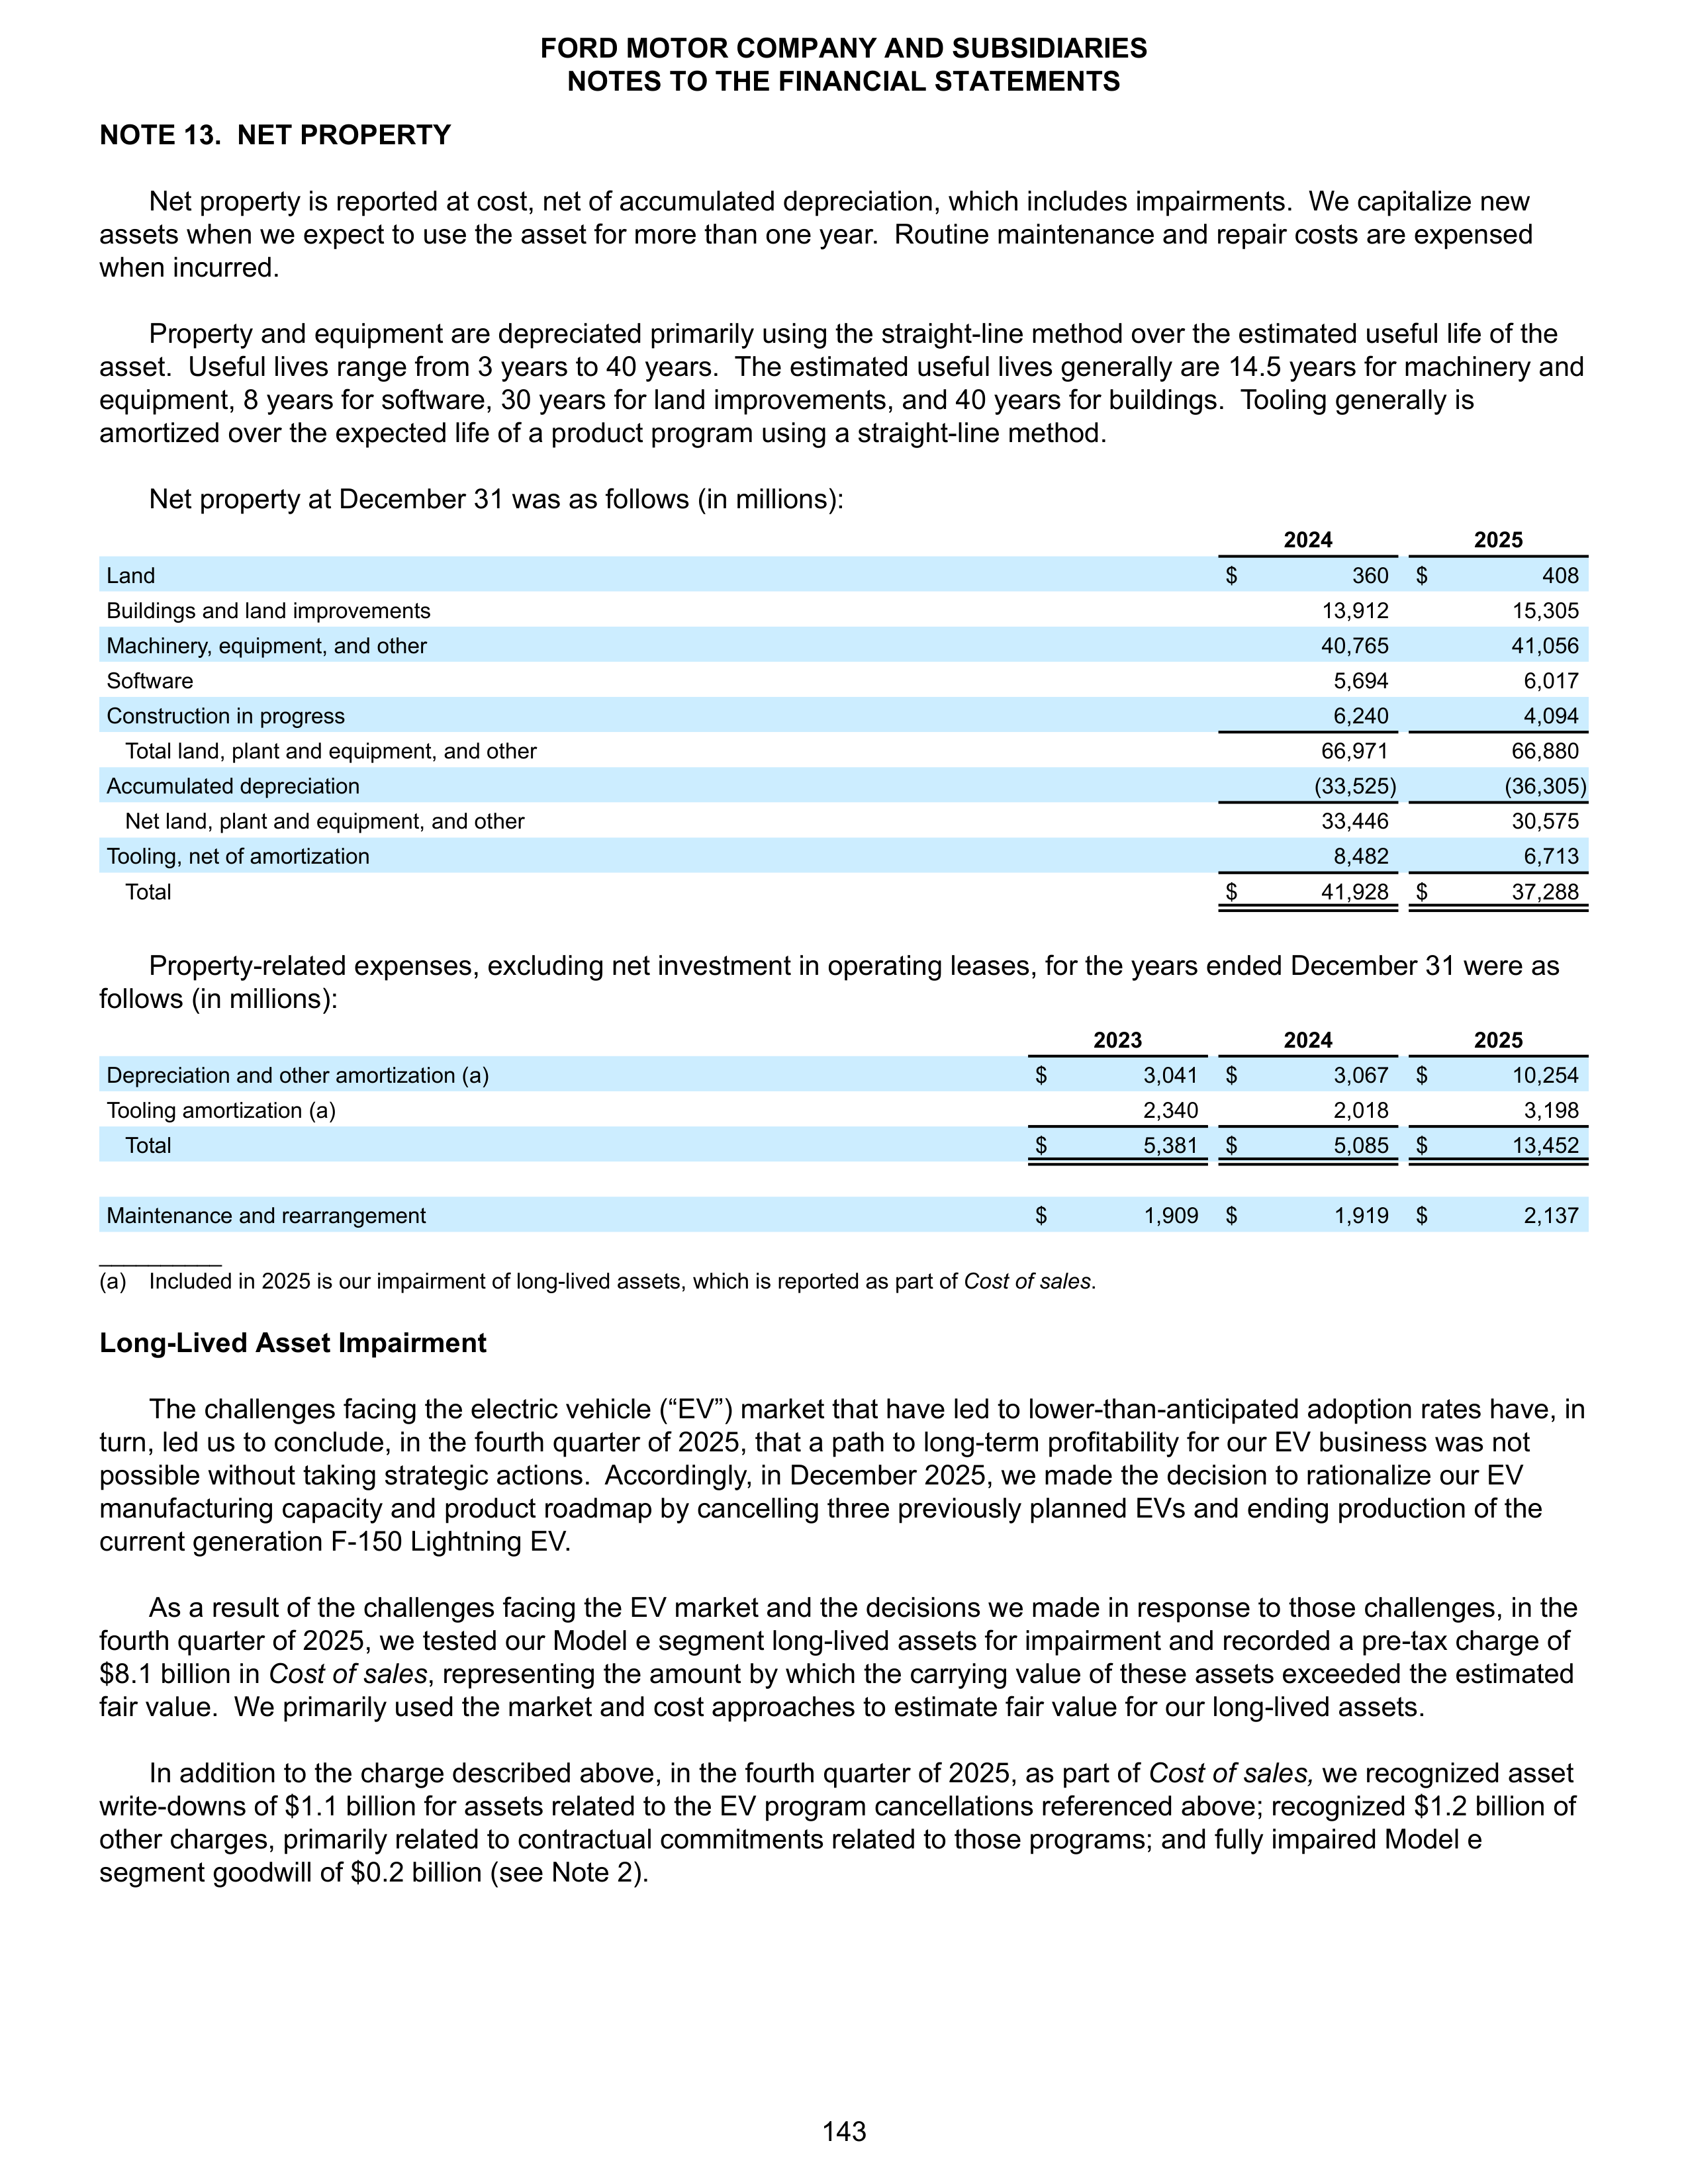
NOTE 13. NET PROPERTY
Net property is reported at cost, net of accumulated depreciation, which includes impairments. We capitalize new
assets when we expect to use the asset for more than one year. Routine maintenance and repair costs are expensed
when incurred.
Property and equipment are depreciated primarily using the straight-line method over the estimated useful life of the
asset. Useful lives range from 3 years to 40 years. The estimated useful lives generally are 14.5 years for machinery and
equipment, 8 years for software, 30 years for land improvements, and 40 years for buildings. Tooling generally is
amortized over the expected life of a product program using a straight-line method.
Net property at December 31 was as follows (in millions):
2024
2025
Land
$
360
$
408
Buildings and land improvements
13,912
15,305
Machinery, equipment, and other
40,765
41,056
Software
5,694
6,017
Construction in progress
6,240
4,094
Total land, plant and equipment, and other
66,971
66,880
Accumulated depreciation
(33,525)
(36,305)
Net land, plant and equipment, and other
33,446
30,575
Tooling, net of amortization
8,482
6,713
Total
$
41,928
$
37,288
Property-related expenses, excluding net investment in operating leases, for the years ended December 31 were as
follows (in millions):
2023
2024
2025
Depreciation and other amortization (a)
$
3,041
$
3,067
$
10,254
Tooling amortization (a)
2,340
2,018
3,198
Total
$
5,381
$
5,085
$
13,452
Maintenance and rearrangement
$
1,909
$
1,919
$
2,137
__________
(a)
Included in 2025 is our impairment of long-lived assets, which is reported as part of
Cost of sales
.
Long-Lived Asset Impairment
The challenges facing the electric vehicle (“EV”) market that have led to lower-than-anticipated adoption rates have, in
turn, led us to conclude, in the fourth quarter of 2025, that a path to long-term profitability for our EV business was not
possible without taking strategic actions. Accordingly, in December 2025, we made the decision to rationalize our EV
manufacturing capacity and product roadmap by cancelling three previously planned EVs and ending production of the
current generation F-150 Lightning EV.
As a result of the challenges facing the EV market and the decisions we made in response to those challenges, in the
fourth quarter of 2025, we tested our Model e segment long-lived assets for impairment and recorded a pre-tax charge of
$8.1 billion in
Cost of sales
, representing the amount by which the carrying value of these assets exceeded the estimated
fair value. We primarily used the market and cost approaches to estimate fair value for our long-lived assets.
In addition to the charge described above, in the fourth quarter of 2025, as part of
Cost of sales,
we recognized asset
write-downs of $1.1 billion for assets related to the EV program cancellations referenced above; recognized $1.2 billion of
other charges, primarily related to contractual commitments related to those programs; and fully impaired Model e
segment goodwill of $0.2 billion (see Note 2).
FORD MOTOR COMPANY AND SUBSIDIARIES
NOTES TO THE FINANCIAL STATEMENTS
143
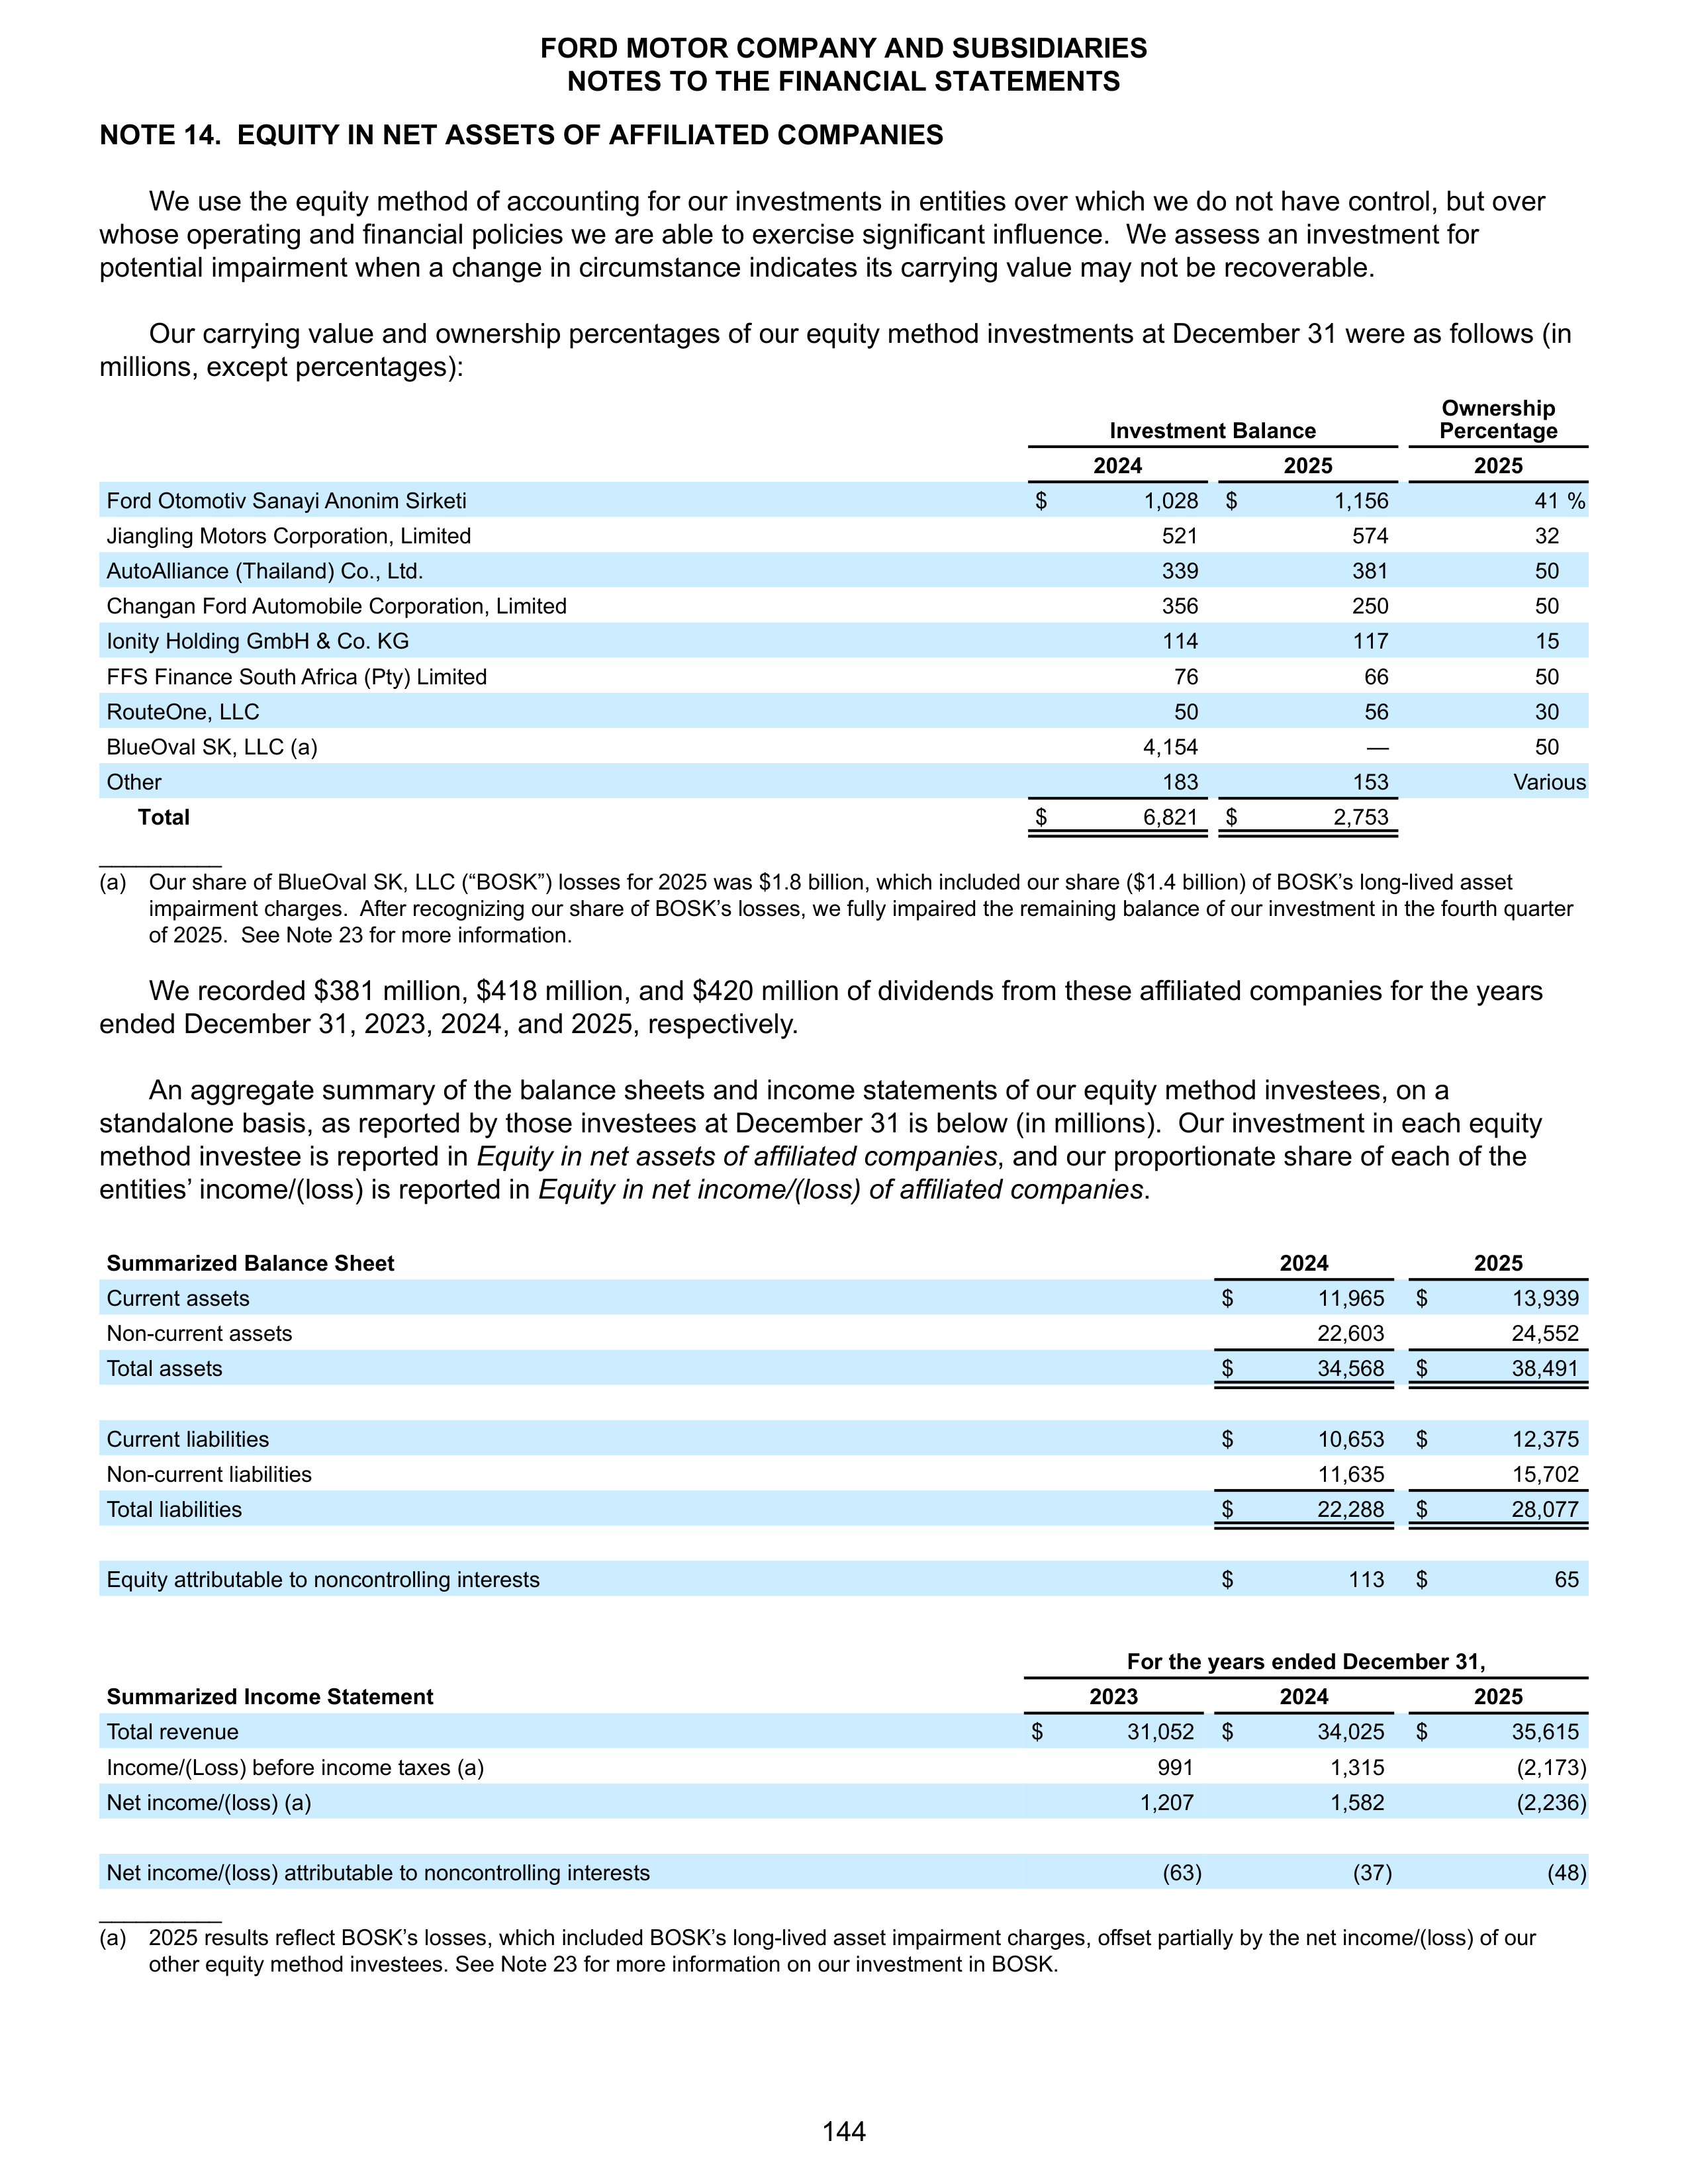
NOTE 14. EQUITY IN NET ASSETS OF AFFILIATED COMPANIES
We use the equity method of accounting for our investments in entities over which we do not have control, but over
whose operating and financial policies we are able to exercise significant influence. We assess an investment for
potential impairment when a change in circumstance indicates its carrying value may not be recoverable.
Our carrying value and ownership percentages of our equity method investments at December 31 were as follows (in
millions, except percentages):
Investment Balance
Ownership
Percentage
2024
2025
2025
Ford Otomotiv Sanayi Anonim Sirketi
$
1,028
$
1,156
41 %
Jiangling Motors Corporation, Limited
521
574
32
AutoAlliance (Thailand) Co., Ltd.
339
381
50
Changan Ford Automobile Corporation, Limited
356
250
50
Ionity Holding GmbH & Co. KG
114
117
15
FFS Finance South Africa (Pty) Limited
76
66
50
RouteOne, LLC
50
56
30
BlueOval SK, LLC (a)
4,154
—
50
Other
183
153
Various
Total
$
6,821
$
2,753
__________
(a)
Our share of BlueOval SK, LLC (“BOSK”) losses for 2025 was $1.8 billion, which included our share ($1.4 billion) of BOSK’s long-lived asset
impairment charges. After recognizing our share of BOSK’s losses, we fully impaired the remaining balance of our investment in the fourth quarter
of 2025. See Note 23 for more information.
We recorded $381 million, $418 million, and $420 million of dividends from these affiliated companies for the years
ended December 31, 2023, 2024, and 2025, respectively.
An aggregate summary of the balance sheets and income statements of our equity method investees, on a
standalone basis, as reported by those investees at December 31 is below (in millions). Our investment in each equity
method investee is reported in
Equity in net assets of affiliated companies
,
and our proportionate share of each of the
entities’ income/(loss) is reported in
Equity in net income/(loss) of affiliated companies
.
Summarized Balance Sheet
2024
2025
Current assets
$
11,965
$
13,939
Non-current assets
22,603
24,552
Total assets
$
34,568
$
38,491
Current liabilities
$
10,653
$
12,375
Non-current liabilities
11,635
15,702
Total liabilities
$
22,288
$
28,077
Equity attributable to noncontrolling interests
$
113
$
65
For the years ended December 31,
Summarized Income Statement
2023
2024
2025
Total revenue
$
31,052
$
34,025
$
35,615
Income/(Loss) before income taxes (a)
991
1,315
(2,173)
Net income/(loss) (a)
1,207
1,582
(2,236)
Net income/(loss) attributable to noncontrolling interests
(63)
(37)
(48)
__________
(a)
2025 results reflect BOSK’s losses, which included BOSK’s long-lived asset impairment charges, offset partially by the net income/(loss) of our
other equity method investees. See Note 23 for more information on our investment in BOSK.
FORD MOTOR COMPANY AND SUBSIDIARIES
NOTES TO THE FINANCIAL STATEMENTS
144
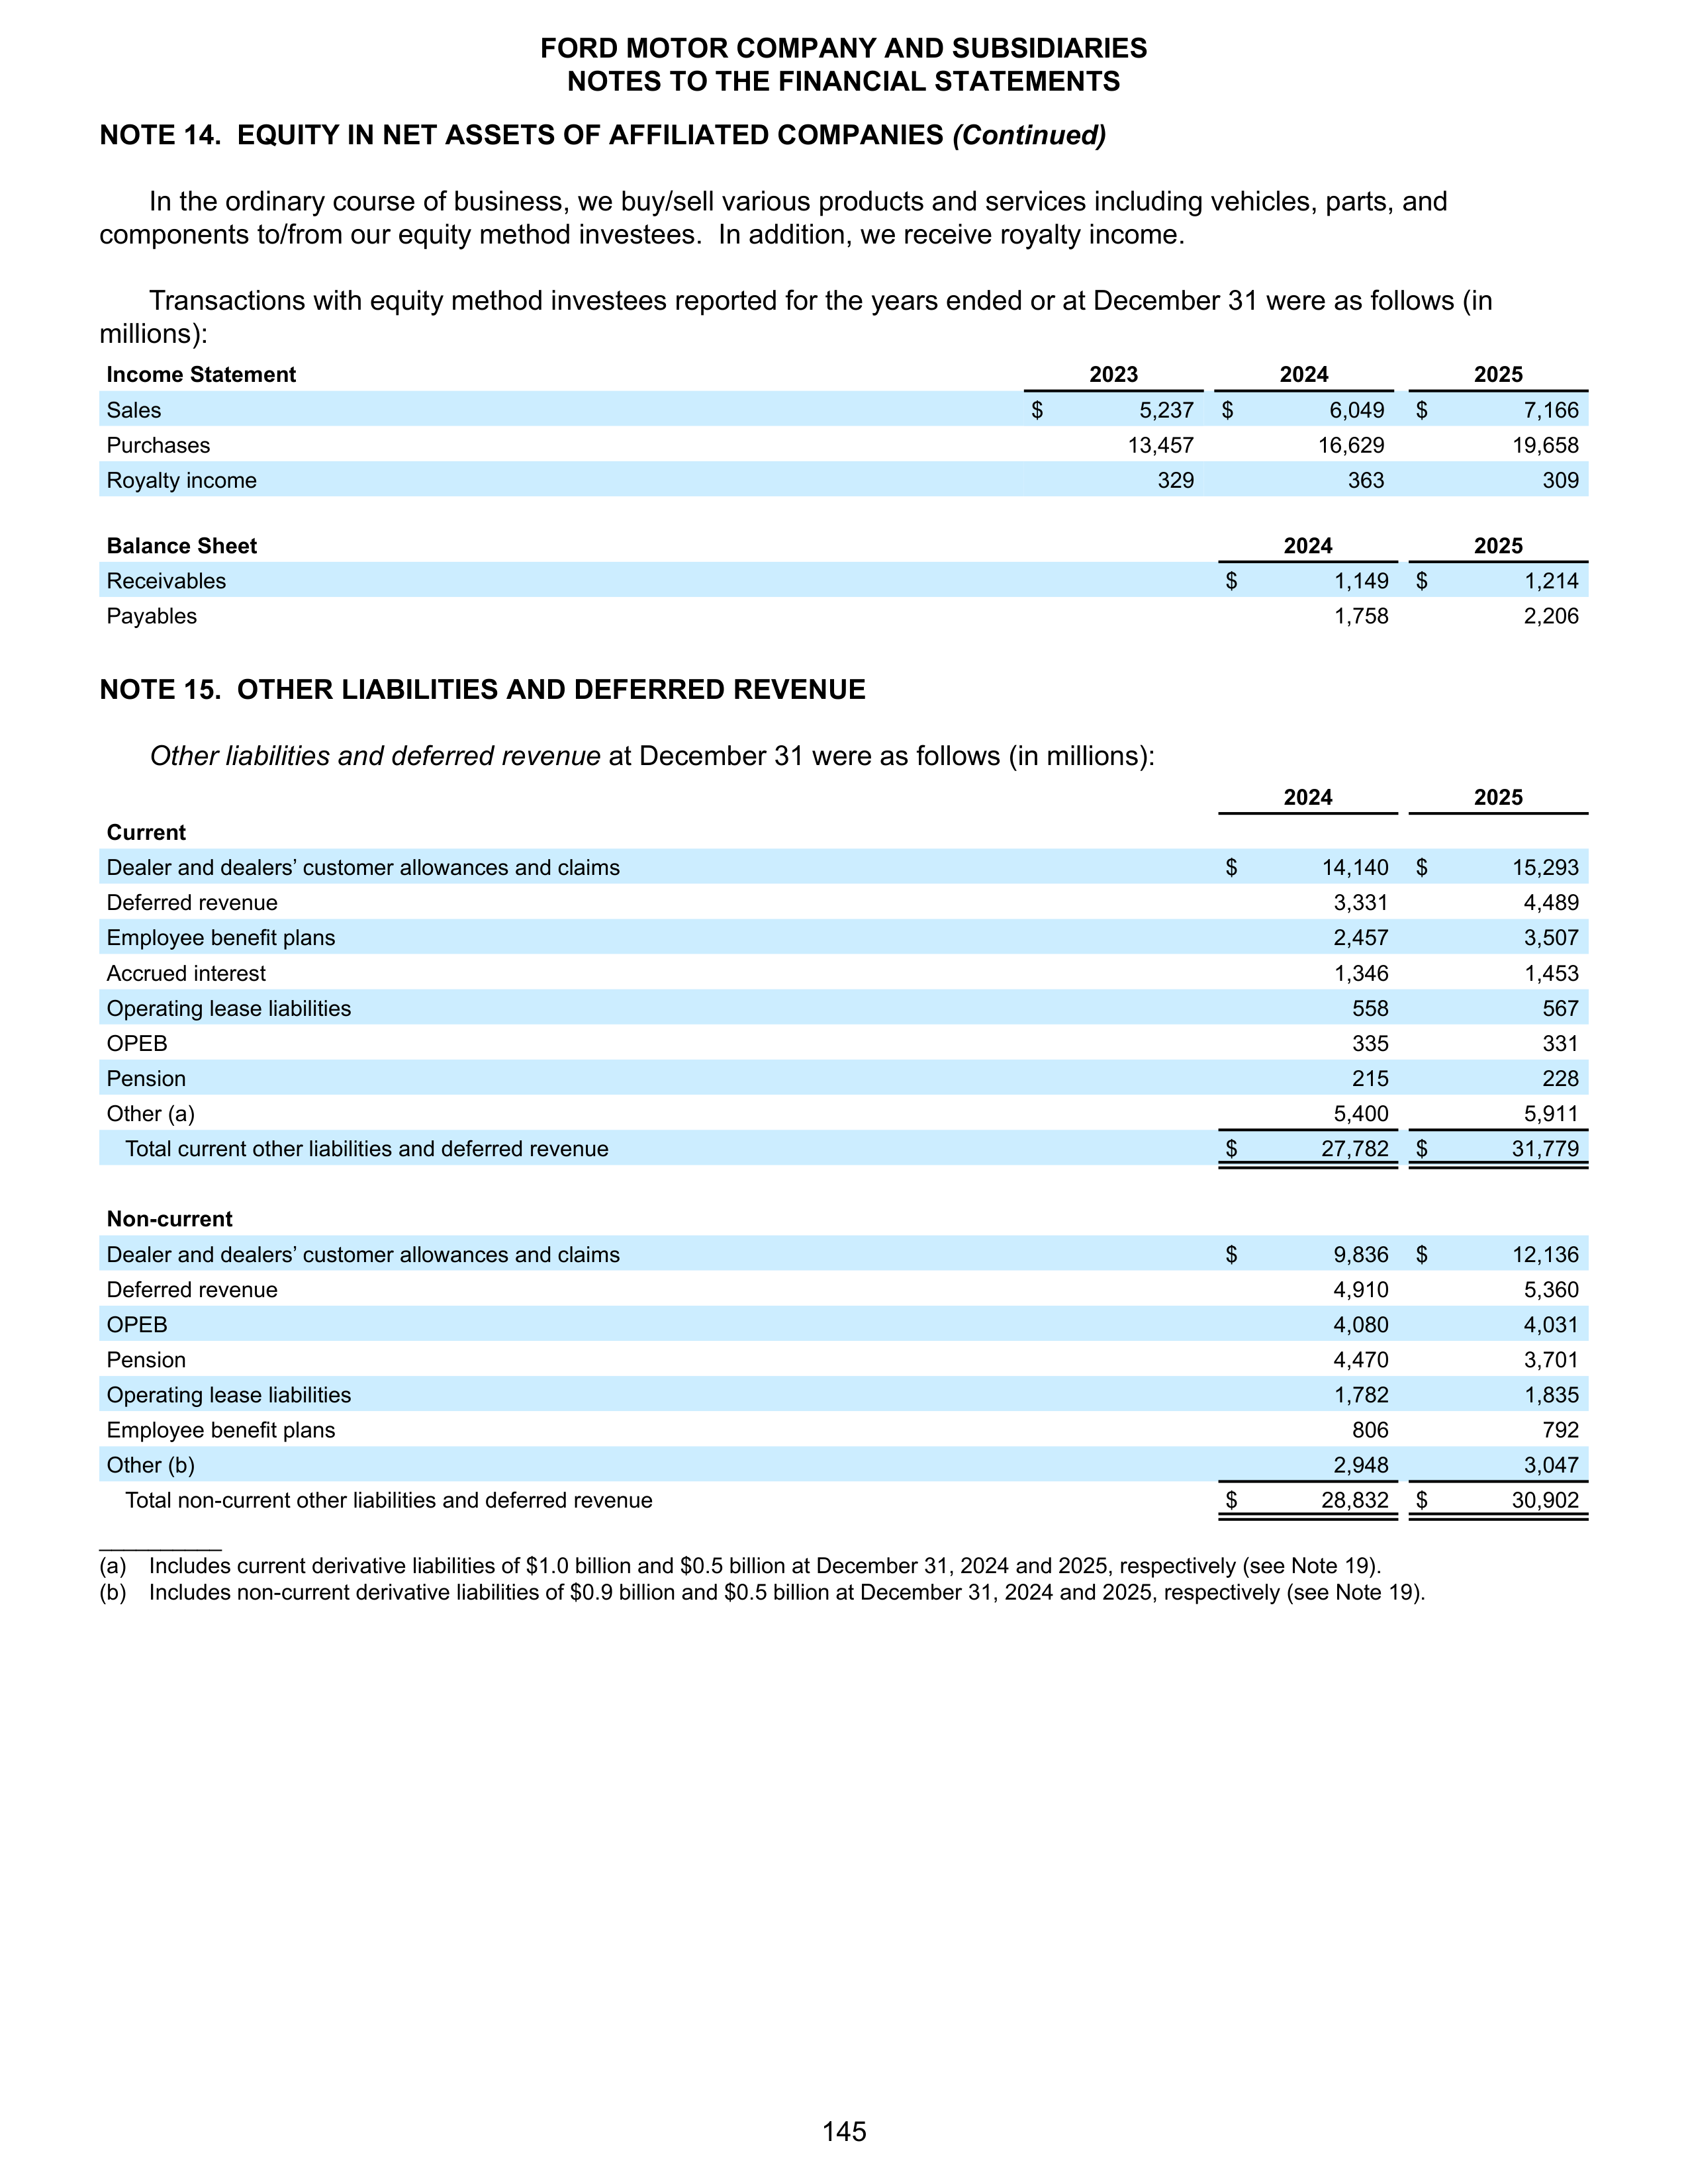
NOTE 14. EQUITY IN NET ASSETS OF AFFILIATED COMPANIES
(Continued)
In the ordinary course of business, we buy/sell various products and services including vehicles, parts, and
components to/from our equity method investees. In addition, we receive royalty income.
Transactions with equity method investees reported for the years ended or at December 31 were as follows (in
millions):
Income Statement
2023
2024
2025
Sales
$
5,237
$
6,049
$
7,166
Purchases
13,457
16,629
19,658
Royalty income
329
363
309
Balance Sheet
2024
2025
Receivables
$
1,149
$
1,214
Payables
1,758
2,206
NOTE 15. OTHER LIABILITIES AND DEFERRED REVENUE
Other liabilities and deferred revenue
at December 31 were as follows (in millions):
2024
2025
Current
Dealer and dealers’ customer allowances and claims
$
14,140
$
15,293
Deferred revenue
3,331
4,489
Employee benefit plans
2,457
3,507
Accrued interest
1,346
1,453
Operating lease liabilities
558
567
OPEB
335
331
Pension
215
228
Other (a)
5,400
5,911
Total current other liabilities and deferred revenue
$
27,782
$
31,779
Non-current
Dealer and dealers’ customer allowances and claims
$
9,836
$
12,136
Deferred revenue
4,910
5,360
OPEB
4,080
4,031
Pension
4,470
3,701
Operating lease liabilities
1,782
1,835
Employee benefit plans
806
792
Other (b)
2,948
3,047
Total non-current other liabilities and deferred revenue
$
28,832
$
30,902
__________
(a) Includes current derivative liabilities of $1.0 billion and $0.5 billion at December 31, 2024 and 2025, respectively (see Note 19).
(b) Includes non-current derivative liabilities of $0.9 billion and $0.5 billion at December 31, 2024 and 2025, respectively (see Note 19).
FORD MOTOR COMPANY AND SUBSIDIARIES
NOTES TO THE FINANCIAL STATEMENTS
145
NOTE 16. RETIREMENT BENEFITS
Defined benefit pension and OPEB plan obligations are remeasured at least annually as of December 31 based on
the present value of projected future benefit payments for all participants for services rendered to date. The measurement
of projected future benefits is dependent on the provisions of each specific plan, demographics of the group covered by
the plan, and other key measurement assumptions. For plans that provide benefits dependent on salary assumptions, we
include a projection of salary growth in our measurements. No assumption is made regarding any potential future
changes to benefit provisions beyond those to which we are presently committed (e.g., in existing labor contracts).
Net periodic benefit costs, including service cost, interest cost, and expected return on assets, are determined using
assumptions regarding the benefit obligation and the fair value of plan assets (where applicable) as of the beginning of
each year. We have elected to use the fair value of plan assets to calculate the expected return on assets in net periodic
benefit cost. The funded status of the benefit plans, which represents the difference between the benefit obligation and
fair value of plan assets, is calculated on a plan-by-plan basis. The benefit obligation and related funded status are
determined using assumptions as of the end of each year. Actuarial gains and losses resulting from plan remeasurement
are recognized in net periodic benefit cost in the period of the remeasurement. The impact of a retroactive plan
amendment is recorded in
Accumulated other comprehensive income/(loss)
and is amortized as a component of net
periodic cost, generally over the remaining service period of the active employees. The service cost component is
included in
Cost of sales
and
Selling, administrative, and other expenses
. Other components of net periodic benefit cost/
(income) are included in
Other income/(loss), net
on our consolidated income statements.
A curtailment results from an event that significantly reduces the expected years of future service or eliminates the
accrual of defined benefits for the future service of a significant number of employees. A curtailment gain is recorded
when the employees who are entitled to a benefit terminate their employment or when a plan suspension or amendment
that results in a curtailment gain is adopted. A curtailment loss is recorded when it becomes probable a curtailment loss
will occur. We recognize settlement expense when the costs associated with all settlements during the year exceed the
interest component of net periodic cost for the affected plan. Expense from curtailments and settlements is recorded in
Other income/(loss), net
.
Defined Benefit Pension Plans.
We have defined benefit pension plans covering hourly and salaried employees in the
United States, Canada, the United Kingdom, Germany, and other locations. The largest portion of our worldwide
obligation is associated with our U.S. plans. Virtually all of our worldwide defined benefit plans are closed to new
participants.
In general, our defined benefit pension plans are funded (i.e., have restricted assets from which benefits are paid).
Our unfunded defined benefit pension plans are treated on a “pay as you go” basis with benefit payments from Company
cash. These unfunded plans primarily include certain plans in Germany and the U.S. defined benefit plans for senior
management.
OPEB
. We have defined benefit OPEB plans, primarily certain health care and life insurance benefits, covering hourly
and salaried employees in the United States, Canada, and other locations. The largest portion of our worldwide obligation
is associated with our U.S. plans. Our OPEB plans are unfunded and the benefits are paid from Company cash.
Defined Contribution and Savings Plans
. We also have defined contribution and savings plans for hourly and salaried
employees in the United States and other locations. Company contributions to these plans are made from Company cash
and are expensed as incurred. The expense for our worldwide defined contribution and savings plans was $546 million,
$699 million, and $761 million for the years ended December 31, 2023, 2024, and 2025, respectively. This includes the
expense for Company-matching contributions to our primary employee savings plan in the United States of $155 million,
$177 million, and $184 million for the years ended December 31, 2023, 2024, and 2025, respectively.
FORD MOTOR COMPANY AND SUBSIDIARIES
NOTES TO THE FINANCIAL STATEMENTS
146
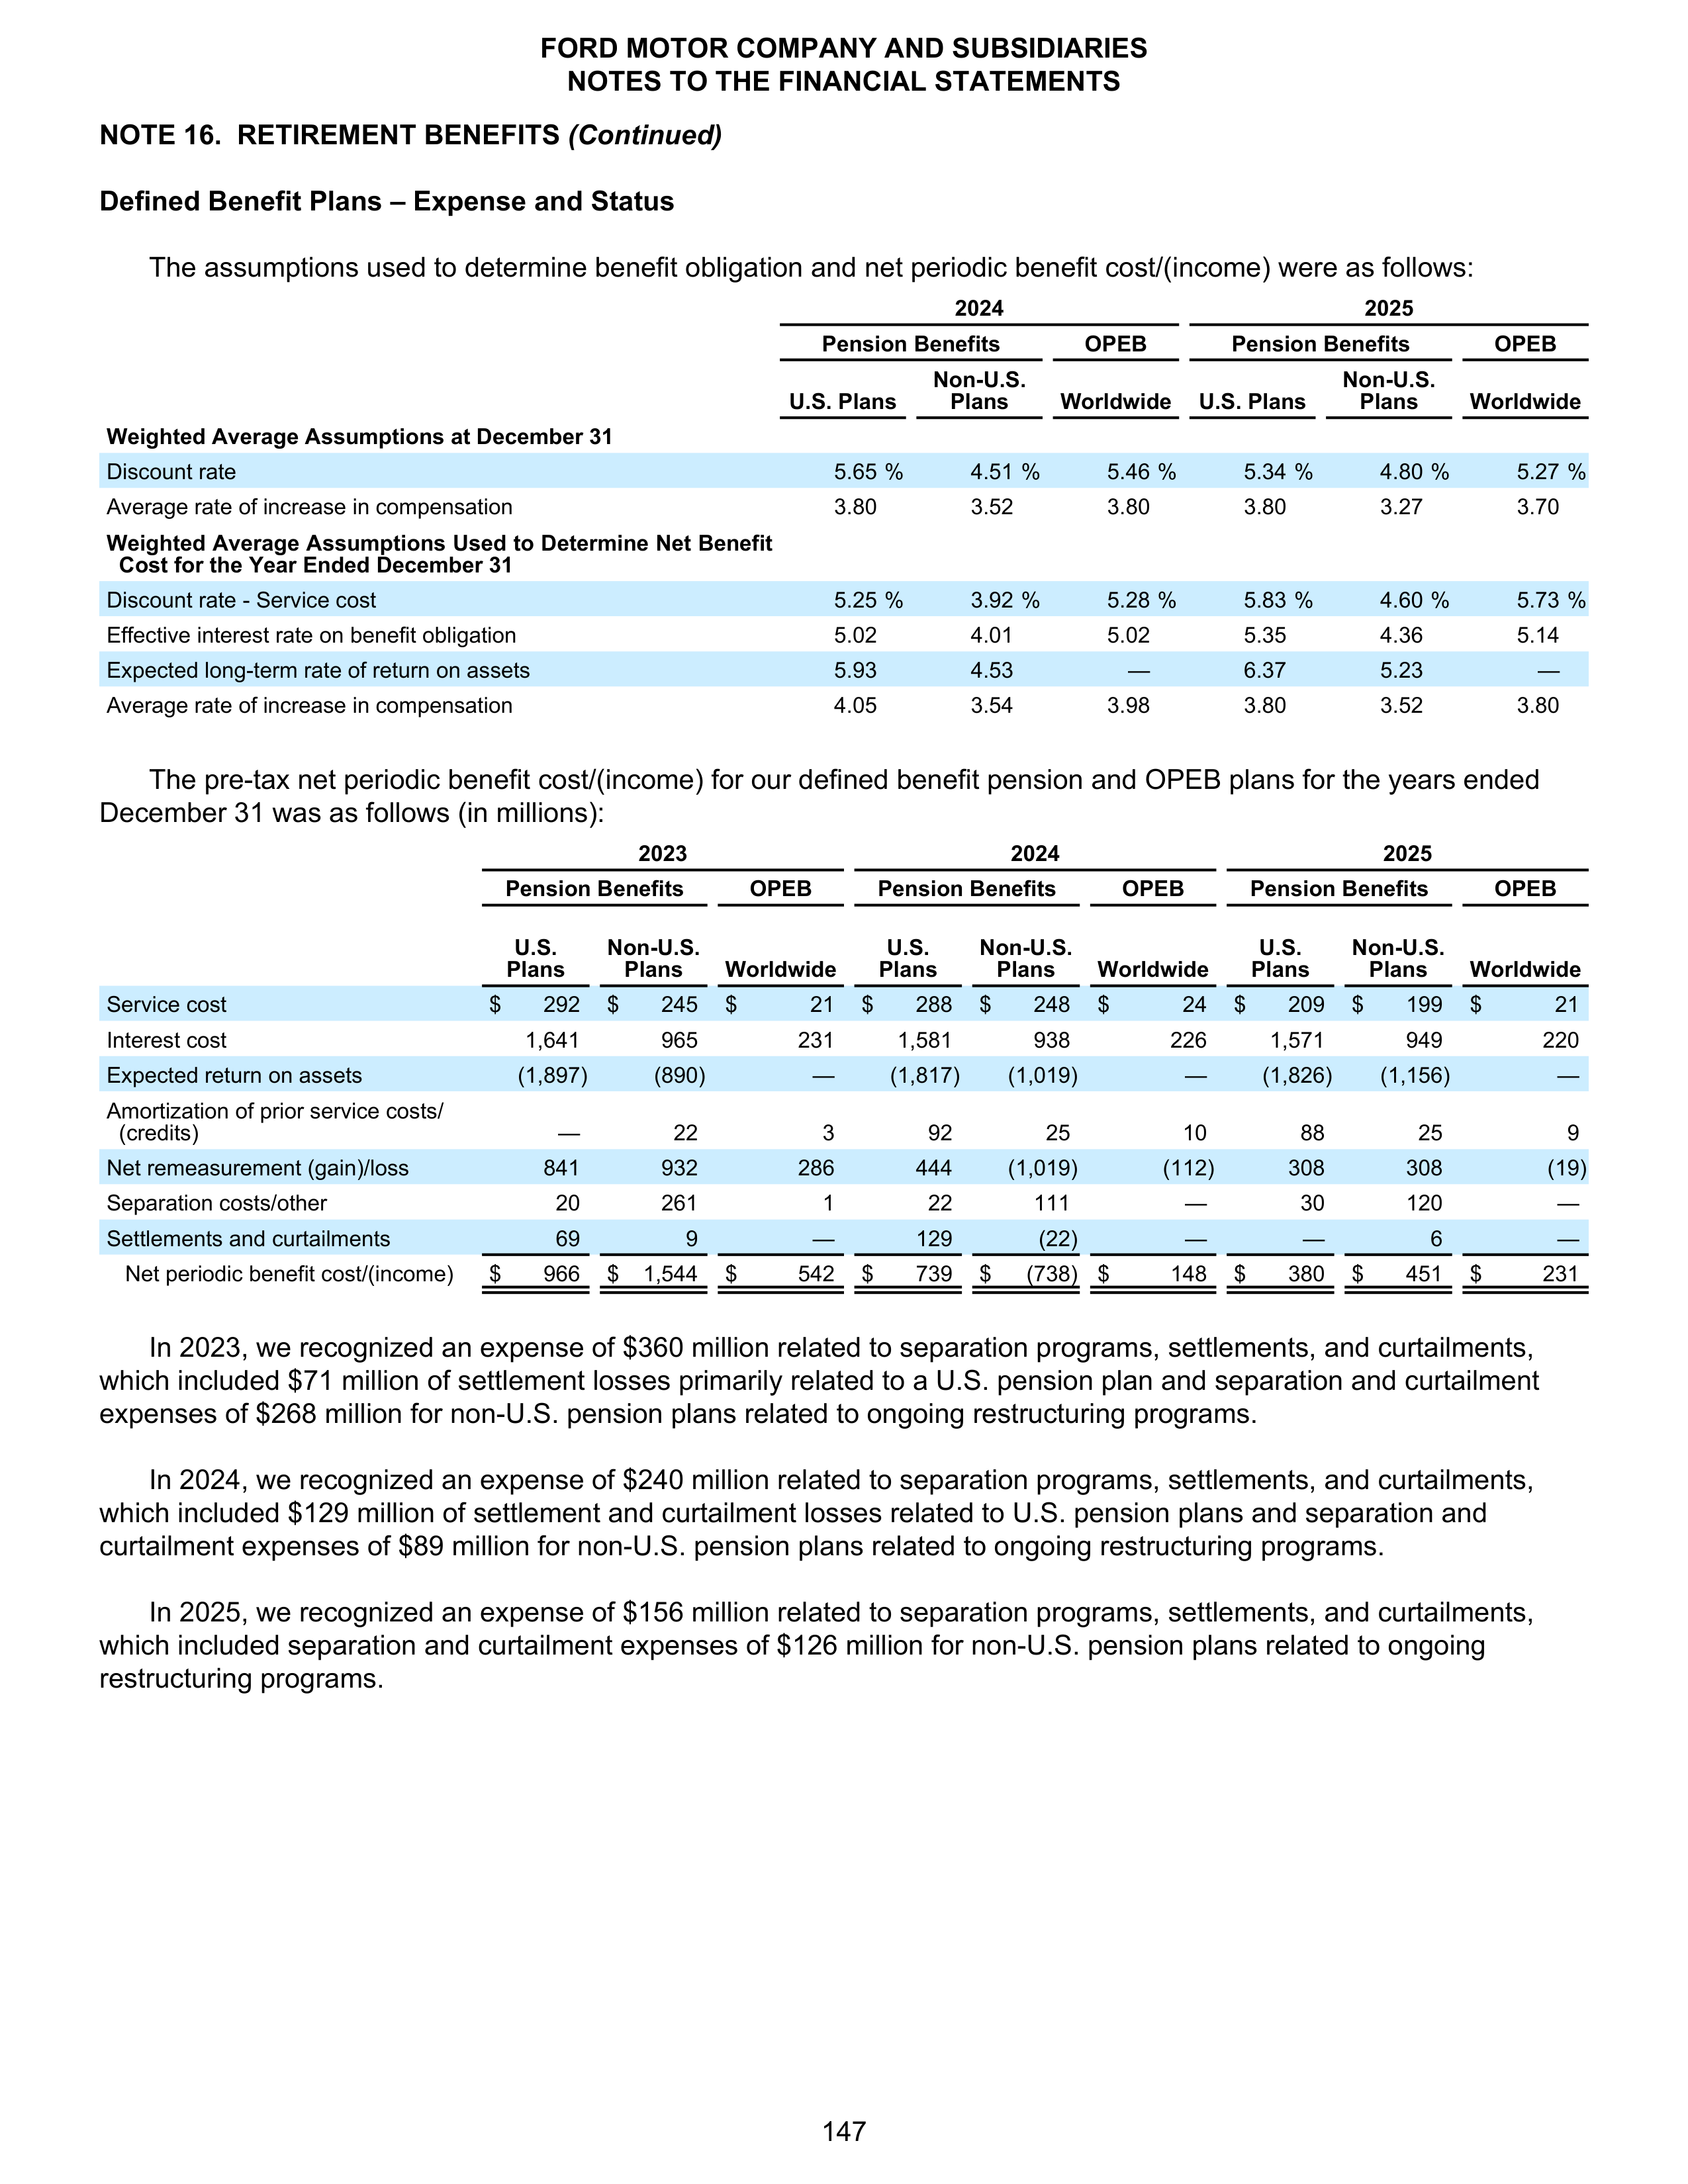
NOTE 16. RETIREMENT BENEFITS
(Continued)
Defined Benefit Plans – Expense and Status
The assumptions used to determine benefit obligation and net periodic benefit cost/(income) were as follows:
2024
2025
Pension Benefits
OPEB
Pension Benefits
OPEB
U.S. Plans
Non-U.S.
Plans
Worldwide
U.S. Plans
Non-U.S.
Plans
Worldwide
Weighted Average Assumptions at December 31
Discount rate
5.65 %
4.51 %
5.46 %
5.34 %
4.80 %
5.27 %
Average rate of increase in compensation
3.80
3.52
3.80
3.80
3.27
3.70
Weighted Average Assumptions Used to Determine Net Benefit
Cost for the Year Ended December 31
Discount rate - Service cost
5.25 %
3.92 %
5.28 %
5.83 %
4.60 %
5.73 %
Effective interest rate on benefit obligation
5.02
4.01
5.02
5.35
4.36
5.14
Expected long-term rate of return on assets
5.93
4.53
—
6.37
5.23
—
Average rate of increase in compensation
4.05
3.54
3.98
3.80
3.52
3.80
The pre-tax net periodic benefit cost/(income) for our defined benefit pension and OPEB plans for the years ended
December 31 was as follows (in millions):
2023
2024
2025
Pension Benefits
OPEB
Pension Benefits
OPEB
Pension Benefits
OPEB
U.S.
Plans
Non-U.S.
Plans
Worldwide
U.S.
Plans
Non-U.S.
Plans
Worldwide
U.S.
Plans
Non-U.S.
Plans
Worldwide
Service cost
$
292
$
245
$
21
$
288
$
248
$
24
$
209
$
199
$
21
Interest cost
1,641
965
231
1,581
938
226
1,571
949
220
Expected return on assets
(1,897)
(890)
—
(1,817)
(1,019)
—
(1,826)
(1,156)
—
Amortization of prior service costs/
(credits)
—
22
3
92
25
10
88
25
9
Net remeasurement (gain)/loss
841
932
286
444
(1,019)
(112)
308
308
(19)
Separation costs/other
20
261
1
22
111
—
30
120
—
Settlements and curtailments
69
9
—
129
(22)
—
—
6
—
Net periodic benefit cost/(income)
$
966
$ 1,544
$
542
$
739
$
(738) $
148
$
380
$
451
$
231
In 2023, we recognized an expense of $360 million related to separation programs, settlements, and curtailments,
which included $71 million of settlement losses primarily related to a U.S. pension plan and separation and curtailment
expenses of $268 million for non-U.S. pension plans related to ongoing restructuring programs.
In 2024, we recognized an expense of $240 million related to separation programs, settlements, and curtailments,
which included $129 million of settlement and curtailment losses related to U.S. pension plans and separation and
curtailment expenses of $89 million for non-U.S. pension plans related to ongoing restructuring programs.
In 2025, we recognized an expense of $156 million related to separation programs, settlements, and curtailments,
which included separation and curtailment expenses of $126 million for non-U.S. pension plans related to ongoing
restructuring programs.
FORD MOTOR COMPANY AND SUBSIDIARIES
NOTES TO THE FINANCIAL STATEMENTS
147
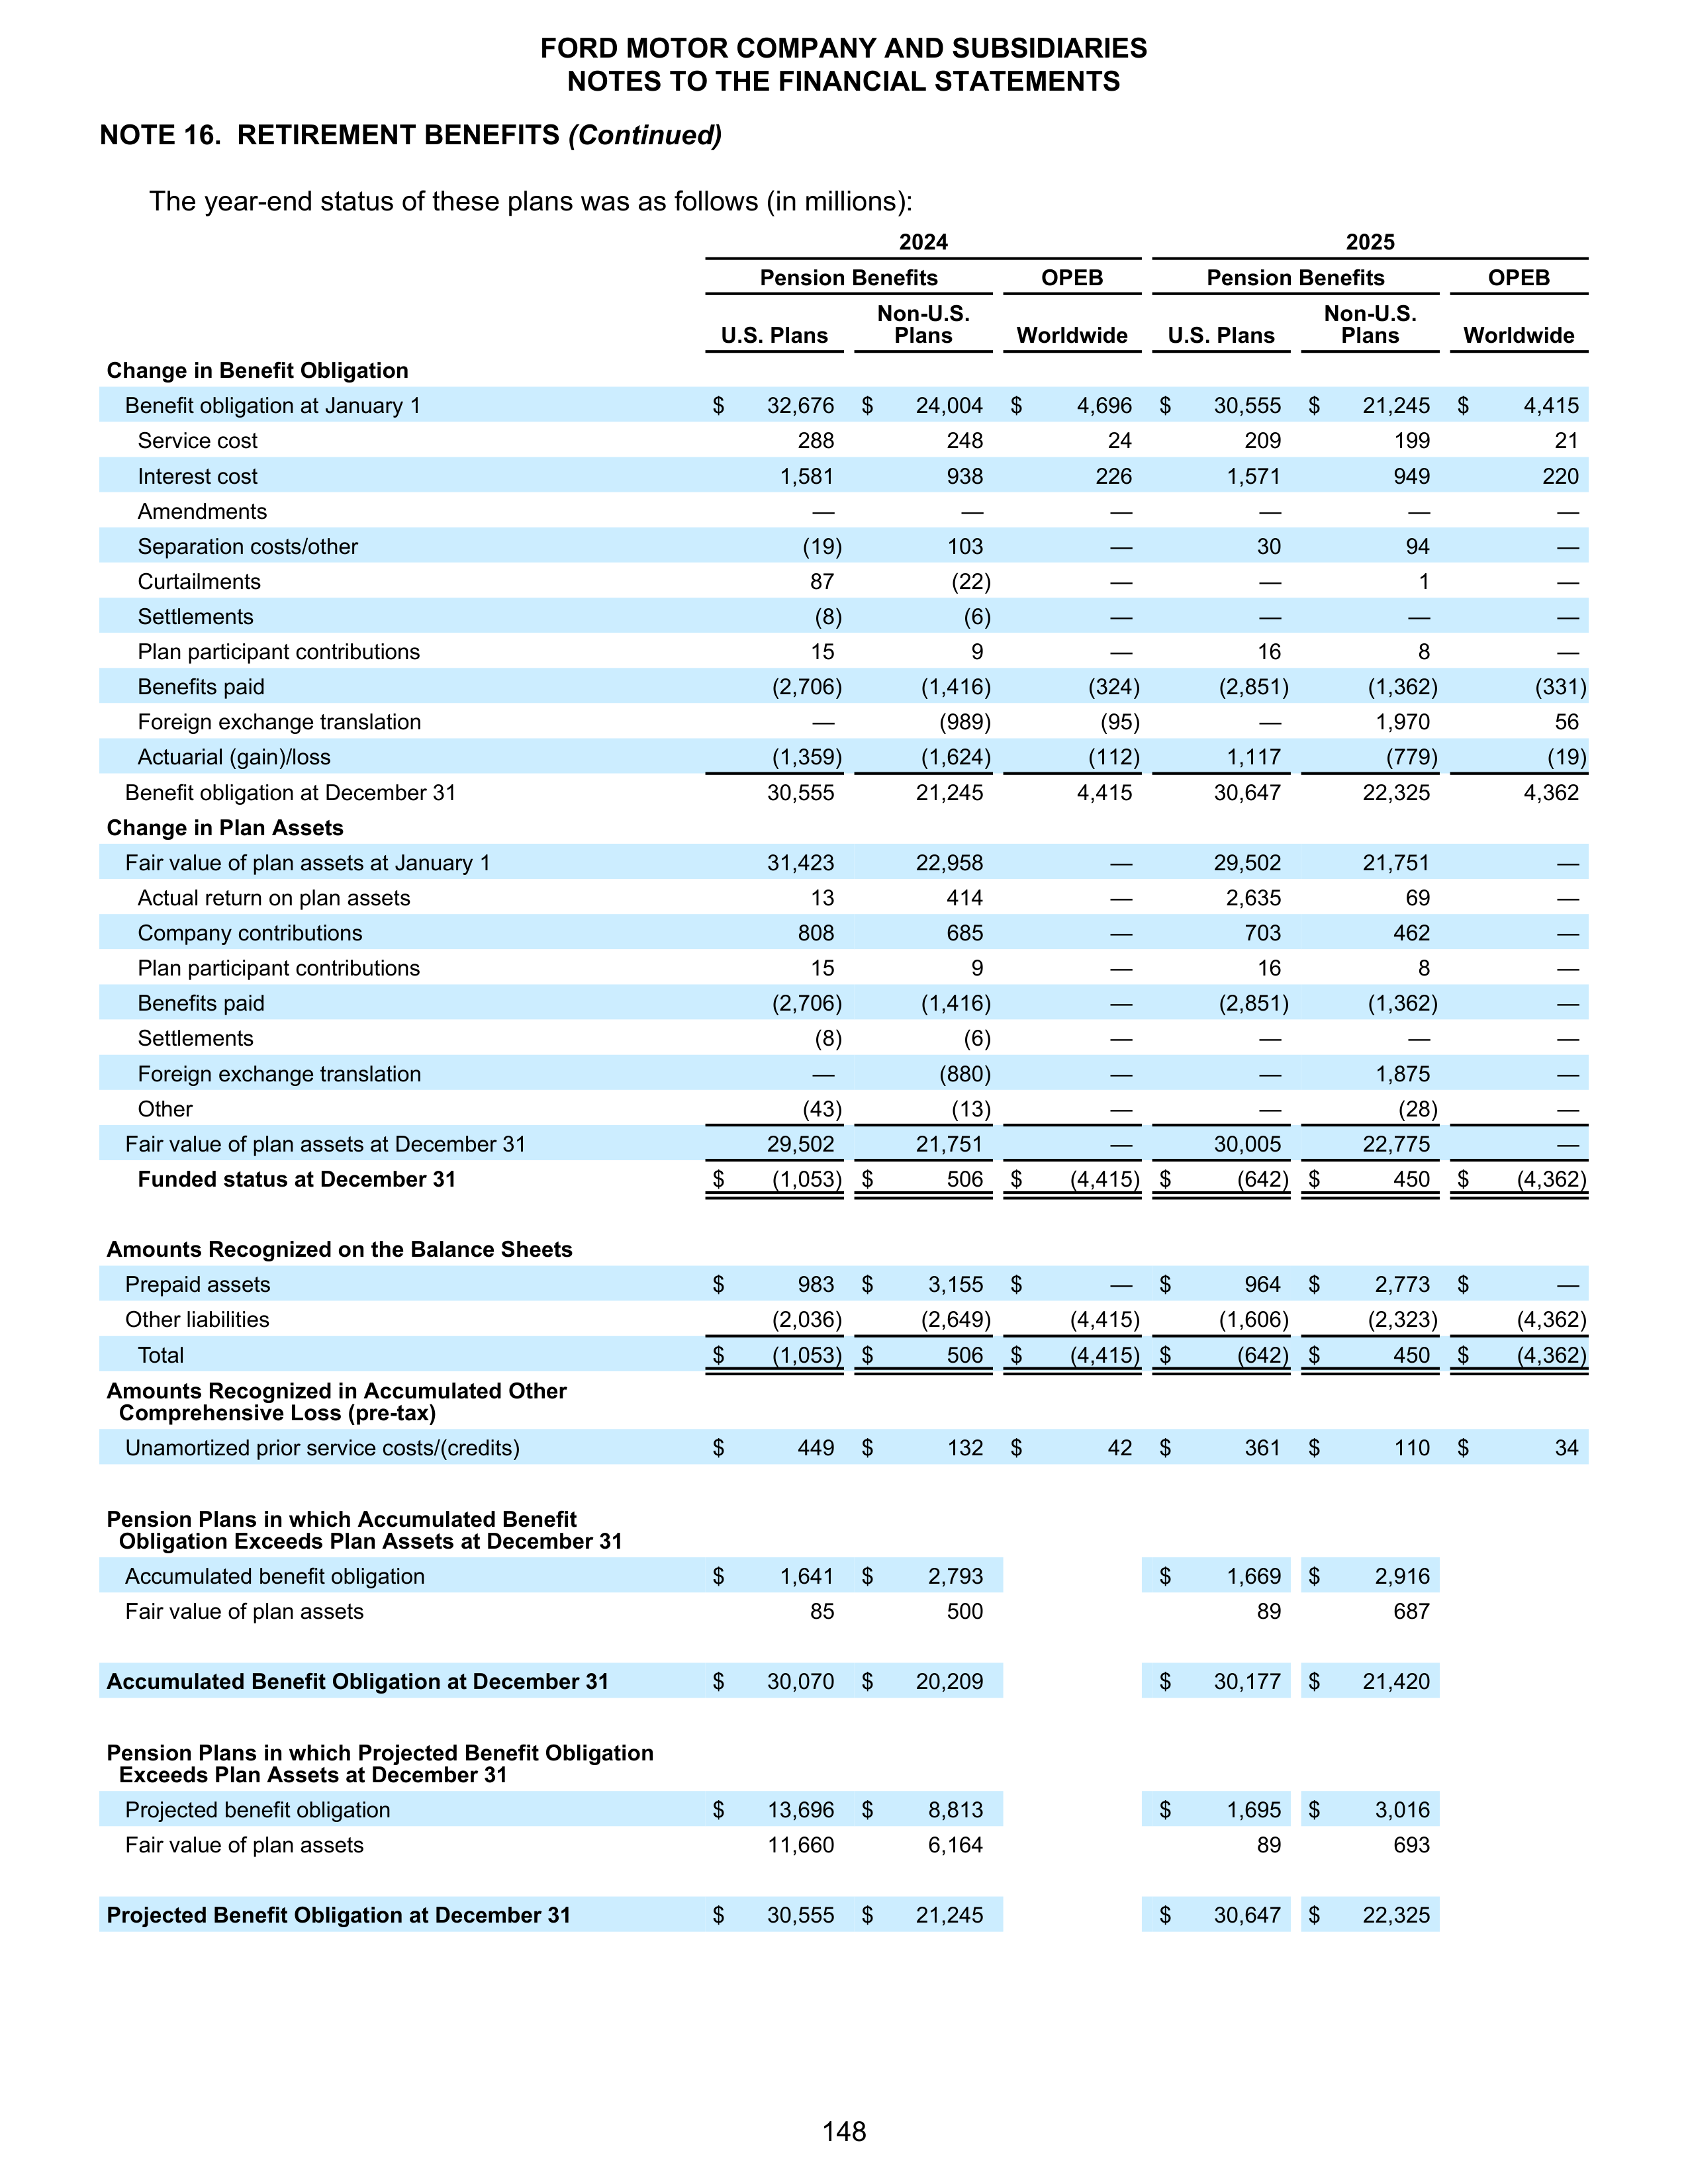
NOTE 16. RETIREMENT BENEFITS
(Continued)
The year-end status of these plans was as follows (in millions):
2024
2025
Pension Benefits
OPEB
Pension Benefits
OPEB
U.S. Plans
Non-U.S.
Plans
Worldwide
U.S. Plans
Non-U.S.
Plans
Worldwide
Change in Benefit Obligation
Benefit obligation at January 1
$
32,676
$
24,004
$
4,696
$
30,555
$
21,245
$
4,415
Service cost
288
248
24
209
199
21
Interest cost
1,581
938
226
1,571
949
220
Amendments
—
—
—
—
—
—
Separation costs/other
(19)
103
—
30
94
—
Curtailments
87
(22)
—
—
1
—
Settlements
(8)
(6)
—
—
—
—
Plan participant contributions
15
9
—
16
8
—
Benefits paid
(2,706)
(1,416)
(324)
(2,851)
(1,362)
(331)
Foreign exchange translation
—
(989)
(95)
—
1,970
56
Actuarial (gain)/loss
(1,359)
(1,624)
(112)
1,117
(779)
(19)
Benefit obligation at December 31
30,555
21,245
4,415
30,647
22,325
4,362
Change in Plan Assets
Fair value of plan assets at January 1
31,423
22,958
—
29,502
21,751
—
Actual return on plan assets
13
414
—
2,635
69
—
Company contributions
808
685
—
703
462
—
Plan participant contributions
15
9
—
16
8
—
Benefits paid
(2,706)
(1,416)
—
(2,851)
(1,362)
—
Settlements
(8)
(6)
—
—
—
—
Foreign exchange translation
—
(880)
—
—
1,875
—
Other
(43)
(13)
—
—
(28)
—
Fair value of plan assets at December 31
29,502
21,751
—
30,005
22,775
—
Funded status at December 31
$
(1,053) $
506
$
(4,415) $
(642) $
450
$
(4,362)
Amounts Recognized on the Balance Sheets
Prepaid assets
$
983
$
3,155
$
—
$
964
$
2,773
$
—
Other liabilities
(2,036)
(2,649)
(4,415)
(1,606)
(2,323)
(4,362)
Total
$
(1,053) $
506
$
(4,415) $
(642) $
450
$
(4,362)
Amounts Recognized in Accumulated Other
Comprehensive Loss (pre-tax)
Unamortized prior service costs/(credits)
$
449
$
132
$
42
$
361
$
110
$
34
Pension Plans in which Accumulated Benefit
Obligation Exceeds Plan Assets at December 31
Accumulated benefit obligation
$
1,641
$
2,793
$
1,669
$
2,916
Fair value of plan assets
85
500
89
687
Accumulated Benefit Obligation at December 31
$
30,070
$
20,209
$
30,177
$
21,420
Pension Plans in which Projected Benefit Obligation
Exceeds Plan Assets at December 31
Projected benefit obligation
$
13,696
$
8,813
$
1,695
$
3,016
Fair value of plan assets
11,660
6,164
89
693
Projected Benefit Obligation at December 31
$
30,555
$
21,245
$
30,647
$
22,325
FORD MOTOR COMPANY AND SUBSIDIARIES
NOTES TO THE FINANCIAL STATEMENTS
148
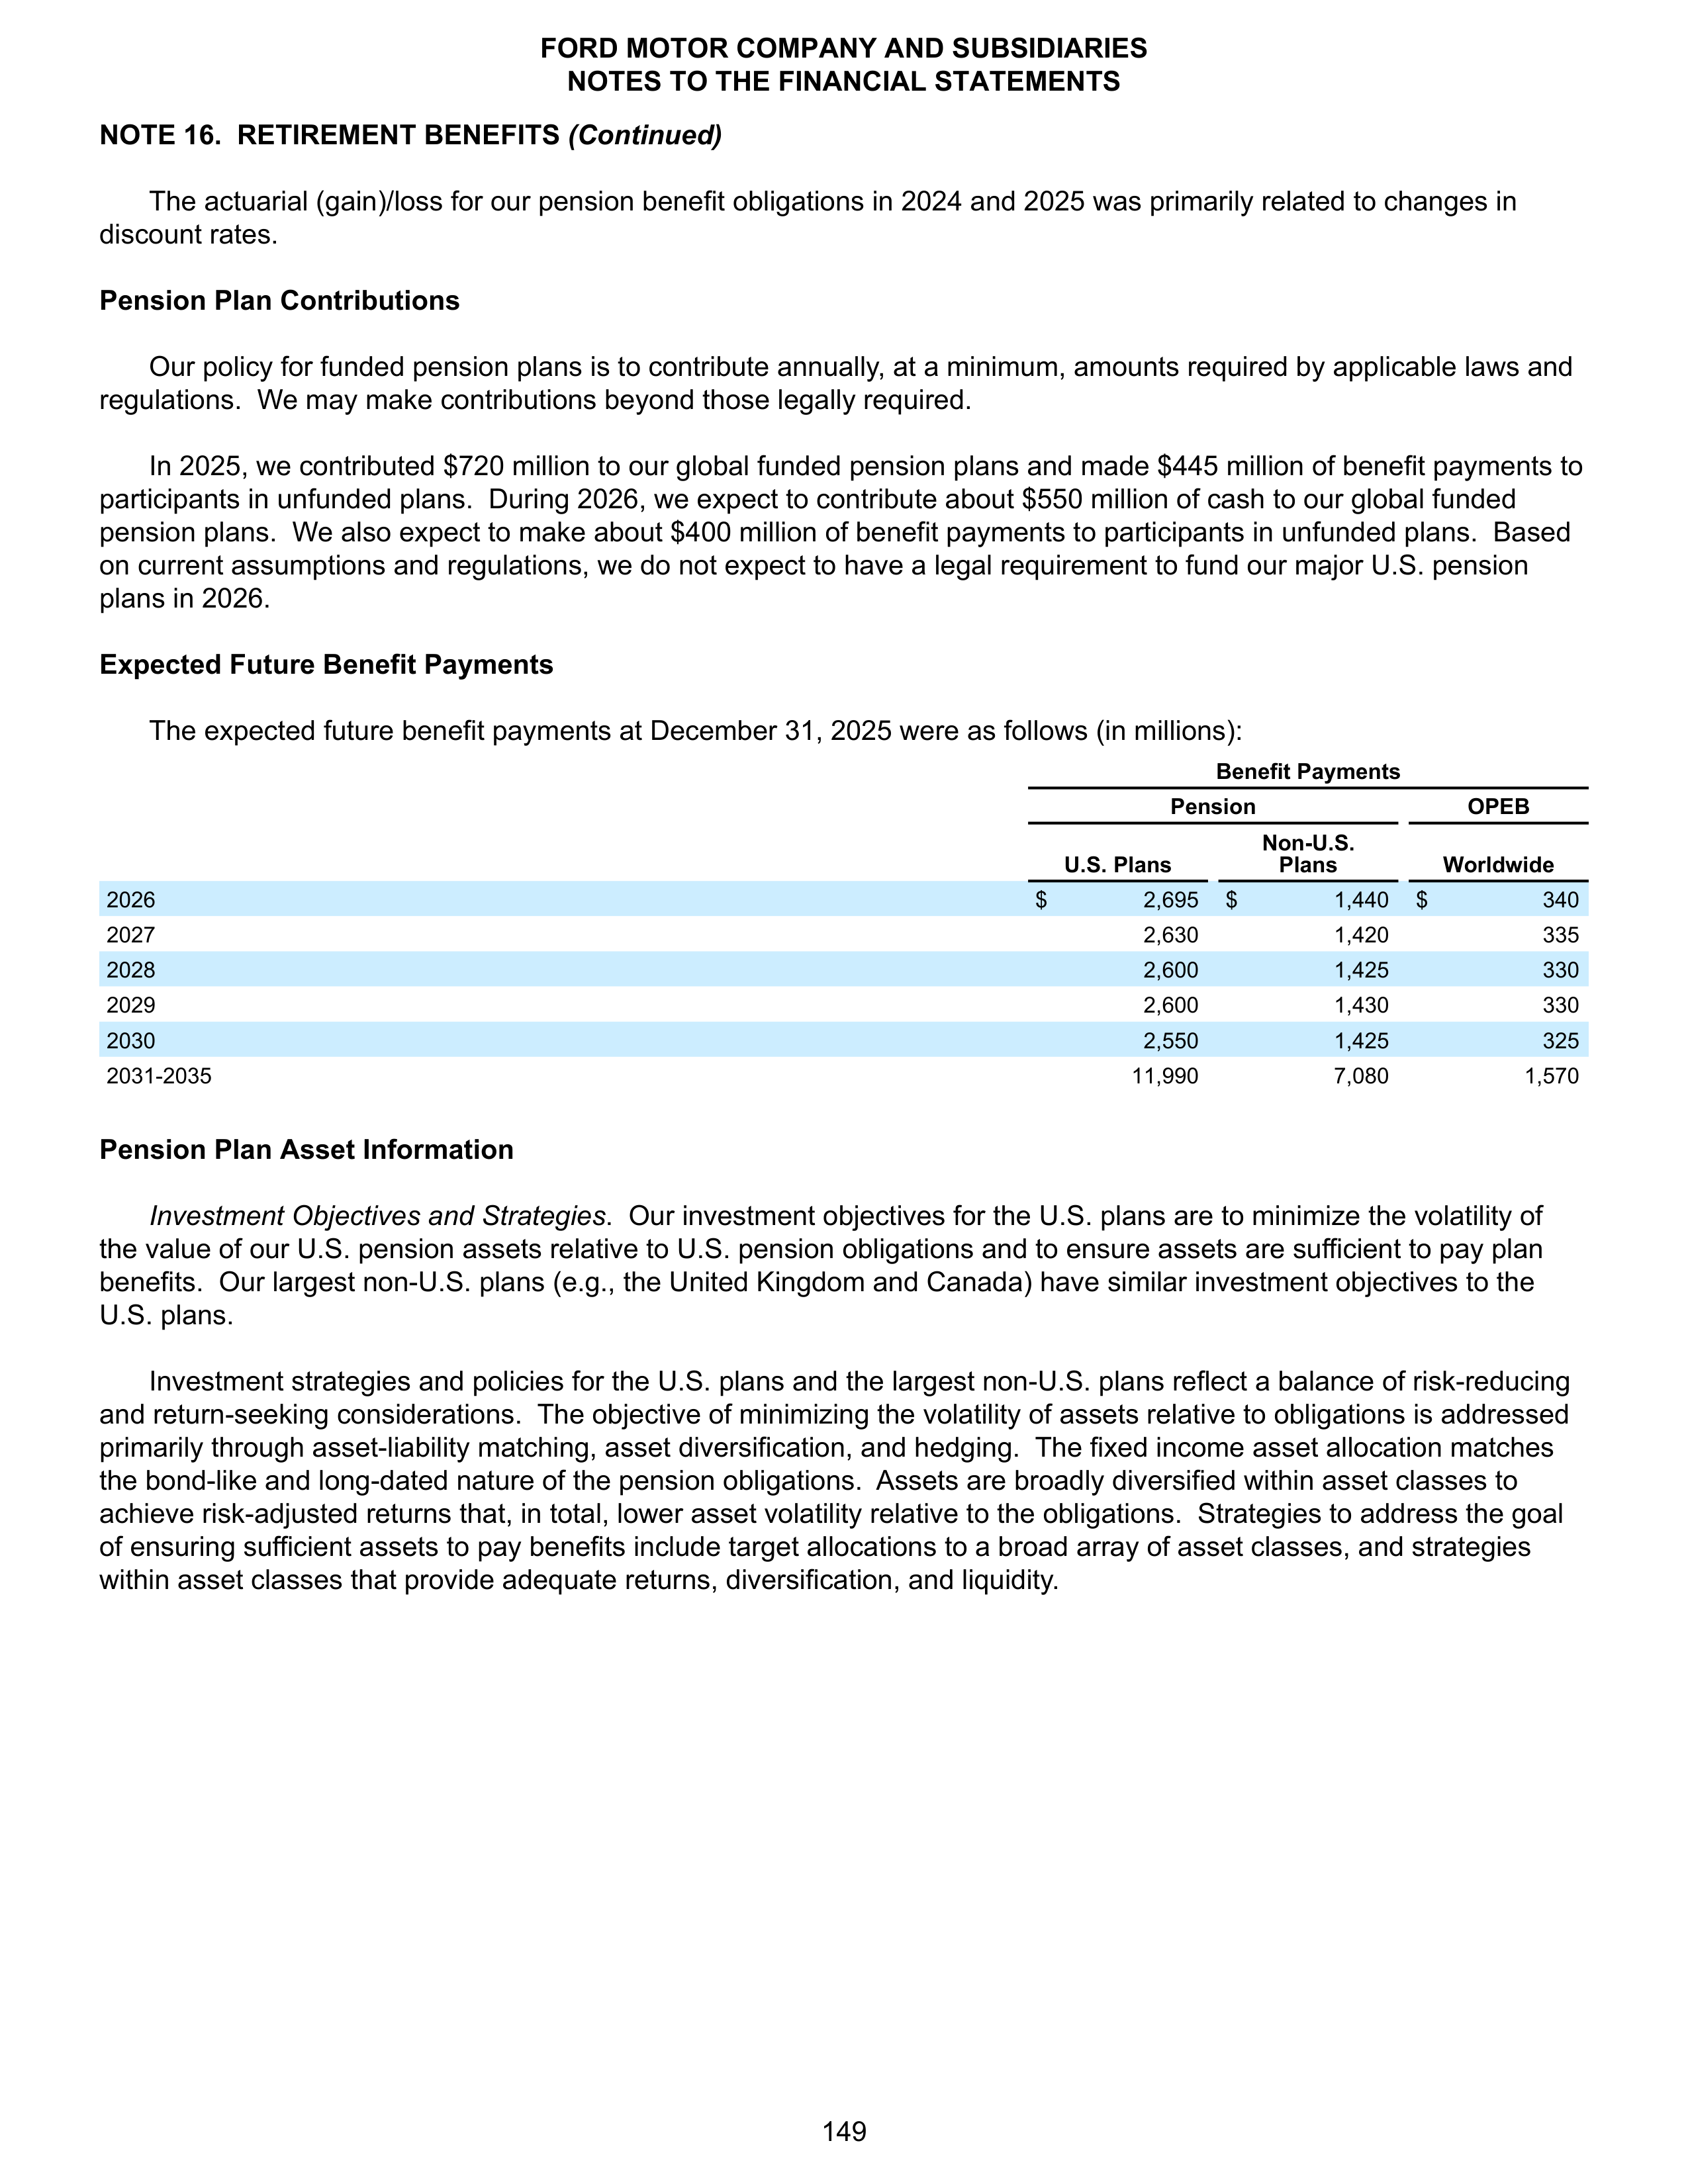
NOTE 16. RETIREMENT BENEFITS
(Continued)
The actuarial (gain)/loss for our pension benefit obligations in 2024 and 2025 was primarily related to changes in
discount rates.
Pension Plan Contributions
Our policy for funded pension plans is to contribute annually, at a minimum, amounts required by applicable laws and
regulations. We may make contributions beyond those legally required.
In 2025, we contributed $720 million to our global funded pension plans and made $445 million of benefit payments to
participants in unfunded plans. During 2026, we expect to contribute about $550 million of cash to our global funded
pension plans. We also expect to make about $400 million of benefit payments to participants in unfunded plans. Based
on current assumptions and regulations, we do not expect to have a legal requirement to fund our major U.S. pension
plans in 2026.
Expected Future Benefit Payments
The expected future benefit payments at December 31, 2025 were as follows (in millions):
Benefit Payments
Pension
OPEB
U.S. Plans
Non-U.S.
Plans
Worldwide
2026
$
2,695
$
1,440
$
340
2027
2,630
1,420
335
2028
2,600
1,425
330
2029
2,600
1,430
330
2030
2,550
1,425
325
2031-2035
11,990
7,080
1,570
Pension Plan Asset Information
Investment Objectives and Strategies
. Our investment objectives for the U.S. plans are to minimize the volatility of
the value of our U.S. pension assets relative to U.S. pension obligations and to ensure assets are sufficient to pay plan
benefits. Our largest non-U.S. plans (e.g., the United Kingdom and Canada) have similar investment objectives to the
U.S. plans.
Investment strategies and policies for the U.S. plans and the largest non-U.S. plans reflect a balance of risk-reducing
and return-seeking considerations. The objective of minimizing the volatility of assets relative to obligations is addressed
primarily through asset-liability matching, asset diversification, and hedging. The fixed income asset allocation matches
the bond-like and long-dated nature of the pension obligations. Assets are broadly diversified within asset classes to
achieve risk-adjusted returns that, in total, lower asset volatility relative to the obligations. Strategies to address the goal
of ensuring sufficient assets to pay benefits include target allocations to a broad array of asset classes, and strategies
within asset classes that provide adequate returns, diversification, and liquidity.
FORD MOTOR COMPANY AND SUBSIDIARIES
NOTES TO THE FINANCIAL STATEMENTS
149
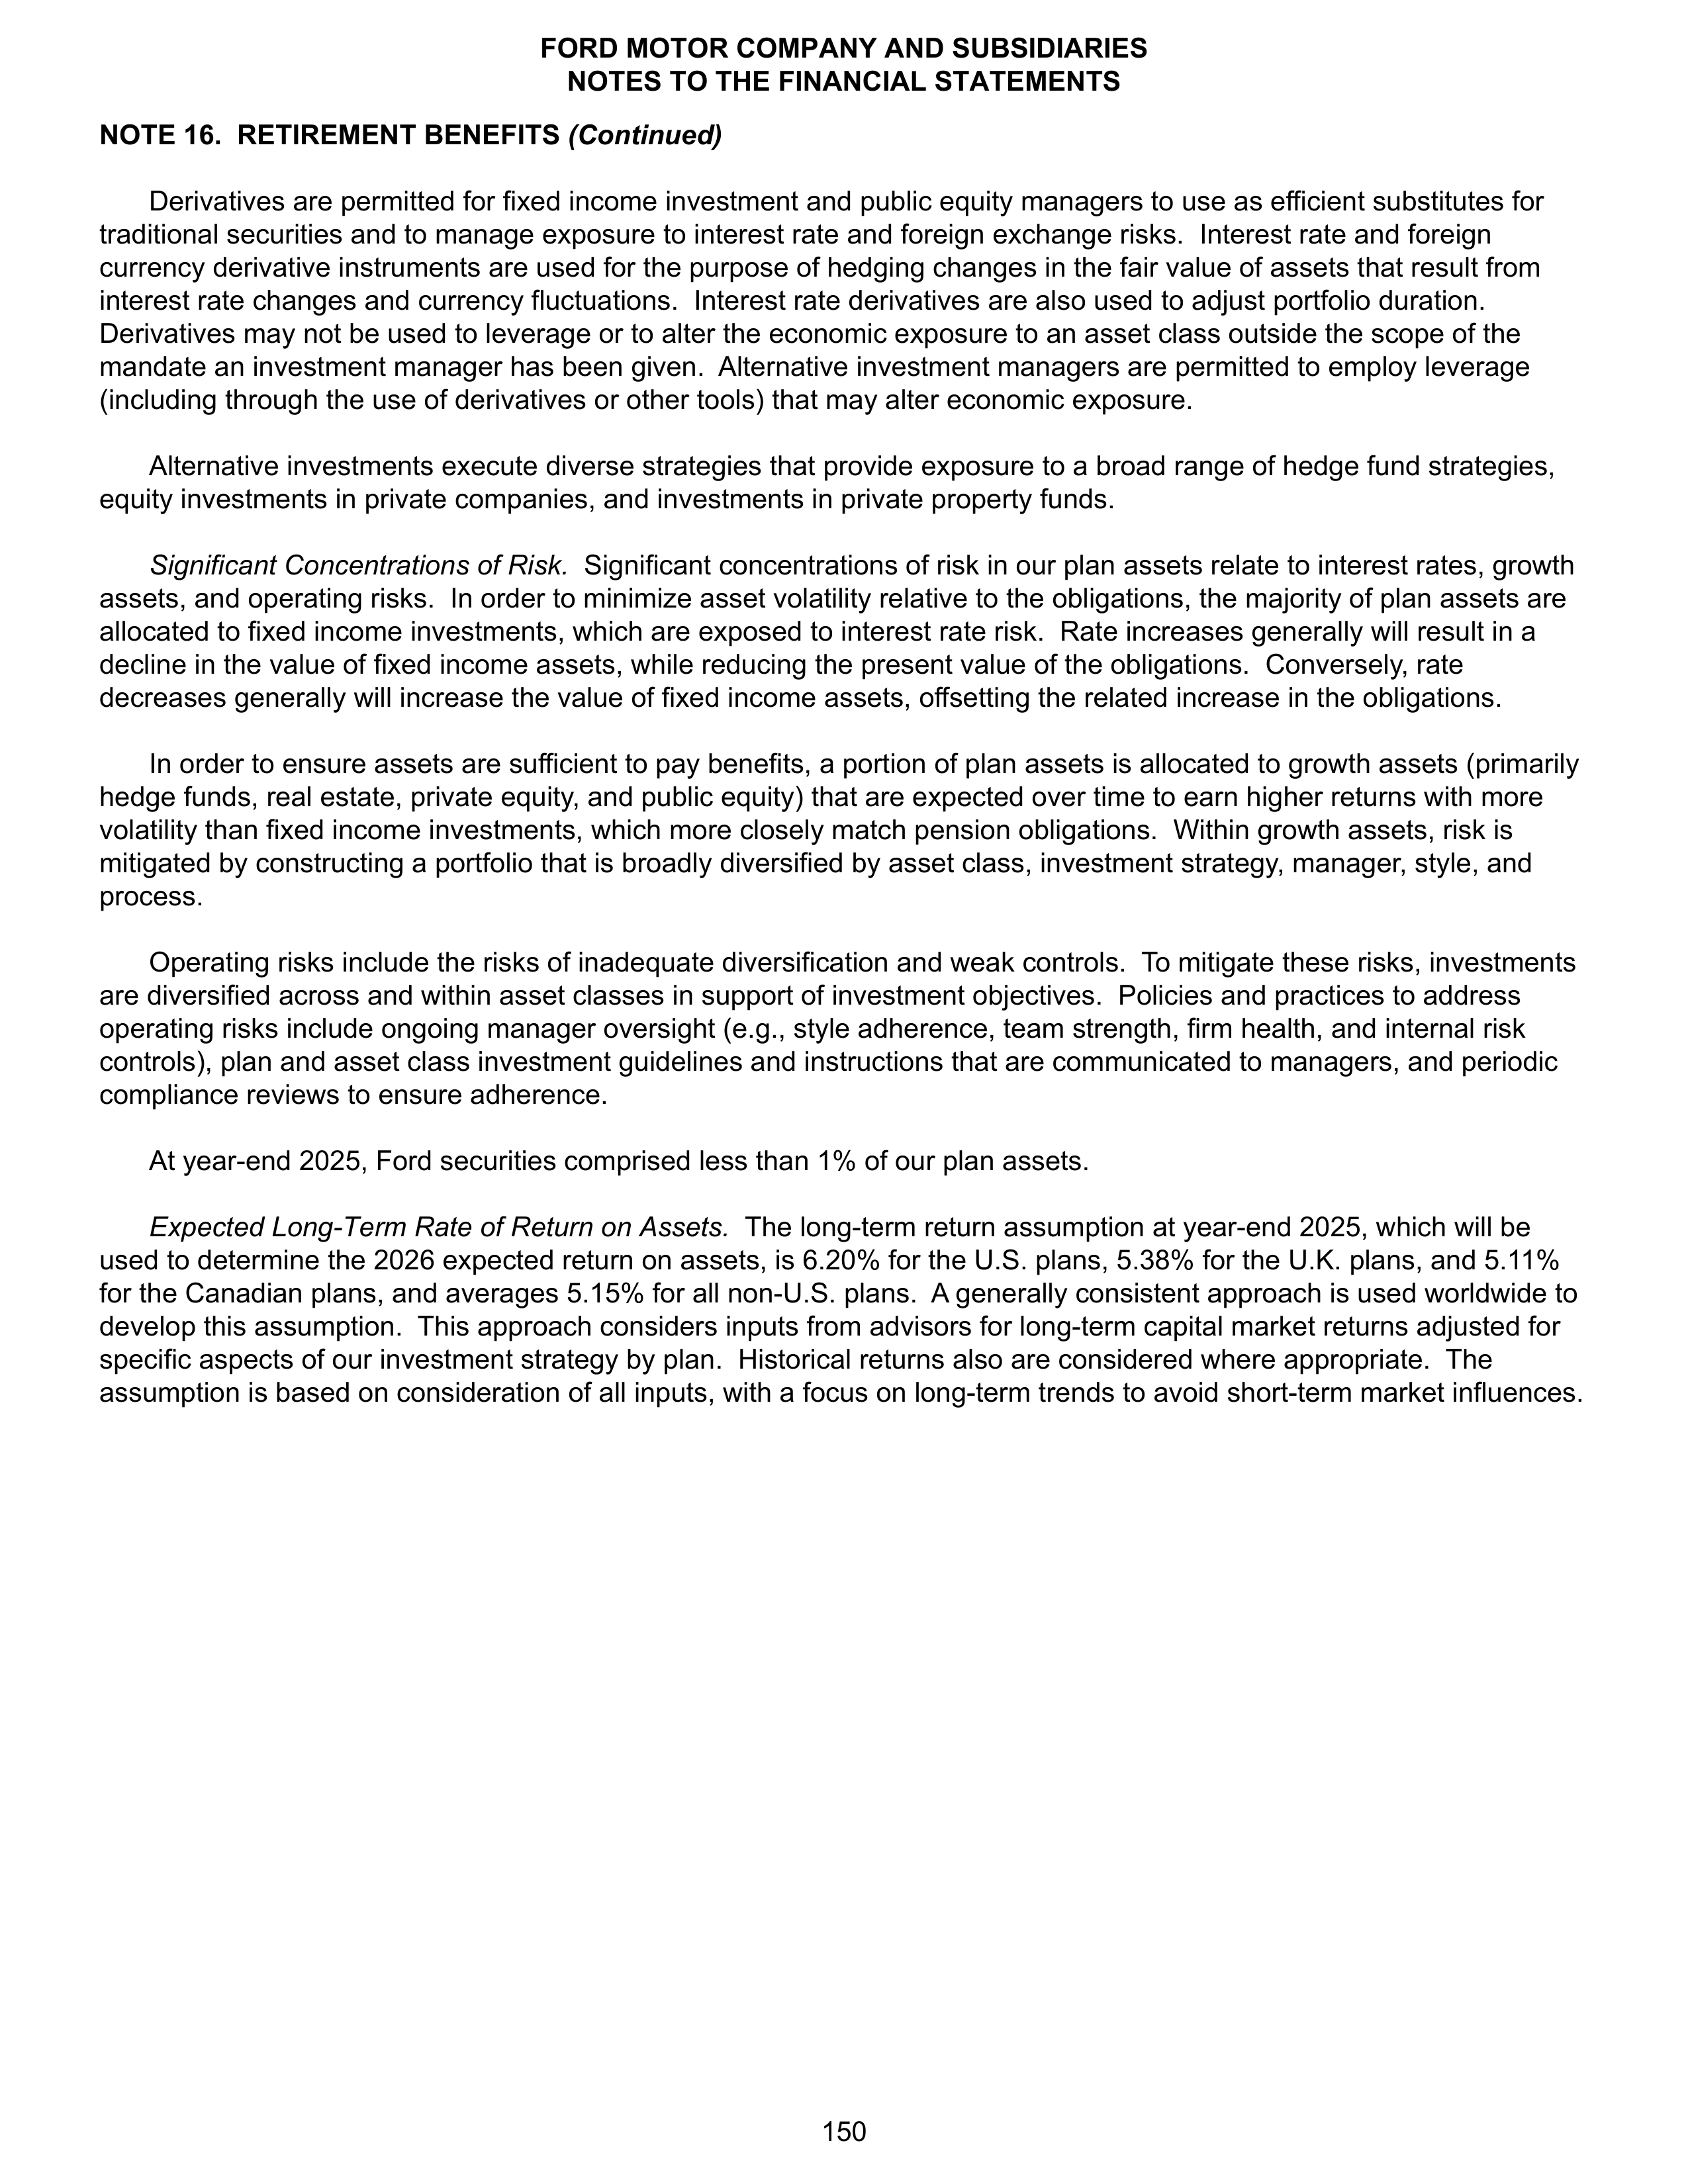
NOTE 16. RETIREMENT BENEFITS
(Continued)
Derivatives are permitted for fixed income investment and public equity managers to use as efficient substitutes for
traditional securities and to manage exposure to interest rate and foreign exchange risks. Interest rate and foreign
currency derivative instruments are used for the purpose of hedging changes in the fair value of assets that result from
interest rate changes and currency fluctuations. Interest rate derivatives are also used to adjust portfolio duration.
Derivatives may not be used to leverage or to alter the economic exposure to an asset class outside the scope of the
mandate an investment manager has been given. Alternative investment managers are permitted to employ leverage
(including through the use of derivatives or other tools) that may alter economic exposure.
Alternative investments execute diverse strategies that provide exposure to a broad range of hedge fund strategies,
equity investments in private companies, and investments in private property funds.
Significant Concentrations of Risk.
Significant concentrations of risk in our plan assets relate to interest rates, growth
assets, and operating risks. In order to minimize asset volatility relative to the obligations, the majority of plan assets are
allocated to fixed income investments, which are exposed to interest rate risk. Rate increases generally will result in a
decline in the value of fixed income assets, while reducing the present value of the obligations. Conversely, rate
decreases generally will increase the value of fixed income assets, offsetting the related increase in the obligations.
In order to ensure assets are sufficient to pay benefits, a portion of plan assets is allocated to growth assets (primarily
hedge funds, real estate, private equity, and public equity) that are expected over time to earn higher returns with more
volatility than fixed income investments, which more closely match pension obligations. Within growth assets, risk is
mitigated by constructing a portfolio that is broadly diversified by asset class, investment strategy, manager, style, and
process.
Operating risks include the risks of inadequate diversification and weak controls. To mitigate these risks, investments
are diversified across and within asset classes in support of investment objectives. Policies and practices to address
operating risks include ongoing manager oversight (e.g., style adherence, team strength, firm health, and internal risk
controls), plan and asset class investment guidelines and instructions that are communicated to managers, and periodic
compliance reviews to ensure adherence.
At year-end 2025, Ford securities comprised less than 1% of our plan assets.
Expected Long-Term Rate of Return on Assets.
The long-term return assumption at year-end 2025, which will be
used to determine the 2026 expected return on assets, is 6.20% for the U.S. plans, 5.38% for the U.K. plans, and 5.11%
for the Canadian plans, and averages 5.15% for all non-U.S. plans. A generally consistent approach is used worldwide to
develop this assumption. This approach considers inputs from advisors for long-term capital market returns adjusted for
specific aspects of our investment strategy by plan. Historical returns also are considered where appropriate. The
assumption is based on consideration of all inputs, with a focus on long-term trends to avoid short-term market influences.
FORD MOTOR COMPANY AND SUBSIDIARIES
NOTES TO THE FINANCIAL STATEMENTS
150
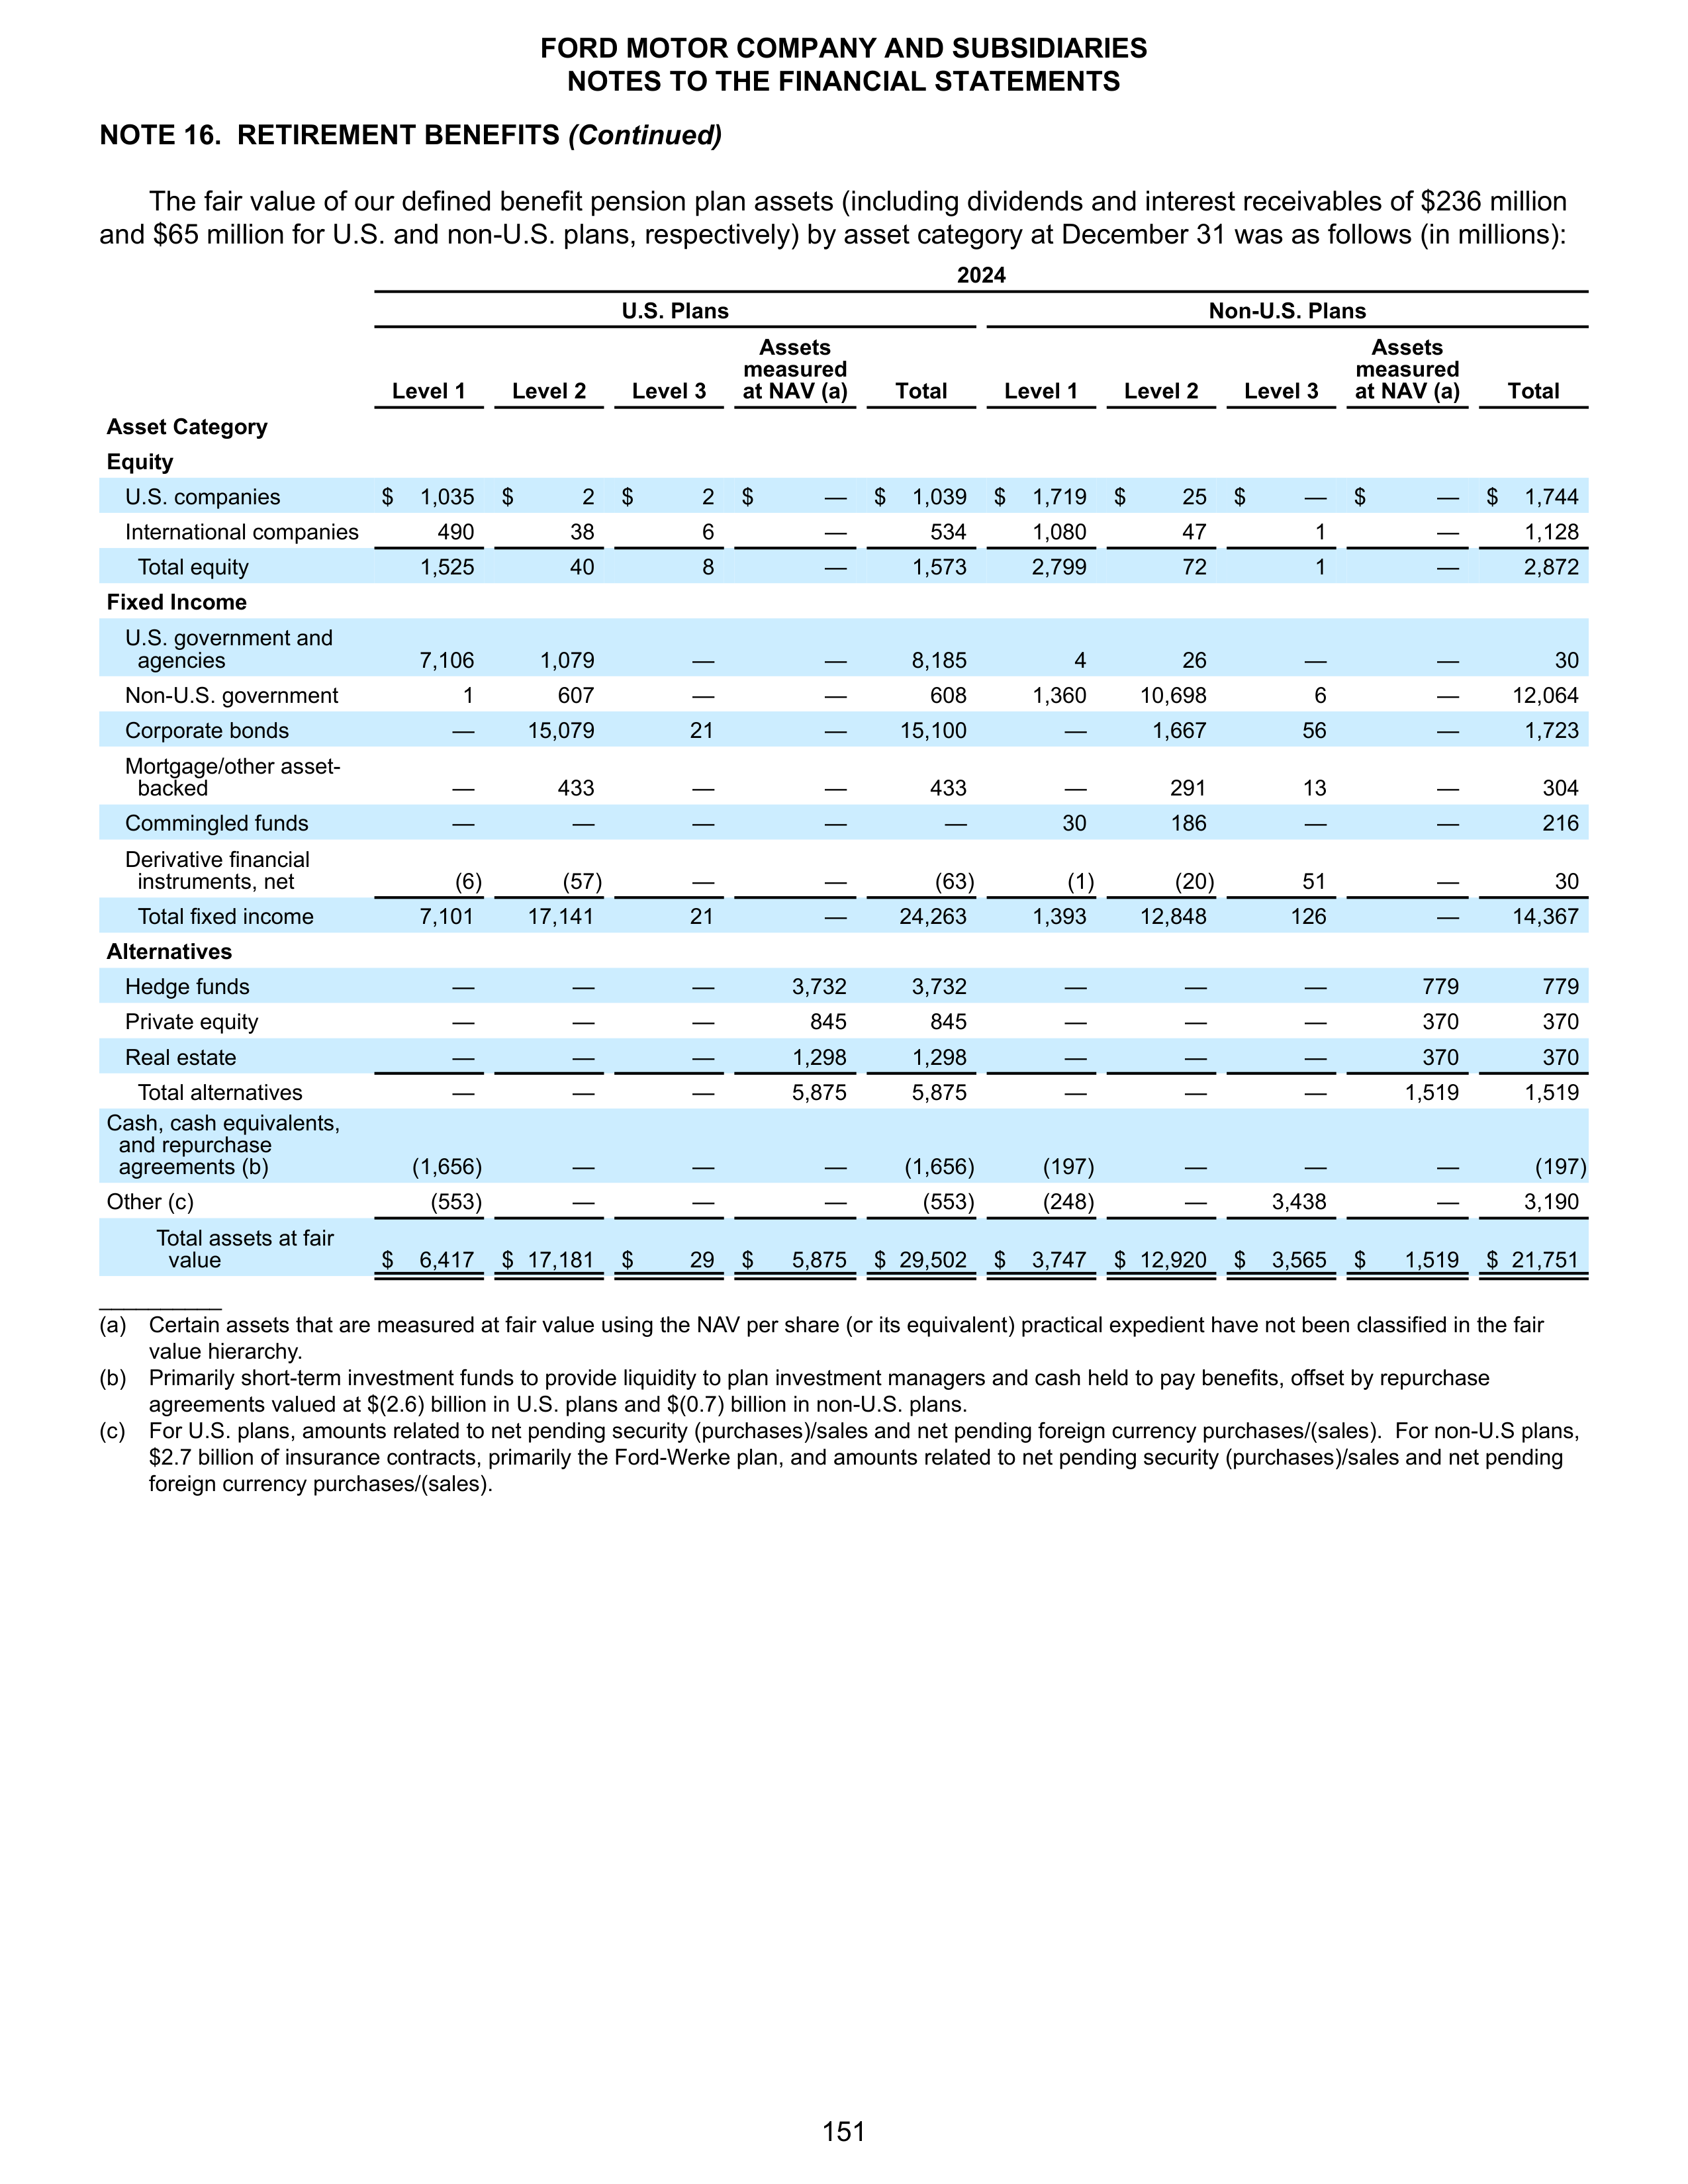
NOTE 16. RETIREMENT BENEFITS
(Continued)
The fair value of our defined benefit pension plan assets (including dividends and interest receivables of $236 million
and $65 million for U.S. and non-U.S. plans, respectively) by asset category at December 31 was as follows (in millions):
2024
U.S. Plans
Non-U.S. Plans
Level 1
Level 2
Level 3
Assets
measured
at NAV (a)
Total
Level 1
Level 2
Level 3
Assets
measured
at NAV (a)
Total
Asset Category
Equity
U.S. companies
$
1,035
$
2
$
2
$
—
$
1,039
$
1,719
$
25
$
—
$
—
$
1,744
International companies
490
38
6
—
534
1,080
47
1
—
1,128
Total equity
1,525
40
8
—
1,573
2,799
72
1
—
2,872
Fixed Income
U.S. government and
agencies
7,106
1,079
—
—
8,185
4
26
—
—
30
Non-U.S. government
1
607
—
—
608
1,360
10,698
6
—
12,064
Corporate bonds
—
15,079
21
—
15,100
—
1,667
56
—
1,723
Mortgage/other asset-
backed
—
433
—
—
433
—
291
13
—
304
Commingled funds
—
—
—
—
—
30
186
—
—
216
Derivative financial
instruments, net
(6)
(57)
—
—
(63)
(1)
(20)
51
—
30
Total fixed income
7,101
17,141
21
—
24,263
1,393
12,848
126
—
14,367
Alternatives
Hedge funds
—
—
—
3,732
3,732
—
—
—
779
779
Private equity
—
—
—
845
845
—
—
—
370
370
Real estate
—
—
—
1,298
1,298
—
—
—
370
370
Total alternatives
—
—
—
5,875
5,875
—
—
—
1,519
1,519
Cash, cash equivalents,
and repurchase
agreements (b)
(1,656)
—
—
—
(1,656)
(197)
—
—
—
(197)
Other (c)
(553)
—
—
—
(553)
(248)
—
3,438
—
3,190
Total assets at fair
value
$
6,417
$ 17,181
$
29
$
5,875
$ 29,502
$
3,747
$ 12,920
$
3,565
$
1,519
$ 21,751
__________
(a)
Certain assets that are measured at fair value using the NAV per share (or its equivalent) practical expedient have not been classified in the fair
value hierarchy.
(b)
Primarily short-term investment funds to provide liquidity to plan investment managers and cash held to pay benefits, offset by repurchase
agreements valued at $(2.6) billion in U.S. plans and $(0.7) billion in non-U.S. plans.
(c)
For U.S. plans, amounts related to net pending security (purchases)/sales and net pending foreign currency purchases/(sales). For non-U.S plans,
$2.7 billion of insurance contracts, primarily the Ford-Werke plan, and amounts related to net pending security (purchases)/sales and net pending
foreign currency purchases/(sales).
FORD MOTOR COMPANY AND SUBSIDIARIES
NOTES TO THE FINANCIAL STATEMENTS
151
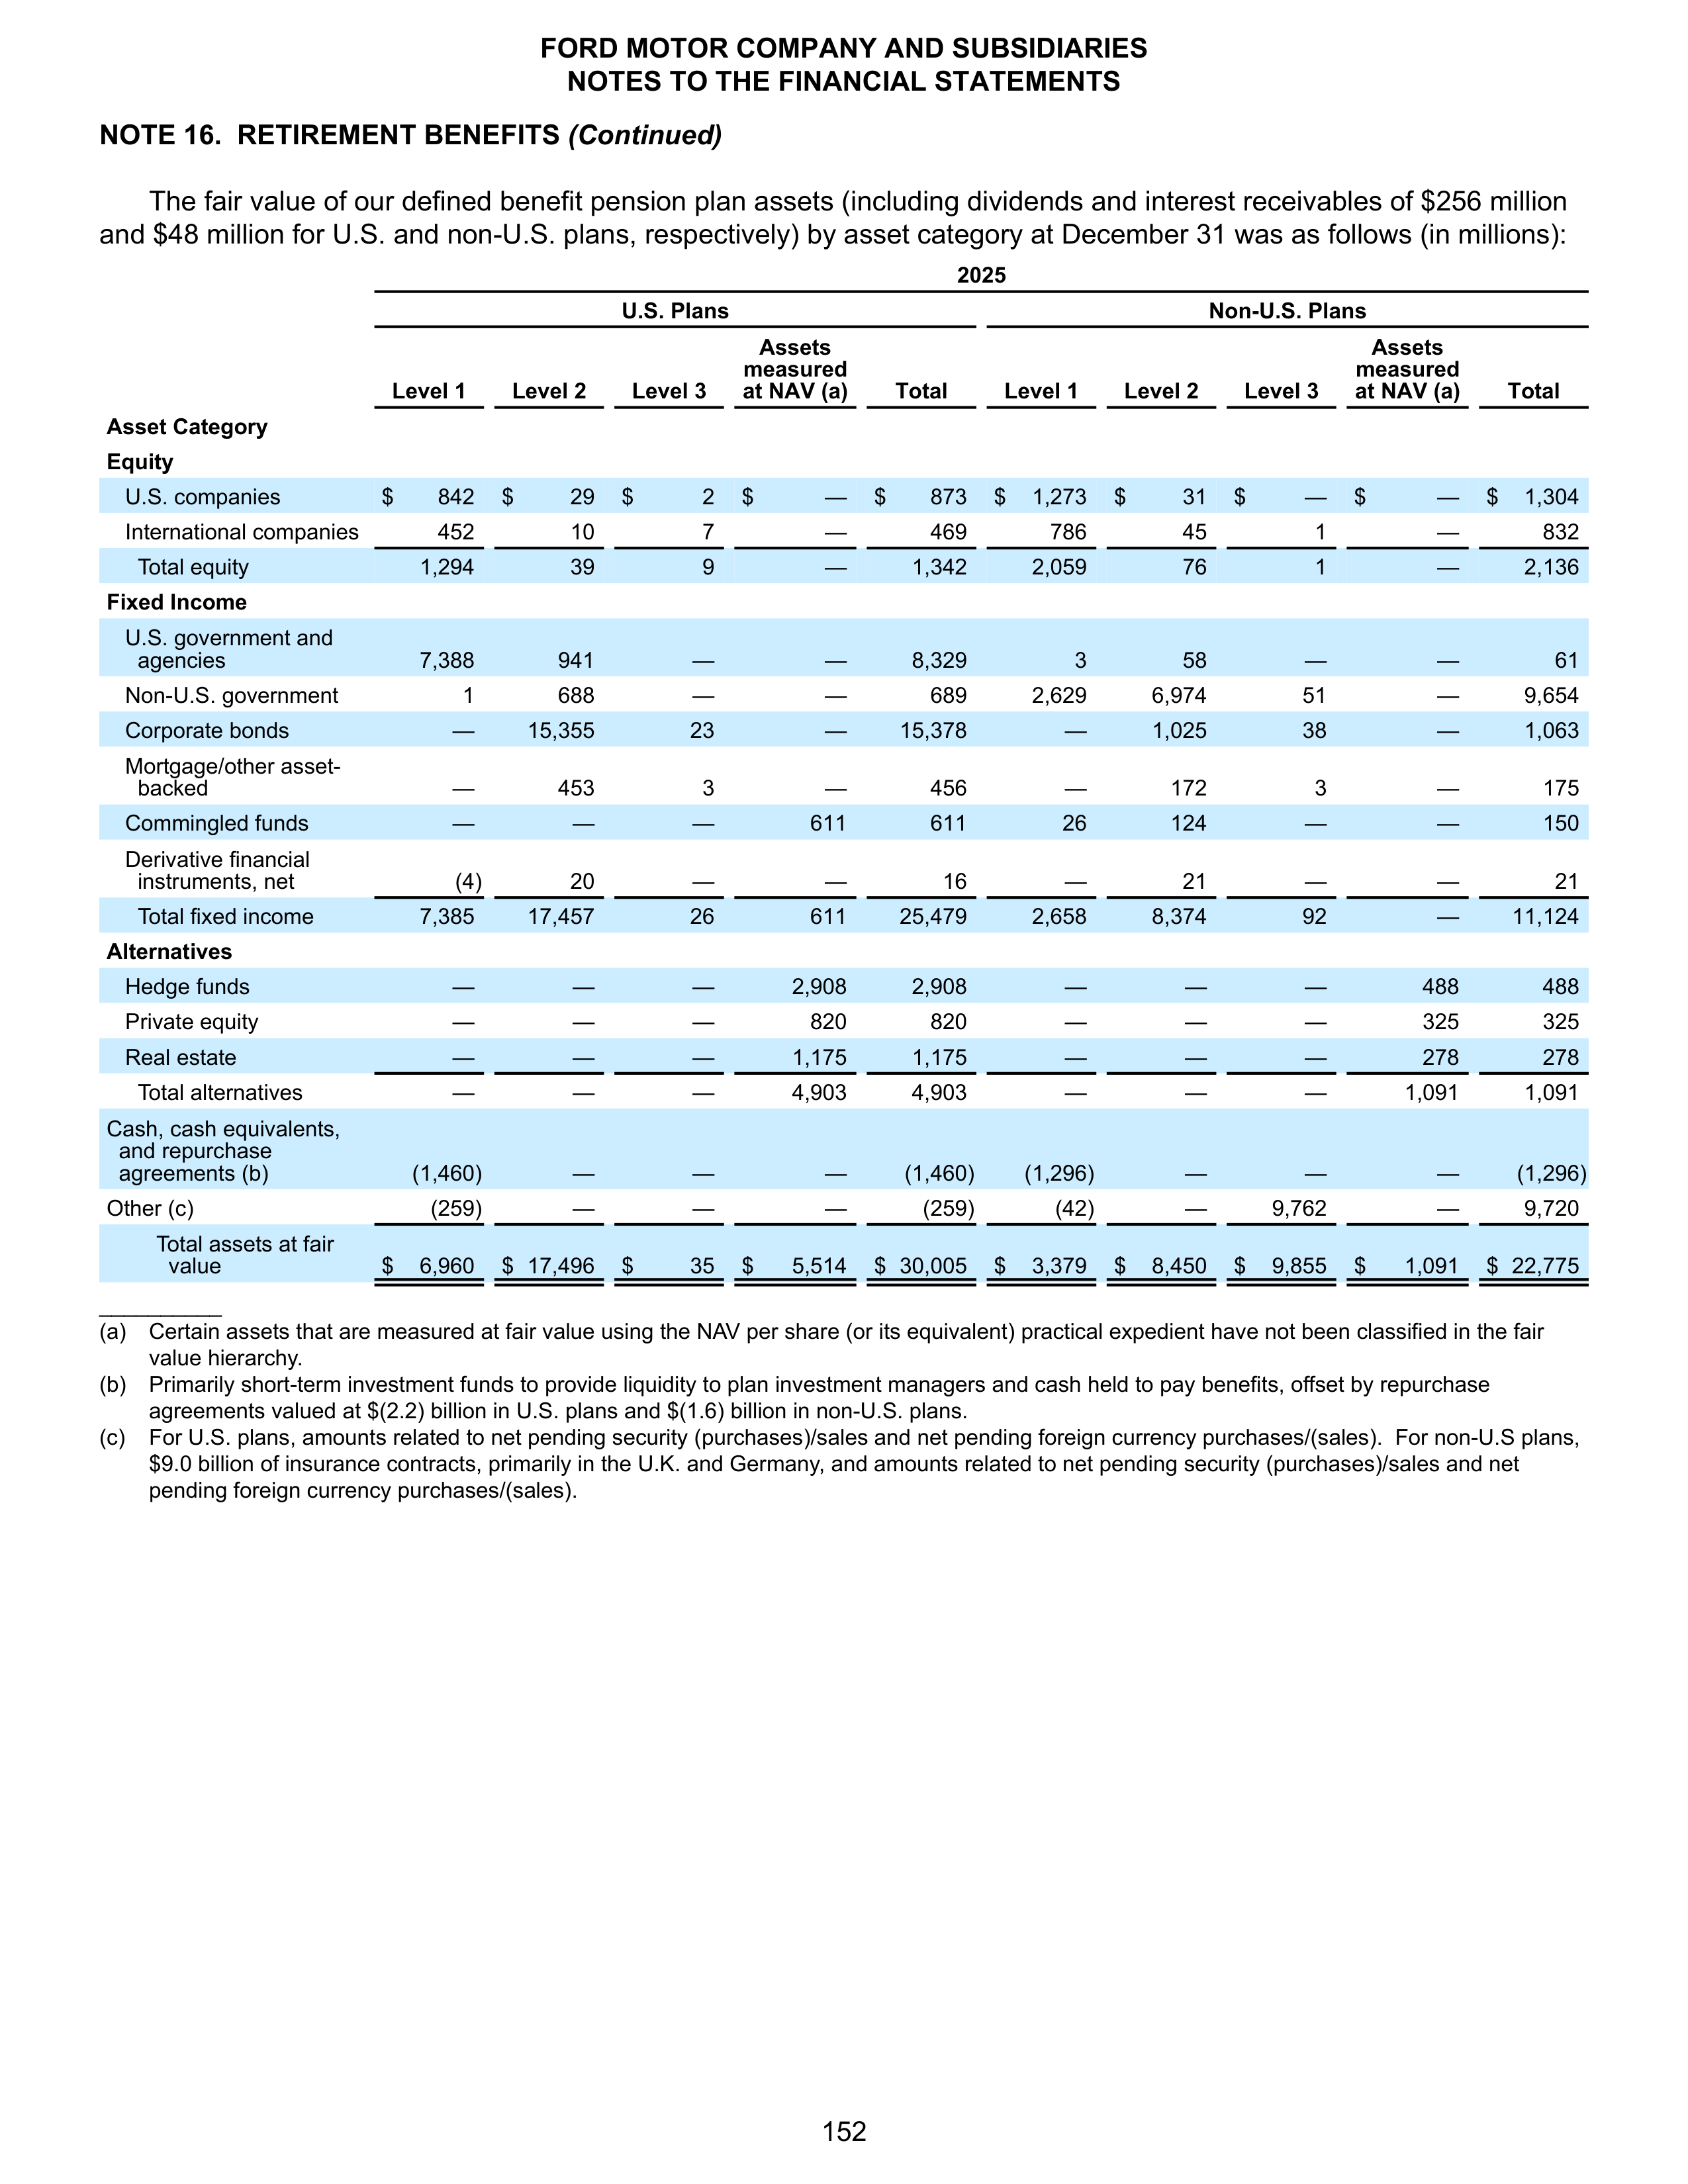
NOTE 16. RETIREMENT BENEFITS
(Continued)
The fair value of our defined benefit pension plan assets (including dividends and interest receivables of $256 million
and $48 million for U.S. and non-U.S. plans, respectively) by asset category at December 31 was as follows (in millions):
2025
U.S. Plans
Non-U.S. Plans
Level 1
Level 2
Level 3
Assets
measured
at NAV (a)
Total
Level 1
Level 2
Level 3
Assets
measured
at NAV (a)
Total
Asset Category
Equity
U.S. companies
$
842
$
29
$
2
$
—
$
873
$
1,273
$
31
$
—
$
—
$
1,304
International companies
452
10
7
—
469
786
45
1
—
832
Total equity
1,294
39
9
—
1,342
2,059
76
1
—
2,136
Fixed Income
U.S. government and
agencies
7,388
941
—
—
8,329
3
58
—
—
61
Non-U.S. government
1
688
—
—
689
2,629
6,974
51
—
9,654
Corporate bonds
—
15,355
23
—
15,378
—
1,025
38
—
1,063
Mortgage/other asset-
backed
—
453
3
—
456
—
172
3
—
175
Commingled funds
—
—
—
611
611
26
124
—
—
150
Derivative financial
instruments, net
(4)
20
—
—
16
—
21
—
—
21
Total fixed income
7,385
17,457
26
611
25,479
2,658
8,374
92
—
11,124
Alternatives
Hedge funds
—
—
—
2,908
2,908
—
—
—
488
488
Private equity
—
—
—
820
820
—
—
—
325
325
Real estate
—
—
—
1,175
1,175
—
—
—
278
278
Total alternatives
—
—
—
4,903
4,903
—
—
—
1,091
1,091
Cash, cash equivalents,
and repurchase
agreements (b)
(1,460)
—
—
—
(1,460)
(1,296)
—
—
—
(1,296)
Other (c)
(259)
—
—
—
(259)
(42)
—
9,762
—
9,720
Total assets at fair
value
$
6,960
$ 17,496
$
35
$
5,514
$ 30,005
$
3,379
$
8,450
$
9,855
$
1,091
$ 22,775
__________
(a)
Certain assets that are measured at fair value using the NAV per share (or its equivalent) practical expedient have not been classified in the fair
value hierarchy.
(b)
Primarily short-term investment funds to provide liquidity to plan investment managers and cash held to pay benefits, offset by repurchase
agreements valued at $(2.2) billion in U.S. plans and $(1.6) billion in non-U.S. plans.
(c)
For U.S. plans, amounts related to net pending security (purchases)/sales and net pending foreign currency purchases/(sales). For non-U.S plans,
$9.0 billion of insurance contracts, primarily in the U.K. and Germany, and amounts related to net pending security (purchases)/sales and net
pending foreign currency purchases/(sales).
FORD MOTOR COMPANY AND SUBSIDIARIES
NOTES TO THE FINANCIAL STATEMENTS
152
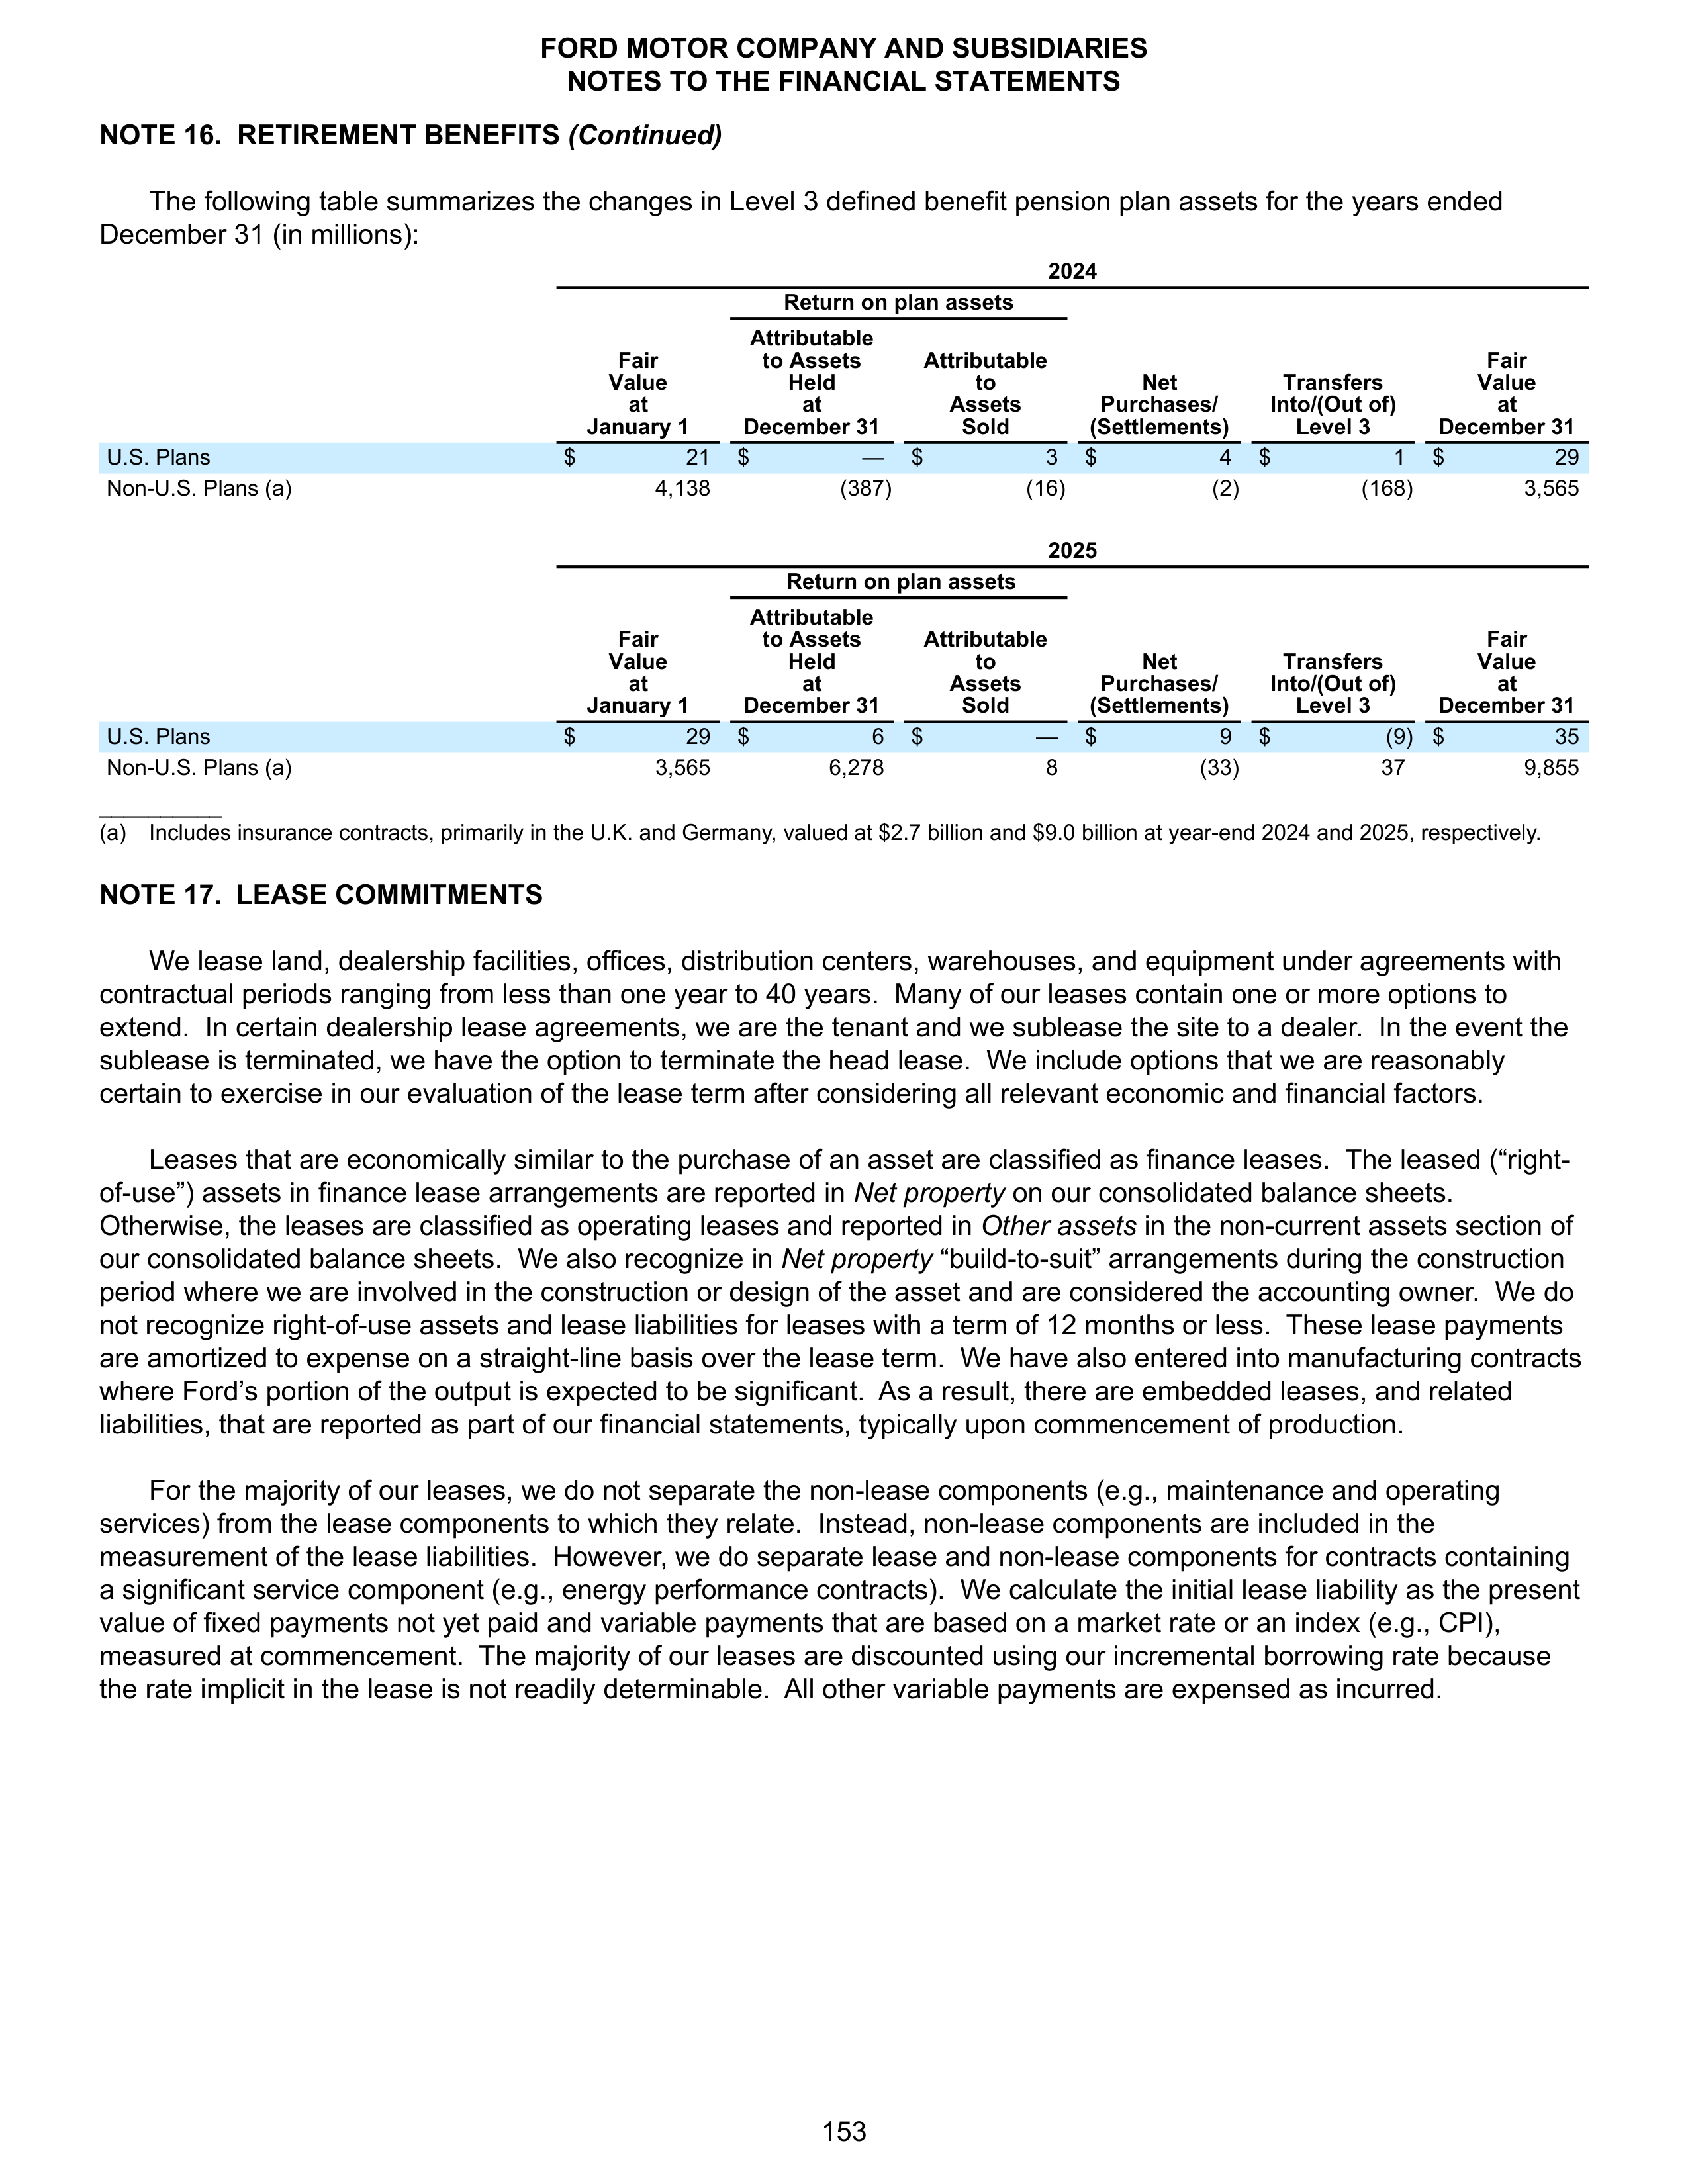
NOTE 16. RETIREMENT BENEFITS
(Continued)
The following table summarizes the changes in Level 3 defined benefit pension plan assets for the years ended
December 31 (in millions):
2024
Return on plan assets
Fair
Value
at
January 1
Attributable
to Assets
Held
at
December 31
Attributable
to
Assets
Sold
Net
Purchases/
(Settlements)
Transfers
Into/(Out of)
Level 3
Fair
Value
at
December 31
U.S. Plans
$
21
$
—
$
3
$
4
$
1
$
29
Non-U.S. Plans (a)
4,138
(387)
(16)
(2)
(168)
3,565
2025
Return on plan assets
Fair
Value
at
January 1
Attributable
to Assets
Held
at
December 31
Attributable
to
Assets
Sold
Net
Purchases/
(Settlements)
Transfers
Into/(Out of)
Level 3
Fair
Value
at
December 31
U.S. Plans
$
29
$
6
$
—
$
9
$
(9) $
35
Non-U.S. Plans (a)
3,565
6,278
8
(33)
37
9,855
__________
(a)
Includes insurance contracts, primarily in the U.K. and Germany, valued at $2.7 billion and $9.0 billion at year-end 2024 and 2025, respectively.
NOTE 17.
LEASE COMMITMENTS
We lease land, dealership facilities, offices, distribution centers, warehouses, and equipment under agreements with
contractual periods ranging from less than one year to 40 years. Many of our leases contain one or more options to
extend. In certain dealership lease agreements, we are the tenant and we sublease the site to a dealer. In the event the
sublease is terminated, we have the option to terminate the head lease. We include options that we are reasonably
certain to exercise in our evaluation of the lease term after considering all relevant economic and financial factors.
Leases that are economically similar to the purchase of an asset are classified as finance leases. The leased (“right-
of-use”) assets in finance lease arrangements are reported in
Net property
on our consolidated balance sheets.
Otherwise, the leases are classified as operating leases and reported in
Other assets
in the non-current assets section of
our consolidated balance sheets. We also recognize in
Net property
“build-to-suit” arrangements during the construction
period where we are involved in the construction or design of the asset and are considered the accounting owner. We do
not recognize right-of-use assets and lease liabilities for leases with a term of 12 months or less. These lease payments
are amortized to expense on a straight-line basis over the lease term. We have also entered into manufacturing contracts
where Ford’s portion of the output is expected to be significant. As a result, there are embedded leases, and related
liabilities, that are reported as part of our financial statements, typically upon commencement of production.
For the majority of our leases, we do not separate the non-lease components (e.g., maintenance and operating
services) from the lease components to which they relate. Instead, non-lease components are included in the
measurement of the lease liabilities. However, we do separate lease and non-lease components for contracts containing
a significant service component (e.g., energy performance contracts). We calculate the initial lease liability as the present
value of fixed payments not yet paid and variable payments that are based on a market rate or an index (e.g., CPI),
measured at commencement. The majority of our leases are discounted using our incremental borrowing rate because
the rate implicit in the lease is not readily determinable. All other variable payments are expensed as incurred.
FORD MOTOR COMPANY AND SUBSIDIARIES
NOTES TO THE FINANCIAL STATEMENTS
153
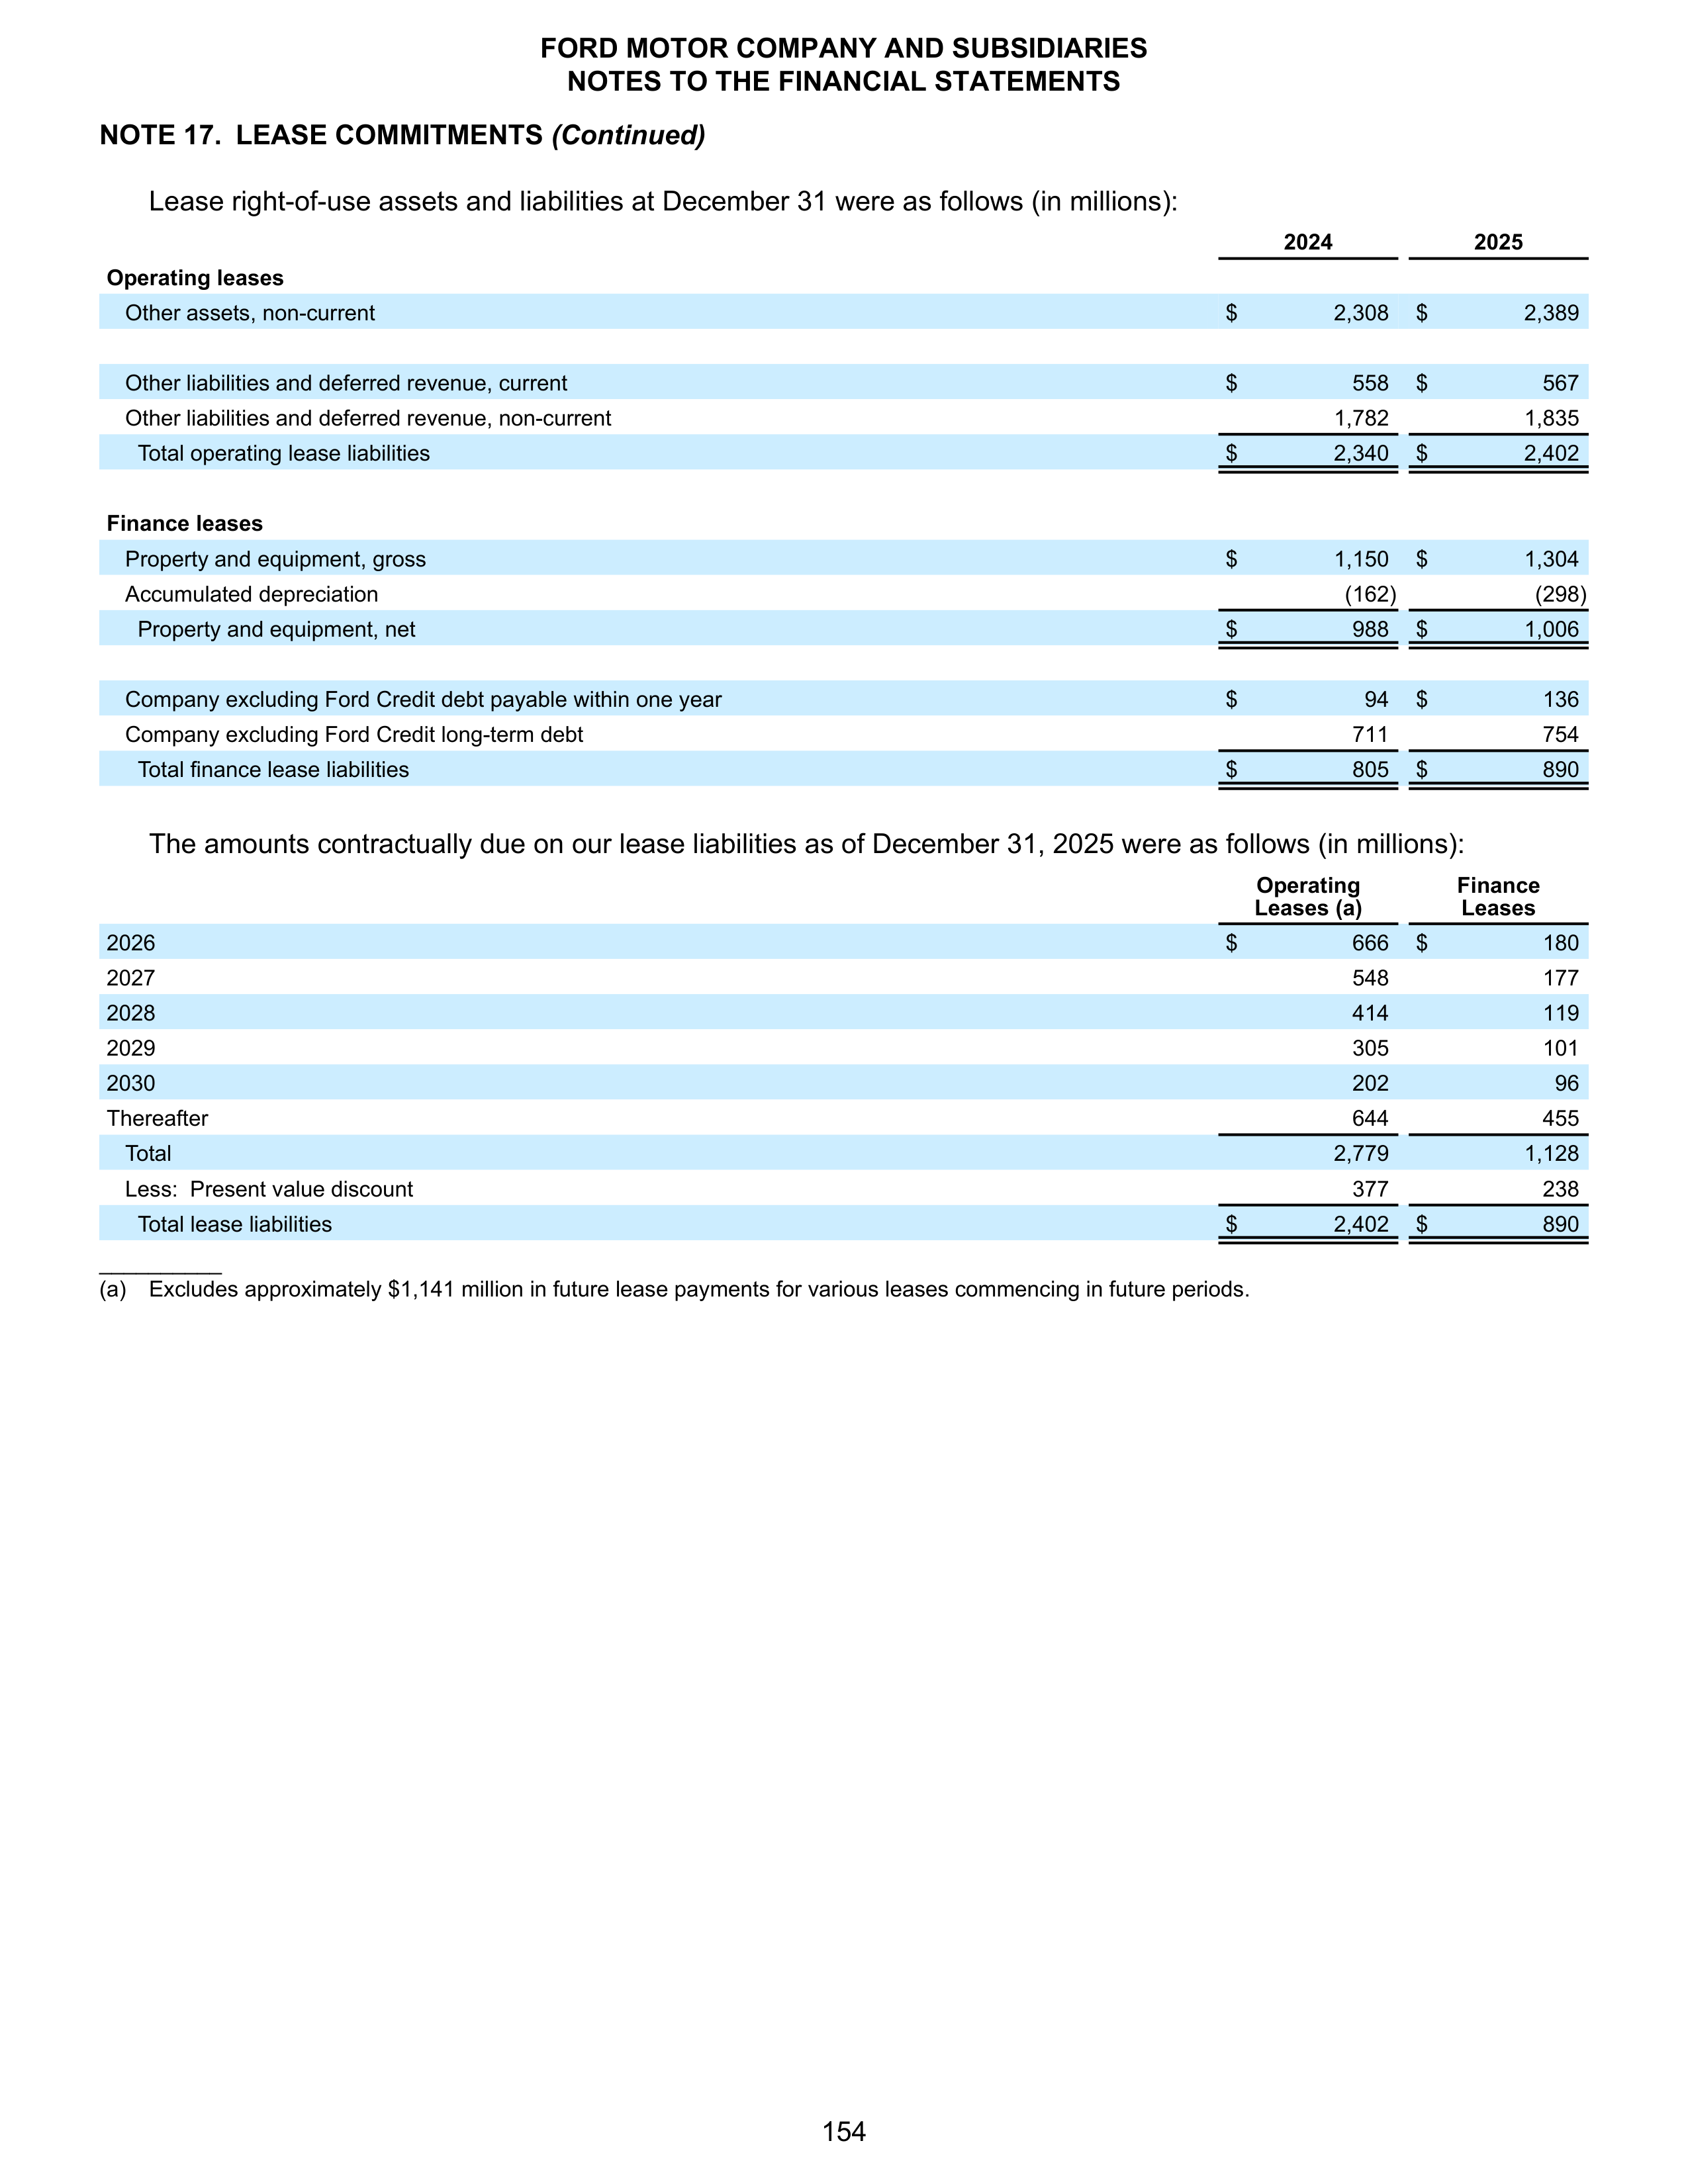
NOTE 17.
LEASE COMMITMENTS
(Continued)
Lease right-of-use assets and liabilities at December 31 were as follows (in millions):
2024
2025
Operating leases
Other assets, non-current
$
2,308
$
2,389
Other liabilities and deferred revenue, current
$
558
$
567
Other liabilities and deferred revenue, non-current
1,782
1,835
Total operating lease liabilities
$
2,340
$
2,402
Finance leases
Property and equipment, gross
$
1,150
$
1,304
Accumulated depreciation
(162)
(298)
Property and equipment, net
$
988
$
1,006
Company excluding Ford Credit debt payable within one year
$
94
$
136
Company excluding Ford Credit long-term debt
711
754
Total finance lease liabilities
$
805
$
890
The amounts contractually due on our lease liabilities as of December 31, 2025 were as follows (in millions):
Operating
Leases (a)
Finance
Leases
2026
$
666
$
180
2027
548
177
2028
414
119
2029
305
101
2030
202
96
Thereafter
644
455
Total
2,779
1,128
Less: Present value discount
377
238
Total lease liabilities
$
2,402
$
890
__________
(a) Excludes approximately $1,141 million in future lease payments for various leases commencing in future periods.
FORD MOTOR COMPANY AND SUBSIDIARIES
NOTES TO THE FINANCIAL STATEMENTS
154
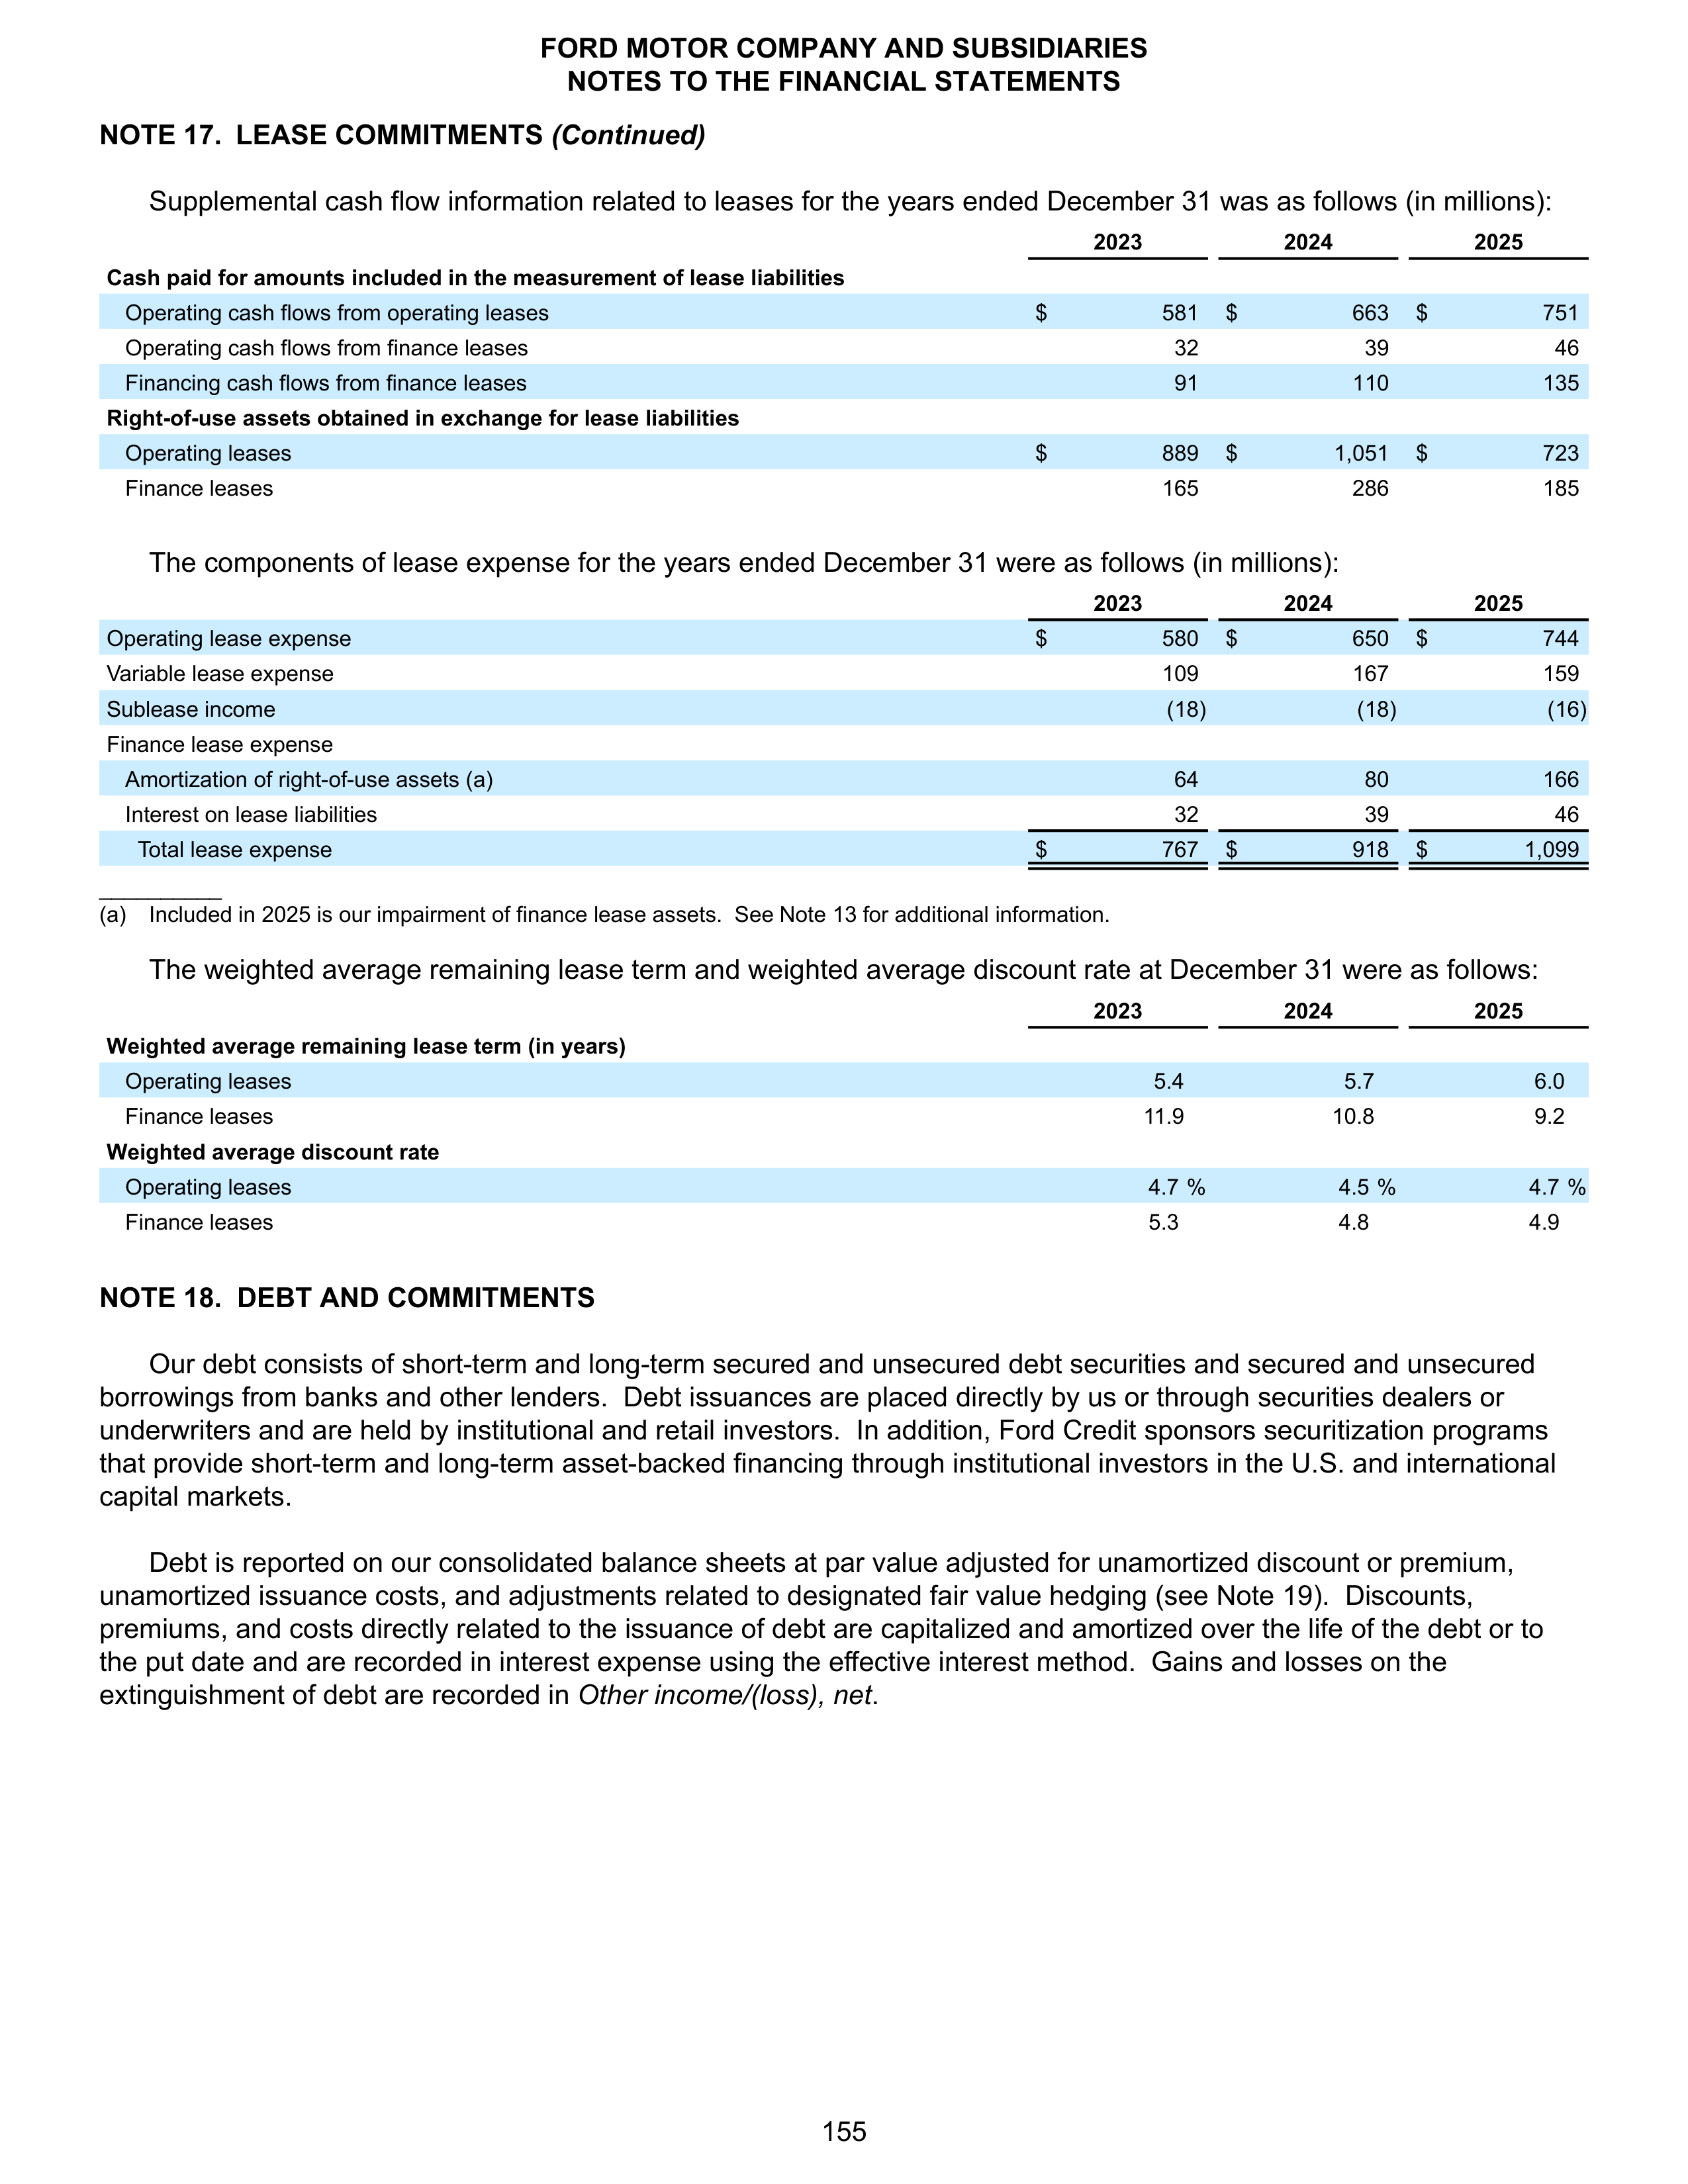
NOTE 17.
LEASE COMMITMENTS
(Continued)
Supplemental cash flow information related to leases for the years ended December 31 was as follows (in millions):
2023
2024
2025
Cash paid for amounts included in the measurement of lease liabilities
Operating cash flows from operating leases
$
581
$
663
$
751
Operating cash flows from finance leases
32
39
46
Financing cash flows from finance leases
91
110
135
Right-of-use assets obtained in exchange for lease liabilities
Operating leases
$
889
$
1,051
$
723
Finance leases
165
286
185
The components of lease expense for the years ended December 31 were as follows (in millions):
2023
2024
2025
Operating lease expense
$
580
$
650
$
744
Variable lease expense
109
167
159
Sublease income
(18)
(18)
(16)
Finance lease expense
Amortization of right-of-use assets (a)
64
80
166
Interest on lease liabilities
32
39
46
Total lease expense
$
767
$
918
$
1,099
__________
(a) Included in 2025 is our impairment of finance lease assets. See Note 13 for additional information.
The weighted average remaining lease term and weighted average discount rate at December 31 were as follows:
2023
2024
2025
Weighted average remaining lease term (in years)
Operating leases
5.4
5.7
6.0
Finance leases
11.9
10.8
9.2
Weighted average discount rate
Operating leases
4.7 %
4.5 %
4.7 %
Finance leases
5.3
4.8
4.9
NOTE 18. DEBT AND COMMITMENTS
Our debt consists of short-term and long-term secured and unsecured debt securities and secured and unsecured
borrowings from banks and other lenders. Debt issuances are placed directly by us or through securities dealers or
underwriters and are held by institutional and retail investors. In addition, Ford Credit sponsors securitization programs
that provide short-term and long-term asset-backed financing through institutional investors in the U.S. and international
capital markets.
Debt is reported on our consolidated balance sheets at par value adjusted for unamortized discount or premium,
unamortized issuance costs, and adjustments related to designated fair value hedging (see Note 19). Discounts,
premiums, and costs directly related to the issuance of debt are capitalized and amortized over the life of the debt or to
the put date and are recorded in interest expense using the effective interest method. Gains and losses on the
extinguishment of debt are recorded in
Other income/(loss), net
.
FORD MOTOR COMPANY AND SUBSIDIARIES
NOTES TO THE FINANCIAL STATEMENTS
155
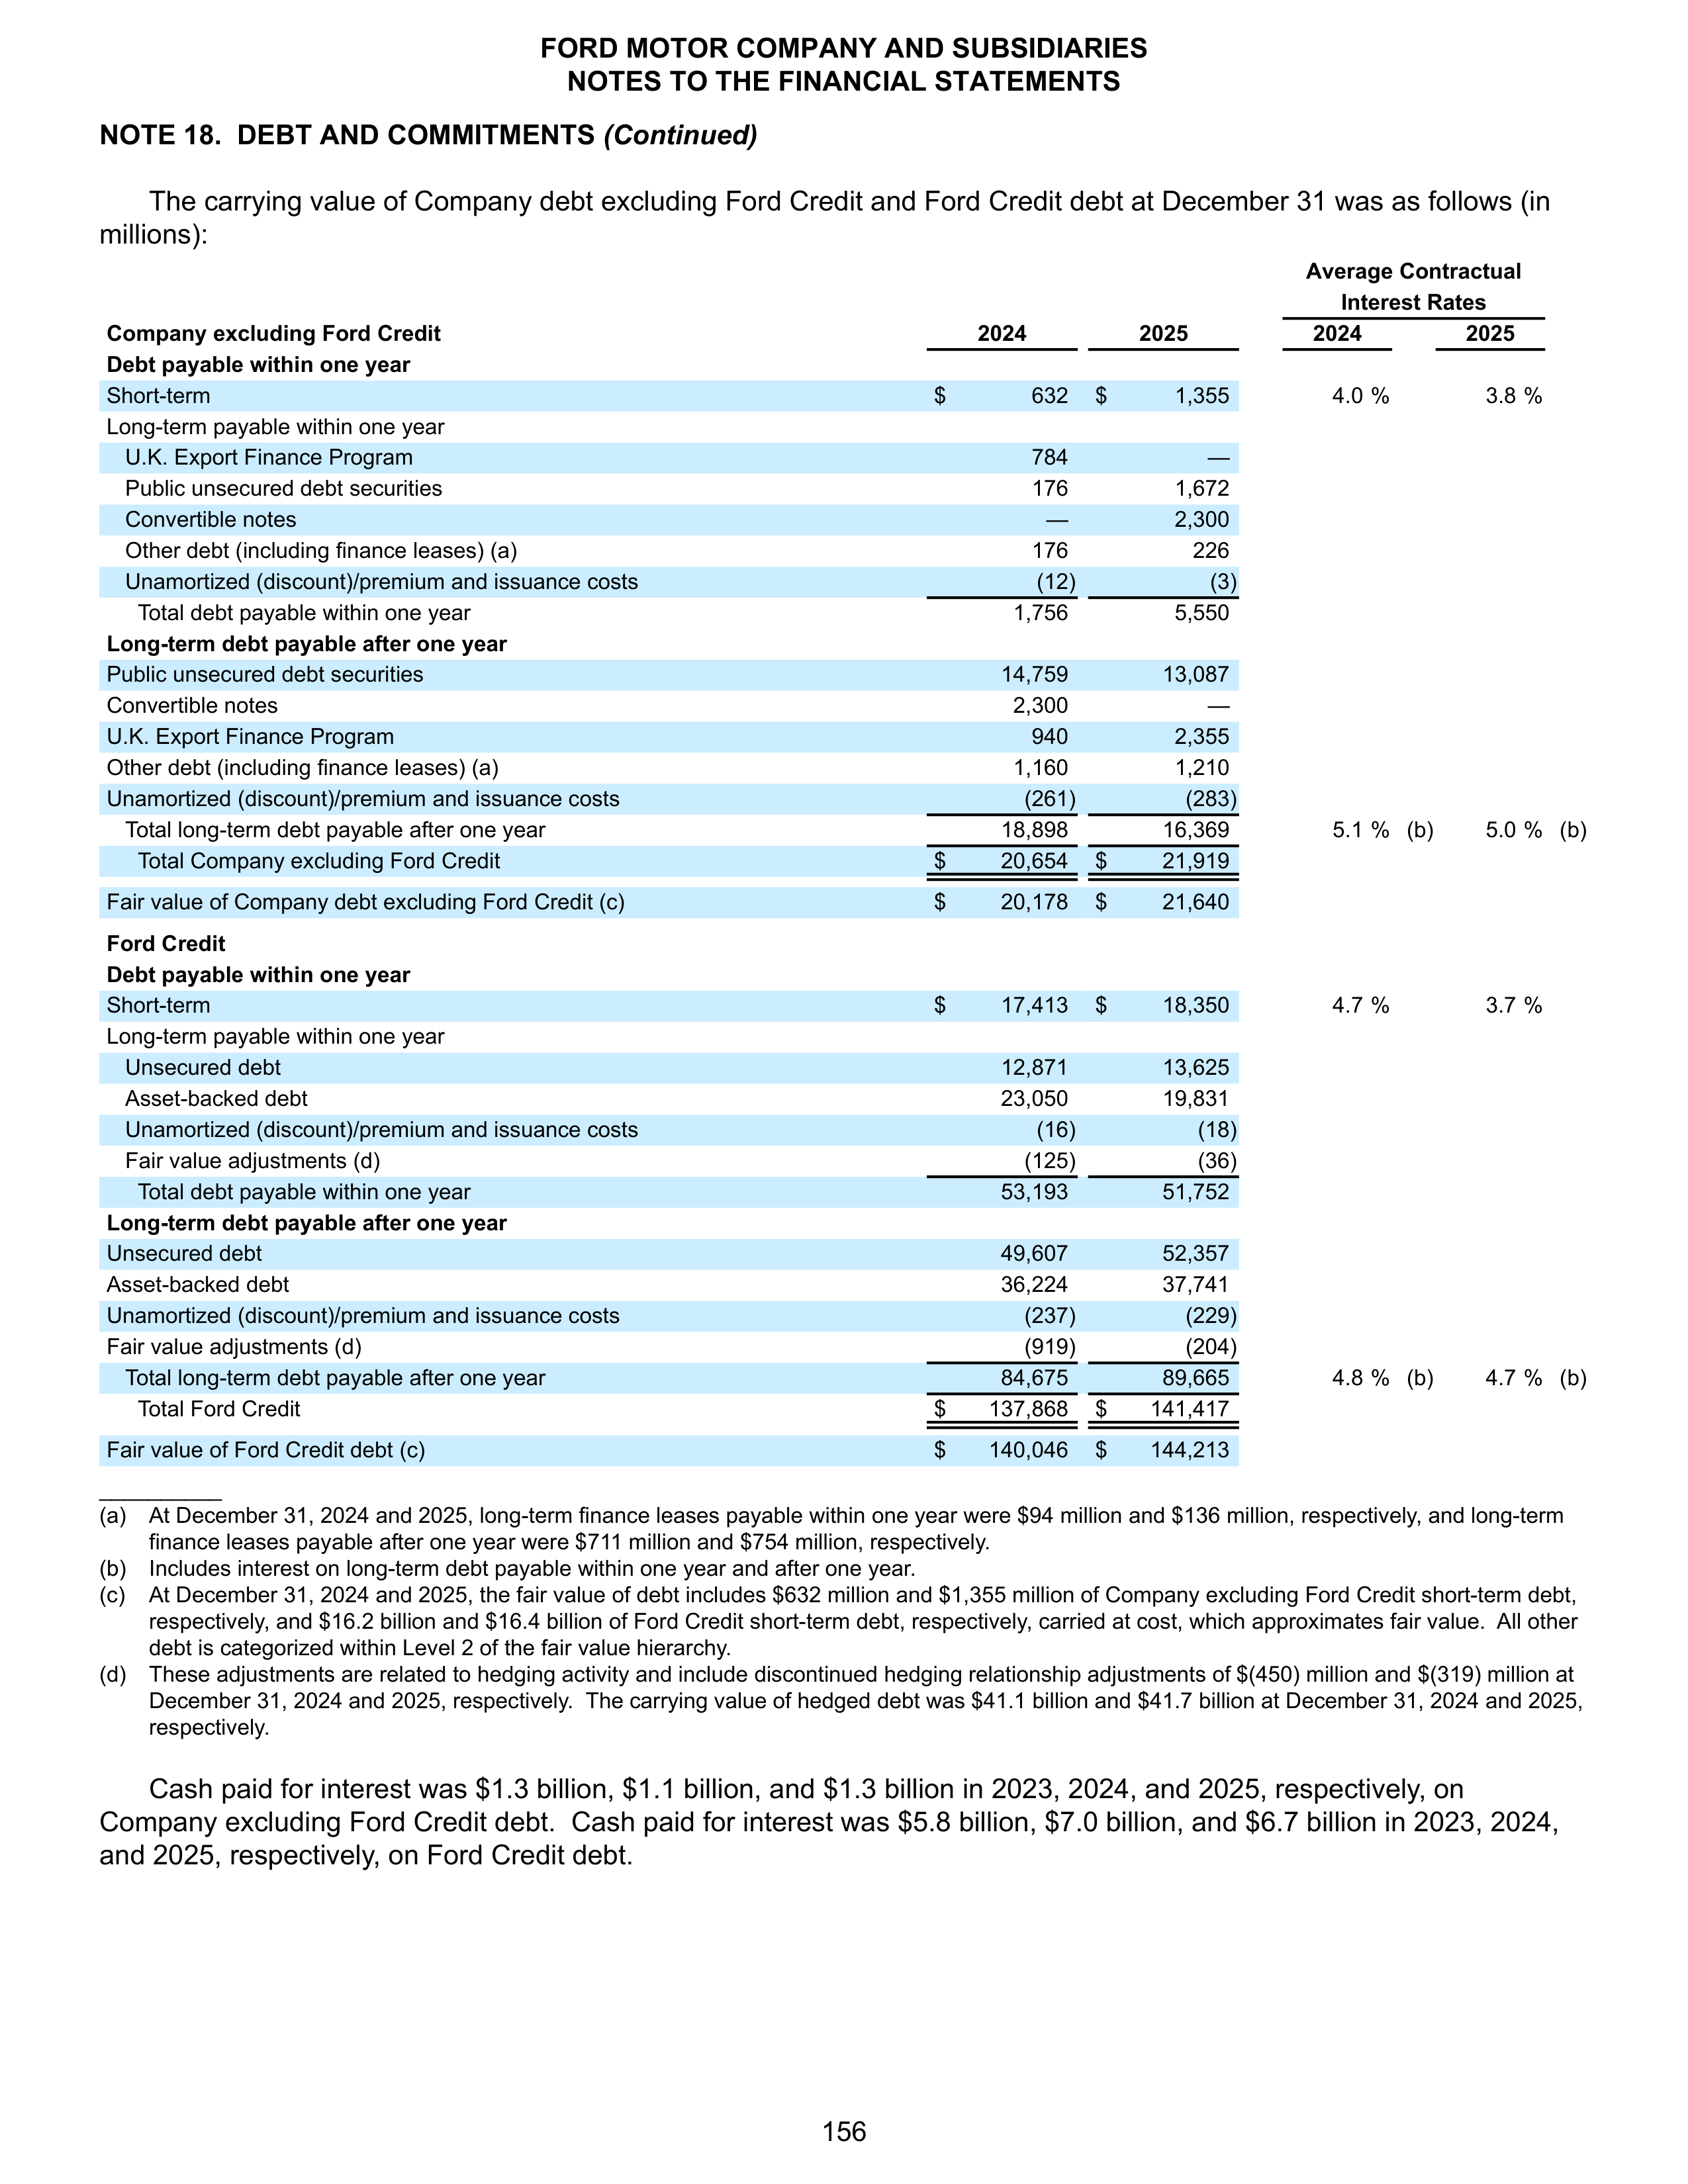
NOTE 18. DEBT AND COMMITMENTS
(Continued)
The carrying value of Company debt excluding Ford Credit and Ford Credit debt at December 31 was as follows (in
millions):
Average Contractual
Interest Rates
Company excluding Ford Credit
2024
2025
2024
2025
Debt payable within one year
Short-term
$
632
$
1,355
4.0 %
3.8 %
Long-term payable within one year
U.K. Export Finance Program
784
—
Public unsecured debt securities
176
1,672
Convertible notes
—
2,300
Other debt (including finance leases) (a)
176
226
Unamortized (discount)/premium and issuance costs
(12)
(3)
Total debt payable within one year
1,756
5,550
Long-term debt payable after one year
Public unsecured debt securities
14,759
13,087
Convertible notes
2,300
—
U.K. Export Finance Program
940
2,355
Other debt (including finance leases) (a)
1,160
1,210
Unamortized (discount)/premium and issuance costs
(261)
(283)
Total long-term debt payable after one year
18,898
16,369
5.1 %
(b)
5.0 %
(b)
Total Company excluding Ford Credit
$
20,654
$
21,919
Fair value of Company debt excluding Ford Credit (c)
$
20,178
$
21,640
Ford Credit
Debt payable within one year
Short-term
$
17,413
$
18,350
4.7 %
3.7 %
Long-term payable within one year
Unsecured debt
12,871
13,625
Asset-backed debt
23,050
19,831
Unamortized (discount)/premium and issuance costs
(16)
(18)
Fair value adjustments (d)
(125)
(36)
Total debt payable within one year
53,193
51,752
Long-term debt payable after one year
Unsecured debt
49,607
52,357
Asset-backed debt
36,224
37,741
Unamortized (discount)/premium and issuance costs
(237)
(229)
Fair value adjustments (d)
(919)
(204)
Total long-term debt payable after one year
84,675
89,665
4.8 %
(b)
4.7 %
(b)
Total Ford Credit
$
137,868
$
141,417
Fair value of Ford Credit debt (c)
$
140,046
$
144,213
__________
(a)
At December 31, 2024 and 2025, long-term finance leases payable within one year were $94 million and $136 million, respectively, and long-term
finance leases payable after one year were $711 million and $754 million, respectively.
(b)
Includes interest on long-term debt payable within one year and after one year.
(c)
At December 31, 2024 and 2025, the fair value of debt includes $632 million and $1,355 million of Company excluding Ford Credit short-term debt,
respectively, and $16.2 billion and $16.4 billion of Ford Credit short-term debt, respectively, carried at cost, which approximates fair value. All other
debt is categorized within Level 2 of the fair value hierarchy.
(d)
These adjustments are related to hedging activity and include discontinued hedging relationship adjustments of $(450) million and $(319) million at
December 31, 2024 and 2025, respectively. The carrying value of hedged debt was $41.1 billion and $41.7 billion at December 31, 2024 and 2025,
respectively.
Cash paid for interest was $1.3 billion, $1.1 billion, and $1.3 billion in 2023, 2024, and 2025, respectively, on
Company excluding Ford Credit debt. Cash paid for interest was $5.8 billion, $7.0 billion, and $6.7 billion in 2023, 2024,
and 2025, respectively, on Ford Credit debt.
FORD MOTOR COMPANY AND SUBSIDIARIES
NOTES TO THE FINANCIAL STATEMENTS
156
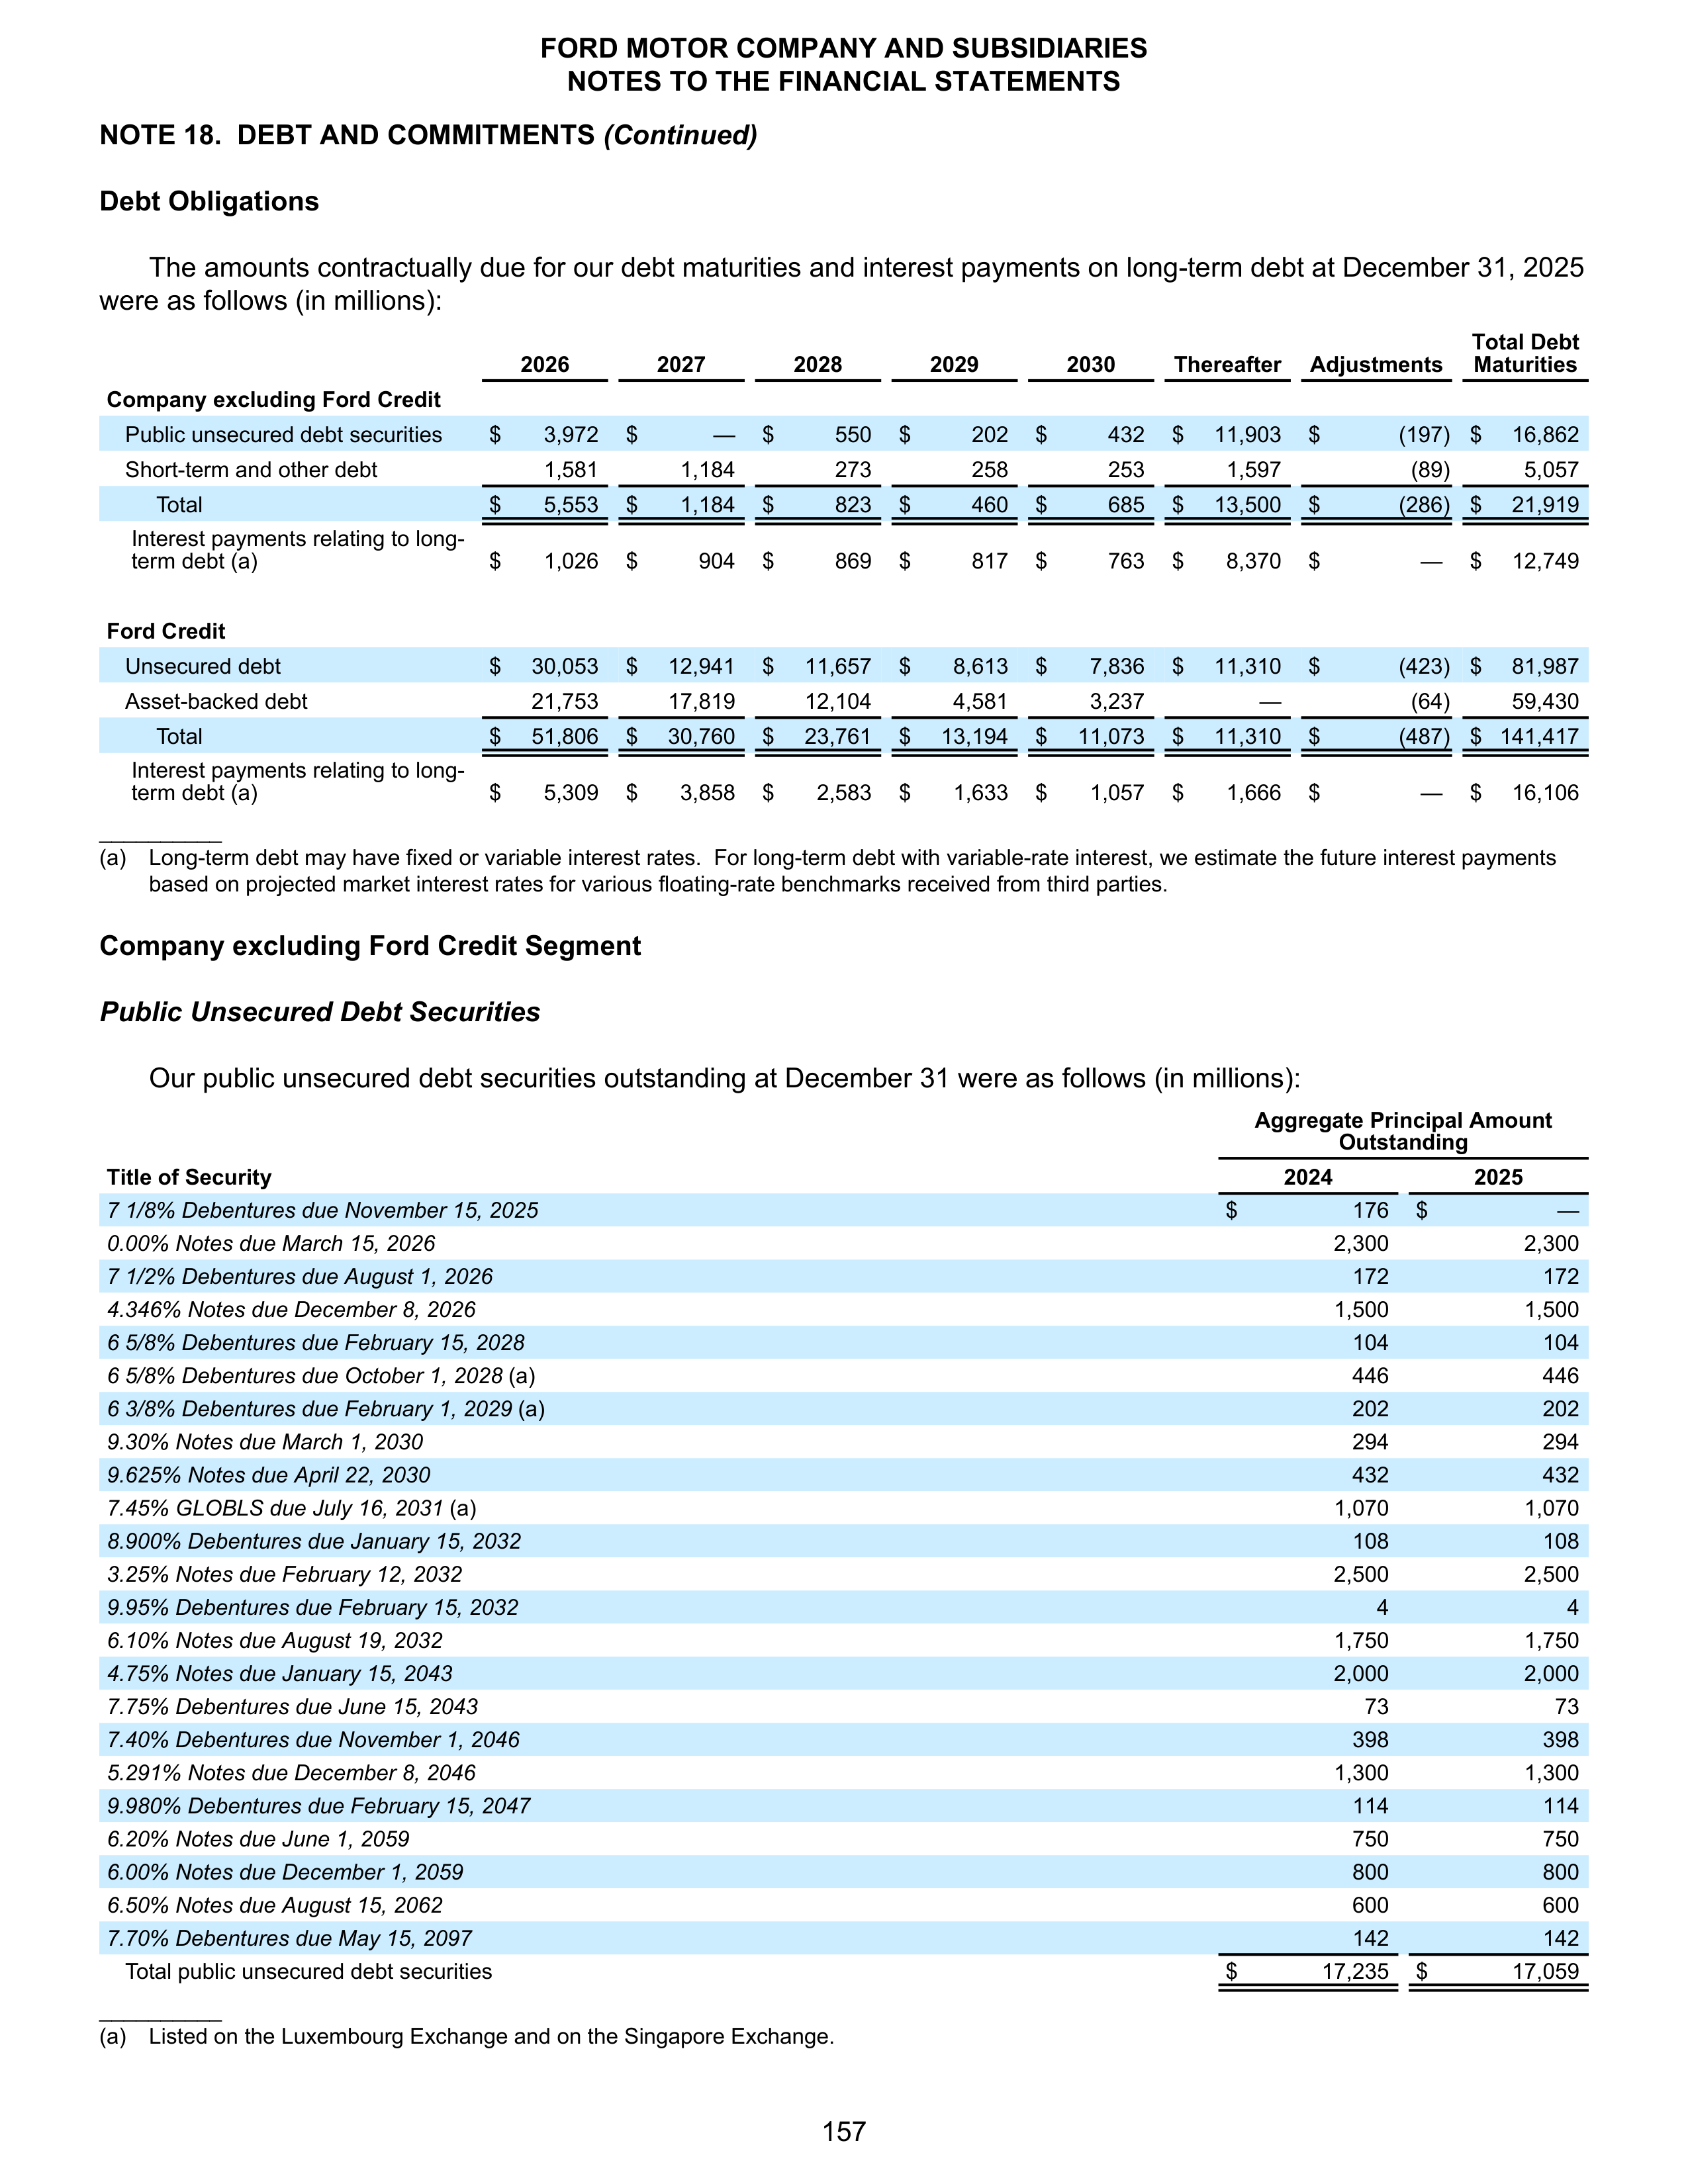
NOTE 18. DEBT AND COMMITMENTS
(Continued)
Debt Obligations
The amounts contractually due for our debt maturities and interest payments on long-term debt at December 31, 2025
were as follows (in millions):
2026
2027
2028
2029
2030
Thereafter
Adjustments
Total Debt
Maturities
Company excluding Ford Credit
Public unsecured debt securities
$
3,972
$
—
$
550
$
202
$
432
$
11,903
$
(197) $
16,862
Short-term and other debt
1,581
1,184
273
258
253
1,597
(89)
5,057
Total
$
5,553
$
1,184
$
823
$
460
$
685
$
13,500
$
(286) $
21,919
Interest payments relating to long-
term debt (a)
$
1,026
$
904
$
869
$
817
$
763
$
8,370
$
—
$
12,749
Ford Credit
Unsecured debt
$
30,053
$
12,941
$
11,657
$
8,613
$
7,836
$
11,310
$
(423) $
81,987
Asset-backed debt
21,753
17,819
12,104
4,581
3,237
—
(64)
59,430
Total
$
51,806
$
30,760
$
23,761
$
13,194
$
11,073
$
11,310
$
(487) $ 141,417
Interest payments relating to long-
term debt (a)
$
5,309
$
3,858
$
2,583
$
1,633
$
1,057
$
1,666
$
—
$
16,106
__________
(a)
Long-term debt may have fixed or variable interest rates. For long-term debt with variable-rate interest, we estimate the future interest payments
based on projected market interest rates for various floating-rate benchmarks received from third parties.
Company excluding Ford Credit Segment
Public Unsecured Debt Securities
Our public unsecured debt securities outstanding at December 31 were as follows (in millions):
Aggregate Principal Amount
Outstanding
Title of Security
2024
2025
7 1/8% Debentures due November 15, 2025
$
176
$
—
0.00% Notes due March 15, 2026
2,300
2,300
7 1/2% Debentures due August 1, 2026
172
172
4.346% Notes due December 8, 2026
1,500
1,500
6 5/8% Debentures due February 15, 2028
104
104
6 5/8% Debentures due October 1, 2028
(a)
446
446
6 3/8% Debentures due February 1, 2029
(a)
202
202
9.30% Notes due March 1, 2030
294
294
9.625% Notes due April 22, 2030
432
432
7.45% GLOBLS due July 16, 2031
(a)
1,070
1,070
8.900% Debentures due January 15, 2032
108
108
3.25% Notes due February 12, 2032
2,500
2,500
9.95% Debentures due February 15, 2032
4
4
6.10% Notes due August 19, 2032
1,750
1,750
4.75% Notes due January 15, 2043
2,000
2,000
7.75% Debentures due June 15, 2043
73
73
7.40% Debentures due November 1, 2046
398
398
5.291% Notes due December 8, 2046
1,300
1,300
9.980% Debentures due February 15, 2047
114
114
6.20% Notes due June 1, 2059
750
750
6.00% Notes due December 1, 2059
800
800
6.50% Notes due August 15, 2062
600
600
7.70% Debentures due May 15, 2097
142
142
Total public unsecured debt securities
$
17,235
$
17,059
__________
(a) Listed on the Luxembourg Exchange and on the Singapore Exchange.
FORD MOTOR COMPANY AND SUBSIDIARIES
NOTES TO THE FINANCIAL STATEMENTS
157
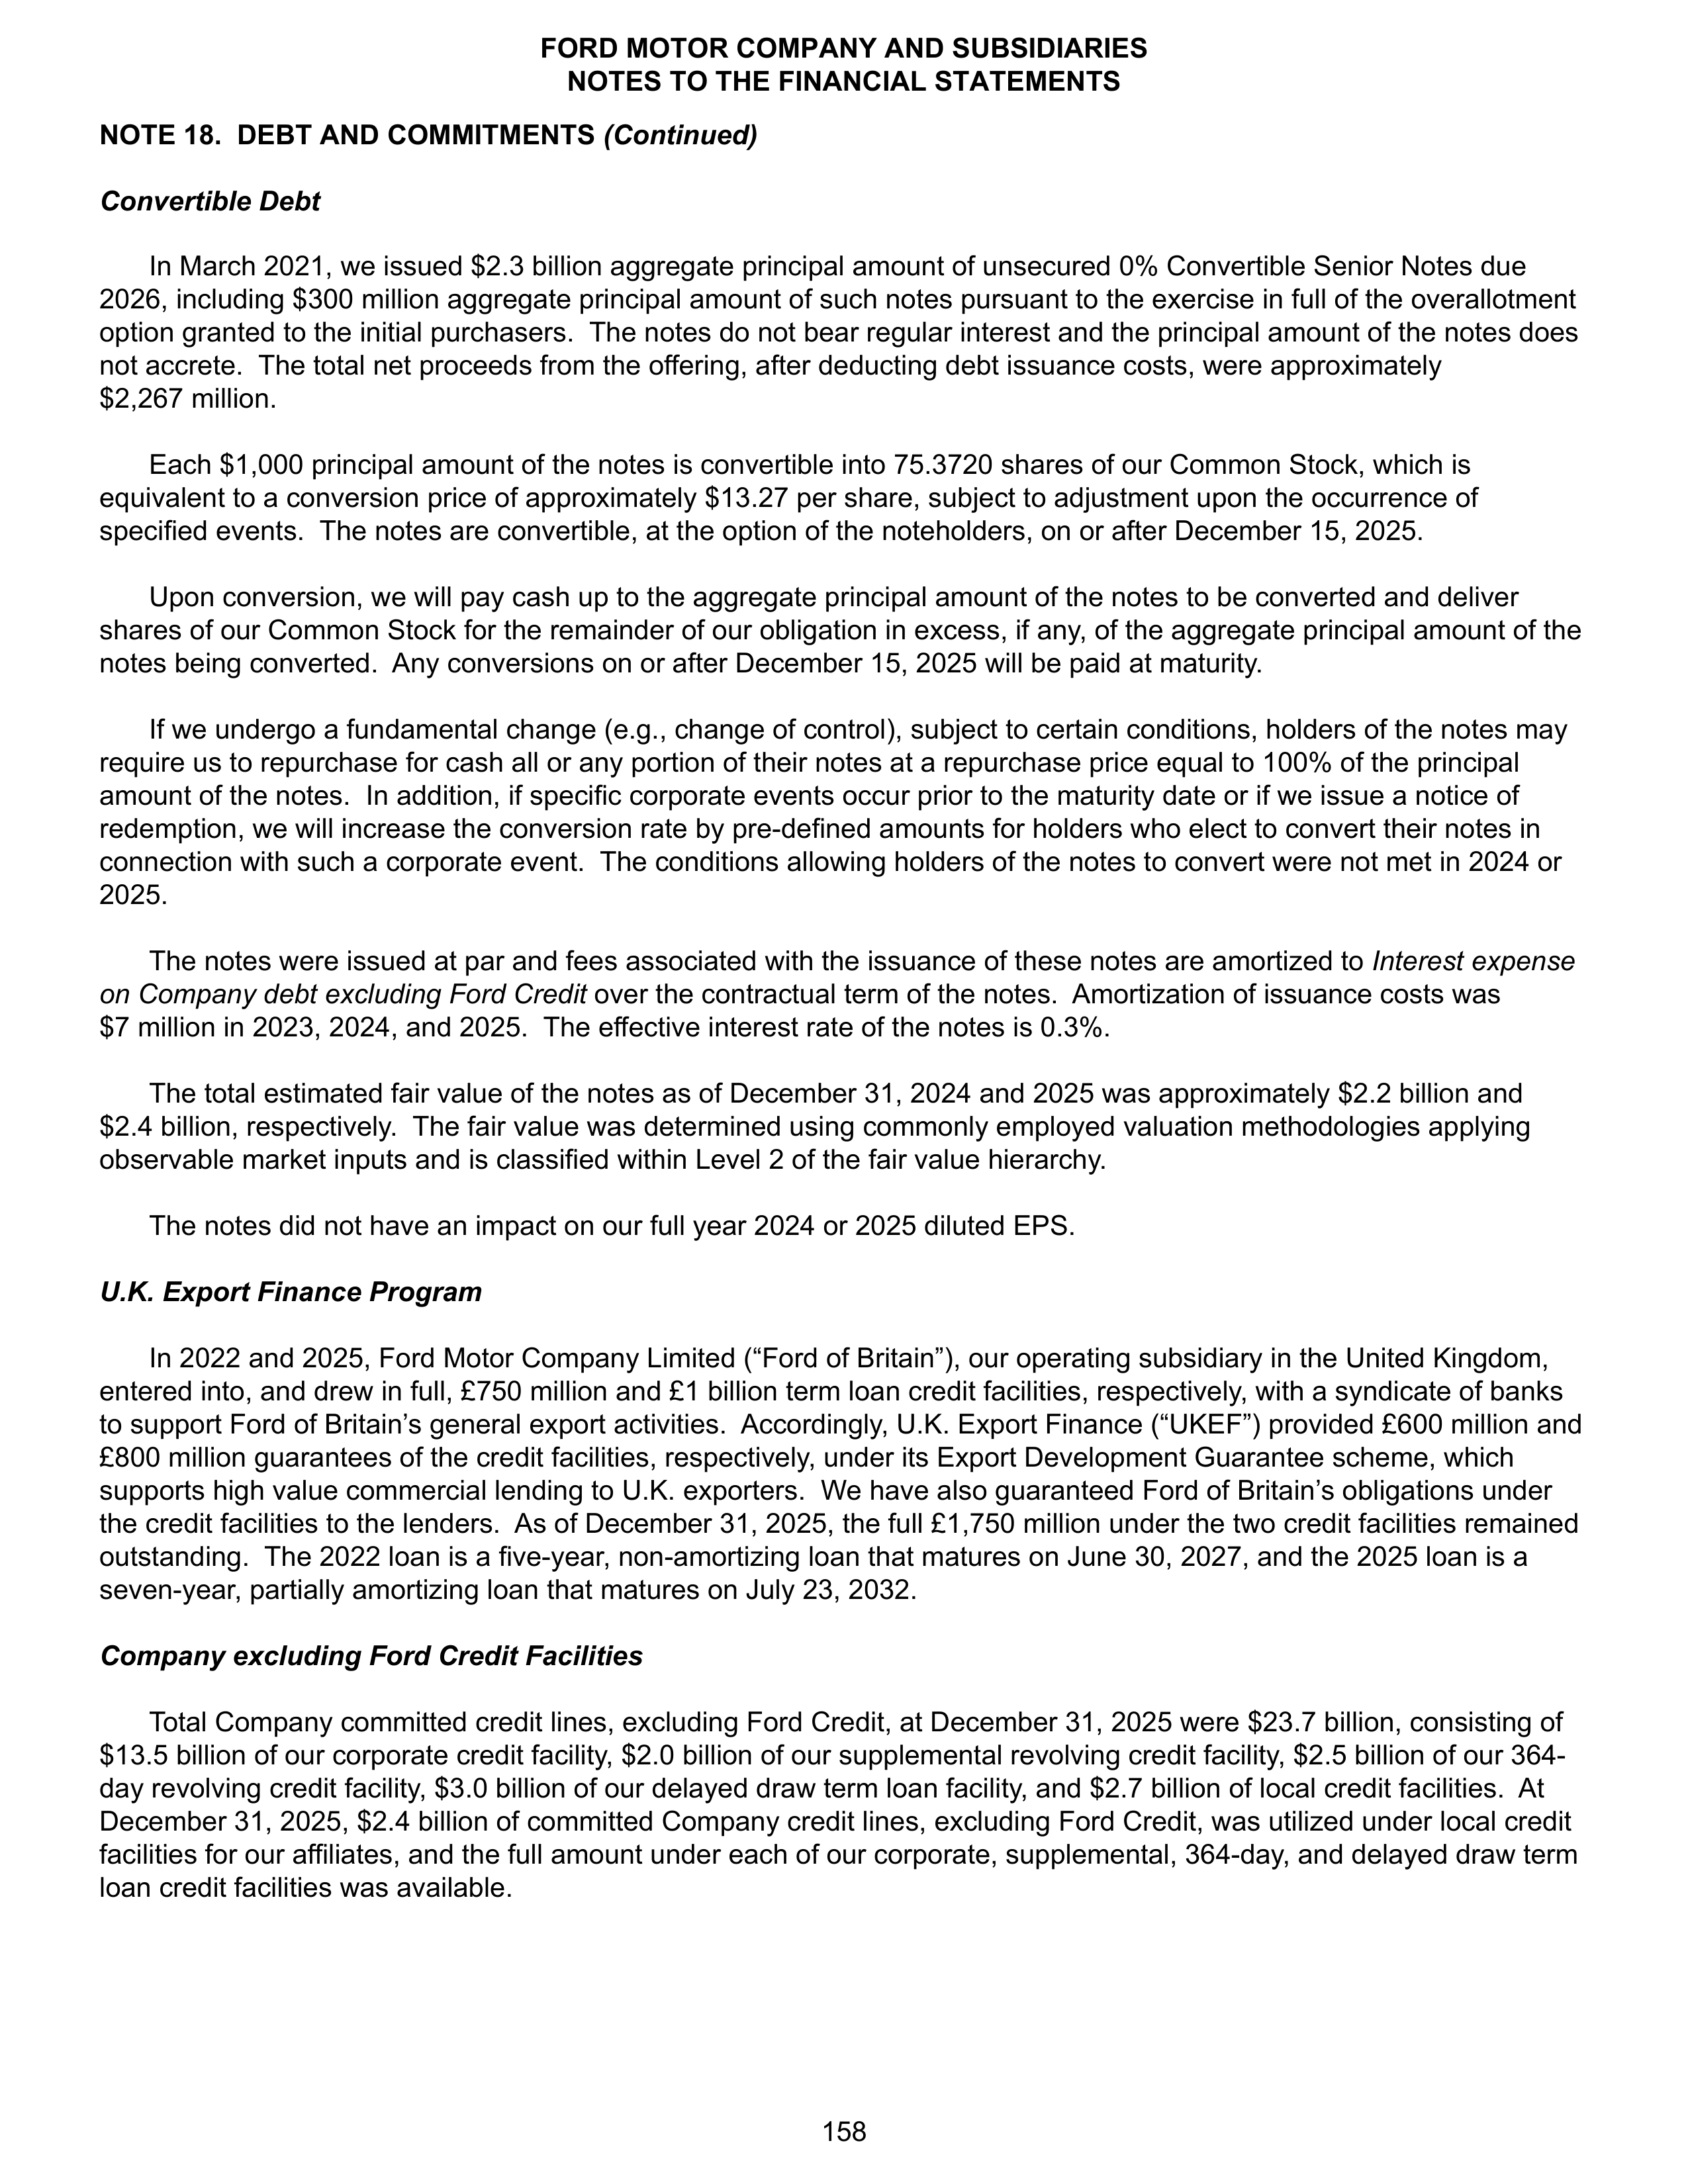
NOTE 18. DEBT AND COMMITMENTS
(Continued)
Convertible Debt
In March 2021, we issued $2.3 billion aggregate principal amount of unsecured 0% Convertible Senior Notes due
2026, including $300 million aggregate principal amount of such notes pursuant to the exercise in full of the overallotment
option granted to the initial purchasers. The notes do not bear regular interest and the principal amount of the notes does
not accrete. The total net proceeds from the offering, after deducting debt issuance costs, were approximately
$2,267 million.
Each $1,000 principal amount of the notes is convertible into 75.3720 shares of our Common Stock, which is
equivalent to a conversion price of approximately $13.27 per share, subject to adjustment upon the occurrence of
specified events. The notes are convertible, at the option of the noteholders, on or after December 15, 2025.
Upon conversion, we will pay cash up to the aggregate principal amount of the notes to be converted and deliver
shares of our Common Stock for the remainder of our obligation in excess, if any, of the aggregate principal amount of the
notes being converted. Any conversions on or after December 15, 2025 will be paid at maturity.
If we undergo a fundamental change (e.g., change of control), subject to certain conditions, holders of the notes may
require us to repurchase for cash all or any portion of their notes at a repurchase price equal to 100% of the principal
amount of the notes. In addition, if specific corporate events occur prior to the maturity date or if we issue a notice of
redemption, we will increase the conversion rate by pre-defined amounts for holders who elect to convert their notes in
connection with such a corporate event. The conditions allowing holders of the notes to convert were not met in 2024 or
2025.
The notes were issued at par and fees associated with the issuance of these notes are amortized to
Interest expense
on Company debt excluding Ford Credit
over the contractual term of the notes. Amortization of issuance costs was
$7 million in 2023, 2024, and 2025. The effective interest rate of the notes is 0.3%.
The total estimated fair value of the notes as of December 31, 2024 and 2025 was approximately $2.2 billion and
$2.4 billion, respectively. The fair value was determined using commonly employed valuation methodologies applying
observable market inputs and is classified within Level 2 of the fair value hierarchy.
The notes did not have an impact on our full year 2024 or 2025 diluted EPS.
U.K. Export Finance Program
In 2022 and 2025, Ford Motor Company Limited (“Ford of Britain”), our operating subsidiary in the United Kingdom,
entered into, and drew in full, £750 million and £1 billion term loan credit facilities, respectively, with a syndicate of banks
to support Ford of Britain’s general export activities. Accordingly, U.K. Export Finance (“UKEF”) provided £600 million and
£800 million guarantees of the credit facilities, respectively, under its Export Development Guarantee scheme, which
supports high value commercial lending to U.K. exporters. We have also guaranteed Ford of Britain’s obligations under
the credit facilities to the lenders. As of December 31, 2025, the full £1,750 million under the two credit facilities remained
outstanding. The 2022 loan is a five-year, non-amortizing loan that matures on June 30, 2027, and the 2025 loan is a
seven-year, partially amortizing loan that matures on July 23, 2032.
Company excluding Ford Credit Facilities
Total Company committed credit lines, excluding Ford Credit, at December 31, 2025 were $23.7 billion, consisting of
$13.5 billion of our corporate credit facility, $2.0 billion of our supplemental revolving credit facility, $2.5 billion of our 364-
day revolving credit facility, $3.0 billion of our delayed draw term loan facility, and $2.7 billion of local credit facilities. At
December 31, 2025, $2.4 billion of committed Company credit lines, excluding Ford Credit, was utilized under local credit
facilities for our affiliates, and the full amount under each of our corporate, supplemental, 364-day, and delayed draw term
loan credit facilities was available.
FORD MOTOR COMPANY AND SUBSIDIARIES
NOTES TO THE FINANCIAL STATEMENTS
158
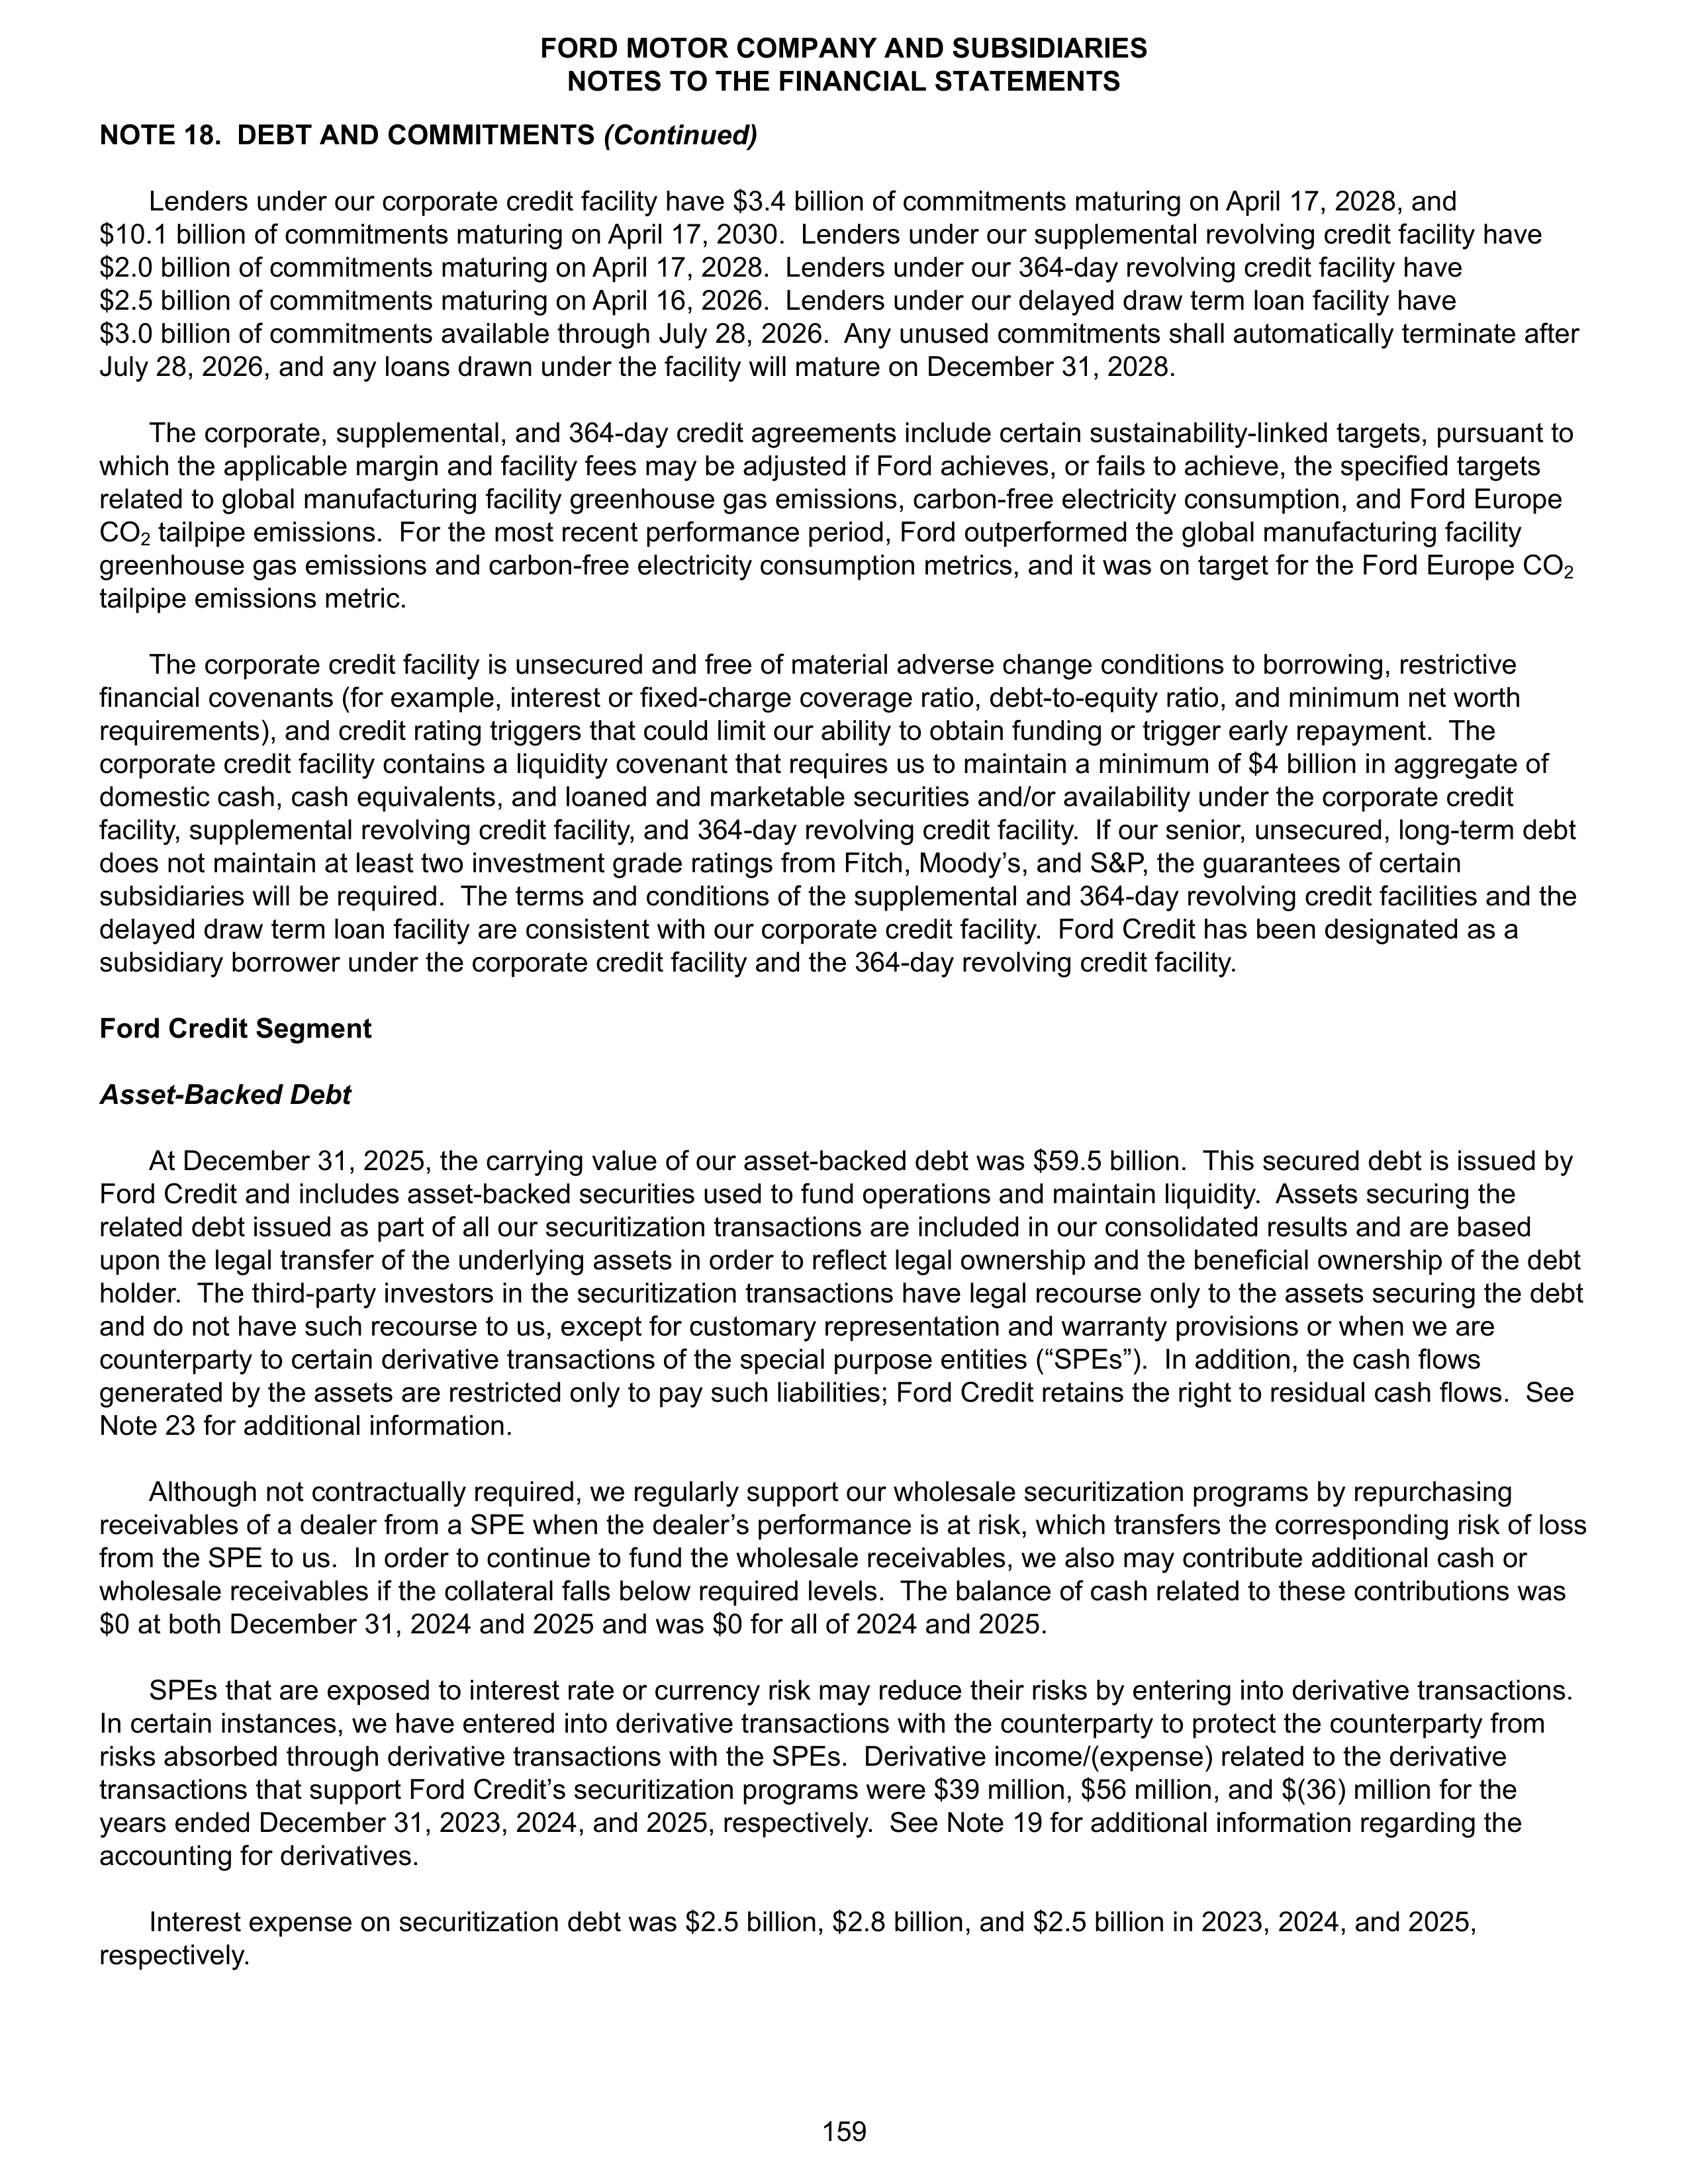
NOTE 18. DEBT AND COMMITMENTS
(Continued)
Lenders under our corporate credit facility have $3.4 billion of commitments maturing on April 17, 2028, and
$10.1 billion of commitments maturing on April 17, 2030. Lenders under our supplemental revolving credit facility have
$2.0 billion of commitments maturing on April 17, 2028. Lenders under our 364-day revolving credit facility have
$2.5 billion of commitments maturing on April 16, 2026. Lenders under our delayed draw term loan facility have
$3.0 billion of commitments available through July 28, 2026. Any unused commitments shall automatically terminate after
July 28, 2026, and any loans drawn under the facility will mature on December 31, 2028.
The corporate, supplemental, and 364-day credit agreements include certain sustainability-linked targets, pursuant to
which the applicable margin and facility fees may be adjusted if Ford achieves, or fails to achieve, the specified targets
related to global manufacturing facility greenhouse gas emissions, carbon-free electricity consumption, and Ford Europe
CO
2
tailpipe emissions. For the most recent performance period, Ford outperformed the global manufacturing facility
greenhouse gas emissions and carbon-free electricity consumption metrics, and it was on target for the Ford Europe CO
2
tailpipe emissions metric.
The corporate credit facility is unsecured and free of material adverse change conditions to borrowing, restrictive
financial covenants (for example, interest or fixed-charge coverage ratio, debt-to-equity ratio, and minimum net worth
requirements), and credit rating triggers that could limit our ability to obtain funding or trigger early repayment. The
corporate credit facility contains a liquidity covenant that requires us to maintain a minimum of $4 billion in aggregate of
domestic cash, cash equivalents, and loaned and marketable securities and/or availability under the corporate credit
facility, supplemental revolving credit facility, and 364-day revolving credit facility. If our senior, unsecured, long-term debt
does not maintain at least two investment grade ratings from Fitch, Moody’s, and S&P, the guarantees of certain
subsidiaries will be required. The terms and conditions of the supplemental and 364-day revolving credit facilities and the
delayed draw term loan facility are consistent with our corporate credit facility. Ford Credit has been designated as a
subsidiary borrower under the corporate credit facility and the 364-day revolving credit facility.
Ford Credit Segment
Asset-Backed Debt
At December 31, 2025, the carrying value of our asset-backed debt was $59.5 billion. This secured debt is issued by
Ford Credit and includes asset-backed securities used to fund operations and maintain liquidity. Assets securing the
related debt issued as part of all our securitization transactions are included in our consolidated results and are based
upon the legal transfer of the underlying assets in order to reflect legal ownership and the beneficial ownership of the debt
holder. The third-party investors in the securitization transactions have legal recourse only to the assets securing the debt
and do not have such recourse to us, except for customary representation and warranty provisions or when we are
counterparty to certain derivative transactions of the special purpose entities (“SPEs”). In addition, the cash flows
generated by the assets are restricted only to pay such liabilities; Ford Credit retains the right to residual cash flows. See
Note 23 for additional information.
Although not contractually required, we regularly support our wholesale securitization programs by repurchasing
receivables of a dealer from a SPE when the dealer’s performance is at risk, which transfers the corresponding risk of loss
from the SPE to us. In order to continue to fund the wholesale receivables, we also may contribute additional cash or
wholesale receivables if the collateral falls below required levels. The balance of cash related to these contributions was
$0 at both December 31, 2024 and 2025 and was $0 for all of 2024 and 2025.
SPEs that are exposed to interest rate or currency risk may reduce their risks by entering into derivative transactions.
In certain instances, we have entered into derivative transactions with the counterparty to protect the counterparty from
risks absorbed through derivative transactions with the SPEs. Derivative income/(expense) related to the derivative
transactions that support Ford Credit’s securitization programs were $39 million, $56 million, and $(36) million for the
years ended December 31, 2023, 2024, and 2025, respectively. See Note 19 for additional information regarding the
accounting for derivatives.
Interest expense on securitization debt was $2.5 billion, $2.8 billion, and $2.5 billion in 2023, 2024, and 2025,
respectively.
FORD MOTOR COMPANY AND SUBSIDIARIES
NOTES TO THE FINANCIAL STATEMENTS
159
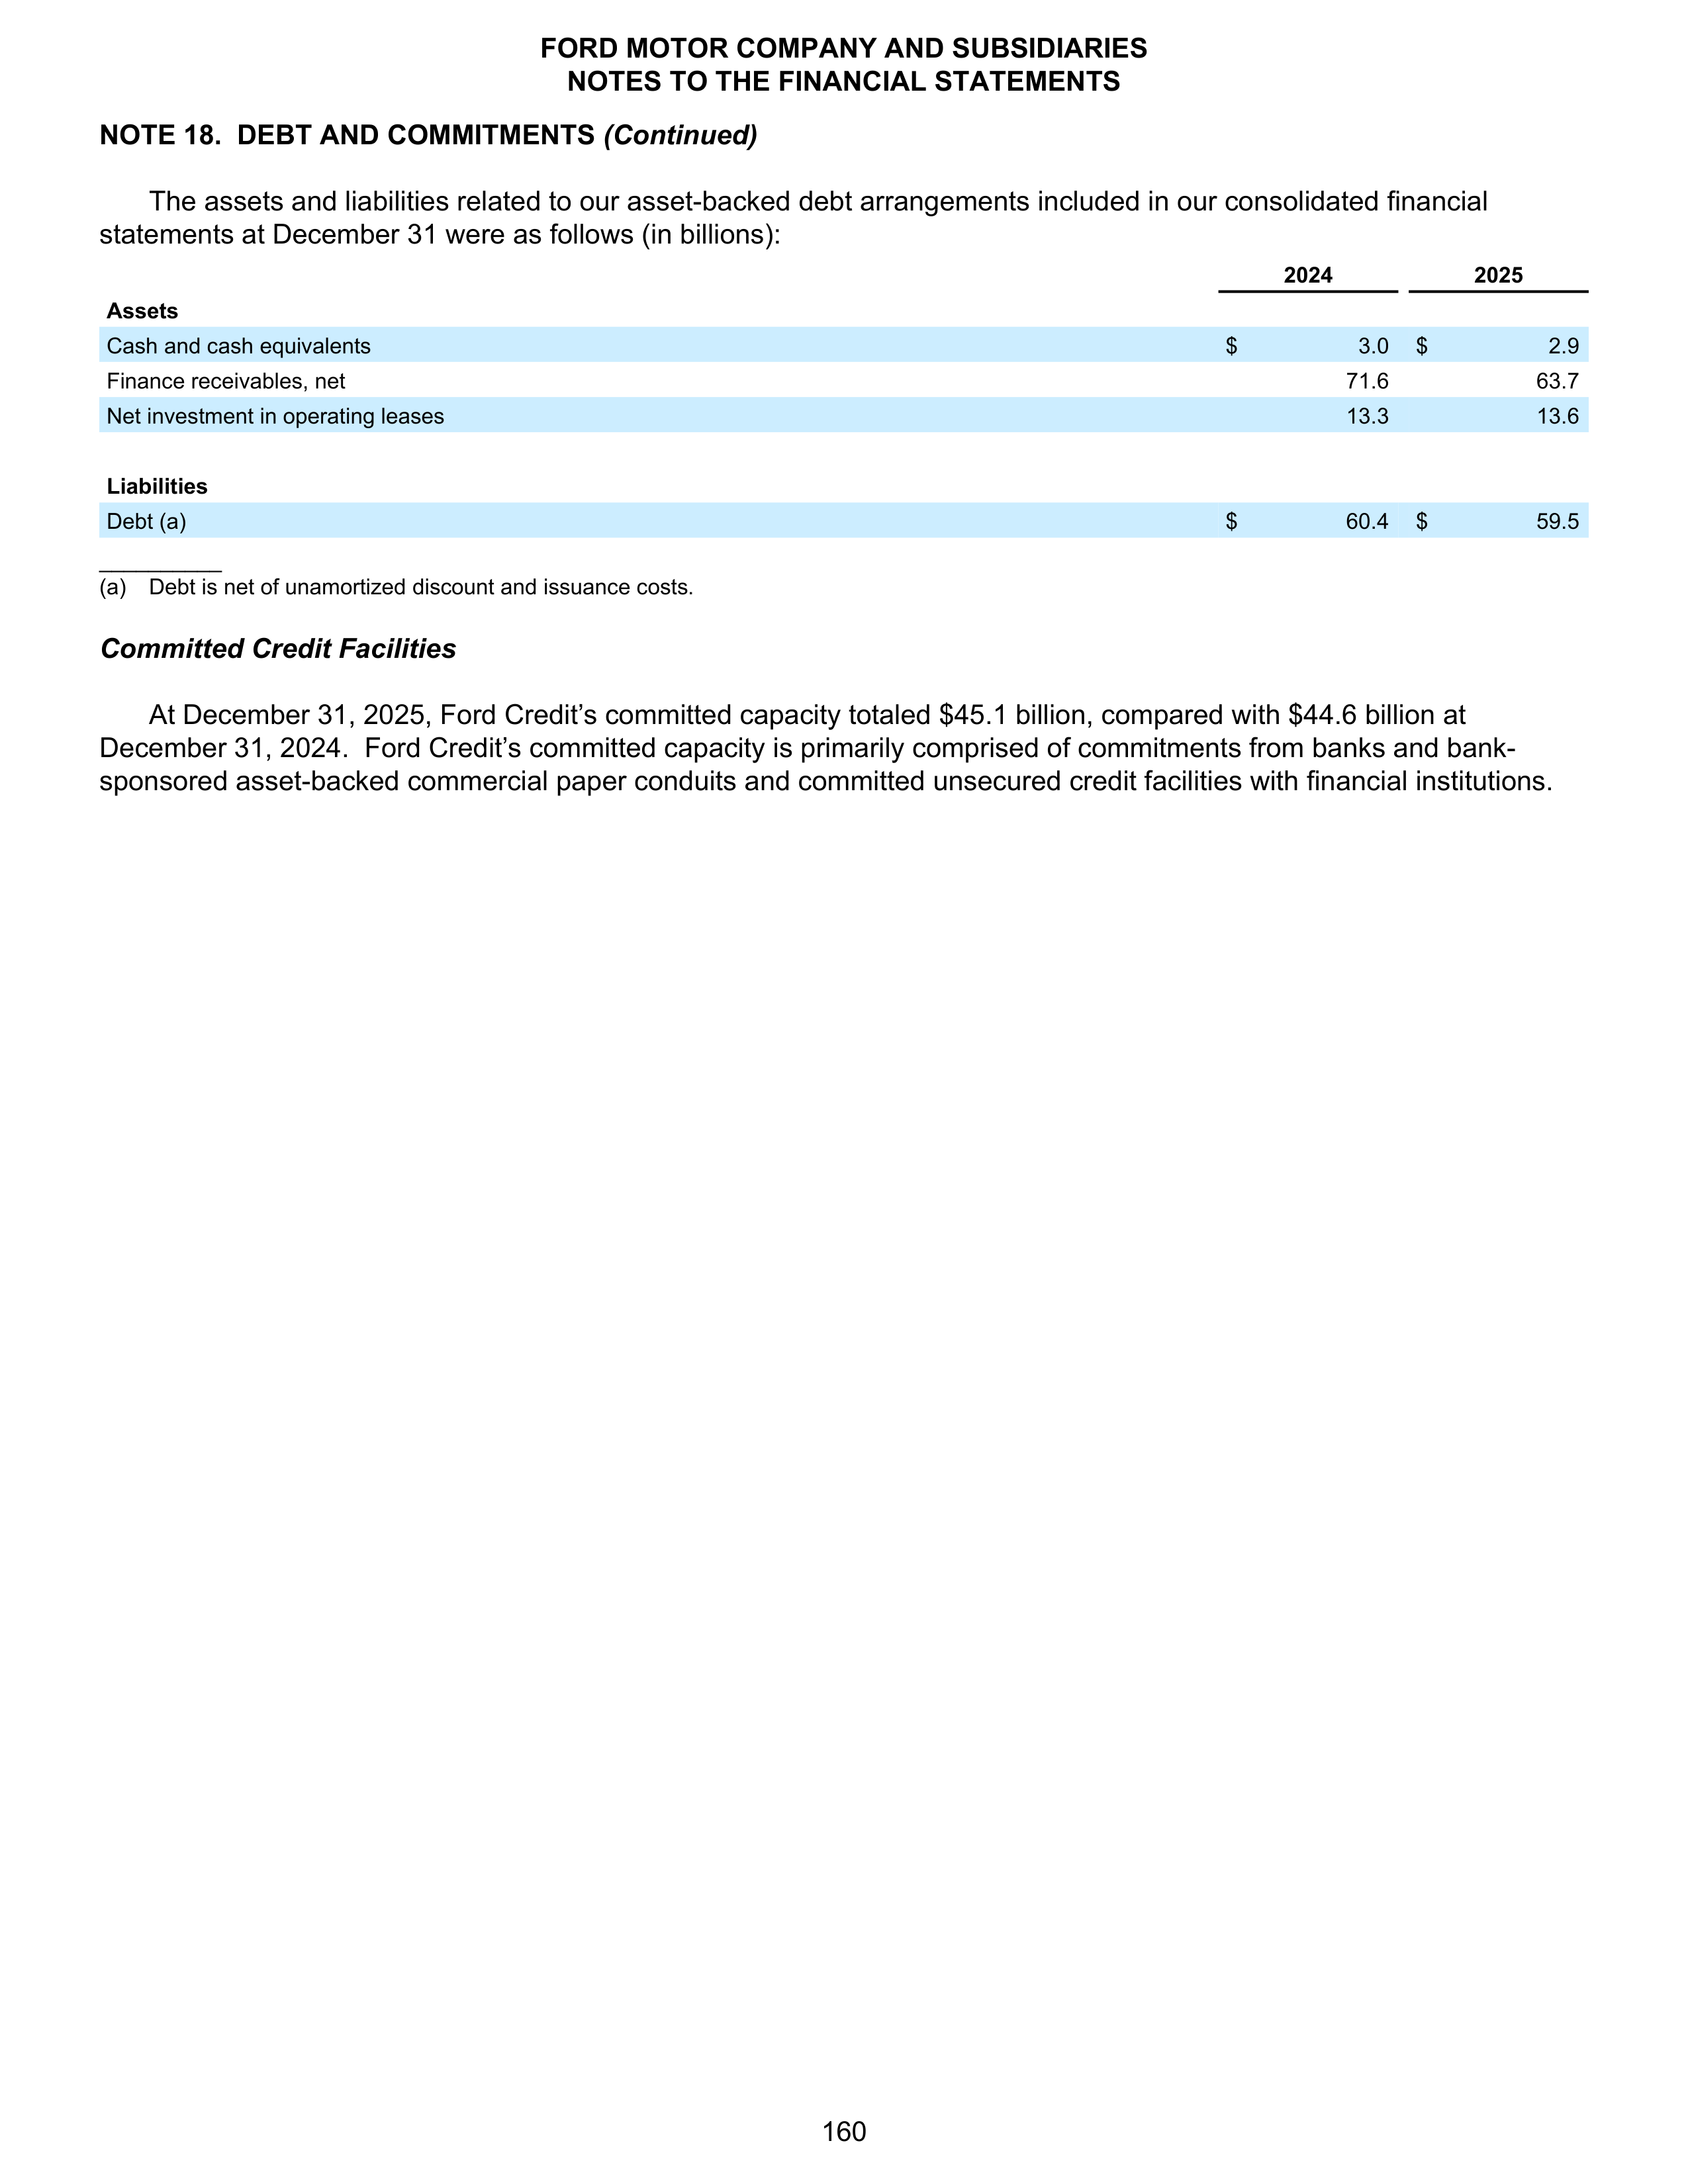
NOTE 18. DEBT AND COMMITMENTS
(Continued)
The assets and liabilities related to our asset-backed debt arrangements included in our consolidated financial
statements at December 31 were as follows (in billions):
2024
2025
Assets
Cash and cash equivalents
$
3.0
$
2.9
Finance receivables, net
71.6
63.7
Net investment in operating leases
13.3
13.6
Liabilities
Debt (a)
$
60.4
$
59.5
__________
(a)
Debt is net of unamortized discount and issuance costs.
Committed Credit Facilities
At December 31, 2025, Ford Credit’s committed capacity totaled $45.1 billion, compared with $44.6 billion at
December 31, 2024. Ford Credit’s committed capacity is primarily comprised of commitments from banks and bank-
sponsored asset-backed commercial paper conduits and committed unsecured credit facilities with financial institutions.
FORD MOTOR COMPANY AND SUBSIDIARIES
NOTES TO THE FINANCIAL STATEMENTS
160
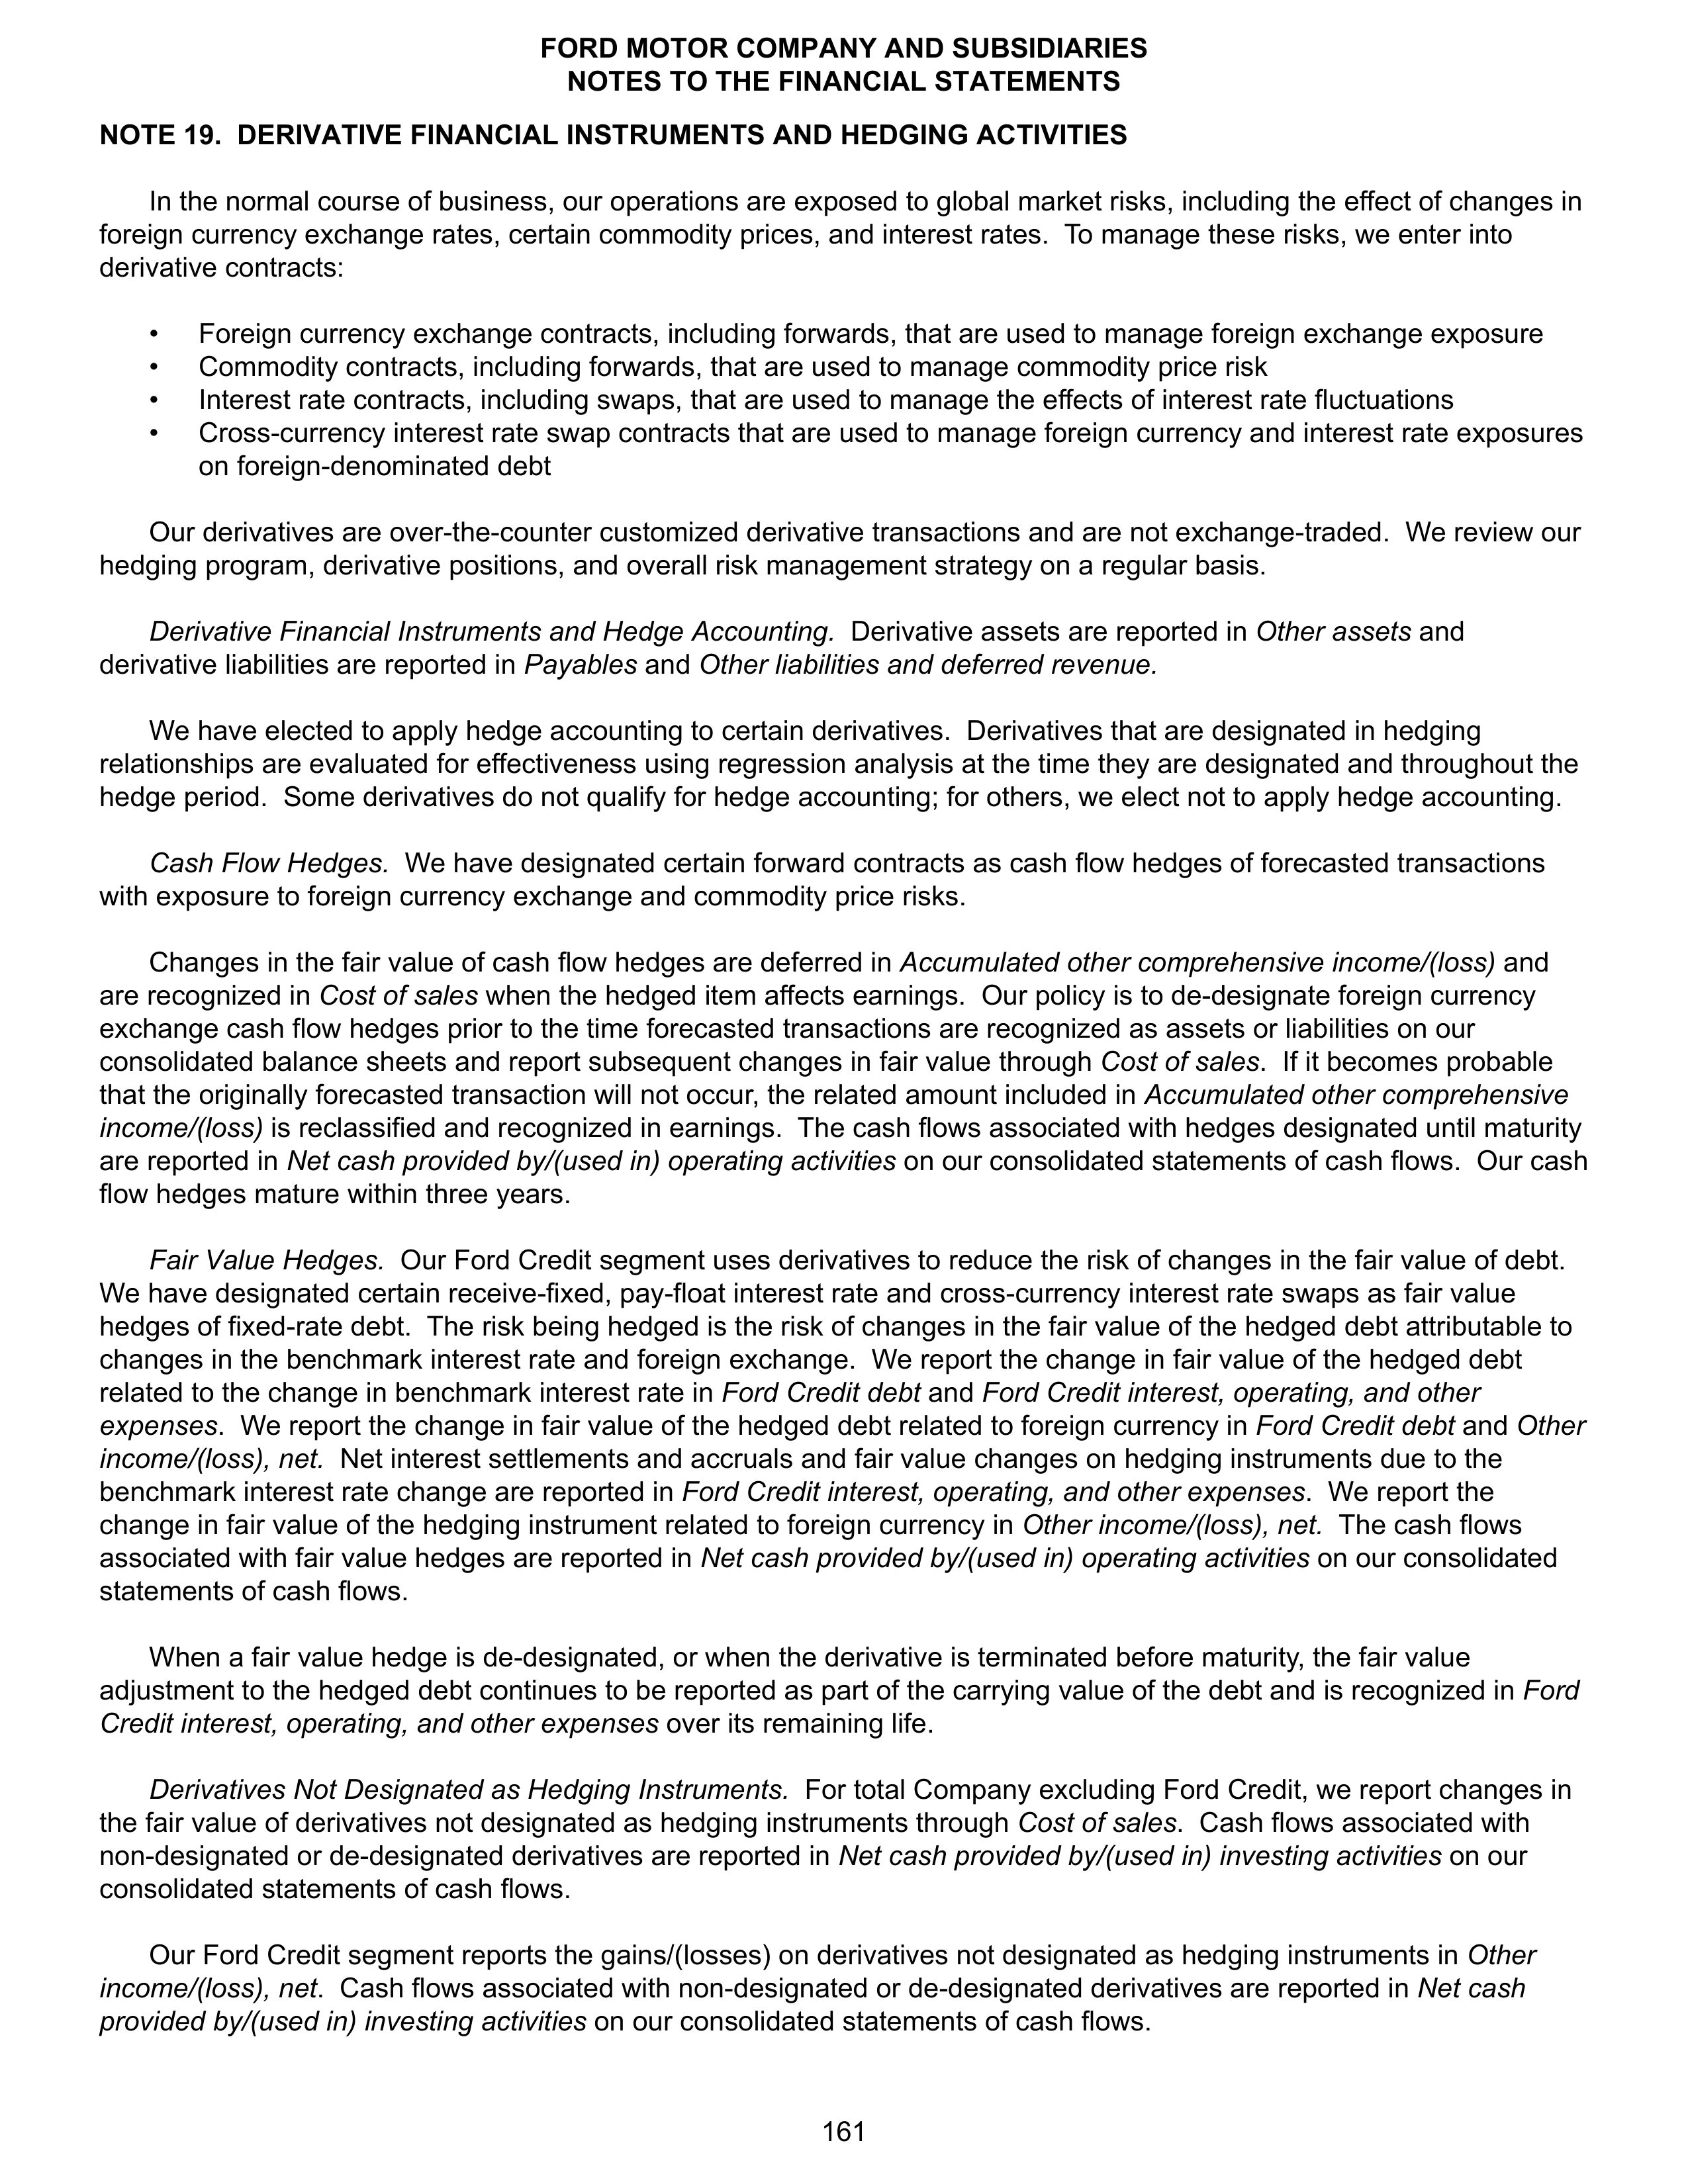
NOTE 19. DERIVATIVE FINANCIAL INSTRUMENTS AND HEDGING ACTIVITIES
In the normal course of business, our operations are exposed to global market risks, including the effect of changes in
foreign currency exchange rates, certain commodity prices, and interest rates. To manage these risks, we enter into
derivative contracts:
•
Foreign currency exchange contracts, including forwards, that are used to manage foreign exchange exposure
•
Commodity contracts, including forwards, that are used to manage commodity price risk
•
Interest rate contracts, including swaps, that are used to manage the effects of interest rate fluctuations
•
Cross-currency interest rate swap contracts that are used to manage foreign currency and interest rate exposures
on foreign-denominated debt
Our derivatives are over-the-counter customized derivative transactions and are not exchange-traded. We review our
hedging program, derivative positions, and overall risk management strategy on a regular basis.
Derivative Financial Instruments and Hedge Accounting.
Derivative assets are reported in
Other assets
and
derivative liabilities are reported in
Payables
and
Other liabilities and deferred revenue.
We have elected to apply hedge accounting to certain derivatives. Derivatives that are designated in hedging
relationships are evaluated for effectiveness using regression analysis at the time they are designated and throughout the
hedge period. Some derivatives do not qualify for hedge accounting; for others, we elect not to apply hedge accounting.
Cash Flow Hedges.
We have designated certain forward contracts as cash flow hedges of forecasted transactions
with exposure to foreign currency exchange and commodity price risks.
Changes in the fair value of cash flow hedges are deferred in
Accumulated other comprehensive income/(loss)
and
are recognized in
Cost of sales
when the hedged item affects earnings. Our policy is to de-designate foreign currency
exchange cash flow hedges prior to the time forecasted transactions are recognized as assets or liabilities on our
consolidated balance sheets and report subsequent changes in fair value through
Cost of sales
. If it becomes probable
that the originally forecasted transaction will not occur, the related amount included in
Accumulated other comprehensive
income/(loss)
is reclassified and recognized in earnings. The cash flows associated with hedges designated until maturity
are reported in
Net cash provided by/(used in) operating activities
on our consolidated statements of cash flows. Our cash
flow hedges mature within three years.
Fair Value Hedges.
Our Ford Credit segment uses derivatives to reduce the risk of changes in the fair value of debt.
We have designated certain receive-fixed, pay-float interest rate and cross-currency interest rate swaps as fair value
hedges of fixed-rate debt. The risk being hedged is the risk of changes in the fair value of the hedged debt attributable to
changes in the benchmark interest rate and foreign exchange. We report the change in fair value of the hedged debt
related to the change in benchmark interest rate in
Ford Credit debt
and
Ford Credit interest, operating, and other
expenses
.
We report the change in fair value of the hedged debt related to foreign currency in
Ford Credit debt
and
Other
income/(loss), net.
Net interest settlements and accruals and fair value changes on hedging instruments due to the
benchmark interest rate change are reported in
Ford Credit interest, operating, and other expenses
. We report the
change in fair value of the hedging instrument related to foreign currency in
Other income/(loss), net.
The cash flows
associated with fair value hedges are reported in
Net cash provided by/(used in) operating activities
on our consolidated
statements of cash flows.
When a fair value hedge is de-designated, or when the derivative is terminated before maturity, the fair value
adjustment to the hedged debt continues to be reported as part of the carrying value of the debt and is recognized in
Ford
Credit interest, operating, and other expenses
over its remaining life.
Derivatives Not Designated as Hedging Instruments.
For total Company excluding Ford Credit, we report changes in
the fair value of derivatives not designated as hedging instruments through
Cost of sales
. Cash flows associated with
non-designated or de-designated derivatives are reported in
Net cash provided by/(used in) investing activities
on our
consolidated statements of cash flows.
Our Ford Credit segment reports the gains/(losses) on derivatives not designated as hedging instruments in
Other
income/(loss), net
. Cash flows associated with non-designated or de-designated derivatives are reported in
Net cash
provided by/(used in) investing activities
on our consolidated statements of cash flows.
FORD MOTOR COMPANY AND SUBSIDIARIES
NOTES TO THE FINANCIAL STATEMENTS
161
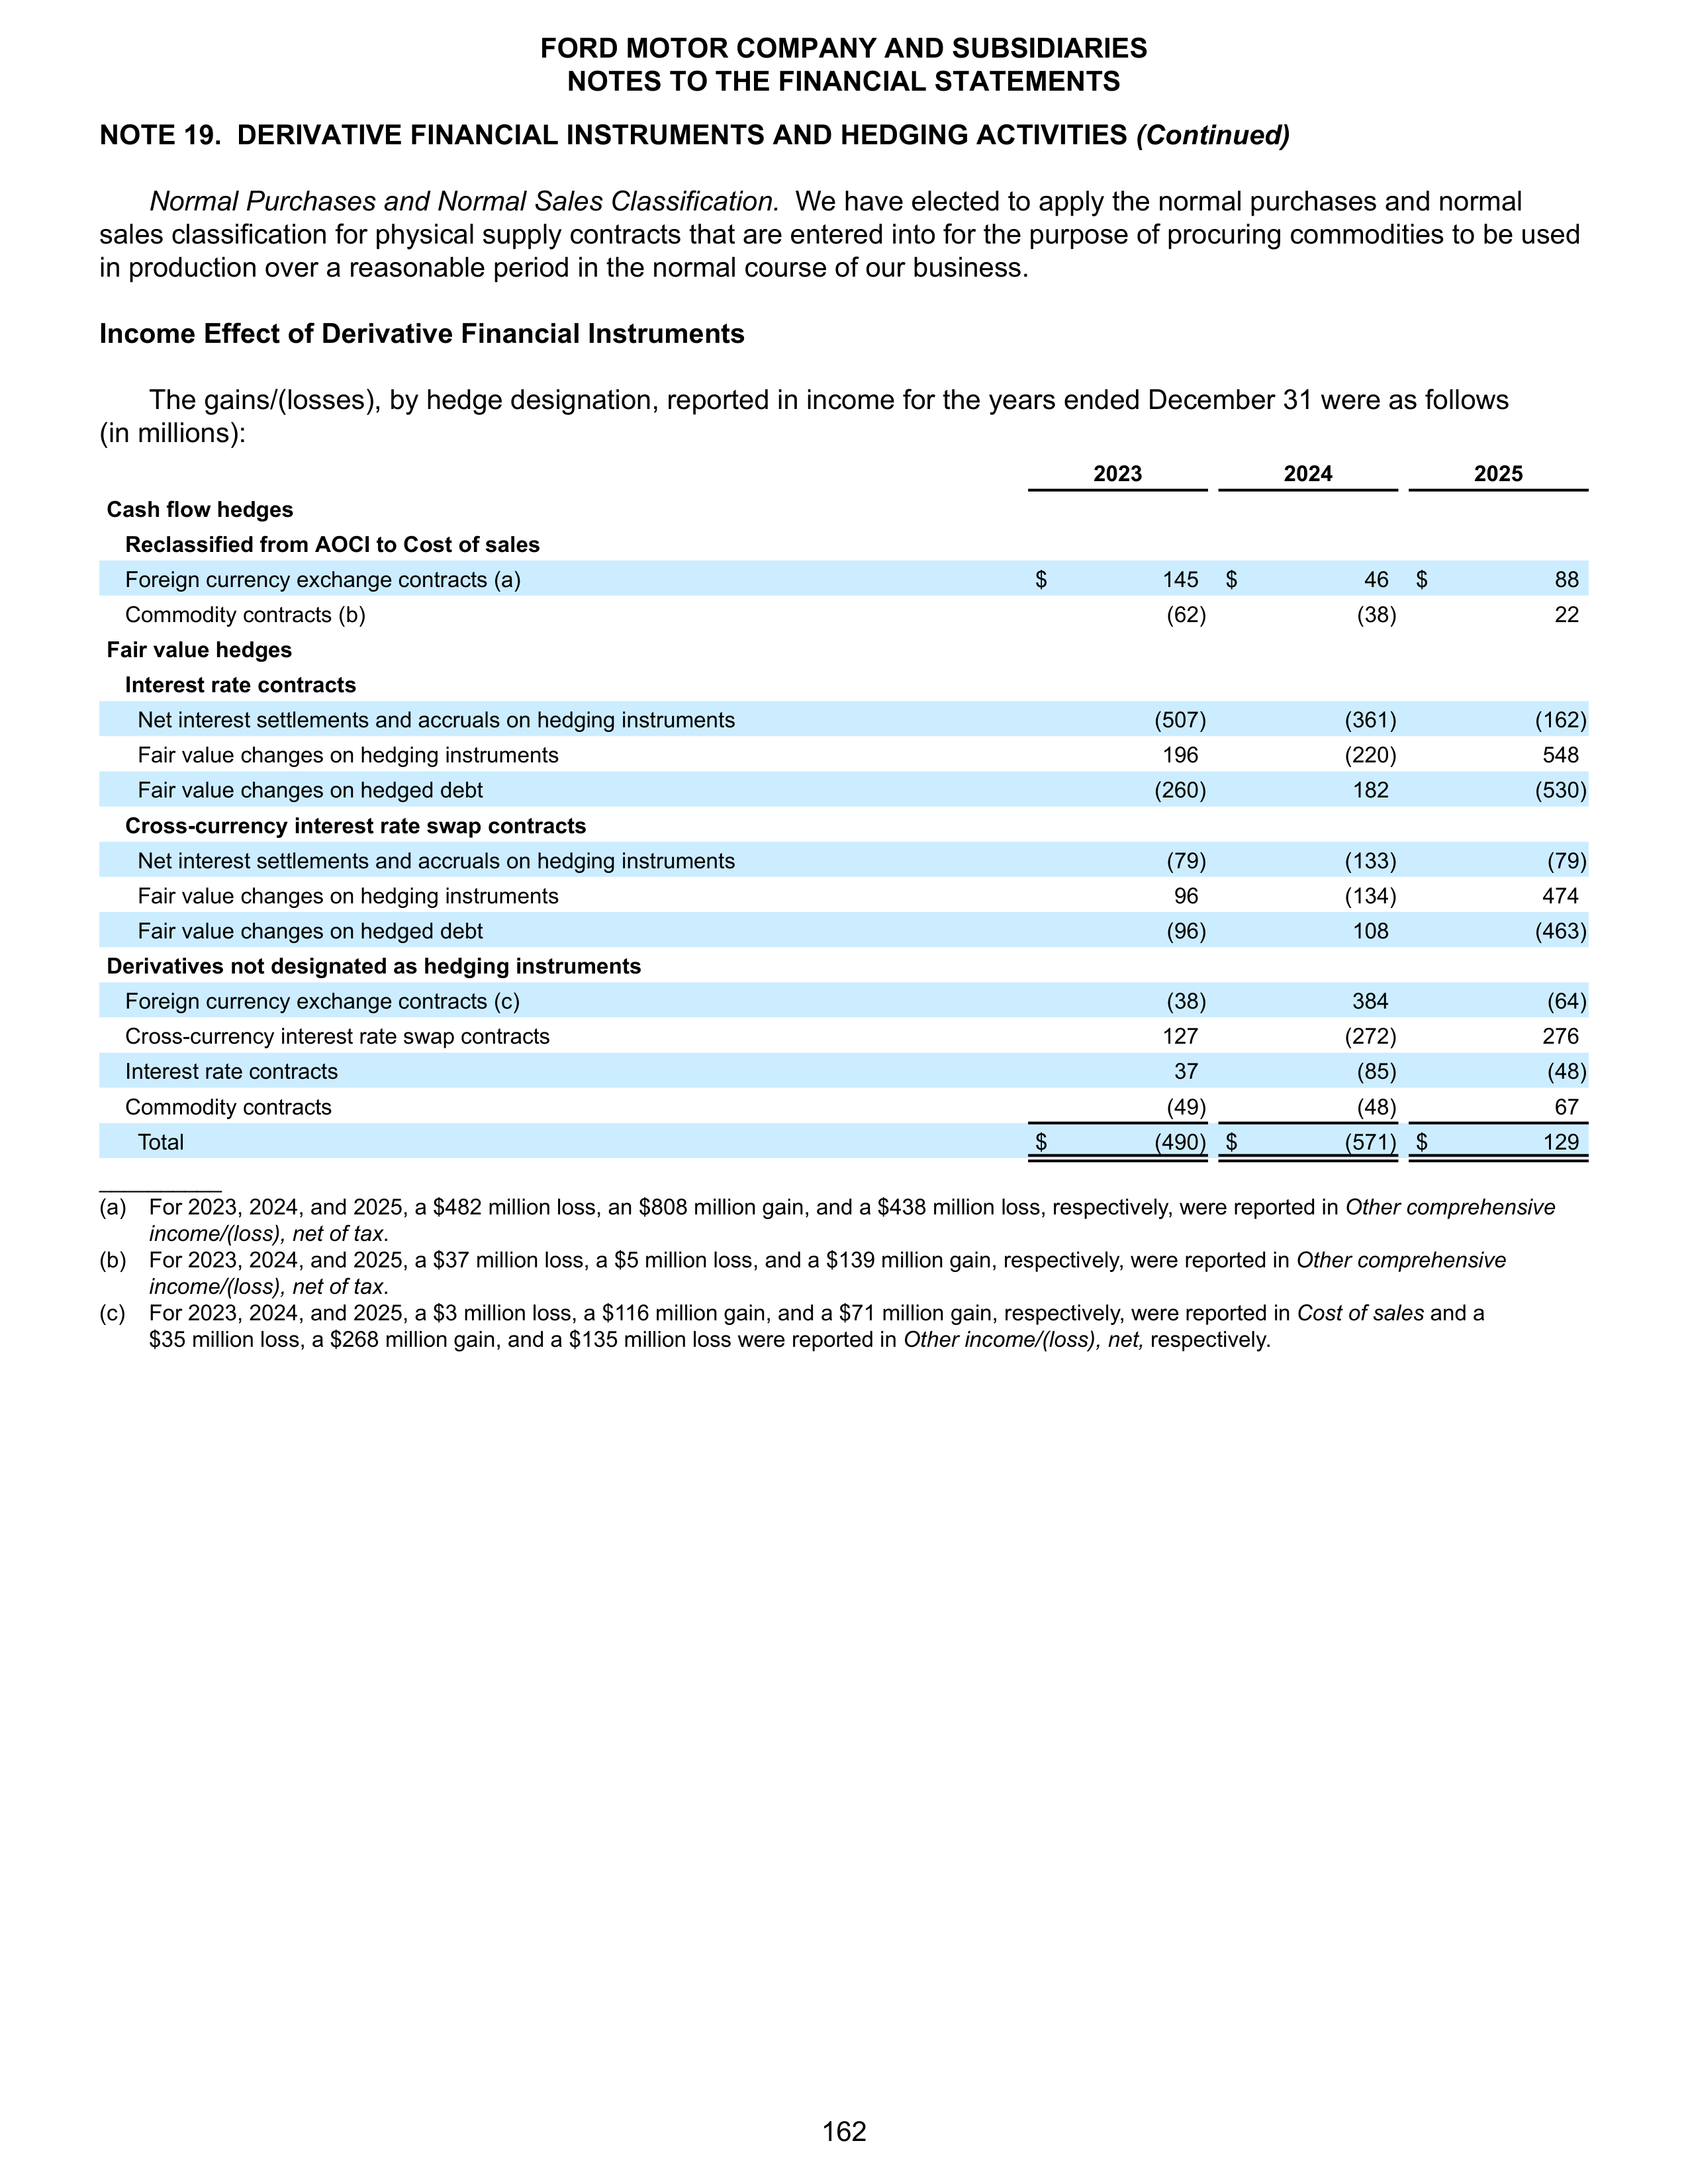
NOTE 19. DERIVATIVE FINANCIAL INSTRUMENTS AND HEDGING ACTIVITIES
(Continued)
Normal Purchases and Normal Sales Classification.
We have elected to apply the normal purchases and normal
sales classification for physical supply contracts that are entered into for the purpose of procuring commodities to be used
in production over a reasonable period in the normal course of our business.
Income Effect of Derivative Financial Instruments
The gains/(losses), by hedge designation, reported in income for the years ended December 31 were as follows
(in millions):
2023
2024
2025
Cash flow hedges
Reclassified from AOCI to Cost of sales
Foreign currency exchange contracts (a)
$
145
$
46
$
88
Commodity contracts (b)
(62)
(38)
22
Fair value hedges
Interest rate contracts
Net interest settlements and accruals on hedging instruments
(507)
(361)
(162)
Fair value changes on hedging instruments
196
(220)
548
Fair value changes on hedged debt
(260)
182
(530)
Cross-currency interest rate swap contracts
Net interest settlements and accruals on hedging instruments
(79)
(133)
(79)
Fair value changes on hedging instruments
96
(134)
474
Fair value changes on hedged debt
(96)
108
(463)
Derivatives not designated as hedging instruments
Foreign currency exchange contracts (c)
(38)
384
(64)
Cross-currency interest rate swap contracts
127
(272)
276
Interest rate contracts
37
(85)
(48)
Commodity contracts
(49)
(48)
67
Total
$
(490) $
(571) $
129
__________
(a)
For 2023, 2024, and 2025, a $482 million loss, an $808 million gain, and a $438 million loss, respectively, were reported in
Other comprehensive
income/(loss), net of tax
.
(b)
For 2023, 2024, and 2025, a $37 million loss, a $5 million loss, and a $139 million gain, respectively, were reported in
Other comprehensive
income/(loss), net of tax
.
(c)
For 2023, 2024, and 2025, a $3 million loss, a $116 million gain, and a $71 million gain, respectively, were reported in
Cost of sales
and a
$35 million loss, a $268 million gain, and a $135 million loss
were reported in
Other income/(loss), net,
respectively.
FORD MOTOR COMPANY AND SUBSIDIARIES
NOTES TO THE FINANCIAL STATEMENTS
162
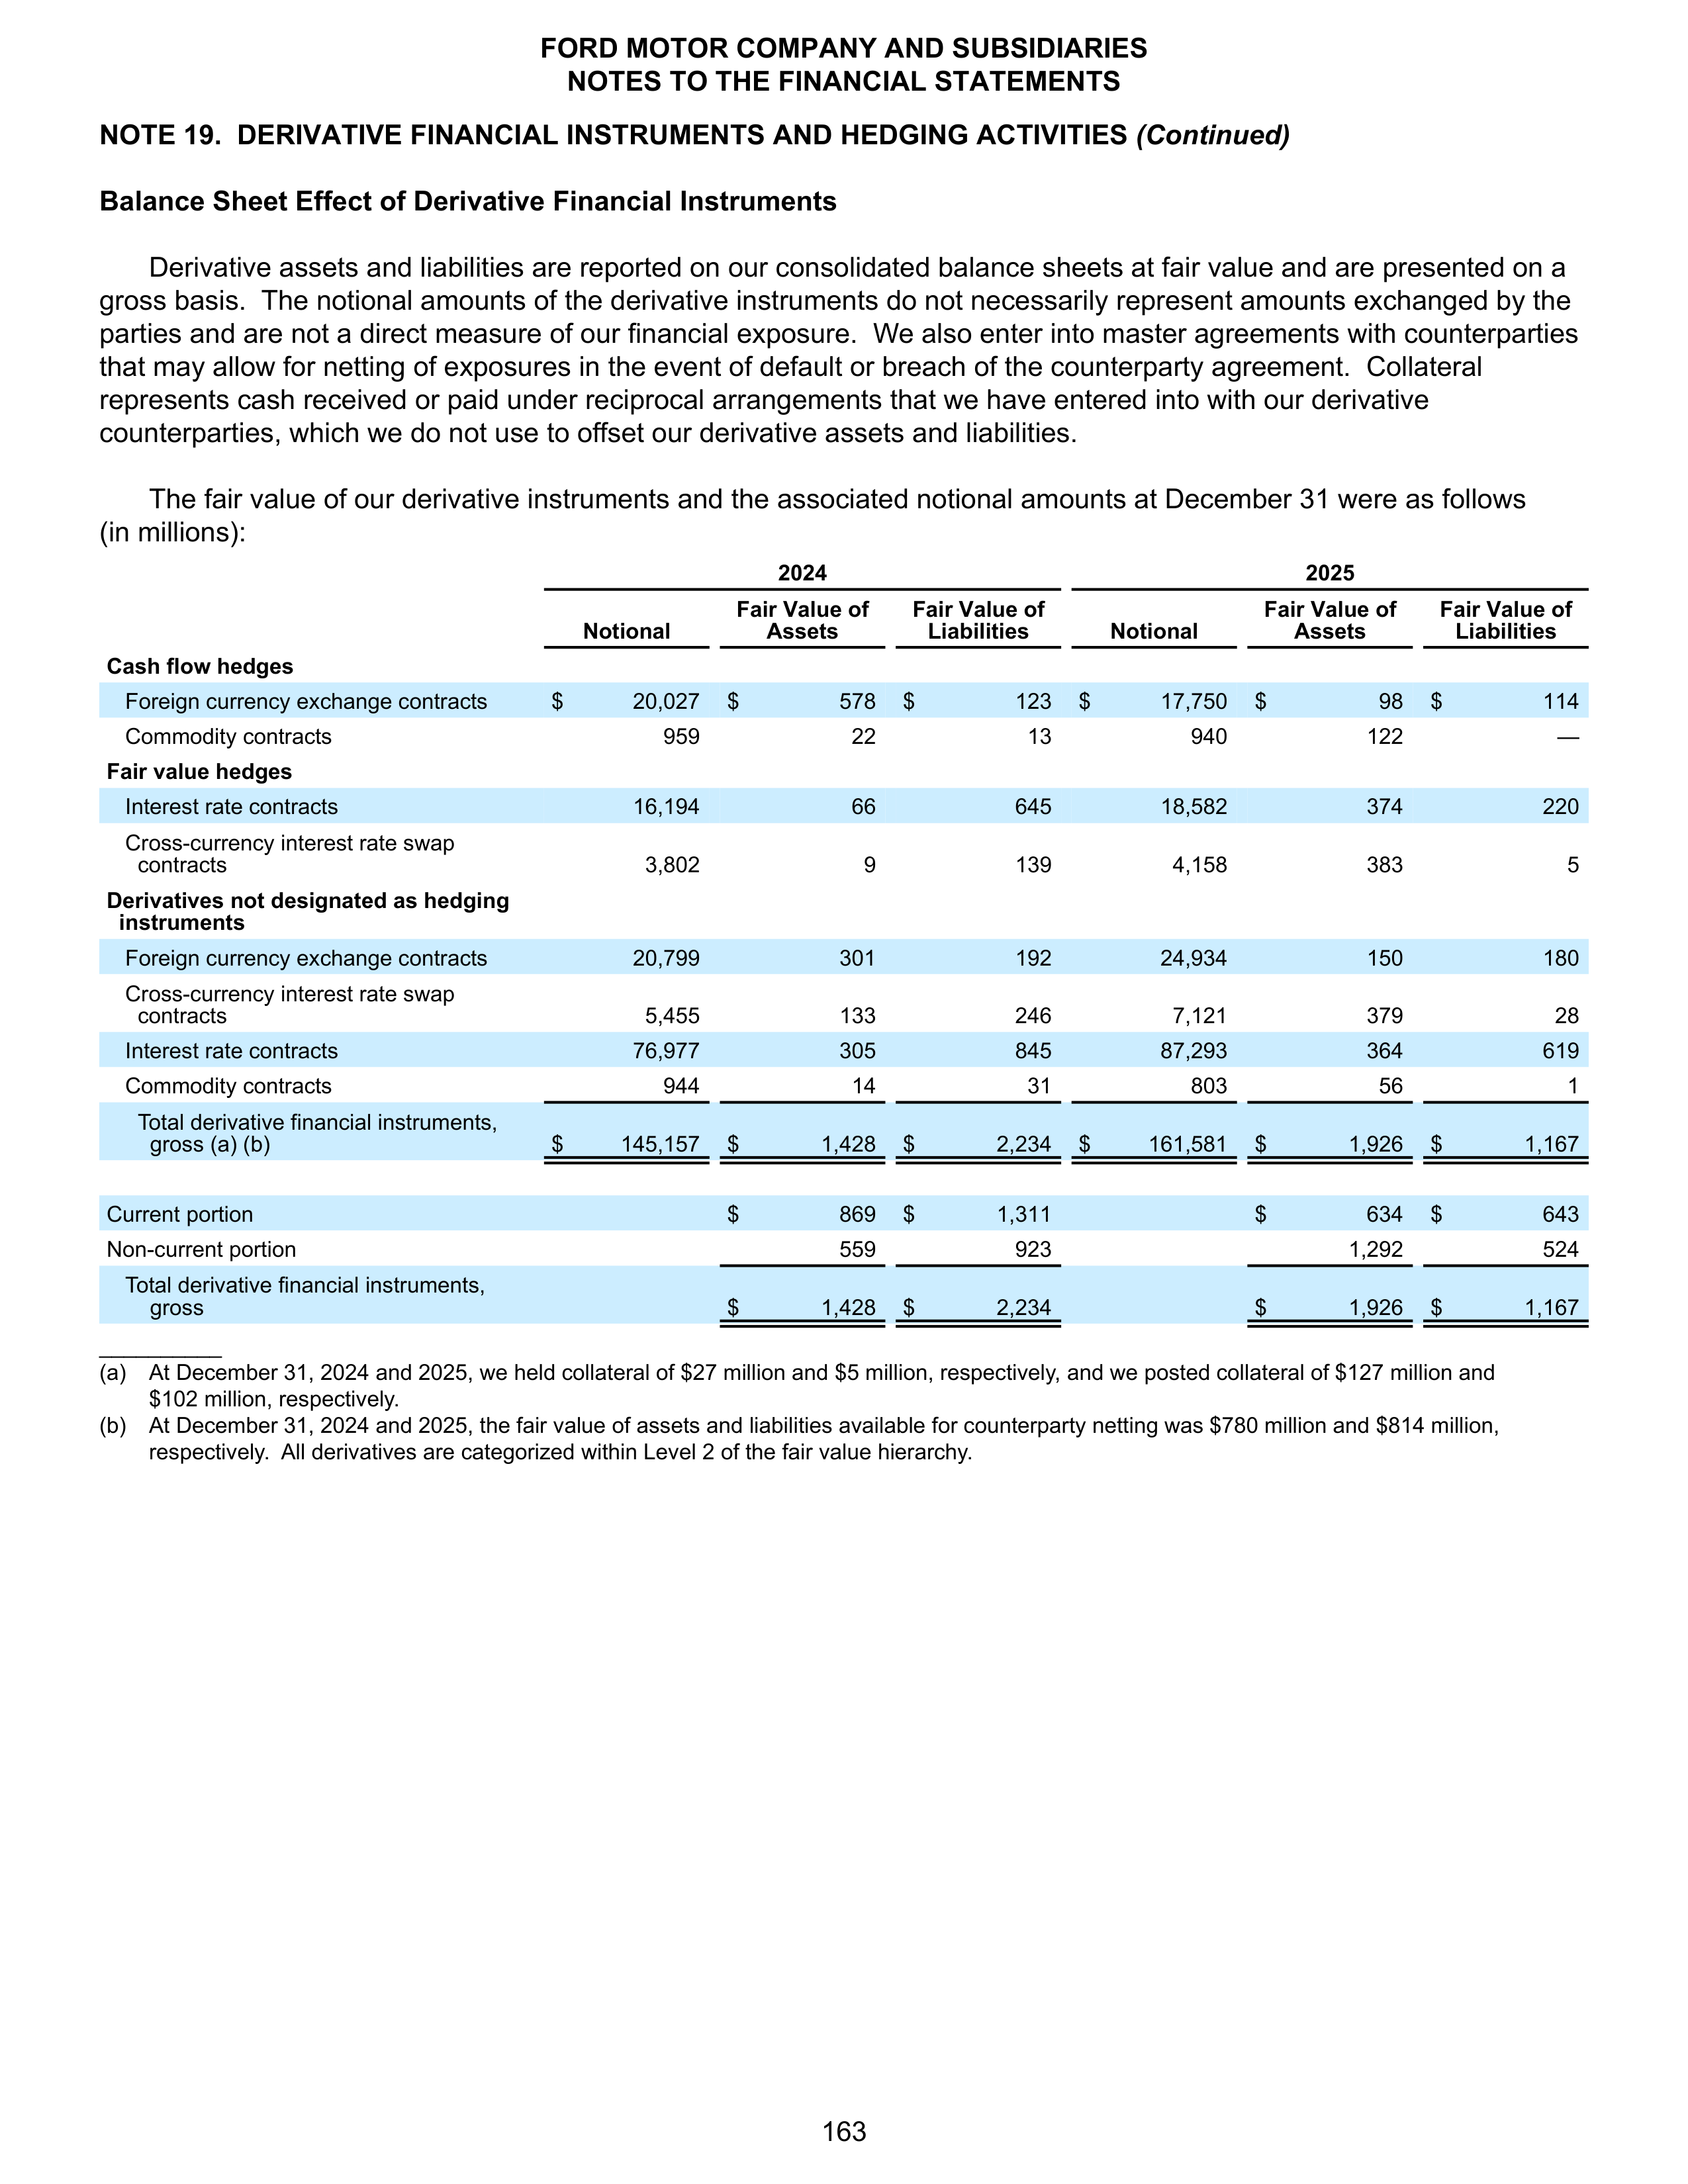
NOTE 19. DERIVATIVE FINANCIAL INSTRUMENTS AND HEDGING ACTIVITIES
(Continued)
Balance Sheet Effect of Derivative Financial Instruments
Derivative assets and liabilities are reported on our consolidated balance sheets at fair value and are presented on a
gross basis. The notional amounts of the derivative instruments do not necessarily represent amounts exchanged by the
parties and are not a direct measure of our financial exposure. We also enter into master agreements with counterparties
that may allow for netting of exposures in the event of default or breach of the counterparty agreement. Collateral
represents cash received or paid under reciprocal arrangements that we have entered into with our derivative
counterparties, which we do not use to offset our derivative assets and liabilities.
The fair value of our derivative instruments and the associated notional amounts at December 31 were as follows
(in millions):
2024
2025
Notional
Fair Value of
Assets
Fair Value of
Liabilities
Notional
Fair Value of
Assets
Fair Value of
Liabilities
Cash flow hedges
Foreign currency exchange contracts
$
20,027
$
578
$
123
$
17,750
$
98
$
114
Commodity contracts
959
22
13
940
122
—
Fair value hedges
Interest rate contracts
16,194
66
645
18,582
374
220
Cross-currency interest rate swap
contracts
3,802
9
139
4,158
383
5
Derivatives not designated as hedging
instruments
Foreign currency exchange contracts
20,799
301
192
24,934
150
180
Cross-currency interest rate swap
contracts
5,455
133
246
7,121
379
28
Interest rate contracts
76,977
305
845
87,293
364
619
Commodity contracts
944
14
31
803
56
1
Total derivative financial instruments,
gross (a) (b)
$
145,157
$
1,428
$
2,234
$
161,581
$
1,926
$
1,167
Current portion
$
869
$
1,311
$
634
$
643
Non-current portion
559
923
1,292
524
Total derivative financial instruments,
gross
$
1,428
$
2,234
$
1,926
$
1,167
__________
(a)
At December 31, 2024 and 2025, we held collateral of $27 million and $5 million, respectively, and we posted collateral of $127 million and
$102 million, respectively.
(b)
At December 31, 2024 and 2025, the fair value of assets and liabilities available for counterparty netting was $780 million and $814 million,
respectively. All derivatives are categorized within Level 2 of the fair value hierarchy.
FORD MOTOR COMPANY AND SUBSIDIARIES
NOTES TO THE FINANCIAL STATEMENTS
163
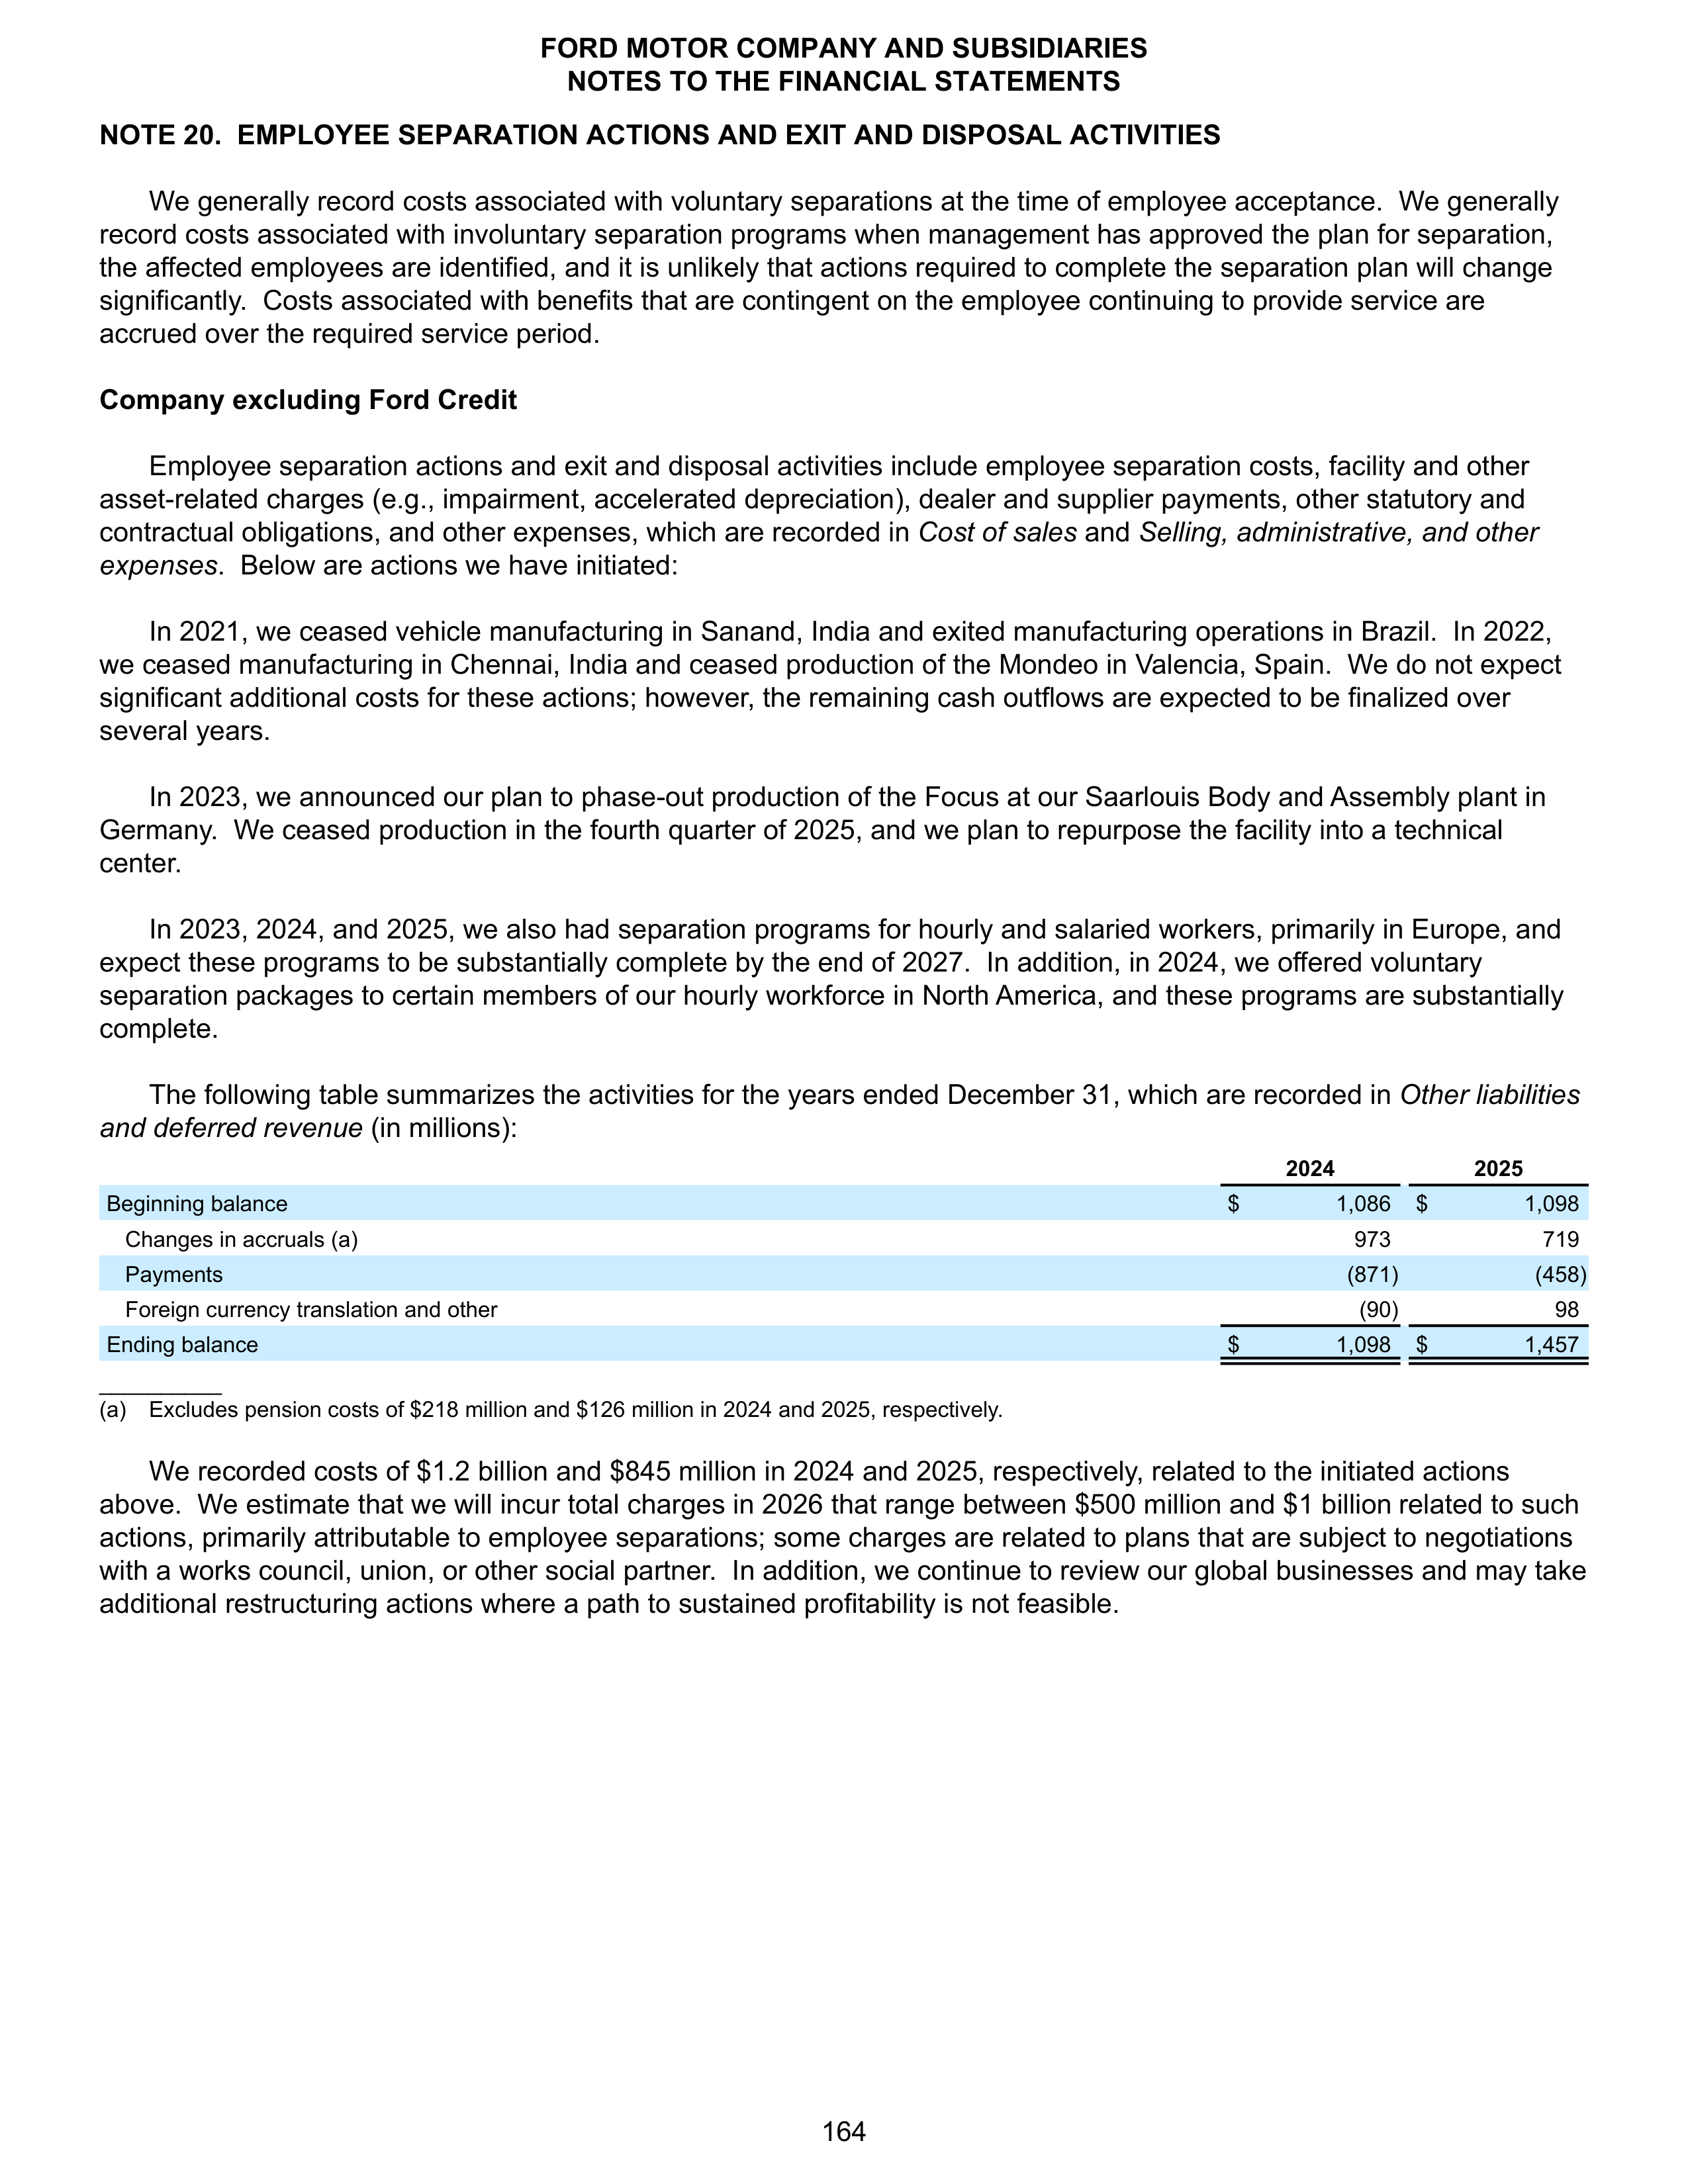
NOTE 20. EMPLOYEE SEPARATION ACTIONS AND EXIT AND DISPOSAL ACTIVITIES
We generally record costs associated with voluntary separations at the time of employee acceptance. We generally
record costs associated with involuntary separation programs when management has approved the plan for separation,
the affected employees are identified, and it is unlikely that actions required to complete the separation plan will change
significantly. Costs associated with benefits that are contingent on the employee continuing to provide service are
accrued over the required service period.
Company excluding Ford Credit
Employee separation actions and exit and disposal activities include employee separation costs, facility and other
asset-related charges (e.g., impairment, accelerated depreciation), dealer and supplier payments, other statutory and
contractual obligations, and other expenses, which are recorded in
Cost of sales
and
Selling, administrative, and other
expenses
. Below are actions we have initiated:
In 2021, we ceased vehicle manufacturing in Sanand, India and exited manufacturing operations in Brazil. In 2022,
we ceased manufacturing in Chennai, India and ceased production of the Mondeo in Valencia, Spain. We do not expect
significant additional costs for these actions; however, the remaining cash outflows are expected to be finalized over
several years.
In 2023, we announced our plan to phase-out production of the Focus at our Saarlouis Body and Assembly plant in
Germany. We ceased production in the fourth quarter of 2025, and we plan to repurpose the facility into a technical
center.
In 2023, 2024, and 2025, we also had separation programs for hourly and salaried workers, primarily in Europe, and
expect these programs to be substantially complete by the end of 2027. In addition, in 2024, we offered voluntary
separation packages to certain members of our hourly workforce in North America, and these programs are substantially
complete.
The following table summarizes the activities for the years ended December 31, which are recorded in
Other liabilities
and deferred revenue
(in millions):
2024
2025
Beginning balance
$
1,086
$
1,098
Changes in accruals (a)
973
719
Payments
(871)
(458)
Foreign currency translation and other
(90)
98
Ending balance
$
1,098
$
1,457
__________
(a) Excludes pension costs of $218 million and $126 million in 2024 and 2025, respectively.
We recorded costs of $1.2 billion and $845 million in 2024 and 2025, respectively, related to the initiated actions
above. We estimate that we will incur total charges in 2026 that range between $500 million and $1 billion
related to such
actions, primarily attributable to employee separations; some charges are related to plans that are subject to negotiations
with a works council, union, or other social partner. In addition, we continue to review our global businesses and may take
additional restructuring actions where a path to sustained profitability is not feasible.
FORD MOTOR COMPANY AND SUBSIDIARIES
NOTES TO THE FINANCIAL STATEMENTS
164
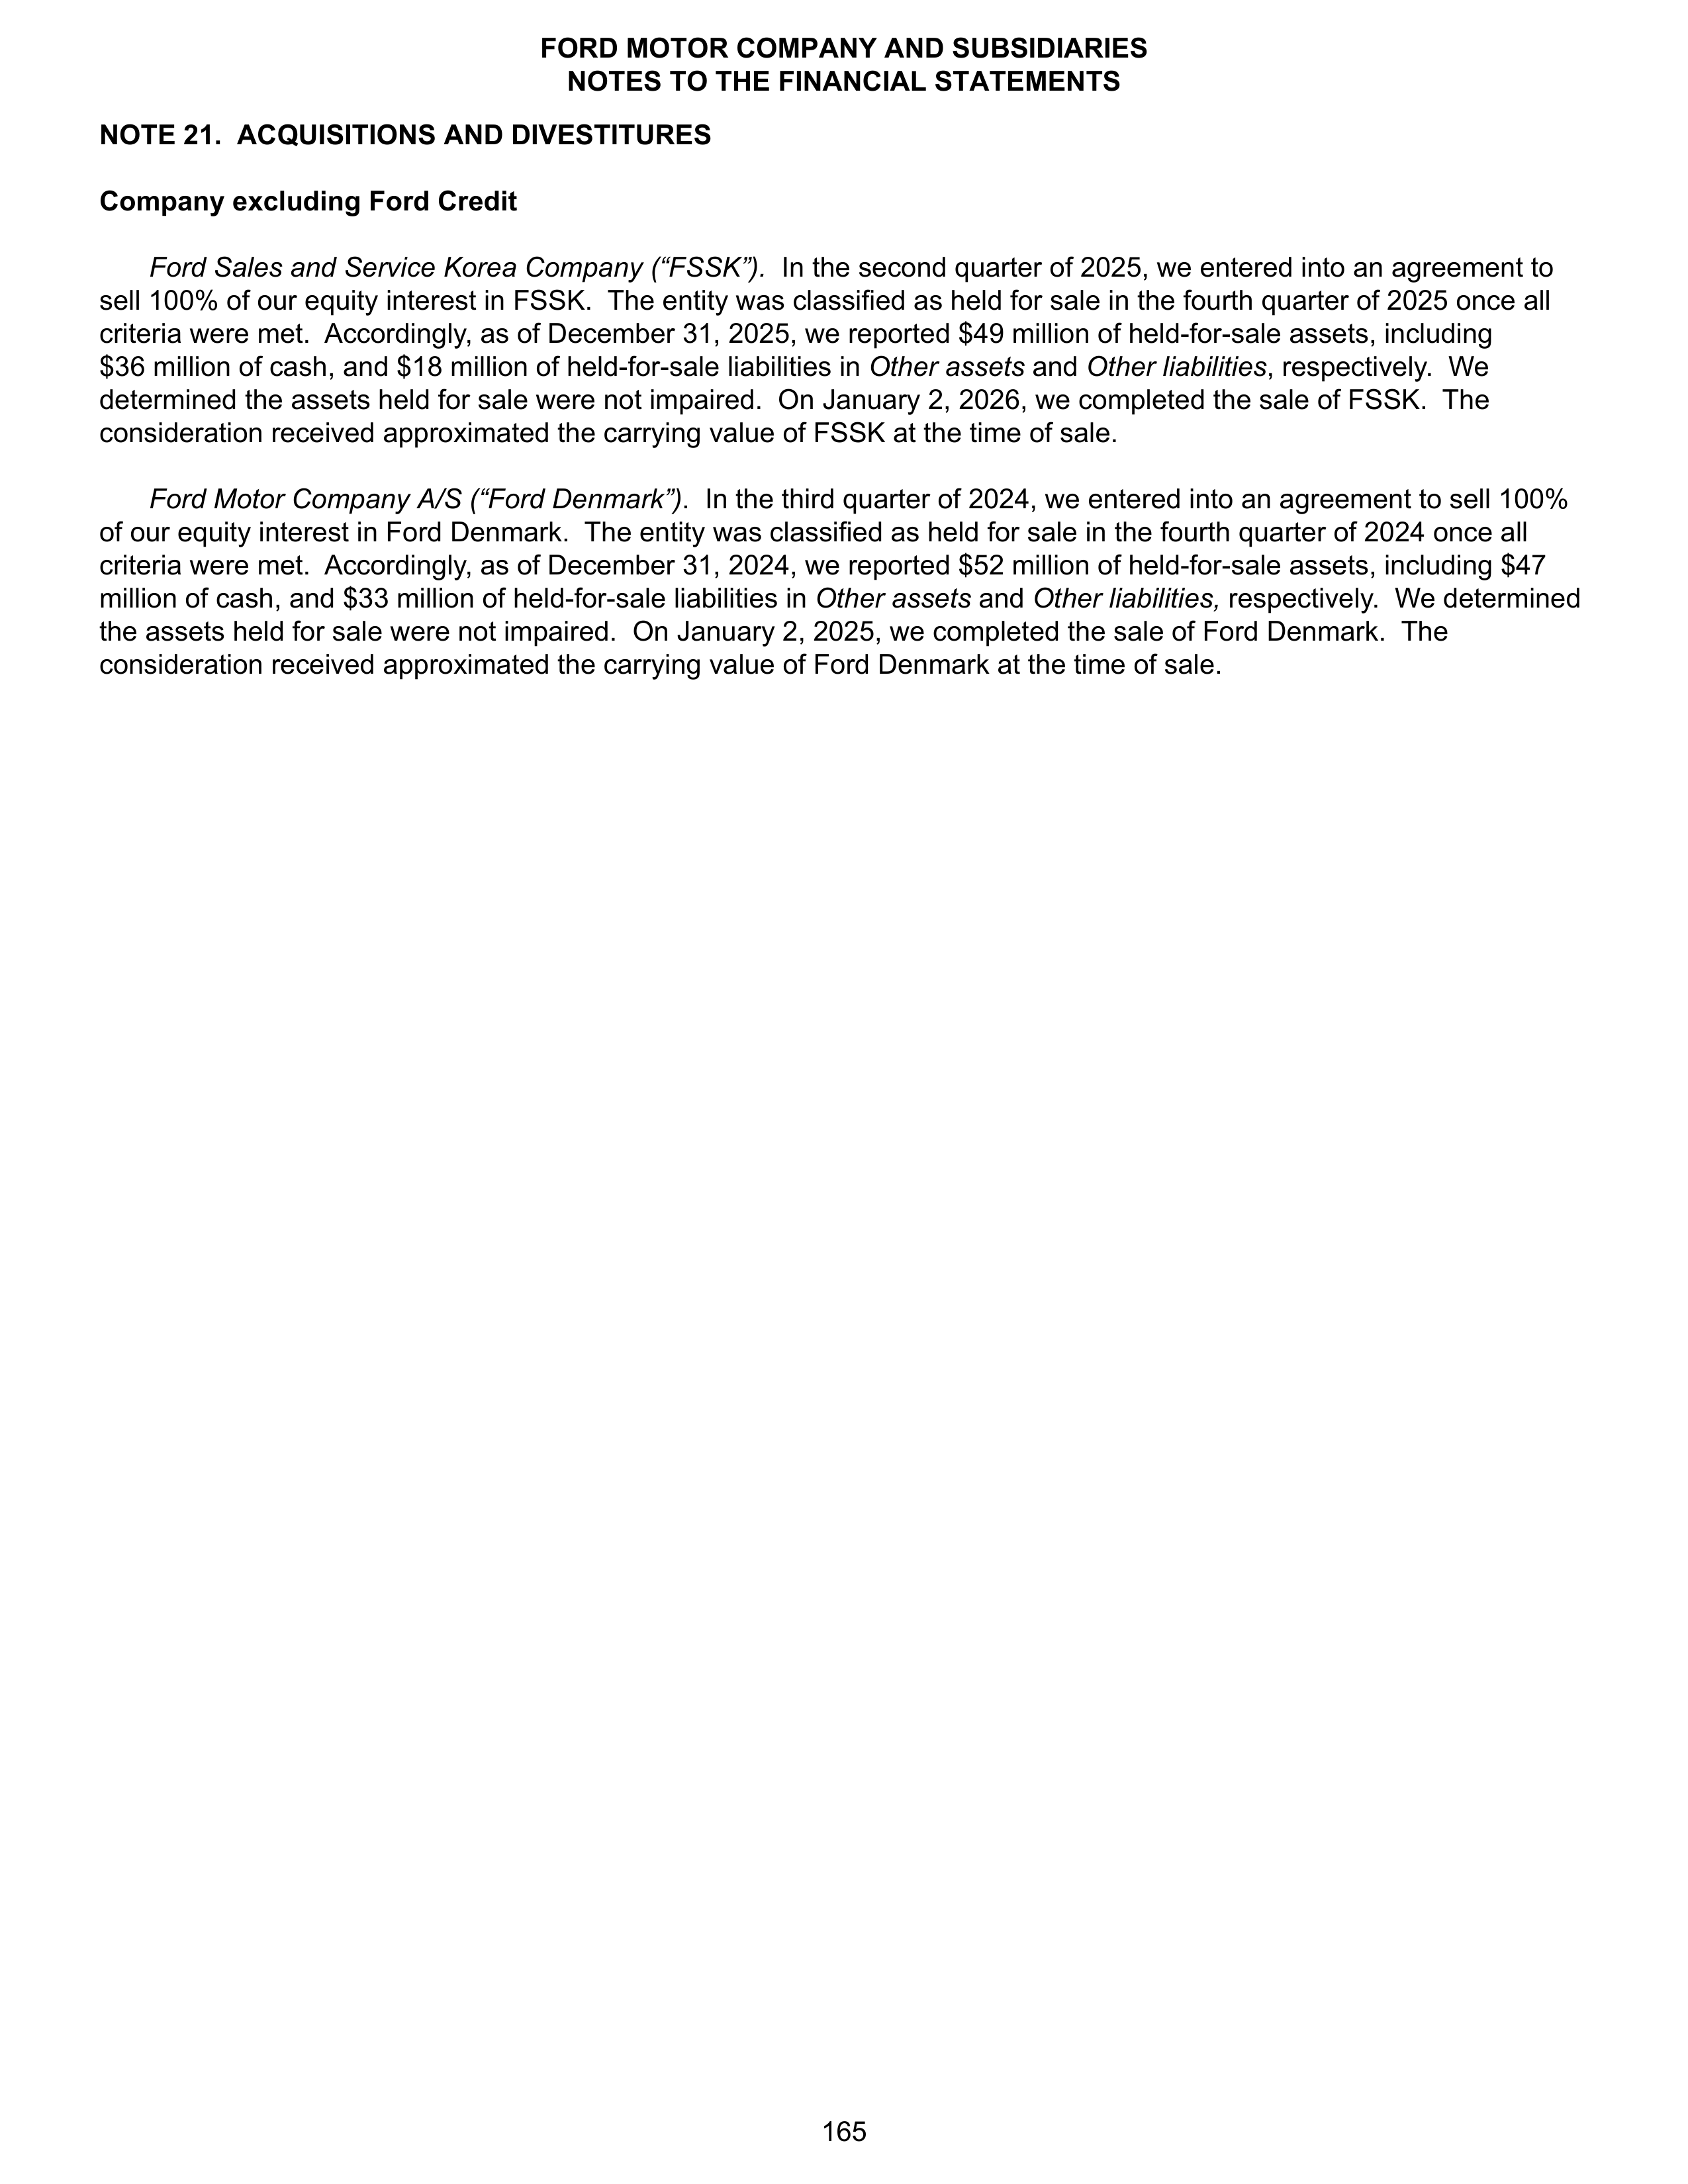
NOTE 21.
ACQUISITIONS AND DIVESTITURES
Company excluding Ford Credit
Ford Sales and Service Korea Company (“FSSK”).
In the second quarter of 2025, we entered into an agreement to
sell 100% of our equity interest in FSSK. The entity was classified as held for sale in the fourth quarter of 2025 once all
criteria were met. Accordingly, as of December 31, 2025, we reported $49 million of held-for-sale assets, including
$36 million of cash, and $18 million of held-for-sale liabilities in
Other assets
and
Other liabilities
, respectively. We
determined the assets held for sale were not impaired. On January 2, 2026, we completed the sale of FSSK. The
consideration received approximated the carrying value of FSSK at the time of sale.
Ford Motor Company A/S (“Ford Denmark”)
. In the third quarter of 2024, we entered into an agreement to sell 100%
of our equity interest in Ford Denmark. The entity was classified as held for sale in the fourth quarter of 2024 once all
criteria were met. Accordingly, as of December 31, 2024, we reported $52 million of held-for-sale assets, including $47
million of cash, and $33 million of held-for-sale liabilities in
Other assets
and
Other liabilities,
respectively. We determined
the assets held for sale were not impaired. On January 2, 2025, we completed the sale of Ford Denmark. The
consideration received approximated the carrying value of Ford Denmark at the time of sale.
FORD MOTOR COMPANY AND SUBSIDIARIES
NOTES TO THE FINANCIAL STATEMENTS
165
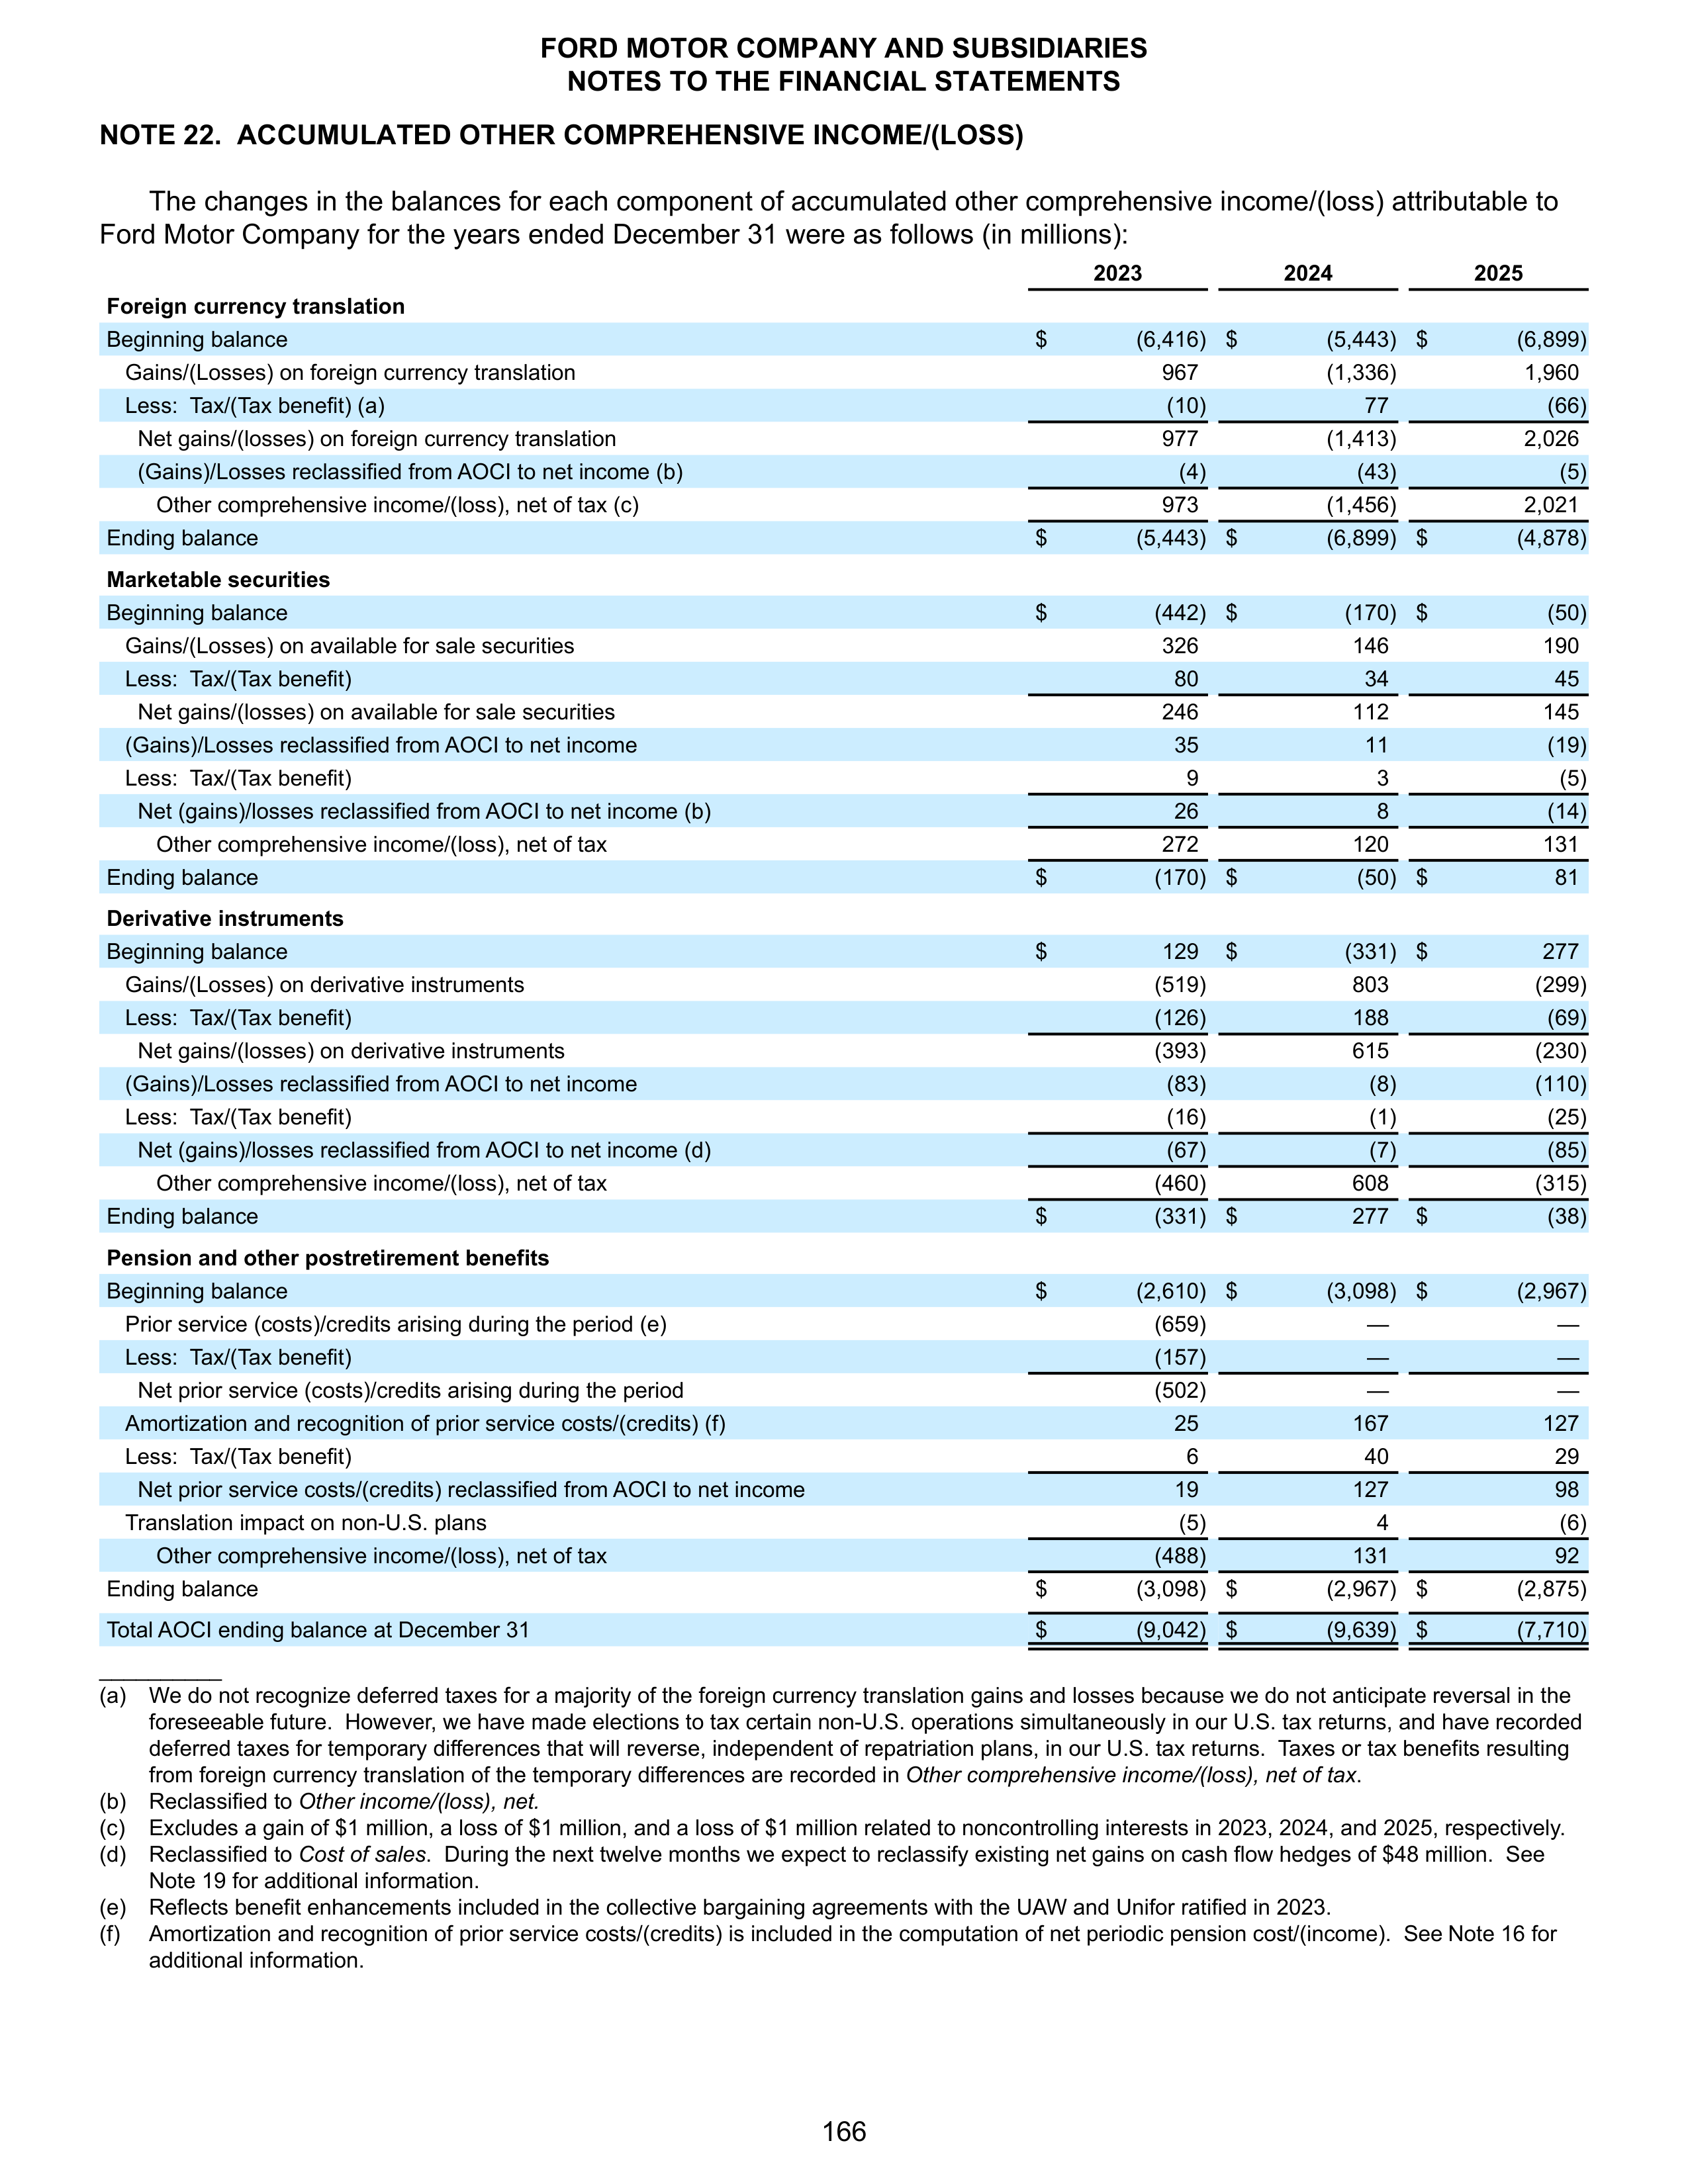
NOTE 22. ACCUMULATED OTHER COMPREHENSIVE INCOME/(LOSS)
The changes in the balances for each component of accumulated other comprehensive income/(loss) attributable to
Ford Motor Company for the years ended December 31 were as follows (in millions):
2023
2024
2025
Foreign currency translation
Beginning balance
$
(6,416) $
(5,443) $
(6,899)
Gains/(Losses) on foreign currency translation
967
(1,336)
1,960
Less: Tax/(Tax benefit) (a)
(10)
77
(66)
Net gains/(losses) on foreign currency translation
977
(1,413)
2,026
(Gains)/Losses reclassified from AOCI to net income (b)
(4)
(43)
(5)
Other comprehensive income/(loss), net of tax (c)
973
(1,456)
2,021
Ending balance
$
(5,443) $
(6,899) $
(4,878)
Marketable securities
Beginning balance
$
(442) $
(170) $
(50)
Gains/(Losses) on available for sale securities
326
146
190
Less: Tax/(Tax benefit)
80
34
45
Net gains/(losses) on available for sale securities
246
112
145
(Gains)/Losses reclassified from AOCI to net income
35
11
(19)
Less: Tax/(Tax benefit)
9
3
(5)
Net (gains)/losses reclassified from AOCI to net income (b)
26
8
(14)
Other comprehensive income/(loss), net of tax
272
120
131
Ending balance
$
(170) $
(50) $
81
Derivative instruments
Beginning balance
$
129
$
(331) $
277
Gains/(Losses) on derivative instruments
(519)
803
(299)
Less: Tax/(Tax benefit)
(126)
188
(69)
Net gains/(losses) on derivative instruments
(393)
615
(230)
(Gains)/Losses reclassified from AOCI to net income
(83)
(8)
(110)
Less: Tax/(Tax benefit)
(16)
(1)
(25)
Net (gains)/losses reclassified from AOCI to net income (d)
(67)
(7)
(85)
Other comprehensive income/(loss), net of tax
(460)
608
(315)
Ending balance
$
(331) $
277
$
(38)
Pension and other postretirement benefits
Beginning balance
$
(2,610) $
(3,098) $
(2,967)
Prior service (costs)/credits arising during the period (e)
(659)
—
—
Less: Tax/(Tax benefit)
(157)
—
—
Net prior service (costs)/credits arising during the period
(502)
—
—
Amortization and recognition of prior service costs/(credits) (f)
25
167
127
Less: Tax/(Tax benefit)
6
40
29
Net prior service costs/(credits) reclassified from AOCI to net income
19
127
98
Translation impact on non-U.S. plans
(5)
4
(6)
Other comprehensive income/(loss), net of tax
(488)
131
92
Ending balance
$
(3,098) $
(2,967) $
(2,875)
Total AOCI ending balance at December 31
$
(9,042) $
(9,639) $
(7,710)
__________
(a)
We do not recognize deferred taxes for a majority of the foreign currency translation gains and losses because we do not anticipate reversal in the
foreseeable future. However, we have made elections to tax certain non-U.S. operations simultaneously in our U.S. tax returns, and have recorded
deferred taxes for temporary differences that will reverse, independent of repatriation plans, in our U.S. tax returns. Taxes or tax benefits resulting
from foreign currency translation of the temporary differences are recorded in
Other comprehensive income/(loss), net of tax
.
(b)
Reclassified to
Other income/(loss), net.
(c)
Excludes a gain of $1 million, a loss of $1 million, and a loss of $1 million related to noncontrolling interests in 2023, 2024, and 2025, respectively.
(d)
Reclassified to
Cost of sales
. During the next twelve months we expect to reclassify existing net gains on cash flow hedges of $48 million. See
Note 19 for additional information.
(e)
Reflects benefit enhancements included in the collective bargaining agreements with the UAW and Unifor ratified in 2023.
(f)
Amortization and recognition of prior service costs/(credits) is included in the computation of net periodic pension cost/(income). See Note 16 for
additional information.
FORD MOTOR COMPANY AND SUBSIDIARIES
NOTES TO THE FINANCIAL STATEMENTS
166
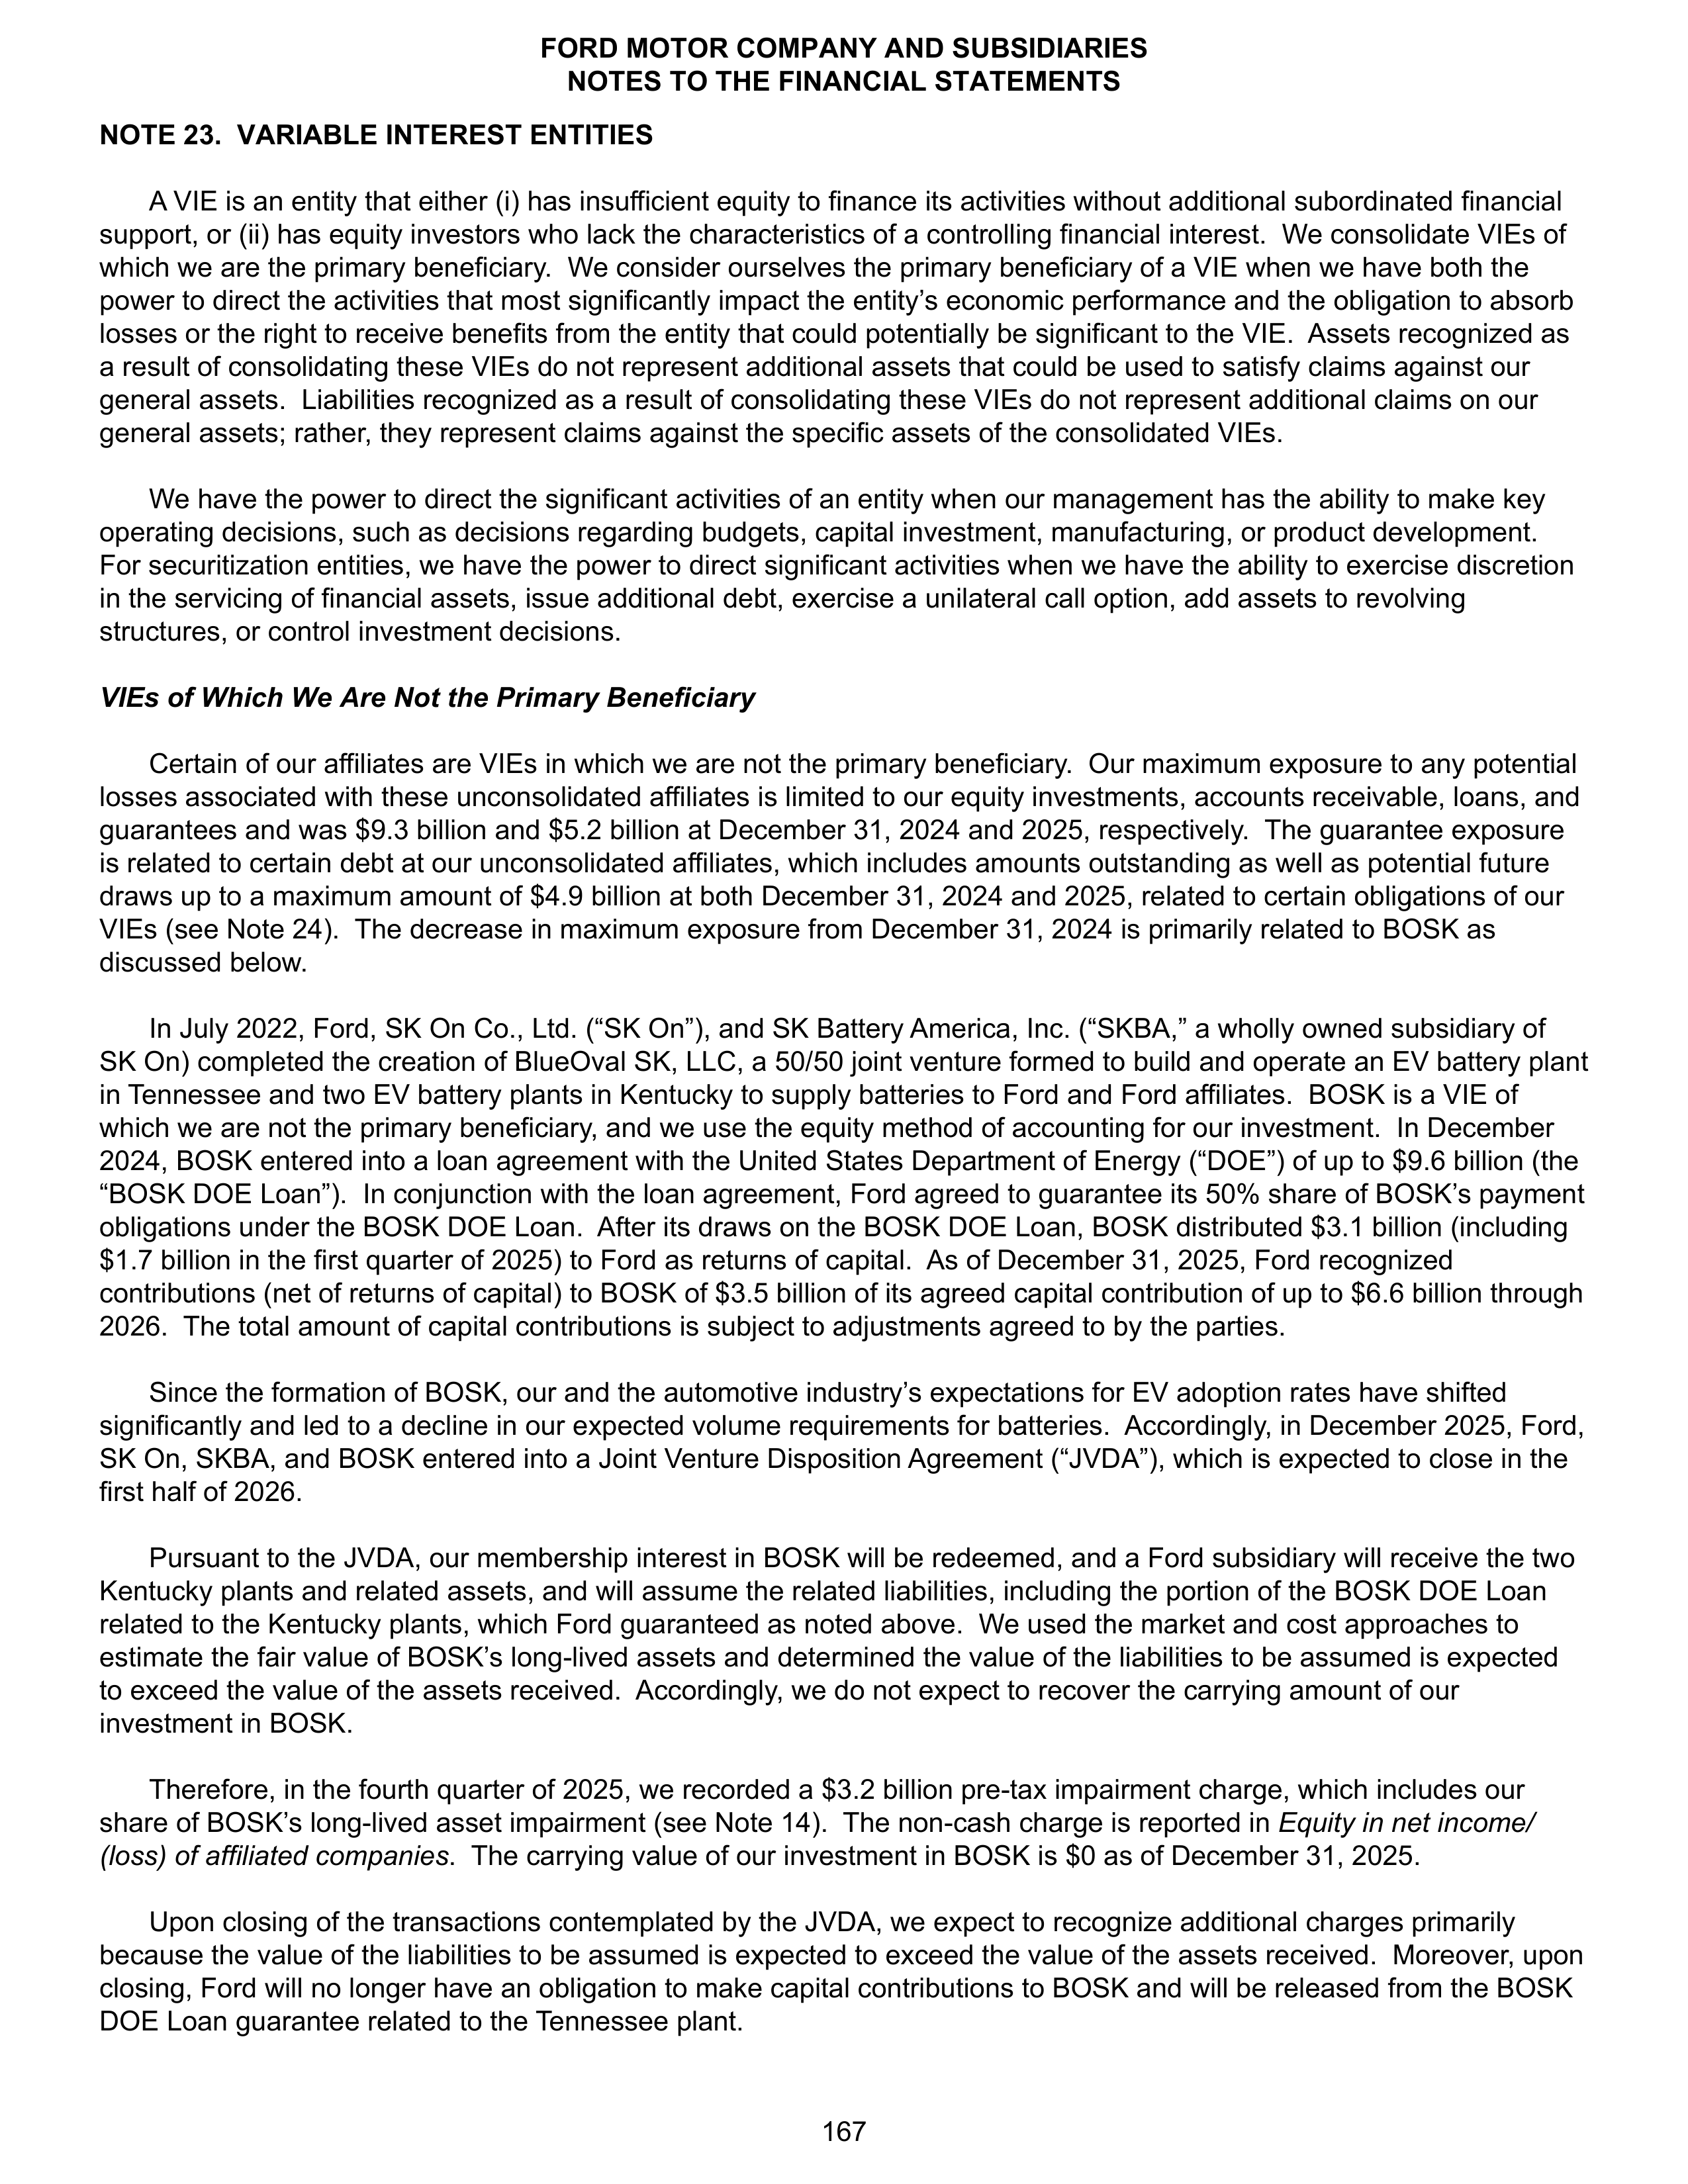
NOTE 23. VARIABLE INTEREST ENTITIES
A VIE is an entity that either (i) has insufficient equity to finance its activities without additional subordinated financial
support, or (ii) has equity investors who lack the characteristics of a controlling financial interest. We consolidate VIEs of
which we are the primary beneficiary. We consider ourselves the primary beneficiary of a VIE when we have both the
power to direct the activities that most significantly impact the entity’s economic performance and the obligation to absorb
losses or the right to receive benefits from the entity that could potentially be significant to the VIE. Assets recognized as
a result of consolidating these VIEs do not represent additional assets that could be used to satisfy claims against our
general assets. Liabilities recognized as a result of consolidating these VIEs do not represent additional claims on our
general assets; rather, they represent claims against the specific assets of the consolidated VIEs.
We have the power to direct the significant activities of an entity when our management has the ability to make key
operating decisions, such as decisions regarding budgets, capital investment, manufacturing, or product development.
For securitization entities, we have the power to direct significant activities when we have the ability to exercise discretion
in the servicing of financial assets, issue additional debt, exercise a unilateral call option, add assets to revolving
structures, or control investment decisions.
VIEs of Which We Are Not the Primary Beneficiary
Certain of our affiliates are VIEs in which we are not the primary beneficiary. Our maximum exposure to any potential
losses associated with these unconsolidated affiliates is limited to our equity investments, accounts receivable, loans, and
guarantees and was $9.3 billion and $5.2 billion at December 31, 2024 and 2025, respectively. The guarantee exposure
is related to certain debt at our unconsolidated affiliates, which includes amounts outstanding as well as potential future
draws up to a maximum amount of $4.9 billion at both December 31, 2024 and 2025, related to certain obligations of our
VIEs (see Note 24). The decrease in maximum exposure from December 31, 2024 is primarily related to BOSK as
discussed below.
In July 2022, Ford, SK On Co., Ltd. (“SK On”), and SK Battery America, Inc. (“SKBA,” a wholly owned subsidiary of
SK On) completed the creation of BlueOval SK, LLC, a 50/50 joint venture formed to build and operate an EV battery plant
in Tennessee and two EV battery plants in Kentucky to supply batteries to Ford and Ford affiliates. BOSK is a VIE of
which we are not the primary beneficiary, and we use the equity method of accounting for our investment. In December
2024, BOSK entered into a loan agreement with the United States Department of Energy (“DOE”) of up to $9.6 billion (the
“BOSK DOE Loan”). In conjunction with the loan agreement, Ford agreed to guarantee its 50% share of BOSK’s payment
obligations under the BOSK DOE Loan. After its draws on the BOSK DOE Loan, BOSK distributed $3.1 billion (including
$1.7 billion in the first quarter of 2025) to Ford as returns of capital. As of December 31, 2025, Ford recognized
contributions (net of returns of capital) to BOSK of $3.5 billion of its agreed capital contribution of up to $6.6 billion through
2026. The total amount of capital contributions is subject to adjustments agreed to by the parties.
Since the formation of BOSK, our and the automotive industry’s expectations for EV adoption rates have shifted
significantly and led to a decline in our expected volume requirements for batteries. Accordingly, in December 2025, Ford,
SK On, SKBA, and BOSK entered into a Joint Venture Disposition Agreement (“JVDA”), which is expected to close in the
first half of 2026.
Pursuant to the JVDA, our membership interest in BOSK will be redeemed, and a Ford subsidiary will receive the two
Kentucky plants and related assets, and will assume the related liabilities, including the portion of the BOSK DOE Loan
related to the Kentucky plants, which Ford guaranteed as noted above. We used the market and cost approaches to
estimate the fair value of BOSK’s long-lived assets and determined the value of the liabilities to be assumed is expected
to exceed the value of the assets received. Accordingly, we do not expect to recover the carrying amount of our
investment in BOSK.
Therefore, in the fourth quarter of 2025, we recorded a $3.2 billion pre-tax impairment charge, which includes our
share of BOSK’s long-lived asset impairment (see Note 14). The non-cash charge is reported in
Equity in net income/
(loss) of affiliated companies
. The carrying value of our investment in BOSK is $0 as of December 31, 2025.
Upon closing of the transactions contemplated by the JVDA, we expect to recognize additional charges primarily
because the value of the liabilities to be assumed is expected to exceed the value of the assets received. Moreover, upon
closing, Ford will no longer have an obligation to make capital contributions to BOSK and will be released from the BOSK
DOE Loan guarantee related to the Tennessee plant.
FORD MOTOR COMPANY AND SUBSIDIARIES
NOTES TO THE FINANCIAL STATEMENTS
167
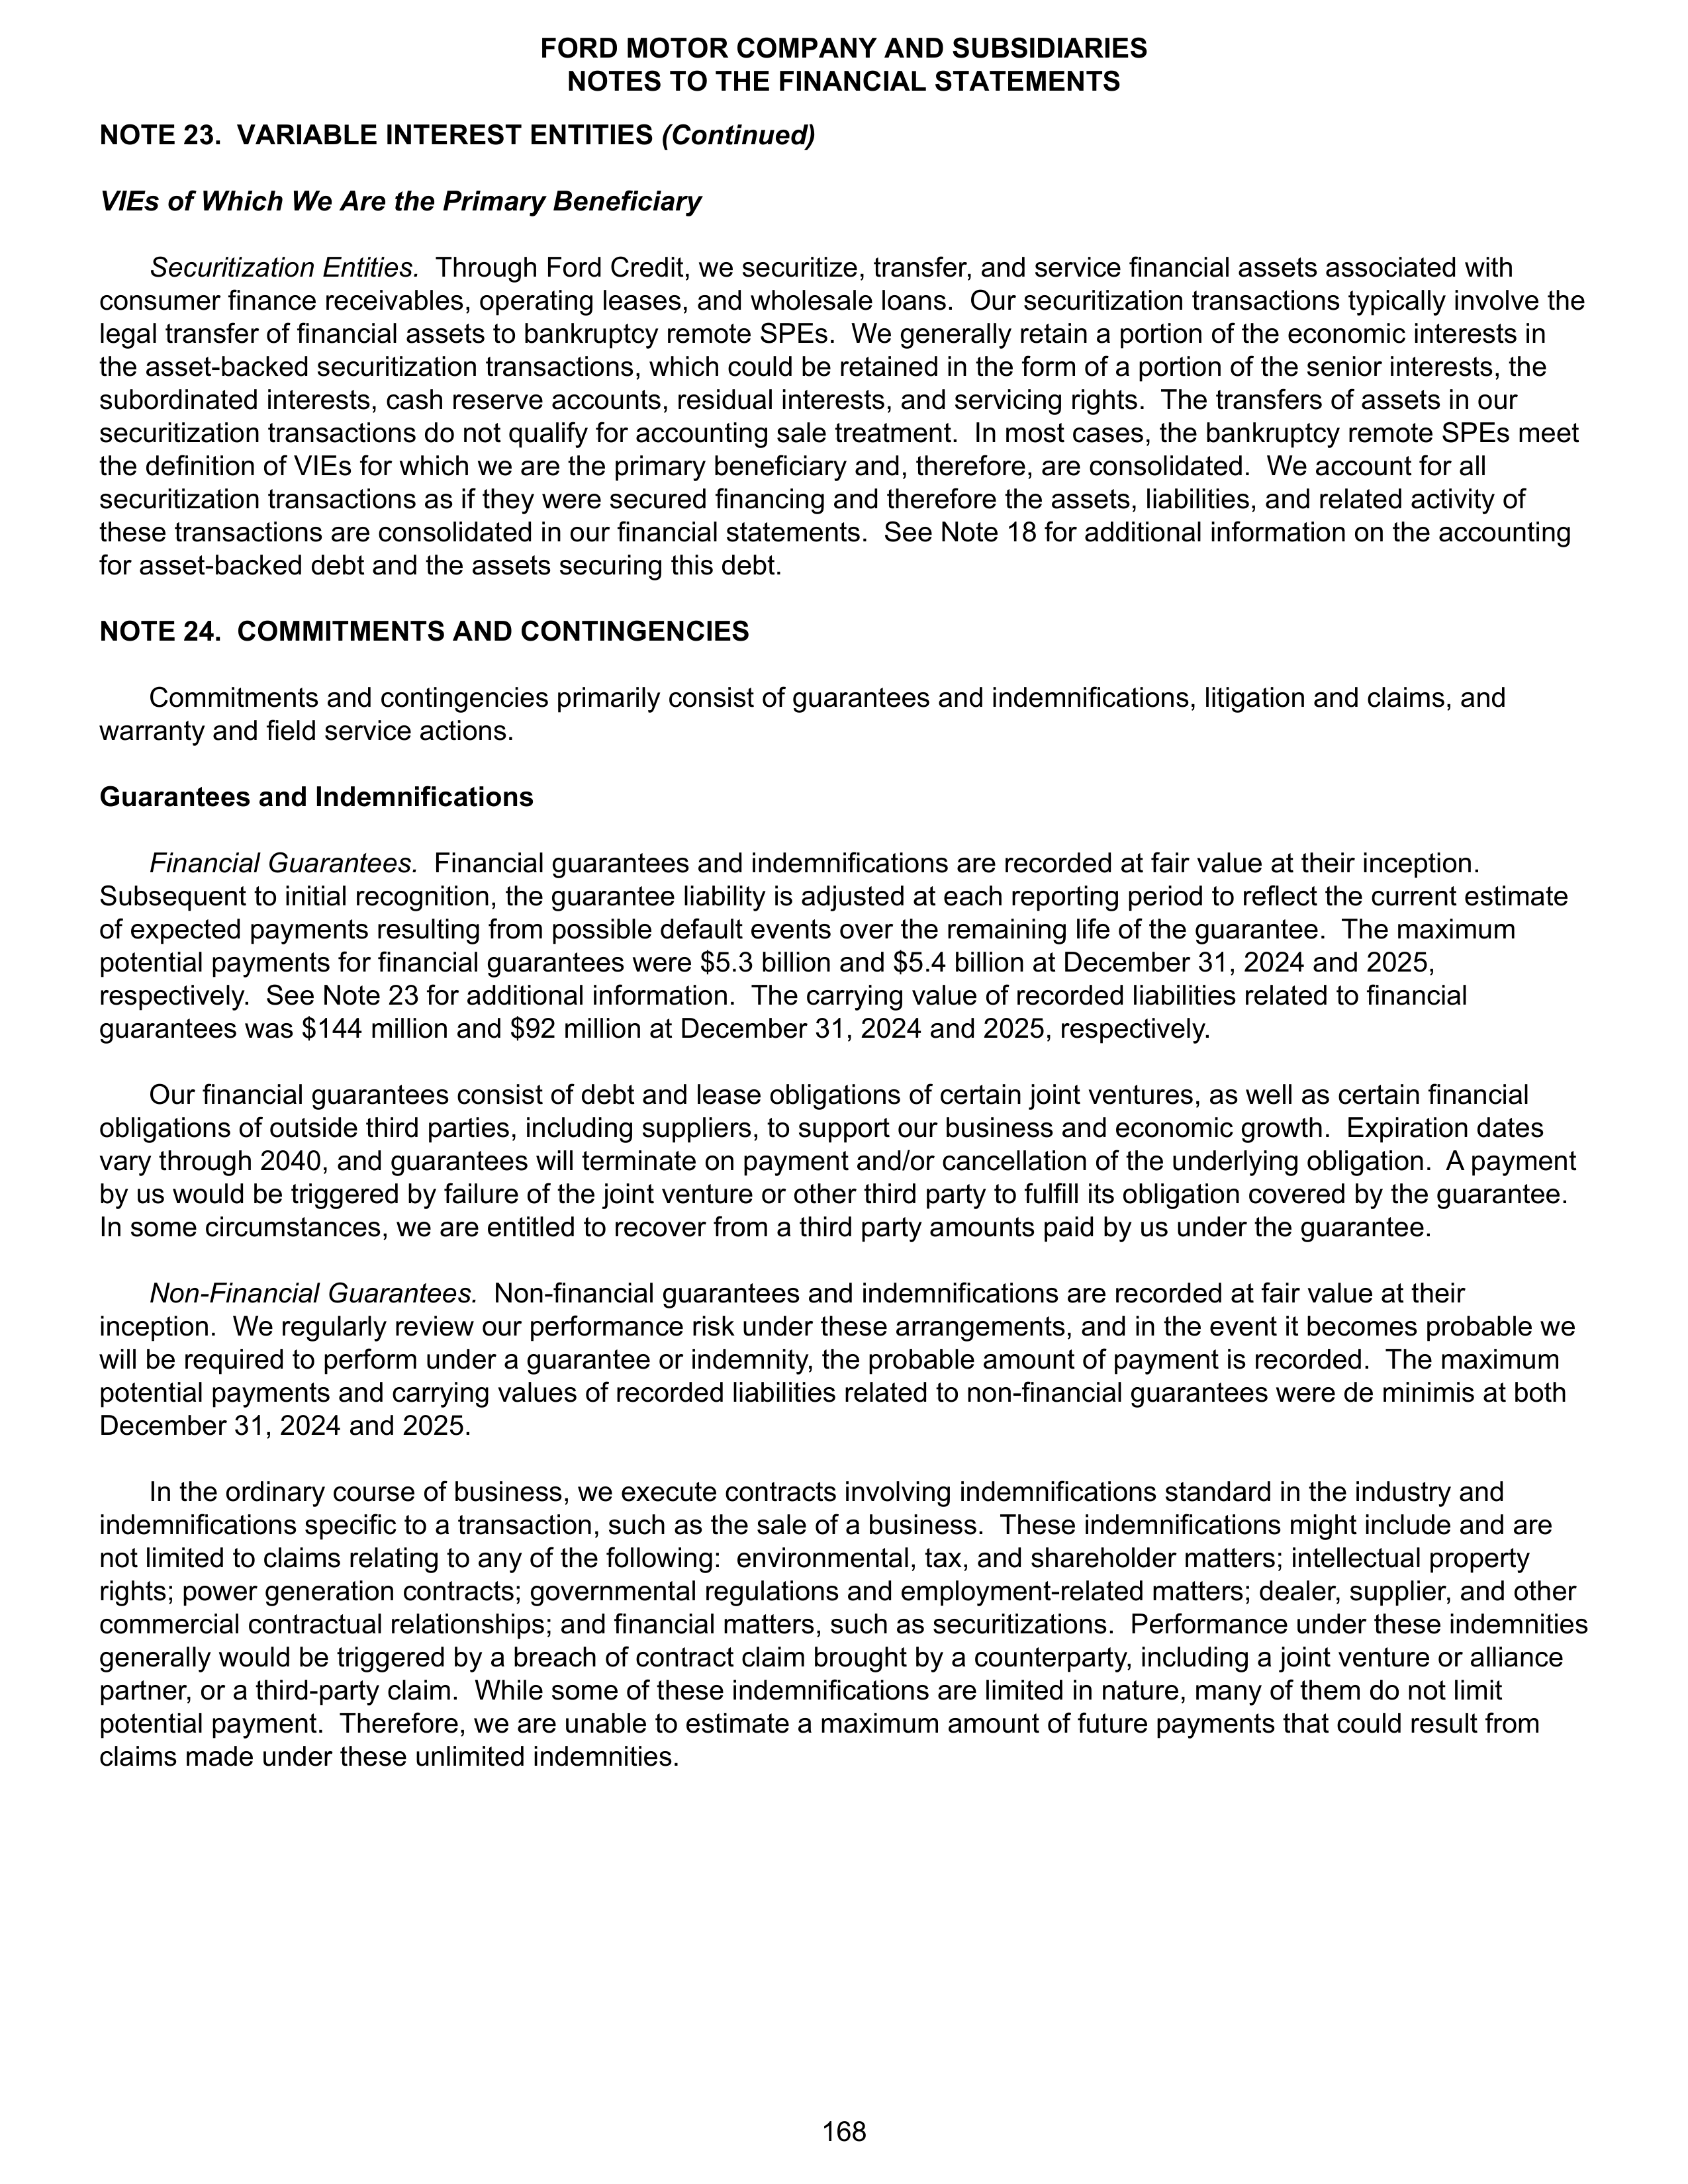
NOTE 23. VARIABLE INTEREST ENTITIES
(Continued)
VIEs of Which We Are the Primary Beneficiary
Securitization Entities.
Through Ford Credit, we securitize, transfer, and service financial assets associated with
consumer finance receivables, operating leases, and wholesale loans. Our securitization transactions typically involve the
legal transfer of financial assets to bankruptcy remote SPEs. We generally retain a portion of the economic interests in
the asset-backed securitization transactions, which could be retained in the form of a portion of the senior interests, the
subordinated interests, cash reserve accounts, residual interests, and servicing rights. The transfers of assets in our
securitization transactions do not qualify for accounting sale treatment. In most cases, the bankruptcy remote SPEs meet
the definition of VIEs for which we are the primary beneficiary and, therefore, are consolidated. We account for all
securitization transactions as if they were secured financing and therefore the assets, liabilities, and related activity of
these transactions are consolidated in our financial statements. See Note 18 for additional information on the accounting
for asset-backed debt and the assets securing this debt.
NOTE 24. COMMITMENTS AND CONTINGENCIES
Commitments and contingencies primarily consist of guarantees and indemnifications, litigation and claims, and
warranty and field service actions.
Guarantees and Indemnifications
Financial Guarantees.
Financial guarantees and indemnifications are recorded at fair value at their inception.
Subsequent to initial recognition, the guarantee liability is adjusted at each reporting period to reflect the current estimate
of expected payments resulting from possible default events over the remaining life of the guarantee. The maximum
potential payments for financial guarantees were $5.3 billion and $5.4 billion at December 31, 2024 and 2025,
respectively. See Note 23 for additional information. The carrying value of recorded liabilities related to financial
guarantees was $144 million and $92 million at December 31, 2024 and 2025, respectively.
Our financial guarantees consist of debt and lease obligations of certain joint ventures, as well as certain financial
obligations of outside third parties, including suppliers, to support our business and economic growth. Expiration dates
vary through 2040, and guarantees will terminate on payment and/or cancellation of the underlying obligation. A payment
by us would be triggered by failure of the joint venture or other third party to fulfill its obligation covered by the guarantee.
In some circumstances, we are entitled to recover from a third party amounts paid by us under the guarantee.
Non-Financial Guarantees.
Non-financial guarantees and indemnifications are recorded at fair value at their
inception. We regularly review our performance risk under these arrangements, and in the event it becomes probable we
will be required to perform under a guarantee or indemnity, the probable amount of payment is recorded. The maximum
potential payments and carrying values of recorded liabilities related to non-financial guarantees were de minimis at both
December 31, 2024 and 2025.
In the ordinary course of business, we execute contracts involving indemnifications standard in the industry and
indemnifications specific to a transaction, such as the sale of a business. These indemnifications might include and are
not limited to claims relating to any of the following: environmental, tax, and shareholder matters; intellectual property
rights; power generation contracts; governmental regulations and employment-related matters; dealer, supplier, and other
commercial contractual relationships; and financial matters, such as securitizations. Performance under these indemnities
generally would be triggered by a breach of contract claim brought by a counterparty, including a joint venture or alliance
partner, or a third-party claim. While some of these indemnifications are limited in nature, many of them do not limit
potential payment. Therefore, we are unable to estimate a maximum amount of future payments that could result from
claims made under these unlimited indemnities.
FORD MOTOR COMPANY AND SUBSIDIARIES
NOTES TO THE FINANCIAL STATEMENTS
168
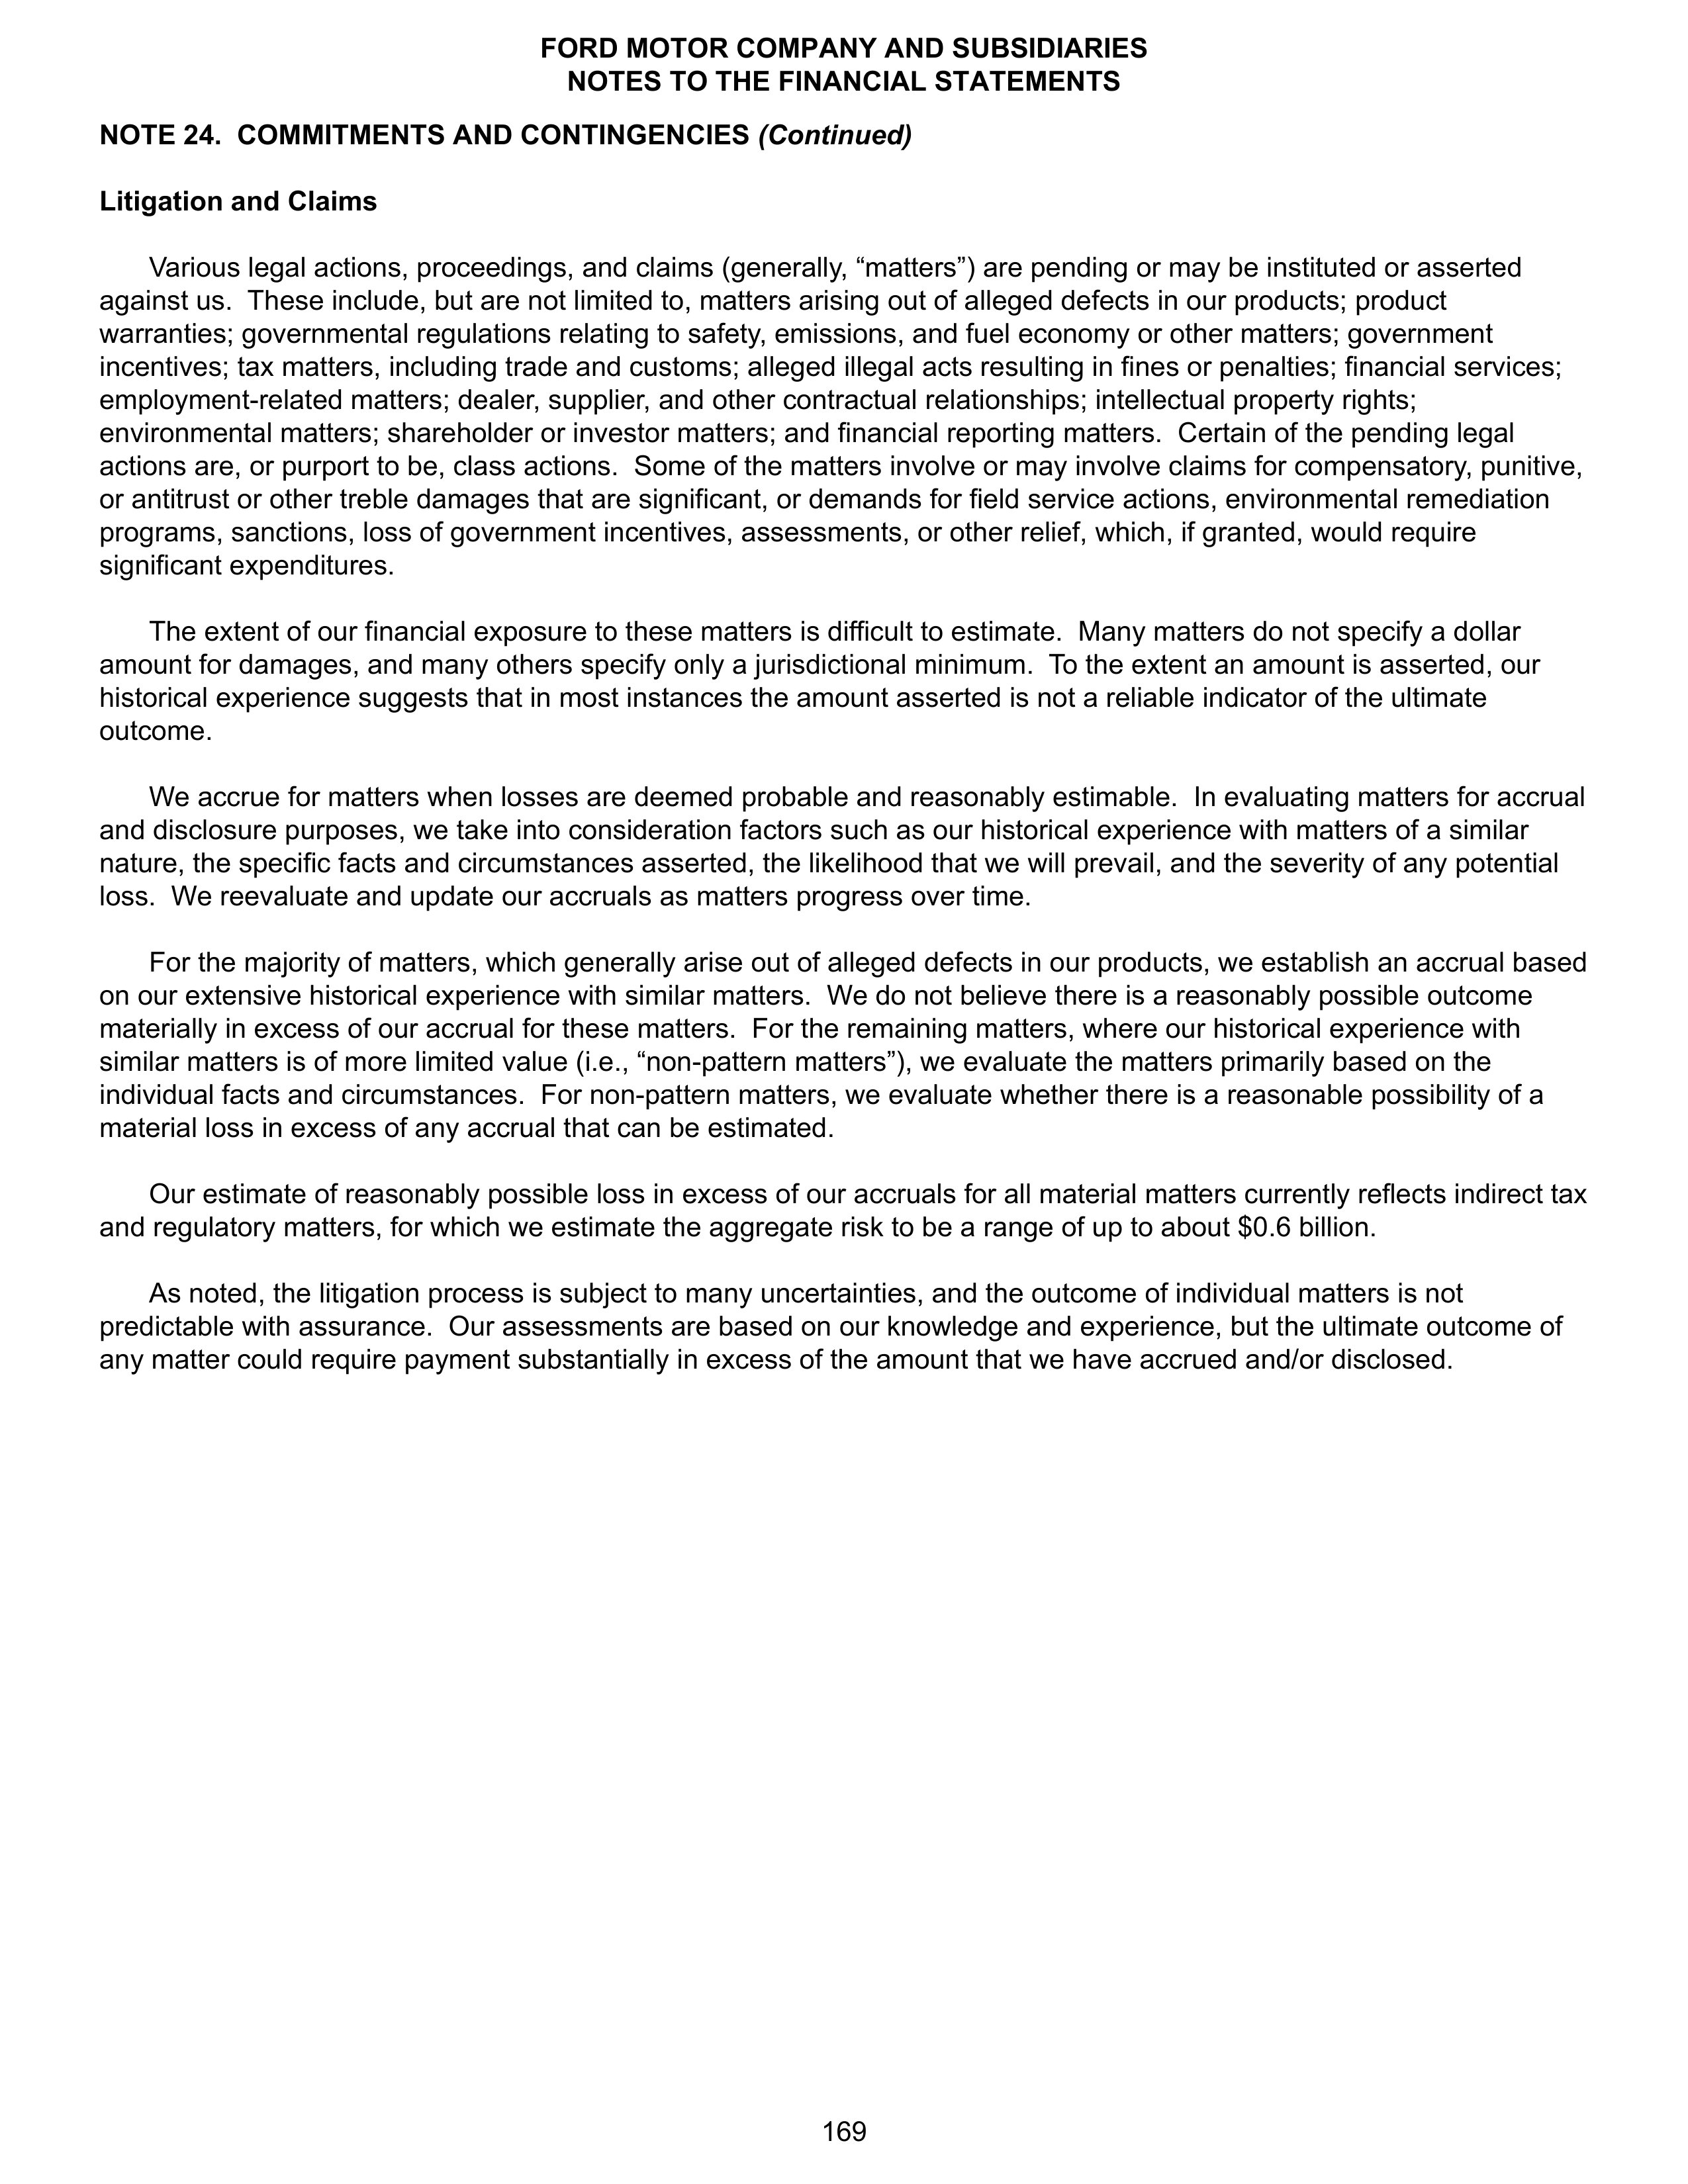
NOTE 24. COMMITMENTS AND CONTINGENCIES
(Continued)
Litigation and Claims
Various legal actions, proceedings, and claims (generally, “matters”) are pending or may be instituted or asserted
against us. These include, but are not limited to, matters arising out of alleged defects in our products; product
warranties; governmental regulations relating to safety, emissions, and fuel economy or other matters; government
incentives; tax matters, including trade and customs; alleged illegal acts resulting in fines or penalties; financial services;
employment-related matters; dealer, supplier, and other contractual relationships; intellectual property rights;
environmental matters; shareholder or investor matters; and financial reporting matters. Certain of the pending legal
actions are, or purport to be, class actions. Some of the matters involve or may involve claims for compensatory, punitive,
or antitrust or other treble damages that are significant, or demands for field service actions, environmental remediation
programs, sanctions, loss of government incentives, assessments, or other relief, which, if granted, would require
significant expenditures.
The extent of our financial exposure to these matters is difficult to estimate. Many matters do not specify a dollar
amount for damages, and many others specify only a jurisdictional minimum. To the extent an amount is asserted, our
historical experience suggests that in most instances the amount asserted is not a reliable indicator of the ultimate
outcome.
We accrue for matters when losses are deemed probable and reasonably estimable. In evaluating matters for accrual
and disclosure purposes, we take into consideration factors such as our historical experience with matters of a similar
nature, the specific facts and circumstances asserted, the likelihood that we will prevail, and the severity of any potential
loss. We reevaluate and update our accruals as matters progress over time.
For the majority of matters, which generally arise out of alleged defects in our products, we establish an accrual based
on our extensive historical experience with similar matters. We do not believe there is a reasonably possible outcome
materially in excess of our accrual for these matters. For the remaining matters, where our historical experience with
similar matters is of more limited value (i.e., “non-pattern matters”), we evaluate the matters primarily based on the
individual facts and circumstances. For non-pattern matters, we evaluate whether there is a reasonable possibility of a
material loss in excess of any accrual that can be estimated.
Our estimate of reasonably possible loss in excess of our accruals for all material matters currently reflects indirect tax
and regulatory matters, for which we estimate the aggregate risk to be a range of up to about $0.6 billion.
As noted, the litigation process is subject to many uncertainties, and the outcome of individual matters is not
predictable with assurance. Our assessments are based on our knowledge and experience, but the ultimate outcome of
any matter could require payment substantially in excess of the amount that we have accrued and/or disclosed.
FORD MOTOR COMPANY AND SUBSIDIARIES
NOTES TO THE FINANCIAL STATEMENTS
169
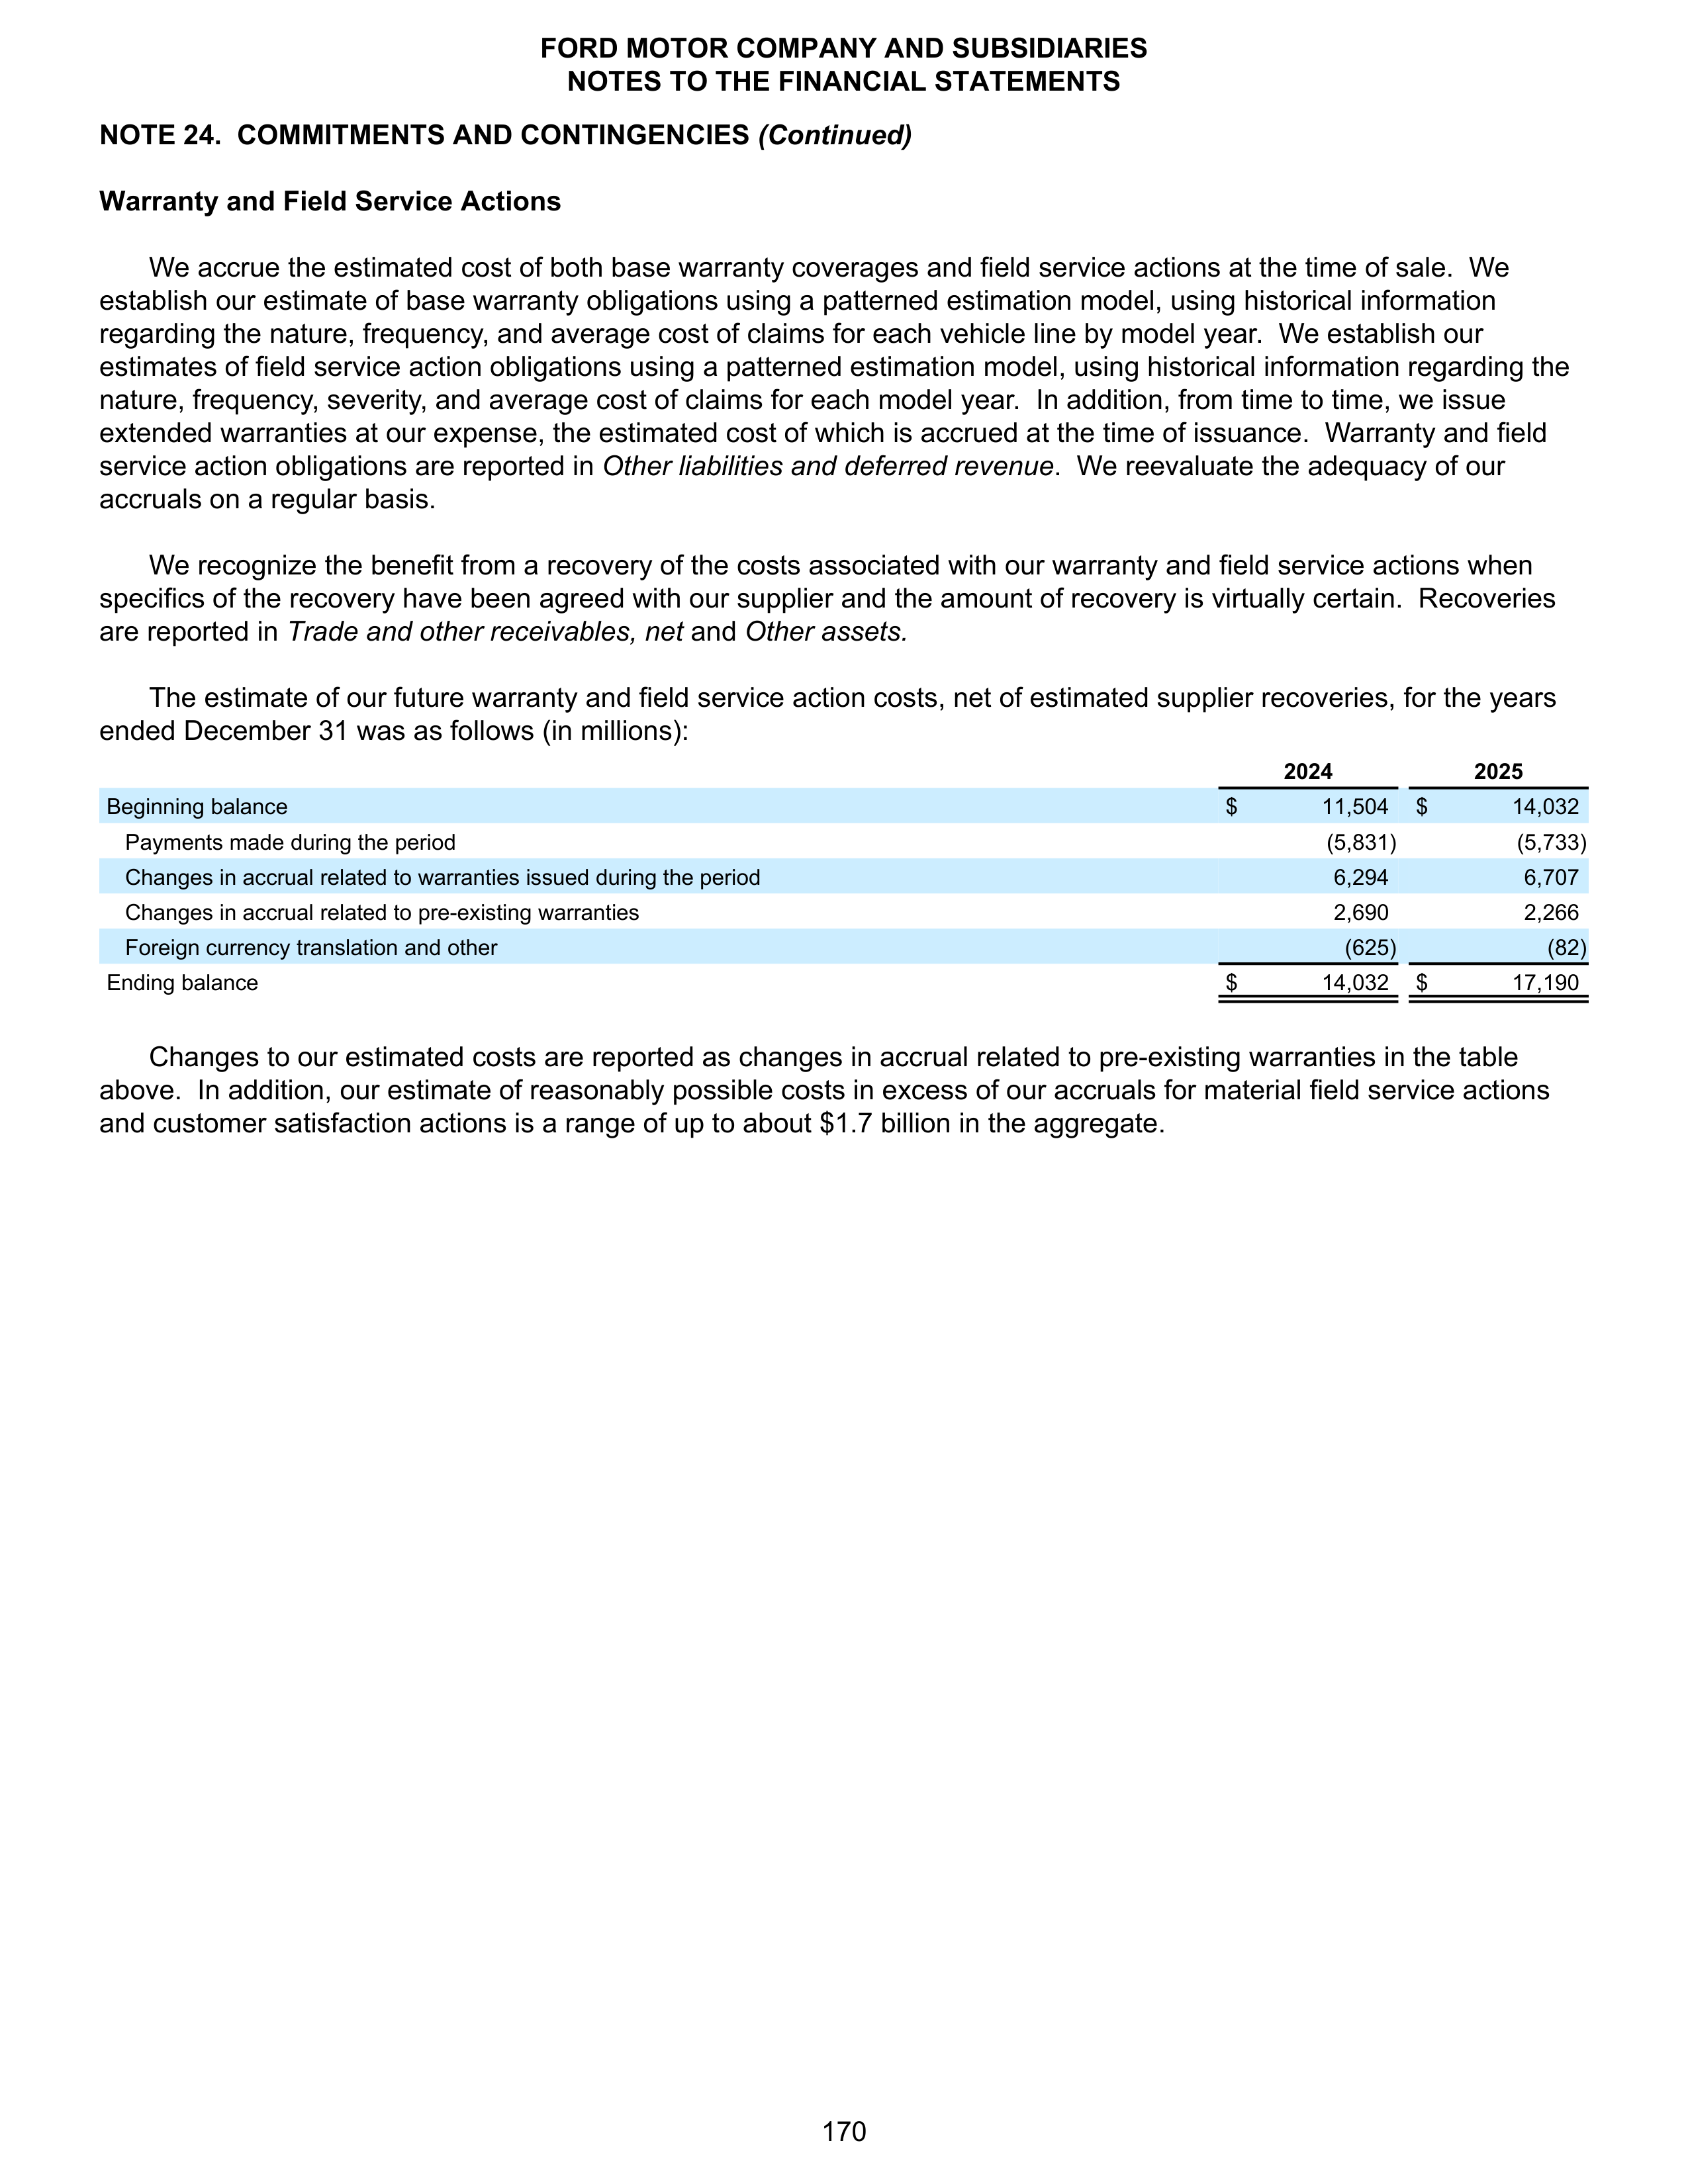
NOTE 24. COMMITMENTS AND CONTINGENCIES
(Continued)
Warranty and Field Service Actions
We accrue the estimated cost of both base warranty coverages and field service actions at the time of sale. We
establish our estimate of base warranty obligations using a patterned estimation model, using historical information
regarding the nature, frequency, and average cost of claims for each vehicle line by model year. We establish our
estimates of field service action obligations using a patterned estimation model, using historical information regarding the
nature, frequency, severity, and average cost of claims for each model year. In addition, from time to time, we issue
extended warranties at our expense, the estimated cost of which is accrued at the time of issuance. Warranty and field
service action obligations are reported in
Other liabilities and deferred revenue
. We reevaluate the adequacy of our
accruals on a regular basis.
We recognize the benefit from a recovery of the costs associated with our warranty and field service actions when
specifics of the recovery have been agreed with our supplier and the amount of recovery is virtually certain. Recoveries
are reported in
Trade and other receivables, net
and
Other assets.
The estimate of our future warranty and field service action costs, net of estimated supplier recoveries, for the years
ended December 31 was as follows (in millions):
2024
2025
Beginning balance
$
11,504
$
14,032
Payments made during the period
(5,831)
(5,733)
Changes in accrual related to warranties issued during the period
6,294
6,707
Changes in accrual related to pre-existing warranties
2,690
2,266
Foreign currency translation and other
(625)
(82)
Ending balance
$
14,032
$
17,190
Changes to our estimated costs are reported as changes in accrual related to pre-existing warranties in the table
above. In addition, our estimate of reasonably possible costs in excess of our accruals for material field service actions
and customer satisfaction actions is a range of up to about $1.7 billion in the aggregate.
FORD MOTOR COMPANY AND SUBSIDIARIES
NOTES TO THE FINANCIAL STATEMENTS
170
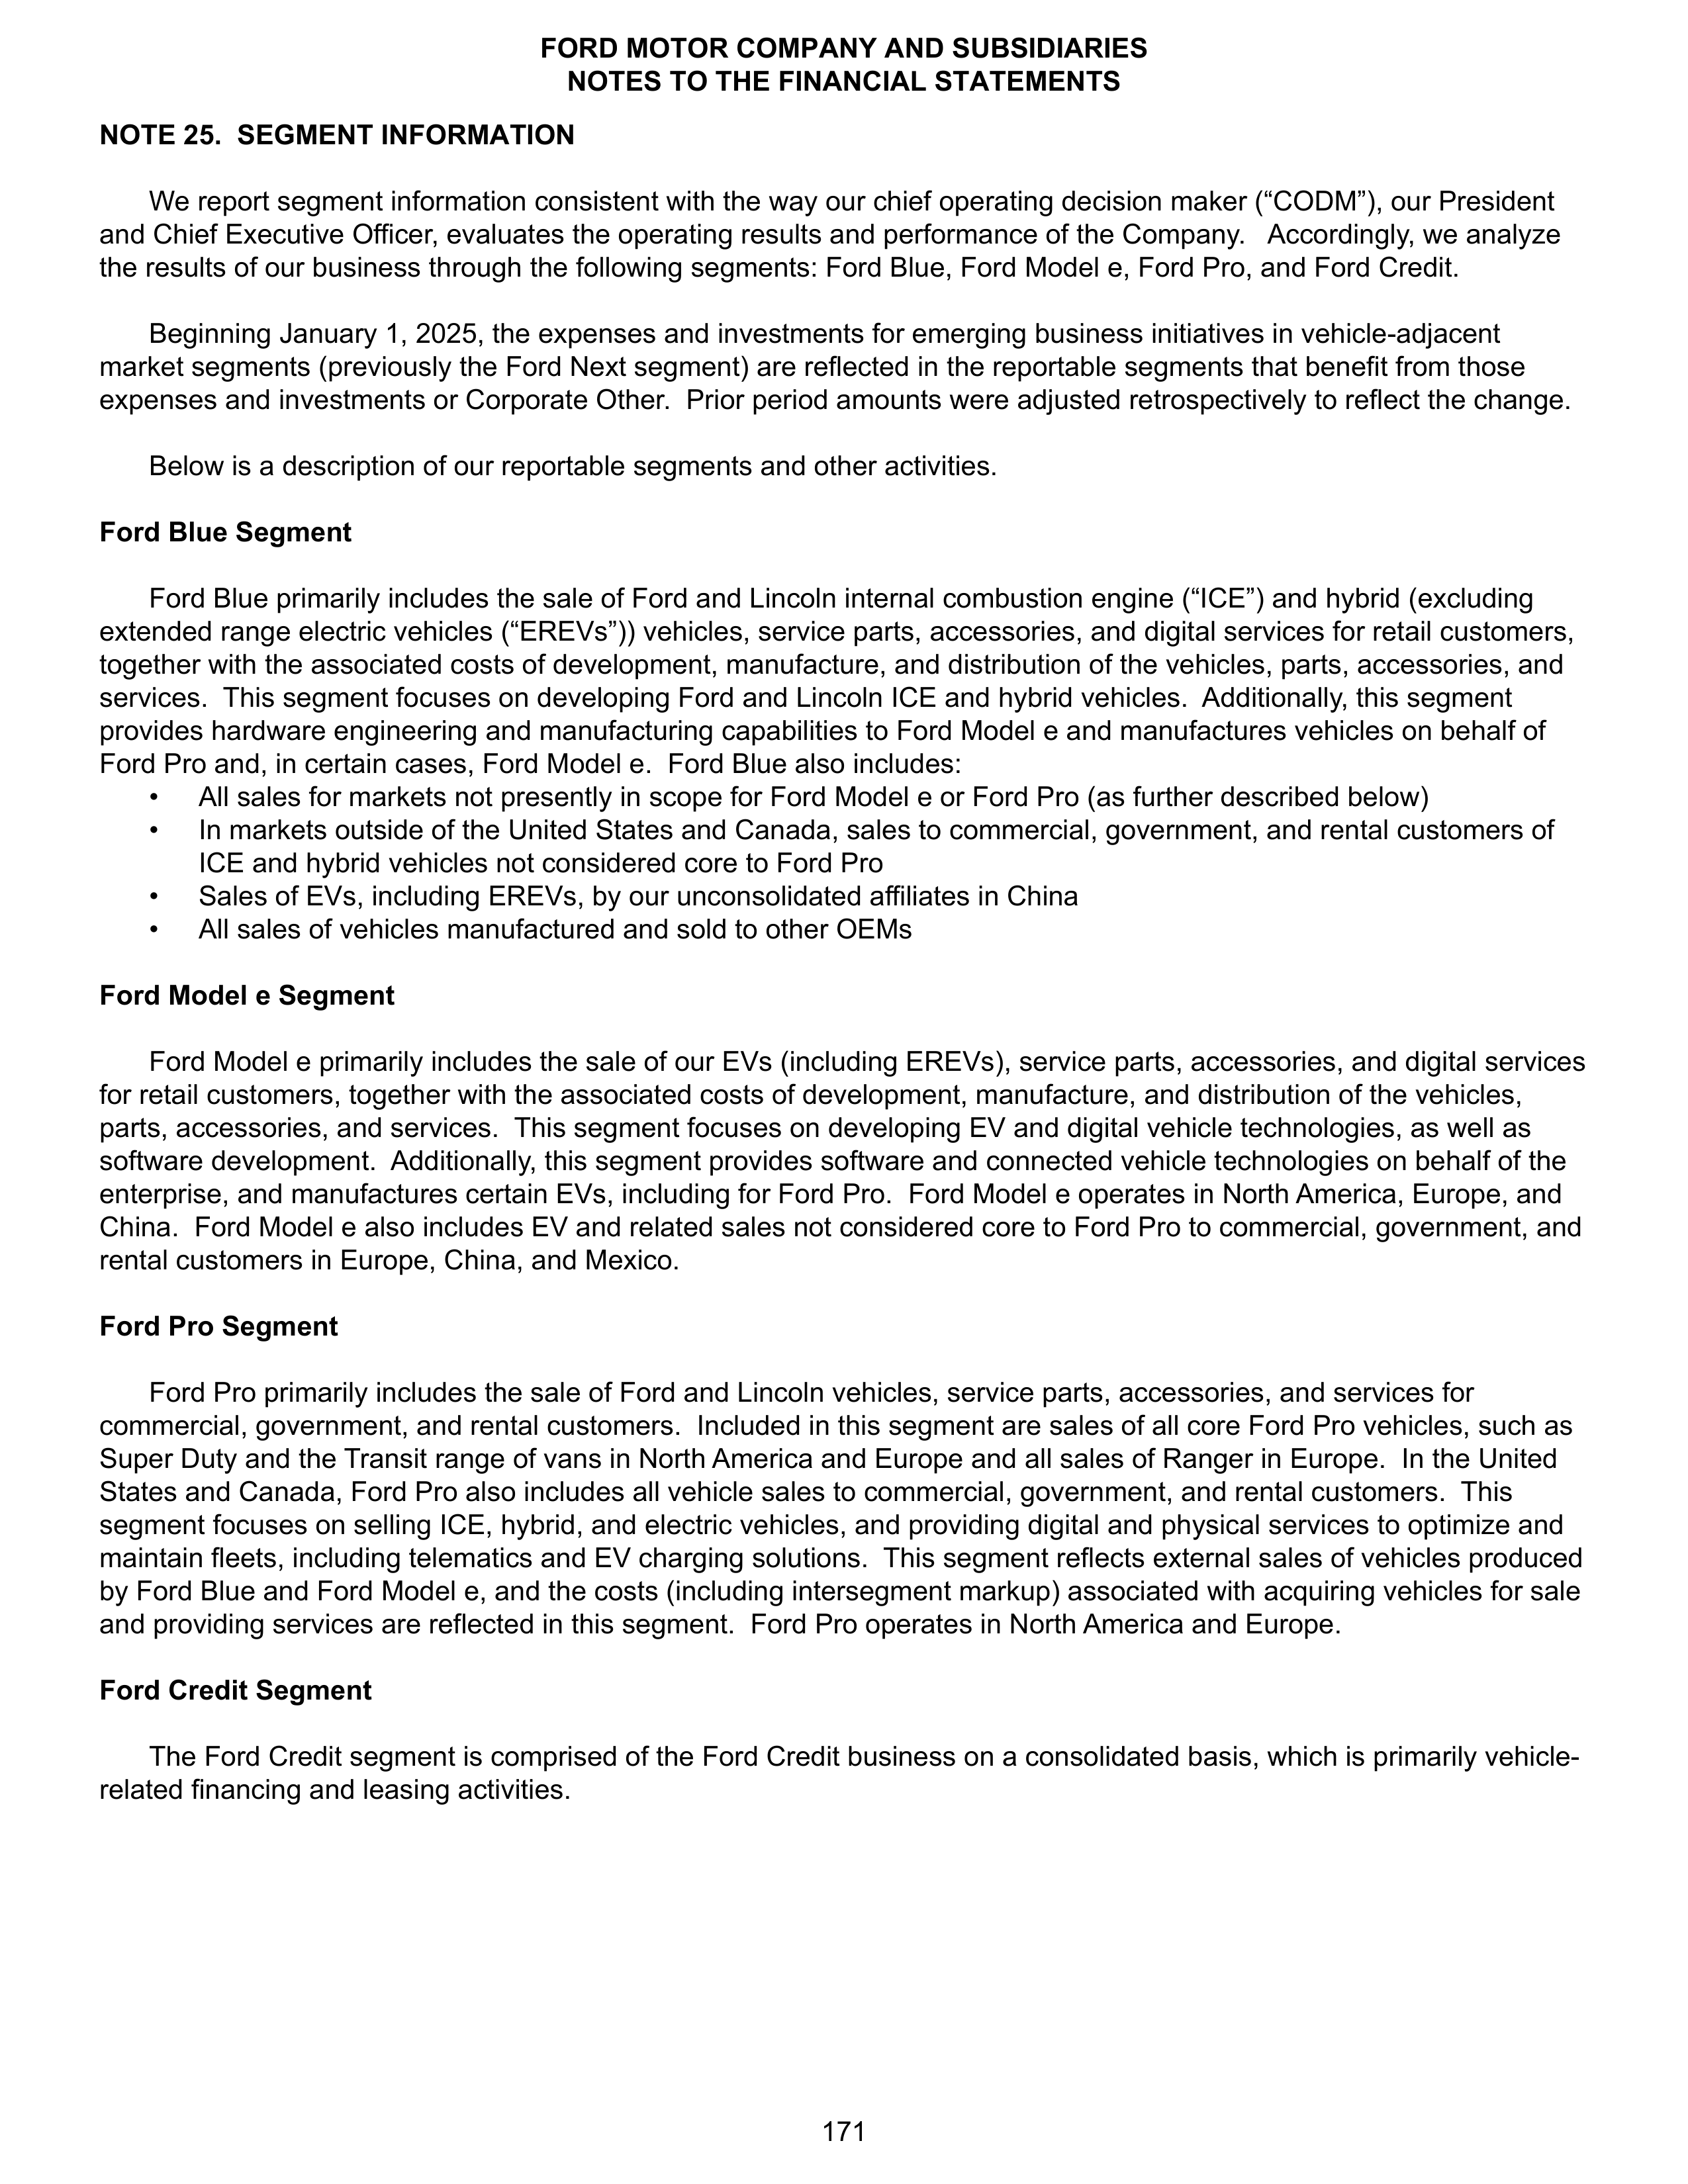
NOTE 25. SEGMENT INFORMATION
We report segment information consistent with the way our chief operating decision maker (“CODM”), our President
and Chief Executive Officer, evaluates the operating results and performance of the Company. Accordingly, we analyze
the results of our business through the following segments: Ford Blue, Ford Model e, Ford Pro, and Ford Credit.
Beginning January 1, 2025, the expenses and investments for emerging business initiatives in vehicle-adjacent
market segments (previously the Ford Next segment) are reflected in the reportable segments that benefit from those
expenses and investments or Corporate Other. Prior period amounts were adjusted retrospectively to reflect the change.
Below is a description of our reportable segments and other activities.
Ford Blue Segment
Ford Blue primarily includes the sale of Ford and Lincoln internal combustion engine (“ICE”) and hybrid (excluding
extended range electric vehicles (“EREVs”)) vehicles, service parts, accessories, and digital services for retail customers,
together with the associated costs of development, manufacture, and distribution of the vehicles, parts, accessories, and
services. This segment focuses on developing Ford and Lincoln ICE and hybrid vehicles. Additionally, this segment
provides hardware engineering and manufacturing capabilities to Ford Model e and manufactures vehicles on behalf of
Ford Pro and, in certain cases, Ford Model e. Ford Blue also includes:
•
All sales for markets not presently in scope for Ford Model e or Ford Pro (as further described below)
•
In markets outside of the United States and Canada, sales to commercial, government, and rental customers of
ICE and hybrid vehicles not considered core to Ford Pro
•
Sales of EVs, including EREVs, by our unconsolidated affiliates in China
•
All sales of vehicles manufactured and sold to other OEMs
Ford Model e Segment
Ford Model e primarily includes the sale of our EVs (including EREVs), service parts, accessories, and digital services
for retail customers, together with the associated costs of development, manufacture, and distribution of the vehicles,
parts, accessories, and services. This segment focuses on developing EV and digital vehicle technologies, as well as
software development. Additionally, this segment provides software and connected vehicle technologies on behalf of the
enterprise, and manufactures certain EVs, including for Ford Pro. Ford Model e operates in North America, Europe, and
China. Ford Model e also includes EV and related sales not considered core to Ford Pro to commercial, government, and
rental customers in Europe, China, and Mexico.
Ford Pro Segment
Ford Pro primarily includes the sale of Ford and Lincoln vehicles, service parts, accessories, and services for
commercial, government, and rental customers. Included in this segment are sales of all core Ford Pro vehicles, such as
Super Duty and the Transit range of vans in North America and Europe and all sales of Ranger in Europe. In the United
States and Canada, Ford Pro also includes all vehicle sales to commercial, government, and rental customers. This
segment focuses on selling ICE, hybrid, and electric vehicles, and providing digital and physical services to optimize and
maintain fleets, including telematics and EV charging solutions. This segment reflects external sales of vehicles produced
by Ford Blue and Ford Model e, and the costs (including intersegment markup) associated with acquiring vehicles for sale
and providing services are reflected in this segment. Ford Pro operates in North America and Europe.
Ford Credit Segment
The Ford Credit segment is comprised of the Ford Credit business on a consolidated basis, which is primarily vehicle-
related financing and leasing activities.
FORD MOTOR COMPANY AND SUBSIDIARIES
NOTES TO THE FINANCIAL STATEMENTS
171
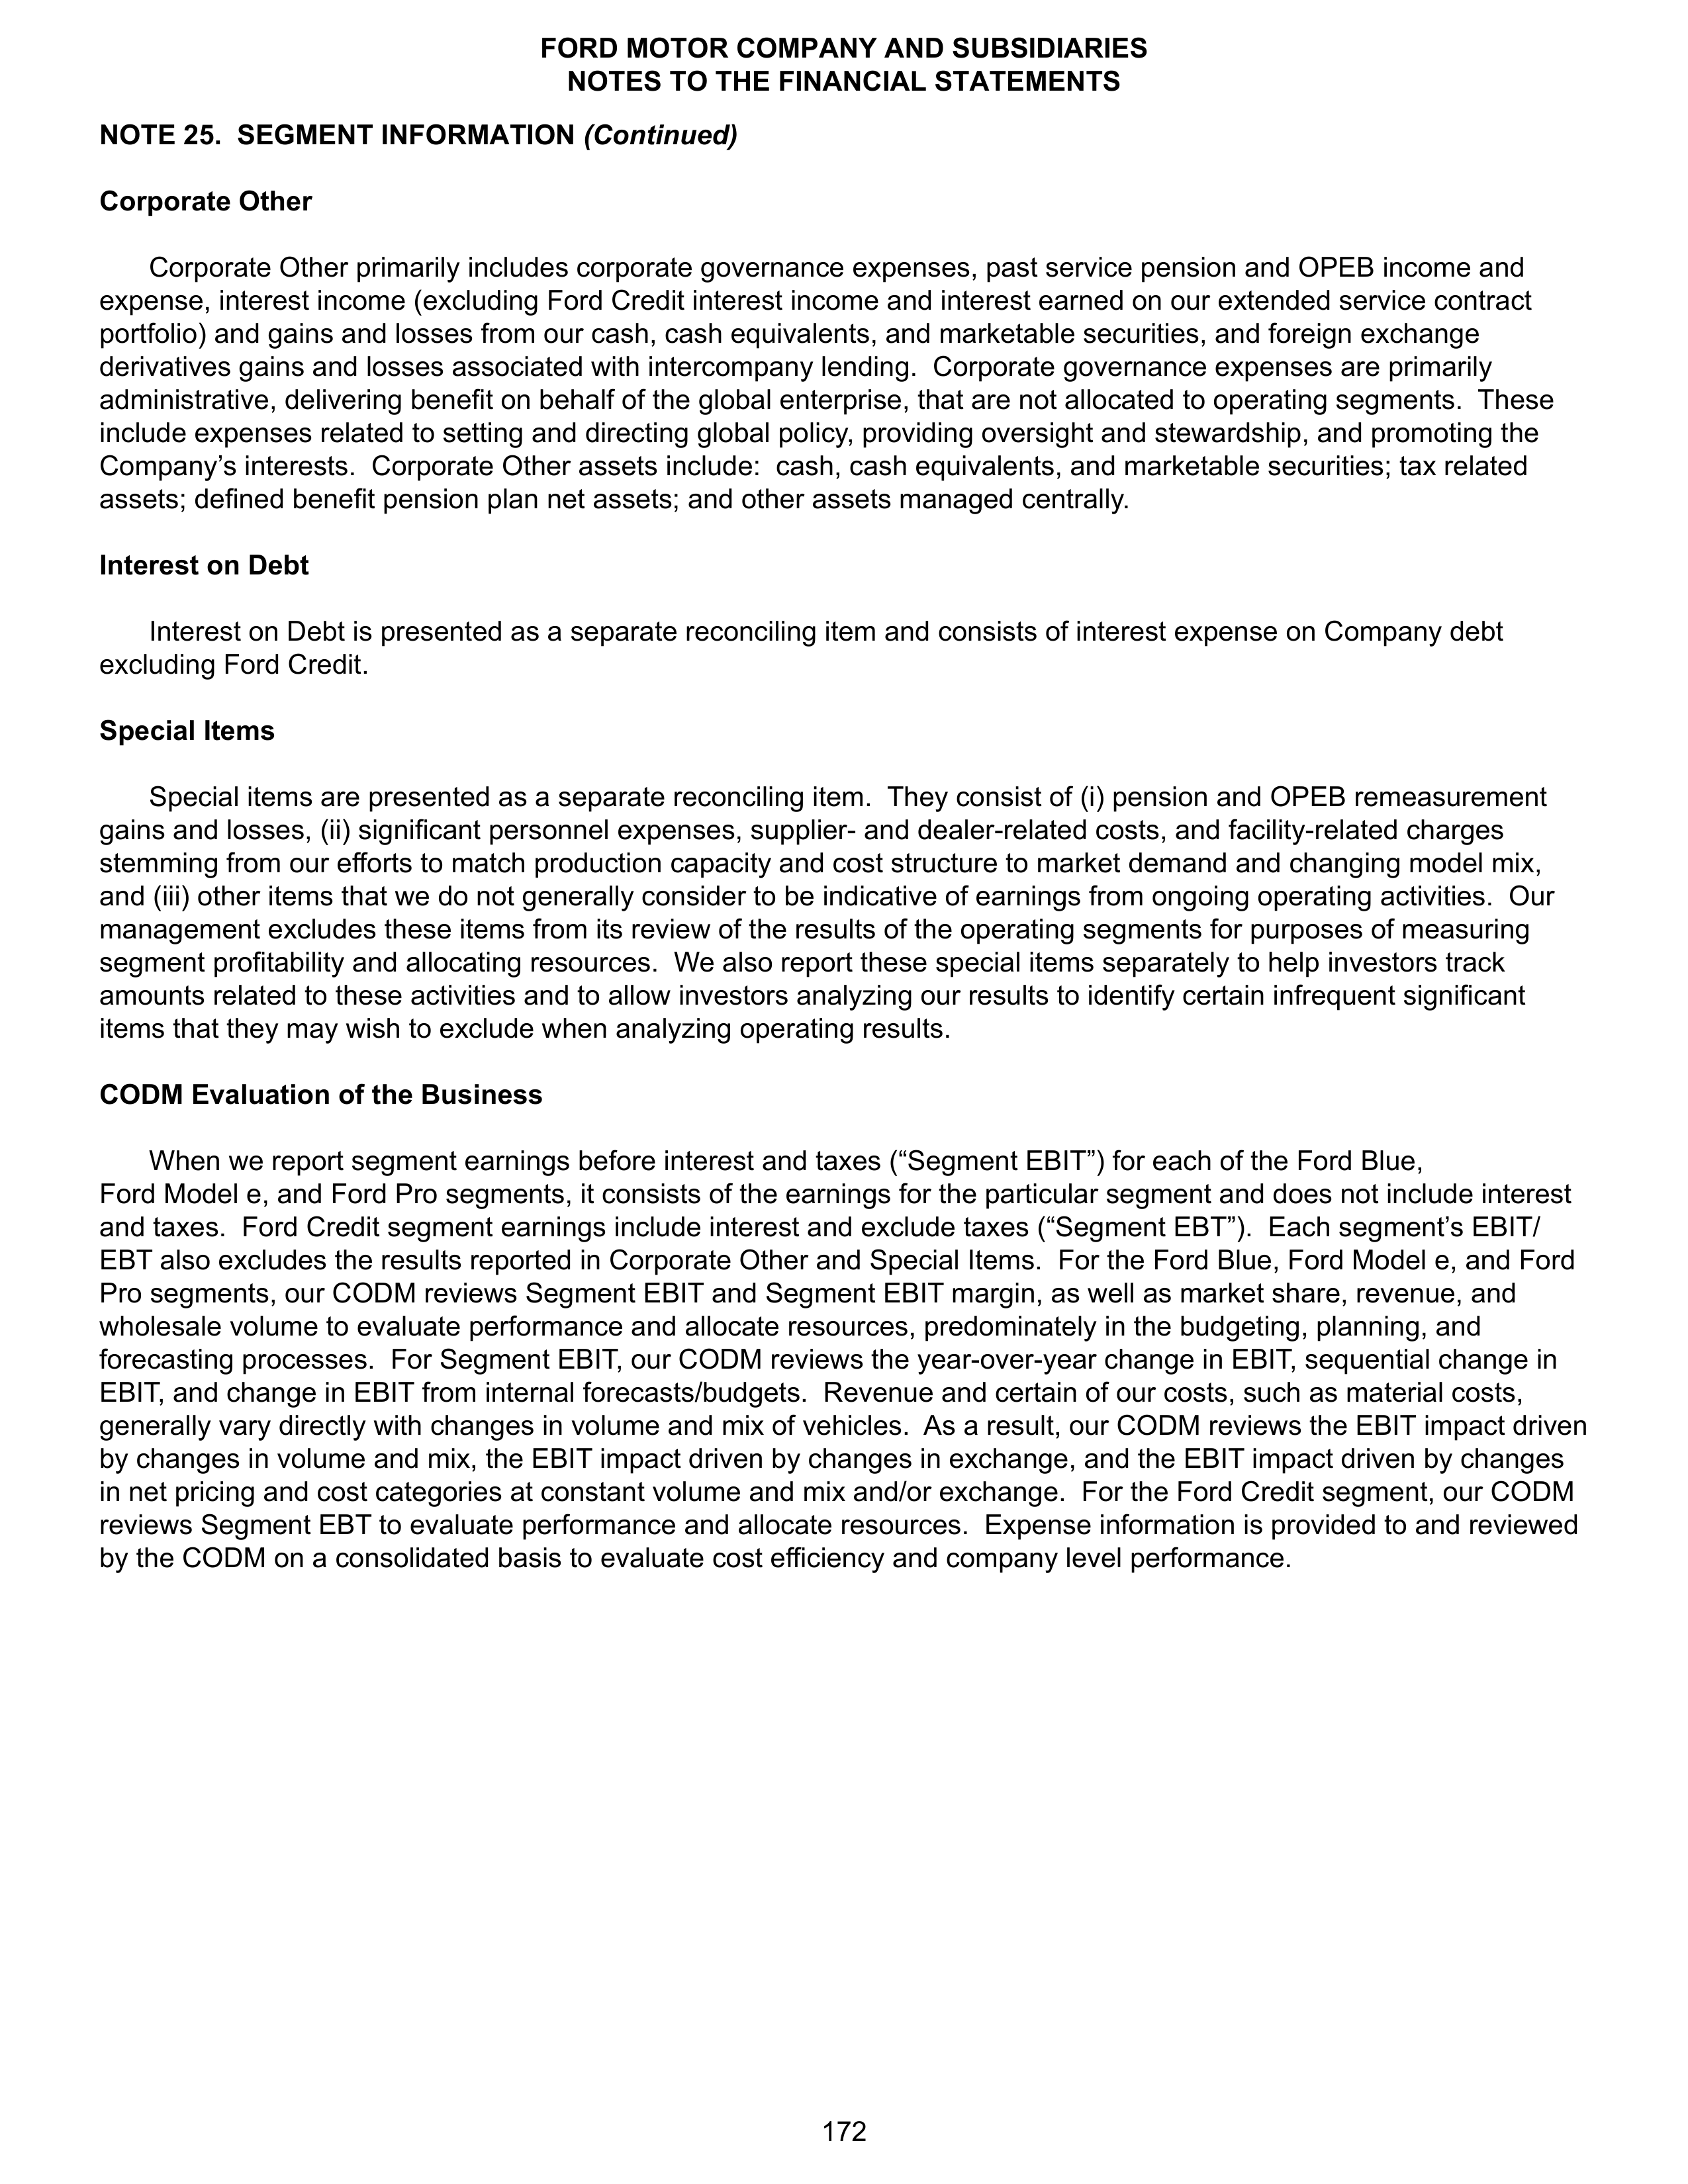
NOTE 25. SEGMENT INFORMATION
(Continued)
Corporate Other
Corporate Other primarily includes corporate governance expenses, past service pension and OPEB income and
expense, interest income (excluding Ford Credit interest income and interest earned on our extended service contract
portfolio) and gains and losses from our cash, cash equivalents, and marketable securities, and foreign exchange
derivatives gains and losses associated with intercompany lending. Corporate governance expenses are primarily
administrative, delivering benefit on behalf of the global enterprise, that are not allocated to operating segments. These
include expenses related to setting and directing global policy, providing oversight and stewardship, and promoting the
Company’s interests. Corporate Other assets include: cash, cash equivalents, and marketable securities; tax related
assets; defined benefit pension plan net assets; and other assets managed centrally.
Interest on Debt
Interest on Debt is presented as a separate reconciling item and consists of interest expense on Company debt
excluding Ford Credit.
Special Items
Special items are presented as a separate reconciling item. They consist of (i) pension and OPEB remeasurement
gains and losses, (ii) significant personnel expenses, supplier- and dealer-related costs, and facility-related charges
stemming from our efforts to match production capacity and cost structure to market demand and changing model mix,
and (iii) other items that we do not generally consider to be indicative of earnings from ongoing operating activities. Our
management excludes these items from its review of the results of the operating segments for purposes of measuring
segment profitability and allocating resources. We also report these special items separately to help investors track
amounts related to these activities and to allow investors analyzing our results to identify certain infrequent significant
items that they may wish to exclude when analyzing operating results.
CODM Evaluation of the Business
When we report segment earnings before interest and taxes (“Segment EBIT”) for each of the Ford Blue,
Ford Model e, and Ford Pro segments, it consists of the earnings for the particular segment and does not include interest
and taxes. Ford Credit segment earnings include interest and exclude taxes (“Segment EBT”). Each segment’s EBIT/
EBT also excludes the results reported in Corporate Other and Special Items. For the Ford Blue, Ford Model e, and Ford
Pro segments, our CODM reviews Segment EBIT and Segment EBIT margin, as well as market share, revenue, and
wholesale volume to evaluate performance and allocate resources, predominately in the budgeting, planning, and
forecasting processes. For Segment EBIT, our CODM reviews the year-over-year change in EBIT, sequential change in
EBIT, and change in EBIT from internal forecasts/budgets. Revenue and certain of our costs, such as material costs,
generally vary directly with changes in volume and mix of vehicles. As a result, our CODM reviews the EBIT impact driven
by changes in volume and mix, the EBIT impact driven by changes in exchange, and the EBIT impact driven by changes
in net pricing and cost categories at constant volume and mix and/or exchange. For the Ford Credit segment, our CODM
reviews Segment EBT to evaluate performance and allocate resources. Expense information is provided to and reviewed
by the CODM on a consolidated basis to evaluate cost efficiency and company level performance.
FORD MOTOR COMPANY AND SUBSIDIARIES
NOTES TO THE FINANCIAL STATEMENTS
172
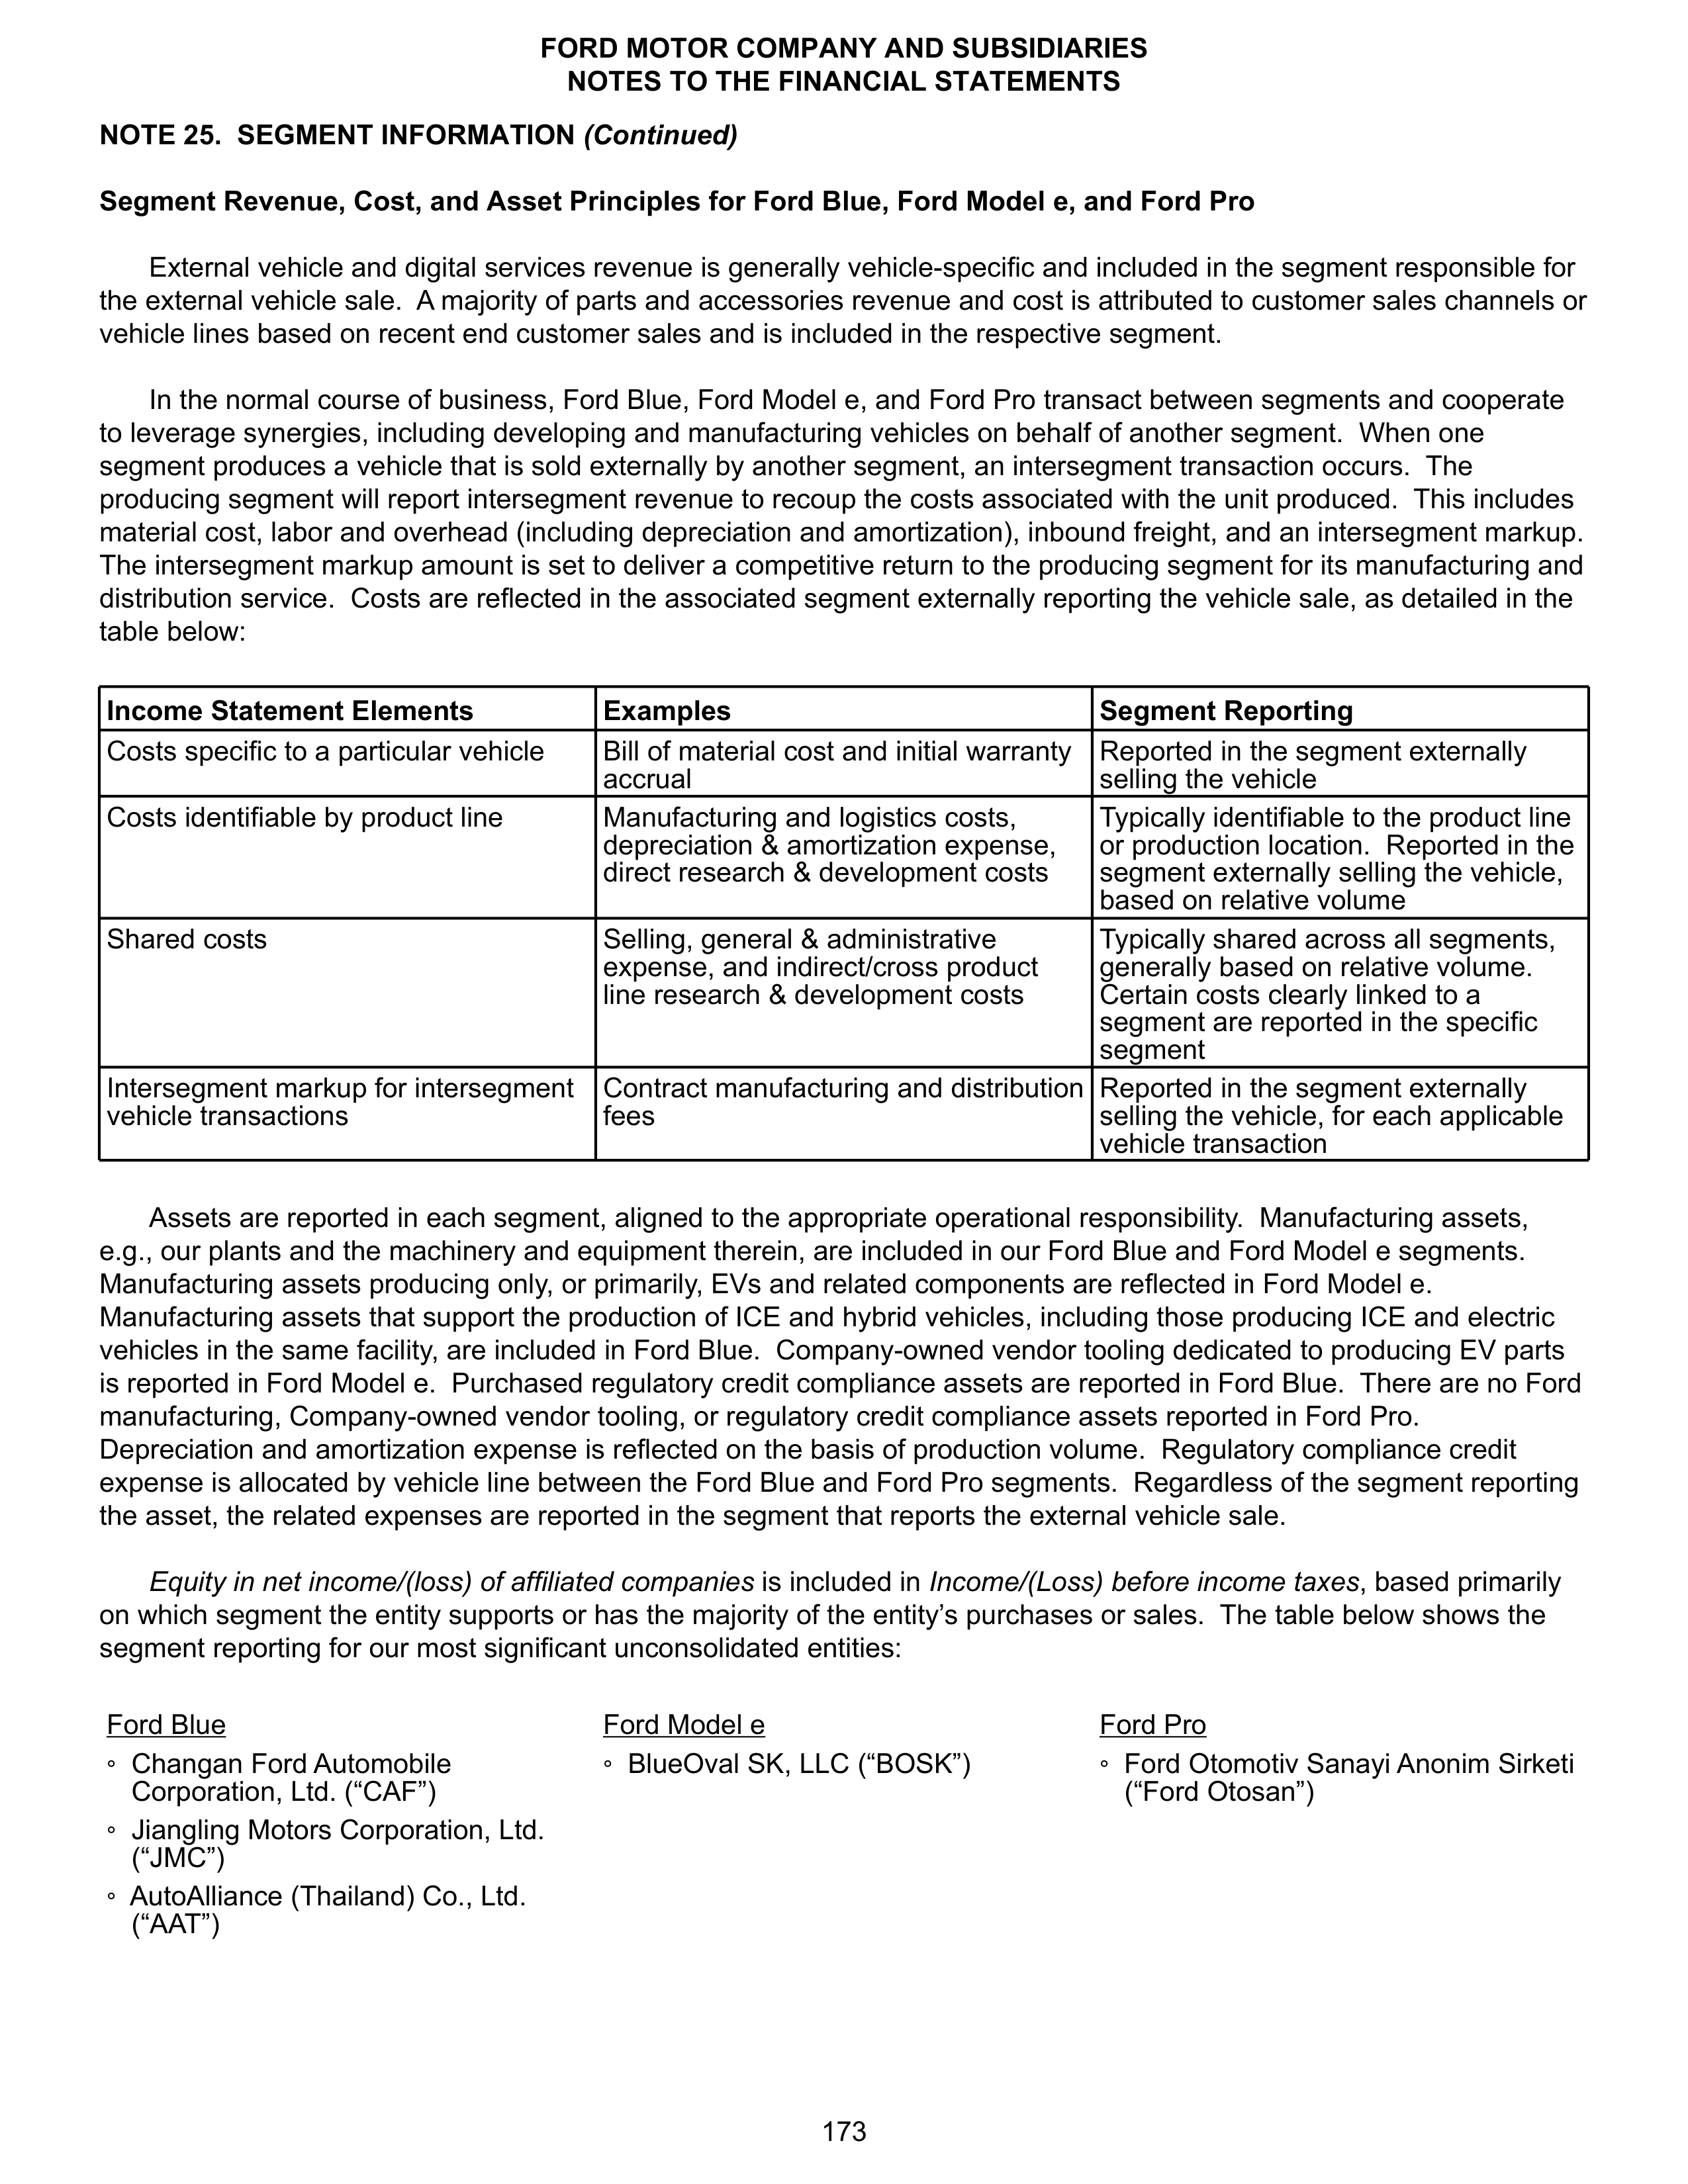
NOTE 25. SEGMENT INFORMATION
(Continued)
Segment Revenue, Cost, and Asset Principles for Ford Blue, Ford Model e, and Ford Pro
External vehicle and digital services revenue is generally vehicle-specific and included in the segment responsible for
the external vehicle sale. A majority of parts and accessories revenue and cost is attributed to customer sales channels or
vehicle lines based on recent end customer sales and is included in the respective segment.
In the normal course of business, Ford Blue, Ford Model e, and Ford Pro transact between segments and cooperate
to leverage synergies, including developing and manufacturing vehicles on behalf of another segment. When one
segment produces a vehicle that is sold externally by another segment, an intersegment transaction occurs. The
producing segment will report intersegment revenue to recoup the costs associated with the unit produced. This includes
material cost, labor and overhead (including depreciation and amortization), inbound freight, and an intersegment markup.
The intersegment markup amount is set to deliver a competitive return to the producing segment for its manufacturing and
distribution service. Costs are reflected in the associated segment externally reporting the vehicle sale, as detailed in the
table below:
Income Statement Elements
Examples
Segment Reporting
Costs specific to a particular vehicle
Bill of material cost and initial warranty
accrual
Reported in the segment externally
selling the vehicle
Costs identifiable by product line
Manufacturing and logistics costs,
depreciation & amortization expense,
direct research & development costs
Typically identifiable to the product line
or production location. Reported in the
segment externally selling the vehicle,
based on relative volume
Shared costs
Selling, general & administrative
expense, and indirect/cross product
line research & development costs
Typically shared across all segments,
generally based on relative volume.
Certain costs clearly linked to a
segment are reported in the specific
segment
Intersegment markup for intersegment
vehicle transactions
Contract manufacturing and distribution
fees
Reported in the segment externally
selling the vehicle, for each applicable
vehicle transaction
Assets are reported in each segment, aligned to the appropriate operational responsibility. Manufacturing assets,
e.g., our plants and the machinery and equipment therein, are included in our Ford Blue and Ford Model e segments.
Manufacturing assets producing only, or primarily, EVs and related components are reflected in Ford Model e.
Manufacturing assets that support the production of ICE and hybrid vehicles, including those producing ICE and electric
vehicles in the same facility, are included in Ford Blue. Company-owned vendor tooling dedicated to producing EV parts
is reported in Ford Model e. Purchased regulatory credit compliance assets are reported in Ford Blue. There are no Ford
manufacturing, Company-owned vendor tooling, or regulatory credit compliance assets reported in Ford Pro.
Depreciation and amortization expense is reflected on the basis of production volume. Regulatory compliance credit
expense is allocated by vehicle line between the Ford Blue and Ford Pro segments. Regardless of the segment reporting
the asset, the related expenses are reported in the segment that reports the external vehicle sale.
Equity in net income/(loss) of affiliated companies
is included in
Income/(Loss) before income taxes
, based primarily
on which segment the entity supports or has the majority of the entity’s purchases or sales. The table below shows the
segment reporting for our most significant unconsolidated entities:
Ford Blue
Ford Model e
Ford Pro
∘
Changan Ford Automobile
Corporation, Ltd. (“CAF”)
∘
BlueOval SK, LLC (“BOSK”)
∘
Ford Otomotiv Sanayi Anonim Sirketi
(“Ford Otosan”)
∘
Jiangling Motors Corporation, Ltd.
(“JMC”)
∘
AutoAlliance (Thailand) Co., Ltd.
(“AAT”)
FORD MOTOR COMPANY AND SUBSIDIARIES
NOTES TO THE FINANCIAL STATEMENTS
173
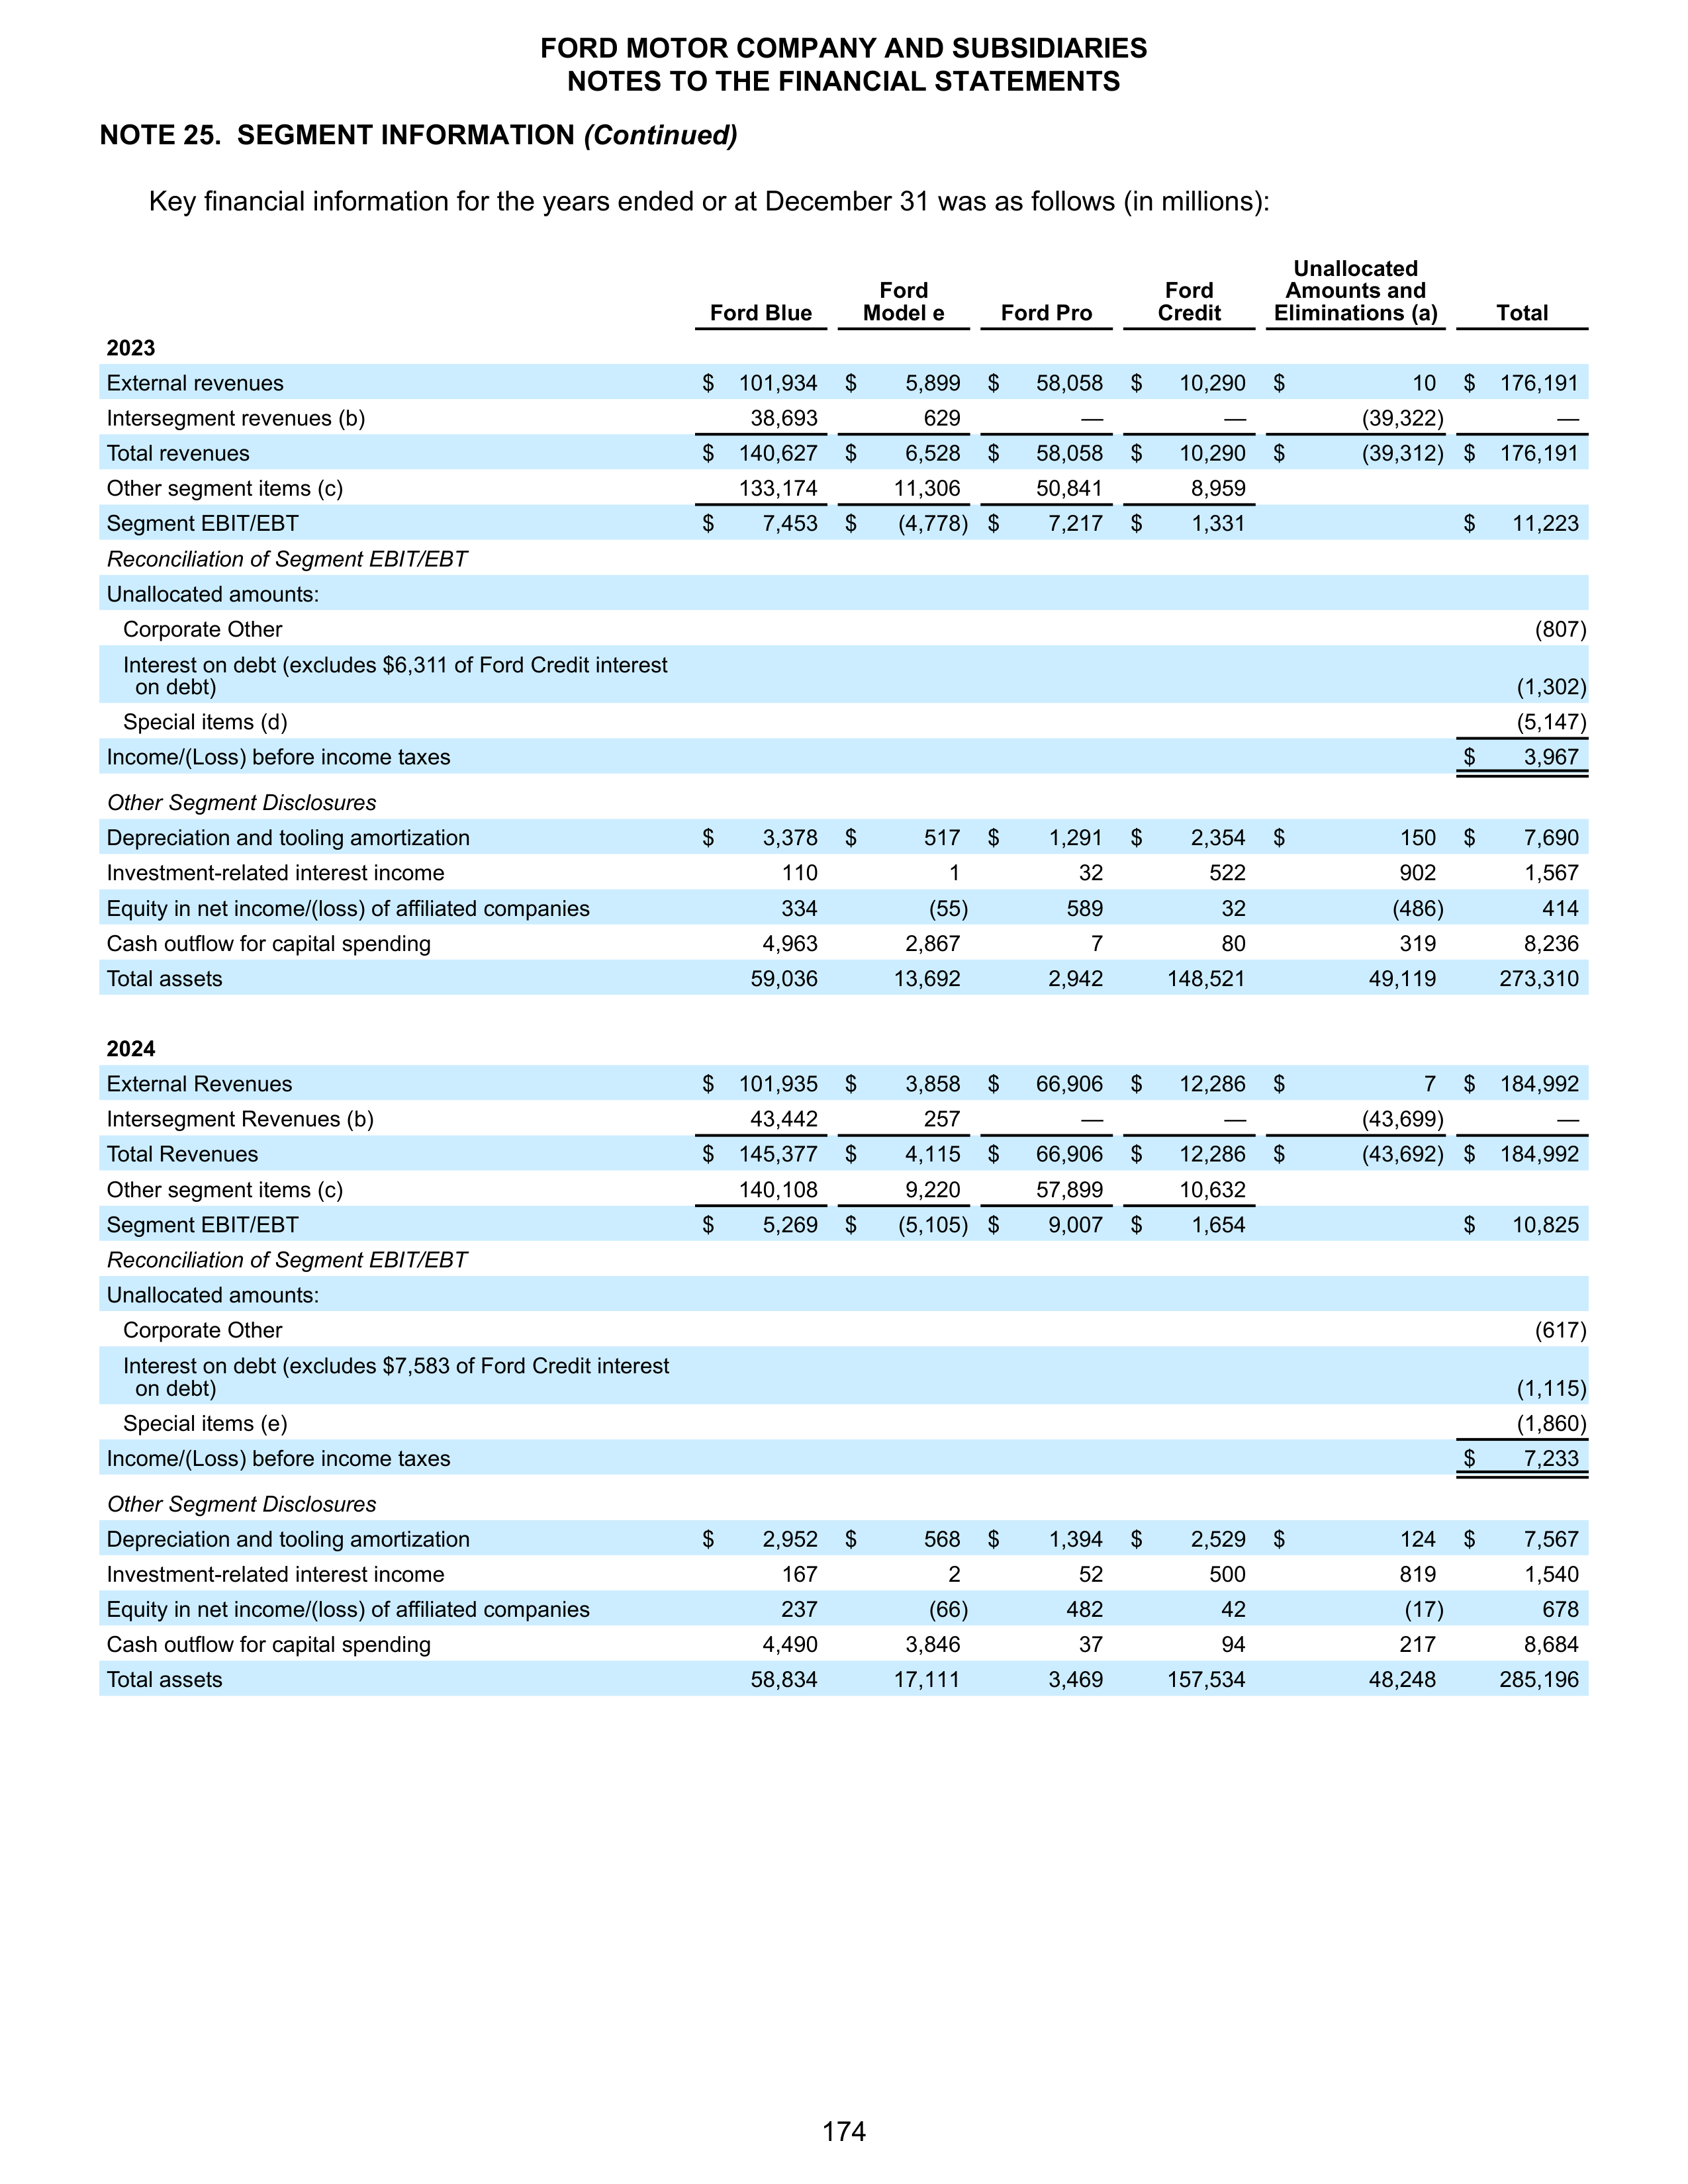
NOTE 25. SEGMENT INFORMATION
(Continued)
Key financial information for the years ended or at December 31 was as follows (in millions):
Ford Blue
Ford
Model e
Ford Pro
Ford
Credit
Unallocated
Amounts and
Eliminations (a)
Total
2023
External revenues
$
101,934
$
5,899
$
58,058
$
10,290
$
10
$
176,191
Intersegment revenues (b)
38,693
629
—
—
(39,322)
—
Total revenues
$
140,627
$
6,528
$
58,058
$
10,290
$
(39,312) $
176,191
Other segment items (c)
133,174
11,306
50,841
8,959
Segment EBIT/EBT
$
7,453
$
(4,778) $
7,217
$
1,331
$
11,223
Reconciliation of Segment EBIT/EBT
Unallocated amounts:
Corporate Other
(807)
Interest on debt (excludes $6,311 of Ford Credit interest
on debt)
(1,302)
Special items (d)
(5,147)
Income/(Loss) before income taxes
$
3,967
Other Segment Disclosures
Depreciation and tooling amortization
$
3,378
$
517
$
1,291
$
2,354
$
150
$
7,690
Investment-related interest income
110
1
32
522
902
1,567
Equity in net income/(loss) of affiliated companies
334
(55)
589
32
(486)
414
Cash outflow for capital spending
4,963
2,867
7
80
319
8,236
Total assets
59,036
13,692
2,942
148,521
49,119
273,310
2024
External Revenues
$
101,935
$
3,858
$
66,906
$
12,286
$
7
$
184,992
Intersegment Revenues (b)
43,442
257
—
—
(43,699)
—
Total Revenues
$
145,377
$
4,115
$
66,906
$
12,286
$
(43,692) $
184,992
Other segment items (c)
140,108
9,220
57,899
10,632
Segment EBIT/EBT
$
5,269
$
(5,105) $
9,007
$
1,654
$
10,825
Reconciliation of Segment EBIT/EBT
Unallocated amounts:
Corporate Other
(617)
Interest on debt (excludes $7,583 of Ford Credit interest
on debt)
(1,115)
Special items (e)
(1,860)
Income/(Loss) before income taxes
$
7,233
Other Segment Disclosures
Depreciation and tooling amortization
$
2,952
$
568
$
1,394
$
2,529
$
124
$
7,567
Investment-related interest income
167
2
52
500
819
1,540
Equity in net income/(loss) of affiliated companies
237
(66)
482
42
(17)
678
Cash outflow for capital spending
4,490
3,846
37
94
217
8,684
Total assets
58,834
17,111
3,469
157,534
48,248
285,196
FORD MOTOR COMPANY AND SUBSIDIARIES
NOTES TO THE FINANCIAL STATEMENTS
174
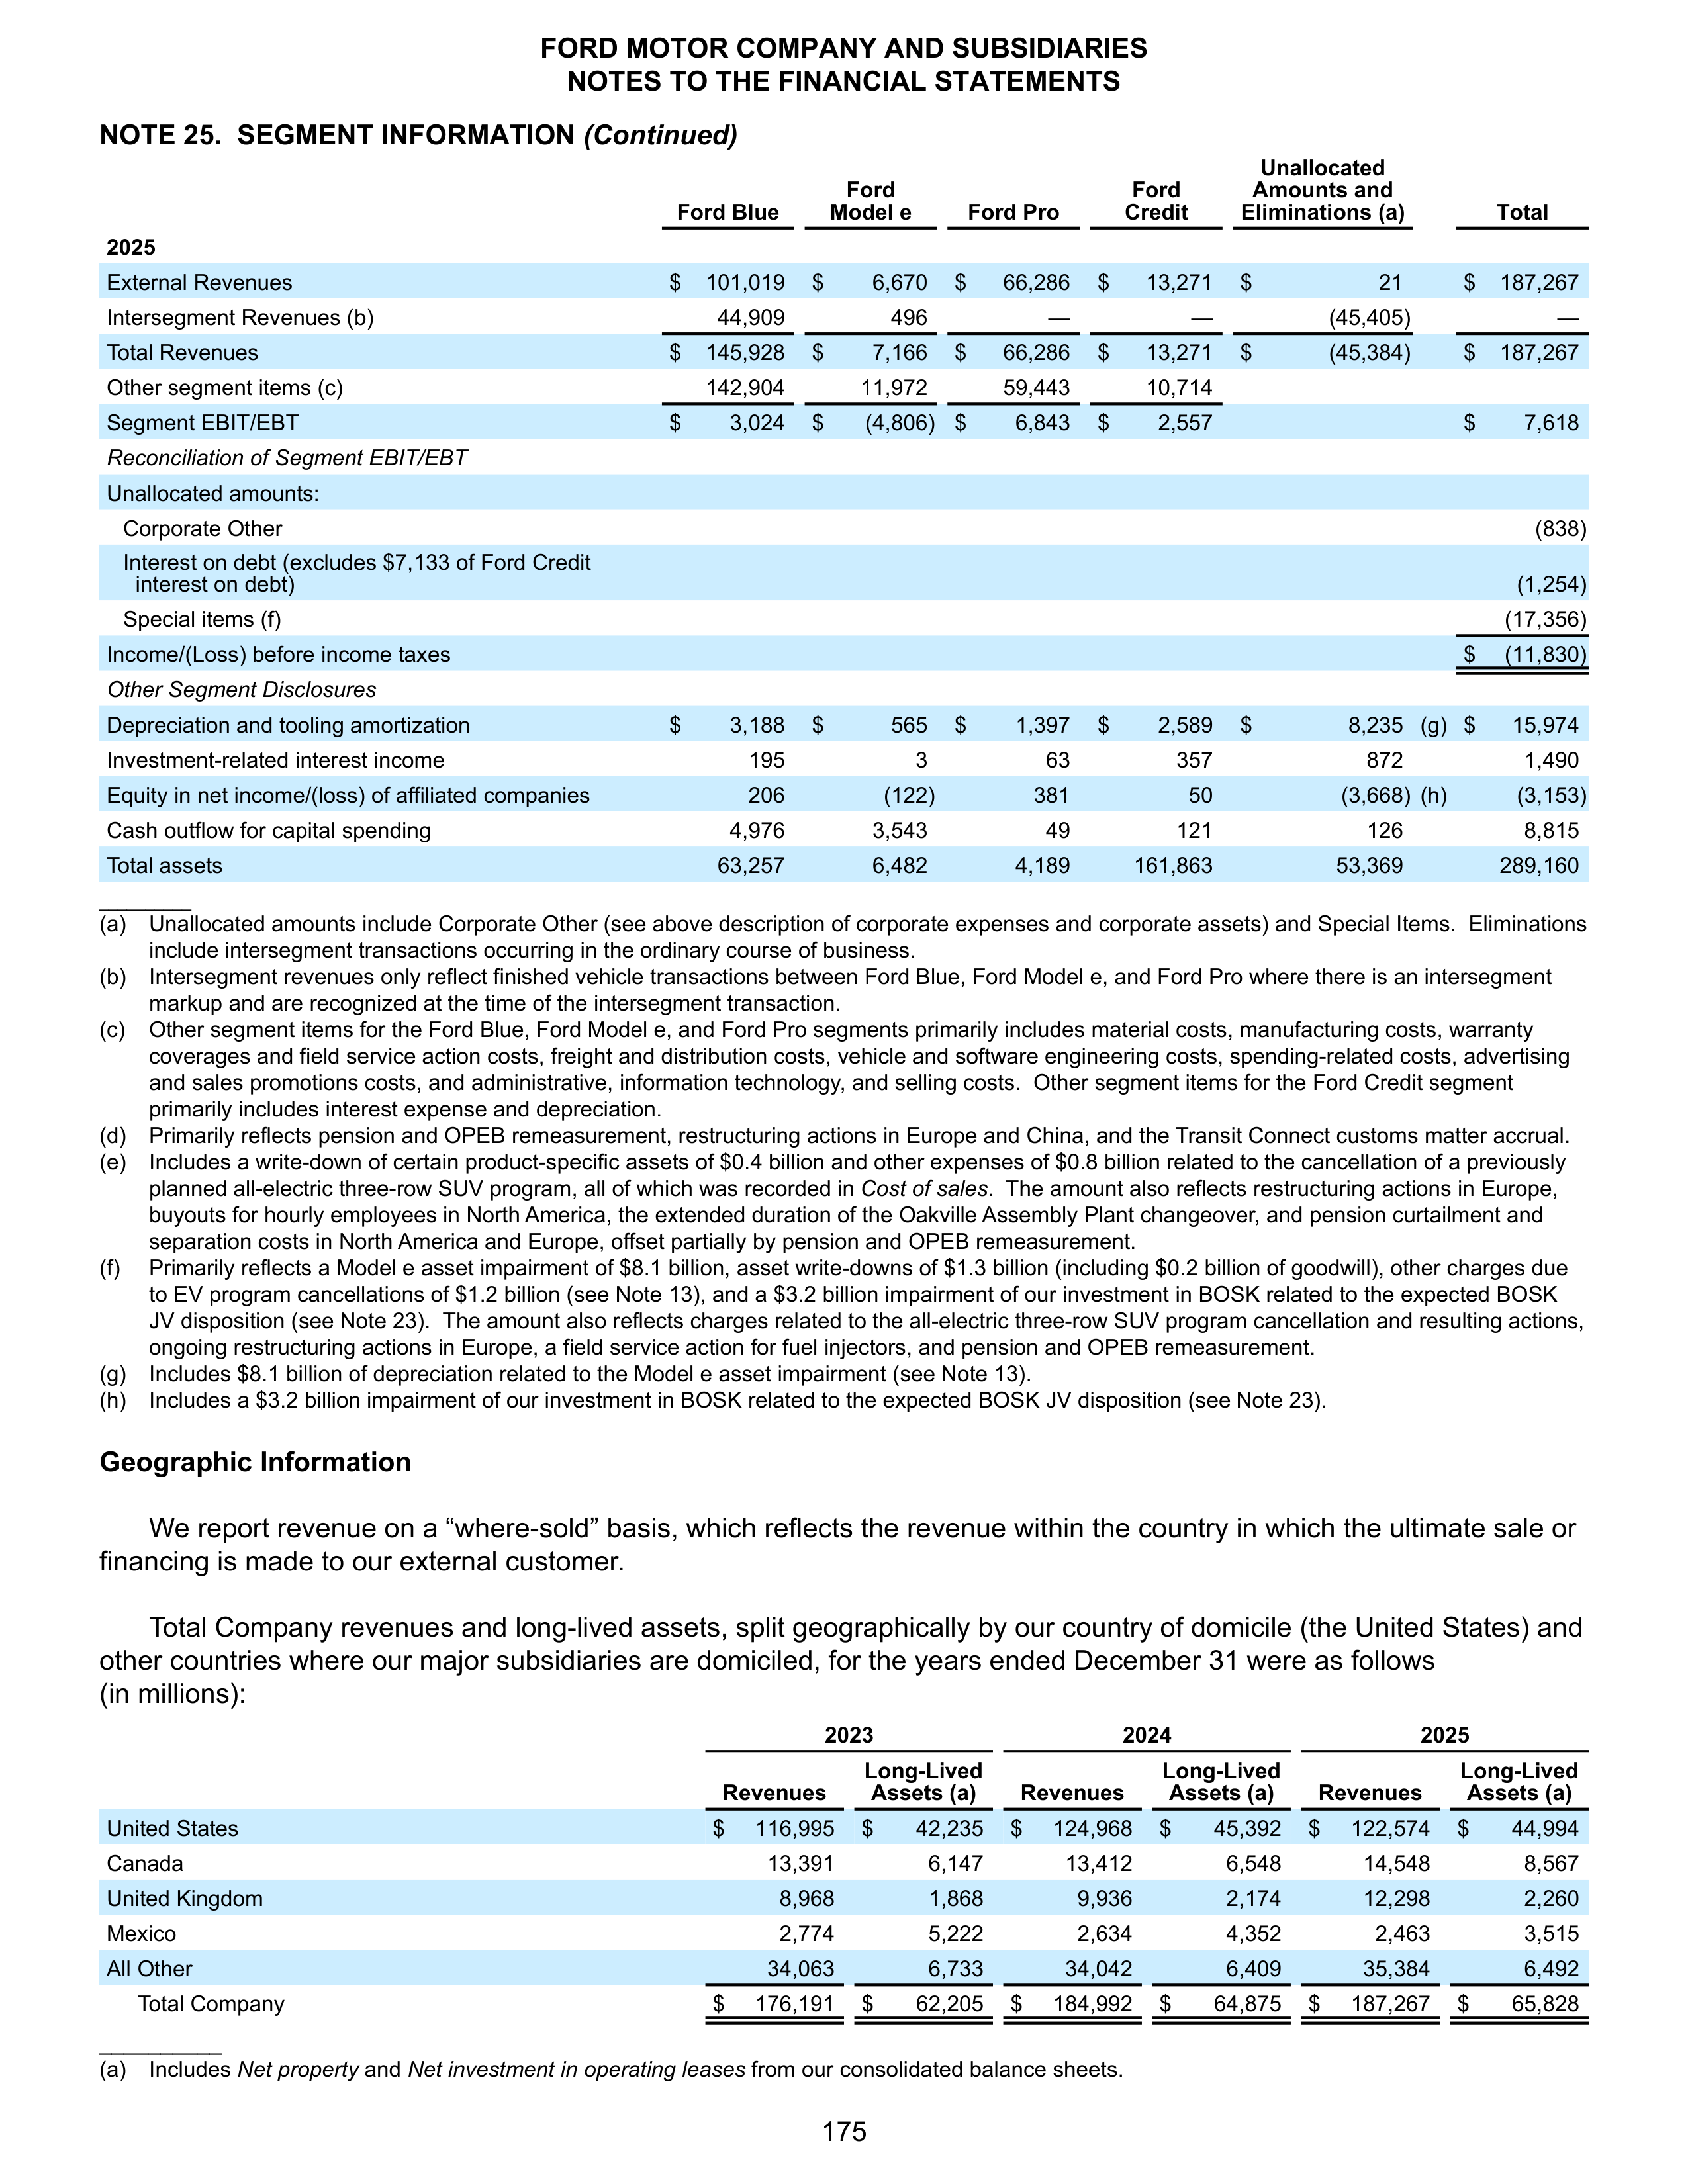
NOTE 25. SEGMENT INFORMATION
(Continued)
Ford Blue
Ford
Model e
Ford Pro
Ford
Credit
Unallocated
Amounts and
Eliminations (a)
Total
2025
External Revenues
$
101,019
$
6,670
$
66,286
$
13,271
$
21
$
187,267
Intersegment Revenues (b)
44,909
496
—
—
(45,405)
—
Total Revenues
$
145,928
$
7,166
$
66,286
$
13,271
$
(45,384)
$
187,267
Other segment items (c)
142,904
11,972
59,443
10,714
Segment EBIT/EBT
$
3,024
$
(4,806) $
6,843
$
2,557
$
7,618
Reconciliation of Segment EBIT/EBT
Unallocated amounts:
Corporate Other
(838)
Interest on debt (excludes $7,133 of Ford Credit
interest on debt)
(1,254)
Special items (f)
(17,356)
Income/(Loss) before income taxes
$
(11,830)
Other Segment Disclosures
Depreciation and tooling amortization
$
3,188
$
565
$
1,397
$
2,589
$
8,235 (g)
$
15,974
Investment-related interest income
195
3
63
357
872
1,490
Equity in net income/(loss) of affiliated companies
206
(122)
381
50
(3,668) (h)
(3,153)
Cash outflow for capital spending
4,976
3,543
49
121
126
8,815
Total assets
63,257
6,482
4,189
161,863
53,369
289,160
__________
(a)
Unallocated amounts include Corporate Other (see above description of corporate expenses and corporate assets) and Special Items. Eliminations
include intersegment transactions occurring in the ordinary course of business.
(b)
Intersegment revenues only reflect finished vehicle transactions between Ford Blue, Ford Model e, and Ford Pro where there is an intersegment
markup and are recognized at the time of the intersegment transaction.
(c)
Other segment items for the Ford Blue, Ford Model e, and Ford Pro segments primarily includes material costs, manufacturing costs, warranty
coverages and field service action costs, freight and distribution costs, vehicle and software engineering costs, spending-related costs, advertising
and sales promotions costs, and administrative, information technology, and selling costs. Other segment items for the Ford Credit segment
primarily includes interest expense and depreciation.
(d)
Primarily reflects pension and OPEB remeasurement, restructuring actions in Europe and China, and the Transit Connect customs matter accrual.
(e)
Includes a write-down of certain product-specific assets of $0.4 billion and other expenses of $0.8 billion related to the cancellation of a previously
planned all-electric three-row SUV program, all of which was recorded in
Cost of sales
. The amount also reflects restructuring actions in Europe,
buyouts for hourly employees in North America, the extended duration of the Oakville Assembly Plant changeover, and pension curtailment and
separation costs in North America and Europe, offset partially by pension and OPEB remeasurement.
(f)
Primarily reflects a Model e asset impairment of $8.1 billion, asset write-downs of $1.3 billion (including $0.2 billion of goodwill), other charges due
to EV program cancellations of $1.2 billion (see Note 13), and a $3.2 billion impairment of our investment in BOSK related to the expected BOSK
JV disposition (see Note 23). The amount also reflects charges related to the all-electric three-row SUV program cancellation and resulting actions,
ongoing restructuring actions in Europe, a field service action for fuel injectors, and pension and OPEB remeasurement.
(g)
Includes $8.1 billion of depreciation related to the Model e asset impairment (see Note 13).
(h)
Includes a $3.2 billion impairment of our investment in BOSK related to the expected BOSK JV disposition (see Note 23).
Geographic Information
We report revenue on a “where-sold” basis, which reflects the revenue within the country in which the ultimate sale or
financing is made to our external customer.
Total Company revenues and long-lived assets, split geographically by our country of domicile (the United States) and
other countries where our major subsidiaries are domiciled, for the years ended December 31 were as follows
(in millions):
2023
2024
2025
Revenues
Long-Lived
Assets (a)
Revenues
Long-Lived
Assets (a)
Revenues
Long-Lived
Assets (a)
United States
$
116,995
$
42,235
$
124,968
$
45,392
$
122,574
$
44,994
Canada
13,391
6,147
13,412
6,548
14,548
8,567
United Kingdom
8,968
1,868
9,936
2,174
12,298
2,260
Mexico
2,774
5,222
2,634
4,352
2,463
3,515
All Other
34,063
6,733
34,042
6,409
35,384
6,492
Total Company
$
176,191
$
62,205
$
184,992
$
64,875
$
187,267
$
65,828
__________
(a) Includes
Net property
and
Net investment in operating leases
from our consolidated balance sheets.
FORD MOTOR COMPANY AND SUBSIDIARIES
NOTES TO THE FINANCIAL STATEMENTS
175
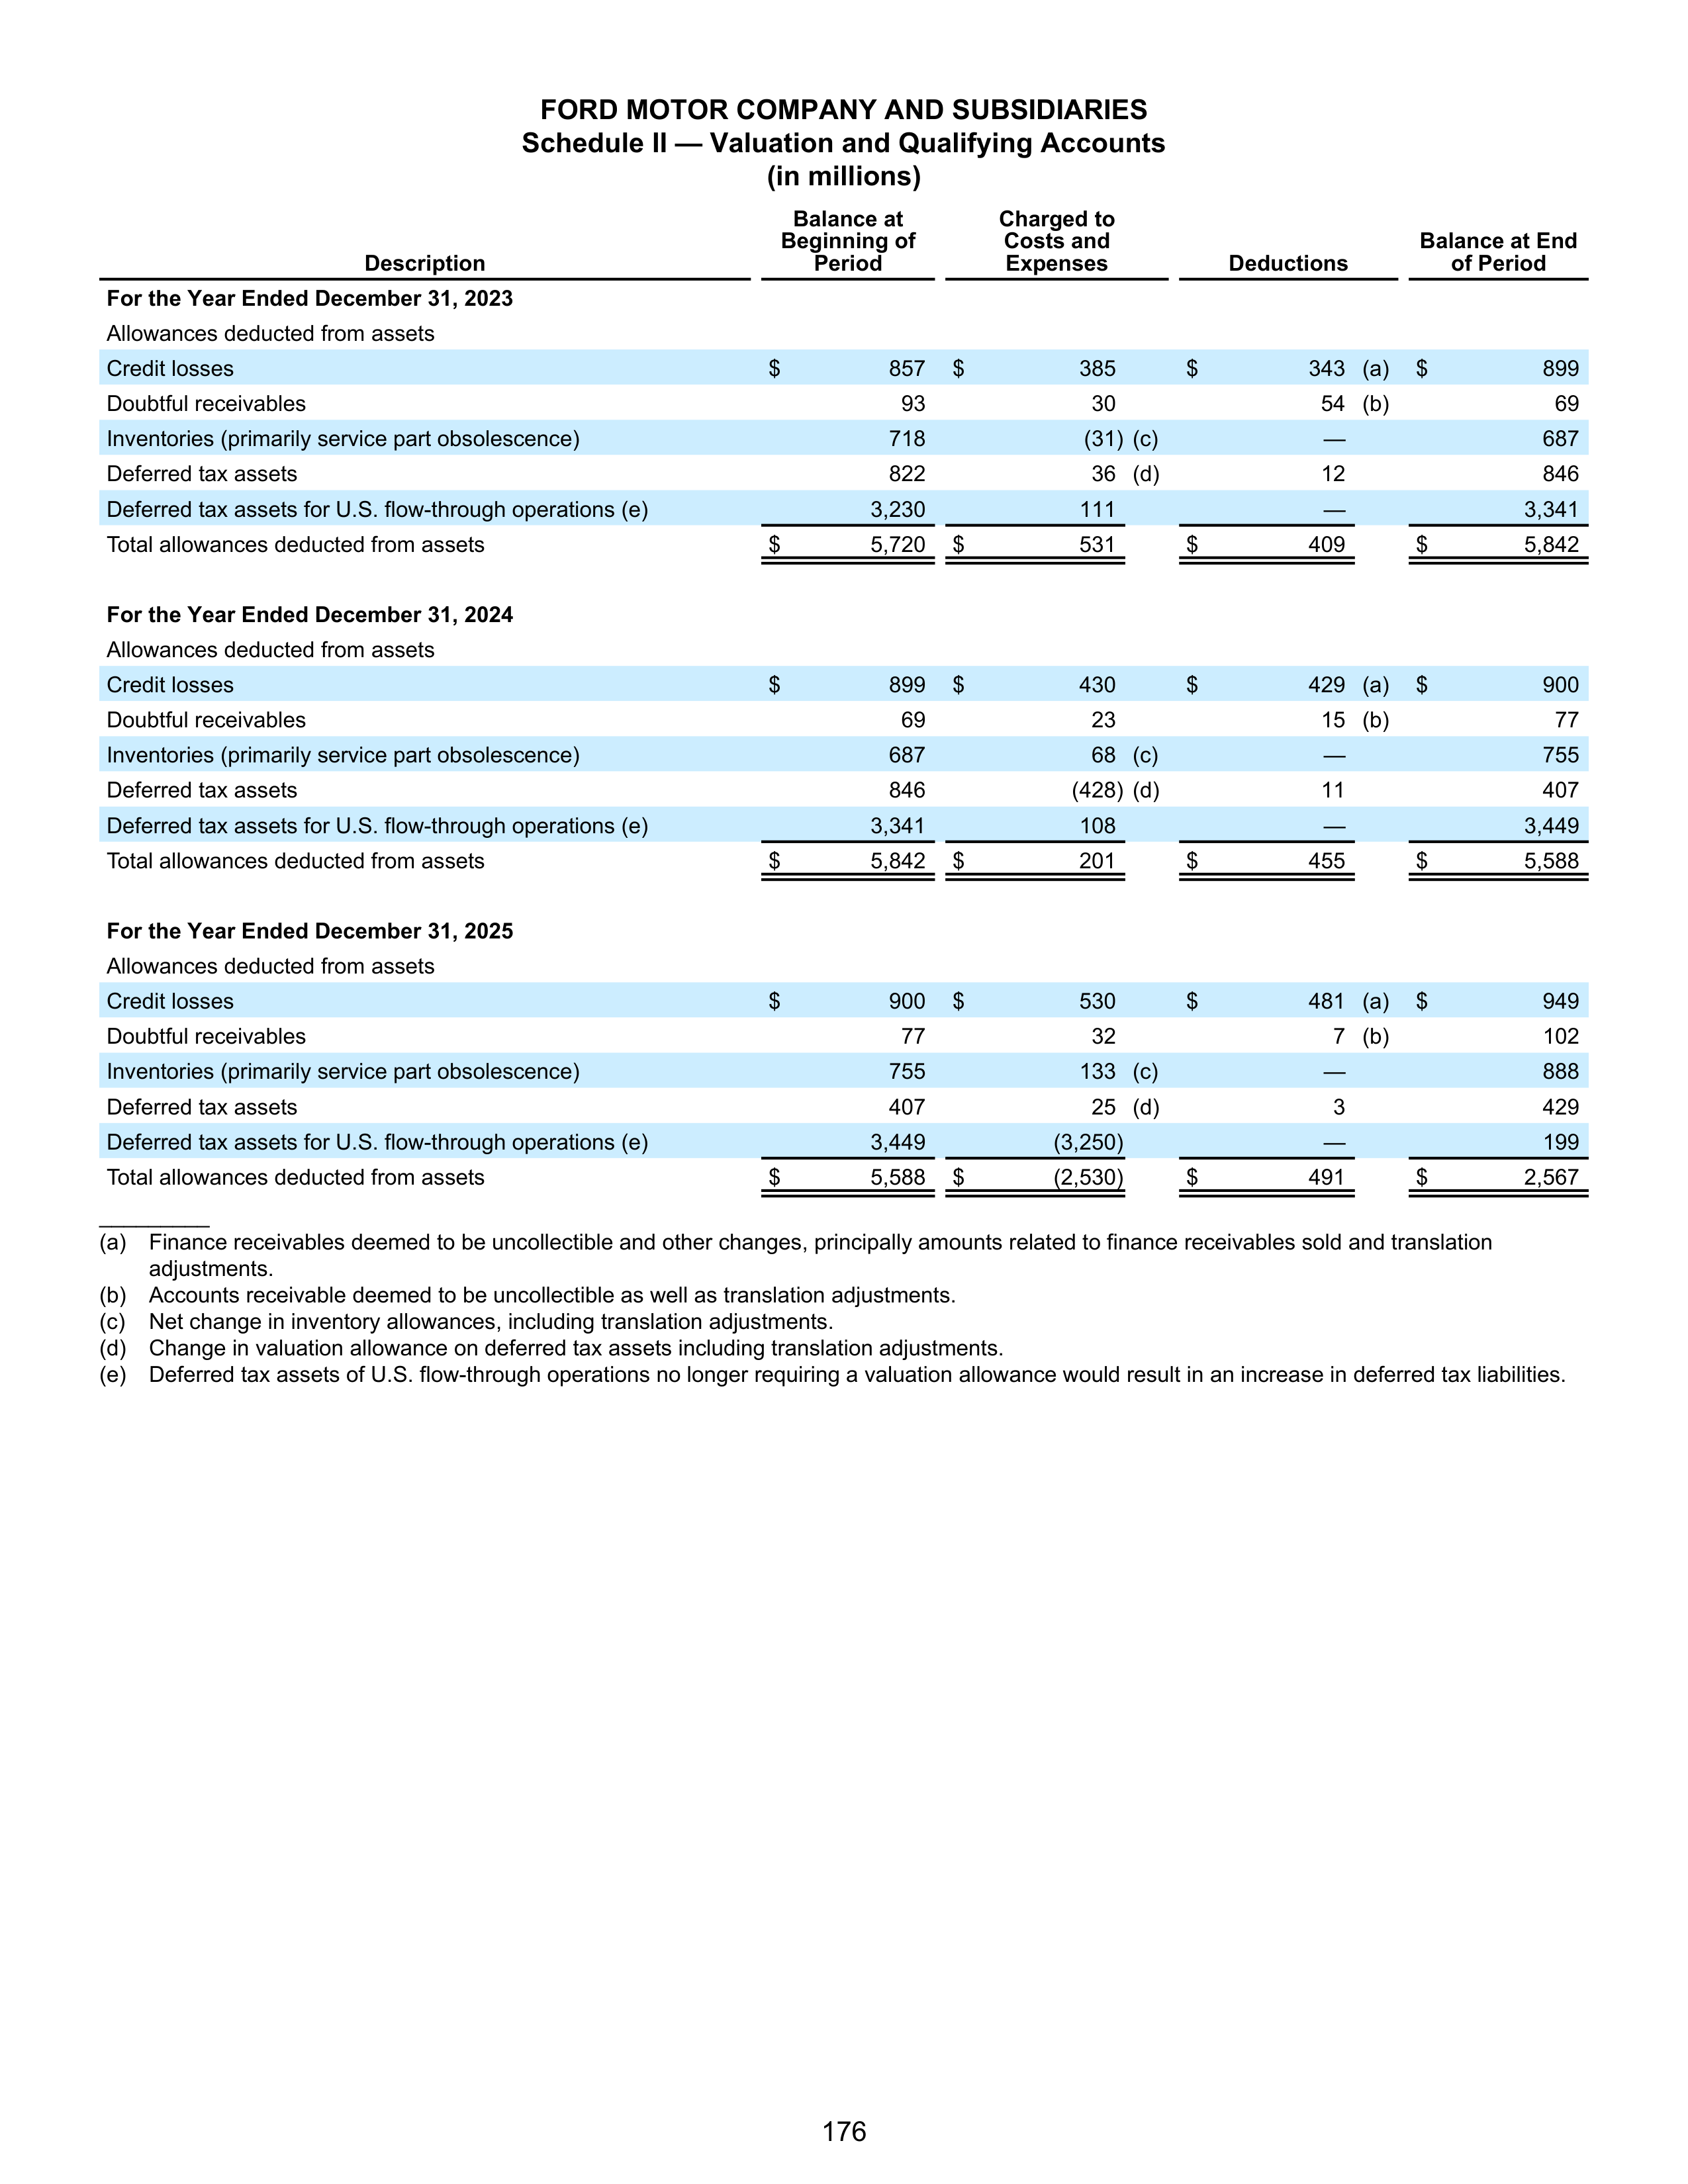
FORD MOTOR COMPANY AND SUBSIDIARIES
Schedule II — Valuation and Qualifying Accounts
(in millions)
Description
Balance at
Beginning of
Period
Charged to
Costs and
Expenses
Deductions
Balance at End
of Period
For the Year Ended December 31, 2023
Allowances deducted from assets
Credit losses
$
857
$
385
$
343 (a)
$
899
Doubtful receivables
93
30
54 (b)
69
Inventories (primarily service part obsolescence)
718
(31) (c)
—
687
Deferred tax assets
822
36 (d)
12
846
Deferred tax assets for U.S. flow-through operations (e)
3,230
111
—
3,341
Total allowances deducted from assets
$
5,720
$
531
$
409
$
5,842
For the Year Ended December 31, 2024
Allowances deducted from assets
Credit losses
$
899
$
430
$
429 (a)
$
900
Doubtful receivables
69
23
15 (b)
77
Inventories (primarily service part obsolescence)
687
68 (c)
—
755
Deferred tax assets
846
(428) (d)
11
407
Deferred tax assets for U.S. flow-through operations (e)
3,341
108
—
3,449
Total allowances deducted from assets
$
5,842
$
201
$
455
$
5,588
For the Year Ended December 31, 2025
Allowances deducted from assets
Credit losses
$
900
$
530
$
481 (a)
$
949
Doubtful receivables
77
32
7 (b)
102
Inventories (primarily service part obsolescence)
755
133 (c)
—
888
Deferred tax assets
407
25 (d)
3
429
Deferred tax assets for U.S. flow-through operations (e)
3,449
(3,250)
—
199
Total allowances deducted from assets
$
5,588
$
(2,530)
$
491
$
2,567
_________
(a) Finance receivables deemed to be uncollectible and other changes, principally amounts related to finance receivables sold and translation
adjustments.
(b) Accounts receivable deemed to be uncollectible as well as translation adjustments.
(c)
Net change in inventory allowances, including translation adjustments.
(d) Change in valuation allowance on deferred tax assets including translation adjustments.
(e) Deferred tax assets of U.S. flow-through operations no longer requiring a valuation allowance would result in an increase in deferred tax liabilities.
176
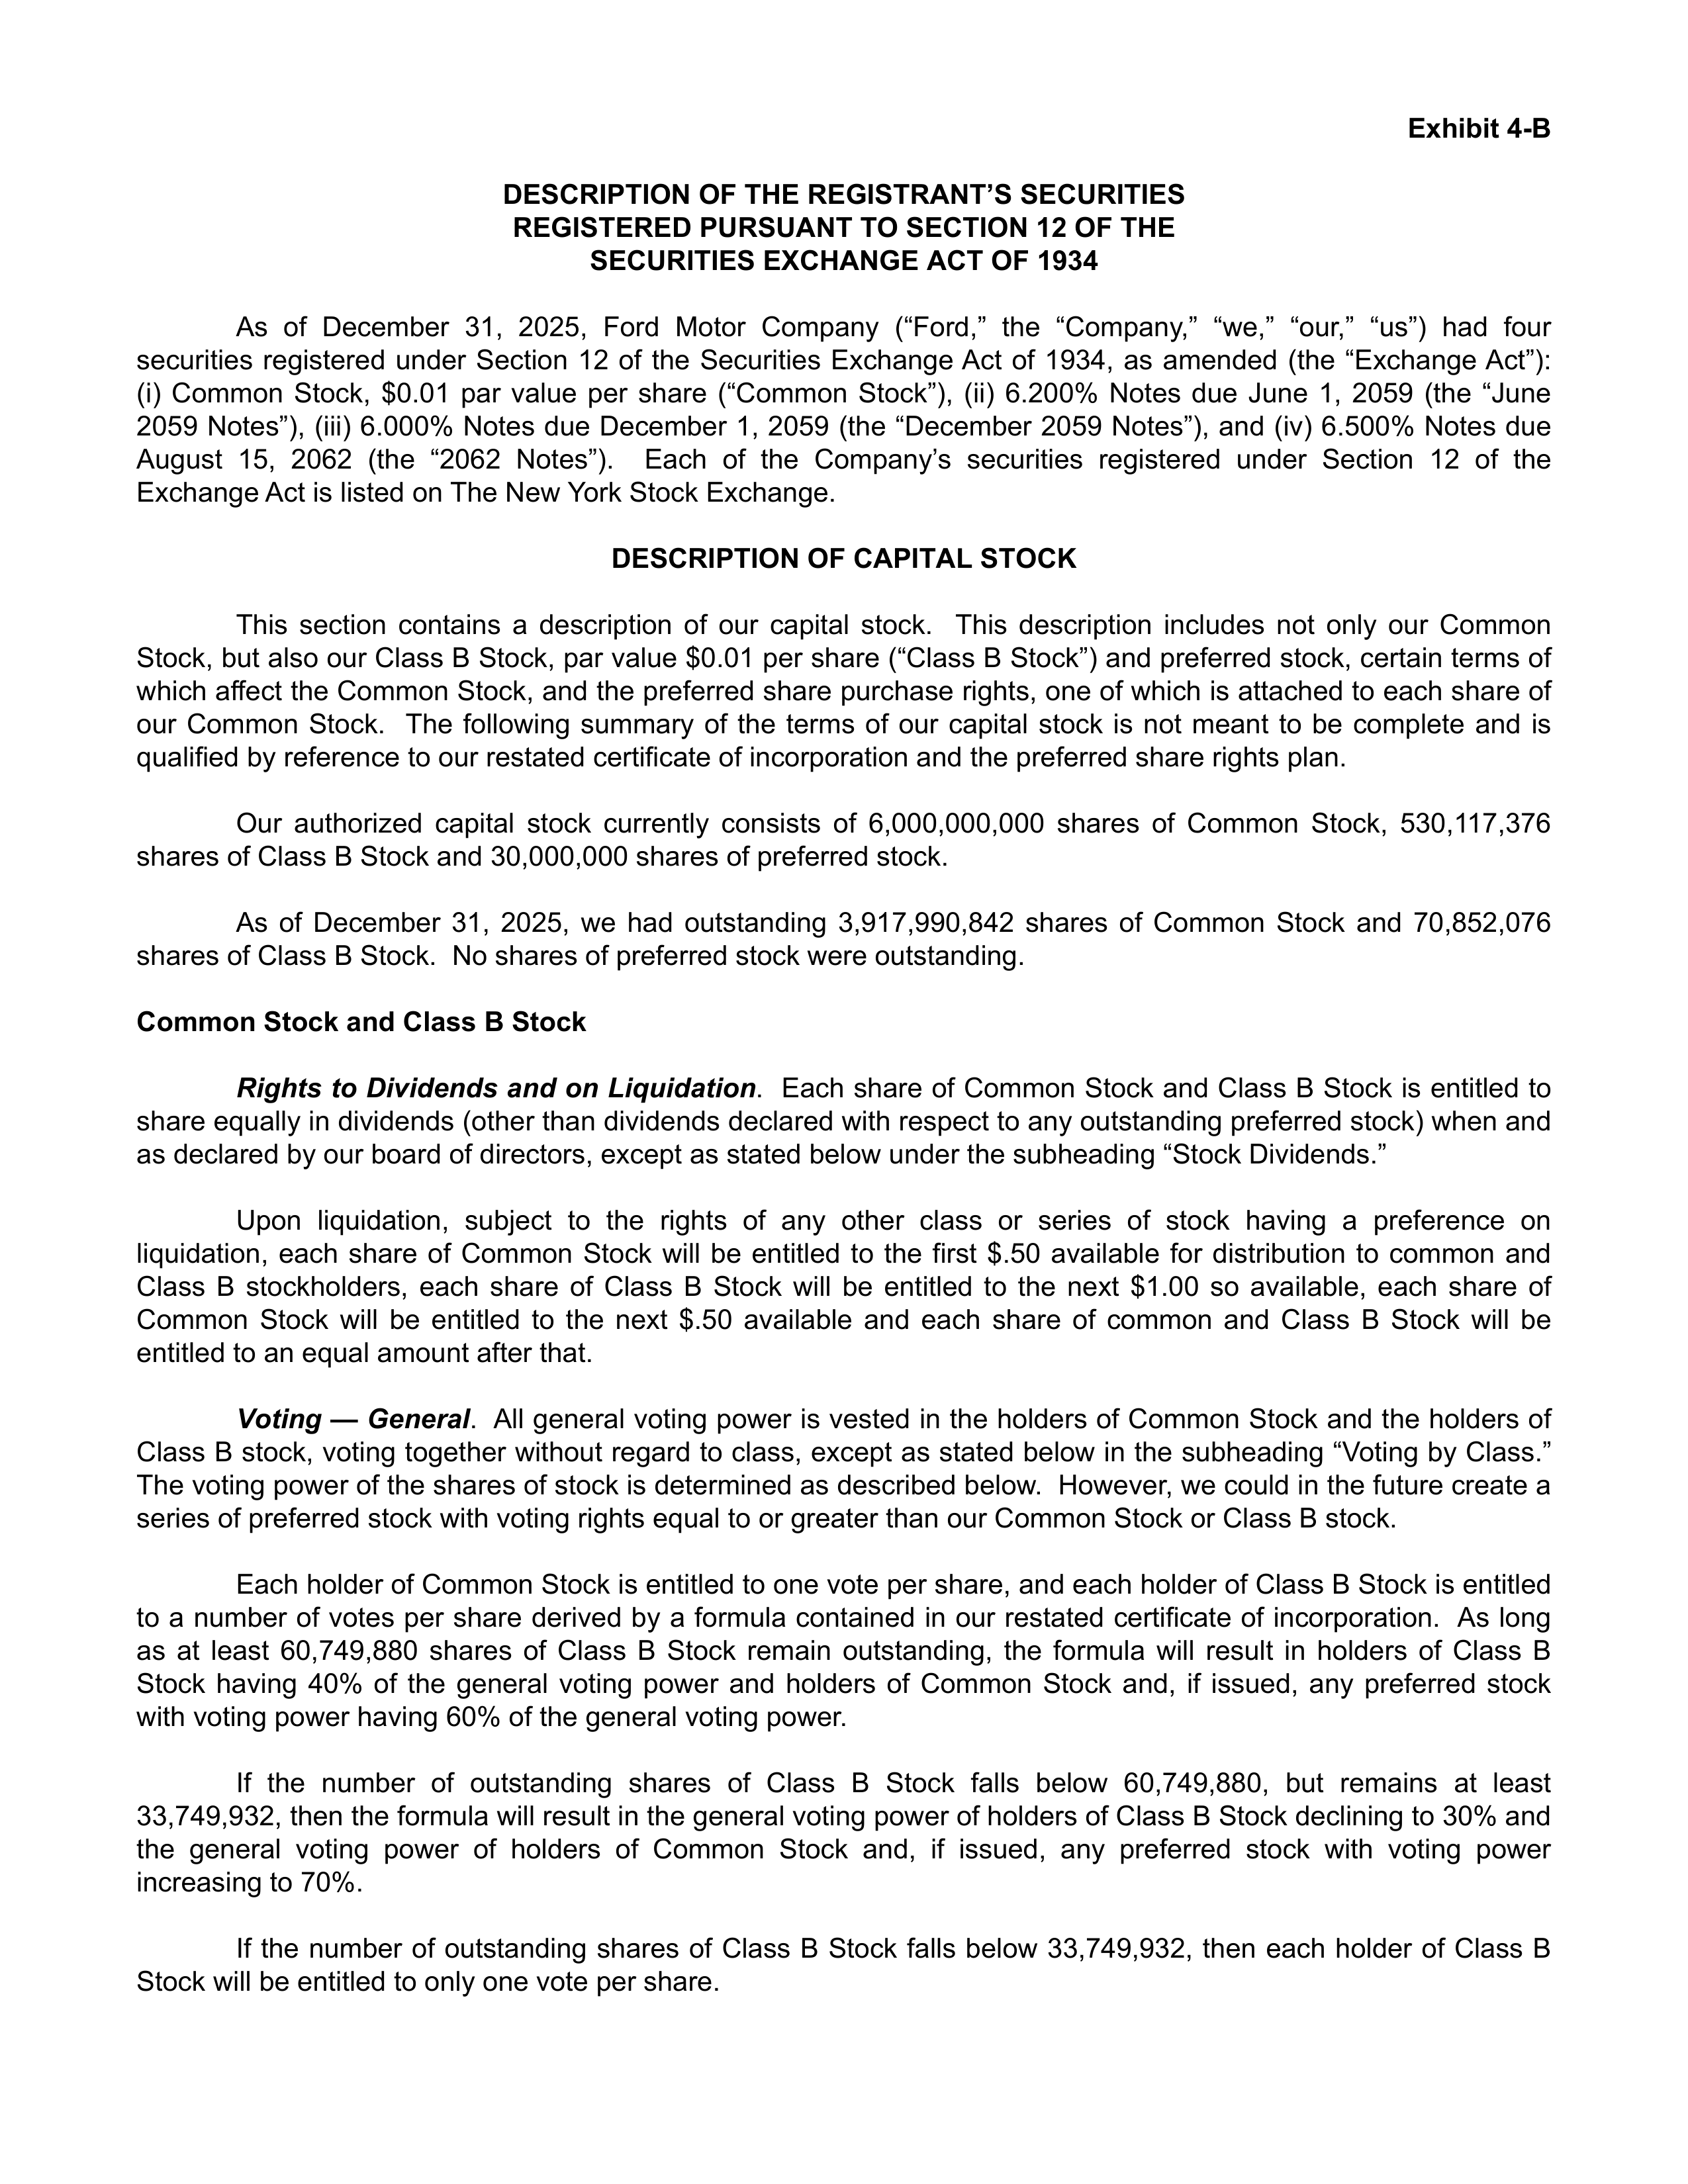
Exhibit 4-B
DESCRIPTION OF THE REGISTRANT’S SECURITIES
REGISTERED PURSUANT TO SECTION 12 OF THE
SECURITIES EXCHANGE ACT OF 1934
As of December 31, 2025, Ford Motor Company (“Ford,” the “Company,” “we,” “our,” “us”) had four
securities registered under Section 12 of the Securities Exchange Act of 1934, as amended (the “Exchange Act”):
(i) Common Stock, $0.01 par value per share (“Common Stock”), (ii) 6.200% Notes due June 1, 2059 (the “June
2059 Notes”), (iii) 6.000% Notes due December 1, 2059 (the “December 2059 Notes”), and (iv) 6.500% Notes due
August 15, 2062 (the “2062 Notes”). Each of the Company’s securities registered under Section 12 of the
Exchange Act is listed on The New York Stock Exchange.
DESCRIPTION OF CAPITAL STOCK
This section contains a description of our capital stock. This description includes not only our Common
Stock, but also our Class B Stock, par value $0.01 per share (“Class B Stock”) and preferred stock, certain terms of
which affect the Common Stock, and the preferred share purchase rights, one of which is attached to each share of
our Common Stock. The following summary of the terms of our capital stock is not meant to be complete and is
qualified by reference to our restated certificate of incorporation and the preferred share rights plan.
Our authorized capital stock currently consists of 6,000,000,000 shares of Common Stock, 530,117,376
shares of Class B Stock and 30,000,000 shares of preferred stock.
As of December 31, 2025, we had outstanding 3,917,990,842 shares of Common Stock and 70,852,076
shares of Class B Stock. No shares of preferred stock were outstanding.
Common Stock and Class B Stock
Rights to Dividends and on Liquidation
. Each share of Common Stock and Class B Stock is entitled to
share equally in dividends (other than dividends declared with respect to any outstanding preferred stock) when and
as declared by our board of directors, except as stated below under the subheading “Stock Dividends.”
Upon liquidation, subject to the rights of any other class or series of stock having a preference on
liquidation, each share of Common Stock will be entitled to the first $.50 available for distribution to common and
Class B stockholders, each share of Class B Stock will be entitled to the next $1.00 so available, each share of
Common Stock will be entitled to the next $.50 available and each share of common and Class B Stock will be
entitled to an equal amount after that.
Voting — General
. All general voting power is vested in the holders of Common Stock and the holders of
Class B stock, voting together without regard to class, except as stated below in the subheading “Voting by Class.”
The voting power of the shares of stock is determined as described below. However, we could in the future create a
series of preferred stock with voting rights equal to or greater than our Common Stock or Class B stock.
Each holder of Common Stock is entitled to one vote per share, and each holder of Class B Stock is entitled
to a number of votes per share derived by a formula contained in our restated certificate of incorporation. As long
as at least 60,749,880 shares of Class B Stock remain outstanding, the formula will result in holders of Class B
Stock having 40% of the general voting power and holders of Common Stock and, if issued, any preferred stock
with voting power having 60% of the general voting power.
If the number of outstanding shares of Class B Stock falls below 60,749,880, but remains at least
33,749,932, then the formula will result in the general voting power of holders of Class B Stock declining to 30% and
the general voting power of holders of Common Stock and, if issued, any preferred stock with voting power
increasing to 70%.
If the number of outstanding shares of Class B Stock falls below 33,749,932, then each holder of Class B
Stock will be entitled to only one vote per share.
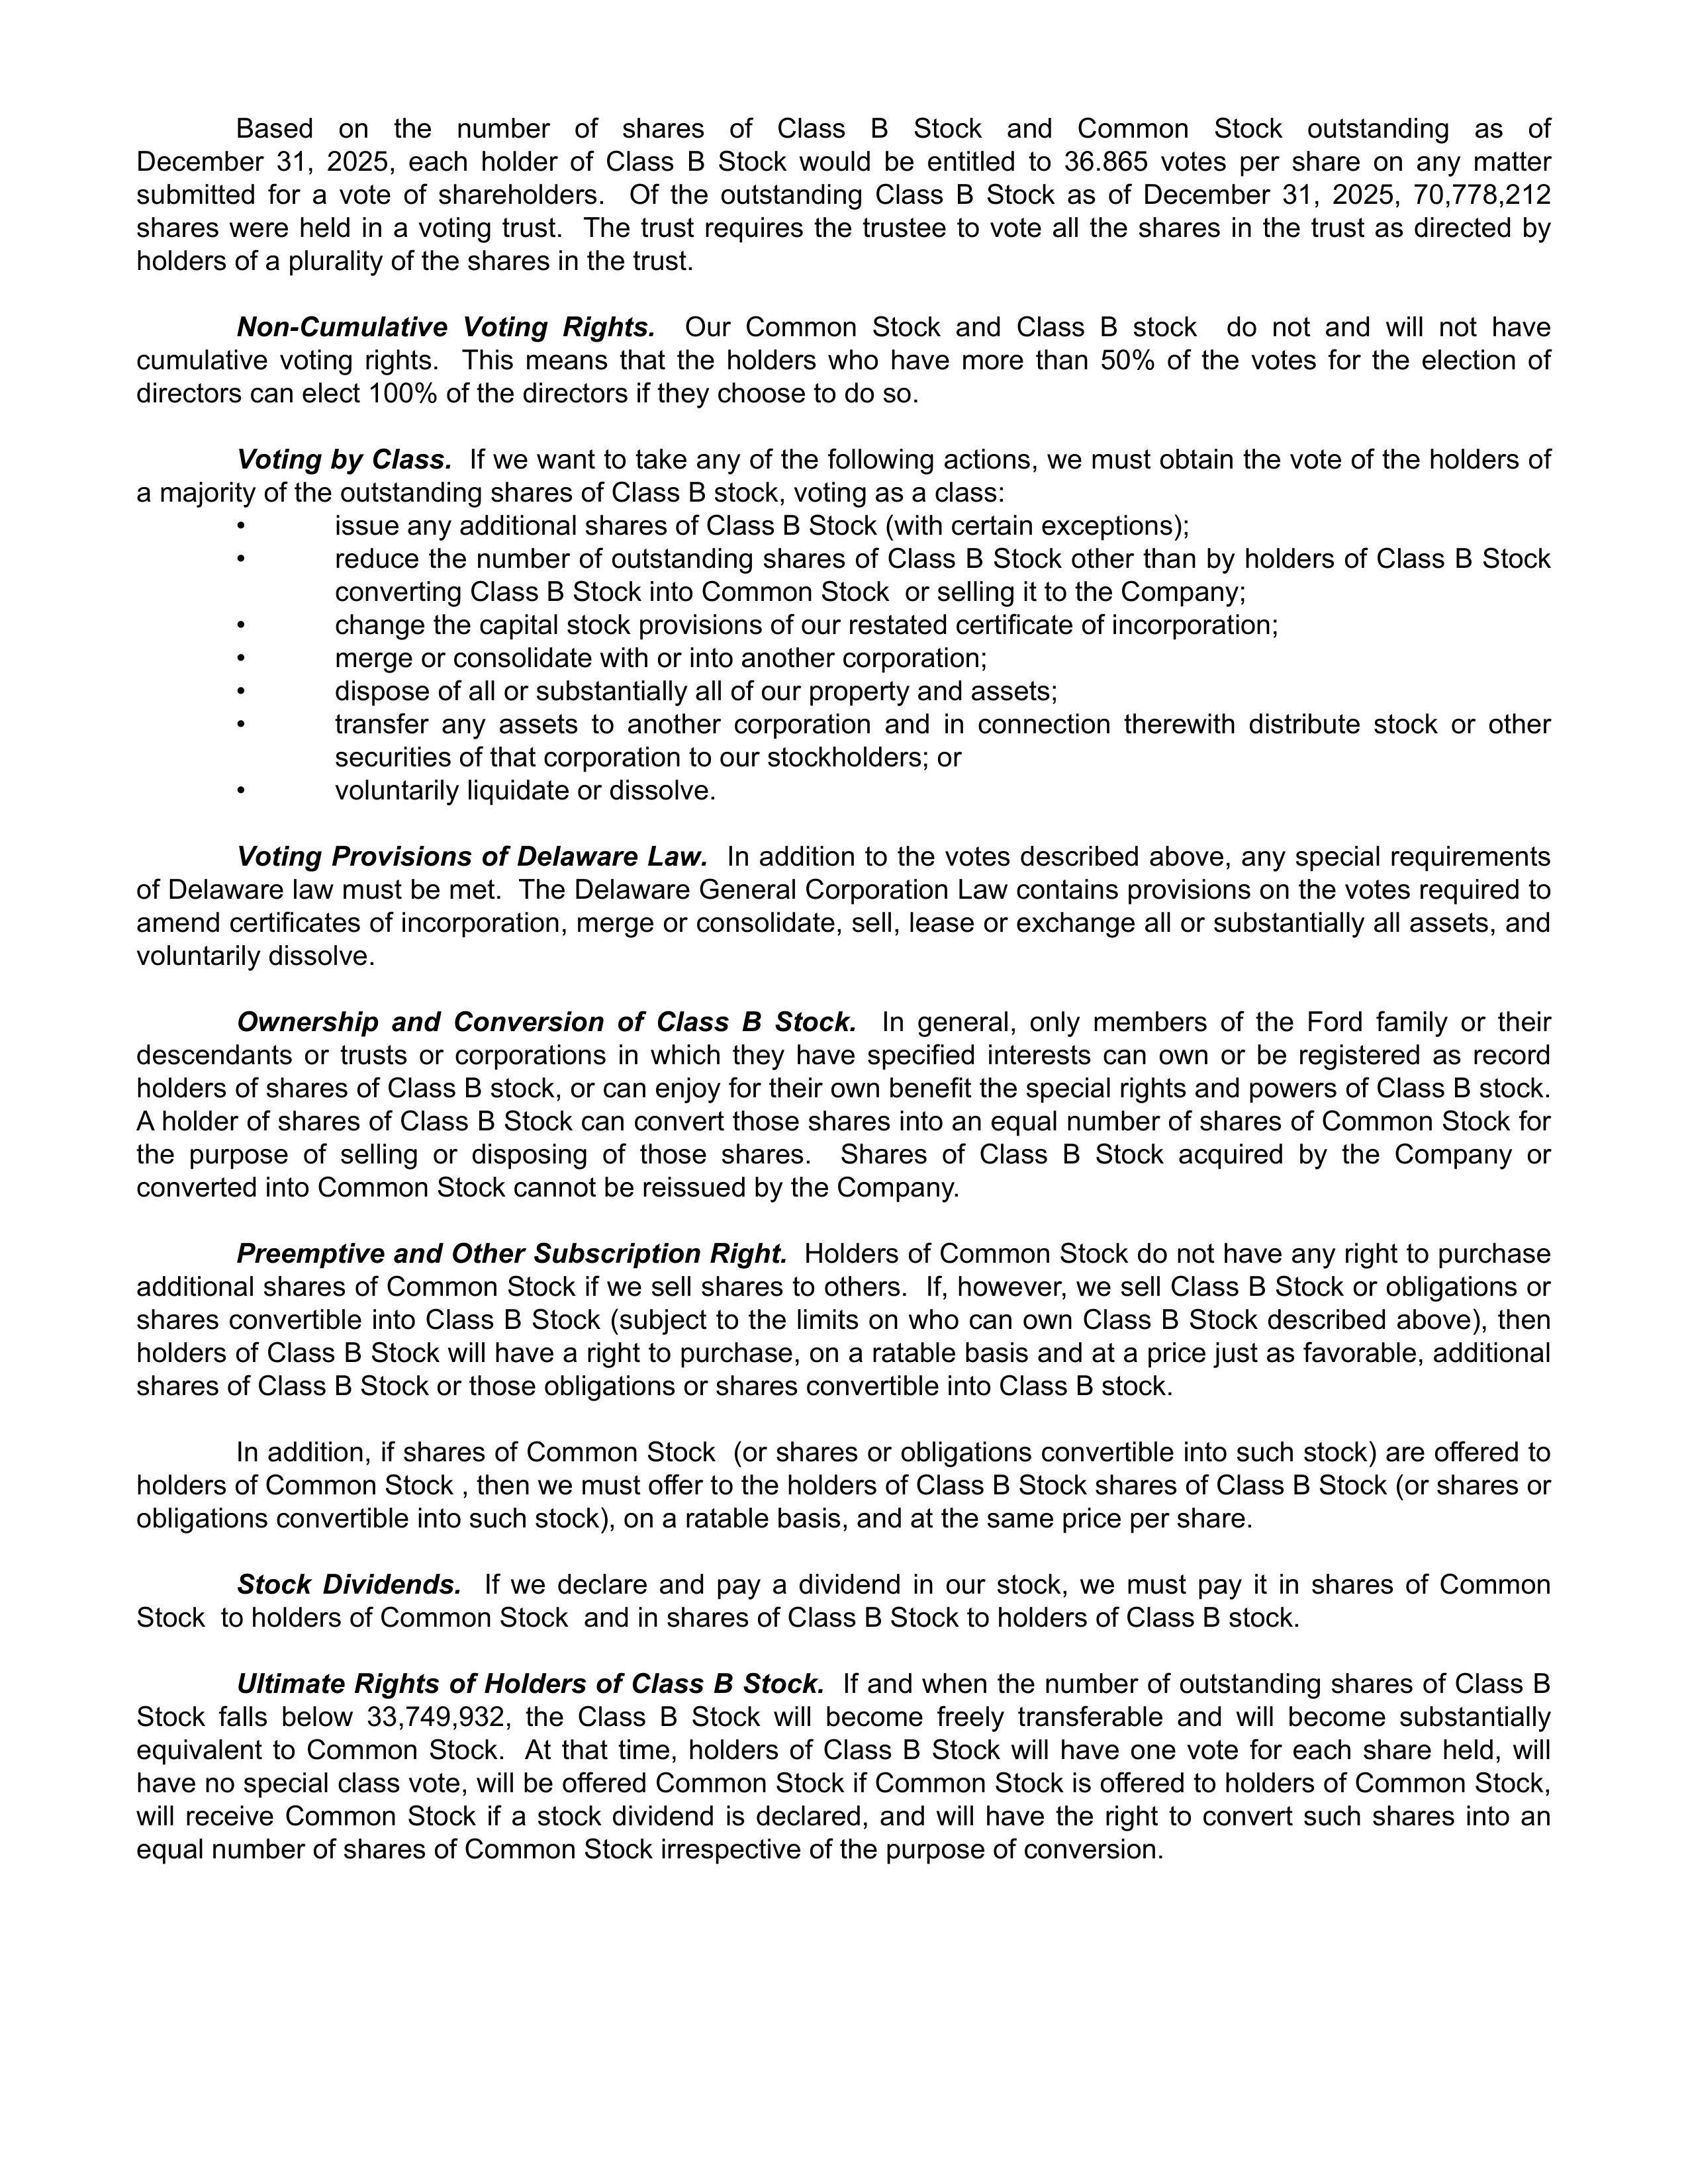
Based on the number of shares of Class B Stock and Common Stock outstanding as of
December 31, 2025, each holder of Class B Stock would be entitled to 36.865 votes per share on any matter
submitted for a vote of shareholders. Of the outstanding Class B Stock as of December 31, 2025, 70,778,212
shares were held in a voting trust. The trust requires the trustee to vote all the shares in the trust as directed by
holders of a plurality of the shares in the trust.
Non-Cumulative Voting Rights.
Our Common Stock and Class B stock do not and will not have
cumulative voting rights. This means that the holders who have more than 50% of the votes for the election of
directors can elect 100% of the directors if they choose to do so.
Voting by Class.
If we want to take any of the following actions, we must obtain the vote of the holders of
a majority of the outstanding shares of Class B stock, voting as a class:
•
issue any additional shares of Class B Stock (with certain exceptions);
•
reduce the number of outstanding shares of Class B Stock other than by holders of Class B Stock
converting Class B Stock into Common Stock or selling it to the Company;
•
change the capital stock provisions of our restated certificate of incorporation;
•
merge or consolidate with or into another corporation;
•
dispose of all or substantially all of our property and assets;
•
transfer any assets to another corporation and in connection therewith distribute stock or other
securities of that corporation to our stockholders; or
•
voluntarily liquidate or dissolve.
Voting Provisions of Delaware Law.
In addition to the votes described above, any special requirements
of Delaware law must be met. The Delaware General Corporation Law contains provisions on the votes required to
amend certificates of incorporation, merge or consolidate, sell, lease or exchange all or substantially all assets, and
voluntarily dissolve.
Ownership and Conversion of Class B Stock.
In general, only members of the Ford family or their
descendants or trusts or corporations in which they have specified interests can own or be registered as record
holders of shares of Class B stock, or can enjoy for their own benefit the special rights and powers of Class B stock.
A holder of shares of Class B Stock can convert those shares into an equal number of shares of Common Stock for
the purpose of selling or disposing of those shares. Shares of Class B Stock acquired by the Company or
converted into Common Stock cannot be reissued by the Company.
Preemptive and Other Subscription Right.
Holders of Common Stock do not have any right to purchase
additional shares of Common Stock if we sell shares to others. If, however, we sell Class B Stock or obligations or
shares convertible into Class B Stock (subject to the limits on who can own Class B Stock described above), then
holders of Class B Stock will have a right to purchase, on a ratable basis and at a price just as favorable, additional
shares of Class B Stock or those obligations or shares convertible into Class B stock.
In addition, if shares of Common Stock (or shares or obligations convertible into such stock) are offered to
holders of Common Stock , then we must offer to the holders of Class B Stock shares of Class B Stock (or shares or
obligations convertible into such stock), on a ratable basis, and at the same price per share.
Stock Dividends.
If we declare and pay a dividend in our stock, we must pay it in shares of Common
Stock to holders of Common Stock and in shares of Class B Stock to holders of Class B stock.
Ultimate Rights of Holders of Class B Stock.
If and when the number of outstanding shares of Class B
Stock falls below 33,749,932, the Class B Stock will become freely transferable and will become substantially
equivalent to Common Stock. At that time, holders of Class B Stock will have one vote for each share held, will
have no special class vote, will be offered Common Stock if Common Stock is offered to holders of Common Stock,
will receive Common Stock if a stock dividend is declared, and will have the right to convert such shares into an
equal number of shares of Common Stock irrespective of the purpose of conversion.
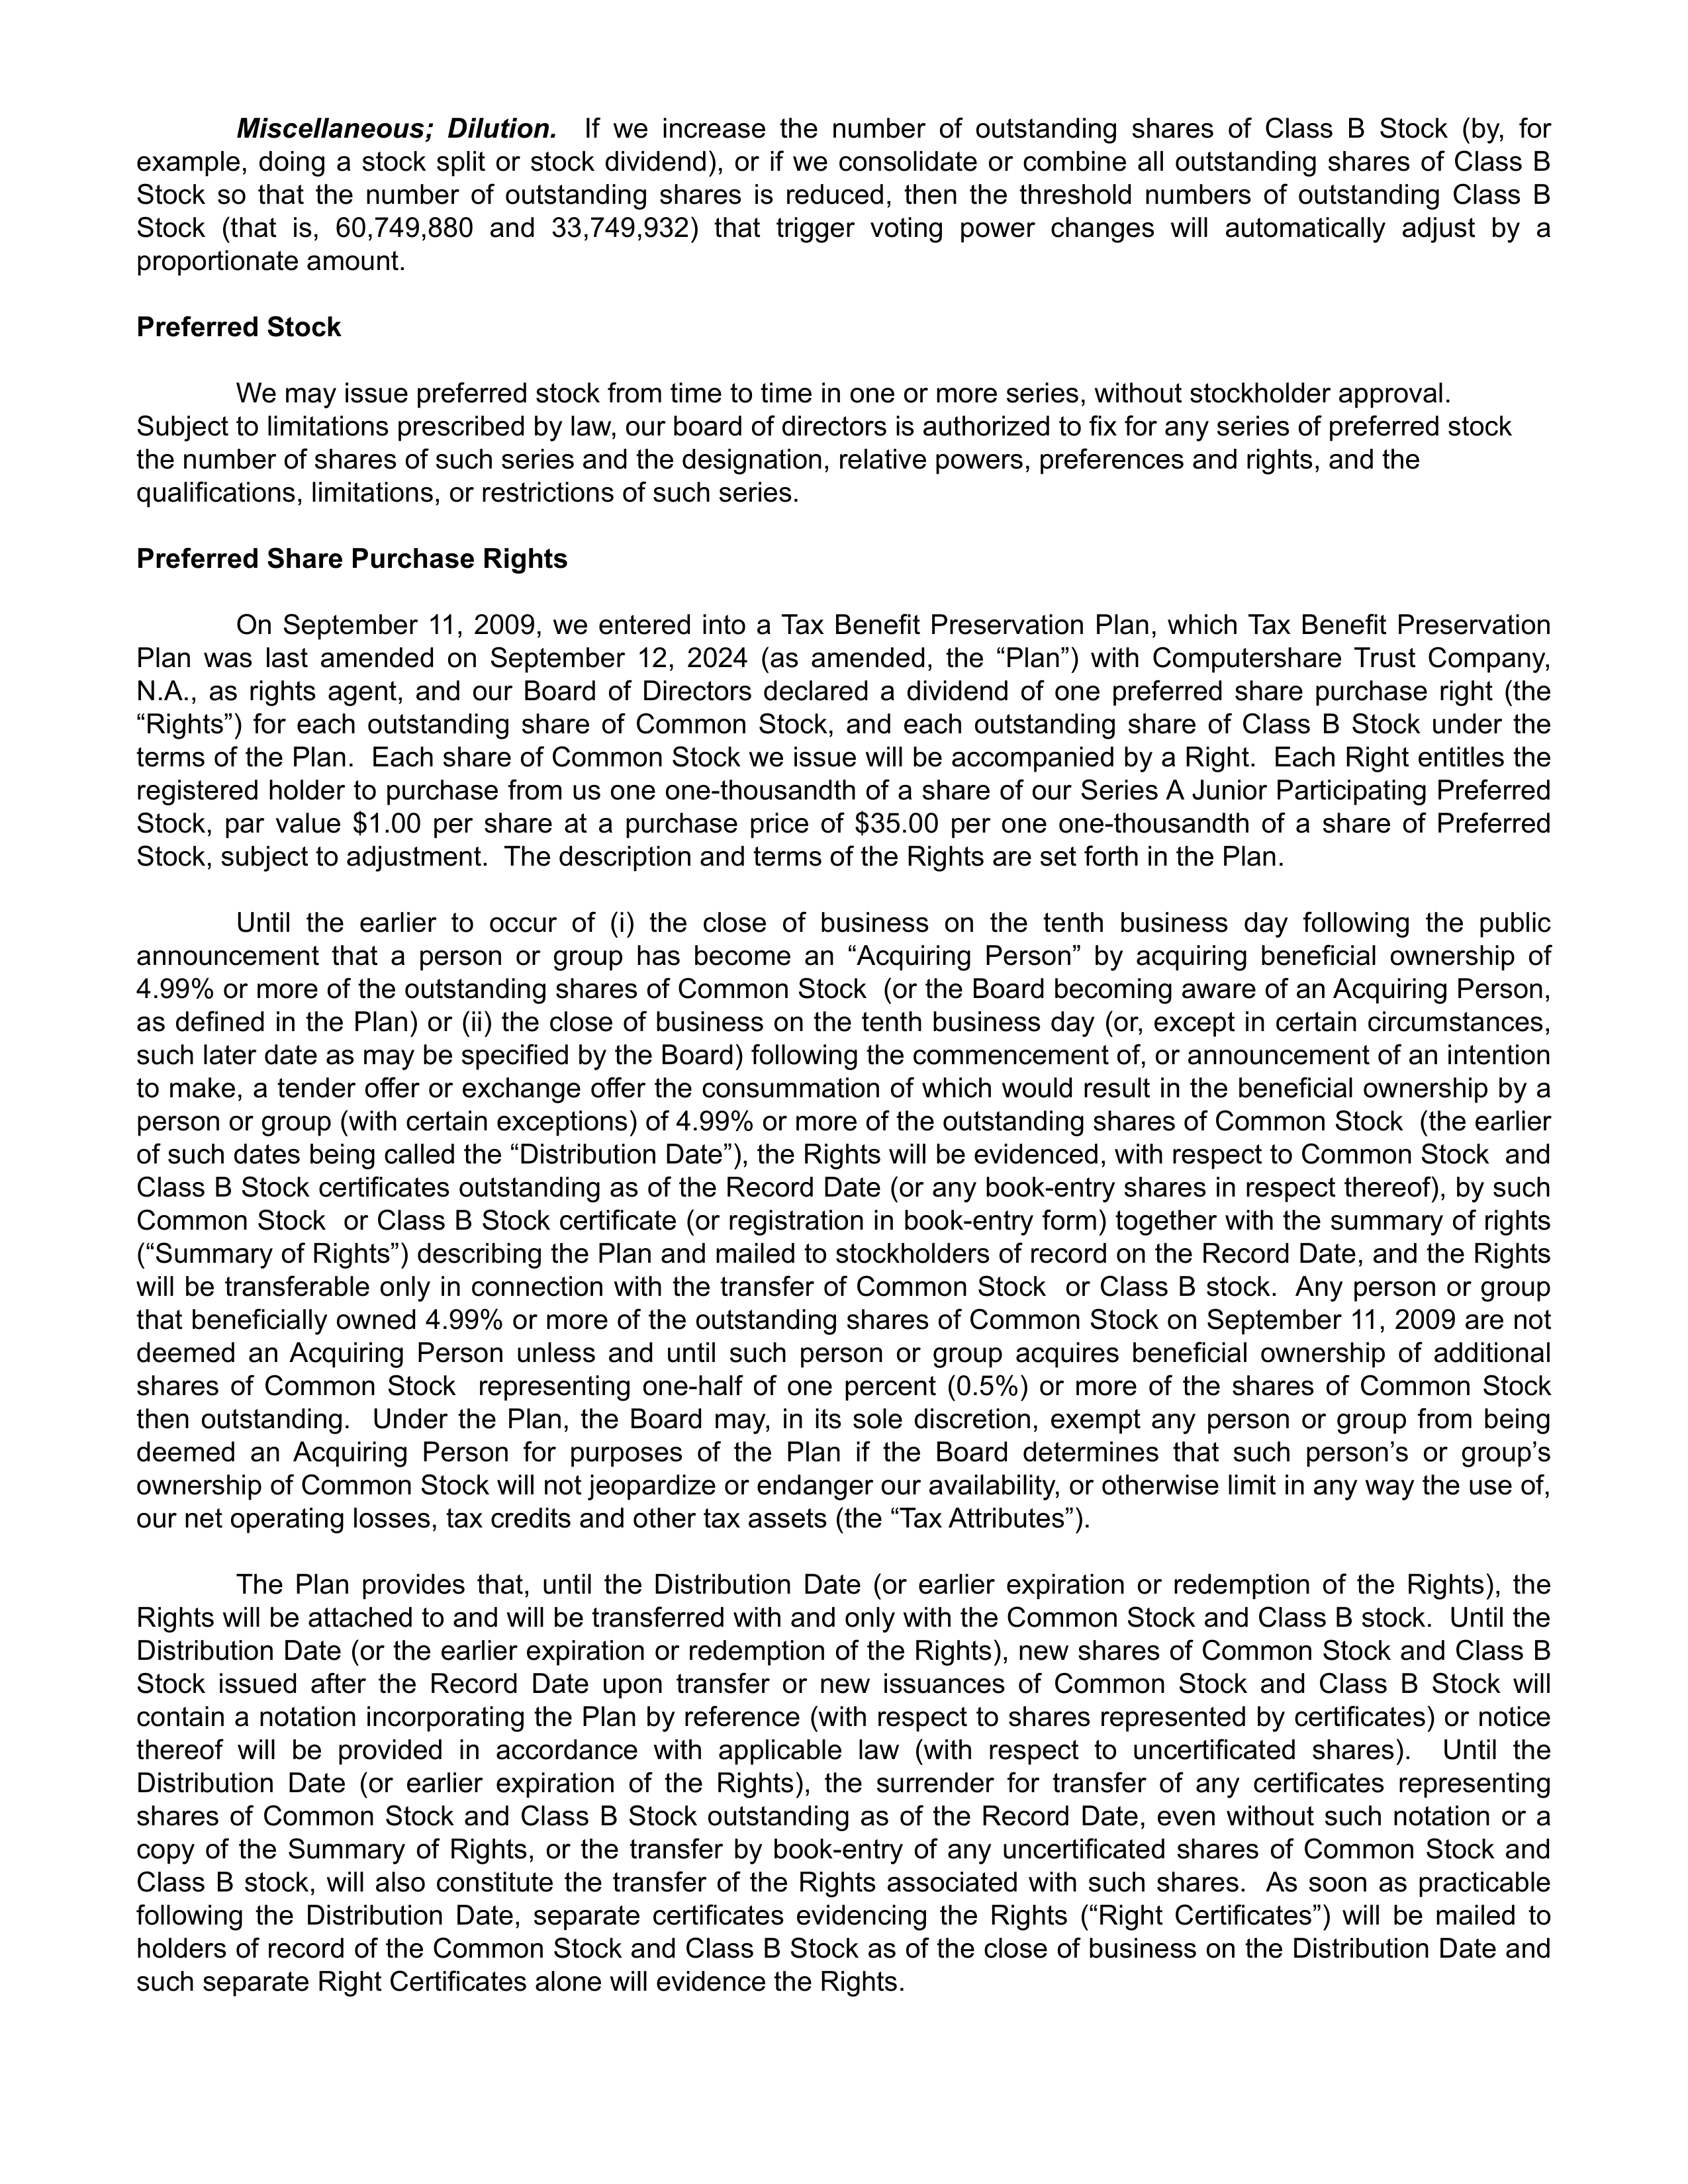
Miscellaneous; Dilution.
If we increase the number of outstanding shares of Class B Stock (by, for
example, doing a stock split or stock dividend), or if we consolidate or combine all outstanding shares of Class B
Stock so that the number of outstanding shares is reduced, then the threshold numbers of outstanding Class B
Stock (that is, 60,749,880 and 33,749,932) that trigger voting power changes will automatically adjust by a
proportionate amount.
Preferred Stock
We may issue preferred stock from time to time in one or more series, without stockholder approval.
Subject to limitations prescribed by law, our board of directors is authorized to fix for any series of preferred stock
the number of shares of such series and the designation, relative powers, preferences and rights, and the
qualifications, limitations, or restrictions of such series.
Preferred Share Purchase Rights
On September 11, 2009, we entered into a Tax Benefit Preservation Plan, which Tax Benefit Preservation
Plan was last amended on September 12, 2024 (as amended, the “Plan”) with Computershare Trust Company,
N.A., as rights agent, and our Board of Directors declared a dividend of one preferred share purchase right (the
“Rights”) for each outstanding share of Common Stock, and each outstanding share of Class B Stock under the
terms of the Plan. Each share of Common Stock we issue will be accompanied by a Right. Each Right entitles the
registered holder to purchase from us one one-thousandth of a share of our Series A Junior Participating Preferred
Stock, par value $1.00 per share at a purchase price of $35.00 per one one-thousandth of a share of Preferred
Stock, subject to adjustment. The description and terms of the Rights are set forth in the Plan.
Until the earlier to occur of (i) the close of business on the tenth business day following the public
announcement that a person or group has become an “Acquiring Person” by acquiring beneficial ownership of
4.99% or more of the outstanding shares of Common Stock (or the Board becoming aware of an Acquiring Person,
as defined in the Plan) or (ii) the close of business on the tenth business day (or, except in certain circumstances,
such later date as may be specified by the Board) following the commencement of, or announcement of an intention
to make, a tender offer or exchange offer the consummation of which would result in the beneficial ownership by a
person or group (with certain exceptions) of 4.99% or more of the outstanding shares of Common Stock (the earlier
of such dates being called the “Distribution Date”), the Rights will be evidenced, with respect to Common Stock and
Class B Stock certificates outstanding as of the Record Date (or any book-entry shares in respect thereof), by such
Common Stock or Class B Stock certificate (or registration in book-entry form) together with the summary of rights
(“Summary of Rights”) describing the Plan and mailed to stockholders of record on the Record Date, and the Rights
will be transferable only in connection with the transfer of Common Stock or Class B stock. Any person or group
that beneficially owned 4.99% or more of the outstanding shares of Common Stock on September 11, 2009 are not
deemed an Acquiring Person unless and until such person or group acquires beneficial ownership of additional
shares of Common Stock representing one-half of one percent (0.5%) or more of the shares of Common Stock
then outstanding. Under the Plan, the Board may, in its sole discretion, exempt any person or group from being
deemed an Acquiring Person for purposes of the Plan if the Board determines that such person’s or group’s
ownership of Common Stock will not jeopardize or endanger our availability, or otherwise limit in any way the use of,
our net operating losses, tax credits and other tax assets (the “Tax Attributes”).
The Plan provides that, until the Distribution Date (or earlier expiration or redemption of the Rights), the
Rights will be attached to and will be transferred with and only with the Common Stock and Class B stock. Until the
Distribution Date (or the earlier expiration or redemption of the Rights), new shares of Common Stock and Class B
Stock issued after the Record Date upon transfer or new issuances of Common Stock and Class B Stock will
contain a notation incorporating the Plan by reference (with respect to shares represented by certificates) or notice
thereof will be provided in accordance with applicable law (with respect to uncertificated shares). Until the
Distribution Date (or earlier expiration of the Rights), the surrender for transfer of any certificates representing
shares of Common Stock and Class B Stock outstanding as of the Record Date, even without such notation or a
copy of the Summary of Rights, or the transfer by book-entry of any uncertificated shares of Common Stock and
Class B stock, will also constitute the transfer of the Rights associated with such shares. As soon as practicable
following the Distribution Date, separate certificates evidencing the Rights (“Right Certificates”) will be mailed to
holders of record of the Common Stock and Class B Stock as of the close of business on the Distribution Date and
such separate Right Certificates alone will evidence the Rights.
The Rights are not exercisable until the Distribution Date. The Rights will expire upon the earliest of the
close of business on September 30, 2027 (unless that date is advanced or extended by the Board), the time at
which the Rights are redeemed or exchanged under the Plan, the repeal of Section 382 of the Internal Revenue
Code of 1986, as amended, or any successor statute if the Board determines that the Plan is no longer necessary
for the preservation of our Tax Attributes, or the beginning of our taxable year to which the Board determines that no
Tax Attributes may be carried forward.
The Purchase Price payable, and the number of shares of Preferred Stock or other securities or property
issuable, upon exercise of the Rights is subject to adjustment from time to time to prevent dilution (i) in the event of
a stock dividend on, or a subdivision, combination or reclassification of, the Preferred Stock, (ii) upon the grant to
holders of the Preferred Stock of certain rights or warrants to subscribe for or purchase Preferred Stock at a price,
or securities convertible into Preferred Stock with a conversion price, less than the then-current market price of the
Preferred Stock or (iii) upon the distribution to holders of the Preferred Stock of evidences of indebtedness or assets
(excluding regular periodic cash dividends or dividends payable in Preferred Stock) or of subscription rights or
warrants.
The number of outstanding Rights is subject to adjustment in the event of a stock dividend on the Common
Stock and Class B Stock payable in shares of Common Stock or Class B Stock or subdivisions, consolidations or
combinations of the Common Stock occurring, in any such case, prior to the Distribution Date.
Shares of Preferred Stock purchasable upon exercise of the Rights will not be redeemable. Each share of
Preferred Stock will be entitled, when, as and if declared, to a minimum preferential quarterly dividend payment of
the greater of (a) $10.00 per share, and (b) an amount equal to 1,000 times the dividend declared per share of
Common Stock . In the event of our liquidation, dissolution or winding up, the holders of the Preferred Stock will be
entitled to a minimum preferential payment of the greater of (a) $1.00 per share (plus any accrued but unpaid
dividends), and (b) an amount equal to 1,000 times the payment made per share of Common Stock . Each share of
Preferred Stock will have 1,000 votes, voting together with the Common Stock and Class B stock. Finally, in the
event of any merger, consolidation or other transaction in which outstanding shares of Common Stock are
converted or exchanged, each share of Preferred Stock will be entitled to receive 1,000 times the amount received
per share of Common Stock. These rights are protected by customary antidilution provisions.
Because of the nature of the Preferred Stock’s dividend, liquidation and voting rights, the value of the one
one-thousandth interest in a share of Preferred Stock purchasable upon exercise of each Right should approximate
the value of one share of Common Stock.
In the event that any person or group becomes an Acquiring Person, each holder of a Right, other than
Rights beneficially owned by the Acquiring Person (which will thereupon become null and void), will thereafter have
the right to receive upon exercise of a Right (including payment of the Purchase Price) that number of shares of
Common Stock having a market value of two times the Purchase Price.
At any time after any person or group becomes an Acquiring Person but prior to the acquisition by such
Acquiring Person of beneficial ownership of 50% or more of the voting power of the shares of Common Stock and
Class B Stock then outstanding, the Board may exchange the Rights (other than Rights owned by such Acquiring
Person, which will have become null and void), in whole or in part, for shares of Common Stock or Preferred Stock
(or a series of our preferred stock having equivalent rights, preferences and privileges), at an exchange ratio of one
share of Common Stock or Class B stock, or a fractional share of Preferred Stock (or other stock) equivalent in
value thereto, per Right (subject to adjustment for stock splits, stock dividends and similar transactions).
With certain exceptions, no adjustment in the Purchase Price will be required until cumulative adjustments
require an adjustment of at least 1% in such Purchase Price. No fractional shares of Preferred Stock, Common
Stock or Class B Stock will be issued (other than fractions of Preferred Stock which are integral multiples of one
one-thousandth of a share of Preferred Stock, which may, at our election, be evidenced by depositary receipts), and
in lieu thereof an adjustment in cash will be made based on the current market price of the Preferred Stock, the
Common Stock or Class B stock.
At any time prior to the time an Acquiring Person becomes such, the Board may redeem the Rights in
whole, but not in part, at a price of $0.001 per Right (the “Redemption Price”) payable, at our option, in cash, shares
of Common Stock or such other form of consideration as the Board shall determine. The redemption of the Rights
may be made effective at such time, on such basis and with such conditions as the Board in its sole discretion may
establish. Immediately upon any redemption of the Rights, the right to exercise the Rights will terminate and the
only right of the holders of Rights will be to receive the Redemption Price.
For so long as the Rights are then redeemable, we may, except with respect to the Redemption Price,
amend the Plan in any manner. After the Rights are no longer redeemable, we may, except with respect to the
Redemption Price, amend the Plan in any manner that does not adversely affect the interests of holders of the
Rights (other than the Acquiring Person).
Until a Right is exercised or exchanged, the holder thereof, as such, will have no rights as our stockholder,
including, without limitation, the right to vote or to receive dividends.
DESCRIPTION OF DEBT SECURITIES
We issue debt securities in one or more series under an Indenture dated as of January 30, 2002 (the
“Indenture”) between us and The Bank of New York Mellon as successor trustee to JPMorgan Chase Bank. The
Indenture may be supplemented from time to time.
The Indenture is a contract between us and The Bank of New York Mellon acting as Trustee. The Trustee
has two main roles. First, the Trustee can enforce debtholders’ rights against us if an “Event of Default” described
below occurs. Second, the Trustee performs certain administrative duties for us. The Indenture is summarized
below.
The June 2059 Notes
We issued $750,000,000 aggregate principal amount of the June 2059 Notes on May 28, 2019. The
maturity date of the June 2059 Notes is June 1, 2059, and interest at a rate of 6.200% per annum is paid quarterly
on March 1, June 1, September 1, and December 1 of each year, beginning on September 1, 2019, and on the
maturity date. The June 2059 Notes are redeemable at our option on June 1, 2024 and on any day thereafter, in
whole or in part, at 100% of their principal amount plus accrued and unpaid interest. The June 2059 Notes are not
subject to repayment at the option of the holder at any time prior to maturity. As of January 31, 2026, $750,000,000
aggregate principal amount of the June 2059 Notes was outstanding.
The December 2059 Notes
We issued $800,000,000 aggregate principal amount of the December 2059 Notes on December 11, 2019.
The maturity date of the December 2059 Notes is December 1, 2059, and interest at a rate of 6.000% per annum is
paid quarterly on March 1, June 1, September 1, and December 1 of each year, beginning on March 1, 2020, and
on the maturity date. The December 2059 Notes are redeemable at our option on December 1, 2024 and on any
day thereafter, in whole or in part, at 100% of their principal amount plus accrued and unpaid interest. The
December 2059 Notes are not subject to repayment at the option of the holder at any time prior to maturity. As of
January 31, 2026, $800,000,000 aggregate principal amount of the December 2059 Notes was outstanding.
The 2062 Notes
We issued $600,000,000 aggregate principal amount of the 2062 Notes on August 15, 2022.
The maturity
date of the 2062 Notes is August 15, 2062, and interest at a rate of 6.500% per annum is paid quarterly on February
15, May 15, August 15, and November 15 each year, beginning on November 15, 2022, and on the maturity date.
The 2062 Notes are redeemable at our option on August 15, 2027, and on any day thereafter, in whole or in part, at
100% of their principal amount plus accrued and unpaid interest. The 2062 Notes are not subject to repayment at
the option of the holder at any time prior to maturity.
As of January 31, 2026, $600,000,000 aggregate principal
amount of 2062 Notes was outstanding.
General
The Indenture does not limit the amount of debt securities that may be issued under it. Therefore,
additional debt securities may be issued under the Indenture.
The debt securities are our unsecured obligations. Senior debt securities rank equally with our other
unsecured and unsubordinated indebtedness (parent company only).
Principal (and premium, if any) and interest, if any, will be paid by us in immediately available funds. The
Indenture does not contain any provisions that give debtholders protection in the event we issue a large amount of
debt or we are acquired by another entity.
Limitation on Liens
The Indenture restricts our ability to pledge some of our assets as security for other debt. Unless we secure
the debt securities on an equal basis, the restriction does not permit us to have or guarantee any debt that is
secured by (1) any of our principal U.S. plants or (2) the stock or debt of any of our subsidiaries that own or lease
one of these plants. This restriction does not apply until the total amount of our secured debt plus the discounted
value of the amount of rent we must pay under sale and leaseback transactions involving principal U.S. plants
exceeds 5% of our consolidated net tangible automotive assets. This restriction also does not apply to any of the
following:
•
liens of a company that exist at the time such company becomes our subsidiary;
•
liens in our favor or in the favor of our subsidiaries;
•
certain liens given to a government;
•
liens on property that exist at the time we acquire the property or liens that we give to secure our
paying for the property; and
•
any extension or replacement of any of the above.
Limitation on Sales and Leasebacks
The Indenture prohibits us from selling and leasing back any principal U.S. plant for a term of more than
three years. This restriction does not apply if:
•
we could create secured debt in an amount equal to the discounted value of the rent to be paid
under the lease without violating the limitation on liens provision discussed above;
•
the lease is with or between any of our subsidiaries; or
•
within 120 days of selling the U.S. plant, we retire our funded debt in an amount equal to the net
proceeds from the sale of the plant or the fair market value of the plant, whichever is greater.
Merger and Consolidation
The Indenture prohibits us from merging or consolidating with any company, or selling all or substantially all
of our assets to any company, if after we do so the surviving company would violate the limitation on liens or the
limitation on sales and leasebacks discussed above. This does not apply if the surviving company secures the debt
securities on an equal basis with the other secured debt of the company.
Events of Default and Notice Thereof
The Indenture defines an “Event of Default” as being any one of the following events:
•
failure to pay interest for 30 days after becoming due;
•
failure to pay principal or any premium for five business days after becoming due;
•
failure to make a sinking fund payment for five days after becoming due;
•
failure to perform any other covenant applicable to the debt securities for 90 days after notice;
•
certain events of bankruptcy, insolvency or reorganization; and
•
any other Event of Default provided in the prospectus supplement.
An Event of Default for a particular series of debt securities will not necessarily constitute an Event of
Default for any other series of debt securities issued under the Indenture.
If an Event of Default occurs and continues, the Trustee or the holders of at least 25% of the total principal
amount of the series may declare the entire principal amount (or, if they are Original Issue Discount Securities (as
defined in the Indenture), the portion of the principal amount as specified in the terms of such series) of all of the
debt securities of that series to be due and payable immediately. If this happens, subject to certain conditions, the
holders of a majority of the total principal amount of the debt securities of that series can void the declaration.
The Indenture provides that within 90 days after default under a series of debt securities, the Trustee will
give the holders of that series notice of all uncured defaults known to it. (The term “default” includes the events
specified above without regard to any period of grace or requirement of notice.) The Trustee may withhold notice of
any default (except a default in the payment of principal, interest or any premium) if it believes that it is in the
interest of the holders.
Annually, we must send to the Trustee a certificate describing any existing defaults under the Indenture.
Other than its duties in case of a default, the Trustee is not obligated to exercise any of its rights or powers
under the Indenture at the request, order or direction of any holders, unless the holders offer the Trustee reasonable
protection from expenses and liability. If they provide this reasonable indemnification, the holders of a majority of
the total principal amount of any series of debt securities may direct the Trustee how to act under the Indenture.
Defeasance and Covenant Defeasance
We have two options to discharge our obligations under a series of debt securities before their maturity
date. These options are known as “defeasance” and “covenant defeasance”. Defeasance means that we will be
deemed to have paid the entire amount of the applicable series of debt securities and we will be released from all of
our obligations relating to that series (except for certain obligations, such as registering transfers of the securities).
Covenant defeasance means that as to the applicable series of debt securities we will not have to comply with the
covenants described above under Limitation on Liens, Limitation on Sales and Leasebacks and Merger and
Consolidation.
To elect either defeasance or covenant defeasance for any series of debt securities, we must deposit with
the Trustee an amount of money and/or U.S. government obligations that will be sufficient to pay principal, interest
and any premium or sinking fund payments on the debt securities when those amounts are scheduled to be paid. In
addition, we must provide a legal opinion stating that as a result of the defeasance or covenant defeasance
debtholders will not be required to recognize income, gain or loss for federal income tax purposes and debtholders
will be subject to federal income tax on the same amounts, in the same manner and at the same times as if the
defeasance or covenant defeasance had not occurred. For defeasance, that opinion must be based on either an
Internal Revenue Service ruling or a change in law since the date the debt securities were issued. We must also
meet other conditions, such as there being no Events of Default. The amount deposited with the Trustee can be
decreased at a later date if in the opinion of a nationally recognized firm of independent public accountants the
deposits are greater than the amount then needed to pay principal, interest and any premium or sinking fund
payments on the debt securities when those amounts are scheduled to be paid.
Our obligations relating to the debt securities will be reinstated if the Trustee is unable to pay the debt
securities with the deposits held in trust, due to an order of any court or governmental authority. It is possible that a
series of debt securities for which we elect covenant defeasance may later be declared immediately due in full
because of an Event of Default (not relating to the covenants that were defeased). If that happens, we must pay the
debt securities in full at that time, using the deposits held in trust or other money.
Modification of the Indenture
With certain exceptions, our rights and obligations and debtholders’ rights under a particular series of debt
securities may be modified with the consent of the holders of not less than two-thirds of the total principal amount of
those debt securities. No modification of the principal or interest payment terms, and no modification reducing the
percentage required for modifications, will be effective against debtholder without debtholders’ consent.
Global Securities
The debt securities of each series has been issued in the form of one or more global certificates which have
been deposited with The Depository Trust Company, New York, New York (“DTC”), which acts as depositary for the
global certificates. Beneficial interests in global certificates will be shown on, and transfers of global certificates will
be effected only through, records maintained by DTC and its participants. Therefore, if debtholders wish to own
debt securities that are represented by one or more global certificates, debtholders can do so only indirectly or
“beneficially” through an account with a broker, bank or other financial institution that has an account with DTC (that
is, a DTC participant) or through an account directly with DTC if such debtholder is a DTC participant.
While the debt securities are represented by one or more global certificates:
•
Debtholders will not be able to have the debt securities registered in their name.
•
Debtholders will not be able to receive a physical certificate for the debt securities.
•
Our obligations, as well as the obligations of the Trustee and any of our agents, under the debt
securities will run only to DTC as the registered owner of the debt securities. For example, once we
make payment to DTC, we will have no further responsibility for the payment even if DTC or a
debtholder’s broker, bank or other financial institution fails to pass it on so that such debtholder
receives it.
•
Debtholders’ rights under the debt securities relating to payments, transfers, exchanges and other
matters will be governed by applicable law and by the contractual arrangements between the
debtholder and such debtholder’s broker, bank or other financial institution, and/or the contractual
arrangements a debtholder or any debtholder’s broker, bank or financial institution has with DTC.
Neither we nor the Trustee has any responsibility for the actions of DTC or any debtholder’s broker,
bank or financial institution.
•
Debtholders may not be able to sell their interests in the debt securities to some insurance
companies and others who are required by law to own their debt securities in the form of physical
certificates.
•
Because the debt securities will trade in DTC’s Same-Day Funds Settlement System, when a
debtholder buys or sells interests in the debt securities, payment for them will have to be made in
immediately available funds. This could affect the attractiveness of the debt securities to others.
A global certificate generally can be transferred only as a whole, unless it is being transferred to certain
nominees of the depositary or it is exchanged in whole or in part for debt securities in physical form. If a global
certificate is exchanged for debt securities in physical form, they will be in denominations of $1,000 and integral
multiples thereof.
Exhibit 10-F
Description of Executive Wellness Program Allowance
Ford Motor Company provides an executive wellness allowance for professional financial
planning, tax planning, executive physical, or other wellness or financial related services for
senior level executives of the Company (Leadership Level 2 and above employees). The
Executive Wellness Program Allowance is paid in a lump sum in February of each year to all
eligible LL1 and LL2 employees. Employees may utilize the allowance as they choose and are
taxed on the value of the payment.

Jim Farley
President and Chief Executive Officer
April 19, 2024
Sherry House
Dear Sherry,
On behalf of Ford Motor Company and pending Board of Directors approval, I am pleased to offer you the
position of Chief Financial Officer reporting to me. Before formally assuming the CFO role, there will be a
transition period of approximately 6 months where you will serve as the Vice President, Finance reporting
to John Lawler, Chief Financial Officer. In this transitionary role, you will have responsibility for the
Financial Planning and Analysis and the Business Unit CFOs. Upon completing the transition period, you
will become the Chief Financial Officer reporting to me. This is an at-will, Leadership Level 1 position,
Reward Band 1, based in Dearborn, MI. We believe you have the personal and professional qualifications
to make a significant addition to our senior leadership team.
Included within this communication is a summary of the broader range of compensation and benefits
related to this offer
1
. The main features of our offer are summarized below. Note: This offer supersedes
the offer presented on April 11, 2024.
Base Salary
:
$900,000 per year
This amount is payable monthly, according to the Company’s regular payroll practices.
Signing Bonus
:
$1,250,000
You will receive your signing bonus once your direct deposit has been confirmed with Payroll. Please
review the Signing Bonus Agreement (below) as part of your offer acceptance
2
.
2024 Annual Long-Term Incentive Program Stock Award
:
$5,000,000
Pending final approval by the Compensation, Talent & Culture Committee, you will receive an initial stock
award with a grant date value of $5,000,000. This award will be structured the similarly to the annual
stock award program, except the grant date will be June 1
st
, 2024 (assuming your effective date of hire is
on or prior to this date), instead of the first week of March 2024 (normal annual award grant date). This
award will be in the form of 40% time-vested restricted stock units (RSUs) and 60% performance stock
units (PSUs)
3
. The quantity of RSUs and PSUs will be determined by the Fair Market Value (FMV) of
Ford Common Stock using the closing price for Ford Motor Company Common Stock (trading the regular
way on the NYSE) on the grant date. More information on the
Initial Stock Award
and
Annual Long-Term
Incentive Programs
can be found here.
Hiring Stock Award
:
$3,000,000
You will receive an initial stock award with a grant date value of $3,000,000. This award will be granted in
the form of time-vested restricted stock units (RSUs), on June 1st 2024 (assuming your effective date of
hire is on or prior to this date). The quantity of RSUs will be determined by the Fair Market Value (FMV)
of Ford Common Stock using the closing price for Ford Motor Company Common Stock (trading the
regular way on the NYSE) on this date
3
.
Exhibit 10-M
1
Vesting Schedule
$1,500,000 will vest immediately upon grant on June 1, 2024. $1,500,000 will vest on the first
anniversary of the grant date.
Annual Performance Bonus Target: 125% of you base salary ($1,125,000)
You will be eligible to participate in the Company’s Annual Performance Bonus Plan with a pro-rated
bonus for service in the current performance year provided you have commenced your employment with
Ford before the end of the current year
4
. In March of each performance year, employees are notified of
their Bonus target. Assuming the Company makes a bonus payment for the current performance year, it
will be paid in March of the following year. More information on this plan can be found here.
Ongoing Annual Long-Term Incentive Program (Stock Award): $5,000,000
Ongoing, you will be eligible to participate in the Company’s annual stock award program with the March
grant date beginning in 2025. The present stock award planning value for your position is
$5,000,000. Awards vary year to year and are approved by the Compensation, Talent & Culture
Committee. These stock awards are usually granted in March of each year in the form of 40%
time-vested restricted stock units and 60% performance-based restricted stock units
3
. More information on
the
Initial Stock Award
and
Annual Long-Term Incentive Programs
can be found here.
Ford Benefits:
Upon your hire, you will be eligible for other Company benefits, as detailed in the benefits summary found
here
1
. Please refer to the summary for additional information relating to compensation and benefits.
Retirement/Savings Plans:
Upon hire, you will be eligible to participate in the following benefit plans:
•
Savings and Stock Investment Plan (SSIP):
A Company-sponsored 401(k) retirement plan.
The SSIP has two components:
I.
Ford Retirement Plan (FRP) Contribution:
Employees hired on or after January 1,
2004, are eligible to receive FRP Contribution. Ford makes FRP Contribution into your
SSIP account each pay period based on your age as of December 31 each year:
Age as of December 31
FRP Contribution (% of base pay)
Under age 40
3.5%
Age 40-49
4.5%
Age 50 and over
5.5%
II.
Company Match:
Ford matches 90 cents per dollar on the first 5% of your own
contributions. The FRP Contribution and Company Match become vested (yours to keep) three
years following your original date of hire, if you're still employed with Ford.
•
Benefit Equalization Plan (BEP):
The company credits notional contributions to a BEP
account on your behalf to make up for FRP Contribution and Company Match that would have
been made to the SSIP but were not permitted due to legal limitations on the amount of
compensation and/or contributions. This is a non-qualified unfunded plan.
•
Defined Contribution Supplemental Executive Retirement Plan (DC SERP):
An additional
benefit provided to certain executives where notional contributions are credited to a DC SERP
account on your behalf, based upon your age and leadership level. This is a non-qualified
unfunded plan.
•
The combination of FRP, BEP and DC SERP contributions total 14% of your salary.
2
Relocation:
You are eligible for relocation benefits as provided by Company policy for new hires.
5
The Company offers
a comprehensive relocation program that provides financial assistance, professional services and
administrative support to employees who relocate at the request of the Company. A standard set of
relocation provisions is offered to help minimize disruptions and to provide efficient and reasonable
assistance. Ford has established a partnership with a Relocation Management Company (RMC) to
administer the relocation policy and assist eligible employees through the relocation process. You should
not initiate any relocation activity or contact real estate Brokers/agents prior to speaking with the RMC
otherwise you may forfeit your eligibility for certain relocation benefits. We can have you speak to a
mobility SME for more details.
Paid Time Off
You will be eligible for paid time off per Ford's Vacation, Flexible Family Care, and Holidays policy. Annual
vacation entitlement (30 days) may be prorated based on your start date.
Vehicle Program
:
You will be eligible for two free Evaluation vehicles, one of which must be an electric vehicle, for the
purpose of obtaining on-road testing and evaluation. Evaluation vehicles are provided at no cost and
include maintenance, repairs, insurance, and fuel. You will also be eligible for up to two lease vehicles
under the terms of the Management Lease Vehicle Evaluation Program.
Severance Pay
:
Your employment with Ford Motor Company will be at-will. In the event that the Company terminates your
employment for any reason other than ‘for cause’ during the first year of your employment, the Company
will pay you the equivalent of one-year base salary as a separation payment. Any such separation
payment will be made no later than March 15
th
of the calendar year following the calendar year in which
you are involuntarily terminated other than ‘for cause’.
Should you leave Ford Motor Company under these circumstances and receive this separation payment, it
is made on the condition that you will sign and deliver an acceptable general claims release. The
non-compete agreement will remain in effect.
For the purposes of this offer letter, the term ‘for cause’ is described as:
(a)
Any material act of dishonesty or knowing and willful breach of fiduciary duty on your part
which is intended to result in your personal enrichment or gain at the expense of Ford or any
of its affiliates or subsidiaries; or
(b)
your commission of any felony, or any misdemeanor (or securities law violation) involving
moral turpitude or unlawful, dishonest, or unethical conduct that a reasonable person would
consider damaging to the reputation or image of Ford or any of its affiliates or subsidiaries; or
(c)
any material violation of the published standards of conduct applicable to Officers or
executives of Ford or any of its affiliates or subsidiaries that warrants termination; or
(d)
insubordination or refusal to perform assigned duties or to comply with the lawful directions of
your superiors; or
(e)
any deliberate, willful, or intentional act that causes substantial harm, loss, or injury to Ford
or any of its affiliates or subsidiaries.
Tax Consequences and Possible Delays in Payment to Avoid Penalties
:
You are solely responsible and liable for all taxes that may arise in connection with the compensation
and benefits that you receive from Ford. This includes any tax arising under Section 409A of the Internal
Revenue Code of 1986, as amended (Code). In the event Ford determines that you are a “specified
employee” under Code Section 409A, any nonqualified deferred compensation benefit payable upon
termination of employment while a “specified employee” will be delayed until the first day of the seventh
month following such termination. Please consult your personal financial or tax advisor about the tax
consequences of your compensation and benefits. No one at Ford is authorized to provide this advice to
you.
3
Accepting Offer of Employment:
This offer of at-will employment is subject to the following conditions:
•
Producing a valid proof of identification and acceptable evidence that you are authorized to work in
the United States
•
Determination, to our satisfaction, that information provided by you in your job application and/
or resume is valid. This offer is contingent upon successful completion and passing of the
background check.
•
Completing all other required new hire forms
•
Establishment to Ford’s reasonable satisfaction that your commencement of employment with
Ford will not violate any agreement (such as a non-competition agreement) between you and any
prior employer.
Signing Bonus Agreement
This Signing Bonus Agreement ("Agreement") is entered into on June 1
st
, 2024, between Ford Motor
Company, a Delaware corporation (“Ford” or “the Company”) and the Employee executing this Agreement
below (“Employee”).
The Signing Bonus is subject to federal, state, and local laws, and Ford will withhold from the Signing
Bonus all applicable taxes, withholdings and deductions required by such laws.
Eligibility for the installment of the signing bonus is conditioned on Employee’s active regular salaried
employment with Ford Motor Company. If Employee voluntarily leaves the Company within two years of
the most recent Signing Bonus installment or if Employee is discharged “for cause” within the same
period, Employee shall, within thirty (30) days of Employee’s last date of employment with the Company,
repay to the Company the gross amount of the most recent Signing Bonus installment.
By signing this offer letter, Employee provides Ford with full, free, and written consent to make
deductions from Employee’s wages and any other monies owed by Ford to Employee, to the extent permitted
by law, to recoup any unpaid portion of the Signing Bonus.
2
I agree to the terms and conditions of this employment agreement. I further acknowledge and understand
that my electronic signature shall have the same legal effect as a handwritten signature. By signing and
accepting this offer, you are also providing your signature/agreement of the following:
•
Signing Bonus Agreement
•
Michigan Trade Secrets Non-Compete Assignment of Invention (attached)
This offer remains in effect until
April 22, 2024
. We anticipate that your effective date of hire will be
June 1, 2024
. Michigan law will control all issues arising under this offer.
Sherry, we are pleased to offer you this opportunity to join the Ford team and look forward to your
favorable response. If you have any questions, please contact Tracy Pass at 1-313-549-4167 or
traceyp@ford.com.
Sincerely,
Jim Farley
President and Chief Executive Officer
4
I have read the foregoing offer of at-will employment. I agree with and accept this offer of employment subject
to the terms and conditions detailed above.
Signature:
/s/ Sherry House
Date: April 19, 2024
Sherry House
1 Items described in this letter and the attachments, are subject to the terms and conditions of the individual plans and programs. To the
extent this summary conflicts with the terms and conditions of the individual plan and program documents, the individual plan and
program documents will control. The Company reserves the right to amend or terminate its benefit or pension plans at any time in the
future. All incentive-based compensation (including, but not limited to, Annual Performance Bonus Plan awards and Performance Stock
Unit grants and final awards under the Long-Term Incentive Plan (LTIP)) is subject to any recoupment, “clawback” or similar provision of
applicable law, as well as any applicable recoupment or “clawback” policies of Ford Motor Company (or Ford Motor Credit Company, as
applicable) that may be in effect from time to time, including, without limitation, to the extent applicable to you: (1) the Ford Motor
Company Corporate Officer Compensation Recoupment Policy, (2) the Ford Motor Company Financial Statement Compensation
Recoupment Policy (Section 16 Officers), and (3) the Ford Motor Credit Company Financial Statement Compensation Recoupment
Policy (Ford Motor Credit Company “executive officers”).
If Ford takes action to enforce its rights under this Agreement through any legal proceeding or other collection action of any type or sort,
then Employee agrees to pay, in addition to all other sums then due under this Agreement, all reasonable expenses of collection,
including, without limitation, reasonable attorneys’ fees and costs, and those incurred in any bankruptcy, reorganization, insolvency or
other similar proceeding.
3 Stock award grants are subject to the terms and conditions of the Company’s LTIP and approval by the Compensation, Talent &
Culture Committee of the Board of Directors, or its permitted delegates, as provided in the LTIP. Among other provisions, the LTIP
requires stock award grants to be canceled if your employment is terminated for any reason within six months of the grant date.
4 The Annual Performance Bonus payments for each performance year are made the following March, subject to the Annual
Performance Bonus Plan’s terms and conditions. Please note this payment will not be made if you are discharged ‘for cause’ or if you
terminate employment prior to the payment being made. The Annual Salary used in this target calculation is based on your actual salary
of each month and a on a 12-month basis, excluding additional local base salary payments, if applicable. During the year, if your
Leadership Level, monthly base salary, or employment status changes, your target will be prorated.
5 If you voluntarily leave Ford Motor Company within one year of your hire date, you must repay the relocation expenses as indicated in
the Relocation Repayment Agreement provided with your relocation materials.
5

Jim Farley
President and Chief Executive Officer
September 11, 2025
Alicia Boler Davis
Dear Alicia,
On behalf of Ford Motor Company, I am pleased to offer you the position of President, Ford Pro, an at-
will, Leadership Level 1 position, Reward Band 1, reporting to me, subject to Board and Committee
approval.
This position will be
based in Dearborn, MI. We believe you have the personal and professional
qualifications to make a significant addition to our senior leadership team.
Included within this communication is a summary of the broader range of compensation and benefits
related to this offer.
1
The main features of our offer are summarized below.
Base Salary
: $1,200,000 per year
You will be paid on a monthly basis, according to the Company’s regular payroll practices.
Annual Performance Bonus Target:
125% of your base salary
You will be eligible to participate in the Company’s Annual Performance Bonus plan with a pro-rated
bonus for service in the current year provided you have commenced your employment with Ford before
the end of the current year.
4
In March of each performance year, employees are notified of their Bonus
target. Assuming the Company makes a bonus payment for the current performance year, it will be paid in
March of the following year. More information on this plan can be found here.
Total Signing Bonus:
$5,100,000 (Total amount of all Signing Bonus payments) payable as follows:
•
Installment 1: $3,250,000 This amount will be paid once your direct deposit has been confirmed
with Payroll after your start date.
•
Installment 2: $1,850,000 This amount will be paid on or as soon as administratively feasible after
the one-year anniversary of your date of hire.
Please review the Signing Bonus Agreement (below) as part of your offer acceptance.
2
Initial Stock Award
: $12,000,000
You will receive an initial stock award with a grant date value of $12,000,000.
•
$6,000,000 of this award will be made in the form of time-vested restricted stock units, on the
next regular grant date after your effective date of employment. The quantity of restricted stock
units will be determined by the Fair Market Value (FMV) of Ford Common Stock on the grant date
for this stock award.
3
This award will vest over a two-year period – 50% one year from the grant
date, and the remaining 50% two years from the grant date.
•
$6,000,000 of this award will be made in the form of Performance Stock Units (PSUs) which will
begin their performance period in 2025 and complete their performance period at the end of
2027.
Special Stock Awards
: $5,000,000
You will receive a Special stock award with a grant date value of $5,000,000 made in the form of time-
vested restricted stock units, on or near October 15, 2026, assuming a start date prior to October 15,
2025. The quantity of restricted stock units will be determined by the Fair Market Value (FMV) of Ford
Exhibit 10-N
1
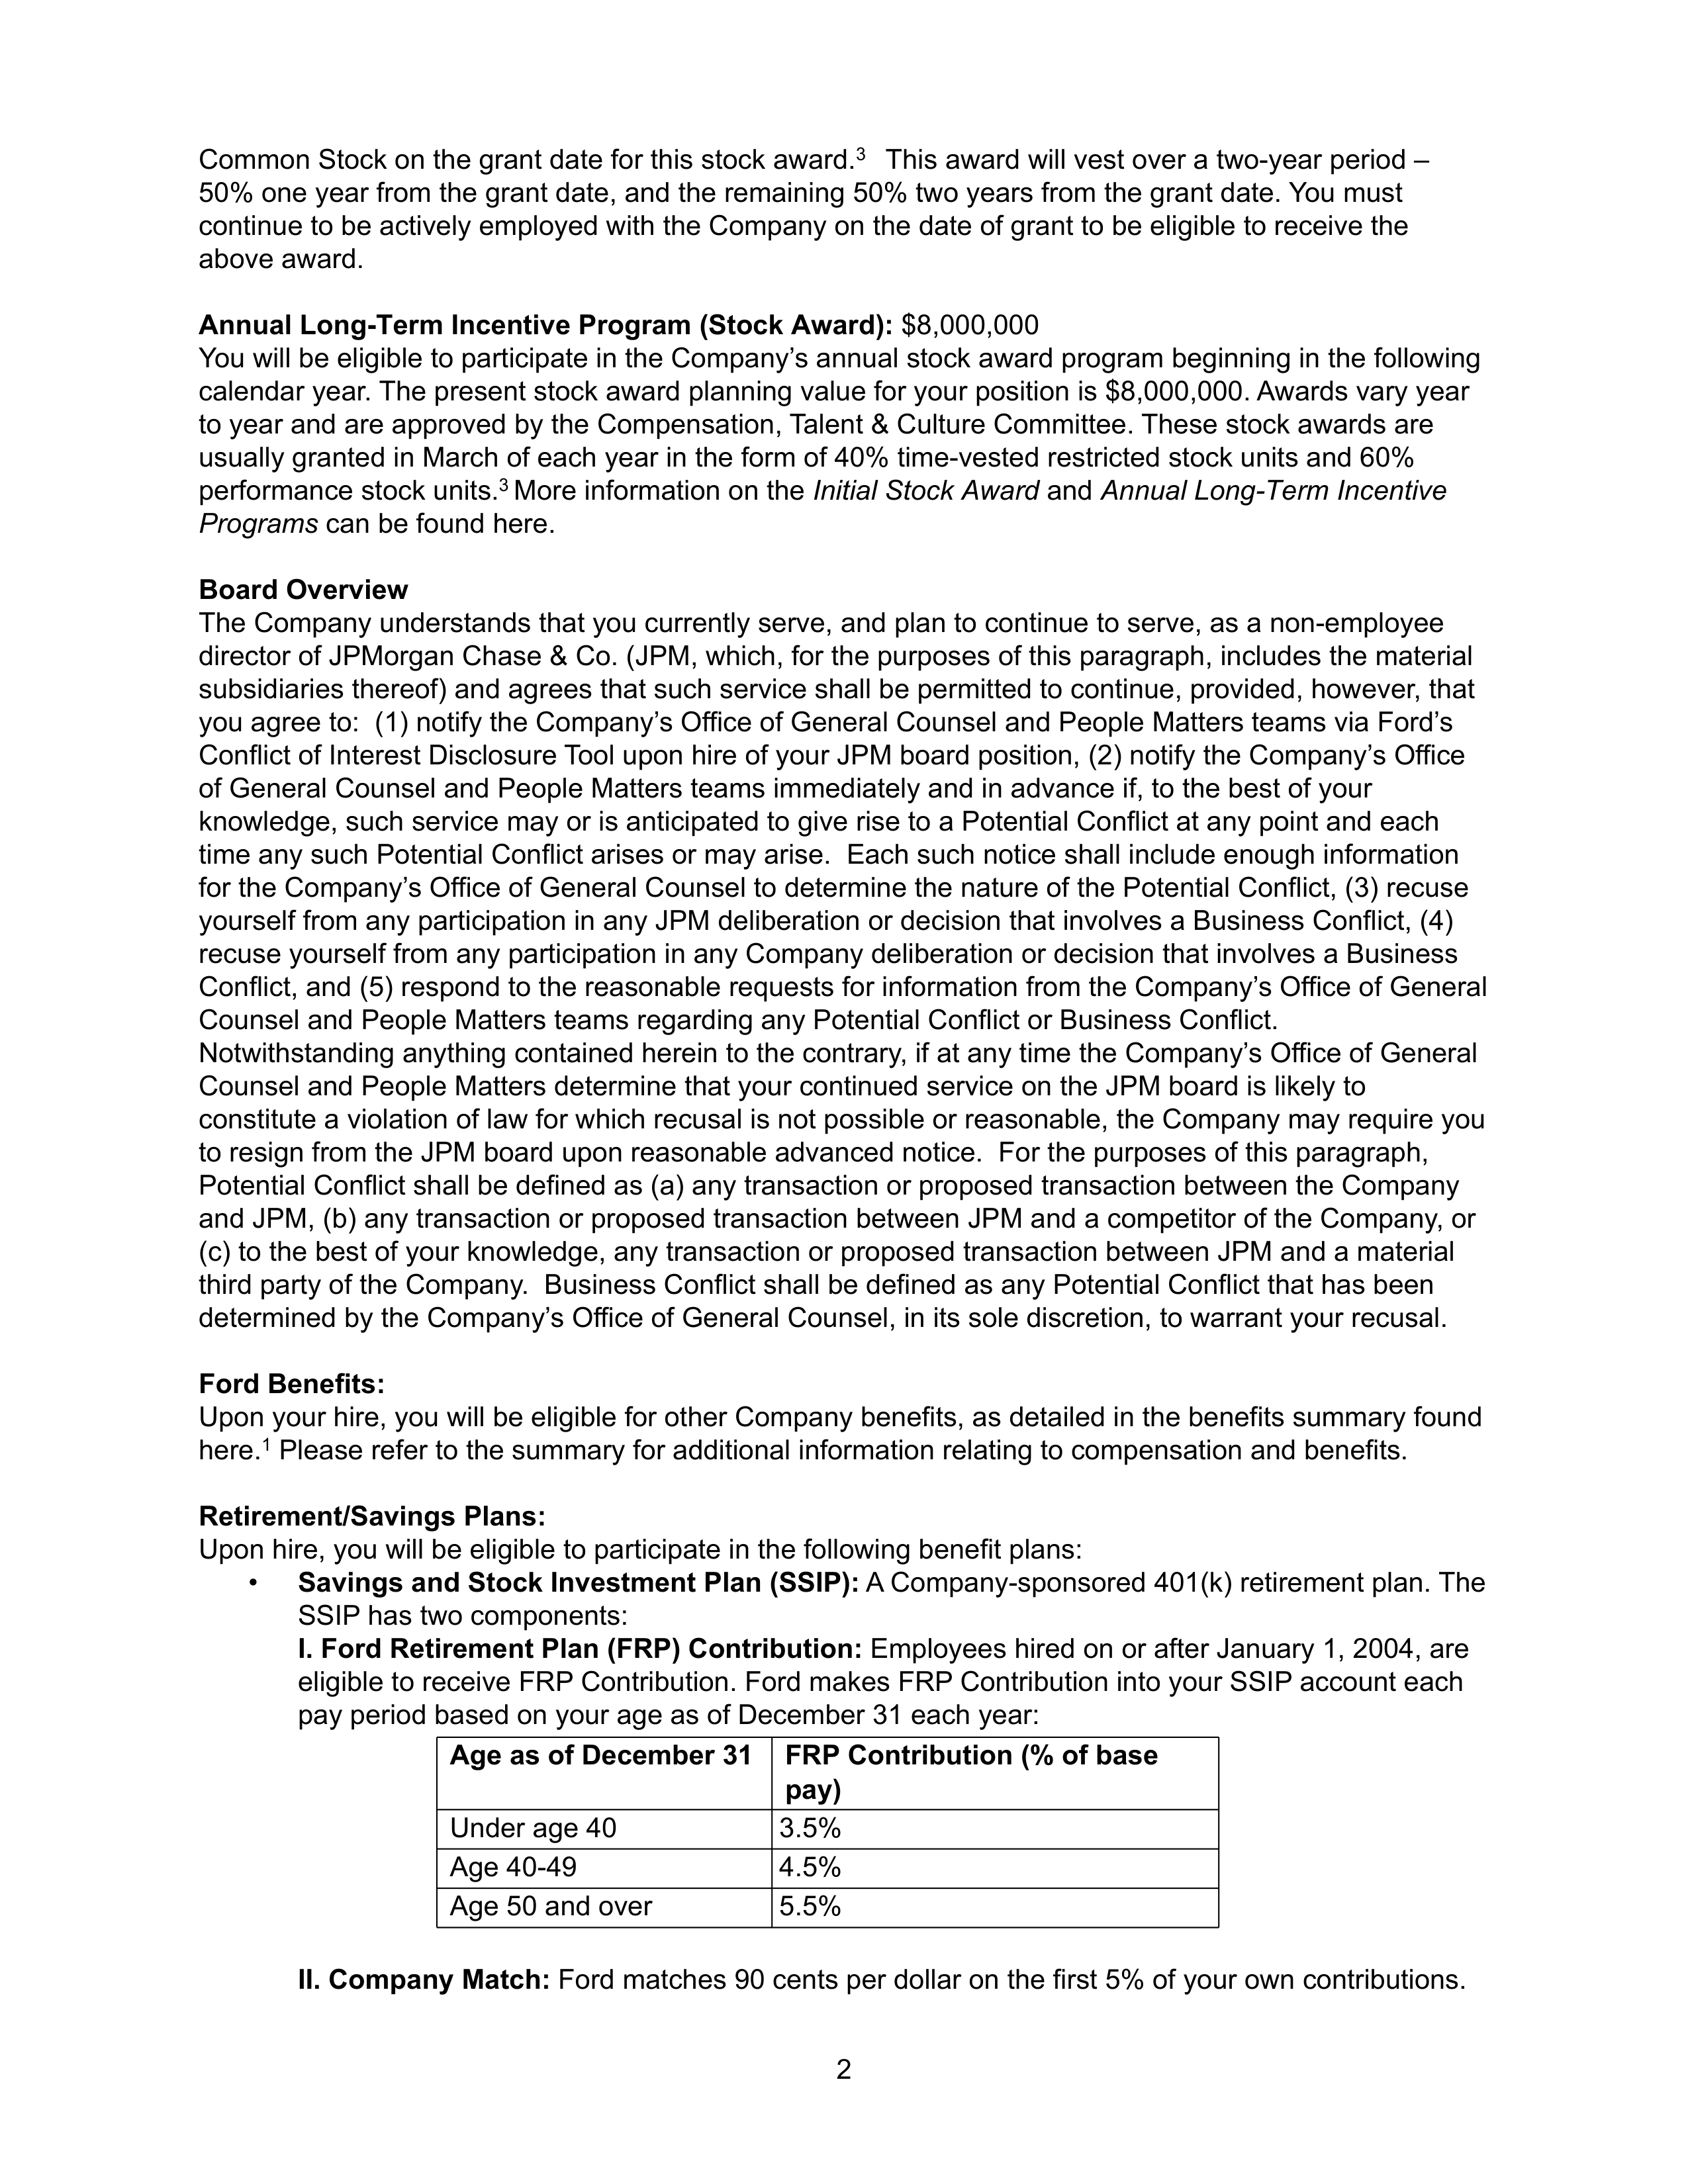
Common Stock on the grant date for this stock award.
3
This award will vest over a two-year period –
50% one year from the grant date, and the remaining 50% two years from the grant date. You must
continue to be actively employed with the Company on the date of grant to be eligible to receive the
above award.
Annual Long-Term Incentive Program (Stock Award):
$8,000,000
You will be eligible to participate in the Company’s annual stock award program beginning in the following
calendar year. The present stock award planning value for your position is $8,000,000. Awards vary year
to year and are approved by the Compensation, Talent & Culture Committee. These stock awards are
usually granted in March of each year in the form of 40% time-vested restricted stock units and 60%
performance stock units.
3
More information on the
Initial Stock Award
and
Annual Long-Term Incentive
Programs
can be found here.
Board Overview
The Company understands that you currently serve, and plan to continue to serve, as a non-employee
director of JPMorgan Chase & Co. (JPM, which, for the purposes of this paragraph, includes the material
subsidiaries thereof) and agrees that such service shall be permitted to continue, provided, however, that
you agree to: (1) notify the Company’s Office of General Counsel and People Matters teams via Ford’s
Conflict of Interest Disclosure Tool upon hire of your JPM board position, (2) notify the Company’s Office
of General Counsel and People Matters teams immediately and in advance if, to the best of your
knowledge, such service may or is anticipated to give rise to a Potential Conflict at any point and each
time any such Potential Conflict arises or may arise. Each such notice shall include enough information
for the Company’s Office of General Counsel to determine the nature of the Potential Conflict, (3) recuse
yourself from any participation in any JPM deliberation or decision that involves a Business Conflict, (4)
recuse yourself from any participation in any Company deliberation or decision that involves a Business
Conflict, and (5) respond to the reasonable requests for information from the Company’s Office of General
Counsel and People Matters teams regarding any Potential Conflict or Business Conflict.
Notwithstanding anything contained herein to the contrary, if at any time the Company’s Office of General
Counsel and People Matters determine that your continued service on the JPM board is likely to
constitute a violation of law for which recusal is not possible or reasonable, the Company may require you
to resign from the JPM board upon reasonable advanced notice. For the purposes of this paragraph,
Potential Conflict shall be defined as (a) any transaction or proposed transaction between the Company
and JPM, (b) any transaction or proposed transaction between JPM and a competitor of the Company, or
(c) to the best of your knowledge, any transaction or proposed transaction between JPM and a material
third party of the Company. Business Conflict shall be defined as any Potential Conflict that has been
determined by the Company’s Office of General Counsel, in its sole discretion, to warrant your recusal.
Ford Benefits:
Upon your hire, you will be eligible for other Company benefits, as detailed in the benefits summary found
here.
1
Please refer to the summary for additional information relating to compensation and benefits.
Retirement/Savings Plans:
Upon hire, you will be eligible to participate in the following benefit plans:
•
Savings and Stock Investment Plan (SSIP):
A Company-sponsored 401(k) retirement plan. The
SSIP has two components:
I. Ford Retirement Plan (FRP) Contribution:
Employees hired on or after January 1, 2004, are
eligible to receive FRP Contribution. Ford makes FRP Contribution into your SSIP account each
pay period based on your age as of December 31 each year:
Age as of December 31
FRP Contribution (% of base
pay)
Under age 40
3.5%
Age 40-49
4.5%
Age 50 and over
5.5%
II. Company Match:
Ford matches 90 cents per dollar on the first 5% of your own contributions.
2
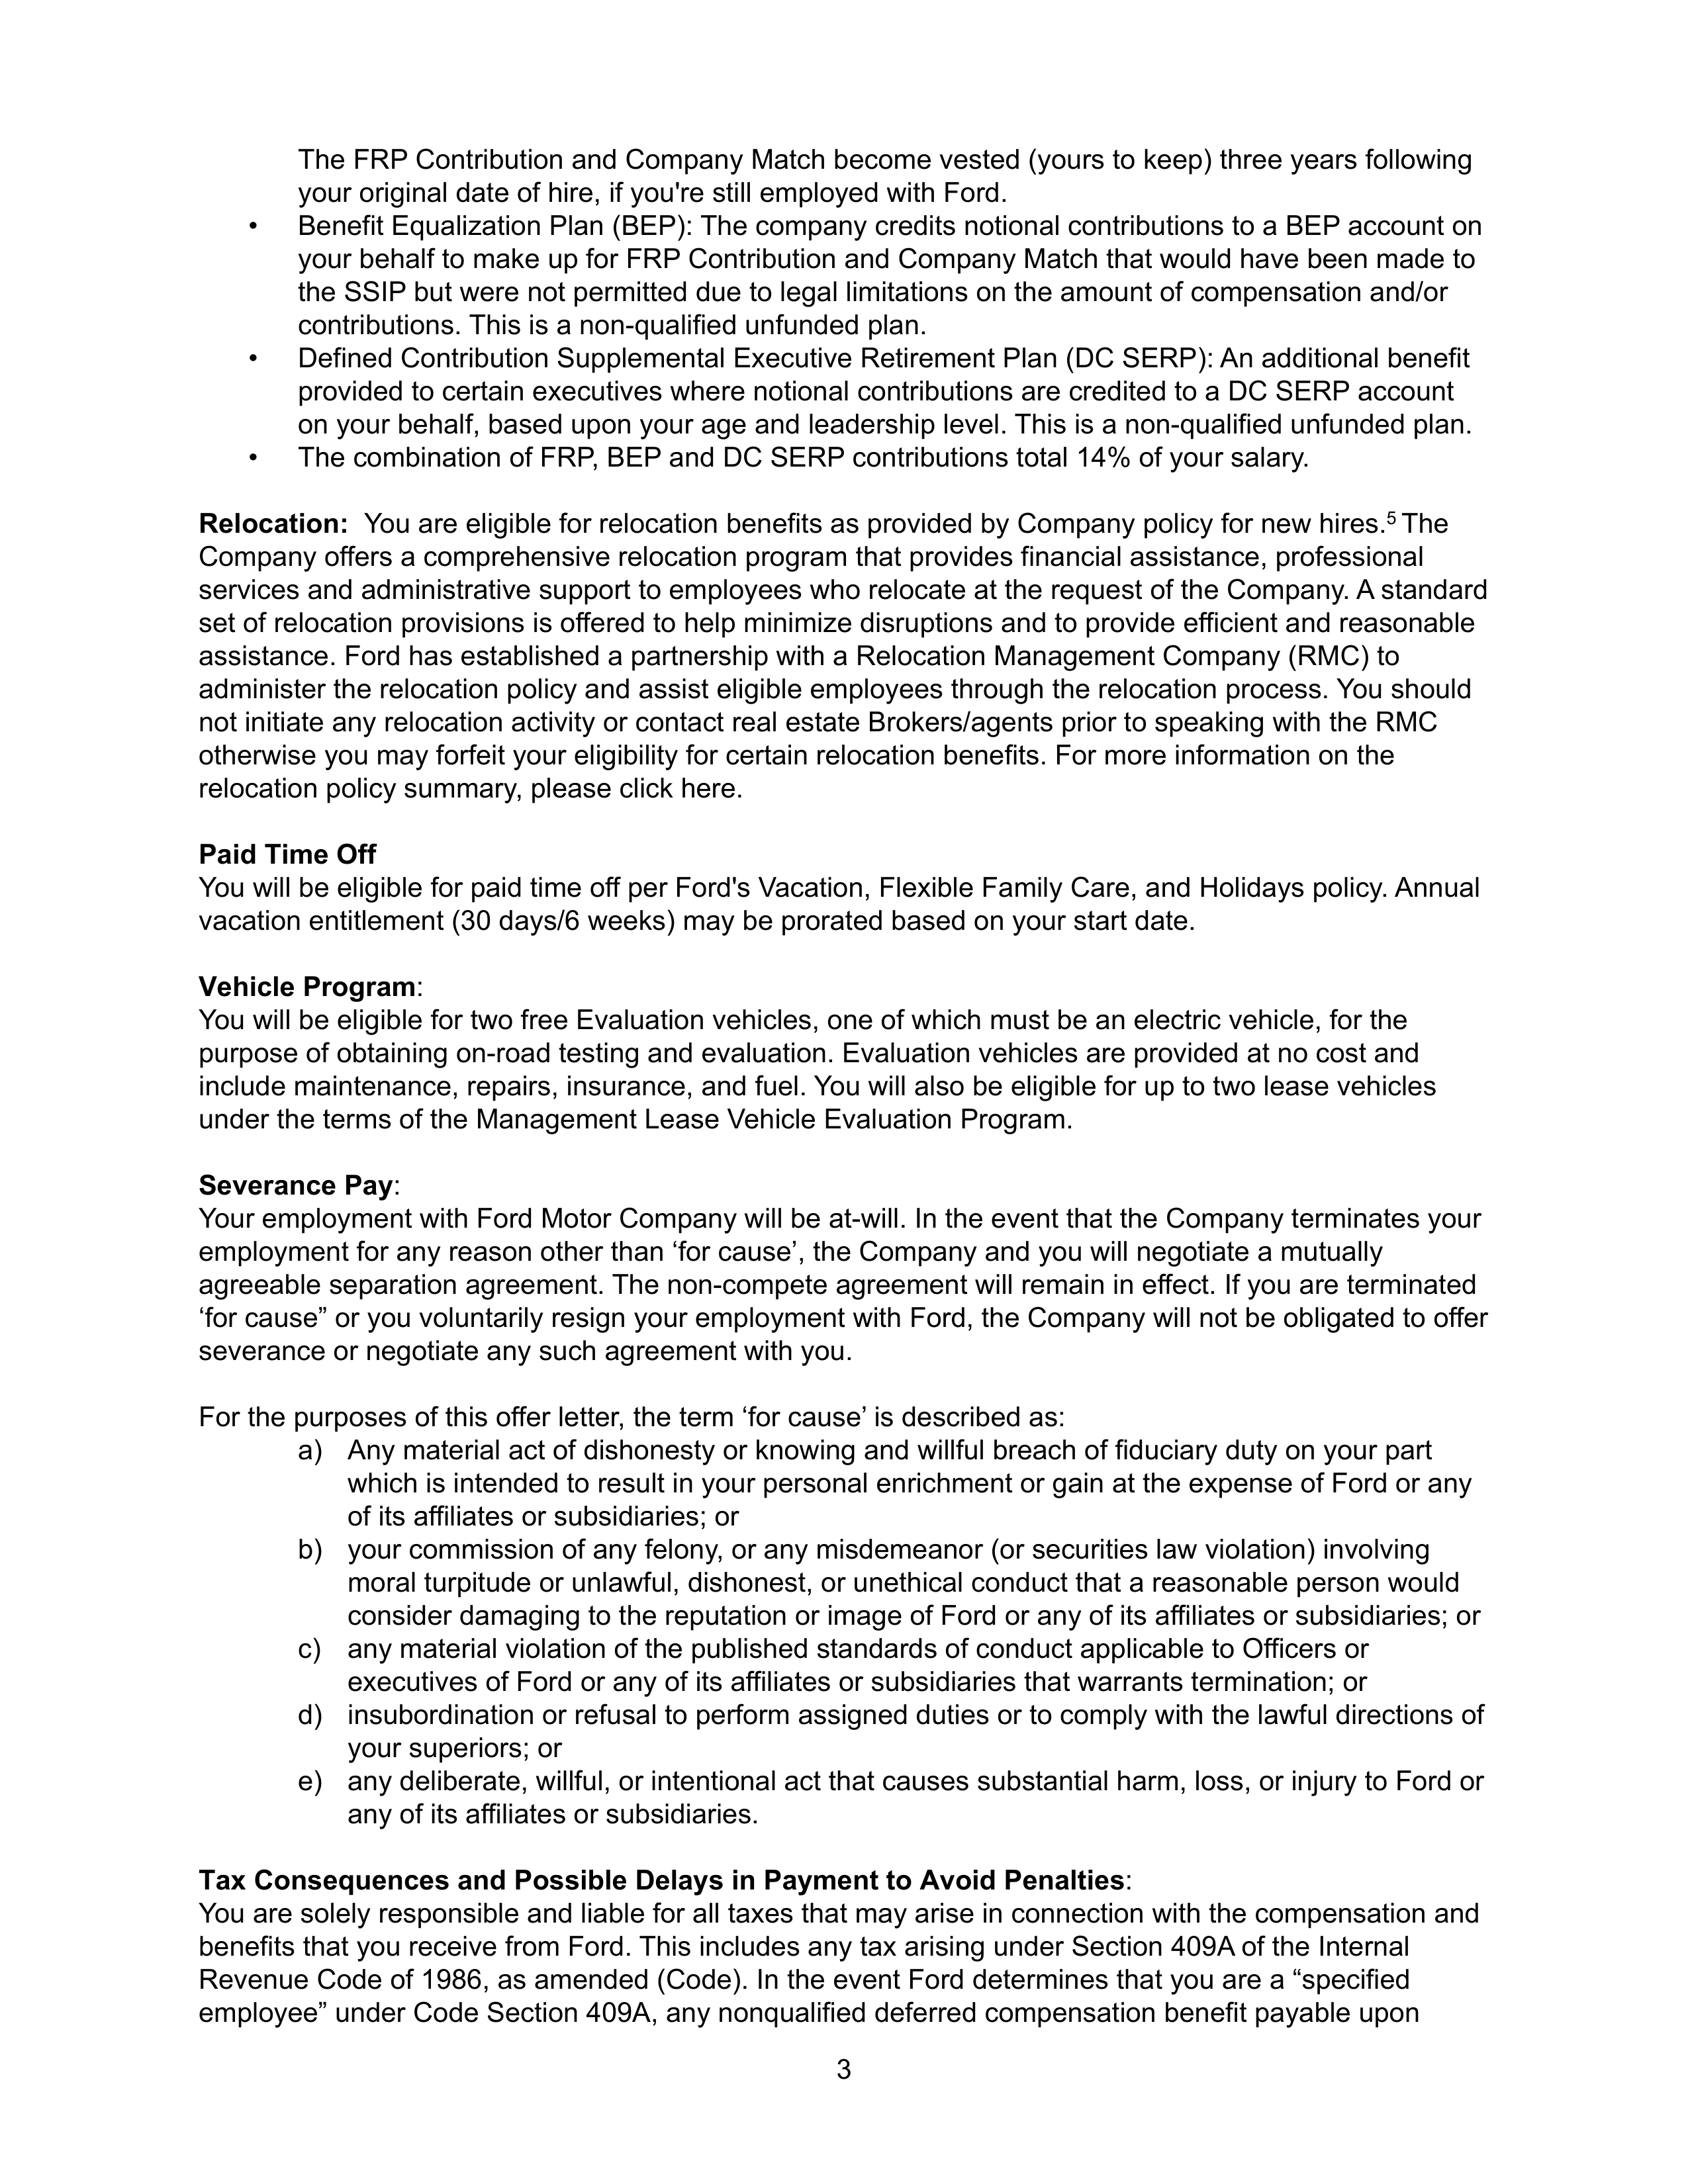
The FRP Contribution and Company Match become vested (yours to keep) three years following
your original date of hire, if you're still employed with Ford.
•
Benefit Equalization Plan (BEP): The company credits notional contributions to a BEP account on
your behalf to make up for FRP Contribution and Company Match that would have been made to
the SSIP but were not permitted due to legal limitations on the amount of compensation and/or
contributions. This is a non-qualified unfunded plan.
•
Defined Contribution Supplemental Executive Retirement Plan (DC SERP): An additional benefit
provided to certain executives where notional contributions are credited to a DC SERP account
on your behalf, based upon your age and leadership level. This is a non-qualified unfunded plan.
•
The combination of FRP, BEP and DC SERP contributions total 14% of your salary.
Relocation:
You are eligible for relocation benefits as provided by Company policy for new hires.
5
The
Company offers a comprehensive relocation program that provides financial assistance, professional
services and administrative support to employees who relocate at the request of the Company. A standard
set of relocation provisions is offered to help minimize disruptions and to provide efficient and reasonable
assistance. Ford has established a partnership with a Relocation Management Company (RMC) to
administer the relocation policy and assist eligible employees through the relocation process. You should
not initiate any relocation activity or contact real estate Brokers/agents prior to speaking with the RMC
otherwise you may forfeit your eligibility for certain relocation benefits. For more information on the
relocation policy summary, please click here.
Paid Time Off
You will be eligible for paid time off per Ford's Vacation, Flexible Family Care, and Holidays policy. Annual
vacation entitlement (30 days/6 weeks) may be prorated based on your start date.
Vehicle Program
:
You will be eligible for two free Evaluation vehicles, one of which must be an electric vehicle, for the
purpose of obtaining on-road testing and evaluation. Evaluation vehicles are provided at no cost and
include maintenance, repairs, insurance, and fuel. You will also be eligible for up to two lease vehicles
under the terms of the Management Lease Vehicle Evaluation Program.
Severance Pay
:
Your employment with Ford Motor Company will be at-will. In the event that the Company terminates your
employment for any reason other than ‘for cause’, the Company and you will negotiate a mutually
agreeable separation agreement. The non-compete agreement will remain in effect. If you are terminated
‘for cause” or you voluntarily resign your employment with Ford, the Company will not be obligated to offer
severance or negotiate any such agreement with you.
For the purposes of this offer letter, the term ‘for cause’ is described as:
a)
Any material act of dishonesty or knowing and willful breach of fiduciary duty on your part
which is intended to result in your personal enrichment or gain at the expense of Ford or any
of its affiliates or subsidiaries; or
b)
your commission of any felony, or any misdemeanor (or securities law violation) involving
moral turpitude or unlawful, dishonest, or unethical conduct that a reasonable person would
consider damaging to the reputation or image of Ford or any of its affiliates or subsidiaries; or
c)
any material violation of the published standards of conduct applicable to Officers or
executives of Ford or any of its affiliates or subsidiaries that warrants termination; or
d)
insubordination or refusal to perform assigned duties or to comply with the lawful directions of
your superiors; or
e)
any deliberate, willful, or intentional act that causes substantial harm, loss, or injury to Ford or
any of its affiliates or subsidiaries.
Tax Consequences and Possible Delays in Payment to Avoid Penalties
:
You are solely responsible and liable for all taxes that may arise in connection with the compensation and
benefits that you receive from Ford. This includes any tax arising under Section 409A of the Internal
Revenue Code of 1986, as amended (Code). In the event Ford determines that you are a “specified
employee” under Code Section 409A, any nonqualified deferred compensation benefit payable upon
3
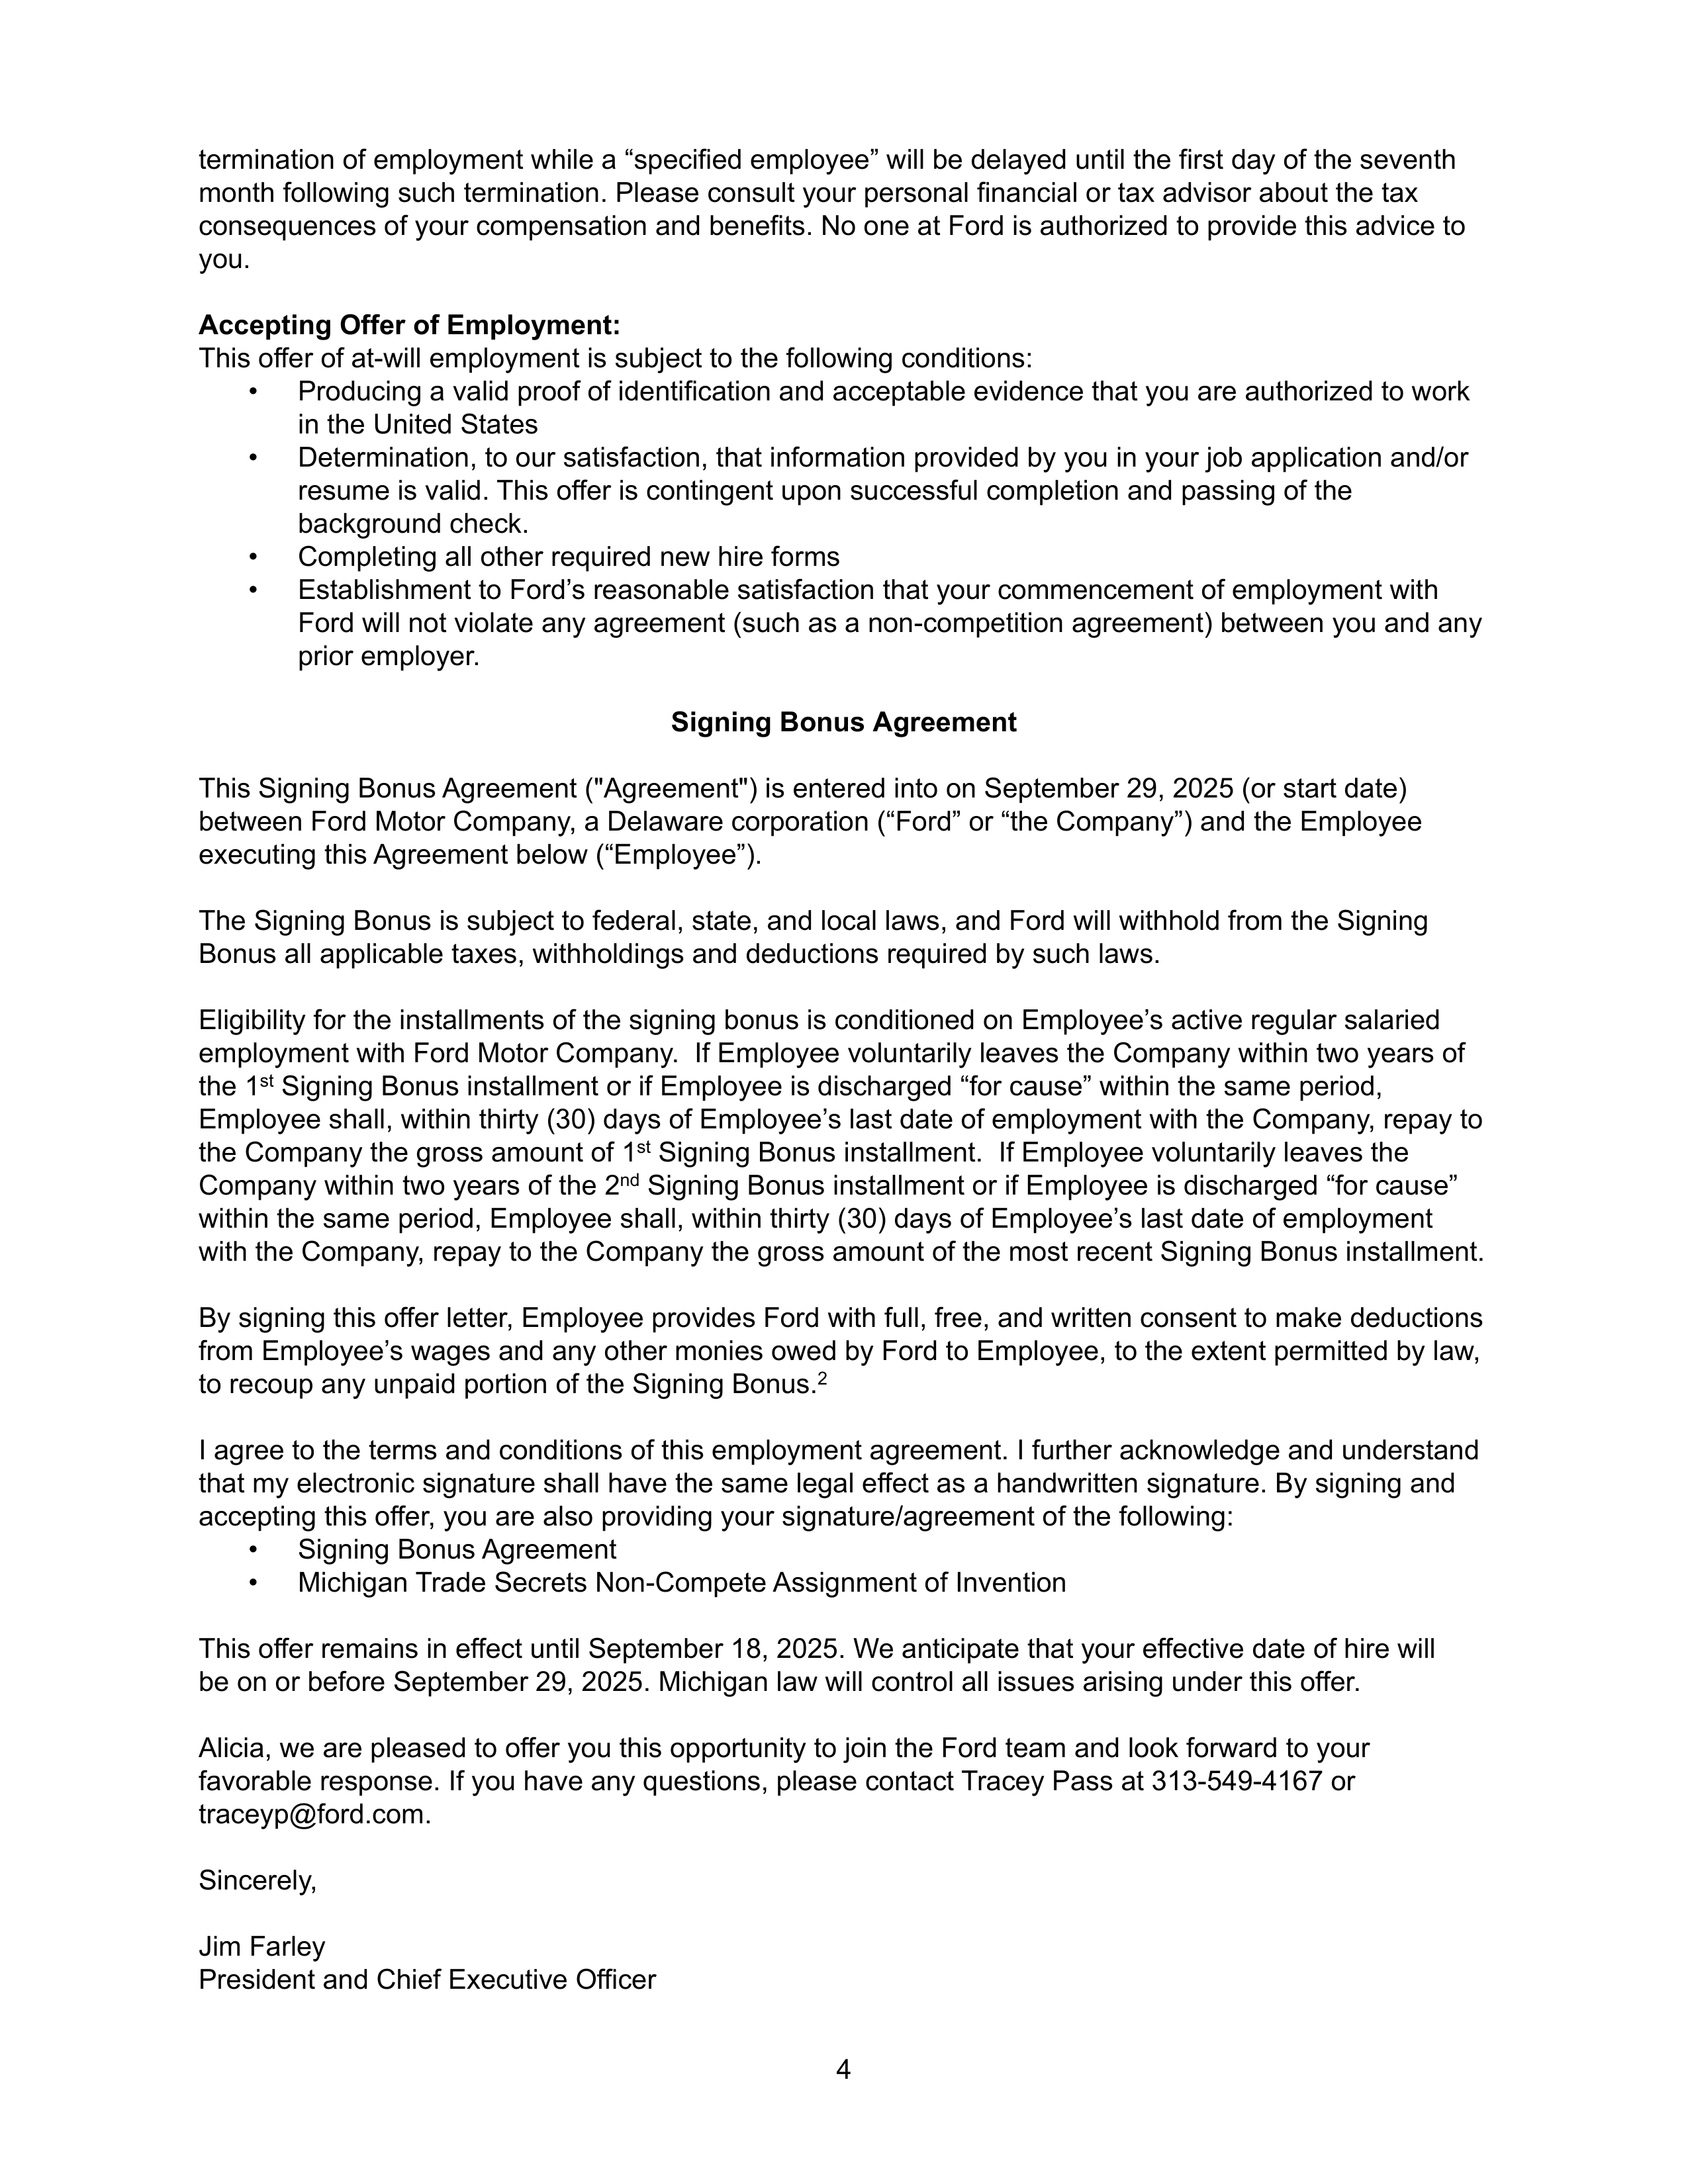
termination of employment while a “specified employee” will be delayed until the first day of the seventh
month following such termination. Please consult your personal financial or tax advisor about the tax
consequences of your compensation and benefits. No one at Ford is authorized to provide this advice to
you.
Accepting Offer of Employment:
This offer of at-will employment is subject to the following conditions:
•
Producing a valid proof of identification and acceptable evidence that you are authorized to work
in the United States
•
Determination, to our satisfaction, that information provided by you in your job application and/or
resume is valid. This offer is contingent upon successful completion and passing of the
background check.
•
Completing all other required new hire forms
•
Establishment to Ford’s reasonable satisfaction that your commencement of employment with
Ford will not violate any agreement (such as a non-competition agreement) between you and any
prior employer.
Signing Bonus Agreement
This Signing Bonus Agreement ("Agreement") is entered into on September 29, 2025 (or start date)
between Ford Motor Company, a Delaware corporation (“Ford” or “the Company”) and the Employee
executing this Agreement below (“Employee”).
The Signing Bonus is subject to federal, state, and local laws, and Ford will withhold from the Signing
Bonus all applicable taxes, withholdings and deductions required by such laws.
Eligibility for the installments of the signing bonus is conditioned on Employee’s active regular salaried
employment with Ford Motor Company. If Employee voluntarily leaves the Company within two years of
the 1
st
Signing Bonus installment or if Employee is discharged “for cause” within the same period,
Employee shall, within thirty (30) days of Employee’s last date of employment with the Company, repay to
the Company the gross amount of 1
st
Signing Bonus installment. If Employee voluntarily leaves the
Company within two years of the 2
nd
Signing Bonus installment or if Employee is discharged “for cause”
within the same period, Employee shall, within thirty (30) days of Employee’s last date of employment
with the Company, repay to the Company the gross amount of the most recent Signing Bonus installment.
By signing this offer letter, Employee provides Ford with full, free, and written consent to make deductions
from Employee’s wages and any other monies owed by Ford to Employee, to the extent permitted by law,
to recoup any unpaid portion of the Signing Bonus.
2
I agree to the terms and conditions of this employment agreement. I further acknowledge and understand
that my electronic signature shall have the same legal effect as a handwritten signature. By signing and
accepting this offer, you are also providing your signature/agreement of the following:
•
Signing Bonus Agreement
•
Michigan Trade Secrets Non-Compete Assignment of Invention
This offer remains in effect until September 18, 2025. We anticipate that your effective date of hire will
be on or before September 29, 2025. Michigan law will control all issues arising under this offer.
Alicia, we are pleased to offer you this opportunity to join the Ford team and look forward to your
favorable response. If you have any questions, please contact Tracey Pass at 313-549-4167 or
traceyp@ford.com.
Sincerely,
Jim Farley
President and Chief Executive Officer
4

I have read the foregoing offer of at-will employment. I agree with and accept this offer of employment
subject to the terms and conditions detailed above.
Signature:
/s/ Alicia Boler Davis
Date: September 17, 2025
Alicia Boler Davis
1
Items described in this letter and the attachments, are subject to the terms and conditions of the individual plans and programs. To
the extent this summary conflicts with the terms and conditions of the individual plan and program documents, the individual plan
and program documents will control. The Company reserves the right to amend or terminate its benefit or pension plans at any time
in the future. All incentive-based compensation (including, but not limited to, Annual Performance Bonus Plan awards and
Performance Stock Unit grants and final awards under the Long-Term Incentive Plan (LTIP)) is subject to any recoupment,
“clawback” or similar provision of applicable law, as well as any applicable recoupment or “clawback” policies of Ford Motor
Company (or Ford Motor Credit Company, as applicable) that may be in effect from time to time, including, without limitation, to the
extent applicable to you: (1) the Ford Motor Company Corporate Officer Compensation Recoupment Policy, (2) the Ford Motor
Company Financial Statement Compensation Recoupment Policy (Section 16 Officers), and (3) the Ford Motor Credit Company
Financial Statement Compensation Recoupment Policy (Ford Motor Credit Company “executive officers”).
2
If Ford takes action to enforce its rights under this Agreement through any legal proceeding or other collection action of any type or
sort, then Employee agrees to pay, in addition to all other sums then due under this Agreement, all reasonable expenses of
collection, including, without limitation, reasonable attorneys’ fees and costs, and those incurred in any bankruptcy, reorganization,
insolvency or other similar proceeding.
3
Stock award grants are subject to the terms and conditions of the Company’s LTIP and approval by the Compensation, Talent &
Culture Committee of the Board of Directors, or its permitted delegates, as provided in the LTIP. Among other provisions, the LTIP
requires stock award grants to be canceled if your employment is terminated for any reason within six months of the grant date.
4
The Annual Performance Bonus payments for each performance year are made the following March, subject to the Annual
Performance Bonus Plan’s terms and conditions. Please note this payment will not be made if you are discharged ‘for cause’ or if
you terminate employment prior to the payment being made. The Annual Salary used in this target calculation is based on your
actual salary of each month and a on a 12-month basis, excluding additional local base salary payments, if applicable. During the
year, if your Leadership Level, monthly base salary, or employment status changes, your target will be prorated.
5
If you voluntarily leave Ford Motor Company within one year of your hire date, you must repay the relocation expenses as indicated
in the Relocation Repayment Agreement provided with your relocation materials.
5
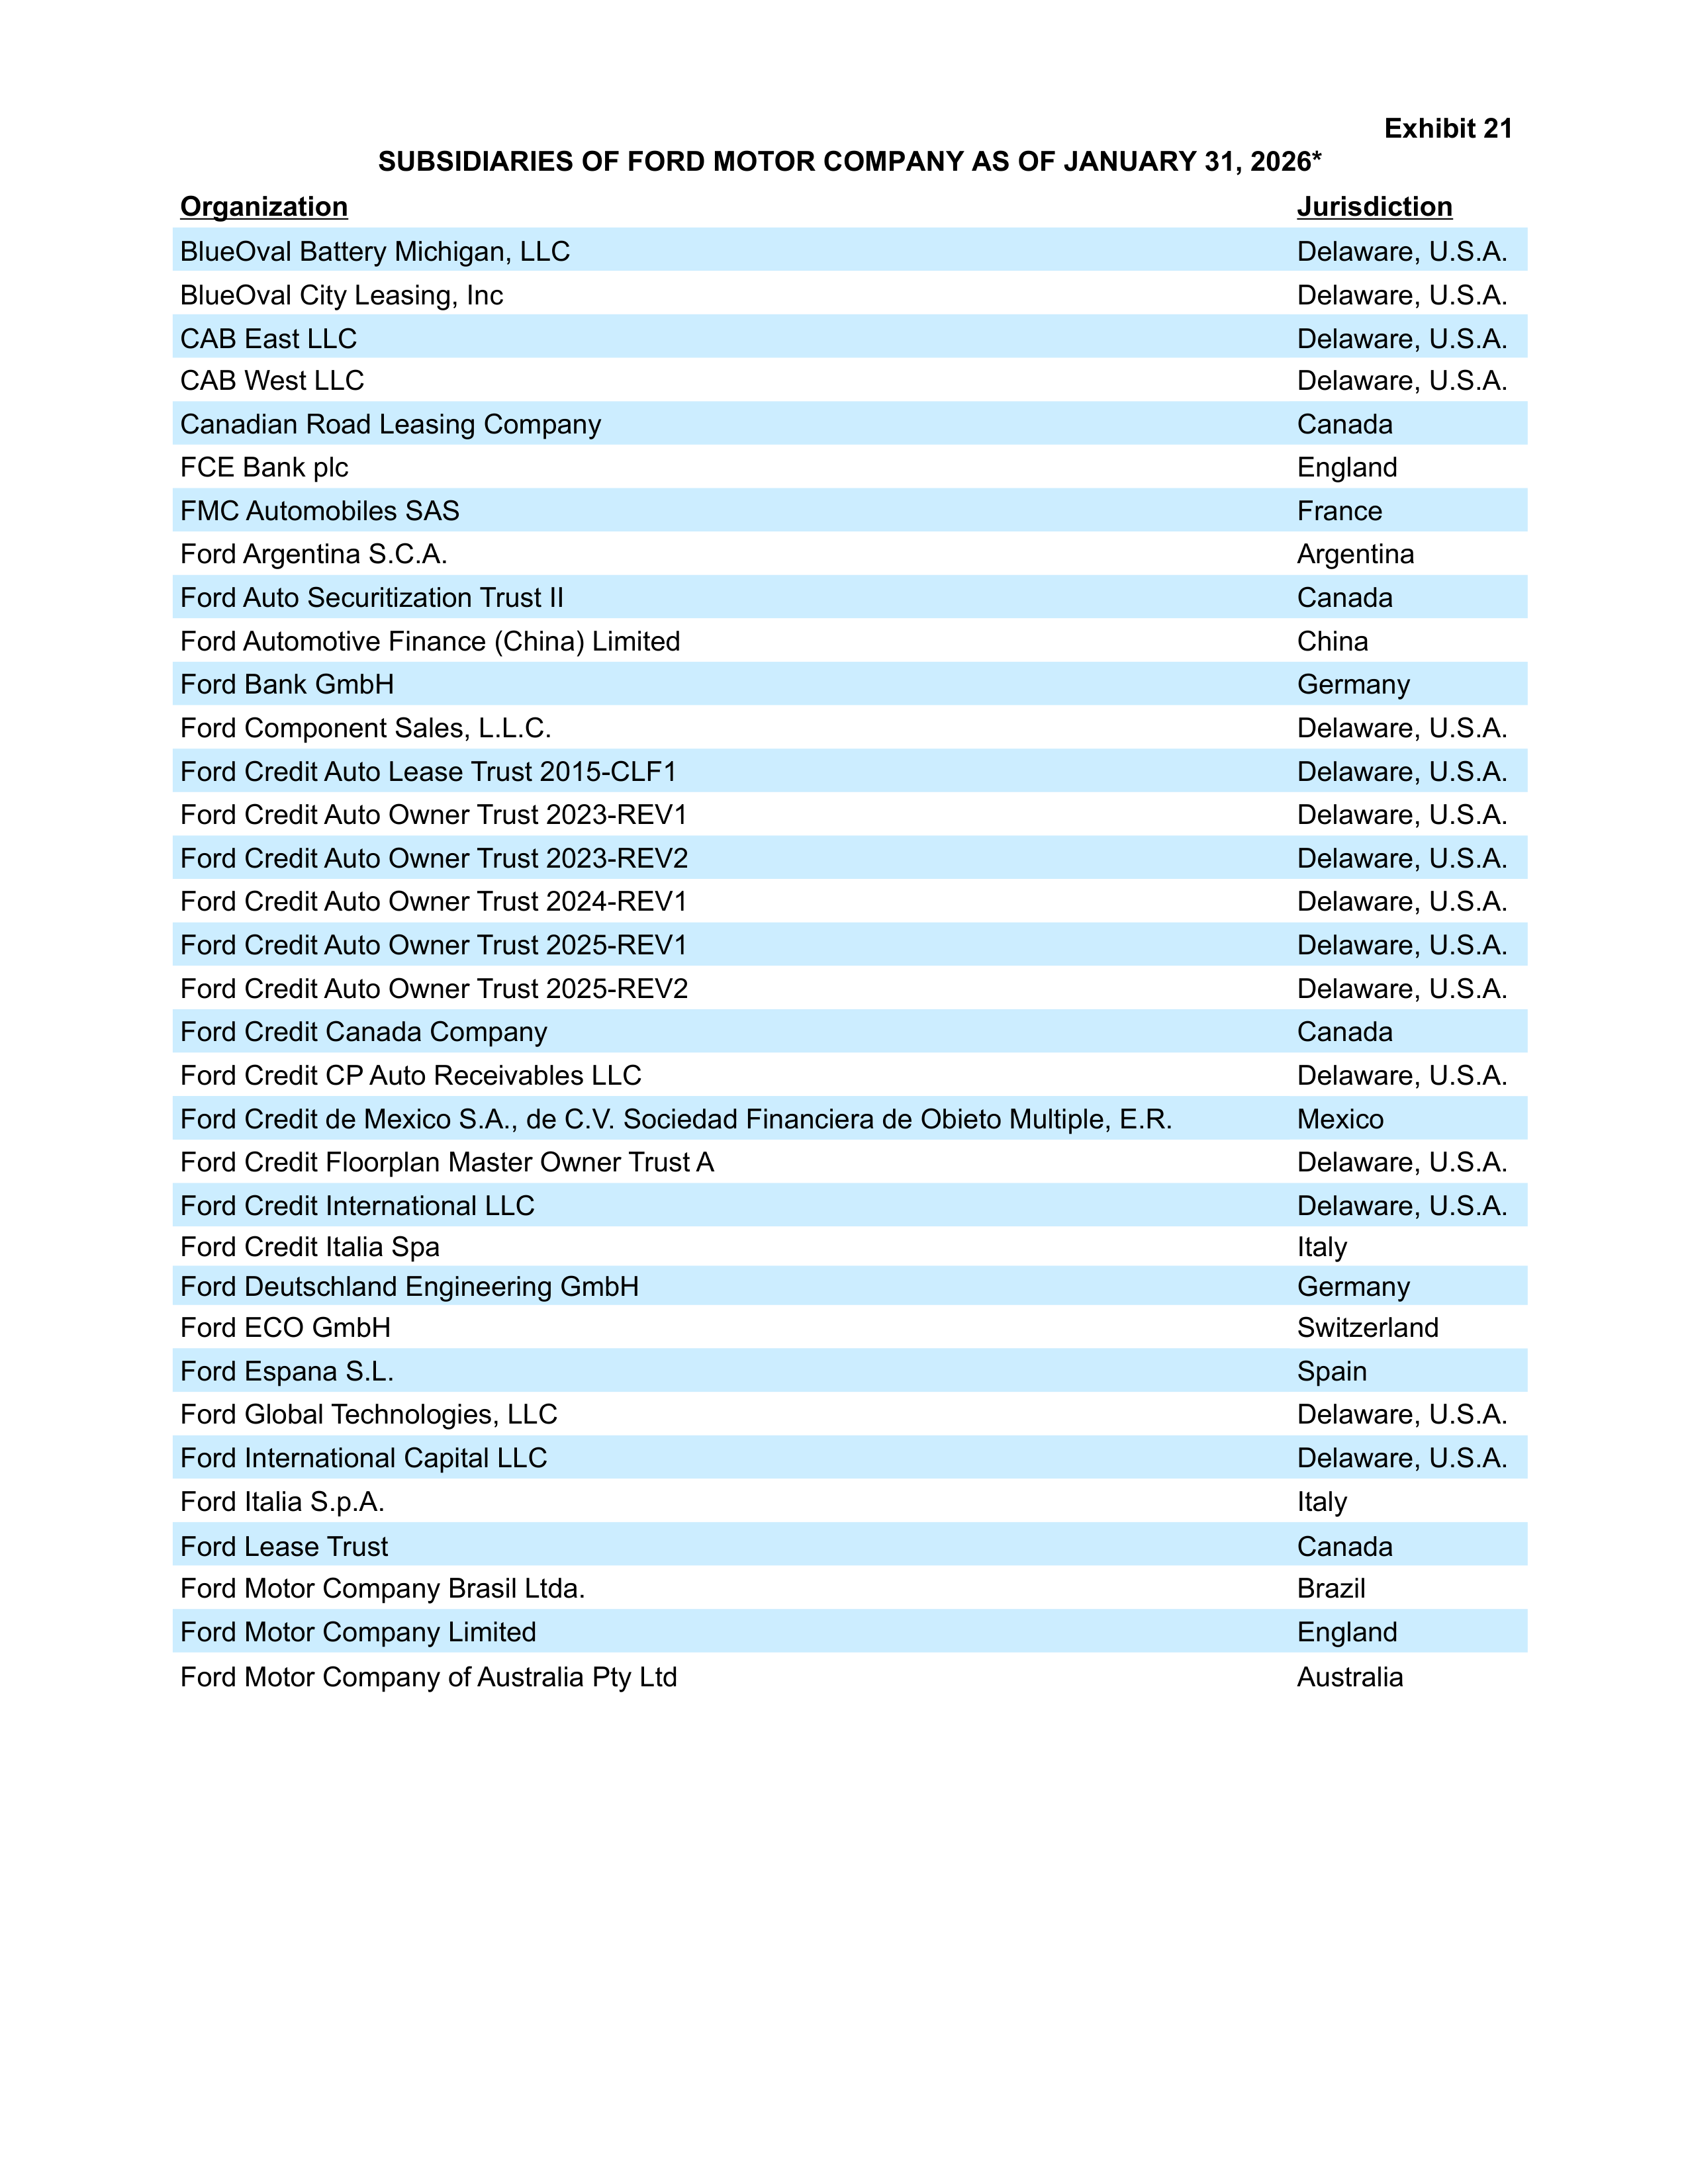
Exhibit 21
SUBSIDIARIES OF FORD MOTOR COMPANY AS OF JANUARY 31, 2026*
Organization
Jurisdiction
BlueOval Battery Michigan, LLC
Delaware, U.S.A.
BlueOval City Leasing, Inc
Delaware, U.S.A.
CAB East LLC
Delaware, U.S.A.
CAB West LLC
Delaware, U.S.A.
Canadian Road Leasing Company
Canada
FCE Bank plc
England
FMC Automobiles SAS
France
Ford Argentina S.C.A.
Argentina
Ford Auto Securitization Trust II
Canada
Ford Automotive Finance (China) Limited
China
Ford Bank GmbH
Germany
Ford Component Sales, L.L.C.
Delaware, U.S.A.
Ford Credit Auto Lease Trust 2015-CLF1
Delaware, U.S.A.
Ford Credit Auto Owner Trust 2023-REV1
Delaware, U.S.A.
Ford Credit Auto Owner Trust 2023-REV2
Delaware, U.S.A.
Ford Credit Auto Owner Trust 2024-REV1
Delaware, U.S.A.
Ford Credit Auto Owner Trust 2025-REV1
Delaware, U.S.A.
Ford Credit Auto Owner Trust 2025-REV2
Delaware, U.S.A.
Ford Credit Canada Company
Canada
Ford Credit CP Auto Receivables LLC
Delaware, U.S.A.
Ford Credit de Mexico S.A., de C.V. Sociedad Financiera de Obieto Multiple, E.R.
Mexico
Ford Credit Floorplan Master Owner Trust A
Delaware, U.S.A.
Ford Credit International LLC
Delaware, U.S.A.
Ford Credit Italia Spa
Italy
Ford Deutschland Engineering GmbH
Germany
Ford ECO GmbH
Switzerland
Ford Espana S.L.
Spain
Ford Global Technologies, LLC
Delaware, U.S.A.
Ford International Capital LLC
Delaware, U.S.A.
Ford Italia S.p.A.
Italy
Ford Lease Trust
Canada
Ford Motor Company Brasil Ltda.
Brazil
Ford Motor Company Limited
England
Ford Motor Company of Australia Pty Ltd
Australia
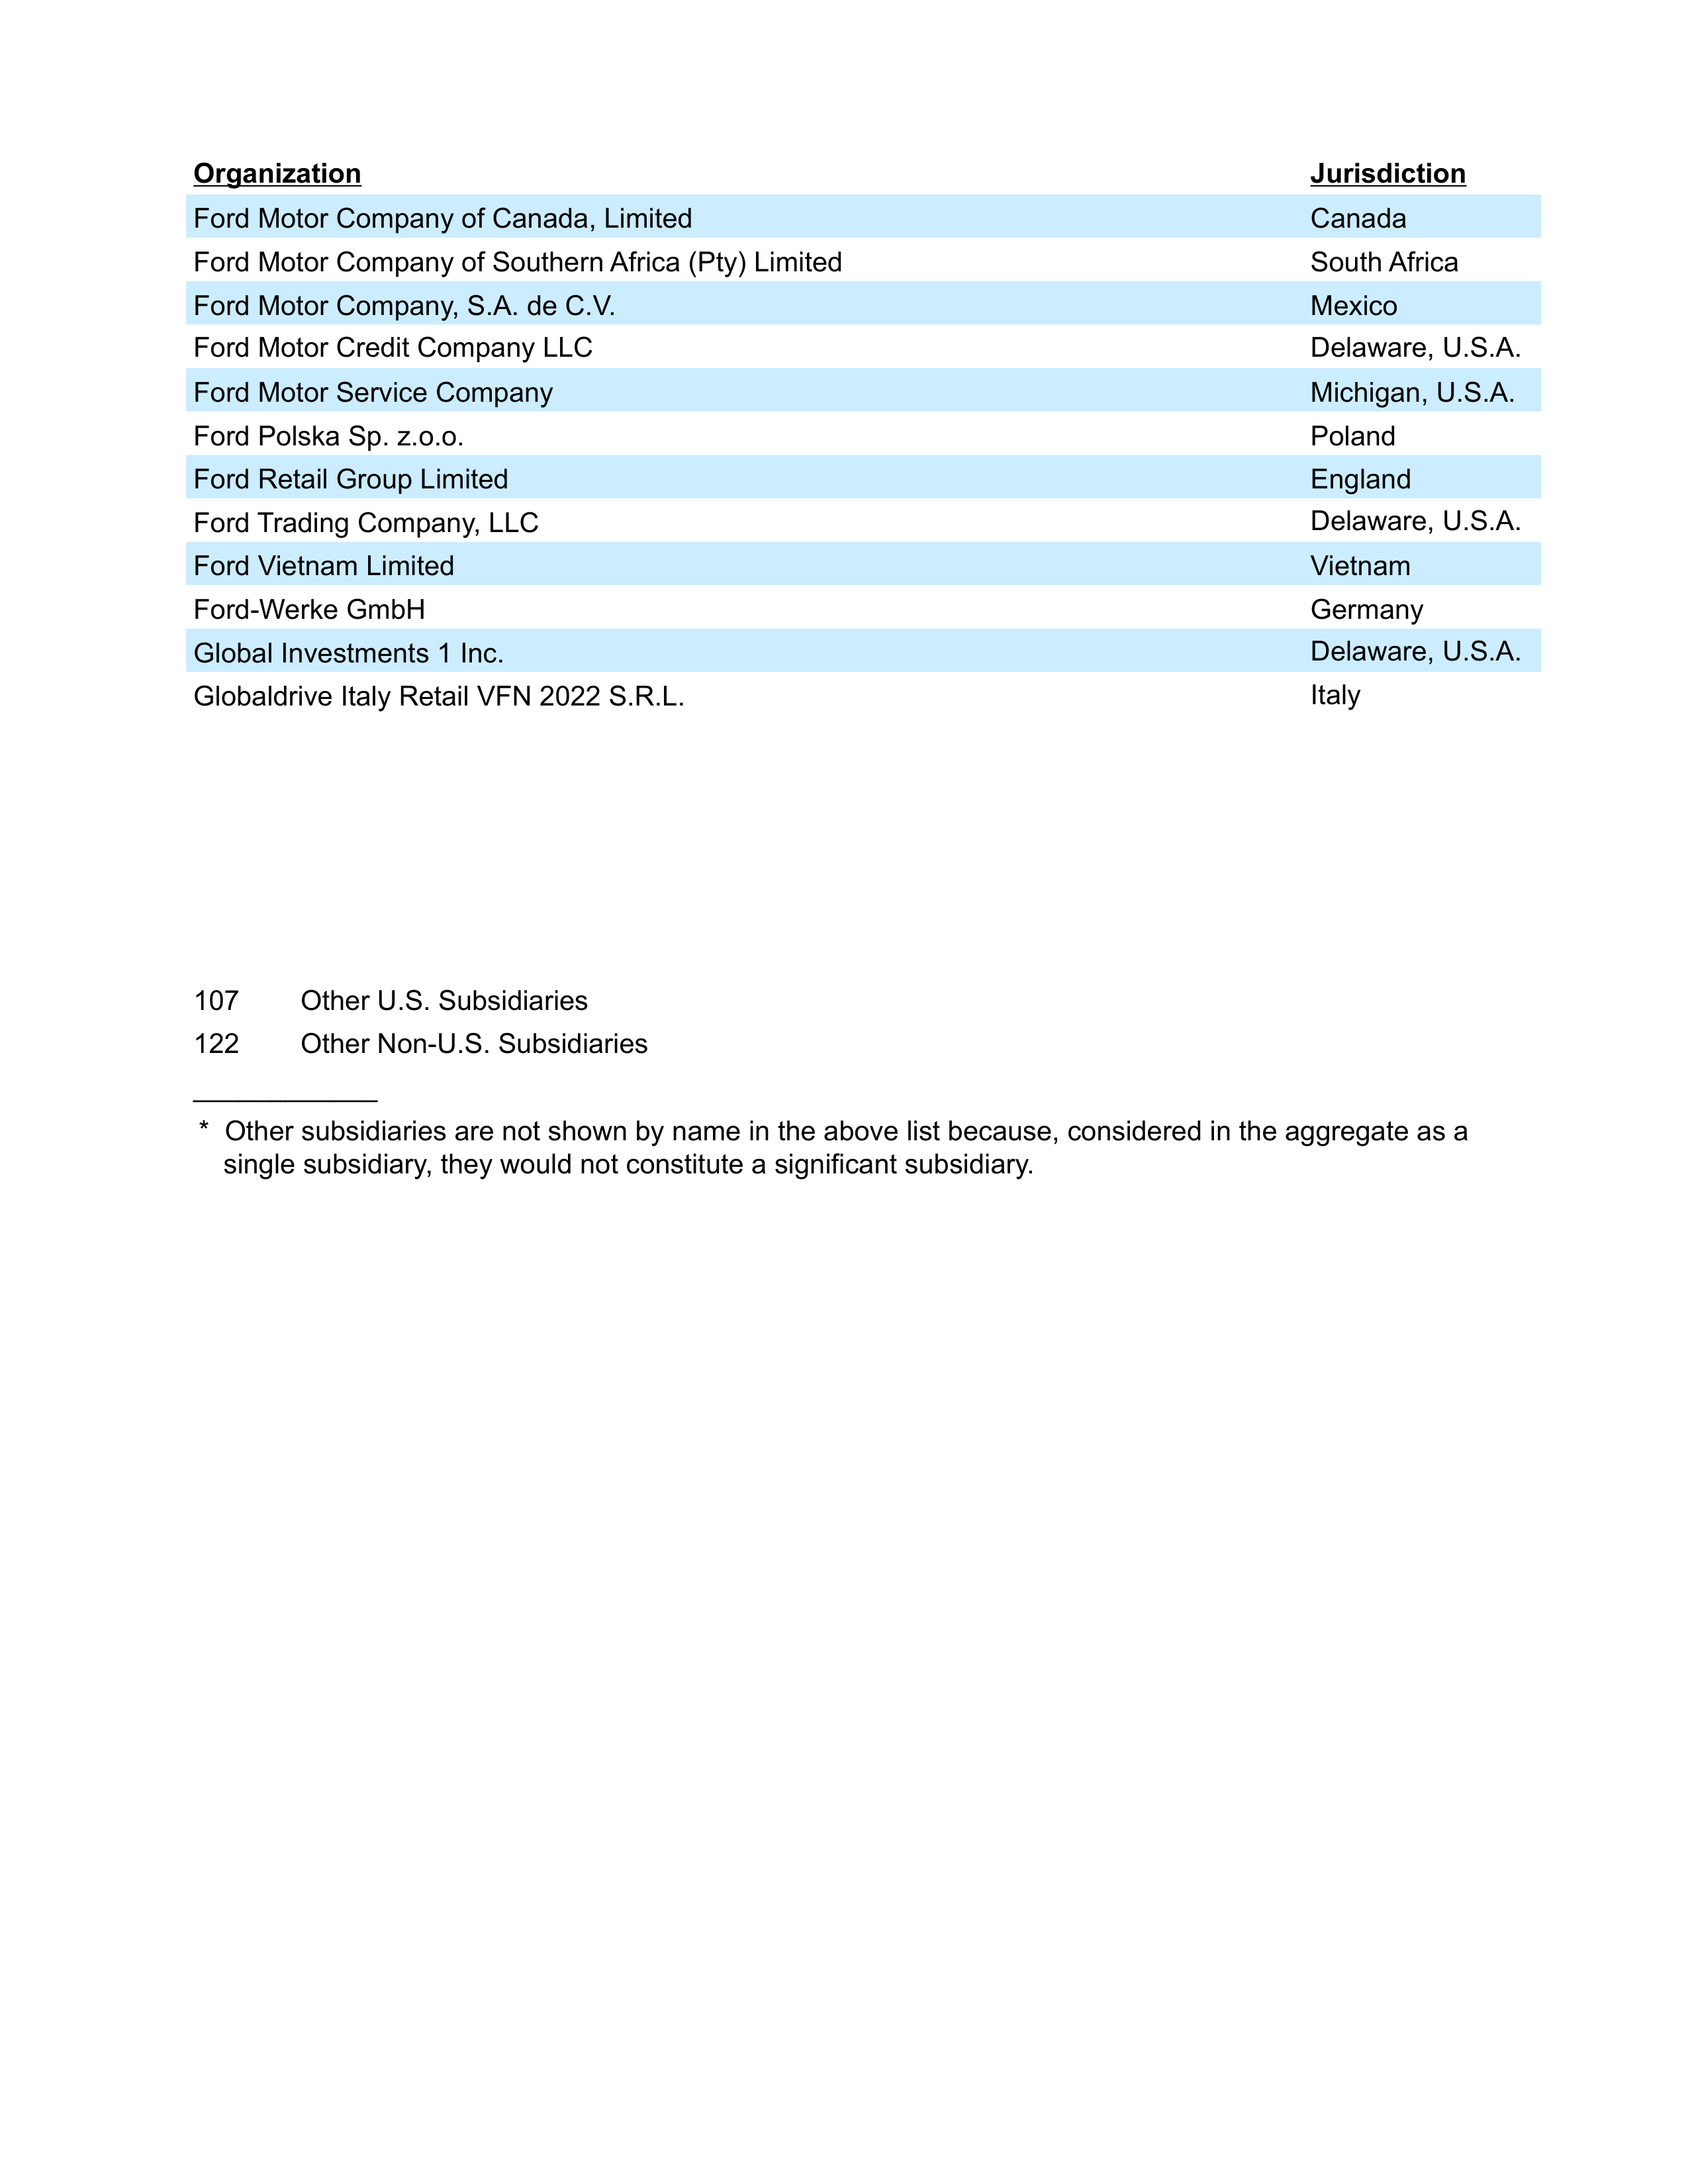
Organization
Jurisdiction
Ford Motor Company of Canada, Limited
Canada
Ford Motor Company of Southern Africa (Pty) Limited
South Africa
Ford Motor Company, S.A. de C.V.
Mexico
Ford Motor Credit Company LLC
Delaware, U.S.A.
Ford Motor Service Company
Michigan, U.S.A.
Ford Polska Sp. z.o.o.
Poland
Ford Retail Group Limited
England
Ford Trading Company, LLC
Delaware, U.S.A.
Ford Vietnam Limited
Vietnam
Ford-Werke GmbH
Germany
Global Investments 1 Inc.
Delaware, U.S.A.
Globaldrive Italy Retail VFN 2022 S.R.L.
Italy
107 Other U.S. Subsidiaries
122 Other Non-U.S. Subsidiaries
____________
* Other subsidiaries are not shown by name in the above list because, considered in the aggregate as a
single subsidiary, they would not constitute a significant subsidiary.
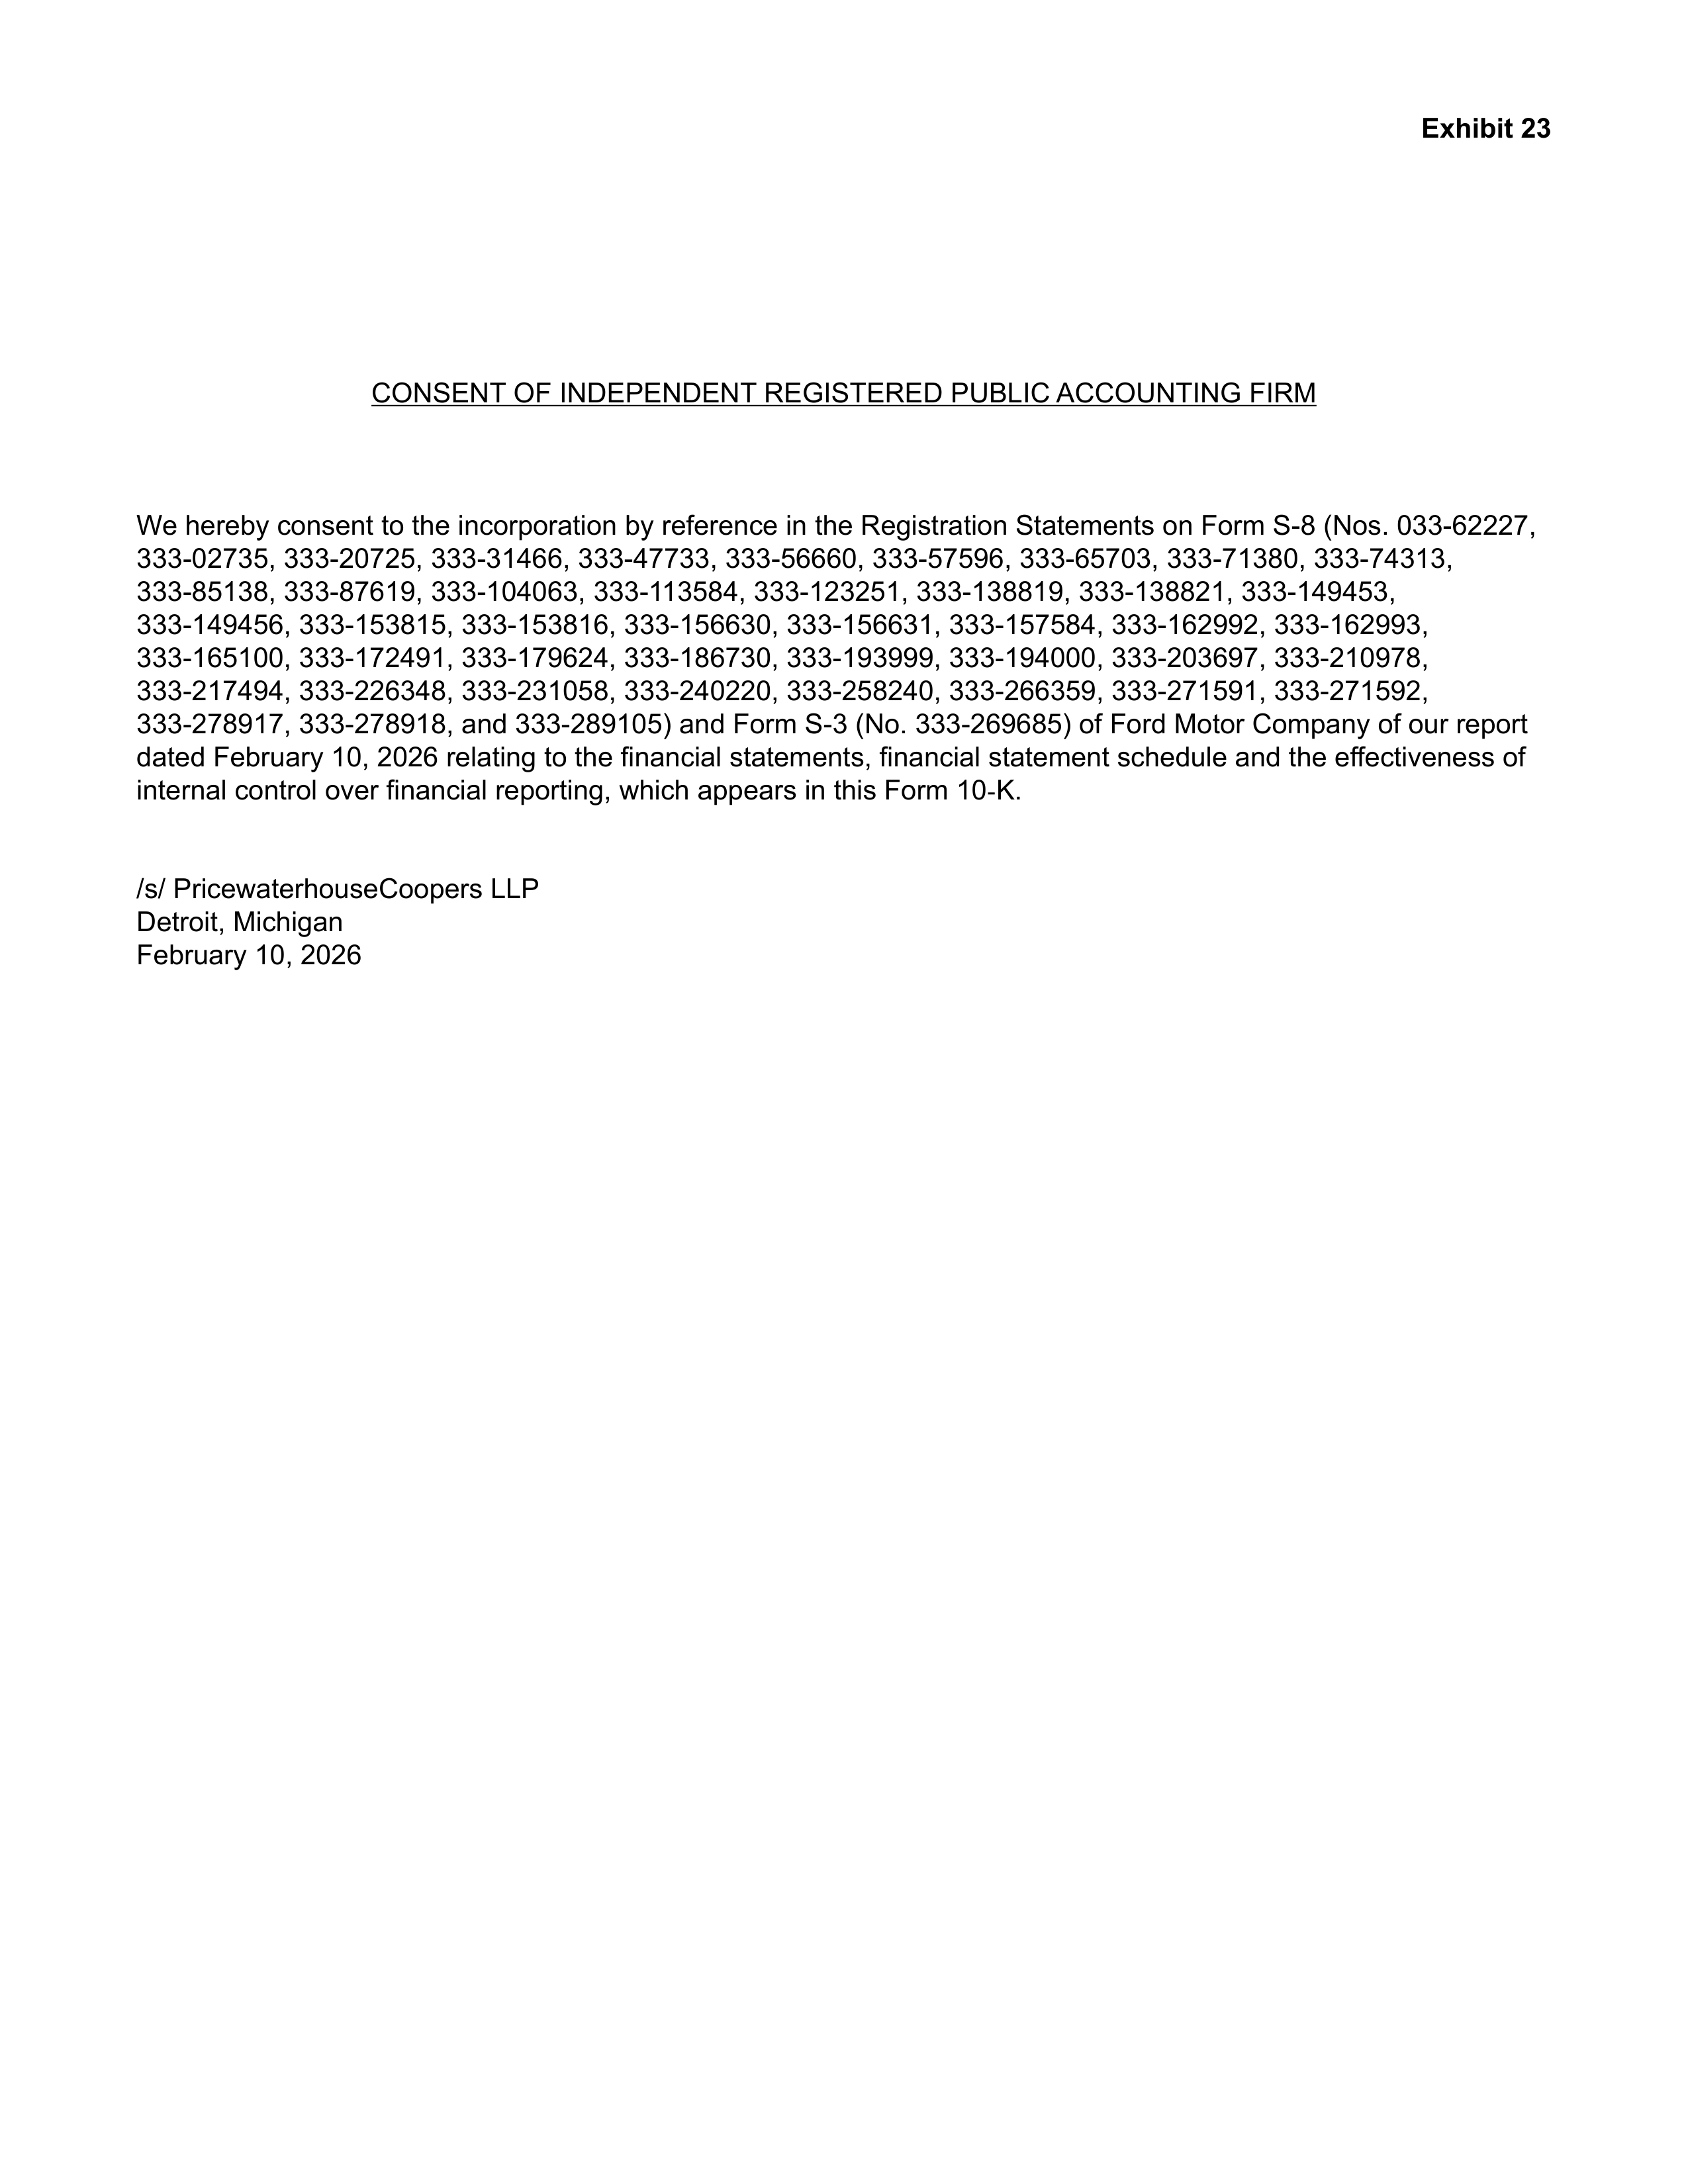
Exhibit 23
CONSENT OF INDEPENDENT REGISTERED PUBLIC ACCOUNTING FIRM
We hereby consent to the incorporation by reference in the Registration Statements on Form S-8 (Nos. 033-62227,
333-02735, 333-20725, 333-31466, 333-47733, 333-56660, 333-57596, 333-65703, 333-71380, 333-74313,
333-85138, 333-87619, 333-104063, 333-113584, 333-123251, 333-138819, 333-138821, 333-149453,
333-149456, 333-153815, 333-153816, 333-156630, 333-156631, 333-157584, 333-162992, 333-162993,
333-165100, 333-172491, 333-179624, 333-186730, 333-193999, 333-194000, 333-203697, 333-210978,
333-217494, 333-226348, 333-231058, 333-240220, 333-258240, 333-266359, 333-271591, 333-271592,
333-278917, 333-278918, and 333-289105) and Form S-3 (No. 333-269685) of Ford Motor Company of our report
dated February 10, 2026 relating to the financial statements, financial statement schedule and the effectiveness of
internal control over financial reporting, which appears in this Form 10
-
K.
/s/ PricewaterhouseCoopers LLP
Detroit, Michigan
February 10, 2026
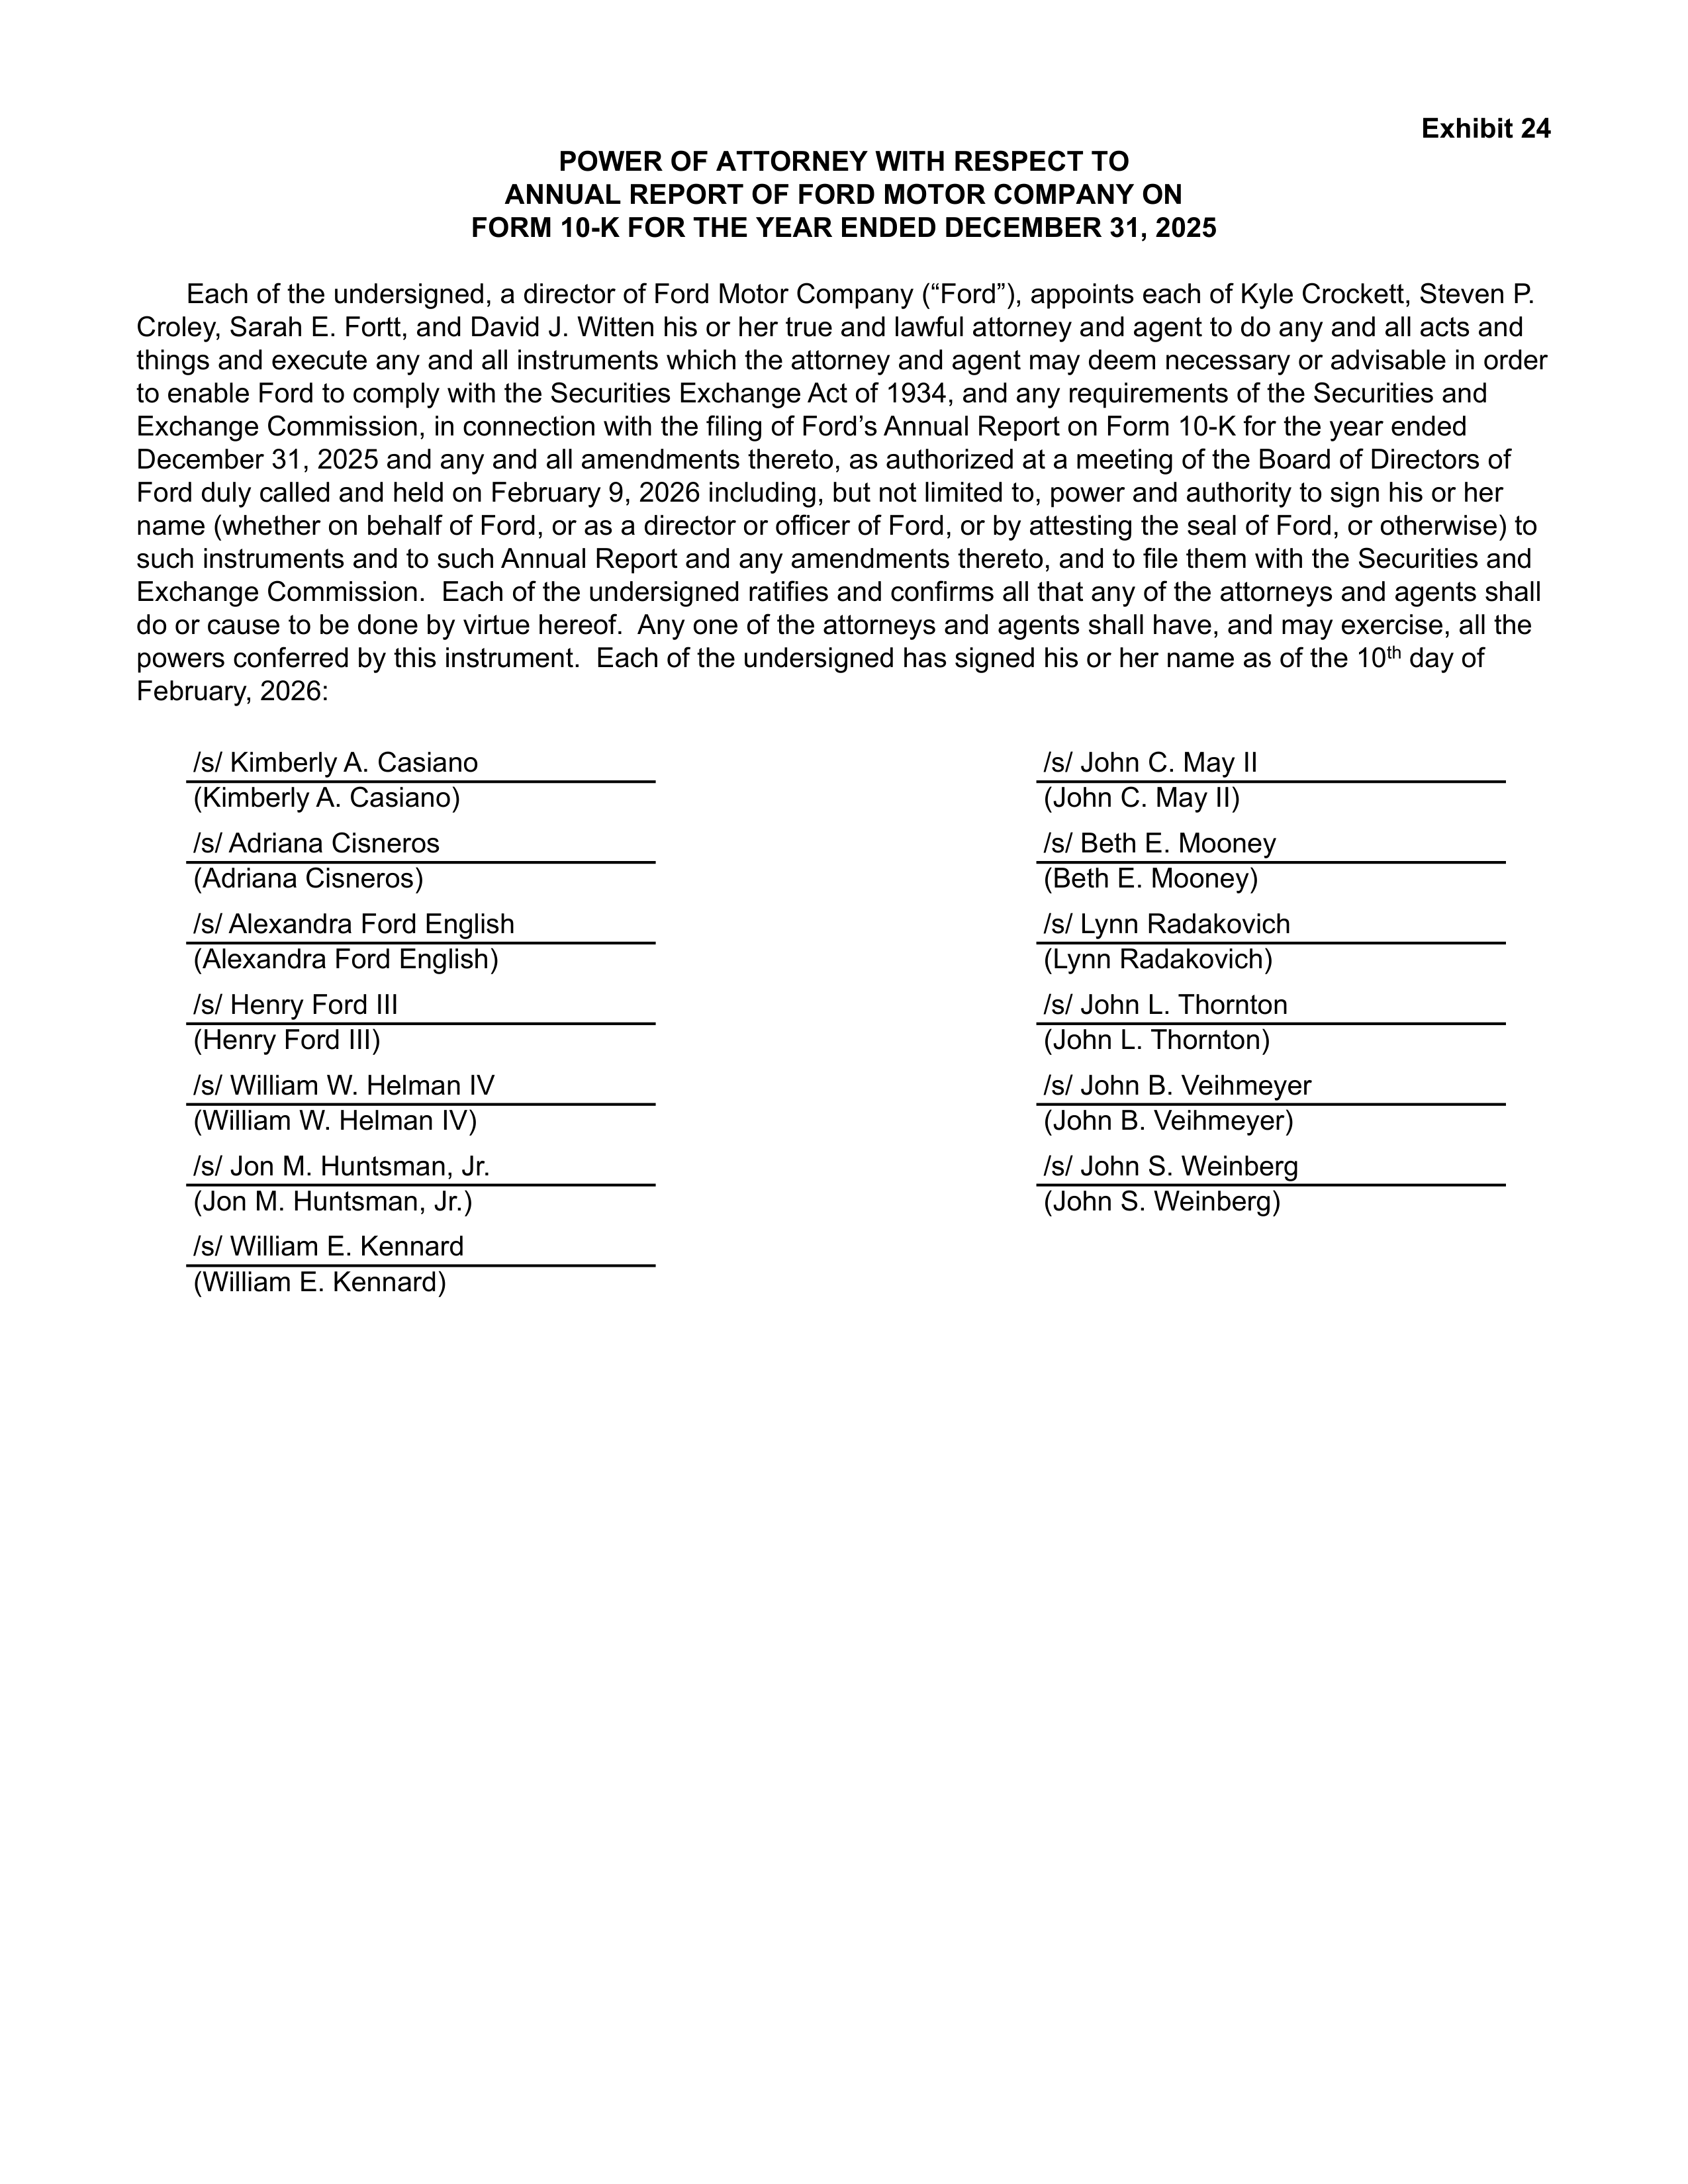
Exhibit 24
POWER OF ATTORNEY WITH RESPECT TO
ANNUAL REPORT OF FORD MOTOR COMPANY ON
FORM 10-K FOR THE YEAR ENDED DECEMBER 31, 2025
Each of the undersigned, a director of Ford Motor Company (“Ford”), appoints each of Kyle Crockett, Steven P.
Croley, Sarah E. Fortt, and David J. Witten his or her true and lawful attorney and agent to do any and all acts and
things and execute any and all instruments which the attorney and agent may deem necessary or advisable in order
to enable Ford to comply with the Securities Exchange Act of 1934, and any requirements of the Securities and
Exchange Commission, in connection with the filing of Ford’s Annual Report on Form 10-K for the year ended
December 31, 2025 and any and all amendments thereto, as authorized at a meeting of the Board of Directors of
Ford duly called and held on February 9, 2026 including, but not limited to, power and authority to sign his or her
name (whether on behalf of Ford, or as a director or officer of Ford, or by attesting the seal of Ford, or otherwise) to
such instruments and to such Annual Report and any amendments thereto, and to file them with the Securities and
Exchange Commission. Each of the undersigned ratifies and confirms all that any of the attorneys and agents shall
do or cause to be done by virtue hereof. Any one of the attorneys and agents shall have, and may exercise, all the
powers conferred by this instrument. Each of the undersigned has signed his or her name as of the 10
th
day of
February, 2026:
/s/ Kimberly A. Casiano
/s/ John C. May II
(Kimberly A. Casiano)
(John C. May II)
/s/ Adriana Cisneros
/s/ Beth E. Mooney
(Adriana Cisneros)
(Beth E. Mooney)
/s/ Alexandra Ford English
/s/ Lynn Radakovich
(Alexandra Ford English)
(Lynn Radakovich)
/s/ Henry Ford III
/s/ John L. Thornton
(Henry Ford III)
(John L. Thornton)
/s/ William W. Helman IV
/s/ John B. Veihmeyer
(William W. Helman IV)
(John B. Veihmeyer)
/s/ Jon M. Huntsman, Jr.
/s/ John S. Weinberg
(Jon M. Huntsman, Jr.)
(John S. Weinberg)
/s/ William E. Kennard
(William E. Kennard)
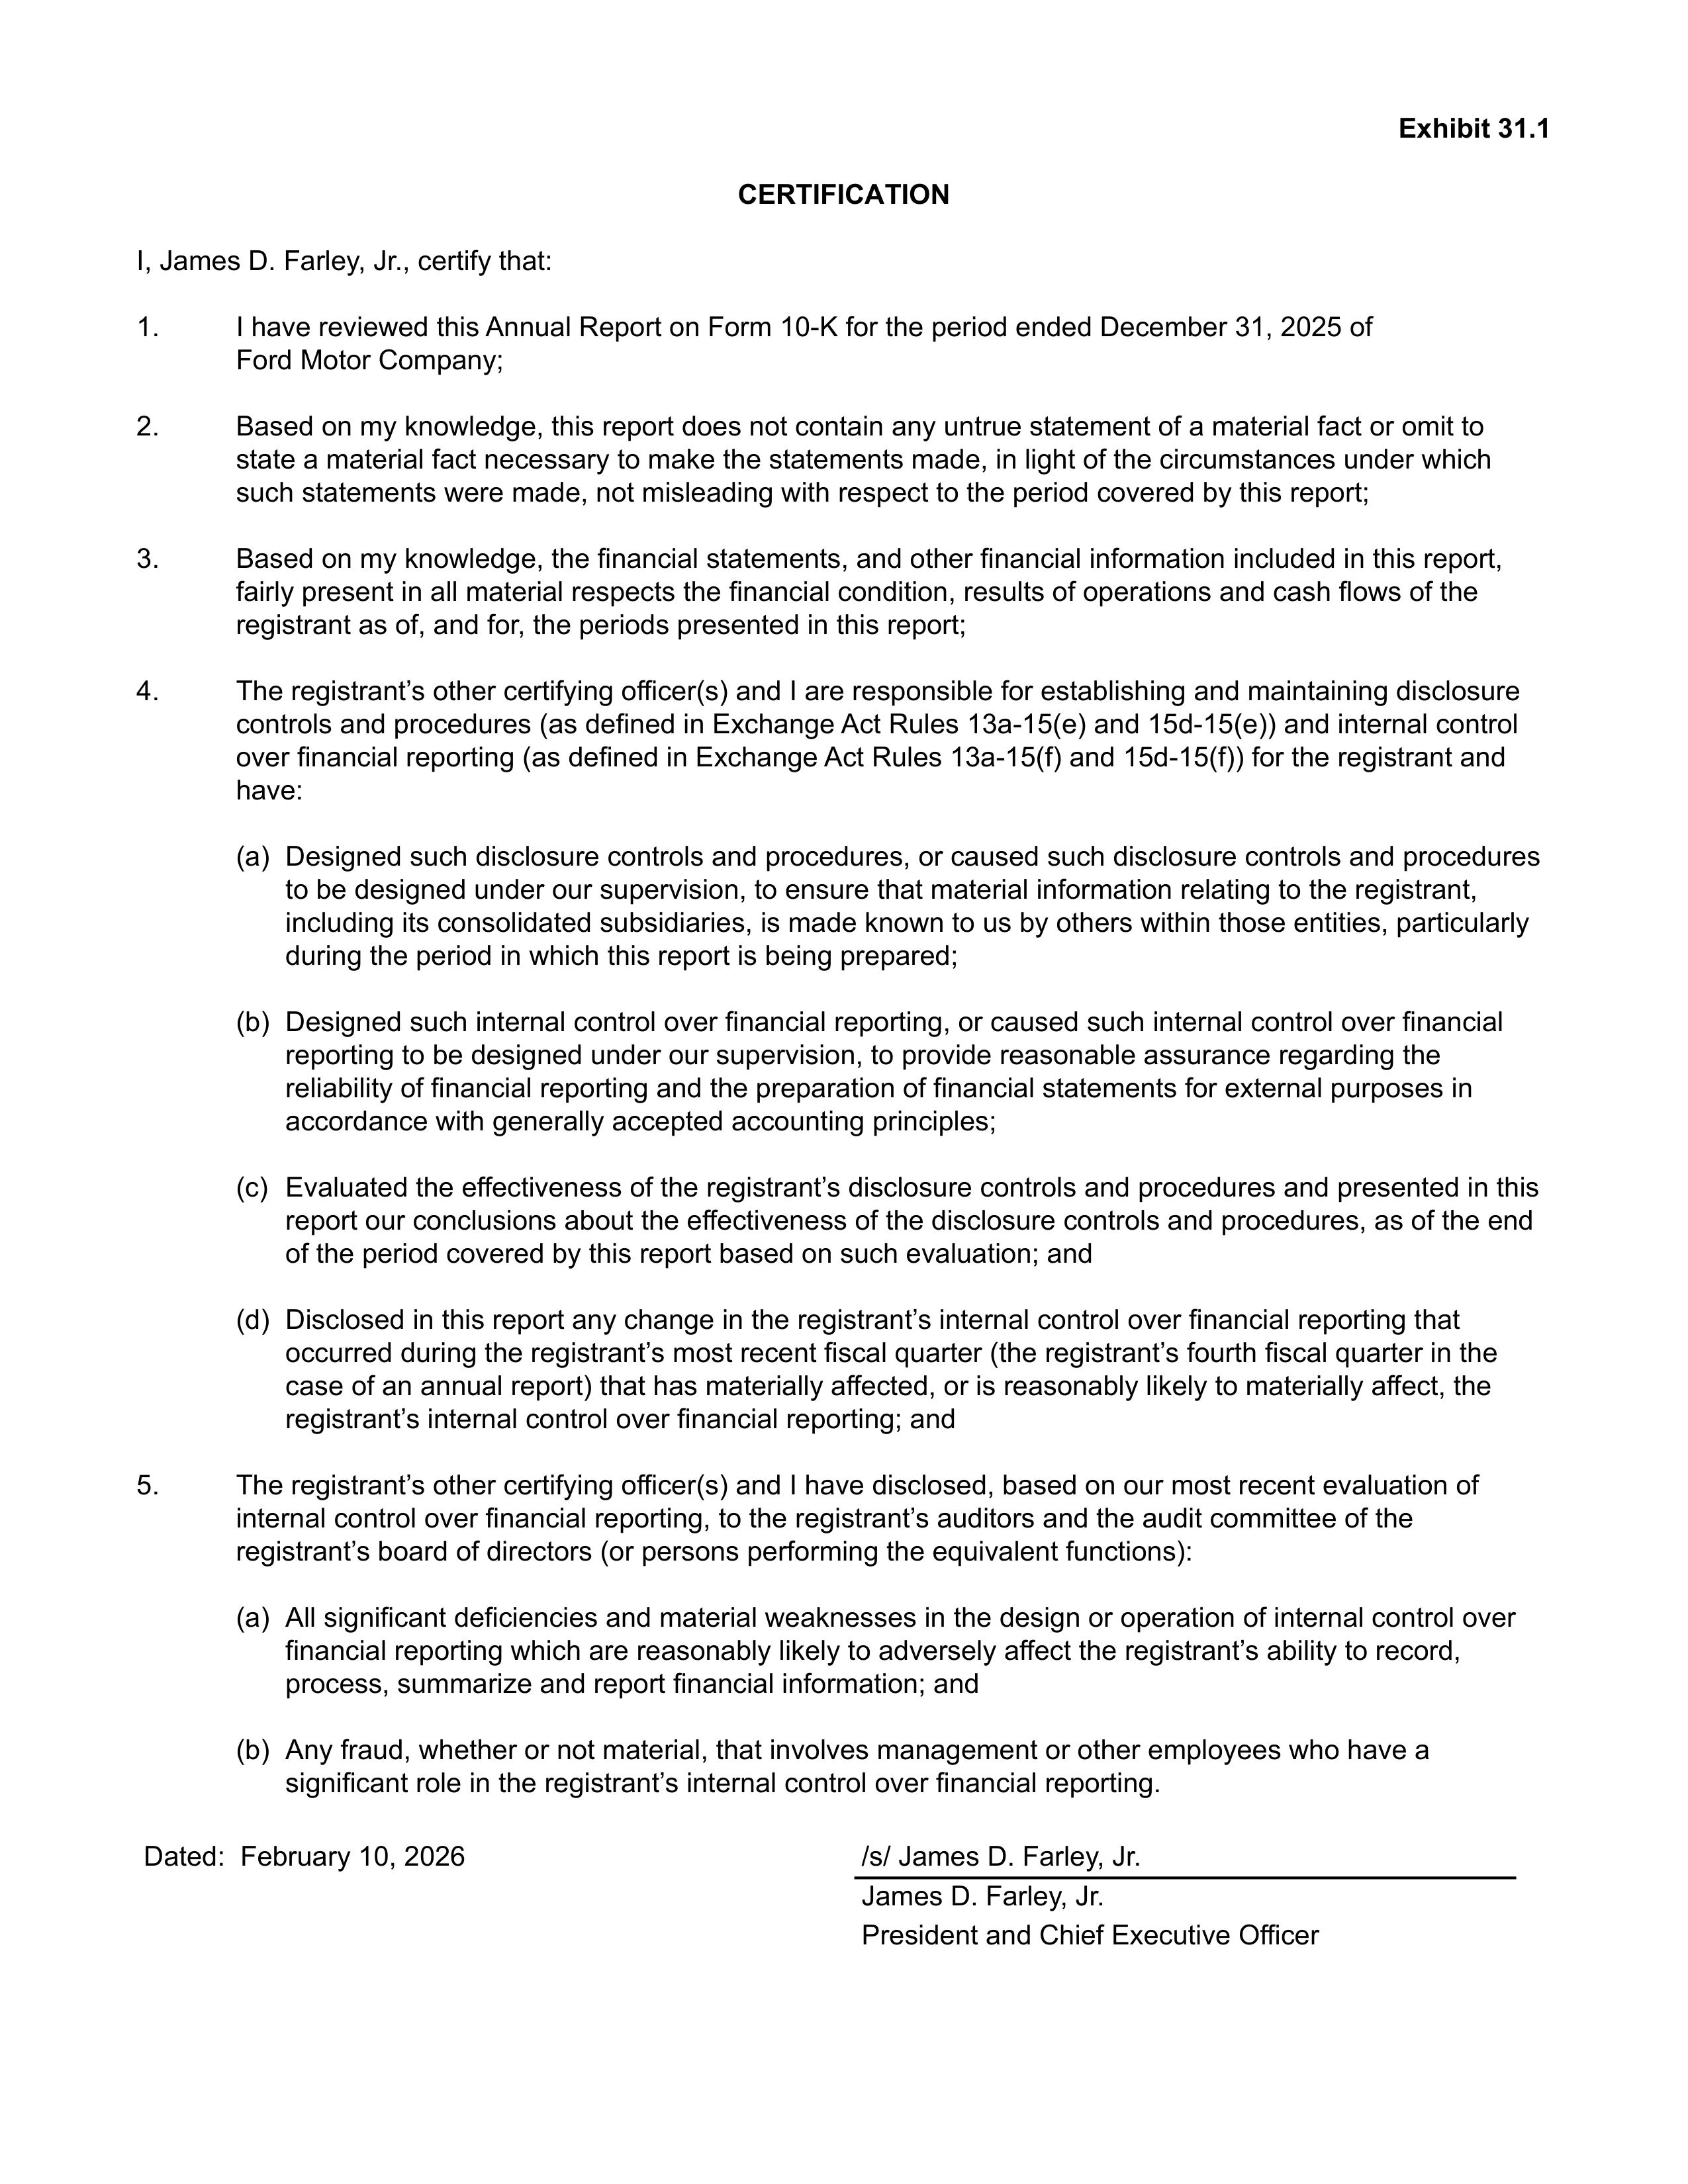
Exhibit 31.1
CERTIFICATION
I, James D. Farley, Jr., certify that:
1.
I have reviewed this Annual Report on Form 10-K for the period ended December 31, 2025 of
Ford Motor Company;
2.
Based on my knowledge, this report does not contain any untrue statement of a material fact or omit to
state a material fact necessary to make the statements made, in light of the circumstances under which
such statements were made, not misleading with respect to the period covered by this report;
3.
Based on my knowledge, the financial statements, and other financial information included in this report,
fairly present in all material respects the financial condition, results of operations and cash flows of the
registrant as of, and for, the periods presented in this report;
4.
The registrant’s other certifying officer(s) and I are responsible for establishing and maintaining disclosure
controls and procedures (as defined in Exchange Act Rules 13a-15(e) and 15d-15(e)) and internal control
over financial reporting (as defined in Exchange Act Rules 13a-15(f) and 15d-15(f)) for the registrant and
have:
(a)
Designed such disclosure controls and procedures, or caused such disclosure controls and procedures
to be designed under our supervision, to ensure that material information relating to the registrant,
including its consolidated subsidiaries, is made known to us by others within those entities, particularly
during the period in which this report is being prepared;
(b)
Designed such internal control over financial reporting, or caused such internal control over financial
reporting to be designed under our supervision, to provide reasonable assurance regarding the
reliability of financial reporting and the preparation of financial statements for external purposes in
accordance with generally accepted accounting principles;
(c)
Evaluated the effectiveness of the registrant’s disclosure controls and procedures and presented in this
report our conclusions about the effectiveness of the disclosure controls and procedures, as of the end
of the period covered by this report based on such evaluation; and
(d)
Disclosed in this report any change in the registrant’s internal control over financial reporting that
occurred during the registrant’s most recent fiscal quarter (the registrant’s fourth fiscal quarter in the
case of an annual report) that has materially affected, or is reasonably likely to materially affect, the
registrant’s internal control over financial reporting; and
5.
The registrant’s other certifying officer(s) and I have disclosed, based on our most recent evaluation of
internal control over financial reporting, to the registrant’s auditors and the audit committee of the
registrant’s board of directors (or persons performing the equivalent functions):
(a)
All significant deficiencies and material weaknesses in the design or operation of internal control over
financial reporting which are reasonably likely to adversely affect the registrant’s ability to record,
process, summarize and report financial information; and
(b)
Any fraud, whether or not material, that involves management or other employees who have a
significant role in the registrant’s internal control over financial reporting.
Dated: February 10, 2026
/s/ James D. Farley, Jr.
James D. Farley, Jr.
President and Chief Executive Officer
Exhibit 31.2
CERTIFICATION
I, Sherry A. House, certify that:
1.
I have reviewed this Annual Report on Form 10-K for the period ended December 31, 2025 of
Ford Motor Company;
2.
Based on my knowledge, this report does not contain any untrue statement of a material fact or omit to
state a material fact necessary to make the statements made, in light of the circumstances under which
such statements were made, not misleading with respect to the period covered by this report;
3.
Based on my knowledge, the financial statements, and other financial information included in this report,
fairly present in all material respects the financial condition, results of operations and cash flows of the
registrant as of, and for, the periods presented in this report;
4.
The registrant’s other certifying officer(s) and I are responsible for establishing and maintaining disclosure
controls and procedures (as defined in Exchange Act Rules 13a-15(e) and 15d-15(e)) and internal control
over financial reporting (as defined in Exchange Act Rules 13a-15(f) and 15d-15(f)) for the registrant and
have:
(a) Designed such disclosure controls and procedures, or caused such disclosure controls and procedures
to be designed under our supervision, to ensure that material information relating to the registrant,
including its consolidated subsidiaries, is made known to us by others within those entities, particularly
during the period in which this report is being prepared;
(b) Designed such internal control over financial reporting, or caused such internal control over financial
reporting to be designed under our supervision, to provide reasonable assurance regarding the
reliability of financial reporting and the preparation of financial statements for external purposes in
accordance with generally accepted accounting principles;
(c) Evaluated the effectiveness of the registrant’s disclosure controls and procedures and presented in this
report our conclusions about the effectiveness of the disclosure controls and procedures, as of the end
of the period covered by this report based on such evaluation; and
(d) Disclosed in this report any change in the registrant’s internal control over financial reporting that
occurred during the registrant’s most recent fiscal quarter (the registrant’s fourth fiscal quarter in the
case of an annual report) that has materially affected, or is reasonably likely to materially affect, the
registrant’s internal control over financial reporting; and
5.
The registrant’s other certifying officer(s) and I have disclosed, based on our most recent evaluation of
internal control over financial reporting, to the registrant’s auditors and the audit committee of the
registrant’s board of directors (or persons performing the equivalent functions):
(a) All significant deficiencies and material weaknesses in the design or operation of internal control over
financial reporting which are reasonably likely to adversely affect the registrant’s ability to record,
process, summarize and report financial information; and
(b) Any fraud, whether or not material, that involves management or other employees who have a
significant role in the registrant’s internal control over financial reporting.
Dated: February 10, 2026
/s/ Sherry A. House
Sherry A. House
Chief Financial Officer
Exhibit 32.1
CERTIFICATION OF CHIEF EXECUTIVE OFFICER
I, James D. Farley, Jr., President and Chief Executive Officer of Ford Motor Company (the “Company”), hereby
certify pursuant to Rule 13a-14(b) or 15d-14(b) of the Securities Exchange Act of 1934, as amended, and Section
1350 of Chapter 63 of Title 18 of the United States Code that to my knowledge:
1.
The Company’s Annual Report on Form 10-K for the period ended December 31, 2025, to which this
statement is furnished as an exhibit (the “Report”), fully complies with the requirements of Section 13(a) or
15(d) of the Securities Exchange Act of 1934, as amended; and
2.
The information contained in this Report fairly presents, in all material respects, the financial condition and
results of operations of the Company.
Dated: February 10, 2026
/s/ James D. Farley, Jr.
James D. Farley, Jr.
President and Chief Executive Officer
Exhibit 32.2
CERTIFICATION OF CHIEF FINANCIAL OFFICER
I, Sherry A. House, Chief Financial Officer of Ford Motor Company (the “Company”), hereby certify pursuant to Rule
13a-14(b) or Rule 15d-14(b) of the Securities Exchange Act of 1934, as amended, and Section 1350 of Chapter 63
of Title 18 of the United States Code that to my knowledge:
1.
The Company’s Annual Report on Form 10-K for the period ended December 31, 2025, to which this
statement is furnished as an exhibit (the “Report”), fully complies with the requirements of Section 13(a) or
15(d) of the Securities Exchange Act of 1934, as amended; and
2.
The information contained in this Report fairly presents, in all material respects, the financial condition and
results of operations of the Company.
Dated: February 10, 2026
/s/ Sherry A. House
Sherry A. House
Chief Financial Officer



Ford Motor Company
One American Road
Dearborn, Michigan 48126-2798
www.corporate.ford.com
Printed in U.S.A. Please recycle.