


https://doi.org/10.70454/JRIST.020205
Volume No. 02, Issue. 02, 2026
Page 66
Journal of Recent Innovation in
Science and Technology
E-ISSN: 3117-3926, P- 3117-535X
Received: 2026-03-20
Accepted: 2026-06-20
Published Online: 2026-06-25
DOI: 10.70454/JRIST.020205
Stock Market Prediction Using Machine Learning and Deep
Learning: A Systematic Literature Review
Anjali Parmar*
1
, Dr. Pharindra Kumar Sharma
2
1
M.Tech Student, Dept. of CSE, SRCEM
2
Associate Professor, Dept. of CSE, SRCEM
*Corresponding Author:
parmaranjali0116@gmail.com
This is an open-access article distributed under the terms of the
Creative Commons Attribution 4.0
International License
, which permits unrestricted use, distribution, and reproduction in any medium, provided the
original
work
is
properly
cited.
1. Introduction
The stock market plays a vital role in the economic development of every country by facilitating capital
formation and investment. Predicting future stock prices has attracted researchers for decades because even
small improvements in forecasting accuracy can generate substantial financial returns. However, stock
markets are influenced by numerous uncertain factors including economic conditions, company performance,
geopolitical events, investor sentiment, government policies, and unexpected global crises. [1,2]
Traditional forecasting methods such as statistical regression and econometric models assume linear
relationships among variables. Unfortunately, financial markets exhibit nonlinear behavior, high volatility,
randomness, and noise, making prediction extremely difficult.
Recent advances in Artificial Intelligence have transformed stock prediction research. Machine learning
algorithms can identify hidden patterns in historical data, while deep learning models automatically extract
Abstract
Stock market prediction has emerged as one of the most challenging and important research areas in
finance and artificial intelligence. Accurate prediction of stock prices enables investors, financial
institutions, and policymakers to make informed investment decisions and manage financial risks
effectively. Traditional statistical forecasting models have shown limited performance due to the
nonlinear, dynamic, and highly volatile nature of financial markets. In recent years, Machine Learning
(ML), Deep Learning (DL), and Artificial Intelligence (AI) techniques have significantly improved
prediction capabilities by learning complex relationships from historical market data, technical
indicators, fundamental information, and textual sentiment extracted from news and social media. This
review systematically examines recent developments in stock market prediction, focusing on traditional
statistical models, machine learning algorithms, deep learning architectures, hybrid approaches,
reinforcement learning, and transformer-based models. The paper also discusses commonly used
datasets, evaluation metrics, challenges, and future research directions. The review provides researchers
with a comprehensive understanding of current methodologies and emerging trends in intelligent
financial forecasting.
Keywords:
Stock Market Prediction, Machine Learning, Deep Learning, Artificial Intelligence, LSTM,
Transformer, Financial Forecasting, Time Series Analysis

https://doi.org/10.70454/JRIST.020205
Volume No. 02, Issue. 02, 2026
Page 67
Journal of Recent Innovation in
Science and Technology
E-ISSN: 3117-3926, P- 3117-535X
Received: 2026-03-20
Accepted: 2026-06-20
Published Online: 2026-06-25
DOI: 10.70454/JRIST.020205
hierarchical features from large datasets. Furthermore, Natural Language Processing (NLP) allows
researchers to incorporate financial news, social media sentiment, and corporate announcements into
predictive models.
This review summarizes existing stock market prediction techniques, compares their strengths and
weaknesses, discusses publicly available datasets and evaluation methods, identifies research challenges, and
highlights future opportunities.
2. Background of Stock Market Prediction
Stock market prediction is one of the most challenging and extensively researched areas in finance,
economics, and computer science. It involves forecasting the future prices or movements of stocks, stock
indices, or financial assets using historical market data, financial indicators, economic variables, and investor
sentiment. Accurate stock market prediction can help investors maximize returns, minimize risks, and make
informed investment decisions.
The stock market plays a vital role in the global economy by facilitating capital formation, wealth creation,
and economic growth. However, stock prices are influenced by numerous interconnected factors, including
company performance, macroeconomic conditions, government policies, geopolitical events, investor
psychology, and unexpected global crises. These factors make stock prices highly volatile and difficult to
predict with complete accuracy.
[1,2]
Traditionally, stock market prediction relied on Fundamental Analysis and Technical Analysis. Fundamental
analysis evaluates a company's intrinsic value by examining financial statements, earnings, management
quality, industry conditions, and economic indicators. In contrast, technical analysis studies historical price
movements, trading volume, and chart patterns to identify future market trends. Although these approaches
remain widely used, they often fail to capture the complex and nonlinear behavior of modern financial
markets. The Efficient Market Hypothesis (EMH), proposed by Eugene Fama (1970), argues that stock
prices fully reflect all available information, making it impossible to consistently outperform the market
through prediction. According to EMH, price movements follow a random walk, and future prices cannot be
accurately forecast using historical information alone. However, numerous empirical studies have identified
market inefficiencies, anomalies, and behavioral biases that create opportunities for predictive modeling.
[2,3]
The rapid growth of digital technologies, financial databases, and computational power has significantly
transformed stock market prediction. Massive volumes of structured and unstructured financial data are now
available through stock exchanges, financial reports, news portals, and social media platforms. This
abundance of data has enabled researchers to develop advanced predictive models using Machine Learning
(ML), Deep Learning (DL), Artificial Intelligence (AI), and Natural Language Processing (NLP) techniques.
Machine learning algorithms such as Linear Regression, Decision Trees, Random Forests, Support Vector
Machines (SVM), Naïve Bayes, and K-Nearest Neighbors (KNN) have demonstrated promising performance
by learning hidden patterns from historical stock data. More recently, deep learning architectures including
Artificial Neural Networks (ANN), Recurrent Neural Networks (RNN), Long Short-Term Memory (LSTM),
Gated Recurrent Units (GRU), and Transformer-based models have gained widespread attention due to their
ability to model complex nonlinear relationships and long-term temporal dependencies in financial time
series.
In addition to historical price data, modern prediction models increasingly incorporate alternative data
sources such as financial news, social media sentiment, analyst reports, Google Trends, and macroeconomic
indicators. Sentiment analysis techniques use NLP to quantify public opinion and investor emotions, which

https://doi.org/10.70454/JRIST.020205
Volume No. 02, Issue. 02, 2026
Page 68
Journal of Recent Innovation in
Science and Technology
E-ISSN: 3117-3926, P- 3117-535X
Received: 2026-03-20
Accepted: 2026-06-20
Published Online: 2026-06-25
DOI: 10.70454/JRIST.020205
often influence short-term market movements. The integration of multimodal data has substantially improved
the predictive capability of intelligent forecasting systems.
3. Sentiment Analysis
Sentiment Analysis, also known as
Opinion Mining
, is a Natural Language Processing (NLP) technique
used to identify, extract, and quantify the emotional tone or opinion expressed in textual data. In stock
market prediction, sentiment analysis plays a significant role by analyzing public opinions, financial news,
social media posts, company announcements, analyst reports, and investor discussions to determine whether
market sentiment is positive, negative, or neutral. Since investor emotions and public perception strongly
influence stock prices, sentiment analysis has become an essential component of modern financial
forecasting systems. [3,6]
Traditional stock market prediction models primarily rely on historical price data and technical indicators.
However, these approaches often fail to capture sudden market movements triggered by breaking news,
political events, economic announcements, or investor reactions. Sentiment analysis addresses this limitation
by incorporating textual information into predictive models, enabling them to respond more effectively to
real-world events.
The rapid growth of online financial platforms such as
Twitter (X)
,
Reddit
,
StockTwits
, financial news
portals, blogs, and discussion forums has generated enormous amounts of user-generated content. Investors
frequently express their expectations, concerns, and opinions on these platforms, providing valuable insights
into market psychology. By analyzing this information, sentiment analysis models can estimate the overall
market mood and improve stock price forecasting.
Types of Sentiment
Sentiment analysis generally classifies textual information into three categories:
1.
Positive Sentiment:
Indicates optimism, confidence, or favorable opinions that may lead to an
increase in stock prices.
2.
Negative Sentiment:
Reflects pessimism, uncertainty, or unfavorable opinions that may contribute
to declining stock prices.
3.
Neutral Sentiment:
Represents factual information or opinions without significant positive or
negative implications.
Some advanced systems also assign a continuous sentiment score ranging from –1 (highly negative) to +1
(highly positive), allowing more precise measurement of investor sentiment.
Sources of Sentiment Data
Stock market sentiment can be extracted from various structured and unstructured data sources, including:
Financial news articles
Company press releases and earnings reports
Social media platforms
Analyst recommendations
Online discussion forums
Economic reports and government announcements
Investor blogs and financial websites

https://doi.org/10.70454/JRIST.020205
Volume No. 02, Issue. 02, 2026
Page 69
Journal of Recent Innovation in
Science and Technology
E-ISSN: 3117-3926, P- 3117-535X
Received: 2026-03-20
Accepted: 2026-06-20
Published Online: 2026-06-25
DOI: 10.70454/JRIST.020205
Combining multiple data sources generally improves prediction accuracy because different platforms capture
different aspects of market behavior.
Sentiment Analysis Process [3,6]
The sentiment analysis workflow typically consists of the following stages:
1.
Data Collection:
Gathering textual data from financial news websites, social media, company
reports, and other online sources.
2.
Data Preprocessing:
Cleaning the text by removing stop words, punctuation, URLs, emojis,
duplicate content, and performing tokenization, stemming, and lemmatization.
3.
Feature Extraction:
Transforming textual data into numerical representations using techniques such
as Bag-of-Words (BoW), TF-IDF, Word2Vec, GloVe, FastText, or contextual embeddings like
BERT.
4.
Sentiment Classification:
Applying machine learning or deep learning algorithms to classify
sentiment into positive, negative, or neutral categories.
5.
Prediction Integration:
Combining sentiment scores with historical stock prices, technical
indicators, and financial variables to improve forecasting performance.
4. Datasets
The performance of any stock market prediction model largely depends on the quality, quantity, and
diversity of the datasets used for training and evaluation. Stock market datasets contain historical and real-
time information related to stock prices, trading activities, company financials, macroeconomic indicators,
and investor sentiment. These datasets enable machine learning and deep learning algorithms to identify
hidden patterns, trends, and relationships that can be used to forecast future stock price movements. [4,5]
With the advancement of Artificial Intelligence (AI), Machine Learning (ML), and Big Data technologies,
researchers increasingly combine multiple data sources rather than relying solely on historical price data.
Integrating numerical financial data with textual information from news articles and social media has
significantly improved prediction accuracy and model robustness.
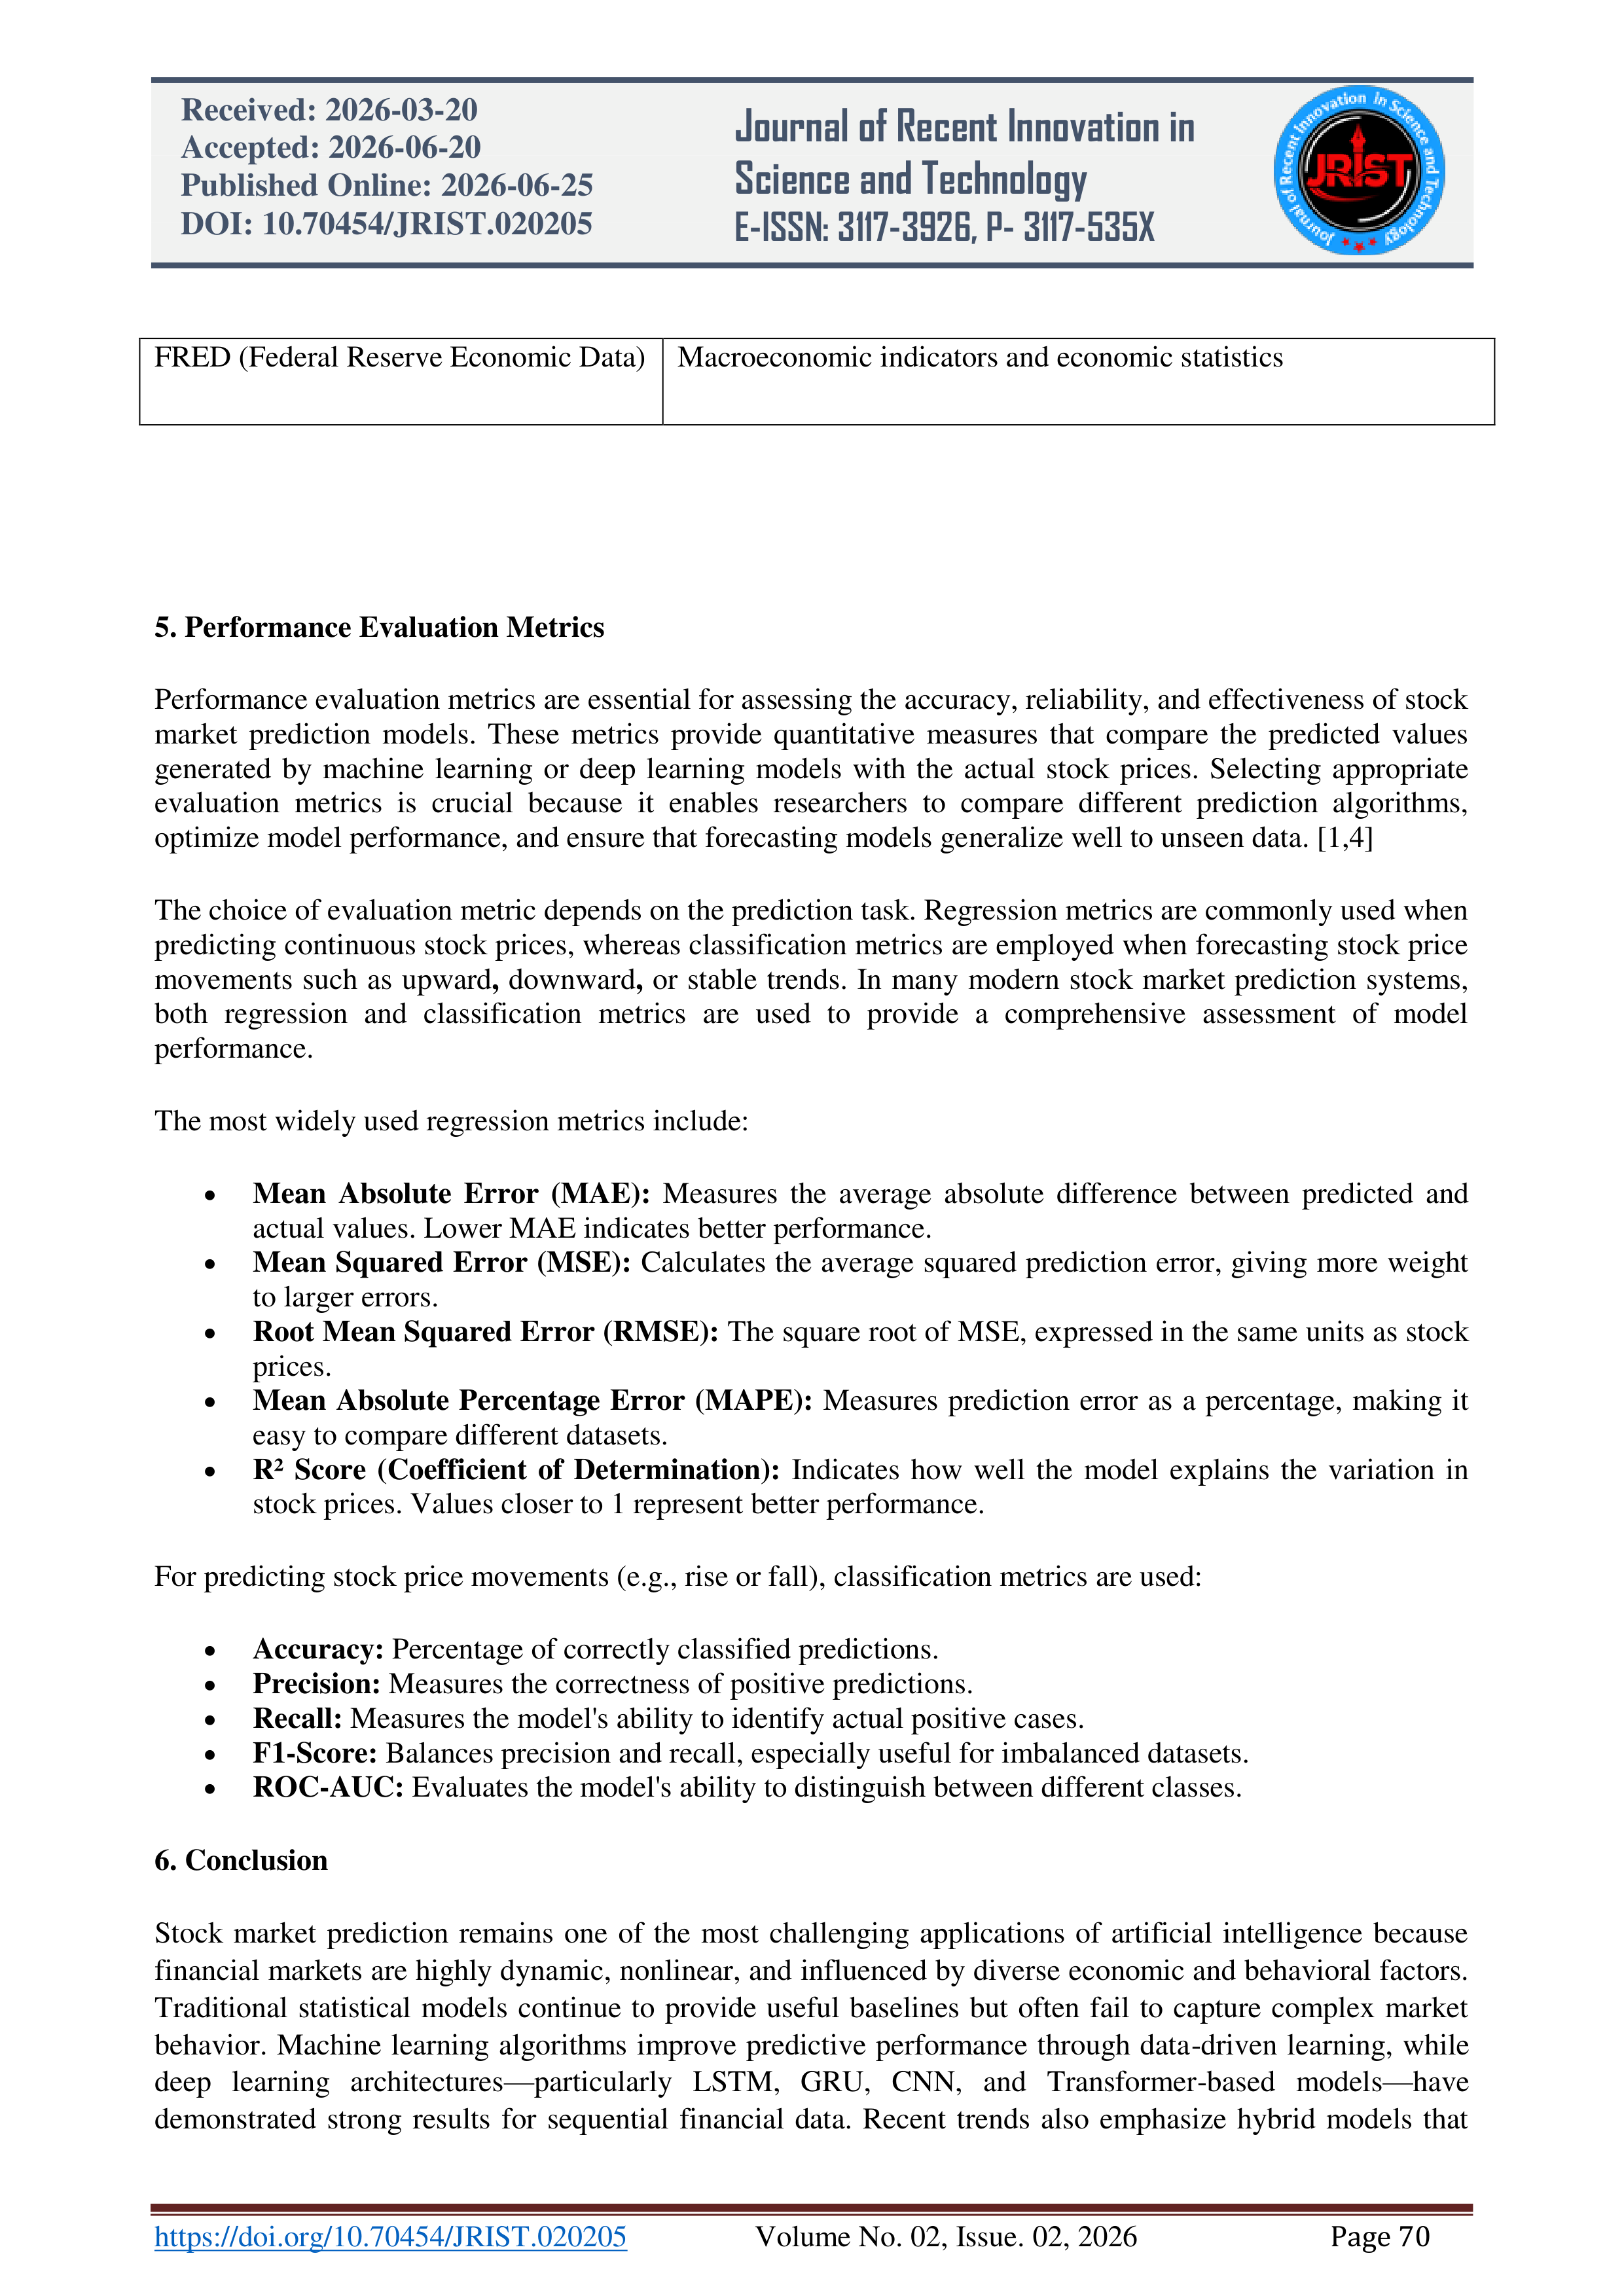
Dataset
Description
Yahoo Finance
Historical stock prices, trading volume, and adjusted closing
prices
Alpha Vantage
Real-time and historical stock market data with technical
indicators
Google Finance
Market prices and financial information
Kaggle Stock Market Datasets
Curated datasets for machine learning research
NASDAQ Historical Data
Historical trading data for NASDAQ-listed companies
New York Stock Exchange (NYSE)
Data
Historical stock market information
Investing.com
Market prices, indices, commodities, and economic indicators
Quandl (Nasdaq Data Link)
Financial and economic datasets for research

https://doi.org/10.70454/JRIST.020205
Volume No. 02, Issue. 02, 2026
Page 70
Journal of Recent Innovation in
Science and Technology
E-ISSN: 3117-3926, P- 3117-535X
Received: 2026-03-20
Accepted: 2026-06-20
Published Online: 2026-06-25
DOI: 10.70454/JRIST.020205
FRED (Federal Reserve Economic Data)
Macroeconomic indicators and economic statistics
5. Performance Evaluation Metrics
Performance evaluation metrics are essential for assessing the accuracy, reliability, and effectiveness of stock
market prediction models. These metrics provide quantitative measures that compare the predicted values
generated by machine learning or deep learning models with the actual stock prices. Selecting appropriate
evaluation metrics is crucial because it enables researchers to compare different prediction algorithms,
optimize model performance, and ensure that forecasting models generalize well to unseen data. [1,4]
The choice of evaluation metric depends on the prediction task. Regression metrics are commonly used when
predicting continuous stock prices, whereas classification metrics are employed when forecasting stock price
movements such as upward
,
downward
,
or stable trends. In many modern stock market prediction systems,
both regression and classification metrics are used to provide a comprehensive assessment of model
performance.
The most widely used regression metrics include:
Mean Absolute Error (MAE):
Measures the average absolute difference between predicted and
actual values. Lower MAE indicates better performance.
Mean Squared Error (MSE):
Calculates the average squared prediction error, giving more weight
to larger errors.
Root Mean Squared Error (RMSE):
The square root of MSE, expressed in the same units as stock
prices.
Mean Absolute Percentage Error (MAPE):
Measures prediction error as a percentage, making it
easy to compare different datasets.
R² Score (Coefficient of Determination):
Indicates how well the model explains the variation in
stock prices. Values closer to 1 represent better performance.
For predicting stock price movements (e.g., rise or fall), classification metrics are used:
Accuracy:
Percentage of correctly classified predictions.
Precision:
Measures the correctness of positive predictions.
Recall:
Measures the model's ability to identify actual positive cases.
F1-Score:
Balances precision and recall, especially useful for imbalanced datasets.
ROC-AUC:
Evaluates the model's ability to distinguish between different classes.
6. Conclusion
Stock market prediction remains one of the most challenging applications of artificial intelligence because
financial markets are highly dynamic, nonlinear, and influenced by diverse economic and behavioral factors.
Traditional statistical models continue to provide useful baselines but often fail to capture complex market
behavior. Machine learning algorithms improve predictive performance through data-driven learning, while
deep learning architectures—particularly LSTM, GRU, CNN, and Transformer-based models—have
demonstrated strong results for sequential financial data. Recent trends also emphasize hybrid models that

https://doi.org/10.70454/JRIST.020205
Volume No. 02, Issue. 02, 2026
Page 71
Journal of Recent Innovation in
Science and Technology
E-ISSN: 3117-3926, P- 3117-535X
Received: 2026-03-20
Accepted: 2026-06-20
Published Online: 2026-06-25
DOI: 10.70454/JRIST.020205
integrate numerical data with textual sentiment from news and social media. Despite these advances,
challenges such as overfitting, interpretability, data quality, and generalization remain significant. Future
research is expected to focus on explainable AI, multimodal learning, reinforcement learning, and large
language models to build more robust, transparent, and adaptive stock prediction systems.
References
[1]
D. P. Gandhmal and K. Kumar, "Systematic Analysis and Review of Stock Market Prediction
Techniques,"
Computer Science Review
, 2019.
[2]
I. K. Nti, A. F. Adekoya, and B. A. Weyori, "A Systematic Review of Fundamental and Technical
Analysis of Stock Market Predictions,"
Artificial Intelligence Review
, 2020.
[3]
D. Shah, H. Isah, and F. Zulkernine, "Stock Market Analysis: A Review and Taxonomy of
Prediction Techniques,"
International Journal of Financial Studies
, 2019.
[4]
Deepak Kumar, P. K. Sarangi, and R. Verma, "A Systematic Review of Stock Market Prediction
Using Machine Learning and Statistical Techniques,"
Materials Today: Proceedings
, 2022.
[5]
H. H. Htun, M. Biehl, and N. Petkov, "Survey of Feature Selection and Extraction Techniques for
Stock Market Prediction,"
Financial Innovation
, 2023.
[6]
J. Zou et al., "Stock Market Prediction via Deep Learning Techniques: A Survey,"
arXiv
, 2022.
[7]
M. Saberironaghi, J. Ren, and A. Saberironaghi, "Stock Market Prediction Using Machine Learning
and Deep Learning Techniques: A Review,"
AppliedMath
, 2025.